

Compact Muon Solenoid
LHC, CERN
| CMS-PAS-HIG-21-018 | ||
| Combined measurements and interpretations of Higgs boson production and decay at $ \sqrt{s}= $ 13 TeV | ||
| CMS Collaboration | ||
| 14 April 2025 | ||
| Abstract: Combined measurements of Higgs boson production and decay rates are presented. The analyses included use proton-proton collision data recorded by the CMS experiment at $ \sqrt{s}= $ 13 TeV from 2016 to 2018, corresponding to an integrated luminosity of 138 fb$ ^{-1} $. The statistical combination is based on analyses which measure the following decay channels: $ \mathrm{H}\rightarrow\gamma\gamma $, $ \mathrm{H}\rightarrow\mathrm{ZZ} $, $ \mathrm{H}\rightarrow\mathrm{WW} $, $ \mathrm{H}\rightarrow\tau\tau $, $ \mathrm{H}\rightarrow\mathrm{bb} $, $ \mathrm{H}\rightarrow\mu\mu $ and $ \mathrm{H}\rightarrow\mathrm{Z}\gamma $. Each decay channel targets multiple Higgs boson production modes. Searches for invisible Higgs boson decays are also considered, as well as an analysis which measures offshell Higgs boson production in the $ \mathrm{H} \rightarrow \mathrm{ZZ} \rightarrow 4\ell $ decay channel. The best-fit inclusive signal yield is measured to be 1.014 $ ^{+0.055}_{-0.053} $ times the standard model expectation, for a Higgs boson mass of 125.38 GeV. Additional results are provided for various assumptions on Higgs boson production and decay. This includes measurements of production mode cross sections and branching fractions, measurements of kinematic regions defined by the simplified template cross section framework, as well as interpretations in the coupling modifier and standard model effective field theory frameworks. This note represents the most comprehensive study of Higgs boson production and decay performed by the CMS experiment to-date. | ||
| Links: CDS record (PDF) ; CADI line (restricted) ; | ||
| Figures | |
png pdf |
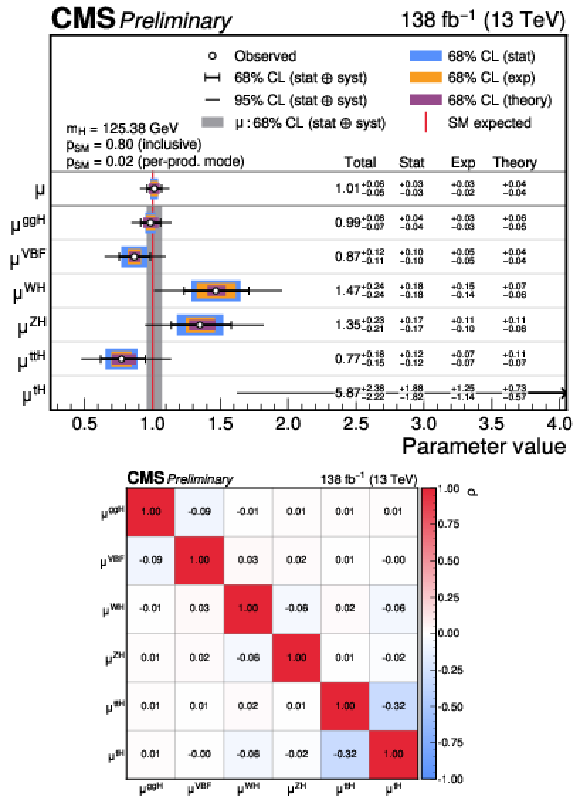
Figure 1:
The measured inclusive ($ \mu $) and per-production mode ($ \mu^i $) signal-strength modifiers. In the top plot, the thick (thin) black lines indicate the 68% (95%) CL intervals, with the theoretical systematic, experimental systematic and statistical components of the 68% intervals indicated by the purple, orange, and blue bands, respectively. The grey band shows the 68% CL interval on the inclusive signal-strength modifier. The $ p_{\rm{SM}} $ values are shown in the plot to indicate the compatibility with the SM hypothesis. The correlations between the 6 parameters in the per-production mode fit are shown in the bottom plot. The size of the correlations is indicated by the colour scale. |
png pdf |
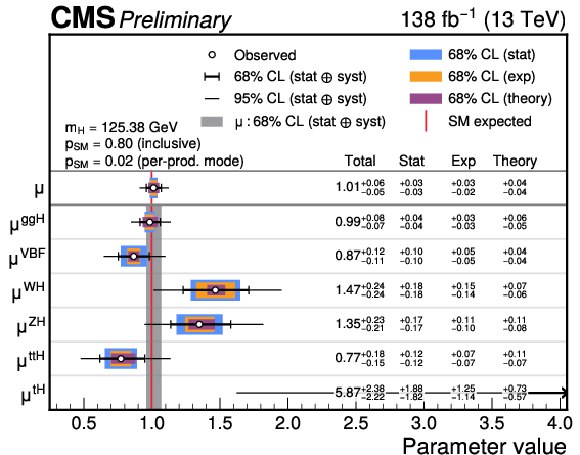
Figure 1-a:
The measured inclusive ($ \mu $) and per-production mode ($ \mu^i $) signal-strength modifiers. In the top plot, the thick (thin) black lines indicate the 68% (95%) CL intervals, with the theoretical systematic, experimental systematic and statistical components of the 68% intervals indicated by the purple, orange, and blue bands, respectively. The grey band shows the 68% CL interval on the inclusive signal-strength modifier. The $ p_{\rm{SM}} $ values are shown in the plot to indicate the compatibility with the SM hypothesis. The correlations between the 6 parameters in the per-production mode fit are shown in the bottom plot. The size of the correlations is indicated by the colour scale. |
png pdf |
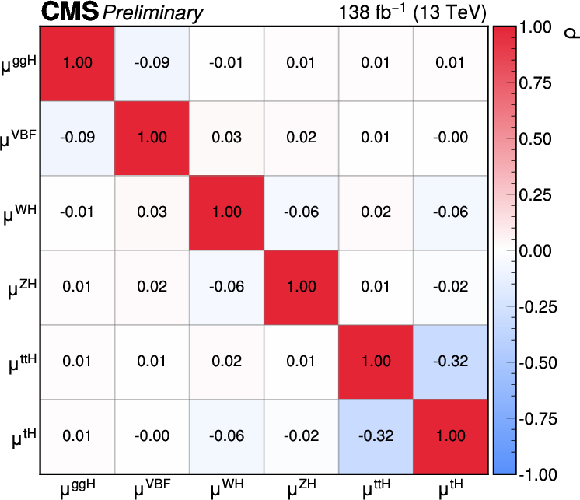
Figure 1-b:
The measured inclusive ($ \mu $) and per-production mode ($ \mu^i $) signal-strength modifiers. In the top plot, the thick (thin) black lines indicate the 68% (95%) CL intervals, with the theoretical systematic, experimental systematic and statistical components of the 68% intervals indicated by the purple, orange, and blue bands, respectively. The grey band shows the 68% CL interval on the inclusive signal-strength modifier. The $ p_{\rm{SM}} $ values are shown in the plot to indicate the compatibility with the SM hypothesis. The correlations between the 6 parameters in the per-production mode fit are shown in the bottom plot. The size of the correlations is indicated by the colour scale. |
png pdf |
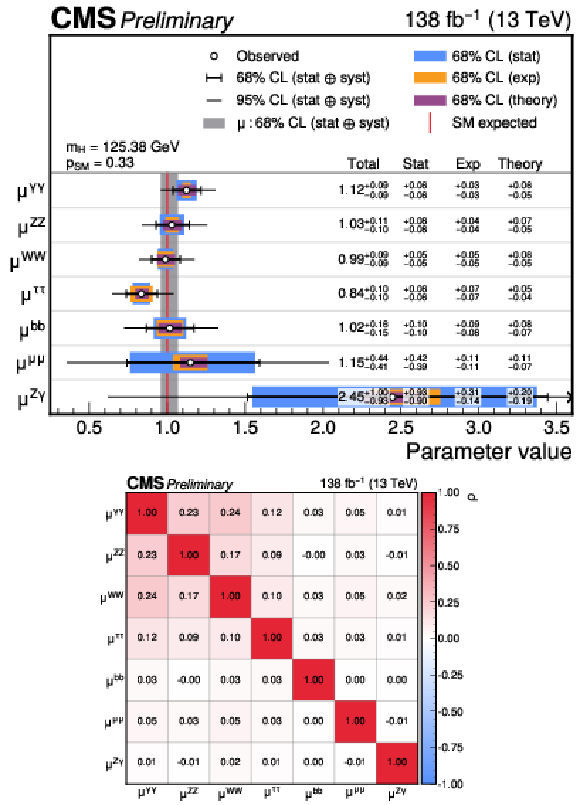
Figure 2:
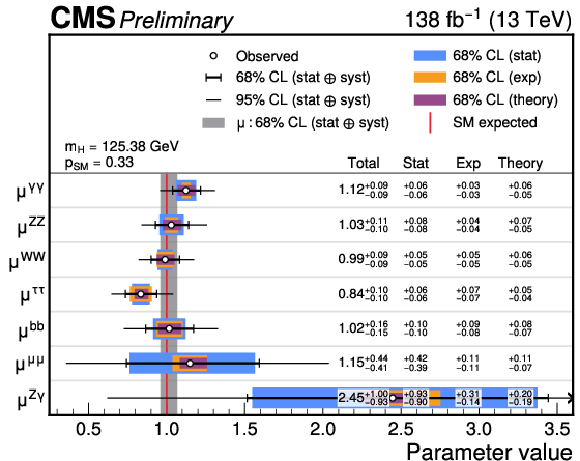
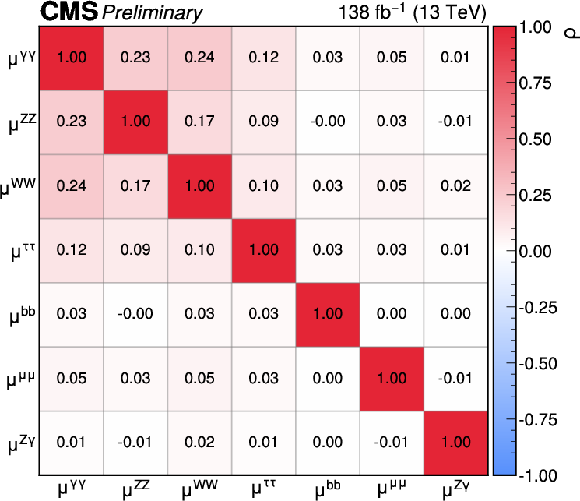
The measured per-decay channel signal-strength modifiers, $ \mu^f $. In the top plot, the thick (thin) black lines indicate the 68% (95%) CL intervals, with the theoretical systematic, experimental systematic and statistical components of the 68% intervals indicated by the purple, orange, and blue bands, respectively. The grey band shows the 68% CL interval on the inclusive signal-strength modifier. The $ p_{\rm{SM}} $ value is shown in the plot to indicate the compatibility with the SM hypothesis. The correlations between the 7 parameters considered in this fit are shown in the bottom plot. The size of the correlations is indicated by the colour scale. |
png pdf |
Figure 2-a:
The measured per-decay channel signal-strength modifiers, $ \mu^f $. In the top plot, the thick (thin) black lines indicate the 68% (95%) CL intervals, with the theoretical systematic, experimental systematic and statistical components of the 68% intervals indicated by the purple, orange, and blue bands, respectively. The grey band shows the 68% CL interval on the inclusive signal-strength modifier. The $ p_{\rm{SM}} $ value is shown in the plot to indicate the compatibility with the SM hypothesis. The correlations between the 7 parameters considered in this fit are shown in the bottom plot. The size of the correlations is indicated by the colour scale. |
png pdf |
Figure 2-b:
The measured per-decay channel signal-strength modifiers, $ \mu^f $. In the top plot, the thick (thin) black lines indicate the 68% (95%) CL intervals, with the theoretical systematic, experimental systematic and statistical components of the 68% intervals indicated by the purple, orange, and blue bands, respectively. The grey band shows the 68% CL interval on the inclusive signal-strength modifier. The $ p_{\rm{SM}} $ value is shown in the plot to indicate the compatibility with the SM hypothesis. The correlations between the 7 parameters considered in this fit are shown in the bottom plot. The size of the correlations is indicated by the colour scale. |
png pdf |
Figure 3:
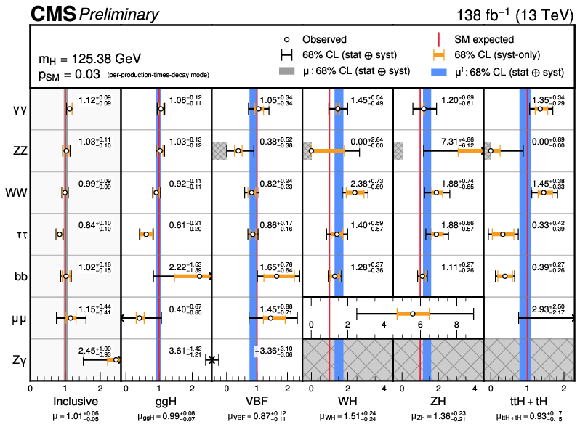
Summary of the signal-strength modifier measurements. The white circles and black lines represent the best-fit points and 68% CL intervals, respectively. The orange lines indicate the systematic components of the total 68% CL intervals. The left-hand panel shows the measurements of the per-decay channel signal-strengths, whilst the grey band shows the 68% CL interval on the inclusive signal-strength modifier. The other panels show the measurements of the per-production-times-decay channel signal-strength modifiers, $ \mu^{if} $. Within these panels, the blue bands indicate the 68% CL intervals on the per-production mode signal-strength modifiers. The SM predicted values are indicated by the red lines, and the $ p_{\rm{SM}} $ value from the per-production-times-decay channel fit is shown in the plot to indicate the compatibility with the SM hypothesis. The central values and 68% CL intervals for the $ \mu^{if} $ parameters are explicitly written in each panel of the plot. The $ \mathrm{H}\to\mathrm{Z}\mathrm{Z} $ signal-strengths are constrained to be non-negative as indicated by the hatched boxes. Additionally, the $ \mathrm{WH} $, $ \mathrm{ZH} $ and $ \mathrm{ttH} $ + tH production modes for the $ \mathrm{H}\to\mathrm{Z}\gamma $ channel are constrained to the SM predictions, a feature which is also indicated by hatched boxes. |

png pdf |
Figure 4:
The correlations between the 31 parameters considered in the per-production-times-decay channel fit. The size of the correlations is indicated by the colour scale. Correlations with an absolute magnitude of less than 0.005 are not shown. |
png pdf |
Figure 5:
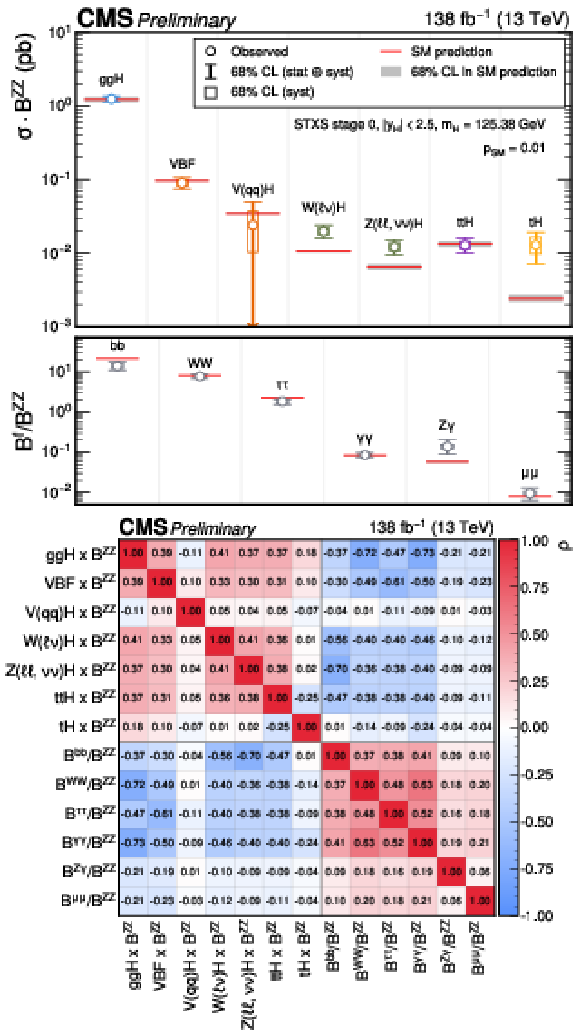
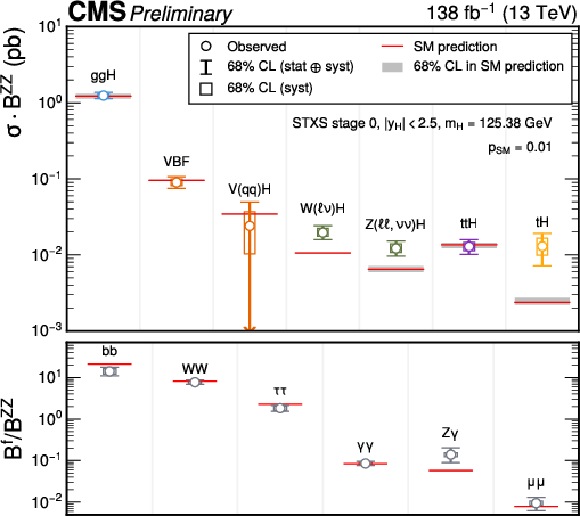
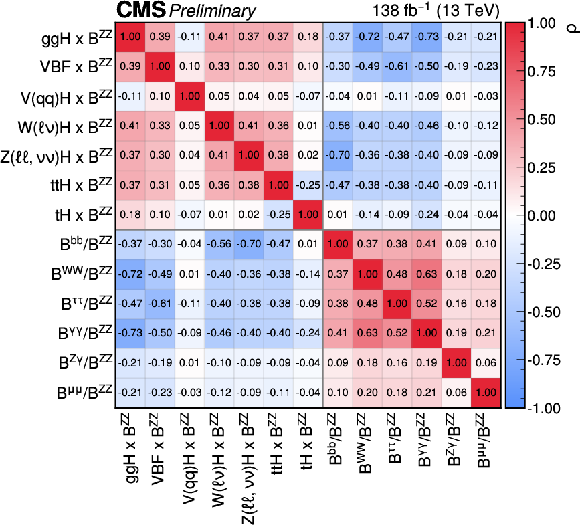
The measured STXS stage 0 cross sections and branching fraction ratios. Theory uncertainties which affect the normalisations of the measured parameters are not included in the fit. In the top plot, the points indicate the best fit values and the vertical lines with caps indicate the 68% CL intervals. The wider boxes show the systematic uncertainty components of the 68% CL intervals. Each measured quantity is compared to the SM prediction in red, where the grey bands indicate the theoretical uncertainty in the respective prediction. The bottom plot shows the correlations between the 13 parameters considered in this fit. The size of the correlations is indicated by the colour scale. |
png pdf |
Figure 5-a:
The measured STXS stage 0 cross sections and branching fraction ratios. Theory uncertainties which affect the normalisations of the measured parameters are not included in the fit. In the top plot, the points indicate the best fit values and the vertical lines with caps indicate the 68% CL intervals. The wider boxes show the systematic uncertainty components of the 68% CL intervals. Each measured quantity is compared to the SM prediction in red, where the grey bands indicate the theoretical uncertainty in the respective prediction. The bottom plot shows the correlations between the 13 parameters considered in this fit. The size of the correlations is indicated by the colour scale. |
png pdf |
Figure 5-b:
The measured STXS stage 0 cross sections and branching fraction ratios. Theory uncertainties which affect the normalisations of the measured parameters are not included in the fit. In the top plot, the points indicate the best fit values and the vertical lines with caps indicate the 68% CL intervals. The wider boxes show the systematic uncertainty components of the 68% CL intervals. Each measured quantity is compared to the SM prediction in red, where the grey bands indicate the theoretical uncertainty in the respective prediction. The bottom plot shows the correlations between the 13 parameters considered in this fit. The size of the correlations is indicated by the colour scale. |

png pdf |
Figure 6:
The measured STXS stage 1.2 cross sections and branching fraction ratios. Theory uncertainties which affect the normalisations of the measured parameters are not included in the fit. In the top panel, the points indicate the best-fit values whilst the coloured lines indicate the 68% CL intervals. The wider coloured boxes show the systematic uncertainty components of the 68% CL intervals. Each measured quantity is compared to the SM prediction in red, where the grey bands indicate the theoretical uncertainty for the respective parameter. The bottom panel plots the ratio of the measured $ \sigma^i\times\mathcal{B}^{\mathrm{Z}\mathrm{Z}} $ with respect to the SM predictions. The best-fit values and 68% CL intervals for the $ \mathrm{ggH} $ 450 $ < p_{\mathrm{T}}^{\mathrm{H}} < $ 650 GeV and tH STXS bins lie outside of the range of the ratio panel, and are thus represented by arrows. |
png pdf |
Figure 7:
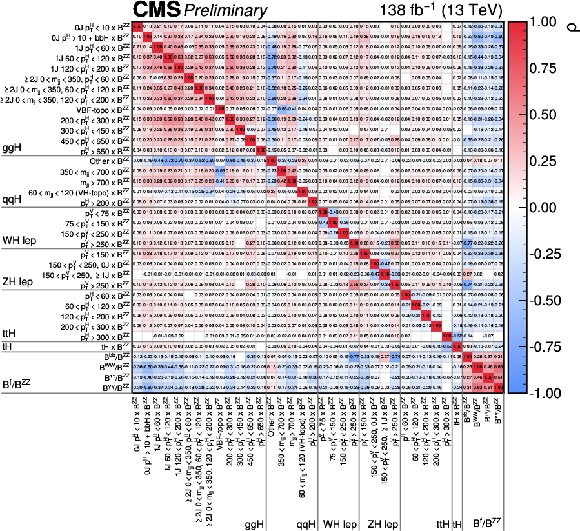
The correlations between the 36 parameters considered in STXS stage 1.2 fit. The size of the correlations is indicated by the colour scale. Correlations of (absolute) size less than 0.005 are not shown. |
png pdf |
Figure 8:
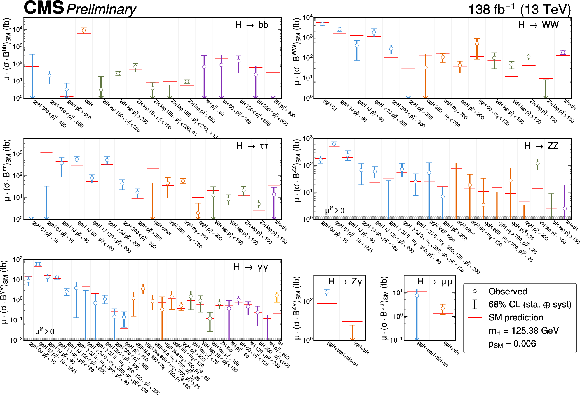
The best fit values (white circles) and 68% CL intervals (coloured lines) for the cross section times branching fraction fit. Theory uncertainties which affect the cross section normalisations and branching fractions are included in the fit. The best-fit cross section times branching fractions are obtained by multiplying the fit parameters $ \mu^{if} $ by the SM predictions at the highest-available order. Different panels show the measurements for the different Higgs boson decay channels. The ($ \mathrm{ttH} p_{\mathrm{T}}^{\mathrm{H}} > $ 300 GeV, $ \mathrm{H}\to\mathrm{b}\mathrm{b} $), ($ \mathrm{ggH} p_{\mathrm{T}}^{\mathrm{H}} > $ 300 GeV, $ \mathrm{H}\to\mathrm{W}\mathrm{W} $) and ($ \mathrm{ggH} $ 0J $ p_{\mathrm{T}}^{\mathrm{H}} < $ 10 GeV, $ \mathrm{H}\to\tau\tau $) best-fit values and 68% CL intervals are entirely contained in the negative domain, and are represented by arrows as they cannot be added to the log-scale axes. The $ \mathrm{H}\to\gamma\gamma $ and $ \mathrm{H}\to\mathrm{Z}\mathrm{Z} $ parameters are restricted to non-negative values which is marked by the hatched grey lines in the corresponding panels. |
png pdf |
Figure 9:
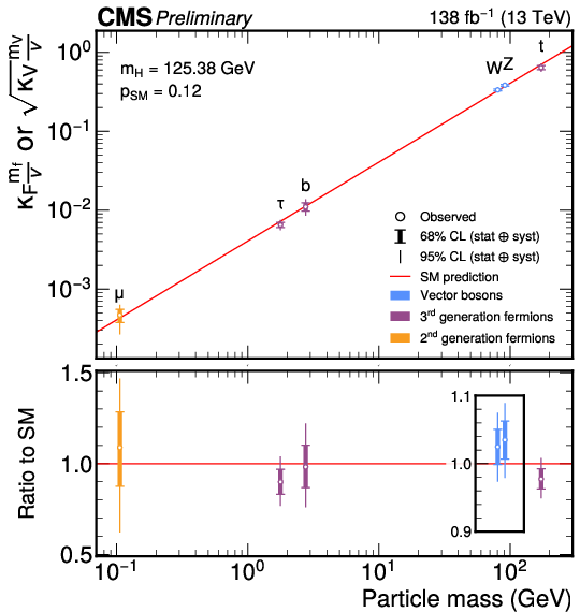
The measured coupling modifiers of the Higgs boson to fermions and gauge bosons, as measured in the resolved coupling modifier fit. The measurements are shown as functions of the fermion or gauge boson mass, where $ v $ is the vacuum expectation value of the BEH field. The particle masses are evaluated at the Higgs boson mass scale. The uncertainties in the particle mass values are not shown in the plot. For gauge bosons, the square root of the coupling modifier is plotted to keep a linear proportionality to the mass, as predicted by the SM. |
png pdf |
Figure 10:
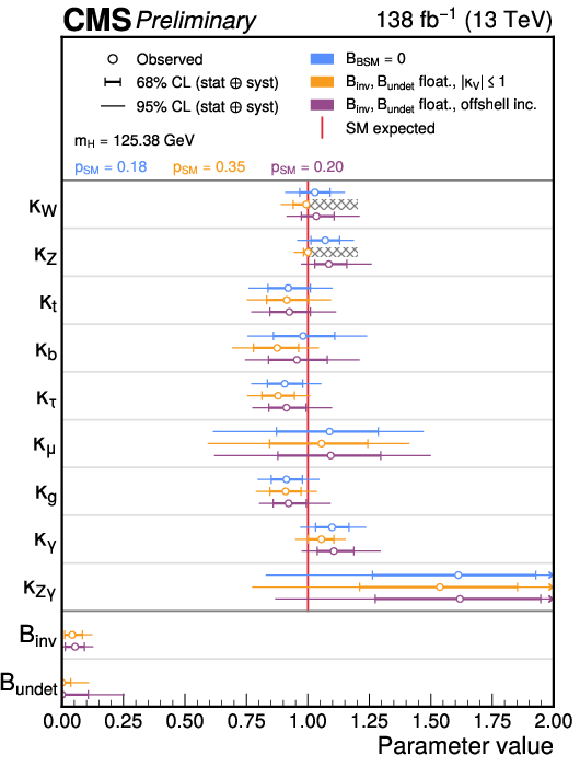
The measured Higgs boson coupling modifiers in the effective coupling configuration. The best-fit values, and 68% and 95% CL intervals are shown for each of the models considered. The results where no additional BSM contributions to the Higgs boson total decay width are shown in blue. The results for the model which introduces BSM contributions but places an external constraint (hatched boxes) on $ |\kappa_{\mathrm{W}}| $ and $ |\kappa_{\mathrm{Z}}| $ are shown in orange. The results for the fit in which the offshell analysis regions are included are shown in purple. |
png pdf |
Figure 11:
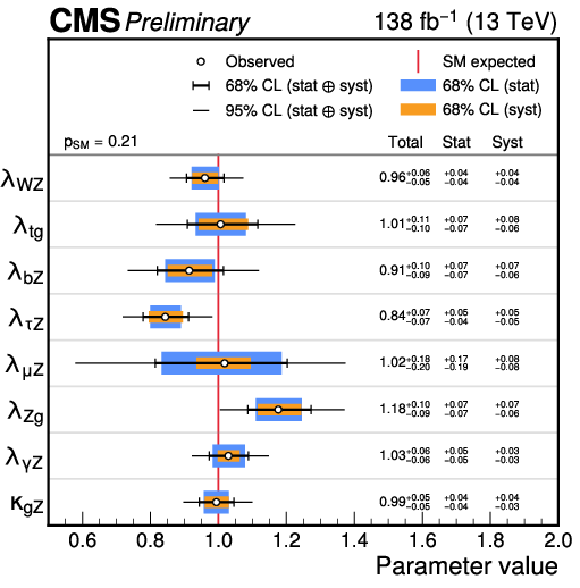
The measured parameters in the ratios of coupling modifiers fit. The thick (thin) black lines indicate the 68% (95%) CL intervals, with the statistical and systematic components of the 68% interval indicated by the blue and orange bands, respectively. |
png pdf |
Figure 12:
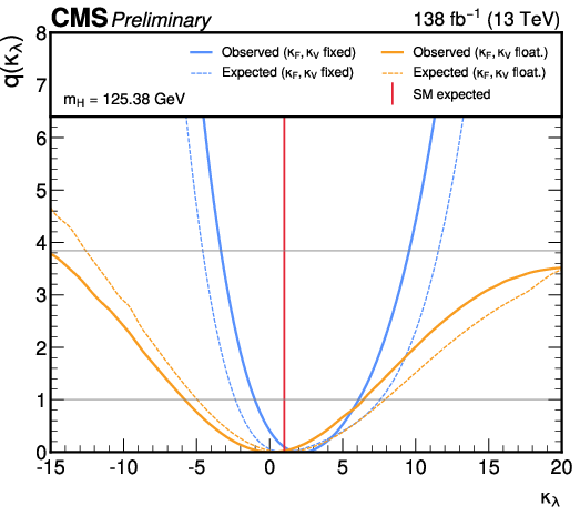
Profile likelhood scans as a function of $ \kappa_\lambda $ for the observed data (solid lines). The expected results assuming a SM Higgs boson derived using an Asimov data set with $ \kappa_\lambda= $ 1 are shown by the dashed lines. The blue lines represent the case where $ \kappa_{\mathrm{F}} $ and $ \kappa_{\mathrm{V}} $ are fixed to 1. The orange lines represent the case where $ \kappa_{\mathrm{F}} $ and $ \kappa_{\mathrm{V}} $ are profiled. |
png pdf |
Figure 13:
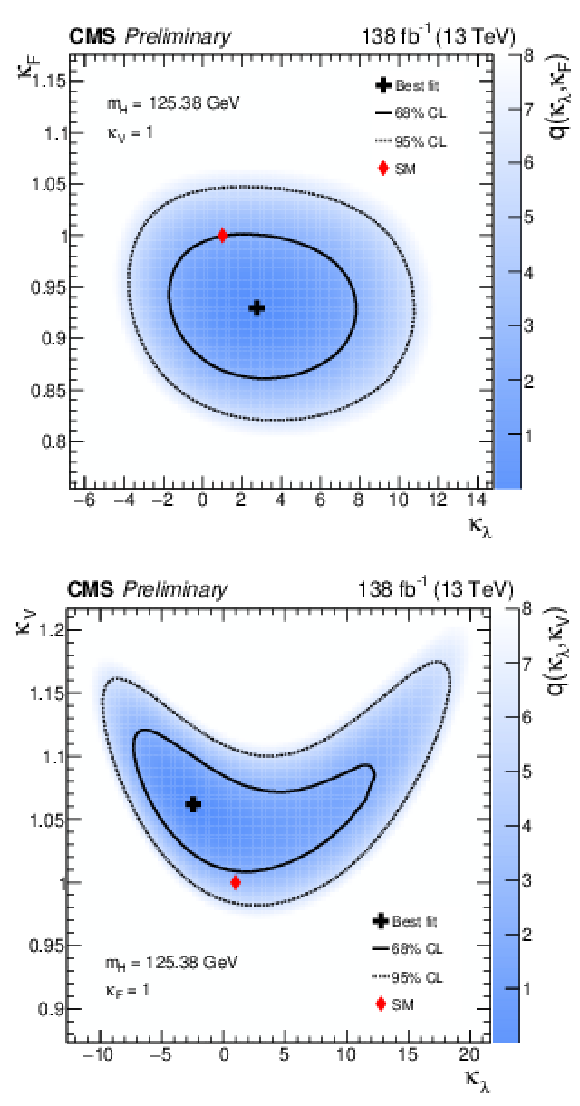
Profile likelihood scans as a function of $ \kappa_{\lambda} $-vs-$ \kappa_{\mathrm{F}} $ (top) and $ \kappa_{\lambda} $-vs-$ \kappa_{\mathrm{V}} $ (bottom). The blue colour scale shows the value of $ q $ at each point in the scan. The black marker, and solid and dashed lines show the best-fit point, and the 68% and 95% CL contours, respectively. The red marker corresponds to the SM prediction. |
png pdf |
Figure 13-a:
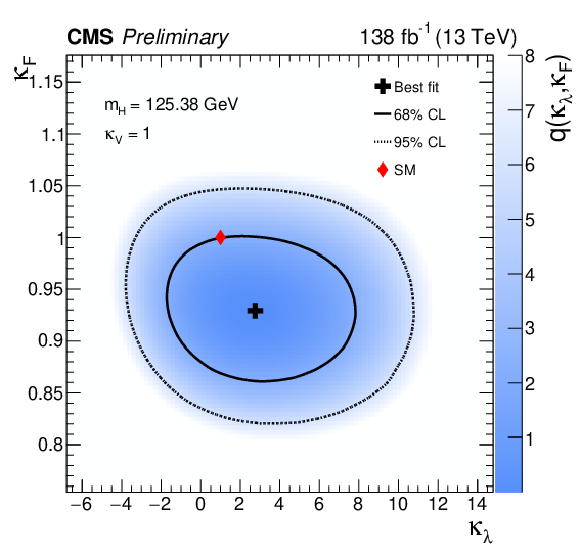
Profile likelihood scans as a function of $ \kappa_{\lambda} $-vs-$ \kappa_{\mathrm{F}} $ (top) and $ \kappa_{\lambda} $-vs-$ \kappa_{\mathrm{V}} $ (bottom). The blue colour scale shows the value of $ q $ at each point in the scan. The black marker, and solid and dashed lines show the best-fit point, and the 68% and 95% CL contours, respectively. The red marker corresponds to the SM prediction. |
png pdf |
Figure 13-b:
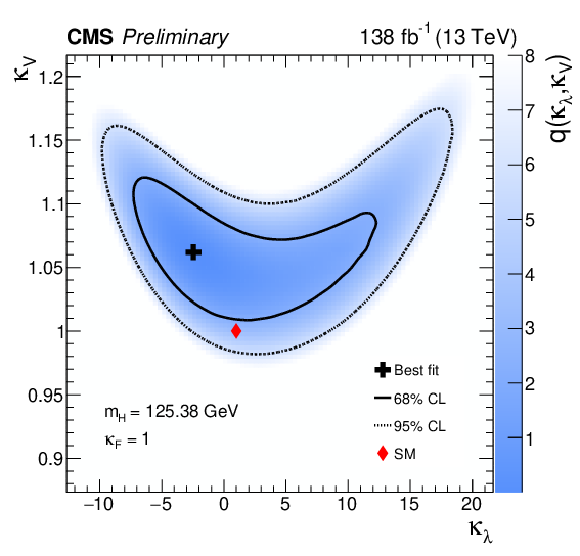
Profile likelihood scans as a function of $ \kappa_{\lambda} $-vs-$ \kappa_{\mathrm{F}} $ (top) and $ \kappa_{\lambda} $-vs-$ \kappa_{\mathrm{V}} $ (bottom). The blue colour scale shows the value of $ q $ at each point in the scan. The black marker, and solid and dashed lines show the best-fit point, and the 68% and 95% CL contours, respectively. The red marker corresponds to the SM prediction. |
png pdf |
Figure 14:
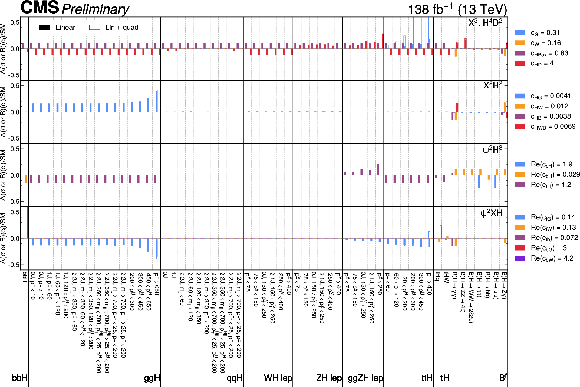
Impact of the SMEFT operators on the Higgs boson cross sections and branching fractions. Units of GeV are assumed for all numerical values related to the $ p_{\mathrm{T}}^\mathrm{H} $, $ m_{\rm{jj}} $, $ p_{\mathrm{T}}^{\mathrm{H}\rm{jj}} $, and $ p_{\mathrm{T}}^\mathrm{V} $ variables. The impacts are shown for operators from the following groups: $ X^3 $, $ H^4D^2 $, $ X^2H^2 $, $ \psi^2H^3 $ and $ \psi^2XH $. The WCs are set to the expected symmetrised 95% CL interval value in the linear-plus-quadratic parametrisation, assuming all other WCs are set to zero (SM). The impacts are shown relative to the SM predictions for the linear parametrisation in the filled histograms, and the linear-plus-quadratic parametrisation in the unfilled histograms. |

png pdf |
Figure 15:
Impact of the SMEFT operators on the Higgs boson cross sections and branching fractions. Units of GeV are assumed for all numerical values related to the $ p_{\mathrm{T}}^\mathrm{H} $, $ m_{\rm{jj}} $, $ p_{\mathrm{T}}^{\mathrm{H}\rm{jj}} $, and $ p_{\mathrm{T}}^\mathrm{V} $ variables. The impacts are shown for operators from the $ \psi^2H^2D $ group. The WCs are set to the expected symmetrised 95% CL interval value in the linear-plus-quadratic parametrisation, assuming all other WCs are set to zero (SM). The impacts are shown relative to the SM predictions for the linear parametrisation in the filled histograms, and the linear-plus-quadratic parametrisation in the unfilled histograms. |
png pdf |
Figure 16:
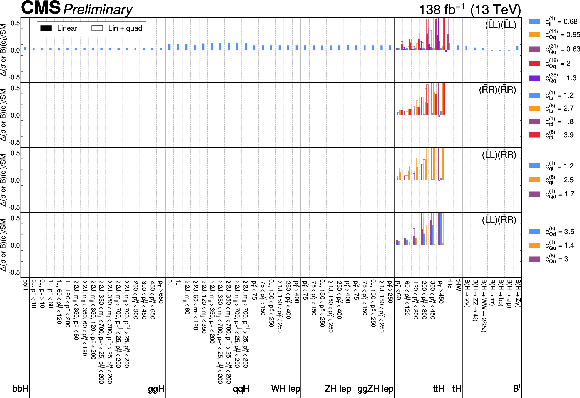
Impact of the SMEFT operators on the Higgs boson cross sections and branching fractions. Units of GeV are assumed for all numerical values related to the $ p_{\mathrm{T}}^\mathrm{H} $, $ m_{\rm{jj}} $, $ p_{\mathrm{T}}^{\mathrm{H}\rm{jj}} $, and $ p_{\mathrm{T}}^\mathrm{V} $ variables. The impacts are shown for operators from the four-fermion groups. The WCs are set to the expected symmetrised 95% CL interval value in the linear-plus-quadratic parametrisation, assuming all other WCs are set to zero (SM). The impacts are shown relative to the SM predictions for the linear parametrisation in the filled histograms, and the linear-plus-quadratic parametrisation in the unfilled histograms. |

png pdf |
Figure 17:
Individual constraints on the SMEFT WCs. The left panel shows the best-fit values, and the 68% and 95% CL intervals when considering modifications in one SMEFT operator at a time. The results from the linear and linear-plus-quadratic parametrisations are shown in blue and orange, respectively. In the right panel, the results are translated into a 95% lower limit on the new physics energy scale. The WCs are categorised into operators from the same group, and then listed in order of the probed energy scale using the linear-plus-quadratic parametrisation. The hatched lines represent WCs which cannot be constrained in the linear-only parametrisation. |
png pdf |
Figure 18:
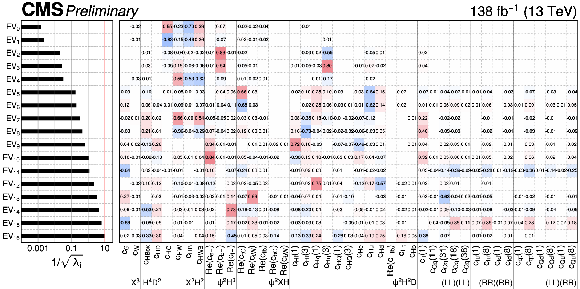
Truncated rotation matrix $ \mathcal{R} $, derived using the PCA procedure. Only the 17 eigenvectors which are included in the fit are shown. Each row represents a different eigenvector $ \mathrm{EV}_j $ ordered by constraining power. The left panel shows 1 $ /\sqrt{\lambda_j} $ for each eigenvector, where $ \lambda_j $ is the corresponding eigenvalue. This quantity provides an estimate of the expected 68% CL intervals. The vertical red line identifies the threshold beyond which the eigenvectors are not considered in the fit. The right panel shows the rotation matrix elements, $ \mathcal{R}_{jk} $, for each Wilson coefficient $ c_k $, such that $ \mathrm{EV}_j = \sum_k \mathcal{R}_{jk}c_k $. The size of each element is represented by a colour scale with red meaning large positive values and blue meaning large negative values. The value of each element is also shown in the plot. |

png pdf |
Figure 19:
Impact of the eigenvectors $ \mathrm{EV}_j $ on the $ \mu^{if} $ parameters from the 97 POI fit (Fig. 8), for the $ \mathrm{H}\to\gamma\gamma $, $ \mathrm{H}\to\mathrm{Z}\mathrm{Z}\to4\ell $, $ \mathrm{H}\to\mu\mu $ and $ \mathrm{H}\to\mathrm{Z}\gamma $ decay channels. Units of GeV are assumed for all numerical values related to the $ p_{\mathrm{T}}^\mathrm{H} $, $ m_{\rm{jj}} $, $ p_{\mathrm{T}}^{\mathrm{H}\rm{jj}} $, and $ p_{\mathrm{T}}^\mathrm{V} $ variables. The $ \mathrm{EV}_j $ are individually set to their expected symmetrised 95% CL interval value in the fully profiled fit. When varying one eigenvector, all other eigenvectors are set to zero (SM). The impacts are shown relative to the SM predictions for the linear parametrisation. The eigenvectors are ordered from most sensitive (top) to least sensitive (bottom). All eigenvectors included in the fit are shown. |
png pdf |
Figure 20:
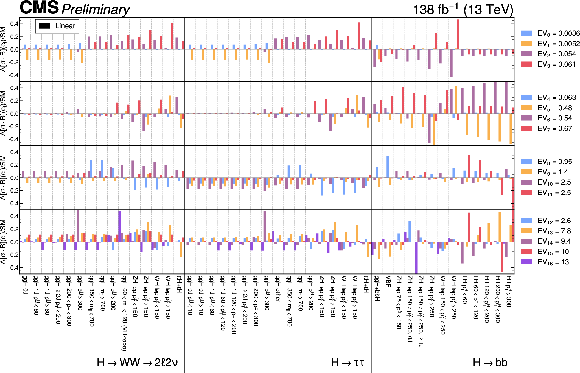
Impact of the eigenvectors $ \mathrm{EV}_j $ on the $ \mu^{if} $ parameters from the 97 POI fit (Fig. 8), for the $ \mathrm{H}\to\mathrm{W}\mathrm{W}\to\ell\nu\ell\nu $, $ \mathrm{H}\to\tau\tau $ and $ \mathrm{H}\to\mathrm{b}\mathrm{b} $ decay channels. Units of GeV are assumed for all numerical values related to the $ p_{\mathrm{T}}^\mathrm{H} $, $ m_{\rm{jj}} $, $ p_{\mathrm{T}}^{\mathrm{H}\rm{jj}} $, and $ p_{\mathrm{T}}^\mathrm{V} $ variables. The $ \mathrm{EV}_j $ are individually set to their expected symmetrised 95% CL interval value in the fully profiled fit. When varying one eigenvector, all other eigenvectors are set to zero (SM). The impacts are shown relative to the SM predictions for the linear parametrisation. The eigenvectors are ordered from most sensitive (top) to least sensitive (bottom). All eigenvectors included in the fit are shown. |

png pdf |
Figure 21:
Constraints on the linear combinations of SMEFT WCs extracted with the PCA procedure. The left panel shows the expected and observed best-fit values, and 68% and 95% CL intervals for a linear parametrisation with terms up to $ \mathcal{O}(\mathrm{EV}/\Lambda^2) $. In the right panel, the results are translated into a 95% lower limit on the new physics energy scale, assuming $ \mathrm{EV}_j = $ 1. The eigenvectors are listed in order of the expected excluded energy scale. |

png pdf |
Figure 22:
Correlation matrix for the linear combinations of SMEFT WCs extracted with the PCA procedure. |
png pdf |
Figure 23:
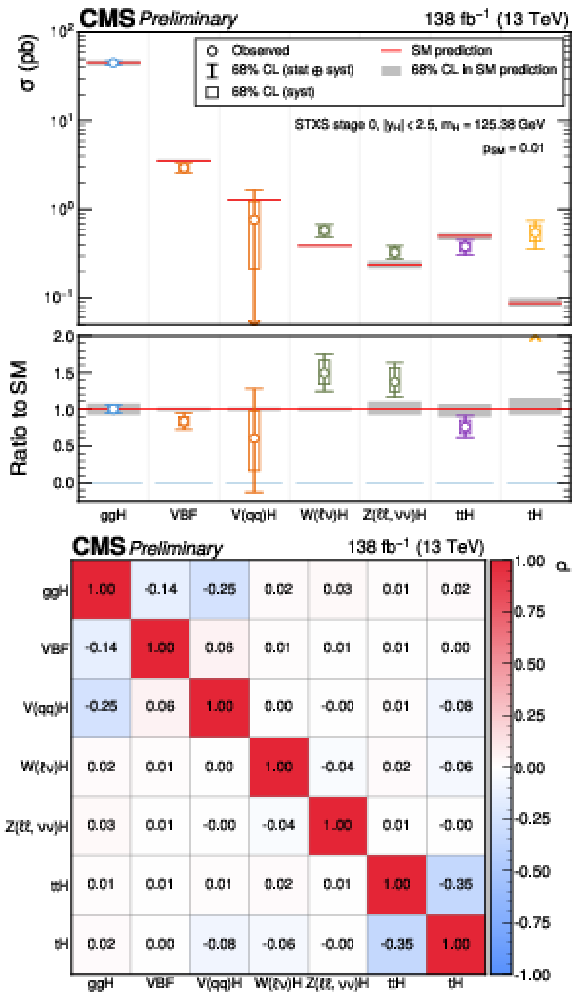
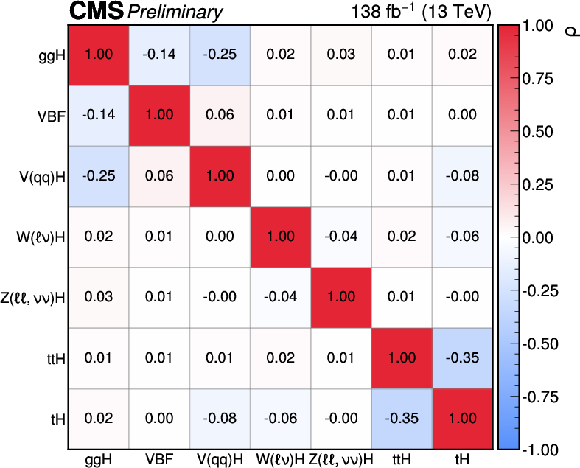
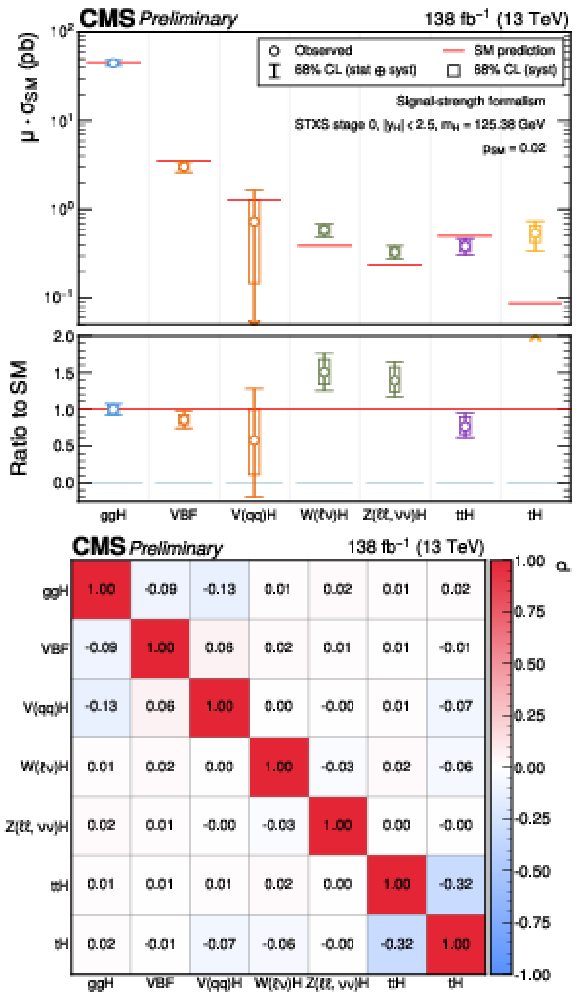
The measured STXS stage 0 cross sections, where the Higgs boson branching fractions are fixed to the SM predictions. Theory uncertainties which affect the normalisations of the measured cross sections are not included in the fit. In the top plot, the points indicate the best fit values and the vertical lines with caps indicate the 68% CL intervals. The wider boxes show the systematic uncertainty components of the 68% CL intervals. Each measured quantity is compared to the SM prediction in red, where the grey bands indicate the theoretical uncertainty in the respective prediction. The bottom panel of the top plot shows the ratio with respect to the SM prediction. The bottom plot shows the correlations between the 7 parameters considered in this fit. The size of the correlations is indicated by the colour scale. |

png pdf |
Figure 23-a:
The measured STXS stage 0 cross sections, where the Higgs boson branching fractions are fixed to the SM predictions. Theory uncertainties which affect the normalisations of the measured cross sections are not included in the fit. In the top plot, the points indicate the best fit values and the vertical lines with caps indicate the 68% CL intervals. The wider boxes show the systematic uncertainty components of the 68% CL intervals. Each measured quantity is compared to the SM prediction in red, where the grey bands indicate the theoretical uncertainty in the respective prediction. The bottom panel of the top plot shows the ratio with respect to the SM prediction. The bottom plot shows the correlations between the 7 parameters considered in this fit. The size of the correlations is indicated by the colour scale. |
png pdf |
Figure 23-b:
The measured STXS stage 0 cross sections, where the Higgs boson branching fractions are fixed to the SM predictions. Theory uncertainties which affect the normalisations of the measured cross sections are not included in the fit. In the top plot, the points indicate the best fit values and the vertical lines with caps indicate the 68% CL intervals. The wider boxes show the systematic uncertainty components of the 68% CL intervals. Each measured quantity is compared to the SM prediction in red, where the grey bands indicate the theoretical uncertainty in the respective prediction. The bottom panel of the top plot shows the ratio with respect to the SM prediction. The bottom plot shows the correlations between the 7 parameters considered in this fit. The size of the correlations is indicated by the colour scale. |
png pdf |
Figure 24:
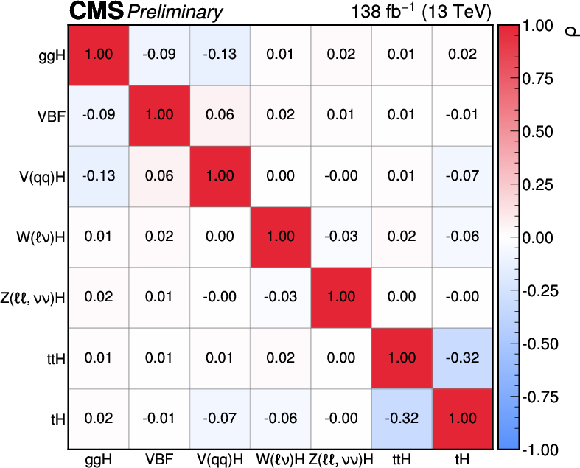
The measured STXS stage 0 cross sections, where the Higgs boson branching fractions are fixed to the SM predictions. This fit is performed in the signal-strength formalism such that the theory uncertainties which affect the cross section normalisations are included in the measurement. In the top plot, the points indicate the best fit values and the vertical lines with caps indicate the 68% CL intervals. The wider boxes show the systematic uncertainty components of the 68% CL intervals. Each measured quantity is compared to the SM prediction in red. The bottom panel of the top plot shows the ratio with respect to the SM prediction. The bottom plot shows the correlations between the 7 parameters considered in this fit. The size of the correlations is indicated by the colour scale. |

png pdf |
Figure 24-a:
The measured STXS stage 0 cross sections, where the Higgs boson branching fractions are fixed to the SM predictions. This fit is performed in the signal-strength formalism such that the theory uncertainties which affect the cross section normalisations are included in the measurement. In the top plot, the points indicate the best fit values and the vertical lines with caps indicate the 68% CL intervals. The wider boxes show the systematic uncertainty components of the 68% CL intervals. Each measured quantity is compared to the SM prediction in red. The bottom panel of the top plot shows the ratio with respect to the SM prediction. The bottom plot shows the correlations between the 7 parameters considered in this fit. The size of the correlations is indicated by the colour scale. |
png pdf |
Figure 24-b:
The measured STXS stage 0 cross sections, where the Higgs boson branching fractions are fixed to the SM predictions. This fit is performed in the signal-strength formalism such that the theory uncertainties which affect the cross section normalisations are included in the measurement. In the top plot, the points indicate the best fit values and the vertical lines with caps indicate the 68% CL intervals. The wider boxes show the systematic uncertainty components of the 68% CL intervals. Each measured quantity is compared to the SM prediction in red. The bottom panel of the top plot shows the ratio with respect to the SM prediction. The bottom plot shows the correlations between the 7 parameters considered in this fit. The size of the correlations is indicated by the colour scale. |
png pdf |
Figure 25:
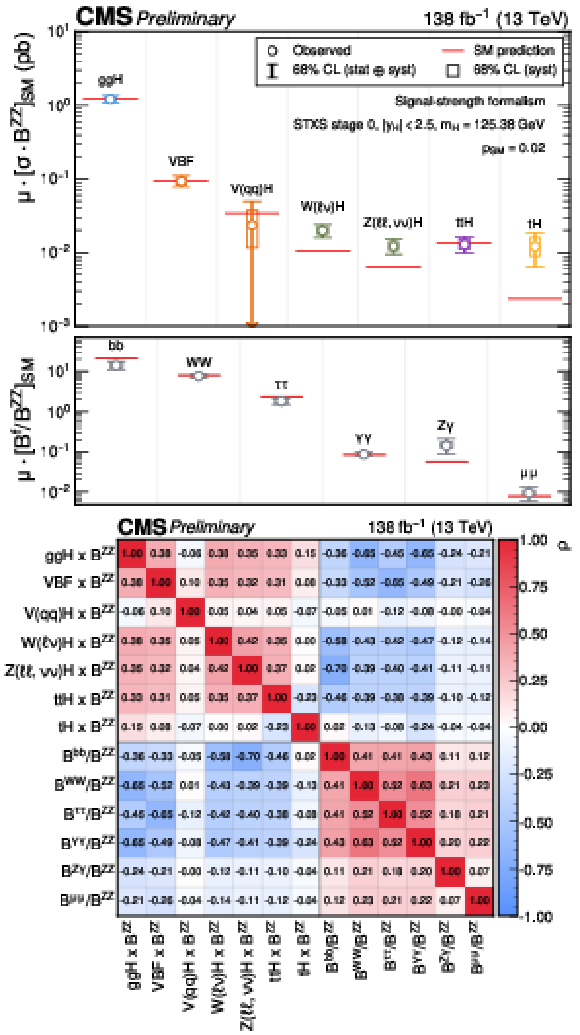
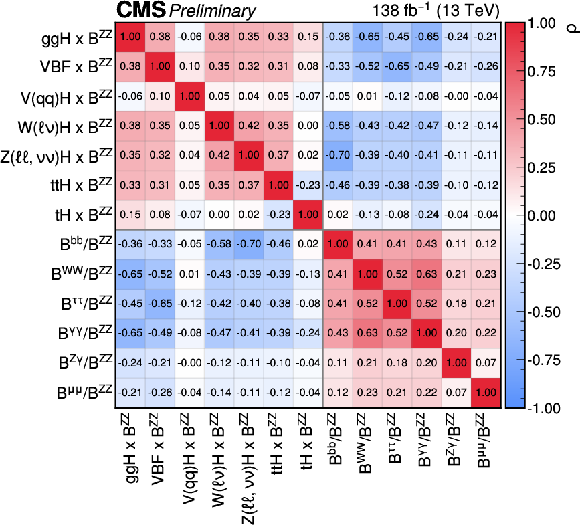
The measured STXS stage 0 cross sections and branching fraction ratios. This fit is performed in the signal-strength formalism such that the theory uncertainties which affect the cross section and branching fraction normalisations are included in the measurement. In the top plot, the points indicate the best fit values and the vertical lines with caps indicate the 68% CL intervals. The wider boxes show the systematic uncertainty components of the 68% CL intervals. Each measured quantity is compared to the SM prediction in red. The bottom plot shows the correlations between the 13 parameters considered in this fit. The size of the correlations is indicated by the colour scale. |
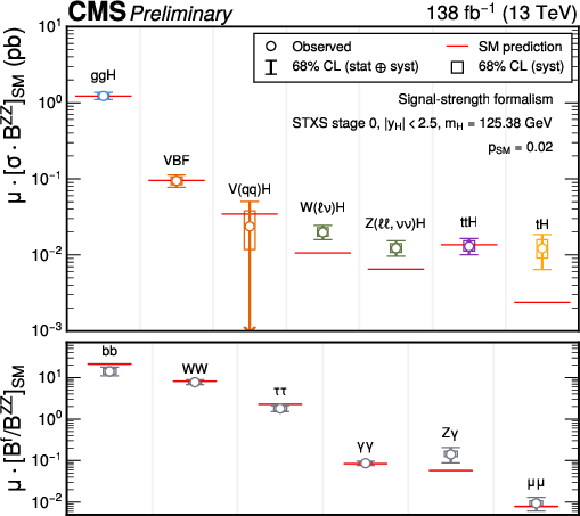
png pdf |
Figure 25-a:
The measured STXS stage 0 cross sections and branching fraction ratios. This fit is performed in the signal-strength formalism such that the theory uncertainties which affect the cross section and branching fraction normalisations are included in the measurement. In the top plot, the points indicate the best fit values and the vertical lines with caps indicate the 68% CL intervals. The wider boxes show the systematic uncertainty components of the 68% CL intervals. Each measured quantity is compared to the SM prediction in red. The bottom plot shows the correlations between the 13 parameters considered in this fit. The size of the correlations is indicated by the colour scale. |
png pdf |
Figure 25-b:
The measured STXS stage 0 cross sections and branching fraction ratios. This fit is performed in the signal-strength formalism such that the theory uncertainties which affect the cross section and branching fraction normalisations are included in the measurement. In the top plot, the points indicate the best fit values and the vertical lines with caps indicate the 68% CL intervals. The wider boxes show the systematic uncertainty components of the 68% CL intervals. Each measured quantity is compared to the SM prediction in red. The bottom plot shows the correlations between the 13 parameters considered in this fit. The size of the correlations is indicated by the colour scale. |
png pdf |
Figure 26:
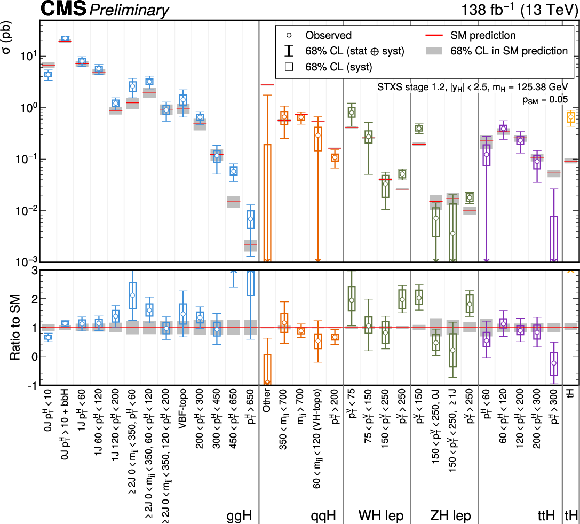
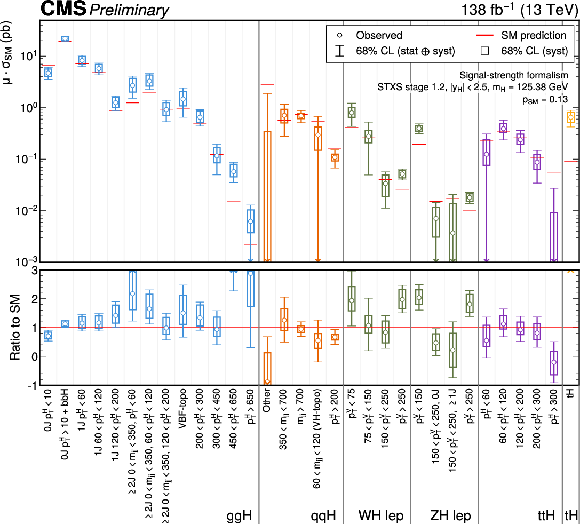
The measured STXS stage 1.2 cross sections, where the Higgs boson branching fractions are fixed to the SM predictions. Theory uncertainties which affect the normalisations of the measured cross sections are not included in the fit. In the top panel, the points indicate the best fit values whilst the coloured lines indicate the 68% CL intervals. The wider coloured boxes show the systematic uncertainty components of the 68% CL intervals. Each measured quantity is compared to the SM prediction in red, where the grey bands indicate the theoretical uncertainty for the respective parameter. The bottom panel plots the ratio of the measured $ \sigma^i $ with respect to the SM predictions. |
png pdf |
Figure 27:
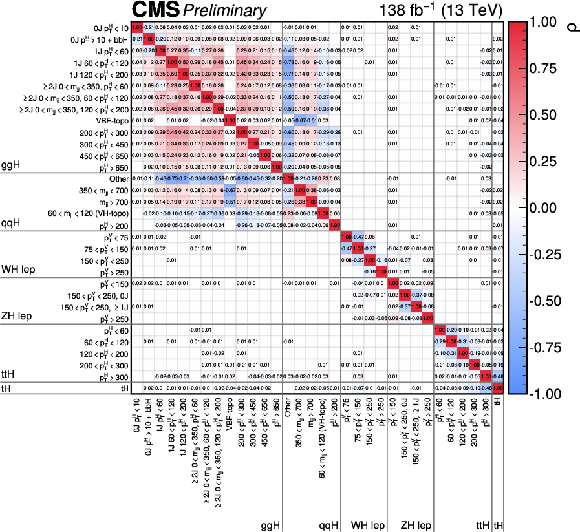
The correlations between the 32 parameters considered in STXS stage 1.2 cross section fit. The size of the correlations is indicated by the colour scale. Correlations of (absolute) size less than 0.005 are not shown. |
png pdf |
Figure 28:
The measured STXS stage 1.2 cross sections, where the Higgs boson branching fractions are fixed to the SM predictions. The fit is performed in the signal-strength formalism such that the theory uncertainties which affect the cross section normalisations are included in the measurement. In the top panel, the points indicate the best fit values whilst the coloured lines indicate the 68% CL intervals. The wider coloured boxes show the systematic uncertainty components of the 68% CL intervals. Each measured quantity is compared to the SM prediction in red. The bottom panel plots the ratio of the measured $ \sigma^i $ with respect to the SM predictions. |
png pdf |
Figure 29:
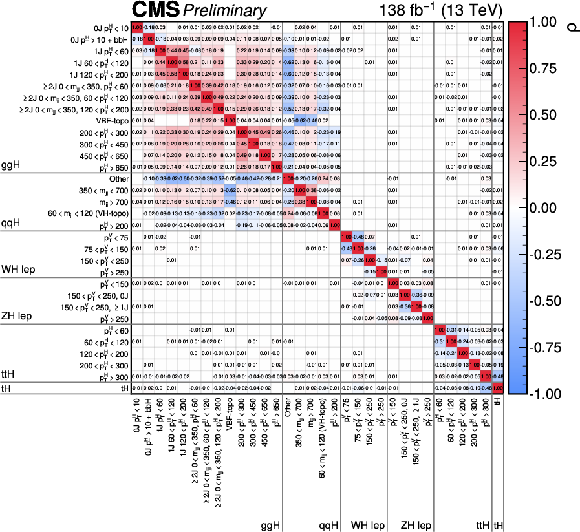
The correlations between the 32 parameters considered in STXS stage 1.2 cross section fit, where the fit has been performed in the signal-strength formalism. The size of the correlations is indicated by the colour scale. Correlations of (absolute) size less than 0.005 are not shown. |
png pdf |
Figure 30:
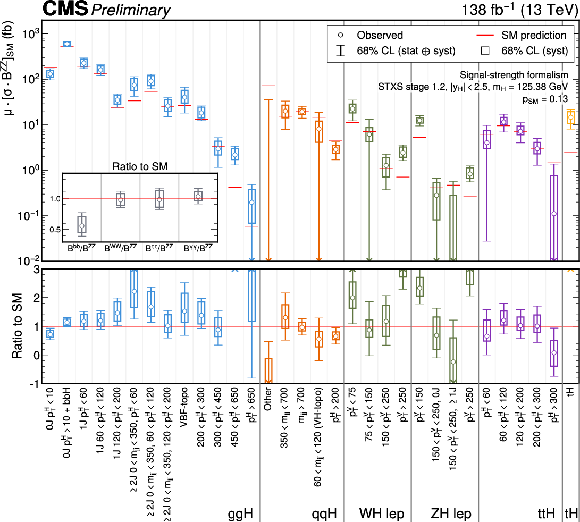
The measured STXS stage 1.2 cross sections and branching fraction ratios. The fit is performed in the signal-strength formalism such that the theory uncertainties which affect the cross section and branching fraction normalisations are included in the measurement. In the top panel, the points indicate the best fit values whilst the coloured lines indicate the 68% CL intervals. The wider coloured boxes show the systematic uncertainty components of the 68% CL intervals. Each measured quantity is compared to the SM prediction in red. The bottom panel plots the ratio of the measured $ \sigma^i $ with respect to the SM predictions. |
png pdf |
Figure 31:
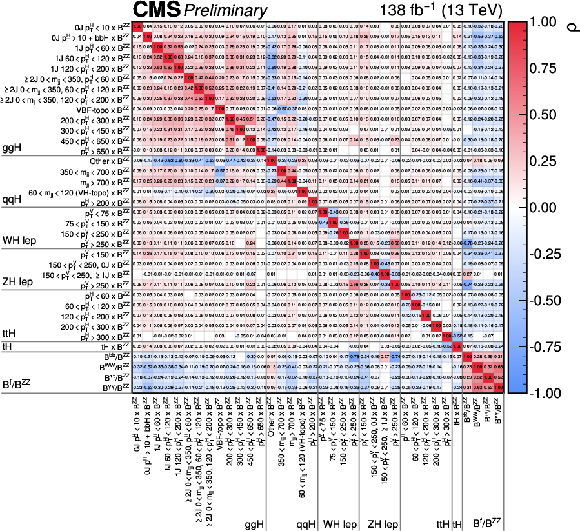
The correlations between the 36 parameters considered in STXS stage 1.2 fit, where the fit has been performed in the signal-strength formalism. The size of the correlations is indicated by the colour scale. Correlations of (absolute) size less than 0.005 are not shown. |
png pdf |
Figure 32:
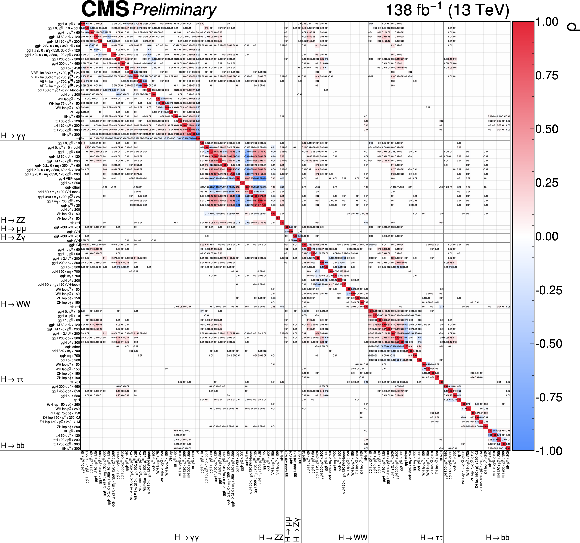
The correlations between the 97 parameters considered in the cross section times branching fraction fit. The size of the correlations is indicated by the colour scale. Correlations of (absolute) size less than 0.005 are not shown. |
| Tables | |

png pdf |
Table 1:
Summary of the input analyses in the combination. |
png pdf |
Table 2:
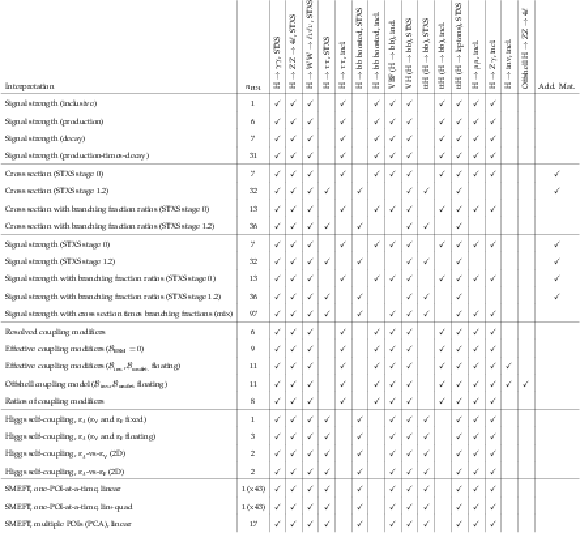
A list of the different signal parametrisation models provided in this combination, and the channels which are included in each fit. The first column indicates the number of POIs in the model. The final column indicates whether the model is included in the main body of this note (no check) or is provided as additional material (check). The remaining columns show ticks for each channel entering the respective model fit. All input channels, except offshell $ \mathrm{H}\to\mathrm{Z}\mathrm{Z}\to4\ell $, are labelled as ``incl.'' or ``STXS'' according to the granularity of the signal processes. As described in Section 3, the $ \mathrm{H}\to\tau\tau $, $ \mathrm{H}\to\mathrm{b}\mathrm{b} $ boosted and $ \mathrm{ttH} $ ($ \mathrm{H}\to\mathrm{b}\mathrm{b} $) inputs implement two sets of analysis regions. The set of analysis regions chosen for each fit is indicated in the table. |

png pdf |
Table 3:
Breakdown of the 68% CL intervals on the best-fit inclusive, per-production mode, and per-decay channel signal-strength modifiers, for the different sources of uncertainty. The contributions are shown as percentages relative to the best-fit signal-strength values. All contributions are symmetrized by taking the average of the upward and downward fluctuations. The systematic uncertainties are divided into theoretical and experimental components. |

png pdf |
Table 4:
Best-fit values and 68% CL intervals for the per-production mode and per-decay channel signal-strengths. The total 68% CL intervals are decomposed into the statistical and systematic components. The expected intervals are given in brackets. |
png pdf |
Table 5:
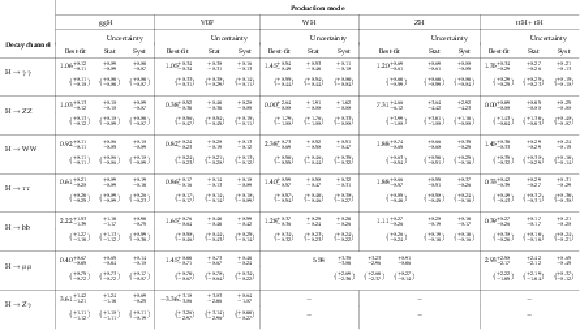
Best-fit values and 68% CL intervals for the per-production-times-decay channel signal-strengths. The total 68% CL intervals are decomposed into the statistical and systematic components. The expected intervals are given in brackets. Some of the signal-strengths are restricted to non-negative values, as described in the text. Truncated intervals are reported for these parameters if the 68% CL interval is not fully contained in the postive domain. |
png pdf |
Table 6:
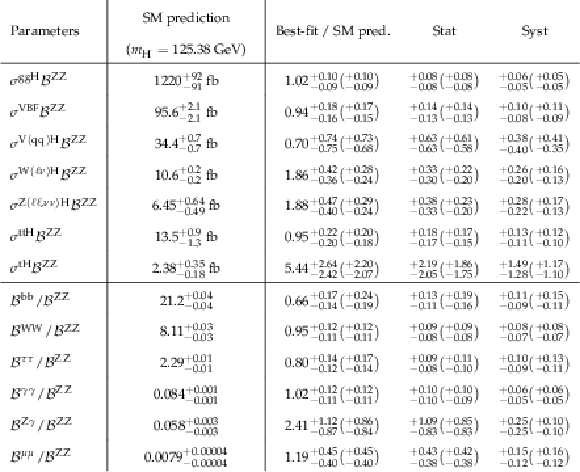
Best-fit values and 68% CL intervals for the parameters in the fit to production mode cross sections and branching fraction ratios. The values are normalised to the SM predictions. The total 68% CL intervals are decomposed into the statistical and systematic components, and the expected intervals are given in brackets. The SM predictions for each of the measured parameters are also provided, along with the corresponding theory uncertainties in the predictions. |
png pdf |
Table 7:
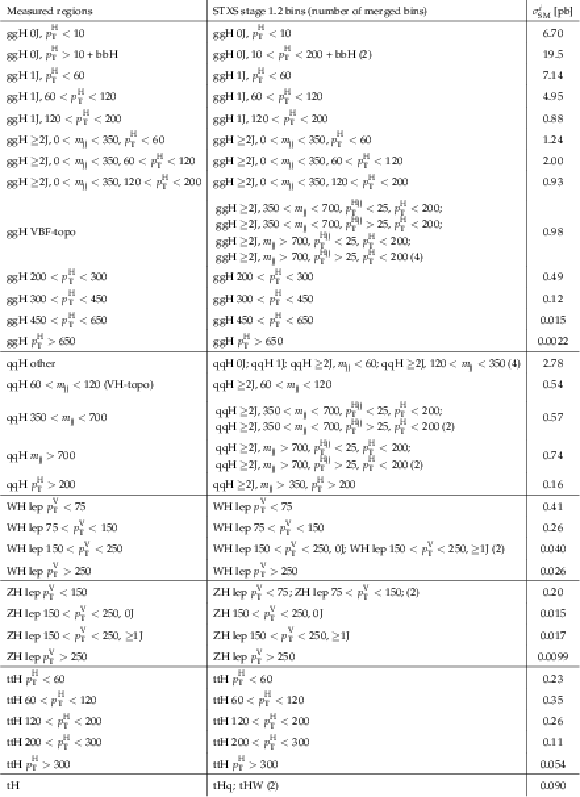
A summary of the STXS regions which are measured in this combination. Some of the measured regions are defined by merging bins from the nominal STXS stage 1.2 binning scheme to ensure reasonable sensitivity. The nominal bins which contribute to each of the measured regions are listed in the table, as well as the number of merged nominal bins if greater than one. The SM predictions for the measured STXS regions are also provided. Units of GeV are assumed for all numerical values related to the $ p_{\mathrm{T}}^\mathrm{H} $, $ m_{\rm{jj}} $, $ p_{\mathrm{T}}^{\mathrm{H}\rm{jj}} $, and $ p_{\mathrm{T}}^\mathrm{V} $ variables. The $ \mathrm{ggH} $ ($ \mathrm{ZH} $ lep) bins include contributions from $ \mathrm{ggZH} $ production in which the Z boson decays hadronically (leptonically). |

png pdf |
Table 8:
Best-fit values and 68% CL intervals for the parameters in the fit to stage 1.2 simplified template cross sections and branching fraction ratios. The values are normalised to the SM predictions. The total 68% CL intervals are decomposed into the statistical and systematic components, and the expected intervals are given in brackets. The SM prediction for each of the measured parameters is also provided, along with the corresponding theory uncertainty in the prediction. |
png pdf |
Table 9:
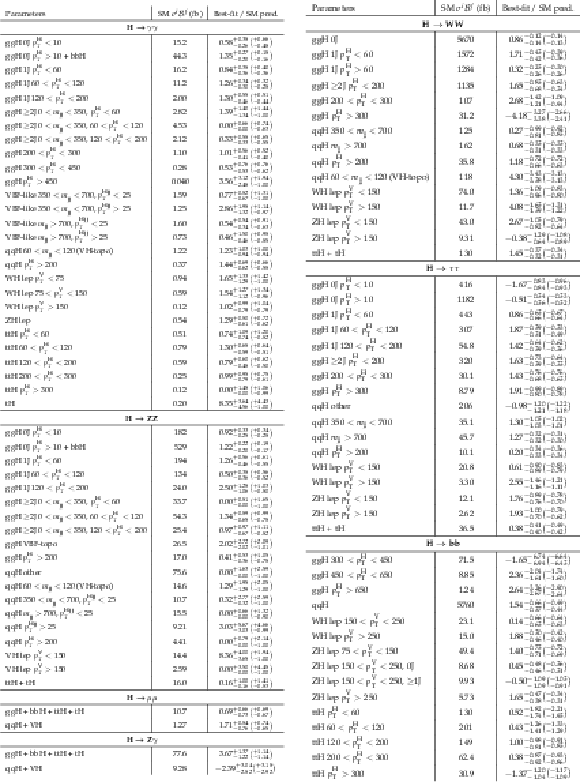
Best-fit values and 68% CL intervals for the fit which introduces a separate parameter of interest for each STXS bin in each decay channel. The values are normalised to the SM predictions, which are also provided. This fit is performed in the signal-strength formalism, such that the theory uncertainties in the SM predictions are folded into the measurement. The expected intervals are given in brackets. Some of the parameters are restricted to non-negative values, as described in the text. Truncated intervals are reported for these parameters if the 68% CL interval is not fully contained in the postive domain. |

png pdf |
Table 10:
Normalization scaling factors for all relevant production mode cross sections, partial decay widths, and the Higgs boson total decay width. For the $ \kappa $ parameters representing loop processes, the resolved scaling in terms of the fundamental SM couplings is also given. Only the dominant terms in the resolved scaling factor functions are provided in the table. The contributions are calculated for $ m_{\mathrm{H}} = $ 125.38 GeV. |

png pdf |
Table 11:
Best-fit values and 68% CL intervals for the Higgs boson coupling modifiers in the resolved coupling configuration. The total 68% CL intervals are decomposed into the statistical and systematic components. The expected intervals are given in brackets. |
png pdf |
Table 12:
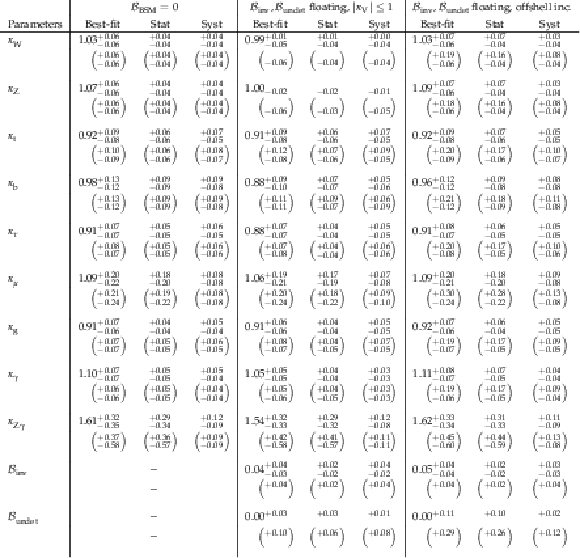
Best-fit values and 68% CL intervals for the Higgs boson coupling modifiers in the effective coupling configuration. The results are shown for each of the models considered. The total 68% CL intervals are decomposed into the statistical and systematic components. The expected intervals are given in brackets. The one-sided intervals represent physical boundaries in the POIs. |
png pdf |
Table 13:
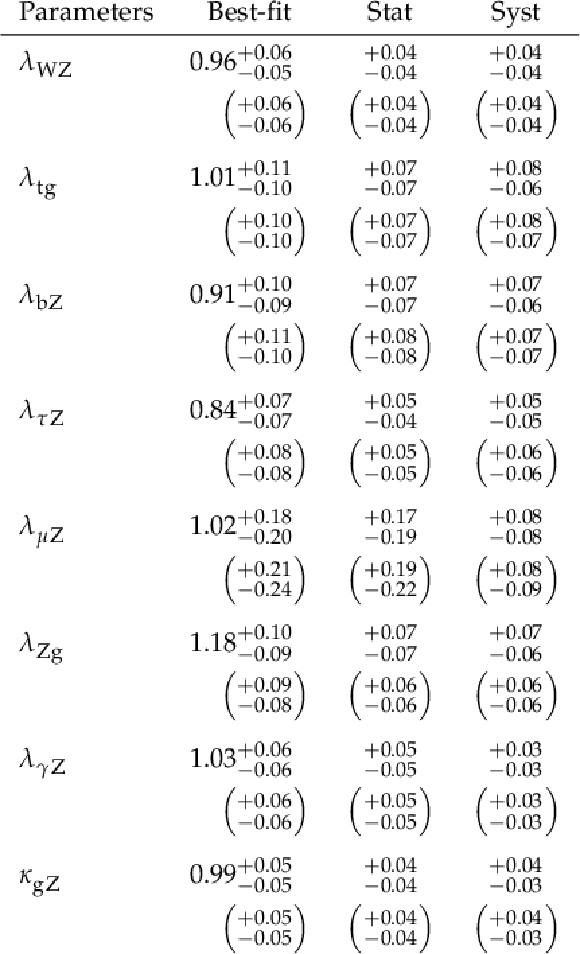
Best-fit values and 68% CL intervals for the coupling modifier ratios. The total 68% CL intervals are decomposed into the statistical and systematic components. The expected intervals are given in brackets. |
png pdf |
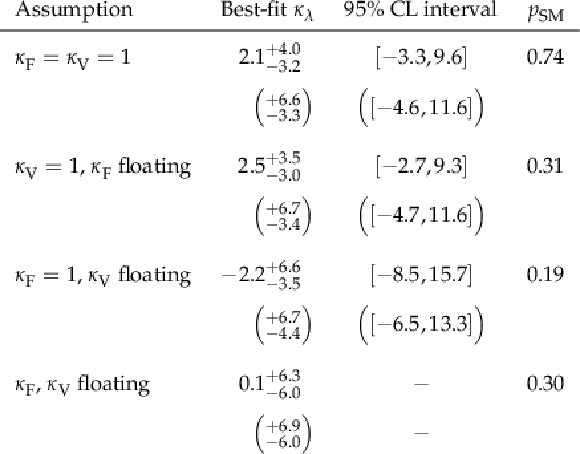
Table 14:
Best-fit values, 68% CL intervals and 95% CL intervals for $ \kappa_\lambda $, with different assumptions on the values of $ \kappa_{\mathrm{F}} $ and $ \kappa_{\mathrm{V}} $. The expected intervals are given in brackets. The $ p_{\rm{SM}} $ values which represent the compatibility with the SM hypothesis are also provided. A 95% CL interval for the fit in which $ \kappa_{\mathrm{F}} $ and $ \kappa_{\mathrm{V}} $ are floating cannot be extracted within the range of validity for this model. |
png pdf |
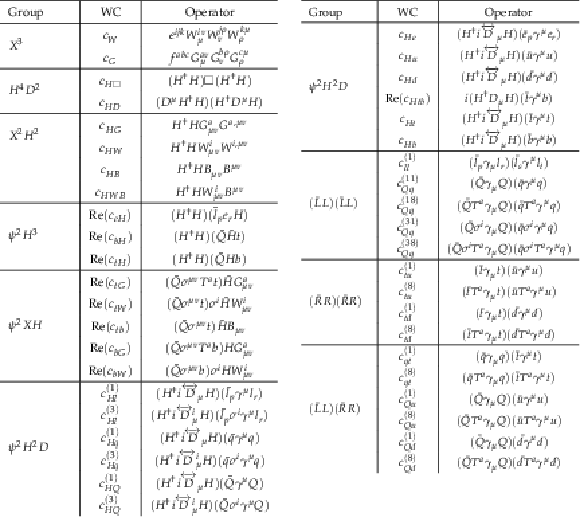
Table 15:
A list of the 43 WCs, $ c_j $, considered in the SMEFT interpretation, and the corresponding dimension-6 operators $ \mathcal{O}_j $. The coefficients are grouped into terms of a similar structure in the SM Lagrangian expansion. The operators follow the same notation at Ref. [72], where $ (q,u,d) $ denote the quarks of the first two generations, $ (Q,t,b) $ quarks of the third generations, and $ (\ell,e,\nu) $ leptons of all three generations. The Higgs doublet is represented by $ H $, a covariant derivative by $ D $, and a vector boson by $ X=G,W,B $. Fermion fields are represented by $ \psi $, with $ L $ and $ R $ indicating left-handed and right-handed fermions. |
png pdf |
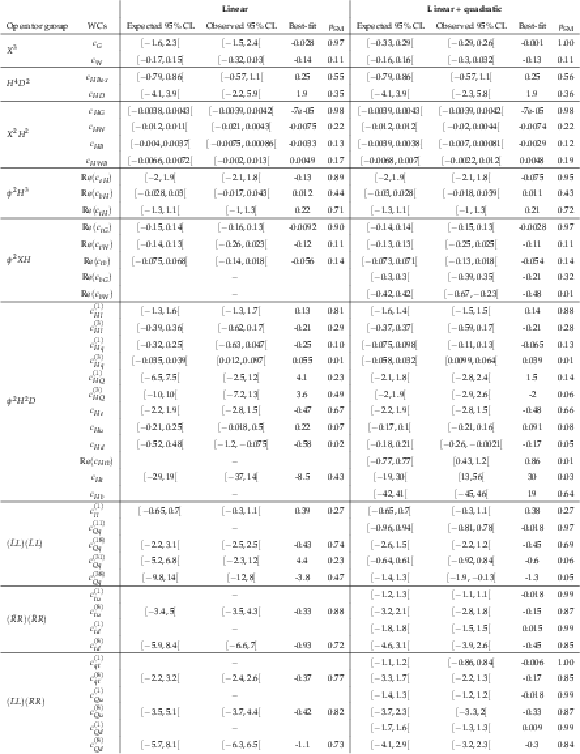
Table 16:
Expected and observed 95% CL intervals on the WCs, when considering modifications to one WC at a time. The results for both the linear and linear-plus-quadratic parametrisations are provided. Only the 95% CL intervals which contain the best-fit points are reported. The best-fit values and $ p_{\rm{SM}} $ values are also given. |

png pdf |
Table 17:
Expected and observed 95% CL intervals on the linear combinations of SMEFT WCs. The results are provided for the linear parametrisation. The best-fit values are also given. |
png pdf |
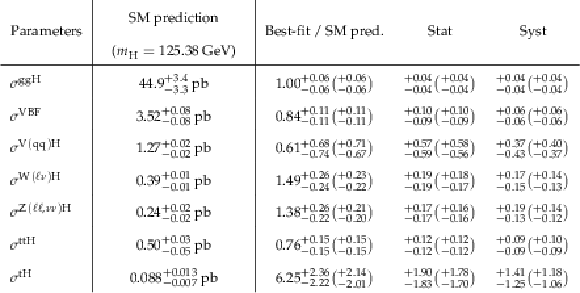
Table 18:
Best-fit values and 68% CL intervals for the parameters in the fit to the production mode cross sections. The Higgs boson branching fractions are fixed to the SM predictions in the fit. The values are normalised to the SM predictions. The total 68% CL intervals are decomposed into the statistical and systematic components, and the expected intervals are given in brackets. The SM predictions for each of the measured parameters are also provided, along with the corresponding theory uncertainties in the predictions. |
png pdf |
Table 19:
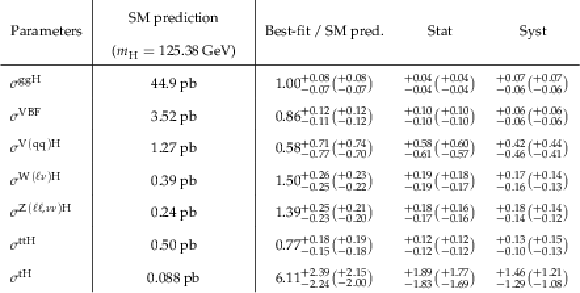
Best-fit values and 68% CL intervals for the parameters in the fit to the production mode cross sections. The Higgs boson branching fractions are fixed to the SM predictions in the fit. This fit is performed in the signal-strength formalism, such that the theory uncertainties in the SM predictions are folded into the measurement. The values are normalised to the SM predictions. The total 68% CL intervals are decomposed into the statistical and systematic components, and the expected intervals are given in brackets. The SM predictions for each of the measured parameters are also provided. |
png pdf |
Table 20:
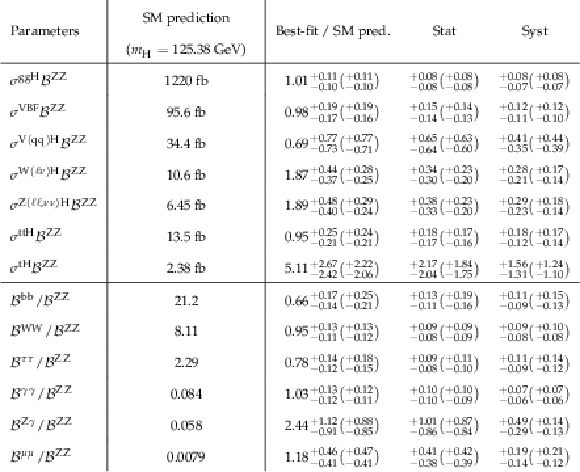
Best-fit values and 68% CL intervals for the parameters in the fit to production mode cross sections and branching fraction ratios. This fit is performed in the signal-strength formalism, such that the theory uncertainties in the SM predictions are folded into the measurement. The values are normalised to the SM predictions. The total 68%CL intervals are decomposed into the statistical and systematic components, and the expected intervals are given in brackets. The SM predictions for each of the measured parameters are also provided. |
png pdf |
Table 21:
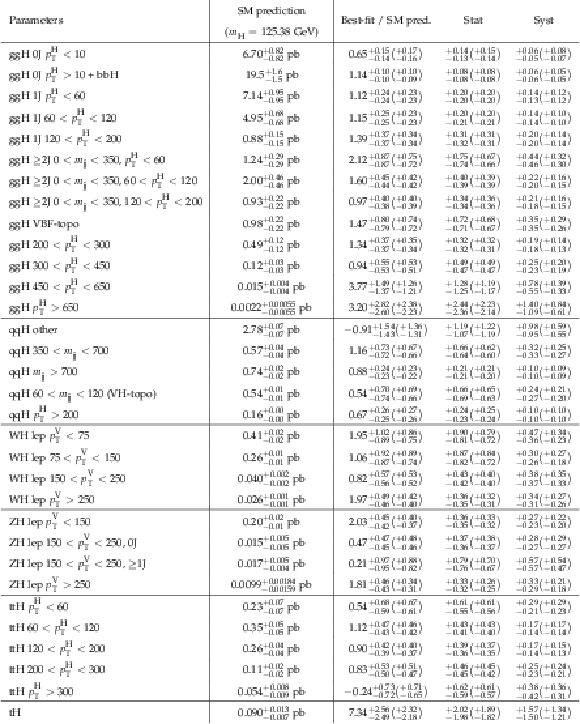
Best-fit values and 68% CL intervals for the parameters in the fit to stage 1.2 simplified template cross sections. The Higgs boson branching fractions are fixed to the SM predictions in the fit. The values are normalised to the SM predictions. The total 68% CL intervals are decomposed into the statistical and systematic components, and the expected intervals are given in brackets. The SM predictions for each of the measured parameters are also provided, along with the corresponding theory uncertainties in the predictions. |
png pdf |
Table 22:
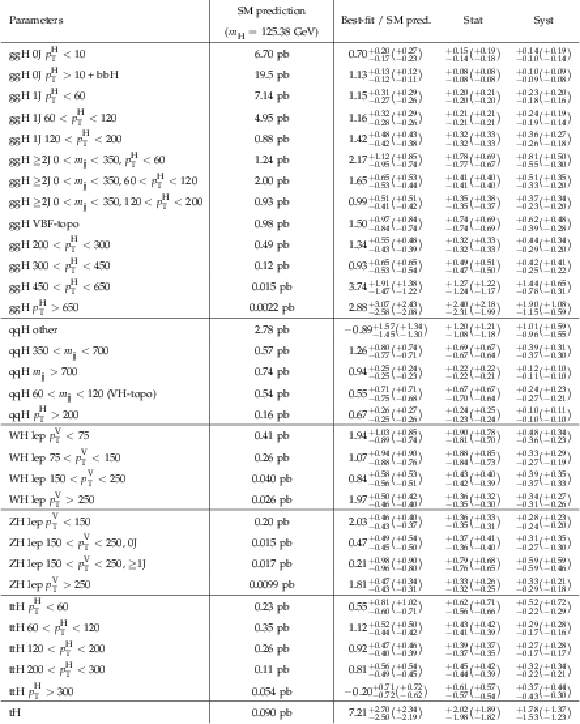
Best-fit values and 68% CL mintervals for the parameters in the fit to stage 1.2 simplified template cross sections. The Higgs boson branching fractions are fixed to the SM predictions in the fit. This fit is performed in the signal-strength formalism, such that the theory uncertainties in the SM predictions are folded into the measurement. The values are normalised to the SM predictions. The total 68% CL intervals are decomposed into the statistical and systematic components, and the expected intervals are given in brackets. The SM predictions for each of the measured parameters are also provided. |
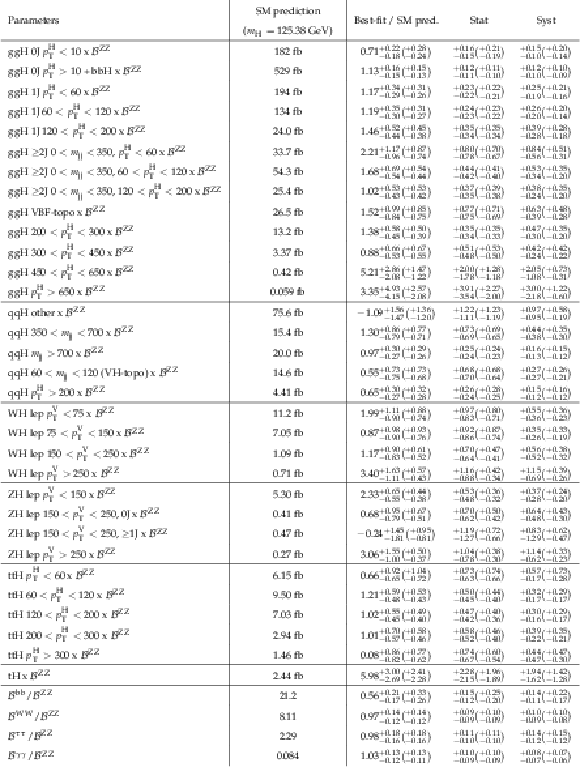
png pdf |
Table 23:
Best-fit values and 68% CL intervals for the parameters in the fit to stage 1.2 simplified template cross sections and branching fraction ratios. This fit is performed in the signal-strength formalism, such that the theory uncertainties in the SM predictions are folded into the measurement. The values are normalised to the SM predictions. The total 68% CL intervals are decomposed into the statistical and systematic components, and the expected intervals are given in brackets. The SM prediction for each of the measured parameters is also provided. |
| Summary |
| Combined measurements of Higgs boson production and decay rates are presented. The combination uses proton-proton collision data recorded by the CMS experiment at $ \sqrt{s}= $ 13 TeV from 2016 to 2018, corresponding to an integrated luminosity of 138 fb$ ^{-1} $. The combined likelihood includes analysis regions targeting the $ \mathrm{H}\to\gamma\gamma $, $ \mathrm{H}\to\mathrm{Z}\mathrm{Z}\to4\ell $, $ \mathrm{H}\to\mathrm{W}\mathrm{W}\to\ell\nu\ell\nu $, $ \mathrm{H}\to\tau\tau $, $ \mathrm{H}\to\mathrm{b}\mathrm{b} $, $ \mathrm{H}\to\mu\mu $ and $ \mathrm{H}\to\mathrm{Z}\gamma $ decay channels. Each decay channel targets several Higgs boson production modes. Results are provided for various assumptions on the scaling behaviour of Higgs boson production and decay. This includes measurements of signal-strengths, production cross sections, branching fractions, and for the first time a combined measurement from the CMS experiment of kinematic regions defined by the simplified template cross section (STXS) framework. The inclusive signal-strength is measured to be 1.014$ ^{+0.055}_{-0.053} $, where the largest contribution to the total uncertainty originates from the theoretical systematic component. The per-production mode signal strengths are measured with 68% CL intervals ranging from 7.5% for $ \mathrm{ggH} $ production to 39% for $ \mathrm{tH} $ production, relative to the best-fit value. The 68% CL intervals on the per-decay channel signal-strengths range from 8% for $ \mathrm{H}\to\gamma\gamma $ to 39% for $ \mathrm{H}\to\mathrm{Z}\gamma $. Cross section measurements are performed at two levels of granularity. The STXS stage 0 measurements correspond to the different Higgs boson production modes, whilst the STXS stage 1.2 measurements further partition the phase space into non-overlapping kinematic regions. In total 32 kinematic regions are simultaneously fit, of which 13 are associated with $ \mathrm{ggH} $ production, 5 with $ \mathrm{qqH} $ production, 4 with both $ \mathrm{WH} $ and $ \mathrm{ZH} $ leptonic production, 5 with $ \mathrm{ttH} $ production, and one inclusive $ \mathrm{tH} $ measurement. The cross sections are extracted as products with the $ \mathrm{H}\to\mathrm{Z}\mathrm{Z} $ branching fraction, and the ratios of branching fractions are included as additional parameters in the fit to account for modifications to the standard model (SM) Higgs boson decay rates. The 68% CL intervals relative to the SM predicted values range from $ \sim $14% for the $ \mathrm{ggH} $ 0J 10 $ < p_{\mathrm{T}}^{\mathrm{H}} < $ 200 GeV STXS bin, to $ \sim $260% for the $ \mathrm{ggH} p_{\mathrm{T}}^{\mathrm{H}} > $ 650 GeV STXS bin. An additional fit is performed which considers a separate parameter for each STXS bin in each decay channel. In total 97 parameters are fitted, which constitutes the most granular measurement of the Higgs boson ever performed by the CMS experiment. A number of interpretations of the measurements are also provided. Higgs boson coupling modifiers are probed in the $ \kappa $-framework for both the resolved and effective configurations. In the resolved coupling modifier fit, the vector boson and third generation fermion coupling modifiers are measured with 68% CL intervals ranging from 5% for $ \kappa_\mathrm{W} $ to 12% for $ \kappa_\mathrm{b} $. The Higgs boson coupling modifier to muons is measured with a 68% CL interval of 20%. Models with different assumptions on the Higgs boson total decay width are provided for the effective coupling modifier configuration, including models with beyond-the-standard model (BSM) decays of the Higgs boson. In order to constrain the branching fraction to invisible final states that are allowed in BSM models, analyses targeting the $ \mathrm{H}\to\mathrm{inv} $ decay are included. One model also includes offshell analysis regions in the combination to provide a constraint on the Higgs boson total decay width directly from data. In this fit, the invisible (undetected) branching fraction is constrained to be less than 13% (25%) at the 95% CL. In addition, ratios of coupling modifiers are extracted, and constraints on the Higgs boson trilinear self-coupling are provided which arise from next-to-leading order electroweak corrections to the Higgs boson production and decay rates. Assuming other Higgs boson couplings are as predicted in the SM, the trilinear self-coupling is measured to be 2.14$ ^{+3.95}_{-3.16} $, relative to the SM prediction. A detailed interpretation in the standard model effective field theory (SMEFT) framework is also performed. SMEFT provides a model-agnostic tool to indirectly probe BSM physics via measurements of Higgs boson production and decay, assuming that the new particles of the BSM theory exist at an energy scale larger than the electroweak scale. A SMEFT parametrisation of STXS measurements is derived using simulation. Individual constraints are extracted on the SMEFT Wilson coefficients (WC). In total, the combination is sensitive to 43 of the SMEFT operators. To assess the compatibility of data with the SM, a $ p $-value is computed for each of the WCs. The largest discrepancy from the SM is observed in the $ c^{(3)}_{Hq} $ parameter ($ p_{\rm{SM}}= $ 0.01), which is driven by the observed excesses in the high-$ p_{\mathrm{T}}^\mathrm{V} \mathrm{WH} $ and $ \mathrm{ZH} $ leptonic STXS measurements. In addition, simultaneous constraints are provided on linear combinations of SMEFT operators, where the constrained directions in parameter space are extracted using a principal component analysis procedure. A total of 17 independent directions in SMEFT parameter space are constrained, and the measurements show decent compatibility with the SM hypothesis ($ p_{\rm{SM}}= $ 0.11). The results show good compatibility with the SM predictions for most of the measured parameters. This note represents the most comprehensive study of Higgs boson production and decay performed by the CMS experiment to-date. |
| References | ||||
| 1 | ATLAS Collaboration | The ATLAS experiment at the CERN Large Hadron Collider | JINST 3 (2008) S08003 | |
| 2 | CMS Collaboration | The CMS experiment at the CERN LHC | JINST 3 (2008) S08004 | |
| 3 | ATLAS Collaboration | Observation of a new particle in the search for the Standard Model Higgs boson with the ATLAS detector at the LHC | PLB 716 (2012) 1 | 1207.7214 |
| 4 | CMS Collaboration | Observation of a new boson at a mass of 125 GeV with the CMS experiment at the lhc | PLB 716 (2012) 30 | CMS-HIG-12-028 1207.7235 |
| 5 | CMS Collaboration | Observation of a New Boson with Mass Near 125 GeV in $ pp $ Collisions at $ \sqrt{s} $ = 7 and 8 TeV | JHEP 06 (2013) 081 | CMS-HIG-12-036 1303.4571 |
| 6 | F. Englert and R. Brout | Broken symmetry and the mass of gauge vector mesons | PRL 13 (1964) 321 | |
| 7 | P. W. Higgs | Broken symmetries, massless particles and gauge fields | PL 12 (1964) 132 | |
| 8 | P. W. Higgs | Broken symmetries and the masses of gauge bosons | PRL 13 (1964) 508 | |
| 9 | G. S. Guralnik, C. R. Hagen, and T. W. B. Kibble | Global conservation laws and massless particles | PRL 13 (1964) 585 | |
| 10 | P. W. Higgs | Spontaneous symmetry breakdown without massless bosons | PR 145 (1966) 1156 | |
| 11 | T. W. B. Kibble | Symmetry breaking in non-Abelian gauge theories | PR 155 (1967) 1554 | |
| 12 | LHC Higgs Cross Section Working Group Collaboration | Handbook of LHC Higgs Cross Sections: 4. Deciphering the Nature of the Higgs Sector | link | 1610.07922 |
| 13 | N. Berger et al. | Simplified Template Cross Sections - Stage 1.1 | 1906.02754 | |
| 14 | LHC Higgs Cross Section Working Group | Handbook of LHC Higgs Cross Sections: 3. Higgs Properties | 1307.1347 | |
| 15 | I. Brivio and M. Trott | The Standard Model as an Effective Field Theory | Phys. Rept. 793 (2019) 1 | 1706.08945 |
| 16 | F. Demartin, F. Maltoni, K. Mawatari, and M. Zaro | Higgs production in association with a single top quark at the LHC | EPJC 75 (2015) 267 | 1504.00611 |
| 17 | ATLAS Collaboration | Measurements of the Higgs boson production and decay rates and coupling strengths using $ pp $ collision data at $ \sqrt{s} $ = 7 and 8 TeV in the ATLAS experiment | EPJC 76 (2016) 6 | 1507.04548 |
| 18 | CMS Collaboration | Precise determination of the mass of the Higgs boson and tests of compatibility of its couplings with the standard model predictions using proton collisions at 7 and 8 TeV | EPJC 75 (2015) 212 | CMS-HIG-14-009 1412.8662 |
| 19 | ATLAS and CMS Collaborations | Measurements of the Higgs boson production and decay rates and constraints on its couplings from a combined ATLAS and CMS analysis of the LHC $ pp $ collision data at $ \sqrt{s} $ = 7 and 8 TeV | JHEP 08 (2016) 45 | 1606.02266 |
| 20 | ATLAS Collaboration | Combined measurements of Higgs boson production and decay using up to 80 fb$ ^{-1} $ of proton-proton collision data at $ \sqrt{s}= $ 13 TeV collected with the ATLAS experiment | PRD 101 (2020) 012002 | 1909.02845 |
| 21 | ATLAS Collaboration | A detailed map of Higgs boson interactions by the ATLAS experiment ten years after the discovery | Nature 607 (2022) 52 | 2207.00092 |
| 22 | ATLAS Collaboration | Interpretations of the ATLAS measurements of Higgs boson production and decay rates and differential cross-sections in pp collisions at $ \sqrt{s} $ = 13 TeV | JHEP 11 (2024) 097 | 2402.05742 |
| 23 | CMS Collaboration | Combined measurements of Higgs boson couplings in proton-proton collisions at $ \sqrt{s}=13 $TeV | EPJC 79 (2019) 421 | CMS-HIG-17-031 1809.10733 |
| 24 | CMS Collaboration | A portrait of the Higgs boson by the CMS experiment ten years after the discovery. | Nature 607 (2022) 60 | CMS-HIG-22-001 2207.00043 |
| 25 | CMS Collaboration | Measurement of the Higgs boson production via vector boson fusion and its decay into bottom quarks in proton-proton collisions at $ \sqrt{s} $ = 13 TeV | JHEP 01 (2024) 173 | CMS-HIG-22-009 2308.01253 |
| 26 | CMS Collaboration | Measurement of boosted Higgs bosons produced via vector boson fusion or gluon fusion in the H $ \to \mathrm{b\bar{b}} $ decay mode using LHC proton-proton collision data at $ \sqrt{s} $ = 13 TeV | JHEP 12 (2024) 035 | CMS-HIG-21-020 2407.08012 |
| 27 | CMS Collaboration | Measurement of the Higgs boson mass and width using the four-lepton final state in proton-proton collisions at $ \sqrt{s} $ = 13 TeV | Submitted to Physical Review D | CMS-HIG-21-019 2409.13663 |
| 28 | CMS Collaboration | A search for decays of the Higgs boson to invisible particles in events with a top-antitop quark pair or a vector boson in proton-proton collisions at $ \sqrt{s} = $ 13 TeV | EPJC 83 (2023) 933 | CMS-HIG-21-007 2303.01214 |
| 29 | CMS Collaboration | Measurement of simplified template cross sections of the Higgs boson produced in association with W or Z bosons in the H $\rightarrow bb$ decay channel in proton-proton collisions at $ \sqrt{s}= $ 13 TeV | PRD 109 (2024) 092011 | CMS-HIG-20-001 2312.07562 |
| 30 | CMS Collaboration | Measurement of the $ \textrm{t}\overline{\textrm{t}}\textrm{H} $ and tH production rates in the H $ \rightarrow \textrm{b}\overline{\textrm{b}} $ decay channel using proton-proton collision data at $ \sqrt{s} $ = 13 TeV | JHEP 02 (2025) 097 | CMS-HIG-19-011 2407.10896 |
| 31 | CMS Collaboration | A measurement of the Higgs boson mass in the diphoton decay channel | PLB 805 (2020) 135425 | CMS-HIG-19-004 2002.06398 |
| 32 | CMS Collaboration | Development of the CMS detector for the CERN LHC Run 3 | JINST 19 (2024) P05064 | CMS-PRF-21-001 2309.05466 |
| 33 | CMS Collaboration | Performance of the CMS Level-1 trigger in proton-proton collisions at $ \sqrt{s} = $ 13 TeV | JINST 15 (2020) P10017 | CMS-TRG-17-001 2006.10165 |
| 34 | CMS Collaboration | The CMS trigger system | JINST 12 (2017) P01020 | CMS-TRG-12-001 1609.02366 |
| 35 | CMS Collaboration | Performance of the CMS high-level trigger during LHC run 2 | JINST 19 (2024) P11021 | CMS-TRG-19-001 2410.17038 |
| 36 | CMS Collaboration | Electron and photon reconstruction and identification with the CMS experiment at the CERN LHC | JINST 16 (2021) P05014 | CMS-EGM-17-001 2012.06888 |
| 37 | CMS Collaboration | Performance of the CMS muon detector and muon reconstruction with proton-proton collisions at $ \sqrt{s}= $ 13 TeV | JINST 13 (2018) P06015 | CMS-MUO-16-001 1804.04528 |
| 38 | CMS Collaboration | Description and performance of track and primary-vertex reconstruction with the CMS tracker | JINST 9 (2014) P10009 | CMS-TRK-11-001 1405.6569 |
| 39 | CMS Collaboration | Measurements of Higgs boson production cross sections and couplings in the diphoton decay channel at $ \sqrt{\mathrm{s}} $ = 13 TeV | JHEP 07 (2021) 027 | CMS-HIG-19-015 2103.06956 |
| 40 | CMS Collaboration | Measurements of production cross sections of the Higgs boson in the four-lepton final state in proton-proton collisions at $ \sqrt{s} = $ 13 TeV | EPJC 81 (2021) 488 | CMS-HIG-19-001 2103.04956 |
| 41 | CMS Collaboration | Measurements of the Higgs boson production cross section and couplings in the W boson pair decay channel in proton-proton collisions at $ \sqrt{s}= $ 13 TeV | EPJC 83 (2023) 667 | CMS-HIG-20-013 2206.09466 |
| 42 | CMS Collaboration | Measurements of Higgs boson production in the decay channel with a pair of $ \tau $ leptons in proton-proton collisions at $ \sqrt{s}= $ 13 TeV | EPJC 83 (2023) 562 | CMS-HIG-19-010 2204.12957 |
| 43 | CMS Collaboration | Measurement of the Higgs boson production rate in association with top quarks in final states with electrons, muons, and hadronically decaying tau leptons at $ \sqrt{s} = $ 13 TeV | EPJC 81 (2021) 378 | CMS-HIG-19-008 2011.03652 |
| 44 | CMS Collaboration | Evidence for Higgs boson decay to a pair of muons | JHEP 01 (2021) 148 | CMS-HIG-19-006 2009.04363 |
| 45 | CMS Collaboration | Search for Higgs boson decays to a Z boson and a photon in proton-proton collisions at $ \sqrt{s} $ = 13 TeV | JHEP 05 (2023) 233 | CMS-HIG-19-014 2204.12945 |
| 46 | CMS Collaboration | Search for new particles in events with energetic jets and large missing transverse momentum in proton-proton collisions at $ \sqrt{s} $ = 13 TeV | JHEP 11 (2021) 153 | CMS-EXO-20-004 2107.13021 |
| 47 | CMS Collaboration | Search for invisible decays of the Higgs boson produced via vector boson fusion in proton-proton collisions at s=13 TeV | PRD 105 (2022) 092007 | CMS-HIG-20-003 2201.11585 |
| 48 | CMS Collaboration | Search for dark matter produced in association with a leptonically decaying Z boson in proton-proton collisions at $ \sqrt{s} = $ 13 TeV | EPJC 81 (2021) 13 | CMS-EXO-19-003 2008.04735 |
| 49 | CMS Collaboration | Particle-flow reconstruction and global event description with the CMS detector | JINST 12 (2017) P10003 | CMS-PRF-14-001 1706.04965 |
| 50 | J. Alwall et al. | The automated computation of tree-level and next-to-leading order differential cross sections, and their matching to parton shower simulations | JHEP 07 (2014) 079 | 1405.0301 |
| 51 | K. Hamilton, P. Nason, E. Re, and G. Zanderighi | NNLOPS simulation of Higgs boson production | JHEP 10 (2013) 222 | 1309.0017 |
| 52 | K. Hamilton, P. Nason, and G. Zanderighi | MINLO: Multi-Scale Improved NLO | JHEP 10 (2012) 155 | 1206.3572 |
| 53 | G. Luisoni, P. Nason, C. Oleari, and F. Tramontano | $ HW^{\pm} $/$HZ$ + 0 and 1 jet at NLO with the POWHEG BOX interfaced to GoSam and their merging within MiNLO | JHEP 10 (2013) 083 | 1306.2542 |
| 54 | T. Sjöstrand et al. | An introduction to PYTHIA 8.2 | Comput. Phys. Commun. 191 (2015) 159 | 1410.3012 |
| 55 | CMS Collaboration | Extraction and validation of a new set of CMS PYTHIA8 tunes from underlying-event measurements | EPJC 80 (2020) 4 | CMS-GEN-17-001 1903.12179 |
| 56 | NNPDF Collaboration | Parton distributions from high-precision collider data | EPJC 77 (2017) 663 | 1706.00428 |
| 57 | K. Becker et al. | Precise predictions for boosted Higgs production | SciPost Phys. Core 7 (2024) 001 | 2005.07762 |
| 58 | ATLAS Collaboration, CMS Collaboration, LHC Higgs Combination Group | Procedure for the LHC Higgs boson search combination in Summer 2011 | technical report, CERN, Geneva, 2011 | |
| 59 | CMS Collaboration | Combined Results of Searches for the Standard Model Higgs Boson in $ pp $ Collisions at $ \sqrt{s}= $ 7 TeV | PLB 710 (2012) 26 | CMS-HIG-11-032 1202.1488 |
| 60 | CMS Collaboration | The CMS Statistical Analysis and Combination Tool: Combine | Comput. Softw. Big Sci. 8 (2024) 19 | CMS-CAT-23-001 2404.06614 |
| 61 | W. Verkerke and D. Kirkby | The RooFit toolkit for data modeling | in Proc. 13th International Conference on Computing in High Energy and Nuclear Physics (CHEP ): La Jolla CA, 2003 link |
physics/0306116 |
| 62 | L. Moneta et al. | The RooStats project | in Proc. 13th International Workshop on Advanced Computing and Analysis Techniques in Physics Research (ACAT ): Jaipur, India, 2010 link |
1009.1003 |
| 63 | G. Cowan, K. Cranmer, E. Gross, and O. Vitells | Asymptotic formulae for likelihood-based tests of new physics | EPJC 71 (2011) 1554 | 1007.1727 |
| 64 | CMS Collaboration | Precision luminosity measurement in proton-proton collisions at $ \sqrt{s}= $ 13 TeV in 2015 and 2016 at CMS | EPJC 81 (2021) 800 | CMS-LUM-17-003 2104.01927 |
| 65 | CMS Collaboration | CMS luminosity measurement for the 2017 data-taking period at $ \sqrt{s}= $ 13 TeV | CMS Physics Analysis Summary, 2018 CMS-PAS-LUM-17-004 |
CMS-PAS-LUM-17-004 |
| 66 | CMS Collaboration | CMS luminosity measurement for the 2018 data-taking period at $ \sqrt{s}= $ 13 TeV | CMS Physics Analysis Summary, 2019 CMS-PAS-LUM-18-002 |
CMS-PAS-LUM-18-002 |
| 67 | G. Degrassi, P. P. Giardino, F. Maltoni, and D. Pagani | Probing the Higgs self coupling via single Higgs production at the LHC | JHEP 12 (2016) 080 | 1607.04251 |
| 68 | F. Maltoni, D. Pagani, A. Shivaji, and X. Zhao | Trilinear Higgs coupling determination via single-Higgs differential measurements at the LHC | EPJC 77 (2017) 887 | 1709.08649 |
| 69 | CMS Collaboration | Constraints on the Higgs boson self-coupling from the combination of single and double Higgs boson production in proton-proton collisions at $ \sqrt{s} $ = 13 TeV | PLB 861 (2025) 139210 | CMS-HIG-23-006 2407.13554 |
| 70 | F. Monti et al. | Modelling of the single-Higgs simplified template cross-sections (STXS 1.2) for the determination of the Higgs boson trilinear self-coupling | technical report, CERN, Geneva, 2022 | |
| 71 | B. Grzadkowski, M. Iskrzynski, M. Misiak, and J. Rosiek | Dimension-Six Terms in the Standard Model Lagrangian | JHEP 10 (2010) 085 | 1008.4884 |
| 72 | I. Brivio | SMEFTsim 3.0 \textemdash a practical guide | JHEP 04 (2021) 073 | 2012.11343 |
| 73 | S. Dawson and P. P. Giardino | Electroweak corrections to Higgs boson decays to $ \gamma\gamma $ and $ {W}^{+}{W}^{-} $ in standard model EFT | PRD 9 (2018) 095005 | 1807.11504 |
| 74 | S. Dawson and P. P. Giardino | Higgs decays to $ ZZ $ and $ Z\gamma $ in the standard model effective field theory: An NLO analysis | PRD 9 (2018) 093003 | 1801.01136 |
| 75 | C. Degrande et al. | Automated one-loop computations in the standard model effective field theory | PRD 103 (2021) 096024 | 2008.11743 |
| 76 | J. Ellis et al. | Top, Higgs, Diboson and Electroweak Fit to the Standard Model Effective Field Theory | JHEP 04 (2021) 279 | 2012.02779 |
| 77 | Particle Data Group Collaboration | Review of Particle Physics | PTEP 2022 (2022) 083C01 | |
| 78 | I. Brivio, T. Corbett, and M. Trott | The Higgs width in the SMEFT | JHEP 10 (2019) 056 | 1906.06949 |
| 79 | G. Brooijmans et al. | Les Houches 2019 Physics at TeV Colliders: New Physics Working Group Report | in 11th Les Houches Workshop on Physics at TeV Colliders: PhysTeV Les Houches. 2, 2020 | 2002.12220 |
| 80 | A. Buckley et al. | Rivet user manual | Comput. Phys. Commun. 184 (2013) 2803 | 1003.0694 |

|
Compact Muon Solenoid LHC, CERN |

|

|

|

|

|

|