

Compact Muon Solenoid
LHC, CERN
| CMS-B2G-24-008 ; CERN-EP-2025-297 | ||
| Search for charged Higgs bosons decaying into top and bottom quarks in lepton+jets final states in proton-proton collisions at $ \sqrt{s} = $ 13 TeV | ||
| CMS Collaboration | ||
| 30 December 2025 | ||
| Submitted to J. High Energy Phys. | ||
| Abstract: A search is presented for charged Higgs bosons ($ \mathrm{H^{\pm}} $) in proton-proton (pp) collision events via the $ \mathrm{p}\mathrm{p}\to(\mathrm{b})\mathrm{H^{\pm}} $ processes, with $ \mathrm{H^{\pm}} $ decaying into top (t) and bottom (b) quarks. The search targets final states with one lepton, missing transverse momentum, and two or more b jets. The analysis is based on data collected at a center-of-mass energy of 13 TeV with the CMS detector at the LHC, corresponding to an integrated luminosity of 138 fb$ ^{-1} $. We search for charged Higgs bosons in the 200 GeV to 1 TeV mass range. The results are interpreted within the generalized two-Higgs-doublet model (g2HDM). This model predicts additional Yukawa couplings of the Higgs bosons to the top quark $ \rho_{\mathrm{t}\mathrm{t}} $, the top and charm quark $ \rho_{\mathrm{t}\mathrm{c}} $, and the top and up quark $ \rho_{\mathrm{t}\mathrm{u}} $. This search focuses on the real components of $ \rho_{\mathrm{t}\mathrm{t}} $ and $ \rho_{\mathrm{t}\mathrm{c}} $, which are probed up to values of unity. An excess is observed with respect to the standard model expectation with a local significance of 2.4 standard deviations for a signal with an $ \mathrm{H^{\pm}} $ boson mass ($ m_{\mathrm{H^{\pm}}} $) of 600 GeV. Limits are derived on the product of the cross section $ \sigma(\mathrm{p}\mathrm{p}\to(\mathrm{b})\mathrm{H}^\pm) $ and branching fraction $ \mathcal{B}(\mathrm{H}^\pm\to\mathrm{t}\mathrm{b}, \mathrm{t}\to\mathrm{b} \ell\nu) $, where $ \ell=\mathrm{e}, \mu $. The values of $ \rho_{\mathrm{t}\mathrm{c}} \gtrsim $ 0.15-0.5 are excluded at 95% confidence level, depending on the $ m_{\mathrm{H^{\pm}}} $ and $ \rho_{\mathrm{t}\mathrm{t}} $ assumptions. The results represent the first search for charged Higgs bosons within the g2HDM framework and complement the existing results on additional neutral Higgs bosons. | ||
| Links: e-print arXiv:2512.24471 [hep-ex] (PDF) ; CDS record ; inSPIRE record ; HepData record ; CADI line (restricted) ; | ||
| Figures | |
png pdf |
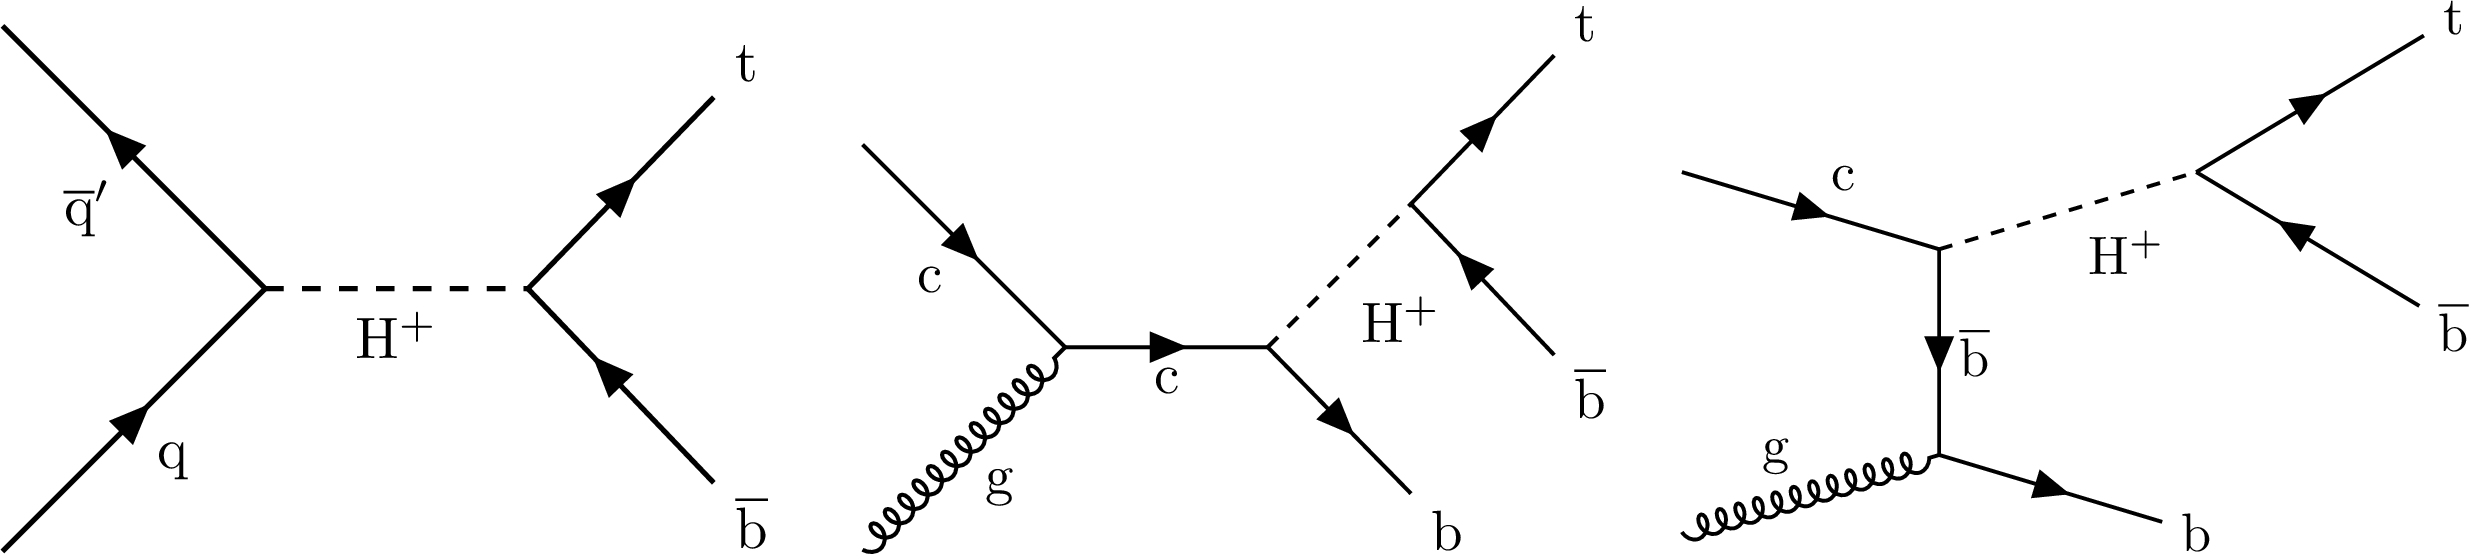
Figure 1:
Representative tree-level Feynman diagrams for the signal processes: $ \mathrm{p}\mathrm{p}\to{\mathrm{H}}{+}, \mathrm{H}^+\to\mathrm{t}\overline{\mathrm{b}} $ (left), and $ \mathrm{p}\mathrm{p}\to\mathrm{b}{\mathrm{H}}{+},\mathrm{H}^+\to\mathrm{t}\overline{\mathrm{b}} $ (middle and right). |
png pdf |
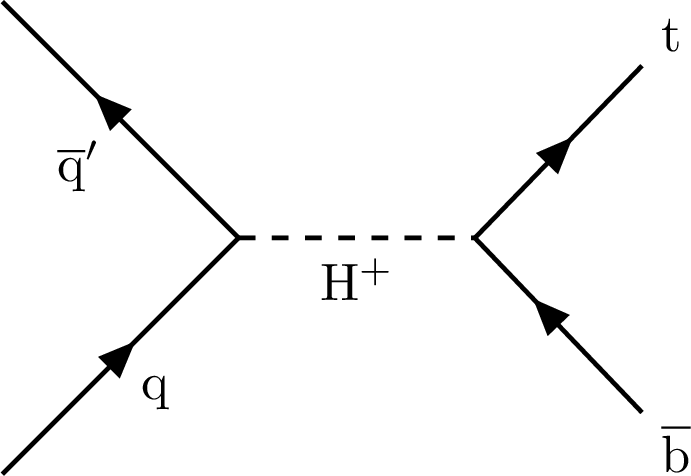
Figure 1-a:
Representative tree-level Feynman diagrams for the signal processes: $ \mathrm{p}\mathrm{p}\to{\mathrm{H}}{+}, \mathrm{H}^+\to\mathrm{t}\overline{\mathrm{b}} $ (left), and $ \mathrm{p}\mathrm{p}\to\mathrm{b}{\mathrm{H}}{+},\mathrm{H}^+\to\mathrm{t}\overline{\mathrm{b}} $ (middle and right). |
png pdf |
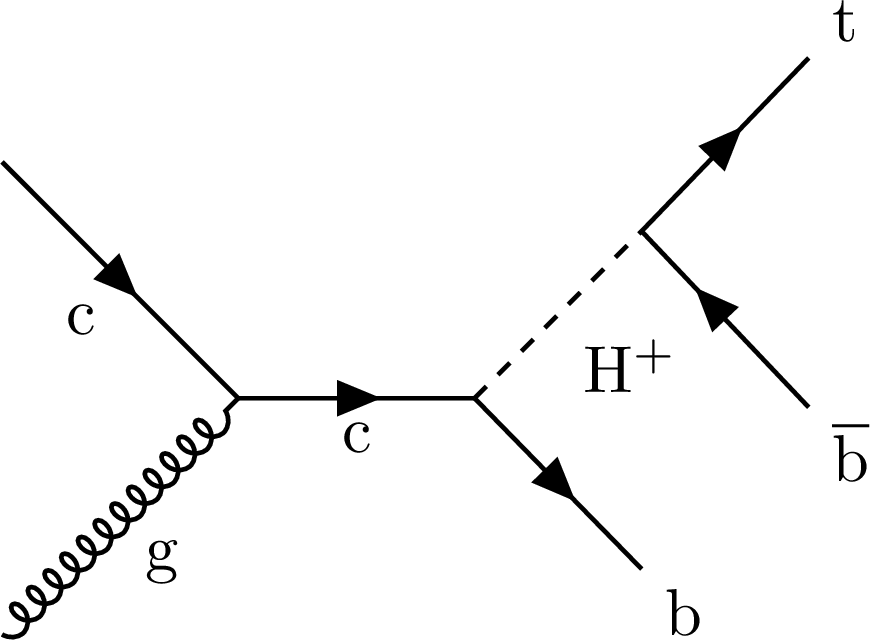
Figure 1-b:
Representative tree-level Feynman diagrams for the signal processes: $ \mathrm{p}\mathrm{p}\to{\mathrm{H}}{+}, \mathrm{H}^+\to\mathrm{t}\overline{\mathrm{b}} $ (left), and $ \mathrm{p}\mathrm{p}\to\mathrm{b}{\mathrm{H}}{+},\mathrm{H}^+\to\mathrm{t}\overline{\mathrm{b}} $ (middle and right). |
png pdf |
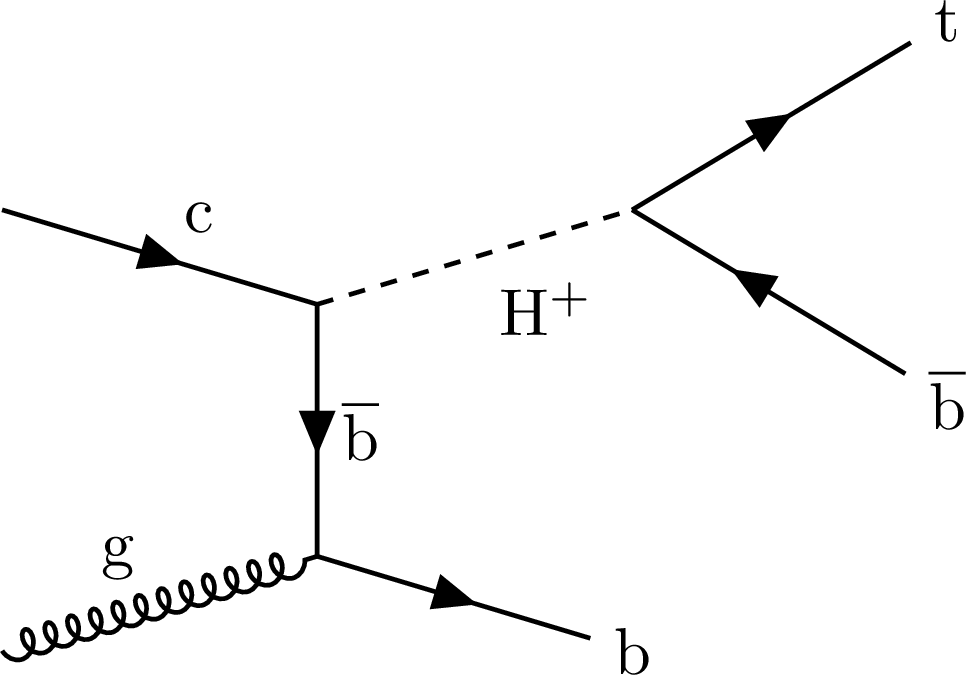
Figure 1-c:
Representative tree-level Feynman diagrams for the signal processes: $ \mathrm{p}\mathrm{p}\to{\mathrm{H}}{+}, \mathrm{H}^+\to\mathrm{t}\overline{\mathrm{b}} $ (left), and $ \mathrm{p}\mathrm{p}\to\mathrm{b}{\mathrm{H}}{+},\mathrm{H}^+\to\mathrm{t}\overline{\mathrm{b}} $ (middle and right). |
png pdf |
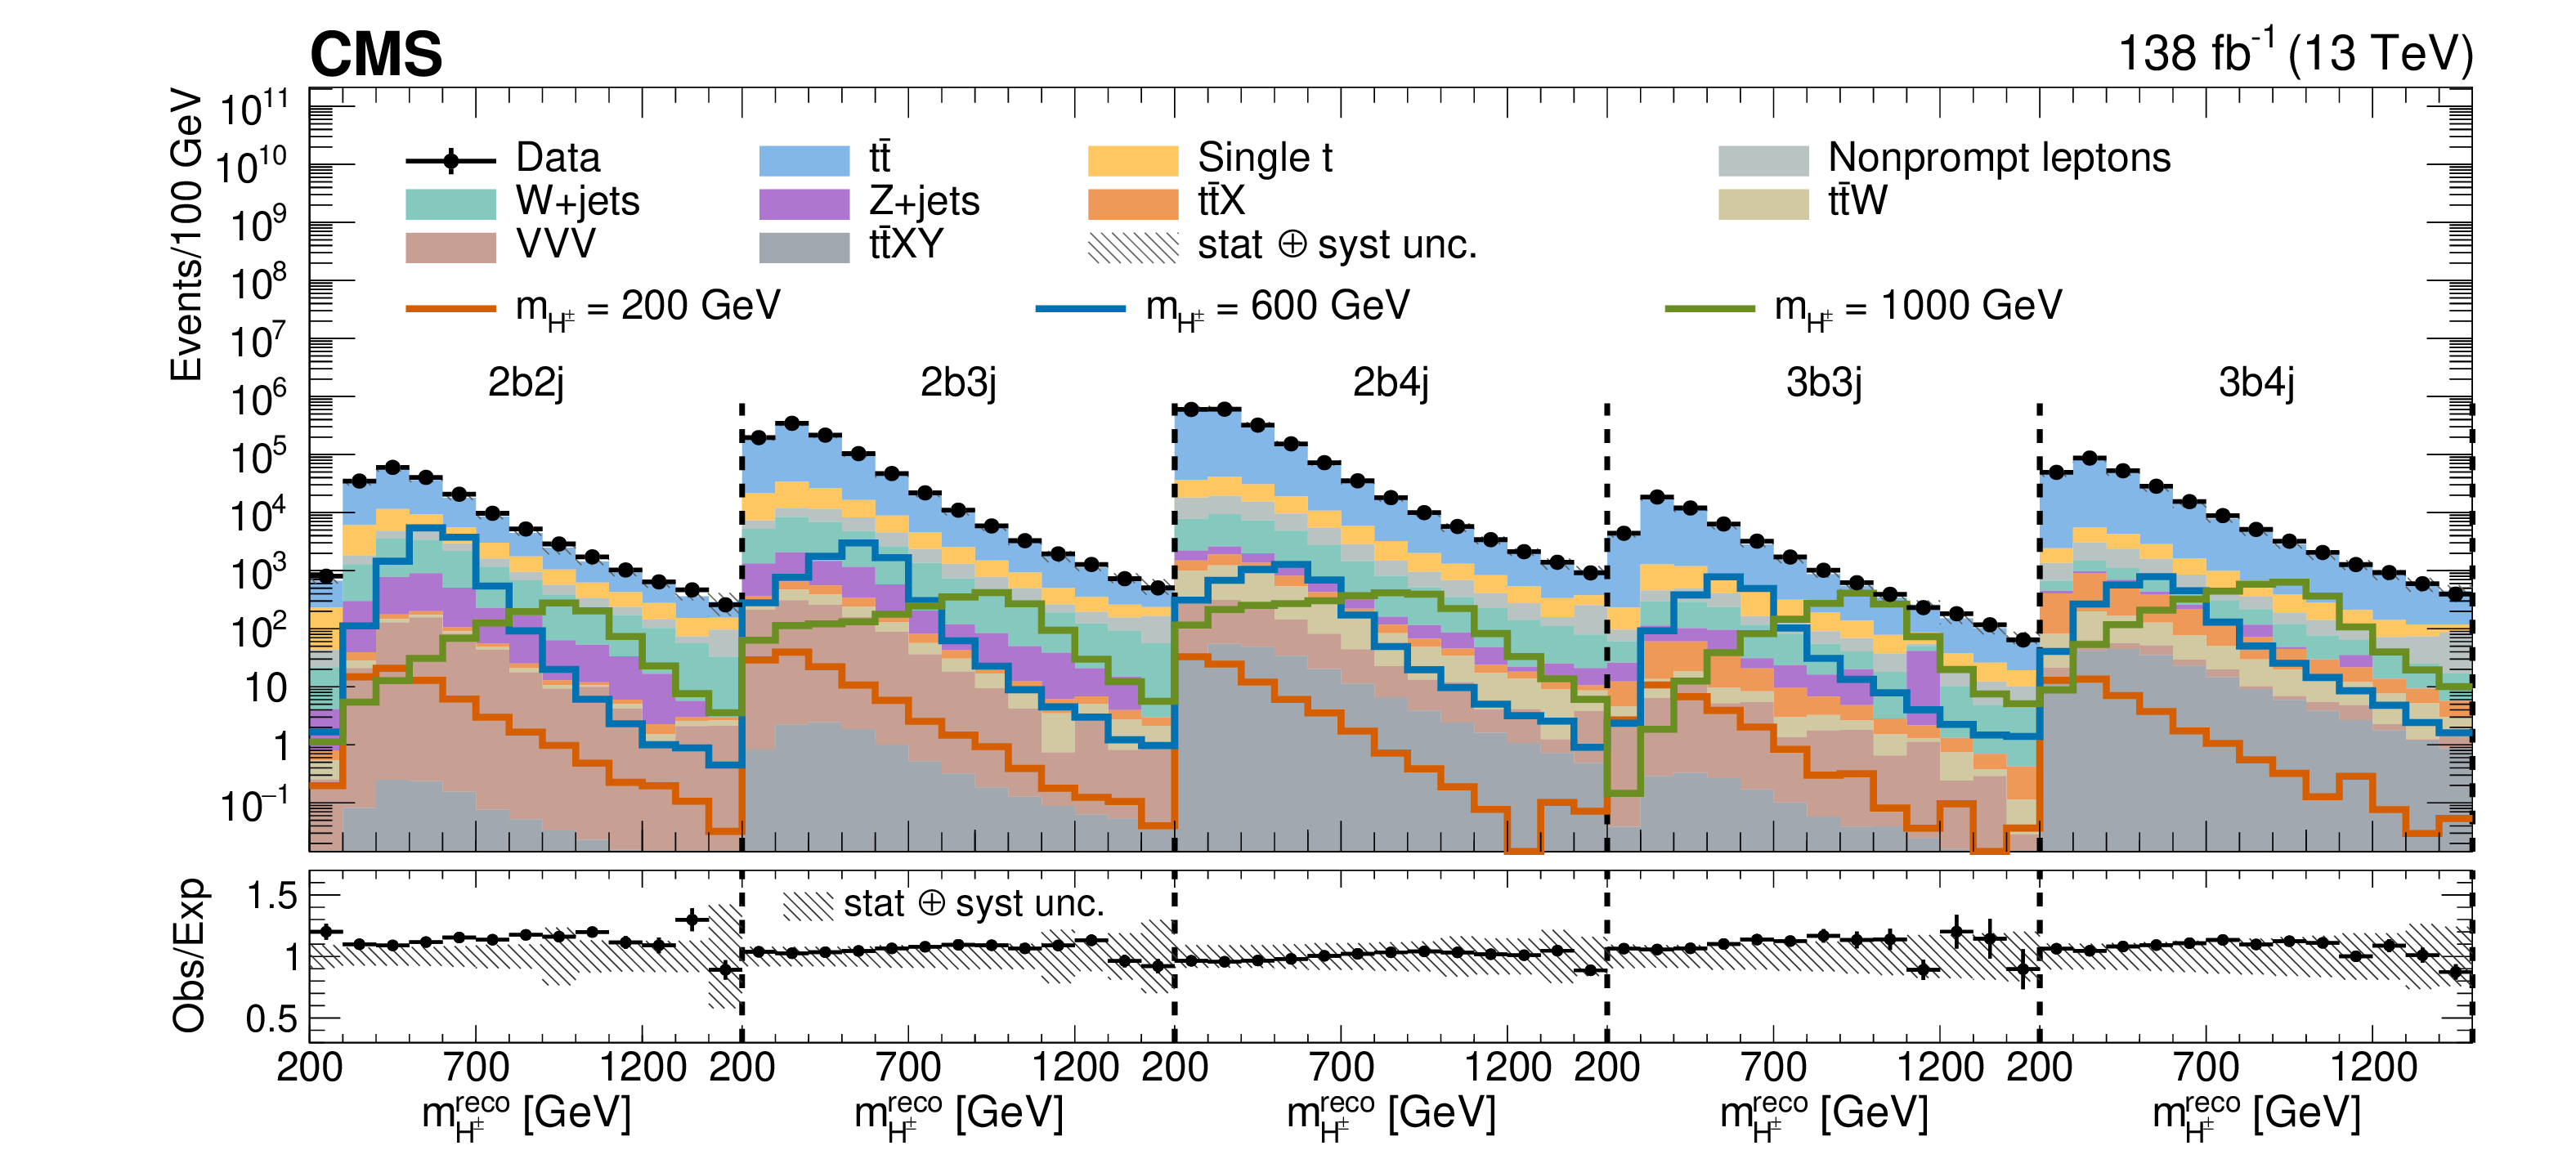
Figure 2:
The reconstructed $ \mathrm{H^{\pm}} $ boson mass distributions in each SR in the combined data set. Predictions for the signal with $ m_{\mathrm{H^{\pm}}}= $ 200, 600, and 1000 GeV, normalized to a cross section of 1 pb, are also shown. Beneath each plot, the ratio of data to predictions is shown. The error bars only consider statistical uncertainties in data, while the hashed bands include both statistical and systematic uncertainties. |
png pdf |
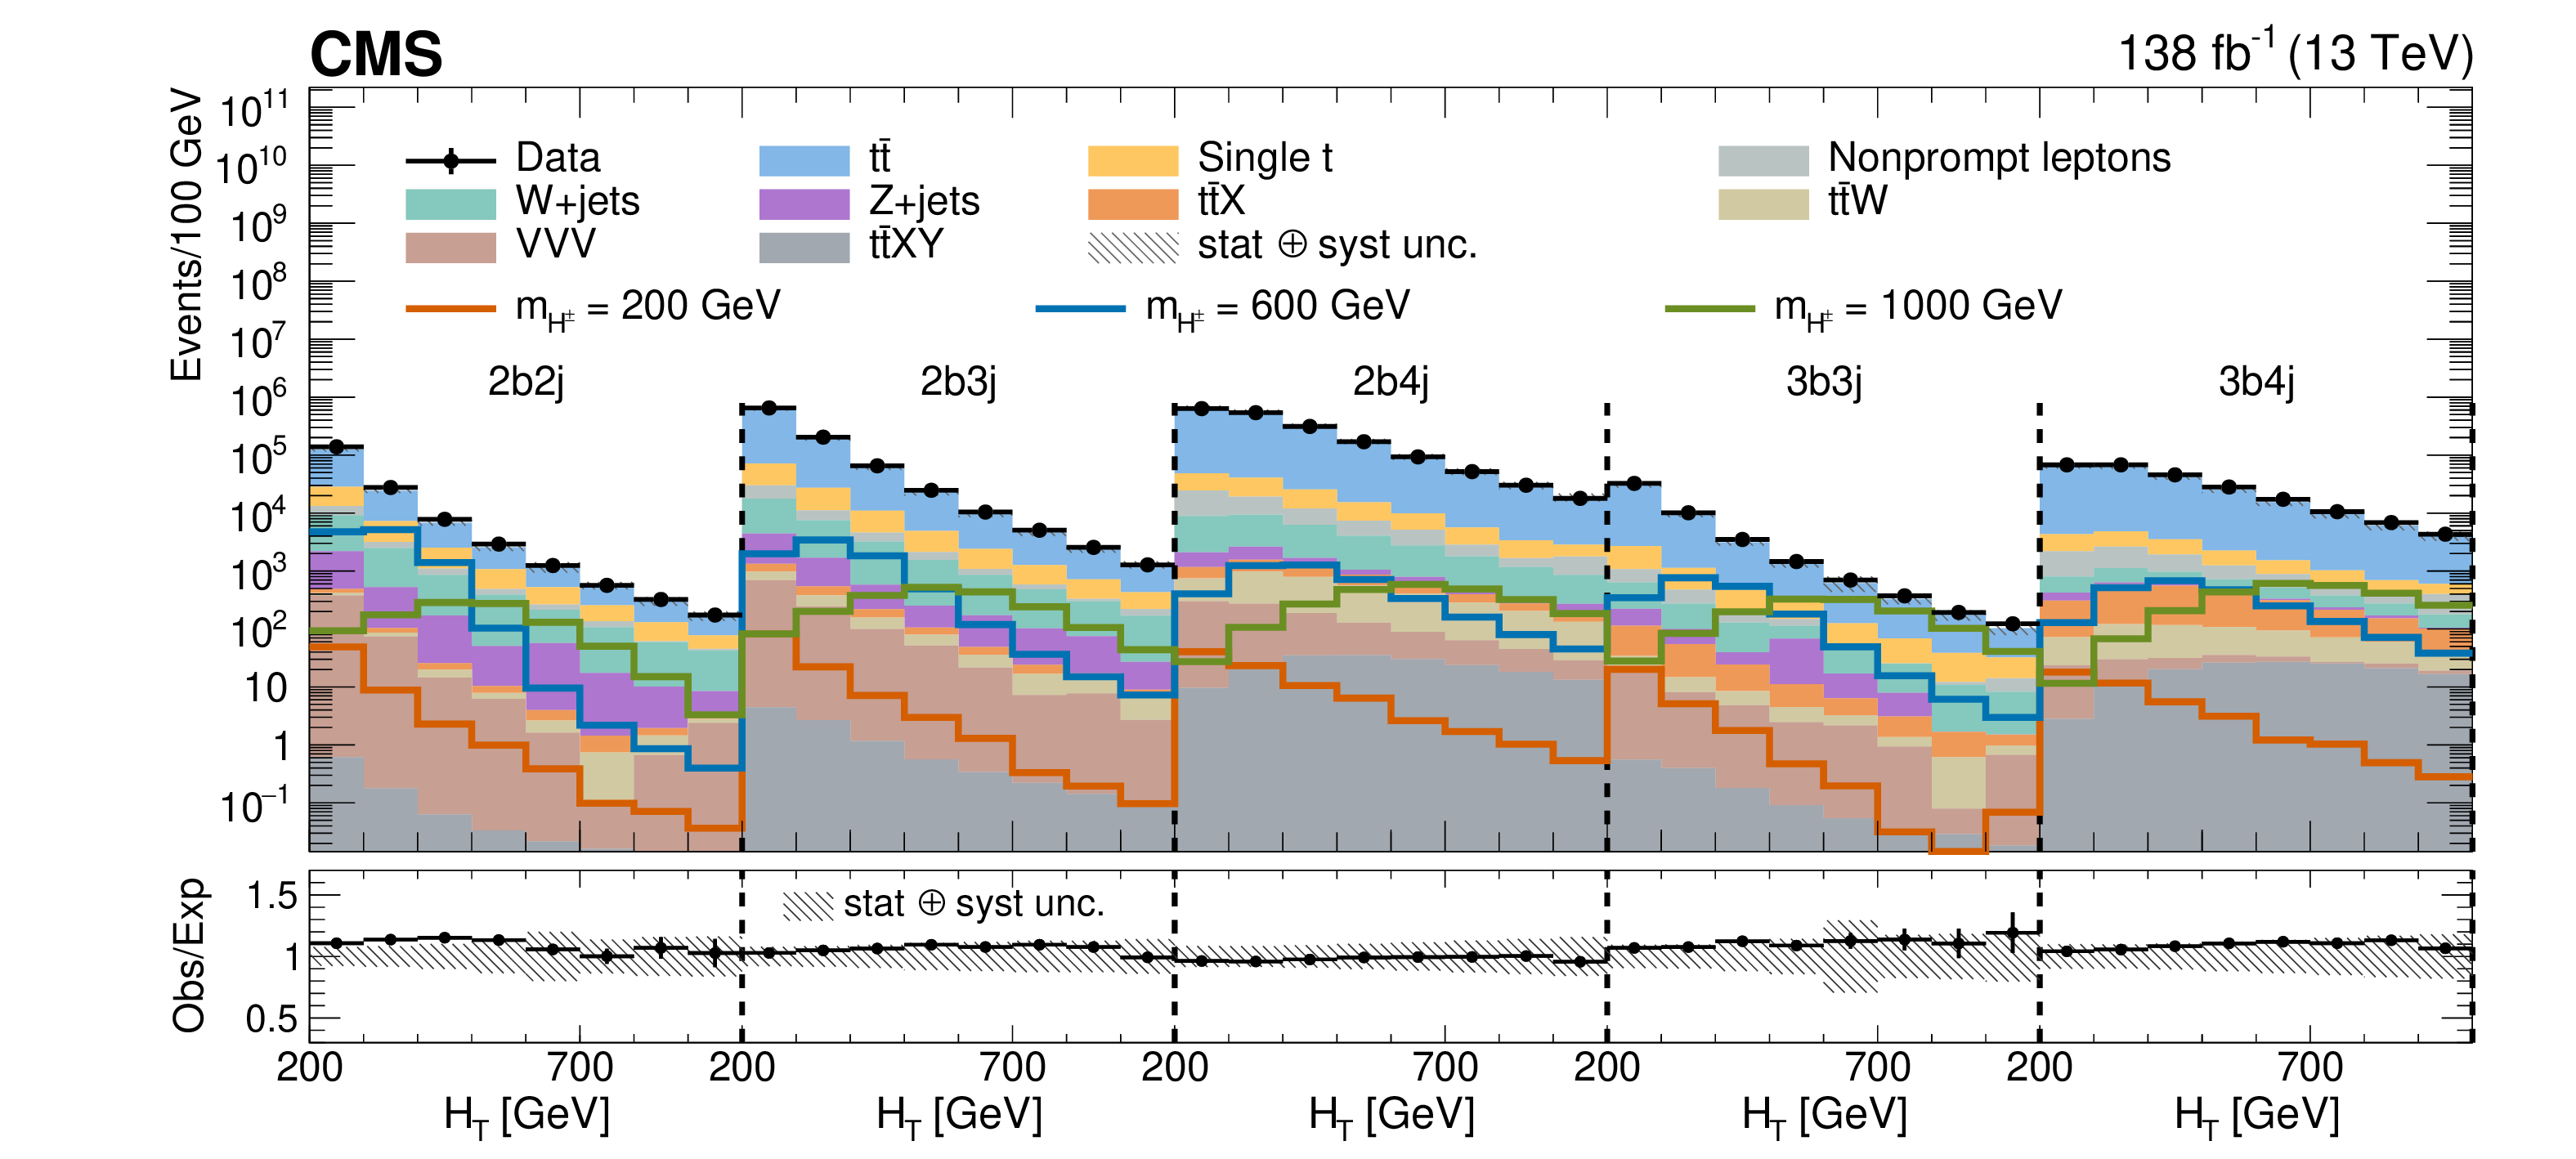
Figure 3:
The reconstructed $ H_{\mathrm{T}} $ distributions in each SR in the combined data set. Predictions for the signal with $ m_{\mathrm{H^{\pm}}}= $ 200, 600, and 1000 GeV, normalized to a cross section of 1 pb, are also shown. Beneath each plot, the ratio of data to predictions is shown. The error bars only consider statistical uncertainties in data, while the hashed bands include both statistical and systematic uncertainties. |
png pdf |
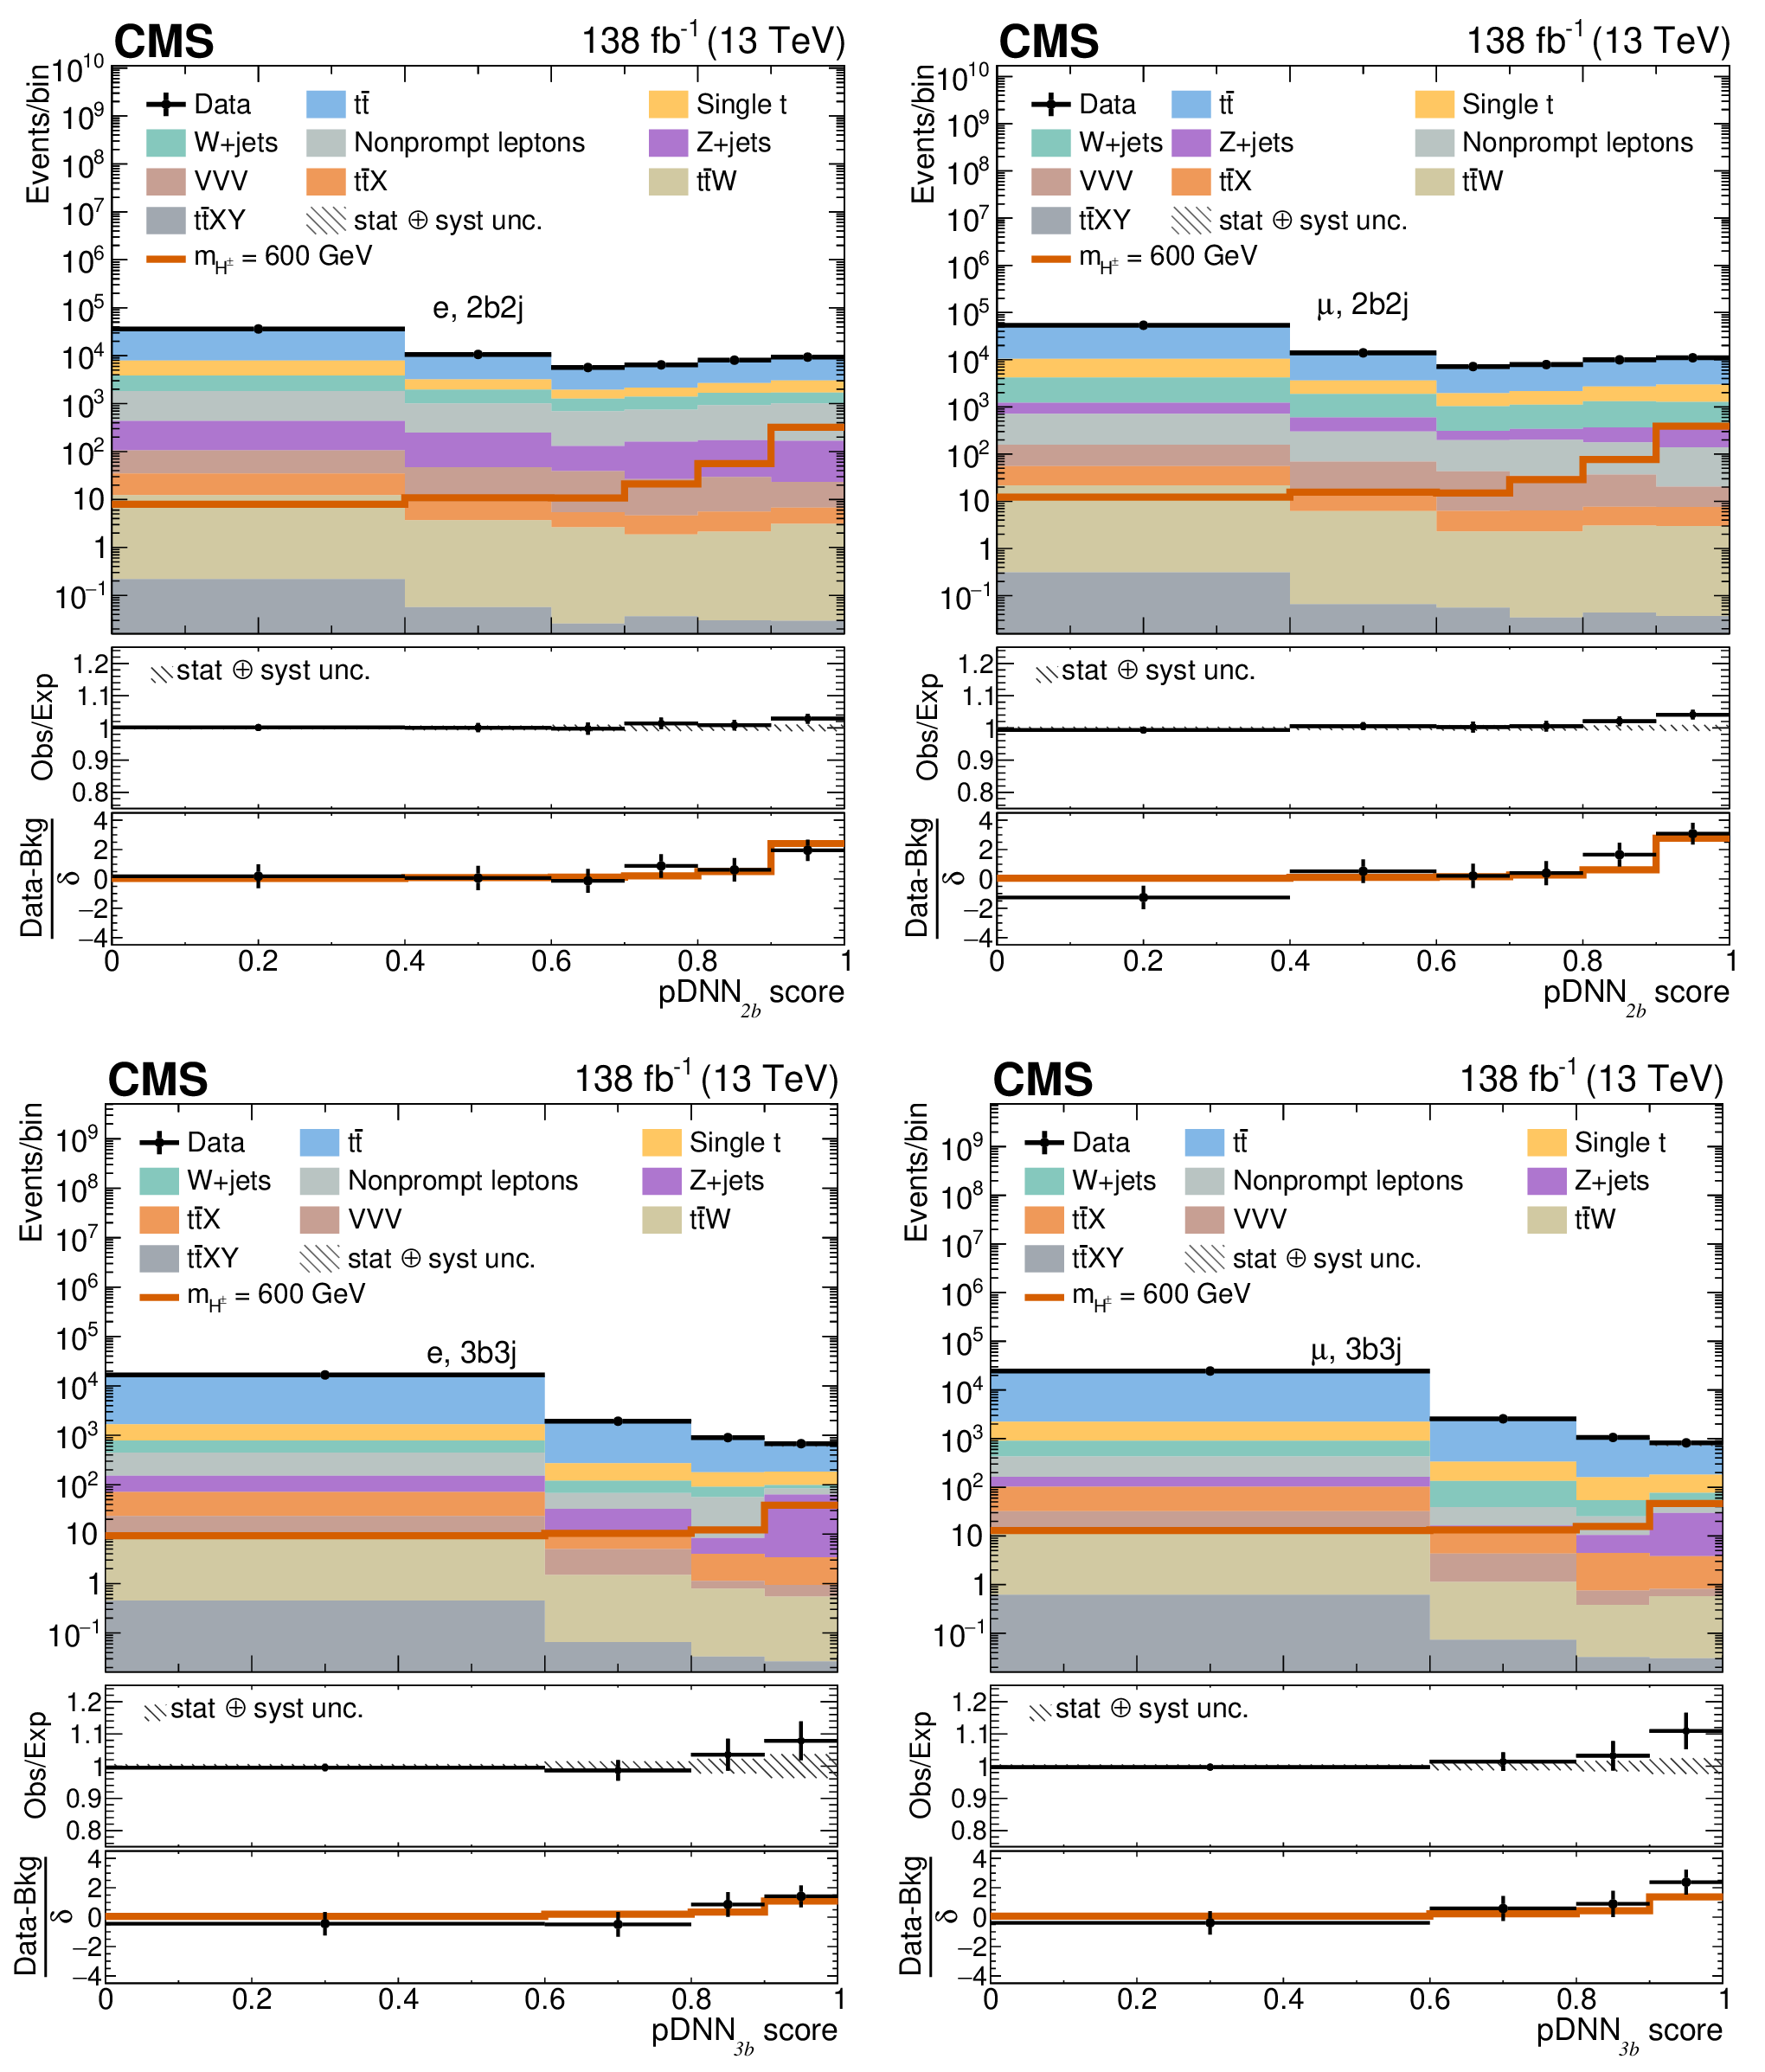
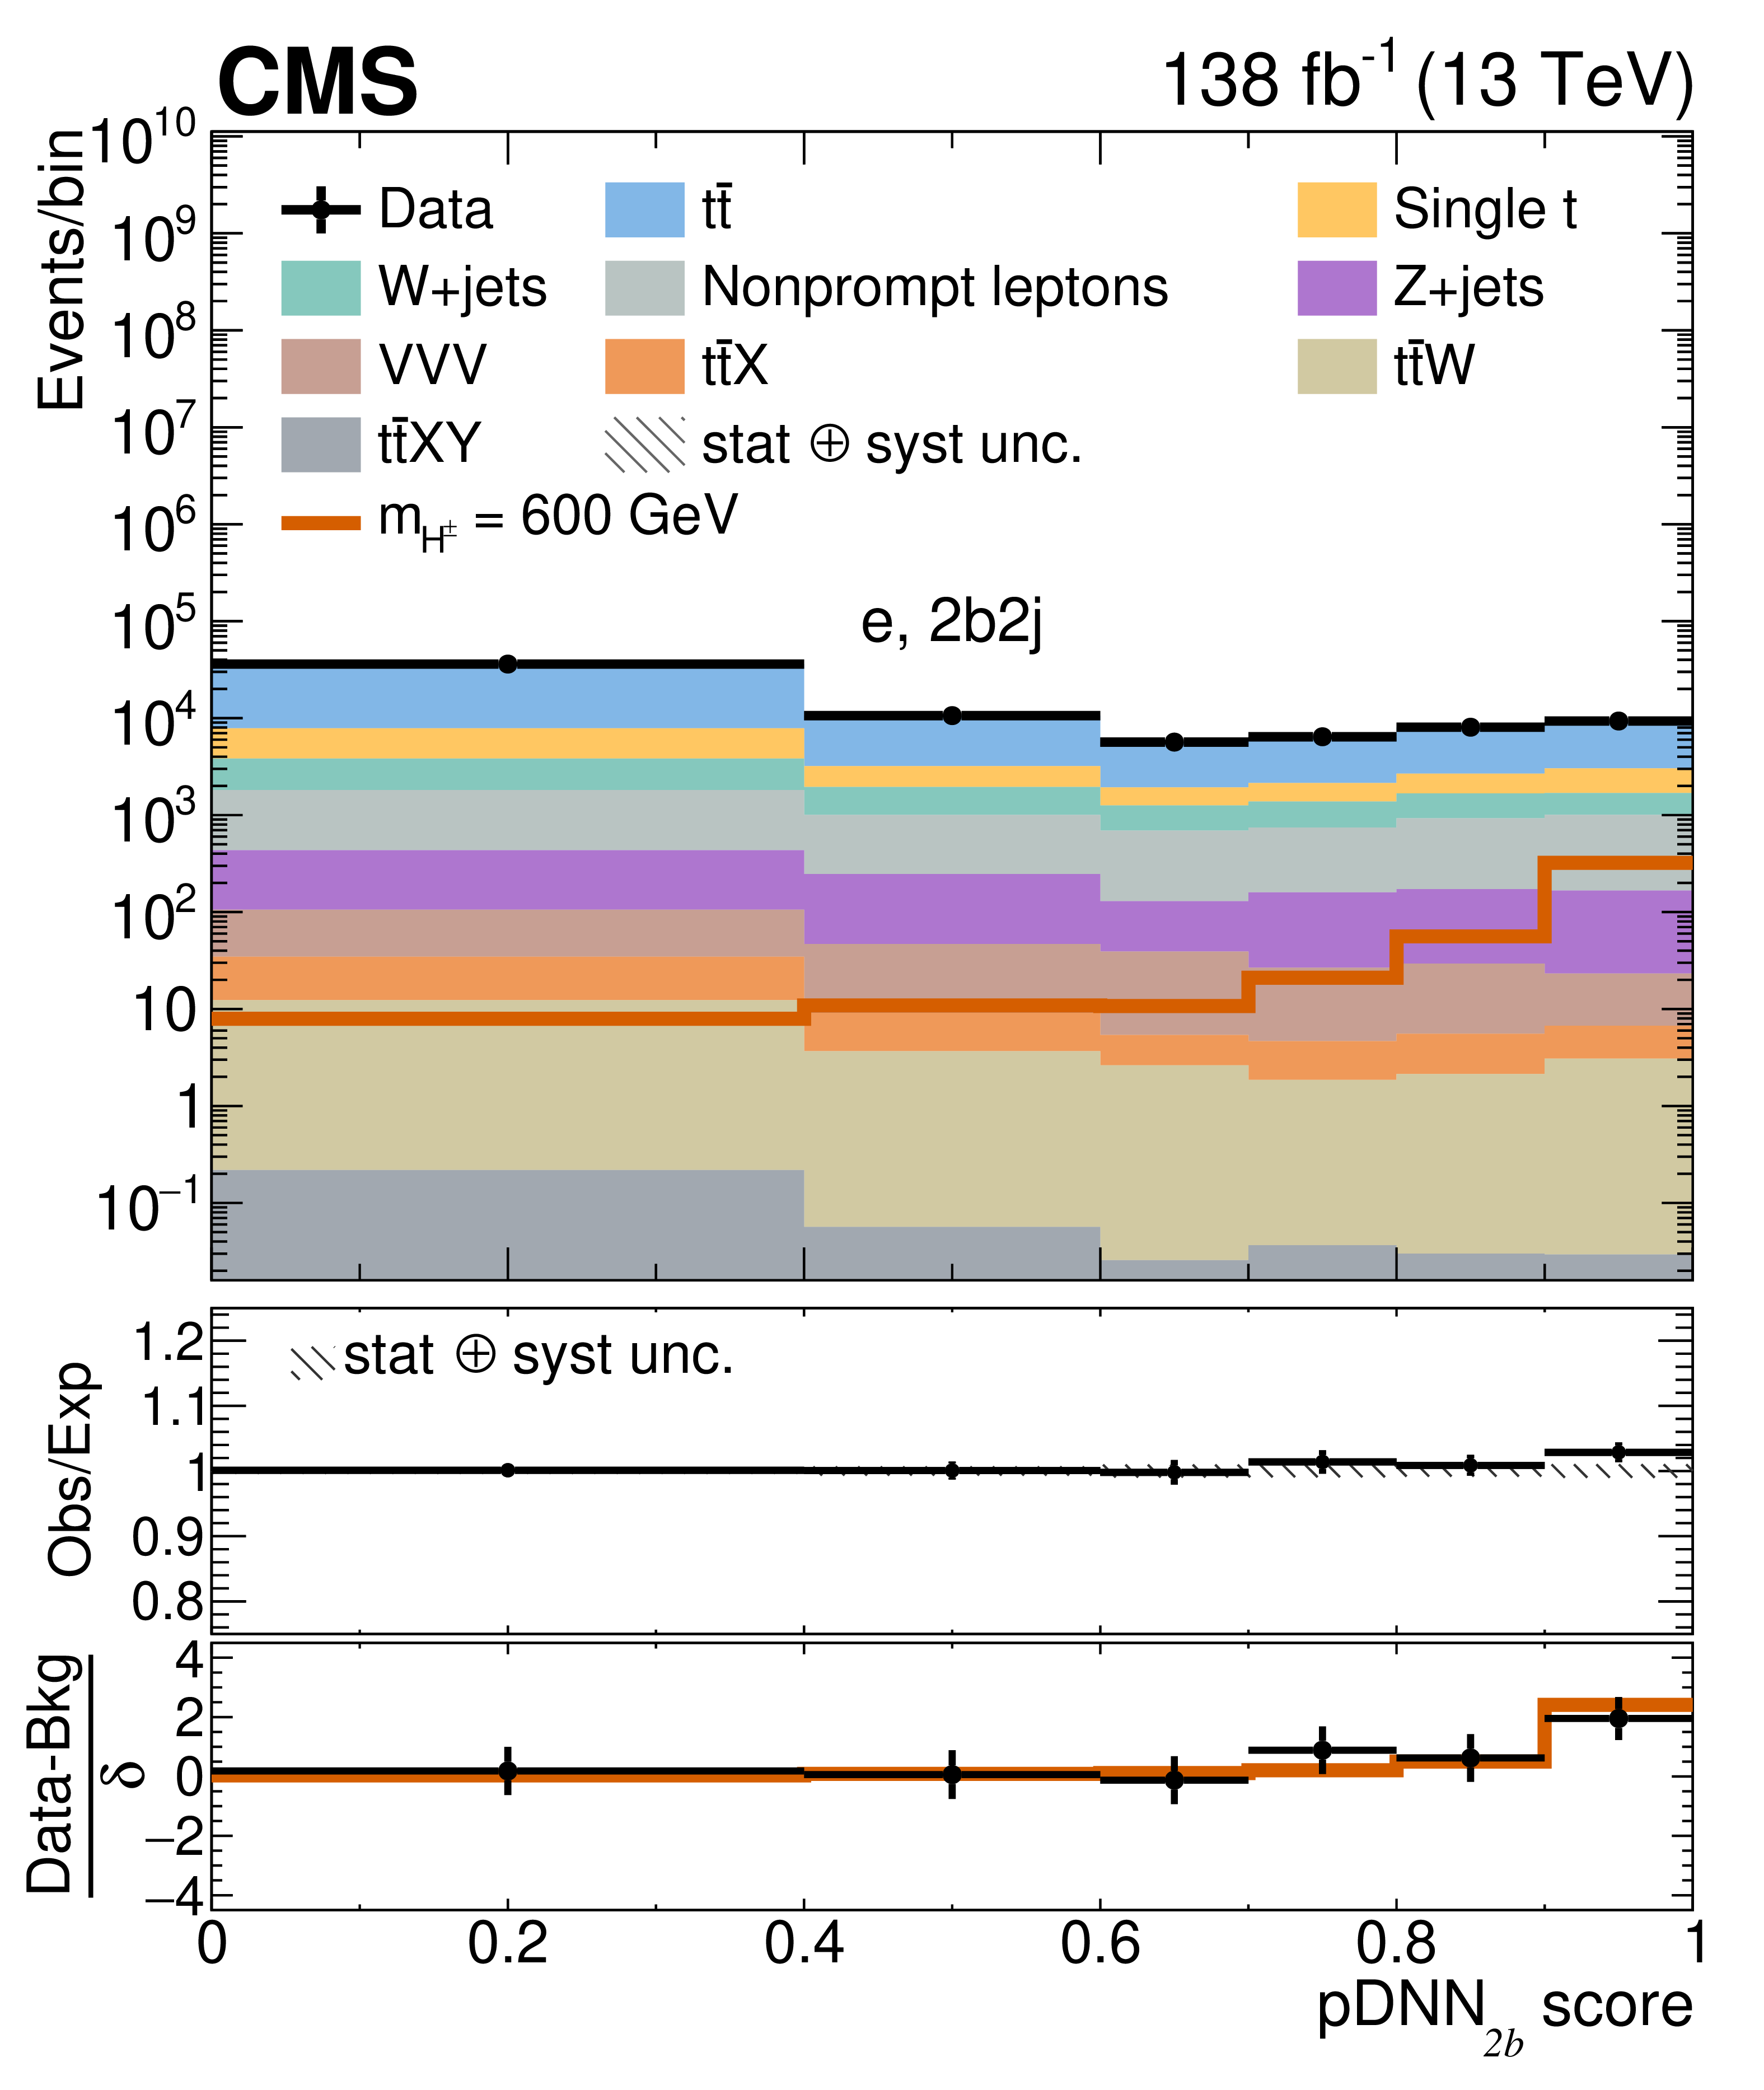
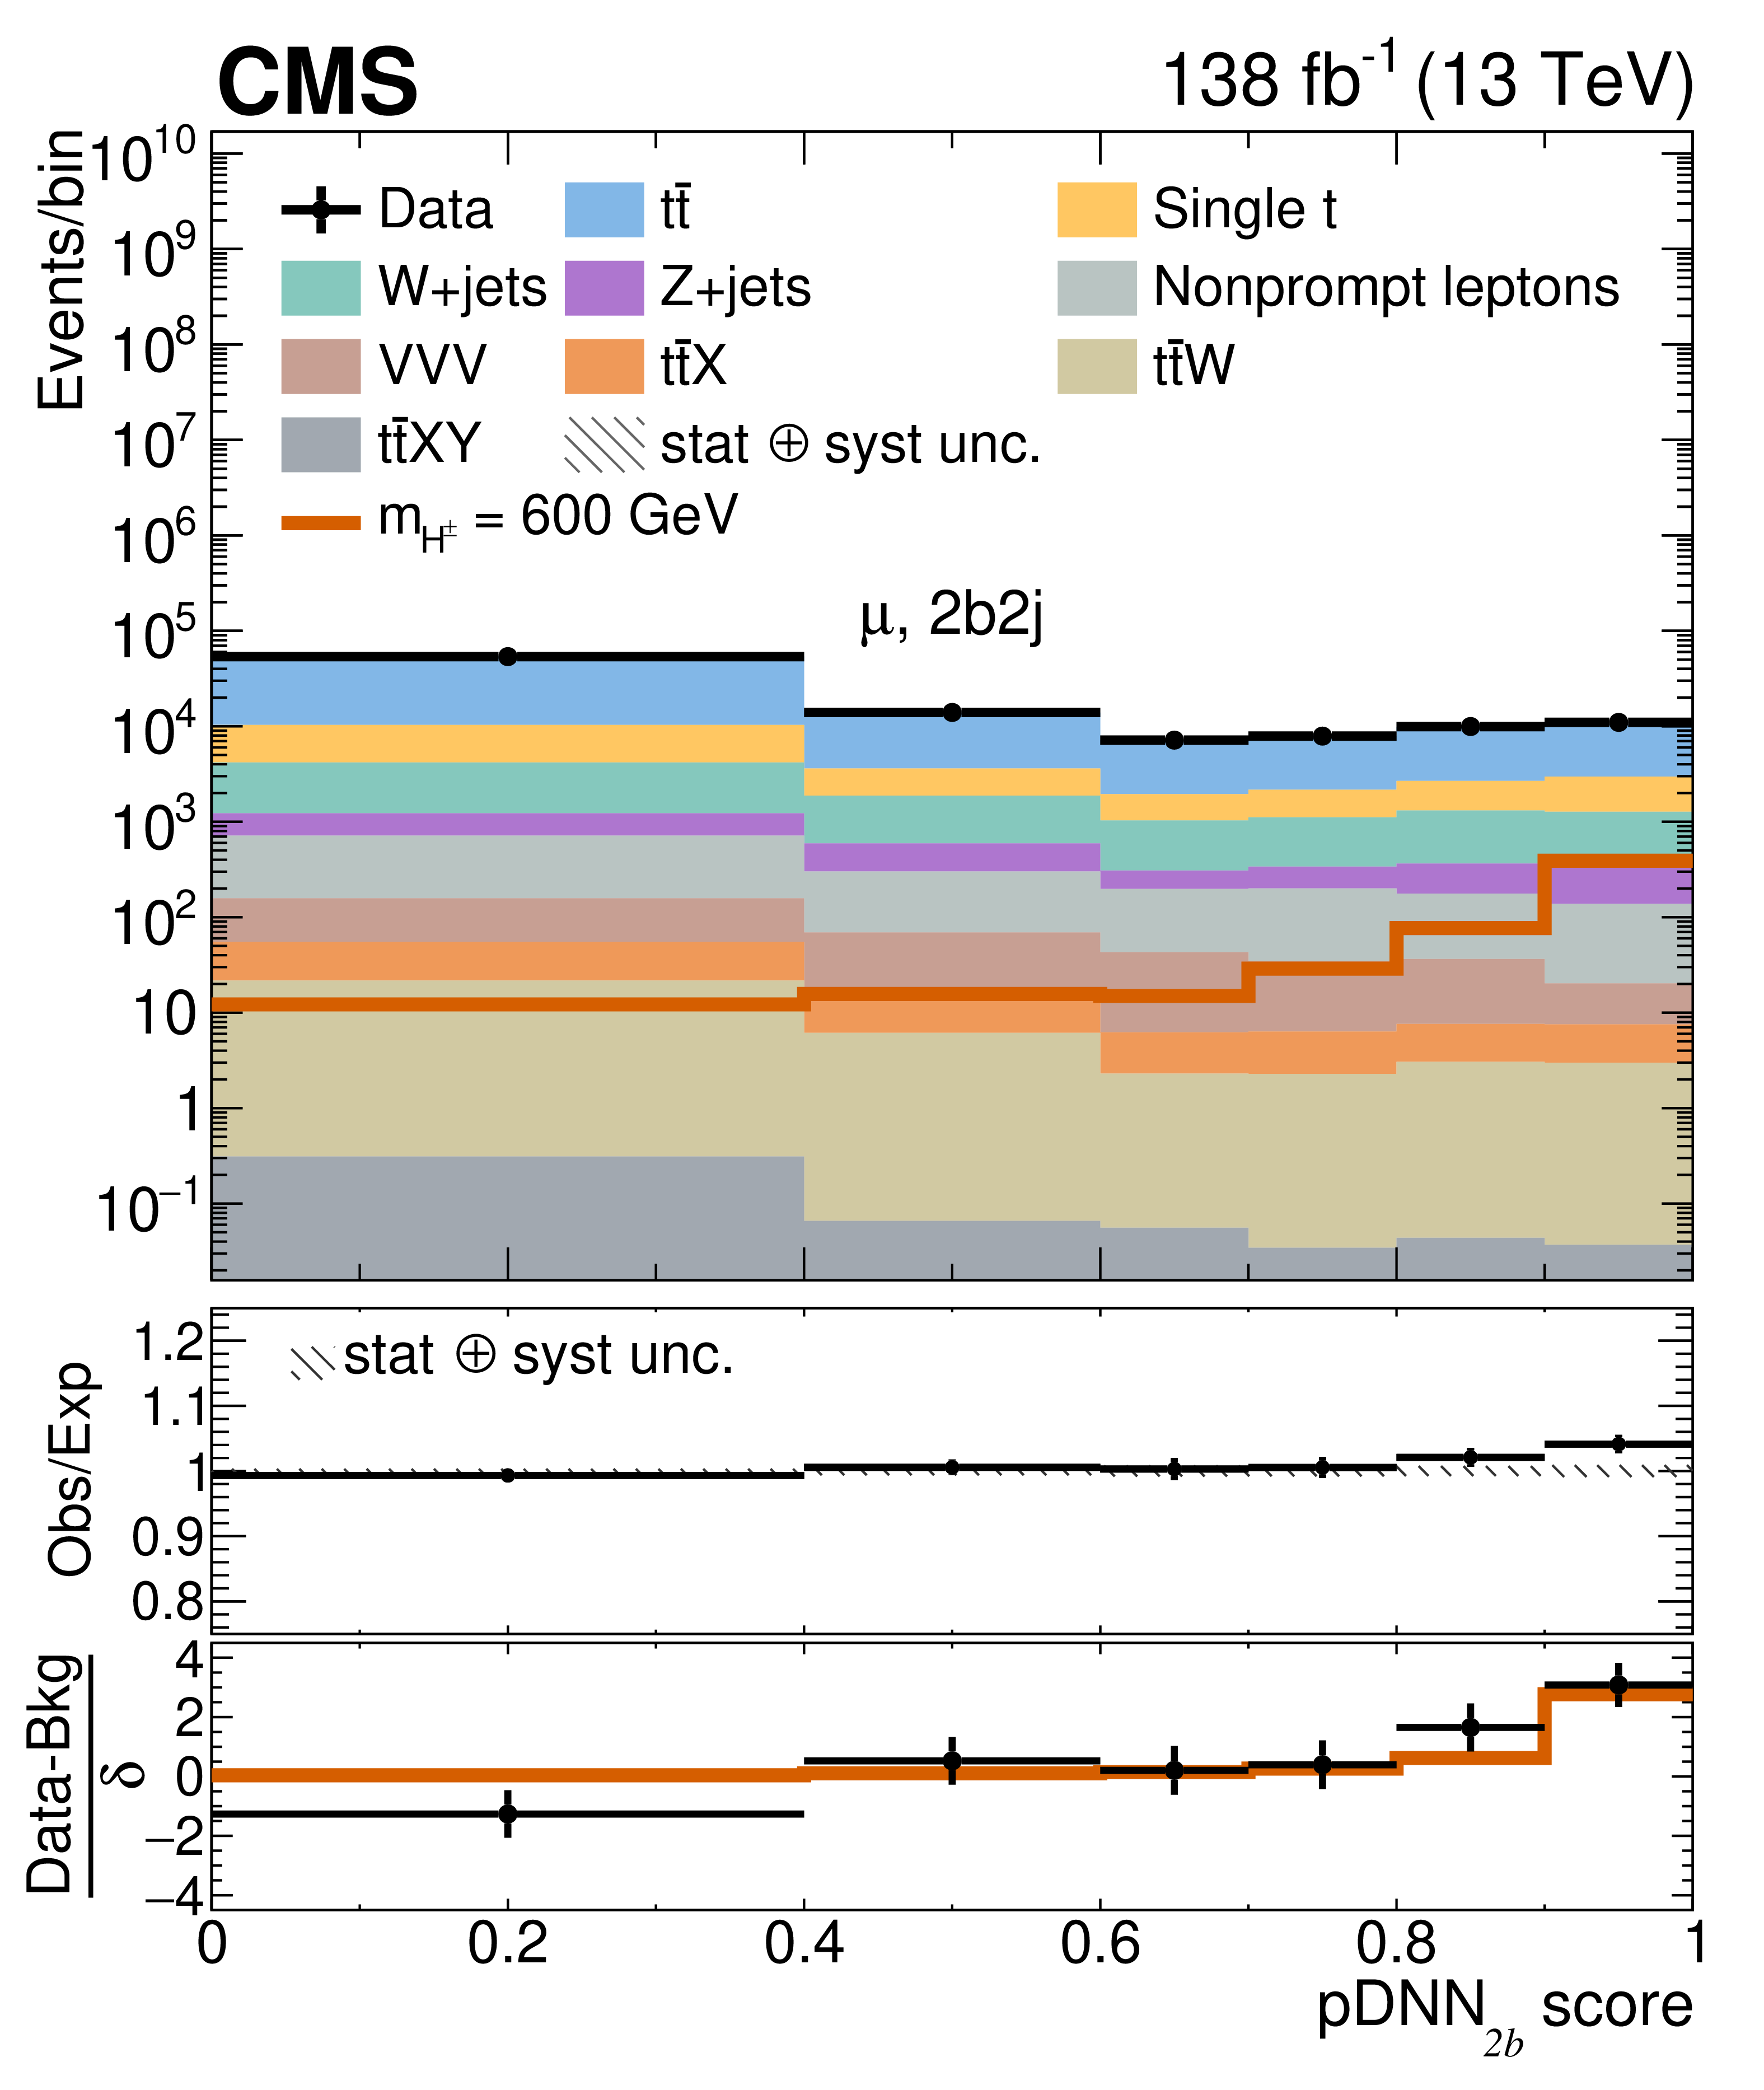
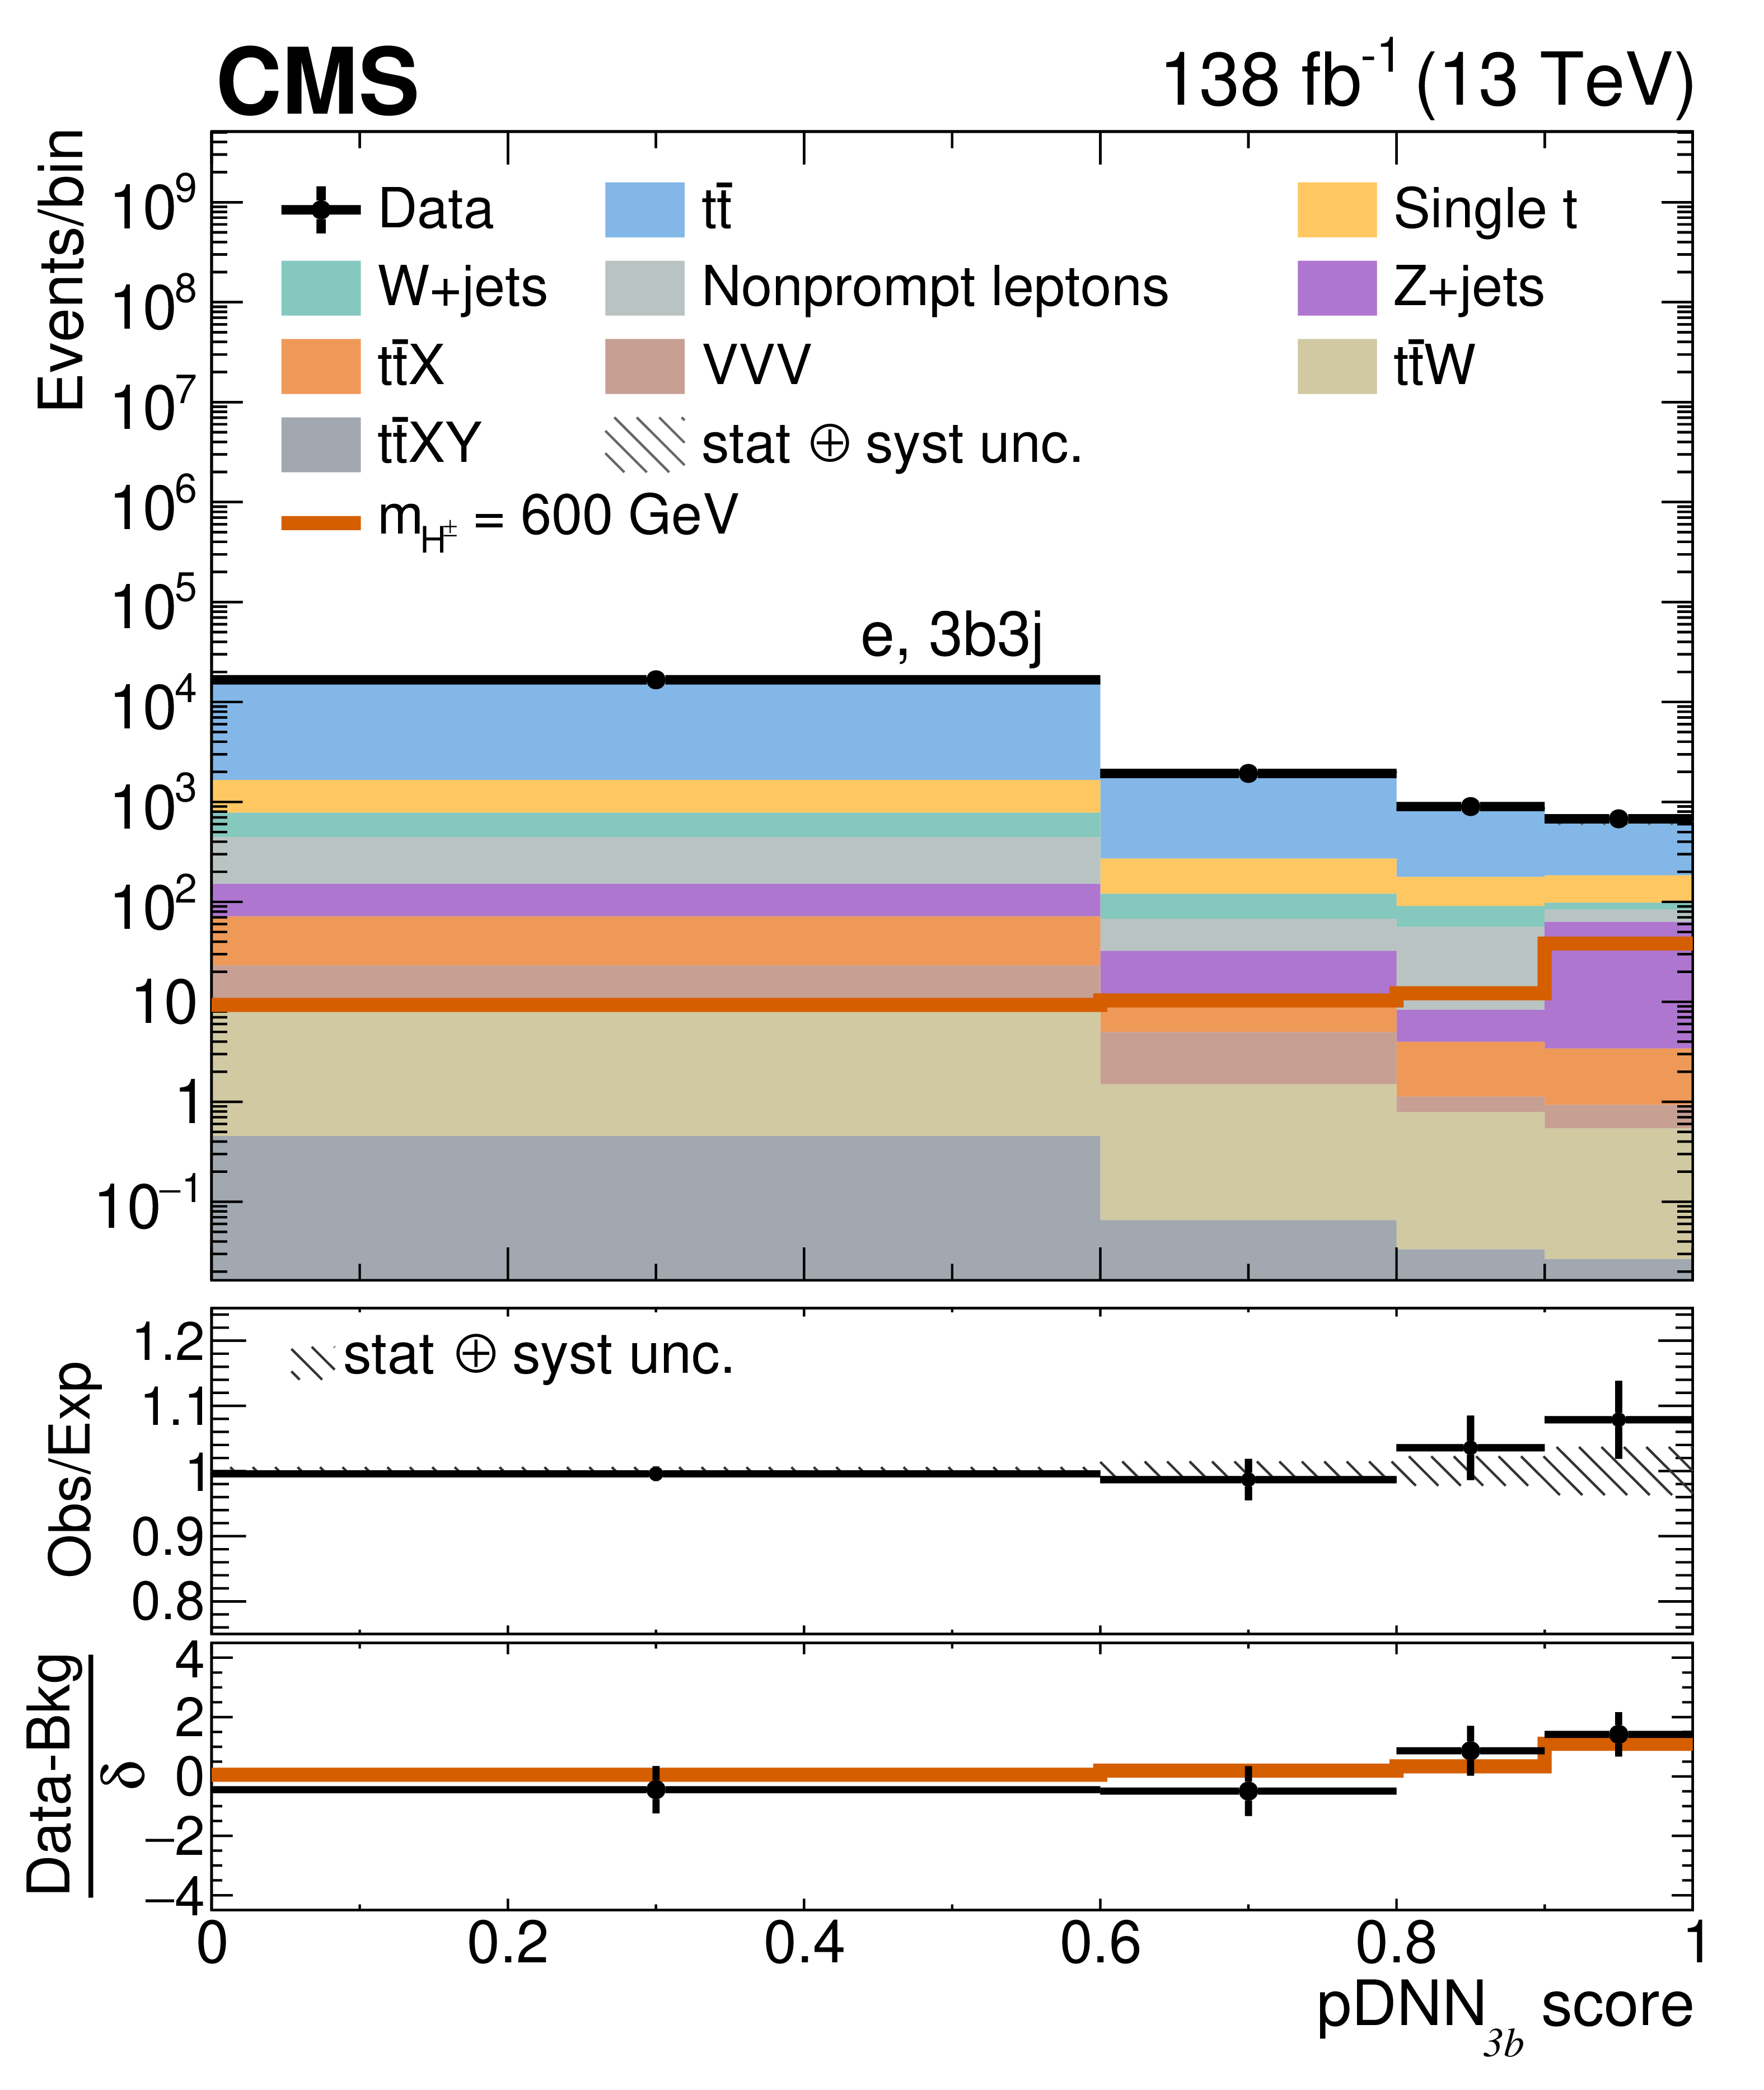
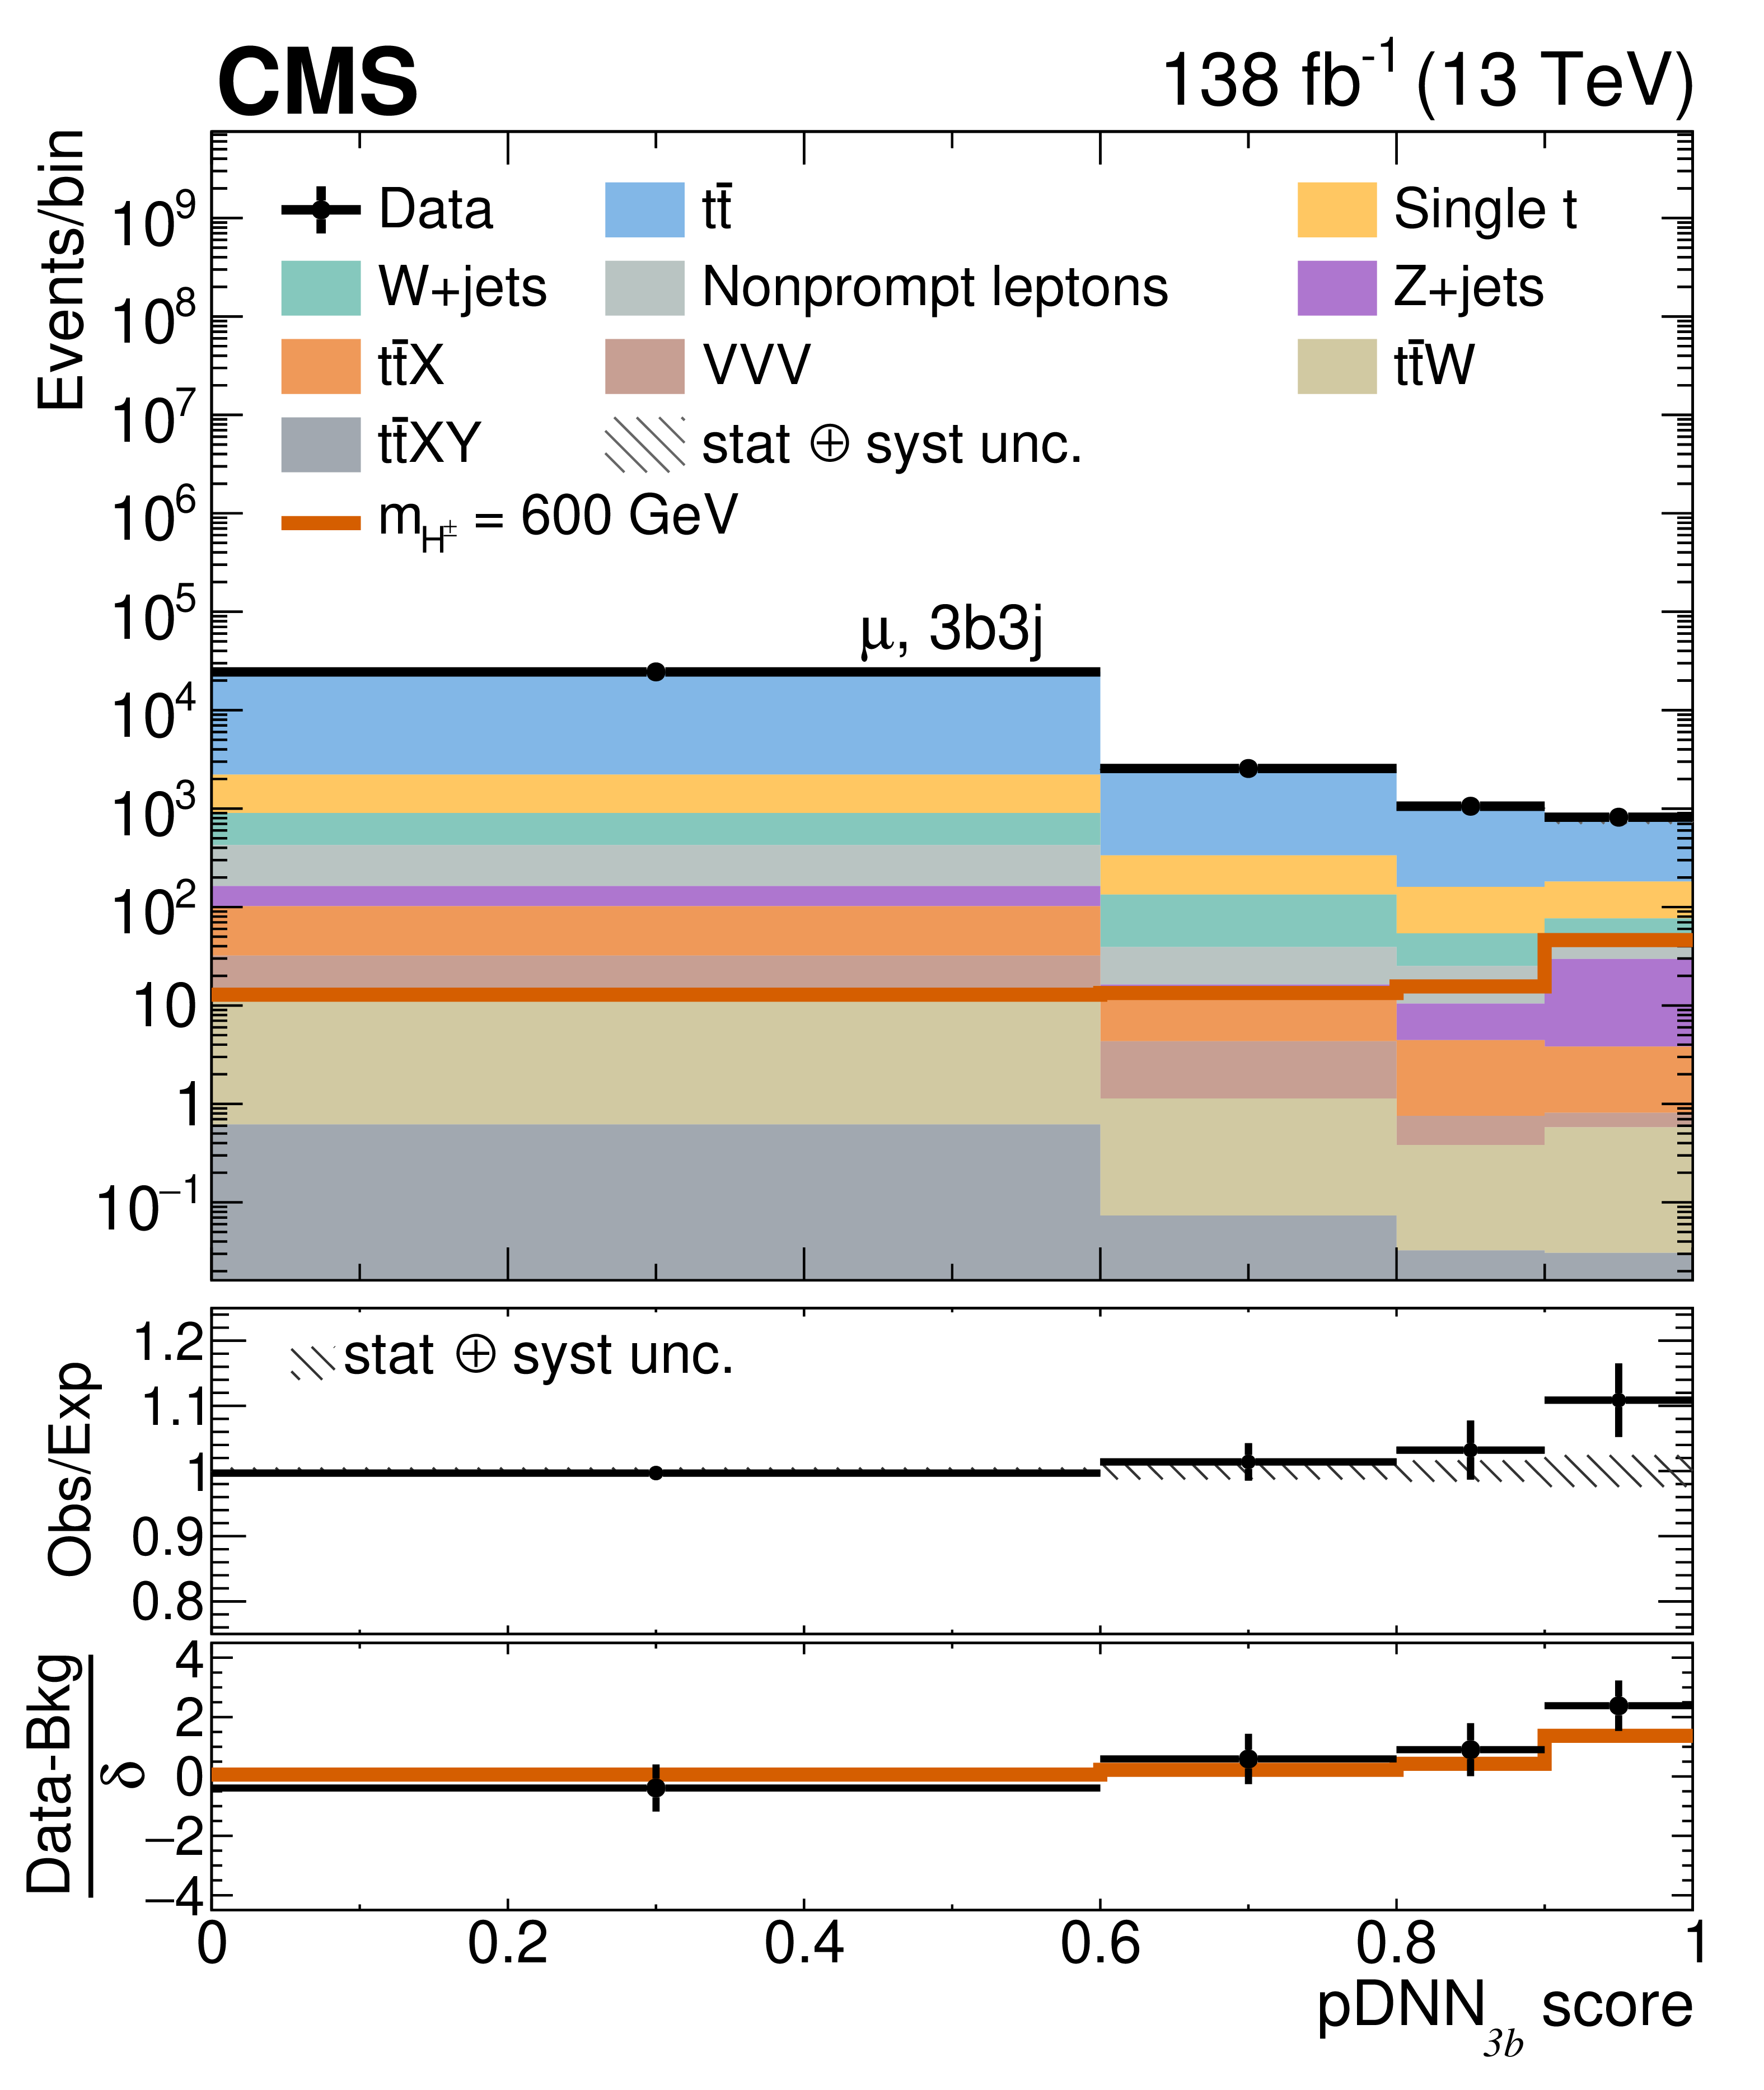
Figure 4:
The postfit pDNN distributions in the SR 2b2j (upper) and 3b3j (lower) for electron (left) and muon (right) channels assuming $ m_{\mathrm{H^{\pm}}}= $ 600 GeV. Postfit signal for $ m_{\mathrm{H^{\pm}}}= $ 600 GeV is also shown. Lower panels display the difference between data and the sum of the SM background predictions, normalized by the combined statistical and systematic uncertainty, $ \delta $. The error bars only consider statistical uncertainties in data, while the hashed bands include both statistical and systematic uncertainties. |
png pdf |
Figure 4-a:
The postfit pDNN distributions in the SR 2b2j (upper) and 3b3j (lower) for electron (left) and muon (right) channels assuming $ m_{\mathrm{H^{\pm}}}= $ 600 GeV. Postfit signal for $ m_{\mathrm{H^{\pm}}}= $ 600 GeV is also shown. Lower panels display the difference between data and the sum of the SM background predictions, normalized by the combined statistical and systematic uncertainty, $ \delta $. The error bars only consider statistical uncertainties in data, while the hashed bands include both statistical and systematic uncertainties. |
png pdf |
Figure 4-b:
The postfit pDNN distributions in the SR 2b2j (upper) and 3b3j (lower) for electron (left) and muon (right) channels assuming $ m_{\mathrm{H^{\pm}}}= $ 600 GeV. Postfit signal for $ m_{\mathrm{H^{\pm}}}= $ 600 GeV is also shown. Lower panels display the difference between data and the sum of the SM background predictions, normalized by the combined statistical and systematic uncertainty, $ \delta $. The error bars only consider statistical uncertainties in data, while the hashed bands include both statistical and systematic uncertainties. |
png pdf |
Figure 4-c:
The postfit pDNN distributions in the SR 2b2j (upper) and 3b3j (lower) for electron (left) and muon (right) channels assuming $ m_{\mathrm{H^{\pm}}}= $ 600 GeV. Postfit signal for $ m_{\mathrm{H^{\pm}}}= $ 600 GeV is also shown. Lower panels display the difference between data and the sum of the SM background predictions, normalized by the combined statistical and systematic uncertainty, $ \delta $. The error bars only consider statistical uncertainties in data, while the hashed bands include both statistical and systematic uncertainties. |
png pdf |
Figure 4-d:
The postfit pDNN distributions in the SR 2b2j (upper) and 3b3j (lower) for electron (left) and muon (right) channels assuming $ m_{\mathrm{H^{\pm}}}= $ 600 GeV. Postfit signal for $ m_{\mathrm{H^{\pm}}}= $ 600 GeV is also shown. Lower panels display the difference between data and the sum of the SM background predictions, normalized by the combined statistical and systematic uncertainty, $ \delta $. The error bars only consider statistical uncertainties in data, while the hashed bands include both statistical and systematic uncertainties. |
png pdf |
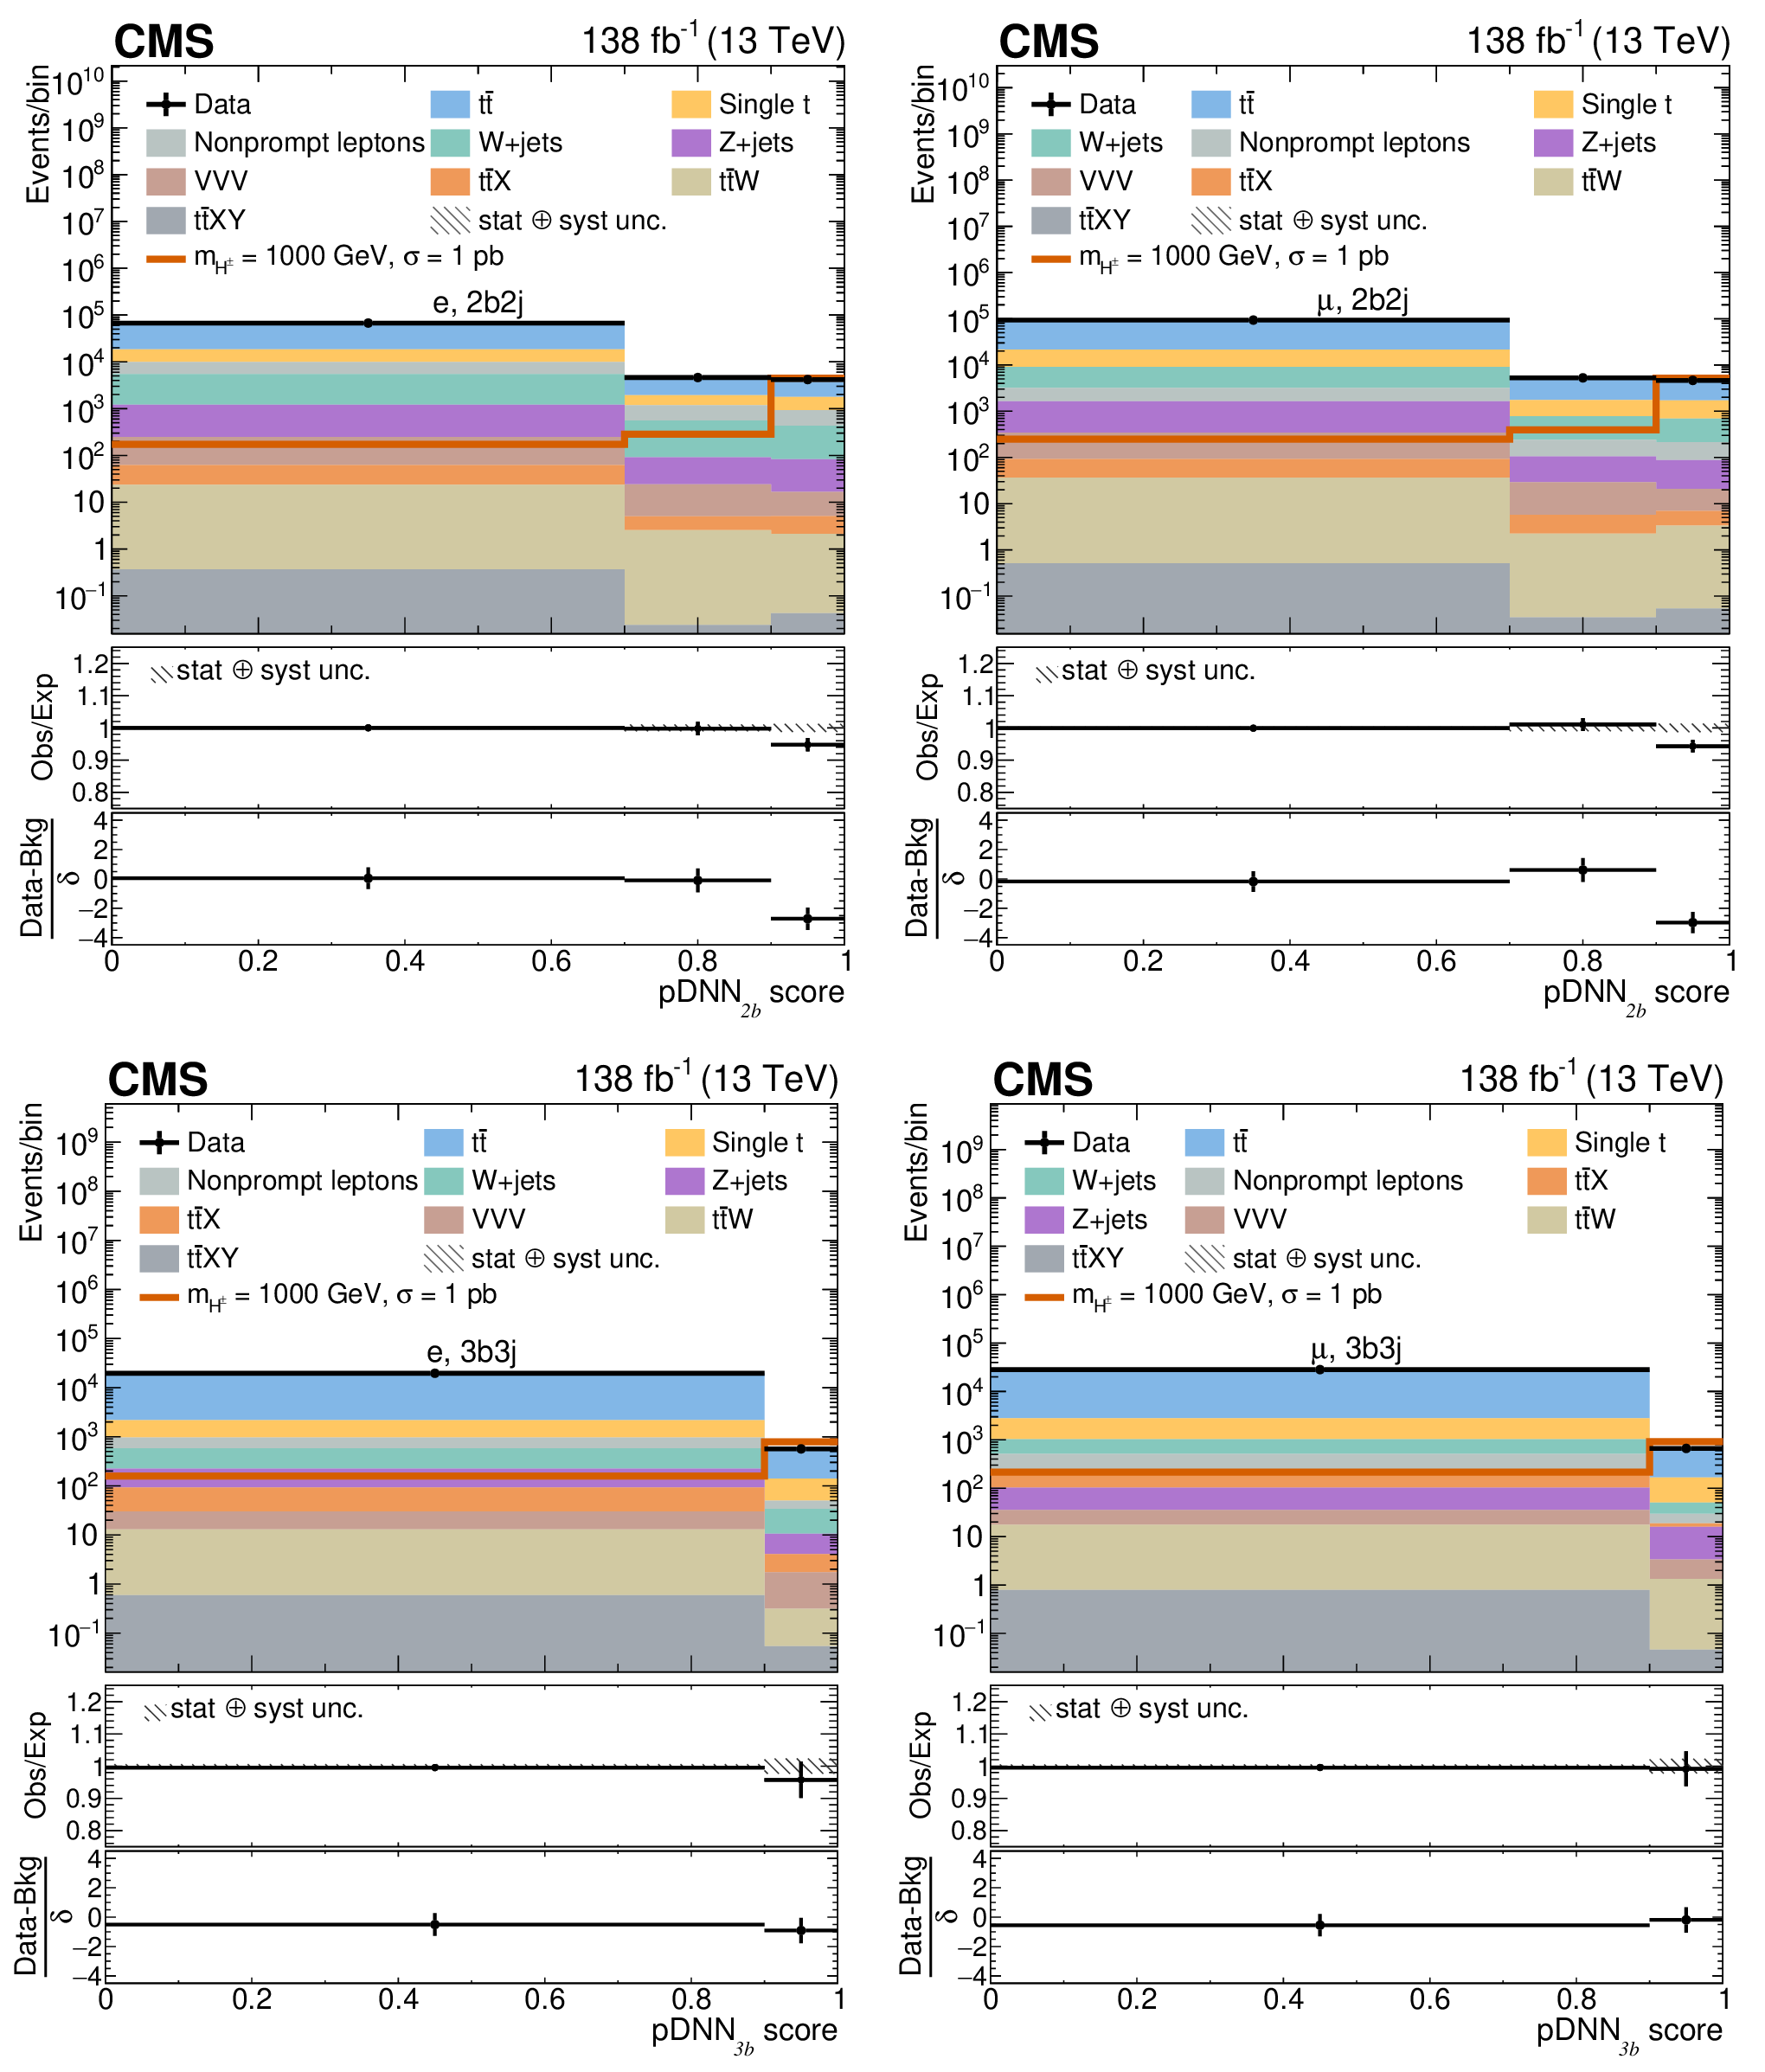
Figure 5:
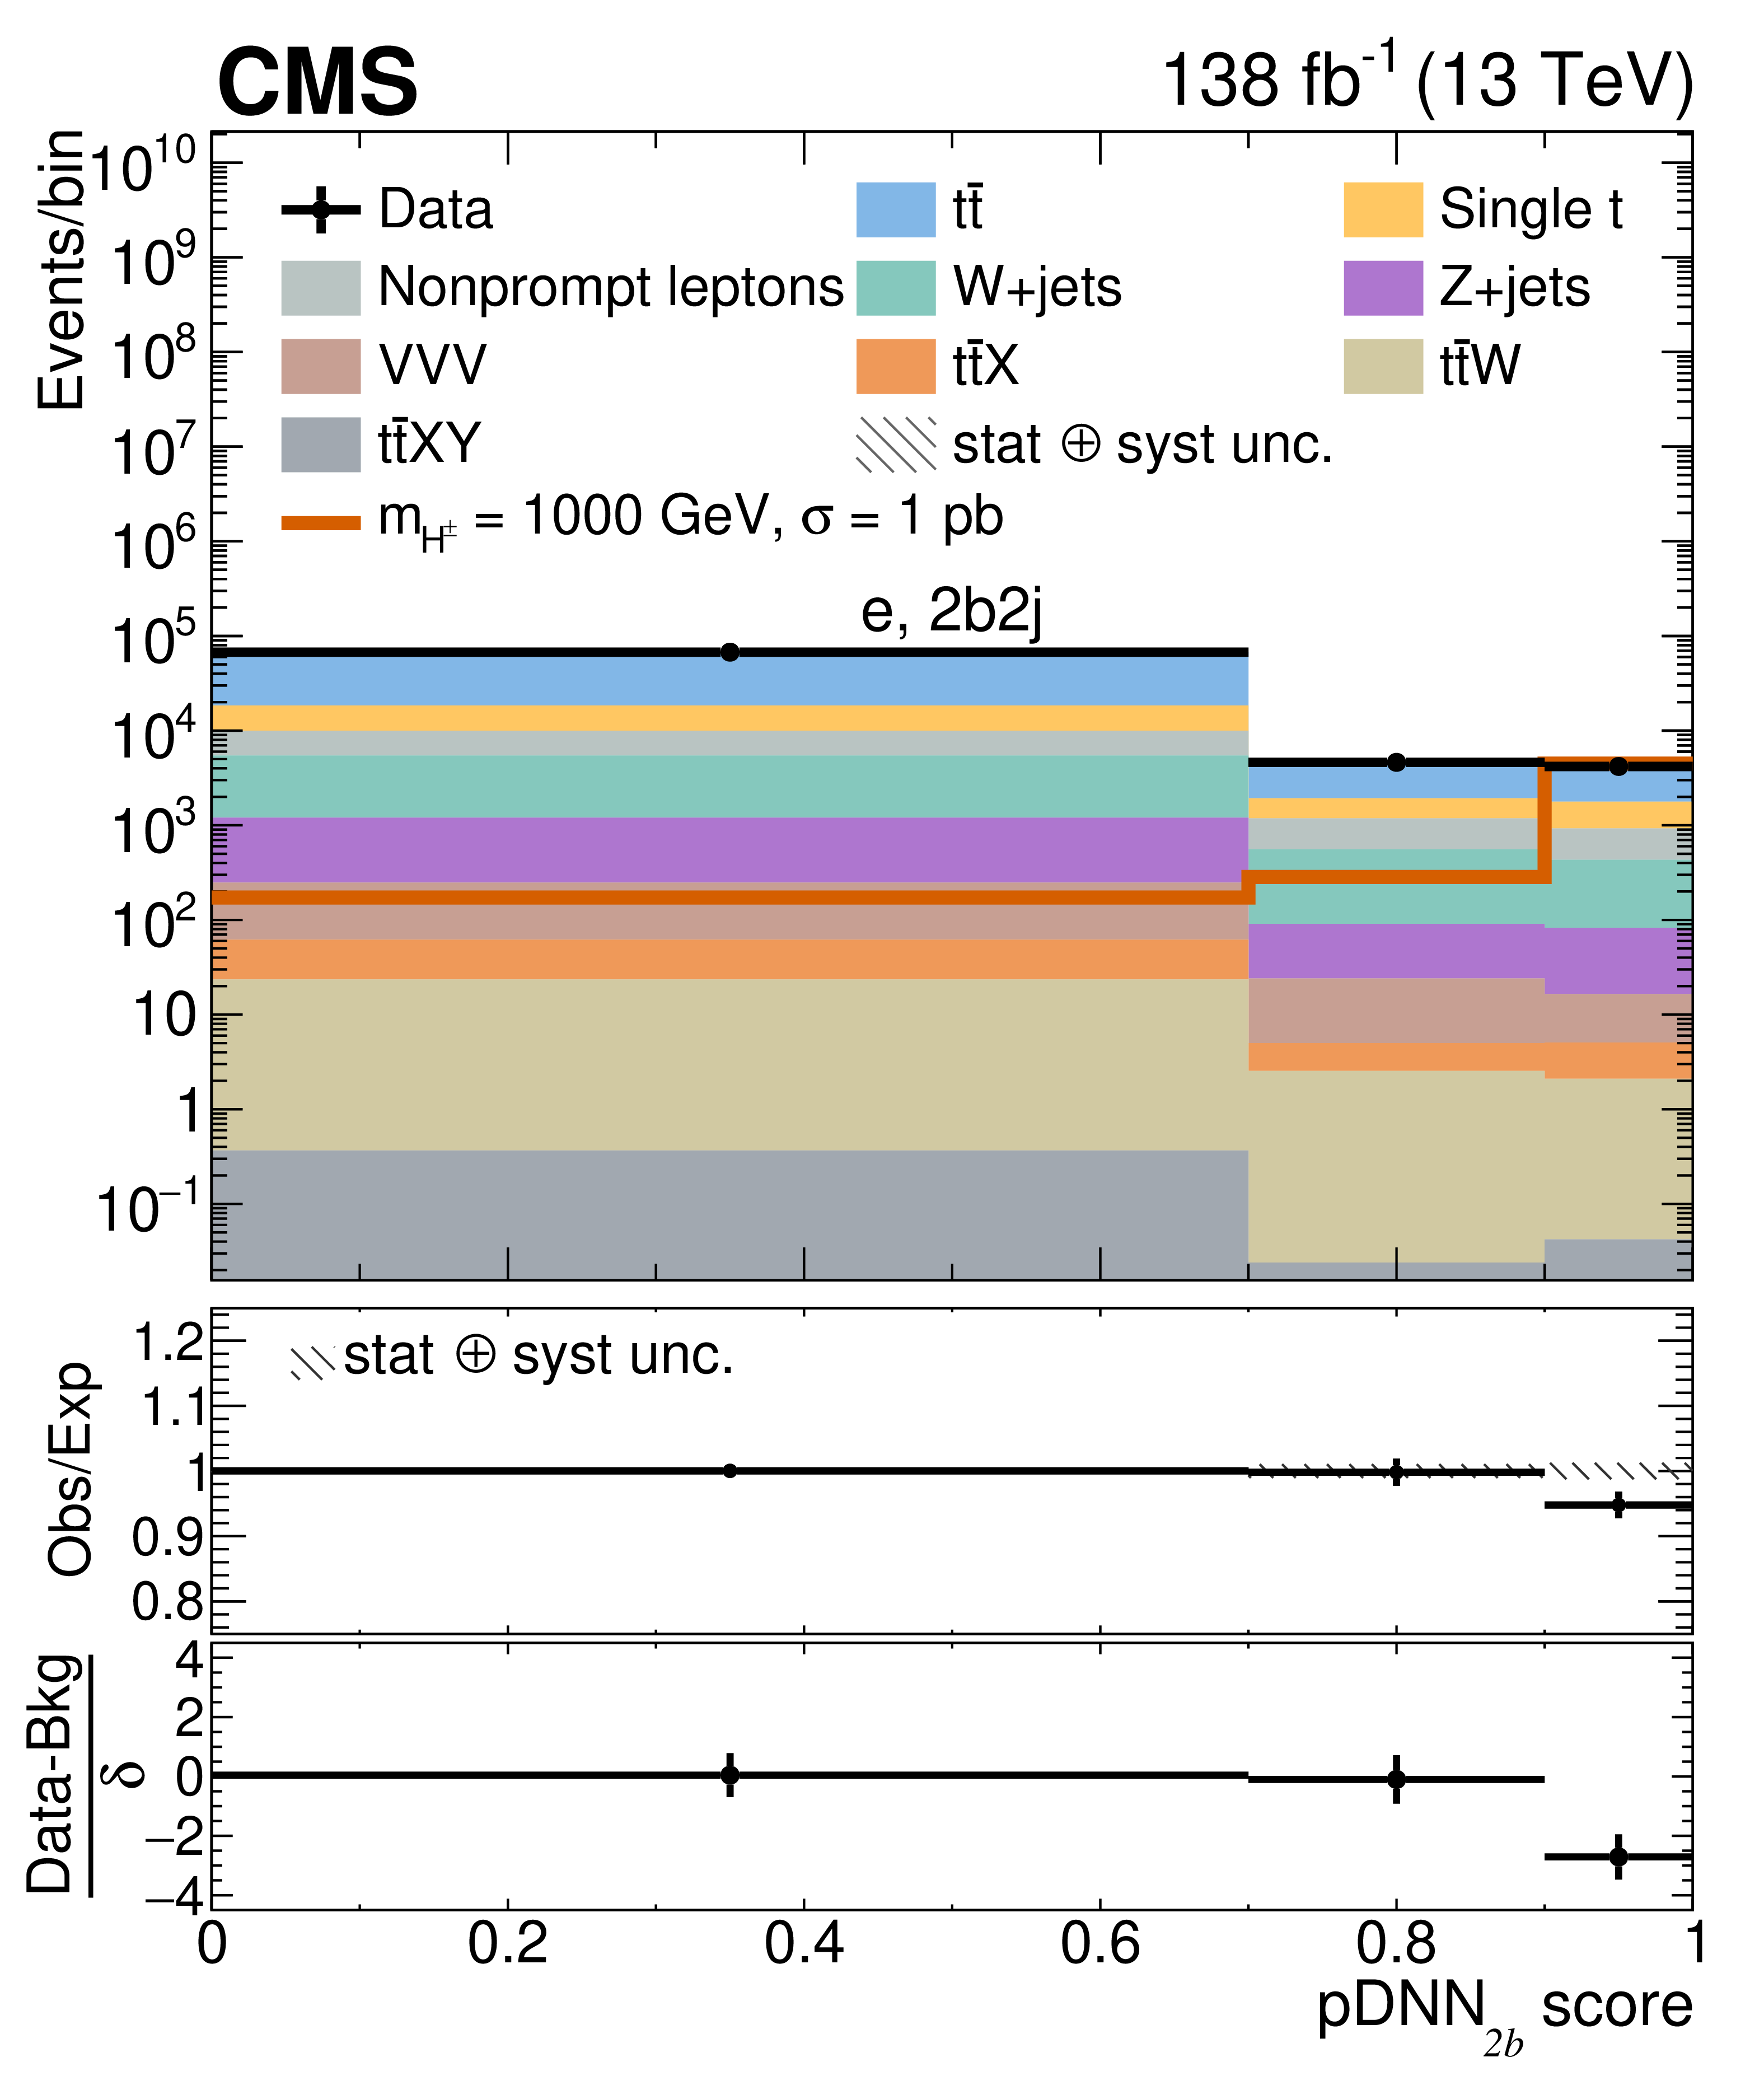
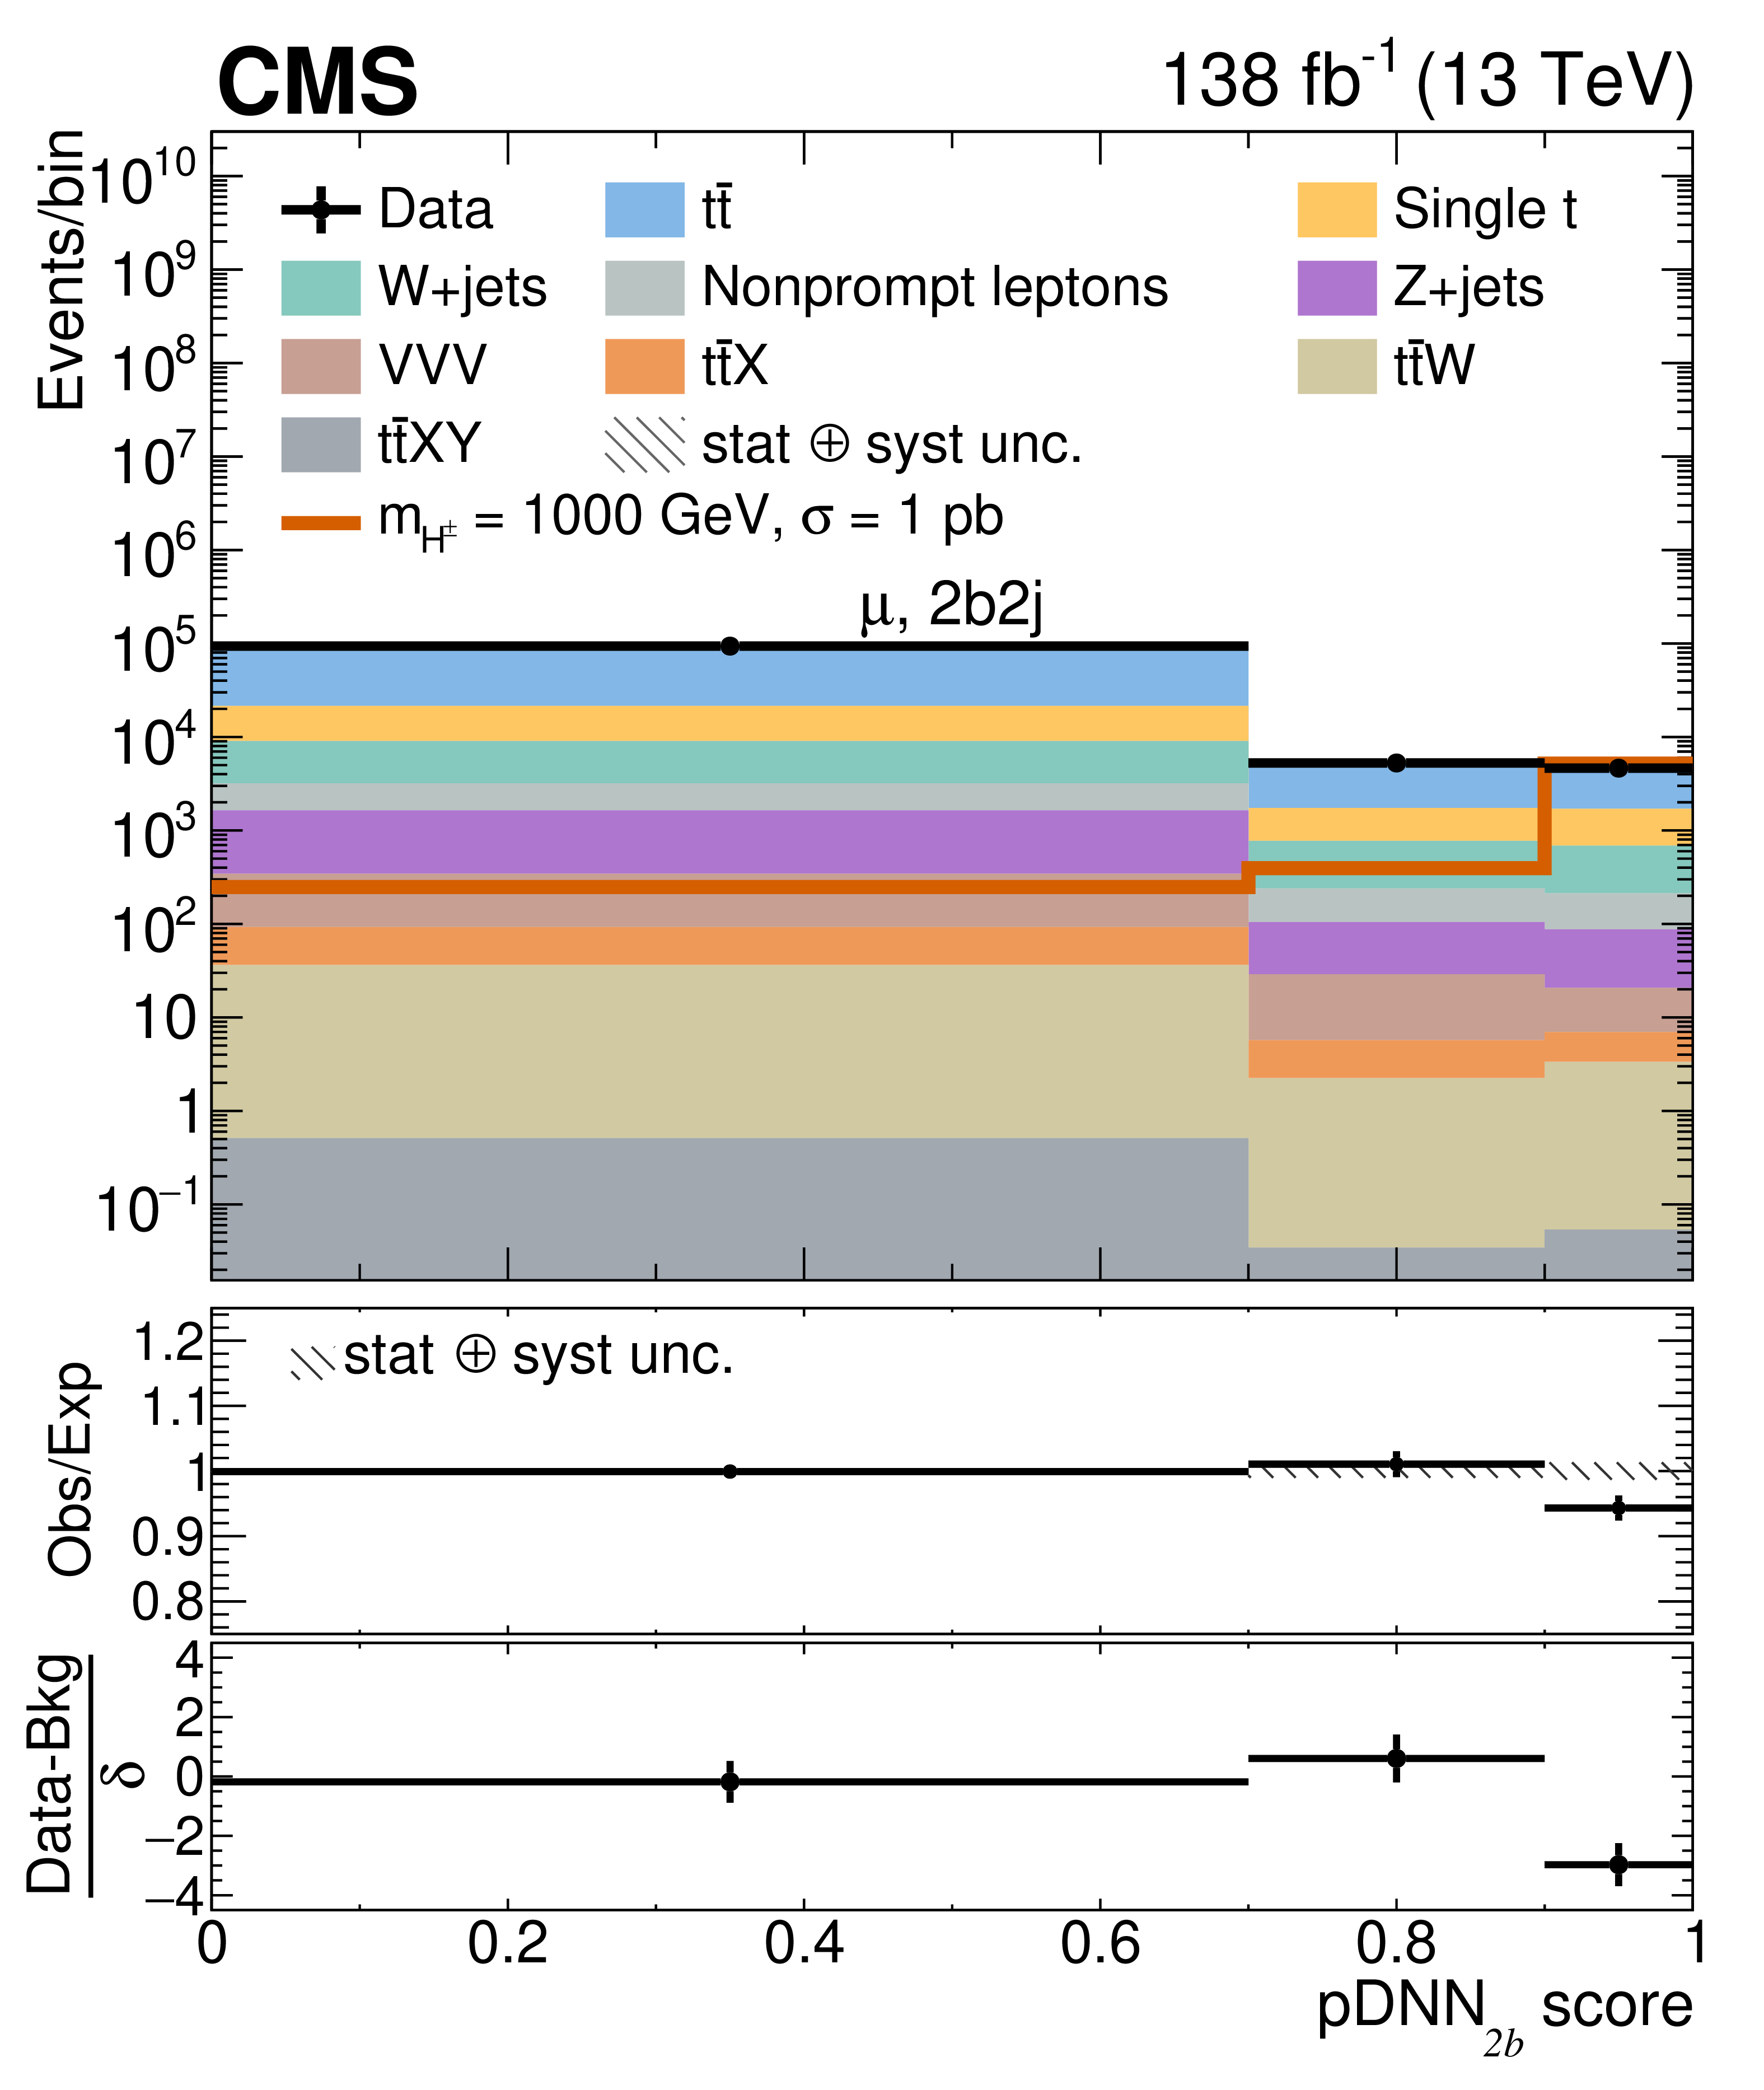
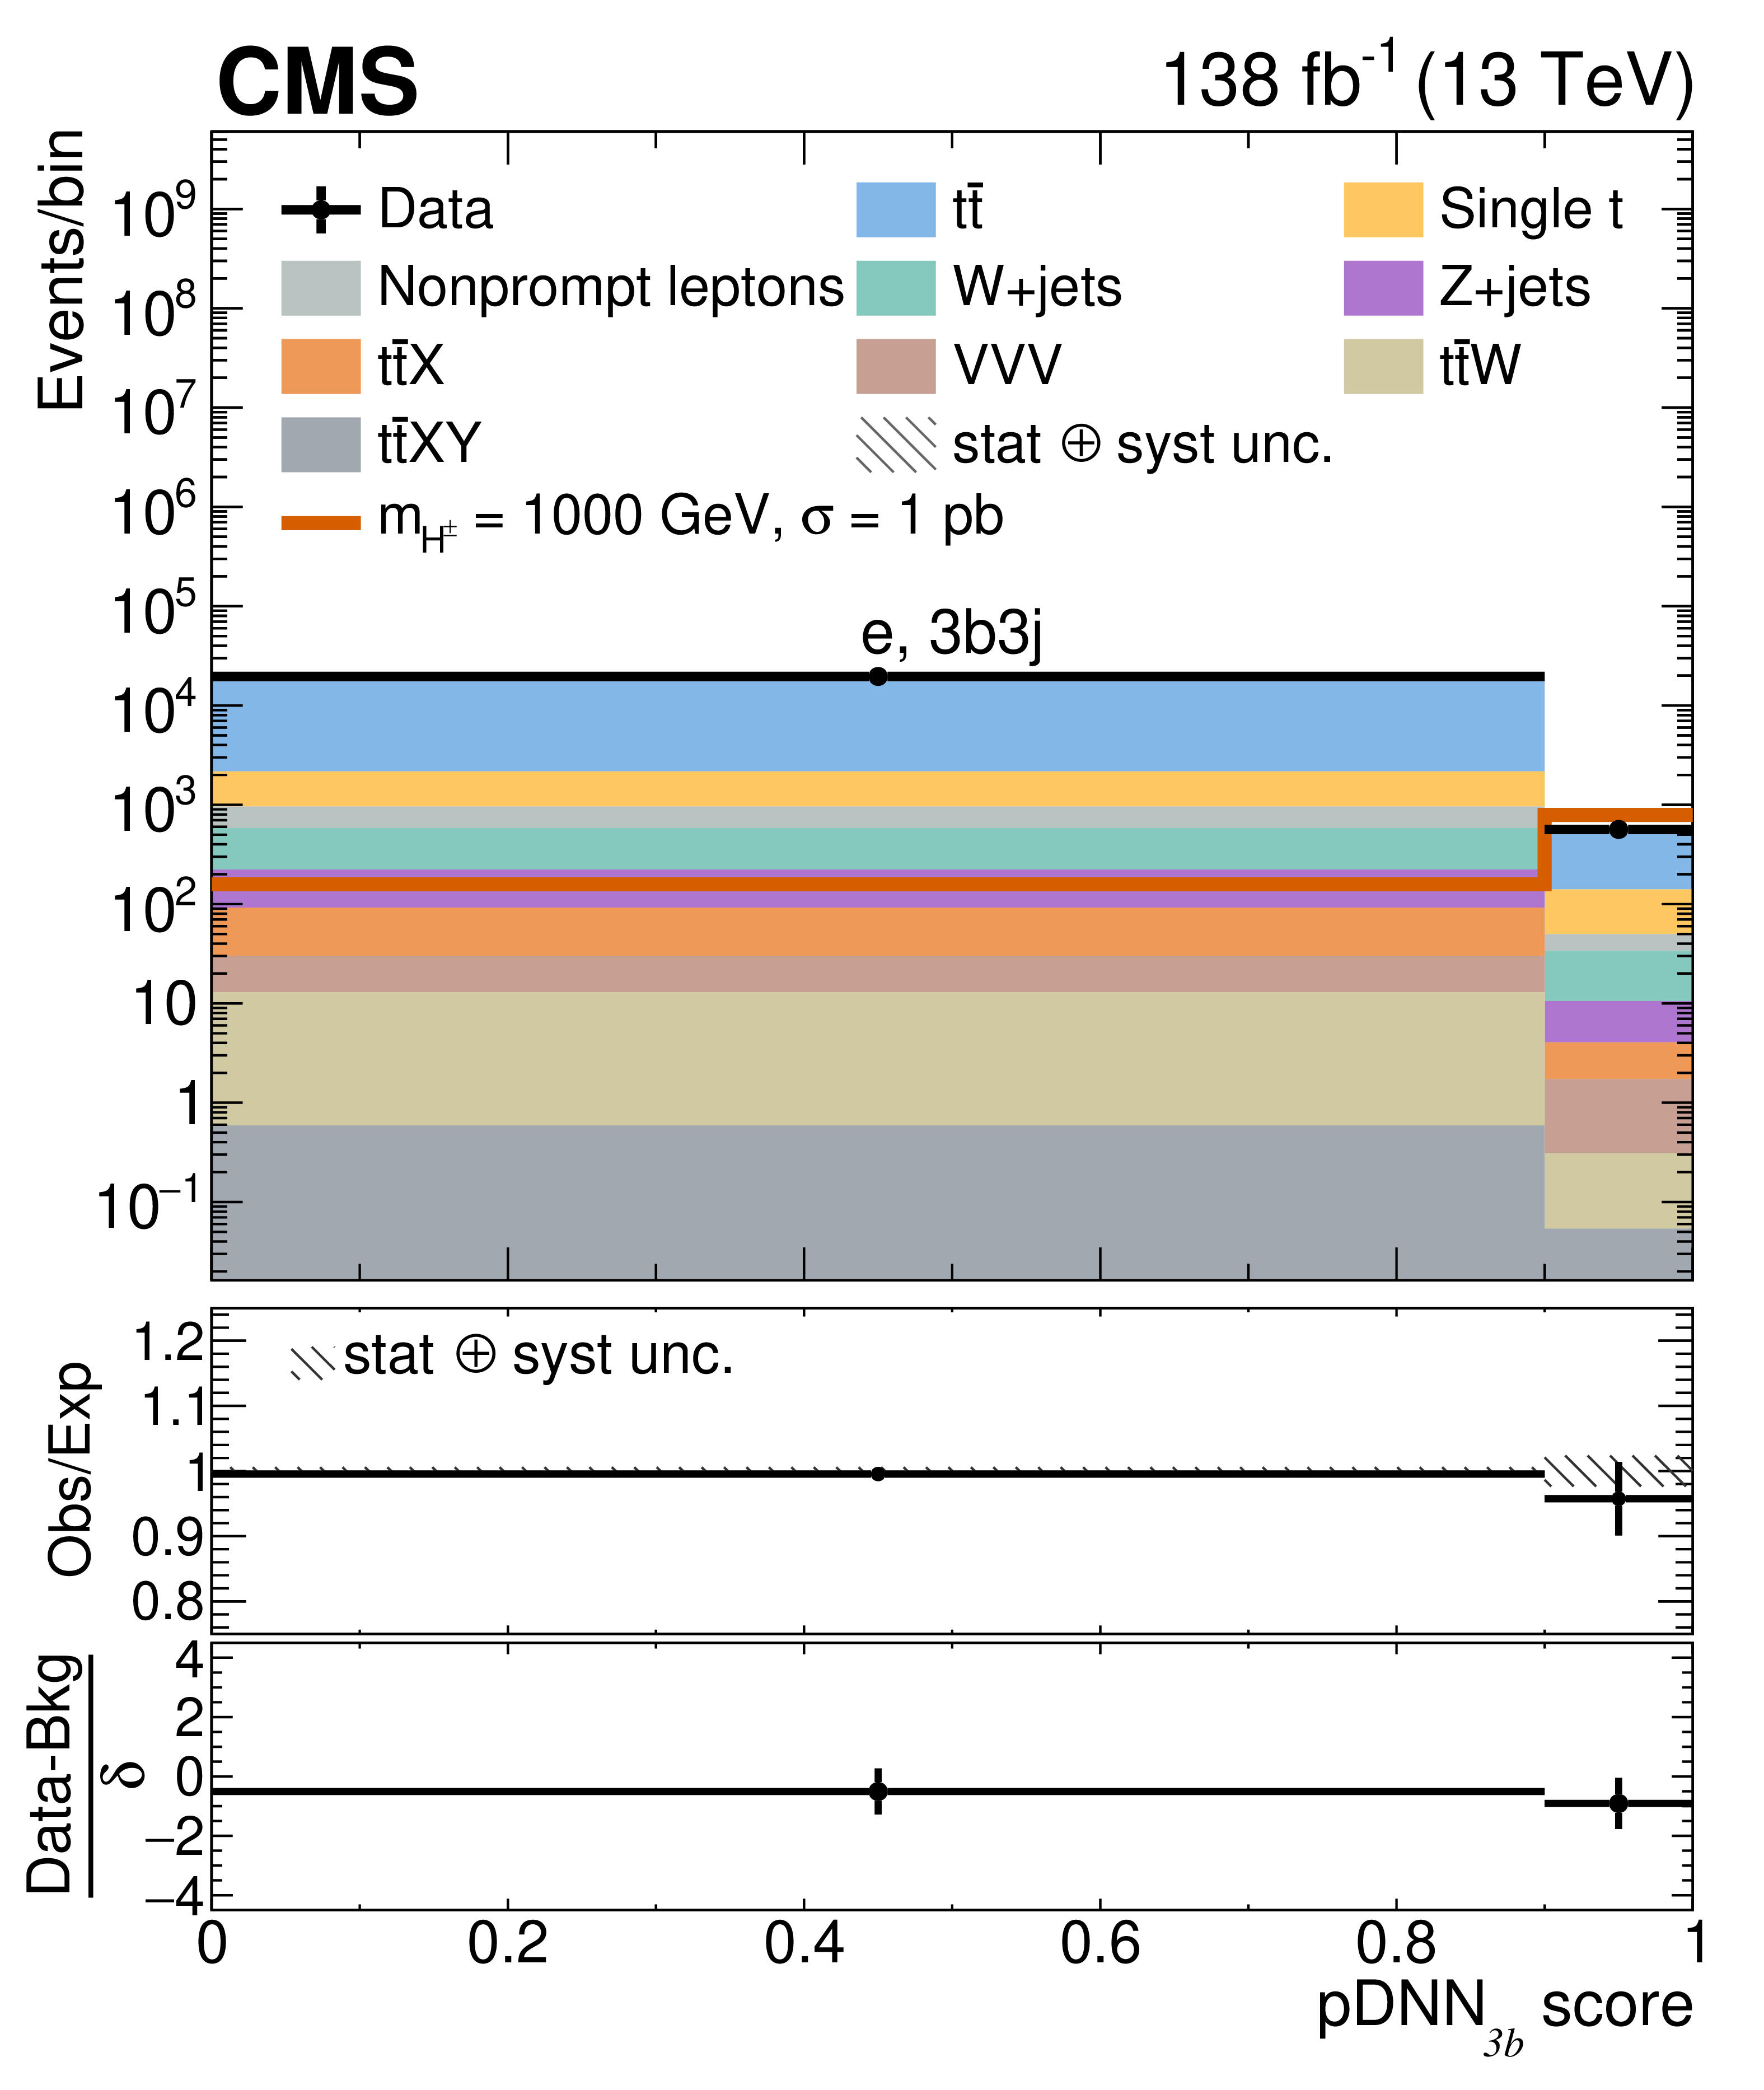
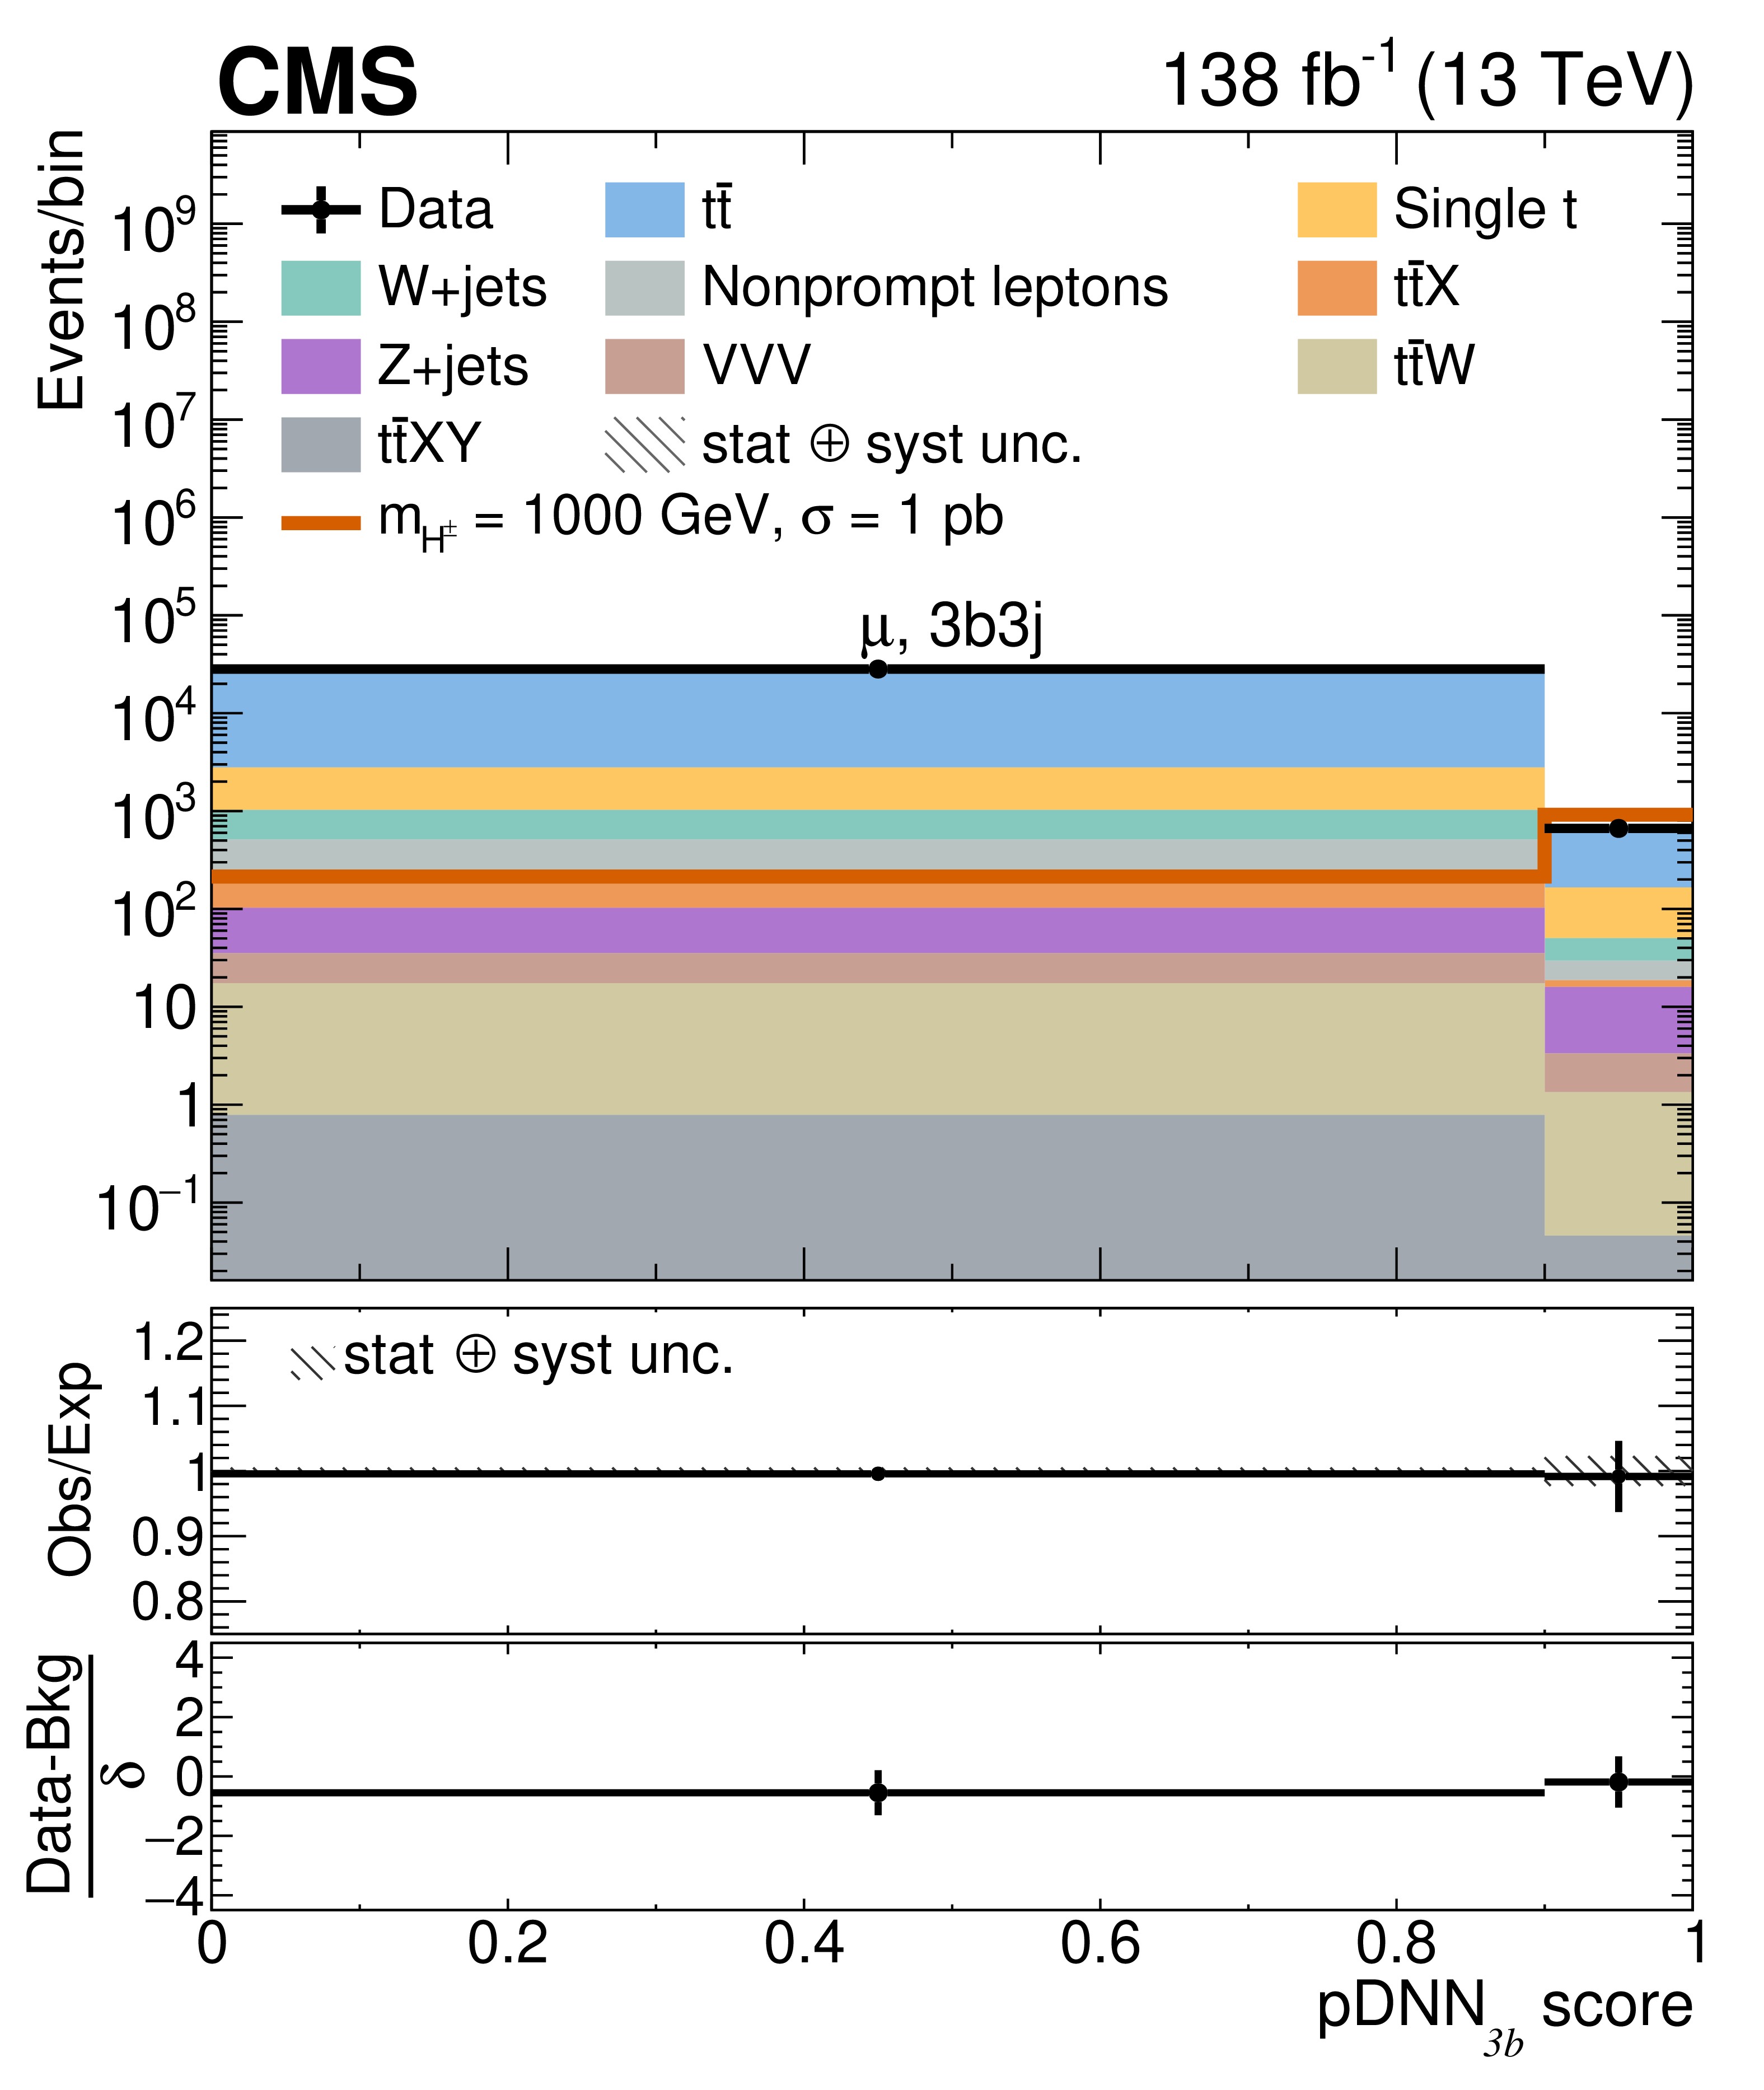
The postfit pDNN distributions in the SR 2b2j (upper) and 3b3j (lower) for electron (left) and muon (right) channels assuming $ m_{\mathrm{H^{\pm}}}= $ 1 TeV. The signal for $ m_{\mathrm{H^{\pm}}}= $ 1 TeV is also shown before the fit, assuming a cross section of 1 pb. Lower panels display the difference between data and the sum of the SM background predictions, normalized by the combined statistical and systematic uncertainty, $ \delta $. The error bars only consider statistical uncertainties in data, while the hashed bands include both statistical and systematic uncertainties. |
png pdf |
Figure 5-a:
The postfit pDNN distributions in the SR 2b2j (upper) and 3b3j (lower) for electron (left) and muon (right) channels assuming $ m_{\mathrm{H^{\pm}}}= $ 1 TeV. The signal for $ m_{\mathrm{H^{\pm}}}= $ 1 TeV is also shown before the fit, assuming a cross section of 1 pb. Lower panels display the difference between data and the sum of the SM background predictions, normalized by the combined statistical and systematic uncertainty, $ \delta $. The error bars only consider statistical uncertainties in data, while the hashed bands include both statistical and systematic uncertainties. |
png pdf |
Figure 5-b:
The postfit pDNN distributions in the SR 2b2j (upper) and 3b3j (lower) for electron (left) and muon (right) channels assuming $ m_{\mathrm{H^{\pm}}}= $ 1 TeV. The signal for $ m_{\mathrm{H^{\pm}}}= $ 1 TeV is also shown before the fit, assuming a cross section of 1 pb. Lower panels display the difference between data and the sum of the SM background predictions, normalized by the combined statistical and systematic uncertainty, $ \delta $. The error bars only consider statistical uncertainties in data, while the hashed bands include both statistical and systematic uncertainties. |
png pdf |
Figure 5-c:
The postfit pDNN distributions in the SR 2b2j (upper) and 3b3j (lower) for electron (left) and muon (right) channels assuming $ m_{\mathrm{H^{\pm}}}= $ 1 TeV. The signal for $ m_{\mathrm{H^{\pm}}}= $ 1 TeV is also shown before the fit, assuming a cross section of 1 pb. Lower panels display the difference between data and the sum of the SM background predictions, normalized by the combined statistical and systematic uncertainty, $ \delta $. The error bars only consider statistical uncertainties in data, while the hashed bands include both statistical and systematic uncertainties. |
png pdf |
Figure 5-d:
The postfit pDNN distributions in the SR 2b2j (upper) and 3b3j (lower) for electron (left) and muon (right) channels assuming $ m_{\mathrm{H^{\pm}}}= $ 1 TeV. The signal for $ m_{\mathrm{H^{\pm}}}= $ 1 TeV is also shown before the fit, assuming a cross section of 1 pb. Lower panels display the difference between data and the sum of the SM background predictions, normalized by the combined statistical and systematic uncertainty, $ \delta $. The error bars only consider statistical uncertainties in data, while the hashed bands include both statistical and systematic uncertainties. |
png pdf |
Figure 6:
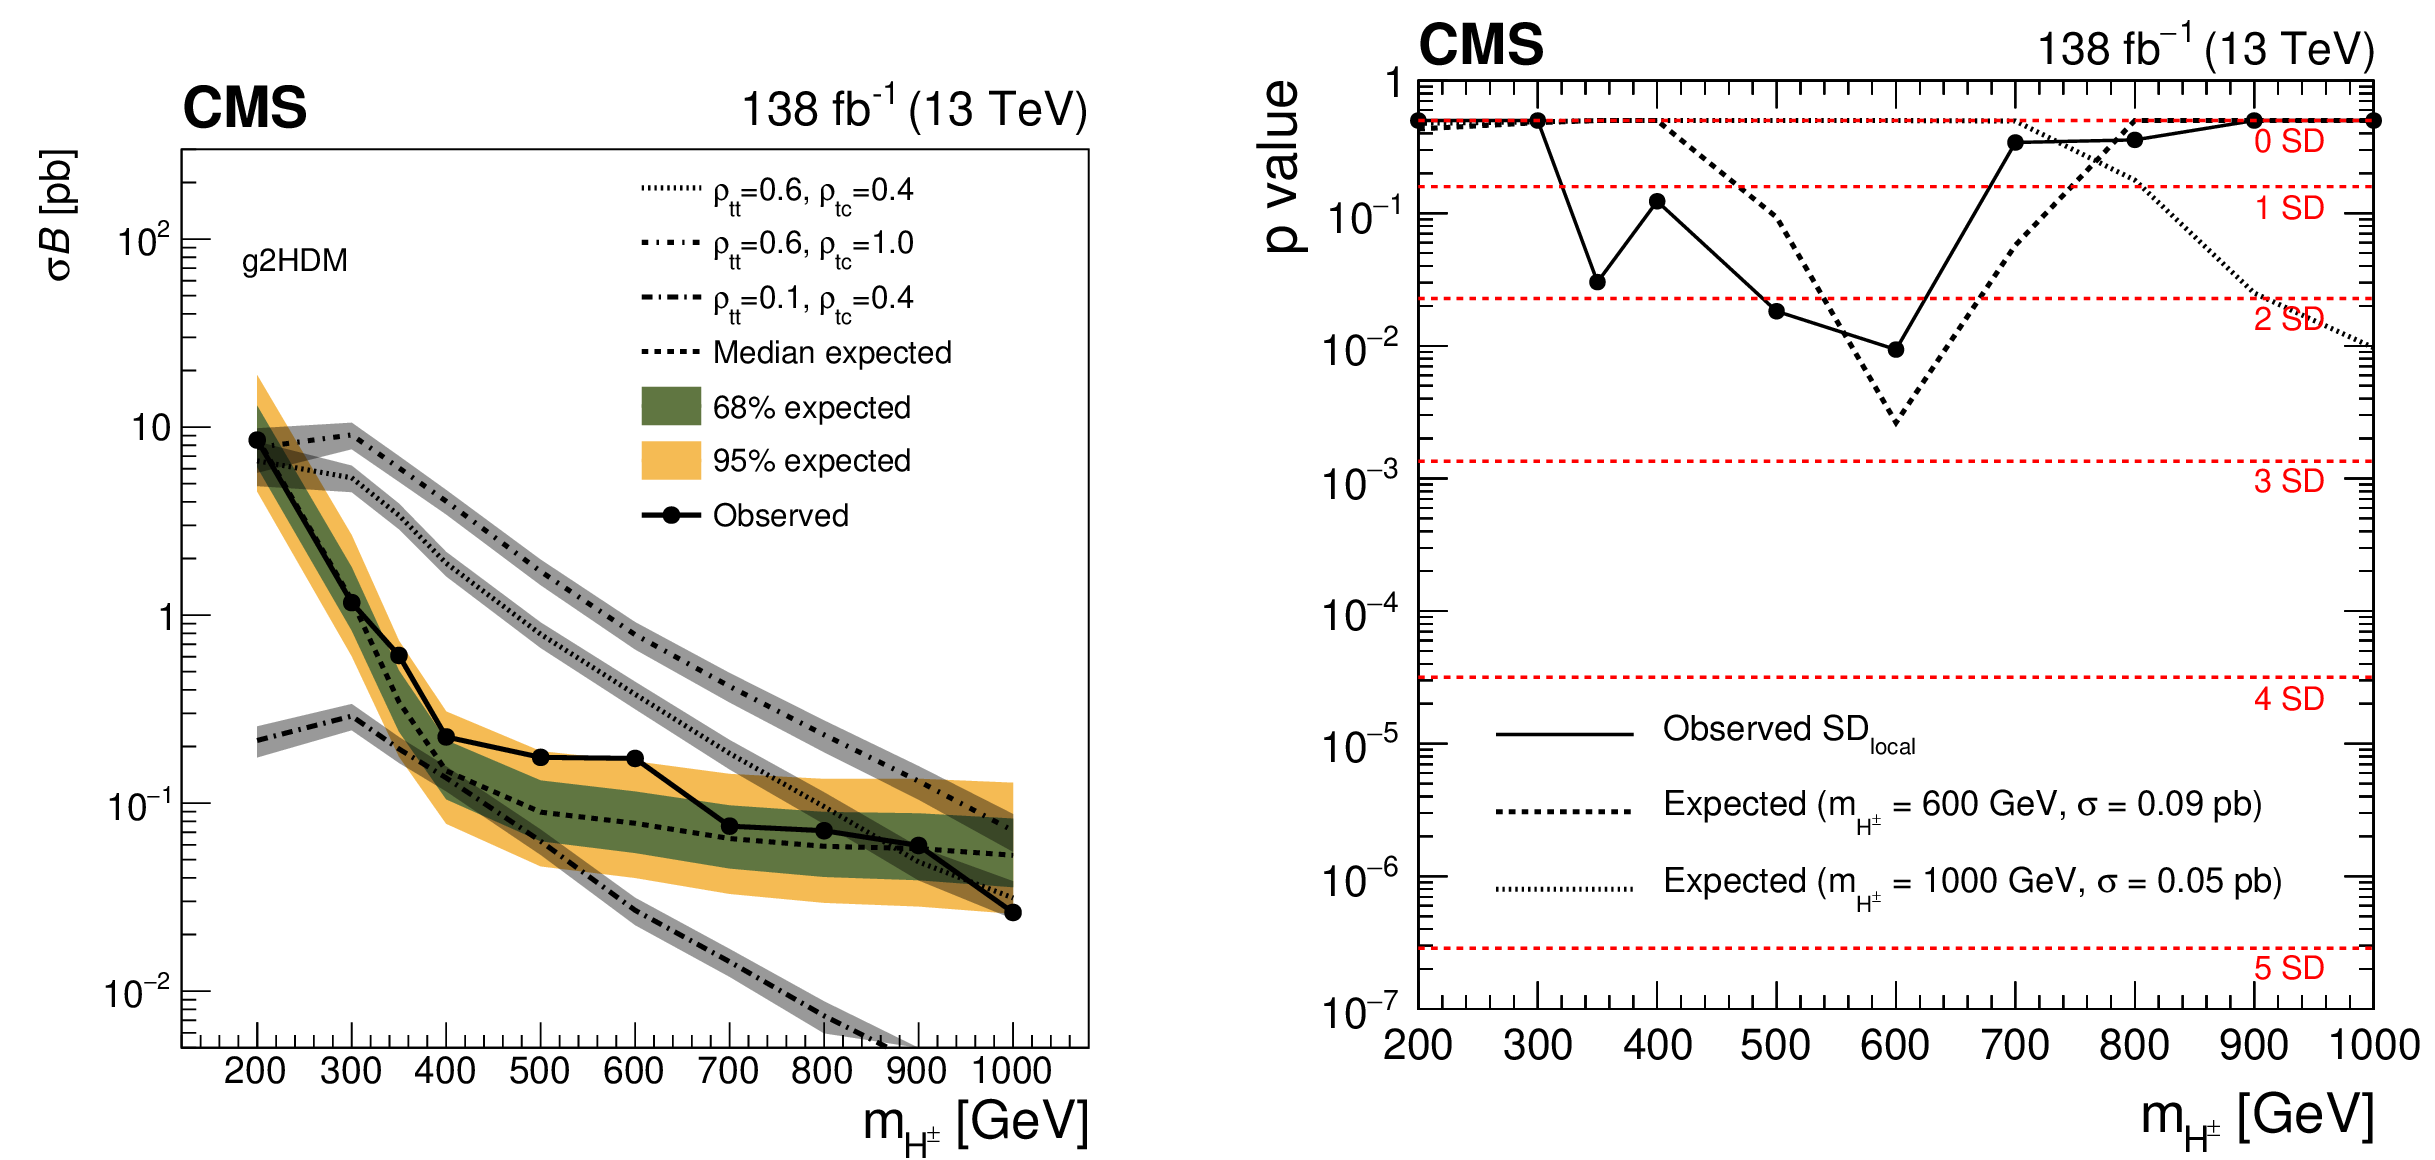
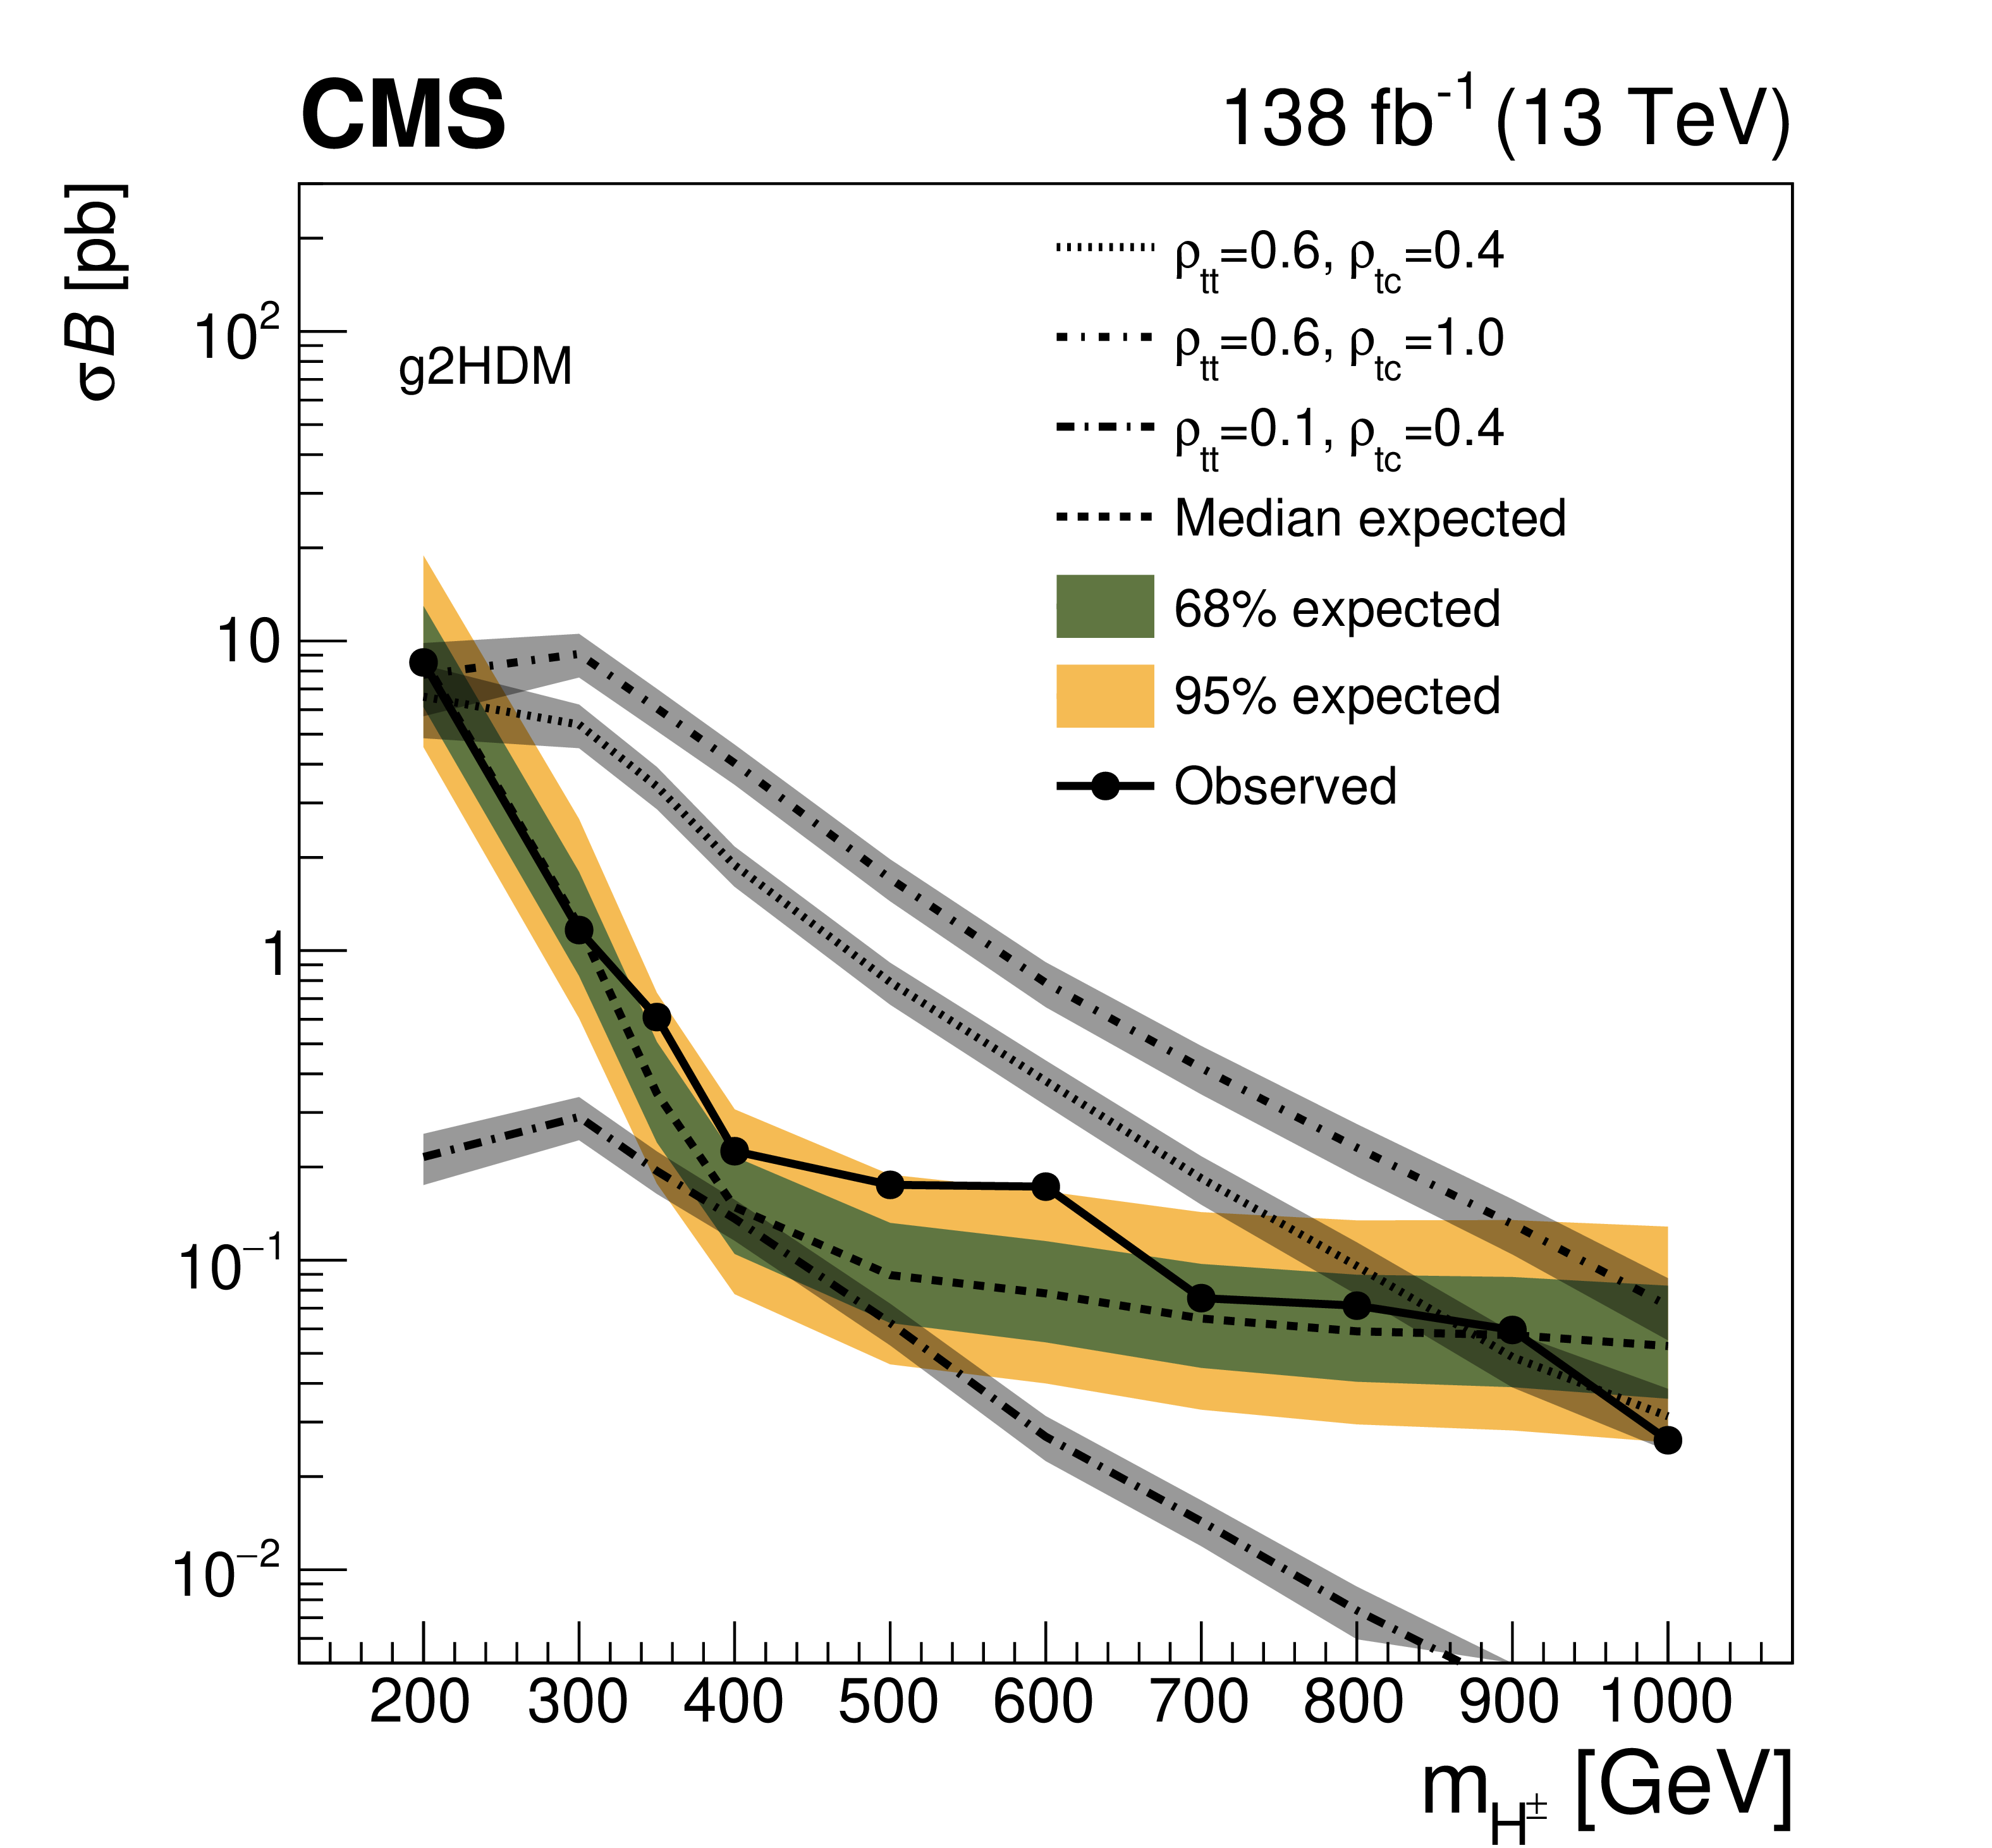
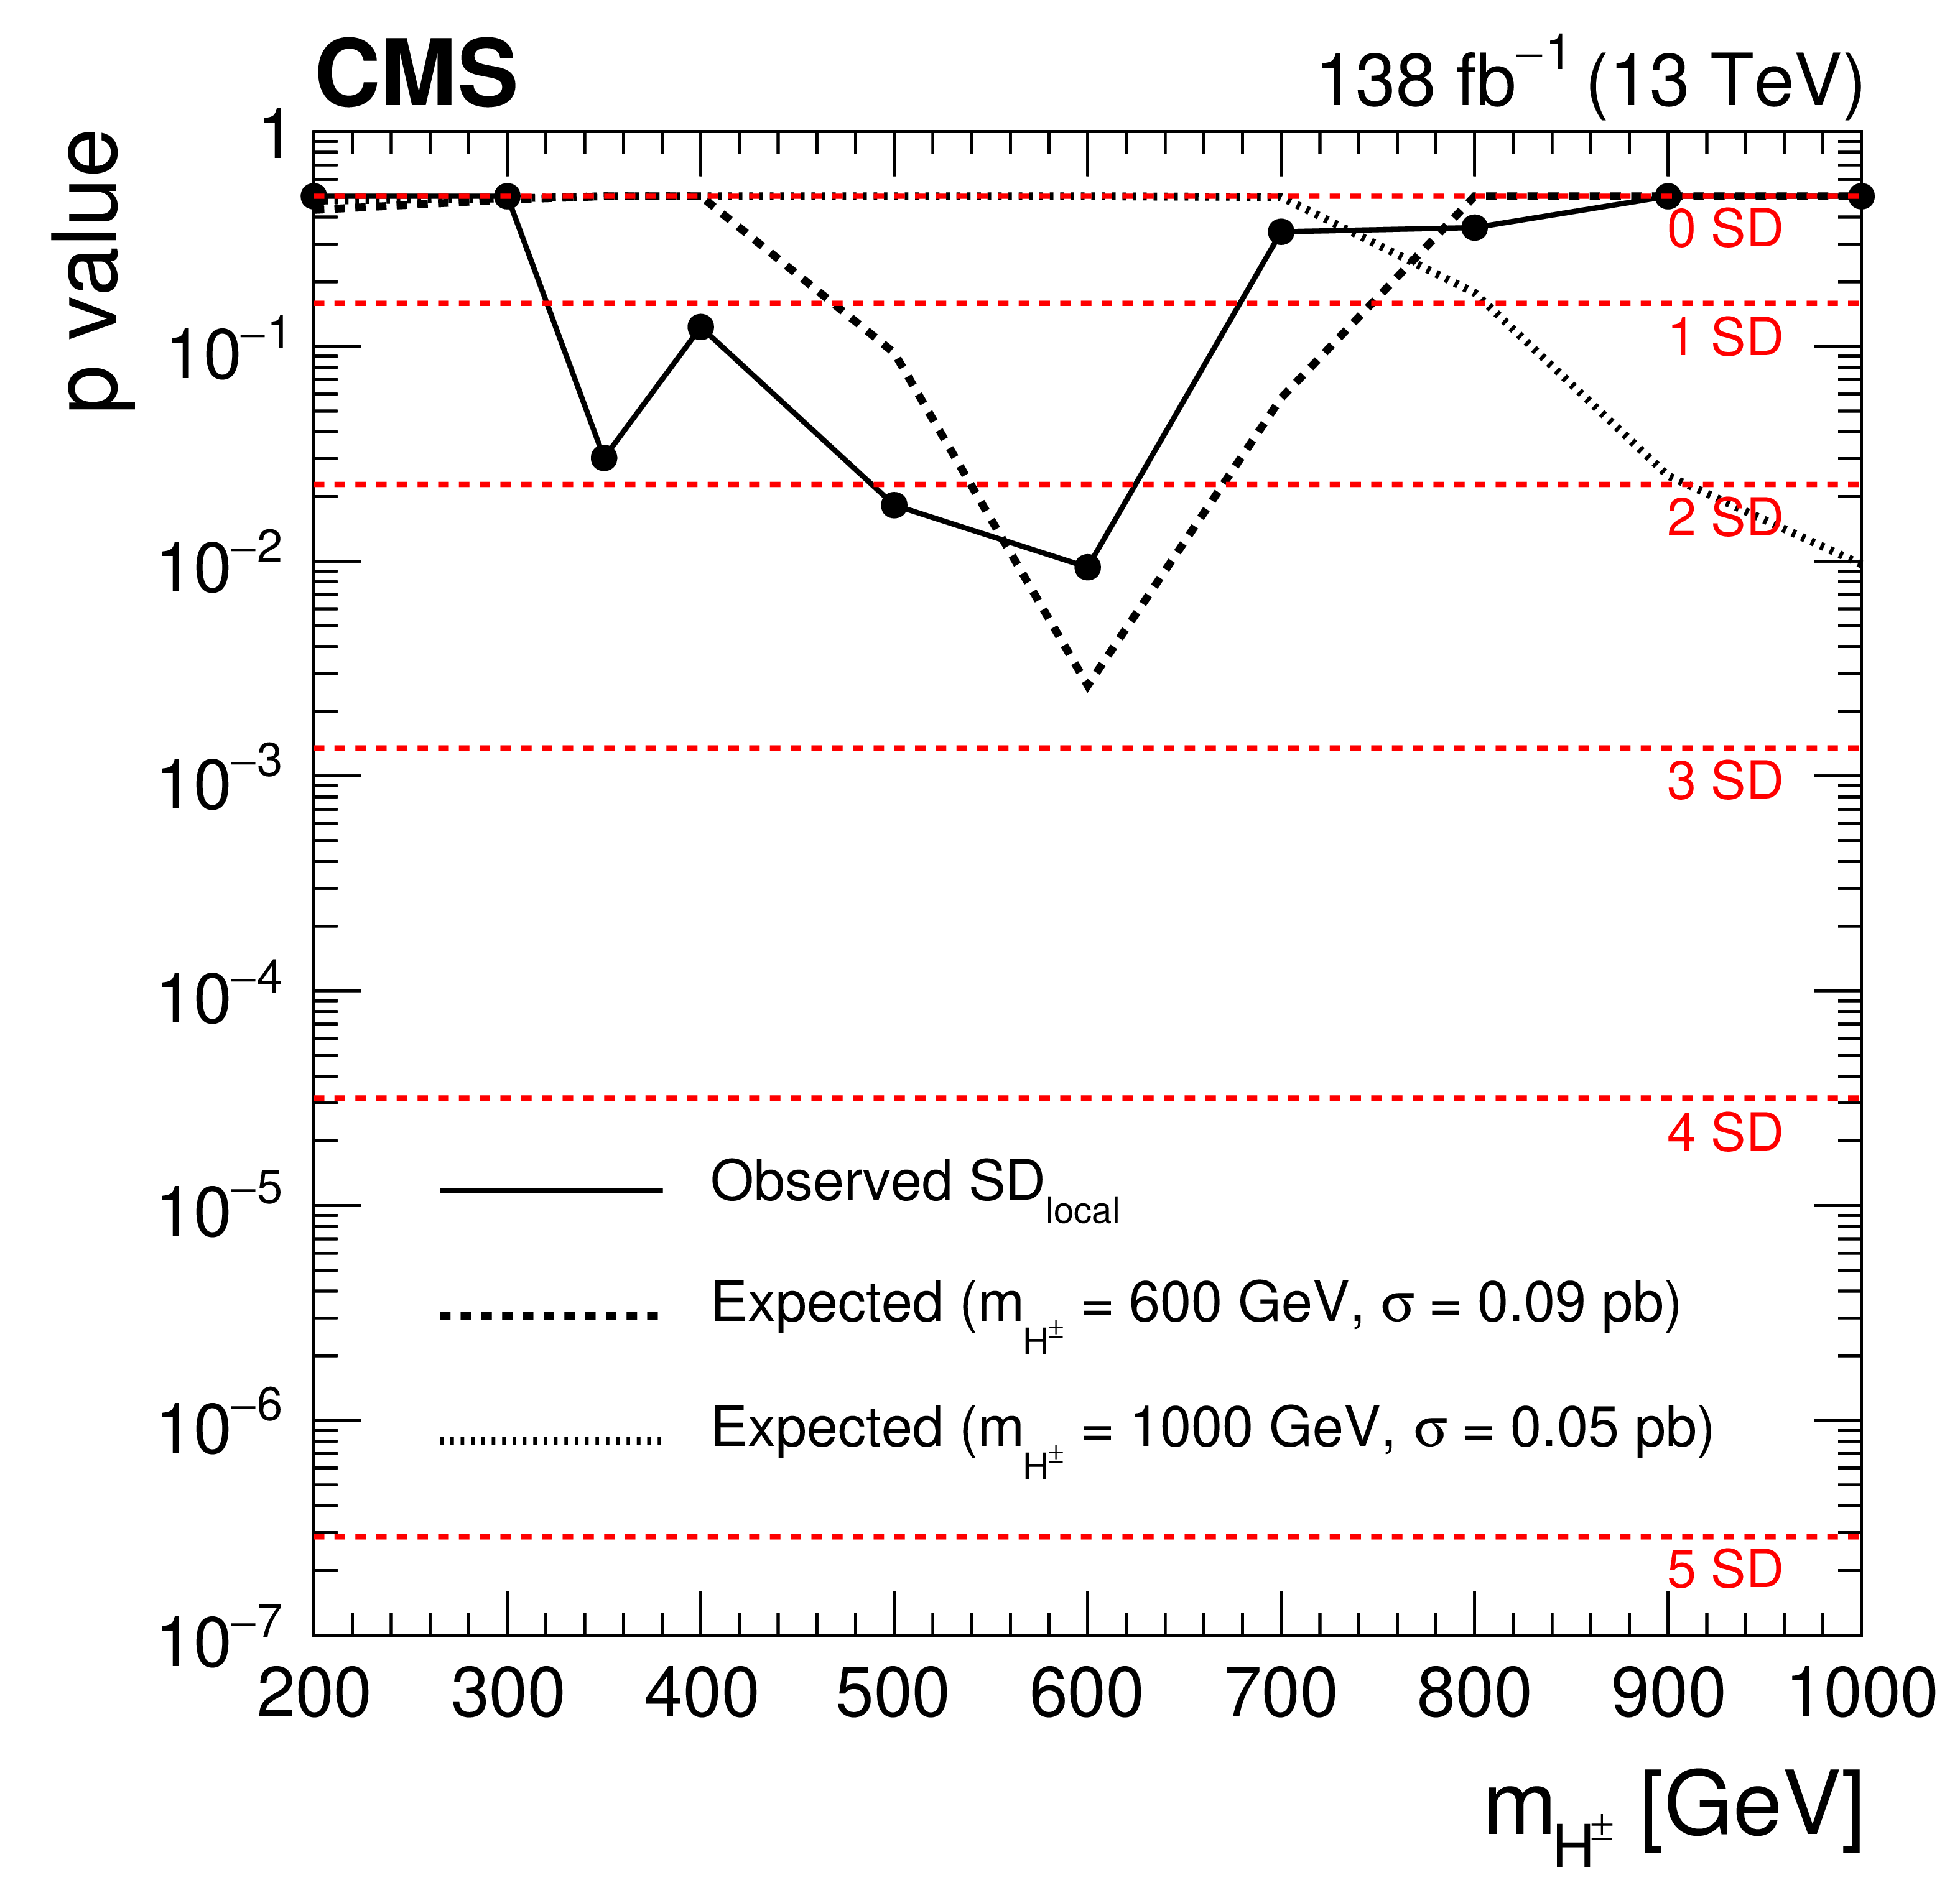
Left: observed and expected 95% CL limits on the cross section times branching fraction ($ \sigma{\mathcal B} $) for different $ \mathrm{H^{\pm}} $ boson mass hypotheses with $ \rho_{\mathrm{t}\mathrm{c}} = $ 0.4 and $ \rho_{\mathrm{t}\mathrm{t}} = $ 0.6. The inner (green) band and the outer (yellow) band represent the regions containing 68 and 95%, respectively, of the distribution of limits expected under the background-only hypothesis. Theoretical prediction with different $ \rho_{\mathrm{t}\mathrm{c}} $ and $ \rho_{\mathrm{t}\mathrm{t}} $ couplings are shown with the grey bands representing the corresponding uncertainties due to the factorization and renormalization scales, and the PDFs. Right: Observed local significance extracted from the pDNN distribution. Expected significances are obtained with the injection of a $ \sigma= $ 0.09 (0.05) pb of g2HDM signal with $ m_{\mathrm{H^{\pm}}}= $ 600 GeV (1 TeV). The injected cross sections are picked as the best fit value for $ m_{\mathrm{H^{\pm}}}= $ 600 GeV, and the theoretical prediction for $ m_{\mathrm{H^{\pm}}}= $ 1 TeV assuming $ \rho_{\mathrm{t}\mathrm{c}}=\rho_{\mathrm{t}\mathrm{t}}= $ 0.6. Local significance values in units of standard deviations (SD) are also shown with dashed horizontal lines on the vertical axis. |
png pdf |
Figure 6-a:
Left: observed and expected 95% CL limits on the cross section times branching fraction ($ \sigma{\mathcal B} $) for different $ \mathrm{H^{\pm}} $ boson mass hypotheses with $ \rho_{\mathrm{t}\mathrm{c}} = $ 0.4 and $ \rho_{\mathrm{t}\mathrm{t}} = $ 0.6. The inner (green) band and the outer (yellow) band represent the regions containing 68 and 95%, respectively, of the distribution of limits expected under the background-only hypothesis. Theoretical prediction with different $ \rho_{\mathrm{t}\mathrm{c}} $ and $ \rho_{\mathrm{t}\mathrm{t}} $ couplings are shown with the grey bands representing the corresponding uncertainties due to the factorization and renormalization scales, and the PDFs. Right: Observed local significance extracted from the pDNN distribution. Expected significances are obtained with the injection of a $ \sigma= $ 0.09 (0.05) pb of g2HDM signal with $ m_{\mathrm{H^{\pm}}}= $ 600 GeV (1 TeV). The injected cross sections are picked as the best fit value for $ m_{\mathrm{H^{\pm}}}= $ 600 GeV, and the theoretical prediction for $ m_{\mathrm{H^{\pm}}}= $ 1 TeV assuming $ \rho_{\mathrm{t}\mathrm{c}}=\rho_{\mathrm{t}\mathrm{t}}= $ 0.6. Local significance values in units of standard deviations (SD) are also shown with dashed horizontal lines on the vertical axis. |
png pdf |
Figure 6-b:
Left: observed and expected 95% CL limits on the cross section times branching fraction ($ \sigma{\mathcal B} $) for different $ \mathrm{H^{\pm}} $ boson mass hypotheses with $ \rho_{\mathrm{t}\mathrm{c}} = $ 0.4 and $ \rho_{\mathrm{t}\mathrm{t}} = $ 0.6. The inner (green) band and the outer (yellow) band represent the regions containing 68 and 95%, respectively, of the distribution of limits expected under the background-only hypothesis. Theoretical prediction with different $ \rho_{\mathrm{t}\mathrm{c}} $ and $ \rho_{\mathrm{t}\mathrm{t}} $ couplings are shown with the grey bands representing the corresponding uncertainties due to the factorization and renormalization scales, and the PDFs. Right: Observed local significance extracted from the pDNN distribution. Expected significances are obtained with the injection of a $ \sigma= $ 0.09 (0.05) pb of g2HDM signal with $ m_{\mathrm{H^{\pm}}}= $ 600 GeV (1 TeV). The injected cross sections are picked as the best fit value for $ m_{\mathrm{H^{\pm}}}= $ 600 GeV, and the theoretical prediction for $ m_{\mathrm{H^{\pm}}}= $ 1 TeV assuming $ \rho_{\mathrm{t}\mathrm{c}}=\rho_{\mathrm{t}\mathrm{t}}= $ 0.6. Local significance values in units of standard deviations (SD) are also shown with dashed horizontal lines on the vertical axis. |
png pdf |
Figure 7:
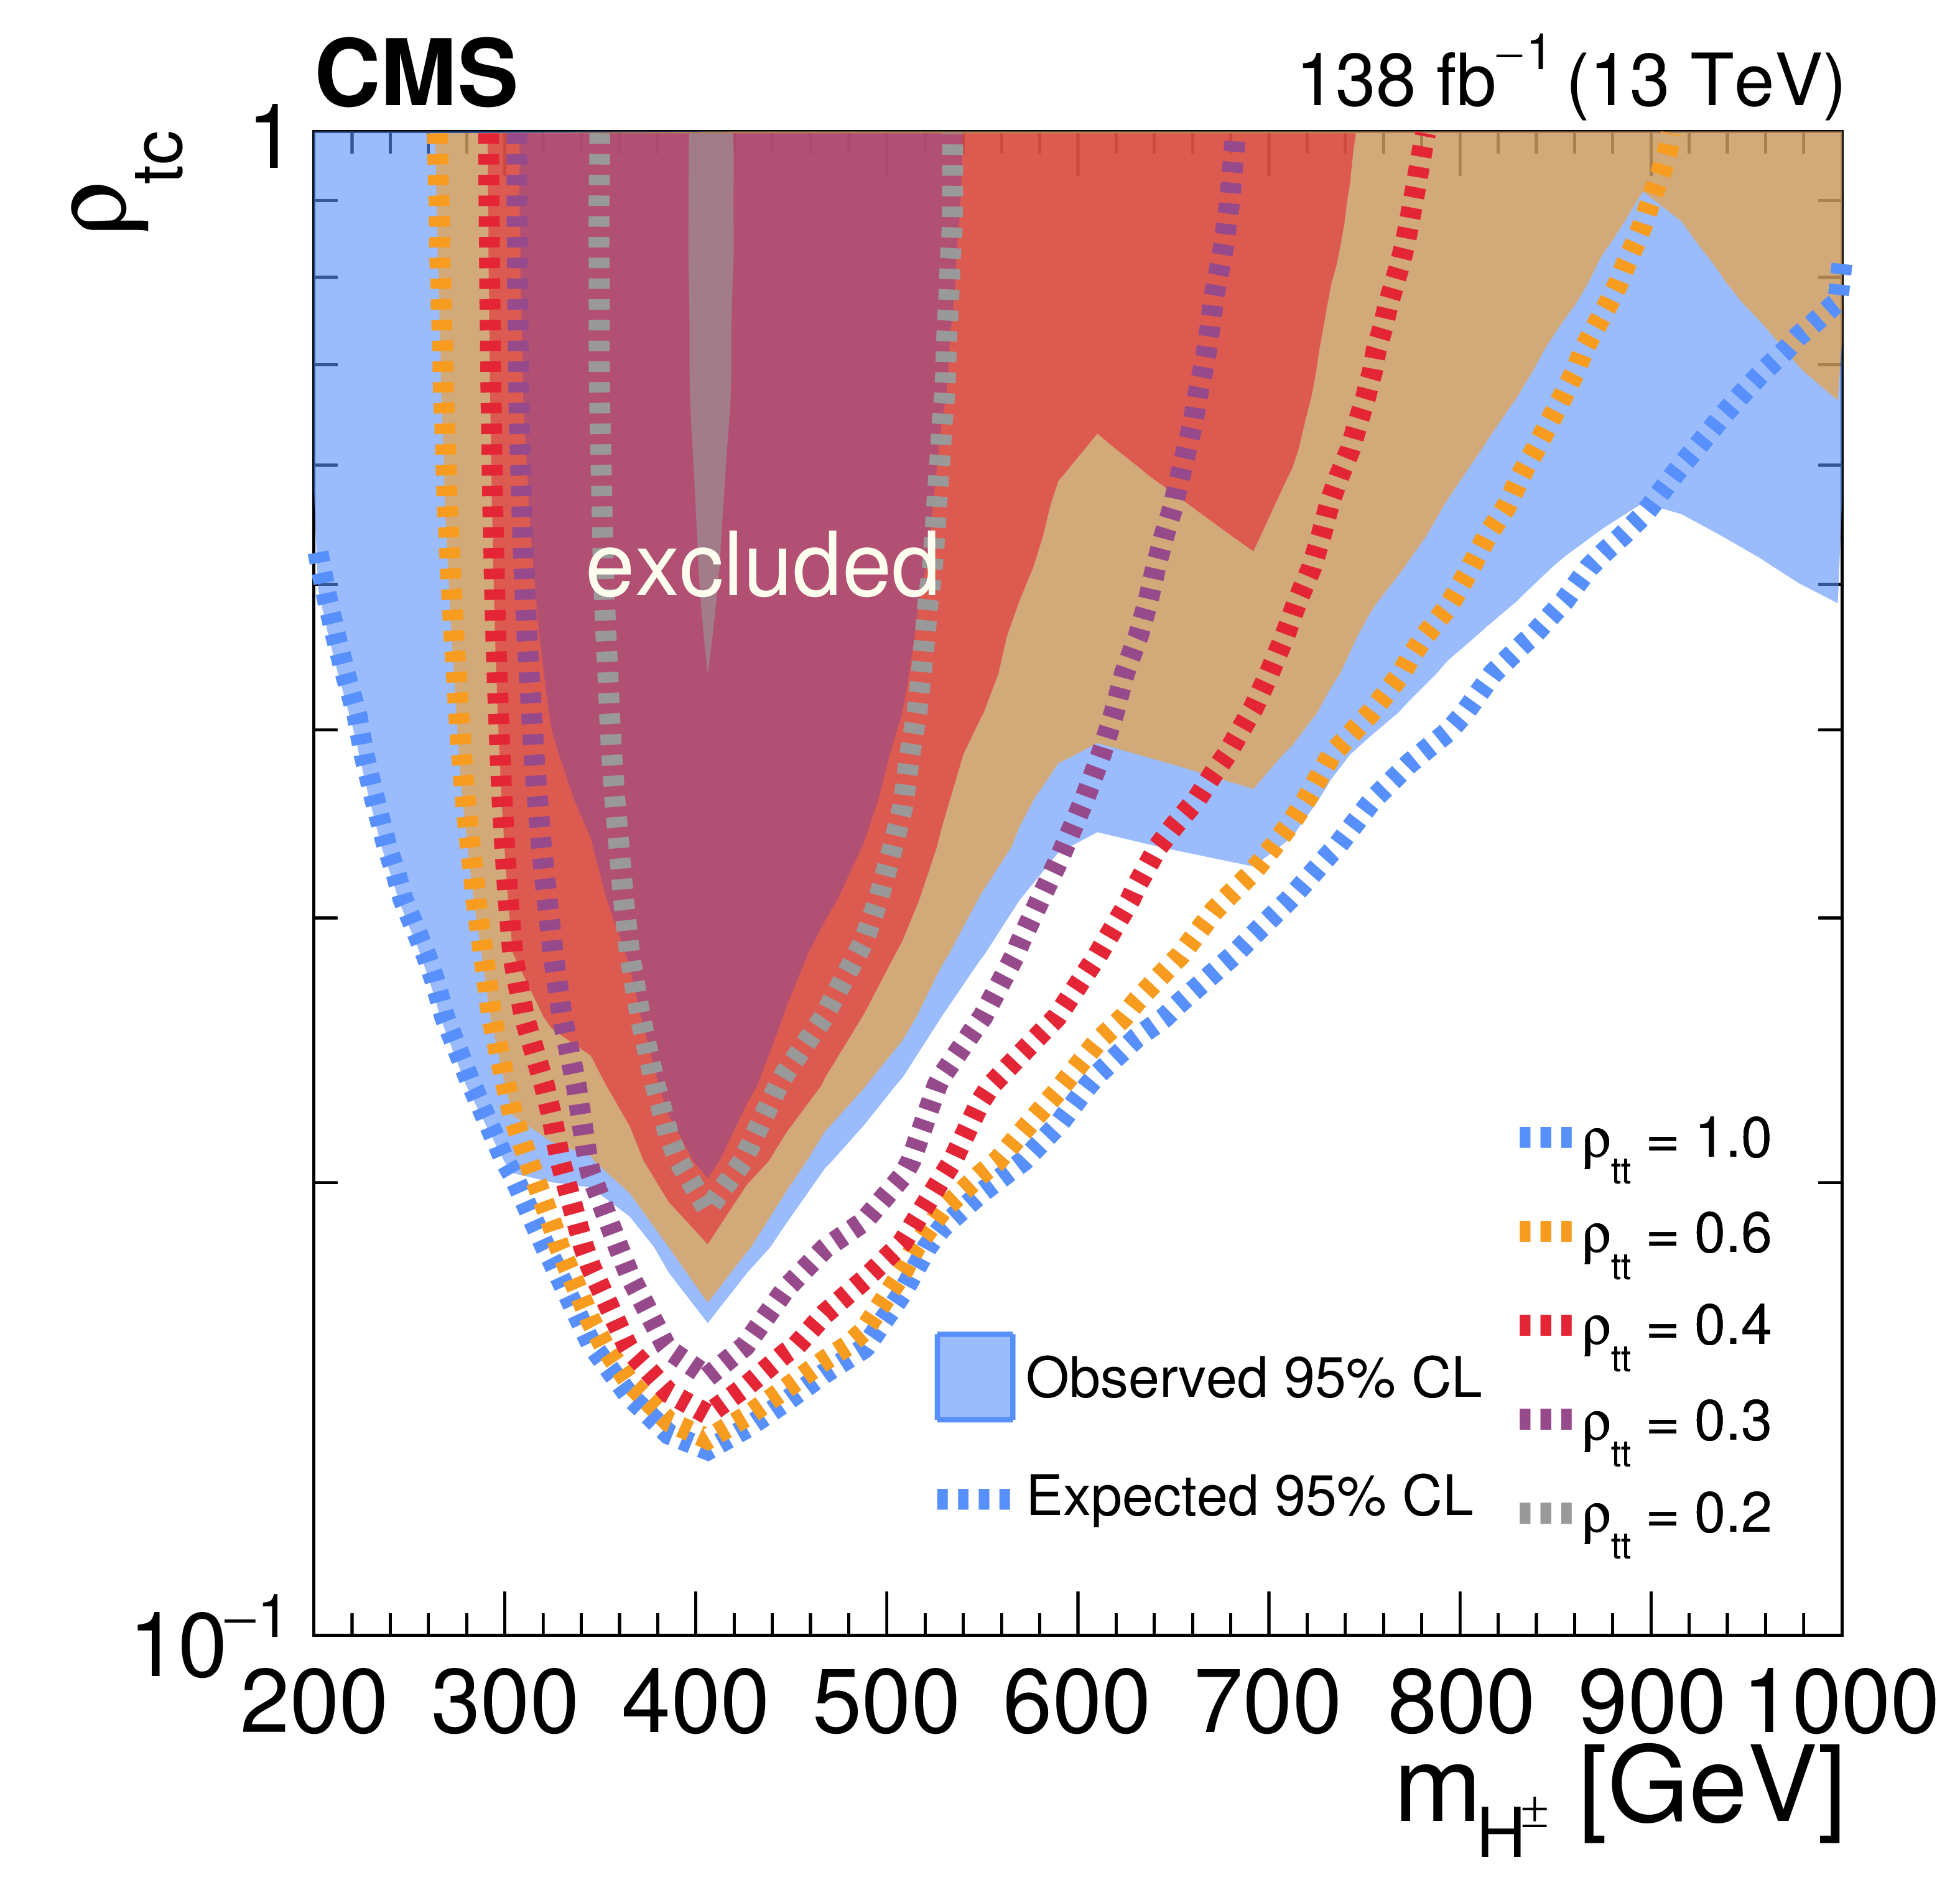
Observed and expected 95% CL excluded phase space regions, as functions of $ m_{\mathrm{H^{\pm}}} $ and $ \rho_{\mathrm{t}\mathrm{c}} $ for various assumed $ \rho_{\mathrm{t}\mathrm{t}} $ values represented with different colors. The limits are extracted from the pDNN distributions based on the g2HDM assuming all the extra Yukawa couplings except $ \rho_{\mathrm{t}\mathrm{t}} $ and $ \rho_{\mathrm{t}\mathrm{c}} $ are zero. The results are obtained from the 95% CL limits on the cross section times branching fraction in Fig. 6. |
png pdf |
Figure 8:
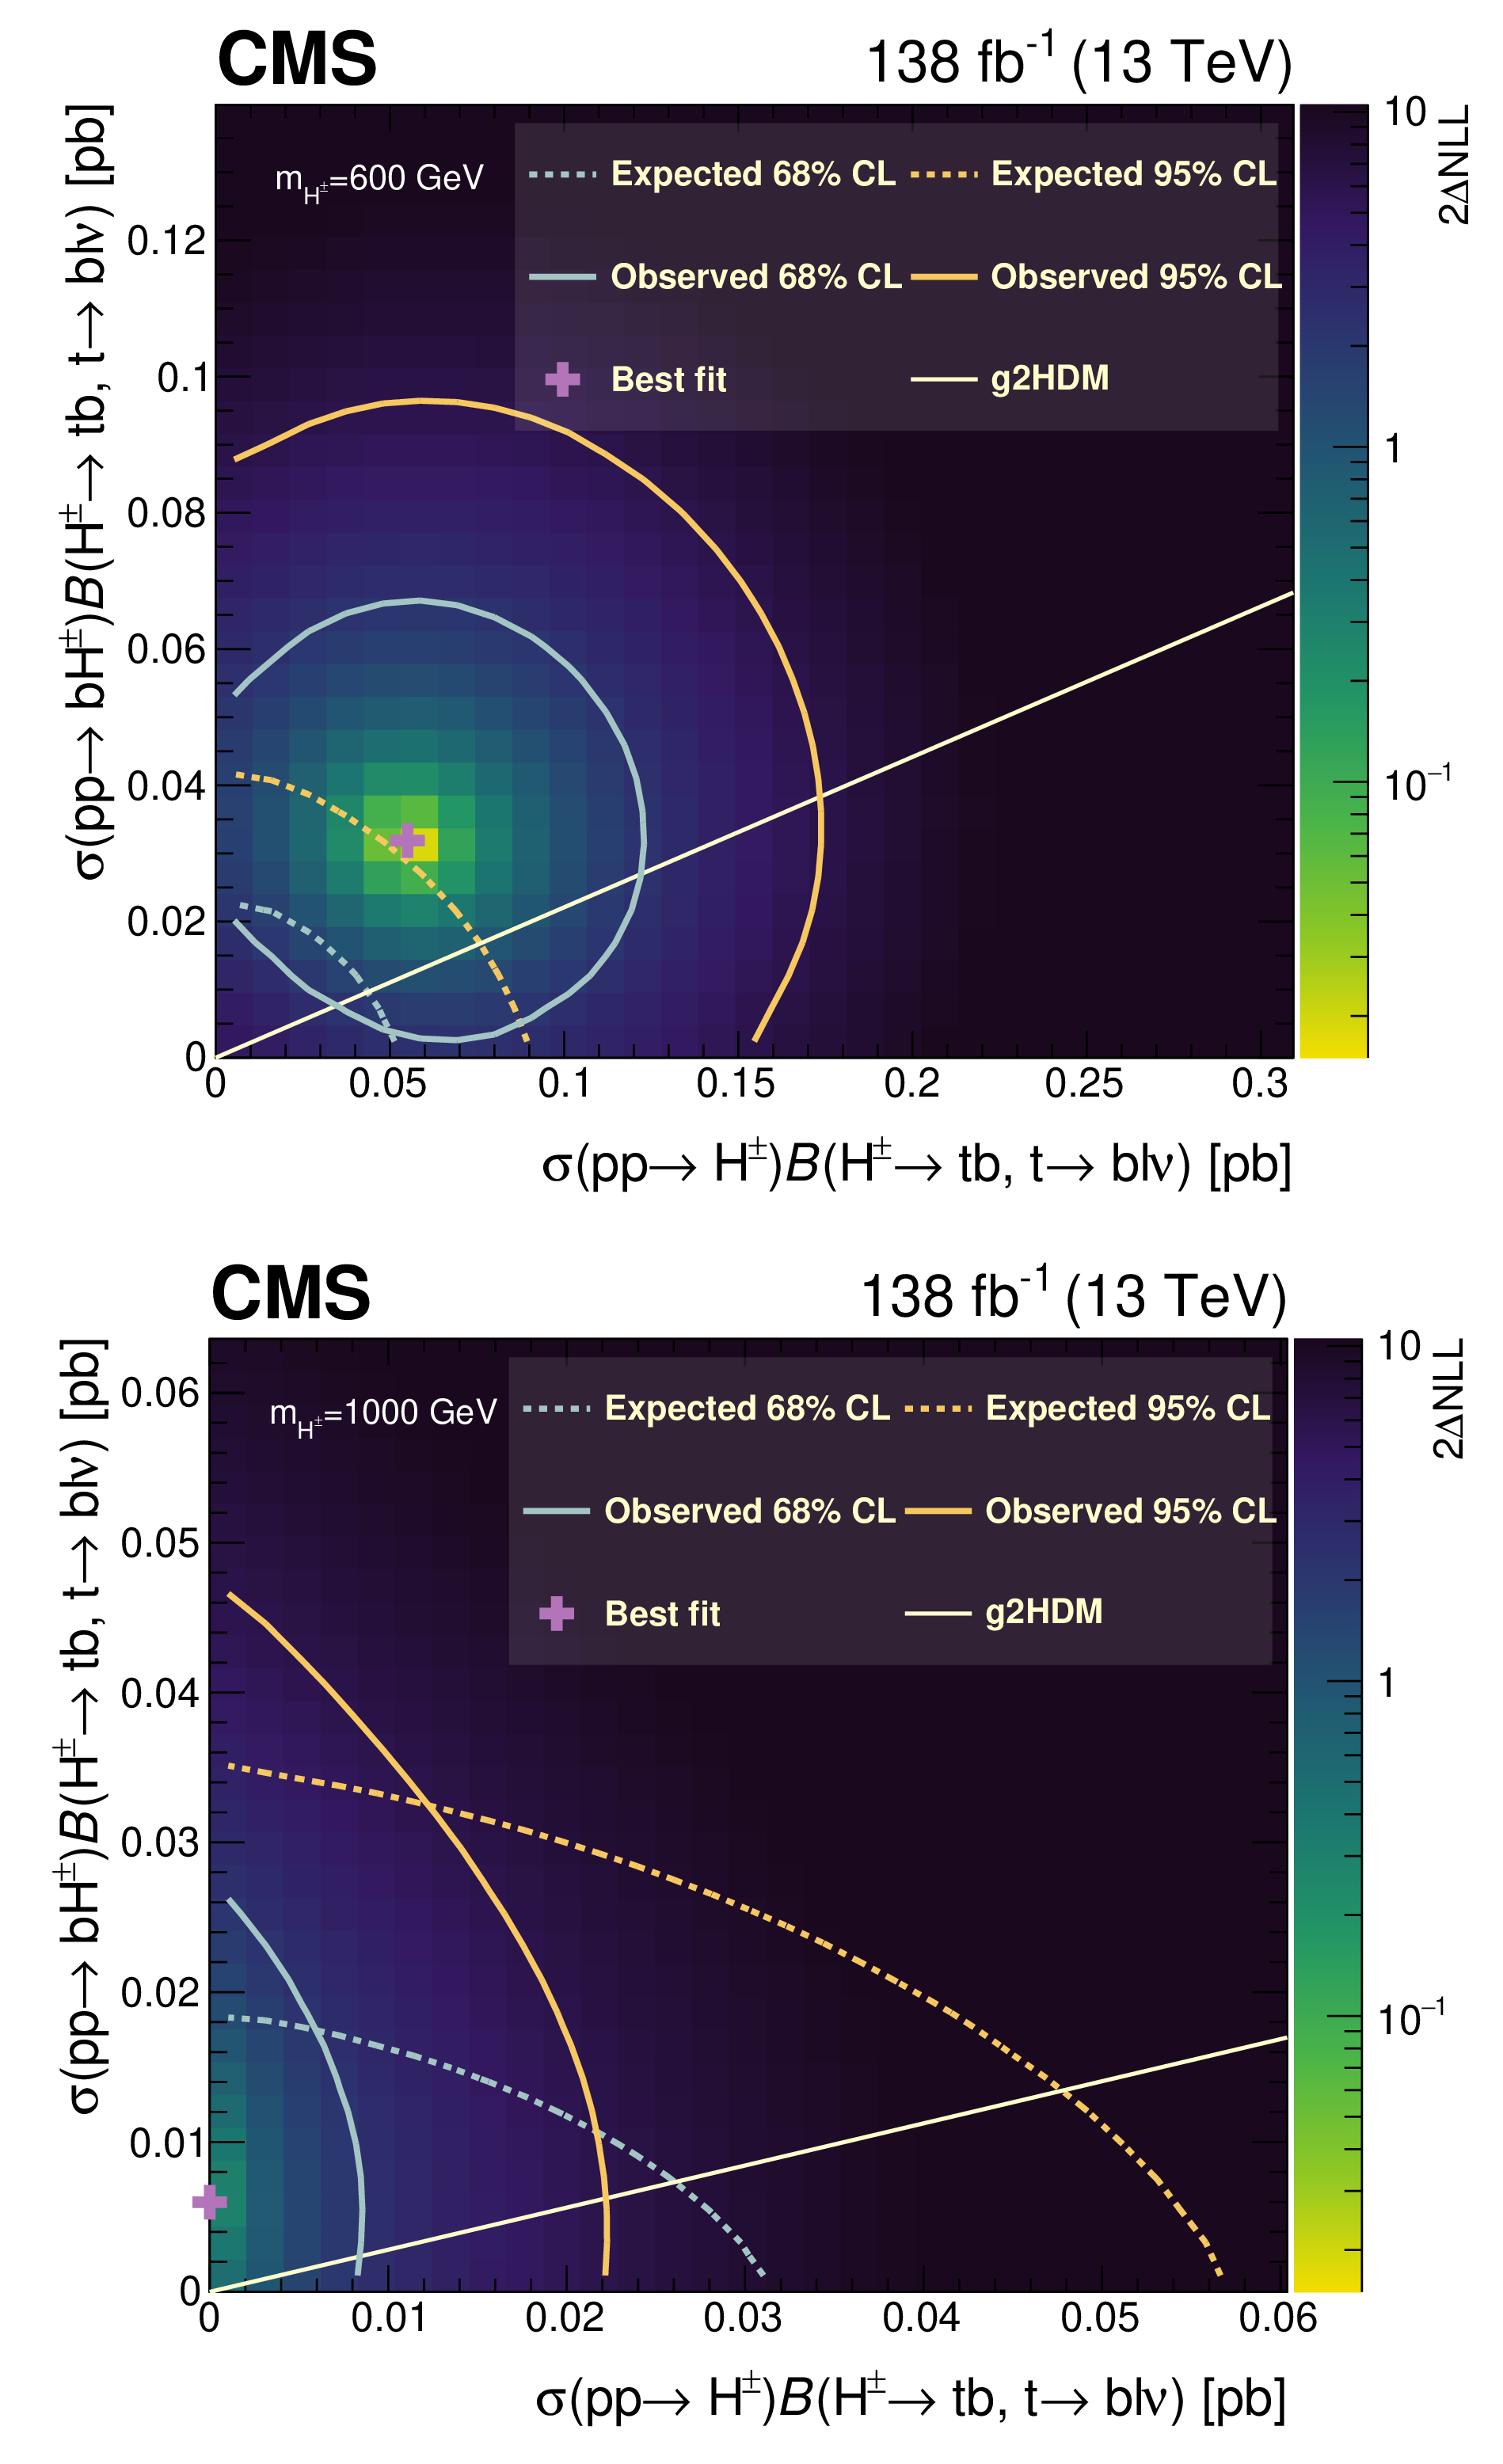
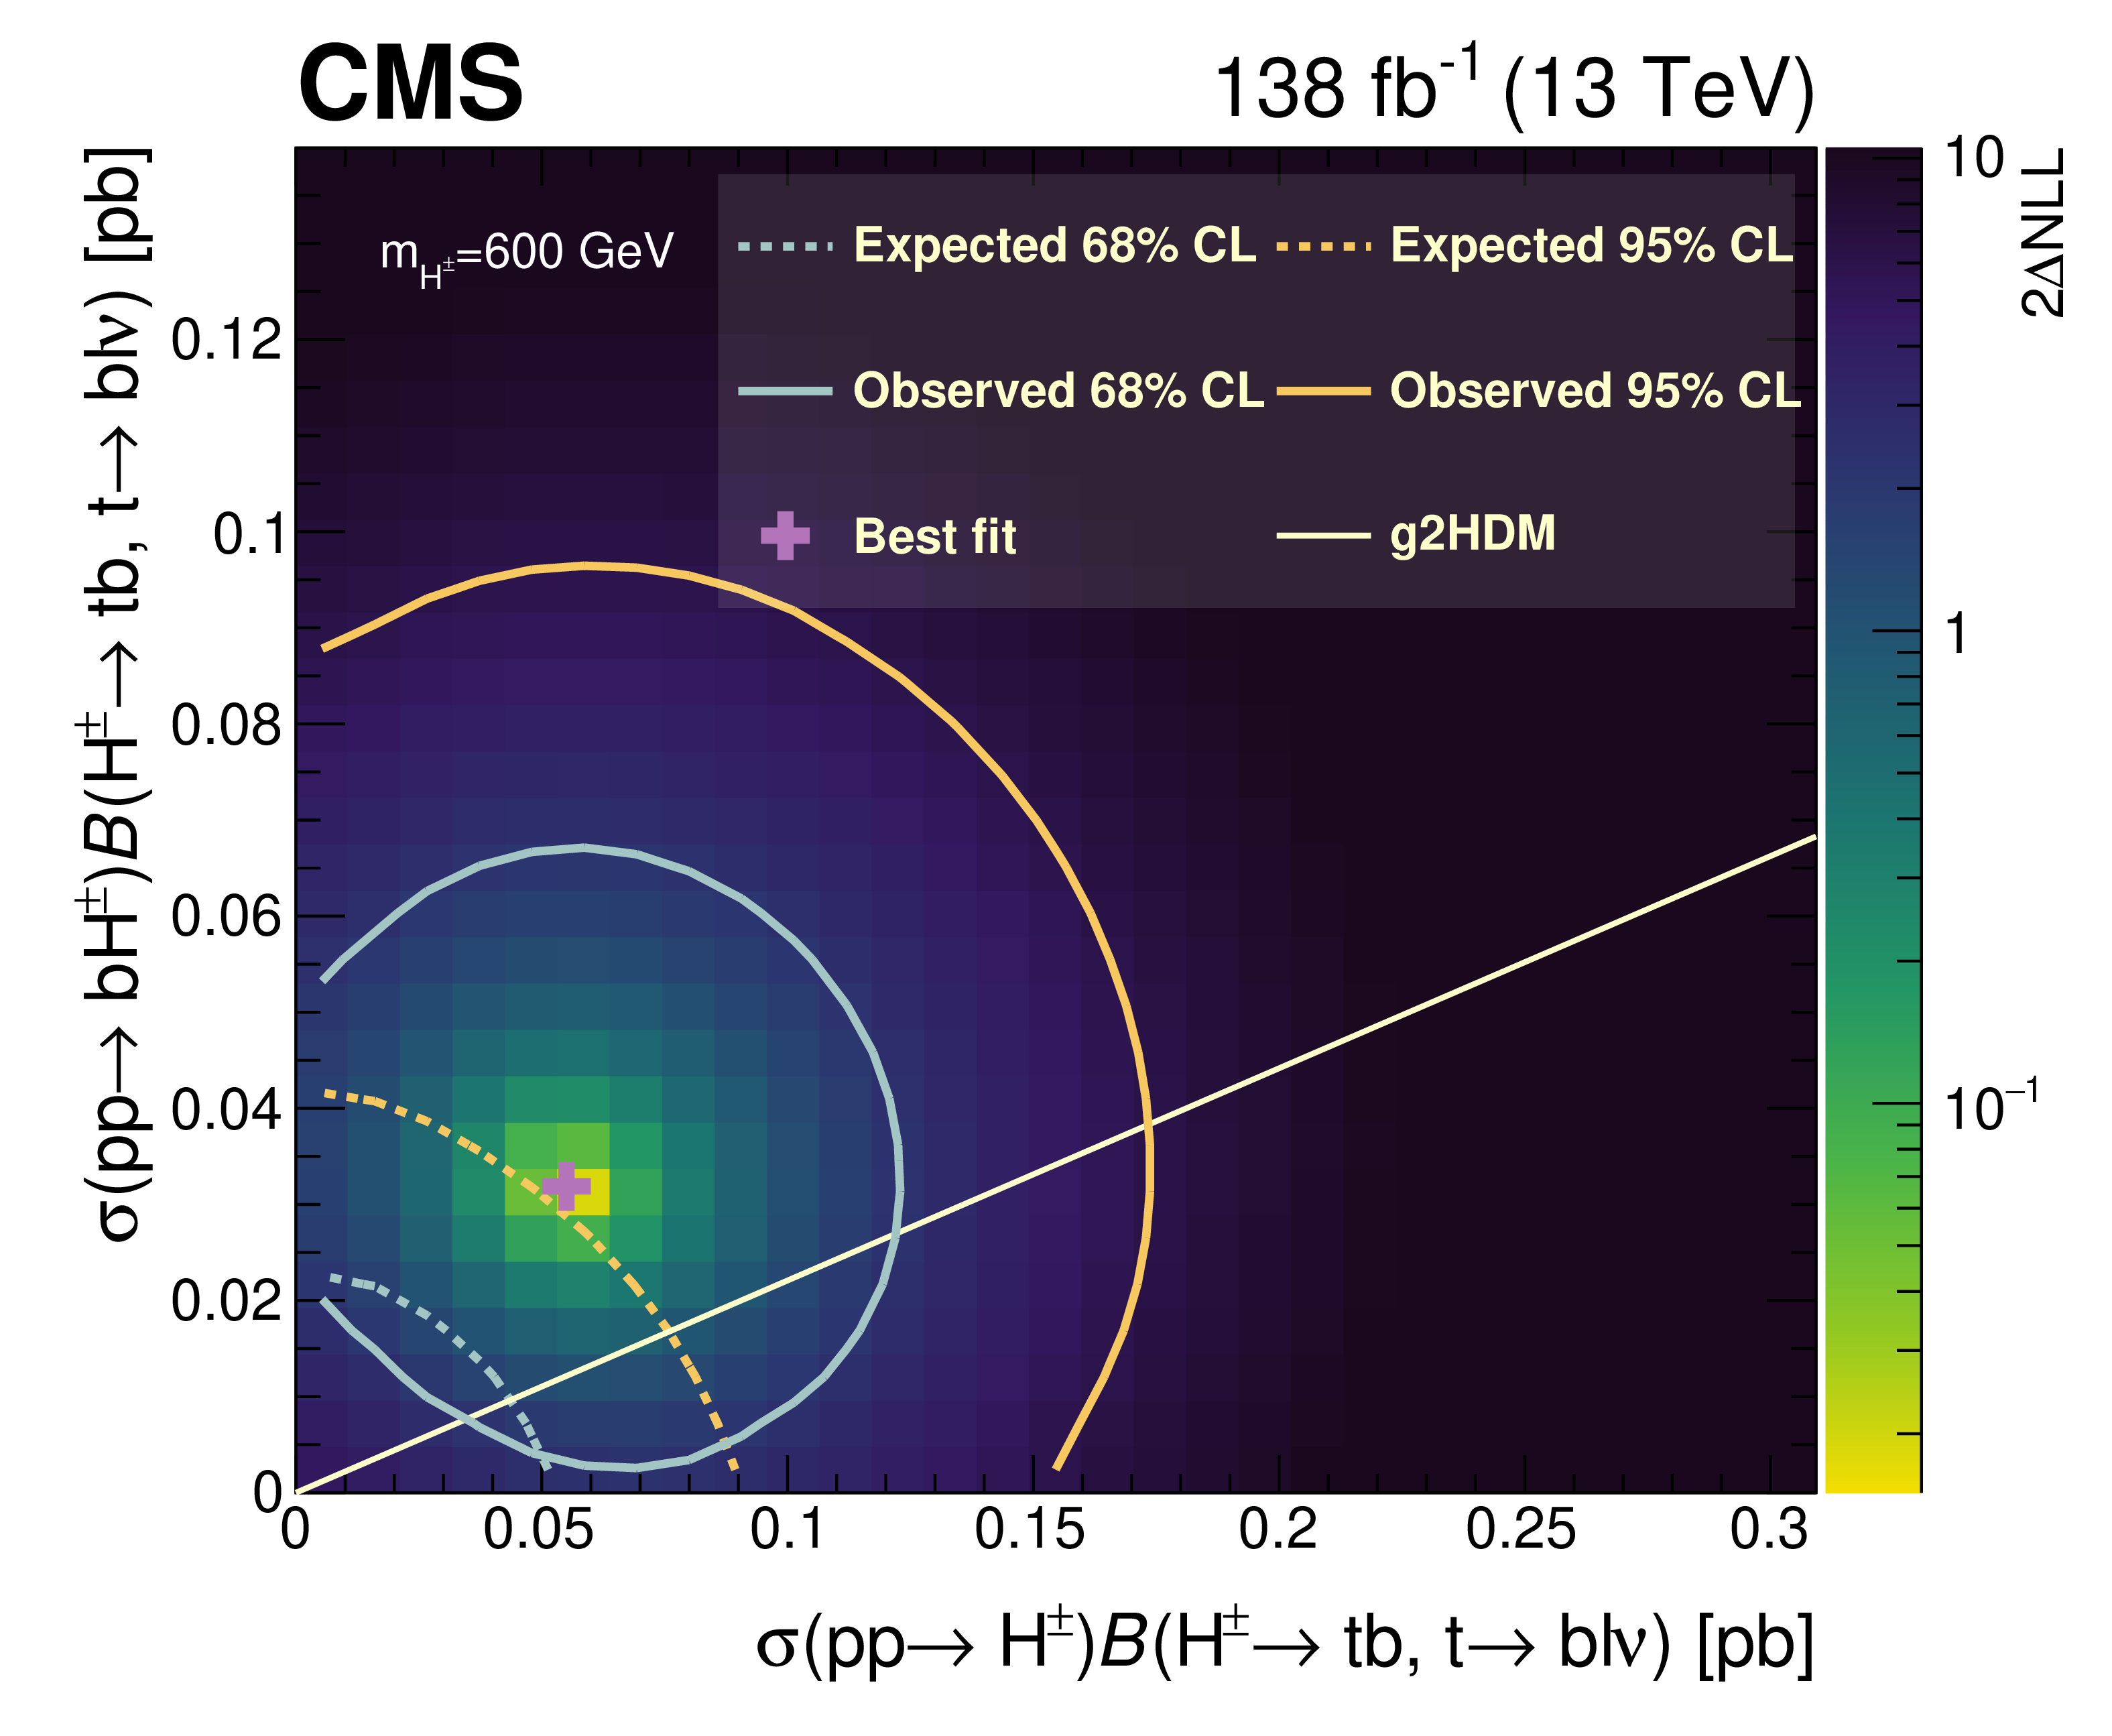
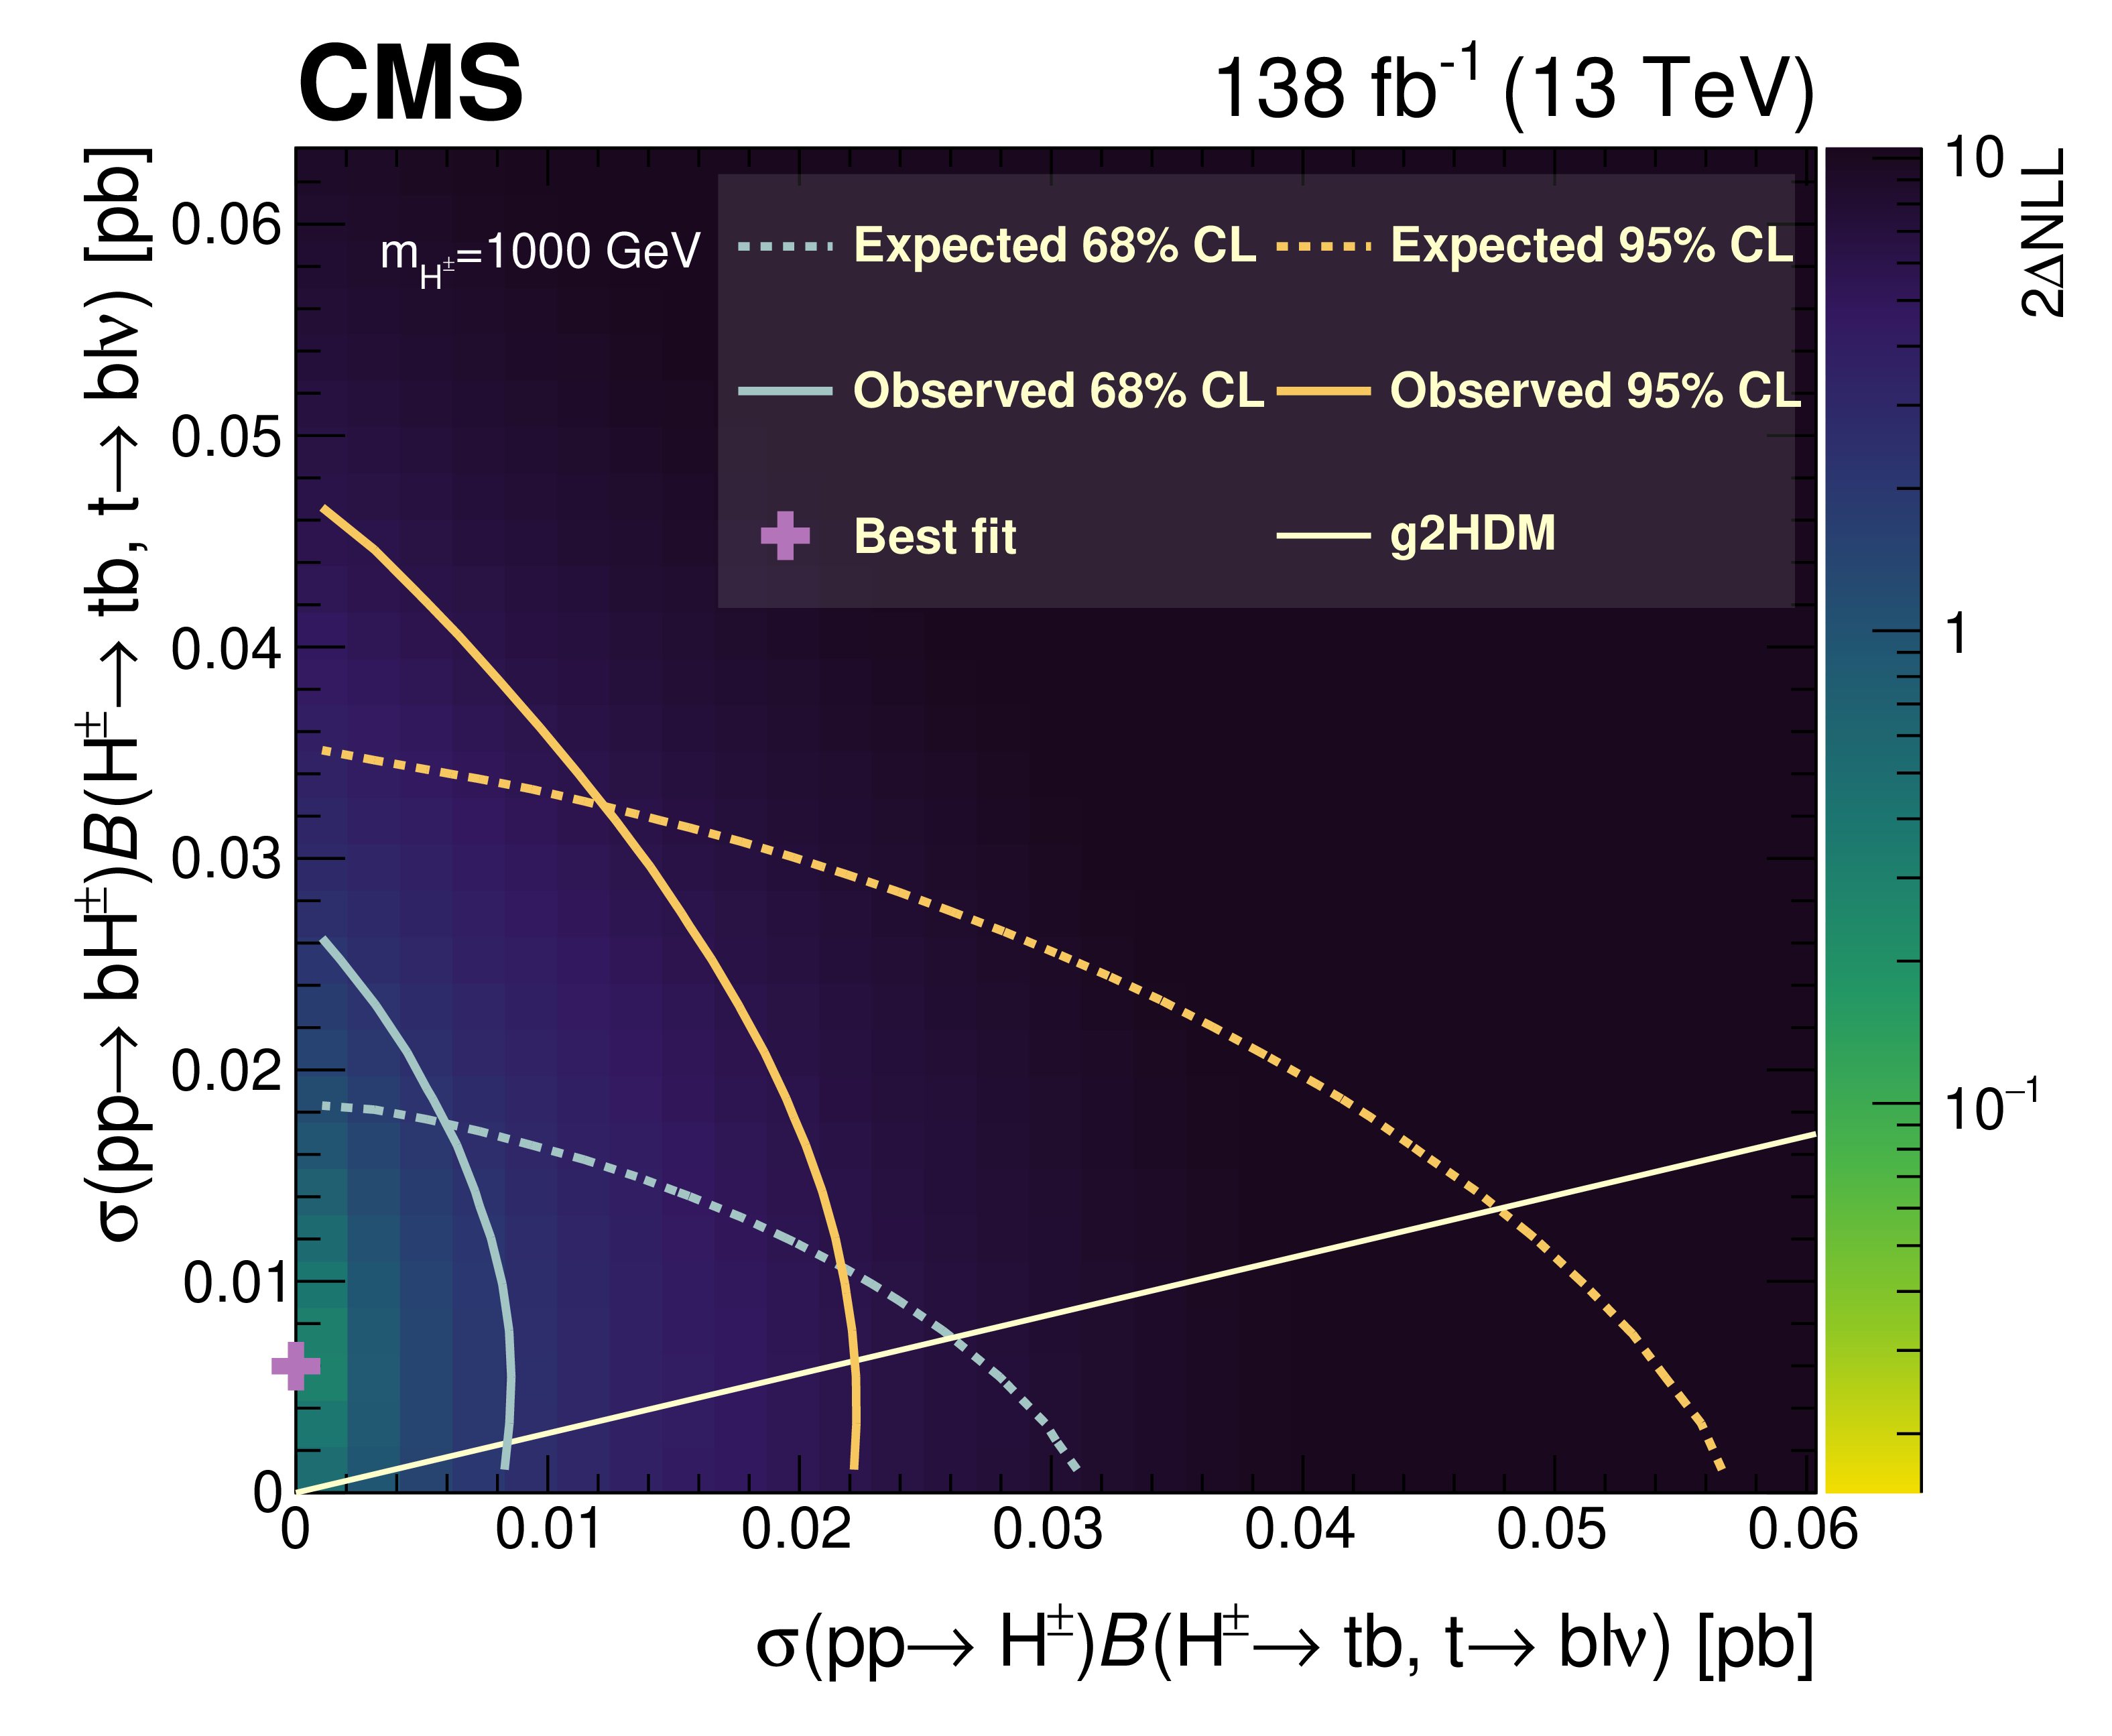
Two times the difference of the negative log-likelihood (NLL) as a function of $ \sigma(\mathrm{p}\mathrm{p}\to\mathrm{H}^\pm) \mathcal{B}(\mathrm{H}^\pm\to\mathrm{t}\mathrm{b}, \mathrm{t}\to\mathrm{b} \ell\nu) $ and $ \sigma(\mathrm{p}\mathrm{p}\to\mathrm{b}\mathrm{H}^\pm) \mathcal{B}(\mathrm{H}^\pm\to\mathrm{t}\mathrm{b}, \mathrm{t}\to\mathrm{b} \ell\nu) $ with the best fit point extracted from the pDNN distribution for the $ \mathrm{H^{\pm}} $ boson mass $ m_{\mathrm{H^{\pm}}} = $ 600 GeV (upper), and $ m_{\mathrm{H^{\pm}}} = $ 1000 GeV (lower). The solid and dashed contours represent the observed and expected limits, respectively. The points along the contours represent 68 and 95% CL regions, extracted from the 2 $ \Delta{\text{NLL}} $ values of 2.30 and 5.99, respectively. The g2HDM predictions are also shown. The points along the g2HDM prediction line represent different $ \rho_{\mathrm{t}\mathrm{t}} $, $ \rho_{\mathrm{t}\mathrm{c}} $ coupling sets, with all other extra Yukawa couplings assumed to be zero. |
png pdf |
Figure 8-a:
Two times the difference of the negative log-likelihood (NLL) as a function of $ \sigma(\mathrm{p}\mathrm{p}\to\mathrm{H}^\pm) \mathcal{B}(\mathrm{H}^\pm\to\mathrm{t}\mathrm{b}, \mathrm{t}\to\mathrm{b} \ell\nu) $ and $ \sigma(\mathrm{p}\mathrm{p}\to\mathrm{b}\mathrm{H}^\pm) \mathcal{B}(\mathrm{H}^\pm\to\mathrm{t}\mathrm{b}, \mathrm{t}\to\mathrm{b} \ell\nu) $ with the best fit point extracted from the pDNN distribution for the $ \mathrm{H^{\pm}} $ boson mass $ m_{\mathrm{H^{\pm}}} = $ 600 GeV (upper), and $ m_{\mathrm{H^{\pm}}} = $ 1000 GeV (lower). The solid and dashed contours represent the observed and expected limits, respectively. The points along the contours represent 68 and 95% CL regions, extracted from the 2 $ \Delta{\text{NLL}} $ values of 2.30 and 5.99, respectively. The g2HDM predictions are also shown. The points along the g2HDM prediction line represent different $ \rho_{\mathrm{t}\mathrm{t}} $, $ \rho_{\mathrm{t}\mathrm{c}} $ coupling sets, with all other extra Yukawa couplings assumed to be zero. |
png pdf |
Figure 8-b:
Two times the difference of the negative log-likelihood (NLL) as a function of $ \sigma(\mathrm{p}\mathrm{p}\to\mathrm{H}^\pm) \mathcal{B}(\mathrm{H}^\pm\to\mathrm{t}\mathrm{b}, \mathrm{t}\to\mathrm{b} \ell\nu) $ and $ \sigma(\mathrm{p}\mathrm{p}\to\mathrm{b}\mathrm{H}^\pm) \mathcal{B}(\mathrm{H}^\pm\to\mathrm{t}\mathrm{b}, \mathrm{t}\to\mathrm{b} \ell\nu) $ with the best fit point extracted from the pDNN distribution for the $ \mathrm{H^{\pm}} $ boson mass $ m_{\mathrm{H^{\pm}}} = $ 600 GeV (upper), and $ m_{\mathrm{H^{\pm}}} = $ 1000 GeV (lower). The solid and dashed contours represent the observed and expected limits, respectively. The points along the contours represent 68 and 95% CL regions, extracted from the 2 $ \Delta{\text{NLL}} $ values of 2.30 and 5.99, respectively. The g2HDM predictions are also shown. The points along the g2HDM prediction line represent different $ \rho_{\mathrm{t}\mathrm{t}} $, $ \rho_{\mathrm{t}\mathrm{c}} $ coupling sets, with all other extra Yukawa couplings assumed to be zero. |
| Tables | |

png pdf |
Table 1:
Input variables of the $ \text{pDNN}_{2\mathrm{b}} $ and $ \text{pDNN}_{3\mathrm{b}} $. Indices $ i < j $ run up to including 2 for $ \text{pDNN}_{2\mathrm{b}} $ and 3 for $ \text{pDNN}_{3\mathrm{b}} $. |
png pdf |
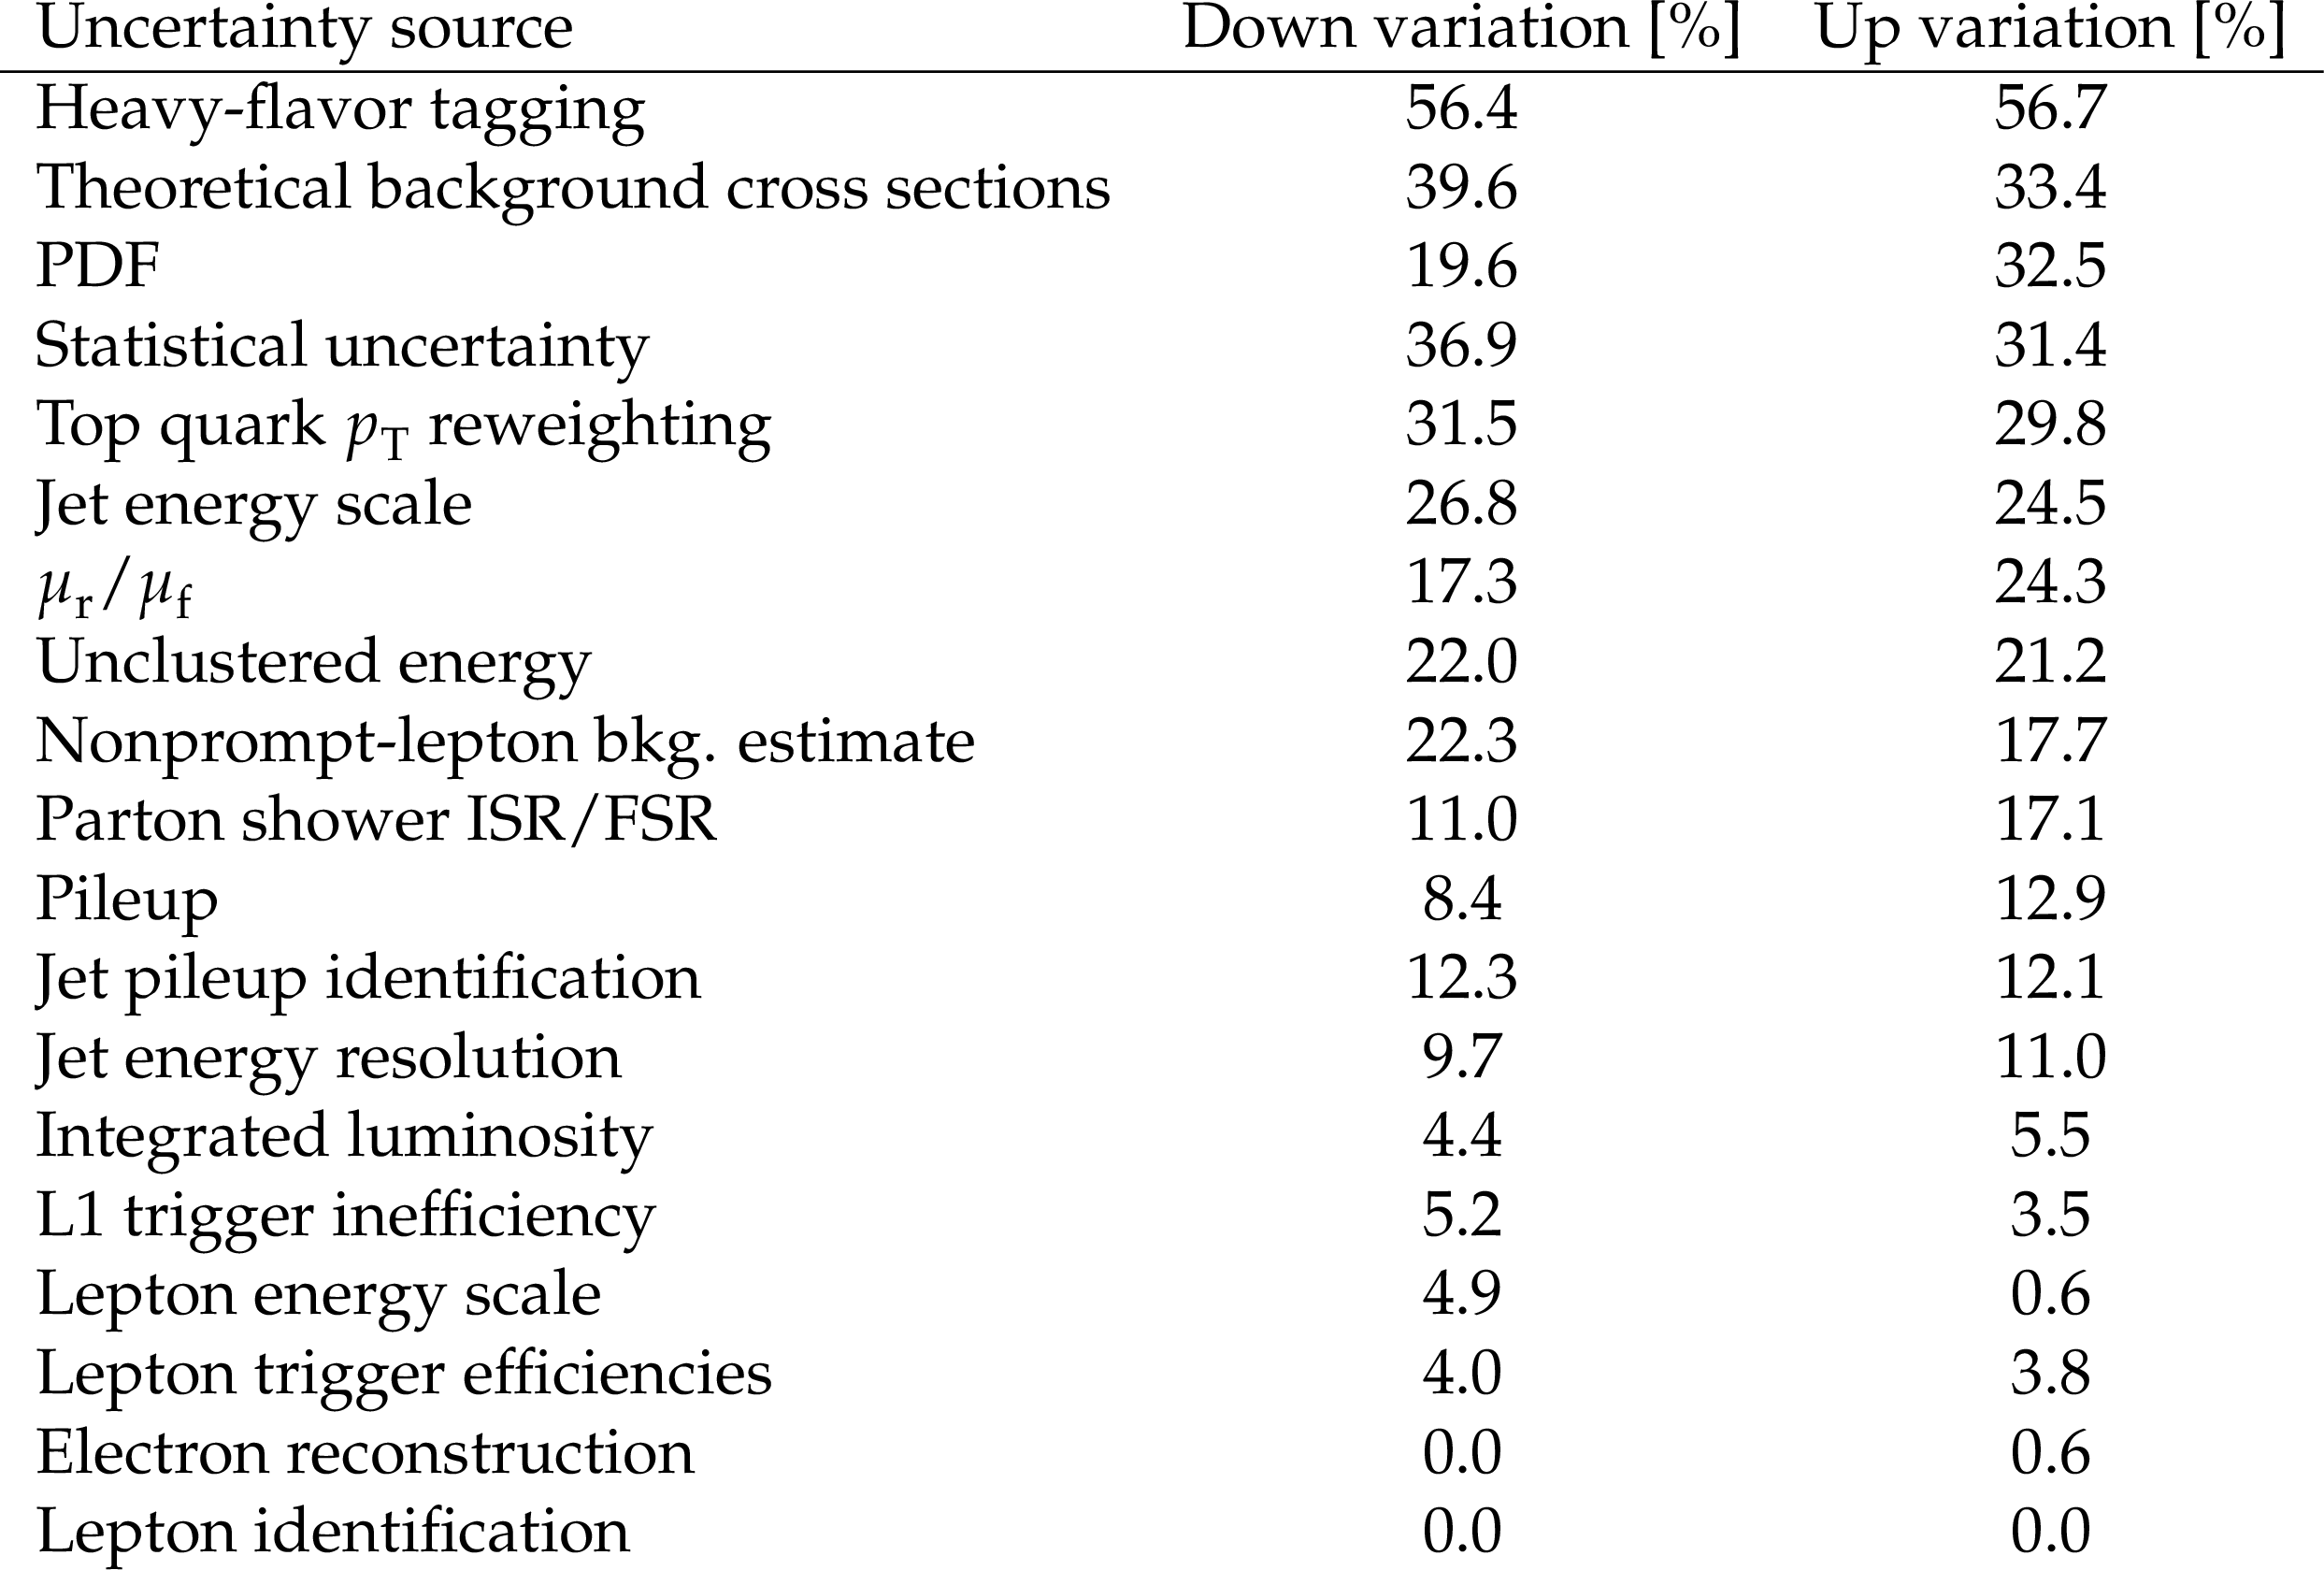
Table 2:
Summary of the systematic uncertainty decomposition with respect to the total uncertainty in the signal strength for the mass hypothesis $ m_{\mathrm{H^{\pm}}} = $ 200 GeV. |
png pdf |
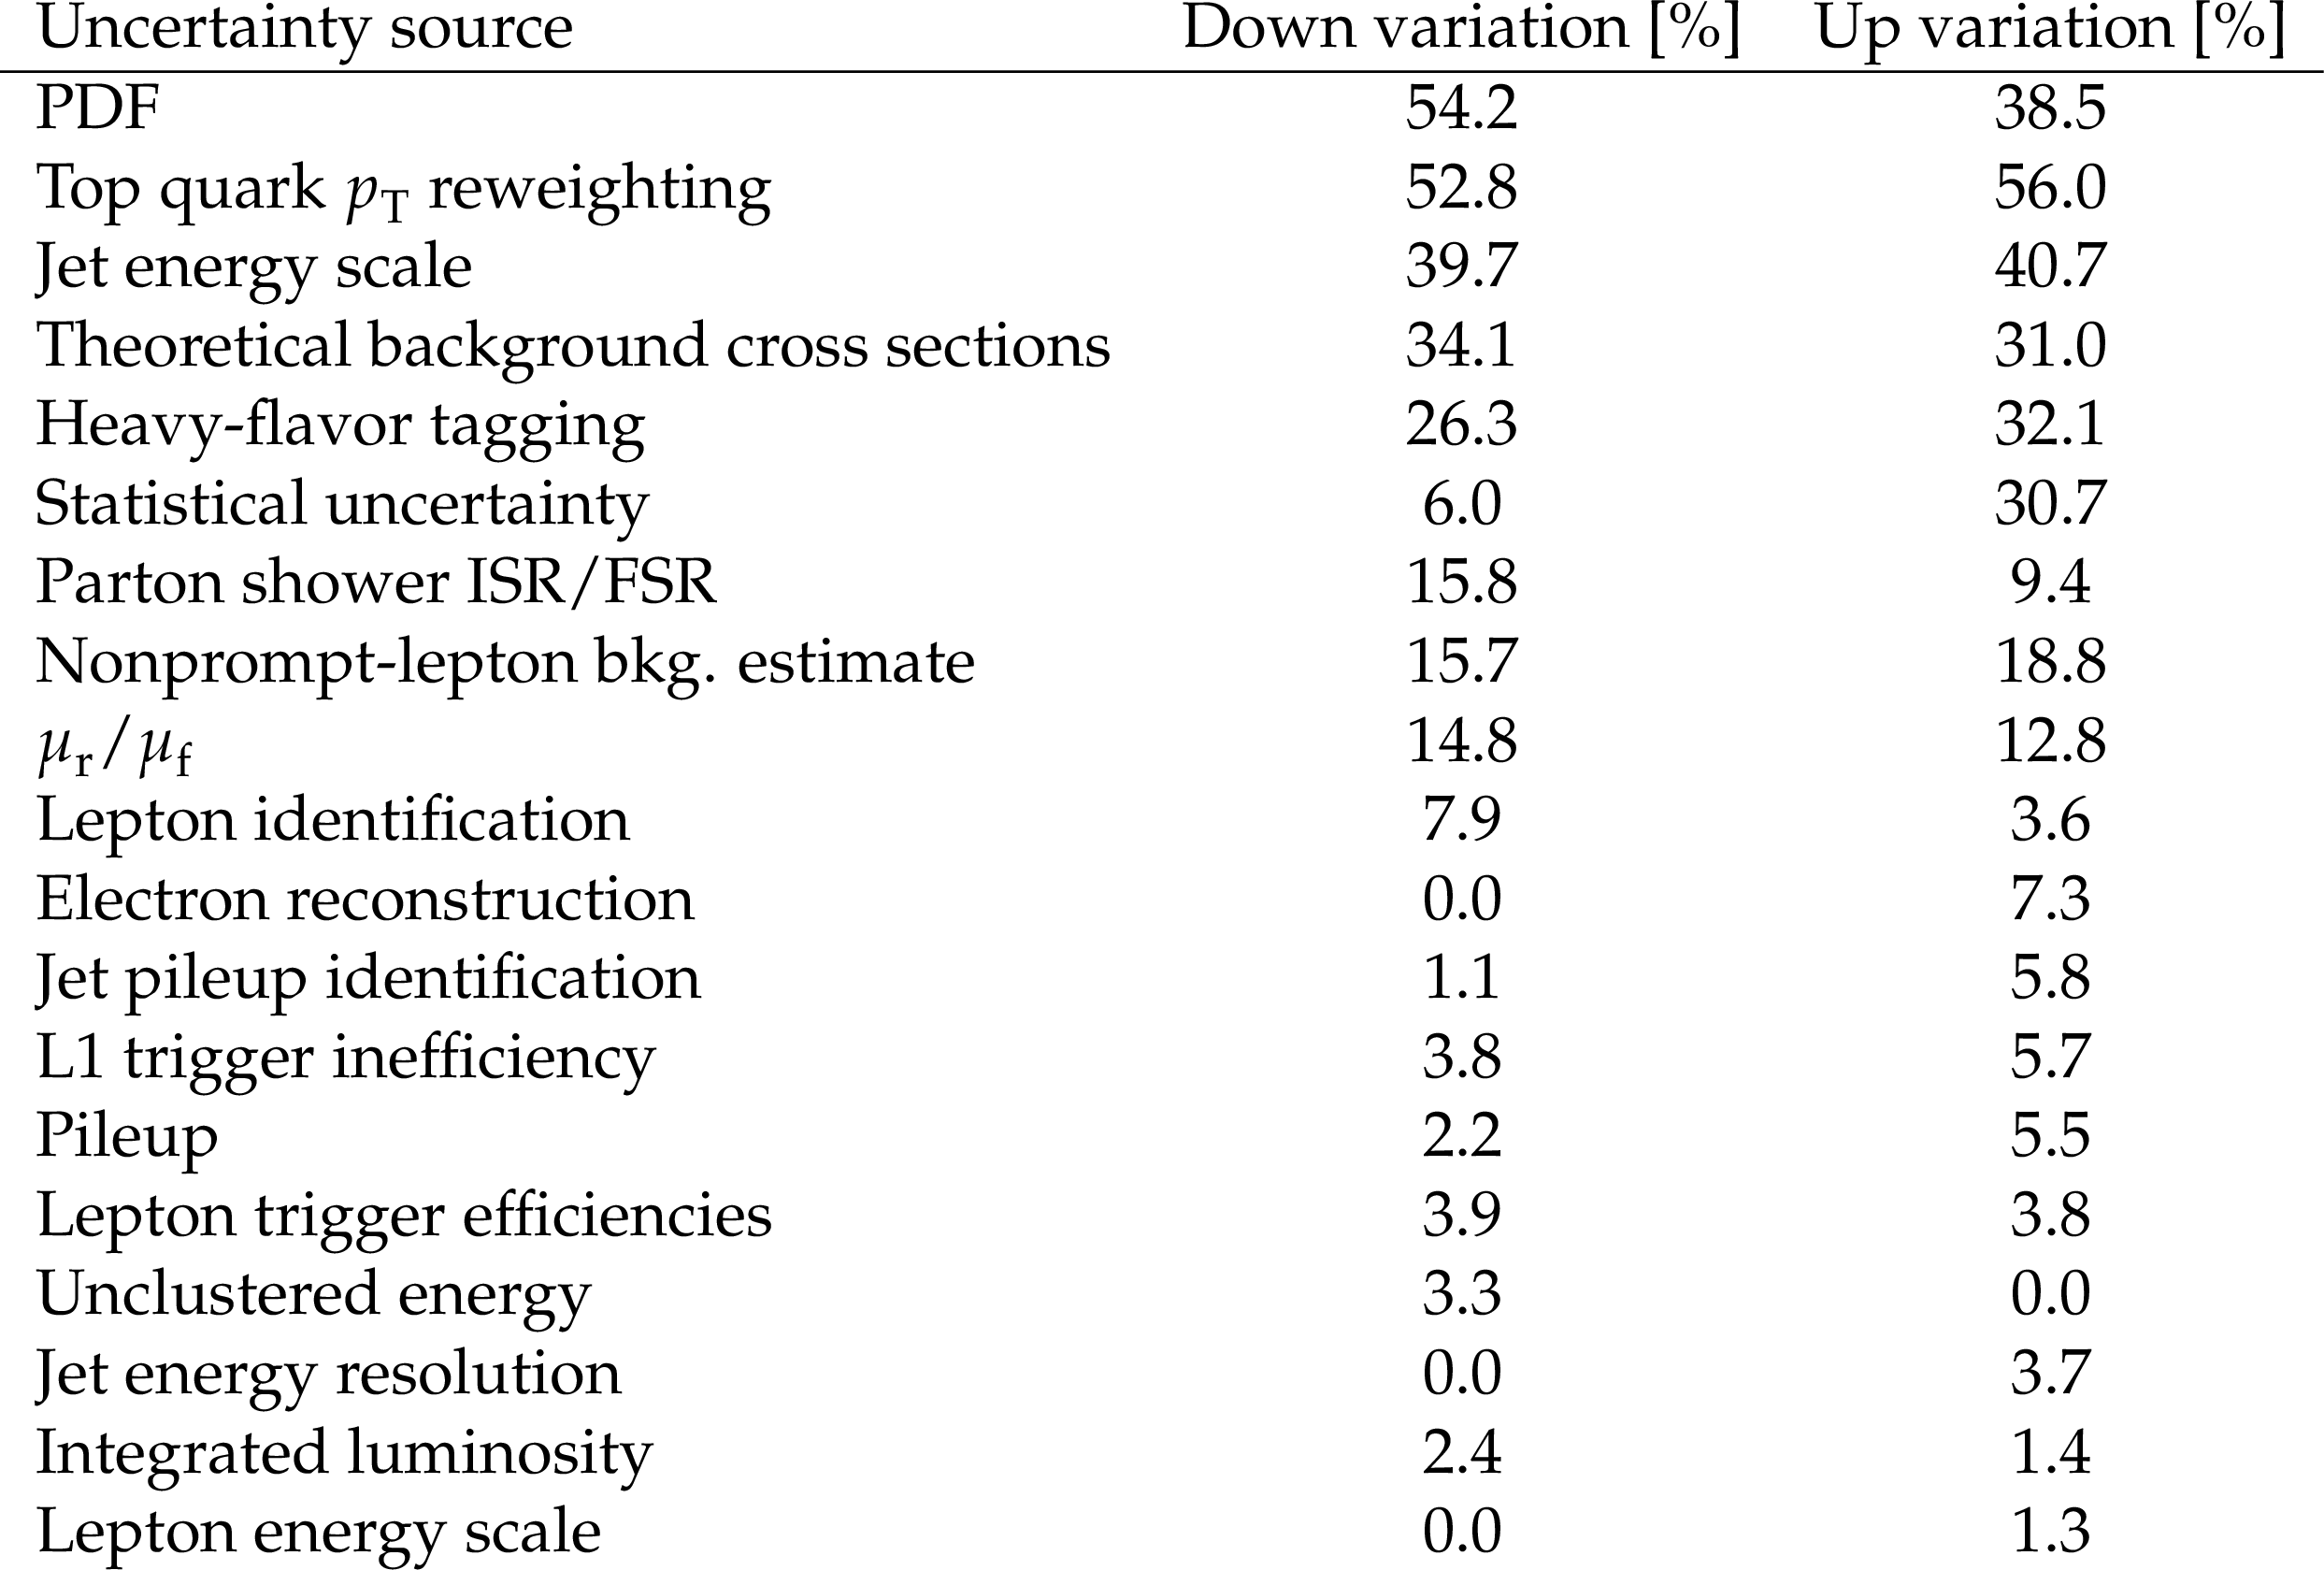
Table 3:
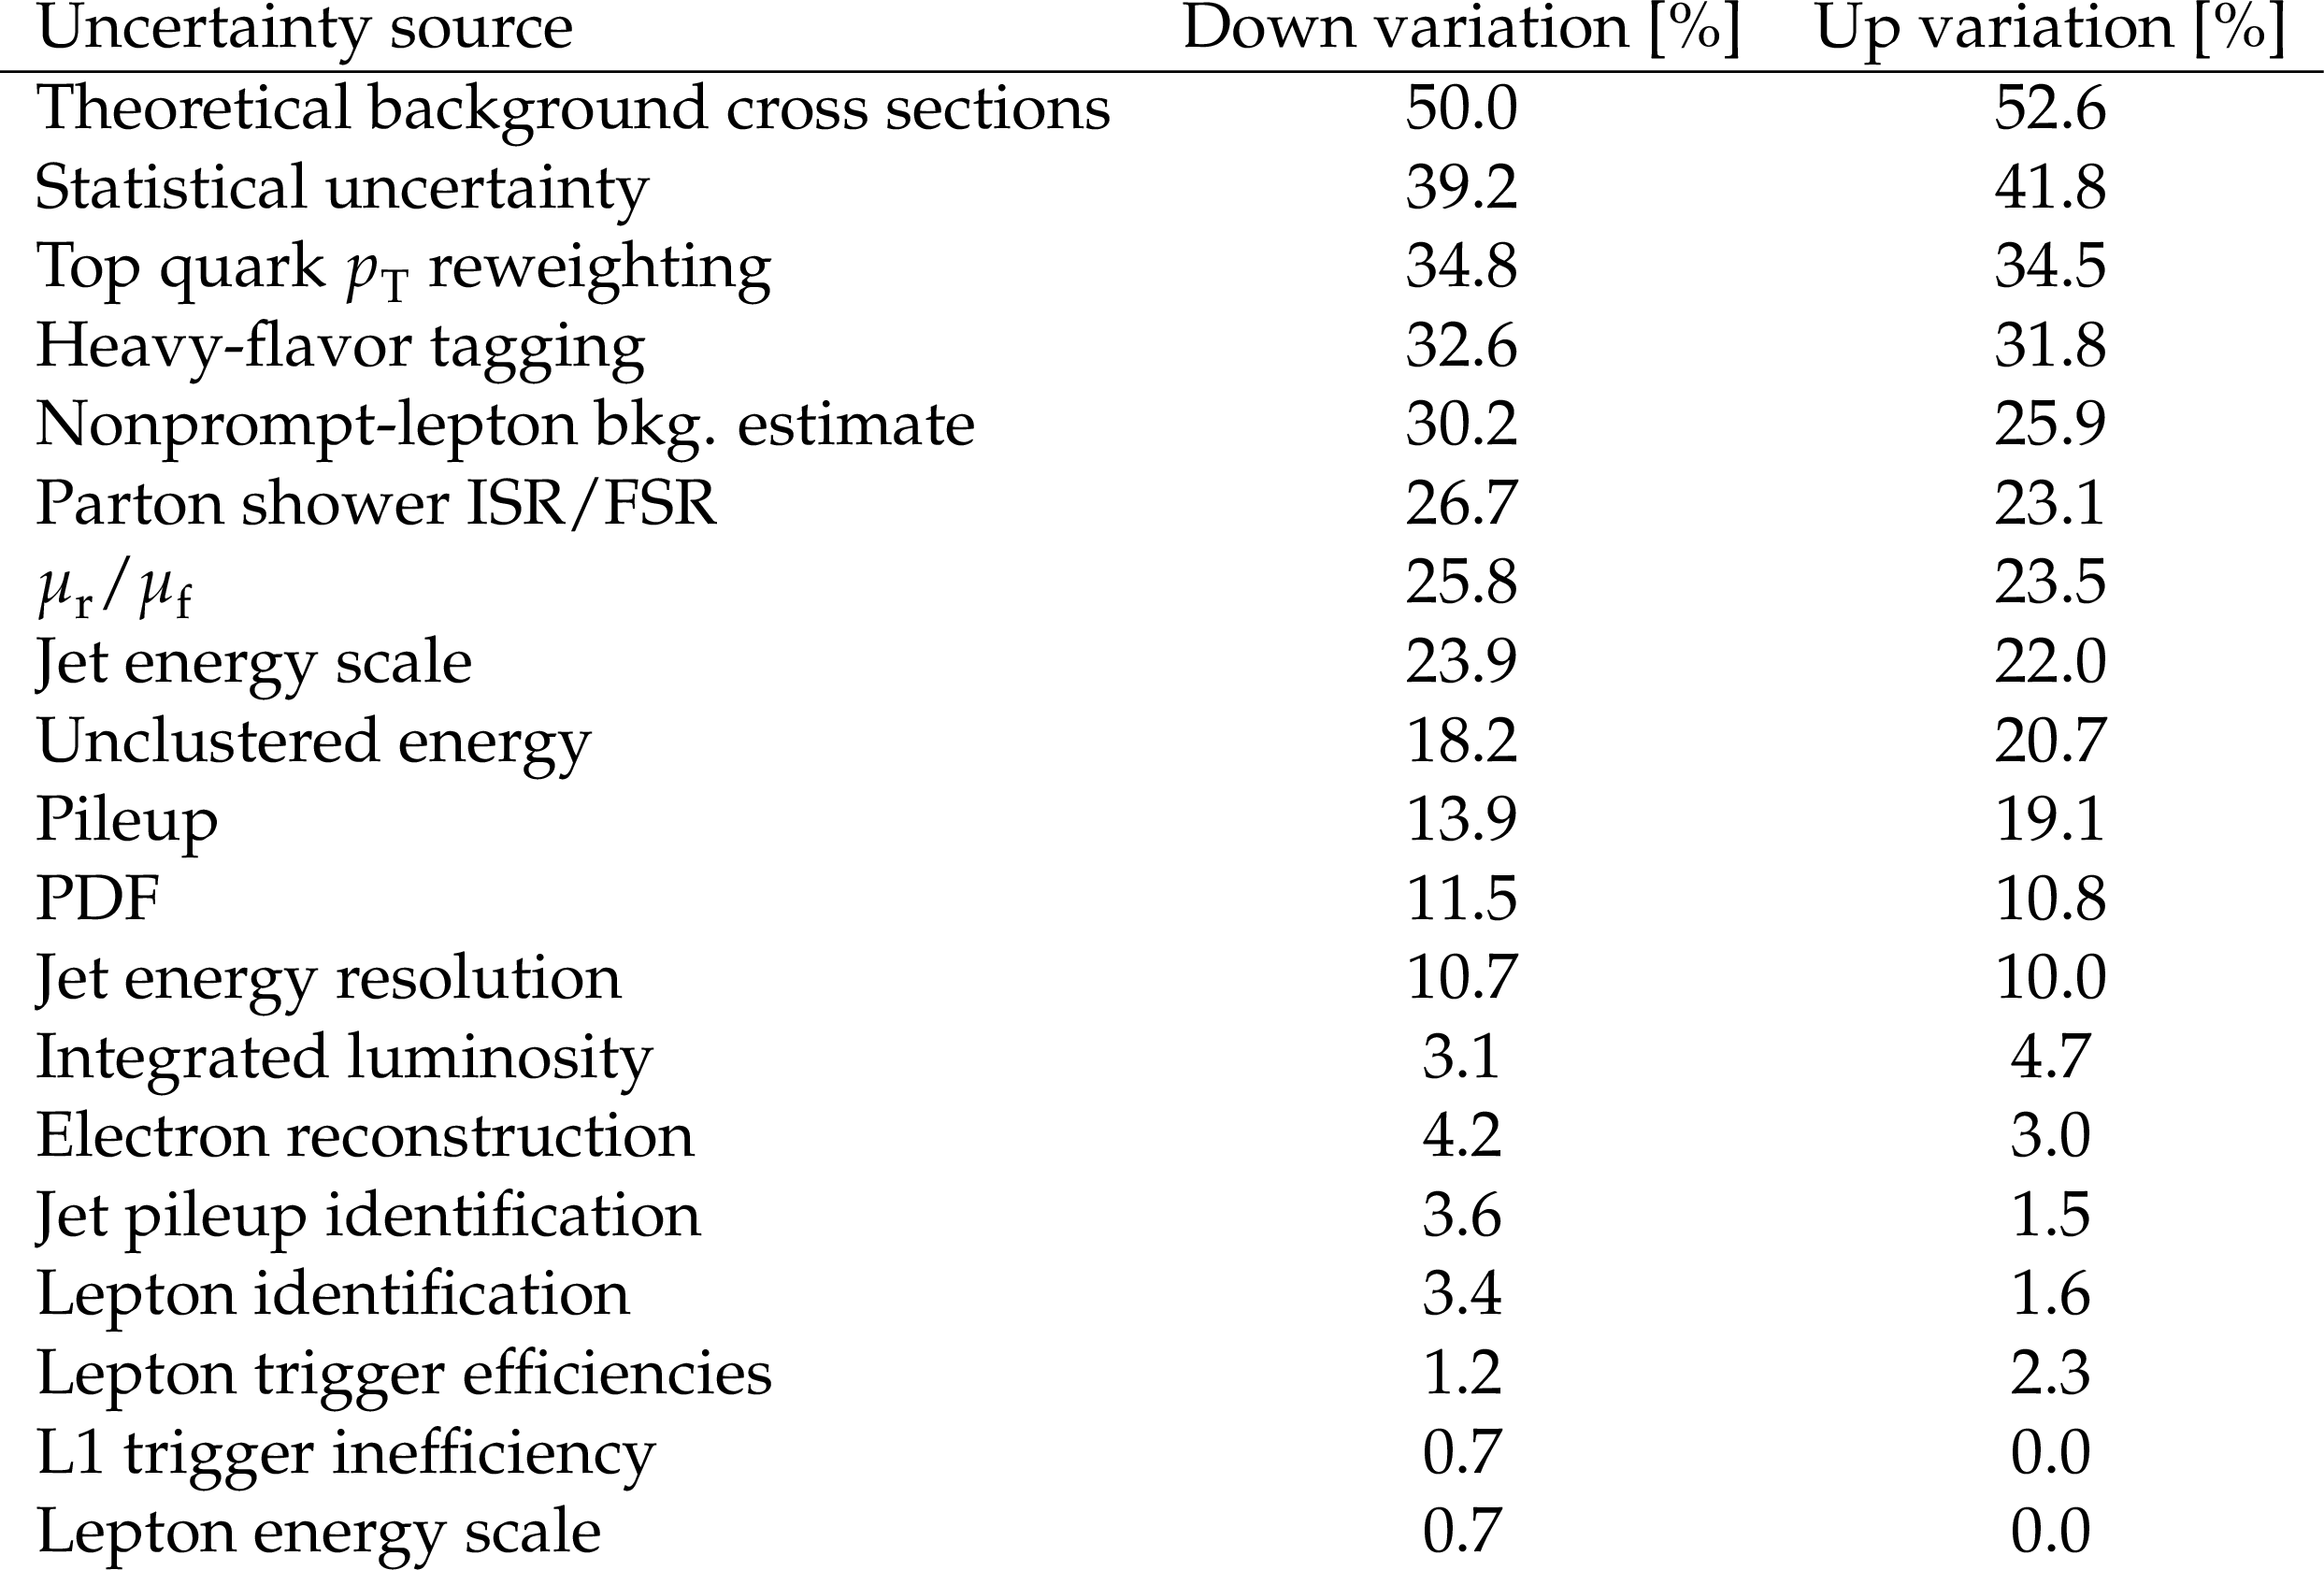
Summary of the systematic uncertainty decomposition with respect to the total uncertainty in the signal strength for the mass hypothesis $ m_{\mathrm{H^{\pm}}} = $ 600 GeV. |
png pdf |
Table 4:
Summary of the systematic uncertainty decomposition with respect to the total uncertainty in the signal strength for the mass hypothesis $ m_{\mathrm{H^{\pm}}} = $ 1000 GeV. |
| Summary |
| A search for charged Higgs bosons ($ \mathrm{H^{\pm}} $) in proton-proton (pp) collisions at a center-of-mass energy of 13 TeV has been presented. The processes considered are $ \mathrm{p}\mathrm{p}\to(\mathrm{b})\mathrm{H^{\pm}} $, with $ \mathrm{H^{\pm}} $ decaying into top (t) and bottom (b) quarks. We consider $ \mathrm{t} \to \mathrm{b}\ell\nu $ decays, where $ \ell = \mathrm{e}, \mu $. The $ \mathrm{H^{\pm}} $ boson mass ($ m_{\mathrm{H^{\pm}}} $) is probed between 200 GeV and 1 TeV. The results of the search are interpreted in the generalized two-Higgs-doublet model (g2HDM), assuming the real parts of extra Yukawa couplings of $ \mathrm{H^{\pm}} $ to the top quark $ \rho_{\mathrm{t}\mathrm{t}} $ and to the top and charm quark $ \rho_{\mathrm{t}\mathrm{c}} $ are both less than one, and the imaginary parts and all other extra Yukawa couplings are zero. An excess is observed with respect to the standard model expectation with a local significance of 2.4 standard deviations for a signal with $ m_{\mathrm{H^{\pm}}} = $ 600 GeV. The best fit cross section ($ \sigma $) times branching fraction ($ \mathcal{B} $) values corresponding to the excess at $ m_{\mathrm{H^{\pm}}} = $ 600 GeV are $ \sigma(\mathrm{p}\mathrm{p}\to\mathrm{H}^\pm)\mathcal{B}(\mathrm{H}^\pm\to\mathrm{t}\mathrm{b}, \mathrm{t}\to\mathrm{b} \ell\nu) = $ 0.055 $ ^{+0.068}_{-0.055} $ pb and $ \sigma(\mathrm{p}\mathrm{p}\to\mathrm{b}\mathrm{H}^\pm)\mathcal{B}(\mathrm{H}^\pm\to\mathrm{t}\mathrm{b}, \mathrm{t}\to\mathrm{b} \ell\nu) = $ 0.032 $ ^{+0.035}_{-0.029} $ pb, where $ \ell=\mathrm{e}, \mu $. Upper limits at 95% confidence level (CL) are set on $ \sigma\mathcal{B} $ for $ m_{\mathrm{H^{\pm}}} $ up to 1 TeV. The values for $ \rho_{\mathrm{t}\mathrm{c}} \gtrsim $ 0.15-0.5 are excluded, depending on the $ m_{\mathrm{H^{\pm}}} $ and $ \rho_{\mathrm{t}\mathrm{t}} $ assumptions. The strongest exclusion is achieved near $ m_{\mathrm{H^{\pm}}}= $ 400 GeV, where values of $ \rho_{\mathrm{t}\mathrm{c}} > $ 0.16 for $ \rho_{\mathrm{t}\mathrm{t}}= $ 1.0 and $ \rho_{\mathrm{t}\mathrm{c}} > $ 0.21 for $ \rho_{\mathrm{t}\mathrm{t}}= $ 0.3 are excluded at 95% CL. For $ \rho_{\mathrm{t}\mathrm{t}}= $ 1, the analysis excludes $ \rho_{\mathrm{t}\mathrm{c}} > $ 0.57 at 95% CL across the mass range from 200 GeV to 1 TeV. This is the first search for $ \mathrm{H^{\pm}} $ bosons within the g2HDM framework. |
| References | ||||
| 1 | ATLAS Collaboration | Observation of a new particle in the search for the standard model Higgs boson with the ATLAS detector at the LHC | PLB 716 (2012) 1 | 1207.7214 |
| 2 | CMS Collaboration | Observation of a new boson at a mass of 125 GeV with the CMS experiment at the LHC | PLB 716 (2012) 30 | CMS-HIG-12-028 1207.7235 |
| 3 | CMS Collaboration | Observation of a new boson with mass near 125 GeV in pp collisions at $ \sqrt{s} = $ 7 and 8 TeV | JHEP 06 (2013) 081 | CMS-HIG-12-036 1303.4571 |
| 4 | CMS Collaboration | A portrait of the Higgs boson by the CMS experiment ten years after the discovery | Nature 607 (2022) 60 | CMS-HIG-22-001 2207.00043 |
| 5 | ATLAS Collaboration | A detailed map of Higgs boson interactions by the ATLAS experiment ten years after the discovery | Nature 607 (2022) 52 | 2207.00092 |
| 6 | CMS Collaboration | Observation of $ \mathrm{t\overline{t}} $H production | PRL 120 (2018) 231801 | CMS-HIG-17-035 1804.02610 |
| 7 | ATLAS Collaboration | Observation of Higgs boson production in association with a top quark pair at the LHC with the ATLAS detector | PLB 784 (2018) 173 | 1806.00425 |
| 8 | CMS Collaboration | Measurement of the top quark Yukawa coupling from $ \mathrm{t\bar{t}} $ kinematic distributions in the dilepton final state in proton-proton collisions at $ \sqrt{s}= $ 13 TeV | PRD 102 (2020) 092013 | CMS-TOP-19-008 2009.07123 |
| 9 | CMS Collaboration | Observation of Higgs boson decay to bottom quarks | PRL 121 (2018) 121801 | CMS-HIG-18-016 1808.08242 |
| 10 | ATLAS Collaboration | Observation of H$ \rightarrow{\rm b\bar{b}} $ decays and \textVH production with the ATLAS detector | PLB 786 (2018) 59 | 1808.08238 |
| 11 | ATLAS Collaboration | Evidence for the Higgs-boson Yukawa coupling to tau leptons with the ATLAS detector | JHEP 04 (2015) 117 | 1501.04943 |
| 12 | CMS Collaboration | Observation of the Higgs boson decay to a pair of $ \tau $ leptons with the CMS detector | PLB 779 (2018) 283 | CMS-HIG-16-043 1708.00373 |
| 13 | CMS Collaboration | Evidence for Higgs boson decay to a pair of muons | JHEP 01 (2021) 148 | CMS-HIG-19-006 2009.04363 |
| 14 | ATLAS Collaboration | Evidence for the dimuon decay of the Higgs boson in pp collisions with the ATLAS detector | Submitted to Phys. Rev. Lett, 2025 | 2507.03595 |
| 15 | ATLAS Collaboration | Measurements of WH and ZH production with Higgs boson decays into bottom quarks and direct constraints on the charm Yukawa coupling in 13 TeV pp collisions with the ATLAS detector | JHEP 04 (2025) 075 | 2410.19611 |
| 16 | CMS Collaboration | Simultaneous probe of the charm and bottom quark Yukawa couplings using ttH events | Submitted to Phys. Rev. Lett, 2025 | CMS-HIG-24-018 2509.22535 |
| 17 | G. C. Branco et al. | Theory and phenomenology of two-Higgs-doublet models | Phys. Rept. 516 (2012) 1 | 1106.0034 |
| 18 | CMS Collaboration | Search for charged Higgs bosons in the h$ ^{\pm} \to \tau^{\pm}\nu_\tau $ decay channel in proton-proton collisions at $ \sqrt{s} = $ 13 TeV | JHEP 07 (2019) 142 | CMS-HIG-18-014 1903.04560 |
| 19 | CMS Collaboration | Search for charged Higgs bosons decaying into a top and a bottom quark in the all-jet final state of pp collisions at $ \sqrt{s} = $ 13 TeV | JHEP 07 (2020) 126 | CMS-HIG-18-015 2001.07763 |
| 20 | ATLAS Collaboration | Search for doubly and singly charged Higgs bosons decaying into vector bosons in multi-lepton final states with the ATLAS detector using proton-proton collisions at $ \sqrt{\mathrm{s}} = $ 13 TeV | JHEP 06 (2021) 146 | 2101.11961 |
| 21 | ATLAS Collaboration | Search for charged Higgs bosons decaying into a top quark and a bottom quark at $ \sqrt{\mathrm{s}} = $ 13 TeV with the ATLAS detector | JHEP 06 (2021) 145 | 2102.10076 |
| 22 | CMS Collaboration | Search for charged Higgs bosons produced in vector boson fusion processes and decaying into vector boson pairs in proton-proton collisions at $ \sqrt{s} = 13 {\text {tev}} $ | EPJC 81 (2021) 723 | CMS-HIG-20-017 2104.04762 |
| 23 | CMS Collaboration | Search for a charged Higgs boson decaying into a heavy neutral Higgs boson and a W boson in proton-proton collisions at $ \sqrt{s} = $ 13 TeV | JHEP 09 (2023) 032 | CMS-HIG-21-010 2207.01046 |
| 24 | ATLAS Collaboration | Search for resonant WZ production in the fully leptonic final state in proton-proton collisions at $ \sqrt{s} = $ 13 TeV with the ATLAS detector | EPJC 83 (2023) 633 | 2207.03925 |
| 25 | ATLAS Collaboration | Search for doubly charged Higgs boson production in multi-lepton final states using 139 fb$ ^{-1} $ of proton-proton collisions at $ \sqrt{s} = $ 13 TeV with the ATLAS detector | EPJC 83 (2023) 605 | 2211.07505 |
| 26 | ATLAS Collaboration | Search for a light charged Higgs boson in $ {\rm t}\rightarrow $H$ ^{\pm} $b decays, with h$ ^{\pm}\rightarrow $cb, in the lepton+jets final state in proton-proton collisions at $ \sqrt{s}= $ 13 TeV with the ATLAS detector | JHEP 09 (2023) 004 | 2302.11739 |
| 27 | ATLAS Collaboration | Search for a light charged Higgs boson in t$ \rightarrow $H$ ^{\pm} $b decays, with H$ ^{\pm}\rightarrow $cs, in pp collisions at $ \sqrt{s}= $ 13 TeV with the ATLAS detector | EPJC 85 (2025) 153 | 2407.10096 |
| 28 | ATLAS Collaboration | Combination of searches for singly and doubly charged Higgs bosons produced via vector-boson fusion in proton-proton collisions at $ \sqrt{s} = $ 13 TeV with the ATLAS detector | PLB 860 (2025) 139137 | 2407.10798 |
| 29 | ATLAS Collaboration | Search for charged Higgs bosons produced in top-quark decays or in association with top quarks and decaying via $H^\pm\to\tau^\pm\nu$ in 13 TeV pp collisions with the ATLAS detector | PRD 111 (2025) 072006 | 2412.17584 |
| 30 | S. Davidson and H. E. Haber | Basis-independent methods for the two-Higgs-doublet model | PRD 72 (2005) 035004 | hep-ph/0504050 |
| 31 | D. K. Ghosh, W.-S. Hou, and T. Modak | Sub-TeV H$ ^+ $ boson production as probe of extra top Yukawa couplings | PRL 125 (2020) 221801 | 1912.10613 |
| 32 | W.-S. Hou | Tree level t$ \to $ch$ ^0 $ or h$ ^0\to $tc decays | PLB 296 (1992) 179 | |
| 33 | W.-S. Hou and M. Kikuchi | Approximate alignment in two Higgs doublet model with extra Yukawa couplings | Eur. Phys. Lett. 123 (2018) 11001 | 1706.07694 |
| 34 | K. Fuyuto, W.-S. Hou, and E. Senaha | Electroweak baryogenesis driven by extra top Yukawa couplings | PLB 776 (2018) 402 | 1705.05034 |
| 35 | K. Fuyuto, W.-S. Hou, and E. Senaha | Cancellation mechanism for the electron electric dipole moment connected with the baryon asymmetry of the universe | PRD 101 (2020) 011901 | 1910.12404 |
| 36 | M. Kohda, T. Modak, and W.-S. Hou | Searching for new scalar bosons via triple-top signature in cg$ \to $tS$ ^0\to $t$ {\rm \bar{t}} $t | PLB 776 (2018) 379 | 1710.07260 |
| 37 | ATLAS Collaboration | Search for heavy Higgs bosons with flavour-violating couplings in multi-lepton plus b-jets final states in pp collisions at 13 TeV with the ATLAS detector | JHEP 12 (2023) 081 | 2307.14759 |
| 38 | CMS Collaboration | Search for new Higgs bosons via same-sign top quark pair production in association with a jet in proton-proton collisions at $ \sqrt{s}= $ 13 TeV | PLB 850 (2024) 138478 | CMS-TOP-22-010 2311.03261 |
| 39 | CMS Collaboration | HEPData record for this analysis | link | |
| 40 | CMS Collaboration | The CMS experiment at the CERN LHC | JINST 3 (2008) S08004 | |
| 41 | CMS Collaboration | Development of the CMS detector for the CERN LHC Run 3 | JINST 19 (2024) P05064 | CMS-PRF-21-001 2309.05466 |
| 42 | CMS Collaboration | Performance of the CMS level-1 trigger in proton-proton collisions at $ \sqrt{s} = $ 13 TeV | JINST 15 (2020) P10017 | CMS-TRG-17-001 2006.10165 |
| 43 | CMS Collaboration | The CMS trigger system | JINST 12 (2017) P01020 | CMS-TRG-12-001 1609.02366 |
| 44 | CMS Collaboration | Performance of the CMS high-level trigger during LHC Run 2 | JINST 19 (2024) P11021 | CMS-TRG-19-001 2410.17038 |
| 45 | CMS Collaboration | Electron and photon reconstruction and identification with the CMS experiment at the CERN LHC | JINST 16 (2021) P05014 | CMS-EGM-17-001 2012.06888 |
| 46 | CMS Collaboration | Performance of the CMS muon detector and muon reconstruction with proton-proton collisions at $ \sqrt{s}= $ 13 TeV | JINST 13 (2018) P06015 | CMS-MUO-16-001 1804.04528 |
| 47 | CMS Collaboration | Description and performance of track and primary-vertex reconstruction with the CMS tracker | JINST 9 (2014) P10009 | CMS-TRK-11-001 1405.6569 |
| 48 | J. Alwall et al. | The automated computation of tree-level and next-to-leading order differential cross sections, and their matching to parton shower simulations | JHEP 07 (2014) 079 | 1405.0301 |
| 49 | J. Alwall et al. | Comparative study of various algorithms for the merging of parton showers and matrix elements in hadronic collisions | EPJC 53 (2008) 473 | 0706.2569 |
| 50 | R. Frederix and S. Frixione | Merging meets matching in MC@NLO | JHEP 12 (2012) 061 | 1209.6215 |
| 51 | P. Nason | A new method for combining NLO QCD with shower Monte Carlo algorithms | JHEP 11 (2004) 040 | hep-ph/0409146 |
| 52 | S. Frixione, P. Nason, and C. Oleari | Matching NLO QCD computations with parton shower simulations: the POWHEG method | JHEP 11 (2007) 070 | 0709.2092 |
| 53 | S. Alioli, P. Nason, C. Oleari, and E. Re | A general framework for implementing NLO calculations in shower Monte Carlo programs: the POWHEG box | JHEP 06 (2010) 043 | 1002.2581 |
| 54 | S. Frixione, P. Nason, and G. Ridolfi | A positive-weight next-to-leading-order Monte Carlo for heavy flavour hadroproduction | JHEP 09 (2007) 126 | 0707.3088 |
| 55 | T. Melia, P. Nason, R. Rontsch, and G. Zanderighi | W$ ^+ $W$ ^- $, WZ and ZZ production in the POWHEG box | JHEP 11 (2011) 078 | 1107.5051 |
| 56 | E. Re | Single-top Wt-channel production matched with parton showers using the POWHEG method | EPJC 71 (2011) 1547 | 1009.2450 |
| 57 | S. Alioli, P. Nason, C. Oleari, and E. Re | NLO single-top production matched with shower in POWHEG: \it s- and \it t-channel contributions | JHEP 09 (2009) 111 | 0907.4076 |
| 58 | H. B. Hartanto, B. Jager, L. Reina, and D. Wackeroth | Higgs boson production in association with top quarks in the POWHEG BOX | PRD 91 (2015) 094003 | 1501.04498 |
| 59 | T. Sjostrand et al. | An introduction to PYTHIA8.2 | Comput. Phys. Commun. 191 (2015) 159 | 1410.3012 |
| 60 | M. Czakon and A. Mitov | Top++: A program for the calculation of the top-pair cross-section at hadron colliders | Comput. Phys. Commun. 185 (2014) 2930 | 1112.5675 |
| 61 | J. Campbell, T. Neumann, and Z. Sullivan | Single-top-quark production in the $ t $-channel at NNLO | JHEP 02 (2021) 040 | 2012.01574 |
| 62 | N. Kidonakis and N. Yamanaka | Higher-order corrections for $ \mathrm{t}\mathrm{W} $ production at high-energy hadron colliders | JHEP 05 (2021) 278 | 2102.11300 |
| 63 | P. Kant et al. | HatHor for single top-quark production: Updated predictions and uncertainty estimates for single top-quark production in hadronic collisions | Comput. Phys. Commun. 191 (2015) 74 | 1406.4403 |
| 64 | M. Aliev et al. | HATHOR: Hadronic top and heavy quarks cross section calculator | Comput. Phys. Commun. 182 (2011) 1034 | 1007.1327 |
| 65 | Y. Li and F. Petriello | Combining QCD and electroweak corrections to dilepton production in FEWZ | PRD 86 (2012) 094034 | 1208.5967 |
| 66 | A. Kulesza et al. | Associated production of a top quark pair with a heavy electroweak gauge boson at NLO+NNLL accuracy | EPJC 79 (2019) 249 | 1812.08622 |
| 67 | R. Frederix and I. Tsinikos | On improving NLO merging for $ \mathrm{t}\overline{\mathrm{t}}\mathrm{W} $ production | JHEP 11 (2021) 029 | 2108.07826 |
| 68 | LHC Higgs Cross Section Working Group | Handbook of LHC Higgs cross sections: 4. deciphering the nature of the Higgs sector | 1610.07922 | |
| 69 | R. Frederix et al. | Higgs pair production at the LHC with NLO and parton-shower effects | PLB 732 (2014) 142 | 1401.7340 |
| 70 | F. Maltoni, D. Pagani, and I. Tsinikos | Associated production of a top-quark pair with vector bosons at NLO in QCD: Impact on $ \mathrm{t}\overline{\mathrm{t}}\mathrm{H} $ searches at the LHC | JHEP 02 (2016) 113 | 1507.05640 |
| 71 | CMS Collaboration | Measurement of the associated production of a single top quark and a Z boson in pp collisions at $ \sqrt{s} = $ 13 TeV | PLB 779 (2018) 358 | CMS-TOP-16-020 1712.02825 |
| 72 | M. van Beekveld, A. Kulesza, and L. M. Valero | Threshold resummation for the production of four top quarks at the LHC | PRL 131 (2023) 211901 | 2212.03259 |
| 73 | CMS Collaboration | Extraction and validation of a new set of CMS PYTHIA8 tunes from underlying-event measurements | EPJC 80 (2020) 4 | CMS-GEN-17-001 1903.12179 |
| 74 | NNPDF Collaboration | Parton distributions from high-precision collider data | EPJC 77 (2017) 663 | 1706.00428 |
| 75 | \GEANTfour Collaboration | GEANT 4 --- a simulation toolkit | NIM A 506 (2003) 250 | |
| 76 | CMS Collaboration | Pileup mitigation at CMS in 13 TeV data | JINST 15 (2020) P09018 | CMS-JME-18-001 2003.00503 |
| 77 | CMS Collaboration | Measurement of differential $ \mathrm{t} \overline{\mathrm{t}} $ production cross sections in the full kinematic range using lepton+jets events from proton-proton collisions at $ \sqrt {s} = $ 13 TeV | PRD 104 (2021) 092013 | CMS-TOP-20-001 2108.02803 |
| 78 | CMS Collaboration | Particle-flow reconstruction and global event description with the CMS detector | JINST 12 (2017) P10003 | CMS-PRF-14-001 1706.04965 |
| 79 | CMS Collaboration | Technical proposal for the phase-II upgrade of the Compact Muon Solenoid | CMS Technical proposal CERN-LHCC-2015-010, CMS-TDR-15-02, 2015 CDS |
|
| 80 | M. Cacciari, G. P. Salam, and G. Soyez | The anti-$ k_{\mathrm{T}} $ jet clustering algorithm | JHEP 04 (2008) 063 | 0802.1189 |
| 81 | M. Cacciari, G. P. Salam, and G. Soyez | FastJet user manual | EPJC 72 (2012) 1896 | 1111.6097 |
| 82 | CMS Collaboration | Jet energy scale and resolution in the CMS experiment in pp collisions at 8 TeV | JINST 12 (2017) P02014 | CMS-JME-13-004 1607.03663 |
| 83 | CMS Collaboration | Performance of missing transverse momentum reconstruction in proton-proton collisions at $ \sqrt{s} = $ 13 TeV using the CMS detector | JINST 14 (2019) P07004 | CMS-JME-17-001 1903.06078 |
| 84 | CMS Collaboration | Performance of reconstruction and identification of $ \tau $ leptons decaying to hadrons and $ \nu_\tau $ in pp collisions at $ \sqrt{s}= $ 13 TeV | JINST 13 (2018) P10005 | CMS-TAU-16-003 1809.02816 |
| 85 | CMS Collaboration | Identification of hadronic tau lepton decays using a deep neural network | JINST 17 (2022) P07023 | CMS-TAU-20-001 2201.08458 |
| 86 | CMS Collaboration | Performance of the DeepTau algorithm for the discrimination of taus against jets, electron, and muons | CMS Detector Performance Note CMS-DP-2019-033, 2019 CDS |
|
| 87 | K. Rehermann and B. Tweedie | Efficient identification of boosted semileptonic top quarks at the LHC | JHEP 03 (2011) 059 | 1007.2221 |
| 88 | CMS Collaboration | Observation of four top quark production in proton-proton collisions at $ \sqrt{s}= $ 13 TeV | PLB 847 (2023) 138290 | CMS-TOP-22-013 2305.13439 |
| 89 | CMS Collaboration | Muon identification using multivariate techniques in the CMS experiment in proton-proton collisions at $ \sqrt{s}= $ 13 TeV | JINST 19 (2024) P02031 | CMS-MUO-22-001 2310.03844 |
| 90 | CMS Collaboration | Measurement of the Higgs boson production rate in association with top quarks in final states with electrons, muons, and hadronically decaying tau leptons at $ \sqrt{s} = $ 13 TeV | EPJC 81 (2021) 378 | CMS-HIG-19-008 2011.03652 |
| 91 | CMS Collaboration | Evidence for associated production of a Higgs boson with a top quark pair in final states with electrons, muons, and hadronically decaying $ \tau $ leptons at $ \sqrt{s} = $ 13 TeV | JHEP 08 (2018) 066 | CMS-HIG-17-018 1803.05485 |
| 92 | CMS Collaboration | Observation of single top quark production in association with a Z boson in proton-proton collisions at $ \sqrt {s} = $ 13 TeV | PRL 122 (2019) 132003 | CMS-TOP-18-008 1812.05900 |
| 93 | CMS Collaboration | Measurements of the electroweak diboson production cross sections in proton-proton collisions at $ \sqrt{s} = $ 5.02 TeV using leptonic decays | PRL 127 (2021) 191801 | CMS-SMP-20-012 2107.01137 |
| 94 | CMS Collaboration | Inclusive and differential cross section measurements of single top quark production in association with a Z boson in proton-proton collisions at $ \sqrt{s} = $ 13 TeV | JHEP 02 (2022) 107 | CMS-TOP-20-010 2111.02860 |
| 95 | CMS Collaboration | Search for electroweak production of charginos and neutralinos in proton-proton collisions at $ \sqrt{s} = $ 13 TeV | JHEP 04 (2022) 147 | CMS-SUS-19-012 2106.14246 |
| 96 | CMS Collaboration | Measurement of the inclusive W and Z production cross sections in pp collisions at $ \sqrt{s}= $ 7 TeV | JHEP 10 (2011) 132 | CMS-EWK-10-005 1107.4789 |
| 97 | E. Bols et al. | Jet flavour classification using DeepJet | JINST 15 (2020) P12012 | 2008.10519 |
| 98 | CMS Collaboration | Performance summary of AK4 jet b tagging with data from proton-proton collisions at 13 TeV with the CMS detector | CMS Detector Performance Note CMS-DP-2023-005, 2023 CDS |
|
| 99 | CMS Collaboration | Identification of heavy-flavour jets with the CMS detector in pp collisions at 13 TeV | JINST 13 (2018) P05011 | CMS-BTV-16-002 1712.07158 |
| 100 | CMS Collaboration | Measurement of the top quark mass using events with a single reconstructed top quark in pp collisions at $ \sqrt{s} = $ 13 TeV | JHEP 12 (2021) 161 | CMS-TOP-19-009 2108.10407 |
| 101 | CMS Collaboration | Search for flavor-changing neutral current interactions of the top quark and Higgs boson in final states with two photons in proton-proton collisions at $ \sqrt{s}= $ 13 TeV | PRL 129 (2022) 032001 | CMS-TOP-20-007 2111.02219 |
| 102 | Particle Data Group , S. Navas et al. | Review of particle physics | PRD 110 (2024) 030001 | |
| 103 | CMS Collaboration | Search for new physics with same-sign isolated dilepton events with jets and missing transverse energy at the LHC | JHEP 06 (2011) 077 | CMS-SUS-10-004 1104.3168 |
| 104 | CMS Collaboration | Search for new physics with same-sign isolated dilepton events with jets and missing transverse energy | PRL 109 (2012) 071803 | CMS-SUS-11-010 1205.6615 |
| 105 | CMS Collaboration | Search for new physics in events with same-sign dileptons and b jets in pp collisions at $ \sqrt{s}= $ 8 TeV | JHEP 03 (2013) 037 | CMS-SUS-12-017 1212.6194 |
| 106 | CMS Collaboration | Search for new physics in events with same-sign dileptons and $ b $-tagged jets in pp collisions at $ \sqrt{s}= $ 7 TeV | JHEP 08 (2012) 110 | CMS-SUS-11-020 1205.3933 |
| 107 | CMS Collaboration | Search for new physics in same-sign dilepton events in proton-proton collisions at $ \sqrt{s} = $ 13 TeV | EPJC 76 (2016) 439 | CMS-SUS-15-008 1605.03171 |
| 108 | P. Baldi et al. | Parameterized neural networks for high-energy physics | EPJC 76 (2016) 235 | 1601.07913 |
| 109 | M. B. Kursa, A. Jankowski, and W. R. Rudnicki | Boruta -- A system for feature selection | Fundam. Informaticae 101 (2010) 271 | |
| 110 | D. P. Kingma and J. Ba | Adam: A method for stochastic optimization | link | 1412.6980 |
| 111 | T. Dozat | Incorporating Nesterov Momentum into Adam | in Proc. 3rd Int. Conf. on Learning Representations, 2015 link |
|
| 112 | hepstats | hepstats package: statistics tools and utilities | https://github.com/scikit-hep/hepstats | |
| 113 | J. D. Scargle , J. P. Norris , B. Jackson , and J. Chiang | Studies in astronomical time series analysis. VI. bayesian block representations | Astrophys. J. 764 (2013) 167 | 1207.5578 |
| 114 | CMS Collaboration | The CMS statistical analysis and combination tool: Combine | Comput. Softw. Big Sci. 8 (2024) 19 | CMS-CAT-23-001 2404.06614 |
| 115 | R. J. Barlow and C. Beeston | Fitting using finite Monte Carlo samples | Comput. Phys. Commun. 77 (1993) 219 | |
| 116 | CMS Collaboration | Precision luminosity measurement in proton-proton collisions at $ \sqrt{s} = $ 13 TeV in 2015 and 2016 at CMS | EPJC 81 (2021) 800 | CMS-LUM-17-003 2104.01927 |
| 117 | CMS Collaboration | CMS luminosity measurement for the 2017 data-taking period at $ \sqrt{s}= $ 13 TeV | CMS Physics Analysis Summary, 2018 CMS-PAS-LUM-17-004 |
CMS-PAS-LUM-17-004 |
| 118 | CMS Collaboration | CMS luminosity measurement for the 2018 data-taking period at $ \sqrt{s}= $ 13 TeV | CMS Physics Analysis Summary, 2019 CMS-PAS-LUM-18-002 |
CMS-PAS-LUM-18-002 |
| 119 | CMS Collaboration | Performance of the CMS muon trigger system in proton-proton collisions at $ \sqrt{s} = $ 13 TeV | JINST 16 (2021) P07001 | CMS-MUO-19-001 2102.04790 |
| 120 | J. Butterworth et al. | PDF4LHC recommendations for LHC Run II | JPG 43 (2016) 023001 | 1510.03865 |
| 121 | LHC Higgs Cross Section Working Group | Handbook of LHC Higgs cross sections: 3. Higgs properties | CERN Report CERN-2013-004, 2013 link |
1307.1347 |
| 122 | T. Junk | Confidence level computation for combining searches with small statistics | NIM A 434 (1999) 435 | hep-ex/9902006 |
| 123 | A. L. Read | Presentation of search results: the CL$ _s $ technique | JPG 28 (2002) 2693 | |
| 124 | G. Cowan, K. Cranmer, E. Gross, and O. Vitells | Asymptotic formulae for likelihood-based tests of new physics | EPJC 71 (2011) 1554 | 1007.1727 |
|
|
Compact Muon Solenoid LHC, CERN |
|

|

|

|

|

|