

Compact Muon Solenoid
LHC, CERN
| CMS-PAS-SUS-21-007 | ||
| Search for supersymmetry in final states with a single electron or muon using angular correlations and heavy object tagging in proton-proton collisions at $\sqrt{s}= $ 13 TeV | ||
| CMS Collaboration | ||
| March 2022 | ||
| Abstract: A search for supersymmetry is presented in events with a single charged lepton (electron or muon) and multiple hadronic jets. The data correspond to a sample of proton-proton collisions at $\sqrt{s}= $ 13 TeV with an integrated luminosity of 138 fb$^{-1}$, recorded by the CMS experiment at the LHC. The search targets gluino pair production, where the gluinos decay into the lightest supersymmetric particle (LSP) and either a top quark-antiquark pair, or a light-flavor quark-antiquark pair and a W boson. Depending on the targeted scenario, some of the jets are required to be identified as originating from b quarks. The main backgrounds, top quark pair production and W+jets production, are suppressed by requirements on the azimuthal angle between the lepton momentum and the reconstructed leptonic W boson candidate, and by top quark and W boson tagging based on a machine-learning technique. A number of exclusive search regions are defined according to the number of jets and several kinematic variables. The number of observed events is consistent with the expectations from standard model processes, and the results are used to set limits on supersymmetric particle masses in the context of two simplified models of gluino pair production. Exclusions for gluino masses reach up to 2130 (2280) GeV at 95% confidence level for a model with gluino decay to a top quark-antiquark pair (a light-flavor quark-antiquark pair and a W boson) and the LSP. For the same models, limits on the mass of the LSP reach up to 1270 (1220) GeV. | ||
|
Links:
CDS record (PDF) ;
CADI line (restricted) ;
These preliminary results are superseded in this paper, Submitted to JHEP. The superseded preliminary plots can be found here. |
||
| Figures | |
png pdf |
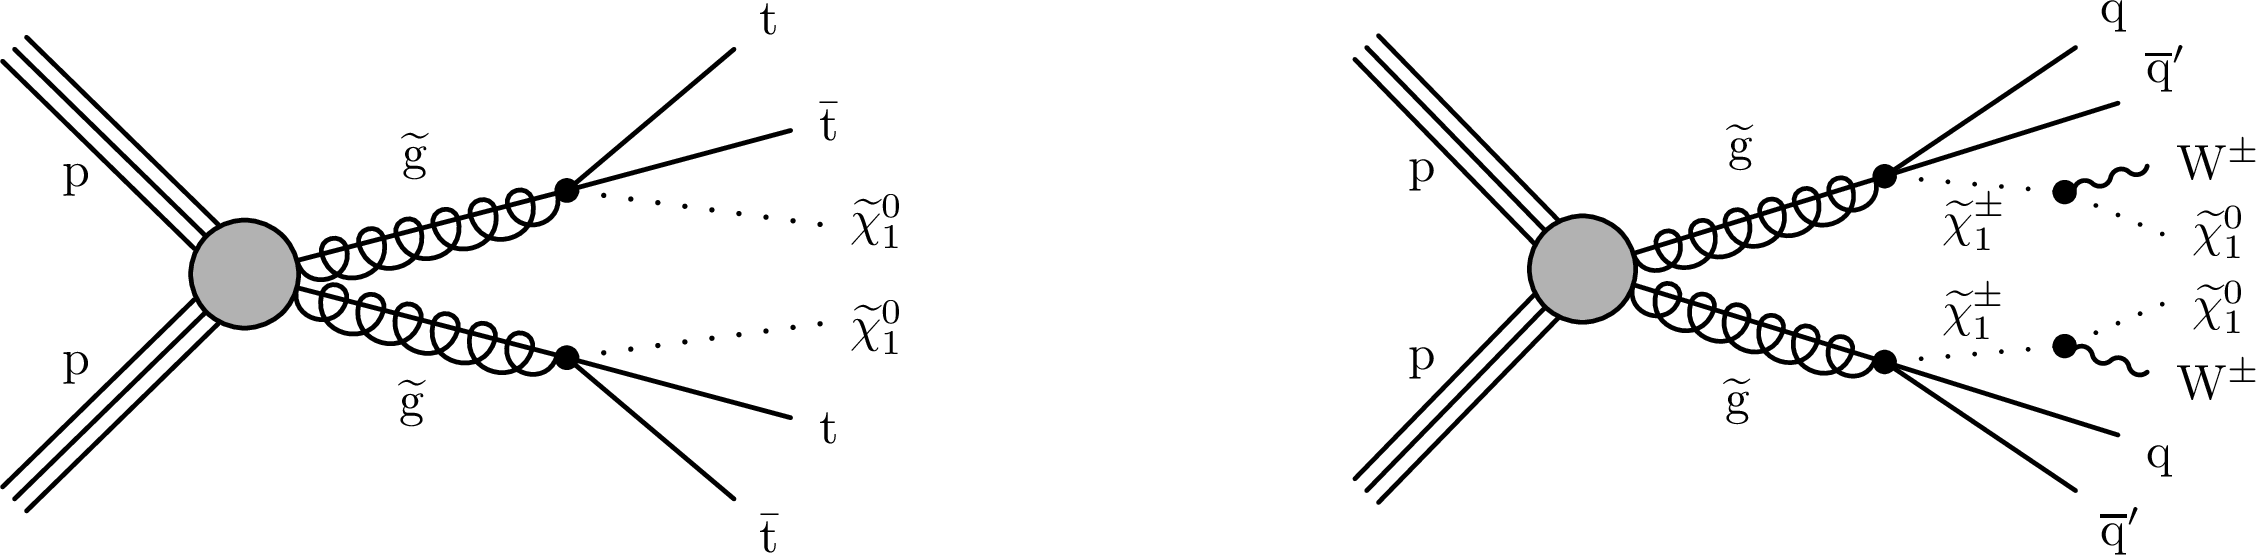
Figure 1:
Diagrams showing the simplified SUSY models (left) T1tttt and (right) T5qqqqWW. In T5qqqqWW, the W boson can be virtual depending on the mass difference between the chargino ($\tilde{\chi}^{\pm}$) and the neutralino ($\tilde{\chi}^0_1$). |
png pdf |
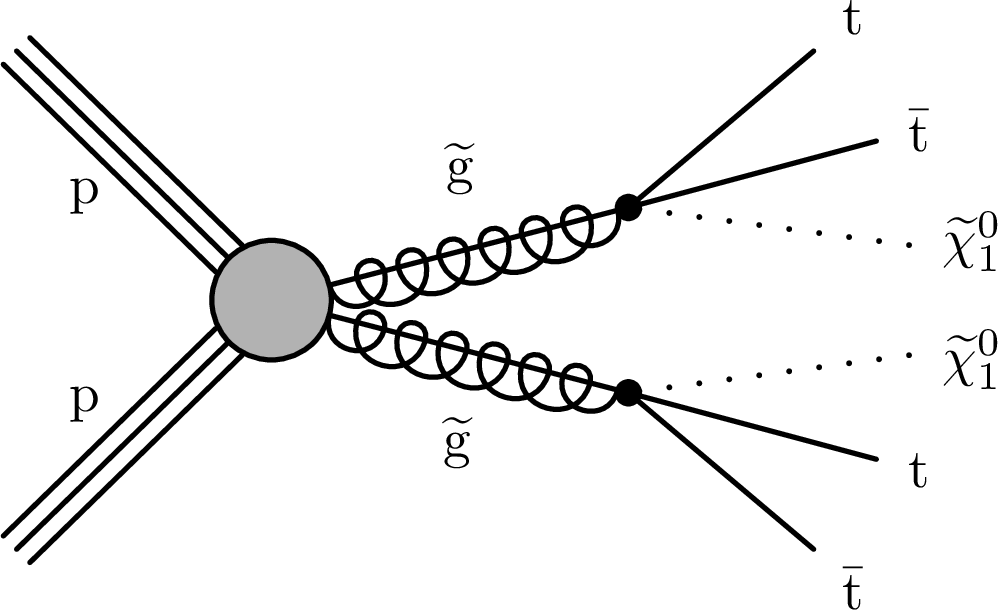
Figure 1-a:
Diagrams showing the simplified SUSY models (left) T1tttt and (right) T5qqqqWW. In T5qqqqWW, the W boson can be virtual depending on the mass difference between the chargino ($\tilde{\chi}^{\pm}$) and the neutralino ($\tilde{\chi}^0_1$). |

png pdf |
Figure 1-b:
Diagrams showing the simplified SUSY models (left) T1tttt and (right) T5qqqqWW. In T5qqqqWW, the W boson can be virtual depending on the mass difference between the chargino ($\tilde{\chi}^{\pm}$) and the neutralino ($\tilde{\chi}^0_1$). |

png pdf |
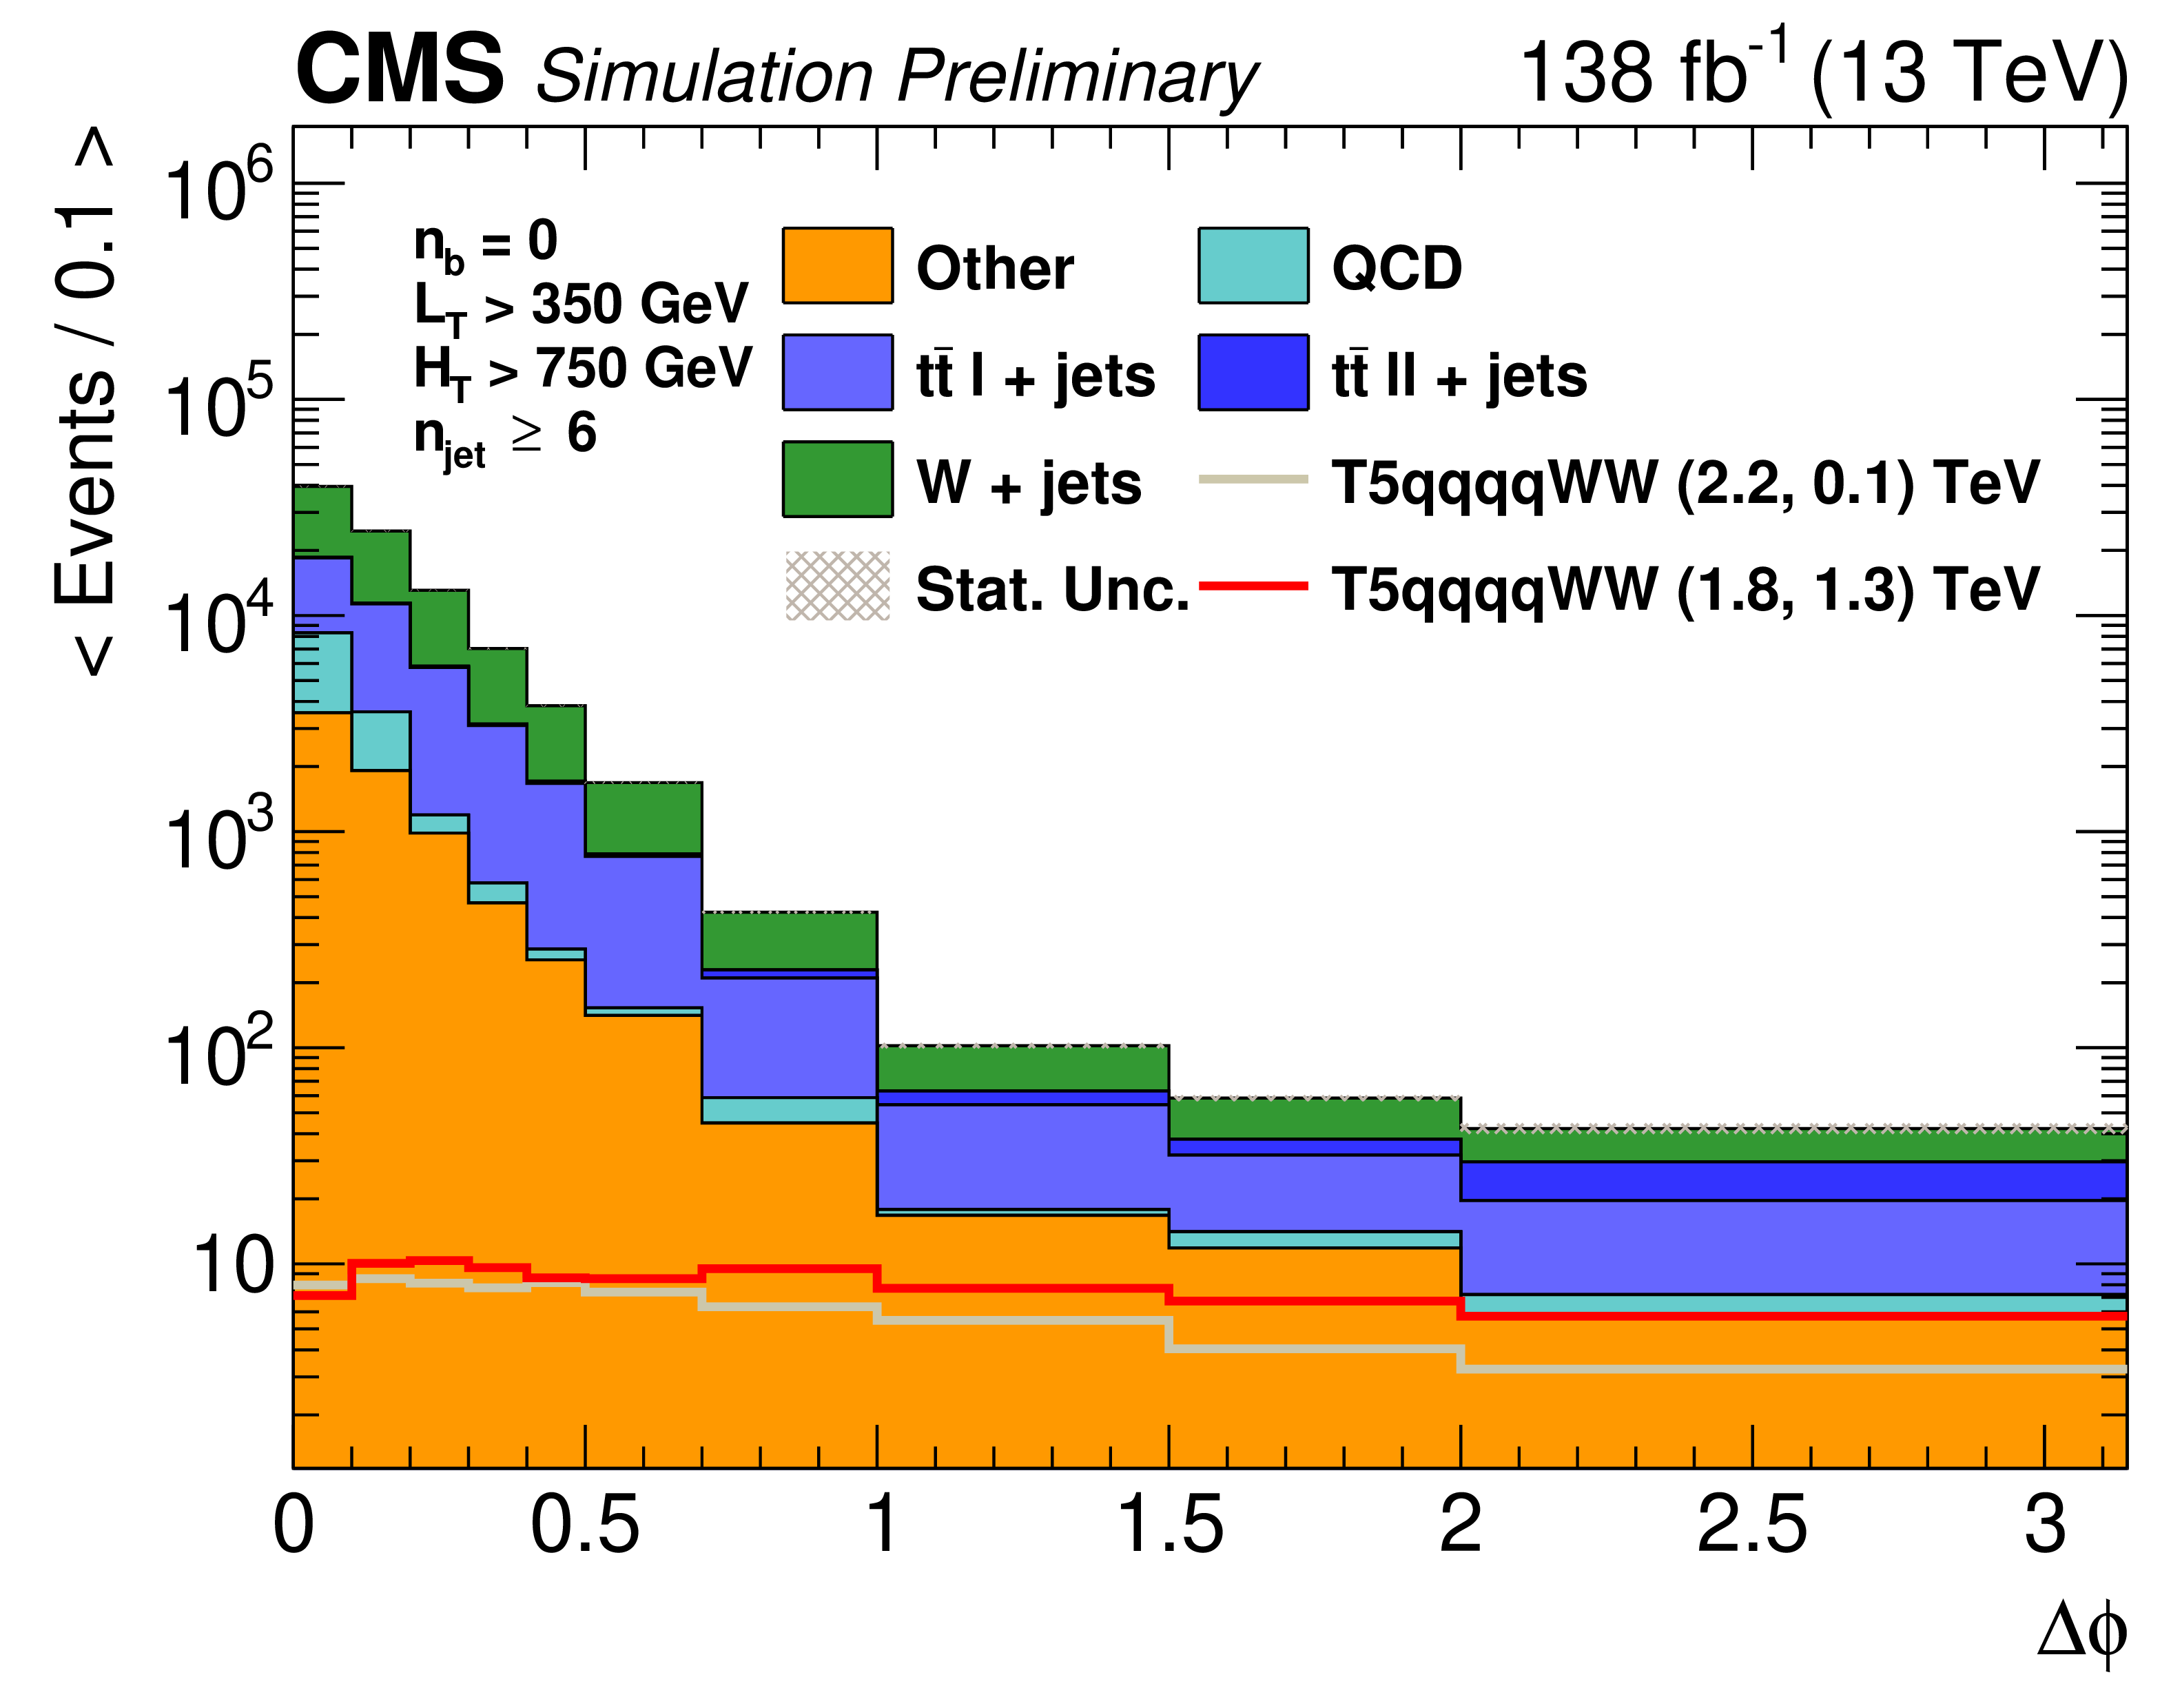
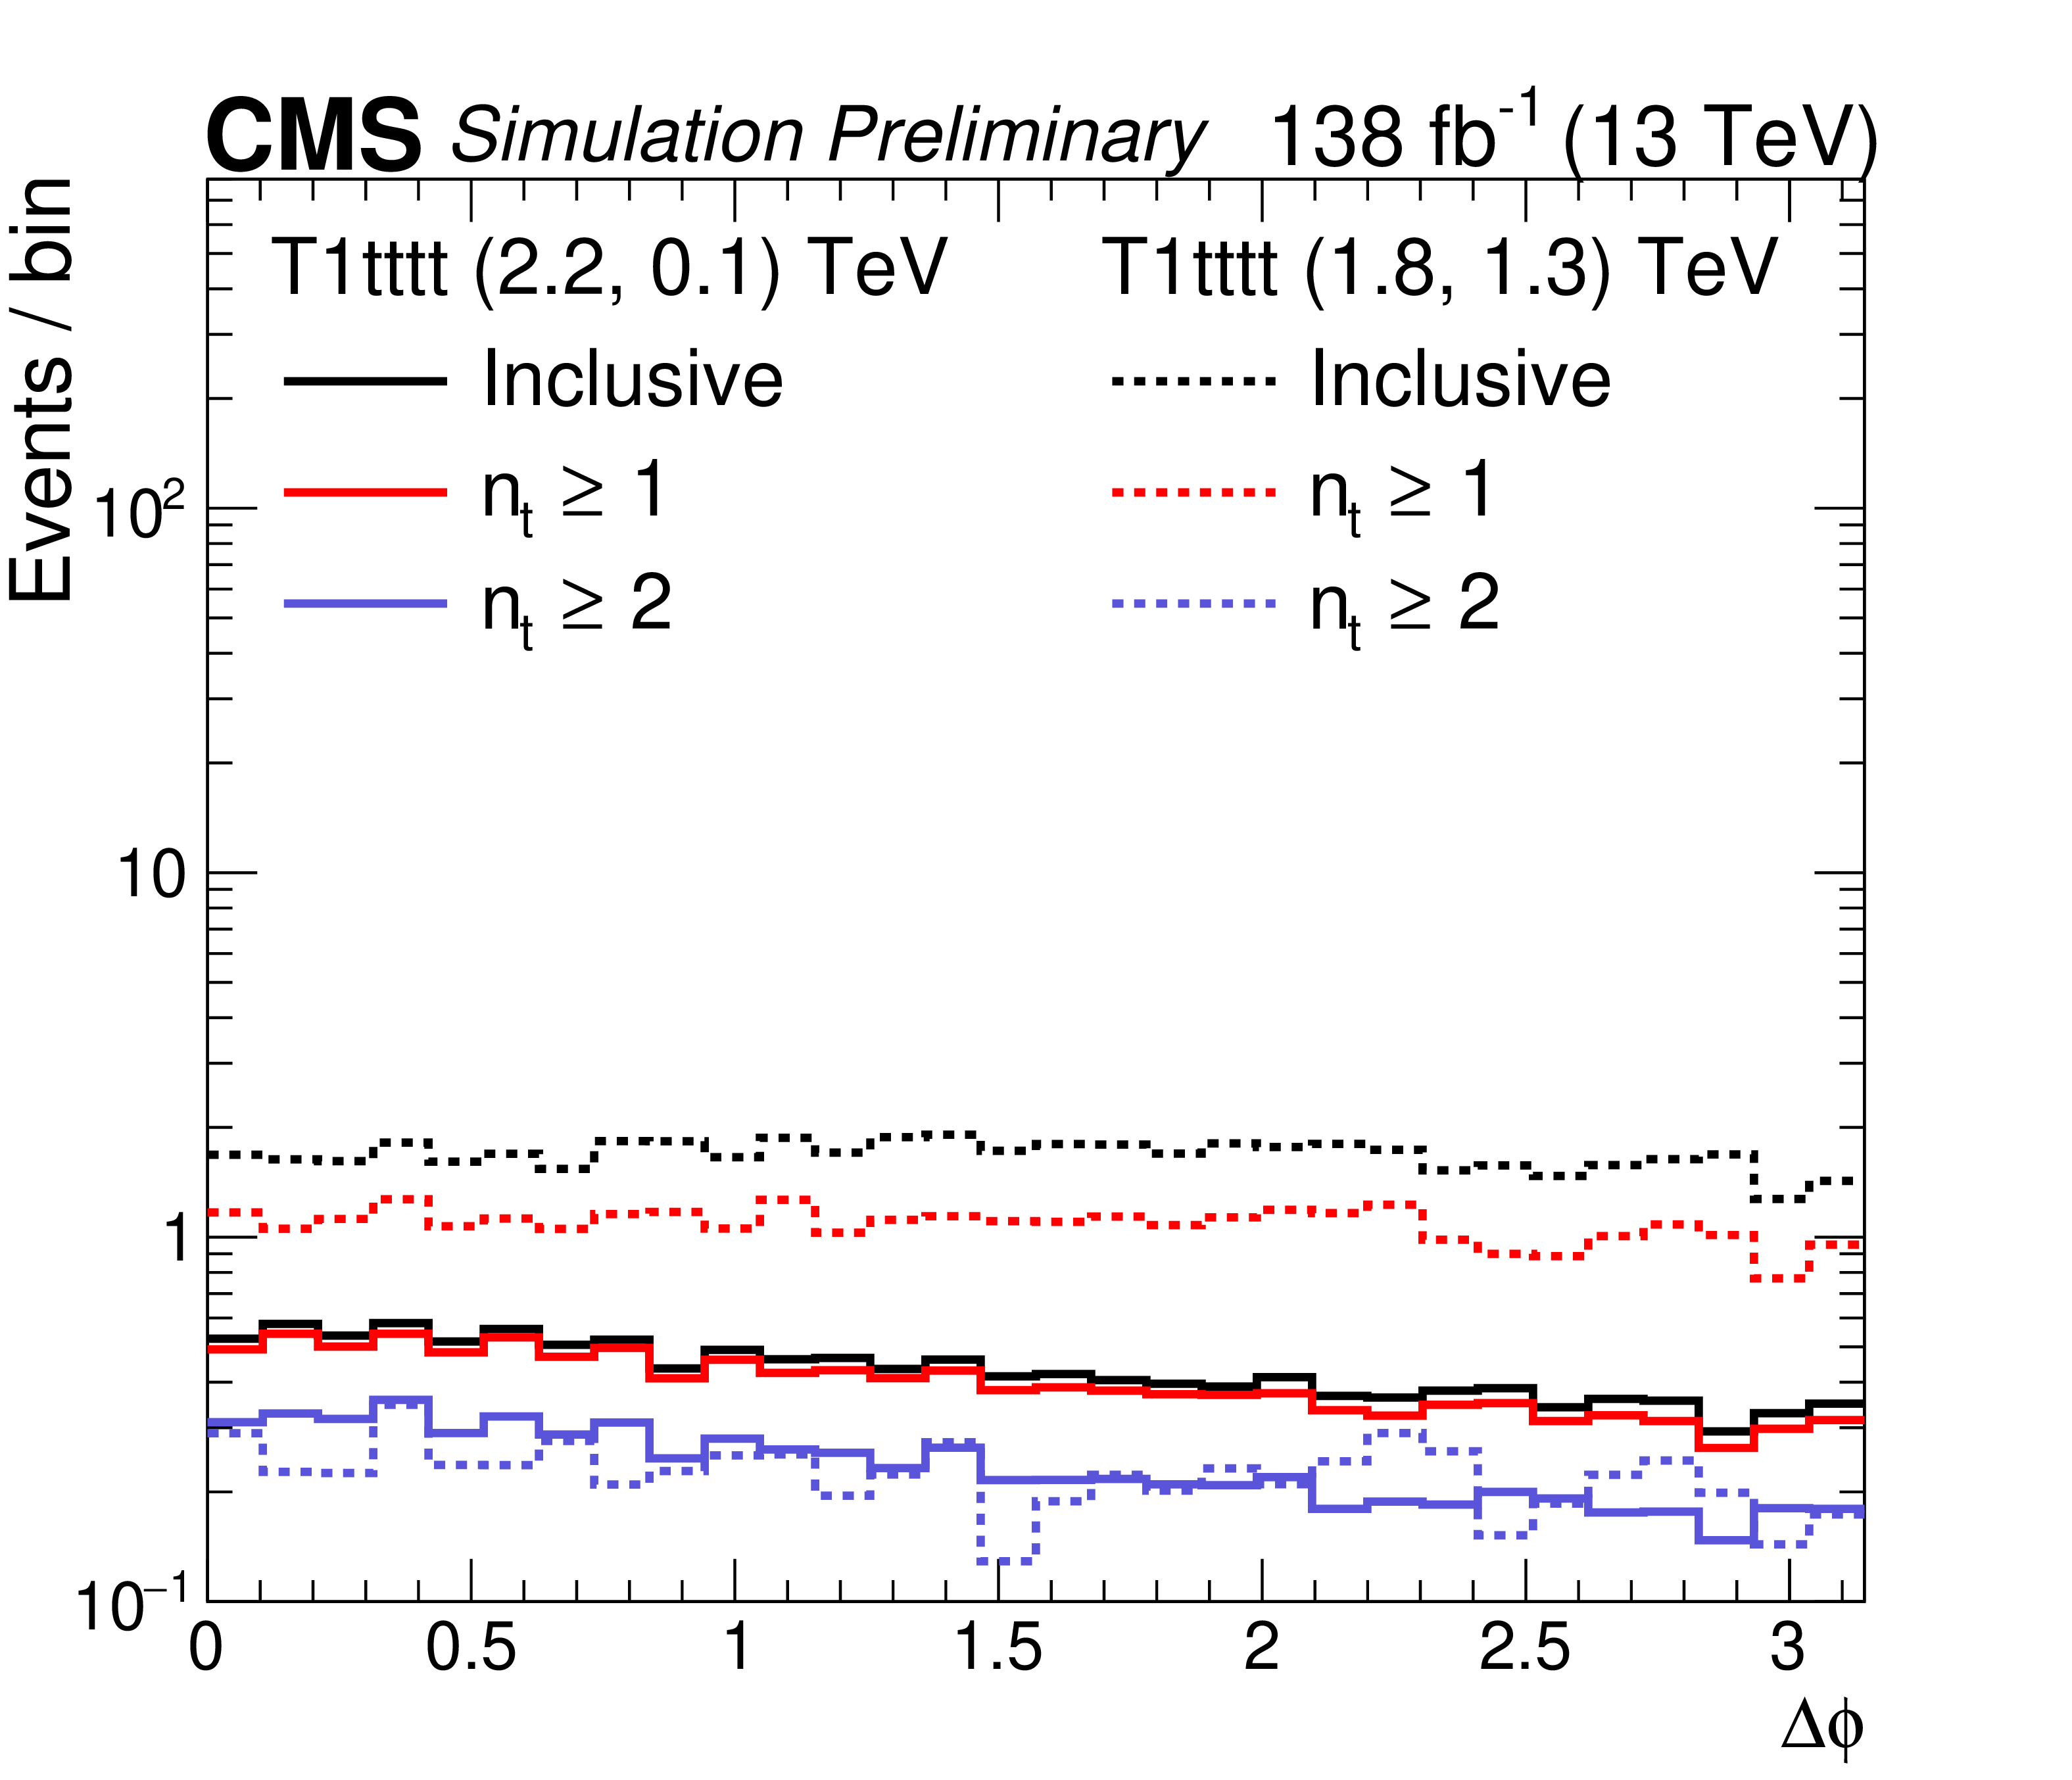
Figure 2:
Comparison of signal and background distributions as predicted by simulation in the ${\Delta \phi}$ variable for (left) the multi-b selection, requiring $ {n_\textrm {jet}} \ge $ 6, $ {L_{\textrm T}} > $ 250 GeV, $ {H_{\mathrm {T}}} > $ 500 GeV, and (right) the zero-b channel, requiring $ {n_\textrm {jet}} \ge $ 6, $ {L_{\textrm T}} > $ 350 GeV, $ {H_{\mathrm {T}}} > $ 750 GeV. While most background contributions are at low ${\Delta \phi}$ values, the signal, shown for two representative combinations of gluino/neutralino masses with large (2.2 TeV / 0.1 TeV) and small (1.8 TeV / 1.3 TeV) mass difference, is almost flat over the whole range. |

png pdf |
Figure 2-a:
Comparison of signal and background distributions as predicted by simulation in the ${\Delta \phi}$ variable for (left) the multi-b selection, requiring $ {n_\textrm {jet}} \ge $ 6, $ {L_{\textrm T}} > $ 250 GeV, $ {H_{\mathrm {T}}} > $ 500 GeV, and (right) the zero-b channel, requiring $ {n_\textrm {jet}} \ge $ 6, $ {L_{\textrm T}} > $ 350 GeV, $ {H_{\mathrm {T}}} > $ 750 GeV. While most background contributions are at low ${\Delta \phi}$ values, the signal, shown for two representative combinations of gluino/neutralino masses with large (2.2 TeV / 0.1 TeV) and small (1.8 TeV / 1.3 TeV) mass difference, is almost flat over the whole range. |
png pdf |
Figure 2-b:
Comparison of signal and background distributions as predicted by simulation in the ${\Delta \phi}$ variable for (left) the multi-b selection, requiring $ {n_\textrm {jet}} \ge $ 6, $ {L_{\textrm T}} > $ 250 GeV, $ {H_{\mathrm {T}}} > $ 500 GeV, and (right) the zero-b channel, requiring $ {n_\textrm {jet}} \ge $ 6, $ {L_{\textrm T}} > $ 350 GeV, $ {H_{\mathrm {T}}} > $ 750 GeV. While most background contributions are at low ${\Delta \phi}$ values, the signal, shown for two representative combinations of gluino/neutralino masses with large (2.2 TeV / 0.1 TeV) and small (1.8 TeV / 1.3 TeV) mass difference, is almost flat over the whole range. |
png pdf |
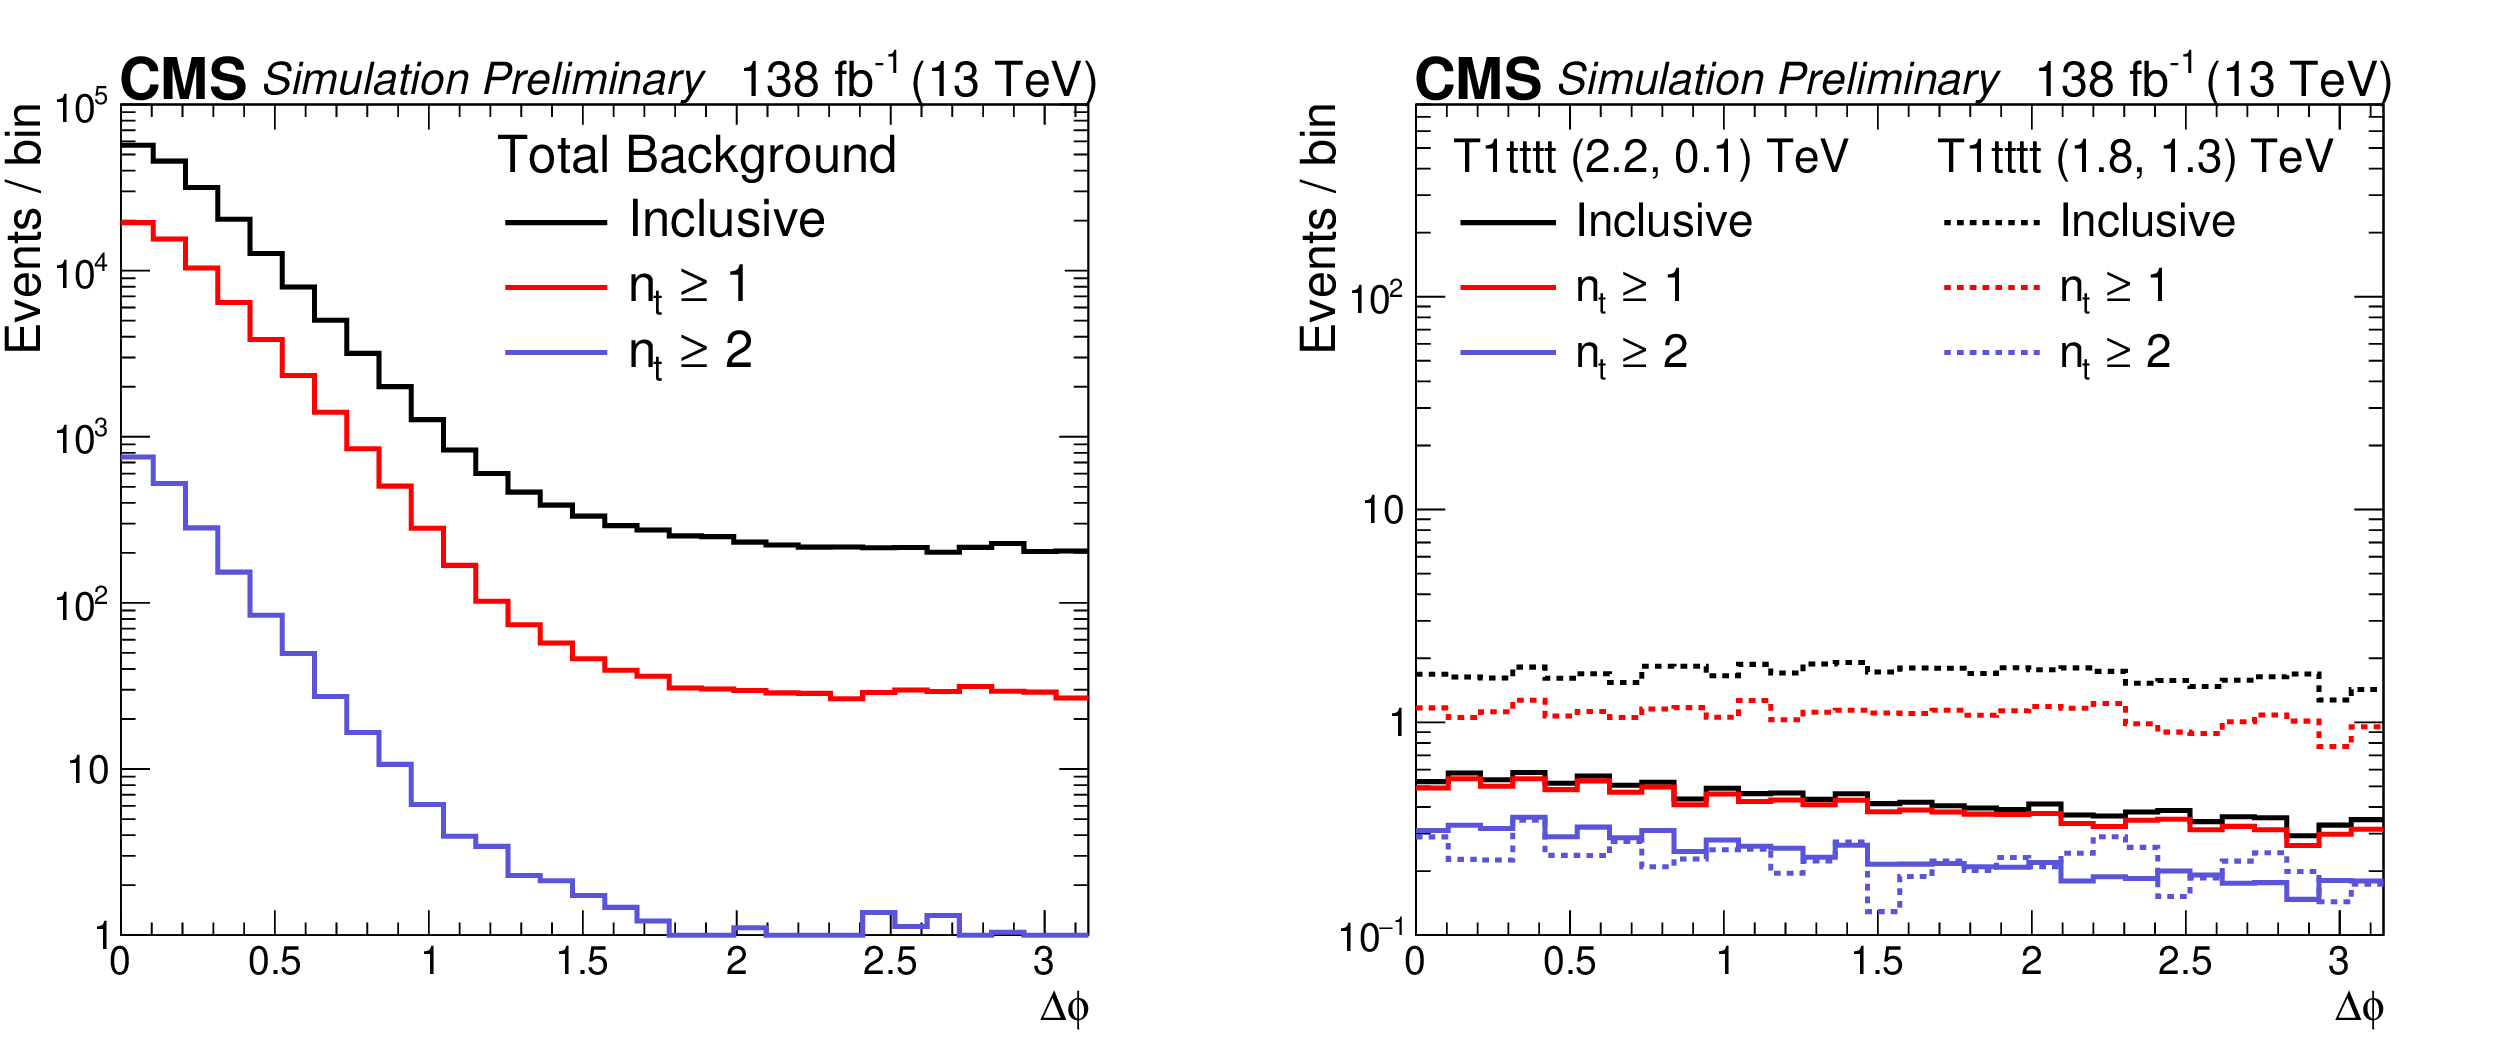
Figure 3:
Distributions of $ {\Delta \phi} $ as obtained from simulation showing the impact of top quark tagging after requiring various top-tag multiplicities for (left) the total background and (right) for the signal in two representative combinations of gluino/neutralino masses with large (2.2 TeV / 0.1 TeV) and small (1.8 TeV / 1.3 TeV) mass difference. After requiring at least one top tag, the background is strongly suppressed, while the efficiency for signal remains high. |

png pdf |
Figure 3-a:
Distributions of $ {\Delta \phi} $ as obtained from simulation showing the impact of top quark tagging after requiring various top-tag multiplicities for (left) the total background and (right) for the signal in two representative combinations of gluino/neutralino masses with large (2.2 TeV / 0.1 TeV) and small (1.8 TeV / 1.3 TeV) mass difference. After requiring at least one top tag, the background is strongly suppressed, while the efficiency for signal remains high. |
png pdf |
Figure 3-b:
Distributions of $ {\Delta \phi} $ as obtained from simulation showing the impact of top quark tagging after requiring various top-tag multiplicities for (left) the total background and (right) for the signal in two representative combinations of gluino/neutralino masses with large (2.2 TeV / 0.1 TeV) and small (1.8 TeV / 1.3 TeV) mass difference. After requiring at least one top tag, the background is strongly suppressed, while the efficiency for signal remains high. |
png pdf |
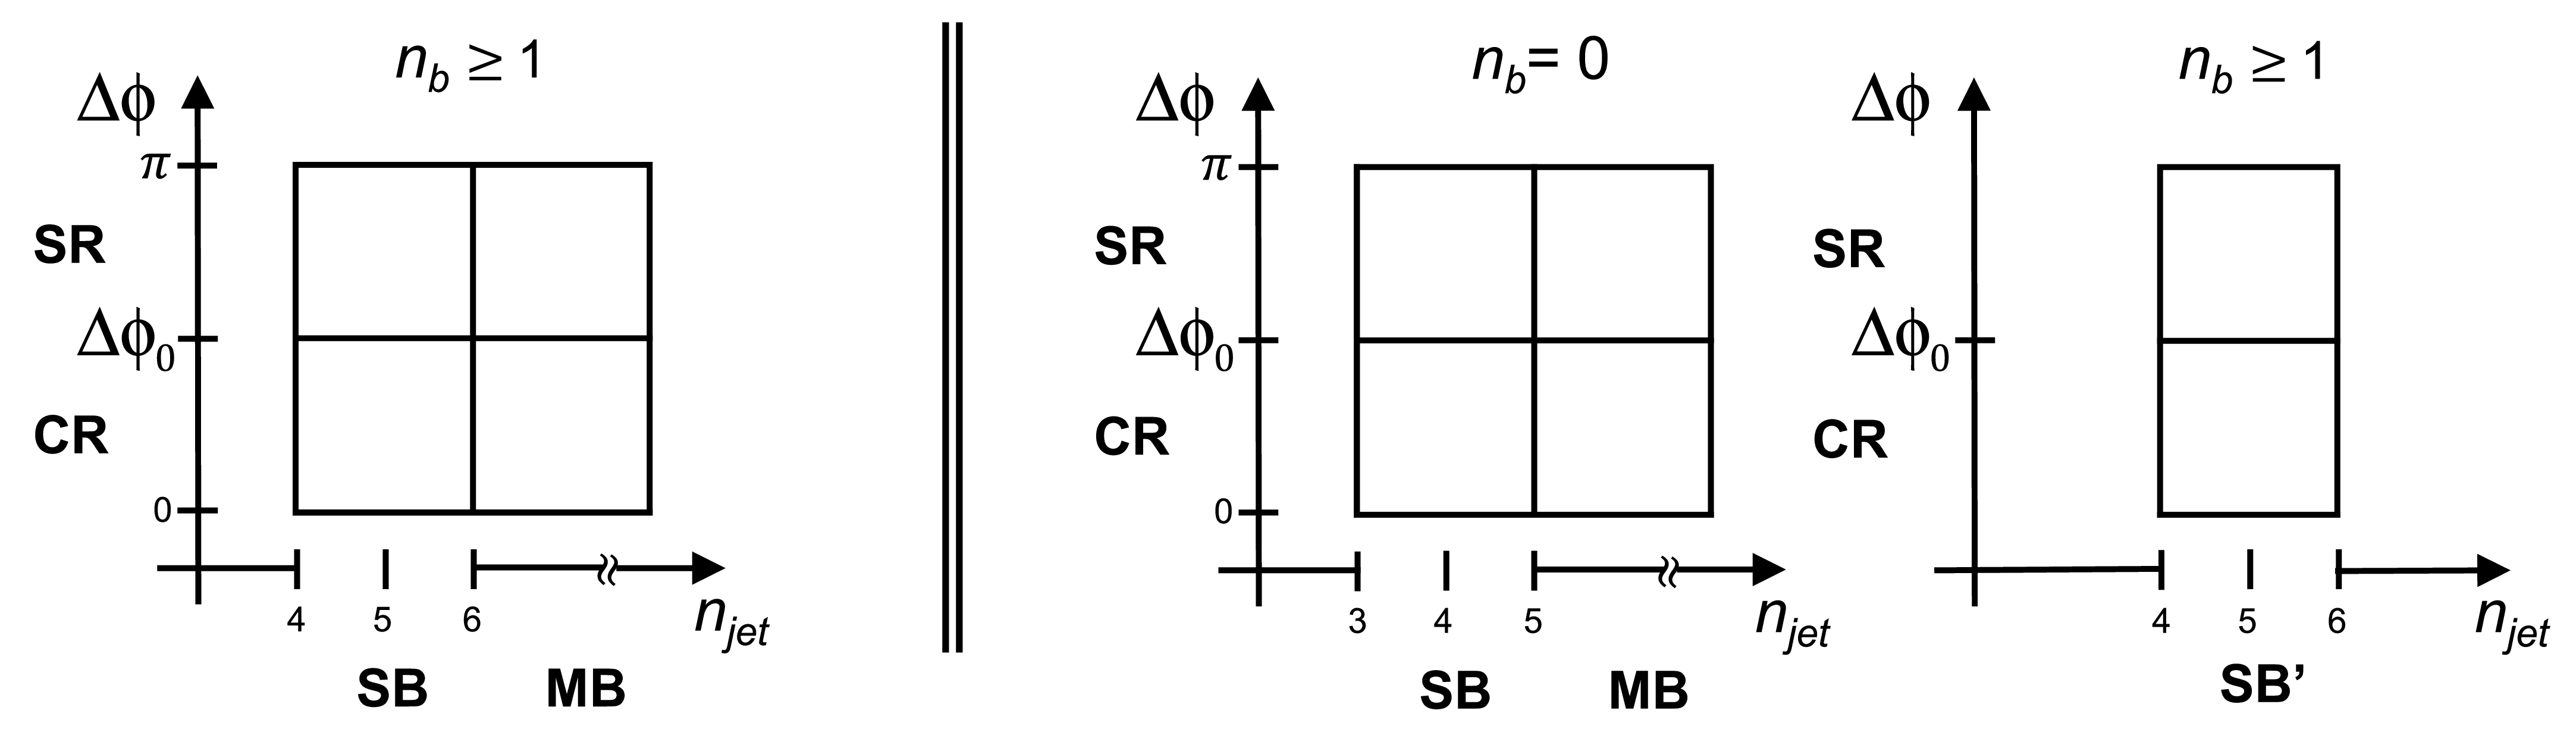
Figure 4:
Graphical presentation of the SB, MB, CR, and SR (left) for the multi-b and (middle and right) for the zero-b analysis. The value of ${\Delta \phi}$ separating CR and SR is labeled as $ {\Delta \phi} _0$. It is constant for the multi-b channel but varies for the zero-b analysis. |

png pdf |
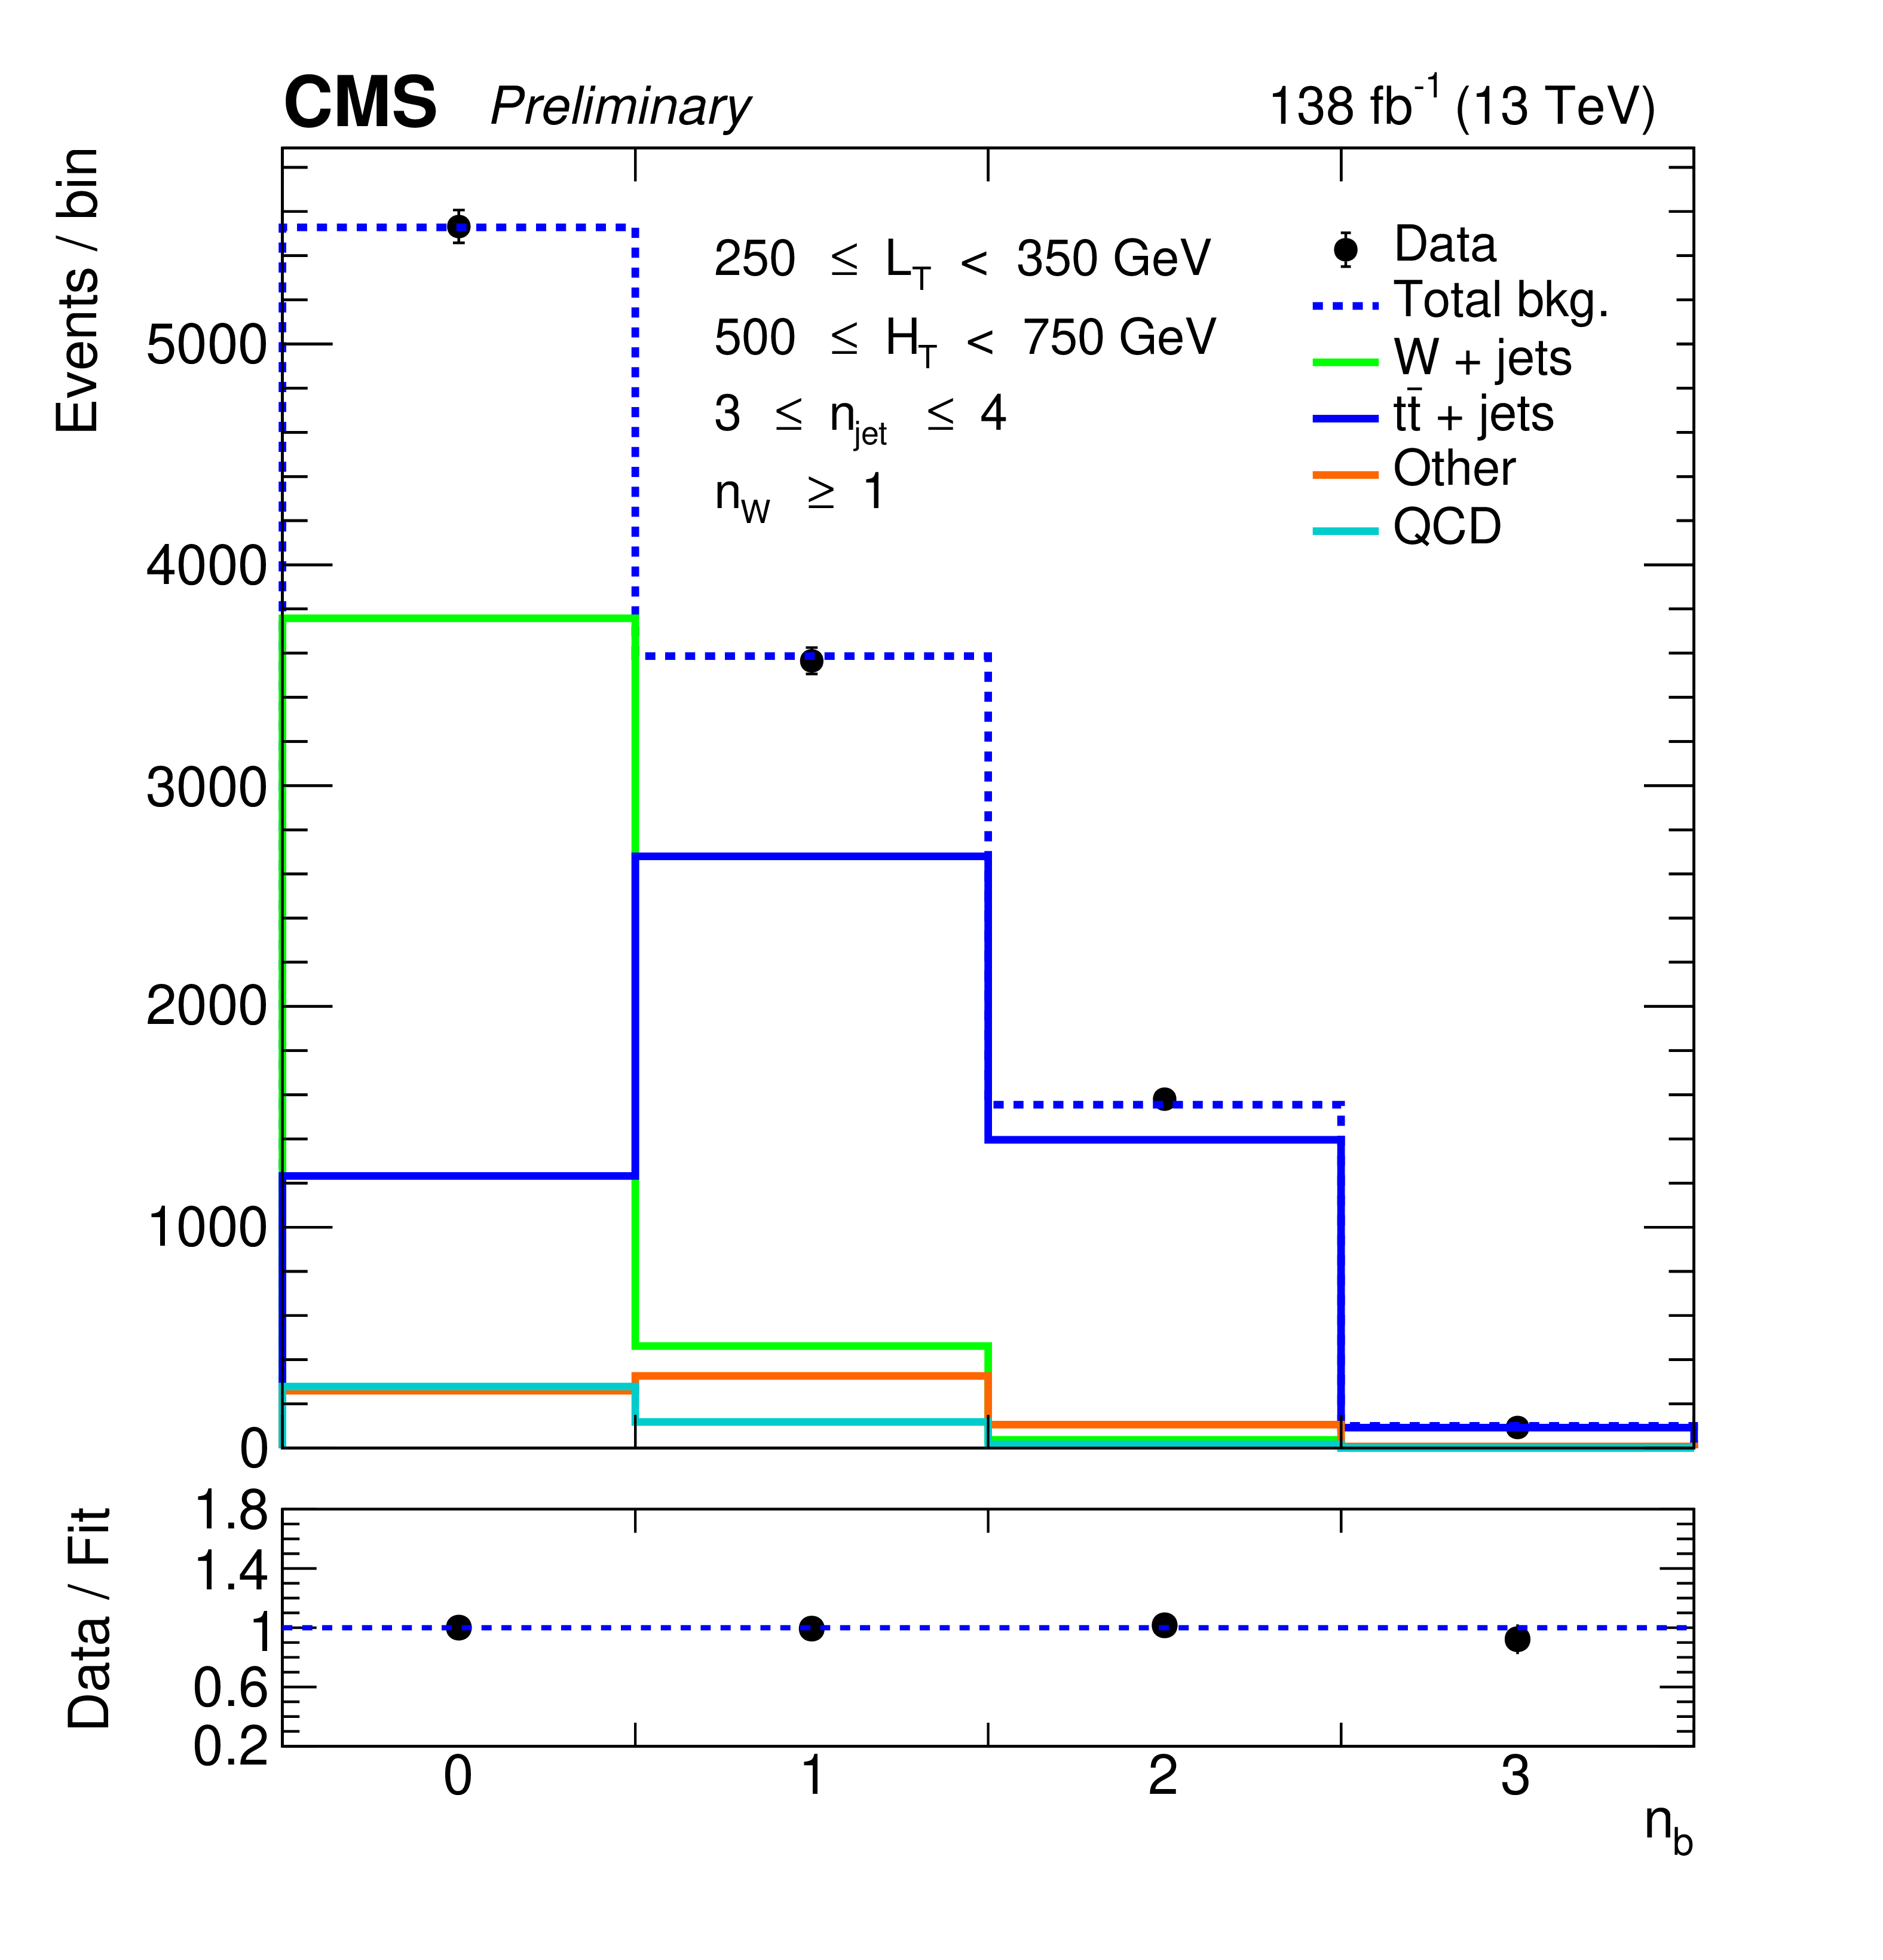
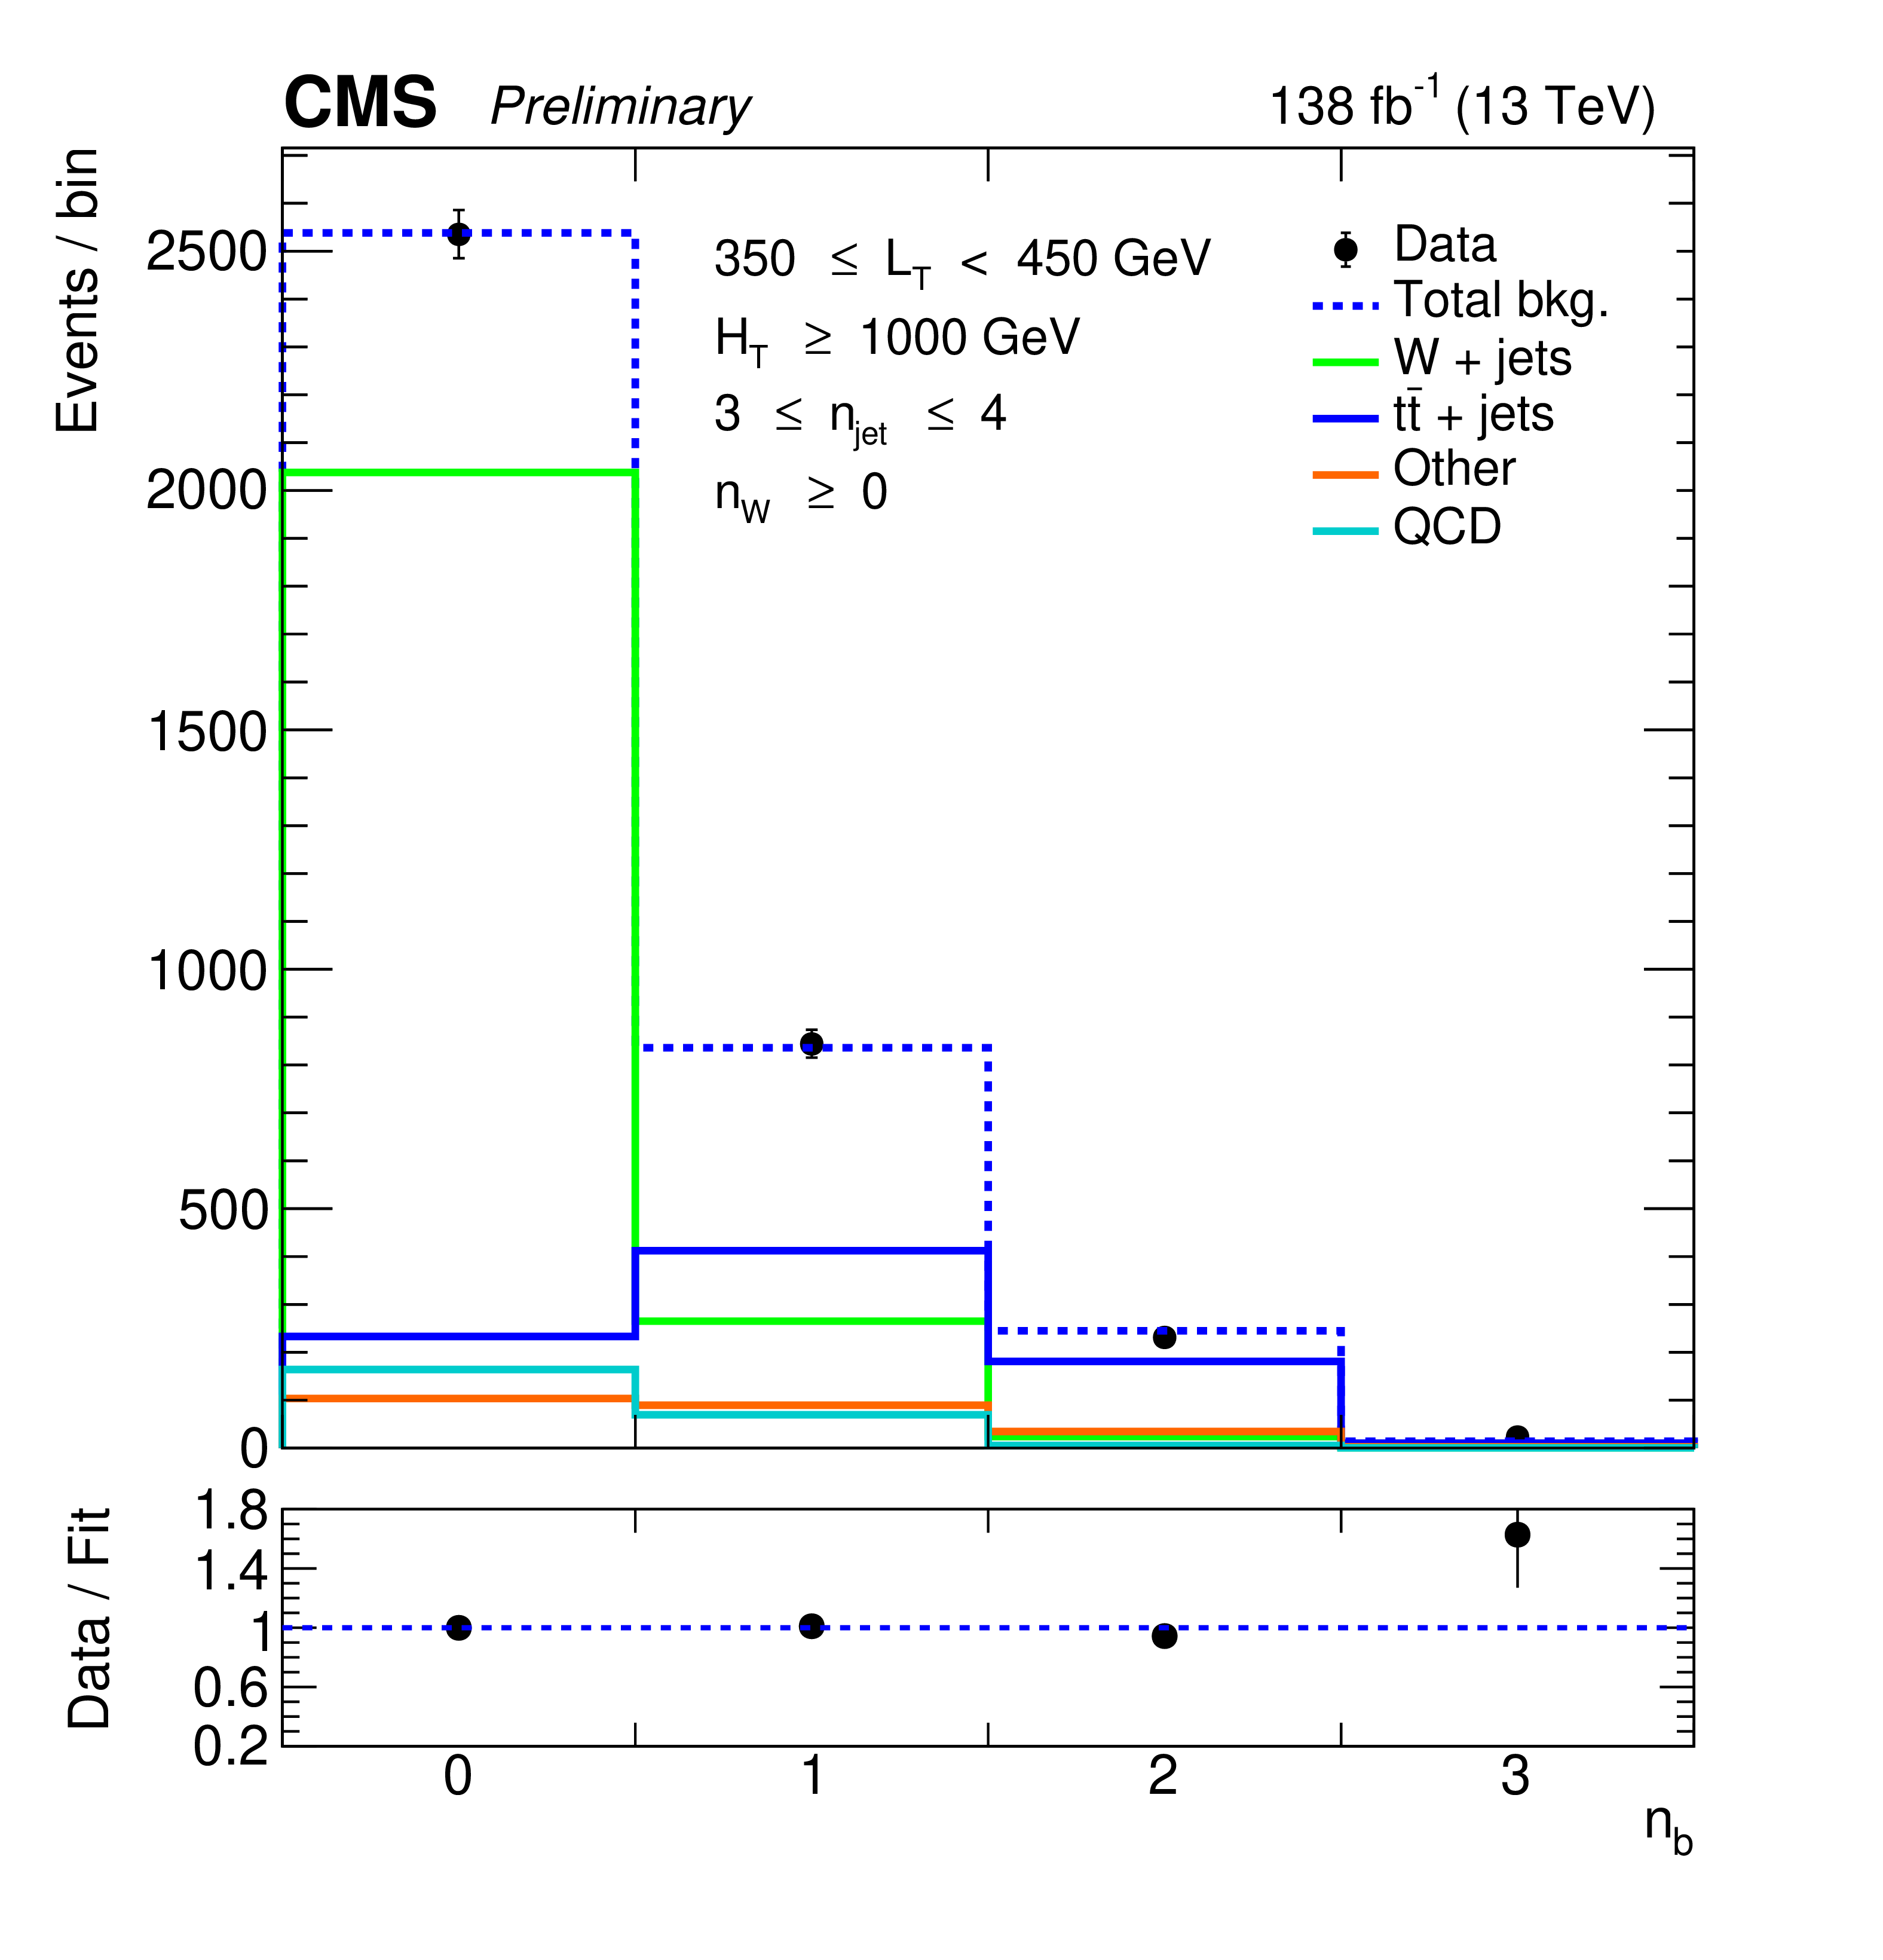
Figure 5:
Fits to the ${n_\textrm {b}}$ multiplicity for control regions for the muon channel and with the requirements (left) 3 $ \leq {n_\textrm {jet}} \leq $ 4, 250 $ < {L_{\textrm T}} < $ 350 GeV, 500 $ < {H_{\mathrm {T}}} < $ 750 GeV, $n_{\mathrm{W}}\geq 1$, $ {\Delta \phi} < $ 1 and (right) 3 $ \leq {n_\textrm {jet}} \leq $ 4, 350 $ < {L_{\textrm T}} < $ 450 GeV, $ {H_{\mathrm {T}}} > $ 1000 GeV, $n_{\mathrm{W}}\ge $ 0, $ {\Delta \phi} < $ 1. |
png pdf |
Figure 5-a:
Fits to the ${n_\textrm {b}}$ multiplicity for control regions for the muon channel and with the requirements (left) 3 $ \leq {n_\textrm {jet}} \leq $ 4, 250 $ < {L_{\textrm T}} < $ 350 GeV, 500 $ < {H_{\mathrm {T}}} < $ 750 GeV, $n_{\mathrm{W}}\geq 1$, $ {\Delta \phi} < $ 1 and (right) 3 $ \leq {n_\textrm {jet}} \leq $ 4, 350 $ < {L_{\textrm T}} < $ 450 GeV, $ {H_{\mathrm {T}}} > $ 1000 GeV, $n_{\mathrm{W}}\ge $ 0, $ {\Delta \phi} < $ 1. |
png pdf |
Figure 5-b:
Fits to the ${n_\textrm {b}}$ multiplicity for control regions for the muon channel and with the requirements (left) 3 $ \leq {n_\textrm {jet}} \leq $ 4, 250 $ < {L_{\textrm T}} < $ 350 GeV, 500 $ < {H_{\mathrm {T}}} < $ 750 GeV, $n_{\mathrm{W}}\geq 1$, $ {\Delta \phi} < $ 1 and (right) 3 $ \leq {n_\textrm {jet}} \leq $ 4, 350 $ < {L_{\textrm T}} < $ 450 GeV, $ {H_{\mathrm {T}}} > $ 1000 GeV, $n_{\mathrm{W}}\ge $ 0, $ {\Delta \phi} < $ 1. |

png pdf |
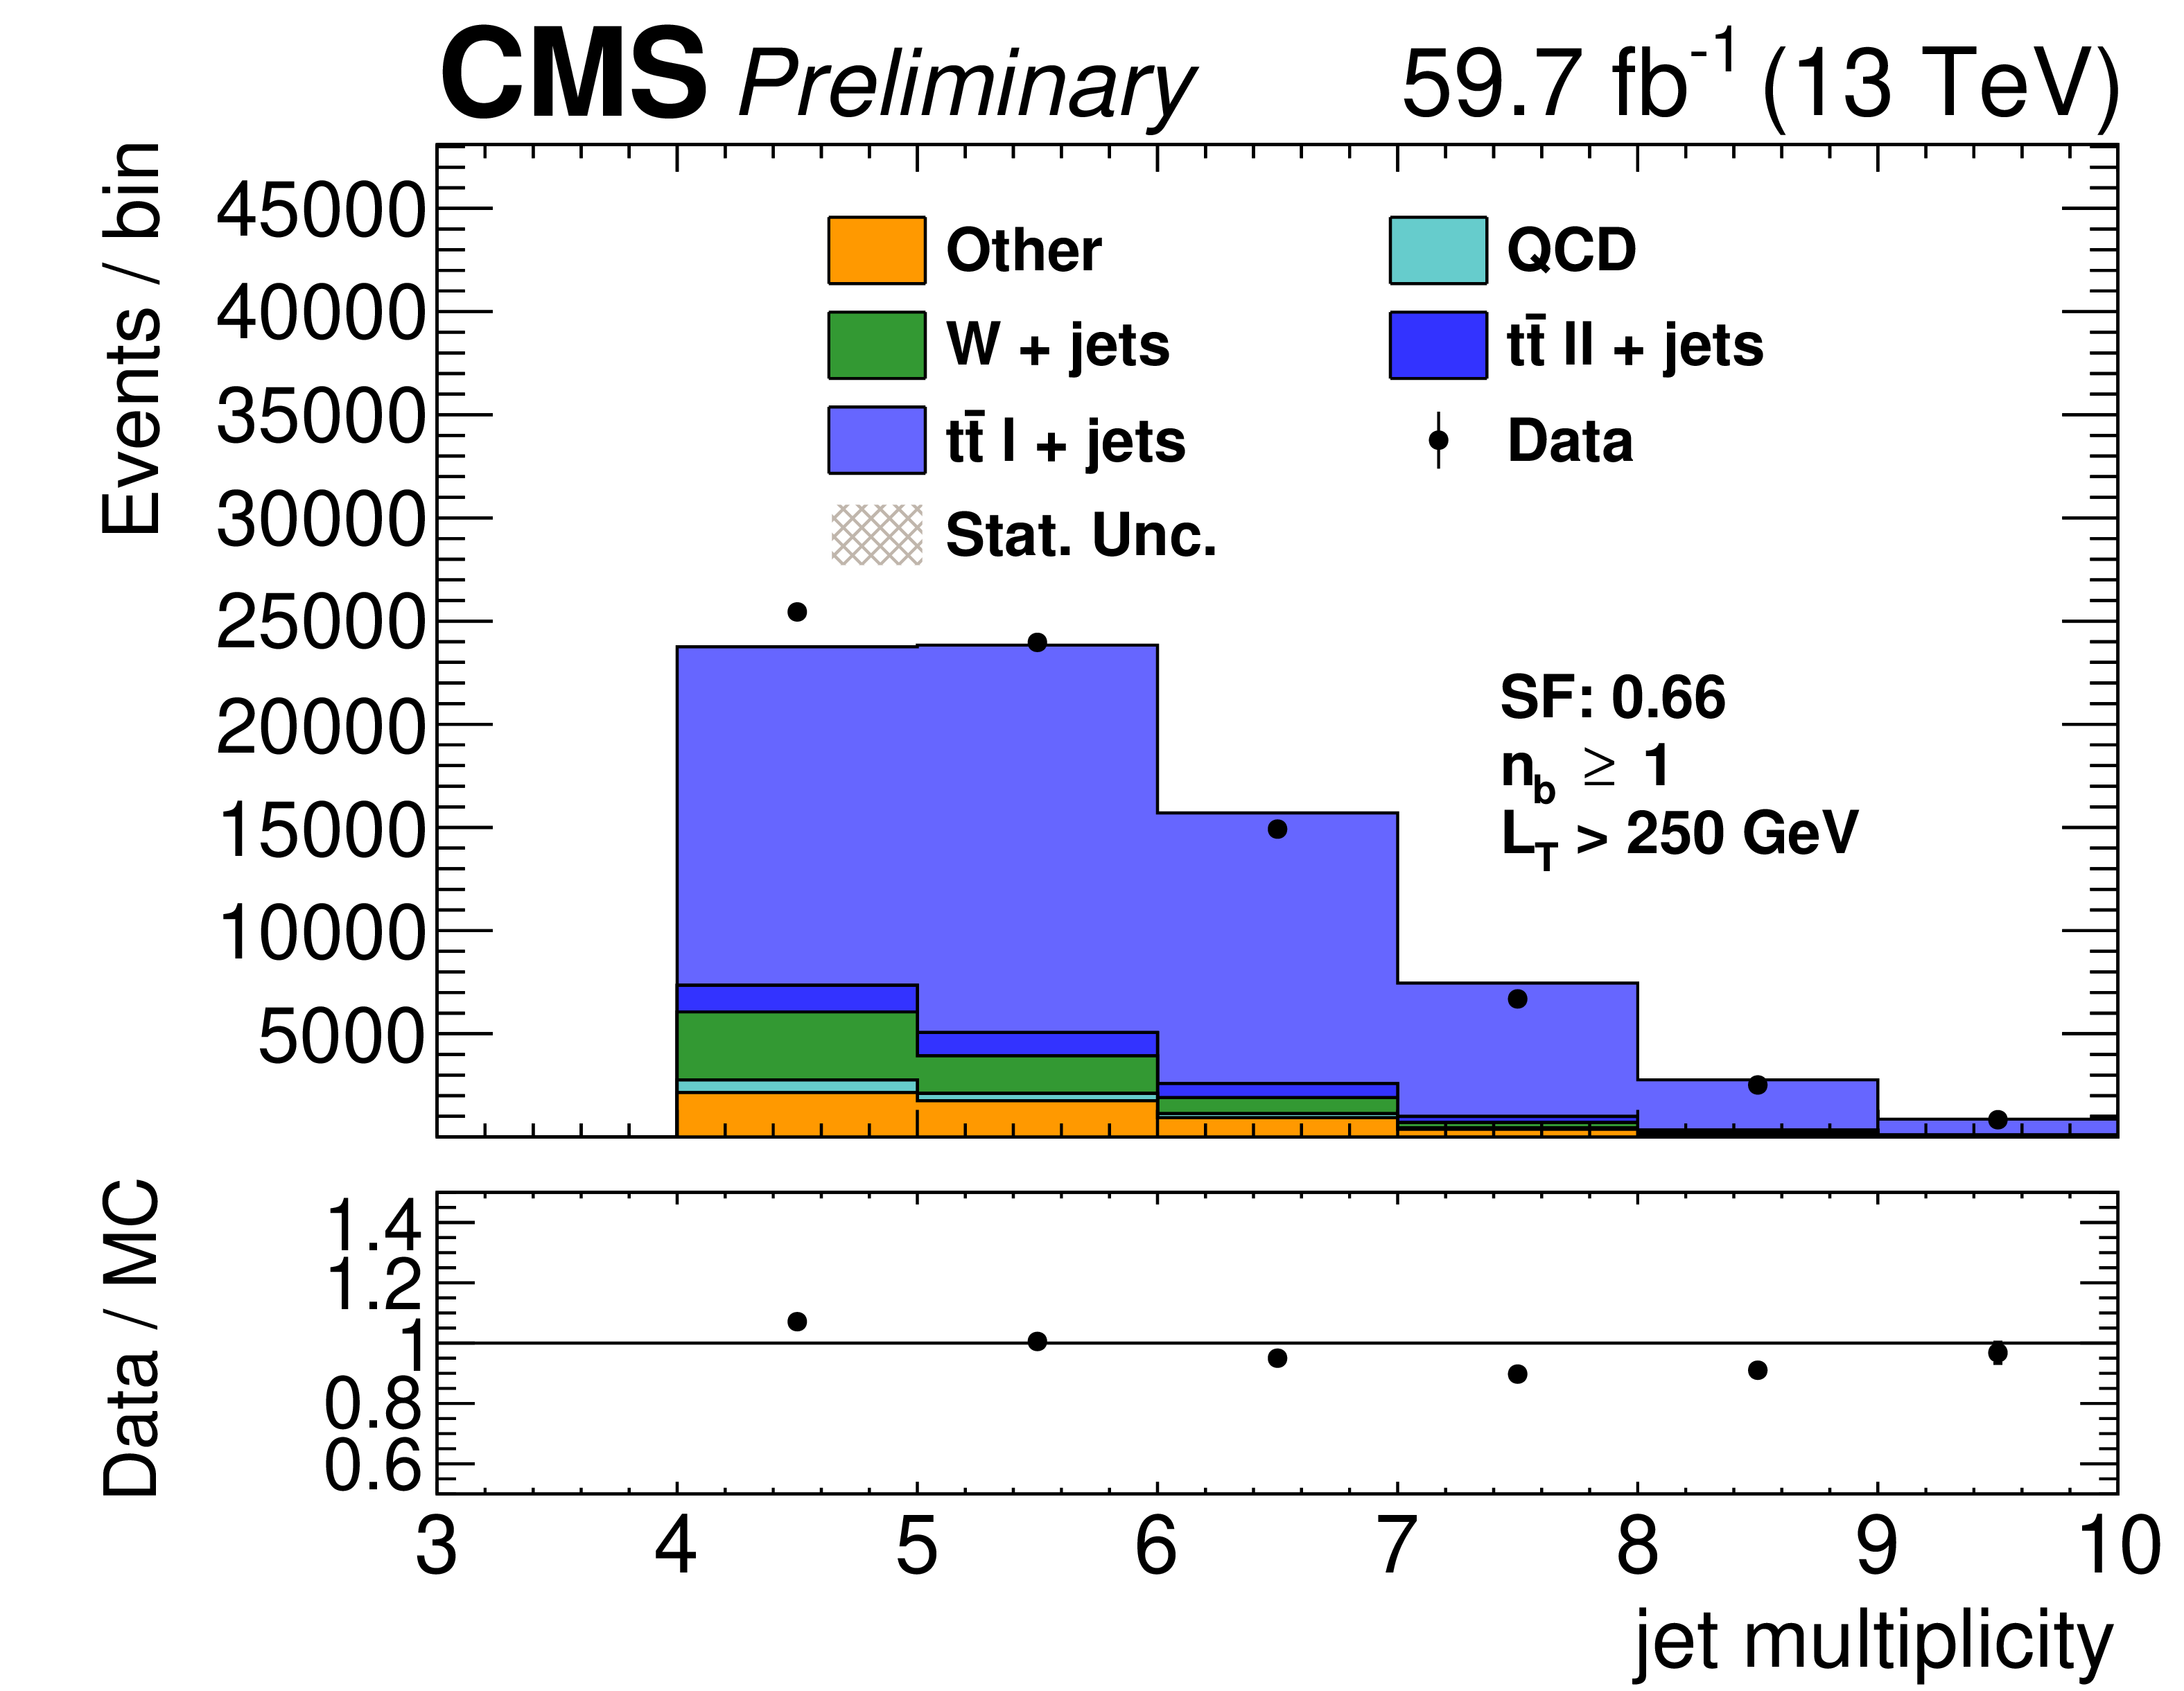
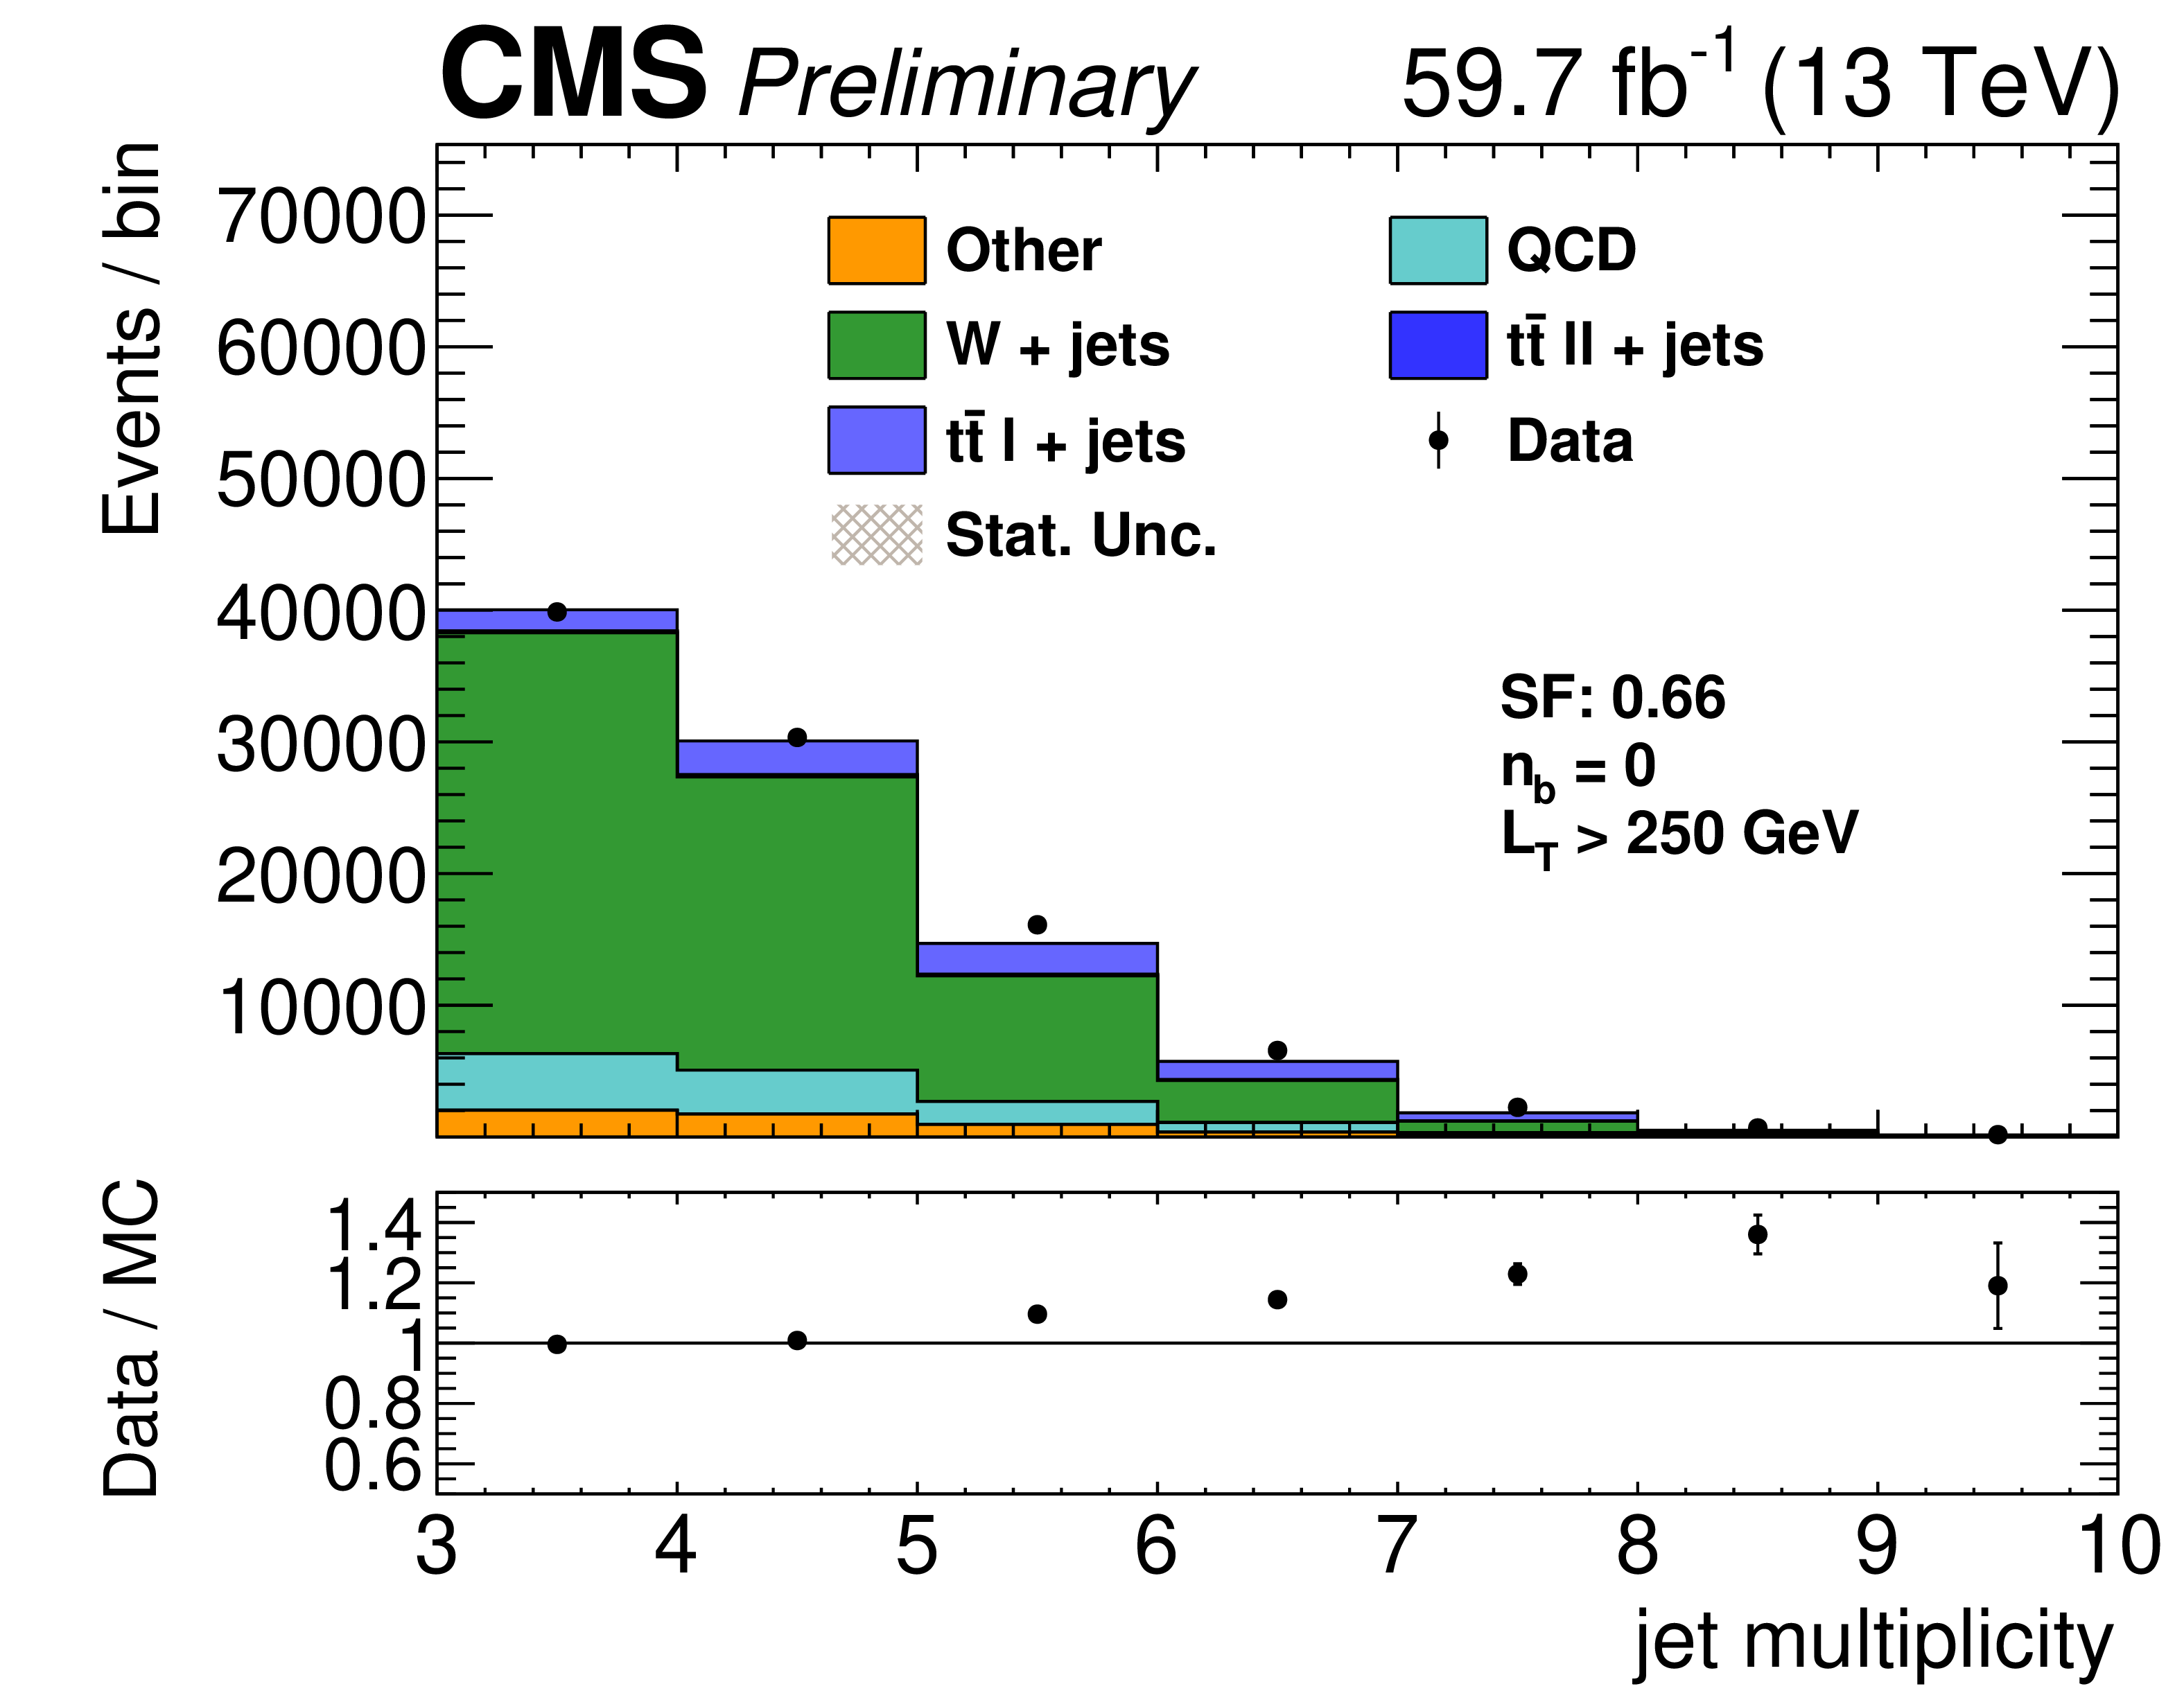
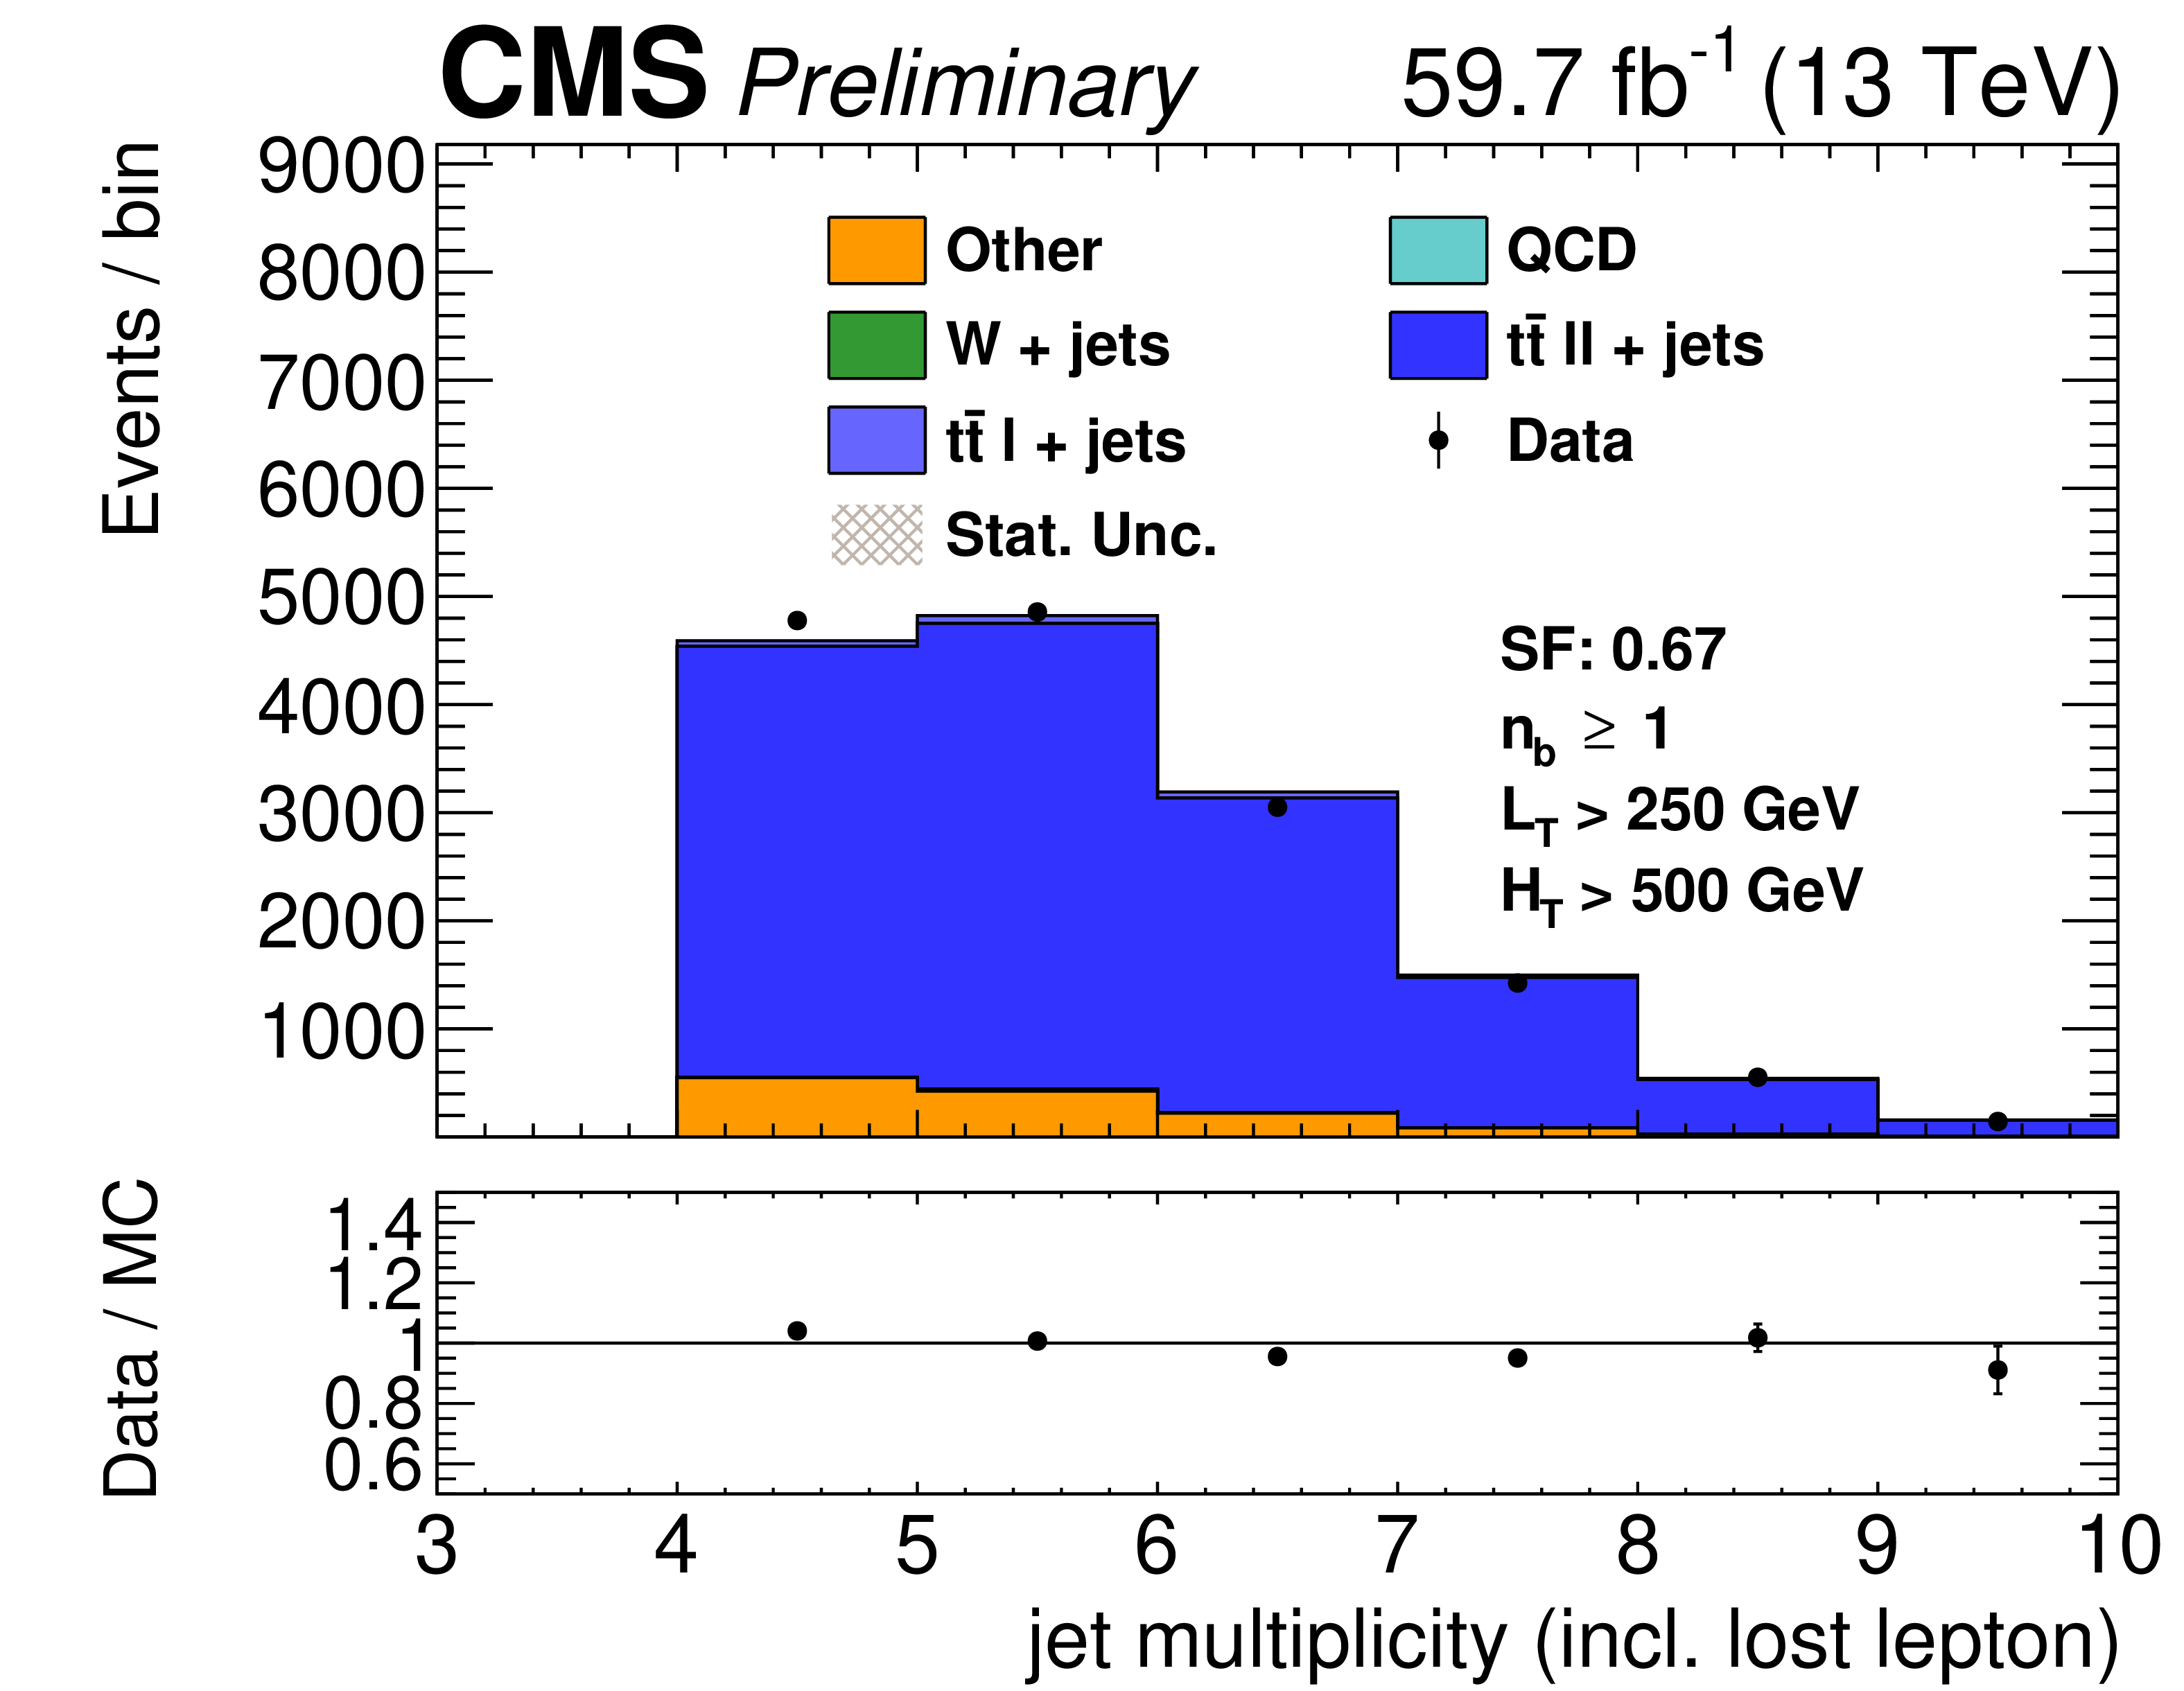
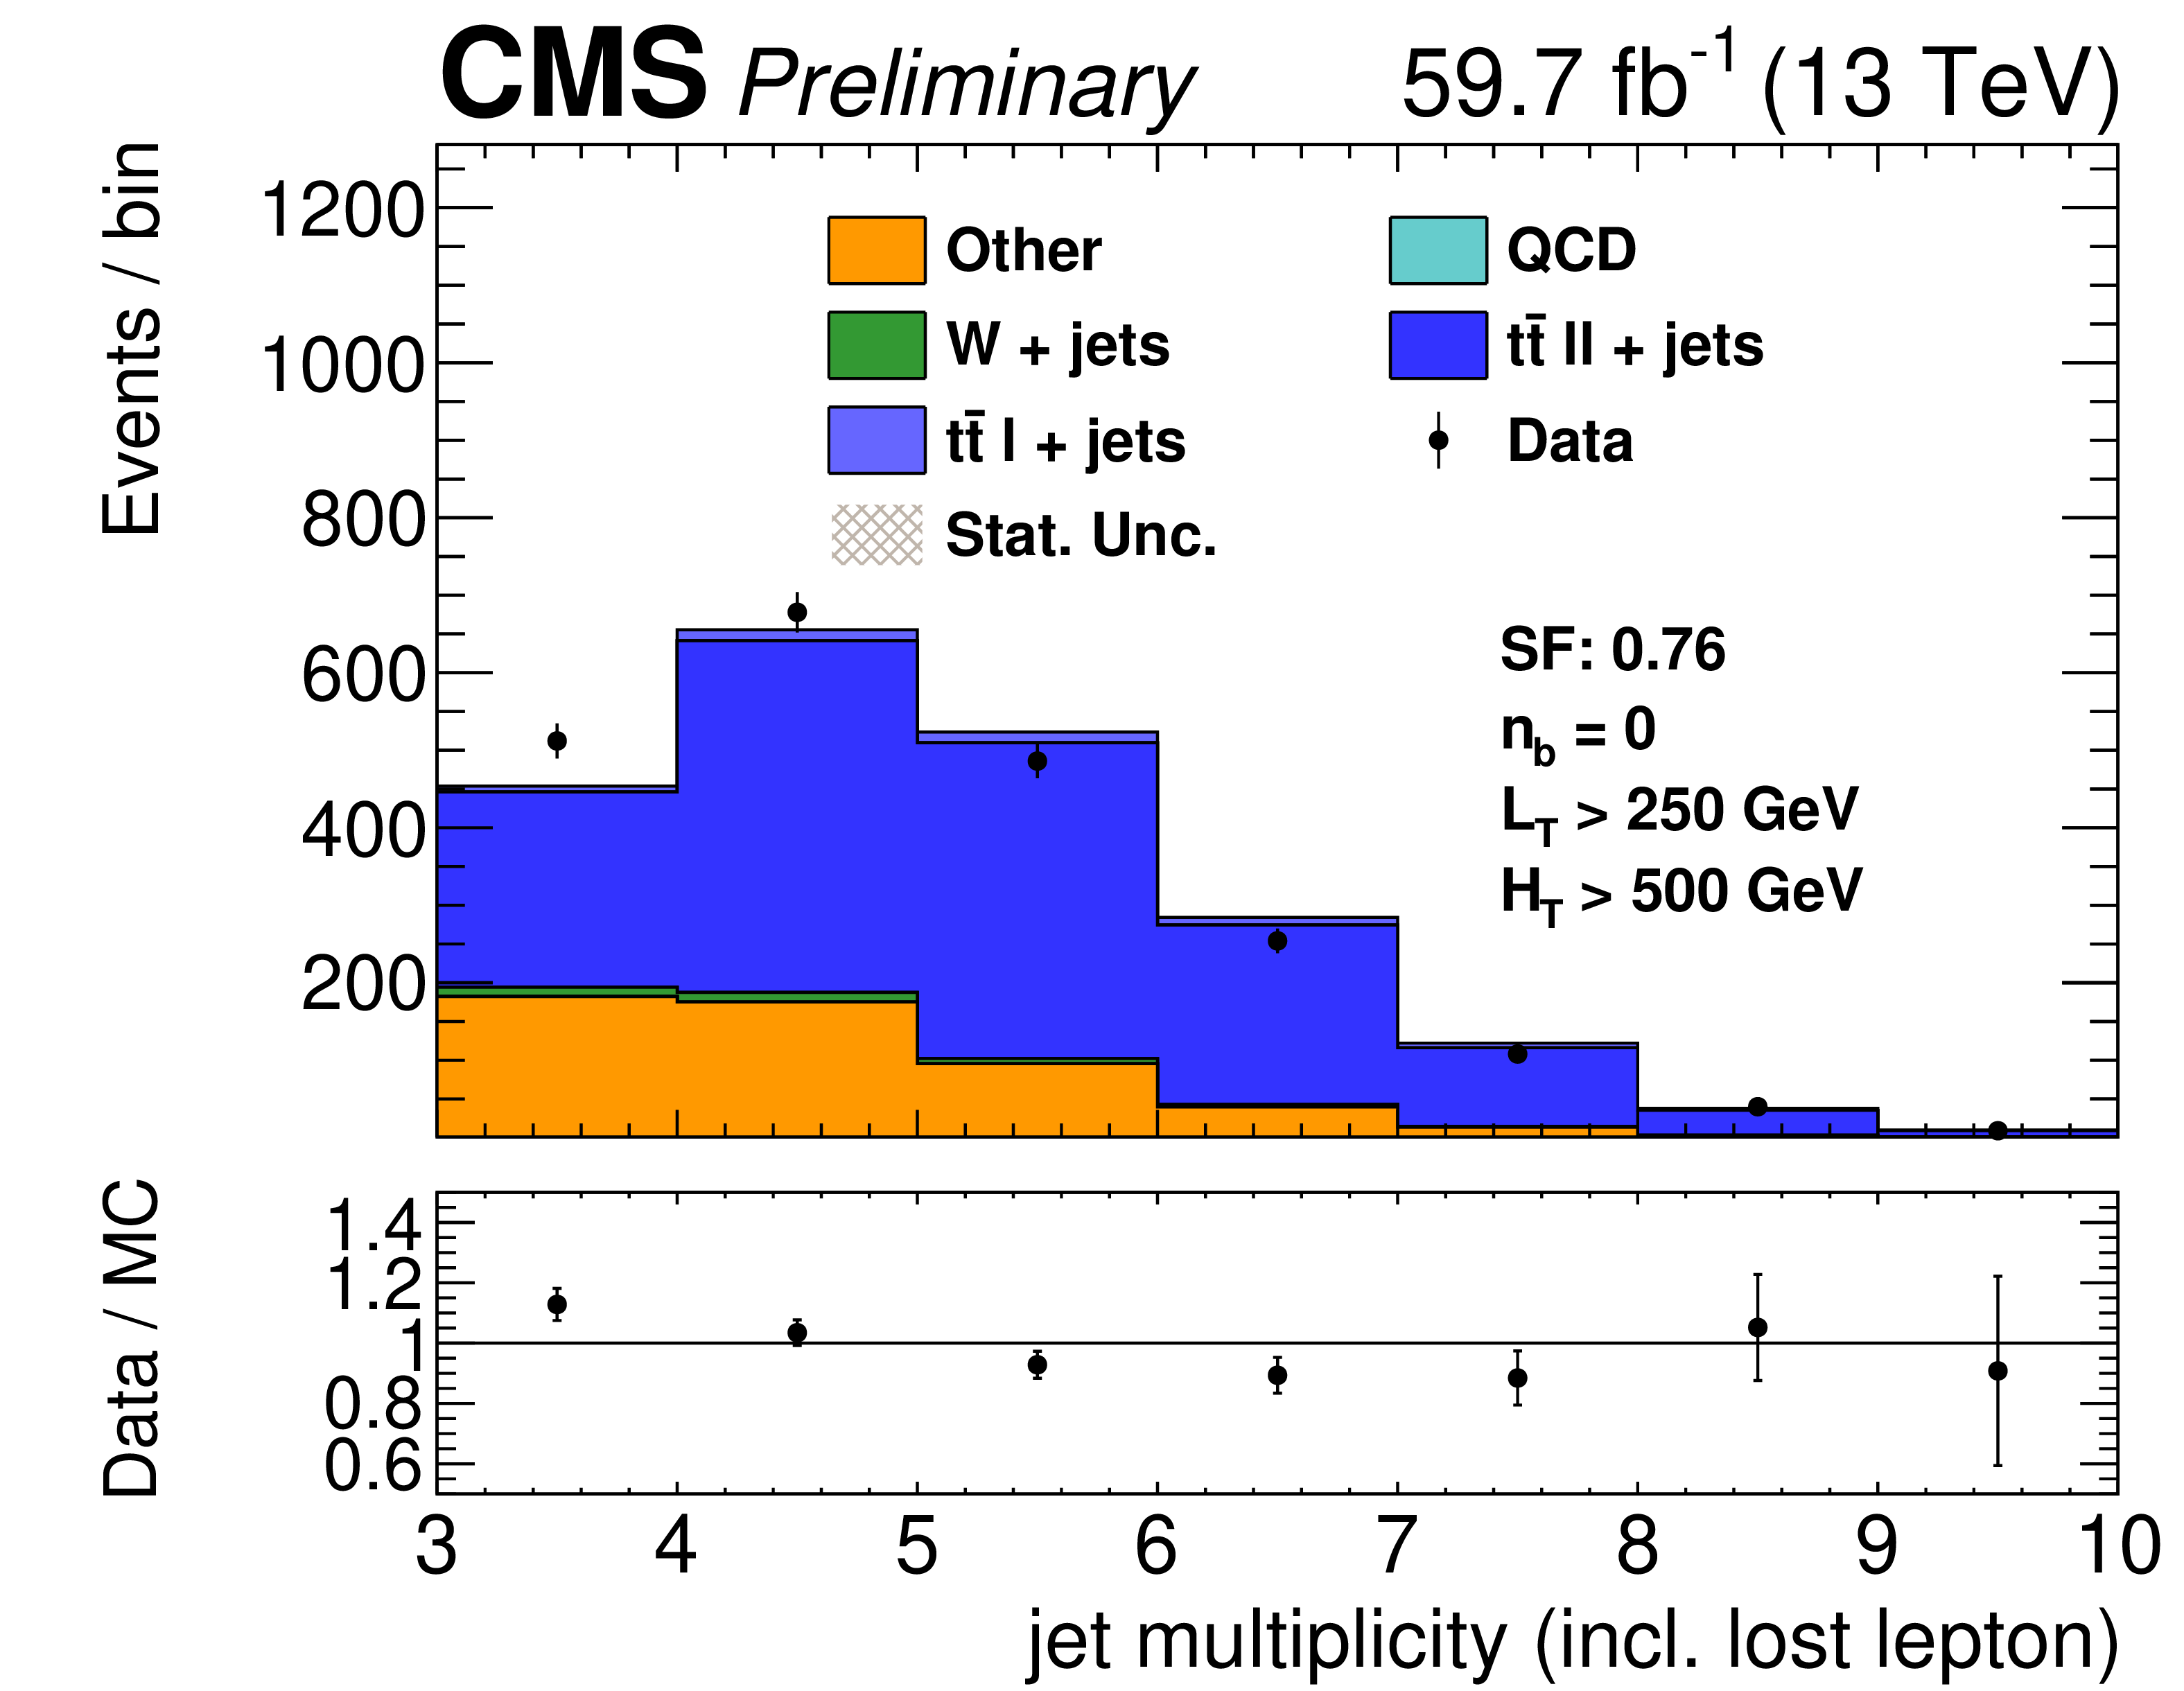
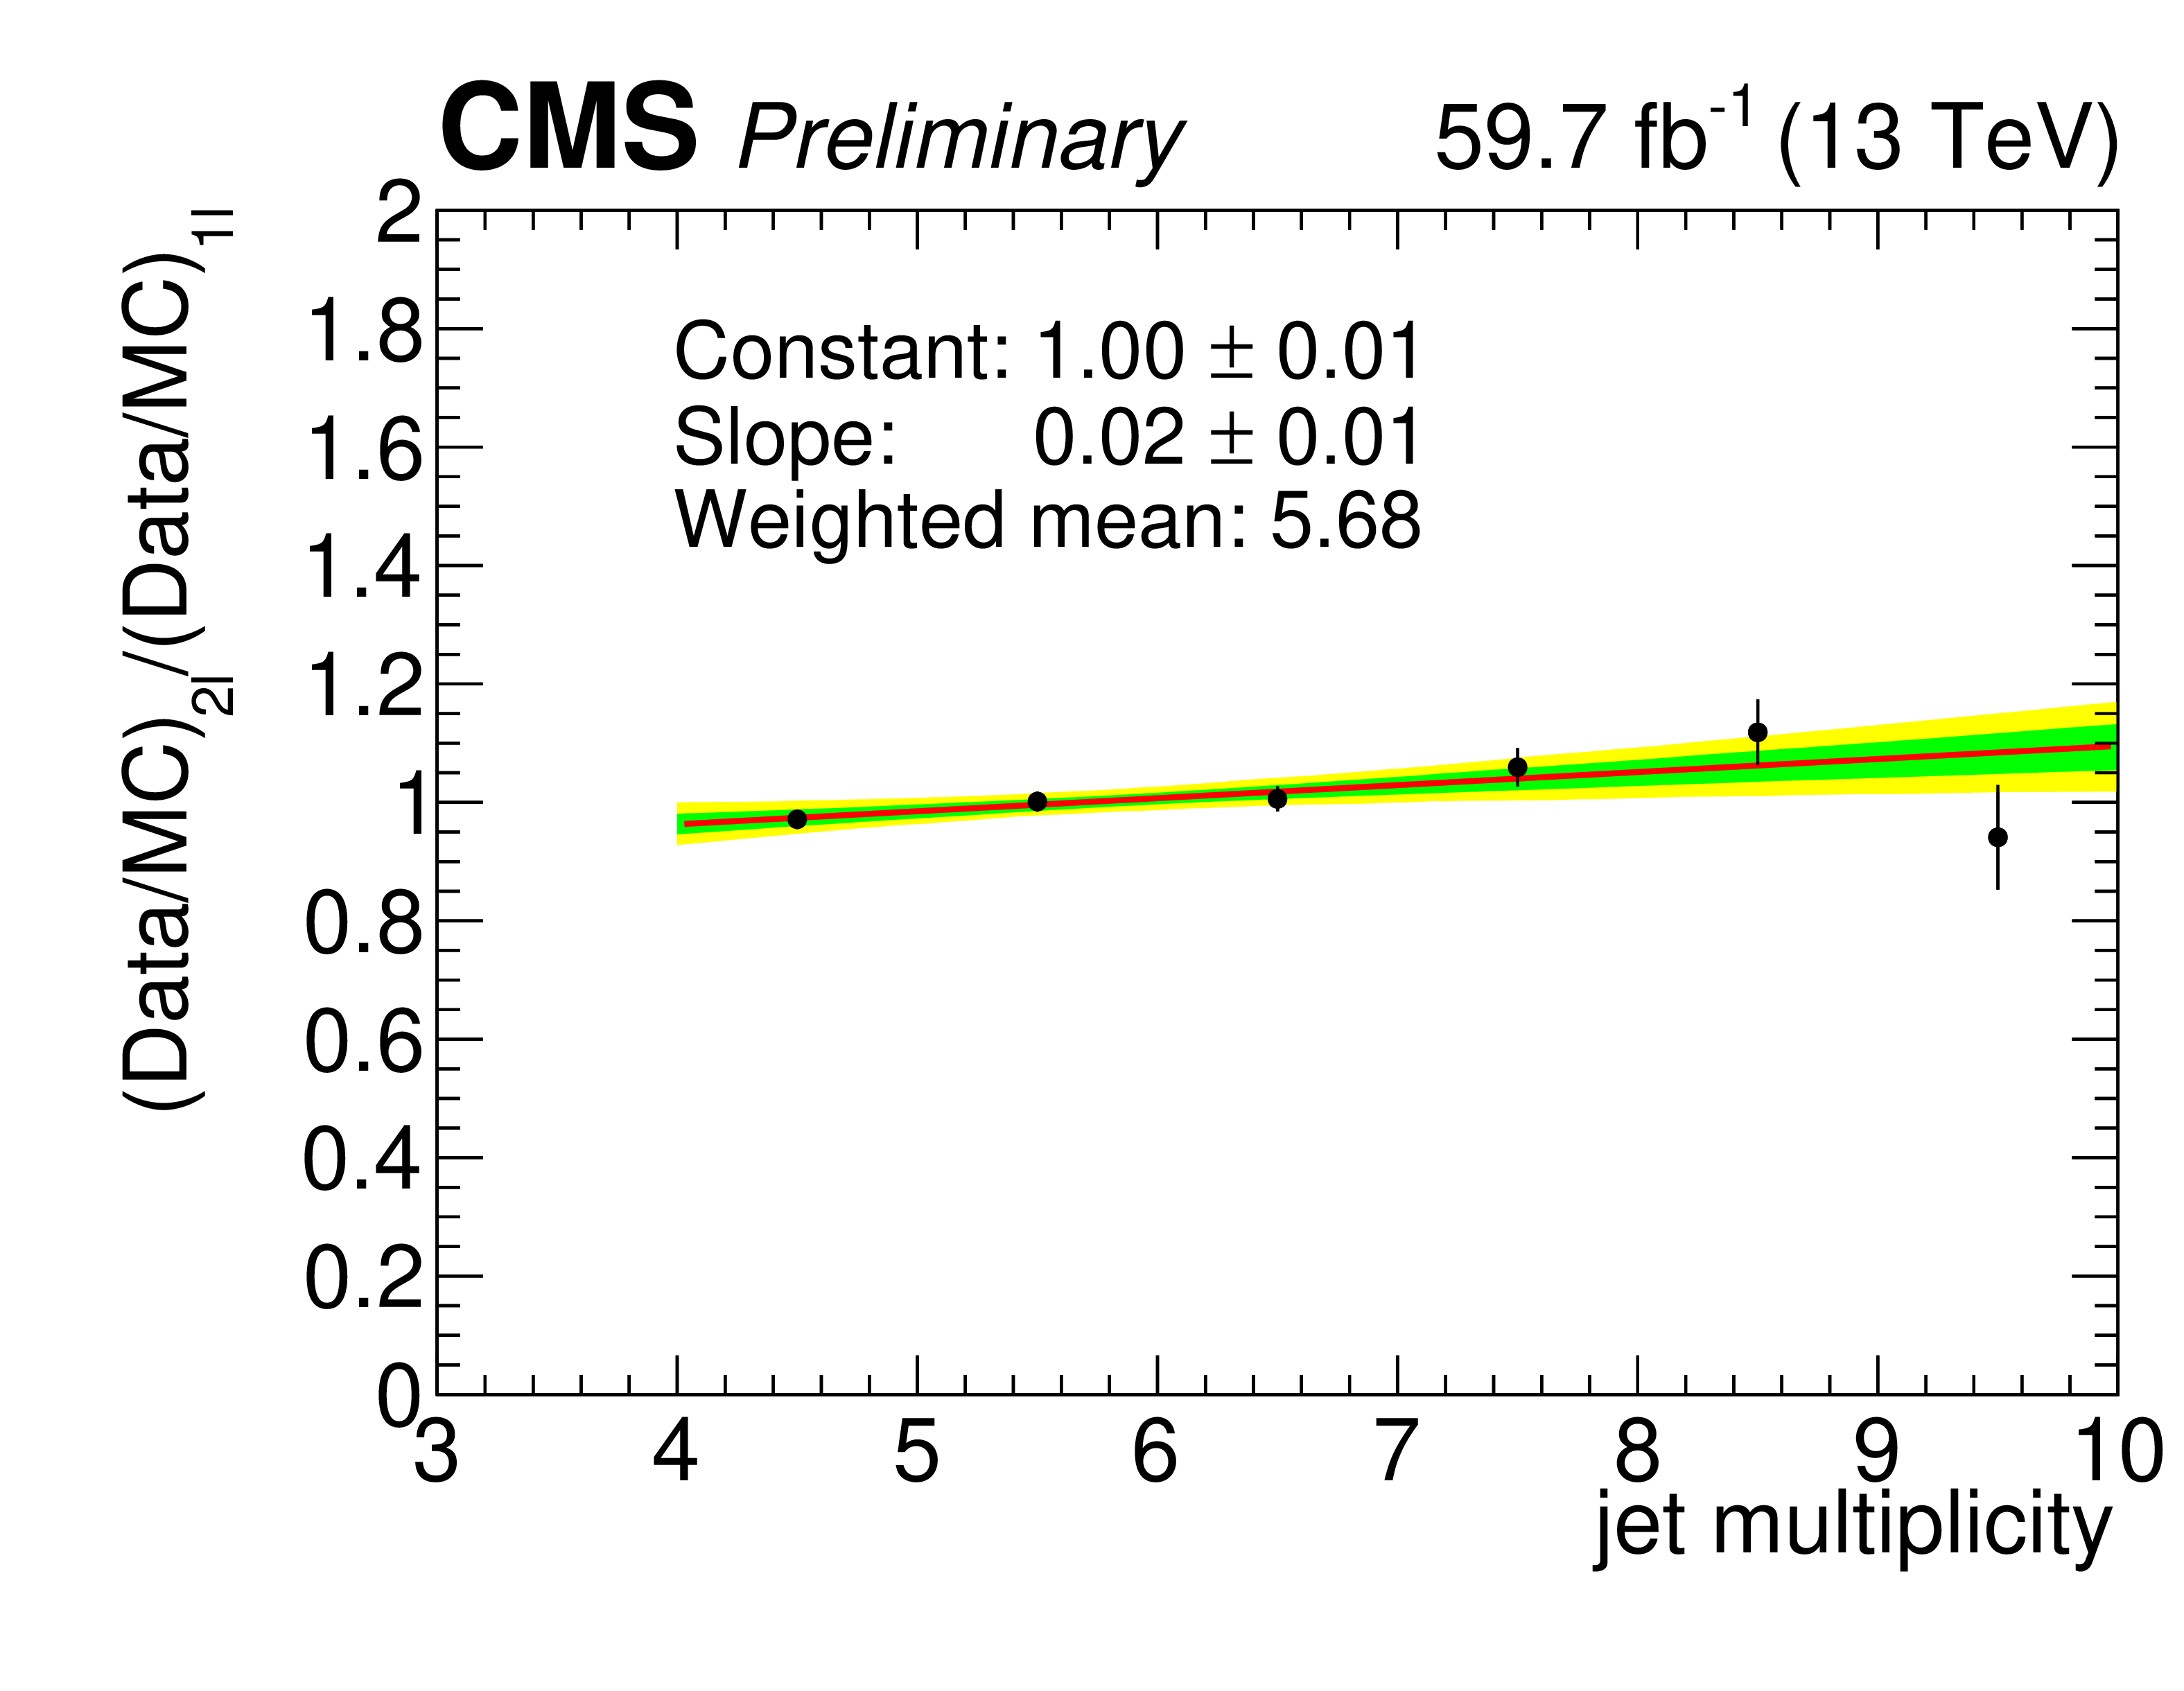
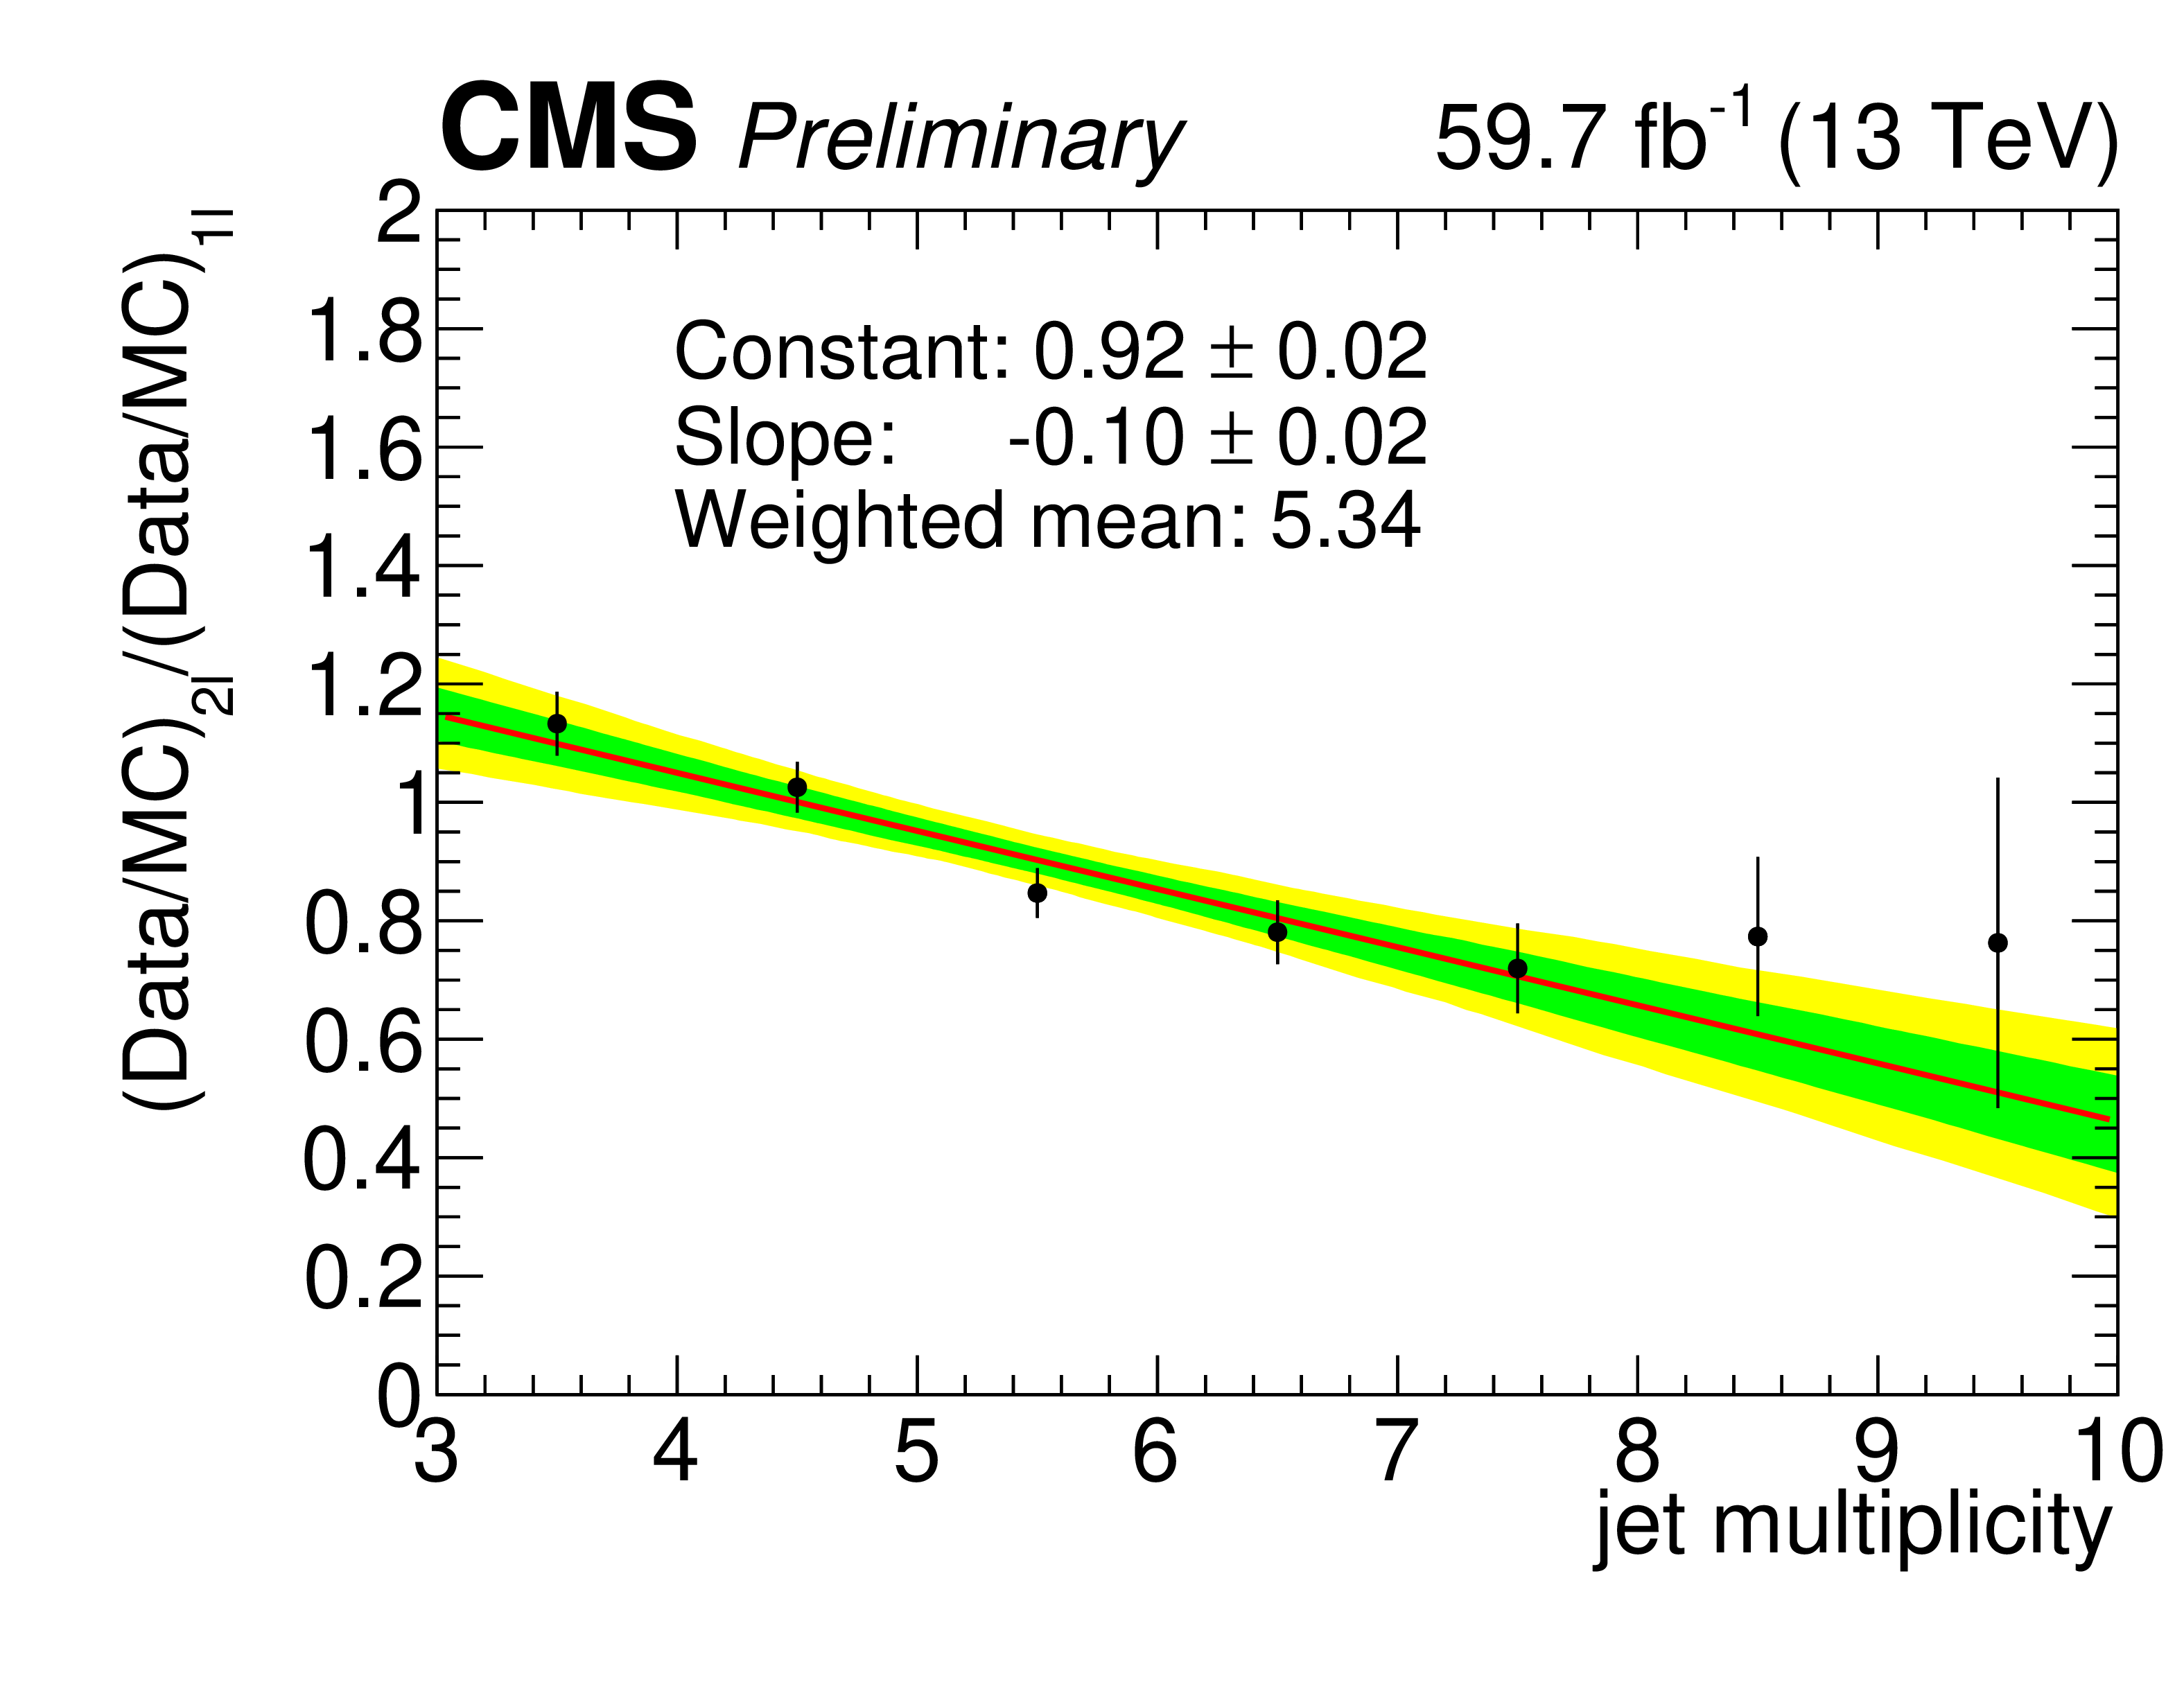
Figure 6:
The top row shows the jet multiplicity distribution after the single-lepton baseline selection excluding the SRs (left) for the multi-b selection and (right) for the zero-b selection, while the middle row contains the dilepton CRs, again (left) for the multi-b selection and (right) for the zero-b selection. The simulation is normalized to data with the scale factor (SF) mentioned in the plot. The double ratio of the single-lepton and dilepton ratio between data and simulation together with the fit is shown in the bottom row for (left) the multi-b and (right) the zero-b analysis. The fits are performed for each data taking year, 2018 is shown as an example. |
png pdf |
Figure 6-a:
The top row shows the jet multiplicity distribution after the single-lepton baseline selection excluding the SRs (left) for the multi-b selection and (right) for the zero-b selection, while the middle row contains the dilepton CRs, again (left) for the multi-b selection and (right) for the zero-b selection. The simulation is normalized to data with the scale factor (SF) mentioned in the plot. The double ratio of the single-lepton and dilepton ratio between data and simulation together with the fit is shown in the bottom row for (left) the multi-b and (right) the zero-b analysis. The fits are performed for each data taking year, 2018 is shown as an example. |
png pdf |
Figure 6-b:
The top row shows the jet multiplicity distribution after the single-lepton baseline selection excluding the SRs (left) for the multi-b selection and (right) for the zero-b selection, while the middle row contains the dilepton CRs, again (left) for the multi-b selection and (right) for the zero-b selection. The simulation is normalized to data with the scale factor (SF) mentioned in the plot. The double ratio of the single-lepton and dilepton ratio between data and simulation together with the fit is shown in the bottom row for (left) the multi-b and (right) the zero-b analysis. The fits are performed for each data taking year, 2018 is shown as an example. |
png pdf |
Figure 6-c:
The top row shows the jet multiplicity distribution after the single-lepton baseline selection excluding the SRs (left) for the multi-b selection and (right) for the zero-b selection, while the middle row contains the dilepton CRs, again (left) for the multi-b selection and (right) for the zero-b selection. The simulation is normalized to data with the scale factor (SF) mentioned in the plot. The double ratio of the single-lepton and dilepton ratio between data and simulation together with the fit is shown in the bottom row for (left) the multi-b and (right) the zero-b analysis. The fits are performed for each data taking year, 2018 is shown as an example. |
png pdf |
Figure 6-d:
The top row shows the jet multiplicity distribution after the single-lepton baseline selection excluding the SRs (left) for the multi-b selection and (right) for the zero-b selection, while the middle row contains the dilepton CRs, again (left) for the multi-b selection and (right) for the zero-b selection. The simulation is normalized to data with the scale factor (SF) mentioned in the plot. The double ratio of the single-lepton and dilepton ratio between data and simulation together with the fit is shown in the bottom row for (left) the multi-b and (right) the zero-b analysis. The fits are performed for each data taking year, 2018 is shown as an example. |
png pdf |
Figure 6-e:
The top row shows the jet multiplicity distribution after the single-lepton baseline selection excluding the SRs (left) for the multi-b selection and (right) for the zero-b selection, while the middle row contains the dilepton CRs, again (left) for the multi-b selection and (right) for the zero-b selection. The simulation is normalized to data with the scale factor (SF) mentioned in the plot. The double ratio of the single-lepton and dilepton ratio between data and simulation together with the fit is shown in the bottom row for (left) the multi-b and (right) the zero-b analysis. The fits are performed for each data taking year, 2018 is shown as an example. |
png pdf |
Figure 6-f:
The top row shows the jet multiplicity distribution after the single-lepton baseline selection excluding the SRs (left) for the multi-b selection and (right) for the zero-b selection, while the middle row contains the dilepton CRs, again (left) for the multi-b selection and (right) for the zero-b selection. The simulation is normalized to data with the scale factor (SF) mentioned in the plot. The double ratio of the single-lepton and dilepton ratio between data and simulation together with the fit is shown in the bottom row for (left) the multi-b and (right) the zero-b analysis. The fits are performed for each data taking year, 2018 is shown as an example. |

png pdf |
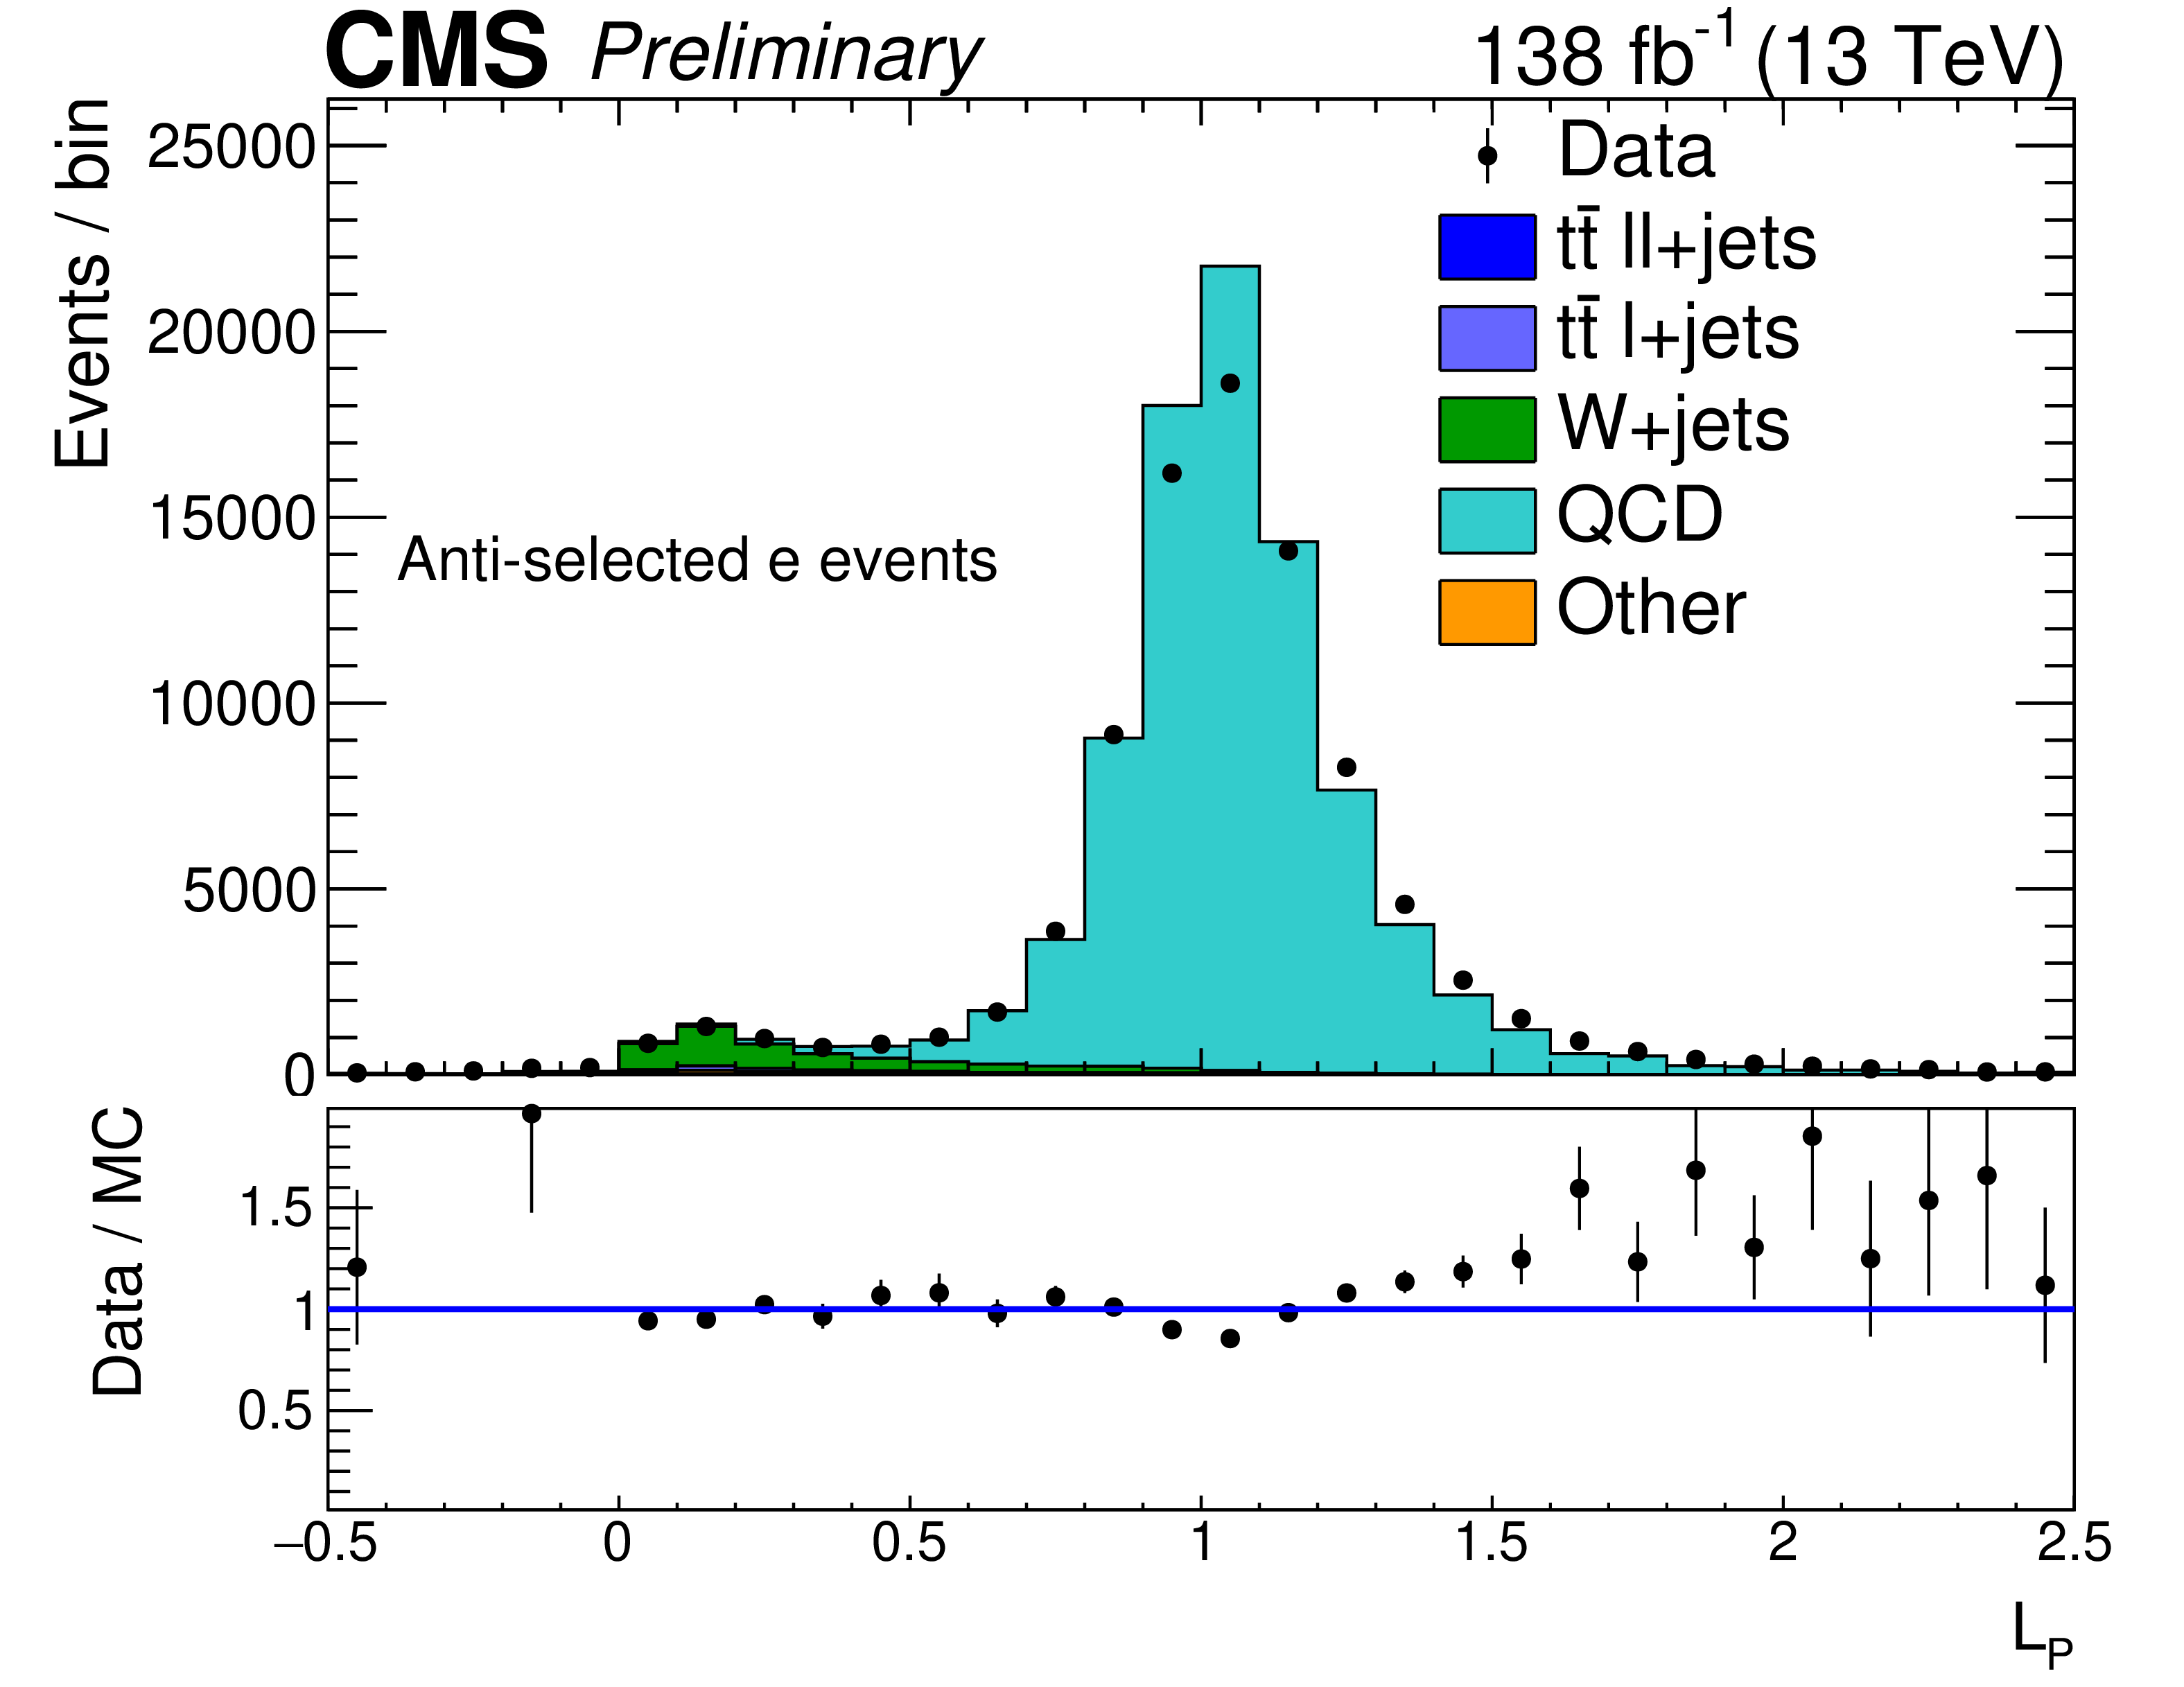
Figure 7:
The ${L_{\textrm P}}$ distribution for (left) selected and (right) anti-selected electron candidates in the baseline QCD selection, with modified requirements of $ {n_\textrm {jet}} \in [3,4]$ and $ {n_\textrm {b}} = $ 0. |

png pdf |
Figure 7-a:
The ${L_{\textrm P}}$ distribution for (left) selected and (right) anti-selected electron candidates in the baseline QCD selection, with modified requirements of $ {n_\textrm {jet}} \in [3,4]$ and $ {n_\textrm {b}} = $ 0. |
png pdf |
Figure 7-b:
The ${L_{\textrm P}}$ distribution for (left) selected and (right) anti-selected electron candidates in the baseline QCD selection, with modified requirements of $ {n_\textrm {jet}} \in [3,4]$ and $ {n_\textrm {b}} = $ 0. |

png pdf |
Figure 8:
Observed event yields in the MB SR of the multi-b analysis compared to signal and background predictions, for all three years combined. The relative fraction of the different SM EW background contributions determined in simulation is shown by the stacked, colored histograms, normalized so that their sum is equal to the background estimated using data control regions. The QCD background is predicted using the ${L_{\textrm P}}$ method. The signal is shown for two representative combinations of gluino/neutralino masses with large (2.2 TeV / 0.1 TeV) and small (1.8 TeV / 1.3 TeV) mass differences. |
png pdf |
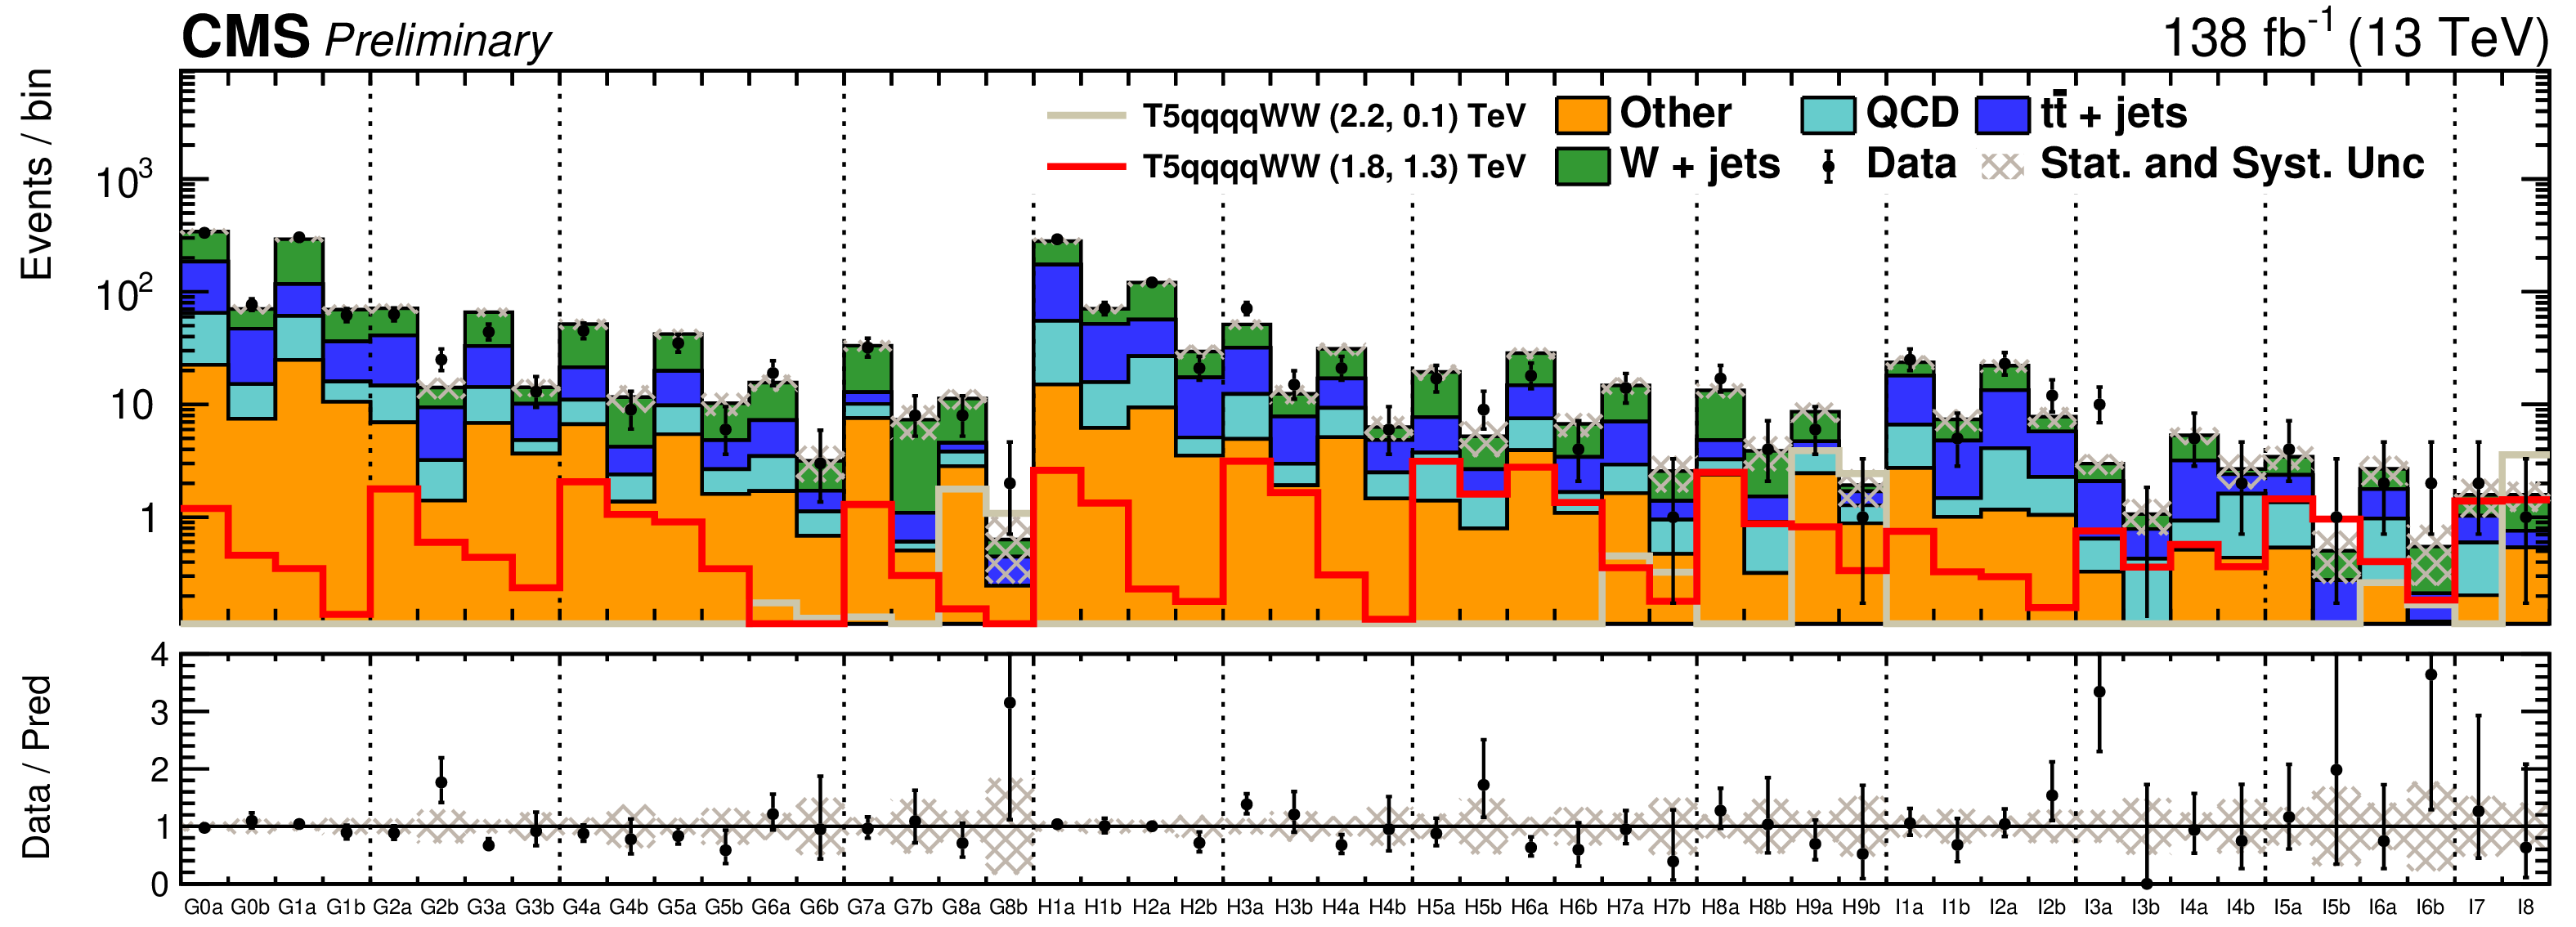
Figure 9:
Observed event yields in the MB SR of the zero-b analysis compared to signal and background predictions, for all three years combined. The W+jets, $\mathrm{t\bar{t}}$, and QCD predictions are extracted from data control samples, while the other background contributions are estimated from simulation. The signal is shown for two representative combinations of gluino/neutralino masses with large (2.2 TeV / 0.1 TeV) and small (1.8 TeV / 1.3 TeV) mass differences. |

png pdf |
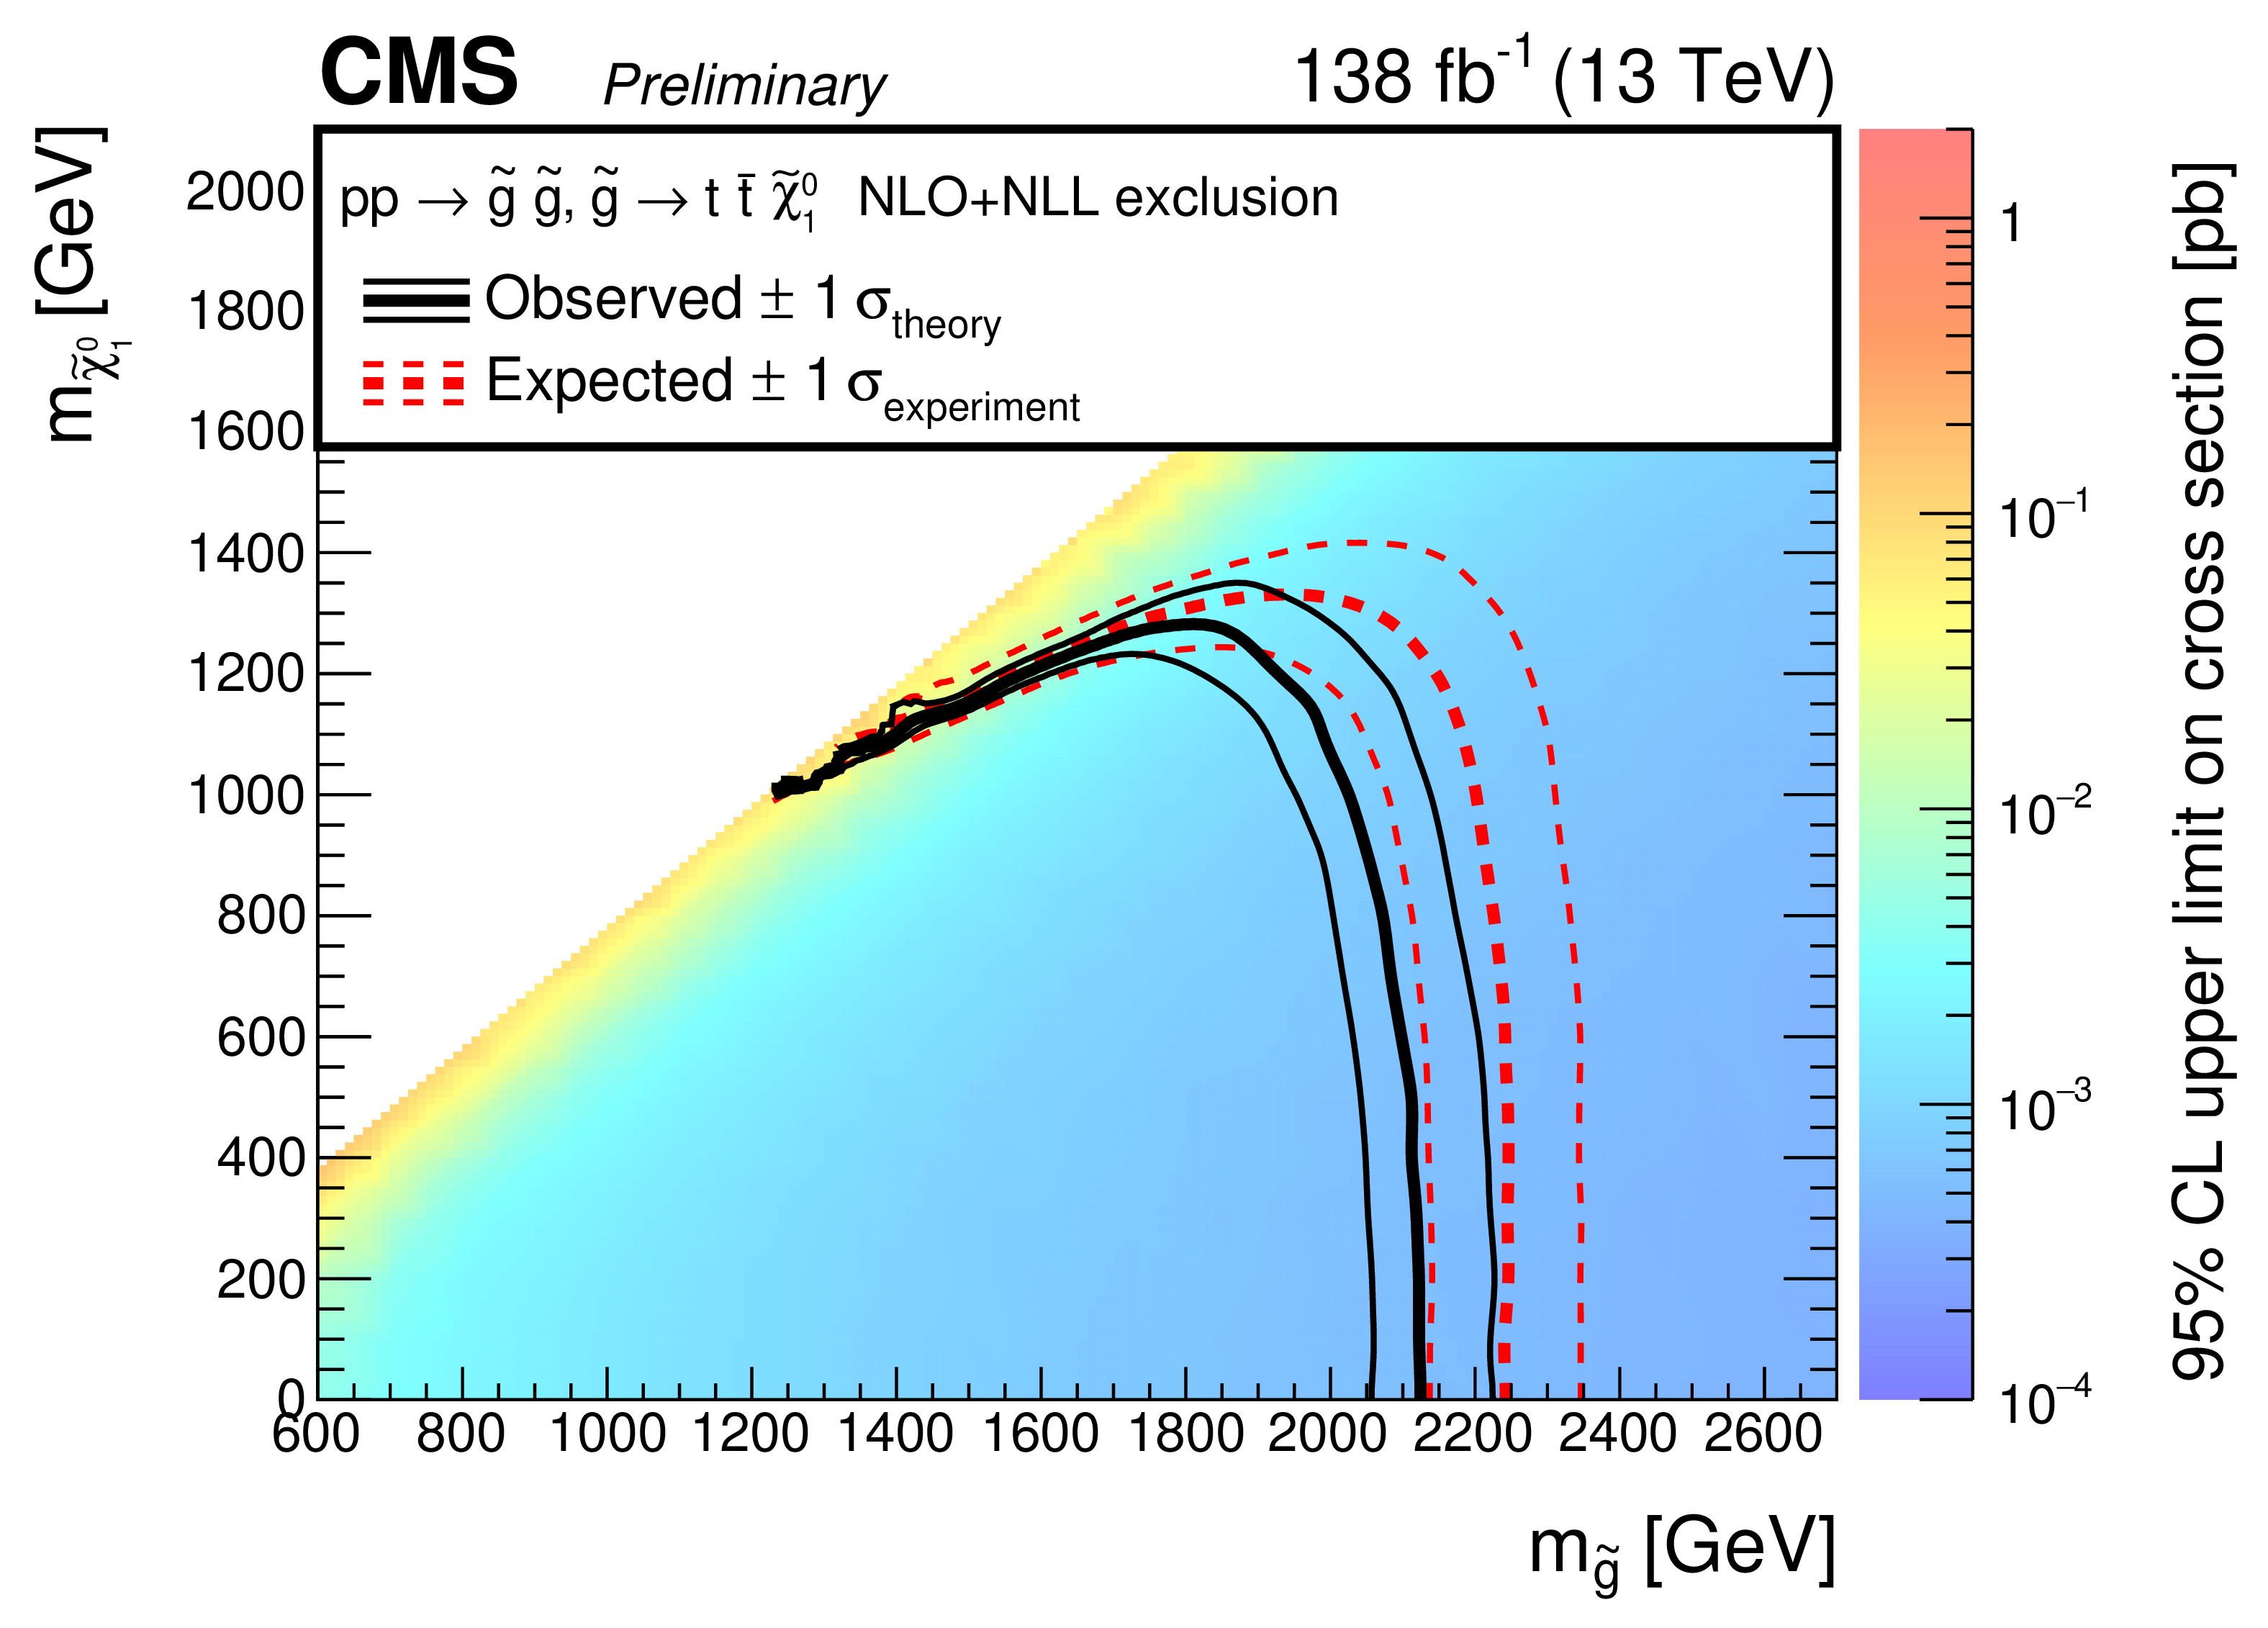
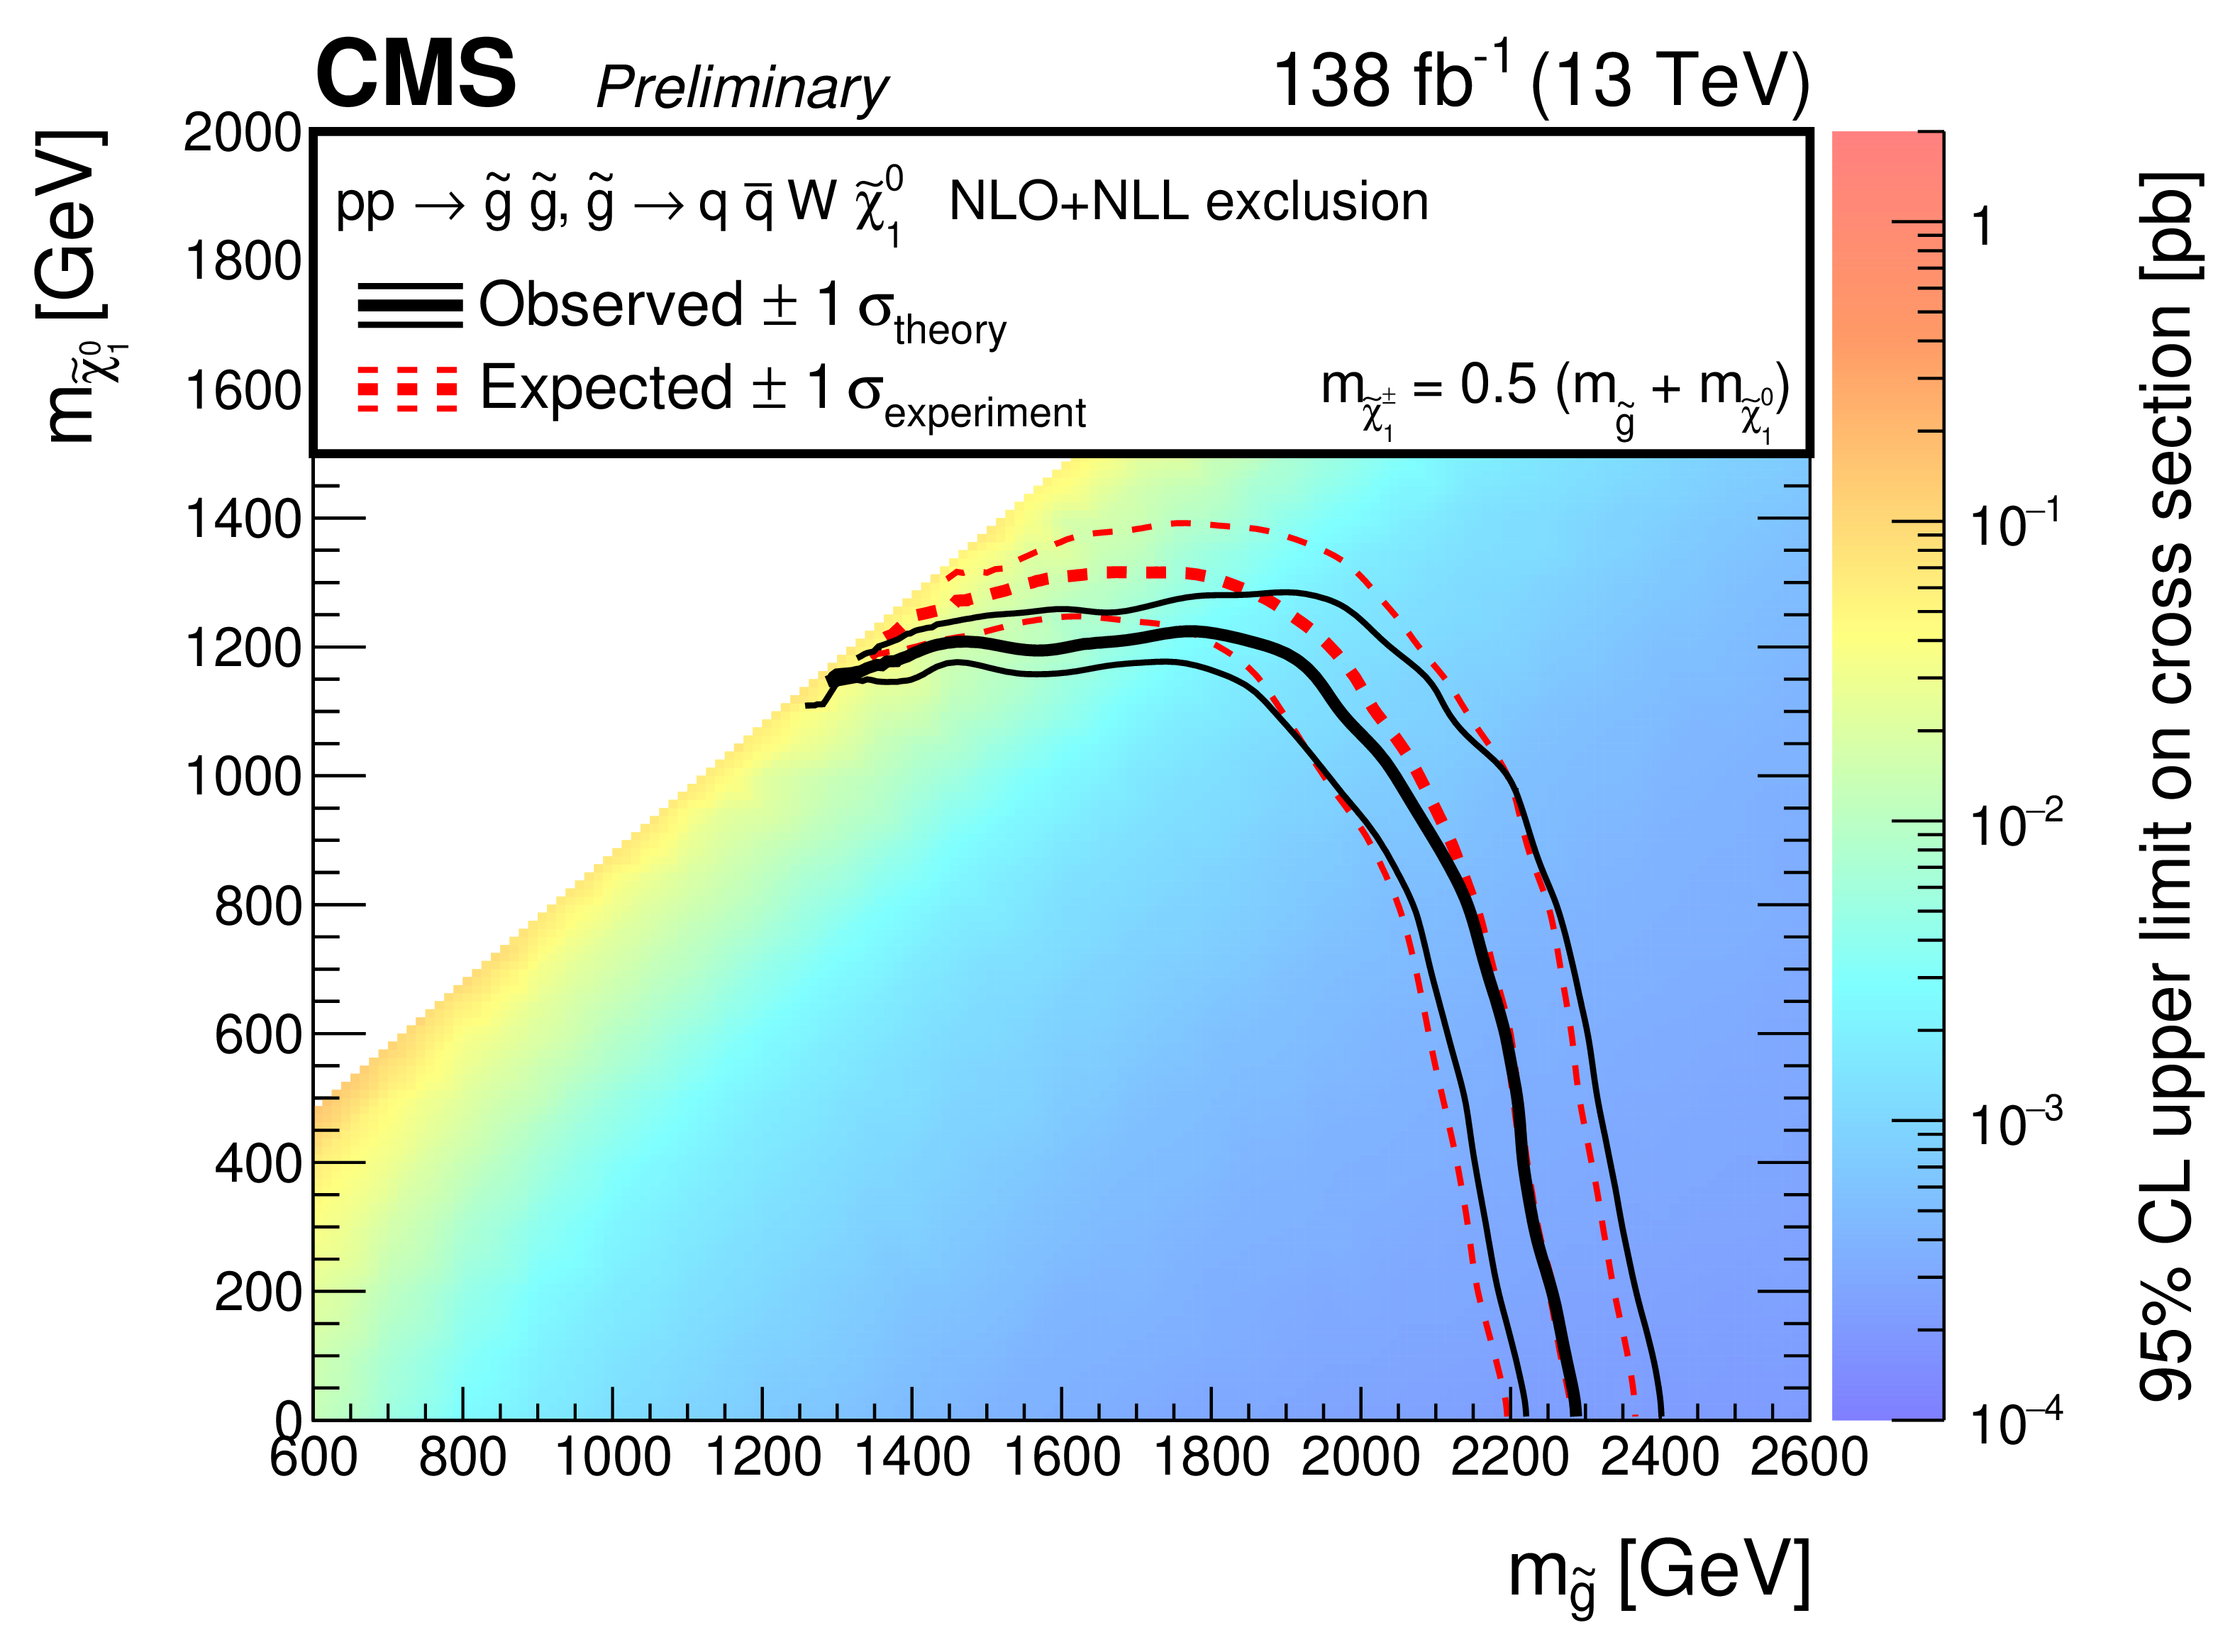
Figure 10:
Cross section limits at 95% CL (left) for the T1tttt and (right) for the T5qqqqWW model, as a function of the gluino and LSP masses, assuming a branching ratio of 100%. The mass of the intermediate chargino is taken to be halfway between the gluino and the neutralino masses. The solid black (dashed red) lines correspond to the observed (expected) mass limits, with the thicker lines representing the central values and the thinner lines representing the $ \pm $1$ \sigma $ uncertainty bands related to the theoretical (experimental) uncertainties. |
png pdf |
Figure 10-a:
Cross section limits at 95% CL (left) for the T1tttt and (right) for the T5qqqqWW model, as a function of the gluino and LSP masses, assuming a branching ratio of 100%. The mass of the intermediate chargino is taken to be halfway between the gluino and the neutralino masses. The solid black (dashed red) lines correspond to the observed (expected) mass limits, with the thicker lines representing the central values and the thinner lines representing the $ \pm $1$ \sigma $ uncertainty bands related to the theoretical (experimental) uncertainties. |
png pdf |
Figure 10-b:
Cross section limits at 95% CL (left) for the T1tttt and (right) for the T5qqqqWW model, as a function of the gluino and LSP masses, assuming a branching ratio of 100%. The mass of the intermediate chargino is taken to be halfway between the gluino and the neutralino masses. The solid black (dashed red) lines correspond to the observed (expected) mass limits, with the thicker lines representing the central values and the thinner lines representing the $ \pm $1$ \sigma $ uncertainty bands related to the theoretical (experimental) uncertainties. |
| Tables | |
png pdf |
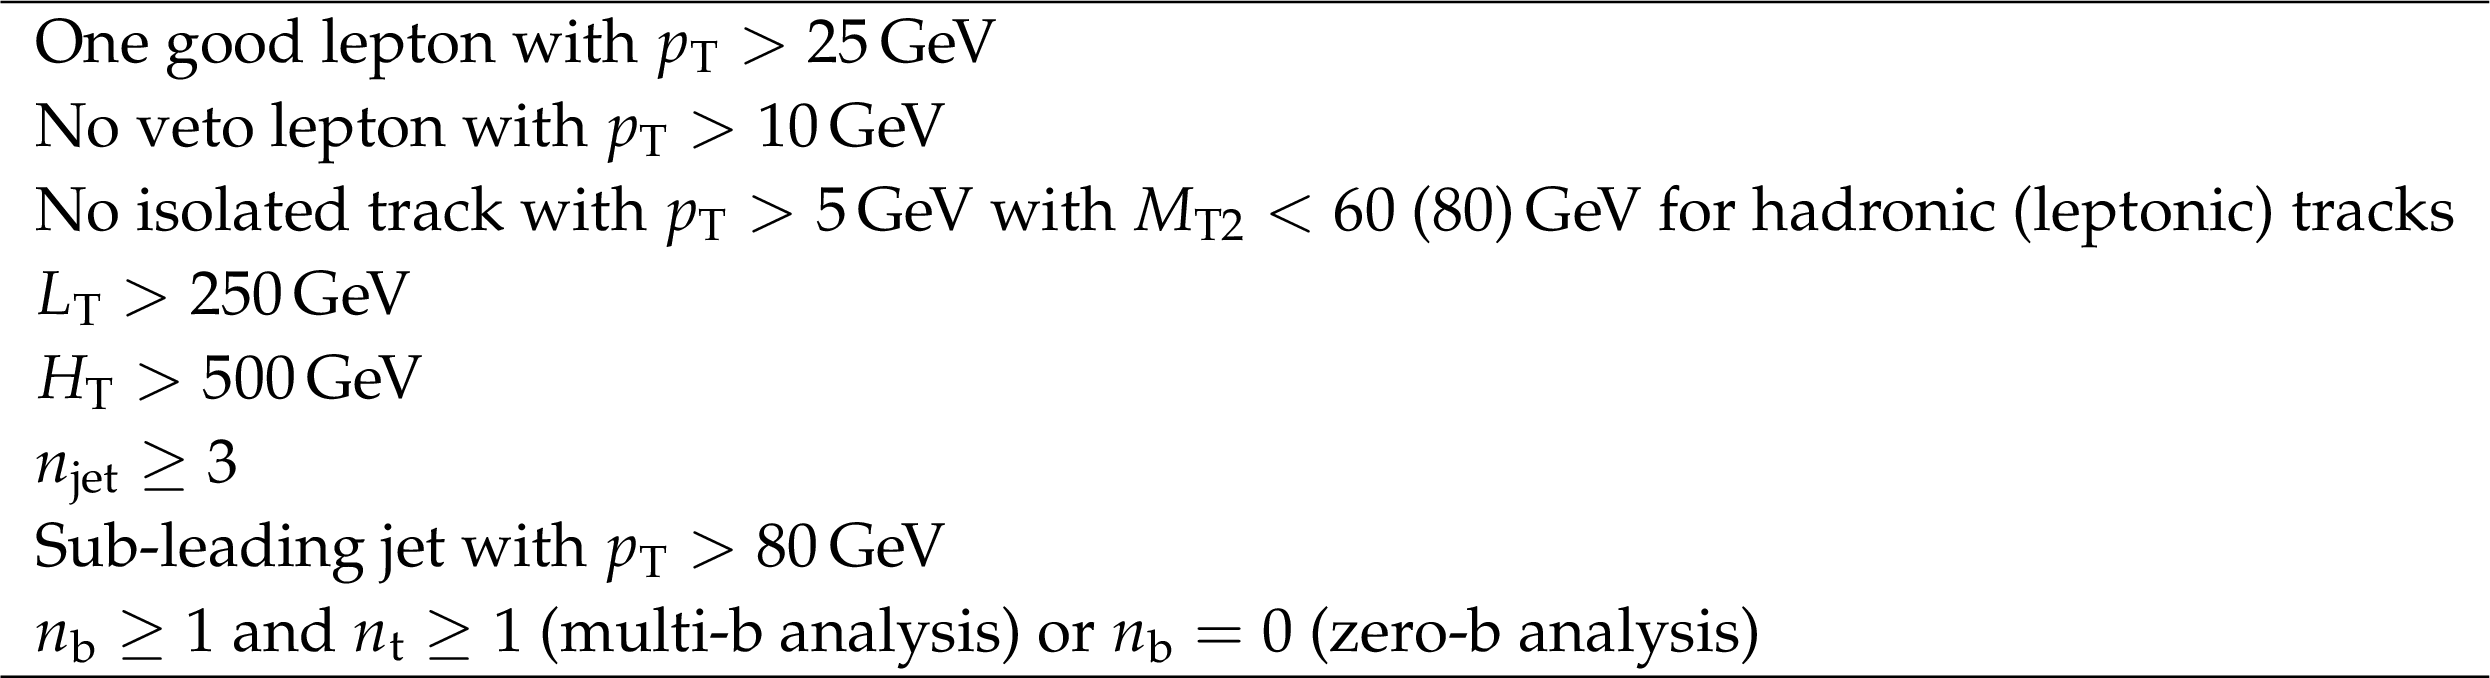
Table 1:
Baseline event selection. |
png pdf |
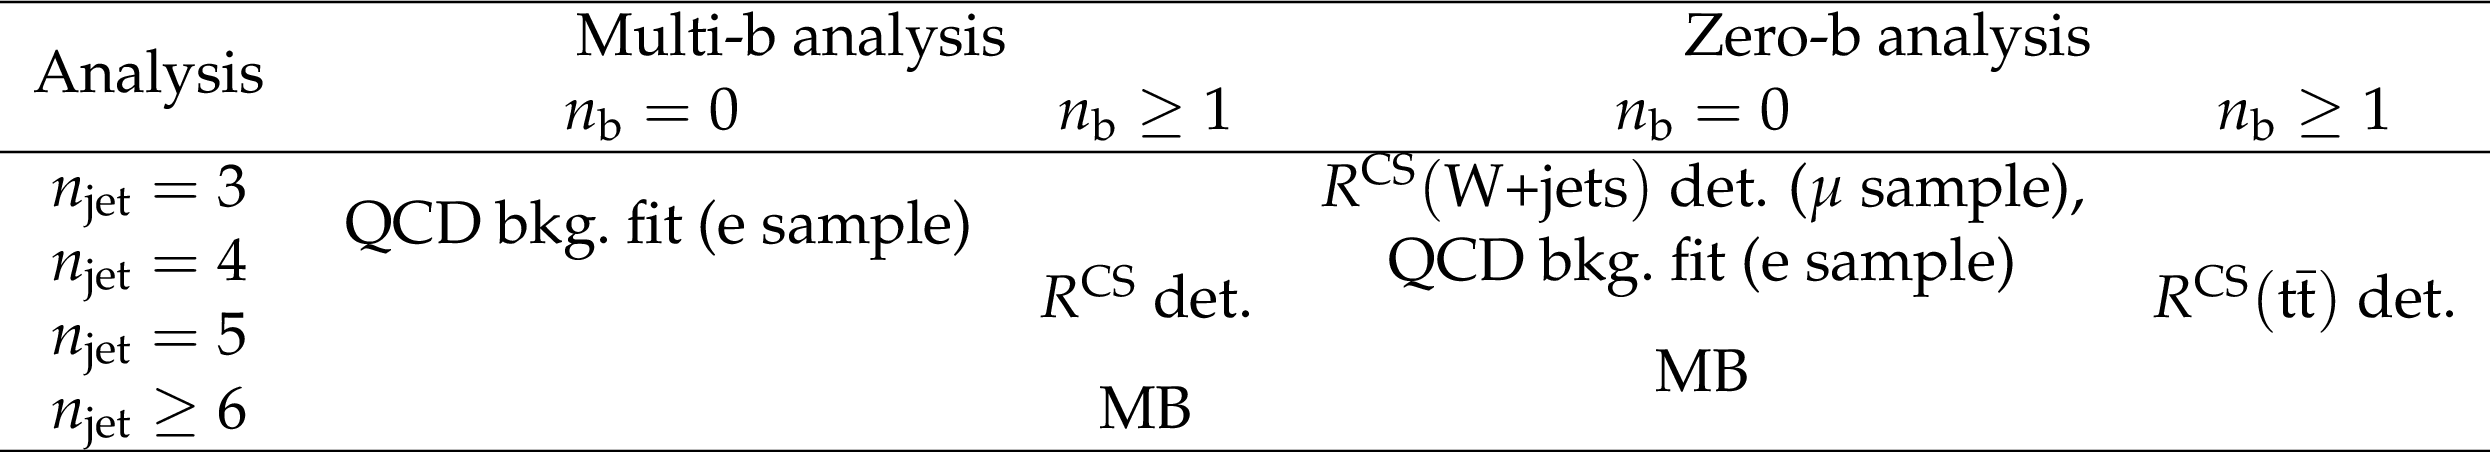
Table 2:
Overview of the definitions of sideband and mainband regions. For the multijet (QCD) fit the electron (e) sample is used, while the muon ($\mu$) sample is used for the determination (det.) of $ {R^{\textrm {CS}}} (\mathrm{W^{\pm}})$. |
png pdf |
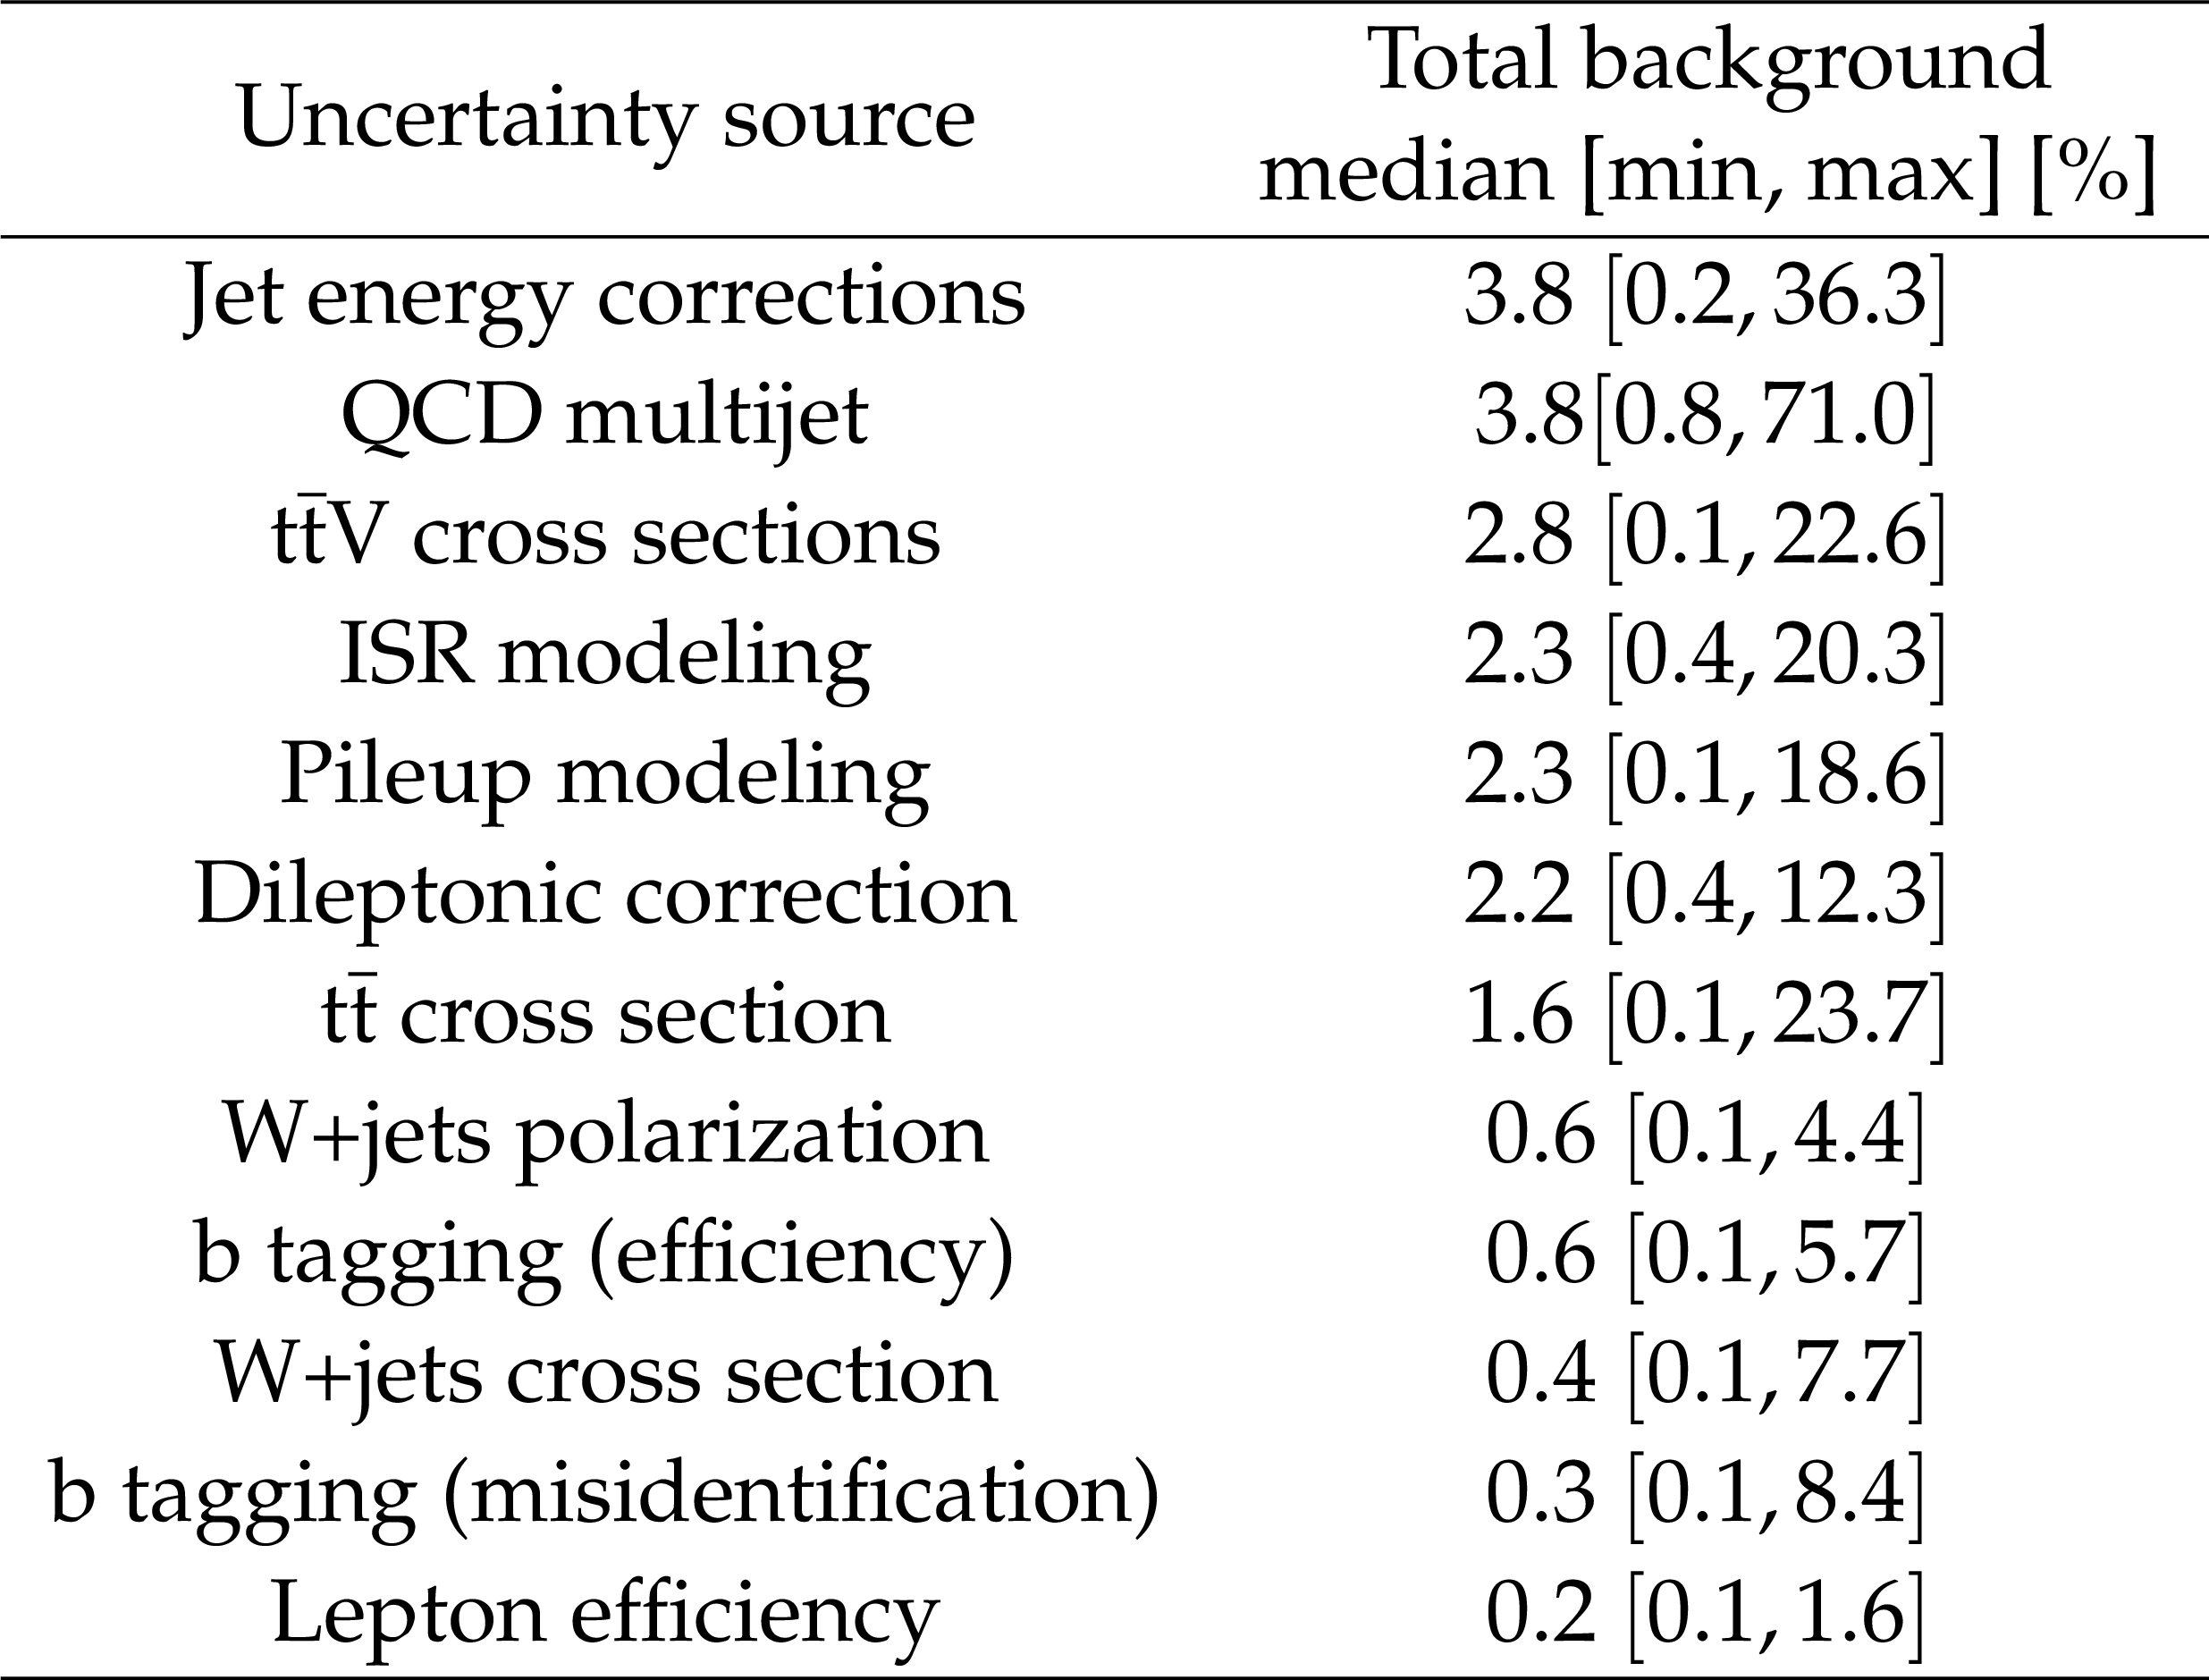
Table 3:
Summary of systematic uncertainties in the background prediction for the multi-b analysis. For each uncertainty source, the median, minimal (min), and maximal (max) impact on the total background prediction is shown, where the three quantities refer to the set of MB SR bins. |

png pdf |
Table 4:
Summary of systematic uncertainties in the background prediction for the zero-b analysis. For each uncertainty source, the median, minimal (min), and maximal (max) impact on the $\mathrm{t\bar{t}}$, W+jets, and total background prediction is shown, where the three quantities refer to the set of MB SR bins. |
png pdf |
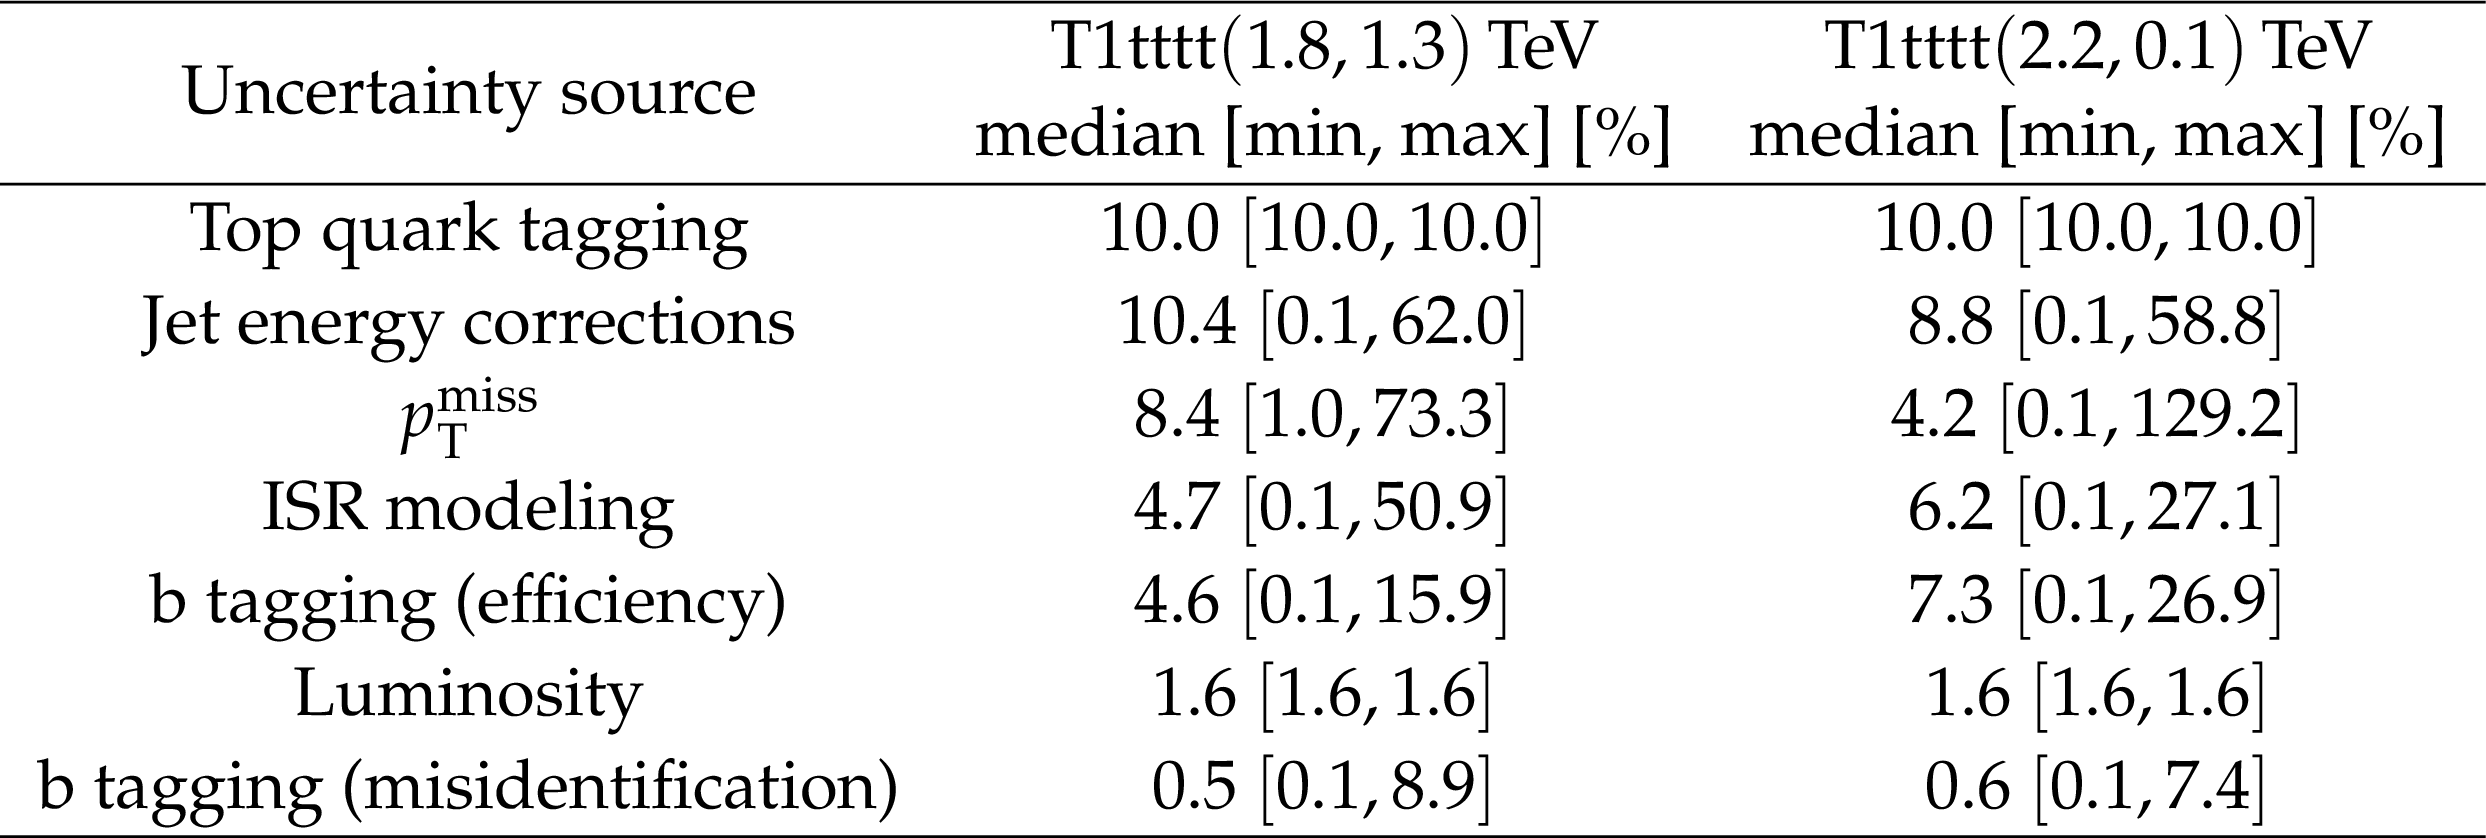
Table 5:
Summary of systematic uncertainties in the signal prediction for the multi-b analysis. For each uncertainty source, the median, minimal (min), and maximal (max) impact on the total background prediction is shown, where the three quantities refer to the set of MB SR bins. The MET uncertainty has a very high maximum value for T1tttt(2.2, 0.1) in one bin with low sensitivity to the signal. The gluino and LSP masses are indicated in units of TeV. |
png pdf |
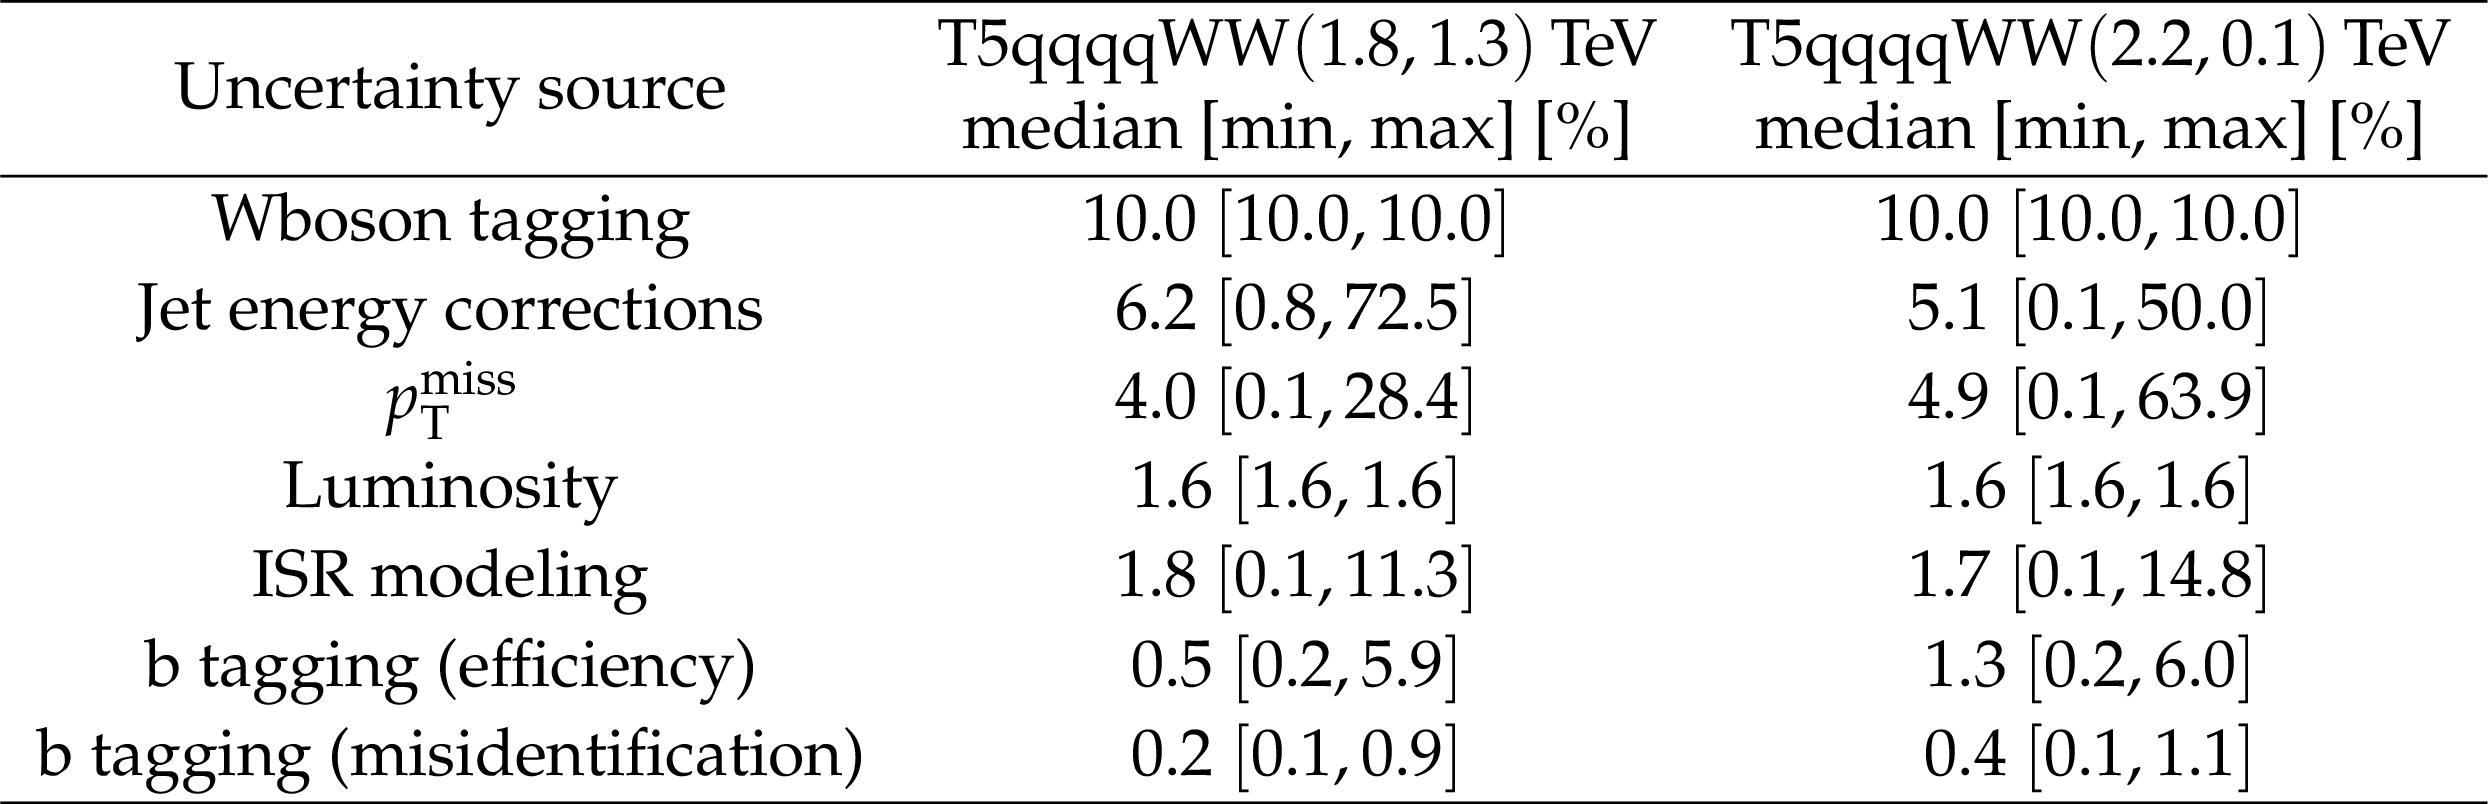
Table 6:
Summary of systematic uncertainties in the signal prediction for the zero-b analysis. For each uncertainty source, the median, minimal (min), and maximal (max) impact on the total background prediction is shown, where the three quantities refer to the set of MB SR bins. The gluino and LSP masses are indicated in units of TeV. |
png pdf |
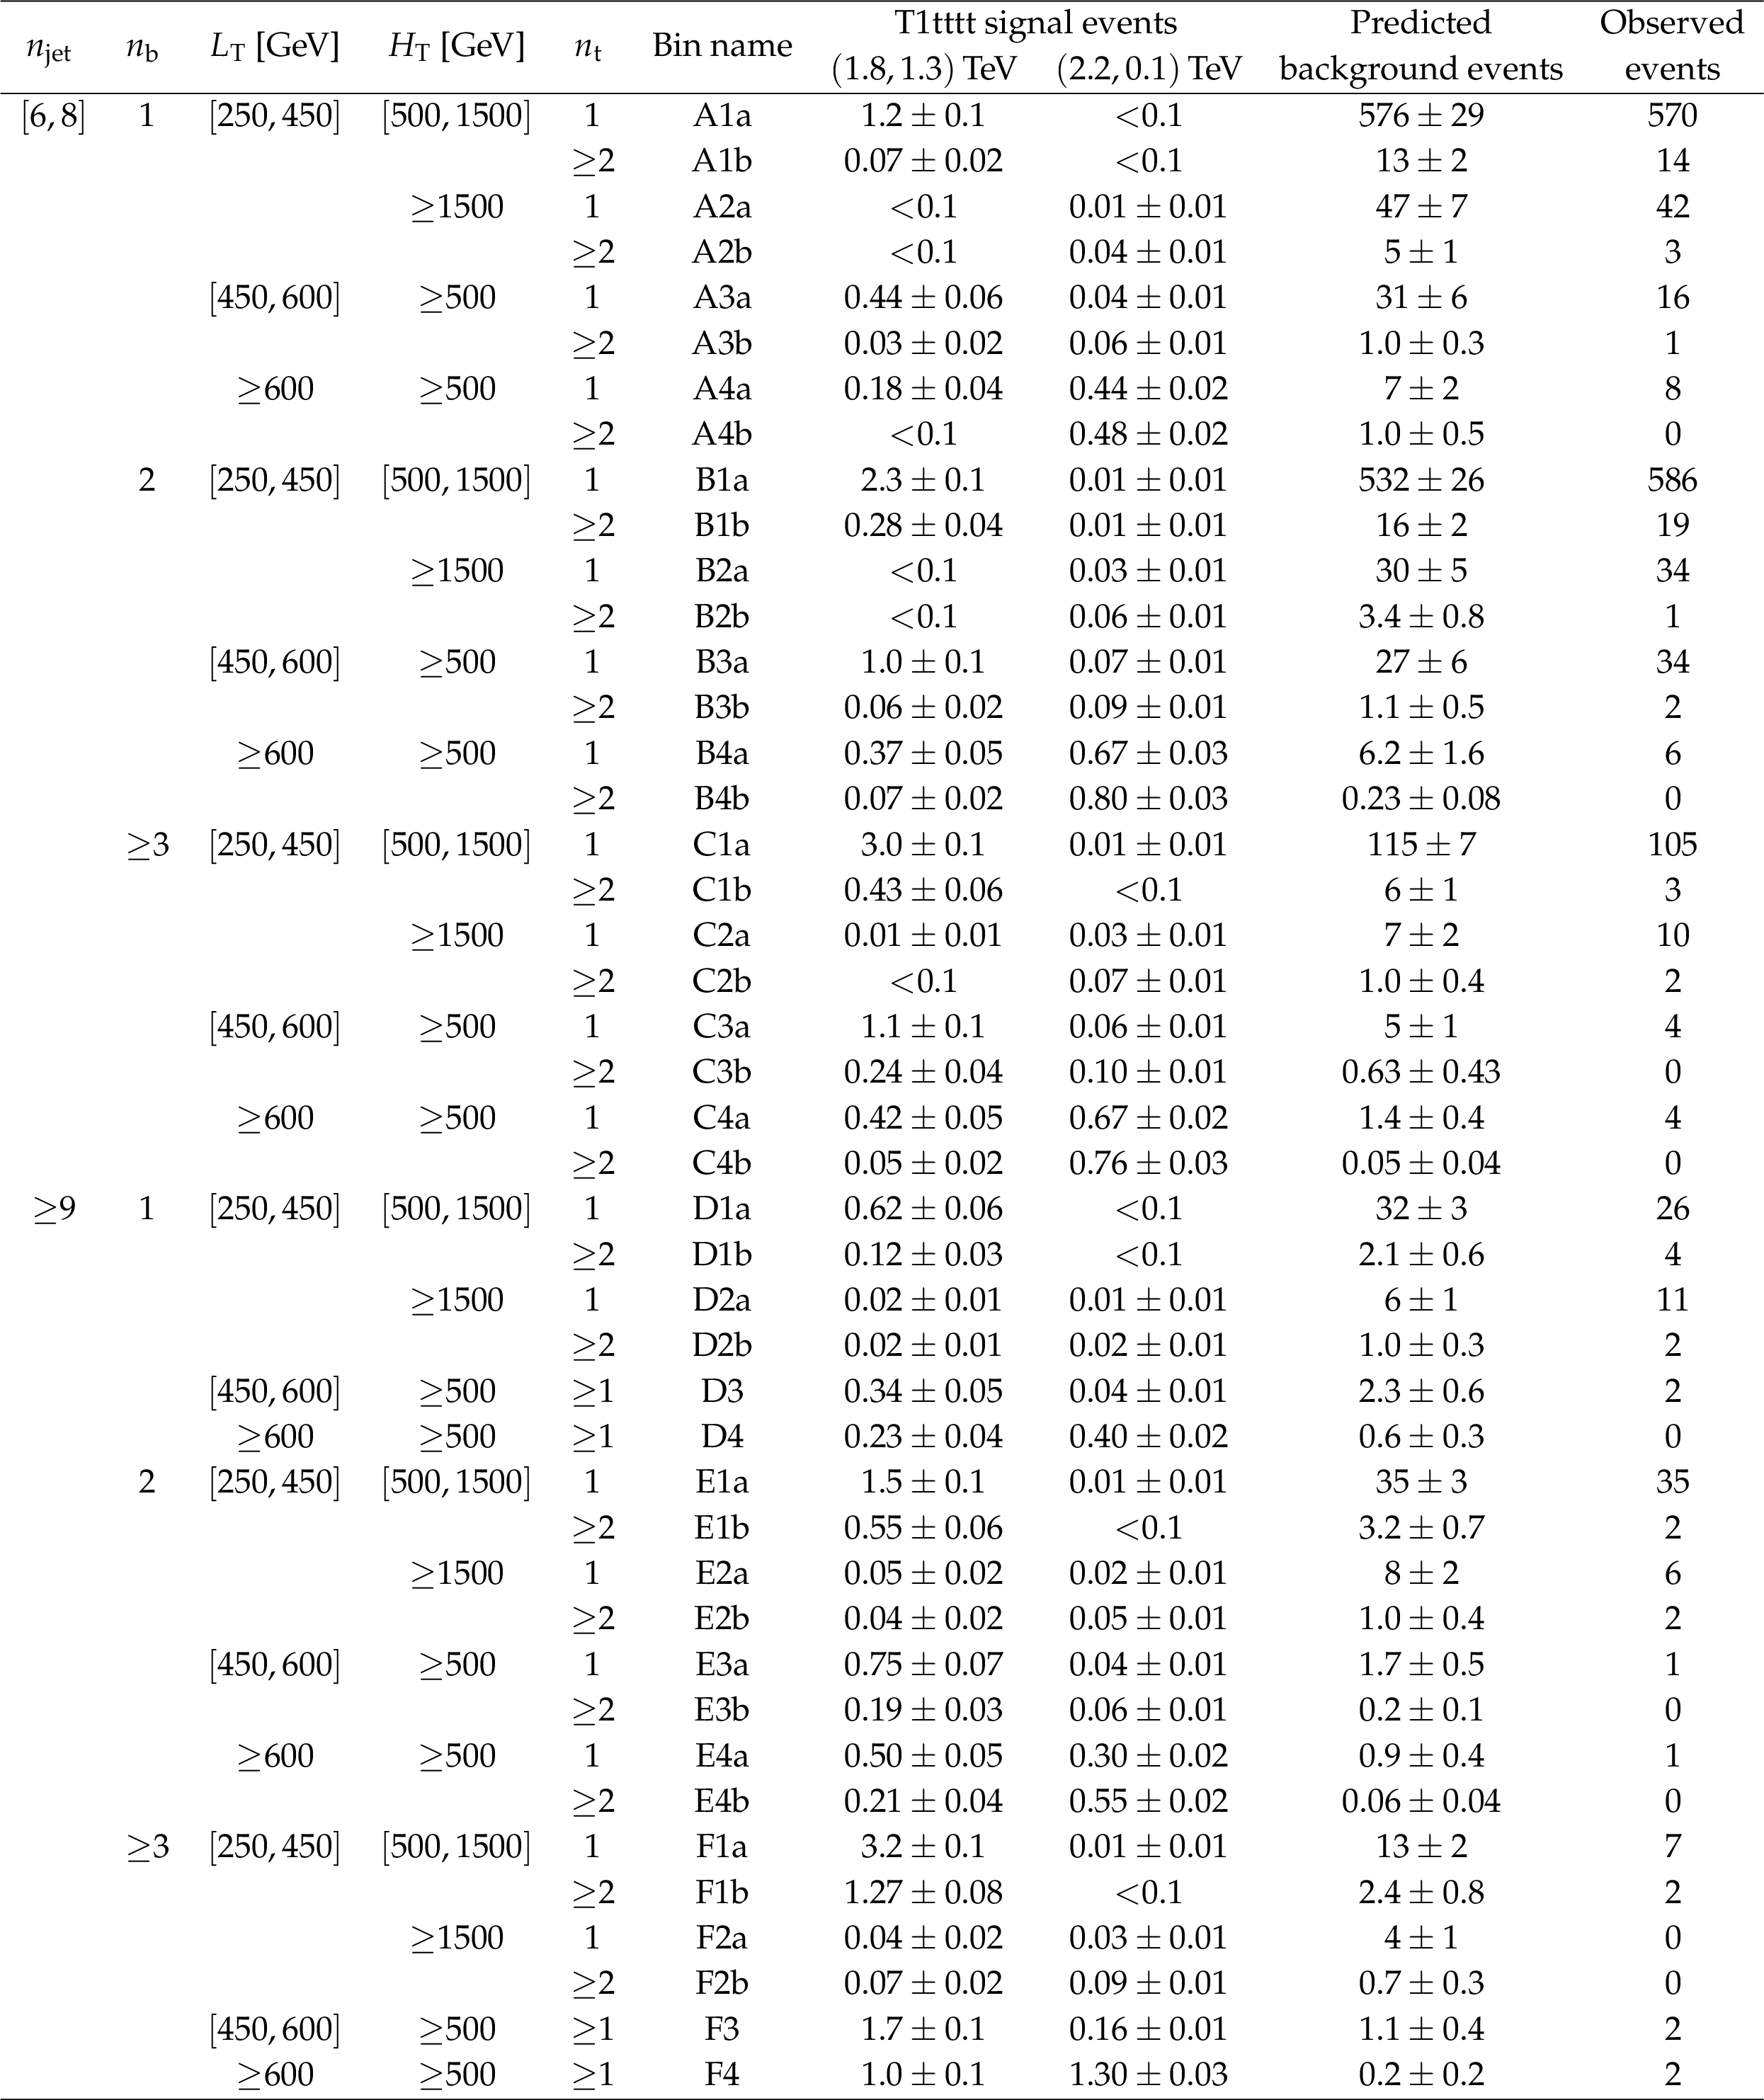
Table 7:
Observed number of events in the search region bins of the multi-b analysis, together with the predicted yields for background and two T1tttt(${m_{{\mathrm{\tilde{g}}}}}$, ${m_{{\tilde{\chi}^0_1}}}$) signal points. For the latter, the gluino and LSP masses are indicated in units of TeV. All bins are defined with $ {\Delta \phi} > 0.75$. |
png pdf |
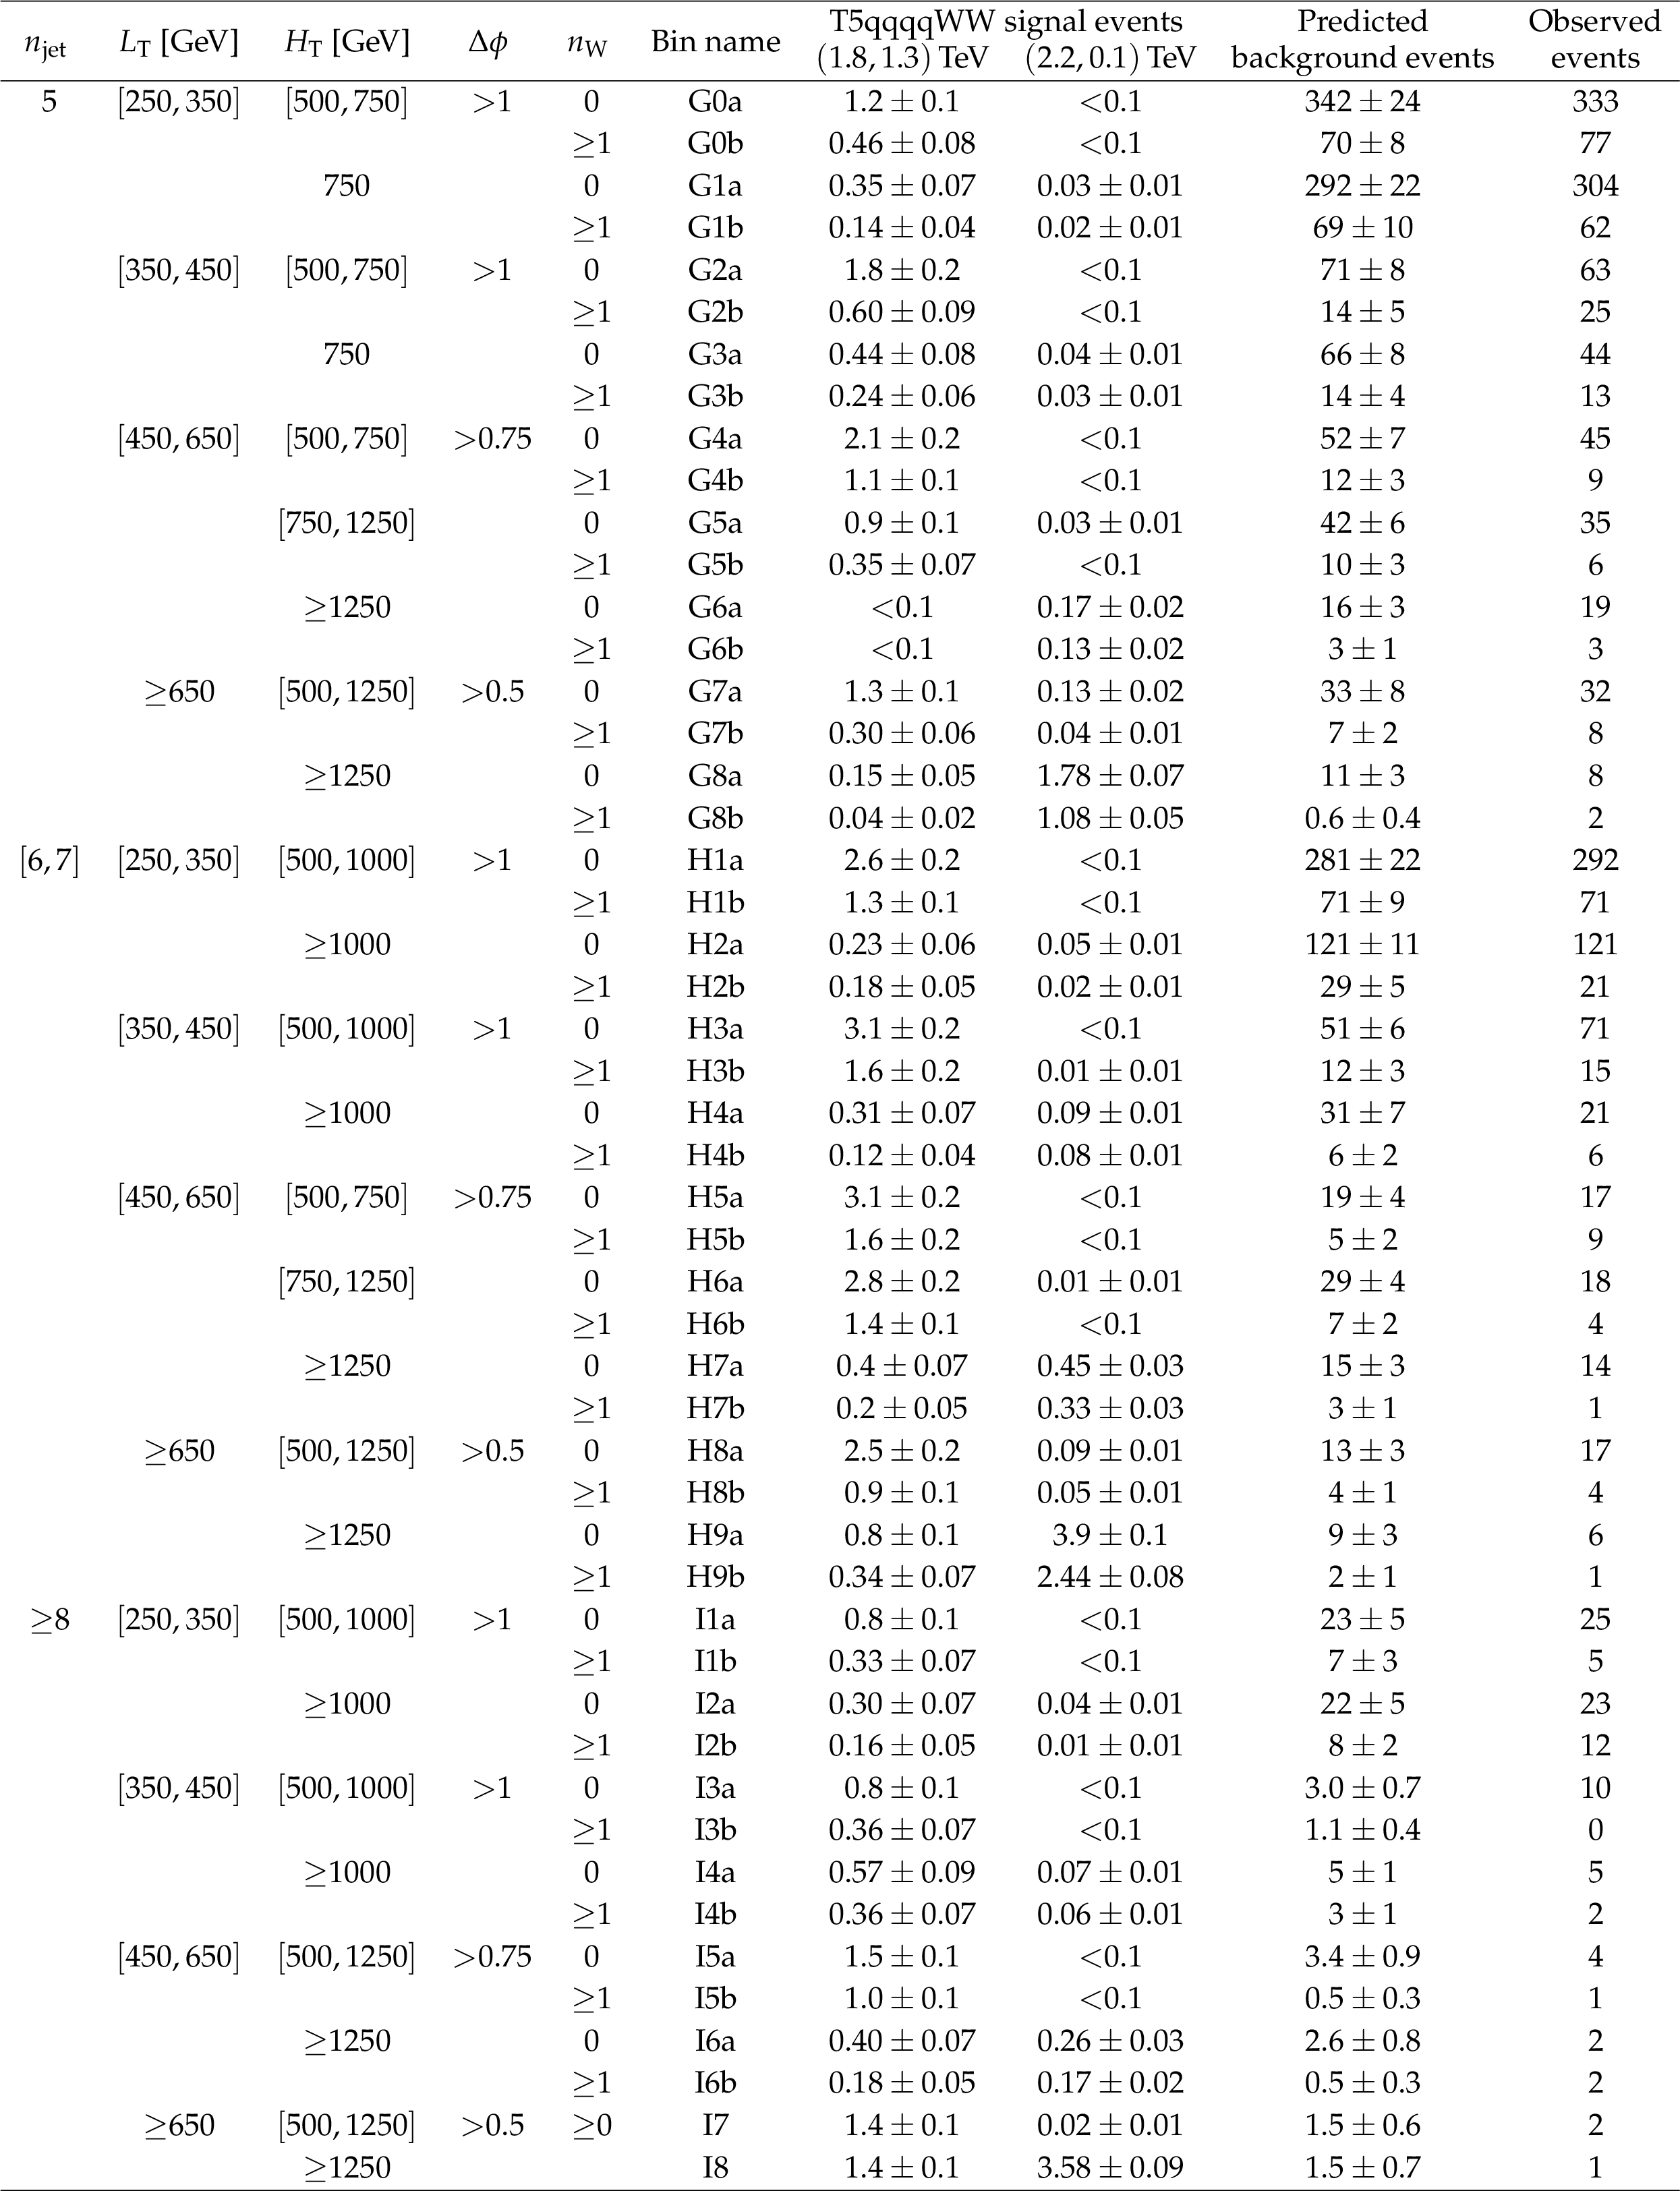
Table 8:
Observed number of events in the search region bins of the zero-b analysis, together with the predicted yields for background and two T5qqqqWW(${m_{{\mathrm{\tilde{g}}}}}$, ${m_{{\tilde{\chi}^0_1}}}$) signal points. For the latter, the gluino and LSP masses are indicated in units of TeV. |
| Summary |
|
A search for supersymmetry has been performed using a sample of proton-proton collisions at $\sqrt{s} = $ 13 TeV with an integrated luminosity of 138 fb$^{-1}$, recorded by the CMS experiment. Events with a single charged lepton (electron or muon) and multiple jets are selected. Top quark and W boson tagging algorithms based on machine-learning techniques are employed to suppress the main background contributions in the analysis. Various exclusive search regions are defined that differ in the number of jets, the number of b-tagged jets, the number of hadronically decaying top quarks or W bosons, the scalar sum of all jet transverse momenta, and the scalar sum of the missing transverse momentum and the transverse momentum of the lepton. To reduce the main background processes from $\mathrm{t\bar{t}}$ and W+jets production, the presence of an electron or muon produced in the leptonic decay of a W boson in the event is exploited. Under the hypothesis that all of the missing transverse momentum in the event originates from the neutrino produced in a leptonic W boson decay, the W boson momentum is calculated. The requirement of a large azimuthal angle between the direction of the lepton and the reconstructed leptonic W boson notably reduces the background contributions. The event yields observed in data are consistent with the expectations from the standard model processes, which are estimated using control samples in data and corrected for deviations observed in simulated event samples. Due to the absence of any significant excess of events, exclusion limits are evaluated on the supersymmetric particle masses in the context of two simplified models of gluino pair production. For the T1tttt simplified model, where each gluino decays to a top quark-antiquark pair and the lightest neutralino, the excluded gluino masses reach up to 2130 GeV, while the excluded neutralino masses reach up to 1270 GeV. This result extends the exclusion limit on gluino (neutralino) masses from a previous CMS search [19] by about 320 (170) GeV. The second simplified model, T5qqqqWW, also targets gluino pair production, but with decays to a light-flavor quark-antiquark pair and a chargino, which decays to a W boson and the lightest neutralino. The chargino mass in this decay channel is assumed to be $m_{\tilde{\chi}^{\pm}_1}=0.5(m_{{\mathrm{\tilde{g}}}}+m_{\tilde{\chi}^0_1})$. The excluded gluino masses reach up to 2280 GeV, while the excluded neutralino masses reach up to 1220 GeV. This corresponds to an improvement on gluino (neutralino) masses by about 380 (270) GeV in comparison with the previous result [19]. |
| References | ||||
| 1 | J. Wess and B. Zumino | A Lagrangian model invariant under supergauge transformations | PLB 49 (1974) 52 | |
| 2 | P. Fayet and S. Ferrara | Supersymmetry | PR 32 (1977) 249 | |
| 3 | R. Barbieri, S. Ferrara, and C. A. Savoy | Gauge models with spontaneously broken local supersymmetry | PLB 119 (1982) 343 | |
| 4 | H. P. Nilles | Supersymmetry, supergravity and particle physics | PR 110 (1984) 1 | |
| 5 | H. E. Haber and G. L. Kane | The search for supersymmetry: probing physics beyond the standard model | PR 117 (1985) 75 | |
| 6 | S. P. Martin | A supersymmetry primer | Adv. Ser. Direct. High Energy Phys. 21 (2010) 1 | hep-ph/9709356 |
| 7 | G. R. Farrar and P. Fayet | Phenomenology of the production, decay, and detection of new hadronic states associated with supersymmetry | PLB 76 (1978) 575 | |
| 8 | N. Arkani-Hamed et al. | MARMOSET: The path from LHC data to the new standard model via on-shell effective theories | 2007 | hep-ph/0703088 |
| 9 | J. Alwall, P. Schuster, and N. Toro | Simplified models for a first characterization of new physics at the LHC | PRD 79 (2009) 075020 | 0810.3921 |
| 10 | J. Alwall, M.-P. Le, M. Lisanti, and J. G. Wacker | Model-independent jets plus missing energy searches | PRD 79 (2009) 015005 | 0809.3264 |
| 11 | D. Alves et al. | Simplified models for LHC new physics searches | JPG 39 (2012) 105005 | 1105.2838 |
| 12 | CMS Collaboration | Interpretation of searches for supersymmetry with simplified models | PRD 88 (2013) 052017 | CMS-SUS-11-016 1301.2175 |
| 13 | ATLAS Collaboration | Search for squarks and gluinos in final states with one isolated lepton, jets, and missing transverse momentum at $ \sqrt{s}=$ 13 TeV with the ATLAS detector | EPJC 81 (2021) 600 | 2101.01629 |
| 14 | ATLAS Collaboration | Search for squarks and gluinos in events with an isolated lepton, jets, and missing transverse momentum at $ \sqrt{s}=$ 13 TeV with the ATLAS detector | PRD 96 (2017) 112010 | 1708.08232 |
| 15 | ATLAS Collaboration | Search for supersymmetry in final states with missing transverse momentum and multiple b-jets in proton-proton collisions at $ \sqrt{s}=$ 13 TeV with the ATLAS detector | JHEP 06 (2018) 107 | 1711.01901 |
| 16 | ATLAS Collaboration | Search for gluinos in events with an isolated lepton, jets and missing transverse momentum at $ \sqrt{s}=$ 13 TeV with the ATLAS detector | EPJC 76 (2016) 565 | 1605.04285 |
| 17 | ATLAS Collaboration | Search for pair production of gluinos decaying via stop and sbottom in events with b-jets and large missing transverse momentum in pp collisions at $ \sqrt{s}=$ 13 TeV with the ATLAS detector | PRD 94 (2016) 032003 | 1605.09318 |
| 18 | CMS Collaboration | Search for supersymmetry in pp collisions at $ \sqrt{s}=$ 13 TeV with 137 fb$^{-1}$ in final states with a single lepton using the sum of masses of large-radius jets | PRD 101 (2020) 052010 | CMS-SUS-19-007 1911.07558 |
| 19 | CMS Collaboration | Search for supersymmetry in events with one lepton and multiple jets exploiting the angular correlation between the lepton and the missing transverse momentum in proton-proton collisions at $ \sqrt{s}=$ 13 TeV | PLB 780 (2018) 384 | CMS-SUS-16-042 1709.09814 |
| 20 | CMS Collaboration | Search for supersymmetry in events with one lepton and multiple jets in proton-proton collisions at $ \sqrt{s}=$ 13 TeV | PRD 95 (2017) 012011 | CMS-SUS-15-006 1609.09386 |
| 21 | CMS Collaboration | Search for supersymmetry in pp collisions at $ \sqrt{s}=$ 13 TeV in the single-lepton final state using the sum of masses of large-radius jets | JHEP 08 (2016) 122 | CMS-SUS-15-007 1605.04608 |
| 22 | CMS Collaboration | Inclusive search for supersymmetry in pp collisions at $ \sqrt{s}=$ 13 TeV tev using razor variables and boosted object identification in zero and one lepton final states | JHEP 03 (2019) 031 | CMS-SUS-16-017 1812.06302 |
| 23 | CMS Collaboration | Search for supersymmetry in pp collisions at $ \sqrt{s}=$ 13 TeV in the single-lepton final state using the sum of masses of large-radius jets | PRL 119 (2017) 151802 | CMS-SUS-16-037 1705.04673 |
| 24 | ATLAS Collaboration | Search for squarks and gluinos in final states with jets and missing transverse momentum using 139 fb$^{-1}$ of $ \sqrt{s}=$ 13 TeV pp collision data with the ATLAS detector | JHEP 02 (2021) 143 | 2010.14293 |
| 25 | ATLAS Collaboration | Search for squarks and gluinos in final states with jets and missing transverse momentum using 36 fb$^{-1}$ of $ \sqrt{s}=$ 13 TeV pp collision data with the ATLAS detector | PRD 97 (2018) 112001 | 1712.02332 |
| 26 | ATLAS Collaboration | Summary of the searches for squarks and gluinos using $ \sqrt{s}=$ 8 TeV pp collisions with the ATLAS experiment at the LHC | JHEP 10 (2015) 054 | 1507.05525 |
| 27 | ATLAS Collaboration | Search for new phenomena in final states with large jet multiplicities and missing transverse momentum using $ \sqrt{s}=$ 13 TeV proton-proton collisions recorded by ATLAS in Run~2 of the LHC | JHEP 10 (2020) 062 | 2008.06032 |
| 28 | CMS Collaboration | Search for physics beyond the standard model in events with two leptons of same sign, missing transverse momentum, and jets in proton-proton collisions at $ \sqrt{s}=$ 13 TeV | EPJC 77 (2017) 578 | CMS-SUS-16-035 1704.07323 |
| 29 | CMS Collaboration | Search for new physics in events with same-sign dileptons and jets in pp collisions at $ \sqrt{s}=$ 8 TeV | JHEP 01 (2014) 163 | CMS-SUS-13-013 1311.6736 |
| 30 | CMS Collaboration | Search for supersymmetry in the multijet and missing transverse momentum final state in pp collisions at 13 TeV | PLB 758 (2016) 152 | CMS-SUS-15-002 1602.06581 |
| 31 | CMS Collaboration | Search for supersymmetry in multijet events with missing transverse momentum in proton-proton collisions at 13 TeV | PRD 96 (2017) 032003 | CMS-SUS-16-033 1704.07781 |
| 32 | CMS Collaboration | Searches for physics beyond the standard model with the $ {M}_\mathrm{T2} $ variable in hadronic final states with and without disappearing tracks in proton-proton collisions at $ \sqrt{s}=$ 13 TeV | EPJC 80 (2020) 3 | CMS-SUS-19-005 1909.03460 |
| 33 | CMS Collaboration | Search for supersymmetry in proton-proton collisions at 13 TeV in final states with jets and missing transverse momentum | JHEP 10 (2019) 244 | CMS-SUS-19-006 1908.04722 |
| 34 | CMS Collaboration | Search for supersymmetry in proton-proton collisions at 13 TeV using identified top quarks | PRD 97 (2018) 012007 | CMS-SUS-16-050 1710.11188 |
| 35 | CMS Collaboration | Search for new phenomena with the $ {M}_\mathrm{T2} $ variable in the all-hadronic final state produced in proton-proton collisions at $ \sqrt{s}=$ 13 TeV | EPJC 77 (2017) 710 | CMS-SUS-16-036 1705.04650 |
| 36 | CMS Collaboration | Performance of the CMS Lone trigger in proton-proton collisions at $ \sqrt{s}=$ 13 TeV | JINST 15 (2020) P10017 | CMS-TRG-17-001 2006.10165 |
| 37 | CMS Collaboration | The CMS trigger system | JINST 12 (2017) P01020 | CMS-TRG-12-001 1609.02366 |
| 38 | CMS Collaboration | The CMS experiment at the CERN LHC | JINST 3 (2008) S08004 | CMS-00-001 |
| 39 | J. Alwall et al. | The automated computation of tree-level and next-to-leading order differential cross sections, and their matching to parton shower simulations | JHEP 07 (2014) 079 | 1405.0301 |
| 40 | R. Frederix and S. Frixione | Merging meets matching in MCatNLO | JHEP 12 (2012) 061 | 1209.6215 |
| 41 | P. Nason | A new method for combining NLO QCD with shower Monte Carlo algorithms | JHEP 11 (2004) 040 | hep-ph/0409146 |
| 42 | S. Frixione, P. Nason, and C. Oleari | Matching NLO QCD computations with parton shower simulations: the POWHEG method | JHEP 11 (2007) 070 | 0709.2092 |
| 43 | S. Alioli, P. Nason, C. Oleari, and E. Re | A general framework for implementing NLO calculations in shower Monte Carlo programs: the POWHEG box | JHEP 06 (2010) 043 | 1002.2581 |
| 44 | S. Alioli, P. Nason, C. Oleari, and E. Re | NLO single-top production matched with shower in $ POWHEG: s $- and $ t $-channel contributions | JHEP 09 (2009) 111 | 0907.4076 |
| 45 | E. Re | Single-top Wt-channel production matched with parton showers using the POWHEG method | EPJC 71 (2011) 1547 | 1009.2450 |
| 46 | T. Melia, P. Nason, R. Rontsch, and G. Zanderighi | $ {\mathrm{W^{+}}\mathrm{W^{-}}} $, $ {\mathrm{W}\mathrm{Z}} $ and $ {\mathrm{Z}\mathrm{Z}} $ production in the POWHEG $ \textscbox $ | JHEP 11 (2011) 078 | 1107.5051 |
| 47 | P. Nason and G. Zanderighi | $ {\mathrm{W^{+}}\mathrm{W^{-}}} $, $ {\mathrm{W}\mathrm{Z}} $ and $ {\mathrm{Z}\mathrm{Z}} $ production in the $ POWHEG-\textscbox-v2 $ | EPJC 74 (2014) 2702 | 1311.1365 |
| 48 | H. B. Hartanto, B. Jager, L. Reina, and D. Wackeroth | Higgs boson production in association with top quarks in the POWHEG box | PRD 91 (2015) 094003 | 1501.04498 |
| 49 | T. Sjostrand et al. | An introduction to PYTHIA8.2 | CPC 191 (2015) 159 | 1410.3012 |
| 50 | S. Quackenbush, R. Gavin, Y. Li, and F. Petriello | W physics at the LHC with FEWZ2.$ | CPC 184 (2013) 209 | 1201.5896 |
| 51 | R. Gavin, Y. Li, F. Petriello, and S. Quackenbush | $ FEWZ2.0: $ A code for hadronic Z production at next-to-next-to-leading order | CPC 182 (2011) 2388 | 1011.3540 |
| 52 | Y. Li and F. Petriello | Combining QCD and electroweak corrections to dilepton production in the framework of the $ FEWZ $ simulation code | PRD 86 (2012) 094034 | 1208.5967 |
| 53 | T. Gehrmann et al. | $ {\mathrm{W^{+}}\mathrm{W^{-}}} $ production at hadron colliders in next to next to leading order QCD | PRL 113 (2014) 212001 | 1408.5243 |
| 54 | J. M. Campbell, R. K. Ellis, and C. Williams | Vector boson pair production at the LHC | JHEP 07 (2011) 018 | 1105.0020 |
| 55 | M. Beneke, P. Falgari, S. Klein, and C. Schwinn | Hadronic top-quark pair production with NNLL threshold resummation | NPB 855 (2012) 695 | 1109.1536 |
| 56 | M. Cacciari et al. | Top-pair production at hadron colliders with next-to-next-to-leading logarithmic soft-gluon resummation | PLB 710 (2012) 612 | 1111.5869 |
| 57 | P. Barnreuther, M. Czakon, and A. Mitov | Percent-level-precision physics at the Tevatron: Next-to-next-to-leading order QCD corrections to $ \mathrm{q\bar{q}}\to\mathrm{t\bar{t}}+{\mathrm{X}} $ | PRL 109 (2012) 132001 | 1204.5201 |
| 58 | M. Czakon and A. Mitov | NNLO corrections to top-pair production at hadron colliders: the all-fermionic scattering channels | JHEP 12 (2012) 054 | 1207.0236 |
| 59 | M. Czakon and A. Mitov | NNLO corrections to top pair production at hadron colliders: the quark-gluon reaction | JHEP 01 (2013) 080 | 1210.6832 |
| 60 | M. Czakon, P. Fiedler, and A. Mitov | Total top-quark pair-production cross section at hadron colliders through $ {O({\alpha_S}^4)} $ | PRL 110 (2013) 252004 | 1303.6254 |
| 61 | M. Czakon and A. Mitov | TOP++: A program for the calculation of the top-pair cross-section at hadron colliders | CPC 185 (2014) 2930 | 1112.5675 |
| 62 | W. Beenakker et al. | NNLL-fast: predictions for coloured supersymmetric particle production at the LHC with threshold and Coulomb resummation | JHEP 12 (2016) 133 | 1607.07741 |
| 63 | W. Beenakker, R. Hopker, M. Spira, and P. M. Zerwas | Squark and gluino production at hadron colliders | NPB 492 (1997) 51 | hep-ph/9610490 |
| 64 | A. Kulesza and L. Motyka | Threshold resummation for squark-antisquark and gluino-pair production at the LHC | PRL 102 (2009) 111802 | 0807.2405 |
| 65 | A. Kulesza and L. Motyka | Soft gluon resummation for the production of gluino-gluino and squark-antisquark pairs at the LHC | PRD 80 (2009) 095004 | 0905.4749 |
| 66 | W. Beenakker et al. | Soft-gluon resummation for squark and gluino hadroproduction | JHEP 12 (2009) 041 | 0909.4418 |
| 67 | W. Beenakker et al. | NNLL resummation for squark-antisquark pair production at the LHC | JHEP 01 (2012) 076 | 1110.2446 |
| 68 | W. Beenakker et al. | Towards NNLL resummation: hard matching coefficients for squark and gluino hadroproduction | JHEP 10 (2013) 120 | 1304.6354 |
| 69 | W. Beenakker et al. | NNLL resummation for squark and gluino production at the LHC | JHEP 12 (2014) 023 | 1404.3134 |
| 70 | W. Beenakker et al. | Stop production at hadron colliders | NPB 515 (1998) 3 | hep-ph/9710451 |
| 71 | W. Beenakker et al. | Supersymmetric top and bottom squark production at hadron colliders | JHEP 08 (2010) 098 | 1006.4771 |
| 72 | W. Beenakker et al. | NNLL resummation for stop pair-production at the LHC | JHEP 05 (2016) 153 | 1601.02954 |
| 73 | M. L. Mangano, M. Moretti, F. Piccinini, and M. Treccani | Matching matrix elements and shower evolution for top-pair production in hadronic collisions | JHEP 01 (2007) 013 | hep-ph/0611129 |
| 74 | CMS Collaboration | Event generator tunes obtained from underlying event and multiparton scattering measurement | EPJC 76 (2016) 155 | CMS-GEN-14-001 1512.00815 |
| 75 | CMS Collaboration | Extraction and validation of a new set of CMS PYTHIA-8 tunes from underlying-event measurements | EPJC 80 (2020) 4 | CMS-GEN-17-001 1903.12179 |
| 76 | NNPDF Collaboration | Parton distributions with QED corrections | NPB 877 (2013) 290 | 1308.0598 |
| 77 | NNPDF Collaboration | Parton distributions from high-precision collider data | EPJC 77 (2017) 663 | 1706.00428 |
| 78 | GEANT4 Collaboration | GEANT4--a simulation toolkit | NIMA 506 (2003) 250 | |
| 79 | S. Abdullin et al. | The fast simulation of the CMS detector at LHC | in Proceedings, 18th International Conference on Computing in High Energy and Nuclear Physics (CHEP 2010): Taipei, Taiwan, October 18-22, 2010 2011 [J. Phys. Conf. Ser. 331 (2011) 032049] | |
| 80 | A. Giammanco | The fast simulation of the CMS experiment | in Proceedings, 20th International Conference on Computing in High Energy and Nuclear Physics (CHEP 2013): Amsterdam, The Netherlands, October 14-18, 2013 2014 [J. Phys. Conf. Ser. 513 (2014) 022012] | |
| 81 | CMS Collaboration | Particle-flow reconstruction and global event description with the CMS detector | JINST 12 (2017) P10003 | CMS-PRF-14-001 1706.04965 |
| 82 | CMS Collaboration | Technical proposal for the Phase-II upgrade of the Compact Muon Solenoid | CMS-PAS-TDR-15-002 | CMS-PAS-TDR-15-002 |
| 83 | CMS Collaboration | Electron and photon reconstruction and identification with the CMS experiment at the CERN LHC | JINST 16 (2021) P05014 | CMS-EGM-17-001 2012.06888 |
| 84 | CMS Collaboration | Performance of the CMS muon detector and muon reconstruction with proton-proton collisions at $ \sqrt{s}=$ 13 TeV | JINST 13 (2018) P06015 | CMS-MUO-16-001 1804.04528 |
| 85 | M. Cacciari, G. P. Salam, and G. Soyez | The anti-$ {k_{\mathrm{T}}} $ jet clustering algorithm | JHEP 04 (2008) 063 | 0802.1189 |
| 86 | M. Cacciari, G. P. Salam, and G. Soyez | $ FastJet $ user manual | EPJC 72 (2012) 1896 | 1111.6097 |
| 87 | CMS Collaboration | Pileup mitigation at CMS in 13 TeV data | JINST 15 (2020) P09018 | CMS-JME-18-001 2003.00503 |
| 88 | CMS Collaboration | Jet energy scale and resolution in the CMS experiment in pp collisions at 8 TeV | JINST 12 (2017) P02014 | CMS-JME-13-004 1607.03663 |
| 89 | CMS Collaboration | Identification of heavy-flavour jets with the CMS detector in pp collisions at 13 TeV | JINST 13 (2018) P05011 | CMS-BTV-16-002 1712.07158 |
| 90 | CMS Collaboration | Identification of heavy, energetic, hadronically decaying particles using machine-learning techniques | JINST 15 (2020) P06005 | CMS-JME-18-002 2004.08262 |
| 91 | CMS Collaboration | Search for direct production of supersymmetric partners of the top quark in the all-jets final state in proton-proton collisions at $ \sqrt{s}=$ 13 TeV | JHEP 10 (2017) 005 | CMS-SUS-16-049 1707.03316 |
| 92 | CMS Collaboration | Performance of missing transverse momentum reconstruction in proton-proton collisions at $ \sqrt{s}=$ 13 TeV using the CMS detector | JINST 14 (2019) P07004 | CMS-JME-17-001 1903.06078 |
| 93 | C. G. Lester and D. J. Summers | Measuring masses of semi-invisibly decaying particle pairs produced at hadron colliders | PLB 463 (1999) 99 | hep-ph/9906349 |
| 94 | CMS Collaboration | Measurement of the polarization of W bosons with large transverse momenta in W+jets events at the LHC | PRL 107 (2011) 021802 | CMS-EWK-10-014 1104.3829 |
| 95 | CMS Collaboration | Search for supersymmetry in pp collisions at $ \sqrt{s}=$ 7 TeV in events with a single lepton, jets, and missing transverse momentum | EPJC 73 (2013) 2404 | CMS-SUS-12-010 1212.6428 |
| 96 | CMS Collaboration | Precision luminosity measurement in proton-proton collisions at $ \sqrt{s}=$ 13 TeV in 2015 and 2016 at CMS | EPJC 81 (2021) 800 | CMS-LUM-17-003 2104.01927 |
| 97 | CMS Collaboration | CMS luminosity measurement for the 2017 data-taking period at $ \sqrt{s}=$ 13 TeV | CMS-PAS-LUM-17-004 | CMS-PAS-LUM-17-004 |
| 98 | CMS Collaboration | CMS luminosity measurement for the 2018 data-taking period at $ \sqrt{s}=$ 13 TeV | CMS-PAS-LUM-18-002 | CMS-PAS-LUM-18-002 |
| 99 | Z. Bern et al. | Left-handed W bosons at the LHC | PRD 84 (2011) 034008 | 1103.5445 |
| 100 | CMS Collaboration | Angular coefficients of Z bosons produced in pp collisions at $ \sqrt{s}=$ 8 TeV and decaying to $ {\mu\mu} $ as a function of transverse momentum and rapidity | PLB 750 (2015) 154 | CMS-SMP-13-010 1504.03512 |
| 101 | ATLAS Collaboration | Measurement of the polarisation of W bosons produced with large transverse momentum in pp collisions at $ \sqrt{s}=$ 7 TeV with the ATLAS experiment | EPJC 72 (2012) 2001 | 1203.2165 |
| 102 | G. Cowan, K. Cranmer, E. Gross, and O. Vitells | Asymptotic formulae for likelihood-based tests of new physics | EPJC 71 (2011) 1554 | 1007.1727 |
| 103 | T. Junk | Confidence level computation for combining searches with small statistics | NIMA 434 (1999) 435 | hep-ex/9902006 |
| 104 | A. Read | Presentation of search results: The CLs technique | JPG 28 (2002) 2693 | |
|
|
Compact Muon Solenoid LHC, CERN |
|

|

|

|

|

|