

Compact Muon Solenoid
LHC, CERN
 Visit us: CMS Public Website, CMS Physics ;
Contact us: CMS Publications Committee
Visit us: CMS Public Website, CMS Physics ;
Contact us: CMS Publications Committee
| CMS-PAS-EXO-25-005 | ||
| Search for long-lived particles with a pair of muon detector showers in proton-proton collisions at $ \sqrt{s}= $ 13.6 TeV | ||
| CMS Collaboration | ||
| 2026-07-07 | ||
| Abstract: A search for long-lived particles (LLPs) decaying in the CMS muon detectors with two muon detector showers in the final state is presented. The decays of LLPs are reconstructed as high multiplicity clusters of hits in the muon detectors. A data sample of proton-proton collisions at $ \sqrt{s}= $ 13.6 TeV corresponding to an integrated luminosity of up to 170 fb$ ^{-1} $, recorded at the LHC in 2022--2024, is used. The result is combined with a previous search using data collected in 2016--2018 at $ \sqrt{s}= $ 13 TeV corresponding to an integrated luminosity of 138 fb$ ^{-1} $. In the context of twin Higgs models, the search is sensitive to LLP masses from 1 to 55 GeV and a broad range of LLP decay modes, including decays to hadrons and $ \tau $ leptons. No excess of events above the standard model background is observed. The most stringent limits to date from LHC data are set on the branching fraction of the Higgs boson decay to a pair of LLPs with masses below 10 GeV. This search also provides the best upper limits to date for various intervals of LLP proper decay length and mass. | ||
| Links: CDS record (PDF) ; CADI line (restricted) ; | ||
| Figures | |
png pdf |
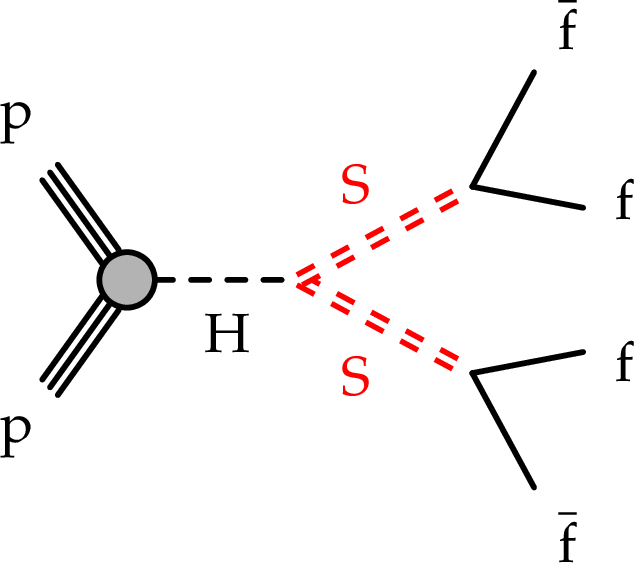
Figure 1:
Diagram representing the twin Higgs models. The SM Higgs boson (H) decays to a pair of neutral long-lived scalars (S) that then subsequently decays to a pair of fermions (f) in the twin Higgs model. |
png pdf |
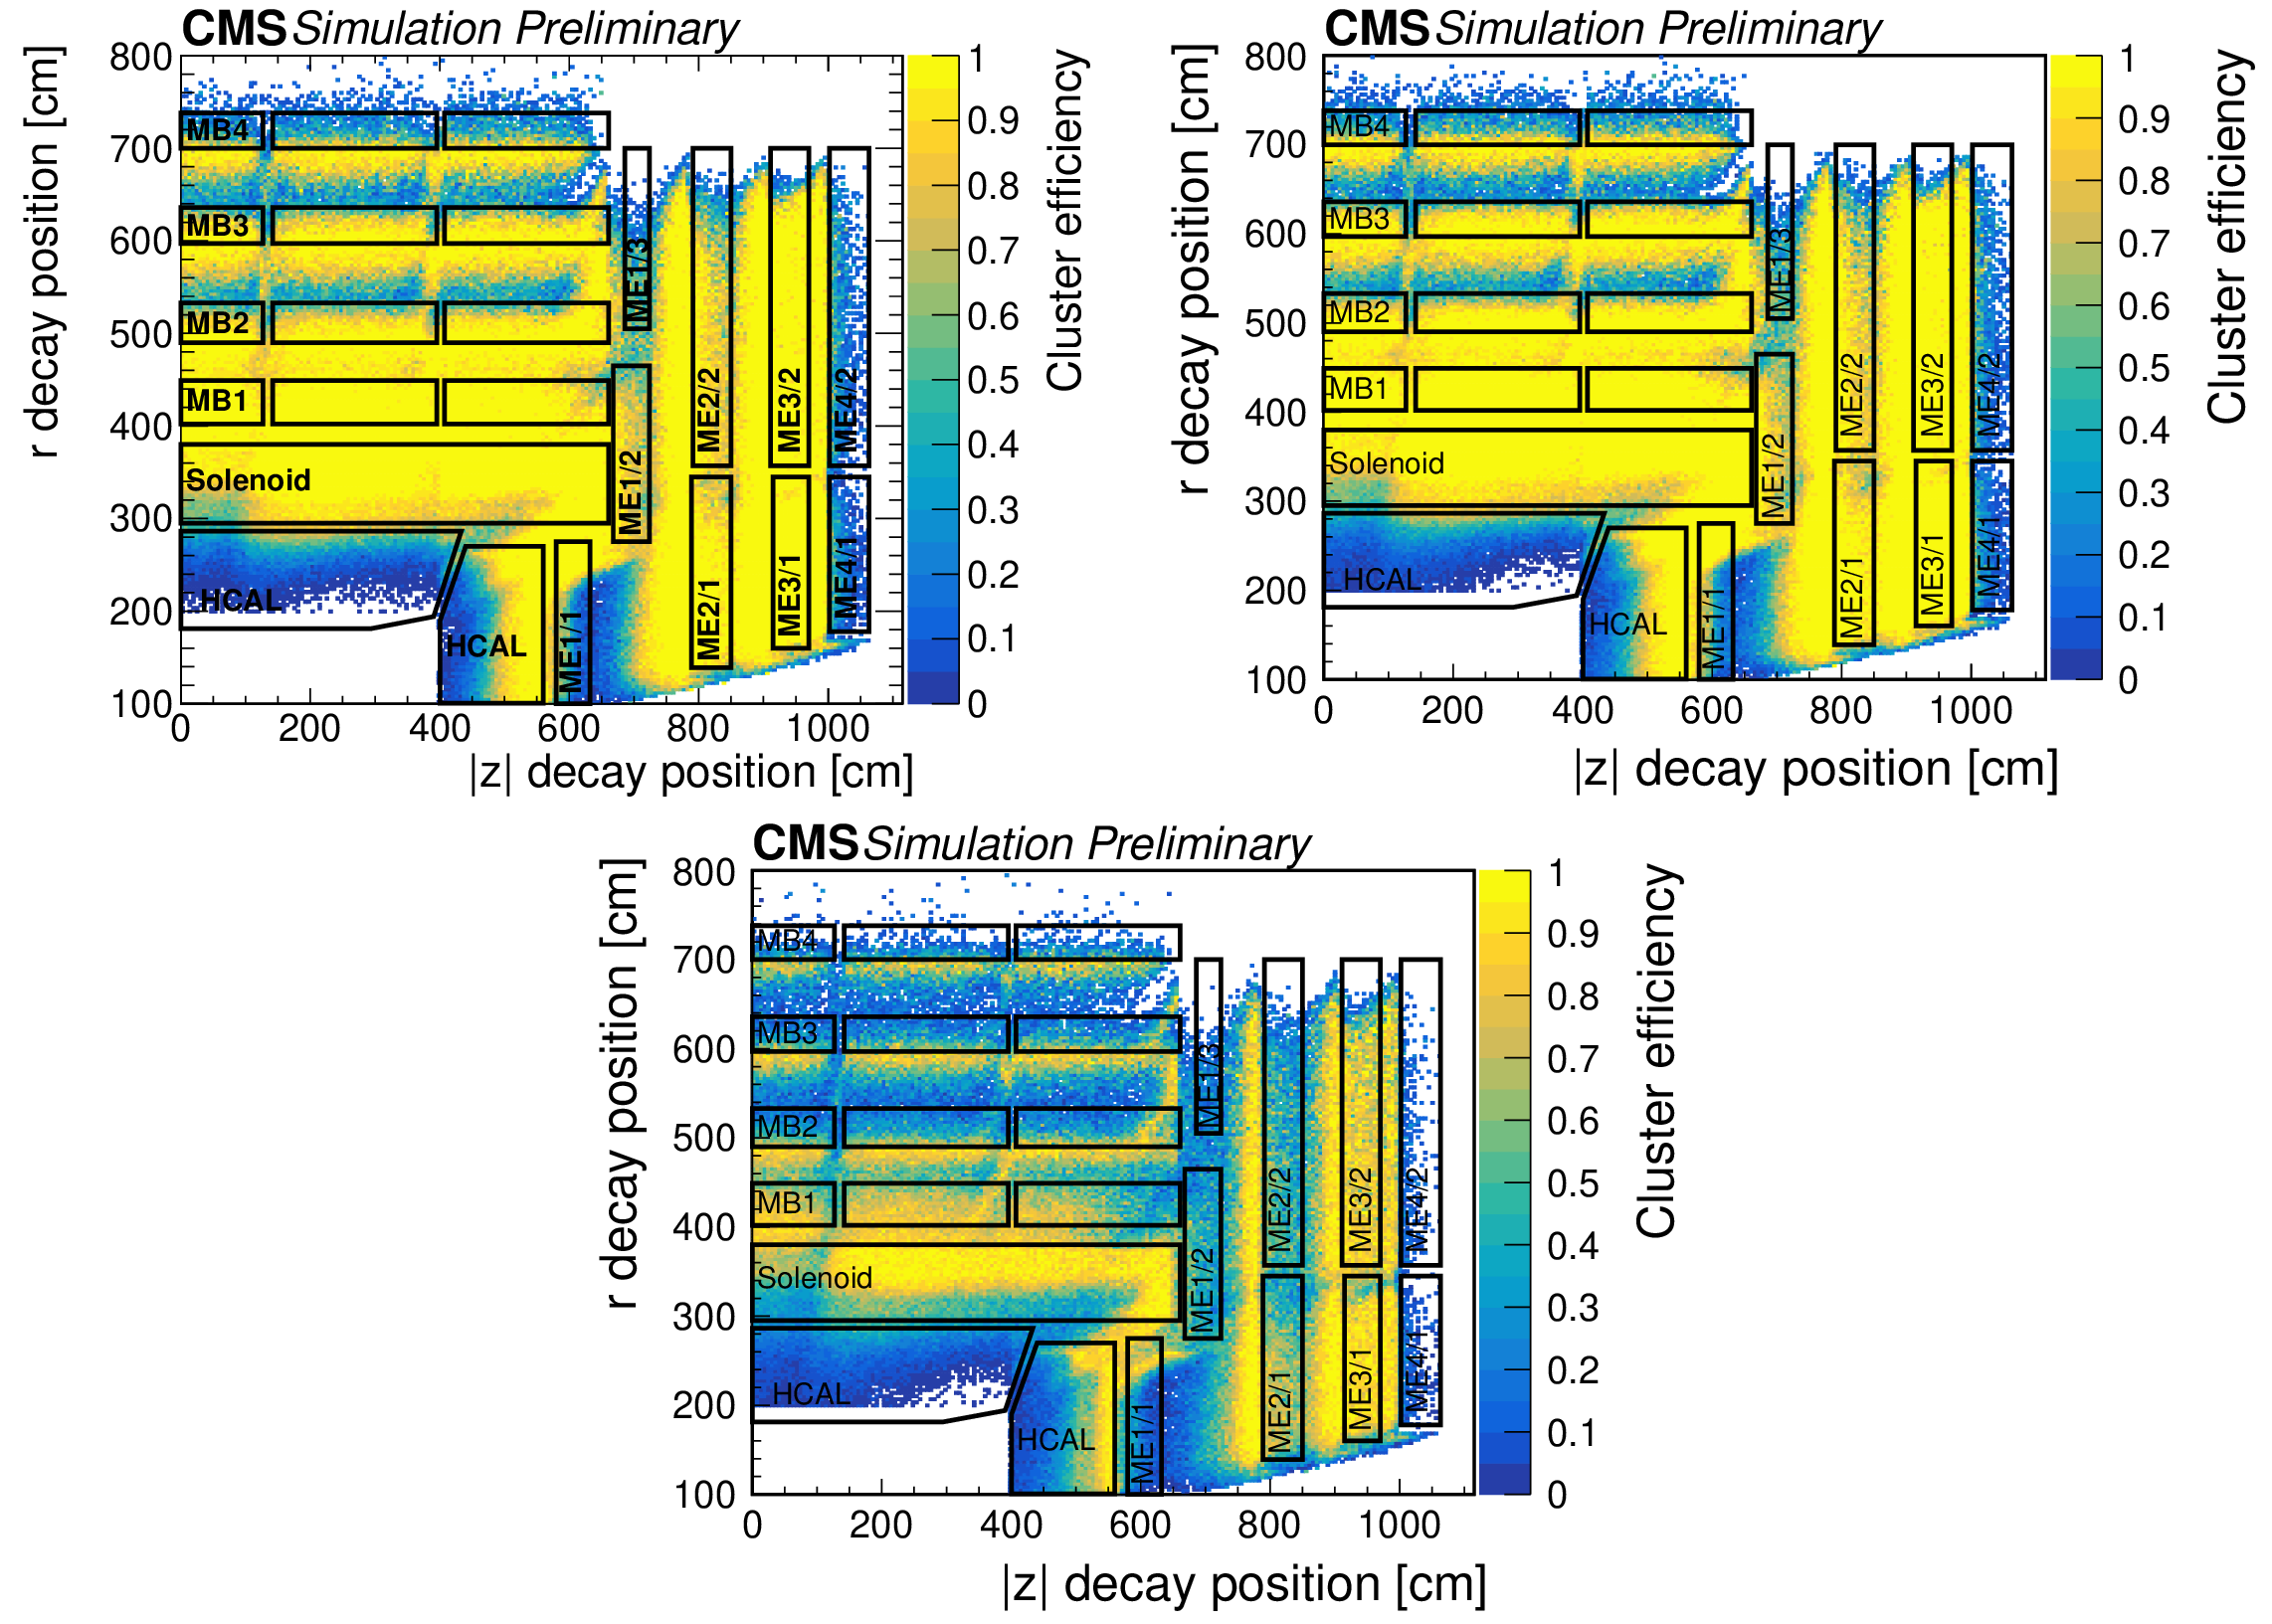
Figure 2:
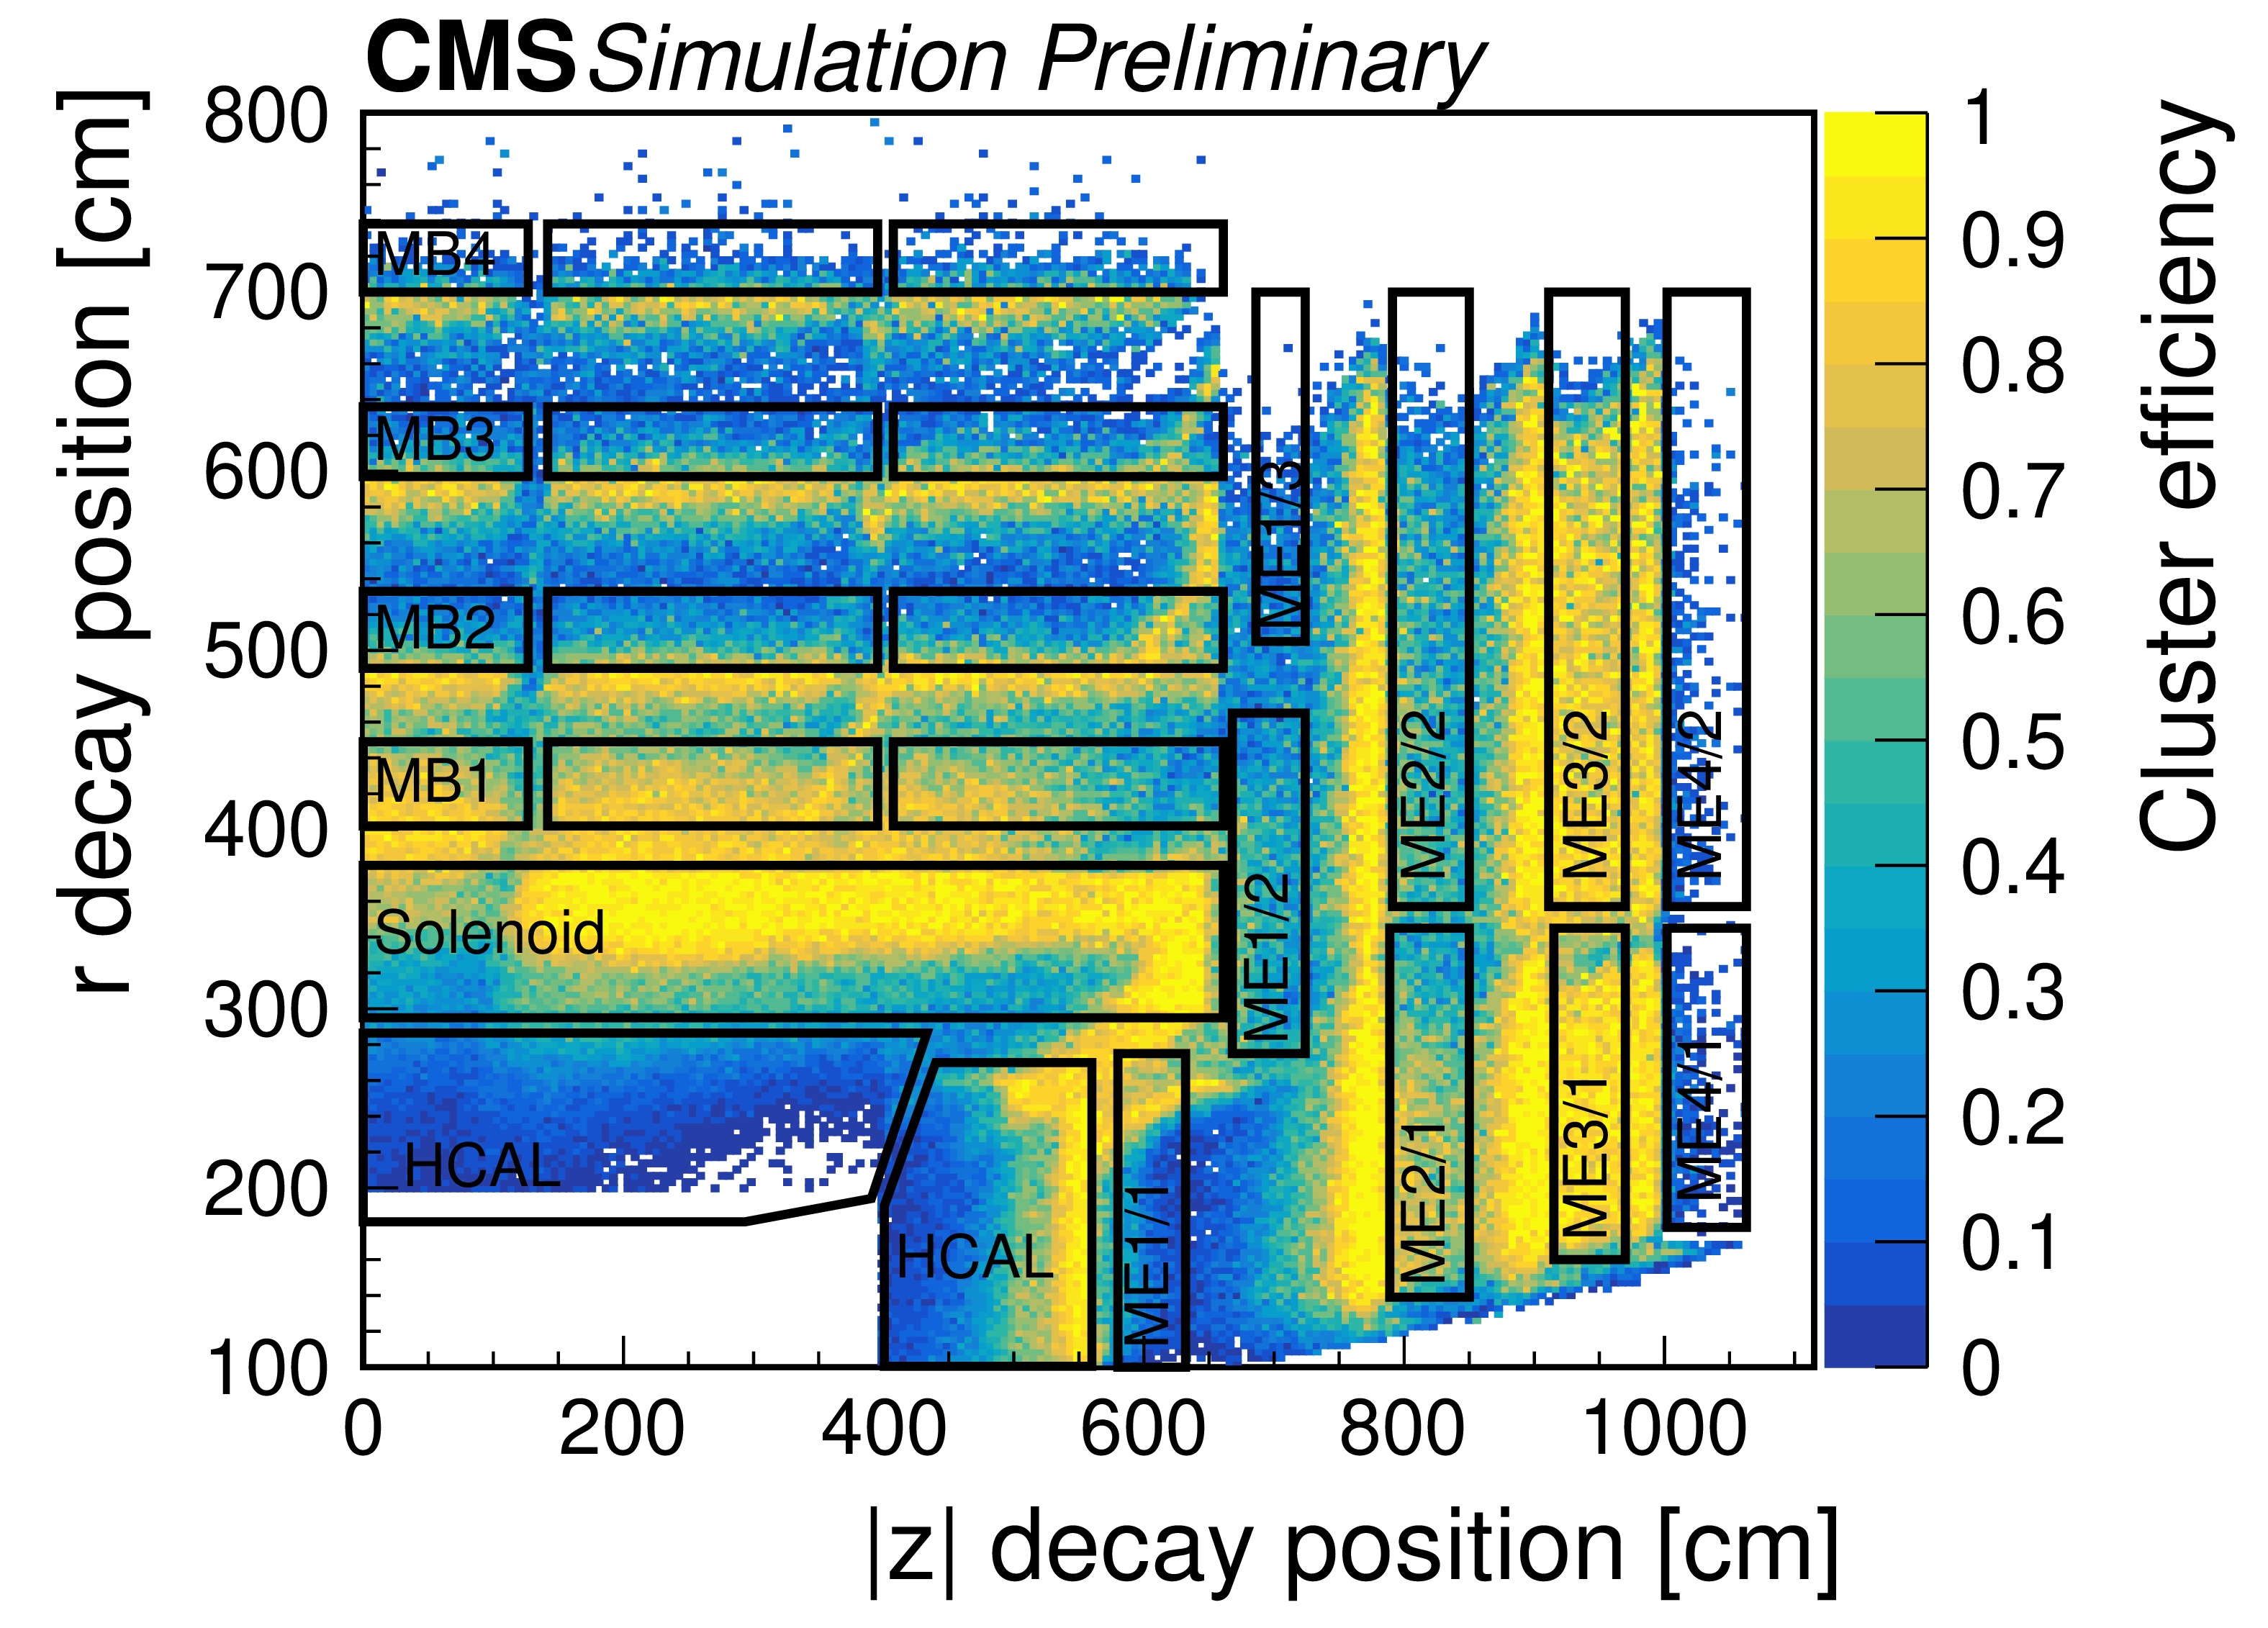
The cluster reconstruction efficiency, including both DT and CSC clusters, as a function of the simulated $ r $ and $ |z| $ decay positions of the particle S decaying to $ \mathrm{d}\overline{\mathrm{d}} $ (top left), $ \mathrm{b}\overline{\mathrm{b}} $ (top right), and $ \tau^{+}\tau^{-} $ (bottom). S has a mass of 40 GeV and a $ c\tau $ of 1\unitm. The cluster reconstruction efficiency appears to be nonzero beyond MB4 because the MB4 chambers are staggered so that the outer radius of the CMS detector ranges from 738 to 800\unitcm. The barrel and endcap muon stations are drawn as black boxes and labeled by their station names. The region between labeled sections are mostly steel return yoke. |
png pdf |
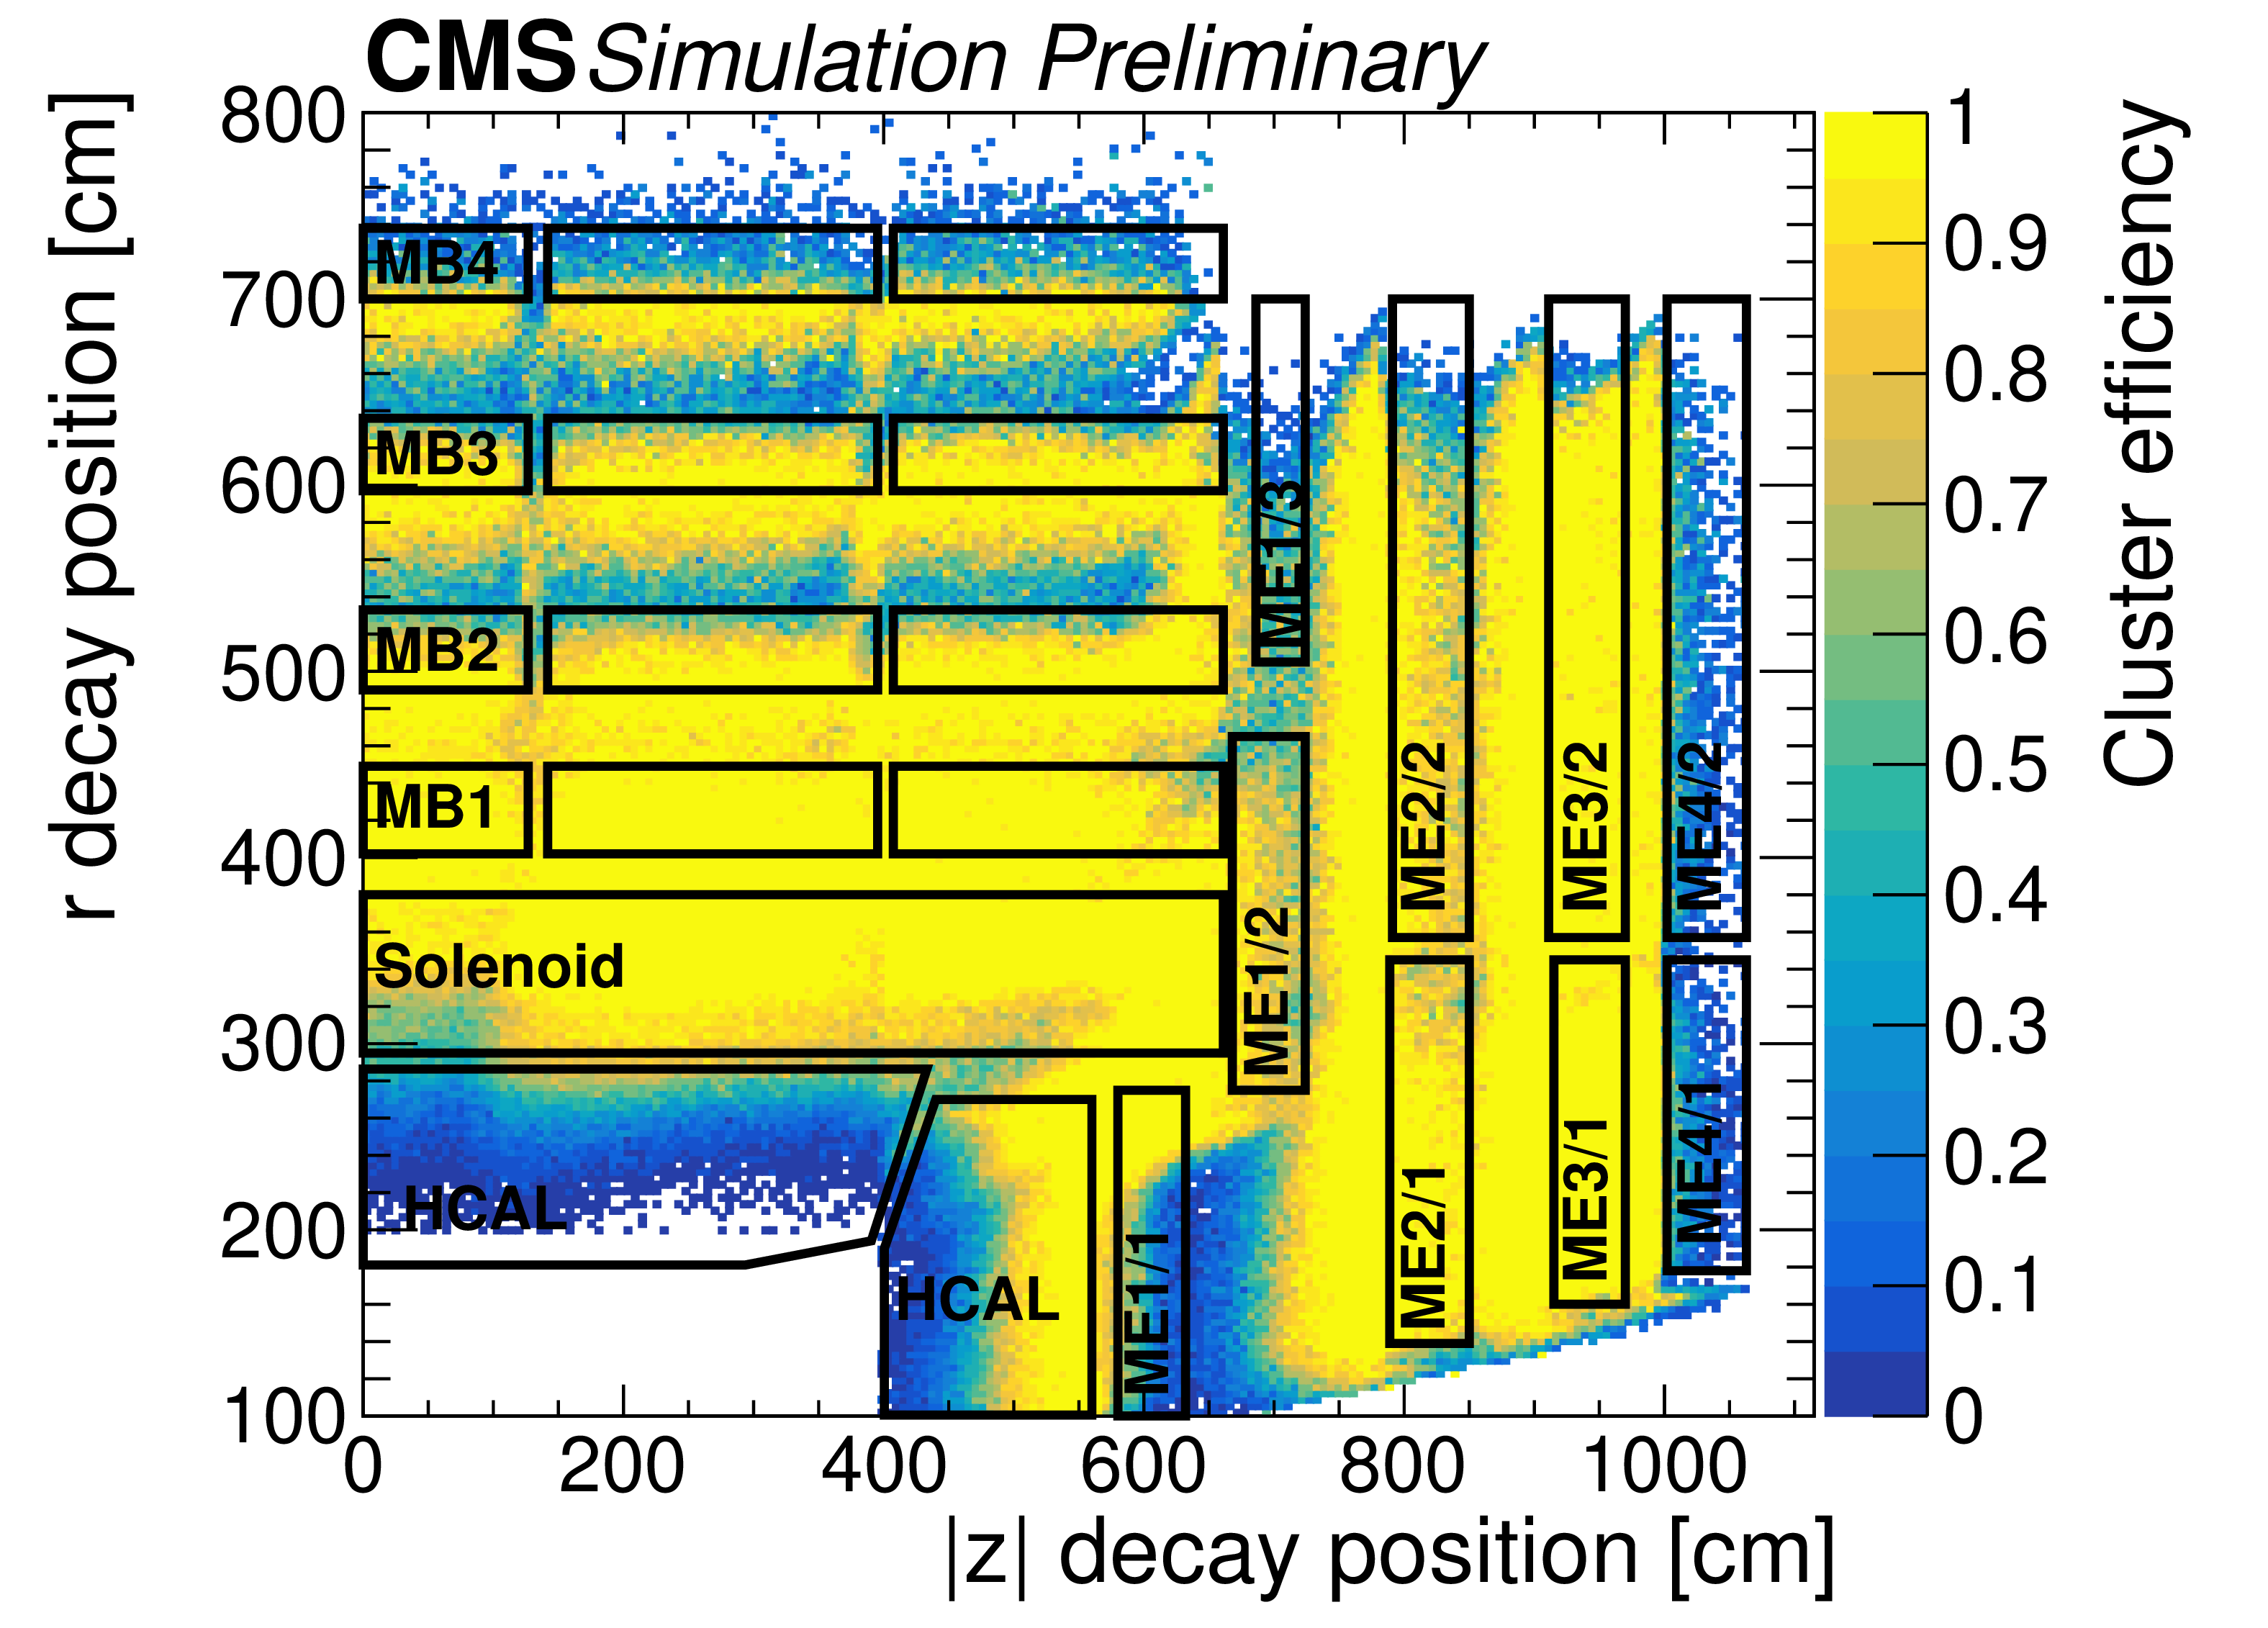
Figure 2-a:
The cluster reconstruction efficiency, including both DT and CSC clusters, as a function of the simulated $ r $ and $ |z| $ decay positions of the particle S decaying to $ \mathrm{d}\overline{\mathrm{d}} $ (top left), $ \mathrm{b}\overline{\mathrm{b}} $ (top right), and $ \tau^{+}\tau^{-} $ (bottom). S has a mass of 40 GeV and a $ c\tau $ of 1\unitm. The cluster reconstruction efficiency appears to be nonzero beyond MB4 because the MB4 chambers are staggered so that the outer radius of the CMS detector ranges from 738 to 800\unitcm. The barrel and endcap muon stations are drawn as black boxes and labeled by their station names. The region between labeled sections are mostly steel return yoke. |
png pdf |
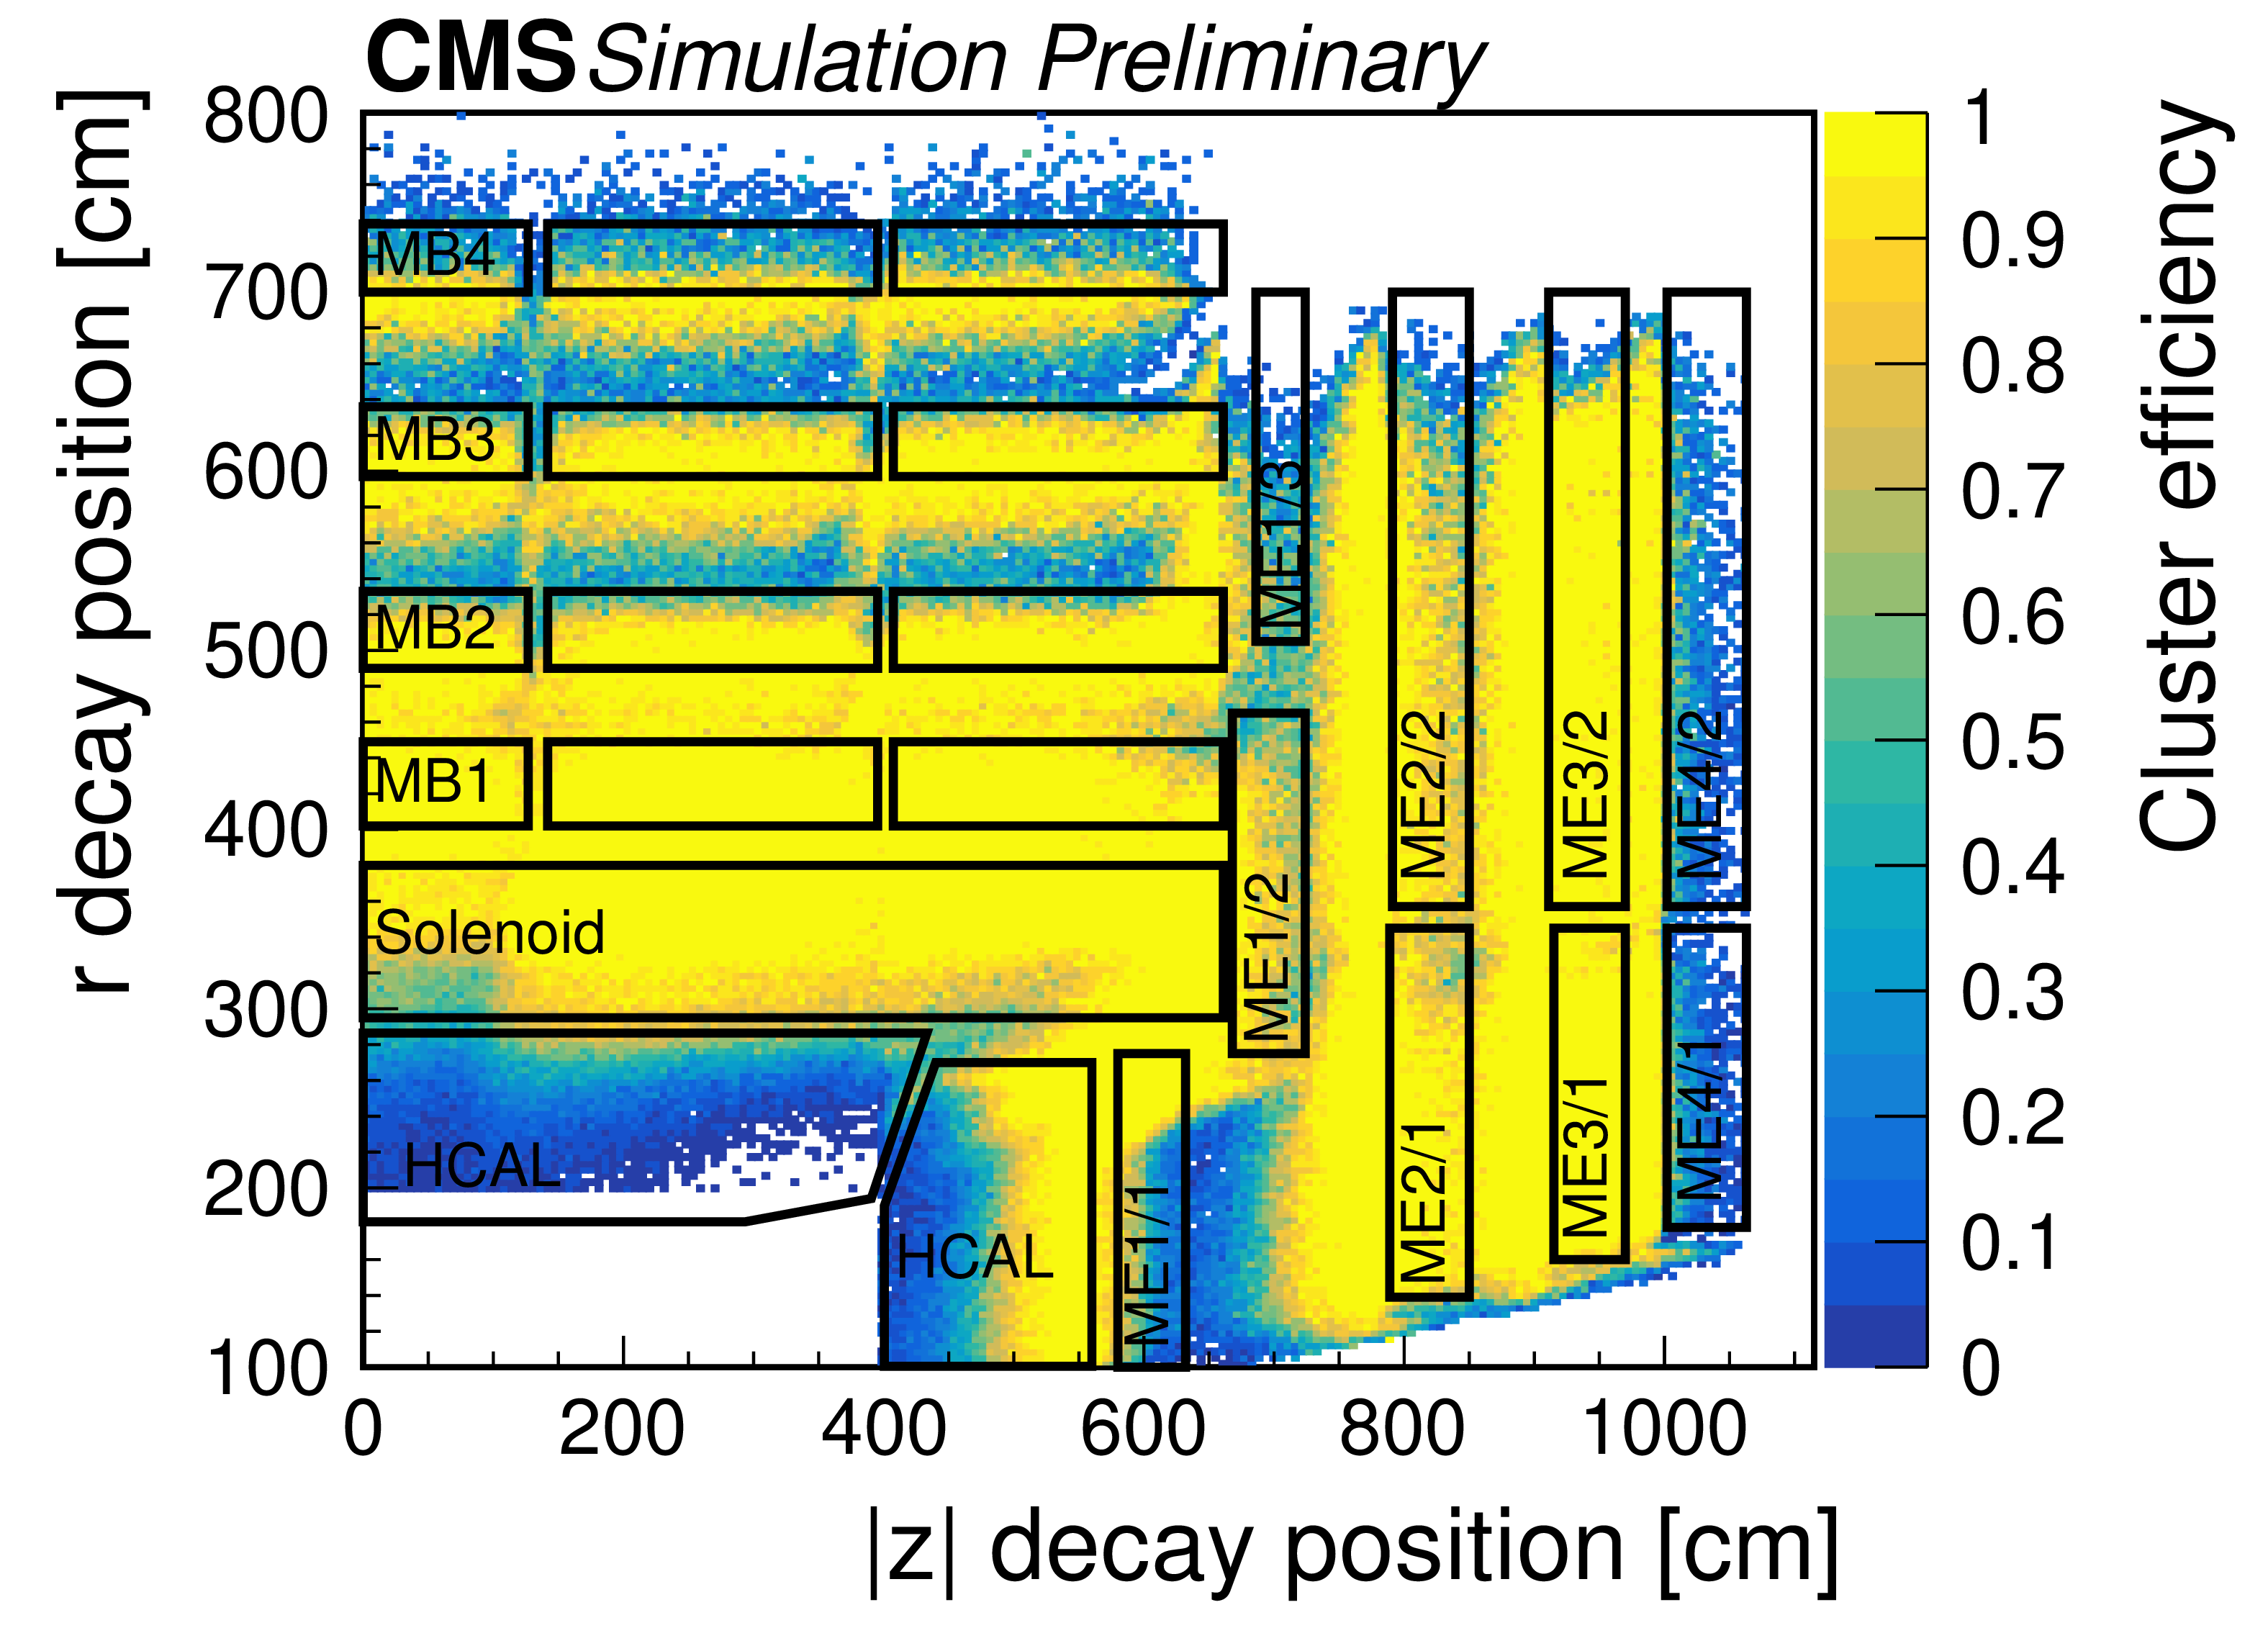
Figure 2-b:
The cluster reconstruction efficiency, including both DT and CSC clusters, as a function of the simulated $ r $ and $ |z| $ decay positions of the particle S decaying to $ \mathrm{d}\overline{\mathrm{d}} $ (top left), $ \mathrm{b}\overline{\mathrm{b}} $ (top right), and $ \tau^{+}\tau^{-} $ (bottom). S has a mass of 40 GeV and a $ c\tau $ of 1\unitm. The cluster reconstruction efficiency appears to be nonzero beyond MB4 because the MB4 chambers are staggered so that the outer radius of the CMS detector ranges from 738 to 800\unitcm. The barrel and endcap muon stations are drawn as black boxes and labeled by their station names. The region between labeled sections are mostly steel return yoke. |
png pdf |
Figure 2-c:
The cluster reconstruction efficiency, including both DT and CSC clusters, as a function of the simulated $ r $ and $ |z| $ decay positions of the particle S decaying to $ \mathrm{d}\overline{\mathrm{d}} $ (top left), $ \mathrm{b}\overline{\mathrm{b}} $ (top right), and $ \tau^{+}\tau^{-} $ (bottom). S has a mass of 40 GeV and a $ c\tau $ of 1\unitm. The cluster reconstruction efficiency appears to be nonzero beyond MB4 because the MB4 chambers are staggered so that the outer radius of the CMS detector ranges from 738 to 800\unitcm. The barrel and endcap muon stations are drawn as black boxes and labeled by their station names. The region between labeled sections are mostly steel return yoke. |
png pdf |
Figure 3:
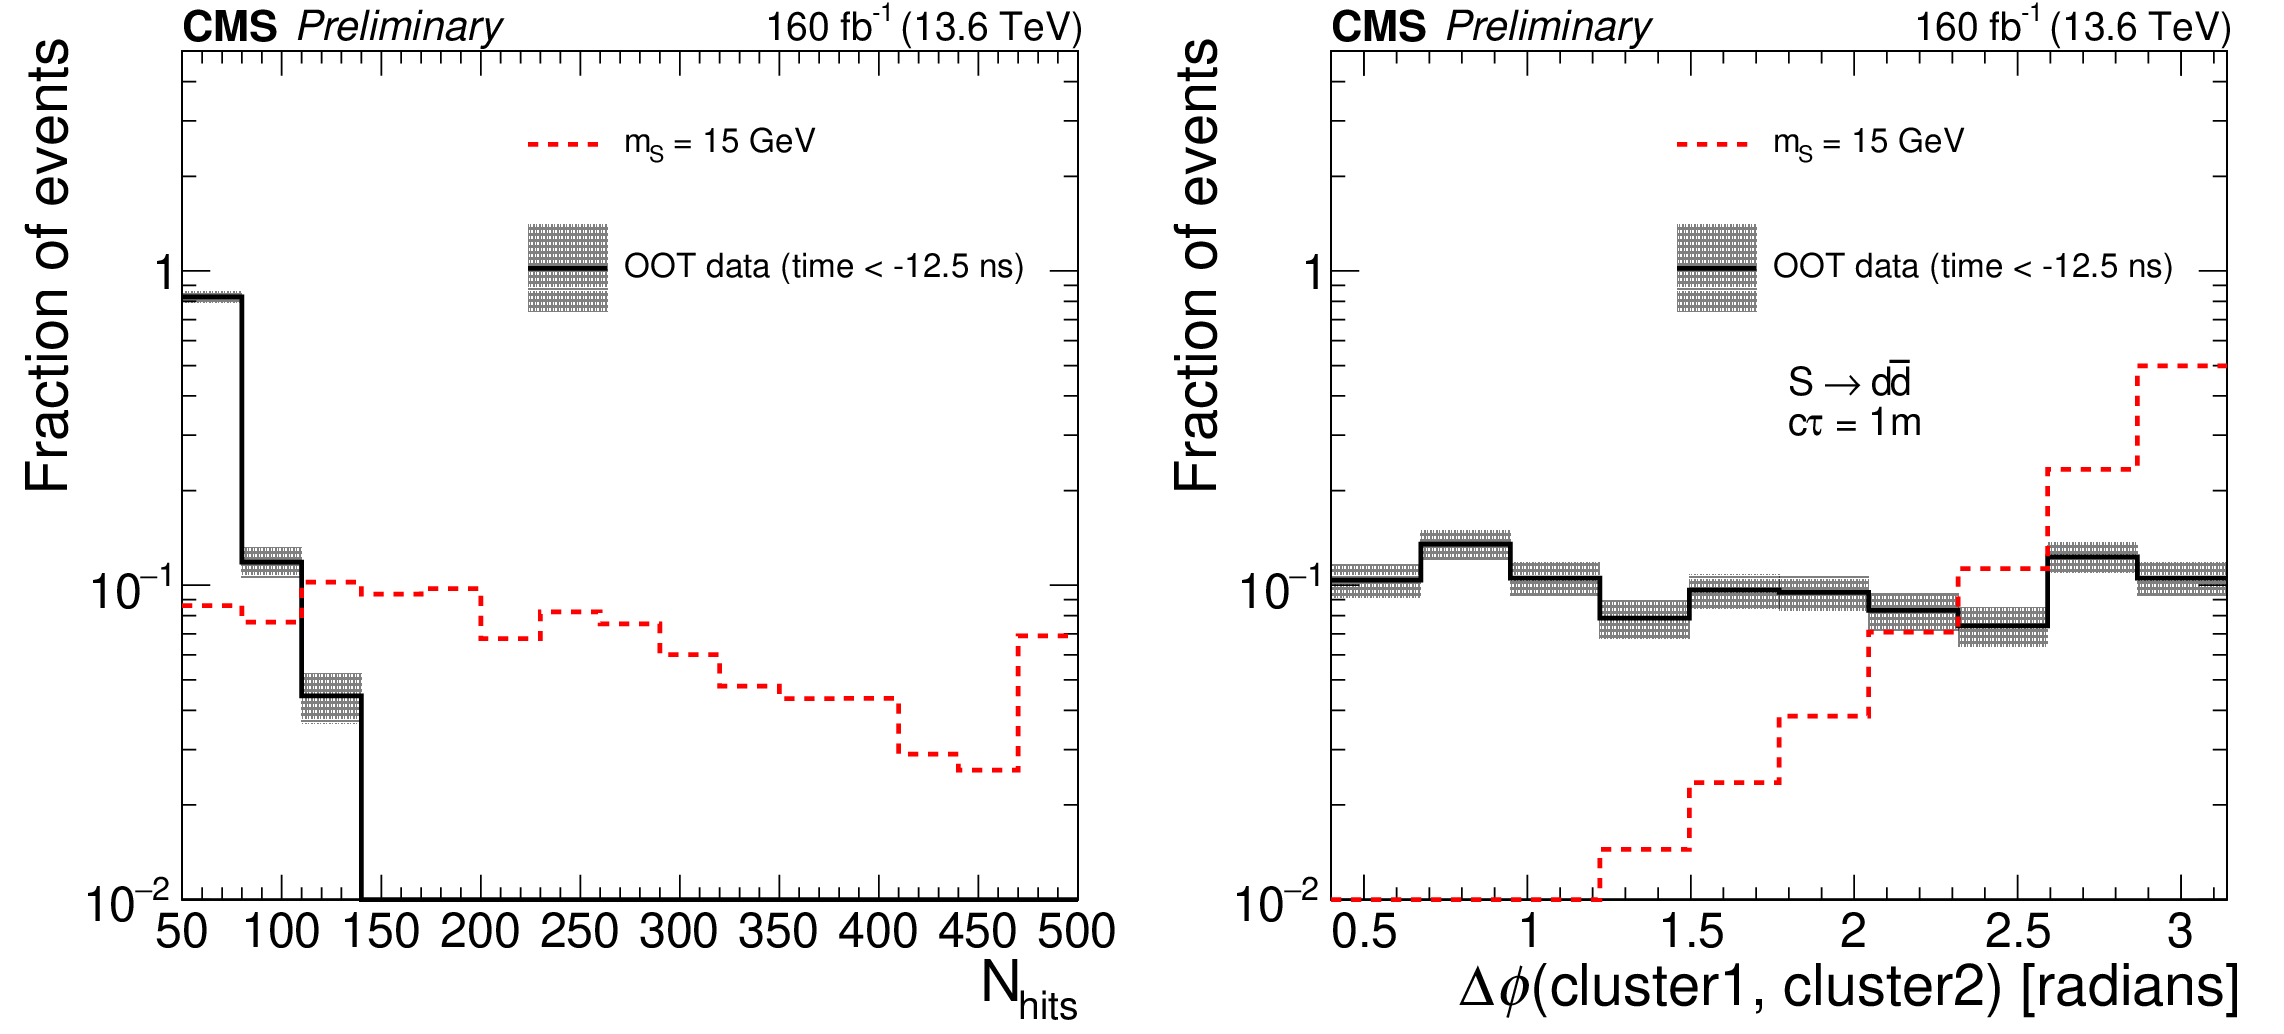
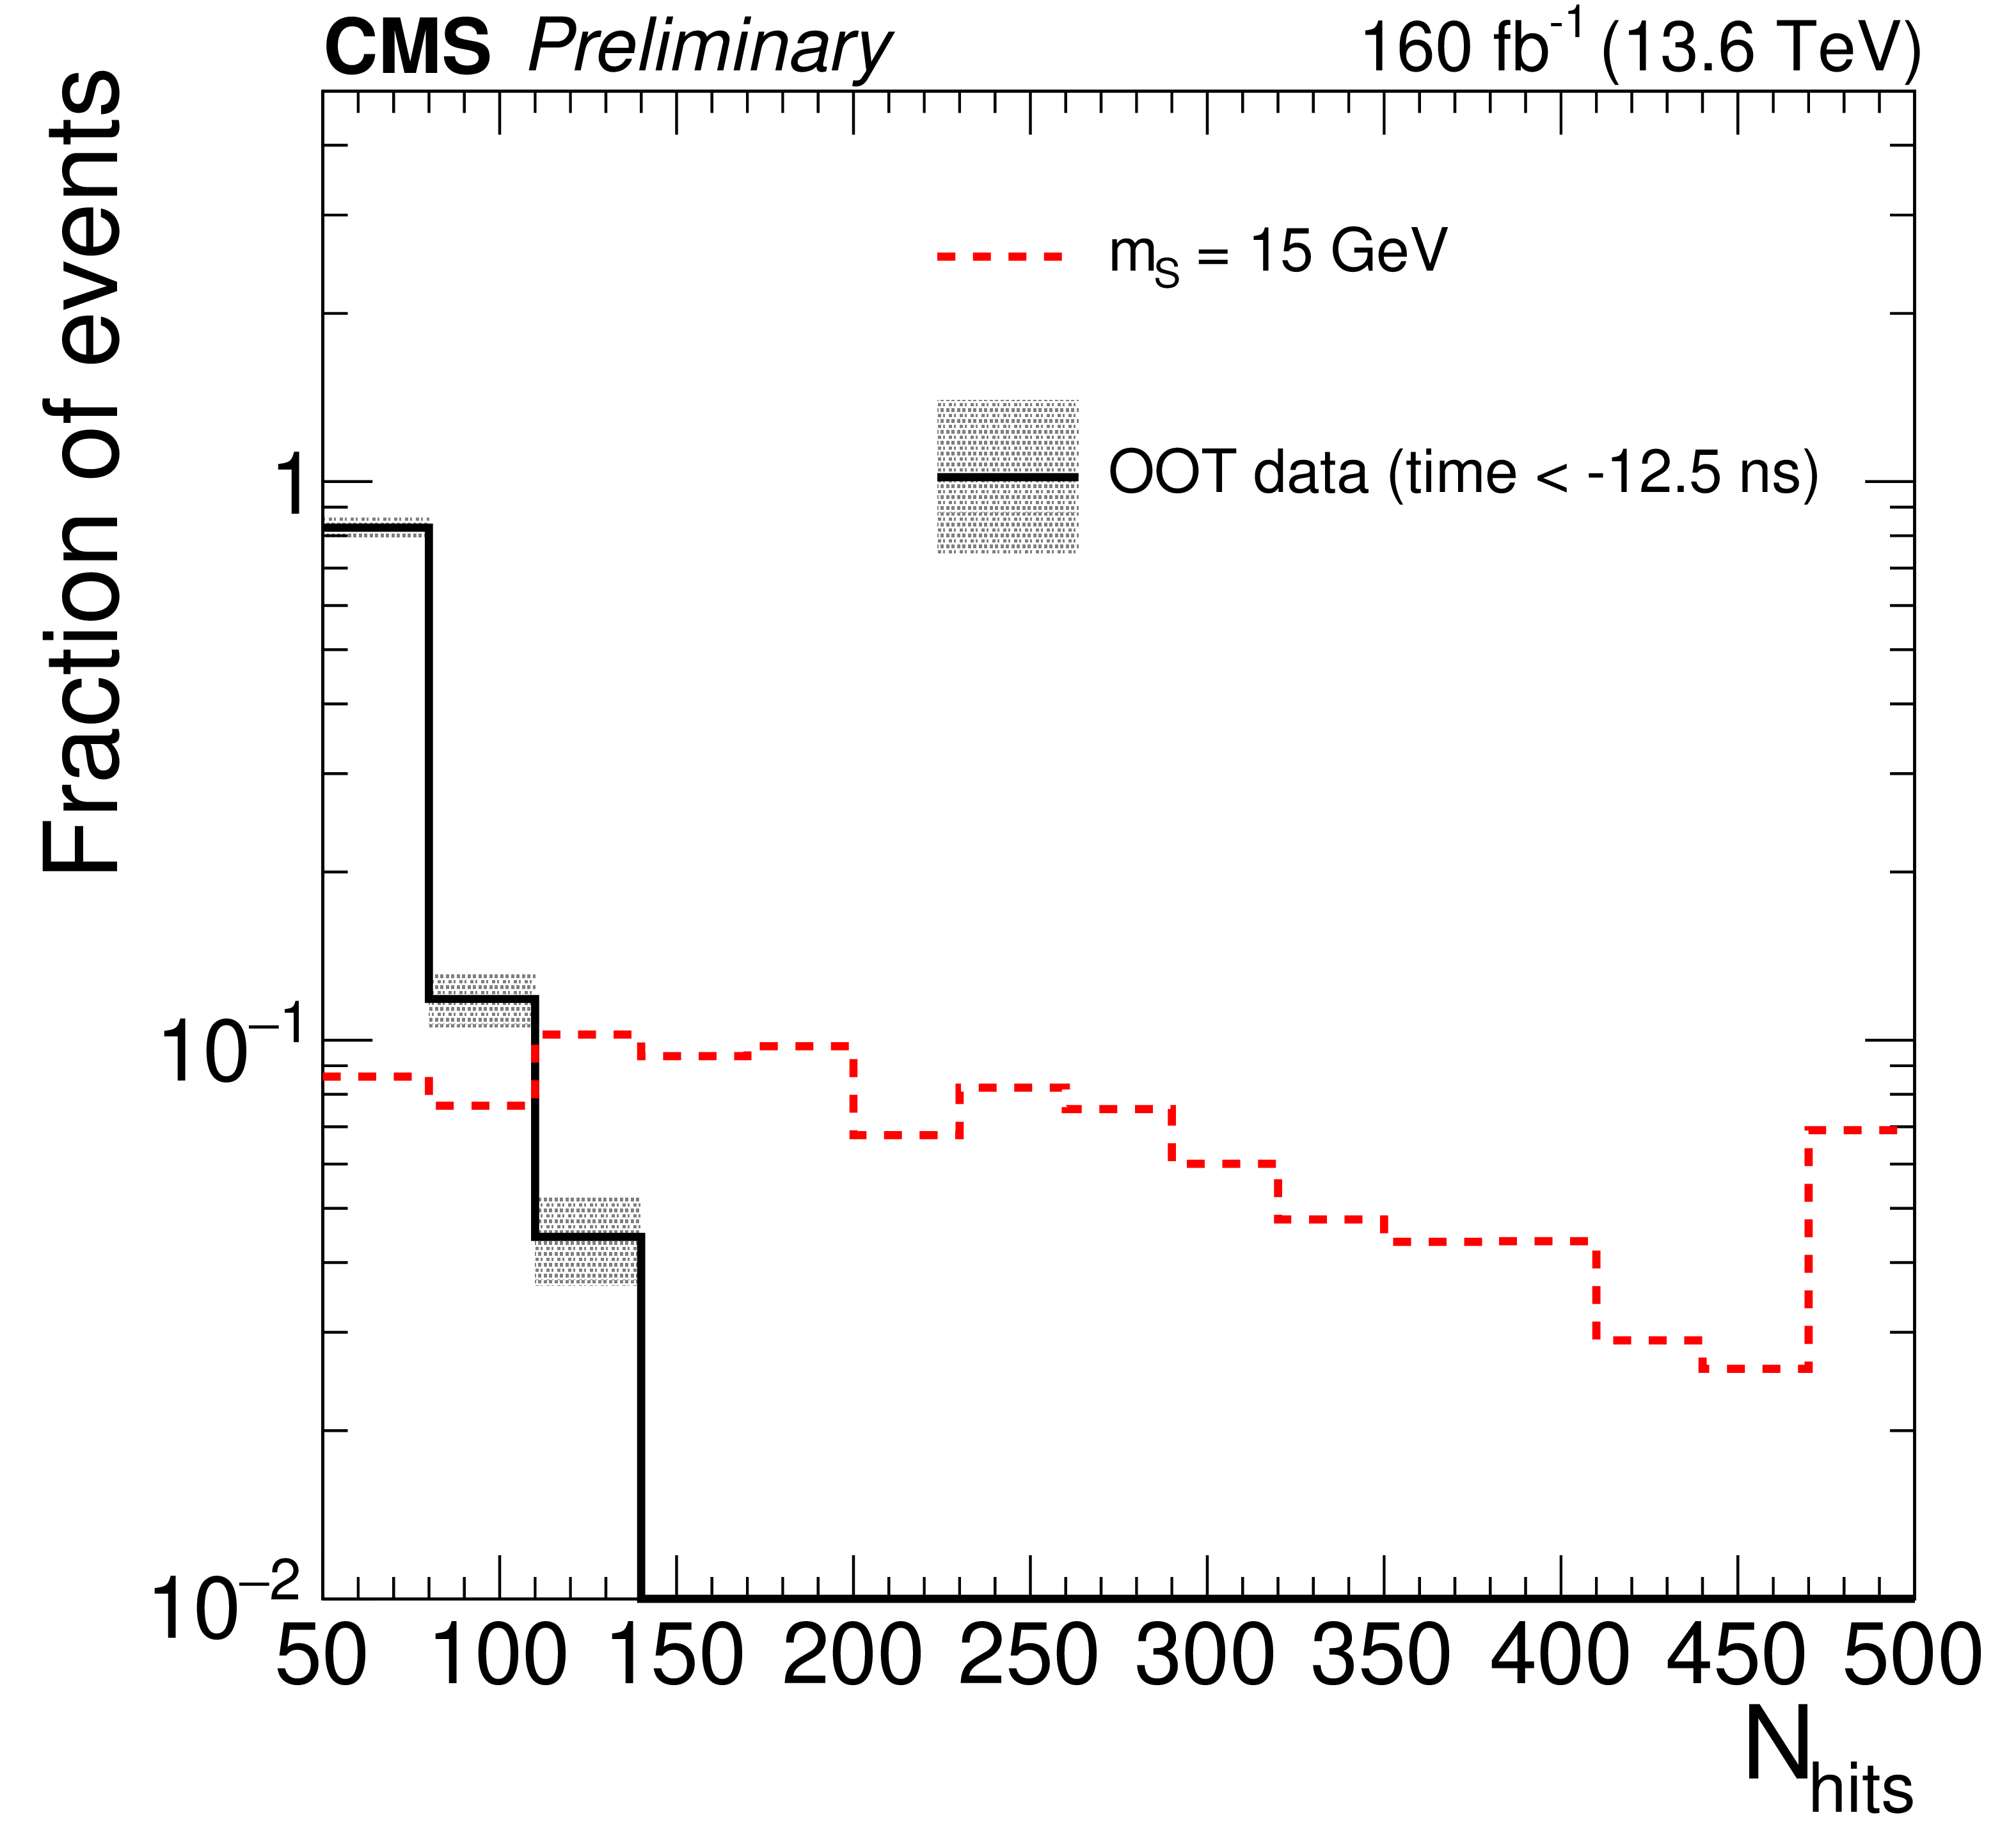
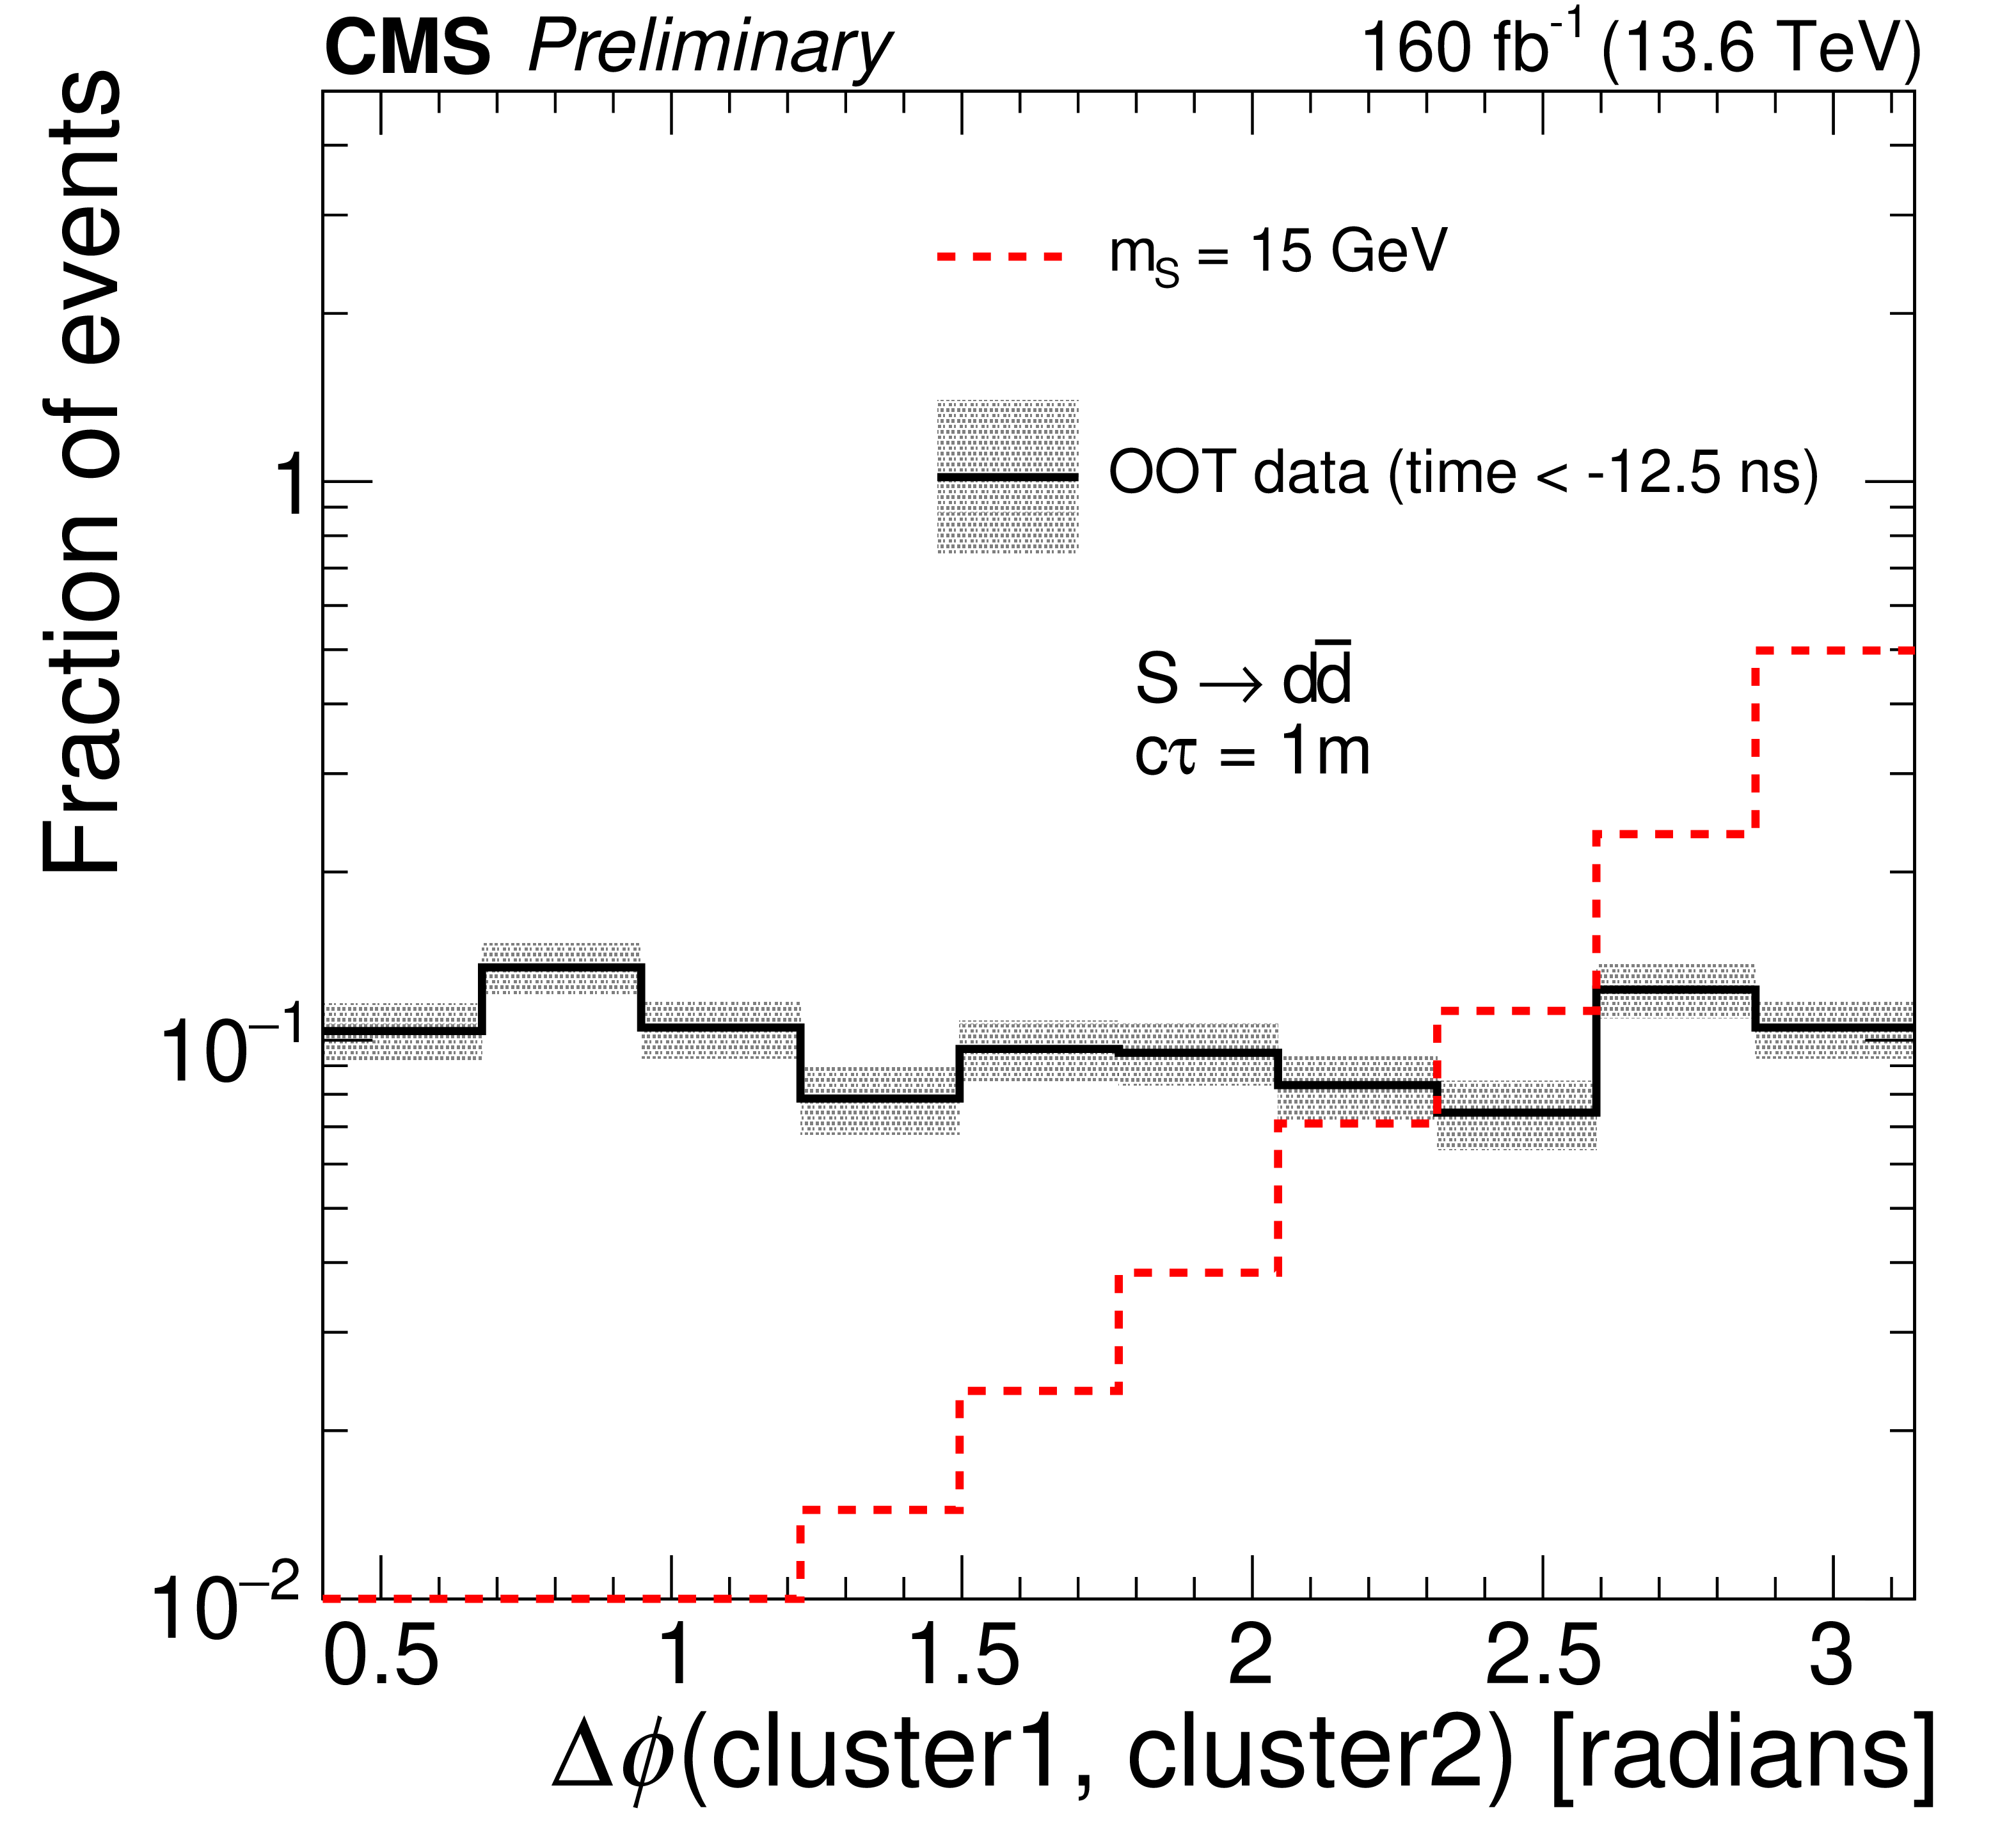
The distributions of $ N_\text{hits} $ (left) and $ \Delta\phi{\mathrm{(cluster1, cluster2)}} $ (right) for the CSC-CSC category are shown for S decaying to $ \mathrm{d}\overline{\mathrm{d}} $ for a proper decay length of 1 m and various masses compared to the shape of background in a selection in which the clusters passes all selections, except for the topological requirements on the $ \Delta R $ and $ \Delta \phi $ between the two clusters. The shaded bands show the statistical uncertainty in the background. |
png pdf |
Figure 3-a:
The distributions of $ N_\text{hits} $ (left) and $ \Delta\phi{\mathrm{(cluster1, cluster2)}} $ (right) for the CSC-CSC category are shown for S decaying to $ \mathrm{d}\overline{\mathrm{d}} $ for a proper decay length of 1 m and various masses compared to the shape of background in a selection in which the clusters passes all selections, except for the topological requirements on the $ \Delta R $ and $ \Delta \phi $ between the two clusters. The shaded bands show the statistical uncertainty in the background. |
png pdf |
Figure 3-b:
The distributions of $ N_\text{hits} $ (left) and $ \Delta\phi{\mathrm{(cluster1, cluster2)}} $ (right) for the CSC-CSC category are shown for S decaying to $ \mathrm{d}\overline{\mathrm{d}} $ for a proper decay length of 1 m and various masses compared to the shape of background in a selection in which the clusters passes all selections, except for the topological requirements on the $ \Delta R $ and $ \Delta \phi $ between the two clusters. The shaded bands show the statistical uncertainty in the background. |
png pdf |
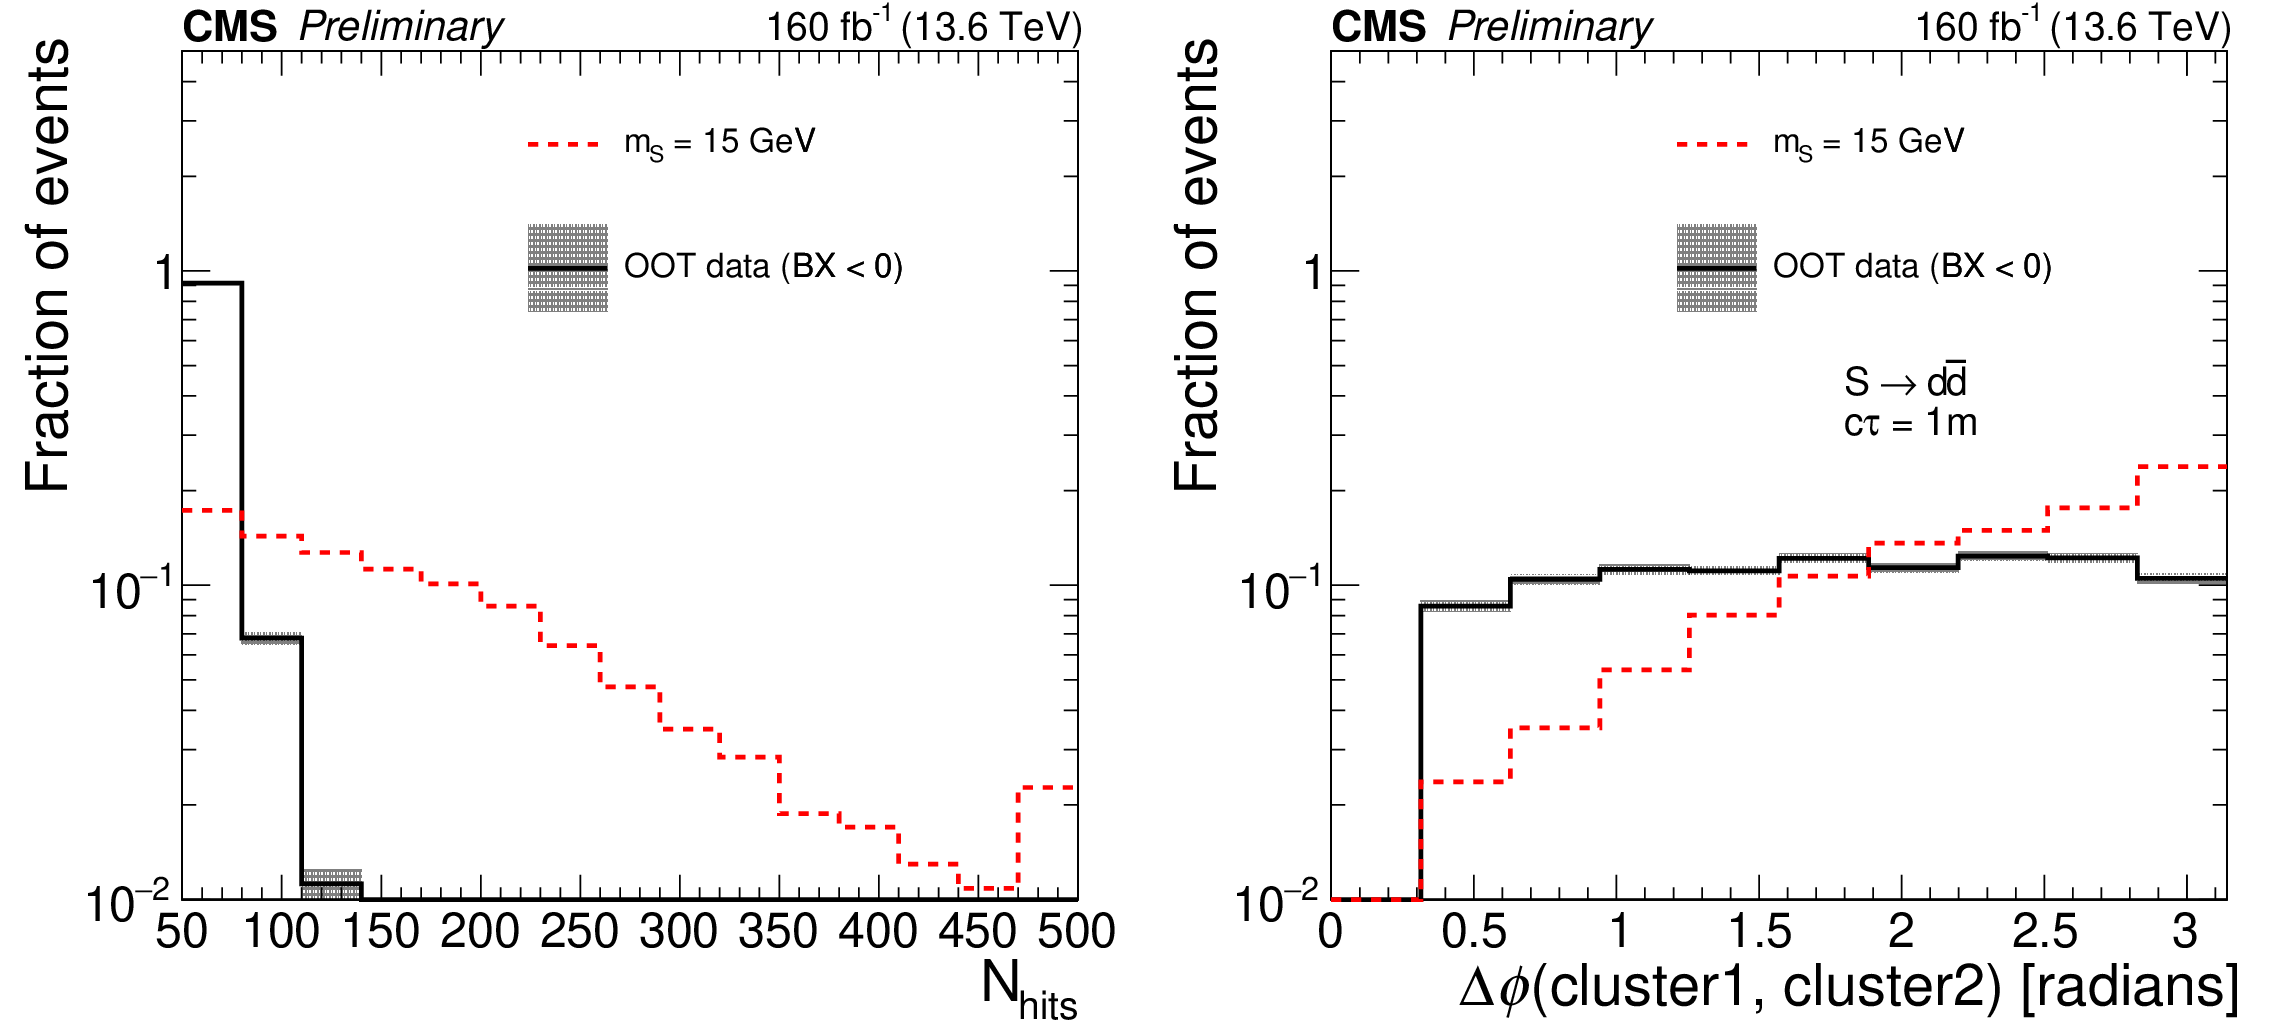
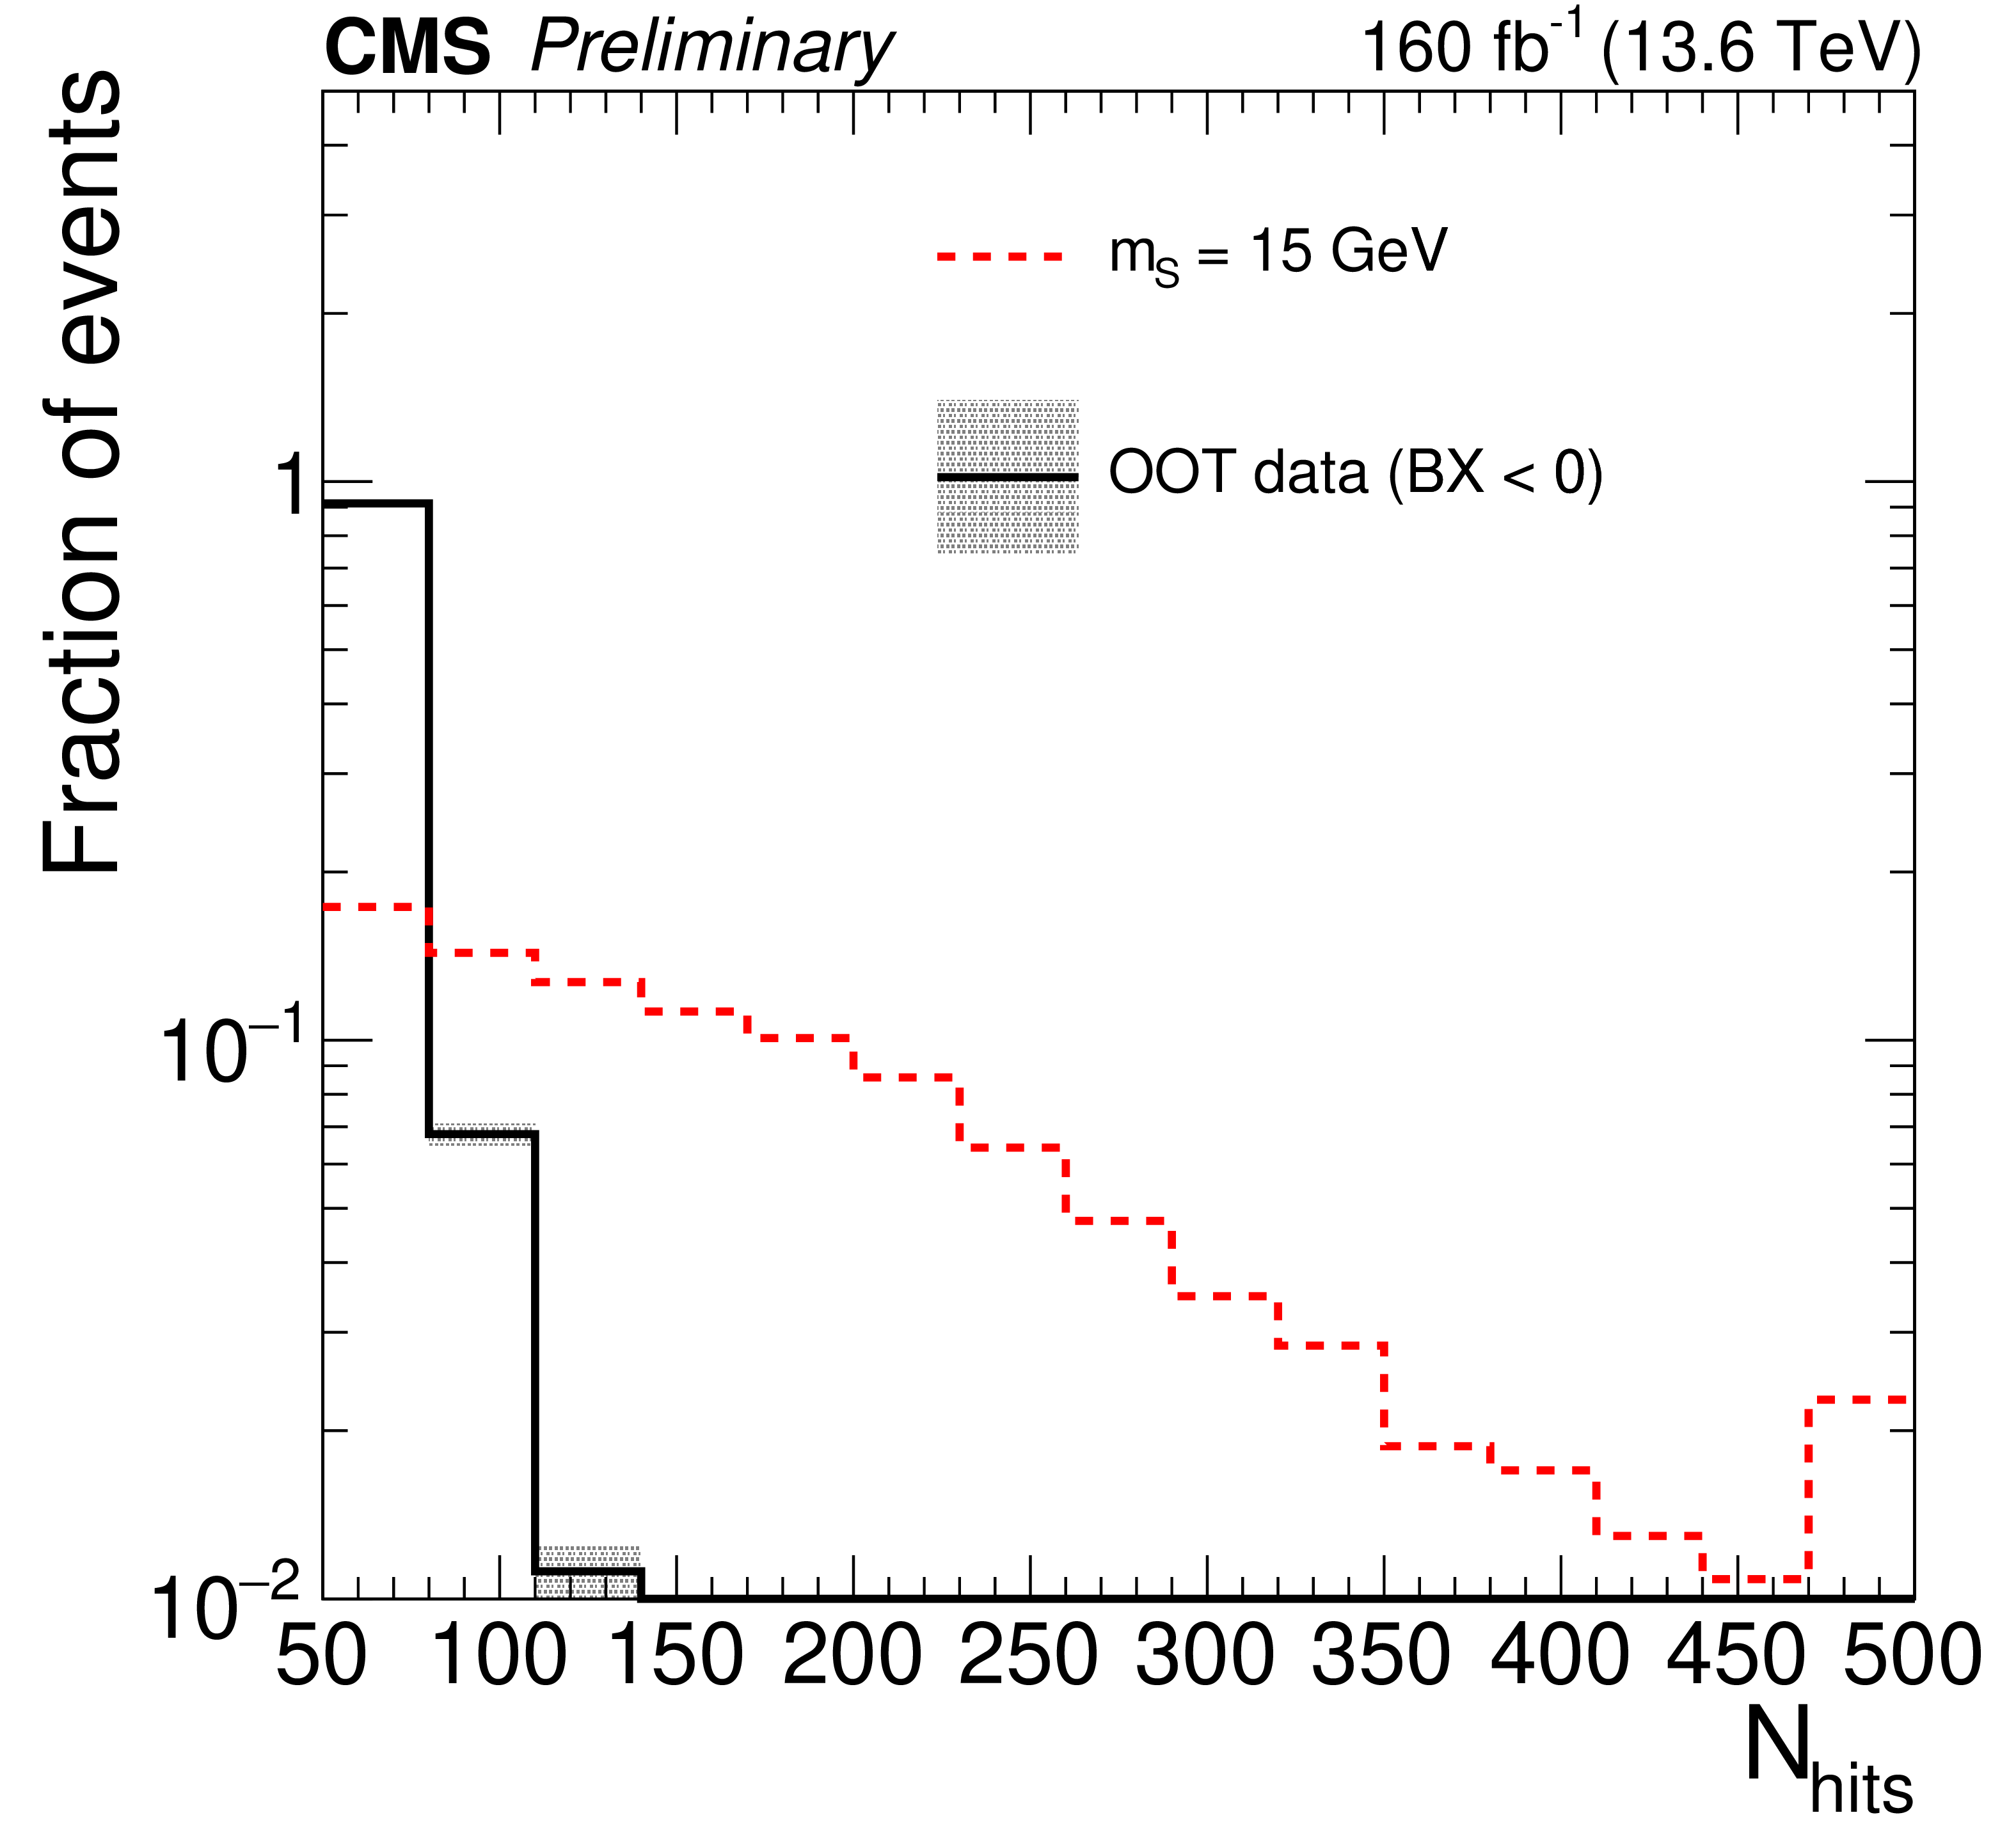
Figure 4:
The distributions of $ N_\text{hits} $ (left) and $ \Delta\phi{\mathrm{(cluster1, cluster2)}} $ (right) for the DT-CSC category are shown for S decaying to $ \mathrm{d}\overline{\mathrm{d}} $ for a proper decay length of 1 m and various masses compared to the shape of background in a selection in which the clusters passes all selections, except for the topological requirements on the $ \Delta R $ and $ \Delta \phi $ between the two clusters. The shaded bands show the statistical uncertainty in the background. |
png pdf |
Figure 4-a:
The distributions of $ N_\text{hits} $ (left) and $ \Delta\phi{\mathrm{(cluster1, cluster2)}} $ (right) for the DT-CSC category are shown for S decaying to $ \mathrm{d}\overline{\mathrm{d}} $ for a proper decay length of 1 m and various masses compared to the shape of background in a selection in which the clusters passes all selections, except for the topological requirements on the $ \Delta R $ and $ \Delta \phi $ between the two clusters. The shaded bands show the statistical uncertainty in the background. |
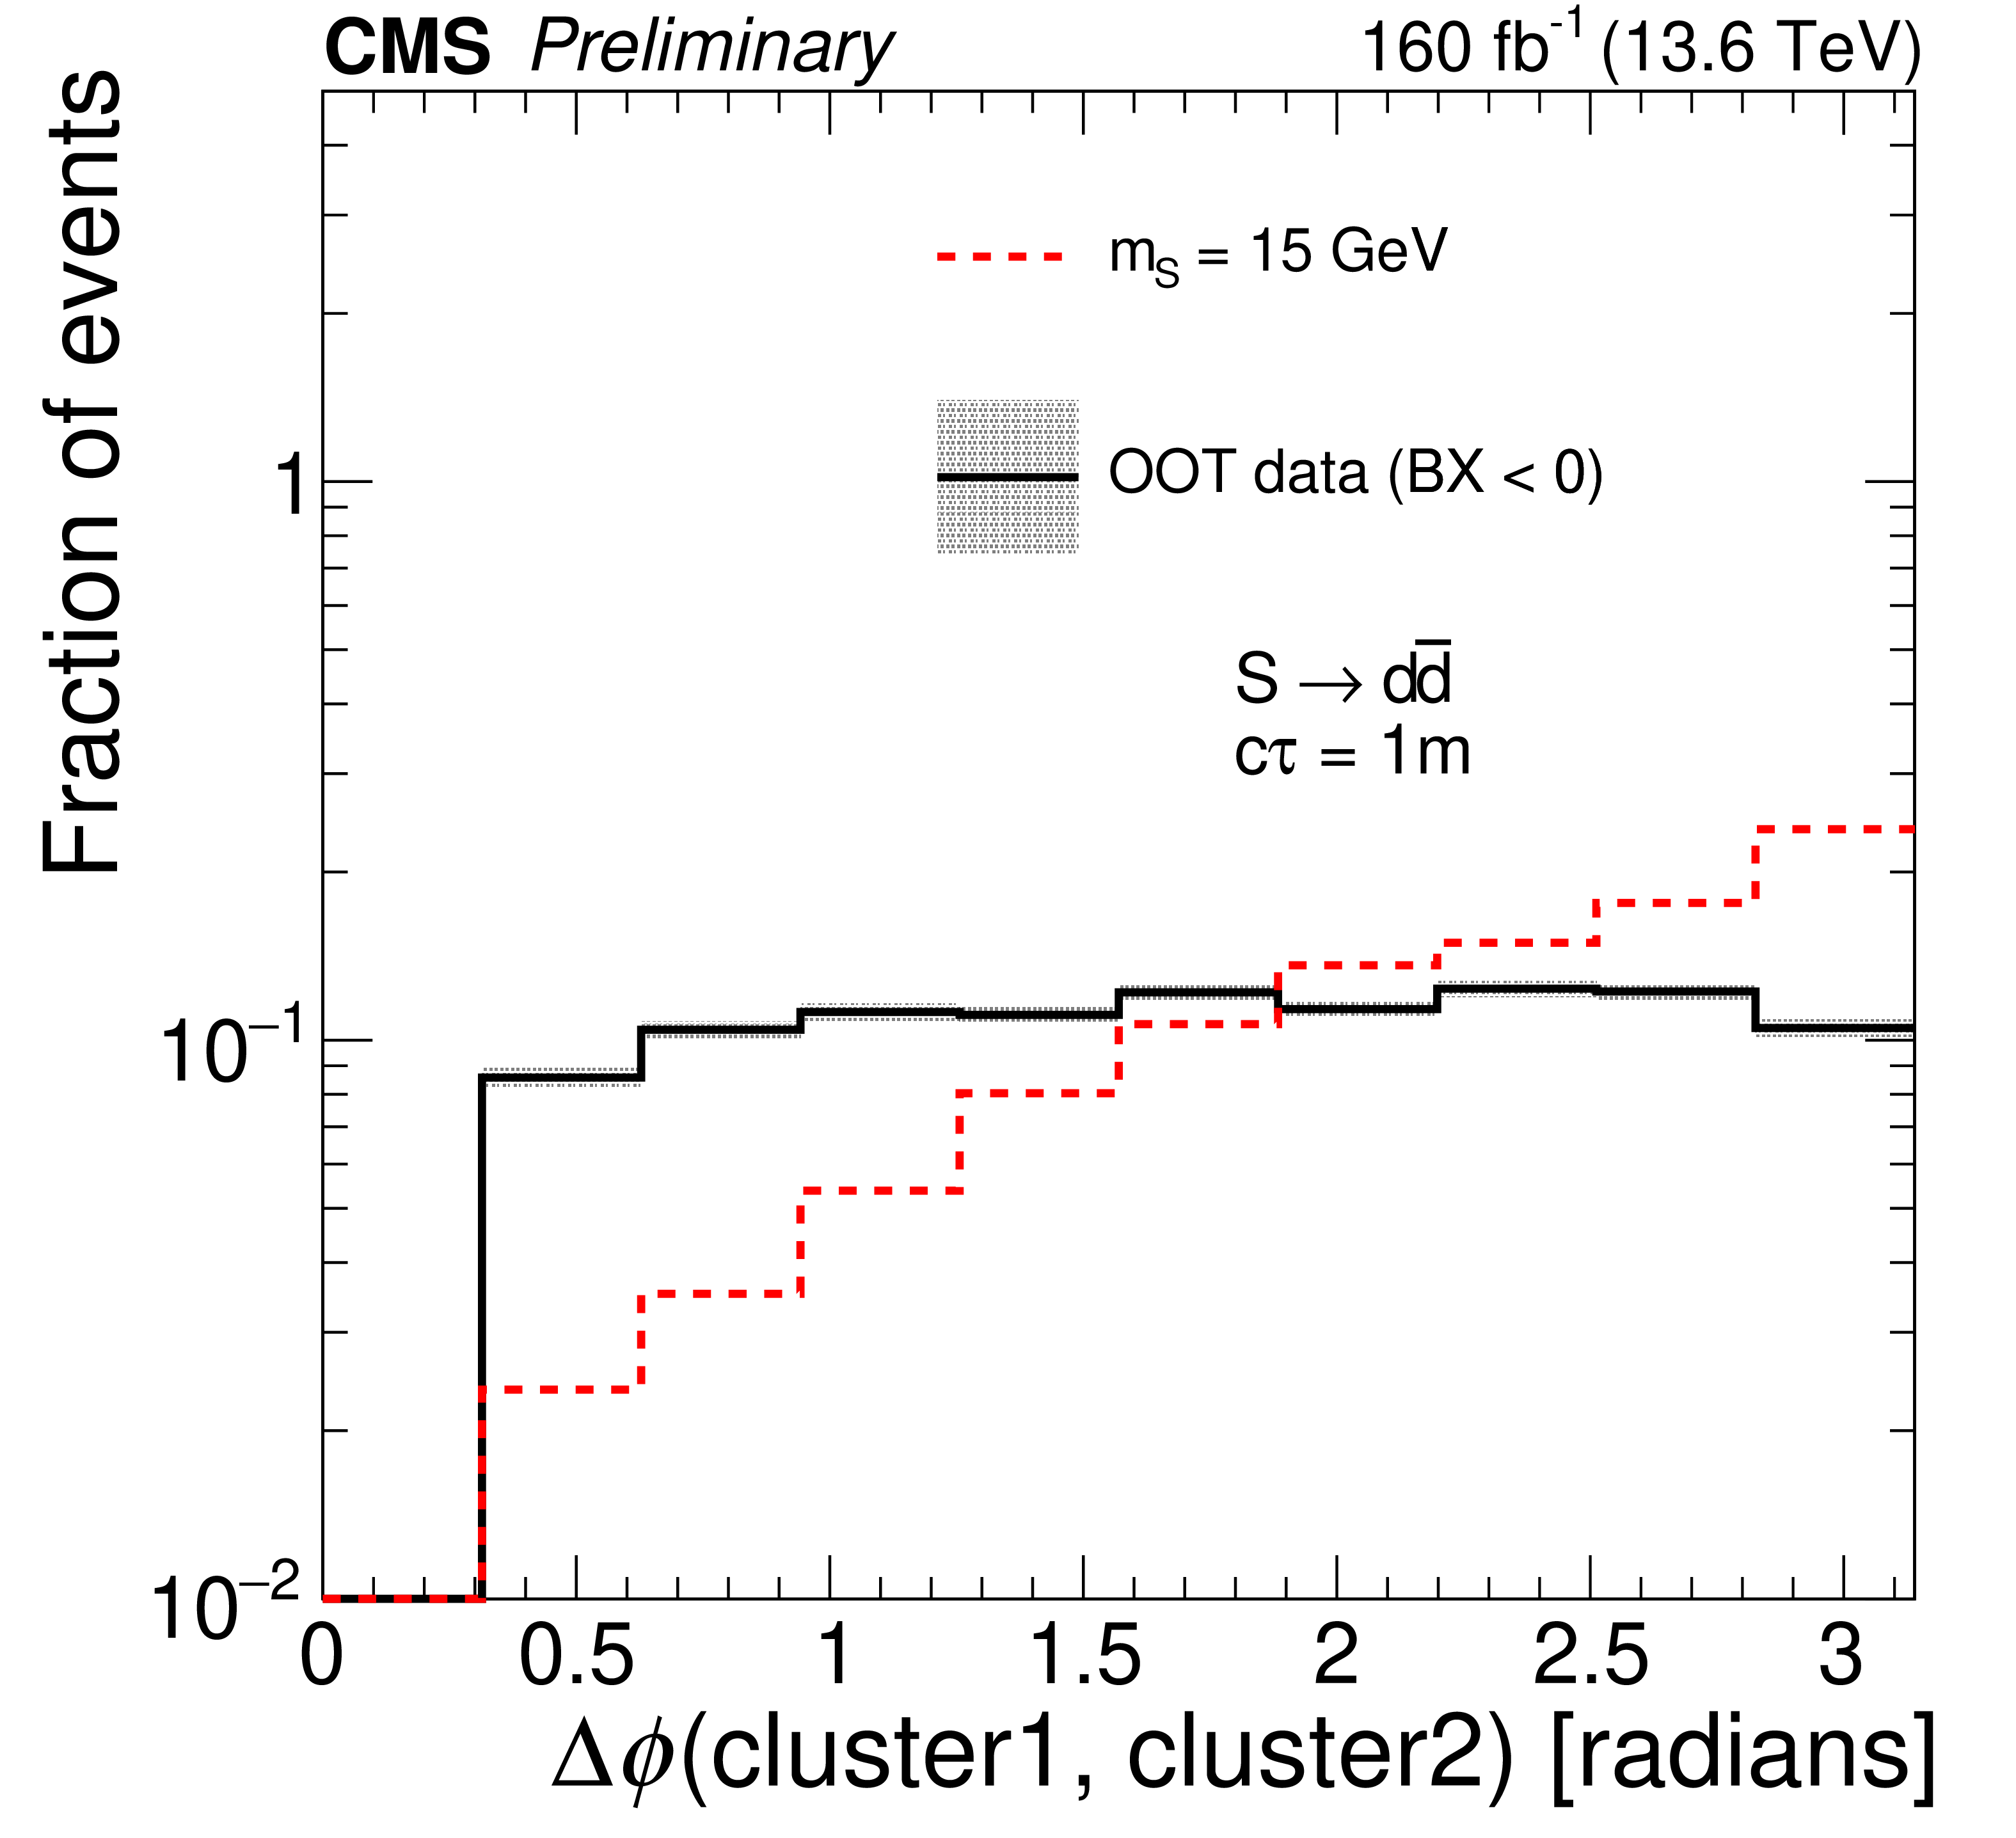
png pdf |
Figure 4-b:
The distributions of $ N_\text{hits} $ (left) and $ \Delta\phi{\mathrm{(cluster1, cluster2)}} $ (right) for the DT-CSC category are shown for S decaying to $ \mathrm{d}\overline{\mathrm{d}} $ for a proper decay length of 1 m and various masses compared to the shape of background in a selection in which the clusters passes all selections, except for the topological requirements on the $ \Delta R $ and $ \Delta \phi $ between the two clusters. The shaded bands show the statistical uncertainty in the background. |
png pdf |
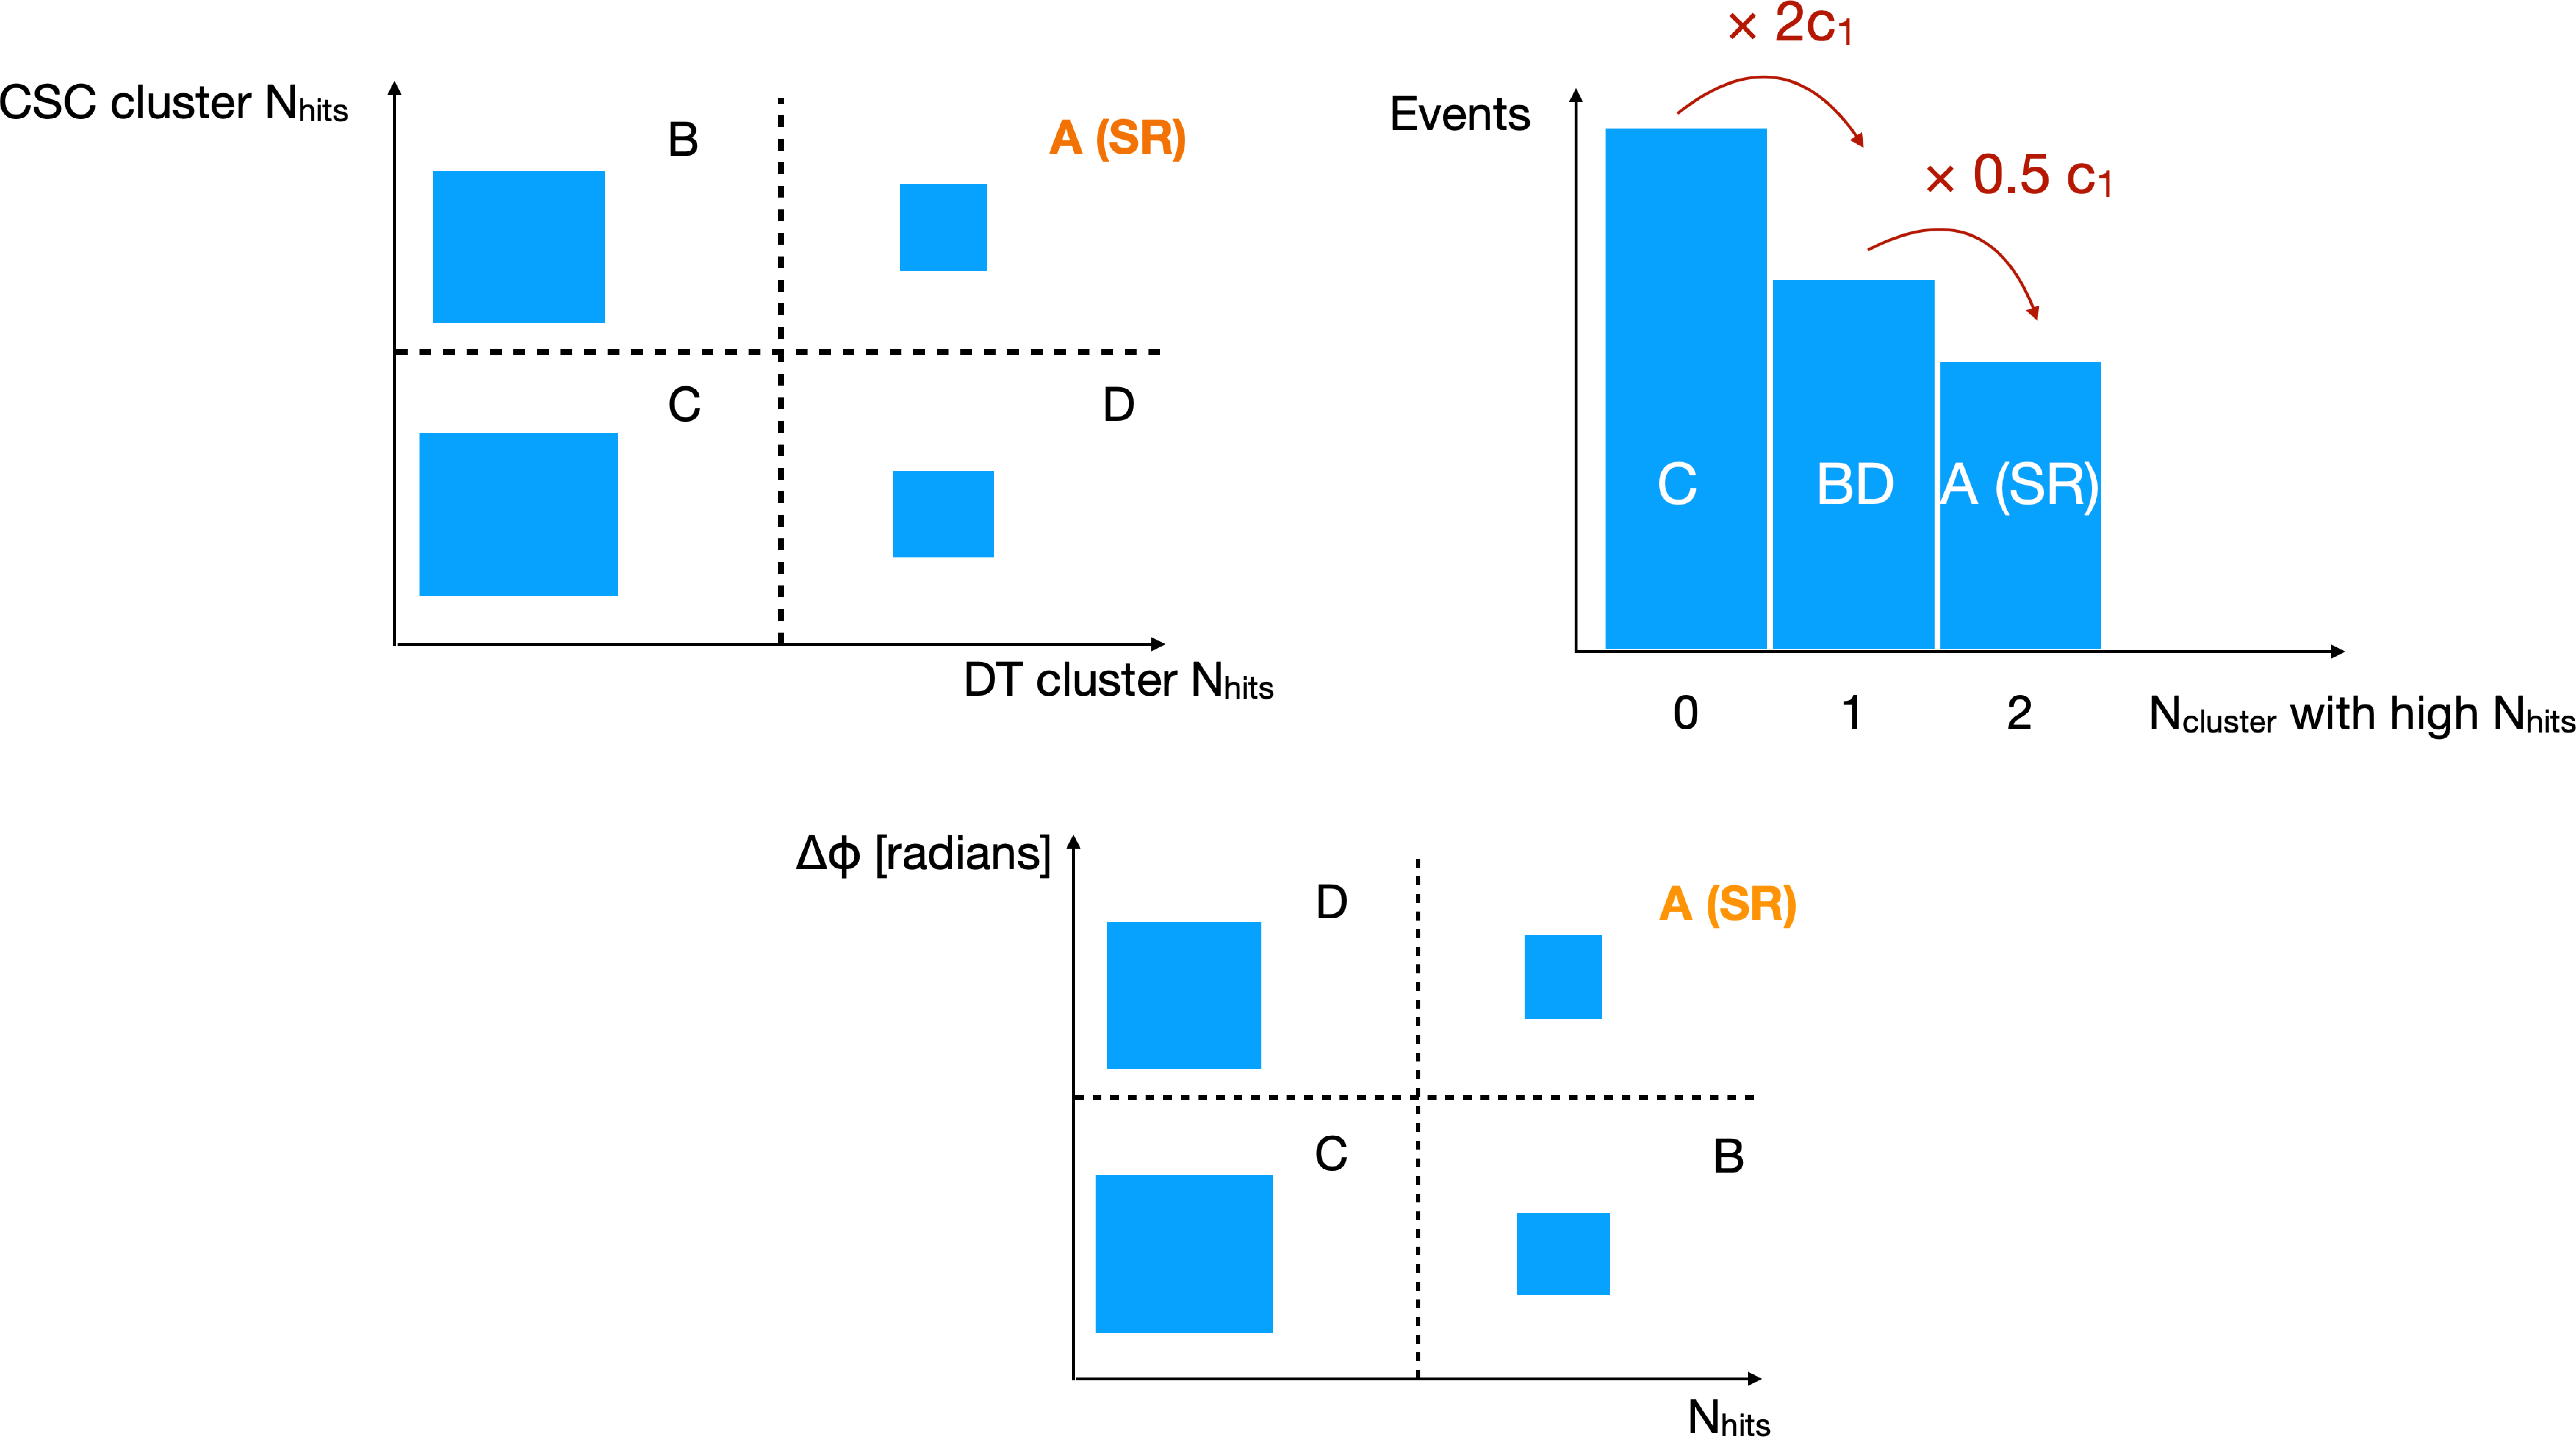
Figure 5:
The diagram of the ABCD plane for $ p_{\mathrm{T}}^\text{miss} $ triggered DT-CSC subcategory (upper left), $ p_{\mathrm{T}}^\text{miss} $ triggered CSC-CSC and DT-DT categories (upper right), and HMT triggered categories (bottom) are shown. The variable $ c_1 $ is the pass-fail ratio of the $ N_\text{hits} $ selection for the background clusters. |
png pdf |
Figure 6:
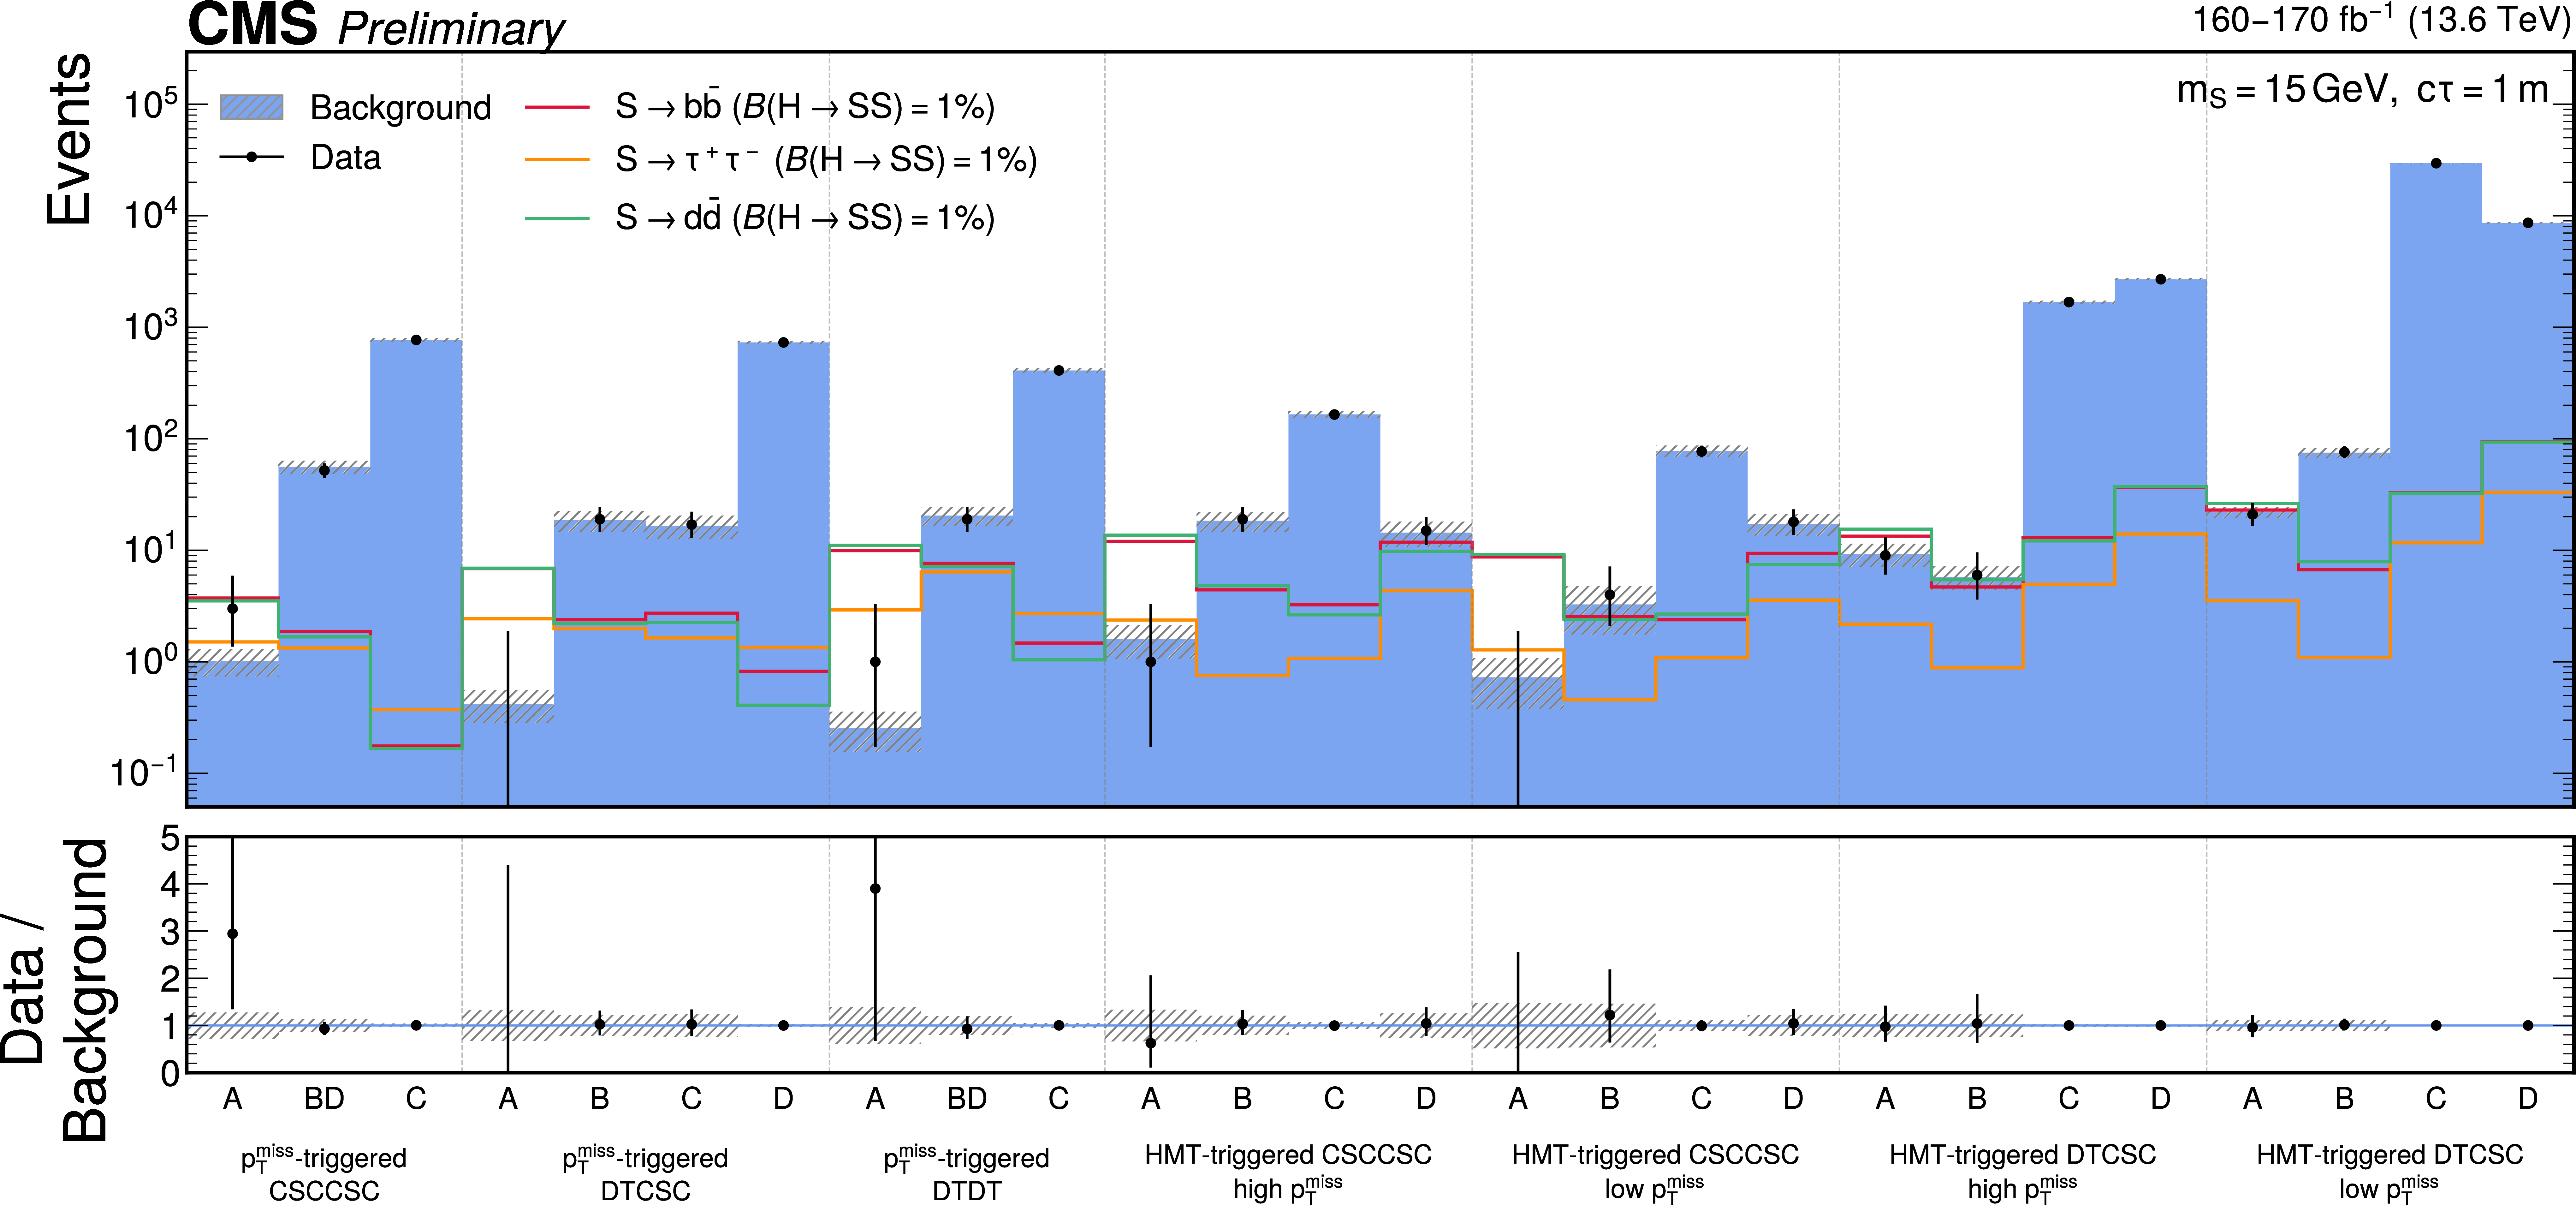
The observed data, background prediction, and expected signal in all categories are shown. The background prediction is obtained from the fit to the observed data assuming no signal contribution, and is shown in blue with the shaded region showing the fitted uncertainty. The expected signal with $ m_S = $ 15 GeV, $ \mathcal{B}(\mathrm{H}\to SS) = $ 0.01 and $ c\tau = $ 1 m is shown for $ S\to\mathrm{d}\overline{\mathrm{d}} $, $ S\to\mathrm{b}\overline{\mathrm{b}} $, and $ S\to\tau^{+}\tau^{-} $ decay modes in various colors. |
png pdf |
Figure 7:
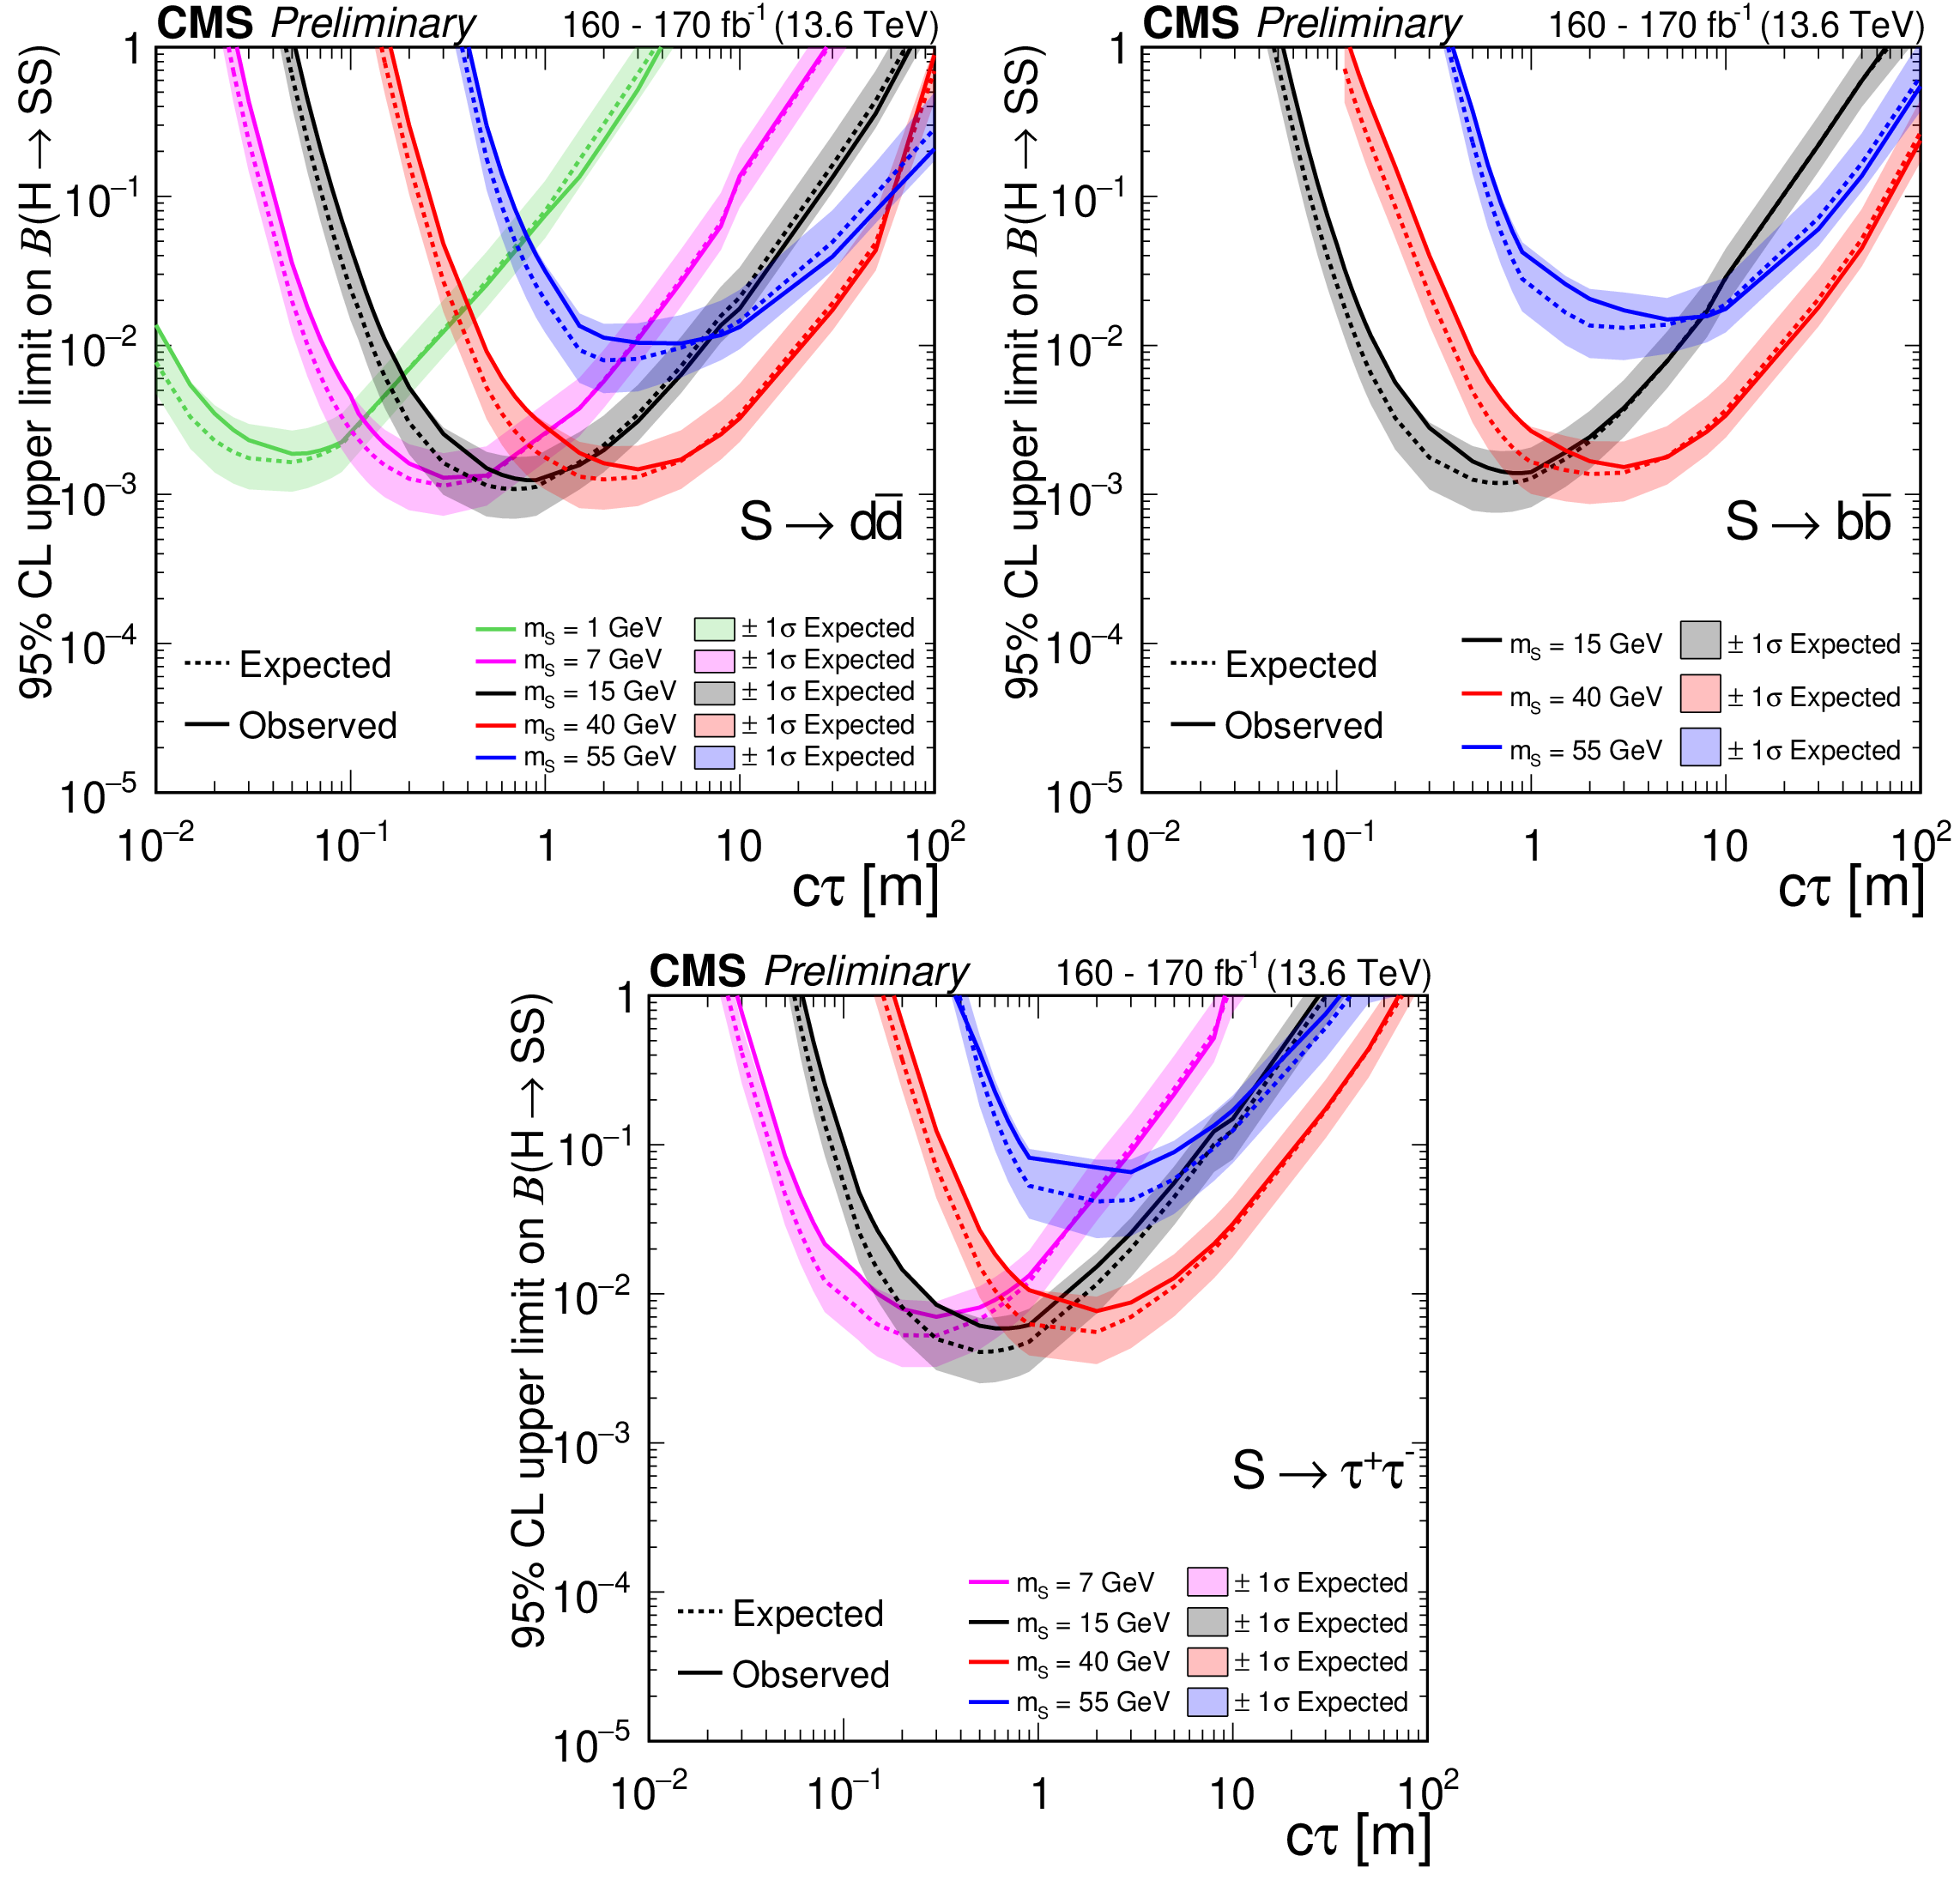
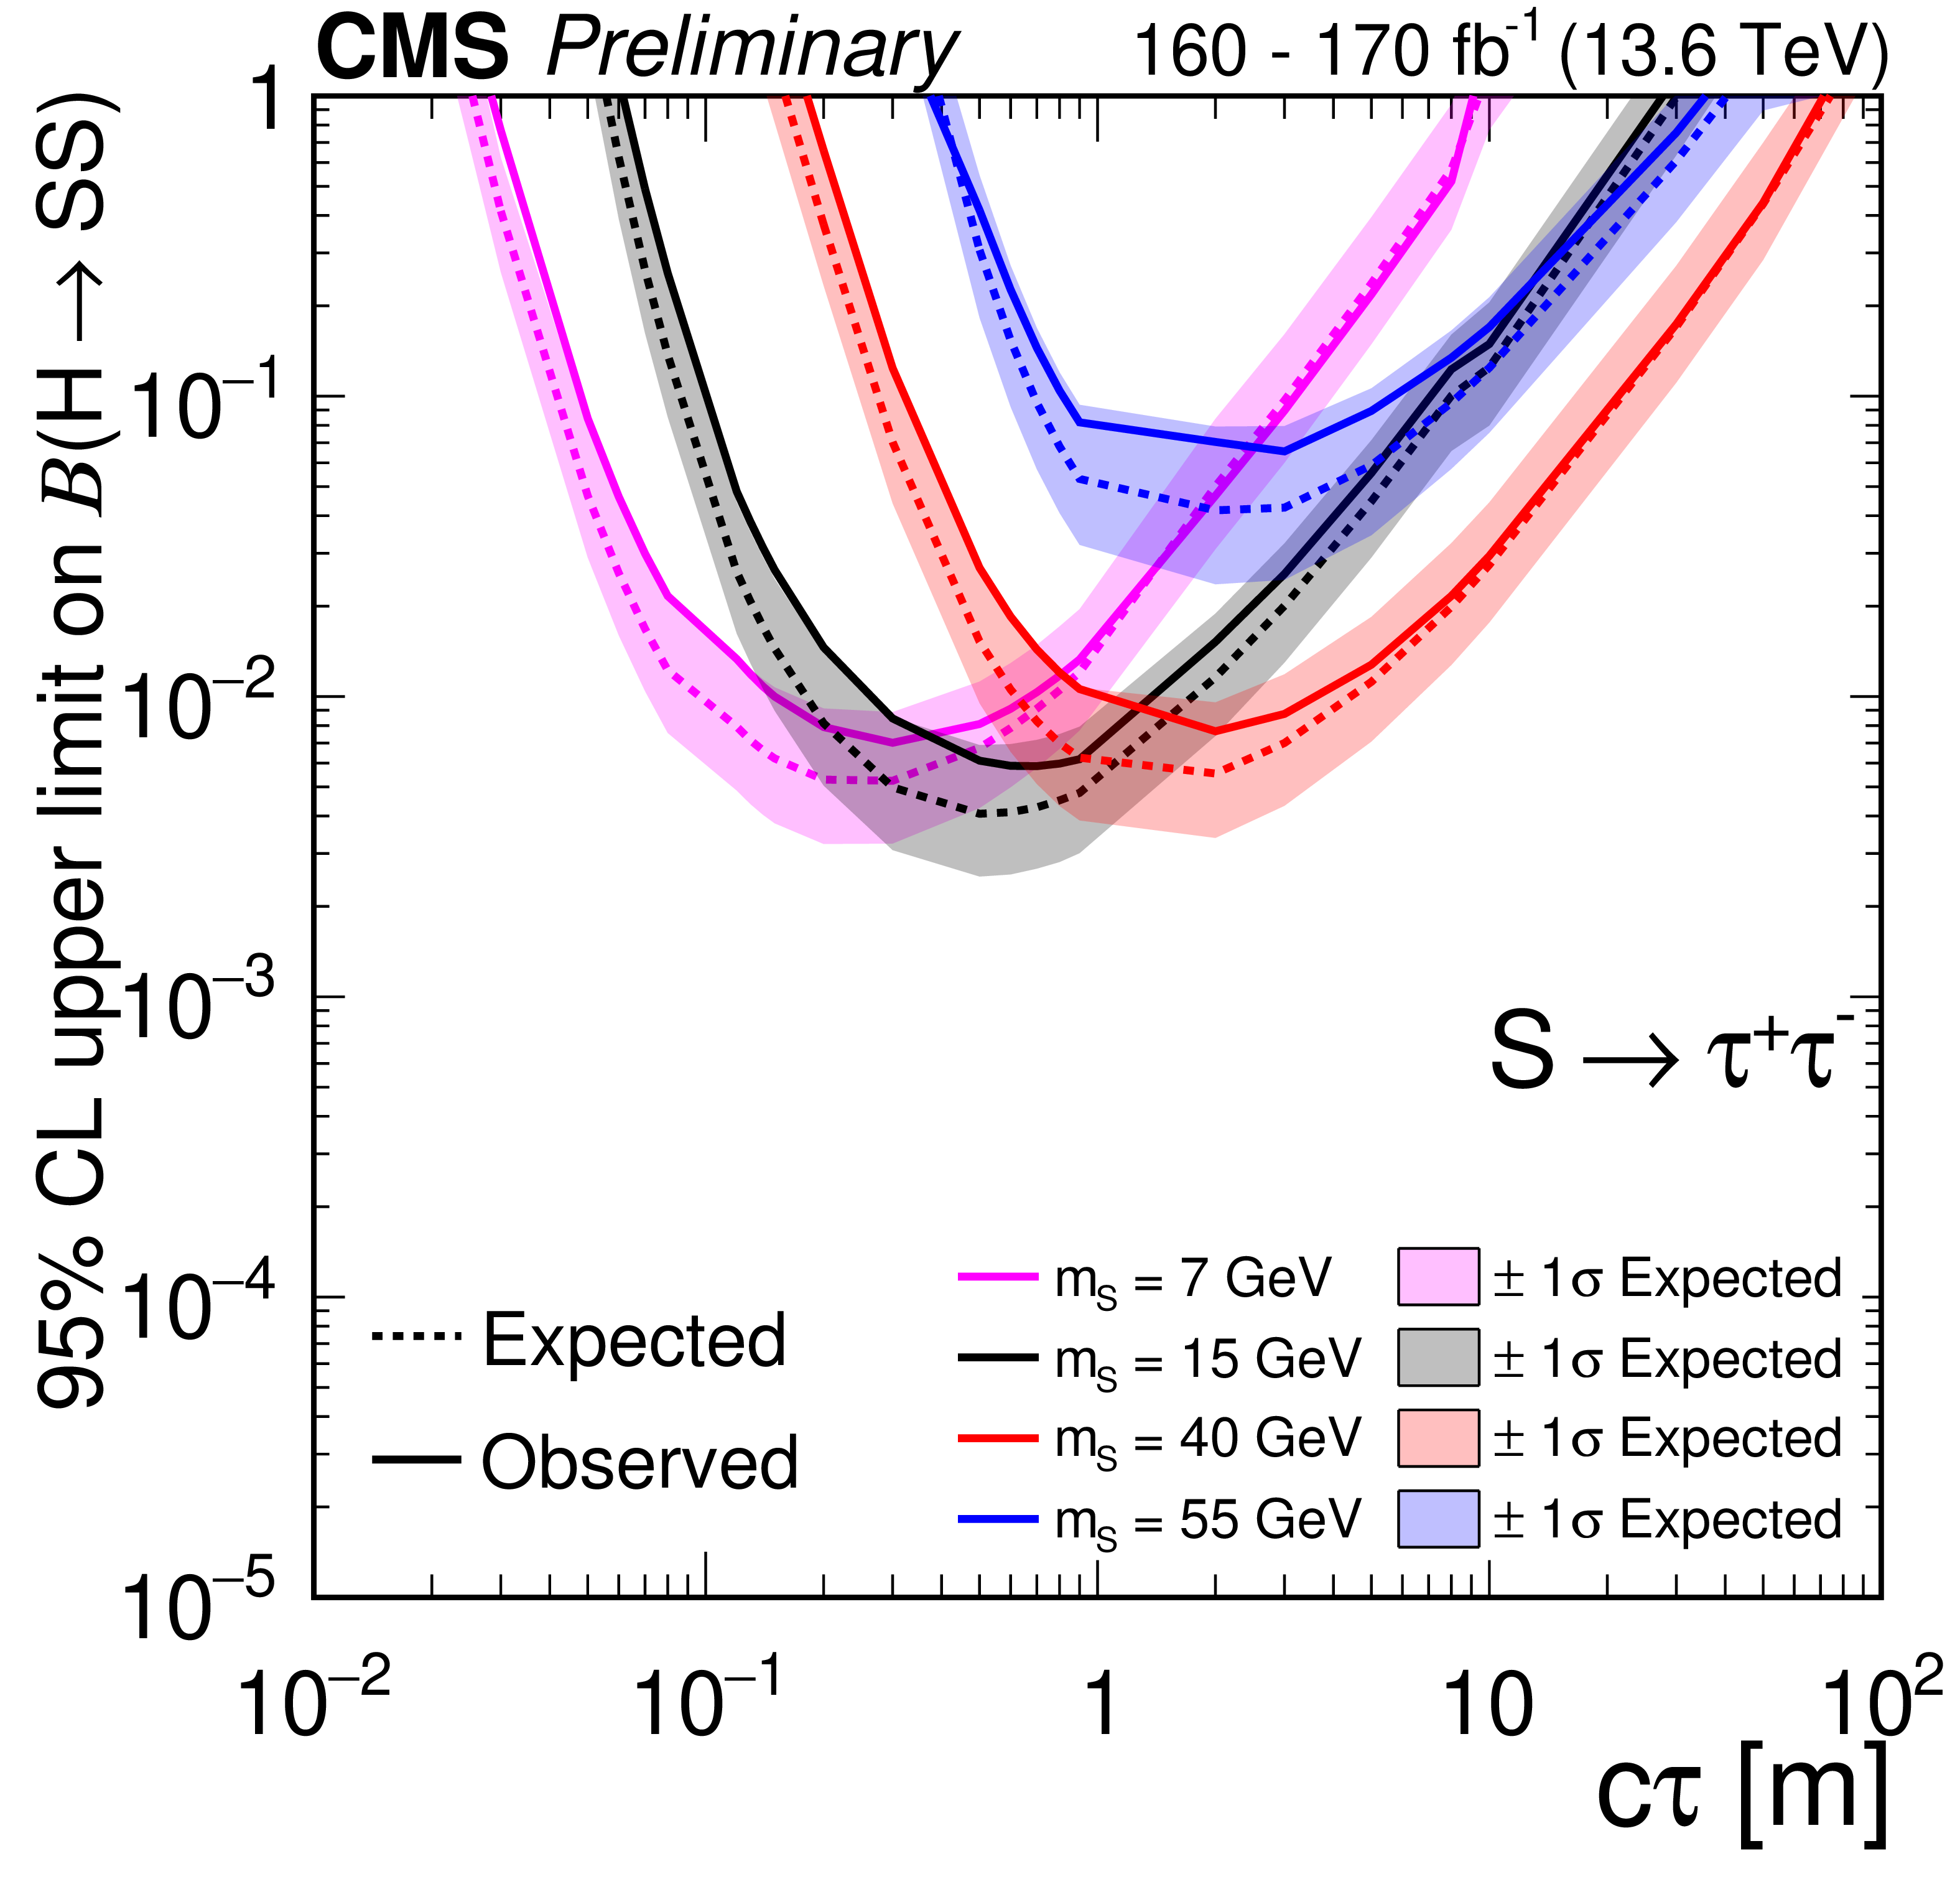
The 95% CL expected (dotted curves) and observed (solid curves) upper limits on the branching fraction $ \mathcal{B}(\mathrm{H}\to SS) $ as functions of $ c\tau $ for the $ S\to\mathrm{d}\overline{\mathrm{d}} $ (upper left), $ S\to\mathrm{b}\overline{\mathrm{b}} $ (upper right), and $ S\to\tau^{+}\tau^{-} $ (lower) decay modes. The exclusion limits are shown for different mass hypotheses. |
png pdf |
Figure 7-a:
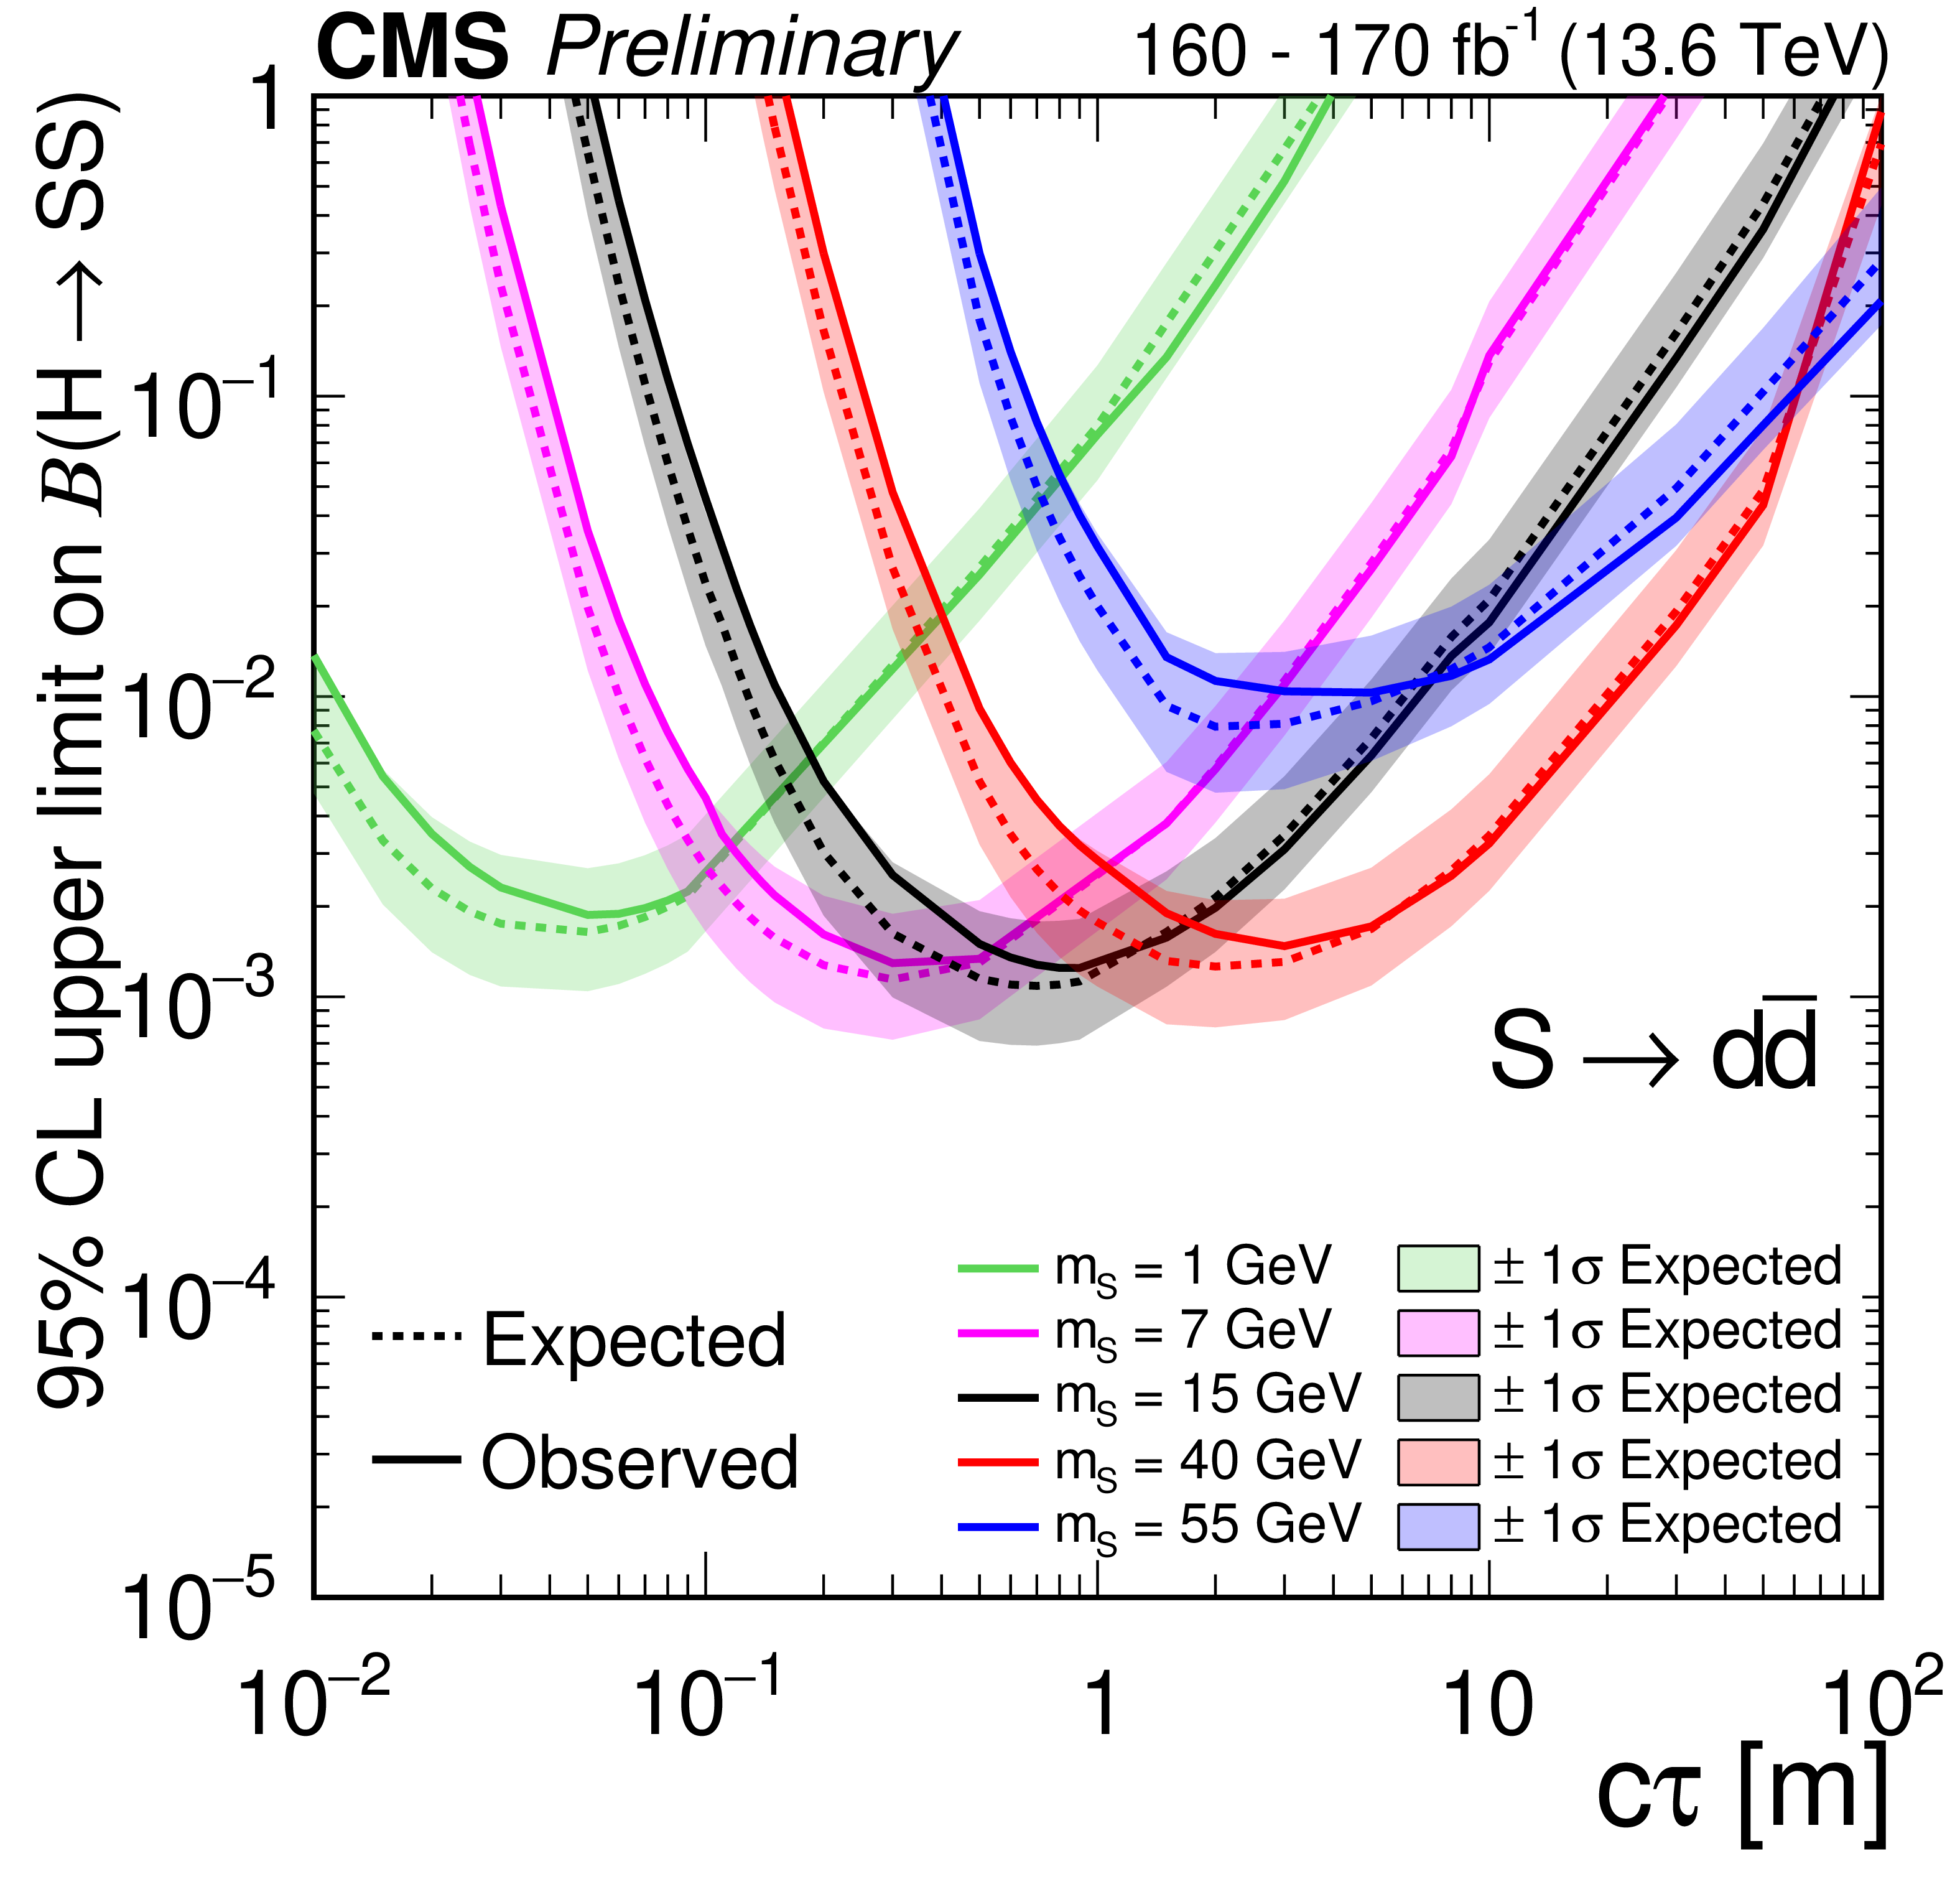
The 95% CL expected (dotted curves) and observed (solid curves) upper limits on the branching fraction $ \mathcal{B}(\mathrm{H}\to SS) $ as functions of $ c\tau $ for the $ S\to\mathrm{d}\overline{\mathrm{d}} $ (upper left), $ S\to\mathrm{b}\overline{\mathrm{b}} $ (upper right), and $ S\to\tau^{+}\tau^{-} $ (lower) decay modes. The exclusion limits are shown for different mass hypotheses. |
png pdf |
Figure 7-b:
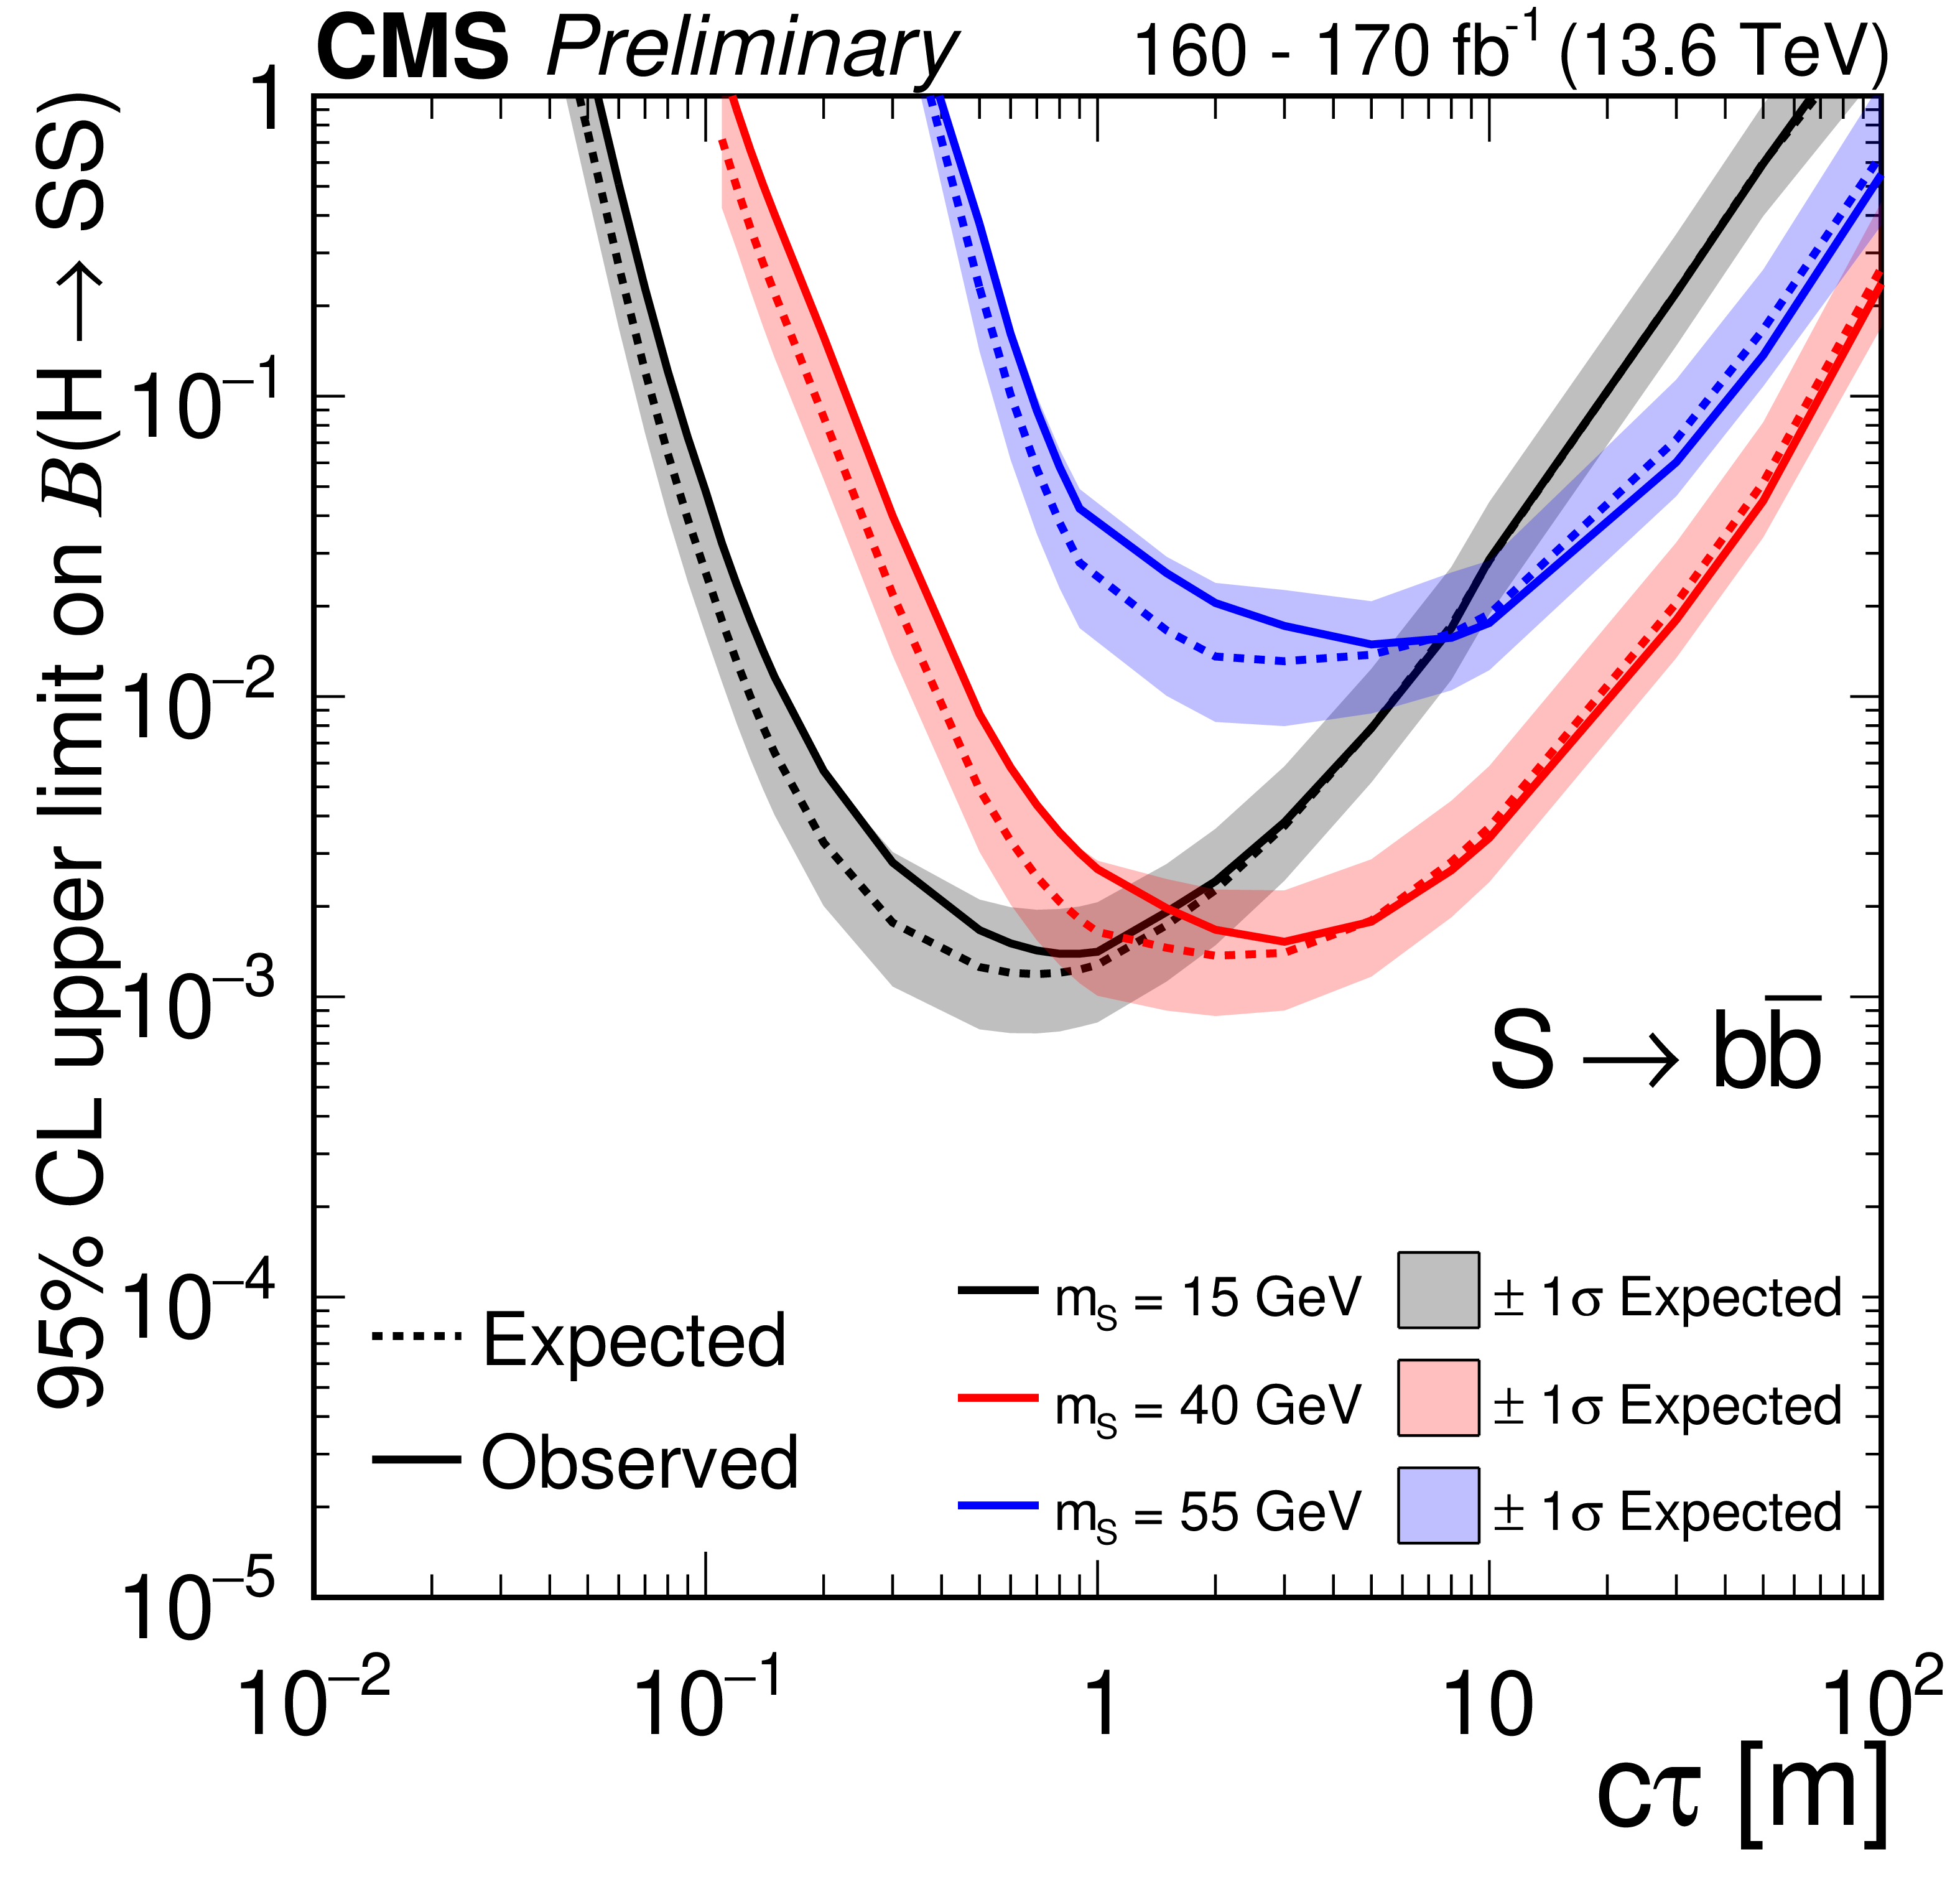
The 95% CL expected (dotted curves) and observed (solid curves) upper limits on the branching fraction $ \mathcal{B}(\mathrm{H}\to SS) $ as functions of $ c\tau $ for the $ S\to\mathrm{d}\overline{\mathrm{d}} $ (upper left), $ S\to\mathrm{b}\overline{\mathrm{b}} $ (upper right), and $ S\to\tau^{+}\tau^{-} $ (lower) decay modes. The exclusion limits are shown for different mass hypotheses. |
png pdf |
Figure 7-c:
The 95% CL expected (dotted curves) and observed (solid curves) upper limits on the branching fraction $ \mathcal{B}(\mathrm{H}\to SS) $ as functions of $ c\tau $ for the $ S\to\mathrm{d}\overline{\mathrm{d}} $ (upper left), $ S\to\mathrm{b}\overline{\mathrm{b}} $ (upper right), and $ S\to\tau^{+}\tau^{-} $ (lower) decay modes. The exclusion limits are shown for different mass hypotheses. |
png pdf |
Figure 8:
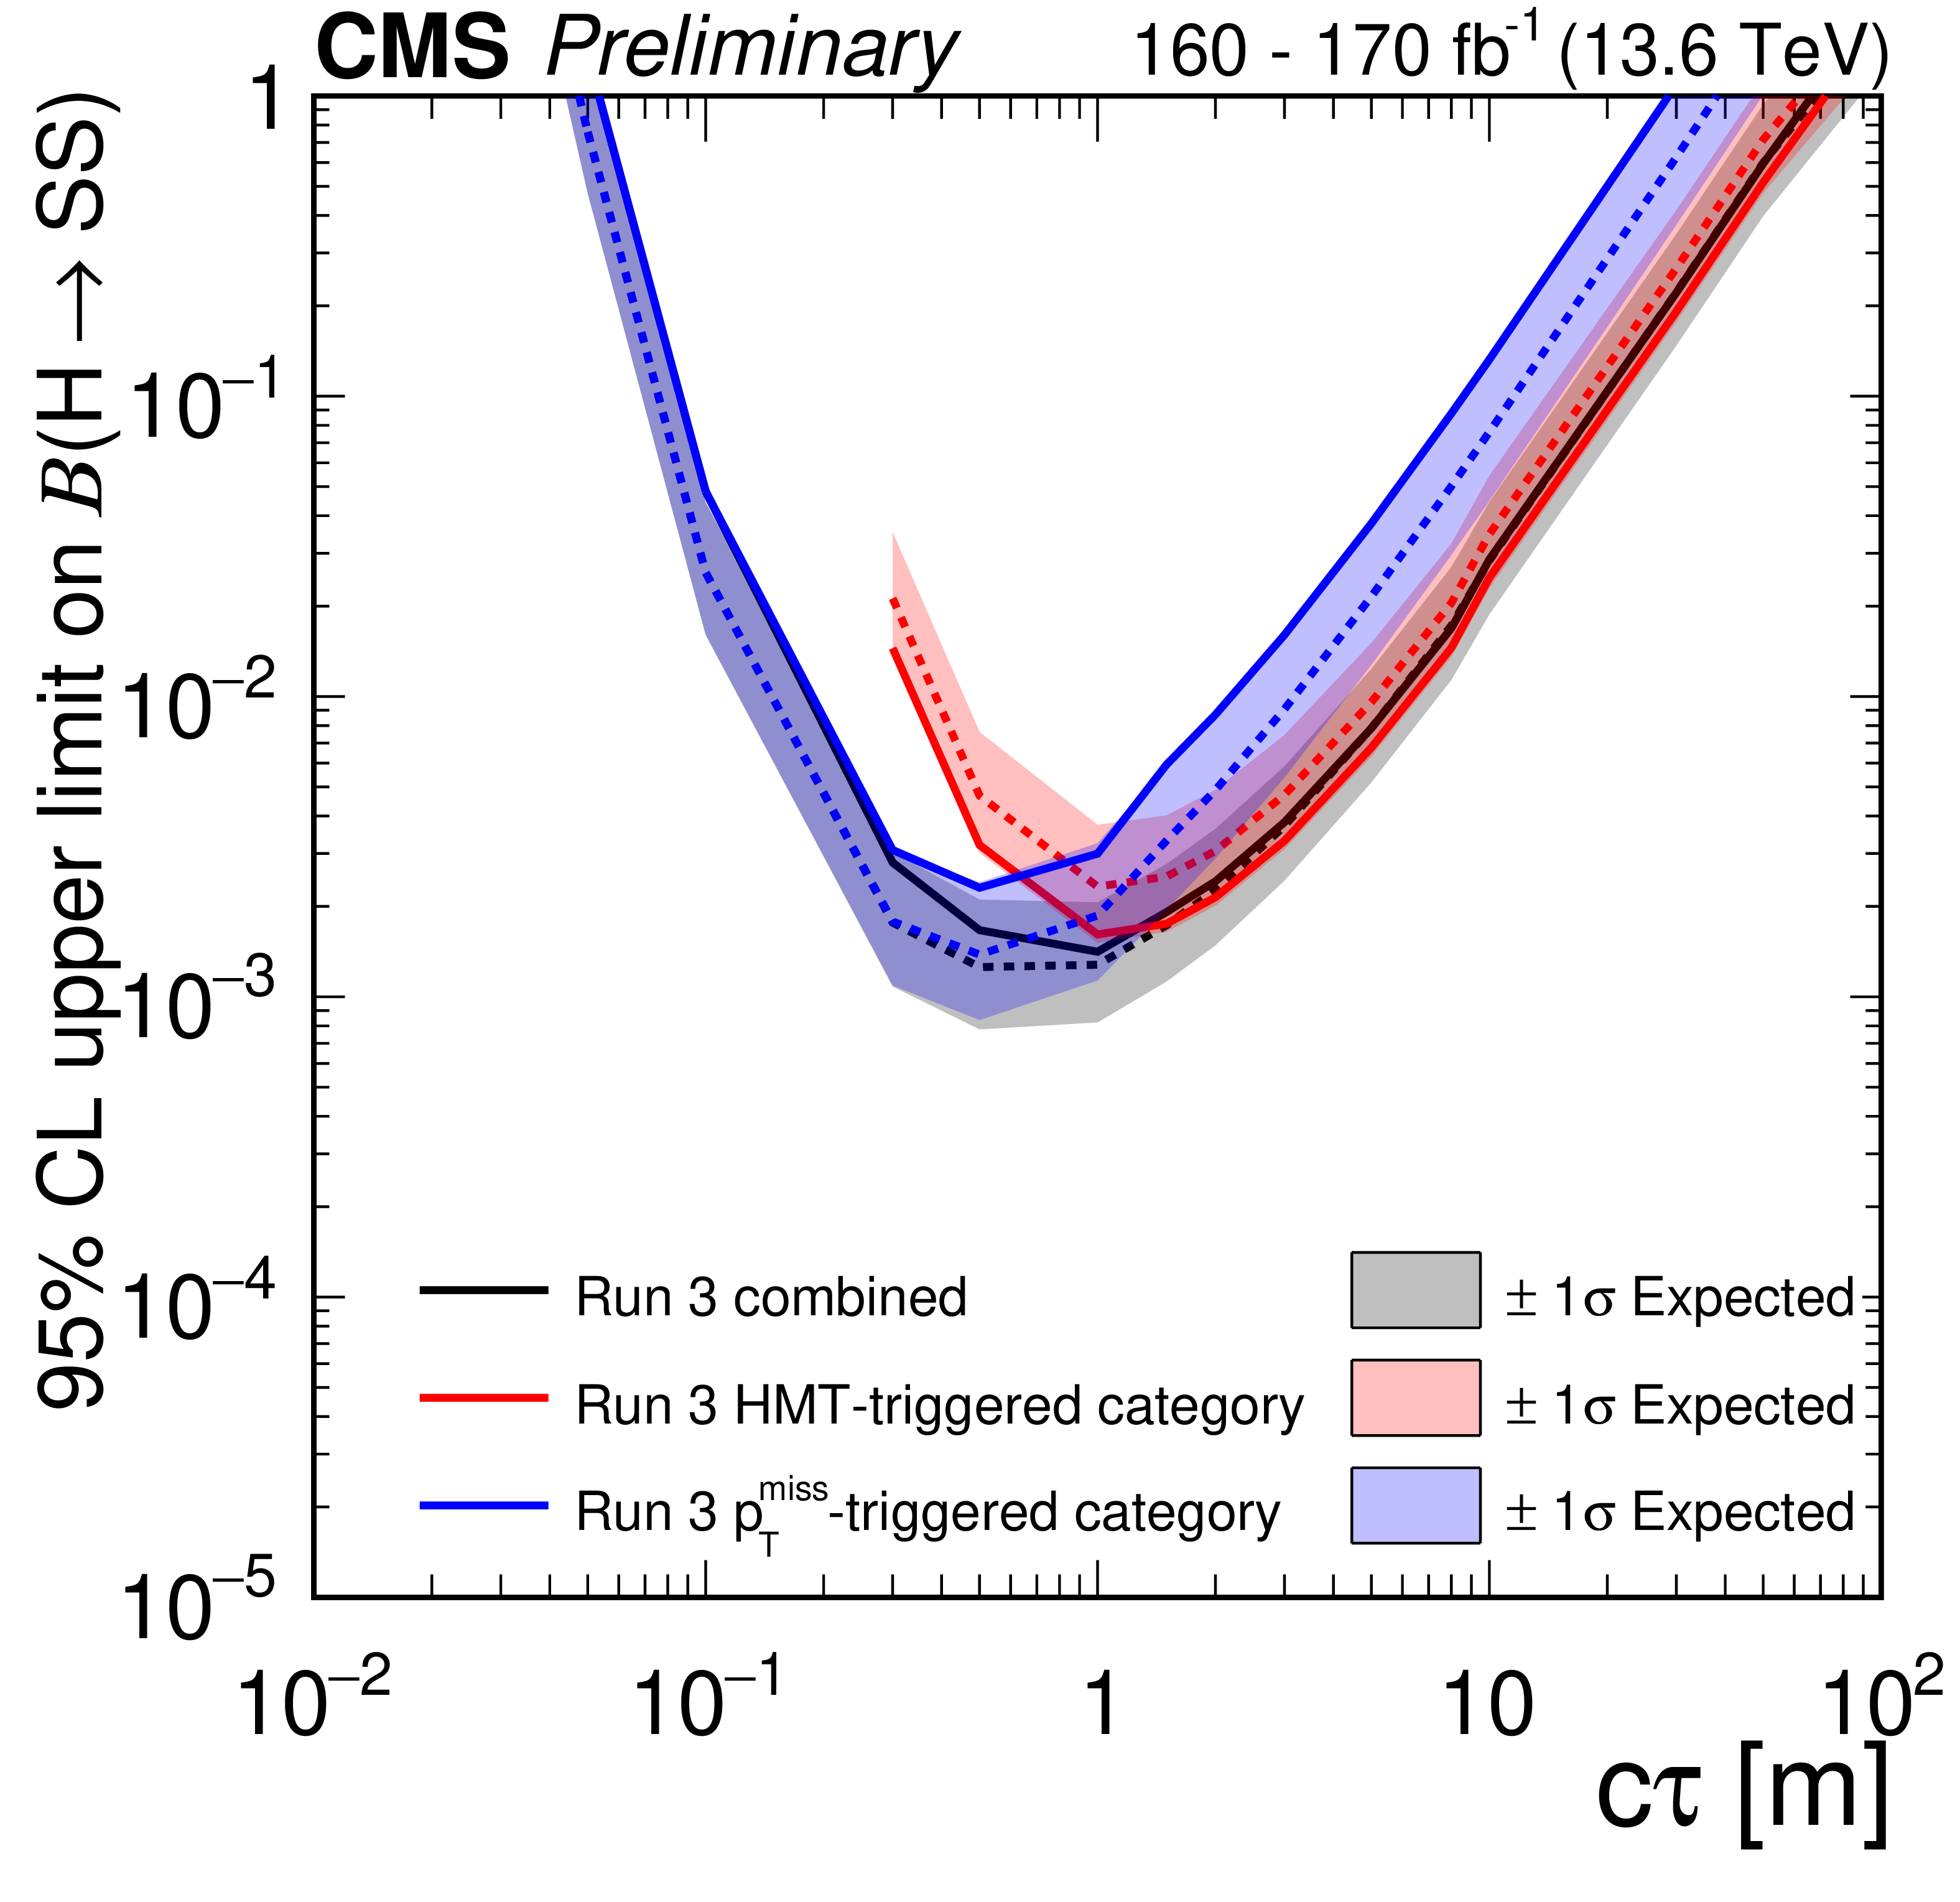
The 95% CL expected (dotted curves) and observed (solid curves) upper limits on the branching fraction $ \mathcal{B}(\mathrm{H}\to SS) $ as functions of $ c\tau $ for mass of 15 GeV and $ S\to\mathrm{b}\overline{\mathrm{b}} $ comparing the HMT-triggered and $ p_{\mathrm{T}}^\text{miss} $-triggered categories are shown. |
png pdf |
Figure 9:
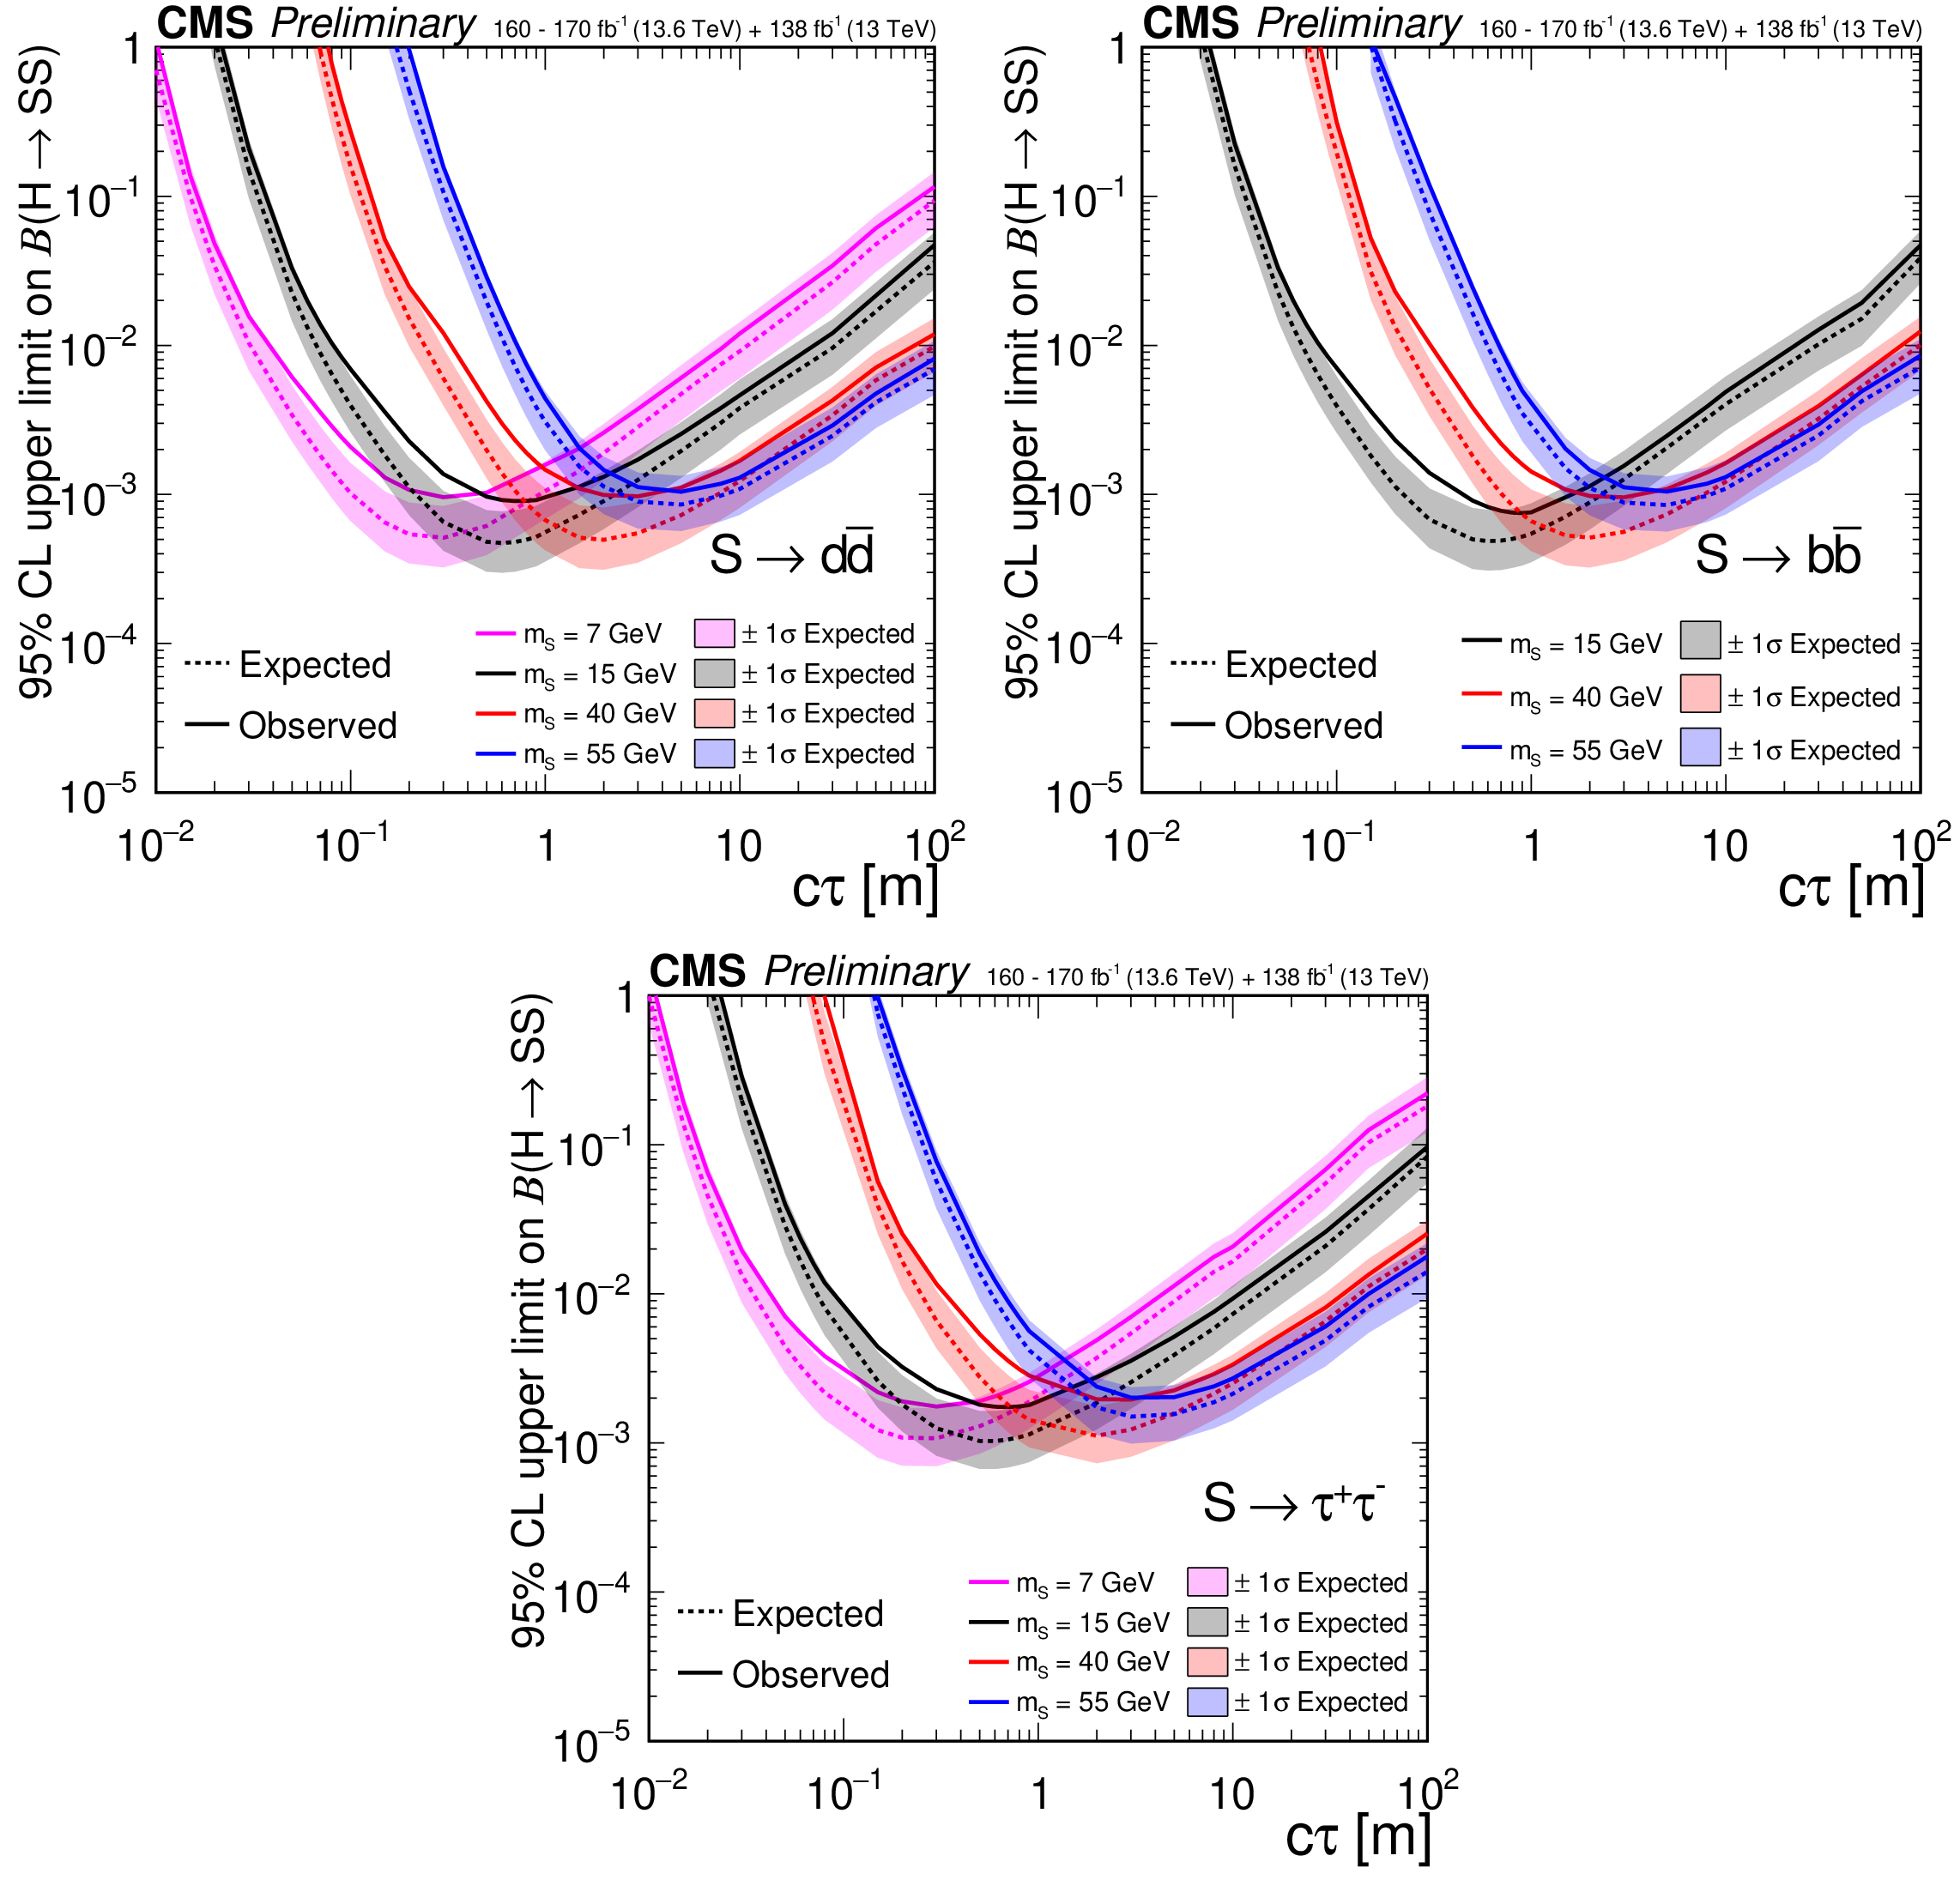
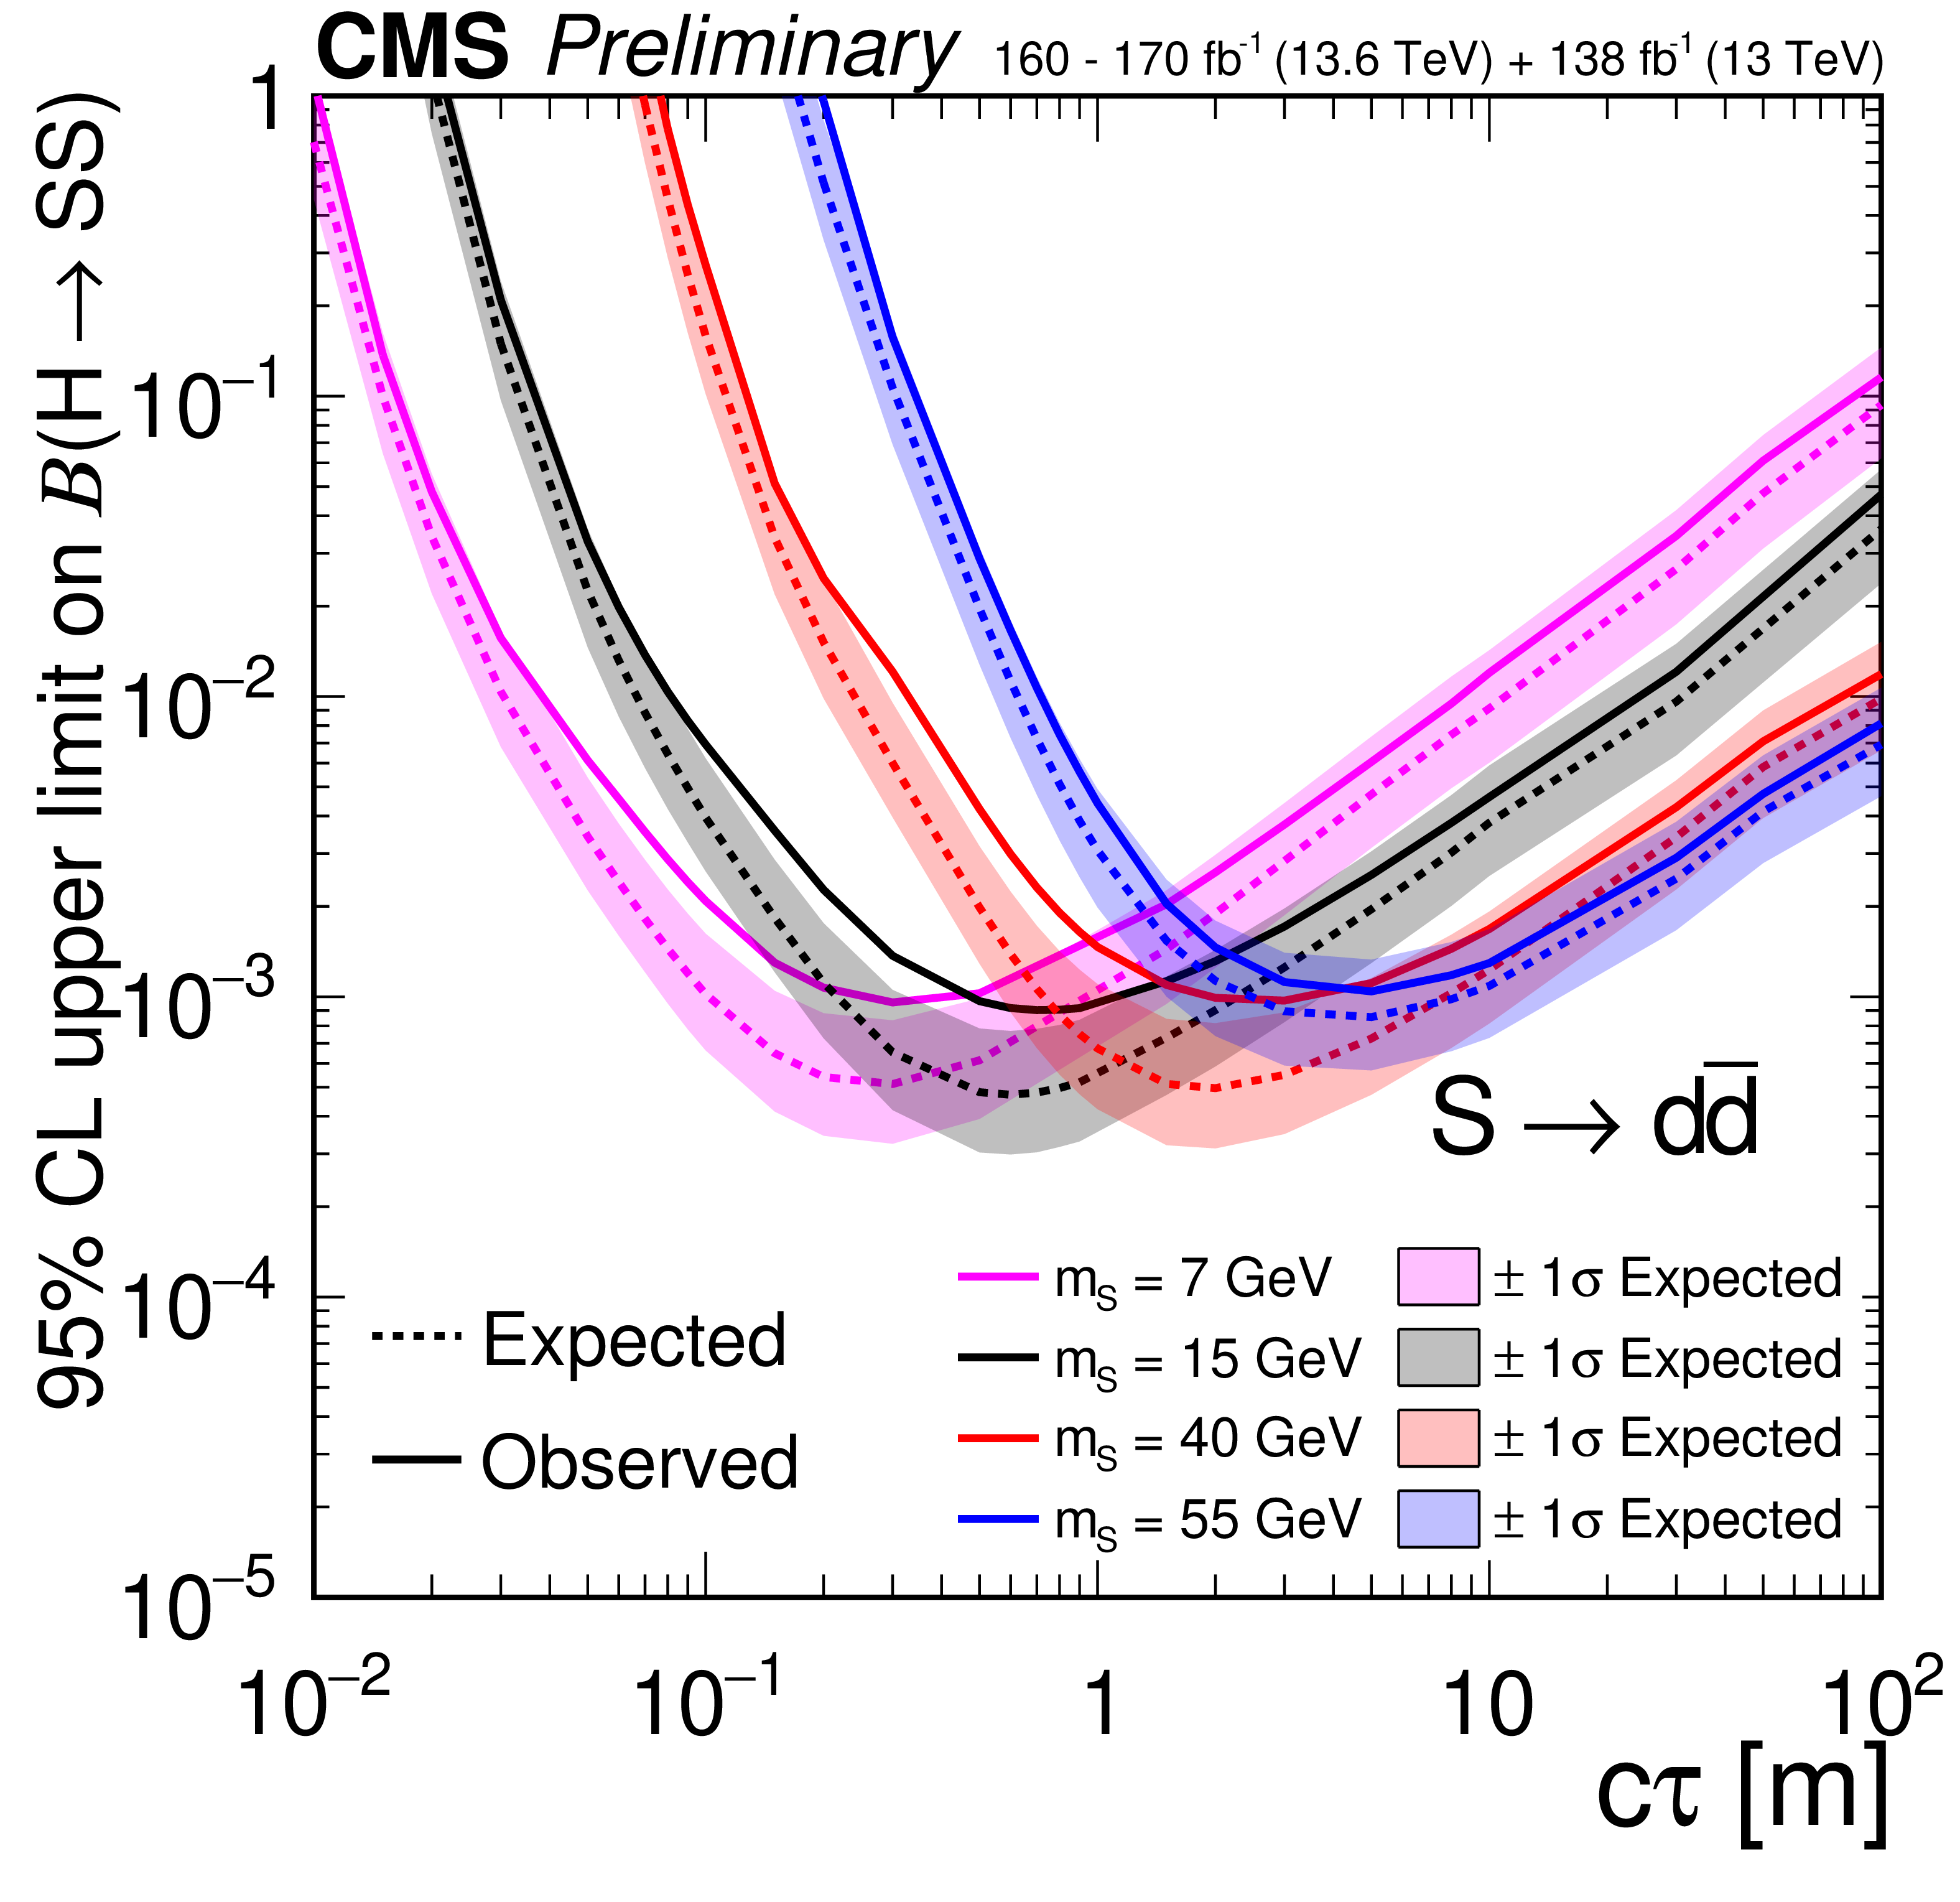
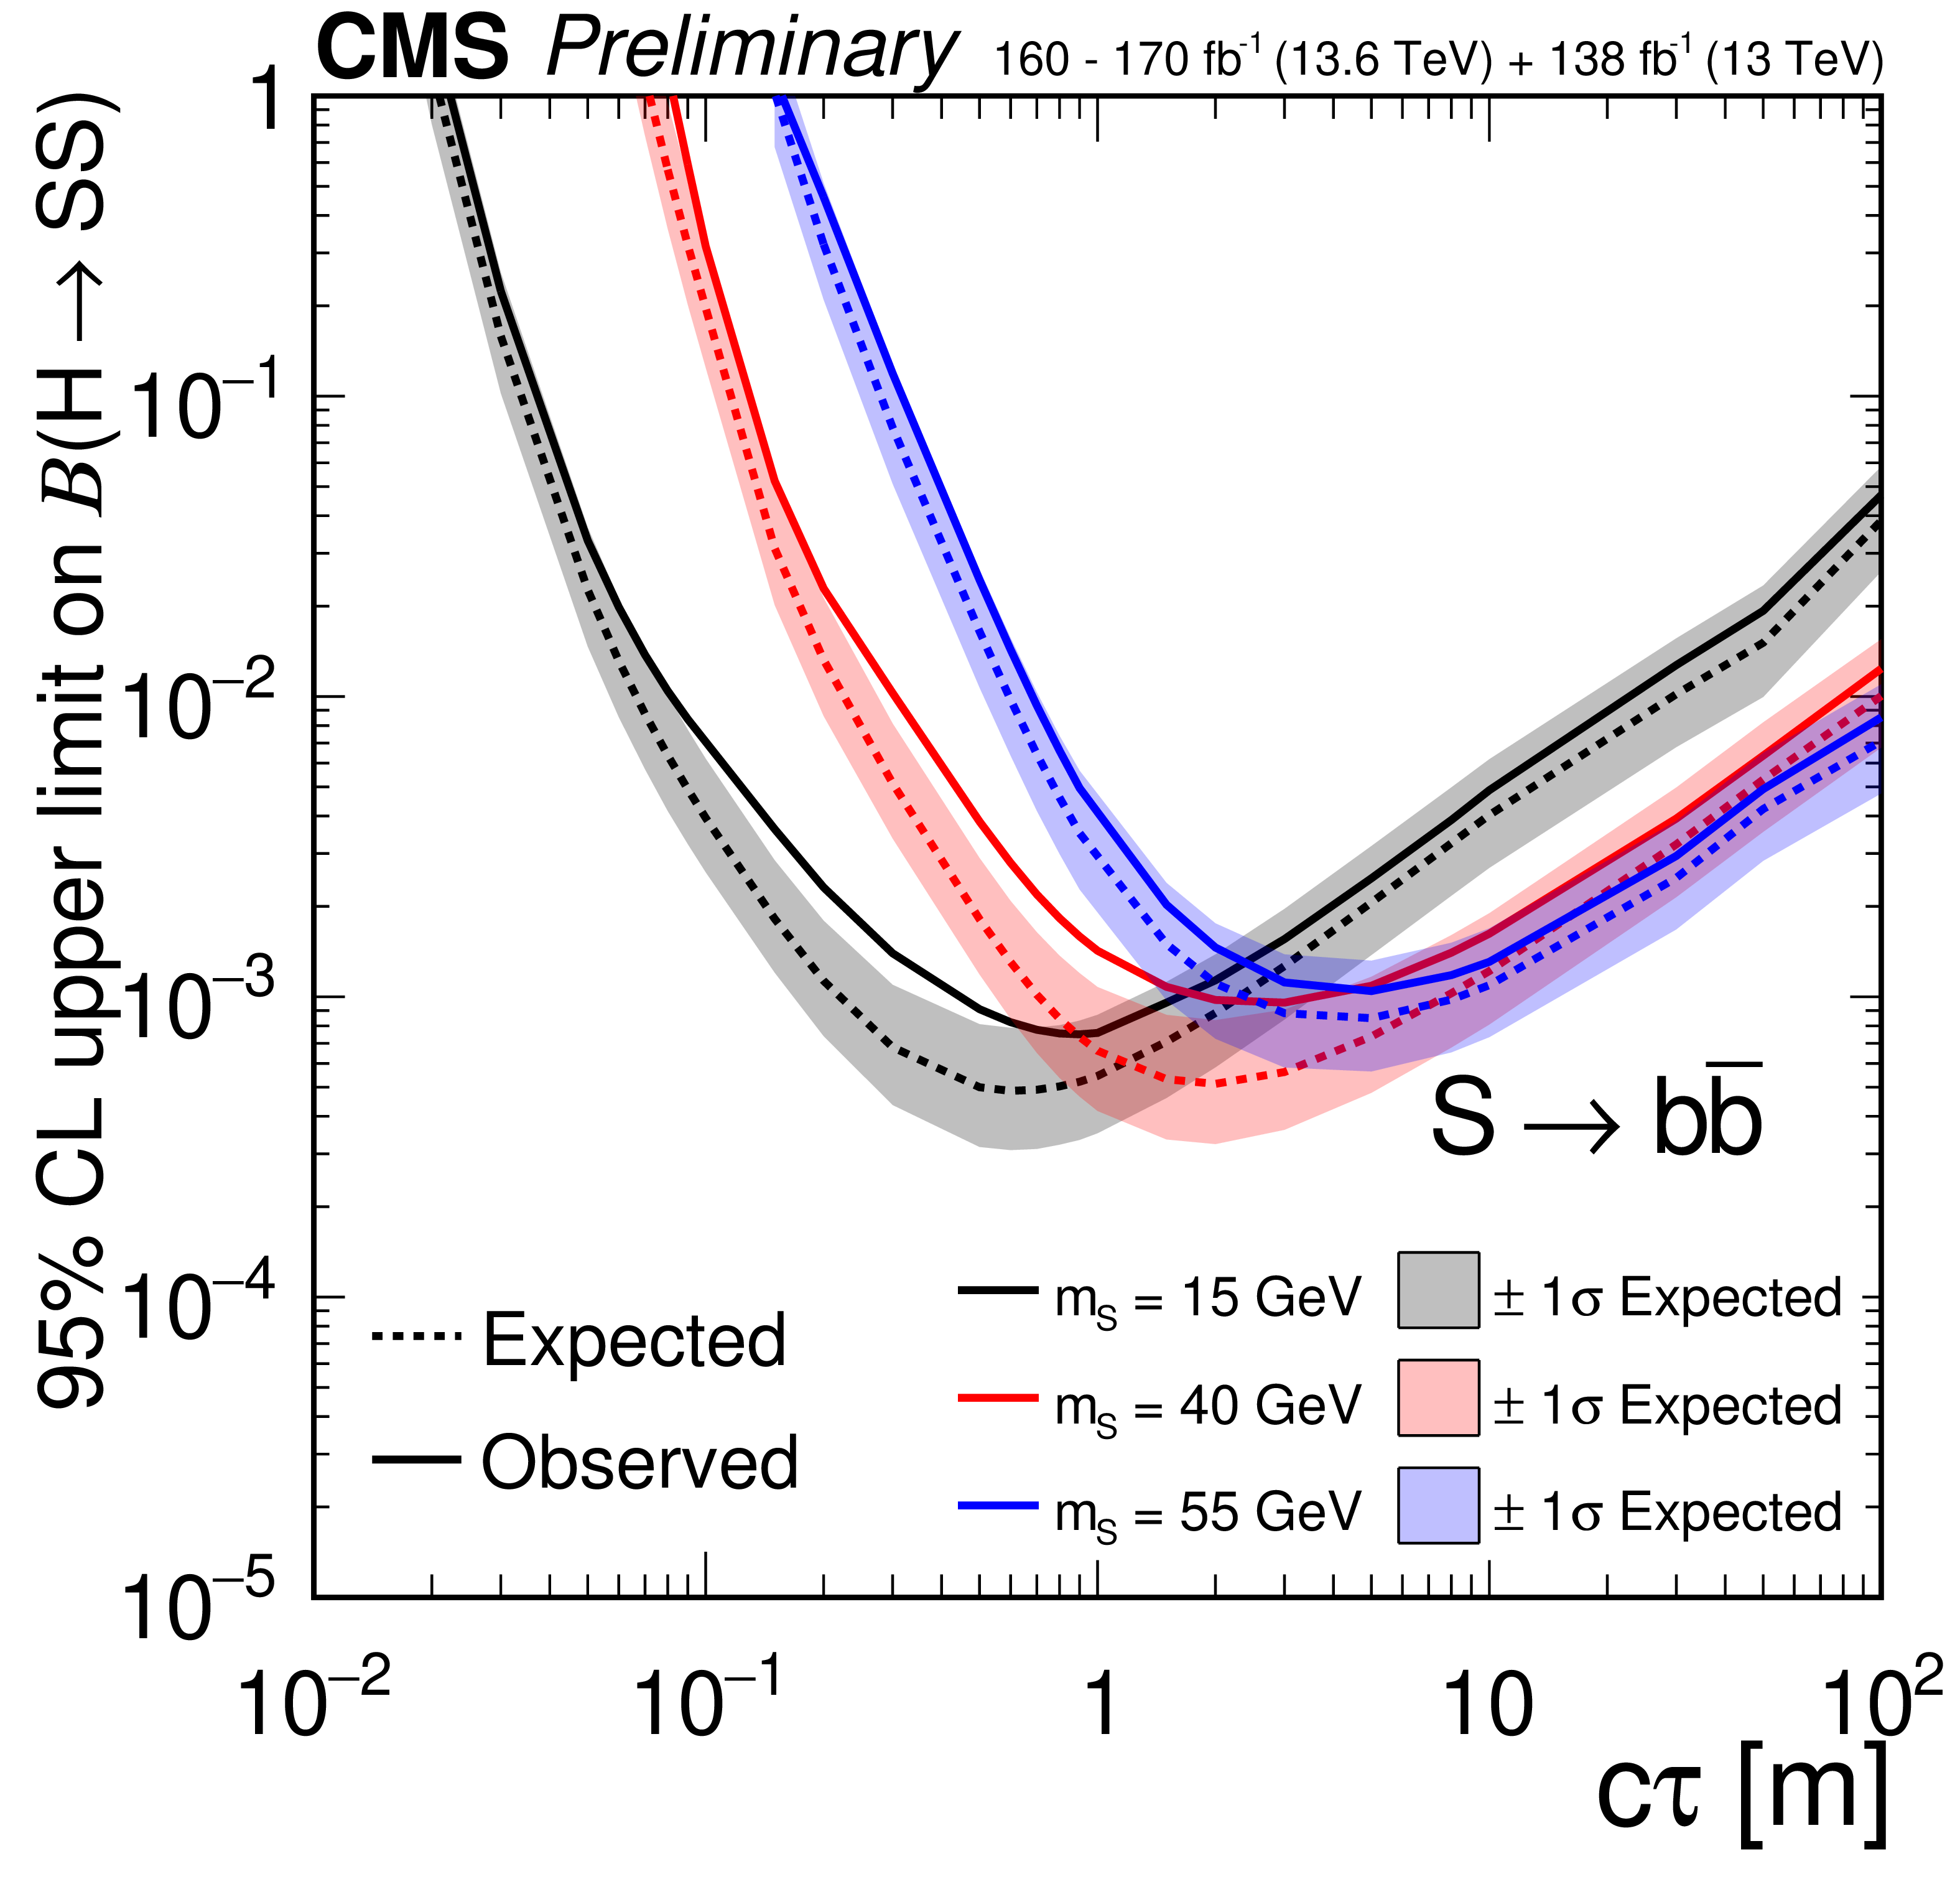
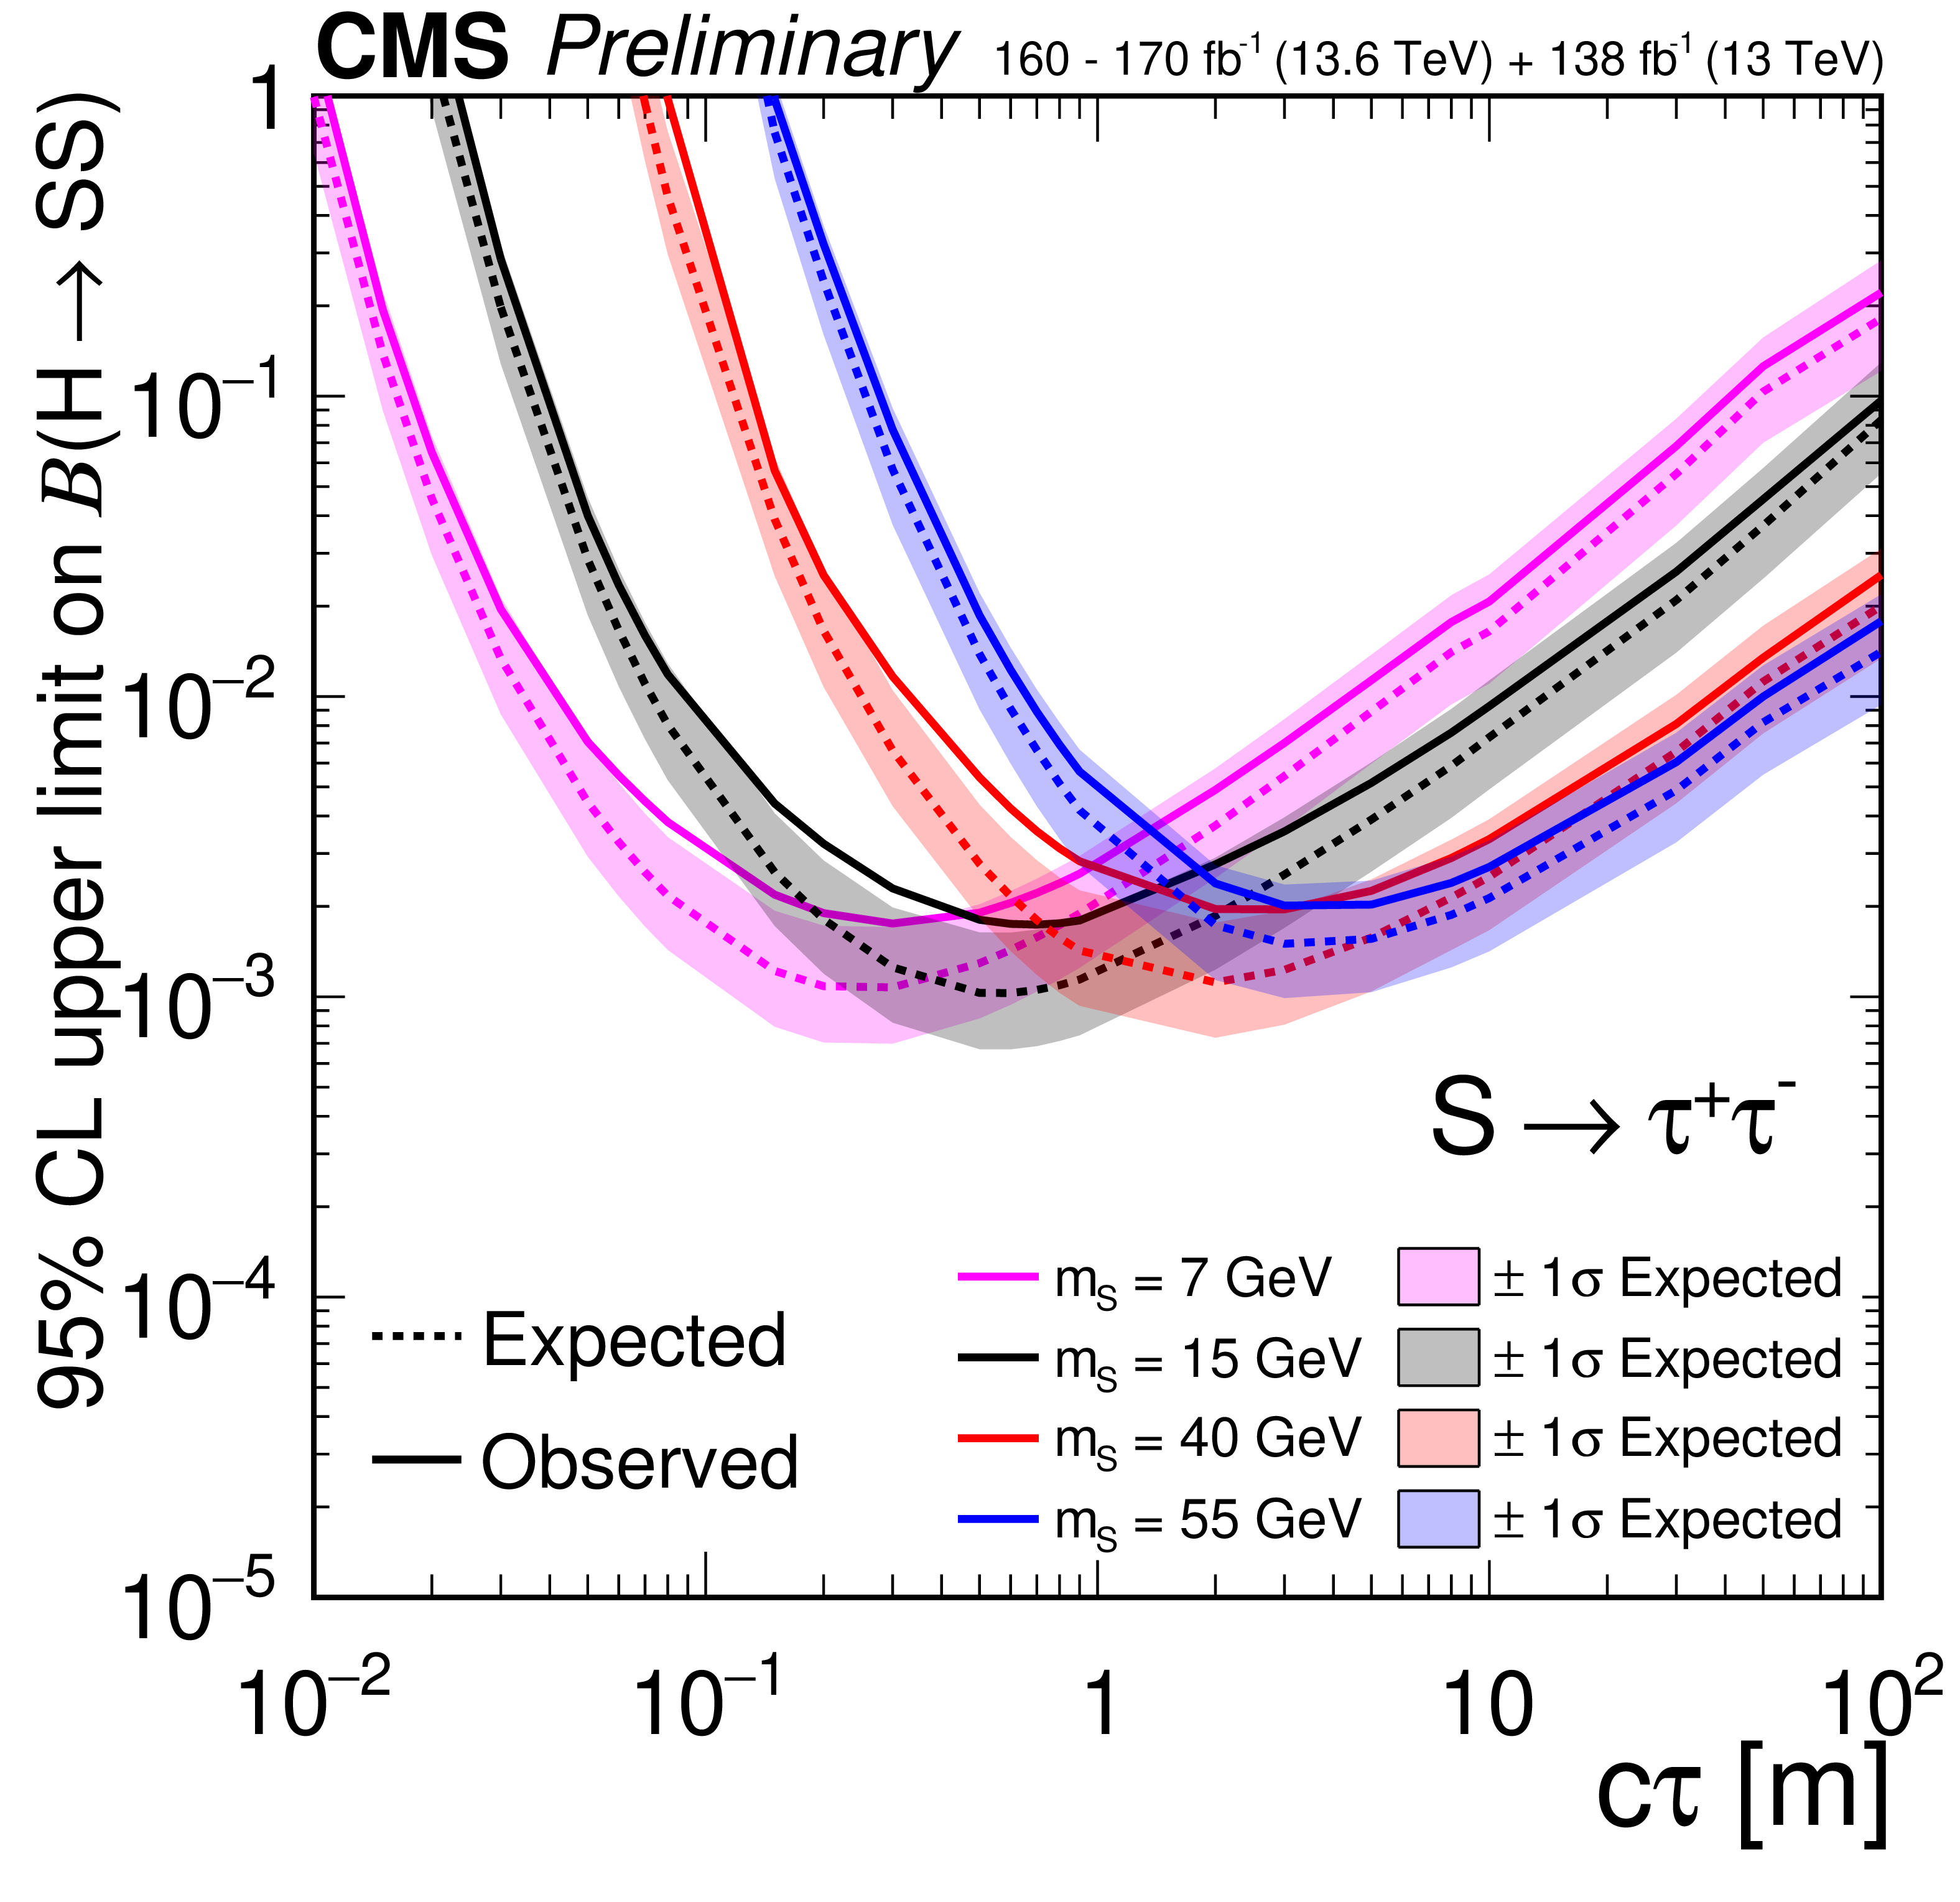
The 95% CL expected (dotted curves) and observed (solid curves) upper limits combining Run 2 and Run 3 results on the branching fraction $ \mathcal{B}(\mathrm{H}\to SS) $ as functions of $ c\tau $ for the $ S\to\mathrm{d}\overline{\mathrm{d}} $ (upper left), $ S\to\mathrm{b}\overline{\mathrm{b}} $ (upper right), and $ S\to\tau^{+}\tau^{-} $ (lower) decay modes. The exclusion limits are shown for different mass hypotheses. |
png pdf |
Figure 9-a:
The 95% CL expected (dotted curves) and observed (solid curves) upper limits combining Run 2 and Run 3 results on the branching fraction $ \mathcal{B}(\mathrm{H}\to SS) $ as functions of $ c\tau $ for the $ S\to\mathrm{d}\overline{\mathrm{d}} $ (upper left), $ S\to\mathrm{b}\overline{\mathrm{b}} $ (upper right), and $ S\to\tau^{+}\tau^{-} $ (lower) decay modes. The exclusion limits are shown for different mass hypotheses. |
png pdf |
Figure 9-b:
The 95% CL expected (dotted curves) and observed (solid curves) upper limits combining Run 2 and Run 3 results on the branching fraction $ \mathcal{B}(\mathrm{H}\to SS) $ as functions of $ c\tau $ for the $ S\to\mathrm{d}\overline{\mathrm{d}} $ (upper left), $ S\to\mathrm{b}\overline{\mathrm{b}} $ (upper right), and $ S\to\tau^{+}\tau^{-} $ (lower) decay modes. The exclusion limits are shown for different mass hypotheses. |
png pdf |
Figure 9-c:
The 95% CL expected (dotted curves) and observed (solid curves) upper limits combining Run 2 and Run 3 results on the branching fraction $ \mathcal{B}(\mathrm{H}\to SS) $ as functions of $ c\tau $ for the $ S\to\mathrm{d}\overline{\mathrm{d}} $ (upper left), $ S\to\mathrm{b}\overline{\mathrm{b}} $ (upper right), and $ S\to\tau^{+}\tau^{-} $ (lower) decay modes. The exclusion limits are shown for different mass hypotheses. |
png pdf |
Figure 10:
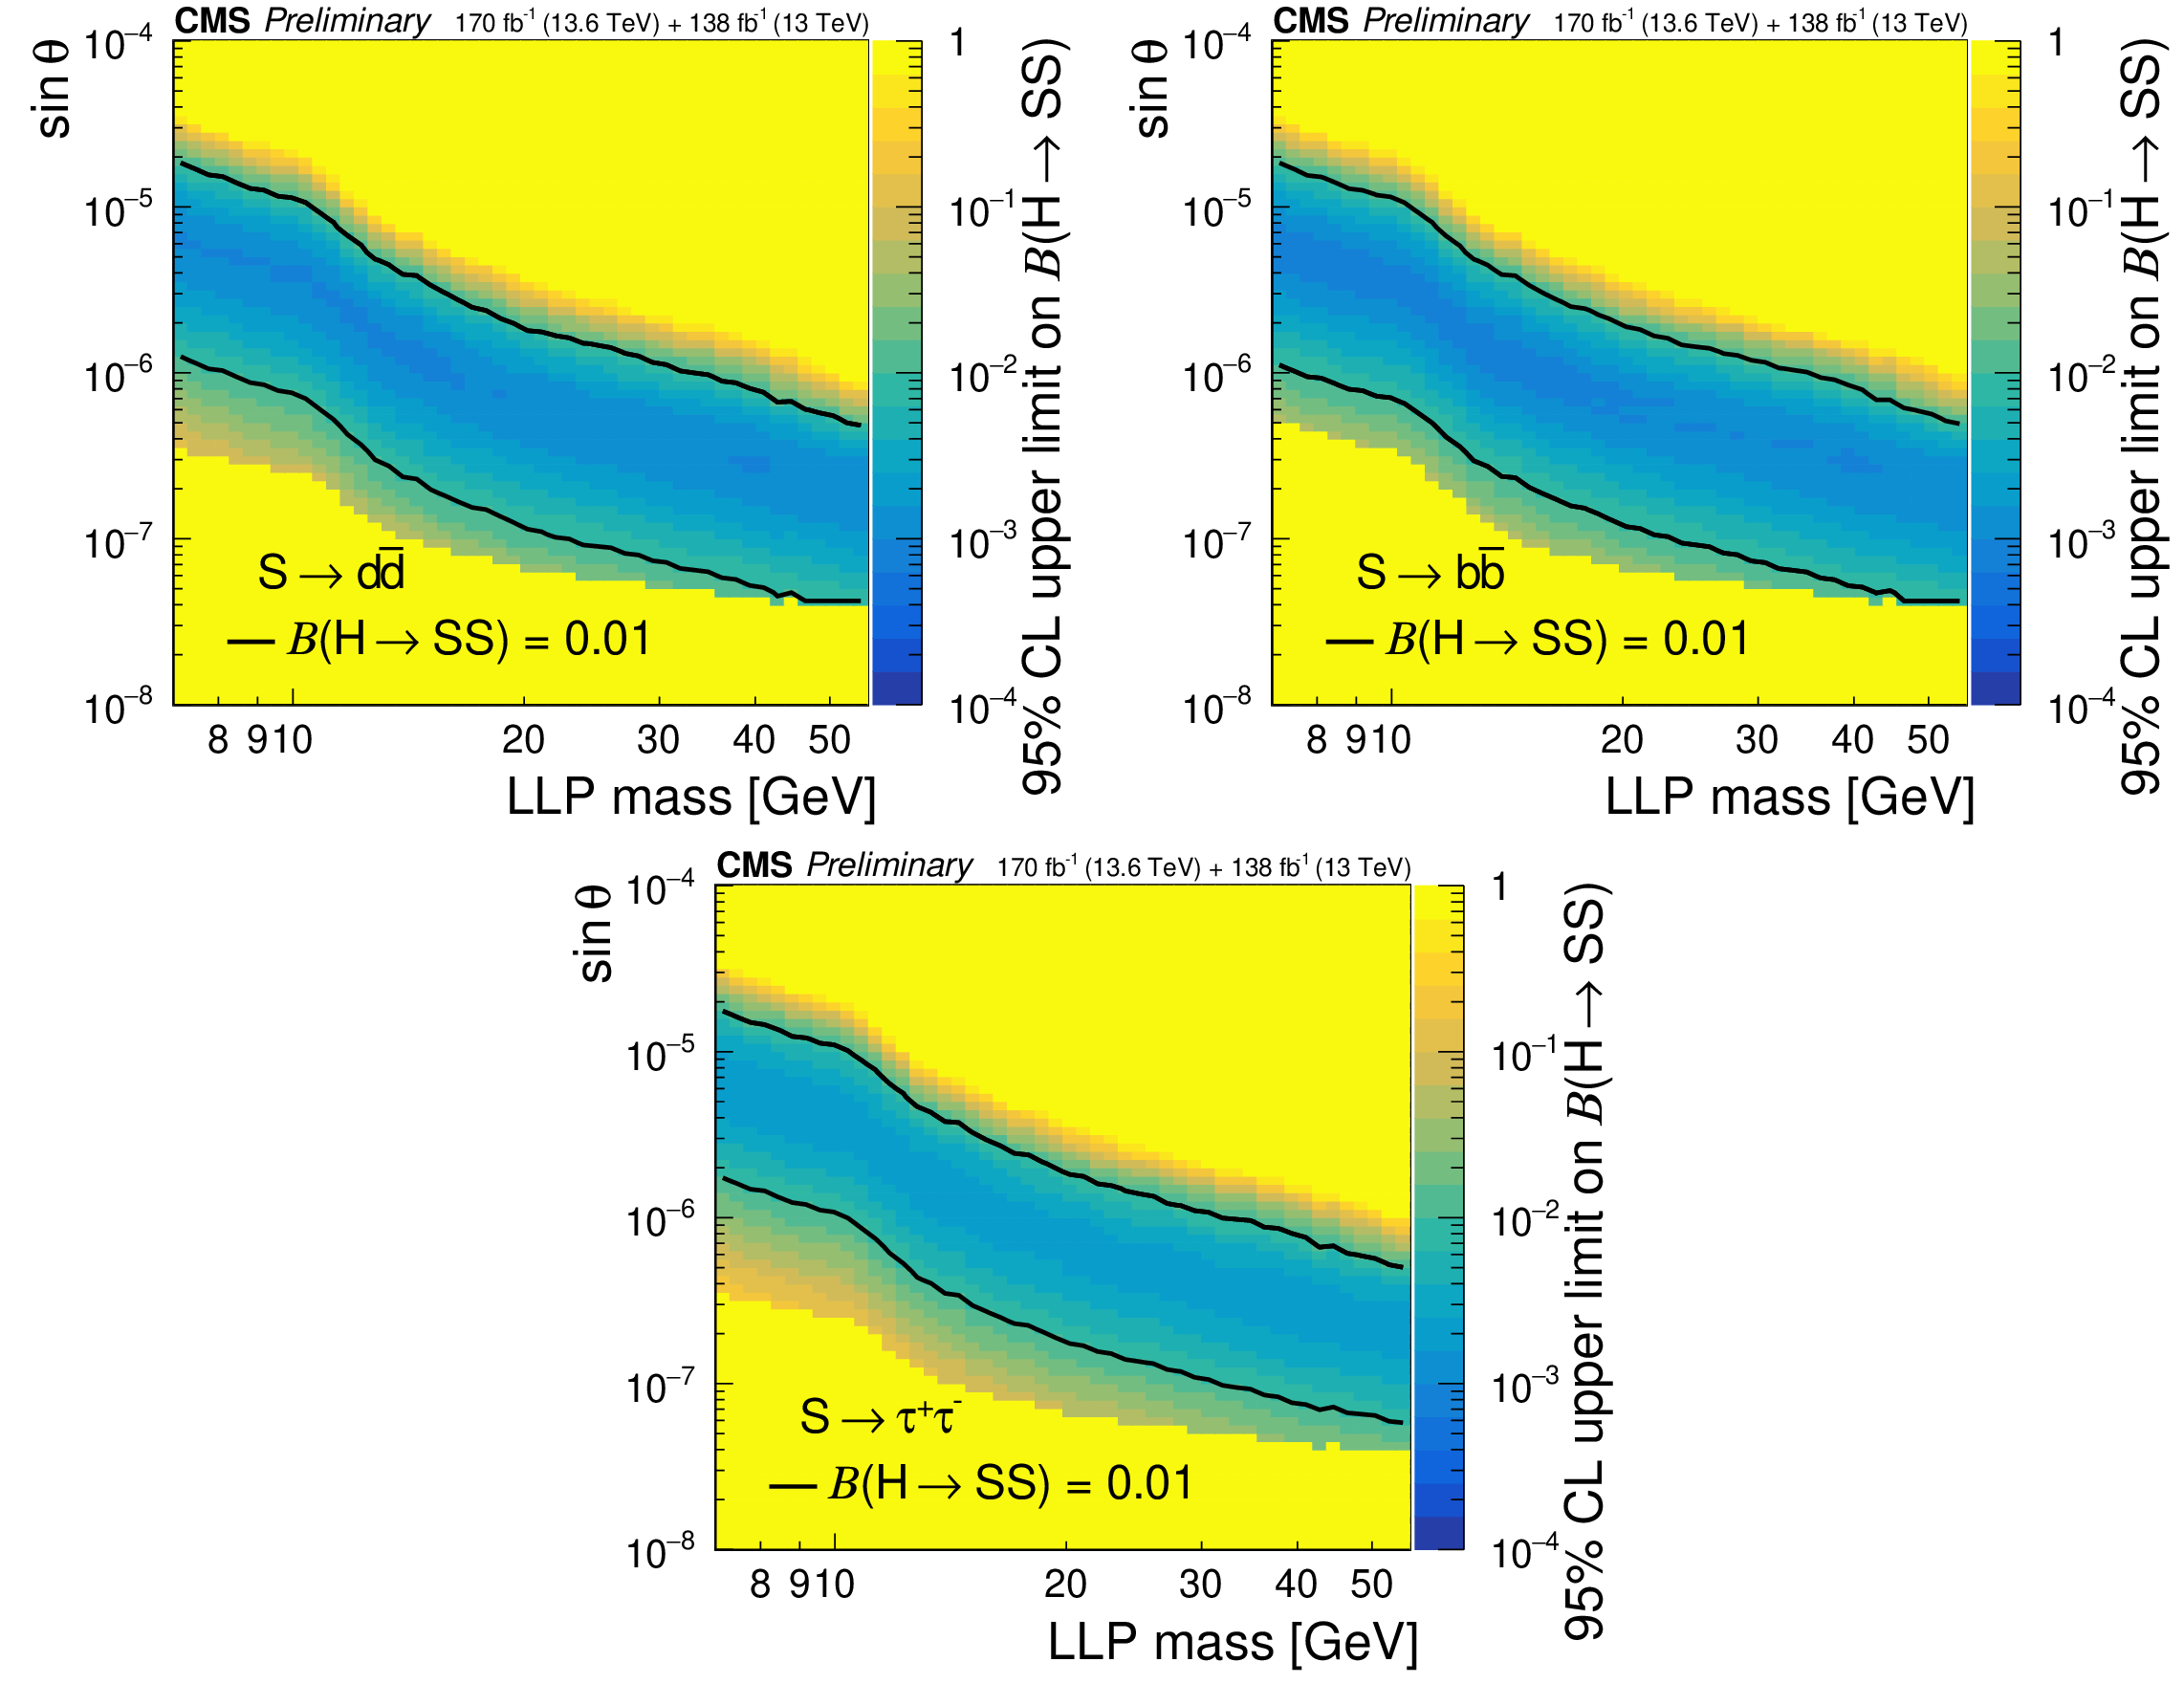
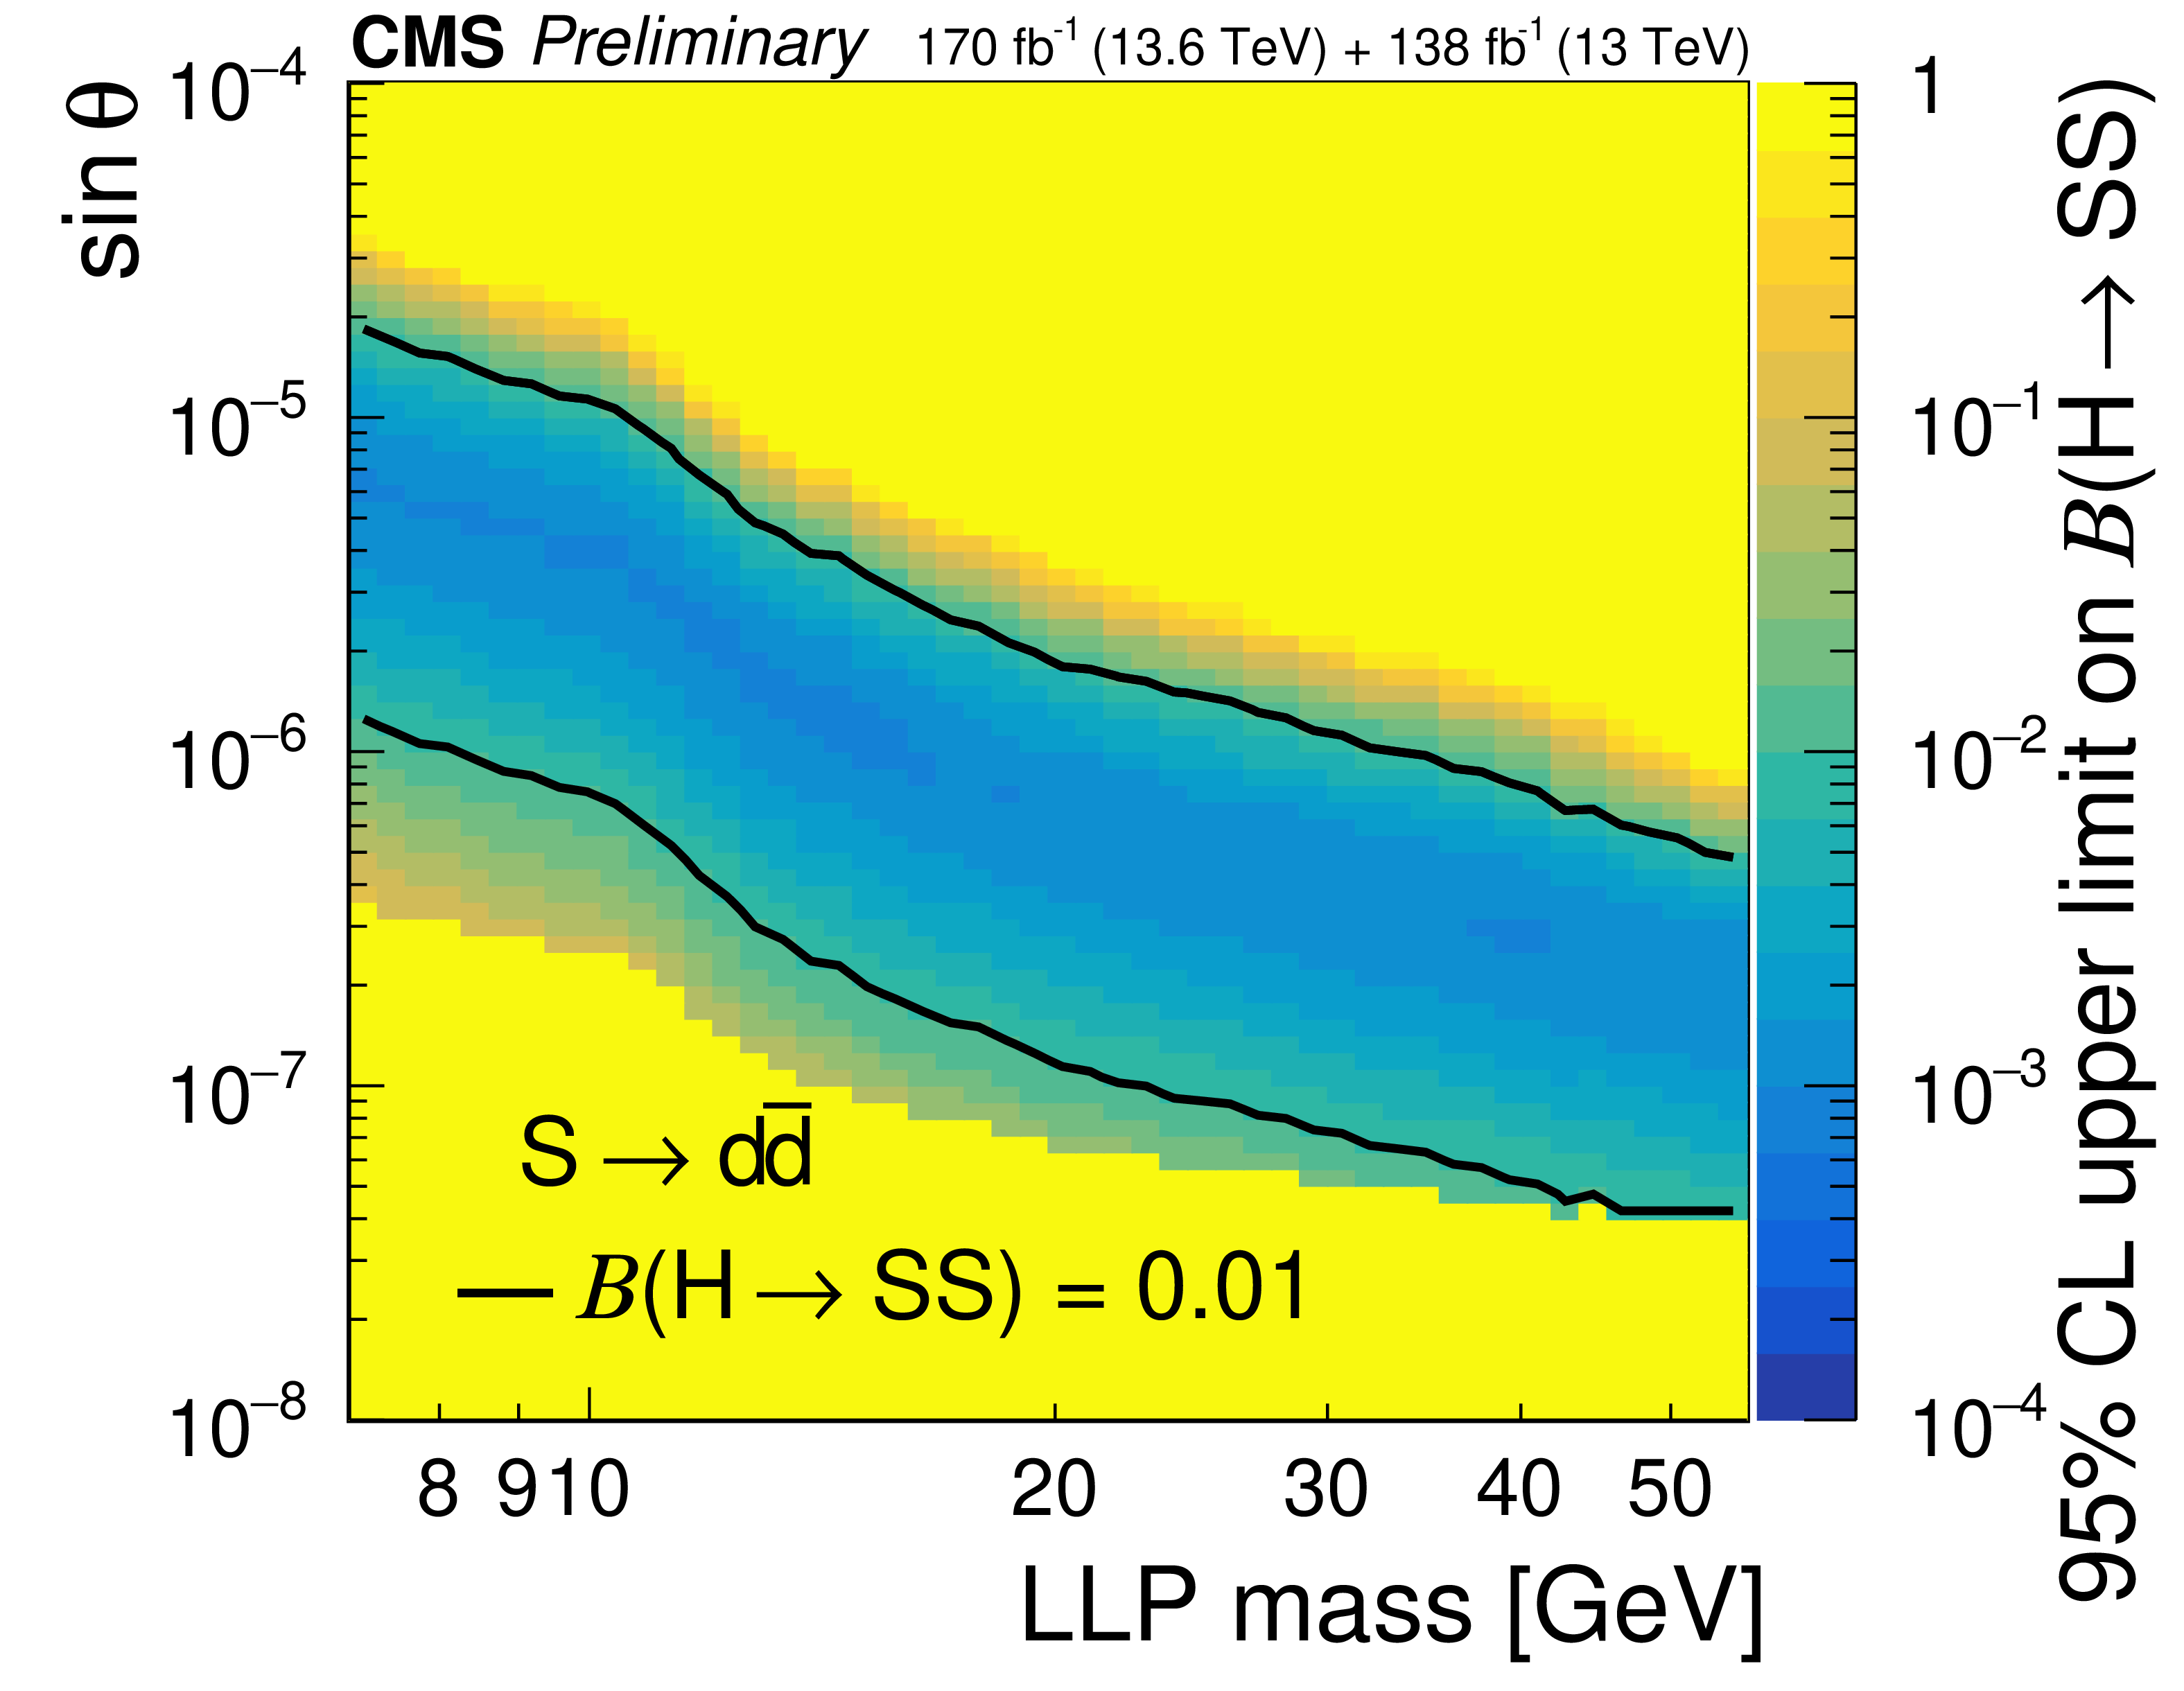
The 95% CL expected (dotted curves) and observed (solid curves) upper limits combining Run 2 and Run 3 results on the branching fraction $ \mathcal{B}(\mathrm{H}\to SS) $ as functions of the LLP mass and mixing angle ($ \theta $) for the $ S\to\mathrm{d}\overline{\mathrm{d}} $ (upper left), $ S\to\mathrm{b}\overline{\mathrm{b}} $ (upper right), and $ S\to\tau^{+}\tau^{-} $ (lower) decay modes. |
png pdf |
Figure 10-a:
The 95% CL expected (dotted curves) and observed (solid curves) upper limits combining Run 2 and Run 3 results on the branching fraction $ \mathcal{B}(\mathrm{H}\to SS) $ as functions of the LLP mass and mixing angle ($ \theta $) for the $ S\to\mathrm{d}\overline{\mathrm{d}} $ (upper left), $ S\to\mathrm{b}\overline{\mathrm{b}} $ (upper right), and $ S\to\tau^{+}\tau^{-} $ (lower) decay modes. |
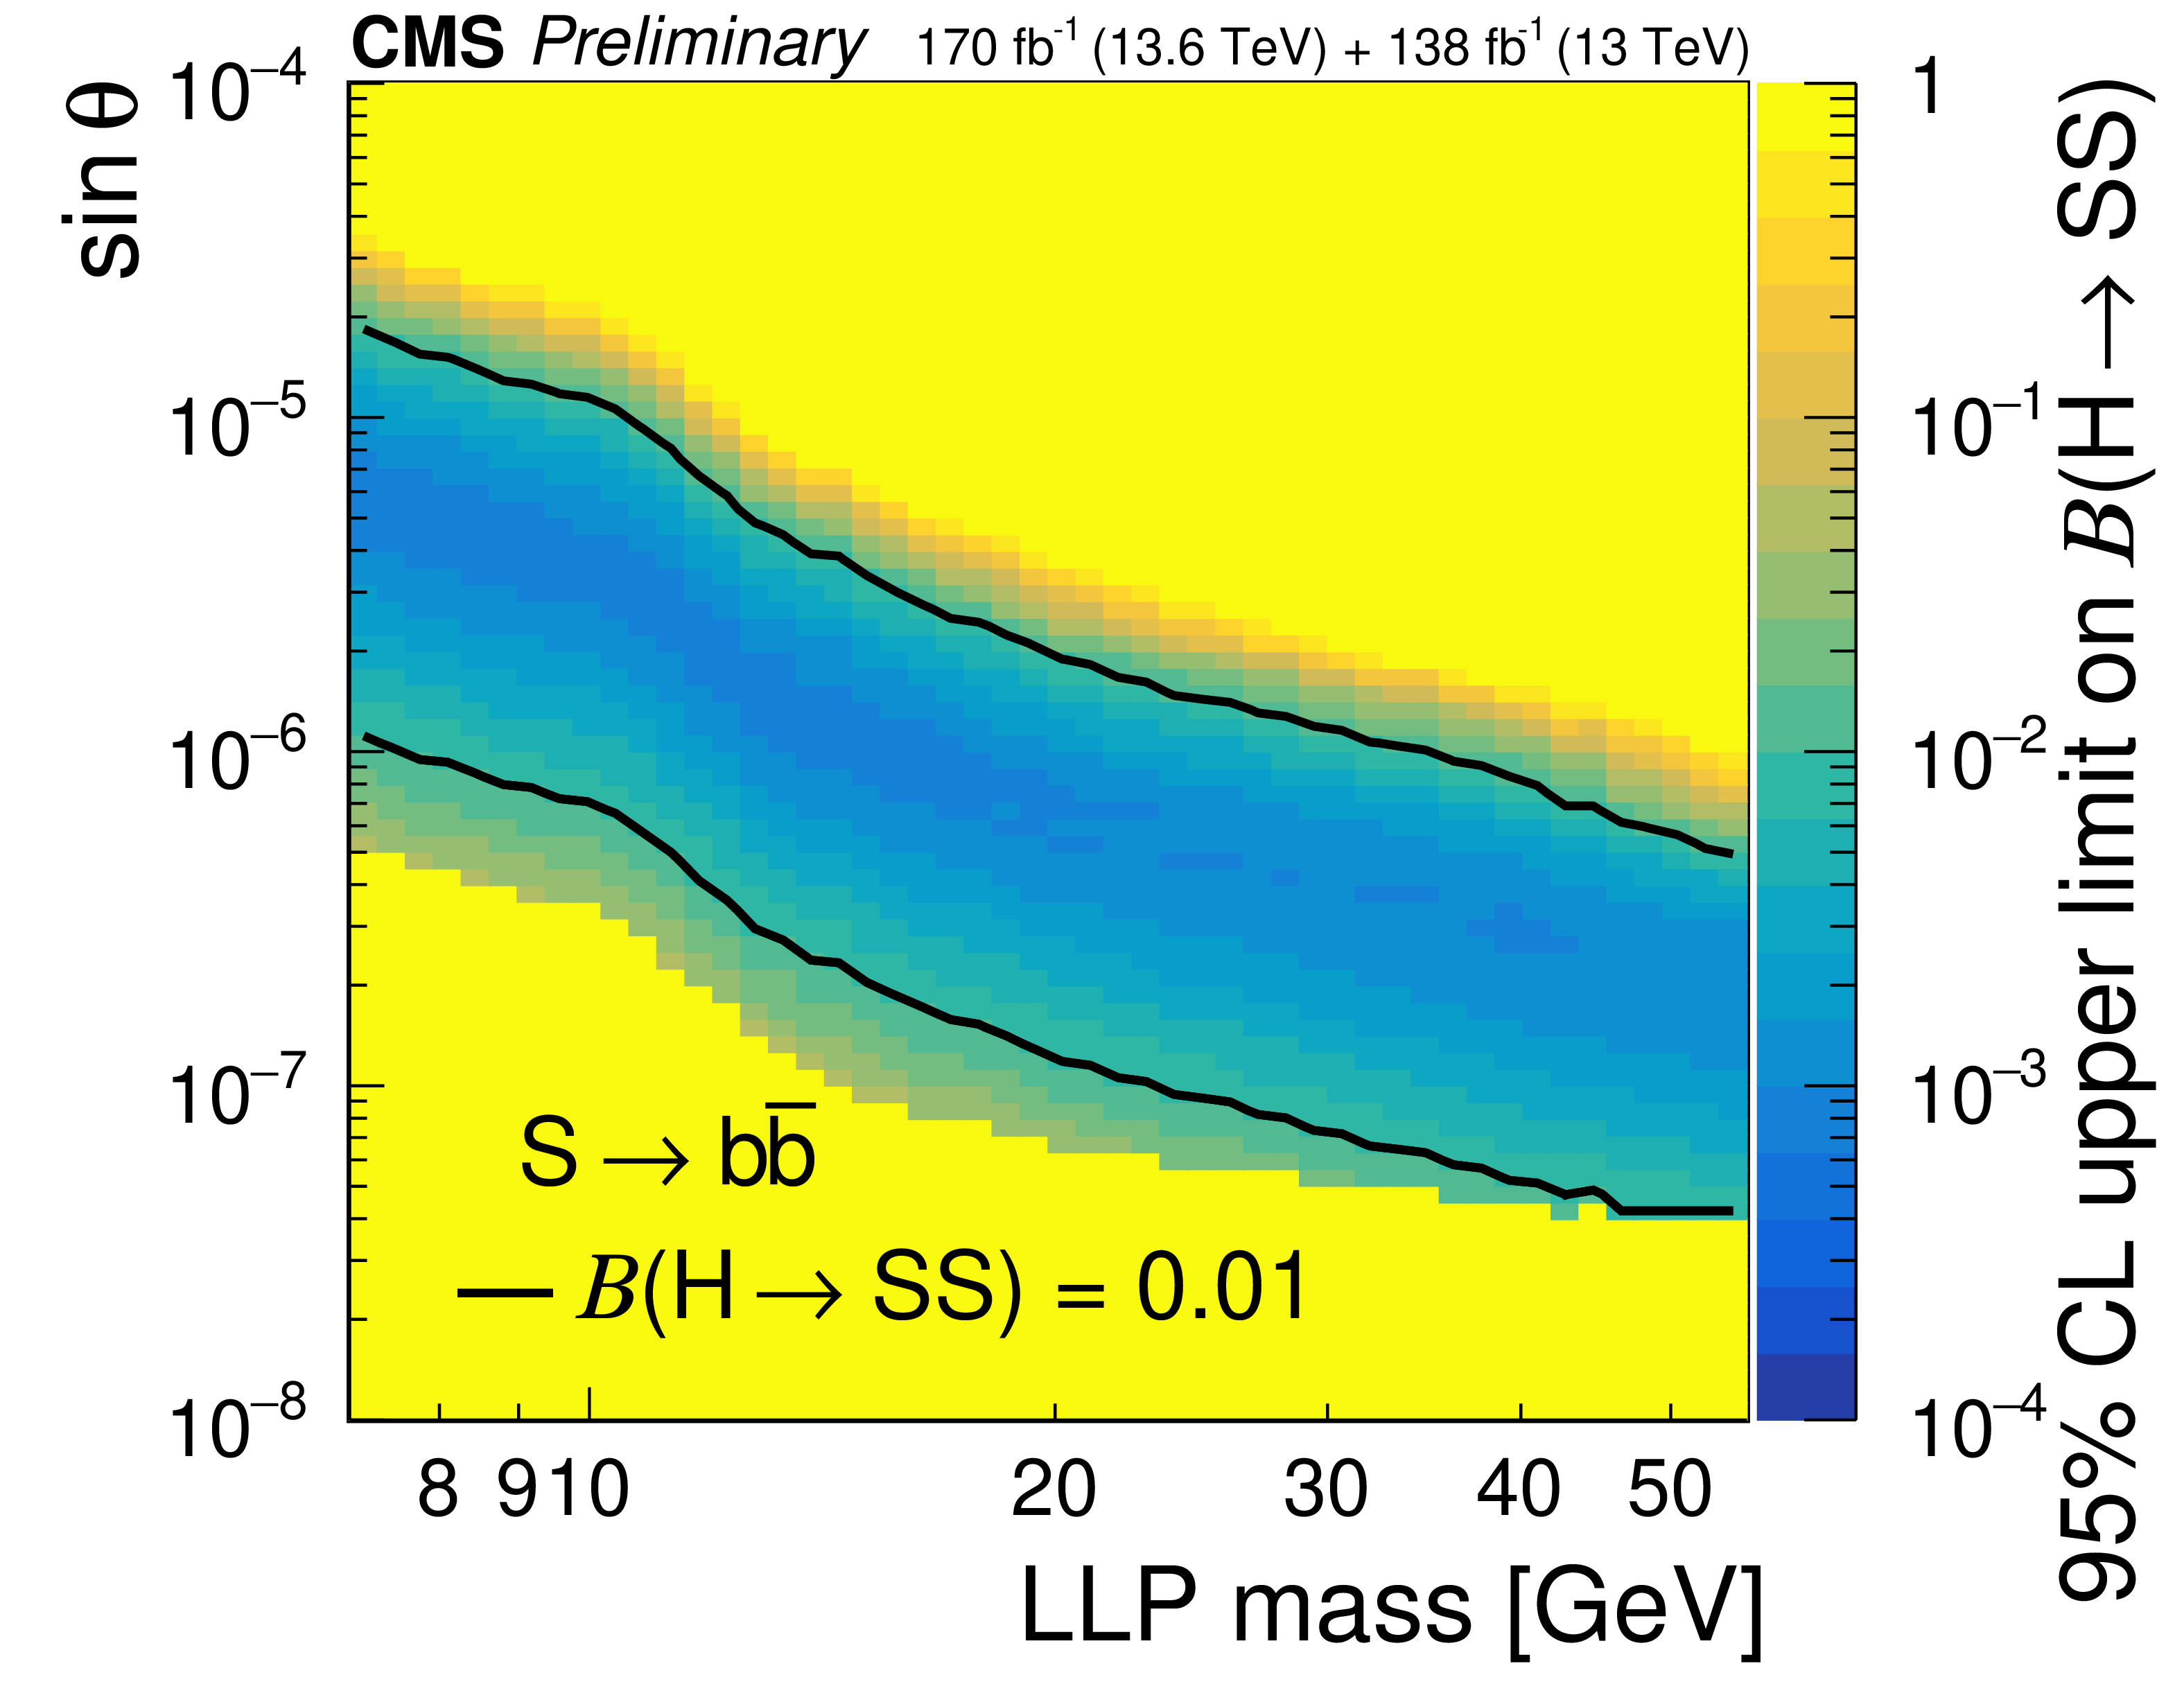
png pdf |
Figure 10-b:
The 95% CL expected (dotted curves) and observed (solid curves) upper limits combining Run 2 and Run 3 results on the branching fraction $ \mathcal{B}(\mathrm{H}\to SS) $ as functions of the LLP mass and mixing angle ($ \theta $) for the $ S\to\mathrm{d}\overline{\mathrm{d}} $ (upper left), $ S\to\mathrm{b}\overline{\mathrm{b}} $ (upper right), and $ S\to\tau^{+}\tau^{-} $ (lower) decay modes. |
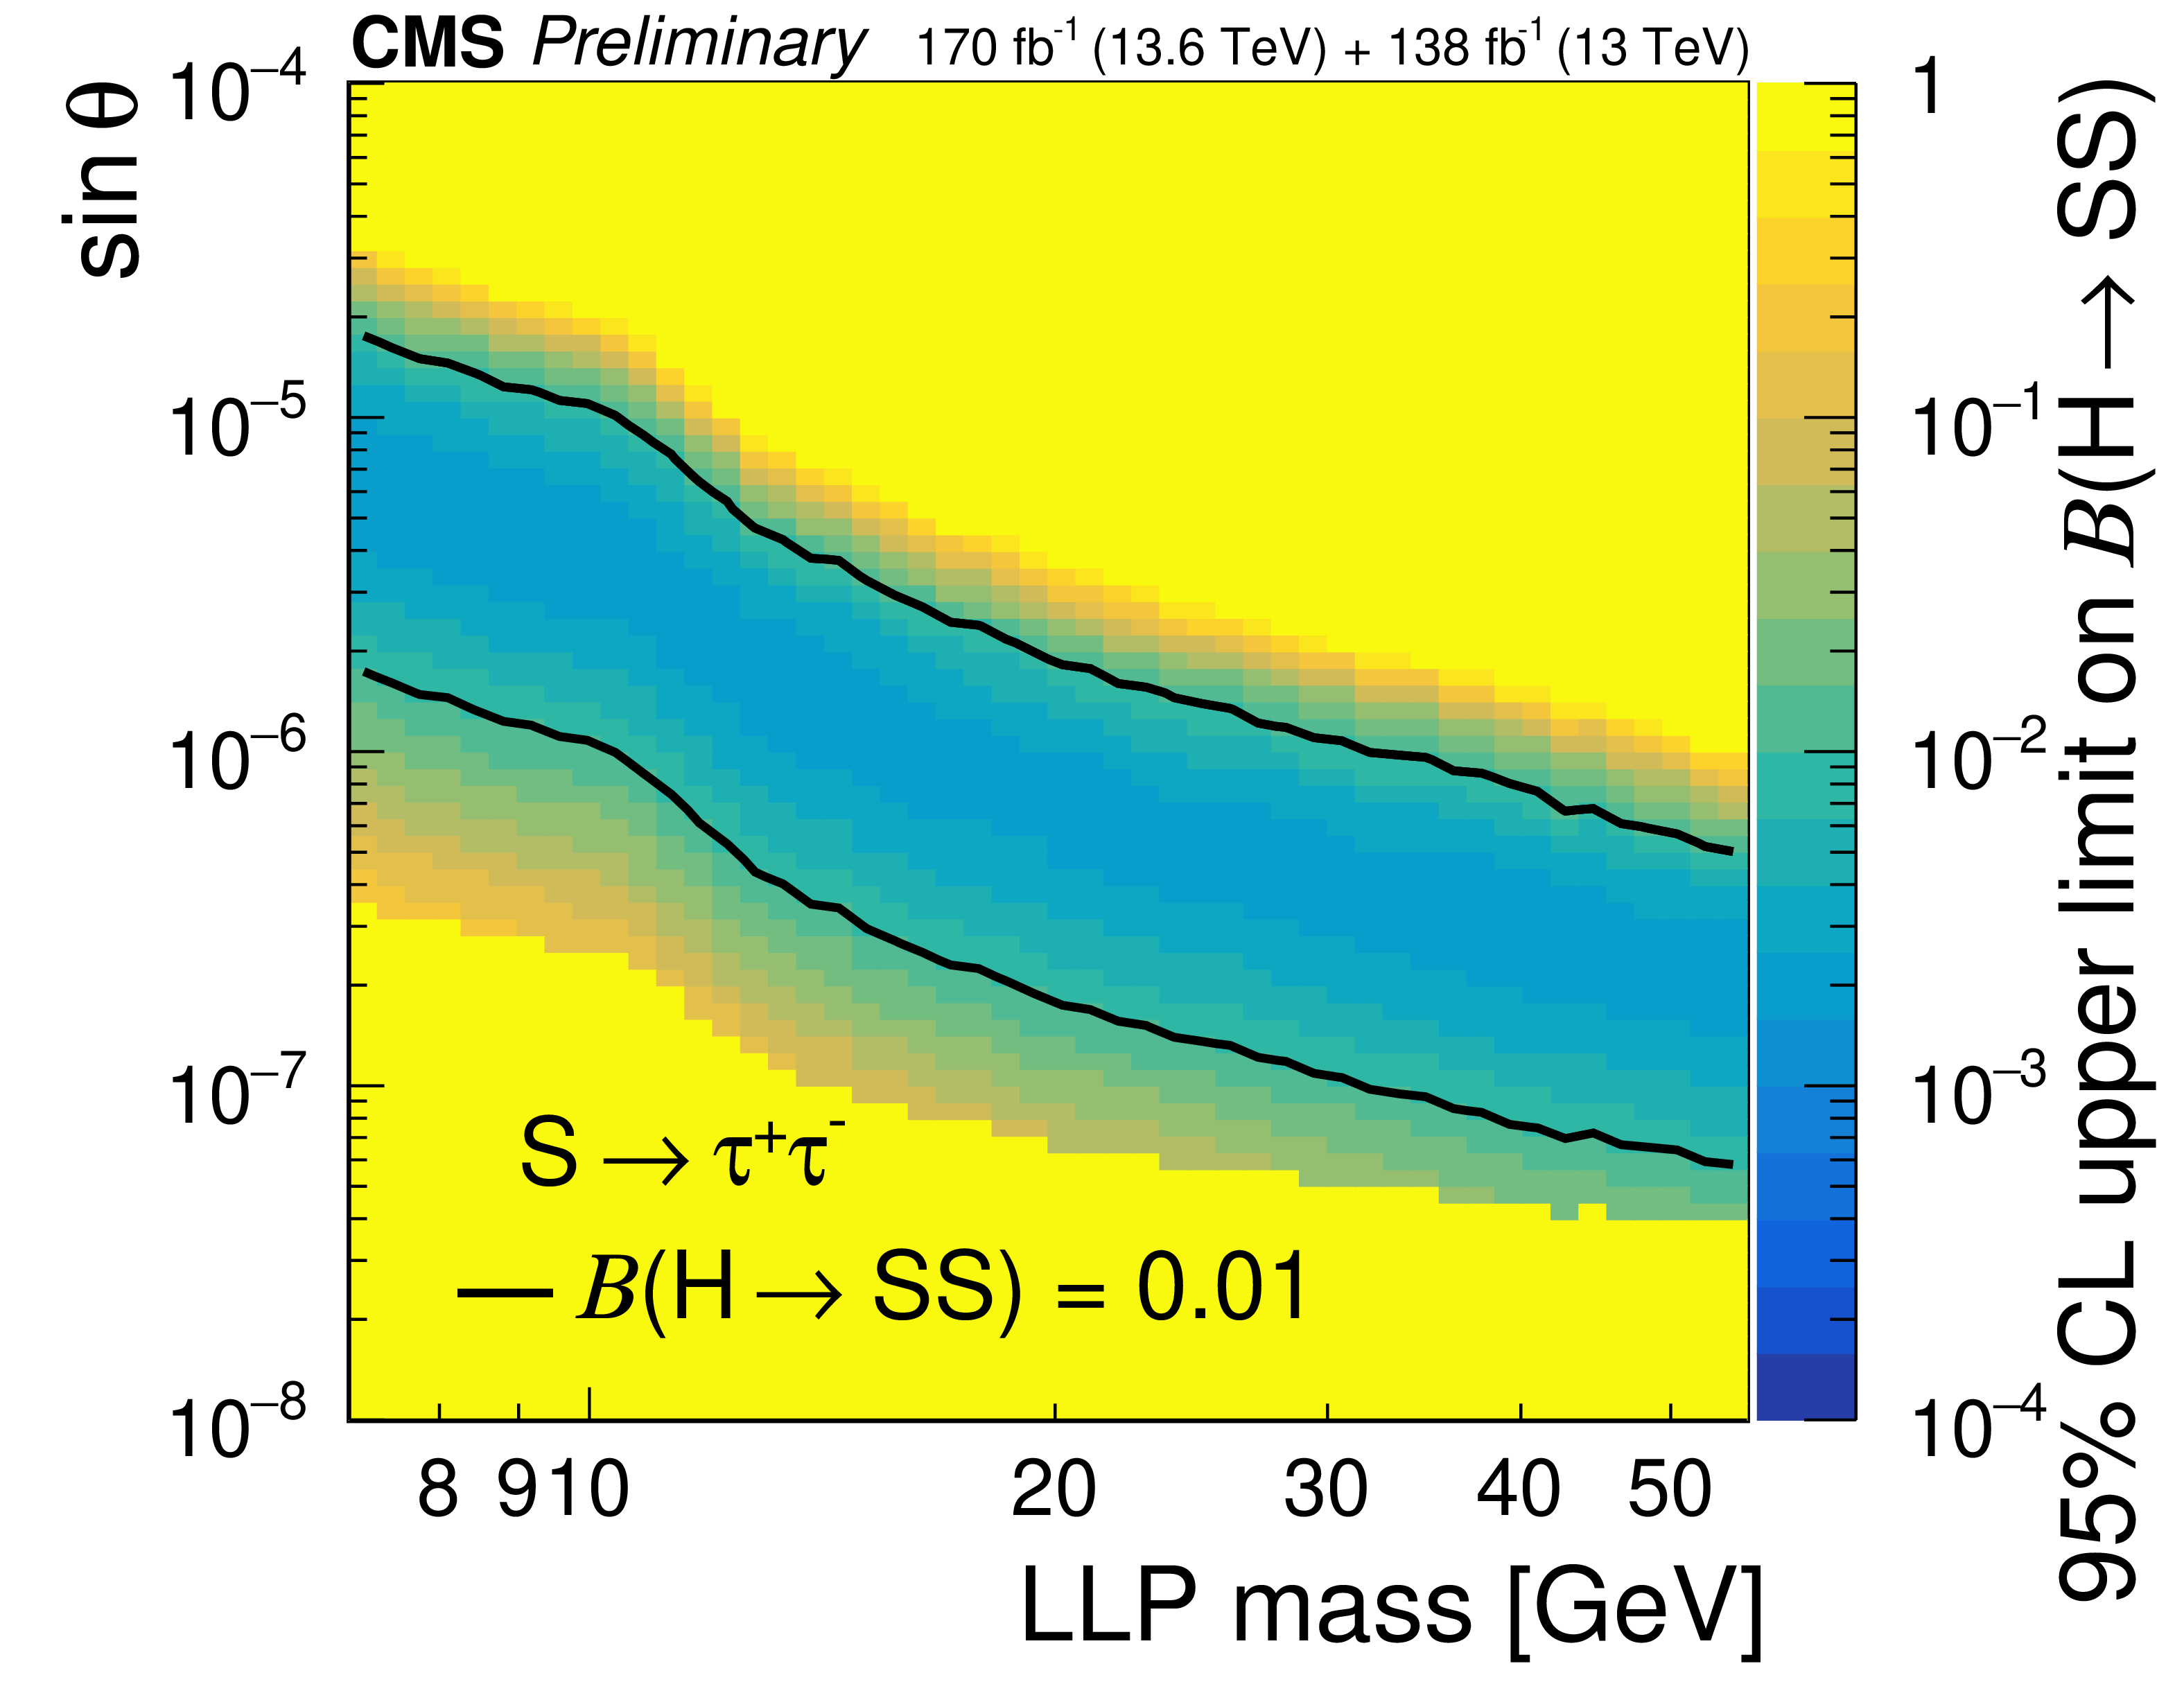
png pdf |
Figure 10-c:
The 95% CL expected (dotted curves) and observed (solid curves) upper limits combining Run 2 and Run 3 results on the branching fraction $ \mathcal{B}(\mathrm{H}\to SS) $ as functions of the LLP mass and mixing angle ($ \theta $) for the $ S\to\mathrm{d}\overline{\mathrm{d}} $ (upper left), $ S\to\mathrm{b}\overline{\mathrm{b}} $ (upper right), and $ S\to\tau^{+}\tau^{-} $ (lower) decay modes. |
| Tables | |
png pdf |
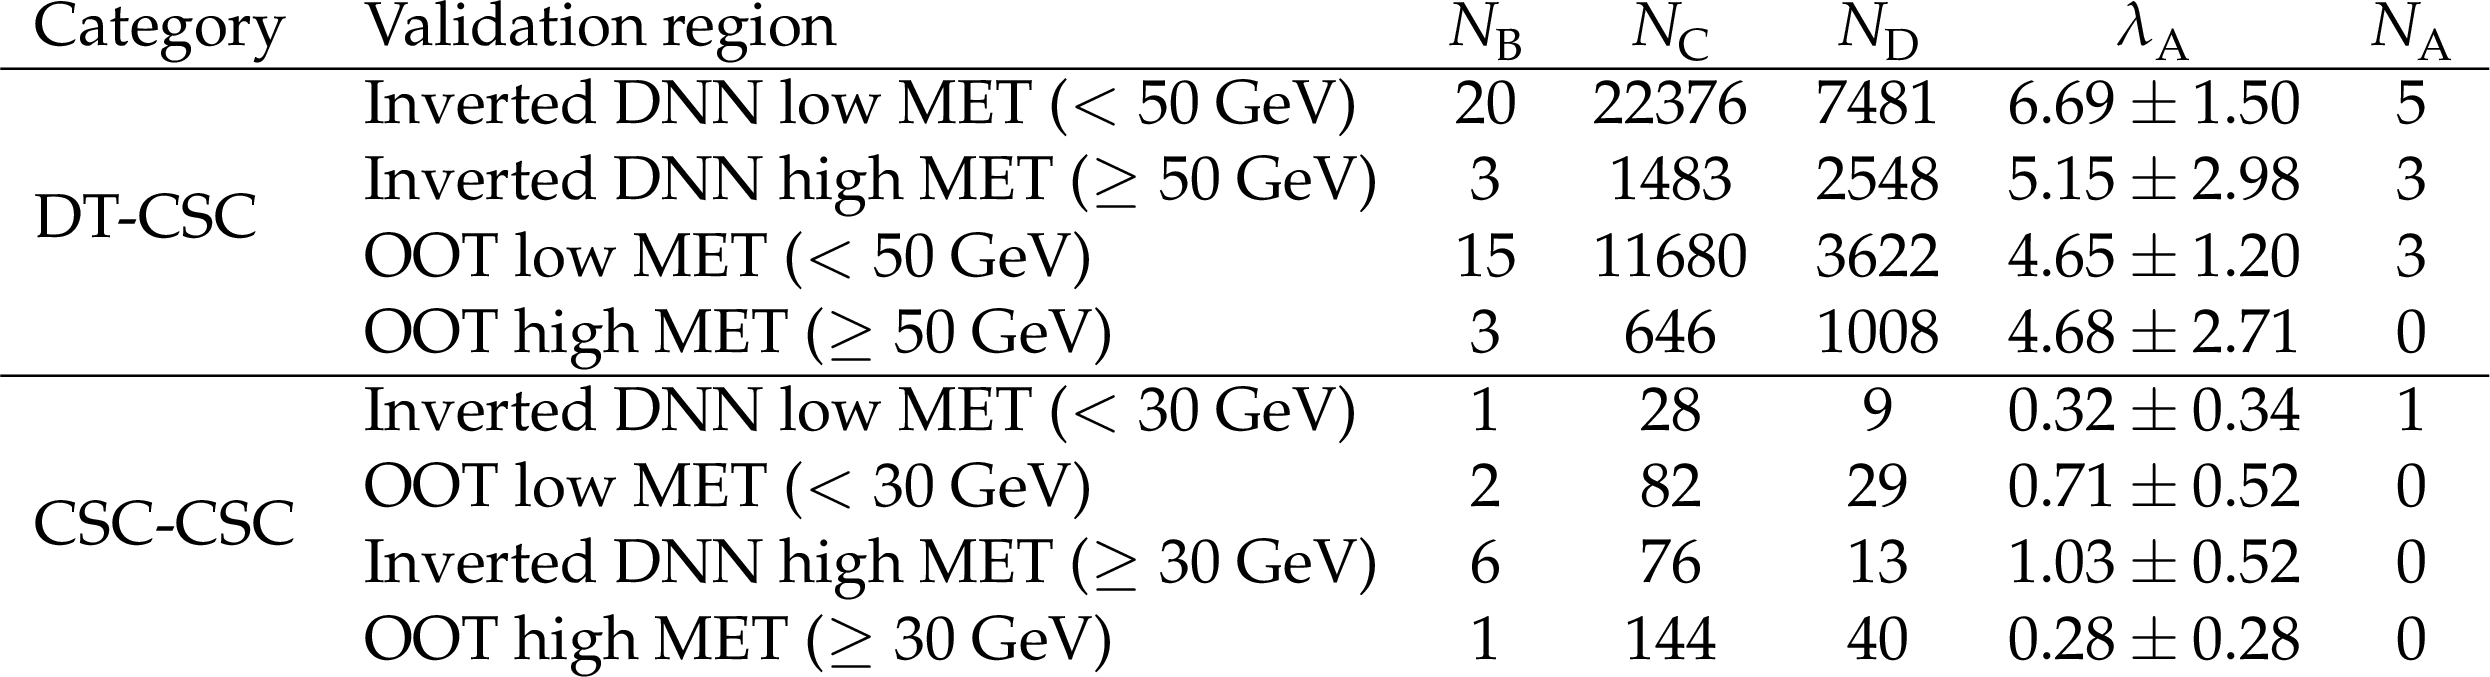
Table 1:
Validation of the background estimation method for the HMT-triggered categories. The uncertainty in the prediction is the statistical uncertainty propagated from bins B, C, and D. The observed event rate in bins A, B, C, and D ($ N_\mathrm{A} $, $ N_\mathrm{B} $, $ N_\mathrm{C} $, and $ N_\mathrm{D} $), together with the predicted background event rate in bin A ($ \lambda_\mathrm{A} $), are shown. |
png pdf |
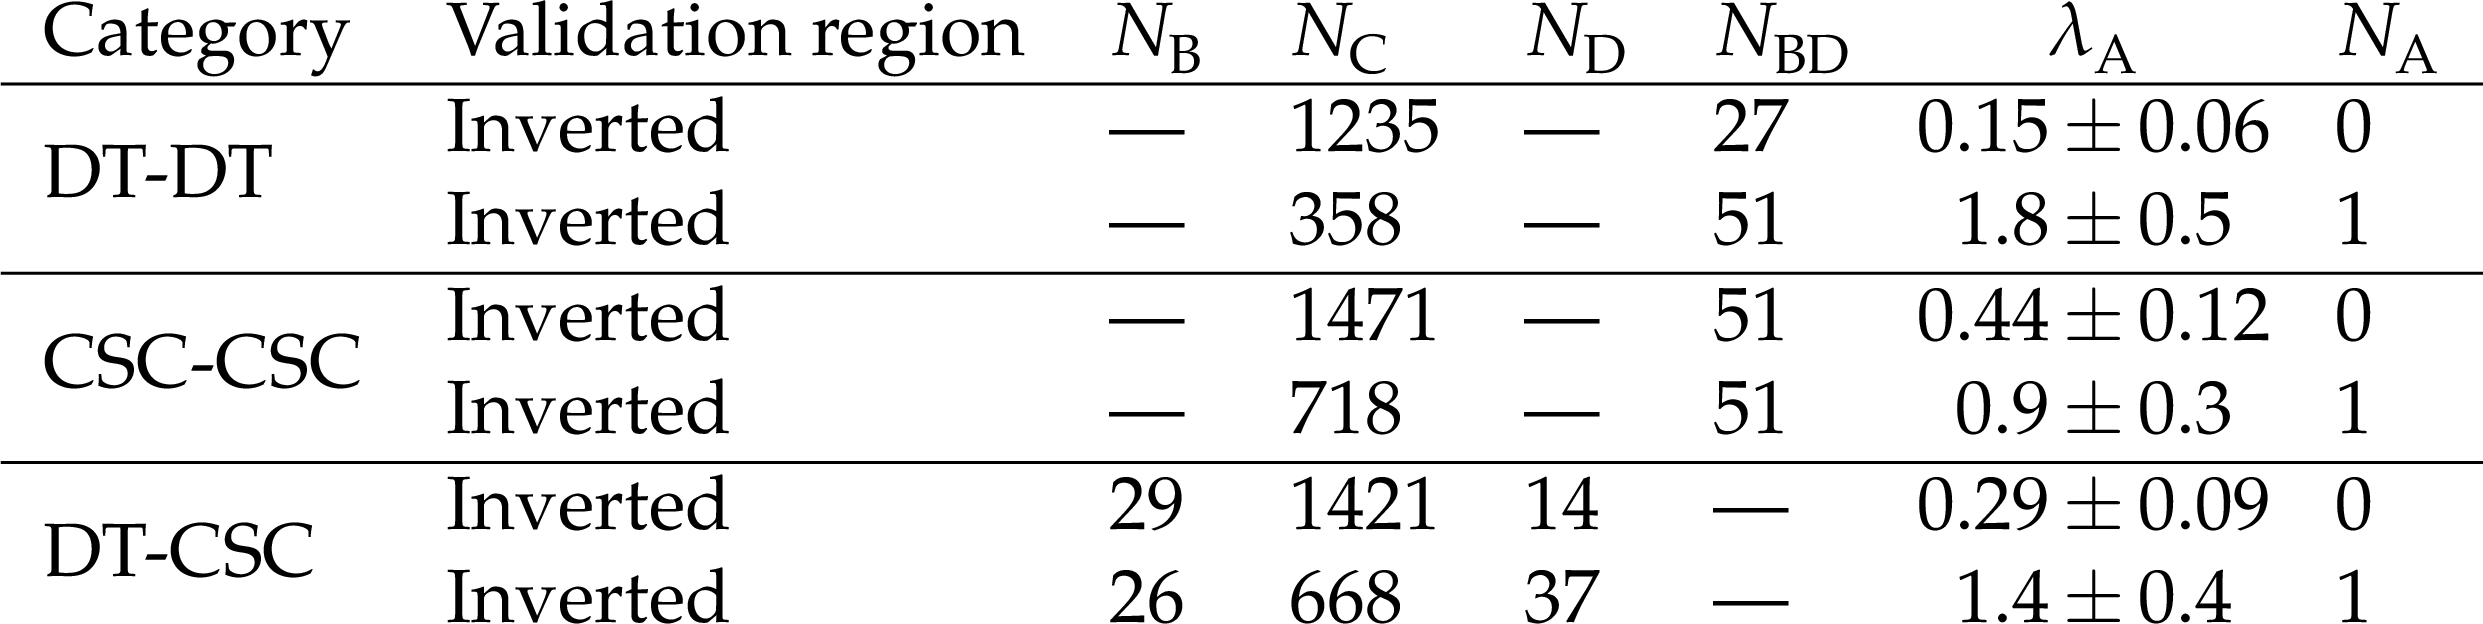
Table 2:
Validation of the background estimation method for the $ p_{\mathrm{T}}^\text{miss} $-triggered categories. The uncertainty in the prediction is the statistical uncertainty propagated from bins B, C, and D or bins BD and C. The expected background event rate in bin A ($ \lambda_\mathrm{A} $) and the background event rate in bins B, C, D, BD, and A ($ N_\mathrm{B} $, $ N_\mathrm{C} $, $ N_\mathrm{D} $, $ N_\mathrm{BD} $, $ N_\mathrm{A} $) are shown. |
png pdf |
Table 3:
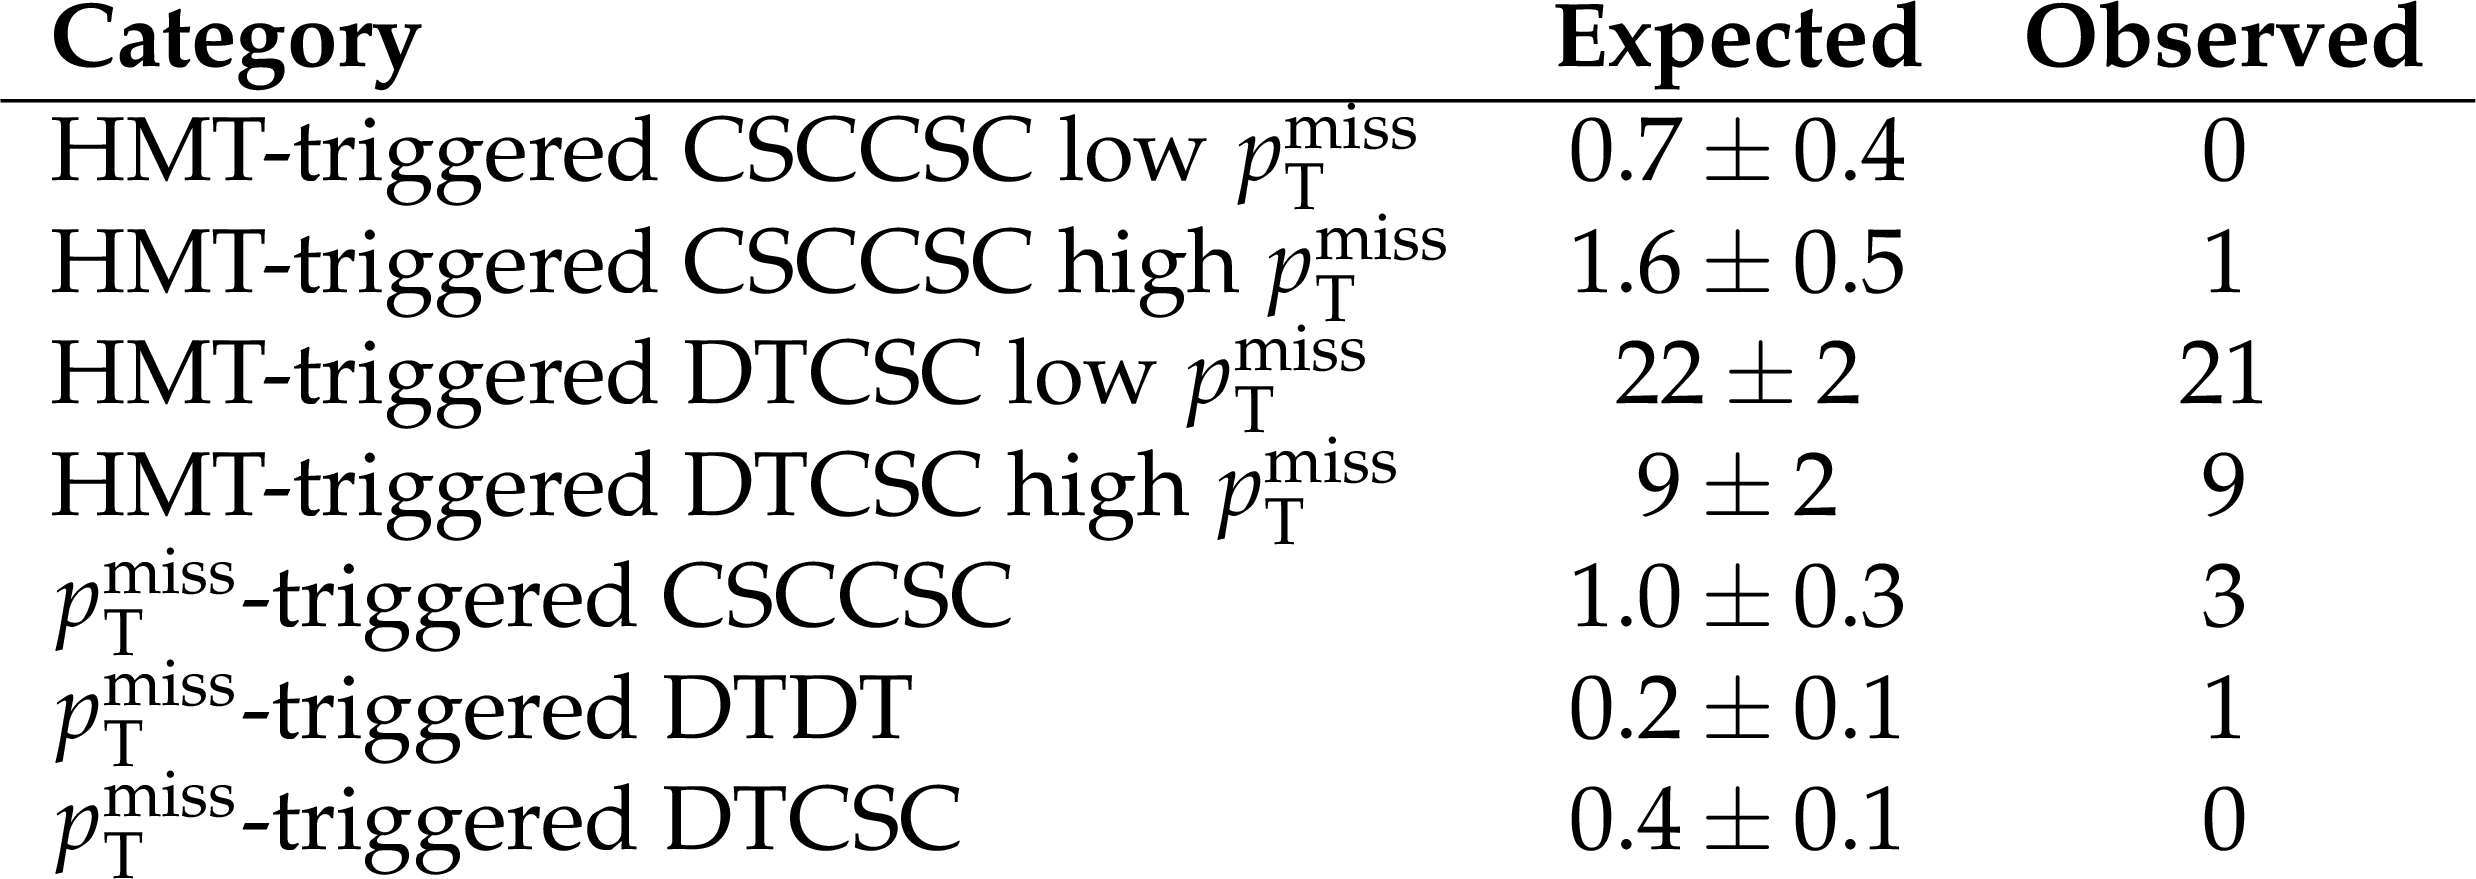
Summary of expected (post-fit) and observed yields in different categories. |
| Summary |
| Data from proton-proton collisions at $ \sqrt{s} = $ 13.6 TeV recorded by the CMS experiment in 2022--2024, corresponding to an integrated luminosity of up to 170 fb$ ^{-1} $, are used to search for LLPs decaying to two muon detector showers. This search utilizes a new dedicated LLP trigger that allow us to target new low $ p_{\mathrm{T}}^\text{miss} $ phase space that was not possible in Run 2. Based on this unique detector signature, the muon detector shower object is largely model-independent, with sensitivity to a broad range of LLP decay modes and masses extending to the GeVns scale. With the excellent shielding provided by the inner CMS detector, the CMS magnet and its steel flux-return yoke, the background is suppressed to a low level. No significant deviation from the standard model background is observed. The result is combined with a previous search using data collected in 2016--2018 at $ \sqrt{s}= $ 13 TeV corresponding to an integrated luminosity of 138 fb$ ^{-1} $. The result provides the most stringent branching fraction limits long proper decay lengths, complementing other LLP searches using the tracker and calorimeters. |
| References | ||||
| 1 | G. F. Giudice and A. Romanino | Split supersymmetry | NPB 699 (2004) 65 | hep-ph/0406088 |
| 2 | J. L. Hewett, B. Lillie, M. Masip, and T. G. Rizzo | Signatures of long-lived gluinos in split supersymmetry | JHEP 09 (2004) 070 | hep-ph/0408248 |
| 3 | N. Arkani-Hamed, S. Dimopoulos, G. F. Giudice, and A. Romanino | Aspects of split supersymmetry | NPB 709 (2005) 3 | hep-ph/0409232 |
| 4 | P. Gambino, G. F. Giudice, and P. Slavich | Gluino decays in split supersymmetry | NPB 726 (2005) 35 | hep-ph/0506214 |
| 5 | A. Arvanitaki, N. Craig, S. Dimopoulos, and G. Villadoro | Mini-split | JHEP 02 (2013) 126 | 1210.0555 |
| 6 | N. Arkani-Hamed et al. | Simply unnatural supersymmetry | 1212.6971 | |
| 7 | P. Fayet | Supergauge invariant extension of the Higgs mechanism and a model for the electron and its neutrino | NPB 90 (1975) 104 | |
| 8 | G. R. Farrar and P. Fayet | Phenomenology of the production, decay, and detection of new hadronic states associated with supersymmetry | PLB 76 (1978) 575 | |
| 9 | S. Weinberg | Supersymmetry at ordinary energies. Masses and conservation laws | PRD 26 (1982) 287 | |
| 10 | R. Barbier et al. | $ R $-parity violating supersymmetry | Phys. Rept. 420 (2005) 1 | hep-ph/0406039 |
| 11 | G. F. Giudice and R. Rattazzi | Theories with gauge mediated supersymmetry breaking | Phys. Rept. 322 (1999) 419 | hep-ph/9801271 |
| 12 | P. Meade, N. Seiberg, and D. Shih | General gauge mediation | Prog. Theor. Phys. Suppl. 177 (2009) 143 | 0801.3278 |
| 13 | M. Buican, P. Meade, N. Seiberg, and D. Shih | Exploring general gauge mediation | JHEP 03 (2009) 016 | 0812.3668 |
| 14 | J. Fan, M. Reece, and J. T. Ruderman | Stealth supersymmetry | JHEP 11 (2011) 012 | 1105.5135 |
| 15 | J. Fan, M. Reece, and J. T. Ruderman | A stealth supersymmetry sampler | JHEP 07 (2012) 196 | 1201.4875 |
| 16 | M. J. Strassler and K. M. Zurek | Echoes of a hidden valley at hadron colliders | PLB 651 (2007) 374 | hep-ph/0604261 |
| 17 | M. J. Strassler and K. M. Zurek | Discovering the Higgs through highly-displaced vertices | PLB 661 (2008) 263 | hep-ph/0605193 |
| 18 | T. Han, Z. Si, K. M. Zurek, and M. J. Strassler | Phenomenology of hidden valleys at hadron colliders | JHEP 07 (2008) 008 | 0712.2041 |
| 19 | D. Smith and N. Weiner | Inelastic dark matter | PRD 64 (2001) 043502 | hep-ph/0101138 |
| 20 | Z. Chacko, H.-S. Goh, and R. Harnik | Natural electroweak breaking from a mirror symmetry | PRL 96 (2006) 231802 | hep-ph/0506256 |
| 21 | D. Curtin and C. B. Verhaaren | Discovering uncolored naturalness in exotic Higgs decays | JHEP 12 (2015) 072 | 1506.06141 |
| 22 | H.-C. Cheng, S. Jung, E. Salvioni, and Y. Tsai | Exotic quarks in twin Higgs models | JHEP 03 (2016) 074 | 1512.02647 |
| 23 | CMS Collaboration | Search for long-lived particles decaying in the CMS end cap muon detectors in proton-proton collisions at $ \sqrt{s} = $ 13 TeV | PRL 127 (2021) 261804 | CMS-EXO-20-015 2107.04838 |
| 24 | CMS Collaboration | Search for long-lived particles decaying in the CMS muon detectors in proton-proton collisions at $ \sqrt{s} = 13.6 \textrm{TeV} $ | PRD 110 (2024) 032007 | CMS-EXO-21-008 2402.01898 |
| 25 | CMS Collaboration | Search for vector-like leptons with long-lived particle decays in the CMS muon system in proton-proton collisions at $ \sqrt{\text{s}} = $ 13 TeV | JHEP 08 (2025) 156 | CMS-EXO-23-015 2503.16699 |
| 26 | CMS Collaboration | Search for long-lived heavy neutral leptons decaying in the CMS muon detectors in proton-proton collisions at $ \sqrt{s} = 13.6 \textrm{TeV} $ | PRD 110 (2024) 012004 | CMS-EXO-22-017 2402.18658 |
| 27 | CMS Collaboration | Search for b-hadron decays to long-lived particles in the CMS endcap muon detectors | PRD 113 (2026) 012009 | CMS-EXO-24-004 2508.06363 |
| 28 | CMS Collaboration | The CMS muon project: Technical Design Report | CMS Technical Design Report CERN-LHCC-97-032, 1997 CDS |
|
| 29 | CMS Collaboration | The CMS experiment at the CERN LHC | JINST 3 (2008) S08004 | |
| 30 | CMS Collaboration | Search for long-lived particles using displaced jets in proton-proton collisions at $ \sqrt{s} = $ 13 TeV | PRD 104 (2021) 012015 | CMS-EXO-19-021 2012.01581 |
| 31 | CMS Collaboration | Search for light long-lived particles decaying to displaced jets in proton-proton collisions at $ \sqrt{s} = 13.6 \textrm{TeV} $ | Rept. Prog. Phys. 88 (2025) 037801 | CMS-EXO-23-013 2409.10806 |
| 32 | ATLAS Collaboration | Search for long-lived particles produced in pp collisions at $ \sqrt{s}= $ 13 TeV that decay into displaced hadronic jets in the ATLAS muon spectrometer | PRD 99 (2019) 052005 | 1811.07370 |
| 33 | ATLAS Collaboration | Search for events with a pair of displaced vertices from long-lived neutral particles decaying into hadronic jets in the ATLAS muon spectrometer in pp collisions at $ \sqrt{s} = $ 13 TeV | PRD 106 (2022) 032005 | 2203.00587 |
| 34 | CMS Collaboration | Development of the CMS detector for the CERN LHC Run 3 | JINST 19 (2024) P05064 | CMS-PRF-21-001 2309.05466 |
| 35 | CMS Collaboration | Performance of the CMS Level-1 trigger in proton-proton collisions at $ \sqrt{s} = $ 13 TeV | JINST 15 (2020) P10017 | CMS-TRG-17-001 2006.10165 |
| 36 | CMS Collaboration | The CMS trigger system | JINST 12 (2017) P01020 | CMS-TRG-12-001 1609.02366 |
| 37 | CMS Collaboration | Performance of the CMS high-level trigger during LHC Run 2 | JINST 19 (2024) P11021 | CMS-TRG-19-001 2410.17038 |
| 38 | CMS Collaboration | Electron and photon reconstruction and identification with the CMS experiment at the CERN LHC | JINST 16 (2021) P05014 | CMS-EGM-17-001 2012.06888 |
| 39 | CMS Collaboration | Performance of the CMS muon detector and muon reconstruction with proton-proton collisions at $ \sqrt{s}= $ 13 TeV | JINST 13 (2018) P06015 | CMS-MUO-16-001 1804.04528 |
| 40 | CMS Collaboration | Description and performance of track and primary-vertex reconstruction with the CMS tracker | JINST 9 (2014) P10009 | CMS-TRK-11-001 1405.6569 |
| 41 | CMS Collaboration | Precision luminosity measurement in proton-proton collisions at $ \sqrt{s} = $ 13 TeV in 2015 and 2016 at CMS | EPJC 81 (2021) 800 | CMS-LUM-17-003 2104.01927 |
| 42 | CMS Collaboration | CMS luminosity measurements for the 2017 data-taking period at $ \sqrt{s} = $ 13 TeV | CMS Physics Analysis Summary, 2017 CMS-PAS-LUM-17-004 |
CMS-PAS-LUM-17-004 |
| 43 | CMS Collaboration | CMS luminosity measurements for the 2018 data-taking period at $ \sqrt{s} = $ 13 TeV | CMS Physics Analysis Summary, 2018 CMS-PAS-LUM-18-002 |
CMS-PAS-LUM-18-002 |
| 44 | CMS Collaboration | Luminosity measurement in proton-proton collisions at 13.6 TeV in 2022 at CMS | CMS Physics Analysis Summary, CERN, 2024 CMS-PAS-LUM-22-001 |
CMS-PAS-LUM-22-001 |
| 45 | CMS Collaboration | Performance of the CMS drift tube chambers with cosmic rays | JINST 5 (2010) T03015 | CMS-CFT-09-012 0911.4855 |
| 46 | CMS Collaboration | Performance of the CMS muon detector and muon reconstruction with proton-proton collisions at $ \sqrt{s}= $ 13 TeV | JINST 13 (2018) P06015 | CMS-MUO-16-001 1804.04528 |
| 47 | CMS Collaboration | Performance of the CMS cathode strip chambers with cosmic rays | JINST 5 (2010) T03018 | CMS-CFT-09-011 0911.4992 |
| 48 | CMS Collaboration | CSC high multiplicity trigger in Run 3 | CMS Detector Performance Summary CMS-DP-2022-062, 2022 CDS |
|
| 49 | CMS Collaboration | High multiplicity trigger for long-lived particles in CMS detector in 2022 and 2023 | CMS Detector Performance Summary CMS-DP-2024-099, 2024 CDS |
|
| 50 | CMS Collaboration | Strategy and performance of the CMS long-lived particle trigger program in proton-proton collisions at $ \sqrt{s} = $ 13.6 TeV | Submitted to Phys. Rept. | CMS-EXO-23-016 2601.17544 |
| 51 | P. Nason | A new method for combining NLO QCD with shower Monte Carlo algorithms | JHEP 11 (2004) 040 | hep-ph/0409146 |
| 52 | S. Frixione, P. Nason, and C. Oleari | Matching NLO QCD computations with parton shower simulations: the POWHEG method | JHEP 11 (2007) 070 | 0709.2092 |
| 53 | S. Alioli, P. Nason, C. Oleari, and E. Re | A general framework for implementing NLO calculations in shower Monte Carlo programs: the POWHEG box | JHEP 06 (2010) 043 | 1002.2581 |
| 54 | E. Re | Single-top $ \mathrm{W}\mathrm{t} $-channel production matched with parton showers using the POWHEG method | EPJC 71 (2011) 1547 | 1009.2450 |
| 55 | T. Sj ö strand et al. | An introduction to PYTHIA 8.2 | Comput. Phys. Commun. 191 (2015) 159 | 1410.3012 |
| 56 | CMS Collaboration | Extraction and validation of a new set of CMS PYTHIA8 tunes from underlying-event measurements | EPJC 80 (2020) 4 | CMS-GEN-17-001 1903.12179 |
| 57 | NNPDF Collaboration | Parton distributions from high-precision collider data | EPJC 77 (2017) 663 | 1706.00428 |
| 58 | GEANT4 Collaboration | GEANT 4---a simulation toolkit | NIM A 506 (2003) 250 | |
| 59 | CMS Collaboration | Particle-flow reconstruction and global event description with the CMS detector | JINST 12 (2017) P10003 | CMS-PRF-14-001 1706.04965 |
| 60 | CMS Collaboration | Performance of the reconstruction and identification of high-momentum muons in proton-proton collisions at $ \sqrt{s} = $ 13 TeV | JINST 15 (2020) P02027 | CMS-MUO-17-001 1912.03516 |
| 61 | M. Cacciari, G. P. Salam, and G. Soyez | The anti-$ k_{\mathrm{T}} $ jet clustering algorithm | JHEP 04 (2008) 063 | 0802.1189 |
| 62 | M. Cacciari, G. P. Salam, and G. Soyez | FASTJET user manual | EPJC 72 (2012) 1896 | 1111.6097 |
| 63 | CMS Collaboration | Jet energy scale and resolution in the CMS experiment in pp collisions at 8 TeV | JINST 12 (2017) P02014 | CMS-JME-13-004 1607.03663 |
| 64 | CMS Collaboration | Pileup mitigation at CMS in 13 TeV data | JINST 15 (2020) P09018 | CMS-JME-18-001 2003.00503 |
| 65 | D. Bertolini, P. Harris, M. Low, and N. Tran | Pileup per particle identification | JHEP 10 (2014) 059 | 1407.6013 |
| 66 | CMS Collaboration | Performance of missing transverse momentum reconstruction in proton-proton collisions at $ \sqrt{s} = $ 13 TeV using the CMS detector | JINST 14 (2019) P07004 | CMS-JME-17-001 1903.06078 |
| 67 | CMS Collaboration | Drift tube performance in 2023 | CMS Detector Performance Summary CMS-DP-2023-049, 2023 CDS |
|
| 68 | CMS Collaboration | Performance of the CMS cathode strip chambers with cosmic rays | JINST 5 (2010) T03018 | CMS-CFT-09-011 0911.4992 |
| 69 | G. Kasieczka and D. Shih | Robust Jet Classifiers through Distance Correlation | PRL 125 (2020) no. 12 | 2001.05310 |
| 70 | CMS Collaboration | CMS jet algorithms performance in 13 TeV data | CMS Physics Analysis Summary, 2016 CMS-PAS-JME-16-003 |
CMS-PAS-JME-16-003 |
| 71 | G. Kasieczka, B. Nachman, M. D. Schwartz, and D. Shih | Automating the ABCD method with machine learning | PRD 103 (2021) 035021 | 2007.14400 |
| 72 | CMS Collaboration | Measurement of the offline integrated luminosity for the CMS proton-proton collision dataset recorded in 2023 | CMS Detector Performance Summary CMS-DP-2024-068, 2024 CDS |
|
| 73 | CMS Collaboration | Measurement of the integrated luminosity with the CMS proton-proton dataset at $ \sqrt{s} = $ 13.6 TeV recorded in 2024 | CMS Detector Performance Summary CMS-DP-2026-003, 2026 CDS |
|
| 74 | CMS Collaboration | The CMS statistical analysis and combination tool: Combine | Comput. Softw. Big Sci. 8 (2024) 19 | CMS-CAT-23-001 2404.06614 |
| 75 | W. Verkerke and D. Kirkby | The RooFit toolkit for data modeling | in the International Conference on Computing in High Energy and Nuclear Physics (CHEP ): La Jolla CA, United States, March 24--28,, 2003 Proc. 1 (2003) 3 |
physics/0306116 |
| 76 | L. Moneta et al. | The RooStats project | in the International Workshop on Advanced Computing and Analysis Techniques in Physics Research (ACAT ): Jaipur, India, February 22--27,.. [PoS (ACAT) 057], 2010 Proc. 1 (2010) 3 |
1009.1003 |
| 77 | T. Junk | Confidence level computation for combining searches with small statistics | NIM A 434 (1999) 435 | hep-ex/9902006 |
| 78 | A. L. Read | Presentation of search results: the CL$ _\mathrm{s} $ technique | JPG 28 (2002) 2693 | |
| 79 | ATLAS and CMS Collaborations, The LHC Higgs Combination Group | Procedure for the LHC Higgs boson search combination in Summer 2011 | Technical Report CMS-NOTE-2011-005, ATL-PHYS-PUB-2011-11, 2011 | |
| 80 | A. Karlberg et al. | Ad interim recommendations for the Higgs boson production cross sections at $ \sqrt{s} = $ 13.6 TeV | 2402.09955 | |
|
|
Compact Muon Solenoid LHC, CERN |

|

|

|

|

|

|