

Compact Muon Solenoid
LHC, CERN
| CMS-PAS-MUO-21-001 | ||
| Performance of CMS muon reconstruction in heavy ion collisions | ||
| CMS Collaboration | ||
| 21 August 2023 | ||
| Abstract: The performance of muon tracking, identification, triggering, momentum scale, and momentum resolution has been studied with the CMS detector at the LHC using data collected in proton-proton (pp) and lead-lead (PbPb) collisions at $ \sqrt {\smash [b]{s_{_{\mathrm {NN}}}}} = $ 5.02 TeV in 2017 and 2018 respectively, and in proton-lead (pPb) collisions at $ \sqrt {\smash [b]{s_{_{\mathrm {NN}}}}} = $ 8.16 TeV in 2016. Muon efficiencies, momentum scales, and momentum resolutions are presented and compared across the aforementioned collision systems, focusing on how the muon reconstruction performance varies from relatively small occupancy pp collisions, to pPb collisions, to the highest track multiplicity PbPb collisions. The muon-tracking, identification, and trigger efficiencies are above 90% throughout most of the studied multiplicity range. The momentum scale and resolution are unaffected by the occupancy. The excellent muon reconstruction of the CMS detector enables precision studies across all available collision systems. | ||
|
Links:
CDS record (PDF) ;
CADI line (restricted) ;
These preliminary results are superseded in this paper, JINST 19 (2024) P09012. The superseded preliminary plots can be found here. |
||
| Figures | |
png pdf |
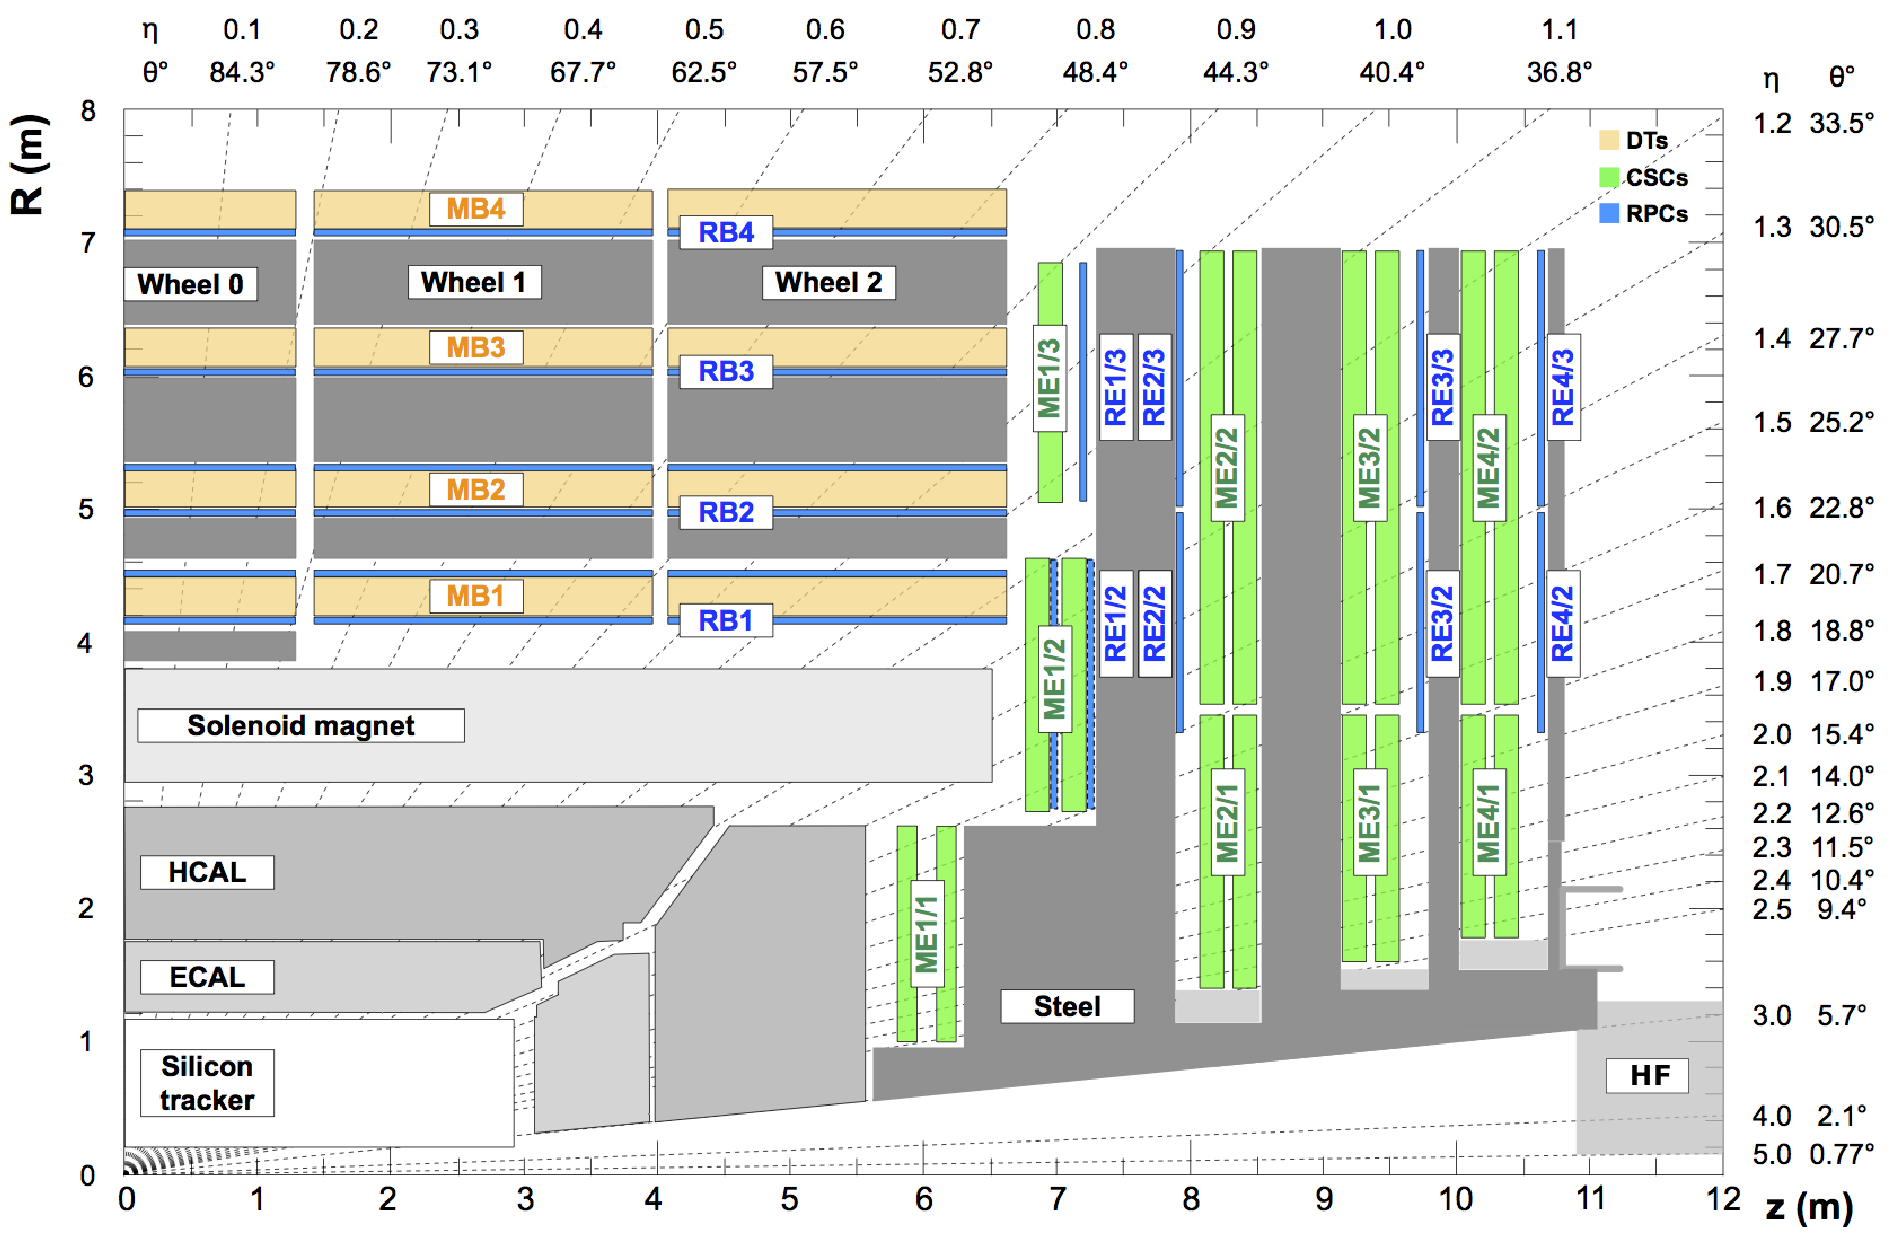
Figure 1:
Longitudinal layout of one quadrant of the CMS detector. The drawing shows the four DT stations in the muon barrel (MB1-MB4, yellow), the four CSC stations in the muon endcap (ME1-ME4, green) and the RPC stations (blue). |
png pdf |
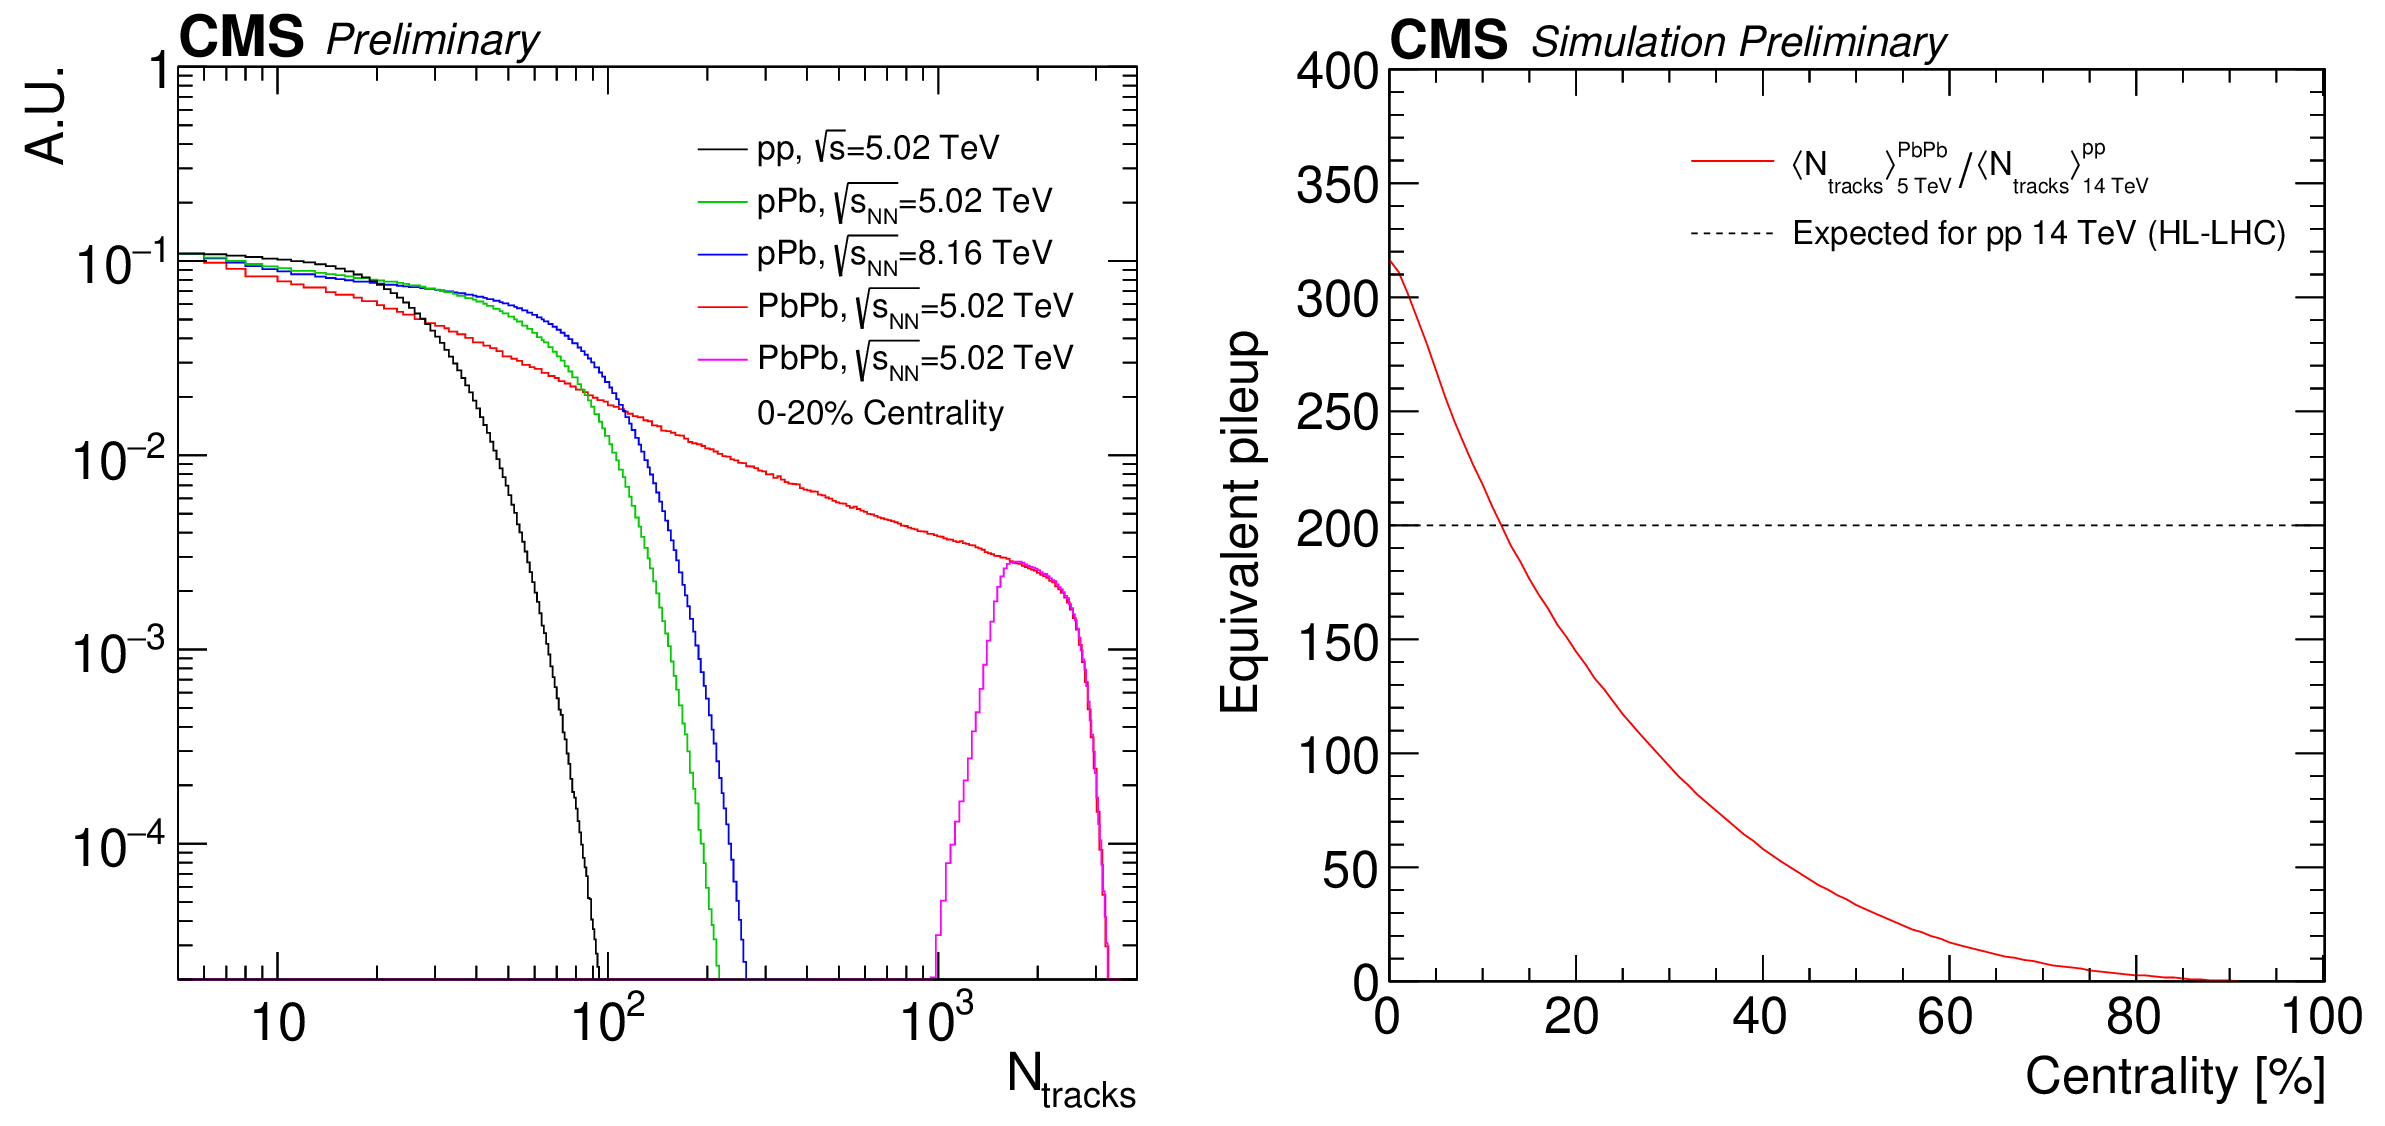
Figure 2:
Left: Distribution of $ N_{\mathrm{tracks}} $ in pp at $ \sqrt{s}= $ 5.02 TeV (black), pPb at $ \sqrt{\smash[b]{s_{_{\mathrm{NN}}}}}= $ 5.02 TeV (green), pPb at $ \sqrt{\smash[b]{s_{_{\mathrm{NN}}}}}= $ 8.16 TeV (blue), and PbPb at $ \sqrt{\smash[b]{s_{_{\mathrm{NN}}}}}= $ 5.02 TeV (red). The distribution of $ N_{\mathrm{tracks}} $ in the most central PbPb collisions (0-20% centrality) is shown in magenta. The values are uncorrected. Right: Translation of the centrality in PbPb collisions at $ \sqrt{\smash[b]{s_{_{\mathrm{NN}}}}}= $ 5.02 TeV into an equivalent pileup in pp collisions at $ \sqrt{s}= $ 14 TeV. |
png pdf |
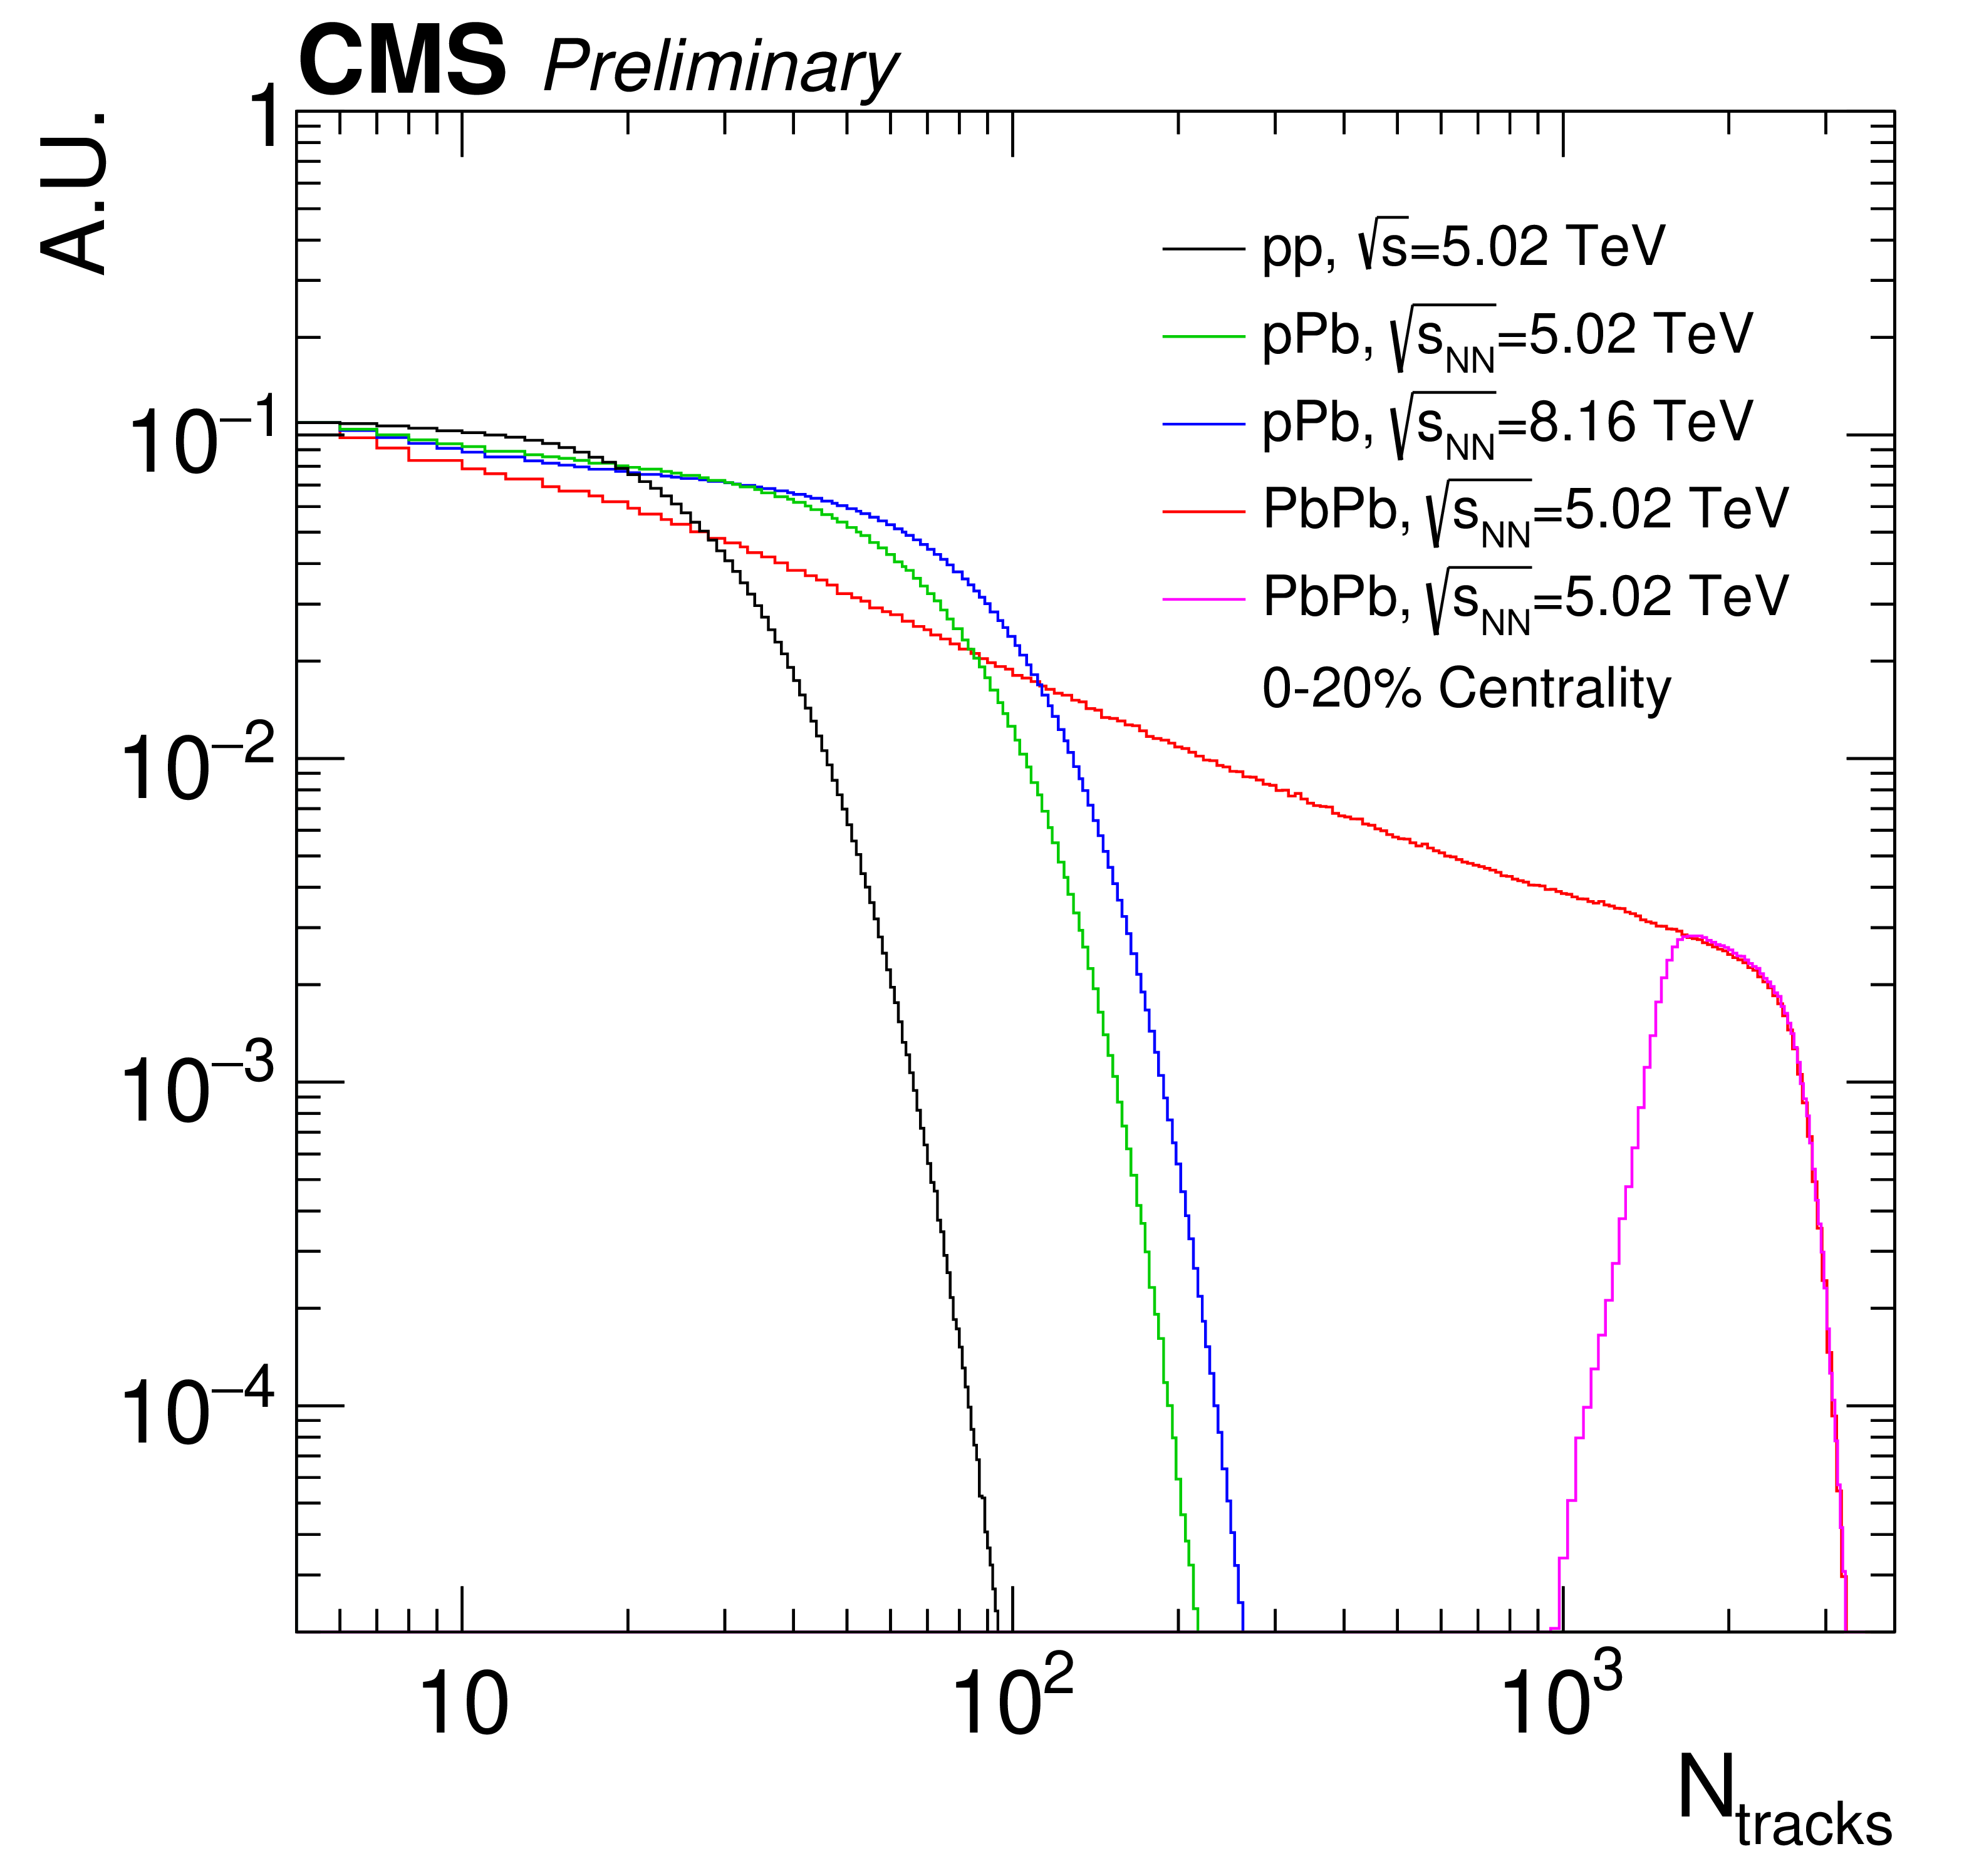
Figure 2-a:
Left: Distribution of $ N_{\mathrm{tracks}} $ in pp at $ \sqrt{s}= $ 5.02 TeV (black), pPb at $ \sqrt{\smash[b]{s_{_{\mathrm{NN}}}}}= $ 5.02 TeV (green), pPb at $ \sqrt{\smash[b]{s_{_{\mathrm{NN}}}}}= $ 8.16 TeV (blue), and PbPb at $ \sqrt{\smash[b]{s_{_{\mathrm{NN}}}}}= $ 5.02 TeV (red). The distribution of $ N_{\mathrm{tracks}} $ in the most central PbPb collisions (0-20% centrality) is shown in magenta. The values are uncorrected. Right: Translation of the centrality in PbPb collisions at $ \sqrt{\smash[b]{s_{_{\mathrm{NN}}}}}= $ 5.02 TeV into an equivalent pileup in pp collisions at $ \sqrt{s}= $ 14 TeV. |
png pdf |
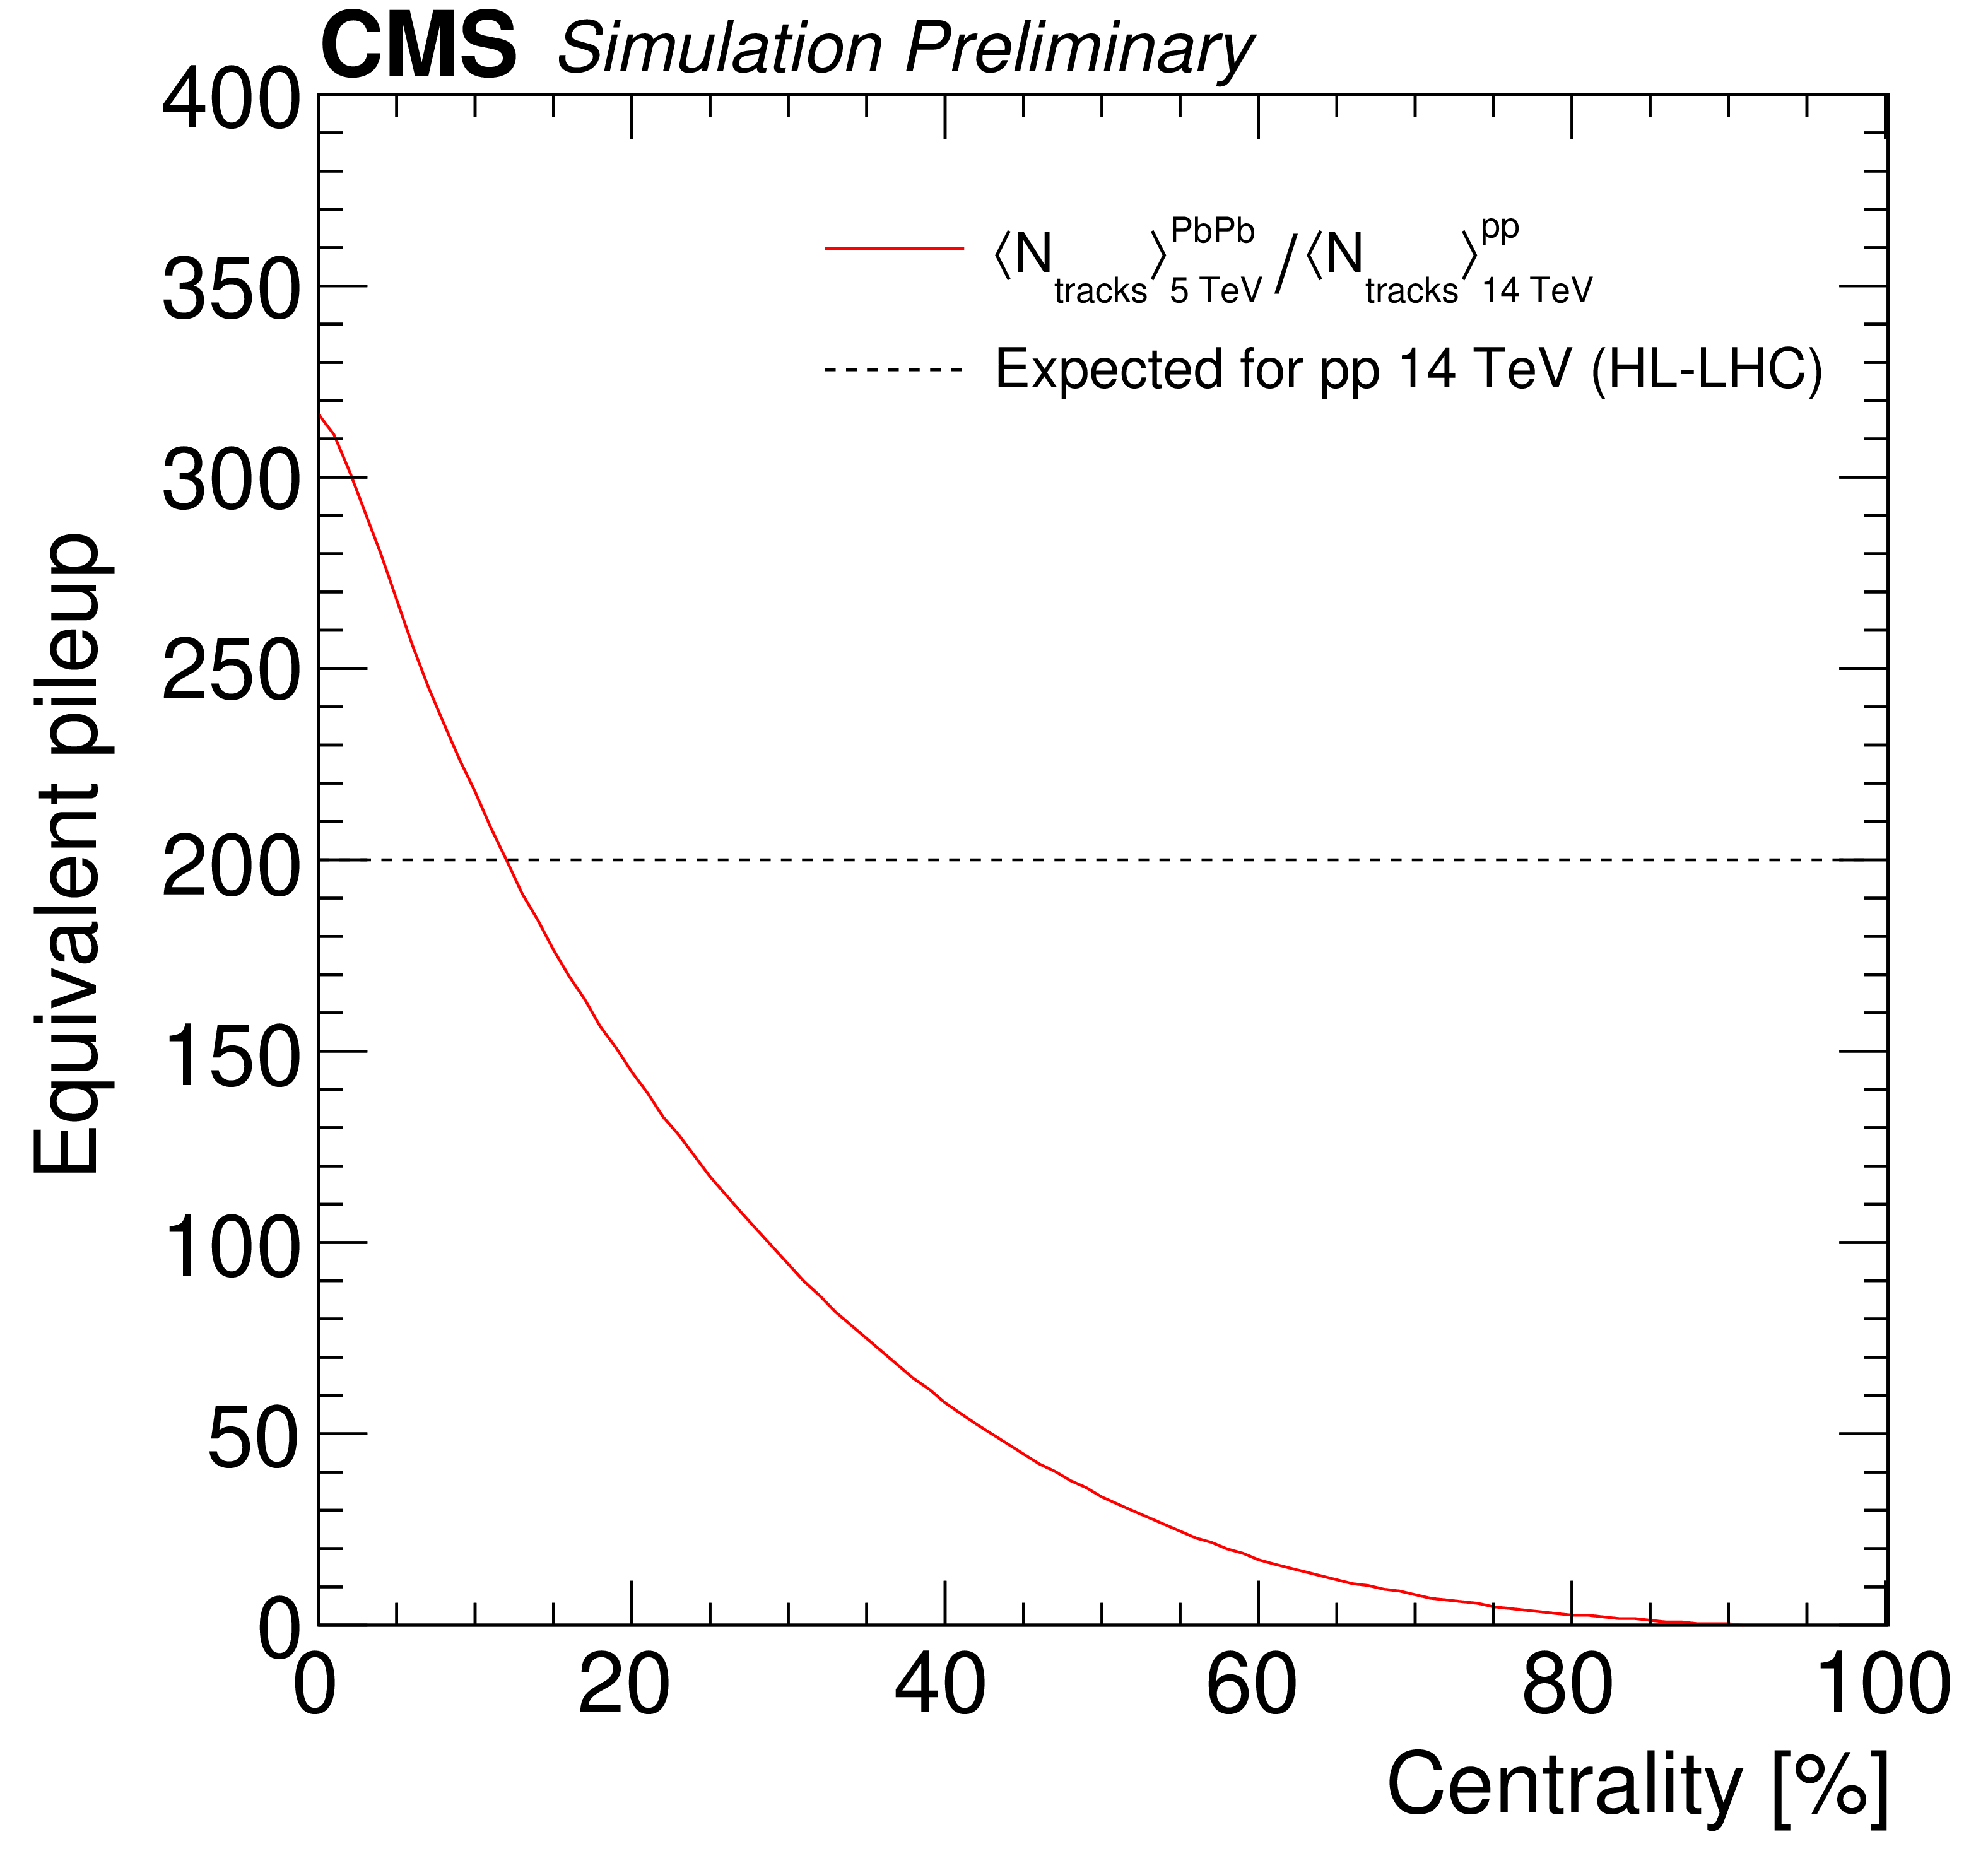
Figure 2-b:
Left: Distribution of $ N_{\mathrm{tracks}} $ in pp at $ \sqrt{s}= $ 5.02 TeV (black), pPb at $ \sqrt{\smash[b]{s_{_{\mathrm{NN}}}}}= $ 5.02 TeV (green), pPb at $ \sqrt{\smash[b]{s_{_{\mathrm{NN}}}}}= $ 8.16 TeV (blue), and PbPb at $ \sqrt{\smash[b]{s_{_{\mathrm{NN}}}}}= $ 5.02 TeV (red). The distribution of $ N_{\mathrm{tracks}} $ in the most central PbPb collisions (0-20% centrality) is shown in magenta. The values are uncorrected. Right: Translation of the centrality in PbPb collisions at $ \sqrt{\smash[b]{s_{_{\mathrm{NN}}}}}= $ 5.02 TeV into an equivalent pileup in pp collisions at $ \sqrt{s}= $ 14 TeV. |
png pdf |
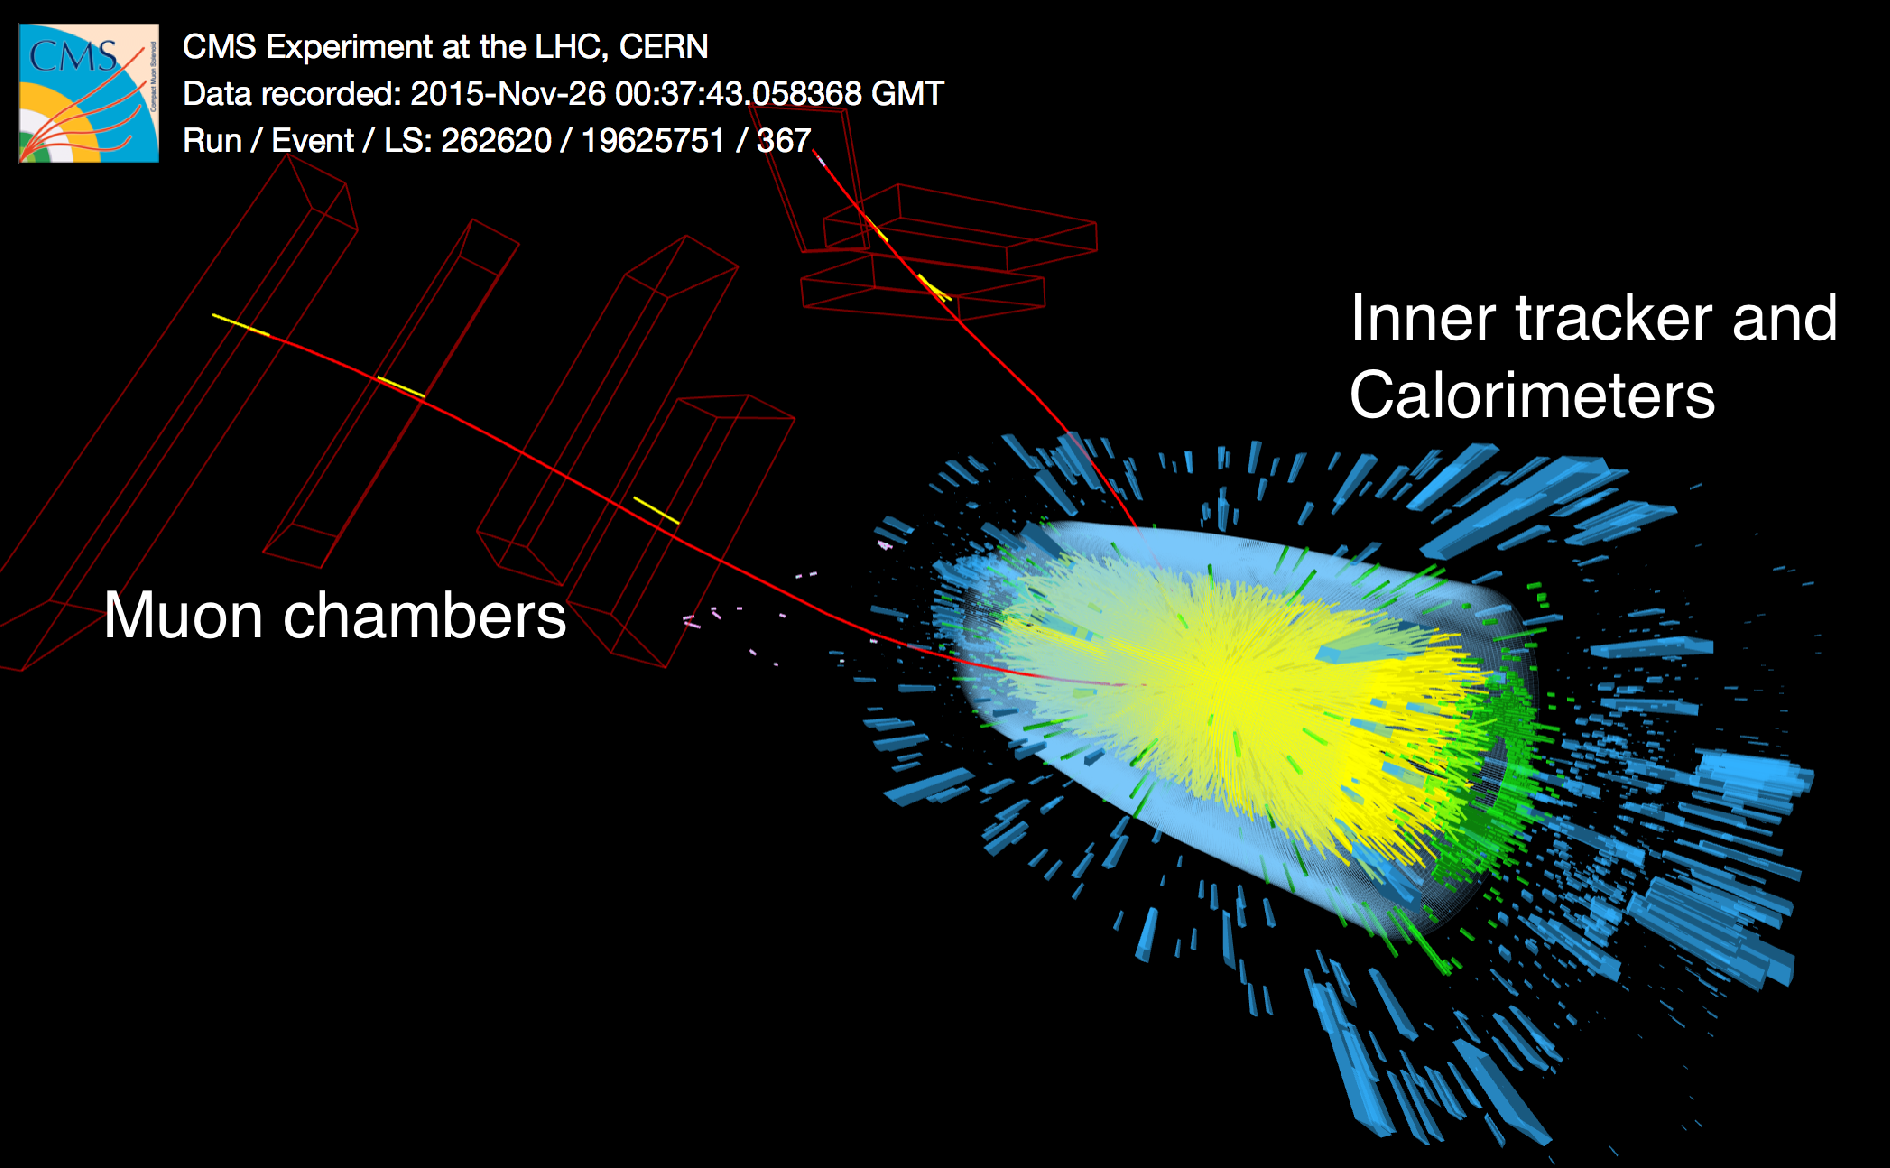
Figure 3:
Dimuon event from a PbPb\ collision in the CMS detector. |
png pdf |
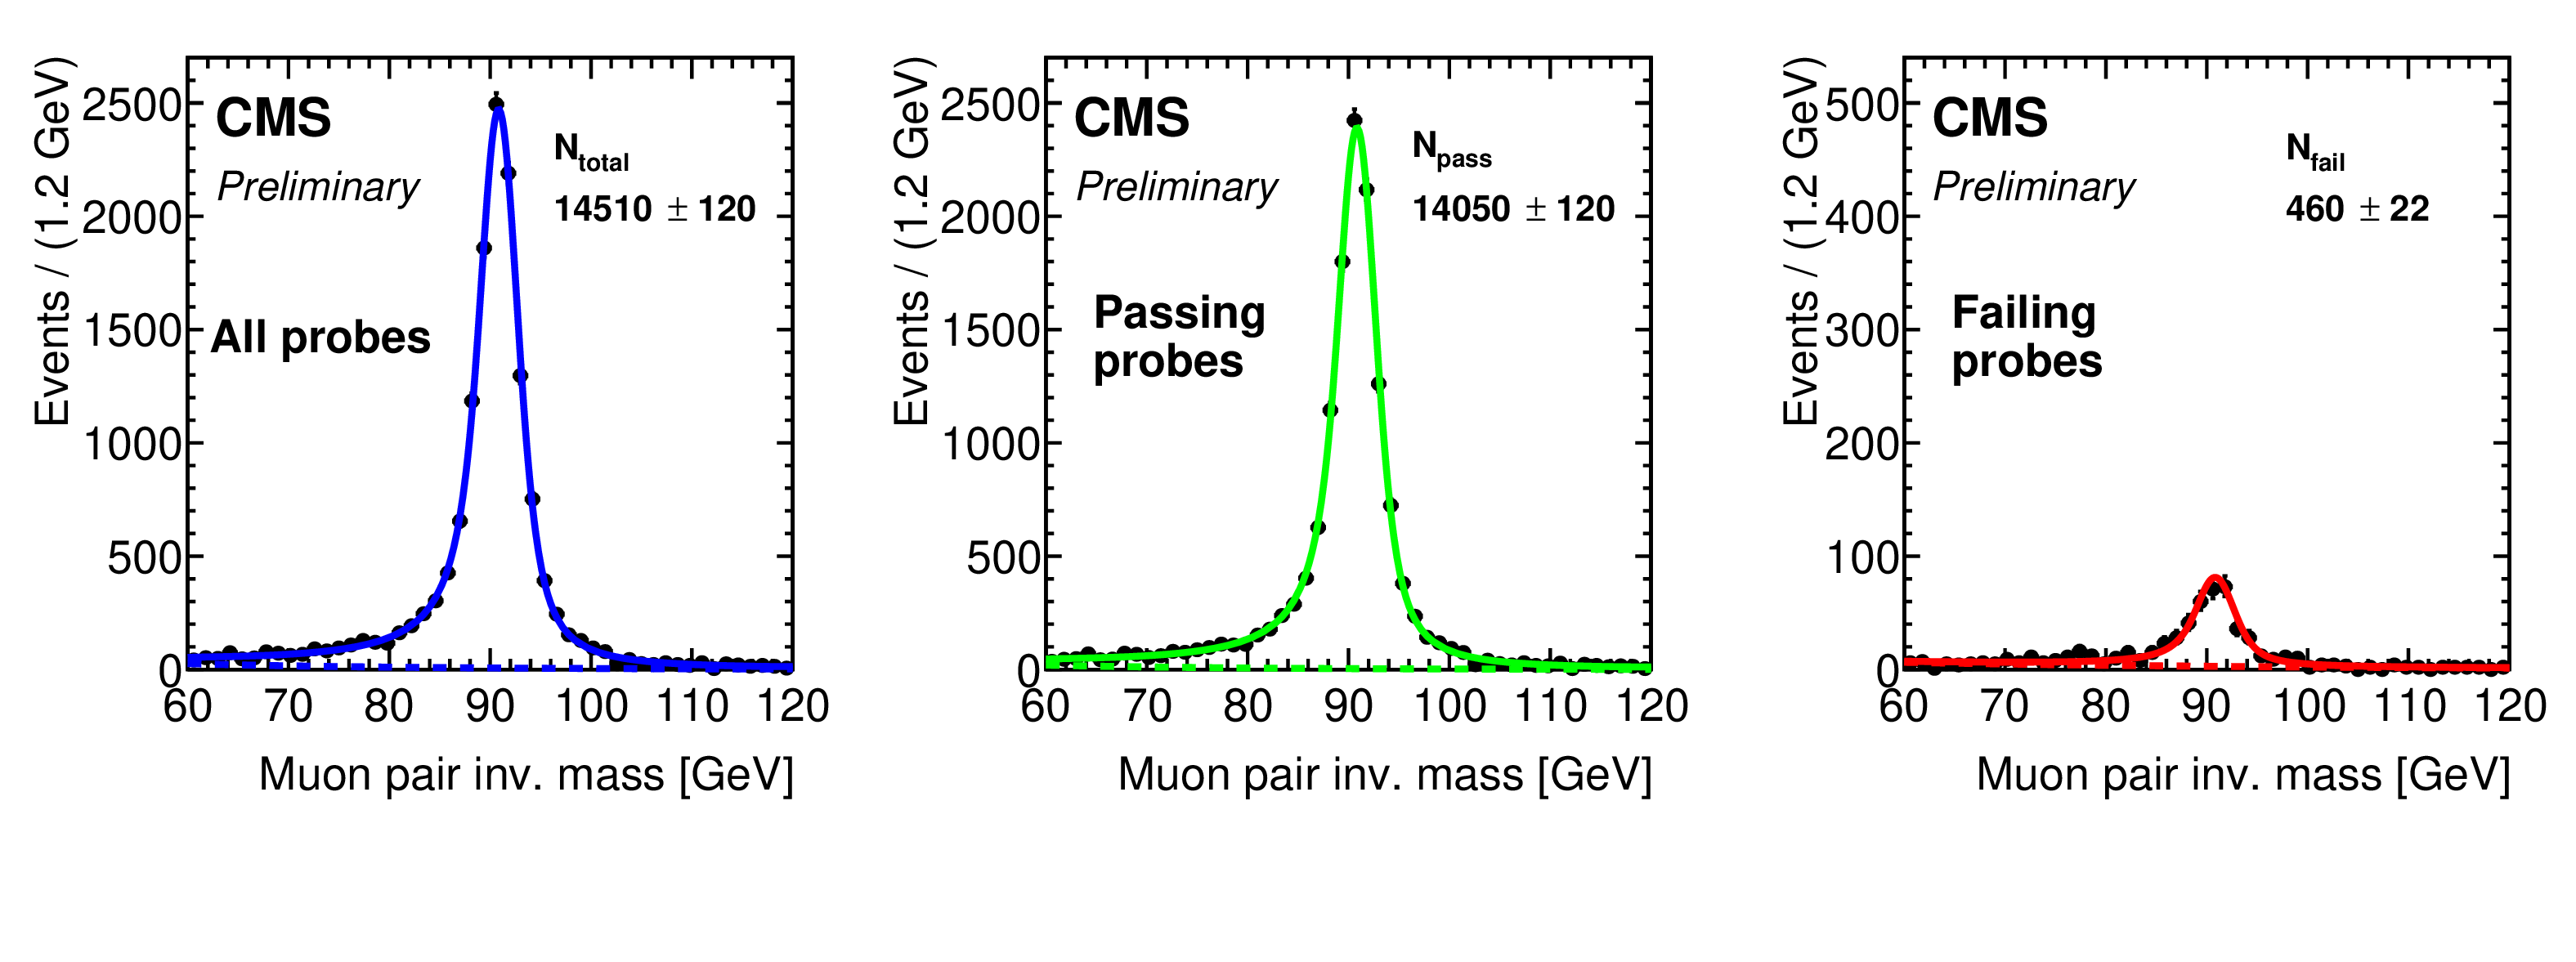
Figure 4:
Example fit to the data in PbPb collisions. The three panels show invariant mass distributions of the tag-and-probe pair in central 0-10% collisions fitted with signal and background components. Left panel: total spectrum. Middle panel: spectrum for pairs where probe passed the muon identification selection. Right panel: spectrum for muon pairs where probe failed the cut. The vertical scale of the failing probes is zoomed-in by a factor of 5 to enlarge the peak. The efficiency is obtained by dividing the number of pairs in the passing peak by number of pairs in the total peak. The efficiency is retrieved directly from the simultaneous fit and in this particular case is $ \epsilon = $ 0.968 $ \pm $ 0.002. |
png pdf |
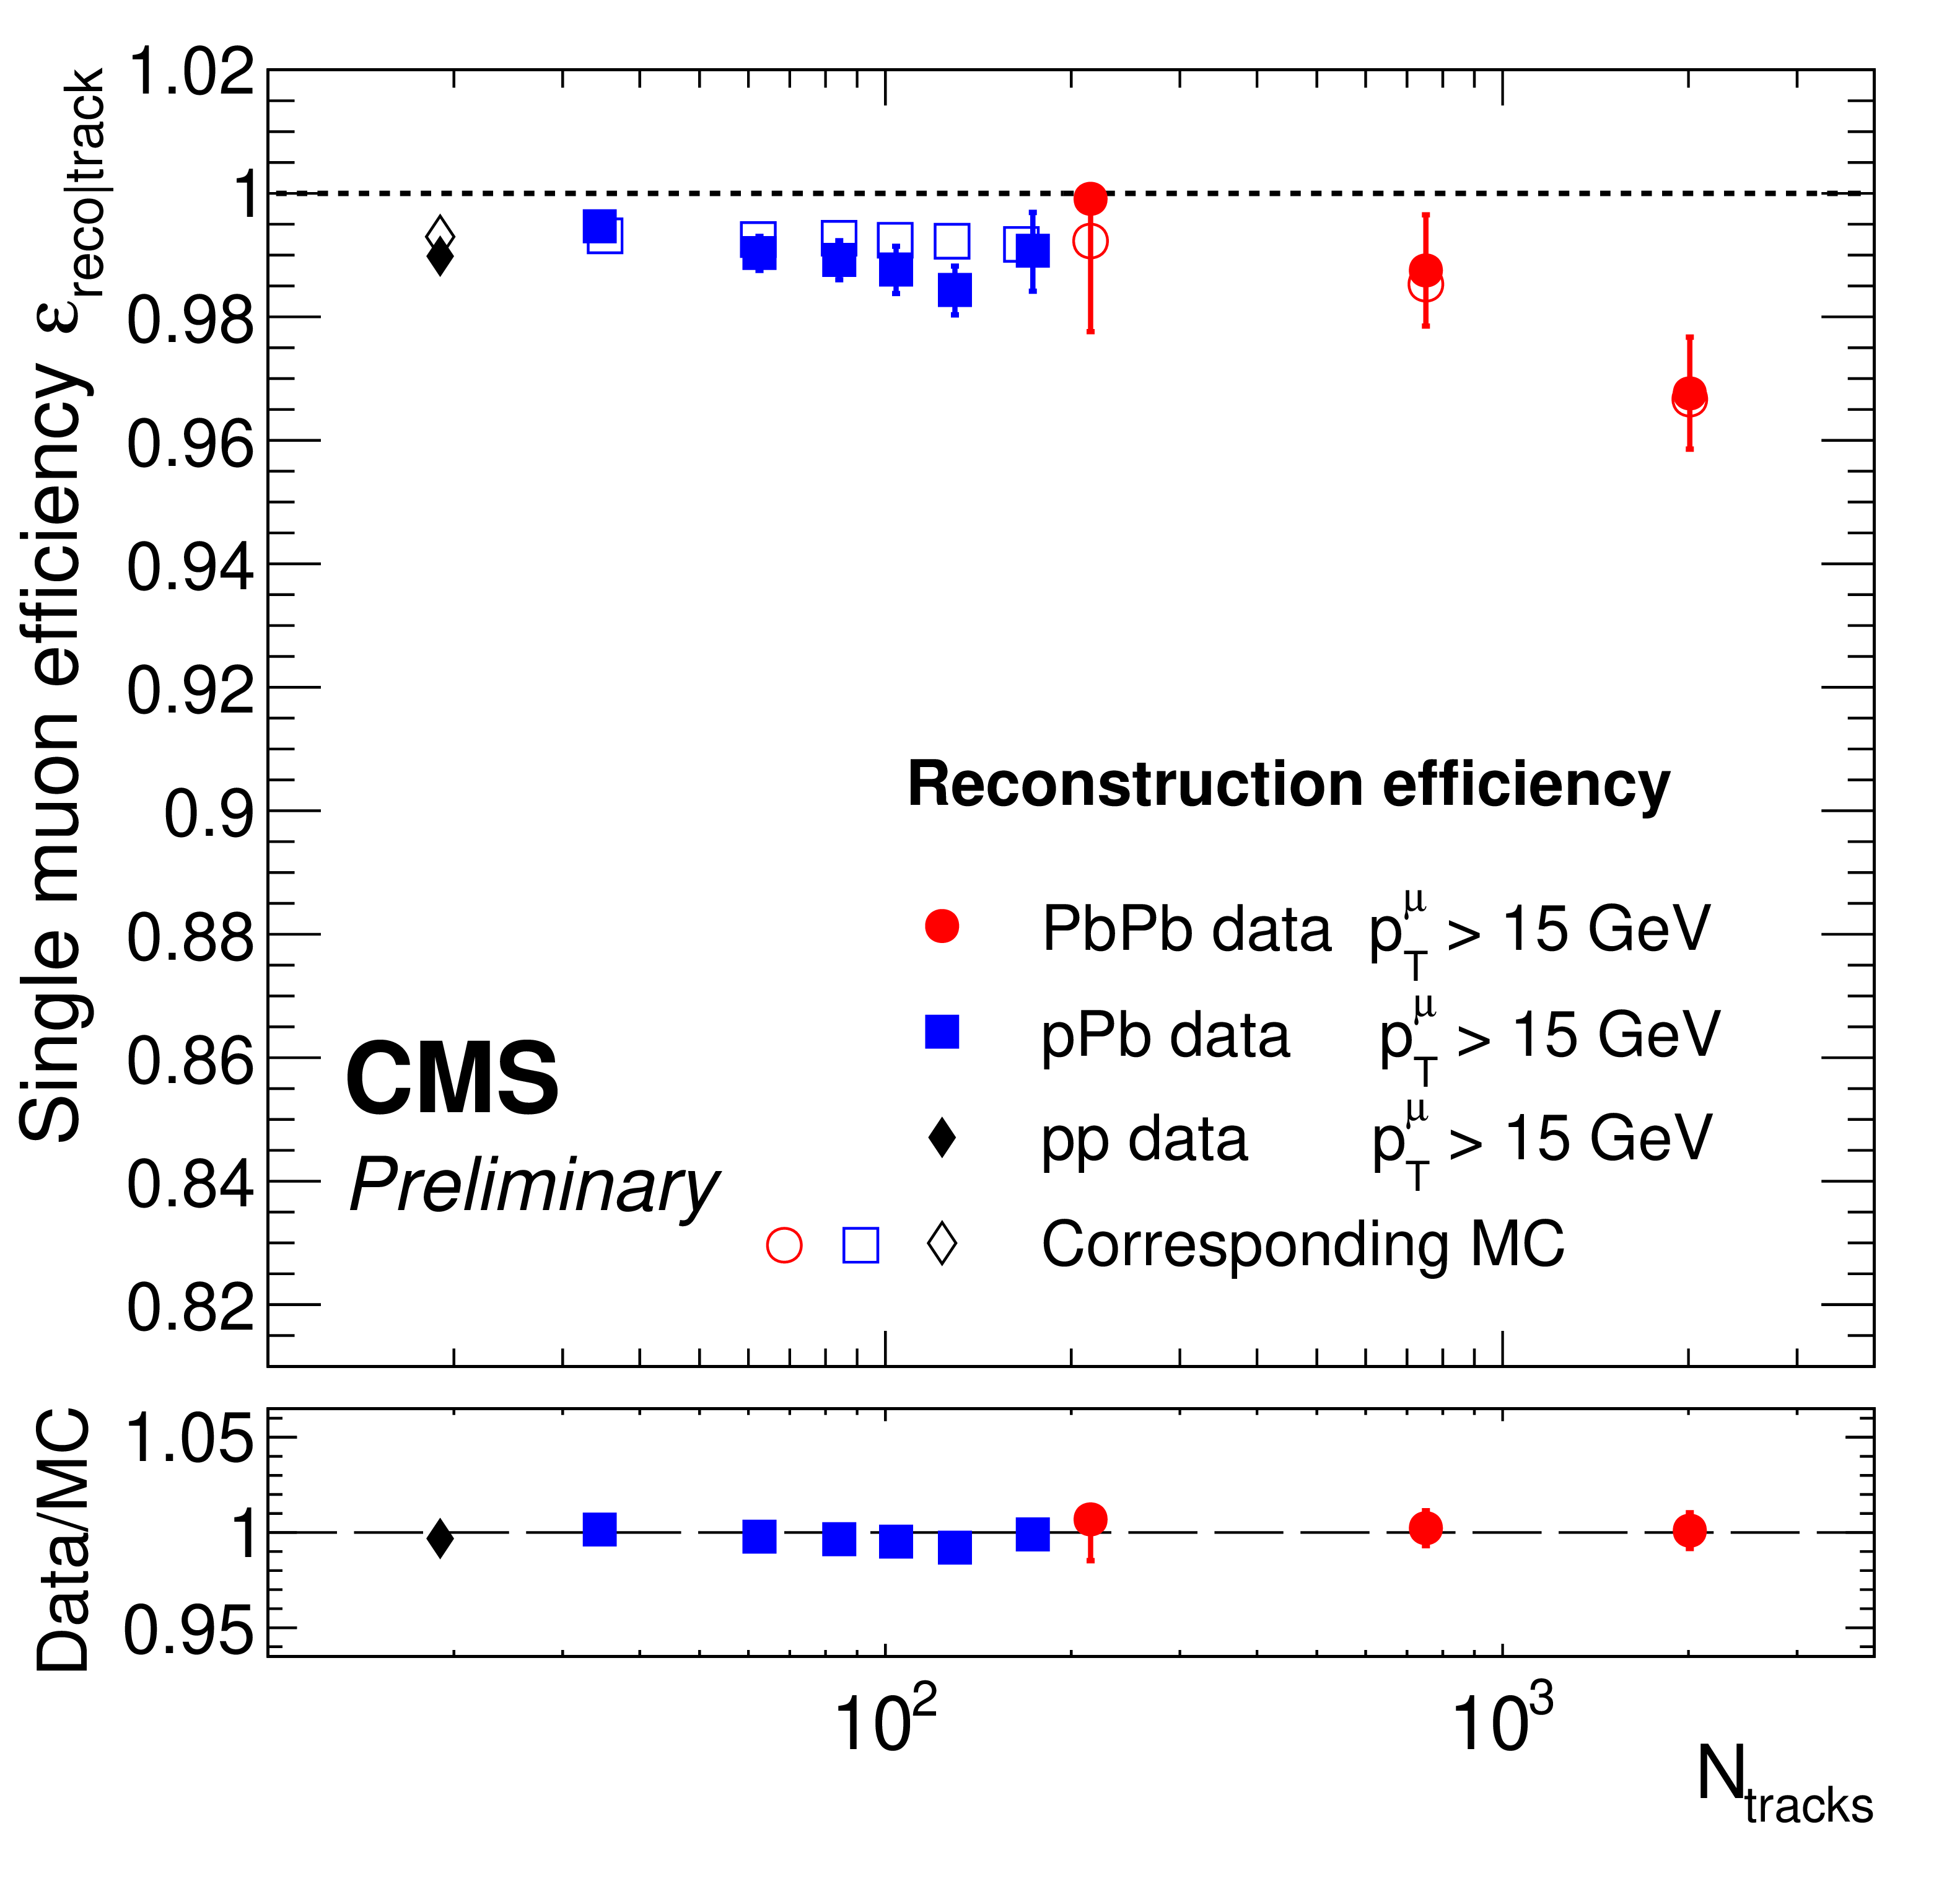
Figure 5:
Muon reconstruction efficiency (defined as the probability that a given muon with a tracker track will be reconstructed as both a global and a PF muon) plotted as a function of the number of tracks in pp, pPb, and PbPb collisions. Open symbols are the MC results corresponding to each data set. Only statistical uncertainties are shown. |
png pdf |
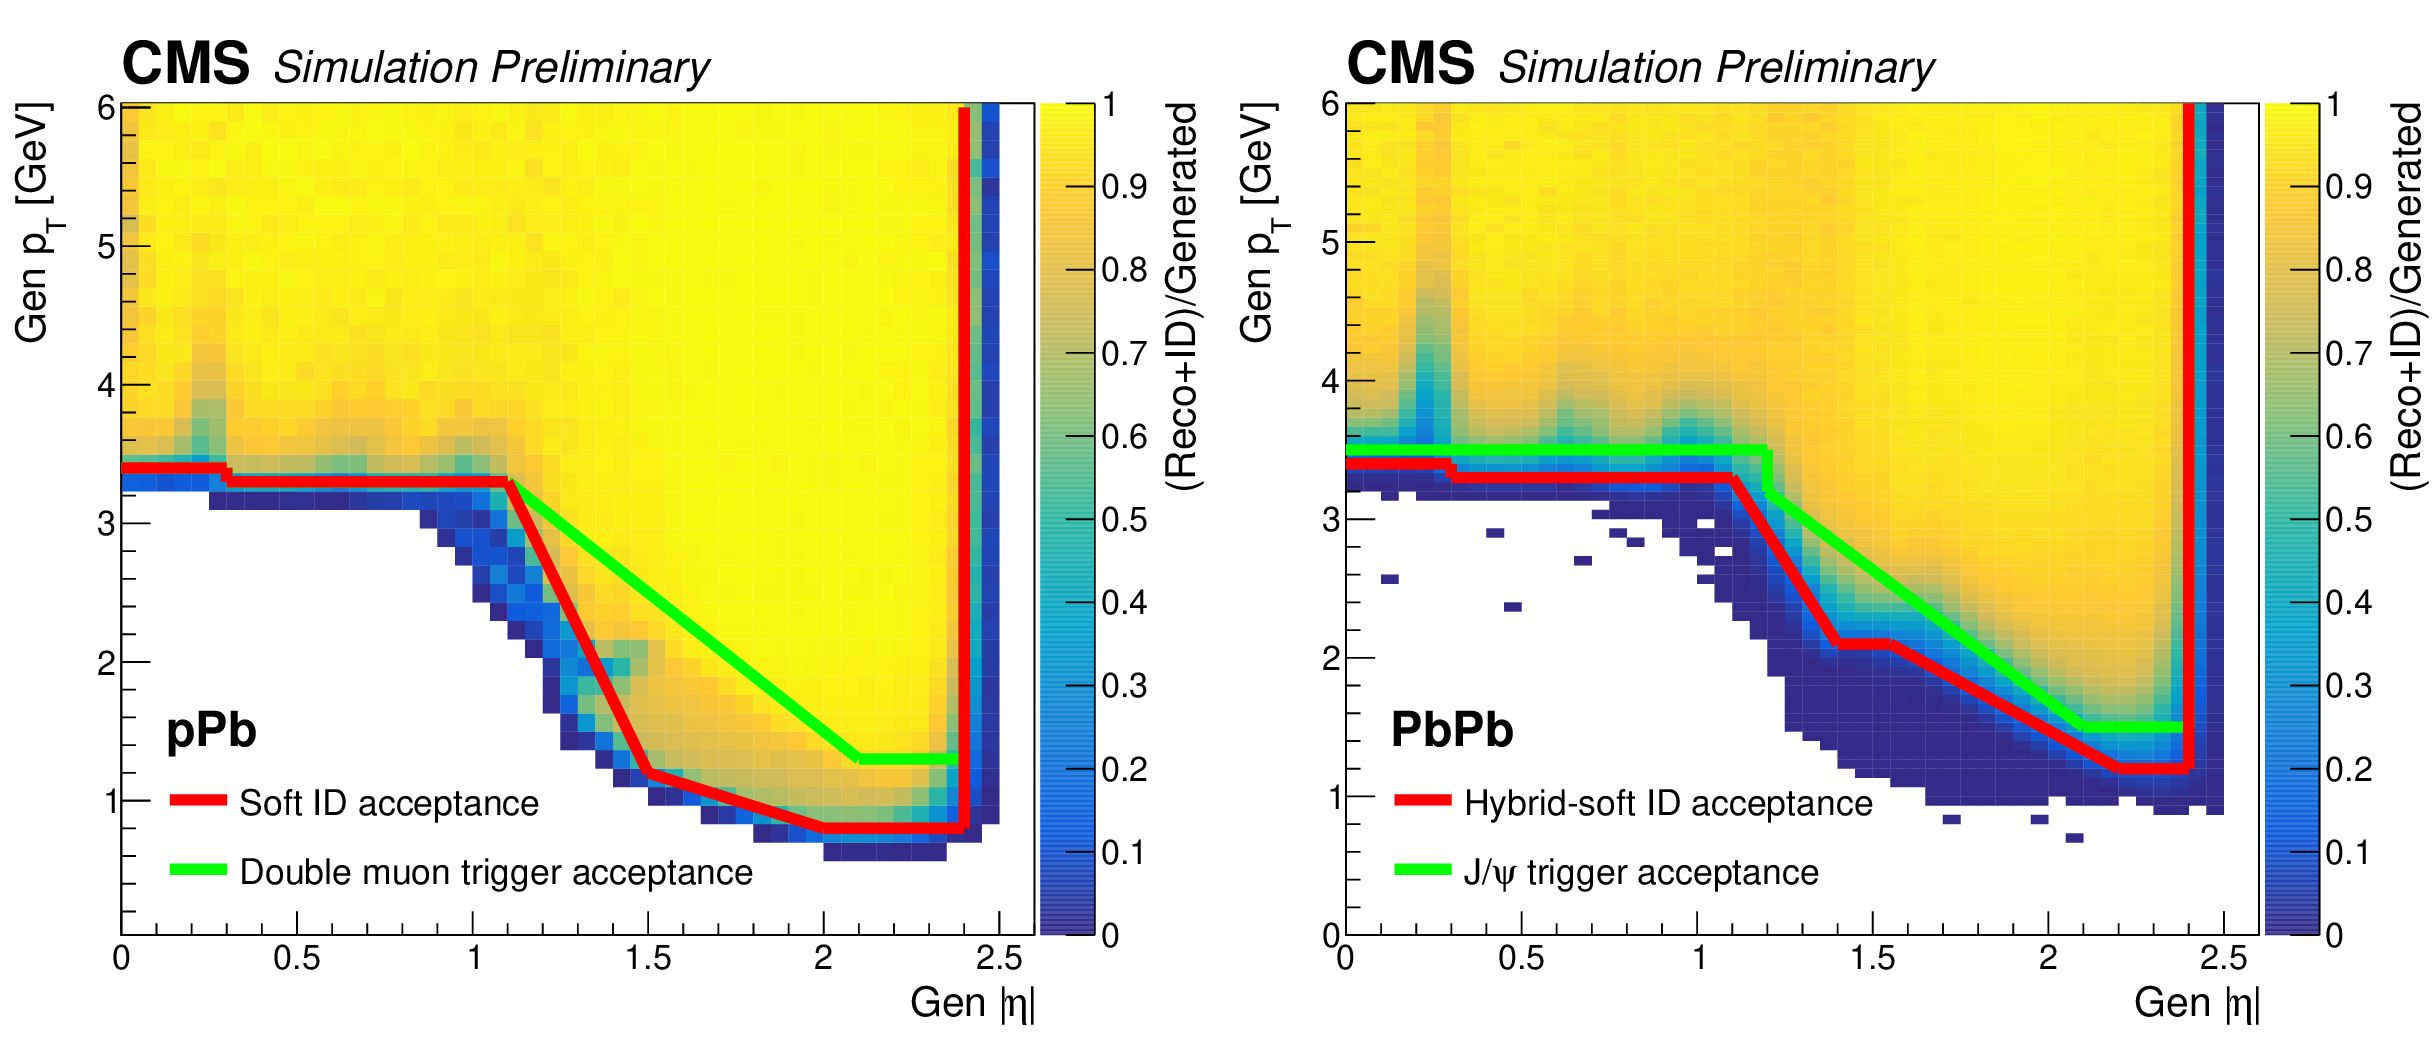
Figure 6:
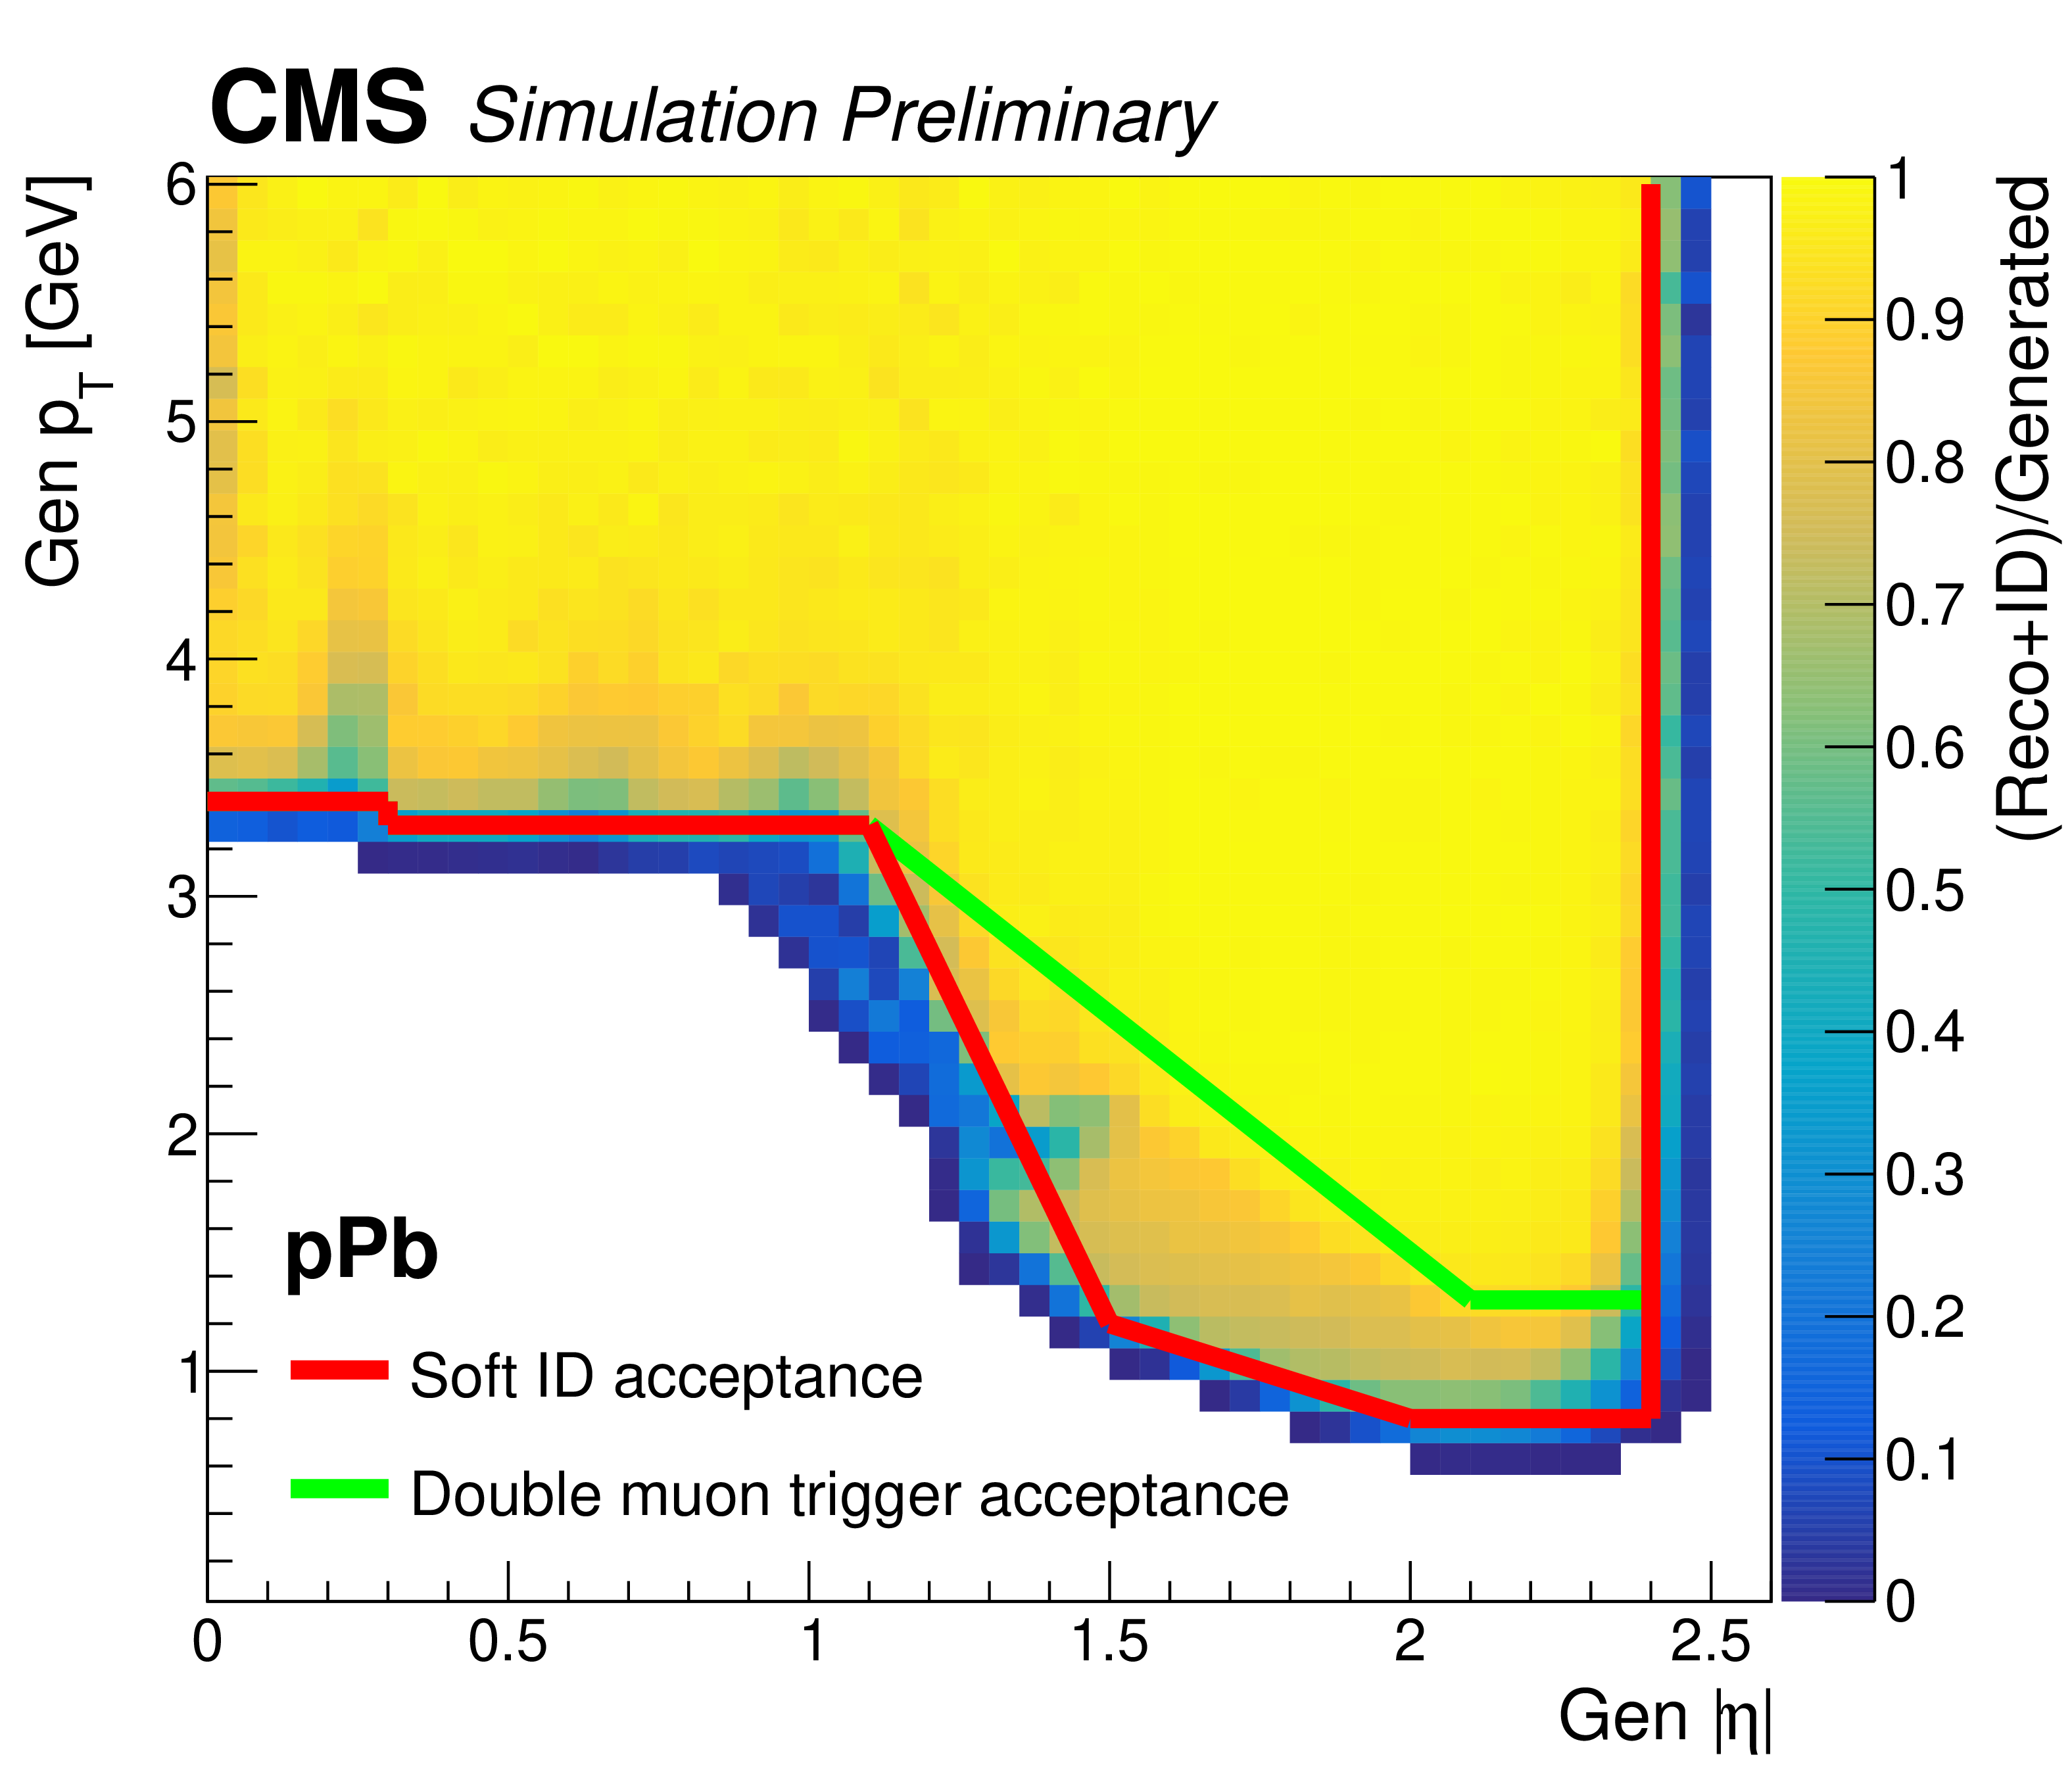
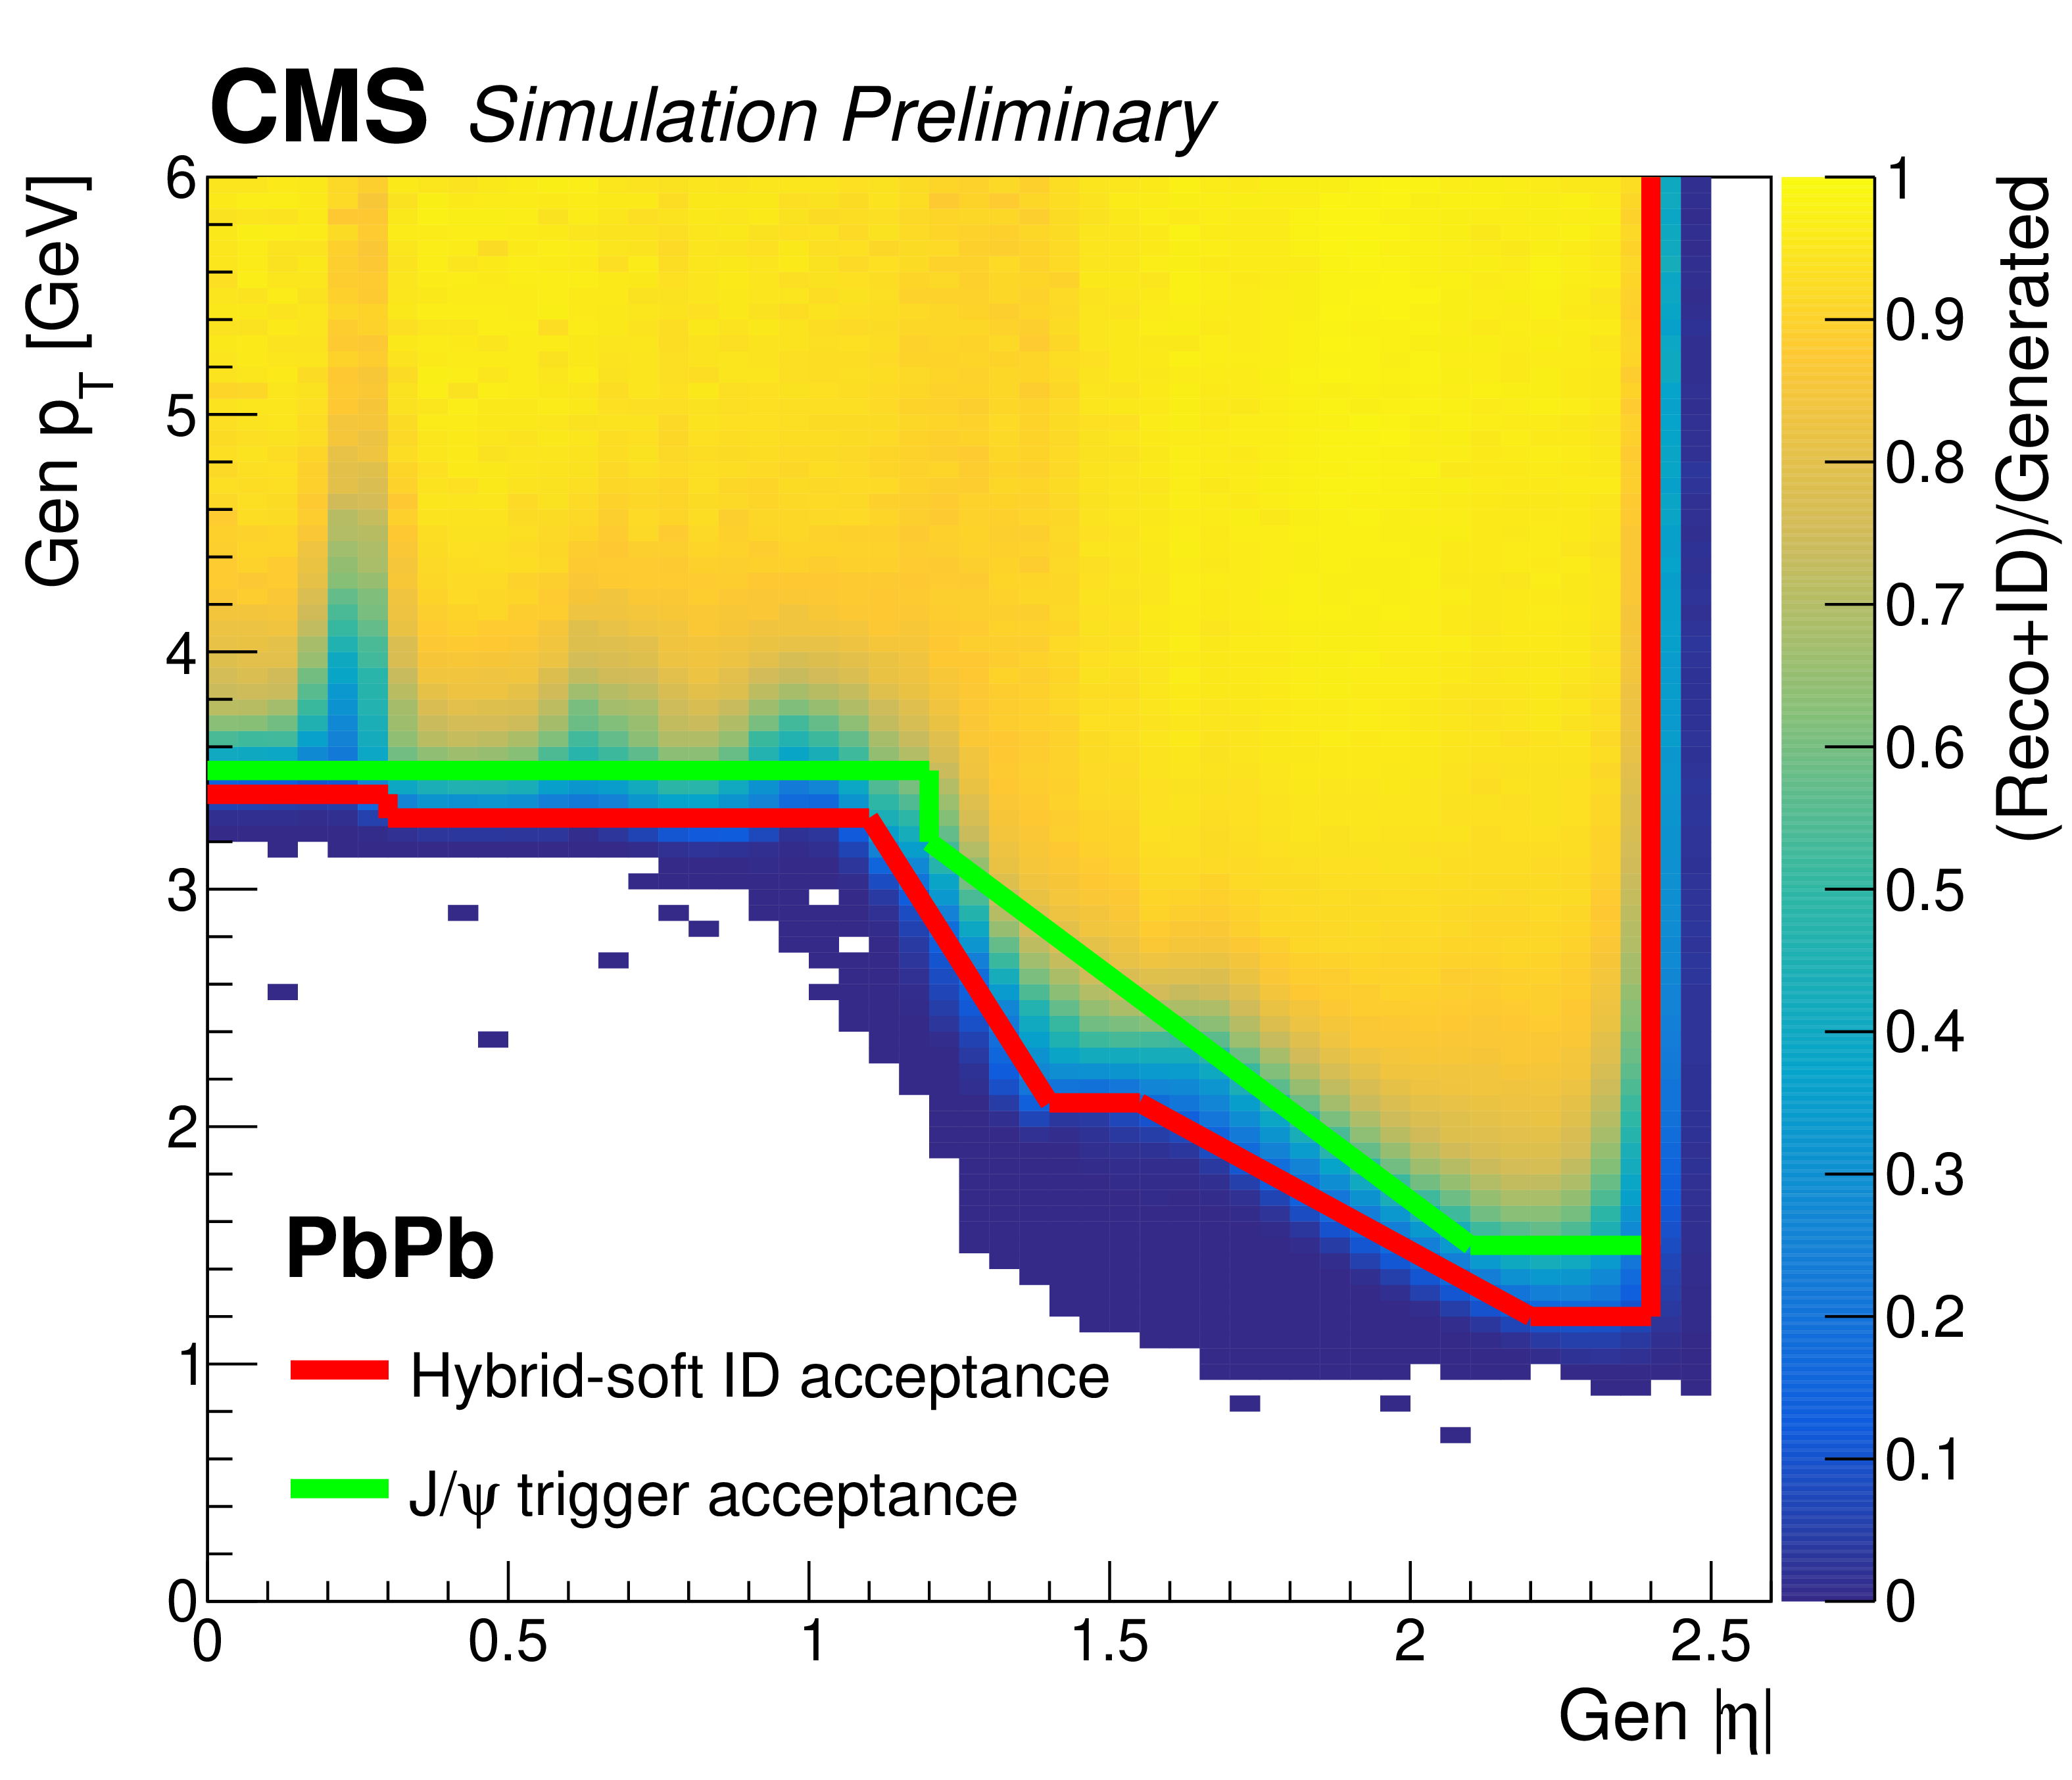
Regions of the CMS detector commonly used in the heavy ion muon analyses for pPb (left) and PbPb (right). For each panel, the simulated single-muon identification efficiency is plotted as a function of generated muon $ |\eta| $ and $ p_{\mathrm{T}} $. The lower-threshold curves are for muon identification, and are used only by those analyses that do not use a dedicated muon trigger. The higher-threshold curves are used by most analyses (those using the muon trigger information). |
png pdf |
Figure 6-a:
Regions of the CMS detector commonly used in the heavy ion muon analyses for pPb (left) and PbPb (right). For each panel, the simulated single-muon identification efficiency is plotted as a function of generated muon $ |\eta| $ and $ p_{\mathrm{T}} $. The lower-threshold curves are for muon identification, and are used only by those analyses that do not use a dedicated muon trigger. The higher-threshold curves are used by most analyses (those using the muon trigger information). |
png pdf |
Figure 6-b:
Regions of the CMS detector commonly used in the heavy ion muon analyses for pPb (left) and PbPb (right). For each panel, the simulated single-muon identification efficiency is plotted as a function of generated muon $ |\eta| $ and $ p_{\mathrm{T}} $. The lower-threshold curves are for muon identification, and are used only by those analyses that do not use a dedicated muon trigger. The higher-threshold curves are used by most analyses (those using the muon trigger information). |
png pdf |
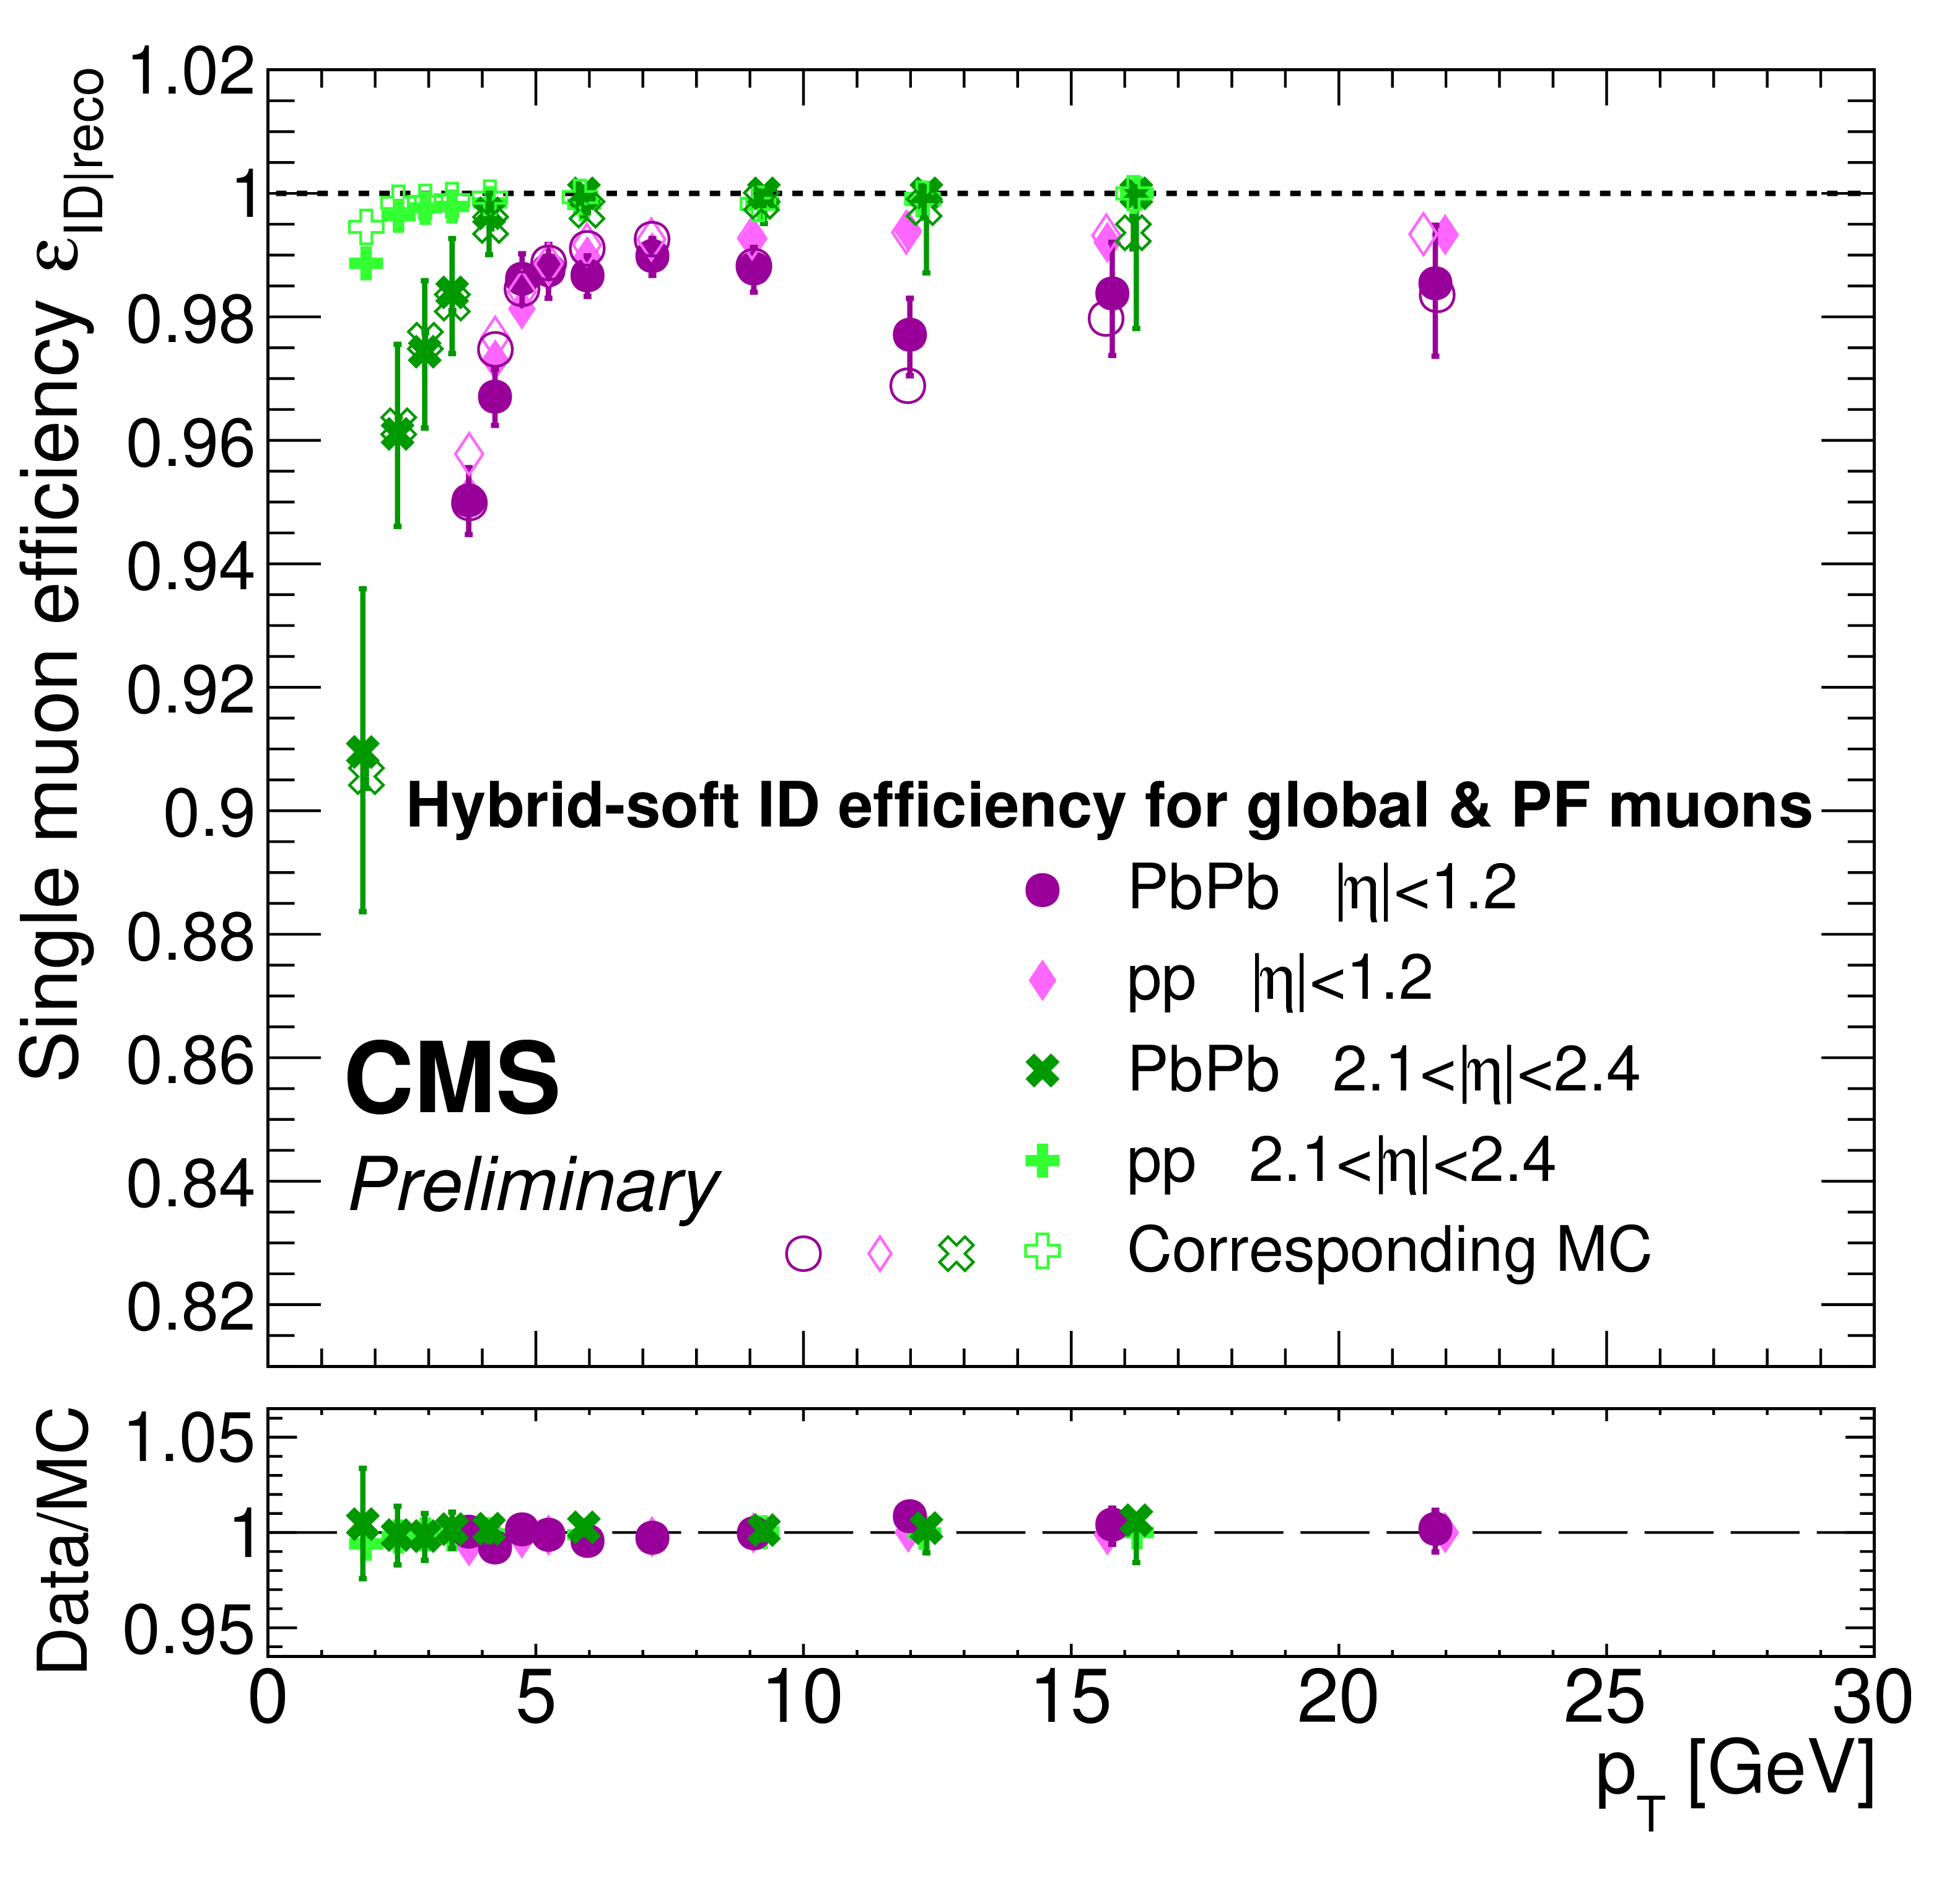
Figure 7:
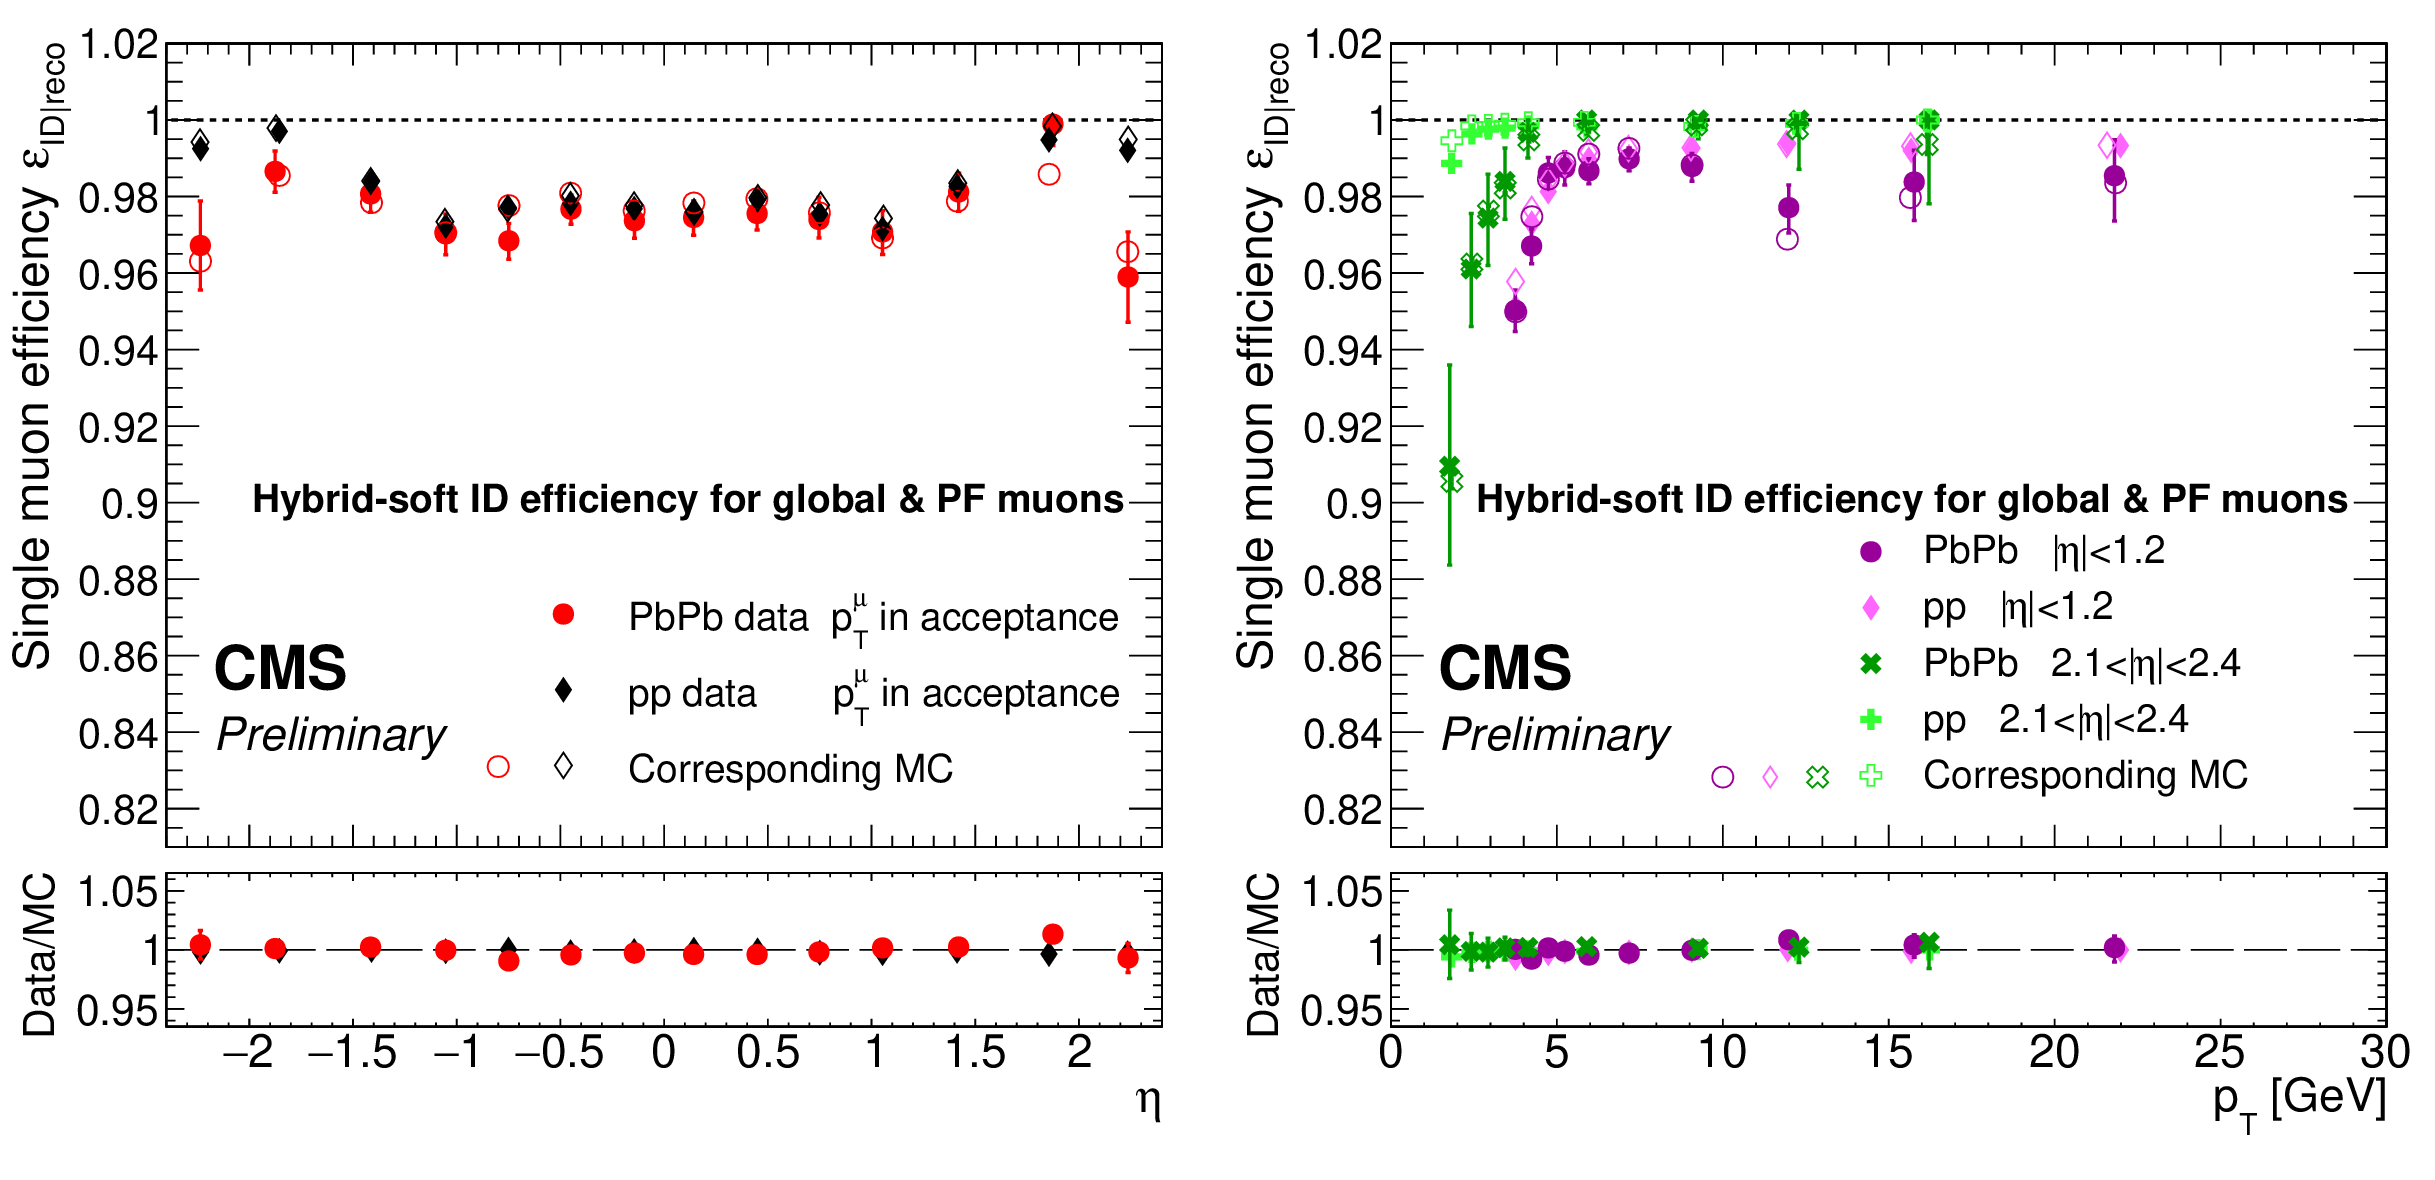
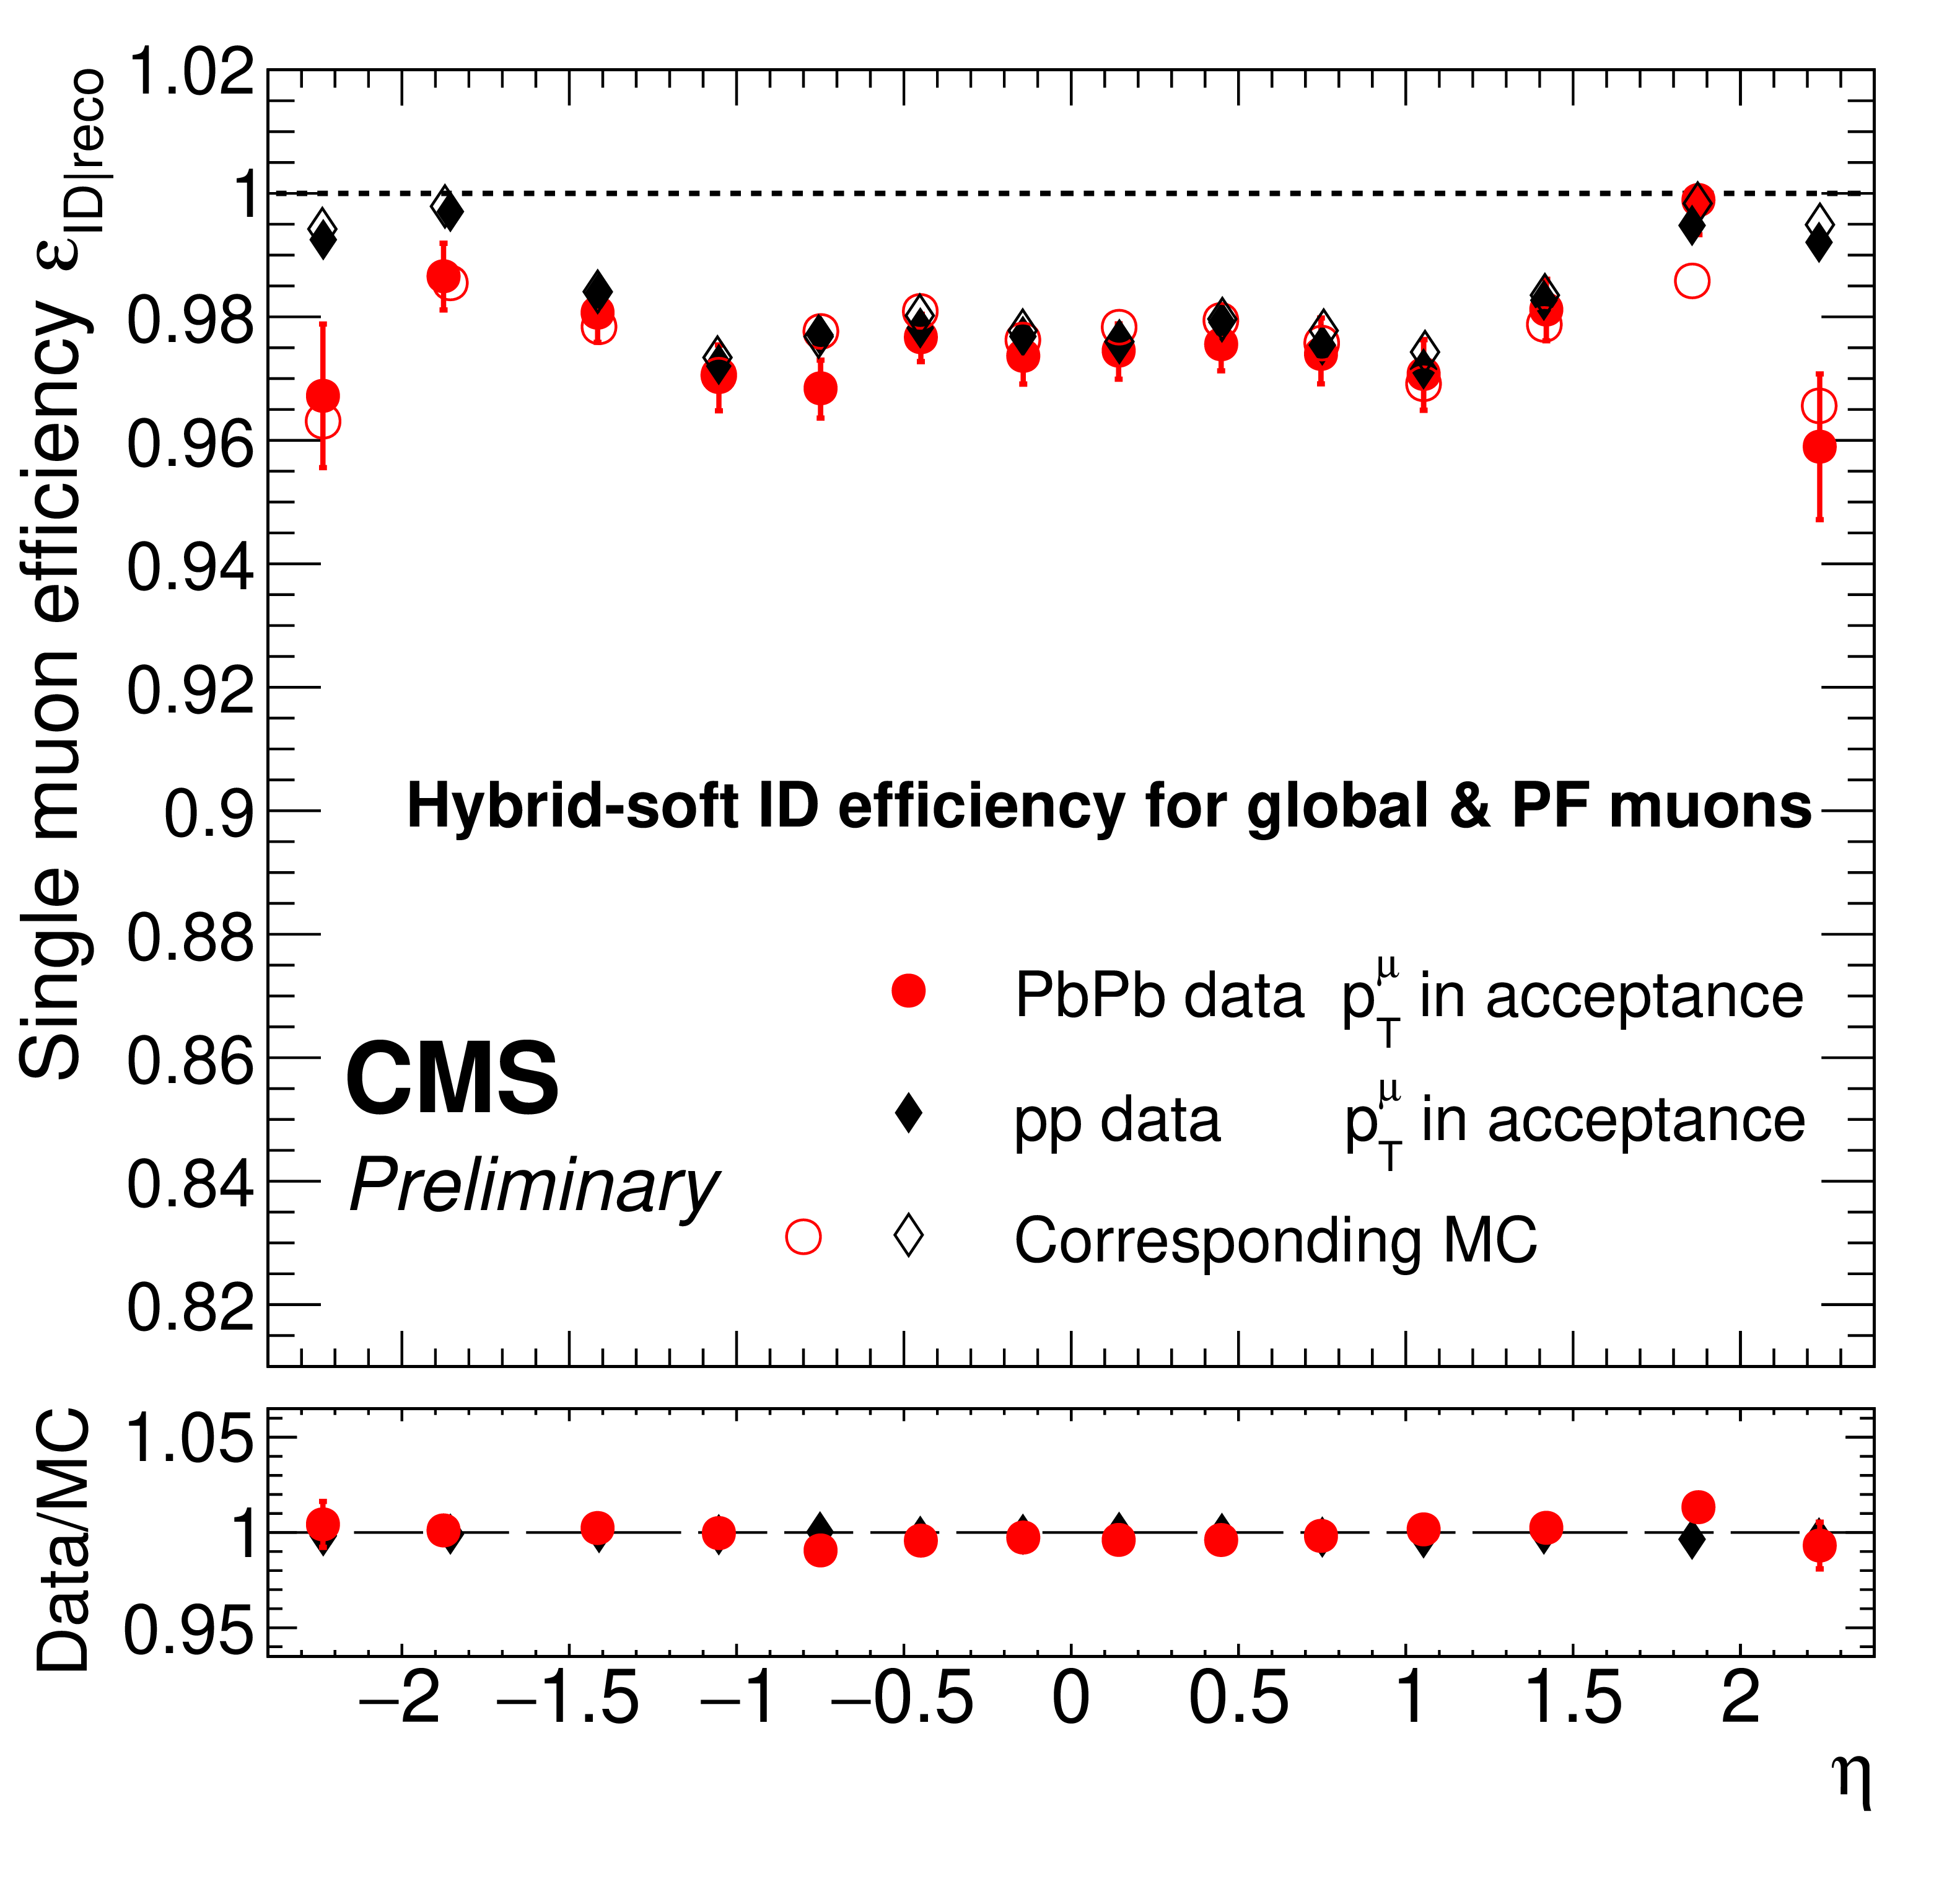
Hybrid-soft ID efficiency for global muons as a function of $ \eta $ (left) and $ p_{\mathrm{T}} $ (right) in pp and PbPb collisions. The muons are restricted in acceptance as shown by the red line in the right panel of Fig. 6. Only statistical uncertainties are shown. |
png pdf |
Figure 7-a:
Hybrid-soft ID efficiency for global muons as a function of $ \eta $ (left) and $ p_{\mathrm{T}} $ (right) in pp and PbPb collisions. The muons are restricted in acceptance as shown by the red line in the right panel of Fig. 6. Only statistical uncertainties are shown. |
png pdf |
Figure 7-b:
Hybrid-soft ID efficiency for global muons as a function of $ \eta $ (left) and $ p_{\mathrm{T}} $ (right) in pp and PbPb collisions. The muons are restricted in acceptance as shown by the red line in the right panel of Fig. 6. Only statistical uncertainties are shown. |
png pdf |
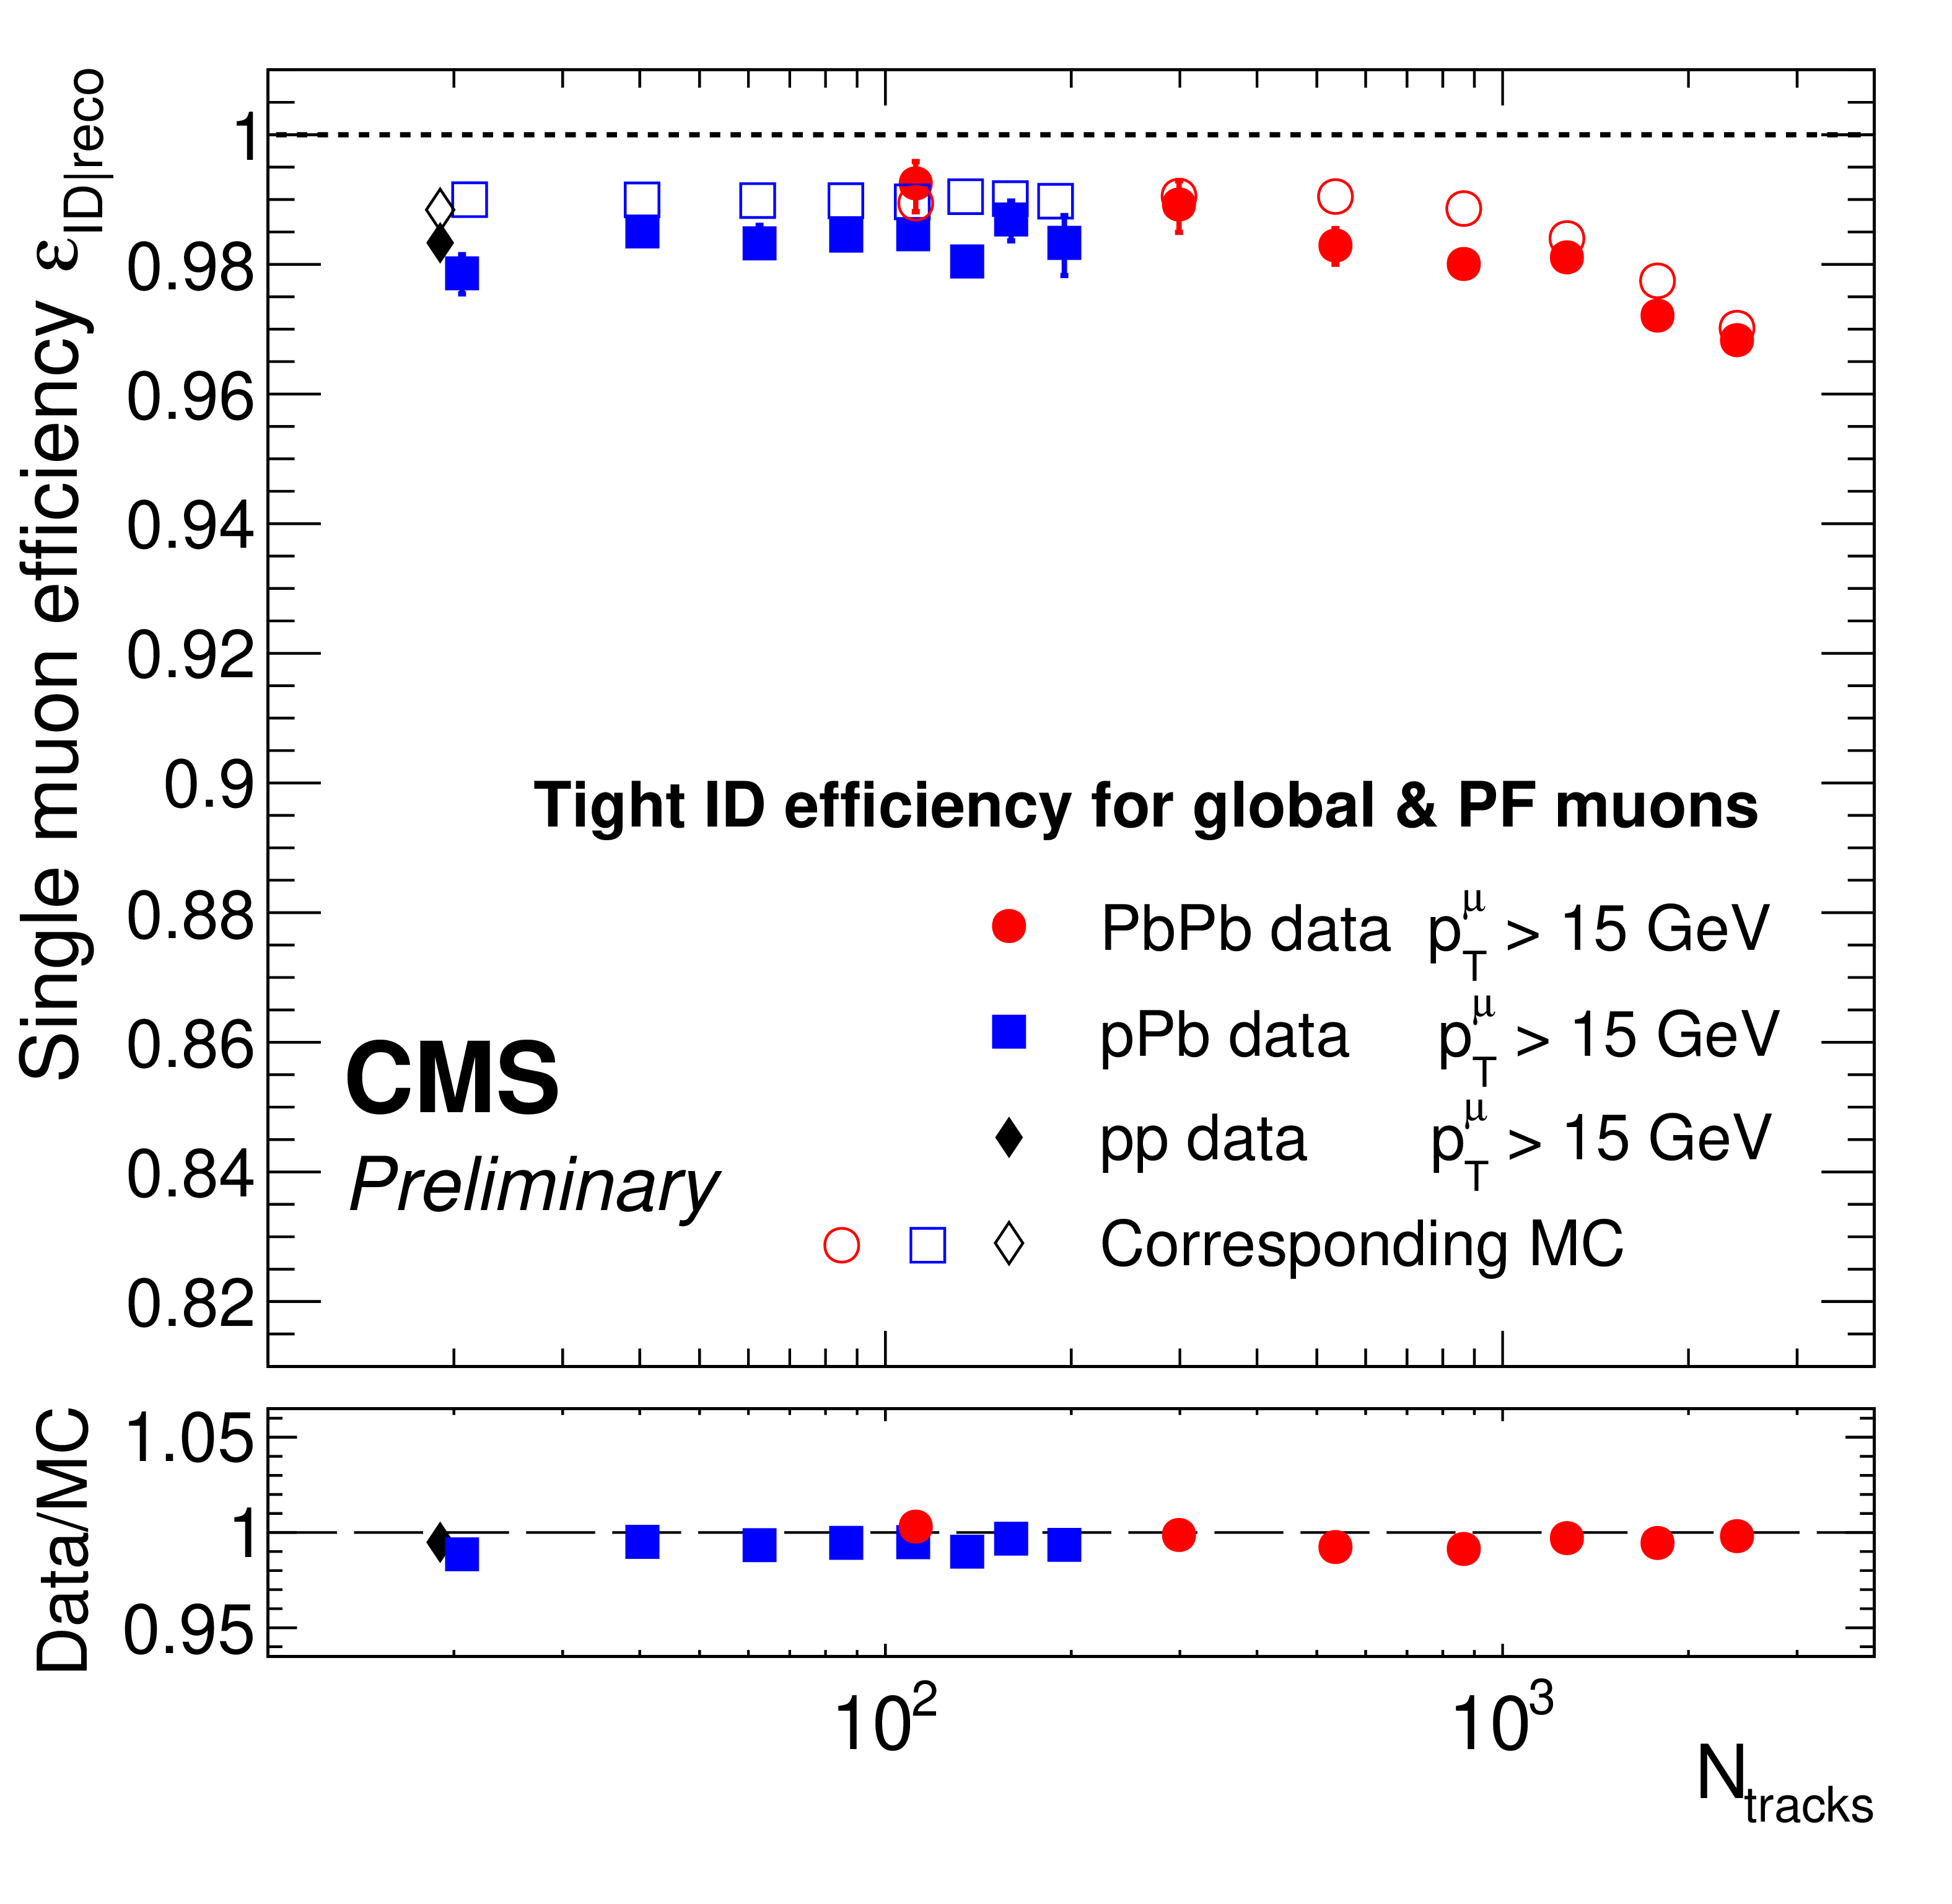
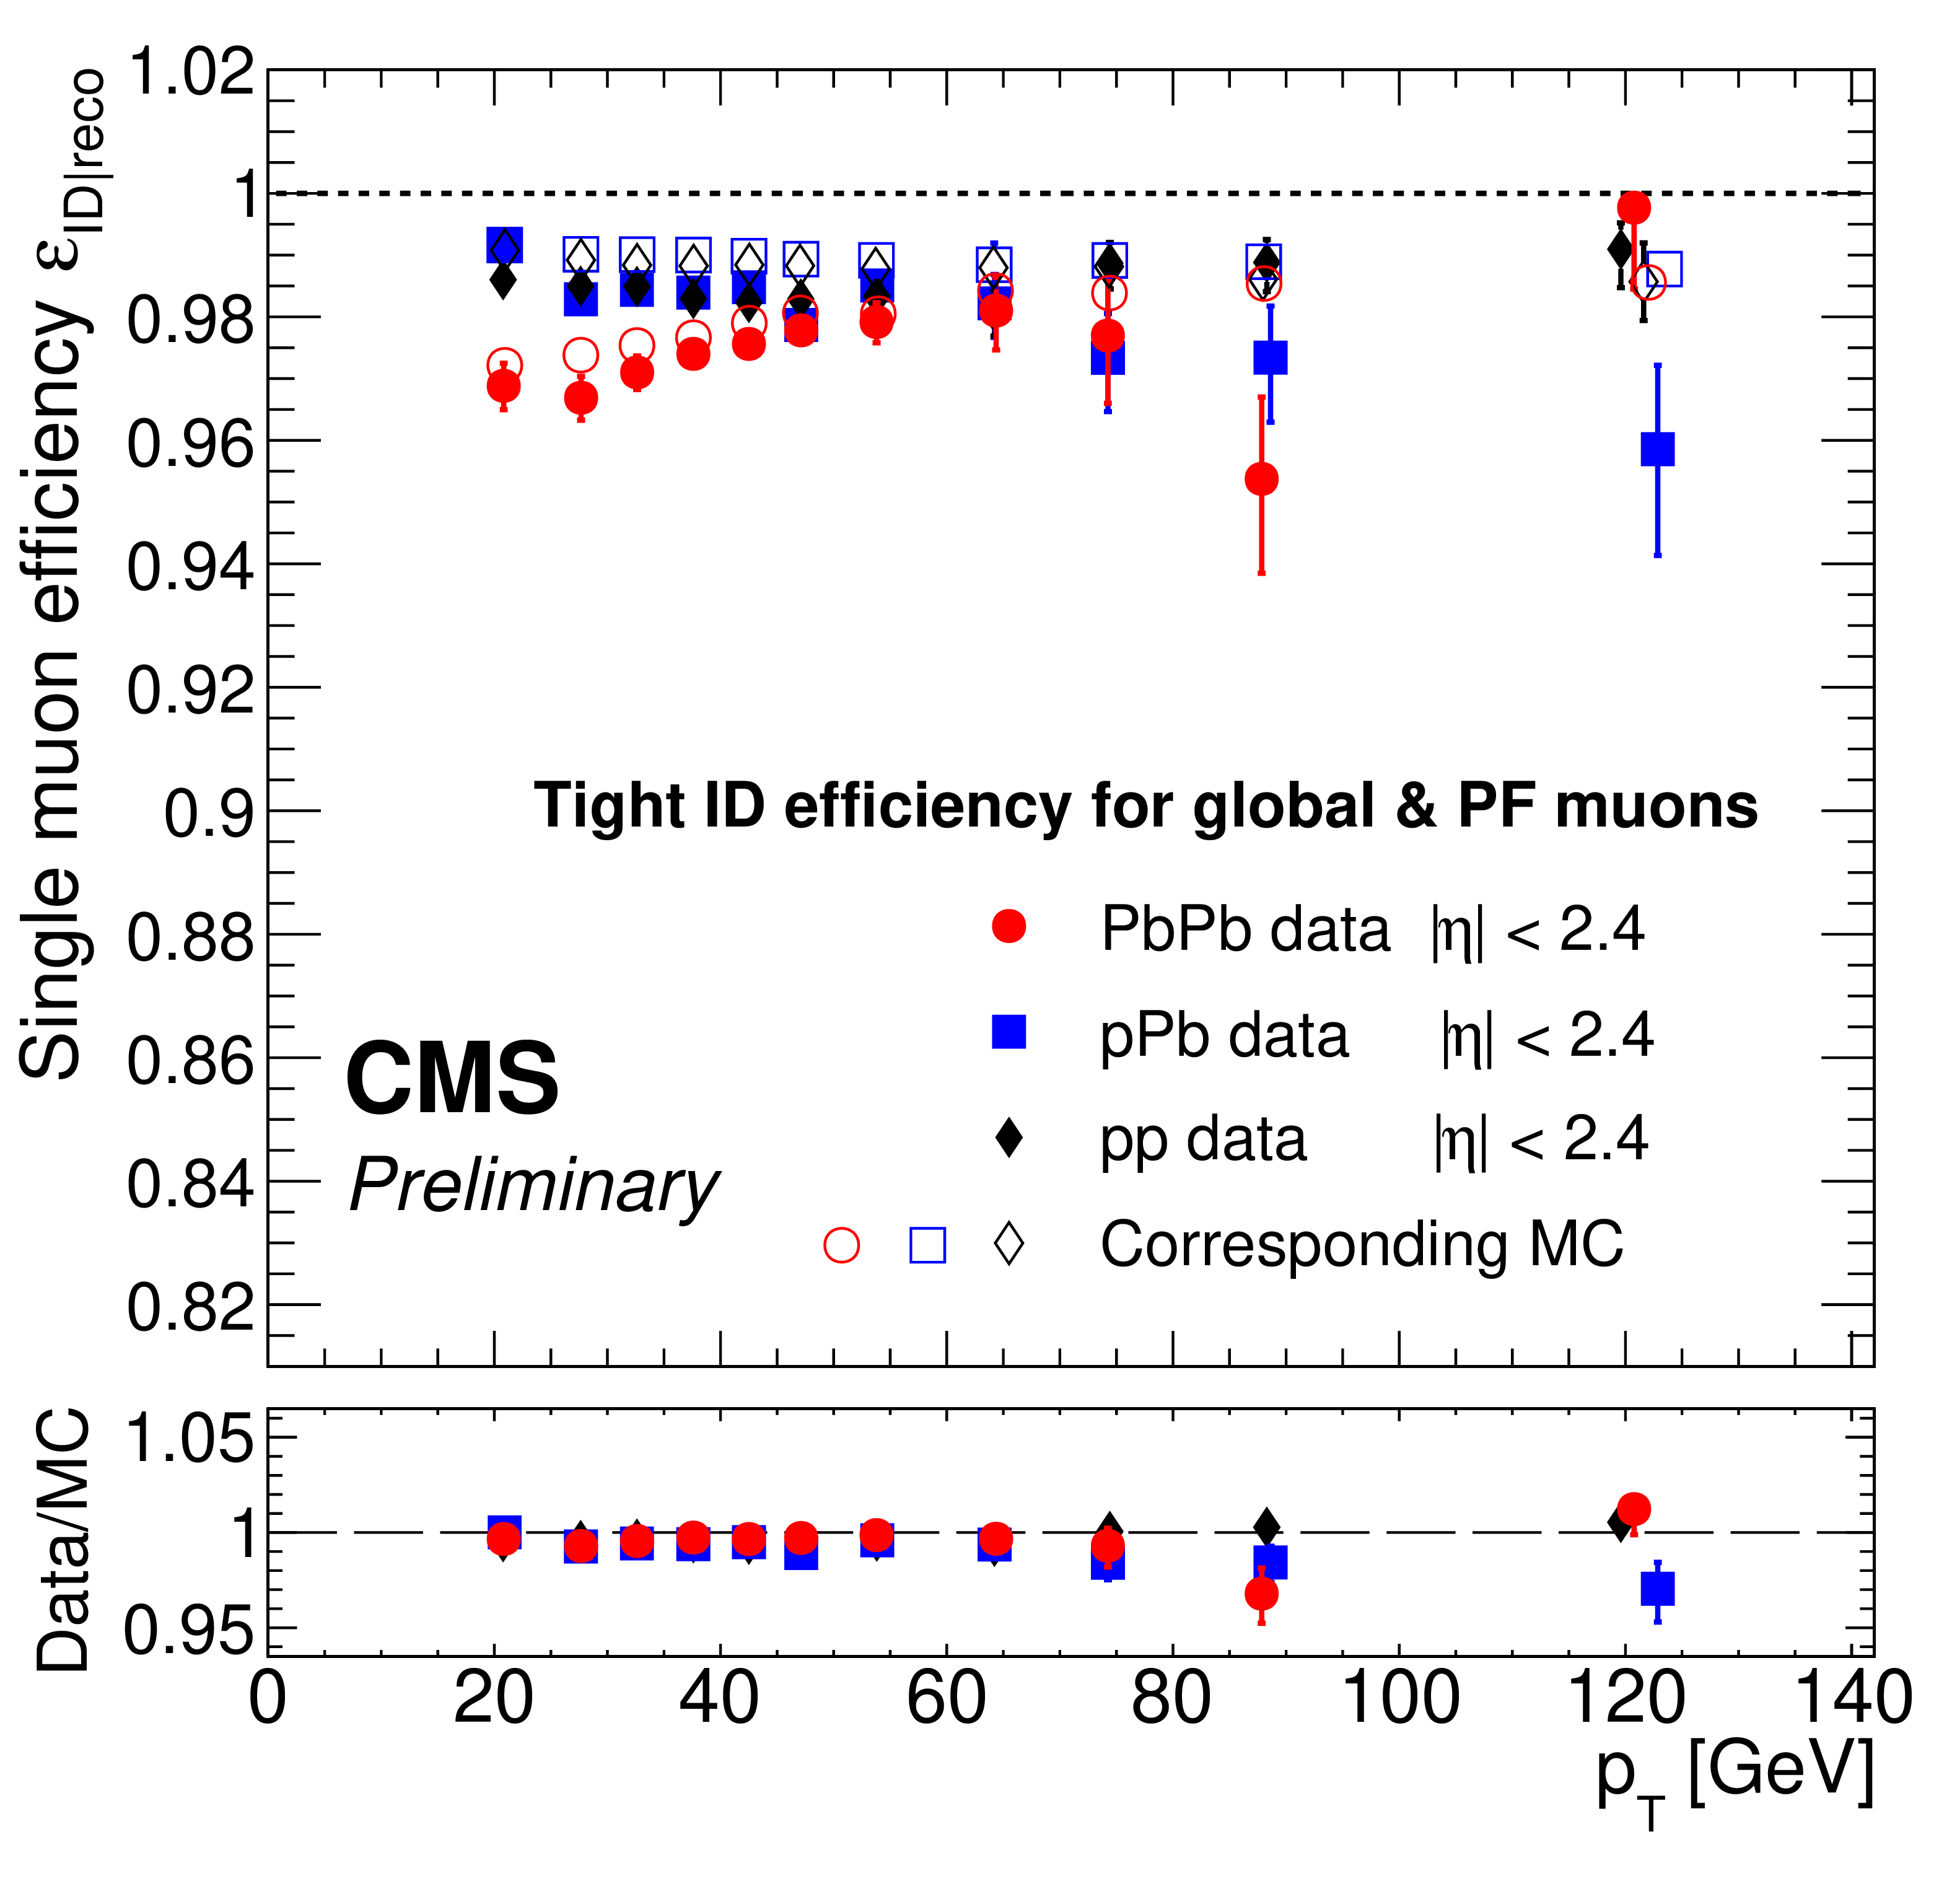
Figure 8:
Tight ID efficiency for global and PF muons as a function of the number of tracks in pp, pPb, and PbPb collisions. Open symbols are the MC results corresponding to each data set. Only statistical uncertainties are shown. |
png pdf |
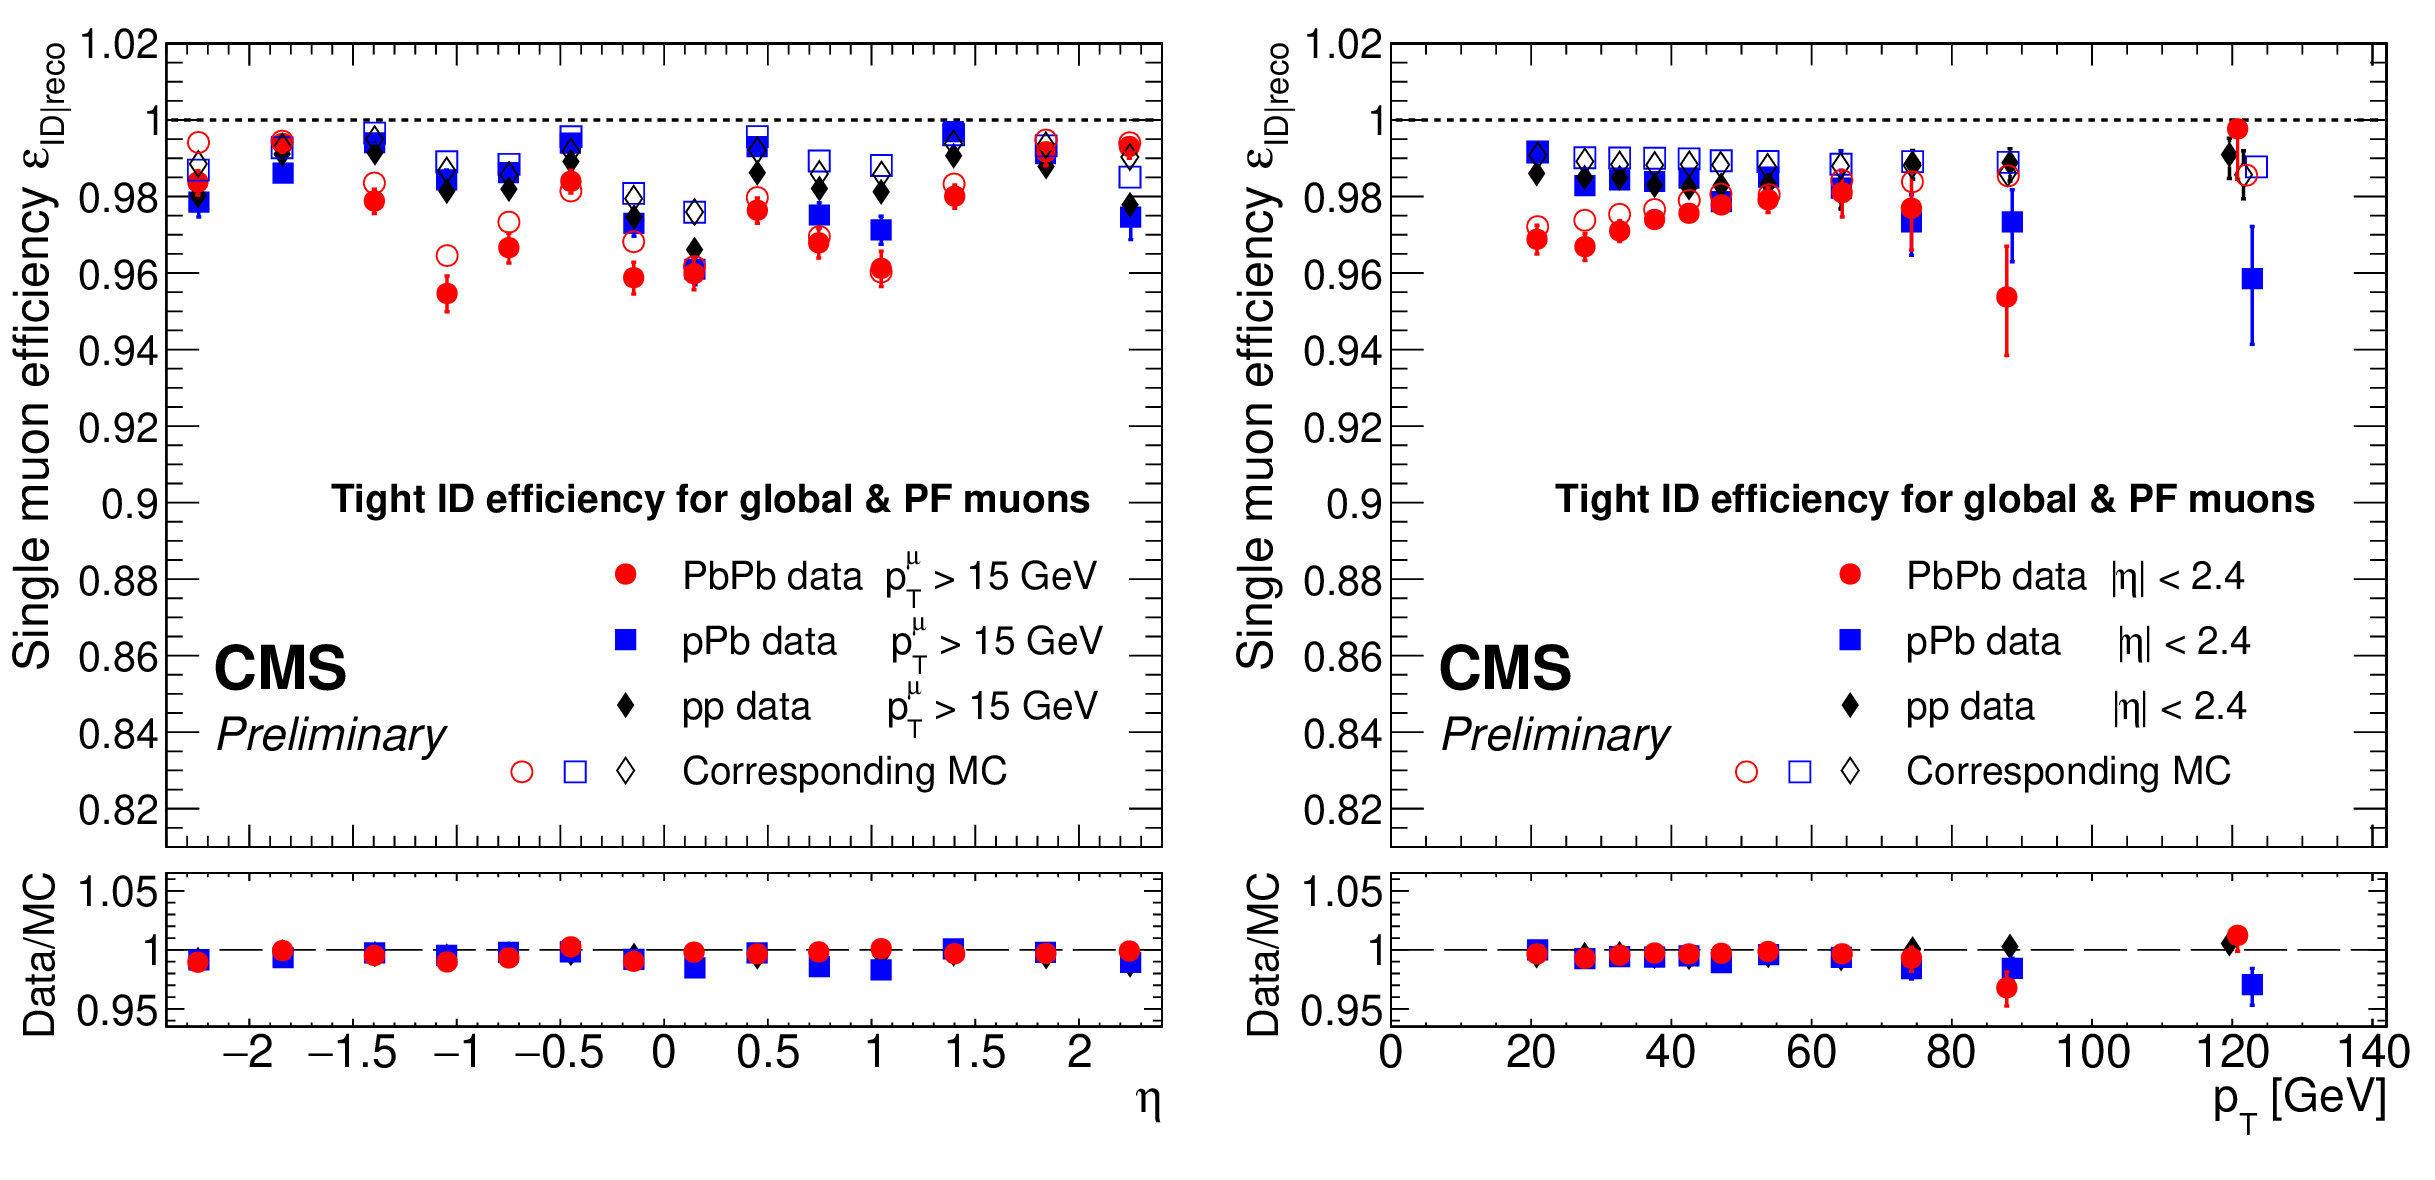
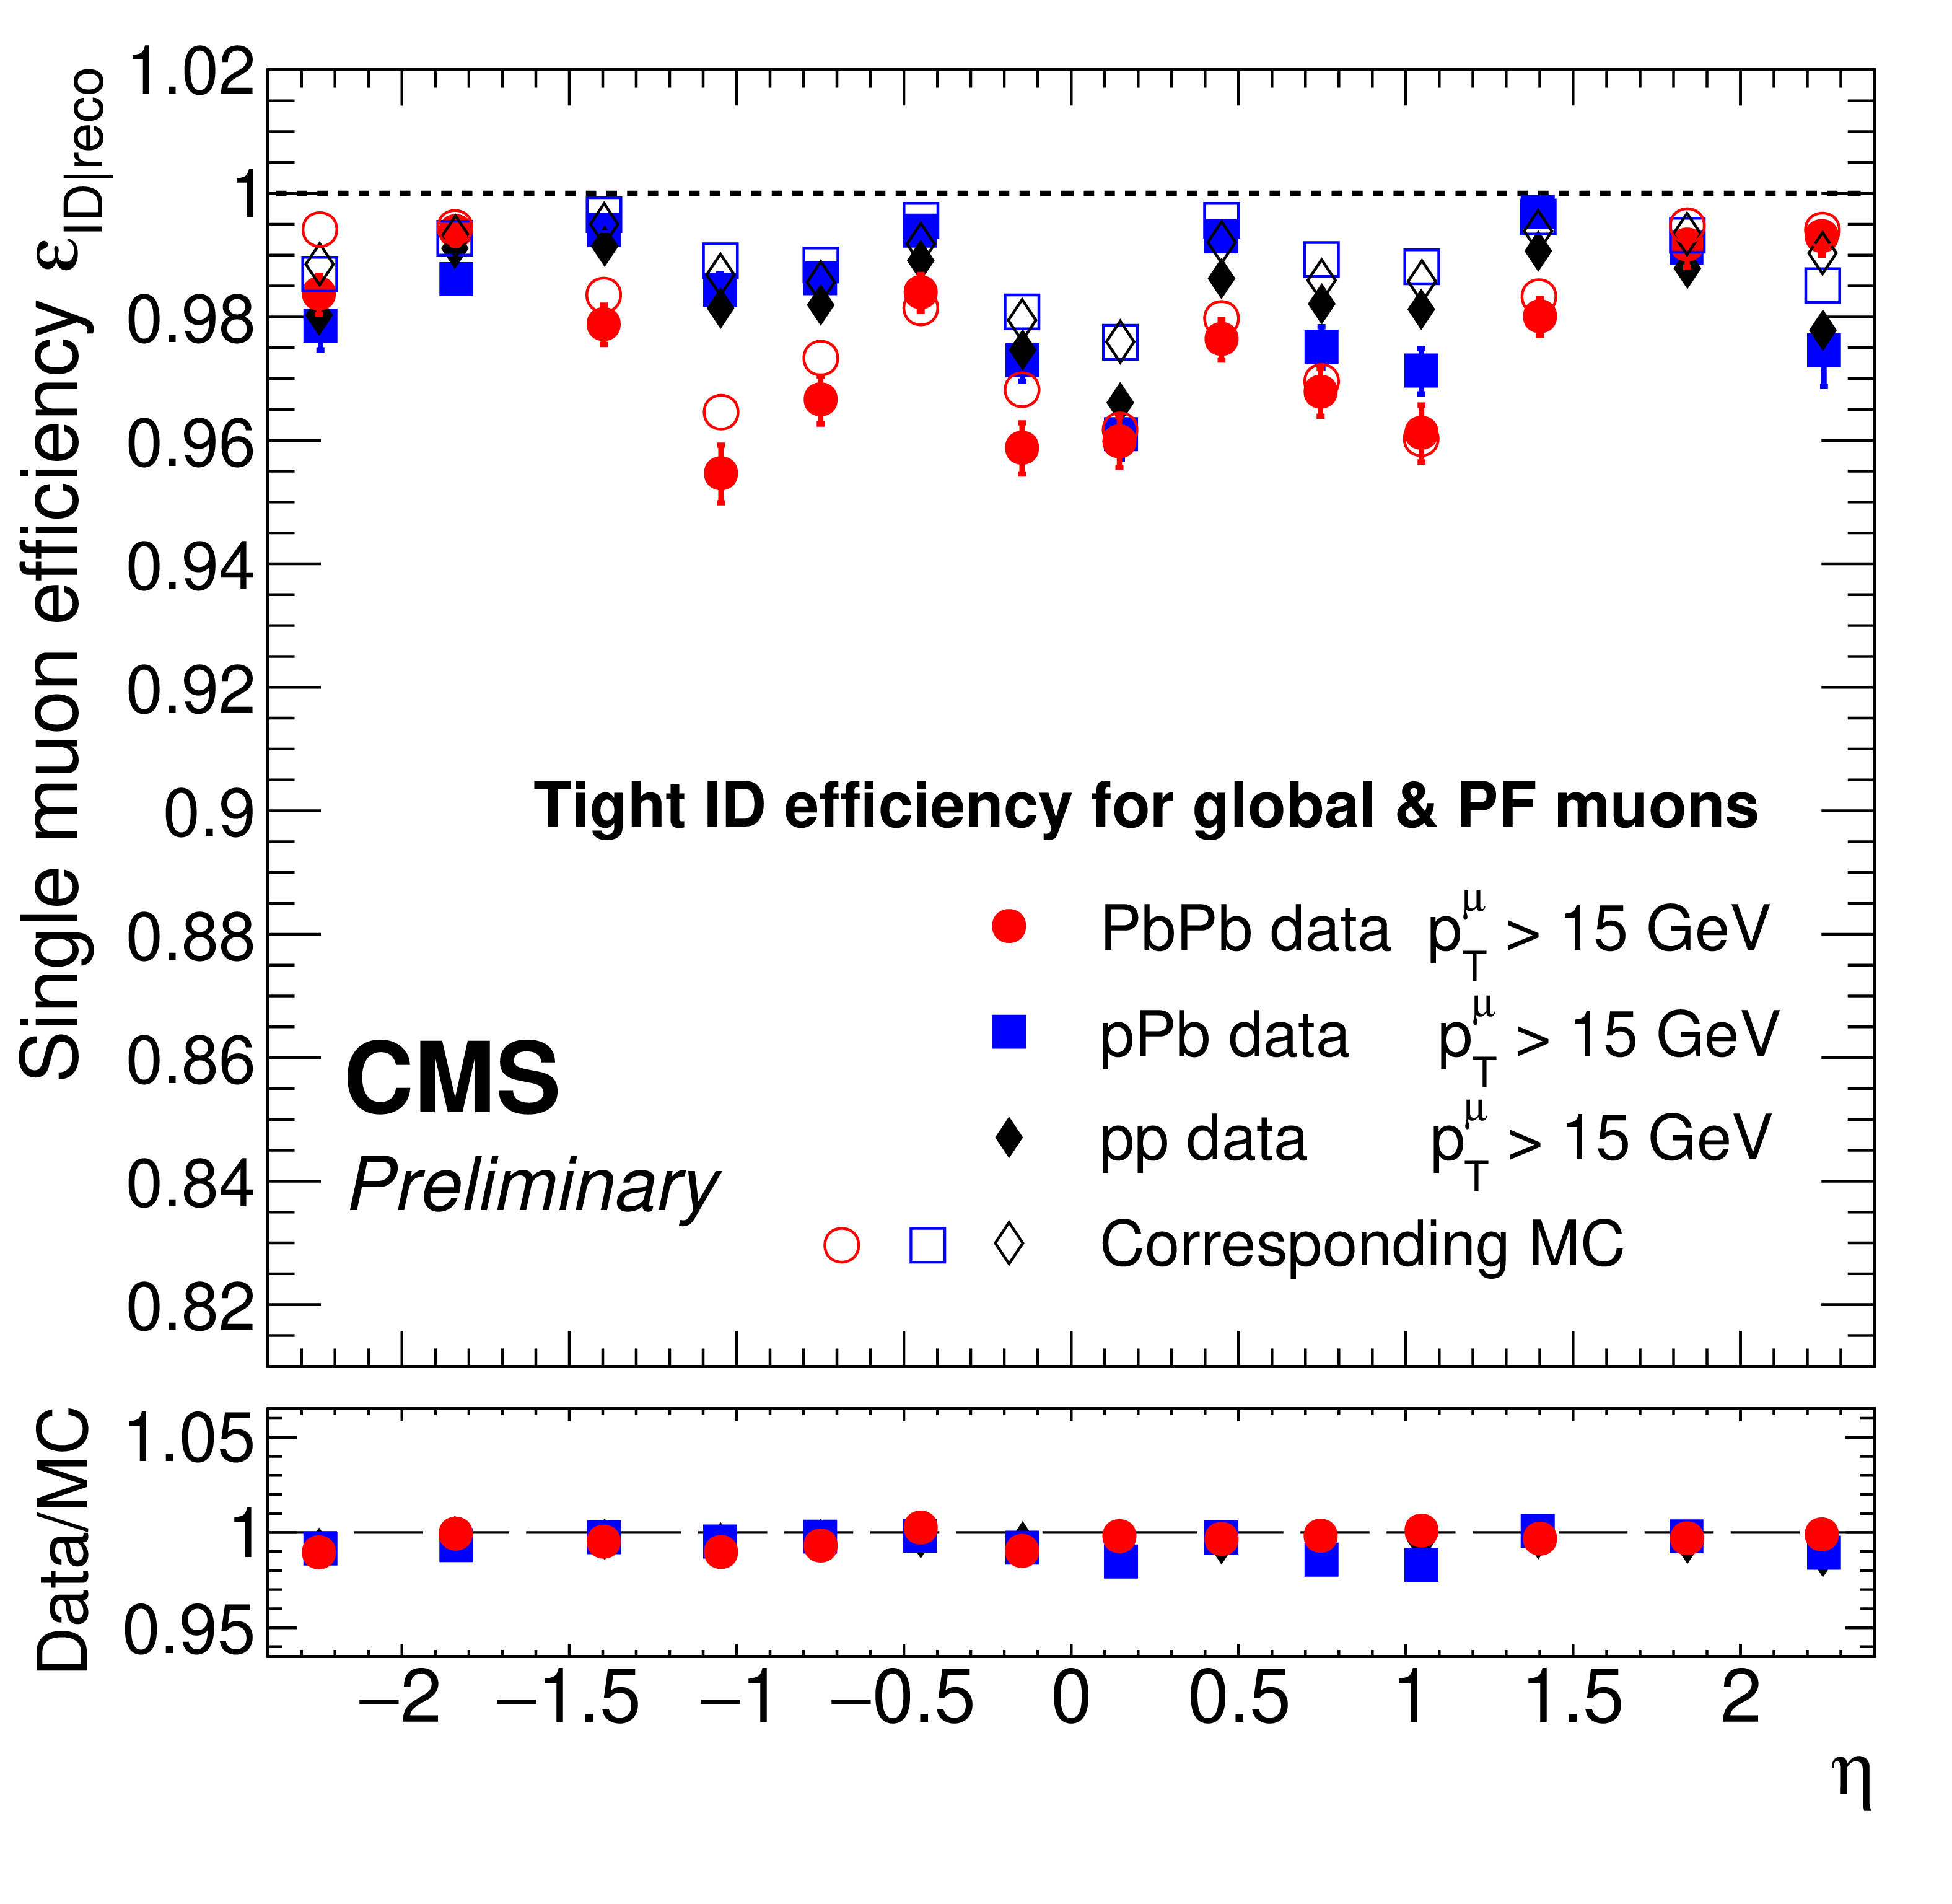
Figure 9:
Tight ID efficiency as a function of $ \eta $ (left) and $ p_{\mathrm{T}} $ (right) in pp, pPb, and PbPb collisions. The probe is both a global muon and a PF muon. Open symbols are the MC results corresponding to each data set. Only statistical uncertainties are shown. |
png pdf |
Figure 9-a:
Tight ID efficiency as a function of $ \eta $ (left) and $ p_{\mathrm{T}} $ (right) in pp, pPb, and PbPb collisions. The probe is both a global muon and a PF muon. Open symbols are the MC results corresponding to each data set. Only statistical uncertainties are shown. |
png pdf |
Figure 9-b:
Tight ID efficiency as a function of $ \eta $ (left) and $ p_{\mathrm{T}} $ (right) in pp, pPb, and PbPb collisions. The probe is both a global muon and a PF muon. Open symbols are the MC results corresponding to each data set. Only statistical uncertainties are shown. |
png pdf |
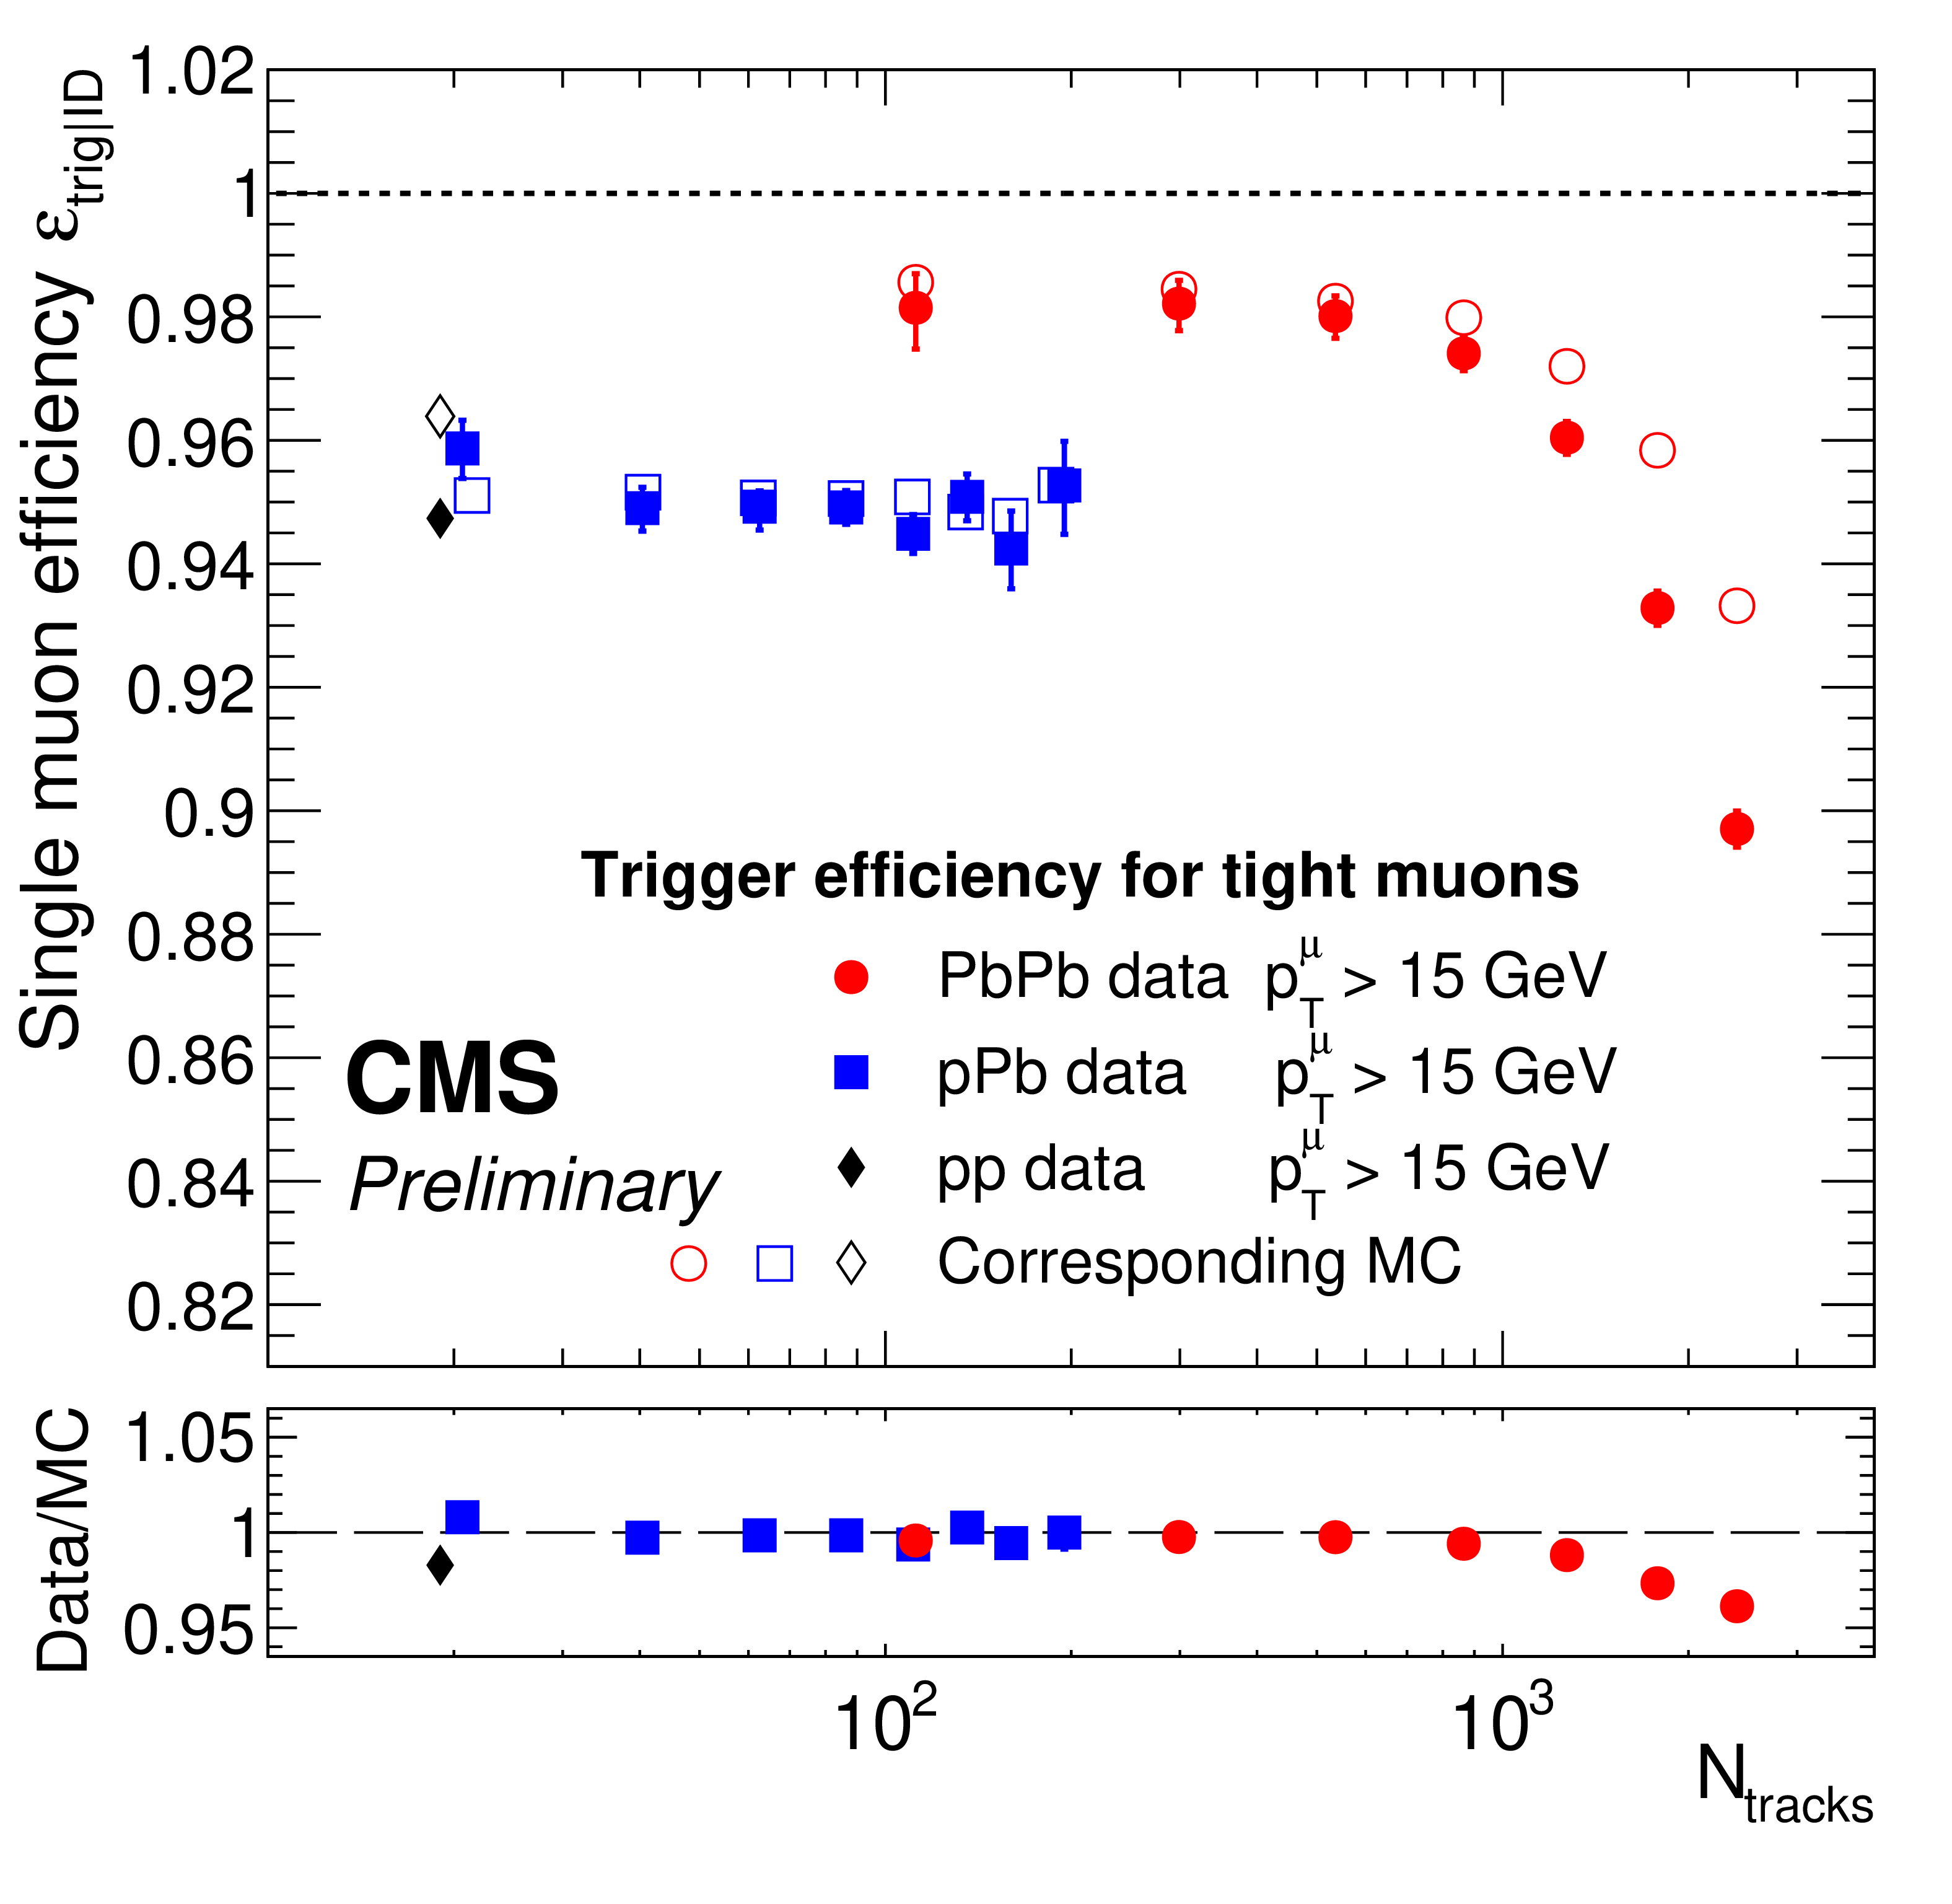
Figure 10:
Trigger efficiency of tight muons as a function of the number of tracks. The trigger requires a single muon with $ p_{\mathrm{T}} $ above 12 GeV. The efficiency is calculated for muons with $ p_{\mathrm{T}} $ above 15 GeV in order to avoid threshold effects. Open symbols are the MC results corresponding to each data set. Only statistical uncertainties are shown. |
png pdf |
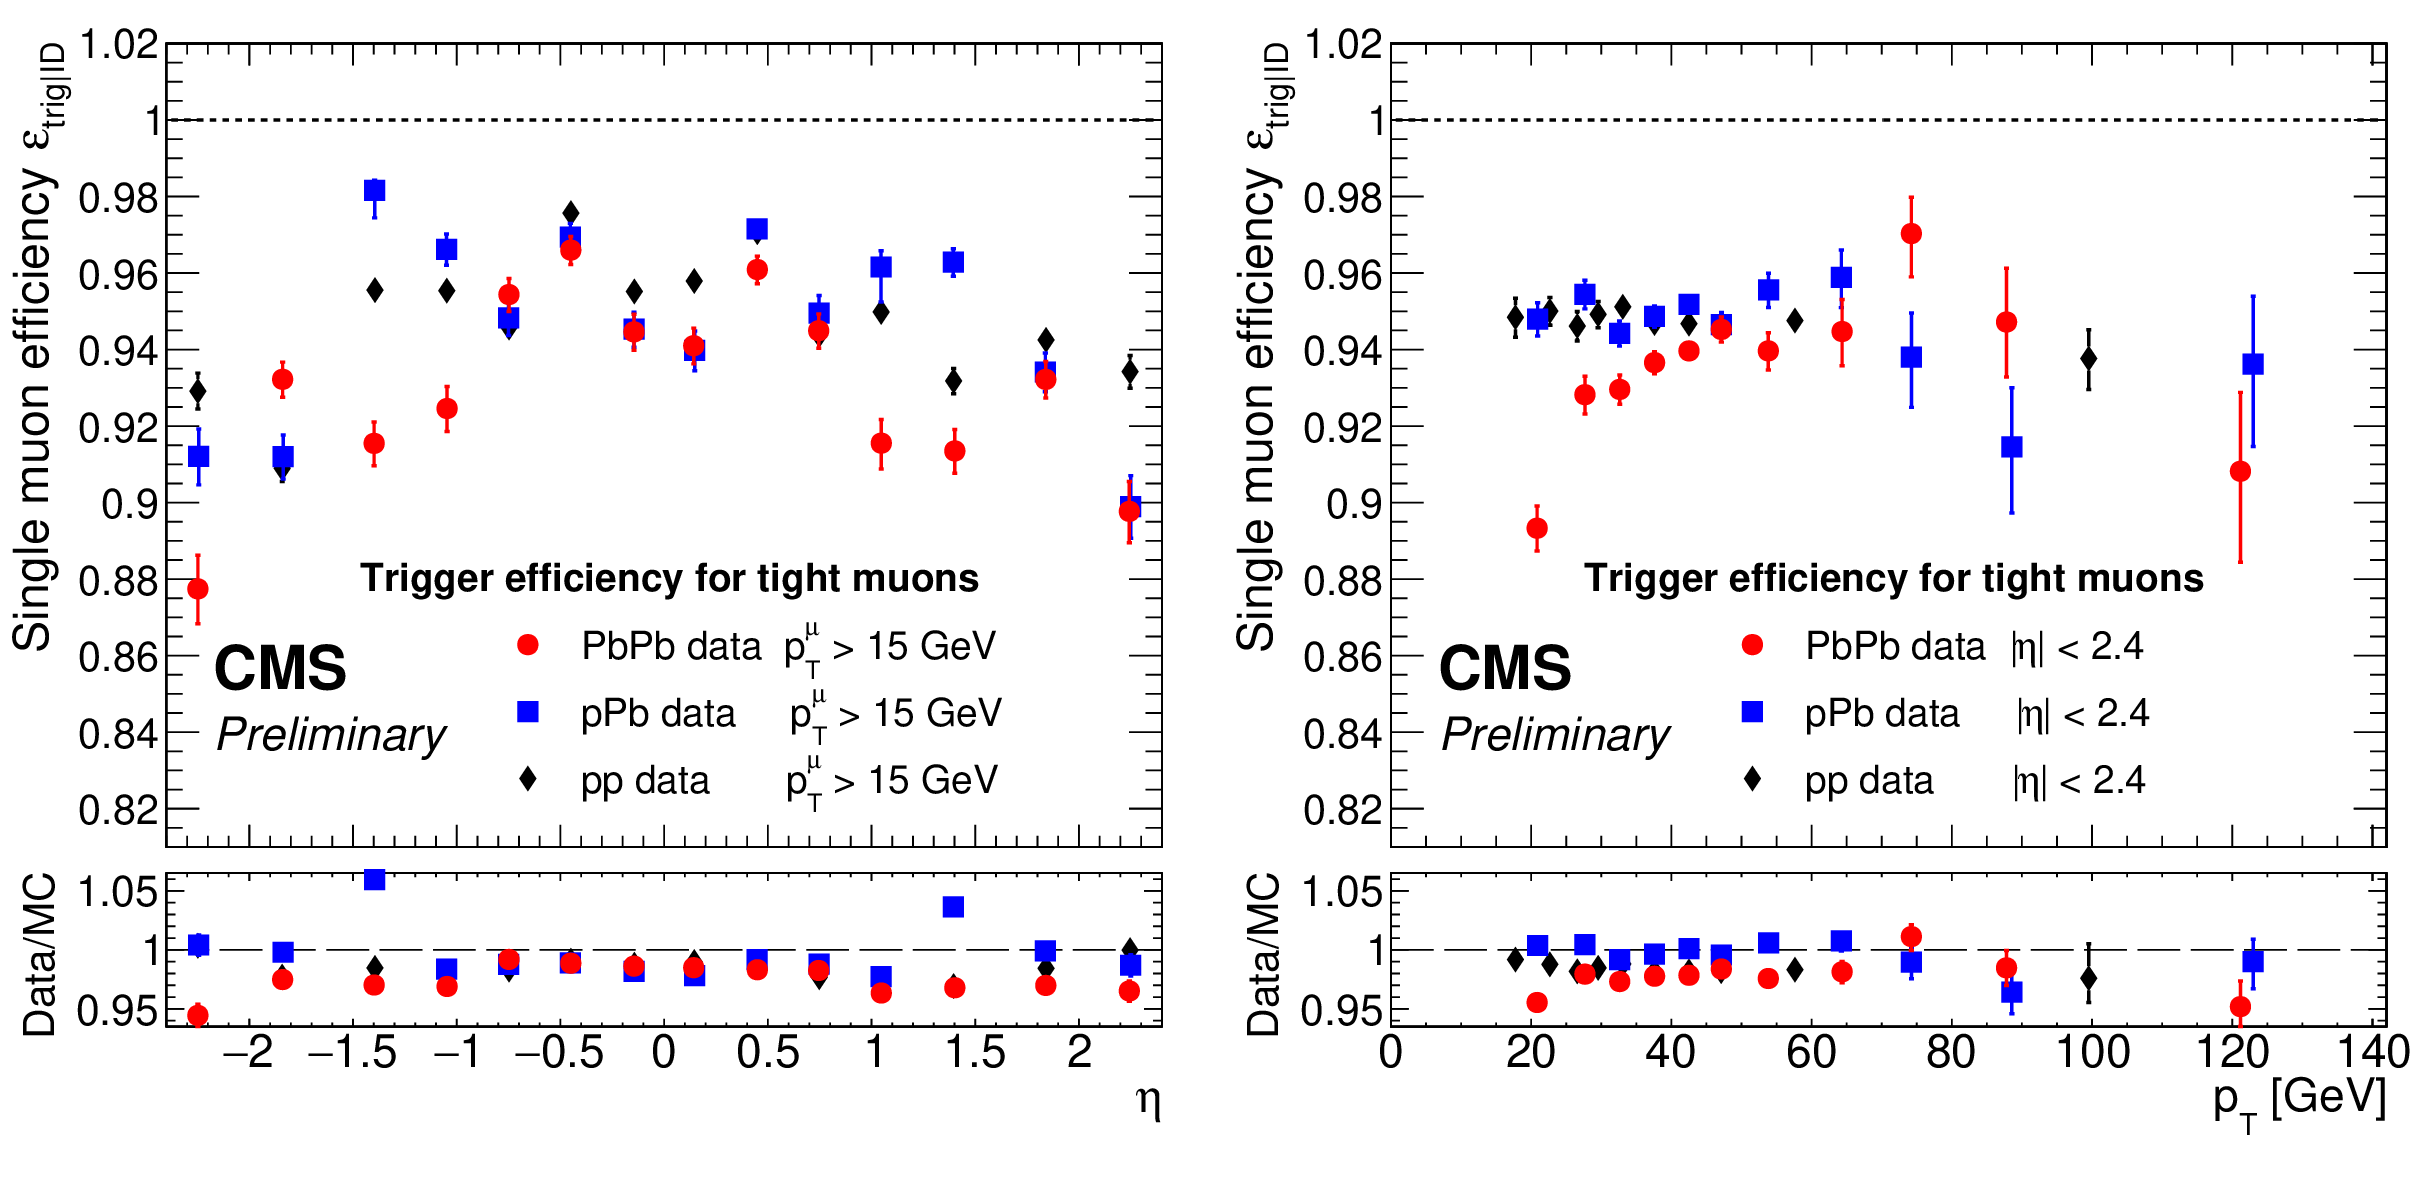
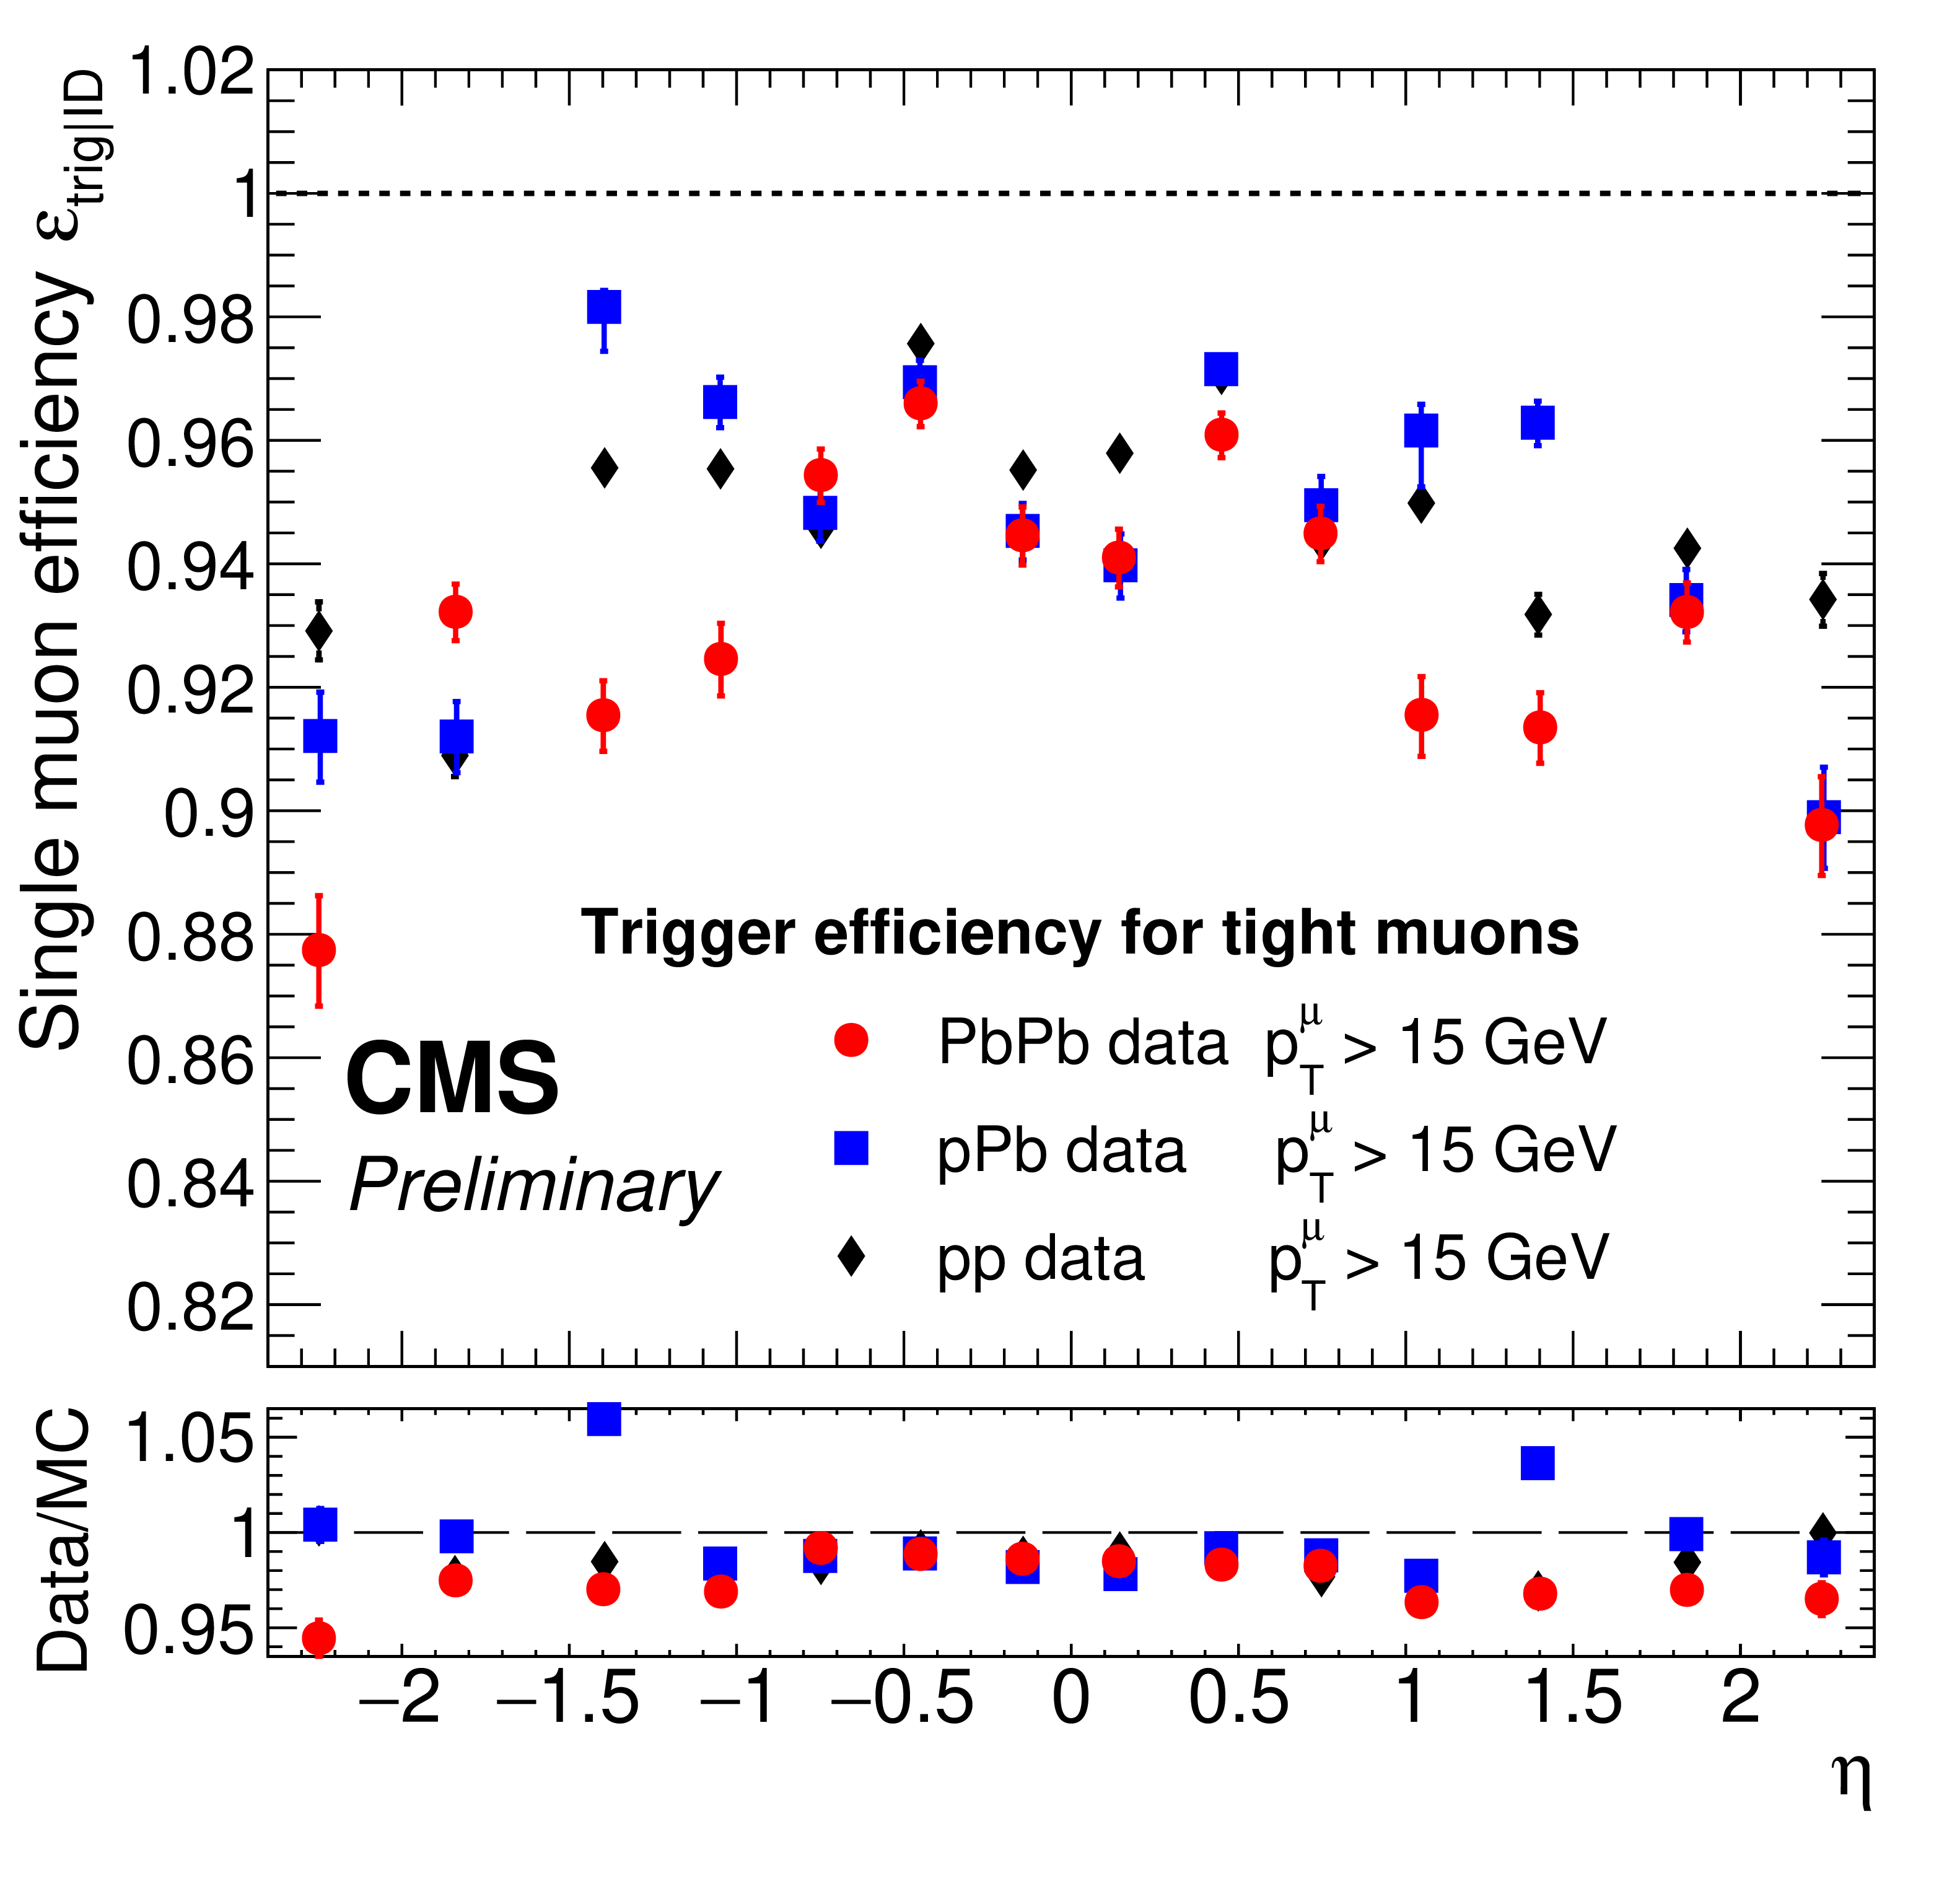
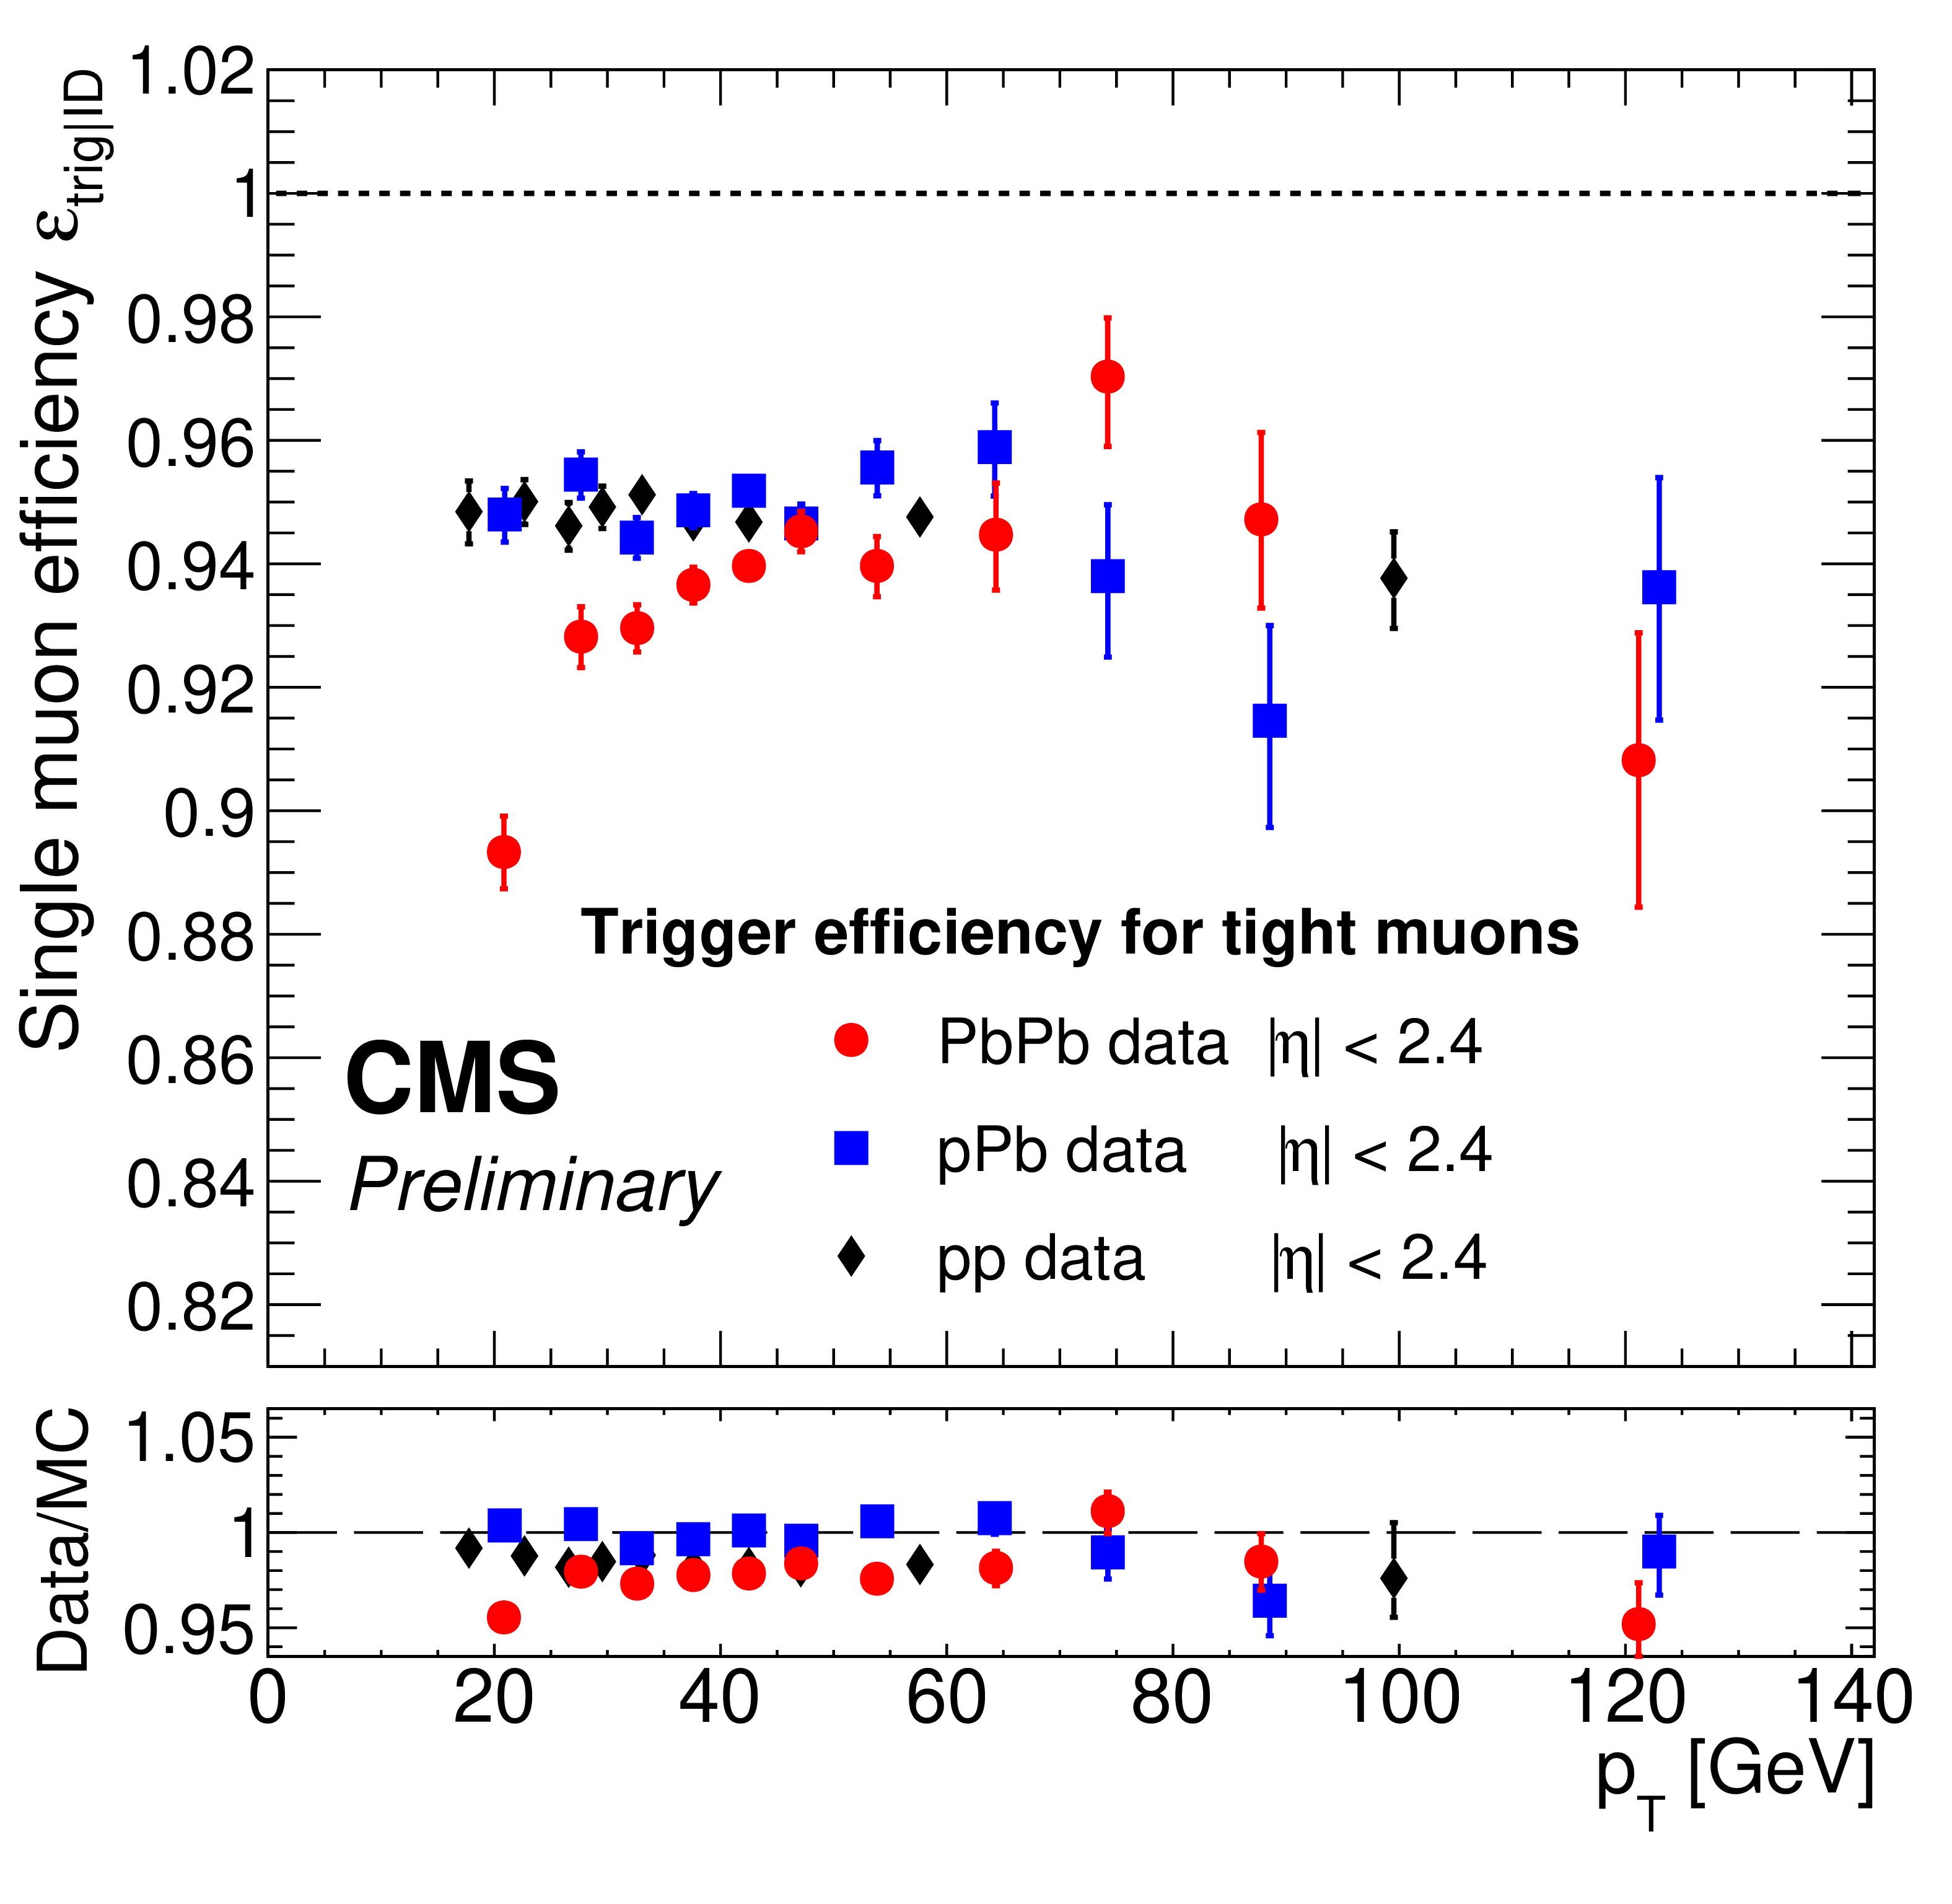
Figure 11:
Trigger efficiency of tight muons as a function of $ \eta $ (left) and $ p_{\mathrm{T}} $ (right) in pp, pPb, and PbPb collisions. Bottom panel shows the ratio between data and MC simulation (MC points are omitted in the top panels for clarity). Only statistical uncertainties are shown. |
png pdf |
Figure 11-a:
Trigger efficiency of tight muons as a function of $ \eta $ (left) and $ p_{\mathrm{T}} $ (right) in pp, pPb, and PbPb collisions. Bottom panel shows the ratio between data and MC simulation (MC points are omitted in the top panels for clarity). Only statistical uncertainties are shown. |
png pdf |
Figure 11-b:
Trigger efficiency of tight muons as a function of $ \eta $ (left) and $ p_{\mathrm{T}} $ (right) in pp, pPb, and PbPb collisions. Bottom panel shows the ratio between data and MC simulation (MC points are omitted in the top panels for clarity). Only statistical uncertainties are shown. |
png pdf |
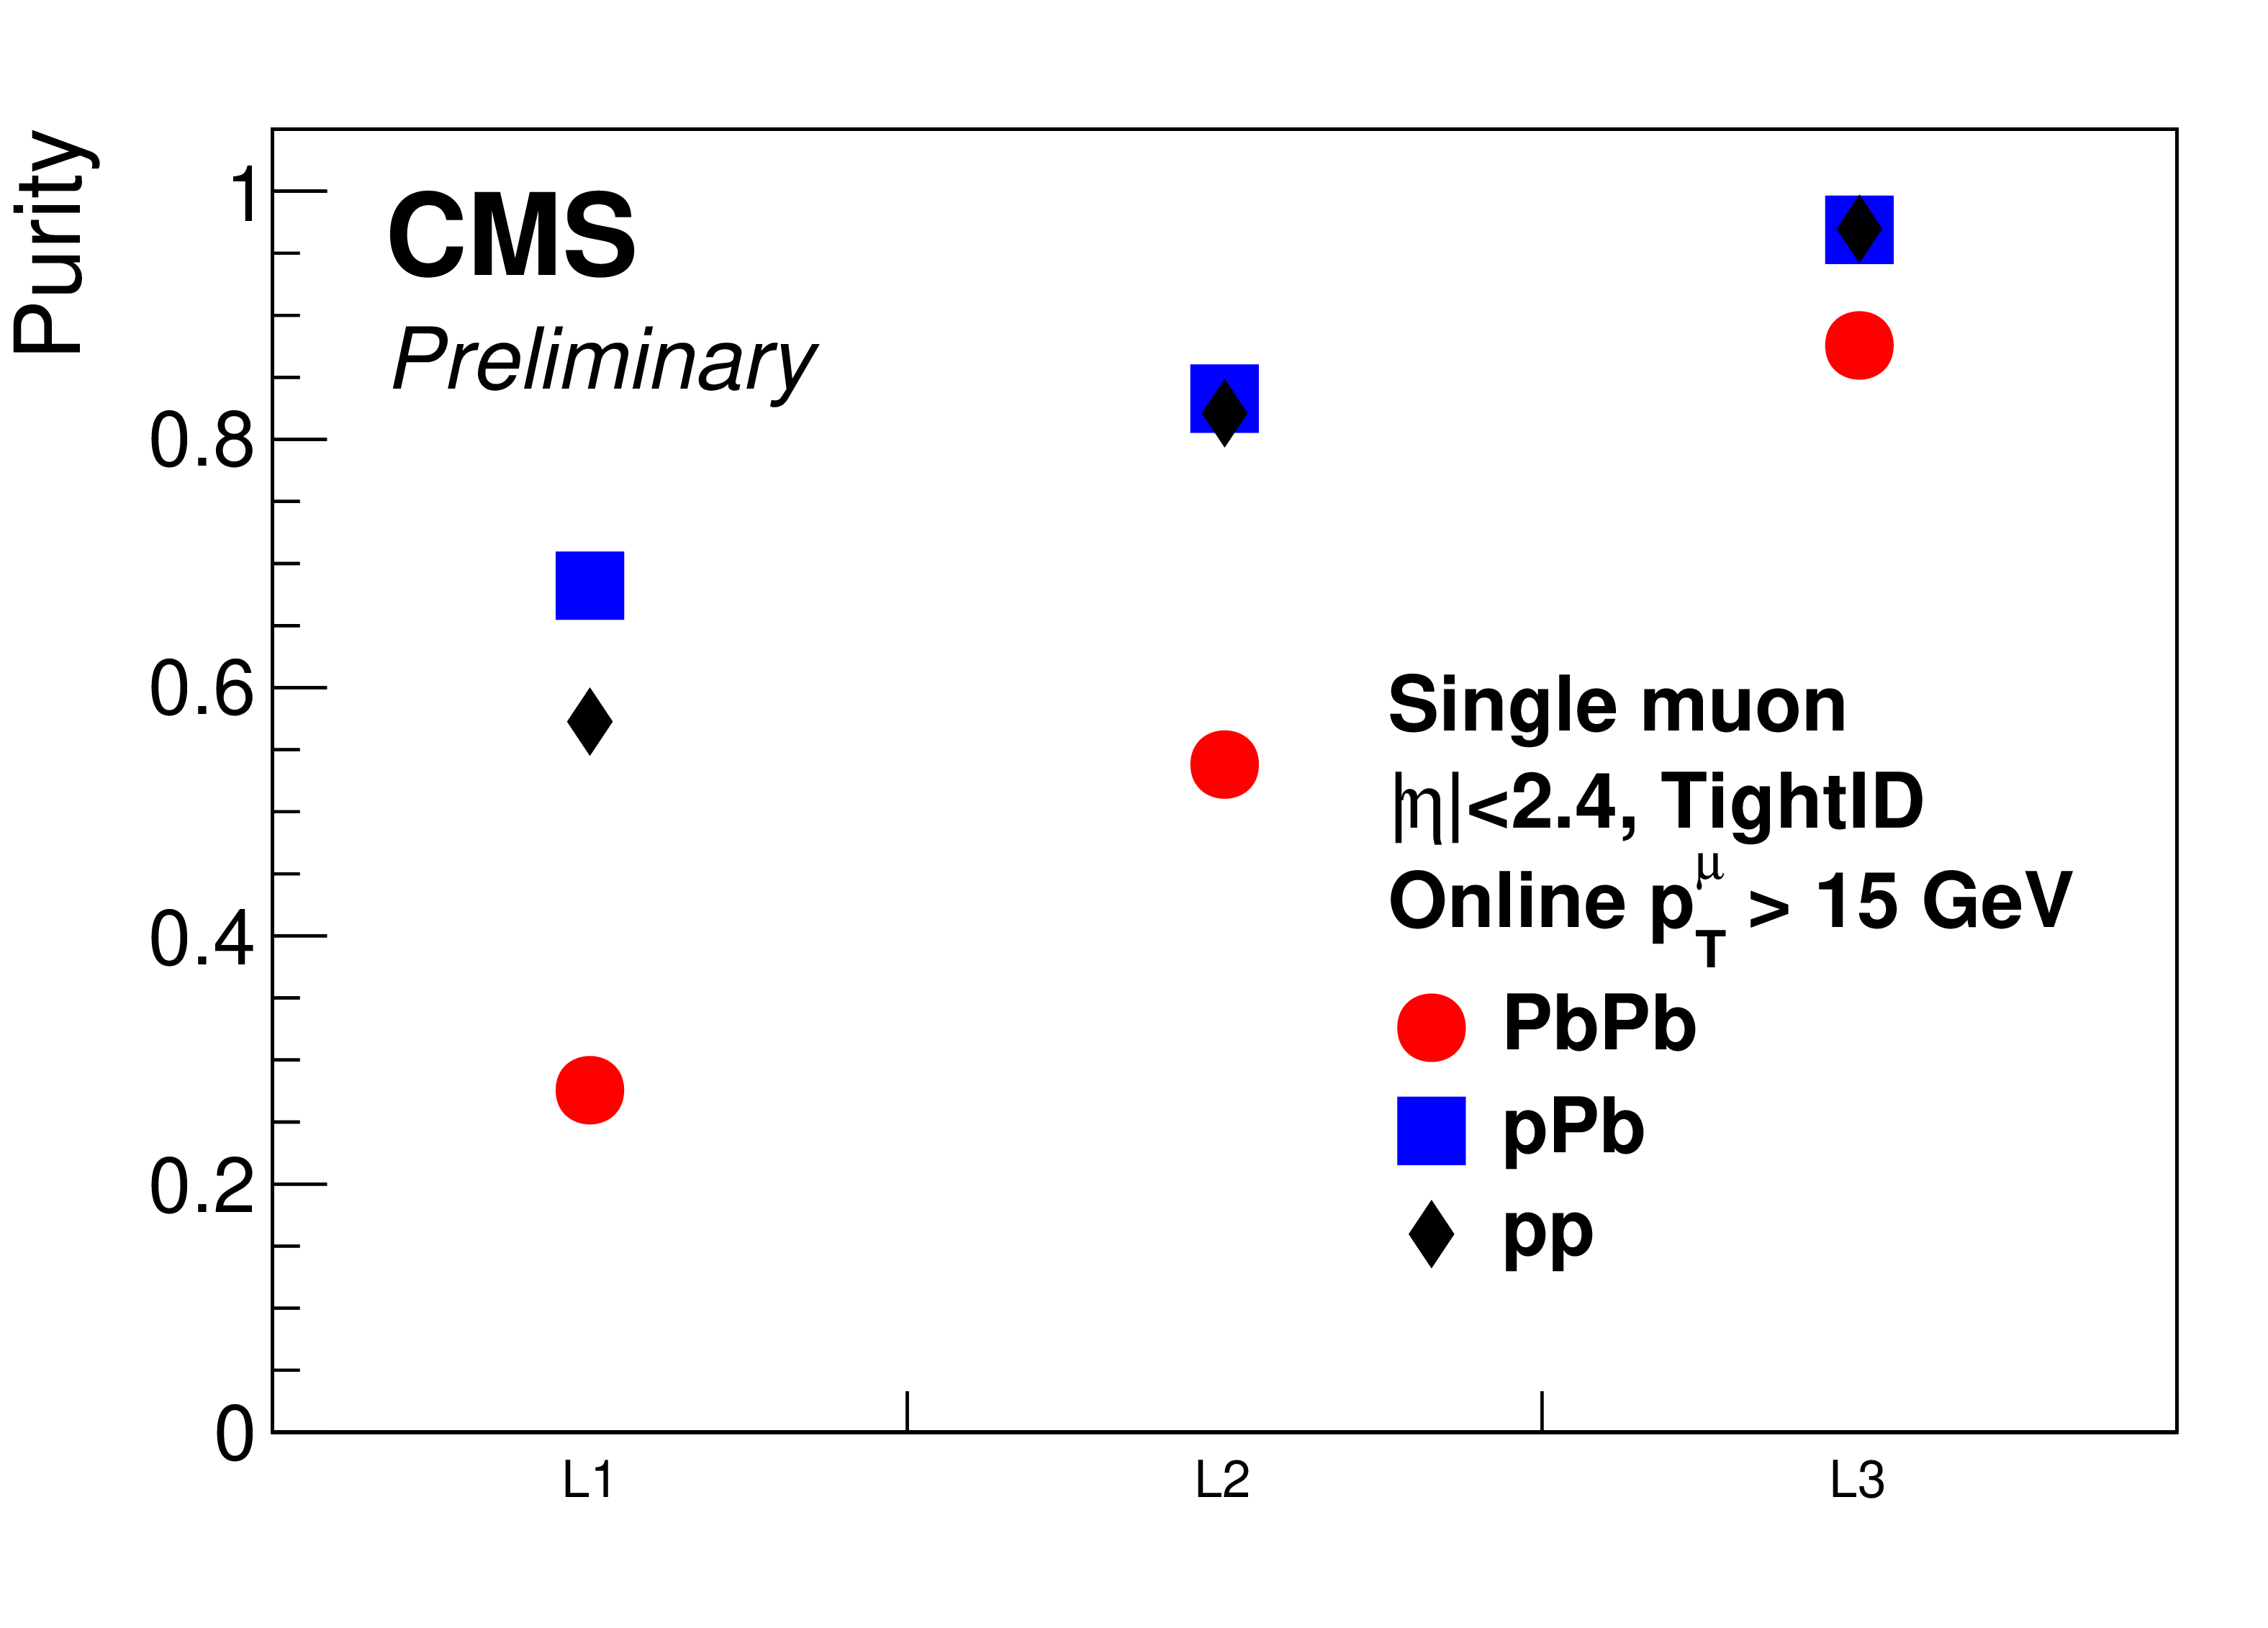
Figure 12:
Purity for the L1, L2, and L3 trigger steps, compared among pp, pPb, and PbPb collisions. The online muon must have $ p_{\mathrm{T}} > $ 15 GeV, while the offline muon matched to it must pass the tight ID selection and have $ |\eta| < $ 2.4. Details of our purity definition are given in the text. Statistical uncertainties are smaller than the symbols. |
png pdf |
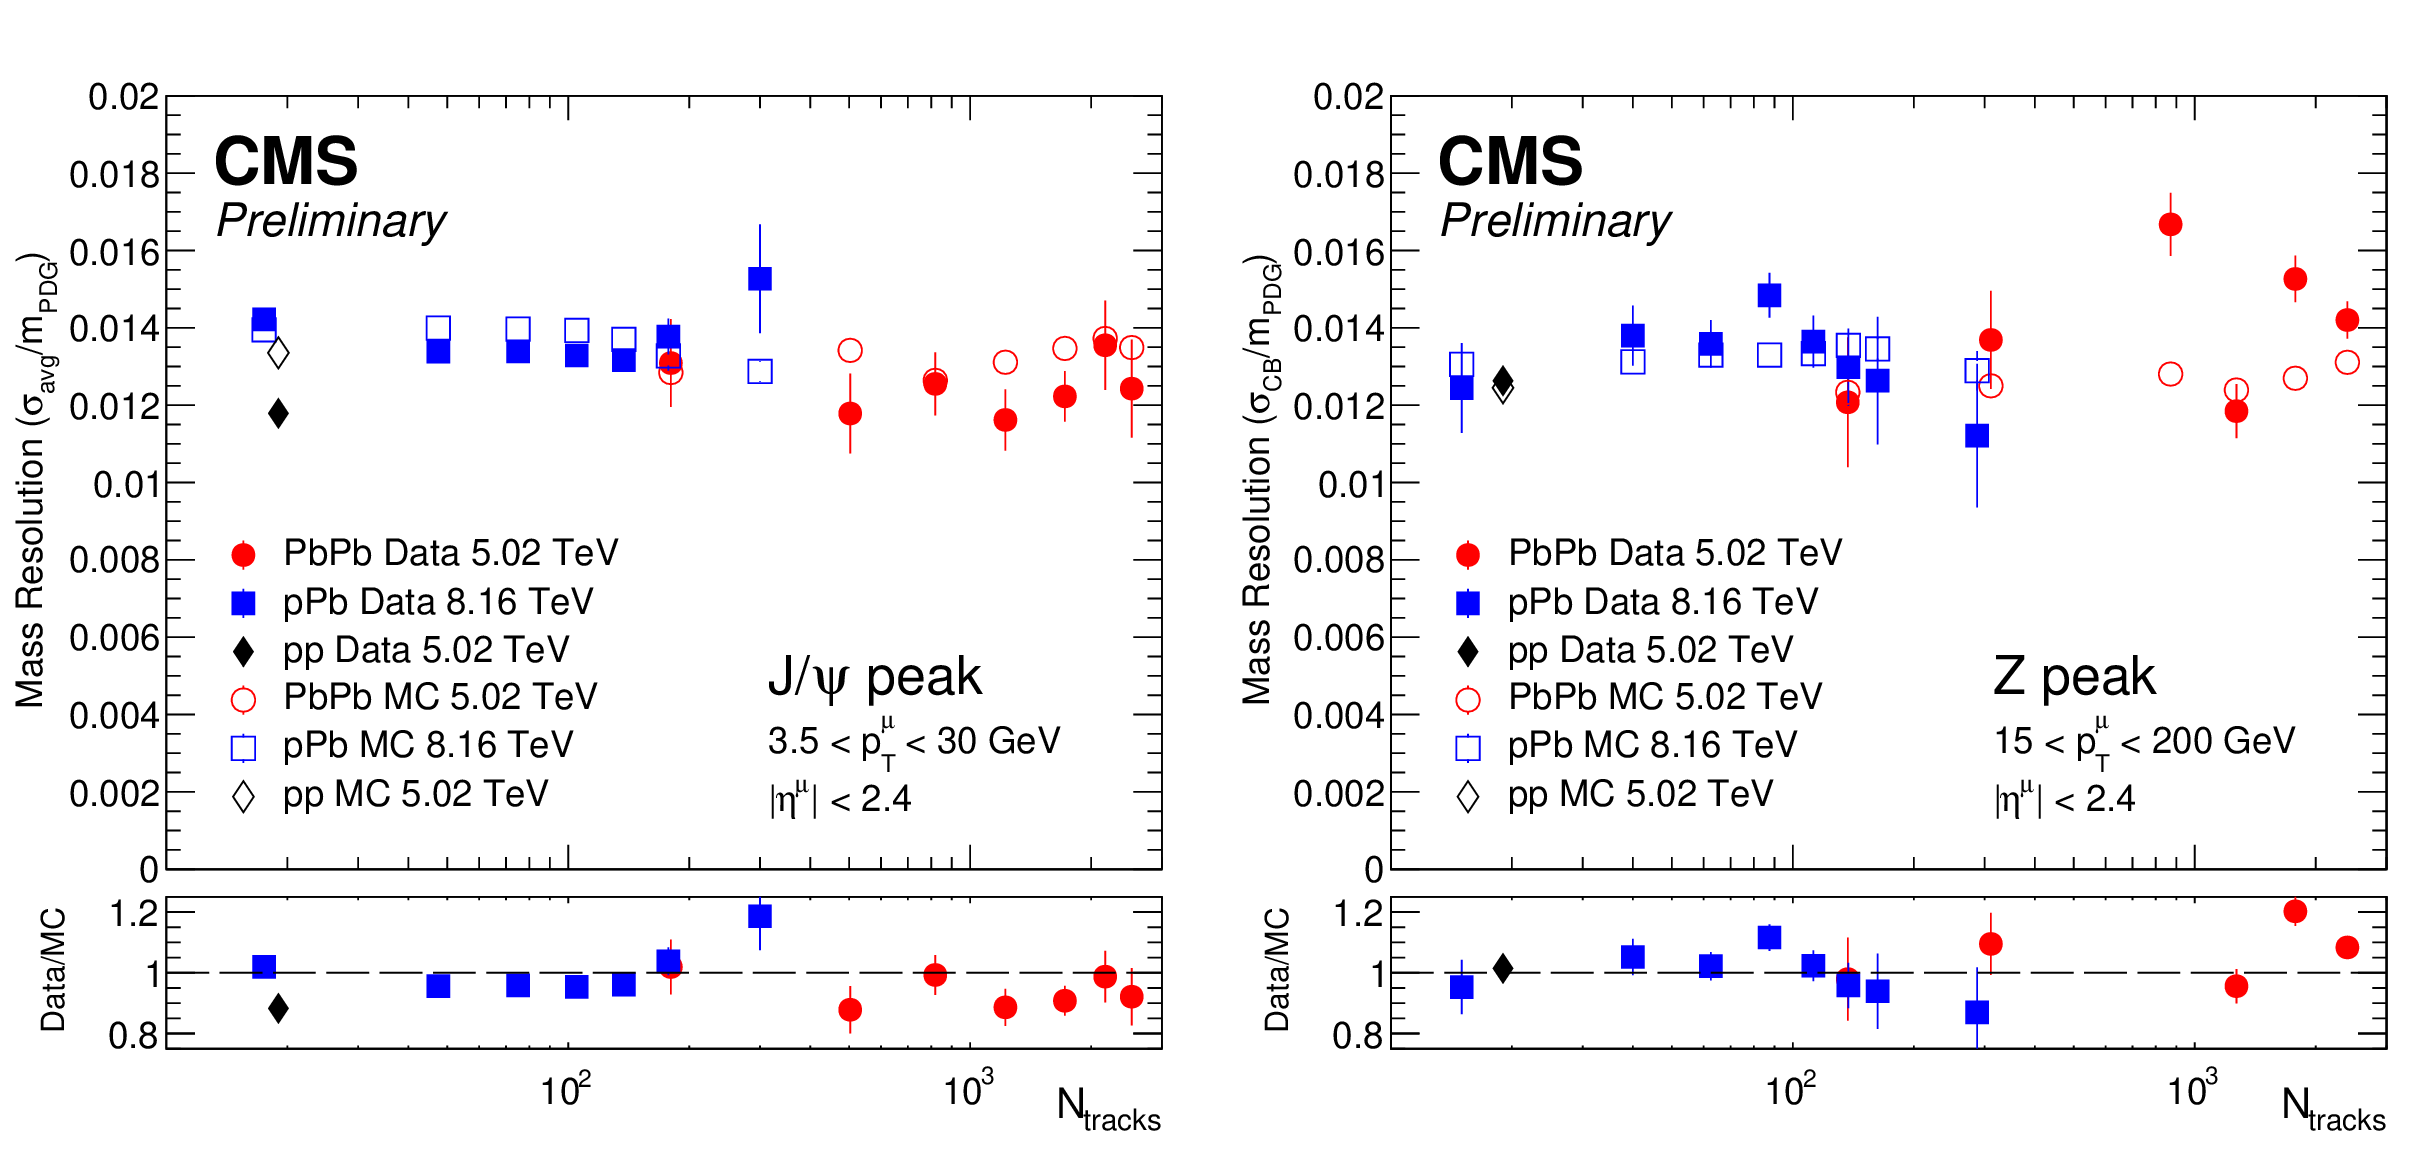
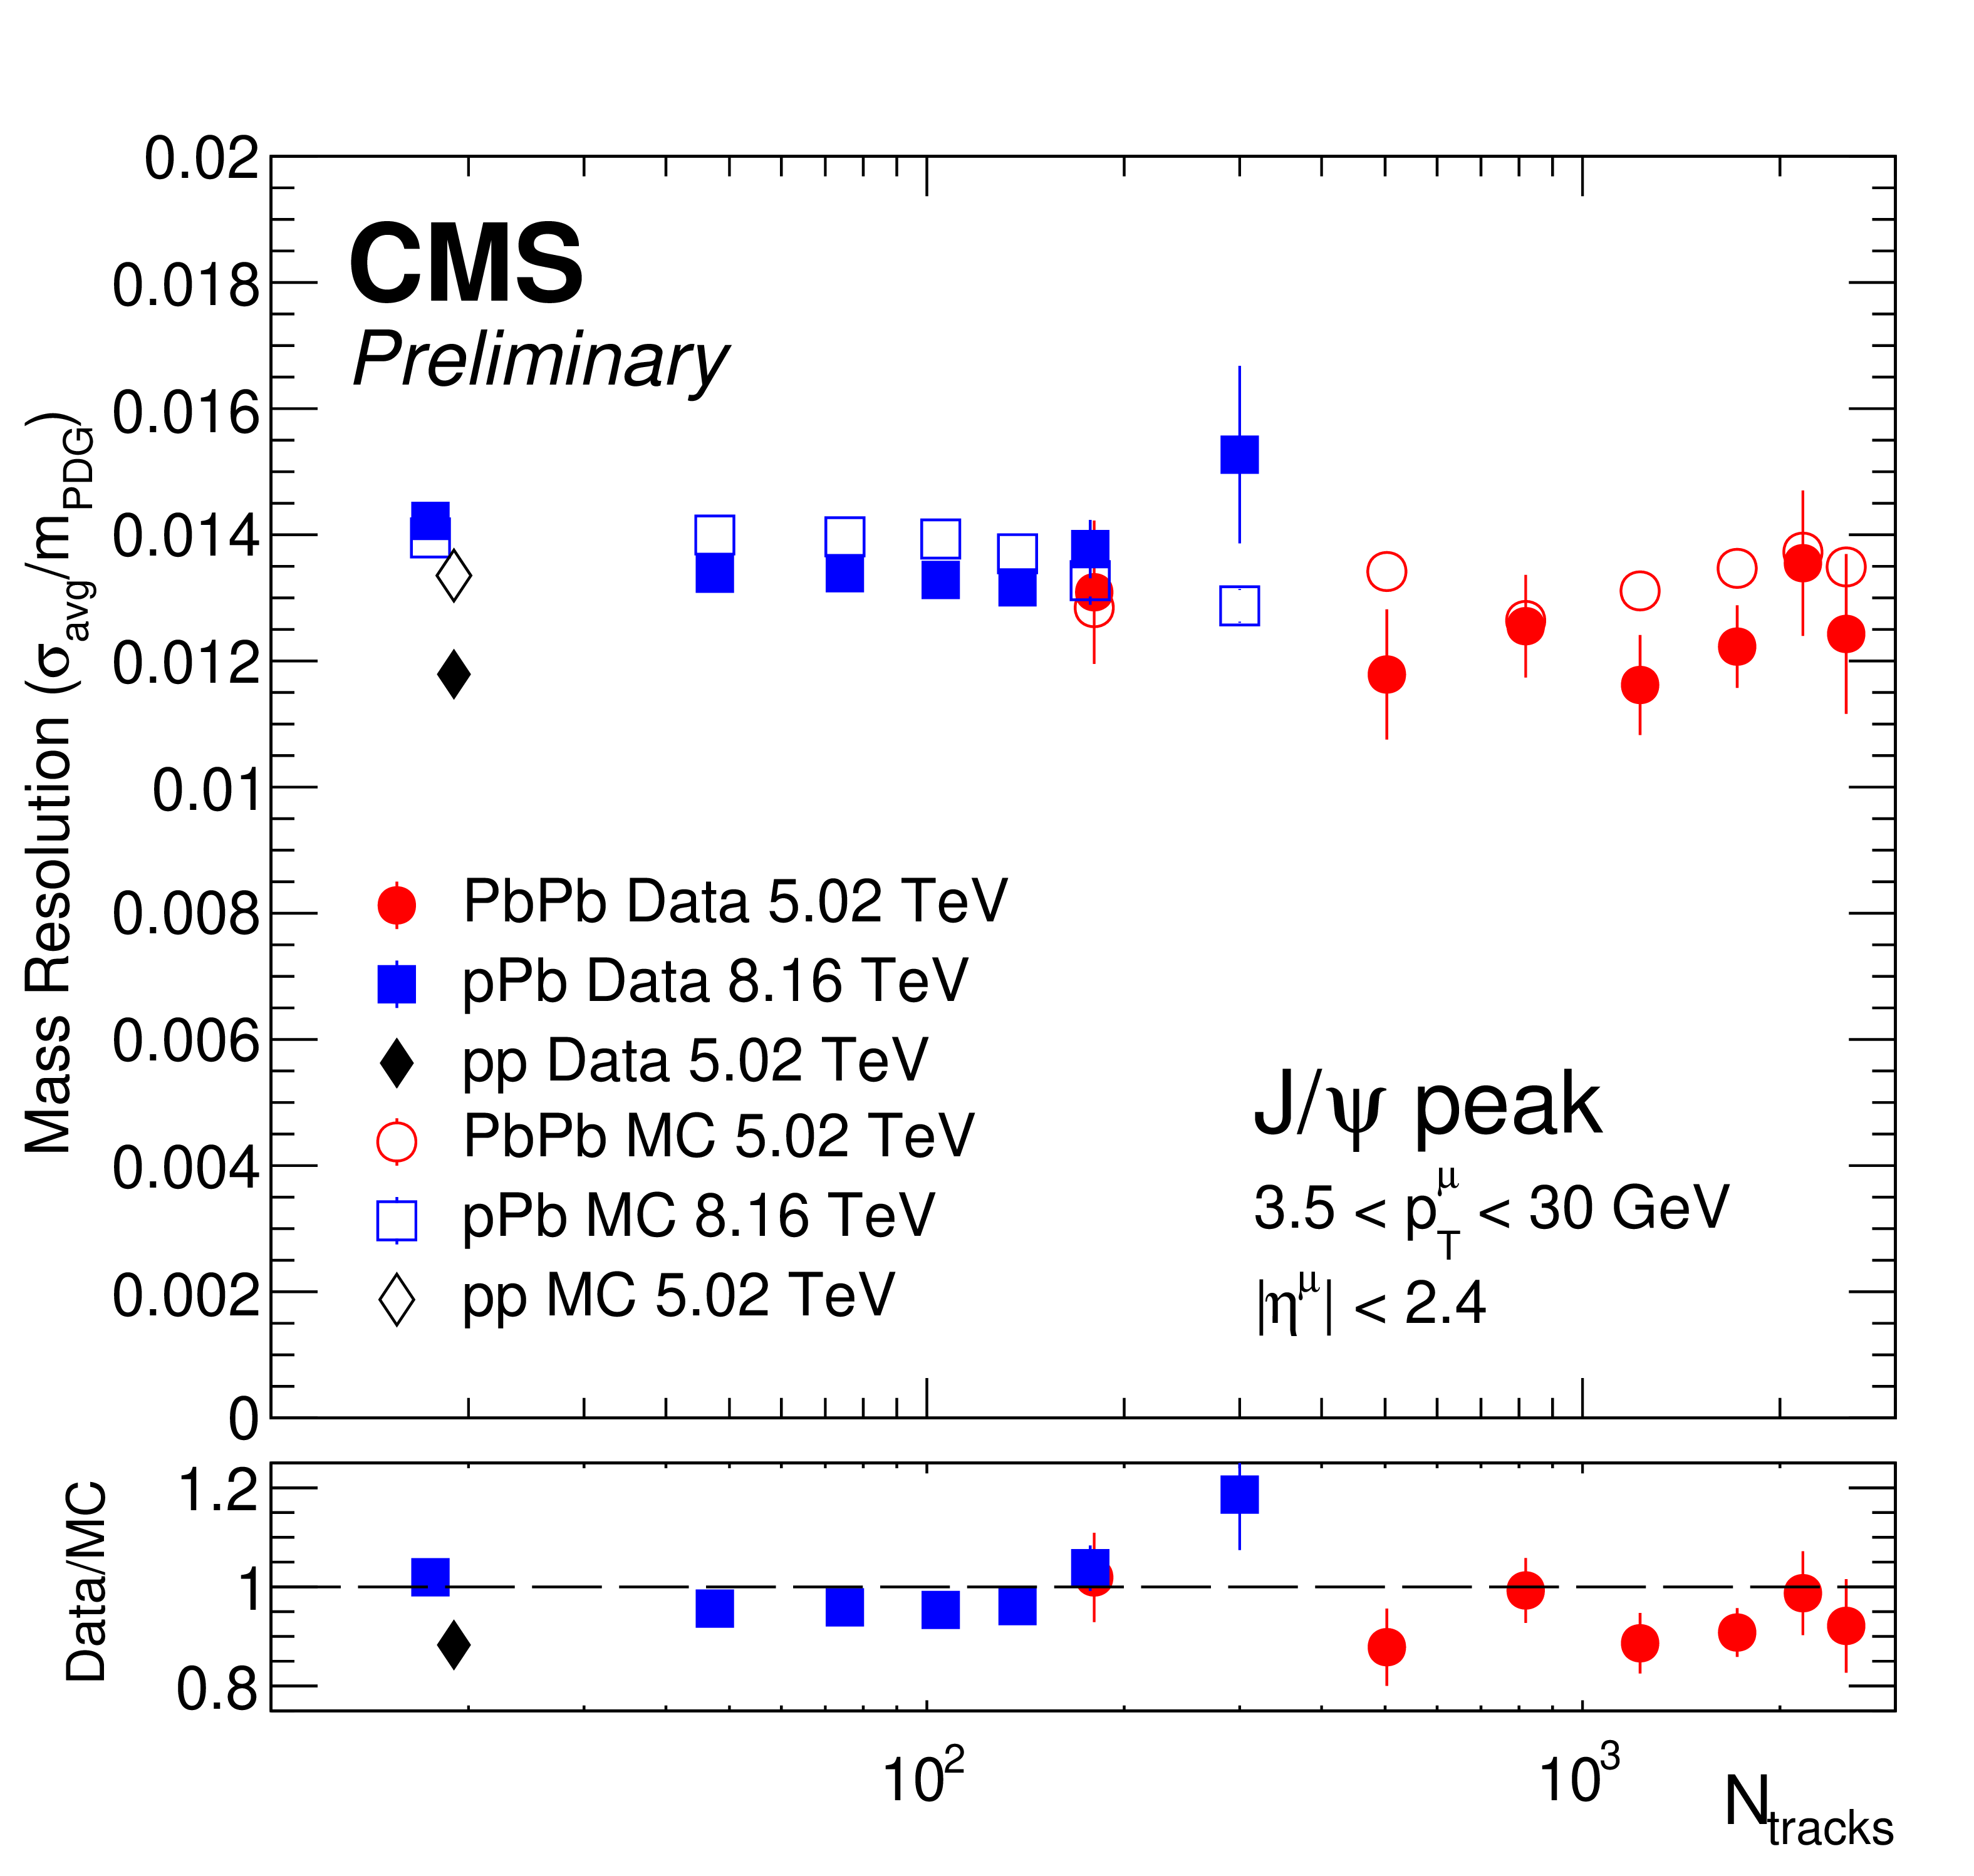
Figure 13:
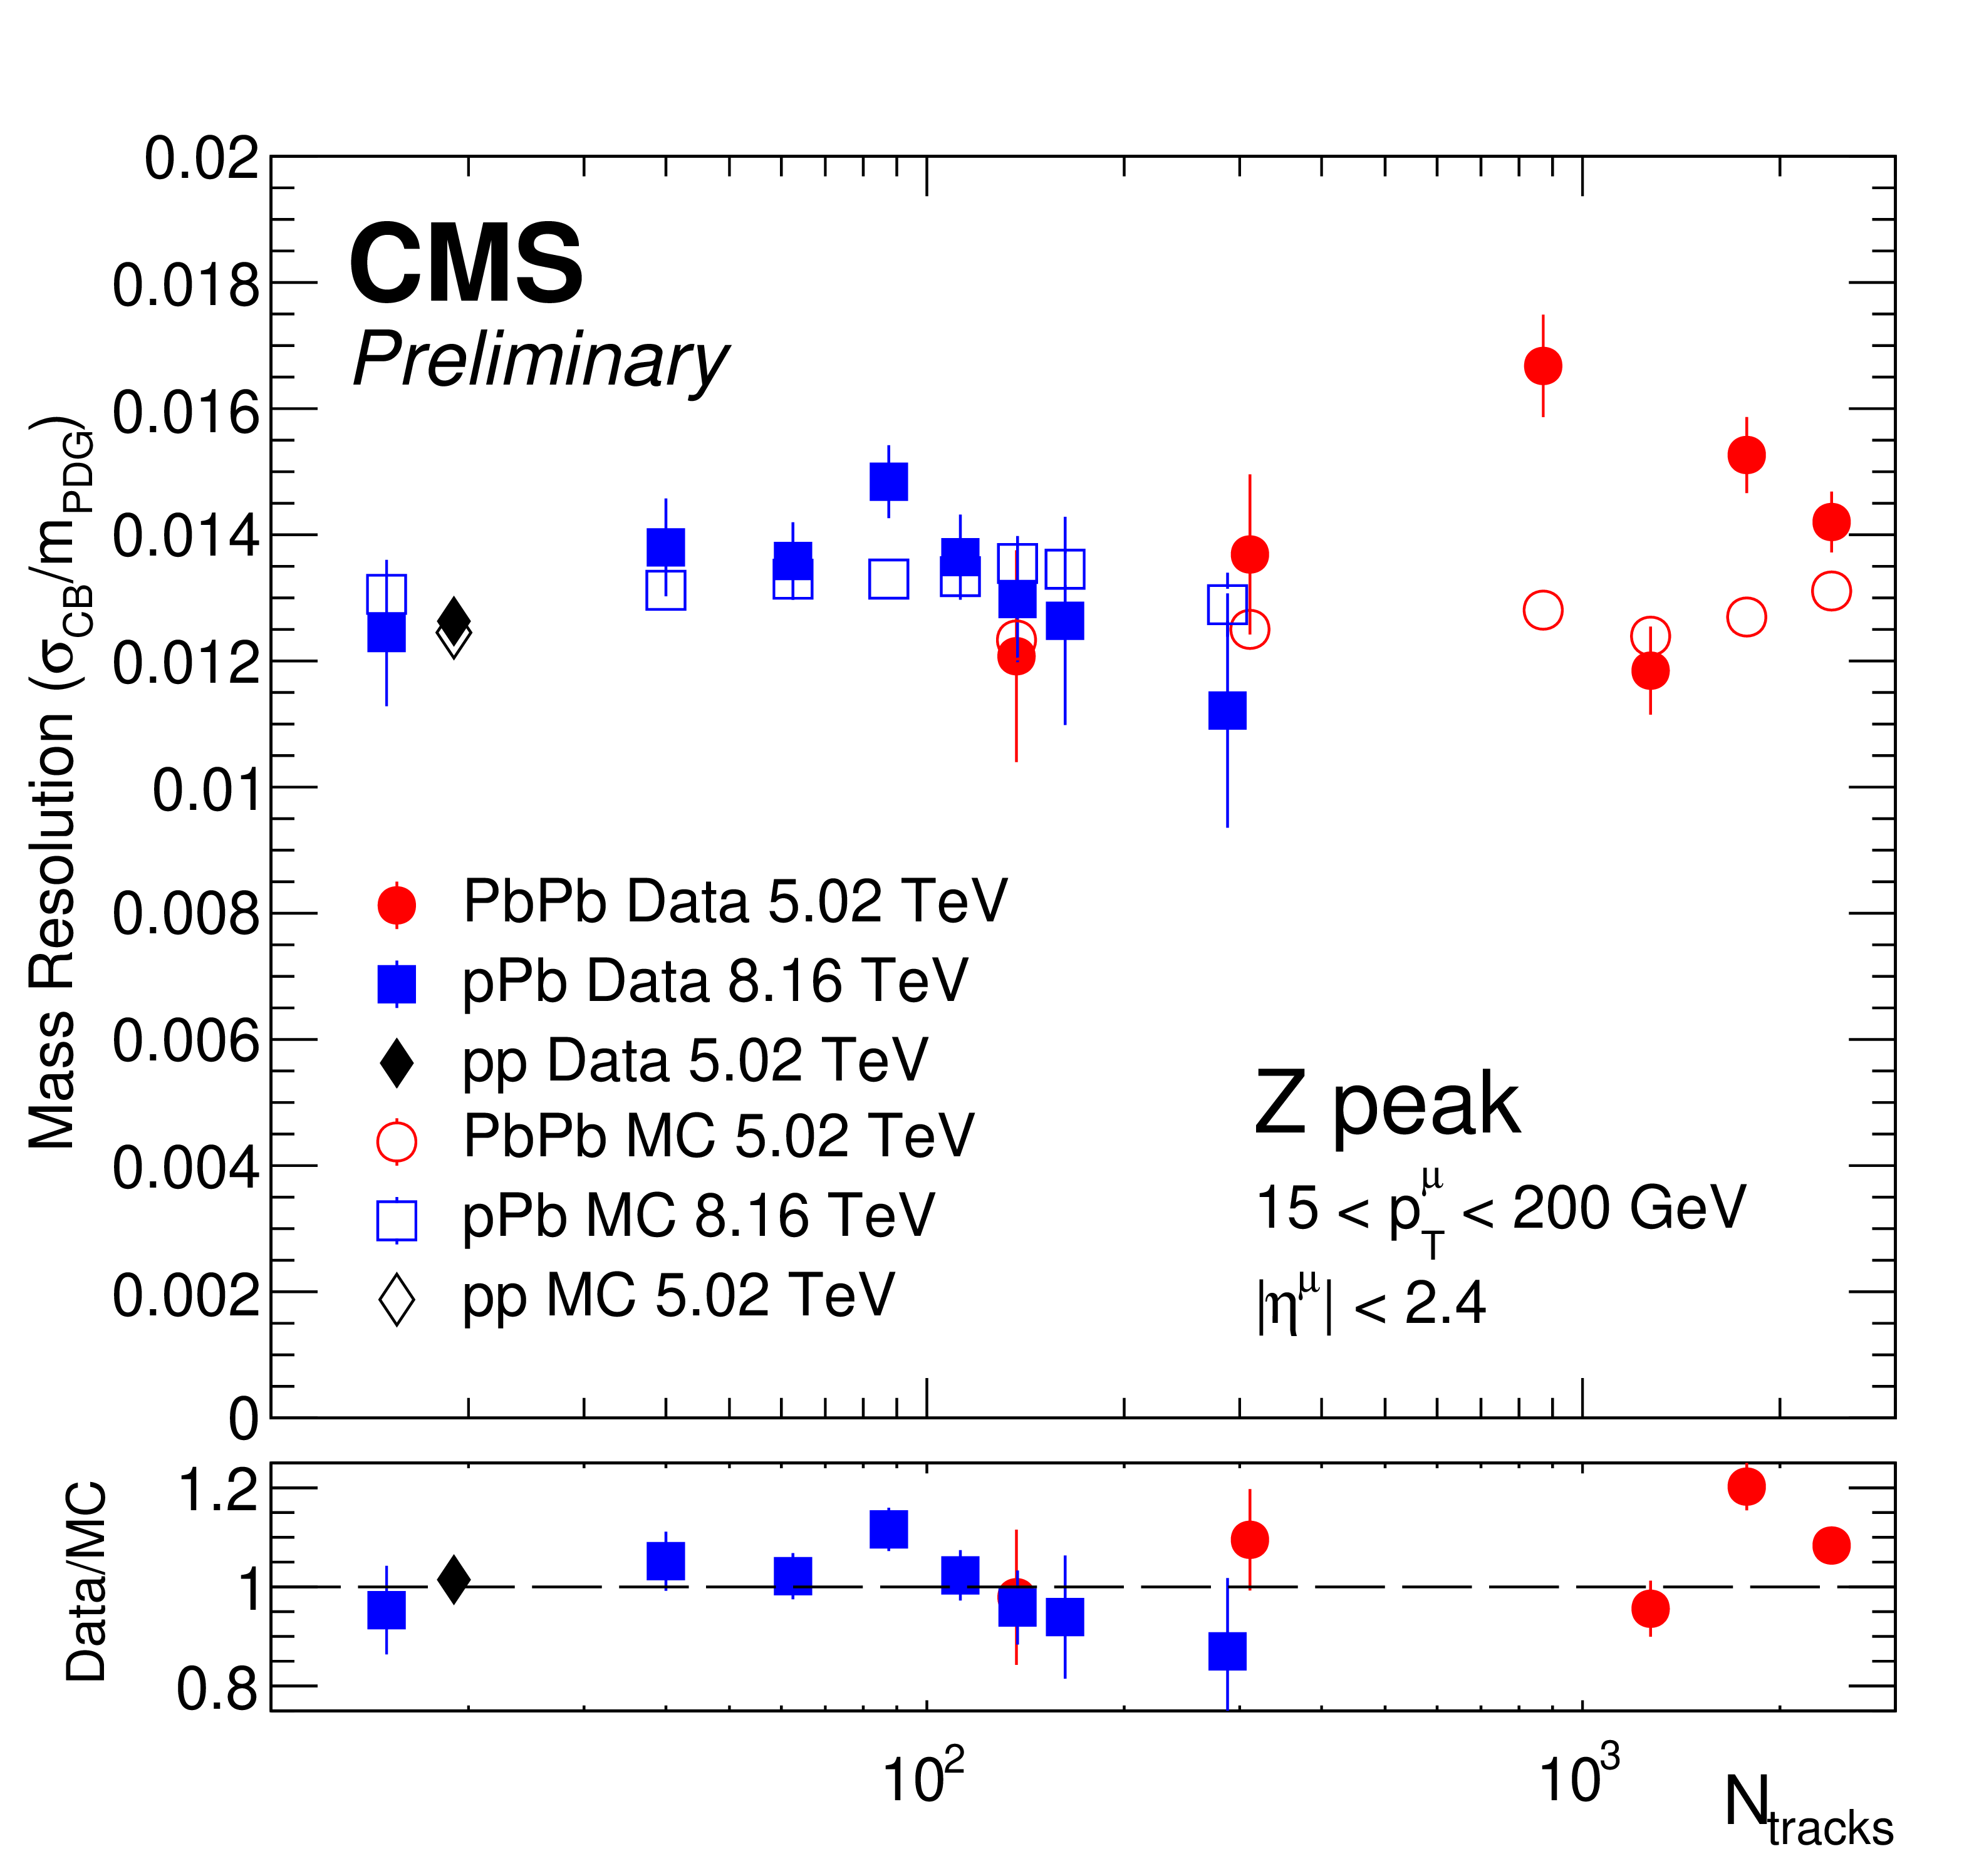
Mass resolution at the $ \mathrm{J}/\psi $ (left) and Z (right) peaks as a function of the number of tracks from MC simulations (open points) and real data (closed points) in pp, pPb, and PbPb collisions. Only statistical uncertainties are shown. |
png pdf |
Figure 13-a:
Mass resolution at the $ \mathrm{J}/\psi $ (left) and Z (right) peaks as a function of the number of tracks from MC simulations (open points) and real data (closed points) in pp, pPb, and PbPb collisions. Only statistical uncertainties are shown. |
png pdf |
Figure 13-b:
Mass resolution at the $ \mathrm{J}/\psi $ (left) and Z (right) peaks as a function of the number of tracks from MC simulations (open points) and real data (closed points) in pp, pPb, and PbPb collisions. Only statistical uncertainties are shown. |
png pdf |
Figure 14:
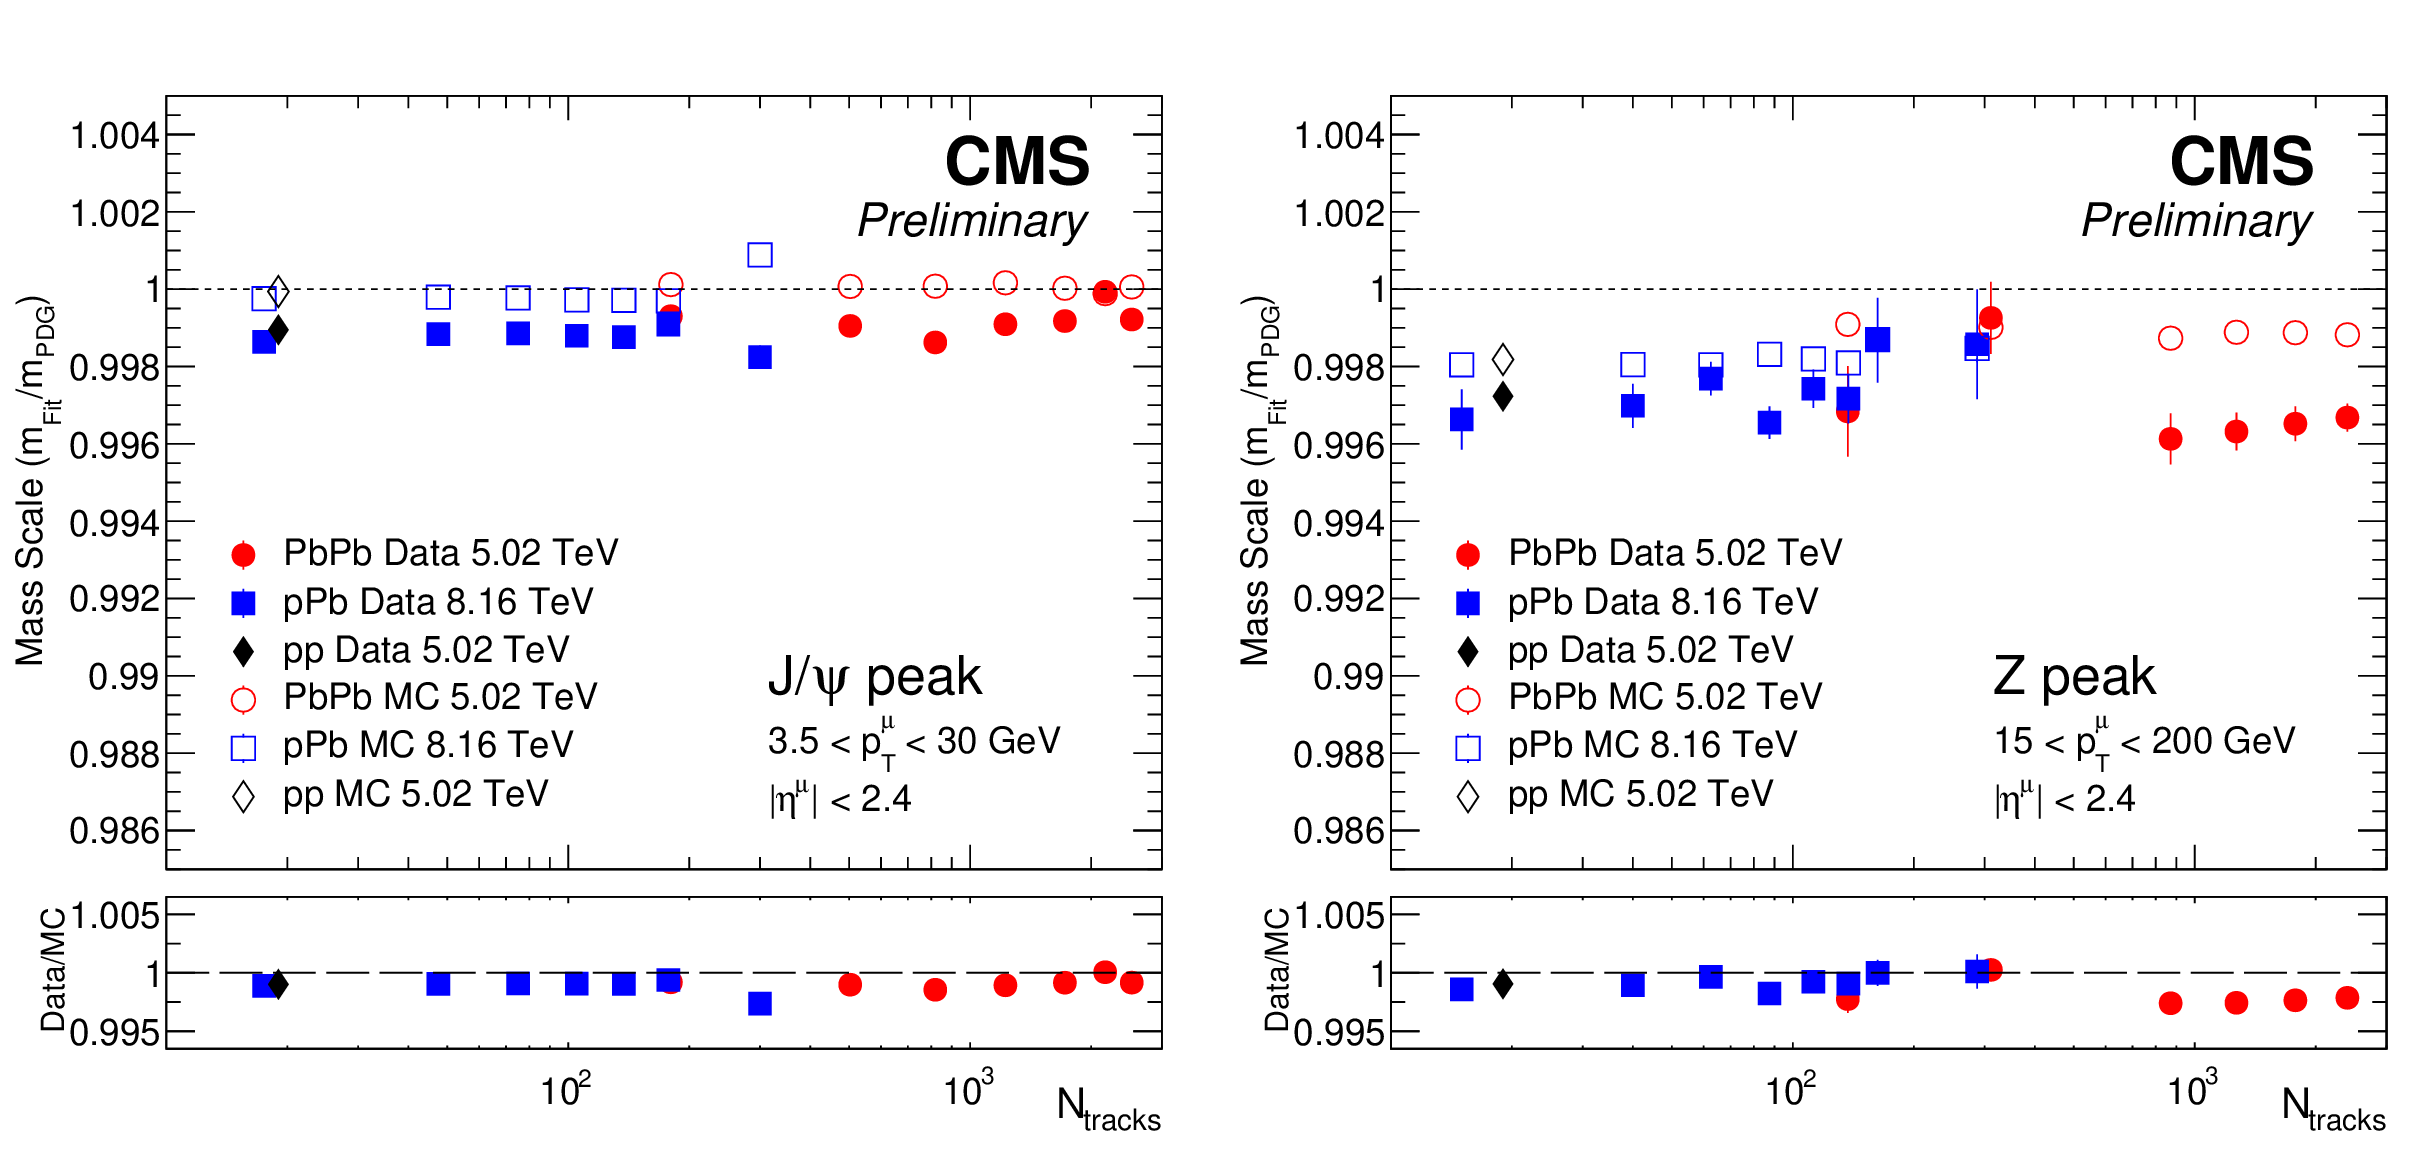
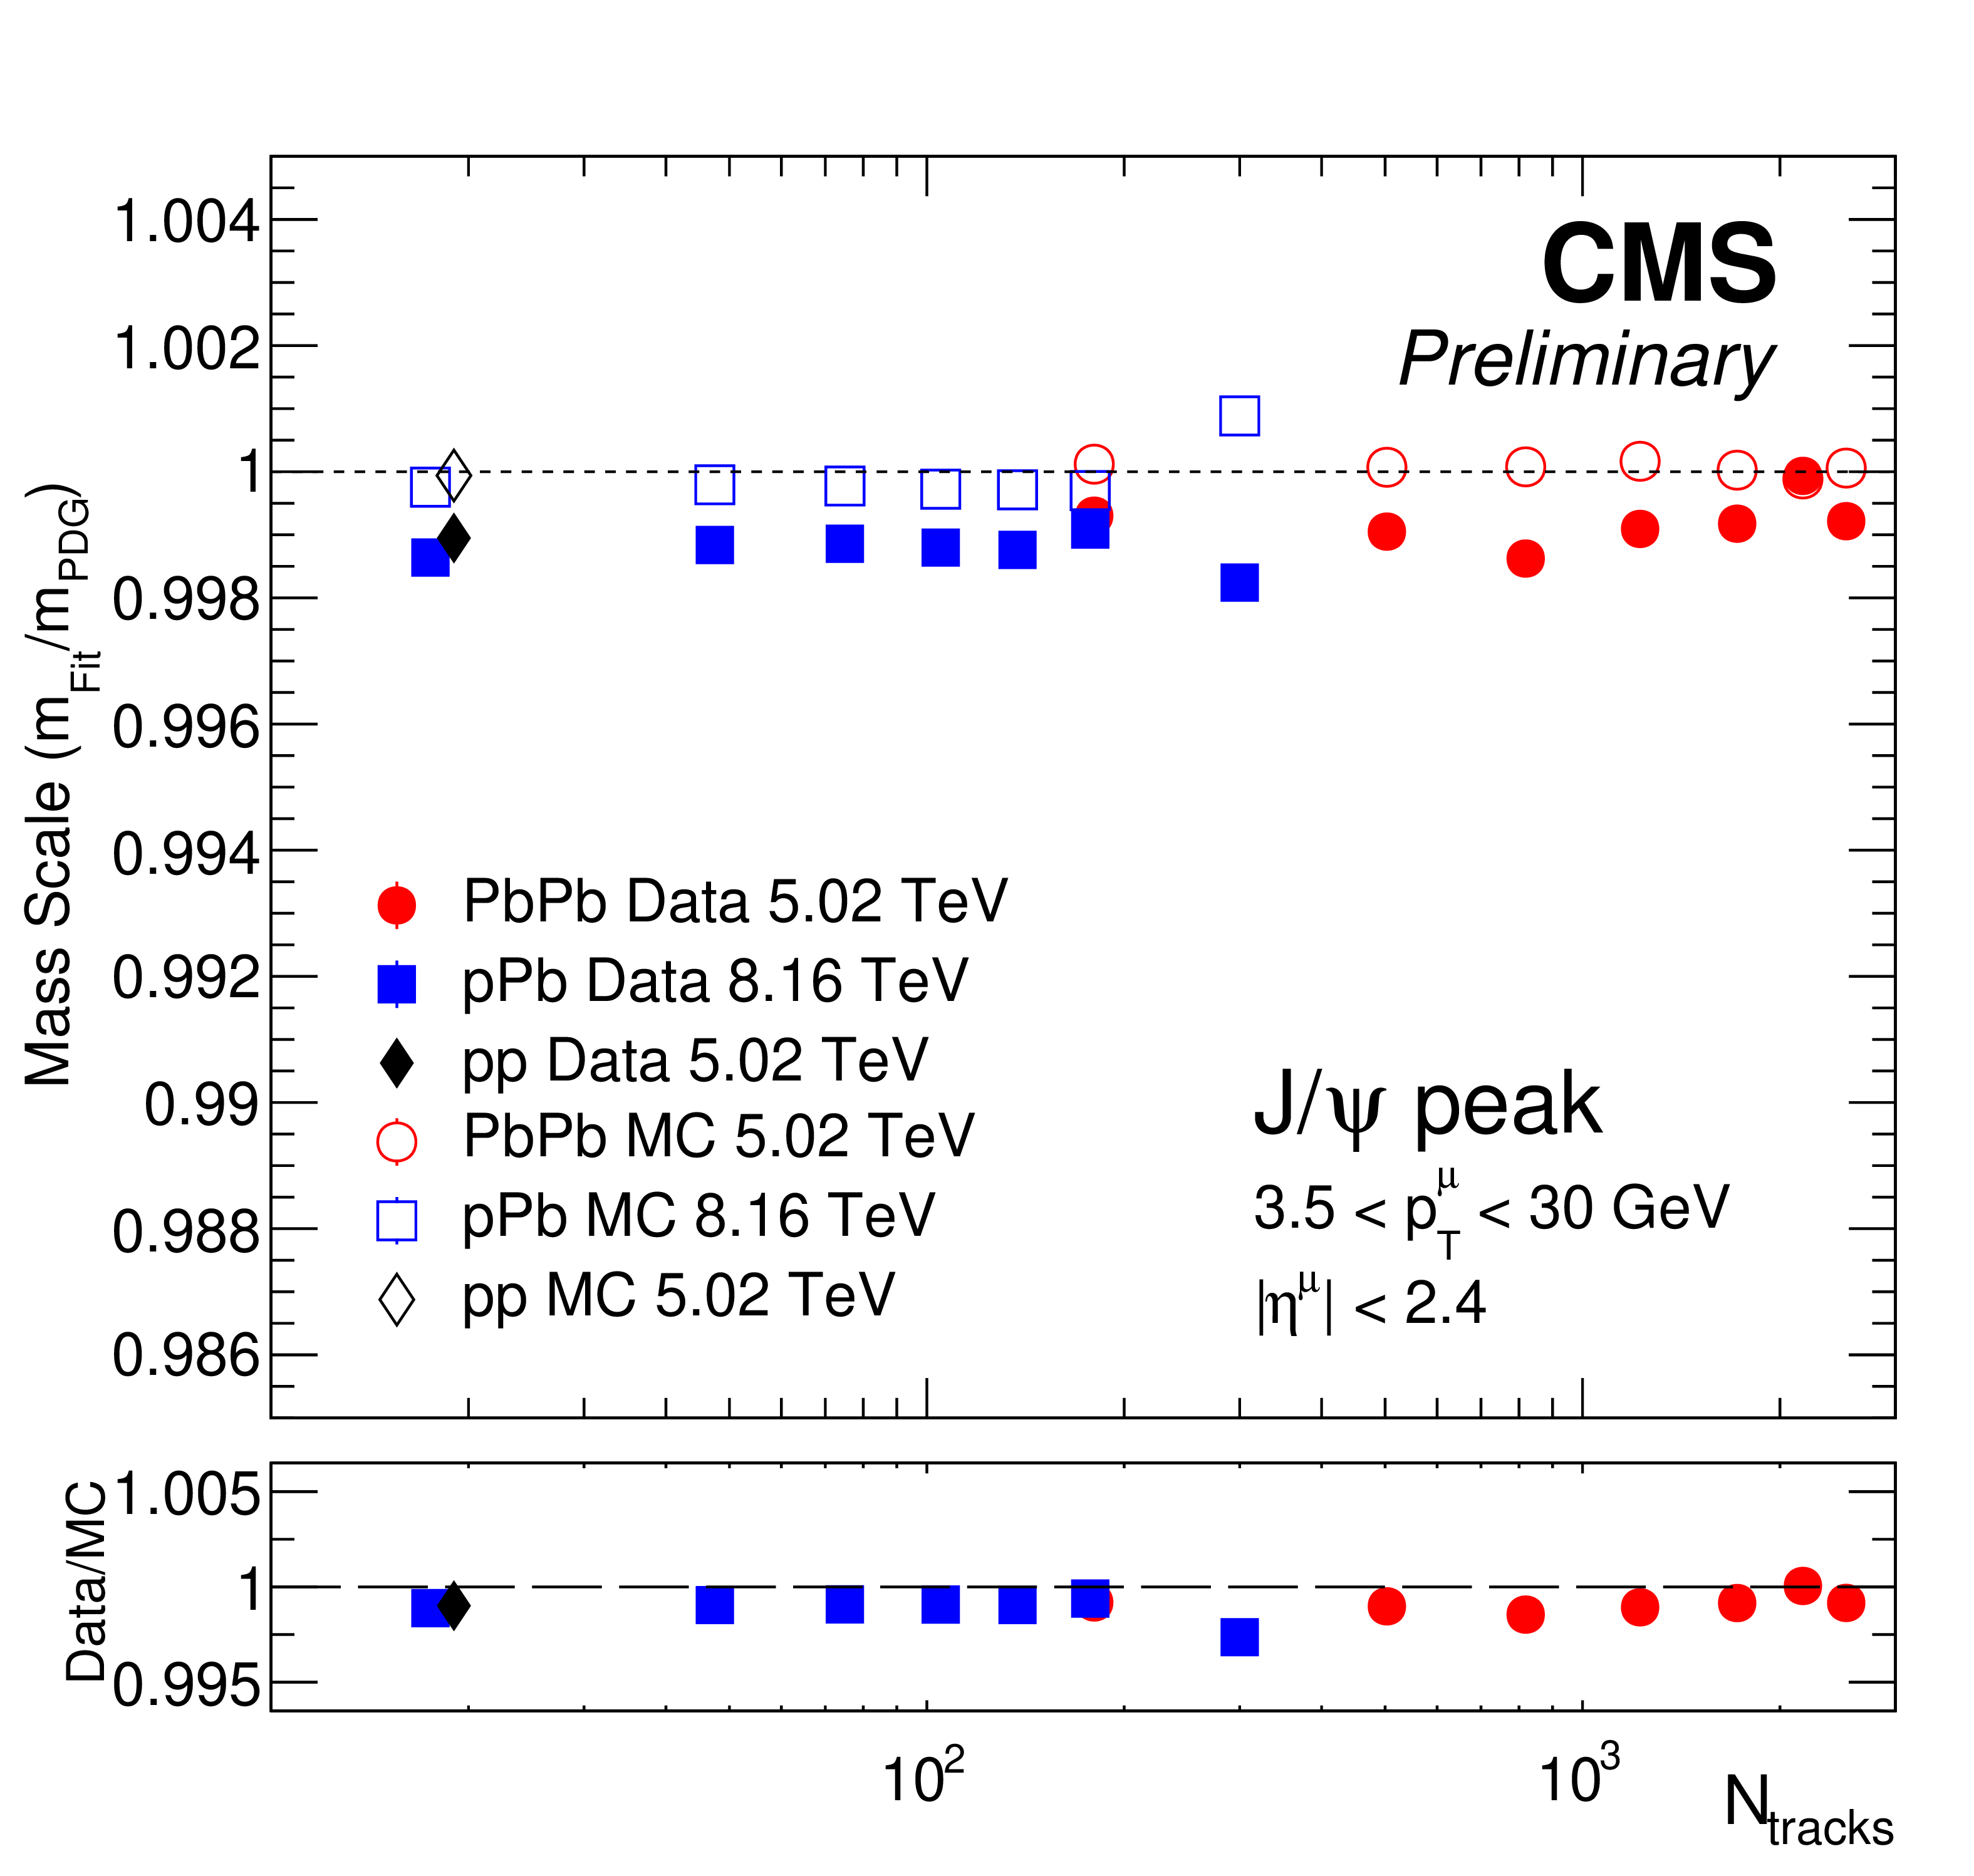
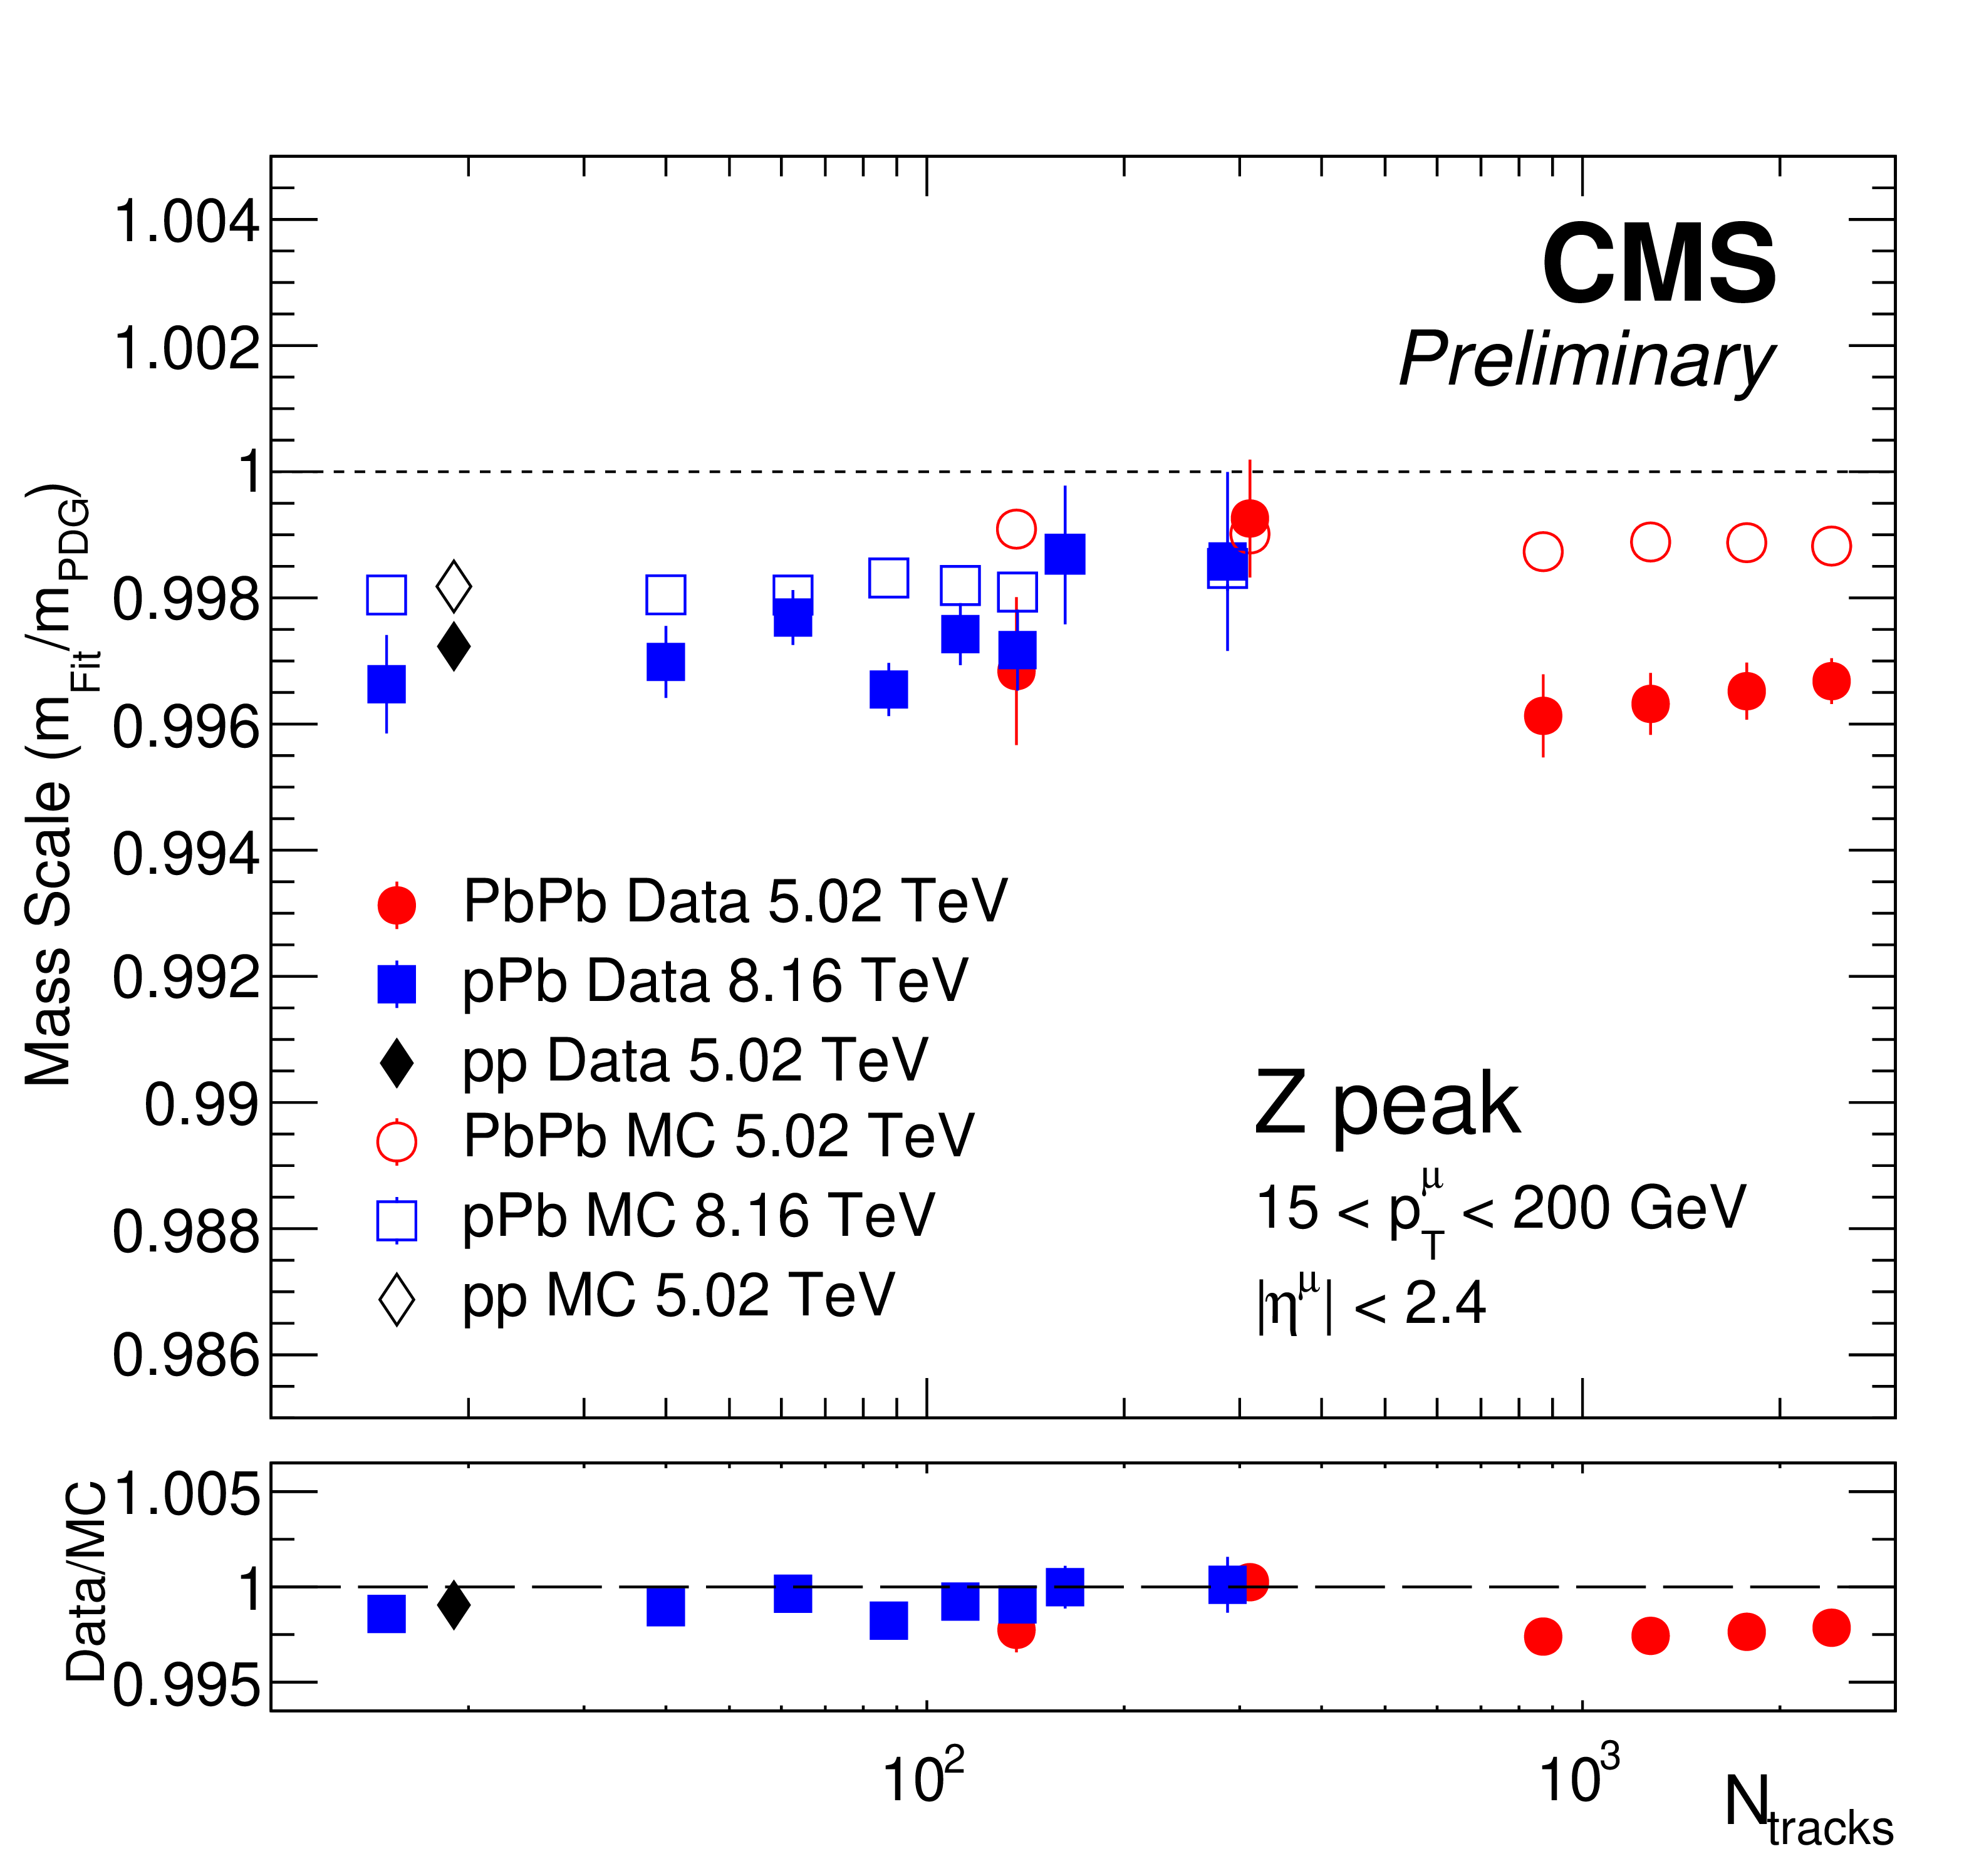
Mass scale at the $ \mathrm{J}/\psi $ (left) and Z (right) peaks as a function of the number of tracks from MC simulations (open points) and real data (closed points) in pp, pPb, and PbPb collisions, calculated as the measured mass $ m_{\textrm{Fit}} $ divided by the PDG mass $ m_{\textrm{PDG}} $. Only statistical uncertainties are shown. |
png pdf |
Figure 14-a:
Mass scale at the $ \mathrm{J}/\psi $ (left) and Z (right) peaks as a function of the number of tracks from MC simulations (open points) and real data (closed points) in pp, pPb, and PbPb collisions, calculated as the measured mass $ m_{\textrm{Fit}} $ divided by the PDG mass $ m_{\textrm{PDG}} $. Only statistical uncertainties are shown. |
png pdf |
Figure 14-b:
Mass scale at the $ \mathrm{J}/\psi $ (left) and Z (right) peaks as a function of the number of tracks from MC simulations (open points) and real data (closed points) in pp, pPb, and PbPb collisions, calculated as the measured mass $ m_{\textrm{Fit}} $ divided by the PDG mass $ m_{\textrm{PDG}} $. Only statistical uncertainties are shown. |
png pdf |
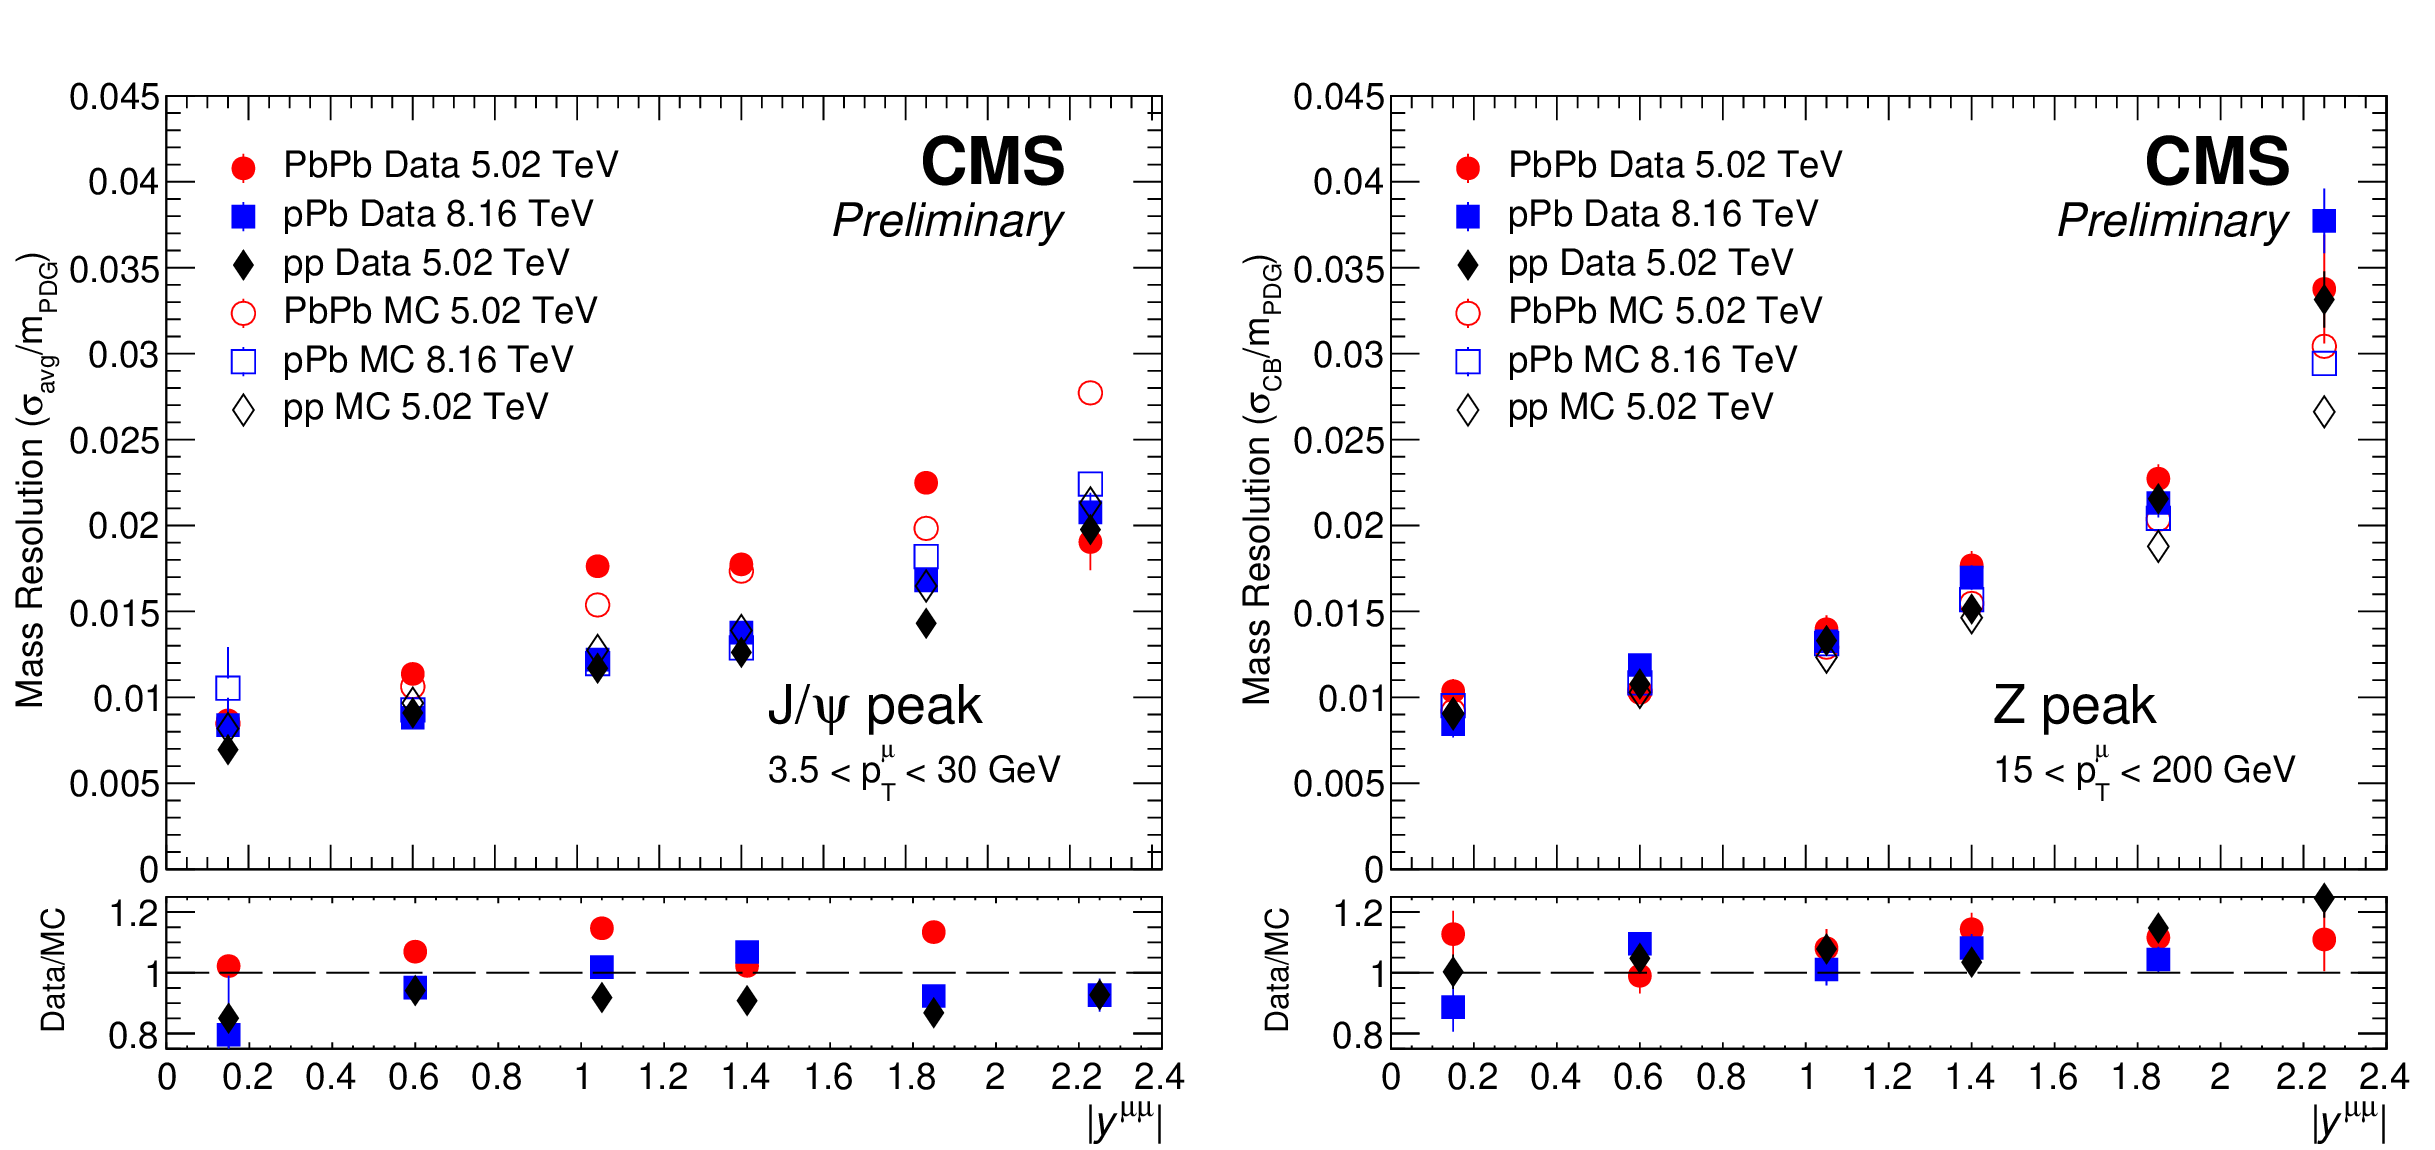
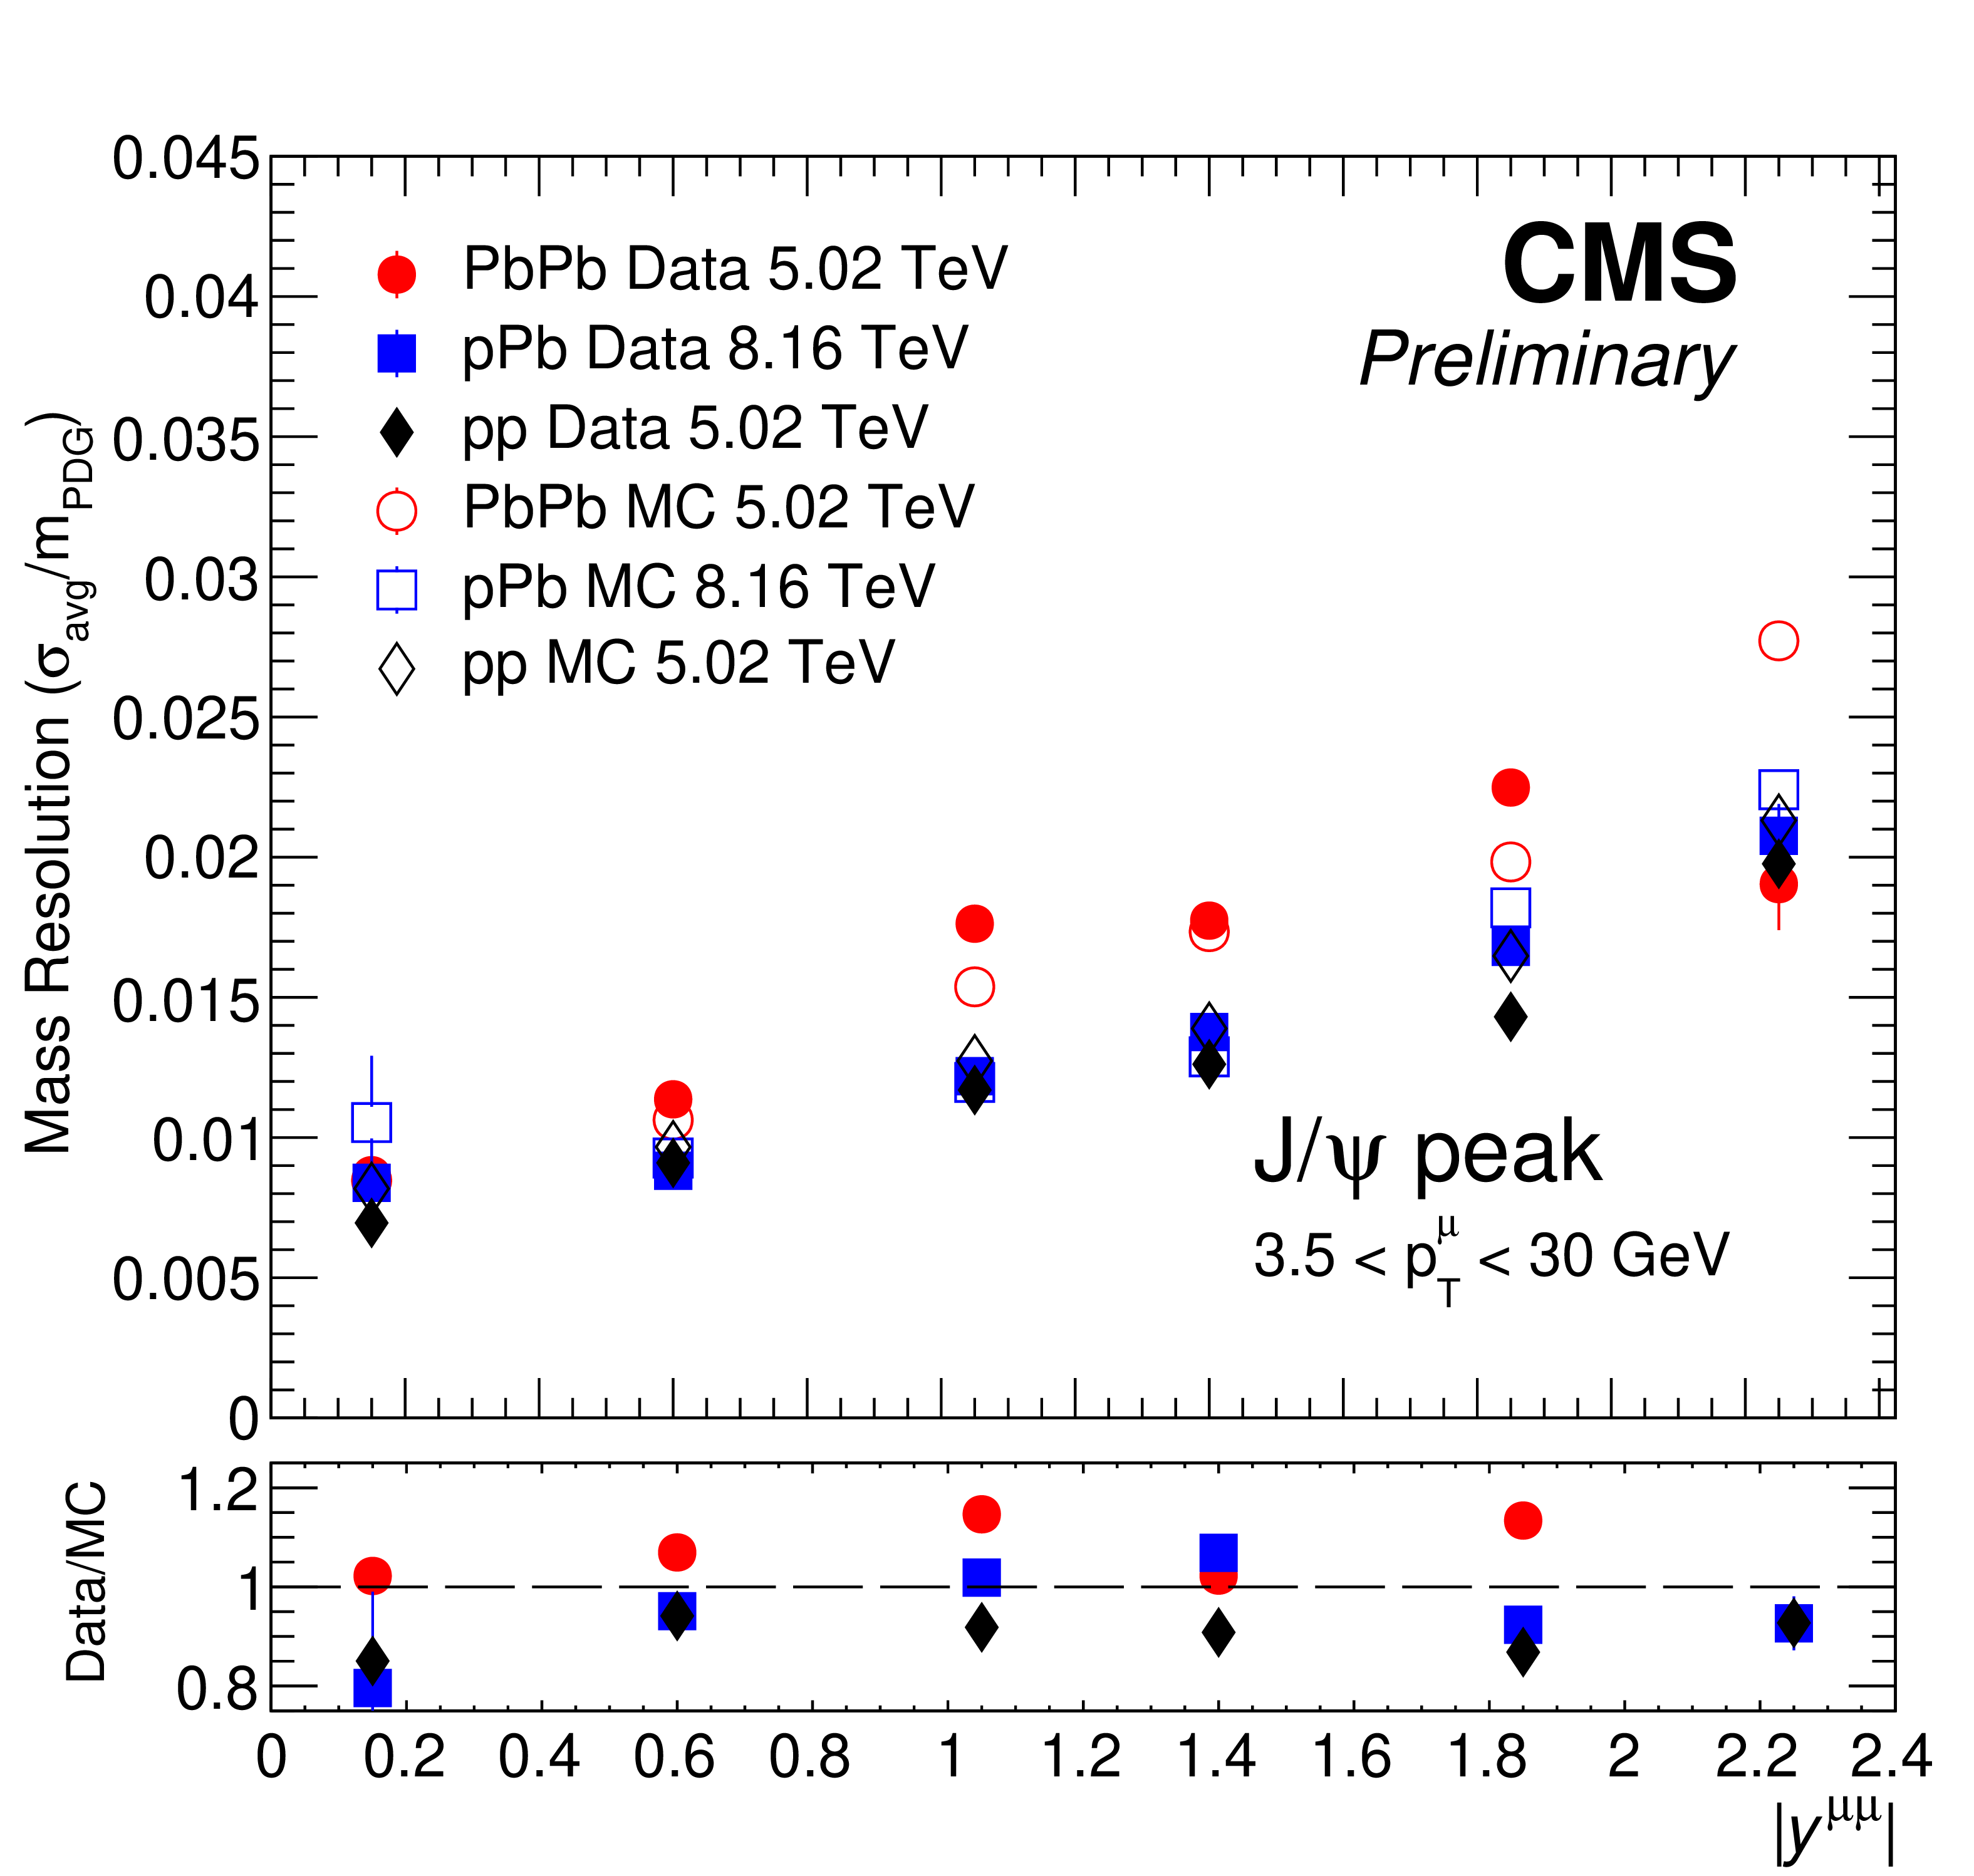
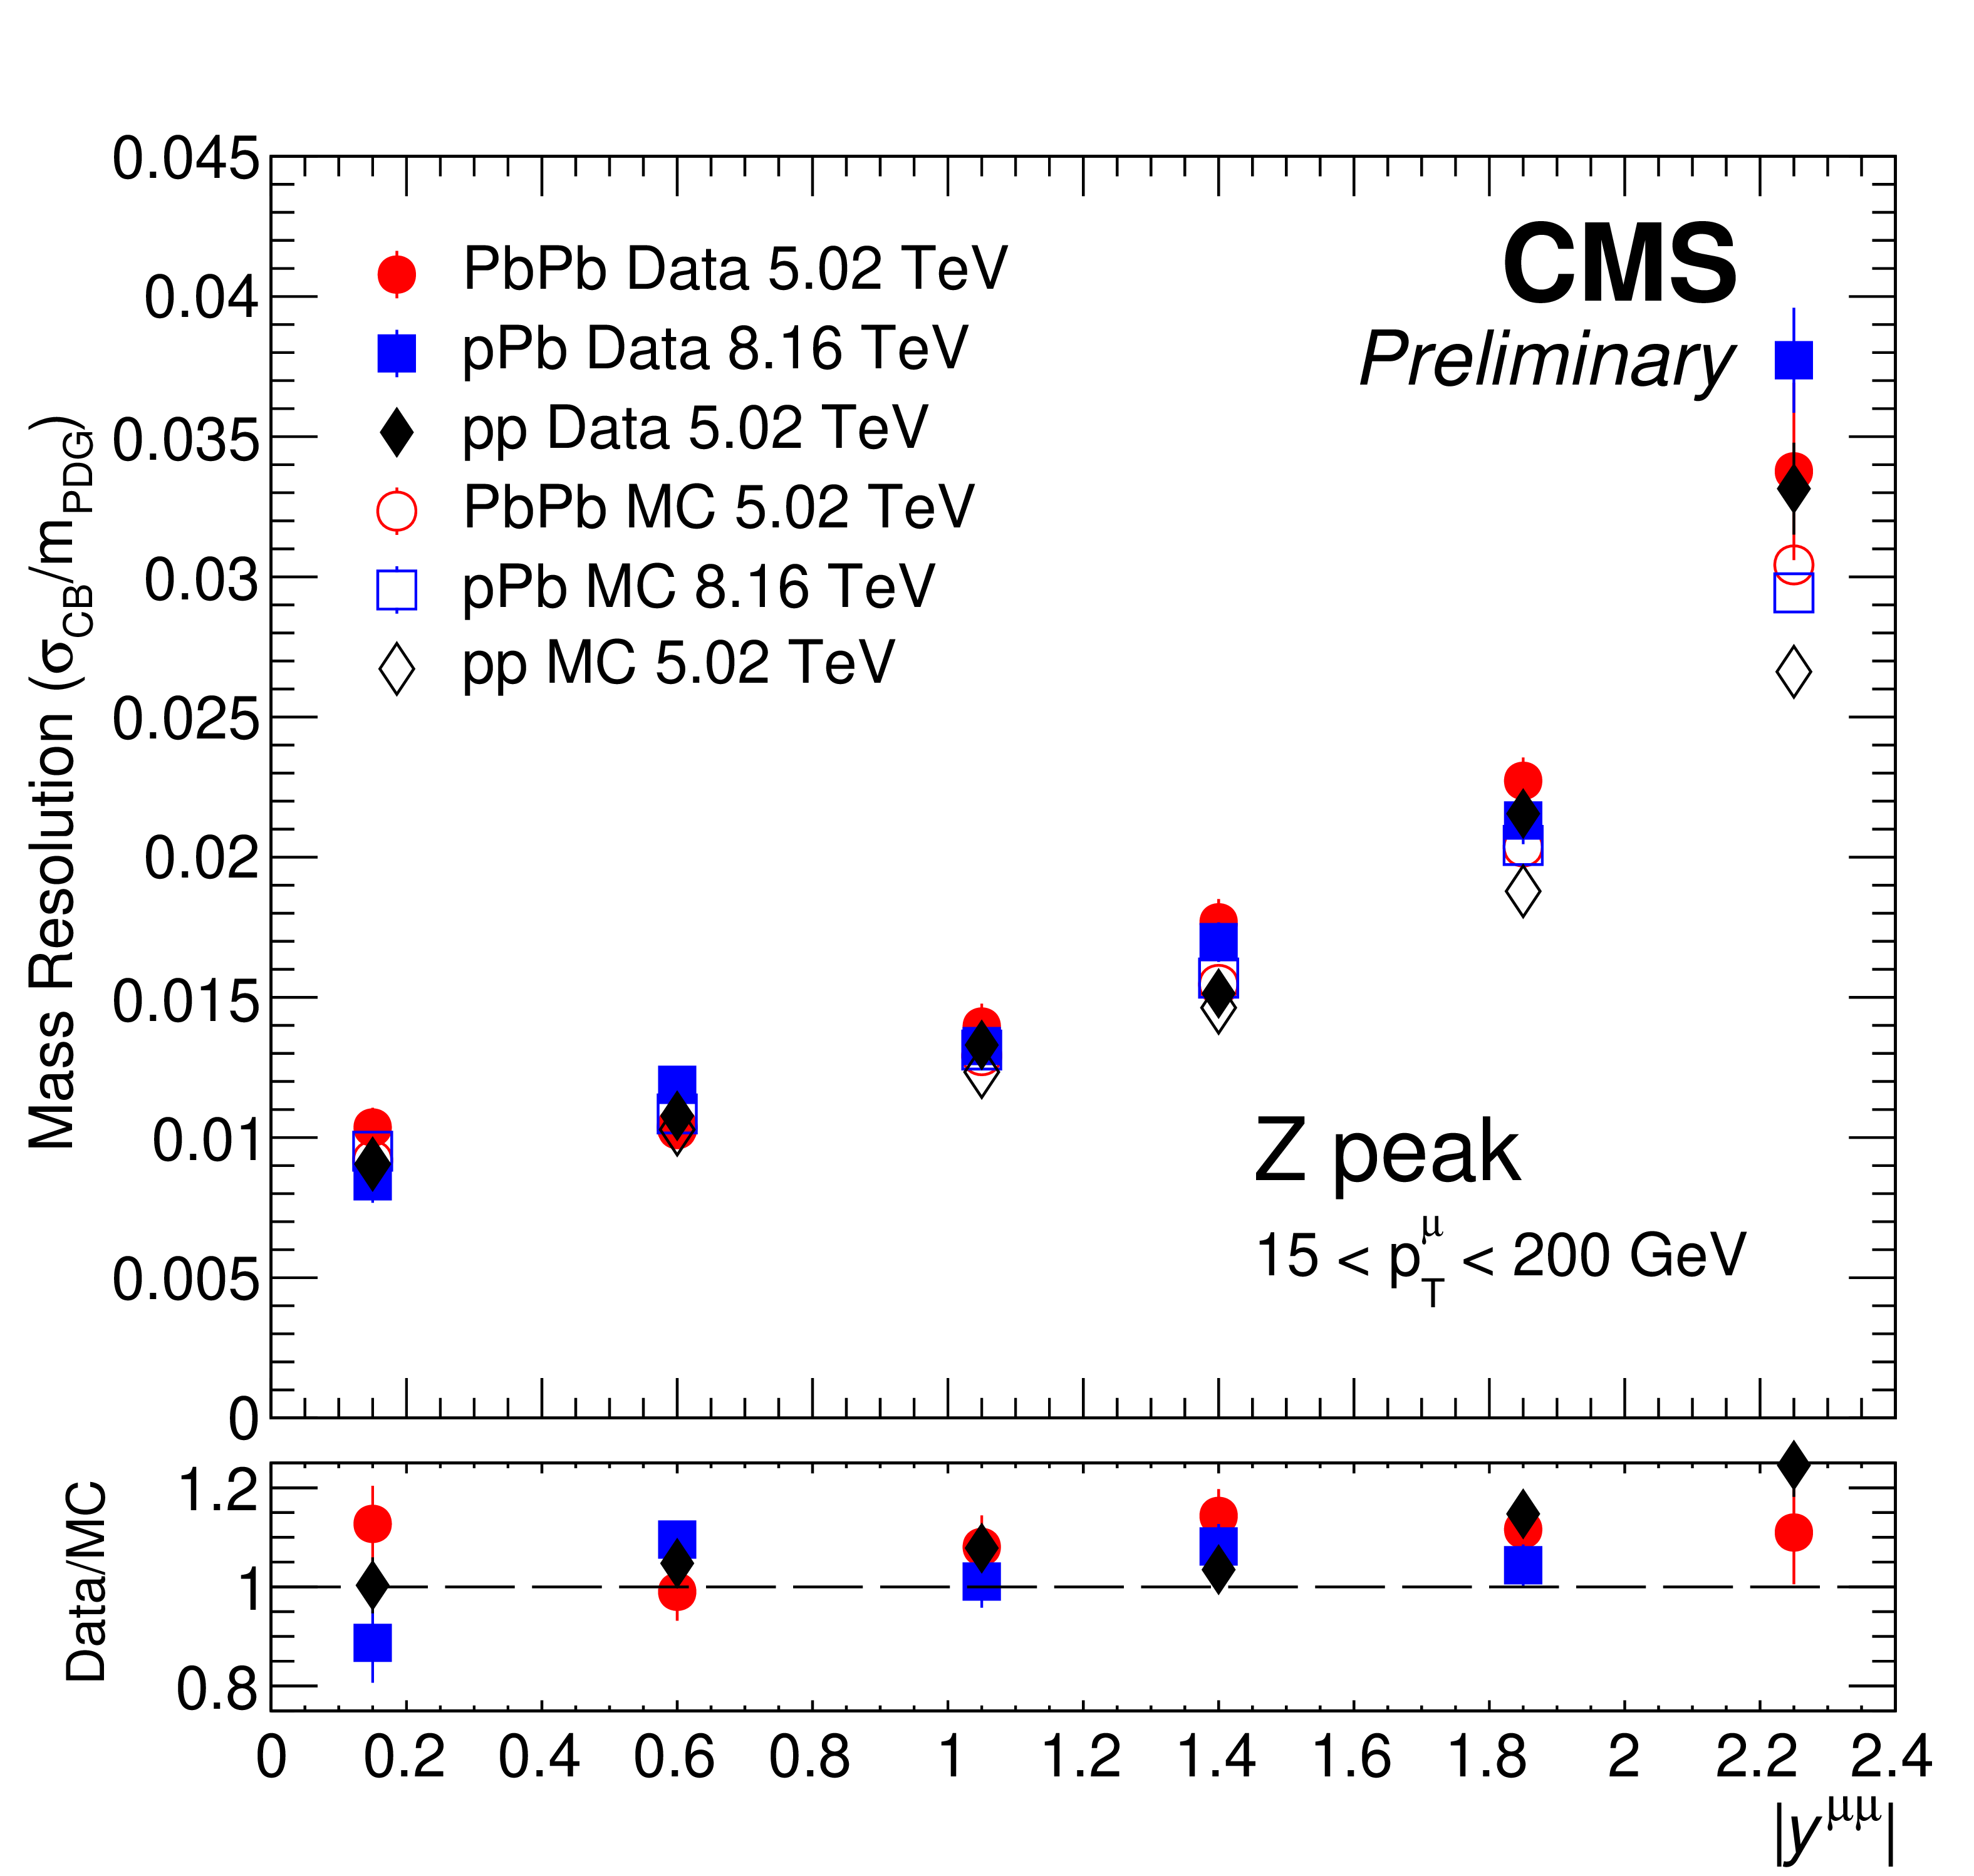
Figure 15:
Mass resolution at the $ \mathrm{J}/\psi $ (left) and Z (right) peaks as a function of $ |y^{\mu\mu}| $ from MC simulations (open points) and real data (closed points) in pp, pPb, and PbPb collisions. Only statistical uncertainties are shown. |
png pdf |
Figure 15-a:
Mass resolution at the $ \mathrm{J}/\psi $ (left) and Z (right) peaks as a function of $ |y^{\mu\mu}| $ from MC simulations (open points) and real data (closed points) in pp, pPb, and PbPb collisions. Only statistical uncertainties are shown. |
png pdf |
Figure 15-b:
Mass resolution at the $ \mathrm{J}/\psi $ (left) and Z (right) peaks as a function of $ |y^{\mu\mu}| $ from MC simulations (open points) and real data (closed points) in pp, pPb, and PbPb collisions. Only statistical uncertainties are shown. |
png pdf |
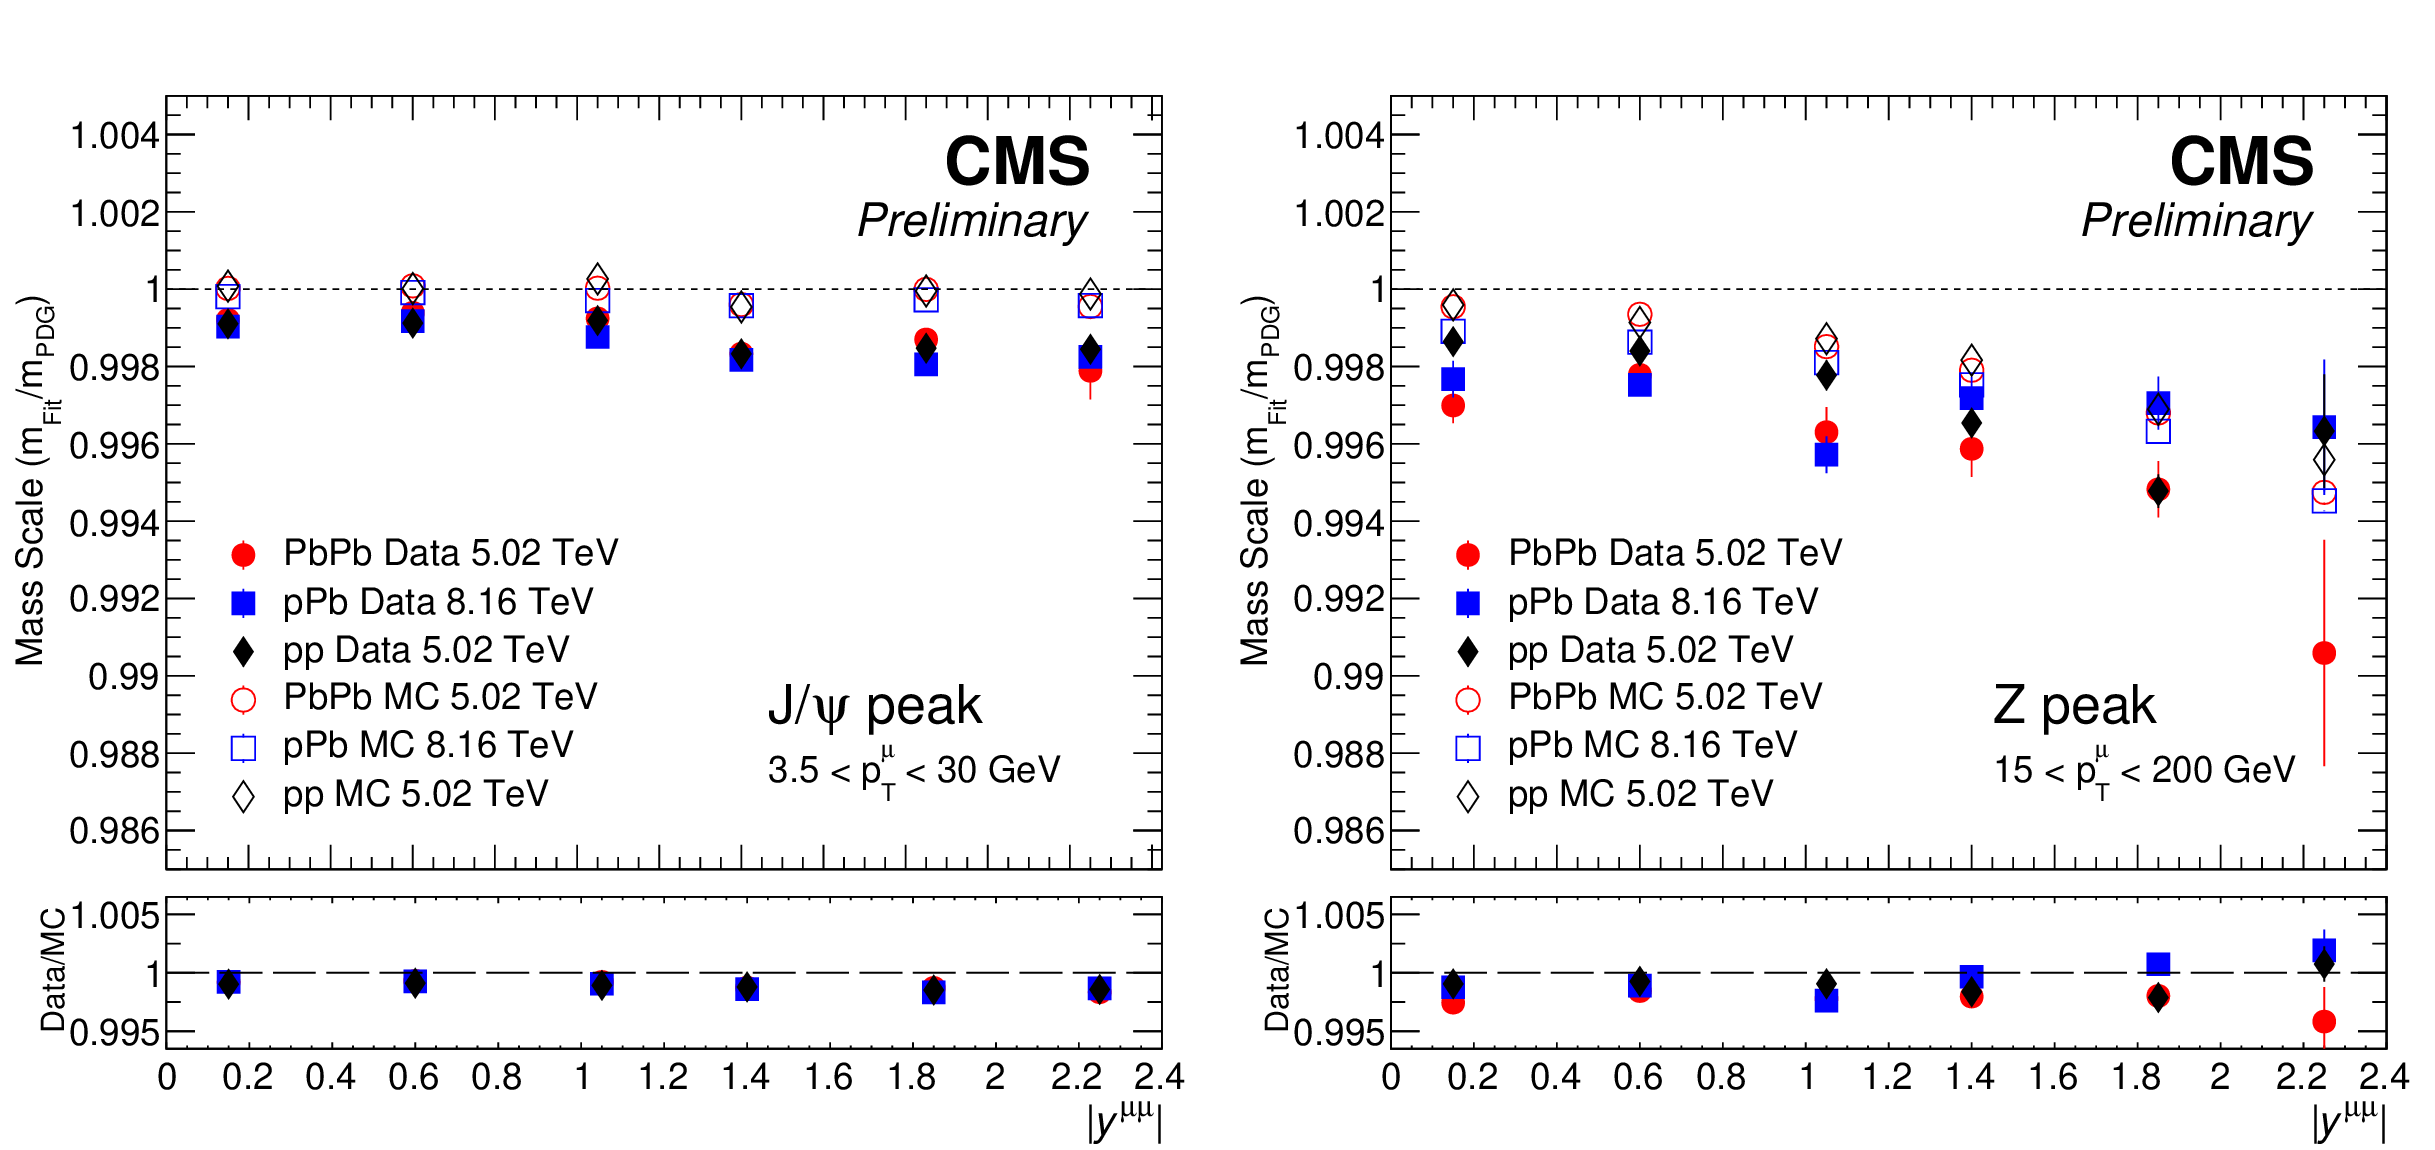
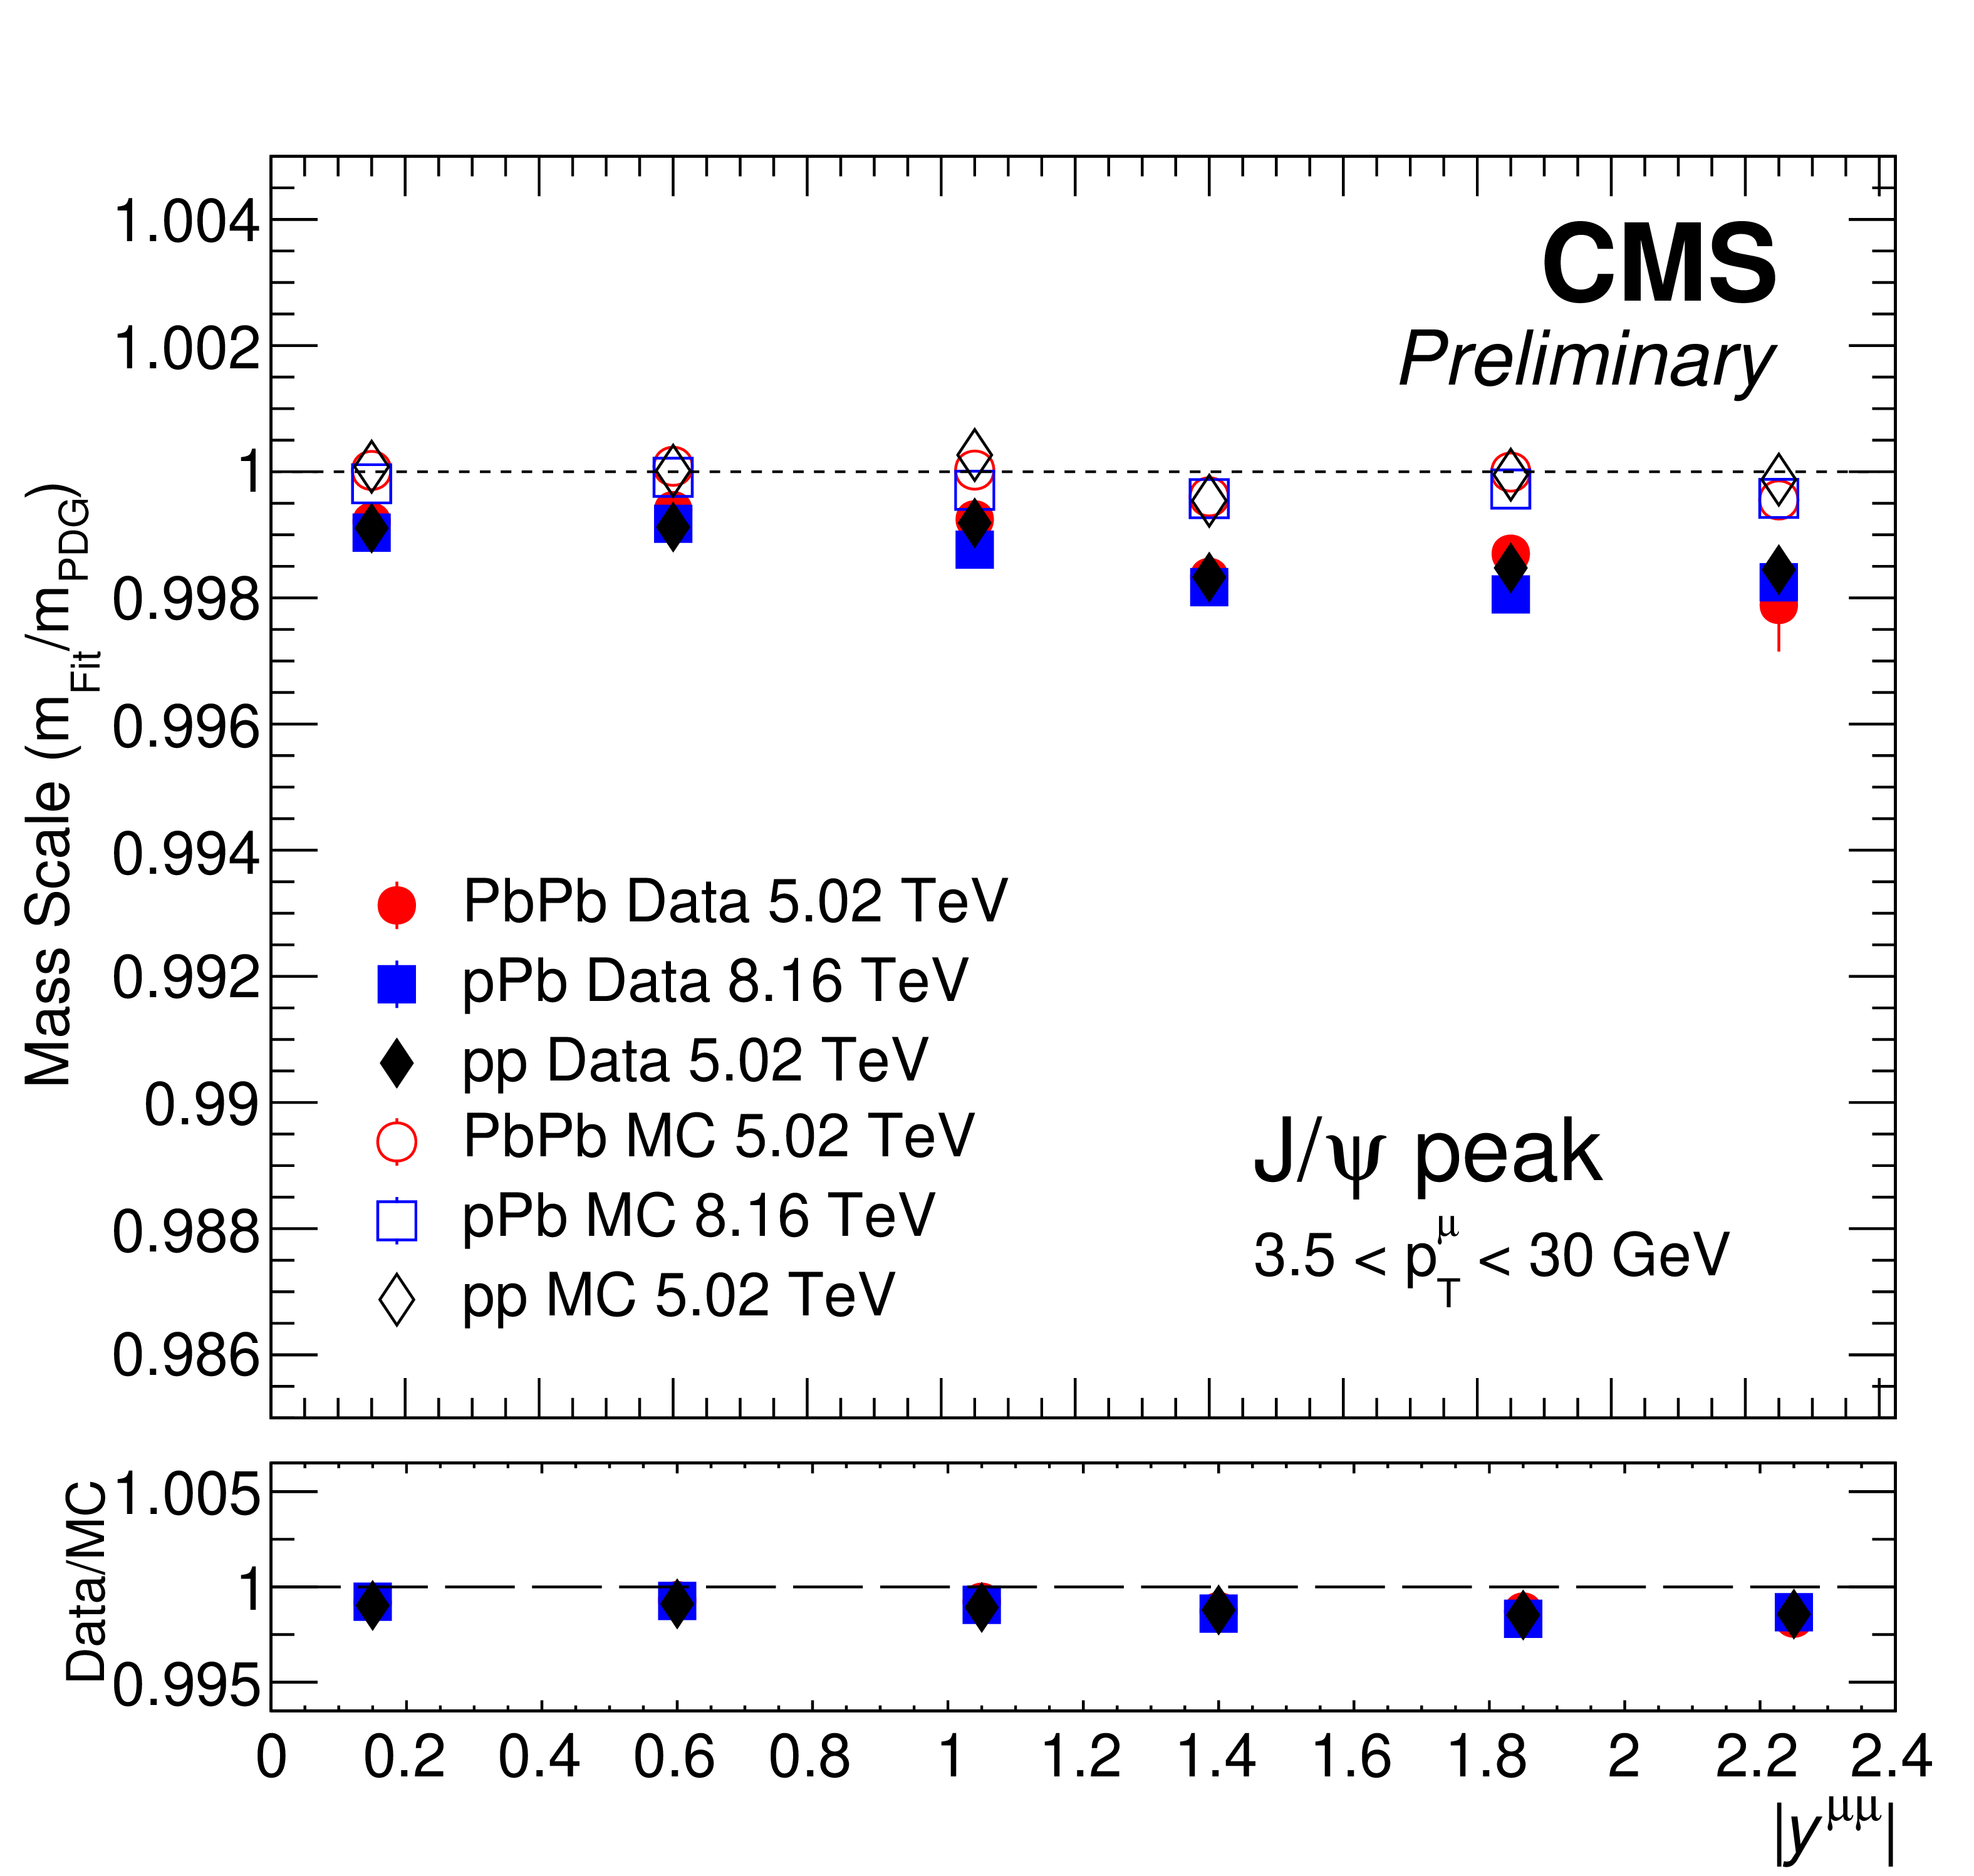
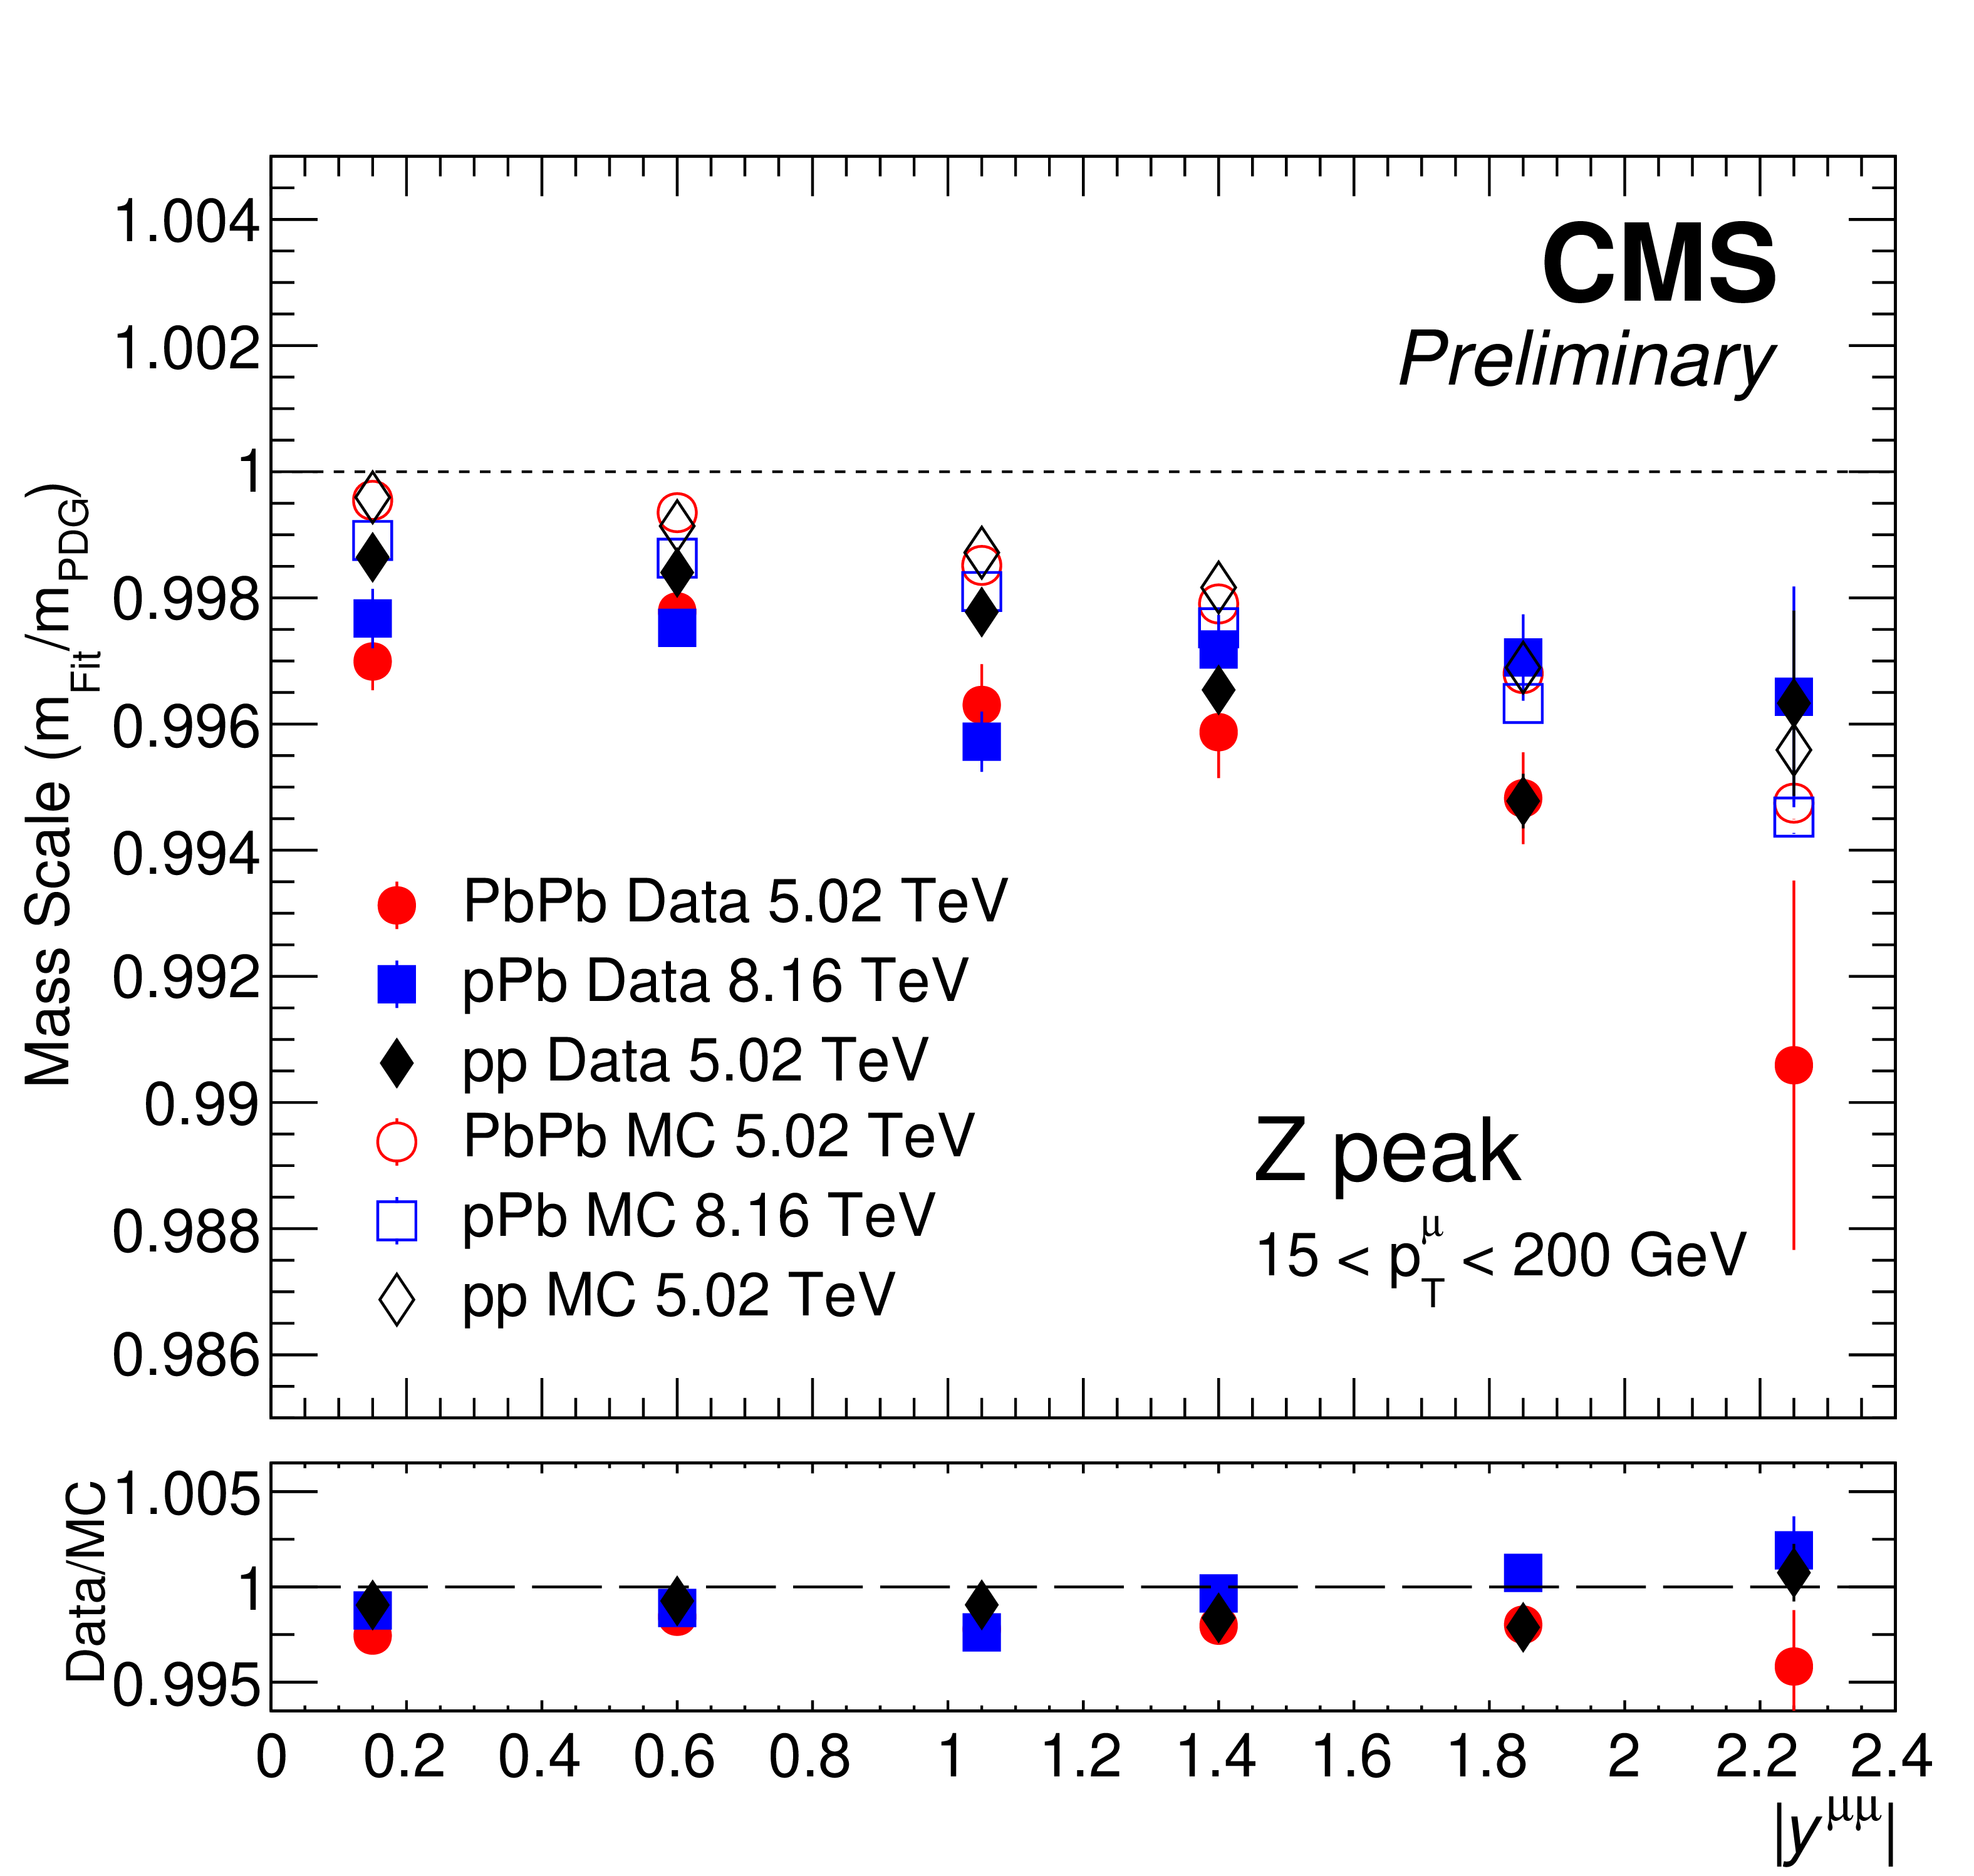
Figure 16:
Mass scale at the $ \mathrm{J}/\psi $ (left) and Z (right) peaks as a function of $ |y^{\mu\mu}| $ from MC simulations (open points) and real data (closed points) in pp, pPb, and PbPb collisions, calculated as the measured mass $ m_{\textrm{Fit}} $ divided by the PDG mass $ m_{\textrm{PDG}} $. Only statistical uncertainties are shown. |
png pdf |
Figure 16-a:
Mass scale at the $ \mathrm{J}/\psi $ (left) and Z (right) peaks as a function of $ |y^{\mu\mu}| $ from MC simulations (open points) and real data (closed points) in pp, pPb, and PbPb collisions, calculated as the measured mass $ m_{\textrm{Fit}} $ divided by the PDG mass $ m_{\textrm{PDG}} $. Only statistical uncertainties are shown. |
png pdf |
Figure 16-b:
Mass scale at the $ \mathrm{J}/\psi $ (left) and Z (right) peaks as a function of $ |y^{\mu\mu}| $ from MC simulations (open points) and real data (closed points) in pp, pPb, and PbPb collisions, calculated as the measured mass $ m_{\textrm{Fit}} $ divided by the PDG mass $ m_{\textrm{PDG}} $. Only statistical uncertainties are shown. |
png pdf |
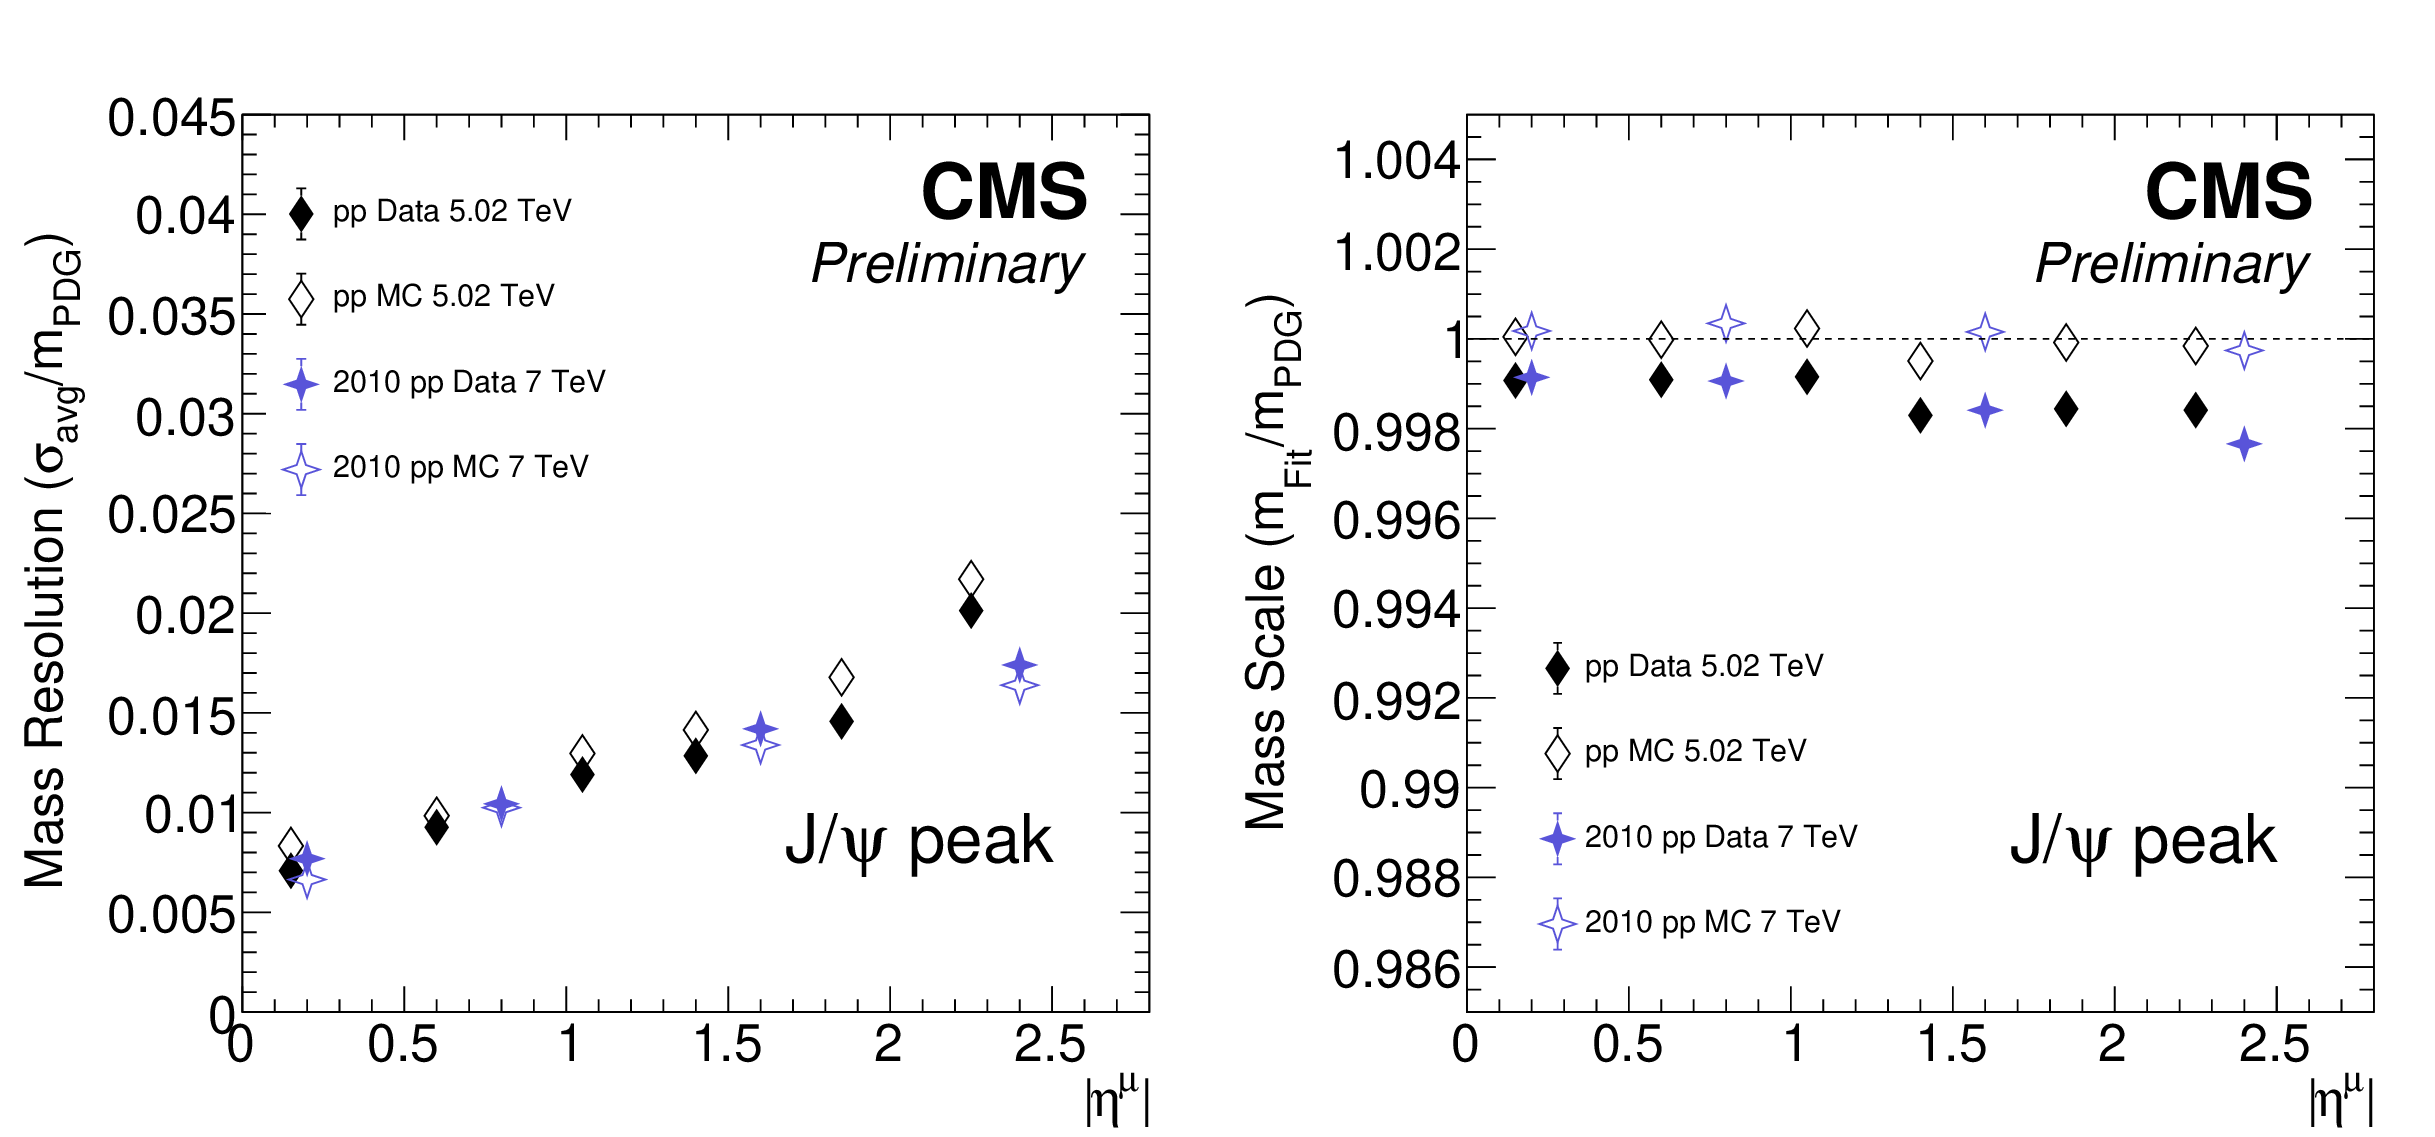
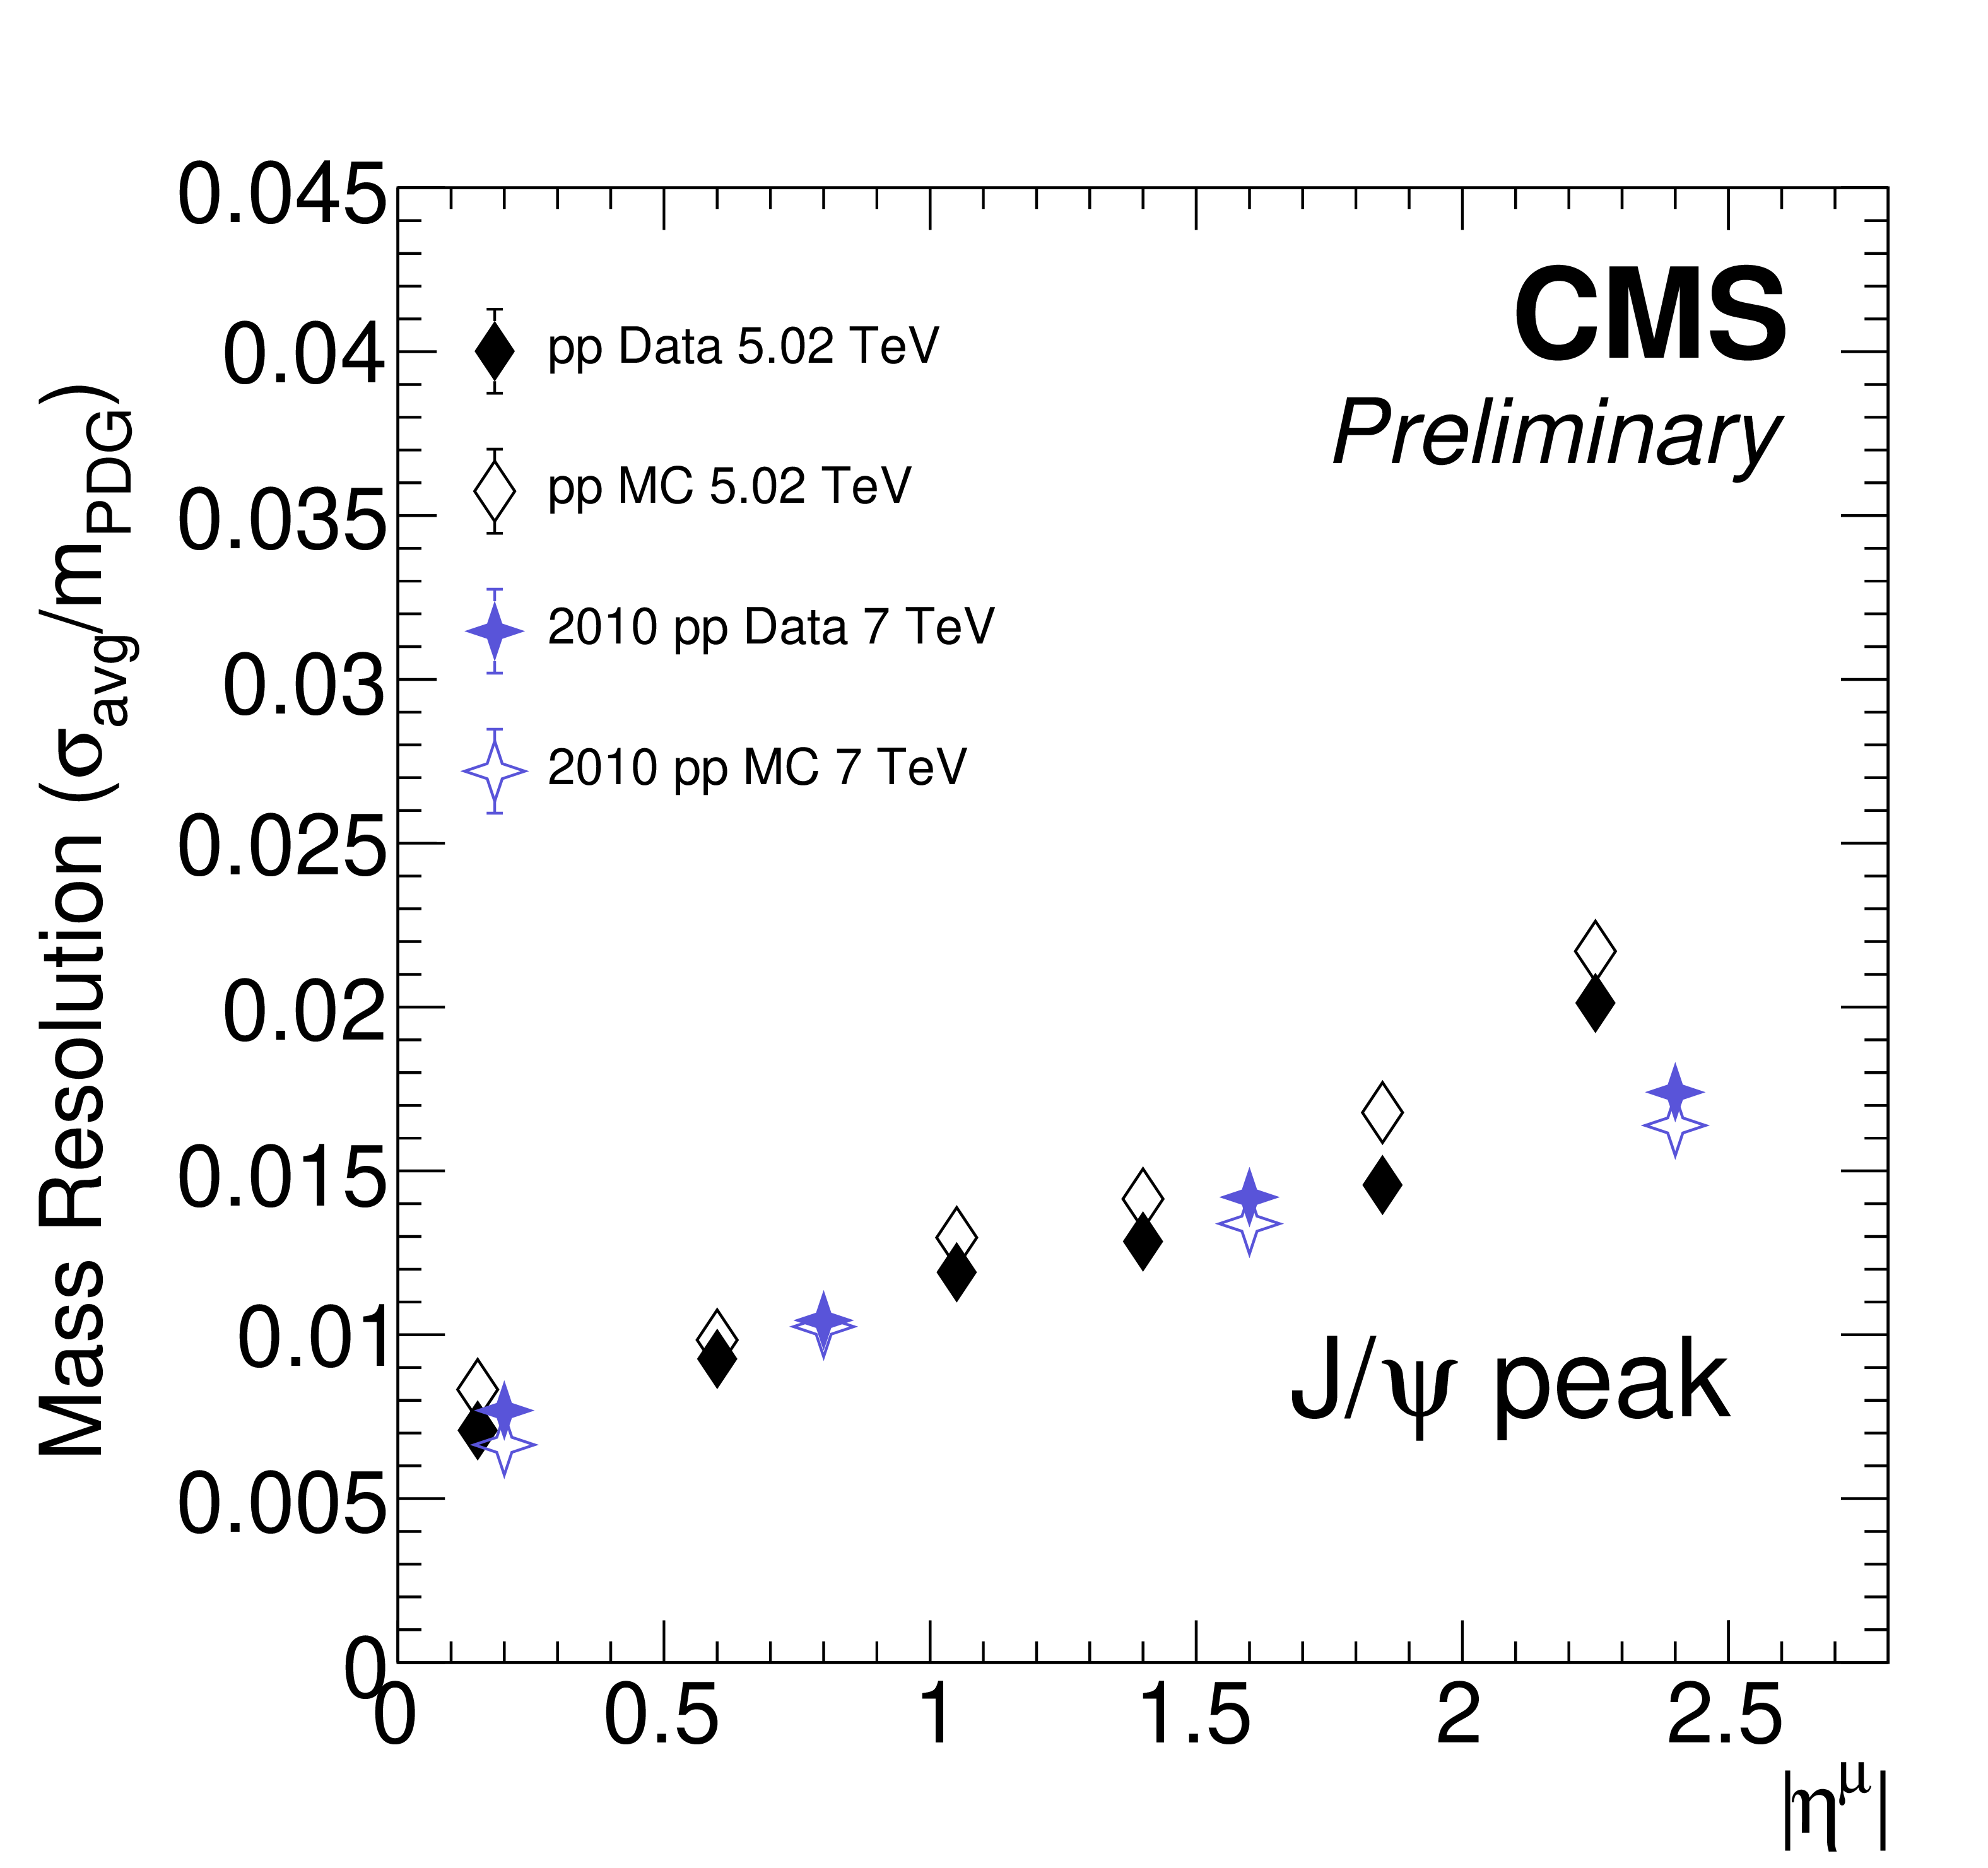
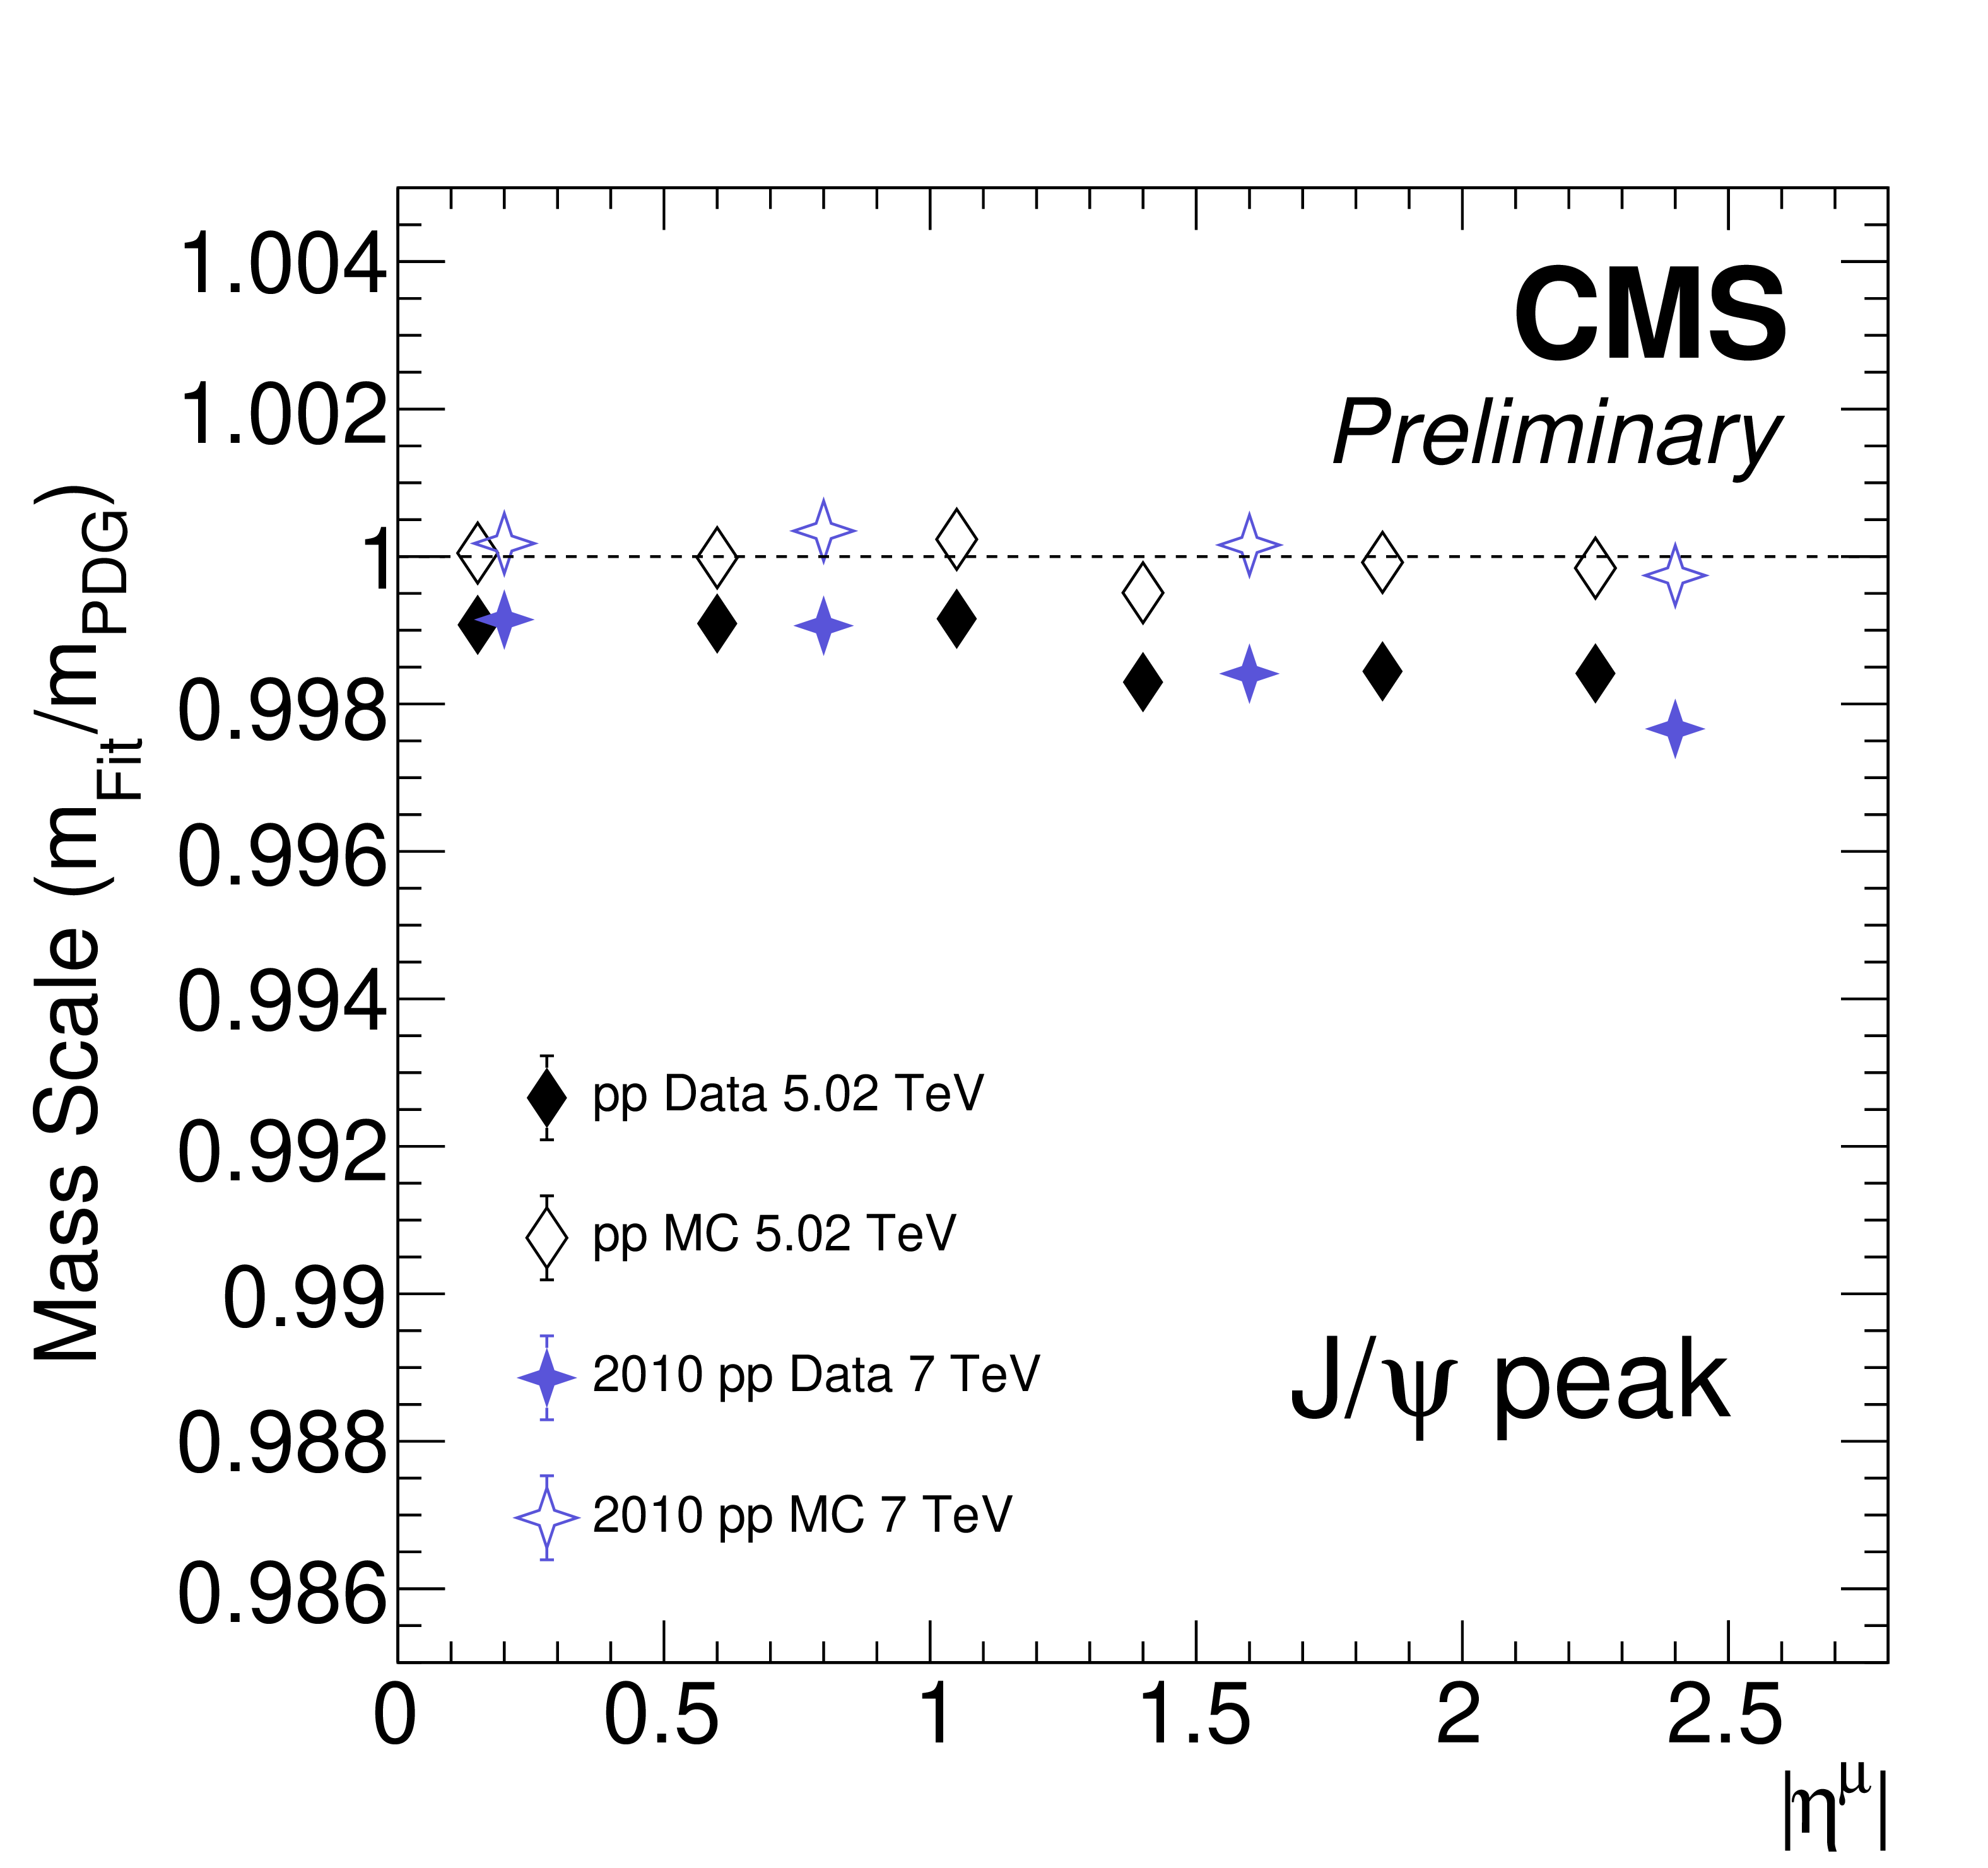
Figure 17:
Mass resolution (left) and mass scale (right) versus the probe muon pseudorapidity $ |\eta^\mu| $ at the $ \mathrm{J}/\psi $ peak in pp collisions. The solid colored points are real data and the open points are MC simulations. Our results (black diamonds) are compared to measurements from a previous pp analysis done at $ \sqrt{s}= $ 7 TeV (purple crosses) [30]. Only statistical uncertainties are shown. |
png pdf |
Figure 17-a:
Mass resolution (left) and mass scale (right) versus the probe muon pseudorapidity $ |\eta^\mu| $ at the $ \mathrm{J}/\psi $ peak in pp collisions. The solid colored points are real data and the open points are MC simulations. Our results (black diamonds) are compared to measurements from a previous pp analysis done at $ \sqrt{s}= $ 7 TeV (purple crosses) [30]. Only statistical uncertainties are shown. |
png pdf |
Figure 17-b:
Mass resolution (left) and mass scale (right) versus the probe muon pseudorapidity $ |\eta^\mu| $ at the $ \mathrm{J}/\psi $ peak in pp collisions. The solid colored points are real data and the open points are MC simulations. Our results (black diamonds) are compared to measurements from a previous pp analysis done at $ \sqrt{s}= $ 7 TeV (purple crosses) [30]. Only statistical uncertainties are shown. |
png pdf |
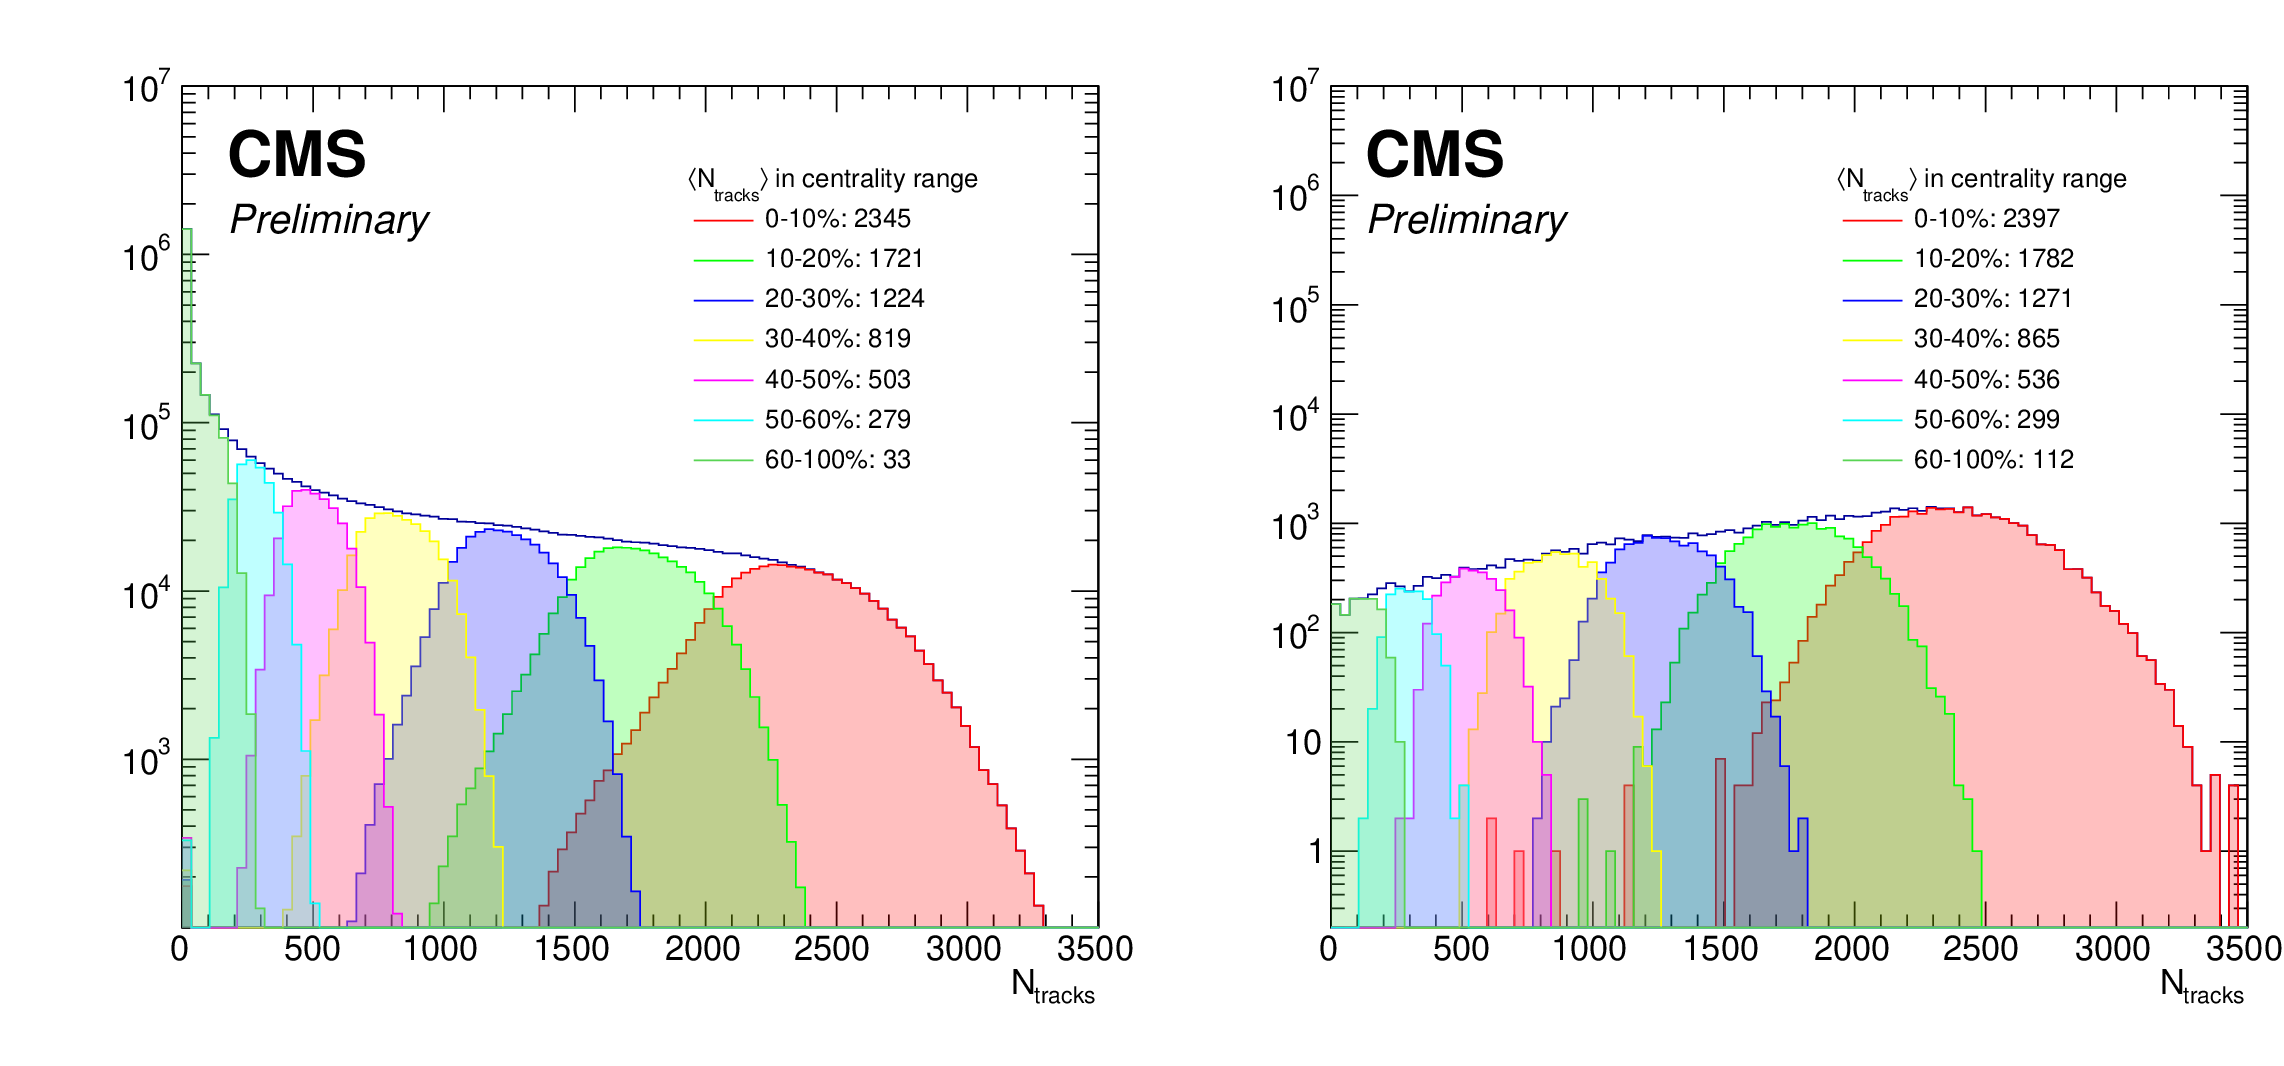
Figure 18:
Distributions of $ N_{\mathrm{tracks}} $ in the PbPb collisions for various ranges of centrality in a minimum bias data set (left) and a triggered data set (right). |
png pdf |
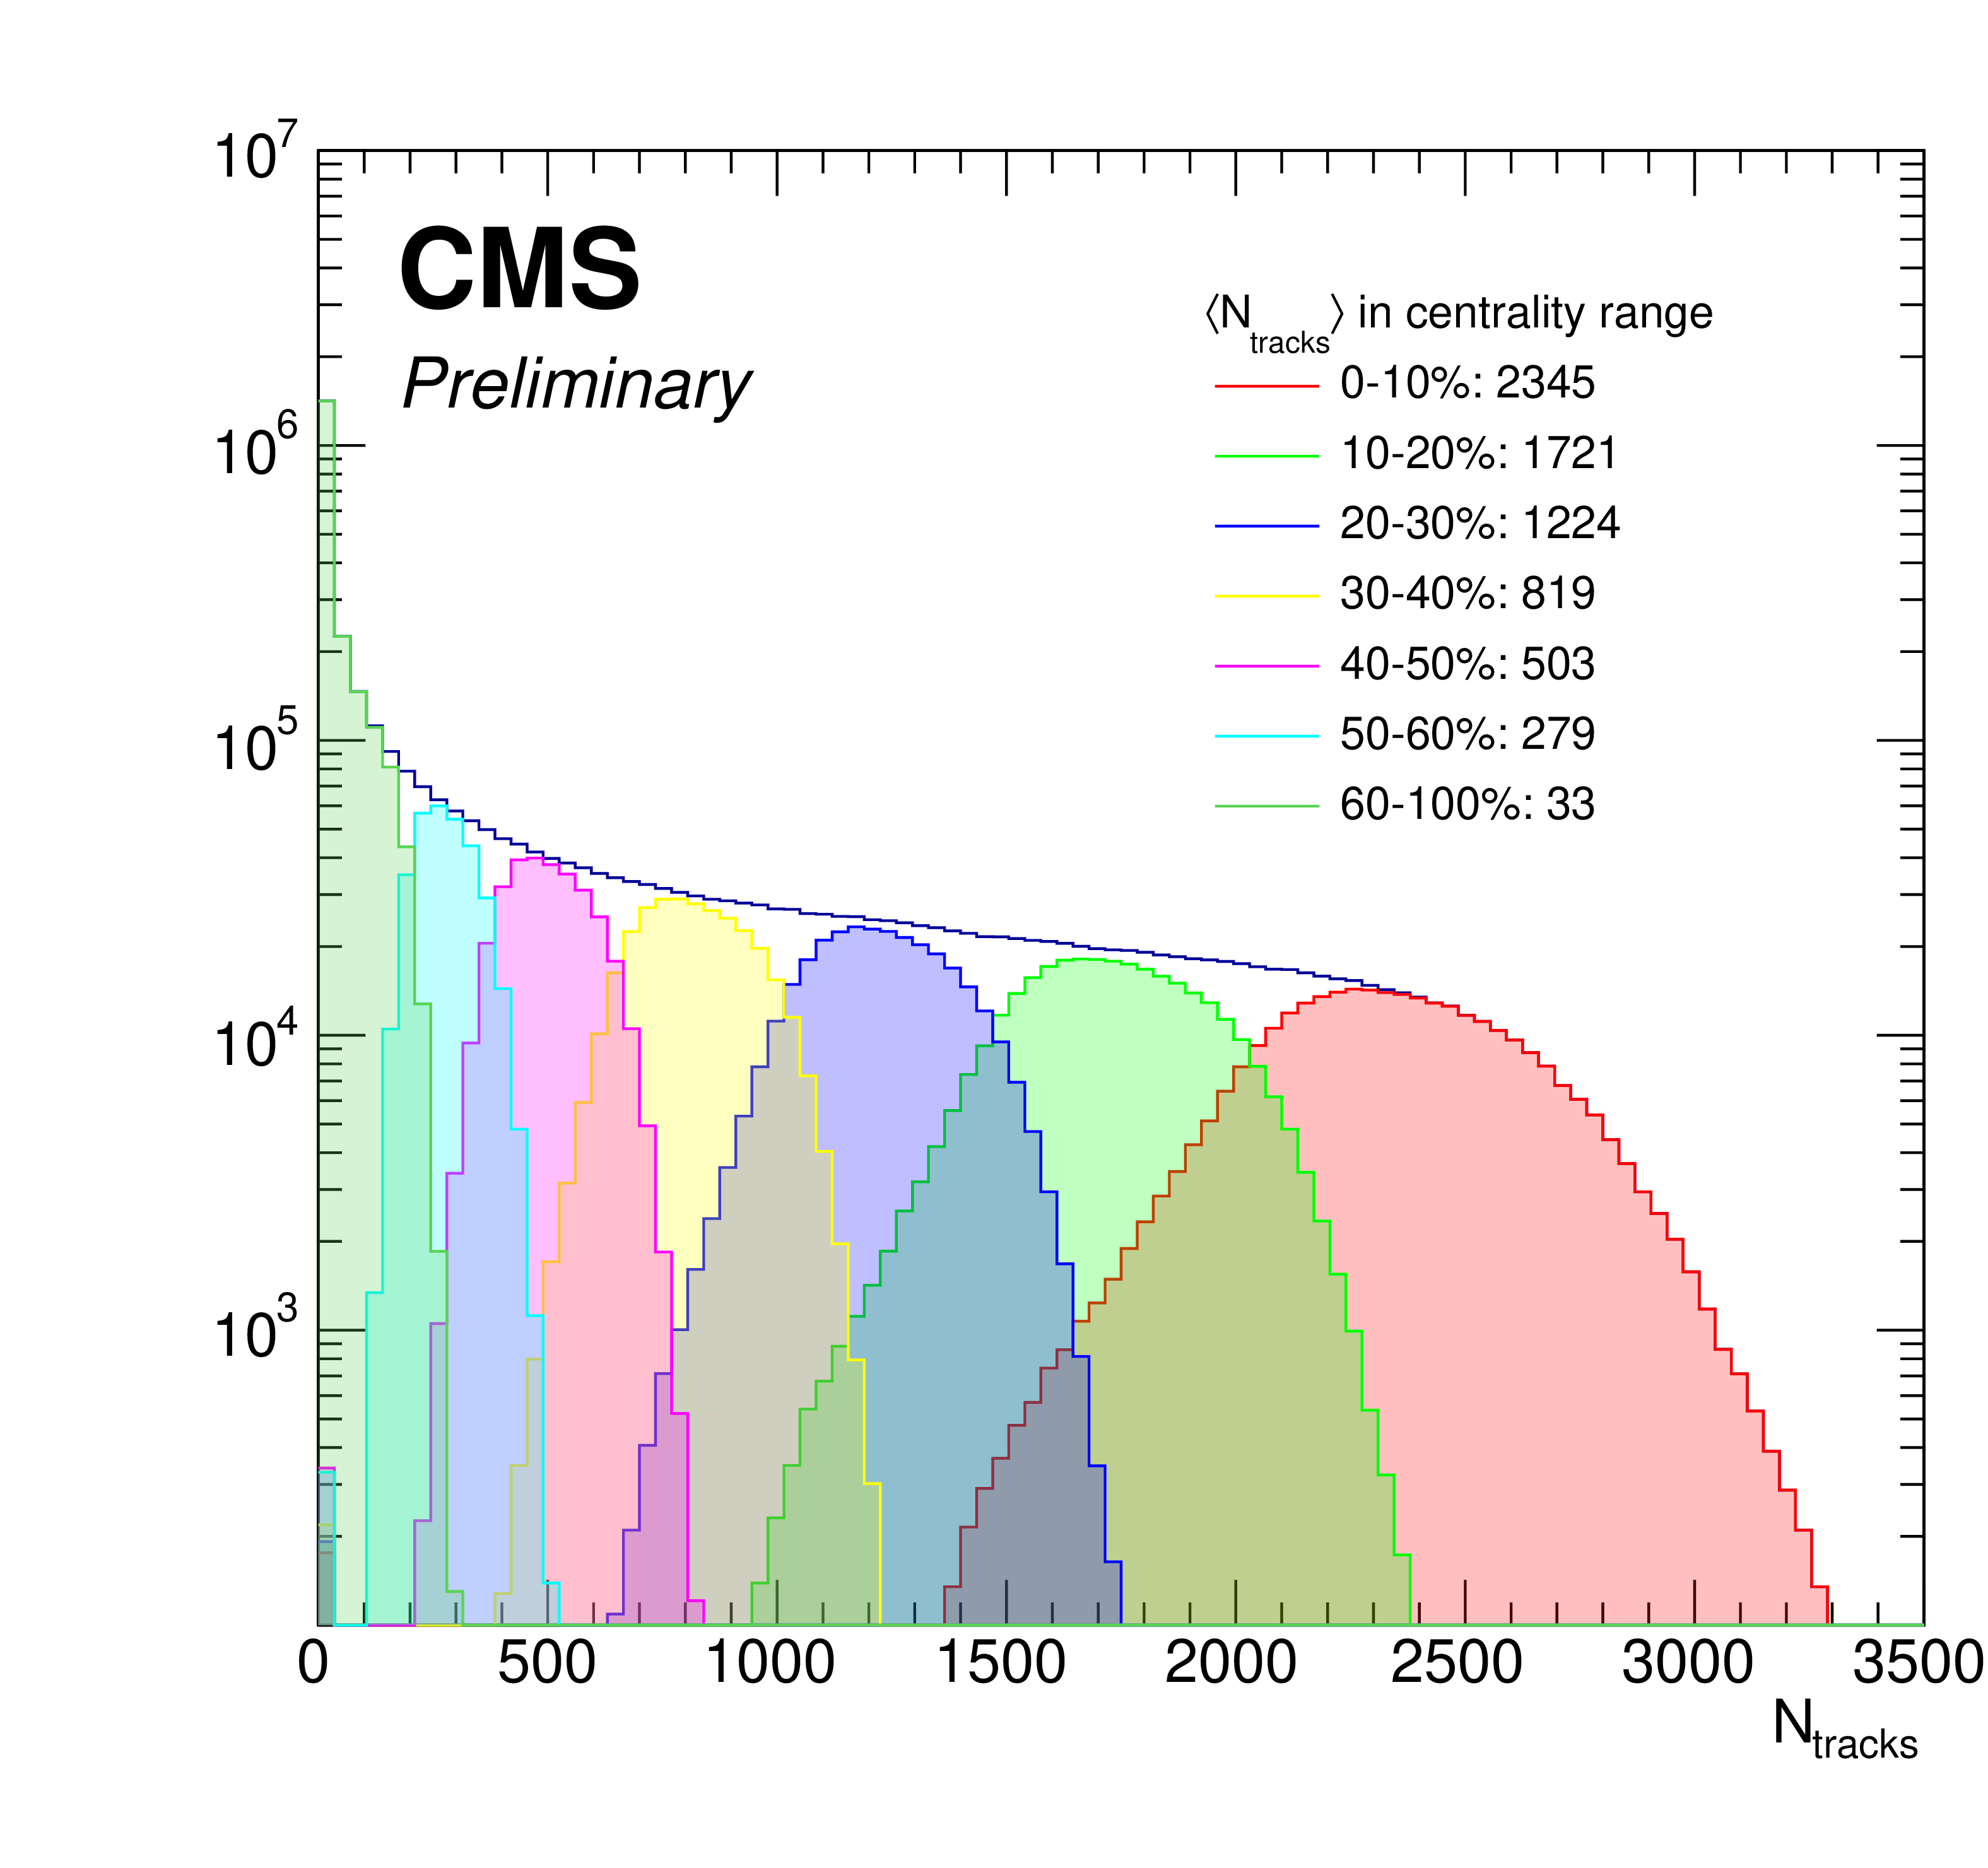
Figure 18-a:
Distributions of $ N_{\mathrm{tracks}} $ in the PbPb collisions for various ranges of centrality in a minimum bias data set (left) and a triggered data set (right). |
png pdf |
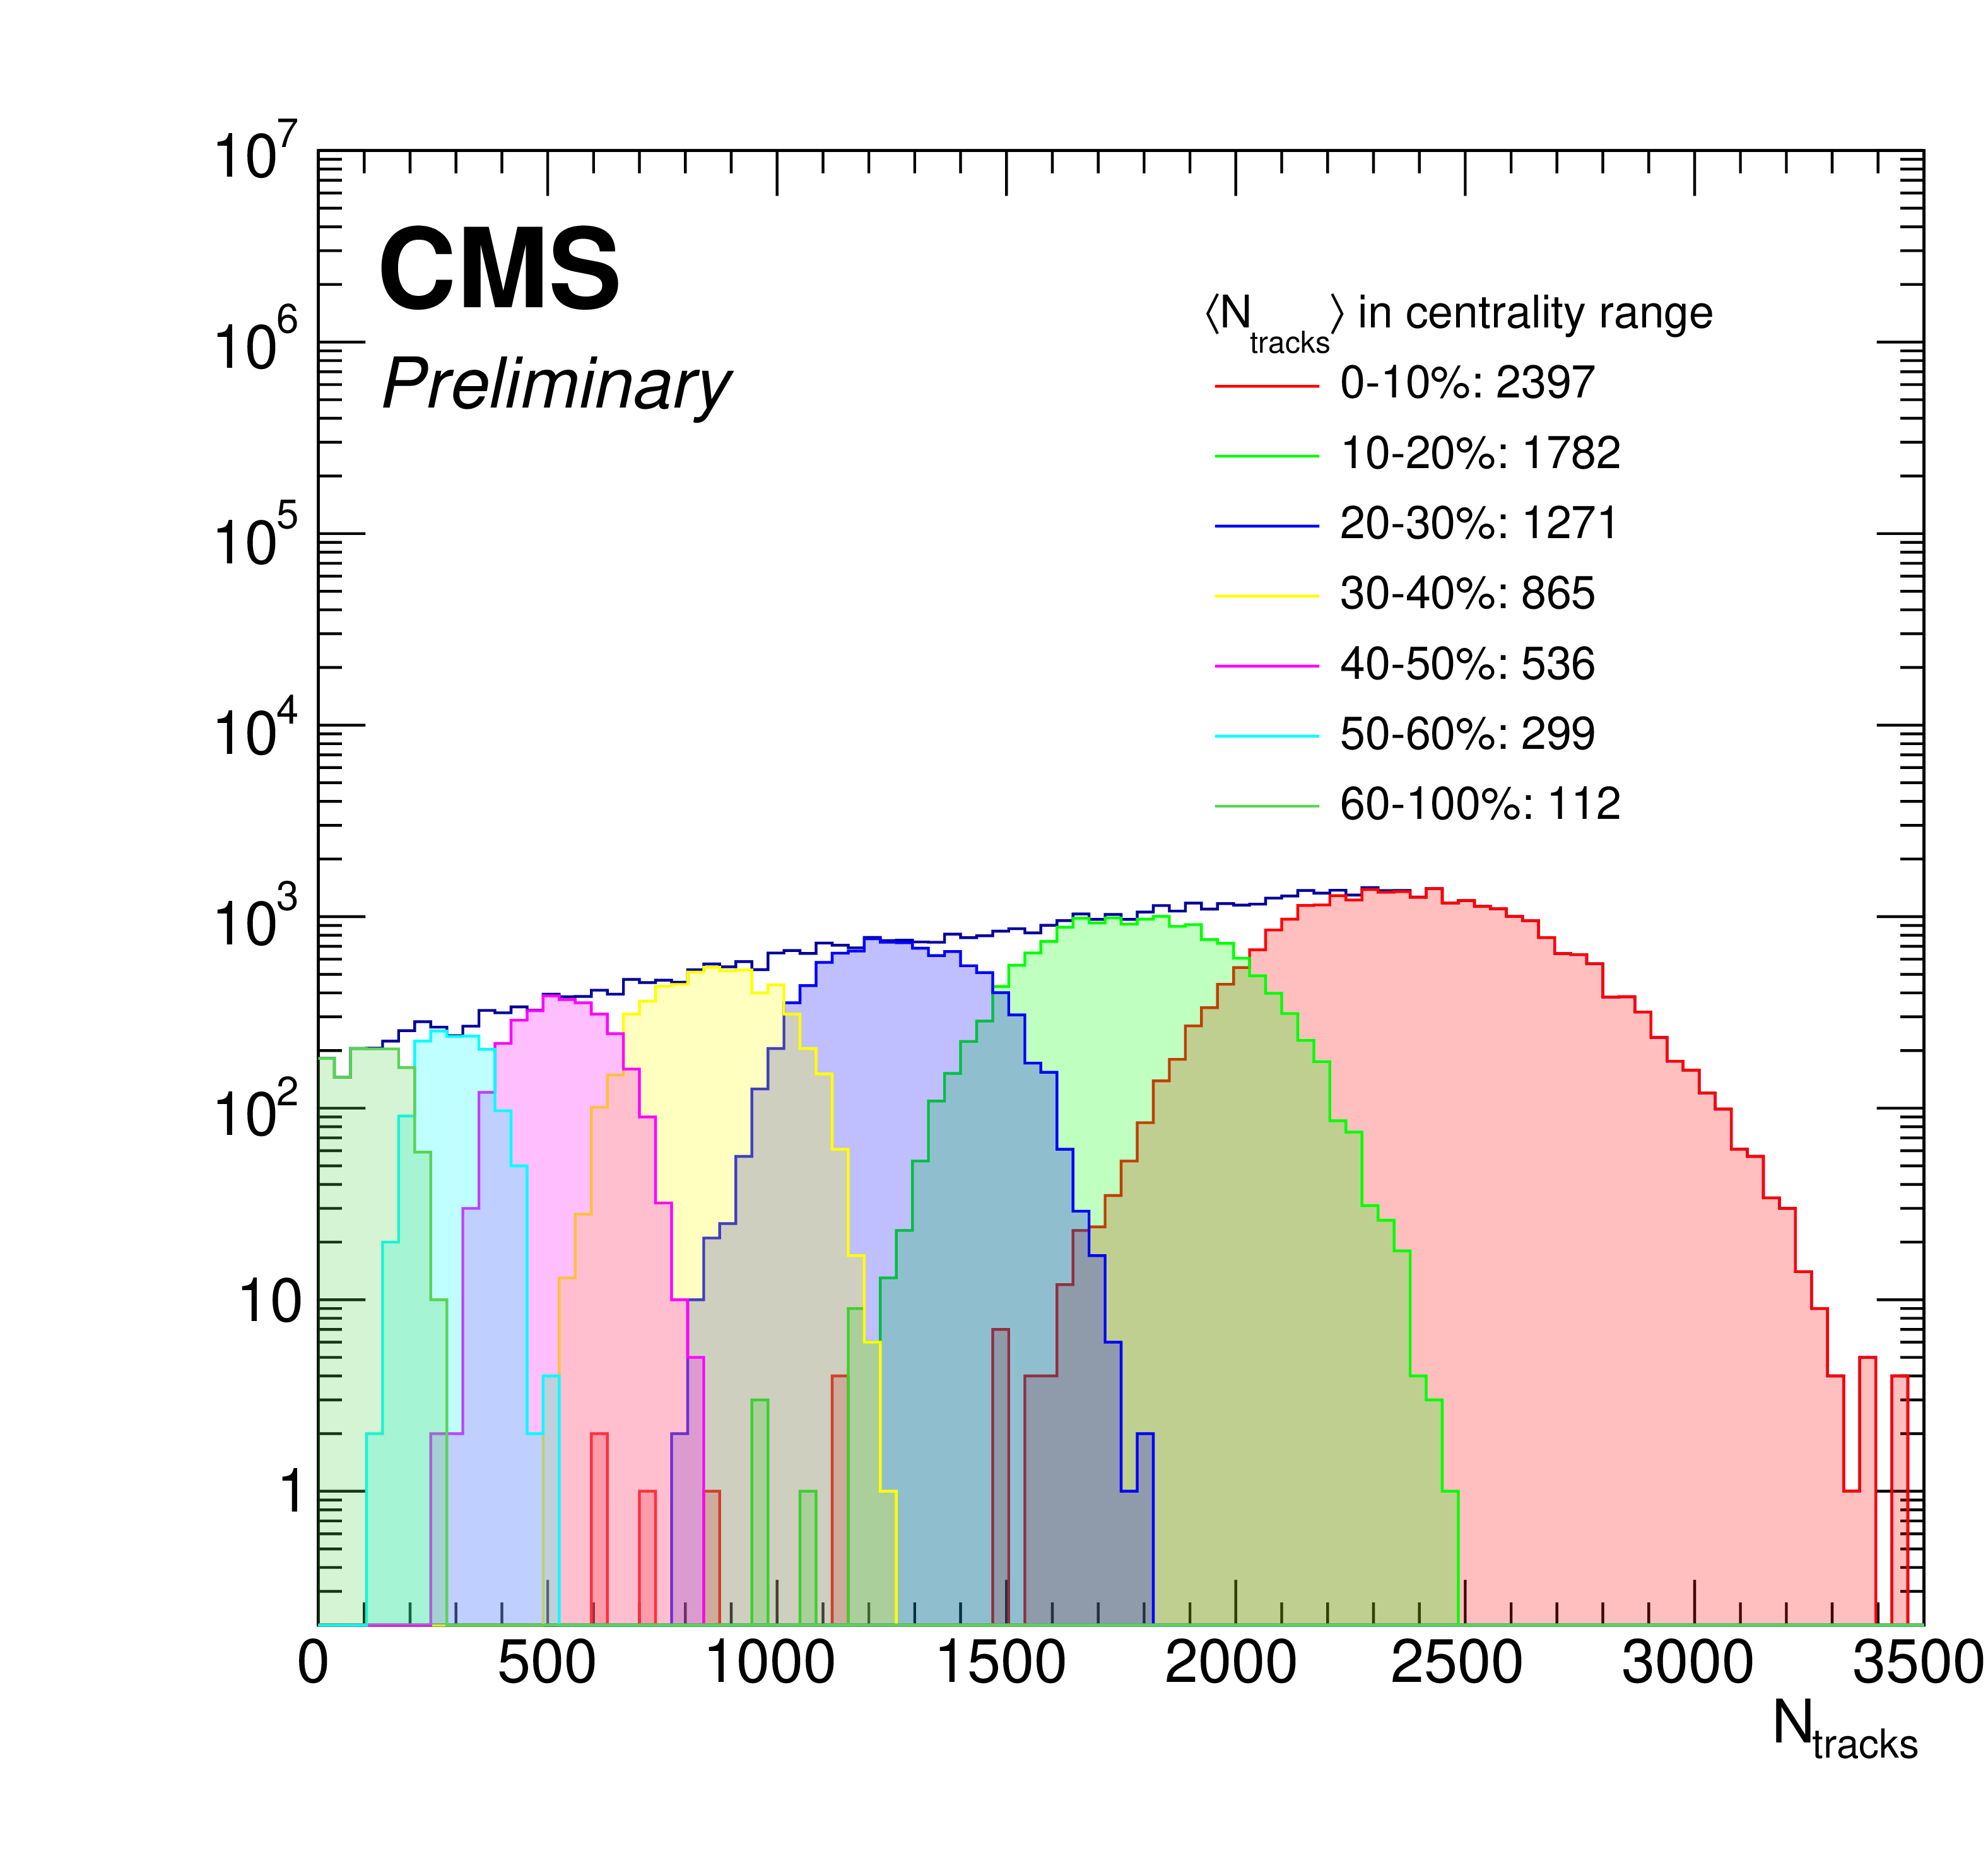
Figure 18-b:
Distributions of $ N_{\mathrm{tracks}} $ in the PbPb collisions for various ranges of centrality in a minimum bias data set (left) and a triggered data set (right). |
| Tables | |
png pdf |
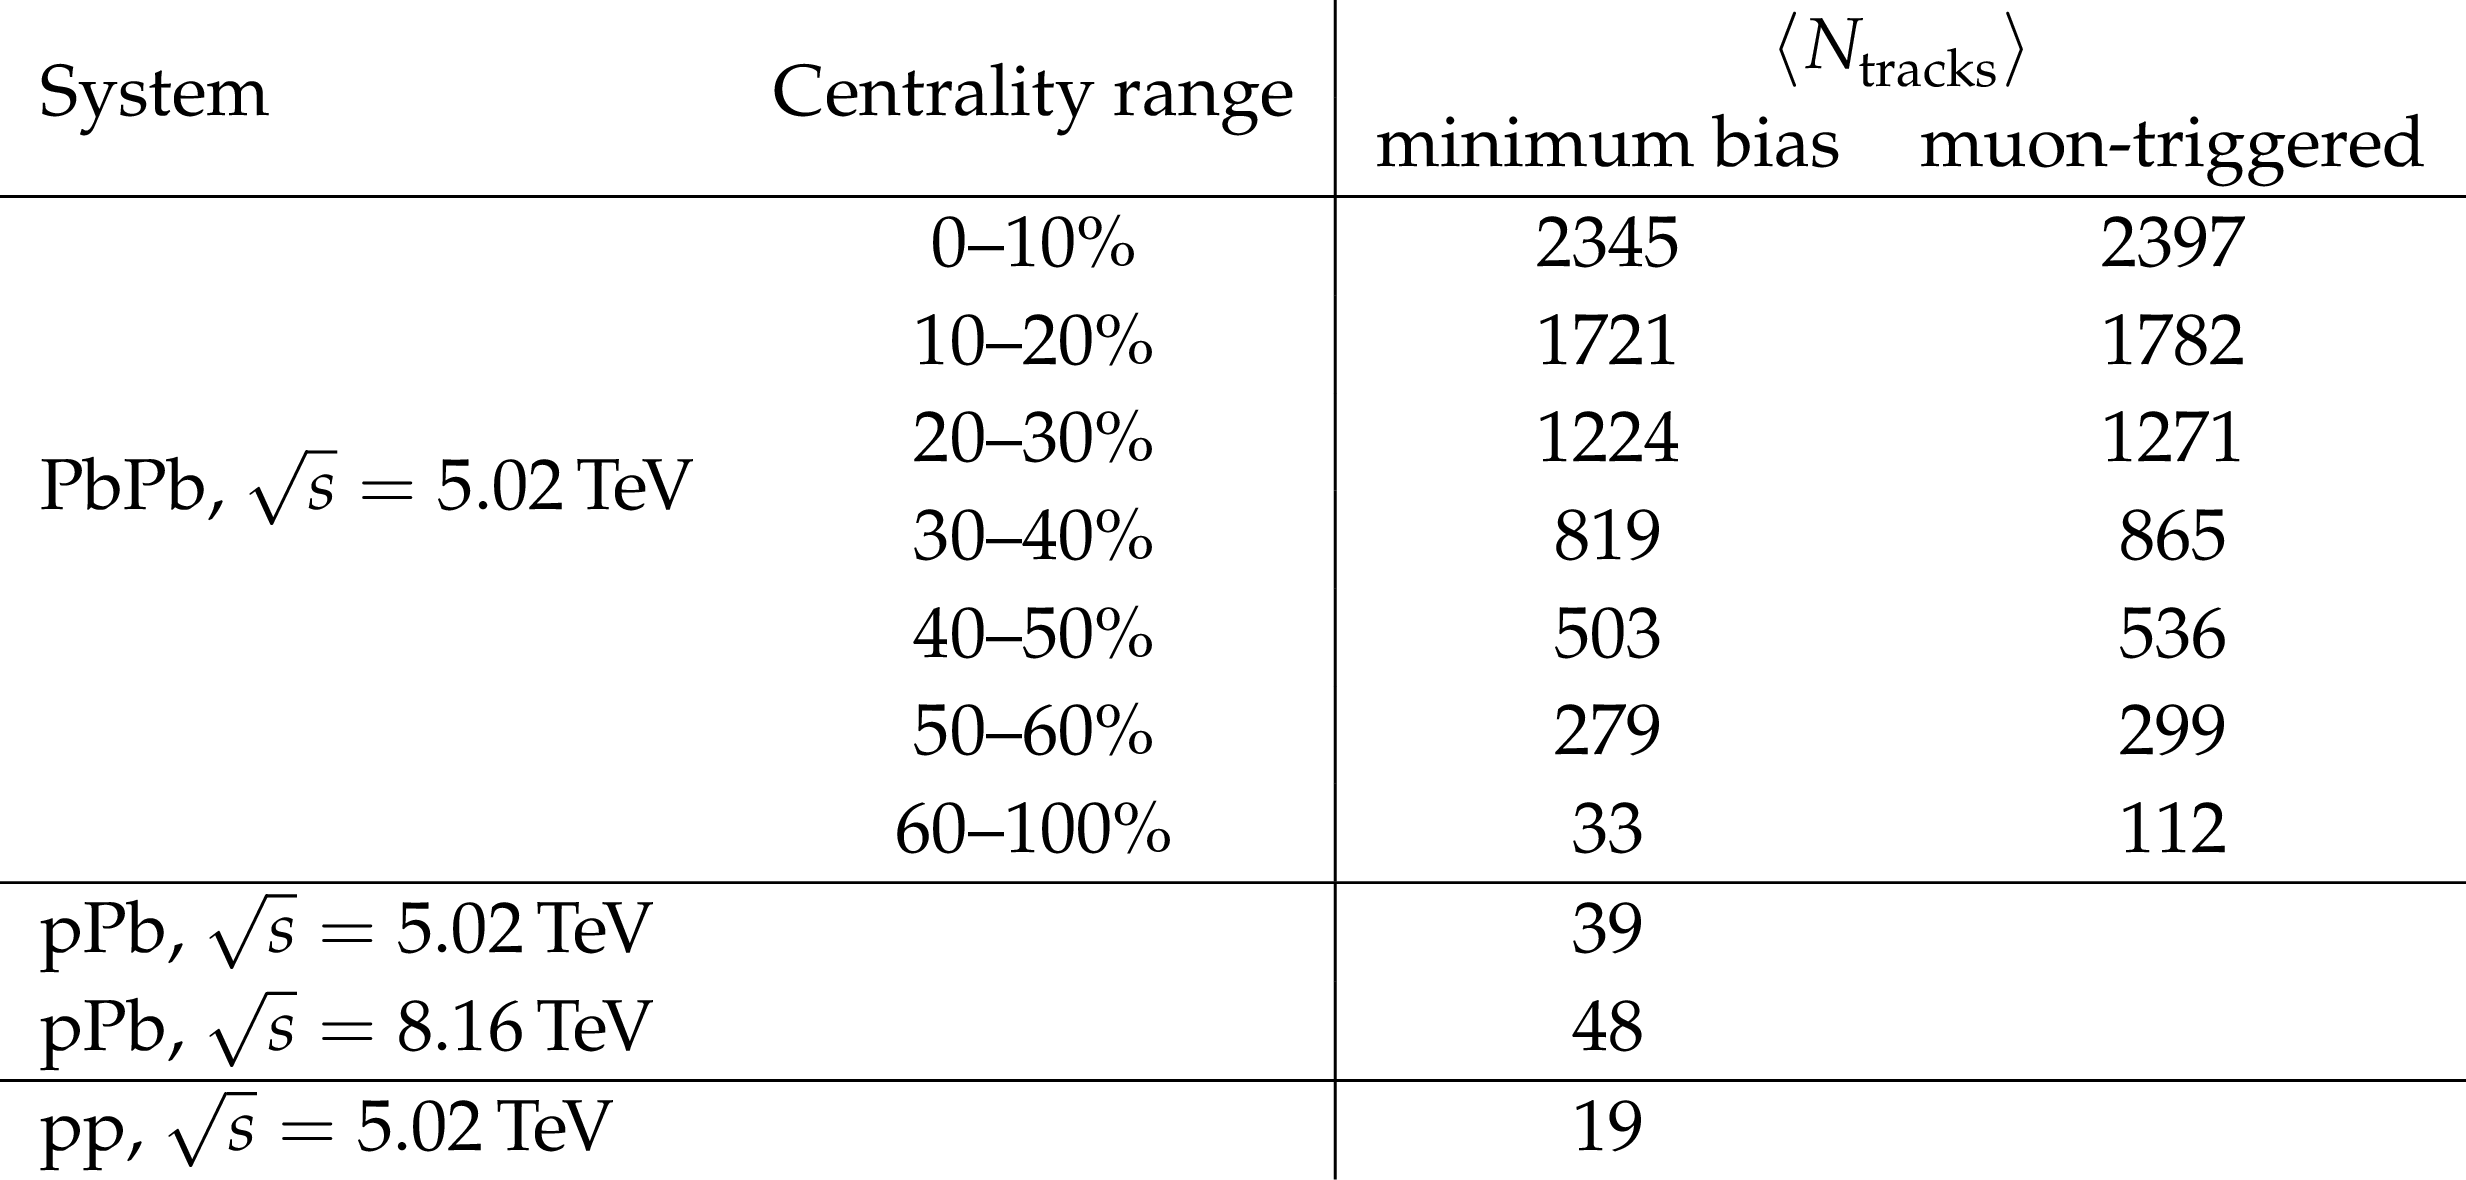
Table 1:
Average number of reconstructed tracks, $ \langle N_{\mathrm{tracks}} \rangle $, in our data sets. The values are not corrected for pileup. Two columns are shown for PbPb. The left column shows the values that are obtained from a minimum-bias data set, and correspond to distributions shown in the left panel of Fig. 2. The right column shows the values in muon-triggered data, and correspond to the location of points shown in the performance plots of this note. Details in Appendix 11. |
png pdf |
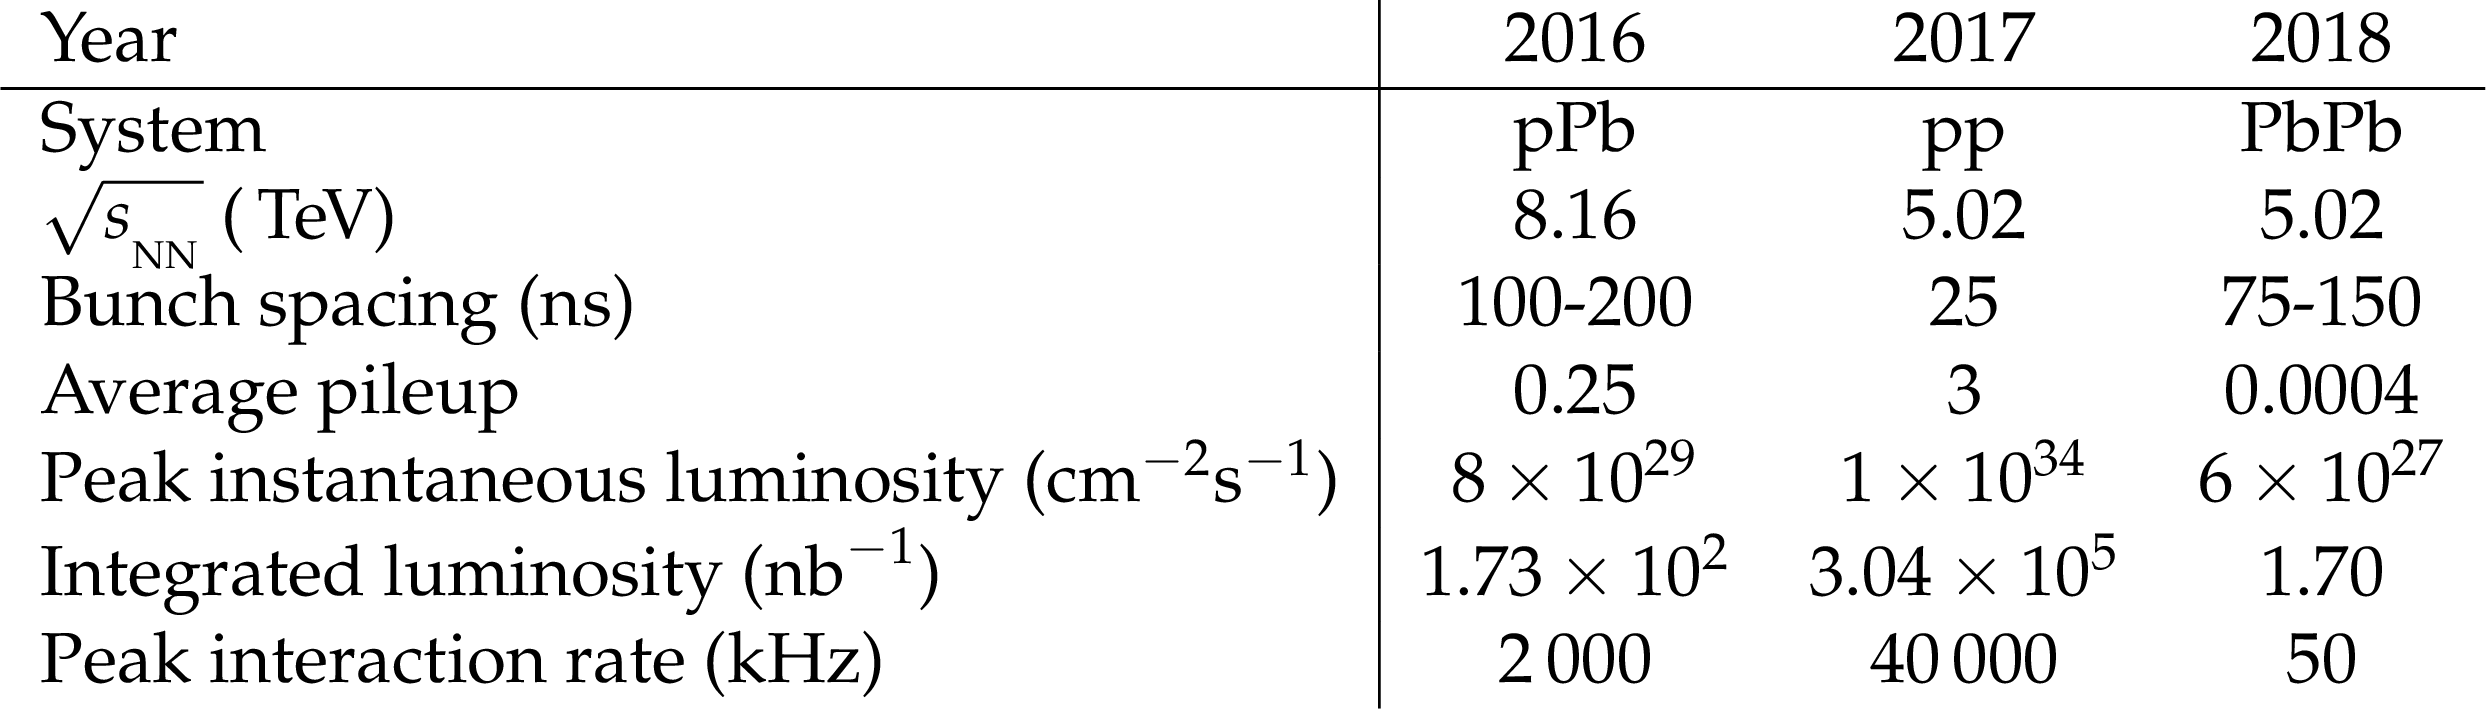
Table 2:
Characteristics of selected collisions collected during LHC Run 2. |
png pdf |
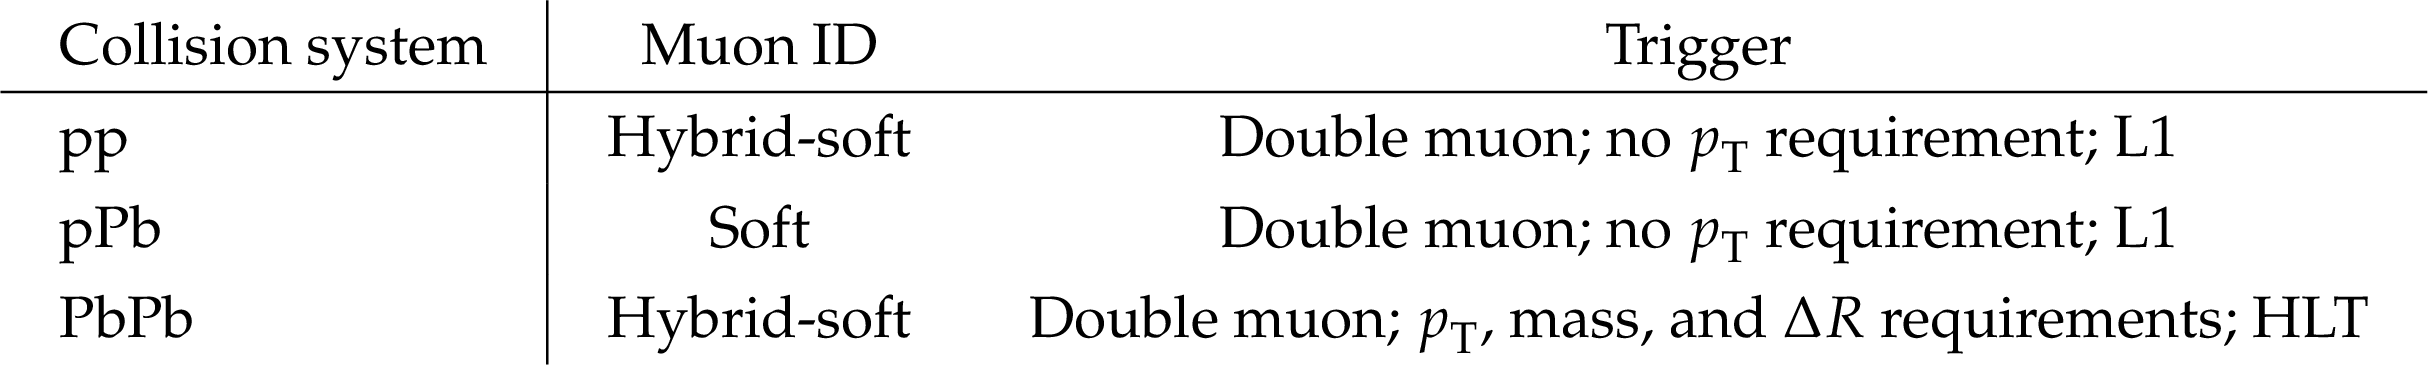
Table 3:
Overview of muon identification and triggers used in $ \mathrm{J}/\psi $ and $ \Upsilon $ analyses. Descriptions of these are given in the text. |
png pdf |
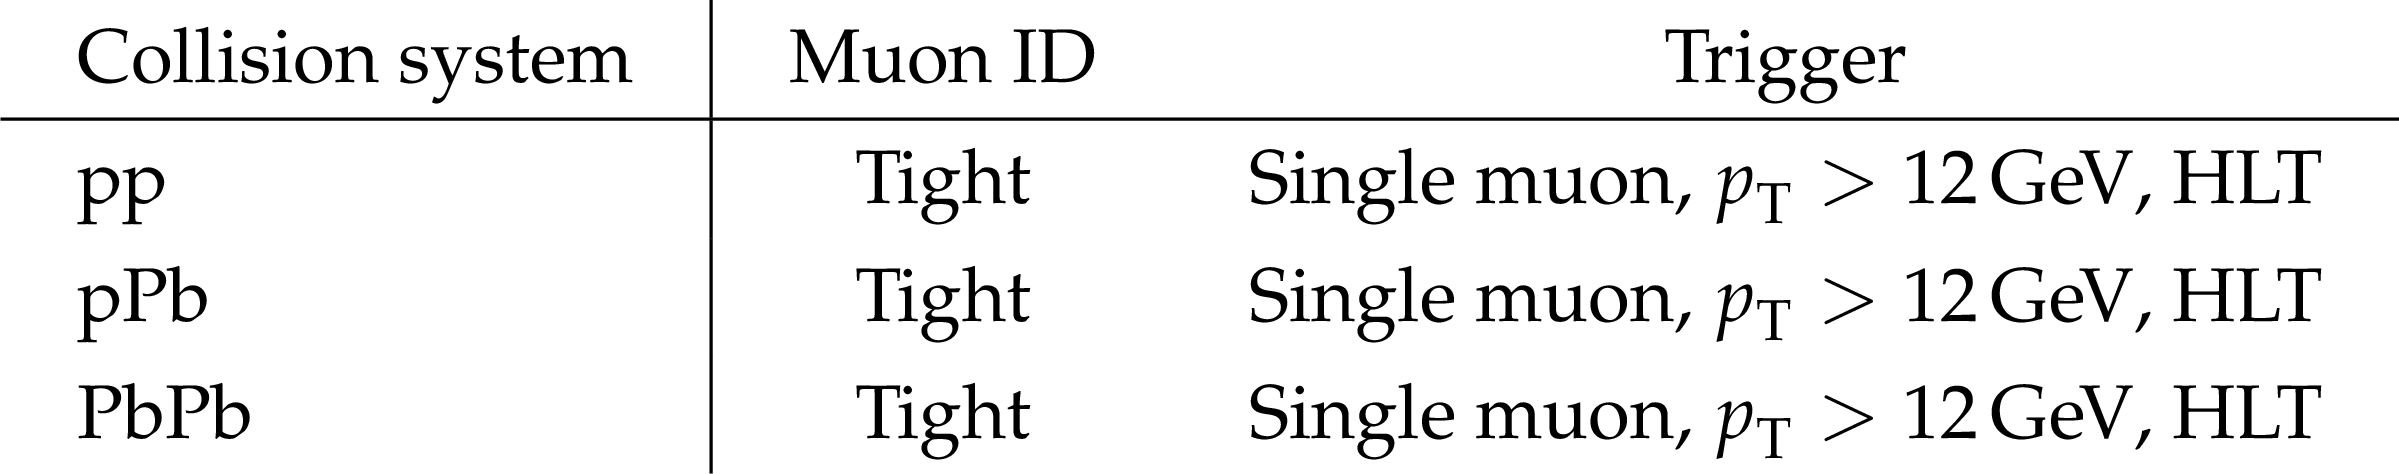
Table 4:
Overview of muon identification and triggers used in Z, W, and t analyses. The settings are comparable among the collision systems. A description of muon identification and triggers is given in the text. |
| Summary |
| We have presented efficiencies of muon reconstruction, identification, and triggering, as well as measurements of the dimuon mass scale and resolution of the CMS detector. The efficiencies were estimated using the data-driven tag-and-probe technique discussed in Section 5. The fits to the invariant mass spectra were also used to derive the mass scale and resolution. We have extended previous studies of the muon performance in pp collisions to the heavy ion environment using PbPb data at $ \sqrt{\smash[b]{s_{_{\mathrm{NN}}}}}= $ 5.02 TeV and pPb data at $ \sqrt{\smash[b]{s_{_{\mathrm{NN}}}}}= $ 8.16 TeV. The efficiencies were also measured in pp data at $ \sqrt{s}= $ 5.02 TeV for comparison across all collision systems as a function of charged particle multiplicity. In all cases, the efficiencies are high (typically above 90%), even with extremely high occupancies. We observe a slight drop (1-2%) in the muon-identification efficiency at high $ p_{\mathrm{T}} $ in the most central PbPb events at multiplicities that are unattainable in pPb or pp events. In the low-$ p_{\mathrm{T}} $ region, the muon-identification efficiency is comparable between pp and PbPb collisions except in the region of highest occupancy at very low $ p_{\mathrm{T}} $ ($ < $ 5 GeV) and forward rapidity ($ |\eta| > $ 2). This drop in efficiency is expected because the high number of tracks in the inner parts of the detector complicates the matching of tracks between the muon chambers and the tracker. A slight decrease ($ {\approx}$3%) in reconstruction efficiency at high occupancies is also observed. Additionally, the trigger efficiency decreases in the most central PbPb events. A relative reduction of $ {\approx}8% $ in trigger efficiency occurs between the lowest and highest $ N_{\mathrm{tracks}} $ bins in PbPb. This reduction is more pronounced than the corresponding decrease in muon identification and reconstruction efficiencies, suggesting that the CMS single muon trigger is more sensitive to detector occupancy. In most cases, Monte Carlo calculations of the corresponding efficiencies capture the trends seen in data, indicating that the main features are contained in the detector simulation. In a few instances, the MC efficiencies overestimate those obtained from real data (by up to 4 percentage points), highlighting the need for independent data-driven techniques of efficiency estimation. The excellent muon performance of the CMS detector has allowed us to have a robust muon and dimuon program in the heavy ion environment, leading to many muon-based measurements, including heavy flavor [31,5,32,33,34,35,36,37,38,39,40], electroweak bosons [41,25,42,43,44,45], and jets [46,47,48,49,50,51,52,53,54,55,56,57,58,59,60,61,62,63]. |
| References | ||||
| 1 | CMS Collaboration | Performance of CMS muon reconstruction in pp collision events at $ \sqrt{s}= $ 7 TeV | JINST 7 (2012) P10002 | CMS-MUO-10-004 1206.4071 |
| 2 | J. W. Harris and B. Muller | The search for the quark - gluon plasma | Ann. Rev. Nucl. Part. Sci. 46 (1996) 71 | hep-ph/9602235 |
| 3 | CMS Collaboration | Measurements of inclusive $ W $ and $ Z $ cross sections in pp collisions at $ \sqrt{s}= $ 7 TeV | JHEP 01 (2011) 080 | CMS-EWK-10-002 1012.2466 |
| 4 | CMS Collaboration | Study of W boson production in pPb collisions at $ \sqrt{s_{\mathrm{NN}}} = $ 5.02 TeV | PLB 750 (2015) 565 | CMS-HIN-13-007 1503.05825 |
| 5 | CMS Collaboration | Suppression of non-prompt $ J/\psi $, prompt $ J/\psi $, and Y(1S) in PbPb collisions at $ \sqrt {\smash [b]{s_{_{\mathrm {NN}}}}}= $ 2.76 TeV | JHEP 05 (2012) 063 | CMS-HIN-10-006 1201.5069 |
| 6 | CMS Collaboration | The CMS Experiment at the CERN LHC | JINST 3 (2008) S08004 | |
| 7 | CMS Collaboration | The CMS trigger system | JINST 12 (2017) P01020 | CMS-TRG-12-001 1609.02366 |
| 8 | GEANT4 Collaboration | GEANT 4---a simulation toolkit | NIM A 506 (2003) 250 | |
| 9 | T. Sjöstrand et al. | An introduction to PYTHIA 8.2 | Comput. Phys. Commun. 191 (2015) 159 | 1410.3012 |
| 10 | J. Alwall et al. | The automated computation of tree-level and next-to-leading order differential cross sections, and their matching to parton shower simulations | JHEP 07 (2014) 079 | 1405.0301 |
| 11 | P. Nason | A new method for combining NLO QCD with shower Monte Carlo algorithms | JHEP 11 (2004) 040 | hepph/0409146 |
| 12 | S. Frixione, P. Nason, and C. Oleari | Matching NLO QCD computations with parton shower simulations: the POWHEG method | JHEP 11 (2007) 070 | 0709.2092 |
| 13 | S. Alioli, P. Nason, C. Oleari, and E. Re | A general framework for implementing NLO calculations in shower Monte Carlo programs: the POWHEG BOX | JHEP 06 (2010) 043 | 1002.2581 |
| 14 | S. Alioli, P. Nason, C. Oleari, and E. Re | NLO vector-boson production matched with shower in POWHEG | JHEP 07 (2008) 060 | 0805.4802 |
| 15 | T. Pierog et al. | EPOS LHC: test of collective hadronization with data measured at the CERN Large Hadron Collider | Phys. Rev. C 92 (2015) 034906 | 1306.0121 |
| 16 | I. P. Lokhtin and A. M. Snigirev | A model of jet quenching in ultrarelativistic heavy ion collisions and high-$ p_{\mathrm{T}} $ hadron spectra at RHIC | EPJC 45 (2006) 211 | hepph/0506189 |
| 17 | CMS Tracker Group Collaboration | The CMS Phase-1 Pixel Detector Upgrade | JINST 16 (2021) P02027 | 2012.14304 |
| 18 | CMS Collaboration | Strategies and performance of the CMS silicon tracker alignment during LHC Run 2 | Nuclear Instruments and Methods in Phys. Res. A 1037 (2022) 166795 | |
| 19 | CMS Collaboration | Performance of the CMS muon detector and muon reconstruction with proton-proton collisions at $ \sqrt{s}= $ 13 TeV | JINST 13 (2018) P06015 | CMS-MUO-16-001 1804.04528 |
| 20 | CMS Collaboration | Performance of CMS muon reconstruction in cosmic-ray events | JINST 5 (2010) T03022 | CMS-CFT-09-014 0911.4994 |
| 21 | CMS Collaboration | Performance of muon identification in pp collisions at $ \sqrt{s} $ = 7 TeV | CMS Physics Analysis Summary, 2010 CMS-PAS-MUO-10-002 |
|
| 22 | CMS Collaboration | Particle-flow reconstruction and global event description with the CMS detector | JINST 12 (2017) P10003 | CMS-PRF-14-001 1706.04965 |
| 23 | CMS Collaboration | CMS Physics: Technical Design Report Volume 1: Detector Performance and Software | ||
| 24 | CMS Collaboration | Description and performance of track and primary-vertex reconstruction with the CMS tracker | JINST 9 (2014) P10009 | CMS-TRK-11-001 1405.6569 |
| 25 | CMS Collaboration | Study of $ W $ boson production in PbPb and pp collisions at $ \sqrt {\smash [b]{s_{_{\mathrm {NN}}}}}= $ 2.76 TeV | PLB 715 (2012) 66 | CMS-HIN-11-008 1205.6334 |
| 26 | CMS Collaboration | Evidence for top quark production in nucleus-nucleus collisions | PRL 125 (2020) 222001 | CMS-HIN-19-001 2006.11110 |
| 27 | CMS Collaboration | Performance of the CMS muon trigger system in proton-proton collisions at $ \sqrt{s} = $ 13 TeV | JINST 16 (2021) P07001 | CMS-MUO-19-001 2102.04790 |
| 28 | Particle Data Group Collaboration | Review of Particle Physics | PTEP 2020 (2020) 083C01 | |
| 29 | M. J. Oreglia | A study of the reactions $ \psi^\prime \to \gamma \gamma \psi $ | PhD thesis, Stanford University, SLAC Report SLAC-R-236, see Appendix D, 1980 link |
|
| 30 | CMS Collaboration | Measurement of momentum scale and resolution of the CMS detector using low-mass resonances and cosmic ray muons | CMS Physics Analysis Summary, 2010 CMS-PAS-TRK-10-004 |
|
| 31 | CMS Collaboration | Indications of suppression of excited $ \Upsilon $ states in PbPb collisions at $ \sqrt {\smash [b]{s_{_{\mathrm {NN}}}}} $ = 2.76 TeV | PRL 107 (2011) 052302 | CMS-HIN-11-007 1105.4894 |
| 32 | CMS Collaboration | Observation of sequential upsilon suppression in PbPb collisions | PRL 109 (2012) 222301 | CMS-HIN-11-011 1208.2826 |
| 33 | CMS Collaboration | Measurement of prompt $ \psi(2S) \to J/\psi $ yield ratios in PbPb and pp collisions at $ \sqrt {\smash [b]{s_{_{\mathrm {NN}}}}}= $ 2.76 TeV | PRL 113 (2014) 262301 | CMS-HIN-12-007 1410.1804 |
| 34 | CMS Collaboration | Relative modification of prompt \ensuremath\psi(2S) and J/\ensuremath\psi yields from pp to PbPb collisions at $ \sqrt {\smash [b]{s_{_{\mathrm {NN}}}}}= $ 5.02 TeV | PRL 118 (2017) 162301 | CMS-HIN-16-004 1611.01438 |
| 35 | CMS Collaboration | Suppression of $ \Upsilon(1S), \Upsilon(2S) $ and $ \Upsilon(3S) $ production in PbPb collisions at $ \sqrt{s_{\rm NN}} $ = 2.76 TeV | PLB 770 (2017) 357 | CMS-HIN-15-001 1611.01510 |
| 36 | CMS Collaboration | Suppression and azimuthal anisotropy of prompt and nonprompt $ {\mathrm{J}}/\psi $ production in PbPb collisions at $ \sqrt {\smash [b]{s_{_{\mathrm {NN}}}}} = $ 2.76 TeV | EPJC 77 (2017) 252 | CMS-HIN-14-005 1610.00613 |
| 37 | CMS Collaboration | Suppression of excited $ \Upsilon $ states relative to the ground state in PbPb collisions at $ \sqrt {\smash [b]{s_{_{\mathrm {NN}}}}}= $ 5.02 TeV | PRL 120 (2018) 142301 | CMS-HIN-16-008 1706.05984 |
| 38 | CMS Collaboration | Measurement of prompt and nonprompt charmonium suppression in PbPb collisions at 5.02 TeV | EPJC 78 (2018) 509 | CMS-HIN-16-025 1712.08959 |
| 39 | CMS Collaboration | Measurement of nuclear modification factors of $ \Upsilon $(1S), $ \Upsilon $(2S), and $ \Upsilon $(3S) mesons in PbPb collisions at $ \sqrt {\smash [b]{s_{_{\mathrm {NN}}}}} = $ 5.02 TeV | PLB 790 (2019) 270 | CMS-HIN-16-023 1805.09215 |
| 40 | CMS Collaboration | Measurement of the azimuthal anisotropy of $ \Upsilon(1S) $ and $ \Upsilon(2S) $ mesons in PbPb collisions at $ \sqrt{s_{\mathrm{NN}}} $ = 5.02 TeV | PLB 819 (2021) 136385 | CMS-HIN-19-002 2006.07707 |
| 41 | CMS Collaboration | Measurement of isolated photon production in pp and PbPb collisions at $ \sqrt {\smash [b]{s_{_{\mathrm {NN}}}}}= $ 2.76 TeV | PLB 710 (2012) 256 | CMS-HIN-11-002 1201.3093 |
| 42 | CMS Collaboration | Study of jet quenching with $ Z+\text{jet} $ correlations in PbPb and pp collisions at $ {\sqrt{s_\mathrm{nn}}}=5.02\text{ }\text{ }\mathrm{TeV} $ | PRL 119 (2017) 082301 | CMS-HIN-15-013 1702.01060 |
| 43 | CMS Collaboration | The production of isolated photons in PbPb and pp collisions at $ \sqrt {\smash [b]{s_{_{\mathrm {NN}}}}} = $ 5.02 TeV | JHEP 07 (2020) 116 | CMS-HIN-18-016 2003.12797 |
| 44 | CMS Collaboration | Study of Z boson production in PbPb collisions at $ \sqrt {\smash [b]{s_{_{\mathrm {NN}}}}} $ = 2.76 TeV | PRL 106 (2011) 212301 | CMS-HIN-10-003 1102.5435 |
| 45 | CMS Collaboration | Constraints on the initial state of PbPb collisions via measurements of Z-boson yields and azimuthal anisotropy at $ \sqrt {\smash [b]{s_{_{\mathrm {NN}}}}}= $ 5.02 TeV | PRL 127 (2021) 102002 | CMS-HIN-19-003 2103.14089 |
| 46 | CMS Collaboration | Observation and studies of jet quenching in PbPb collisions at nucleon-nucleon center-of-mass energy = 2.76 TeV | Phys. Rev. C 84 (2011) 024906 | CMS-HIN-10-004 1102.1957 |
| 47 | CMS Collaboration | Measurement of jet fragmentation into charged particles in pp and PbPb collisions at $ \sqrt {\smash [b]{s_{_{\mathrm {NN}}}}}= $ 2.76 TeV | JHEP 10 (2012) 087 | CMS-HIN-11-004 1205.5872 |
| 48 | CMS Collaboration | Jet momentum dependence of jet quenching in PbPb collisions at $ \sqrt {\smash [b]{s_{_{\mathrm {NN}}}}}= $ 2.76 TeV | PLB 712 (2012) 176 | CMS-HIN-11-013 1202.5022 |
| 49 | CMS Collaboration | Studies of jet quenching using isolated-photon+jet correlations in PbPb and pp collisions at $ \sqrt {\smash [b]{s_{_{\mathrm {NN}}}}}= $ 2.76 TeV | PLB 718 (2013) 773 | CMS-HIN-11-010 1205.0206 |
| 50 | CMS Collaboration | Modification of jet shapes in PbPb collisions at $ \sqrt {\smash [b]{s_{_{\mathrm {NN}}}}} = $ 2.76 TeV | PLB 730 (2014) 243 | CMS-HIN-12-002 1310.0878 |
| 51 | CMS Collaboration | Evidence of b-jet quenching in PbPb collisions at $ \sqrt {\smash [b]{s_{_{\mathrm {NN}}}}}= $ 2.76 TeV | PRL 113 (2014) 132301 | CMS-HIN-12-003 1312.4198 |
| 52 | CMS Collaboration | Measurement of jet fragmentation in PbPb and pp collisions at $ \sqrt {\smash [b]{s_{_{\mathrm {NN}}}}}= $ 2.76 TeV | Phys. Rev. C 90 (2014) 024908 | CMS-HIN-12-013 1406.0932 |
| 53 | CMS Collaboration | Measurement of transverse momentum relative to dijet systems in PbPb and pp collisions at $ \sqrt{s_{\mathrm{NN}}}= $ 2.76 TeV | JHEP 01 (2016) 006 | CMS-HIN-14-010 1509.09029 |
| 54 | CMS Collaboration | Correlations between jets and charged particles in PbPb and pp collisions at $ \sqrt{s_{\mathrm{NN}}}= $ 2.76 TeV | JHEP 02 (2016) 156 | CMS-HIN-14-016 1601.00079 |
| 55 | CMS Collaboration | Measurement of inclusive jet cross sections in pp and PbPb collisions at $ \sqrt {\smash [b]{s_{_{\mathrm {NN}}}}}= $ 2.76 TeV | Phys. Rev. C 96 (2017) 015202 | CMS-HIN-13-005 1609.05383 |
| 56 | CMS Collaboration | Study of jet quenching with isolated-photon+jet correlations in PbPb and pp collisions at $ \sqrt{s_{\mathrm{NN}}} = $ 5.02 TeV | PLB 785 (2018) 14 | CMS-HIN-16-002 1711.09738 |
| 57 | CMS Collaboration | Comparing transverse momentum balance of b jet pairs in pp and PbPb collisions at $ \sqrt{s_{\mathrm{NN}}}= $ 5.02 TeV | JHEP 03 (2018) 181 | CMS-HIN-16-005 1802.00707 |
| 58 | CMS Collaboration | Jet properties in PbPb and pp collisions at $ \sqrt {\smash [b]{s_{_{\mathrm {NN}}}}}= $ 5.02 TeV | JHEP 05 (2018) 006 | CMS-HIN-16-020 1803.00042 |
| 59 | CMS Collaboration | Measurement of the groomed jet mass in PbPb and pp collisions at $ \sqrt{s_{\mathrm{NN}}}= $ 5.02 TeV | JHEP 10 (2018) 161 | CMS-HIN-16-024 1805.05145 |
| 60 | CMS Collaboration | Jet shapes of isolated photon-tagged jets in PbPb and pp collisions at $ \sqrt {\smash [b]{s_{_{\mathrm {NN}}}}} = $ 5.02 TeV | PRL 122 (2019) 152001 | CMS-HIN-18-006 1809.08602 |
| 61 | CMS Collaboration | Measurement of quark- and gluon-like jet fractions using jet charge in PbPb and pp collisions at 5.02 TeV | JHEP 07 (2020) 115 | CMS-HIN-18-018 2004.00602 |
| 62 | CMS Collaboration | In-medium modification of dijets in PbPb collisions at $ \sqrt{s_{\mathrm{NN}}} $ = 5.02 TeV | JHEP 05 (2021) 116 | CMS-HIN-19-013 2101.04720 |
| 63 | CMS Collaboration | First measurement of large area jet transverse momentum spectra in heavy-ion collisions | JHEP 05 (2021) 284 | CMS-HIN-18-014 2102.13080 |
|
|
Compact Muon Solenoid LHC, CERN |
|

|

|

|

|

|