

Compact Muon Solenoid
LHC, CERN
| CMS-HIN-19-001 ; CERN-EP-2020-101 | ||
| Evidence for top quark production in nucleus-nucleus collisions | ||
| CMS Collaboration | ||
| 19 June 2020 | ||
| Phys. Rev. Lett. 125 (2020) 222001 | ||
| Abstract: Ultrarelativistic heavy ion collisions recreate in the laboratory the thermodynamical conditions prevailing in the early universe up to 10$^{-6}$ seconds, thereby allowing the study of the quark-gluon plasma (QGP), a state of quantum chromodynamics (QCD) matter with deconfined partons. The top quark, the heaviest elementary particle known, is accessible in nucleus-nucleus collisions at the CERN LHC, and constitutes a novel probe of the QGP. Here, we report the first-ever evidence for the production of top quarks in nucleus-nucleus collisions, using lead-lead collision data at a nucleon-nucleon centre-of-mass energy of 5.02 TeV recorded by the CMS experiment. Two methods are used to measure the cross section for top quark pair production (${\sigma_{\mathrm{t\bar{t}}}} $) via the decay into charged leptons (electrons or muons) and bottom quarks. One method relies on the leptonic information alone, and the second one exploits, in addition, the presence of bottom quarks. The measured cross sections, ${\sigma_{\mathrm{t\bar{t}}}} = $ 2.54$^{+0.84}_{-0.74}$ and 2.03$^{+0.71}_{-0.64}$ $\mu$b, respectively, are compatible with expectations from scaled proton-proton data and QCD predictions. | ||
| Links: e-print arXiv:2006.11110 [hep-ex] (PDF) ; CDS record ; inSPIRE record ; HepData record ; CADI line (restricted) ; | ||
| Figures & Tables | Summary | Additional Figures | References | CMS Publications |
|---|
| Figures | |
png pdf |
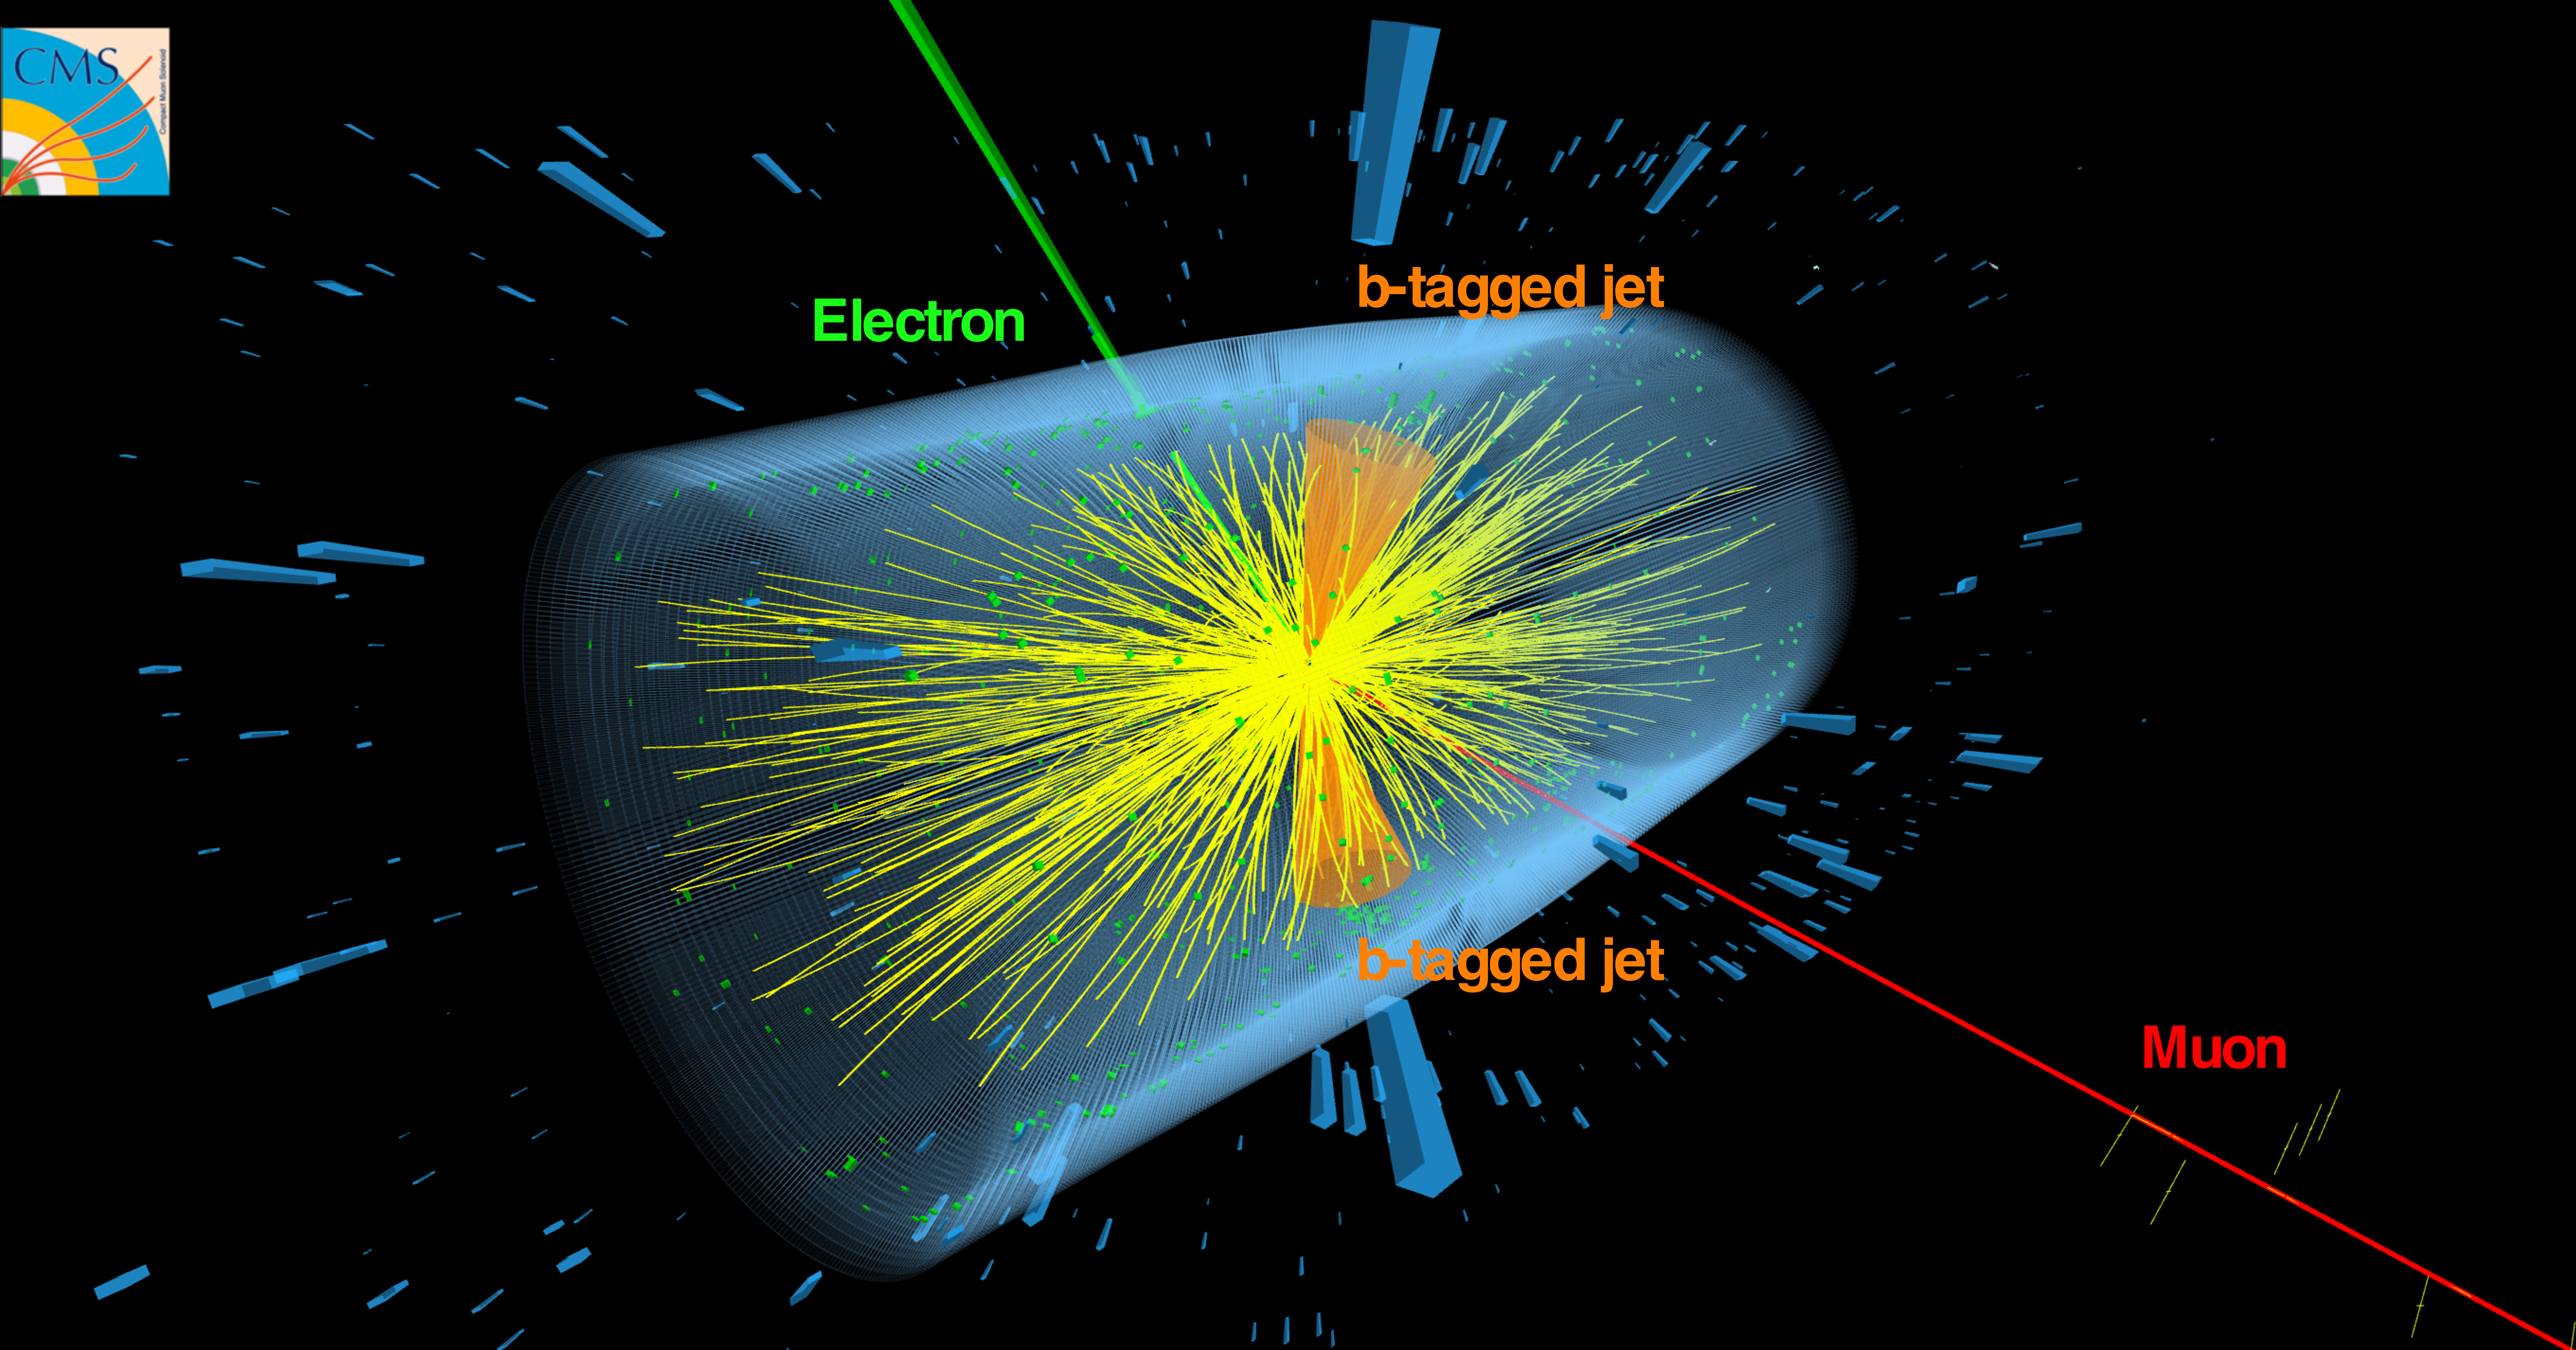
Figure 1:
Event display of a candidate ${\mathrm{t} \mathrm{\bar{t}}}$ event measured in PbPb collisions where each top quark decays into a bottom quark and a W boson. The b quarks and W bosons, in turn, produce jets and leptons, respectively. The event is interpreted as originating from the dilepton decay chain ${\mathrm{t} \mathrm{\bar{t}}} \to (\mathrm{b} \mathrm{W^{+}}) (\mathrm{\bar{b}} \mathrm{W^{-}}) \to (\mathrm{b} \, \mathrm{e^{+}} \nu_{\mathrm{e}}) (\mathrm{\bar{b}} \, \mu^{-} \nu_{\mu})$. |

png pdf |
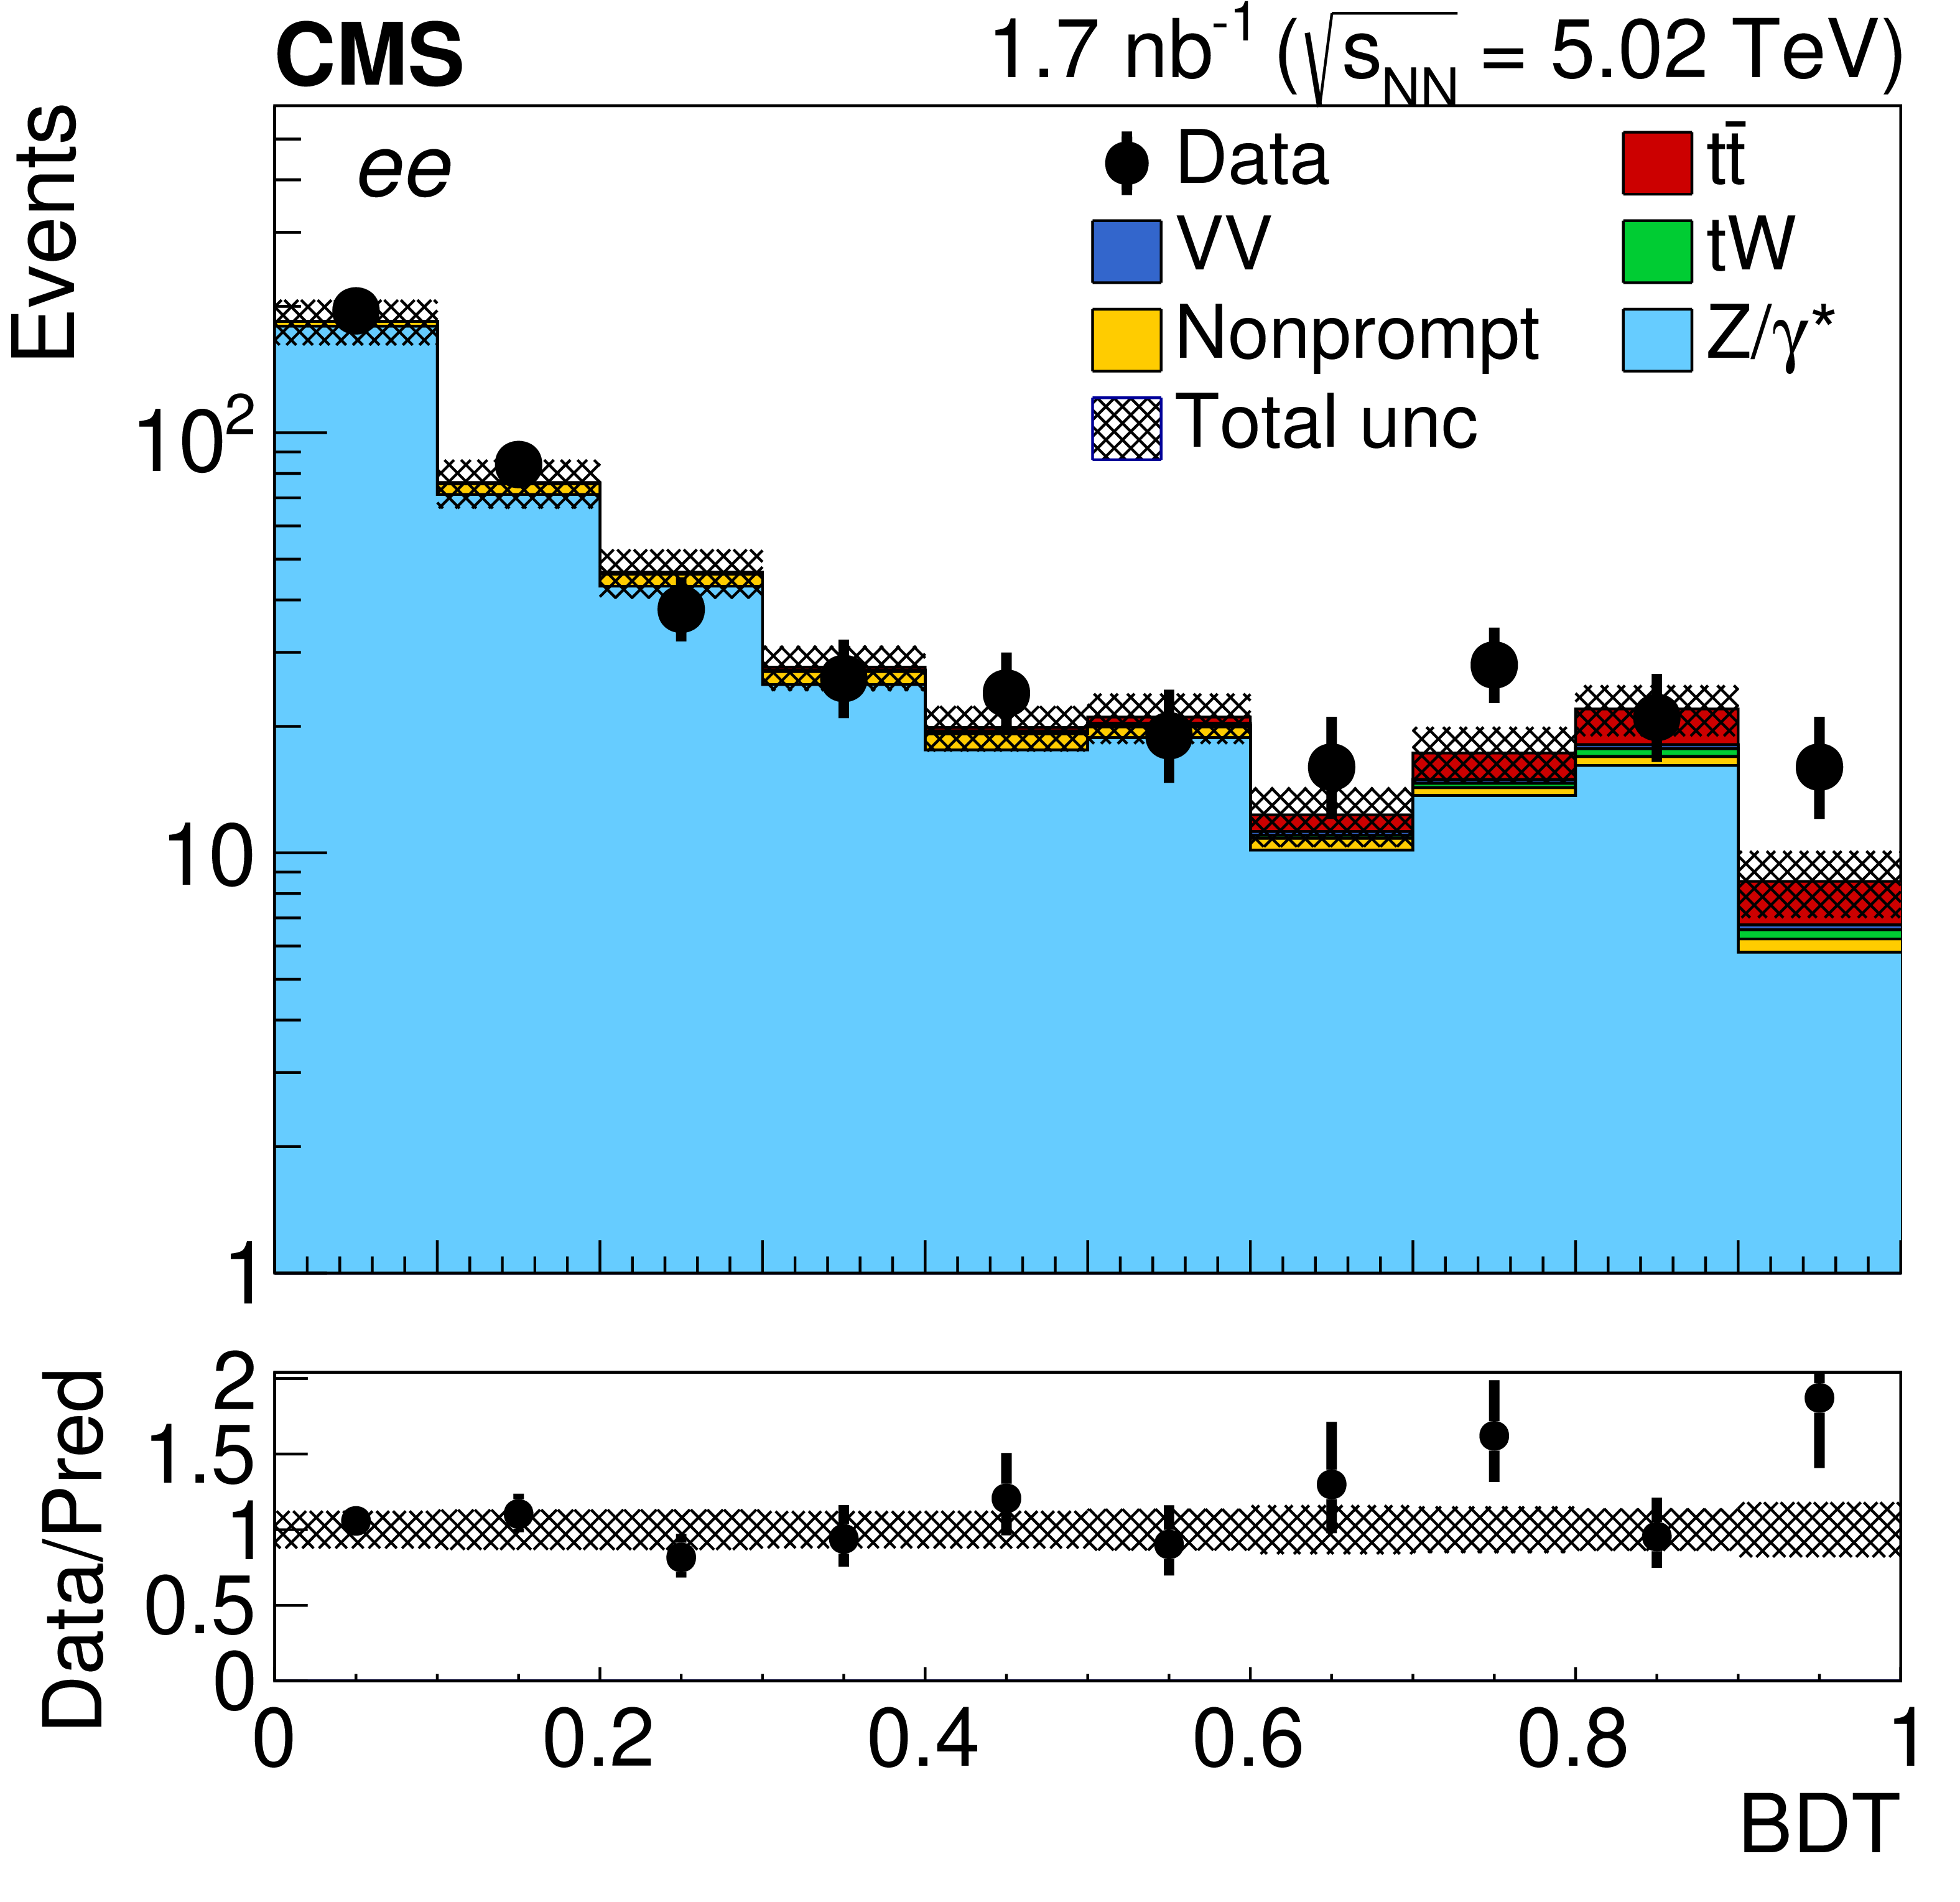
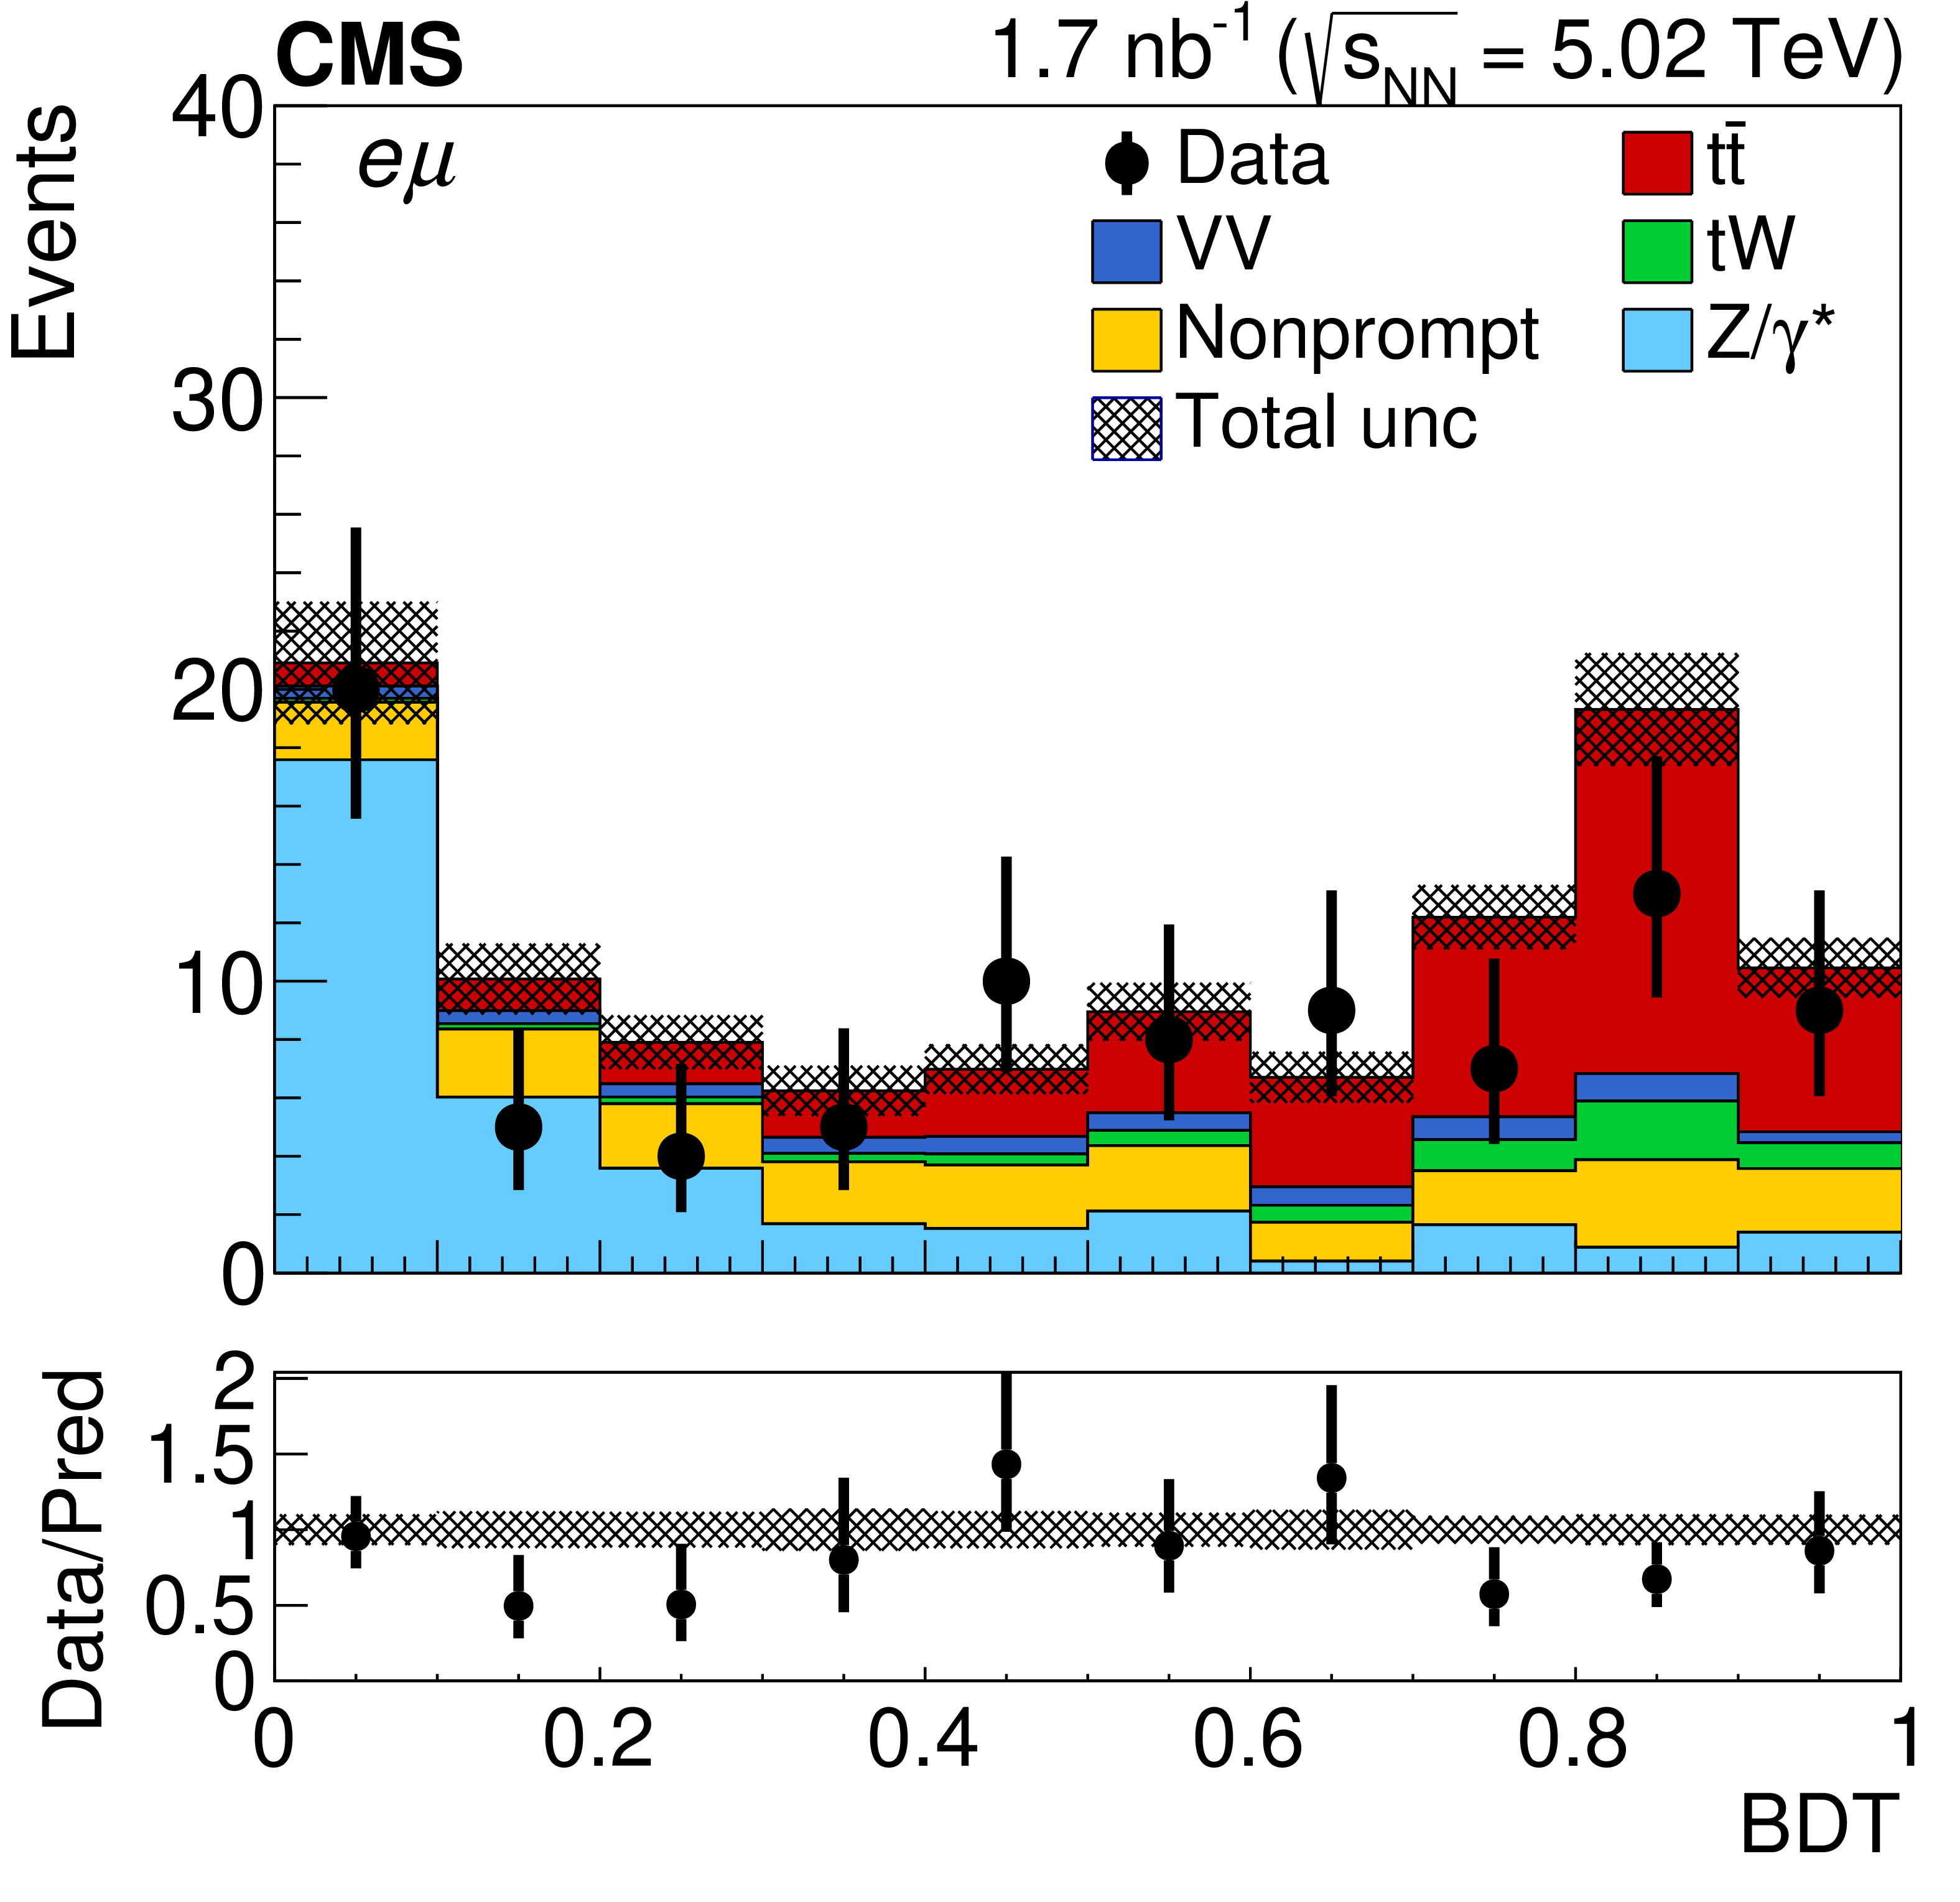
Figure 2:
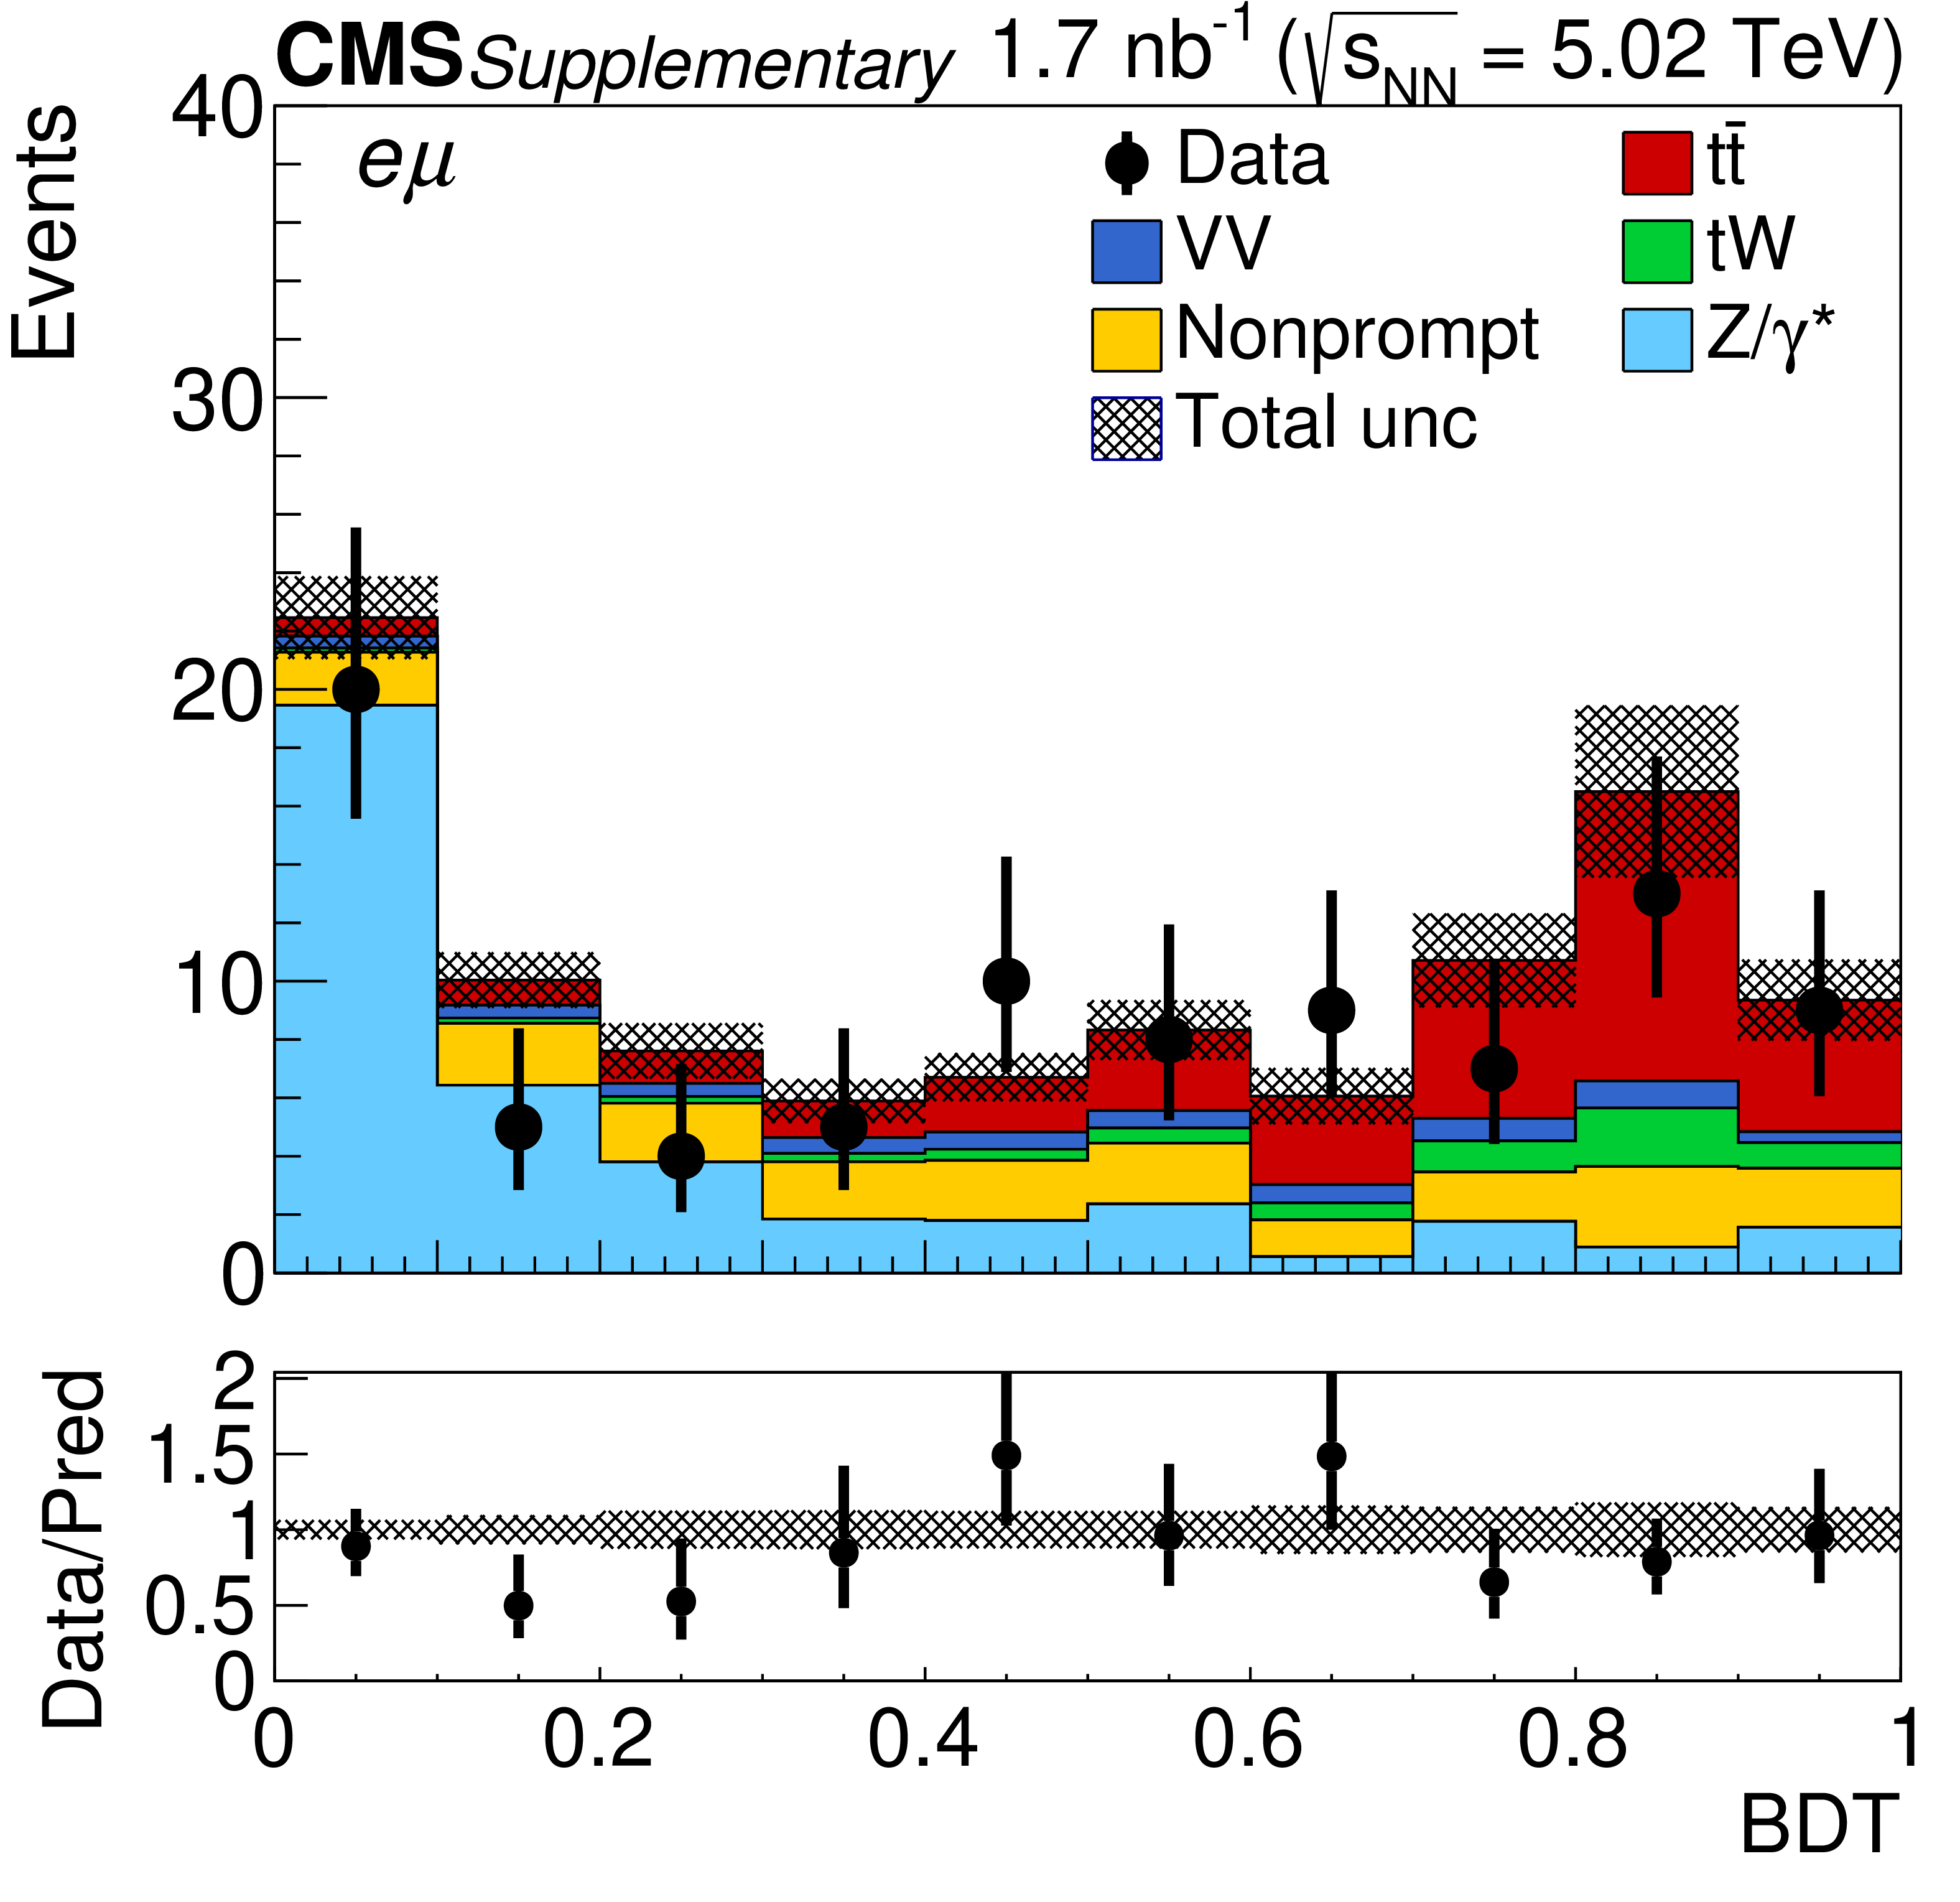
Observed (markers) and prefit expected (filled histograms) BDT discriminator distributions in the ${\mathrm{e^{+}} \mathrm{e^{-}} }$ (left), ${\mu^{+} \mu^{-} }$ (middle), and ${\mathrm{e^{\pm}} \mu ^\mp}$ (right) final states. The data are shown with markers, and the signal and background processes with filled histograms. The vertical bars on the markers represent the statistical uncertainties in data. The hatched regions show the prefit uncertainties in the sum of ${\mathrm{t} \mathrm{\bar{t}}}$ signal and backgrounds. The lower panels display the ratio of the data to expectations, including the ${\mathrm{t} \mathrm{\bar{t}}}$ signal, with bands representing the prefit uncertainties in the expectations. |
png pdf |
Figure 2-a:
Observed (markers) and prefit expected (filled histograms) BDT discriminator distributions in the ${\mathrm{e^{+}} \mathrm{e^{-}} }$ final state. The data are shown with markers, and the signal and background processes with filled histograms. The vertical bars on the markers represent the statistical uncertainties in data. The hatched regions show the prefit uncertainties in the sum of ${\mathrm{t} \mathrm{\bar{t}}}$ signal and backgrounds. The lower panel displays the ratio of the data to expectations, including the ${\mathrm{t} \mathrm{\bar{t}}}$ signal, with bands representing the prefit uncertainties in the expectations. |

png pdf |
Figure 2-b:
Observed (markers) and prefit expected (filled histograms) BDT discriminator distributions in the ${\mu^{+} \mu^{-} }$ final state. The data are shown with markers, and the signal and background processes with filled histograms. The vertical bars on the markers represent the statistical uncertainties in data. The hatched regions show the prefit uncertainties in the sum of ${\mathrm{t} \mathrm{\bar{t}}}$ signal and backgrounds. The lower panel displays the ratio of the data to expectations, including the ${\mathrm{t} \mathrm{\bar{t}}}$ signal, with bands representing the prefit uncertainties in the expectations. |
png pdf |
Figure 2-c:
Observed (markers) and prefit expected (filled histograms) BDT discriminator distributions in the ${\mathrm{e^{\pm}} \mu ^\mp}$ final state. The data are shown with markers, and the signal and background processes with filled histograms. The vertical bars on the markers represent the statistical uncertainties in data. The hatched regions show the prefit uncertainties in the sum of ${\mathrm{t} \mathrm{\bar{t}}}$ signal and backgrounds. The lower panel displays the ratio of the data to expectations, including the ${\mathrm{t} \mathrm{\bar{t}}}$ signal, with bands representing the prefit uncertainties in the expectations. |

png pdf |
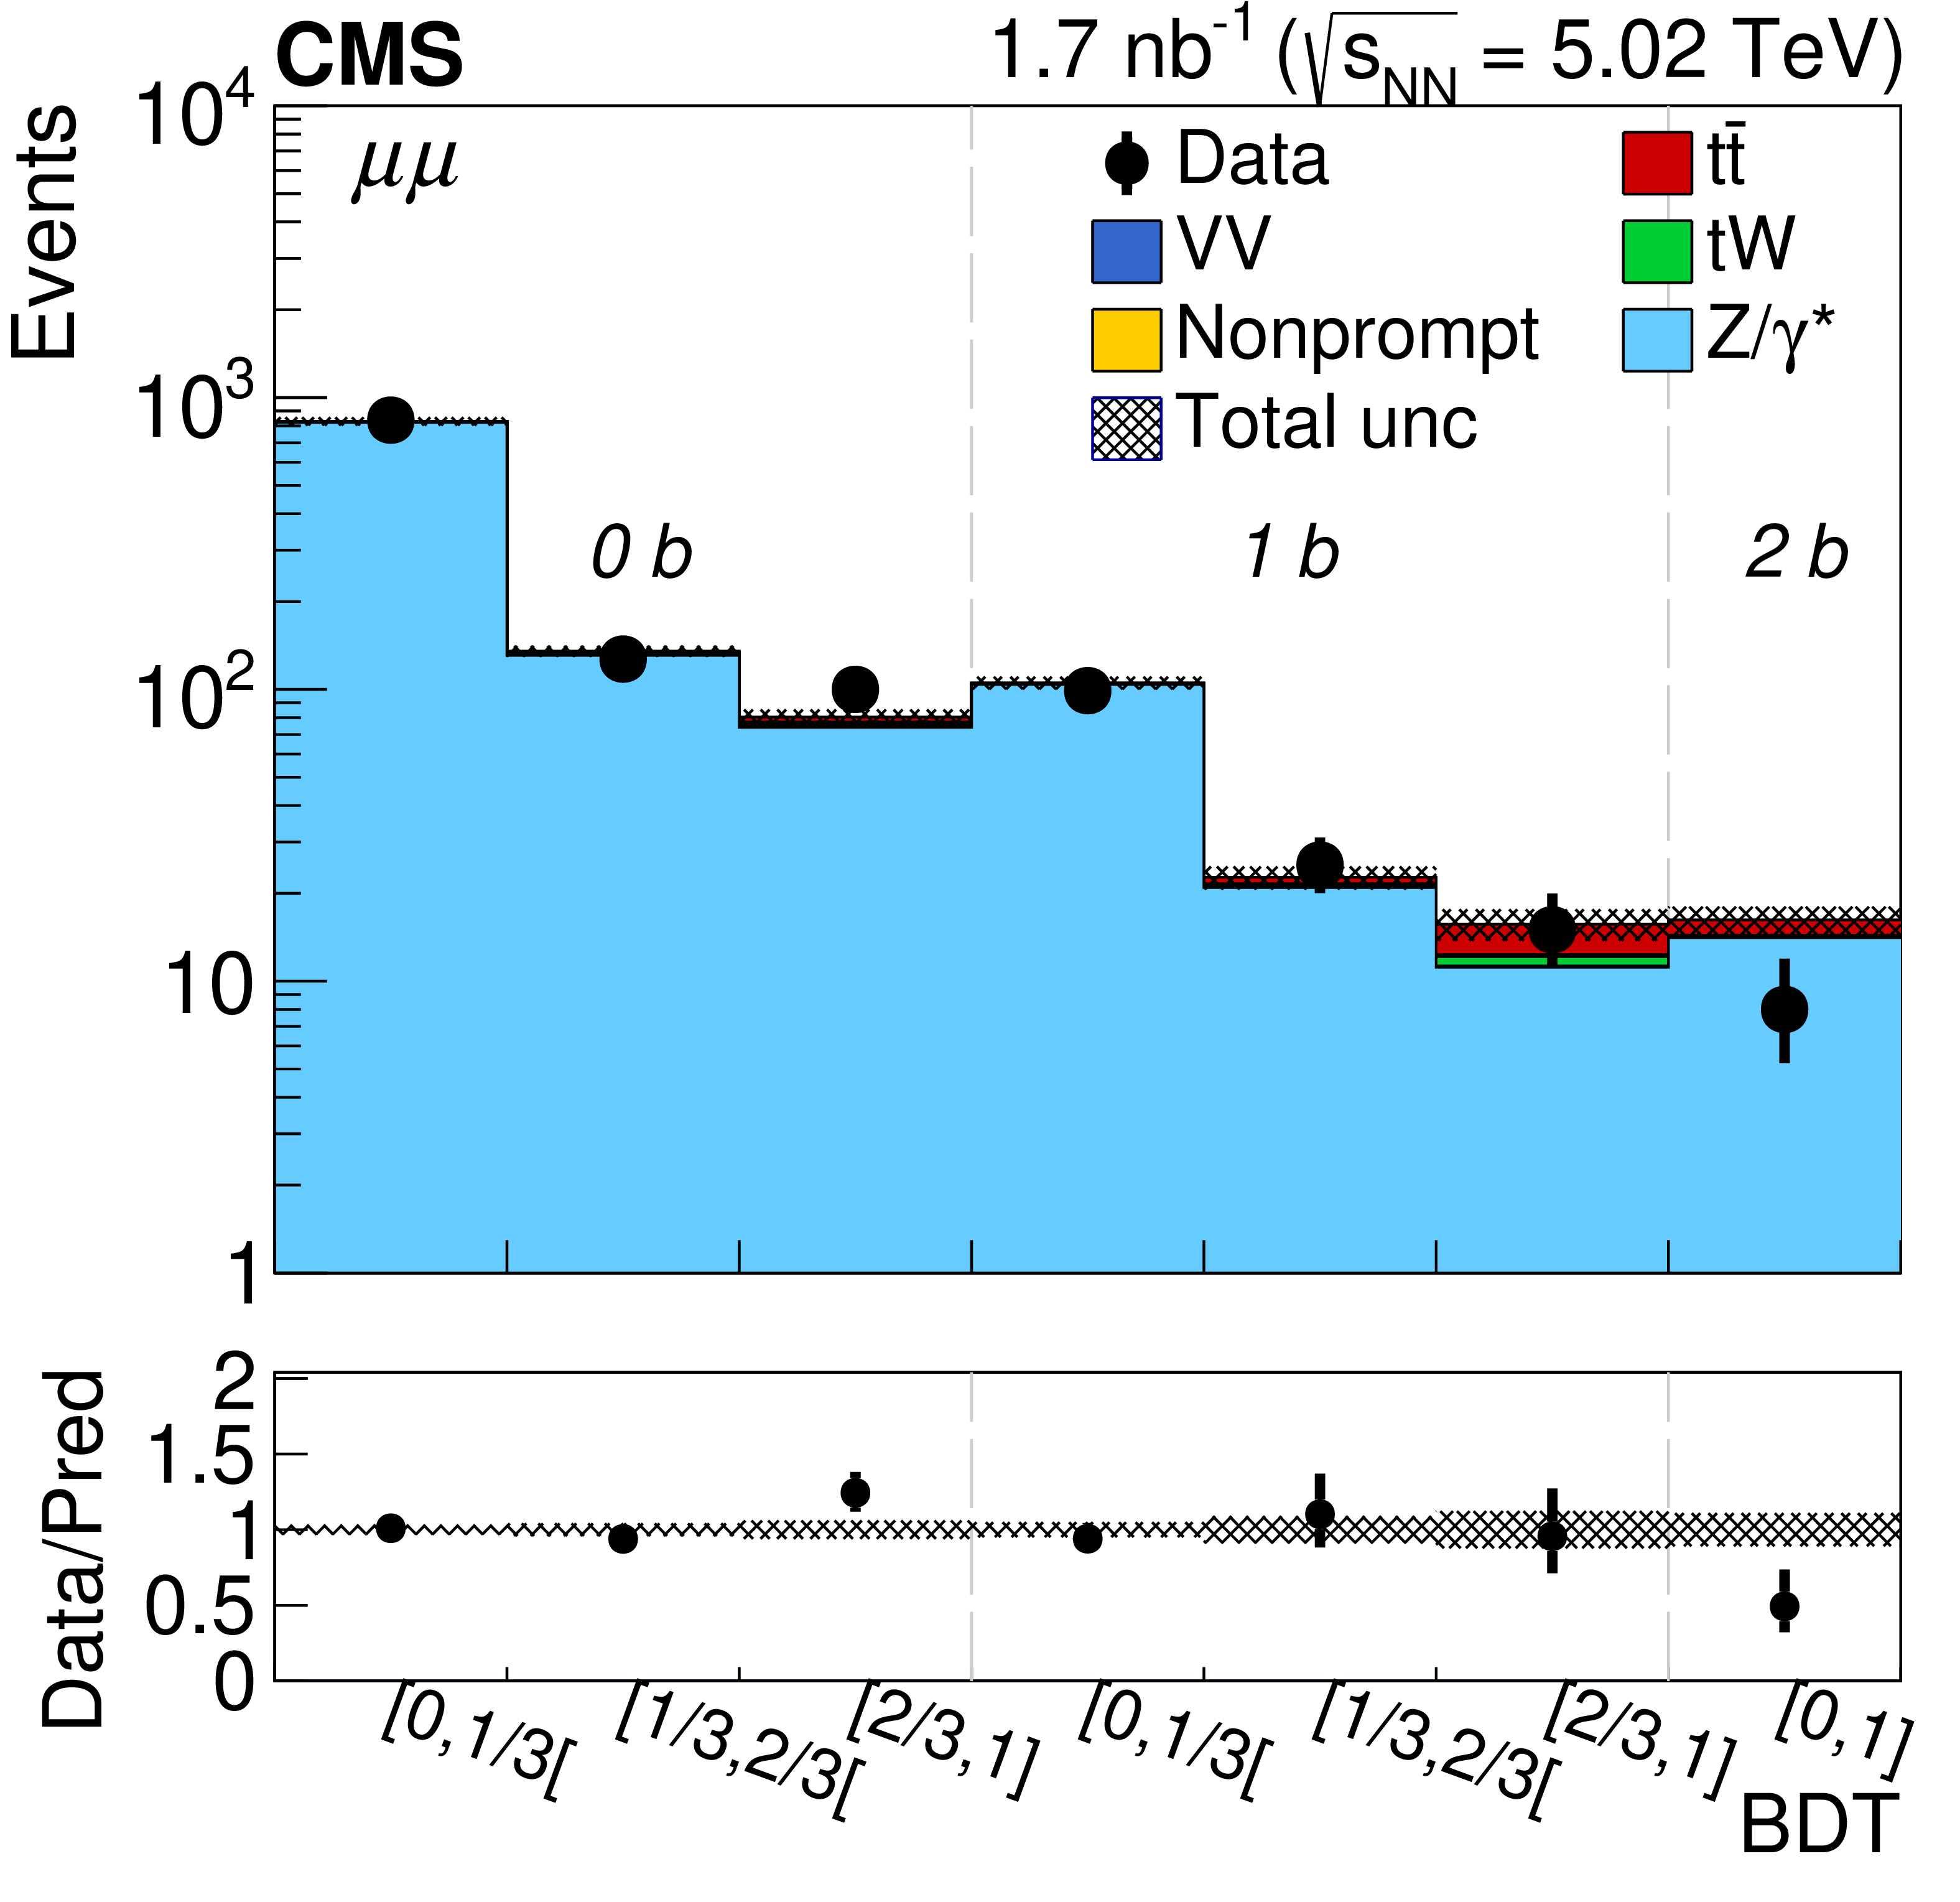
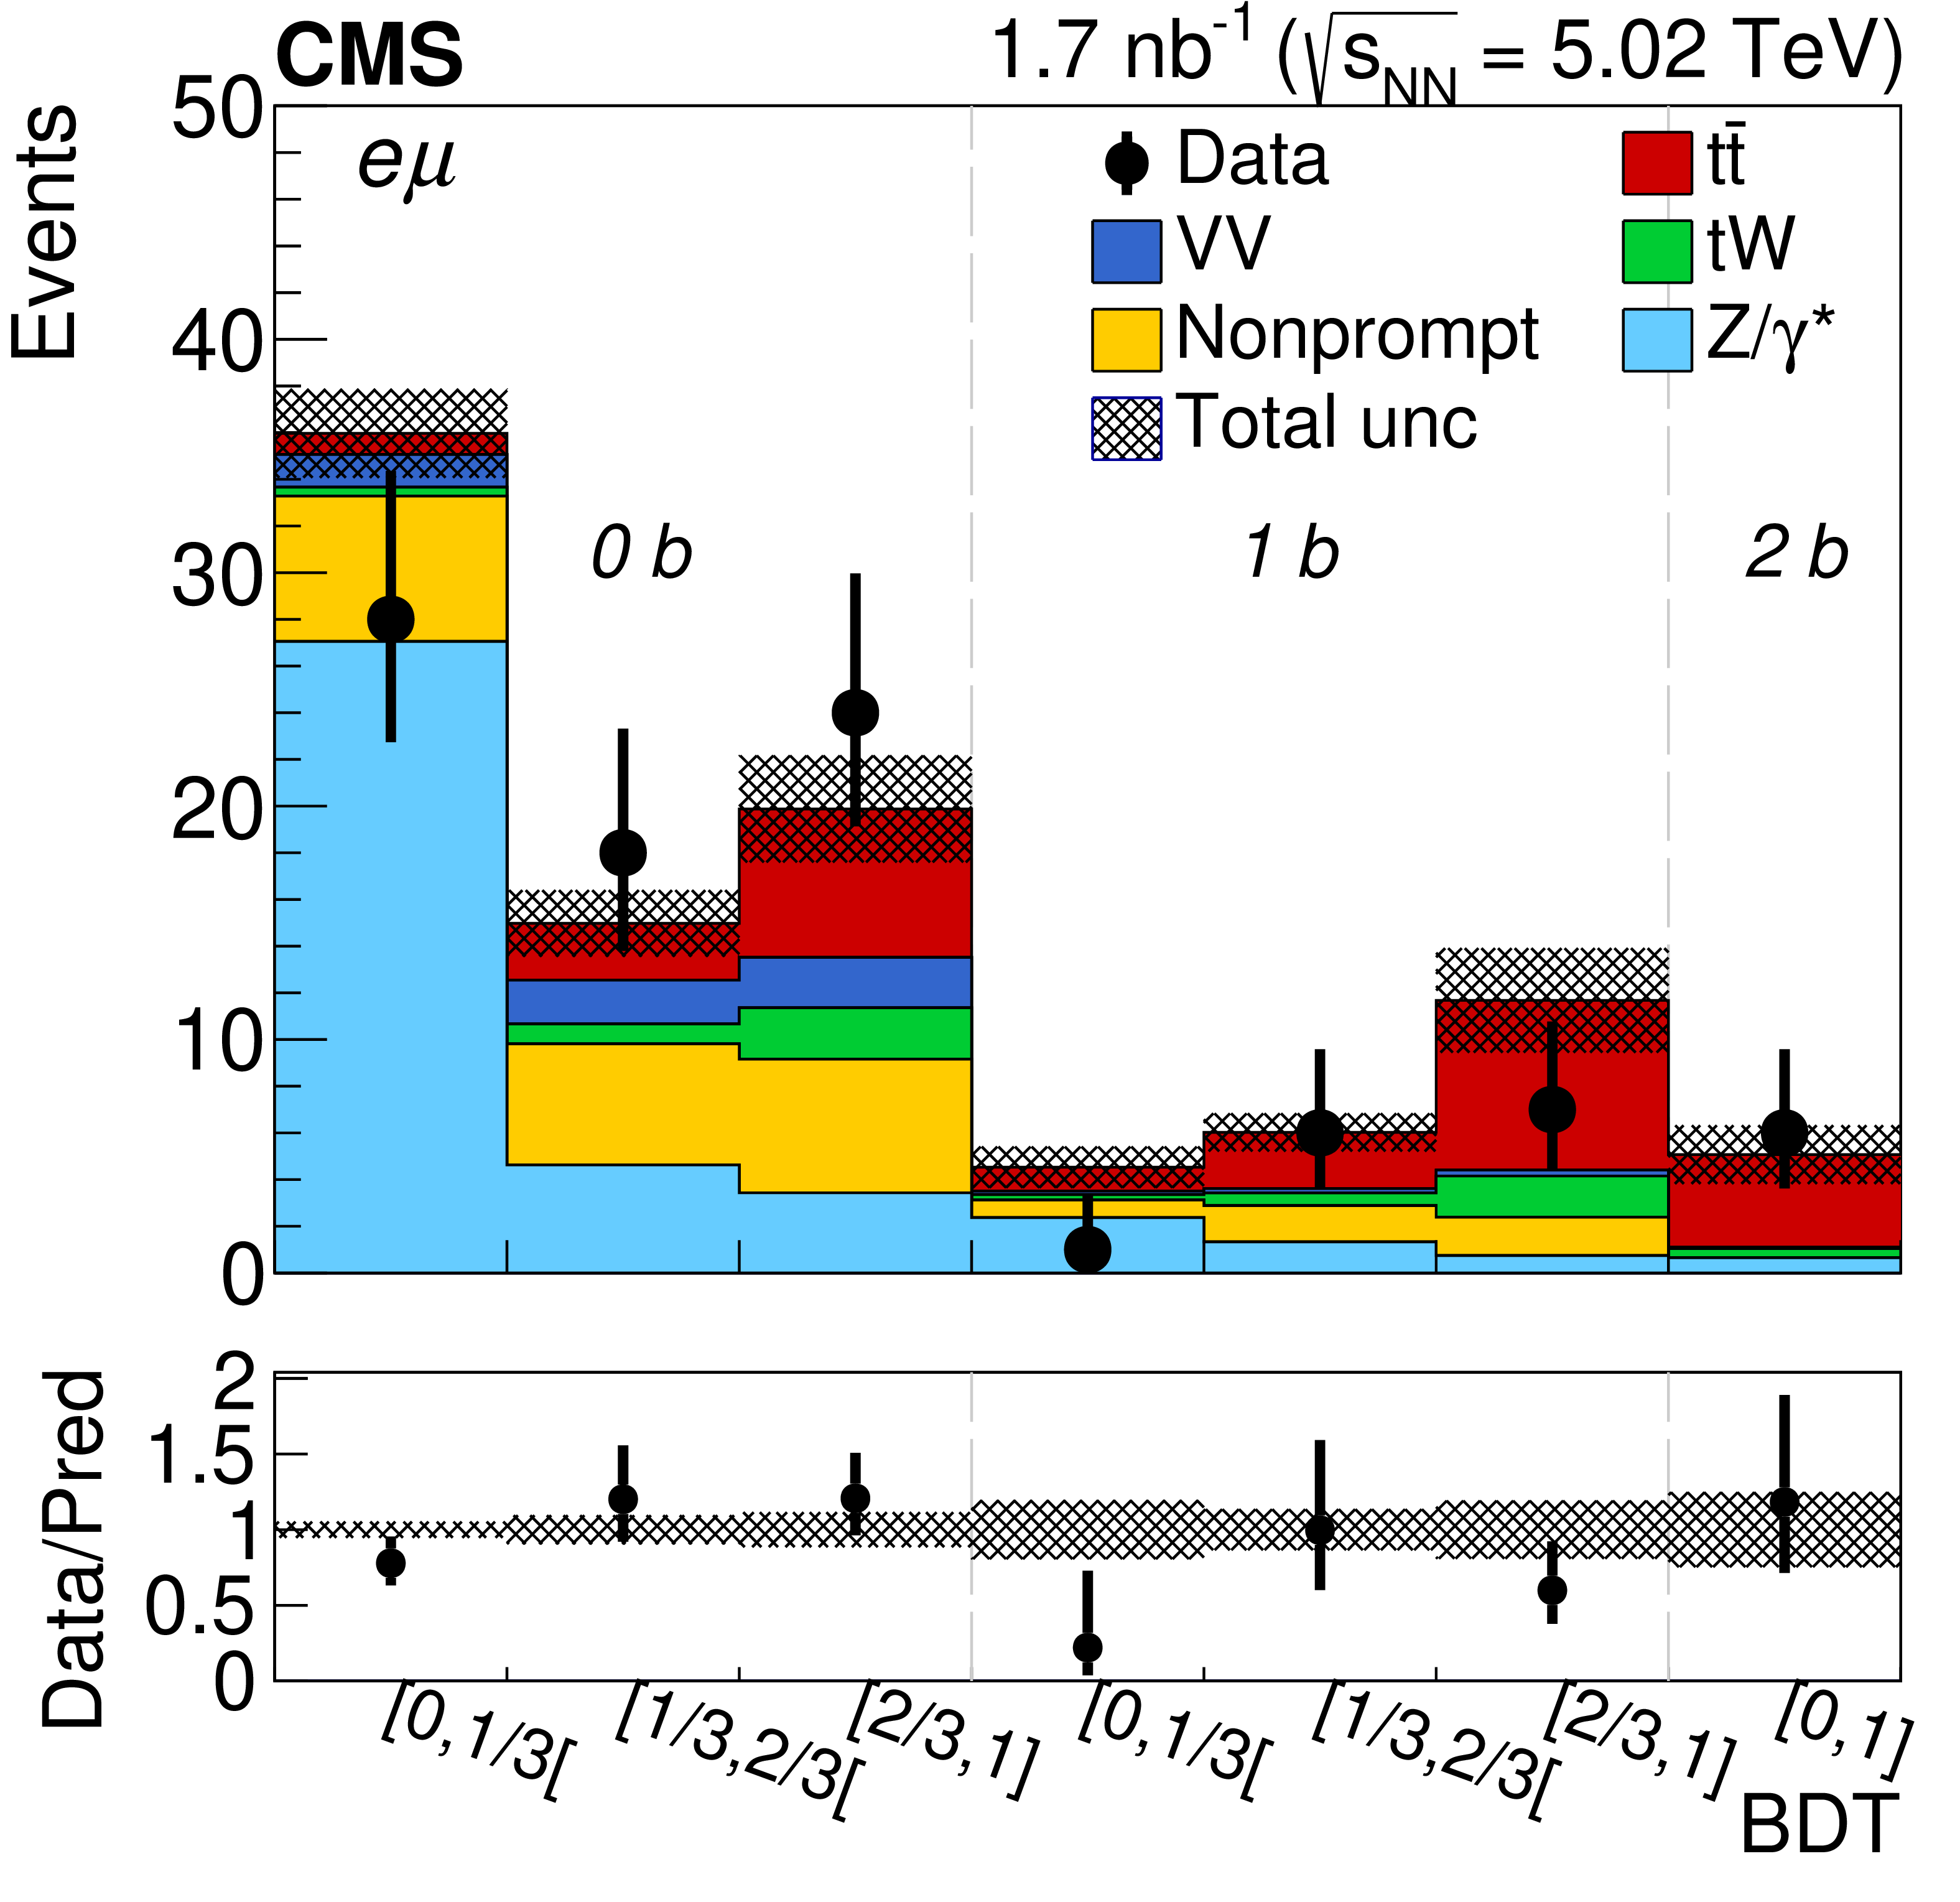
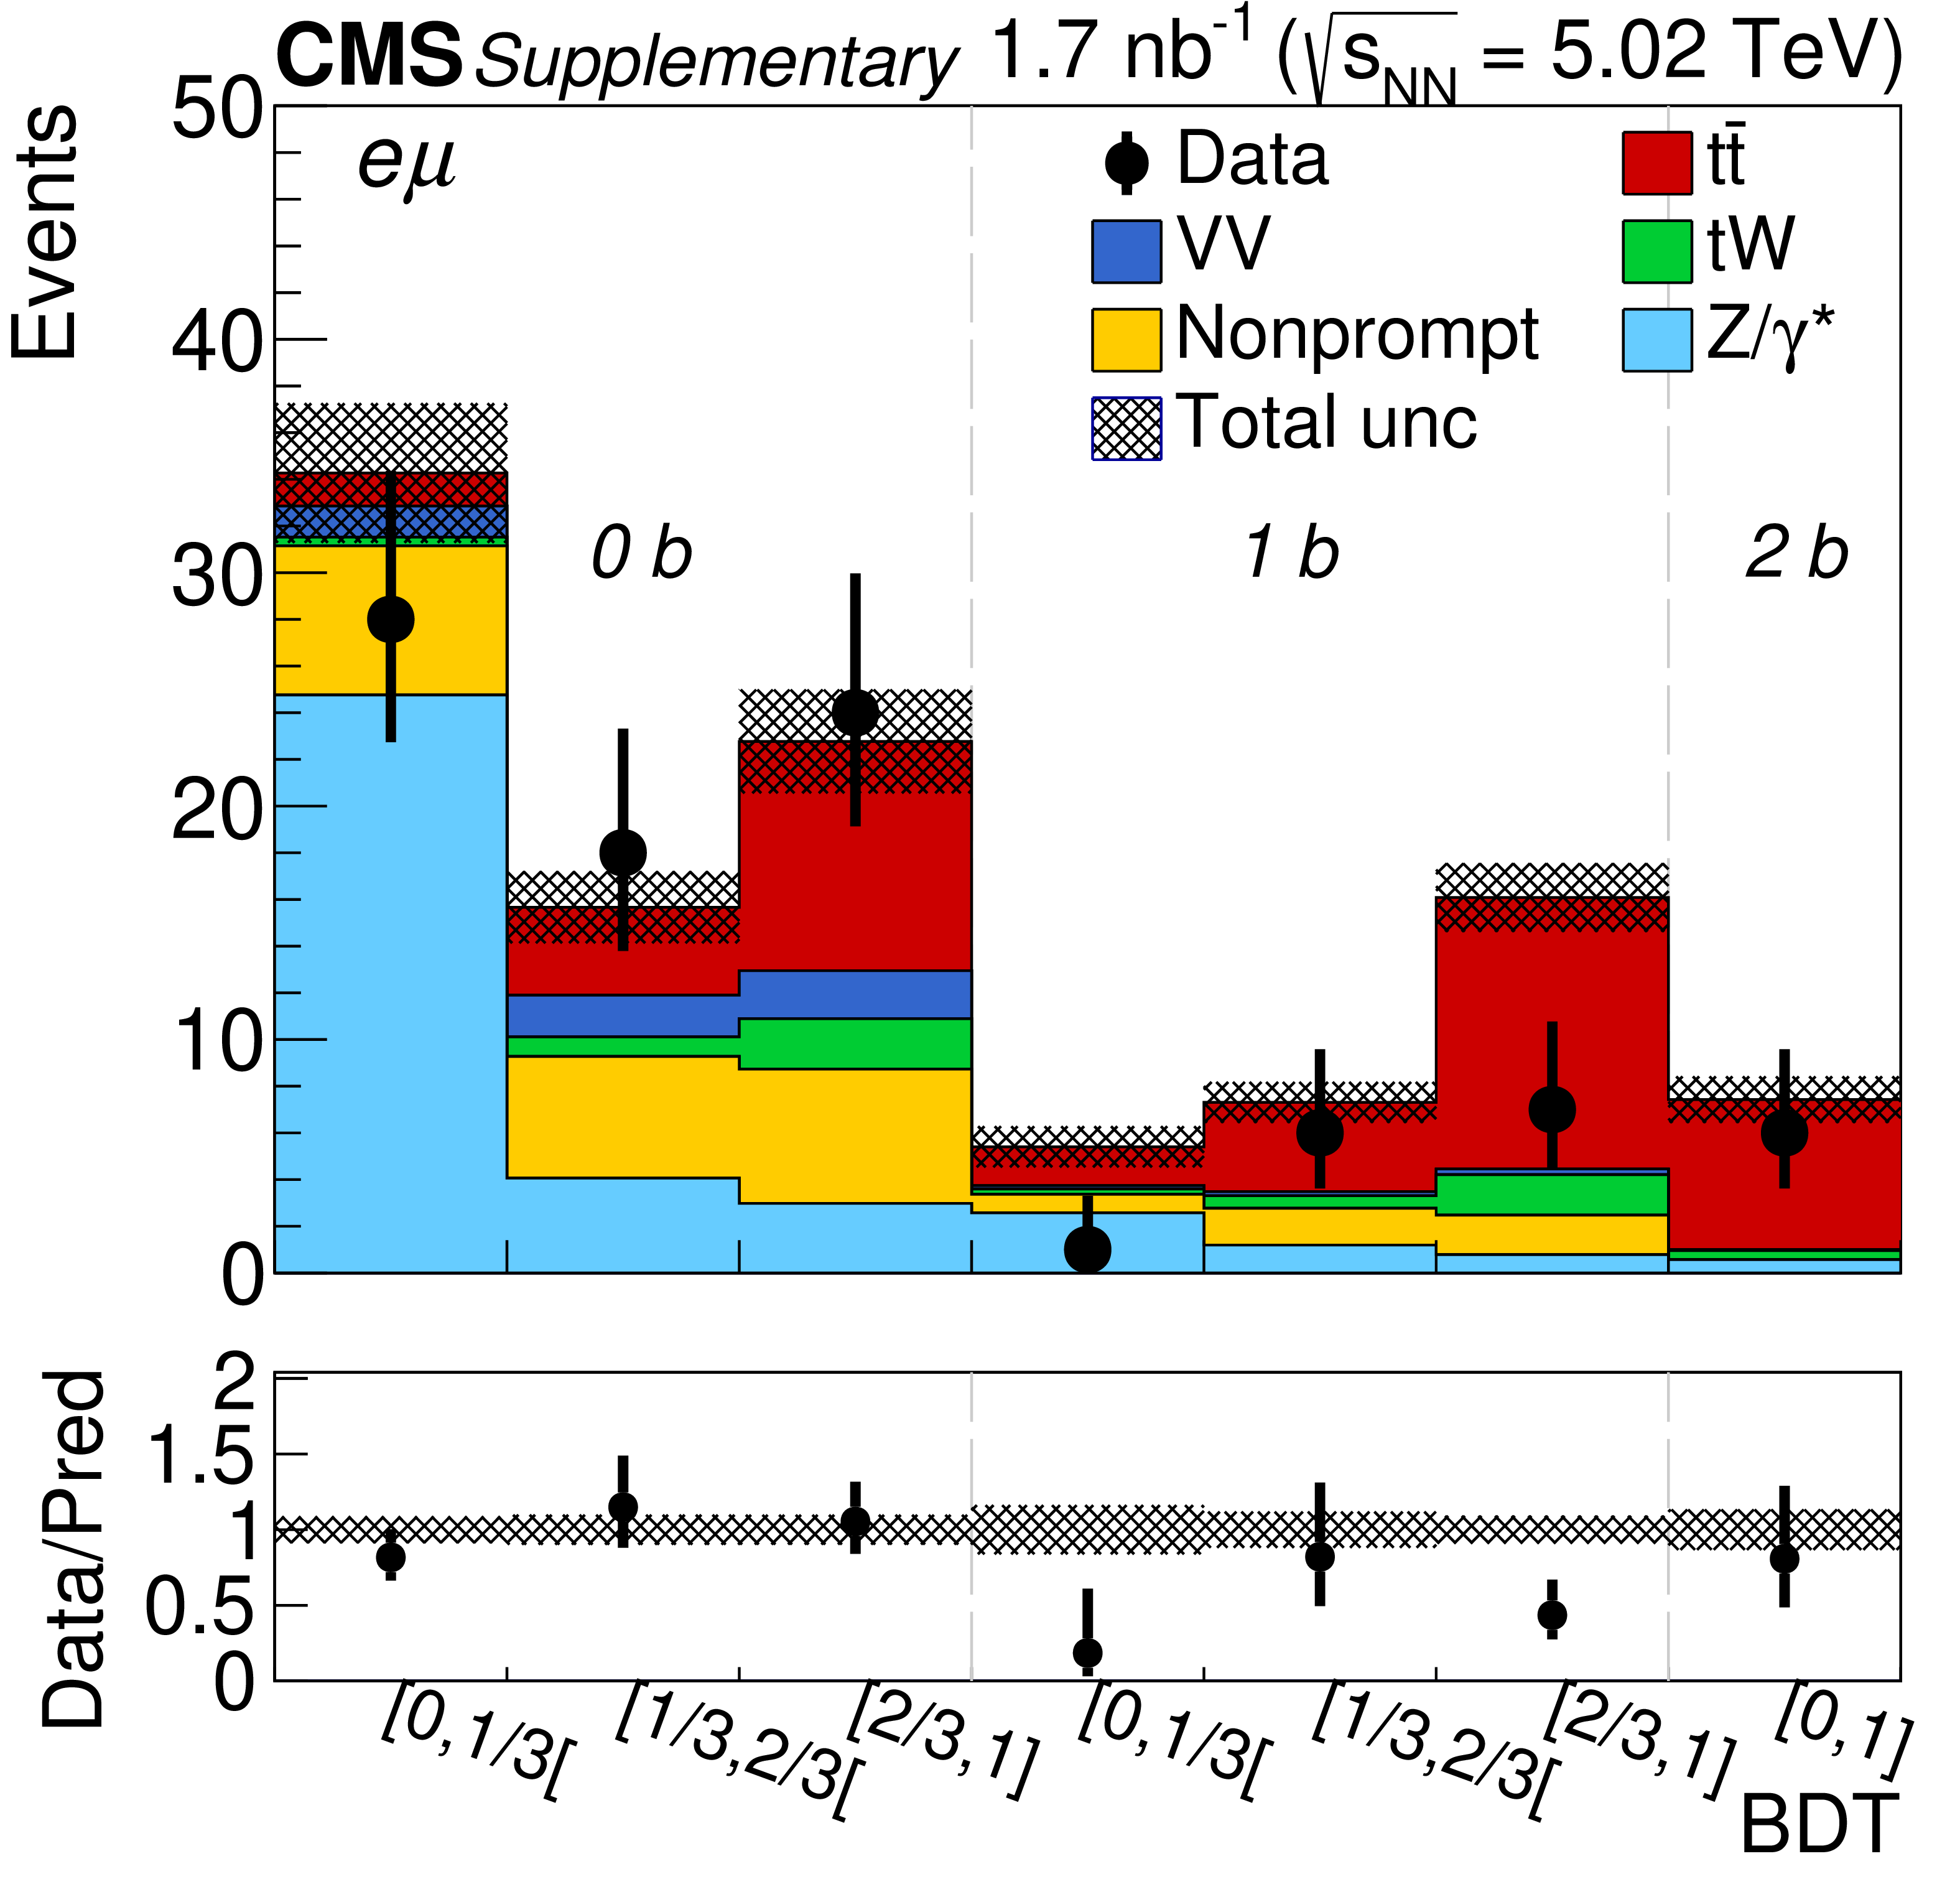
Figure 3:
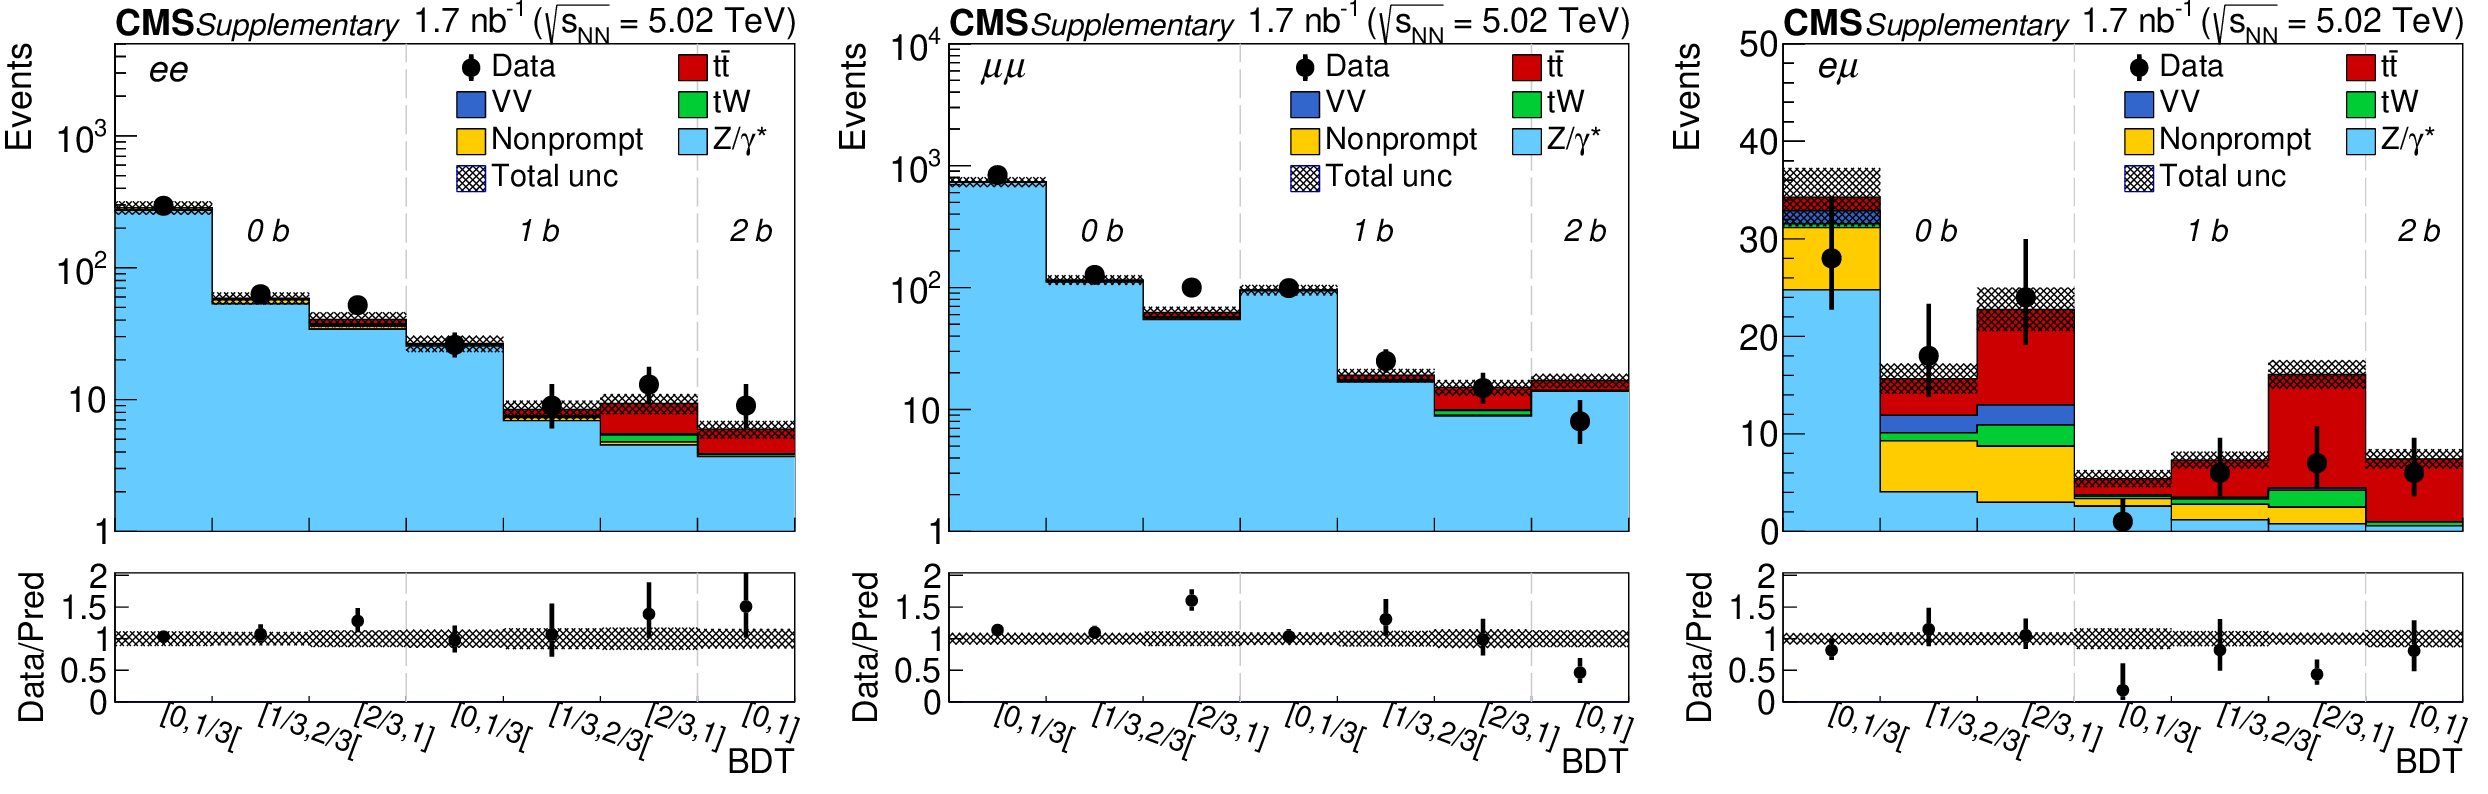
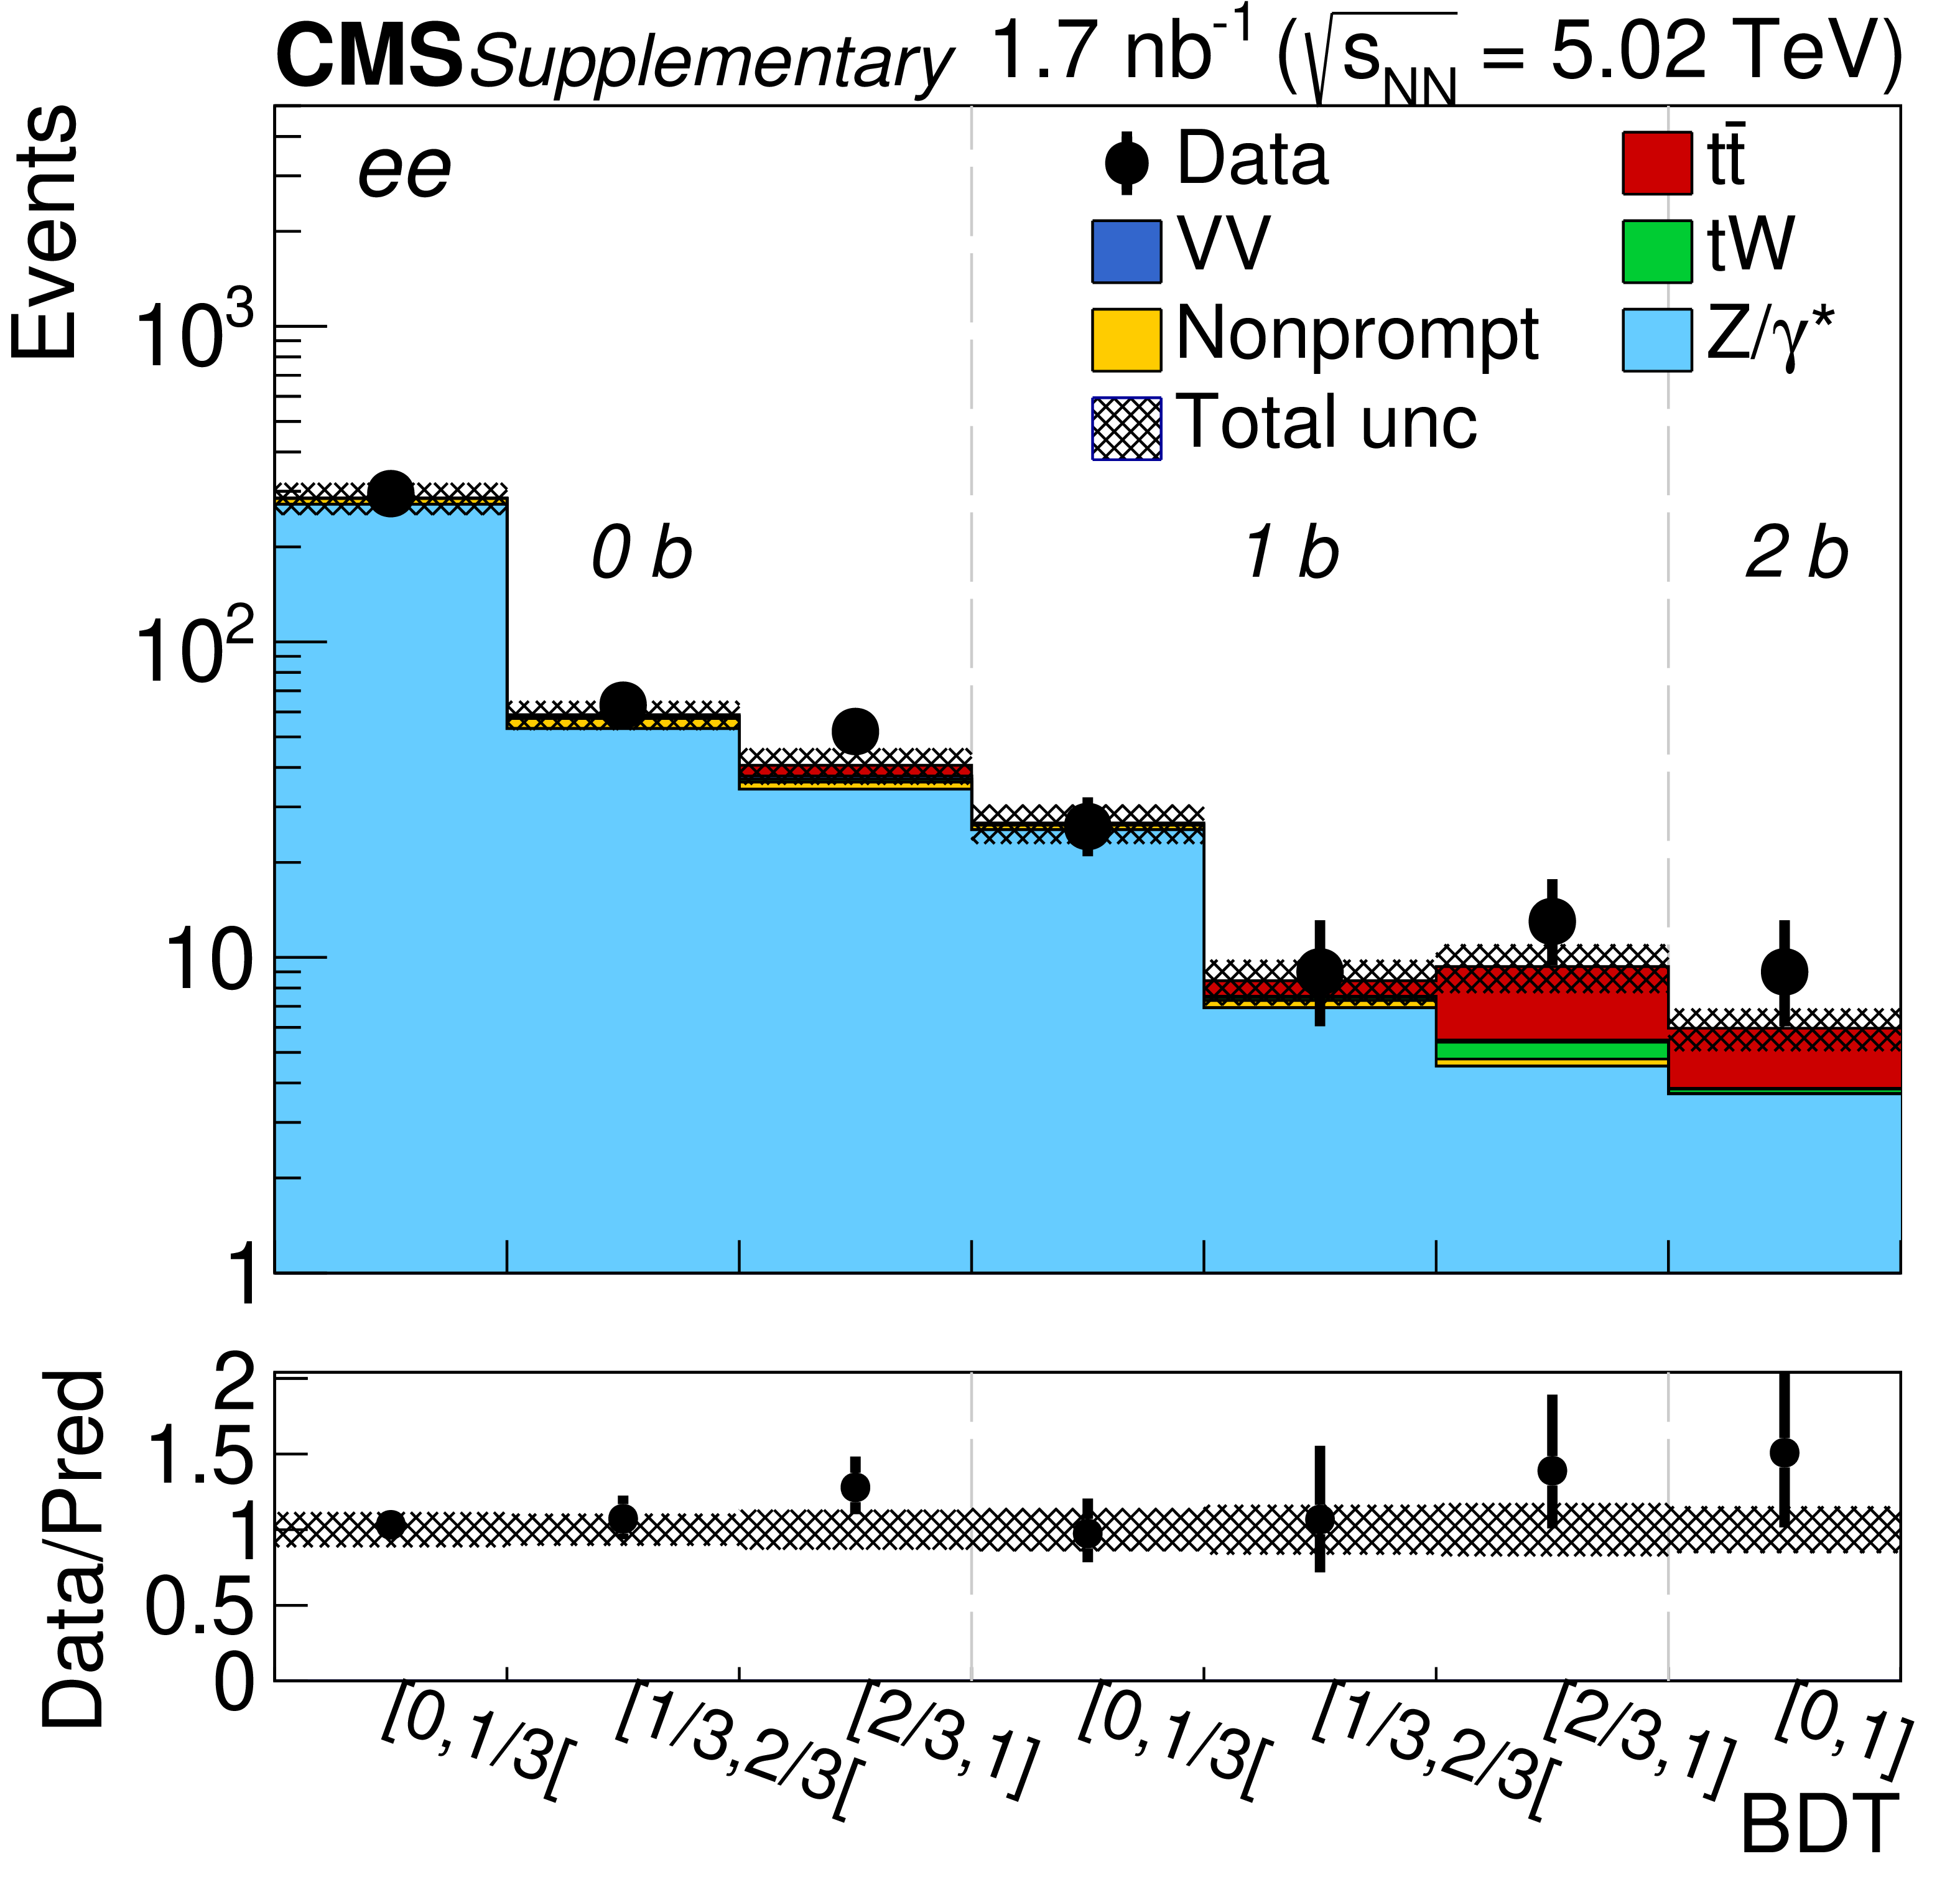
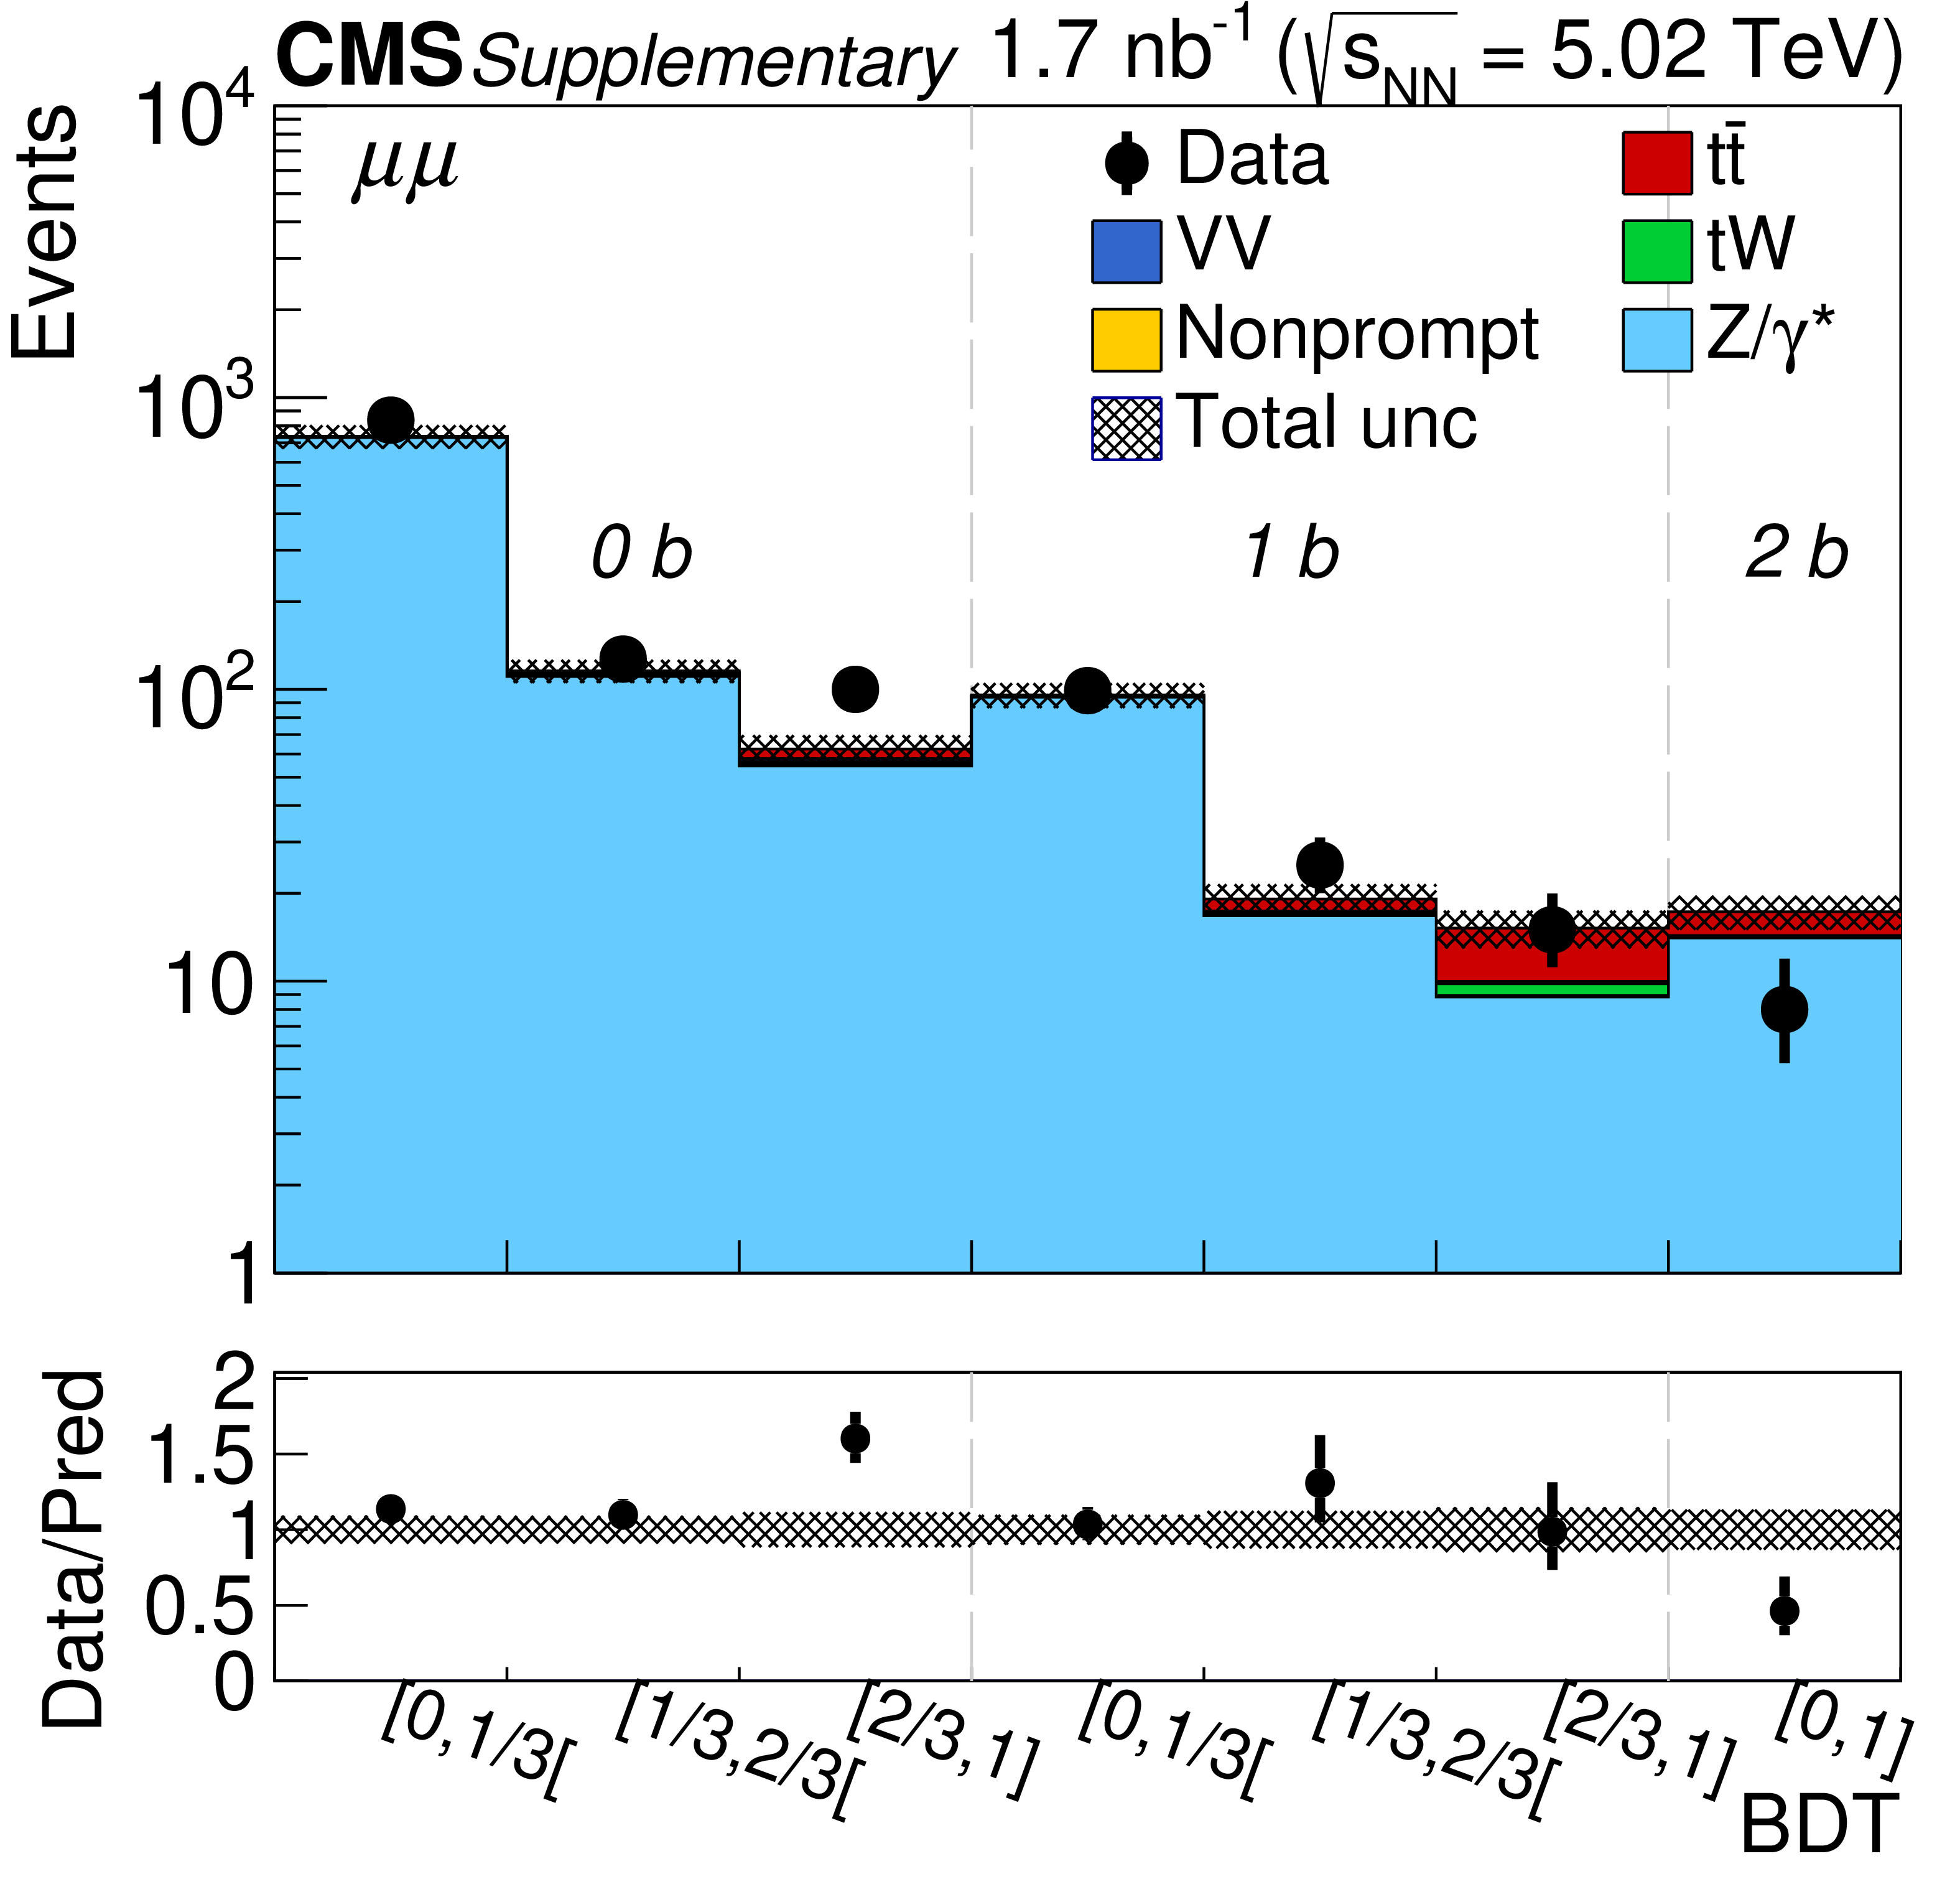
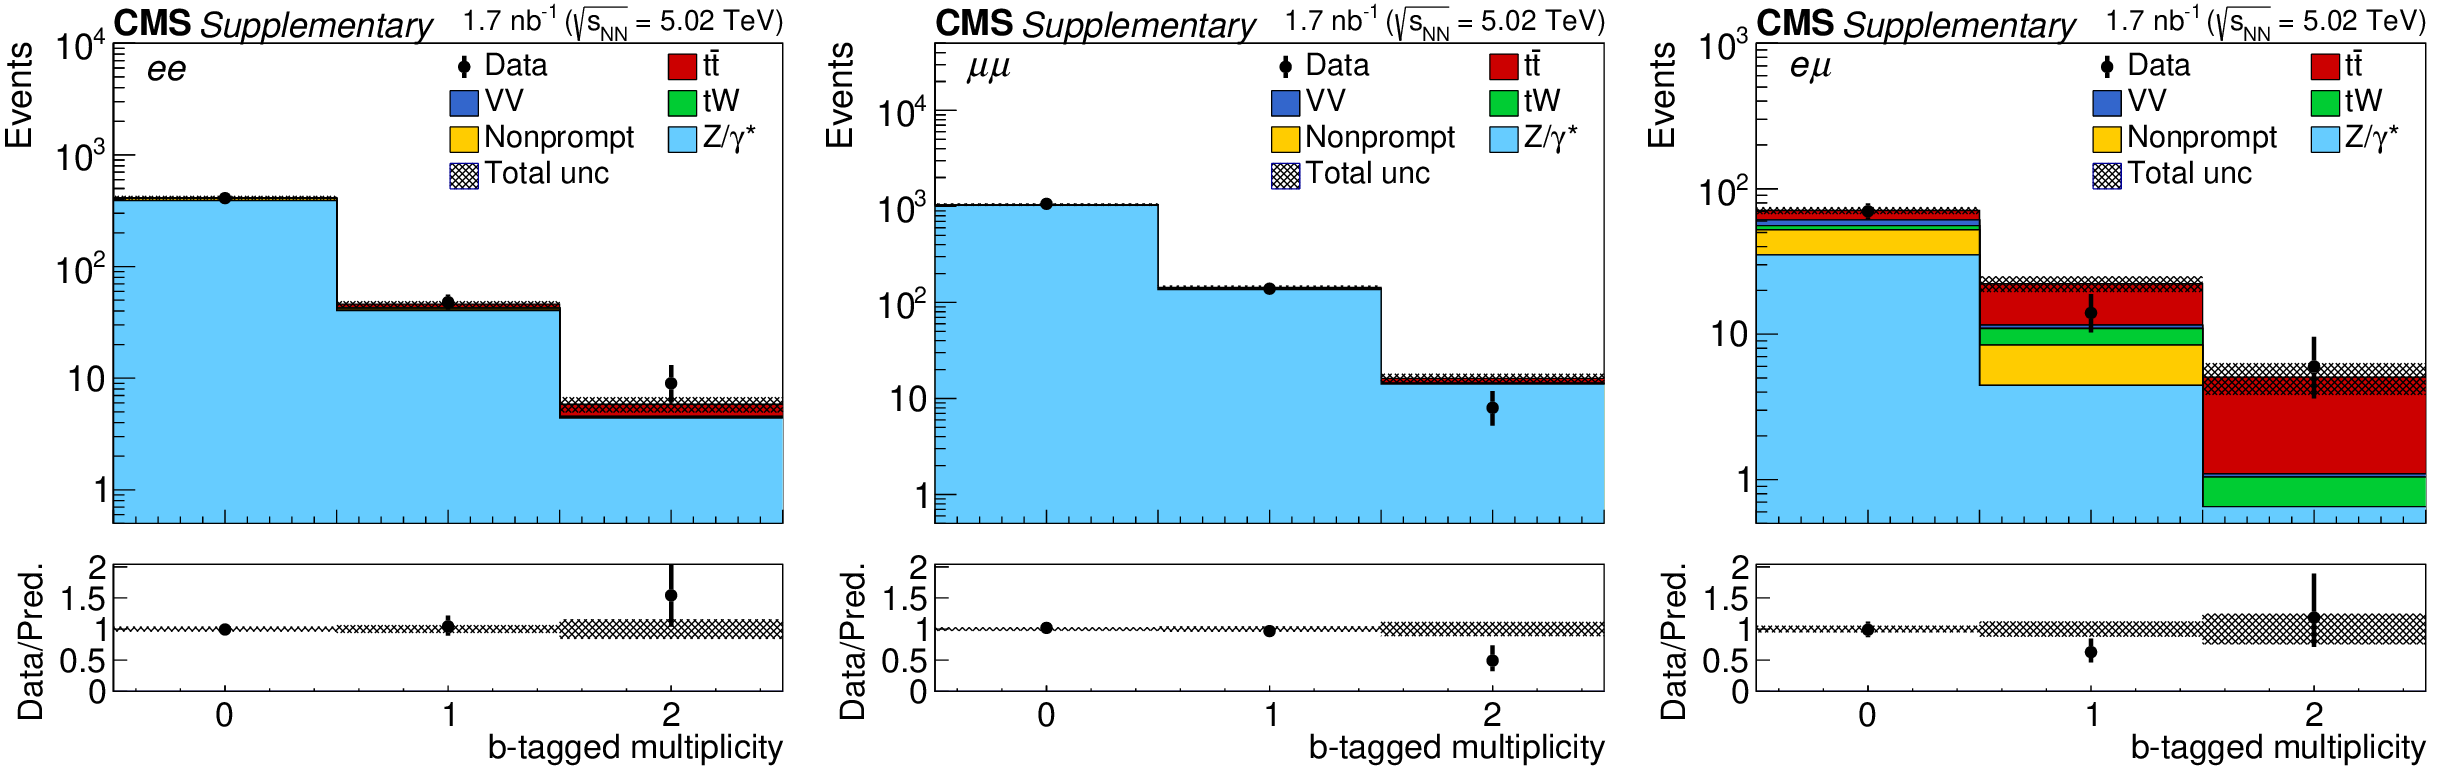
Observed (markers) and postfit predicted (filled histograms) BDT discriminator distributions in the ${\mathrm{e^{+}} \mathrm{e^{-}} }$ (left), ${\mu^{+} \mu^{-} }$ (middle), and ${\mathrm{e^{\pm}} \mu ^\mp}$ (right) final states separately for the 0b-, 1b-, and 2b-tagged jet multiplicity categories. The data are shown with markers, and the signal and background processes with filled histograms. The vertical bars on the markers represent the statistical uncertainties in data. The hatched regions show the postfit uncertainties in the sum of ${\mathrm{t} \mathrm{\bar{t}}}$ signal and backgrounds. The lower panels display the ratio of the data to predictions, including the ${\mathrm{t} \mathrm{\bar{t}}}$ signal, with bands representing the postfit uncertainties in the predictions. |

png pdf |
Figure 3-a:
Observed (markers) and postfit predicted (filled histograms) BDT discriminator distributions in the ${\mathrm{e^{+}} \mathrm{e^{-}} }$ final state separately for the 0b-, 1b-, and 2b-tagged jet multiplicity categories. The data are shown with markers, and the signal and background processes with filled histograms. The vertical bars on the markers represent the statistical uncertainties in data. The hatched regions show the postfit uncertainties in the sum of ${\mathrm{t} \mathrm{\bar{t}}}$ signal and backgrounds. The lower panel displays the ratio of the data to predictions, including the ${\mathrm{t} \mathrm{\bar{t}}}$ signal, with bands representing the postfit uncertainties in the predictions. |
png pdf |
Figure 3-b:
Observed (markers) and postfit predicted (filled histograms) BDT discriminator distributions in the ${\mu^{+} \mu^{-} }$ final state separately for the 0b-, 1b-, and 2b-tagged jet multiplicity categories. The data are shown with markers, and the signal and background processes with filled histograms. The vertical bars on the markers represent the statistical uncertainties in data. The hatched regions show the postfit uncertainties in the sum of ${\mathrm{t} \mathrm{\bar{t}}}$ signal and backgrounds. The lower panel displays the ratio of the data to predictions, including the ${\mathrm{t} \mathrm{\bar{t}}}$ signal, with bands representing the postfit uncertainties in the predictions. |
png pdf |
Figure 3-c:
Observed (markers) and postfit predicted (filled histograms) BDT discriminator distributions in the ${\mathrm{e^{\pm}} \mu ^\mp}$ final state separately for the 0b-, 1b-, and 2b-tagged jet multiplicity categories. The data are shown with markers, and the signal and background processes with filled histograms. The vertical bars on the markers represent the statistical uncertainties in data. The hatched regions show the postfit uncertainties in the sum of ${\mathrm{t} \mathrm{\bar{t}}}$ signal and backgrounds. The lower panel displays the ratio of the data to predictions, including the ${\mathrm{t} \mathrm{\bar{t}}}$ signal, with bands representing the postfit uncertainties in the predictions. |

png pdf |
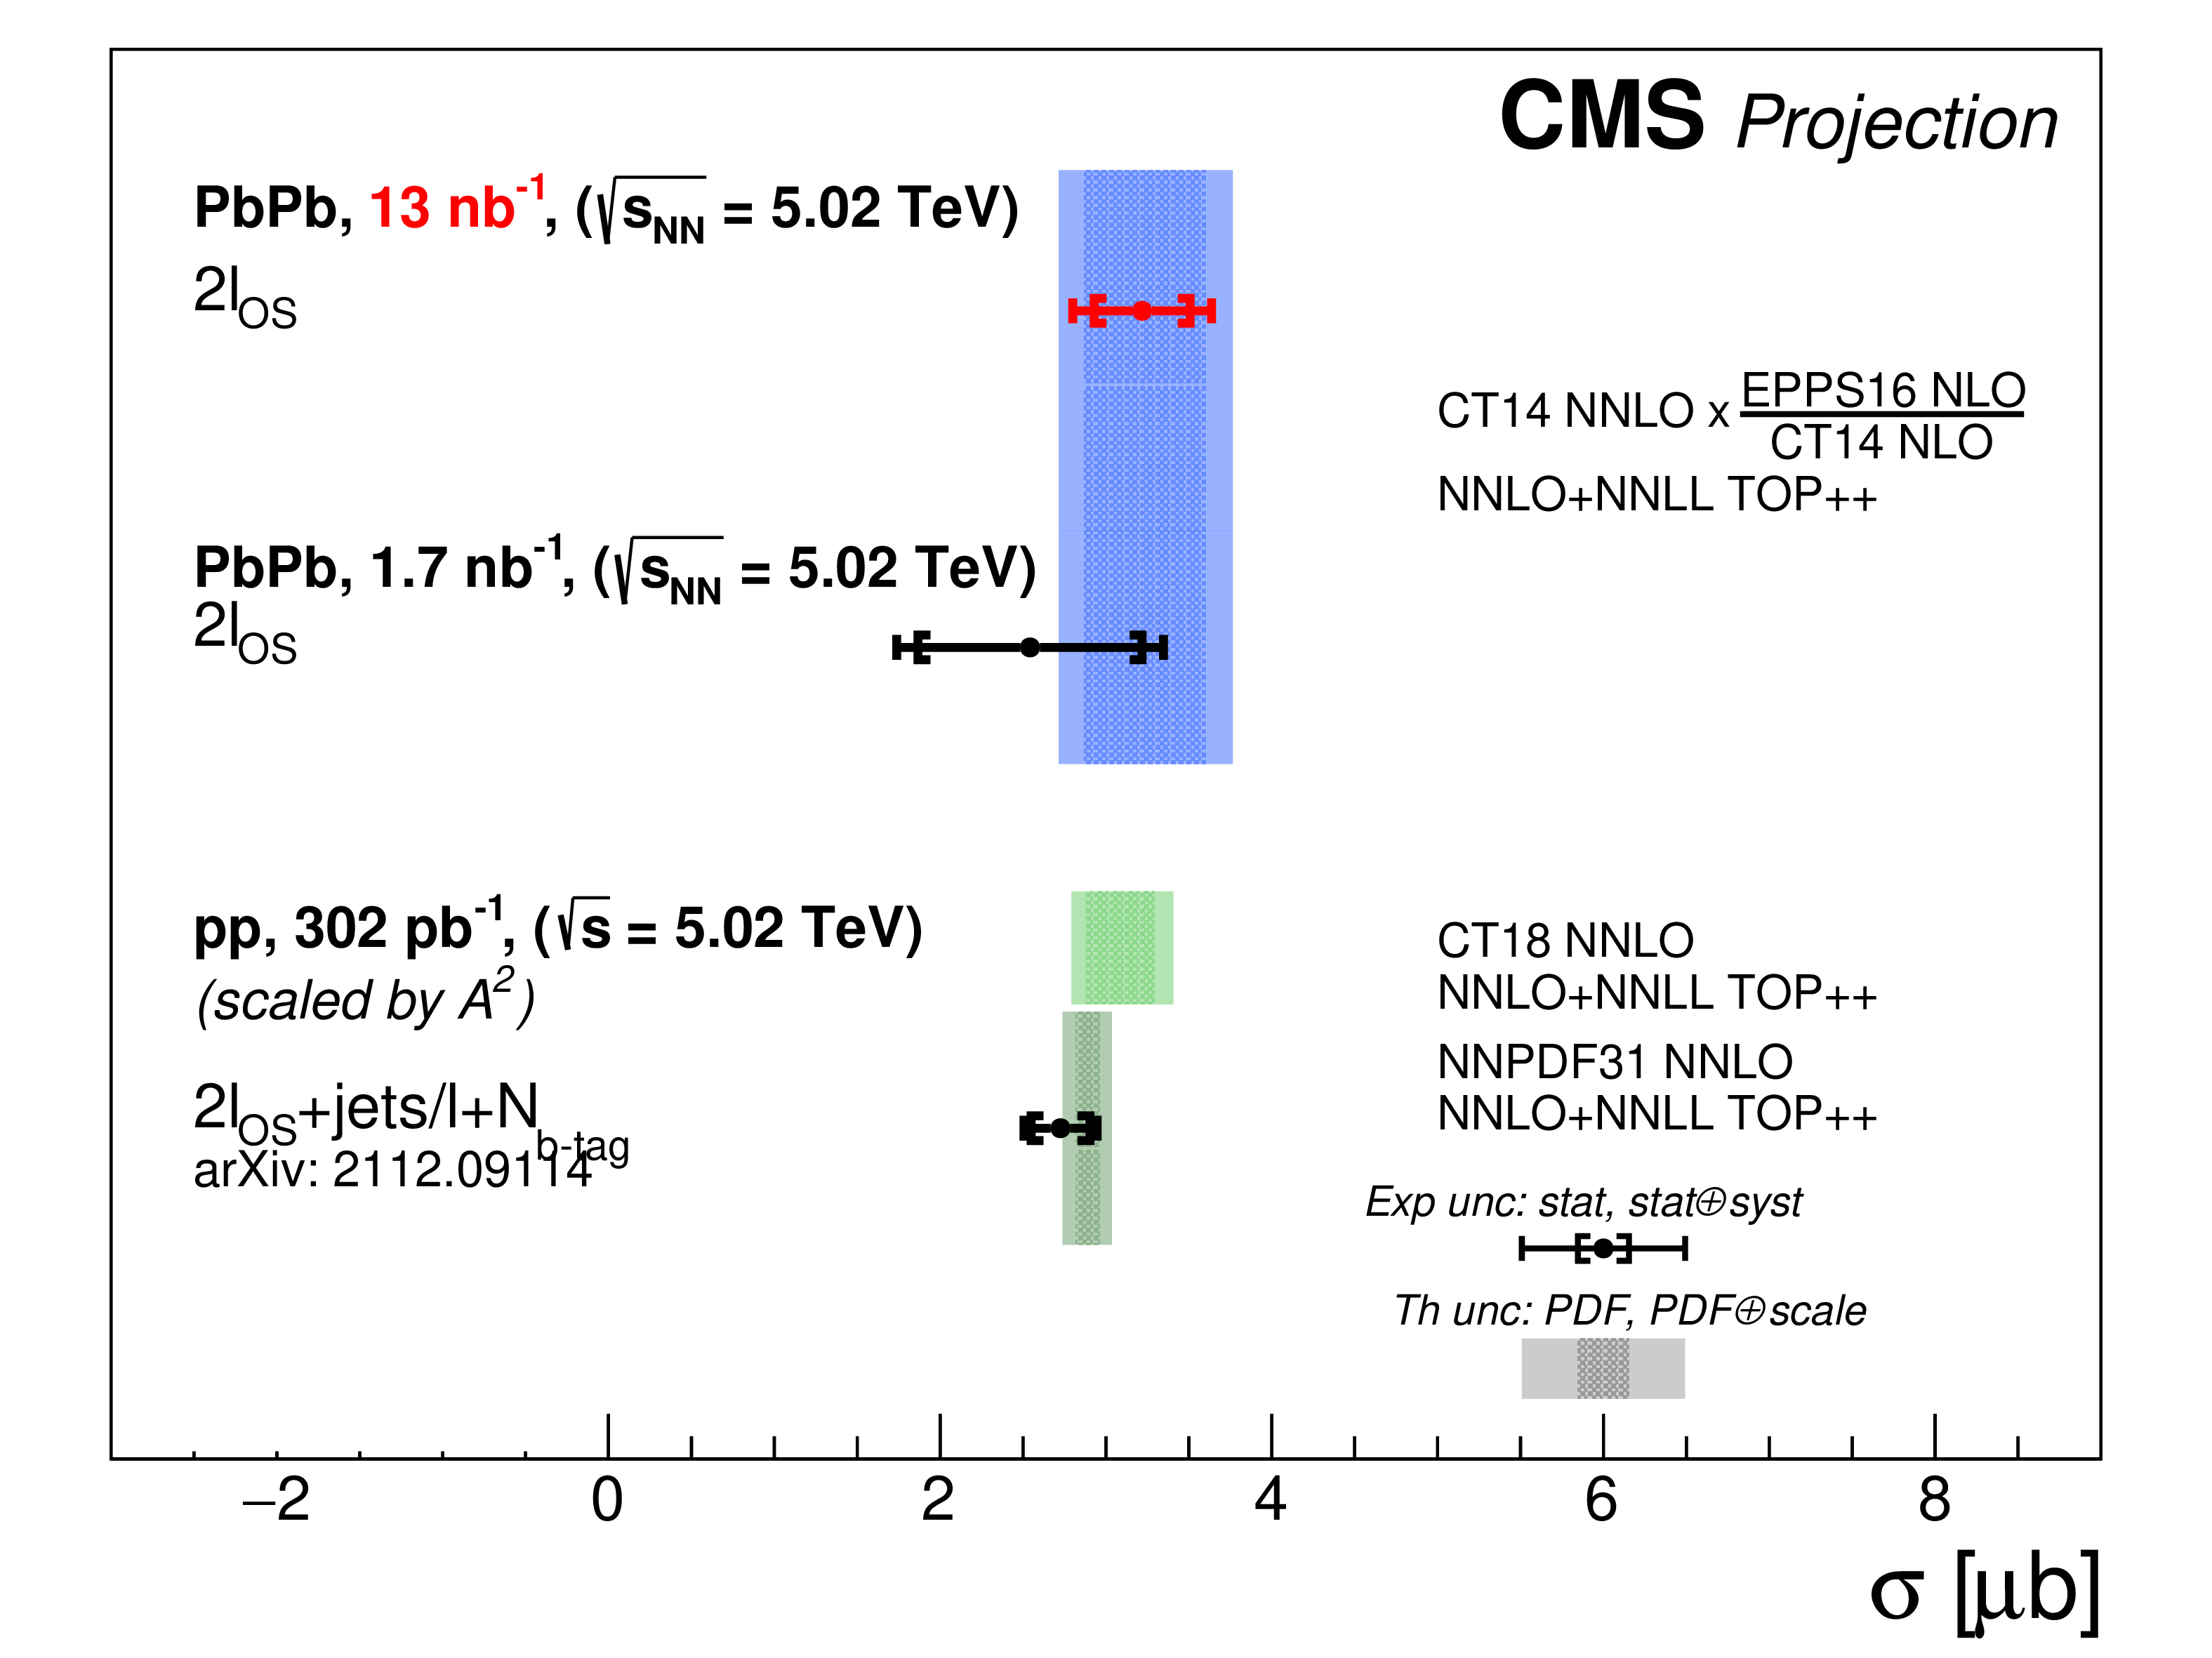
Figure 4:
Inclusive ${\mathrm{t} \mathrm{\bar{t}}}$ cross sections measured with two methods in the combined ${\mathrm{e^{+}} \mathrm{e^{-}} }$, ${\mu^{+} \mu^{-} }$, and ${\mathrm{e^{\pm}} \mu ^\mp}$ final states in PbPb collisions at $ {\sqrt {\smash [b]{s_{_{\mathrm {NN}}}}}} = $ 5.02 TeV, and pp results at $ \sqrt {s} = $ 5.02 TeV (scaled by $A^2$) from Ref. [21]. The measurements are compared with theoretical predictions at NNLO+NNLL accuracy in QCD [37]. The inner (outer) experimental uncertainty bars include statistical (statistical and systematic, added in quadrature) uncertainties. The inner (outer) theoretical uncertainty bands correspond to nuclear [31,36] or free-nucleon [32,33] PDF (PDF and scale, added in quadrature) uncertainties. |
| Tables | |
png pdf |
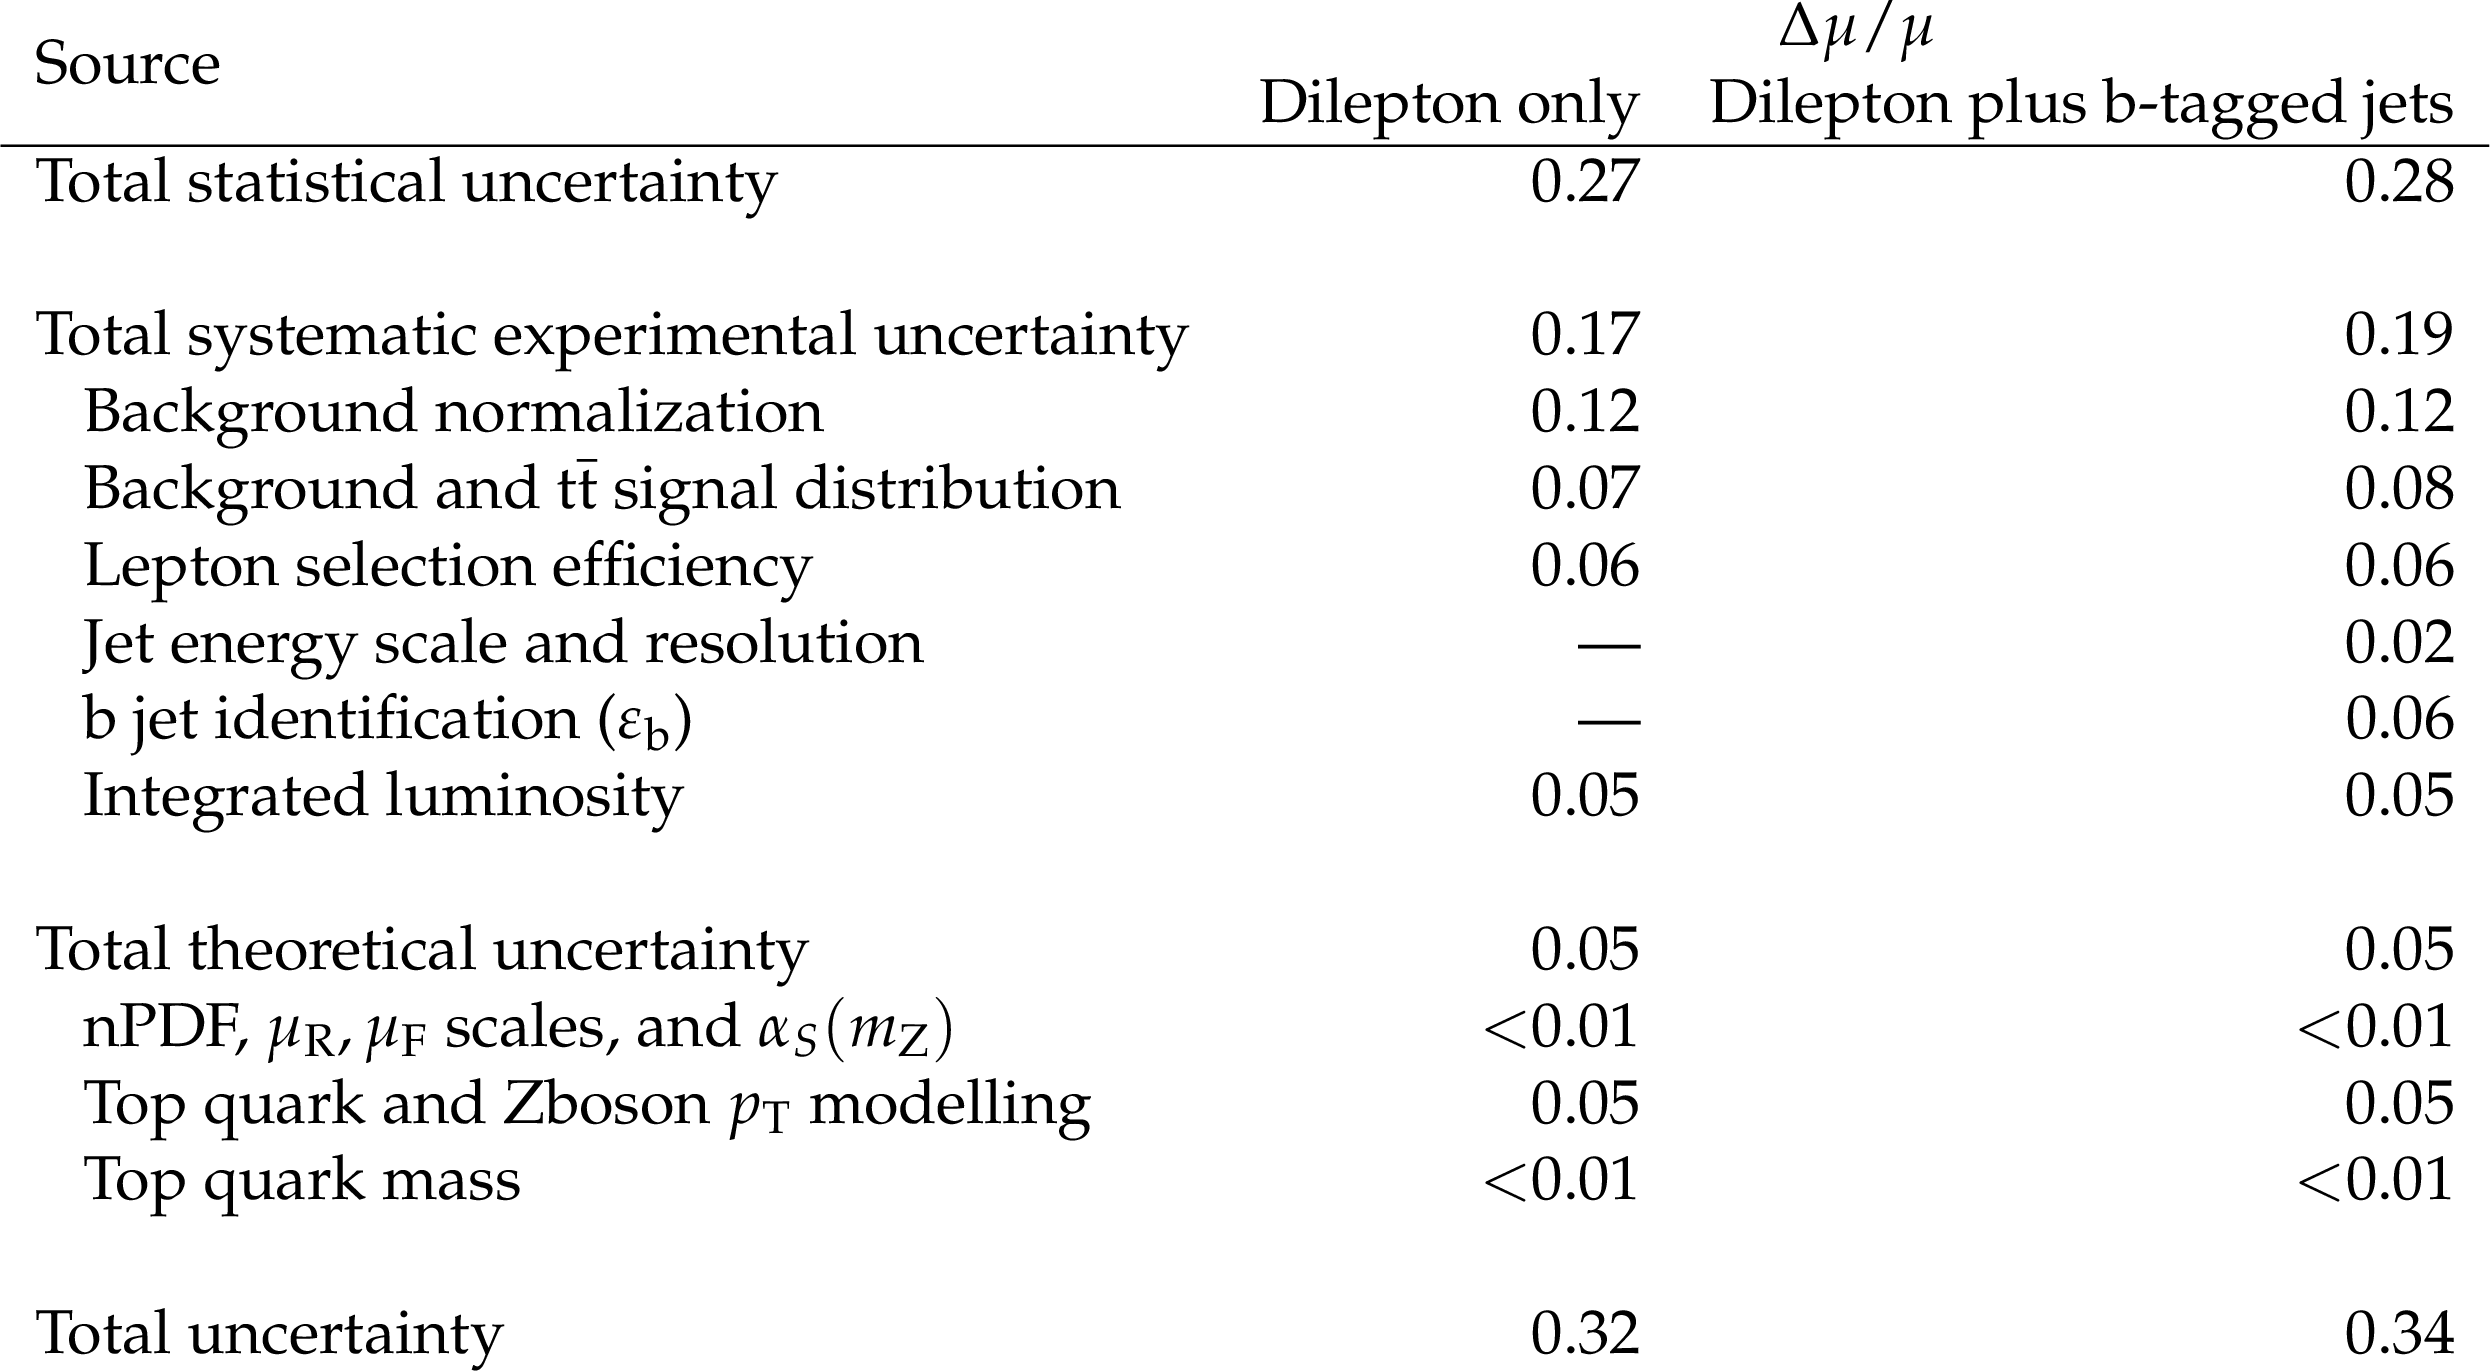
Table 1:
Observed impact of each source of uncertainty on the signal strength $\mu $, for the dilepton-only and dilepton plus b-tagged jets methods. The total uncertainty is obtained from the covariance matrix of the fits. The values quoted are symmetrized. |
| Summary |
| Evidence for top quark pair ($\mathrm{t\bar{t}}$) production in nucleus-nucleus collisions is presented for the first time, using lead-lead collision data at a nucleon-nucleon centre-of-mass energy of 5.02 TeV with a total integrated luminosity of (1.7 $\pm$ 0.1) nb$^{-1}$. The measurement utilises events with at least one pair of isolated and oppositely charged leptons (electrons or muons) with large transverse momenta, and is performed twice, with and without adding the information on the number of jets "tagged'' as originating from the hadronization of bottom (b) quarks ("b-tagged jets''). The inclusive cross section (${\sigma_{\mathrm{t\bar{t}}}} $) is derived from likelihood fits to a multivariate discriminator, which includes different leptonic kinematic variables. Using the dilepton-only and dilepton plus b-tagged jets methods, we demonstrate that top quark decay products can be identified irrespective of any possible final-state interactions with the quark-gluon plasma. The measured cross sections are ${\sigma_{\mathrm{t\bar{t}}}} = $ 2.54$^{+0.84}_{-0.74}$ and 2.03$^{+0.71}_{-0.64}$ $\mu$b, respectively. These values are compatible with, though somewhat lower than, the expectations from scaled proton-proton data and perturbative quantum chromodynamics calculations. The observed (expected) significance of the $\mathrm{t\bar{t}}$ signal against the background-only hypothesis amounts to 3.8 (4.8) and 4.0 (5.8) standard deviations in the two methods. This measurement is a milestone for the heavy ion and top quark physics programs at the LHC, and demonstrates the versatility of the CMS detector to extract such a complex signal in a very intricate environment. This is just the first step in using the top quark as a novel and powerful probe of the quark-gluon plasma. |
| Additional Figures | |
png pdf |
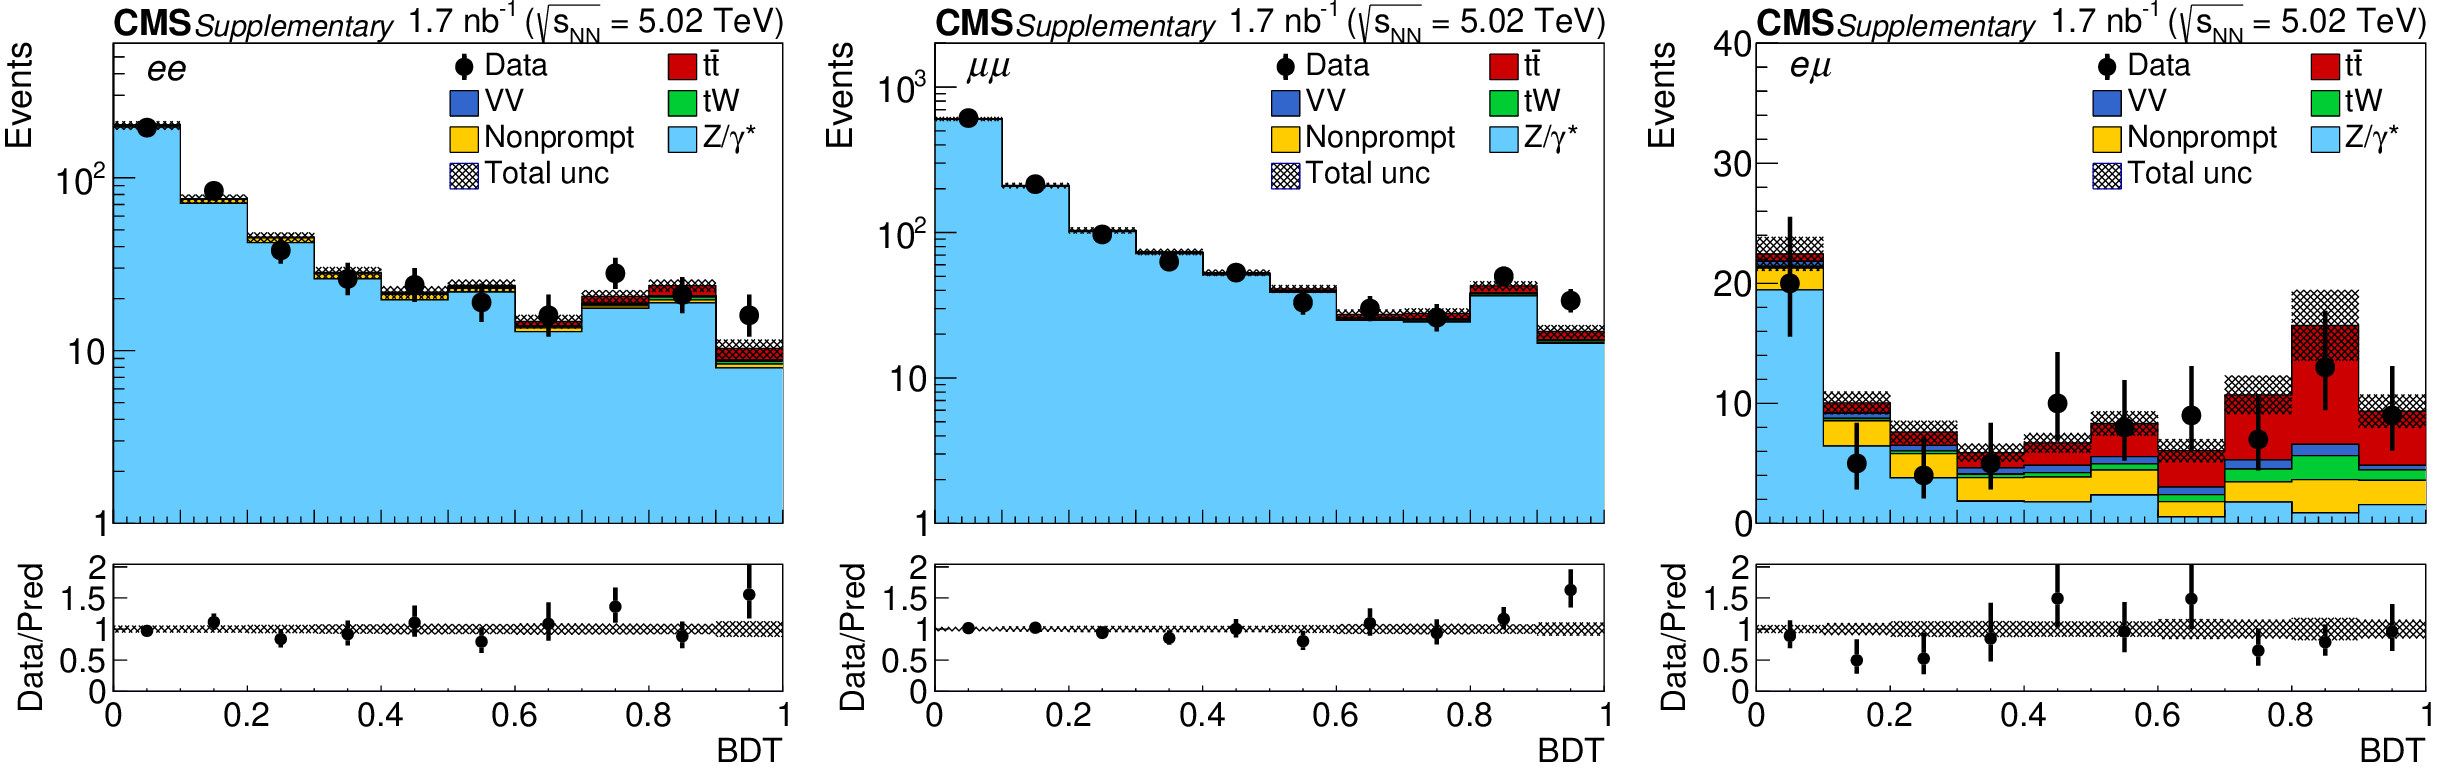
Additional Figure 1:
Observed (markers) and postfit predicted (filled histograms) BDT discriminator distributions in the $\mathrm{e^{+}} \mathrm{e^{-}}$ (left), $\mu^{+} \mu^{-}$ (middle), and $\mathrm{e^{\pm}}\mu^{\mp}$ (right) final states. The data are shown with markers, and the signal and background processes with filled histograms. The vertical bars on the markers represent the statistical uncertainties in data. The hatched regions show the postfit uncertainties in the sum of $\mathrm{t\bar{t}}$ signal and backgrounds. The lower panels display the ratio of the data to predictions, including the $\mathrm{t\bar{t}}$ signal, with bands representing the postfit uncertainties in the predictions. |

png pdf |
Additional Figure 1-a:
Observed (markers) and postfit predicted (filled histograms) BDT discriminator distributions in the $\mathrm{e^{+}} \mathrm{e^{-}}$ final state. The data are shown with markers, and the signal and background processes with filled histograms. The vertical bars on the markers represent the statistical uncertainties in data. The hatched regions show the postfit uncertainties in the sum of $\mathrm{t\bar{t}}$ signal and backgrounds. The lower panels display the ratio of the data to predictions, including the $\mathrm{t\bar{t}}$ signal, with bands representing the postfit uncertainties in the predictions. |
png pdf |
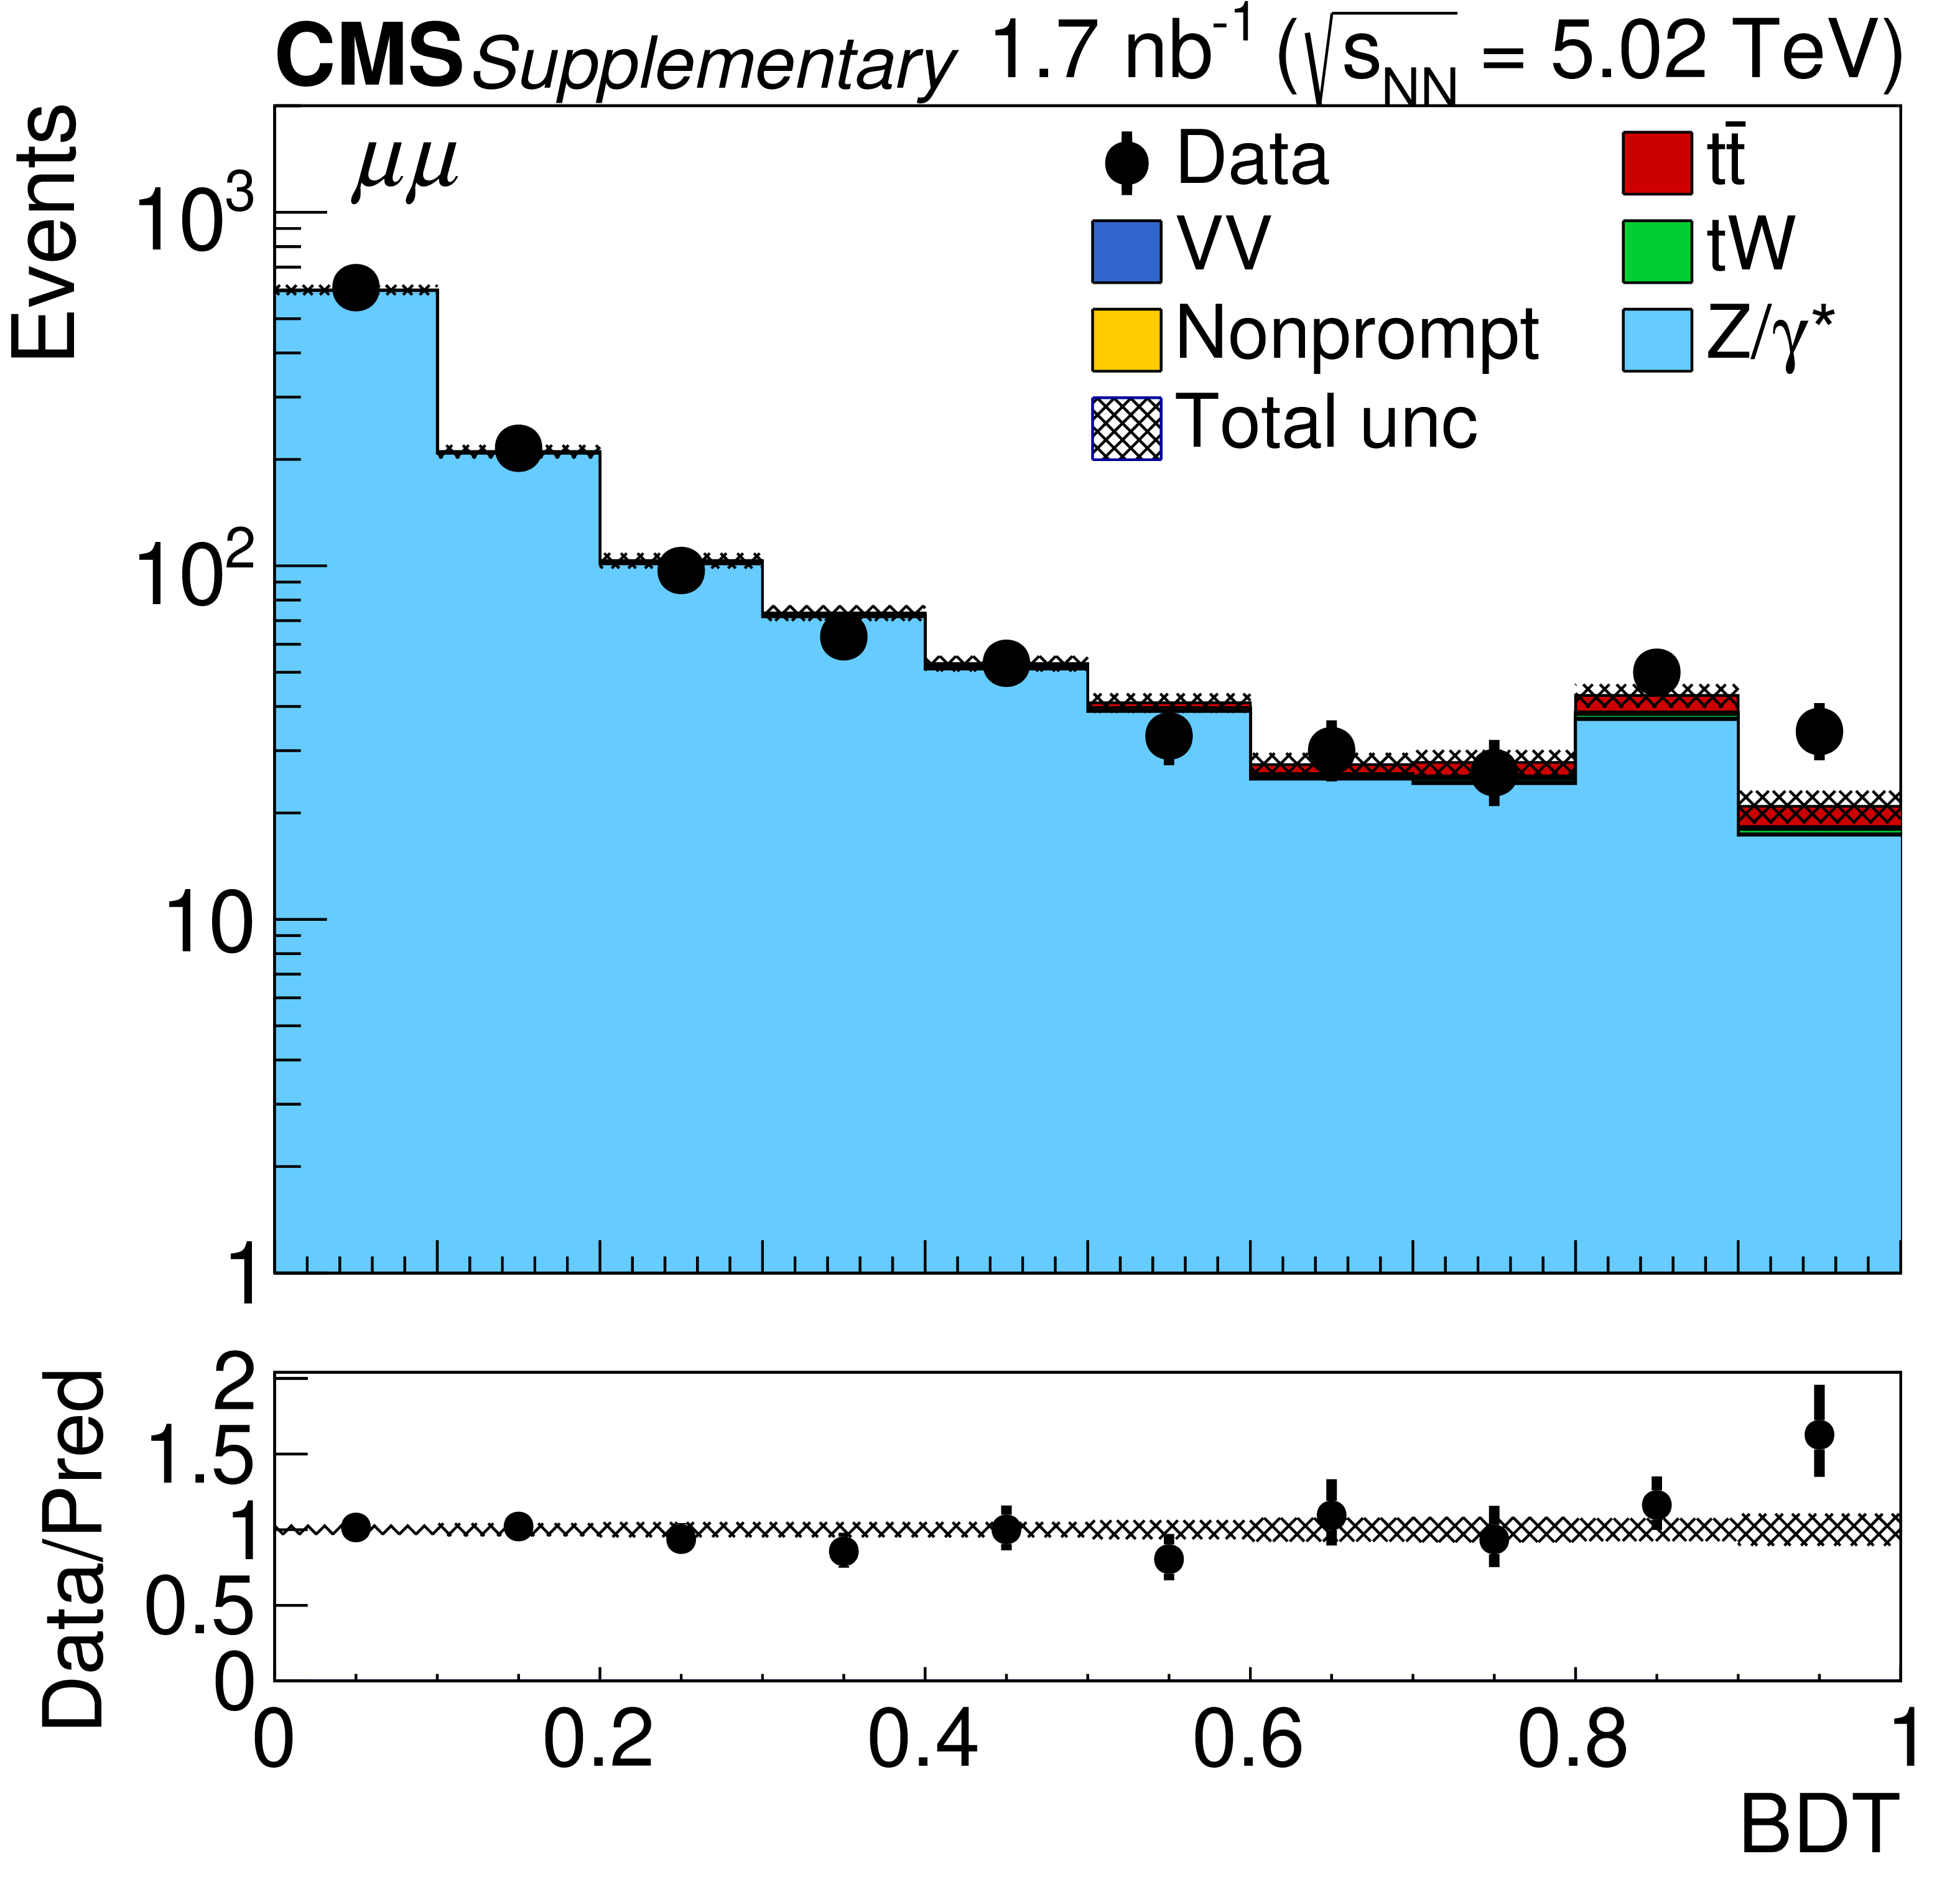
Additional Figure 1-b:
Observed (markers) and postfit predicted (filled histograms) BDT discriminator distributions in the $\mu^{+} \mu^{-}$ final state. The data are shown with markers, and the signal and background processes with filled histograms. The vertical bars on the markers represent the statistical uncertainties in data. The hatched regions show the postfit uncertainties in the sum of $\mathrm{t\bar{t}}$ signal and backgrounds. The lower panels display the ratio of the data to predictions, including the $\mathrm{t\bar{t}}$ signal, with bands representing the postfit uncertainties in the predictions. |
png pdf |
Additional Figure 1-c:
Observed (markers) and postfit predicted (filled histograms) BDT discriminator distributions in the $\mathrm{e^{\pm}}\mu^{\mp}$ final state. The data are shown with markers, and the signal and background processes with filled histograms. The vertical bars on the markers represent the statistical uncertainties in data. The hatched regions show the postfit uncertainties in the sum of $\mathrm{t\bar{t}}$ signal and backgrounds. The lower panels display the ratio of the data to predictions, including the $\mathrm{t\bar{t}}$ signal, with bands representing the postfit uncertainties in the predictions. |
png pdf |
Additional Figure 2:
Observed (markers) and prefit expected (filled histograms) BDT discriminator distributions in the $\mathrm{e^{+}} \mathrm{e^{-}}$ (left), $\mu^{+} \mu^{-}$ (middle), and $\mathrm{e^{\pm}}\mu^{\mp}$ (right) final states separately for the 0b-, 1b-, and 2b-jet multiplicity categories. The data are shown with markers, and the signal and background processes with filled histograms. The vertical bars on the markers represent the statistical uncertainties in data. The hatched regions show the prefit uncertainties in the sum of $\mathrm{t\bar{t}}$ signal and backgrounds. The lower panels display the ratio of the data to expectations, including the $\mathrm{t\bar{t}}$ signal, with bands representing the prefit uncertainties in the expectations. |
png pdf |
Additional Figure 2-a:
Observed (markers) and prefit expected (filled histograms) BDT discriminator distributions in the $\mathrm{e^{+}} \mathrm{e^{-}}$ final state separately for the 0b-, 1b-, and 2b-jet multiplicity categories. The data are shown with markers, and the signal and background processes with filled histograms. The vertical bars on the markers represent the statistical uncertainties in data. The hatched regions show the prefit uncertainties in the sum of $\mathrm{t\bar{t}}$ signal and backgrounds. The lower panels display the ratio of the data to expectations, including the $\mathrm{t\bar{t}}$ signal, with bands representing the prefit uncertainties in the expectations. |
png pdf |
Additional Figure 2-b:
Observed (markers) and prefit expected (filled histograms) BDT discriminator distributions in the $\mu^{+} \mu^{-}$ final state separately for the 0b-, 1b-, and 2b-jet multiplicity categories. The data are shown with markers, and the signal and background processes with filled histograms. The vertical bars on the markers represent the statistical uncertainties in data. The hatched regions show the prefit uncertainties in the sum of $\mathrm{t\bar{t}}$ signal and backgrounds. The lower panels display the ratio of the data to expectations, including the $\mathrm{t\bar{t}}$ signal, with bands representing the prefit uncertainties in the expectations. |
png pdf |
Additional Figure 2-c:
Observed (markers) and prefit expected (filled histograms) BDT discriminator distributions in the $\mathrm{e^{\pm}}\mu^{\mp}$ final state separately for the 0b-, 1b-, and 2b-jet multiplicity categories. The data are shown with markers, and the signal and background processes with filled histograms. The vertical bars on the markers represent the statistical uncertainties in data. The hatched regions show the prefit uncertainties in the sum of $\mathrm{t\bar{t}}$ signal and backgrounds. The lower panels display the ratio of the data to expectations, including the $\mathrm{t\bar{t}}$ signal, with bands representing the prefit uncertainties in the expectations. |
png pdf |
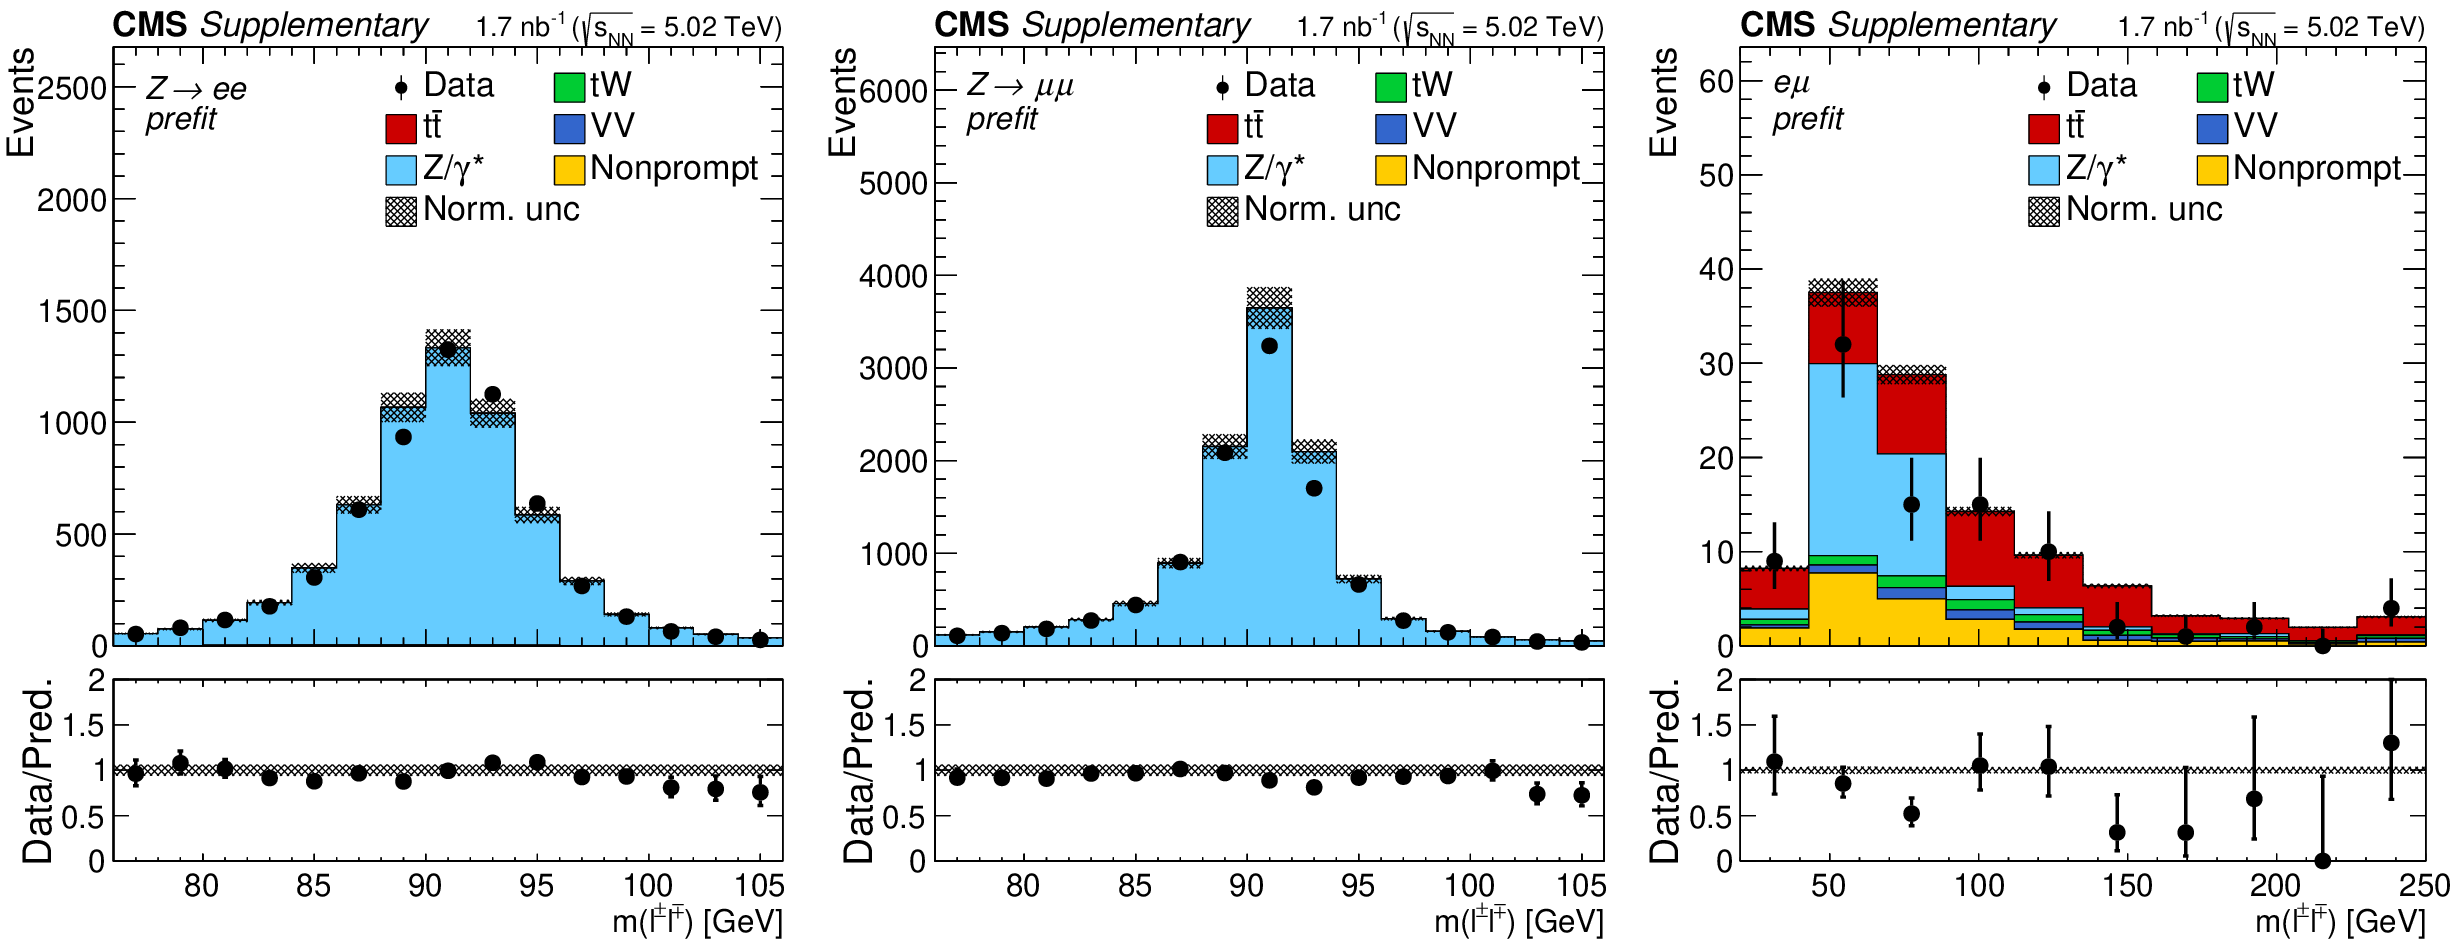
Additional Figure 3:
Invariant mass distributions of the lepton pairs in the $\mathrm{e^{+}} \mathrm{e^{-}}$ (left), $\mu^{+} \mu^{-}$ (middle), and $\mathrm{e^{\pm}}\mu^{\mp}$ (right) channels. Backgrounds and signal are shown with the filled histograms and data are shown with the markers. The vertical bars on the markers represent the statistical uncertainties in data. The hatched regions show the prefit uncertainties in the sum of $\mathrm{t\bar{t}}$ signal and backgrounds. The lower panels display the ratio of the data to expectations, including the $\mathrm{t\bar{t}}$ signal, with bands representing the prefit uncertainties in the expectations. |
png pdf |
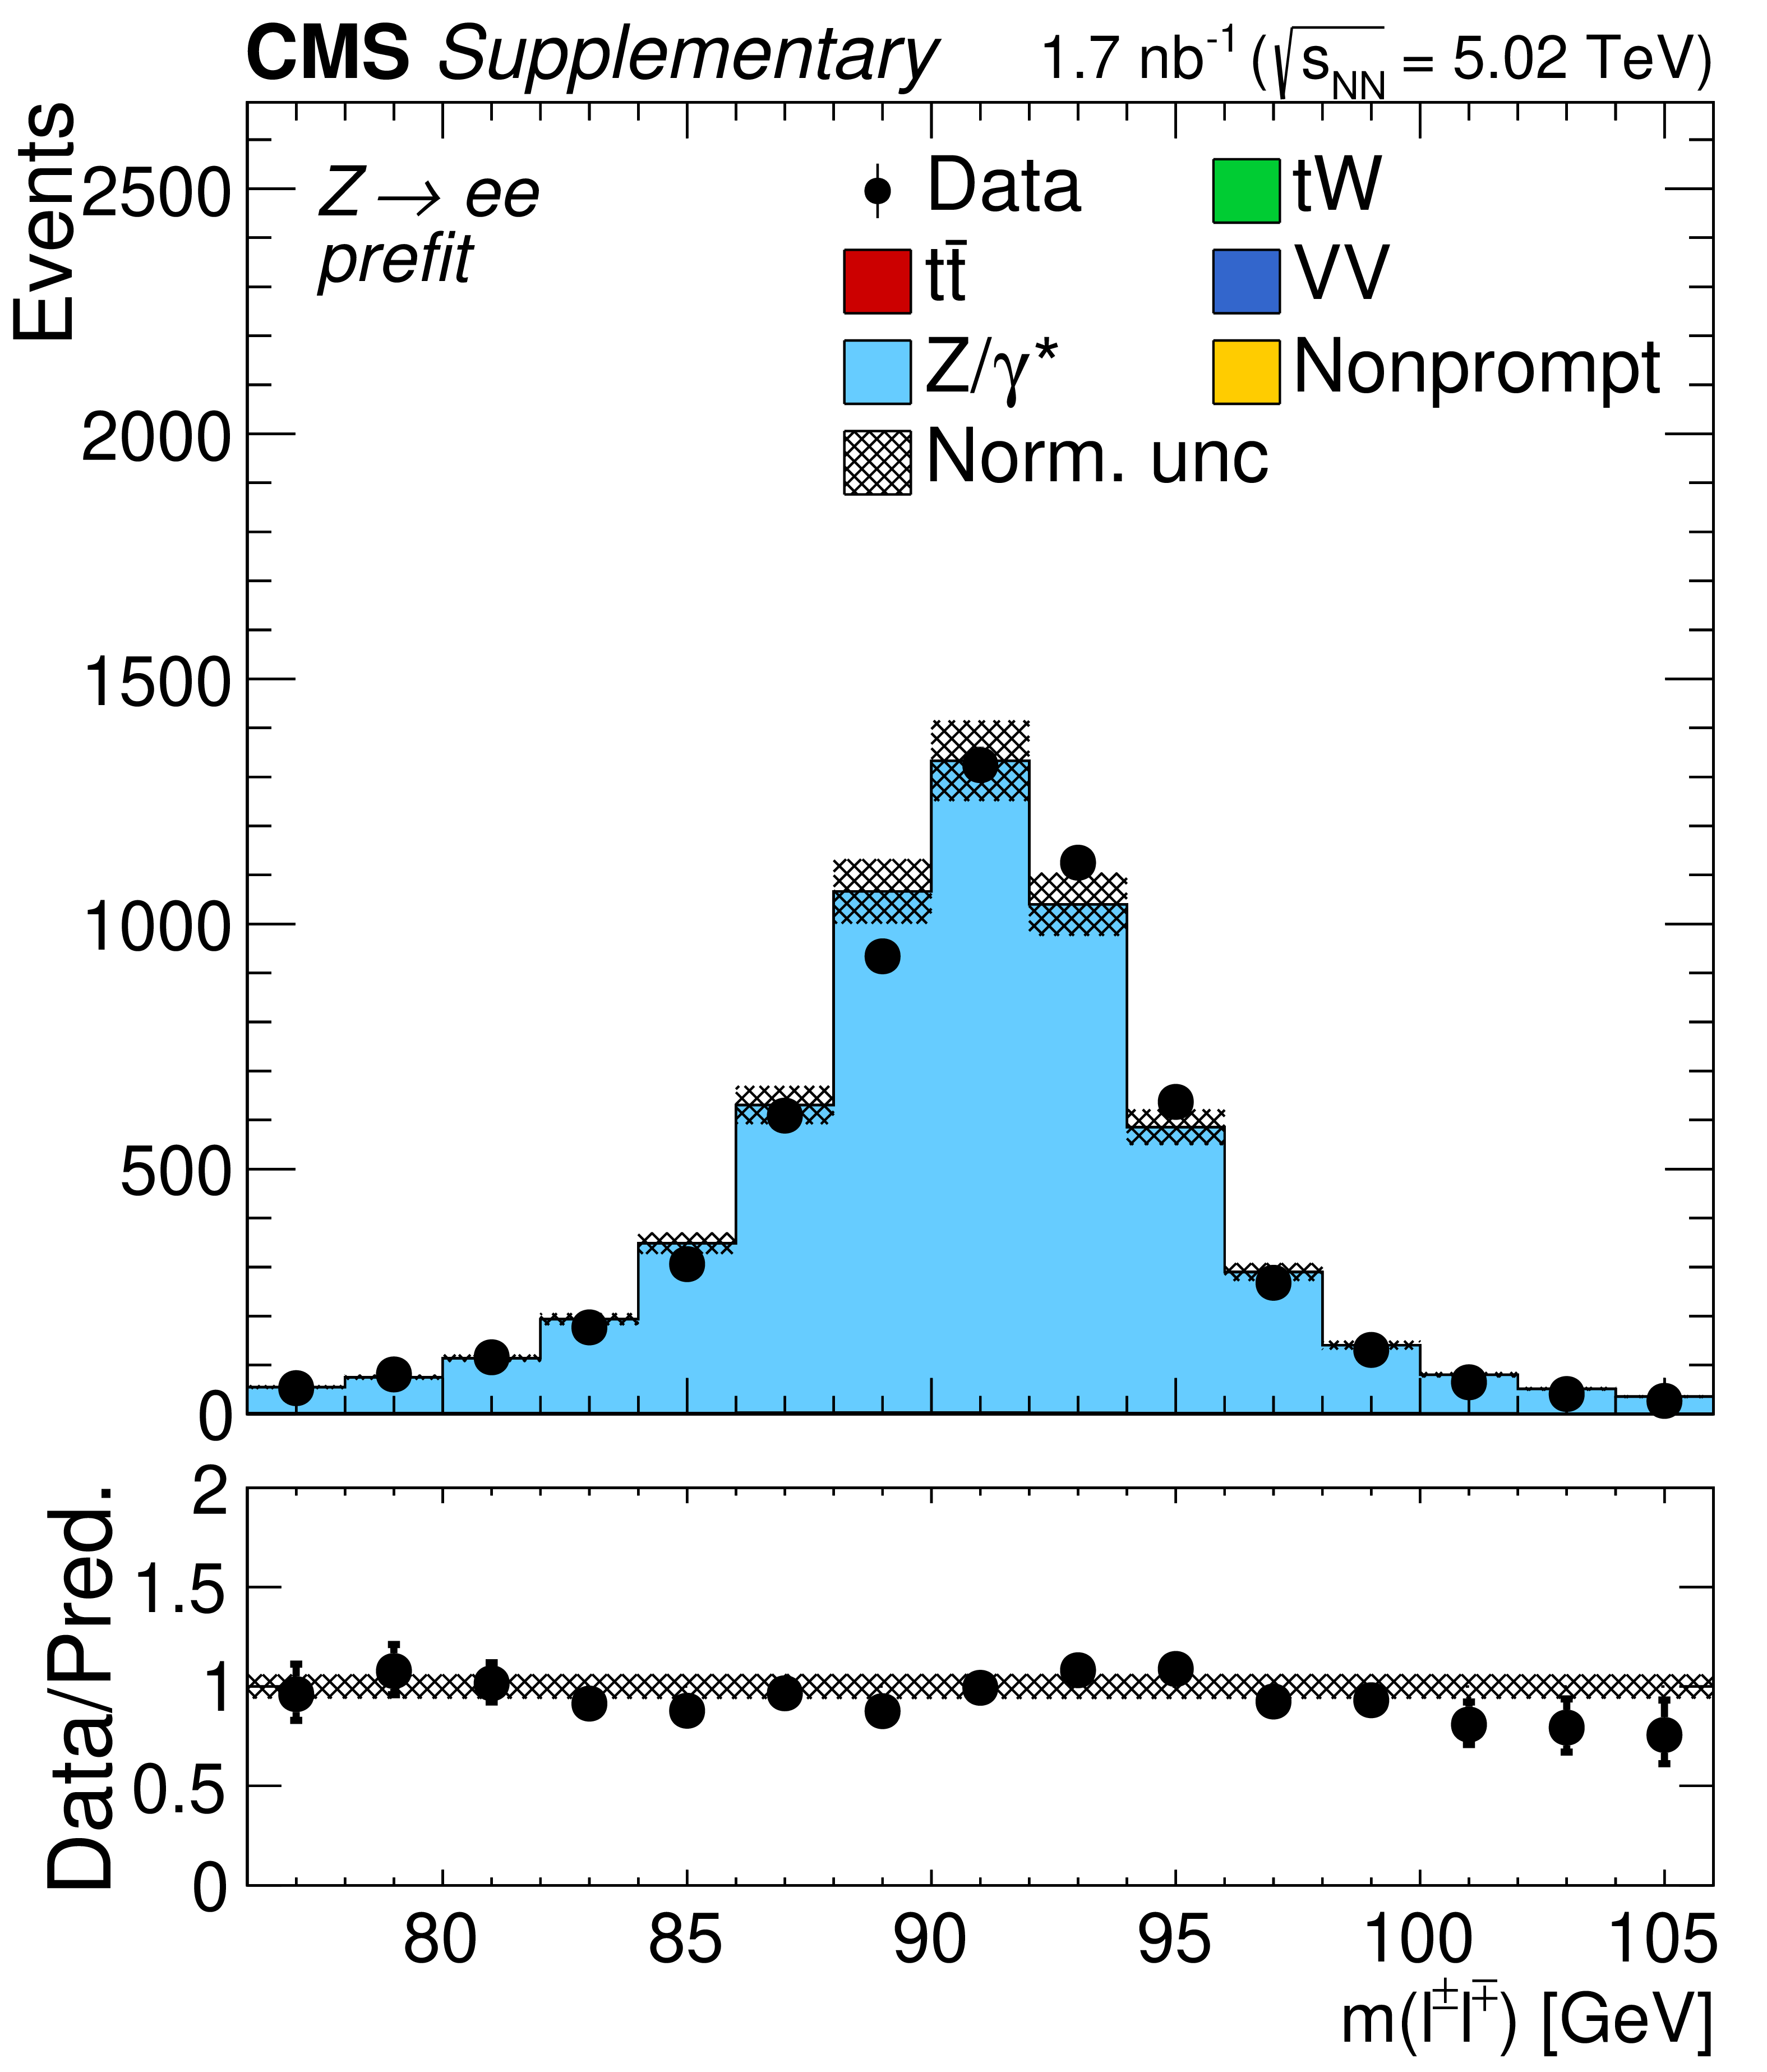
Additional Figure 3-a:
Invariant mass distributions of the lepton pairs in the $\mathrm{e^{+}} \mathrm{e^{-}}$ channel. Backgrounds and signal are shown with the filled histograms and data are shown with the markers. The vertical bars on the markers represent the statistical uncertainties in data. The hatched regions show the prefit uncertainties in the sum of $\mathrm{t\bar{t}}$ signal and backgrounds. The lower panels display the ratio of the data to expectations, including the $\mathrm{t\bar{t}}$ signal, with bands representing the prefit uncertainties in the expectations. |

png pdf |
Additional Figure 3-b:
Invariant mass distributions of the lepton pairs in the $\mu^{+} \mu^{-}$ channel. Backgrounds and signal are shown with the filled histograms and data are shown with the markers. The vertical bars on the markers represent the statistical uncertainties in data. The hatched regions show the prefit uncertainties in the sum of $\mathrm{t\bar{t}}$ signal and backgrounds. The lower panels display the ratio of the data to expectations, including the $\mathrm{t\bar{t}}$ signal, with bands representing the prefit uncertainties in the expectations. |
png pdf |
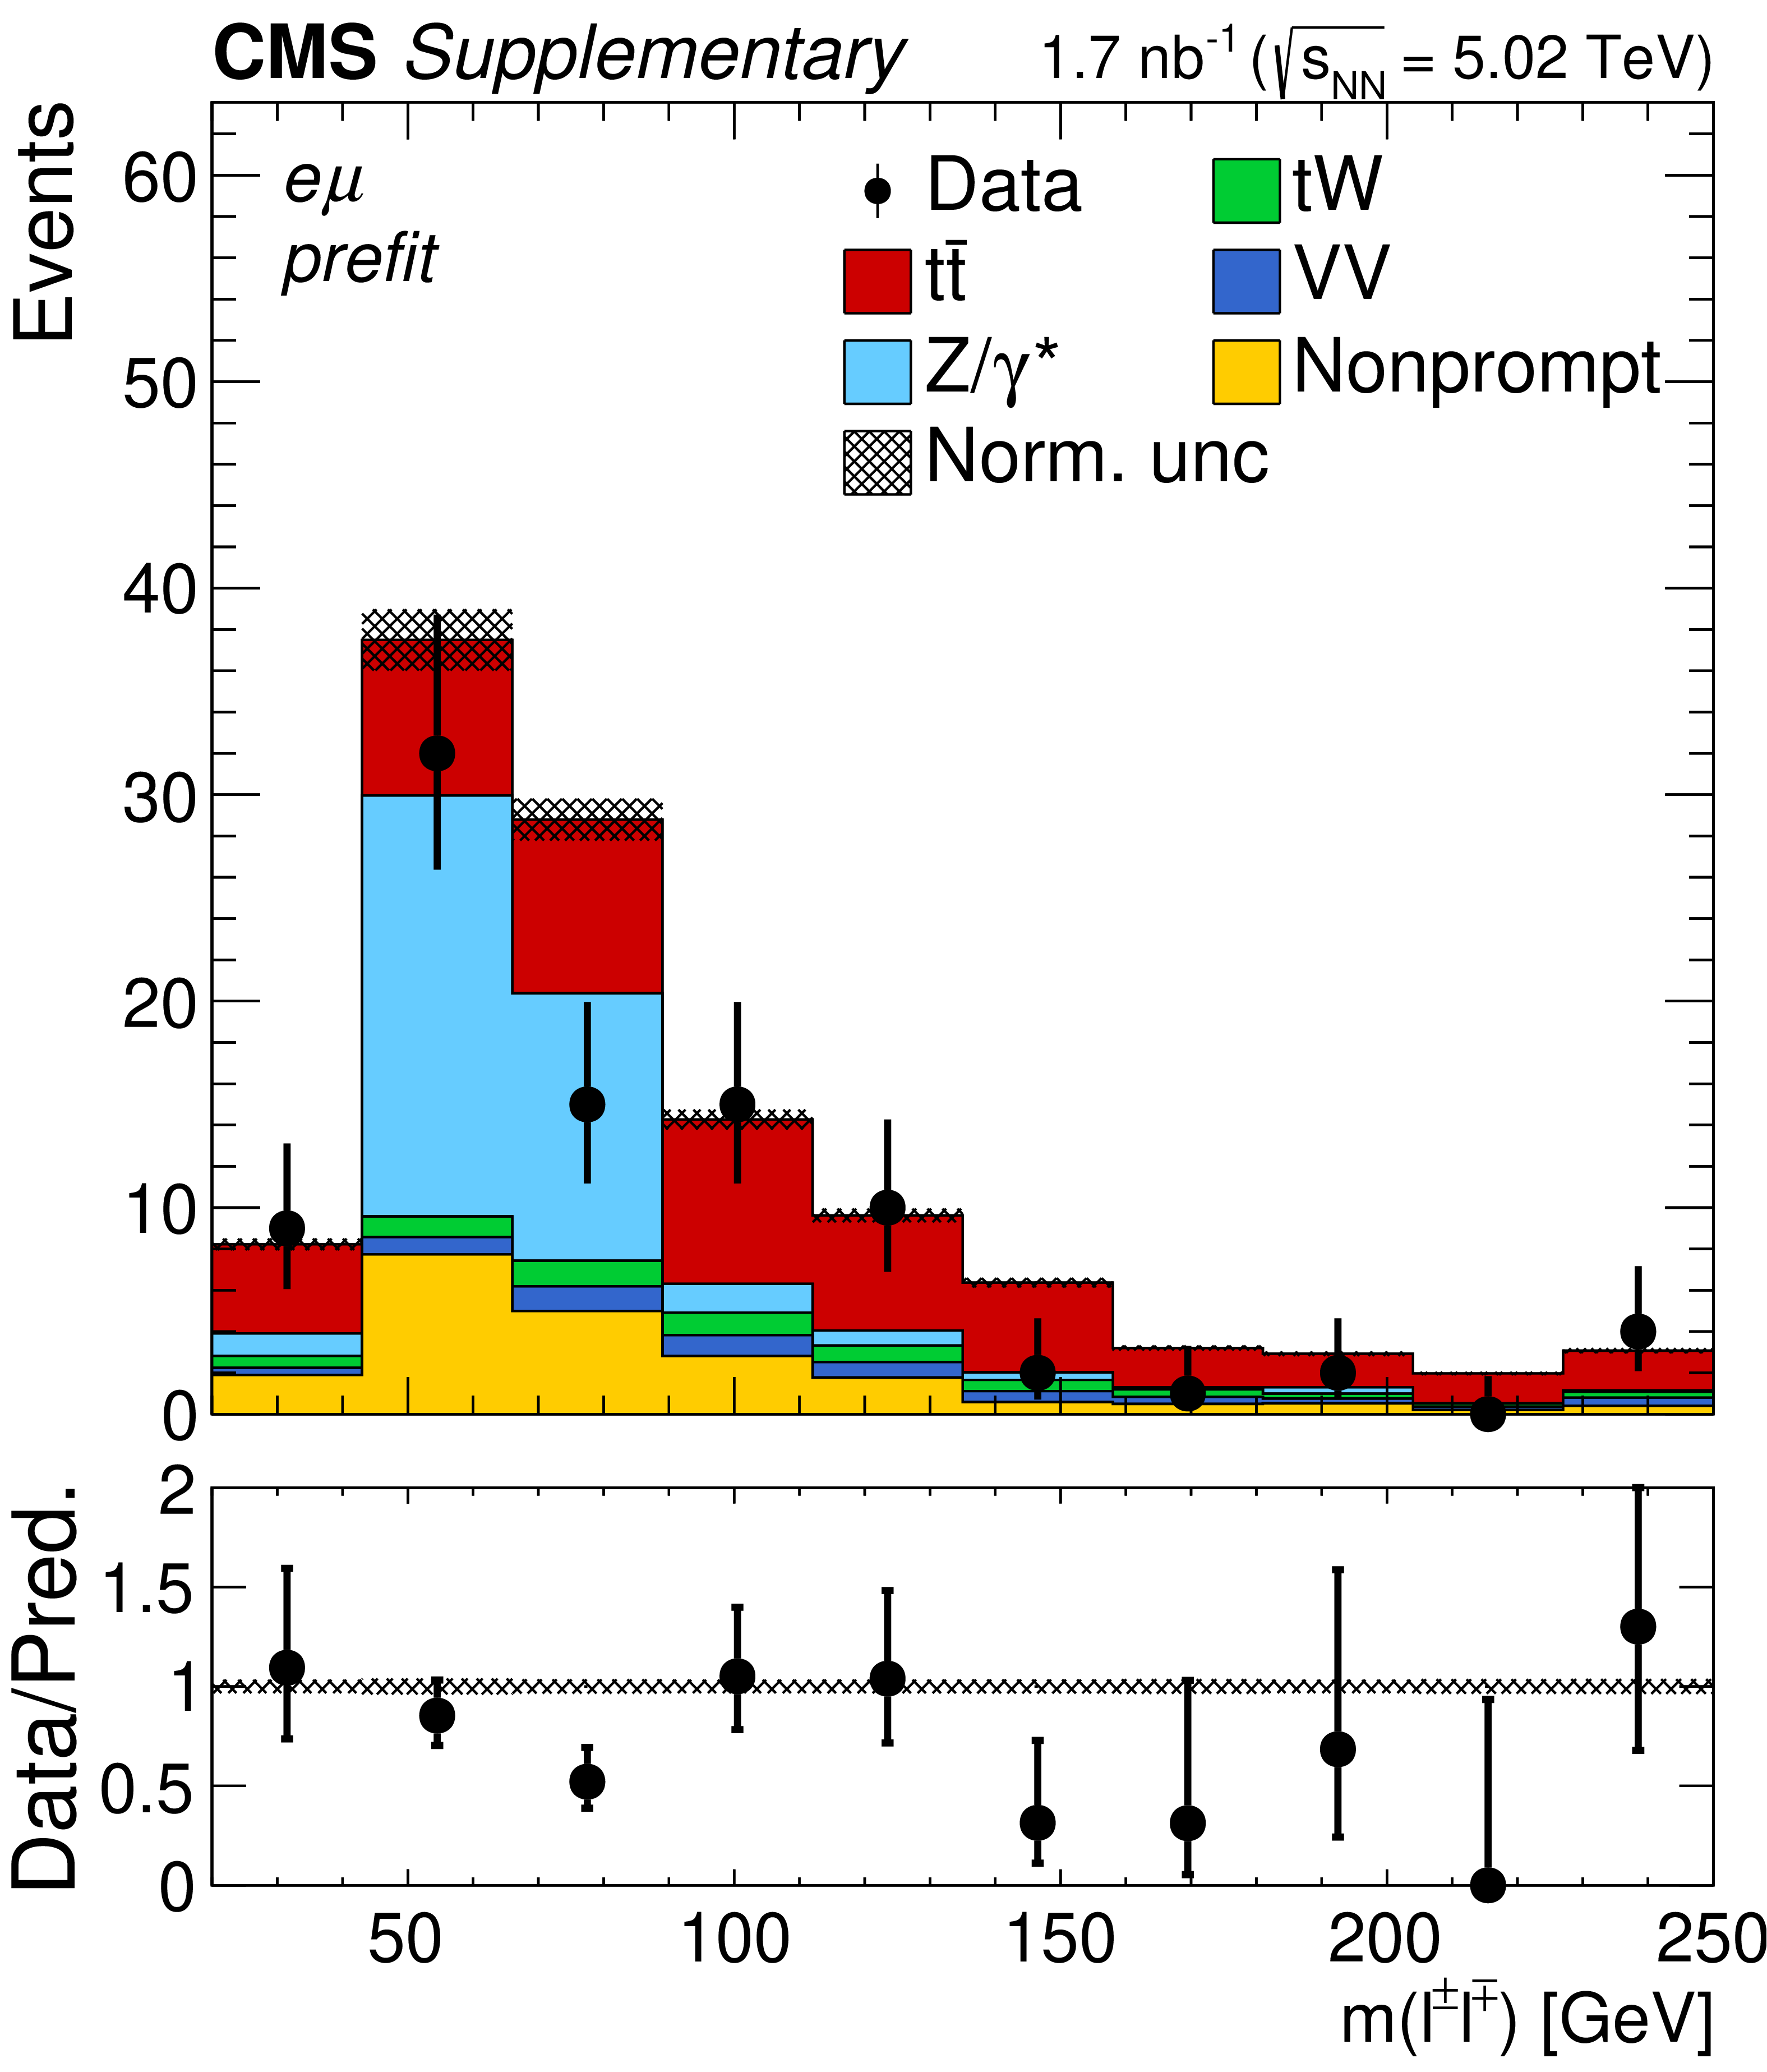
Additional Figure 3-c:
Invariant mass distributions of the lepton pairs in the $\mathrm{e^{\pm}}\mu^{\mp}$ channel. Backgrounds and signal are shown with the filled histograms and data are shown with the markers. The vertical bars on the markers represent the statistical uncertainties in data. The hatched regions show the prefit uncertainties in the sum of $\mathrm{t\bar{t}}$ signal and backgrounds. The lower panels display the ratio of the data to expectations, including the $\mathrm{t\bar{t}}$ signal, with bands representing the prefit uncertainties in the expectations. |
png pdf |
Additional Figure 4:
Postfit predicted multiplicity distributions of the b-tagged jets ($N_{ {b-tag}}$) in the $\mathrm{e^{+}} \mathrm{e^{-}}$ (left), $\mu^{+} \mu^{-}$ (middle), and $\mathrm{e^{\pm}}\mu^{\mp}$ (right) channels. The distribution of the Z/$\gamma ^{*}$ background is taken from the data. Backgrounds and signal are shown with the filled histograms and data are shown with the markers. The vertical bars on the markers represent the statistical uncertainties in data. The hatched regions show the postfit uncertainties in the sum of $\mathrm{t\bar{t}}$ signal and backgrounds. The lower panels display the ratio of the data to predictions, including the $\mathrm{t\bar{t}}$ signal, with bands representing the postfit uncertainties in the predictions. |
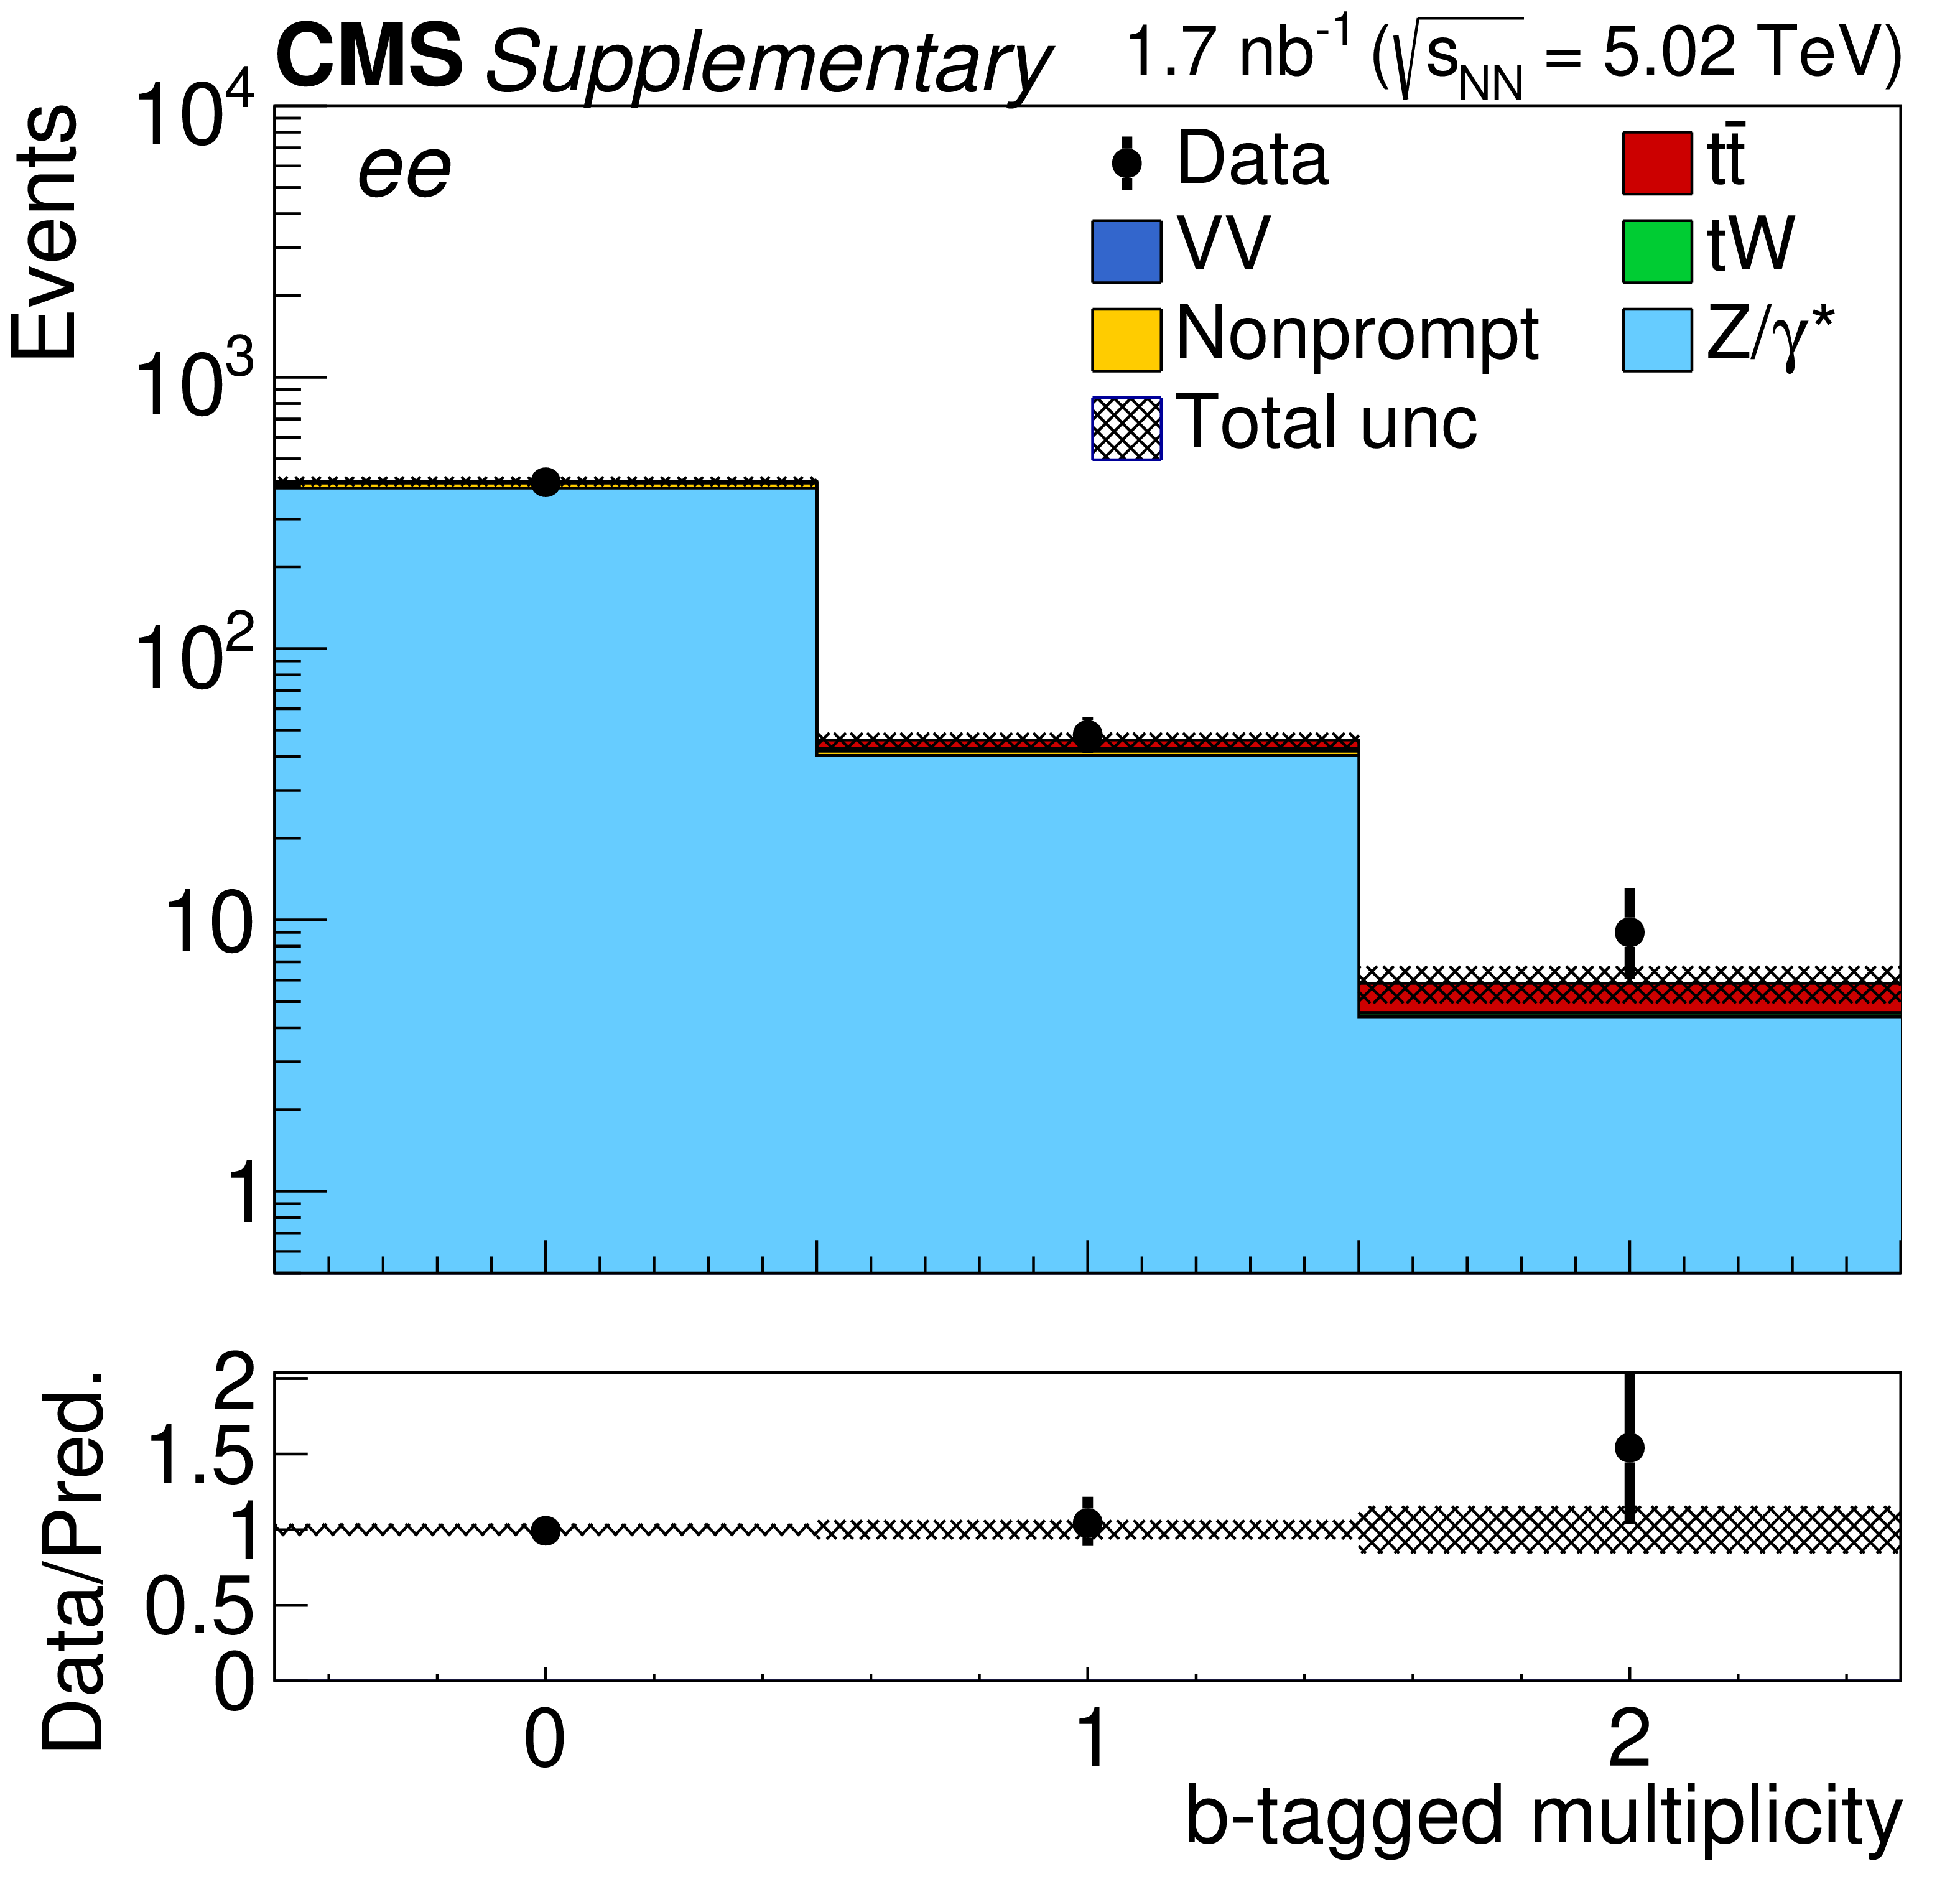
png pdf |
Additional Figure 4-a:
Postfit predicted multiplicity distributions of the b-tagged jets ($N_{ {b-tag}}$) in the $\mathrm{e^{+}} \mathrm{e^{-}}$ channel. The distribution of the Z/$\gamma ^{*}$ background is taken from the data. Backgrounds and signal are shown with the filled histograms and data are shown with the markers. The vertical bars on the markers represent the statistical uncertainties in data. The hatched regions show the postfit uncertainties in the sum of $\mathrm{t\bar{t}}$ signal and backgrounds. The lower panels display the ratio of the data to predictions, including the $\mathrm{t\bar{t}}$ signal, with bands representing the postfit uncertainties in the predictions. |
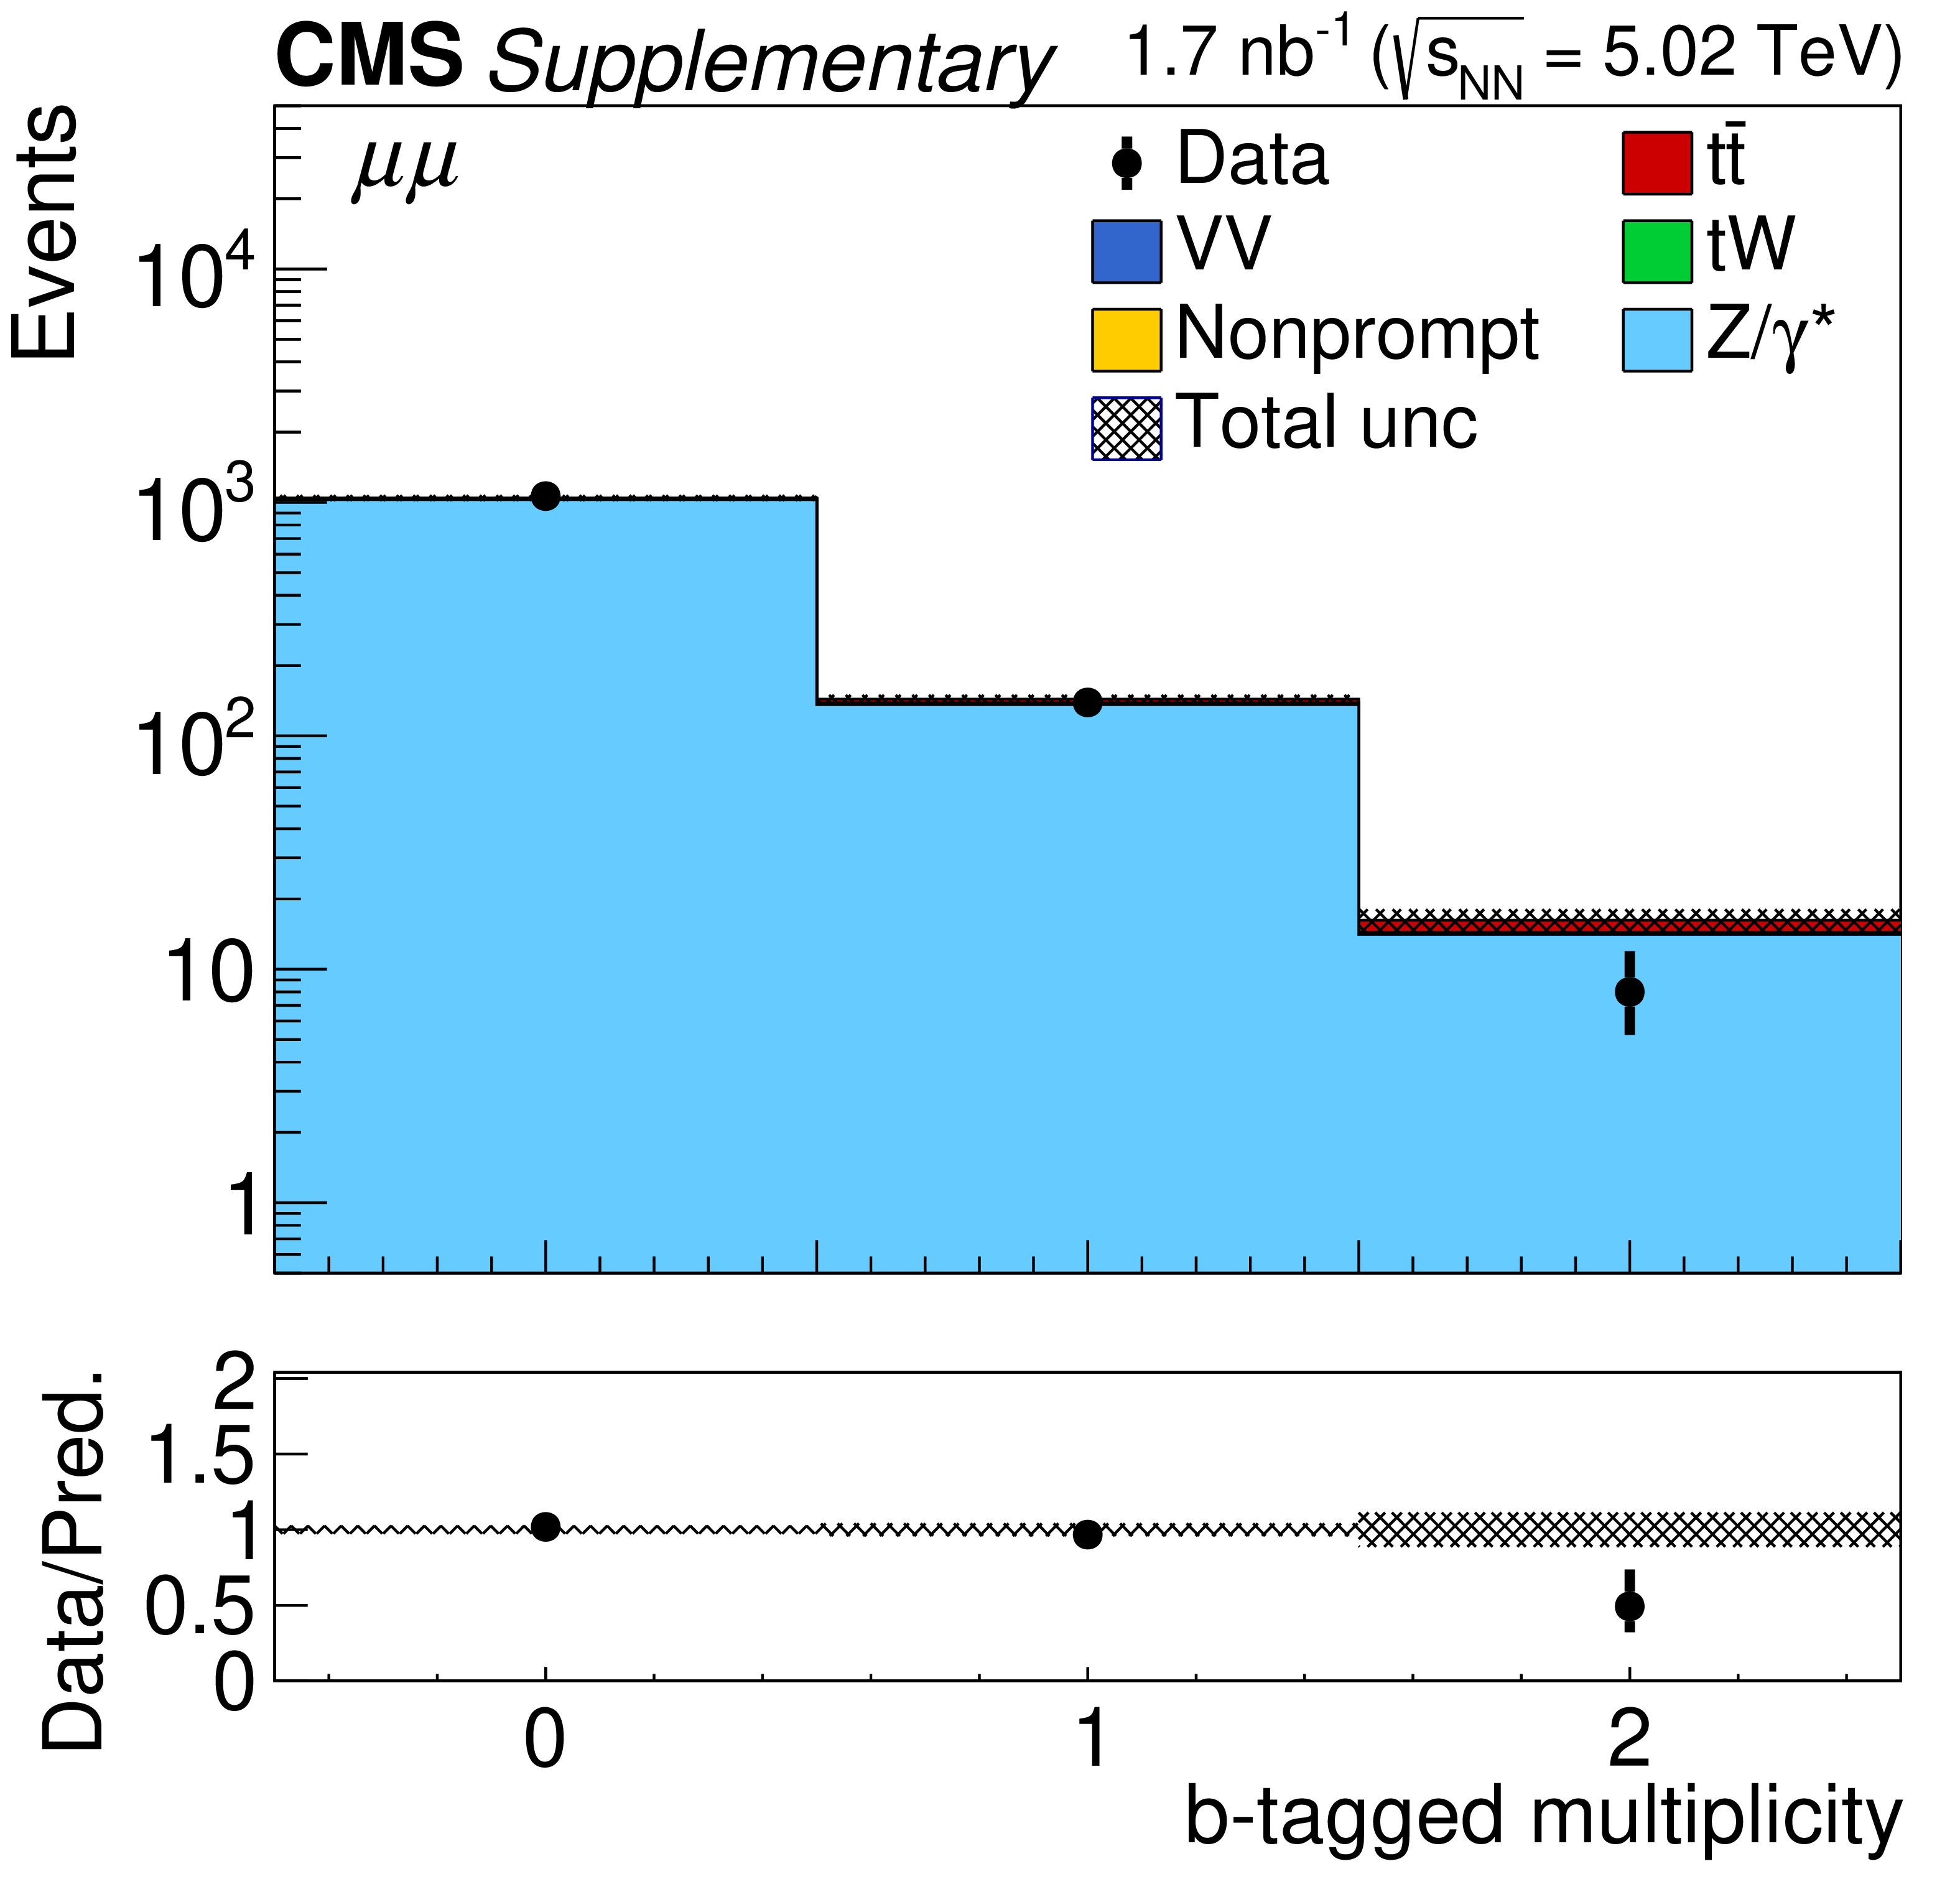
png pdf |
Additional Figure 4-b:
Postfit predicted multiplicity distributions of the b-tagged jets ($N_{ {b-tag}}$) in the $\mu^{+} \mu^{-}$ channel. The distribution of the Z/$\gamma ^{*}$ background is taken from the data. Backgrounds and signal are shown with the filled histograms and data are shown with the markers. The vertical bars on the markers represent the statistical uncertainties in data. The hatched regions show the postfit uncertainties in the sum of $\mathrm{t\bar{t}}$ signal and backgrounds. The lower panels display the ratio of the data to predictions, including the $\mathrm{t\bar{t}}$ signal, with bands representing the postfit uncertainties in the predictions. |
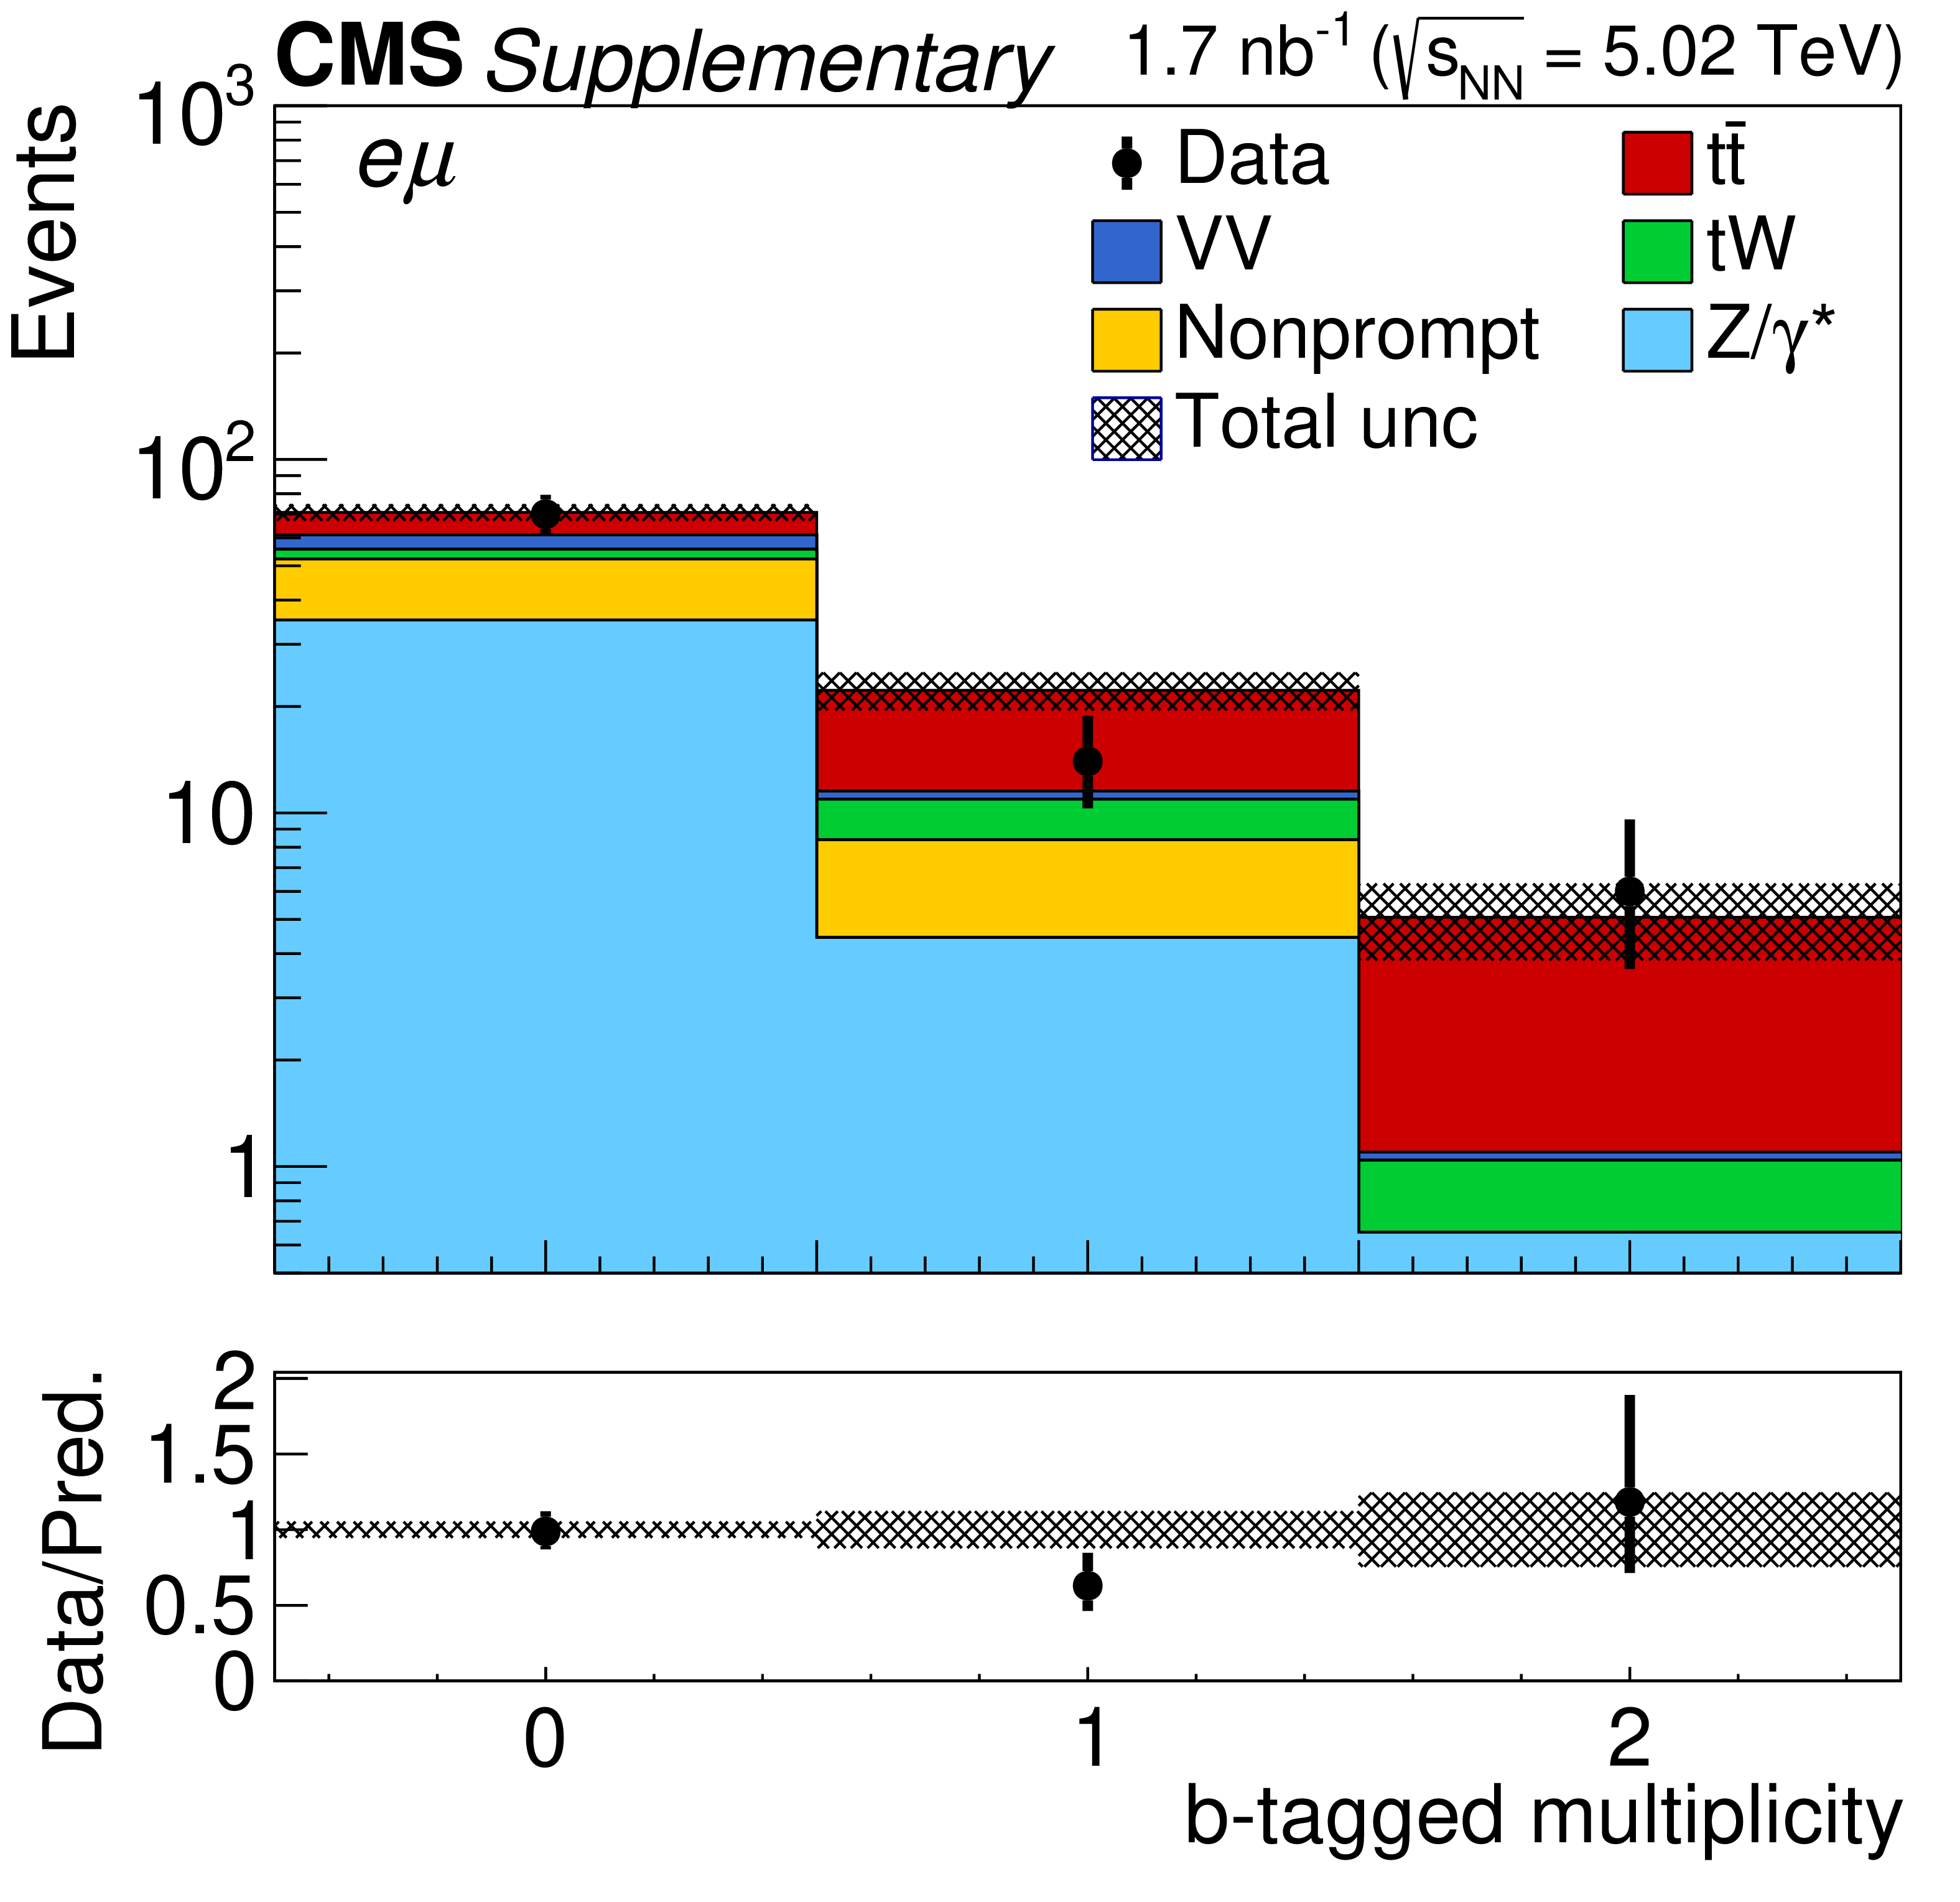
png pdf |
Additional Figure 4-c:
Postfit predicted multiplicity distributions of the b-tagged jets ($N_{ {b-tag}}$) in the $\mathrm{e^{\pm}}\mu^{\mp}$ channel. The distribution of the Z/$\gamma ^{*}$ background is taken from the data. Backgrounds and signal are shown with the filled histograms and data are shown with the markers. The vertical bars on the markers represent the statistical uncertainties in data. The hatched regions show the postfit uncertainties in the sum of $\mathrm{t\bar{t}}$ signal and backgrounds. The lower panels display the ratio of the data to predictions, including the $\mathrm{t\bar{t}}$ signal, with bands representing the postfit uncertainties in the predictions. |
png pdf |
Additional Figure 5:
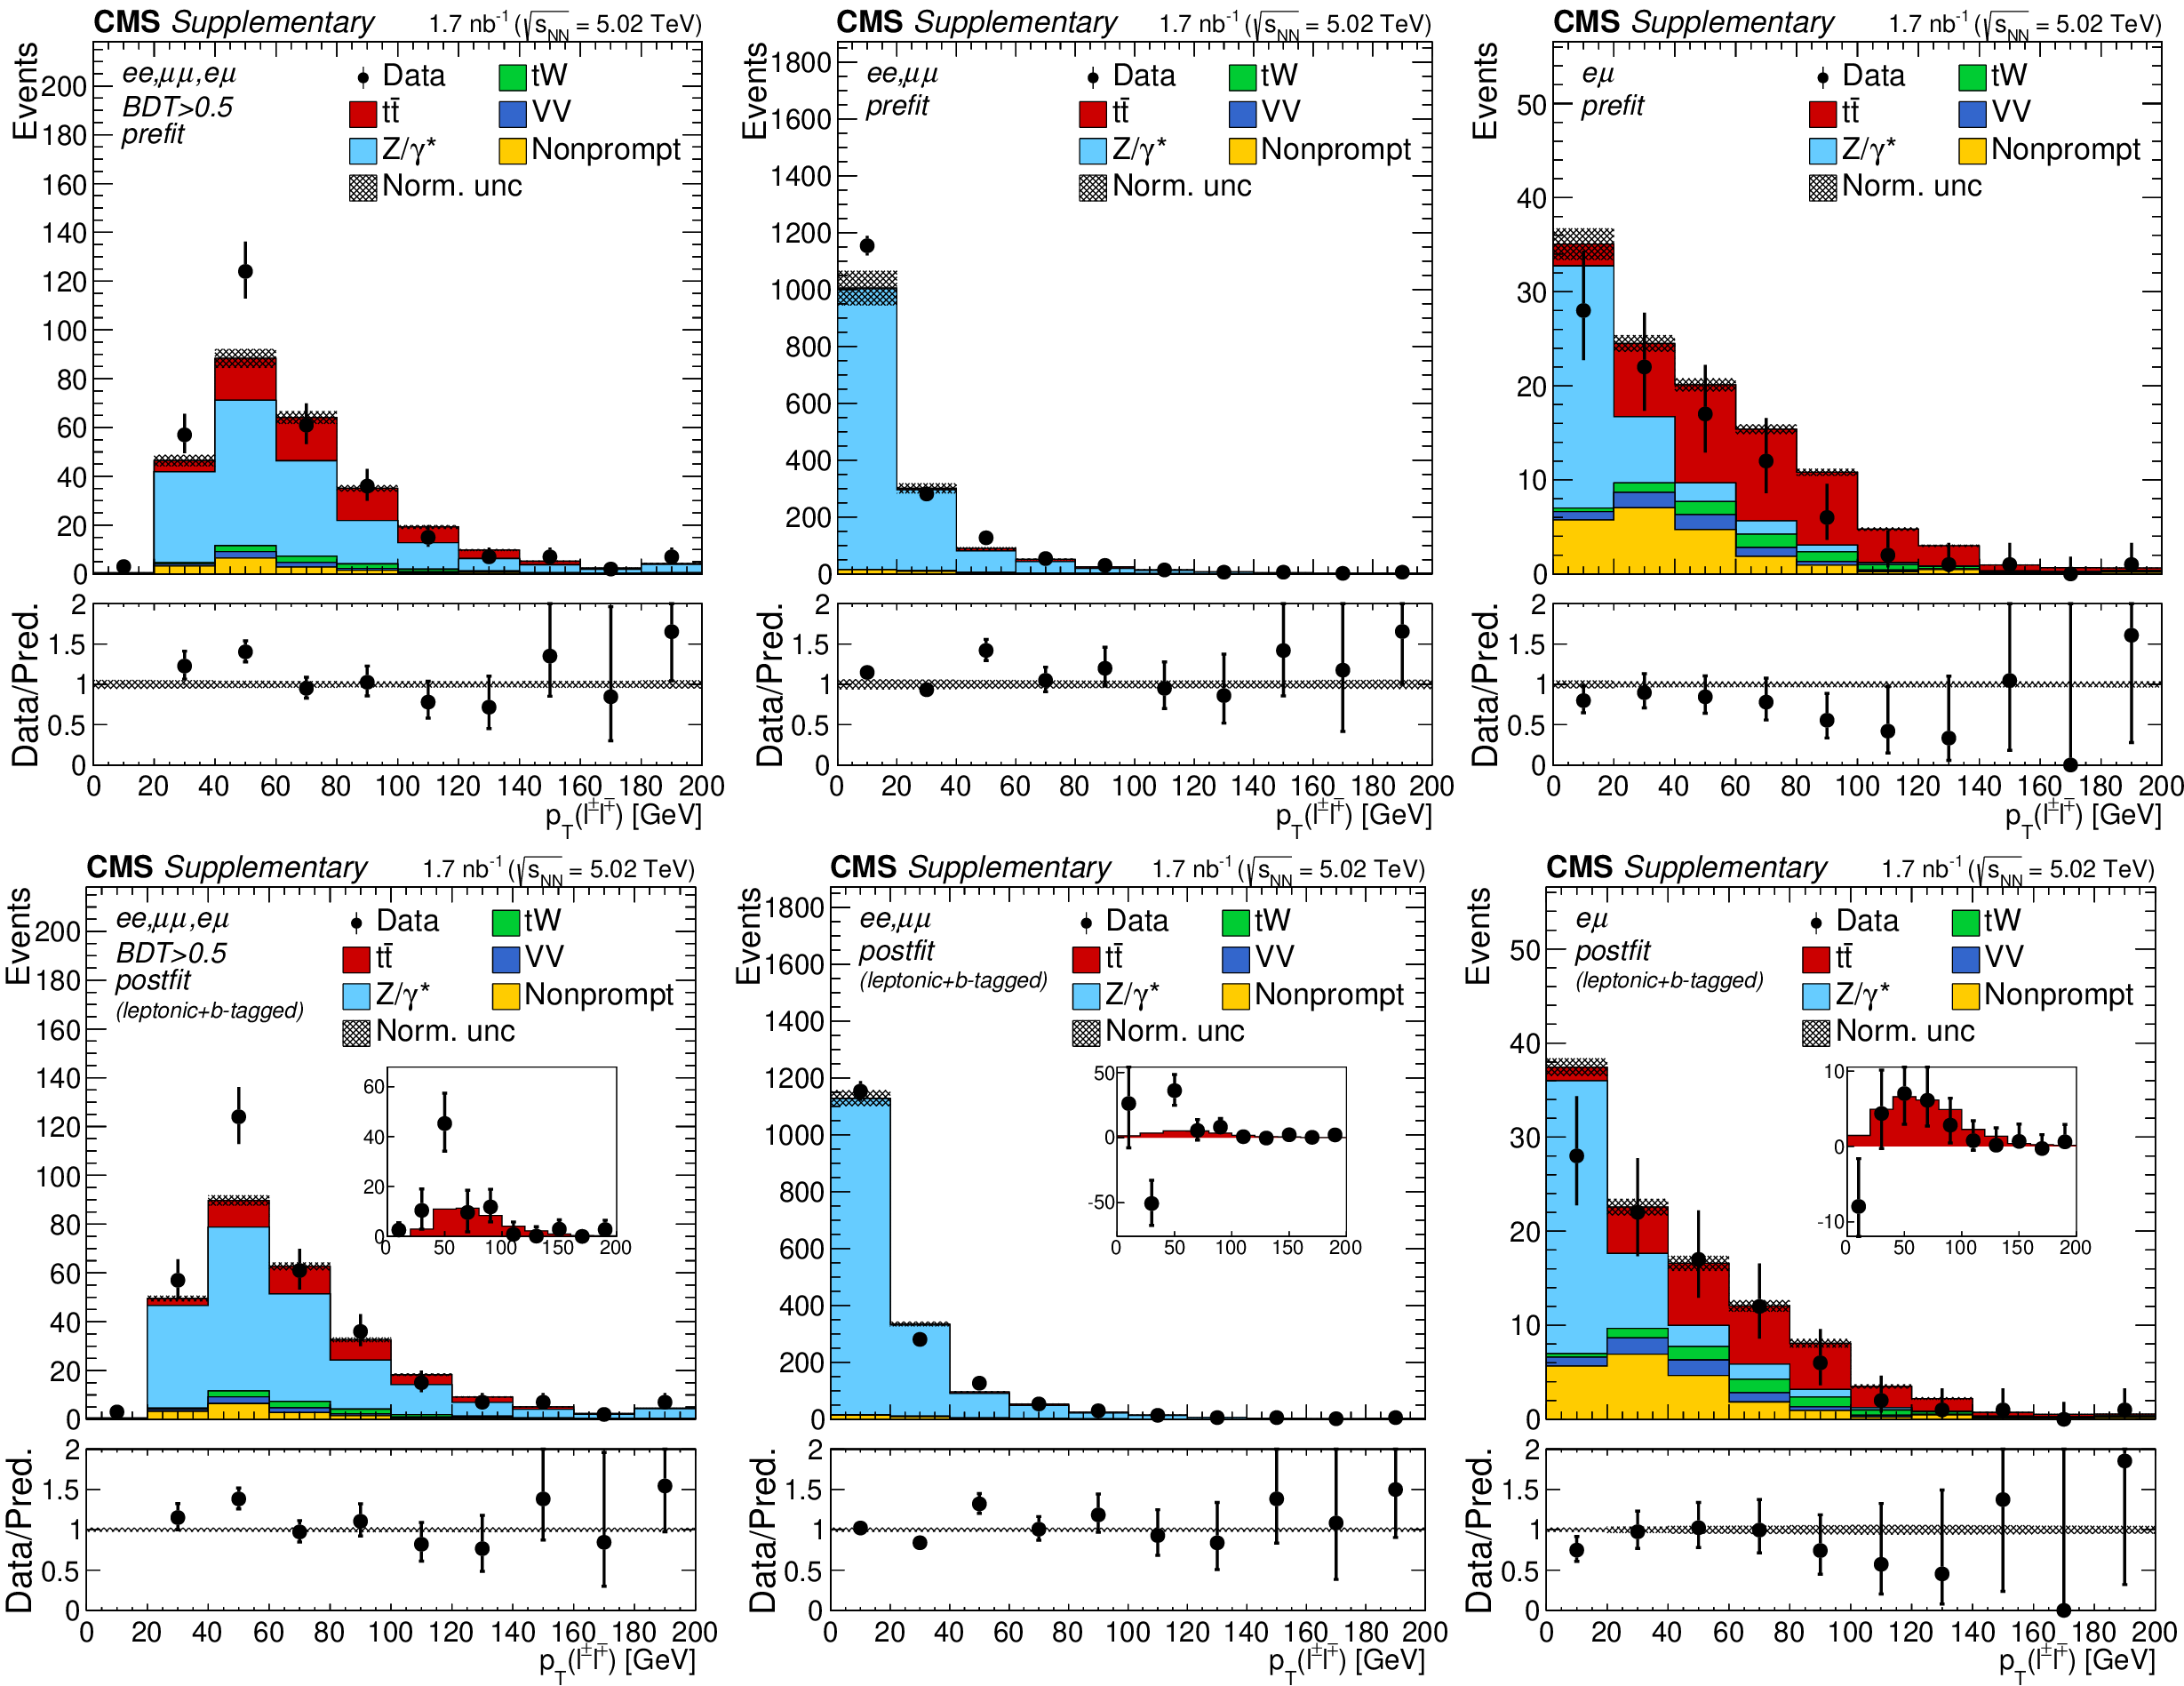
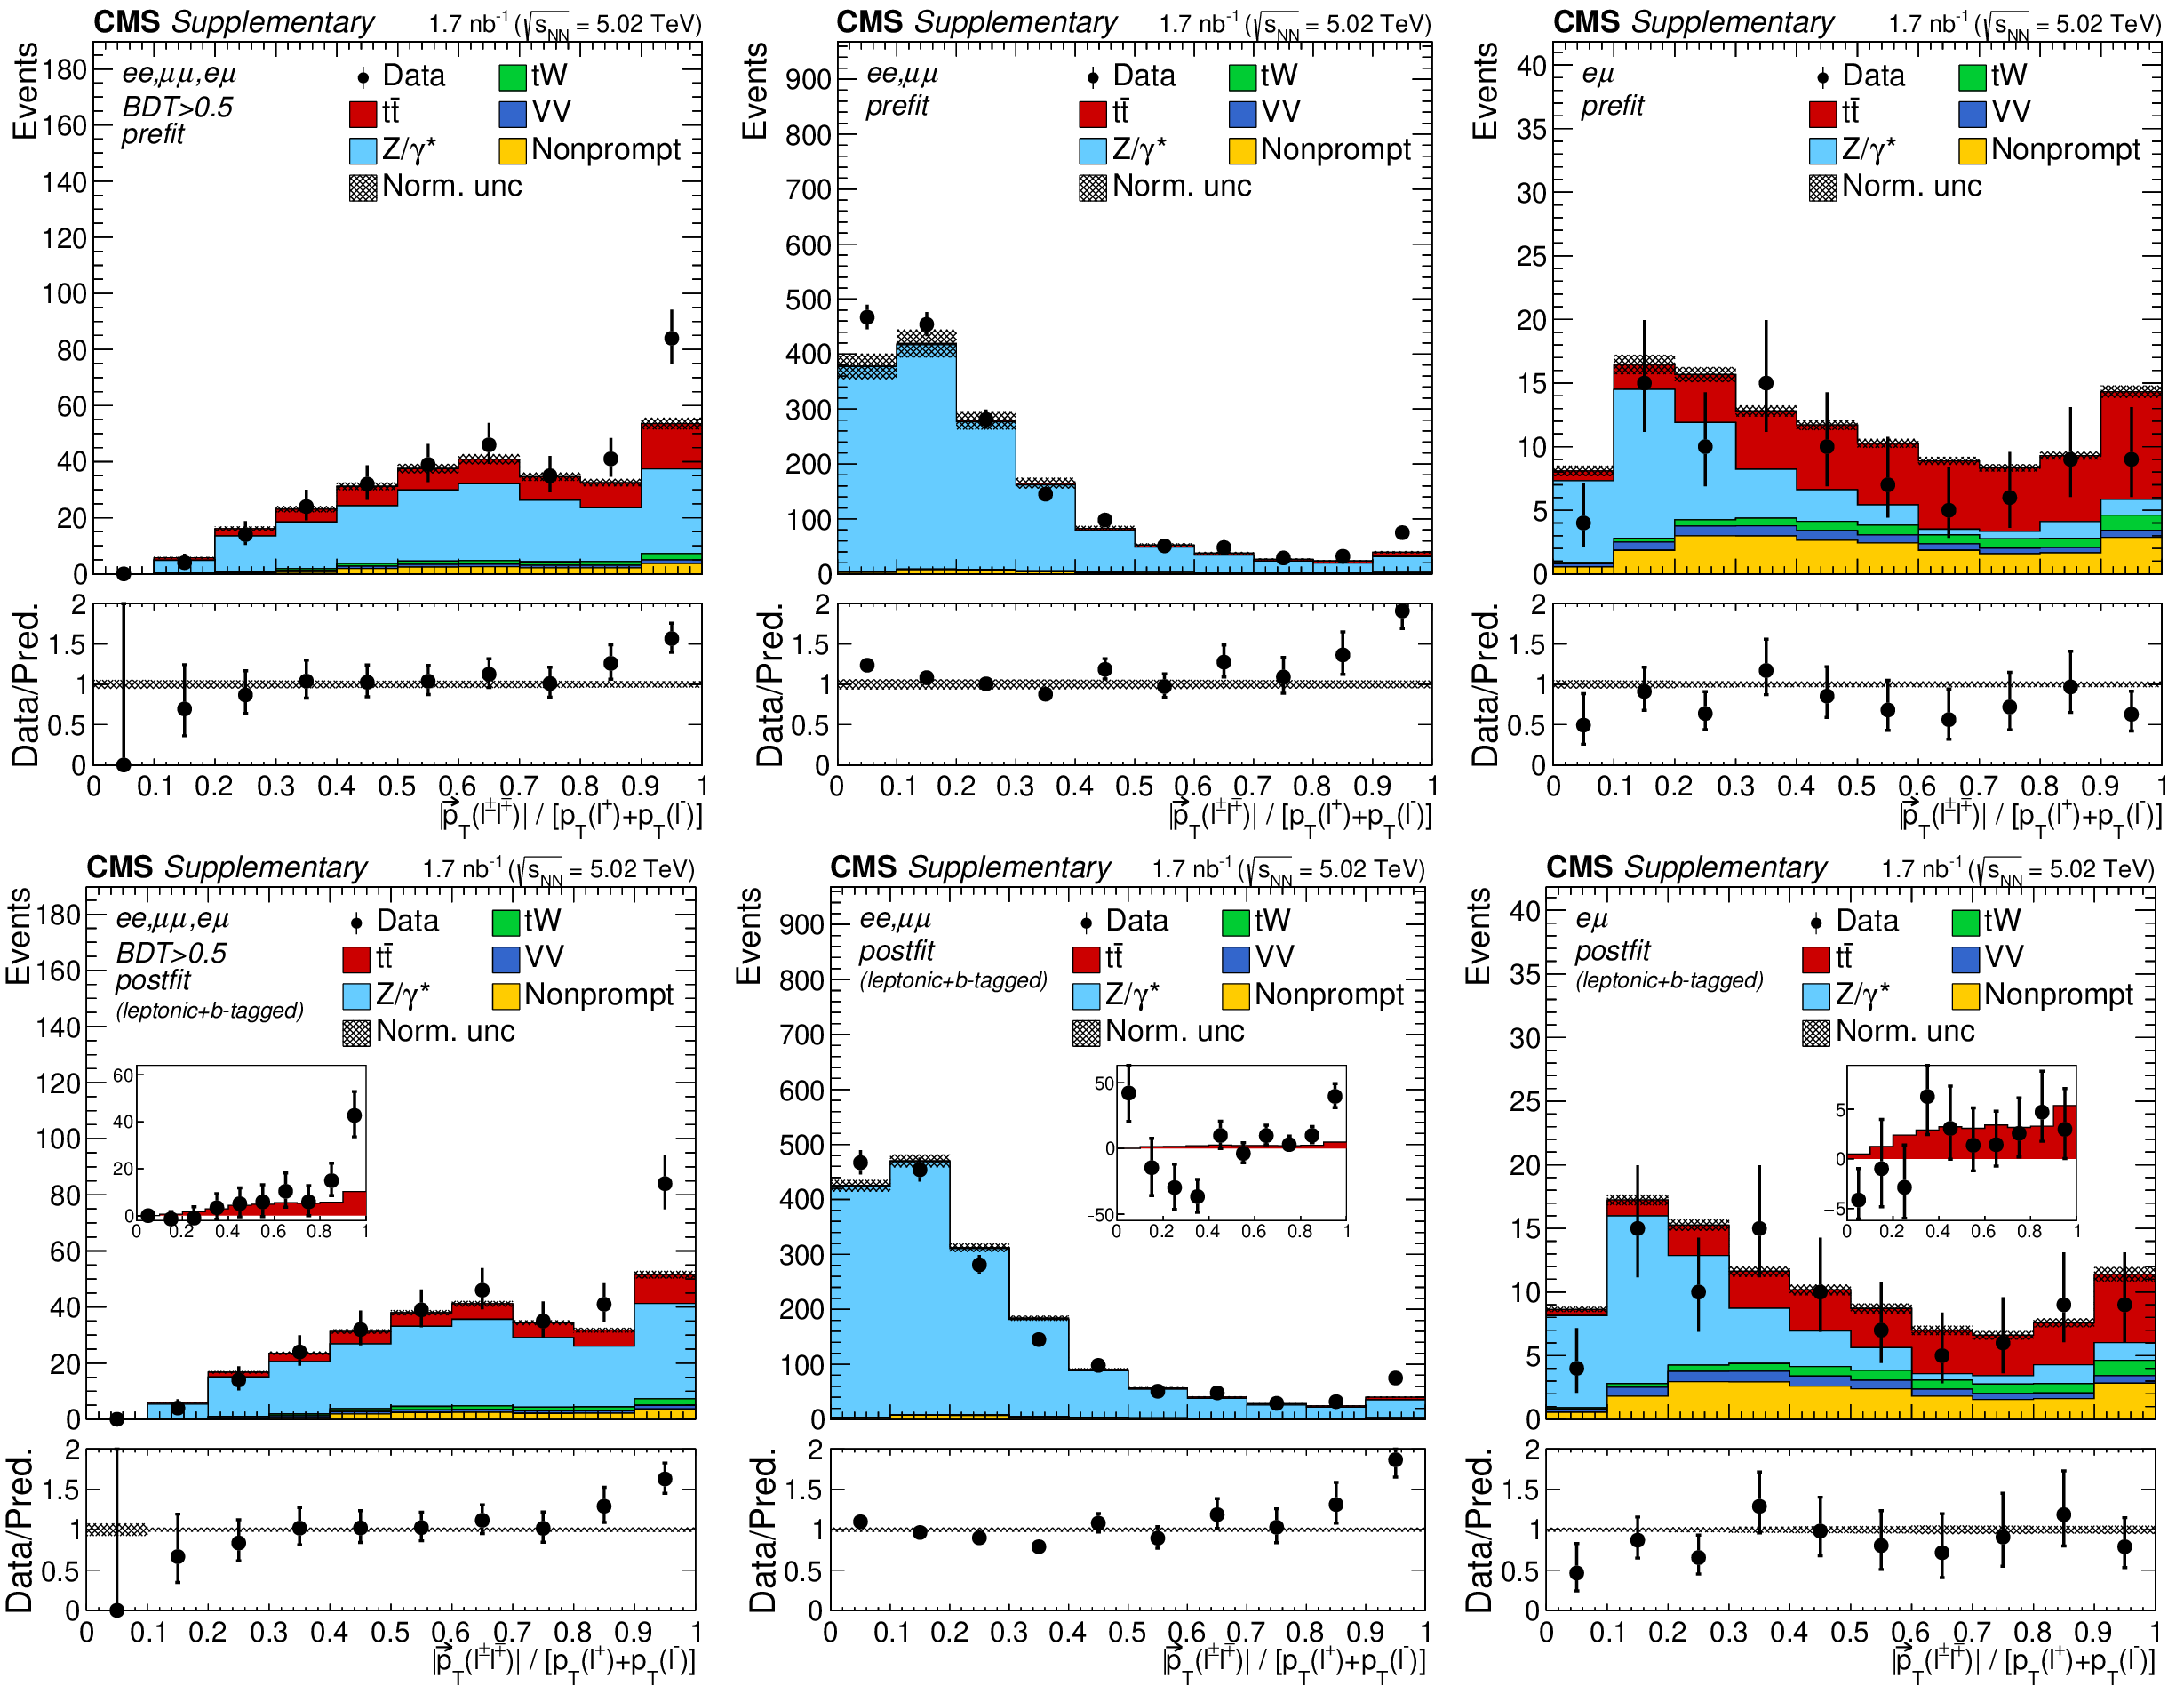
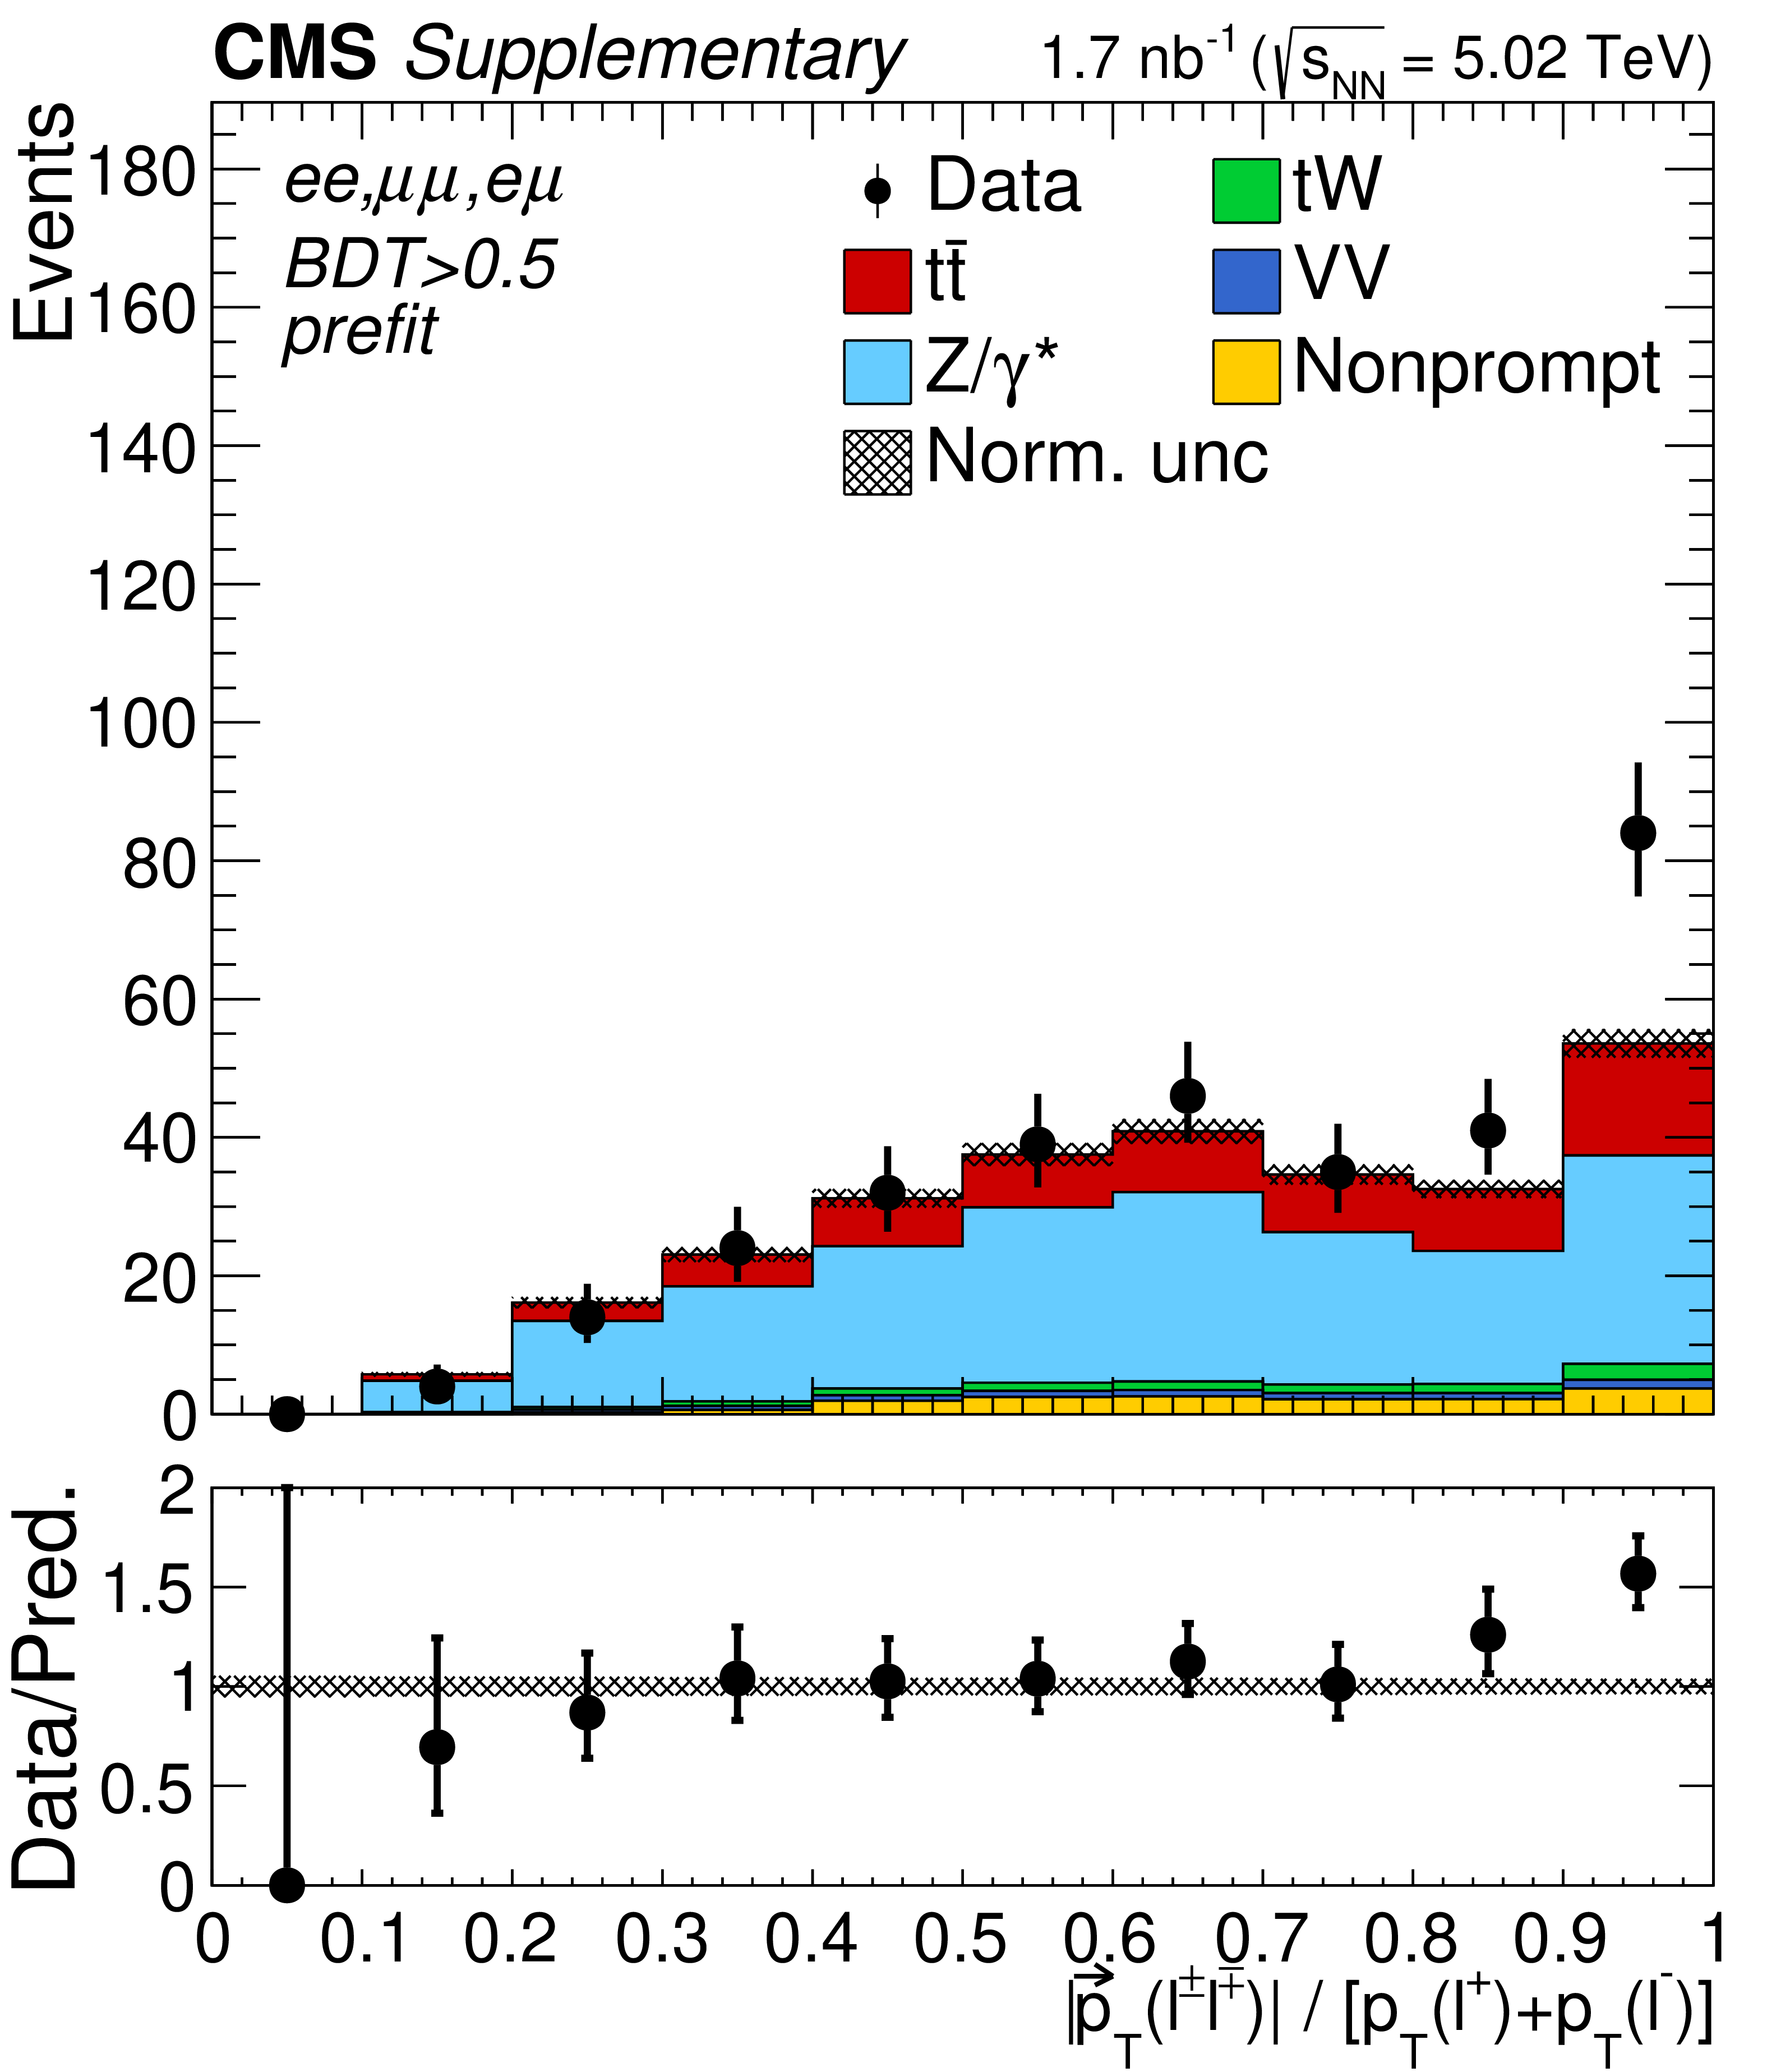
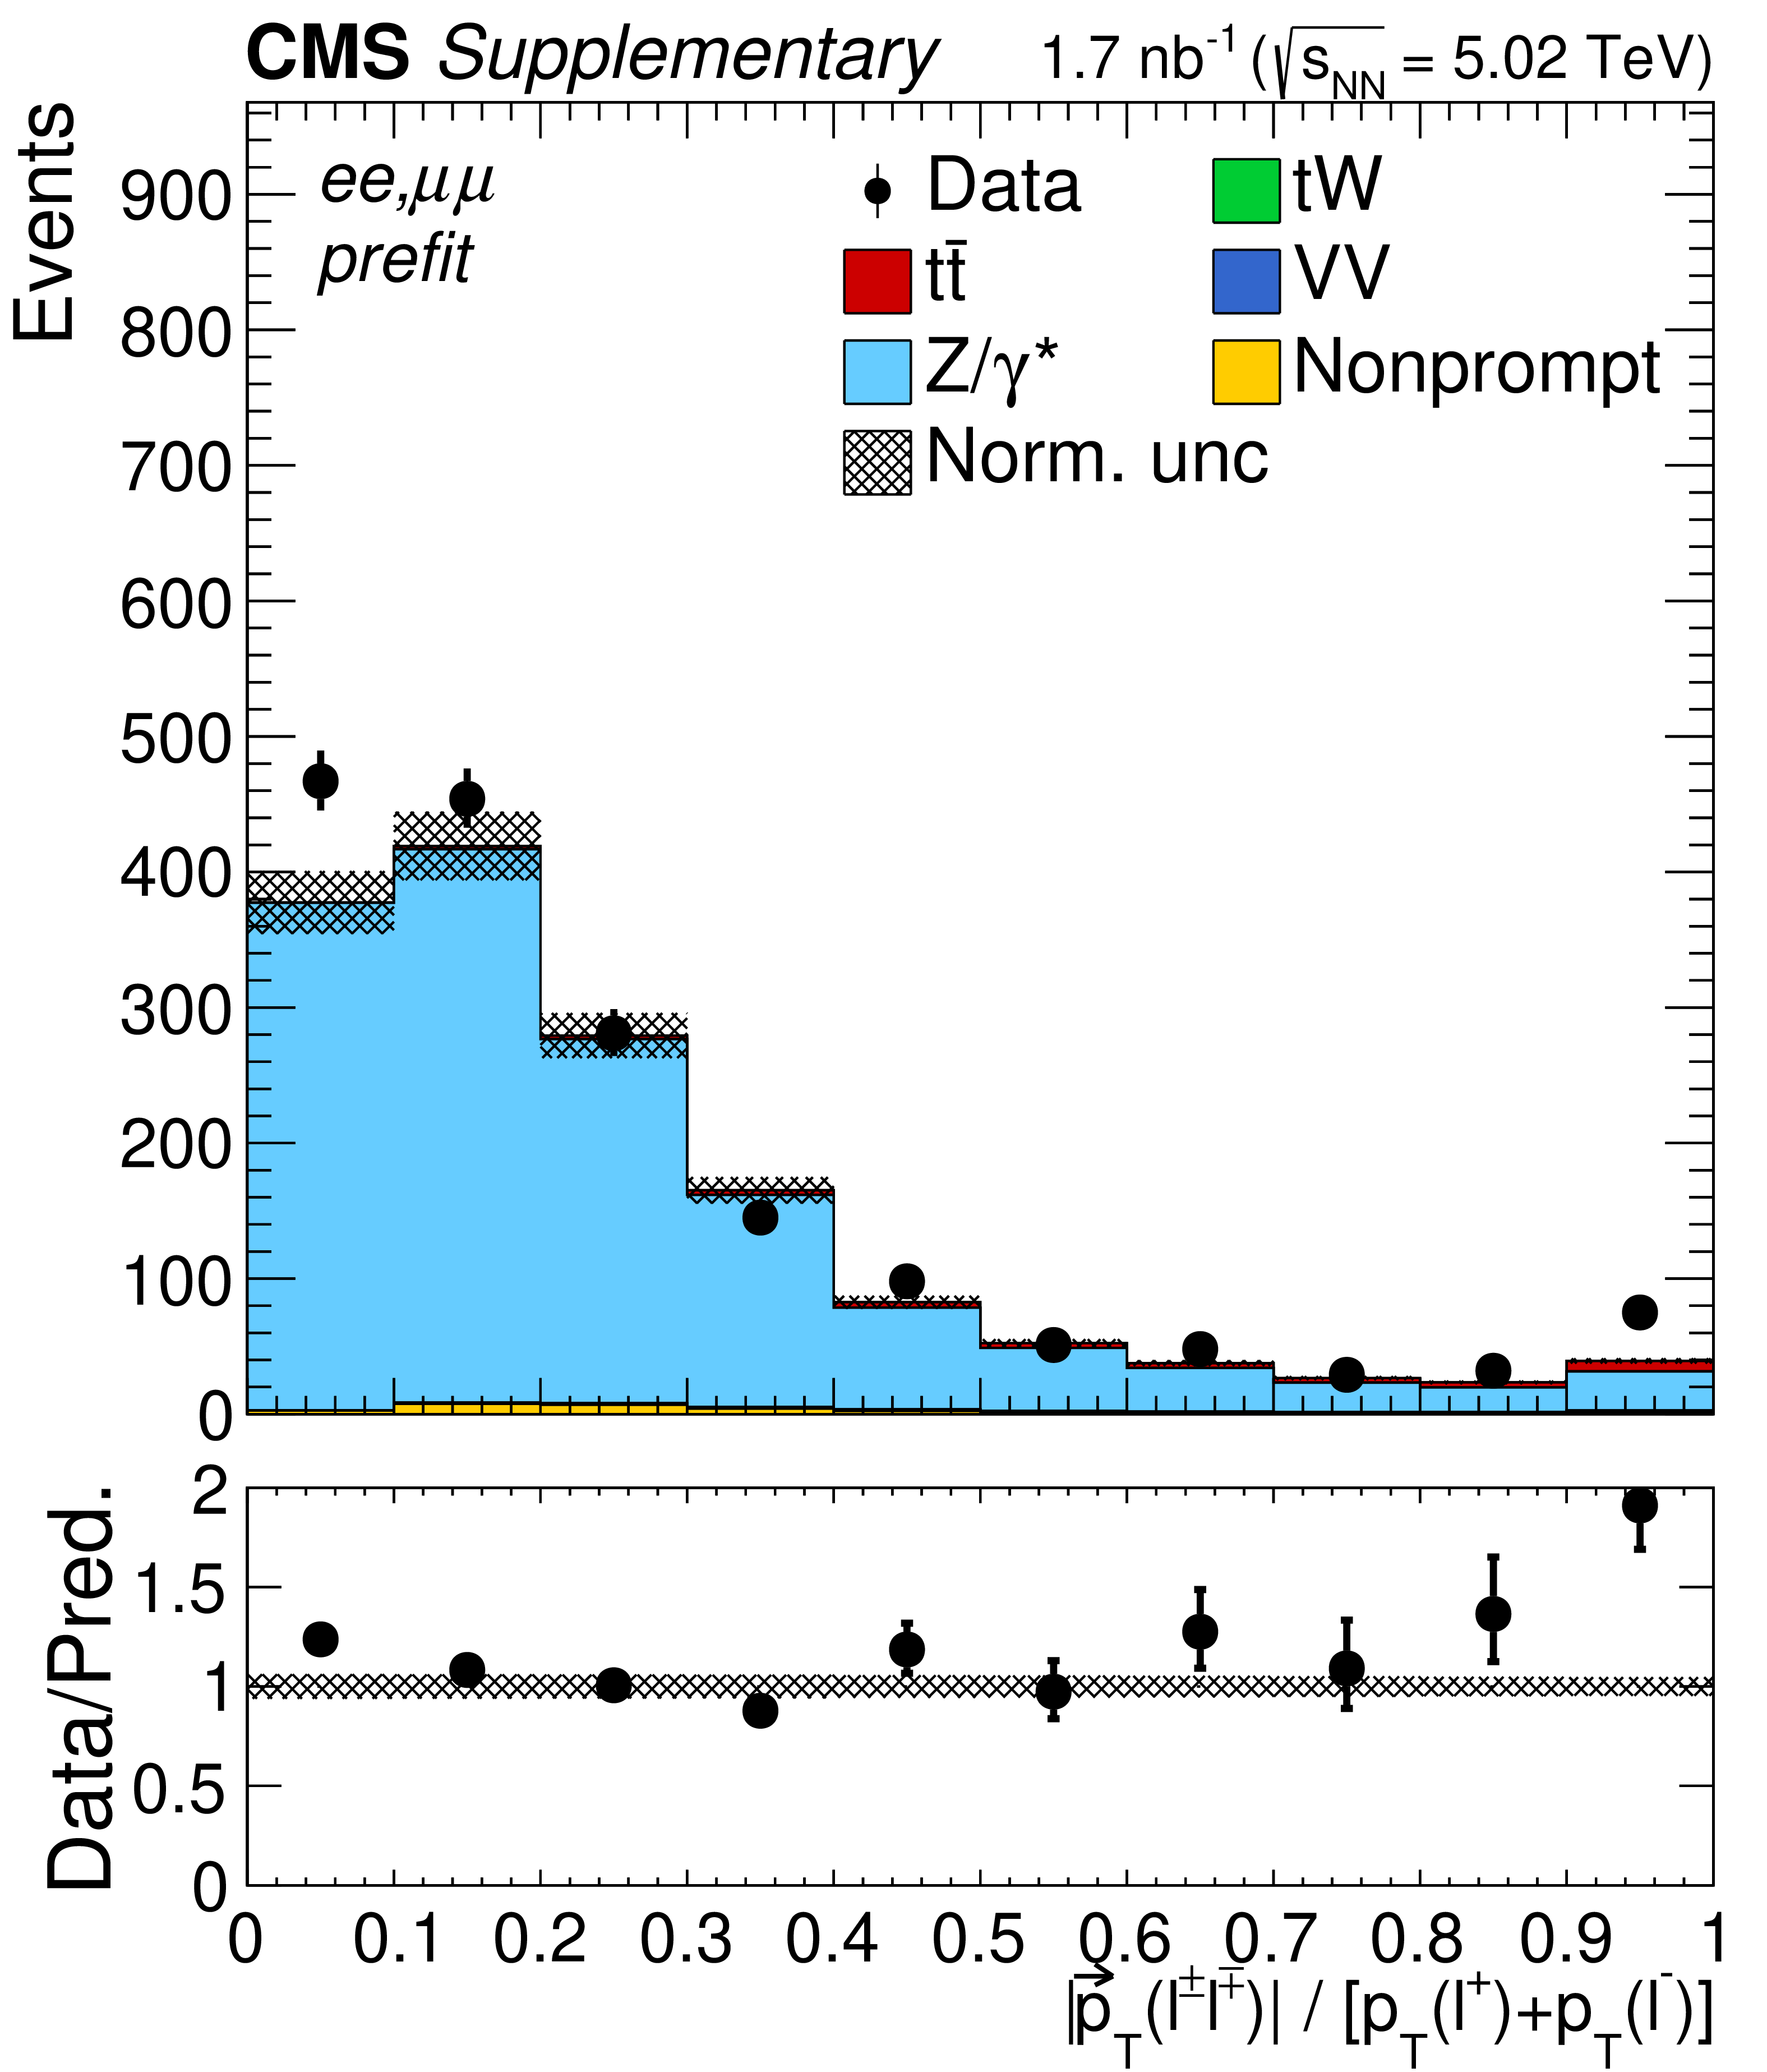
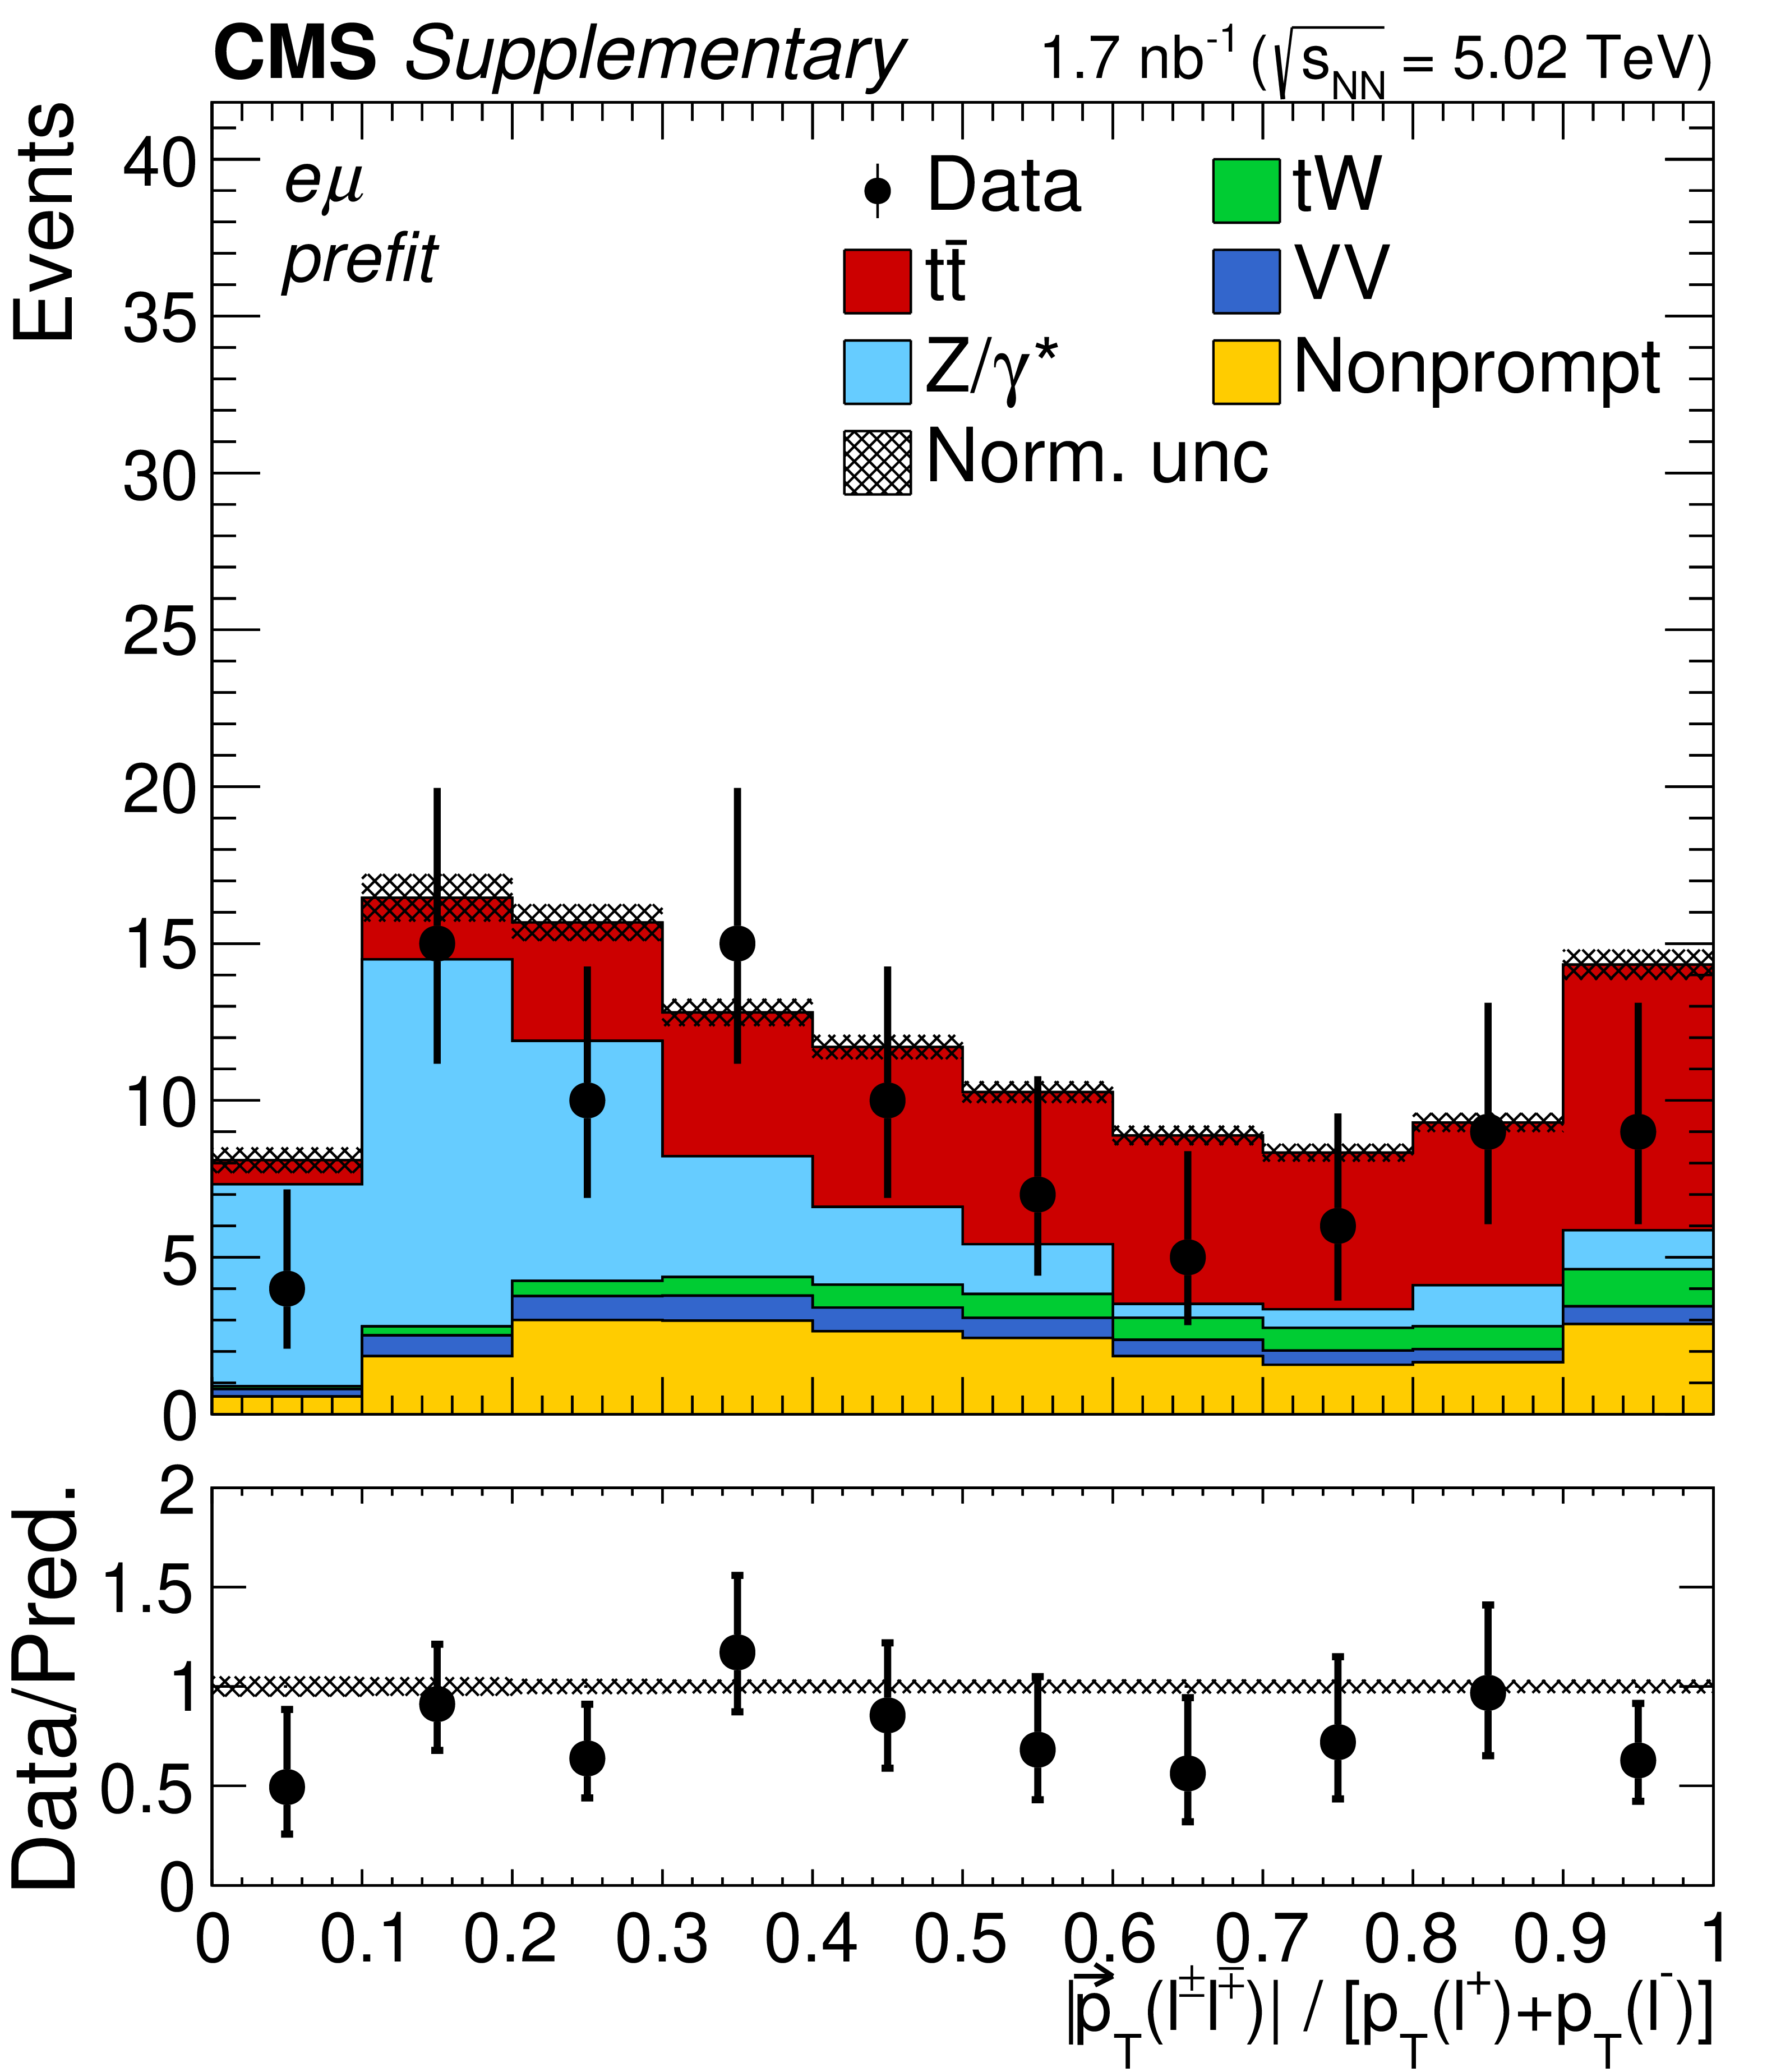
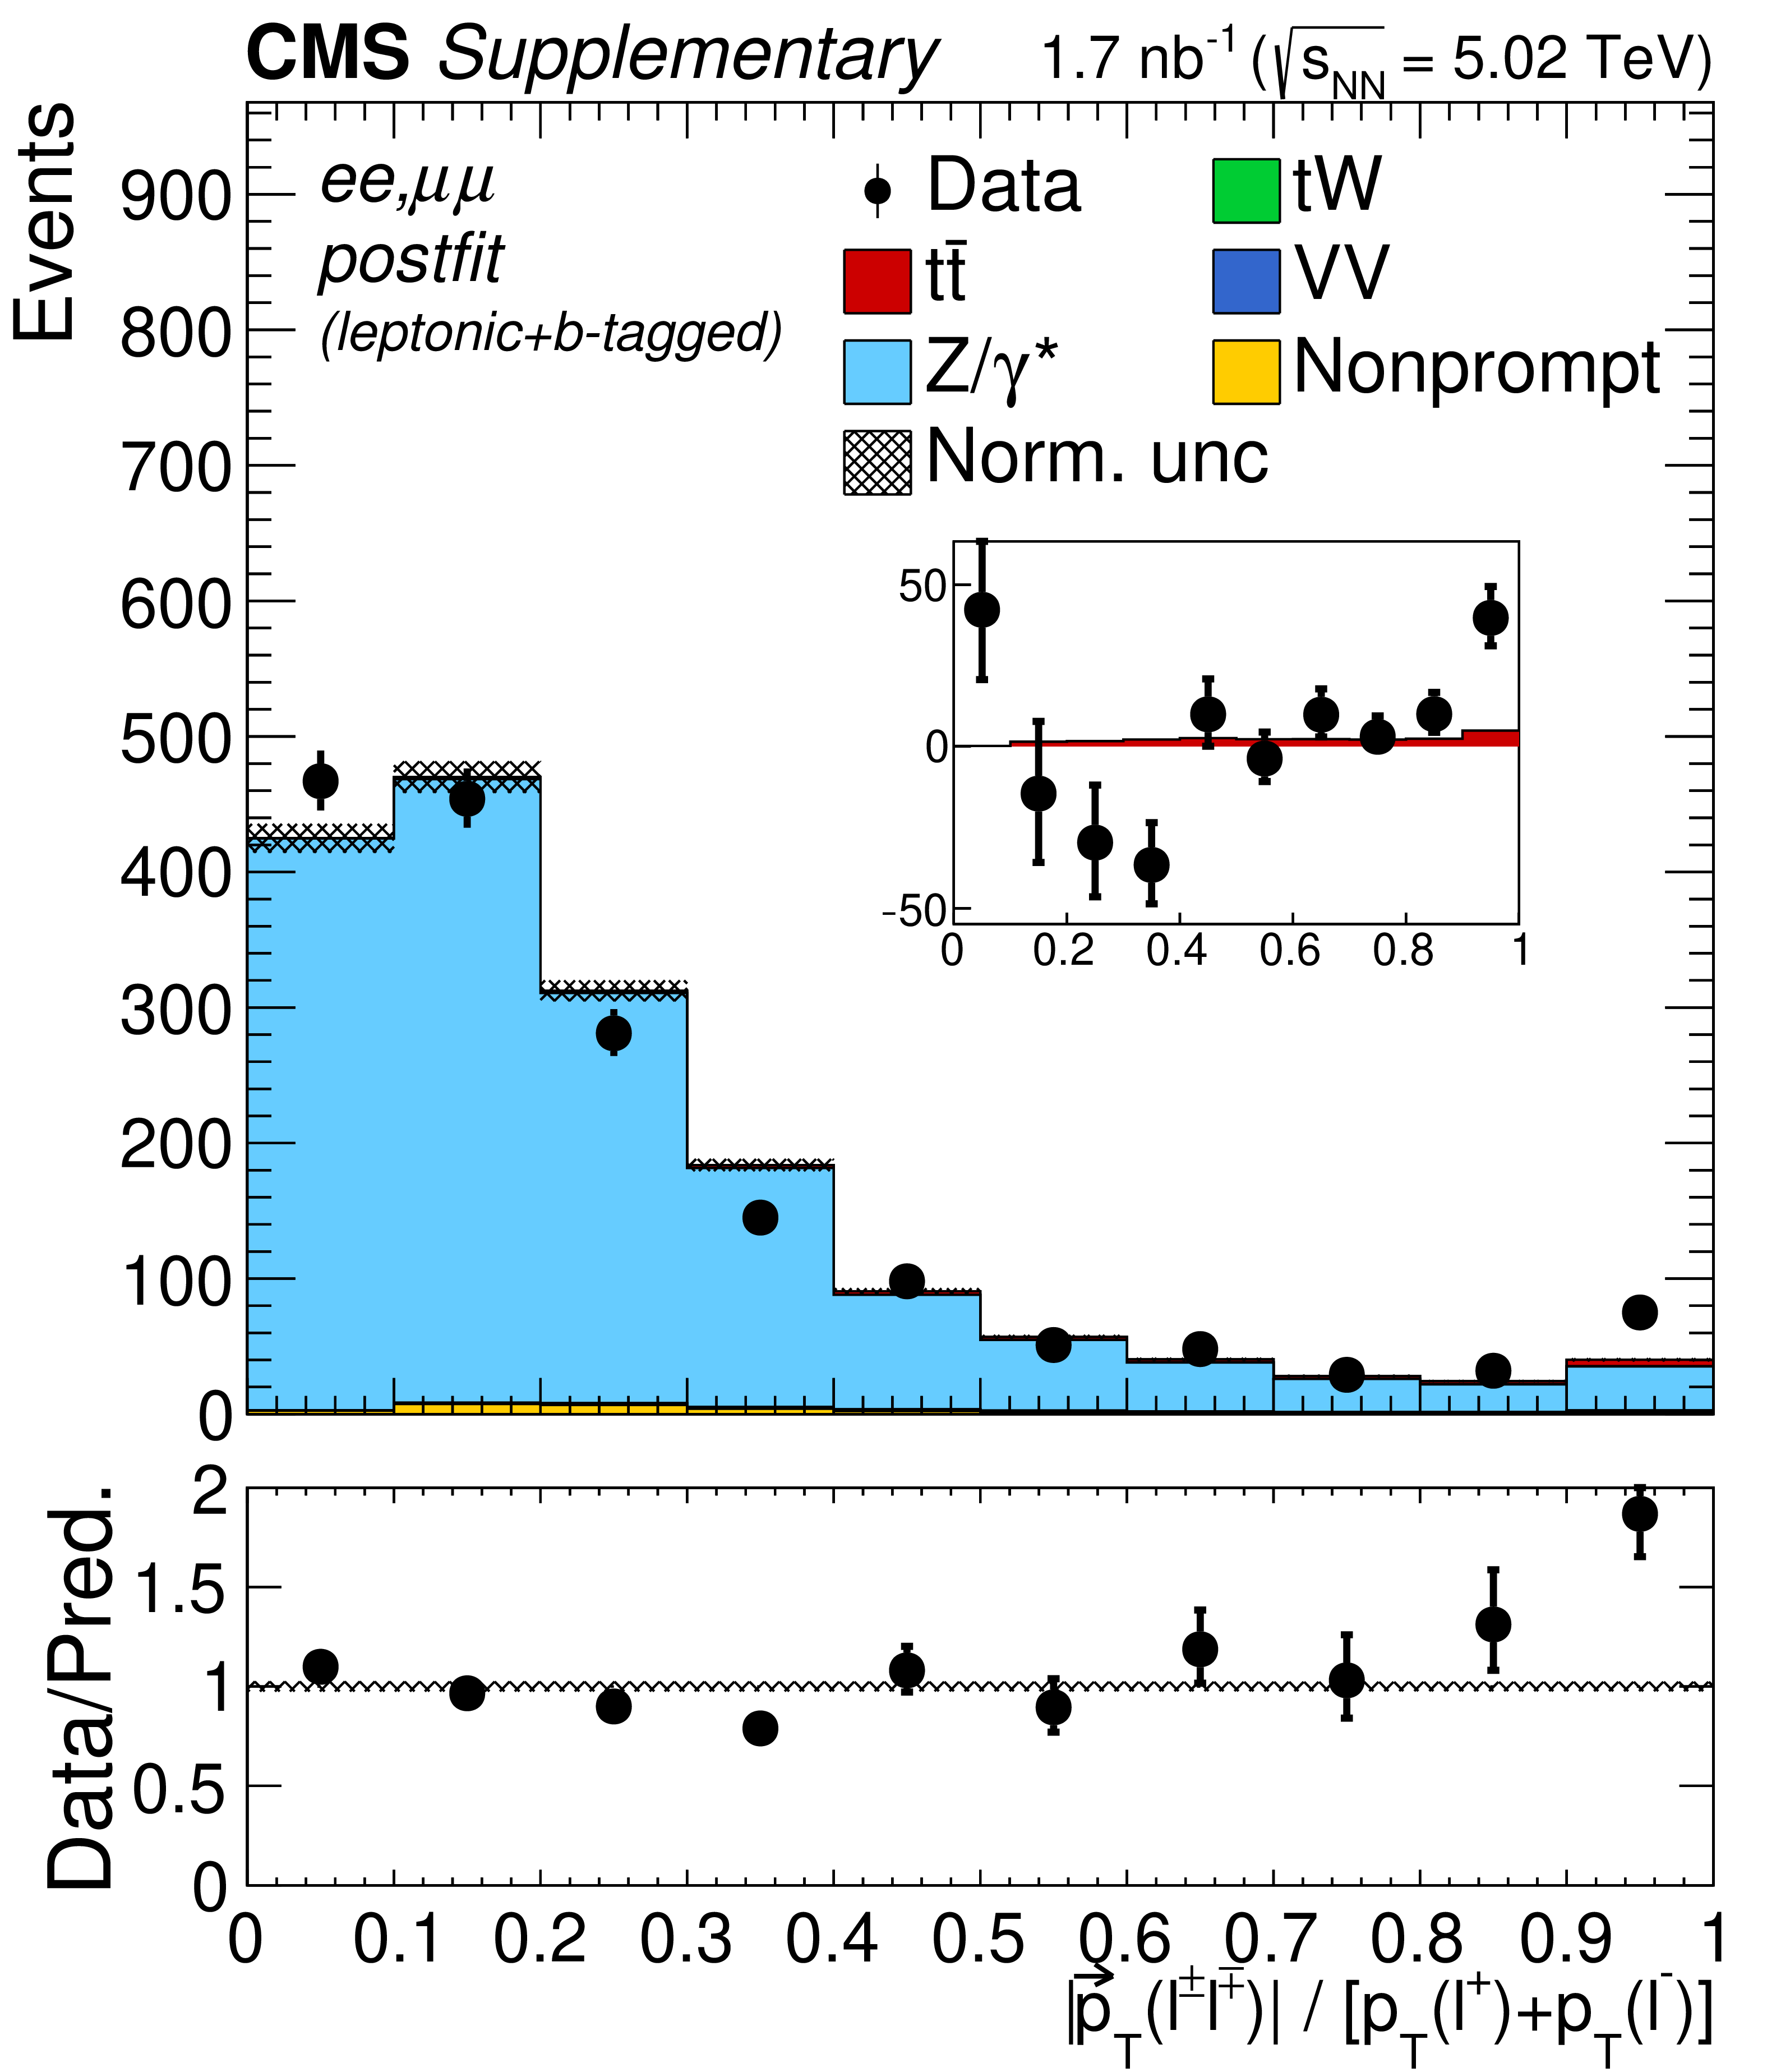
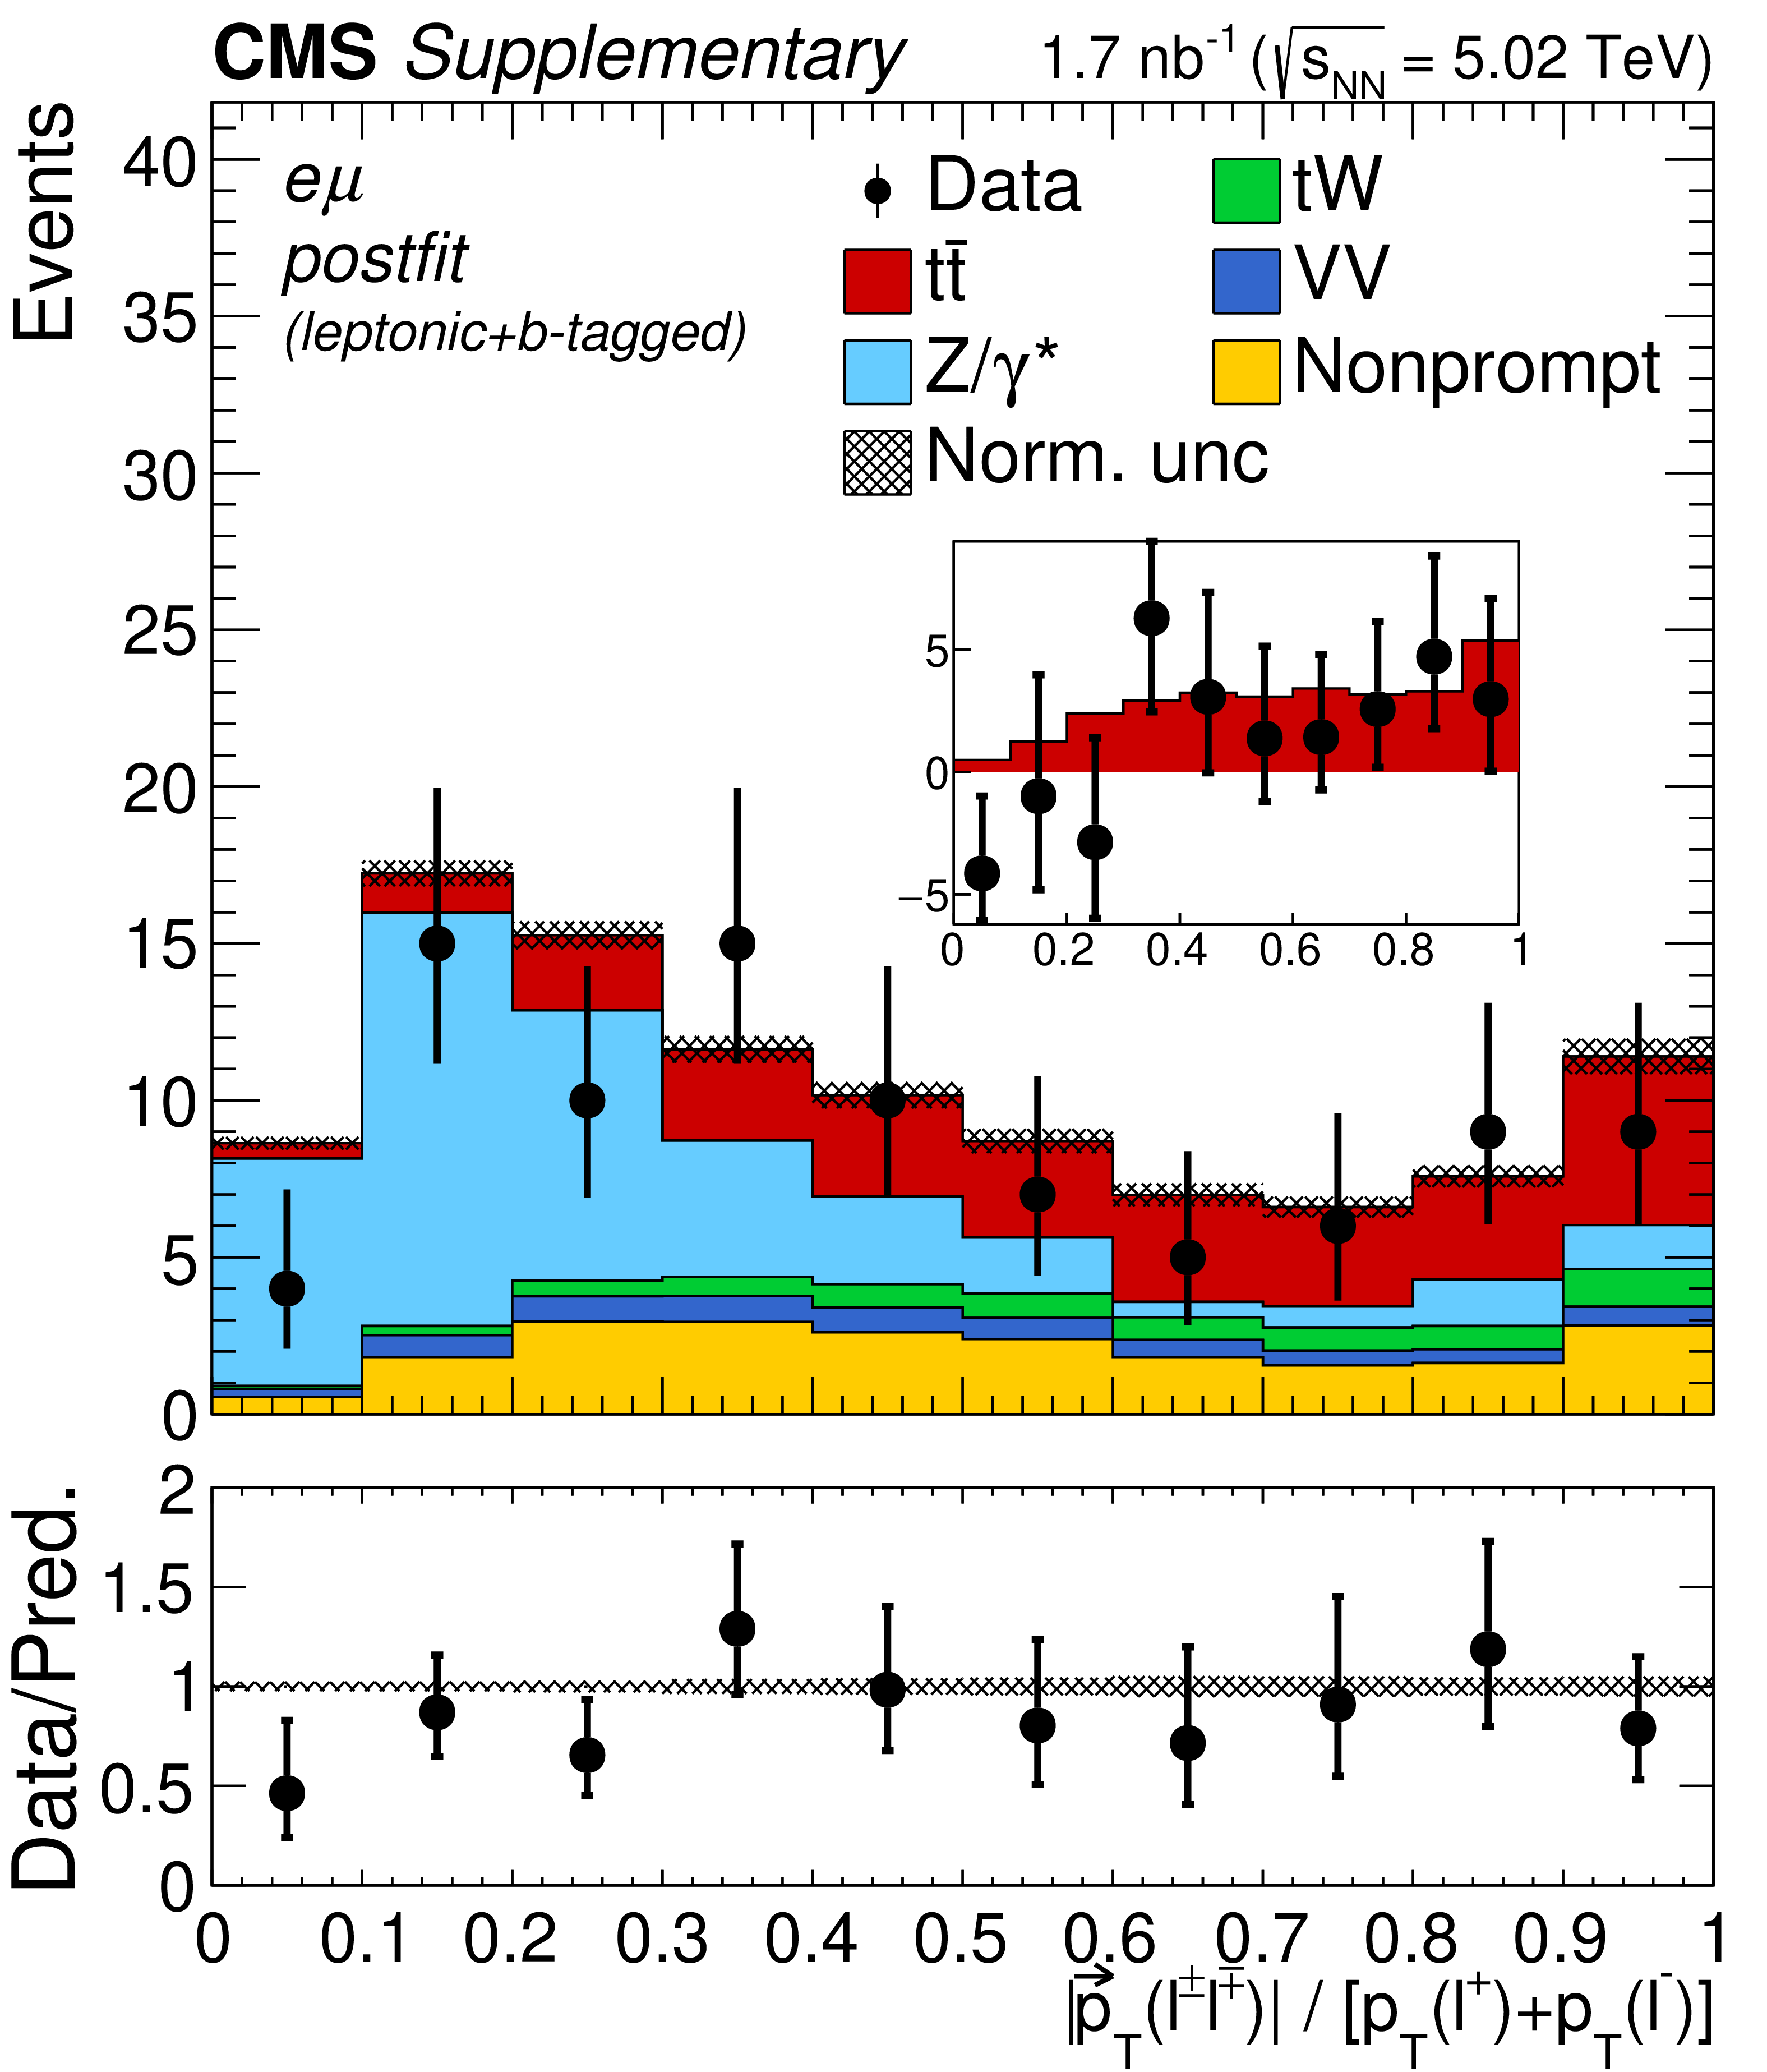
Transverse momentum distributions of the lepton pairs in the $\mathrm{e^{+}} \mathrm{e^{-}}$, $\mu^{+} \mu^{-}$, and $\mathrm{e^{\pm}}\mu^{\mp}$ (BDT $ > $ 0.5, left), $\mathrm{e^{+}} \mathrm{e^{-}}$ and $\mu^{+} \mu^{-}$ (middle), and $\mathrm{e^{\pm}}\mu^{\mp}$ (right) channels. In the upper (lower) row, the prefit (postfit) expectations (predictions) are compared to data. The comparison between the $\mathrm{t\bar{t}}$ signal and the background-subtracted data is shown for the postfit distributions as inset panels. Backgrounds and signal are shown with the filled histograms and data are shown with the markers. The vertical bars on the markers represent the statistical uncertainties in data. The hatched regions show the prefit (postfit) uncertainties in the sum of $\mathrm{t\bar{t}}$ signal and backgrounds. The lower panels display the ratio of the data to expectations (predictions), including the $\mathrm{t\bar{t}}$ signal, with bands representing the prefit (postfit) uncertainties in the predictions. |

png pdf |
Additional Figure 5-a:
Transverse momentum distributions of the lepton pairs in the $\mathrm{e^{+}} \mathrm{e^{-}}$, $\mu^{+} \mu^{-}$, and $\mathrm{e^{\pm}}\mu^{\mp}$ (BDT $ > $ 0.5) channels. The prefit expectations are compared to data. Backgrounds and signal are shown with the filled histograms and data are shown with the markers. The vertical bars on the markers represent the statistical uncertainties in data. The hatched regions show the prefit uncertainties in the sum of $\mathrm{t\bar{t}}$ signal and backgrounds. The lower panel displays the ratio of the data to expectations, including the $\mathrm{t\bar{t}}$ signal, with bands representing the prefit uncertainties in the predictions. |

png pdf |
Additional Figure 5-b:
Transverse momentum distributions of the lepton pairs in the $\mathrm{e^{+}} \mathrm{e^{-}}$ and $\mu^{+} \mu^{-}$ hannels. The prefit expectations are compared to data. Backgrounds and signal are shown with the filled histograms and data are shown with the markers. The vertical bars on the markers represent the statistical uncertainties in data. The hatched regions show the prefit uncertainties in the sum of $\mathrm{t\bar{t}}$ signal and backgrounds. The lower panel displays the ratio of the data to expectations, including the $\mathrm{t\bar{t}}$ signal, with bands representing the prefit uncertainties in the predictions. |
png pdf |
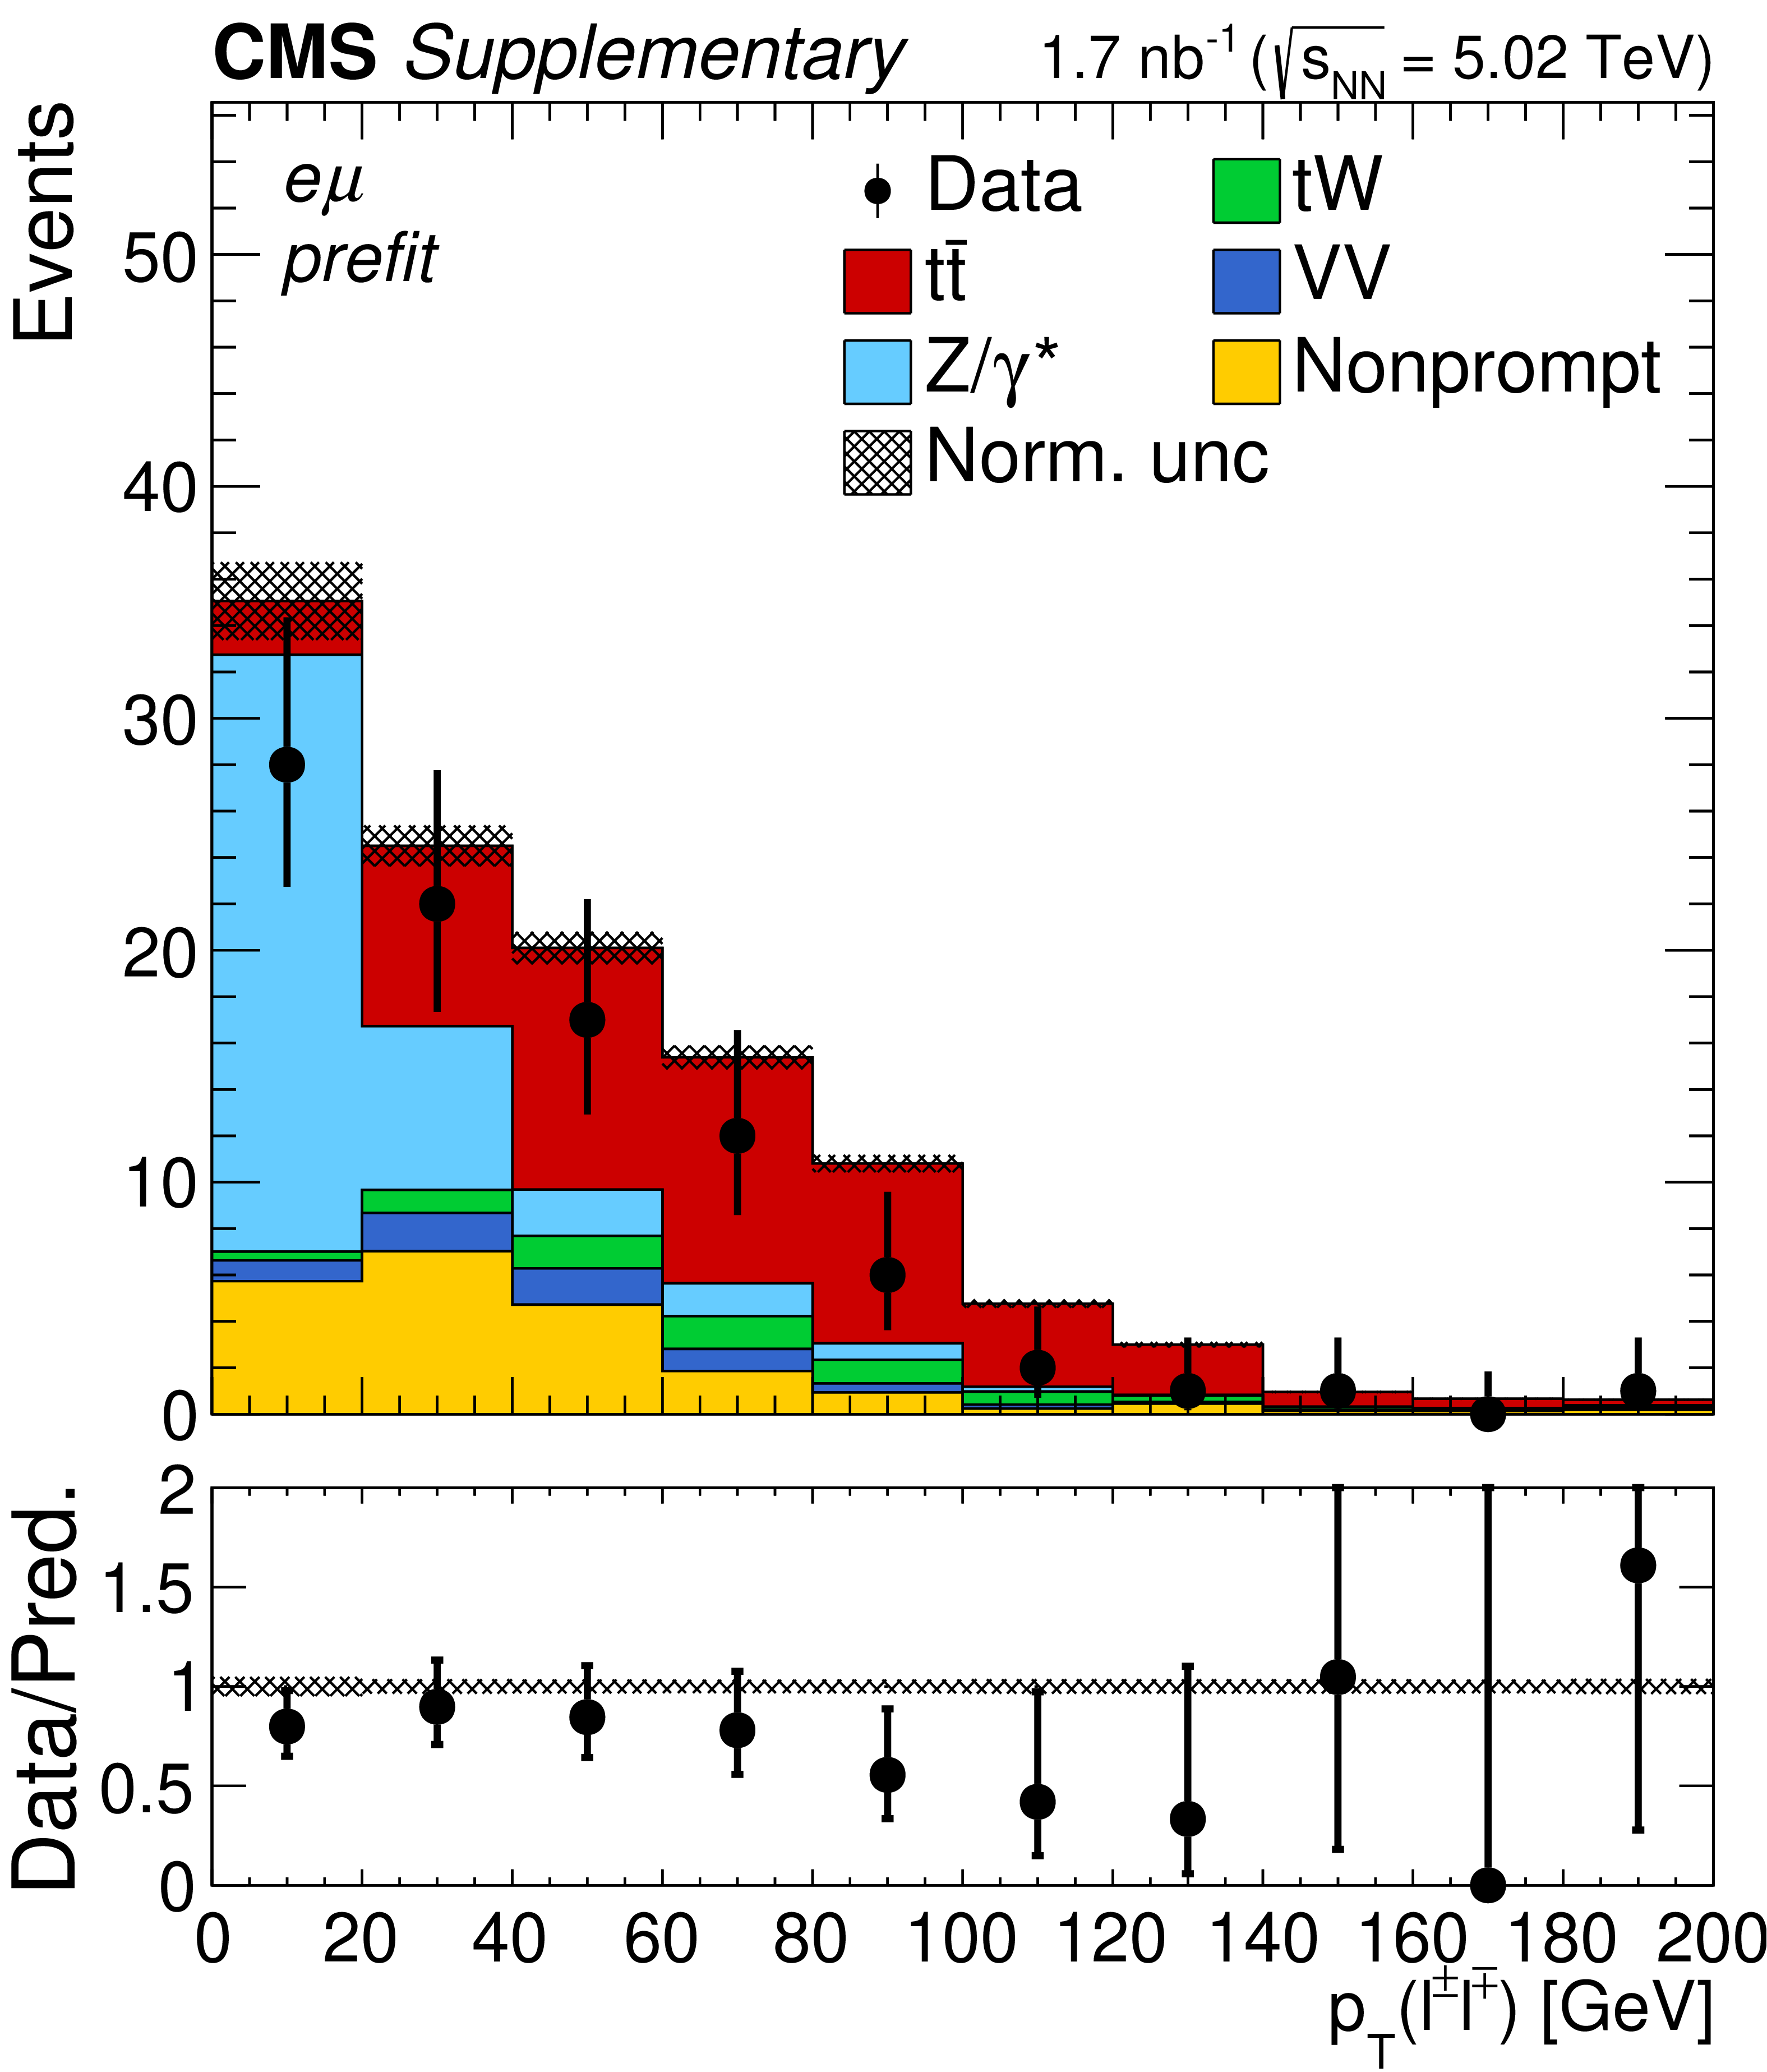
Additional Figure 5-c:
Transverse momentum distributions of the lepton pairs in the $\mathrm{e^{\pm}}\mu^{\mp}$ channels. The prefit expectations are compared to data. Backgrounds and signal are shown with the filled histograms and data are shown with the markers. The vertical bars on the markers represent the statistical uncertainties in data. The hatched regions show the prefit uncertainties in the sum of $\mathrm{t\bar{t}}$ signal and backgrounds. The lower panel displays the ratio of the data to expectations, including the $\mathrm{t\bar{t}}$ signal, with bands representing the prefit uncertainties in the predictions. |
png pdf |
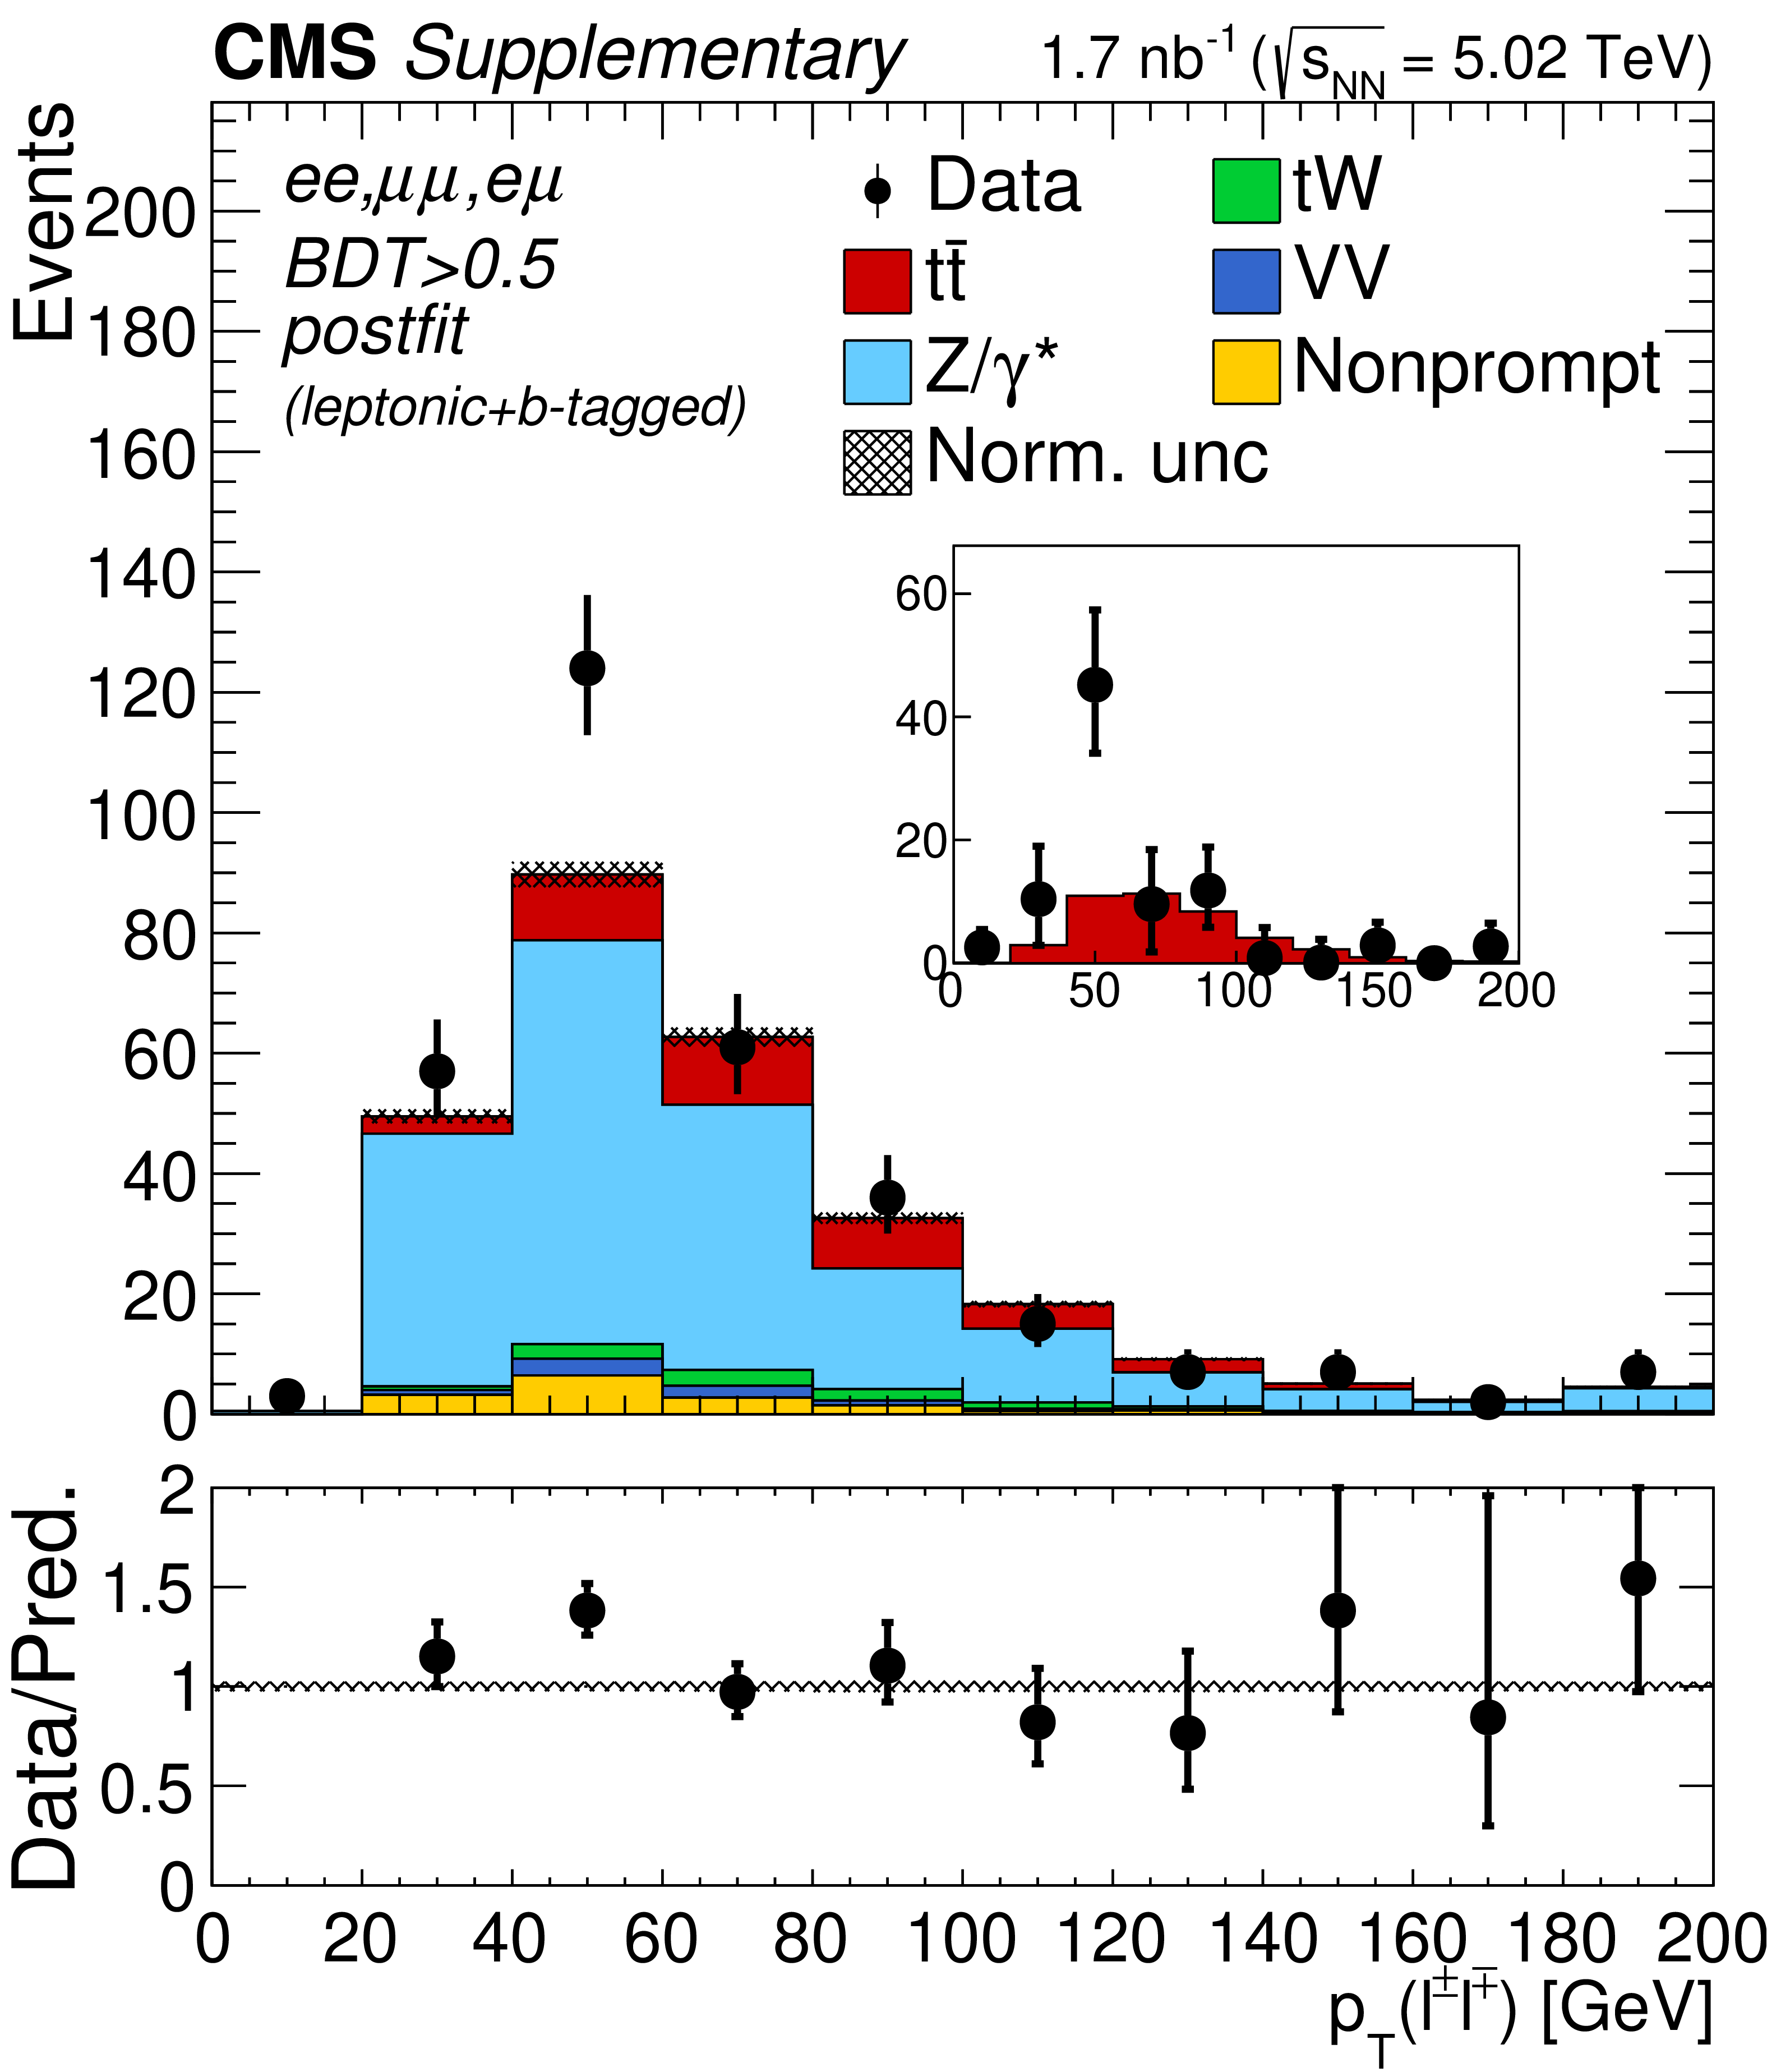
Additional Figure 5-d:
Transverse momentum distributions of the lepton pairs in the $\mathrm{e^{+}} \mathrm{e^{-}}$, $\mu^{+} \mu^{-}$, and $\mathrm{e^{\pm}}\mu^{\mp}$ (BDT $ > $ 0.5) channels. The postfit predictions are compared to data. The comparison between the $\mathrm{t\bar{t}}$ signal and the background-subtracted data is shown as an inset panel. Backgrounds and signal are shown with the filled histograms and data are shown with the markers. The vertical bars on the markers represent the statistical uncertainties in data. The hatched regions show the postfit uncertainties in the sum of $\mathrm{t\bar{t}}$ signal and backgrounds. The lower panel displays the ratio of the data to predictions, including the $\mathrm{t\bar{t}}$ signal, with bands representing the postfit uncertainties in the predictions. |
png pdf |
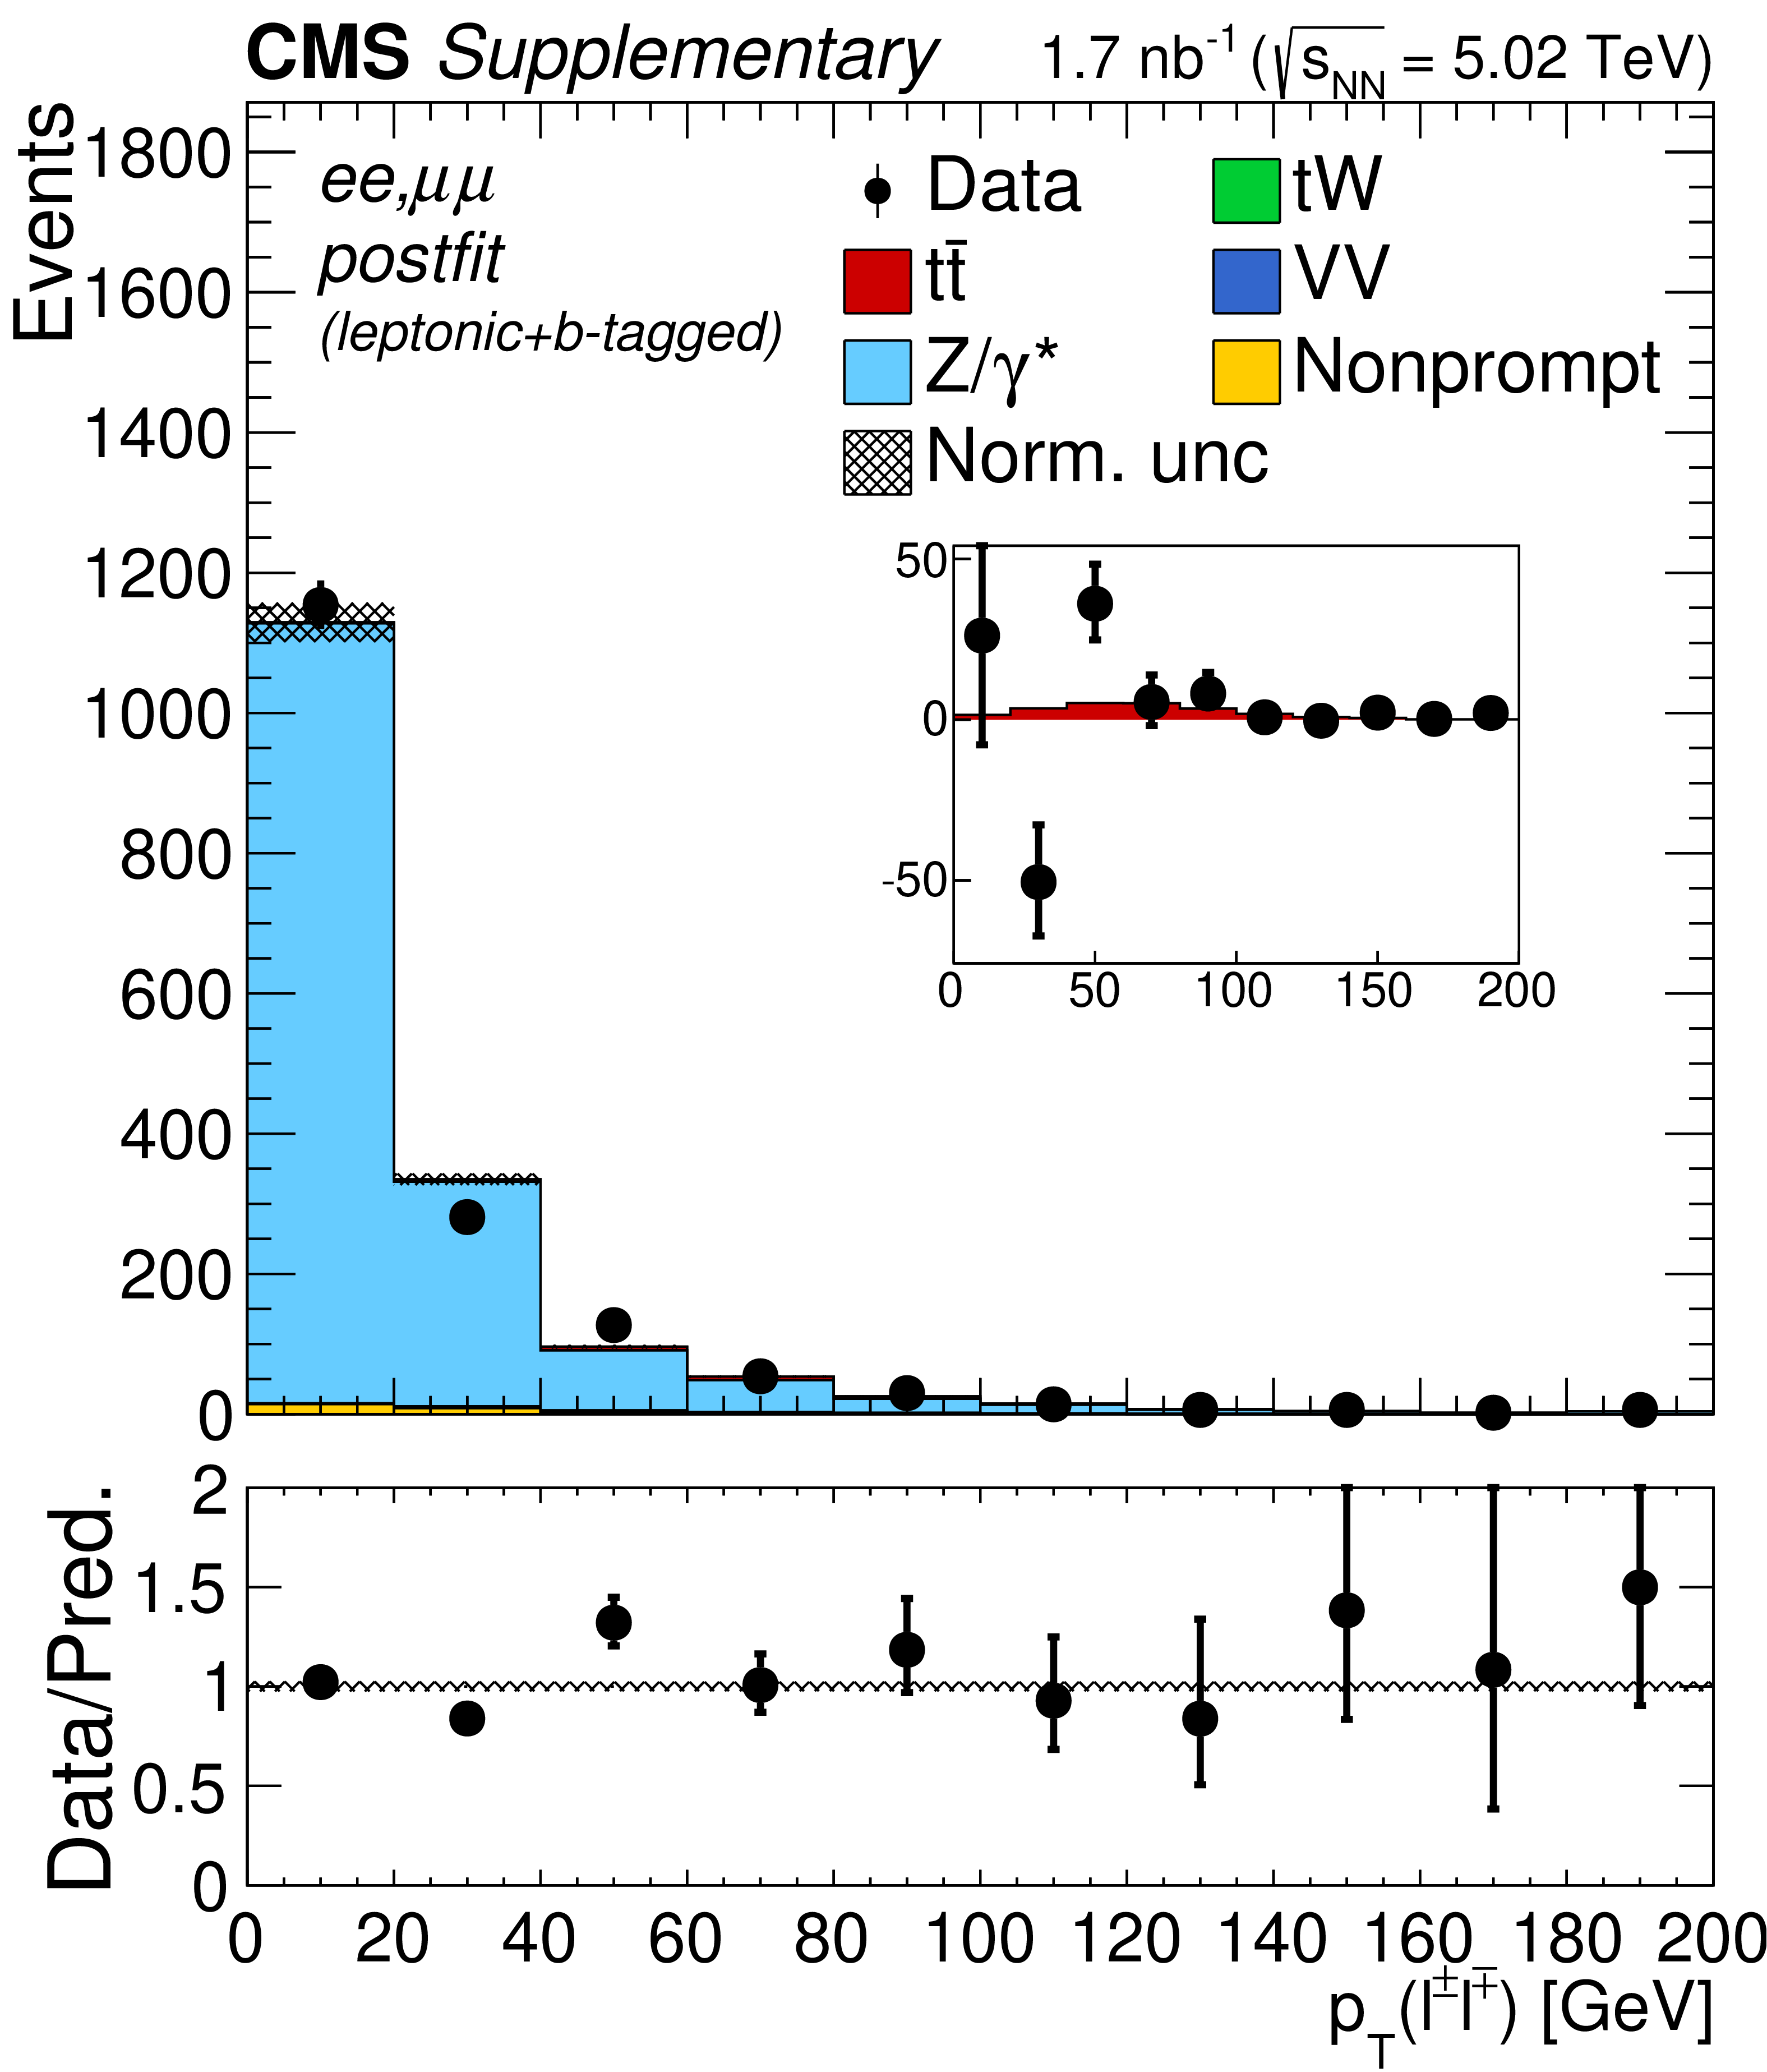
Additional Figure 5-e:
Transverse momentum distributions of the lepton pairs in the $\mathrm{e^{+}} \mathrm{e^{-}}$ and $\mu^{+} \mu^{-}$ hannels. The postfit predictions are compared to data. The comparison between the $\mathrm{t\bar{t}}$ signal and the background-subtracted data is shown as an inset panel. Backgrounds and signal are shown with the filled histograms and data are shown with the markers. The vertical bars on the markers represent the statistical uncertainties in data. The hatched regions show the postfit uncertainties in the sum of $\mathrm{t\bar{t}}$ signal and backgrounds. The lower panel displays the ratio of the data to predictions, including the $\mathrm{t\bar{t}}$ signal, with bands representing the postfit uncertainties in the predictions. |

png pdf |
Additional Figure 5-f:
Transverse momentum distributions of the lepton pairs in the $\mathrm{e^{\pm}}\mu^{\mp}$ channels. The postfit predictions are compared to data. The comparison between the $\mathrm{t\bar{t}}$ signal and the background-subtracted data is shown as an inset panel. Backgrounds and signal are shown with the filled histograms and data are shown with the markers. The vertical bars on the markers represent the statistical uncertainties in data. The hatched regions show the postfit uncertainties in the sum of $\mathrm{t\bar{t}}$ signal and backgrounds. The lower panel displays the ratio of the data to predictions, including the $\mathrm{t\bar{t}}$ signal, with bands representing the postfit uncertainties in the predictions. |
png pdf |
Additional Figure 6:
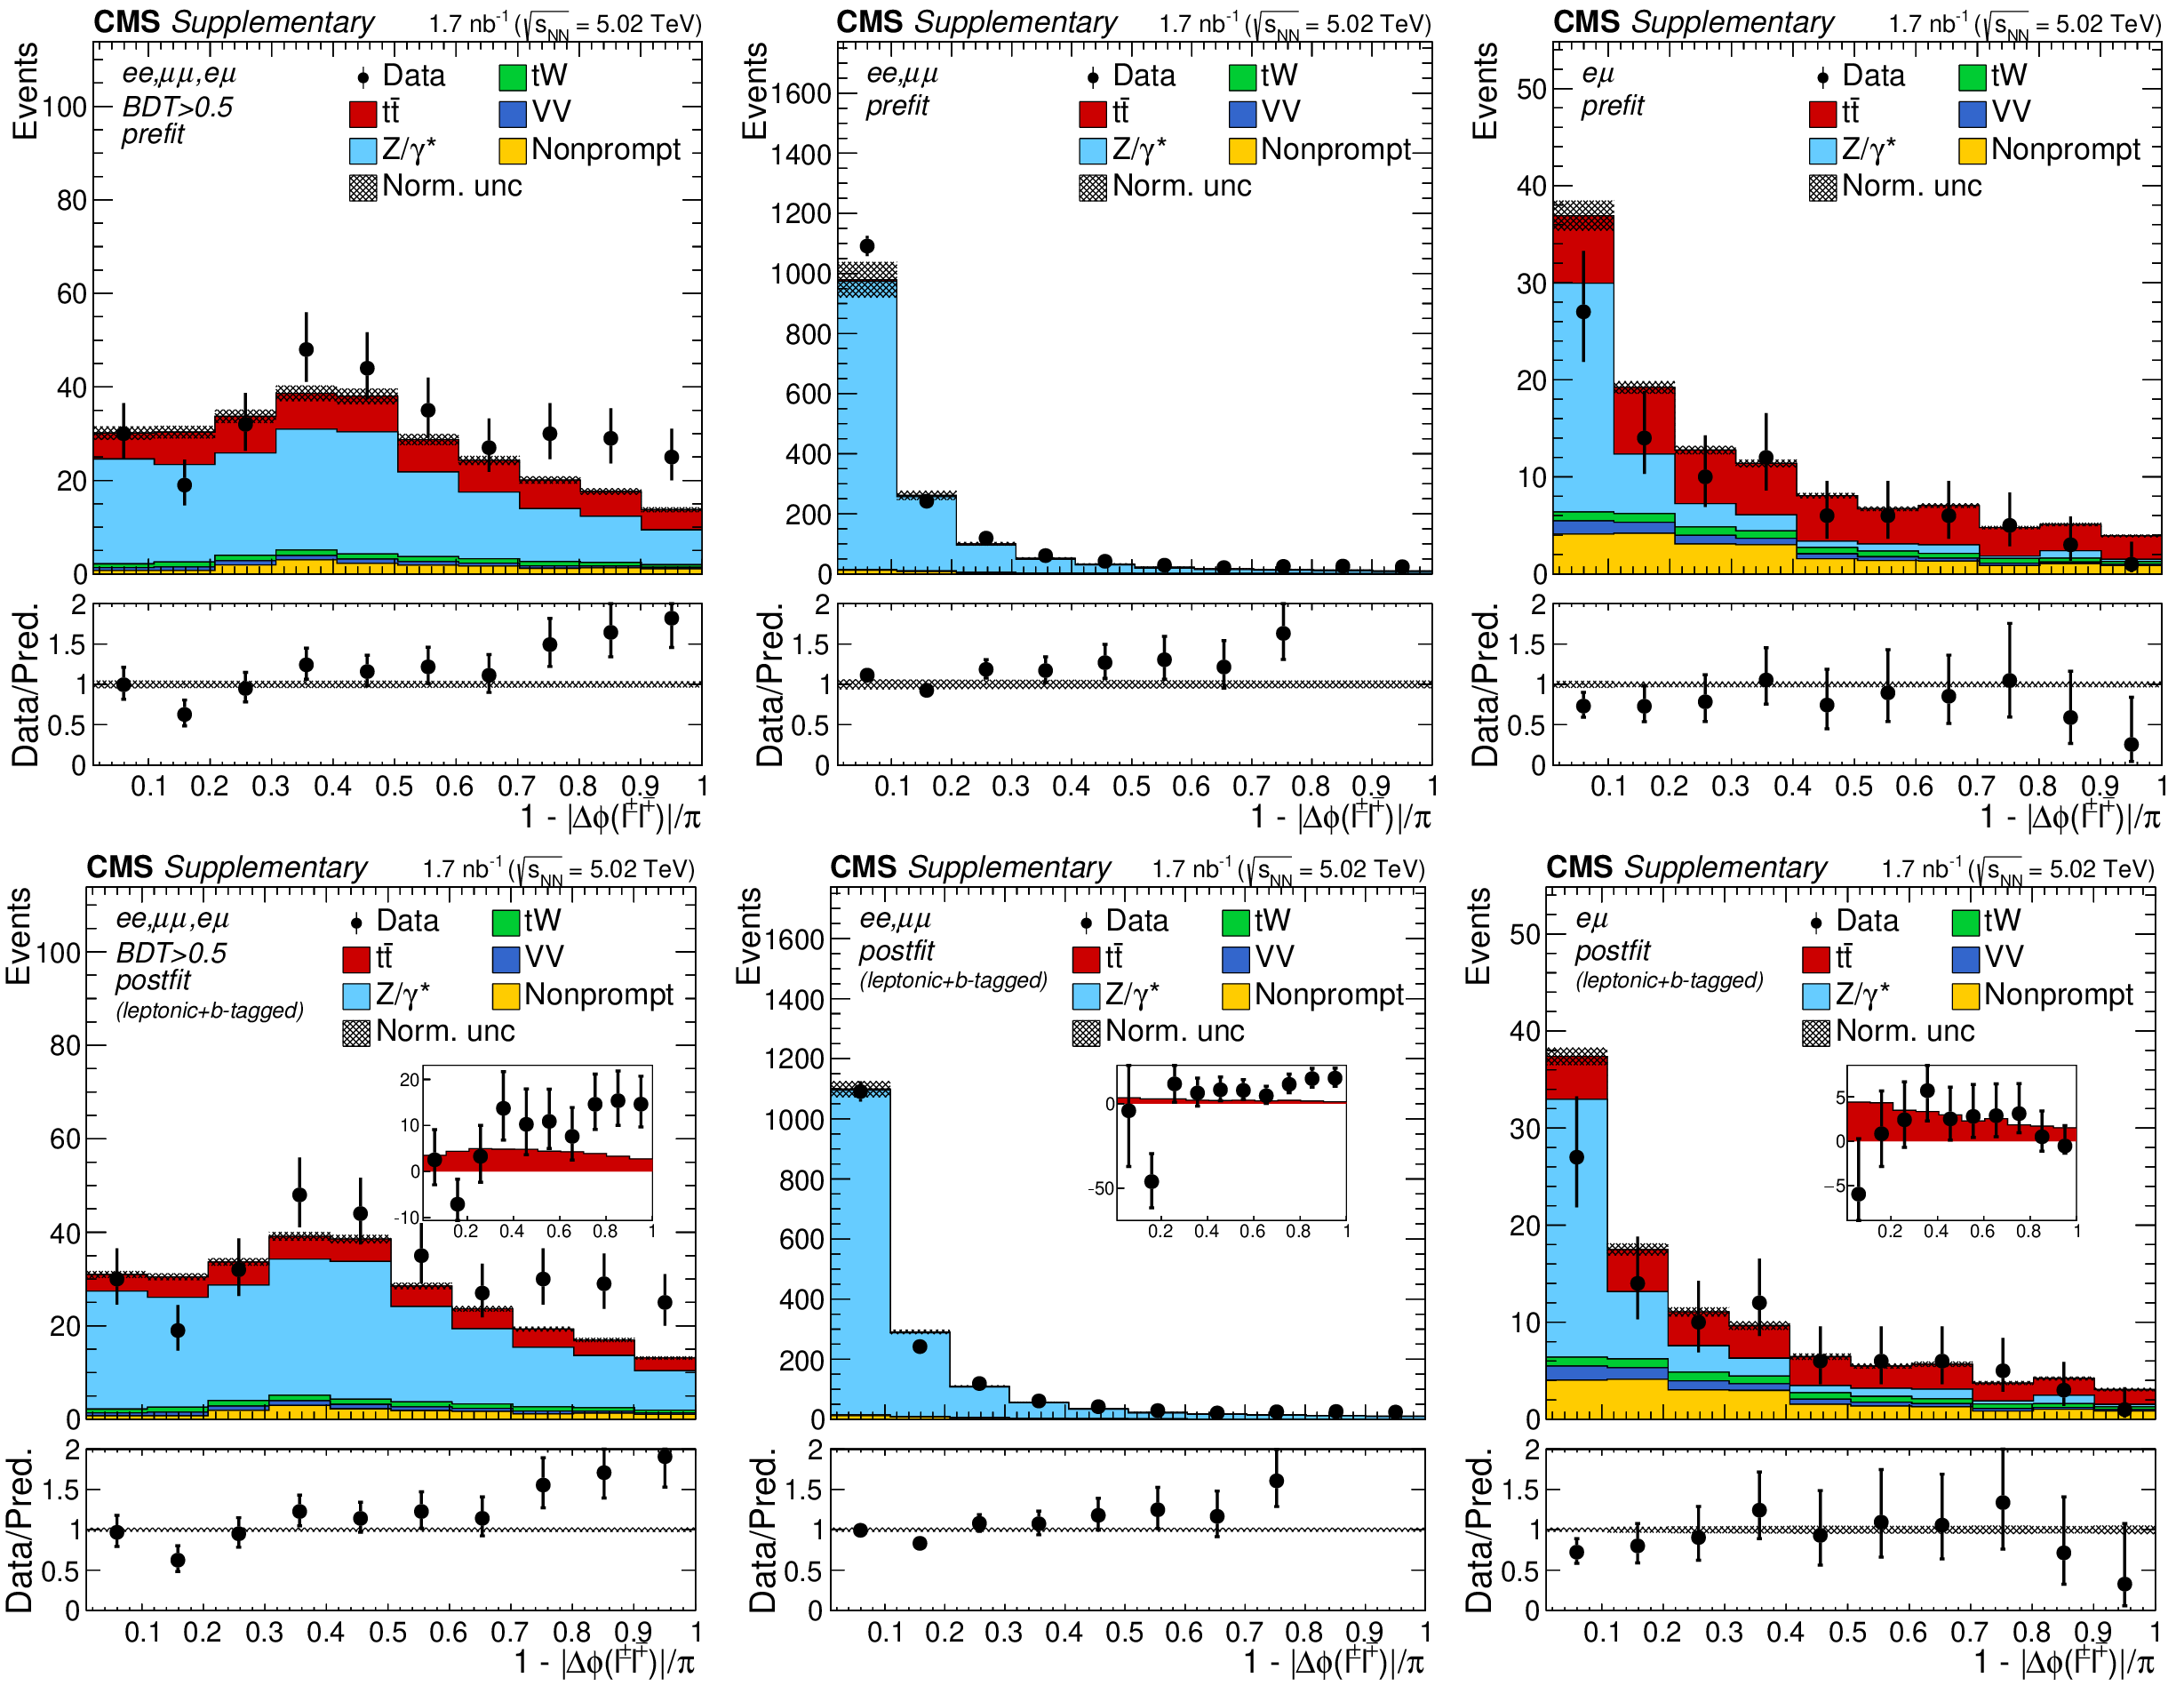
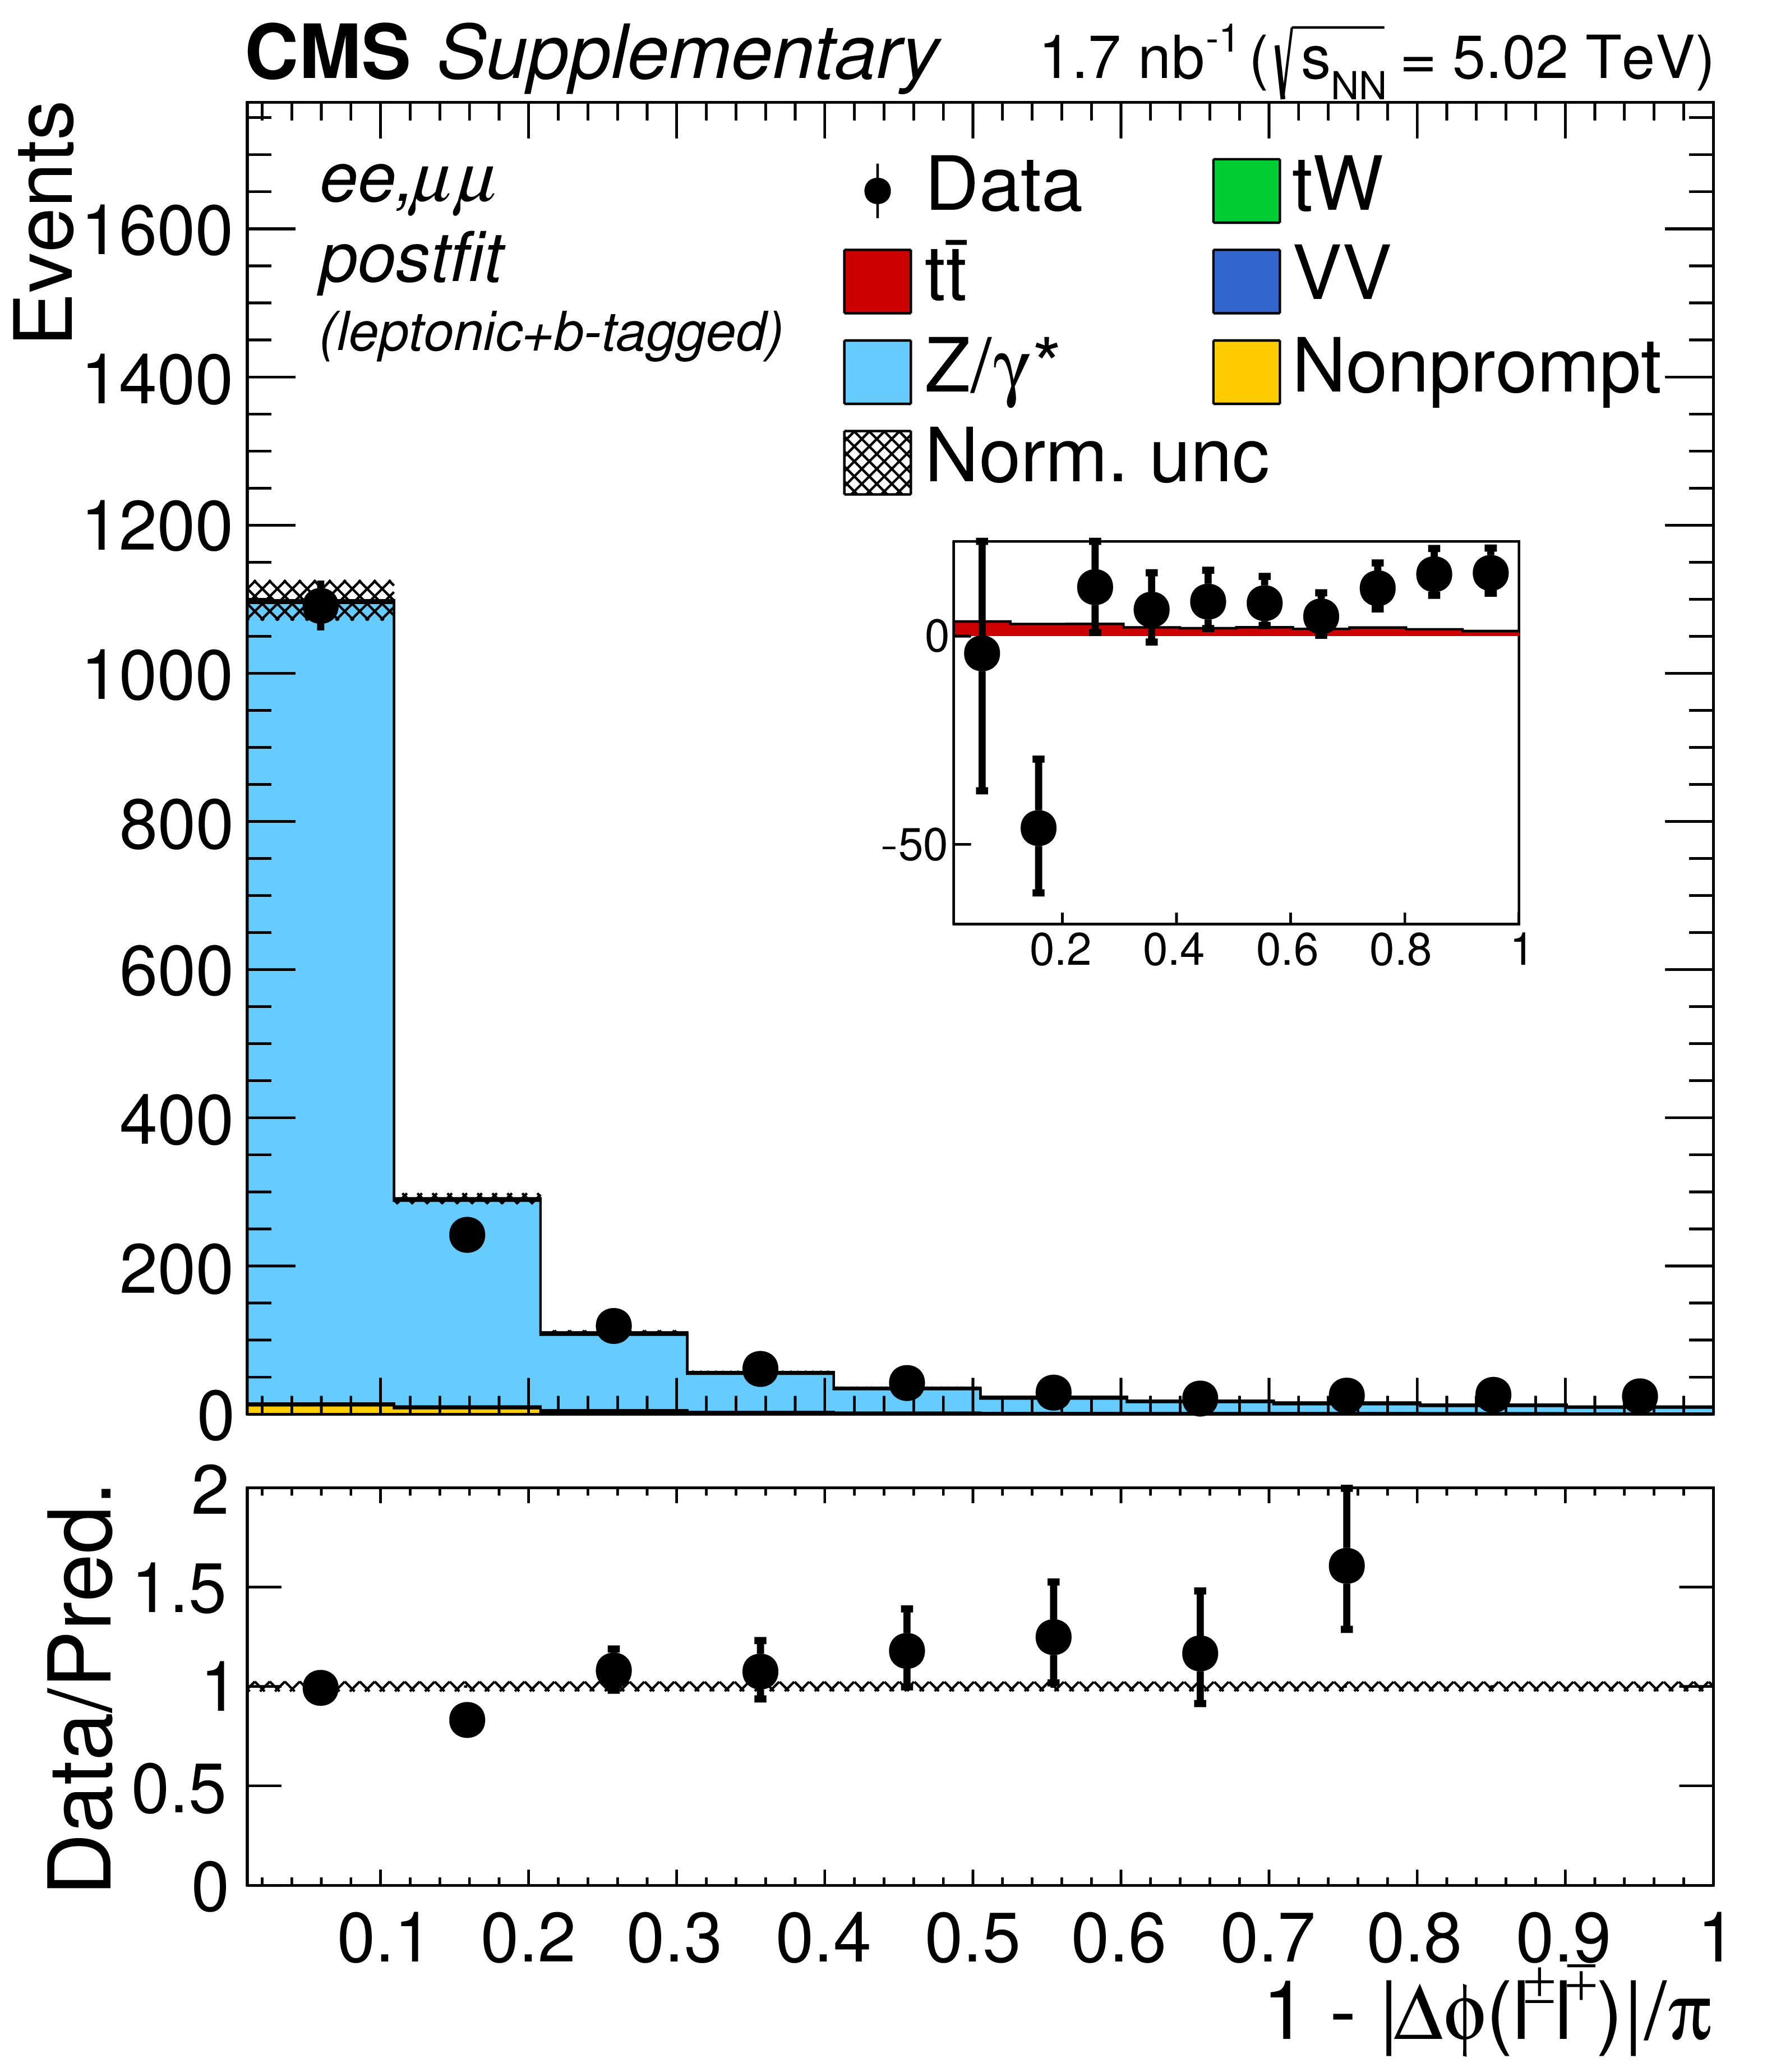
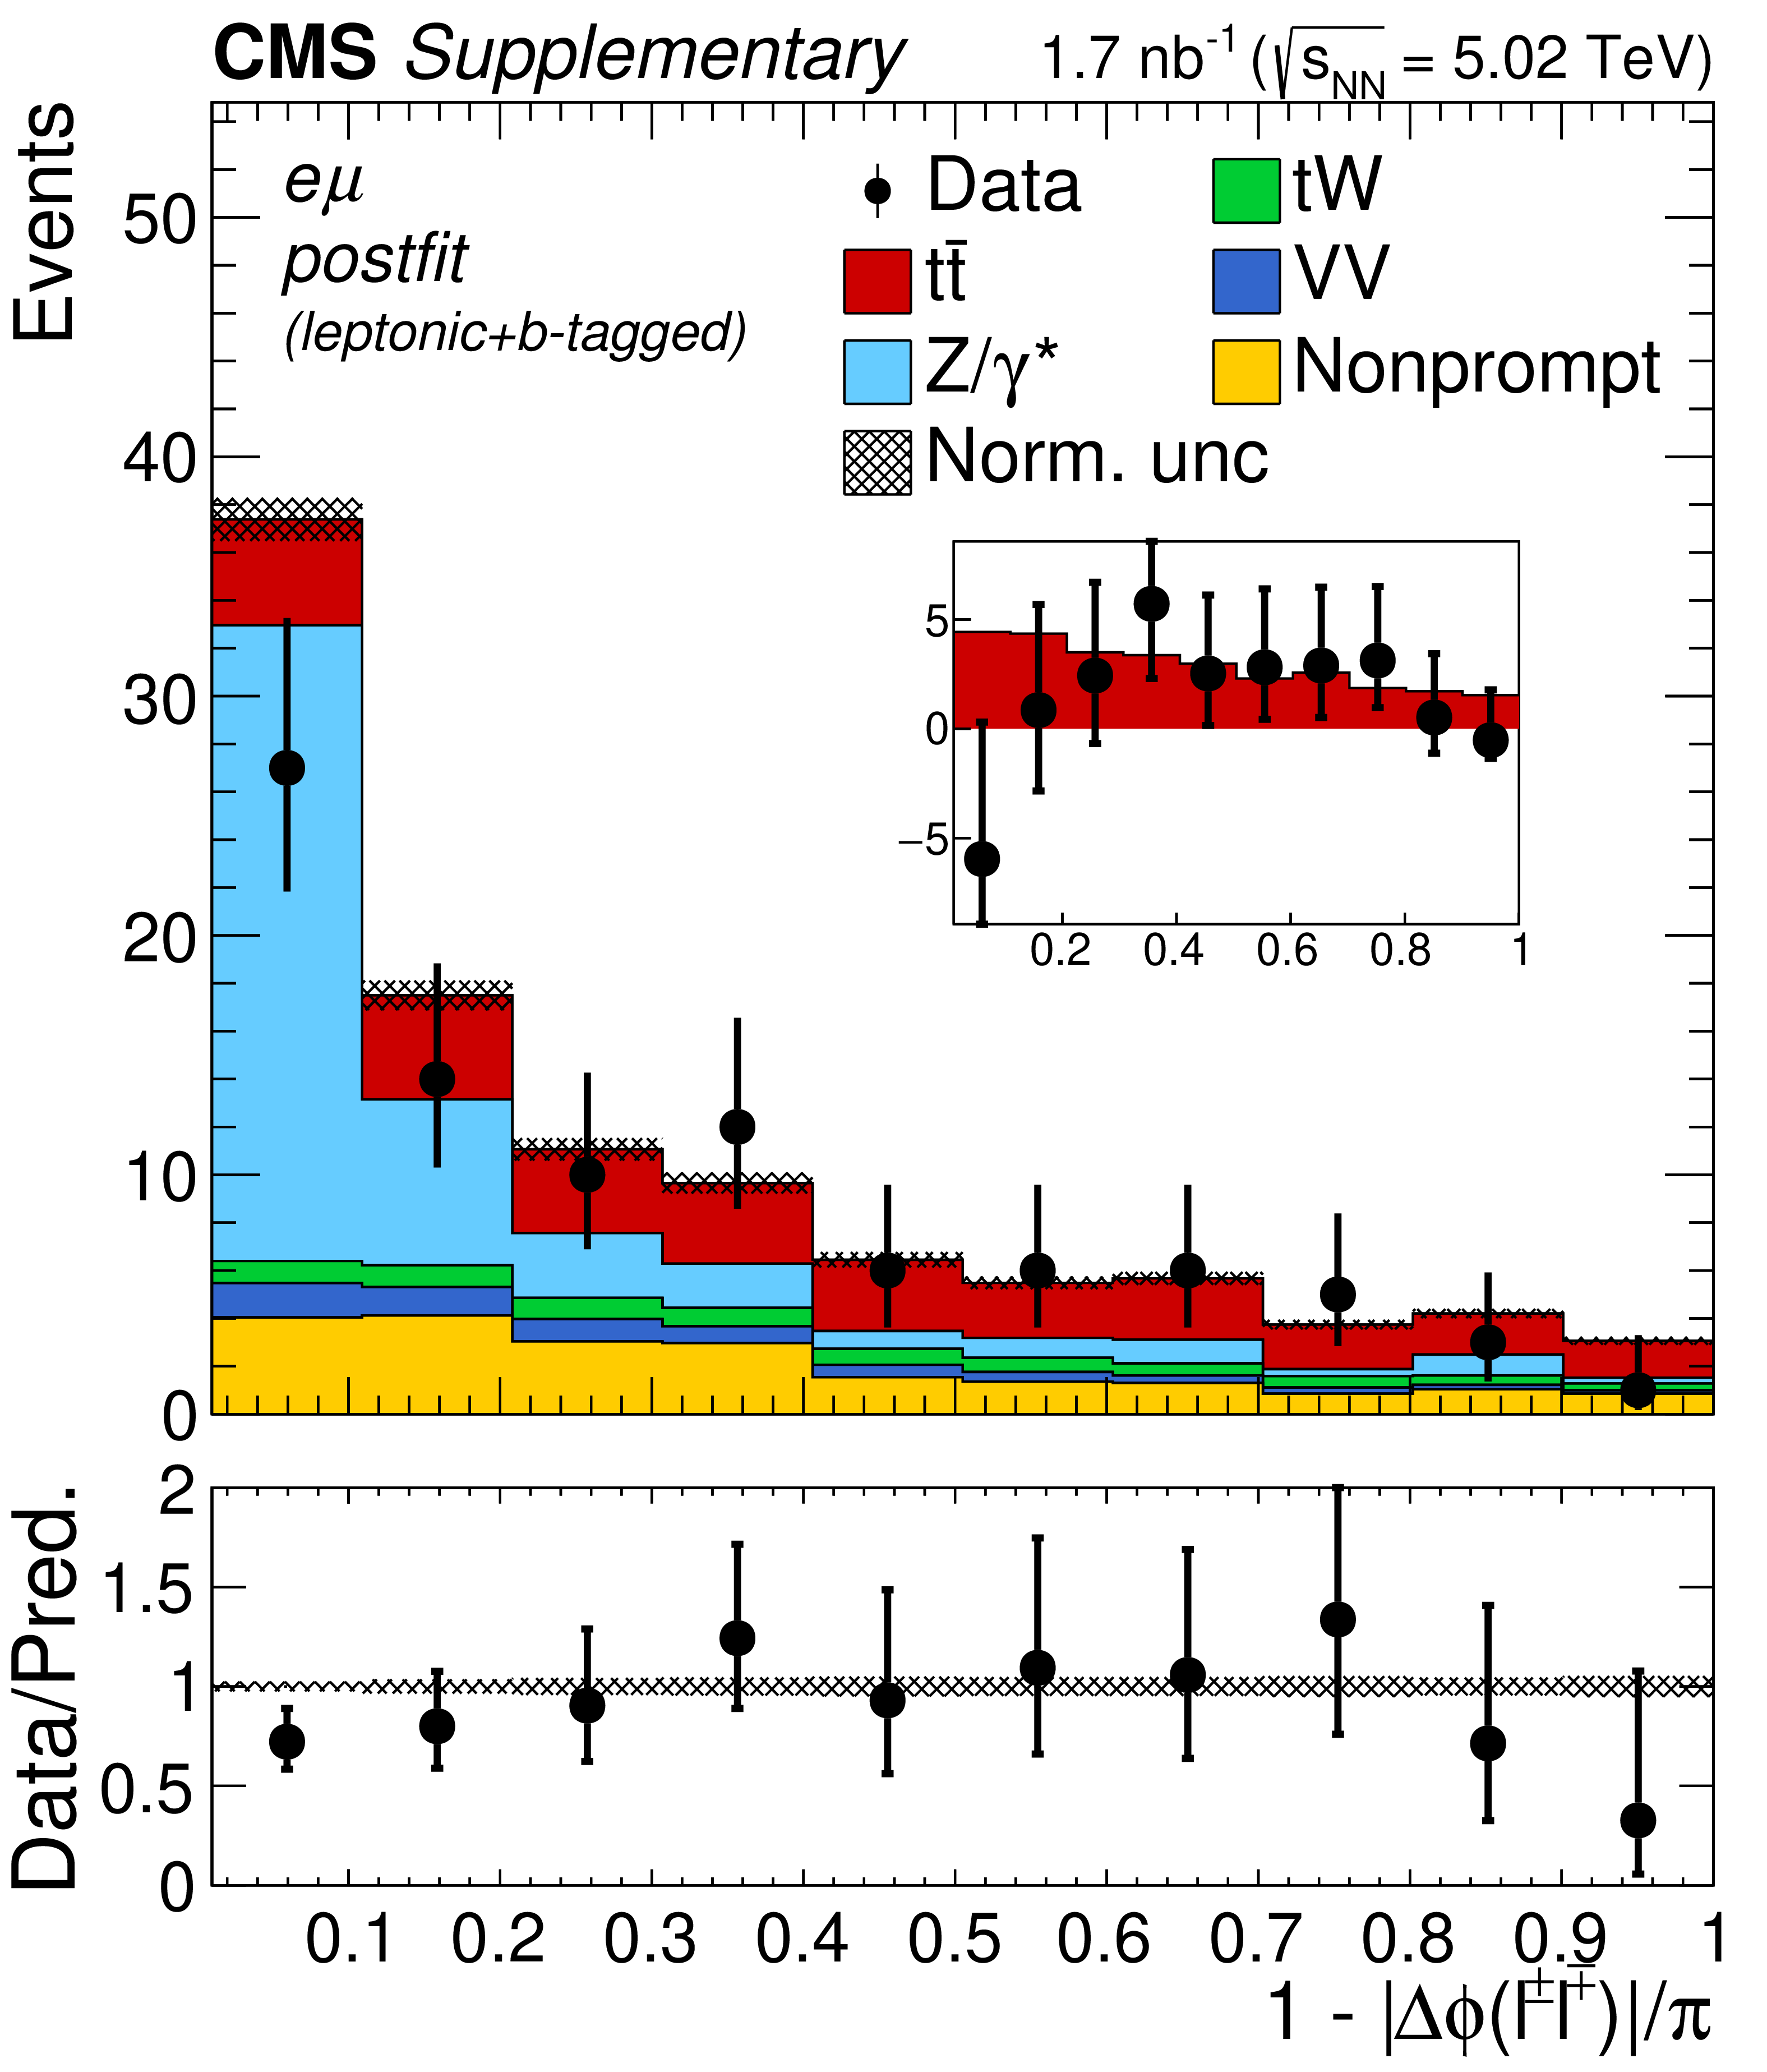
"Acoplanarity'', i.e. 1${-}|\Delta \phi (\ell ^+ \ell ^-)|/\pi $, distributions of the lepton pairs in the $\mathrm{e^{+}} \mathrm{e^{-}}$, $\mu^{+} \mu^{-}$, and $\mathrm{e^{\pm}}\mu^{\mp}$ (BDT $ > $ 0.5, left), $\mathrm{e^{+}} \mathrm{e^{-}}$ and $\mu^{+} \mu^{-}$ (middle), and $\mathrm{e^{\pm}}\mu^{\mp}$ (right) channels. In the upper (lower) row, the prefit (postfit) expectations (predictions) are compared to data. The comparison between the $\mathrm{t\bar{t}}$ signal and the background-subtracted data is shown for the postfit distributions as inset panels. Backgrounds and signal are shown with the filled histograms and data are shown with the markers. The vertical bars on the markers represent the statistical uncertainties in data. The hatched regions show the prefit (postfit) uncertainties in the sum of $\mathrm{t\bar{t}}$ signal and backgrounds. The lower panels display the ratio of the data to expectations (predictions), including the $\mathrm{t\bar{t}}$ signal, with bands representing the prefit (postfit) uncertainties in the predictions. |
png pdf |
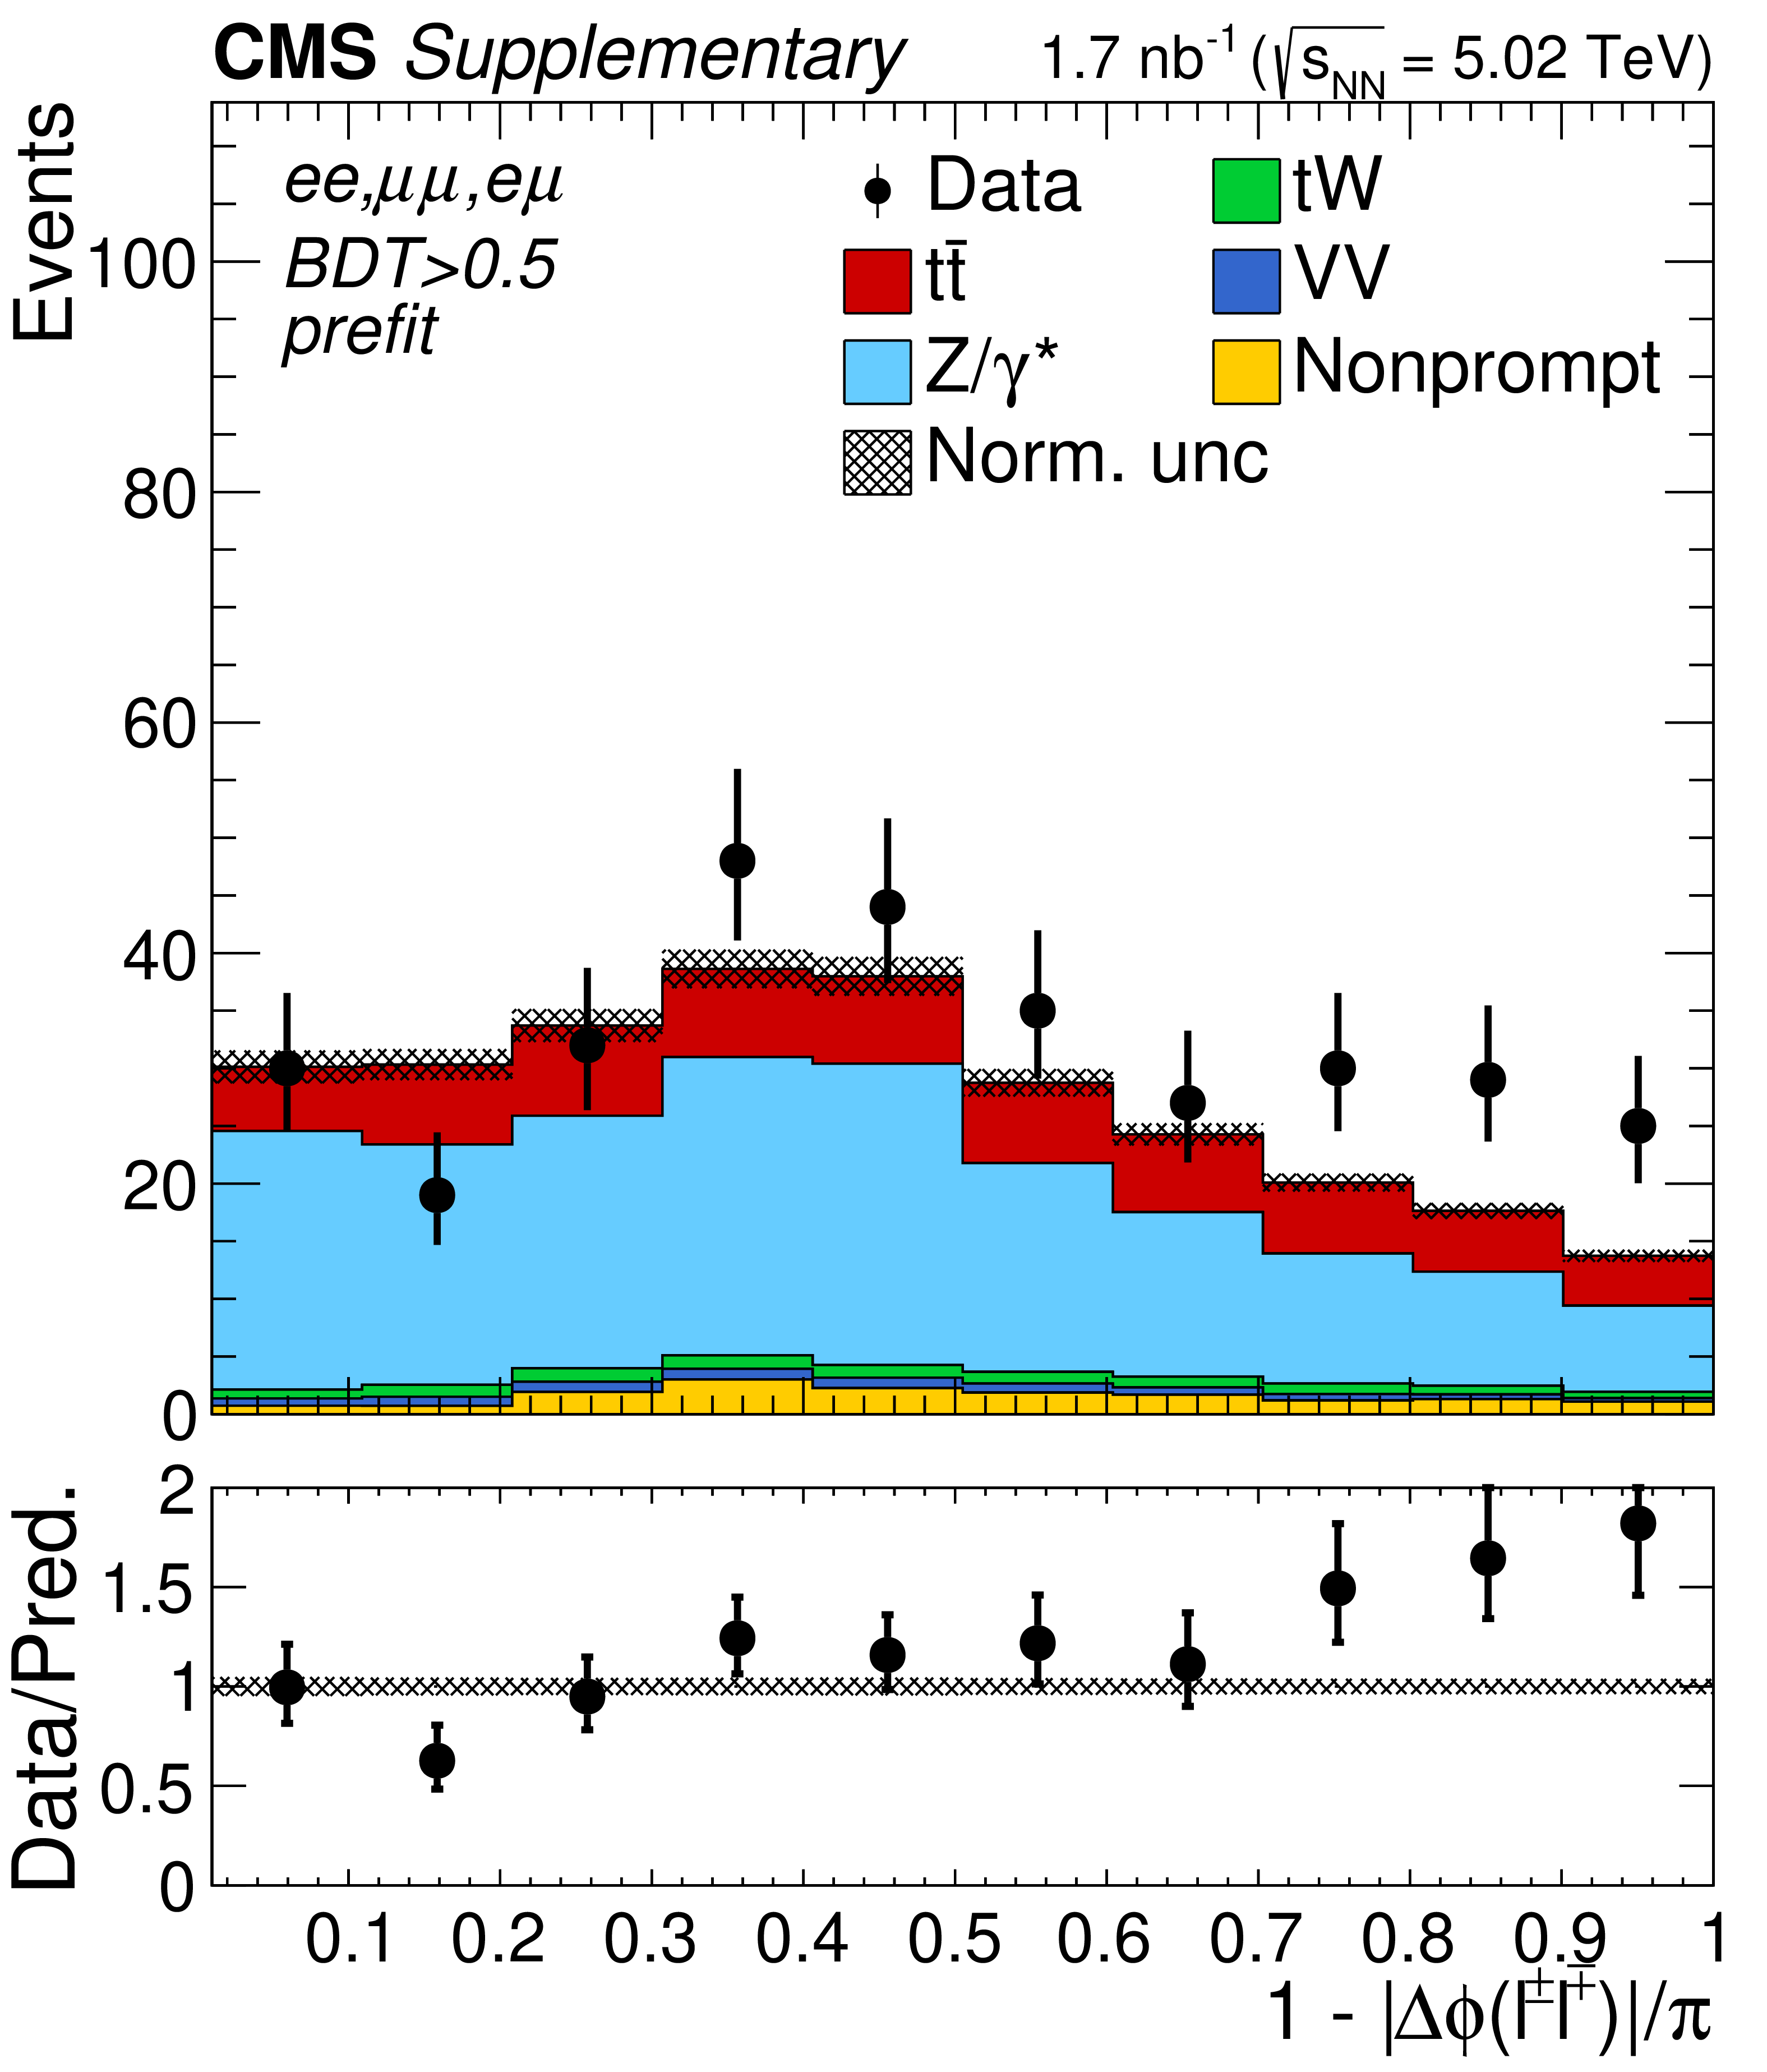
Additional Figure 6-a:
"Acoplanarity'', i.e. 1${-}|\Delta \phi (\ell ^+ \ell ^-)|/\pi $, distributions of the lepton pairs in the $\mathrm{e^{+}} \mathrm{e^{-}}$, $\mu^{+} \mu^{-}$, and $\mathrm{e^{\pm}}\mu^{\mp}$ (BDT $ > $ 0.5) channels. The prefit expectations are compared to data. Backgrounds and signal are shown with the filled histograms and data are shown with the markers. The vertical bars on the markers represent the statistical uncertainties in data. The hatched regions show the prefit uncertainties in the sum of $\mathrm{t\bar{t}}$ signal and backgrounds. The lower panel displays the ratio of the data to expectations, including the $\mathrm{t\bar{t}}$ signal, with bands representing the prefit uncertainties in the predictions. |

png pdf |
Additional Figure 6-b:
"Acoplanarity'', i.e. 1${-}|\Delta \phi (\ell ^+ \ell ^-)|/\pi $, distributions of the lepton pairs in the $\mathrm{e^{+}} \mathrm{e^{-}}$ and $\mu^{+} \mu^{-}$ channels. The prefit expectations are compared to data. Backgrounds and signal are shown with the filled histograms and data are shown with the markers. The vertical bars on the markers represent the statistical uncertainties in data. The hatched regions show the prefit uncertainties in the sum of $\mathrm{t\bar{t}}$ signal and backgrounds. The lower panel displays the ratio of the data to expectations, including the $\mathrm{t\bar{t}}$ signal, with bands representing the prefit uncertainties in the predictions. |
png pdf |
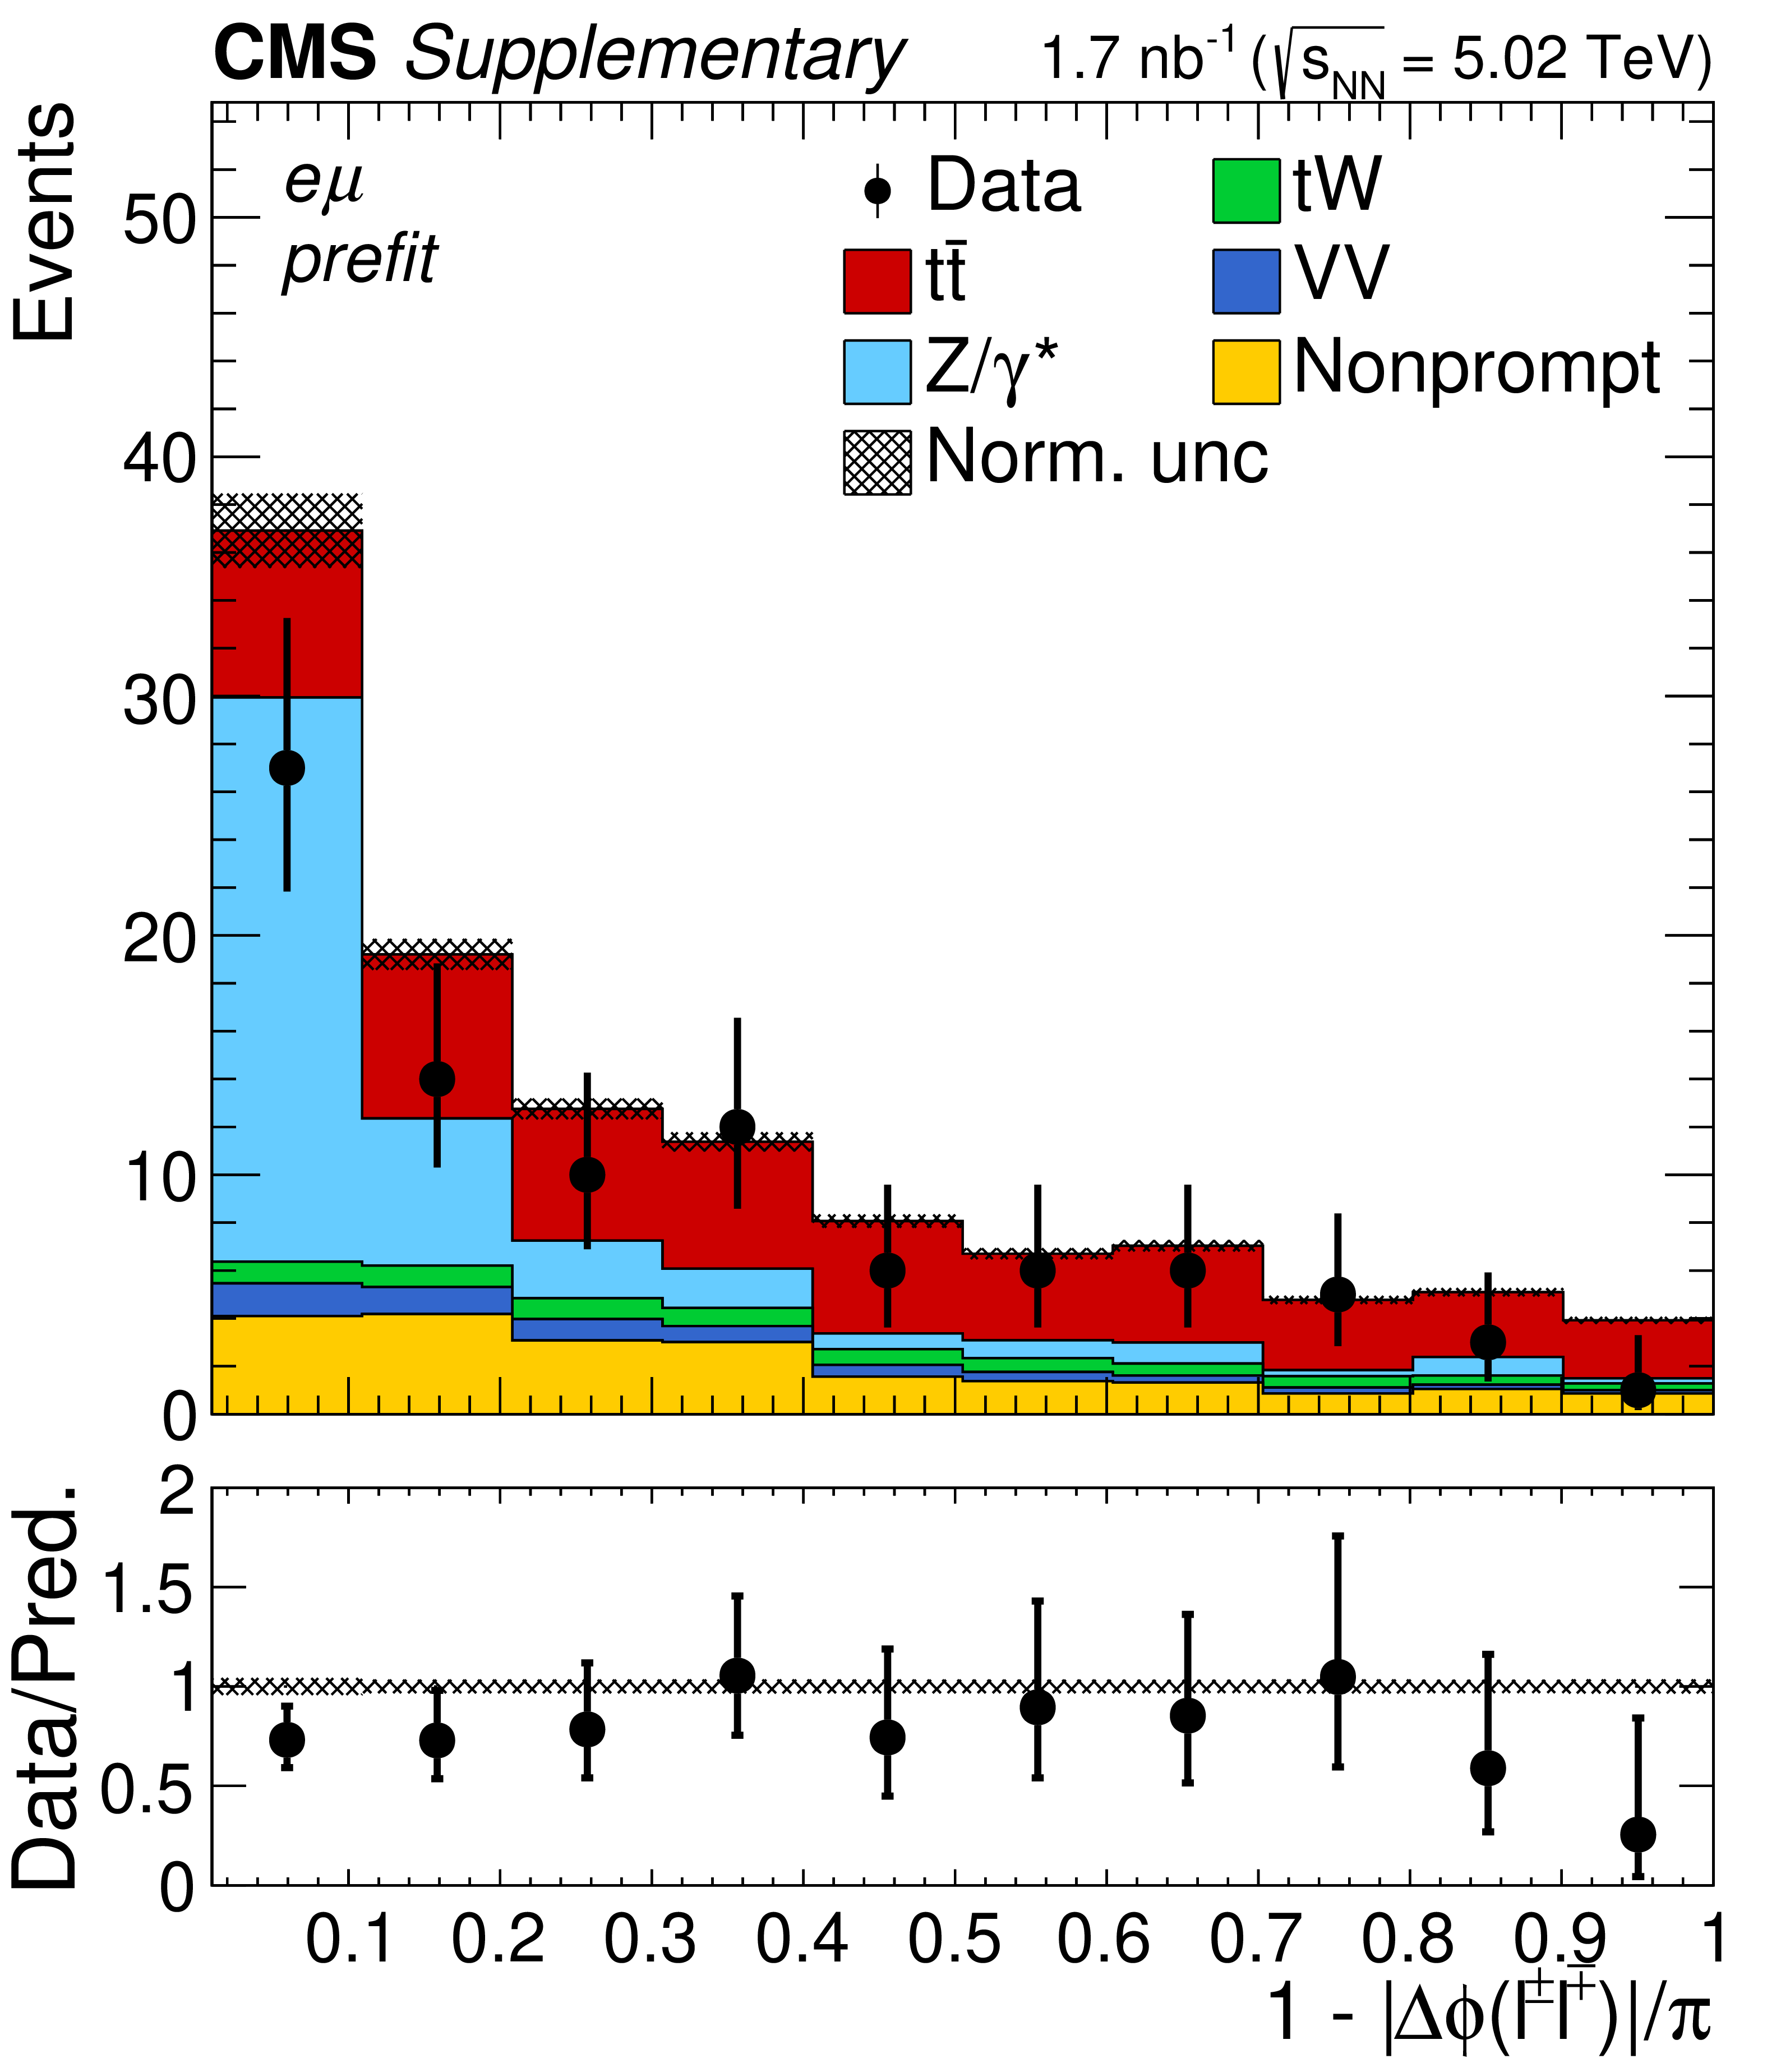
Additional Figure 6-c:
"Acoplanarity'', i.e. 1${-}|\Delta \phi (\ell ^+ \ell ^-)|/\pi $, distributions of the lepton pairs in the $\mathrm{e^{\pm}}\mu^{\mp}$ channels. The prefit expectations are compared to data. Backgrounds and signal are shown with the filled histograms and data are shown with the markers. The vertical bars on the markers represent the statistical uncertainties in data. The hatched regions show the prefit uncertainties in the sum of $\mathrm{t\bar{t}}$ signal and backgrounds. The lower panel displays the ratio of the data to expectations, including the $\mathrm{t\bar{t}}$ signal, with bands representing the prefit uncertainties in the predictions. |
png pdf |
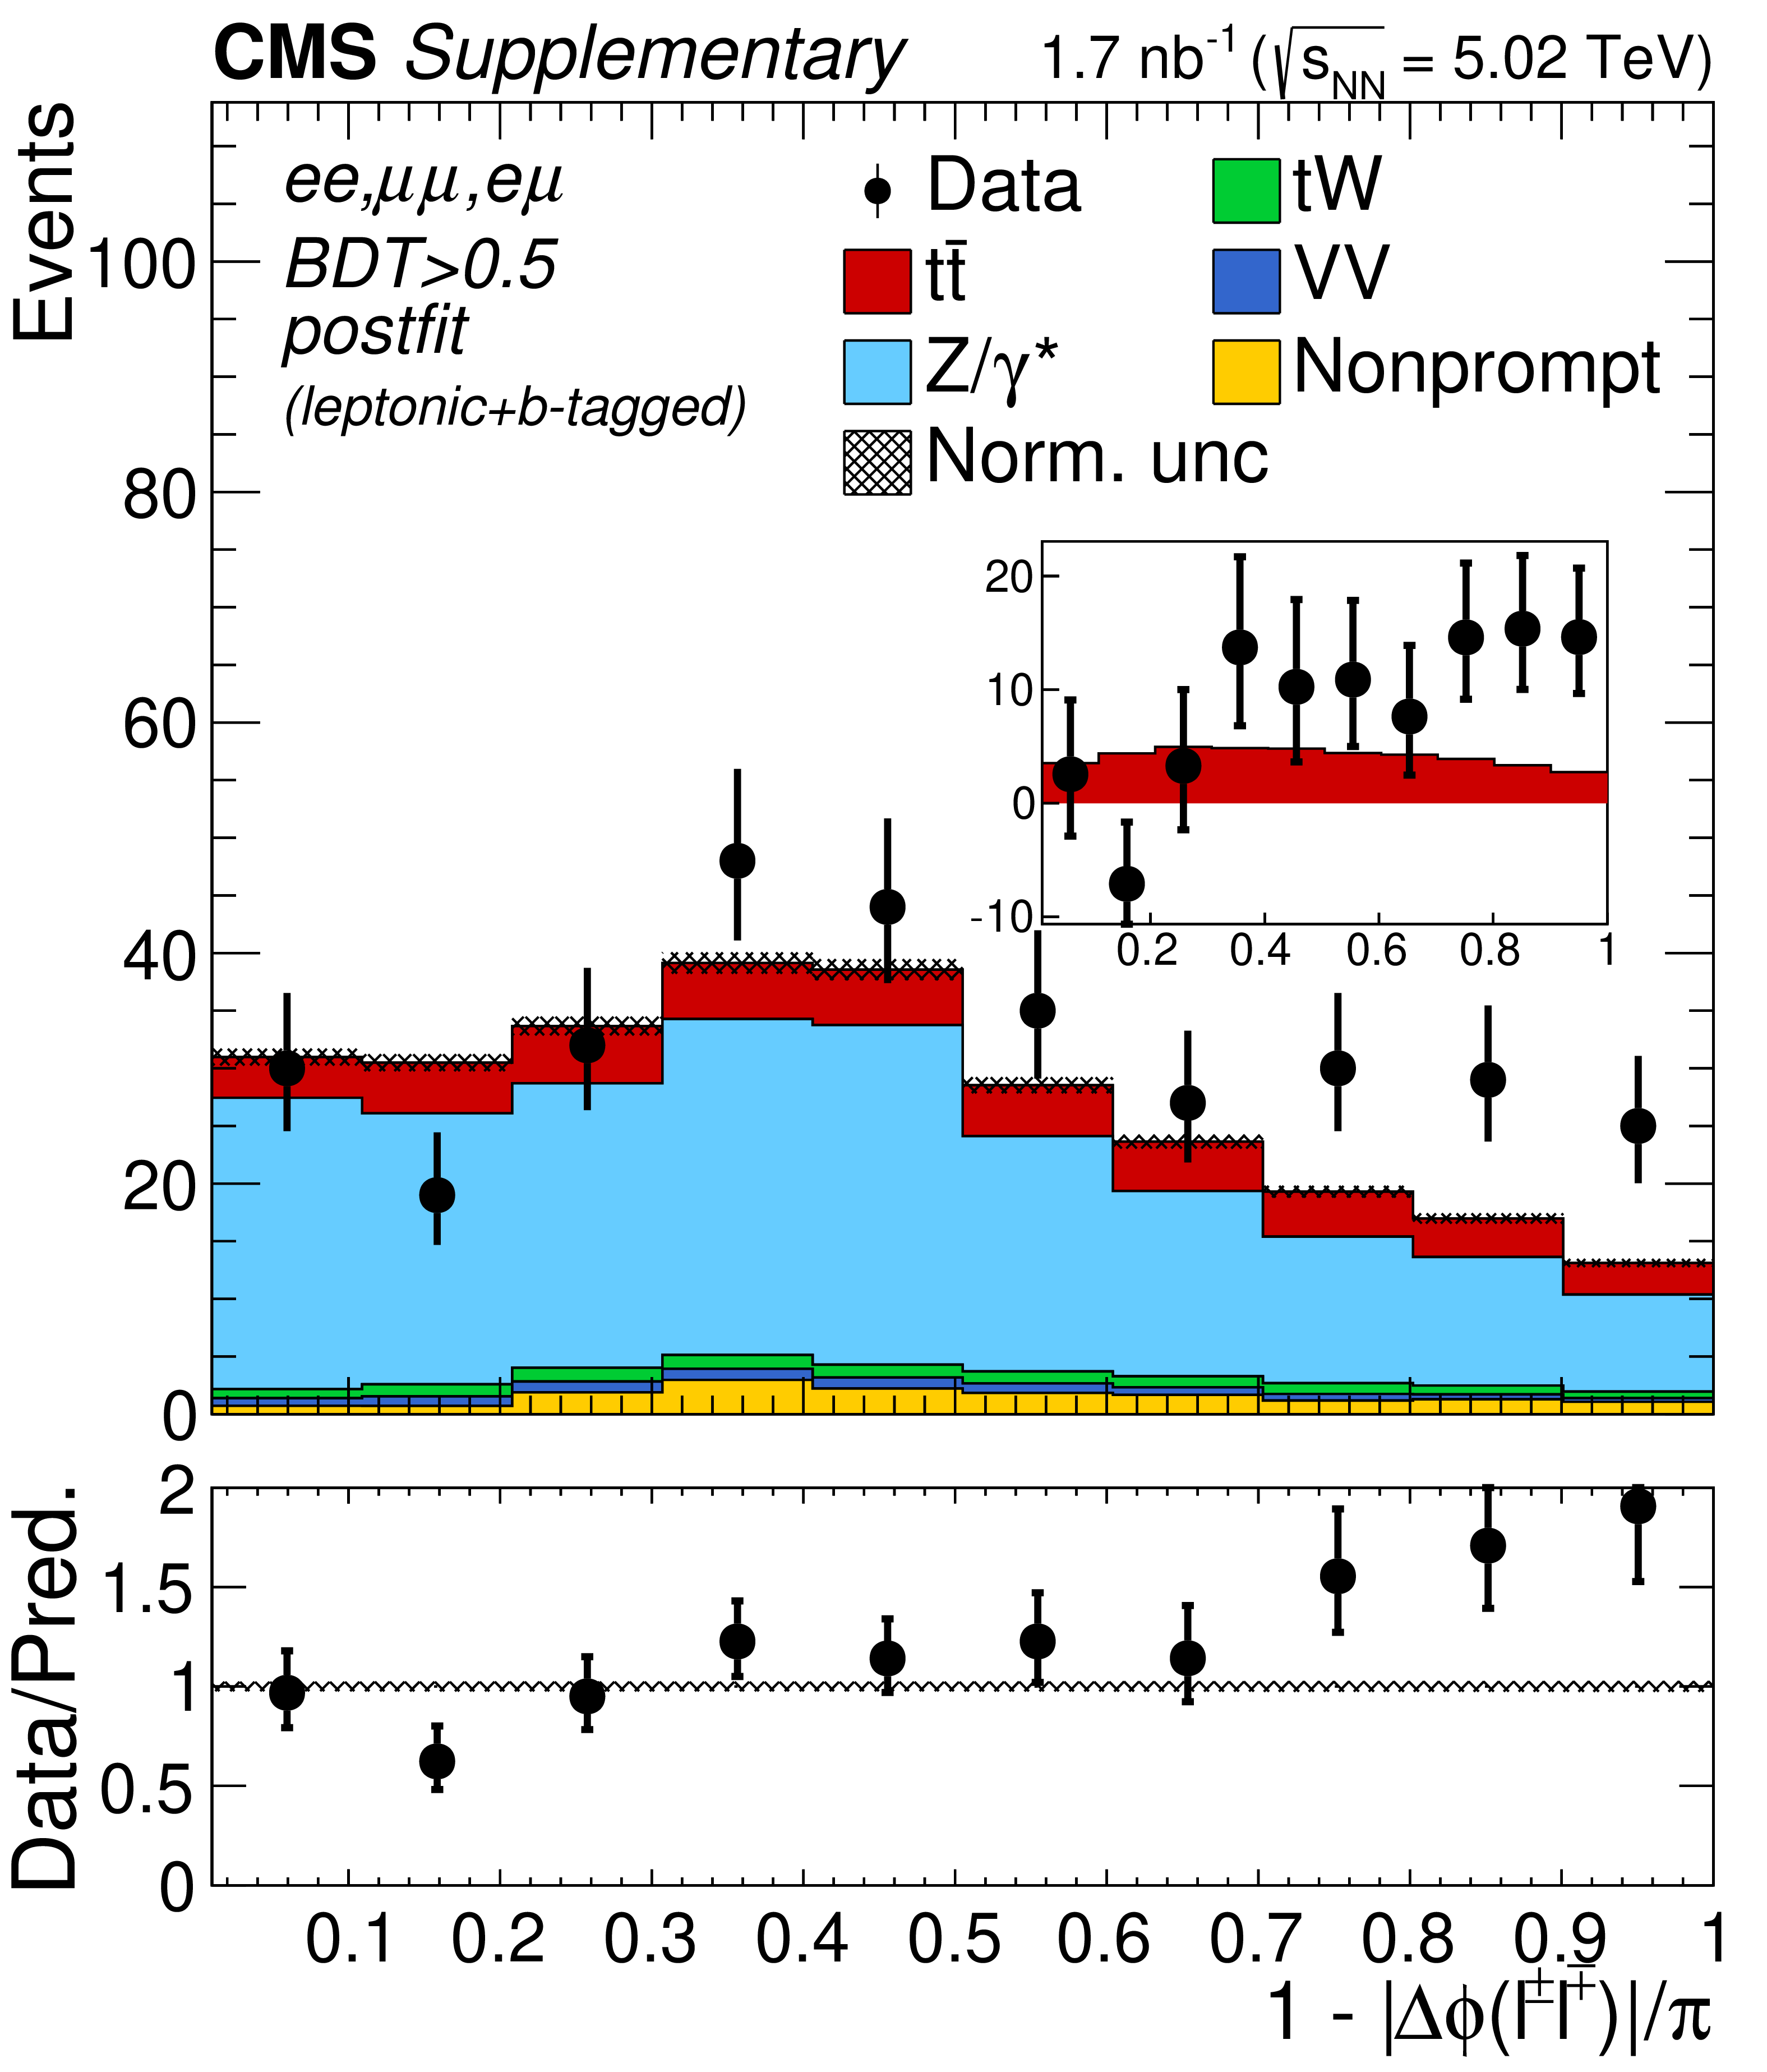
Additional Figure 6-d:
"Acoplanarity'', i.e. 1${-}|\Delta \phi (\ell ^+ \ell ^-)|/\pi $, distributions of the lepton pairs in the $\mathrm{e^{+}} \mathrm{e^{-}}$, $\mu^{+} \mu^{-}$, and $\mathrm{e^{\pm}}\mu^{\mp}$ (BDT $ > $ 0.5) channels. The postfit predictions are compared to data. The comparison between the $\mathrm{t\bar{t}}$ signal and the background-subtracted data is shown as an inset panel. Backgrounds and signal are shown with the filled histograms and data are shown with the markers. The vertical bars on the markers represent the statistical uncertainties in data. The hatched regions show the postfit uncertainties in the sum of $\mathrm{t\bar{t}}$ signal and backgrounds. The lower panel displays the ratio of the data to predictions, including the $\mathrm{t\bar{t}}$ signal, with bands representing the postfit uncertainties in the predictions. |
png pdf |
Additional Figure 6-e:
"Acoplanarity'', i.e. 1${-}|\Delta \phi (\ell ^+ \ell ^-)|/\pi $, distributions of the lepton pairs in the $\mathrm{e^{+}} \mathrm{e^{-}}$ and $\mu^{+} \mu^{-}$ channels. The postfit predictions are compared to data. The comparison between the $\mathrm{t\bar{t}}$ signal and the background-subtracted data is shown as an inset panel. Backgrounds and signal are shown with the filled histograms and data are shown with the markers. The vertical bars on the markers represent the statistical uncertainties in data. The hatched regions show the postfit uncertainties in the sum of $\mathrm{t\bar{t}}$ signal and backgrounds. The lower panel displays the ratio of the data to predictions, including the $\mathrm{t\bar{t}}$ signal, with bands representing the postfit uncertainties in the predictions. |
png pdf |
Additional Figure 6-f:
"Acoplanarity'', i.e. 1${-}|\Delta \phi (\ell ^+ \ell ^-)|/\pi $, distributions of the lepton pairs in the $\mathrm{e^{\pm}}\mu^{\mp}$ channels. The postfit predictions are compared to data. The comparison between the $\mathrm{t\bar{t}}$ signal and the background-subtracted data is shown as an inset panel. Backgrounds and signal are shown with the filled histograms and data are shown with the markers. The vertical bars on the markers represent the statistical uncertainties in data. The hatched regions show the postfit uncertainties in the sum of $\mathrm{t\bar{t}}$ signal and backgrounds. The lower panel displays the ratio of the data to predictions, including the $\mathrm{t\bar{t}}$ signal, with bands representing the postfit uncertainties in the predictions. |
png pdf |
Additional Figure 7:
Sphericity distributions of the lepton pairs in the $\mathrm{e^{+}} \mathrm{e^{-}}$, $\mu^{+} \mu^{-}$, and $\mathrm{e^{\pm}}\mu^{\mp}$ (BDT $ > $ 0.5, left), $\mathrm{e^{+}} \mathrm{e^{-}}$ and $\mu^{+} \mu^{-}$ (middle), and $\mathrm{e^{\pm}}\mu^{\mp}$ (right) channels. In the upper (lower) row, the prefit (postfit) expectations (predictions) are compared to data. The comparison between the $\mathrm{t\bar{t}}$ signal and the background-subtracted data is shown for the postfit distributions as inset panels. Backgrounds and signal are shown with the filled histograms and data are shown with the markers. The vertical bars on the markers represent the statistical uncertainties in data. The hatched regions show the prefit (postfit) uncertainties in the sum of $\mathrm{t\bar{t}}$ signal and backgrounds. The lower panels display the ratio of the data to expectations (predictions), including the $\mathrm{t\bar{t}}$ signal, with bands representing the prefit (postfit) uncertainties in the predictions. |
png pdf |
Additional Figure 7-a:
Sphericity distributions of the lepton pairs in the $\mathrm{e^{+}} \mathrm{e^{-}}$, $\mu^{+} \mu^{-}$, and $\mathrm{e^{\pm}}\mu^{\mp}$ (BDT $ > $ 0.5) channel. The prefit expectations (predictions) are compared to data. Backgrounds and signal are shown with the filled histograms and data are shown with the markers. The vertical bars on the markers represent the statistical uncertainties in data. The hatched regions show the prefit uncertainties in the sum of $\mathrm{t\bar{t}}$ signal and backgrounds. The lower panel displays the ratio of the data to expectations, including the $\mathrm{t\bar{t}}$ signal, with bands representing the prefit uncertainties in the predictions. |
png pdf |
Additional Figure 7-b:
Sphericity distributions of the lepton pairs in the $\mathrm{e^{+}} \mathrm{e^{-}}$ and $\mu^{+} \mu^{-}$ channel. The prefit expectations (predictions) are compared to data. Backgrounds and signal are shown with the filled histograms and data are shown with the markers. The vertical bars on the markers represent the statistical uncertainties in data. The hatched regions show the prefit uncertainties in the sum of $\mathrm{t\bar{t}}$ signal and backgrounds. The lower panel displays the ratio of the data to expectations, including the $\mathrm{t\bar{t}}$ signal, with bands representing the prefit uncertainties in the predictions. |
png pdf |
Additional Figure 7-c:
Sphericity distributions of the lepton pairs in the $\mathrm{e^{\pm}}\mu^{\mp}$ channel. The prefit expectations (predictions) are compared to data. Backgrounds and signal are shown with the filled histograms and data are shown with the markers. The vertical bars on the markers represent the statistical uncertainties in data. The hatched regions show the prefit uncertainties in the sum of $\mathrm{t\bar{t}}$ signal and backgrounds. The lower panel displays the ratio of the data to expectations, including the $\mathrm{t\bar{t}}$ signal, with bands representing the prefit uncertainties in the predictions. |

png pdf |
Additional Figure 7-d:
Sphericity distributions of the lepton pairs in the $\mathrm{e^{+}} \mathrm{e^{-}}$, $\mu^{+} \mu^{-}$, and $\mathrm{e^{\pm}}\mu^{\mp}$ (BDT $ > $ 0.5) channel. The postfit expectations (predictions) are compared to data. The comparison between the $\mathrm{t\bar{t}}$ signal and the background-subtracted data is shown as an inset panel. Backgrounds and signal are shown with the filled histograms and data are shown with the markers. The vertical bars on the markers represent the statistical uncertainties in data. The hatched regions show the postfit uncertainties in the sum of $\mathrm{t\bar{t}}$ signal and backgrounds. The lower panel displays the ratio of the data to predictions, including the $\mathrm{t\bar{t}}$ signal, with bands representing the postfit uncertainties in the predictions. |
png pdf |
Additional Figure 7-e:
Sphericity distributions of the lepton pairs in the $\mathrm{e^{+}} \mathrm{e^{-}}$ and $\mu^{+} \mu^{-}$ channel. The postfit expectations (predictions) are compared to data. The comparison between the $\mathrm{t\bar{t}}$ signal and the background-subtracted data is shown as an inset panel. Backgrounds and signal are shown with the filled histograms and data are shown with the markers. The vertical bars on the markers represent the statistical uncertainties in data. The hatched regions show the postfit uncertainties in the sum of $\mathrm{t\bar{t}}$ signal and backgrounds. The lower panel displays the ratio of the data to predictions, including the $\mathrm{t\bar{t}}$ signal, with bands representing the postfit uncertainties in the predictions. |
png pdf |
Additional Figure 7-f:
Sphericity distributions of the lepton pairs in the $\mathrm{e^{\pm}}\mu^{\mp}$ channel. The postfit expectations (predictions) are compared to data. The comparison between the $\mathrm{t\bar{t}}$ signal and the background-subtracted data is shown as an inset panel. Backgrounds and signal are shown with the filled histograms and data are shown with the markers. The vertical bars on the markers represent the statistical uncertainties in data. The hatched regions show the postfit uncertainties in the sum of $\mathrm{t\bar{t}}$ signal and backgrounds. The lower panel displays the ratio of the data to predictions, including the $\mathrm{t\bar{t}}$ signal, with bands representing the postfit uncertainties in the predictions. |
png pdf |
Additional Figure 8:
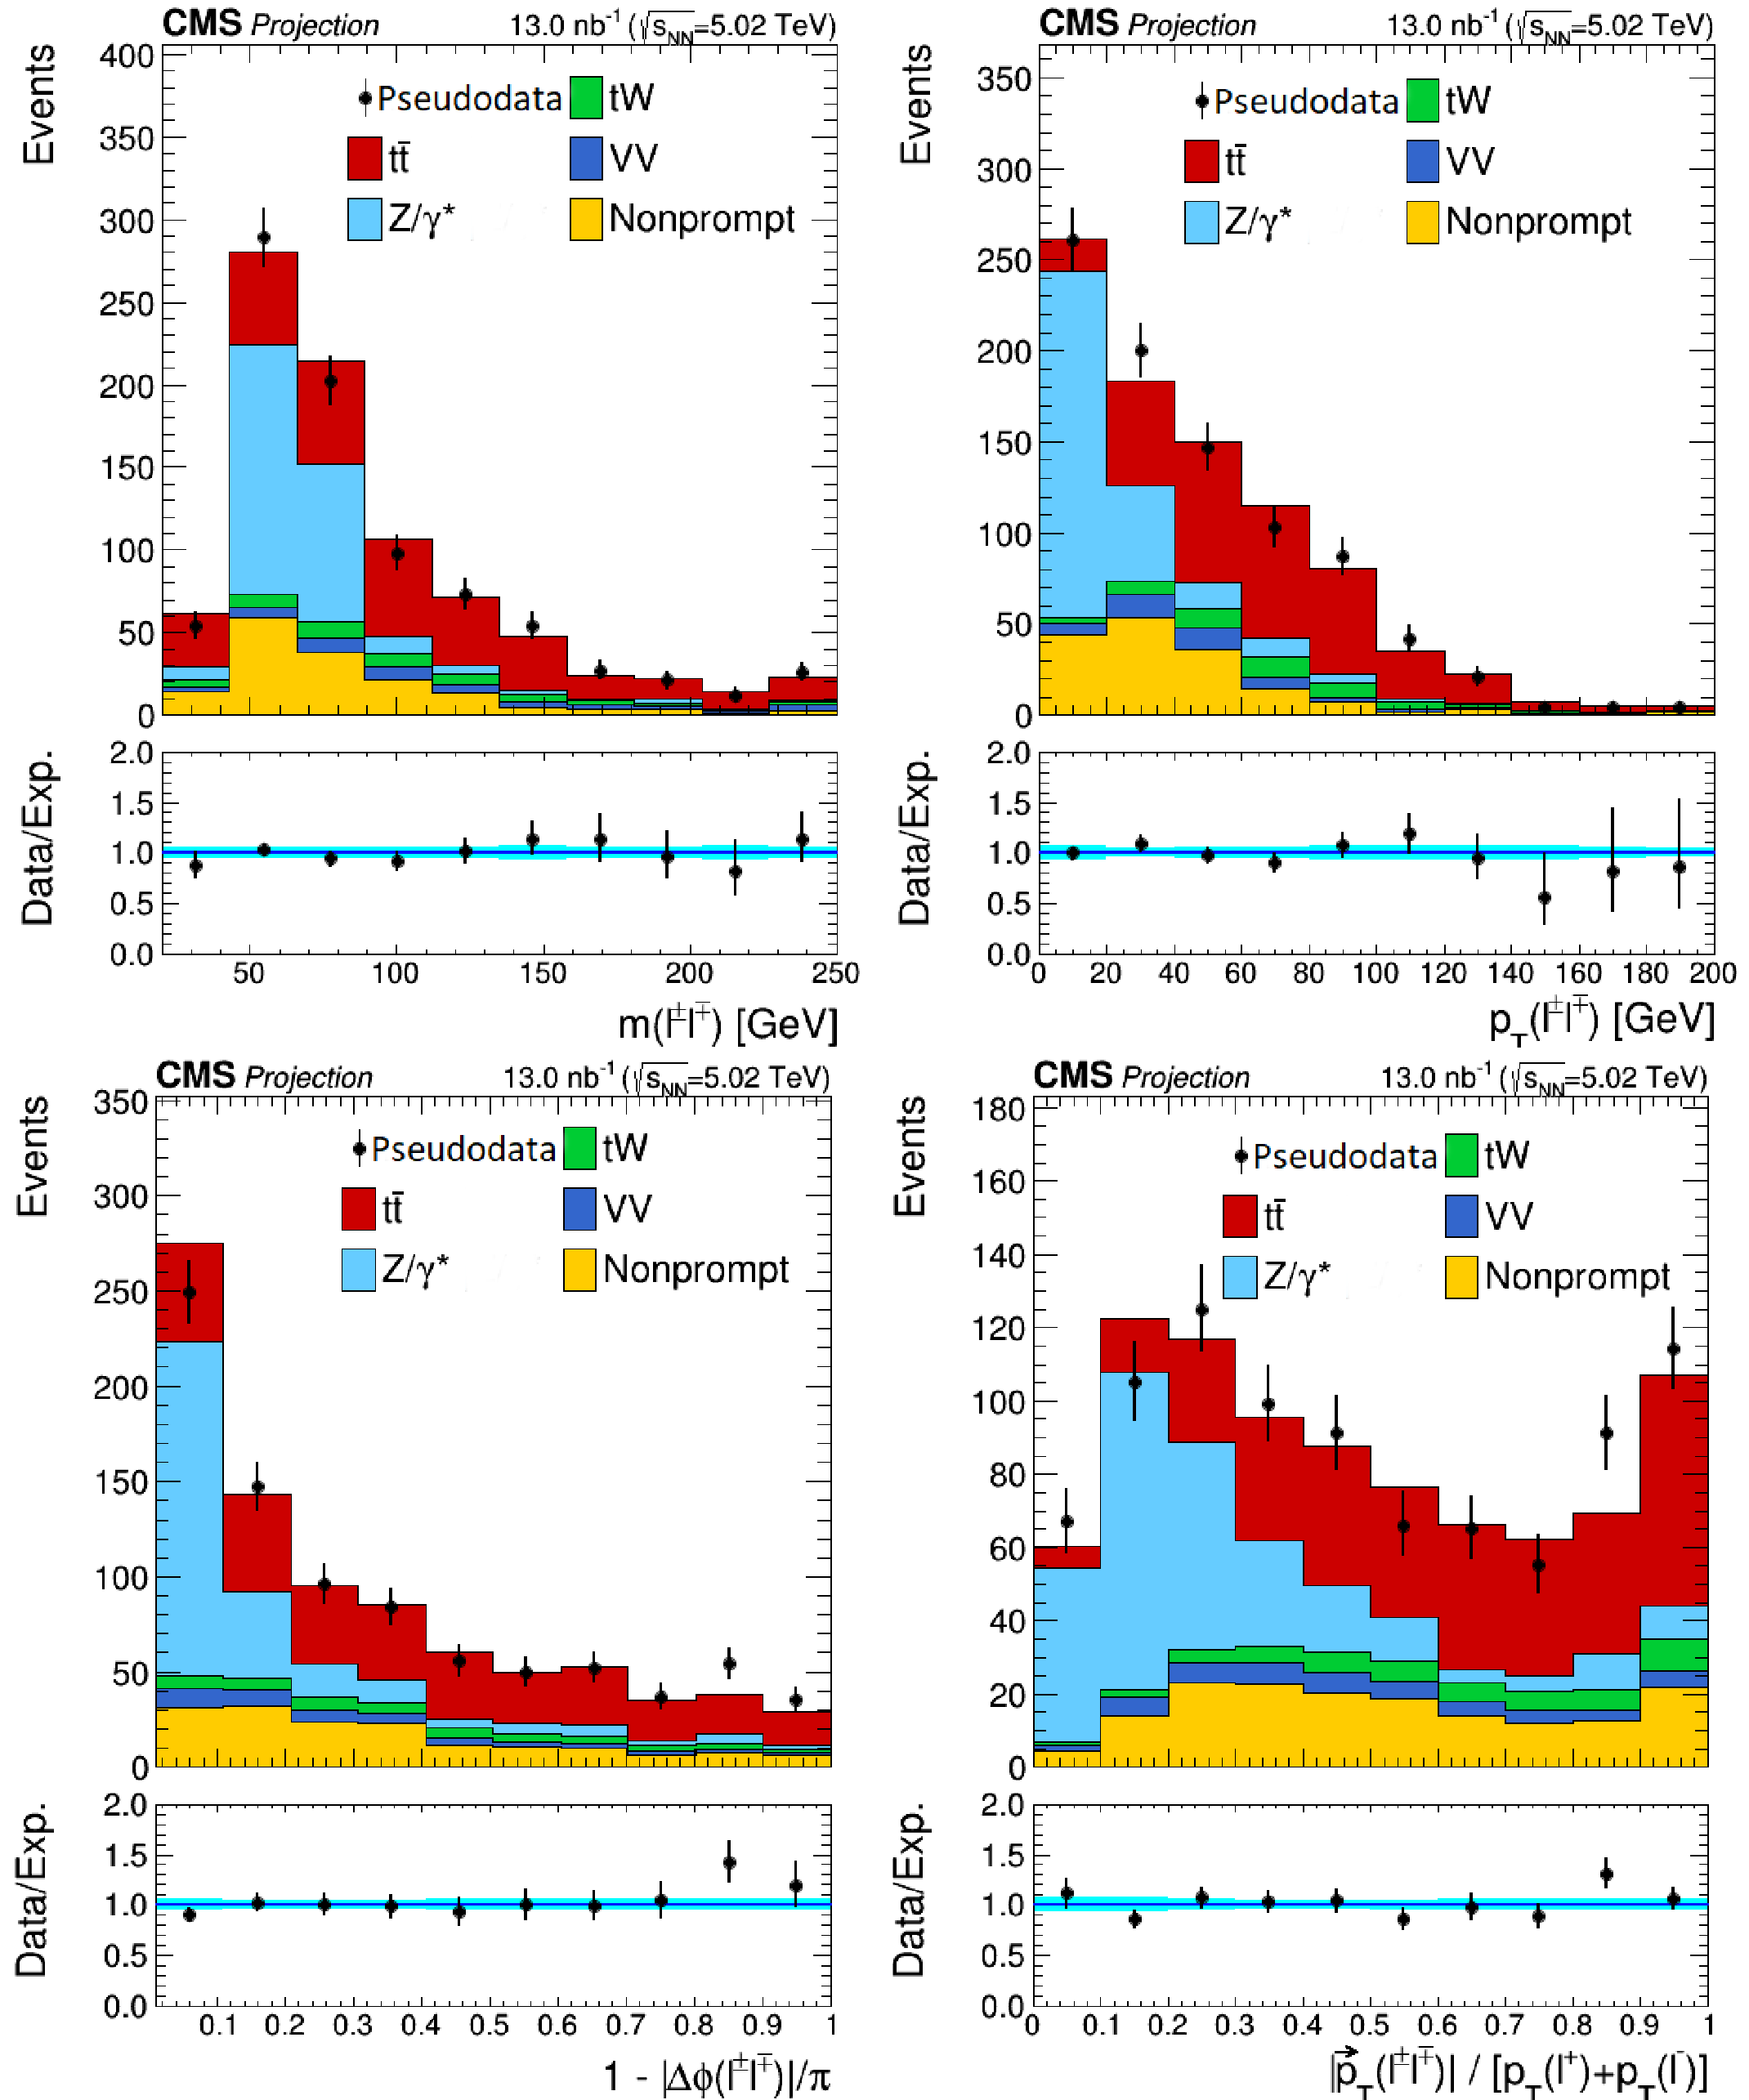
Projected invariant mass (top left), transverse momentum (top right), acoplanarity (bottom left), and sphericity (bottom right) distributions of the lepton pairs in the $\mathrm{e^{\pm}}\mu^{\mp}$ channel at High-Luminosity LHC. Backgrounds and signal are shown with the filled histograms and pseudodata are shown with the markers. The vertical bars on the markers represent the expected statistical uncertainties in pseudodata. The lower panels display the ratio of the pseudodata to expectations, including the $\mathrm{t\bar{t}}$ signal, with bands representing the prefit uncertainties in the expectations. |
png pdf |
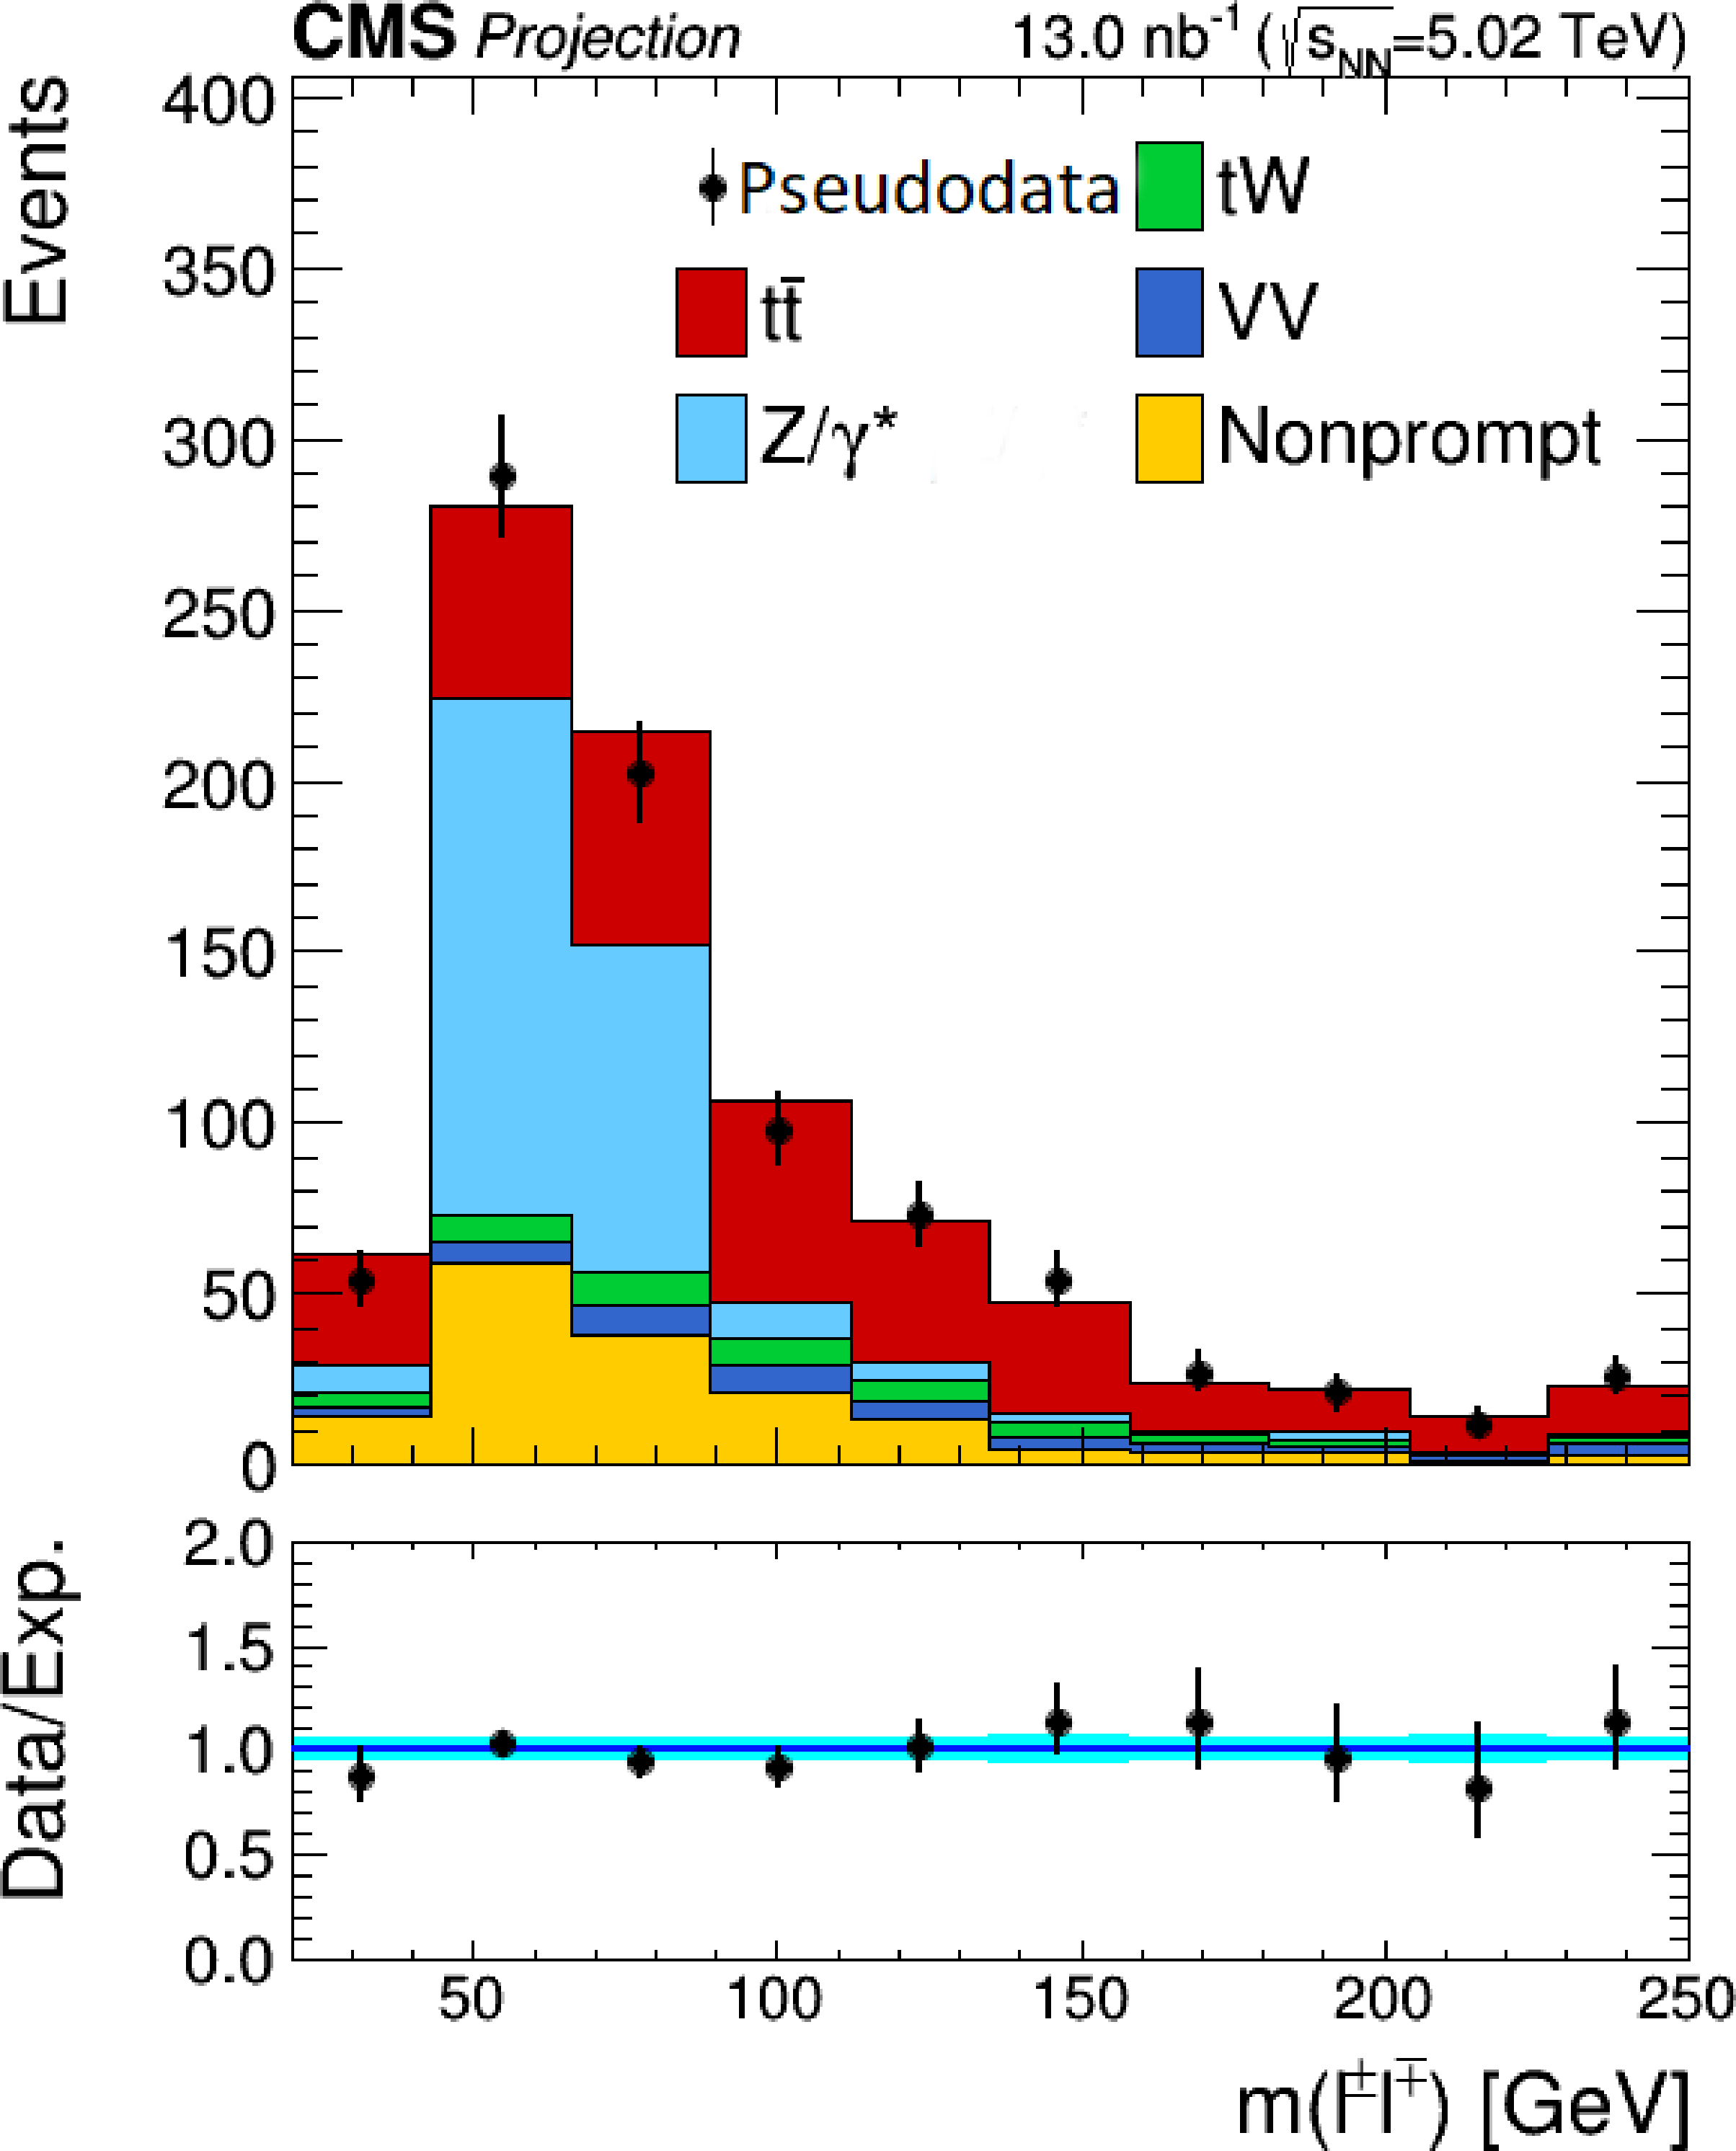
Additional Figure 8-a:
Projected invariant mass distribution of the lepton pairs in the $\mathrm{e^{\pm}}\mu^{\mp}$ channel at High-Luminosity LHC. Backgrounds and signal are shown with the filled histograms and pseudodata are shown with the markers. The vertical bars on the markers represent the expected statistical uncertainties in pseudodata. The lower panel displays the ratio of the pseudodata to expectations, including the $\mathrm{t\bar{t}}$ signal, with bands representing the prefit uncertainties in the expectations. |
png pdf |
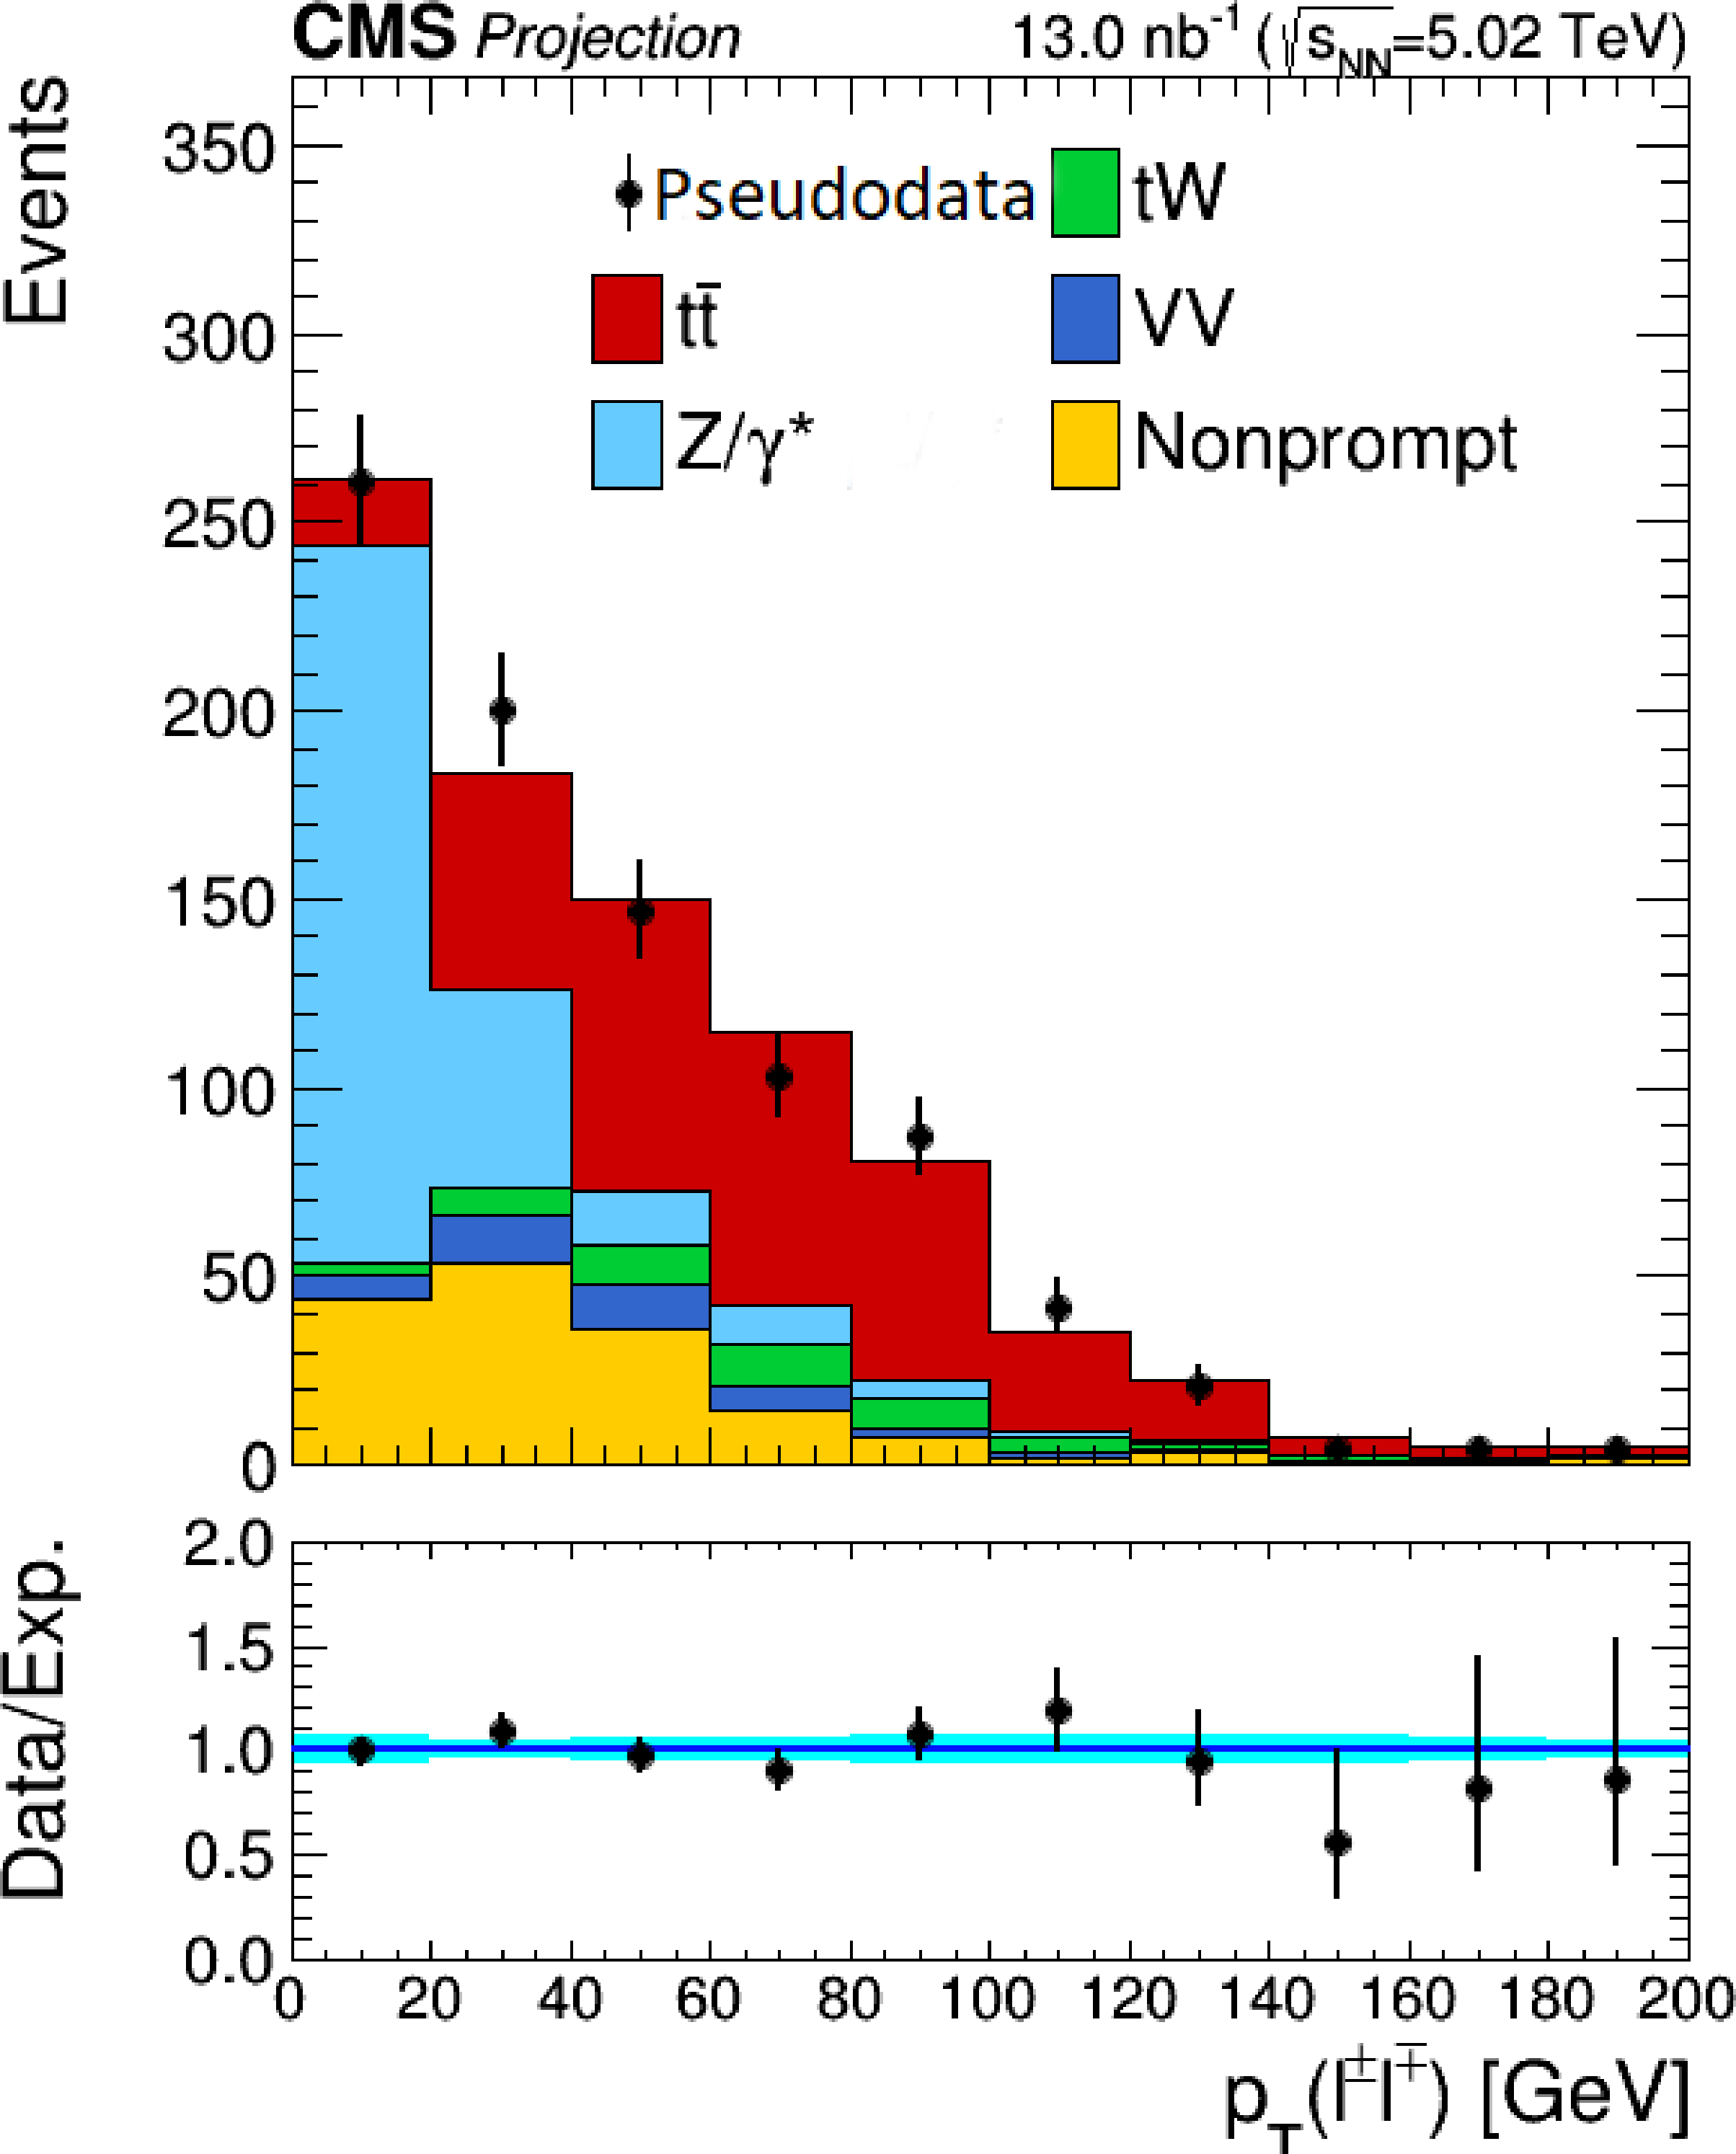
Additional Figure 8-b:
Projected transverse momentum distribution of the lepton pairs in the $\mathrm{e^{\pm}}\mu^{\mp}$ channel at High-Luminosity LHC. Backgrounds and signal are shown with the filled histograms and pseudodata are shown with the markers. The vertical bars on the markers represent the expected statistical uncertainties in pseudodata. The lower panel displays the ratio of the pseudodata to expectations, including the $\mathrm{t\bar{t}}$ signal, with bands representing the prefit uncertainties in the expectations. |

png pdf |
Additional Figure 8-c:
Projected acoplanarity distribution of the lepton pairs in the $\mathrm{e^{\pm}}\mu^{\mp}$ channel at High-Luminosity LHC. Backgrounds and signal are shown with the filled histograms and pseudodata are shown with the markers. The vertical bars on the markers represent the expected statistical uncertainties in pseudodata. The lower panel displays the ratio of the pseudodata to expectations, including the $\mathrm{t\bar{t}}$ signal, with bands representing the prefit uncertainties in the expectations. |
png pdf |
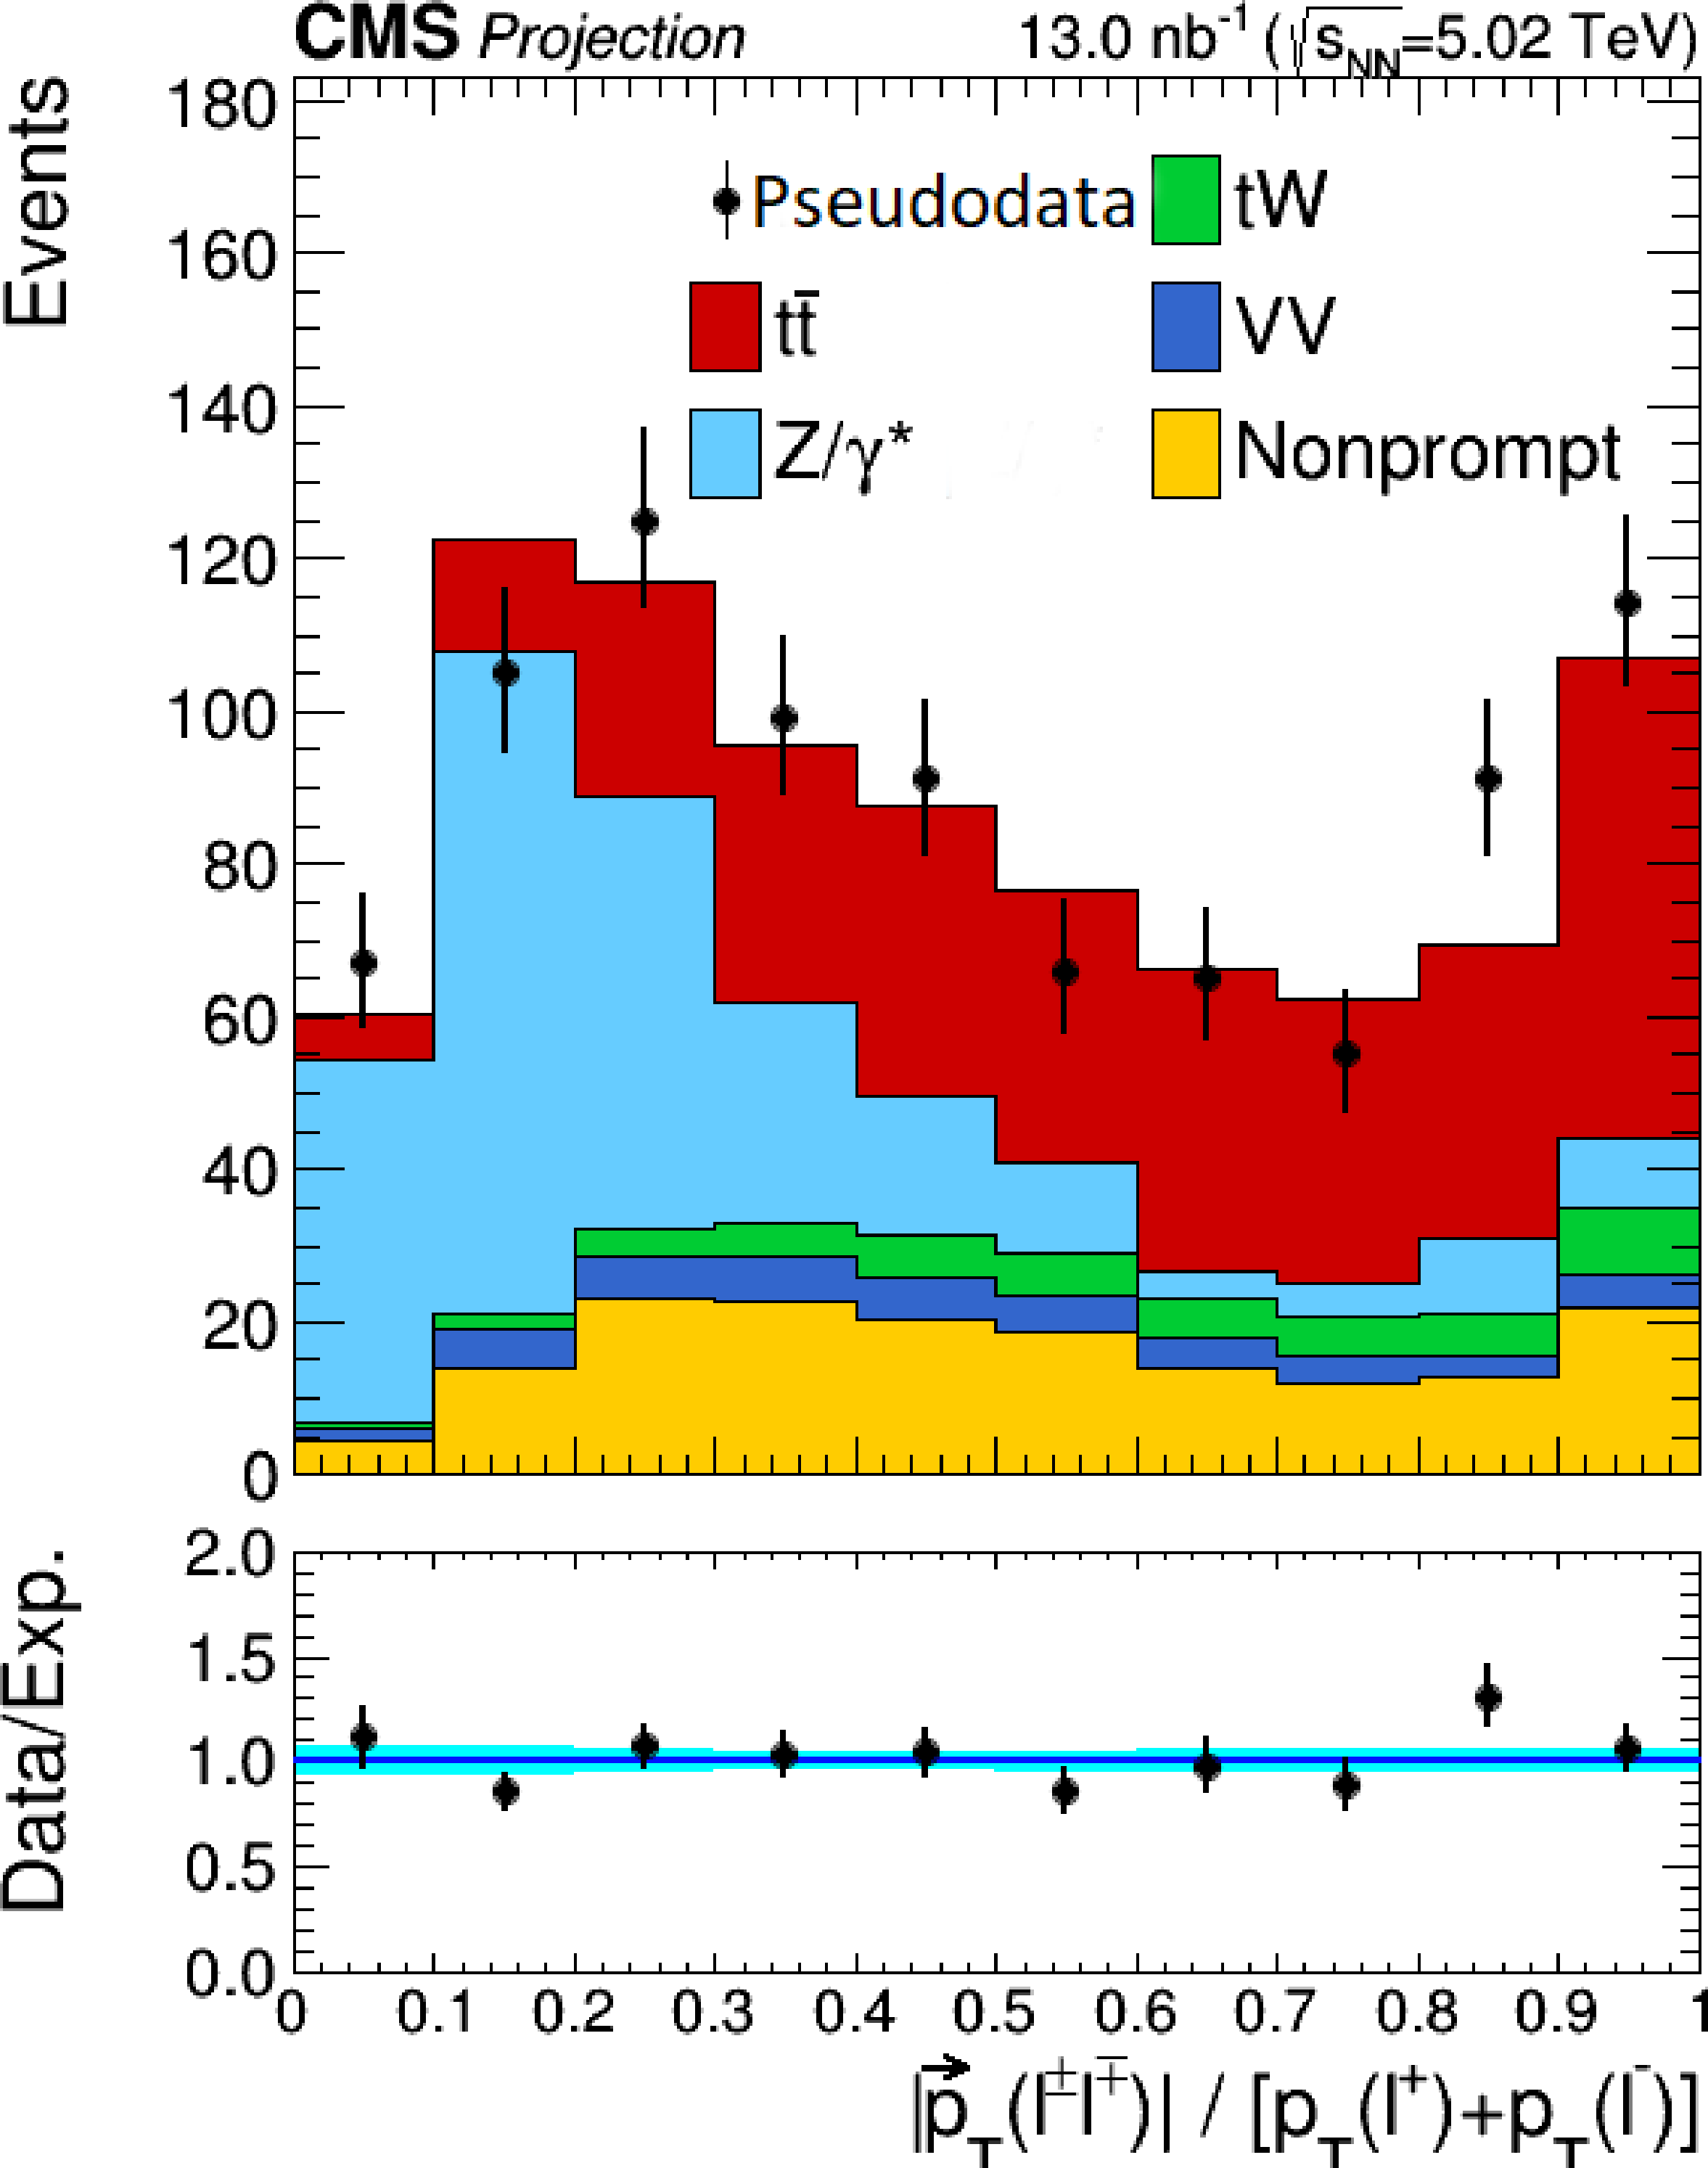
Additional Figure 8-d:
Projected sphericity distribution of the lepton pairs in the $\mathrm{e^{\pm}}\mu^{\mp}$ channel at High-Luminosity LHC. Backgrounds and signal are shown with the filled histograms and pseudodata are shown with the markers. The vertical bars on the markers represent the expected statistical uncertainties in pseudodata. The lower panel displays the ratio of the pseudodata to expectations, including the $\mathrm{t\bar{t}}$ signal, with bands representing the prefit uncertainties in the expectations. |
png pdf |
Additional Figure 9:
The measured and projected at High-Luminosity LHC inclusive $\mathrm{t\bar{t}}$ cross sections making use of the final-state dilepton kinematic properties alone, in the combined ${\mathrm{e^{+}} \mathrm{e^{-}} }$, ${\mu^{+} \mu^{-} }$, and $\mathrm{e^{\pm}}\mu^{\mp}$ final states in PbPB collisions at $ {\sqrt {\smash [b]{s_{_{\mathrm {NN}}}}}} = $ 5.02 TeV, and pp results at $ \sqrt {s} = $ 5.02 TeV (scaled by $A^2$) from Ref. [CMS:2021gwv]. The measurements and projections are compared with theoretical predictions at NNLO+NNLL accuracy in QCD [30,37]. The inner (outer) experimental uncertainty bars include statistical (statistical and systematic, added in quadrature) uncertainties. The inner (outer) theoretical uncertainty bands correspond to nuclear [31,36] or free-nucleon [32,33] PDF (PDF and scale, added in quadrature) uncertainties. |
| References | ||||
| 1 | CMS Collaboration | Study of $ \mathrm{W} $ boson production in PbPb and $ pp $ collisions at $ {\sqrt {\smash [b]{s_{_{\mathrm {NN}}}}}}= $ 2.76 TeV | PLB 715 (2012) 66 | CMS-HIN-11-008 1205.6334 |
| 2 | ATLAS Collaboration | Measurement of the production and lepton charge asymmetry of $ \mathrm{W} $ bosons in PbPb collisions at $ {\sqrt {\smash [b]{s_{_{\mathrm {NN}}}}}}= $ 2.76 TeV with the ATLAS detector | EPJC 75 (2015) 23 | 1408.4674 |
| 3 | CMS Collaboration | Study of $ \mathrm{Z} $ boson production in PbPb collisions at $ {\sqrt {\smash [b]{s_{_{\mathrm {NN}}}}}} = $ 2.76 TeV | PRL 106 (2011) 212301 | CMS-HIN-10-003 1102.5435 |
| 4 | ATLAS Collaboration | Measurement of $ \mathrm{Z} $ boson production in PbPb collisions at $ {\sqrt {\smash [b]{s_{_{\mathrm {NN}}}}}}= $ 2.76 TeV with the ATLAS detector | PRL 110 (2013) 022301 | 1210.6486 |
| 5 | ALICE Collaboration | Measurement of $ \mathrm{Z} $ boson production at large rapidities in PbPb collisions at $ {\sqrt {\smash [b]{s_{_{\mathrm {NN}}}}}}= $ 5.02 TeV | PLB 780 (2018) 372 | 1711.10753 |
| 6 | ATLAS Collaboration | Observation of a new particle in the search for the standard model Higgs boson with the ATLAS detector at the LHC | PLB 716 (2012) 1 | 1207.7214 |
| 7 | CMS Collaboration | Observation of a new boson at a mass of 125 GeV with the CMS experiment at the LHC | PLB 716 (2012) 30 | CMS-HIG-12-028 1207.7235 |
| 8 | D. d'Enterria | Top quark and Higgs boson perspectives at heavy ion colliders | Nucl. Part. Phys. Proc. 289 (2017) 237 | 1701.08047 |
| 9 | D. d'Enterria, D. E. Martins, and P. Rebello Teles | Higgs boson production in photon-photon interactions with proton, light ion, and heavy ion beams at current and future colliders | PRD 101 (2020) 033009 | 1904.11936 |
| 10 | D. d'Enterria, K. Krajcz\'ar, and H. Paukkunen | Top quark production in proton-nucleus and nucleus-nucleus collisions at LHC energies and beyond | PLB 746 (2015) 64 | 1501.05879 |
| 11 | L. Apolin\'ario, J. G. Milhano, G. P. Salam, and C. A. Salgado | Probing the time structure of the quark-gluon plasma with top quarks | PRL 120 (2018) 232301 | 1711.03105 |
| 12 | CMS Collaboration | The CMS experiment at the CERN LHC | JINST 3 (2008) S08004 | CMS-00-001 |
| 13 | M. Czakon, M. L. Mangano, A. Mitov, and J. Rojo | Constraints on the gluon PDF from top quark pair production at hadron colliders | JHEP 07 (2013) 167 | 1303.7215 |
| 14 | Particle Data Group, M. Tanabashi et al. | Review of particle physics | PRD 98 (2018) 030001 | |
| 15 | CMS Collaboration | The CMS trigger system | JINST 12 (2017) P01020 | CMS-TRG-12-001 1609.02366 |
| 16 | CDF Collaboration | Observation of top quark production in $ {\mathrm{p}}\mathrm{\bar{p}} $ collisions | PRL 74 (1995) 2626 | hep-ex/9503002 |
| 17 | D0 Collaboration | Observation of the top quark | PRL 74 (1995) 2632 | hep-ex/9503003 |
| 18 | ATLAS Collaboration | Measurement of the $ \mathrm{t\bar{t}} $ production cross section and lepton differential distributions in e$\mu$ dilepton events from $ pp $ collisions at $ \sqrt{s}= $ 13 TeV with the ATLAS detector | Submitted to EPJC | 1910.08819 |
| 19 | LHCb Collaboration | Measurement of forward top pair production in the dilepton channel in pp collisions at $ \sqrt{s} = $ 13 TeV | JHEP 08 (2018) 174 | 1803.05188 |
| 20 | CMS Collaboration | Measurement of the $ \mathrm{t\bar{t}} $ production cross section, the top quark mass, and the strong coupling constant using dilepton events in pp collisions at $ \sqrt{s}= $ 13 TeV | EPJC 79 (2019) 368 | CMS-TOP-17-001 1812.10505 |
| 21 | CMS Collaboration | Measurement of the inclusive $ \mathrm{t\bar{t}} $ cross section in pp collisions at $ \sqrt{s} = $ 5.02 TeV using final states with at least one charged lepton | JHEP 03 (2018) 115 | CMS-TOP-16-023 1711.03143 |
| 22 | CMS Collaboration | Measurement of the $ \mathrm{t\bar{t}} $ production cross section in the all-jets final state in pp collisions at $ \sqrt{s}= 8 {TeV} $ | EPJC 76 (2016) 128 | CMS-TOP-14-018 1509.06076 |
| 23 | CMS Collaboration | Observation of top quark production in proton-nucleus collisions | PRL 119 (2017) 242001 | CMS-HIN-17-002 1709.07411 |
| 24 | CMS Collaboration | CMS luminosity measurement using 2016 proton-nucleus collisions at nucleon-nucleon center-of-mass energy of 8.16 TeV | CMS-PAS-LUM-17-002 | CMS-PAS-LUM-17-002 |
| 25 | CMS Collaboration | Evidence of b jet quenching in PbPb collisions at $ {\sqrt {\smash [b]{s_{_{\mathrm {NN}}}}}}= $ 2.76 TeV | PRL 113 (2014) 132301 | CMS-HIN-12-003 1312.4198 |
| 26 | J. R. Klein and A. Roodman | Blind analysis in nuclear and particle physics | Ann. Rev. Nucl. Part. Sci. 55 (2005) 141 | |
| 27 | CMS Collaboration | Identification of heavy-flavor jets with the CMS detector in $ pp $ collisions at 13 TeV | JINST 13 (2018) P05011 | CMS-BTV-16-002 1712.07158 |
| 28 | F. Pedregosa et al. | Scikit-learn: machine learning in Python | J. Mach. Learn. Res 12 (2011) 2825 | 1201.0490 |
| 29 | H. Voss, A. Hocker, J. Stelzer, and F. Tegenfeldt | TMVA, the toolkit for multivariate data analysis with ROOT | in XIth International Workshop on Advanced Computing and Analysis Techniques in Physics Research (ACAT), p. 40 2007 [PoS(ACAT)040] | physics/0703039 |
| 30 | M. Czakon and A. Mitov | Top++: a program for the calculation of the top pair cross section at hadron colliders | CPC 185 (2014) 2930 | 1112.5675 |
| 31 | K. J. Eskola, P. Paakkinen, H. Paukkunen, and C. A. Salgado | EPPS16: Nuclear parton distributions with LHC data | EPJC 77 (2017) 163 | 1612.05741 |
| 32 | S. Dulat et al. | New parton distribution functions from a global analysis of quantum chromodynamics | PRD 93 (2016) 033006 | 1506.07443 |
| 33 | NNPDF Collaboration | Parton distributions for the LHC Run II | JHEP 04 (2015) 040 | 1410.8849 |
| 34 | F. Arleo | Tomography of cold and hot QCD matter: tools and diagnosis | JHEP 11 (2002) 044 | hep-ph/0210104 |
| 35 | F. Arleo | Quenching of hadron spectra in heavy ion collisions at the LHC | PRL 119 (2017) 062302 | 1703.10852 |
| 36 | A. Kusina et al. | Vector boson production in pPb and PbPb collisions at the LHC and its impact on nCTEQ15 PDFs | EPJC 77 (2017) 488 | 1610.02925 |
| 37 | M. Czakon, P. Fiedler, and A. Mitov | Total top quark pair production cross section at hadron colliders through $ \mathcal{O}({\alpha_S}^4) $ | PRL 110 (2013) 252004 | 1303.6254 |
| 38 | CMS Collaboration | Description and performance of track and primary-vertex reconstruction with the CMS tracker | JINST 9 (2014) P10009 | CMS-TRK-11-001 1405.6569 |
| 39 | CMS Collaboration | Performance of electron reconstruction and selection with the CMS detector in proton-proton collisions at $ \sqrt{s} = $ 8 TeV | JINST 10 (2015) P06005 | CMS-EGM-13-001 1502.02701 |
| 40 | CMS Collaboration | Performance of the CMS muon detector and muon reconstruction with proton-proton collisions at $ \sqrt{s}= $ 13 TeV | JINST 13 (2018) P06015 | CMS-MUO-16-001 1804.04528 |
| 41 | CMS Collaboration | Jet energy scale and resolution in the CMS experiment in pp collisions at 8 TeV | JINST 12 (2017) P02014 | CMS-JME-13-004 1607.03663 |
| 42 | CMS Collaboration | Jet momentum dependence of jet quenching in PbPb collisions at $ {\sqrt {\smash [b]{s_{_{\mathrm {NN}}}}}} = $ 2.76 TeV | PLB 712 (2012) 176 | CMS-HIN-11-013 1202.5022 |
| 43 | J. Alwall et al. | The automated computation of tree-level and next-to-leading order differential cross sections, and their matching to parton shower simulations | JHEP 07 (2014) 079 | 1405.0301 |
| 44 | S. Frixione, P. Nason, and C. Oleari | Matching NLO QCD computations with parton shower simulations: the POWHEG method | JHEP 11 (2007) 070 | 0709.2092 |
| 45 | S. Alioli, P. Nason, C. Oleari, and E. Re | A general framework for implementing NLO calculations in shower Monte Carlo programs: the POWHEG BOX | JHEP 06 (2010) 043 | 1002.2581 |
| 46 | CMS Collaboration | Measurement of the top quark mass in the all-jets final state at $ \sqrt{s} = $ 13 TeV and combination with the lepton+jets channel | EPJC 79 (2019) 313 | CMS-TOP-17-008 1812.10534 |
| 47 | E. Todesco and J. Wenninger | Large Hadron Collider momentum calibration and accuracy | PRAccel. Beams 20 (2017) 081003 | |
| 48 | Y. Li and F. Petriello | Combining QCD and electroweak corrections to dilepton production in FEWZ | PRD 86 (2012) 094034 | 1208.5967 |
| 49 | J. M. Campbell, R. K. Ellis, and C. Williams | Vector boson pair production at the LHC | JHEP 07 (2011) 018 | 1105.0020 |
| 50 | E. Re | Single-top $ \mathrm{W}\mathrm{t}$-channel production matched with parton showers using the POWHEG method | EPJC 71 (2011) 1547 | 1009.2450 |
| 51 | N. Kidonakis | Top quark production | in Proceedings, Helmholtz International Summer School on Physics of Heavy Quarks and Hadrons (HQ 2013), p. 139 Verlag Deutsches Elektronen-Synchrotron, Hamburg | 1311.0283 |
| 52 | T. Sjostrand et al. | An introduction to PYTHIA 8.2 | CPC 191 (2015) 159 | 1410.3012 |
| 53 | CMS Collaboration | Extraction and validation of a new set of CMS PYTHIA 8 tunes from underlying-event measurements | EPJC 80 (2020) 4 | CMS-GEN-17-001 1903.12179 |
| 54 | C. Loizides, J. Kamin, and D. d'Enterria | Improved Monte Carlo Glauber predictions at present and future nuclear colliders | PRC 97 (2018) 054910 | 1710.07098 |
| 55 | I. P. Lokhtin and A. M. Snigirev | A model of jet quenching in ultrarelativistic heavy ion collisions and high-$ {p_{\mathrm{T}}} $ hadron spectra at RHIC | EPJC 45 (2016) 211 | hep-ph/0506189 |
| 56 | GEANT4 Collaboration | GEANT4--a simulation toolkit | NIMA 506 (2003) 250 | |
| 57 | CMS Collaboration | Particle-flow reconstruction and global-event description with the CMS detector | JINST 12 (2017) P10003 | CMS-PRF-14-001 1706.04965 |
| 58 | CMS Collaboration | Technical proposal for the Phase-II upgrade of the Compact Muon Solenoid | CMS-PAS-TDR-15-002 | CMS-PAS-TDR-15-002 |
| 59 | M. Cacciari, G. P. Salam, and G. Soyez | The anti-$ {k_{\mathrm{T}}} $ jet clustering algorithm | JHEP 04 (2008) 063 | 0802.1189 |
| 60 | M. Cacciari and G. P. Salam | Pileup subtraction using jet areas | PLB 659 (2008) 119 | 0707.1378 |
| 61 | M. Cacciari, G. P. Salam, and G. Soyez | FastJet user manual | EPJC 72 (2012) 1896 | 1111.6097 |
| 62 | CMS Collaboration | Measurements of inclusive W and Z cross sections in pp collisions at $ \sqrt{s} = $ 7 TeV | JHEP 01 (2011) 080 | CMS-EWK-10-002 1012.2466 |
| 63 | CMS Collaboration | Measurement of Higgs boson production and properties in the WW decay channel with leptonic final states | JHEP 01 (2014) 096 | CMS-HIG-13-023 1312.1129 |
| 64 | P. Berta, M. Spousta, D. W. Miller, and R. Leitner | Particle-level pileup subtraction for jets and jet shapes | JHEP 06 (2014) 092 | 1403.3108 |
| 65 | CMS Collaboration | Measurement of the splitting function in $ pp $ and PbPb collisions at $ {\sqrt {\smash [b]{s_{_{\mathrm {NN}}}}}} = $ 5.02 TeV | PRL 120 (2018) 142302 | CMS-HIN-16-006 1708.09429 |
| 66 | W. Verkerke and D. P. Kirkby | The RooFit toolkit for data modelling | eConf C 0303241 (2003) MOLT007 | physics/0306116 |
| 67 | L. Moneta et al. | The RooStats Project | PoS ACAT (2010) 057 | 1009.1003 |
| 68 | G. Cowan, K. Cranmer, E. Gross, and O. Vitells | Asymptotic formulae for likelihood-based tests of new physics | EPJC 71 (2011) 1554 | 1007.1727 |
| 69 | CMS Collaboration | Precise determination of the mass of the Higgs boson and tests of compatibility of its couplings with the standard model predictions using proton collisions at 7 and 8 TeV | EPJC 75 (2015) 212 | CMS-HIG-14-009 1412.8662 |
|
|
Compact Muon Solenoid LHC, CERN |
|

|

|

|

|

|