

Compact Muon Solenoid
LHC, CERN
| CMS-HIN-14-010 ; CERN-PH-EP-2015-260 | ||
| Measurement of transverse momentum relative to dijet systems in PbPb and pp collisions at $\sqrt{s_{\mathrm{NN}}} = $ 2.76 TeV | ||
| CMS Collaboration | ||
| 30 September 2015 | ||
| J. High Energy Phys. 01 (2016) 006 | ||
| Abstract: An analysis of dijet events in PbPb and pp collisions is performed to explore the properties of energy loss by partons traveling in a quark-gluon plasma. Data are collected at a nucleon-nucleon center-of-mass energy of 2.76 TeV at the LHC. The distribution of transverse momentum ($p_{\mathrm{T}}$) surrounding dijet systems is measured by selecting charged particles in different ranges of $p_{\mathrm{T}}$ and at different angular cones of pseudorapidity and azimuth. The measurement is performed as a function of centrality of the PbPb collisions, the $p_{\mathrm{T}}$ asymmetry of the jets in the dijet pair, and the distance parameter R used in the anti-$k_t$ jet clustering algorithm. In events with unbalanced dijets, PbPb collisions show an enhanced multiplicity in the hemisphere of the subleading jet, with the $p_{\mathrm{T}}$ imbalance compensated by an excess of low-$p_{\mathrm{T}}$ particles at large angles from the jet axes. | ||
| Links: e-print arXiv:1509.09029 [nucl-ex] (PDF) ; CDS record ; inSPIRE record ; CADI line (restricted) ; | ||
| Figures | |
png pdf |
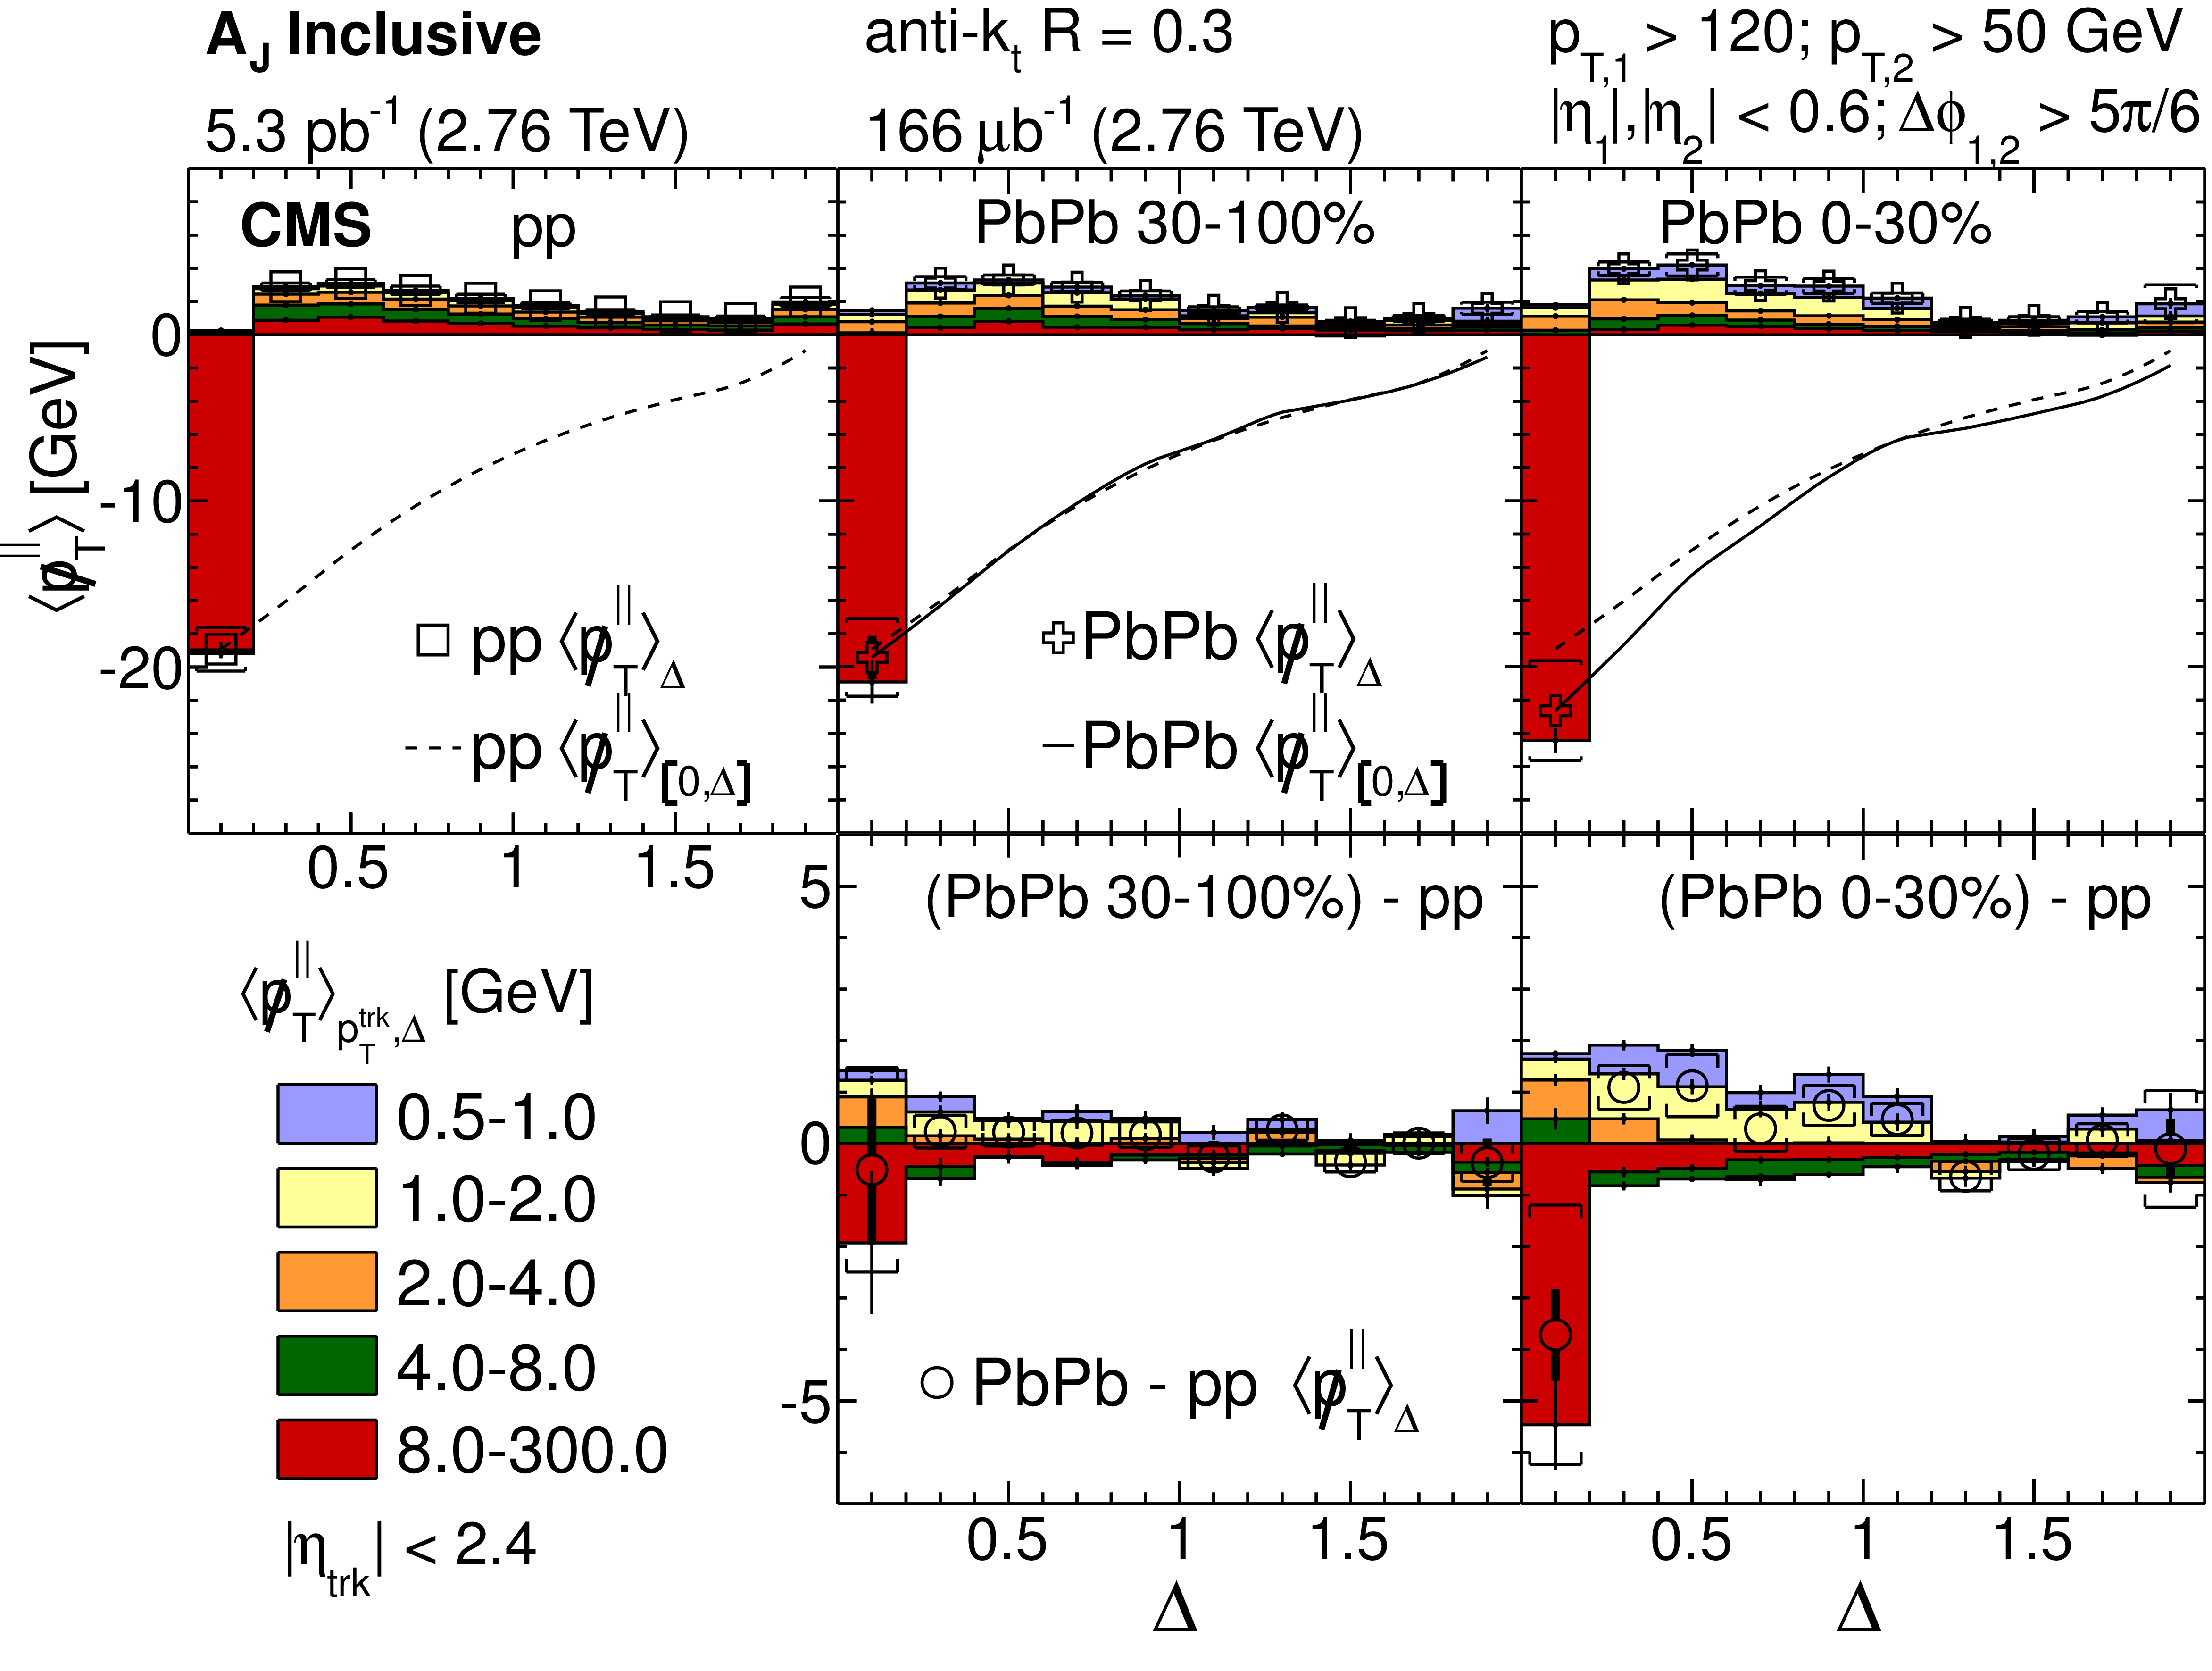
Figure 1:
(Color online) Upper row: $ < p_{\mathrm {T}}^{\parallel } > _{p_{\rm T}^{\rm {trk}},\Delta } $ distributions for pp, and for 30--100% and 0--30% PbPb data for five track-$ {p_{\mathrm {T}}} $ ranges (colored boxes), for momentum ranges from 0.5 $ < {p_{\mathrm {T}}} <$ 1 GeV (light blue) to 8 $< {p_{\mathrm {T}}} <$ 300 GeV (red), as a function of $\Delta $. Also shown is $ < {\not } p_{\mathrm {T}}^{\parallel } >_{\Delta } $ as a function of $\Delta $ for pp (open squares) and PbPb data (open plus symbols). Dashed lines (pp) and solid lines (PbPb) show $ < \displaystyle {\not } p_{\mathrm {T}}^{\parallel } >_{[0,\Delta ]} $ (i.e. integrating the $ < \displaystyle {\not } p_{\mathrm {T}}^{\parallel } > _{\Delta } $ over $\Delta $ from $\Delta =0$ up to the point of interest). Lower row: Difference between the PbPb and pp $ < \displaystyle {\not } p_{\mathrm {T}}^{\parallel } > _{p_{\rm T}^{\rm {trk}},\Delta } $ distributions according to the range in $ {p_{\mathrm {T}}} $, as a function of $\Delta $ (colored boxes), and difference of $ < \displaystyle {\not } p_{\mathrm {T}}^{\parallel } > _{\Delta } $ as a function of $\Delta $ (open circles), error bars and brackets represent statistical and systematic uncertainties, respectively. |
png pdf |
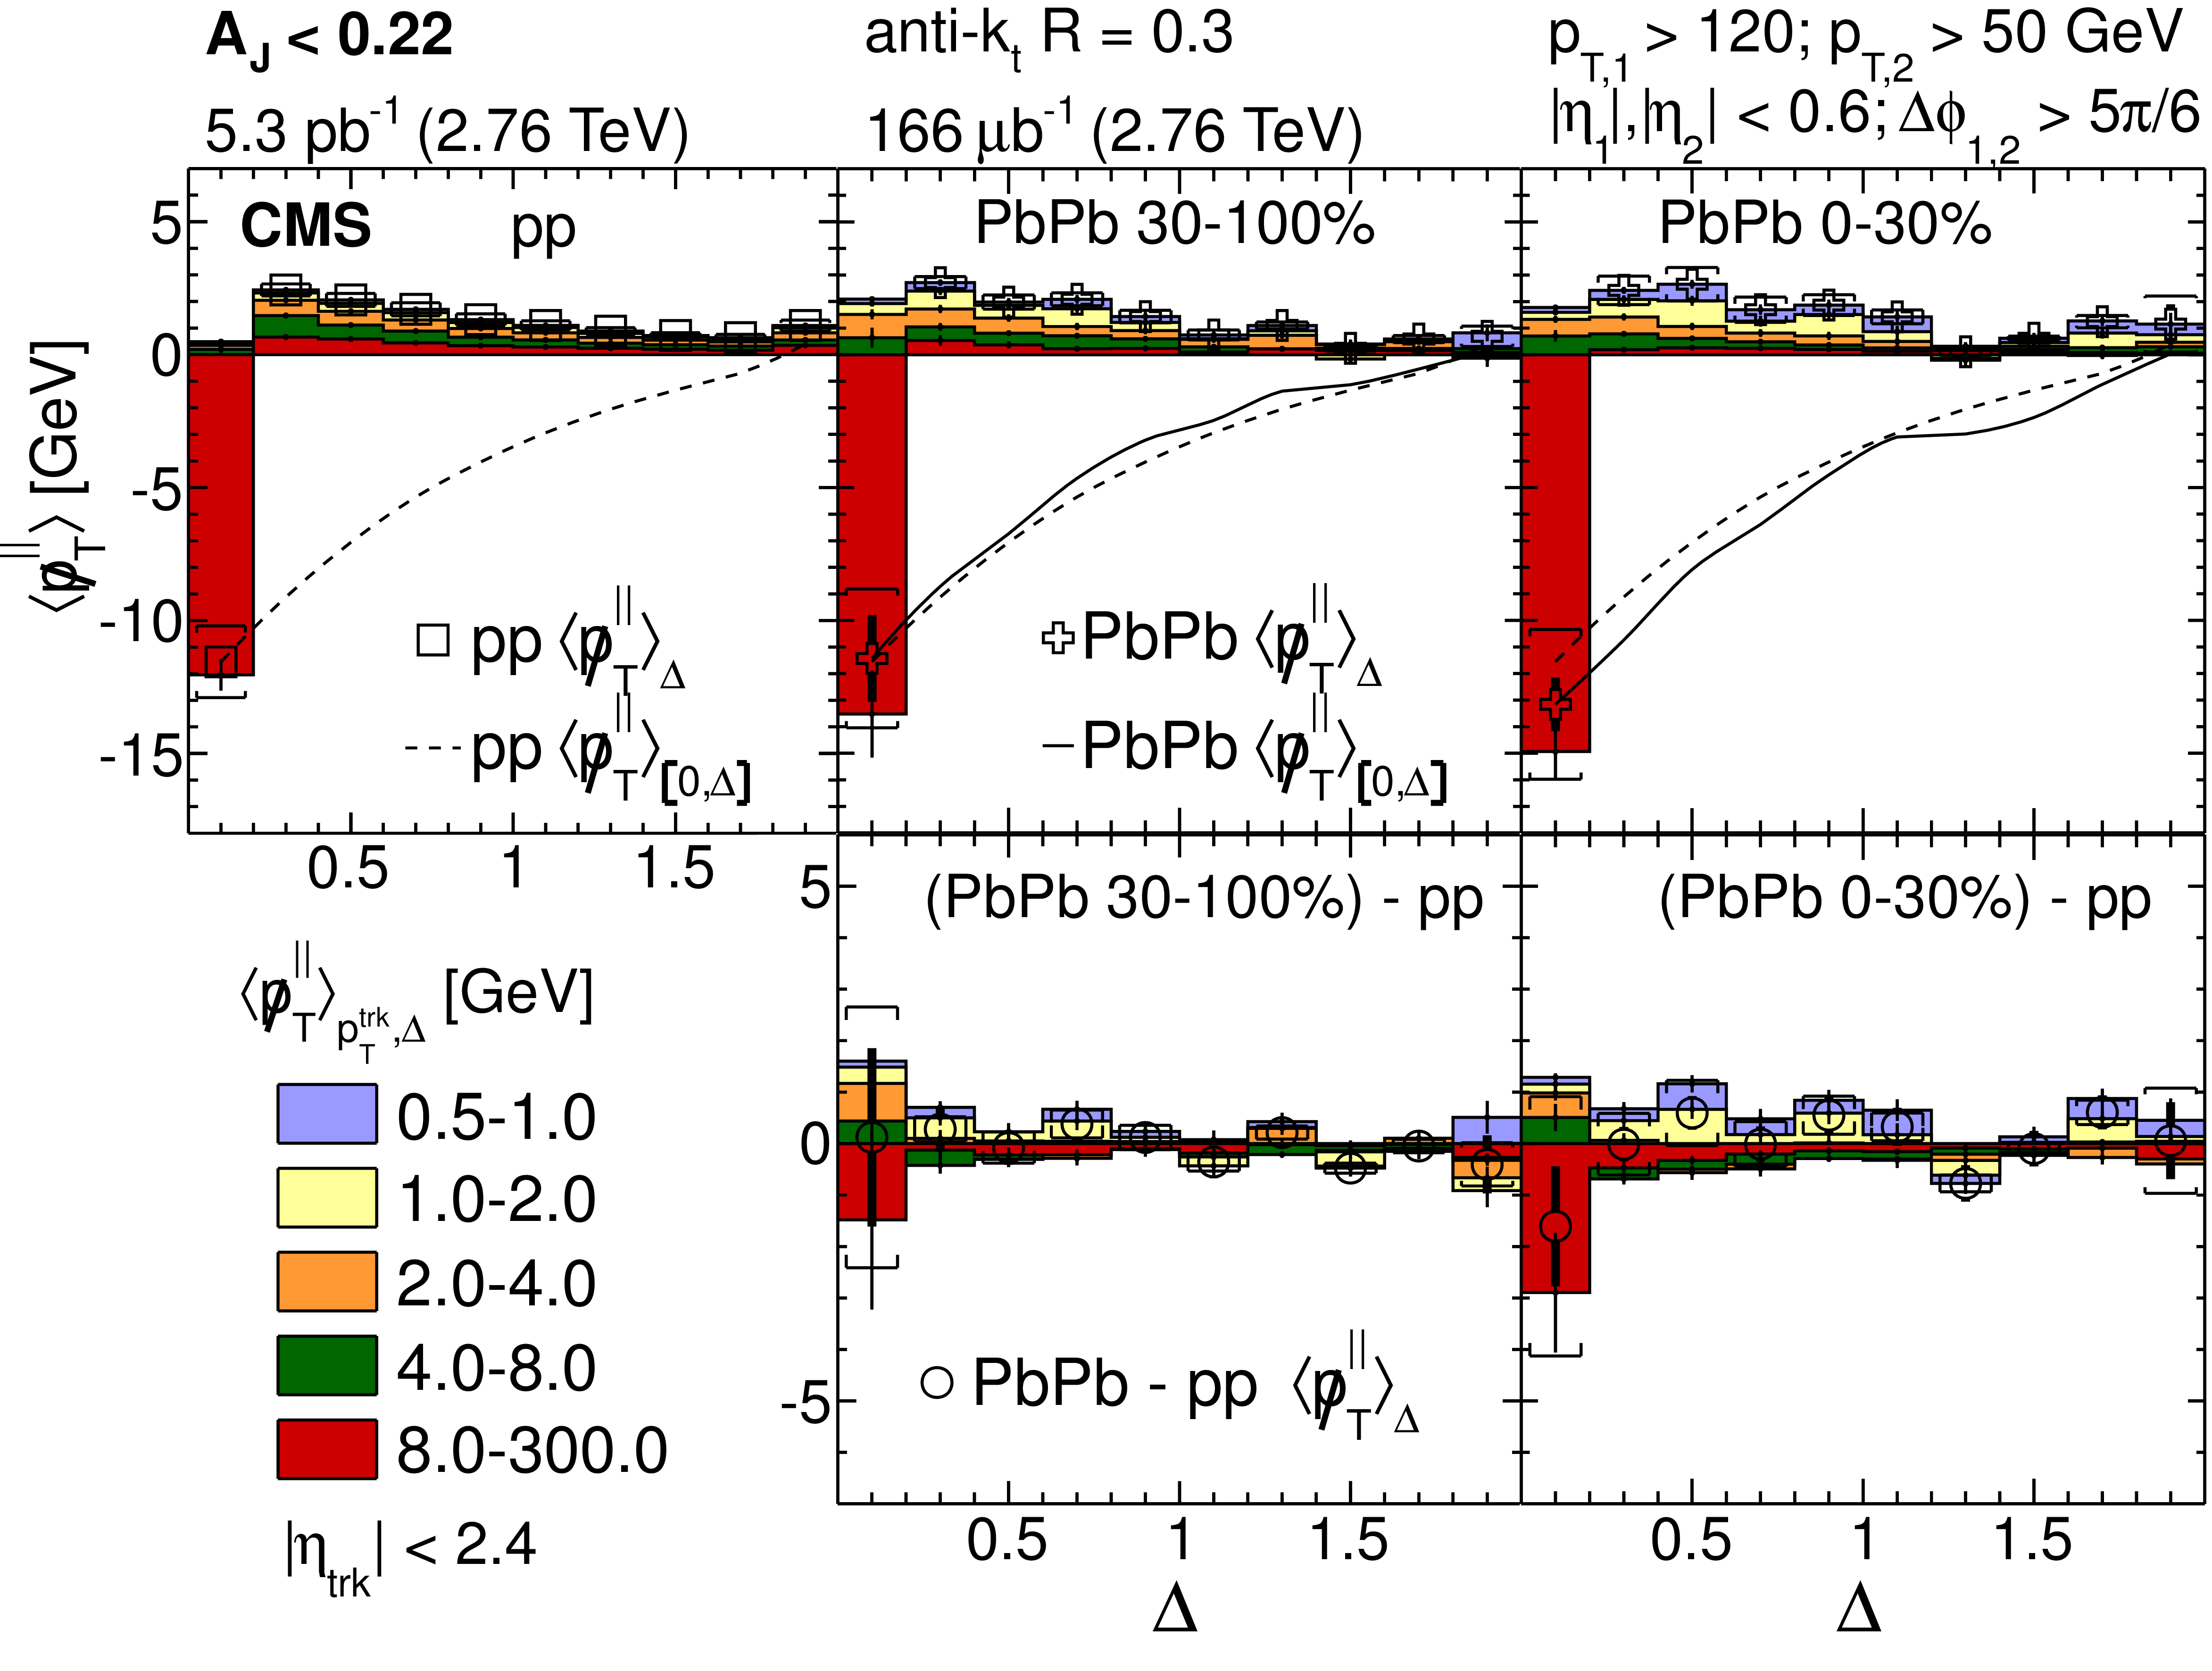
Figure 2:
(Color online) Same as Fig. 1, but with a balanced dijet selection ($ {A_J} < 0.22$). Upper row: $ < \displaystyle {\not } p_{\mathrm {T}}^{\parallel } > _{p_{\rm T}^{\rm {trk}},\Delta } $ distributions for pp, and for 30--100% and 0--30% PbPb data for five track $ {p_{\mathrm {T}}} $ ranges (colored boxes), as a function of $\Delta $. Also shown is $ < \displaystyle {\not } p_{\mathrm {T}}^{\parallel } > _{\Delta } $ as a function of $\Delta $ for pp (open squares) and for PbPb data (open plus symbols). Dashed lines (pp) and solid lines (PbPb) show $ < \displaystyle {\not } p_{\mathrm {T}}^{\parallel } > _{[0,\Delta ]} $ (i.e. integrating the $ < \displaystyle {\not } p_{\mathrm {T}}^{\parallel } > _{\Delta } $ over $\Delta $ from $\Delta = 0$ up to the point of interest). Lower row: Difference in the $ < \displaystyle {\not } p_{\mathrm {T}}^{\parallel } > _{p_{\rm T}^{\rm {trk}},\Delta } $ distributions for the PbPb and pp according to the range in $ {p_{\mathrm {T}}} $, as a function of $\Delta $ (colored boxes), and difference of $ < \displaystyle {\not } p_{\mathrm {T}}^{\parallel } > _{\Delta } $ as a function of $\Delta $ (open circles). Error bars and brackets represent statistical and systematic uncertainties, respectively. The $y$-axis range on the top panels are smaller than in Fig. 1. |
png pdf |
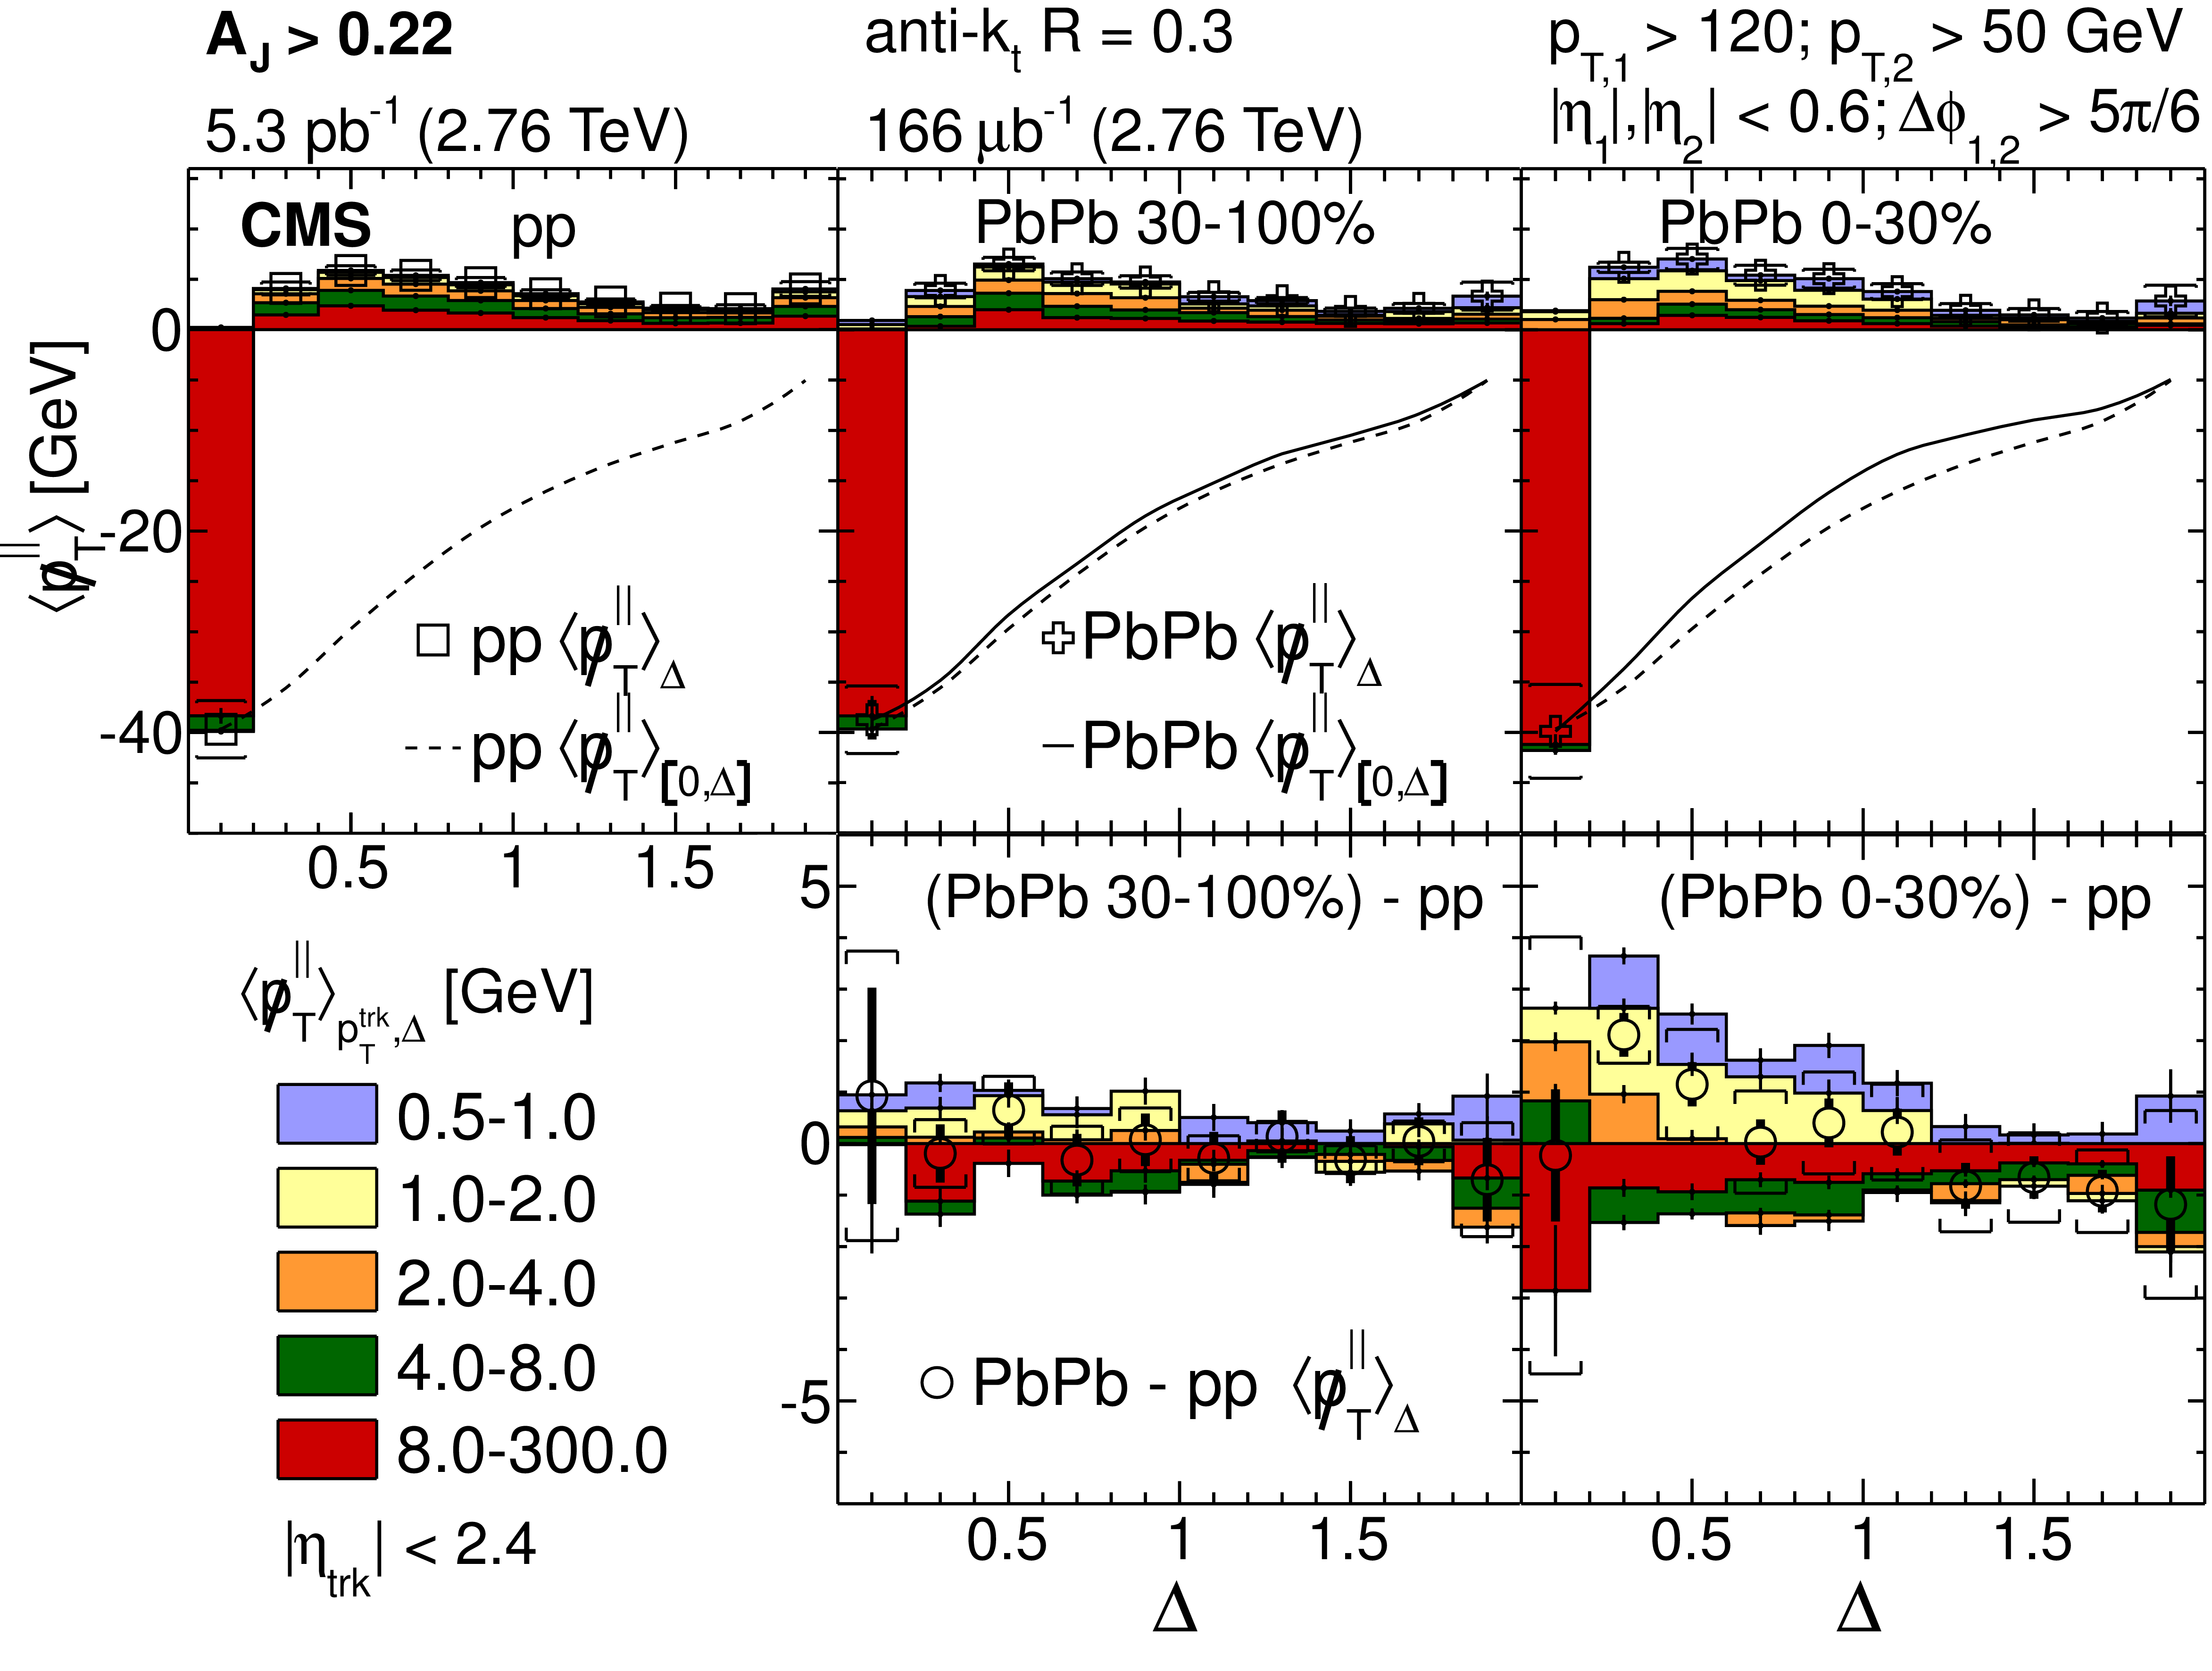
Figure 3:
(Color online) Same as Fig. 1, but with an unbalanced dijet selection ($ {A_J} > 0.22$). Upper row: $ < \displaystyle {\not } p_{\mathrm {T}}^{\parallel } > _{p_{\rm T}^{\rm {trk}},\Delta } $ distributions for pp, and for 30--100% and 0--30% PbPb data for five track $ {p_{\mathrm {T}}} $ ranges, as a function of $\Delta $. Also shown is $ < \displaystyle {\not } p_{\mathrm {T}}^{\parallel } > _{\Delta } $ as a function of $\Delta $ for pp and for PbPb data. Dashed lines (pp) and solid lines (PbPb) show $ < \displaystyle {\not } p_{\mathrm {T}}^{\parallel } > _{[0,\Delta ]} $ (i.e. integrating the $ < \displaystyle {\not } p_{\mathrm {T}}^{\parallel } > _{\Delta } $ over $\Delta $ from $\Delta = 0$ up to the point of interest). Lower row: Difference in the $ < \displaystyle {\not } p_{\mathrm {T}}^{\parallel } > _{p_{\rm T}^{\rm {trk}},\Delta } $ distributions for the PbPb and pp. Error bars and brackets represent statistical and systematic uncertainties, respectively. The $y$-axis range on the top panels are larger than in Fig. 1. |
png pdf |
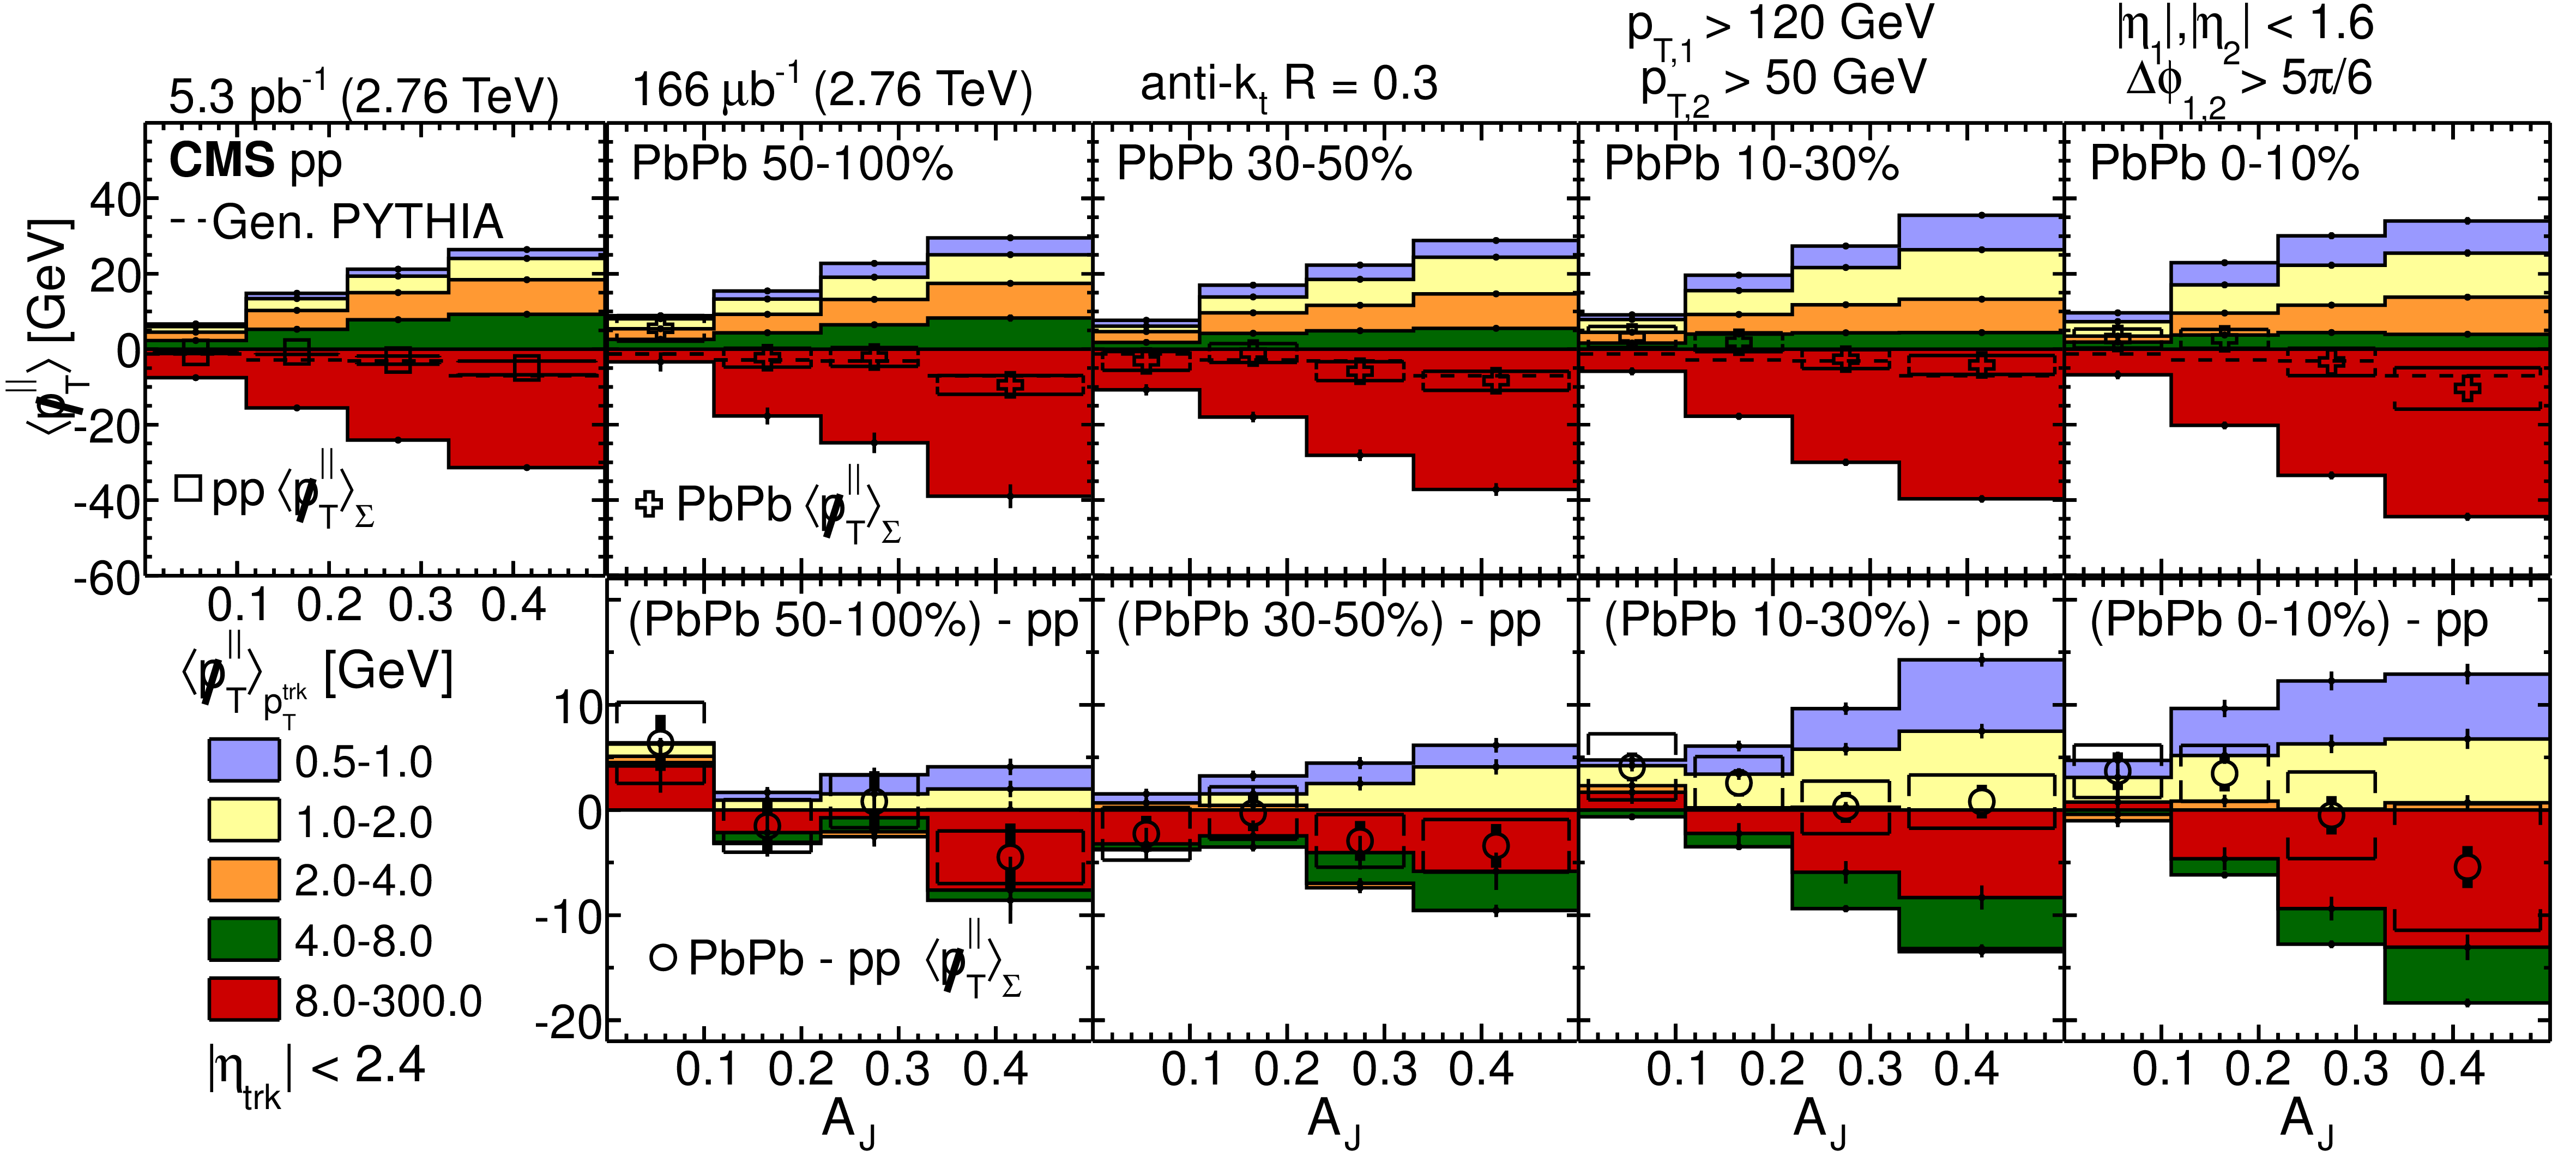
Figure 4:
(Color online) Upper row has $ < \displaystyle {\not } p_{\mathrm {T}}^{\parallel } > _{p_{\rm T}^{\rm {trk}}}$ and $ < \displaystyle {\not } p_{\mathrm {T}}^{\parallel } > _{\Sigma }$ in pp collisions (leftmost) and in four selections of PbPb for collision centralities from 50--100% to 0--10%. The open markers show $ < \displaystyle {\not } p_{\mathrm {T}}^{\parallel } > _{\Sigma } $, $ {p_{\mathrm {T}}} $ balance for tracks with 0.5 $< {p_{\mathrm {T}}} <$ 300 GeV, while the colored boxes show the $ < \displaystyle {\not } p_{\mathrm {T}}^{\parallel } > _{p_{\rm T}^{\rm {trk}}}$ contributions for different track $ {p_{\mathrm {T}}} $ ranges. For each panel, $ < \displaystyle {\not } p_{\mathrm {T}}^{\parallel } > _{p_{\rm T}^{\rm {trk}}} $ and $ < \displaystyle {\not } p_{\mathrm {T}}^{\parallel } > _{\Sigma } $ values are shown as a function of dijet asymmetry. The lower row shows the difference between $ < \displaystyle {\not } p_{\mathrm {T}}^{\parallel } > _{p_{\rm T}^{\rm {trk}}} $ and $ < \displaystyle {\not } p_{\mathrm {T}}^{\parallel } > _{\Sigma } $ for PbPb and pp data. Error bars and brackets represent statistical and systematic uncertainties, respectively. |
png pdf |
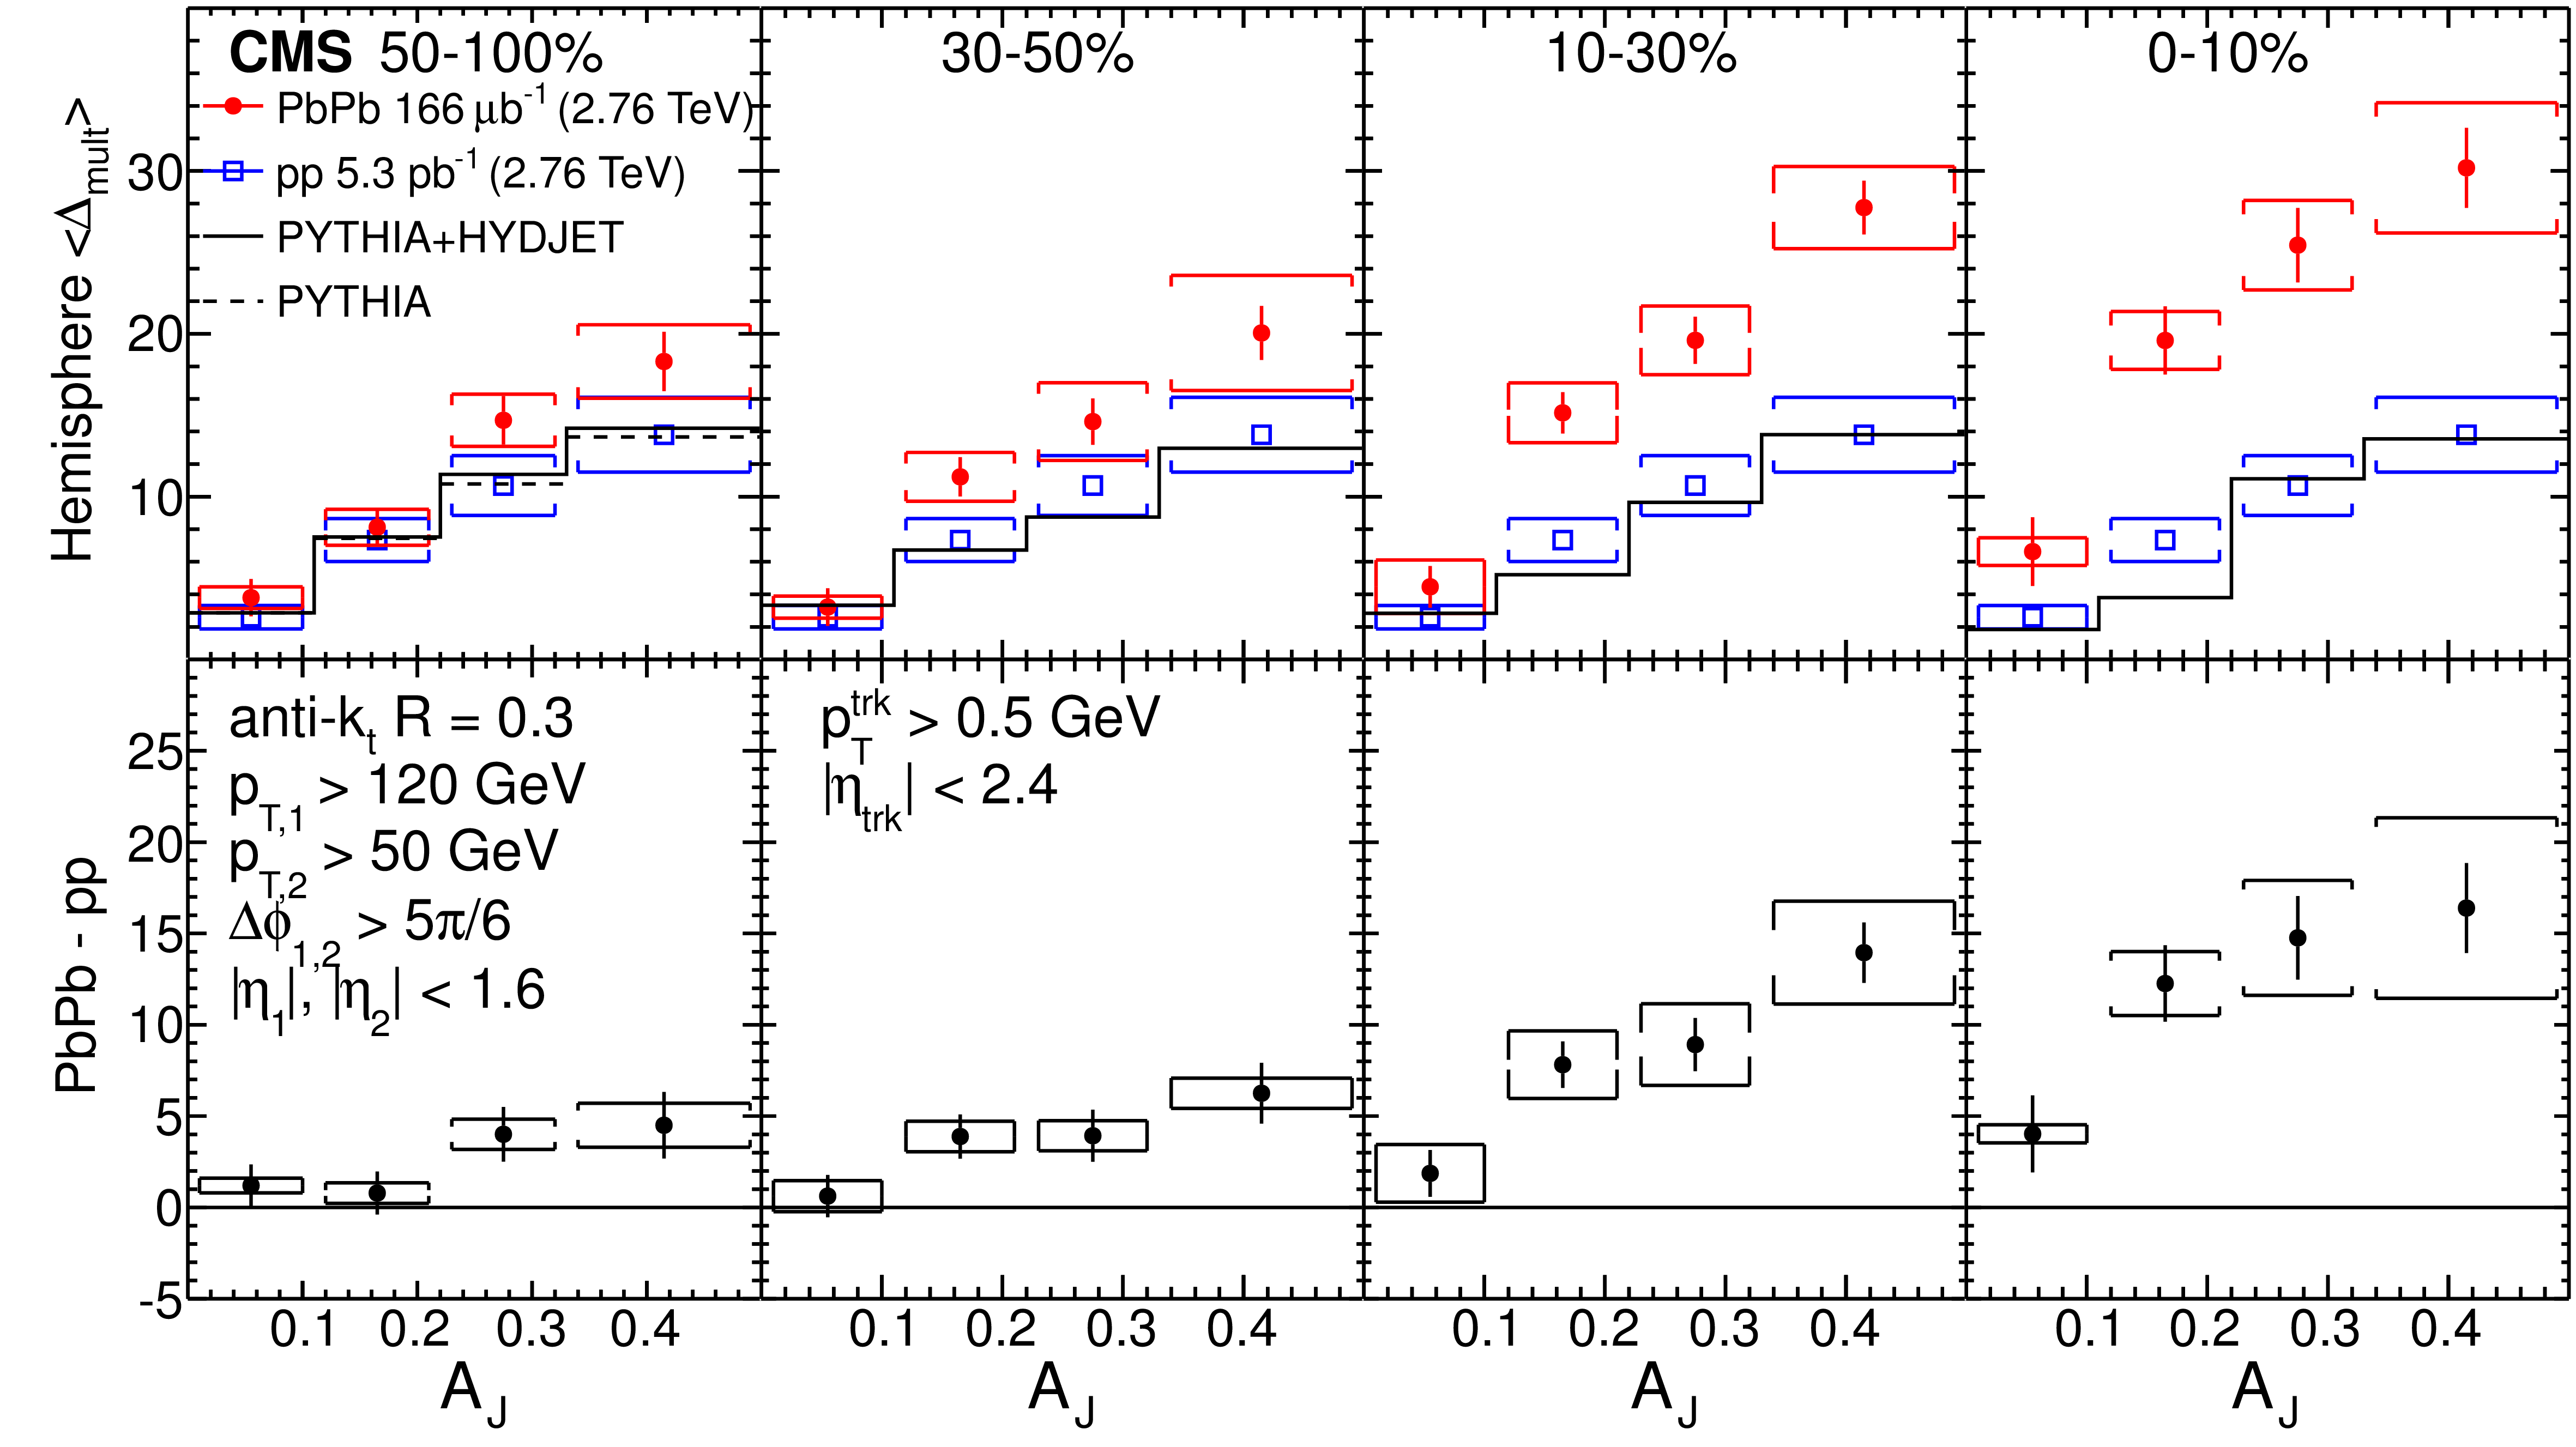
Figure 5:
(Color online) Upper panels show the comparison of the mean difference in multiplicity $< \Delta _{\rm mult} > $ between the subleading jet hemisphere and leading jet hemisphere, as a function of dijet asymmetry $ {A_J} $ for pp (blue squares), PbPb (red filed circles), PYTHIA (dashed histogram), and PYTHIA+HYDJET events (black histogram). The centralities of PbPb collisions are 50--100%, 30--50%, 10--30 %, and 0--10%, respectively, from leftmost to rightmost panel. Lower panels provide the difference in $< \Delta _{\rm mult}> $ between PbPb and pp collisions. Statistical and systematic uncertainties are shown as error bars and brackets, respectively. |
png pdf |
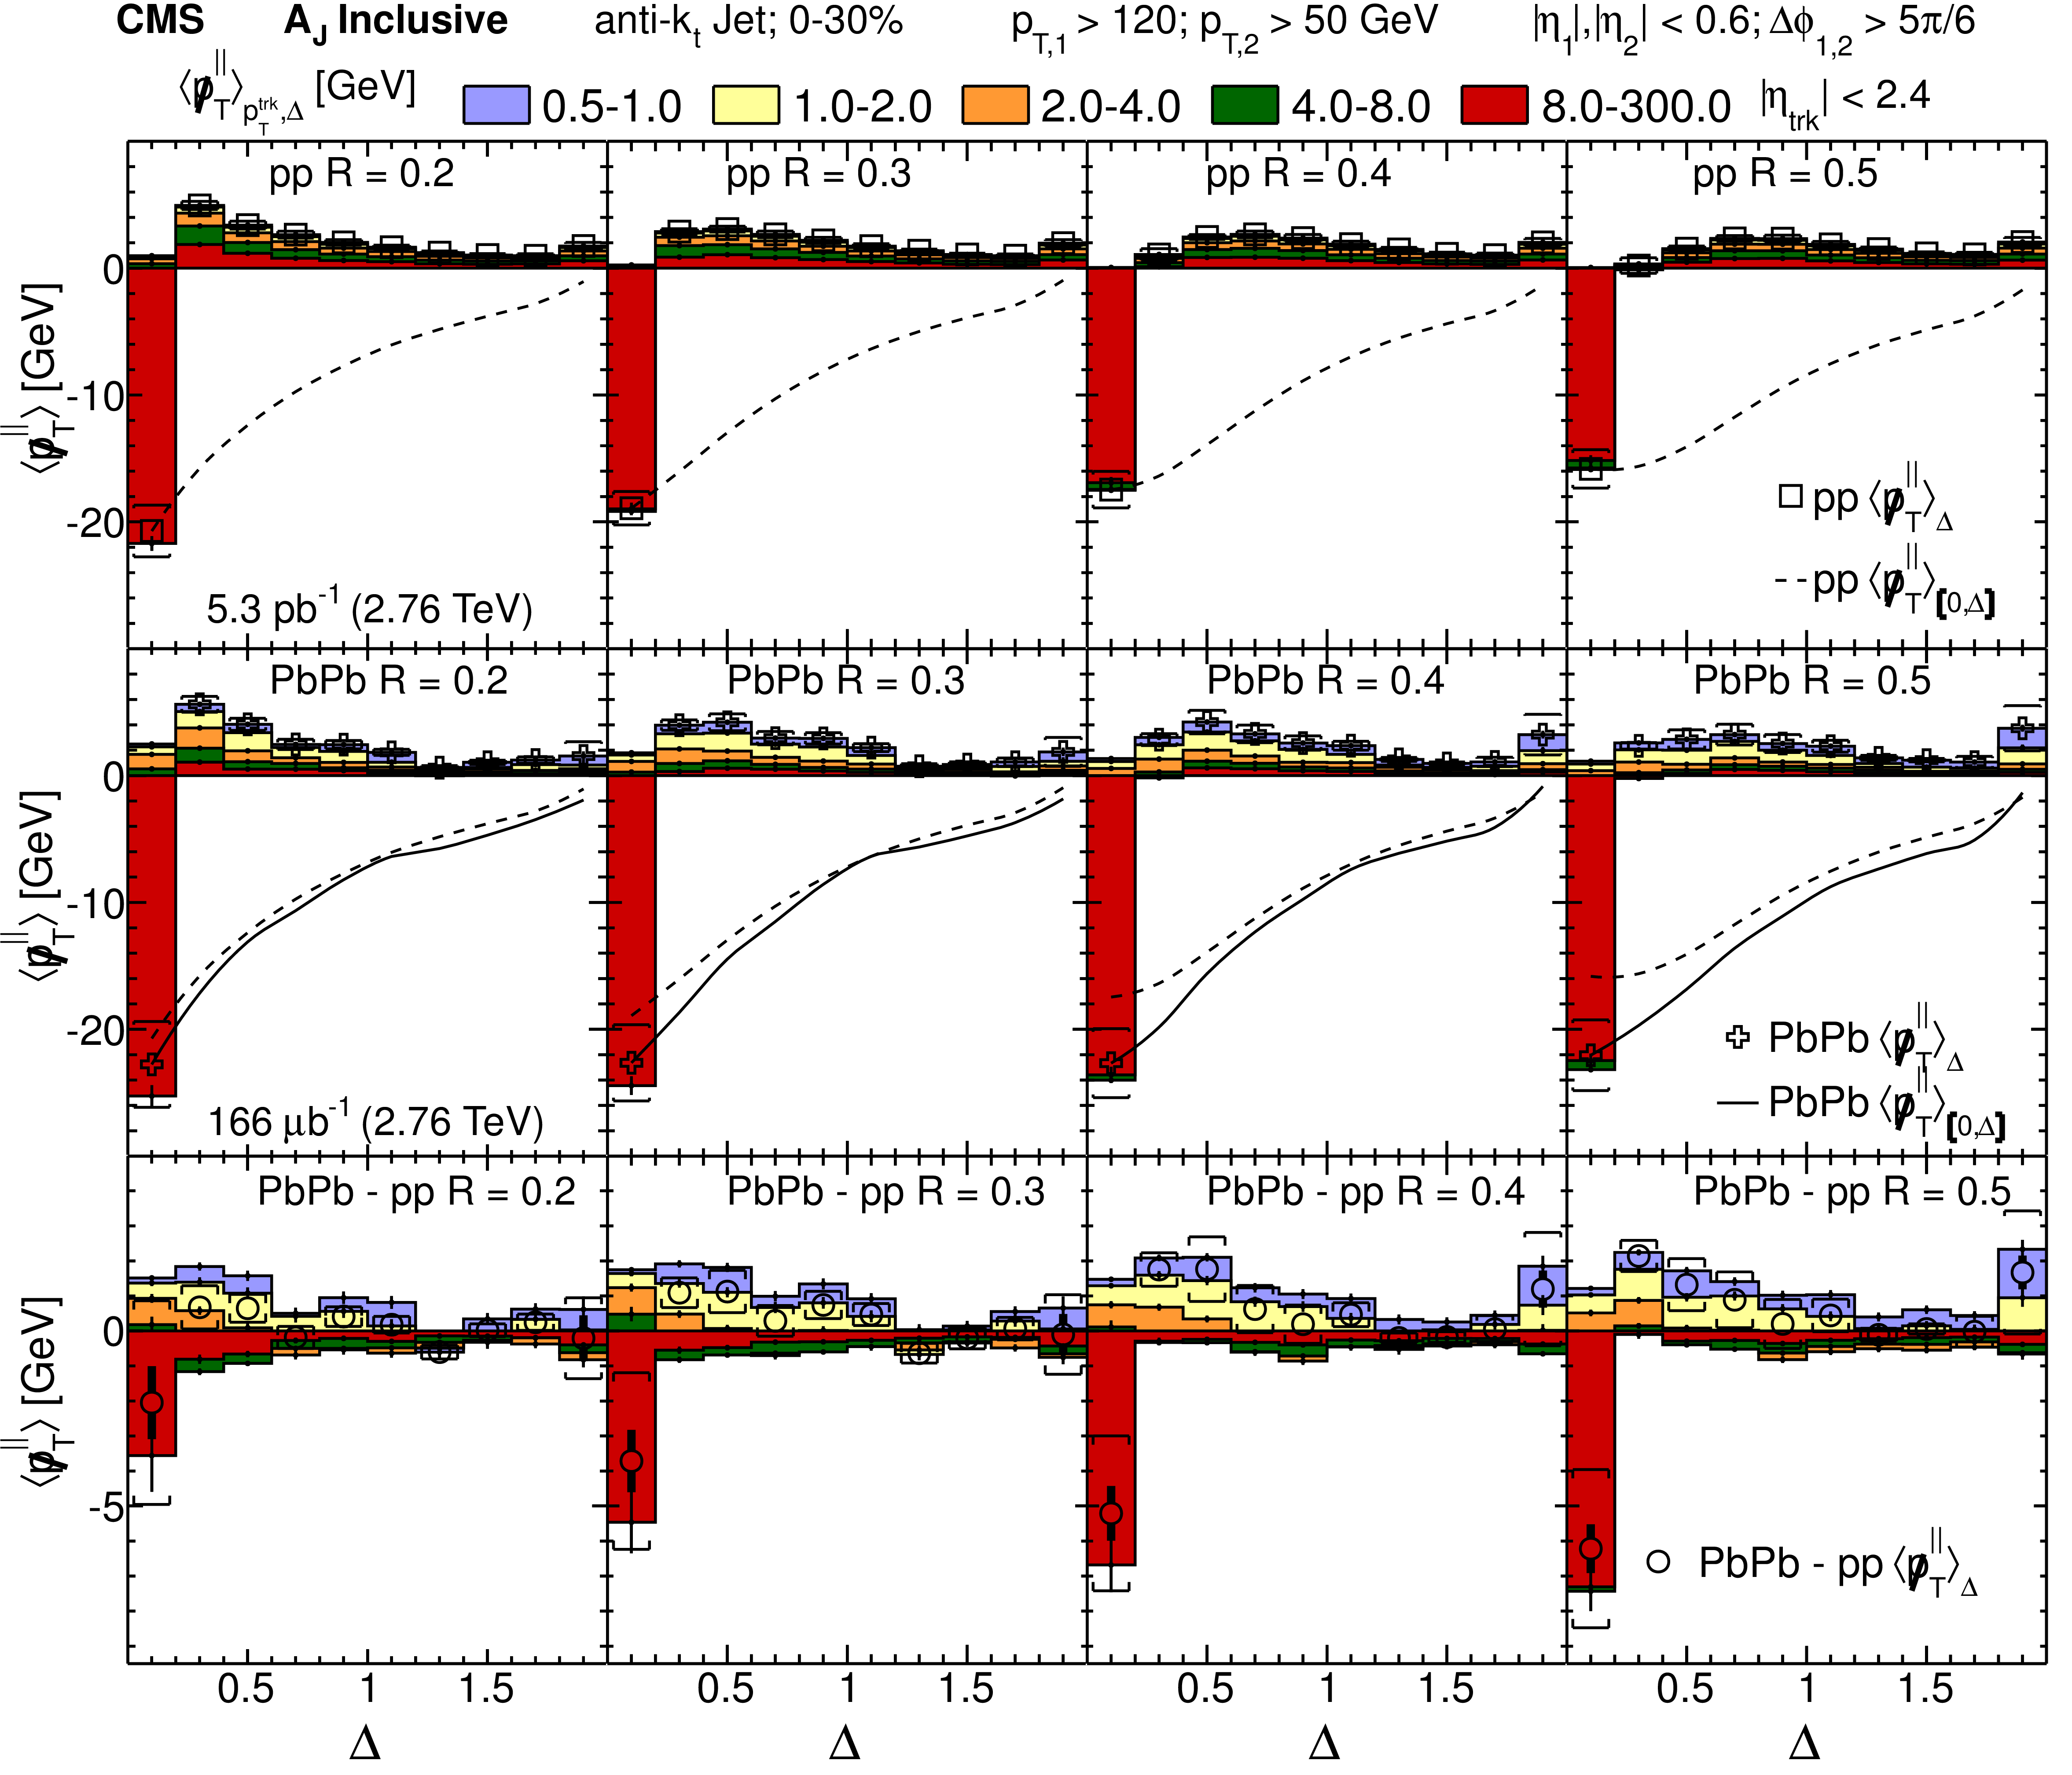
Figure 6:
(Color online) Upper row shows $ < \displaystyle {\not } p_{\mathrm {T}}^{\parallel } > _{p_{\rm T}^{\rm {trk}},\Delta }$ in pp collisions as a function of $\Delta $, for a distance parameter $R = 0.2$, $0.3$, $0.4$, and $0.5$, from left to right for different ranges of track $ {p_{\mathrm {T}}} $, and $ < \displaystyle {\not } p_{\mathrm {T}}^{\parallel } > _{\Delta } $ (i.e. $ < \displaystyle {\not } p_{\mathrm {T}}^{\parallel } > _{p_{\rm T}^{\rm {trk}},\Delta } $ summed over all $ {p_{\mathrm {T}}} $ for a given $\Delta $ bin). Dashed lines indicate cumulative results for $ < \displaystyle {\not } p_{\mathrm {T}}^{\parallel } > _{[0,\Delta ]} $ in pp, for each distance parameter (i.e. integrating $ < \displaystyle {\not } p_{\mathrm {T}}^{\parallel } > _{\Delta } $ over the $\Delta $ range from $\Delta $ = 0 to the point of interest). Middle row provides $ < \displaystyle {\not } p_{\mathrm {T}}^{\parallel } > _{p_{\rm T}^{\rm {trk}},\Delta } $ and $ < \displaystyle {\not } p_{\mathrm {T}}^{\parallel } > _{\Delta } $ in PbPb collisions of centrality range 0--30% as a function of $\Delta $, for distance parameters $R = 0.2$, $0.3$, $0.4$, and $0.5$ from left to right. Solid line indicates $ < \displaystyle {\not } p_{\mathrm {T}}^{\parallel } > _{[0,\Delta ]} $ in PbPb for each distance parameter. Lower row has the difference between PbPb and pp. Error bars and brackets represent statistical and systematic uncertainties, respectively. The results are inclusive in the dijet asymmetry parameter $ {A_J} $. |
png pdf |
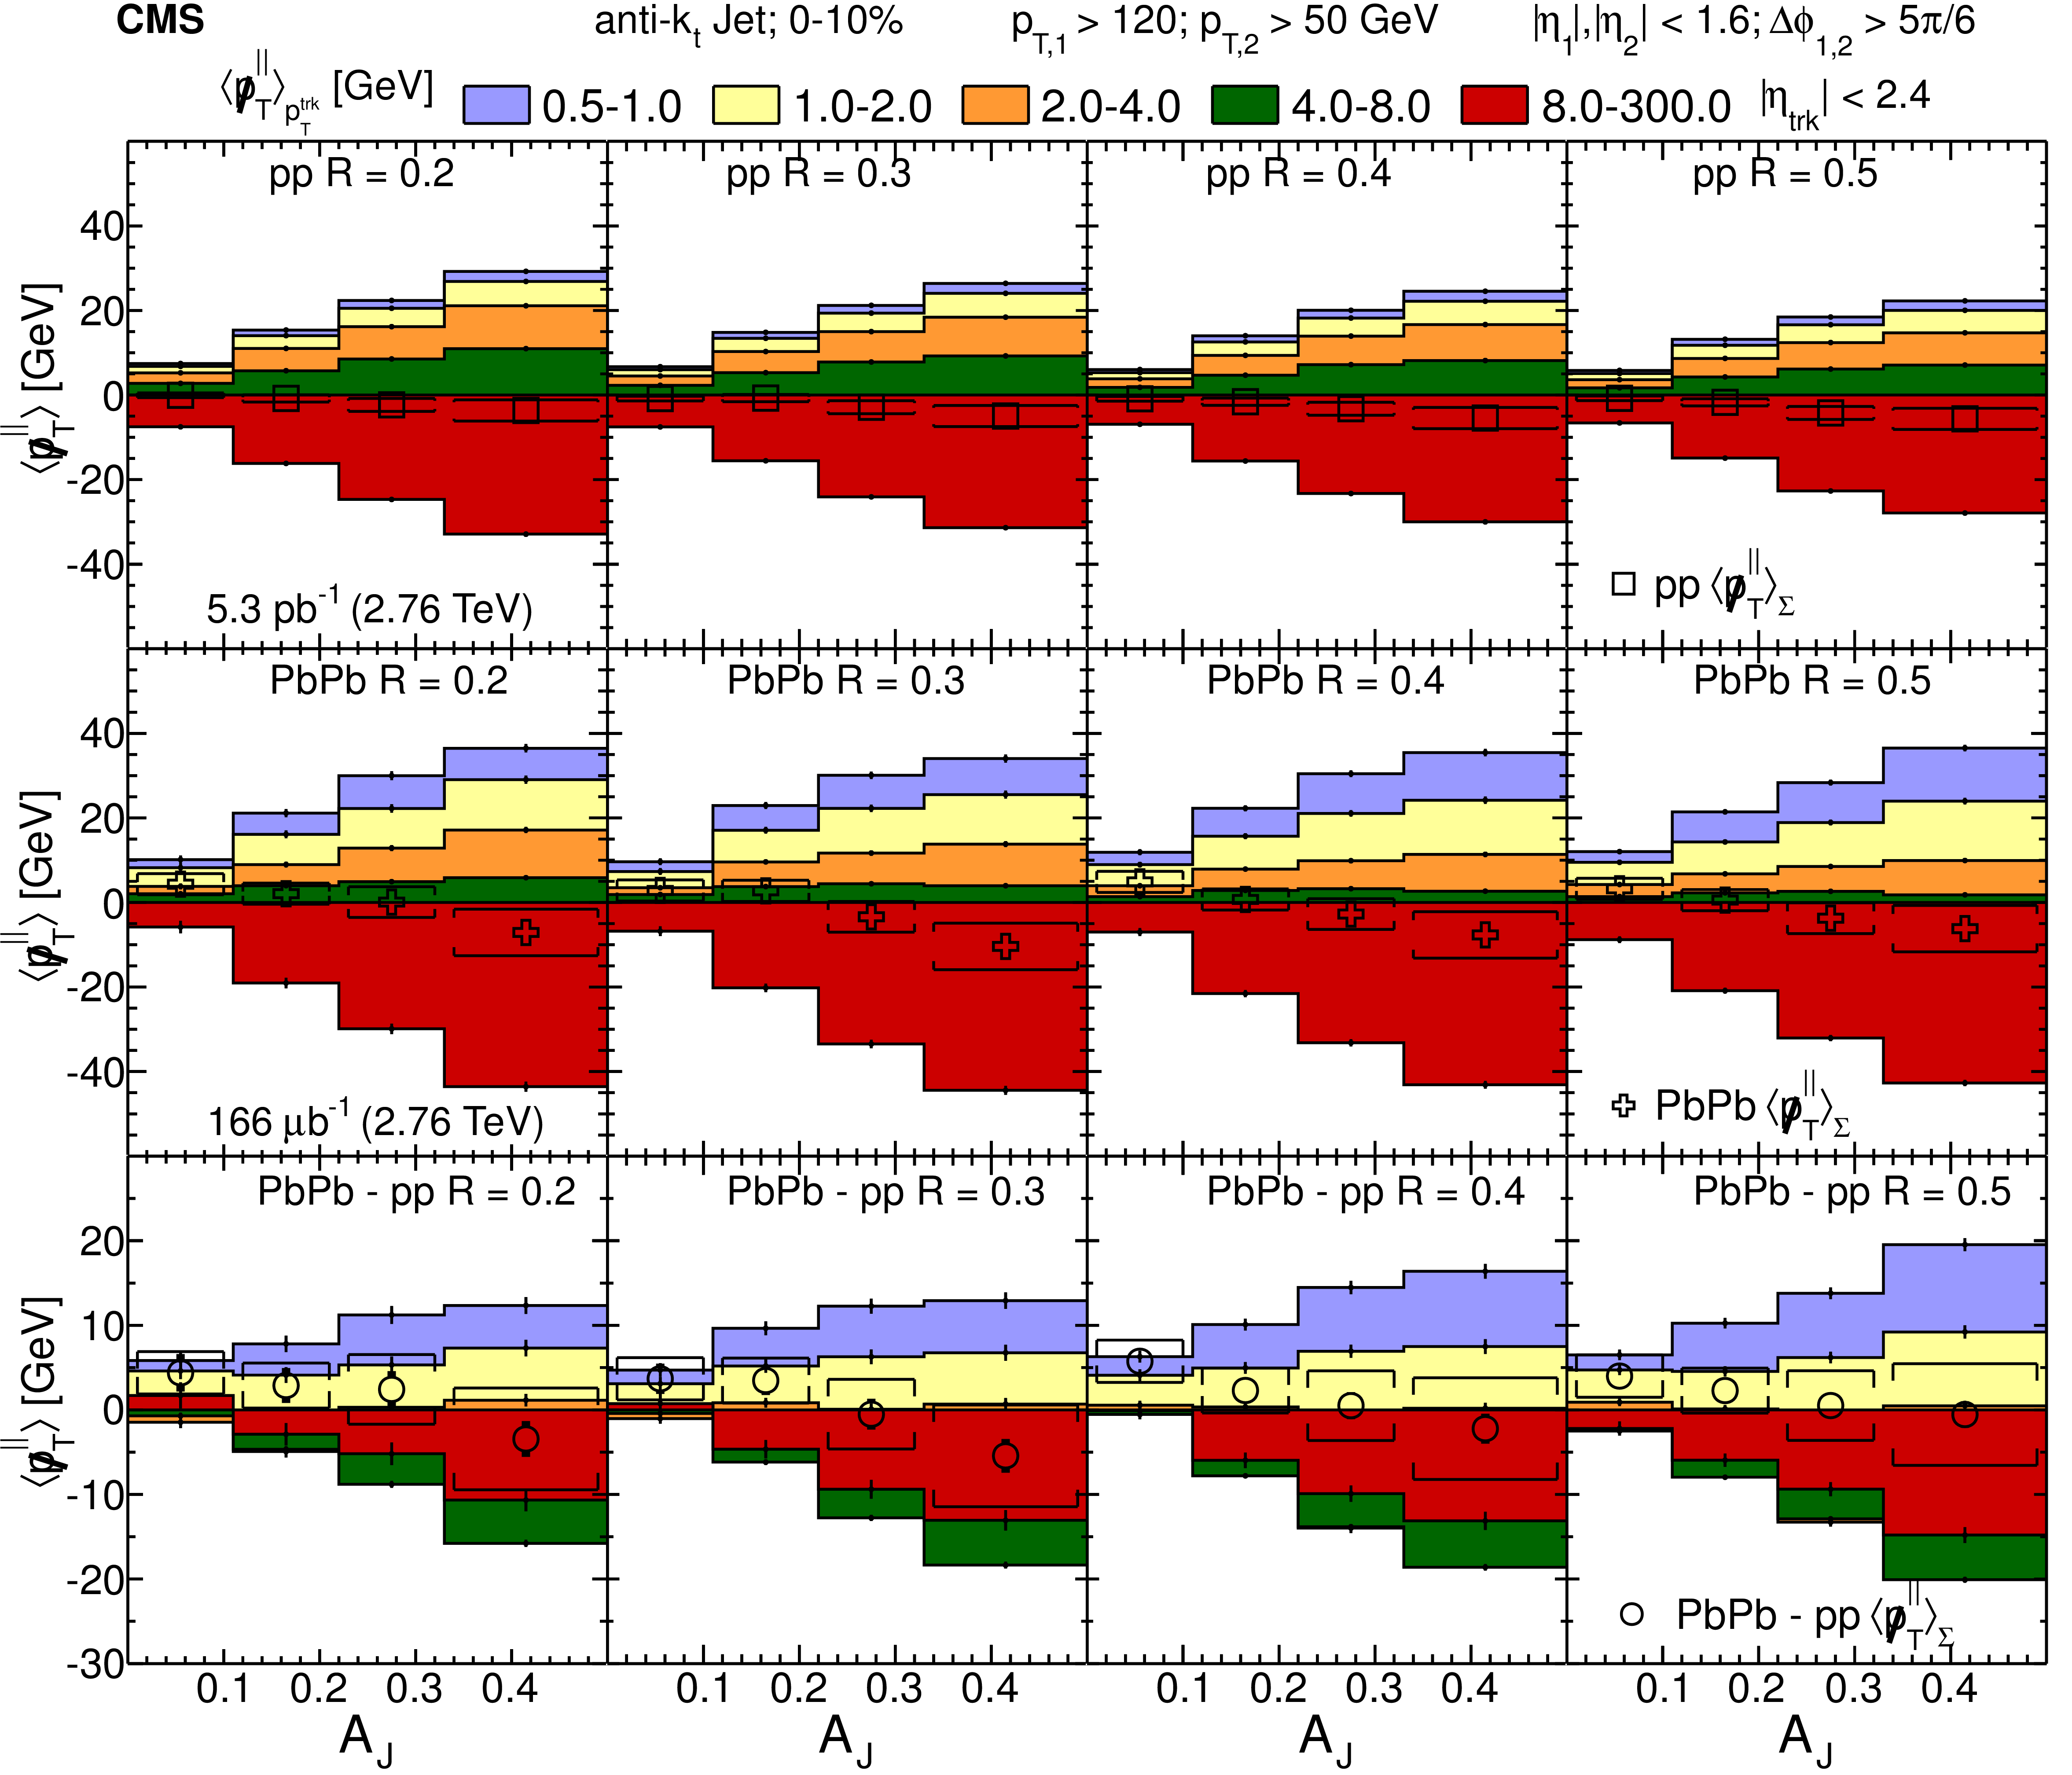
Figure 7:
(Color online) Upper row shows $ < \displaystyle {\not } p_{\mathrm {T}}^{\parallel } > _{p_{\rm T}^{\rm {trk}}} $ (the individual track $ {p_{\mathrm {T}}} $) and $ < \displaystyle {\not } p_{\mathrm {T}}^{\parallel } > _{\Sigma } $ (sum over all ranges of track $ {p_{\mathrm {T}}} $) as a function of $ {A_J} $ in pp collisions for distance parameters $R = 0.2$, $0.3$, $0.4$, and $0.5$, from left to right. The dijet asymmetry ranges from almost balanced ($ {A_J} < 0.11$) to unbalanced ($ {A_J} > 0.33$) dijets. Middle row provides $ < \displaystyle {\not } p_{\mathrm {T}}^{\parallel } > _{p_{\rm T}^{\rm {trk}}} $ and $ < \displaystyle {\not } p_{\mathrm {T}}^{\parallel } > _{\Sigma } $ as a function of $ {A_J} $ in PbPb collisions of centrality range 0--10%, for distance parameter $R = 0.2$, $0.3$, $0.4$, and $0.5$, from left to right. Lower row has the difference PbPb $-$ pp of the $ < \displaystyle {\not } p_{\mathrm {T}}^{\parallel } > _{p_{\rm T}^{\rm {trk}}} $, and $ < \displaystyle {\not } p_{\mathrm {T}}^{\parallel } > _{\Sigma } $, which are shown in the upper panels. Error bars and brackets represent statistical and systematic uncertainties, respectively. |
png pdf |
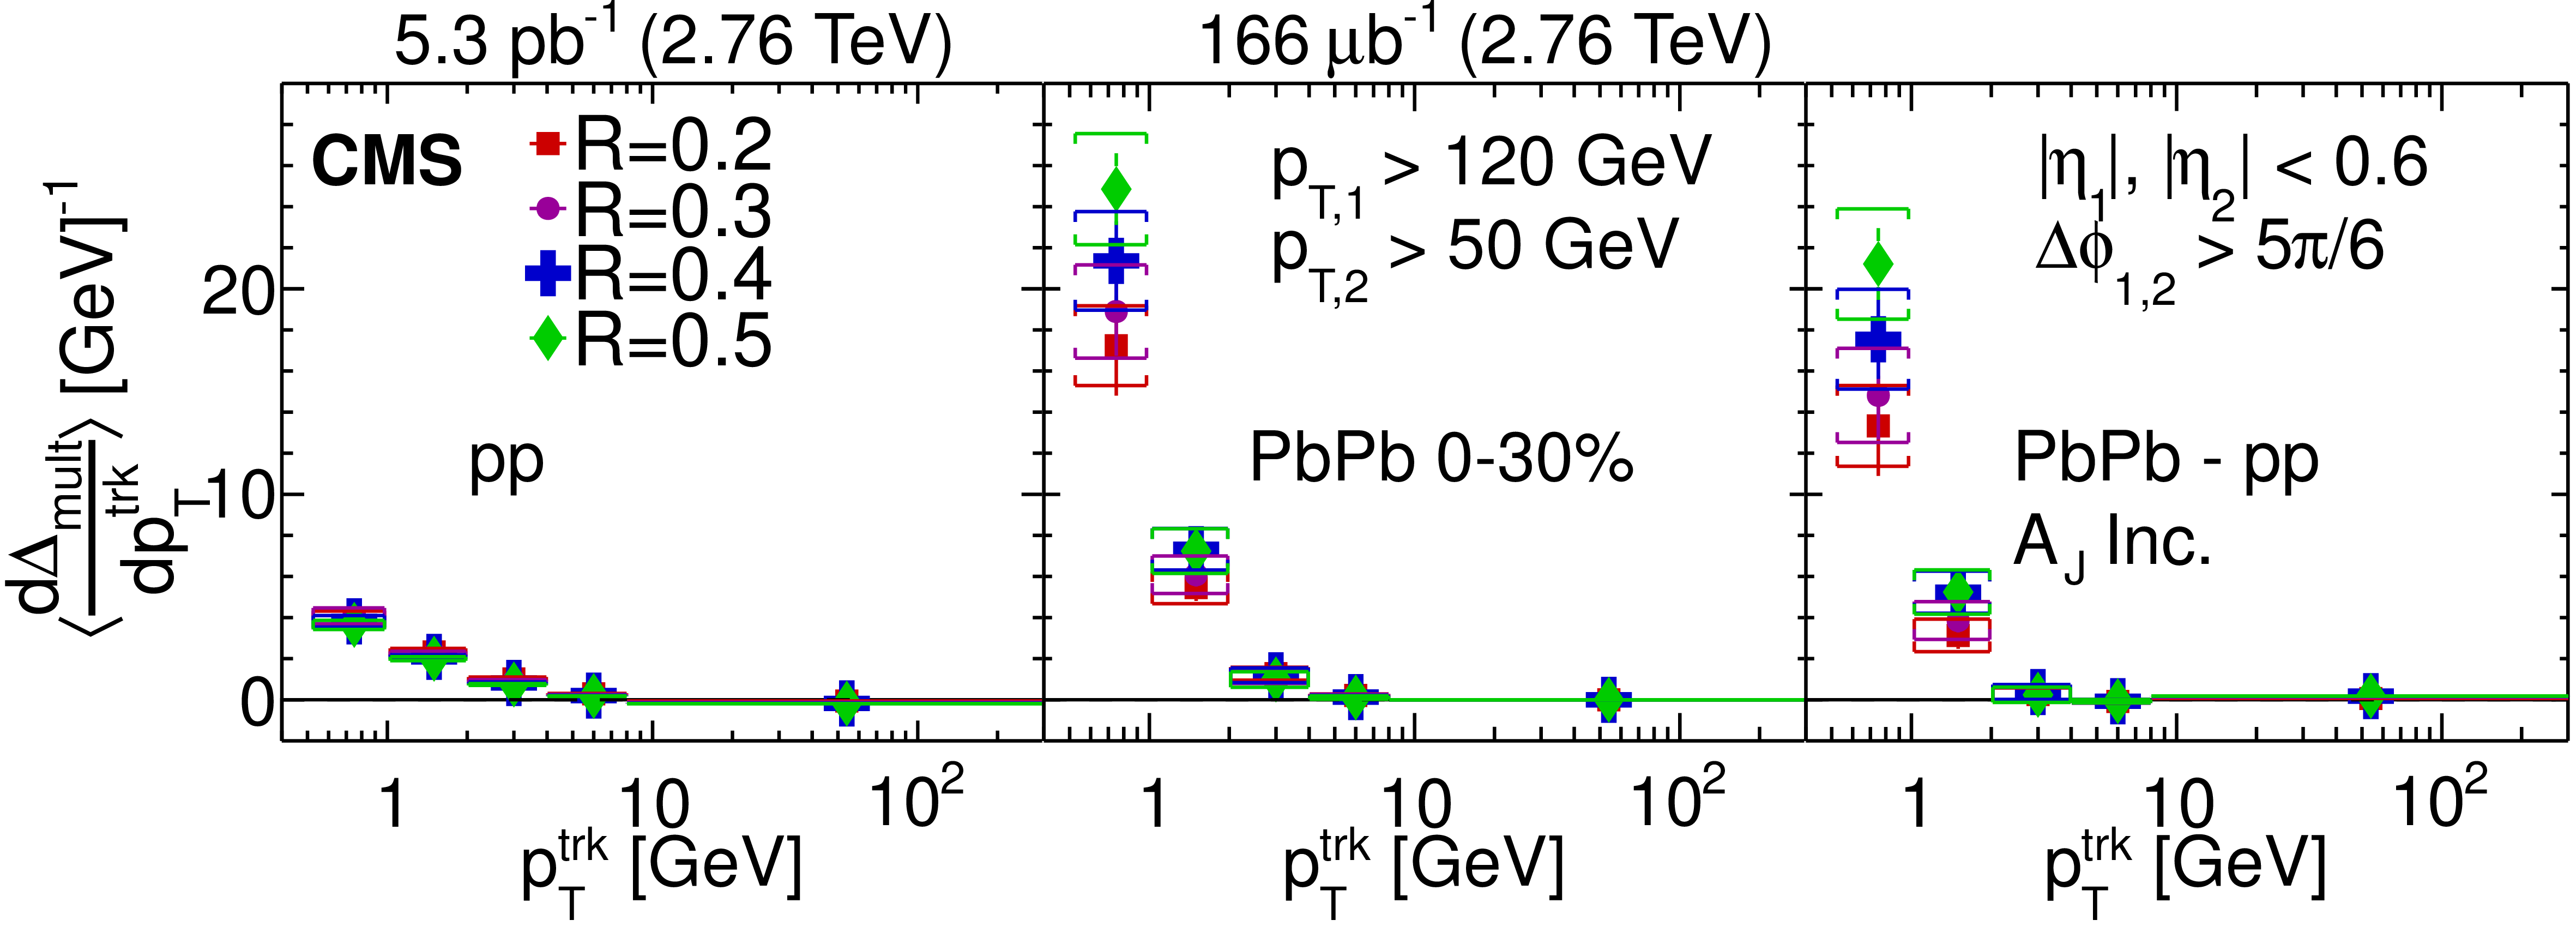
Figure 8:
(Color online) Difference in differential multiplicity $ < { {\mathrm {d}}\Delta _{\rm mult}}/{ {\mathrm {d}}p_{\mathrm {T}^{\rm trk}}}> $ between the away-side and leading-jet hemispheres as a function of track $ {p_{\mathrm {T}}} $, using an inclusive dijet asymmetry selection. Left panel has measurements in pp for jet radii $R = 0.2$, $0.3$, $0.4$, and $0.5$, and the middle panel displays similar measurements in PbPb. Right panel provides the difference in $ < { {\mathrm {d}}\Delta _{\rm mult}}/{ {\mathrm {d}}p_{\mathrm {T}}^{\rm trk}}> $ between PbPb and pp collisions for each momentum range. Systematic uncertainties are shown as boxes. Error bars represent statistical uncertainties. |
| Tables | |
png pdf |
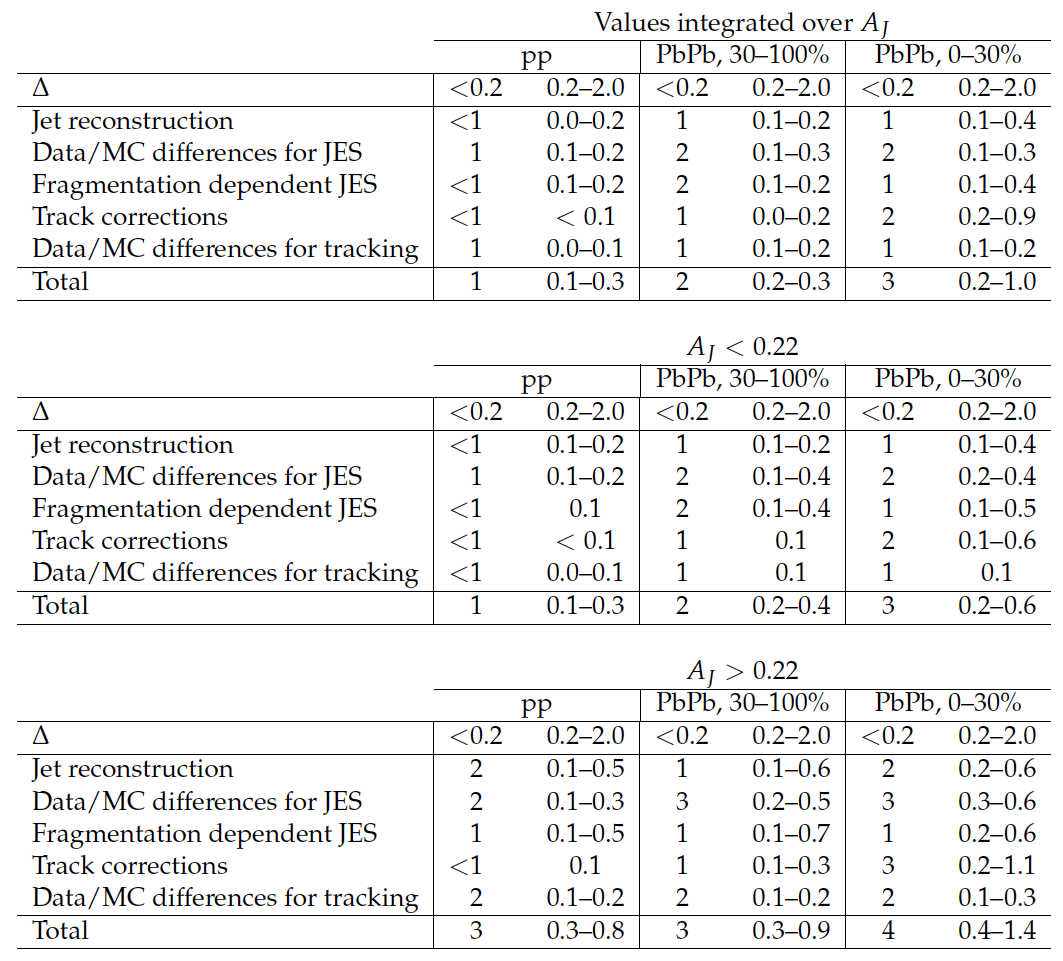
Table 1:
Systematic uncertainties in $ < \displaystyle {\not } p_{\mathrm {T}}^{\parallel } > _{\Delta } $ for jets clustered with distance parameter of 0.3 in pp, and in central and peripheral PbPb collisions, for different $ {A_J} $ selections. Uncertainties are shown as shifts in the values in units of GeV (rather than as fractions) for two $\Delta $ selections. |
png pdf |
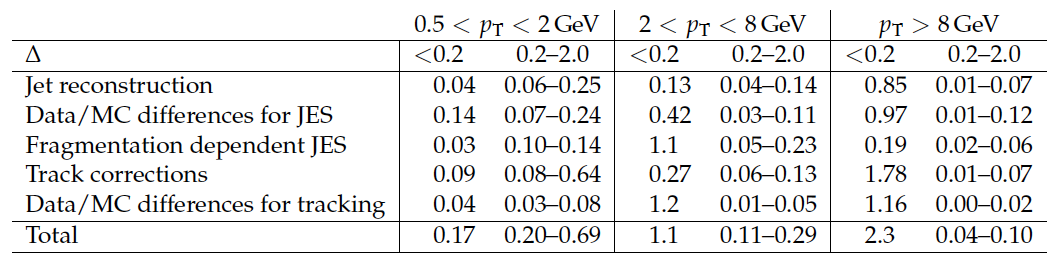
Table 2:
Systematic uncertainties in $ < \displaystyle {\not } p_{\mathrm {T}}^{\parallel } > _{p_{\rm T}^{\rm {trk}},\Delta } $ in 0--30% PbPb collisions, for jets clustered with a distance parameter of 0.3, as a function of charged-particle $ {p_{\mathrm {T}}} $. Uncertainties are shown as shifts in the values in units of GeV (rather than as fractions) for two $\Delta $ selections. |
png pdf |
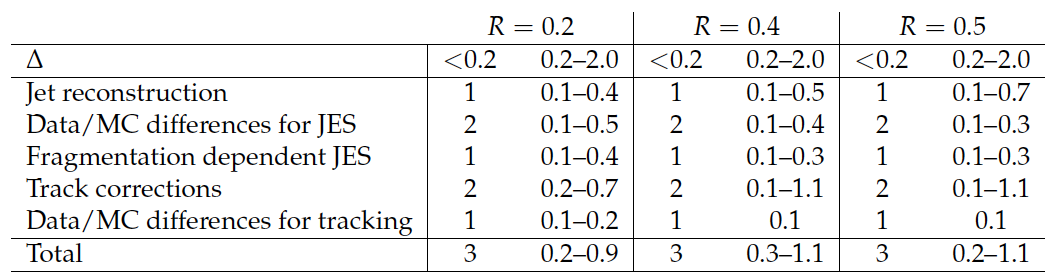
Table 3:
Systematic uncertainties in $ < \displaystyle {\not } p_{\mathrm {T}}^{\parallel } > _{p_{\rm T}^{\rm {trk}},\Delta } $ in 0--30% PbPb collisions are shown for jets clustered with distance parameters of 0.2, 0.4 and 0.5. Uncertainties are shown as shifts in the values in units of GeV (rather than as fractions) for two $\Delta $ selections. |
png pdf |
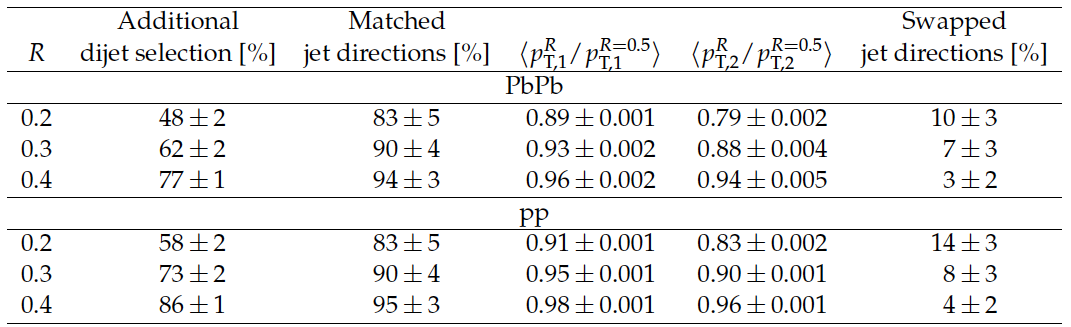
Table 4:
Overlap in event selections for 0-100% PbPb and pp collisions. The second column gives the percentage of events that pass dijet selections and a tight pseudorapidity requirement ($ | \eta | < 0.6 $) for $R = 0.5$, and an additional dijet selection also required for a smaller $R$ value. In columns 3-6 the leading and subleading jets with $R = 0.5$ are matched to the leading and subleading jets with smaller $R$ values, requiring only $R = 0.5 $ selection on jets. The third column shows the percentage of these events where both leading and subleading jets point in the same direction ($ \Delta_i = \sqrt{ ( \eta_i^{R} - \eta_i^{R=0.5} )^2 + ( \phi_i^{R} - \phi_i^{R=0.5} )^2 } < 0.5 $ for $ i =$ 1 and 2). The average value of the ratio of $p_{\mathrm{T}}$ of the leading and subleading jets at jet for a given $R$, to their $p_{\mathrm{T}}$ for $R = 0.5 $ are shown in the fourth and fifth columns, respectively. The sixth column shows percentage of events in which subleading jets with the given $R$ parameter match the $R = 0.5$ leading jet, and the leading jet matches the $R = 0.5$ subleading jet. |
| Summary |
| The transverse momentum flow relative to the dijet axis in PbPb and pp collisions containing jets with large $p_{\mathrm{T}}$ has been studied using data corresponding to integrated luminosities of 166 $\mu$b$^{-1}$ and 5.3 pb$^{-1}$, respectively, collected at a nucleon-nucleon center-of-mass energy of 2.76 TeV. Dijet events were selected containing a leading jet with transverse momentum $p_{\rm T,1} > 120 $ GeV and a subleading jet with $p_{\rm T,2} >$ 50 GeV, reconstructed using the anti-$k_t$ algorithm, with distance parameters of $R = 0.2$, $0.3$, $0.4$ and $0.5$. For PbPb collisions, the dijet events show a larger asymmetry in $ p_{\mathrm{T}}$ between the leading and subleading jets than in pp collisions. The multiplicity, angular, and $p_{\mathrm{T}}$ spectra of the radiation balancing this asymmetry are characterized using several techniques as a function of PbPb collision centrality and $p_{\mathrm{T}}$ asymmetry. For a given dijet asymmetry, the imbalance in $p_{\mathrm{T}}$ in PbPb collisions is found to be compensated by particles at $p_{\mathrm{T}} =$ 0.5-2 GeV, whereas in pp collisions most of the momentum balance is found in the $p_{\mathrm{T}}$ range of 2-8 GeV, reflecting a softening of the radiation responsible for the imbalance in $p_{\mathrm{T}} $ of the asymmetric dijet system in PbPb interactions. Correspondingly, a larger multiplicity of associated particles is seen in PbPb than in pp collisions. Both measurements show larger differences between PbPb and pp for more central PbPb collisions. The current data provide the first detailed study of the angular dependence of charged particle contributions to the asymmetry up to large angles from the jet axis ($\Delta = 1.8$). Despite the large shift in the $p_{\mathrm{T}}$ spectrum of particles, the angular pattern of energy flow in PbPb events as a function of $\Delta$ matches that seen in pp collisions, especially for small $R$ parameters. The results suggest that either the leading jet is getting narrower, or the subleading jet is getting broader after quenching. In pp collisions, the balancing distribution shifts to larger $\Delta$ with increasing distance parameter $R$, likely because of the presence of a third jet further away from the dijet axis. The shift is more pronounced than in PbPb collisions, where there is an excess of low $p_{\mathrm{T}}$ particles close to the jet axes. These results constrain the redistribution of transverse momentum in the modelling of QCD energy loss processes of partons traversing the hot and dense medium created in heavy-ion collisions. |
|
|
Compact Muon Solenoid LHC, CERN |
|

|

|

|

|

|