

Compact Muon Solenoid
LHC, CERN
| CMS-TOP-24-007 ; CERN-EP-2025-061 | ||
| Observation of a pseudoscalar excess at the top quark pair production threshold | ||
| CMS Collaboration | ||
| 28 March 2025 | ||
| Rep. Prog. Phys, 88 (2025) 087801 | ||
| Abstract: A search for resonances in top quark pair ($ \mathrm{t} \overline{\mathrm{t}} $) production in final states with two charged leptons and multiple jets is presented, based on proton-proton collision data collected by the CMS experiment at the CERN LHC at $ \sqrt{s}= $ 13 TeV, corresponding to 138 fb$ ^{-1} $. The analysis explores the invariant mass of the $ \mathrm{t} \overline{\mathrm{t}} $ system and two angular observables that provide direct access to the correlation of top quark and antiquark spins. A significant excess of events is observed near the kinematic $ \mathrm{t} \overline{\mathrm{t}} $ threshold compared to the nonresonant production predicted by fixed-order perturbative quantum chromodynamics (pQCD). The observed enhancement is consistent with the production of a color-singlet pseudoscalar ($ ^1\mathrm{S}_0^{[1]} $) quasi-bound toponium state, as predicted by nonrelativistic quantum chromodynamics. Using a simplified model for $ ^1\mathrm{S}_0^{[1]} $ toponium, the cross section of the excess above the pQCD prediction is measured to be 8.8 $ ^{+1.2}_{-1.4} $ pb. | ||
| Links: e-print arXiv:2503.22382 [hep-ex] (PDF) ; CDS record ; inSPIRE record ; HepData record ; Physics Briefing ; CADI line (restricted) ; | ||
| Figures | |
png pdf |
Figure 1:
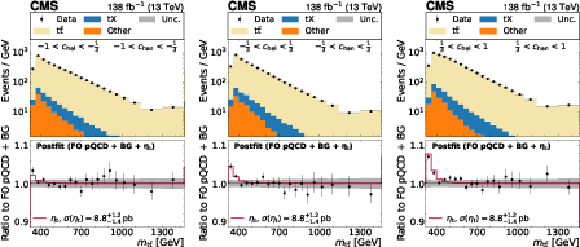
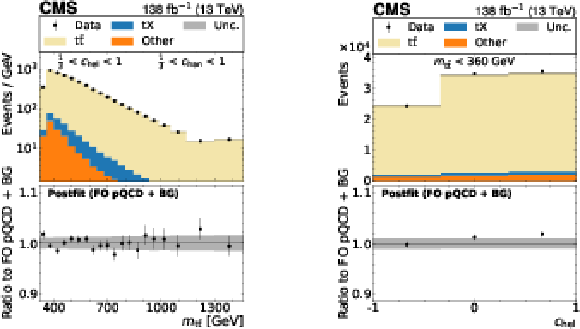
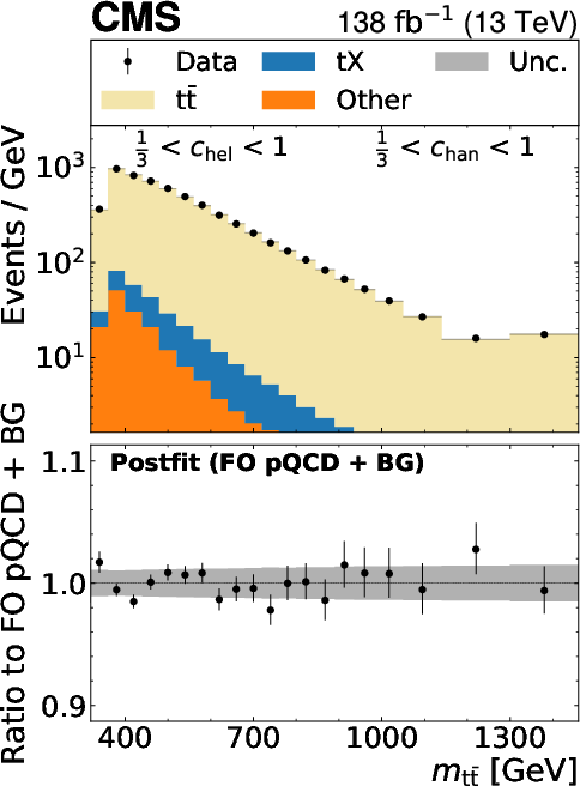
Observed (points with statistical error bars) and predicted (stacked colored histograms) $ m_{{\mathrm{t}\overline{\mathrm{t}}} } $ distribution in three out of nine ($ c_\text{hel} $, $ c_\text{han} $) bins. In the upper panels, the $ \mathrm{t} \overline{\mathrm{t}} $ histogram shows the FO pQCD prediction after the fit to the data that includes the $ \eta_{\mathrm{t}} $ signal model (whose contribution is not drawn), and the shown event rates are divided by the bin width. The lower panels display the ratio of the data to the FO pQCD$+$background prediction, with $ \eta_{\mathrm{t}} $ signal overlaid at its best fit $ \eta_{\mathrm{t}} $ cross section (red line). The gray band indicates the postfit uncertainty. The first and last $ m_{{\mathrm{t}\overline{\mathrm{t}}} } $ bins include all events with reconstructed $ m_{{\mathrm{t}\overline{\mathrm{t}}} } $ below 360 and above 1300 GeV, respectively, and the drawn bin width is used for the normalization in these bins. |
png pdf |
Figure 1-a:
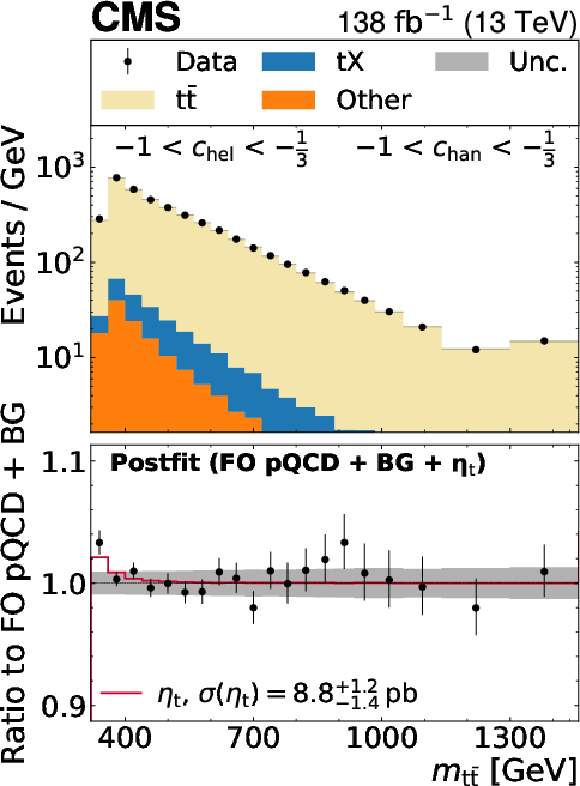
Observed (points with statistical error bars) and predicted (stacked colored histograms) $ m_{{\mathrm{t}\overline{\mathrm{t}}} } $ distribution in one out of nine bins ($ c_\text{hel} \in [-1, -1/3] $, $ c_\text{han} \in [-1, -1/3] $). In the upper panel, the $ \mathrm{t} \overline{\mathrm{t}} $ histogram shows the FO pQCD prediction after the fit to the data that includes the $ \eta_{\mathrm{t}} $ signal model (whose contribution is not drawn), and the shown event rates are divided by the bin width. The lower panel displays the ratio of the data to the FO pQCD$+$background prediction, with $ \eta_{\mathrm{t}} $ signal overlaid at its best fit $ \eta_{\mathrm{t}} $ cross section (red line). The gray band indicates the postfit uncertainty. The first and last $ m_{{\mathrm{t}\overline{\mathrm{t}}} } $ bins include all events with reconstructed $ m_{{\mathrm{t}\overline{\mathrm{t}}} } $ below 360 and above 1300 GeV, respectively, and the drawn bin width is used for the normalization in these bins. |
png pdf |
Figure 1-b:
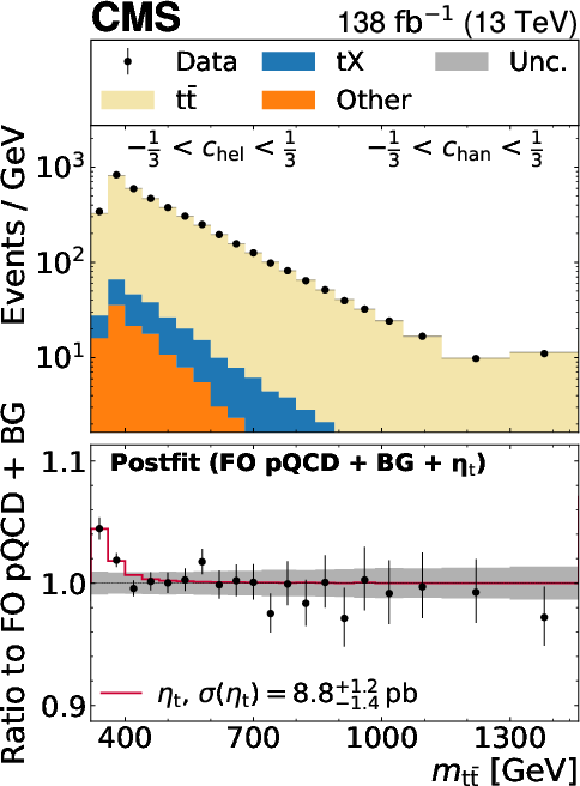
Observed (points with statistical error bars) and predicted (stacked colored histograms) $ m_{{\mathrm{t}\overline{\mathrm{t}}} } $ distribution in one out of nine bins ($ c_\text{hel} \in [-1/3,1/3] $, $ c_\text{han} \in [-1/3,1/3] $). In the upper panel, the $ \mathrm{t} \overline{\mathrm{t}} $ histogram shows the FO pQCD prediction after the fit to the data that includes the $ \eta_{\mathrm{t}} $ signal model (whose contribution is not drawn), and the shown event rates are divided by the bin width. The lower panel displays the ratio of the data to the FO pQCD$+$background prediction, with $ \eta_{\mathrm{t}} $ signal overlaid at its best fit $ \eta_{\mathrm{t}} $ cross section (red line). The gray band indicates the postfit uncertainty. The first and last $ m_{{\mathrm{t}\overline{\mathrm{t}}} } $ bins include all events with reconstructed $ m_{{\mathrm{t}\overline{\mathrm{t}}} } $ below 360 and above 1300 GeV, respectively, and the drawn bin width is used for the normalization in these bins. |
png pdf |
Figure 1-c:
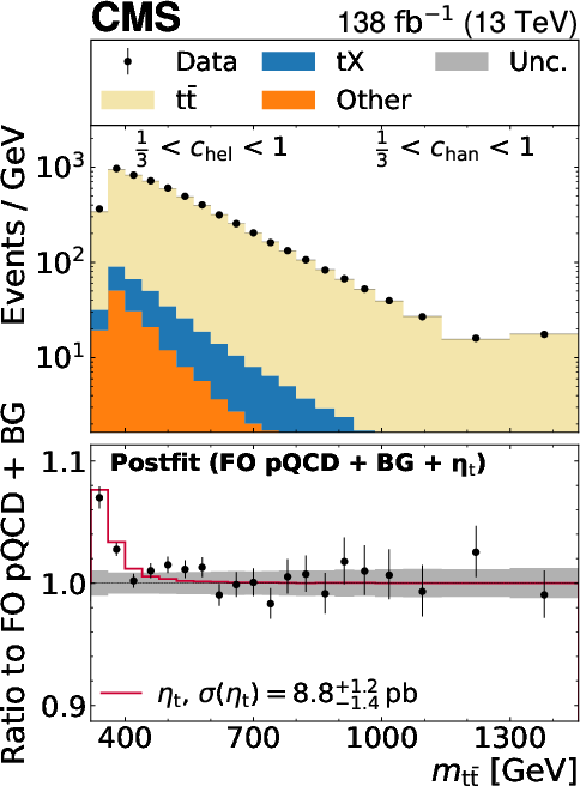
Observed (points with statistical error bars) and predicted (stacked colored histograms) $ m_{{\mathrm{t}\overline{\mathrm{t}}} } $ distribution in one out of nine bins ($ c_\text{hel} \in [1/3,1] $, $ c_\text{han} \in [1/3,1] $). In the upper panel, the $ \mathrm{t} \overline{\mathrm{t}} $ histogram shows the FO pQCD prediction after the fit to the data that includes the $ \eta_{\mathrm{t}} $ signal model (whose contribution is not drawn), and the shown event rates are divided by the bin width. The lower panel displays the ratio of the data to the FO pQCD$+$background prediction, with $ \eta_{\mathrm{t}} $ signal overlaid at its best fit $ \eta_{\mathrm{t}} $ cross section (red line). The gray band indicates the postfit uncertainty. The first and last $ m_{{\mathrm{t}\overline{\mathrm{t}}} } $ bins include all events with reconstructed $ m_{{\mathrm{t}\overline{\mathrm{t}}} } $ below 360 and above 1300 GeV, respectively, and the drawn bin width is used for the normalization in these bins. |
png pdf |
Figure 2:
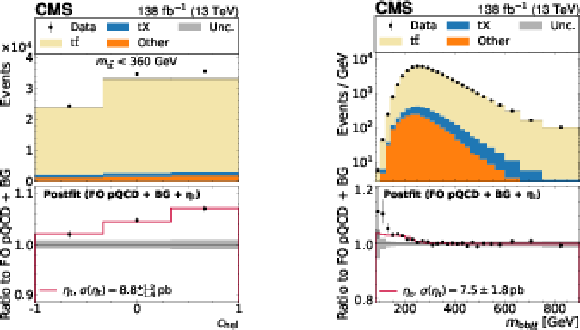
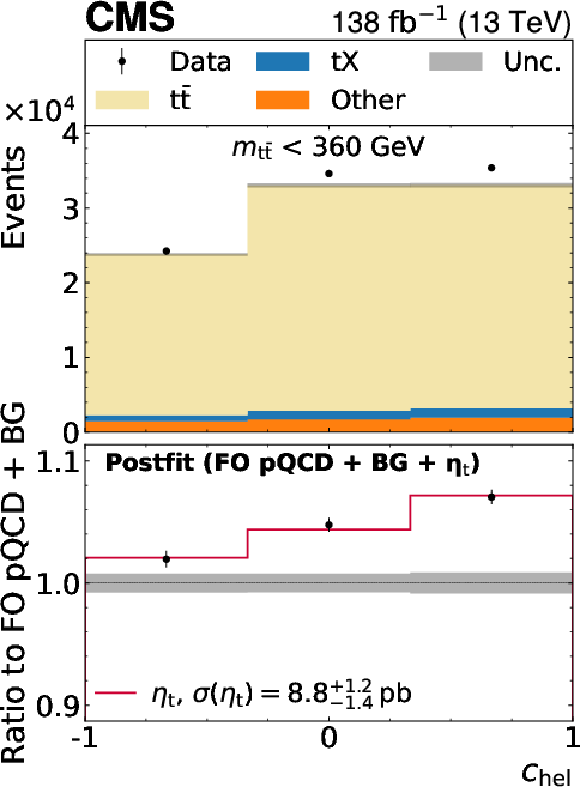
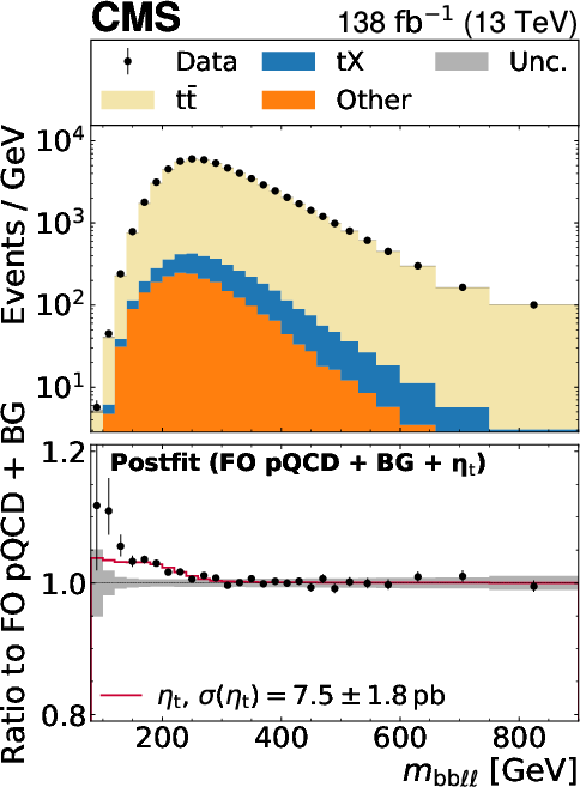
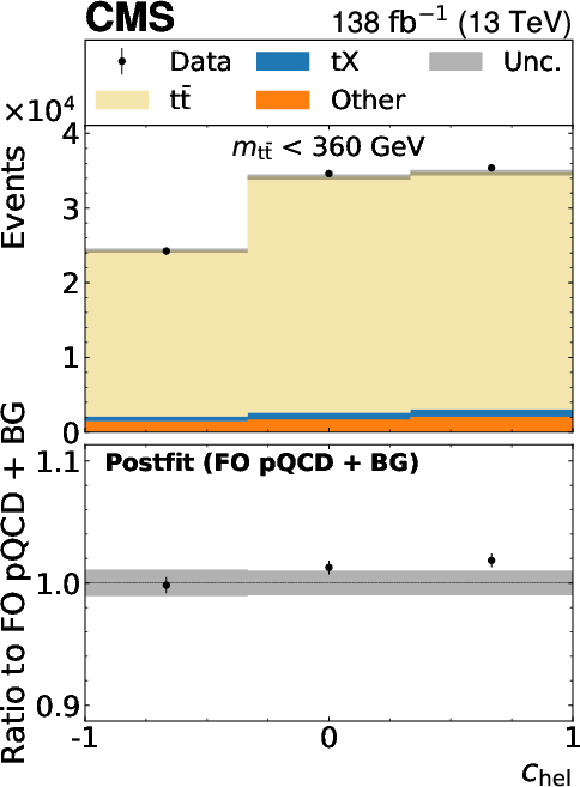
Observed (points with statistical error bars) and predicted (stacked colored histograms) distributions. Left: $ c_\text{hel} $ for $ m_{{\mathrm{t}\overline{\mathrm{t}}} } < $ 360 GeV and integrated over $ c_\text{han} $, from the nominal fit using $ m_{{\mathrm{t}\overline{\mathrm{t}}} } $. Right: $ \smash{m_{\mathrm{b}\mathrm{b}\ell\ell}} $ integrated over $ c_\text{hel} $ and $ c_\text{han} $, from the alternative fit using $ \smash{m_{\mathrm{b}\mathrm{b}\ell\ell}} $ instead of $ m_{{\mathrm{t}\overline{\mathrm{t}}} } $, which is discussed in Section 4.1. In the upper panels, the $ \mathrm{t} \overline{\mathrm{t}} $ histogram shows the FO pQCD prediction after the fit to the data that includes the $ \eta_{\mathrm{t}} $ signal model (whose contribution is not drawn). On the right, the shown event rates are divided by the bin width. The lower panels display the ratio of the data to the FO pQCD$+$background prediction, with $ \eta_{\mathrm{t}} $ signal overlaid at its best fit $ \eta_{\mathrm{t}} $ cross section (red line). The gray band indicates the postfit uncertainty. The first and last $ \smash{m_{\mathrm{b}\mathrm{b}\ell\ell}} $ bins include all events with reconstructed $ \smash{m_{\mathrm{b}\mathrm{b}\ell\ell}} $ below 100 and above 750 GeV, respectively, and the drawn bin width is used for the normalization in these bins. |
png pdf |
Figure 2-a:
Observed (points with statistical error bars) and predicted (stacked colored histograms) $ c_\text{hel} $ distribution for $ m_{{\mathrm{t}\overline{\mathrm{t}}} } < $ 360 GeV and integrated over $ c_\text{han} $, from the nominal fit using $ m_{{\mathrm{t}\overline{\mathrm{t}}} } $. In the upper panel, the $ \mathrm{t} \overline{\mathrm{t}} $ histogram shows the FO pQCD prediction after the fit to the data that includes the $ \eta_{\mathrm{t}} $ signal model (whose contribution is not drawn). The lower panel displays the ratio of the data to the FO pQCD$+$background prediction, with $ \eta_{\mathrm{t}} $ signal overlaid at its best fit $ \eta_{\mathrm{t}} $ cross section (red line). The gray band indicates the postfit uncertainty. |
png pdf |
Figure 2-b:
Observed (points with statistical error bars) and predicted (stacked colored histograms) $ \smash{m_{\mathrm{b}\mathrm{b}\ell\ell}} $ distribution integrated over $ c_\text{hel} $ and $ c_\text{han} $, from the alternative fit using $ \smash{m_{\mathrm{b}\mathrm{b}\ell\ell}} $ instead of $ m_{{\mathrm{t}\overline{\mathrm{t}}} } $, which is discussed in Section 4.1. In the upper panel, the $ \mathrm{t} \overline{\mathrm{t}} $ histogram shows the FO pQCD prediction after the fit to the data that includes the $ \eta_{\mathrm{t}} $ signal model (whose contribution is not drawn). The shown event rates are divided by the bin width. The lower panel displays the ratio of the data to the FO pQCD$+$background prediction, with $ \eta_{\mathrm{t}} $ signal overlaid at its best fit $ \eta_{\mathrm{t}} $ cross section (red line). The gray band indicates the postfit uncertainty. The first and last $ \smash{m_{\mathrm{b}\mathrm{b}\ell\ell}} $ bins include all events with reconstructed $ \smash{m_{\mathrm{b}\mathrm{b}\ell\ell}} $ below 100 and above 750 GeV, respectively, and the drawn bin width is used for the normalization in these bins. |
png pdf |
Figure 3:
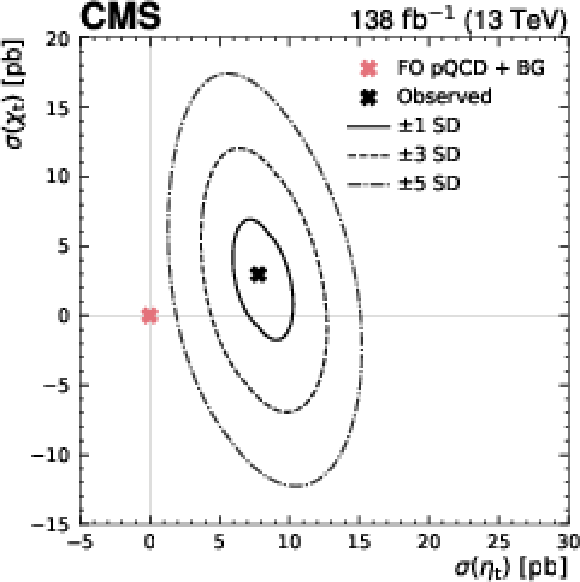
Best fit value (cross) and allowed regions at one (solid line), three (dashed line), and five (dotted-dashed line) SDs for the cross section of $ \eta_{\mathrm{t}} $ and $ \chi \mathrm{t} $ production, as observed in data (black). The FO pQCD$+$background expectation of zero $ \eta_{\mathrm{t}} $ and $ \chi \mathrm{t} $ contributions is denoted by a pink star. Negative cross section values refer to a reduction of the $ \mathrm{t} \overline{\mathrm{t}} $ production cross sections with respect to the FO pQCD$+$background prediction around the threshold. |
png pdf |
Figure 4:
Observed (points with statistical error bars) and predicted (stacked colored histograms) $ m_{{\mathrm{t}\overline{\mathrm{t}}} } $ distribution in the ($ c_\text{hel} $, $ c_\text{han} $) bin with the highest expected $ \eta_{\mathrm{t}} $ contribution (left) and $ c_\text{hel} $ distribution for $ m_{{\mathrm{t}\overline{\mathrm{t}}} } < $ 360 GeV and integrated over $ c_\text{han} $ (right). In the upper panels, the histograms account only for the FO pQCD$+$background prediction, and are shown after the background-only fit to the data. On the left, the shown event rates are divided by the bin width. The lower panels display the ratio of the data to the FO pQCD$+$background prediction. The gray band indicates the postfit uncertainty. The binning is the same as in Figs. 1 and 2 (left). |
png pdf |
Figure 4-a:
Observed (points with statistical error bars) and predicted (stacked colored histograms) $ m_{{\mathrm{t}\overline{\mathrm{t}}} } $ distribution in the ($ c_\text{hel} $, $ c_\text{han} $) bin with the highest expected $ \eta_{\mathrm{t}} $ contribution. In the upper panel, the histograms account only for the FO pQCD$+$background prediction, and are shown after the background-only fit to the data. The shown event rates are divided by the bin width. The lower panel displays the ratio of the data to the FO pQCD$+$background prediction. The gray band indicates the postfit uncertainty. The binning is the same as in Figs. 1. |
png pdf |
Figure 4-b:
Observed (points with statistical error bars) and predicted (stacked colored histograms) $ c_\text{hel} $ distribution for $ m_{{\mathrm{t}\overline{\mathrm{t}}} } < $ 360 GeV and integrated over $ c_\text{han} $. In the upper panel, the histograms account only for the FO pQCD$+$background prediction, and are shown after the background-only fit to the data. The lower panel displays the ratio of the data to the FO pQCD$+$background prediction. The gray band indicates the postfit uncertainty. The binning is the same as in Fig. 2-a. |
png pdf |
Figure 5:
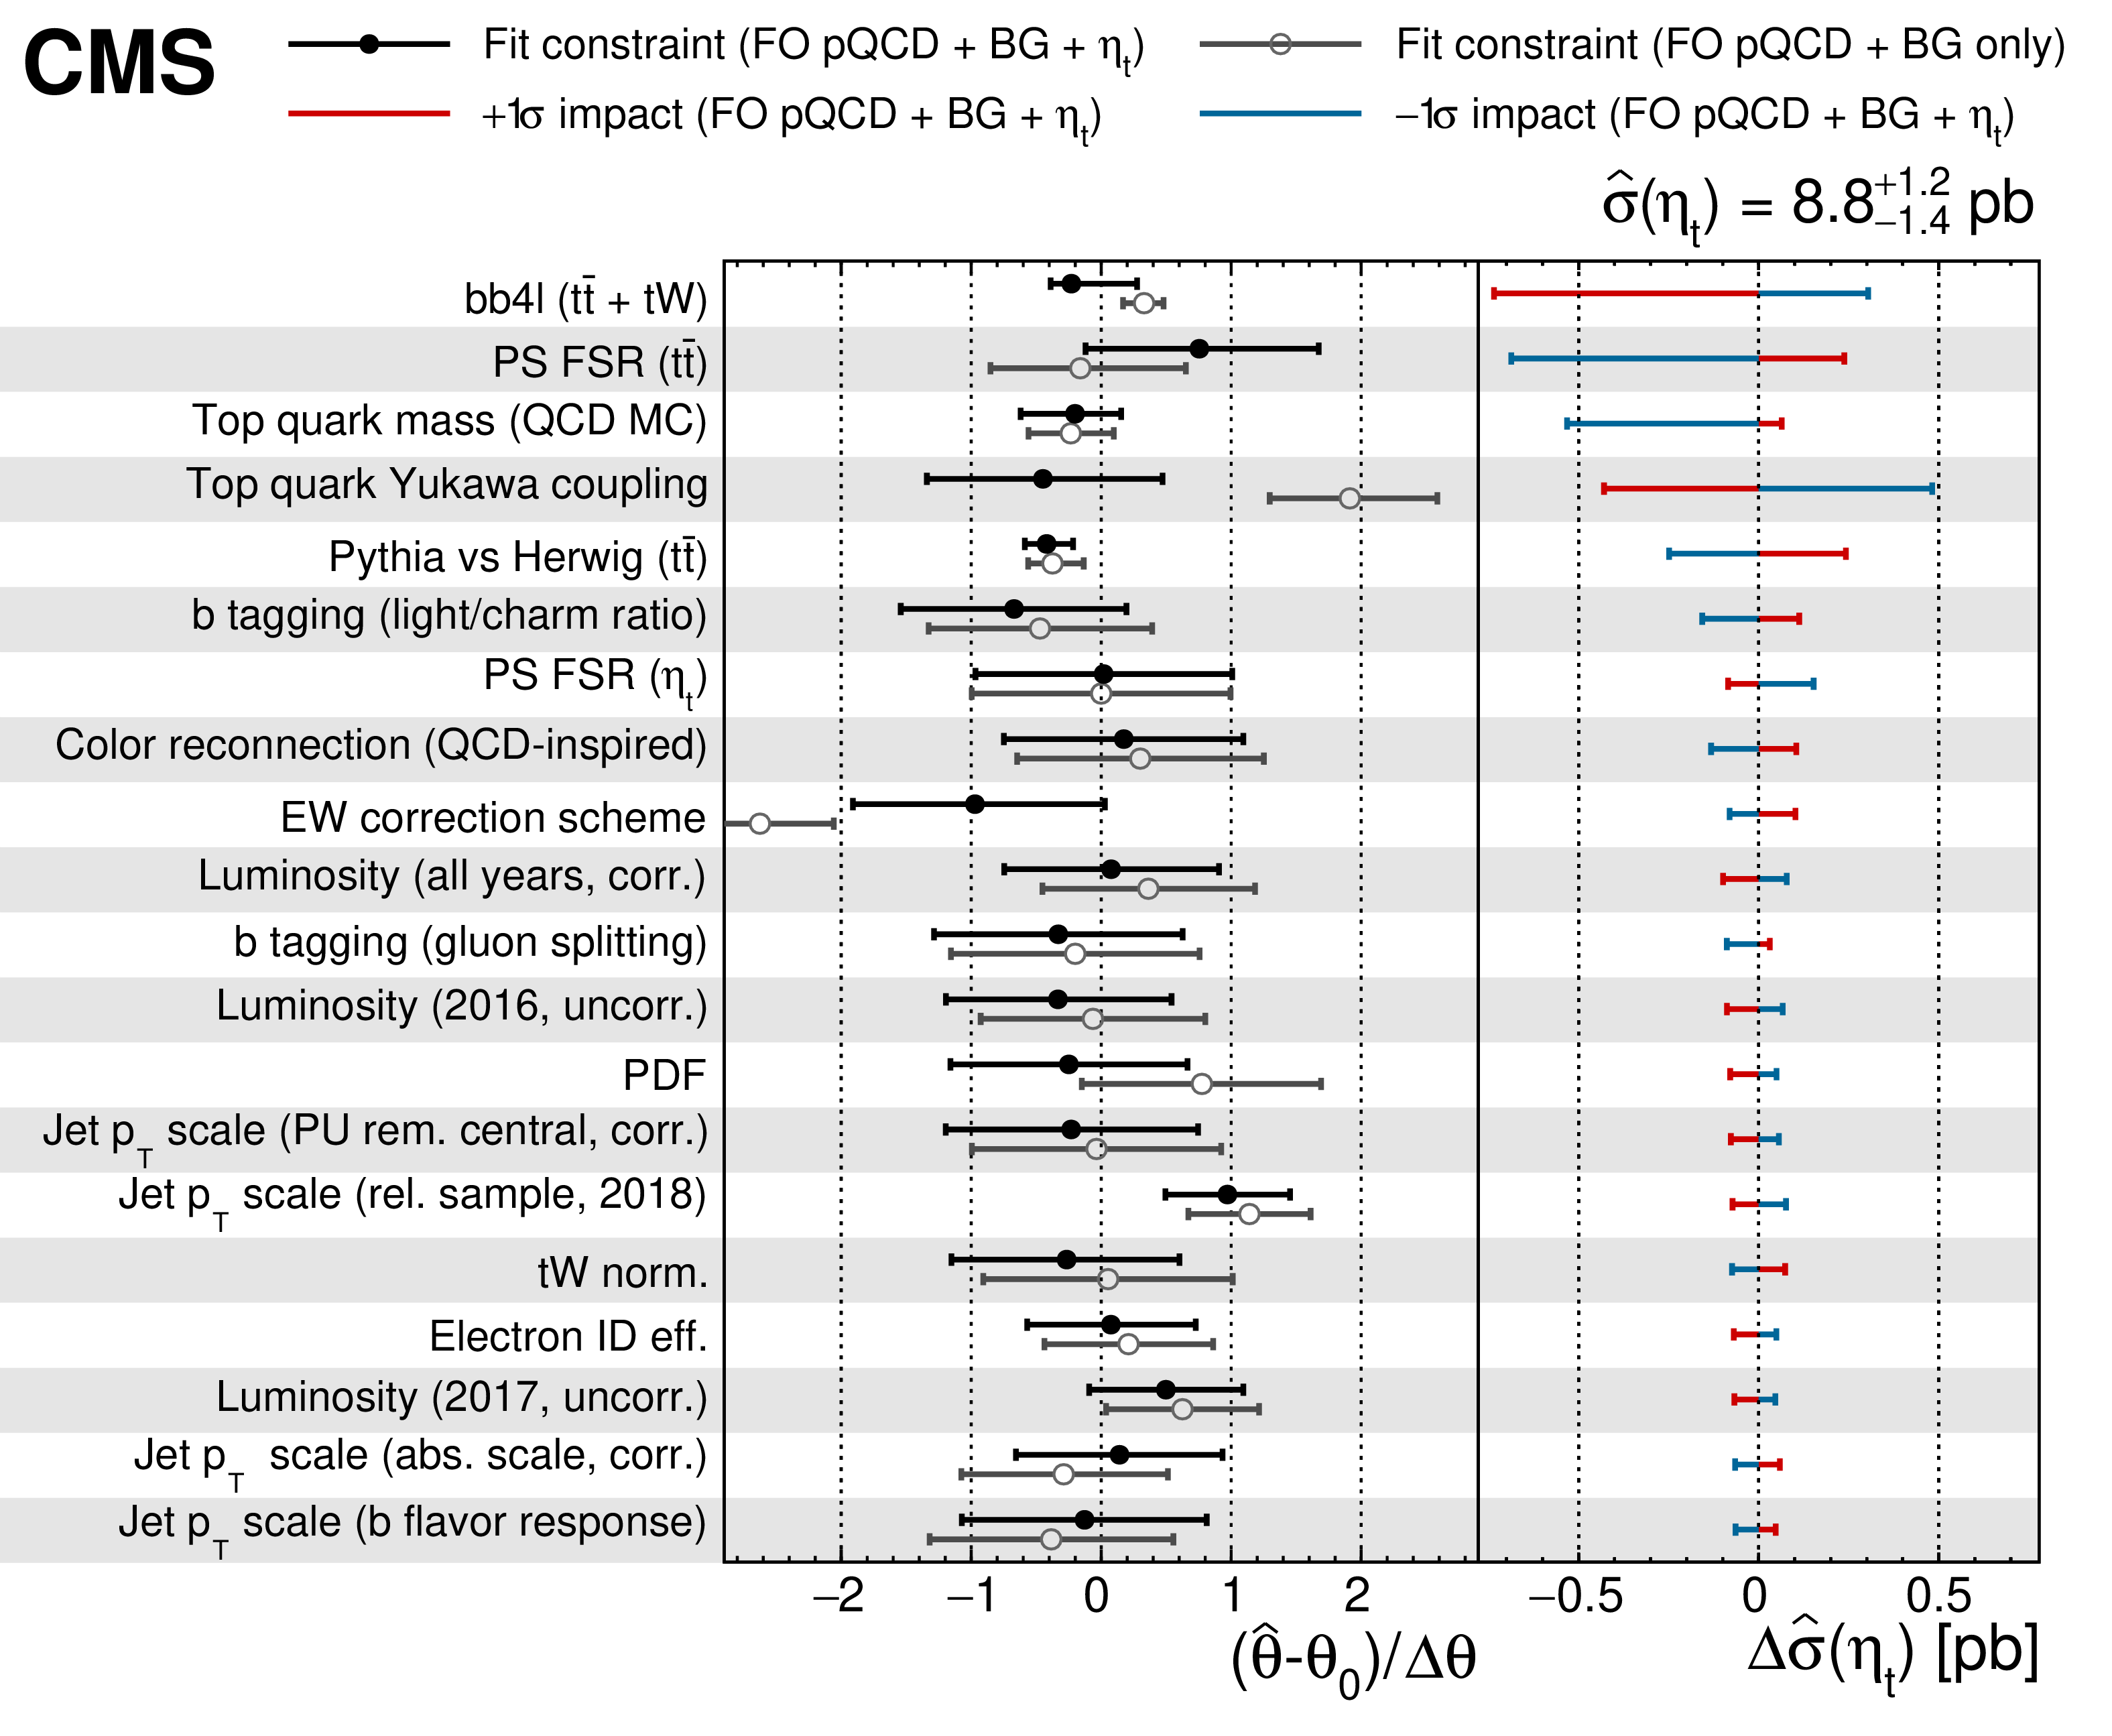
For the nuisance parameters listed in the left column, the pulls $ (\hat{\theta}-\theta_0)/\Delta\theta $ (middle column), where $ \hat{\theta} $ and $ \theta_0 $ are the postfit and prefit values of the nuisance parameters and $ \Delta\theta $ is the prefit uncertainty, are shown for the FO pQCD$+$background${+}\eta_{\mathrm{t}} $ (black filled circles) and FO pQCD$+$background (gray empty circles) fit, as well as the impacts $ \Delta\hat{\sigma}({{\eta}_{\mathrm{t}}} ) $ (right column) for the FO pQCD$+$background${+}\eta_{\mathrm{t}} $ fit. The impact $ \Delta\hat{\sigma}({{\eta}_{\mathrm{t}}} ) $ for a nuisance parameter $ \theta $ is calculated by varying $ \theta $ by $ \pm $1 SD and evaluating the shift in $ \sigma({{\eta}_{\mathrm{t}}} ) $. The nuisance parameters are ordered by the maximum of their $ \pm $1 SD impacts in the FO pQCD$+$background${+}\eta_{\mathrm{t}} $ fit. |
png pdf |
Figure 6:
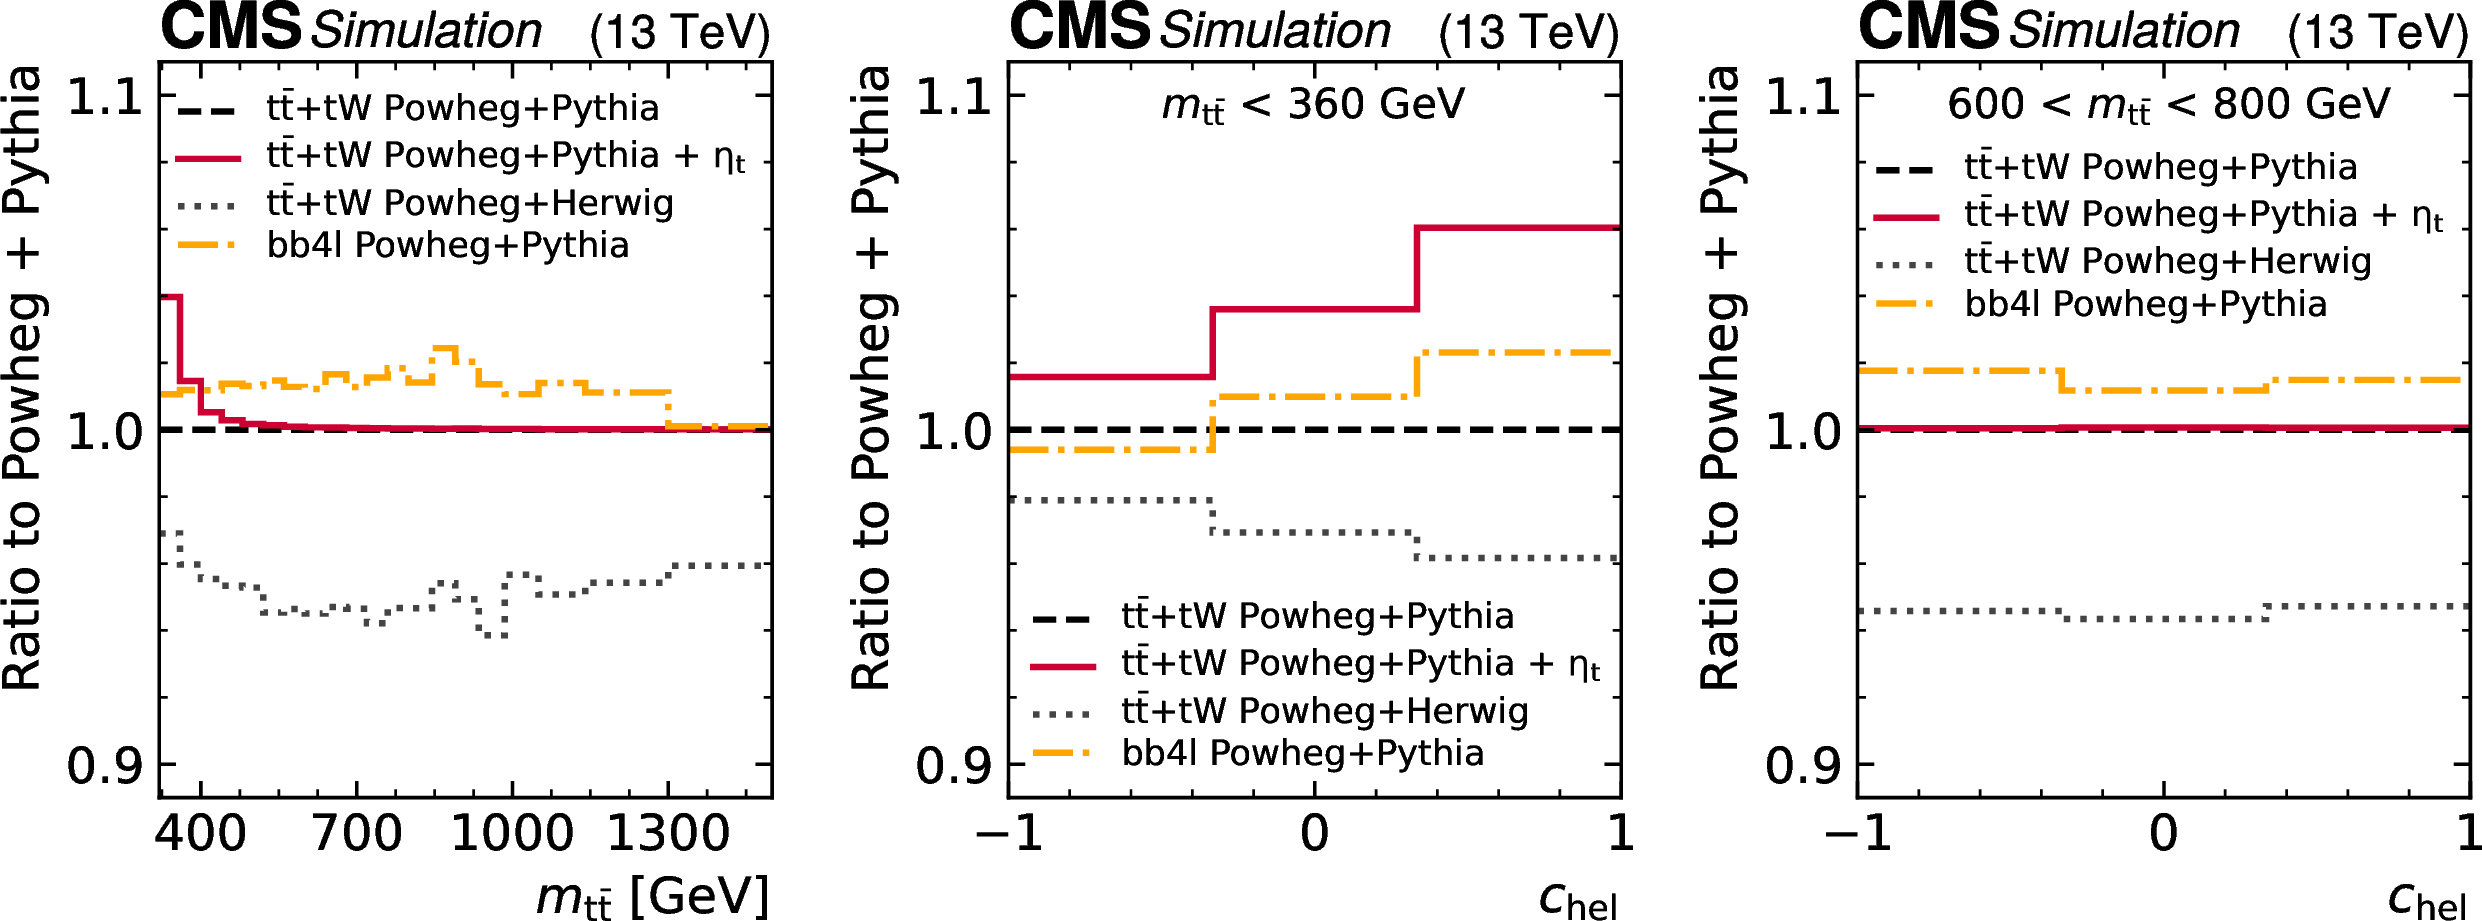
Ratios of the predictions for POWHEG v2 hvq$+$HERWIG (gray) as well as POWHEG vRES bb4l$+$PYTHIA (orange) to POWHEG v2 hvq$+$PYTHIA (black) for $ m_{{\mathrm{t}\overline{\mathrm{t}}} } $ (left), $ c_\text{hel} $ at the $ \mathrm{t} \overline{\mathrm{t}} $ threshold ($ m_{{\mathrm{t}\overline{\mathrm{t}}} } < $ 360 GeV, center), and $ c_\text{hel} $ in the $ \mathrm{t} \overline{\mathrm{t}} $ continuum (600 $ < m_{{\mathrm{t}\overline{\mathrm{t}}} } < $ 800 GeV, right), both integrated over $ c_\text{han} $. The effect of adding $ \eta_{\mathrm{t}} $ to POWHEG v2 hvq$+$PYTHIA is shown in red for comparison. The binning is the same as in Figs. 1 and 2 (left). |
png pdf |
Figure 6-a:
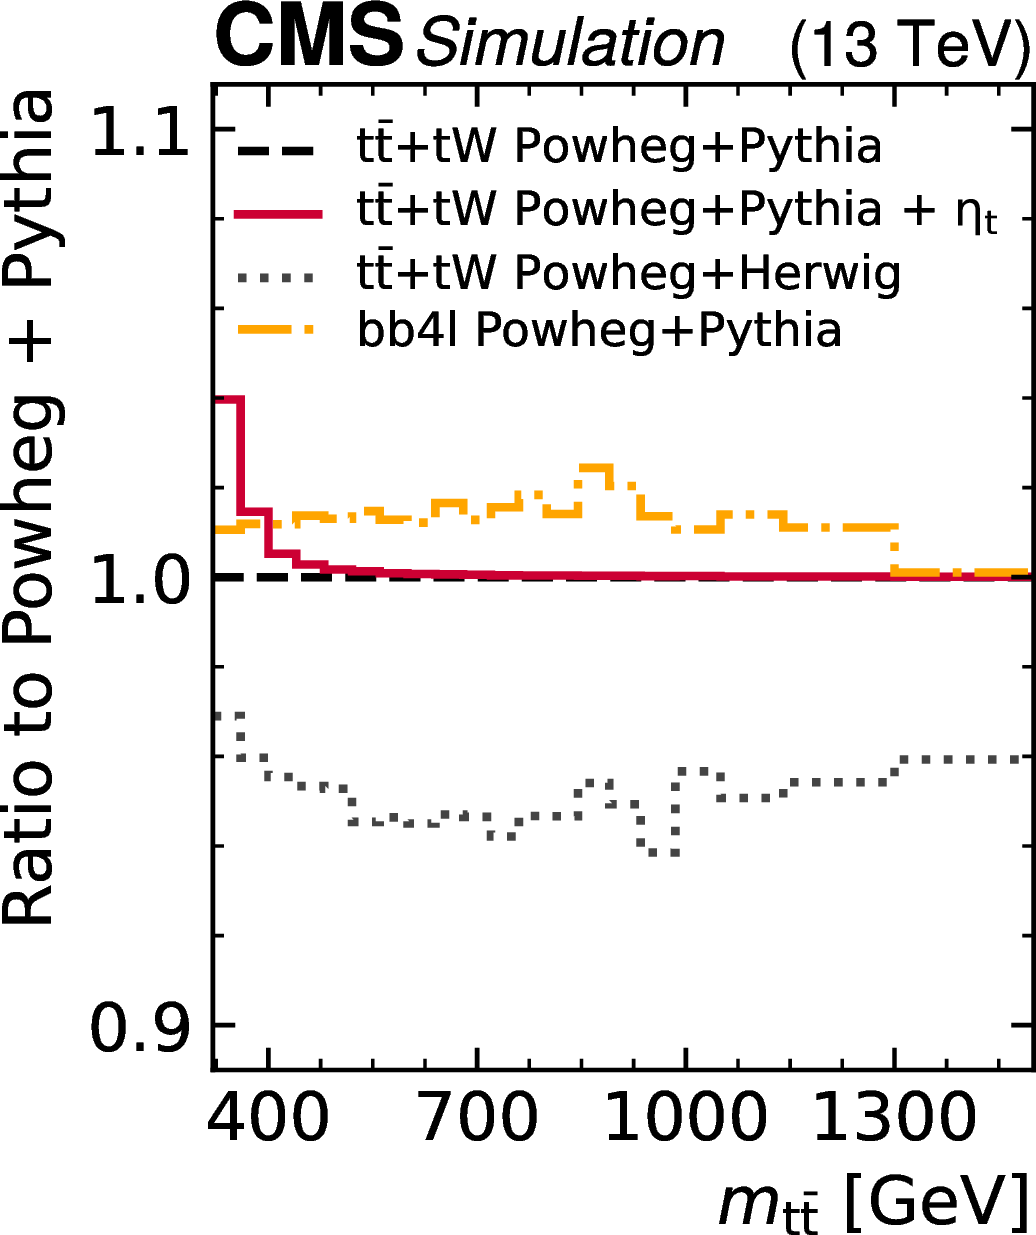
Ratios of the predictions for POWHEG v2 hvq$+$HERWIG (gray) as well as POWHEG vRES bb4l$+$PYTHIA (orange) to POWHEG v2 hvq$+$PYTHIA (black) for $ m_{{\mathrm{t}\overline{\mathrm{t}}} } $ The effect of adding $ \eta_{\mathrm{t}} $ to POWHEG v2 hvq$+$PYTHIA is shown in red for comparison. The binning is the same as in Figs. 1. |
png pdf |
Figure 6-b:
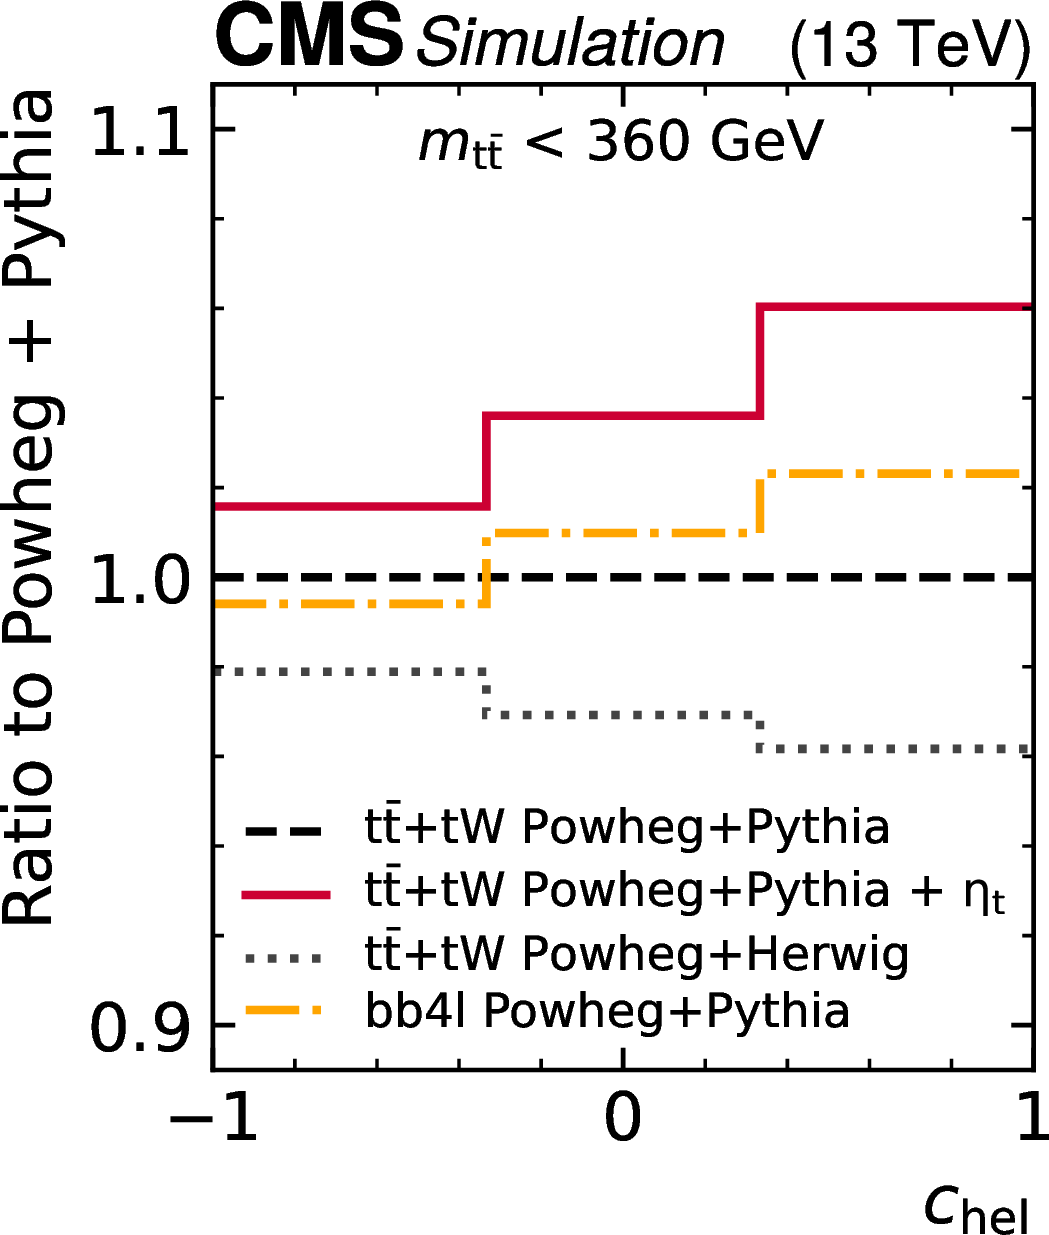
Ratios of the predictions for POWHEG v2 hvq$+$HERWIG (gray) as well as POWHEG vRES bb4l$+$PYTHIA (orange) to POWHEG v2 hvq$+$PYTHIA (black) for $ c_\text{hel} $ at the $ \mathrm{t} \overline{\mathrm{t}} $ threshold ($ m_{{\mathrm{t}\overline{\mathrm{t}}} } < $ 360 GeV), integrated over $ c_\text{han} $. The effect of adding $ \eta_{\mathrm{t}} $ to POWHEG v2 hvq$+$PYTHIA is shown in red for comparison. The binning is the same as in Fig 2-a. |
png pdf |
Figure 6-c:
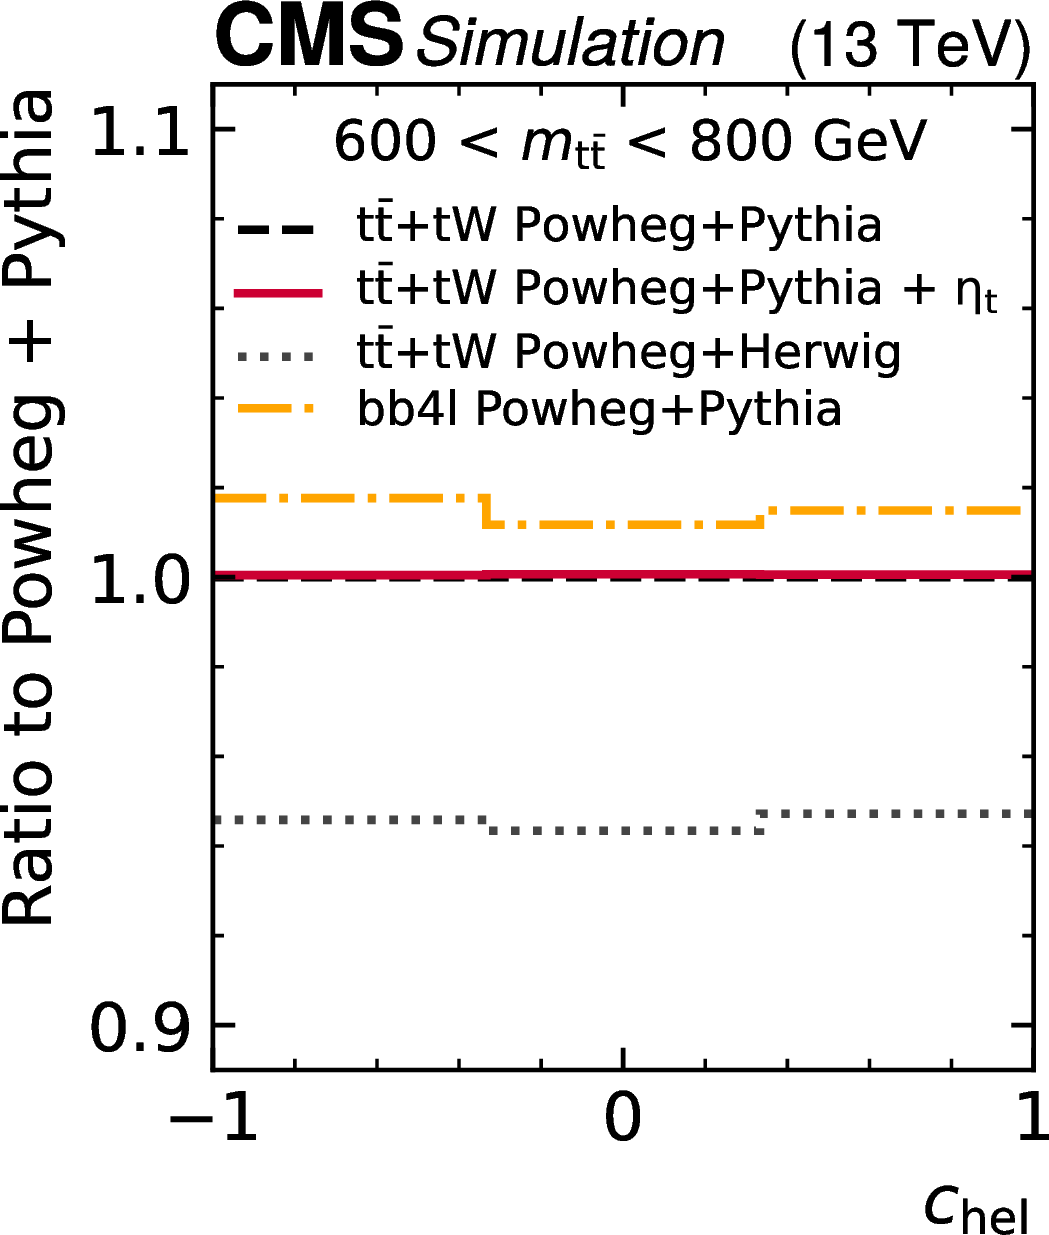
Ratios of the predictions for POWHEG v2 hvq$+$HERWIG (gray) as well as POWHEG vRES bb4l$+$PYTHIA (orange) to POWHEG v2 hvq$+$PYTHIA (black) for $ c_\text{hel} $ in the $ \mathrm{t} \overline{\mathrm{t}} $ continuum (600 $ < m_{{\mathrm{t}\overline{\mathrm{t}}} } < $ 800 GeV), integrated over $ c_\text{han} $. The effect of adding $ \eta_{\mathrm{t}} $ to POWHEG v2 hvq$+$PYTHIA is shown in red for comparison. The binning is the same as in Fig 2-a. |
| Tables | |
png pdf |
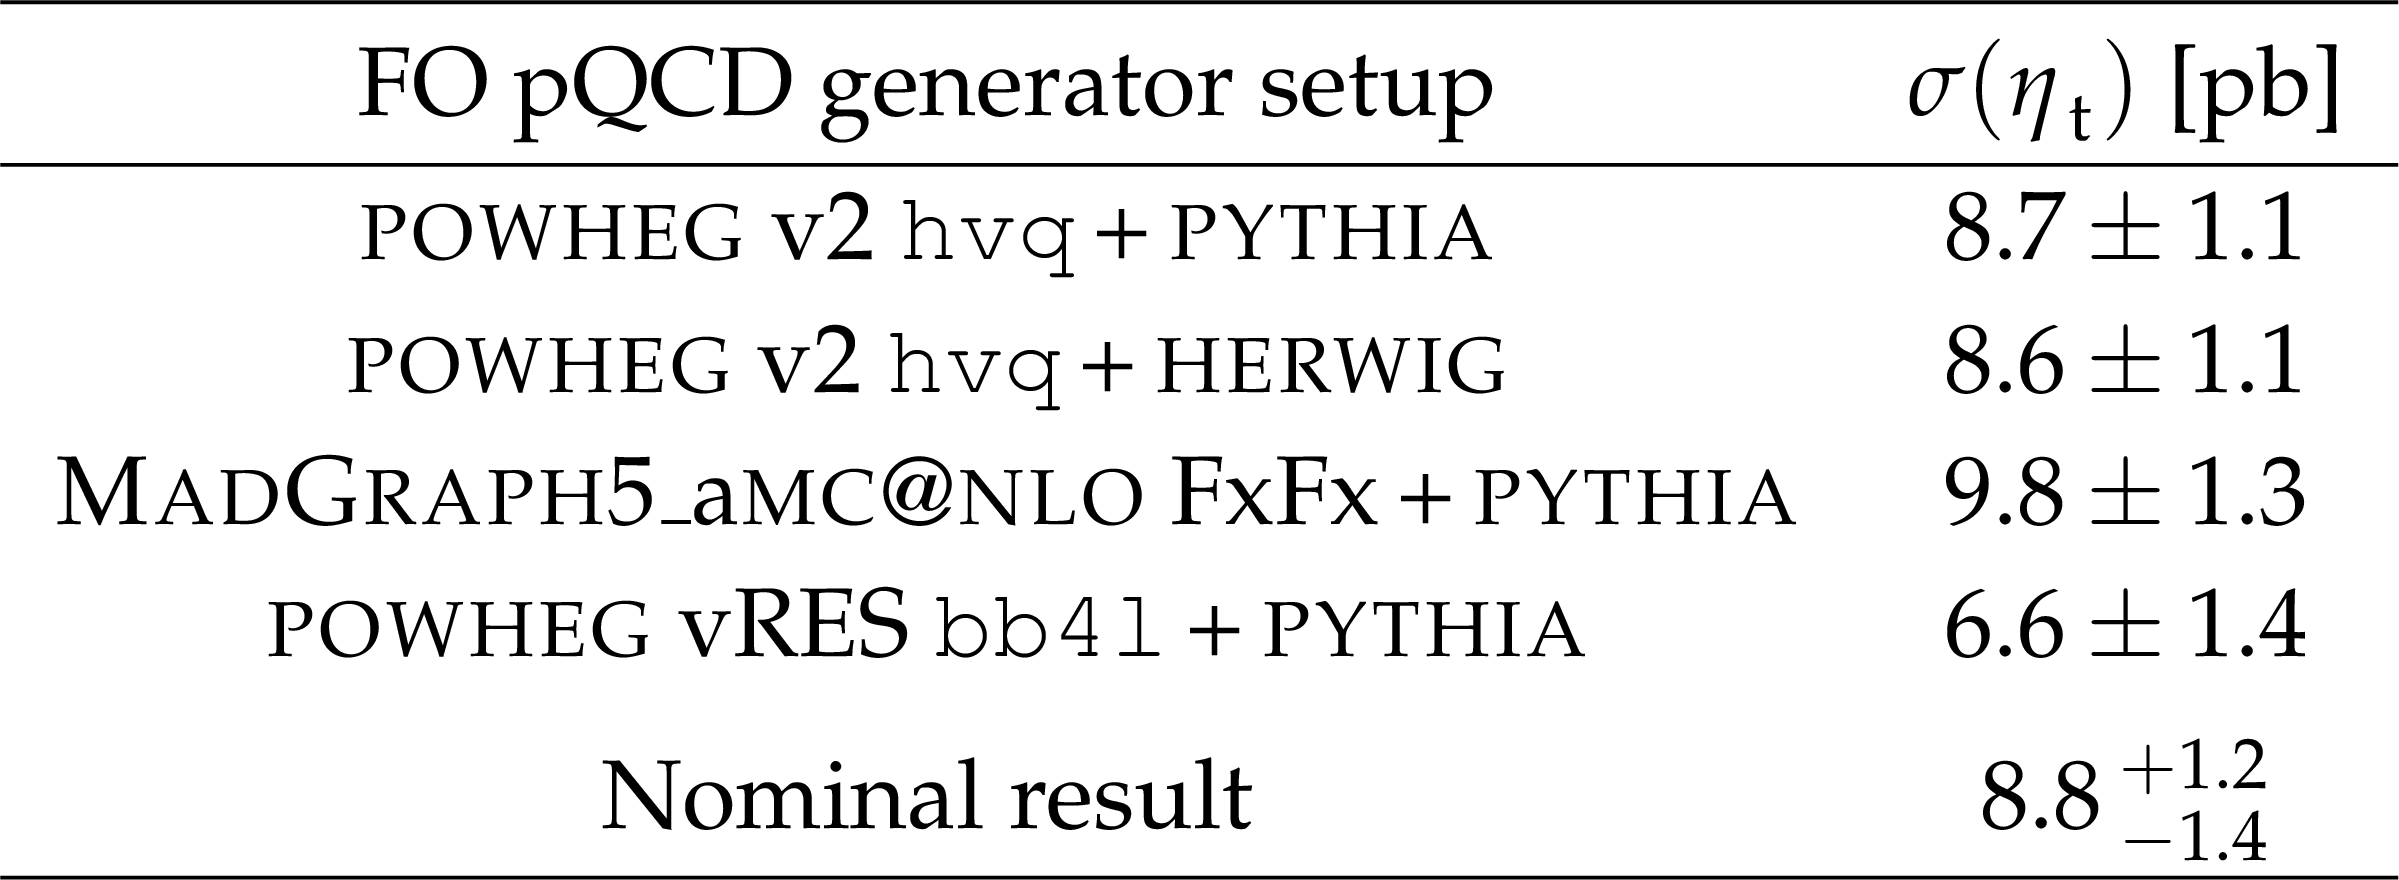
Table 1:
Results for $ \sigma({{\eta}_{\mathrm{t}}} ) $ obtained with different simulated event samples for the FO pQCD $ \mathrm{t} \overline{\mathrm{t}} $ (+$ \mathrm{t}\mathrm{W} $) prediction. Nuisance parameters encoding the difference between different generators are not included in these results. The nominal result, i.e.,, POWHEG v2 hvq$+$PYTHIA including these nuisance parameters, is shown for comparison. |
| Summary |
| We report the observation of resonant top quark-antiquark ($ \mathrm{t} \overline{\mathrm{t}} $) production near the kinematic production threshold, with spin properties consistent with contributions from a pseudoscalar state, using proton-proton collision data recorded by the CMS experiment at $ \sqrt{s}= $ 13 TeV in 2016-2018 and corresponding to an integrated luminosity of 138 fb$ ^{-1} $. The data is compared to the standard model prediction including only nonresonant $ \mathrm{t} \overline{\mathrm{t}} $ production obtained with fixed-order calculations in perturbative quantum chromodynamics. An excess is observed with respect to this model, with a statistical significance exceeding five standard deviations. We emphasize, however, that the modeling of the $ \mathrm{t} \overline{\mathrm{t}} $ threshold region is challenging and requires further theoretical investigation. It is worth noting that alternative explanations of the excess are also plausible, given the current experimental resolution of the $ \mathrm{t} \overline{\mathrm{t}} $ invariant mass; we explore this direction further in Ref. [20]. The result is compatible with the formation of a $ ^1\mathrm{S}_0^{[1]} $ toponium quasi-bound state $ \eta_{\mathrm{t}} $ with a measured cross section of $ \sigma({{\eta}{\mathrm{t}}} )= $ 8.8 $^{+1.2}_{-1.4} $ pb, based on a simplified model inspired by nonrelativistic quantum chromodynamics. |
| References | ||||
| 1 | CDF Collaboration | Observation of top quark production in $ {\overline{\mathrm{p}}\mathrm{p}} $ collisions with the Collider Detector at Fermilab | PRL 74 (1995) 2626 | hep-ex/9503002 |
| 2 | D0 Collaboration | Observation of the top quark | PRL 74 (1995) 2632 | hep-ex/9503003 |
| 3 | I. Bigi et al. | Production and decay properties of ultra-heavy quarks | PLB 181 (1986) 157 | |
| 4 | W. Bernreuther | Top-quark physics at the LHC | JPG 35 (2008) 083001 | 0805.1333 |
| 5 | W. Bernreuther and Z.-G. Si | Distributions and correlations for top quark pair production and decay at the Tevatron and LHC | NPB 837 (2010) 90 | 1003.3926 |
| 6 | G. Mahlon and S. Parke | Angular correlations in top quark pair production and decay at hadron colliders | PRD 53 (1996) 4886 | hep-ph/9512264 |
| 7 | D0 Collaboration | Spin correlation in $ \mathrm{t} \overline{\mathrm{t}} $ production from $ {\mathrm{p}\overline{\mathrm{p}}} $ collisions at $ \sqrt{s}= $ 1.8 TeV | PRL 85 (2000) 256 | hep-ex/0002058 |
| 8 | CDF Collaboration | Measurement of $ \mathrm{t} \overline{\mathrm{t}} $ spin correlation in $ {\mathrm{p}\overline{\mathrm{p}}} $ collisions using the CDF II detector at the Tevatron | PRD 83 (2011) 031104 | 1012.3093 |
| 9 | ATLAS Collaboration | Observation of spin correlation in $ \mathrm{t} \overline{\mathrm{t}} $ events from $ {\mathrm{p}\mathrm{p}} $ collisions at $ \sqrt{s}= $ 7 TeV using the ATLAS detector | PRL 108 (2012) 212001 | 1203.4081 |
| 10 | CMS Collaboration | Measurements of $ \mathrm{t} \overline{\mathrm{t}} $ spin correlations and top-quark polarization using dilepton final states in $ {\mathrm{p}\mathrm{p}} $ collisions at $ \sqrt{s}= $ 7 TeV | PRL 112 (2014) 182001 | CMS-TOP-13-003 1311.3924 |
| 11 | ATLAS Collaboration | Measurements of top-quark pair spin correlations in the $ {\mathrm{e}\mu} $ channel at $ \sqrt{s}= $ 13 TeV using $ {\mathrm{p}\mathrm{p}} $ collisions in the ATLAS detector | EPJC 80 (2020) 754 | 1903.07570 |
| 12 | CMS Collaboration | Measurement of the top quark polarization and $ \mathrm{t} \overline{\mathrm{t}} $ spin correlations using dilepton final states in proton-proton collisions at $ \sqrt{s}= $ 13 TeV | PRD 100 (2019) 072002 | CMS-TOP-18-006 1907.03729 |
| 13 | V. S. Fadin, V. A. Khoze, and T. Sjöstrand | On the threshold behaviour of heavy top production | Z. Phys. C 48 (1990) 613 | |
| 14 | Y. Kiyo et al. | Top-quark pair production near threshold at LHC | EPJC 60 (2009) 375 | 0812.0919 |
| 15 | Y. Sumino and H. Yokoya | Bound-state effects on kinematical distributions of top quarks at hadron colliders | JHEP 09 (2010) 034 | 1007.0075 |
| 16 | W.-L. Ju et al. | Top quark pair production near threshold: single/double distributions and mass determination | JHEP 06 (2020) 158 | 2004.03088 |
| 17 | B. Fuks, K. Hagiwara, K. Ma, and Y.-J. Zheng | Signatures of toponium formation in LHC run 2 data | PRD 104 (2021) 034023 | 2102.11281 |
| 18 | M. V. Garzelli et al. | Updated predictions for toponium production at the LHC | 2412.16685 | |
| 19 | B. Fuks, K. Hagiwara, K. Ma, and Y.-J. Zheng | Simulating toponium formation signals at the LHC | EPJC 85 (2025) 157 | 2411.18962 |
| 20 | CMS Collaboration | HEPData record for this analysis | link | |
| 21 | CMS Collaboration | Search for heavy pseudoscalar and scalar bosons decaying to a top quark pair in proton-proton collisions at $ \sqrt{s}= $ 13 TeV | Submitted to Rep. Prog. Phys, 2025 | CMS-HIG-22-013 2507.05119 |
| 22 | CMS Collaboration | Search for heavy Higgs bosons decaying to a top quark pair in proton-proton collisions at $ \sqrt{s}= $ 13 TeV | JHEP 04 (2020) 171 | CMS-HIG-17-027 1908.01115 |
| 23 | ATLAS Collaboration | Search for heavy Higgs bosons A/H decaying to a top quark pair in $ {\mathrm{p}\mathrm{p}} $ collisions at $ \sqrt{s}= $ 8 TeV with the ATLAS detector | PRL 119 (2017) 191803 | 1707.06025 |
| 24 | ATLAS Collaboration | Search for heavy neutral Higgs bosons decaying into a top quark pair in 140 fb$ ^{-1} $ of proton-proton collision data at $ \sqrt{s}= $ 13 TeV with the ATLAS detector | JHEP 08 (2024) 013 | 2404.18986 |
| 25 | ATLAS Collaboration | Inclusive and differential cross-sections for dilepton $ \mathrm{t} \overline{\mathrm{t}} $ production measured in $ \sqrt{s}= $ 13 TeV $ {\mathrm{p}\mathrm{p}} $ collisions with the ATLAS detector | JHEP 07 (2023) 141 | 2303.15340 |
| 26 | CMS Collaboration | Measurement of $ \mathrm{t} \overline{\mathrm{t}} $ normalised multi-differential cross sections in $ {\mathrm{p}\mathrm{p}} $ collisions at $ \sqrt{s}= $ 13 TeV, and simultaneous determination of the strong coupling strength, top quark pole mass, and parton distribution functions | EPJC 80 (2020) 658 | CMS-TOP-18-004 1904.05237 |
| 27 | ATLAS Collaboration | Observation of quantum entanglement with top quarks at the ATLAS detector | Nature 633 (2024) 542 | 2311.07288 |
| 28 | CMS Collaboration | Observation of quantum entanglement in top quark pair production in proton-proton collisions at $ \sqrt{s}= $ 13 TeV | Rep. Prog. Phys. 87 (2024) 117801 | CMS-TOP-23-001 2406.03976 |
| 29 | CMS Collaboration | The CMS experiment at the CERN LHC | JINST 3 (2008) S08004 | |
| 30 | CMS Collaboration | Development of the CMS detector for the CERN LHC Run 3 | JINST 19 (2024) P05064 | CMS-PRF-21-001 2309.05466 |
| 31 | CMS Collaboration | The CMS trigger system | JINST 12 (2017) P01020 | CMS-TRG-12-001 1609.02366 |
| 32 | CMS Collaboration | Performance of the CMS Level-1 trigger in proton-proton collisions at $ \sqrt{s}= $ 13 TeV | JINST 15 (2020) P10017 | CMS-TRG-17-001 2006.10165 |
| 33 | CMS Collaboration | Electron and photon reconstruction and identification with the CMS experiment at the CERN LHC | JINST 16 (2021) P05014 | CMS-EGM-17-001 2012.06888 |
| 34 | CMS Collaboration | Performance of the CMS muon detector and muon reconstruction with proton-proton collisions at $ \sqrt{s}= $ 13 TeV | JINST 13 (2018) P06015 | CMS-MUO-16-001 1804.04528 |
| 35 | CMS Collaboration | Description and performance of track and primary-vertex reconstruction with the CMS tracker | JINST 9 (2014) P10009 | CMS-TRK-11-001 1405.6569 |
| 36 | CMS Collaboration | Performance of the CMS high-level trigger during LHC \mboxRun 2 | JINST 19 (2024) P11021 | CMS-TRG-19-001 2410.17038 |
| 37 | CMS Collaboration | Particle-flow reconstruction and global event description with the CMS detector | JINST 12 (2017) P10003 | CMS-PRF-14-001 1706.04965 |
| 38 | CMS Collaboration | Jet energy scale and resolution in the CMS experiment in $ {\mathrm{p}\mathrm{p}} $ collisions at 8 TeV | JINST 12 (2017) P02014 | CMS-JME-13-004 1607.03663 |
| 39 | CMS Collaboration | Performance of missing transverse momentum reconstruction in proton-proton collisions at $ \sqrt{s}= $ 13 TeV using the CMS detector | JINST 14 (2019) P07004 | CMS-JME-17-001 1903.06078 |
| 40 | CMS Collaboration | ECAL 2016 refined calibration and Run 2 summary plots | CMS Detector Performance Note CMS-DP-2020-021, 2020 CDS |
|
| 41 | M. Cacciari, G. P. Salam, and G. Soyez | The anti-$ k_{\mathrm{T}} $ jet clustering algorithm | JHEP 04 (2008) 063 | 0802.1189 |
| 42 | M. Cacciari, G. P. Salam, and G. Soyez | FASTJET user manual | EPJC 72 (2012) 1896 | 1111.6097 |
| 43 | CMS Collaboration | Identification of heavy-flavour jets with the CMS detector in $ {\mathrm{p}\mathrm{p}} $ collisions at 13 TeV | JINST 13 (2018) P05011 | CMS-BTV-16-002 1712.07158 |
| 44 | E. Bols et al. | Jet flavour classification using DeepJet | JINST 15 (2020) P12012 | 2008.10519 |
| 45 | CMS Collaboration | Performance summary of AK4 jet b tagging with data from proton-proton collisions at 13 TeV with the CMS detector | CMS Detector Performance Note CMS-DP-2023-005, 2023 CDS |
|
| 46 | NNPDF Collaboration | Parton distributions for the LHC run II | JHEP 04 (2015) 040 | 1410.8849 |
| 47 | T. Sjöstrand et al. | An introduction to PYTHIA8.2 | Comput. Phys. Commun. 191 (2015) 159 | 1410.3012 |
| 48 | P. Skands, S. Carrazza, and J. Rojo | Tuning PYTHIA8.1: the Monash 2013 tune | EPJC 74 (2014) 3024 | 1404.5630 |
| 49 | CMS Collaboration | Extraction and validation of a new set of CMS PYTHIA8 tunes from underlying-event measurements | EPJC 80 (2020) 4 | CMS-GEN-17-001 1903.12179 |
| 50 | GEANT4 Collaboration | GEANT 4---a simulation toolkit | NIM A 506 (2003) 250 | |
| 51 | F. Maltoni, C. Severi, S. Tentori, and E. Vryonidou | Quantum detection of new physics in top-quark pair production at the LHC | JHEP 03 (2024) 099 | 2401.08751 |
| 52 | J. Alwall et al. | The automated computation of tree-level and next-to-leading order differential cross sections, and their matching to parton shower simulations | JHEP 07 (2014) 079 | 1405.0301 |
| 53 | P. Nason | A new method for combining NLO QCD with shower Monte Carlo algorithms | JHEP 11 (2004) 040 | hep-ph/0409146 |
| 54 | S. Frixione, P. Nason, and C. Oleari | Matching NLO QCD computations with parton shower simulations: the POWHEG method | JHEP 11 (2007) 070 | 0709.2092 |
| 55 | S. Alioli, P. Nason, C. Oleari, and E. Re | A general framework for implementing NLO calculations in shower Monte Carlo programs: the POWHEG box | JHEP 06 (2010) 043 | 1002.2581 |
| 56 | S. Frixione, G. Ridolfi, and P. Nason | A positive-weight next-to-leading-order Monte Carlo for heavy flavour hadroproduction | JHEP 09 (2007) 126 | 0707.3088 |
| 57 | M. A. Gigg and P. Richardson | Simulation of finite width effects in physics beyond the standard model | 0805.3037 | |
| 58 | M. Czakon and A. Mitov | top++: a program for the calculation of the top-pair cross-section at hadron colliders | Comput. Phys. Commun. 185 (2014) 2930 | 1112.5675 |
| 59 | M. Grazzini, S. Kallweit, and M. Wiesemann | Fully differential NNLO computations with matrix | EPJC 78 (2018) 537 | 1711.06631 |
| 60 | W. Bernreuther, M. Fücker, and Z. G. Si | Mixed QCD and weak corrections to top quark pair production at hadron colliders | PLB 633 (2006) 54 | hep-ph/0508091 |
| 61 | J. H. Kühn, A. Scharf, and P. Uwer | Electroweak corrections to top-quark pair production in quark-antiquark annihilation | EPJC 45 (2006) 139 | hep-ph/0508092 |
| 62 | W. Bernreuther, M. Fücker, and Z.-G. Si | Weak interaction corrections to hadronic top quark pair production | PRD 74 (2006) 113005 | hep-ph/0610334 |
| 63 | J. H. Kühn, A. Scharf, and P. Uwer | Electroweak effects in top-quark pair production at hadron colliders | EPJC 51 (2007) 37 | hep-ph/0610335 |
| 64 | M. Aliev et al. | hathor: Hadronic top and heavy quarks cross section calculator | Comput. Phys. Commun. 182 (2011) 1034 | 1007.1327 |
| 65 | J. H. Kühn, A. Scharf, and P. Uwer | Weak interactions in top-quark pair production at hadron colliders: An update | PRD 91 (2015) 014020 | 1305.5773 |
| 66 | J. Bellm et al. | HERWIG 7.0/ HERWIG++ 3.0 release note | EPJC 76 (2016) 196 | 1512.01178 |
| 67 | M. Bähr et al. | HERWIG++ physics and manual | EPJC 58 (2008) 639 | 0803.0883 |
| 68 | R. Frederix and S. Frixione | Merging meets matching in MC@NLO | JHEP 12 (2012) 061 | 1209.6215 |
| 69 | T. Ježo and P. Nason | On the treatment of resonances in next-to-leading order calculations matched to a parton shower | JHEP 12 (2015) 065 | 1509.09071 |
| 70 | T. Ježo et al. | An NLO+PS generator for $ \mathrm{t} \overline{\mathrm{t}} $ and $ {\mathrm{W}\mathrm{t}} $ production and decay including non-resonant and interference effects | EPJC 76 (2016) 691 | 1607.04538 |
| 71 | T. Ježo, J. M. Lindert, and S. Pozzorini | Resonance-aware NLOPS matching for off-shell $ {\mathrm{t}\overline{\mathrm{t}}} +{\mathrm{t}\mathrm{W}} $ production with semileptonic decays | JHEP 10 (2023) 008 | 2307.15653 |
| 72 | A. Djouadi, J. Ellis, and J. Quevillon | Discriminating between pseudoscalar Higgs and toponium states at the LHC and beyond | 2412.15138 | |
| 73 | J. A. Aguilar-Saavedra | Toponium hunter's guide | PRD 110 (2024) 054032 | 2407.20330 |
| 74 | E. Re | Single-top $ {\mathrm{W}\mathrm{t}} $-channel production matched with parton showers using the POWHEG method | EPJC 71 (2011) 1547 | 1009.2450 |
| 75 | S. Alioli, P. Nason, C. Oleari, and E. Re | NLO single-top production matched with shower in POWHEG: $ s $- and $ t $-channel contributions | JHEP 09 (2009) 111 | 0907.4076 |
| 76 | P. Kant et al. | hathor for single top-quark production: Updated predictions and uncertainty estimates for single top-quark production in hadronic collisions | Comput. Phys. Commun. 191 (2015) 74 | 1406.4403 |
| 77 | N. Kidonakis and N. Yamanaka | Higher-order corrections for $ {\mathrm{t}\mathrm{W}} $ production at high-energy hadron colliders | JHEP 05 (2021) 278 | 2102.11300 |
| 78 | S. Frixione et al. | Single-top hadroproduction in association with a W boson | JHEP 07 (2008) 029 | 0805.3067 |
| 79 | P. F. Monni et al. | MiNNLOps: a new method to match NNLO QCD to parton showers | JHEP 05 (2020) 143 | 1908.06987 |
| 80 | P. F. Monni, E. Re, and M. Wiesemann | MiNNLO\textsubscriptps: optimizing 2 $ \to $ 1 hadronic processes | EPJC 80 (2020) 1075 | 2006.04133 |
| 81 | E. Barberio and Z. Was | PHOTOS---a universal Monte Carlo for QED radiative corrections: version 2.0 | Comput. Phys. Commun. 79 (1994) 291 | |
| 82 | P. Golonka and Z. Was | PHOTOS Monte Carlo: a precision tool for QED corrections in Z and W decays | EPJC 45 (2006) 97 | hep-ph/0506026 |
| 83 | CMS Collaboration | Measurement of the $ \mathrm{t} \overline{\mathrm{t}} $ production cross section and the top quark mass in the dilepton channel in $ {\mathrm{p}\mathrm{p}} $ collisions at $ \sqrt{s}= $ 7 TeV | JHEP 07 (2011) 049 | CMS-TOP-11-002 1105.5661 |
| 84 | T. Gehrmann et al. | $ {\mathrm{W^+}\mathrm{W^-}} $ production at hadron colliders in next to next to leading order QCD | PRL 113 (2014) 212001 | 1408.5243 |
| 85 | J. M. Campbell and R. K. Ellis | MCFM for the Tevatron and the LHC | in Proc. 10th DESY Workshop on Elementary Particle Theory: Loops and Legs in Quantum Field Theory (LL): Wörlitz, Germany, 2010 Nucl. Phys. B Proc. Suppl. 205-206 (2010) 10 |
1007.3492 |
| 86 | Particle Data Group, S. Navas et al. | Review of particle physics | PRD 110 (2024) 030001 | |
| 87 | CMS Collaboration | Measurement of the differential cross section for top quark pair production in $ {\mathrm{p}\mathrm{p}} $ collisions at $ \sqrt{s} = $ 8 TeV | EPJC 75 (2015) 542 | CMS-TOP-12-028 1505.04480 |
| 88 | L. Sonnenschein | Analytical solution of $ \mathrm{t} \overline{\mathrm{t}} $ dilepton equations | PRD 73 (2006) 054015 | hep-ph/0603011 |
| 89 | CMS Collaboration | Measurement of double-differential cross sections for top quark pair production in $ {\mathrm{p}\mathrm{p}} $ collisions at $ \sqrt{s}= $ 8 TeV and impact on parton distribution functions | EPJC 77 (2017) 459 | CMS-TOP-14-013 1703.01630 |
| 90 | I. Korol | Measurement of double differential $ \mathrm{t} \overline{\mathrm{t}} $ production cross sections with the CMS detector | PhD thesis, Universität Hamburg, CERN-THESIS-2016-060, DESY-THESIS-2016-011, 2016 link |
|
| 91 | W. Bernreuther, A. Brandenburg, Z. G. Si, and P. Uwer | Top quark pair production and decay at hadron colliders | NPB 690 (2004) 81 | hep-ph/0403035 |
| 92 | W. Bernreuther, D. Heisler, and Z.-G. Si | A set of top quark spin correlation and polarization observables for the LHC: Standard model predictions and new physics contributions | JHEP 12 (2015) 026 | 1508.05271 |
| 93 | J. A. Aguilar-Saavedra and J. A. Casas | Improved tests of entanglement and Bell inequalities with LHC tops | EPJC 82 (2022) 666 | 2205.00542 |
| 94 | T. Junk | Confidence level computation for combining searches with small statistics | NIM A 434 (1999) 435 | hep-ex/9902006 |
| 95 | A. L. Read | Presentation of search results: The $ \text{CL}_\text{s} $ technique | JPG 28 (2002) 2693 | |
| 96 | G. Cowan, K. Cranmer, E. Gross, and O. Vitells | Asymptotic formulae for likelihood-based tests of new physics | EPJC 71 (2011) 1554 | 1007.1727 |
| 97 | ATLAS and CMS Collaborations, and LHC Higgs Combination Group | Procedure for the LHC Higgs boson search combination in Summer 2011 | Technical Report CMS-NOTE-2011-005, ATL-PHYS-PUB-2011-11, 2011 | |
| 98 | CMS Collaboration | The CMS statistical analysis and combination tool: combine | Comput. Softw. Big Sci. 8 (2024) 19 | CMS-CAT-23-001 2404.06614 |
| 99 | CMS Collaboration | Precision luminosity measurement in proton-proton collisions at $ \sqrt{s}= $ 13 TeV in 2015 and 2016 at CMS | EPJC 81 (2021) 800 | CMS-LUM-17-003 2104.01927 |
| 100 | CMS Collaboration | CMS luminosity measurement for the 2017 data-taking period at $ \sqrt{s}= $ 13 TeV | CMS Physics Analysis Summary, 2018 CMS-PAS-LUM-17-004 |
CMS-PAS-LUM-17-004 |
| 101 | CMS Collaboration | CMS luminosity measurement for the 2018 data-taking period at $ \sqrt{s}= $ 13 TeV | CMS Physics Analysis Summary, 2019 CMS-PAS-LUM-18-002 |
CMS-PAS-LUM-18-002 |
| 102 | CMS Collaboration | Combined measurements of Higgs boson couplings in proton-proton collisions at $ \sqrt{s}= $ 13 TeV | EPJC 79 (2019) 421 | CMS-HIG-17-031 1809.10733 |
| 103 | CMS Collaboration | Measurement of the top quark mass using proton-proton data at $ \sqrt{s}= $ 7 and 8 TeV | PRD 93 (2016) 072004 | CMS-TOP-14-022 1509.04044 |
| 104 | J. Butterworth et al. | PDF4LHC recommendations for LHC Run 2 | JPG 43 (2016) 023001 | 1510.03865 |
| 105 | J. R. Christiansen and P. Z. Skands | String formation beyond leading colour | JHEP 08 (2015) 003 | 1505.01681 |
| 106 | CMS Collaboration | CMS PYTHIA8 colour reconnection tunes based on underlying-event data | EPJC 83 (2023) 587 | CMS-GEN-17-002 2205.02905 |
| 107 | CMS Collaboration | Investigations of the impact of the parton shower tuning in PYTHIA8 in the modelling of $ \mathrm{t} \overline{\mathrm{t}} $ at $ \sqrt{s}= $ 8 and 13 TeV | CMS Physics Analysis Summary, 2016 CMS-PAS-TOP-16-021 |
CMS-PAS-TOP-16-021 |
| 108 | ATLAS Collaboration | Measurement of the inclusive cross-sections of single top-quark and top-antiquark $ t $-channel production in $ {\mathrm{p}\mathrm{p}} $ collisions at $ \sqrt{s}= $ 13 TeV with the ATLAS detector | JHEP 04 (2017) 086 | 1609.03920 |
| 109 | CMS Collaboration | Measurement of the single top quark and antiquark production cross sections in the $ t $ channel and their ratio in proton-proton collisions at $ \sqrt{s}= $ 13 TeV | PLB 800 (2020) 135042 | CMS-TOP-17-011 1812.10514 |
| 110 | CMS Collaboration | Measurement of the production cross section for single top quarks in association with W bosons in proton-proton collisions at $ \sqrt{s}= $ 13 TeV | JHEP 10 (2018) 117 | CMS-TOP-17-018 1805.07399 |
| 111 | CMS Collaboration | Measurement of the cross section for top quark pair production in association with a W or Z boson in proton-proton collisions at $ \sqrt{s}= $ 13 TeV | JHEP 08 (2018) 011 | CMS-TOP-17-005 1711.02547 |
| 112 | ATLAS Collaboration | Measurement of the $ {{\mathrm{t}\overline{\mathrm{t}}} \mathrm{Z}} $ and $ {{\mathrm{t}\overline{\mathrm{t}}} \mathrm{W}} $ cross sections in proton-proton collisions at $ \sqrt{s}= $ 13 TeV with the ATLAS detector | PRD 99 (2019) 072009 | 1901.03584 |
| 113 | ATLAS Collaboration | Measurements of top-quark pair to Z-boson cross-section ratios at $ \sqrt{s}= $ 13, 8, 7 TeV with the ATLAS detector | JHEP 02 (2017) 117 | 1612.03636 |

|
Compact Muon Solenoid LHC, CERN |

|

|

|

|

|

|