

Compact Muon Solenoid
LHC, CERN
| CMS-PAS-TOP-16-021 | ||
| Investigations of the impact of the parton shower tuning in Pythia 8 in the modelling of $\mathrm{t\overline{t}}$ at $\sqrt{s}= $ 8 and 13 TeV | ||
| CMS Collaboration | ||
| November 2016 | ||
| Abstract: Studies are presented comparing top quark pair differential distribution data collected with the CMS detector at $\sqrt{s}=$ 8 and 13 TeV to state-of-the-art theoretical predictions. A tuning of POWHEG v2+PYTHIA8 through jet kinematics in top quark pair events and global variables is described and the studies validating the new settings along with the new event tune are presented. With the new event tune, the description of top quark pair and jet kinematics in top quark pair events, as well as the overall description of observables are improved. Studies of independent matrix element and parton shower scale variations along with initial-state and final-state radiation variations with several differential cross section measurements are also presented and the effects of these variations on particular observables are identified. | ||
| Links: CDS record (PDF) ; inSPIRE record ; CADI line (restricted) ; | ||
| Figures & Tables | Summary | Additional Figures | References | CMS Publications |
|---|
| Figures | |

png pdf |
Figure 1:
Sensitivity of (a) the multiplicity of jets with $ {p_{\mathrm {T}}} > $ 30 GeV and (b) the leading additional jet ${p_{\mathrm {T}}}$ to the tuning parameters. |
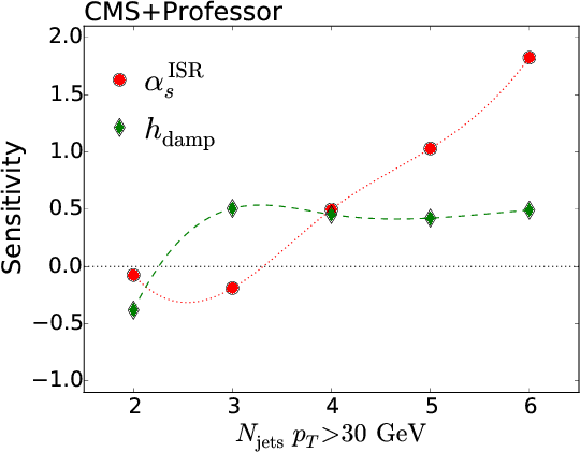
png pdf |
Figure 1-a:
Sensitivity of (a) the multiplicity of jets with $ {p_{\mathrm {T}}} > $ 30 GeV and (b) the leading additional jet ${p_{\mathrm {T}}}$ to the tuning parameters. |
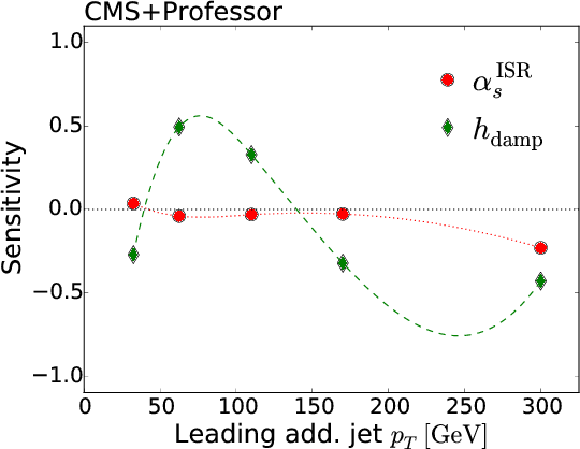
png pdf |
Figure 1-b:
Sensitivity of (a) the multiplicity of jets with $ {p_{\mathrm {T}}} > $ 30 GeV and (b) the leading additional jet ${p_{\mathrm {T}}}$ to the tuning parameters. |
png pdf |
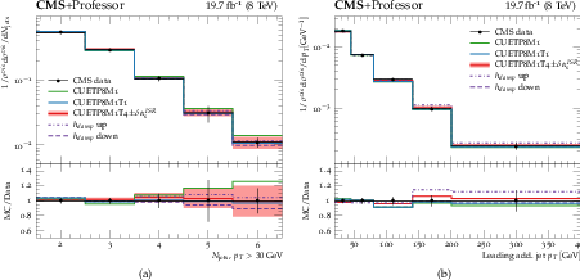
Figure 2:
Different tunes compared to (a) the multiplicity of jets with $ {p_{\mathrm {T}}} >$ 30 GeV and (b) the leading additional jet ${p_{\mathrm {T}}} $. The uncertainty band shows the $\alpha _{s}^{\text {ISR}}$ uncertainty on the tuned prediction, while the dashed lines indicate the $h_\text {damp}$ uncertainty. |

png pdf |
Figure 2-a:
Different tunes compared to (a) the multiplicity of jets with $ {p_{\mathrm {T}}} >$ 30 GeV and (b) the leading additional jet ${p_{\mathrm {T}}} $. The uncertainty band shows the $\alpha _{s}^{\text {ISR}}$ uncertainty on the tuned prediction, while the dashed lines indicate the $h_\text {damp}$ uncertainty. |
png pdf |
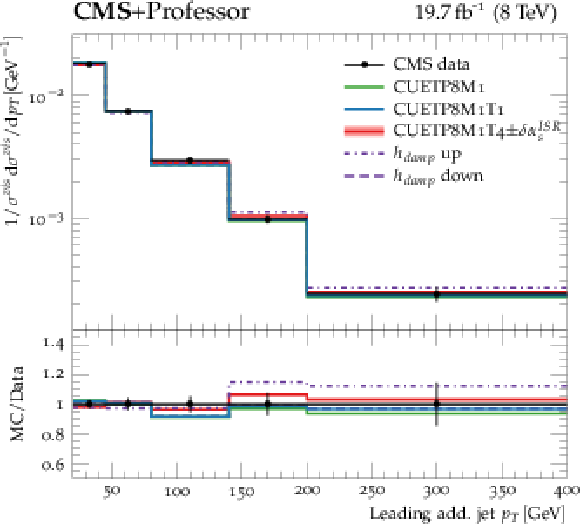
Figure 2-b:
Different tunes compared to (a) the multiplicity of jets with $ {p_{\mathrm {T}}} >$ 30 GeV and (b) the leading additional jet ${p_{\mathrm {T}}} $. The uncertainty band shows the $\alpha _{s}^{\text {ISR}}$ uncertainty on the tuned prediction, while the dashed lines indicate the $h_\text {damp}$ uncertainty. |
png pdf |
Figure 3:
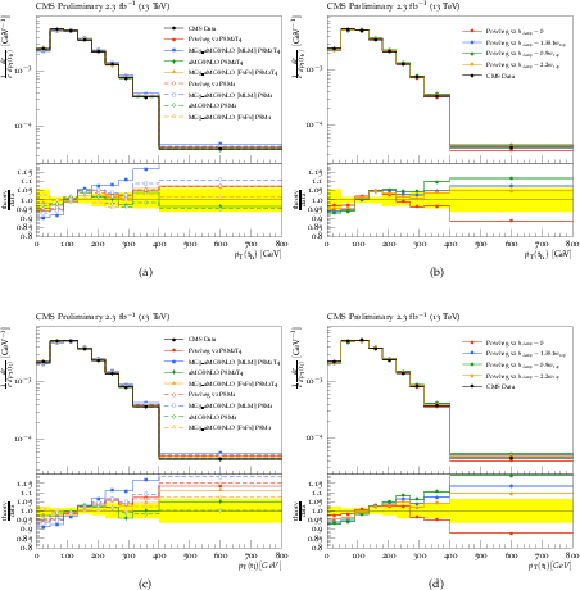
Normalized ${\mathrm{ t } {}\mathrm{ \bar{t} } }$ cross section in bins of ${p_{\mathrm {T}}} ^t$ in data and MC in the lepton+jets channel at $\sqrt {s}=$ 13 TeV (Analysis A). The upper plots (a and b) show the hadronically decaying top quarks ($t_h$) and the lower plots (c and d) the leptonically decaying top quarks $t_l$. In plots a and c, the cross sections are compared to the predictions of POWHEG , mg5-amc@nloeither with MLM mathing or FXFX merging, and amc@nlo . For each case the PS simulation is done by PYTHIA 8 with the old (CUETP8M1) and the new (CUETP8M2T4) event tunes. In plots b and d, the cross sections are compared to the predictions of POWHEG with different $h_{damp}$ values with $h_{damp}=$ 1.581$m_{top}$ corresponding to the central value obtained from the tuning. Below each panel, the ratios of the predictions to data are shown with the yellow band indicating the total data uncertainties. |
png pdf |
Figure 3-a:
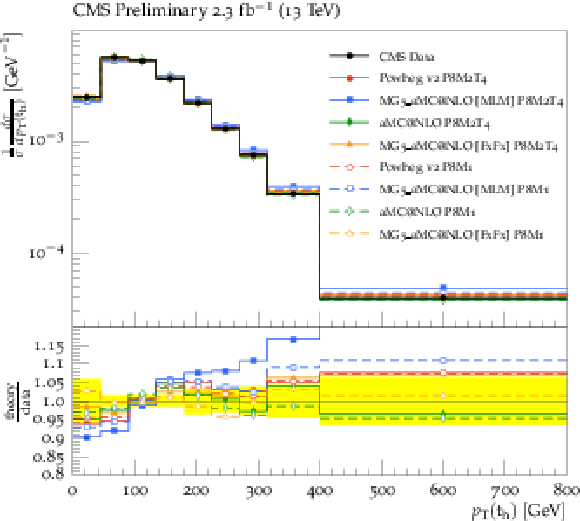
Normalized ${\mathrm{ t } {}\mathrm{ \bar{t} } }$ cross section in bins of ${p_{\mathrm {T}}} ^t$ in data and MC in the lepton+jets channel at $\sqrt {s}=$ 13 TeV (Analysis A). The upper plots (a and b) show the hadronically decaying top quarks ($t_h$) and the lower plots (c and d) the leptonically decaying top quarks $t_l$. In plots a and c, the cross sections are compared to the predictions of POWHEG , mg5-amc@nloeither with MLM mathing or FXFX merging, and amc@nlo . For each case the PS simulation is done by PYTHIA 8 with the old (CUETP8M1) and the new (CUETP8M2T4) event tunes. In plots b and d, the cross sections are compared to the predictions of POWHEG with different $h_{damp}$ values with $h_{damp}=$ 1.581$m_{top}$ corresponding to the central value obtained from the tuning. Below each panel, the ratios of the predictions to data are shown with the yellow band indicating the total data uncertainties. |
png pdf |
Figure 3-b:
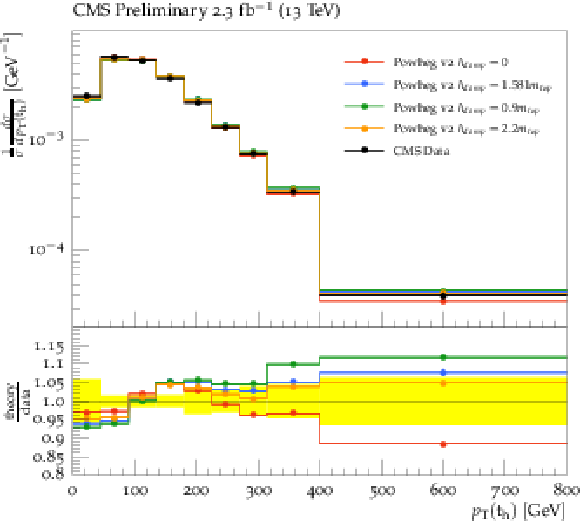
Normalized ${\mathrm{ t } {}\mathrm{ \bar{t} } }$ cross section in bins of ${p_{\mathrm {T}}} ^t$ in data and MC in the lepton+jets channel at $\sqrt {s}=$ 13 TeV (Analysis A). The upper plots (a and b) show the hadronically decaying top quarks ($t_h$) and the lower plots (c and d) the leptonically decaying top quarks $t_l$. In plots a and c, the cross sections are compared to the predictions of POWHEG , mg5-amc@nloeither with MLM mathing or FXFX merging, and amc@nlo . For each case the PS simulation is done by PYTHIA 8 with the old (CUETP8M1) and the new (CUETP8M2T4) event tunes. In plots b and d, the cross sections are compared to the predictions of POWHEG with different $h_{damp}$ values with $h_{damp}=$ 1.581$m_{top}$ corresponding to the central value obtained from the tuning. Below each panel, the ratios of the predictions to data are shown with the yellow band indicating the total data uncertainties. |
png pdf |
Figure 3-c:
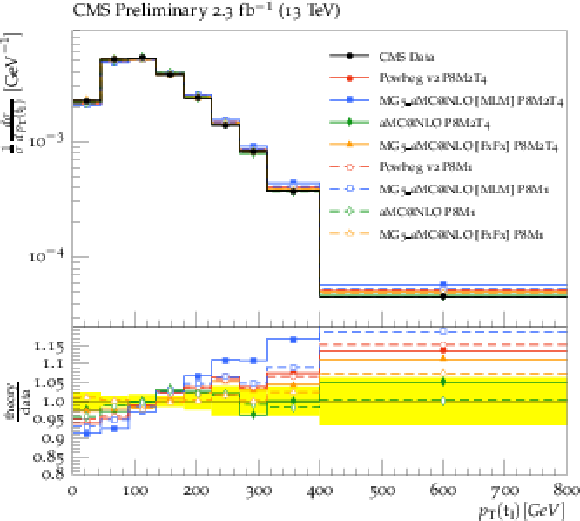
Normalized ${\mathrm{ t } {}\mathrm{ \bar{t} } }$ cross section in bins of ${p_{\mathrm {T}}} ^t$ in data and MC in the lepton+jets channel at $\sqrt {s}=$ 13 TeV (Analysis A). The upper plots (a and b) show the hadronically decaying top quarks ($t_h$) and the lower plots (c and d) the leptonically decaying top quarks $t_l$. In plots a and c, the cross sections are compared to the predictions of POWHEG , mg5-amc@nloeither with MLM mathing or FXFX merging, and amc@nlo . For each case the PS simulation is done by PYTHIA 8 with the old (CUETP8M1) and the new (CUETP8M2T4) event tunes. In plots b and d, the cross sections are compared to the predictions of POWHEG with different $h_{damp}$ values with $h_{damp}=$ 1.581$m_{top}$ corresponding to the central value obtained from the tuning. Below each panel, the ratios of the predictions to data are shown with the yellow band indicating the total data uncertainties. |

png pdf |
Figure 3-d:
Normalized ${\mathrm{ t } {}\mathrm{ \bar{t} } }$ cross section in bins of ${p_{\mathrm {T}}} ^t$ in data and MC in the lepton+jets channel at $\sqrt {s}=$ 13 TeV (Analysis A). The upper plots (a and b) show the hadronically decaying top quarks ($t_h$) and the lower plots (c and d) the leptonically decaying top quarks $t_l$. In plots a and c, the cross sections are compared to the predictions of POWHEG , mg5-amc@nloeither with MLM mathing or FXFX merging, and amc@nlo . For each case the PS simulation is done by PYTHIA 8 with the old (CUETP8M1) and the new (CUETP8M2T4) event tunes. In plots b and d, the cross sections are compared to the predictions of POWHEG with different $h_{damp}$ values with $h_{damp}=$ 1.581$m_{top}$ corresponding to the central value obtained from the tuning. Below each panel, the ratios of the predictions to data are shown with the yellow band indicating the total data uncertainties. |
png pdf |
Figure 4:
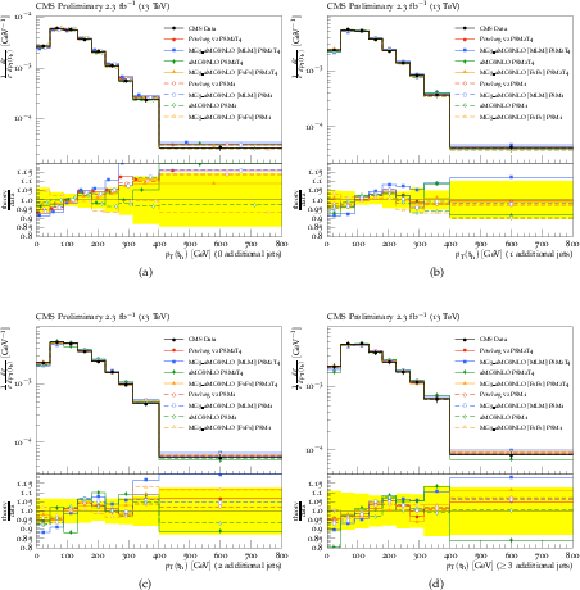
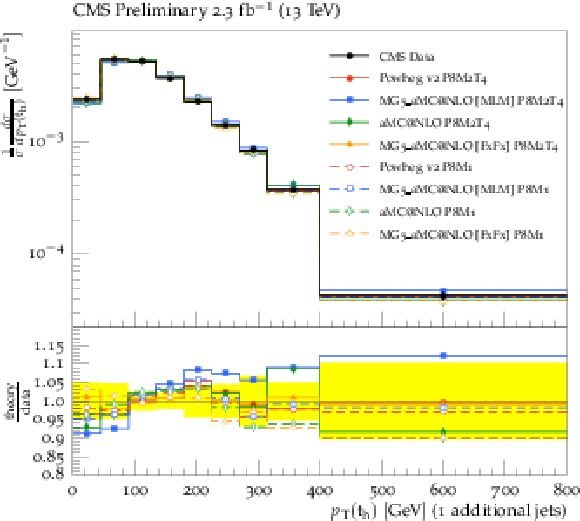
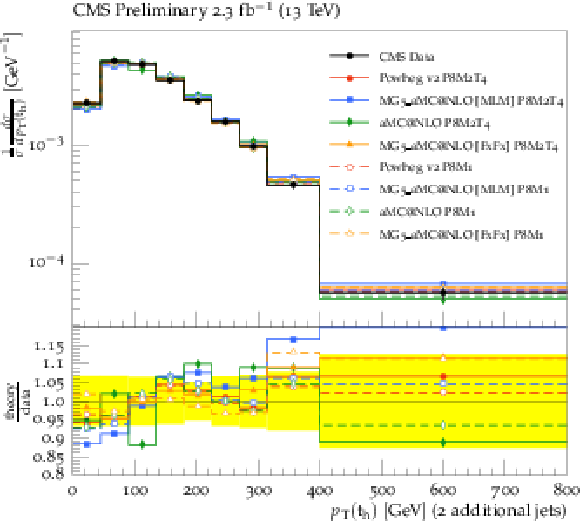
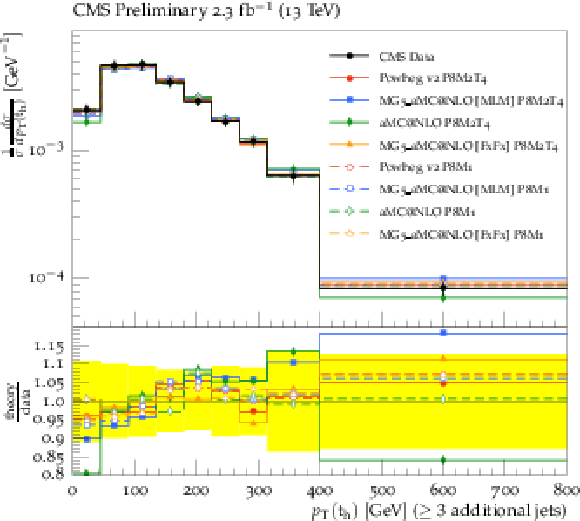
Normalized ${\mathrm{ t } {}\mathrm{ \bar{t} } }$ cross section in bins of ${p_{\mathrm {T}}} ^t$ for the hadronically decaying top quarks ($t_h$) in data and MC in the lepton+jets channel at $\sqrt {s}=$ 13 TeV (Analysis A). Panels a to d display ${p_{\mathrm {T}}} ^t$ in events with no, one, two, and three additional jets, respectively. The cross sections are compared to the predictions of POWHEG , mg5-amc@nloeither with MLM mathing or FXFX merging, and amc@nlo . For each case the PS simulation is done by PYTHIA 8 with the old (CUETP8M1) and the new (CUETP8M2T4) event tunes. Below each panel, the ratios of the predictions to data are shown with the yellow band indicating the total data uncertainties. |

png pdf |
Figure 4-a:
Normalized ${\mathrm{ t } {}\mathrm{ \bar{t} } }$ cross section in bins of ${p_{\mathrm {T}}} ^t$ for the hadronically decaying top quarks ($t_h$) in data and MC in the lepton+jets channel at $\sqrt {s}=$ 13 TeV (Analysis A). Panels a to d display ${p_{\mathrm {T}}} ^t$ in events with no, one, two, and three additional jets, respectively. The cross sections are compared to the predictions of POWHEG , mg5-amc@nloeither with MLM mathing or FXFX merging, and amc@nlo . For each case the PS simulation is done by PYTHIA 8 with the old (CUETP8M1) and the new (CUETP8M2T4) event tunes. Below each panel, the ratios of the predictions to data are shown with the yellow band indicating the total data uncertainties. |
png pdf |
Figure 4-b:
Normalized ${\mathrm{ t } {}\mathrm{ \bar{t} } }$ cross section in bins of ${p_{\mathrm {T}}} ^t$ for the hadronically decaying top quarks ($t_h$) in data and MC in the lepton+jets channel at $\sqrt {s}=$ 13 TeV (Analysis A). Panels a to d display ${p_{\mathrm {T}}} ^t$ in events with no, one, two, and three additional jets, respectively. The cross sections are compared to the predictions of POWHEG , mg5-amc@nloeither with MLM mathing or FXFX merging, and amc@nlo . For each case the PS simulation is done by PYTHIA 8 with the old (CUETP8M1) and the new (CUETP8M2T4) event tunes. Below each panel, the ratios of the predictions to data are shown with the yellow band indicating the total data uncertainties. |
png pdf |
Figure 4-c:
Normalized ${\mathrm{ t } {}\mathrm{ \bar{t} } }$ cross section in bins of ${p_{\mathrm {T}}} ^t$ for the hadronically decaying top quarks ($t_h$) in data and MC in the lepton+jets channel at $\sqrt {s}=$ 13 TeV (Analysis A). Panels a to d display ${p_{\mathrm {T}}} ^t$ in events with no, one, two, and three additional jets, respectively. The cross sections are compared to the predictions of POWHEG , mg5-amc@nloeither with MLM mathing or FXFX merging, and amc@nlo . For each case the PS simulation is done by PYTHIA 8 with the old (CUETP8M1) and the new (CUETP8M2T4) event tunes. Below each panel, the ratios of the predictions to data are shown with the yellow band indicating the total data uncertainties. |
png pdf |
Figure 4-d:
Normalized ${\mathrm{ t } {}\mathrm{ \bar{t} } }$ cross section in bins of ${p_{\mathrm {T}}} ^t$ for the hadronically decaying top quarks ($t_h$) in data and MC in the lepton+jets channel at $\sqrt {s}=$ 13 TeV (Analysis A). Panels a to d display ${p_{\mathrm {T}}} ^t$ in events with no, one, two, and three additional jets, respectively. The cross sections are compared to the predictions of POWHEG , mg5-amc@nloeither with MLM mathing or FXFX merging, and amc@nlo . For each case the PS simulation is done by PYTHIA 8 with the old (CUETP8M1) and the new (CUETP8M2T4) event tunes. Below each panel, the ratios of the predictions to data are shown with the yellow band indicating the total data uncertainties. |
png pdf |
Figure 5:
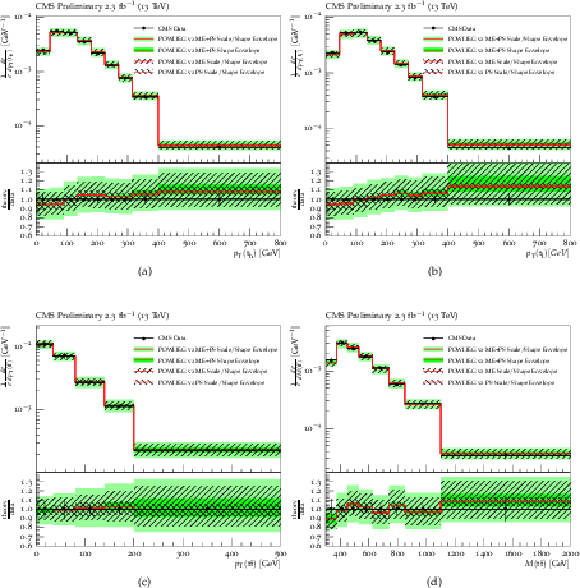
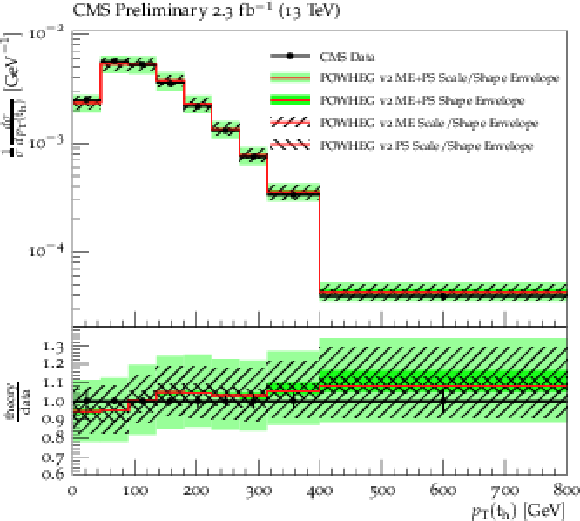
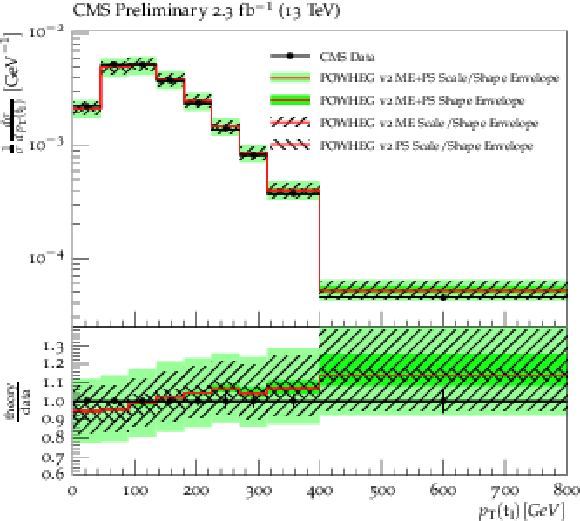
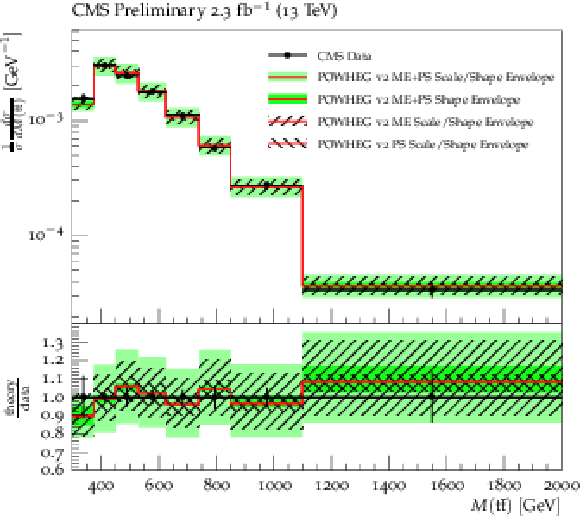
Normalized ${\mathrm{ t } {}\mathrm{ \bar{t} } }$ cross section in bins of ${p_{\mathrm {T}}} ^t$ for the hadronically decaying top quarks ($t_h$) (a), for the leptonically decaying top quarks ($t_l$) (b), in bins of ${p_{\mathrm {T}}} ({\mathrm{ t } {}\mathrm{ \bar{t} } } )$ (c), and in bins of $M({\mathrm{ t } {}\mathrm{ \bar{t} } } )$ (d) in data and MC along with ME+PS normalization scale factor + shape and shape envelopes in the lepton+jets channel at $\sqrt {s}=$ 13 TeV (Analysis A). |
png pdf |
Figure 5-a:
Normalized ${\mathrm{ t } {}\mathrm{ \bar{t} } }$ cross section in bins of ${p_{\mathrm {T}}} ^t$ for the hadronically decaying top quarks ($t_h$) (a), for the leptonically decaying top quarks ($t_l$) (b), in bins of ${p_{\mathrm {T}}} ({\mathrm{ t } {}\mathrm{ \bar{t} } } )$ (c), and in bins of $M({\mathrm{ t } {}\mathrm{ \bar{t} } } )$ (d) in data and MC along with ME+PS normalization scale factor + shape and shape envelopes in the lepton+jets channel at $\sqrt {s}=$ 13 TeV (Analysis A). |
png pdf |
Figure 5-b:
Normalized ${\mathrm{ t } {}\mathrm{ \bar{t} } }$ cross section in bins of ${p_{\mathrm {T}}} ^t$ for the hadronically decaying top quarks ($t_h$) (a), for the leptonically decaying top quarks ($t_l$) (b), in bins of ${p_{\mathrm {T}}} ({\mathrm{ t } {}\mathrm{ \bar{t} } } )$ (c), and in bins of $M({\mathrm{ t } {}\mathrm{ \bar{t} } } )$ (d) in data and MC along with ME+PS normalization scale factor + shape and shape envelopes in the lepton+jets channel at $\sqrt {s}=$ 13 TeV (Analysis A). |

png pdf |
Figure 5-c:
Normalized ${\mathrm{ t } {}\mathrm{ \bar{t} } }$ cross section in bins of ${p_{\mathrm {T}}} ^t$ for the hadronically decaying top quarks ($t_h$) (a), for the leptonically decaying top quarks ($t_l$) (b), in bins of ${p_{\mathrm {T}}} ({\mathrm{ t } {}\mathrm{ \bar{t} } } )$ (c), and in bins of $M({\mathrm{ t } {}\mathrm{ \bar{t} } } )$ (d) in data and MC along with ME+PS normalization scale factor + shape and shape envelopes in the lepton+jets channel at $\sqrt {s}=$ 13 TeV (Analysis A). |
png pdf |
Figure 5-d:
Normalized ${\mathrm{ t } {}\mathrm{ \bar{t} } }$ cross section in bins of ${p_{\mathrm {T}}} ^t$ for the hadronically decaying top quarks ($t_h$) (a), for the leptonically decaying top quarks ($t_l$) (b), in bins of ${p_{\mathrm {T}}} ({\mathrm{ t } {}\mathrm{ \bar{t} } } )$ (c), and in bins of $M({\mathrm{ t } {}\mathrm{ \bar{t} } } )$ (d) in data and MC along with ME+PS normalization scale factor + shape and shape envelopes in the lepton+jets channel at $\sqrt {s}=$ 13 TeV (Analysis A). |
png pdf |
Figure 6:
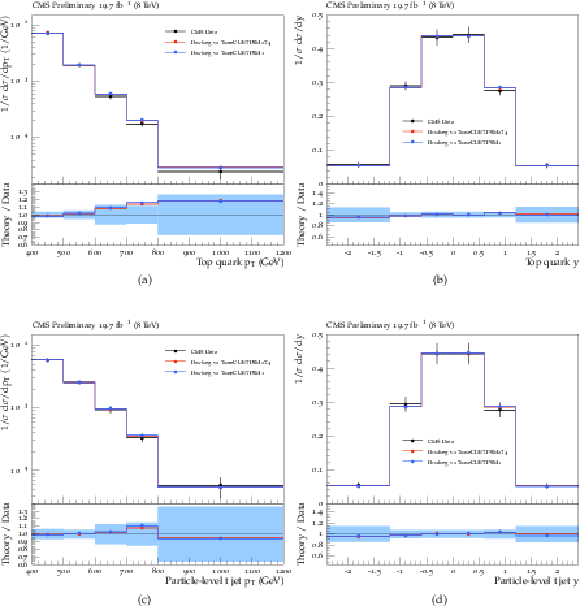
Normalized ${\mathrm{ t } {}\mathrm{ \bar{t} } }$ cross section in bins of parton-level top quark ${p_{\mathrm {T}}}$ (a) and rapidity (b), particle-level t jet ${p_{\mathrm {T}}}$ (c) and y (d) in the lepton+jets channel at $\sqrt {s}=$ 8 TeV (Analysis D). The boosted distributions shown are normalized to the integrated cross section for events with top quark ${p_{\mathrm {T}}} >$ 400 GeV. The cross section is compared to the predictions of POWHEG combined with PYTHIA 8 with the old (CUETP8M1) and the new (CUETP8M2T4) event tunes. The data points are shown with the total uncertainties. In the lower plot, the ratios of the predictions to data are shown with the blue band indicating the total data uncertainties. |

png pdf |
Figure 6-a:
Normalized ${\mathrm{ t } {}\mathrm{ \bar{t} } }$ cross section in bins of parton-level top quark ${p_{\mathrm {T}}}$ (a) and rapidity (b), particle-level t jet ${p_{\mathrm {T}}}$ (c) and y (d) in the lepton+jets channel at $\sqrt {s}=$ 8 TeV (Analysis D). The boosted distributions shown are normalized to the integrated cross section for events with top quark ${p_{\mathrm {T}}} >$ 400 GeV. The cross section is compared to the predictions of POWHEG combined with PYTHIA 8 with the old (CUETP8M1) and the new (CUETP8M2T4) event tunes. The data points are shown with the total uncertainties. In the lower plot, the ratios of the predictions to data are shown with the blue band indicating the total data uncertainties. |
png pdf |
Figure 6-b:
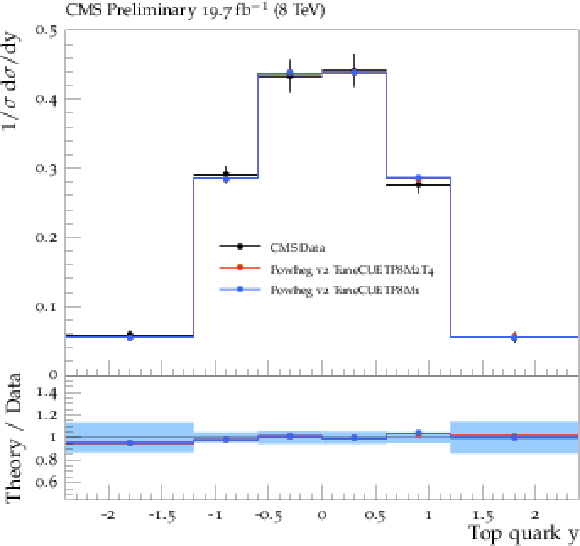
Normalized ${\mathrm{ t } {}\mathrm{ \bar{t} } }$ cross section in bins of parton-level top quark ${p_{\mathrm {T}}}$ (a) and rapidity (b), particle-level t jet ${p_{\mathrm {T}}}$ (c) and y (d) in the lepton+jets channel at $\sqrt {s}=$ 8 TeV (Analysis D). The boosted distributions shown are normalized to the integrated cross section for events with top quark ${p_{\mathrm {T}}} >$ 400 GeV. The cross section is compared to the predictions of POWHEG combined with PYTHIA 8 with the old (CUETP8M1) and the new (CUETP8M2T4) event tunes. The data points are shown with the total uncertainties. In the lower plot, the ratios of the predictions to data are shown with the blue band indicating the total data uncertainties. |
png pdf |
Figure 6-c:
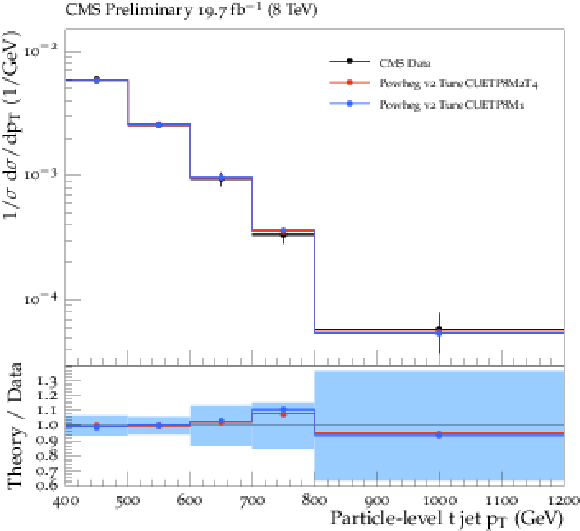
Normalized ${\mathrm{ t } {}\mathrm{ \bar{t} } }$ cross section in bins of parton-level top quark ${p_{\mathrm {T}}}$ (a) and rapidity (b), particle-level t jet ${p_{\mathrm {T}}}$ (c) and y (d) in the lepton+jets channel at $\sqrt {s}=$ 8 TeV (Analysis D). The boosted distributions shown are normalized to the integrated cross section for events with top quark ${p_{\mathrm {T}}} >$ 400 GeV. The cross section is compared to the predictions of POWHEG combined with PYTHIA 8 with the old (CUETP8M1) and the new (CUETP8M2T4) event tunes. The data points are shown with the total uncertainties. In the lower plot, the ratios of the predictions to data are shown with the blue band indicating the total data uncertainties. |
png pdf |
Figure 6-d:
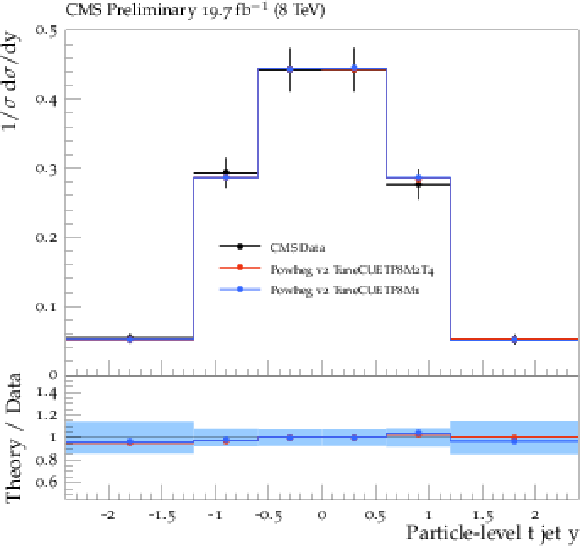
Normalized ${\mathrm{ t } {}\mathrm{ \bar{t} } }$ cross section in bins of parton-level top quark ${p_{\mathrm {T}}}$ (a) and rapidity (b), particle-level t jet ${p_{\mathrm {T}}}$ (c) and y (d) in the lepton+jets channel at $\sqrt {s}=$ 8 TeV (Analysis D). The boosted distributions shown are normalized to the integrated cross section for events with top quark ${p_{\mathrm {T}}} >$ 400 GeV. The cross section is compared to the predictions of POWHEG combined with PYTHIA 8 with the old (CUETP8M1) and the new (CUETP8M2T4) event tunes. The data points are shown with the total uncertainties. In the lower plot, the ratios of the predictions to data are shown with the blue band indicating the total data uncertainties. |
png pdf |
Figure 7:
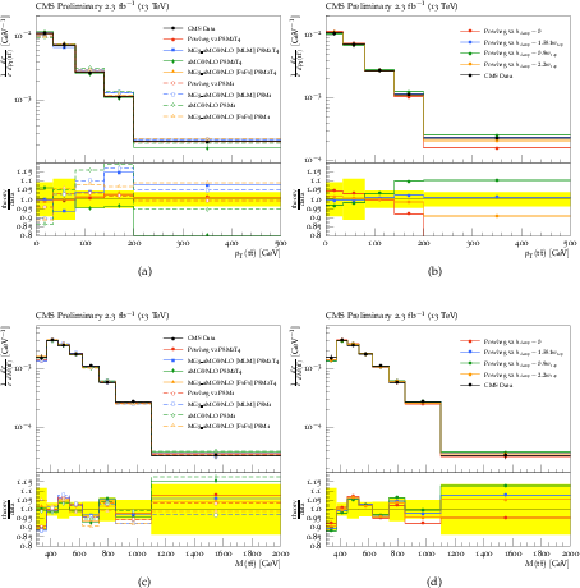
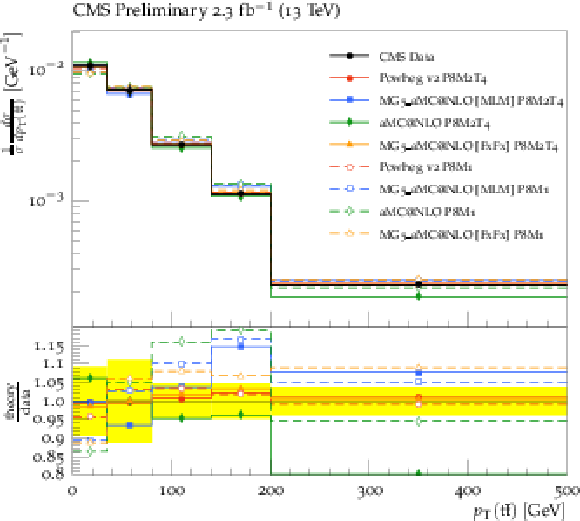
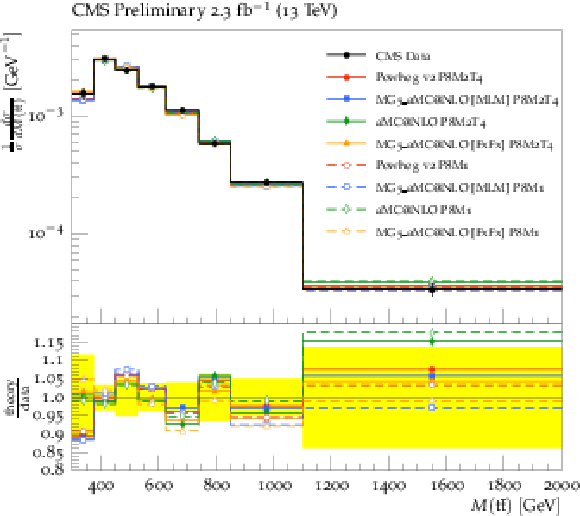
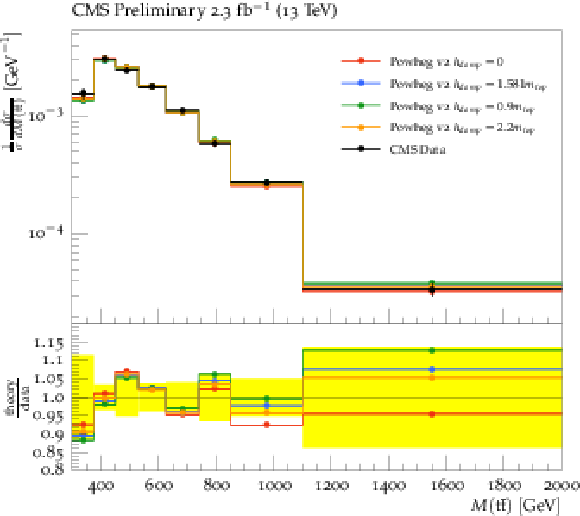
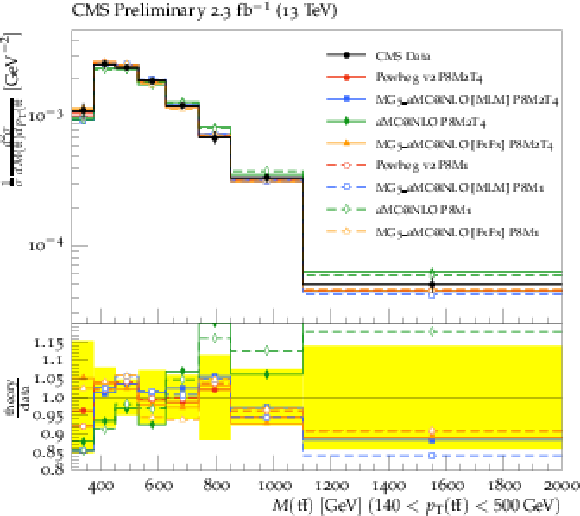
Normalized ${\mathrm{ t } {}\mathrm{ \bar{t} } }$ cross section in bins of ${p_{\mathrm {T}}} ({\mathrm{ t } {}\mathrm{ \bar{t} } } )$ (top) and of $M({\mathrm{ t } {}\mathrm{ \bar{t} } } )$ (bottom) in data and MC in the lepton+jets channel at $\sqrt {s}=$ 13 TeV (Analysis A). The cross sections are compared to the predictions of POWHEG , mg5-amc@nloeither with MLM mathing or FXFX merging, and amc@nlo . For each case the PS simulation is done by PYTHIA 8 with the old (CUETP8M1) and the new (CUETP8M2T4) event tunes. In the lower panel of each plot, the ratios of the predictions to data are shown with the yellow band indicating the total data uncertainties. |
png pdf |
Figure 7-a:
Normalized ${\mathrm{ t } {}\mathrm{ \bar{t} } }$ cross section in bins of ${p_{\mathrm {T}}} ({\mathrm{ t } {}\mathrm{ \bar{t} } } )$ (top) and of $M({\mathrm{ t } {}\mathrm{ \bar{t} } } )$ (bottom) in data and MC in the lepton+jets channel at $\sqrt {s}=$ 13 TeV (Analysis A). The cross sections are compared to the predictions of POWHEG , mg5-amc@nloeither with MLM mathing or FXFX merging, and amc@nlo . For each case the PS simulation is done by PYTHIA 8 with the old (CUETP8M1) and the new (CUETP8M2T4) event tunes. In the lower panel of each plot, the ratios of the predictions to data are shown with the yellow band indicating the total data uncertainties. |

png pdf |
Figure 7-b:
Normalized ${\mathrm{ t } {}\mathrm{ \bar{t} } }$ cross section in bins of ${p_{\mathrm {T}}} ({\mathrm{ t } {}\mathrm{ \bar{t} } } )$ (top) and of $M({\mathrm{ t } {}\mathrm{ \bar{t} } } )$ (bottom) in data and MC in the lepton+jets channel at $\sqrt {s}=$ 13 TeV (Analysis A). The cross sections are compared to the predictions of POWHEG , mg5-amc@nloeither with MLM mathing or FXFX merging, and amc@nlo . For each case the PS simulation is done by PYTHIA 8 with the old (CUETP8M1) and the new (CUETP8M2T4) event tunes. In the lower panel of each plot, the ratios of the predictions to data are shown with the yellow band indicating the total data uncertainties. |
png pdf |
Figure 7-c:
Normalized ${\mathrm{ t } {}\mathrm{ \bar{t} } }$ cross section in bins of ${p_{\mathrm {T}}} ({\mathrm{ t } {}\mathrm{ \bar{t} } } )$ (top) and of $M({\mathrm{ t } {}\mathrm{ \bar{t} } } )$ (bottom) in data and MC in the lepton+jets channel at $\sqrt {s}=$ 13 TeV (Analysis A). The cross sections are compared to the predictions of POWHEG , mg5-amc@nloeither with MLM mathing or FXFX merging, and amc@nlo . For each case the PS simulation is done by PYTHIA 8 with the old (CUETP8M1) and the new (CUETP8M2T4) event tunes. In the lower panel of each plot, the ratios of the predictions to data are shown with the yellow band indicating the total data uncertainties. |
png pdf |
Figure 7-d:
Normalized ${\mathrm{ t } {}\mathrm{ \bar{t} } }$ cross section in bins of ${p_{\mathrm {T}}} ({\mathrm{ t } {}\mathrm{ \bar{t} } } )$ (top) and of $M({\mathrm{ t } {}\mathrm{ \bar{t} } } )$ (bottom) in data and MC in the lepton+jets channel at $\sqrt {s}=$ 13 TeV (Analysis A). The cross sections are compared to the predictions of POWHEG , mg5-amc@nloeither with MLM mathing or FXFX merging, and amc@nlo . For each case the PS simulation is done by PYTHIA 8 with the old (CUETP8M1) and the new (CUETP8M2T4) event tunes. In the lower panel of each plot, the ratios of the predictions to data are shown with the yellow band indicating the total data uncertainties. |
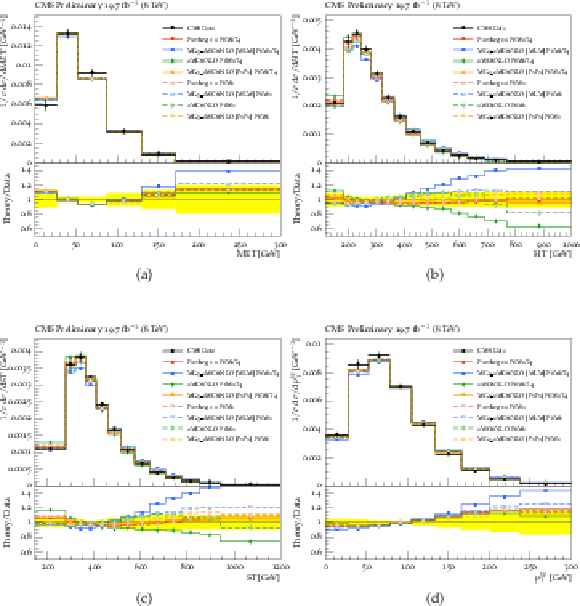
png pdf |
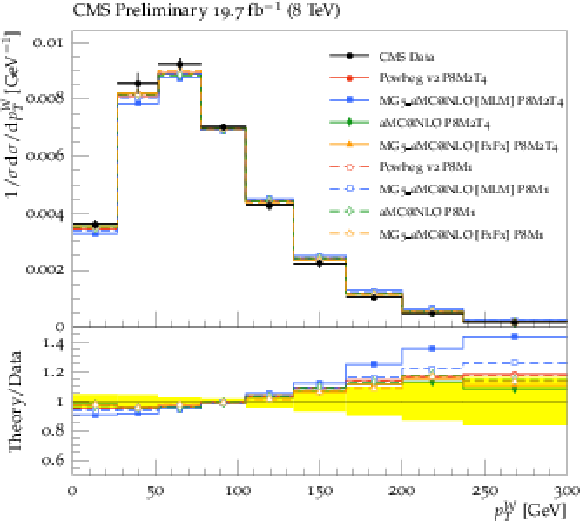
Figure 8:
Normalized ${\mathrm{ t } {}\mathrm{ \bar{t} } }$ cross section in bins of missing $E_T$ (a), $H_T$ (b), $S_T$ (c), and ${p_{\mathrm {T}}} ^\mathrm{ W } $ (d) in data and MC in the lepton+jets channel at $\sqrt {s}=$ 8 TeV (Analysis C). The cross sections are compared to the predictions of POWHEG , mg5-amc@nloeither with MLM mathing or FXFX merging, and amc@nlo . For each case the PS simulation is done by PYTHIA 8 with the old (CUETP8M1) and the new (CUETP8M2T4) event tunes. In the lower panel of each plot, the ratios of the predictions to data are shown with the yellow band indicating the total data uncertainties. |
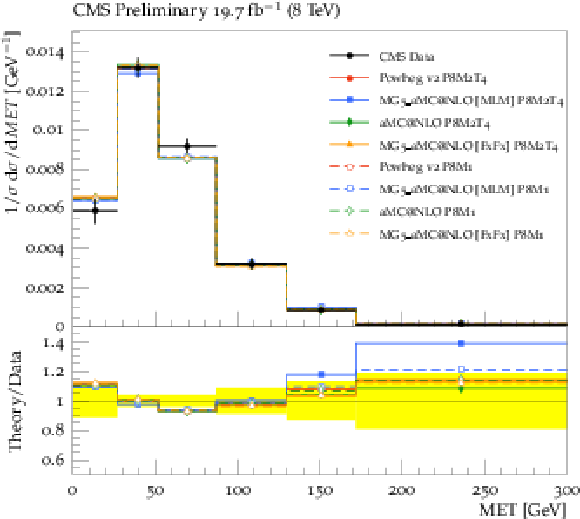
png pdf |
Figure 8-a:
Normalized ${\mathrm{ t } {}\mathrm{ \bar{t} } }$ cross section in bins of missing $E_T$ (a), $H_T$ (b), $S_T$ (c), and ${p_{\mathrm {T}}} ^\mathrm{ W } $ (d) in data and MC in the lepton+jets channel at $\sqrt {s}=$ 8 TeV (Analysis C). The cross sections are compared to the predictions of POWHEG , mg5-amc@nloeither with MLM mathing or FXFX merging, and amc@nlo . For each case the PS simulation is done by PYTHIA 8 with the old (CUETP8M1) and the new (CUETP8M2T4) event tunes. In the lower panel of each plot, the ratios of the predictions to data are shown with the yellow band indicating the total data uncertainties. |
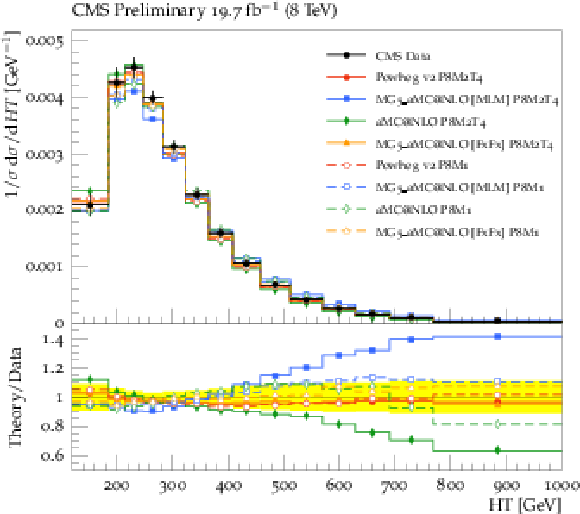
png pdf |
Figure 8-b:
Normalized ${\mathrm{ t } {}\mathrm{ \bar{t} } }$ cross section in bins of missing $E_T$ (a), $H_T$ (b), $S_T$ (c), and ${p_{\mathrm {T}}} ^\mathrm{ W } $ (d) in data and MC in the lepton+jets channel at $\sqrt {s}=$ 8 TeV (Analysis C). The cross sections are compared to the predictions of POWHEG , mg5-amc@nloeither with MLM mathing or FXFX merging, and amc@nlo . For each case the PS simulation is done by PYTHIA 8 with the old (CUETP8M1) and the new (CUETP8M2T4) event tunes. In the lower panel of each plot, the ratios of the predictions to data are shown with the yellow band indicating the total data uncertainties. |
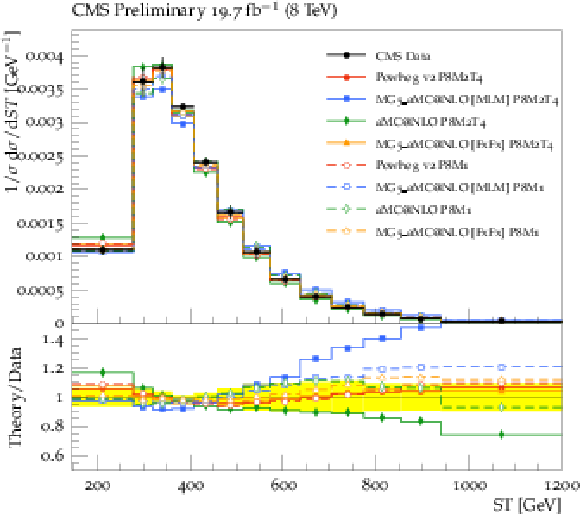
png pdf |
Figure 8-c:
Normalized ${\mathrm{ t } {}\mathrm{ \bar{t} } }$ cross section in bins of missing $E_T$ (a), $H_T$ (b), $S_T$ (c), and ${p_{\mathrm {T}}} ^\mathrm{ W } $ (d) in data and MC in the lepton+jets channel at $\sqrt {s}=$ 8 TeV (Analysis C). The cross sections are compared to the predictions of POWHEG , mg5-amc@nloeither with MLM mathing or FXFX merging, and amc@nlo . For each case the PS simulation is done by PYTHIA 8 with the old (CUETP8M1) and the new (CUETP8M2T4) event tunes. In the lower panel of each plot, the ratios of the predictions to data are shown with the yellow band indicating the total data uncertainties. |
png pdf |
Figure 8-d:
Normalized ${\mathrm{ t } {}\mathrm{ \bar{t} } }$ cross section in bins of missing $E_T$ (a), $H_T$ (b), $S_T$ (c), and ${p_{\mathrm {T}}} ^\mathrm{ W } $ (d) in data and MC in the lepton+jets channel at $\sqrt {s}=$ 8 TeV (Analysis C). The cross sections are compared to the predictions of POWHEG , mg5-amc@nloeither with MLM mathing or FXFX merging, and amc@nlo . For each case the PS simulation is done by PYTHIA 8 with the old (CUETP8M1) and the new (CUETP8M2T4) event tunes. In the lower panel of each plot, the ratios of the predictions to data are shown with the yellow band indicating the total data uncertainties. |
png pdf |
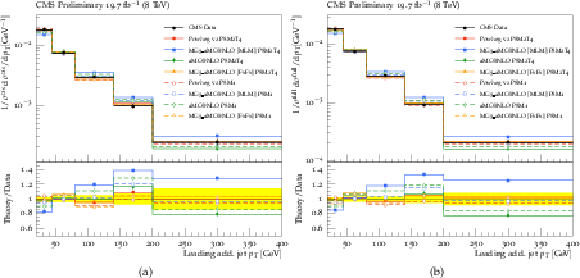
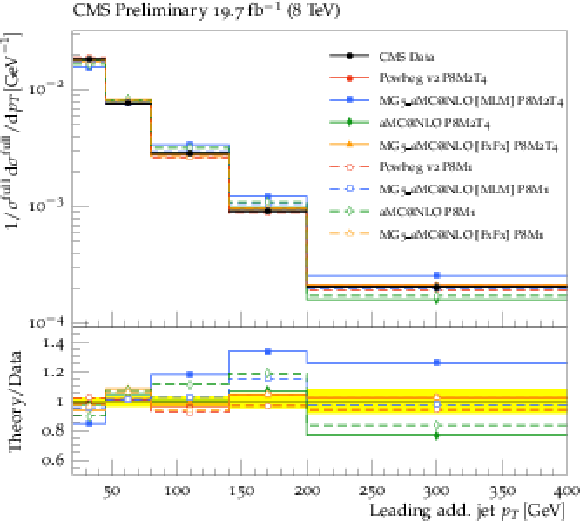
Figure 9:
Normalized ${\mathrm{ t } {}\mathrm{ \bar{t} } }$ cross section in bins of ${p_{\mathrm {T}}}$ of the leading additional jet in the visible phase space (a) and in the full ${\mathrm{ t } {}\mathrm{ \bar{t} } }$ phase space (b) in the dilepton channel at $\sqrt {s} =$ 8 TeV (Analysis B). The cross sections are compared to the predictions of POWHEG , mg5-amc@nloeither with [MLM] mathing or [FXFX] merging, and amc@nlo . For each case the PS simulation is done by PYTHIA 8 with the old (CUETP8M1) and the new (CUETP8M2T4) event tunes. In the lower panel of each plot, the ratios of the predictions to data are shown with the yellow band indicating the total data uncertainties. |

png pdf |
Figure 9-a:
Normalized ${\mathrm{ t } {}\mathrm{ \bar{t} } }$ cross section in bins of ${p_{\mathrm {T}}}$ of the leading additional jet in the visible phase space (a) and in the full ${\mathrm{ t } {}\mathrm{ \bar{t} } }$ phase space (b) in the dilepton channel at $\sqrt {s} =$ 8 TeV (Analysis B). The cross sections are compared to the predictions of POWHEG , mg5-amc@nloeither with [MLM] mathing or [FXFX] merging, and amc@nlo . For each case the PS simulation is done by PYTHIA 8 with the old (CUETP8M1) and the new (CUETP8M2T4) event tunes. In the lower panel of each plot, the ratios of the predictions to data are shown with the yellow band indicating the total data uncertainties. |
png pdf |
Figure 9-b:
Normalized ${\mathrm{ t } {}\mathrm{ \bar{t} } }$ cross section in bins of ${p_{\mathrm {T}}}$ of the leading additional jet in the visible phase space (a) and in the full ${\mathrm{ t } {}\mathrm{ \bar{t} } }$ phase space (b) in the dilepton channel at $\sqrt {s} =$ 8 TeV (Analysis B). The cross sections are compared to the predictions of POWHEG , mg5-amc@nloeither with [MLM] mathing or [FXFX] merging, and amc@nlo . For each case the PS simulation is done by PYTHIA 8 with the old (CUETP8M1) and the new (CUETP8M2T4) event tunes. In the lower panel of each plot, the ratios of the predictions to data are shown with the yellow band indicating the total data uncertainties. |

png pdf |
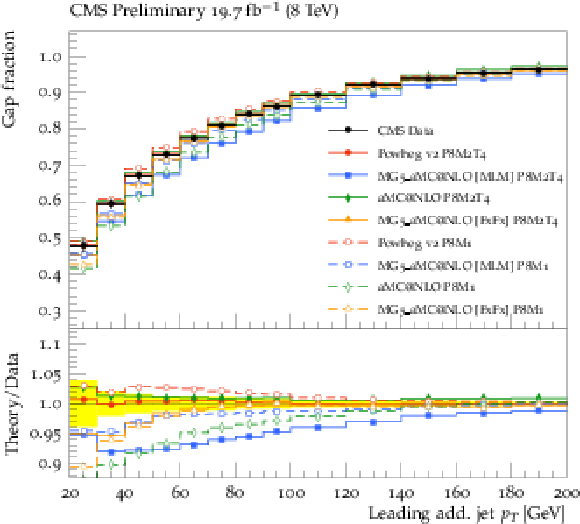
Figure 10:
Gap fraction in bins of ${p_{\mathrm {T}}}$ of the leading additional jet in the dilepton channel at $\sqrt {s} =$ 8 TeV (Analysis B). Panel a displays the gap fraction without any requirements on $\eta $. Panel b to d display the gap fraction in different $\eta $ regions of the additional jets. |
png pdf |
Figure 10-a:
Gap fraction in bins of ${p_{\mathrm {T}}}$ of the leading additional jet in the dilepton channel at $\sqrt {s} =$ 8 TeV (Analysis B). Panel a displays the gap fraction without any requirements on $\eta $. Panel b to d display the gap fraction in different $\eta $ regions of the additional jets. |
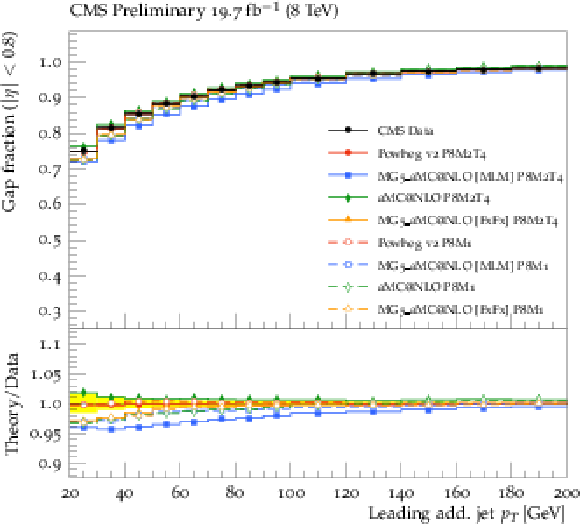
png pdf |
Figure 10-b:
Gap fraction in bins of ${p_{\mathrm {T}}}$ of the leading additional jet in the dilepton channel at $\sqrt {s} =$ 8 TeV (Analysis B). Panel a displays the gap fraction without any requirements on $\eta $. Panel b to d display the gap fraction in different $\eta $ regions of the additional jets. |
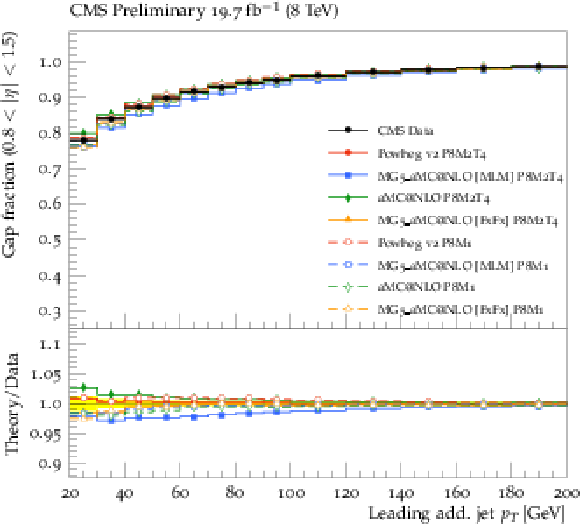
png pdf |
Figure 10-c:
Gap fraction in bins of ${p_{\mathrm {T}}}$ of the leading additional jet in the dilepton channel at $\sqrt {s} =$ 8 TeV (Analysis B). Panel a displays the gap fraction without any requirements on $\eta $. Panel b to d display the gap fraction in different $\eta $ regions of the additional jets. |
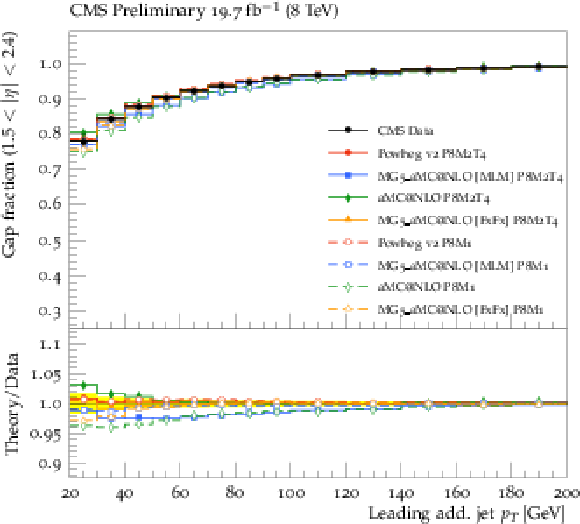
png pdf |
Figure 10-d:
Gap fraction in bins of ${p_{\mathrm {T}}}$ of the leading additional jet in the dilepton channel at $\sqrt {s} =$ 8 TeV (Analysis B). Panel a displays the gap fraction without any requirements on $\eta $. Panel b to d display the gap fraction in different $\eta $ regions of the additional jets. |
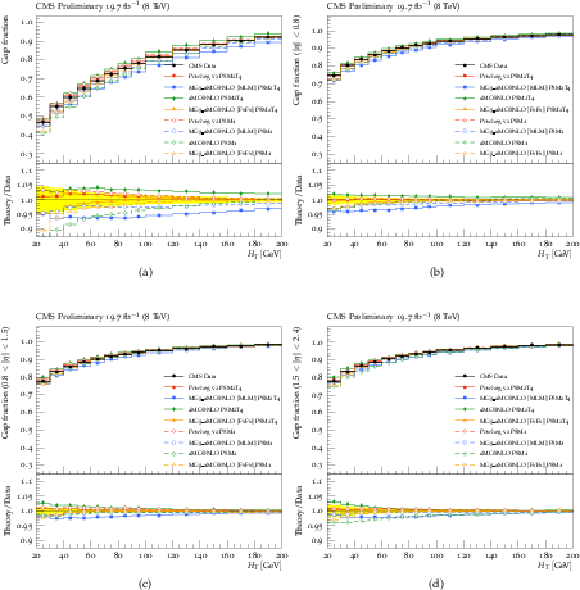
png pdf |
Figure 11:
Gap fraction in bins of $H_T$ in the dilepton channel at $\sqrt {s} =$ 8 TeV (Analysis B). Panel a displays the gap fraction without any requirements on $\eta $. Panel b to d display the gap fraction in different $\eta $ regions of the additional jets. |

png pdf |
Figure 11-a:
Gap fraction in bins of $H_T$ in the dilepton channel at $\sqrt {s} =$ 8 TeV (Analysis B). Panel a displays the gap fraction without any requirements on $\eta $. Panel b to d display the gap fraction in different $\eta $ regions of the additional jets. |
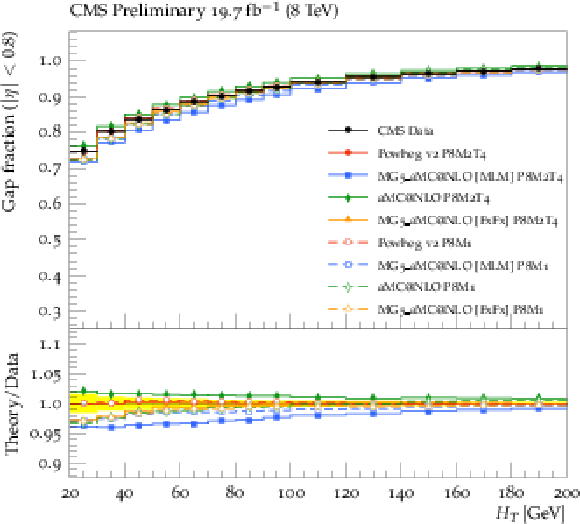
png pdf |
Figure 11-b:
Gap fraction in bins of $H_T$ in the dilepton channel at $\sqrt {s} =$ 8 TeV (Analysis B). Panel a displays the gap fraction without any requirements on $\eta $. Panel b to d display the gap fraction in different $\eta $ regions of the additional jets. |
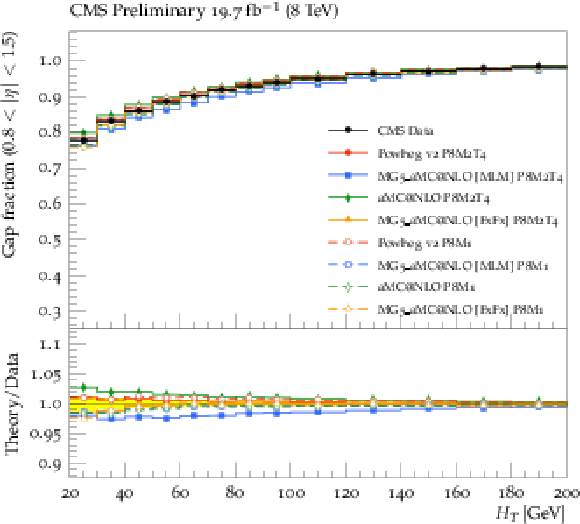
png pdf |
Figure 11-c:
Gap fraction in bins of $H_T$ in the dilepton channel at $\sqrt {s} =$ 8 TeV (Analysis B). Panel a displays the gap fraction without any requirements on $\eta $. Panel b to d display the gap fraction in different $\eta $ regions of the additional jets. |
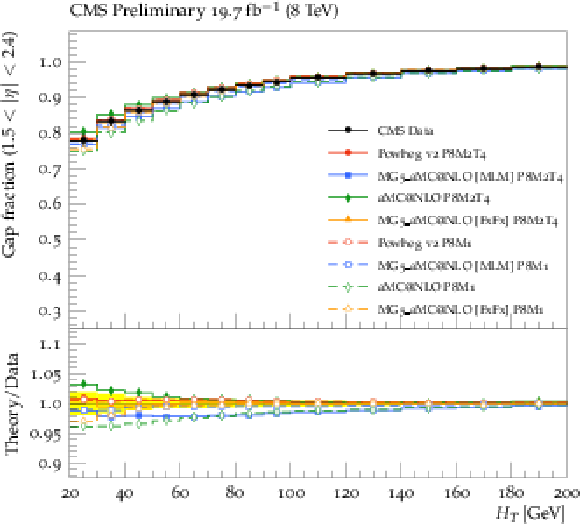
png pdf |
Figure 11-d:
Gap fraction in bins of $H_T$ in the dilepton channel at $\sqrt {s} =$ 8 TeV (Analysis B). Panel a displays the gap fraction without any requirements on $\eta $. Panel b to d display the gap fraction in different $\eta $ regions of the additional jets. |
png pdf |
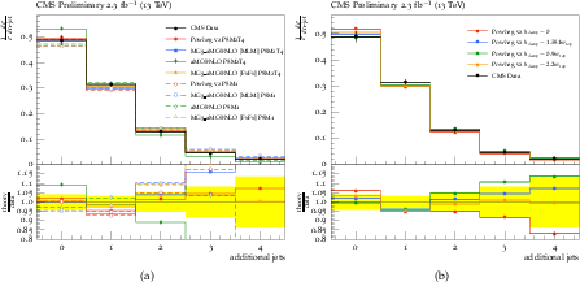
Figure 12:
Normalized ${\mathrm{ t } {}\mathrm{ \bar{t} } }$ cross section in bins of number of additional jets in data and MC in the lepton+jets channel at $\sqrt {s}=$ 13 TeV (Analysis A). In plot a, the cross sections are compared to the predictions of POWHEG , mg5-amc@nloeither with MLM mathing or FXFX merging, and amc@nlo . For each case the PS simulation is done by PYTHIA 8 with the old (CUETP8M1) and the new (CUETP8M2T4) event tunes. In plot b, the cross sections are compared to the predictions of POWHEG with different $h_{damp}$ values with $h_{damp} =$ 1.581$m_{top}$ corresponding to the central value obtained from the tuning. Below each panel, the ratios of the predictions to data are shown with the yellow band indicating the total data uncertainties. |

png pdf |
Figure 12-a:
Normalized ${\mathrm{ t } {}\mathrm{ \bar{t} } }$ cross section in bins of number of additional jets in data and MC in the lepton+jets channel at $\sqrt {s}=$ 13 TeV (Analysis A). In plot a, the cross sections are compared to the predictions of POWHEG , mg5-amc@nloeither with MLM mathing or FXFX merging, and amc@nlo . For each case the PS simulation is done by PYTHIA 8 with the old (CUETP8M1) and the new (CUETP8M2T4) event tunes. In plot b, the cross sections are compared to the predictions of POWHEG with different $h_{damp}$ values with $h_{damp} =$ 1.581$m_{top}$ corresponding to the central value obtained from the tuning. Below each panel, the ratios of the predictions to data are shown with the yellow band indicating the total data uncertainties. |
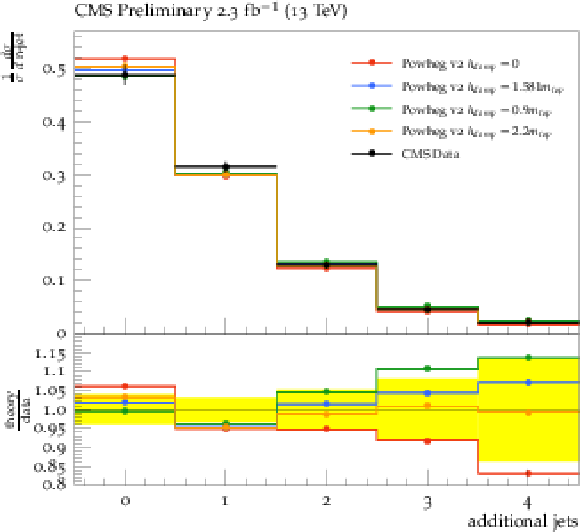
png pdf |
Figure 12-b:
Normalized ${\mathrm{ t } {}\mathrm{ \bar{t} } }$ cross section in bins of number of additional jets in data and MC in the lepton+jets channel at $\sqrt {s}=$ 13 TeV (Analysis A). In plot a, the cross sections are compared to the predictions of POWHEG , mg5-amc@nloeither with MLM mathing or FXFX merging, and amc@nlo . For each case the PS simulation is done by PYTHIA 8 with the old (CUETP8M1) and the new (CUETP8M2T4) event tunes. In plot b, the cross sections are compared to the predictions of POWHEG with different $h_{damp}$ values with $h_{damp} =$ 1.581$m_{top}$ corresponding to the central value obtained from the tuning. Below each panel, the ratios of the predictions to data are shown with the yellow band indicating the total data uncertainties. |
png pdf |
Figure 13:
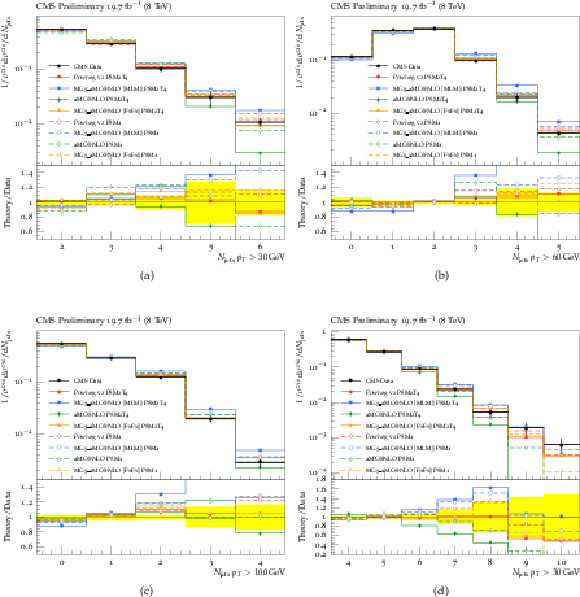
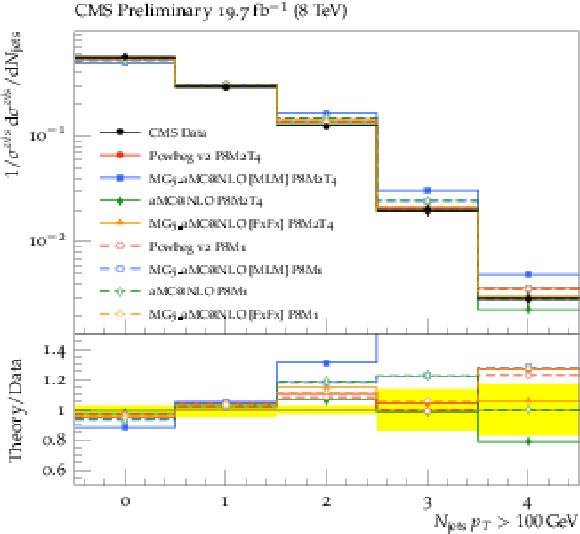
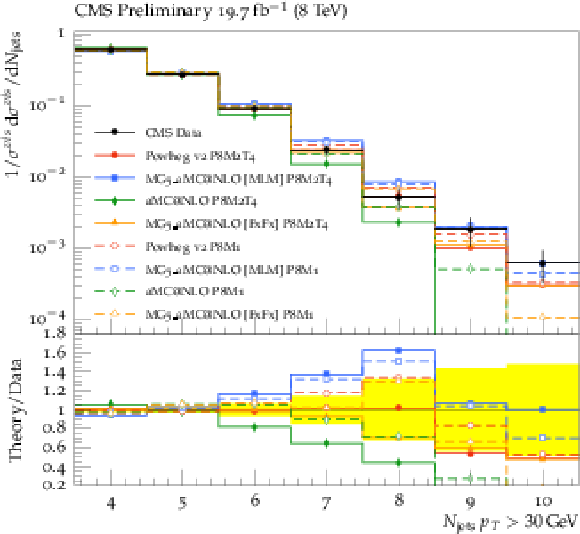
Normalized ${\mathrm{ t } {}\mathrm{ \bar{t} } } $ cross section in bins of number of jets in data and MC in the dilepton channel (a to c) (Analysis B) and lepton+jets channel (d) (Analysis E) at $\sqrt {s}=$ 8 TeV. Figures a to c show normalized ${\mathrm{ t } {}\mathrm{ \bar{t} } }$ cross sections with a jet ${p_{\mathrm {T}}}$ cut of 30, 60, and 100 GeV, respectively. Figure d shows normalized ${\mathrm{ t } {}\mathrm{ \bar{t} } }$ cross sections with a jet ${p_{\mathrm {T}}}$ cut of 30 GeV. The cross sections are compared to the predictions of POWHEG , mg5-amc@nloeither with MLM mathing or FXFX merging, and amc@nlo . For each case the PS simulation is done by PYTHIA 8 with the old (CUETP8M1) and the new (CUETP8M2T4) event tunes. Below each panel, the ratios of the predictions to data are shown with the yellow band indicating the total data uncertainties. |
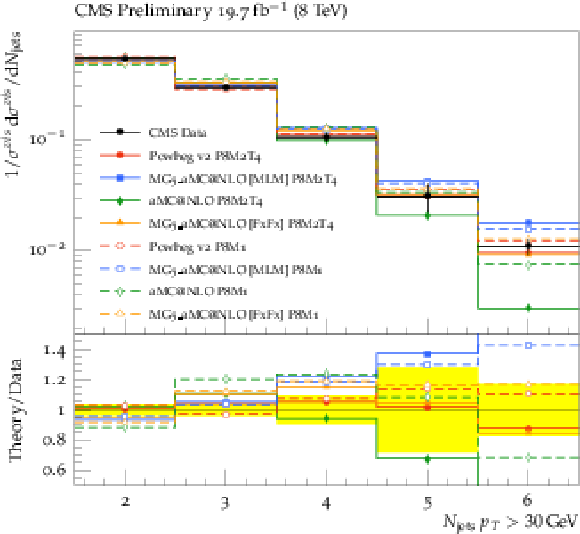
png pdf |
Figure 13-a:
Normalized ${\mathrm{ t } {}\mathrm{ \bar{t} } } $ cross section in bins of number of jets in data and MC in the dilepton channel (a to c) (Analysis B) and lepton+jets channel (d) (Analysis E) at $\sqrt {s}=$ 8 TeV. Figures a to c show normalized ${\mathrm{ t } {}\mathrm{ \bar{t} } }$ cross sections with a jet ${p_{\mathrm {T}}}$ cut of 30, 60, and 100 GeV, respectively. Figure d shows normalized ${\mathrm{ t } {}\mathrm{ \bar{t} } }$ cross sections with a jet ${p_{\mathrm {T}}}$ cut of 30 GeV. The cross sections are compared to the predictions of POWHEG , mg5-amc@nloeither with MLM mathing or FXFX merging, and amc@nlo . For each case the PS simulation is done by PYTHIA 8 with the old (CUETP8M1) and the new (CUETP8M2T4) event tunes. Below each panel, the ratios of the predictions to data are shown with the yellow band indicating the total data uncertainties.-a |
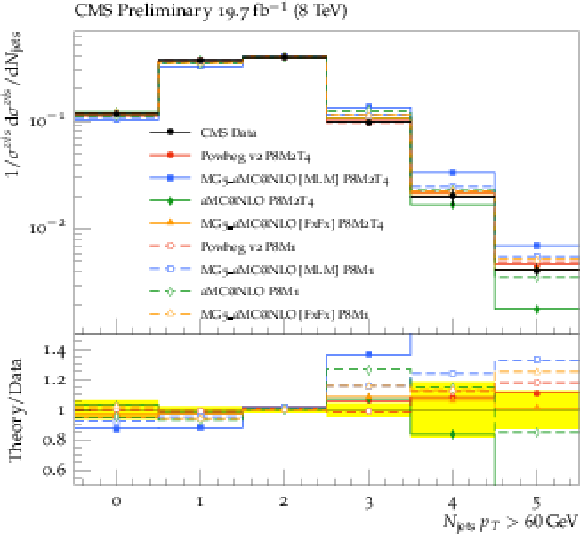
png pdf |
Figure 13-b:
Normalized ${\mathrm{ t } {}\mathrm{ \bar{t} } } $ cross section in bins of number of jets in data and MC in the dilepton channel (a to c) (Analysis B) and lepton+jets channel (d) (Analysis E) at $\sqrt {s}=$ 8 TeV. Figures a to c show normalized ${\mathrm{ t } {}\mathrm{ \bar{t} } }$ cross sections with a jet ${p_{\mathrm {T}}}$ cut of 30, 60, and 100 GeV, respectively. Figure d shows normalized ${\mathrm{ t } {}\mathrm{ \bar{t} } }$ cross sections with a jet ${p_{\mathrm {T}}}$ cut of 30 GeV. The cross sections are compared to the predictions of POWHEG , mg5-amc@nloeither with MLM mathing or FXFX merging, and amc@nlo . For each case the PS simulation is done by PYTHIA 8 with the old (CUETP8M1) and the new (CUETP8M2T4) event tunes. Below each panel, the ratios of the predictions to data are shown with the yellow band indicating the total data uncertainties.-b |
png pdf |
Figure 13-c:
Normalized ${\mathrm{ t } {}\mathrm{ \bar{t} } } $ cross section in bins of number of jets in data and MC in the dilepton channel (a to c) (Analysis B) and lepton+jets channel (d) (Analysis E) at $\sqrt {s}=$ 8 TeV. Figures a to c show normalized ${\mathrm{ t } {}\mathrm{ \bar{t} } }$ cross sections with a jet ${p_{\mathrm {T}}}$ cut of 30, 60, and 100 GeV, respectively. Figure d shows normalized ${\mathrm{ t } {}\mathrm{ \bar{t} } }$ cross sections with a jet ${p_{\mathrm {T}}}$ cut of 30 GeV. The cross sections are compared to the predictions of POWHEG , mg5-amc@nloeither with MLM mathing or FXFX merging, and amc@nlo . For each case the PS simulation is done by PYTHIA 8 with the old (CUETP8M1) and the new (CUETP8M2T4) event tunes. Below each panel, the ratios of the predictions to data are shown with the yellow band indicating the total data uncertainties.-c |
png pdf |
Figure 13-d:
Normalized ${\mathrm{ t } {}\mathrm{ \bar{t} } } $ cross section in bins of number of jets in data and MC in the dilepton channel (a to c) (Analysis B) and lepton+jets channel (d) (Analysis E) at $\sqrt {s}=$ 8 TeV. Figures a to c show normalized ${\mathrm{ t } {}\mathrm{ \bar{t} } }$ cross sections with a jet ${p_{\mathrm {T}}}$ cut of 30, 60, and 100 GeV, respectively. Figure d shows normalized ${\mathrm{ t } {}\mathrm{ \bar{t} } }$ cross sections with a jet ${p_{\mathrm {T}}}$ cut of 30 GeV. The cross sections are compared to the predictions of POWHEG , mg5-amc@nloeither with MLM mathing or FXFX merging, and amc@nlo . For each case the PS simulation is done by PYTHIA 8 with the old (CUETP8M1) and the new (CUETP8M2T4) event tunes. Below each panel, the ratios of the predictions to data are shown with the yellow band indicating the total data uncertainties.-d |
png pdf |
Figure 14:
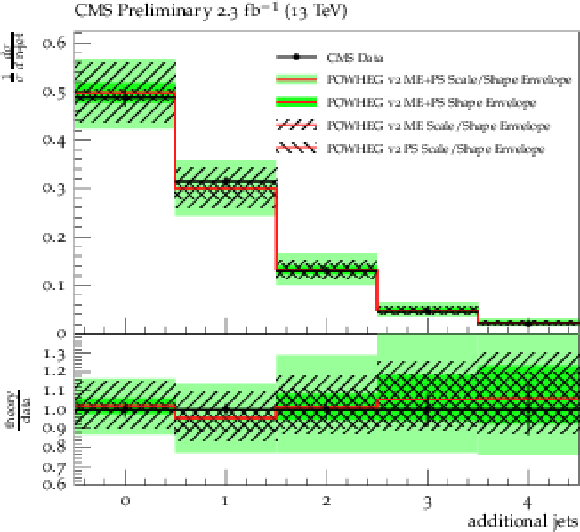
Normalized ${\mathrm{ t } {}\mathrm{ \bar{t} } }$ cross section in bins of number of additional jets in data and MC along with ME, PS, and ME+PS normalization scale factor and shape envelopes in the lepton+jets channel at $\sqrt {s}=$ 13 TeV (Analysis A). |

png pdf |
Figure 15:
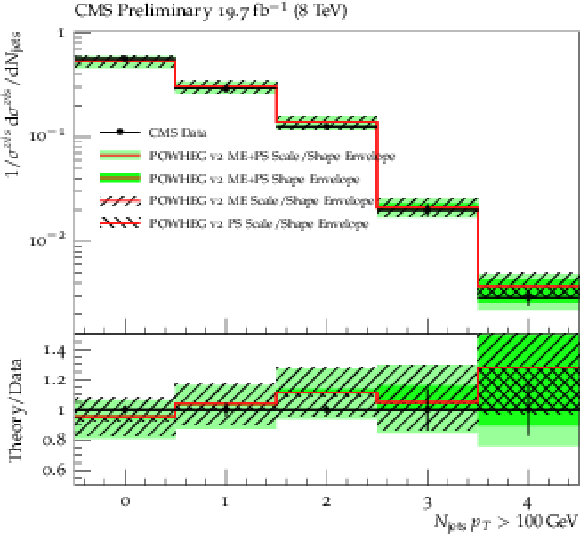
Normalized ${\mathrm{ t } {}\mathrm{ \bar{t} } }$ cross section in bins of number of jets in data and MC in the dilepton channel (a, b, and c) (Analysis B) and lepton+jets channel (d) (Analysis E) at $\sqrt {s}=$ 8 TeV along with ME, PS, and ME+PS normalization scale factor and shape envelopes. |

png pdf |
Figure 15-a:
Normalized ${\mathrm{ t } {}\mathrm{ \bar{t} } }$ cross section in bins of number of jets in data and MC in the dilepton channel (a, b, and c) (Analysis B) and lepton+jets channel (d) (Analysis E) at $\sqrt {s}=$ 8 TeV along with ME, PS, and ME+PS normalization scale factor and shape envelopes. |

png pdf |
Figure 15-b:
Normalized ${\mathrm{ t } {}\mathrm{ \bar{t} } }$ cross section in bins of number of jets in data and MC in the dilepton channel (a, b, and c) (Analysis B) and lepton+jets channel (d) (Analysis E) at $\sqrt {s}=$ 8 TeV along with ME, PS, and ME+PS normalization scale factor and shape envelopes. |
png pdf |
Figure 15-c:
Normalized ${\mathrm{ t } {}\mathrm{ \bar{t} } }$ cross section in bins of number of jets in data and MC in the dilepton channel (a, b, and c) (Analysis B) and lepton+jets channel (d) (Analysis E) at $\sqrt {s}=$ 8 TeV along with ME, PS, and ME+PS normalization scale factor and shape envelopes. |

png pdf |
Figure 15-d:
Normalized ${\mathrm{ t } {}\mathrm{ \bar{t} } }$ cross section in bins of number of jets in data and MC in the dilepton channel (a, b, and c) (Analysis B) and lepton+jets channel (d) (Analysis E) at $\sqrt {s}=$ 8 TeV along with ME, PS, and ME+PS normalization scale factor and shape envelopes. |

png pdf |
Figure 16:
Normalized ${\mathrm{ t } {}\mathrm{ \bar{t} } }$ cross section in bins of $y^t$ in data and MC in the lepton+jets channel at $\sqrt {s}=$ 13 TeV (Analysis A). The upper plots (a and b) show the hadronically decaying top quarks ($t_h$) and the lower plots (c and d) the leptonically decaying top quarks $t_l$. In plots a and c, the cross sections are compared to the predictions of POWHEG , mg5-amc@nloeither with [MLM] mathing or [FXFX] merging, and amc@nlo . For each case the PS simulation is done by PYTHIA 8 with the old (CUETP8M1) and the new (CUETP8M2T4) event tunes. In plots b and d, the cross sections are compared to the predictions of POWHEG with different $h_{damp}$ values with $h_{damp} =$ 1.581$m_{top}$ corresponding to the central value obtained from the tuning. Below each panel, the ratios of the predictions to data are shown with the yellow band indicating the total data uncertainties. |
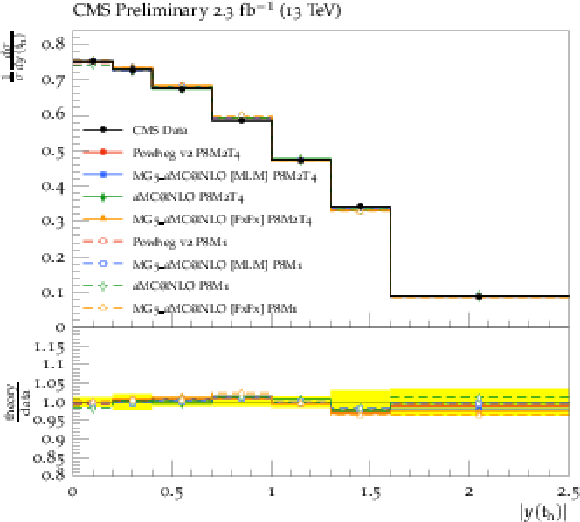
png pdf |
Figure 16-a:
Normalized ${\mathrm{ t } {}\mathrm{ \bar{t} } }$ cross section in bins of $y^t$ in data and MC in the lepton+jets channel at $\sqrt {s}=$ 13 TeV (Analysis A). The upper plots (a and b) show the hadronically decaying top quarks ($t_h$) and the lower plots (c and d) the leptonically decaying top quarks $t_l$. In plots a and c, the cross sections are compared to the predictions of POWHEG , mg5-amc@nloeither with [MLM] mathing or [FXFX] merging, and amc@nlo . For each case the PS simulation is done by PYTHIA 8 with the old (CUETP8M1) and the new (CUETP8M2T4) event tunes. In plots b and d, the cross sections are compared to the predictions of POWHEG with different $h_{damp}$ values with $h_{damp} =$ 1.581$m_{top}$ corresponding to the central value obtained from the tuning. Below each panel, the ratios of the predictions to data are shown with the yellow band indicating the total data uncertainties. |
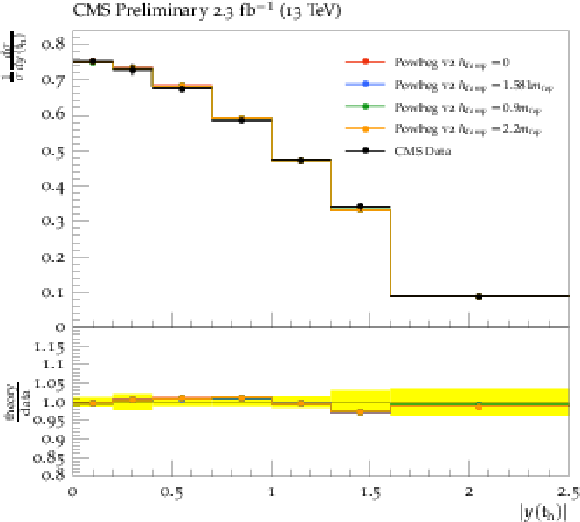
png pdf |
Figure 16-b:
Normalized ${\mathrm{ t } {}\mathrm{ \bar{t} } }$ cross section in bins of $y^t$ in data and MC in the lepton+jets channel at $\sqrt {s}=$ 13 TeV (Analysis A). The upper plots (a and b) show the hadronically decaying top quarks ($t_h$) and the lower plots (c and d) the leptonically decaying top quarks $t_l$. In plots a and c, the cross sections are compared to the predictions of POWHEG , mg5-amc@nloeither with [MLM] mathing or [FXFX] merging, and amc@nlo . For each case the PS simulation is done by PYTHIA 8 with the old (CUETP8M1) and the new (CUETP8M2T4) event tunes. In plots b and d, the cross sections are compared to the predictions of POWHEG with different $h_{damp}$ values with $h_{damp} =$ 1.581$m_{top}$ corresponding to the central value obtained from the tuning. Below each panel, the ratios of the predictions to data are shown with the yellow band indicating the total data uncertainties. |
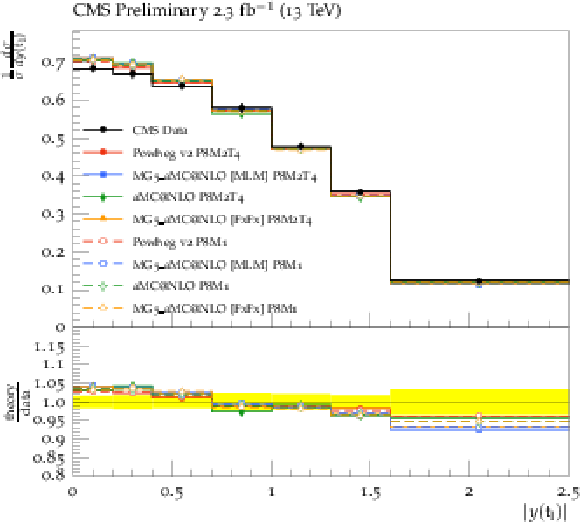
png pdf |
Figure 16-c:
Normalized ${\mathrm{ t } {}\mathrm{ \bar{t} } }$ cross section in bins of $y^t$ in data and MC in the lepton+jets channel at $\sqrt {s}=$ 13 TeV (Analysis A). The upper plots (a and b) show the hadronically decaying top quarks ($t_h$) and the lower plots (c and d) the leptonically decaying top quarks $t_l$. In plots a and c, the cross sections are compared to the predictions of POWHEG , mg5-amc@nloeither with [MLM] mathing or [FXFX] merging, and amc@nlo . For each case the PS simulation is done by PYTHIA 8 with the old (CUETP8M1) and the new (CUETP8M2T4) event tunes. In plots b and d, the cross sections are compared to the predictions of POWHEG with different $h_{damp}$ values with $h_{damp} =$ 1.581$m_{top}$ corresponding to the central value obtained from the tuning. Below each panel, the ratios of the predictions to data are shown with the yellow band indicating the total data uncertainties. |

png pdf |
Figure 16-d:
Normalized ${\mathrm{ t } {}\mathrm{ \bar{t} } }$ cross section in bins of $y^t$ in data and MC in the lepton+jets channel at $\sqrt {s}=$ 13 TeV (Analysis A). The upper plots (a and b) show the hadronically decaying top quarks ($t_h$) and the lower plots (c and d) the leptonically decaying top quarks $t_l$. In plots a and c, the cross sections are compared to the predictions of POWHEG , mg5-amc@nloeither with [MLM] mathing or [FXFX] merging, and amc@nlo . For each case the PS simulation is done by PYTHIA 8 with the old (CUETP8M1) and the new (CUETP8M2T4) event tunes. In plots b and d, the cross sections are compared to the predictions of POWHEG with different $h_{damp}$ values with $h_{damp} =$ 1.581$m_{top}$ corresponding to the central value obtained from the tuning. Below each panel, the ratios of the predictions to data are shown with the yellow band indicating the total data uncertainties. |
png pdf |
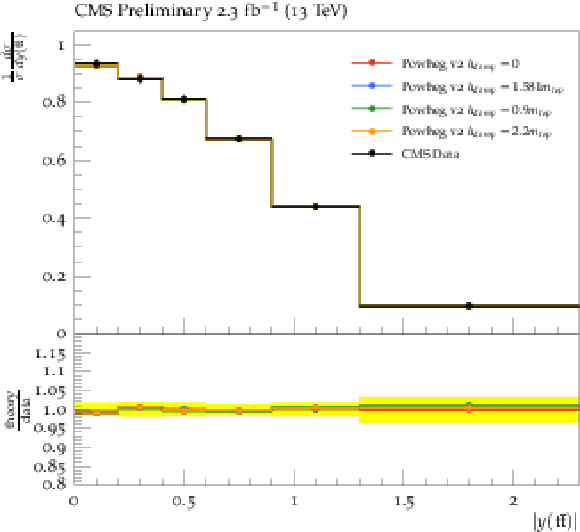
Figure 17:
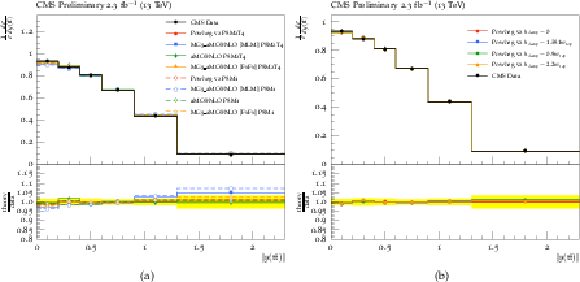
Normalized $ {\mathrm{ t } {}\mathrm{ \bar{t} } } $ cross section in bins of $y({\mathrm{ t } {}\mathrm{ \bar{t} } } )$ in data and MC in the lepton+jets channel at $\sqrt {s}=$ 13 TeV (Analysis A). The cross sections are compared to the predictions of POWHEG , mg5-amc@nloeither with MLM mathing or FXFX merging, and amc@nlo (left). For each case the PS simulation is done by PYTHIA 8 with the old (CUETP8M1) and the new (CUETP8M2T4) event tunes. The cross sections are also compared to the predictions of POWHEG with different $h_{damp}$ values with $h_{damp}=$ 1.581$m_{top}$ corresponding to the central value obtained from the tuning (right). In the lower panel of each plot, the ratios of the predictions to data are shown with the yellow band indicating the total data uncertainties. |

png pdf |
Figure 17-a:
Normalized $ {\mathrm{ t } {}\mathrm{ \bar{t} } } $ cross section in bins of $y({\mathrm{ t } {}\mathrm{ \bar{t} } } )$ in data and MC in the lepton+jets channel at $\sqrt {s}=$ 13 TeV (Analysis A). The cross sections are compared to the predictions of POWHEG , mg5-amc@nloeither with MLM mathing or FXFX merging, and amc@nlo (left). For each case the PS simulation is done by PYTHIA 8 with the old (CUETP8M1) and the new (CUETP8M2T4) event tunes. The cross sections are also compared to the predictions of POWHEG with different $h_{damp}$ values with $h_{damp}=$ 1.581$m_{top}$ corresponding to the central value obtained from the tuning (right). In the lower panel of each plot, the ratios of the predictions to data are shown with the yellow band indicating the total data uncertainties. |
png pdf |
Figure 17-b:
Normalized $ {\mathrm{ t } {}\mathrm{ \bar{t} } } $ cross section in bins of $y({\mathrm{ t } {}\mathrm{ \bar{t} } } )$ in data and MC in the lepton+jets channel at $\sqrt {s}=$ 13 TeV (Analysis A). The cross sections are compared to the predictions of POWHEG , mg5-amc@nloeither with MLM mathing or FXFX merging, and amc@nlo (left). For each case the PS simulation is done by PYTHIA 8 with the old (CUETP8M1) and the new (CUETP8M2T4) event tunes. The cross sections are also compared to the predictions of POWHEG with different $h_{damp}$ values with $h_{damp}=$ 1.581$m_{top}$ corresponding to the central value obtained from the tuning (right). In the lower panel of each plot, the ratios of the predictions to data are shown with the yellow band indicating the total data uncertainties. |
png pdf |
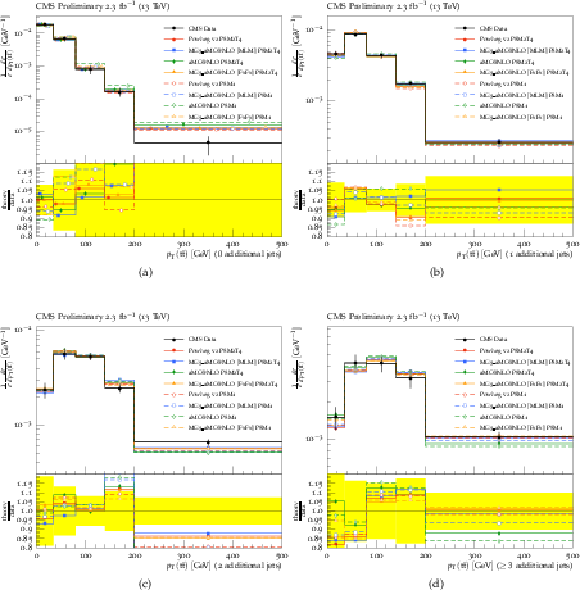
Figure 18:
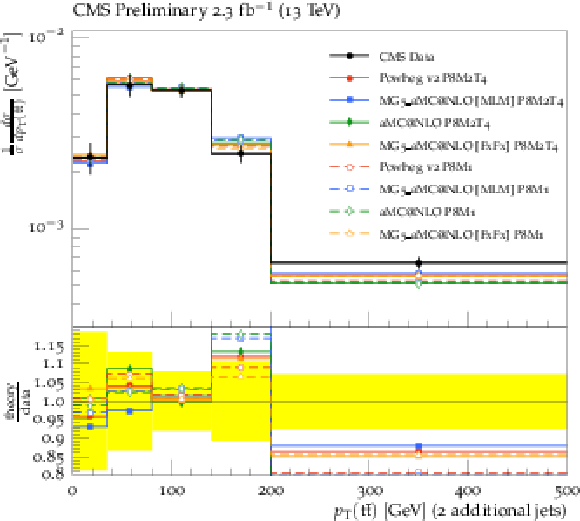
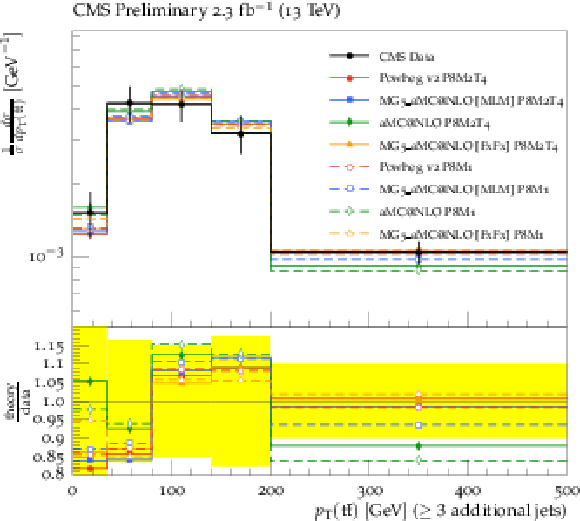
Normalized $ {\mathrm{ t } {}\mathrm{ \bar{t} } } $ cross section in bins of $ {p_{\mathrm {T}}} ({\mathrm{ t } {}\mathrm{ \bar{t} } } ) $ for 0,1,2 and 3 or more additional jets in data and MC in the lepton+jets channel at $\sqrt {s}=$ 13 TeV (Analysis A). The cross sections are compared to the predictions of POWHEG , mg5-amc@nloeither with MLM mathing or FXFX merging, and amc@nlo . For each case the PS simulation is done by PYTHIA 8 with the old (CUETP8M1) and the new (CUETP8M2T4) event tunes. In the lower panel of each plot, the ratios of the predictions to data are shown with the yellow band indicating the total data uncertainties. |
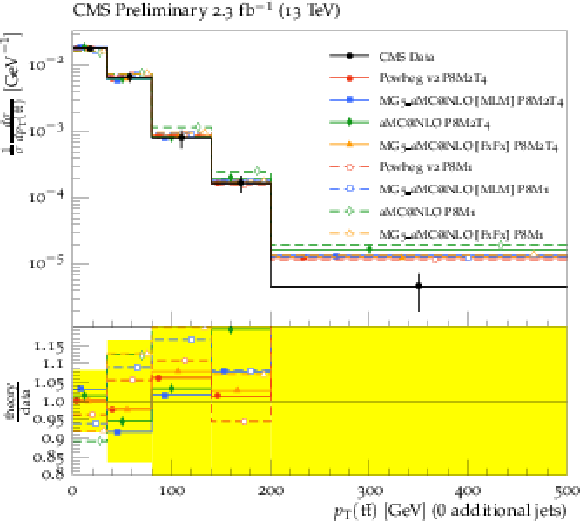
png pdf |
Figure 18-a:
Normalized $ {\mathrm{ t } {}\mathrm{ \bar{t} } } $ cross section in bins of $ {p_{\mathrm {T}}} ({\mathrm{ t } {}\mathrm{ \bar{t} } } ) $ for 0,1,2 and 3 or more additional jets in data and MC in the lepton+jets channel at $\sqrt {s}=$ 13 TeV (Analysis A). The cross sections are compared to the predictions of POWHEG , mg5-amc@nloeither with MLM mathing or FXFX merging, and amc@nlo . For each case the PS simulation is done by PYTHIA 8 with the old (CUETP8M1) and the new (CUETP8M2T4) event tunes. In the lower panel of each plot, the ratios of the predictions to data are shown with the yellow band indicating the total data uncertainties. |
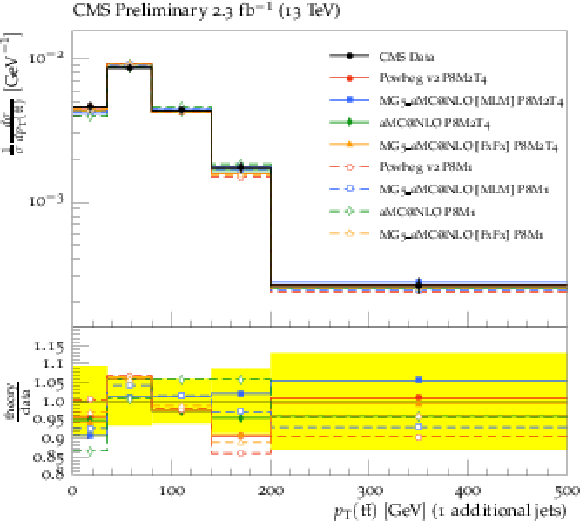
png pdf |
Figure 18-b:
Normalized $ {\mathrm{ t } {}\mathrm{ \bar{t} } } $ cross section in bins of $ {p_{\mathrm {T}}} ({\mathrm{ t } {}\mathrm{ \bar{t} } } ) $ for 0,1,2 and 3 or more additional jets in data and MC in the lepton+jets channel at $\sqrt {s}=$ 13 TeV (Analysis A). The cross sections are compared to the predictions of POWHEG , mg5-amc@nloeither with MLM mathing or FXFX merging, and amc@nlo . For each case the PS simulation is done by PYTHIA 8 with the old (CUETP8M1) and the new (CUETP8M2T4) event tunes. In the lower panel of each plot, the ratios of the predictions to data are shown with the yellow band indicating the total data uncertainties. |
png pdf |
Figure 18-c:
Normalized $ {\mathrm{ t } {}\mathrm{ \bar{t} } } $ cross section in bins of $ {p_{\mathrm {T}}} ({\mathrm{ t } {}\mathrm{ \bar{t} } } ) $ for 0,1,2 and 3 or more additional jets in data and MC in the lepton+jets channel at $\sqrt {s}=$ 13 TeV (Analysis A). The cross sections are compared to the predictions of POWHEG , mg5-amc@nloeither with MLM mathing or FXFX merging, and amc@nlo . For each case the PS simulation is done by PYTHIA 8 with the old (CUETP8M1) and the new (CUETP8M2T4) event tunes. In the lower panel of each plot, the ratios of the predictions to data are shown with the yellow band indicating the total data uncertainties. |
png pdf |
Figure 18-d:
Normalized $ {\mathrm{ t } {}\mathrm{ \bar{t} } } $ cross section in bins of $ {p_{\mathrm {T}}} ({\mathrm{ t } {}\mathrm{ \bar{t} } } ) $ for 0,1,2 and 3 or more additional jets in data and MC in the lepton+jets channel at $\sqrt {s}=$ 13 TeV (Analysis A). The cross sections are compared to the predictions of POWHEG , mg5-amc@nloeither with MLM mathing or FXFX merging, and amc@nlo . For each case the PS simulation is done by PYTHIA 8 with the old (CUETP8M1) and the new (CUETP8M2T4) event tunes. In the lower panel of each plot, the ratios of the predictions to data are shown with the yellow band indicating the total data uncertainties. |

png pdf |
Figure 19:
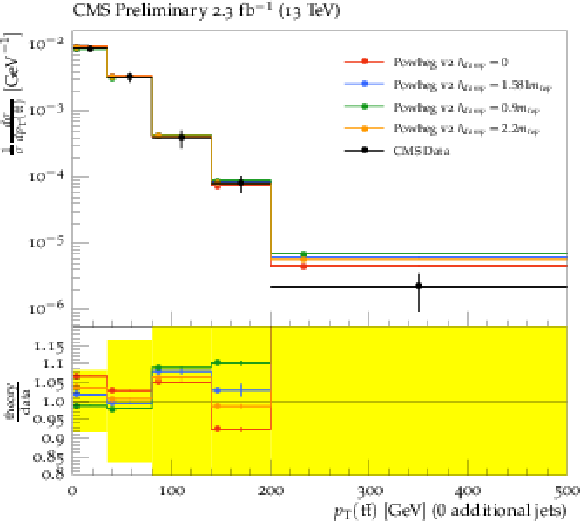
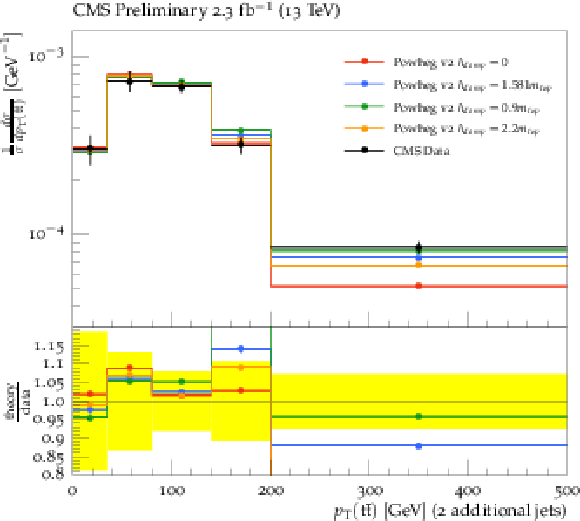
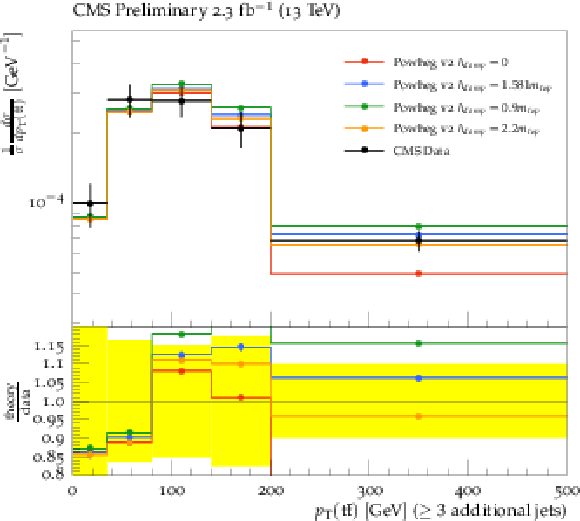
Normalized $ {\mathrm{ t } {}\mathrm{ \bar{t} } } $ cross section in bins of $ {p_{\mathrm {T}}} ({\mathrm{ t } {}\mathrm{ \bar{t} } } ) $ for 0,1,2 and 3 or more additional jets in data and MC in the lepton+jets channel at $\sqrt {s}=$ 13 TeV (Analysis A). The cross sections are compared to the predictions of POWHEG with different $h_{damp}$ values with $h_{damp}=$ 1.581$m_{top}$ corresponding to the central value obtained from the tuning. In the lower panel of each plot, the ratios of the predictions to data are shown with the yellow band indicating the total data uncertainties. |
png pdf |
Figure 19-a:
Normalized $ {\mathrm{ t } {}\mathrm{ \bar{t} } } $ cross section in bins of $ {p_{\mathrm {T}}} ({\mathrm{ t } {}\mathrm{ \bar{t} } } ) $ for 0,1,2 and 3 or more additional jets in data and MC in the lepton+jets channel at $\sqrt {s}=$ 13 TeV (Analysis A). The cross sections are compared to the predictions of POWHEG with different $h_{damp}$ values with $h_{damp}=$ 1.581$m_{top}$ corresponding to the central value obtained from the tuning. In the lower panel of each plot, the ratios of the predictions to data are shown with the yellow band indicating the total data uncertainties. |

png pdf |
Figure 19-b:
Normalized $ {\mathrm{ t } {}\mathrm{ \bar{t} } } $ cross section in bins of $ {p_{\mathrm {T}}} ({\mathrm{ t } {}\mathrm{ \bar{t} } } ) $ for 0,1,2 and 3 or more additional jets in data and MC in the lepton+jets channel at $\sqrt {s}=$ 13 TeV (Analysis A). The cross sections are compared to the predictions of POWHEG with different $h_{damp}$ values with $h_{damp}=$ 1.581$m_{top}$ corresponding to the central value obtained from the tuning. In the lower panel of each plot, the ratios of the predictions to data are shown with the yellow band indicating the total data uncertainties. |
png pdf |
Figure 19-c:
Normalized $ {\mathrm{ t } {}\mathrm{ \bar{t} } } $ cross section in bins of $ {p_{\mathrm {T}}} ({\mathrm{ t } {}\mathrm{ \bar{t} } } ) $ for 0,1,2 and 3 or more additional jets in data and MC in the lepton+jets channel at $\sqrt {s}=$ 13 TeV (Analysis A). The cross sections are compared to the predictions of POWHEG with different $h_{damp}$ values with $h_{damp}=$ 1.581$m_{top}$ corresponding to the central value obtained from the tuning. In the lower panel of each plot, the ratios of the predictions to data are shown with the yellow band indicating the total data uncertainties. |
png pdf |
Figure 19-d:
Normalized $ {\mathrm{ t } {}\mathrm{ \bar{t} } } $ cross section in bins of $ {p_{\mathrm {T}}} ({\mathrm{ t } {}\mathrm{ \bar{t} } } ) $ for 0,1,2 and 3 or more additional jets in data and MC in the lepton+jets channel at $\sqrt {s}=$ 13 TeV (Analysis A). The cross sections are compared to the predictions of POWHEG with different $h_{damp}$ values with $h_{damp}=$ 1.581$m_{top}$ corresponding to the central value obtained from the tuning. In the lower panel of each plot, the ratios of the predictions to data are shown with the yellow band indicating the total data uncertainties. |
png pdf |
Figure 20:
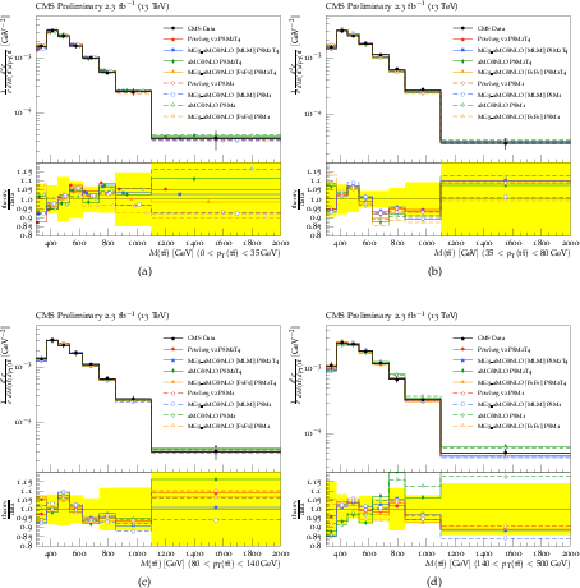
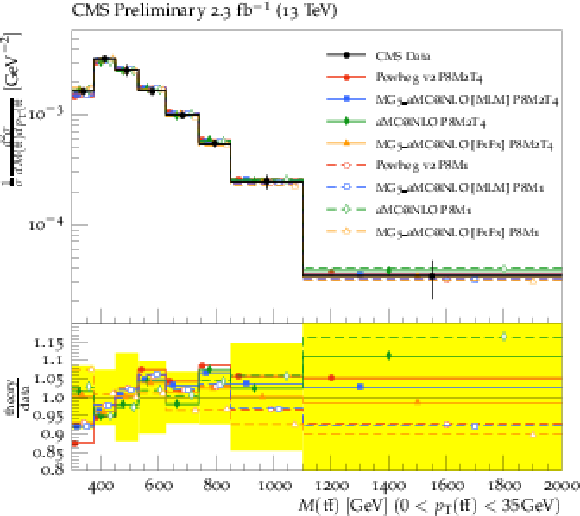
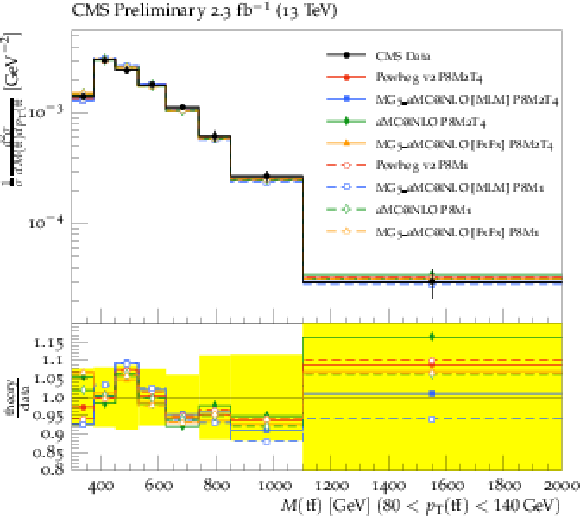
Normalized $ {\mathrm{ t } {}\mathrm{ \bar{t} } } $ cross section in bins of $ M({\mathrm{ t } {}\mathrm{ \bar{t} } } ) $ for different $ {p_{\mathrm {T}}} ({\mathrm{ t } {}\mathrm{ \bar{t} } } ) $ bins in data and MC in the lepton+jets channel at $\sqrt {s}=$ 13 TeV (Analysis A). The cross sections are compared to the predictions of POWHEG , mg5-amc@nloeither with MLM mathing or FXFX merging, and amc@nlo . For each case the PS simulation is done by PYTHIA 8 with the old (CUETP8M1) and the new (CUETP8M2T4) event tunes. In the lower panel of each plot, the ratios of the predictions to data are shown with the yellow band indicating the total data uncertainties. |
png pdf |
Figure 20-a:
Normalized $ {\mathrm{ t } {}\mathrm{ \bar{t} } } $ cross section in bins of $ M({\mathrm{ t } {}\mathrm{ \bar{t} } } ) $ for different $ {p_{\mathrm {T}}} ({\mathrm{ t } {}\mathrm{ \bar{t} } } ) $ bins in data and MC in the lepton+jets channel at $\sqrt {s}=$ 13 TeV (Analysis A). The cross sections are compared to the predictions of POWHEG , mg5-amc@nloeither with MLM mathing or FXFX merging, and amc@nlo . For each case the PS simulation is done by PYTHIA 8 with the old (CUETP8M1) and the new (CUETP8M2T4) event tunes. In the lower panel of each plot, the ratios of the predictions to data are shown with the yellow band indicating the total data uncertainties. |

png pdf |
Figure 20-b:
Normalized $ {\mathrm{ t } {}\mathrm{ \bar{t} } } $ cross section in bins of $ M({\mathrm{ t } {}\mathrm{ \bar{t} } } ) $ for different $ {p_{\mathrm {T}}} ({\mathrm{ t } {}\mathrm{ \bar{t} } } ) $ bins in data and MC in the lepton+jets channel at $\sqrt {s}=$ 13 TeV (Analysis A). The cross sections are compared to the predictions of POWHEG , mg5-amc@nloeither with MLM mathing or FXFX merging, and amc@nlo . For each case the PS simulation is done by PYTHIA 8 with the old (CUETP8M1) and the new (CUETP8M2T4) event tunes. In the lower panel of each plot, the ratios of the predictions to data are shown with the yellow band indicating the total data uncertainties. |
png pdf |
Figure 20-c:
Normalized $ {\mathrm{ t } {}\mathrm{ \bar{t} } } $ cross section in bins of $ M({\mathrm{ t } {}\mathrm{ \bar{t} } } ) $ for different $ {p_{\mathrm {T}}} ({\mathrm{ t } {}\mathrm{ \bar{t} } } ) $ bins in data and MC in the lepton+jets channel at $\sqrt {s}=$ 13 TeV (Analysis A). The cross sections are compared to the predictions of POWHEG , mg5-amc@nloeither with MLM mathing or FXFX merging, and amc@nlo . For each case the PS simulation is done by PYTHIA 8 with the old (CUETP8M1) and the new (CUETP8M2T4) event tunes. In the lower panel of each plot, the ratios of the predictions to data are shown with the yellow band indicating the total data uncertainties. |
png pdf |
Figure 20-d:
Normalized $ {\mathrm{ t } {}\mathrm{ \bar{t} } } $ cross section in bins of $ M({\mathrm{ t } {}\mathrm{ \bar{t} } } ) $ for different $ {p_{\mathrm {T}}} ({\mathrm{ t } {}\mathrm{ \bar{t} } } ) $ bins in data and MC in the lepton+jets channel at $\sqrt {s}=$ 13 TeV (Analysis A). The cross sections are compared to the predictions of POWHEG , mg5-amc@nloeither with MLM mathing or FXFX merging, and amc@nlo . For each case the PS simulation is done by PYTHIA 8 with the old (CUETP8M1) and the new (CUETP8M2T4) event tunes. In the lower panel of each plot, the ratios of the predictions to data are shown with the yellow band indicating the total data uncertainties. |
png pdf |
Figure 21:
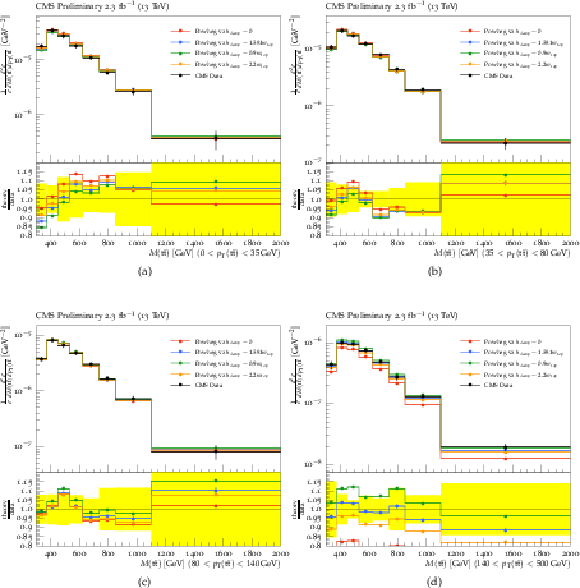
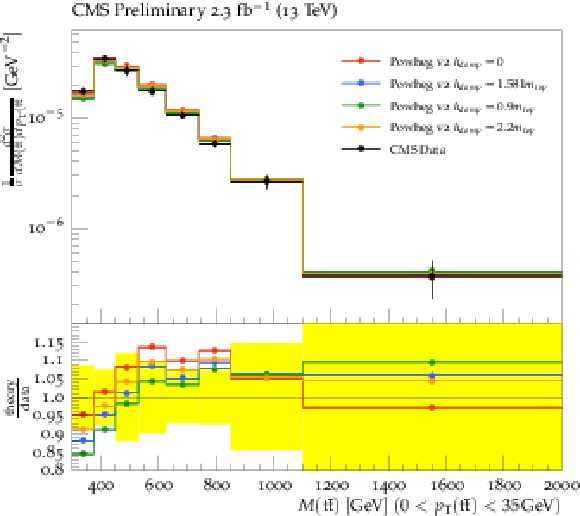
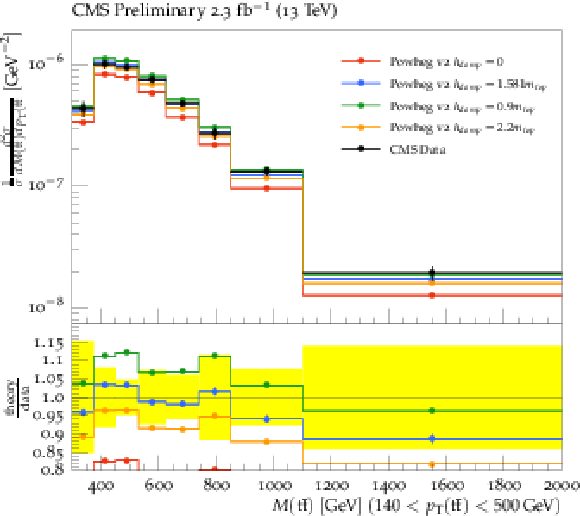
Normalized $ {\mathrm{ t } {}\mathrm{ \bar{t} } } $ cross section in bins of $ M({\mathrm{ t } {}\mathrm{ \bar{t} } } ) $ for different $ {p_{\mathrm {T}}} ({\mathrm{ t } {}\mathrm{ \bar{t} } } ) $ bins in data and MC in the lepton+jets channel at $\sqrt {s}=$ 13 TeV (Analysis A). The cross sections are compared to the predictions of POWHEG with different $h_{damp}$ values with $h_{damp}=$ 1.581$m_{top}$ corresponding to the central value obtained from the tuning. In the lower panel of each plot, the ratios of the predictions to data are shown with the yellow band indicating the total data uncertainties. |
png pdf |
Figure 21-a:
Normalized $ {\mathrm{ t } {}\mathrm{ \bar{t} } } $ cross section in bins of $ M({\mathrm{ t } {}\mathrm{ \bar{t} } } ) $ for different $ {p_{\mathrm {T}}} ({\mathrm{ t } {}\mathrm{ \bar{t} } } ) $ bins in data and MC in the lepton+jets channel at $\sqrt {s}=$ 13 TeV (Analysis A). The cross sections are compared to the predictions of POWHEG with different $h_{damp}$ values with $h_{damp}=$ 1.581$m_{top}$ corresponding to the central value obtained from the tuning. In the lower panel of each plot, the ratios of the predictions to data are shown with the yellow band indicating the total data uncertainties. |

png pdf |
Figure 21-b:
Normalized $ {\mathrm{ t } {}\mathrm{ \bar{t} } } $ cross section in bins of $ M({\mathrm{ t } {}\mathrm{ \bar{t} } } ) $ for different $ {p_{\mathrm {T}}} ({\mathrm{ t } {}\mathrm{ \bar{t} } } ) $ bins in data and MC in the lepton+jets channel at $\sqrt {s}=$ 13 TeV (Analysis A). The cross sections are compared to the predictions of POWHEG with different $h_{damp}$ values with $h_{damp}=$ 1.581$m_{top}$ corresponding to the central value obtained from the tuning. In the lower panel of each plot, the ratios of the predictions to data are shown with the yellow band indicating the total data uncertainties. |

png pdf |
Figure 21-c:
Normalized $ {\mathrm{ t } {}\mathrm{ \bar{t} } } $ cross section in bins of $ M({\mathrm{ t } {}\mathrm{ \bar{t} } } ) $ for different $ {p_{\mathrm {T}}} ({\mathrm{ t } {}\mathrm{ \bar{t} } } ) $ bins in data and MC in the lepton+jets channel at $\sqrt {s}=$ 13 TeV (Analysis A). The cross sections are compared to the predictions of POWHEG with different $h_{damp}$ values with $h_{damp}=$ 1.581$m_{top}$ corresponding to the central value obtained from the tuning. In the lower panel of each plot, the ratios of the predictions to data are shown with the yellow band indicating the total data uncertainties. |
png pdf |
Figure 21-d:
Normalized $ {\mathrm{ t } {}\mathrm{ \bar{t} } } $ cross section in bins of $ M({\mathrm{ t } {}\mathrm{ \bar{t} } } ) $ for different $ {p_{\mathrm {T}}} ({\mathrm{ t } {}\mathrm{ \bar{t} } } ) $ bins in data and MC in the lepton+jets channel at $\sqrt {s}=$ 13 TeV (Analysis A). The cross sections are compared to the predictions of POWHEG with different $h_{damp}$ values with $h_{damp}=$ 1.581$m_{top}$ corresponding to the central value obtained from the tuning. In the lower panel of each plot, the ratios of the predictions to data are shown with the yellow band indicating the total data uncertainties. |

png pdf |
Figure 22:
Normalized $ {\mathrm{ t } {}\mathrm{ \bar{t} } } $ cross section in bins of $ {p_{\mathrm {T}}} ^t$ for the hadronically decaying top quarks ($t_h$) in data and MC in the lepton+jets channel at $\sqrt {s}=$ 13 TeV (Analysis A). Panels a to d display $ {p_{\mathrm {T}}} ^t$ in events with no, one, two, and three additional jets, respectively. The cross sections are compared to the predictions of POWHEG combined with PYTHIA 8 with the new (CUETP8M2T4) event tune with different $h_{damp}$ values with $h_{damp}=$ 1.581$m_{top}$ corresponding to the central value obtained from the tuning. |

png pdf |
Figure 22-a:
Normalized $ {\mathrm{ t } {}\mathrm{ \bar{t} } } $ cross section in bins of $ {p_{\mathrm {T}}} ^t$ for the hadronically decaying top quarks ($t_h$) in data and MC in the lepton+jets channel at $\sqrt {s}=$ 13 TeV (Analysis A). Panels a to d display $ {p_{\mathrm {T}}} ^t$ in events with no, one, two, and three additional jets, respectively. The cross sections are compared to the predictions of POWHEG combined with PYTHIA 8 with the new (CUETP8M2T4) event tune with different $h_{damp}$ values with $h_{damp}=$ 1.581$m_{top}$ corresponding to the central value obtained from the tuning. |

png pdf |
Figure 22-b:
Normalized $ {\mathrm{ t } {}\mathrm{ \bar{t} } } $ cross section in bins of $ {p_{\mathrm {T}}} ^t$ for the hadronically decaying top quarks ($t_h$) in data and MC in the lepton+jets channel at $\sqrt {s}=$ 13 TeV (Analysis A). Panels a to d display $ {p_{\mathrm {T}}} ^t$ in events with no, one, two, and three additional jets, respectively. The cross sections are compared to the predictions of POWHEG combined with PYTHIA 8 with the new (CUETP8M2T4) event tune with different $h_{damp}$ values with $h_{damp}=$ 1.581$m_{top}$ corresponding to the central value obtained from the tuning. |

png pdf |
Figure 22-c:
Normalized $ {\mathrm{ t } {}\mathrm{ \bar{t} } } $ cross section in bins of $ {p_{\mathrm {T}}} ^t$ for the hadronically decaying top quarks ($t_h$) in data and MC in the lepton+jets channel at $\sqrt {s}=$ 13 TeV (Analysis A). Panels a to d display $ {p_{\mathrm {T}}} ^t$ in events with no, one, two, and three additional jets, respectively. The cross sections are compared to the predictions of POWHEG combined with PYTHIA 8 with the new (CUETP8M2T4) event tune with different $h_{damp}$ values with $h_{damp}=$ 1.581$m_{top}$ corresponding to the central value obtained from the tuning. |

png pdf |
Figure 22-d:
Normalized $ {\mathrm{ t } {}\mathrm{ \bar{t} } } $ cross section in bins of $ {p_{\mathrm {T}}} ^t$ for the hadronically decaying top quarks ($t_h$) in data and MC in the lepton+jets channel at $\sqrt {s}=$ 13 TeV (Analysis A). Panels a to d display $ {p_{\mathrm {T}}} ^t$ in events with no, one, two, and three additional jets, respectively. The cross sections are compared to the predictions of POWHEG combined with PYTHIA 8 with the new (CUETP8M2T4) event tune with different $h_{damp}$ values with $h_{damp}=$ 1.581$m_{top}$ corresponding to the central value obtained from the tuning. |

png pdf |
Figure 23:
Normalized $ {\mathrm{ t } {}\mathrm{ \bar{t} } } $ cross section in bins of $ {p_{\mathrm {T}}} ^t$ for the hadronically decaying top quarks ($t_h$) in data and MC along with ME+FSR, ME+ISR and ME+ISR and FSR variations shape envelopes in the lepton+jets channel at $\sqrt {s}=$ 13 TeV (Analysis A). Panels a to d display $ {p_{\mathrm {T}}} ^t$ in events with 0, 1, 2, and 3 or more additional jets, respectively. |
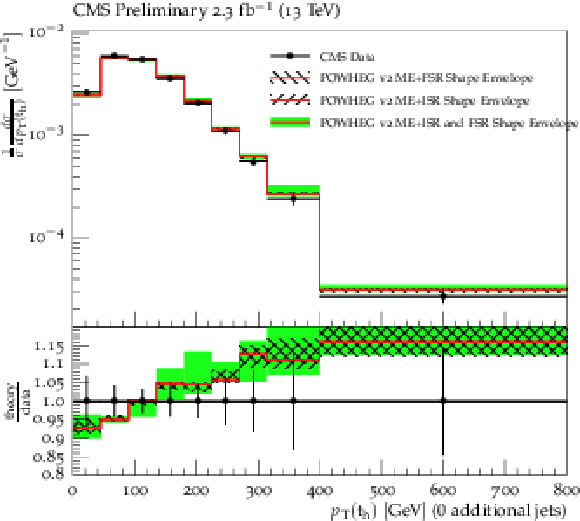
png pdf |
Figure 23-a:
Normalized $ {\mathrm{ t } {}\mathrm{ \bar{t} } } $ cross section in bins of $ {p_{\mathrm {T}}} ^t$ for the hadronically decaying top quarks ($t_h$) in data and MC along with ME+FSR, ME+ISR and ME+ISR and FSR variations shape envelopes in the lepton+jets channel at $\sqrt {s}=$ 13 TeV (Analysis A). Panels a to d display $ {p_{\mathrm {T}}} ^t$ in events with 0, 1, 2, and 3 or more additional jets, respectively. |
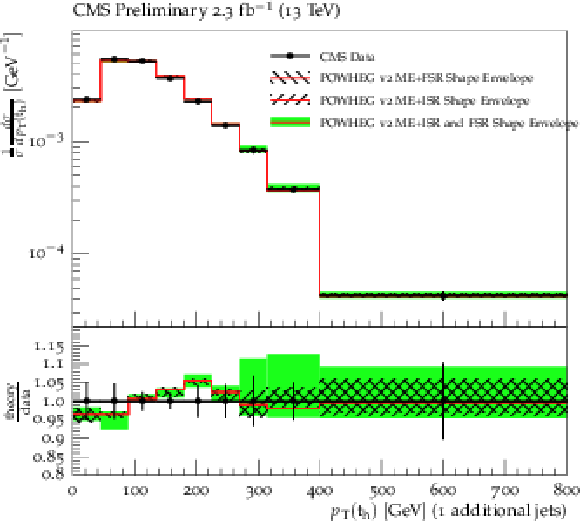
png pdf |
Figure 23-b:
Normalized $ {\mathrm{ t } {}\mathrm{ \bar{t} } } $ cross section in bins of $ {p_{\mathrm {T}}} ^t$ for the hadronically decaying top quarks ($t_h$) in data and MC along with ME+FSR, ME+ISR and ME+ISR and FSR variations shape envelopes in the lepton+jets channel at $\sqrt {s}=$ 13 TeV (Analysis A). Panels a to d display $ {p_{\mathrm {T}}} ^t$ in events with 0, 1, 2, and 3 or more additional jets, respectively. |
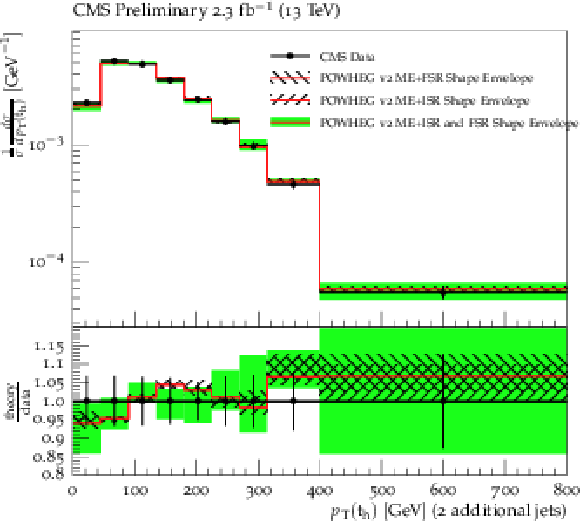
png pdf |
Figure 23-c:
Normalized $ {\mathrm{ t } {}\mathrm{ \bar{t} } } $ cross section in bins of $ {p_{\mathrm {T}}} ^t$ for the hadronically decaying top quarks ($t_h$) in data and MC along with ME+FSR, ME+ISR and ME+ISR and FSR variations shape envelopes in the lepton+jets channel at $\sqrt {s}=$ 13 TeV (Analysis A). Panels a to d display $ {p_{\mathrm {T}}} ^t$ in events with 0, 1, 2, and 3 or more additional jets, respectively. |
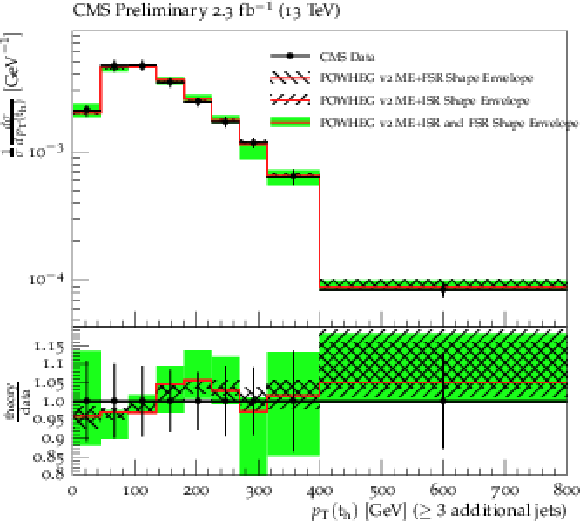
png pdf |
Figure 23-d:
Normalized $ {\mathrm{ t } {}\mathrm{ \bar{t} } } $ cross section in bins of $ {p_{\mathrm {T}}} ^t$ for the hadronically decaying top quarks ($t_h$) in data and MC along with ME+FSR, ME+ISR and ME+ISR and FSR variations shape envelopes in the lepton+jets channel at $\sqrt {s}=$ 13 TeV (Analysis A). Panels a to d display $ {p_{\mathrm {T}}} ^t$ in events with 0, 1, 2, and 3 or more additional jets, respectively. |
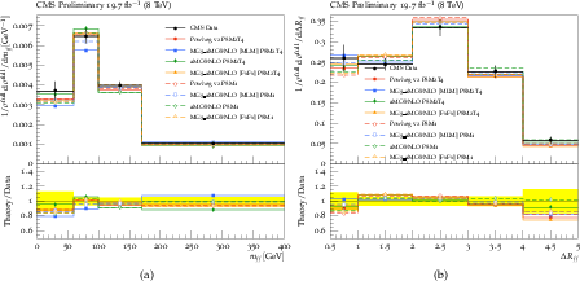
png pdf |
Figure 24:
Normalized $ {\mathrm{ t } {}\mathrm{ \bar{t} } } $ cross section in bins of invariant mass (left) and the angular distance (right) of the leading and subleading additional jets in the dilepton channel at $\sqrt {s}=$ 8 TeV (Analysis B). The cross sections are compared to the predictions of POWHEG , mg5-amc@nloeither with MLM mathing or FXFX merging, and amc@nlo . In the lower panel of each plot, the ratios of the predictions to data are shown with the yellow band indicating the total data uncertainties. |
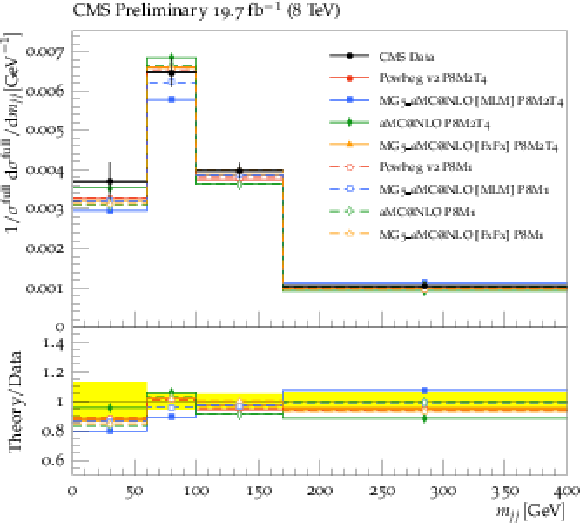
png pdf |
Figure 24-a:
Normalized $ {\mathrm{ t } {}\mathrm{ \bar{t} } } $ cross section in bins of invariant mass (left) and the angular distance (right) of the leading and subleading additional jets in the dilepton channel at $\sqrt {s}=$ 8 TeV (Analysis B). The cross sections are compared to the predictions of POWHEG , mg5-amc@nloeither with MLM mathing or FXFX merging, and amc@nlo . In the lower panel of each plot, the ratios of the predictions to data are shown with the yellow band indicating the total data uncertainties. |
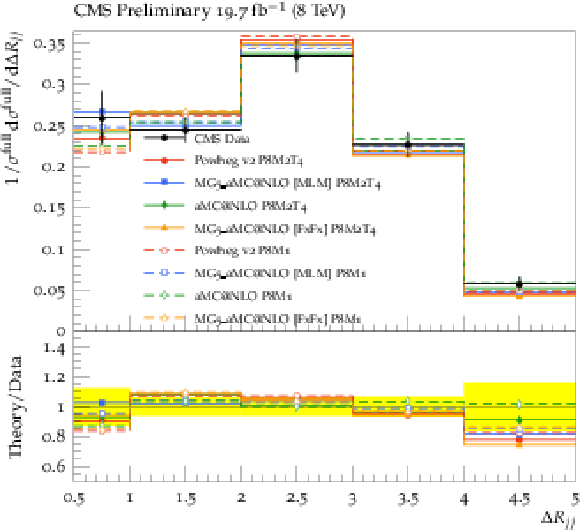
png pdf |
Figure 24-b:
Normalized $ {\mathrm{ t } {}\mathrm{ \bar{t} } } $ cross section in bins of invariant mass (left) and the angular distance (right) of the leading and subleading additional jets in the dilepton channel at $\sqrt {s}=$ 8 TeV (Analysis B). The cross sections are compared to the predictions of POWHEG , mg5-amc@nloeither with MLM mathing or FXFX merging, and amc@nlo . In the lower panel of each plot, the ratios of the predictions to data are shown with the yellow band indicating the total data uncertainties. |

png pdf |
Figure 25:
Normalized $ {\mathrm{ t } {}\mathrm{ \bar{t} } } $ cross section in bins of leading additional b jet ${p_{\mathrm {T}}}$ in the dilepton channel at $\sqrt {s}=$ 8 TeV (Analysis B). The cross sections are compared to the predictions of POWHEG , mg5-amc@nloeither with MLM mathing or FXFX merging, and amc@nlo . In the lower panel, the ratios of the predictions to data are shown with the yellow band indicating the total data uncertainties. |
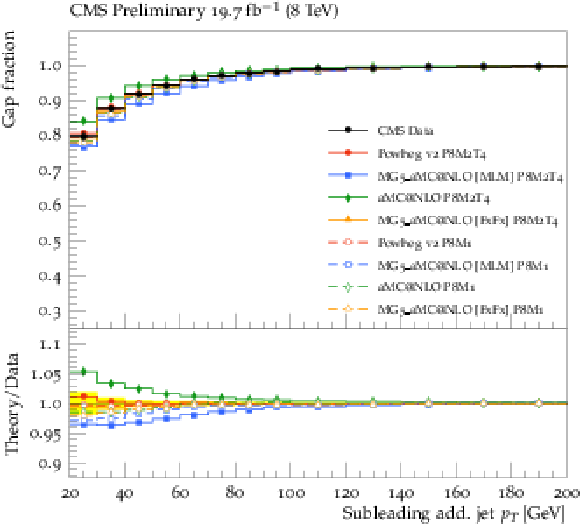
png pdf |
Figure 26:
Normalized $ {\mathrm{ t } {}\mathrm{ \bar{t} } } $ cross section in bins of subleading additional jet ${p_{\mathrm {T}}}$ in the dilepton channel at $\sqrt {s}=$ 8 TeV (Analysis B). The cross sections are compared to the predictions of POWHEG , mg5-amc@nloeither with MLM mathing or FXFX merging, and amc@nlo . In the lower panel, the ratios of the predictions to data are shown with the yellow band indicating the total data uncertainties. |
| Tables | |
png pdf |
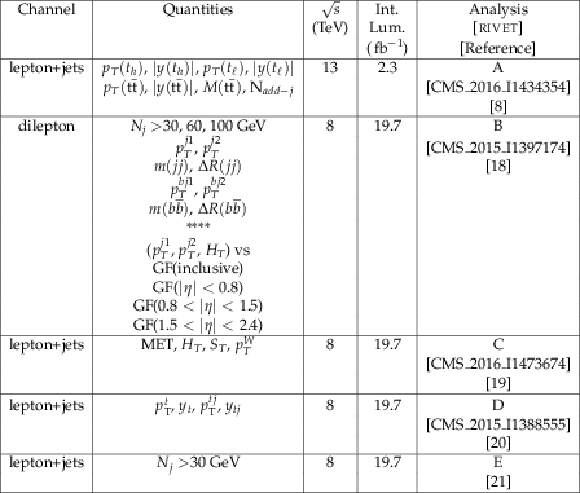
Table 1:
List of analyses and distributions used for the comparisons in this manuscript. The columns list the final state (channel) analyzed, the quantities compared in this note and the level (parton or particle) to which they correspond, the center-of-mass energy, the integrated luminosity, and the designation assigned in this note to the rivet repository when available. |

png pdf |
Table 2:
The input data and distributions used in the $alpha_s^{ISR}+h_{damp}$ tuning. |

png pdf |
Table 3:
The parameters of the old tune (CUETP8M1) and the new tune (CUETP8M2T4). The parameter (in italic) relative to the energy dependence of the partonic cross section cutoff (ecmPow) is fixed to the value of CUETP8M1 in the fit of the new tune. In the new tune, the ISR $\alpha _s$ is fixed to the value extracted from the ${\mathrm{ t } {}\mathrm{ \bar{t} } }$ events described previously. |

png pdf |
Table 4:
The MC samples used in the comparisons performed in this manuscripts. |
| Summary |
| A new PYTHIA8 tune with a lower parton shower $\alpha_s$, with respect to the one used in the CUETP8M1 [27,30] tune along with a new $h_{damp}$ value in POWHEG v2 is found to improve the description of $\mathrm{ t \bar{t} }$ kinematics, as well as the overall description of observables at $\sqrt{s}=$ 8 and 13 TeV. The tuned $\alpha_s$ and $h_{damp}$ values are found to be consistent with the ATLAS optimized values [41,42]. POWHEG v2+PYTHIA8 with the new tune agrees well with all considered distributions and the new tune applied to MadGraph in FxFx configuration gives consistent results with data as well. In most of the distributions, the new tune does not improve MadGraph [MLM] or aMC +PYTHIA8 predictions. Tuning a parameter in the parton shower can potentially bias particular new physics searches, in particular if the tune is based on the dataset where the search is performed. In this study we have shown that tuning $\alpha_s+h_{damp}$ using $N_{jets}$ and $p_{\mathrm{T}}$ of the leading additional jet in $\mathrm{ t \bar{t} }$ events does not change the predictions of POWHEG+PYTHIA8 and MadGraph+PYTHIA8. In particular, the fact that global event variables such as missing $E_T$ and $H_T$ are not changed by the new tune gives us confidence that searches involving missing $E_T$ will not be biased. However, one should pay particular attention if the new physics search relies on $N_{jets}$, $p_{\mathrm{T}} (\mathrm{ t \bar{t} })$ or $p_{\mathrm{T}}$ of leading additional jets in $\mathrm{ t \bar{t} }$-like processes. In the Run 1 of the LHC it was observed that the leading order (LO) generator MadGraph 5.1.3.30 with up to three additional partons interfaced with PYTHIA 6.426 using the Z2* underlying event tune describes well most of the differential $\mathrm{ t \bar{t} }$ distributions obtained from data, except for top quark $p_{\mathrm{T}}$. The $\alpha_s^{ISR}$ value used for the MadGraph+PYTHIA6 in Run I was 0.1273 and the $\alpha_s$ used in the ME was 0.130. In Run II, when the ME $\alpha_s$ is 0.118 (as in MadGraph+PYTHIA8 [FxFx] and POWHEG+PYTHIA8) and the parton shower value, $\alpha_s^{ISR}$, is 0.1108, all differential $\mathrm{ t \bar{t} }$ distributions are described well as with the Run I configuration. In addition, using $\alpha_s^{ISR}=$ 0.1108 in the MadGraph+PYTHIA8 [MLM] configuration which uses $\alpha_s =$ 0.130 in the ME does not describe the data well. The observations above point that the consistency of the $\alpha_s$ value between the parton shower and the ME may be particularly important for emissions which are matched or merged (see e.g. [43] for MLM matching). For POWHEG+PYTHIA this does not apply since POWHEG almost exclusively handles the first emission, while PYTHIA exclusively handles all the subsequent emissions. For aMC+PYTHIA (i.e. no merging), this applies to the first emission, and for MadGraph+PYTHIA FxFx and MLM configurations this applies to approximately the first three emissions. Considering these, it may be desirable to set different values for matched/merged and unmatched emissions. The hypotheses above will be tested in more detailed studies. We have also studied independent ME scale variations along with ISR and FSR variations with several different differential cross section measurements. We have observed that ME scale variations affect the normalization scale factor more than the shape and they are larger than PS variations. |
| Additional Figures | |
png pdf |
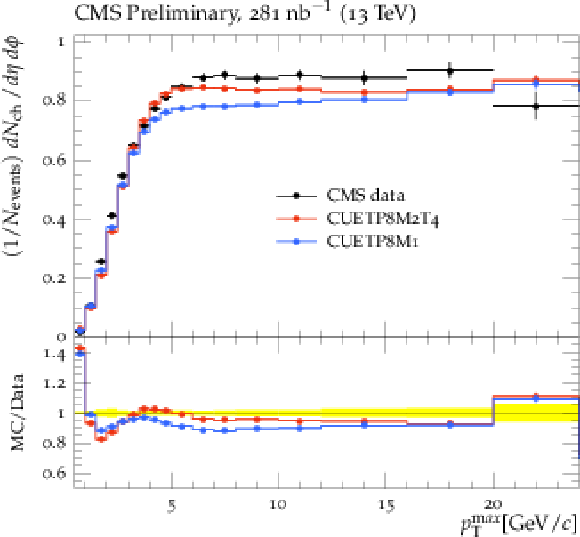
Additional Figure 1:
CMS data [31] at $\sqrt{s} =$ 13 TeV on particle densities for charged particles with $ {p_{\mathrm {T}}} >$ 0.5 GeV and $|\eta | <$ 0.8 in the TransMIN region as defined by the leading charged particle, as a function of the transverse momentum of the leading charged-particle $p_{\textrm {T}}^{\textrm {max}}$. The data are compared to predictions of PYTHIA 8 Tune CUETP8M1 and CUETP8M2T4. The ratios of MC events to data are given below each panel. |
png pdf |
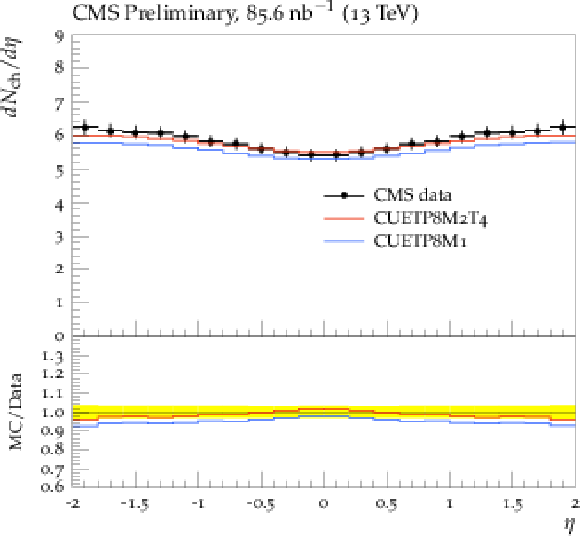
Additional Figure 2:
CMS data [32] at $\sqrt{s} =$ 13 TeV for the charged-particle pseudorapidity distribution, $\mathrm{d}N_{\textrm {ch}}/\mathrm{d} \eta $, in inelastic proton-proton collisions. The data are compared to predictions of PYTHIA 8 Tune CUETP8M1 and CUETP8M2T4. The ratios of MC events to data are given below each panel. |
| References | ||||
| 1 | J. Alwall, M. Herquet, and F. Maltoni | MadGraph 5: Going Beyond | JHEP 6 (2011) 128 | |
| 2 | T. Sj\"ostrand, S. Mrenna, and P. Skands | PYTHIA 6.4 physics and manual | JHEP 05 (2006) 026 | hep-ph/0603175 |
| 3 | R. Field | Early LHC Underlying Event Data - Findings and Surprises | in Hadron collider physics. Proceedings, 22nd Conference, HCP 2010, Toronto, Canada, August 23-27, 2010 2010 | 1010.3558 |
| 4 | J. Pumplin et al. | New generation of parton distributions with uncertainties from global QCD analysis | JHEP 07 (2002) 012 | hep-ph/0201195 |
| 5 | CMS Collaboration | Event generator tunes obtained from underlying event and multiparton scattering measurements | EPJC76 (2016), no. 3, 155 | CMS-GEN-14-001 1512.00815 |
| 6 | CMS Collaboration | Measurement of the differential cross section for top quark pair production in pp collisions at $ \sqrt{s} = 8\,\text {TeV} $ | EPJC75 (2015), no. 11, 542 | CMS-TOP-12-028 1505.04480 |
| 7 | CMS Collaboration | Measurement of particle level differential $ t\overline{t} $ cross sections in the dilepton channel at $ \sqrt{s} $ = 13 TeV | CMS-PAS-TOP-16-007 | CMS-PAS-TOP-16-007 |
| 8 | CMS Collaboration | Measurement of differential cross sections for top quark pair production using the lepton+jets final state in proton-proton collisions at 13 TeV | Submitted to PRD | CMS-TOP-16-008 1610.04191 |
| 9 | CMS Collaboration | Measurement of the differential cross section for $ t\overline{t} $ production in the dilepton final state at $ \sqrt{s}=13 $ TeV | CMS-PAS-TOP-16-011 | CMS-PAS-TOP-16-011 |
| 10 | CMS Collaboration | Measurement of the $\rm t \bar t$ production cross section at 13 TeV in the all-jets final state | CDS | |
| 11 | P. Nason | A New method for combining NLO QCD with shower Monte Carlo algorithms | JHEP 11 (2004) 040 | 0409146 |
| 12 | S. Frixione, P. Nason, and C. Oleari | Matching NLO QCD computations with Parton Shower simulations: the POWHEG method | JHEP 11 (2007) 070 | 0709.2092 |
| 13 | S. Alioli, P. Nason, C. Oleari, and E. Re | A general framework for implementing NLO calculations in shower Monte Carlo programs: the POWHEG BOX | JHEP 06 (2010) 043 | 1002.2581 |
| 14 | A. Buckley, J. Butterworth, D. Grellscheid et al. | Rivet user manual | CPC 184 (2013) 2803 | 1003.0694 |
| 15 | CMS Collaboration | Comparisons of Theory Predictions for the $ t\overline{t} $ Process with Data from pp Collisions at $ \sqrt{s} $= 8 TeV | CMS-PAS-TOP-15-011 | CMS-PAS-TOP-15-011 |
| 16 | M. Dobbs and J. Hansen | The HepMC C++ Monte Carlo event record for High Energy Physics | CPC 134 (2001) 41 | |
| 17 | J. Alwall, R. Frederix, S. Frixione et al. | The automated computation of tree-level and next-to-leading order differential cross sections, and their matching to parton shower simulations | JHEP 07 (2014) 079 | 1405.0301 |
| 18 | CMS Collaboration | Measurement of $ \mathrm {t}\overline{\mathrm {t}} $ production with additional jet activity, including $ \mathrm {b} $ quark jets, in the dilepton decay channel using pp collisions at $ \sqrt{s} = $ 8 TeV | EPJC76 (2016), no. 7, 379 | CMS-TOP-12-041 1510.03072 |
| 19 | CMS Collaboration | Measurement of the differential cross sections for top quark pair production as a function of kinematic event variables in pp collisions at $ \sqrt s $=7 and 8 TeV | PRD94 (2016), no. 5, 052006 | CMS-TOP-12-042 1607.00837 |
| 20 | CMS Collaboration | Measurement of the integrated and differential t-tbar production cross sections for high-pt top quarks in pp collisions at $ \sqrt{s} $ = 8 TeV | PRD. (2016) , [Phys. Rev.D94,072002(2016)] | CMS-TOP-14-012 1605.00116 |
| 21 | CMS Collaboration | Measurement of the differential production cross section for top-quark pairs as a function of jet multiplicity in the lepton+jets final state at $ \sqrt{s}=8 $ TeV with the CMS detector | CMS-PAS-TOP-15-006 | CMS-PAS-TOP-15-006 |
| 22 | C. Matteo, S. G. P., and S. Gregory | The anti-$ k_t $ jet clustering algorithm | JHEP 04 (2008) 063 | 0802.1189 |
| 23 | M. Wobisch and T. Wengler | Hadronization corrections to jet cross-sections in deep inelastic scattering | in Monte Carlo generators for HERA physics. Proceedings, Workshop, Hamburg, Germany, 1998-1999 1998 | hep-ph/9907280 |
| 24 | Y. L. Dokshitzer, G. D. Leder, S. Moretti, and B. R. Webber | Better jet clustering algorithms | JHEP 08 (1997) 001 | hep-ph/9707323 |
| 25 | L3 Collaboration | Studies of hadronic event structure in $ e^{+} e^{-} $ annihilation from 30-GeV to 209-GeV with the L3 detector | PR 399 (2004) 71--174 | hep-ex/0406049 |
| 26 | A. Buckley et al. | Systematic event generator tuning for the LHC | EPJC65 (2010) 331--357 | 0907.2973 |
| 27 | CMS Collaboration | Event generator tunes obtained from underlying event and multiparton scattering measurements | EPJC 76 (2016), no. 3, 155 | CMS-GEN-14-001 1512.00815 |
| 28 | CMS Collaboration | Measurement of $ \mathrm {t}\overline{\mathrm {t}} $ production with additional jet activity, including $ \mathrm {b} $ quark jets, in the dilepton decay channel using pp collisions at $ \sqrt{s} = $ 8 TeV | EPJC76 (2016), no. 7, , http://cms-results.web.cern.ch/cms-results/public-results/publications/TOP-12-041/index.html\#AddFig | CMS-TOP-12-041 1510.03072 |
| 29 | T. Sjostrand, S. Mrenna, and P. Skands | A Brief Introduction to PYTHIA 8.1 | CPC 178 (2008) 852 | 0710.3820 |
| 30 | P. Skands, S. Carrazza, and J. Rojo | Tuning PYTHIA 8.1: the Monash 2013 Tune | EPJC74 (2014), no. 8 | 1404.5630 |
| 31 | CMS Collaboration | Underlying Event Measurements with Leading Particles and Jets in pp collisions at $ \sqrt{s} = 13 $ TeV | CMS-PAS-FSQ-15-007 | CMS-PAS-FSQ-15-007 |
| 32 | CMS Collaboration | Pseudorapidity distribution of charged hadrons in proton-proton collisions at $ \sqrt{s} $ = 13 TeV | PLB751 (2015) 143--163 | CMS-FSQ-15-001 1507.05915 |
| 33 | CMS Collaboration | Measurement of the pseudorapidity dependence of the energy and transverse energy density in pp collisions at $ \sqrt{s}= $ 13 TeV with CMS | CMS-PAS-FSQ-15-006 | CMS-PAS-FSQ-15-006 |
| 34 | CMS Collaboration | Measurement of pseudorapidity distributions of charged particles in proton-proton collisions at $ \sqrt{s} = $ 13 TeV by the CMS experiment. | CMS-PAS-FSQ-15-008 | CMS-PAS-FSQ-15-008 |
| 35 | CMS Collaboration | Z+jets differential cross section at 8 TeV | CMS-PAS-SMP-13-007 | CMS-PAS-SMP-13-007 |
| 36 | R. Frederix and S. Frixione | Merging meets matching in MC@NLO | JHEP 12 (2012) 061 | 1209.6215 |
| 37 | J. Alwall et al. | Comparative study of various algorithms for the merging of parton showers and matrix elements in hadronic collisions | EPJC53 (2008) 473--500 | 0706.2569 |
| 38 | S. Frixione and B. R. Webber | Matching NLO QCD computations and parton shower simulations | JHEP 06 (2002) 029 | hep-ph/0204244 |
| 39 | R. D. Ball et al. | Parton distributions for the LHC Run II | JHEP 04 (2015) 040 | 1410.8849 |
| 40 | R. D. Ball et al. | Parton distributions with LHC data | Nucl.Phys. B 867 (2013) 244 | 1207.1303 |
| 41 | ATLAS Collaboration | A study of the sensitivity to the Pythia8 parton shower parameters of $ t\bar{t} $ production measurements in $ pp $ collisions at $ \sqrt{s} = 7 $ TeV with the ATLAS experiment at the LHC | ATL-PHYS-PUB-2015-007 | |
| 42 | ATLAS Collaboration | Studies on top-quark Monte Carlo modelling for Top2016 | ATL-PHYS-PUB-2016-020 | |
| 43 | B. Cooper et al. | Importance of a consistent choice of $ \alpha_s $ in the matching of AlpGen and Pythia | EPJC72 (2012) 2078 | 1109.5295 |

|
Compact Muon Solenoid LHC, CERN |

|

|

|

|

|

|