

Compact Muon Solenoid
LHC, CERN
| CMS-PAS-TOP-16-007 | ||
| Measurement of particle level differential $\mathrm{ t \bar{t} }$ cross sections in the dilepton channel at $\sqrt{s} =$ 13 TeV | ||
| CMS Collaboration | ||
| August 2016 | ||
| Abstract: The normalised differential cross section for top quark pair production is measured in the dilepton ($\mathrm{e}^{+}\mathrm{e}^{-}$, $\mu^{+}\mu^{-}$, and $\mu^{\mp}\mathrm{e}^{\pm}$) decay channel in proton-proton collisions at a center-of-mass energy of 13 TeV. The measurements are performed with data corresponding to an integrated luminosity of 2.2 fb$^{-1}$ collected in 2015 using the CMS detector at the LHC. The cross section is measured differentially as a function of the kinematic properties of the leptons, b jets, top quarks, and top quark pairs at particle level. The results are compared to several models of perturbative QCD and found to be in agreement with the standard model predictions. | ||
|
Links:
CDS record (PDF) ;
inSPIRE record ;
CADI line (restricted) ;
These preliminary results are superseded in this paper, JHEP 04 (2018) 060. The superseded preliminary plots can be found here. |
||
| Figures | |
png pdf |
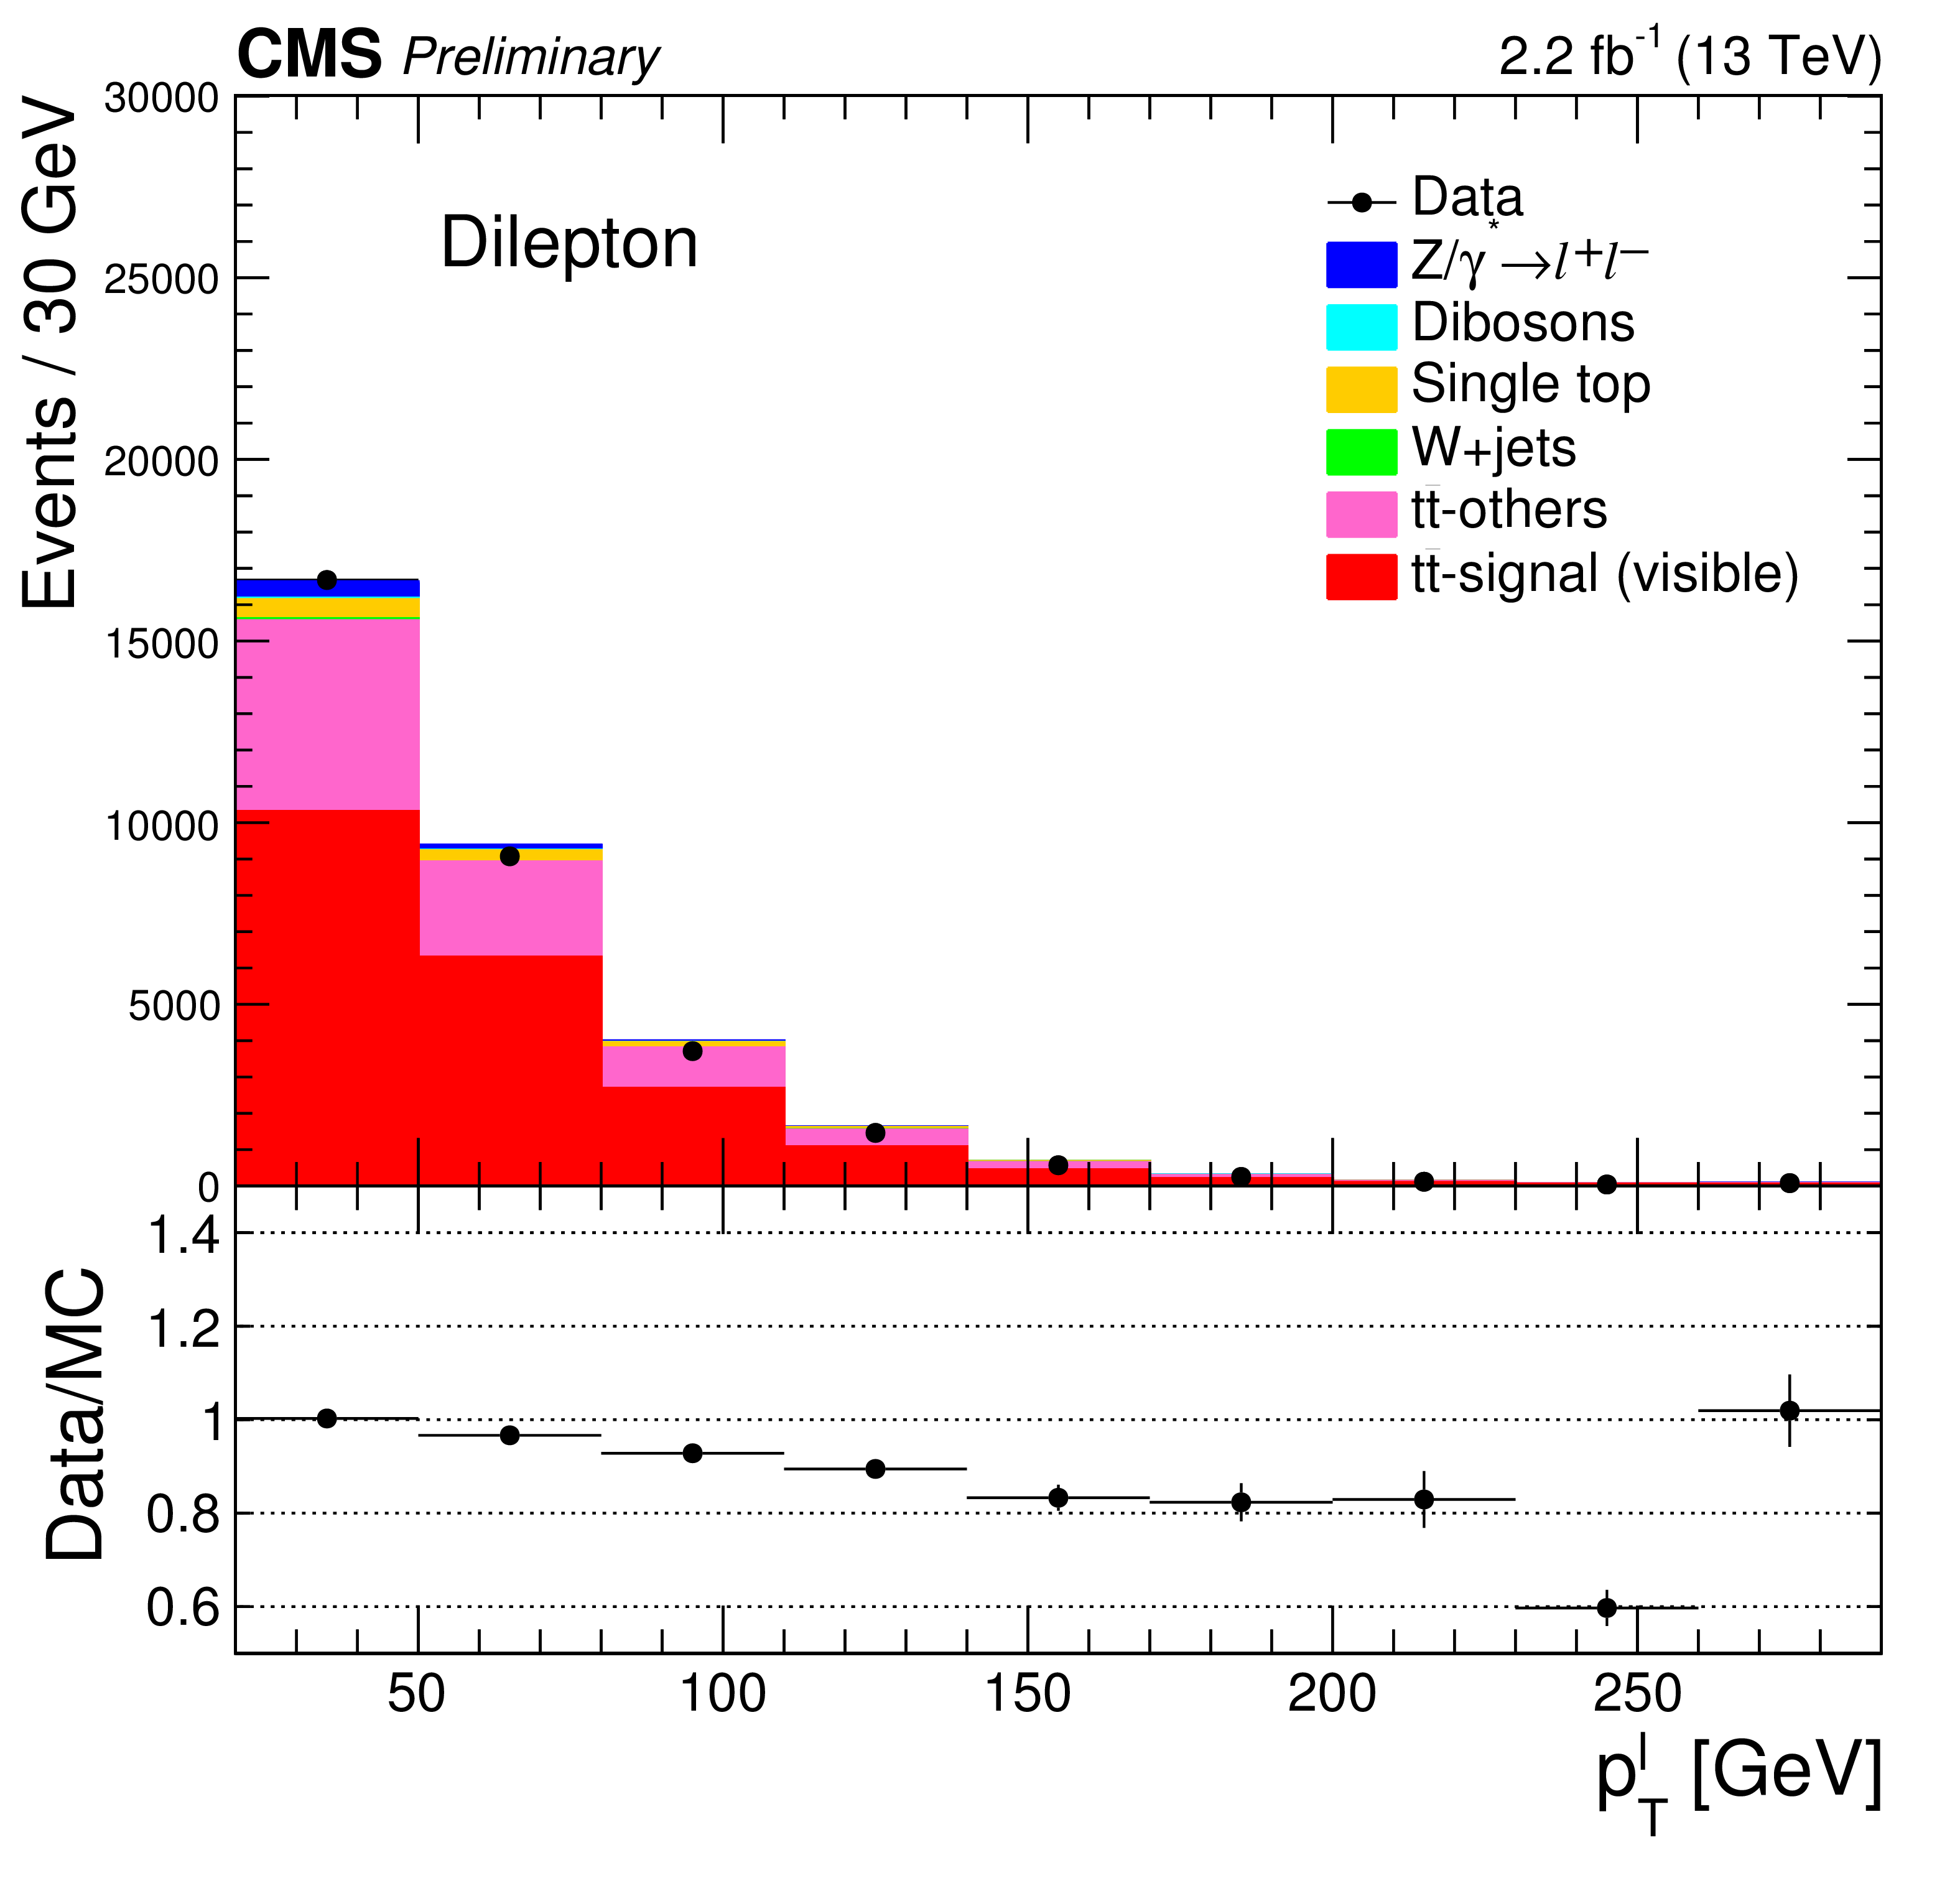
Figure 1-a:
Reconstructed $p_{\mathrm{T}}^{\ell}$, $p_{\mathrm{T}}^{\mathrm{j}}$, $p_{\mathrm{T}}^{\mathrm{t}}$, and $y^{\mathrm{t}}$ distributions. All corrections described in the text are applied to the simulation. |
png pdf |
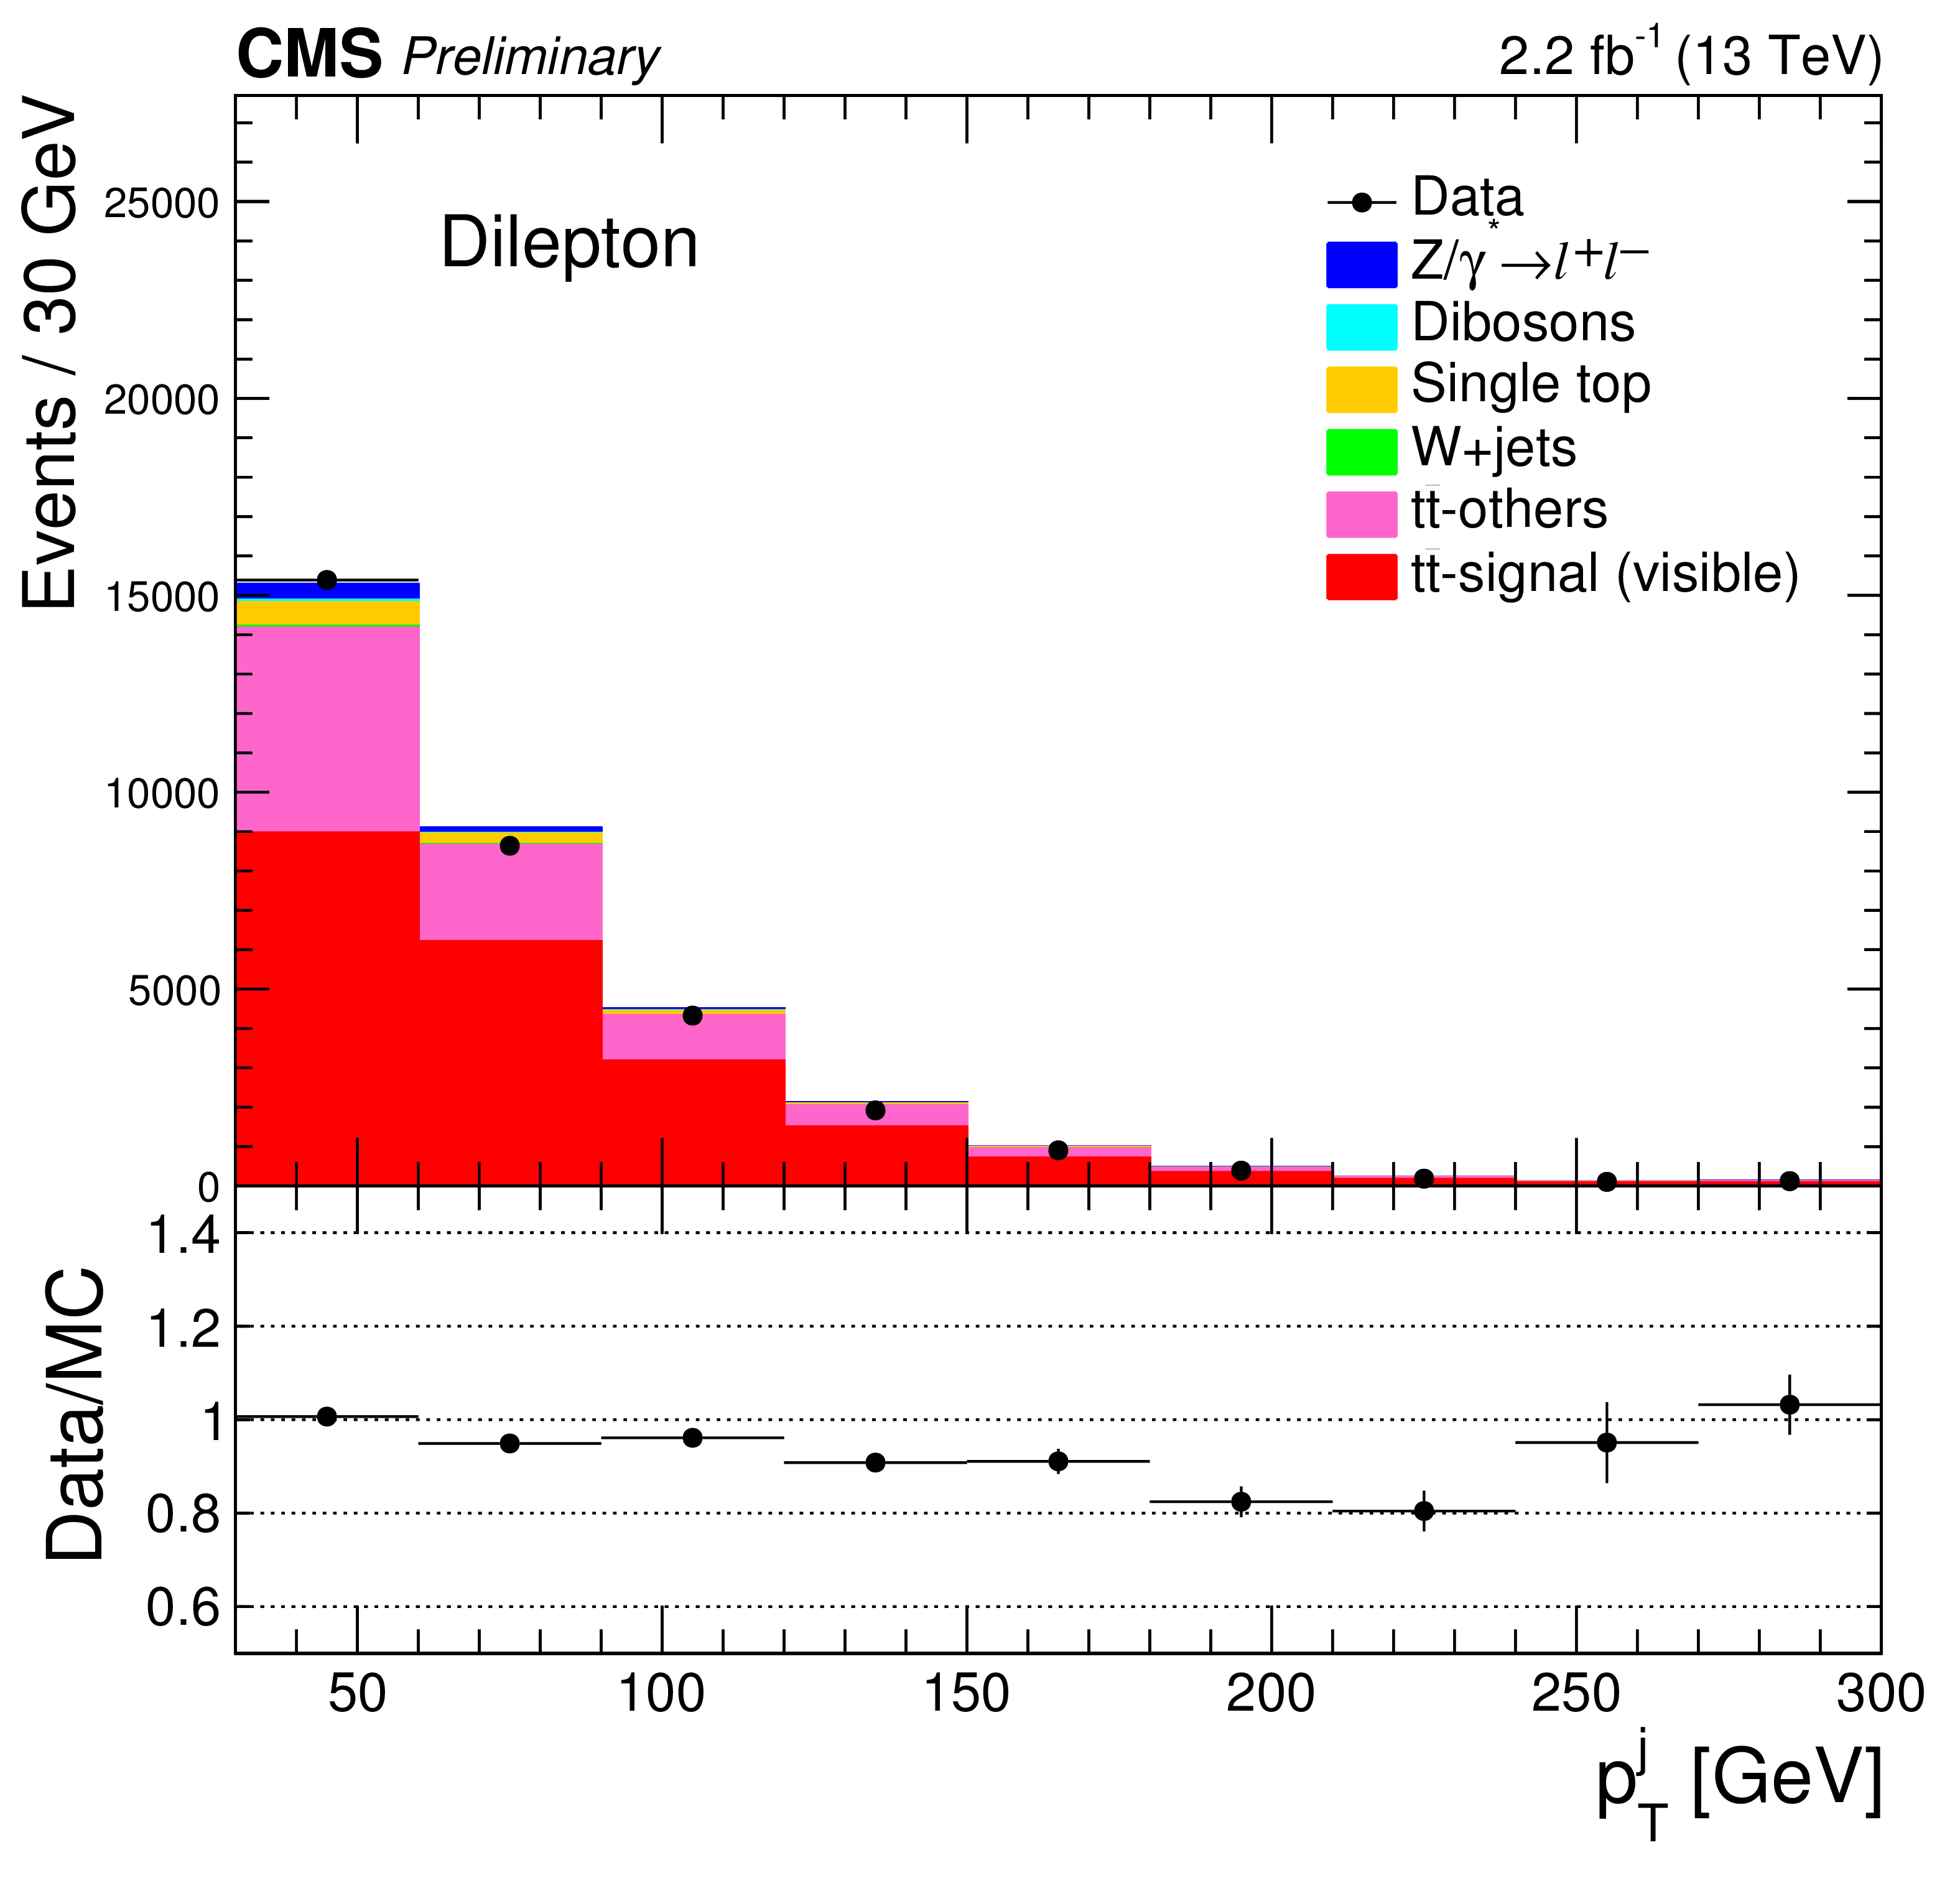
Figure 1-b:
Reconstructed $p_{\mathrm{T}}^{\ell}$, $p_{\mathrm{T}}^{\mathrm{j}}$, $p_{\mathrm{T}}^{\mathrm{t}}$, and $y^{\mathrm{t}}$ distributions. All corrections described in the text are applied to the simulation. |
png pdf |
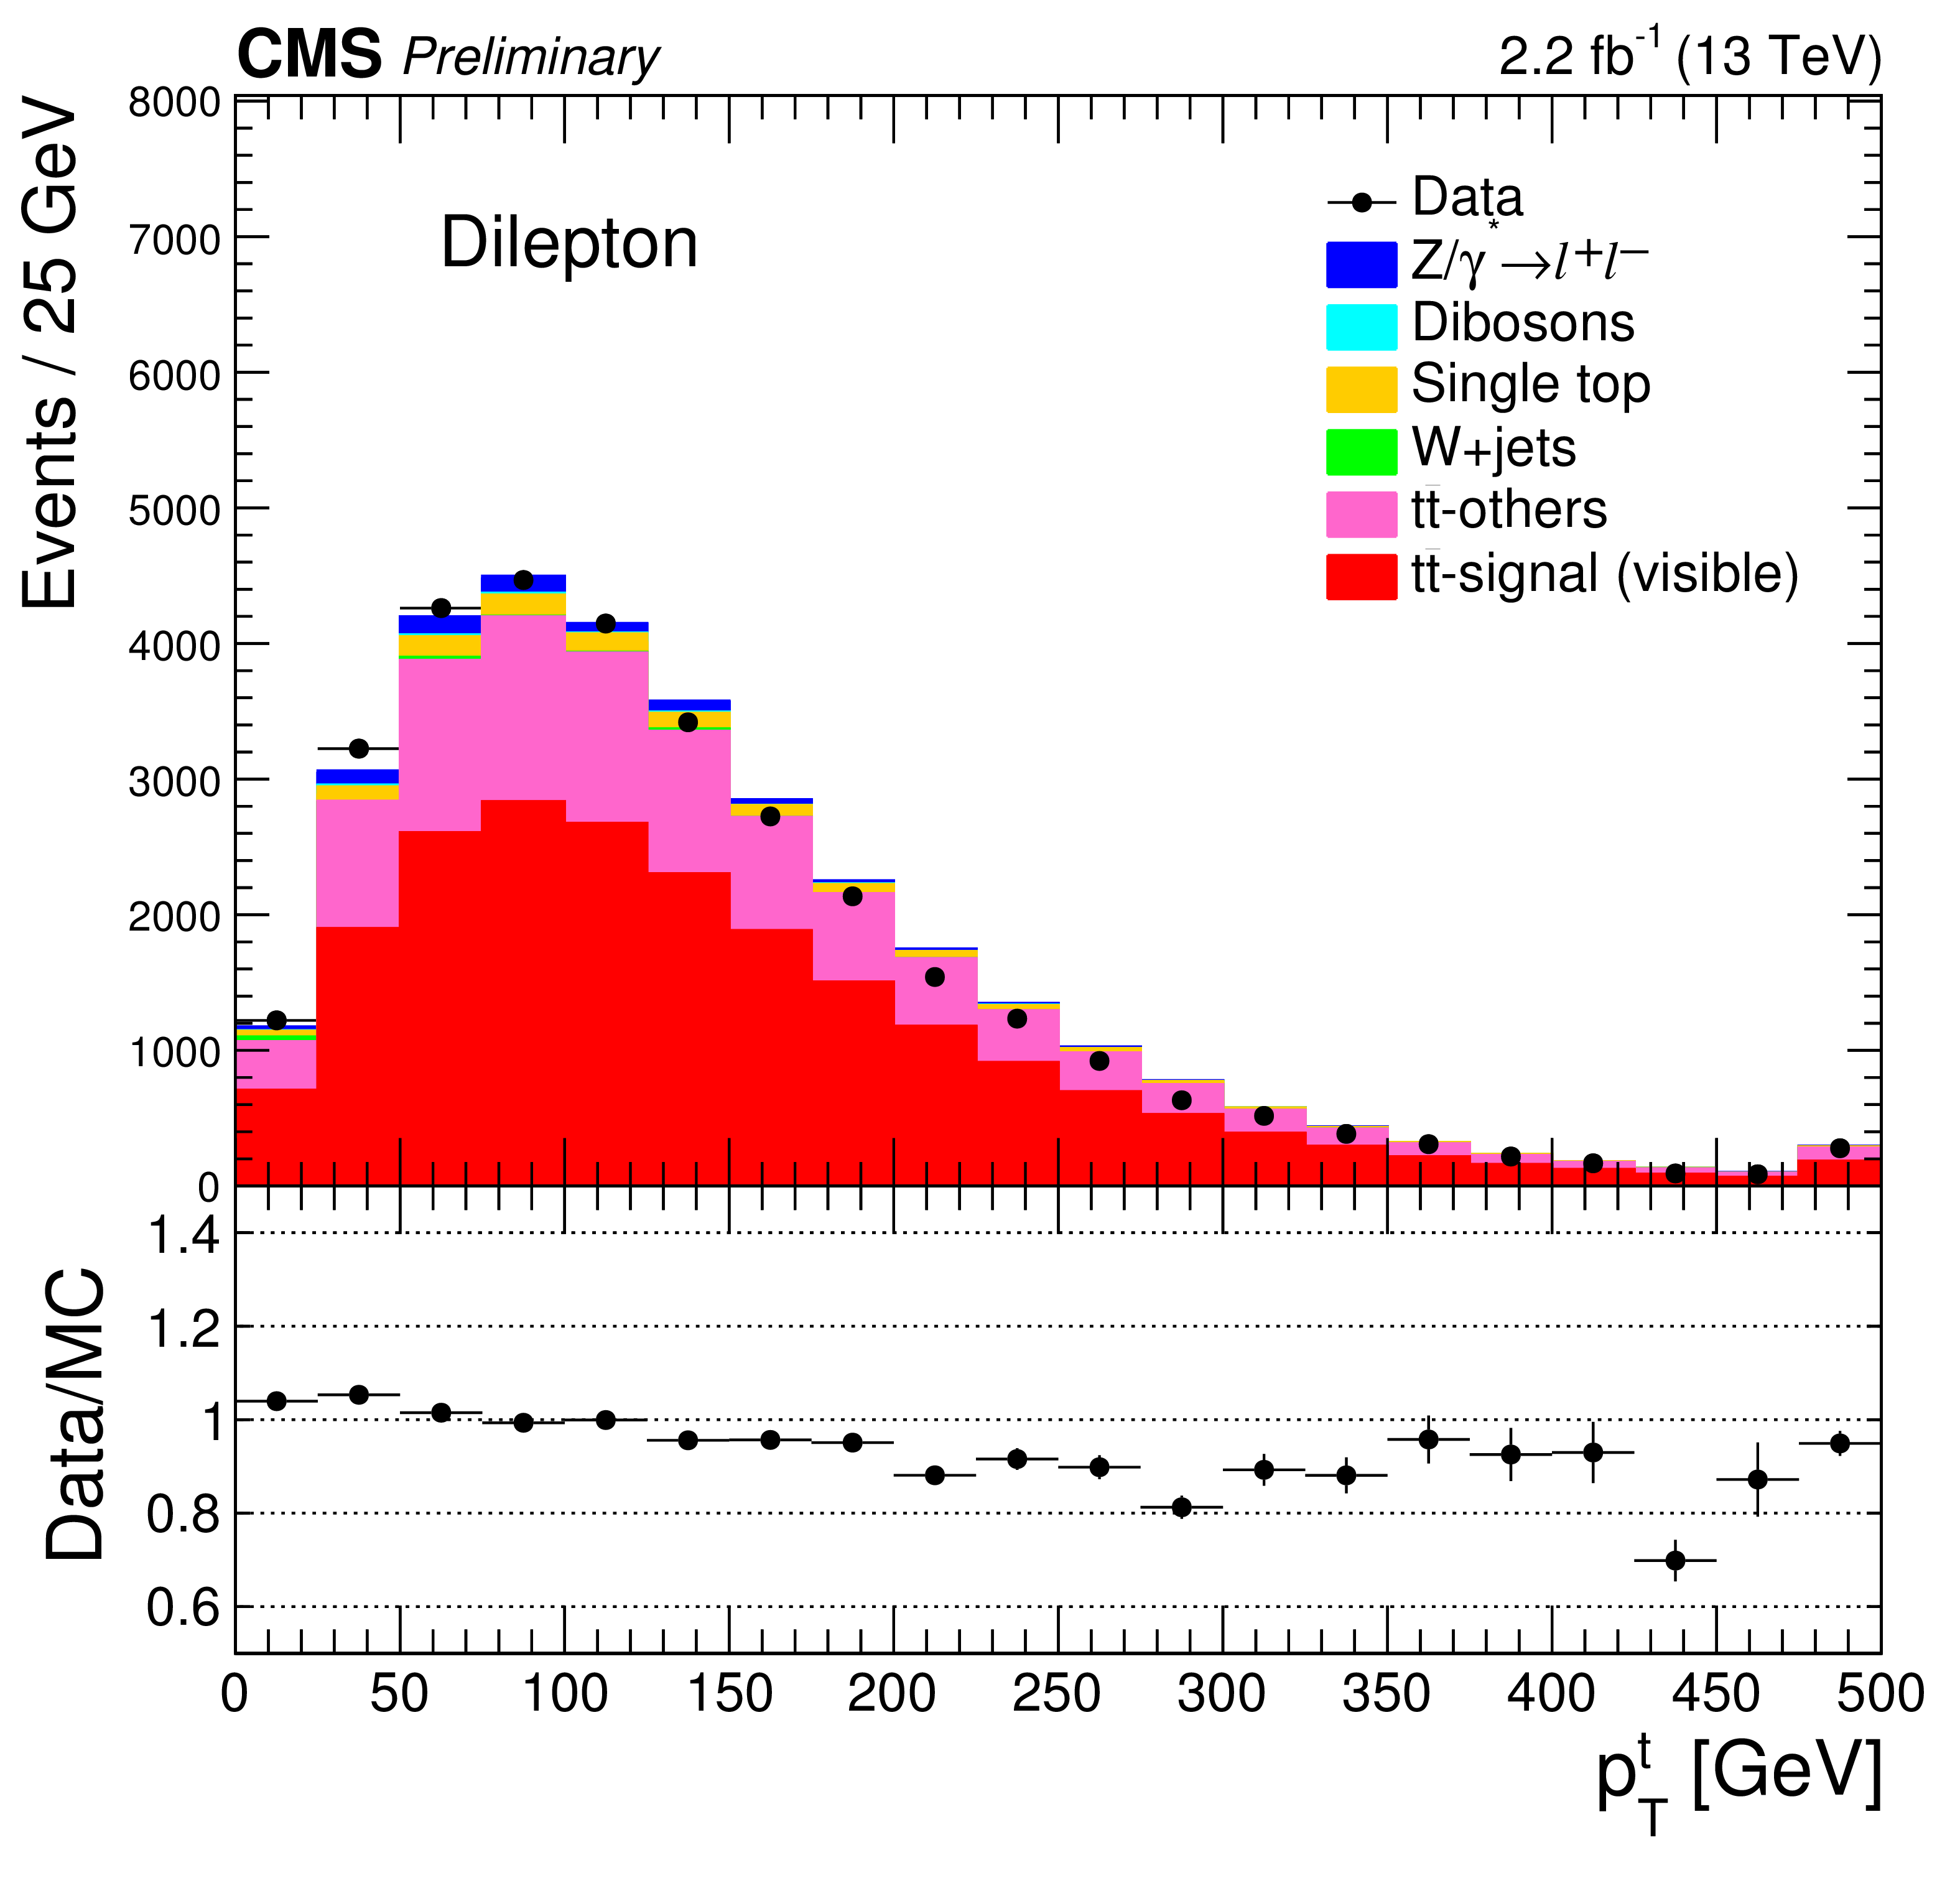
Figure 1-c:
Reconstructed $p_{\mathrm{T}}^{\ell}$, $p_{\mathrm{T}}^{\mathrm{j}}$, $p_{\mathrm{T}}^{\mathrm{t}}$, and $y^{\mathrm{t}}$ distributions. All corrections described in the text are applied to the simulation. |
png pdf |
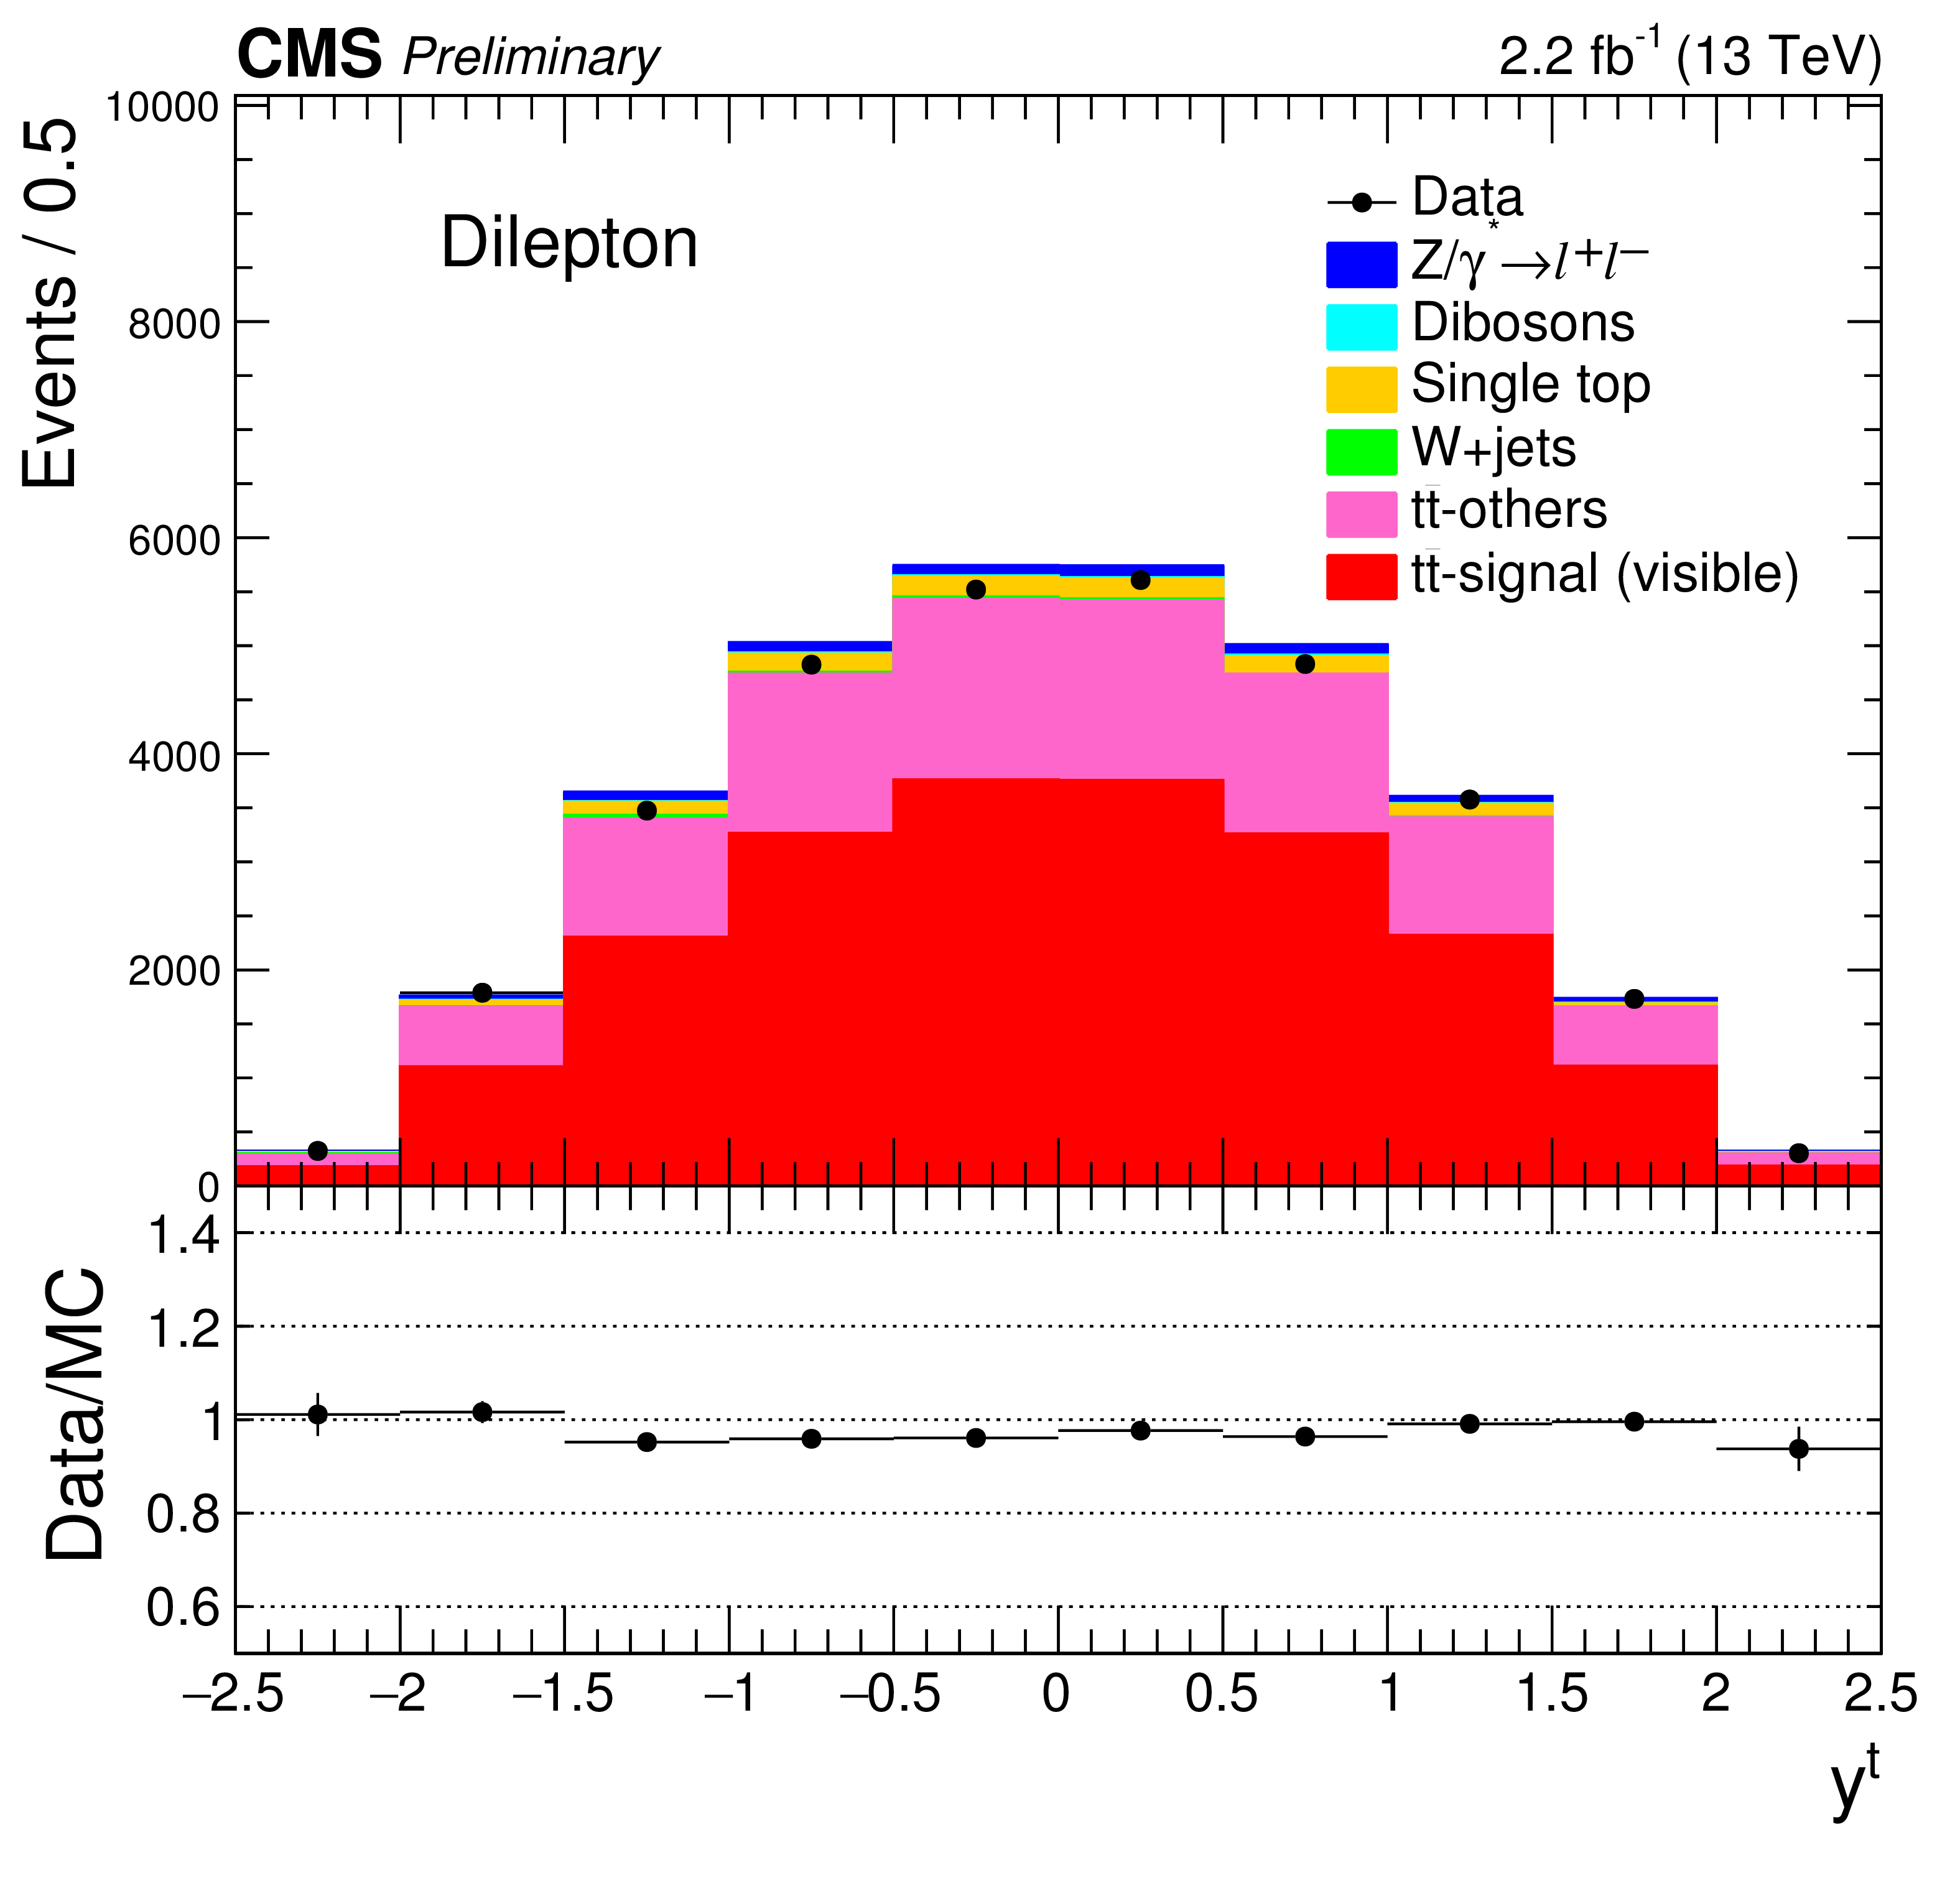
Figure 1-d:
Reconstructed $p_{\mathrm{T}}^{\ell}$, $p_{\mathrm{T}}^{\mathrm{j}}$, $p_{\mathrm{T}}^{\mathrm{t}}$, and $y^{\mathrm{t}}$ distributions. All corrections described in the text are applied to the simulation. |
png pdf |
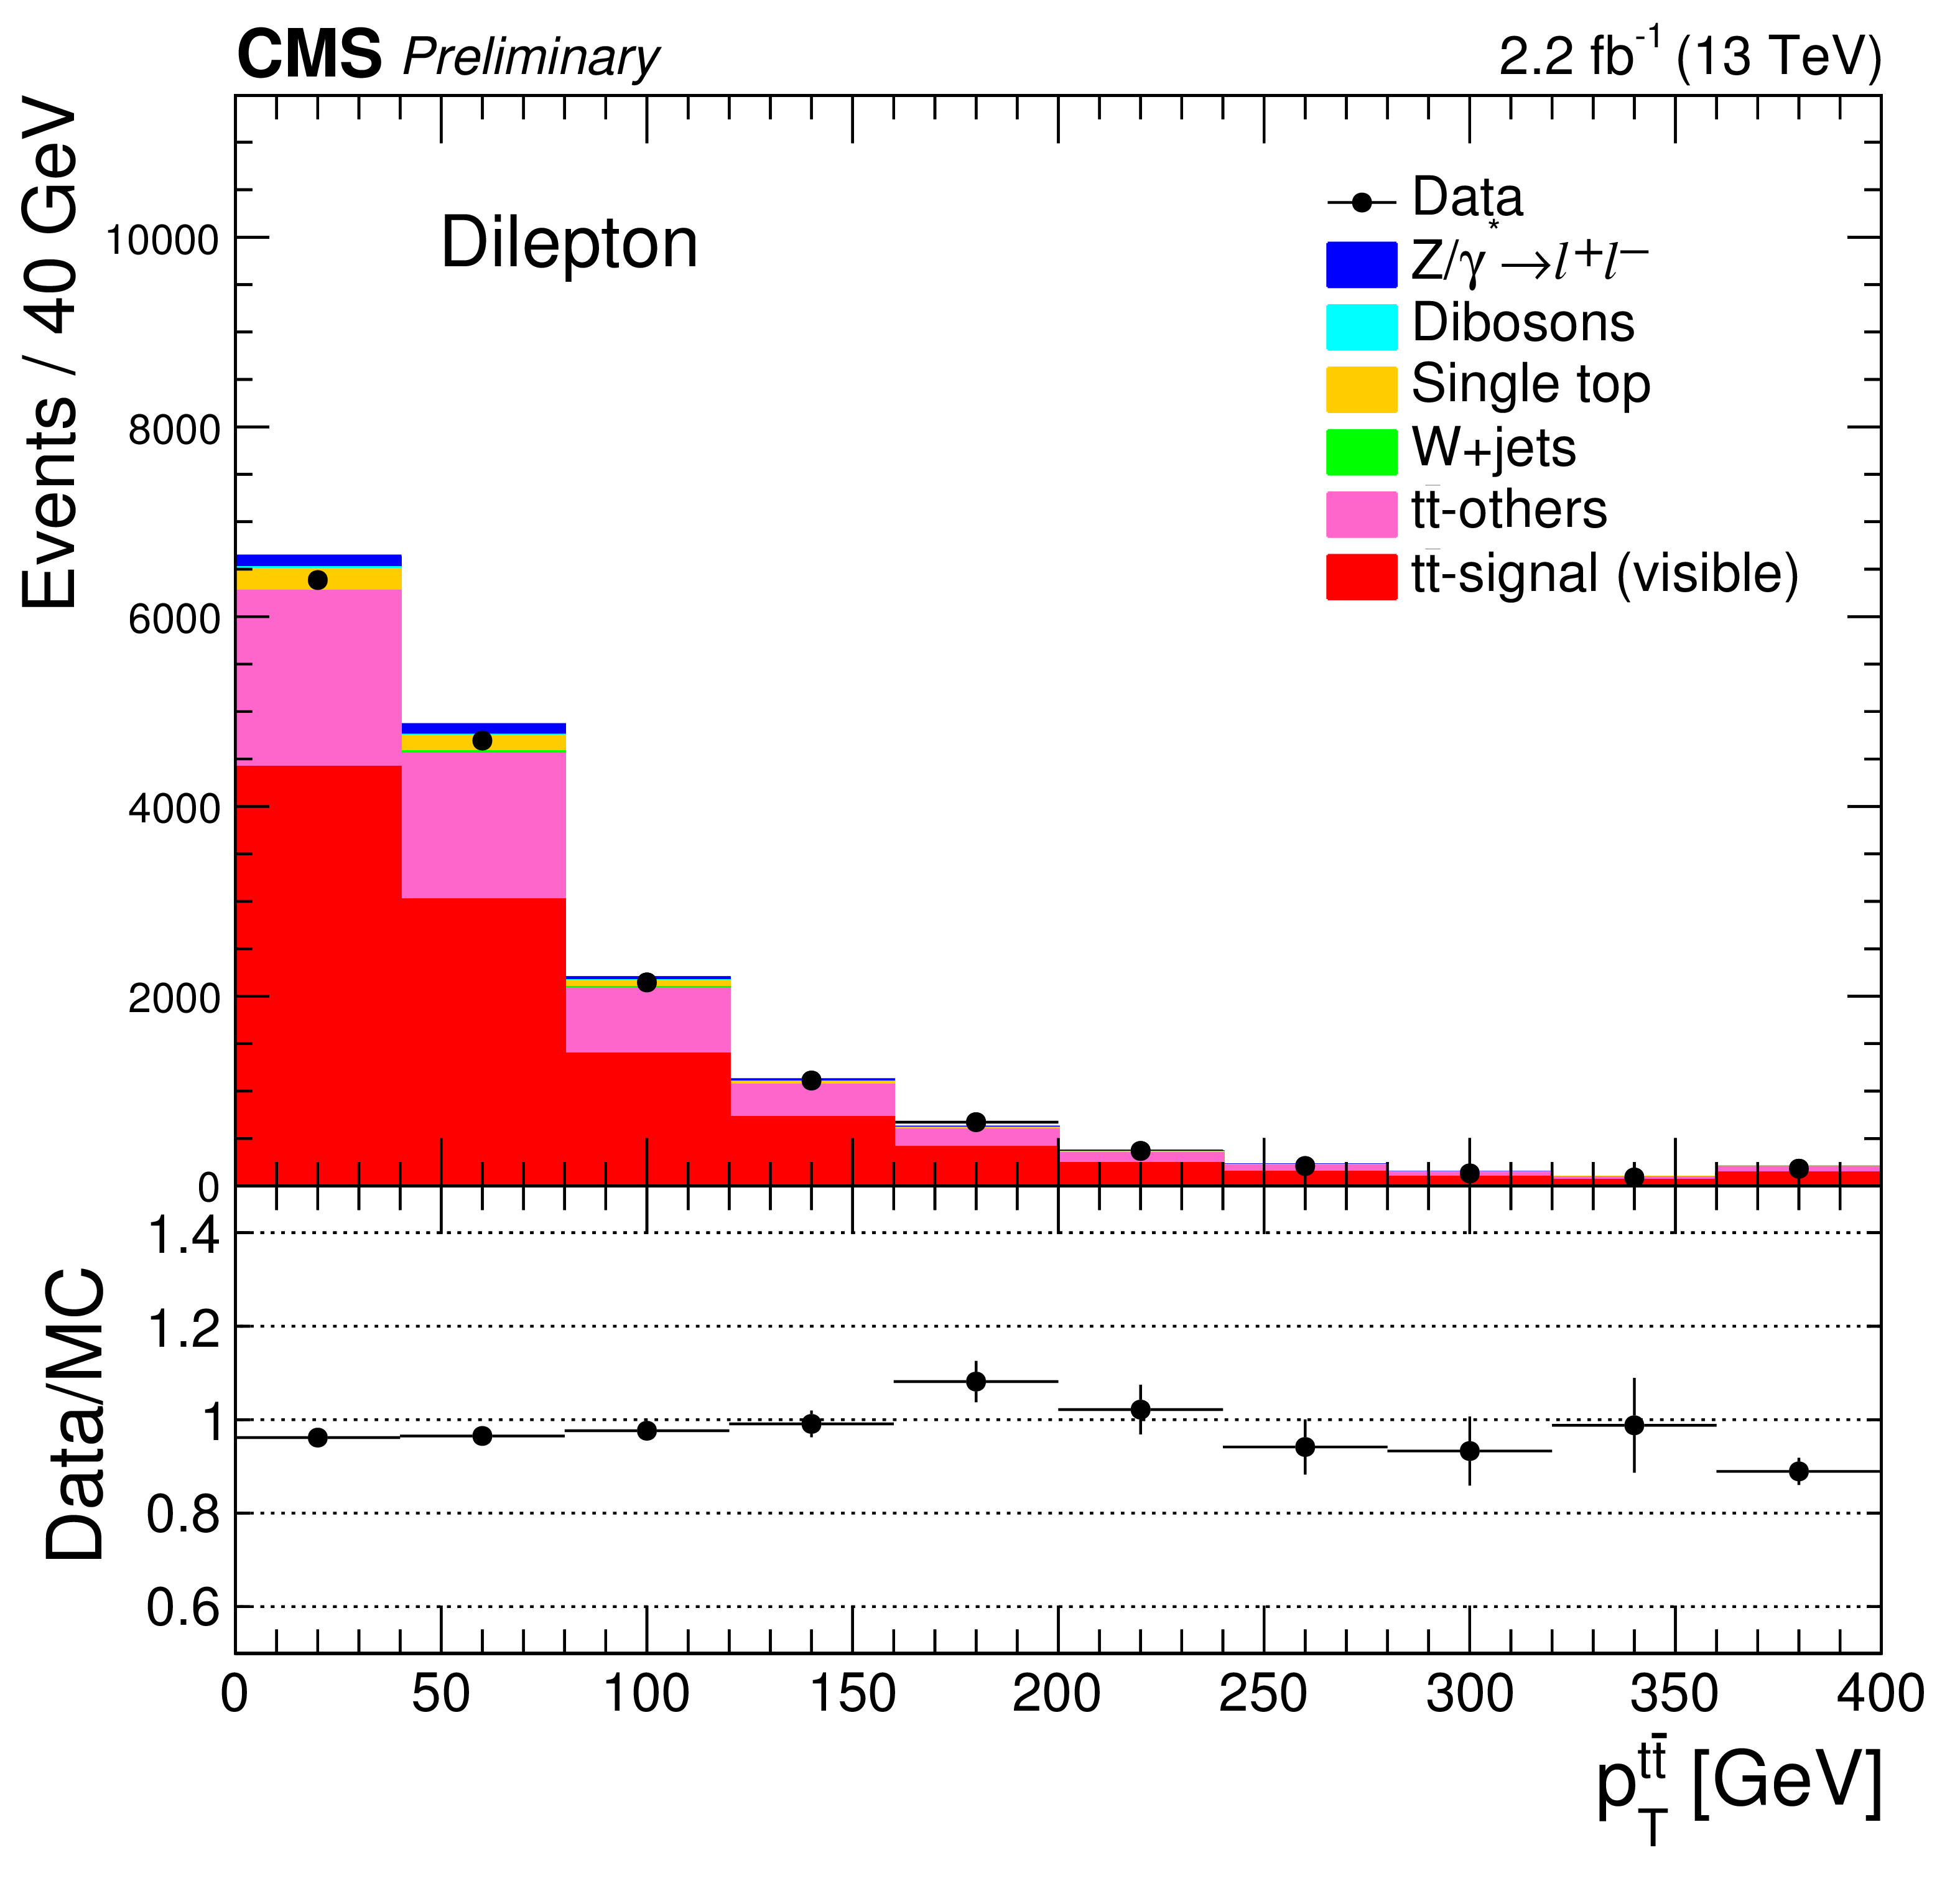
Figure 2-a:
Reconstructed $p_{\mathrm{T}}^{ {\mathrm {t}\overline {\mathrm {t}}} }$, $y^{ {\mathrm {t}\overline {\mathrm {t}}} }$, $M^{ {\mathrm {t}\overline {\mathrm {t}}} }$, and $\Delta \phi ^{ {\mathrm {t}\overline {\mathrm {t}}} }$ distributions. All corrections described in the text are applied to the simulation. |

png pdf |
Figure 2-b:
Reconstructed $p_{\mathrm{T}}^{ {\mathrm {t}\overline {\mathrm {t}}} }$, $y^{ {\mathrm {t}\overline {\mathrm {t}}} }$, $M^{ {\mathrm {t}\overline {\mathrm {t}}} }$, and $\Delta \phi ^{ {\mathrm {t}\overline {\mathrm {t}}} }$ distributions. All corrections described in the text are applied to the simulation. |
png pdf |
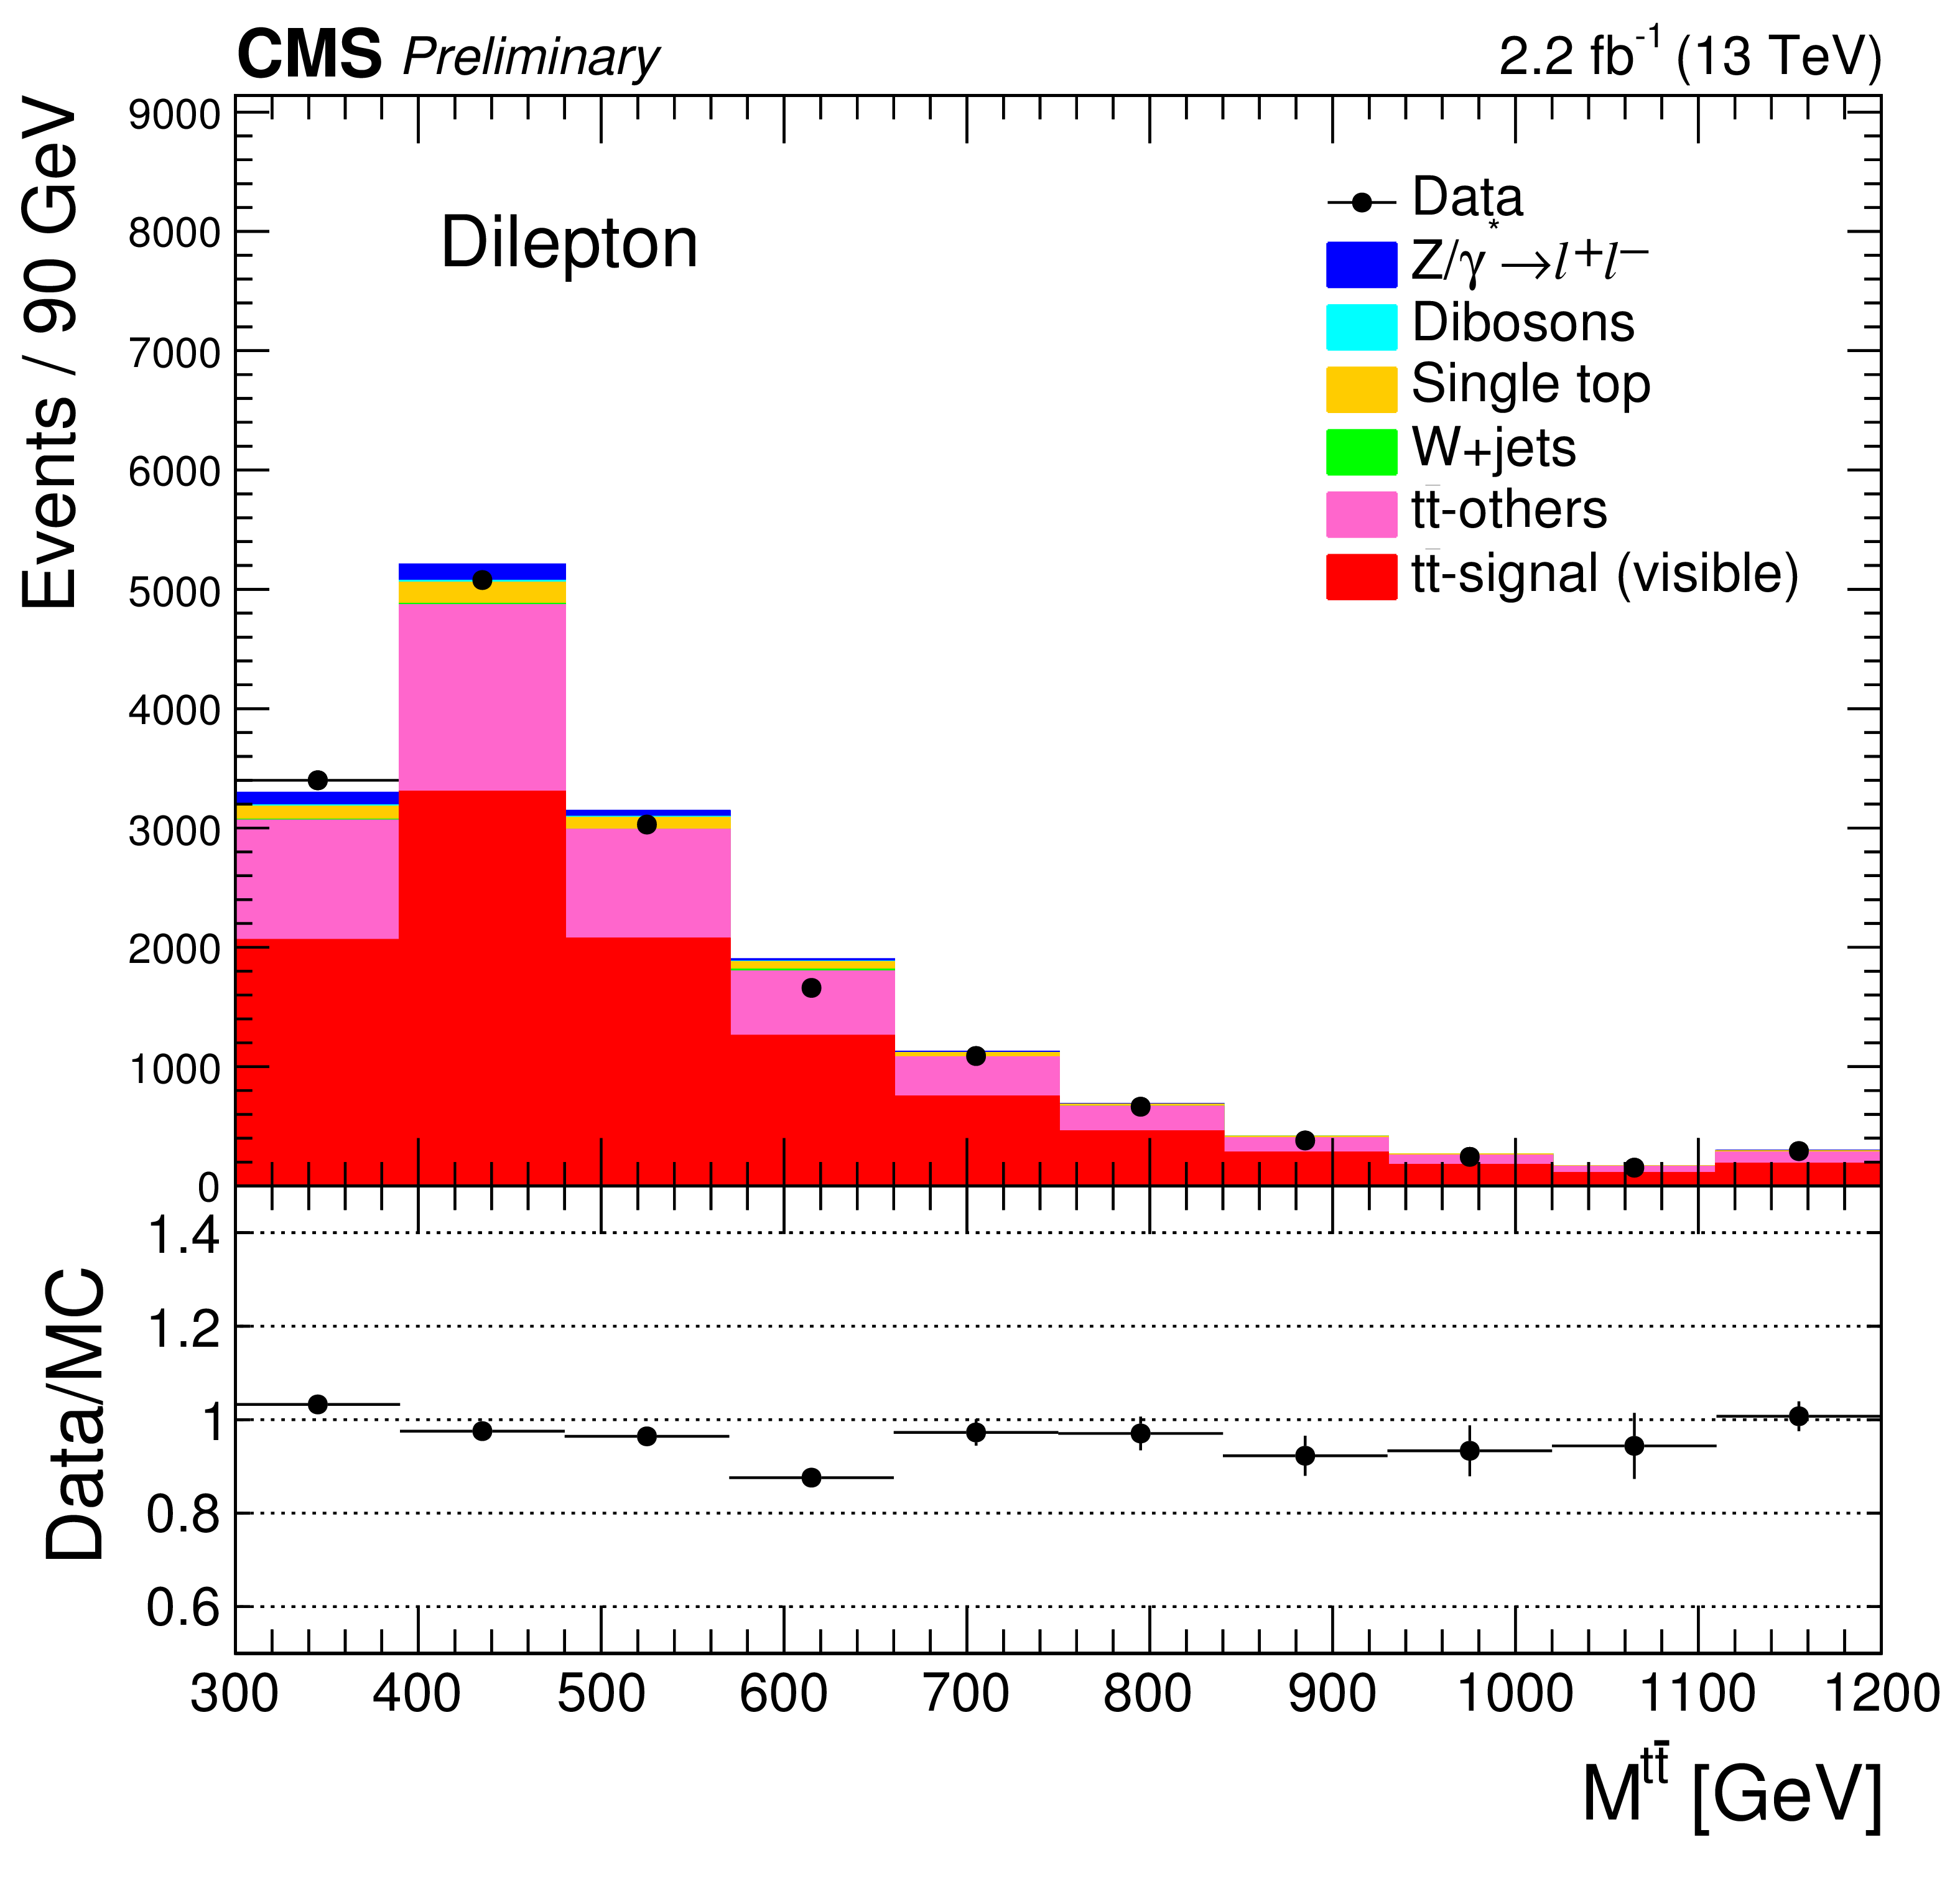
Figure 2-c:
Reconstructed $p_{\mathrm{T}}^{ {\mathrm {t}\overline {\mathrm {t}}} }$, $y^{ {\mathrm {t}\overline {\mathrm {t}}} }$, $M^{ {\mathrm {t}\overline {\mathrm {t}}} }$, and $\Delta \phi ^{ {\mathrm {t}\overline {\mathrm {t}}} }$ distributions. All corrections described in the text are applied to the simulation. |
png pdf |
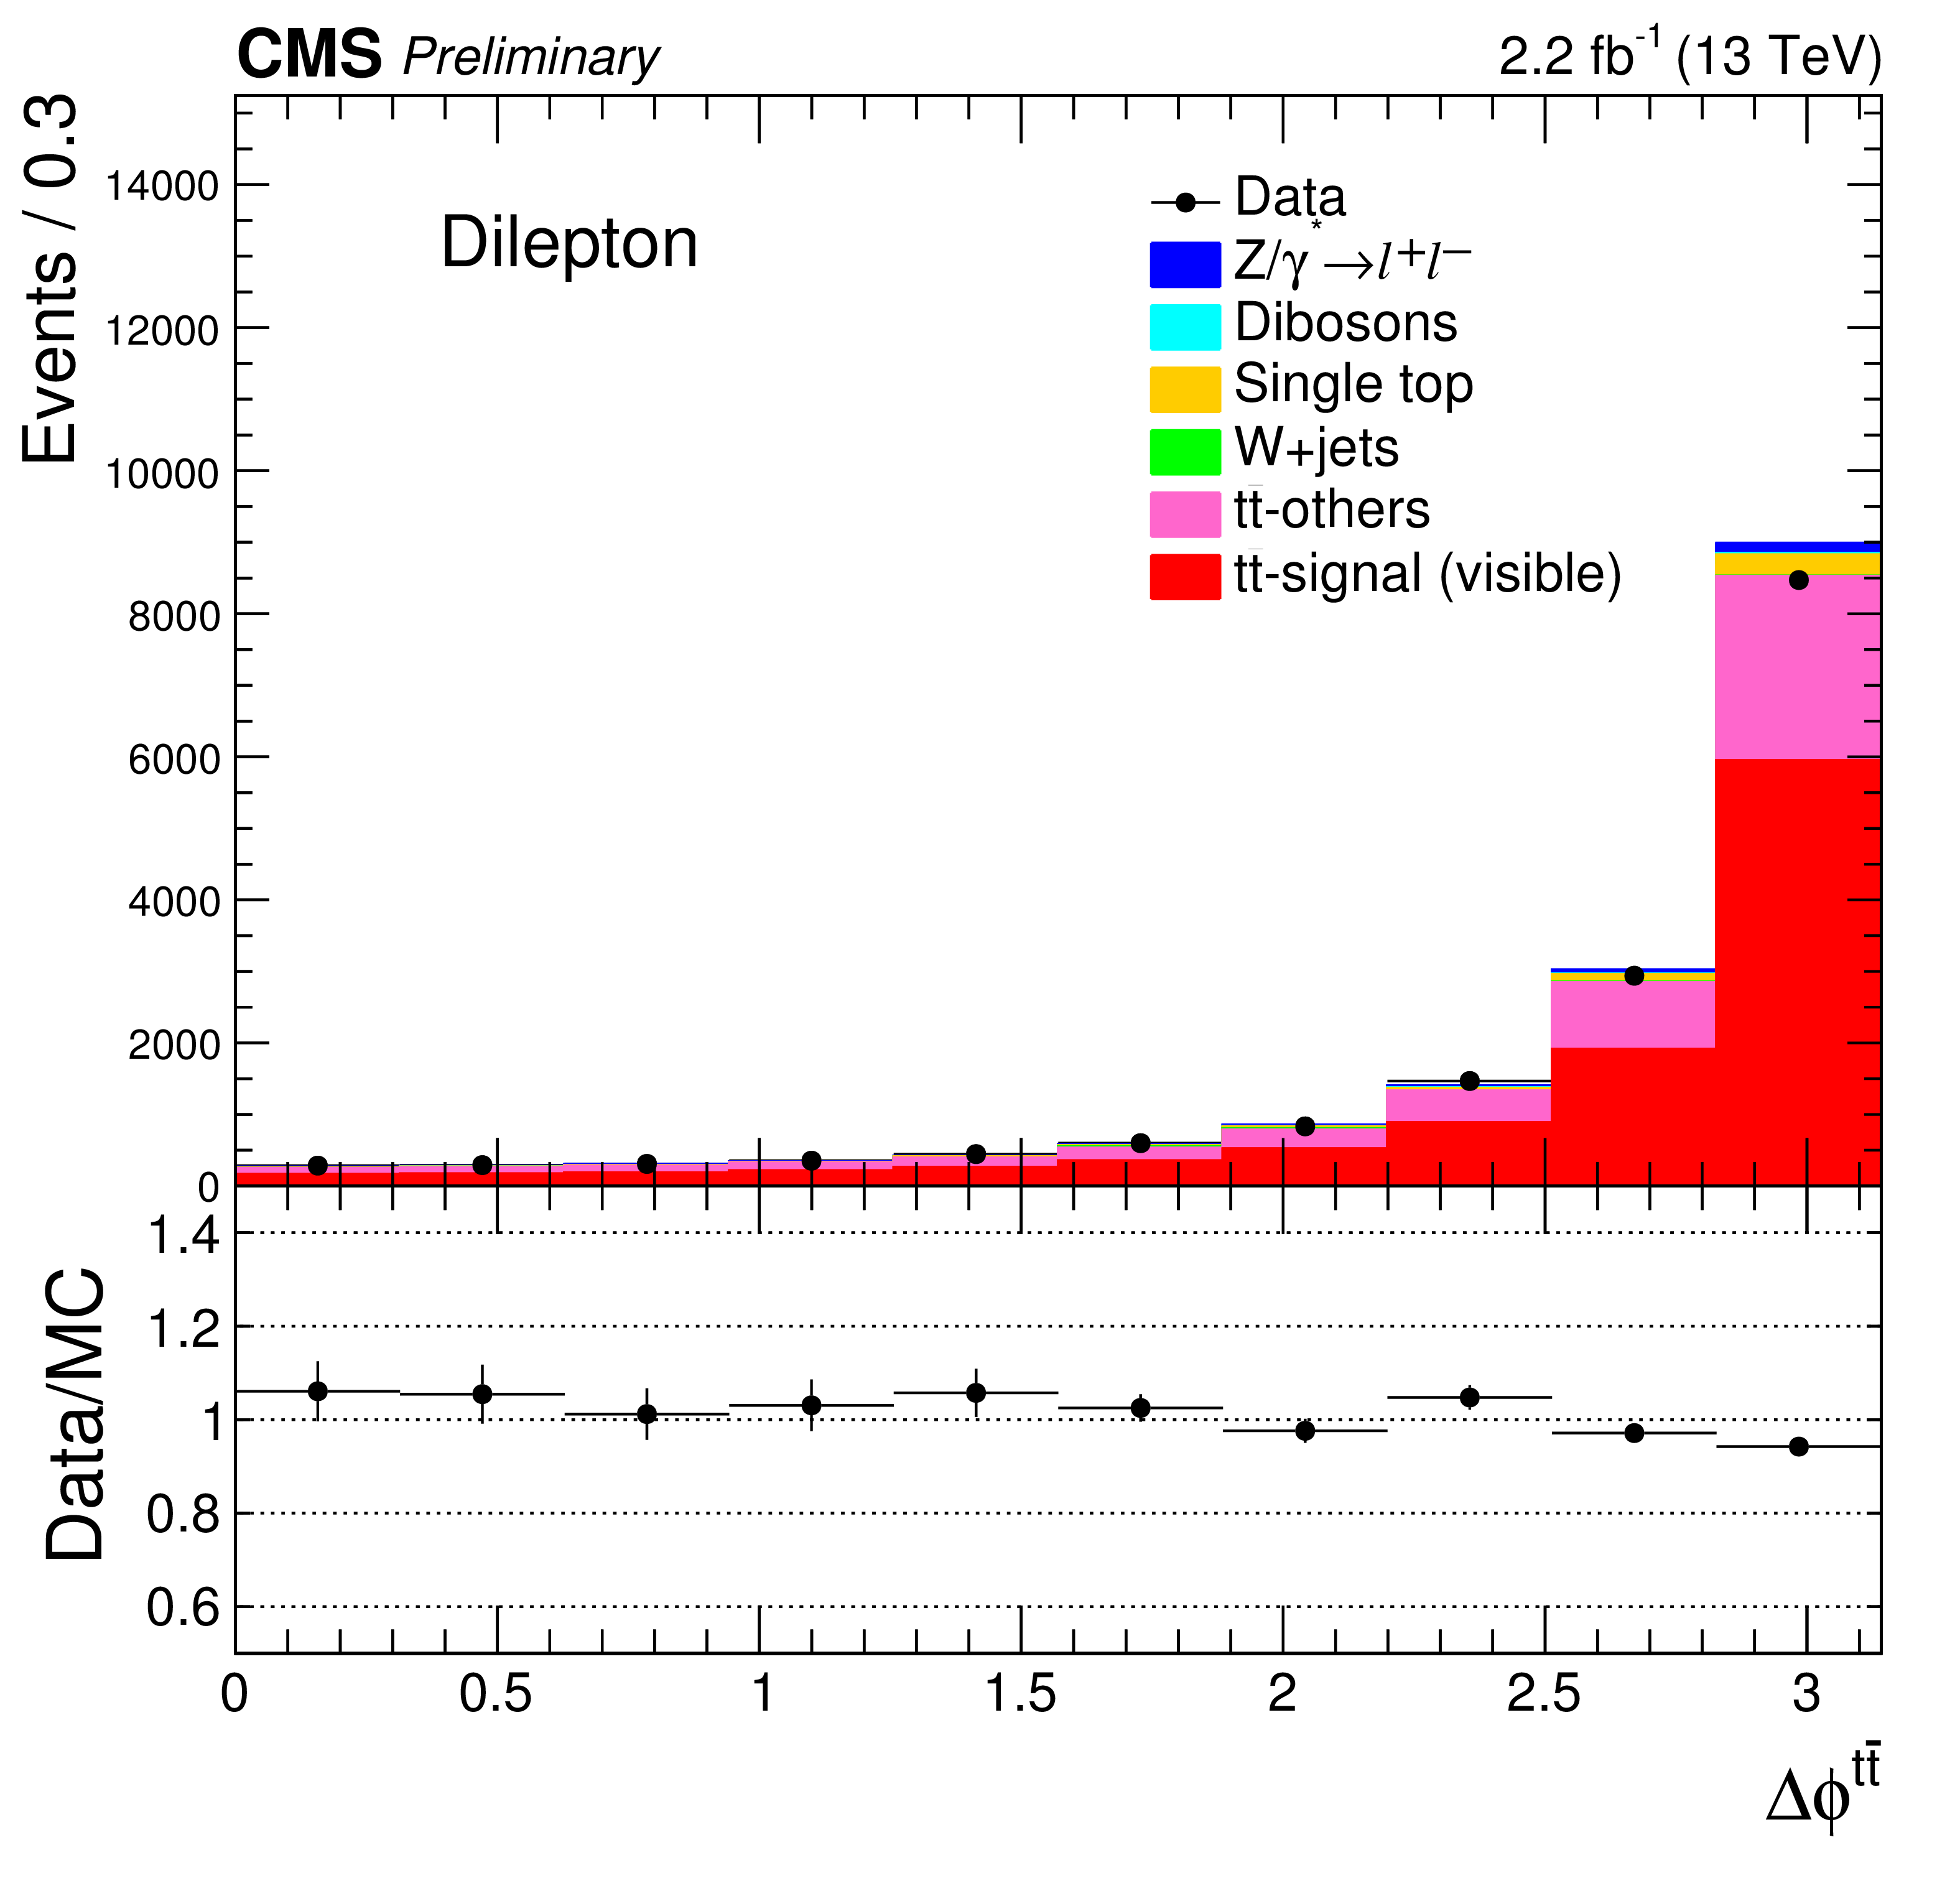
Figure 2-d:
Reconstructed $p_{\mathrm{T}}^{ {\mathrm {t}\overline {\mathrm {t}}} }$, $y^{ {\mathrm {t}\overline {\mathrm {t}}} }$, $M^{ {\mathrm {t}\overline {\mathrm {t}}} }$, and $\Delta \phi ^{ {\mathrm {t}\overline {\mathrm {t}}} }$ distributions. All corrections described in the text are applied to the simulation. |
png pdf |
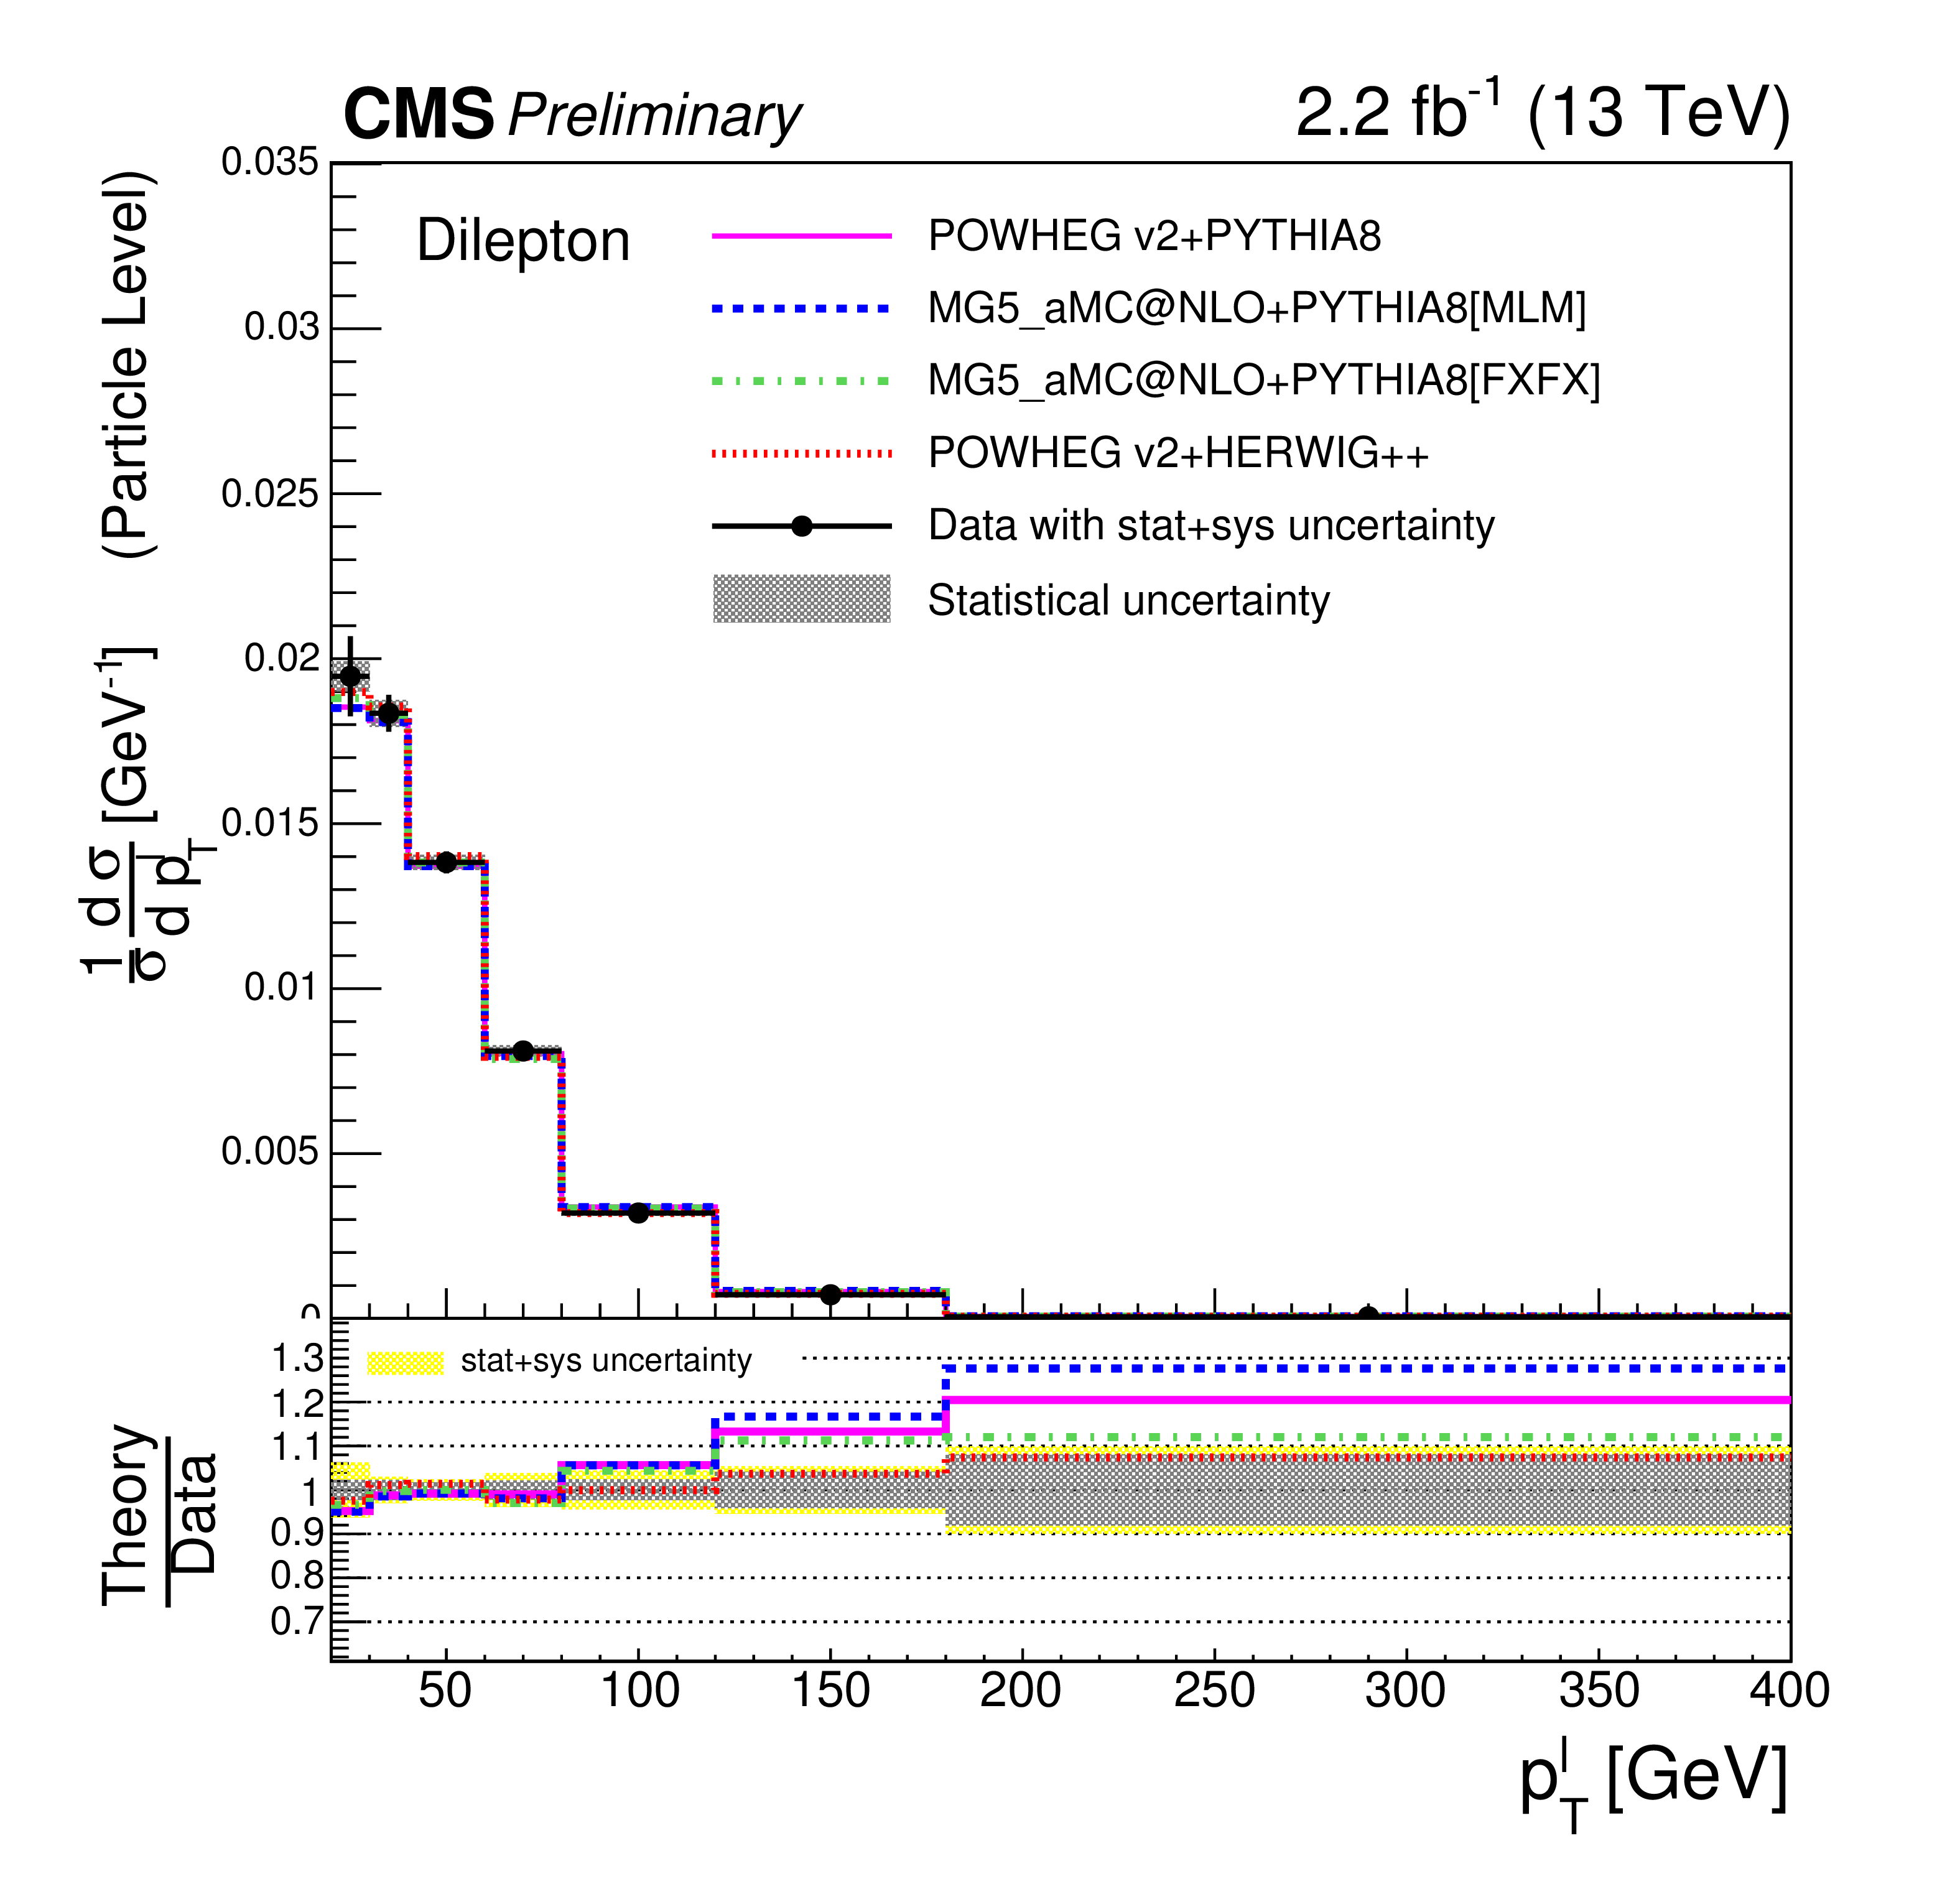
Figure 3-a:
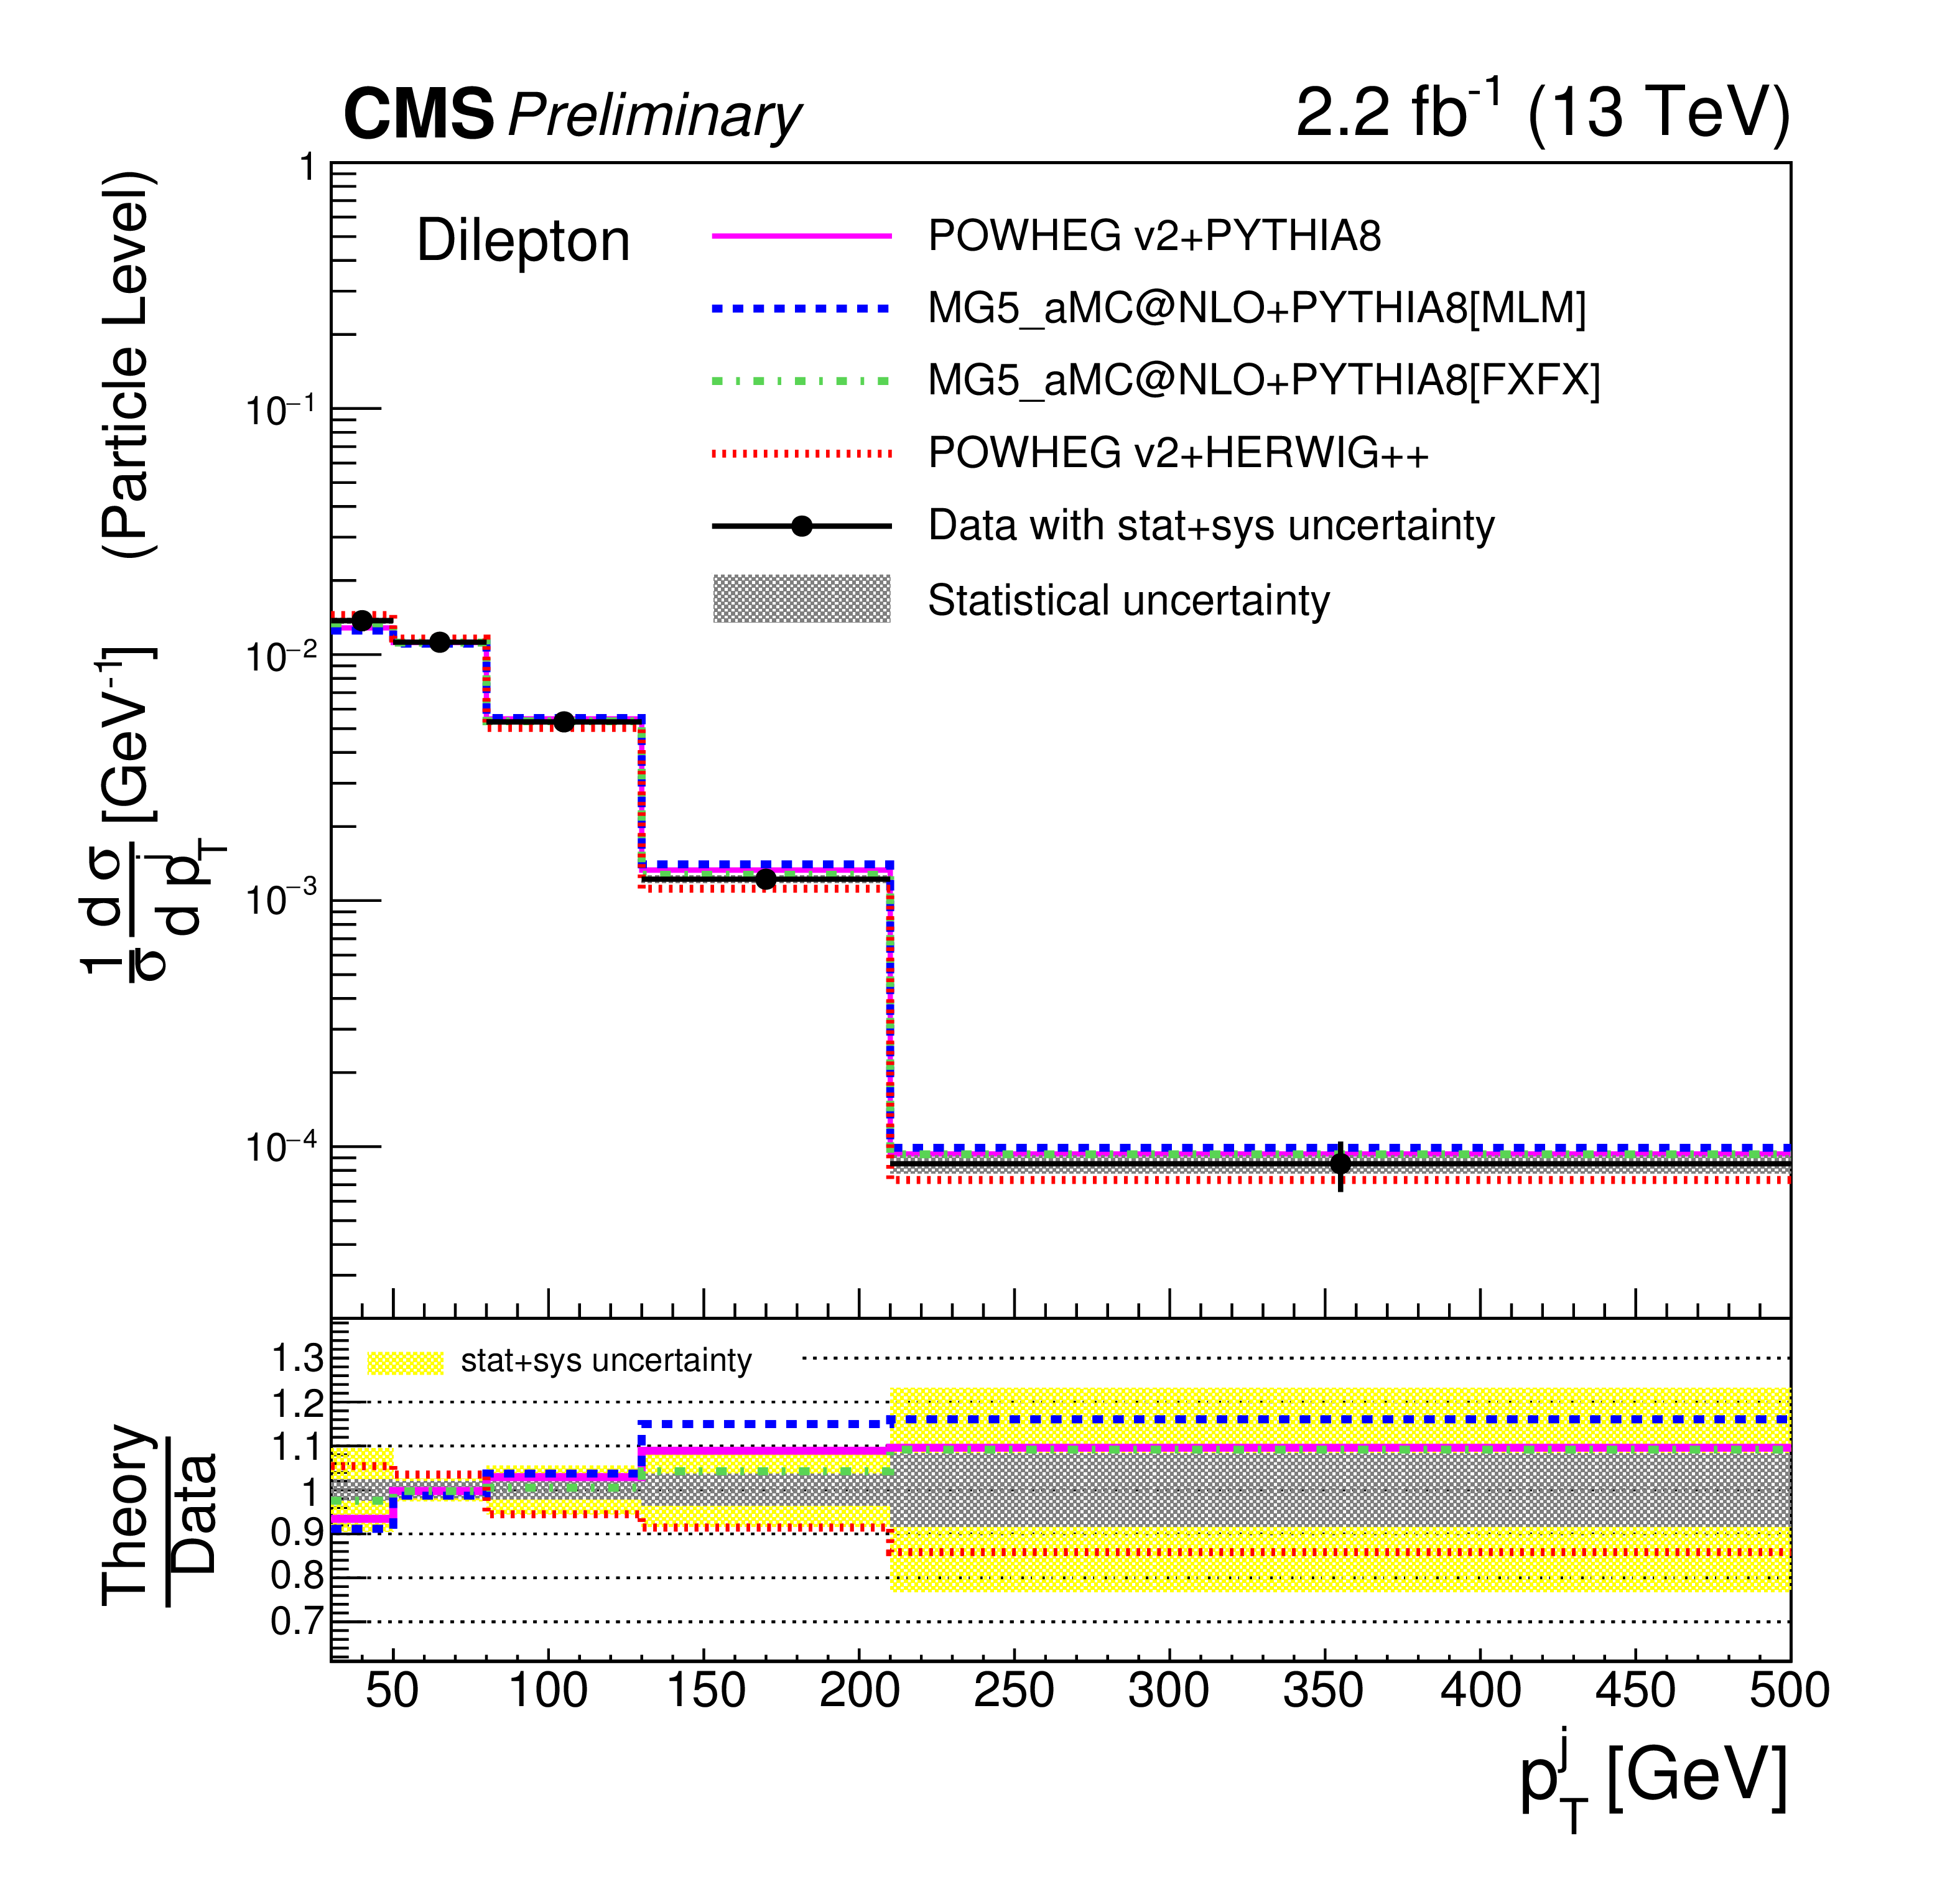
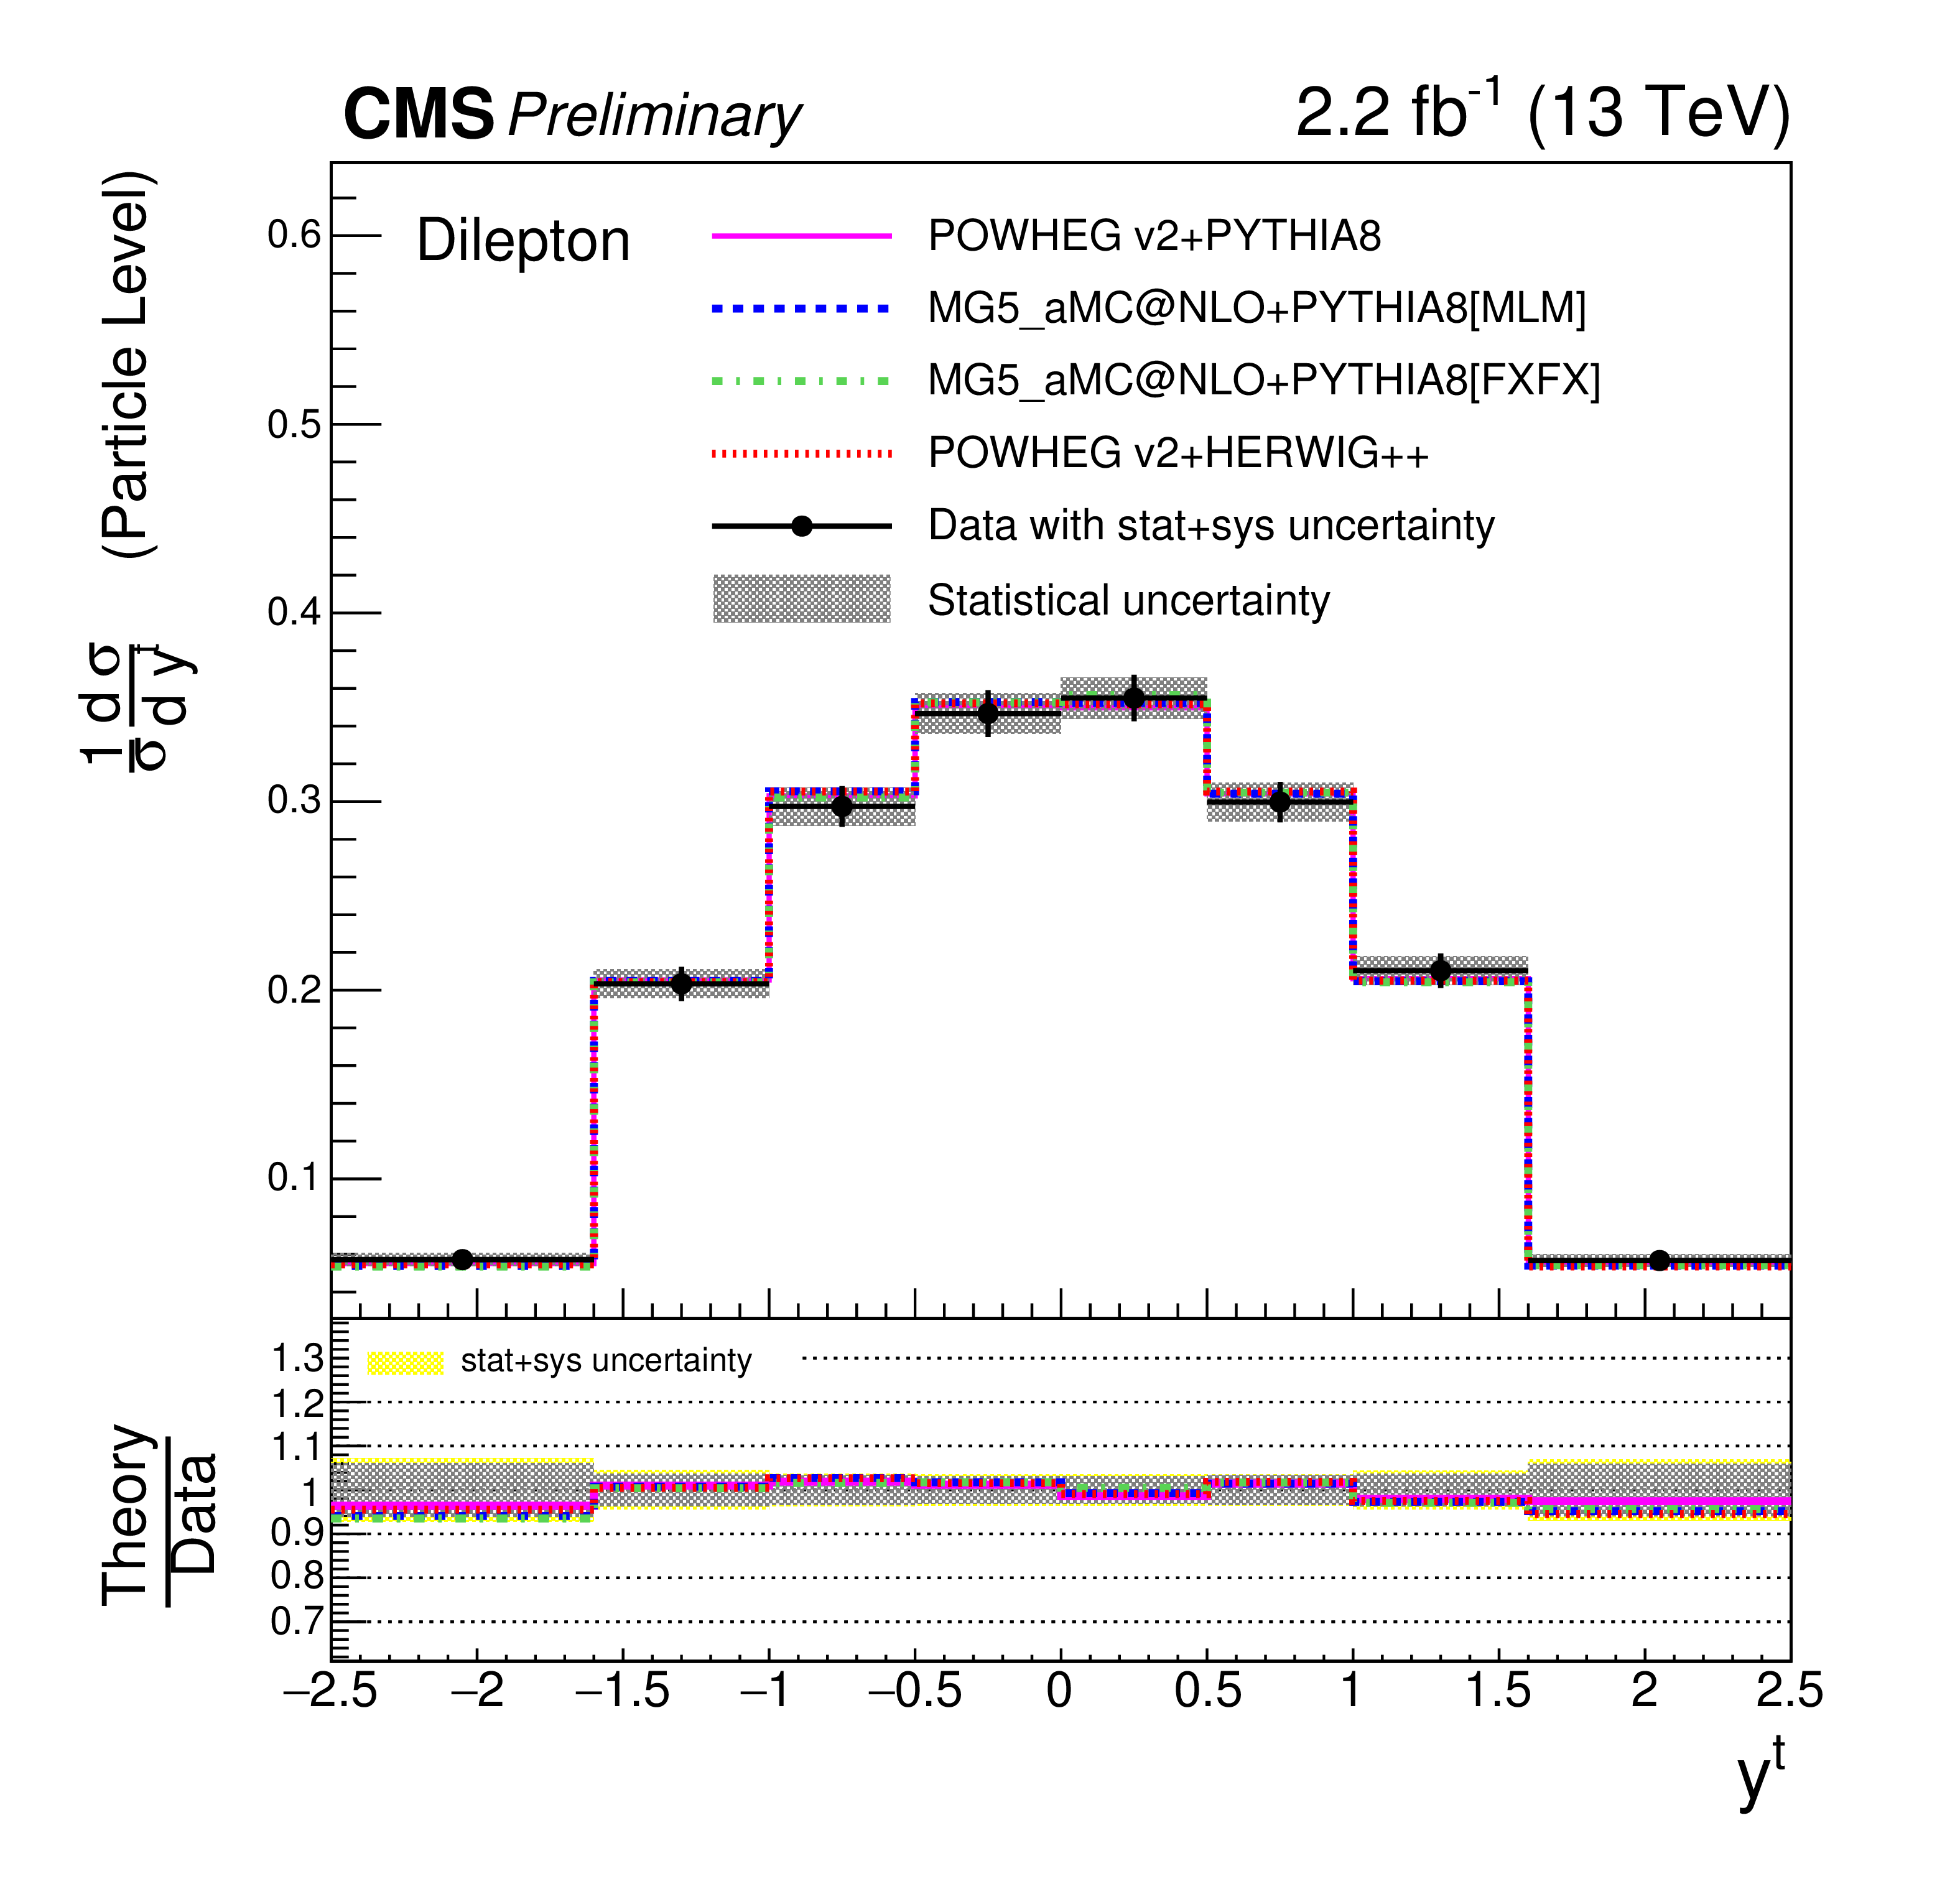
Normalised differential cross section as a function of lepton, jet, and top quark ${p_{\mathrm {T}}}$ and top quark rapidity, measured at particle level in the visible phase space and combining the distributions for top quarks and antiquarks. The error bars on the data points indicate the total (combined statistical and systematic) uncertainties, while the dark shaded band shows the statistical uncertainty. The measurements are compared to predictions from POWHEG+PHYTHIA-8, MG5-aMCatNLO+PYTHIA-8[FXFX], MG5-aMCatNLO+PYTHIA-8[MLM], and POWHEG+HERWIG++ . |
png pdf |
Figure 3-b:
Normalised differential cross section as a function of lepton, jet, and top quark ${p_{\mathrm {T}}}$ and top quark rapidity, measured at particle level in the visible phase space and combining the distributions for top quarks and antiquarks. The error bars on the data points indicate the total (combined statistical and systematic) uncertainties, while the dark shaded band shows the statistical uncertainty. The measurements are compared to predictions from POWHEG+PHYTHIA-8, MG5-aMCatNLO+PYTHIA-8[FXFX], MG5-aMCatNLO+PYTHIA-8[MLM], and POWHEG+HERWIG++ . |
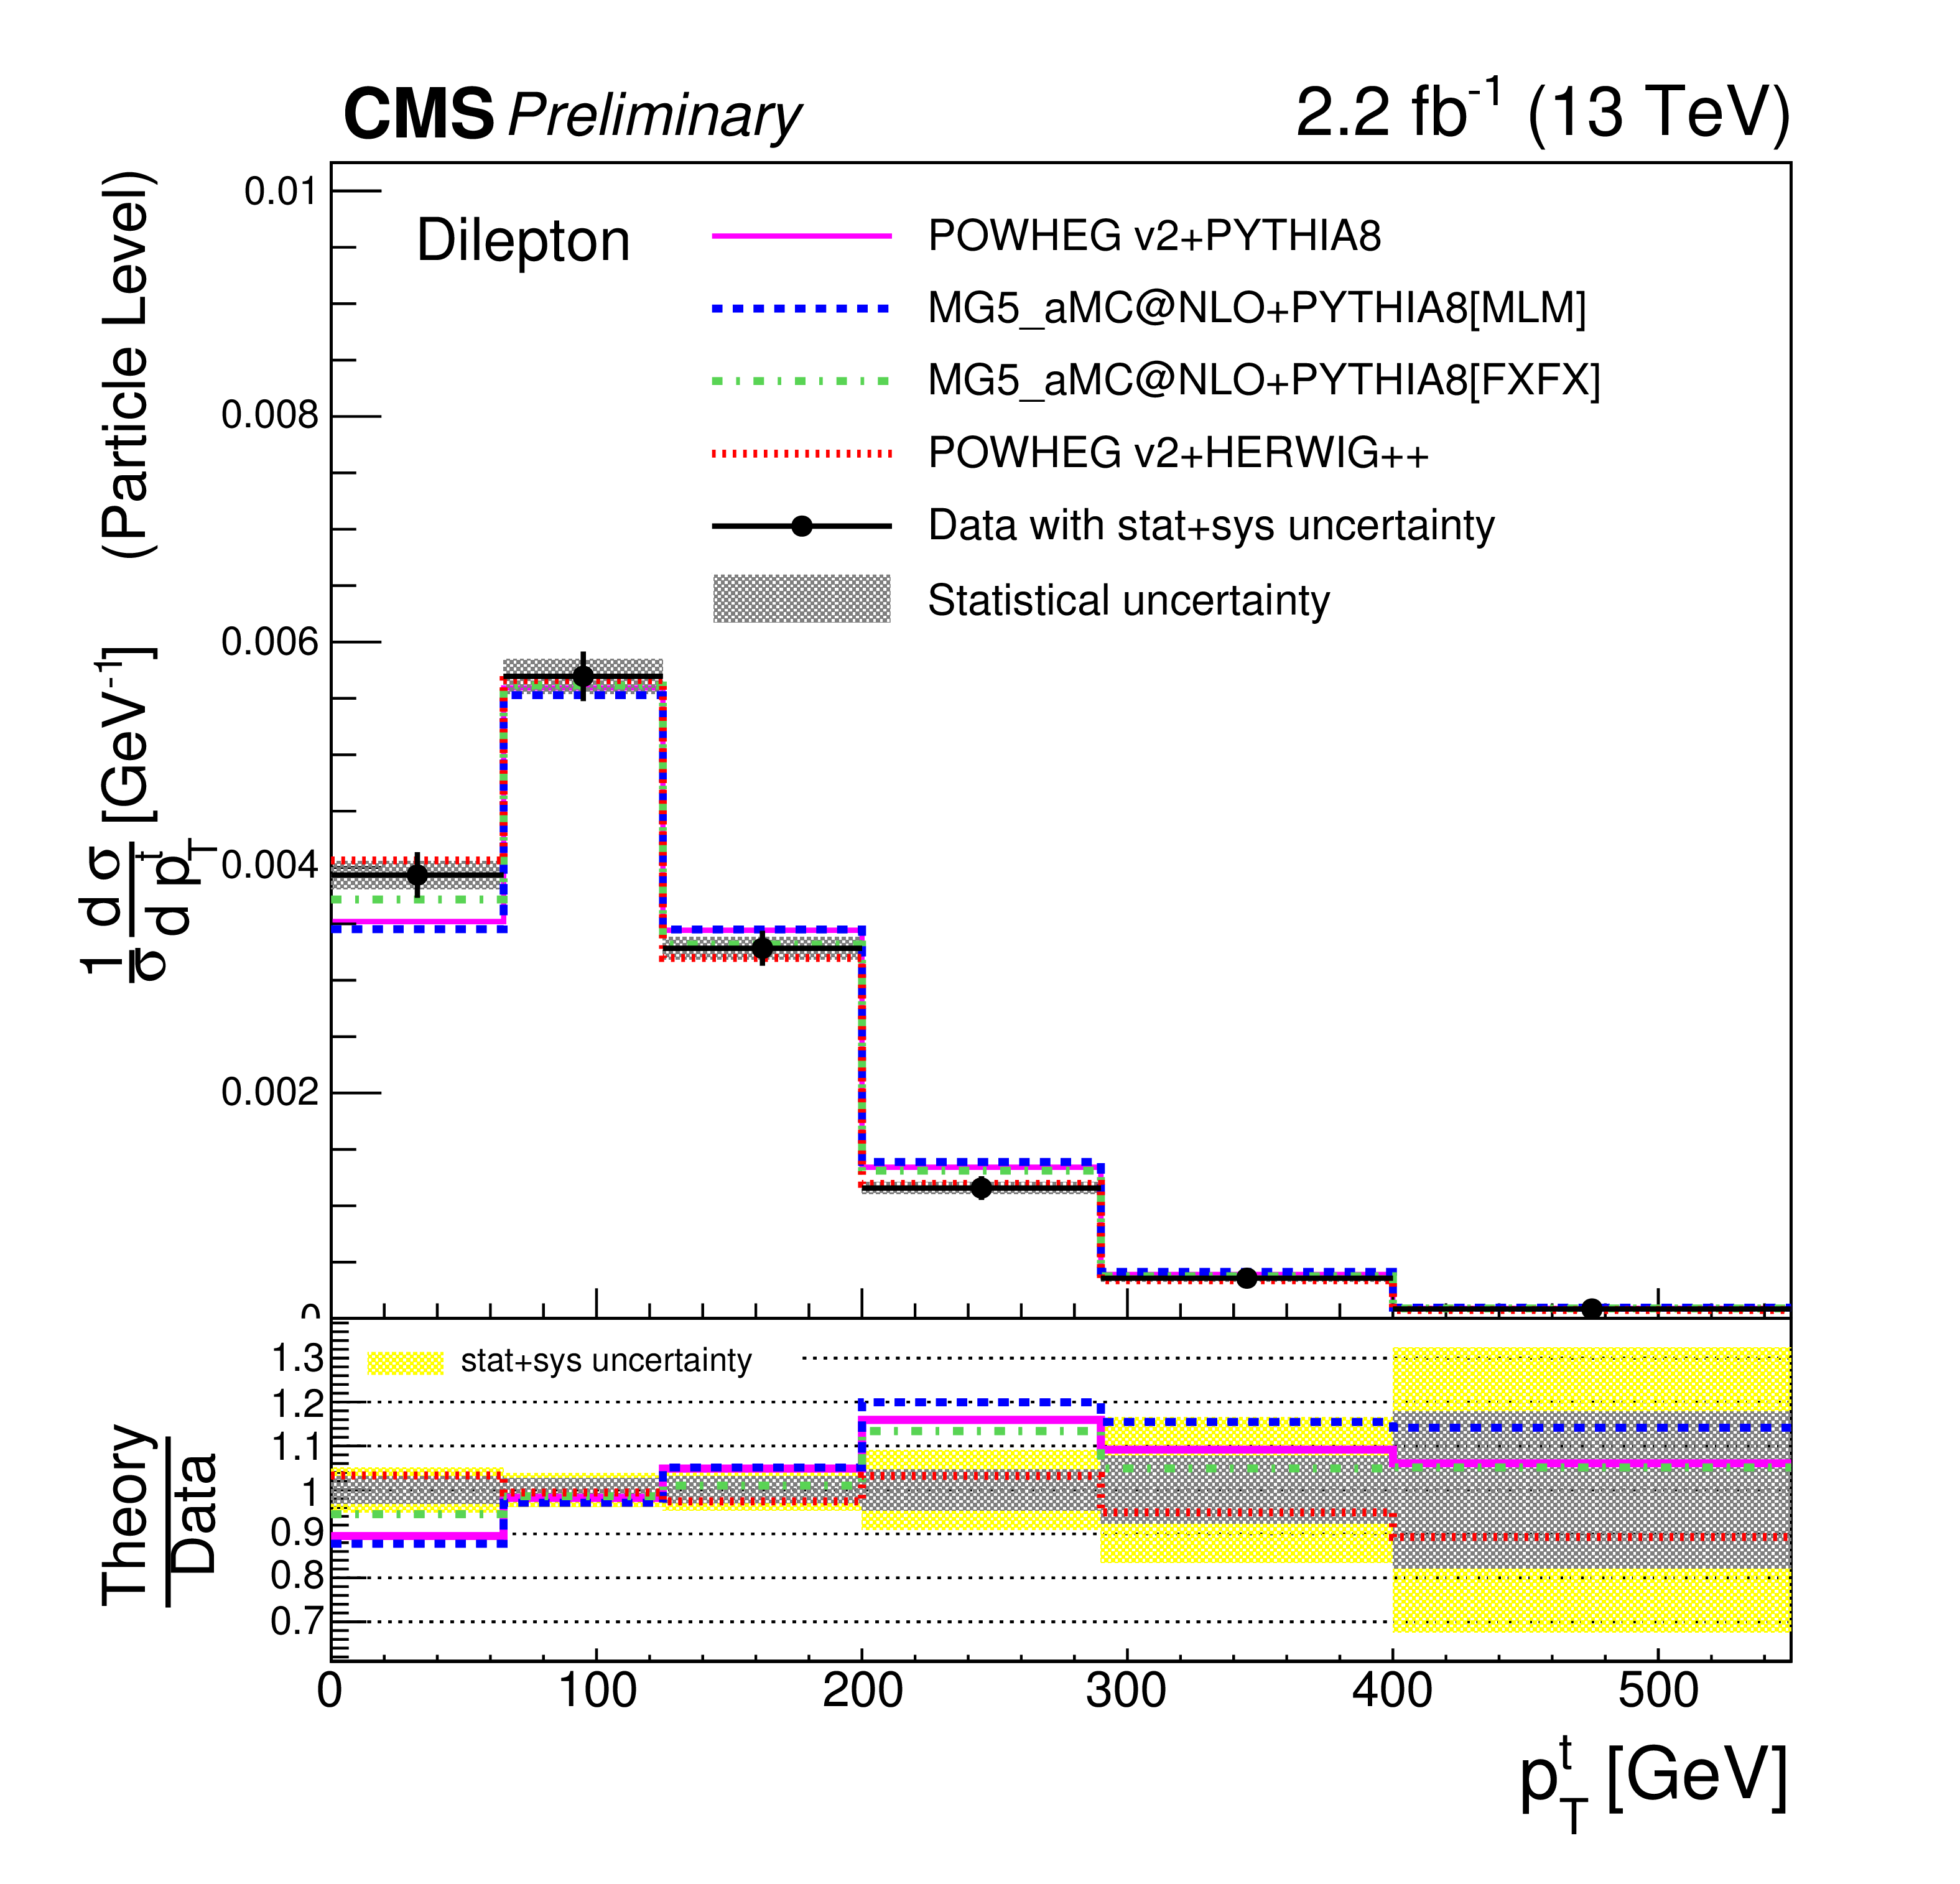
png pdf |
Figure 3-c:
Normalised differential cross section as a function of lepton, jet, and top quark ${p_{\mathrm {T}}}$ and top quark rapidity, measured at particle level in the visible phase space and combining the distributions for top quarks and antiquarks. The error bars on the data points indicate the total (combined statistical and systematic) uncertainties, while the dark shaded band shows the statistical uncertainty. The measurements are compared to predictions from POWHEG+PHYTHIA-8, MG5-aMCatNLO+PYTHIA-8[FXFX], MG5-aMCatNLO+PYTHIA-8[MLM], and POWHEG+HERWIG++ . |
png pdf |
Figure 3-d:
Normalised differential cross section as a function of lepton, jet, and top quark ${p_{\mathrm {T}}}$ and top quark rapidity, measured at particle level in the visible phase space and combining the distributions for top quarks and antiquarks. The error bars on the data points indicate the total (combined statistical and systematic) uncertainties, while the dark shaded band shows the statistical uncertainty. The measurements are compared to predictions from POWHEG+PHYTHIA-8, MG5-aMCatNLO+PYTHIA-8[FXFX], MG5-aMCatNLO+PYTHIA-8[MLM], and POWHEG+HERWIG++ . |
png pdf |
Figure 4-a:
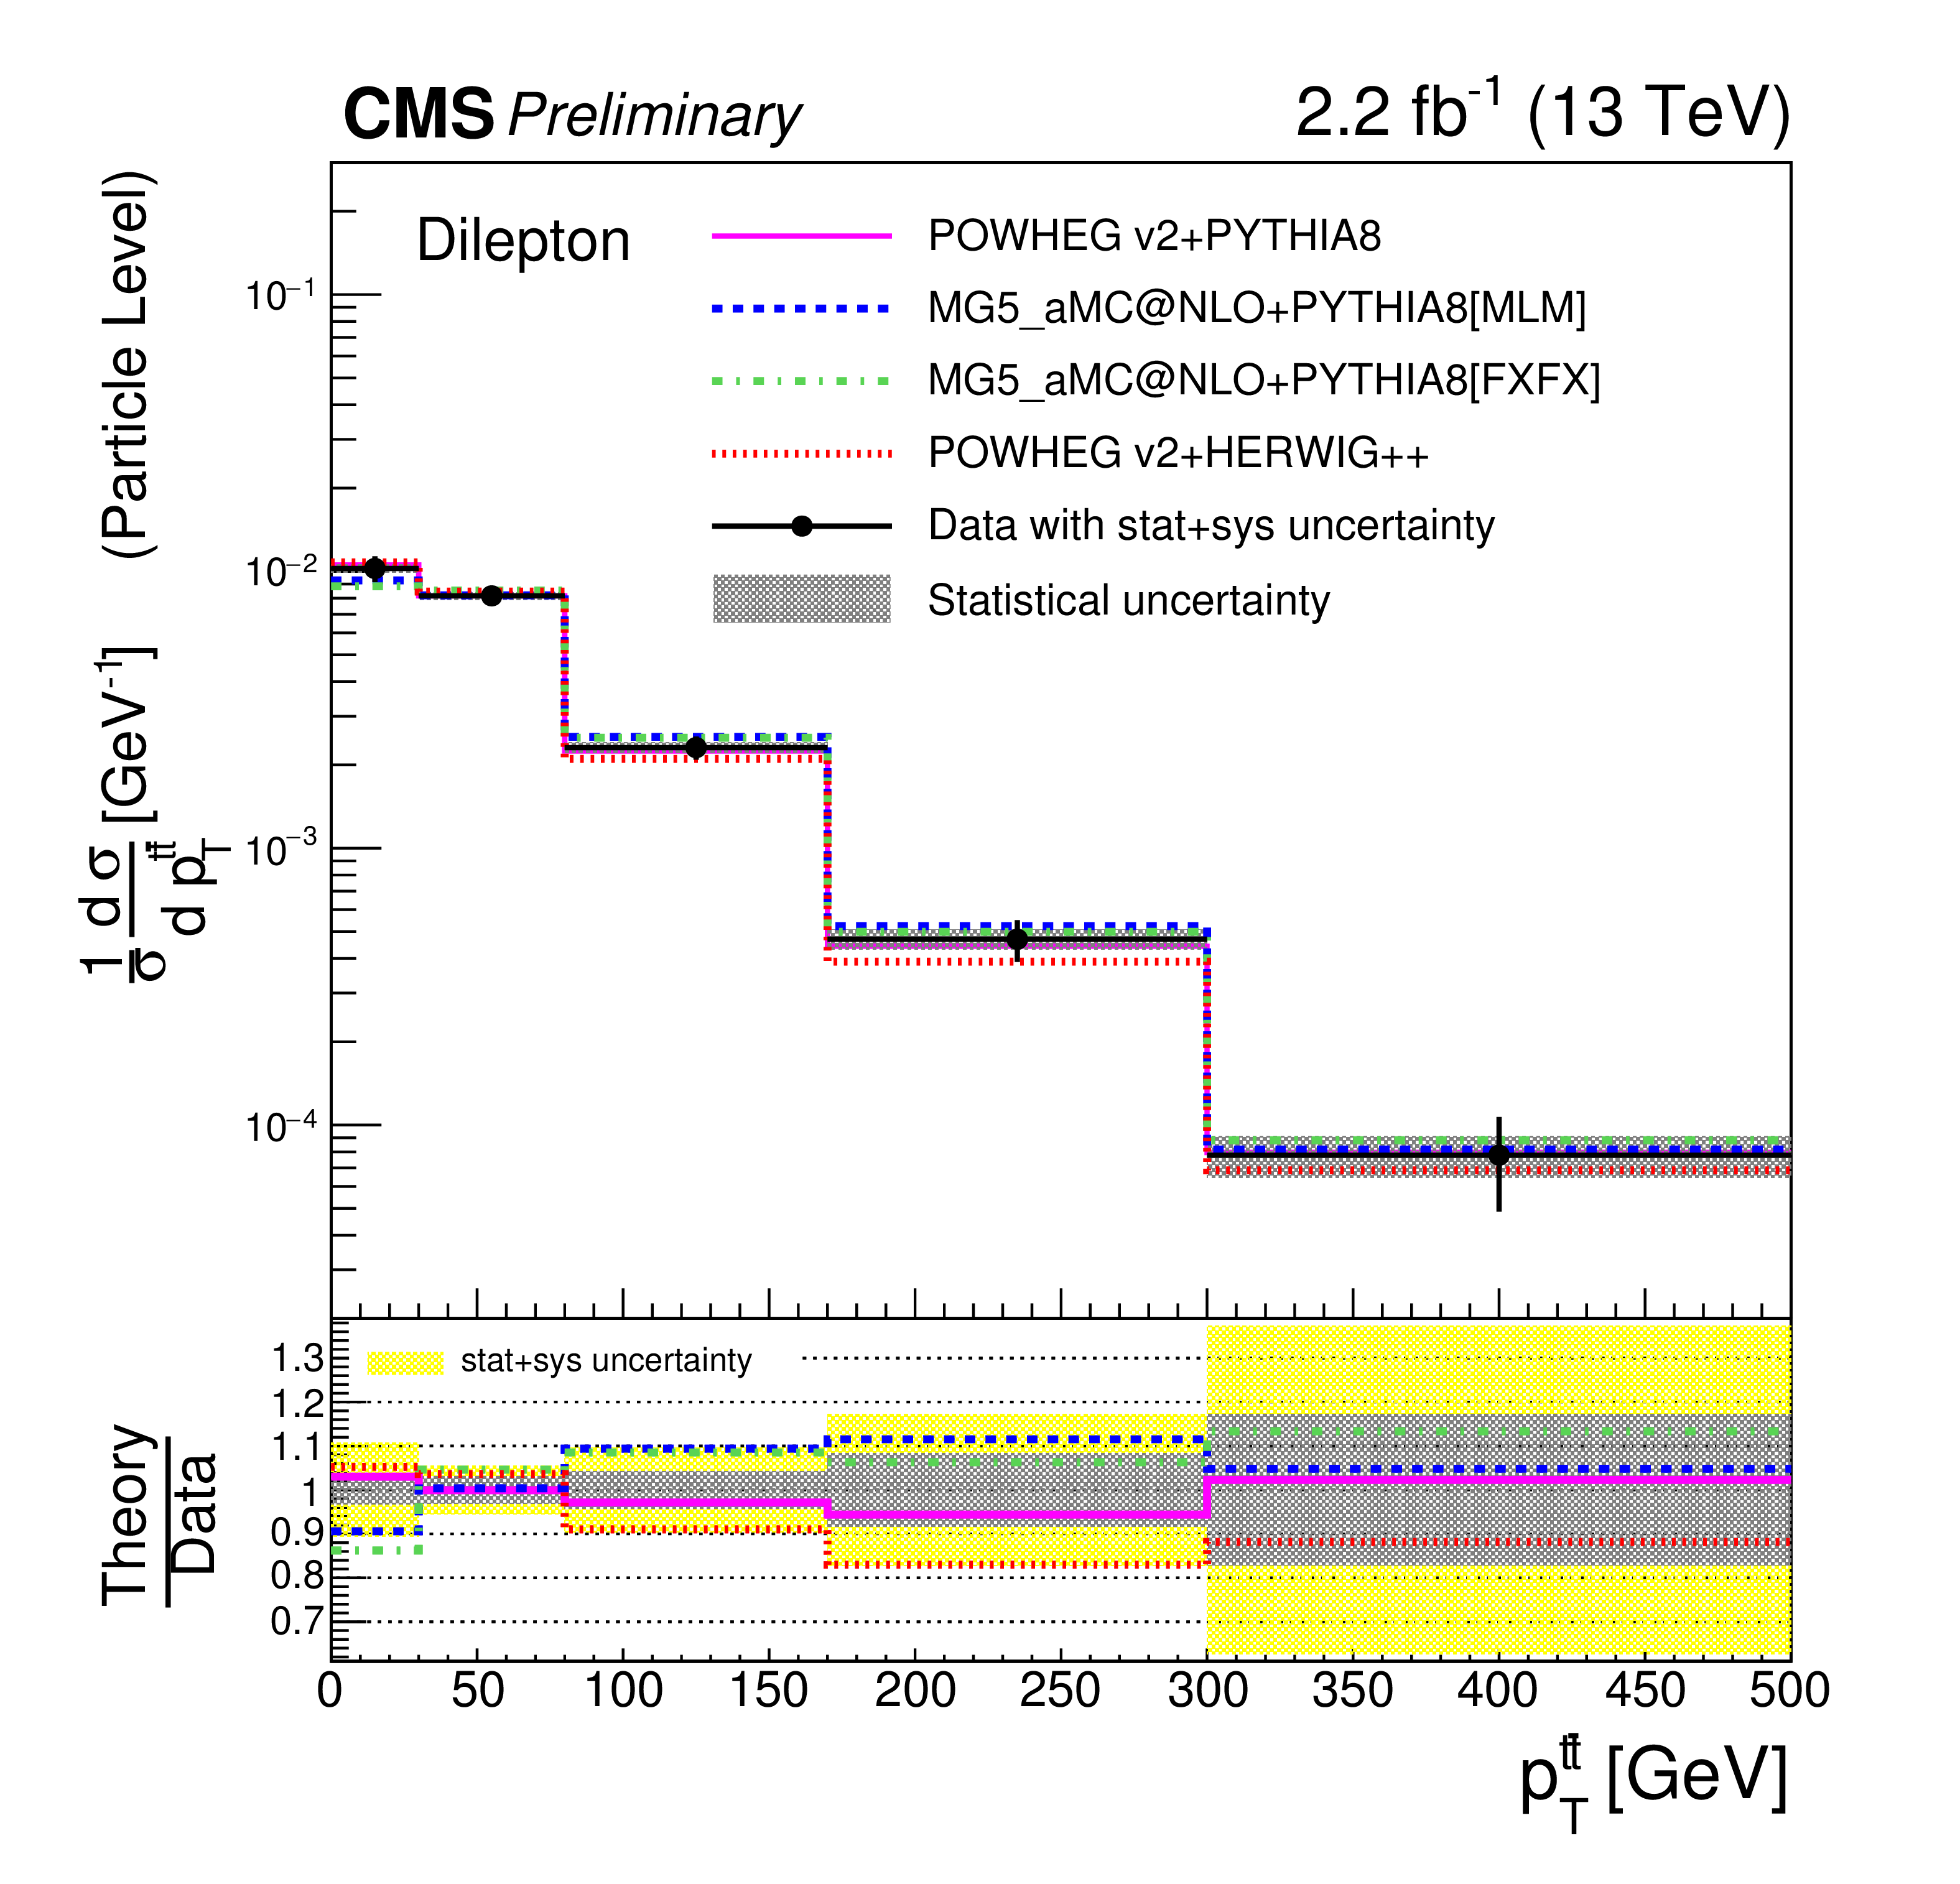
Normalised differential cross section as a function of $p_{\mathrm{T}}^{ {\mathrm {t}\overline {\mathrm {t}}} }$, $y^{ {\mathrm {t}\overline {\mathrm {t}}} }$, $M^{ {\mathrm {t}\overline {\mathrm {t}}} }$, and $\Delta \phi ^{ {\mathrm {t}\overline {\mathrm {t}}} }$ for the top quarks or antiquarks, measured at particle level in the visible phase space. The error bars on the data points indicate the total (combined statistical and systematic) uncertainties, while the dark shaded band shows the statistical uncertainty. The measurements are compared to predictions from POWHEG+PHYTHIA-8, MG5-aMCatNLO+PYTHIA-8[FXFX], MG5-aMCatNLO+PYTHIA-8[MLM], and POWHEG+HERWIG++ . |
png pdf |
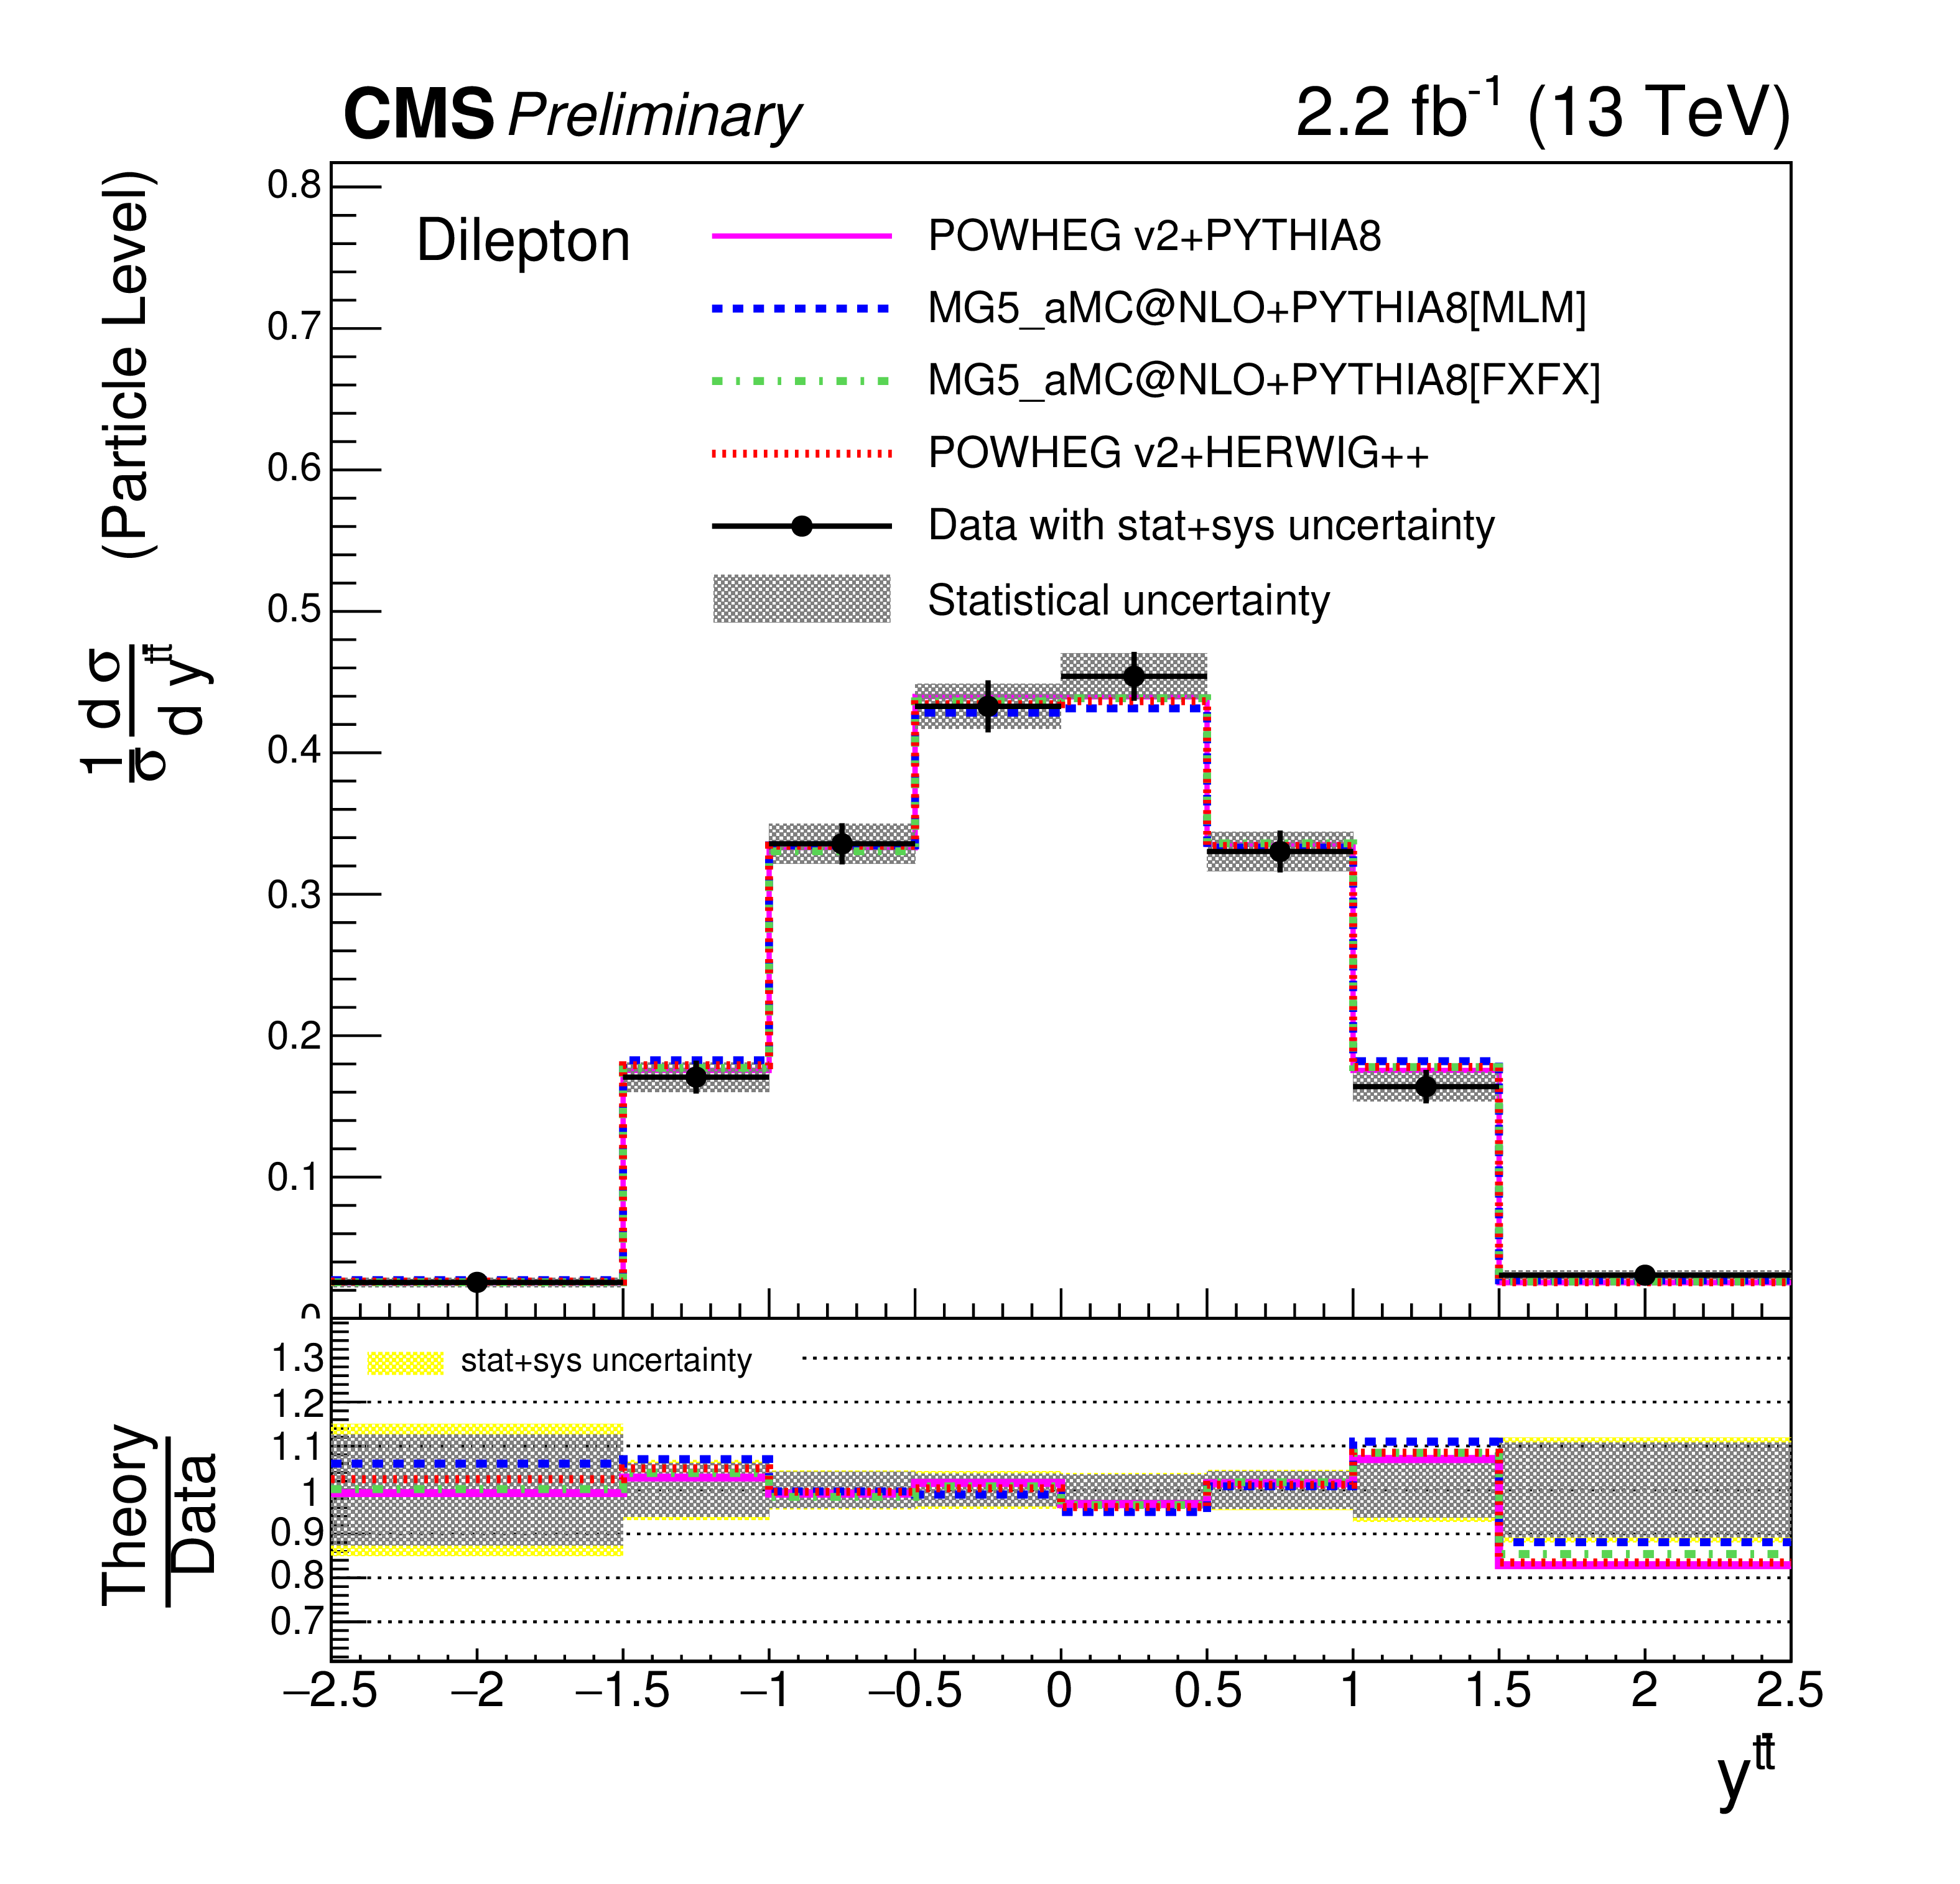
Figure 4-b:
Normalised differential cross section as a function of $p_{\mathrm{T}}^{ {\mathrm {t}\overline {\mathrm {t}}} }$, $y^{ {\mathrm {t}\overline {\mathrm {t}}} }$, $M^{ {\mathrm {t}\overline {\mathrm {t}}} }$, and $\Delta \phi ^{ {\mathrm {t}\overline {\mathrm {t}}} }$ for the top quarks or antiquarks, measured at particle level in the visible phase space. The error bars on the data points indicate the total (combined statistical and systematic) uncertainties, while the dark shaded band shows the statistical uncertainty. The measurements are compared to predictions from POWHEG+PHYTHIA-8, MG5-aMCatNLO+PYTHIA-8[FXFX], MG5-aMCatNLO+PYTHIA-8[MLM], and POWHEG+HERWIG++ . |
png pdf |
Figure 4-c:
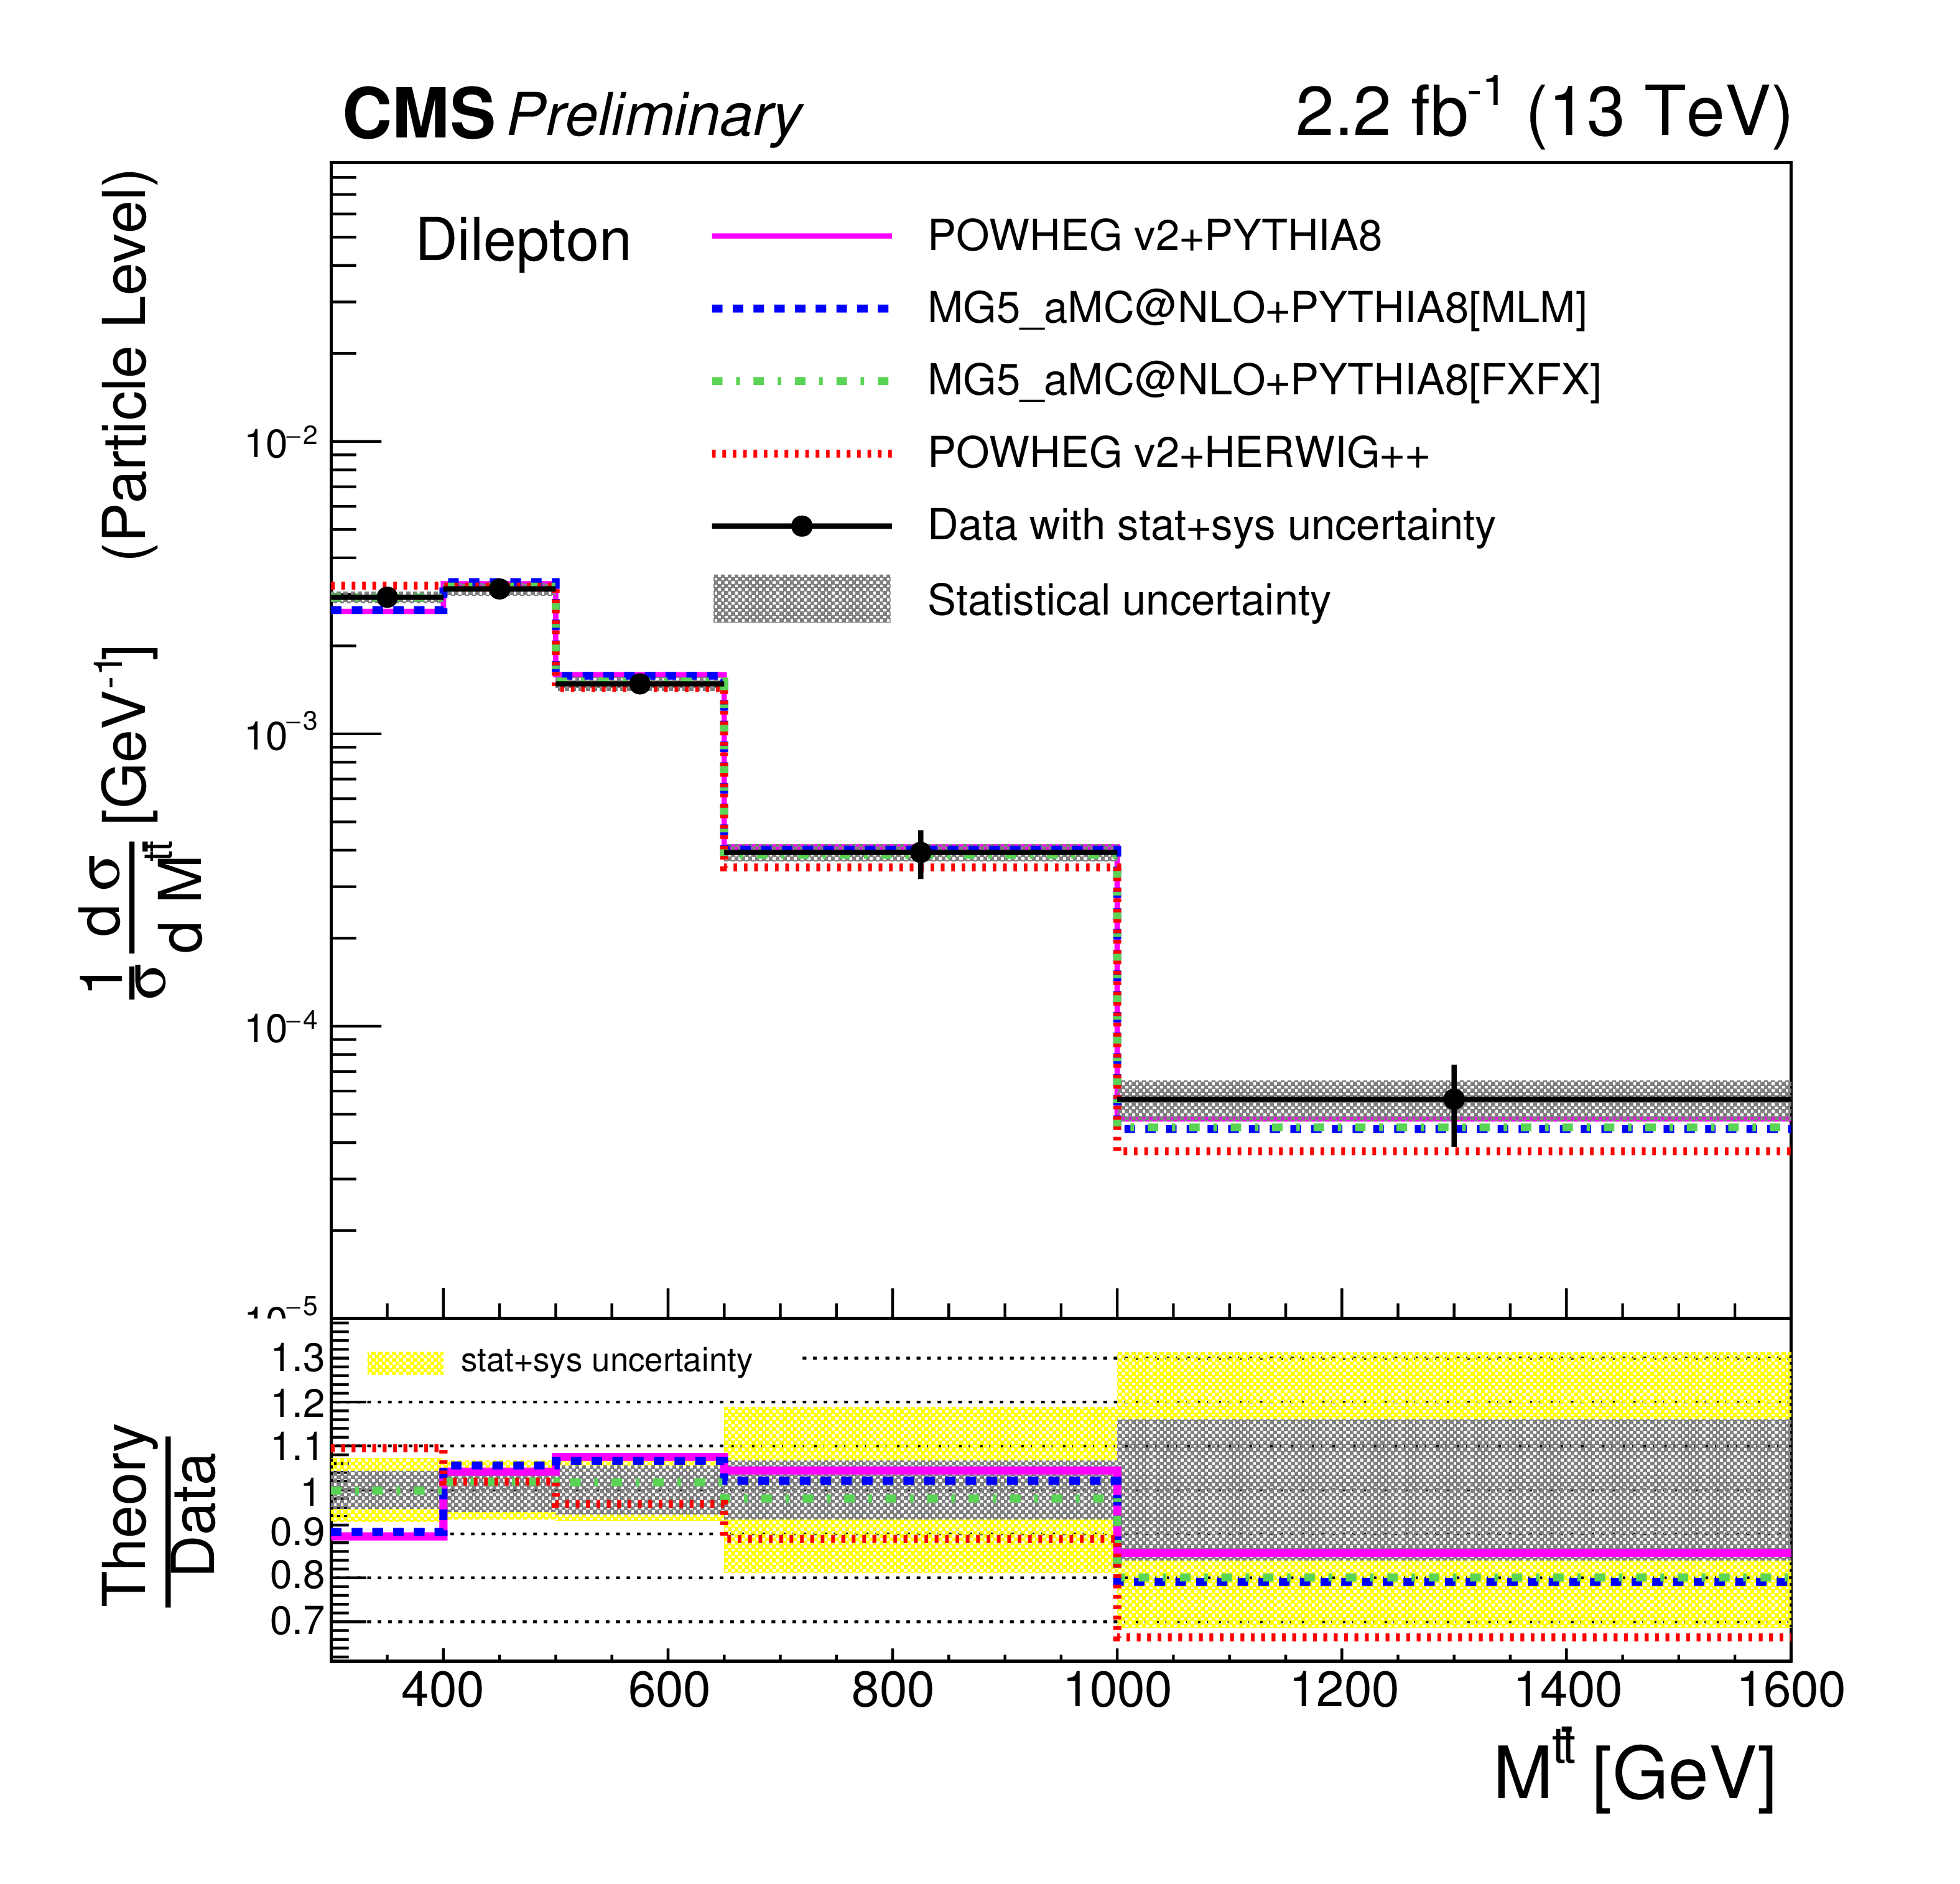
Normalised differential cross section as a function of $p_{\mathrm{T}}^{ {\mathrm {t}\overline {\mathrm {t}}} }$, $y^{ {\mathrm {t}\overline {\mathrm {t}}} }$, $M^{ {\mathrm {t}\overline {\mathrm {t}}} }$, and $\Delta \phi ^{ {\mathrm {t}\overline {\mathrm {t}}} }$ for the top quarks or antiquarks, measured at particle level in the visible phase space. The error bars on the data points indicate the total (combined statistical and systematic) uncertainties, while the dark shaded band shows the statistical uncertainty. The measurements are compared to predictions from POWHEG+PHYTHIA-8, MG5-aMCatNLO+PYTHIA-8[FXFX], MG5-aMCatNLO+PYTHIA-8[MLM], and POWHEG+HERWIG++ . |
png pdf |
Figure 4-d:
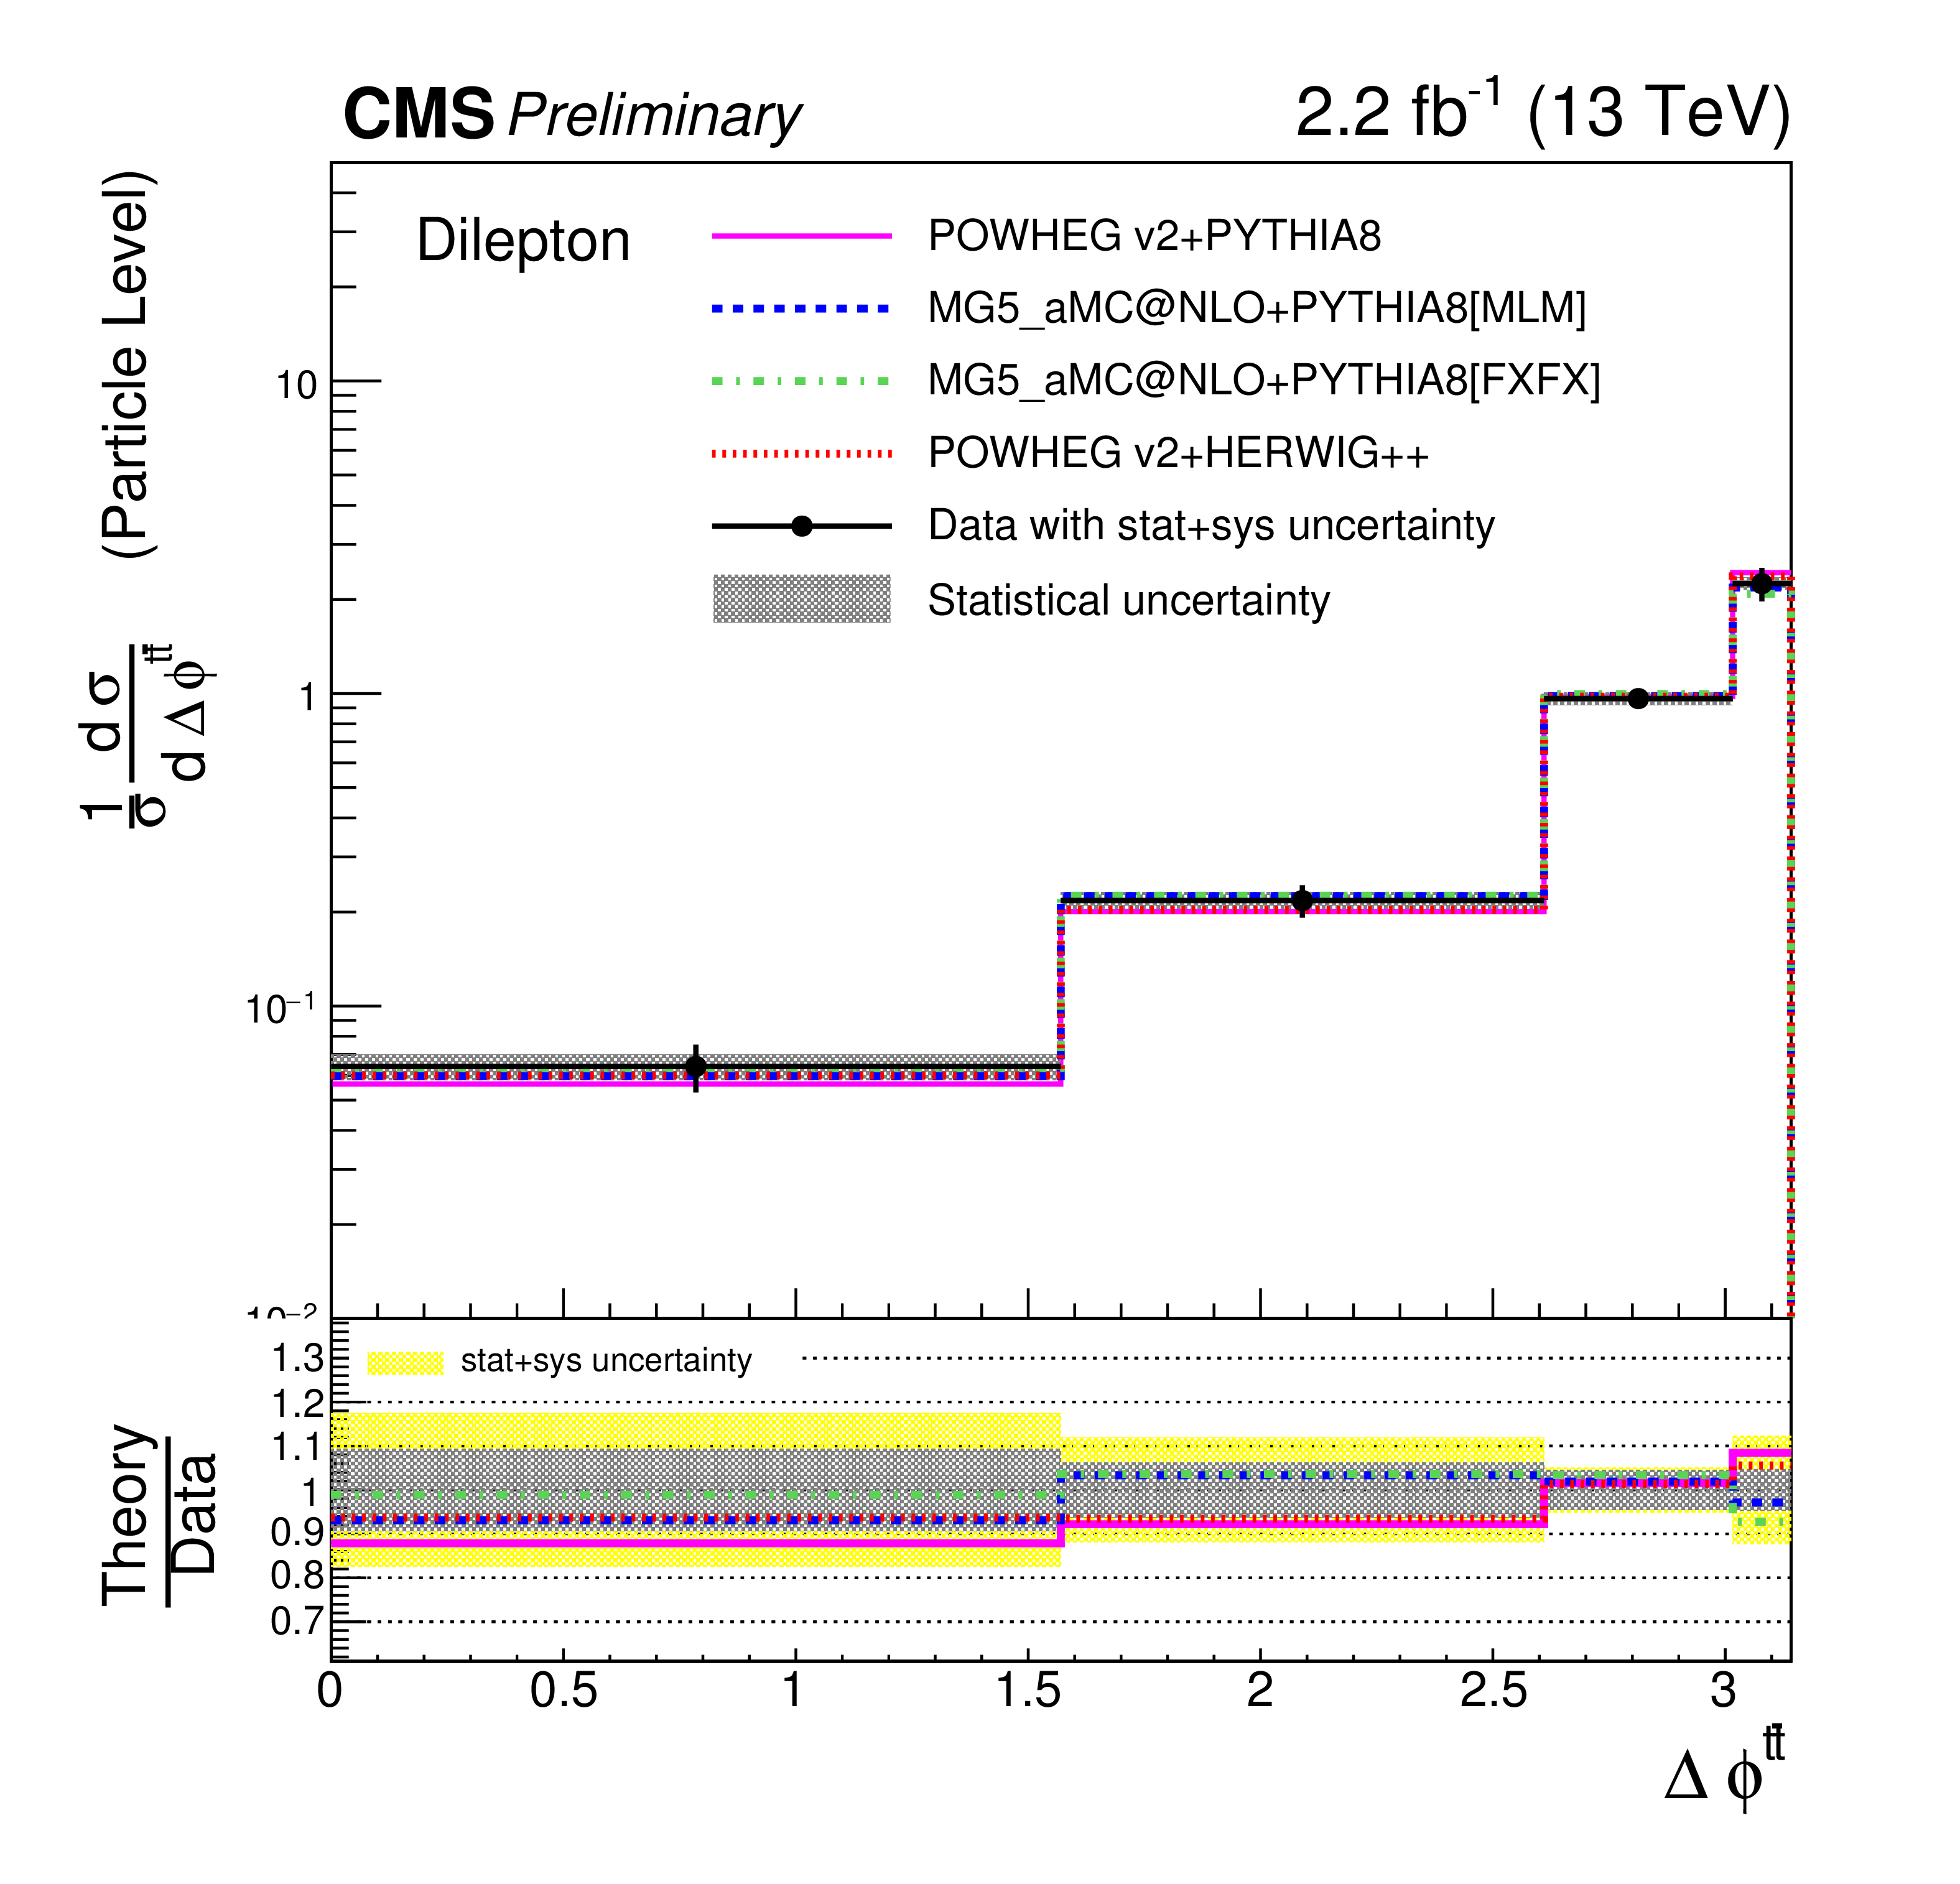
Normalised differential cross section as a function of $p_{\mathrm{T}}^{ {\mathrm {t}\overline {\mathrm {t}}} }$, $y^{ {\mathrm {t}\overline {\mathrm {t}}} }$, $M^{ {\mathrm {t}\overline {\mathrm {t}}} }$, and $\Delta \phi ^{ {\mathrm {t}\overline {\mathrm {t}}} }$ for the top quarks or antiquarks, measured at particle level in the visible phase space. The error bars on the data points indicate the total (combined statistical and systematic) uncertainties, while the dark shaded band shows the statistical uncertainty. The measurements are compared to predictions from POWHEG+PHYTHIA-8, MG5-aMCatNLO+PYTHIA-8[FXFX], MG5-aMCatNLO+PYTHIA-8[MLM], and POWHEG+HERWIG++ . |
| Tables | |
png pdf |
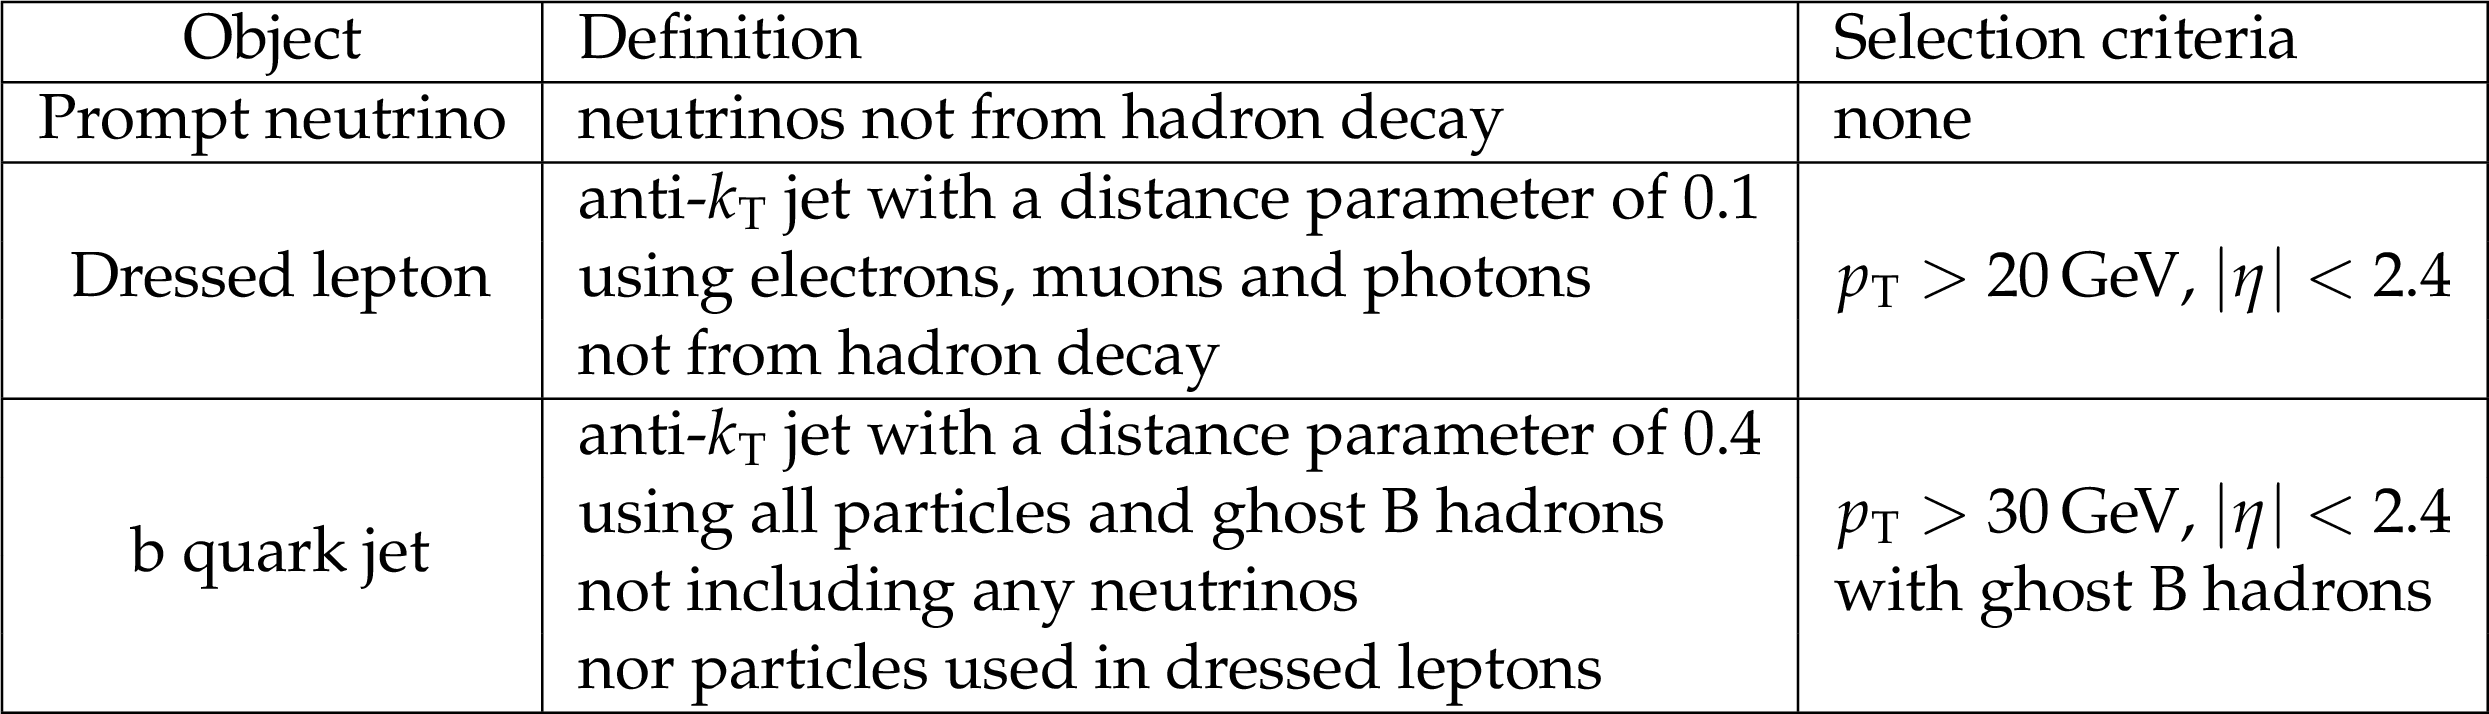
Table 1:
Summary of object definitions at the particle level. |
png pdf |
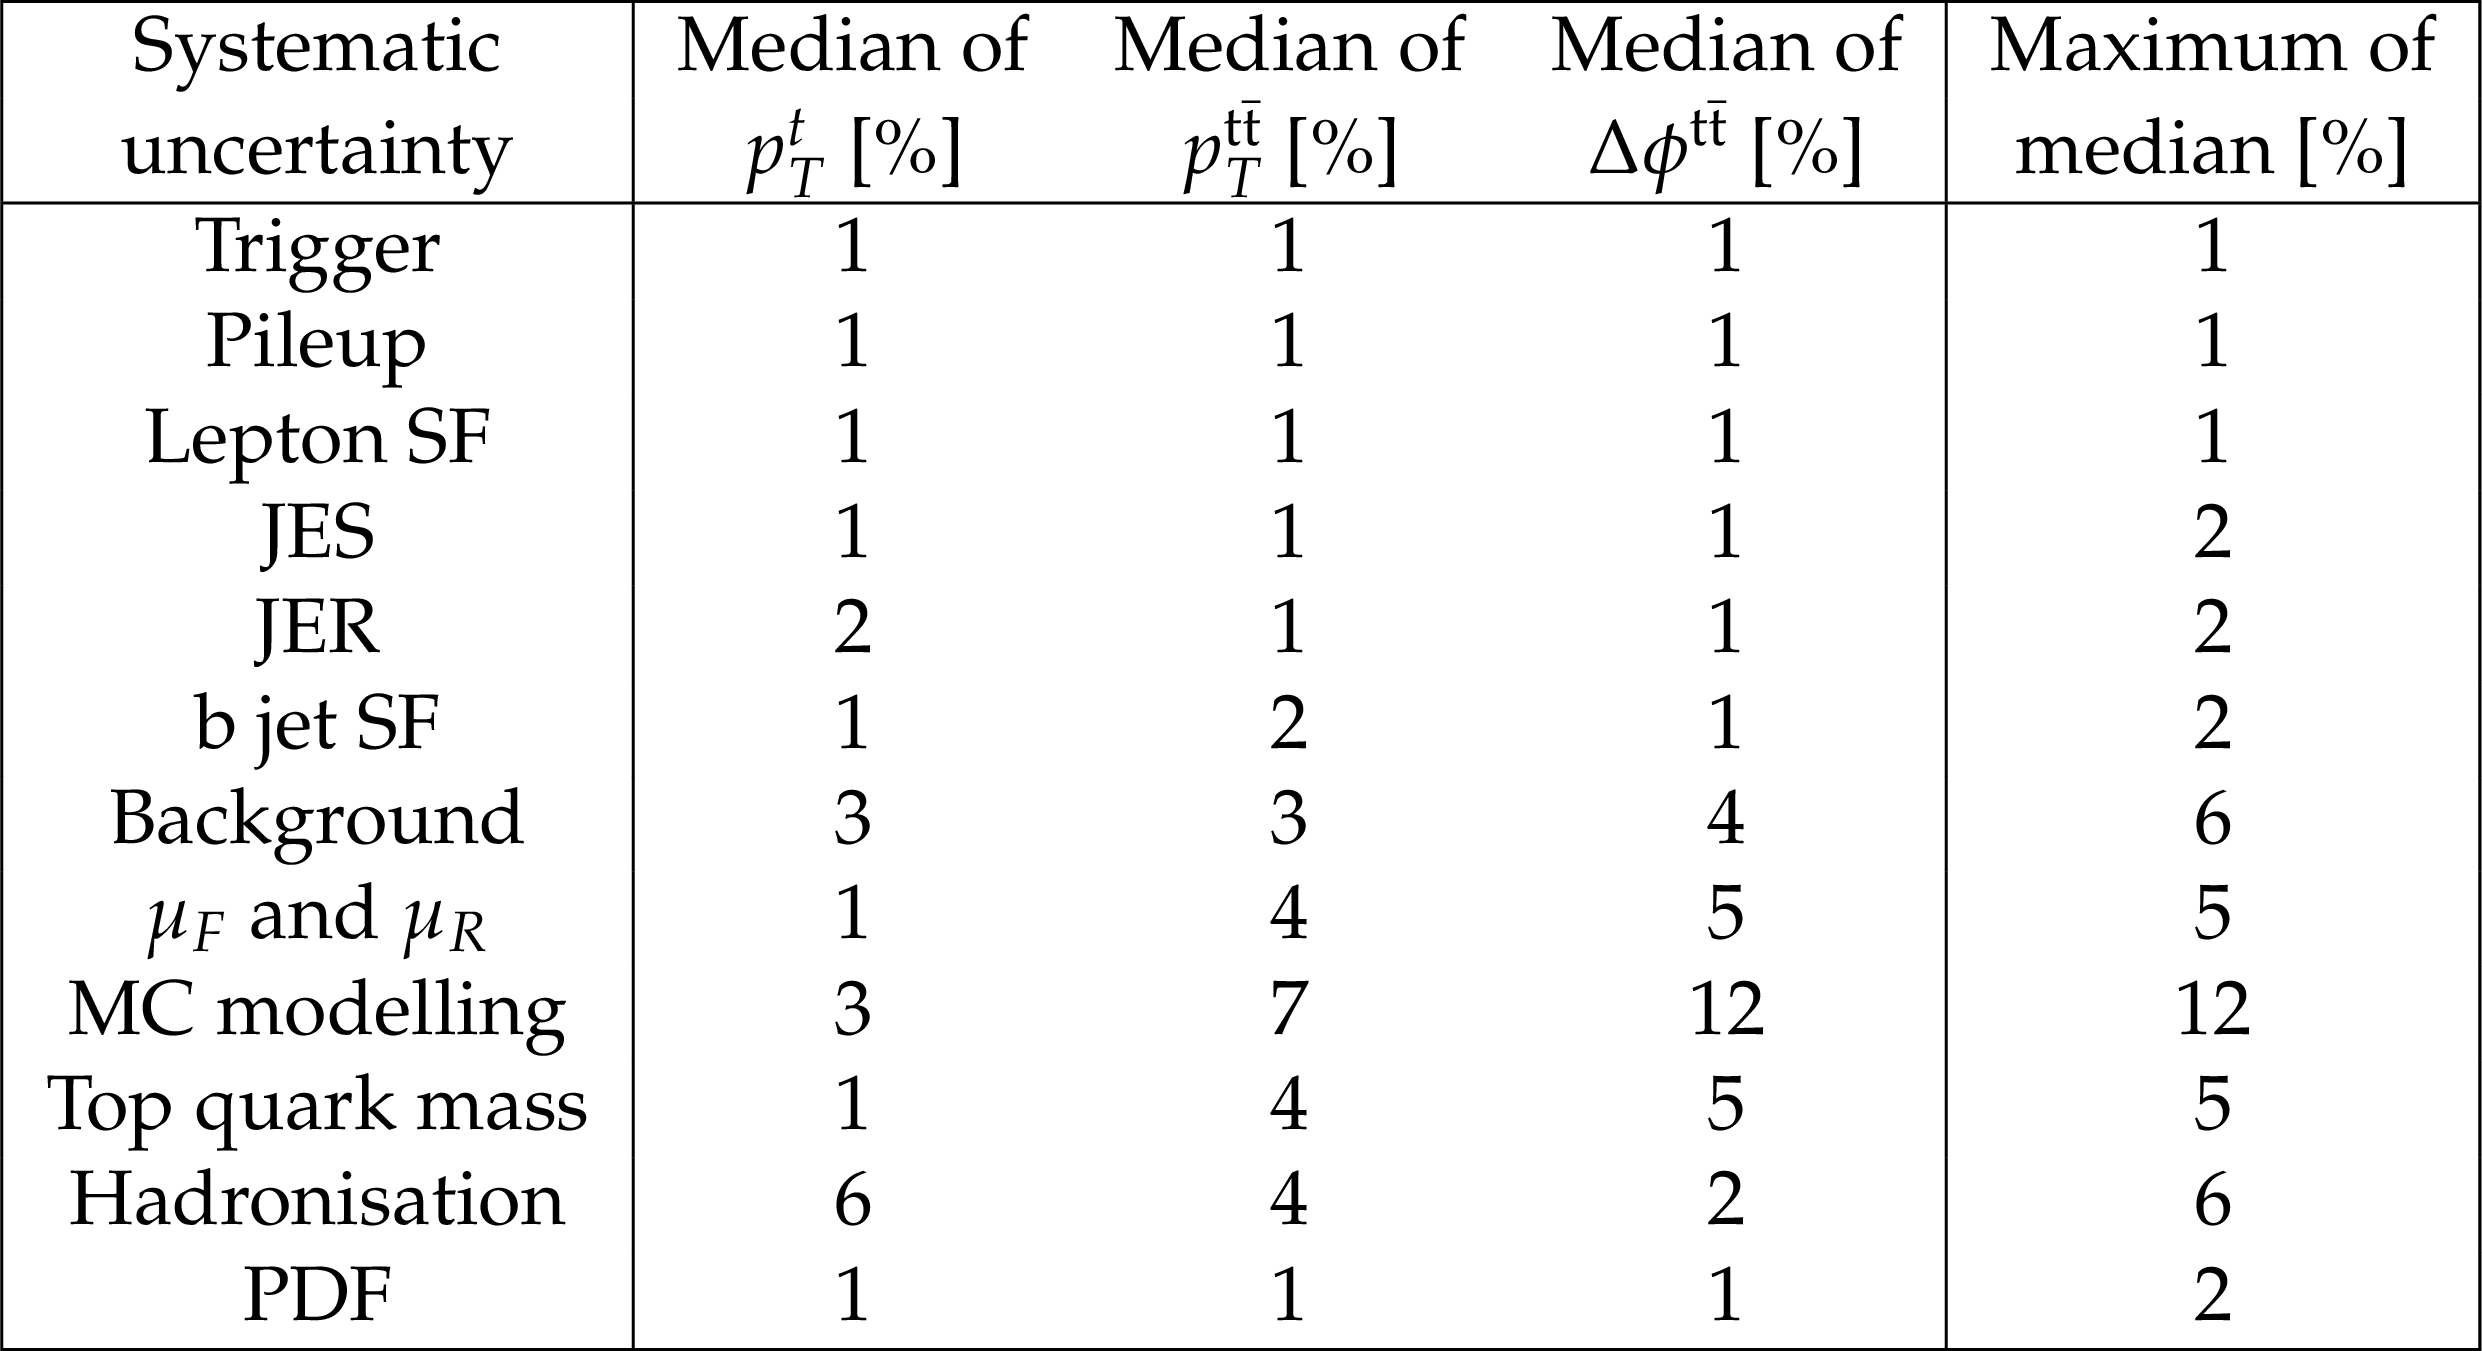
Table 2:
Median systematic uncertainties in the normalised differential cross section for three representative kinematic variables. The maximum over all measured variables is given in the last column. |
| Summary |
| The normalised differential cross section for top quark pair production is measured in the dilepton decay channel in pp collisions at $\sqrt{s} =$ 13 TeV with data corresponding to an integrated luminosity of 2.2 fb$^{-1}$. The differential cross section is measured as a function of $p_{\mathrm{T}}^{\ell}$, $p_{\mathrm{T}}^{\mathrm{j}}$, $p_{\mathrm{T}}^{\mathrm{t}}$, $y^{\mathrm{t}}$, $p_{\mathrm{T}}^{\mathrm{ t \bar{t} }}$, $y^{\mathrm{ t \bar{t} }}$, $M^{\mathrm{ t \bar{t} }}$, and $\Delta \phi^{\mathrm{ t \bar{t} }}$ at particle level in the visible phase space. The measurements are compared to the predictions from POWHEG+PHYTHIA-8, aMCatNLO+PYTHIA-8[FXFX], aMCatNLO+PYTHIA-8[MLM], and POWHEG+HERWIG++, and are found to be in agreement with the standard model. |
| References | ||||
| 1 | A. Denner, S. Dittmaier, S. Kallweit, and S. Pozzorini | NLO QCD corrections to off-shell $ \mathrm{ t \bar{t} } $ production at hadron colliders | PoS LL2012 (2012) 015 | 1208.4053 |
| 2 | S. Choi and H. S. Lee | Azimuthal decorrelation in $ t\bar{t} $ production at hadron colliders | PRD 87 (2013), no. 3, 034012 | 1207.1484 |
| 3 | CMS Collaboration | The CMS experiment at the CERN LHC | Journal of Instrumentation 3 (2008), no. 08, S08004 | CMS-00-001 |
| 4 | S. Alioli, P. Nason, C. Oleari, and E. Re | A general framework for implementing NLO calculations in shower Monte Carlo programs: the POWHEG BOX | JHEP 06 (2010) 043 | 1002.2581 |
| 5 | J. Alwall et al. | The automated computation of tree-level and next-to-leading order differential cross sections, and their matching to parton shower simulations | JHEP 07 (2014) 079 | 1405.0301 |
| 6 | NNPDF Collaboration | Parton distributions for the LHC Run II | JHEP 04 (2015) 040 | 1410.8849 |
| 7 | T. Sjostrand, S. Mrenna, and P. Z. Skands | A Brief Introduction to PYTHIA 8.1 | CPC 178 (2008) 852--867 | 0710.3820 |
| 8 | P. Skands, S. Carrazza, and J. Rojo | Tuning PYTHIA 8.1: the Monash 2013 Tune | EPJC 74 (2014) 3024 | 1404.5630 |
| 9 | R. Frederix and S. Frixione | Merging meets matching in MC@NLO | JHEP 12 (2012) 061 | 1209.6215 |
| 10 | S. Hoeche et al. | Matching parton showers and matrix elements | in HERA and the LHC: A Workshop on the implications of HERA for LHC physics: Proceedings Part A 2006 | hep-ph/0602031 |
| 11 | M. Czakon and A. Mitov | Top++: A Program for the Calculation of the Top-Pair Cross-Section at Hadron Colliders | CPC 185 (2014) 2930 | 1112.5675 |
| 12 | Y. Li and F. Petriello | Combining QCD and electroweak corrections to dilepton production in FEWZ | PRD 86 (2012) 094034 | 1208.5967 |
| 13 | N. Kidonakis | NNLL threshold resummation for top-pair and single-top production | Phys. Part. Nucl. 45 (2014), no. 4, 714--722 | 1210.7813 |
| 14 | T. Gehrmann et al. | $ {W}^{+}{W}^{-} $ Production at Hadron Colliders in Next to Next to Leading Order QCD | PRL 113 (Nov, 2014) 212001 | |
| 15 | J. Allison et al. | Geant4 developments and applications | IEEE Trans. Nucl. Sci. 53 (2006) 270 | |
|
|
Compact Muon Solenoid LHC, CERN |
|

|

|

|

|

|