

Compact Muon Solenoid
LHC, CERN
| CMS-TOP-17-018 ; CERN-EP-2018-074 | ||
| Measurement of the production cross section for single top quarks in association with W bosons in proton-proton collisions at $\sqrt{s} = $ 13 TeV | ||
| CMS Collaboration | ||
| 18 May 2018 | ||
| JHEP 10 (2018) 117 | ||
| Abstract: A measurement is presented of the associated production of a single top quark and a W boson in proton-proton collisions at $\sqrt{s} = $ 13 TeV by the CMS Collaboration at the CERN LHC. The data collected corresponds to an integrated luminosity of 35.9 fb$^{-1}$. The measurement is performed using events with one electron and one muon in the final state along with at least one jet originated from a bottom quark. A multivariate discriminant, exploiting the kinematic properties of the events, is used to separate the signal from the dominant $ \mathrm{t\bar{t}} $ background. The measured cross section of 63.1 $\pm$ 1.8 (stat) $\pm$ 6.4 (syst) $\pm$ 2.1 (lumi) pb is in agreement with the standard model expectation. | ||
| Links: e-print arXiv:1805.07399 [hep-ex] (PDF) ; CDS record ; inSPIRE record ; HepData record ; CADI line (restricted) ; | ||
| Figures | |
png pdf |
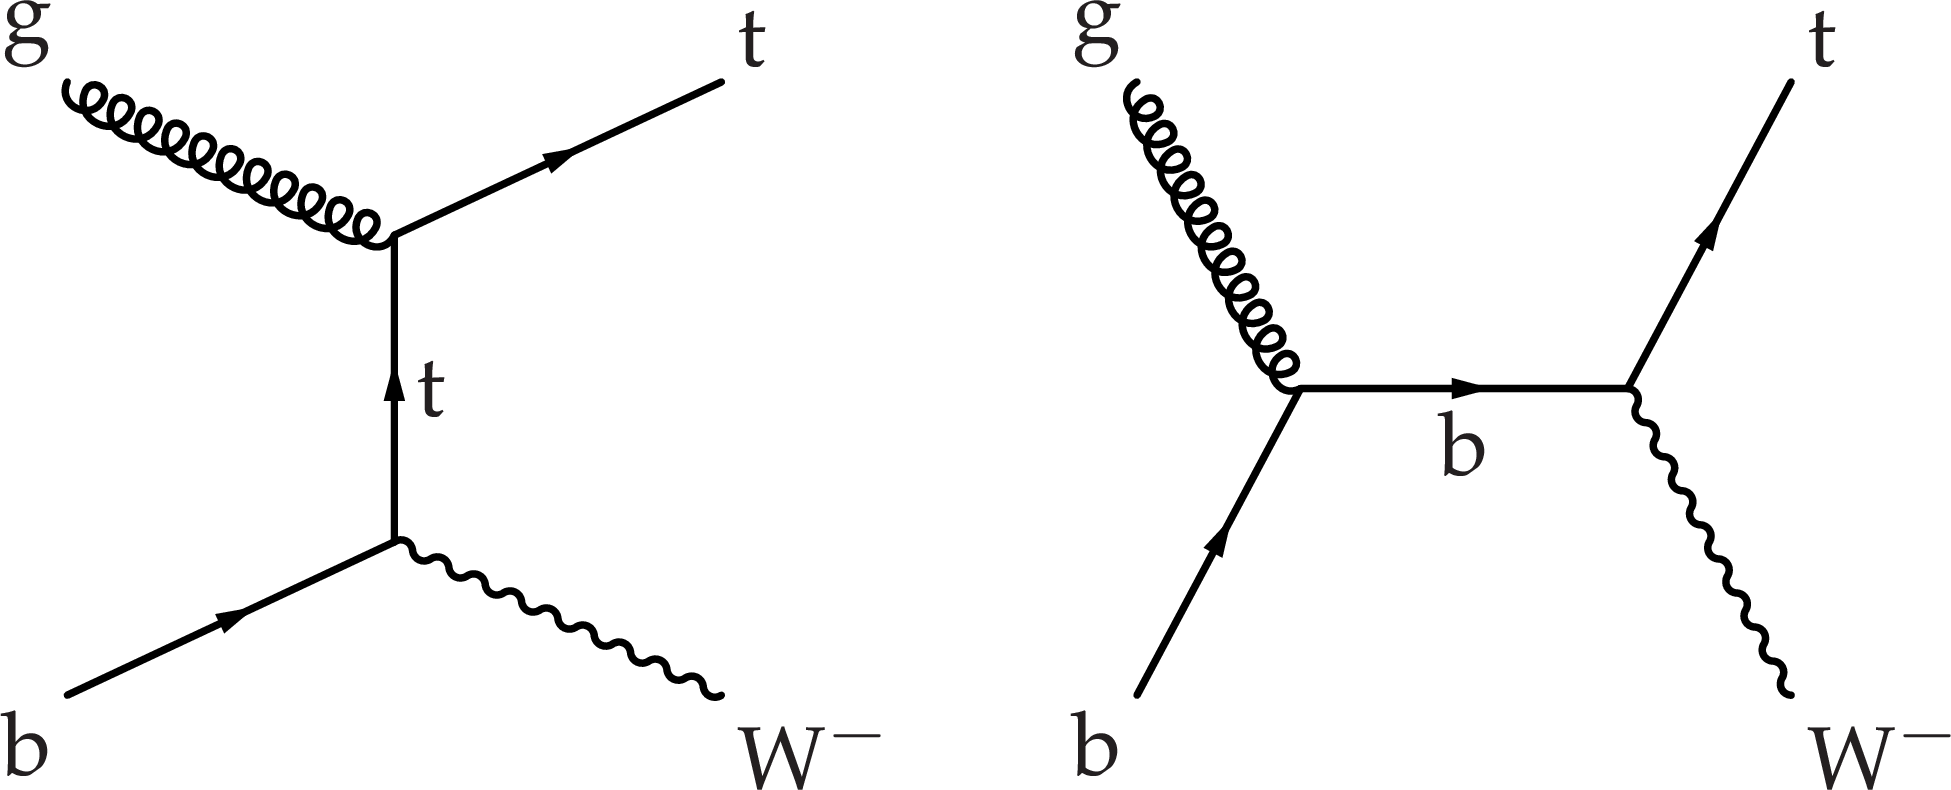
Figure 1:
Leading-order Feynman diagrams for single top quark production in the tW channel that implicitly include the charge-conjugate contributions. |
png pdf |
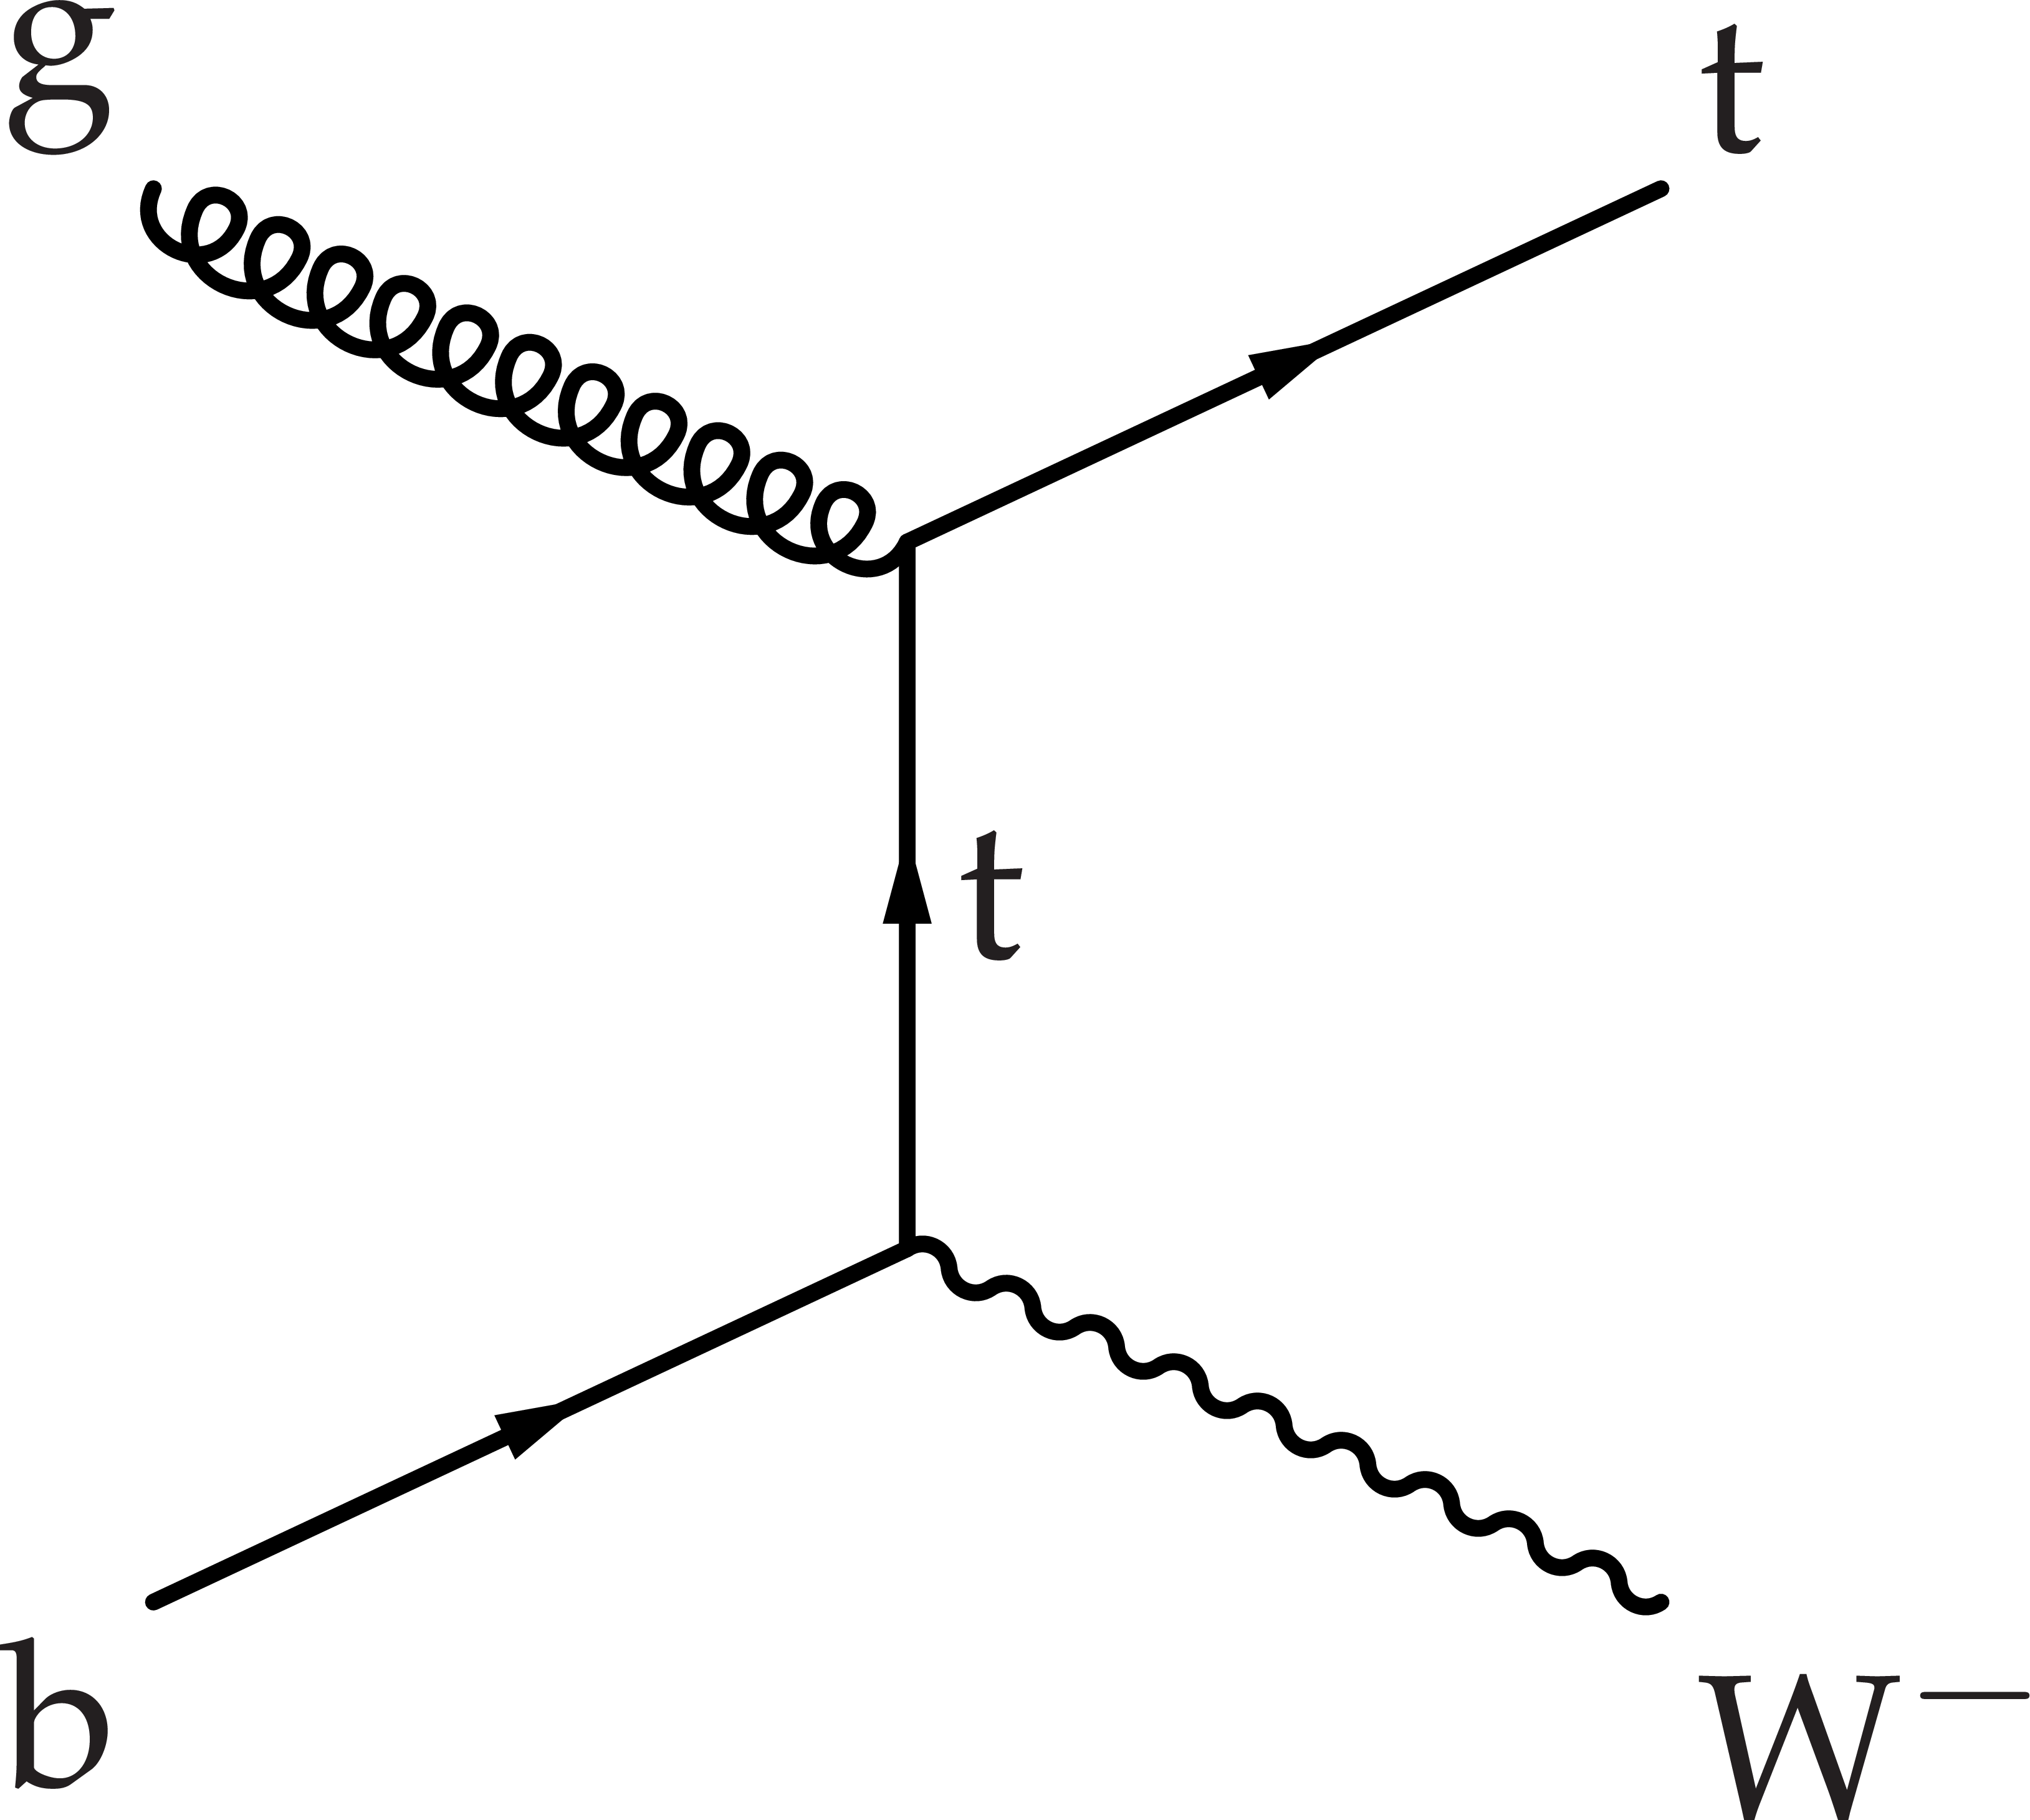
Figure 1-a:
Leading-order Feynman diagram for single top quark production in the tW channel that implicitly include the charge-conjugate contributions. |
png pdf |
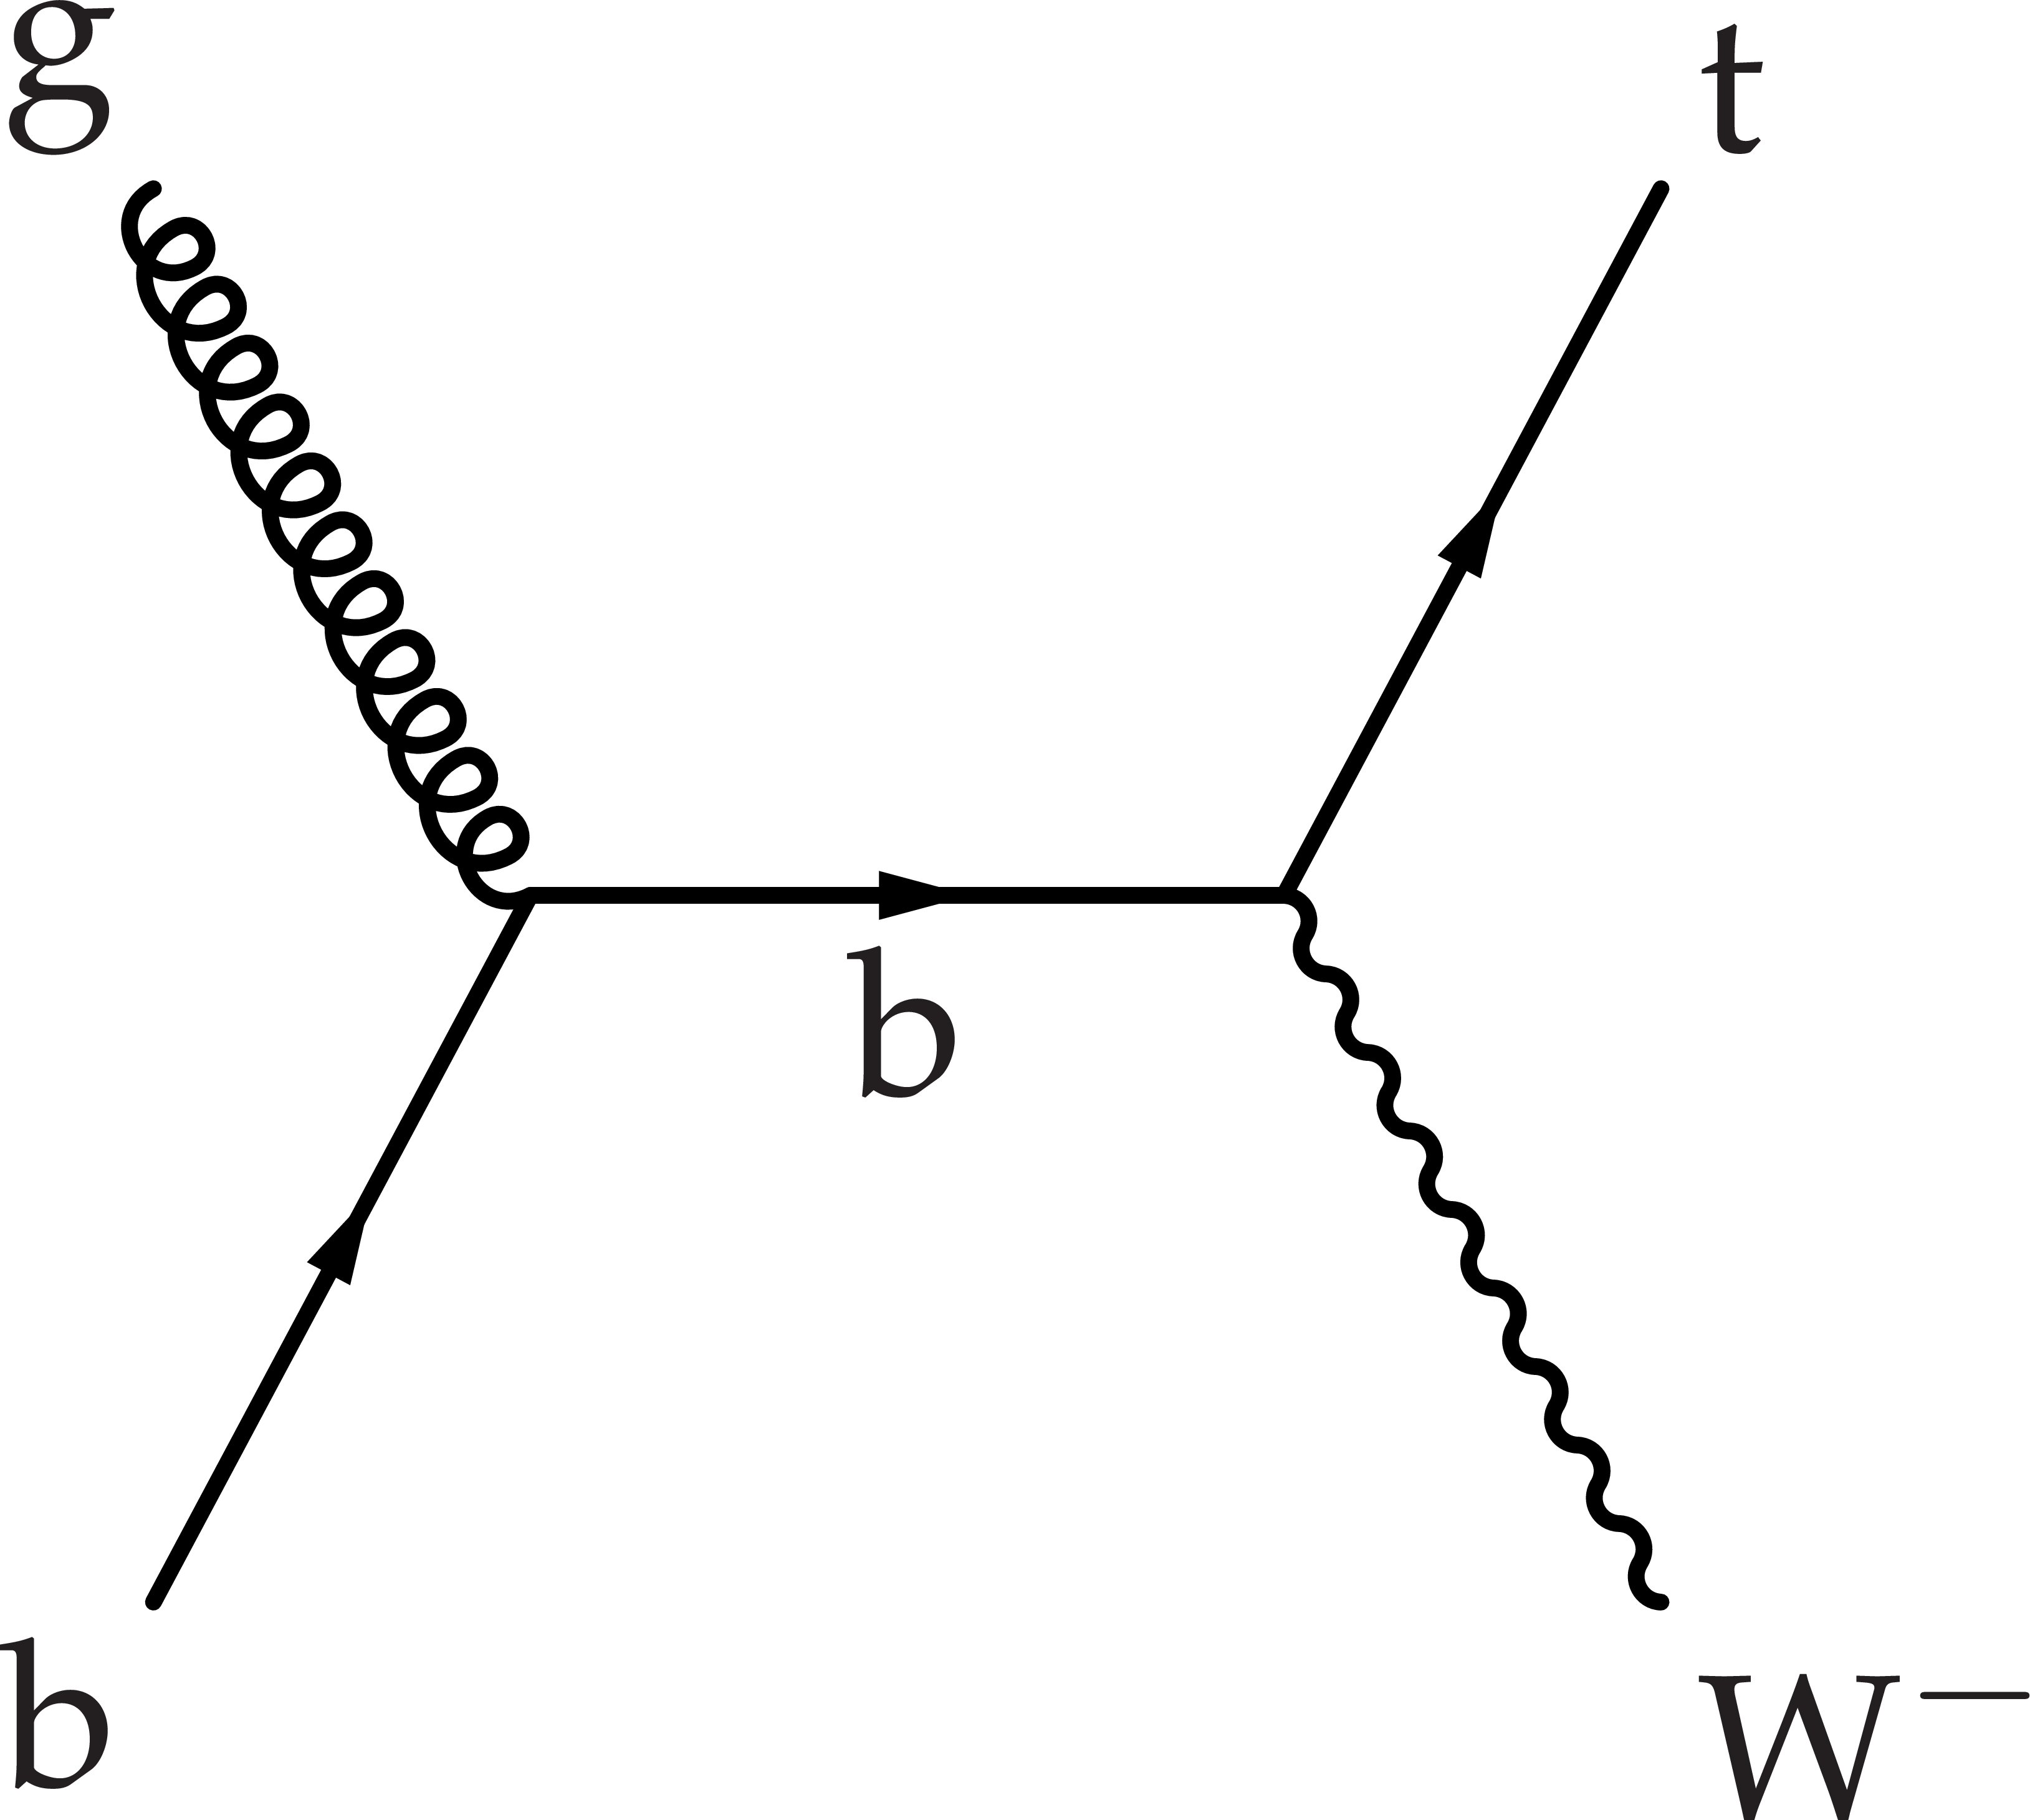
Figure 1-b:
Leading-order Feynman diagram for single top quark production in the tW channel that implicitly include the charge-conjugate contributions. |
png pdf |
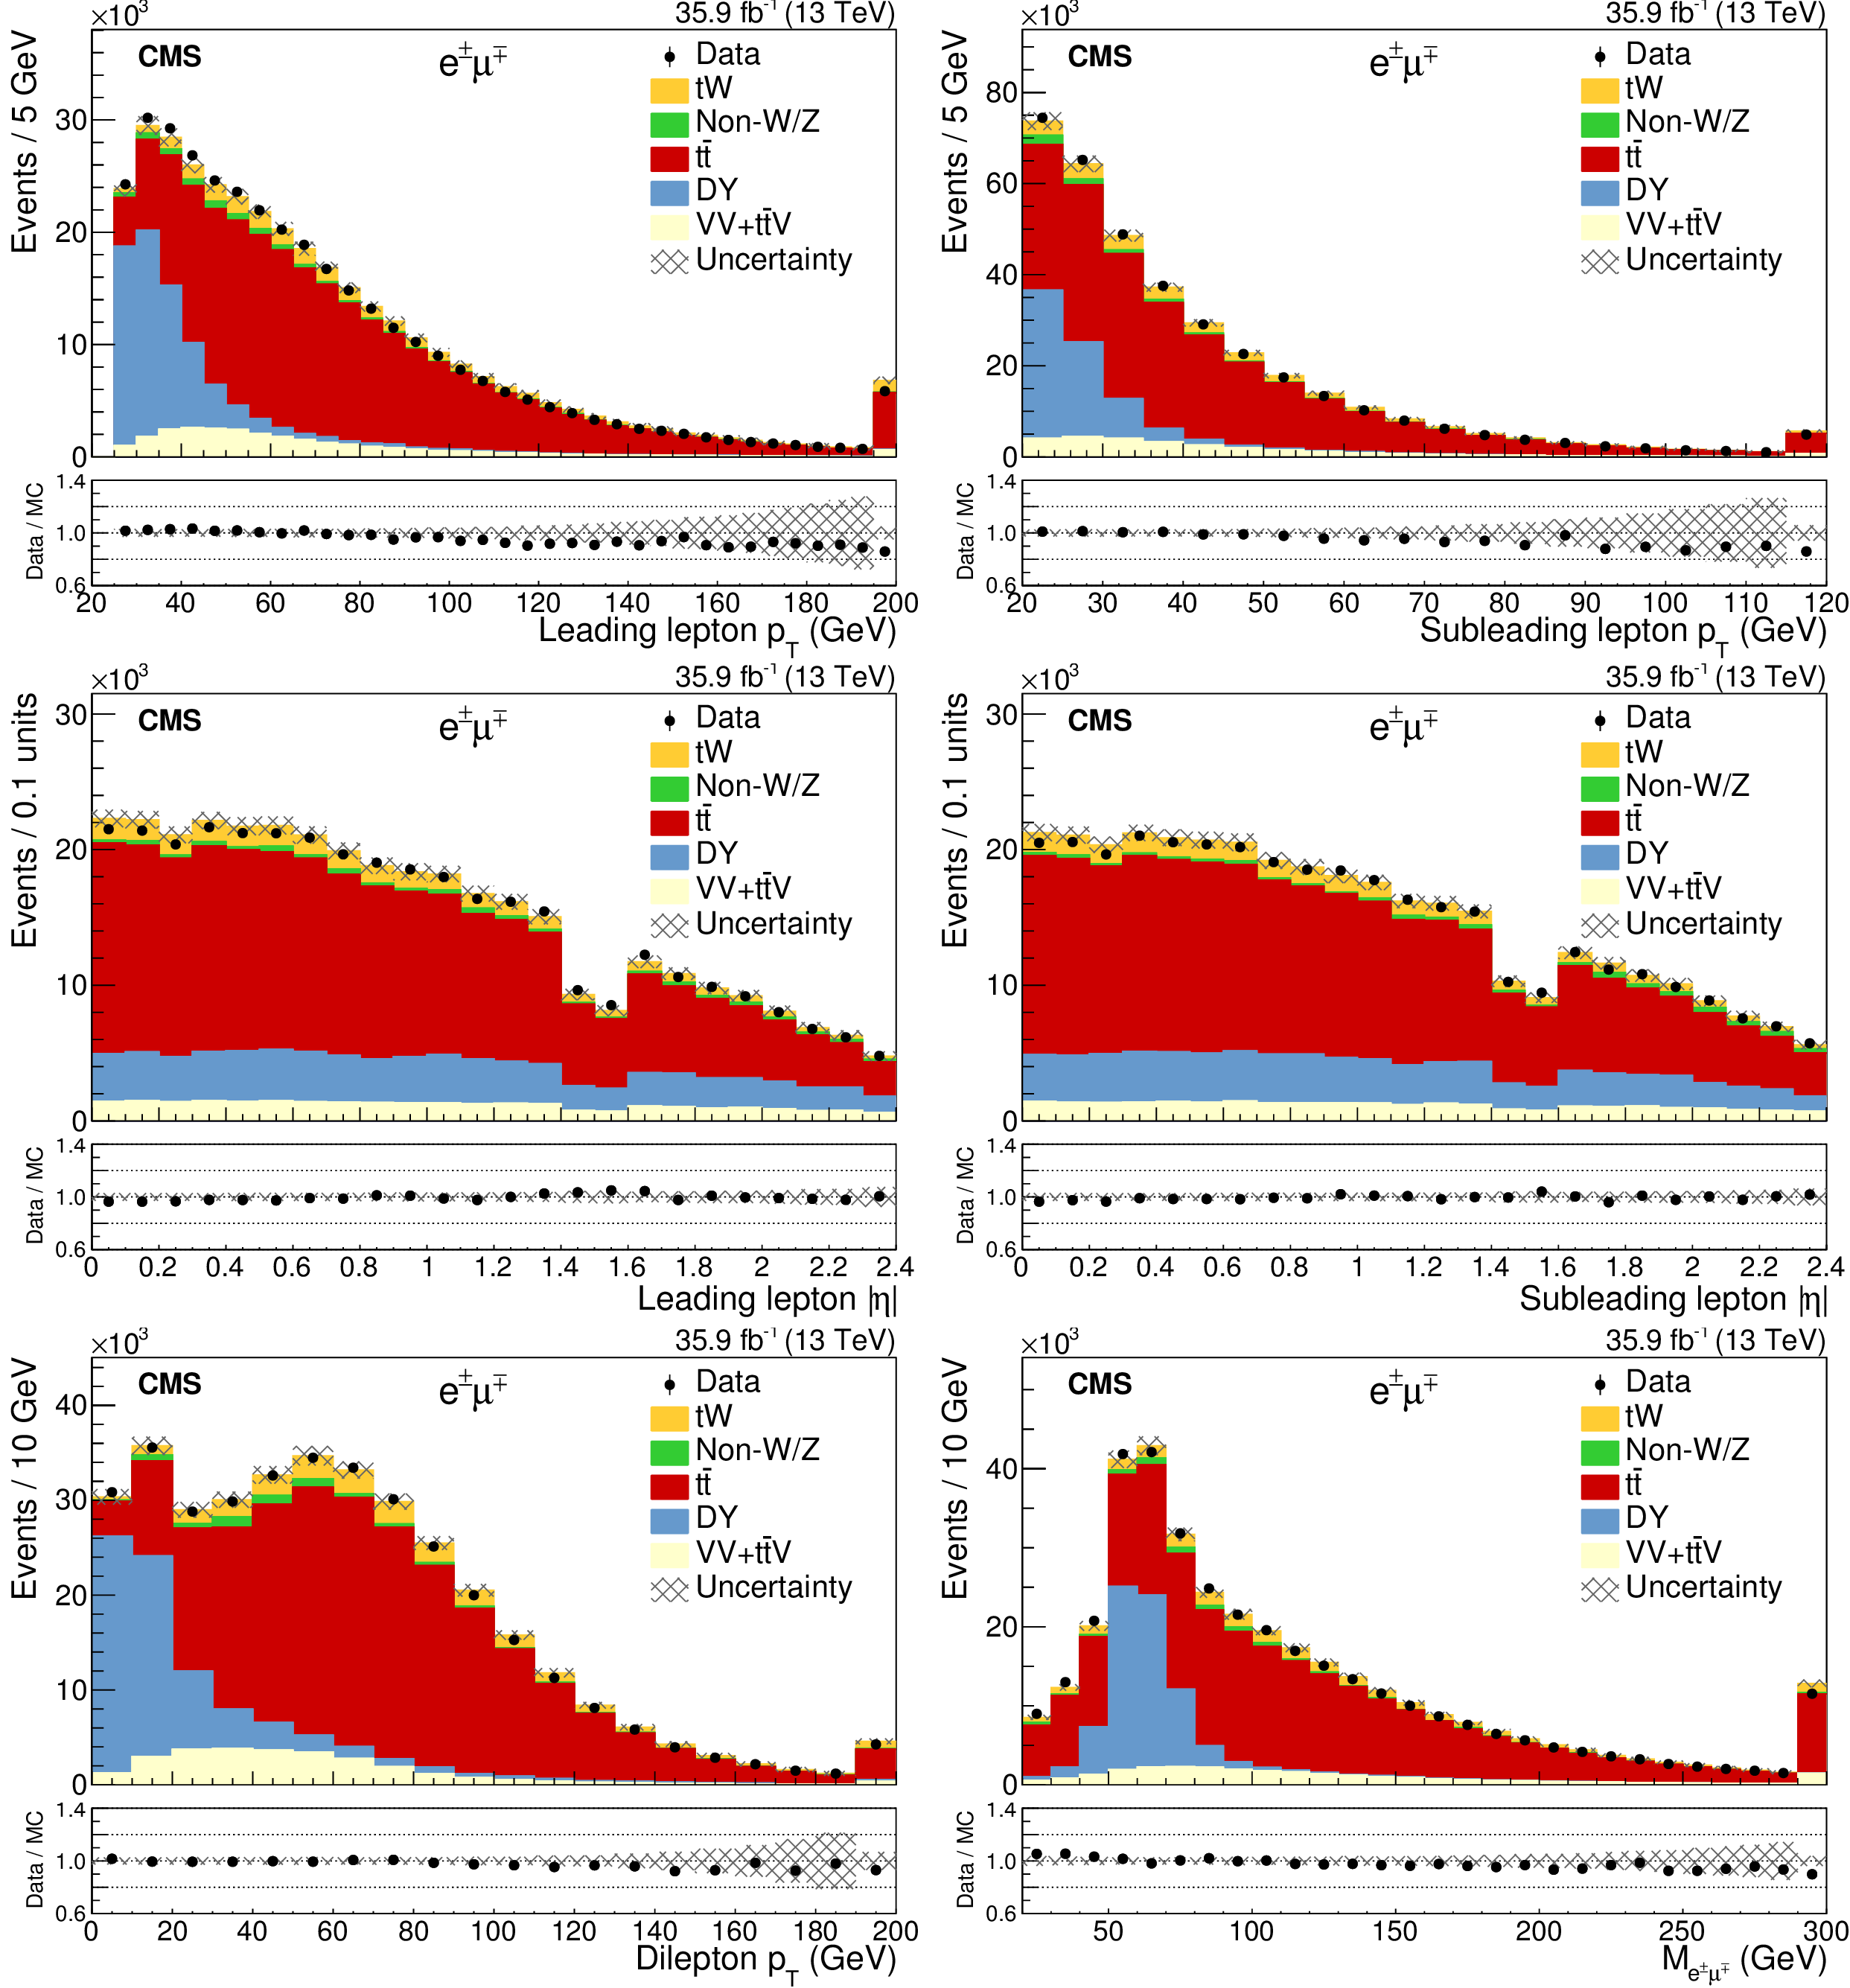
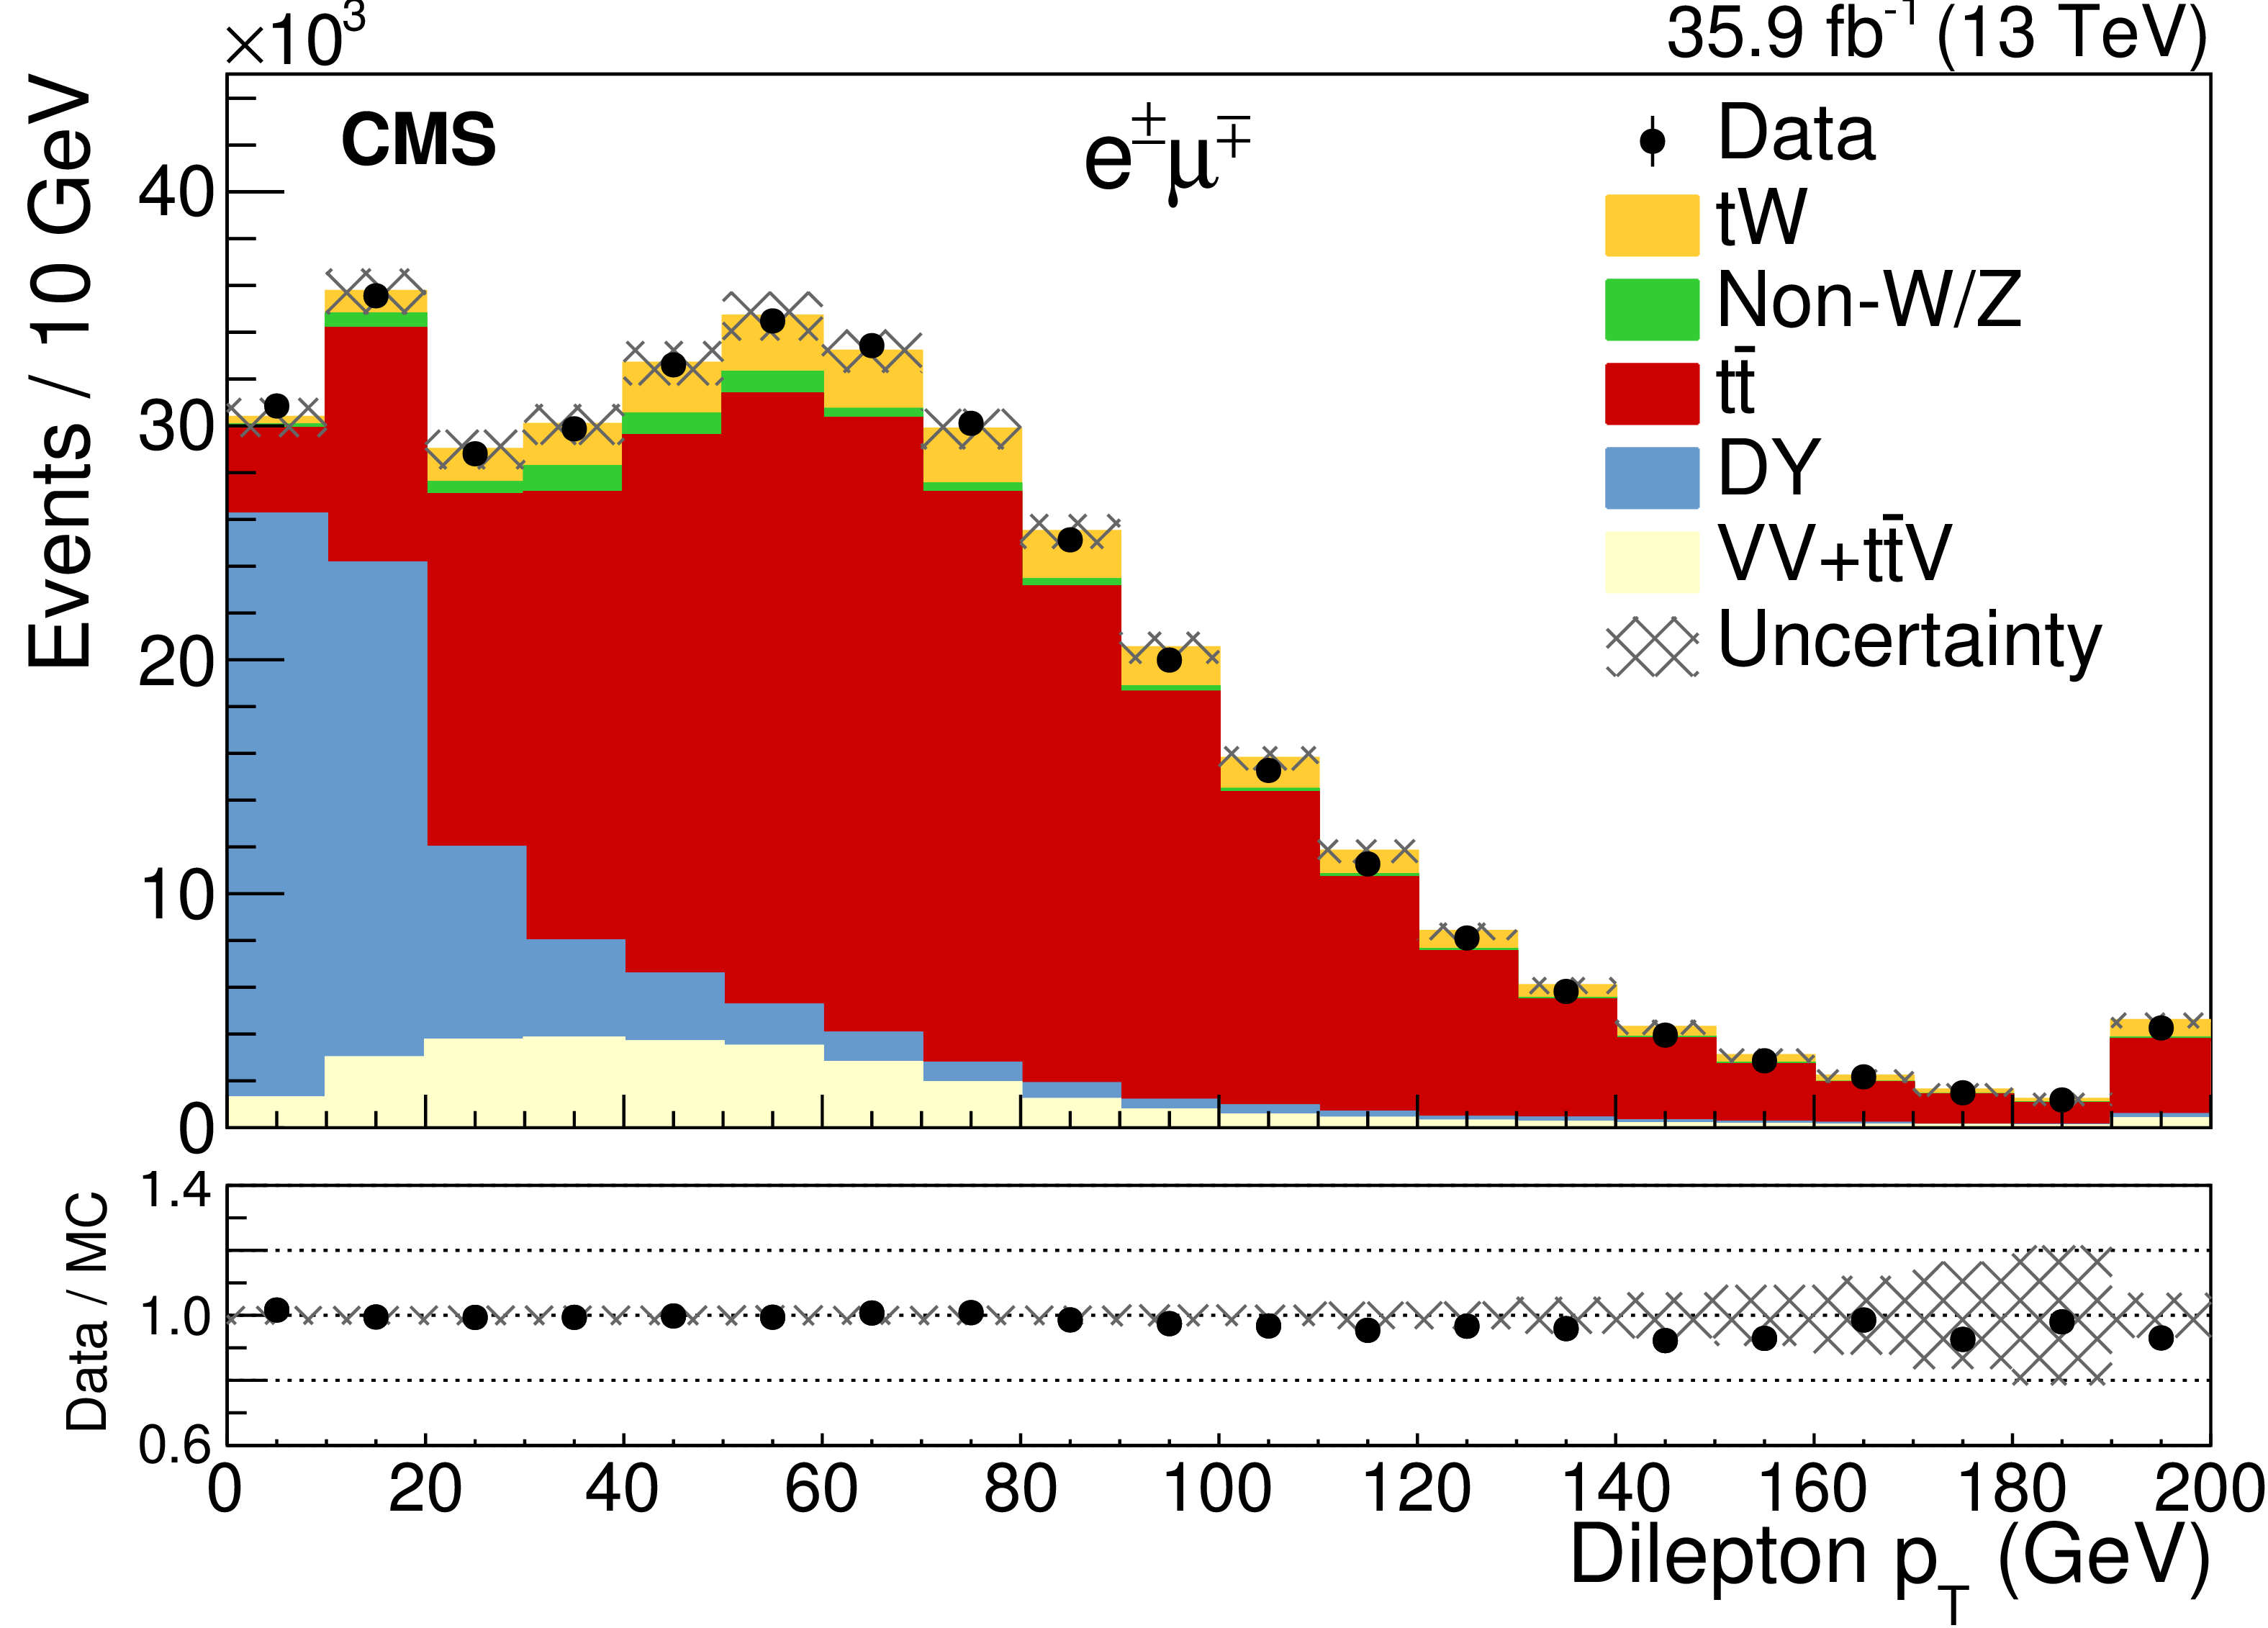
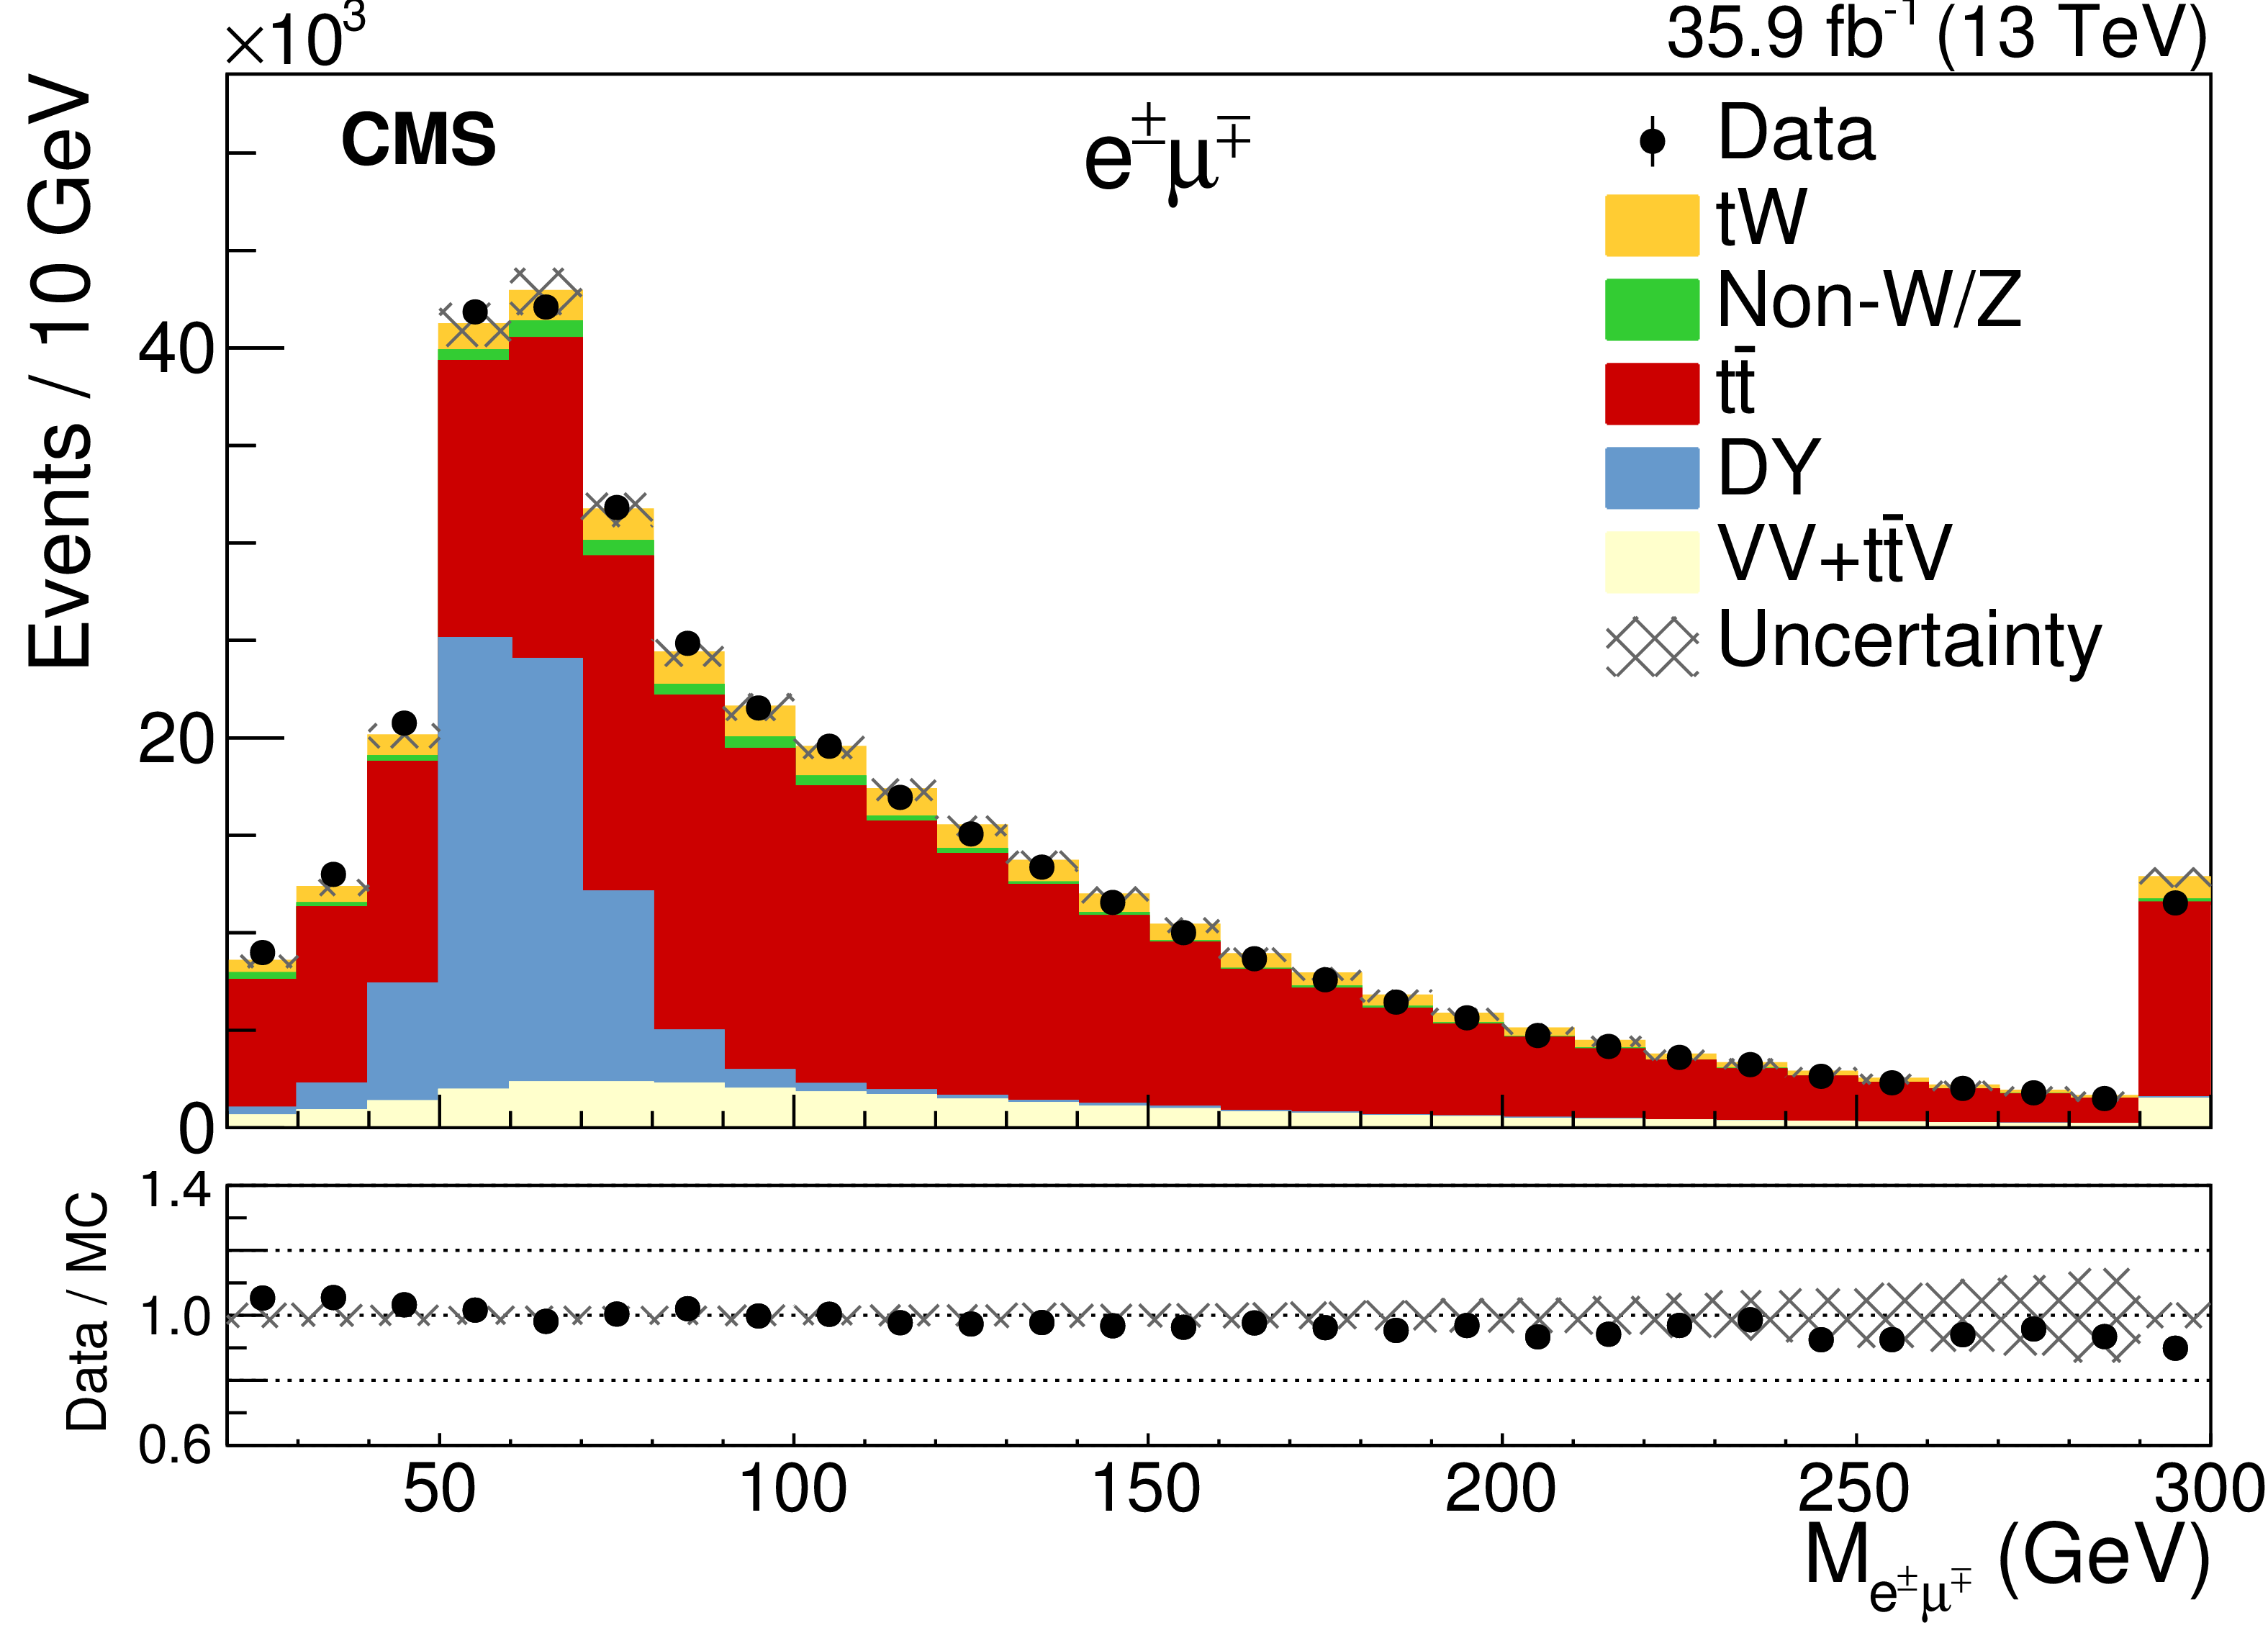
Figure 2:
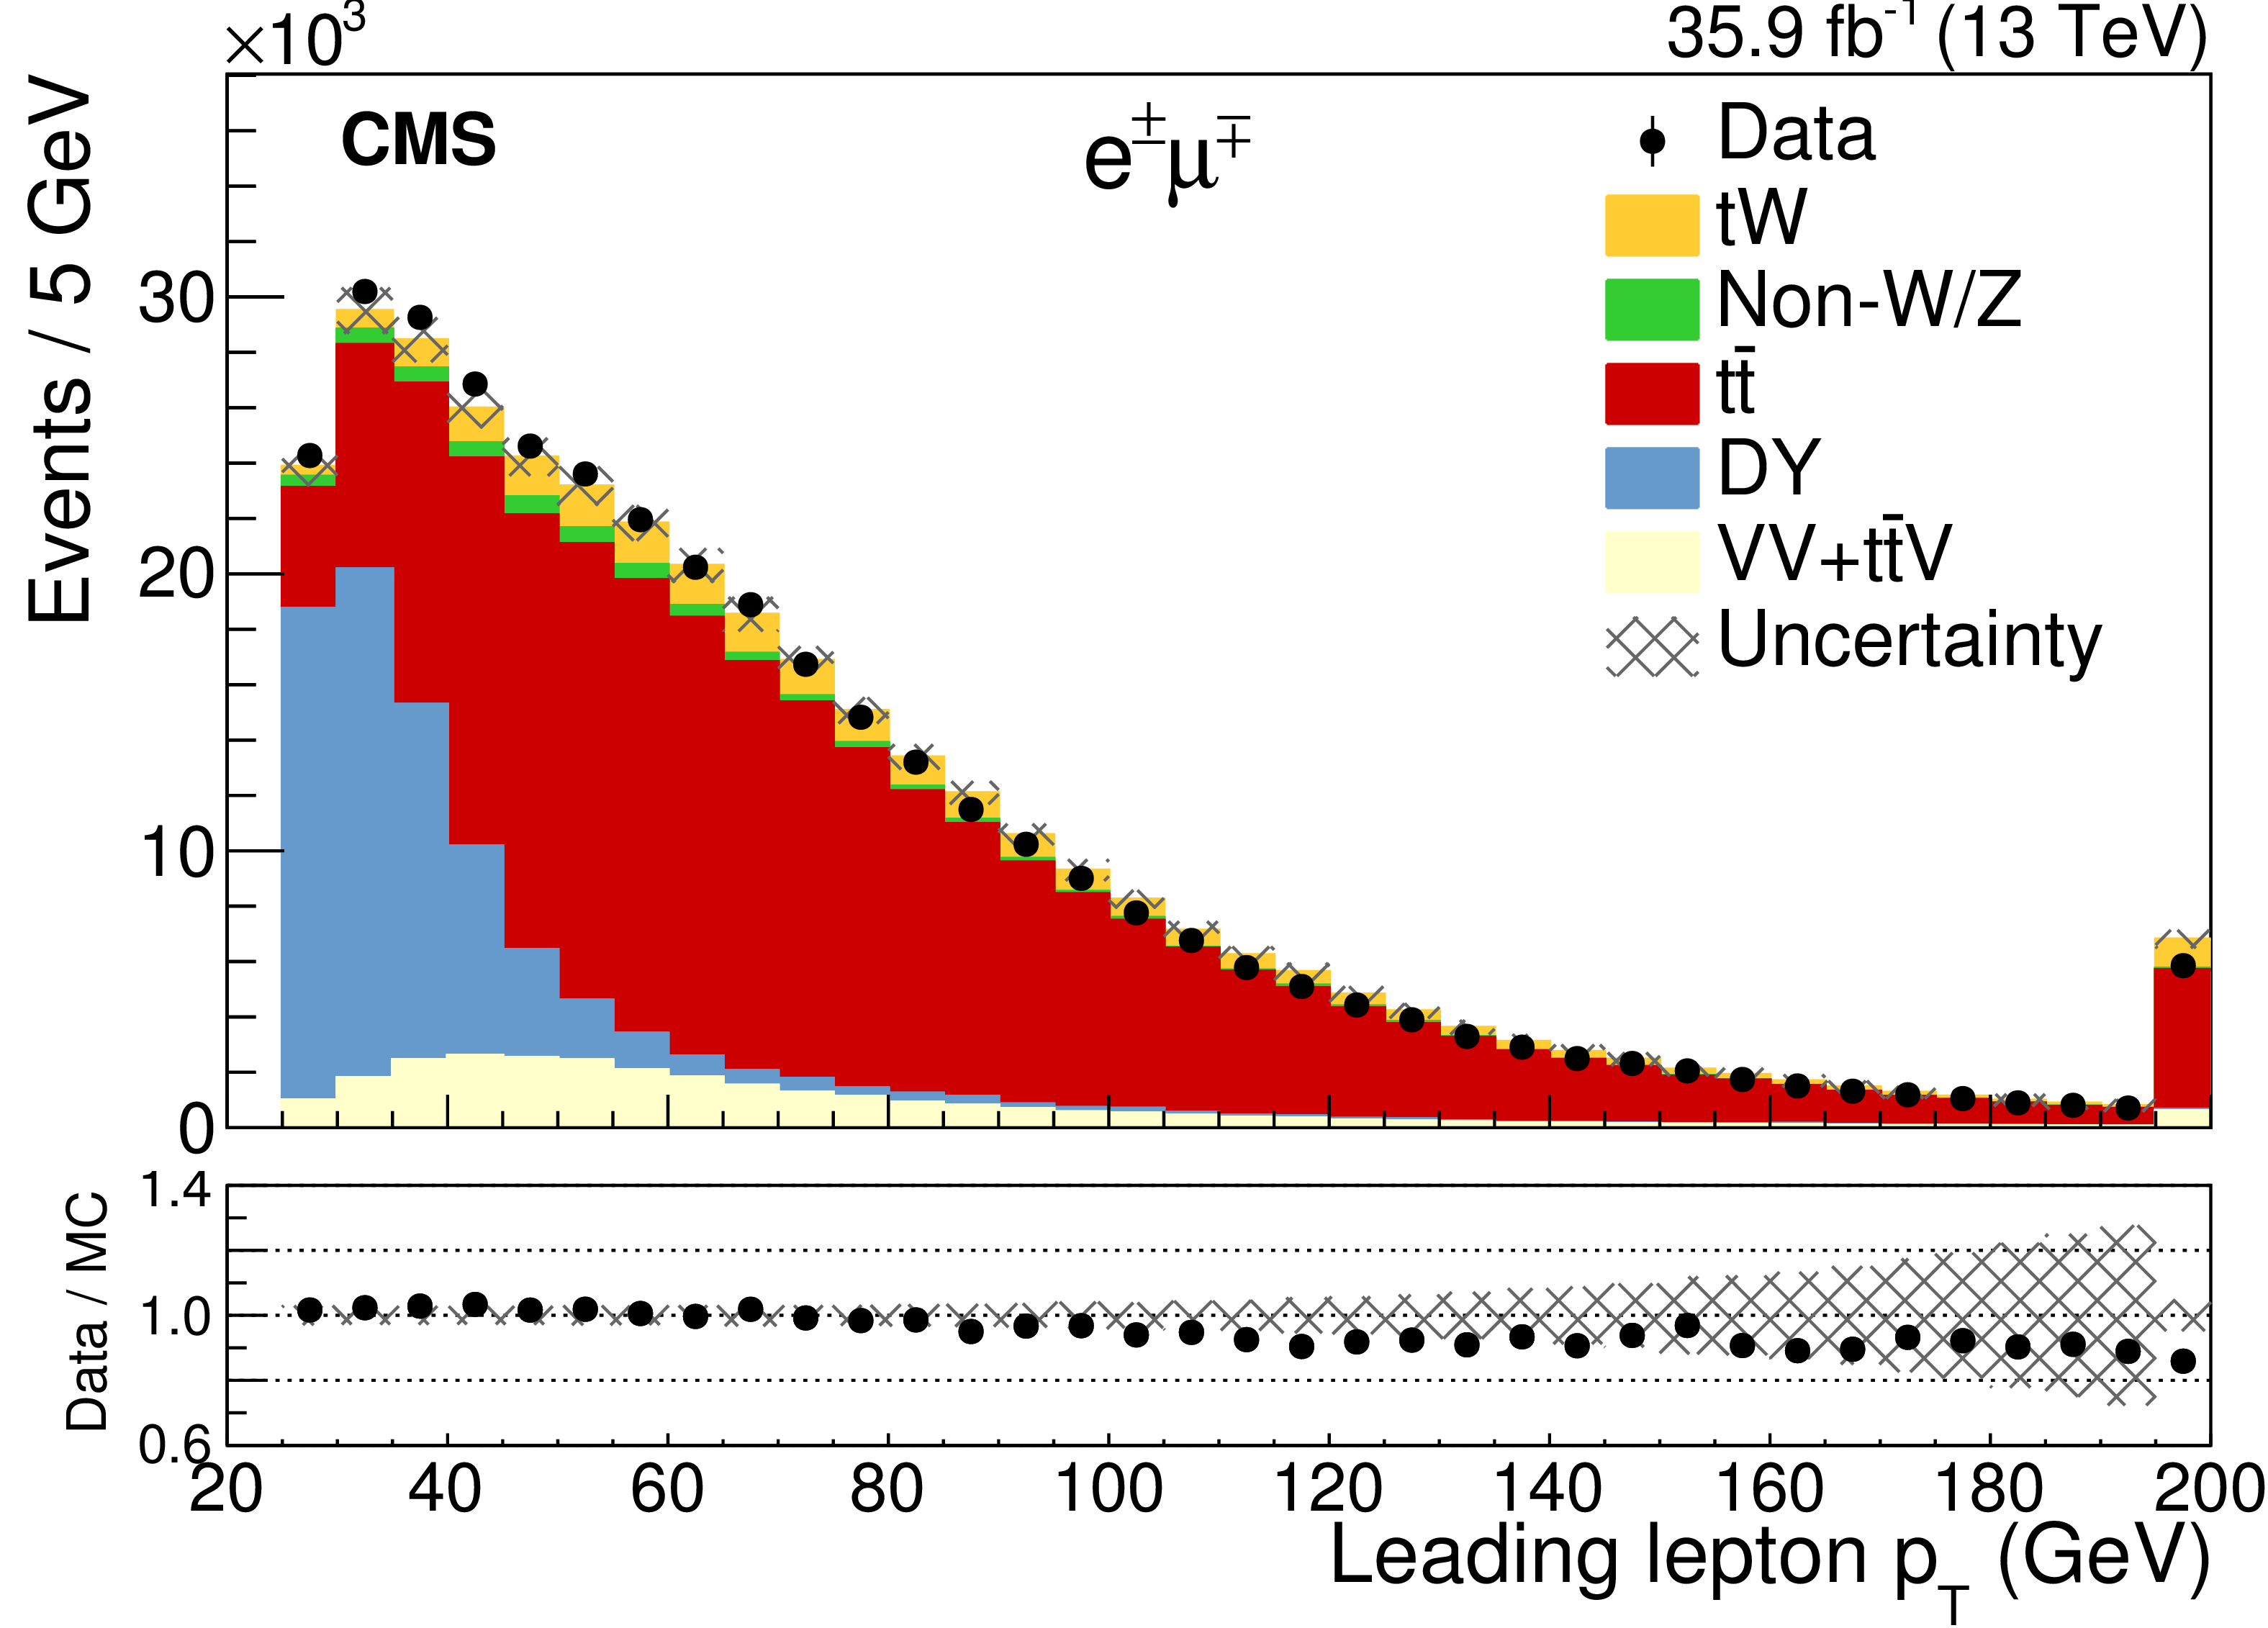
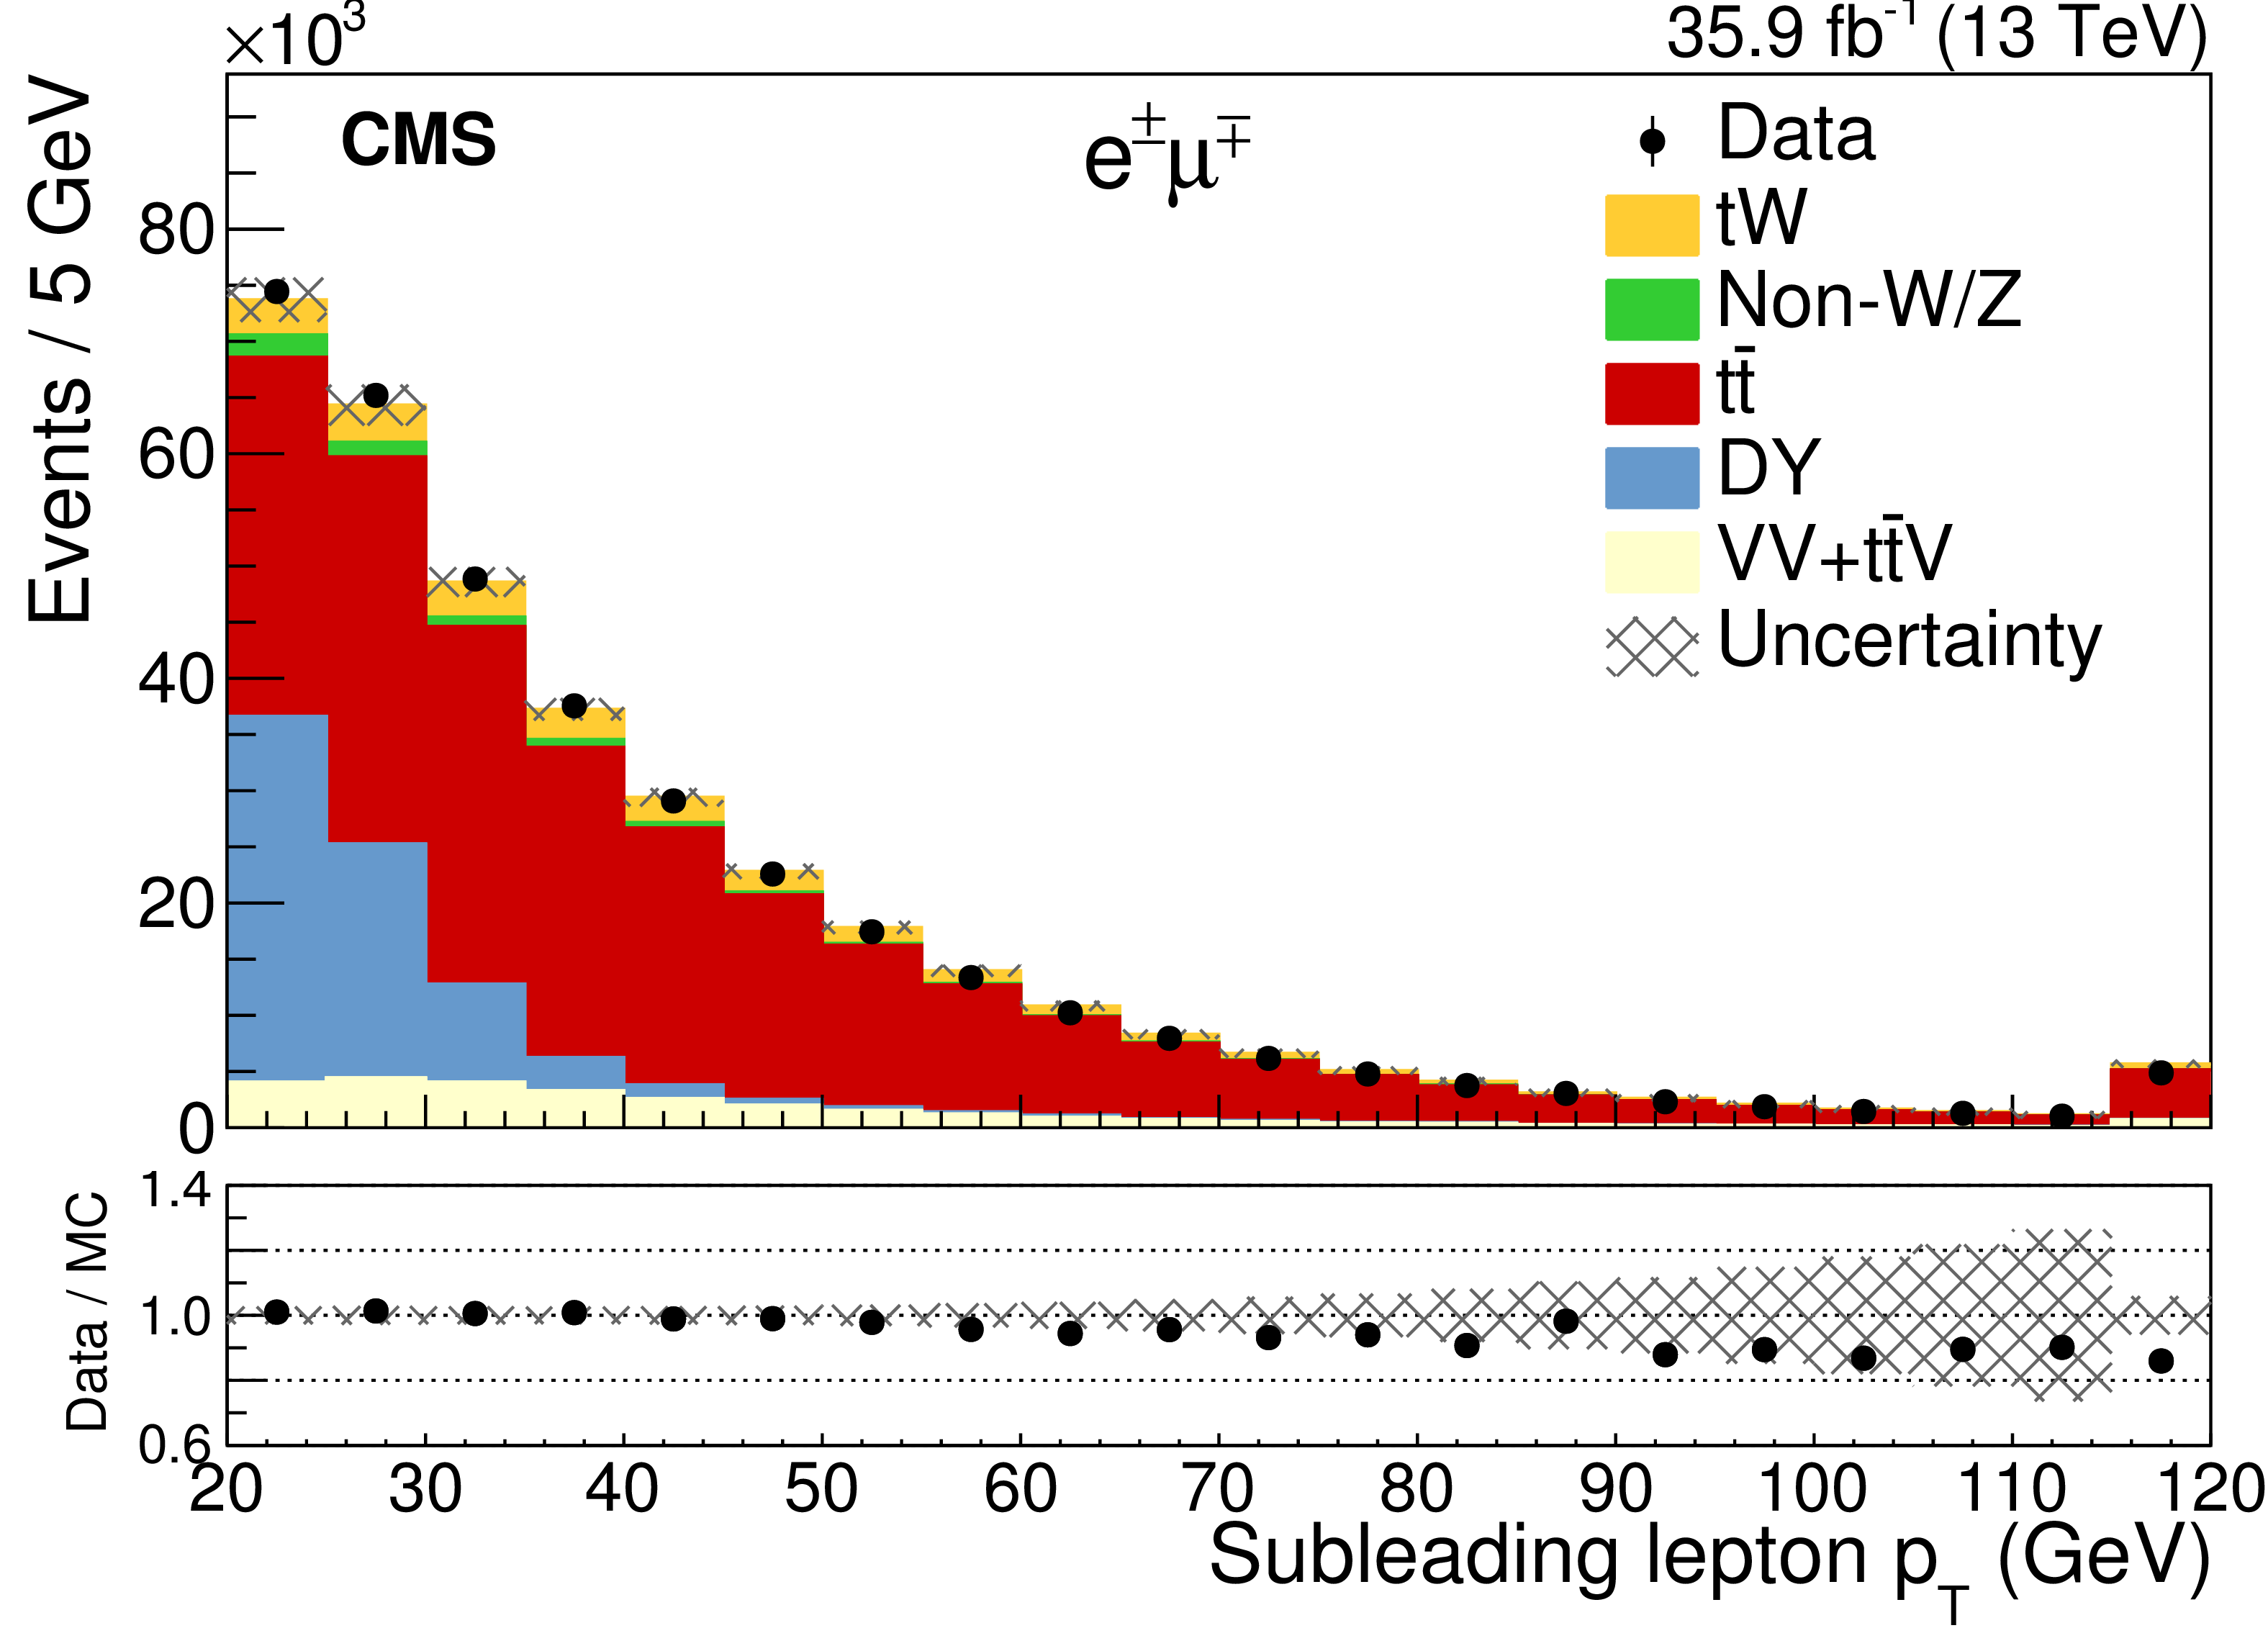
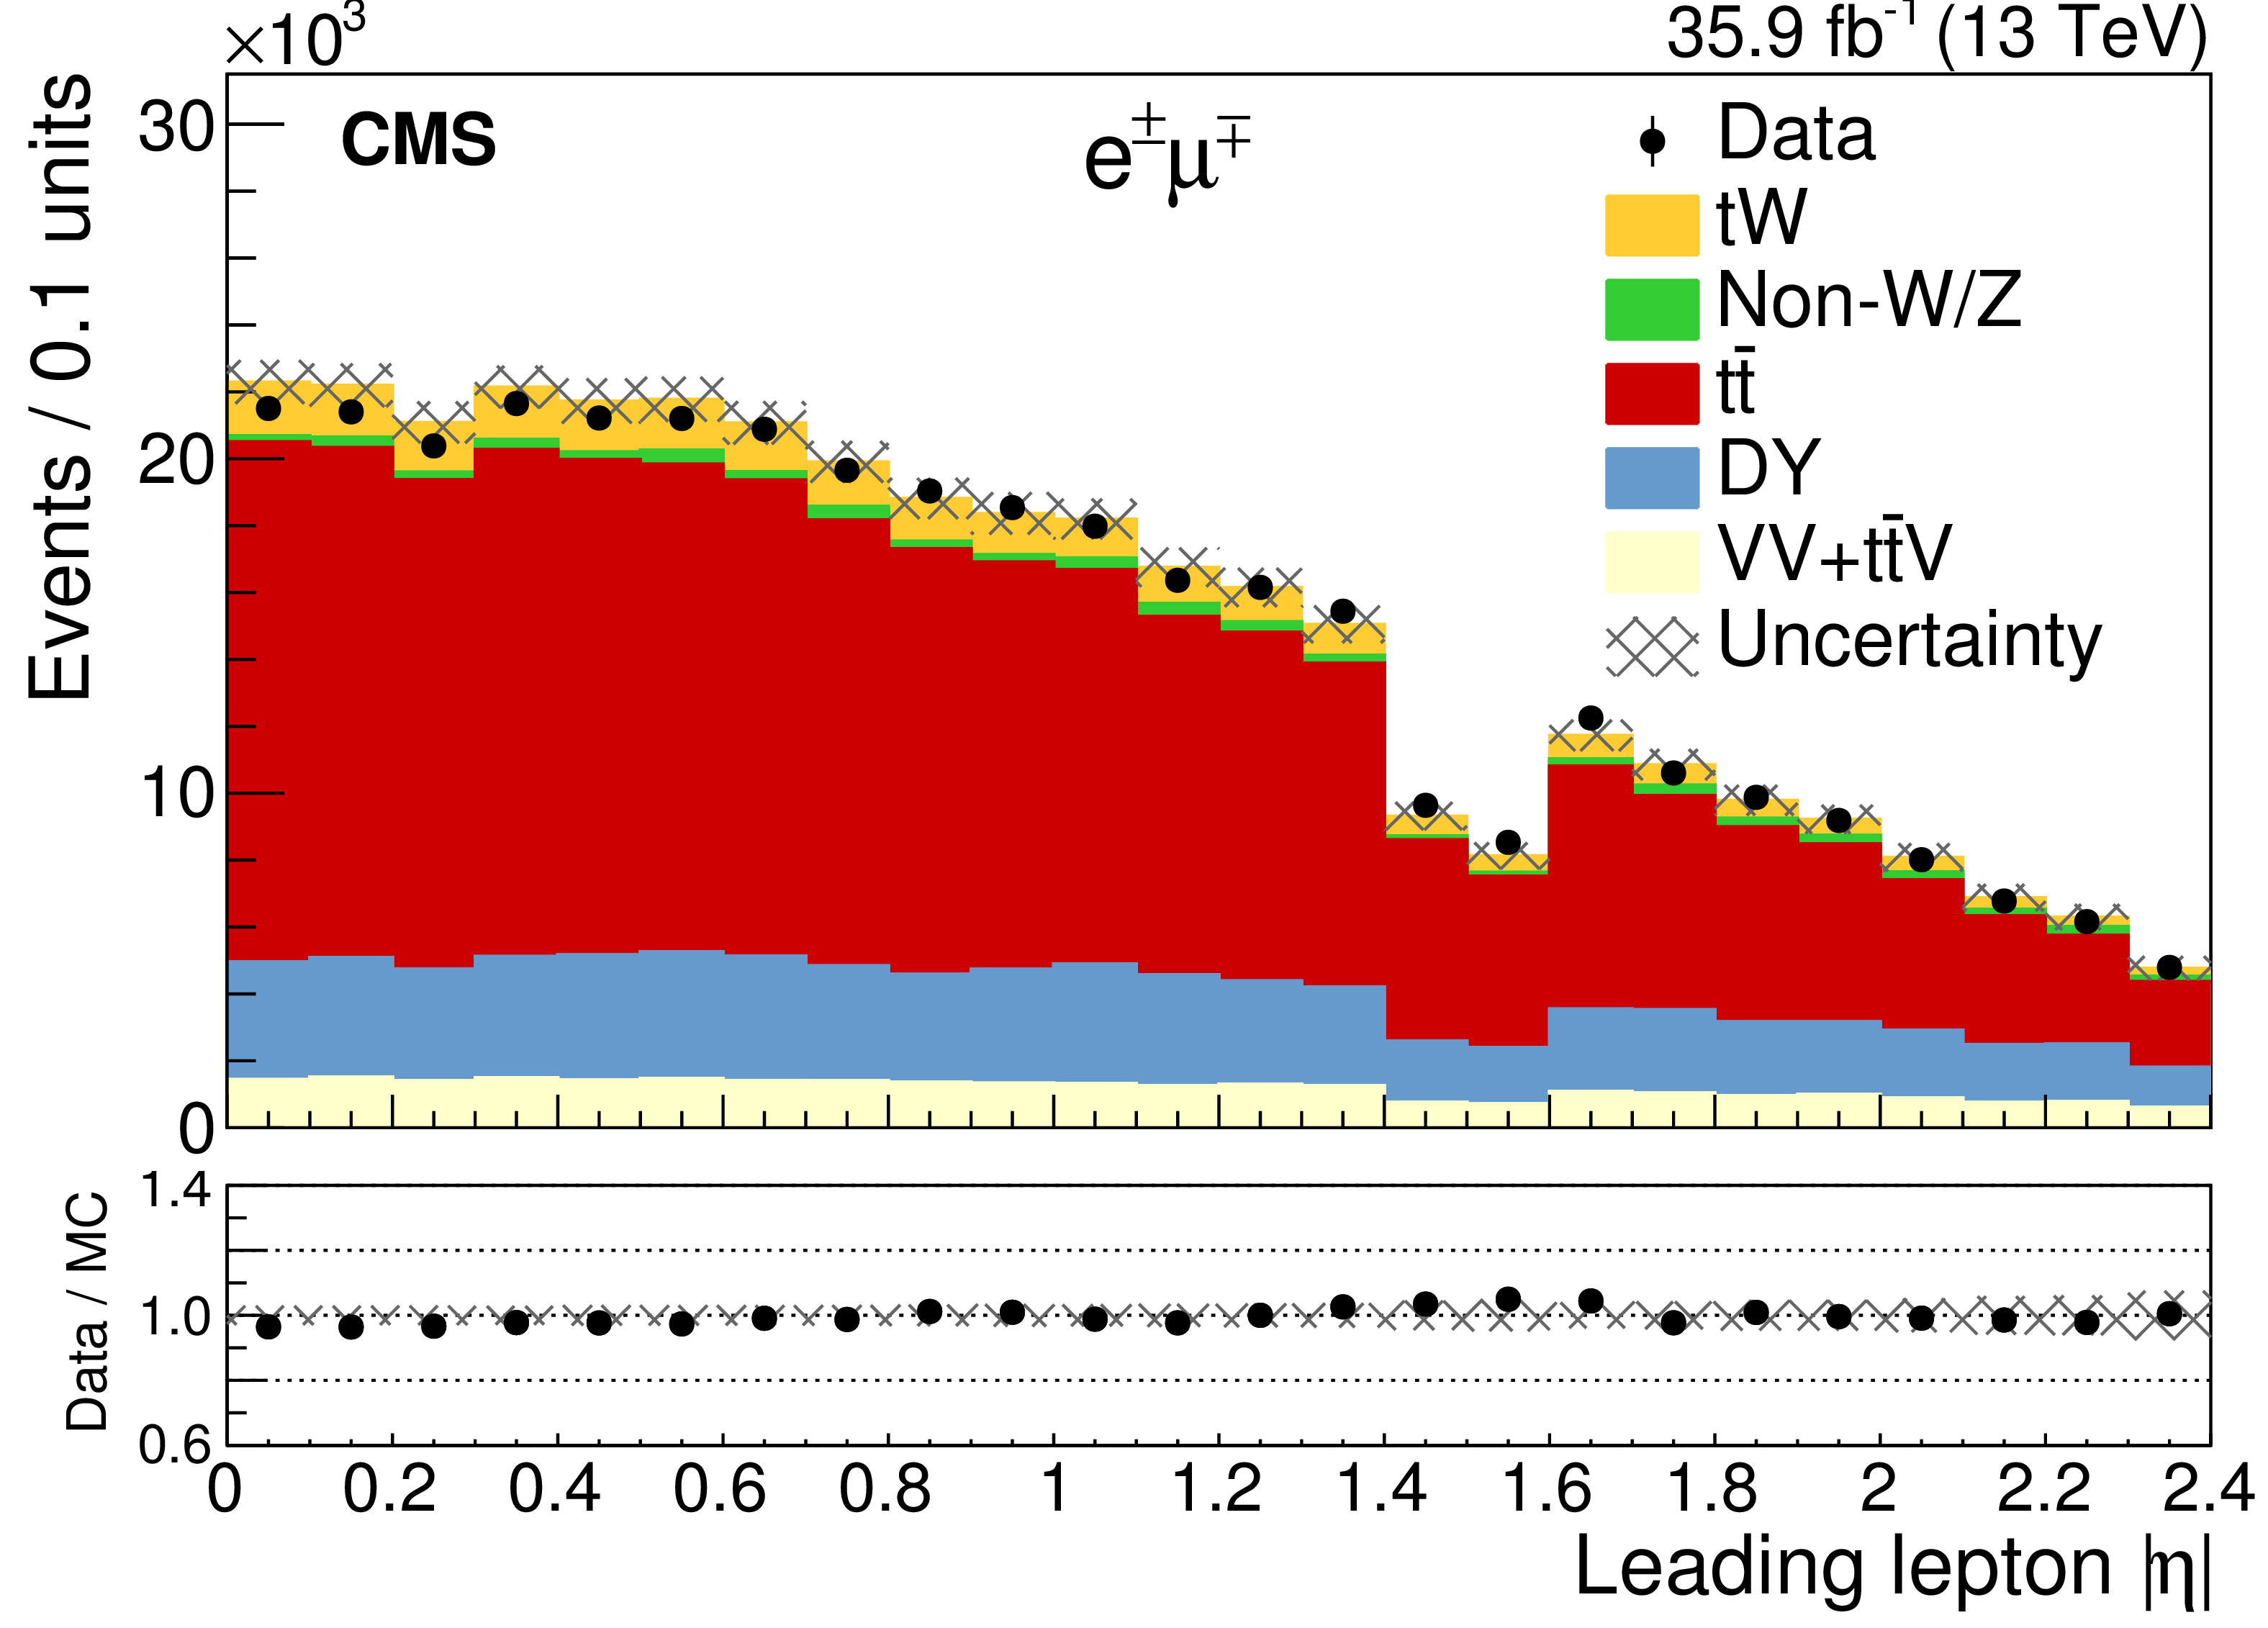
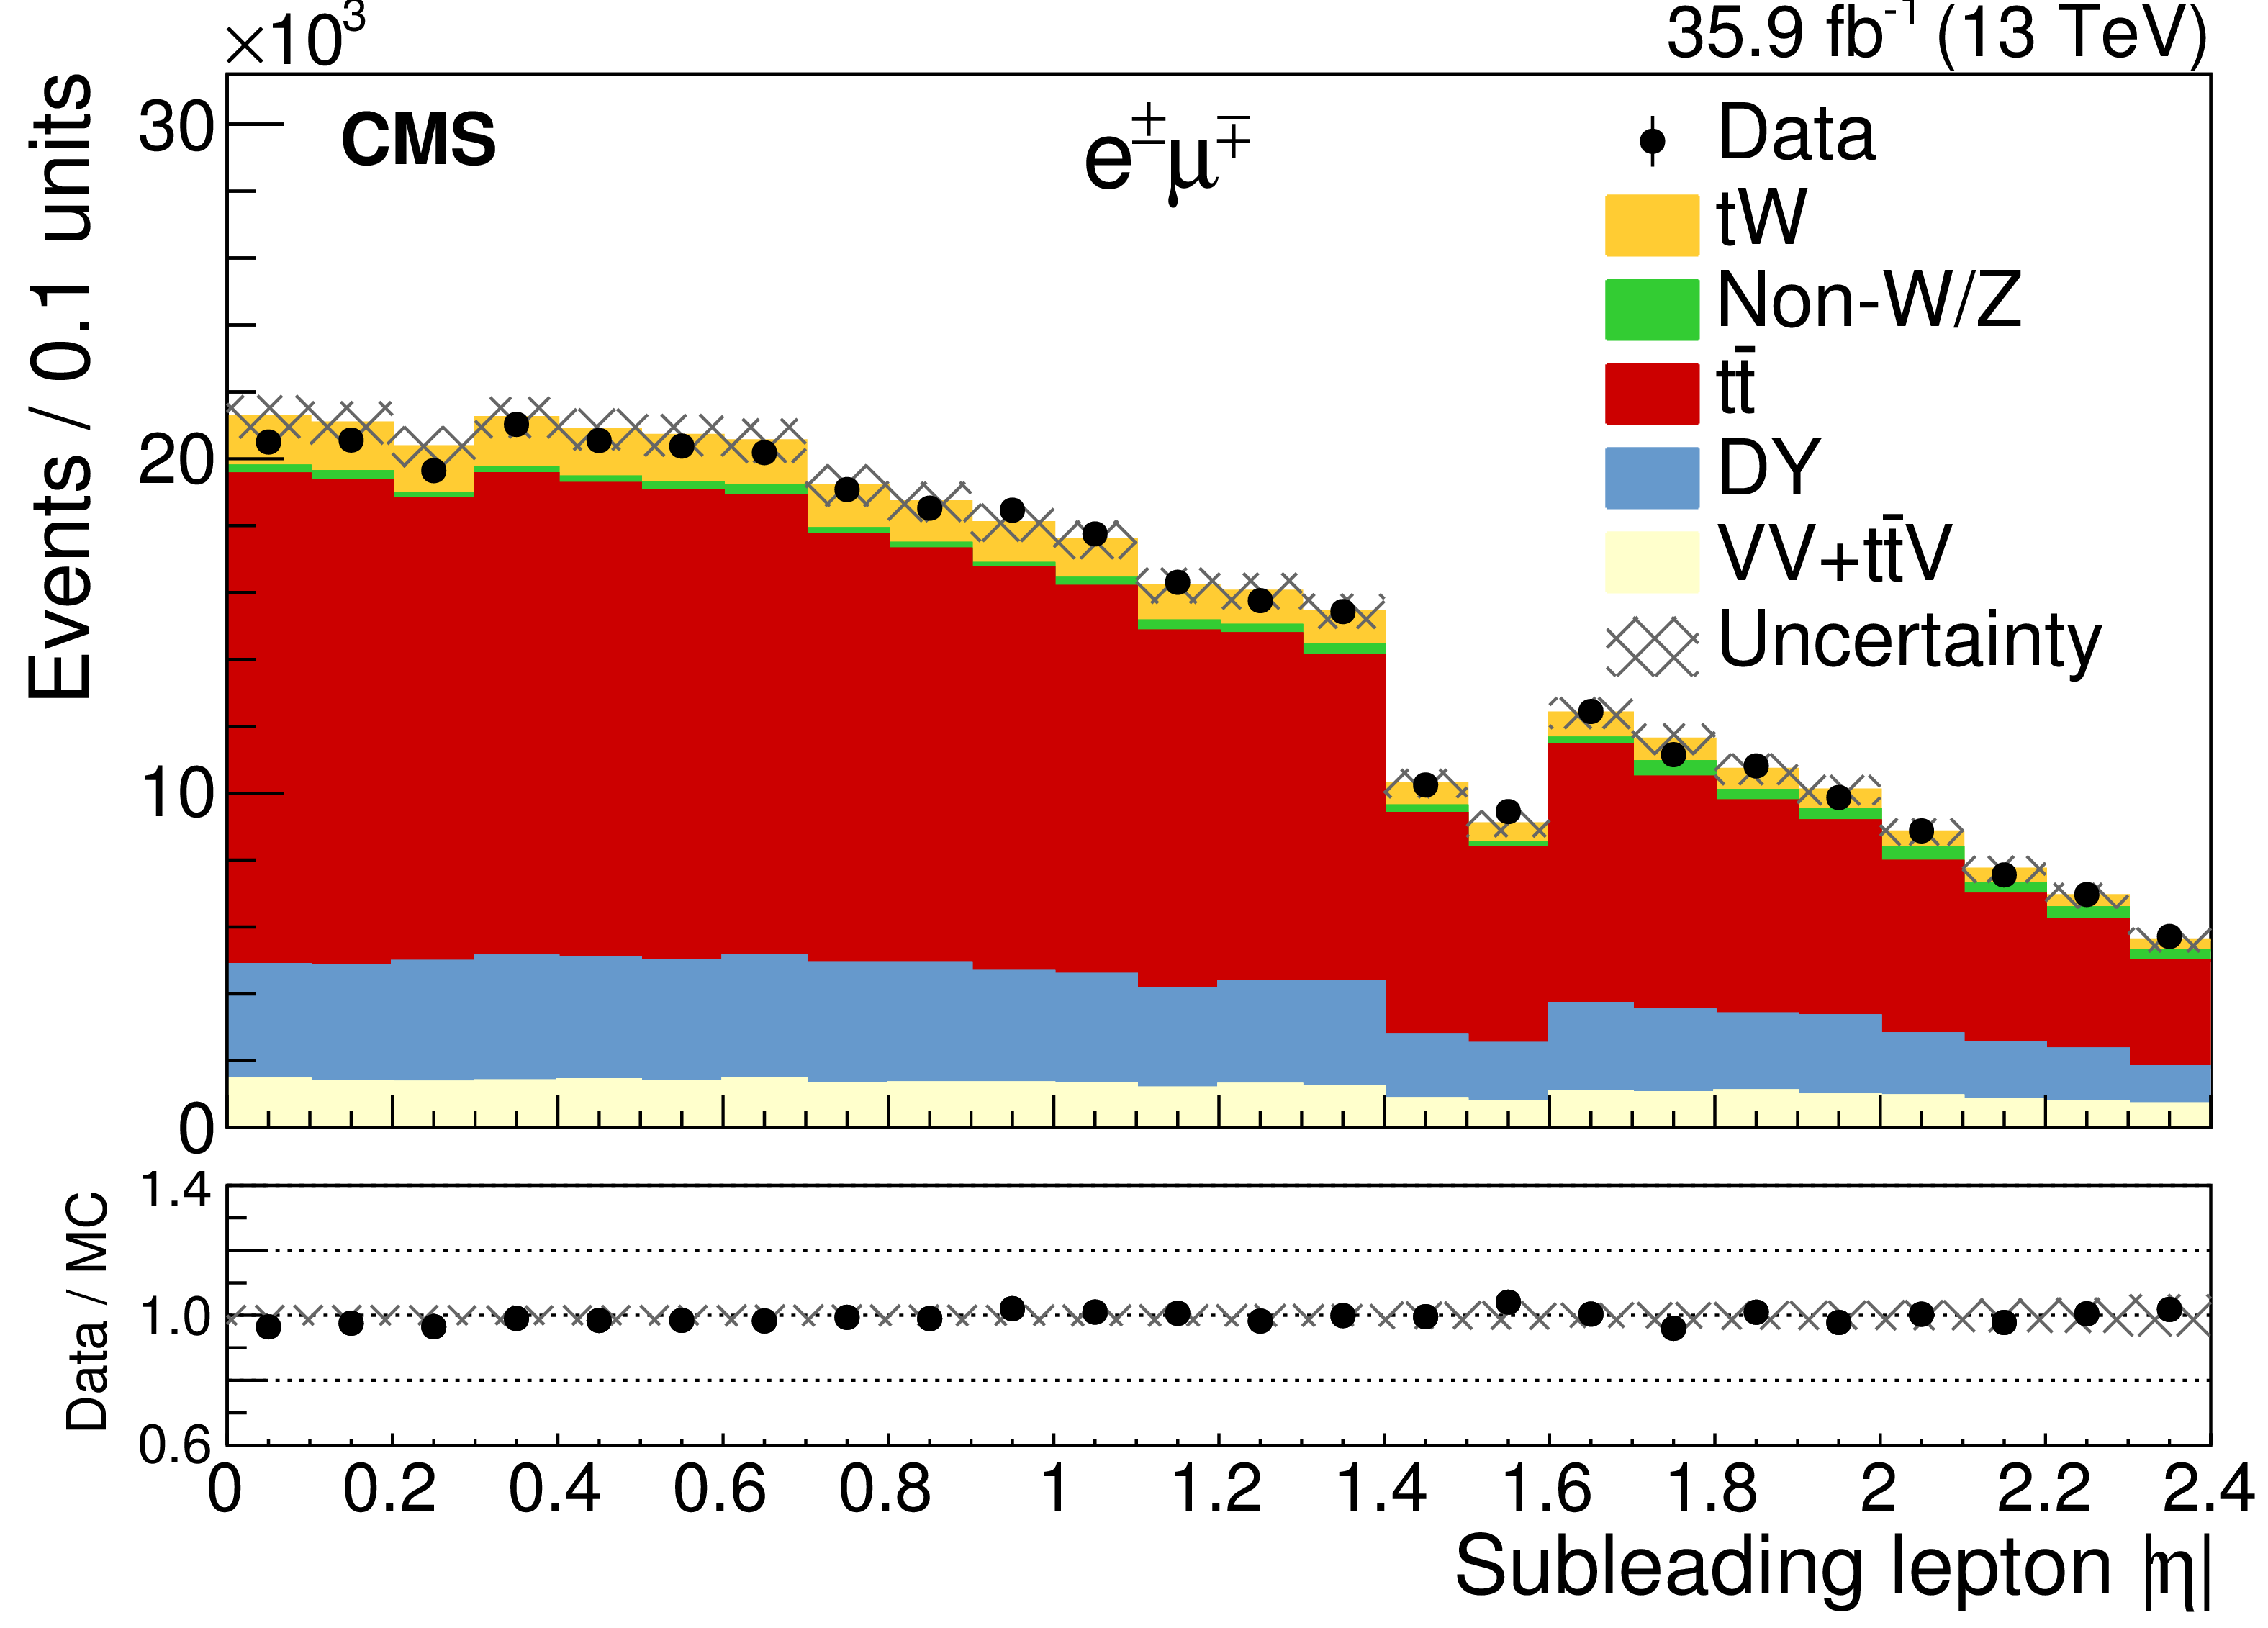
Comparison of several lepton kinematic variables for the observed data and simulated events after the dilepton selection is applied. The last bin includes overflow events. The error band includes the statistical and all systematic uncertainties, except those from background normalization. The bottom of each panel shows the ratios of data to the sum of the expected yields. |
png pdf |
Figure 2-a:
Comparison of the leading lepton $p_{\mathrm{T}}$ for the observed data and simulated events after the dilepton selection is applied. The last bin includes overflow events. The error band includes the statistical and all systematic uncertainties, except those from background normalization. The bottom of the panel shows the ratios of data to the sum of the expected yields. |
png pdf |
Figure 2-b:
Comparison of the subleading lepton $p_{\mathrm{T}}$ for the observed data and simulated events after the dilepton selection is applied. The last bin includes overflow events. The error band includes the statistical and all systematic uncertainties, except those from background normalization. The bottom of the panel shows the ratios of data to the sum of the expected yields. |
png pdf |
Figure 2-c:
Comparison of the leading lepton $| \eta |$ for the observed data and simulated events after the dilepton selection is applied. The last bin includes overflow events. The error band includes the statistical and all systematic uncertainties, except those from background normalization. The bottom of the panel shows the ratios of data to the sum of the expected yields. |
png pdf |
Figure 2-d:
Comparison of the subleading lepton $| \eta |$ for the observed data and simulated events after the dilepton selection is applied. The last bin includes overflow events. The error band includes the statistical and all systematic uncertainties, except those from background normalization. The bottom of the panel shows the ratios of data to the sum of the expected yields. |
png pdf |
Figure 2-e:
Comparison of the dilepton $p_{\mathrm{T}}$ for the observed data and simulated events after the dilepton selection is applied. The last bin includes overflow events. The error band includes the statistical and all systematic uncertainties, except those from background normalization. The bottom of the panel shows the ratios of data to the sum of the expected yields. |
png pdf |
Figure 2-f:
Comparison of $ M_{\mathrm{e}^{\pm}\mu^{\mp}} $ for the observed data and simulated events after the dilepton selection is applied. The last bin includes overflow events. The error band includes the statistical and all systematic uncertainties, except those from background normalization. The bottom of the panel shows the ratios of data to the sum of the expected yields. |
png pdf |
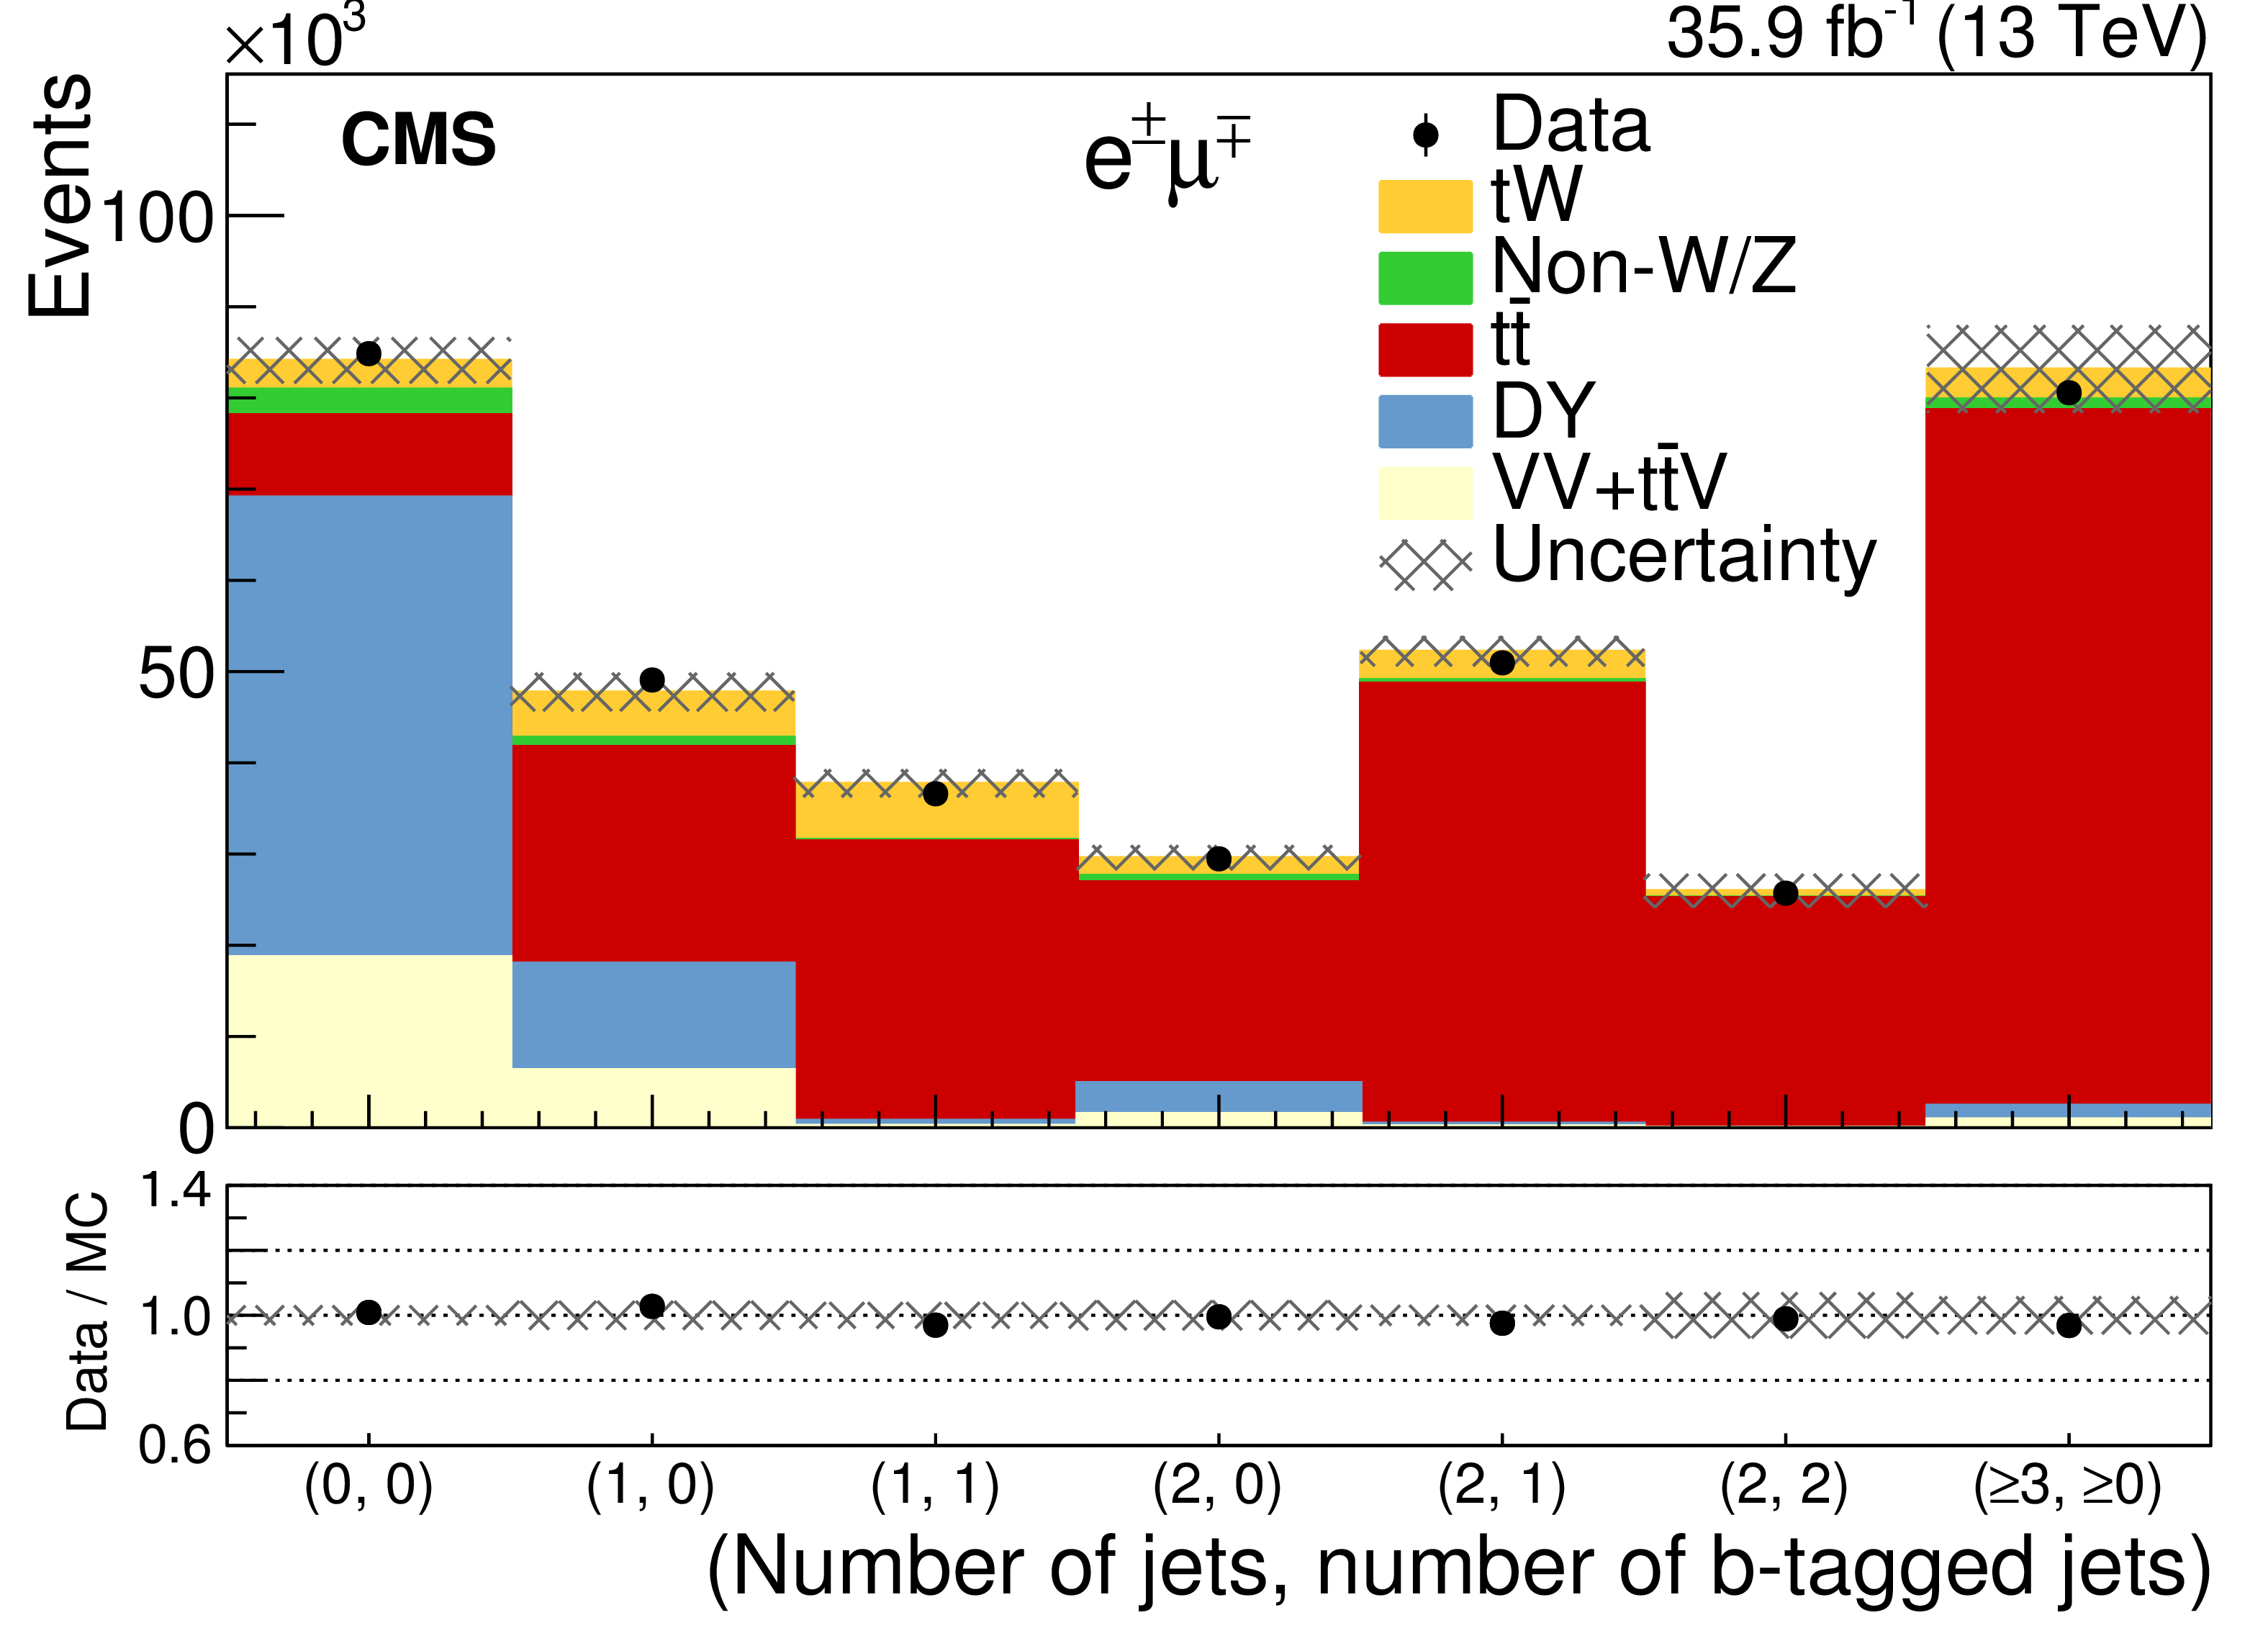
Figure 3:
Yields observed in data, compared with those expected from simulation, as a function of the number of jets and number of b-tagged jets for events passing the baseline dilepton selection. The error band includes the statistical and all systematic uncertainties, except those from background normalization. The bottom of each panel shows the ratios of data to the sum of the expected yields. |
png pdf |
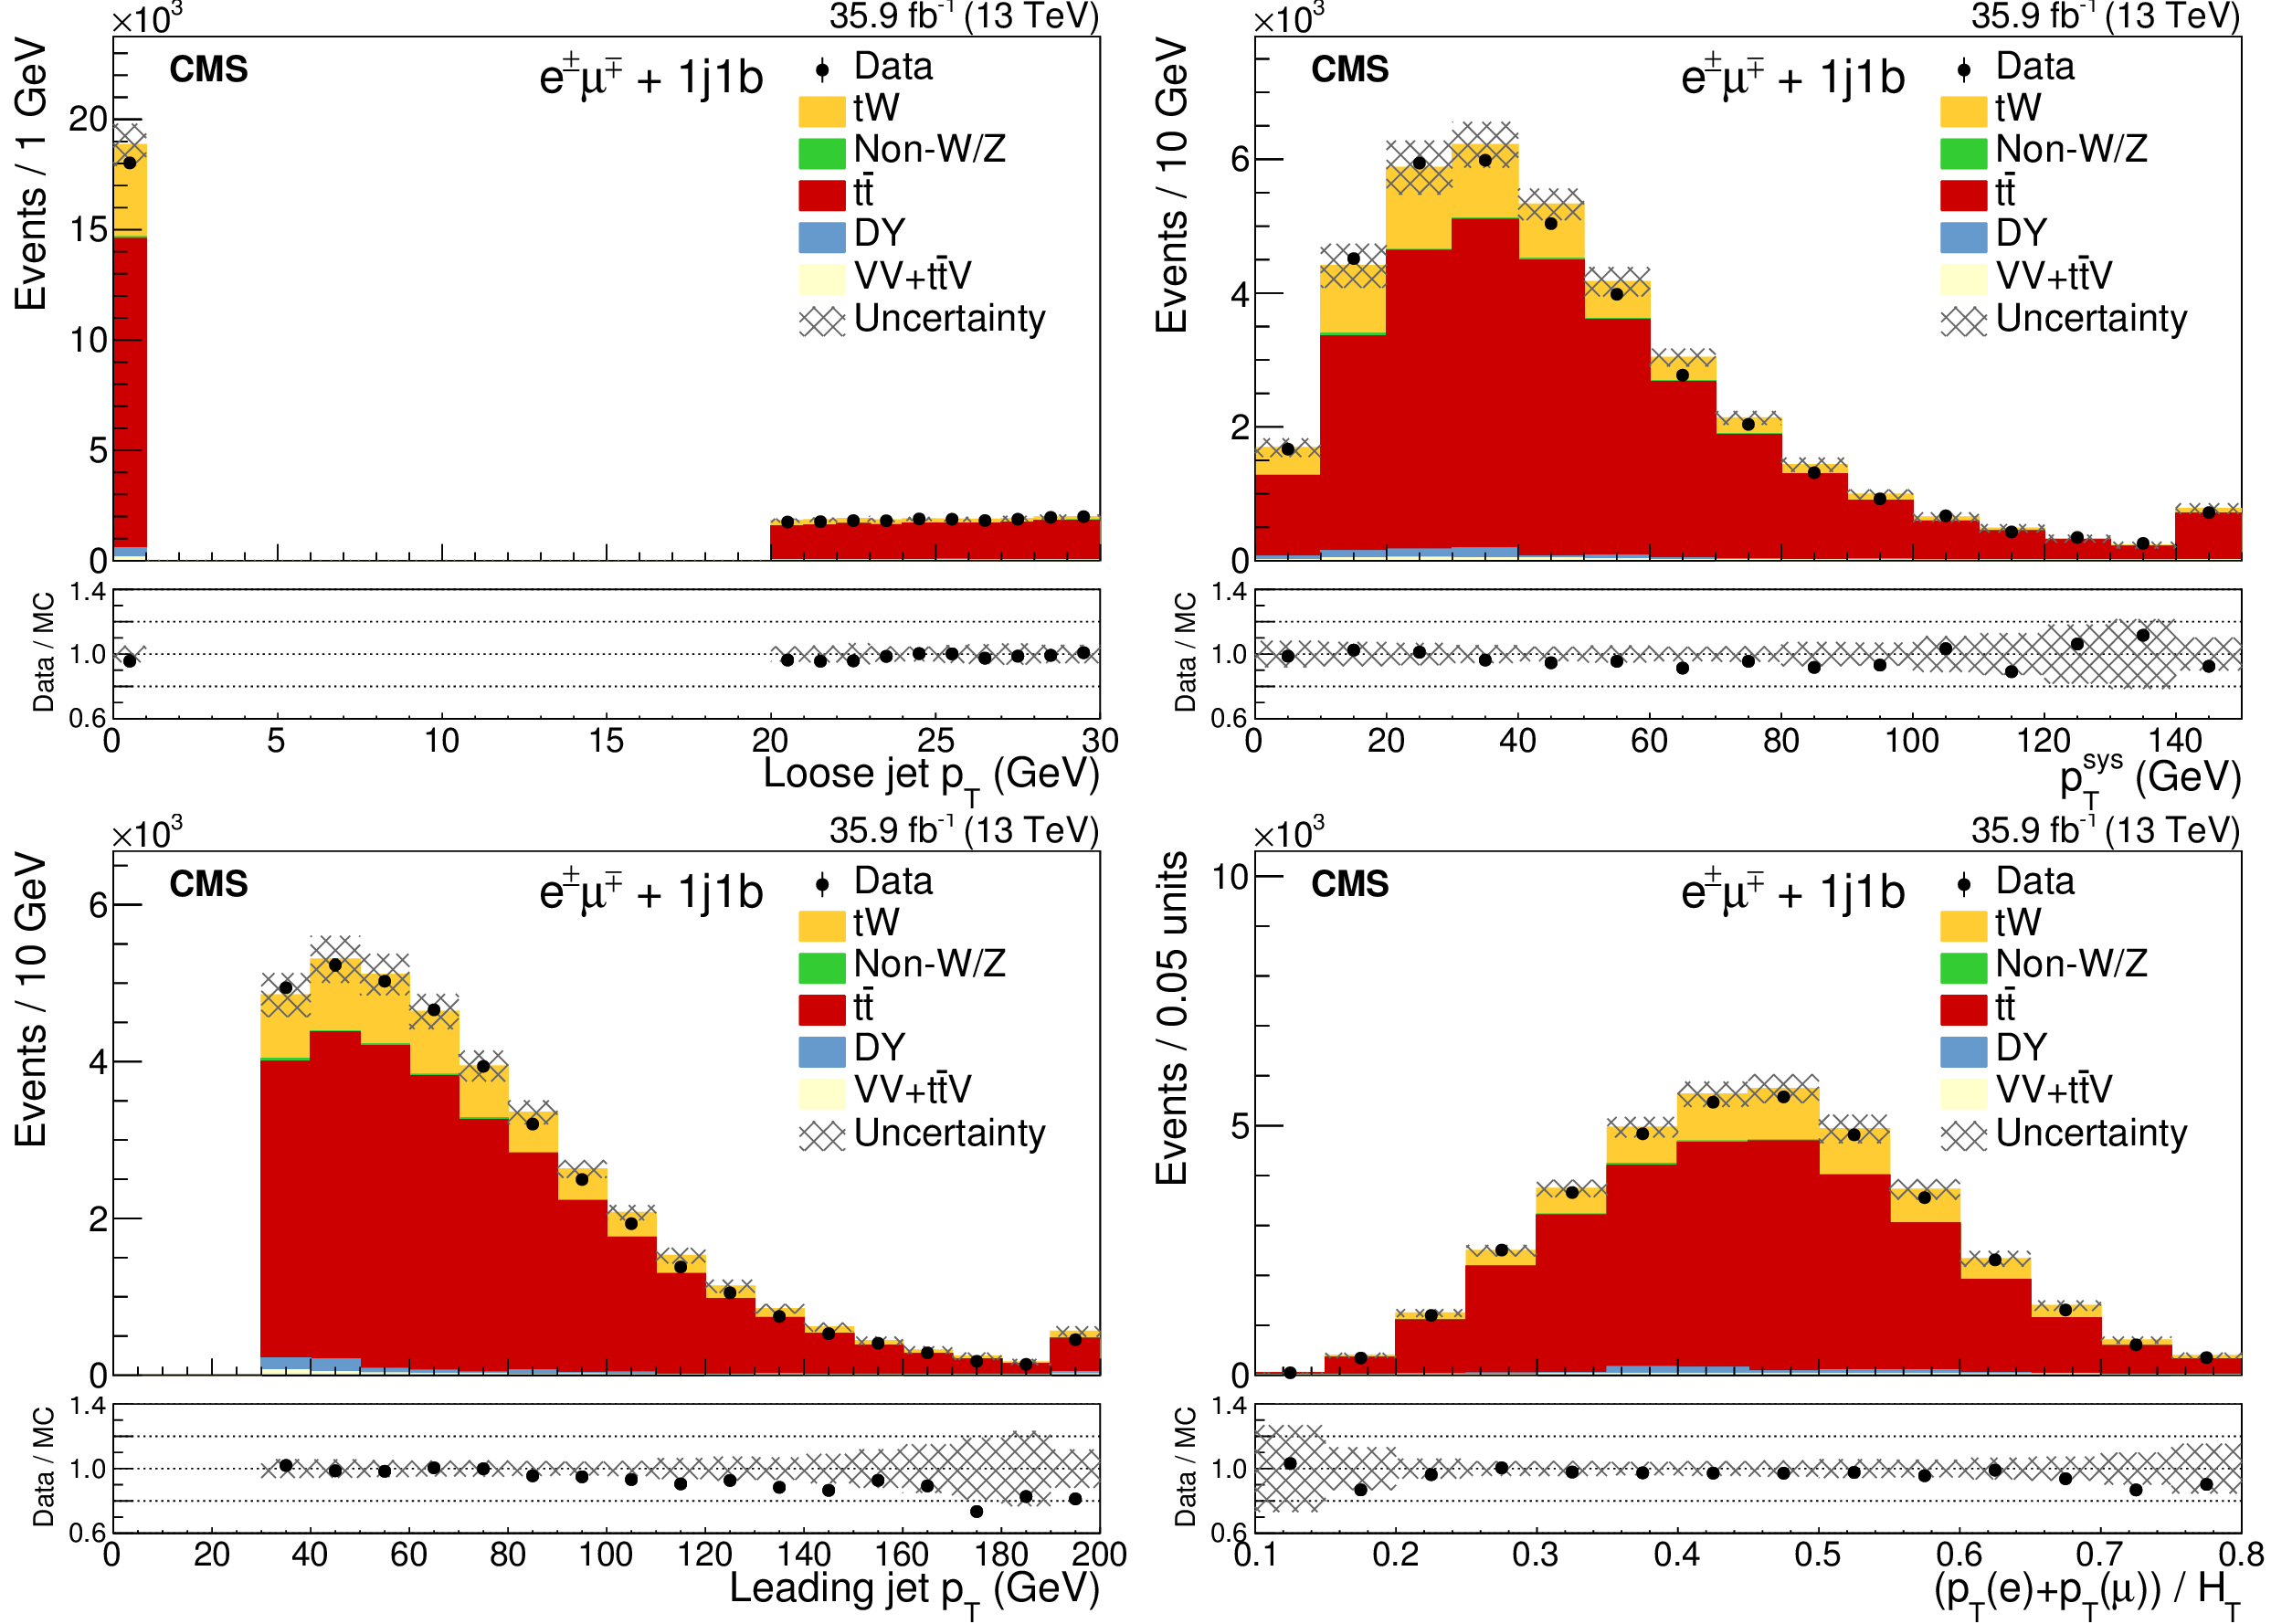
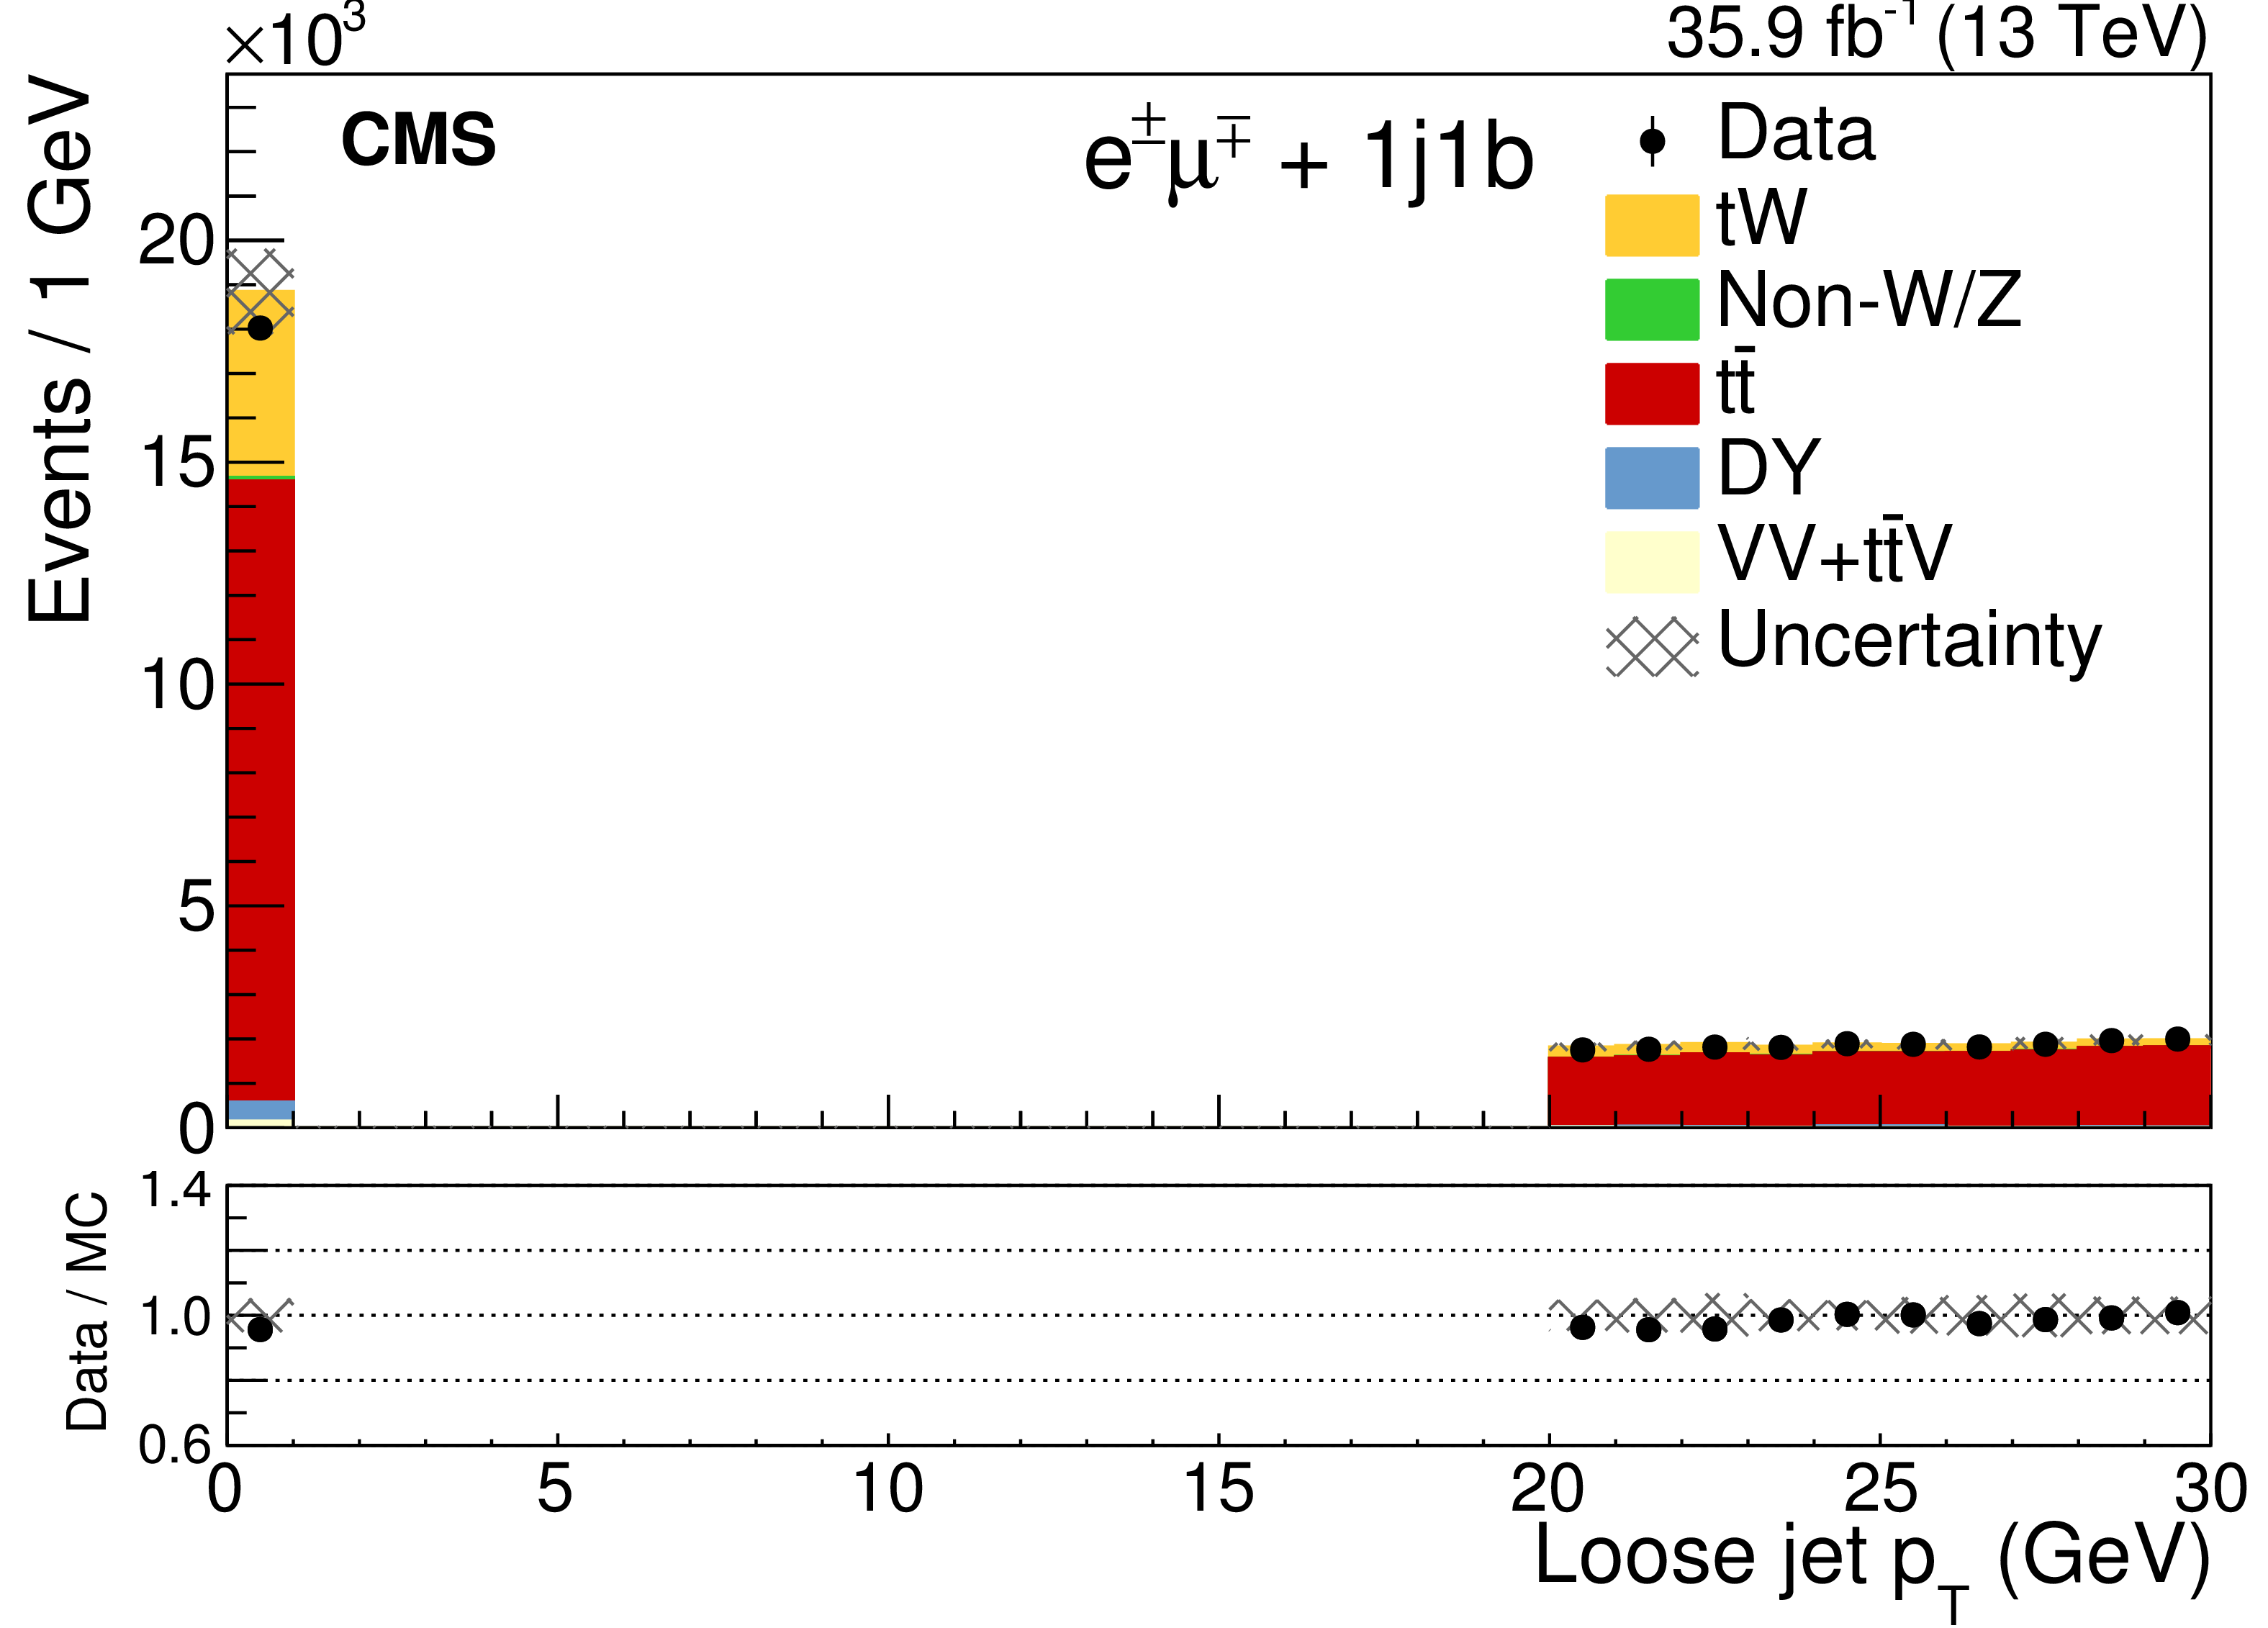
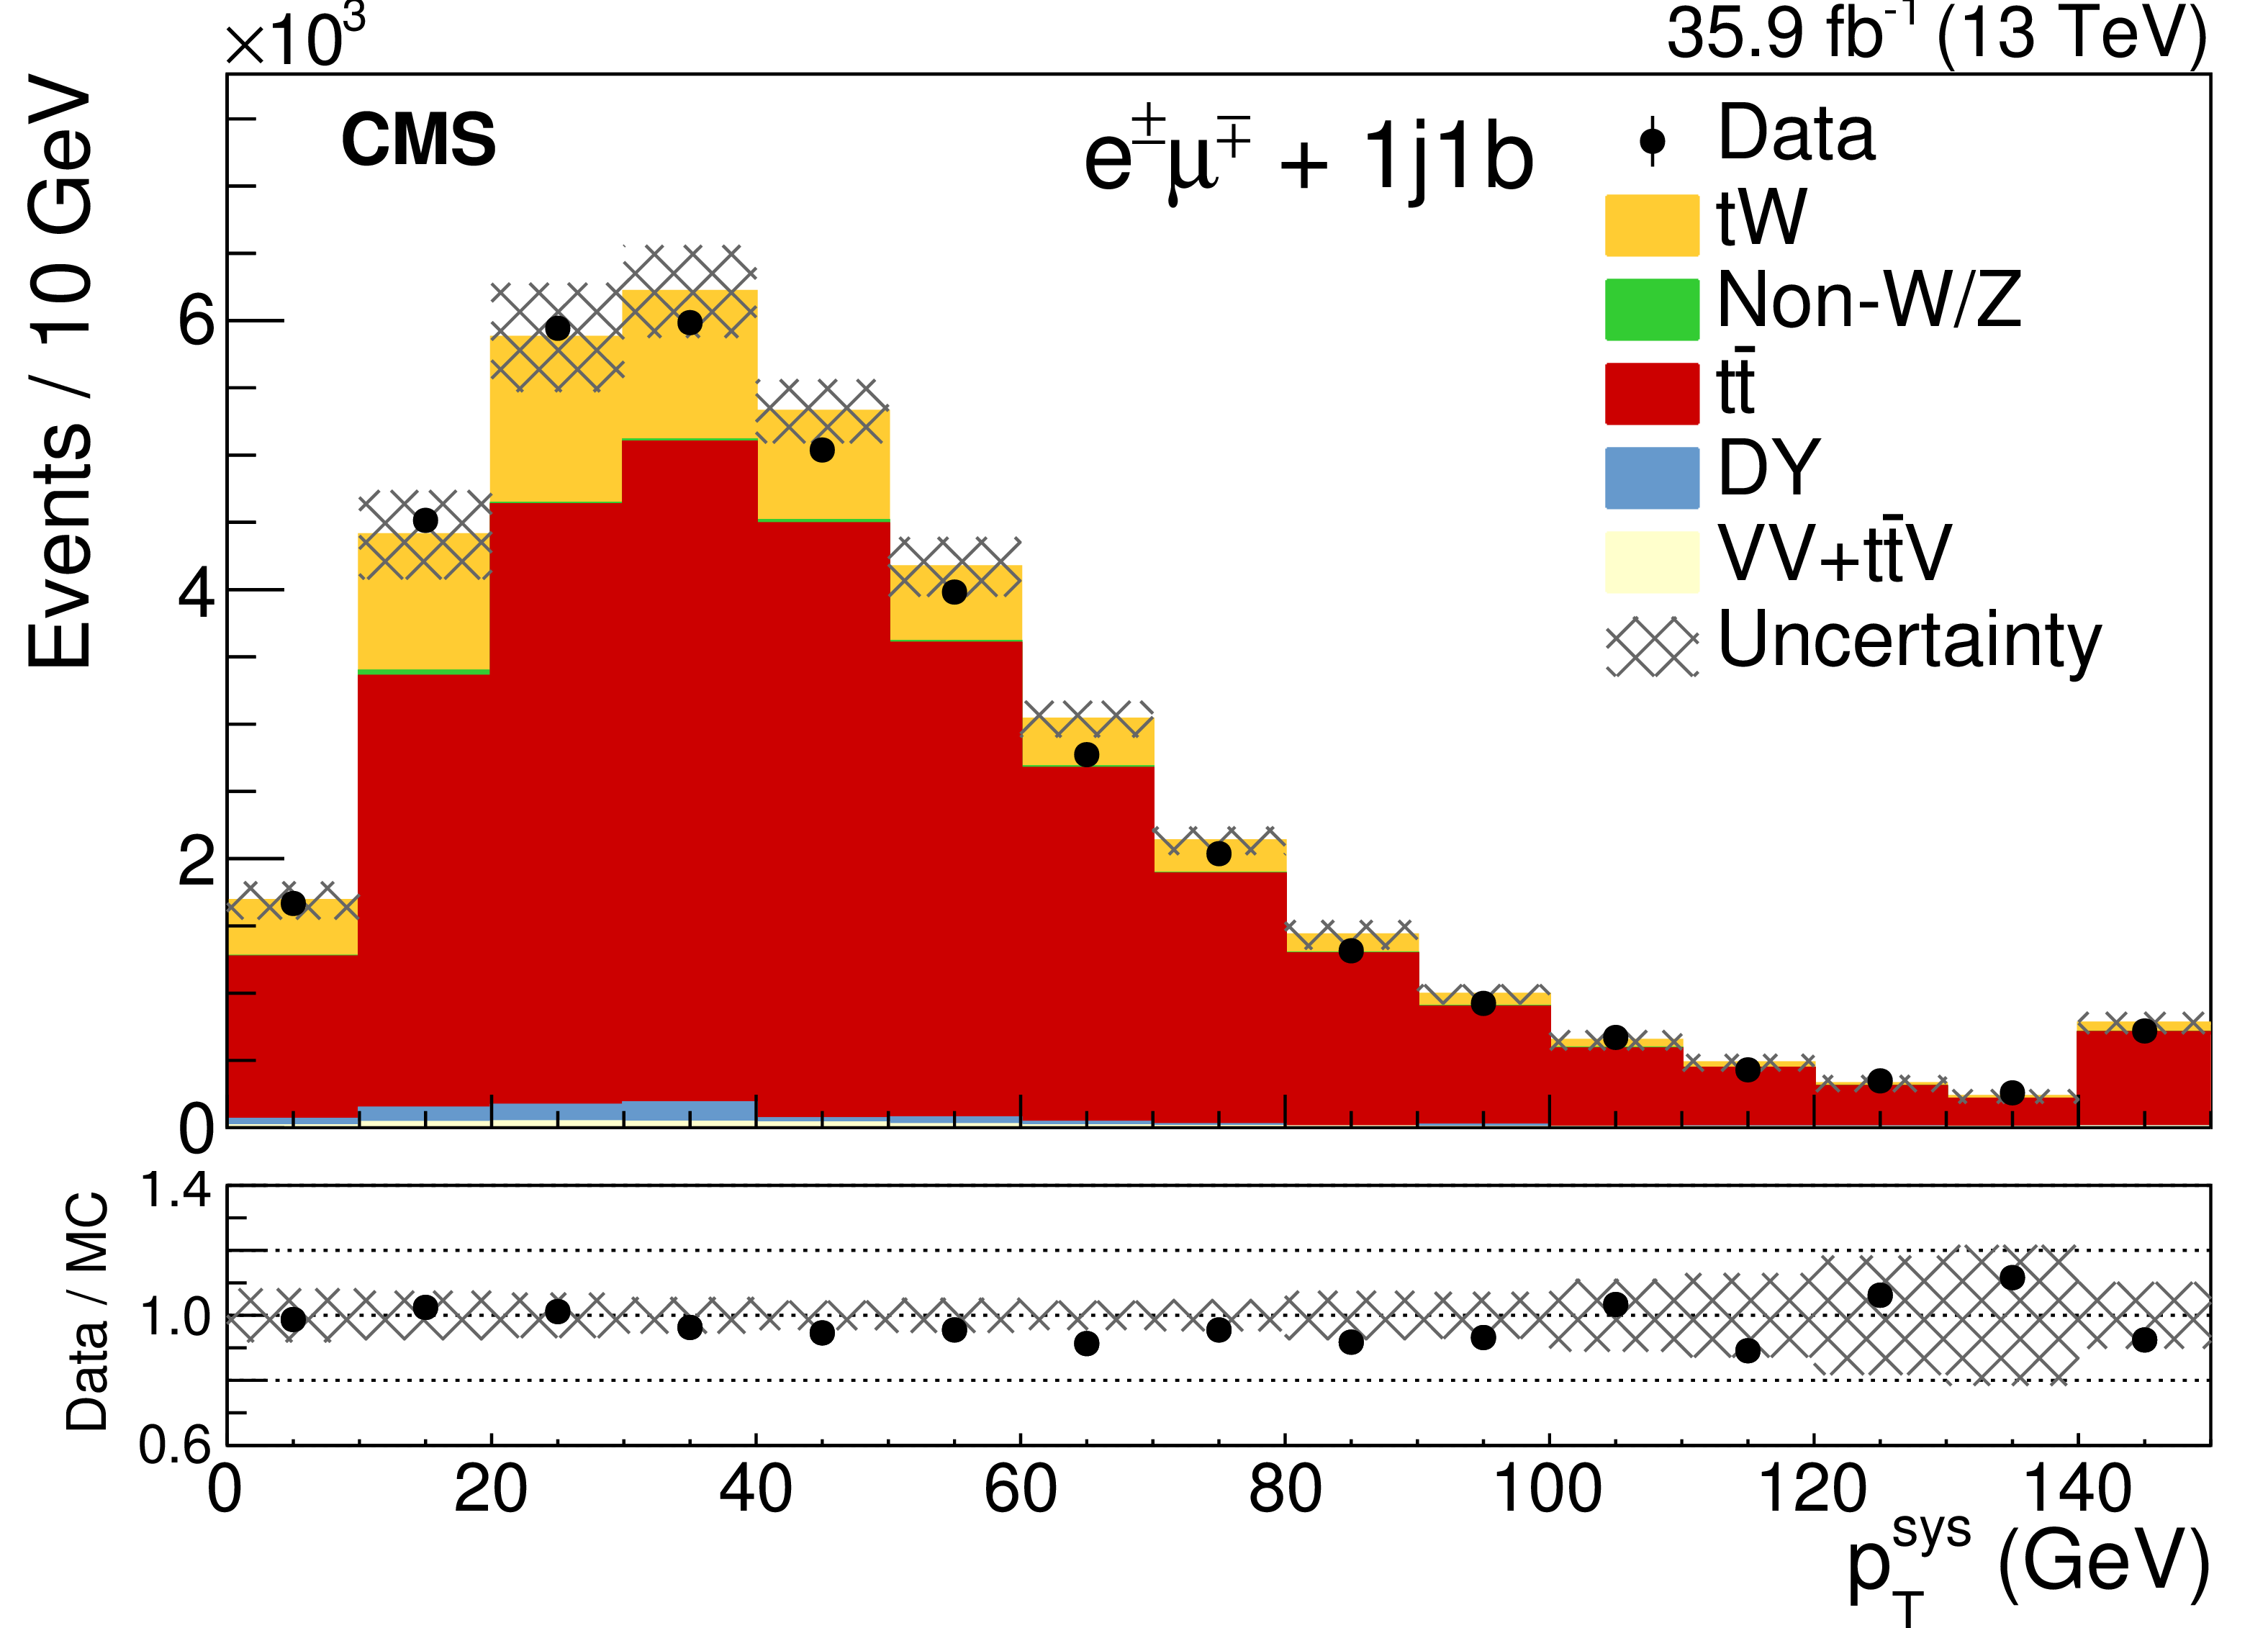
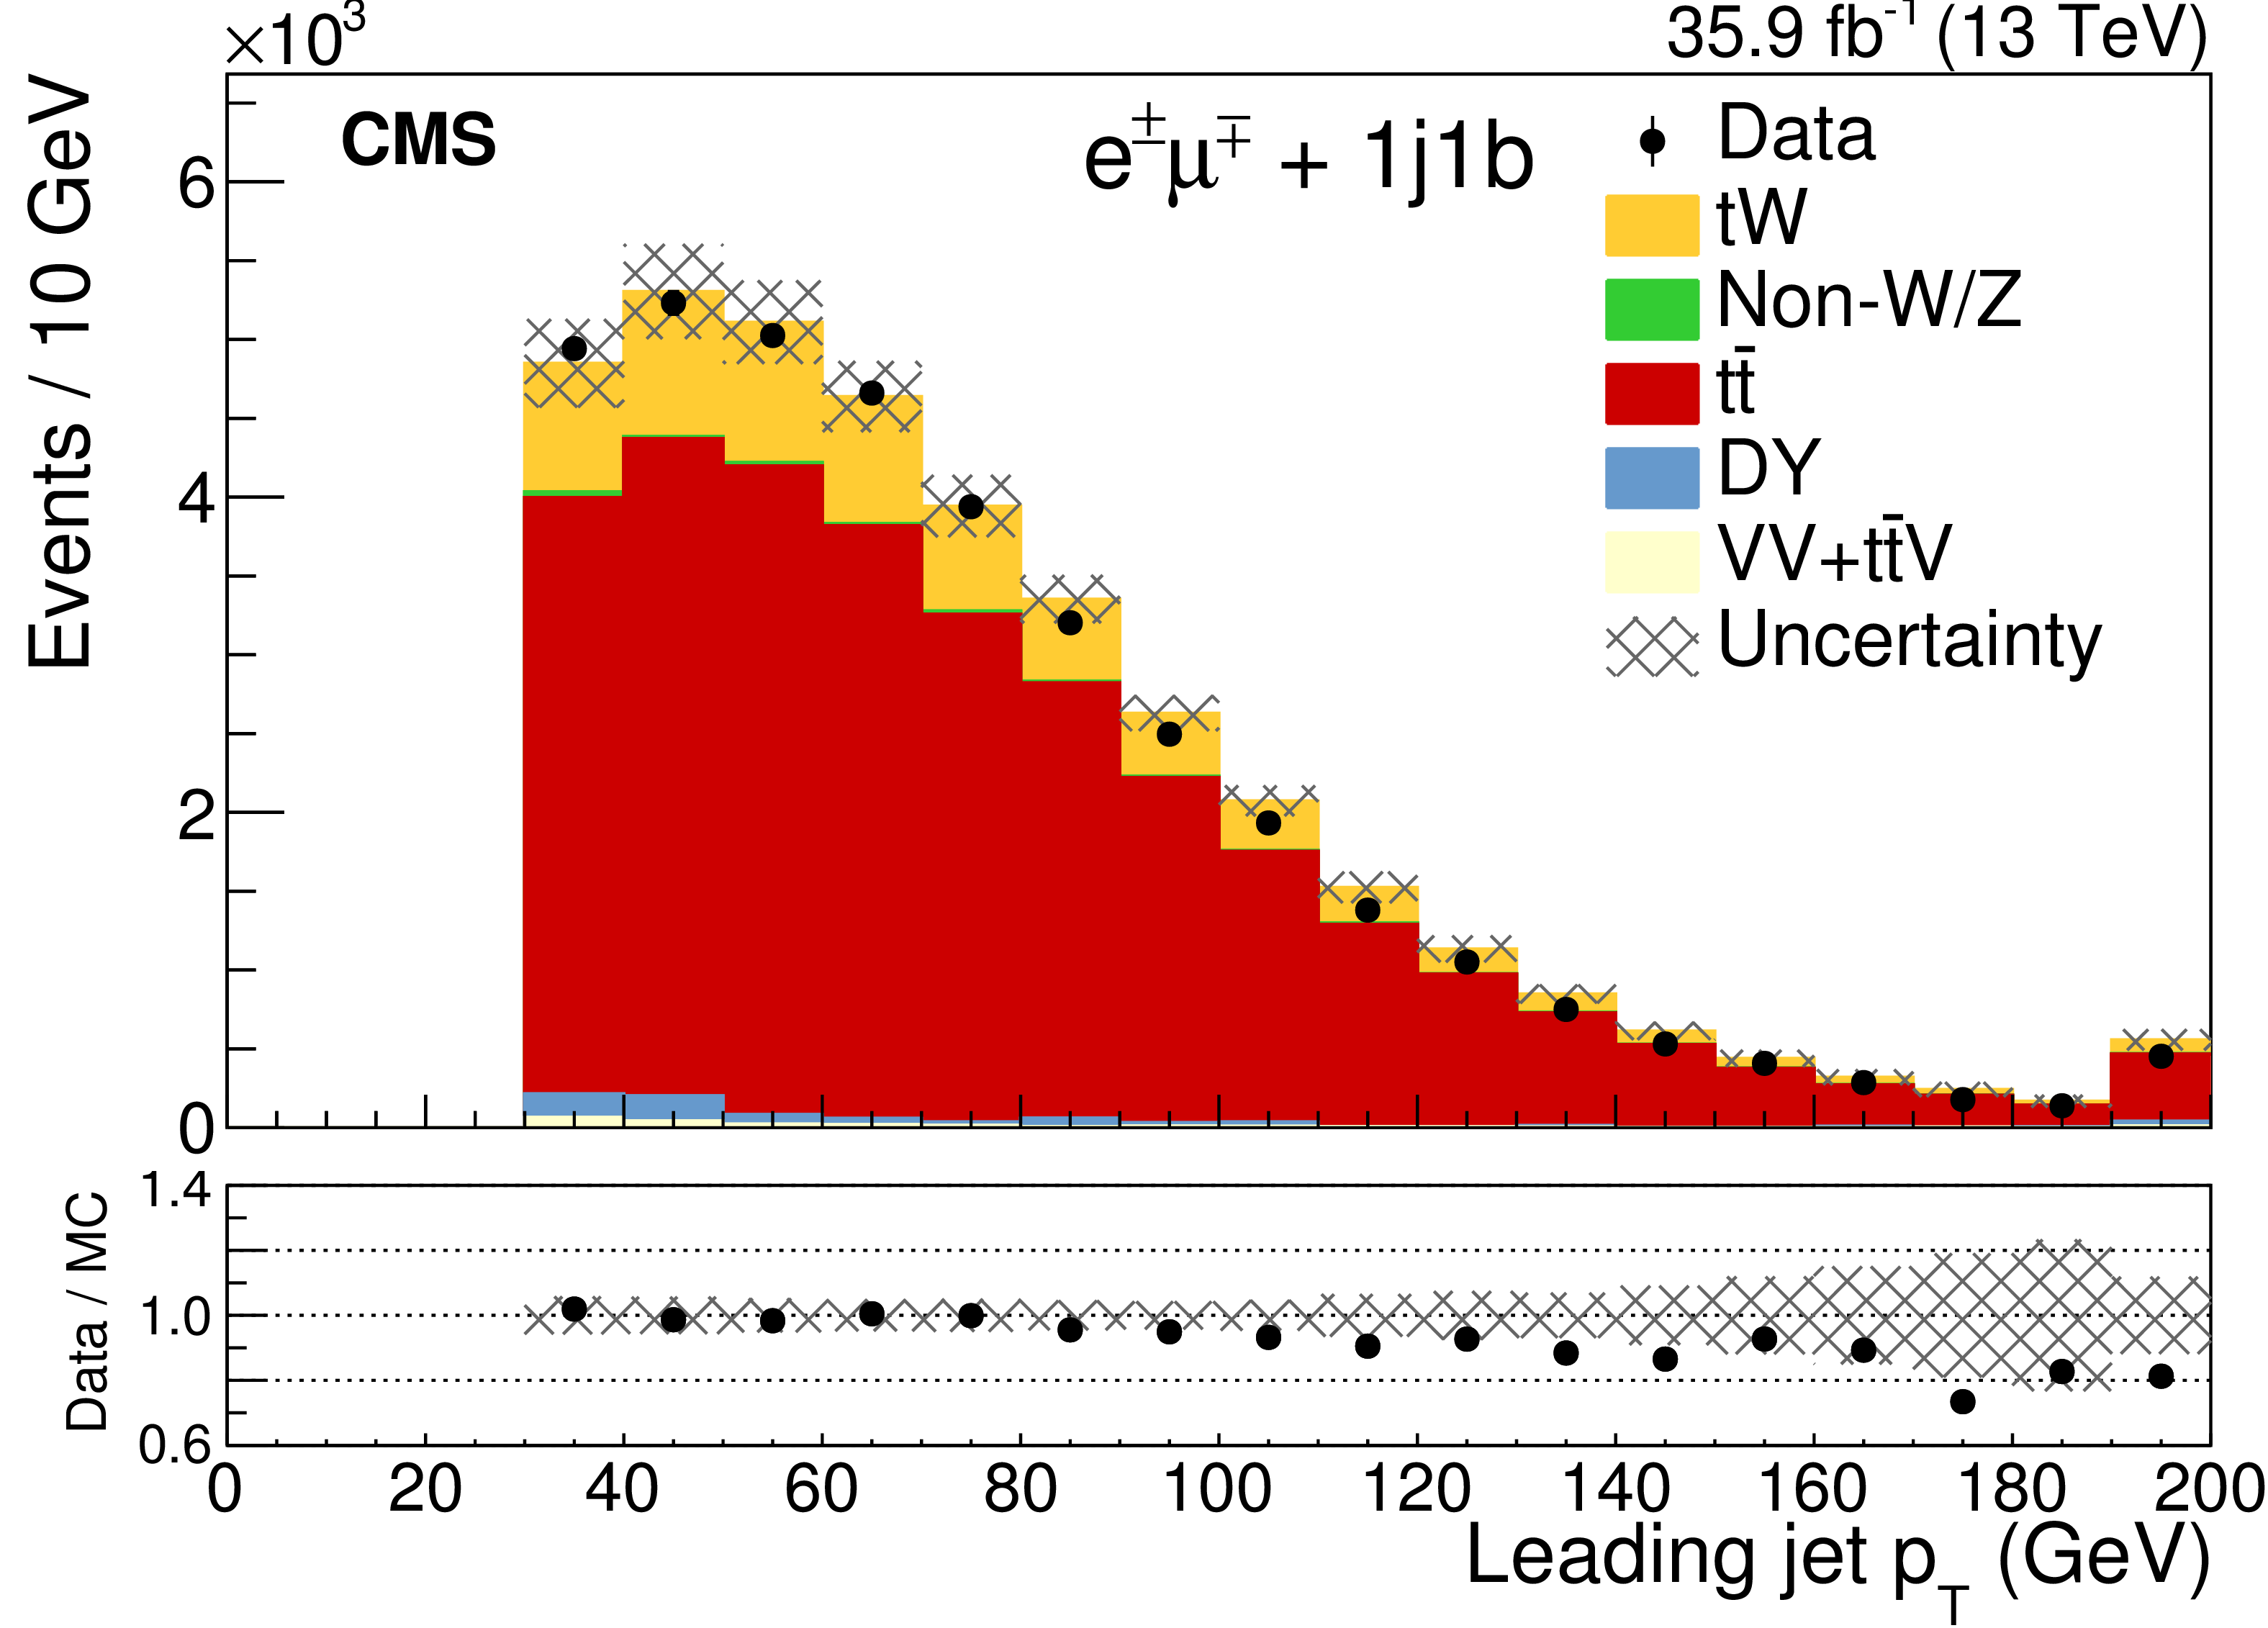
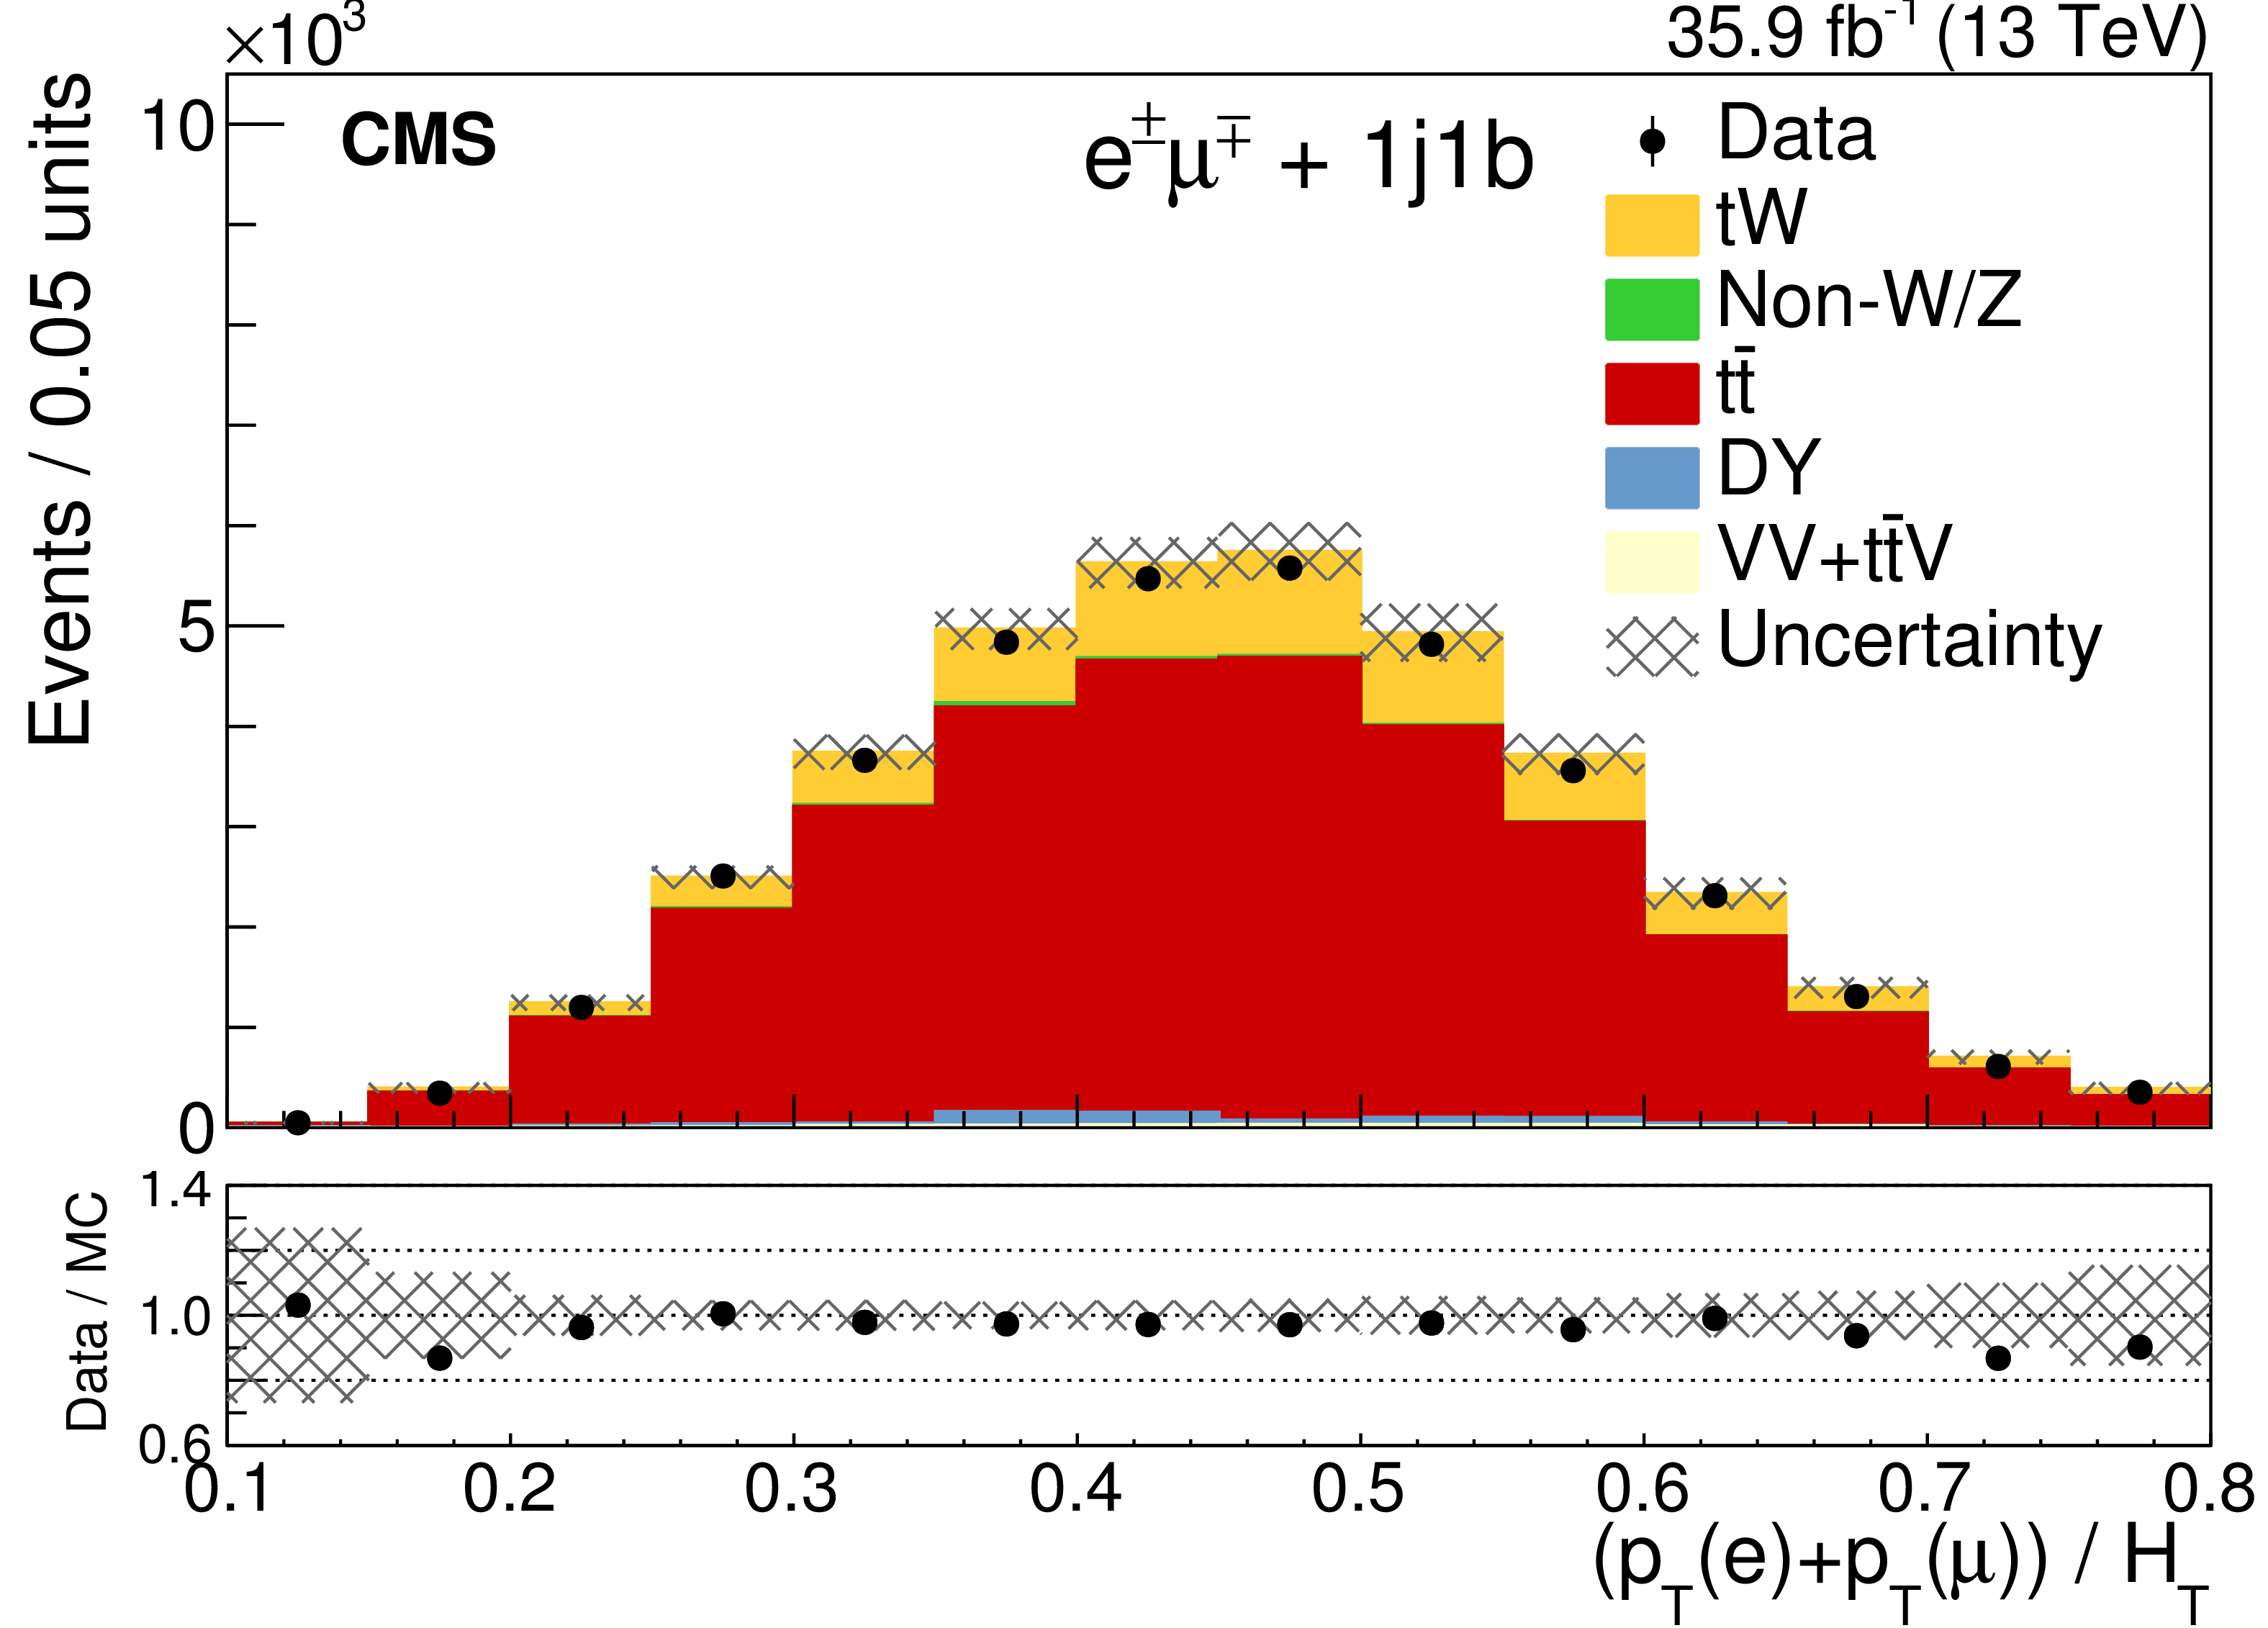
Figure 4:
Most discriminating variables used for the training of the BDT in the 1j1b category. The last bin includes overflow events. The error band includes the statistical and all systematic uncertainties. The bottom of each panel shows the ratios of data to the sum of the expected yields. |
png pdf |
Figure 4-a:
Loose jet $p_{\mathrm{T}}$. The last bin includes overflow events. The error band includes the statistical and all systematic uncertainties. The bottom of the panel shows the ratios of data to the sum of the expected yields. |
png pdf |
Figure 4-b:
$p_{\mathrm{T}}^{\text{sys}}$. The last bin includes overflow events. The error band includes the statistical and all systematic uncertainties. The bottom of the panel shows the ratios of data to the sum of the expected yields. |
png pdf |
Figure 4-c:
Leading jet $p_{\mathrm{T}}$. The last bin includes overflow events. The error band includes the statistical and all systematic uncertainties. The bottom of the panel shows the ratios of data to the sum of the expected yields. |
png pdf |
Figure 4-d:
$( p_{\mathrm{T}}(\mathrm{e})+p_{\mathrm{T}}(\mu) )/H_{\mathrm{T}} $. The last bin includes overflow events. The error band includes the statistical and all systematic uncertainties. The bottom of the panel shows the ratios of data to the sum of the expected yields. |
png pdf |
Figure 5:
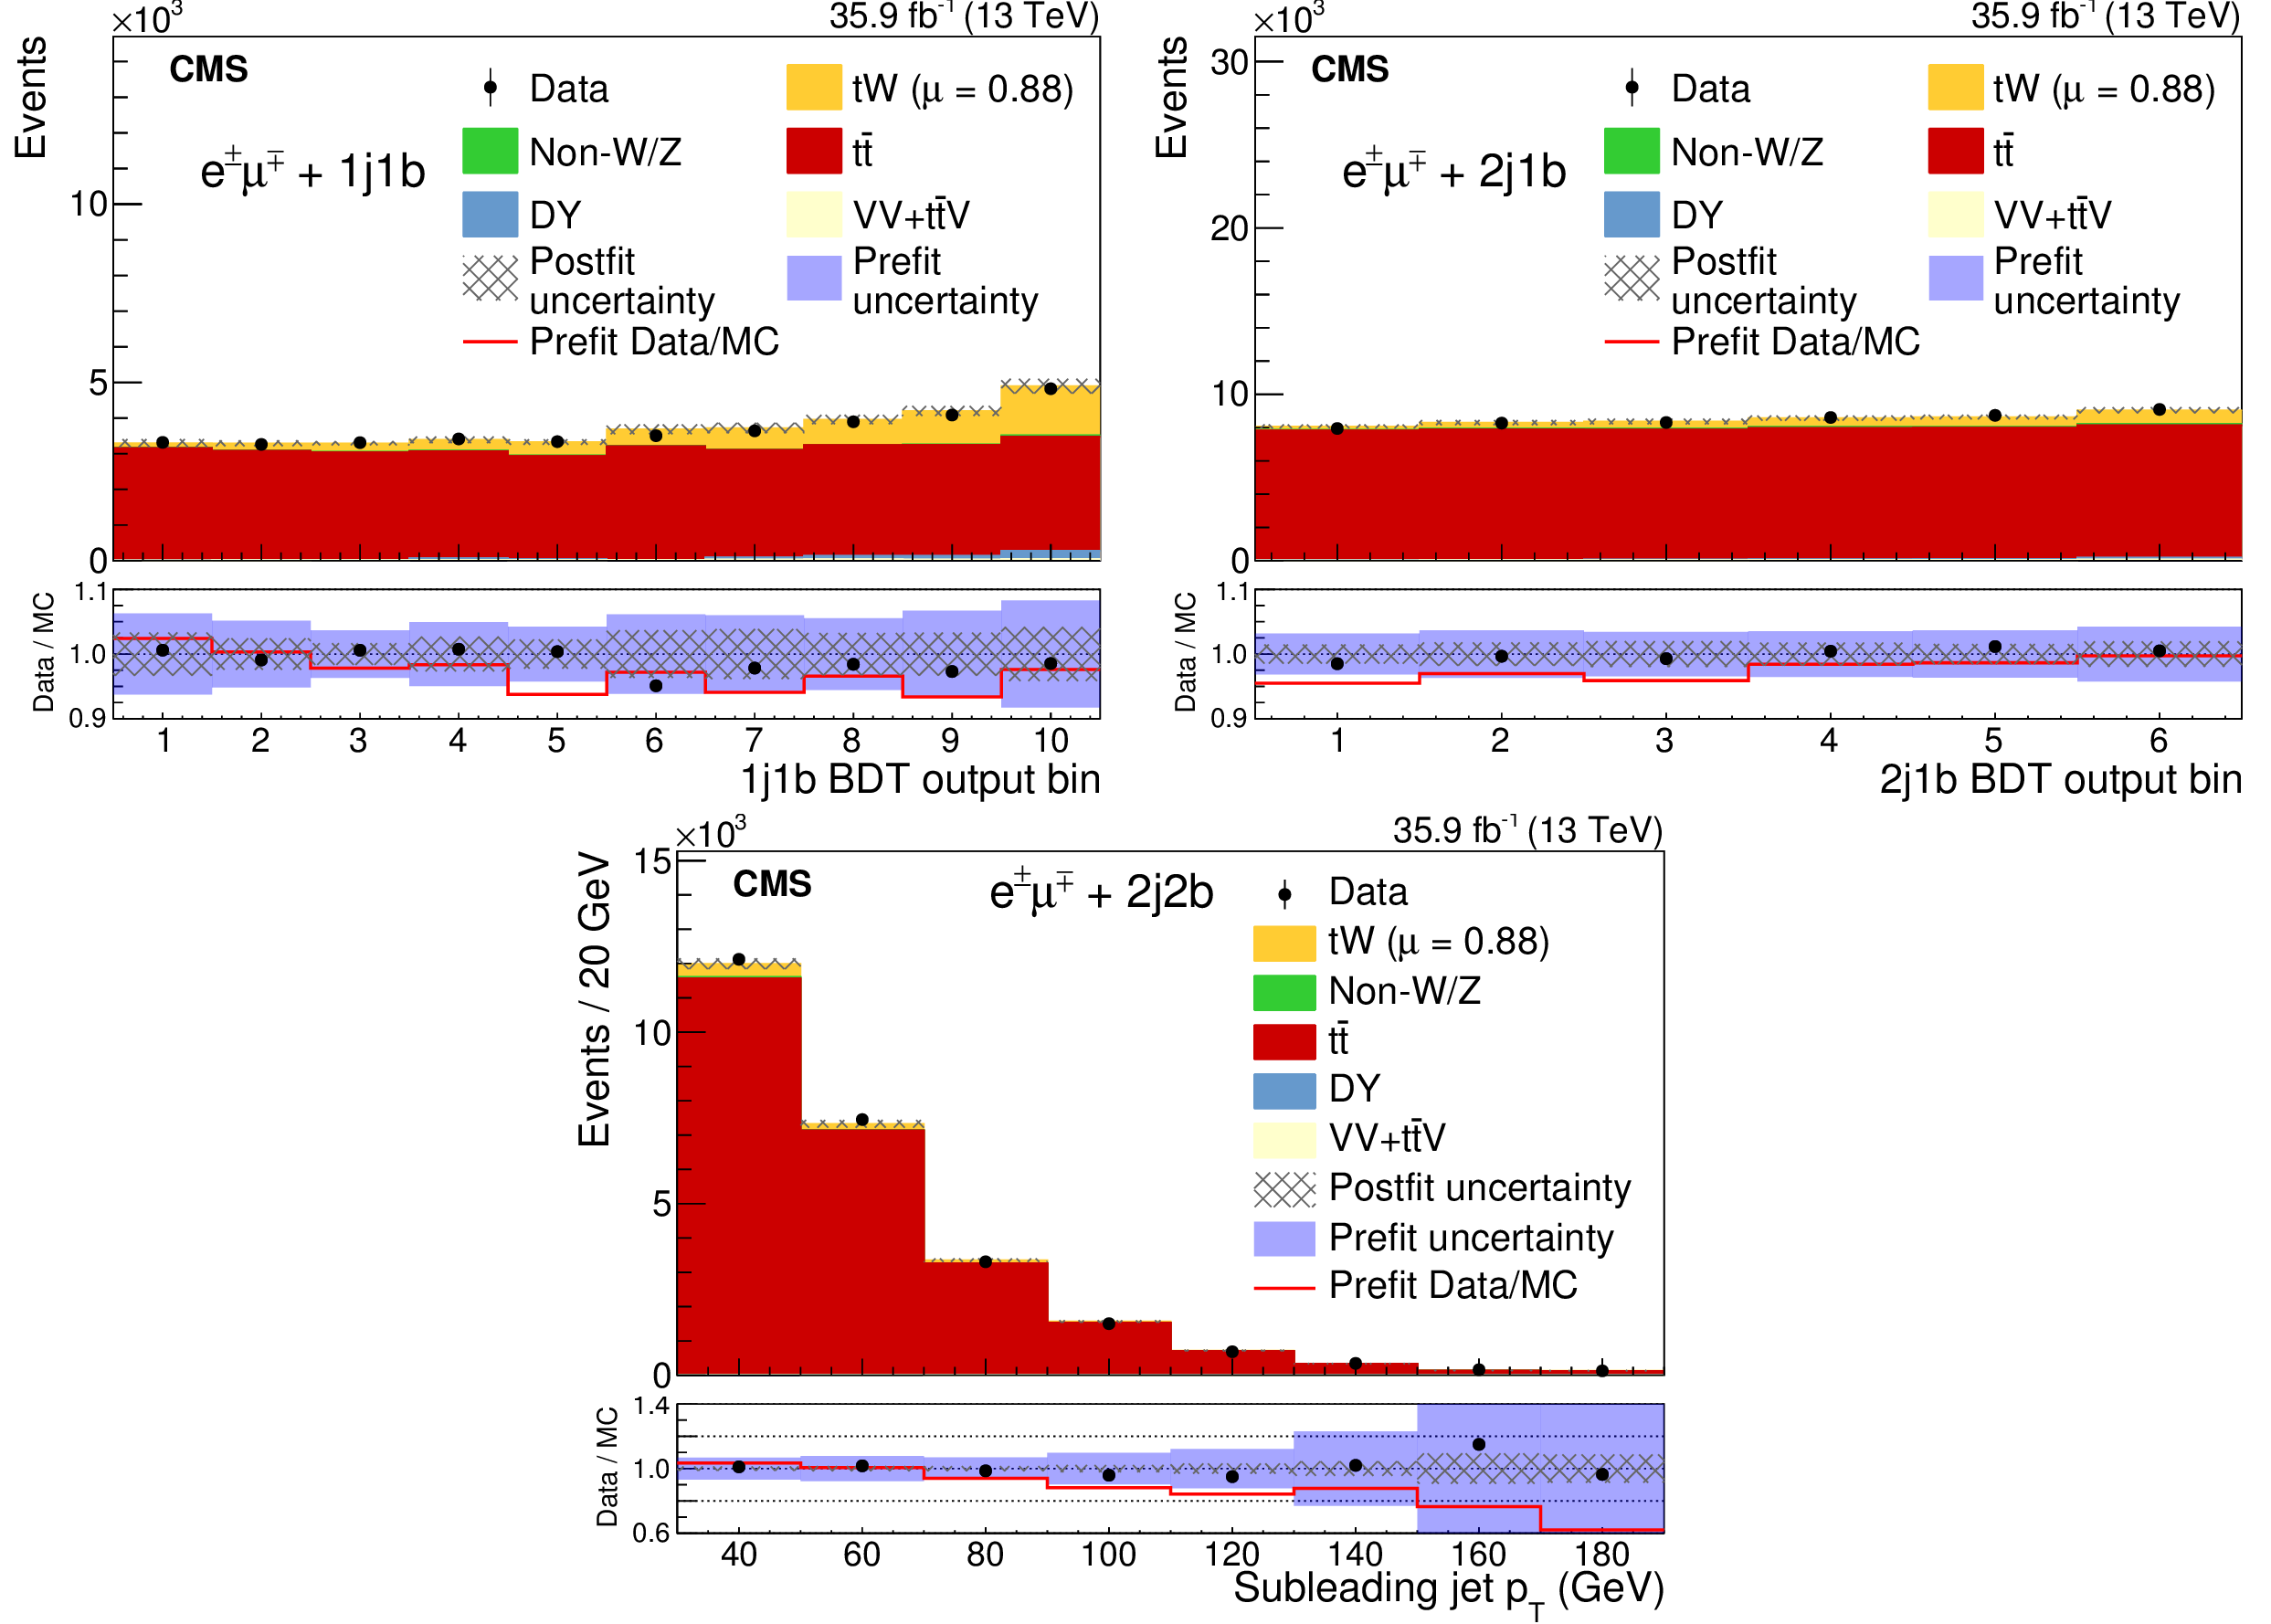
Comparison of the BDT output in the 1j1b (upper left) and 2j1b (upper right) regions and the ${p_{\mathrm {T}}}$ of the subleading jet in the 2j2b region (lower) distributions after the fit is performed for the observed data and simulated events. The error band includes the statistical and systematic uncertainties. The bottom of each panel shows the ratios of data to the prediction from simulations and from the fit. |

png pdf |
Figure 5-a:
Comparison of the BDT output in the 1j1b region, after the fit is performed for the observed data and simulated events. The error band includes the statistical and systematic uncertainties. The bottom of the panel shows the ratios of data to the prediction from simulations and from the fit. |
png pdf |
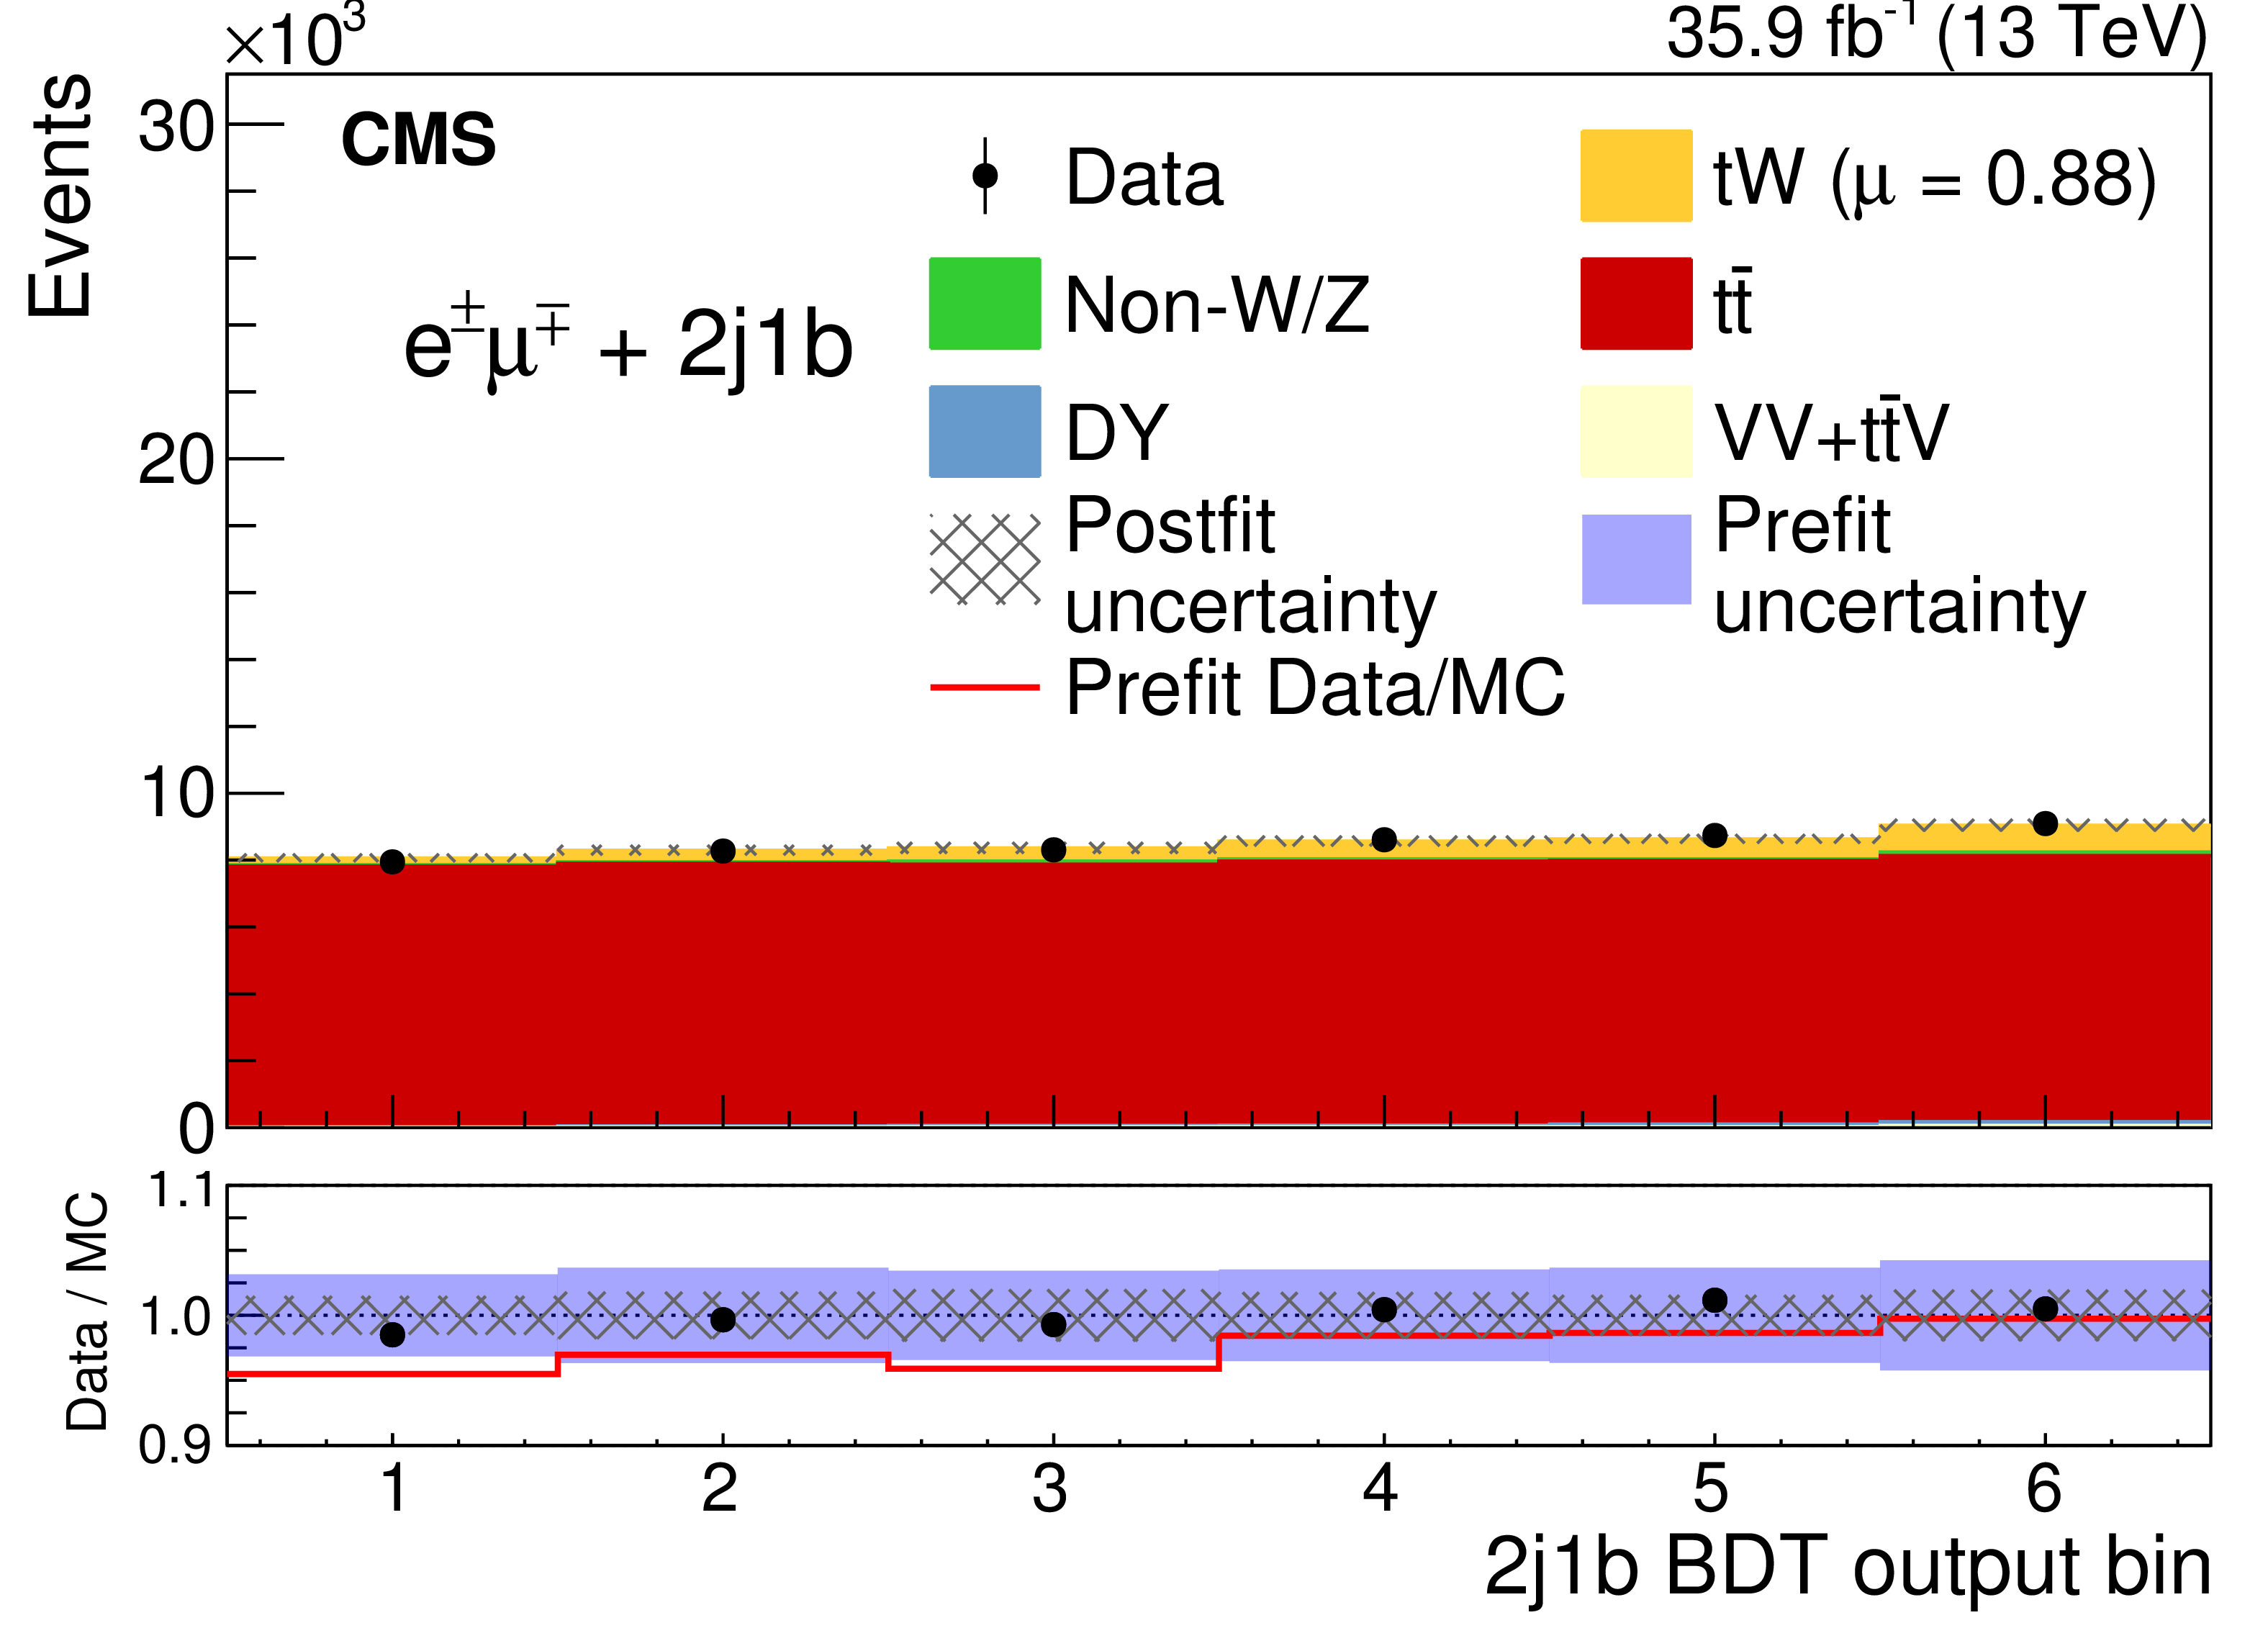
Figure 5-b:
Comparison of the BDT output in the 2j1b region, after the fit is performed for the observed data and simulated events. The error band includes the statistical and systematic uncertainties. The bottom of the panel shows the ratios of data to the prediction from simulations and from the fit. |
png pdf |
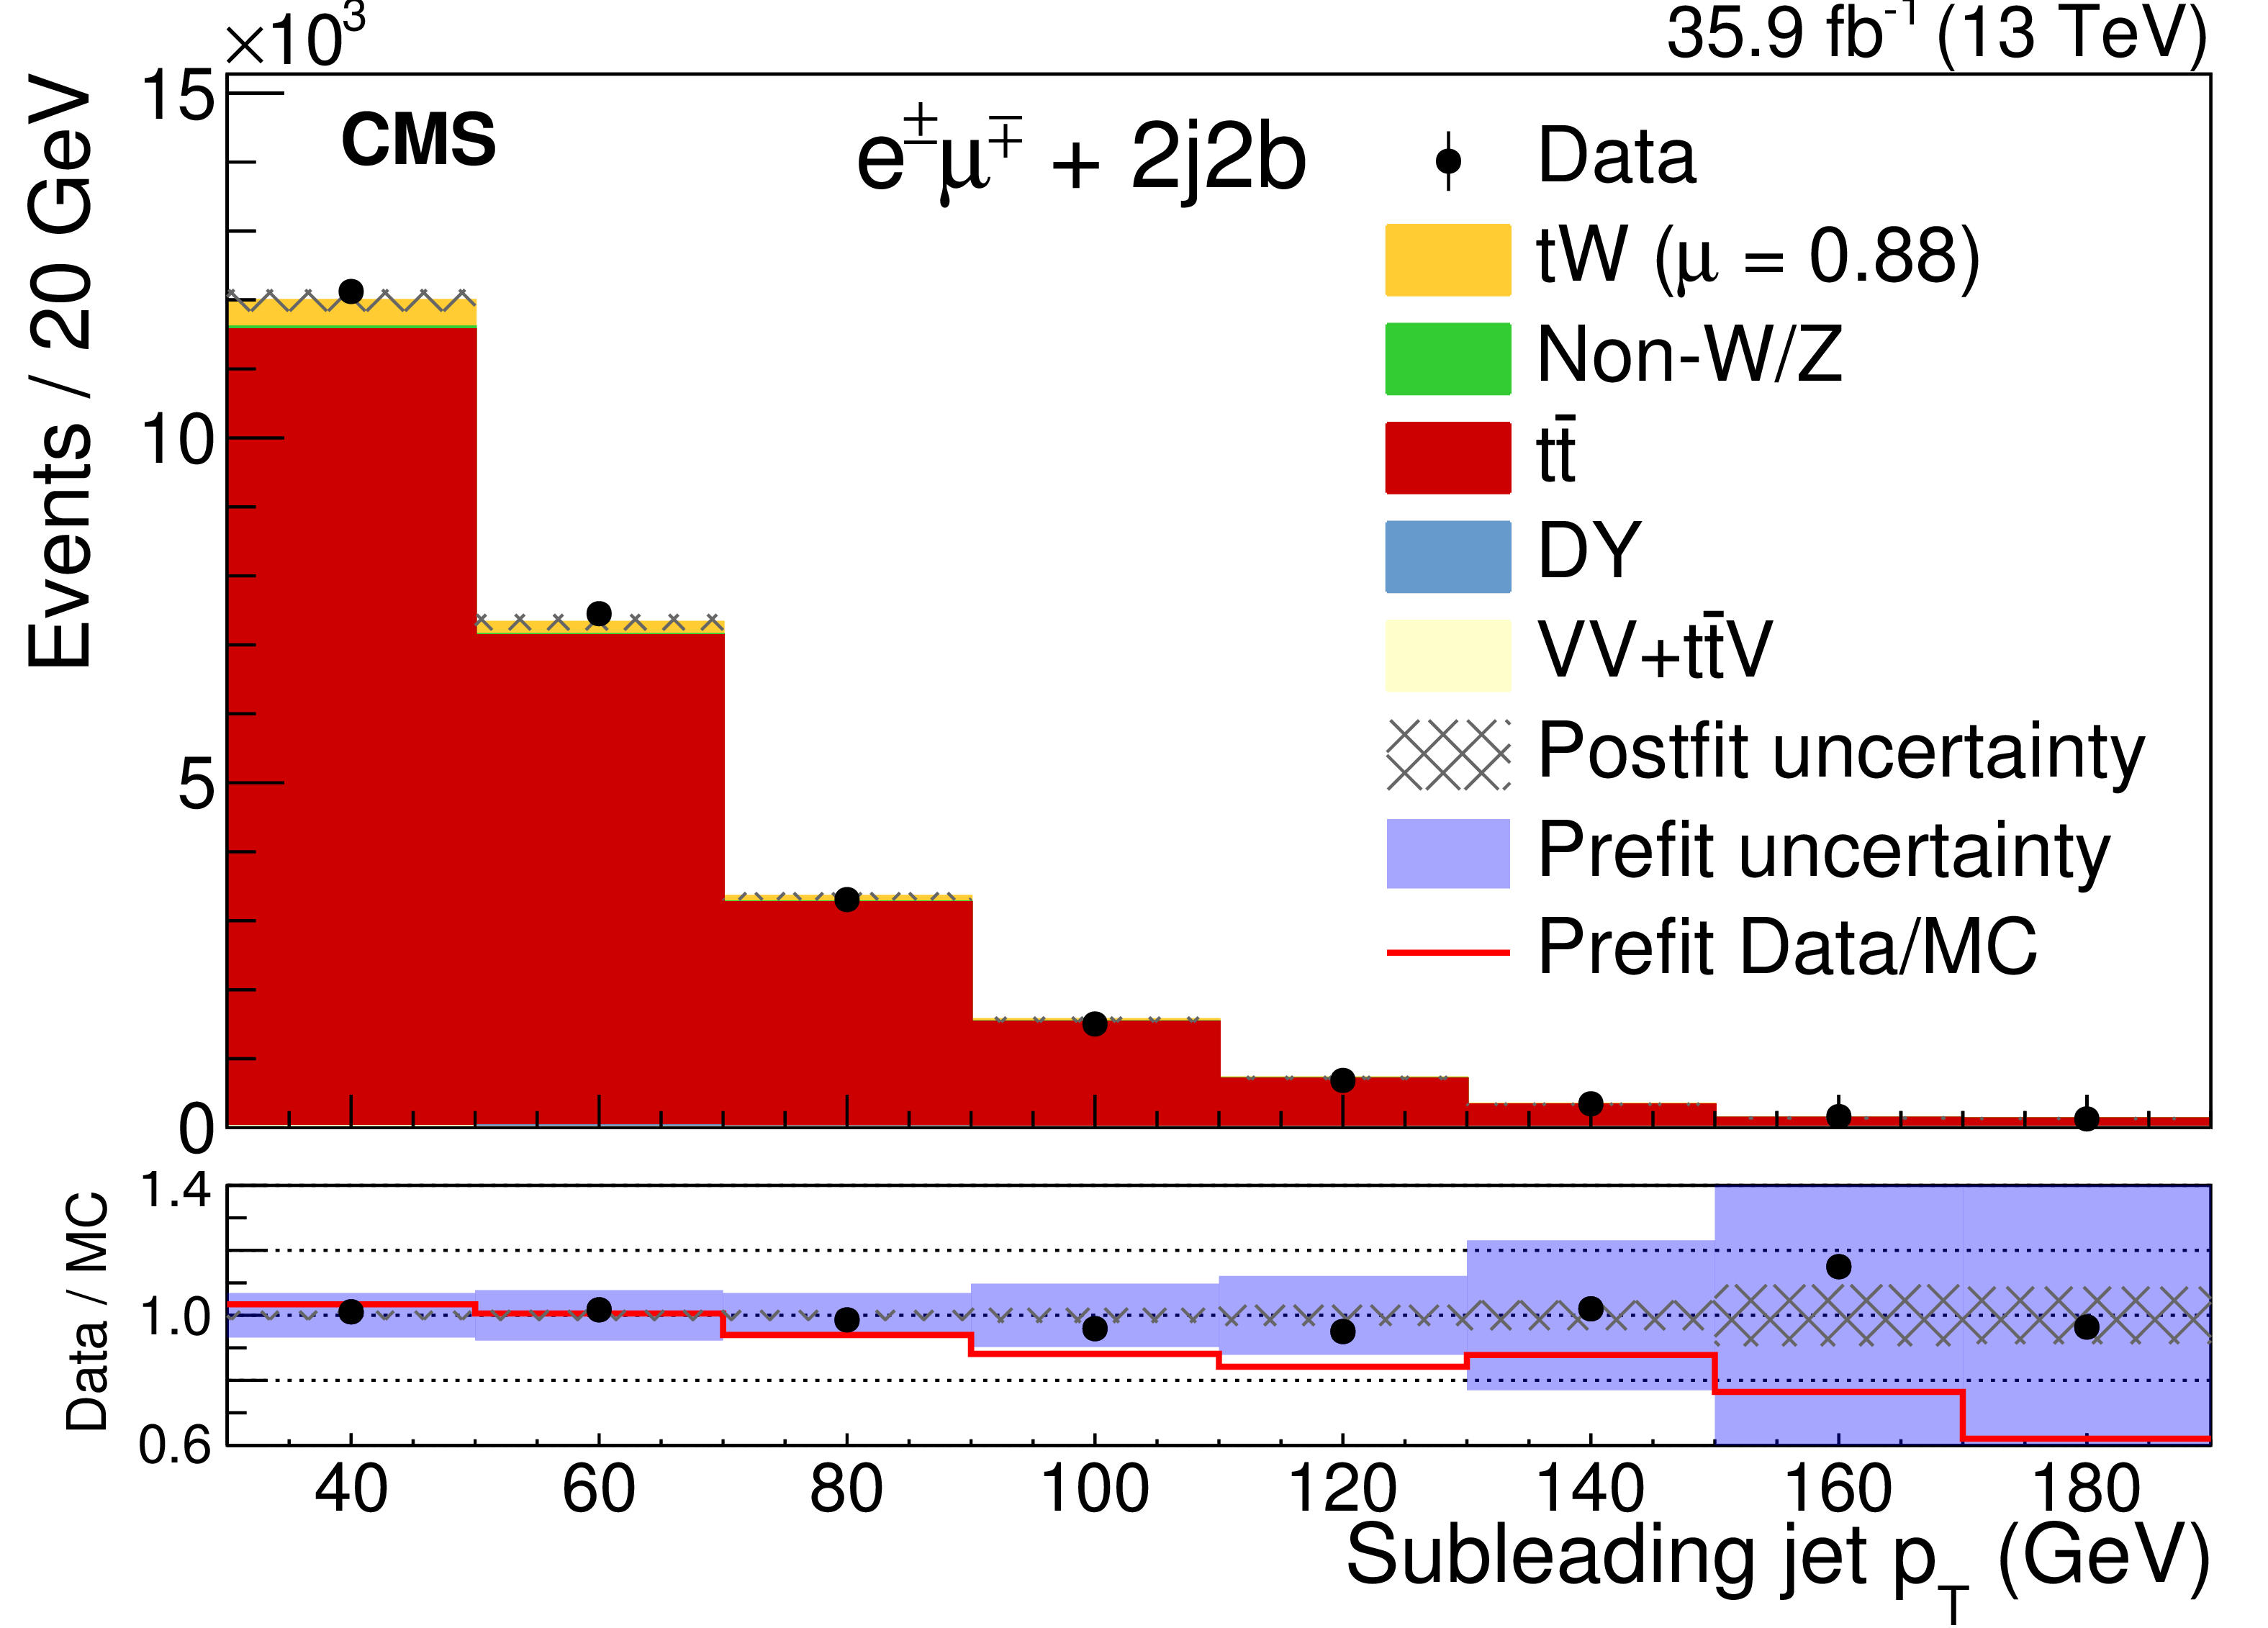
Figure 5-c:
Distribution of the ${p_{\mathrm {T}}}$ of the subleading jet in the 2j2b region, after the fit is performed for the observed data and simulated events. The error band includes the statistical and systematic uncertainties. The bottom of the panel shows the ratios of data to the prediction from simulations and from the fit. |
| Tables | |
png pdf |
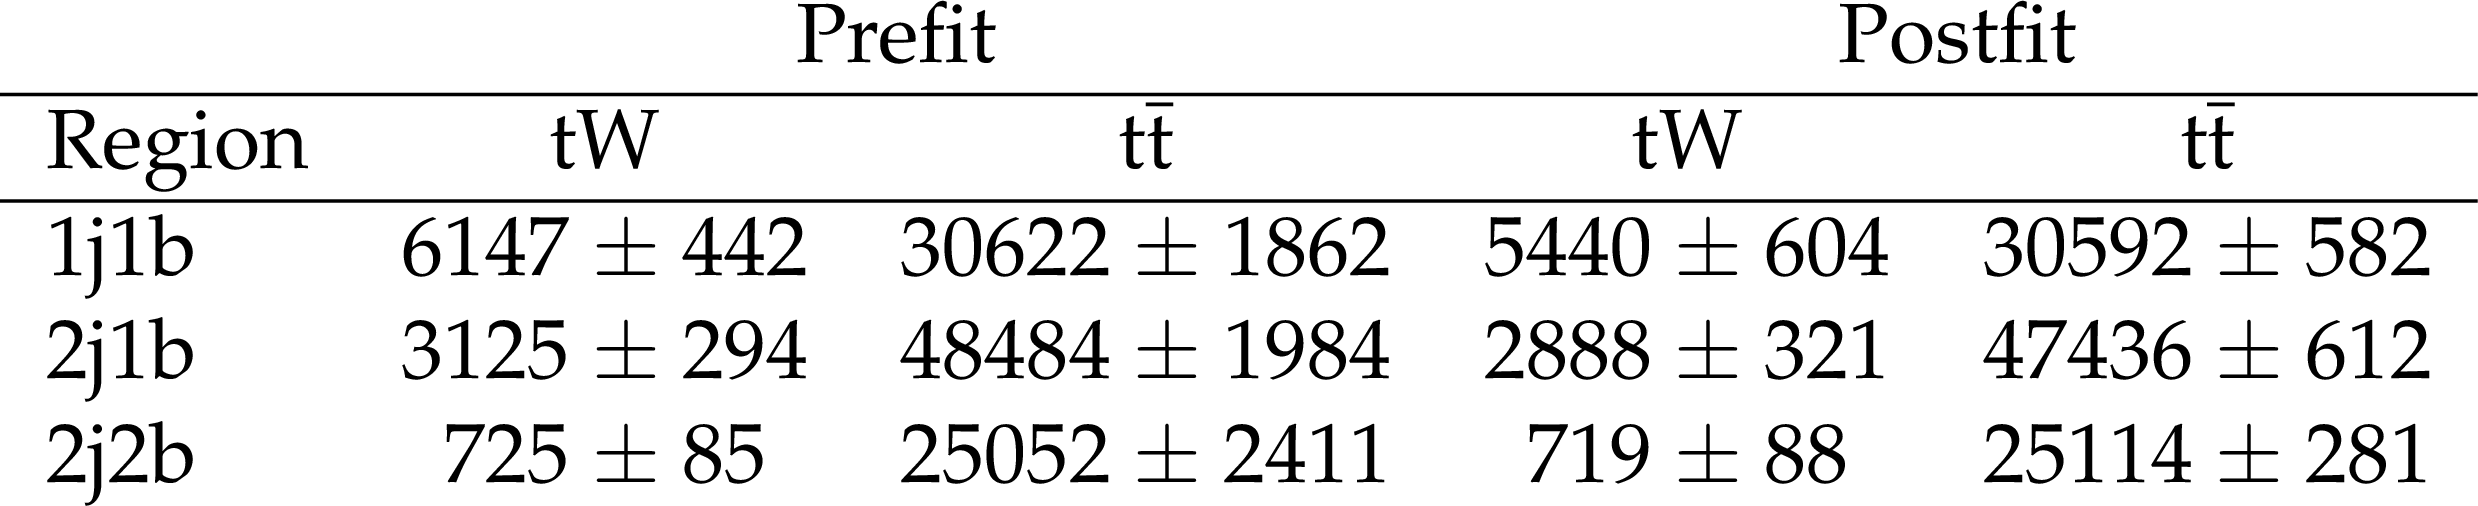
Table 1:
Number of expected prefit and postfit signal and $ {{\mathrm {t}\overline {\mathrm {t}}}} $ background events. |
png pdf |
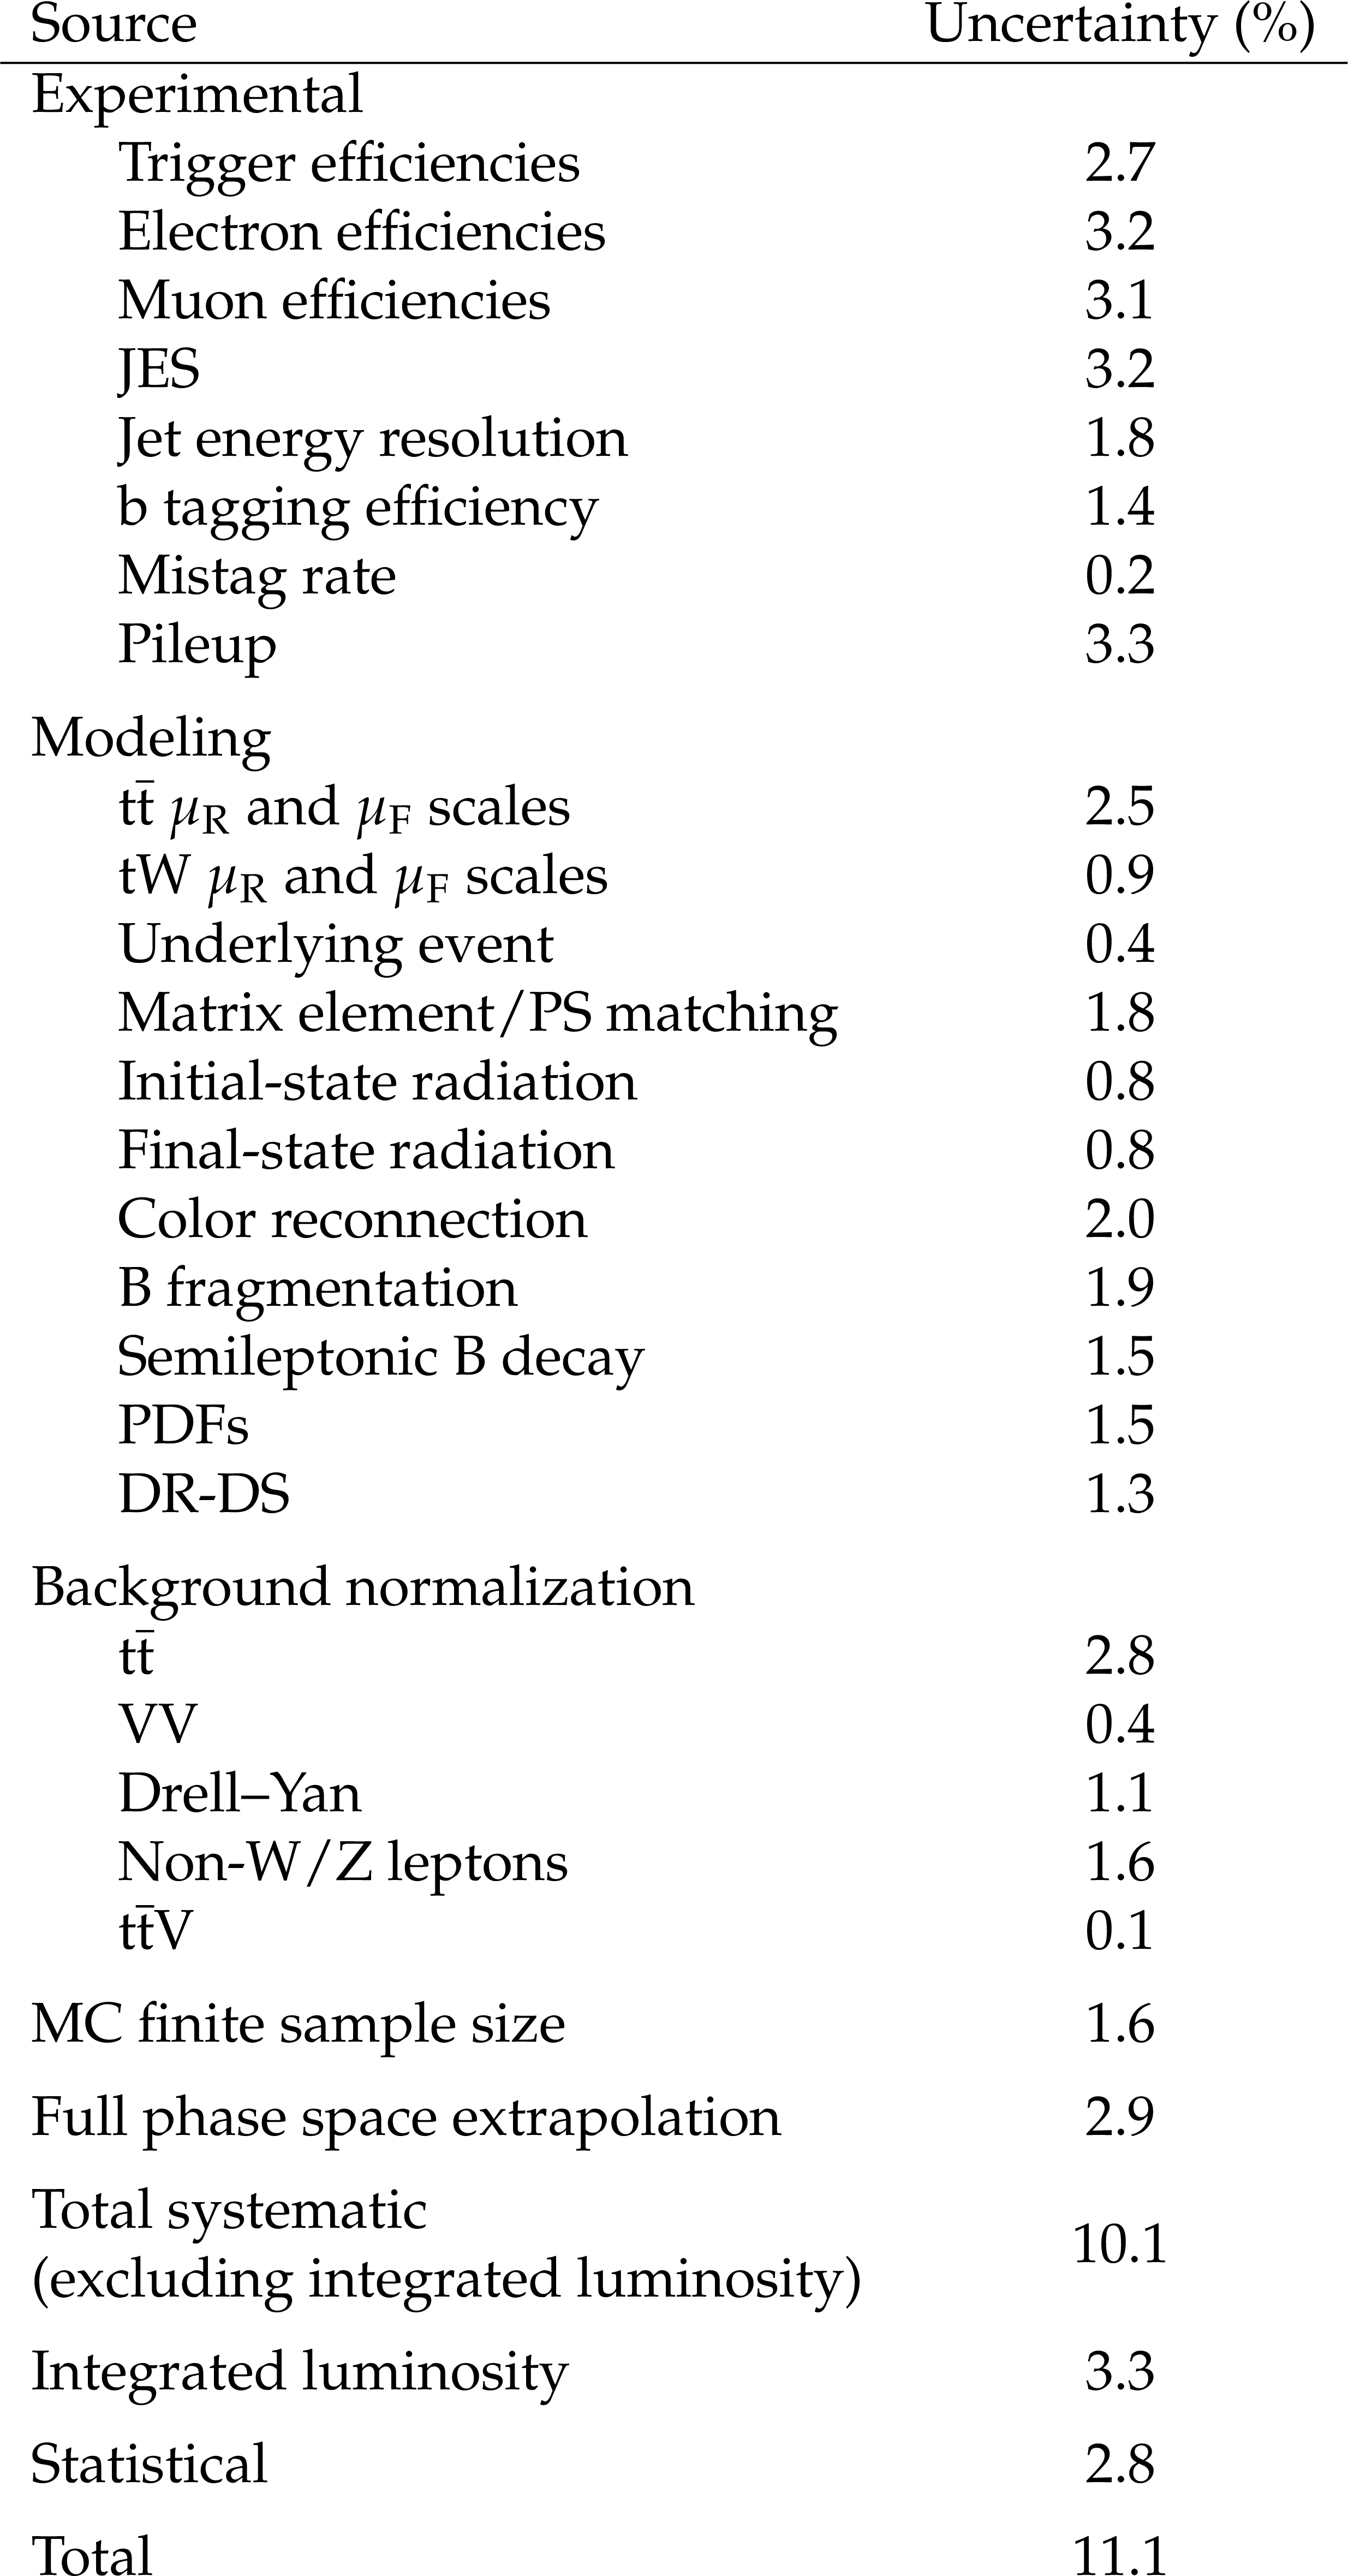
Table 2:
Estimation of the effect on the signal strength of each source of uncertainty in the fit. Experimental and modeling uncertainties affect both the rate and the shape of the templates while background normalization uncertainties affect only the rate. |
| Summary |
| The data recorded by CMS at 13 TeV, corresponding to an integrated luminosity of 35.9 $\pm$ 0.9 fb$^{-1}$, are used to measure the tW production cross section in the ${\mathrm{e^{\pm}}\mu^{\mp}}$ channel, classifying the events in terms of the number of jets and jets originating from bottom quarks. The signal is measured using a maximum likelihood fit to the distribution of boosted decision tree discriminants in two of the categories, and to the ${p_{\mathrm{T}}}$ distribution of the second jet with highest ${p_{\mathrm{T}}}$ in a third category. The measured cross section for tW production is found to be 63.1 $\pm$ 1.8 (stat) $\pm$ 6.4 (syst) $\pm$ 2.1 (lumi) pb, achieving a relative uncertainty of 11%. This is the first measurement of this process by the CMS Collaboration at $\sqrt{s} = $ 13 TeV. The measured cross section is in agreement with the standard model prediction of 71.7 $\pm$ 1.8 (scale) $\pm$ 3.4 (PDF) pb and with a similar measurement by the ATLAS Collaboration [13]. |
| References | ||||
| 1 | D0 Collaboration | Observation of single top quark production | PRL 103 (2009) 092001 | 0903.0850 |
| 2 | CDF Collaboration | First observation of electroweak single top quark production | PRL 103 (2009) 092002 | 0903.0885 |
| 3 | S. Frixione et al. | Single-top hadroproduction in association with a W boson | JHEP 07 (2008) 029 | 0805.3067 |
| 4 | A. S. Belyaev, E. E. Boos, and L. V. Dudko | Single top quark at future hadron colliders: Complete signal and background study | PRD 59 (1999) 075001 | hep-ph/9806332 |
| 5 | C. D. White, S. Frixione, E. Laenen, and F. Maltoni | Isolating Wt production at the LHC | JHEP 11 (2009) 074 | 0908.0631 |
| 6 | T. M. P. Tait and C. P. Yuan | Single top quark production as a window to physics beyond the standard model | PRD 63 (2000) 014018 | hep-ph/0007298 |
| 7 | Q.-H. Cao, J. Wudka, and C. P. Yuan | Search for new physics via single top production at the LHC | PLB 658 (2007) 50 | 0704.2809 |
| 8 | V. Barger, M. McCaskey, and G. Shaughnessy | Single top and Higgs associated production at the LHC | PRD 81 (2010) 034020 | 0911.1556 |
| 9 | CMS Collaboration | Evidence for associated production of a single top quark and W boson in pp collisions at $ \sqrt{s} = $ 7 TeV | PRL 110 (2013) 022003 | CMS-TOP-11-022 1209.3489 |
| 10 | ATLAS Collaboration | Evidence for the associated production of a $ W $ boson and a top quark in ATLAS at $ \sqrt{s}= $ 7 TeV | PLB 716 (2012) 142 | 1205.5764 |
| 11 | CMS Collaboration | Observation of the associated production of a single top quark and a $ W $ boson in pp collisions at $ \sqrt s = $ 8 TeV | PRL 112 (2014) 231802 | CMS-TOP-12-040 1401.2942 |
| 12 | ATLAS Collaboration | Measurement of the production cross-section of a single top quark in association with a $ W $ boson at 8 TeV with the ATLAS experiment | JHEP 01 (2016) 064 | 1510.03752 |
| 13 | ATLAS Collaboration | Measurement of the cross-section for producing a W boson in association with a single top quark in pp collisions at $ \sqrt{s}= $ 13 TeV with ATLAS | JHEP 01 (2018) 063 | 1612.07231 |
| 14 | N. Kidonakis | Theoretical results for electroweak-boson and single-top production | in Proceedings, 23rd International Workshop on Deep-Inelastic Scattering and Related Subjects (DIS 2015): Dallas, Texas, USA, April 27-May 01, 2015, volume DIS2015, p. 170 2015 | 1506.04072 |
| 15 | CMS Collaboration | The CMS experiment at the CERN LHC | JINST 3 (2008) S08004 | CMS-00-001 |
| 16 | E. Re | Single-top Wt-channel production matched with parton showers using the POWHEG method | EPJC 71 (2011) 1547 | 1009.2450 |
| 17 | NNPDF Collaboration | Parton distributions for the LHC Run II | JHEP 04 (2015) 040 | 1410.8849 |
| 18 | T. Sjostrand, S. Mrenna, and P. Skands | PYTHIA 6.4 physics and manual | JHEP 05 (2006) 026 | hep-ph/0603175 |
| 19 | T. Sjostrand et al. | An introduction to PYTHIA 8.2 | CPC 191 (2015) 159 | 1410.3012 |
| 20 | CMS Collaboration | Event generator tunes obtained from underlying event and multiparton scattering measurements | EPJC 76 (2016) 155 | CMS-GEN-14-001 1512.00815 |
| 21 | P. Skands, S. Carrazza, and J. Rojo | Tuning PYTHIA 8.1: the Monash 2013 Tune | EPJC 74 (2014) 3024 | 1404.5630 |
| 22 | T. M. P. Tait | $ t{W}^- $ mode of single top quark production | PRD 61 (1999) 034001 | |
| 23 | S. Alioli, P. Nason, C. Oleari, and E. Re | A general framework for implementing NLO calculations in shower Monte Carlo programs: the POWHEG BOX | JHEP 06 (2010) 043 | 1002.2581 |
| 24 | CMS Collaboration | Investigations of the impact of the parton shower tuning in Pythia 8 in the modelling of $ \mathrm{t\overline{t}} $ at $ \sqrt{s}= $ 8 and 13 TeV | CMS-PAS-TOP-16-021 | CMS-PAS-TOP-16-021 |
| 25 | J. Alwall et al. | The automated computation of tree-level and next-to-leading order differential cross sections, and their matching to parton shower simulations | JHEP 07 (2014) 079 | 1405.0301 |
| 26 | R. Frederix and S. Frixione | Merging meets matching in MC@NLO | JHEP 12 (2012) 061 | 1209.6215 |
| 27 | Y. Li and F. Petriello | Combining QCD and electroweak corrections to dilepton production in the framework of the FEWZ simulation code | PRD 86 (2012) 094034 | 1208.5967 |
| 28 | J. M. Campbell, R. K. Ellis, and C. Williams | Vector boson pair production at the LHC | JHEP 07 (2011) 018 | 1105.0020 |
| 29 | M. Czakon, P. Fiedler, and A. Mitov | Total top-quark pair-production cross section at hadron colliders through o($ \alpha_s^4 $) | PRL 110 (2013) 252004 | 1303.6254 |
| 30 | M. Czakon and A. Mitov | Top++: A program for the calculation of the top-pair cross-section at hadron colliders | CPC 185 (2014) 2930 | 1112.5675 |
| 31 | CMS Collaboration | Measurement of the $ \rm{t\bar{t}} $ production cross section using events in the e$ \mu $ final state in pp collisions at $ \sqrt{s} = $ 13 TeV | EPJC 77 (2017) 172 | CMS-TOP-16-005 1611.04040 |
| 32 | CMS Collaboration | Particle-flow reconstruction and global event description with the CMS detector | JINST 12 (2017) P10003 | CMS-PRF-14-001 1706.04965 |
| 33 | CMS Collaboration | Performance of electron reconstruction and selection with the CMS detector in proton-proton collisions at $ \sqrt{s} = $ 8 TeV | JINST 10 (2015) P06005 | CMS-EGM-13-001 1502.02701 |
| 34 | CMS Collaboration | Performance of CMS muon reconstruction in pp collision events at $ \sqrt{s}= $ 7 TeV | JINST 7 (2012) P10002 | CMS-MUO-10-004 1206.4071 |
| 35 | M. Cacciari, G. P. Salam, and G. Soyez | The anti-$ {k_{\mathrm{T}}} $ jet clustering algorithm | JHEP 04 (2008) 063 | 0802.1189 |
| 36 | M. Cacciari, G. P. Salam, and G. Soyez | FastJet user manual | EPJC 72 (2012) 1896 | 1111.6097 |
| 37 | CMS Collaboration | Jet algorithms performance in 13 TeV data | CMS-PAS-JME-16-003 | CMS-PAS-JME-16-003 |
| 38 | CMS Collaboration | Performance of missing energy reconstruction in $ \sqrt{s}= $ 13 TeV pp collision data using the CMS detector | CMS-PAS-JME-16-004 | CMS-PAS-JME-16-004 |
| 39 | CMS Collaboration | Identification of heavy-flavour jets with the CMS detector in pp collisions at 13 TeV | JINST 13 (2018) P05011 | CMS-BTV-16-002 1712.07158 |
| 40 | J. Therhaag et al. | TMVA --- Toolkit for multivariate data analysis | in Proceedings, Int'l Conf. on Computational Methods in Science and Engineering, 2009, ICCMSE2009, volume 1504, p. 1013 2012 | |
| 41 | H.-J. Yang, B. P. Roe, and J. Zhu | Studies of boosted decision trees for MiniBooNE particle identification | NIMA 555 (2005) 370 | physics/0508045 |
| 42 | CMS Collaboration | Precise determination of the mass of the Higgs boson and tests of compatibility of its couplings with the standard model predictions using proton collisions at 7 and 8 TeV | EPJC 75 (2015) 212 | CMS-HIG-14-009 1412.8662 |
| 43 | ATLAS Collaboration | Measurement of the inelastic proton-proton cross section at $ \sqrt{s} = $ 13 tev with the ATLAS detector at the LHC | PRL 117 (2016) 182002 | 1606.02625 |
| 44 | CMS Collaboration | CMS luminosity measurements for the 2016 data taking period | CMS-PAS-LUM-17-001 | CMS-PAS-LUM-17-001 |
| 45 | J. R. Christiansen and P. Z. Skands | String formation beyond leading colour | JHEP 08 (2015) 003 | 1505.01681 |
| 46 | S. Argyropoulos and T. Sjostrand | Effects of color reconnection on $ \rm{t\bar{t}} $ final states at the LHC | JHEP 11 (2014) 043 | 1407.6653 |
| 47 | Particle Data Group, C. Patrignani et al. | Review of particle physics | CPC 40 (2016) 100001 | |
| 48 | M. G. Bowler | $ {\rm e}^{+}{\rm e}^{-} $ production of heavy quarks in the string model | Z. Phys. C 11 (1981) 169 | |
| 49 | ALEPH Collaboration | Study of the fragmentation of b quarks into B mesons at the Z peak | PLB 512 (2001) 30 | hep-ex/0106051 |
| 50 | DELPHI Collaboration | A study of the b-quark fragmentation function with the DELPHI detector at LEP I and an averaged distribution obtained at the Z Pole | EPJC 71 (2011) 1557 | 1102.4748 |
| 51 | C. Peterson, D. Schlatter, I. Schmitt, and P. M. Zerwas | Scaling violations in inclusive $ {\rm e}^{+}{\rm e}^{{-}} $ annihilation spectra | PRD 27 (1983) 105 | |
|
|
Compact Muon Solenoid LHC, CERN |
|

|

|

|

|

|