

Compact Muon Solenoid
LHC, CERN
| CMS-SUS-24-007 ; CERN-EP-2025-288 | ||
| Search for dark matter produced in association with a Higgs boson decaying to bottom quarks in proton-proton collisions at $ \sqrt{s} = $ 13 TeV | ||
| CMS Collaboration | ||
| 16 January 2026 | ||
| Phys. Rev. D 113, 092016 | ||
| Abstract: A search for dark matter particles produced in association with a Higgs boson decaying to a bottom quark-antiquark pair in proton-proton collisions at $ \sqrt{s}= $ 13 TeV is presented. The data, collected with the CMS detector at the LHC, correspond to an integrated luminosity of 101 fb$ ^{-1} $. The analysis is performed in exclusive categories targeting both Lorentz-boosted (merged) and resolved b jet pair topologies, covering a wide range of Higgs boson transverse momentum. A statistical combination is made with a previous search using data collected in 2016 and corresponding to an integrated luminosity of 35.9 fb$ ^{-1} $. The observed data agree with the standard model background predictions. Constraints are placed on models predicting new particles or interactions, such as those in the simplified frameworks of baryonic-$ \mathrm{Z}^{'} $ and 2HDM+$ \mathrm{a} $, where the latter is a type-II two-Higgs-doublet model featuring a heavy pseudoscalar with an additional light pseudoscalar. Upper limits at 95% confidence level are set on the production cross section for these models. For the baryonic-$ \mathrm{Z}^{'} $ model, $ \mathrm{Z}^{'} $ boson masses below 2.25 TeV are excluded for a dark matter particle candidate mass of 1 GeV. In the 2HDM+$ \mathrm{a} $ model, heavy pseudoscalar masses between 850 and 1300 GeV are excluded for a light pseudoscalar mass of 350 GeV. | ||
| Links: e-print arXiv:2601.11330 [hep-ex] (PDF) ; CDS record ; inSPIRE record ; Physics Briefing ; CADI line (restricted) ; | ||
| Figures | |
png pdf |
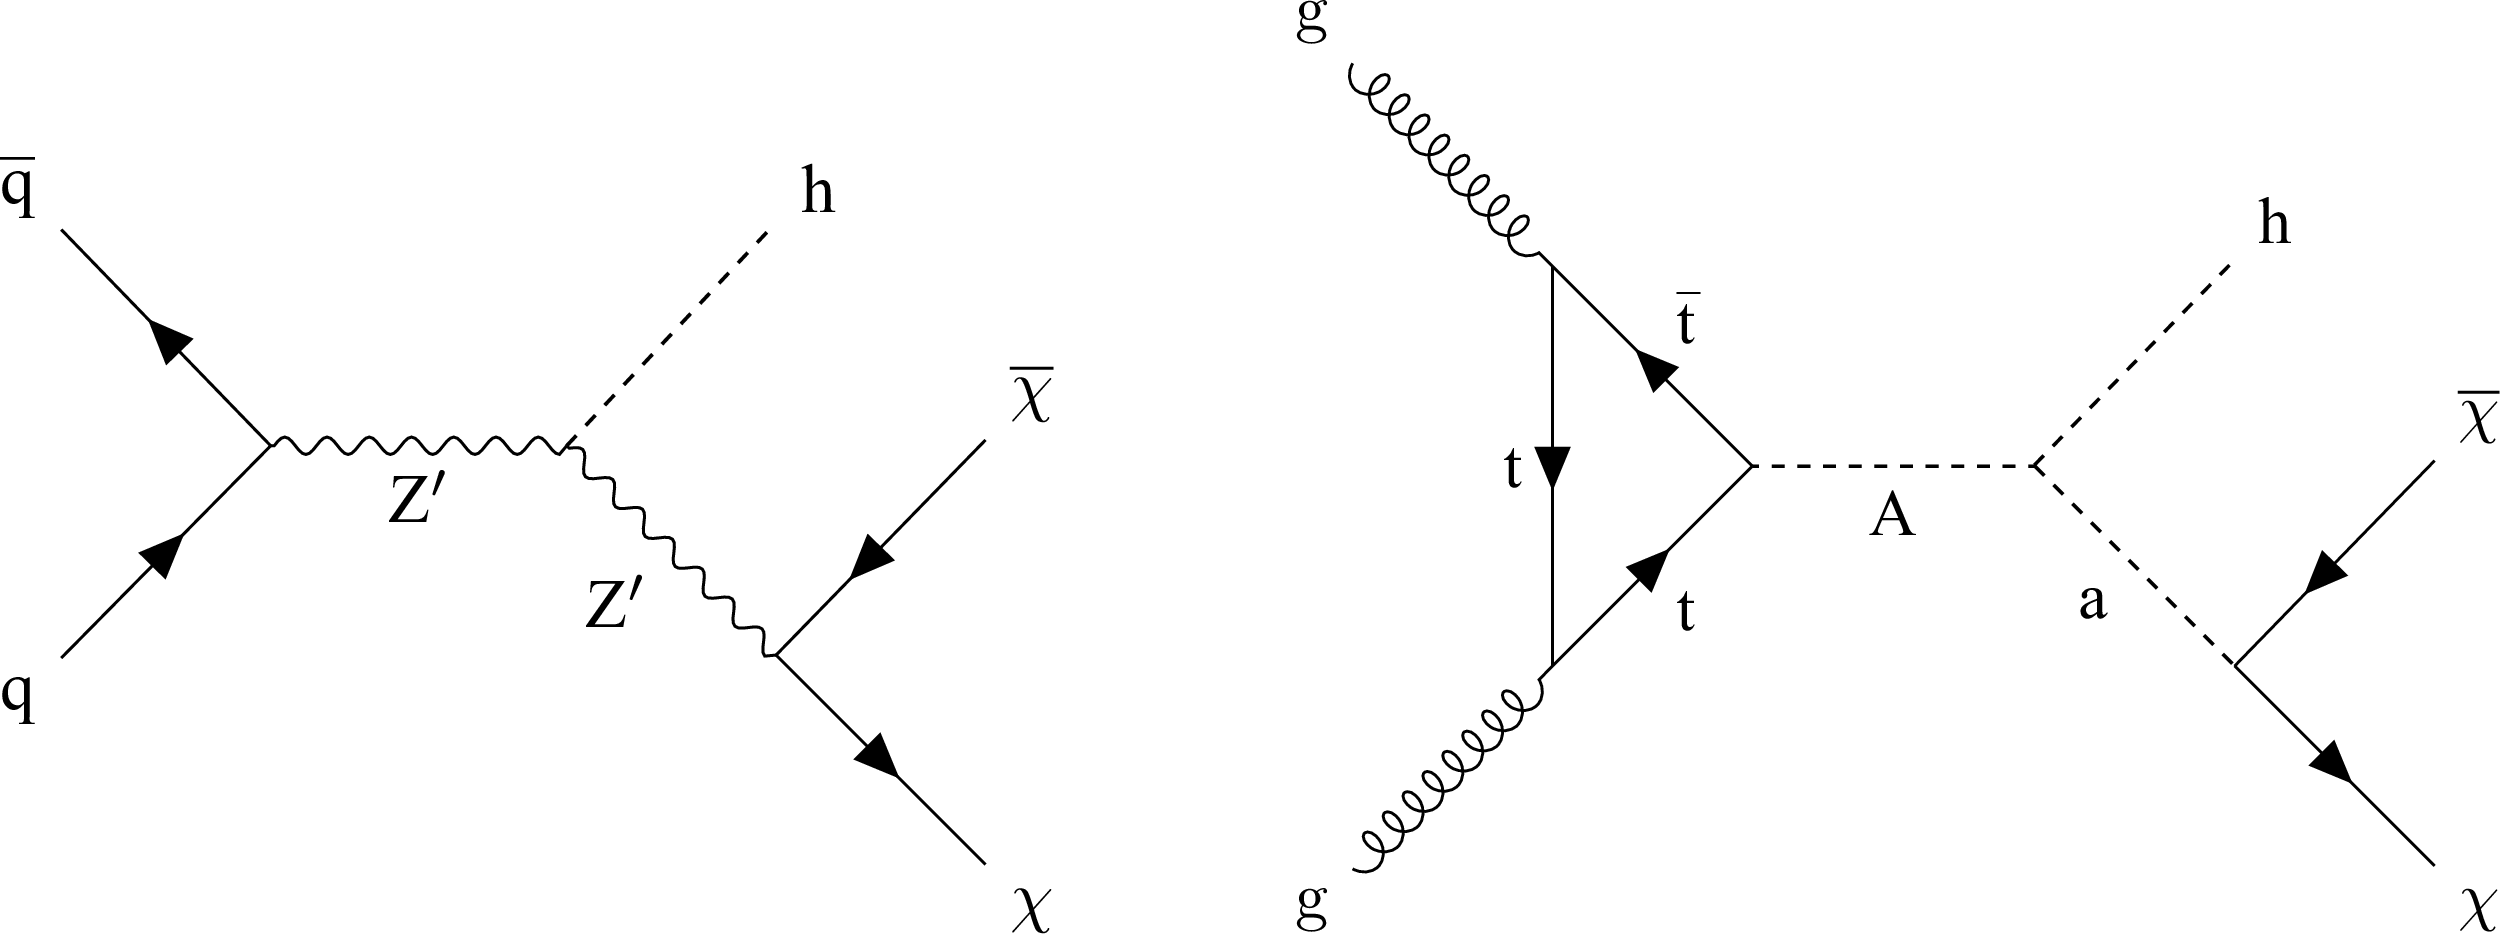
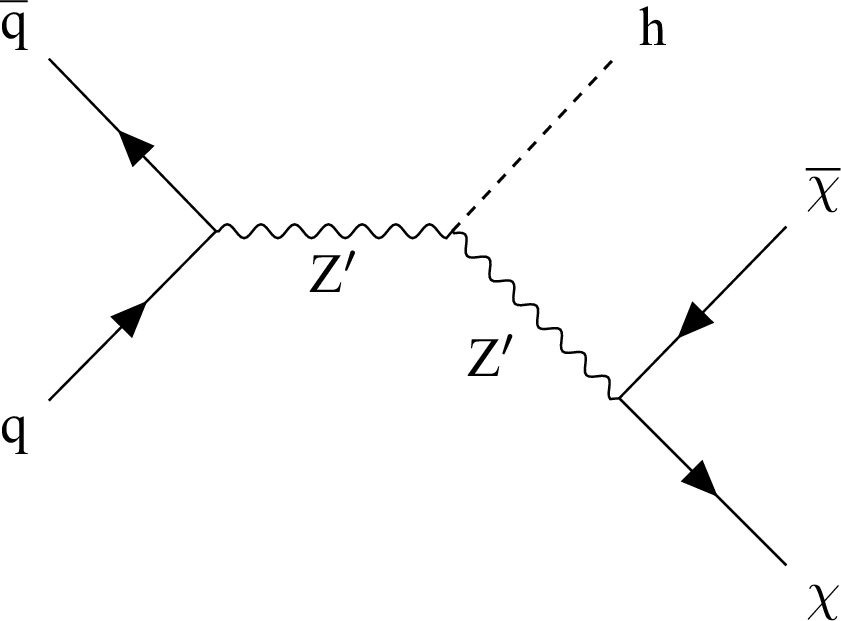
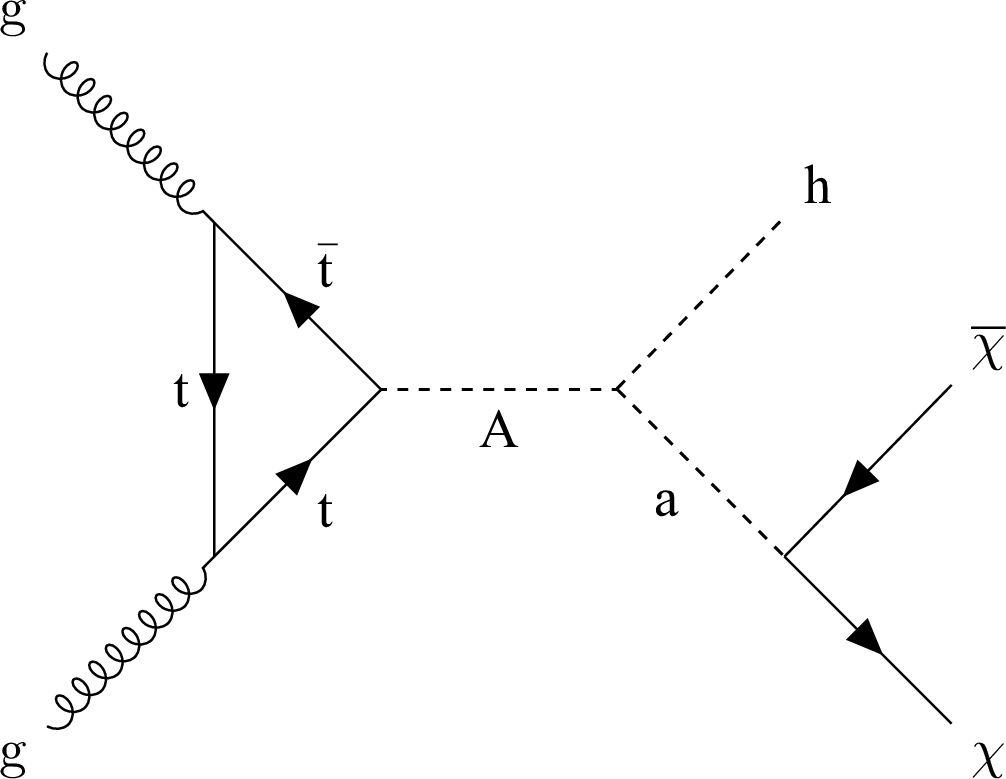
Figure 1:
Feynman diagrams for simplified benchmark models considered in this analysis: the baryonic-$ \mathrm{Z}^{'} $ model (left) and 2HDM+$ \mathrm{a} $ model (right) [15,16]. |
png pdf |
Figure 1-a:
Feynman diagrams for simplified benchmark models considered in this analysis: the baryonic-$ \mathrm{Z}^{'} $ model (left) and 2HDM+$ \mathrm{a} $ model (right) [15,16]. |
png pdf |
Figure 1-b:
Feynman diagrams for simplified benchmark models considered in this analysis: the baryonic-$ \mathrm{Z}^{'} $ model (left) and 2HDM+$ \mathrm{a} $ model (right) [15,16]. |
png pdf |
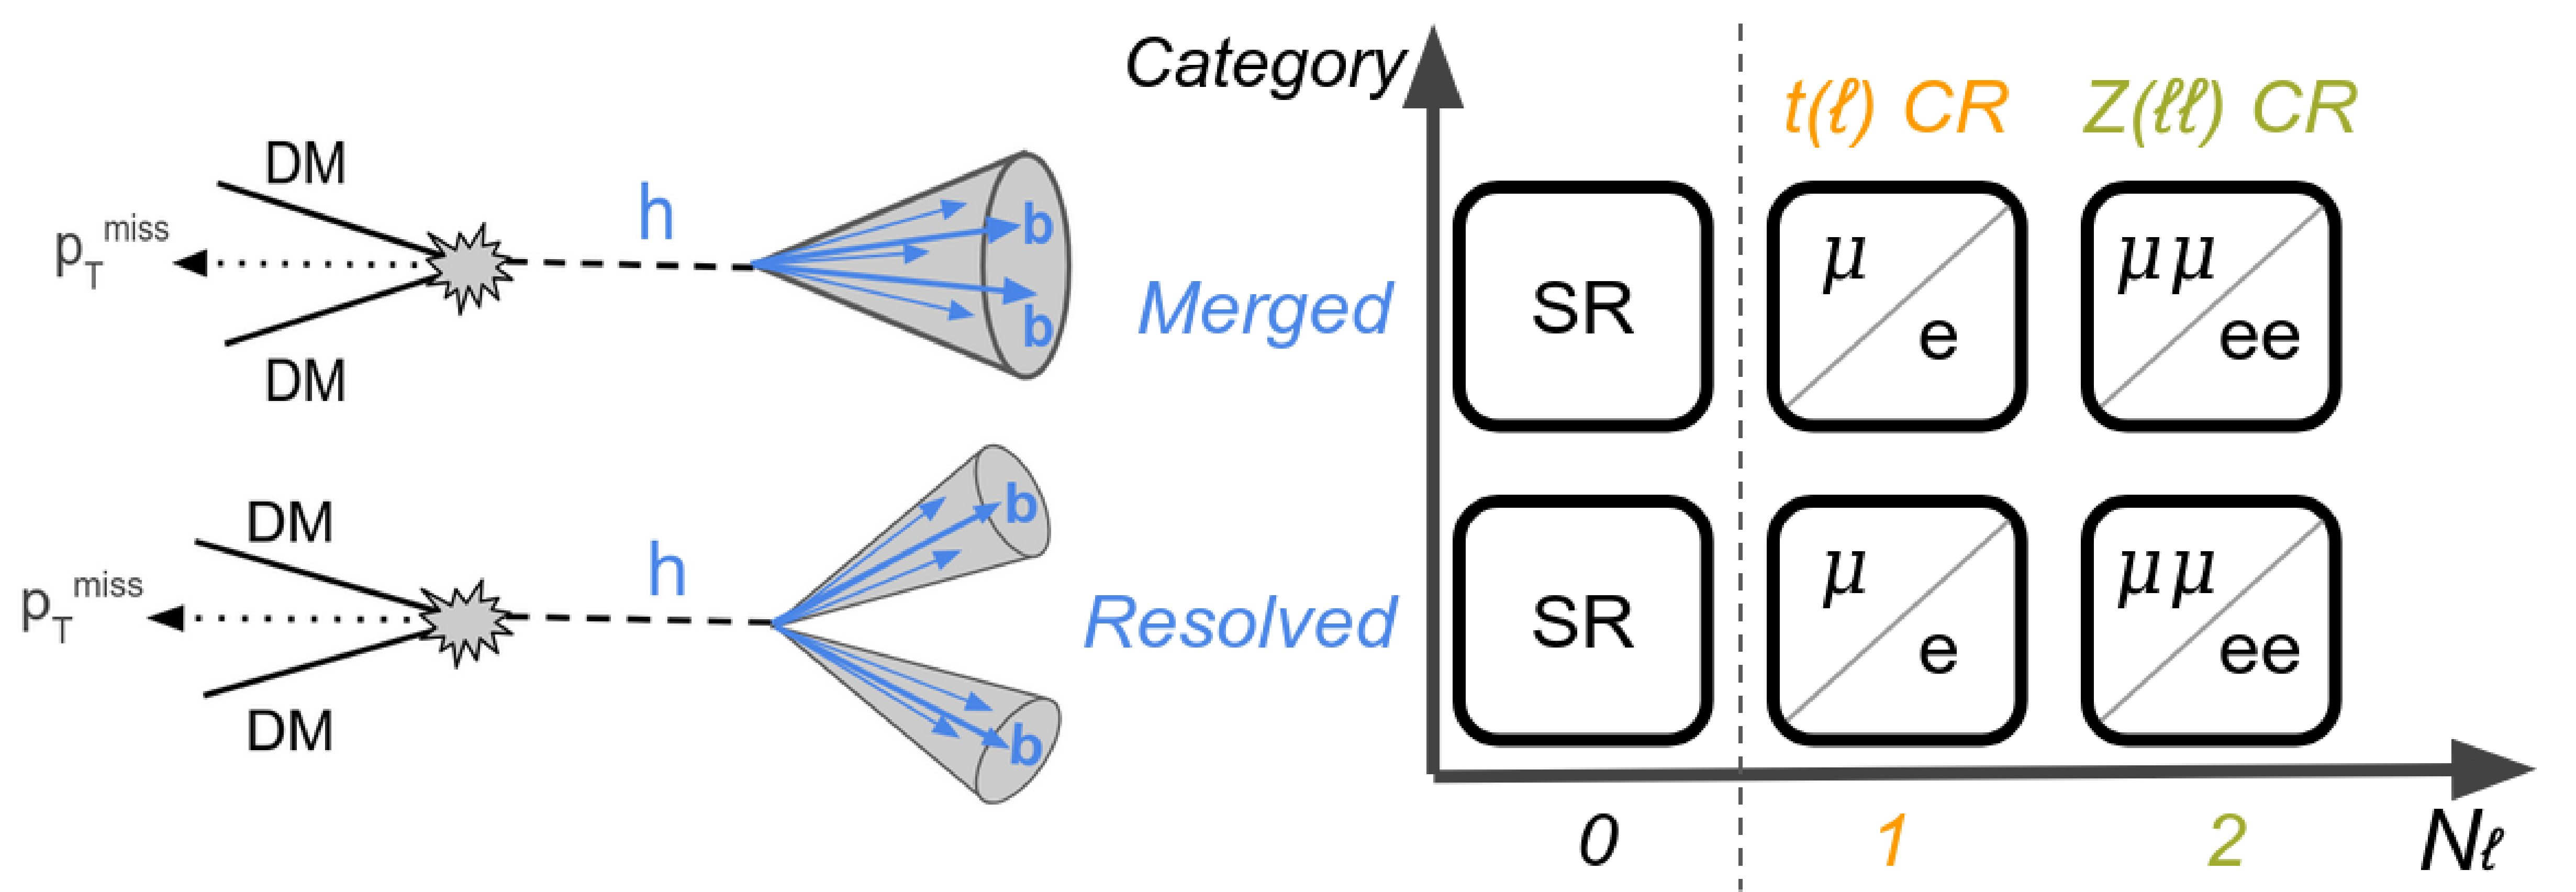
Figure 2:
Schematic representation of the analysis regions. |
png pdf |
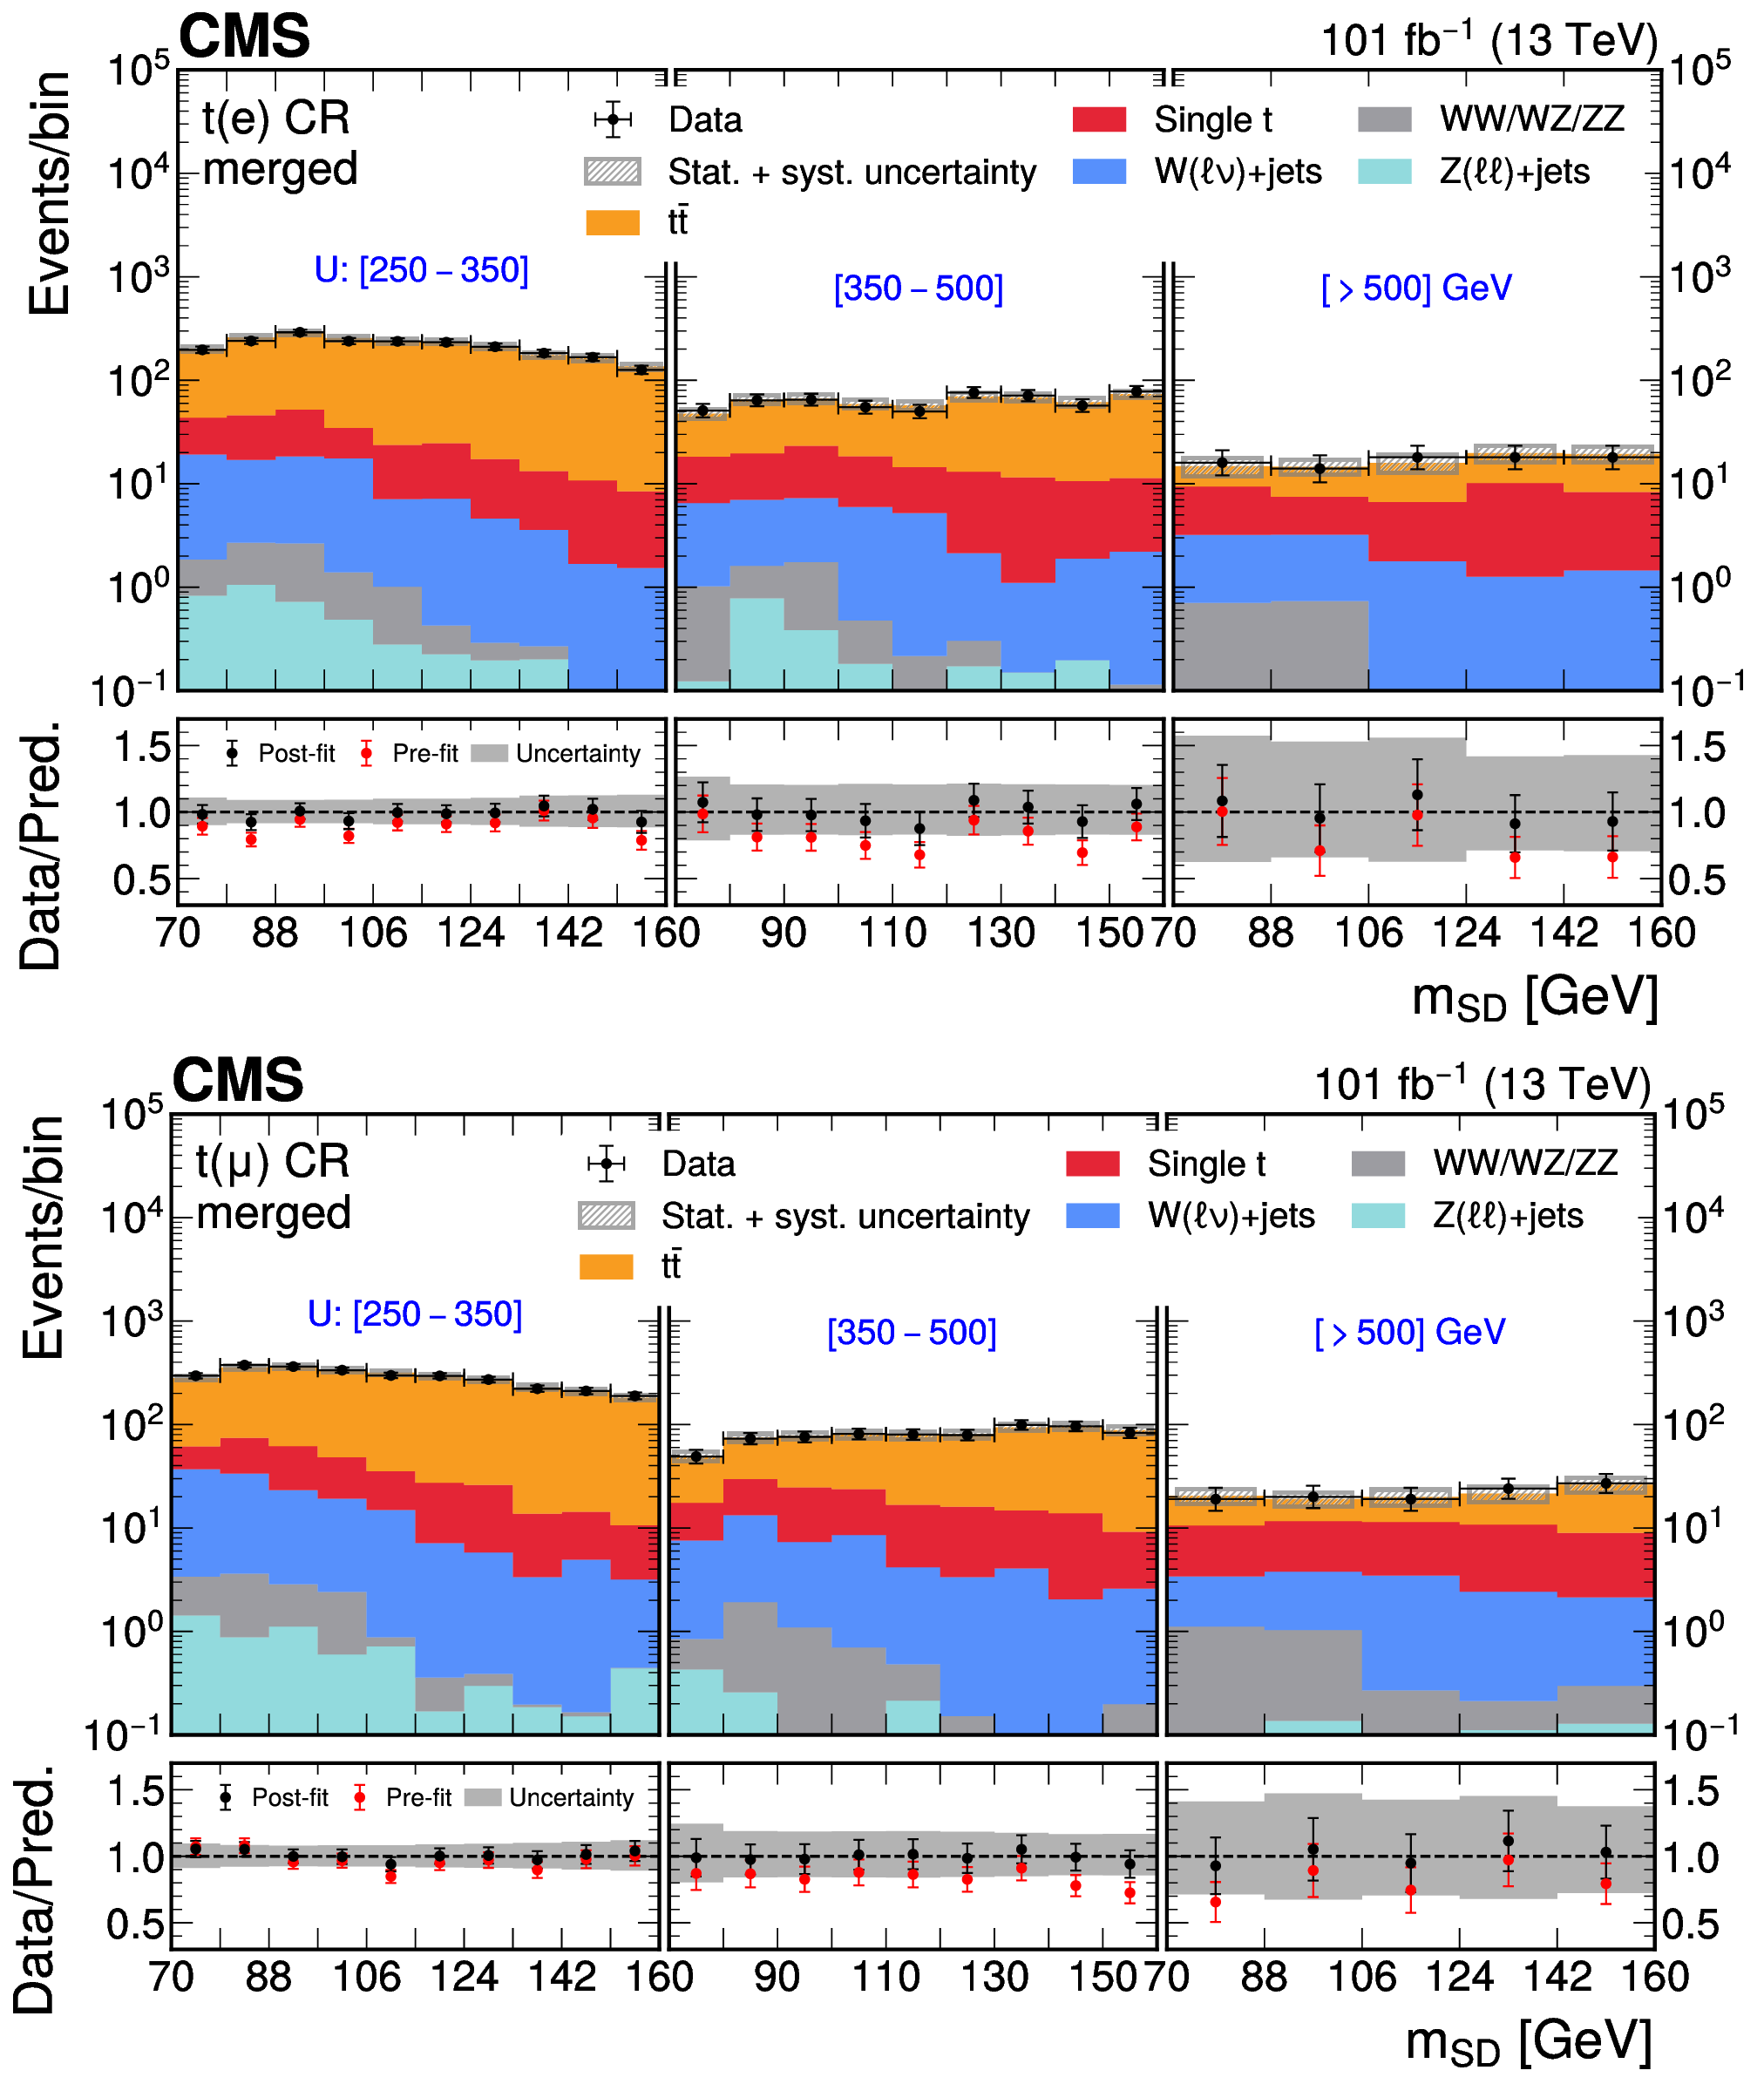
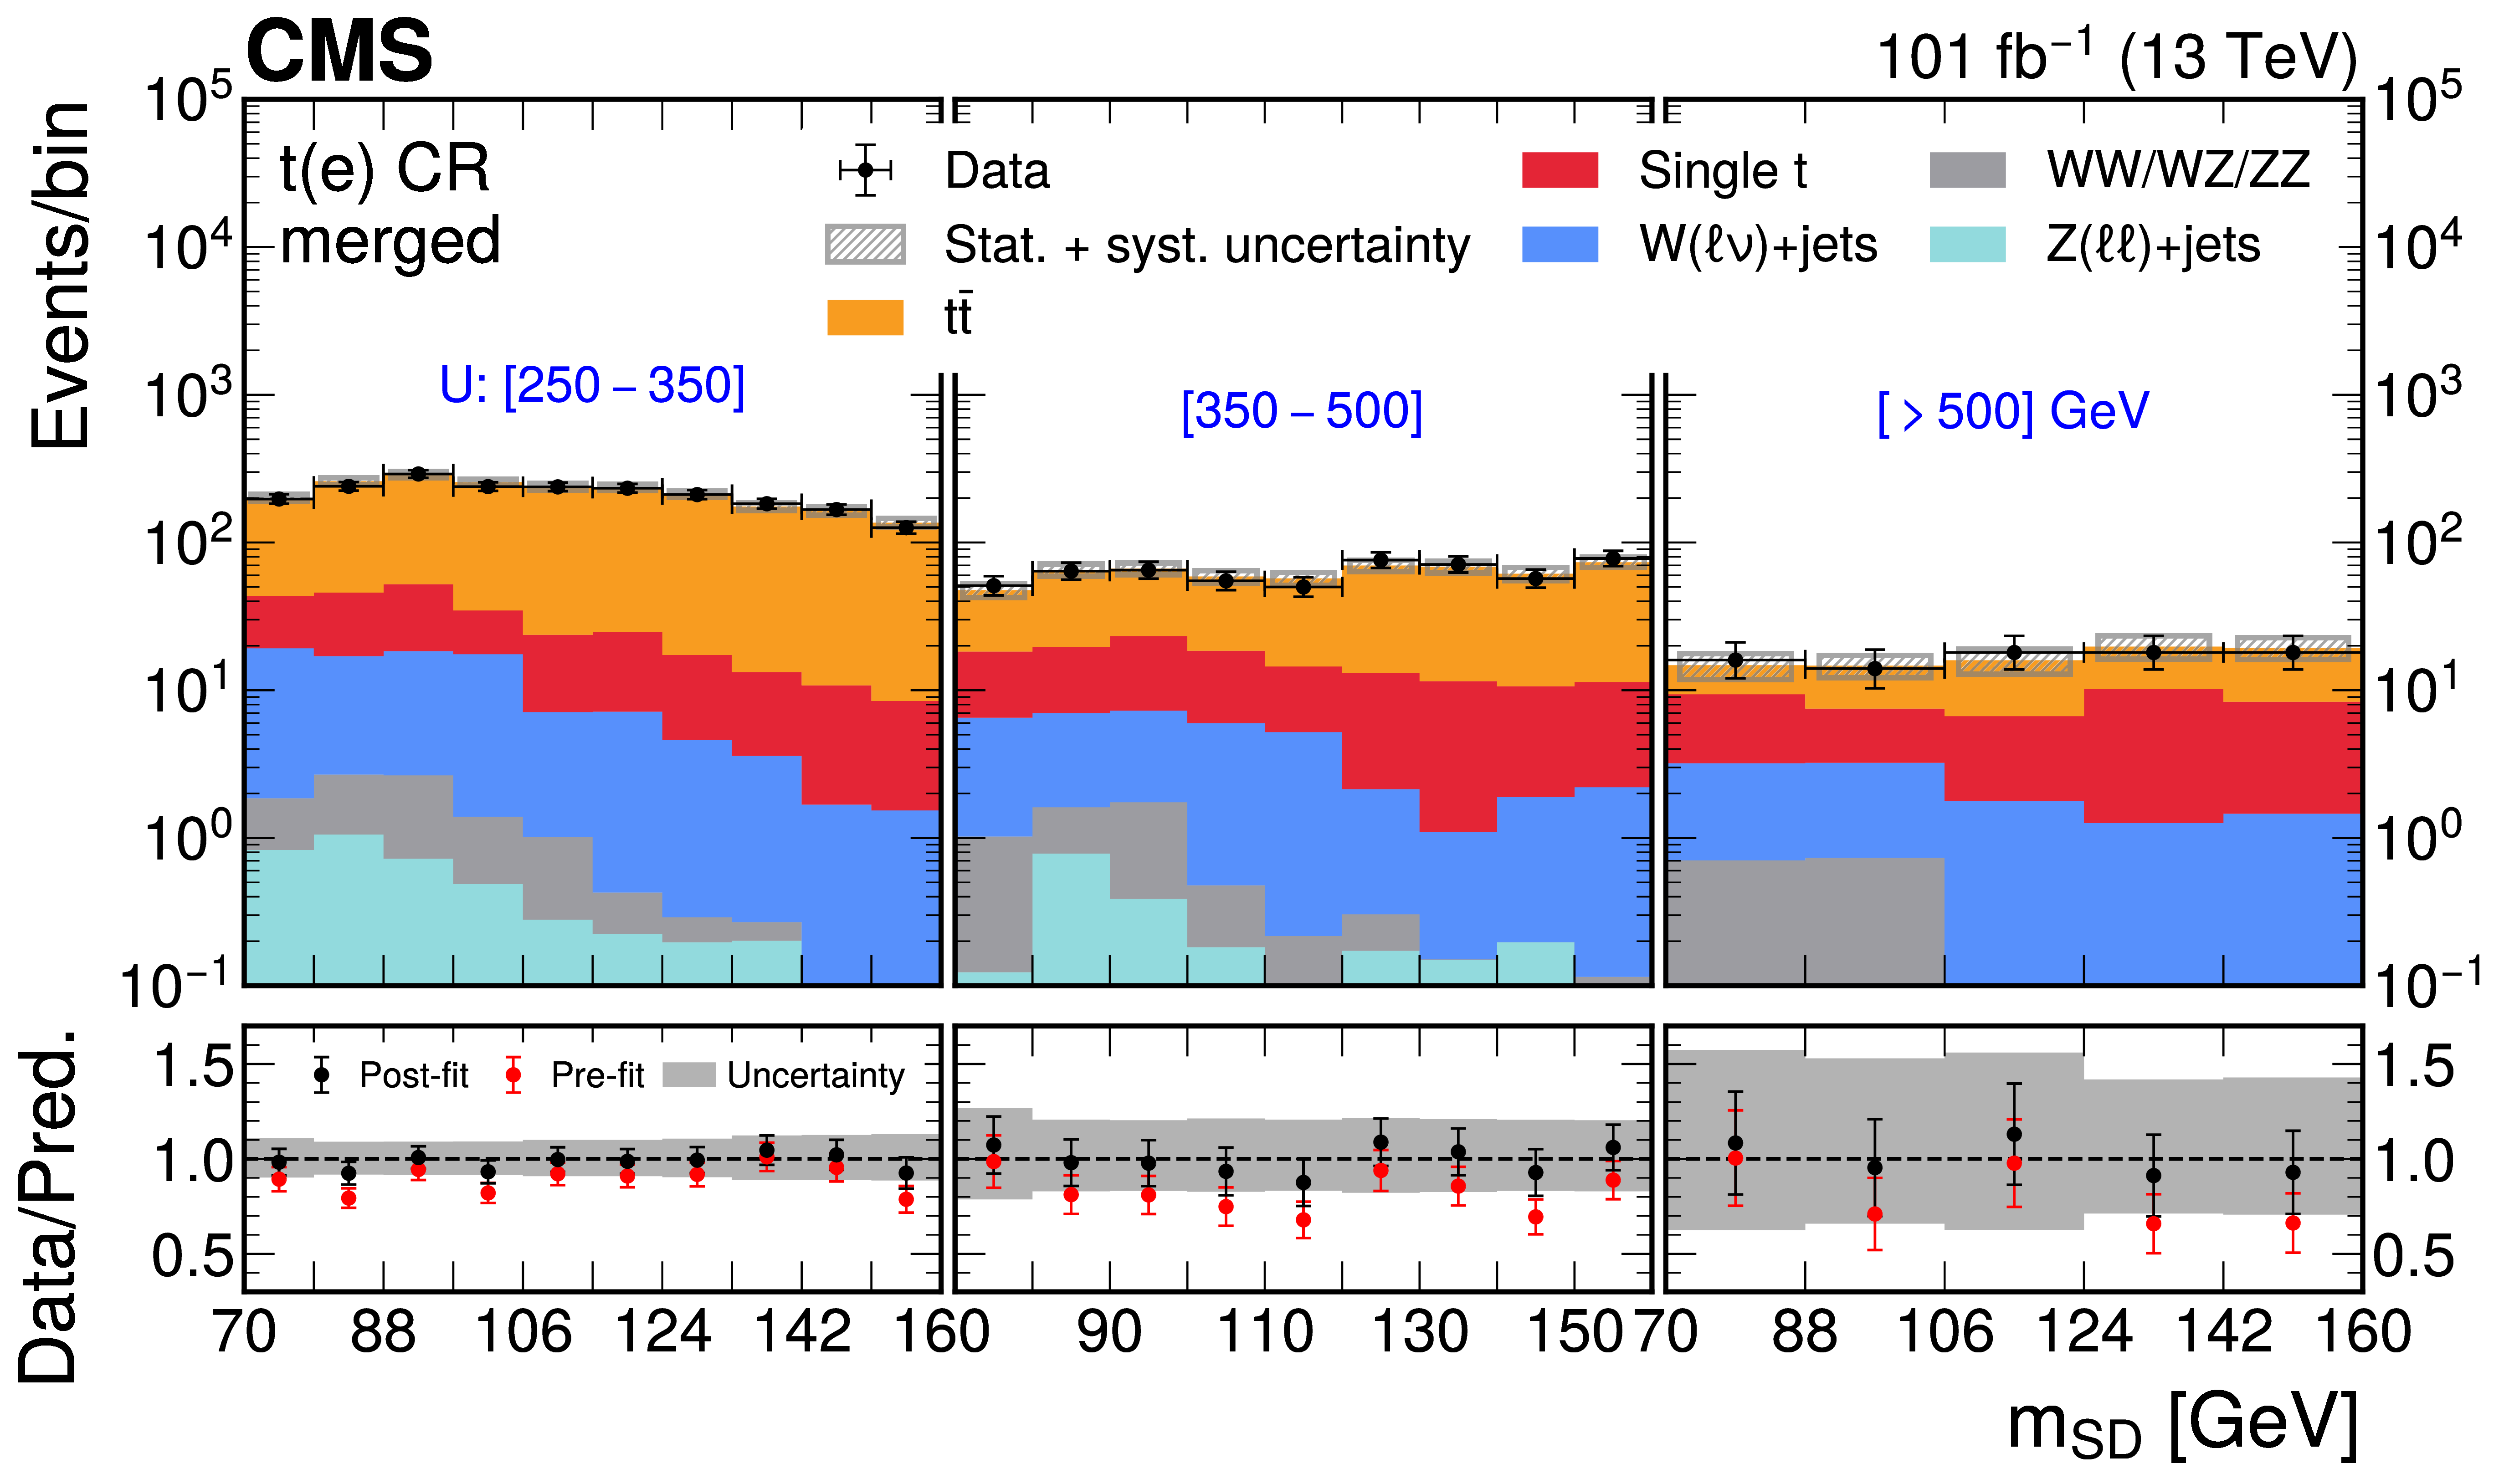
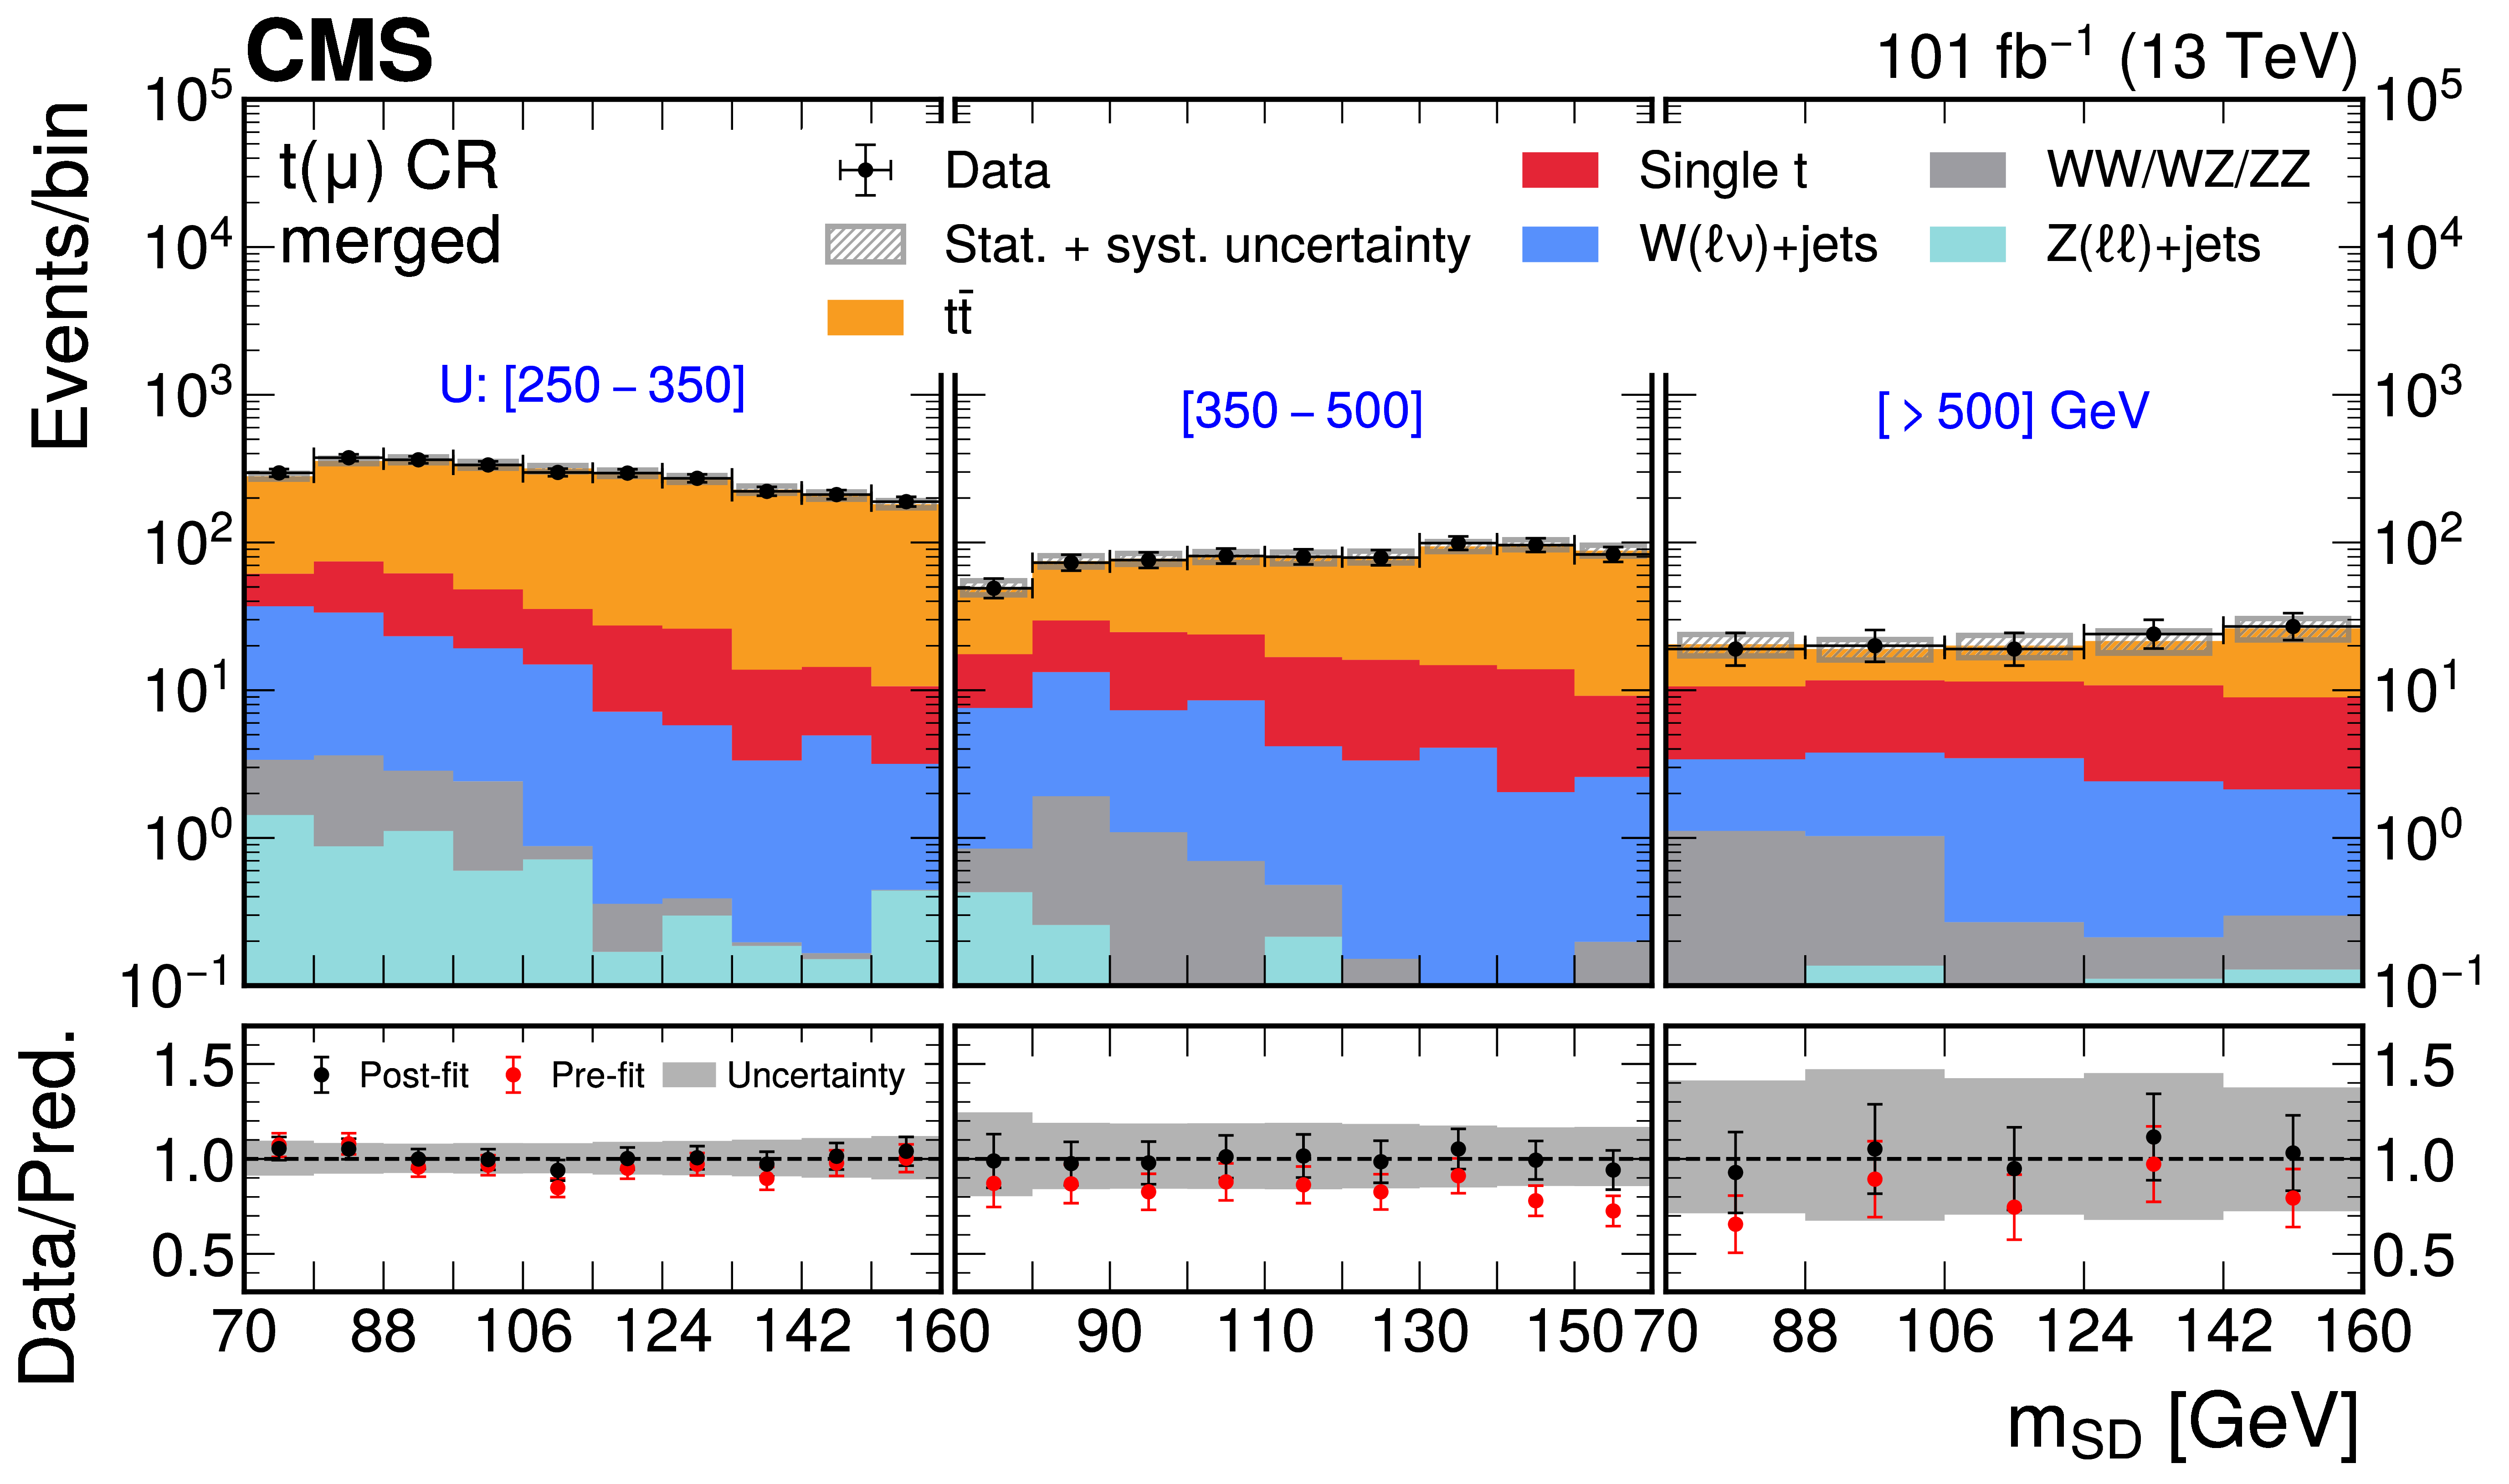
Figure 3:
The AK8 jet $ m_{\text{SD}} $ distributions after the simultaneous likelihood background-only fit sliced in three $ U $ bins, for the merged-category $ \mathrm{t}(\mathrm{e}) $ (above) and $ \mathrm{t}(\mu) $ (below) CRs. The black markers with statistical uncertainty bars show the observed data, the stacked colored histograms show the predicted background, and the gray shading shows the systematic uncertainty in the prediction. The lower panels show the ratios of the observed data to the background predicted before (pre-fit in red) and after (post-fit in black) the fit, with the gray bands indicating the post-fit uncertainty obtained from combining all statistical and systematic sources. |
png pdf |
Figure 3-a:
The AK8 jet $ m_{\text{SD}} $ distributions after the simultaneous likelihood background-only fit sliced in three $ U $ bins, for the merged-category $ \mathrm{t}(\mathrm{e}) $ (above) and $ \mathrm{t}(\mu) $ (below) CRs. The black markers with statistical uncertainty bars show the observed data, the stacked colored histograms show the predicted background, and the gray shading shows the systematic uncertainty in the prediction. The lower panels show the ratios of the observed data to the background predicted before (pre-fit in red) and after (post-fit in black) the fit, with the gray bands indicating the post-fit uncertainty obtained from combining all statistical and systematic sources. |
png pdf |
Figure 3-b:
The AK8 jet $ m_{\text{SD}} $ distributions after the simultaneous likelihood background-only fit sliced in three $ U $ bins, for the merged-category $ \mathrm{t}(\mathrm{e}) $ (above) and $ \mathrm{t}(\mu) $ (below) CRs. The black markers with statistical uncertainty bars show the observed data, the stacked colored histograms show the predicted background, and the gray shading shows the systematic uncertainty in the prediction. The lower panels show the ratios of the observed data to the background predicted before (pre-fit in red) and after (post-fit in black) the fit, with the gray bands indicating the post-fit uncertainty obtained from combining all statistical and systematic sources. |
png pdf |
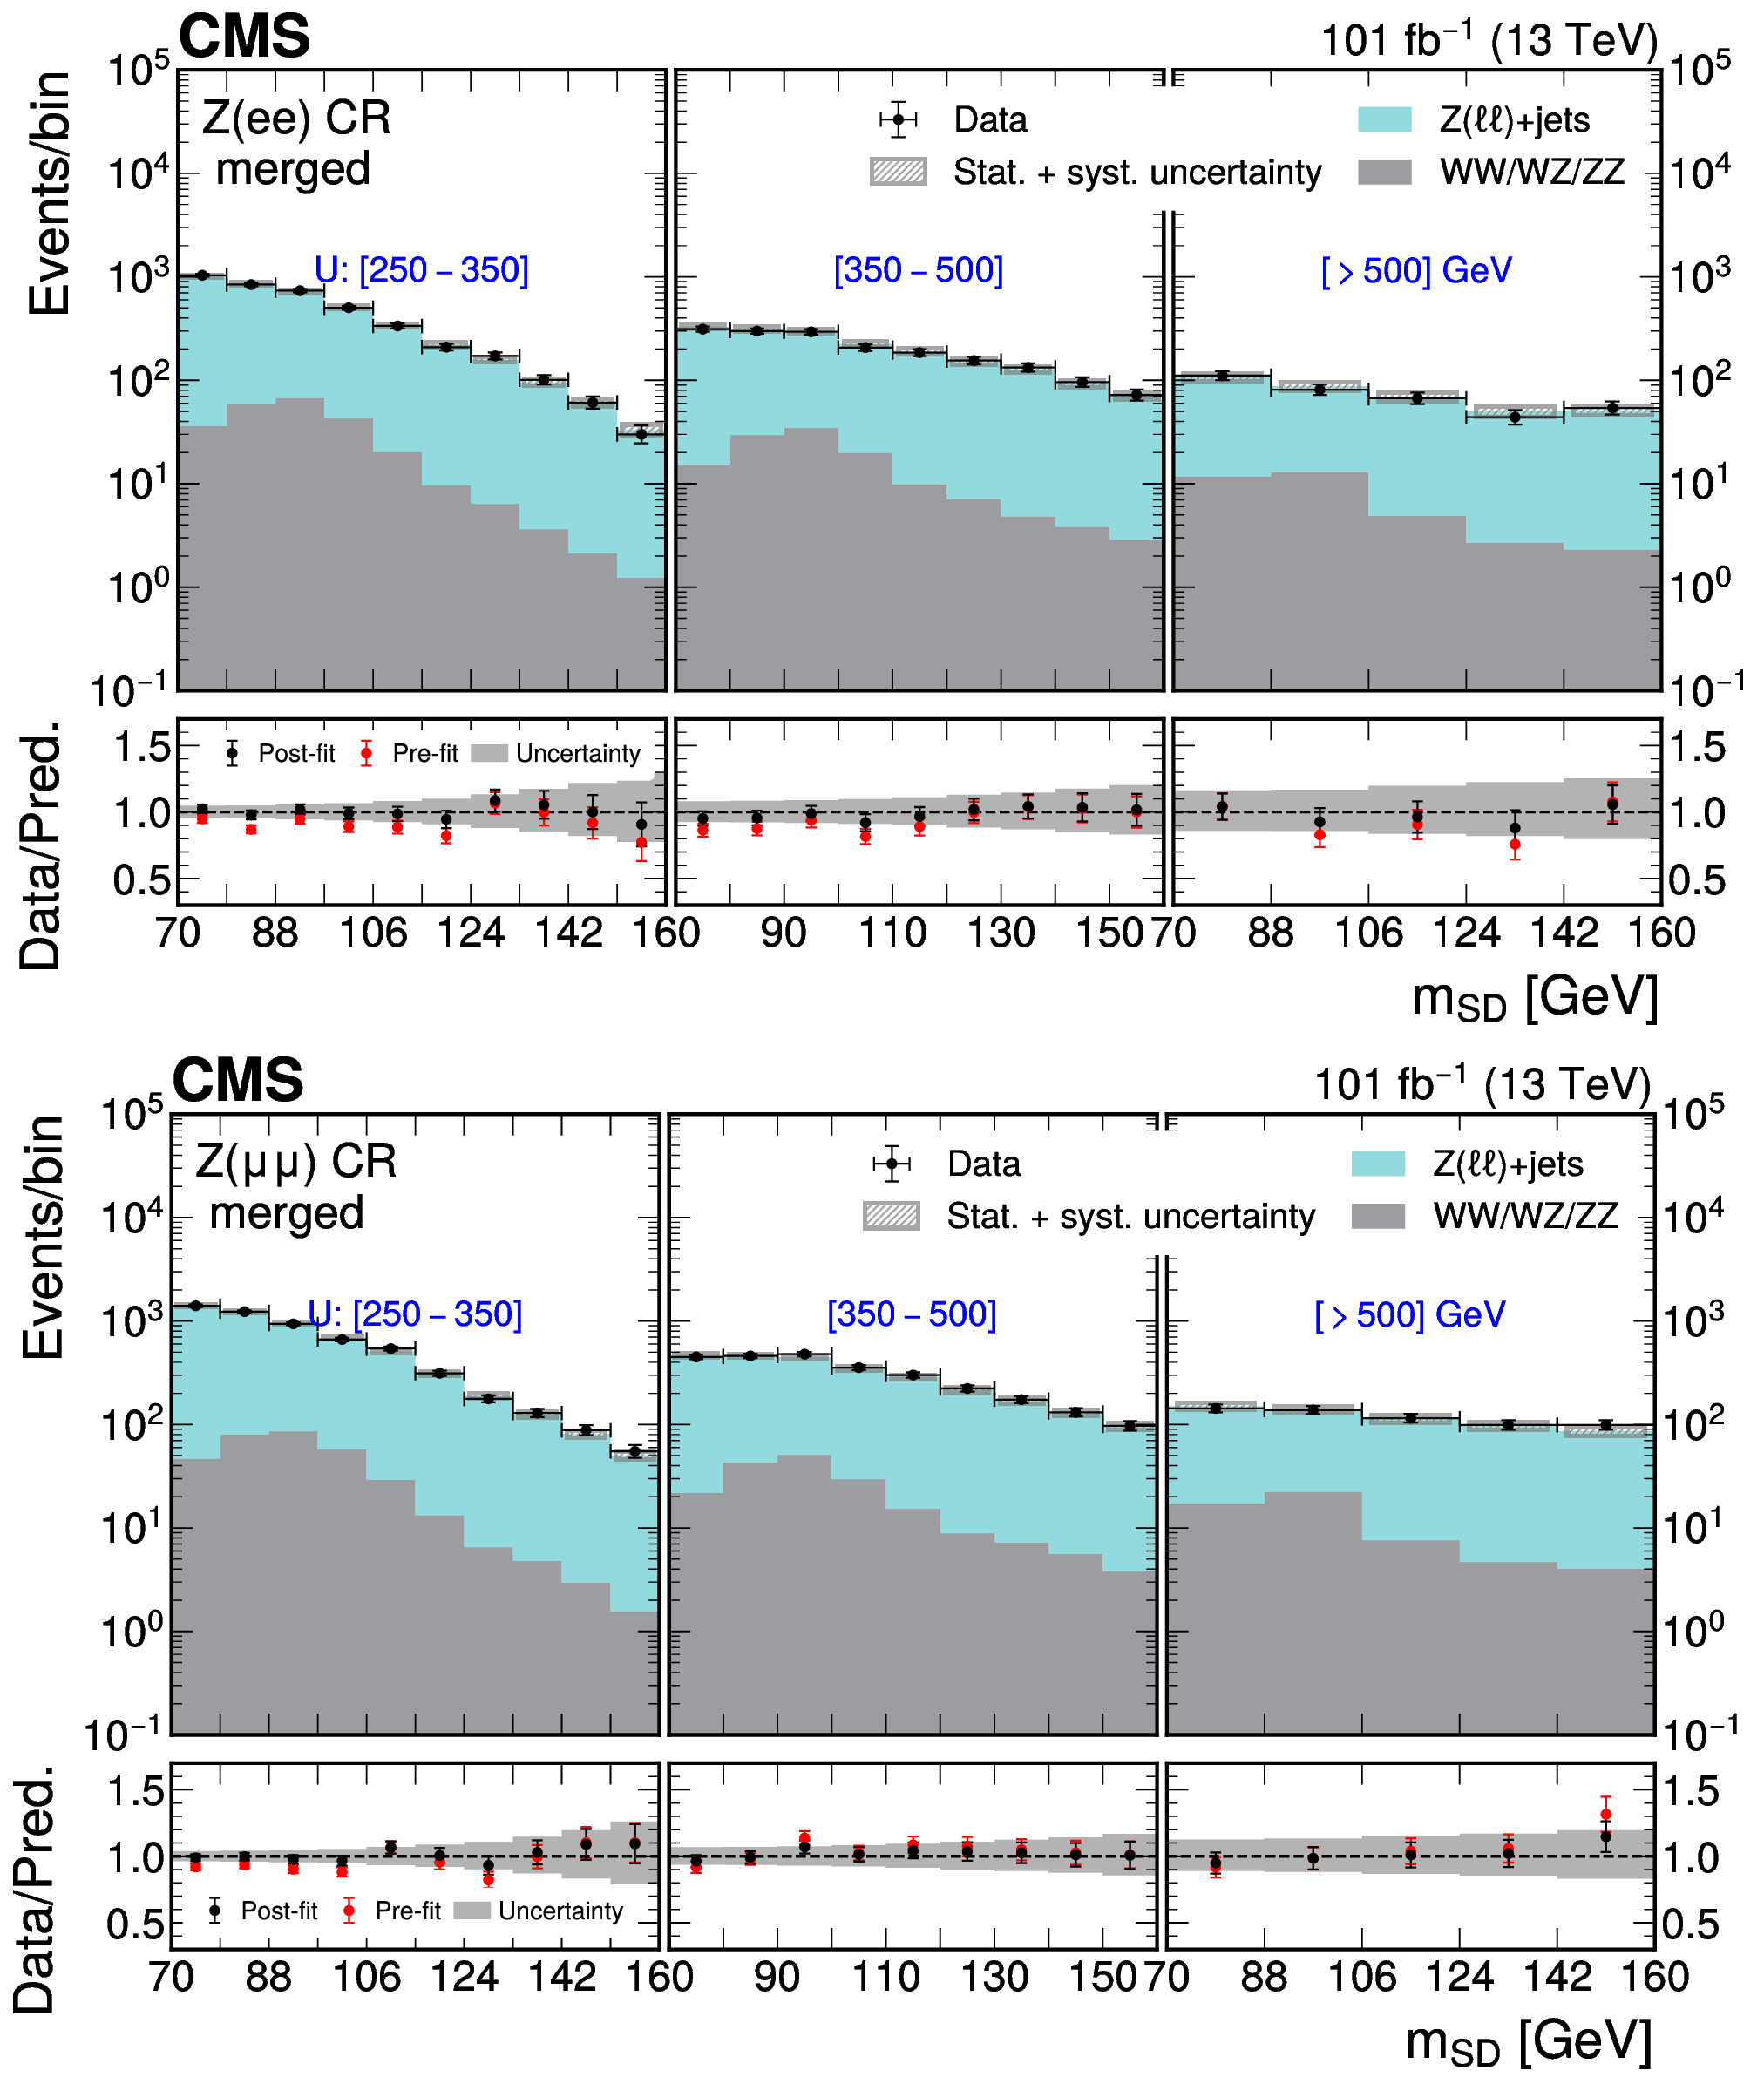
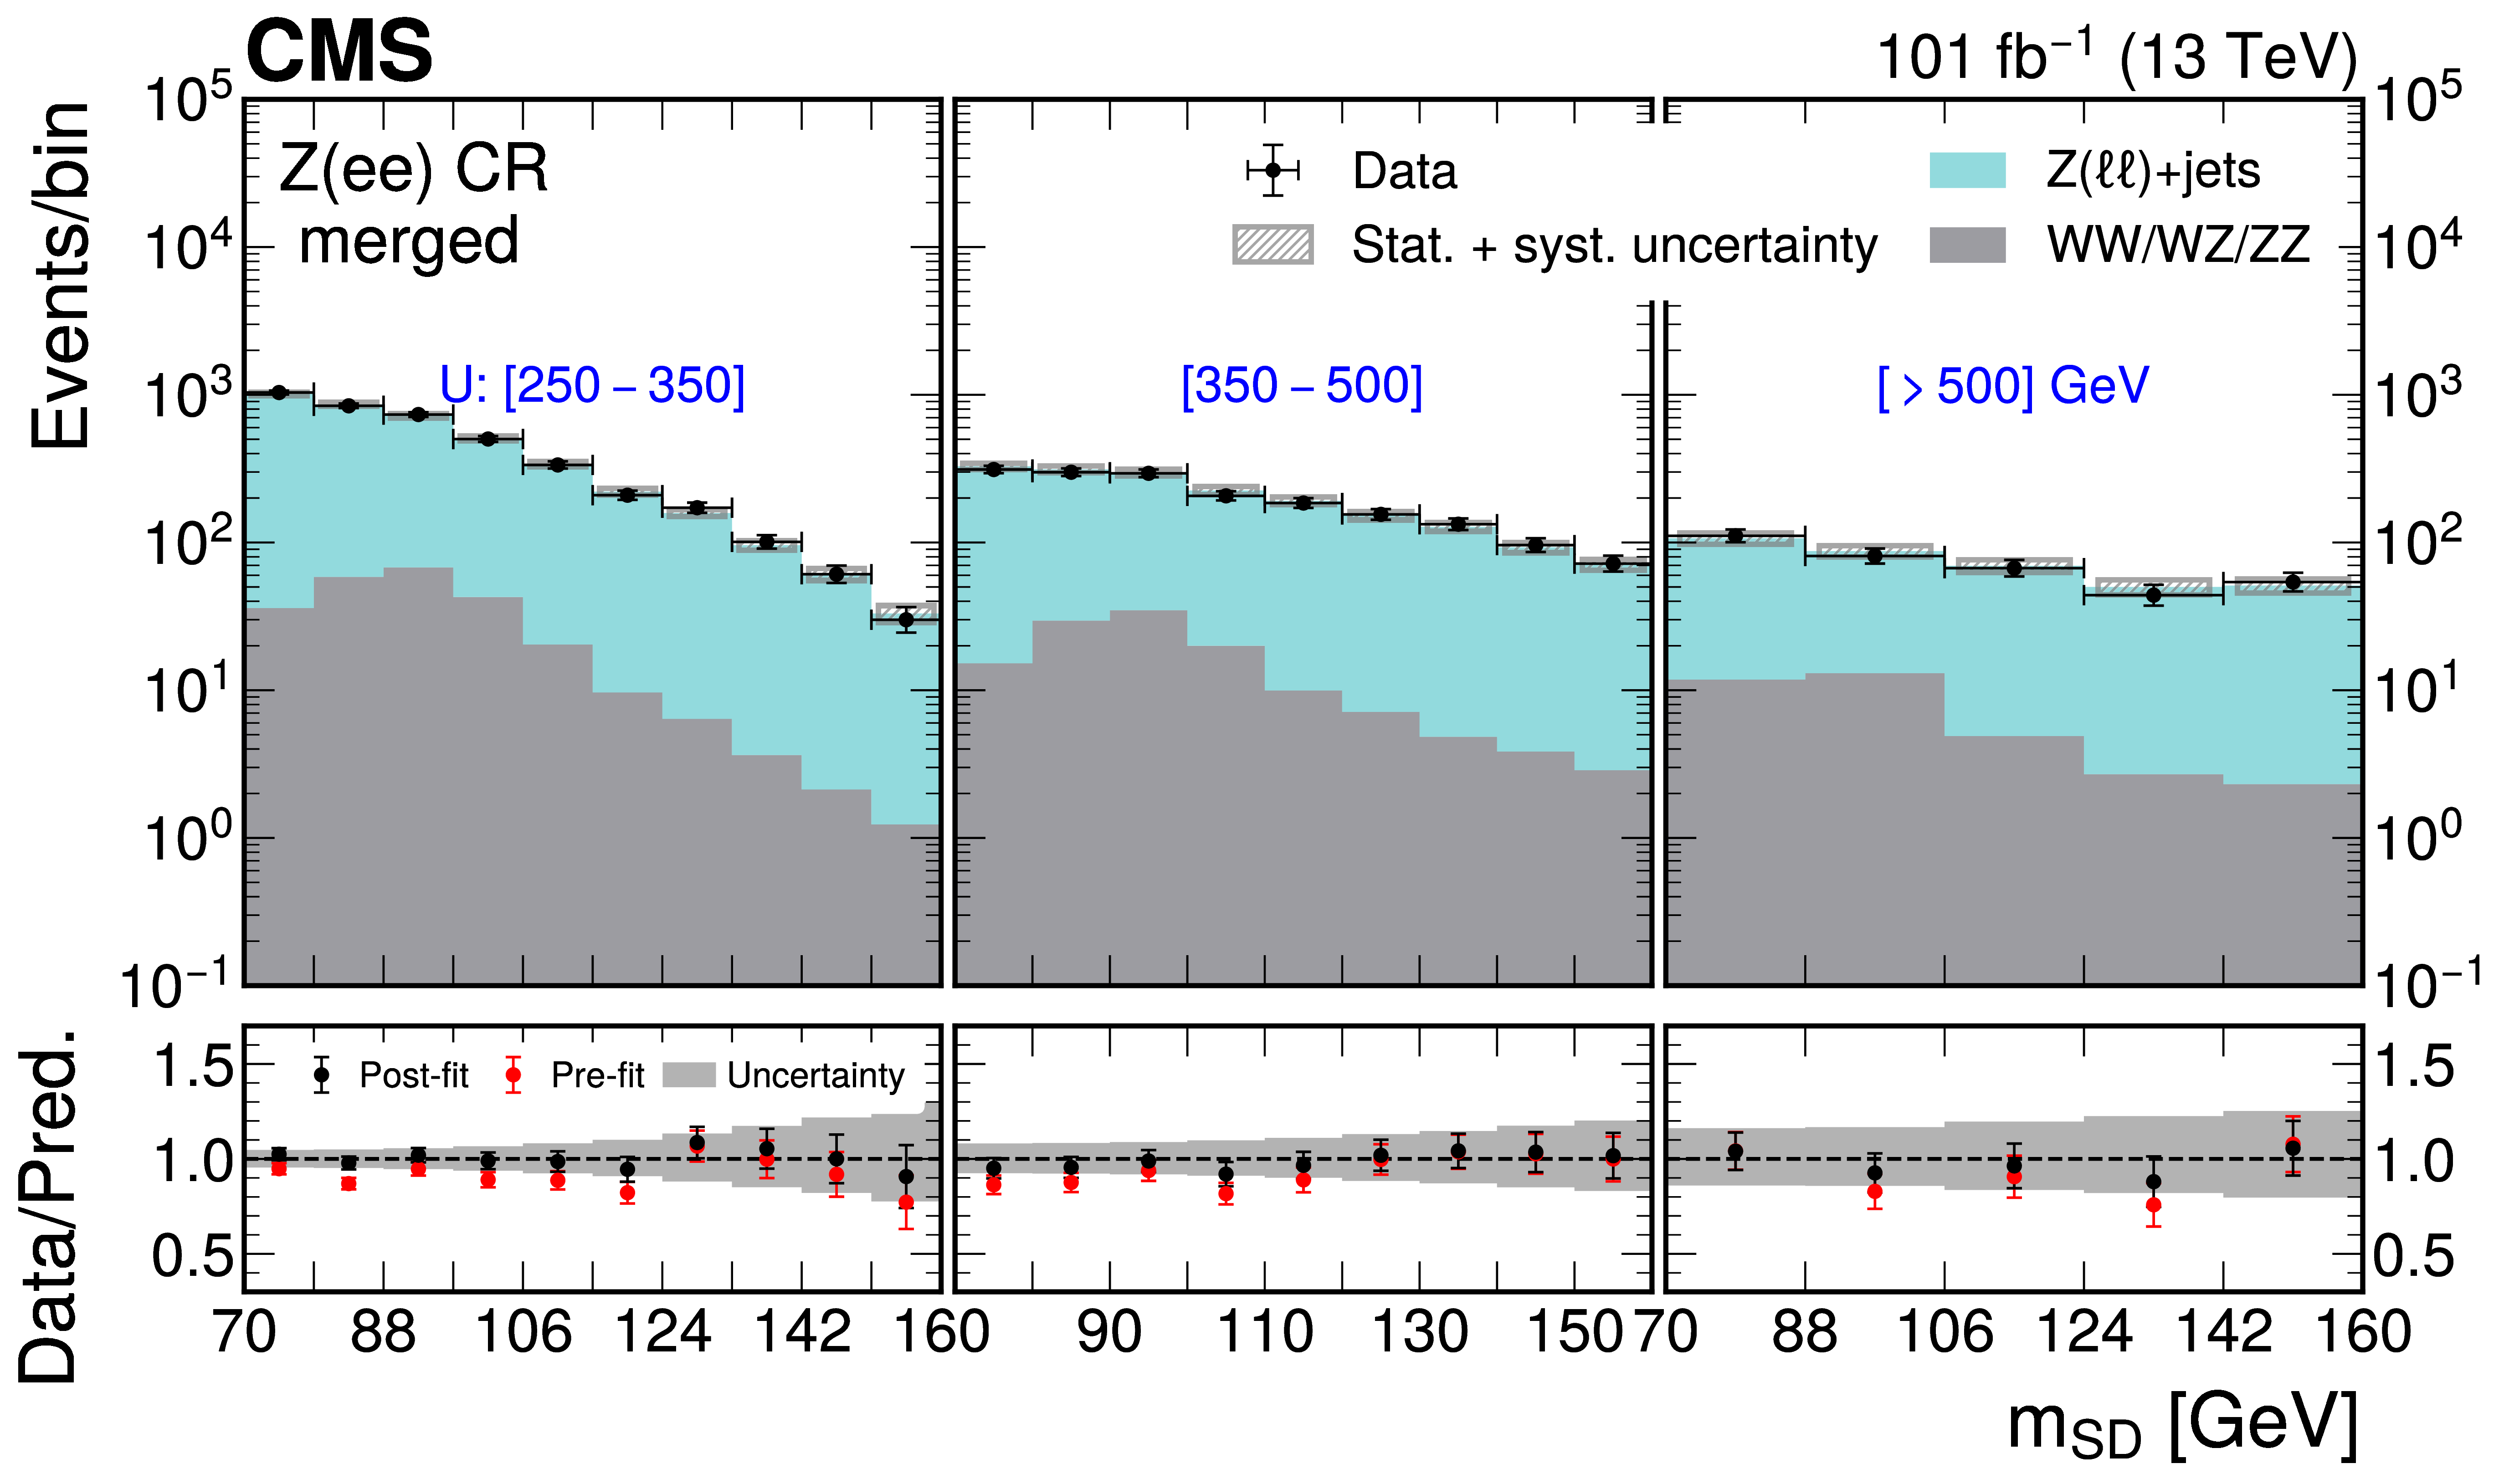
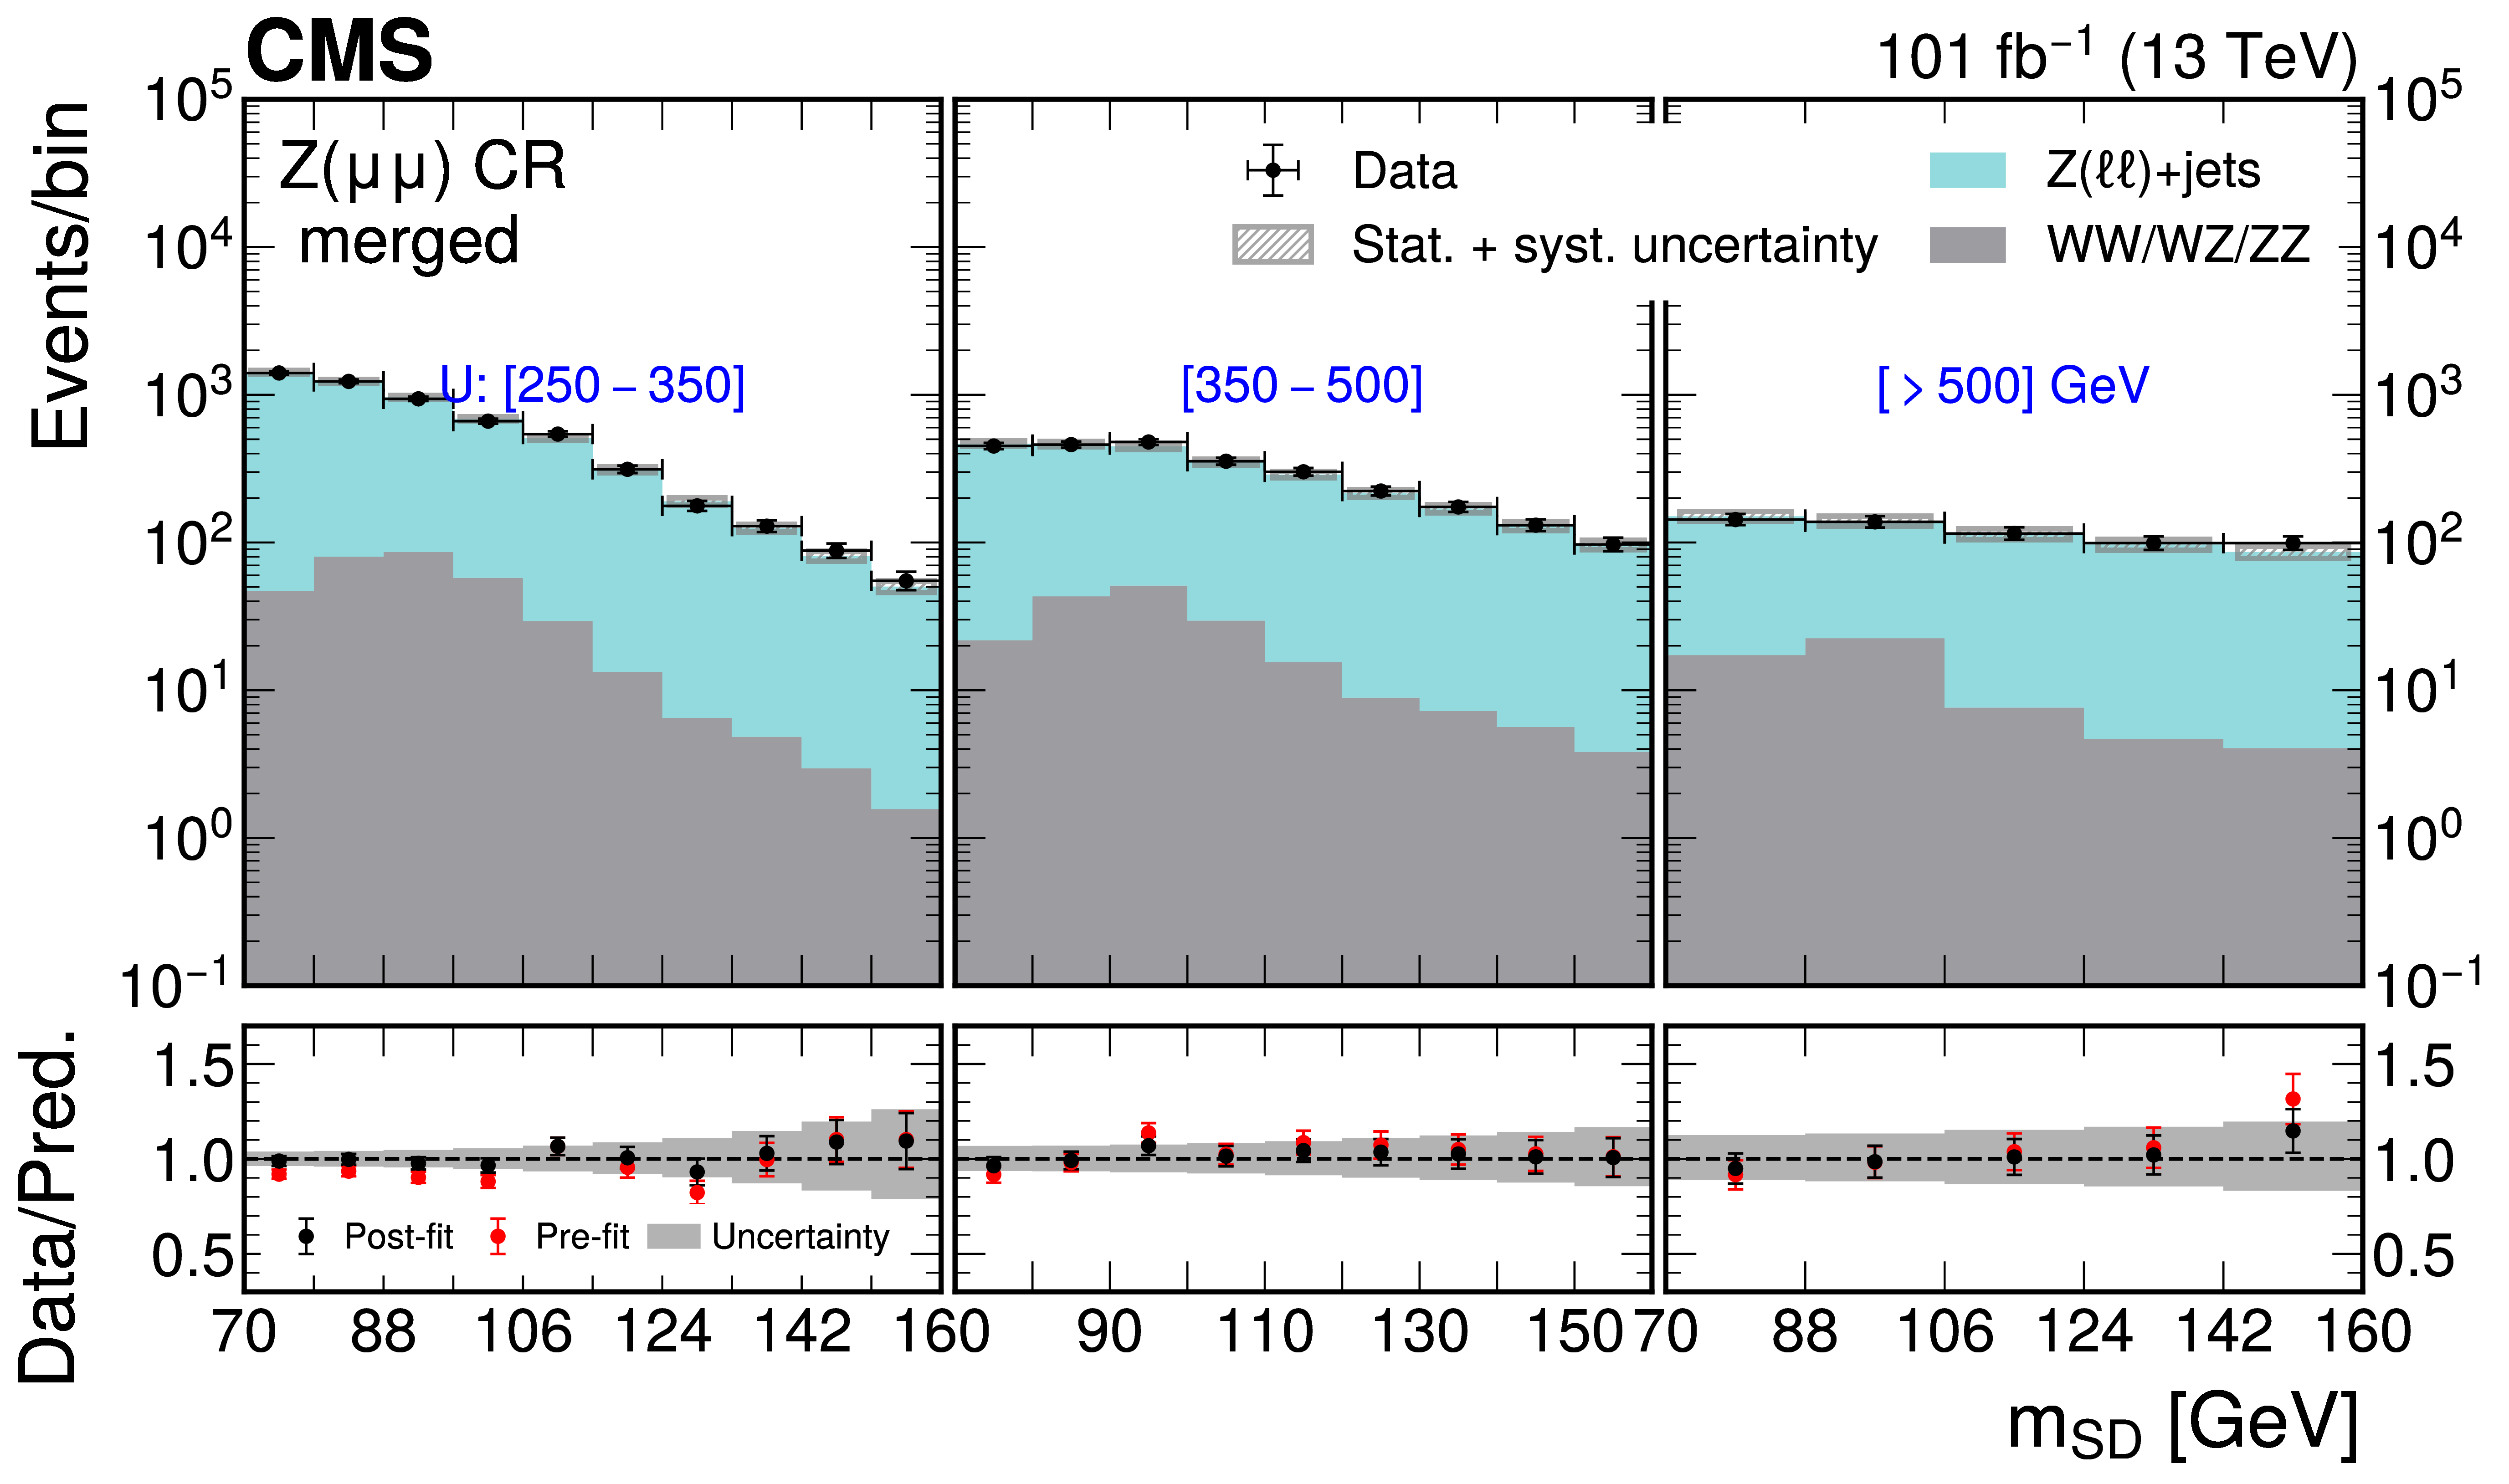
Figure 4:
The AK8 jet $ m_{\text{SD}} $ distributions after the simultaneous likelihood background-only fit sliced in three $ U $ bins, for the merged-category $ \mathrm{Z}(\mathrm{e}\mathrm{e}) $ (above) and $ \mathrm{Z}(\mu\mu) $ (below) CRs. The black markers with statistical uncertainty bars show the observed data, the stacked colored histograms show the predicted background, and the gray shading shows the systematic uncertainty in the prediction. The lower panels show the ratios of the observed data to the background predicted before (pre-fit in red) and after (post-fit in black) the fit, with the gray bands indicating the post-fit uncertainty obtained from combining all statistical and systematic sources. |
png pdf |
Figure 4-a:
The AK8 jet $ m_{\text{SD}} $ distributions after the simultaneous likelihood background-only fit sliced in three $ U $ bins, for the merged-category $ \mathrm{Z}(\mathrm{e}\mathrm{e}) $ (above) and $ \mathrm{Z}(\mu\mu) $ (below) CRs. The black markers with statistical uncertainty bars show the observed data, the stacked colored histograms show the predicted background, and the gray shading shows the systematic uncertainty in the prediction. The lower panels show the ratios of the observed data to the background predicted before (pre-fit in red) and after (post-fit in black) the fit, with the gray bands indicating the post-fit uncertainty obtained from combining all statistical and systematic sources. |
png pdf |
Figure 4-b:
The AK8 jet $ m_{\text{SD}} $ distributions after the simultaneous likelihood background-only fit sliced in three $ U $ bins, for the merged-category $ \mathrm{Z}(\mathrm{e}\mathrm{e}) $ (above) and $ \mathrm{Z}(\mu\mu) $ (below) CRs. The black markers with statistical uncertainty bars show the observed data, the stacked colored histograms show the predicted background, and the gray shading shows the systematic uncertainty in the prediction. The lower panels show the ratios of the observed data to the background predicted before (pre-fit in red) and after (post-fit in black) the fit, with the gray bands indicating the post-fit uncertainty obtained from combining all statistical and systematic sources. |
png pdf |
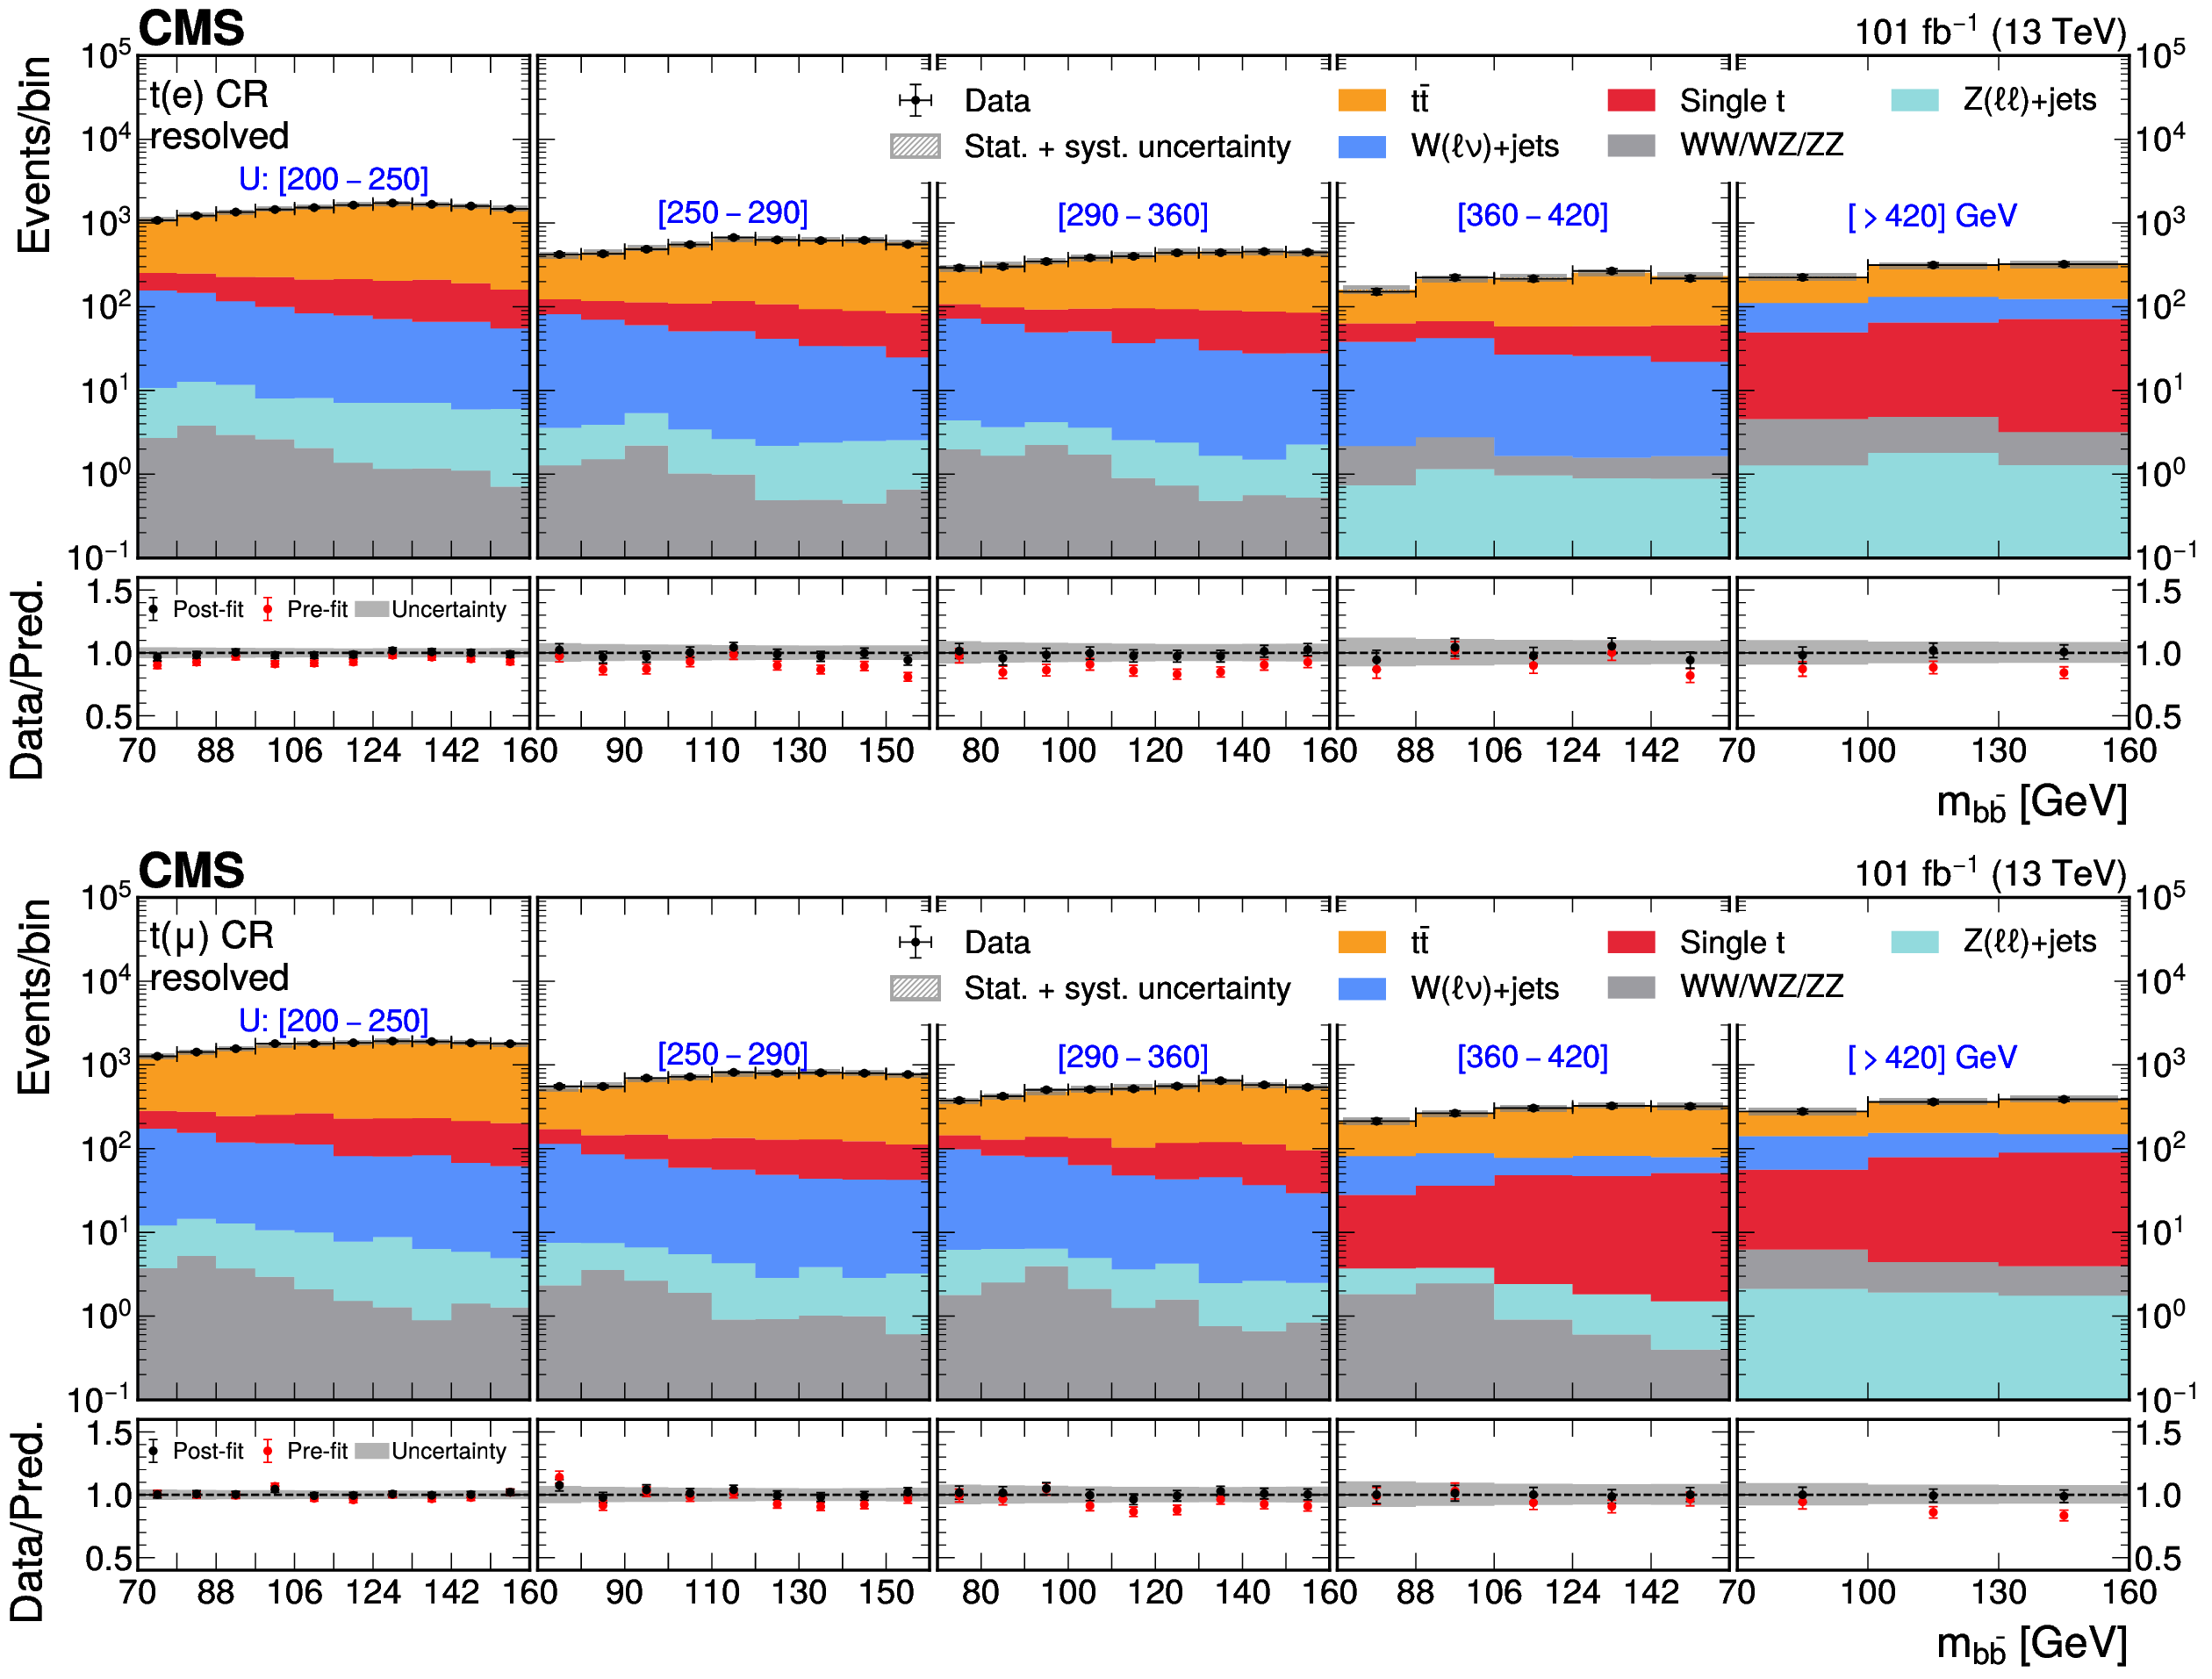
Figure 5:
The dijet $ m_{\mathrm{b}\overline{\mathrm{b}}} $ distributions after the simultaneous likelihood background-only fit sliced in five $ U $ bins, for the resolved-category $ \mathrm{t}(\mathrm{e}) $ (above) and $ \mathrm{t}(\mu) $ (below) CRs. The black markers with statistical uncertainty bars show the observed data, the stacked colored histograms show the predicted background, and the gray shading shows the systematic uncertainty in the prediction. The lower panels show the ratios of the observed data to the background predicted before (pre-fit in red) and after (post-fit in black) the fit, with the gray bands indicating the post-fit uncertainty obtained from combining all statistical and systematic sources. |

png pdf |
Figure 5-a:
The dijet $ m_{\mathrm{b}\overline{\mathrm{b}}} $ distributions after the simultaneous likelihood background-only fit sliced in five $ U $ bins, for the resolved-category $ \mathrm{t}(\mathrm{e}) $ (above) and $ \mathrm{t}(\mu) $ (below) CRs. The black markers with statistical uncertainty bars show the observed data, the stacked colored histograms show the predicted background, and the gray shading shows the systematic uncertainty in the prediction. The lower panels show the ratios of the observed data to the background predicted before (pre-fit in red) and after (post-fit in black) the fit, with the gray bands indicating the post-fit uncertainty obtained from combining all statistical and systematic sources. |

png pdf |
Figure 5-b:
The dijet $ m_{\mathrm{b}\overline{\mathrm{b}}} $ distributions after the simultaneous likelihood background-only fit sliced in five $ U $ bins, for the resolved-category $ \mathrm{t}(\mathrm{e}) $ (above) and $ \mathrm{t}(\mu) $ (below) CRs. The black markers with statistical uncertainty bars show the observed data, the stacked colored histograms show the predicted background, and the gray shading shows the systematic uncertainty in the prediction. The lower panels show the ratios of the observed data to the background predicted before (pre-fit in red) and after (post-fit in black) the fit, with the gray bands indicating the post-fit uncertainty obtained from combining all statistical and systematic sources. |
png pdf |
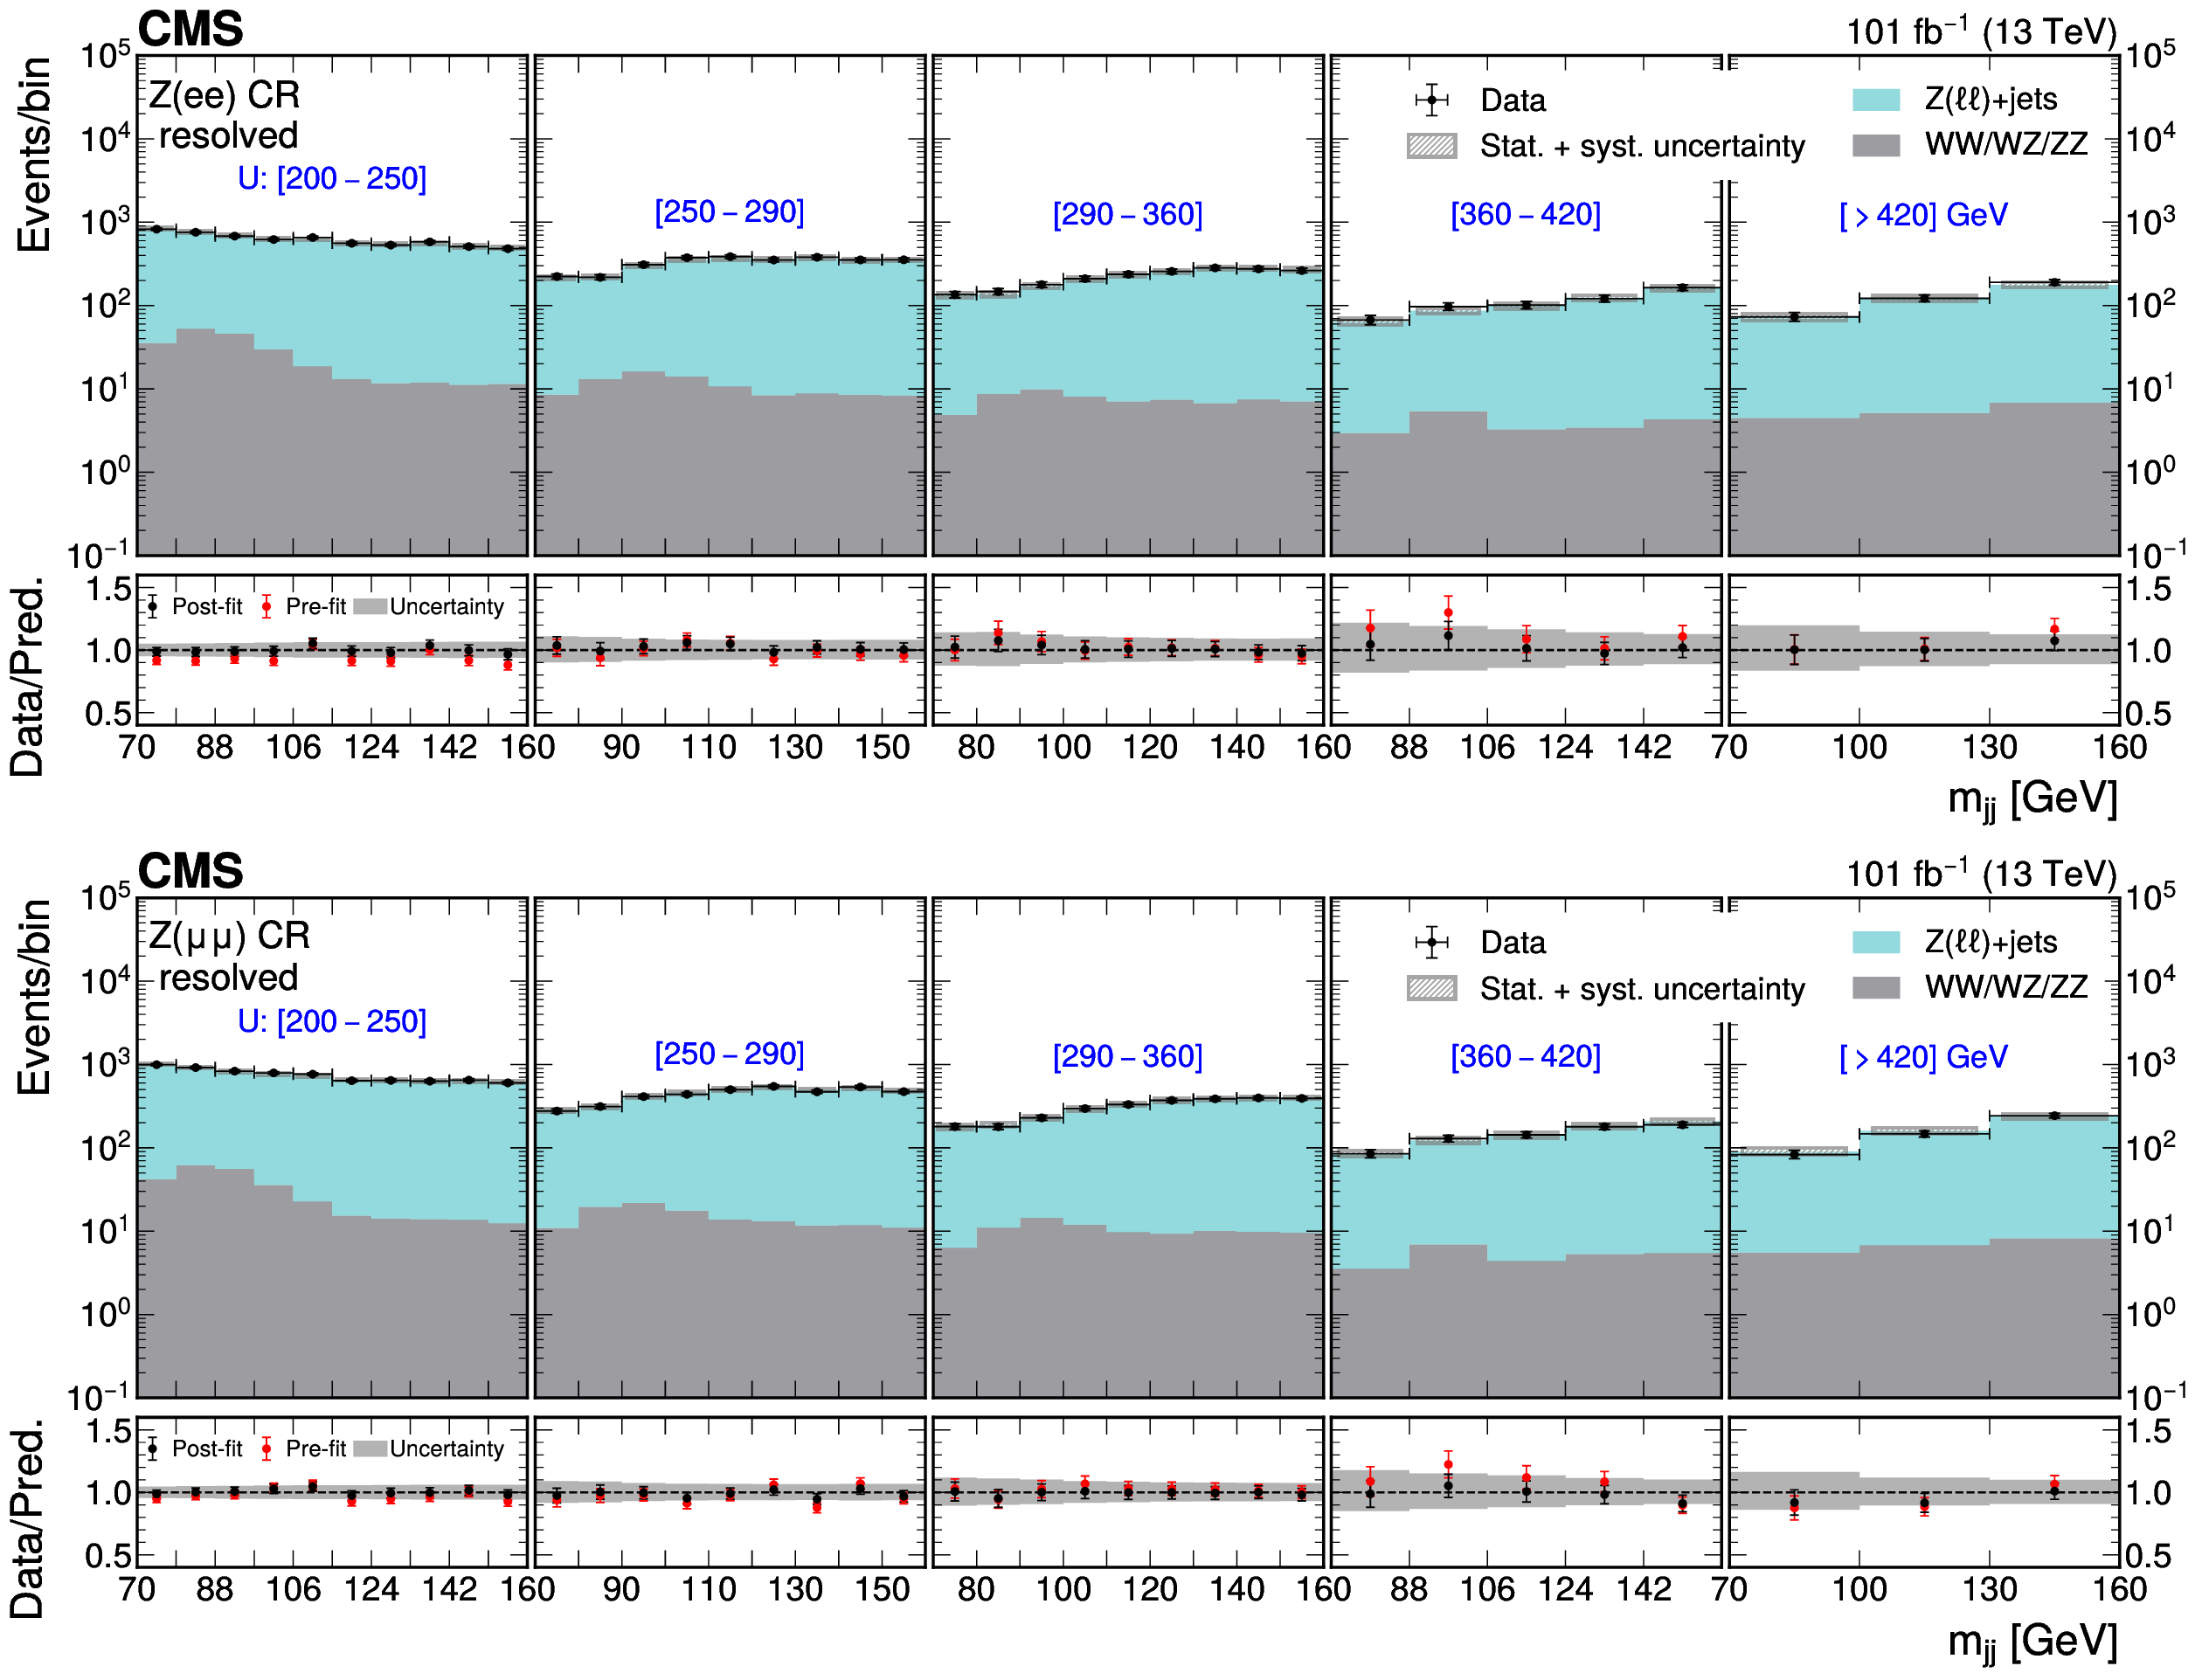
Figure 6:
The dijet $ m_{jj} $ distributions after the simultaneous likelihood background-only fit sliced in five $ U $ bins, for the resolved-category $ \mathrm{Z}(\mathrm{e}\mathrm{e}) $ (above) and $ \mathrm{Z}(\mu\mu) $ (below) CRs. The black markers with statistical uncertainty bars show the observed data, the stacked colored histograms show the predicted background, and the gray shading shows the systematic uncertainty in the prediction. The lower panels show the ratios of the observed data to the background predicted before (pre-fit in red) and after (post-fit in black) the fit, with the gray bands indicating the post-fit uncertainty obtained from combining all statistical and systematic sources. |
png pdf |
Figure 6-a:
The dijet $ m_{jj} $ distributions after the simultaneous likelihood background-only fit sliced in five $ U $ bins, for the resolved-category $ \mathrm{Z}(\mathrm{e}\mathrm{e}) $ (above) and $ \mathrm{Z}(\mu\mu) $ (below) CRs. The black markers with statistical uncertainty bars show the observed data, the stacked colored histograms show the predicted background, and the gray shading shows the systematic uncertainty in the prediction. The lower panels show the ratios of the observed data to the background predicted before (pre-fit in red) and after (post-fit in black) the fit, with the gray bands indicating the post-fit uncertainty obtained from combining all statistical and systematic sources. |
png pdf |
Figure 6-b:
The dijet $ m_{jj} $ distributions after the simultaneous likelihood background-only fit sliced in five $ U $ bins, for the resolved-category $ \mathrm{Z}(\mathrm{e}\mathrm{e}) $ (above) and $ \mathrm{Z}(\mu\mu) $ (below) CRs. The black markers with statistical uncertainty bars show the observed data, the stacked colored histograms show the predicted background, and the gray shading shows the systematic uncertainty in the prediction. The lower panels show the ratios of the observed data to the background predicted before (pre-fit in red) and after (post-fit in black) the fit, with the gray bands indicating the post-fit uncertainty obtained from combining all statistical and systematic sources. |
png pdf |
Figure 7:
The AK8 jet $ m_{\text{SD}} $ (above) and dijet $ m_{\mathrm{b}\overline{\mathrm{b}}} $ (below) distributions after the simultaneous likelihood background-only fit sliced in three and five $ p_{\mathrm{T}}^\text{miss} $ bins, for the merged- and resolved-category SRs respectively. The black markers with statistical uncertainty bars show the observed data, the stacked colored histograms show the predicted background, and the gray shading shows the systematic uncertainty in the prediction. The signal predictions are overlaid as cyan and yellow dashed lines, one for each benchmark model. The lower panels show the ratios of the observed data to pre-fit (red points) and post-fit (black points) background predictions, with the gray bands indicating the post-fit uncertainty obtained from combining all statistical and systematic sources. |
png pdf |
Figure 7-a:
The AK8 jet $ m_{\text{SD}} $ (above) and dijet $ m_{\mathrm{b}\overline{\mathrm{b}}} $ (below) distributions after the simultaneous likelihood background-only fit sliced in three and five $ p_{\mathrm{T}}^\text{miss} $ bins, for the merged- and resolved-category SRs respectively. The black markers with statistical uncertainty bars show the observed data, the stacked colored histograms show the predicted background, and the gray shading shows the systematic uncertainty in the prediction. The signal predictions are overlaid as cyan and yellow dashed lines, one for each benchmark model. The lower panels show the ratios of the observed data to pre-fit (red points) and post-fit (black points) background predictions, with the gray bands indicating the post-fit uncertainty obtained from combining all statistical and systematic sources. |
png pdf |
Figure 7-b:
The AK8 jet $ m_{\text{SD}} $ (above) and dijet $ m_{\mathrm{b}\overline{\mathrm{b}}} $ (below) distributions after the simultaneous likelihood background-only fit sliced in three and five $ p_{\mathrm{T}}^\text{miss} $ bins, for the merged- and resolved-category SRs respectively. The black markers with statistical uncertainty bars show the observed data, the stacked colored histograms show the predicted background, and the gray shading shows the systematic uncertainty in the prediction. The signal predictions are overlaid as cyan and yellow dashed lines, one for each benchmark model. The lower panels show the ratios of the observed data to pre-fit (red points) and post-fit (black points) background predictions, with the gray bands indicating the post-fit uncertainty obtained from combining all statistical and systematic sources. |
png pdf |
Figure 8:
Exclusion limits at 95% CL on the signal cross section $ \sigma_{\mathrm{h}+\text{DM}} $ for the baryonic-$ \mathrm{Z}^{'} $ model as a function of $ m_{\mathrm{Z}^{'}} $ and $ m_{\chi} $. The coupling parameters are fixed to $ g_{\mathrm{q}}= $ 0.25 and $ g_{\chi}= $ 1. The areas within the solid black and red contours represent the exclusion regions where the theoretical cross sections are larger than the observed and expected experimental limits, respectively. The areas within the dashed and dotted red contours show the excluded regions at $ \pm $1 and $ \pm $2 standard deviations from the expected limits, respectively. |
png pdf |
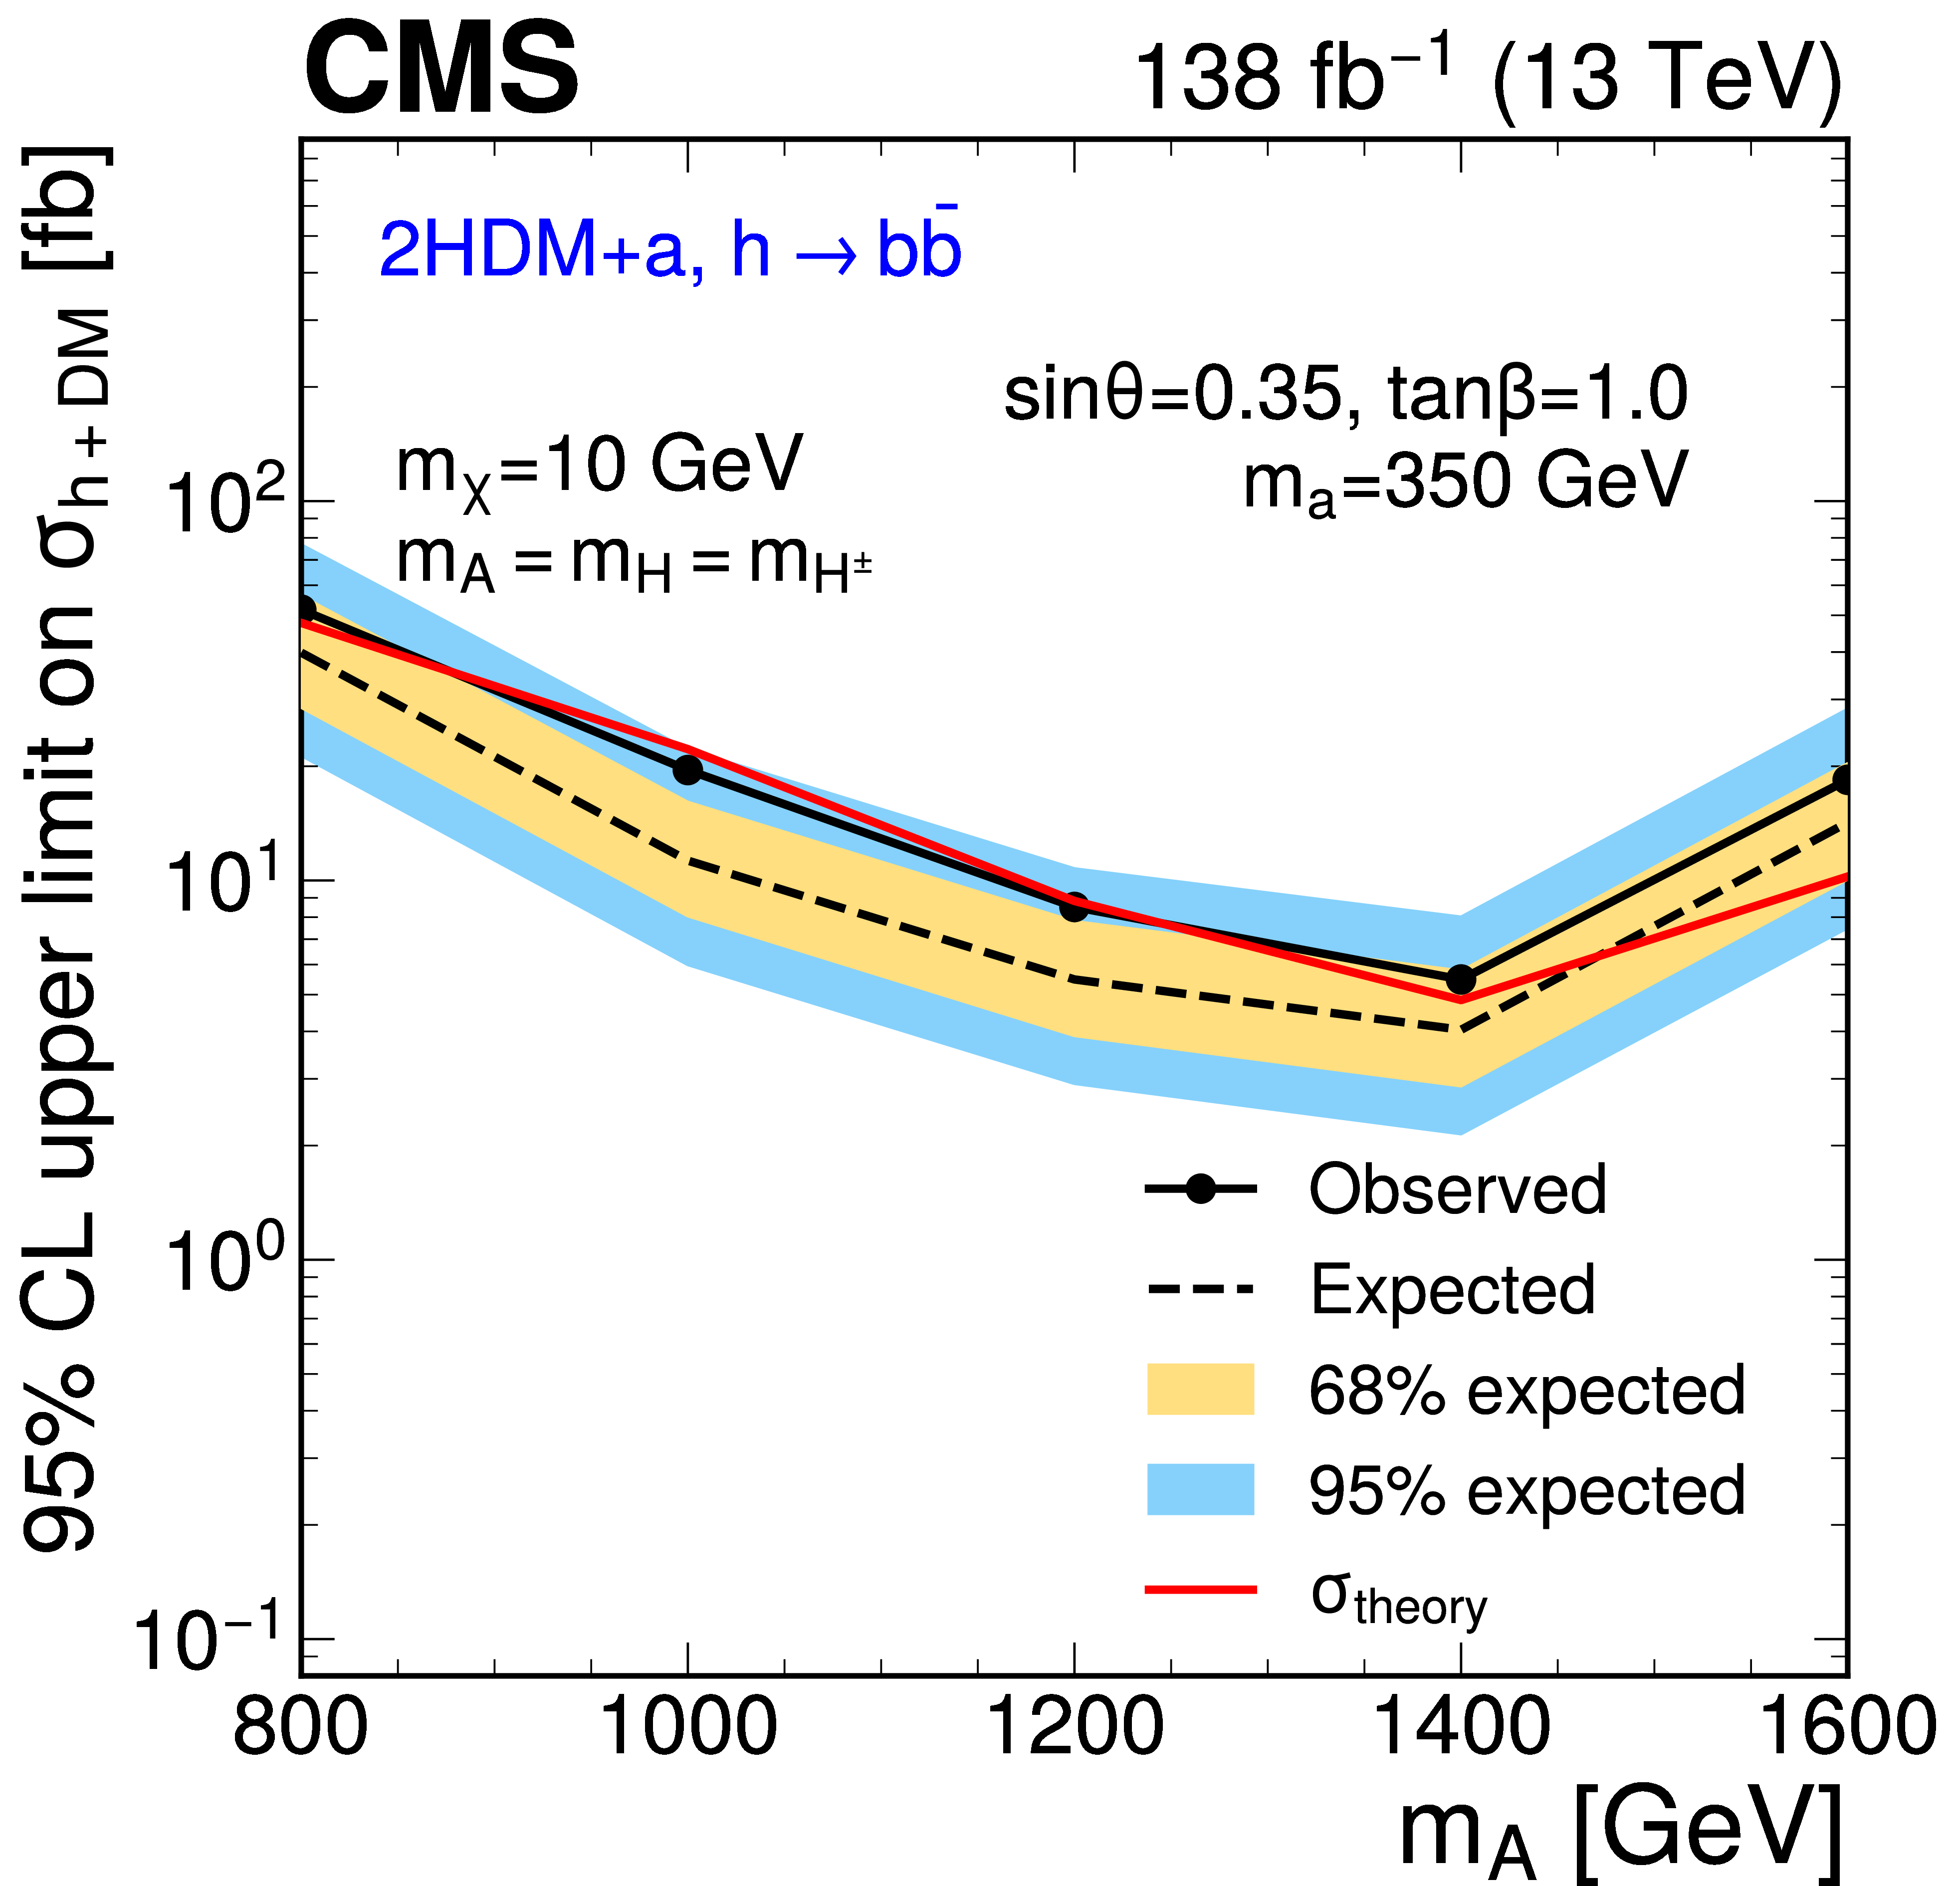
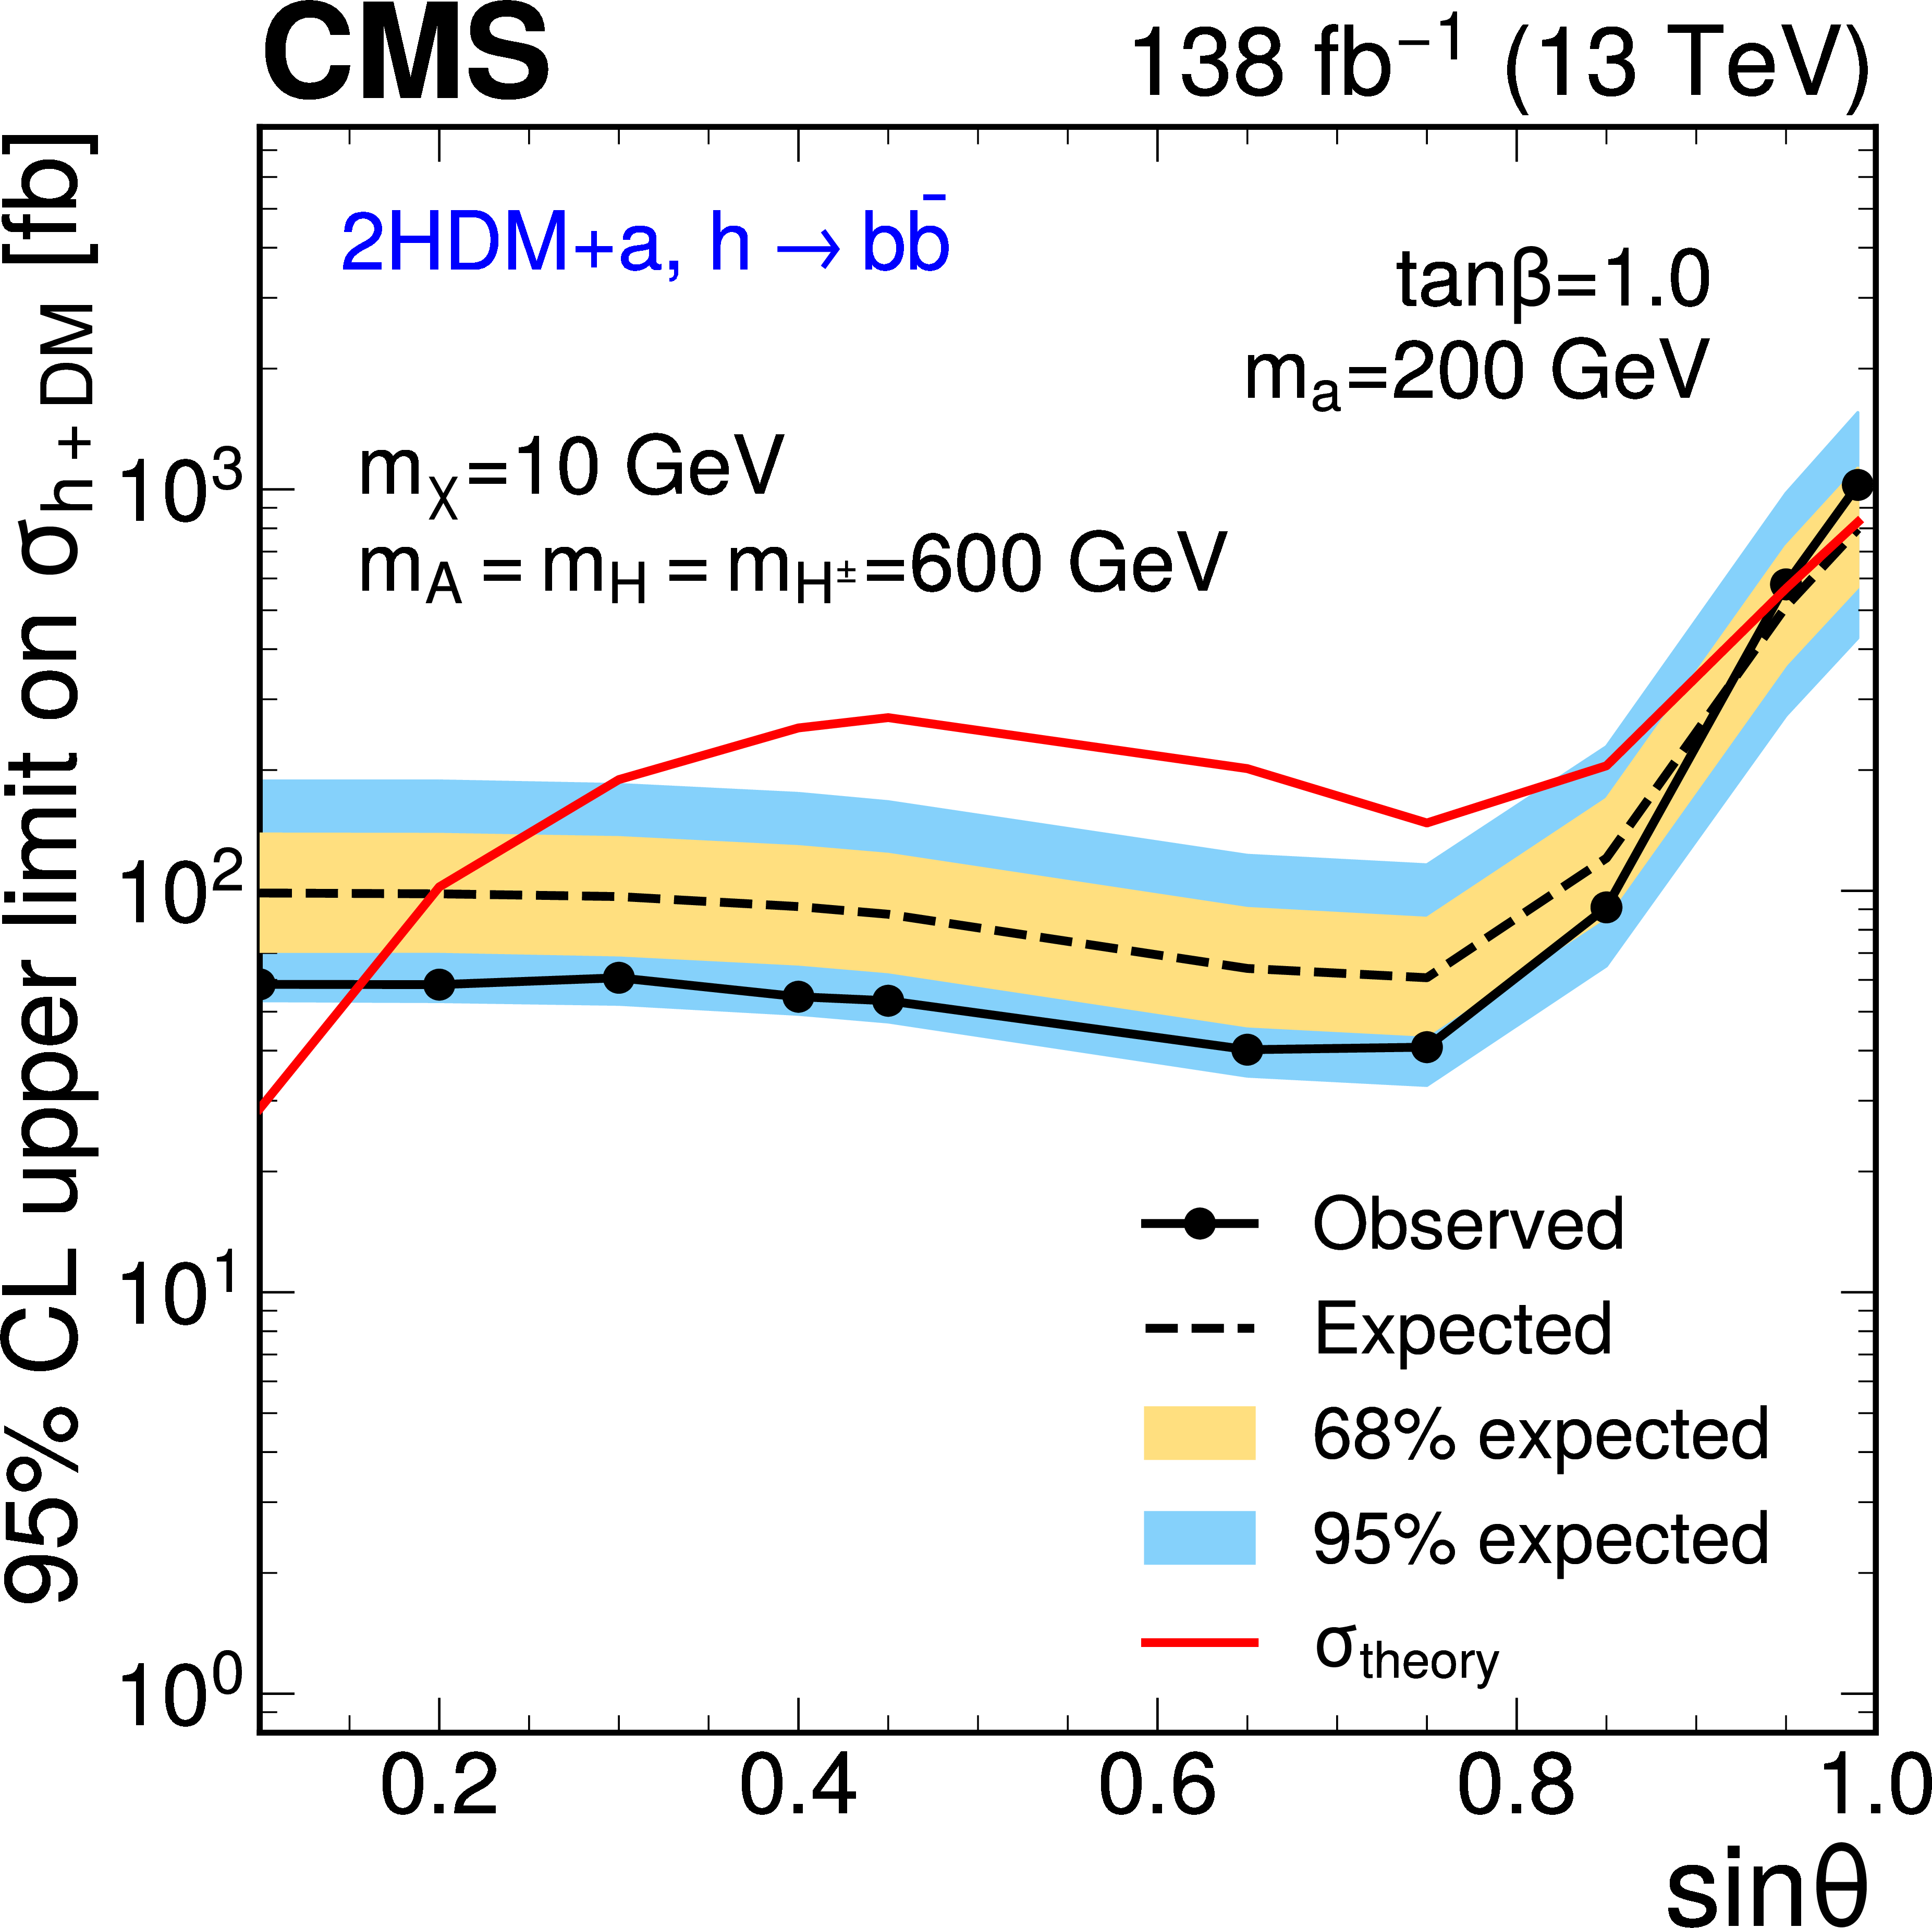
Figure 9:
Observed and expected exclusion limits at 95% CL on the signal cross section $ \sigma_{\mathrm{h}+\text{DM}} $ for the 2HDM+$ \mathrm{a} $ model as a function of the model parameters: $ m_{\mathrm{a}} $ (upper left), $ m_{\mathrm{A}} $ (upper right), $ \sin\theta $ (lower left), and $ \tan\beta $ (lower right) while fixing the values of the other parameters, as indicated in the legends. Different sets of model parameters are tested to probe distinct regions of phase space. Mass points below the solid red line are excluded. |
png pdf |
Figure 9-a:
Observed and expected exclusion limits at 95% CL on the signal cross section $ \sigma_{\mathrm{h}+\text{DM}} $ for the 2HDM+$ \mathrm{a} $ model as a function of the model parameters: $ m_{\mathrm{a}} $ (upper left), $ m_{\mathrm{A}} $ (upper right), $ \sin\theta $ (lower left), and $ \tan\beta $ (lower right) while fixing the values of the other parameters, as indicated in the legends. Different sets of model parameters are tested to probe distinct regions of phase space. Mass points below the solid red line are excluded. |
png pdf |
Figure 9-b:
Observed and expected exclusion limits at 95% CL on the signal cross section $ \sigma_{\mathrm{h}+\text{DM}} $ for the 2HDM+$ \mathrm{a} $ model as a function of the model parameters: $ m_{\mathrm{a}} $ (upper left), $ m_{\mathrm{A}} $ (upper right), $ \sin\theta $ (lower left), and $ \tan\beta $ (lower right) while fixing the values of the other parameters, as indicated in the legends. Different sets of model parameters are tested to probe distinct regions of phase space. Mass points below the solid red line are excluded. |
png pdf |
Figure 9-c:
Observed and expected exclusion limits at 95% CL on the signal cross section $ \sigma_{\mathrm{h}+\text{DM}} $ for the 2HDM+$ \mathrm{a} $ model as a function of the model parameters: $ m_{\mathrm{a}} $ (upper left), $ m_{\mathrm{A}} $ (upper right), $ \sin\theta $ (lower left), and $ \tan\beta $ (lower right) while fixing the values of the other parameters, as indicated in the legends. Different sets of model parameters are tested to probe distinct regions of phase space. Mass points below the solid red line are excluded. |

png pdf |
Figure 9-d:
Observed and expected exclusion limits at 95% CL on the signal cross section $ \sigma_{\mathrm{h}+\text{DM}} $ for the 2HDM+$ \mathrm{a} $ model as a function of the model parameters: $ m_{\mathrm{a}} $ (upper left), $ m_{\mathrm{A}} $ (upper right), $ \sin\theta $ (lower left), and $ \tan\beta $ (lower right) while fixing the values of the other parameters, as indicated in the legends. Different sets of model parameters are tested to probe distinct regions of phase space. Mass points below the solid red line are excluded. |
| Tables | |
png pdf |
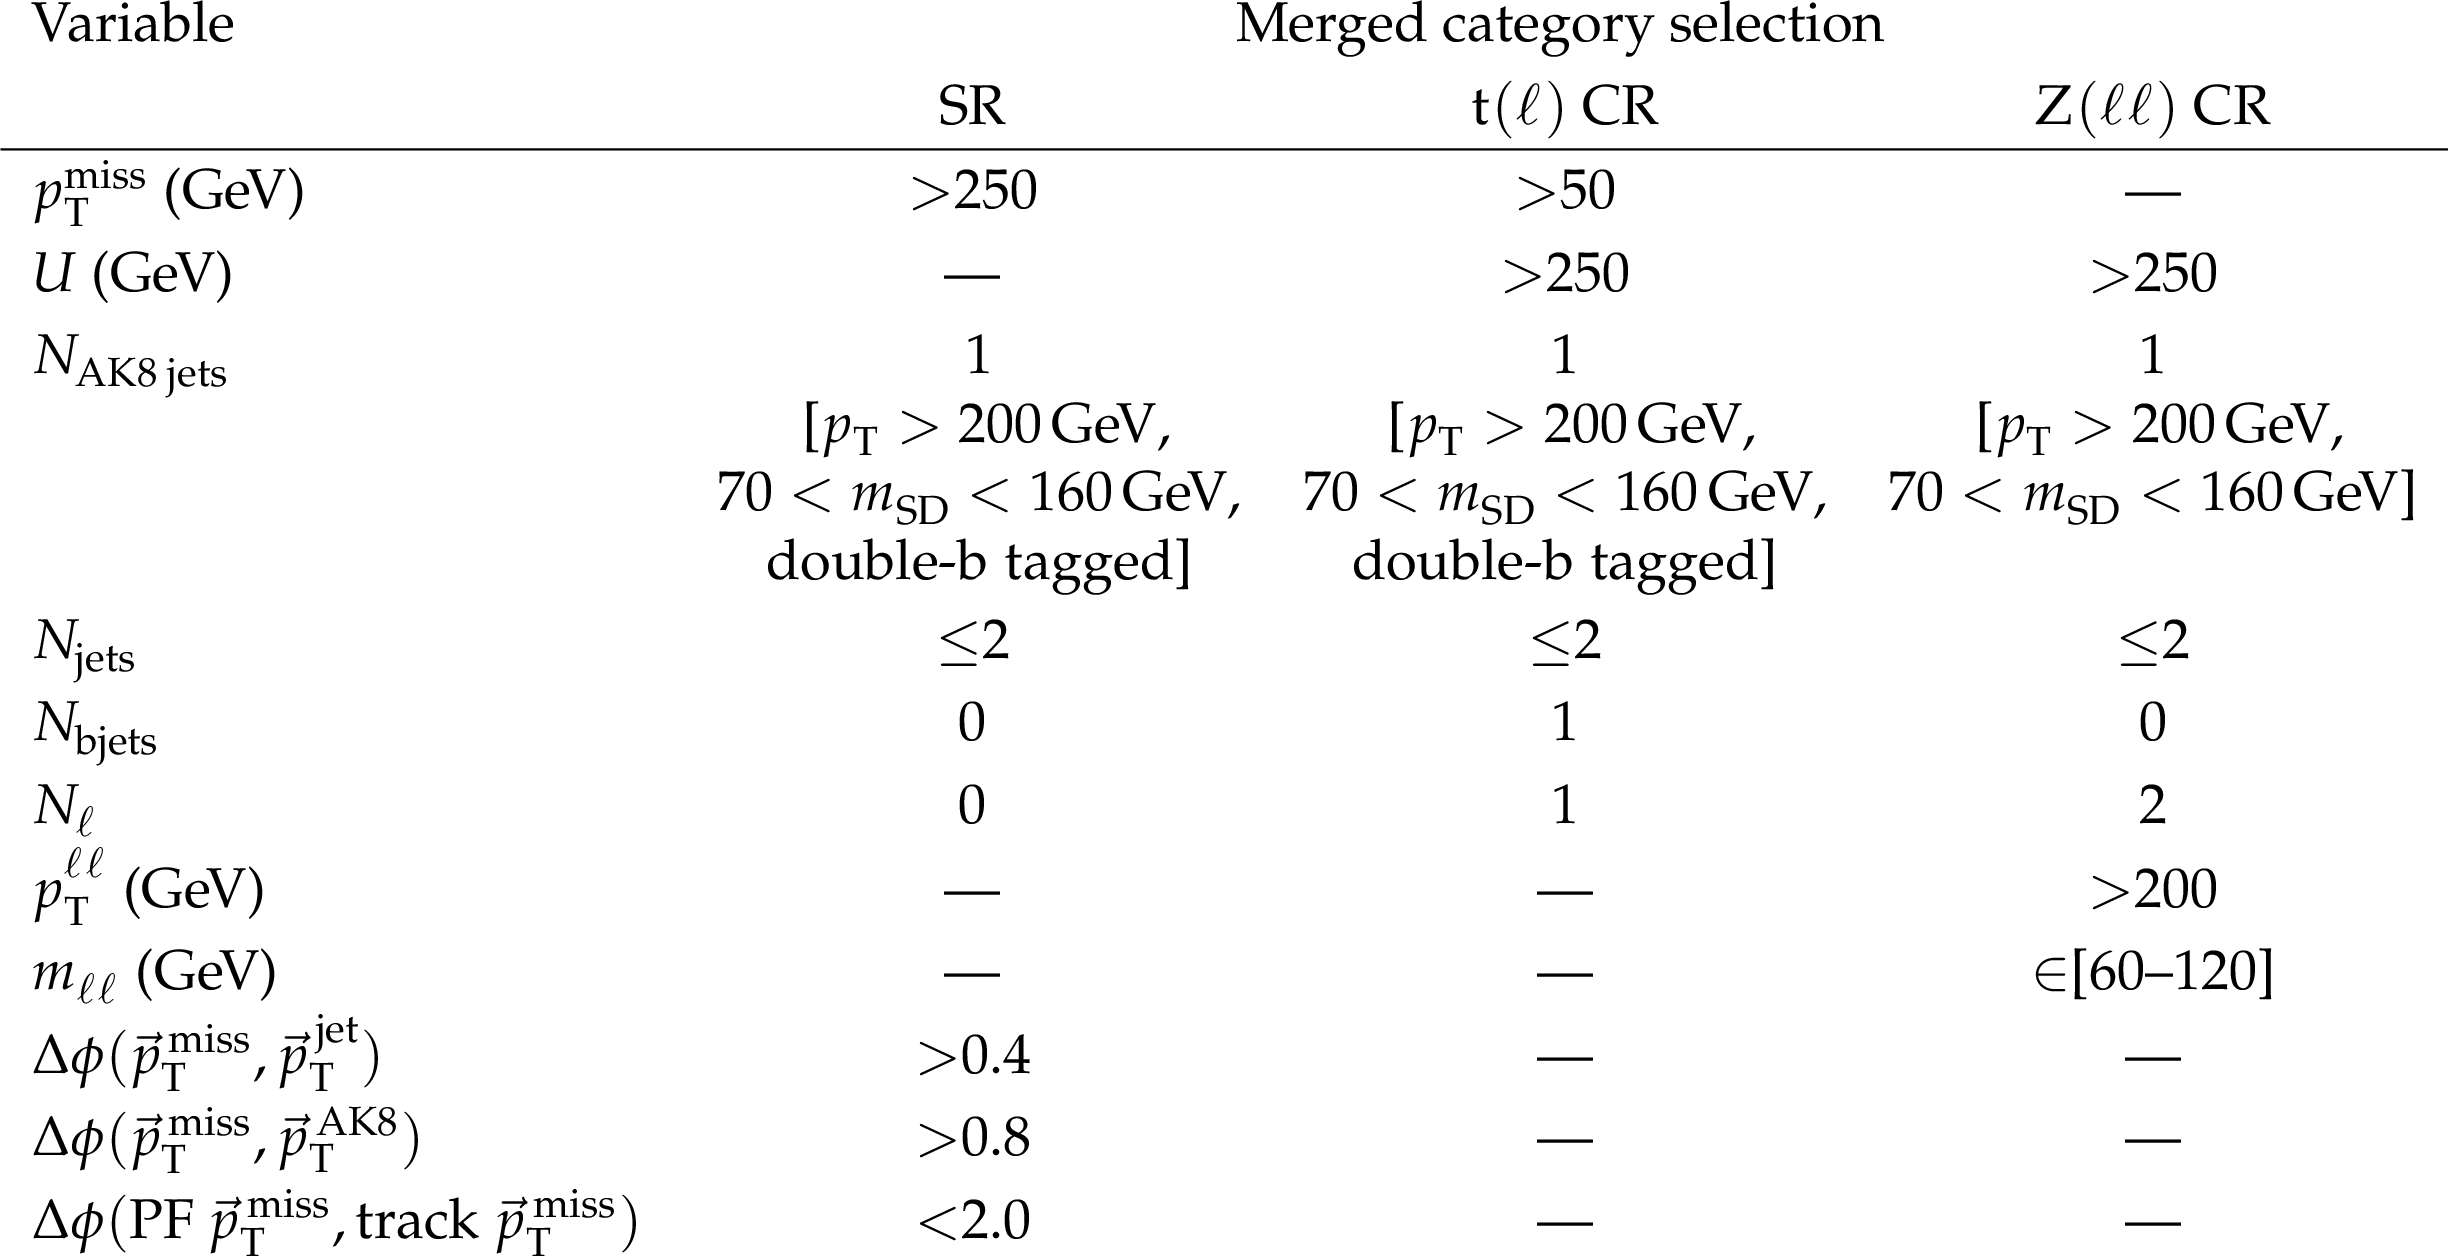
Table 1:
Event selections applied to the merged-category SR and CRs. Events in all the analysis regions have a photon and tau lepton candidate veto. Here ``jets'' refers to the AK4 jets with $ \Delta R > $ 0.8 between the jet and the double-b tagged AK8 jet. |
png pdf |
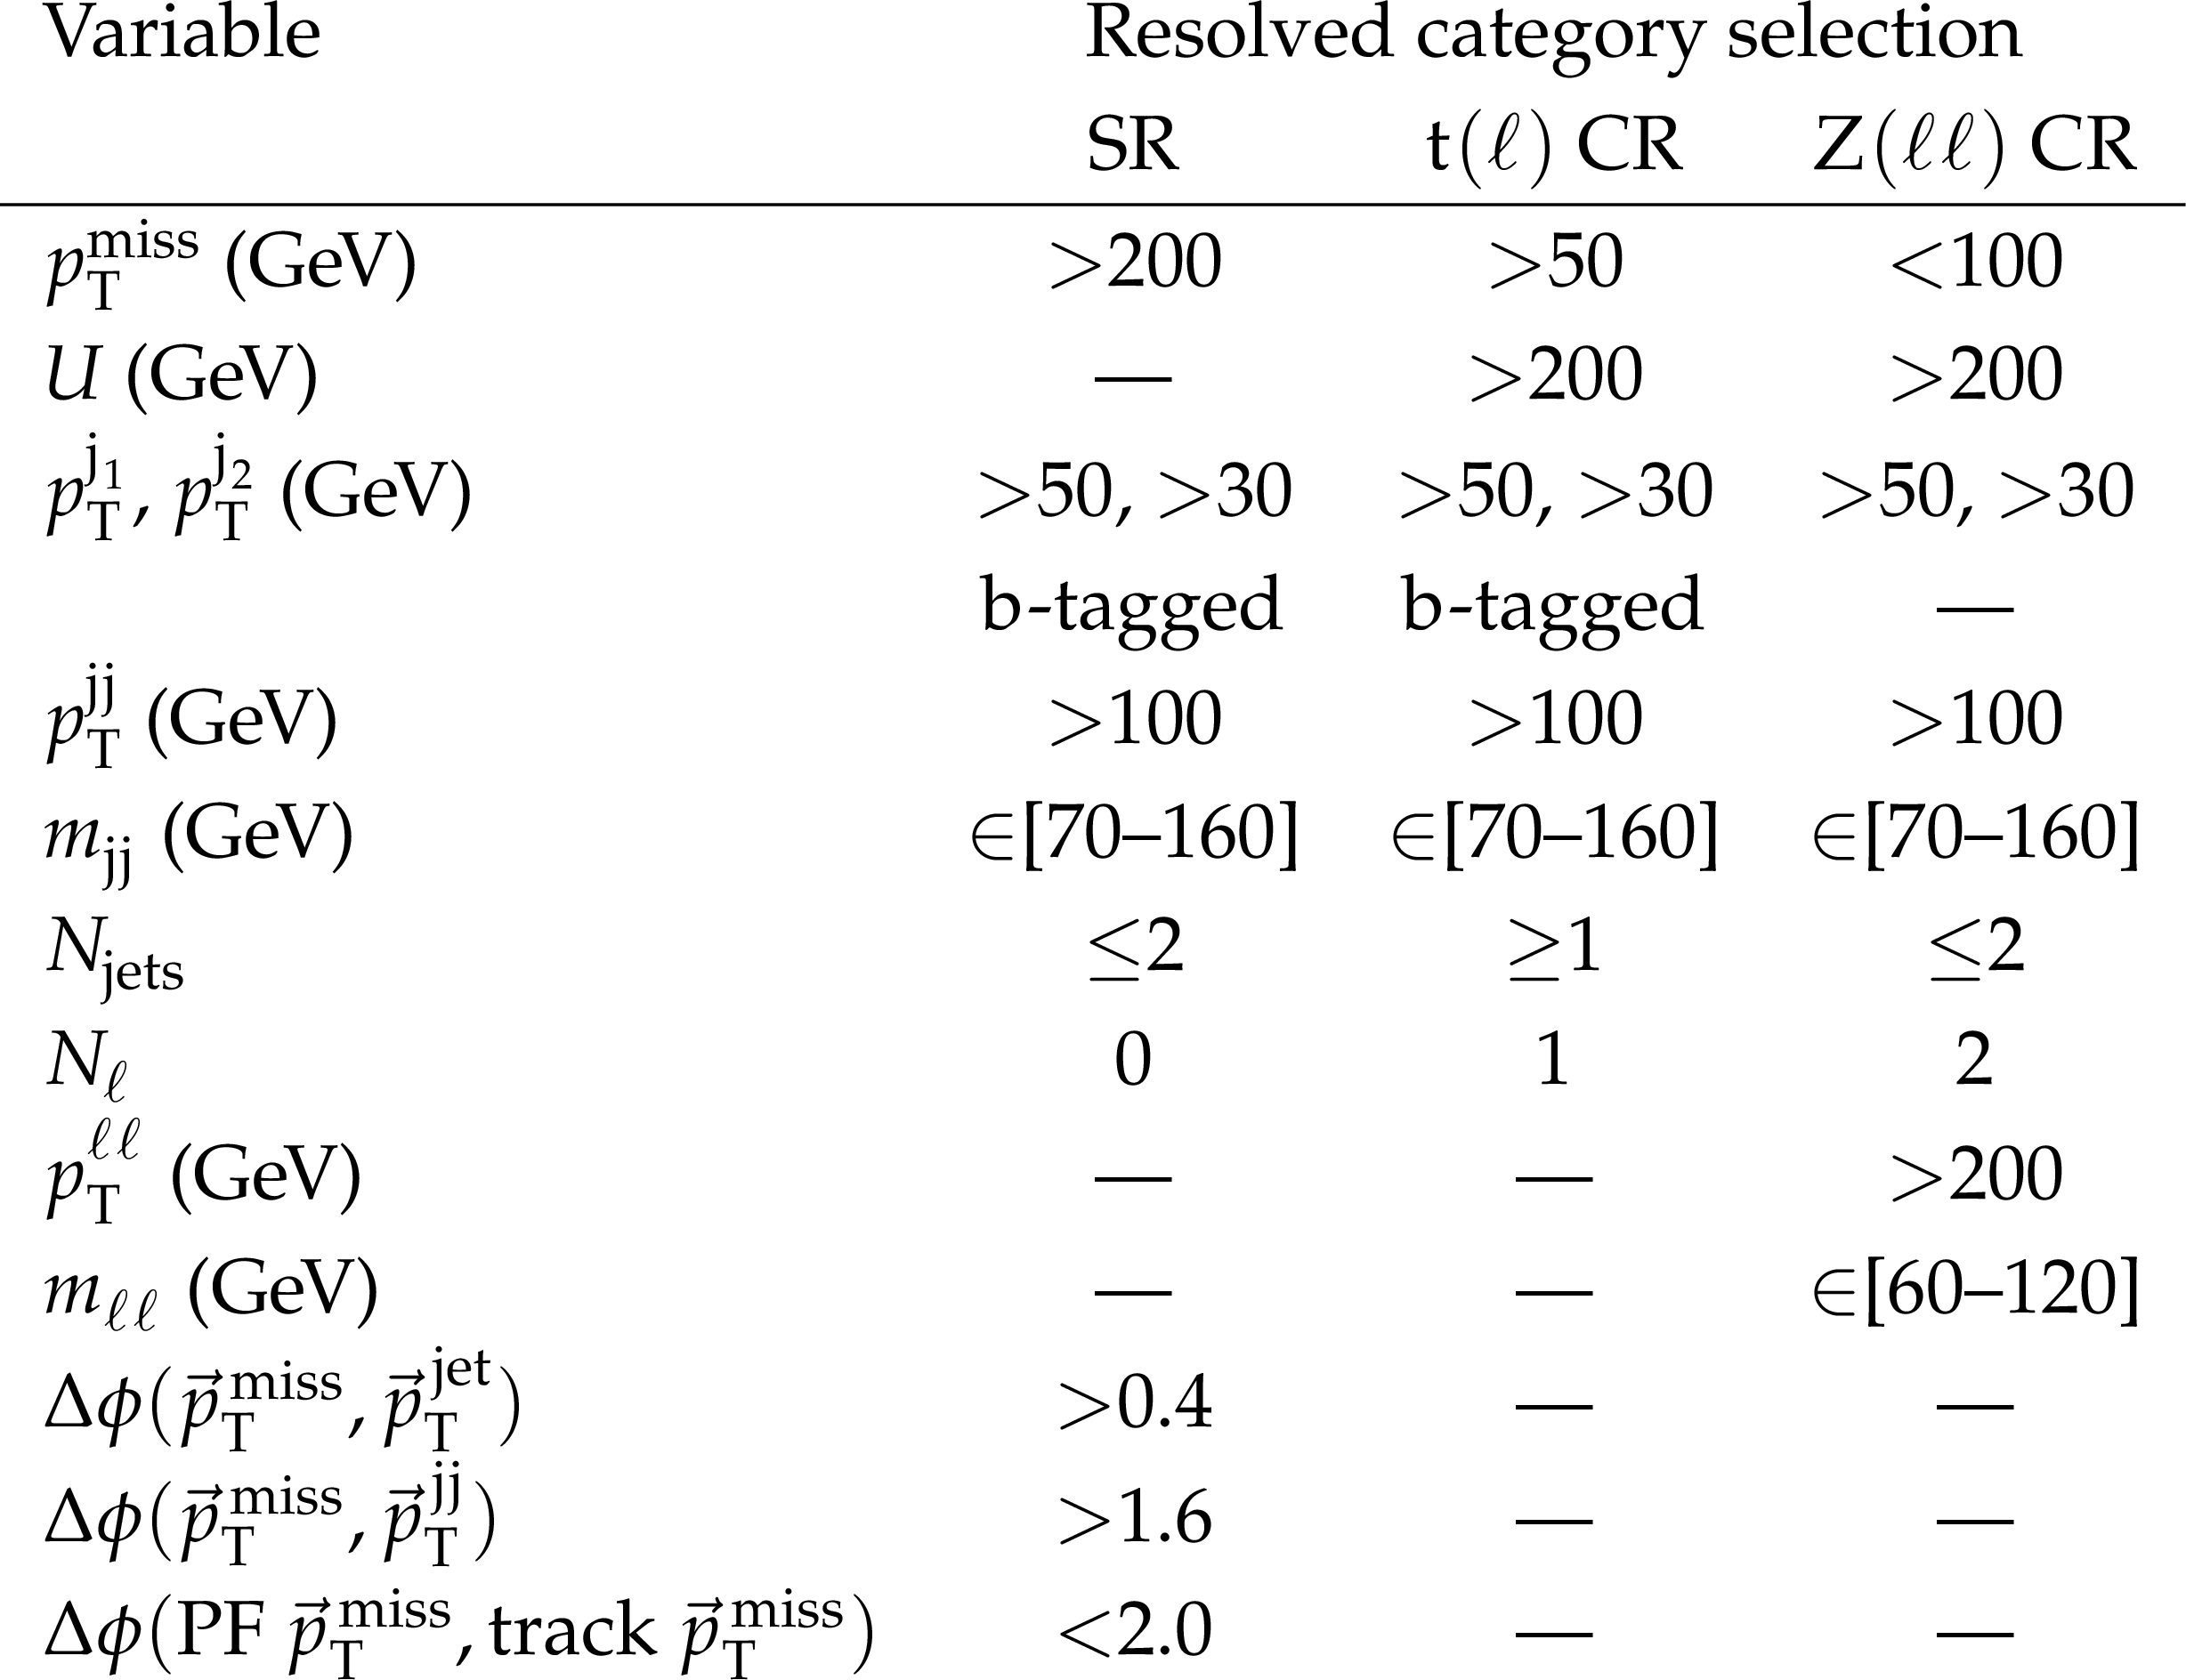
Table 2:
Event selections applied to the resolved-category SR and CRs. Events in all the analysis regions have a photon and tau lepton candidate veto. Here ``jets'' refers to the AK4 jets with $ \Delta R > $ 0.4 between this jet and the leading ($j _1$) and subleading ($j_2$) b-tagged jets forming the Higgs boson candidate dijet ($jj$) system. |
png pdf |
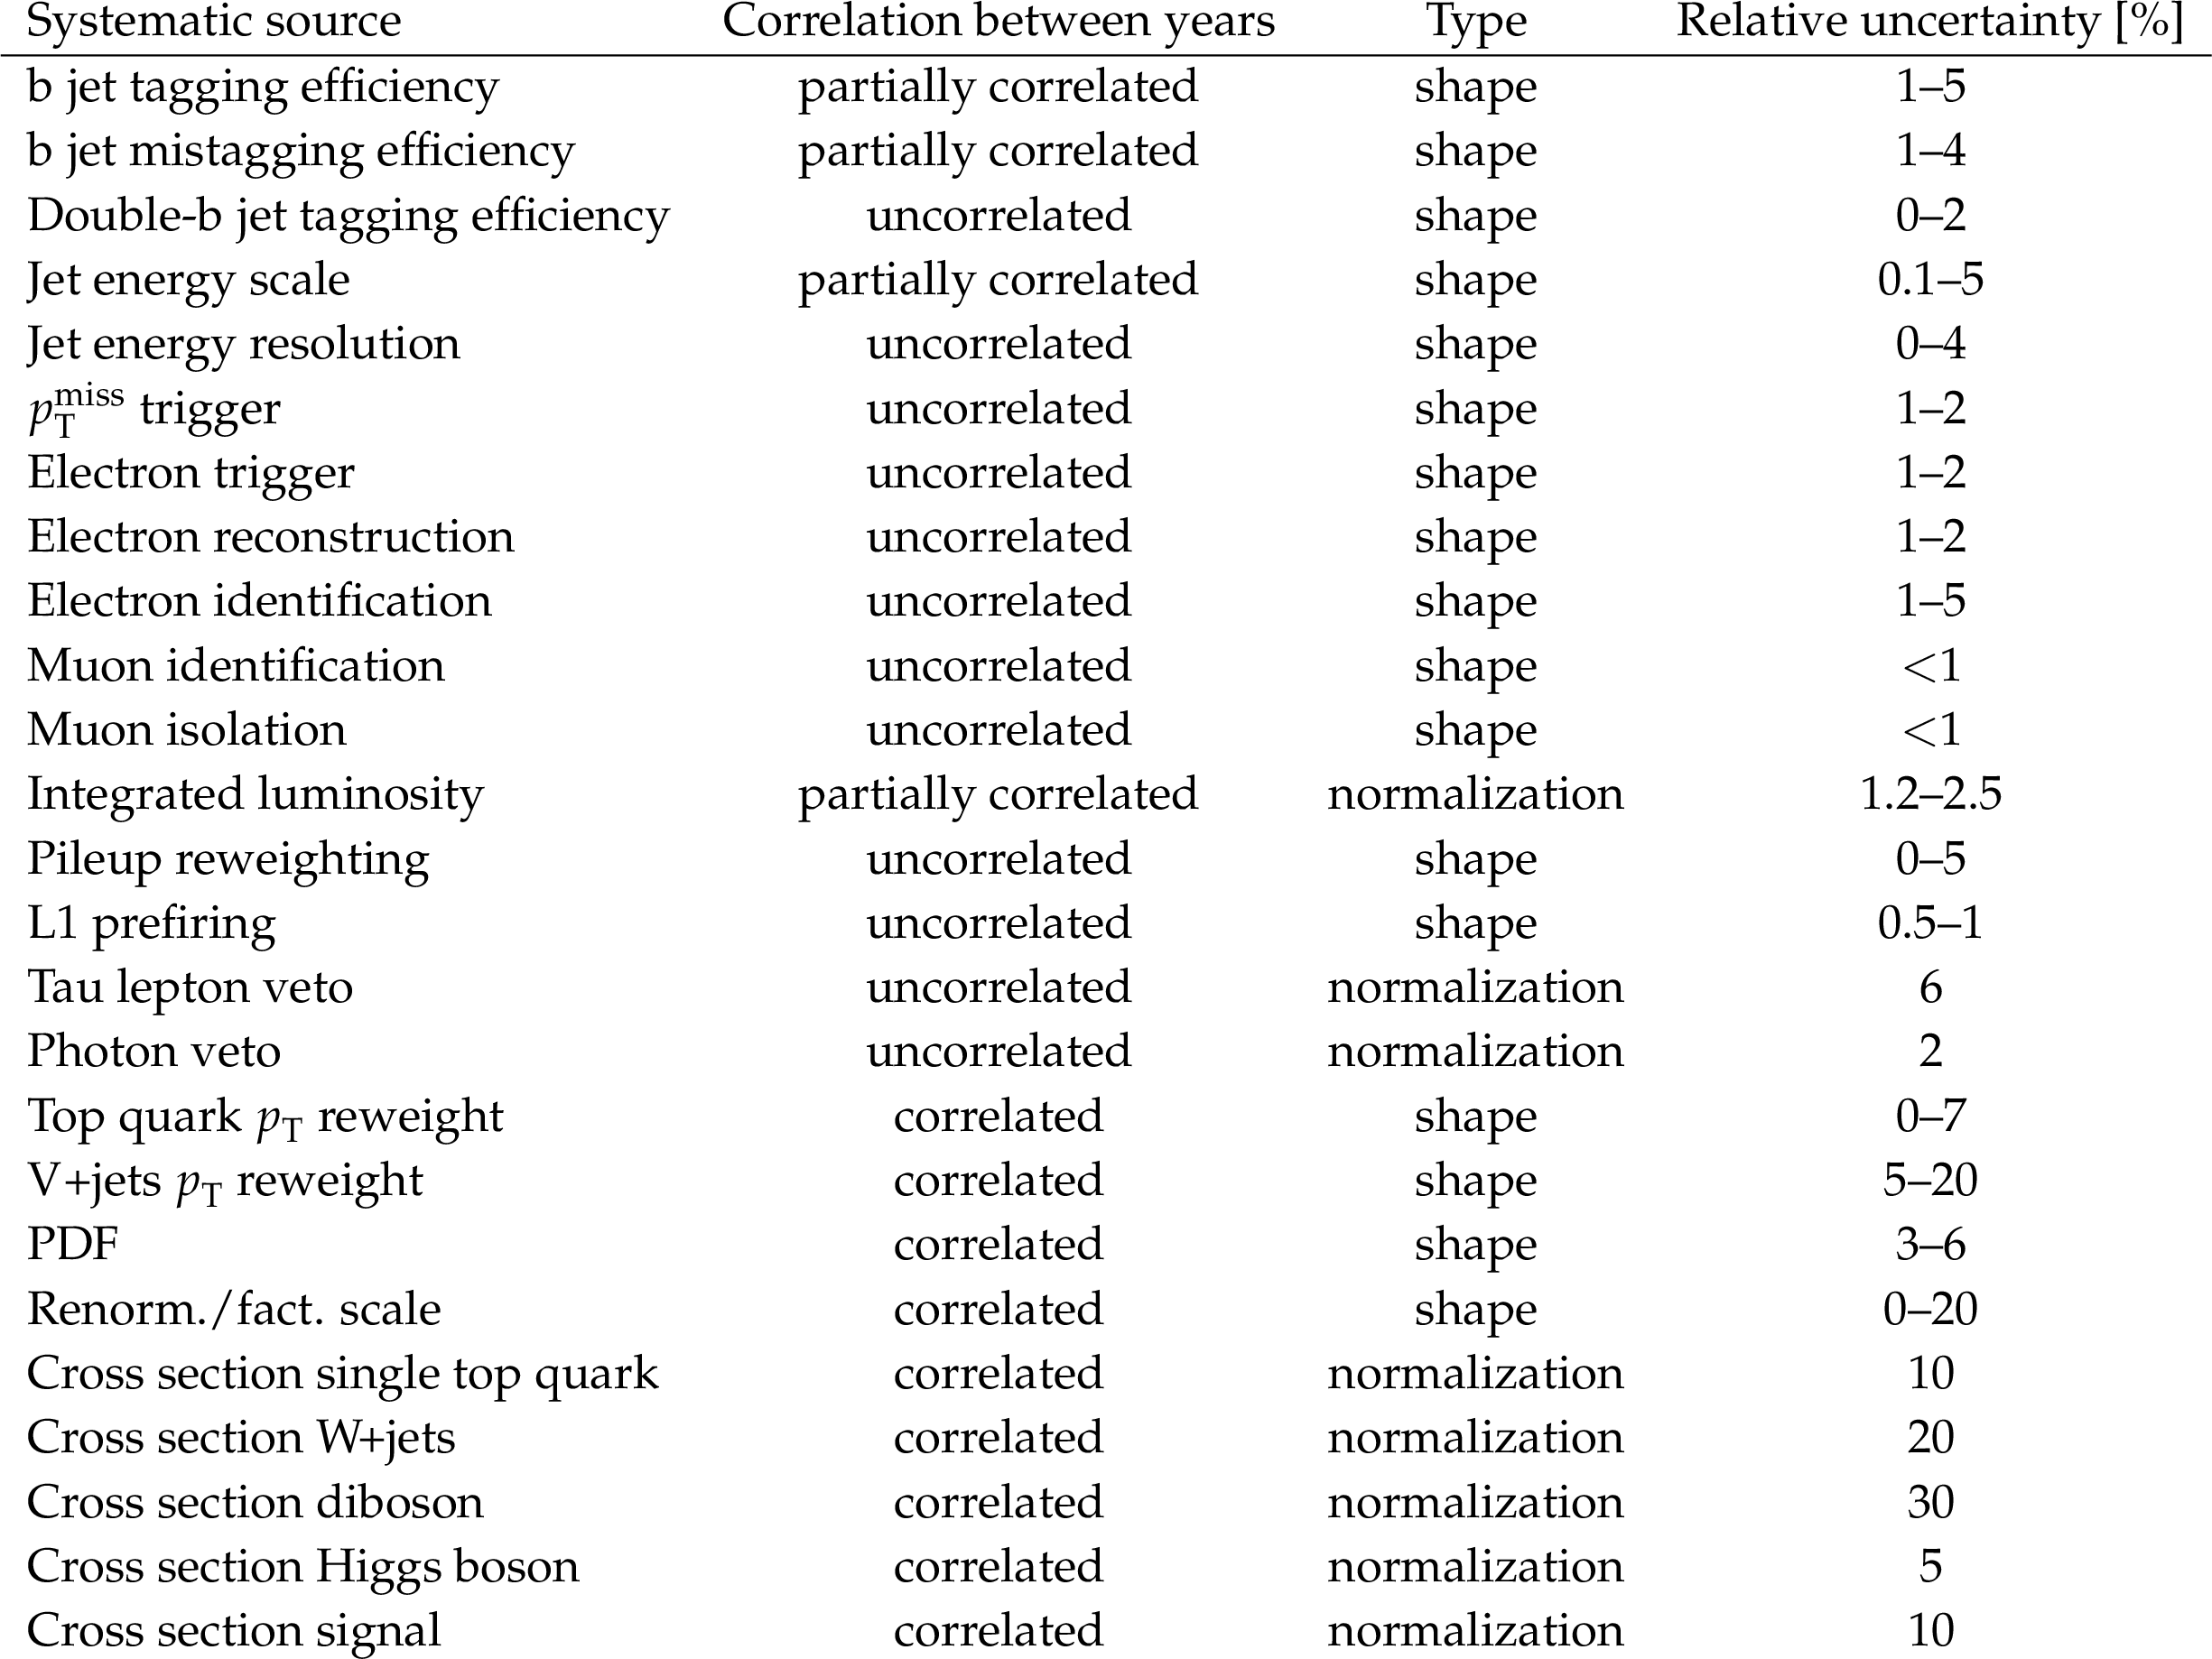
Table 3:
The sources of systematic uncertainty and the correlation scheme between the 2017 and 2018 data-taking periods, along with the type (normalization or shape) and their relative values. |
| Summary |
| A search for dark matter (DM) produced in association with a standard model Higgs boson decaying to a bottom quark-antiquark pair has been presented. The analysis is based on proton-proton collision data collected in 2017 and 2018 by the CMS experiment at $ \sqrt{s}= $ 13 TeV, corresponding to an integrated luminosity of 101 fb$ ^{-1} $. The search has been performed in merged and resolved categories to cover a wide range of Lorentz boosts of the Higgs boson. The signal is extracted using a simultaneous fit to the signal and control regions by combining the two categories. The observed data agree with the standard model background prediction, indicating no evidence for new physics. The results are statistically combined with an earlier search using 2016 data, corresponding to an integrated luminosity of 35.9 fb$ ^{-1} $. The full 2016--2018 results have been interpreted in two simplified models, the baryonic-$ \mathrm{Z}^{'} $ model where a high mass resonance ($ \mathrm{Z}^{'} $) decays to a pair of DM particles and a Higgs boson, and the 2HDM+$ \mathrm{a} $ model where a heavy pseudoscalar couples to a Higgs boson and a lighter pseudoscalar that decays to a pair of DM particles. Exclusion limits are set on the model parameters at 95% confidence level. For the baryonic-$ \mathrm{Z}^{'} $ model, mediator $ \mathrm{Z}^{'} $ masses up to 2.25 TeV are excluded for a DM mass of 1 GeV, and DM particle masses up to 550 GeV are excluded for a 1.25 TeV $ \mathrm{Z}^{'} $ particle. In the 2HDM+$ \mathrm{a} $ framework, light pseudoscalar masses $ m_{\mathrm{a}} $ below 360 GeV are excluded for a heavy pseudoscalar mass $ m_{\mathrm{A}} $ of 1000 GeV, and $ m_{\mathrm{A}} $ masses between 850 and 1300 GeV are excluded for $ m_{\mathrm{a}} $ of 350 GeV. For the other model parameters, $ \sin\theta $ values between 0.15 and 0.95 are excluded, while $ \tan\beta $ values less than 4.2 are excluded. These results improve upon the previously existing CMS limits owing to the larger integrated luminosity and improved identification of $ \mathrm{h}\to\mathrm{b}\overline{\mathrm{b}} $ decay. |
| References | ||||
| 1 | Planck Collaboration | Planck 2018 results. I. Overview and the cosmological legacy of Planck | Astron. Astrophys. 641 (2020) A1 | 1807.06205 |
| 2 | J. L. Feng | Dark matter candidates from particle physics and methods of detection | Ann. Rev. Astron. Astrophys. 48 (2010) 495 | 1003.0904 |
| 3 | R. J. Scherrer and M. S. Turner | On the relic, cosmic abundance of stable weakly interacting massive particles | [Erratum: \doi10.1103/PhysRevD.34.3263], 1986 PRD 33 (1986) 1585 |
|
| 4 | G. Steigman and M. S. Turner | Cosmological constraints on the properties of weakly interacting massive particles | NPB 253 (1985) 375 | |
| 5 | G. Jungman, M. Kamionkowski, and K. Griest | Supersymmetric dark matter | Phys. Rept. 267 (1996) 195 | hep-ph/9506380 |
| 6 | ATLAS Collaboration | Observation of a new particle in the search for the standard model Higgs boson with the ATLAS detector at the LHC | PLB 716 (2012) 1 | 1207.7214 |
| 7 | CMS Collaboration | Observation of a new boson at a mass of 125 GeV with the CMS experiment at the LHC | PLB 716 (2012) 30 | CMS-HIG-12-028 1207.7235 |
| 8 | CMS Collaboration | Observation of a new boson with mass near 125 GeV in $ {\mathrm{p}\mathrm{p}} $ collisions at $ \sqrt{s}= $ 7 and 8 TeV | JHEP 06 (2013) 081 | CMS-HIG-12-036 1303.4571 |
| 9 | L. Carpenter et al. | Mono-Higgs-boson: A new collider probe of dark matter | PRD 89 (2014) 075017 | 1312.2592 |
| 10 | A. Berlin, T. Lin, and L.-T. Wang | Mono-Higgs detection of dark matter at the LHC | JHEP 06 (2014) 078 | 1402.7074 |
| 11 | A. A. Petrov and W. Shepherd | Searching for dark matter at LHC with mono-Higgs production | PLB 730 (2014) 178 | 1311.1511 |
| 12 | G. Bertone, D. Hooper, and J. Silk | Particle dark matter: evidence, candidates and constraints | Phys. Rept. 405 (2005) 279 | hep-ph/0404175 |
| 13 | C. P. Burgess, M. Pospelov, and T. ter Veldhuis | The minimal model of nonbaryonic dark matter: a singlet scalar | NPB 619 (2001) 709 | hep-ph/0011335 |
| 14 | J. March-Russell, S. M. West, D. Cumberbatch, and D. Hooper | Heavy dark matter through the Higgs portal | JHEP 07 (2008) 058 | 0801.3440 |
| 15 | D. Abercrombie et al. | Dark matter benchmark models for early LHC \mboxRun 2 searches: Report of the ATLAS/CMS dark matter forum | Phys. Dark Univ. 27 (2020) 100371 | 1507.00966 |
| 16 | T. Abe et al. | LHC Dark Matter Working Group: Next-generation spin-0 dark matter models | Phys. Dark Univ. 27 (2020) 100351 | 1810.09420 |
| 17 | M. Bauer, U. Haisch, and F. Kahlhoefer | Simplified dark matter models with two Higgs doublets: I. Pseudoscalar mediators | JHEP 05 (2017) 138 | 1701.07427 |
| 18 | G. C. Branco et al. | Theory and phenomenology of two-Higgs-doublet models | Phys. Rept. 516 (2012) 1 | 1106.0034 |
| 19 | CMS Collaboration | Search for dark matter produced in association with a Higgs boson decaying to a pair of bottom quarks in proton-proton collisions at $ \sqrt{s}= $ 13 TeV | EPJC 79 (2019) 280 | CMS-EXO-16-050 1811.06562 |
| 20 | ATLAS Collaboration | Search for dark matter produced in association with a standard model Higgs boson decaying into b-quarks using the full \mboxRun 2 dataset from the ATLAS detector | JHEP 11 (2021) 209 | 2108.13391 |
| 21 | J. Thaler and K. Van Tilburg | Identifying boosted objects with $ {N} $-subjettiness | JHEP 03 (2011) 015 | 1011.2268 |
| 22 | CMS Collaboration | HEPData record for this analysis | link | |
| 23 | CMS Collaboration | The CMS experiment at the CERN LHC | JINST 3 (2008) S08004 | |
| 24 | CMS Collaboration | Development of the CMS detector for the CERN LHC \mboxRun 3 | JINST 19 (2024) P05064 | CMS-PRF-21-001 2309.05466 |
| 25 | CMS Collaboration | Performance of the CMS Level-1 trigger in proton-proton collisions at $ \sqrt{s}= $ 13 TeV | JINST 15 (2020) P10017 | CMS-TRG-17-001 2006.10165 |
| 26 | CMS Collaboration | The CMS trigger system | JINST 12 (2017) P01020 | CMS-TRG-12-001 1609.02366 |
| 27 | NNPDF Collaboration | Parton distributions from high-precision collider data | EPJC 77 (2017) 663 | 1706.00428 |
| 28 | CMS Collaboration | Event generator tunes obtained from underlying event and multiparton scattering measurements | EPJC 76 (2016) 155 | CMS-GEN-14-001 1512.00815 |
| 29 | T. Sjöstrand et al. | An introduction to PYTHIA8.2 | Comput. Phys. Commun. 191 (2015) 159 | 1410.3012 |
| 30 | CMS Collaboration | Extraction and validation of a new set of CMS PYTHIA8 tunes from underlying-event measurements | EPJC 80 (2020) 4 | CMS-GEN-17-001 1903.12179 |
| 31 | GEANT4 Collaboration | GEANT 4---a simulation toolkit | NIM A 506 (2003) 250 | |
| 32 | J. Alwall et al. | The automated computation of tree-level and next-to-leading order differential cross sections, and their matching to parton shower simulations | JHEP 07 (2014) 079 | 1405.0301 |
| 33 | P. Nason | A new method for combining NLO QCD with shower Monte Carlo algorithms | JHEP 11 (2004) 040 | hep-ph/0409146 |
| 34 | S. Frixione, P. Nason, and C. Oleari | Matching NLO QCD computations with parton shower simulations: the POWHEG method | JHEP 11 (2007) 070 | 0709.2092 |
| 35 | S. Alioli, P. Nason, C. Oleari, and E. Re | A general framework for implementing NLO calculations in shower Monte Carlo programs: the POWHEG box | JHEP 06 (2010) 043 | 1002.2581 |
| 36 | CMS Collaboration | Measurement of differential cross sections for the production of top quark pairs and of additional jets in lepton+jets events from $ {\mathrm{p}\mathrm{p}} $ collisions at $ \sqrt{s}= $ 13 TeV | PRD 97 (2018) 112003 | CMS-TOP-17-002 1803.08856 |
| 37 | R. Frederix, E. Re, and P. Torrielli | Single-top $ t $-channel hadroproduction in the four-flavors scheme with POWHEG and aMC@NLO | JHEP 09 (2012) 130 | 1207.5391 |
| 38 | E. Re | Single-top $ {\mathrm{W}\mathrm{t}} $-channel production matched with parton showers using the POWHEG method | EPJC 71 (2011) 1547 | 1009.2450 |
| 39 | J. Alwall et al. | Comparative study of various algorithms for the merging of parton showers and matrix elements in hadronic collisions | EPJC 53 (2008) 473 | 0706.2569 |
| 40 | R. Frederix and S. Frixione | Merging meets matching in MC@NLO | JHEP 12 (2012) 061 | 1209.6215 |
| 41 | CMS Collaboration | Particle-flow reconstruction and global event description with the CMS detector | JINST 12 (2017) P10003 | CMS-PRF-14-001 1706.04965 |
| 42 | CMS Collaboration | Technical proposal for the Phase-II upgrade of the Compact Muon Solenoid | CMS Technical Proposal CERN-LHCC-2015-010, CMS-TDR-15-02, 2015 link |
|
| 43 | CMS Collaboration | Electron and photon reconstruction and identification with the CMS experiment at the CERN LHC | JINST 16 (2021) P05014 | CMS-EGM-17-001 2012.06888 |
| 44 | CMS Collaboration | ECAL 2016 refined calibration and \mboxRun 2 summary plots | CMS Detector Performance Note CMS-DP-2020-021, 2020 CDS |
|
| 45 | CMS Collaboration | Performance of the CMS muon detector and muon reconstruction with proton-proton collisions at $ \sqrt{s}= $ 13 TeV | JINST 13 (2018) P06015 | CMS-MUO-16-001 1804.04528 |
| 46 | CMS Collaboration | Performance of reconstruction and identification of $ \tau $ leptons decaying to hadrons and $ \nu_{\!\tau} $ in $ {\mathrm{p}\mathrm{p}} $ collisions at $ \sqrt{s}= $ 13 TeV | JINST 13 (2018) P10005 | CMS-TAU-16-003 1809.02816 |
| 47 | CMS Collaboration | Identification of hadronic tau lepton decays using a deep neural network | JINST 17 (2022) P07023 | CMS-TAU-20-001 2201.08458 |
| 48 | M. Cacciari, G. P. Salam, and G. Soyez | The anti-$ k_{\mathrm{T}} $ jet clustering algorithm | JHEP 04 (2008) 063 | 0802.1189 |
| 49 | M. Cacciari, G. P. Salam, and G. Soyez | FASTJET user manual | EPJC 72 (2012) 1896 | 1111.6097 |
| 50 | CMS Collaboration | Pileup mitigation at CMS in 13 TeV data | JINST 15 (2020) P09018 | CMS-JME-18-001 2003.00503 |
| 51 | D. Bertolini, P. Harris, M. Low, and N. Tran | Pileup per particle identification | JHEP 10 (2014) 059 | 1407.6013 |
| 52 | CMS Collaboration | Jet energy scale and resolution in the CMS experiment in $ {\mathrm{p}\mathrm{p}} $ collisions at 8 TeV | JINST 12 (2017) P02014 | CMS-JME-13-004 1607.03663 |
| 53 | CMS Collaboration | Jet energy scale and resolution measurements with legacy \mboxRun 2 data collected by CMS at 13 TeV | CMS Detector Performance Note CMS-DP-2021-033, 2021 CDS |
|
| 54 | CMS Collaboration | Performance of missing transverse momentum reconstruction in proton-proton collisions at $ \sqrt{s}= $ 13 TeV using the CMS detector | JINST 14 (2019) P07004 | CMS-JME-17-001 1903.06078 |
| 55 | Y. L. Dokshitzer, G. D. Leder, S. Moretti, and B. R. Webber | Better jet clustering algorithms | JHEP 08 (1997) 001 | hep-ph/9707323 |
| 56 | M. Wobisch and T. Wengler | Hadronization corrections to jet cross-sections in deep inelastic scattering | in Proc. Workshop on Monte Carlo Generators for HERA Physics: Hamburg, Germany, --30,, 1998 April 2 (1998) 270 |
hep-ph/9907280 |
| 57 | M. Dasgupta, A. Fregoso, S. Marzani, and G. P. Salam | Towards an understanding of jet substructure | JHEP 09 (2013) 029 | 1307.0007 |
| 58 | J. M. Butterworth, A. R. Davison, M. Rubin, and G. P. Salam | Jet substructure as a new Higgs search channel at the LHC | PRL 100 (2008) 242001 | 0802.2470 |
| 59 | A. J. Larkoski, S. Marzani, G. Soyez, and J. Thaler | Soft drop | JHEP 05 (2014) 146 | 1402.2657 |
| 60 | E. Bols et al. | Jet flavour classification using DeepJet | JINST 15 (2020) P12012 | 2008.10519 |
| 61 | CMS Collaboration | Identification of heavy-flavour jets with the CMS detector in $ {\mathrm{p}\mathrm{p}} $ collisions at 13 TeV | JINST 13 (2018) P05011 | CMS-BTV-16-002 1712.07158 |
| 62 | CMS Collaboration | Performance summary of AK4 jet b tagging with data from proton-proton collisions at 13 TeV with the CMS detector | CMS Detector Performance Note CMS-DP-2023-005, 2023 CDS |
|
| 63 | H. Qu and L. Gouskos | Jet tagging via particle clouds | PRD 101 (2020) 056019 | 1902.08570 |
| 64 | CMS Collaboration | Calibration of the mass-decorrelated ParticleNet tagger for boosted $ \mathrm{b}\overline{\mathrm{b}} $ and $ \mathrm{c}\overline{\mathrm{c}} $ jets using LHC \mboxRun 2 data | CMS Detector Performance Note CMS-DP-2022-005, 2024 CDS |
|
| 65 | CMS Collaboration | Performance of heavy-flavour jet identification in Lorentz-boosted topologies in proton-proton collisions at $ \sqrt{s}= $ 13 TeV | JINST 20 (2025) P11006 | CMS-BTV-22-001 2510.10228 |
| 66 | CMS Collaboration | Precision luminosity measurement in proton-proton collisions at $ \sqrt{s}= $ 13 TeV in 2015 and 2016 at CMS | EPJC 81 (2021) 800 | CMS-LUM-17-003 2104.01927 |
| 67 | CMS Collaboration | CMS luminosity measurement for the 2017 data-taking period at $ \sqrt{s}= $ 13 TeV | CMS Physics Analysis Summary, 2018 CMS-PAS-LUM-17-004 |
CMS-PAS-LUM-17-004 |
| 68 | CMS Collaboration | CMS luminosity measurement for the 2018 data-taking period at $ \sqrt{s}= $ 13 TeV | CMS Physics Analysis Summary, 2019 CMS-PAS-LUM-18-002 |
CMS-PAS-LUM-18-002 |
| 69 | CMS Collaboration | Precision luminosity measurement in proton-proton collisions at $ \sqrt{s}= $ 13 TeV with the CMS detector | CMS Physics Analysis Summary, 2025 CMS-PAS-LUM-20-001 |
CMS-PAS-LUM-20-001 |
| 70 | CMS Collaboration | Measurement of the inelastic proton-proton cross section at $ \sqrt{s}= $ 13 TeV | JHEP 07 (2018) 161 | CMS-FSQ-15-005 1802.02613 |
| 71 | CMS Collaboration | Search for new particles in events with energetic jets and large missing transverse momentum in proton-proton collisions at $ \sqrt{s}= $ 13 TeV | JHEP 11 (2021) 153 | CMS-EXO-20-004 2107.13021 |
| 72 | J. Butterworth et al. | PDF4LHC recommendations for LHC \mboxRun 2 | JPG 43 (2016) 023001 | 1510.03865 |
| 73 | CMS Collaboration | Observation of the associated production of a single top quark and a W boson in $ {\mathrm{p}\mathrm{p}} $ collisions at $ \sqrt{s}= $ 8 TeV | PRL 112 (2014) 231802 | CMS-TOP-12-040 1401.2942 |
| 74 | CMS Collaboration | Measurements of inclusive W and Z cross sections in $ {\mathrm{p}\mathrm{p}} $ collisions at $ \sqrt{s}= $ 7 TeV | JHEP 01 (2011) 080 | CMS-EWK-10-002 1012.2466 |
| 75 | CMS Collaboration | Measurement of the $ {\mathrm{Z}\mathrm{Z}} $ production cross section and $ {\mathrm{Z}\to\ell^+\ell^-\ell^{\prime+}\ell^{\prime-}} $ branching fraction in $ {\mathrm{p}\mathrm{p}} $ collisions at $ \sqrt{s}= $ 13 TeV | PLB 763 (2016) 280 | CMS-SMP-16-001 1607.08834 |
| 76 | CMS Collaboration | Measurement of the inclusive and differential $ {\mathrm{W}\mathrm{Z}} $ production cross sections, polarization angles, and triple gauge couplings in $ {\mathrm{p}\mathrm{p}} $ collisions at $ \sqrt{s}= $ 13 TeV | JHEP 07 (2022) 032 | CMS-SMP-20-014 2110.11231 |
| 77 | CMS Collaboration | The CMS statistical analysis and combination tool: combine | Comput. Softw. Big Sci. 8 (2024) 19 | CMS-CAT-23-001 2404.06614 |
| 78 | R. Barlow and C. Beeston | Fitting using finite Monte Carlo samples | Comput. Phys. Commun. 77 (1993) 219 | |
| 79 | T. Junk | Confidence level computation for combining searches with small statistics | NIM A 434 (1999) 435 | hep-ex/9902006 |
| 80 | A. L. Read | Presentation of search results: The $ \text{CL}_\text{s} $ technique | JPG 28 (2002) 2693 | |
| 81 | ATLAS and CMS Collaborations, and LHC Higgs Combination Group | Procedure for the LHC Higgs boson search combination in Summer 2011 | Technical Report CMS-NOTE-2011-005, ATL-PHYS-PUB-2011-11, 2011 | |
| 82 | G. Cowan, K. Cranmer, E. Gross, and O. Vitells | Asymptotic formulae for likelihood-based tests of new physics | EPJC 71 (2011) 1554 | 1007.1727 |
| 83 | Particle Data Group , S. Navas et al. | Review of particle physics | PRD 110 (2024) 030001 | |
|
|
Compact Muon Solenoid LHC, CERN |
|

|

|

|

|

|