

Compact Muon Solenoid
LHC, CERN
| CMS-EXO-16-050 ; CERN-EP-2018-287 | ||
| Search for dark matter produced in association with a Higgs boson decaying to a pair of bottom quarks in proton-proton collisions at $\sqrt{s} = $ 13 TeV | ||
| CMS Collaboration | ||
| 16 November 2018 | ||
| Eur. Phys. J. C 79 (2019) 280 | ||
| Abstract: A search for dark matter produced in association with a Higgs boson decaying to a pair of bottom quarks is performed in proton-proton collisions at a center-of-mass energy of 13 TeV collected with the CMS detector at the LHC. The analyzed data sample corresponds to an integrated luminosity of 35.9 fb$^{-1}$. The signal is characterized by a large missing transverse momentum recoiling against a bottom quark-antiquark system that has a large Lorentz boost. The number of events observed in the data is consistent with the standard model background prediction. Results are interpreted in terms of limits both on parameters of the type-2 two-Higgs doublet model extended by an additional light pseudoscalar boson $ \mathrm{a} $ (2HDM+$ \mathrm{a} $) and on parameters of a baryonic Z' simplified model. The 2HDM+$ \mathrm{a} $ model is tested experimentally for the first time. For the baryonic Z' model, the presented results constitute the most stringent constraints to date. | ||
| Links: e-print arXiv:1811.06562 [hep-ex] (PDF) ; CDS record ; inSPIRE record ; CADI line (restricted) ; | ||
| Figures | |

png pdf |
Figure 1:
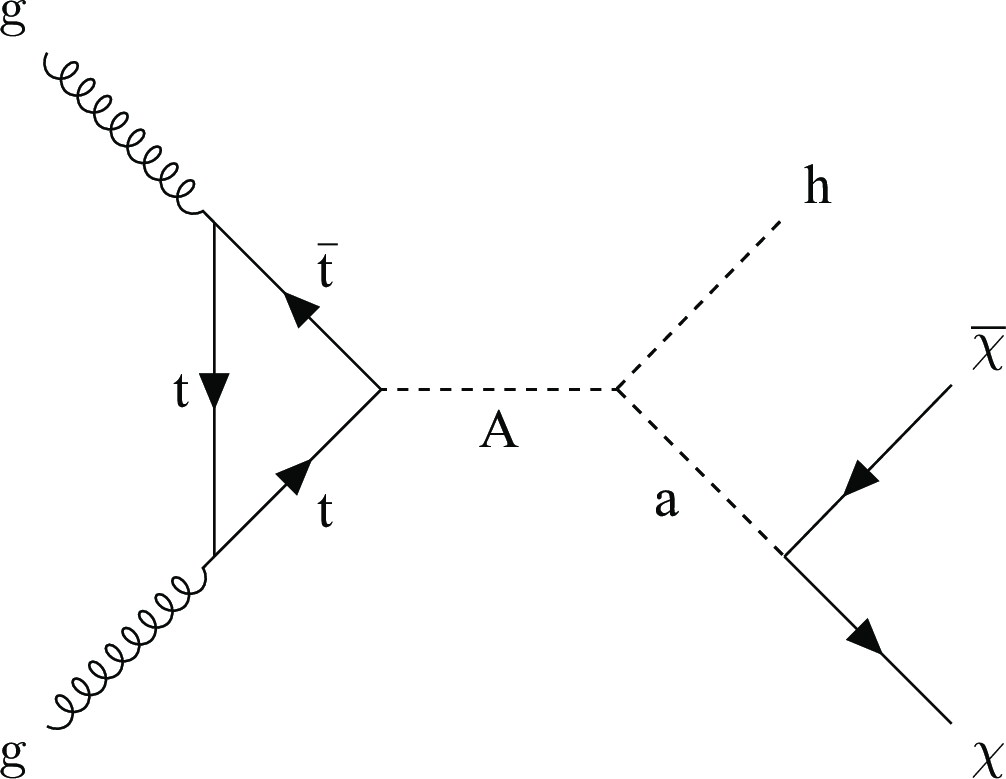
Feynman diagrams for the 2HDM+$ {\mathrm {a}}$ model (left) and the baryonic Z' model (right). In both models, the scalar h can be identified with the observed 125 GeV Higgs boson. |
png pdf |
Figure 1-a:
Feynman diagram for the 2HDM+$ {\mathrm {a}}$ model. The scalar h can be identified with the observed 125 GeV Higgs boson. |

png pdf |
Figure 1-b:
Feynman diagram for the baryonic Z' model. The scalar h can be identified with the observed 125 GeV Higgs boson. |

png pdf |
Figure 2:
The $N_2^\text {DDT}$ distribution as expected for CA15 jets originating from a Higgs boson decaying to a $ {{\mathrm {b}} {\overline {\mathrm {b}}}} $ pair (solid red) is compared with the expected distribution for CA15 jets originating from the decay products of top quarks decaying hadronically (dotted grey). The distribution corresponding to CA15 jets that do not originate from a heavy resonance decay is also shown (dashed blue). |

png pdf |
Figure 3:
The $ {{p_{\mathrm {T}}} ^\text {miss}} $ distribution in the signal region before and after a likelihood fit. The data are in agreement with post-fit background predictions for the SM backgrounds, and no significant excess is observed. The dashed red histogram corresponds to the pre-fit estimate for the SM backgrounds. The lower panel shows the ratio of the data to the predicted SM background, before and after the fit. |

png pdf |
Figure 4:
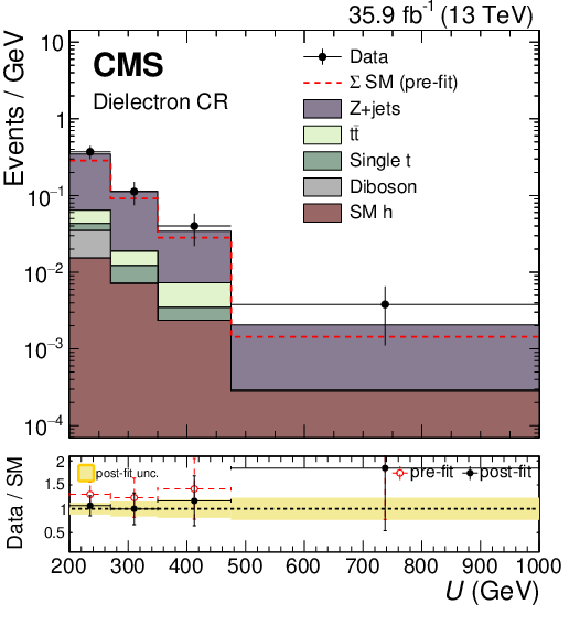
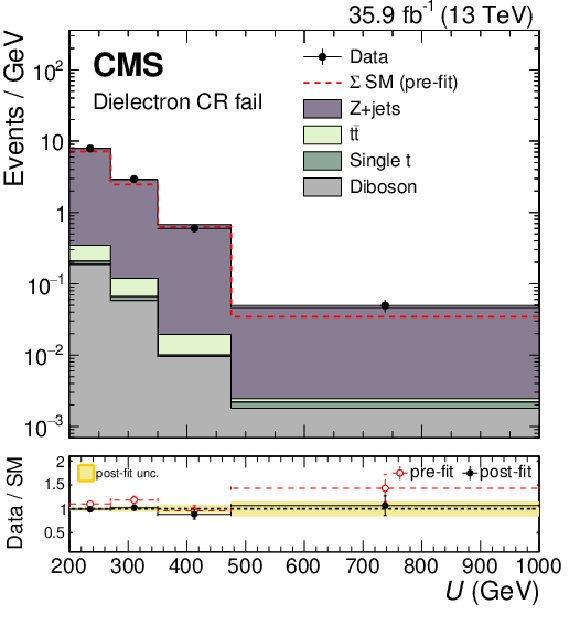
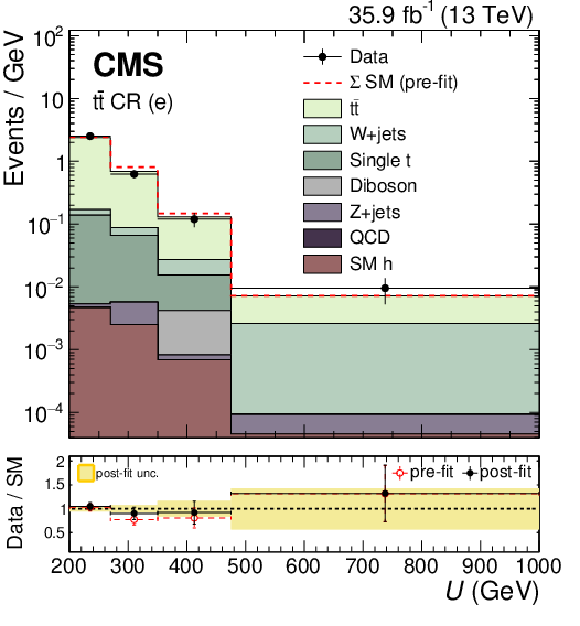
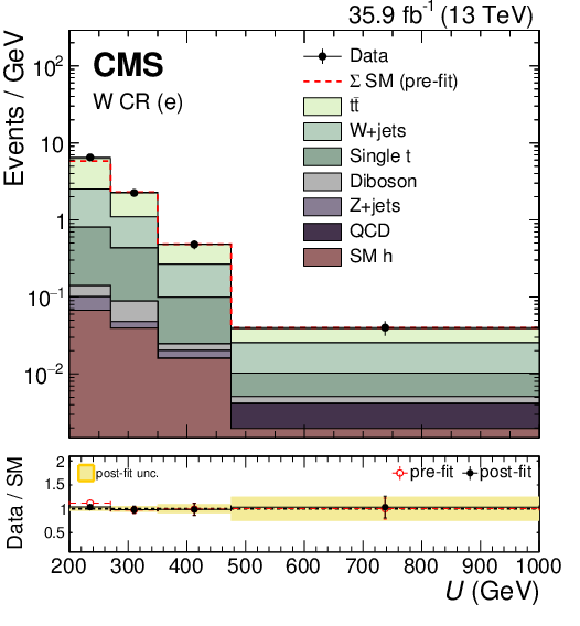
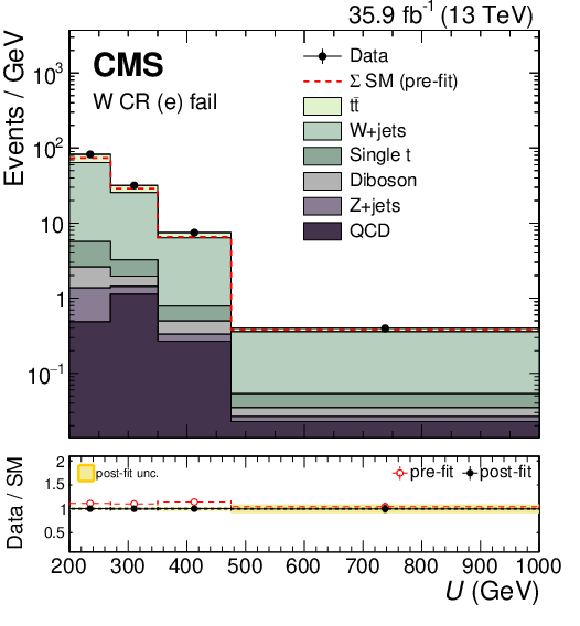
The $U$ distribution in the electron control regions before and after a background-only fit to data, including the data in the signal region in the likelihood. For the distributions on the left the CA15 jet passes the double-b tag requirement and for the distributions on the right it fails the double-b tag requirement. The lower panel shows the ratio of the data to the predicted SM background, before and after the fit. |
png pdf |
Figure 4-a:
The $U$ distribution in the dielectron control region before and after a background-only fit to data, including the data in the signal region in the likelihood. In this distribution the CA15 jet passes the double-b tag requirement. The lower panel shows the ratio of the data to the predicted SM background, before and after the fit. |
png pdf |
Figure 4-b:
The $U$ distribution in the dielectron control region before and after a background-only fit to data, including the data in the signal region in the likelihood. In this distribution the CA15 jet fails the double-b tag requirement. The lower panel shows the ratio of the data to the predicted SM background, before and after the fit. |
png pdf |
Figure 4-c:
The $U$ distribution in the $\mathrm{t\bar{t}}$ (electron) control region before and after a background-only fit to data, including the data in the signal region in the likelihood. In this distribution the CA15 jet passes the double-b tag requirement. The lower panel shows the ratio of the data to the predicted SM background, before and after the fit. |

png pdf |
Figure 4-d:
The $U$ distribution in the $\mathrm{t\bar{t}}$ (electron) control region before and after a background-only fit to data, including the data in the signal region in the likelihood. In this distribution the CA15 jet fails the double-b tag requirement. The lower panel shows the ratio of the data to the predicted SM background, before and after the fit. |
png pdf |
Figure 4-e:
The $U$ distribution in the W (electron) control region before and after a background-only fit to data, including the data in the signal region in the likelihood. In this distribution the CA15 jet passes the double-b tag requirement. The lower panel shows the ratio of the data to the predicted SM background, before and after the fit. |
png pdf |
Figure 4-f:
The $U$ distribution in the W (electron) control region before and after a background-only fit to data, including the data in the signal region in the likelihood. In this distribution the CA15 jet fails fails the double-b tag requirement. The lower panel shows the ratio of the data to the predicted SM background, before and after the fit. |

png pdf |
Figure 5:
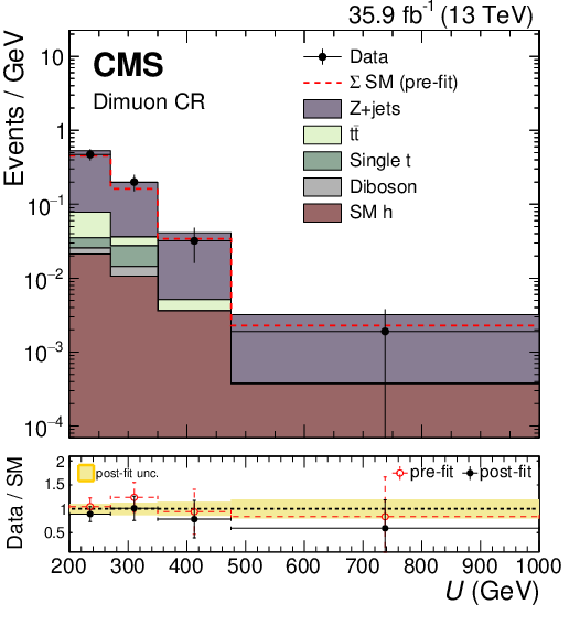
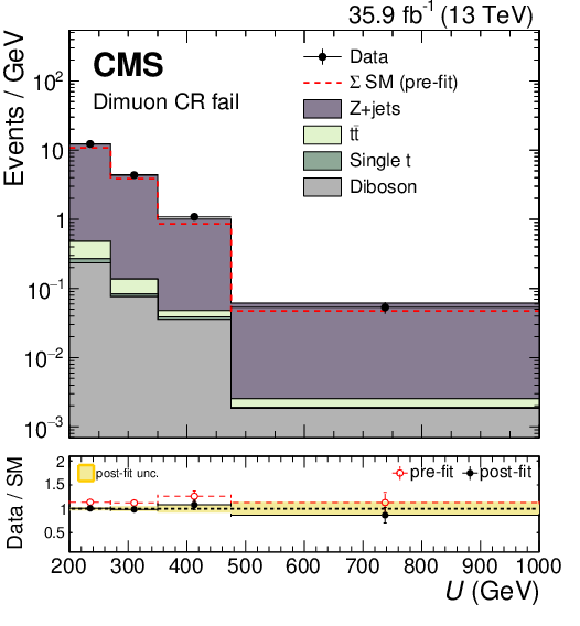
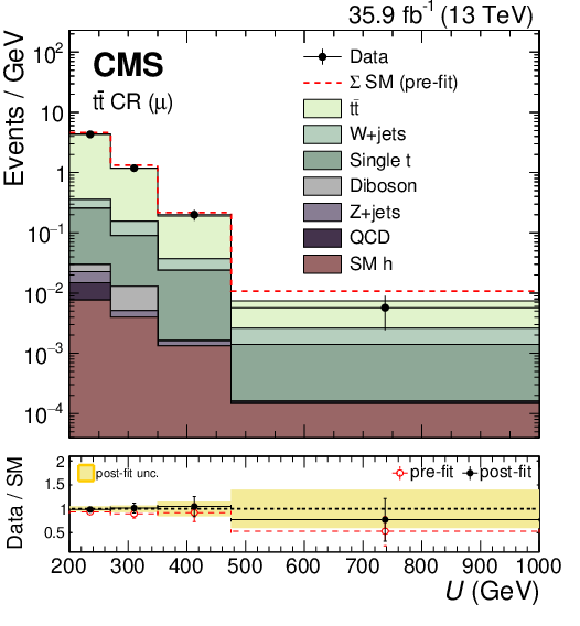
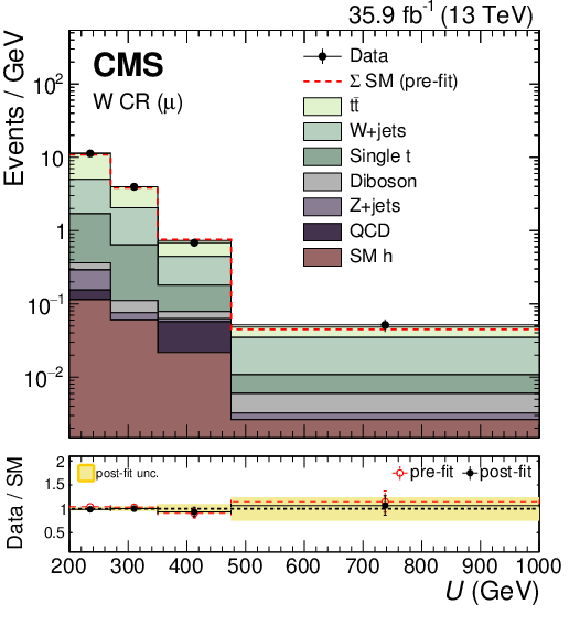
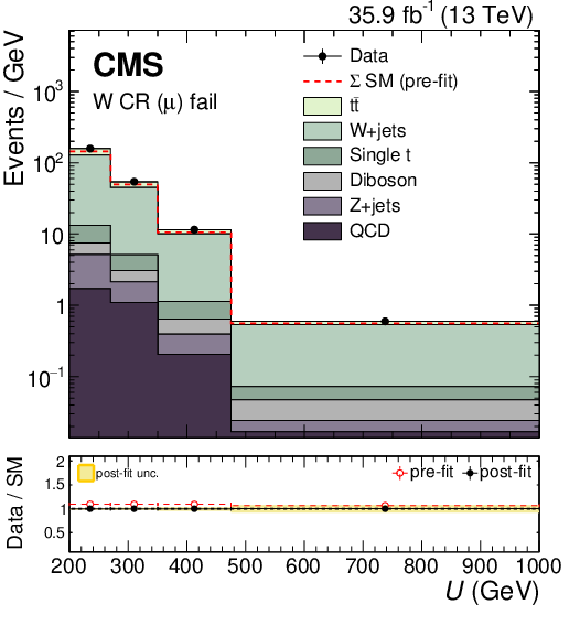
The $U$ distribution in the muon control regions before and after a background-only fit to data, including the data in the signal region in the likelihood. For the distributions on the left the CA15 jet passes the double-b tag requirement and for the distributions on the right it fails the double-b tag requirement. The lower panel shows the ratio of the data to the predicted SM background, before and after the fit. |
png pdf |
Figure 5-a:
The $U$ distribution in the dimuon control region before and after a background-only fit to data, including the data in the signal region in the likelihood. In this distribution the CA15 jet passes the double-b tag requirement. The lower panel shows the ratio of the data to the predicted SM background, before and after the fit. |
png pdf |
Figure 5-b:
The $U$ distribution in the dimuon control region before and after a background-only fit to data, including the data in the signal region in the likelihood. In this distribution the CA15 jet fails the double-b tag requirement. The lower panel shows the ratio of the data to the predicted SM background, before and after the fit. |
png pdf |
Figure 5-c:
The $U$ distribution in the $\mathrm{t\bar{t}}$ (muon) control region before and after a background-only fit to data, including the data in the signal region in the likelihood. In this distribution the CA15 jet passes the double-b tag requirement. The lower panel shows the ratio of the data to the predicted SM background, before and after the fit. |

png pdf |
Figure 5-d:
The $U$ distribution in the $\mathrm{t\bar{t}}$ (muon) control region before and after a background-only fit to data, including the data in the signal region in the likelihood. In this distribution the CA15 jet fails the double-b tag requirement. The lower panel shows the ratio of the data to the predicted SM background, before and after the fit. |
png pdf |
Figure 5-e:
The $U$ distribution in the W (muon) control region before and after a background-only fit to data, including the data in the signal region in the likelihood. In this distribution the CA15 jet passes the double-b tag requirement. The lower panel shows the ratio of the data to the predicted SM background, before and after the fit. |
png pdf |
Figure 5-f:
The $U$ distribution in the W (muon) control region before and after a background-only fit to data, including the data in the signal region in the likelihood. In this distribution the CA15 jet fails the double-b tag requirement. The lower panel shows the ratio of the data to the predicted SM background, before and after the fit. |
png pdf |
Figure 6:
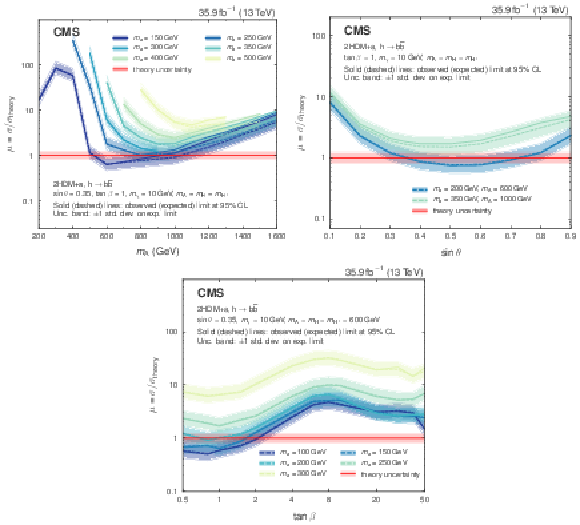
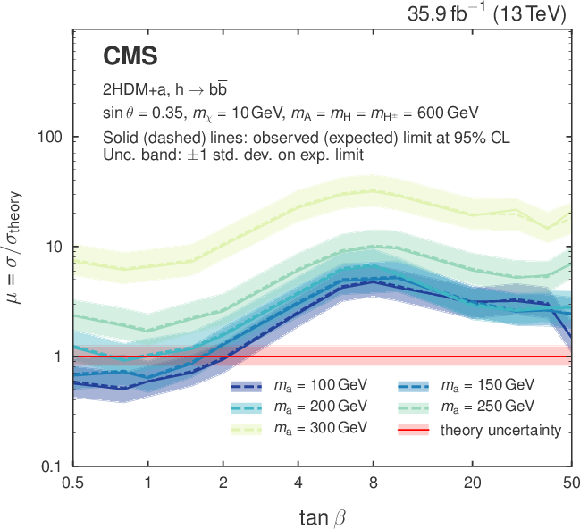
Upper limits at 95% CL on the signal strength modifier, defined as $\mu =\sigma /\sigma _\text {theory}$, where $\sigma _\text {theory}$ is the predicted production cross section of DM candidates in association with a Higgs boson and $\sigma $ is the upper limit on the observed cross section. Limits are shown for the 2HDM+$ {\mathrm {a}}$ model when scanning $m_ {\mathrm {A}} $ and $m_ {\mathrm {a}} $ (upper left), the mixing angle $\theta $ (upper right), or $\tan\beta $ (lower). The uncertainty in the computation of $\sigma _\text {theory}$ is 20% and is shown as a red band around the exclusion line at $\mu =$ 1. |

png pdf |
Figure 6-a:
Upper limits at 95% CL on the signal strength modifier, defined as $\mu =\sigma /\sigma _\text {theory}$, where $\sigma _\text {theory}$ is the predicted production cross section of DM candidates in association with a Higgs boson and $\sigma $ is the upper limit on the observed cross section. Limits are shown for the 2HDM+$ {\mathrm {a}}$ model when scanning $m_ {\mathrm {A}} $ and $m_ {\mathrm {a}} $. The uncertainty in the computation of $\sigma _\text {theory}$ is 20% and is shown as a red band around the exclusion line at $\mu =$ 1. |

png pdf |
Figure 6-b:
Upper limits at 95% CL on the signal strength modifier, defined as $\mu =\sigma /\sigma _\text {theory}$, where $\sigma _\text {theory}$ is the predicted production cross section of DM candidates in association with a Higgs boson and $\sigma $ is the upper limit on the observed cross section. Limits are shown for the 2HDM+$ {\mathrm {a}}$ model when scanning the mixing angle $\theta $. The uncertainty in the computation of $\sigma _\text {theory}$ is 20% and is shown as a red band around the exclusion line at $\mu =$ 1. |
png pdf |
Figure 6-c:
Upper limits at 95% CL on the signal strength modifier, defined as $\mu =\sigma /\sigma _\text {theory}$, where $\sigma _\text {theory}$ is the predicted production cross section of DM candidates in association with a Higgs boson and $\sigma $ is the upper limit on the observed cross section. Limits are shown for the 2HDM+$ {\mathrm {a}}$ model when scanning $\tan\beta $. The uncertainty in the computation of $\sigma _\text {theory}$ is 20% and is shown as a red band around the exclusion line at $\mu =$ 1. |

png pdf |
Figure 7:
Upper limits at 95% CL on the signal strength modifier, defined as $\mu =\sigma /\sigma _\text {theory}$, where $\sigma _\text {theory}$ is the predicted production cross section of DM candidates in association with a Higgs boson and $\sigma $ is the upper limit on the observed cross section. Limits are shown for the baryonic Z' model as a function of $m_{{\mathrm {Z}'}}$ and $m_\chi $. Mediators of up to 1.6 TeV are excluded for a DM mass of 1 GeV. Masses of the DM particle itself are excluded up to 430 GeV for a Z' mass of 1.25 TeV. |

png pdf |
Figure 8:
The 90% CL exclusion limits on the DM-nucleon SI scattering cross section as a function of $m_{\chi}$. Results for the baryonic Z' model obtained in this analysis are compared with those from a selection of direct detection (DD) experiments. The latter exclude the regions above the curves. Limits from CRESST-II [67], CDMSlite [68], LUX [69], XENON-1T [70], PandaX-II [71], and CDEX-10 [72] are shown. |
| Tables | |

png pdf |
Table 1:
Event selection criteria defining the signal and control regions. These criteria are applied in addition to the preselection common to all regions, as described in the text. The presence of a b-tagged AK4 jet that does not overlap with the CA15 jet is vetoed in all analysis regions except for the single-lepton CR enriched in $ {{\mathrm {t}\overline {\mathrm {t}}}} $ events, for which such an AK4 b tag is required. |
png pdf |
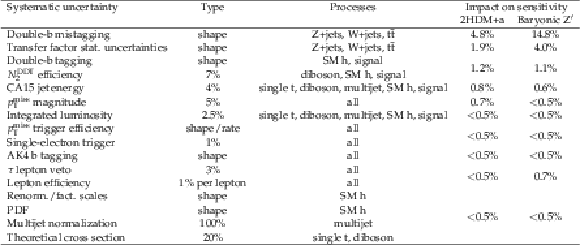
Table 2:
Sources of systematic uncertainty, along with the type (rate/shape) of uncertainty and the affected processes. For the rate uncertainties, the percentage value of the prior is quoted. The last column denotes the improvement in the expected limit when removing the uncertainty group from the list of nuisances included in the likelihood fit. Such improvement is estimated considering as signal processes the 2HDM+$ {\mathrm {a}}$ model with $m_ {\mathrm {A}} = $ 1.1 TeV and $m_ {\mathrm {a}} = $ 150 GeV and the baryonic Z' model with $m_{{\mathrm {Z}'}} = $ 0.2 TeV and $m_\chi = $ 50 GeV. |

png pdf |
Table 3:
Post-fit event yield expectations per $ {{p_{\mathrm {T}}} ^\text {miss}} $ bin for the SM backgrounds in the signal region when including the signal region data in the likelihood fit, under the background-only assumption. Also quoted are the expected yields for two signal models. Uncertainties quoted in the predictions include both the systematic and statistical components. |
| Summary |
| A search for dark matter (DM) produced in association with a Higgs boson decaying to a pair of bottom quarks in a sample of proton-proton collision data corresponding to 35.9 fb$^{-1}$ is presented. No significant deviation from the predictions of the standard model is observed, and 95% CL upper limits on the production cross sections predicted by a type-2 two-Higgs doublet model extended by an additional light pseudoscalar boson $ \mathrm{a} $ (2HDM+$ \mathrm{a} $) and by the baryonic Z' model are established. These limits constitute the most stringent exclusions from collider experiments placed on the parameters of these models to date. The 2HDM+$ \mathrm{a} $ model is probed experimentally for the first time. For the nominal choice of the mixing angles $\sin\theta$ and $\tan\beta$ in the 2HDM+$ \mathrm{a} $ model, the search excludes masses 500 $ < m_{\mathrm{A}} < $ 900 GeV (where $A$ is the heavy pseudoscalar boson) assuming $m_{ \mathrm{a} } = $ 150 GeV. Scanning over $\sin\theta$ with $\tan\beta$ = 1, we exclude 0.35 $ < \sin\theta < $ 0.75 for $m_{\mathrm{A}} = $ 600 GeV and $m_{ \mathrm{a} } = $ 200 GeV. Finally, $\tan\beta$ values between 0.5 and 2.0 (1.6) are excluded for $m_{\mathrm{A}} = $ 600 GeV and $m_{ \mathrm{a} }= $ 100 (150) GeV and $\sin\theta > $ 0.35. In all 2HDM+$ \mathrm{a} $ interpretations, a DM mass of $m_\chi = $ 10 GeV is assumed. For the baryonic Z' model, we exclude Z' boson masses up to 1.6 TeV for a DM mass of 1 GeV, and DM masses up to 430 GeV for a Z' boson mass of 1.1 TeV. The reinterpretation of the results for the baryonic Z' model in terms of an SI nucleon scattering cross section yields a higher sensitivity for $m_\chi < $ 5 GeV than existing results from direct detection experiments, under the assumptions imposed by the model. |
| References | ||||
| 1 | G. Bertone, D. Hooper, and J. Silk | Particle dark matter: Evidence, candidates and constraints | PR 405 (2005) 279 | hep-ph/0404175 |
| 2 | J. L. Feng | Dark matter candidates from particle physics and methods of detection | Ann. Rev. Astron. Astrophys. 48 (2010) 495 | 1003.0904 |
| 3 | T. A. Porter, R. P. Johnson, and P. W. Graham | Dark matter searches with astroparticle data | Ann. Rev. Astron. Astrophys. 49 (2011) 155 | 1104.2836 |
| 4 | Planck Collaboration | Planck 2015 results. XIII. Cosmological parameters | Astron. Astrophys. 594 (2016) A13 | 1502.01589 |
| 5 | ATLAS Collaboration | Observation of a new particle in the search for the standard model Higgs boson with the ATLAS detector at the LHC | PLB 716 (2012) 1 | 1207.7214 |
| 6 | CMS Collaboration | Observation of a new boson at a mass of 125 GeV with the CMS experiment at the LHC | PLB 716 (2012) 30 | CMS-HIG-12-028 1207.7235 |
| 7 | CMS Collaboration | Observation of a new boson with mass near 125 GeV in pp collisions at $ \sqrt{s} = $ 7 and 8 TeV | JHEP 06 (2013) 81 | CMS-HIG-12-036 1303.4571 |
| 8 | A. A. Petrov and W. Shepherd | Searching for dark matter at LHC with mono-Higgs production | PLB 730 (2014) 178 | 1311.1511 |
| 9 | A. Berlin, T. Lin, and L.-T. Wang | Mono-Higgs detection of dark matter at the LHC | JHEP 06 (2014) 078 | 1402.7074 |
| 10 | L. Carpenter et al. | Mono-Higgs-boson: A new collider probe of dark matter | PRD 89 (2014) 075017 | 1312.2592 |
| 11 | CMS Collaboration | The CMS experiment at the CERN LHC | JINST 3 (2008) 08004 | CMS-00-001 |
| 12 | ATLAS Collaboration | Search for dark matter in events with missing transverse momentum and a Higgs boson decaying to two photons in pp collisions at $ \sqrt{s}=$ 8 TeV with the ATLAS detector | PRL 115 (2015) 131801 | |
| 13 | ATLAS Collaboration | Search for dark matter produced in association with a Higgs boson decaying to $ \text{b}\overline{\text{b}} $ using 36 fb$^{-}$ of pp collisions at $ \sqrt{s}=$ 13 TeV with the ATLAS detector | PRL 119 (2017) 181804 | |
| 14 | CMS Collaboration | Search for heavy resonances decaying into a vector boson and a Higgs boson in final states with charged leptons, neutrinos and b quarks at $ \sqrt{s} = $ 13 TeV | Submitted to JHEP | CMS-B2G-17-004 1807.02826 |
| 15 | M. Bauer, U. Haisch, and F. Kahlhoefer | Simplified dark matter models with two Higgs doublets: I. Pseudoscalar mediators | JHEP 05 (2017) 138 | 1701.07427 |
| 16 | ATLAS and CMS Collaborations | Measurements of the Higgs boson production and decay rates and constraints on its couplings from a combined ATLAS and CMS analysis of the LHC pp collision data at $ \sqrt{s}= $ 7 and 8 TeV | JHEP 08 (2016) 045 | 1606.02266 |
| 17 | CMS Collaboration | Search for associated production of dark matter with a Higgs boson decaying to $ \mathrm{b}\overline{\mathrm{b}} $ or $ \gamma \gamma $ at $ \sqrt{s} = $ 13 TeV | JHEP 10 (2017) 180 | CMS-EXO-16-012 1703.05236 |
| 18 | LHC Dark Matter Working Group Collaboration | LHC Dark Matter Working Group: Next-generation spin-0 dark matter models | 1810.09420 | |
| 19 | D. Abercrombie et al. | Dark matter benchmark models for early LHC run-2 searches: Report of the ATLAS/CMS dark matter forum | 1507.00966 | |
| 20 | CMS Collaboration | The CMS trigger system | JINST 12 (2017) P01020 | CMS-TRG-12-001 1609.02366 |
| 21 | J. Alwall et al. | The automated computation of tree-level and next-to-leading order differential cross sections, and their matching to parton shower simulations | JHEP 07 (2014) 079 | 1405.0301 |
| 22 | P. Nason | A new method for combining NLO QCD with shower Monte Carlo algorithms | JHEP 11 (2004) 040 | hep-ph/0409146 |
| 23 | S. Frixione, P. Nason, and C. Oleari | Matching NLO QCD computations with parton shower simulations: the POWHEG method | JHEP 11 (2007) 070 | 0709.2092 |
| 24 | S. Alioli, P. Nason, C. Oleari, and E. Re | A general framework for implementing NLO calculations in shower Monte Carlo programs: the POWHEG BOX | JHEP 06 (2010) 043 | 1002.2581 |
| 25 | M. Czakon, P. Fiedler, and A. Mitov | Total top-quark pair-production cross section at hadron colliders through $ o(\alpha^4_s) $ | PRL 110 (2013) 252004 | 1303.6254 |
| 26 | M. L. Mangano, M. Moretti, F. Piccinini, and M. Treccani | Matching matrix elements and shower evolution for top-quark production in hadronic collisions | JHEP 01 (2007) 013 | hep-ph/0611129 |
| 27 | R. Frederix and S. Frixione | Merging meets matching in MC@NLO | JHEP 12 (2012) 061 | 1209.6215 |
| 28 | J. H. Kuhn, A. Kulesza, S. Pozzorini, and M. Schulze | Electroweak corrections to hadronic photon production at large transverse momenta | JHEP 03 (2006) 059 | hep-ph/0508253 |
| 29 | S. Kallweit et al. | NLO QCD+EW automation and precise predictions for V+multijet production | in 50th Rencontres de Moriond on QCD and High Energy Interactions La Thuile, Italy, March 21-28, 2015 2015 | 1505.05704 |
| 30 | S. Kallweit et al. | NLO QCD+EW predictions for V+jets including off-shell vector-boson decays and multijet merging | JHEP 04 (2016) 021 | 1511.08692 |
| 31 | T. Sjostrand et al. | An Introduction to PYTHIA 8.2 | CPC 191 (2015) 159 | 1410.3012 |
| 32 | J. M. Campbell, R. K. Ellis, and C. Williams | Vector boson pair production at the LHC | JHEP 07 (2011) 018 | 1105.0020 |
| 33 | NNPDF Collaboration | Parton distributions for the LHC Run II | JHEP 04 (2015) 040 | 1410.8849 |
| 34 | CMS Collaboration | Event generator tunes obtained from underlying event and multiparton scattering measurements | EPJC 76 (2016) 155 | CMS-GEN-14-001 1512.00815 |
| 35 | P. Skands, S. Carrazza, and J. Rojo | Tuning PYTHIA 8.1: the Monash 2013 tune | EPJC 74 (2014) 3024 | 1404.5630 |
| 36 | GEANT4 Collaboration | GEANT4--a simulation toolkit | NIMA 506 (2003) 250 | |
| 37 | M. Cacciari, G. P. Salam, and G. Soyez | The anti-$ {k_{\mathrm{T}}} $ jet clustering algorithm | JHEP 04 (2008) 063 | 0802.1189 |
| 38 | M. Cacciari, G. P. Salam, and G. Soyez | FastJet user manual | EPJC 72 (2012) 1896 | 1111.6097 |
| 39 | CMS Collaboration | Particle-flow reconstruction and global event description with the CMS detector | JINST 12 (2017) 10003 | CMS-PRF-14-001 1706.04965 |
| 40 | CMS Collaboration | A Cambridge-Aachen (C-A) based jet algorithm for boosted top-jet tagging | CDS | |
| 41 | D. Berteloni, P. Harris, M. Low, and N. Tran | Pileup per particle identification | JHEP 59 (2014) 059 | 1407.6013 |
| 42 | CMS Collaboration | Jet energy scale and resolution in the CMS experiment in pp collisions at 8 TeV | JINST 12 (2017) 02014 | CMS-JME-13-004 1607.03663 |
| 43 | A. J. Larkoski, S. Marzani, G. Soyez, and J. Thaler | Soft drop | JHEP 05 (2014) 146 | 1402.2657 |
| 44 | CMS Collaboration | Identification of heavy-flavour jets with the CMS detector in pp collisions at 13 TeV | JINST 13 (2018) 05011 | CMS-BTV-16-002 1712.07158 |
| 45 | I. Moult, L. Necib, and J. Thaler | New angles on energy correlation functions | JHEP 12 (2016) 153 | 1609.07483 |
| 46 | J. Dolen et al. | Thinking outside the ROCs: Designing decorrelated taggers (DDT) for jet substructure | JHEP 05 (2016) 156 | 1603.00027 |
| 47 | CMS Collaboration | Performance of electron reconstruction and selection with the CMS detector in proton-proton collisions at $ \sqrt{s} = 8 tev $ | JINST 10 (2015) 06005 | CMS-EGM-13-001 1502.02701 |
| 48 | CMS Collaboration | Performance of CMS muon reconstruction in pp collision events at $ \sqrt{s} = $ 7 TeV | JINST 7 (2012) 10002 | CMS-MUO-10-004 1206.4071 |
| 49 | CMS Collaboration | Reconstruction and identification of $ \tau $ lepton decays to hadrons and $ \nu_{\tau} $ at CMS | JINST 11 (2016) 01019 | CMS-TAU-14-001 1510.07488 |
| 50 | CMS Collaboration | Performance of the CMS muon detector and muon reconstruction with proton-proton collisions $ \sqrt{s} = $ 13 TeV | JINST 13 (2018) 06015 | CMS-MUO-16-001 1804.04528 |
| 51 | CMS Collaboration | Performance of missing energy reconstruction in 13 TeV pp collision data using the CMS detector | CMS-PAS-JME-16-004 | CMS-PAS-JME-16-004 |
| 52 | L. Moneta et al. | The RooStats Project | in 13$^\textth$ International Workshop on Advanced Computing and Analysis Techniques in Physics Research (ACAT2010) SISSA | 1009.1003 |
| 53 | CMS Collaboration | Performance of the CMS missing transverse momentum reconstruction in pp data at $ \sqrt{s} = $ 8 TeV | JINST 10 (2015) 02006 | CMS-JME-13-003 1411.0511 |
| 54 | CMS Collaboration | CMS luminosity measurements for the 2016 data taking period | CMS-PAS-LUM-17-001 | CMS-PAS-LUM-17-001 |
| 55 | CMS Collaboration | Differential cross section measurements for the production of a W boson in association with jets in proton-proton collisions at $ \sqrt s = $ 7 TeV | PLB 741 (2015) 12 | CMS-SMP-12-023 1406.7533 |
| 56 | CMS Collaboration | Measurement of the production cross section for a W boson and two b jets in pp collisions at $ \sqrt{s} = $ 7 TeV | PLB 735 (2014) 204 | CMS-SMP-12-026 1312.6608 |
| 57 | CMS Collaboration | Measurements of jet multiplicity and differential production cross sections of Z+jets events in proton-proton collisions at $ \sqrt{s} = $ 7 TeV | PRD 91 (2015) 052008 | CMS-SMP-12-017 1408.3104 |
| 58 | CMS Collaboration | Measurement of the production cross sections for a Z boson and one or more b jets in pp collisions at $ \sqrt{s} = $ 7 TeV | JHEP 06 (2014) 120 | CMS-SMP-13-004 1402.1521 |
| 59 | CMS Collaboration | Observation of the associated production of a single top quark and a $ W $ boson in pp collisions at $ \sqrt s = $ 8 TeV | PRL 112 (2014) 231802 | CMS-TOP-12-040 1401.2942 |
| 60 | CMS Collaboration | Measurement of the ZZ production cross section and Z $ \to \ell^+\ell^-\ell'^+\ell'^- $ branching fraction in pp collisions at $ \sqrt s = $ 13 TeV | PLB 763 (2016) 280 | CMS-SMP-16-001 1607.08834 |
| 61 | CMS Collaboration | Measurement of the WZ production cross section in pp collisions at $ \sqrt s = $ 13 TeV | PLB 766 (2017) 268 | CMS-SMP-16-002 1607.06943 |
| 62 | S. Heinemeyer et al. | Handbook of LHC Higgs cross sections: 3. Higgs properties | CERN-2013-004 | 1307.1347 |
| 63 | A. L. Read | Presentation of search results: the CL$ _s $ technique | JPG 28 (2002) 2693 | |
| 64 | T. Junk | Confidence level computation for combining searches with small statistics | NIMA 434 (1999) 435 | hep-ex/9902006 |
| 65 | G. Cowan, K. Cranmer, E. Gross, and O. Vitells | Asymptotic formulae for likelihood-based tests of new physics | EPJC 71 (2011) 1554 | 1007.1727 |
| 66 | A. Boveia et al. | Recommendations on presenting LHC searches for missing transverse energy signals using simplified $ s $-channel models of dark matter | 1603.04156 | |
| 67 | CRESST-II Collaboration | Results on light dark matter particles with a low-threshold CRESST-II detector | EPJC 76 (2016) 25 | 1509.01515 |
| 68 | SuperCDMS Collaboration | New results from the search for low-mass weakly interacting massive particles with the CDMS low ionization threshold experiment | PRL 116 (2016) 071301 | 1509.02448 |
| 69 | LUX Collaboration | Results from a search for dark matter in the complete LUX exposure | PRL 118 (2017) 021303 | 1608.07648 |
| 70 | XENON Collaboration | First dark matter search results from the XENON1T experiment | PRL 119 (2017) 181301 | 1705.06655 |
| 71 | PandaX-II Collaboration | Dark matter results from 54-ton-day exposure of PandaX-II experiment | PRL 119 (2017) 181302 | 1708.06917 |
| 72 | CDEX Collaboration | Limits on light weakly interacting massive particles from the first 102.8$ kg {\times} $ day data of the CDEX-10 experiment | PRL 120 (2018) 241301 | 1802.09016 |

|
Compact Muon Solenoid LHC, CERN |

|

|

|

|

|

|