

Compact Muon Solenoid
LHC, CERN
| CMS-SMP-16-002 ; CERN-EP-2016-169 | ||
| Measurement of the WZ production cross section in pp collisions at $\sqrt{s} = $ 13 TeV | ||
| CMS Collaboration | ||
| 23 July 2016 | ||
| Phys. Lett. B 766 (2017) 268 | ||
| Abstract: The WZ production cross section in proton-proton collisions at $\sqrt{s} = $ 13 TeV is measured with the CMS experiment at the LHC using a data sample corresponding to an integrated luminosity of 2.3 fb$^{-1}$. The measurement is performed in the leptonic decay modes ${\mathrm{ W }\mathrm{Z}} \to \ell\nu\ell'\ell'$, where $\ell$, $\ell' = \mathrm{ e }$, $\mu$. The measured cross section for the range 60 $ < m_{{\ell'\ell'}} < $ 120 GeV is $\sigma({\mathrm{ p }\mathrm{ p }} \to {\mathrm{ W }\mathrm{Z}} =$ 39.9 $\pm$ 3.2 (stat) ${}^{+2.9}_{-3.1 }$ (syst) $\pm$ 0.4 (theory) $\pm$ 1.3 (lumi) pb, consistent with the standard model prediction. | ||
| Links: e-print arXiv:1607.06943 [hep-ex] (PDF) ; CDS record ; inSPIRE record ; HepData record ; CADI line (restricted) ; | ||
| Figures | |
png pdf |
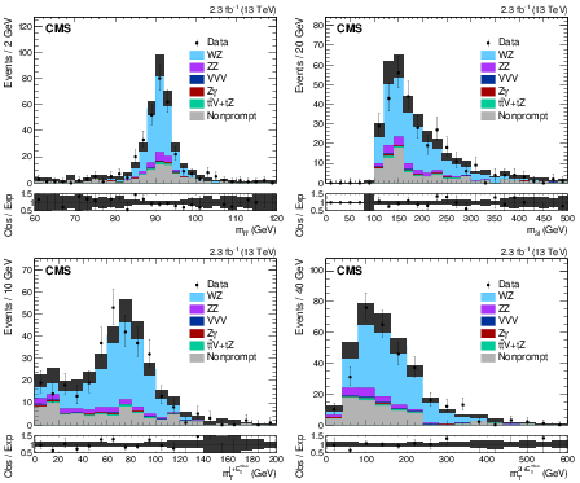
Figure 1:
(a) Distribution of the reconstructed $\ell '\ell '$ pair mass summed for all decay channels with the $m_{\ell '\ell '}$ selection extended to 60-120 GeV. (b) Distribution of the $\ell \ell '\ell '$ reconstructed mass summed for all decay channels with the $m_{3\ell } > $ 100 GeV selection requirement removed. (c) The transverse mass of the lepton from the W boson and the $ {E_{\mathrm {T}}^{\text {miss}}} $ system. (d) The transverse mass of the three leptons and the $ {E_{\mathrm {T}}^{\text {miss}}} $ system. Solid symbols represent the data with statistical uncertainty, while histograms represent the expected WZ signal and backgrounds. Uncertainties in the signal and background yields include experimental systematic, theoretical, and integrated luminosity uncertainties in addition to the statistical uncertainty. The background shapes are taken from simulation or data, as described in the text. |
png pdf |
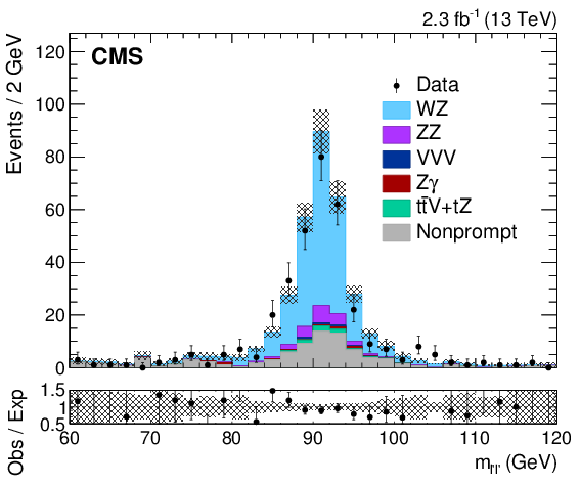
Figure 1-a:
(a) Distribution of the reconstructed $\ell '\ell '$ pair mass summed for all decay channels with the $m_{\ell '\ell '}$ selection extended to 60-120 GeV. (b) Distribution of the $\ell \ell '\ell '$ reconstructed mass summed for all decay channels with the $m_{3\ell } > $ 100 GeV selection requirement removed. (c) The transverse mass of the lepton from the W boson and the $ {E_{\mathrm {T}}^{\text {miss}}} $ system. (d) The transverse mass of the three leptons and the $ {E_{\mathrm {T}}^{\text {miss}}} $ system. Solid symbols represent the data with statistical uncertainty, while histograms represent the expected WZ signal and backgrounds. Uncertainties in the signal and background yields include experimental systematic, theoretical, and integrated luminosity uncertainties in addition to the statistical uncertainty. The background shapes are taken from simulation or data, as described in the text. |

png pdf |
Figure 1-b:
(a) Distribution of the reconstructed $\ell '\ell '$ pair mass summed for all decay channels with the $m_{\ell '\ell '}$ selection extended to 60-120 GeV. (b) Distribution of the $\ell \ell '\ell '$ reconstructed mass summed for all decay channels with the $m_{3\ell } > $ 100 GeV selection requirement removed. (c) The transverse mass of the lepton from the W boson and the $ {E_{\mathrm {T}}^{\text {miss}}} $ system. (d) The transverse mass of the three leptons and the $ {E_{\mathrm {T}}^{\text {miss}}} $ system. Solid symbols represent the data with statistical uncertainty, while histograms represent the expected WZ signal and backgrounds. Uncertainties in the signal and background yields include experimental systematic, theoretical, and integrated luminosity uncertainties in addition to the statistical uncertainty. The background shapes are taken from simulation or data, as described in the text. |
png pdf |
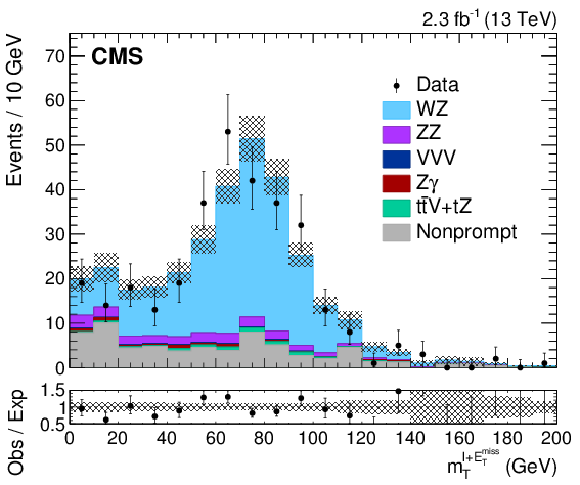
Figure 1-c:
(a) Distribution of the reconstructed $\ell '\ell '$ pair mass summed for all decay channels with the $m_{\ell '\ell '}$ selection extended to 60-120 GeV. (b) Distribution of the $\ell \ell '\ell '$ reconstructed mass summed for all decay channels with the $m_{3\ell } > $ 100 GeV selection requirement removed. (c) The transverse mass of the lepton from the W boson and the $ {E_{\mathrm {T}}^{\text {miss}}} $ system. (d) The transverse mass of the three leptons and the $ {E_{\mathrm {T}}^{\text {miss}}} $ system. Solid symbols represent the data with statistical uncertainty, while histograms represent the expected WZ signal and backgrounds. Uncertainties in the signal and background yields include experimental systematic, theoretical, and integrated luminosity uncertainties in addition to the statistical uncertainty. The background shapes are taken from simulation or data, as described in the text. |
png pdf |
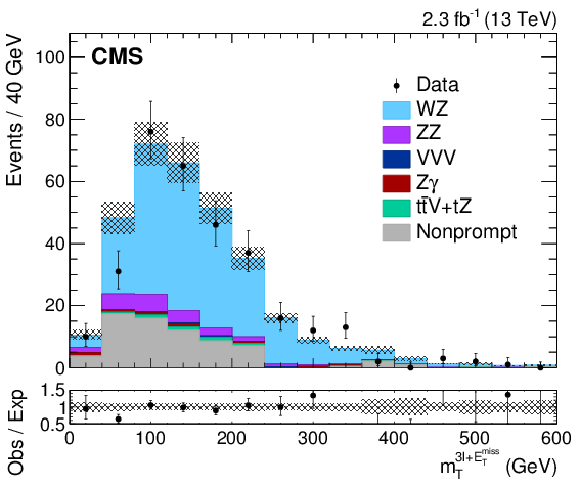
Figure 1-d:
(a) Distribution of the reconstructed $\ell '\ell '$ pair mass summed for all decay channels with the $m_{\ell '\ell '}$ selection extended to 60-120 GeV. (b) Distribution of the $\ell \ell '\ell '$ reconstructed mass summed for all decay channels with the $m_{3\ell } > $ 100 GeV selection requirement removed. (c) The transverse mass of the lepton from the W boson and the $ {E_{\mathrm {T}}^{\text {miss}}} $ system. (d) The transverse mass of the three leptons and the $ {E_{\mathrm {T}}^{\text {miss}}} $ system. Solid symbols represent the data with statistical uncertainty, while histograms represent the expected WZ signal and backgrounds. Uncertainties in the signal and background yields include experimental systematic, theoretical, and integrated luminosity uncertainties in addition to the statistical uncertainty. The background shapes are taken from simulation or data, as described in the text. |
png pdf |
Figure 2:
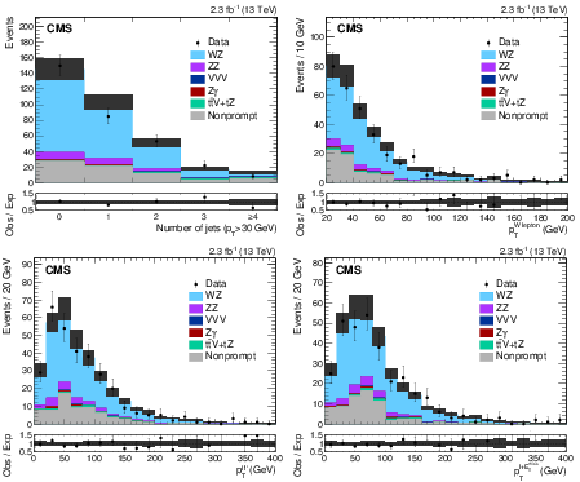
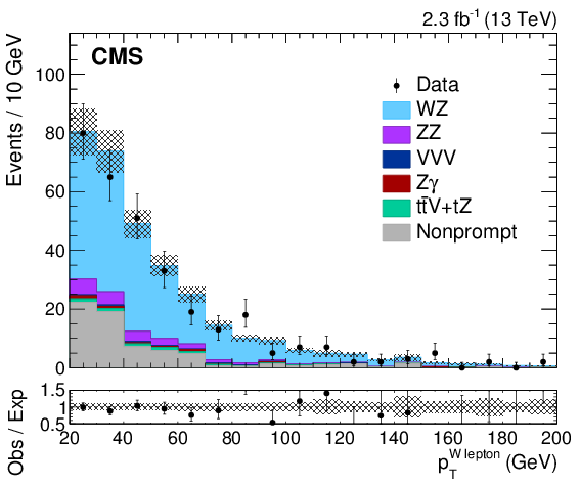
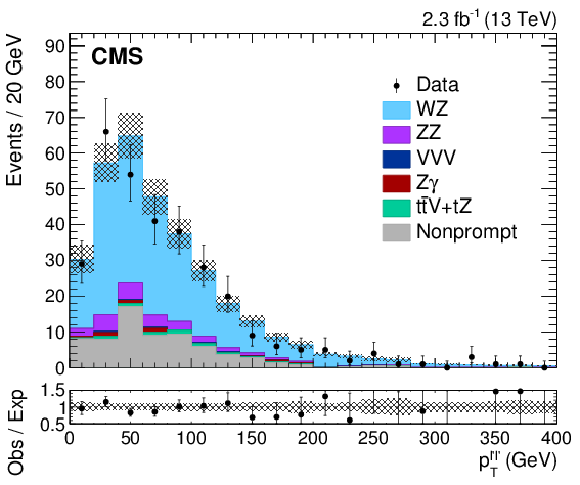
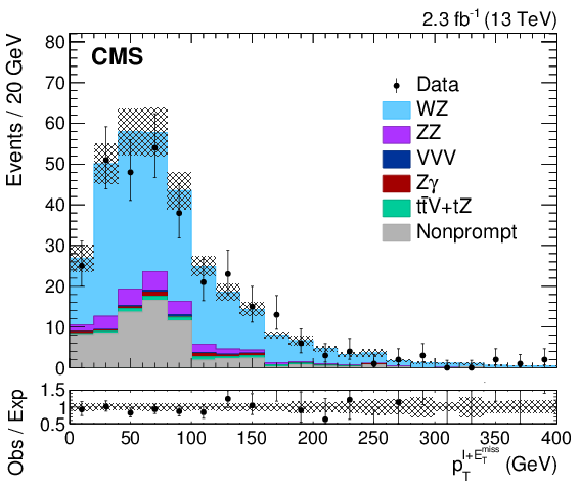
(a) Distribution of the number of jets with $ {p_{\mathrm {T}}} > $ 30 GeV in the event. (b) Transverse momentum of the lepton associated with the W boson. (c) Transverse momentum of selected Z boson candidates. (d) Transverse momentum of selected W boson candidates. Solid symbols represent the data with statistical uncertainty, while histograms represent the expected WZ signal and backgrounds. Uncertainties in signal and background yields include experimental systematic, theoretical, and integrated luminosity uncertainties in addition to the statistical uncertainty. The background shapes are taken from simulation or data, as described in the text. |

png pdf |
Figure 2-a:
(a) Distribution of the number of jets with $ {p_{\mathrm {T}}} > $ 30 GeV in the event. (b) Transverse momentum of the lepton associated with the W boson. (c) Transverse momentum of selected Z boson candidates. (d) Transverse momentum of selected W boson candidates. Solid symbols represent the data with statistical uncertainty, while histograms represent the expected WZ signal and backgrounds. Uncertainties in signal and background yields include experimental systematic, theoretical, and integrated luminosity uncertainties in addition to the statistical uncertainty. The background shapes are taken from simulation or data, as described in the text. |
png pdf |
Figure 2-b:
(a) Distribution of the number of jets with $ {p_{\mathrm {T}}} > $ 30 GeV in the event. (b) Transverse momentum of the lepton associated with the W boson. (c) Transverse momentum of selected Z boson candidates. (d) Transverse momentum of selected W boson candidates. Solid symbols represent the data with statistical uncertainty, while histograms represent the expected WZ signal and backgrounds. Uncertainties in signal and background yields include experimental systematic, theoretical, and integrated luminosity uncertainties in addition to the statistical uncertainty. The background shapes are taken from simulation or data, as described in the text. |
png pdf |
Figure 2-c:
(a) Distribution of the number of jets with $ {p_{\mathrm {T}}} > $ 30 GeV in the event. (b) Transverse momentum of the lepton associated with the W boson. (c) Transverse momentum of selected Z boson candidates. (d) Transverse momentum of selected W boson candidates. Solid symbols represent the data with statistical uncertainty, while histograms represent the expected WZ signal and backgrounds. Uncertainties in signal and background yields include experimental systematic, theoretical, and integrated luminosity uncertainties in addition to the statistical uncertainty. The background shapes are taken from simulation or data, as described in the text. |
png pdf |
Figure 2-d:
(a) Distribution of the number of jets with $ {p_{\mathrm {T}}} > $ 30 GeV in the event. (b) Transverse momentum of the lepton associated with the W boson. (c) Transverse momentum of selected Z boson candidates. (d) Transverse momentum of selected W boson candidates. Solid symbols represent the data with statistical uncertainty, while histograms represent the expected WZ signal and backgrounds. Uncertainties in signal and background yields include experimental systematic, theoretical, and integrated luminosity uncertainties in addition to the statistical uncertainty. The background shapes are taken from simulation or data, as described in the text. |
| Tables | |

png pdf |
Table 1:
The contributions of each systematic uncertainty source to the final uncertainty in the cross section measurement. The integrated luminosity as well as the PDF and scale uncertainties are reported separately while the other uncertainties are combined into a single systematic uncertainty. |

png pdf |
Table 2:
The expected yields of WZ events and the estimated yields of background events, consisting of the prompt leptons estimated from simulation and nonprompt from a data driven method, compared to the number of observed events for each decay channel. |
| Summary |
| The WZ production cross section in proton-proton collisions at $\sqrt{s} = $ 13 TeV has been measured with the CMS experiment at the LHC using a data sample corresponding to an integrated luminosity of 2.3 fb$^{-1}$. The measurement is performed in the leptonic decay modes ${\mathrm{ W }\mathrm{Z}} \to \ell\nu\ell'\ell'$, where $\ell$, $\ell' = \mathrm{ e }$, $\mu$. The measured fiducial ${\mathrm{ W }\mathrm{Z}} \to \ell\nu\ell'\ell'$ cross section for two leptons from the Z boson decay with $p_{\mathrm{T}} > $ 20 and 10 GeV, the lepton from the W boson decay with $p_{\mathrm{T}} > $ 20 GeV, all leptons within $|\eta | < $ 2.5 , and 60 $ < m_{\ell'\ell'} < $ 120 GeV is $\sigma_{\text{fid}} ({\mathrm{ p }\mathrm{ p }} \to \mathrm{ W }\mathrm{ Z } \to \ell\nu\ell'\ell') =$ 258 $\pm$ 21 (stat) ${}^{+19}_{-20}$ (syst) $\pm$ 8 (lumi) fb. The corresponding total cross section is $\sigma({\mathrm{ p }\mathrm{ p }} \to \mathrm{ W }\mathrm{ Z }) =$ 39.9 $\pm$ 3.2 (stat) ${}^{+2.9}_{-3.1}$ (syst) $\pm$ 0.4 (theory) $\pm$ 1.3 pb for the dilepton mass range 60 $ < m_{\ell'\ell'} < $ 120 GeV. This measurement is consistent with the theoretical values of 274$^{+11}_{-8}$ (scale) $\pm$ 4 (PDF) fb for the fiducial cross section and 42.3$^{+1.4}_{-1.1}$ (scale) $\pm$ 0.6 (PDF) pb for the total cross section calculated with MCFM at NLO with NNPDF3.0 PDFs, with dynamic renormalization and factorization scales set to $\mu_R = \mu_F = m_{\mathrm{ W }\mathrm{Z}}$, and with the NNLO prediction. |
| References | ||||
| 1 | CDF Collaboration | Observation of $ WZ $ Production | PRL 98 (2007) 161801 | hep-ex/0702027 |
| 2 | CDF Collaboration | Measurement of the WZ Cross Section and Triple Gauge Couplings in $ \text{p} \bar{\text{p}} $ Collisions at $ \sqrt{s} = $ 1.96 TeV | PRD 86 (2012) 031104 | 1202.6629 |
| 3 | D0 Collaboration | A measurement of the WZ and ZZ production cross sections using leptonic final states in 8.6 fb$ ^{-1} $ of $ \text{p}\bar{\text{p}} $ collisions | PRD 85 (2012) 112005 | 1201.5652 |
| 4 | CMS Collaboration | Measurement of WZ and ZZ production in pp collisions at $ \sqrt{s} = $ 8 TeV in final states with b-tagged jets | EPJC 74 (2014) 2973 | CMS-SMP-13-011 1403.3047 |
| 5 | ATLAS Collaboration | Measurement of WZ production in proton-proton collisions at $ \sqrt{s}= $ 7 TeV with the ATLAS detector | EPJC 72 (2012) 2173 | 1208.1390 |
| 6 | ATLAS Collaboration | Measurements of $ \rm{W}^\pm \rm{Z} $ production cross sections in pp collisions at $ \sqrt{s} = $ 8 TeV with the ATLAS detector and limits on anomalous gauge boson self-couplings | PRD 93 (2016) 092004 | 1603.02151 |
| 7 | ATLAS Collaboration | Measurement of the $ \rm{W}^{\pm}\rm{Z} $-boson production cross sections in pp collisions at $ \sqrt{s}= $ 13 TeV with the ATLAS detector | PLB 759 (2016) 601 | 1606.04017 |
| 8 | CMS Collaboration | The CMS experiment at the CERN LHC | JINST 3 (2008) S08004 | CMS-00-001 |
| 9 | T. Melia, P. Nason, R. Rontsch, and G. Zanderighi | $ \text{W}^{+}\text{W}^{-} $, WZ and ZZ production in the POWHEG BOX | JHEP 11 (2011) 078 | 1107.5051 |
| 10 | P. Nason | A new method for combining NLO QCD with shower Monte Carlo algorithms | JHEP 11 (2004) 040 | hep-ph/0409146 |
| 11 | S. Frixione, P. Nason, and C. Oleari | Matching NLO QCD computations with parton shower simulations: the POWHEG method | JHEP 11 (2007) 070 | 0709.2092 |
| 12 | S. Alioli, P. Nason, C. Oleari, and E. Re | A General Framework for Implementing NLO Calculations in Shower Monte Carlo Programs: the POWHEG BOX | JHEP 06 (2010) 043 | 1002.2581 |
| 13 | J. M. Campbell, R. K. Ellis, and C. Williams | Vector boson pair production at the LHC | JHEP 07 (2011) 18 | 1105.0020 |
| 14 | J. Alwall et al. | The automated computation of tree-level and next-to-leading order differential cross sections, and their matching to parton shower simulations | JHEP 07 (2014) 079 | 1405.0301 |
| 15 | F. Cascioli et al. | ZZ production at hadron colliders in NNLO QCD | PLB 735 (2014) 311 | 1405.2219 |
| 16 | F. Caola, K. Melnikov, R. Rontsch, and L. Tancredi | QCD corrections to ZZ production in gluon fusion at the LHC | PRD 92 (2015) 094028 | 1509.06734 |
| 17 | T. Sjostrand et al. | An introduction to PYTHIA 8.2 | CPC 191 (2015) 159 | 1410.3012 |
| 18 | CMS Collaboration | Event generator tunes obtained from underlying event and multiparton scattering measurements | The European Physical Journal C 76 (2016) 1 | CMS-GEN-14-001 1512.00815 |
| 19 | NNPDF Collaboration | Parton distributions for the LHC Run II | JHEP 04 (2015) 040 | 1410.8849 |
| 20 | GEANT4 Collaboration | GEANT4---a simulation toolkit | NIMA 506 (2003) 250 | |
| 21 | CMS Collaboration | Particle-Flow Event Reconstruction in CMS and Performance for Jets, Taus, and MET | CMS-PAS-PFT-09-001 | |
| 22 | CMS Collaboration | Commissioning of the Particle-flow Event Reconstruction with the first LHC collisions recorded in the CMS detector | CMS-PAS-PFT-10-001 | |
| 23 | CMS Collaboration | Performance of electron reconstruction and selection with the CMS detector in proton-proton collisions at $ \sqrt{s} = $ 8 TeV | JINST 10 (2015) P06005 | CMS-EGM-13-001 1502.02701 |
| 24 | CMS Collaboration | Performance of CMS muon reconstruction in pp collision events at $ \sqrt{s}= $ 7 TeV | JINST 7 (2012) P10002 | CMS-MUO-10-004 1206.4071 |
| 25 | CMS Collaboration | Description and performance of track and primary-vertex reconstruction with the CMS tracker | JINST 9 (2014), no. 10, P10009 | CMS-TRK-11-001 1405.6569 |
| 26 | M. Cacciari, G. P. Salam, and G. Soyez | The anti-$ k_{\rm{t}} $ jet clustering algorithm | JHEP 04 (2008) 063 | 0802.1189 |
| 27 | CMS Collaboration | Determination of jet energy calibration and transverse momentum resolution in CMS | JINST 6 (2011) P11002 | CMS-JME-10-011 1107.4277 |
| 28 | CMS Collaboration | Pileup Jet Identification | CMS-PAS-JME-13-005 | CMS-PAS-JME-13-005 |
| 29 | CMS Collaboration | Identification of b quark jets with the CMS experiment | JINST 8 (2013) P04013 | CMS-BTV-12-001 1211.4462 |
| 30 | CMS Collaboration | Identification of b quark jets at the CMS experiment in the LHC Run 2 | CMS-PAS-BTV-15-001 | CMS-PAS-BTV-15-001 |
| 31 | M. Cacciari and G. P. Salam | Pileup subtraction using jet areas | PLB 659 (2008) 119 | 0707.1378 |
| 32 | CMS Collaboration | Measurement of the inclusive W and Z production cross sections in pp collisions at $ \sqrt{s}= $ 7 TeV with the CMS experiment | JHEP 10 (2011) 132 | CMS-EWK-10-005 1107.4789 |
| 33 | CMS Collaboration | CMS Luminosity Measurement for the 2015 Data Taking Period | CMS-PAS-LUM-15-001 | CMS-PAS-LUM-15-001 |
| 34 | M. Grazzini, S. Kallweit, and D. Rathlev | ZZ production at the LHC: fiducial cross sections and distributions in NNLO QCD | PLB 750 (2015) 407 | 1507.06257 |
| 35 | J. M. Campbell and R. K. Ellis | $ t\bar{t}W^\pm $ production and decay at NLO | JHEP 07 (2012) 52 | 1204.5678 |
| 36 | M. V. Garzelli, A. Kardos, C. G. Papadopoulos, and Z. Trocsanyi | t $ \bar{\rm{t}} \rm{W}^{\pm} $ and t $ \bar{\rm{t}} $ Z Hadroproduction at NLO accuracy in QCD with Parton Shower and Hadronization effects | JHEP 11 (2012) 56 | 1208.2665 |
| 37 | S. Dulat et al. | New parton distribution functions from a global analysis of quantum chromodynamics | PRD 93 (2016) 033006 | 1506.07443 |
| 38 | L. A. Harland-Lang, A. D. Martin, P. Motylinski, and R. S. Thorne | Parton distributions in the LHC era: MMHT 2014 PDFs | EPJC 75 (2015) 204 | 1412.3989 |
| 39 | Particle Data Group, K. A. Olive et al. | Review of particle physics | CPC 38 (2014) 090001 | |
| 40 | M. Grazzini, S. Kallweit, D. Rathlev, and M. Wiesemann | $ \rm{W}^{\pm}\rm{Z} $ production at hadron colliders in NNLO QCD | 1604.08576 | |

|
Compact Muon Solenoid LHC, CERN |

|

|

|

|

|

|