

Compact Muon Solenoid
LHC, CERN
| CMS-SMP-22-003 ; CERN-EP-2025-294 | ||
| Simultaneous measurements of $ N $-subjettiness observables in jets from gluons and light-flavour quarks, and in decays of boosted W bosons and top quarks | ||
| CMS Collaboration | ||
| 28 April 2026 | ||
| Submitted to the Journal of High Energy Physics | ||
| Abstract: A simultaneous measurement of 25 substructure observables is presented using large-radius jets with high transverse momentum from proton-proton collisions at $ \sqrt{s}= $ 13 TeV. The measurement is carried out on dijet events and $ \mathrm{t} \overline{\mathrm{t}} $ events enriched in Lorentz-boosted W bosons and top quarks decaying hadronically. The three data samples consist of jets with one, two, or three prongs from the showering and hadronization of a gluon or light-flavour quark, two quarks, or three quarks, respectively. The data correspond to an integrated luminosity of 138 fb$ ^{-1} $, recorded by the CMS experiment in 2016--2018. A detailed characterization of the jet substructure is provided using a 6-body basis of $ N $-subjettiness observables that overconstrains the phase space of the resolved emissions in the jet. The measurements are unfolded to the level of stable particles, and an estimate of the particle-level correlations between observables is provided, ensuring that the results can be used to systematically assess and refine the modelling of radiation in jets. | ||
| Links: e-print arXiv:2604.25538 [hep-ex] (PDF) ; CDS record ; inSPIRE record ; HepData record ; CADI line (restricted) ; | ||
| Figures | |
png pdf |
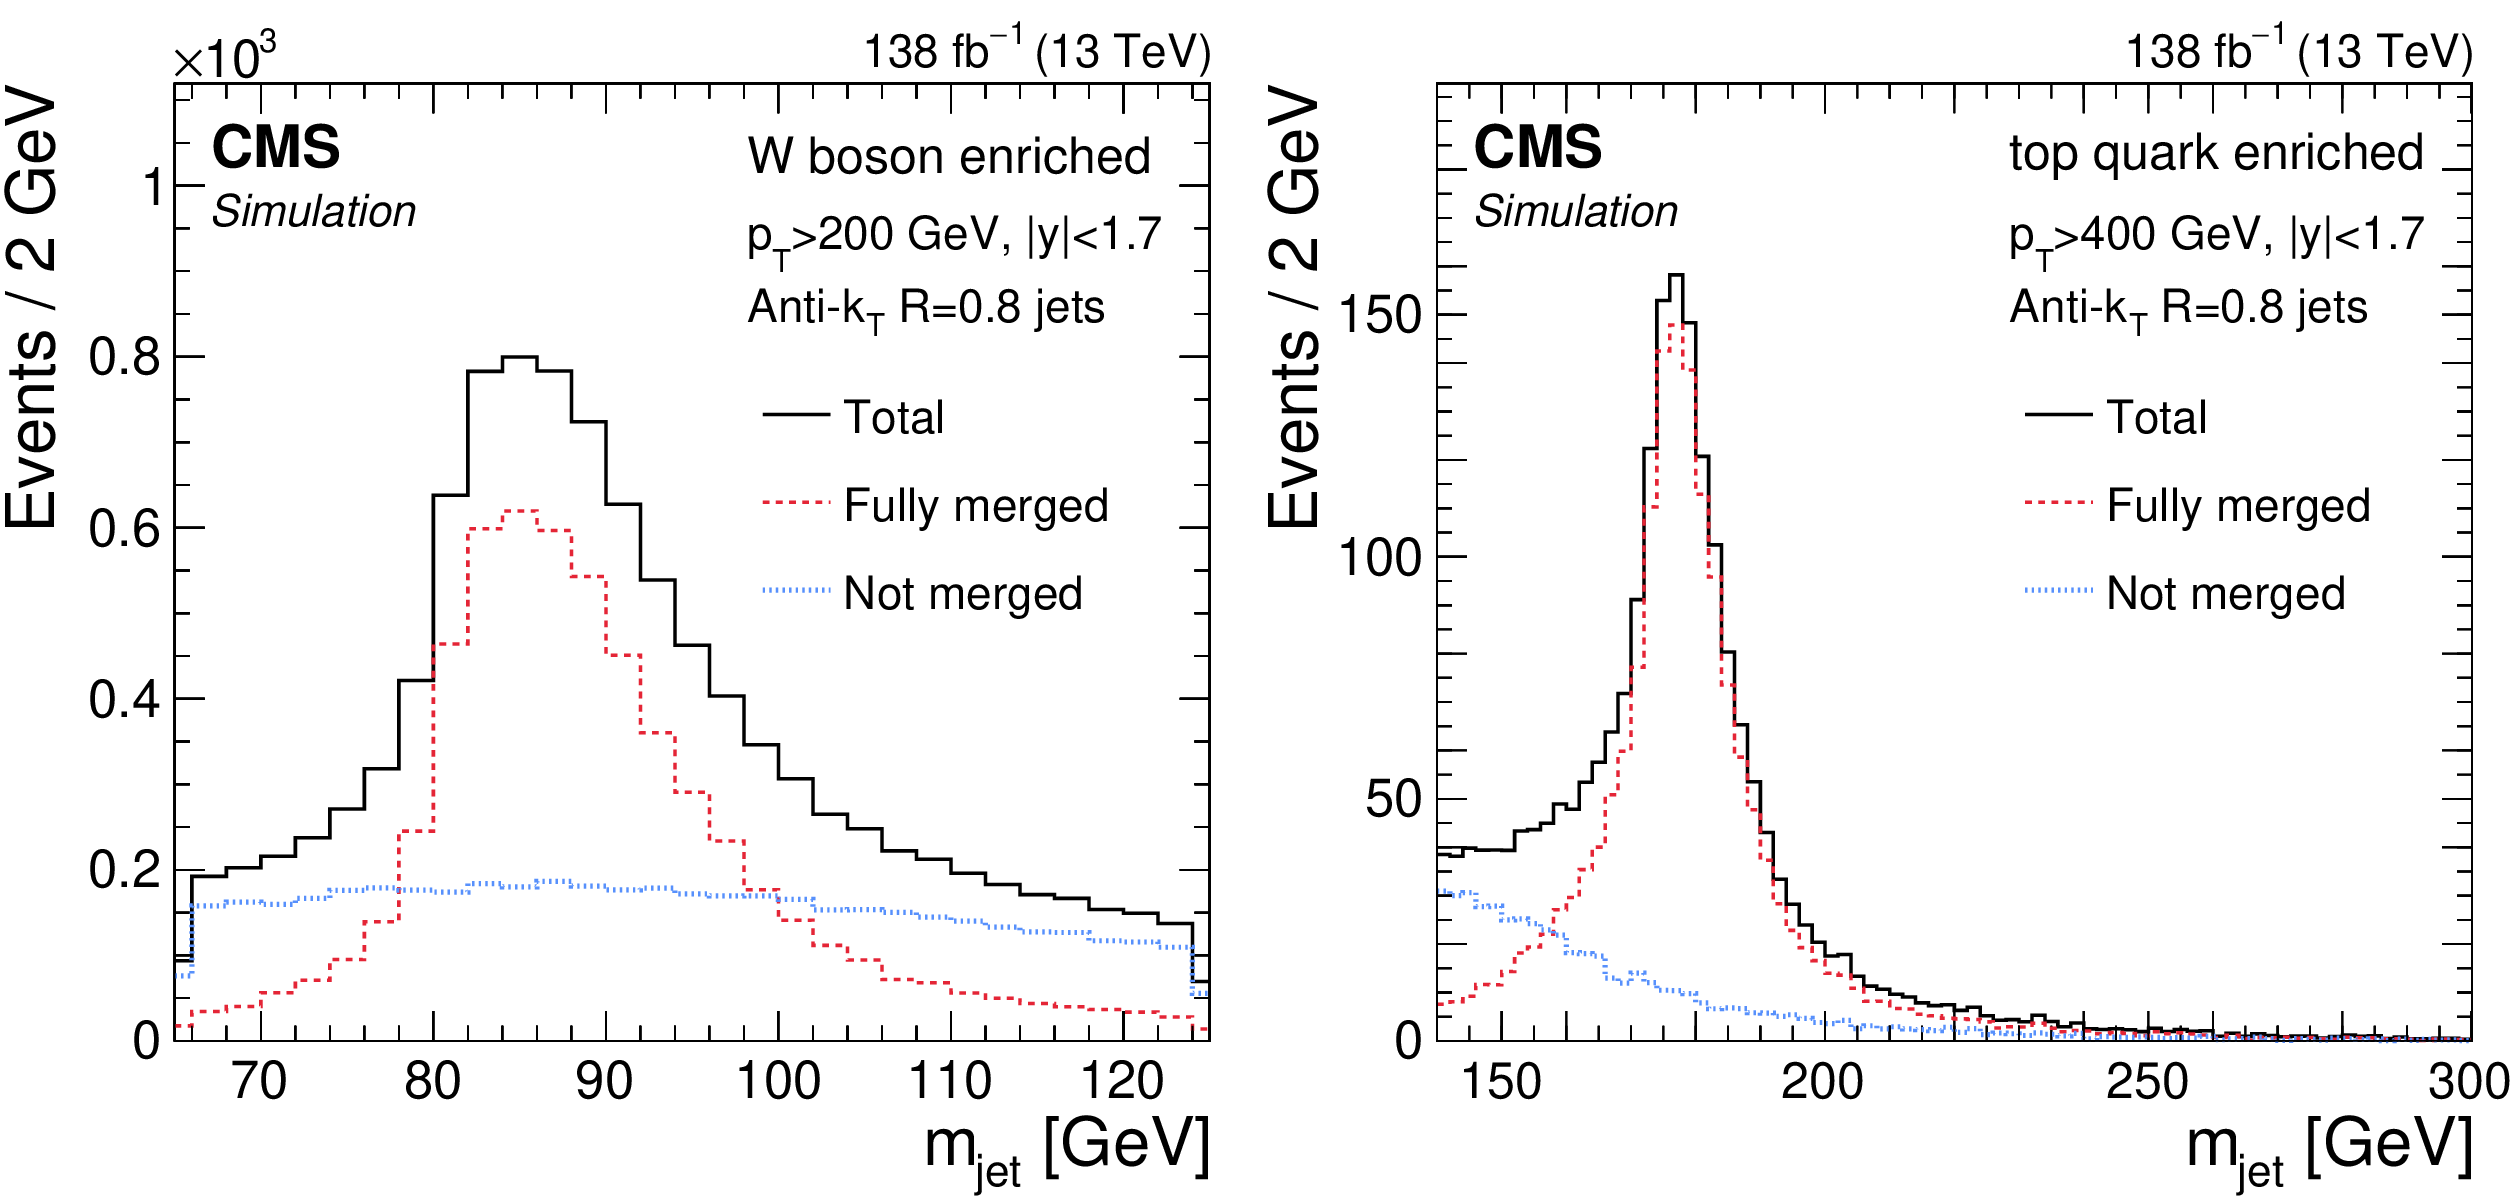
Figure 1:
Distributions of the particle-level AK8 jet mass in fiducial regions enriched in hadronic decays of boosted W bosons (left) and top quarks (right), obtained from events in the muon+jets channel of $ \mathrm{t} \overline{\mathrm{t}} $ production. The contributions to the total jet mass distribution (black) from fully-merged (red) AK8 jets and not or partially-merged (blue) jets are illustrated in the figures. |
png pdf |
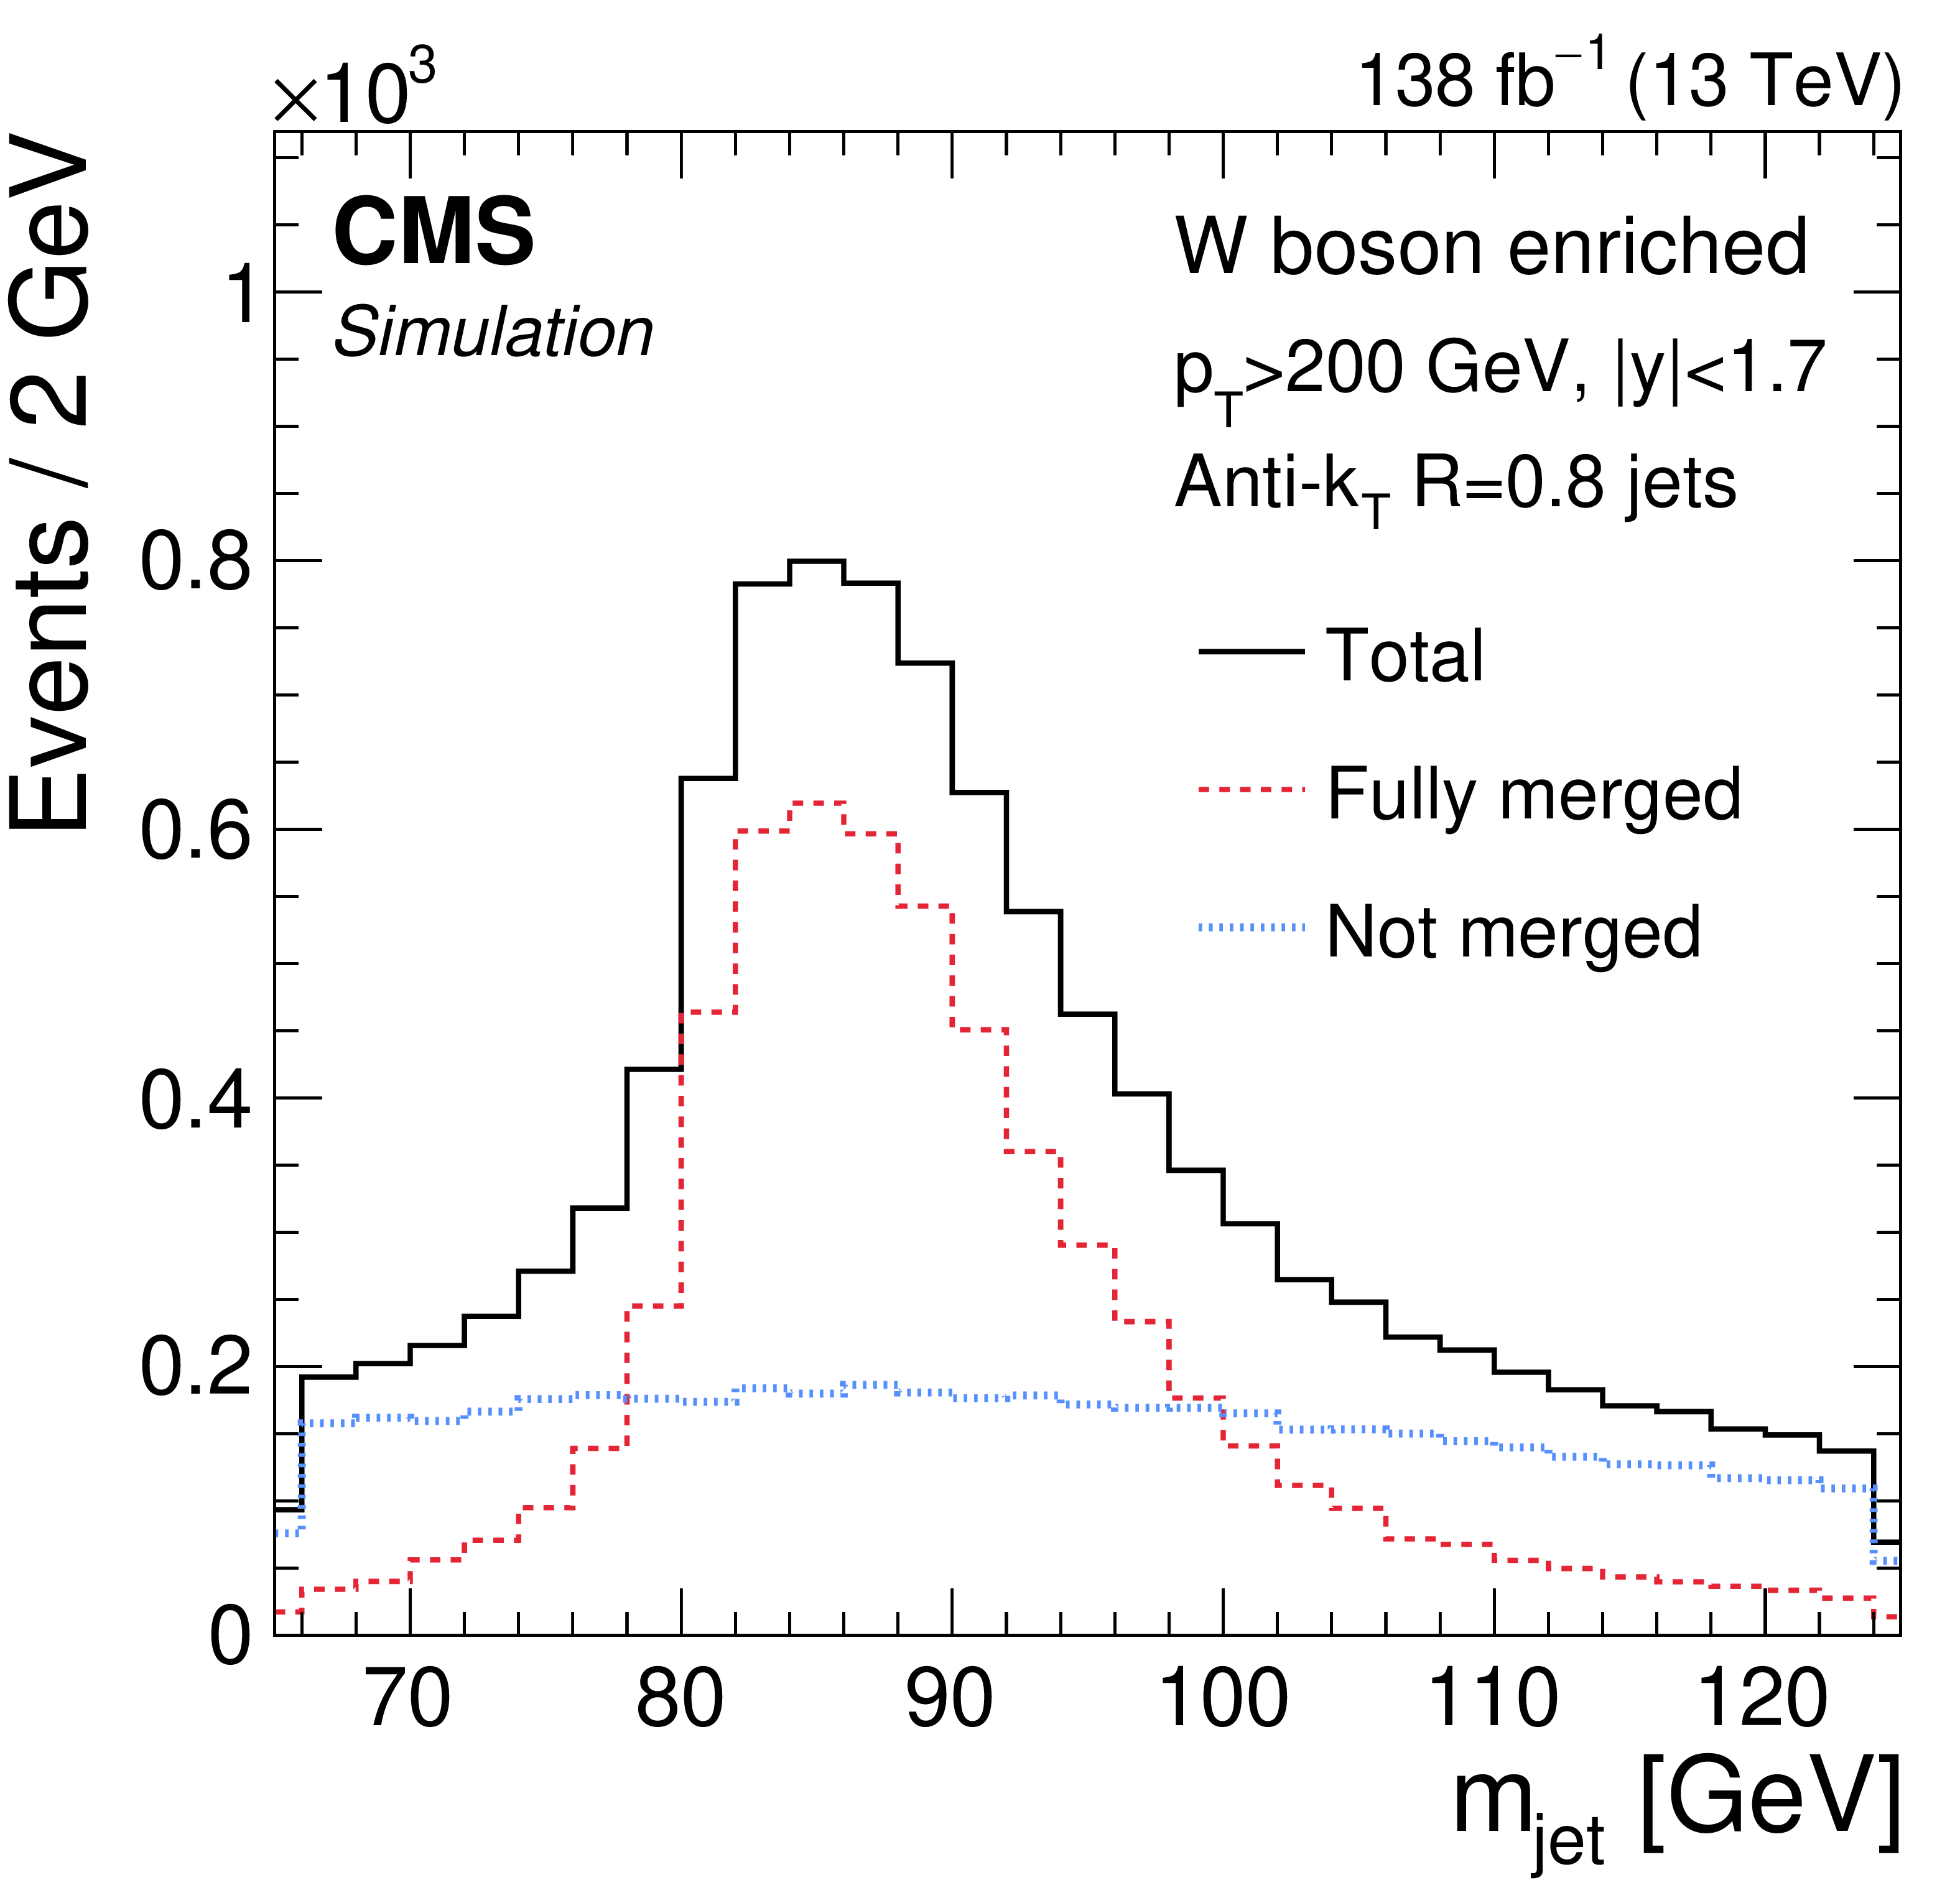
Figure 1-a:
Distributions of the particle-level AK8 jet mass in fiducial regions enriched in hadronic decays of boosted W bosons (left) and top quarks (right), obtained from events in the muon+jets channel of $ \mathrm{t} \overline{\mathrm{t}} $ production. The contributions to the total jet mass distribution (black) from fully-merged (red) AK8 jets and not or partially-merged (blue) jets are illustrated in the figures. |
png pdf |
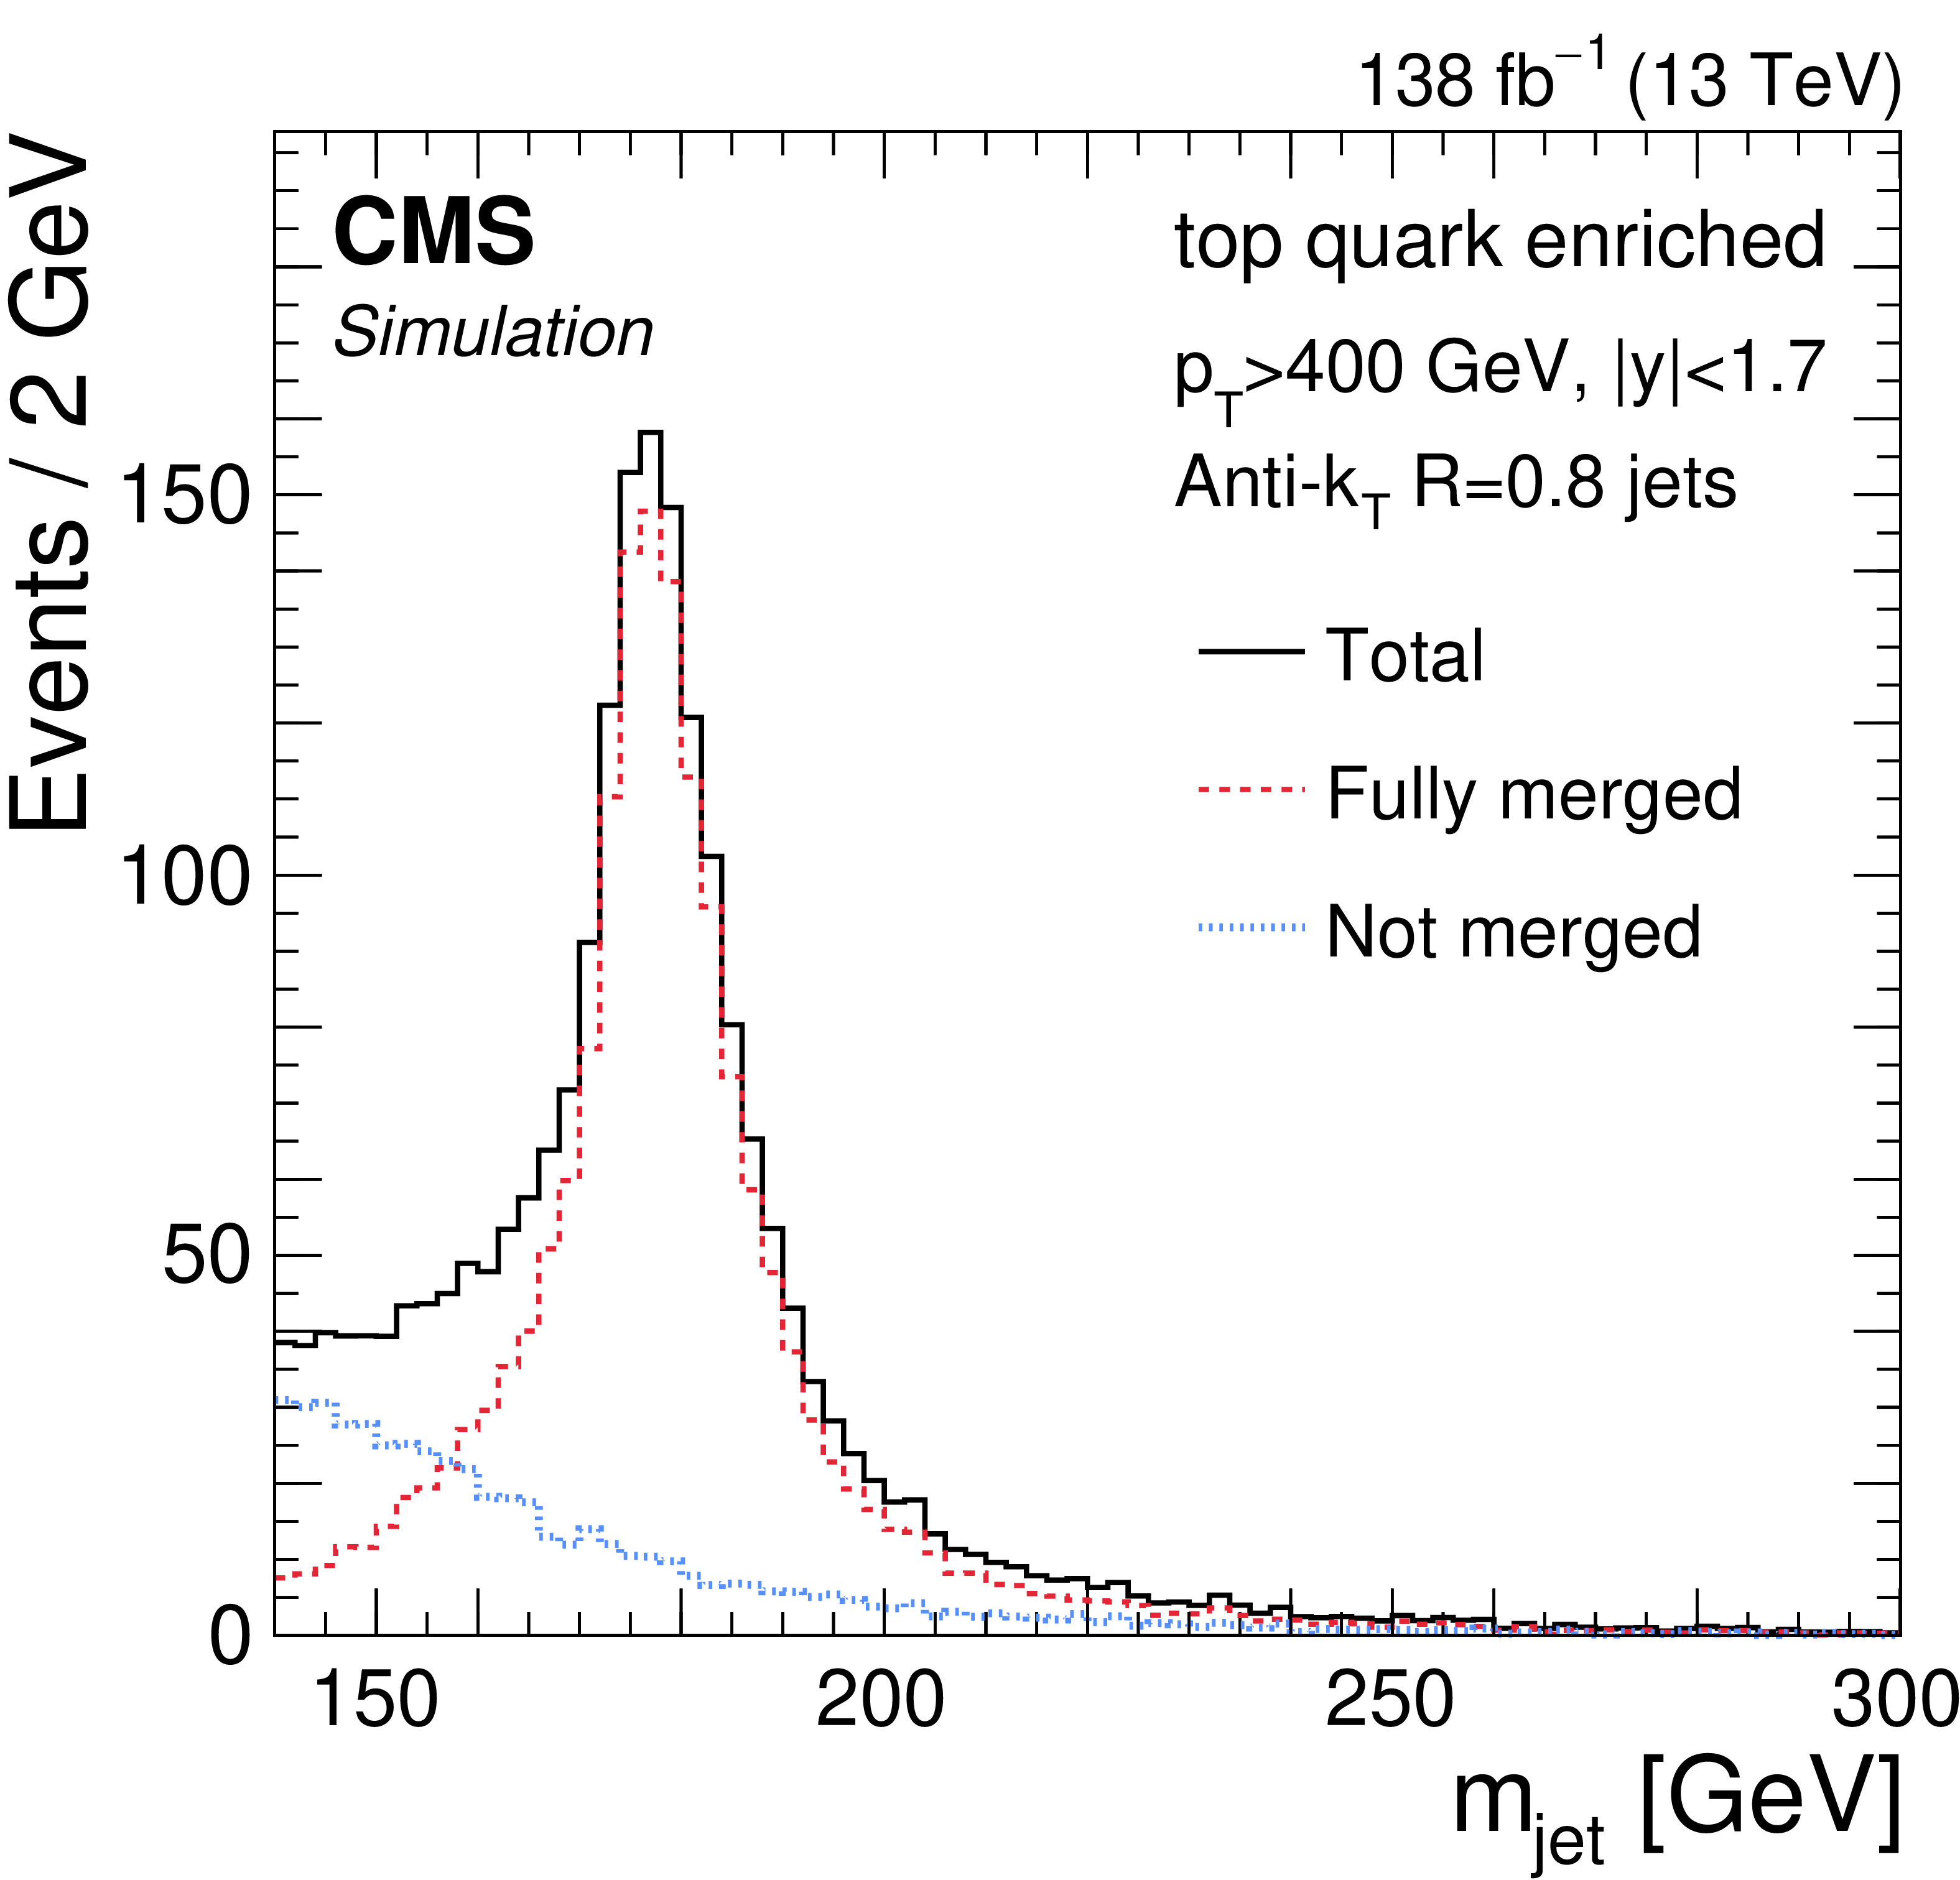
Figure 1-b:
Distributions of the particle-level AK8 jet mass in fiducial regions enriched in hadronic decays of boosted W bosons (left) and top quarks (right), obtained from events in the muon+jets channel of $ \mathrm{t} \overline{\mathrm{t}} $ production. The contributions to the total jet mass distribution (black) from fully-merged (red) AK8 jets and not or partially-merged (blue) jets are illustrated in the figures. |
png pdf |
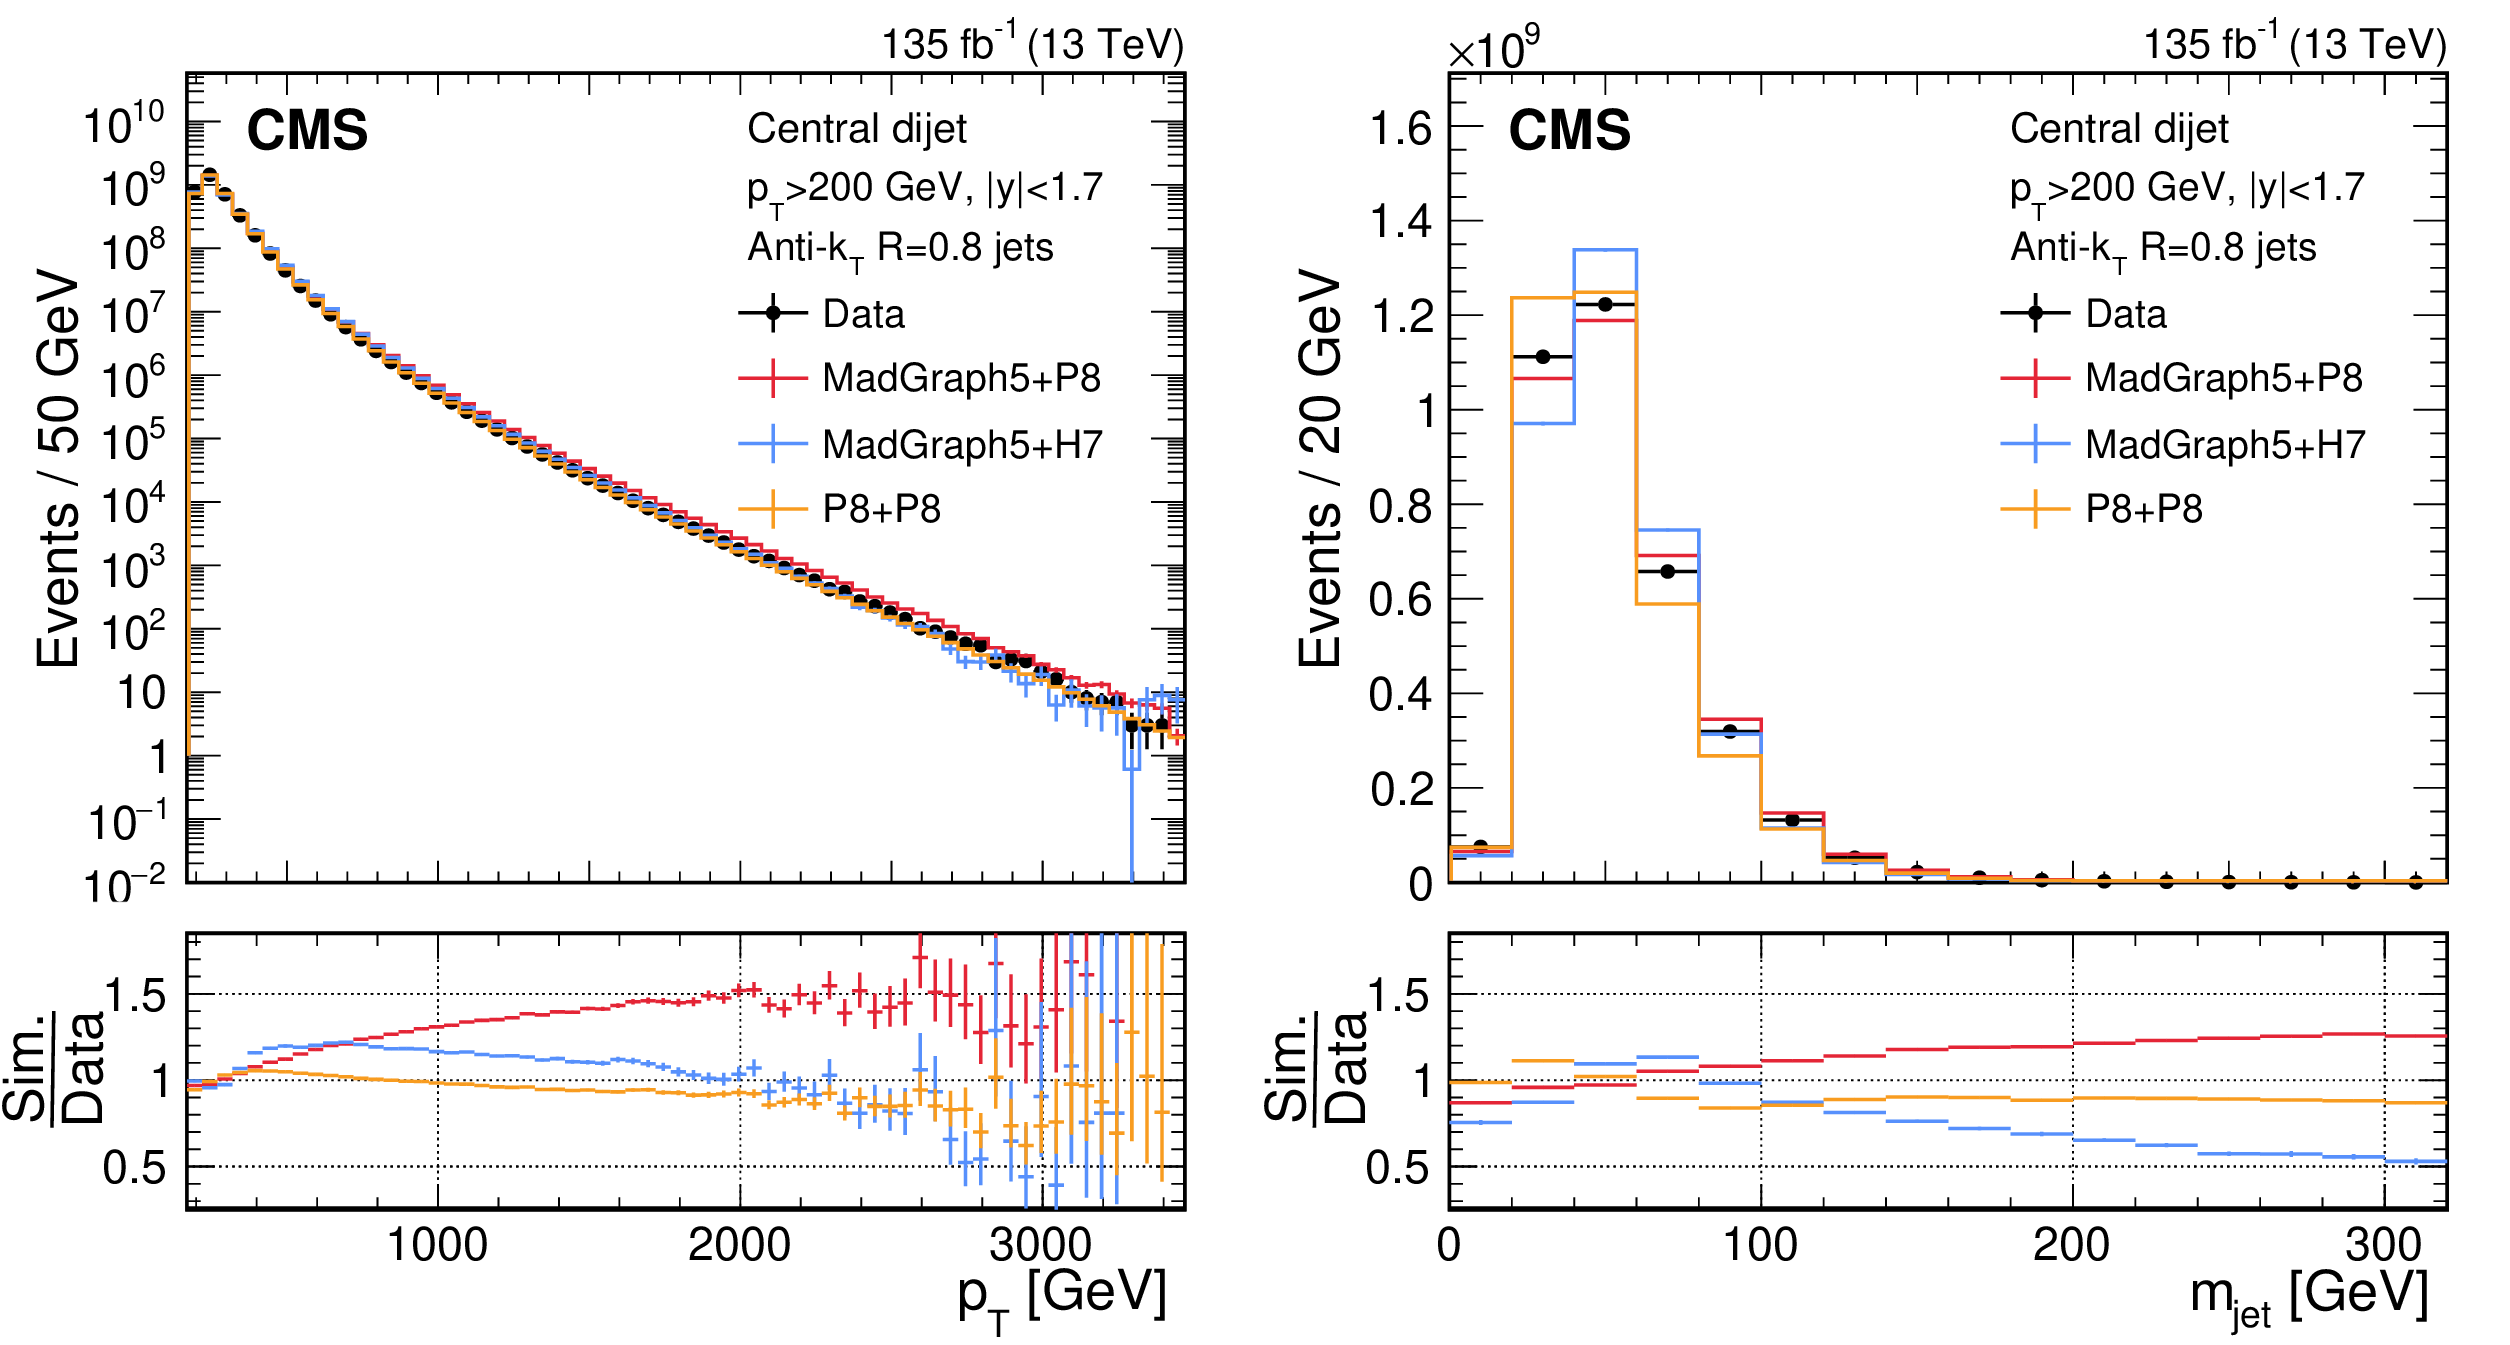
Figure 2:
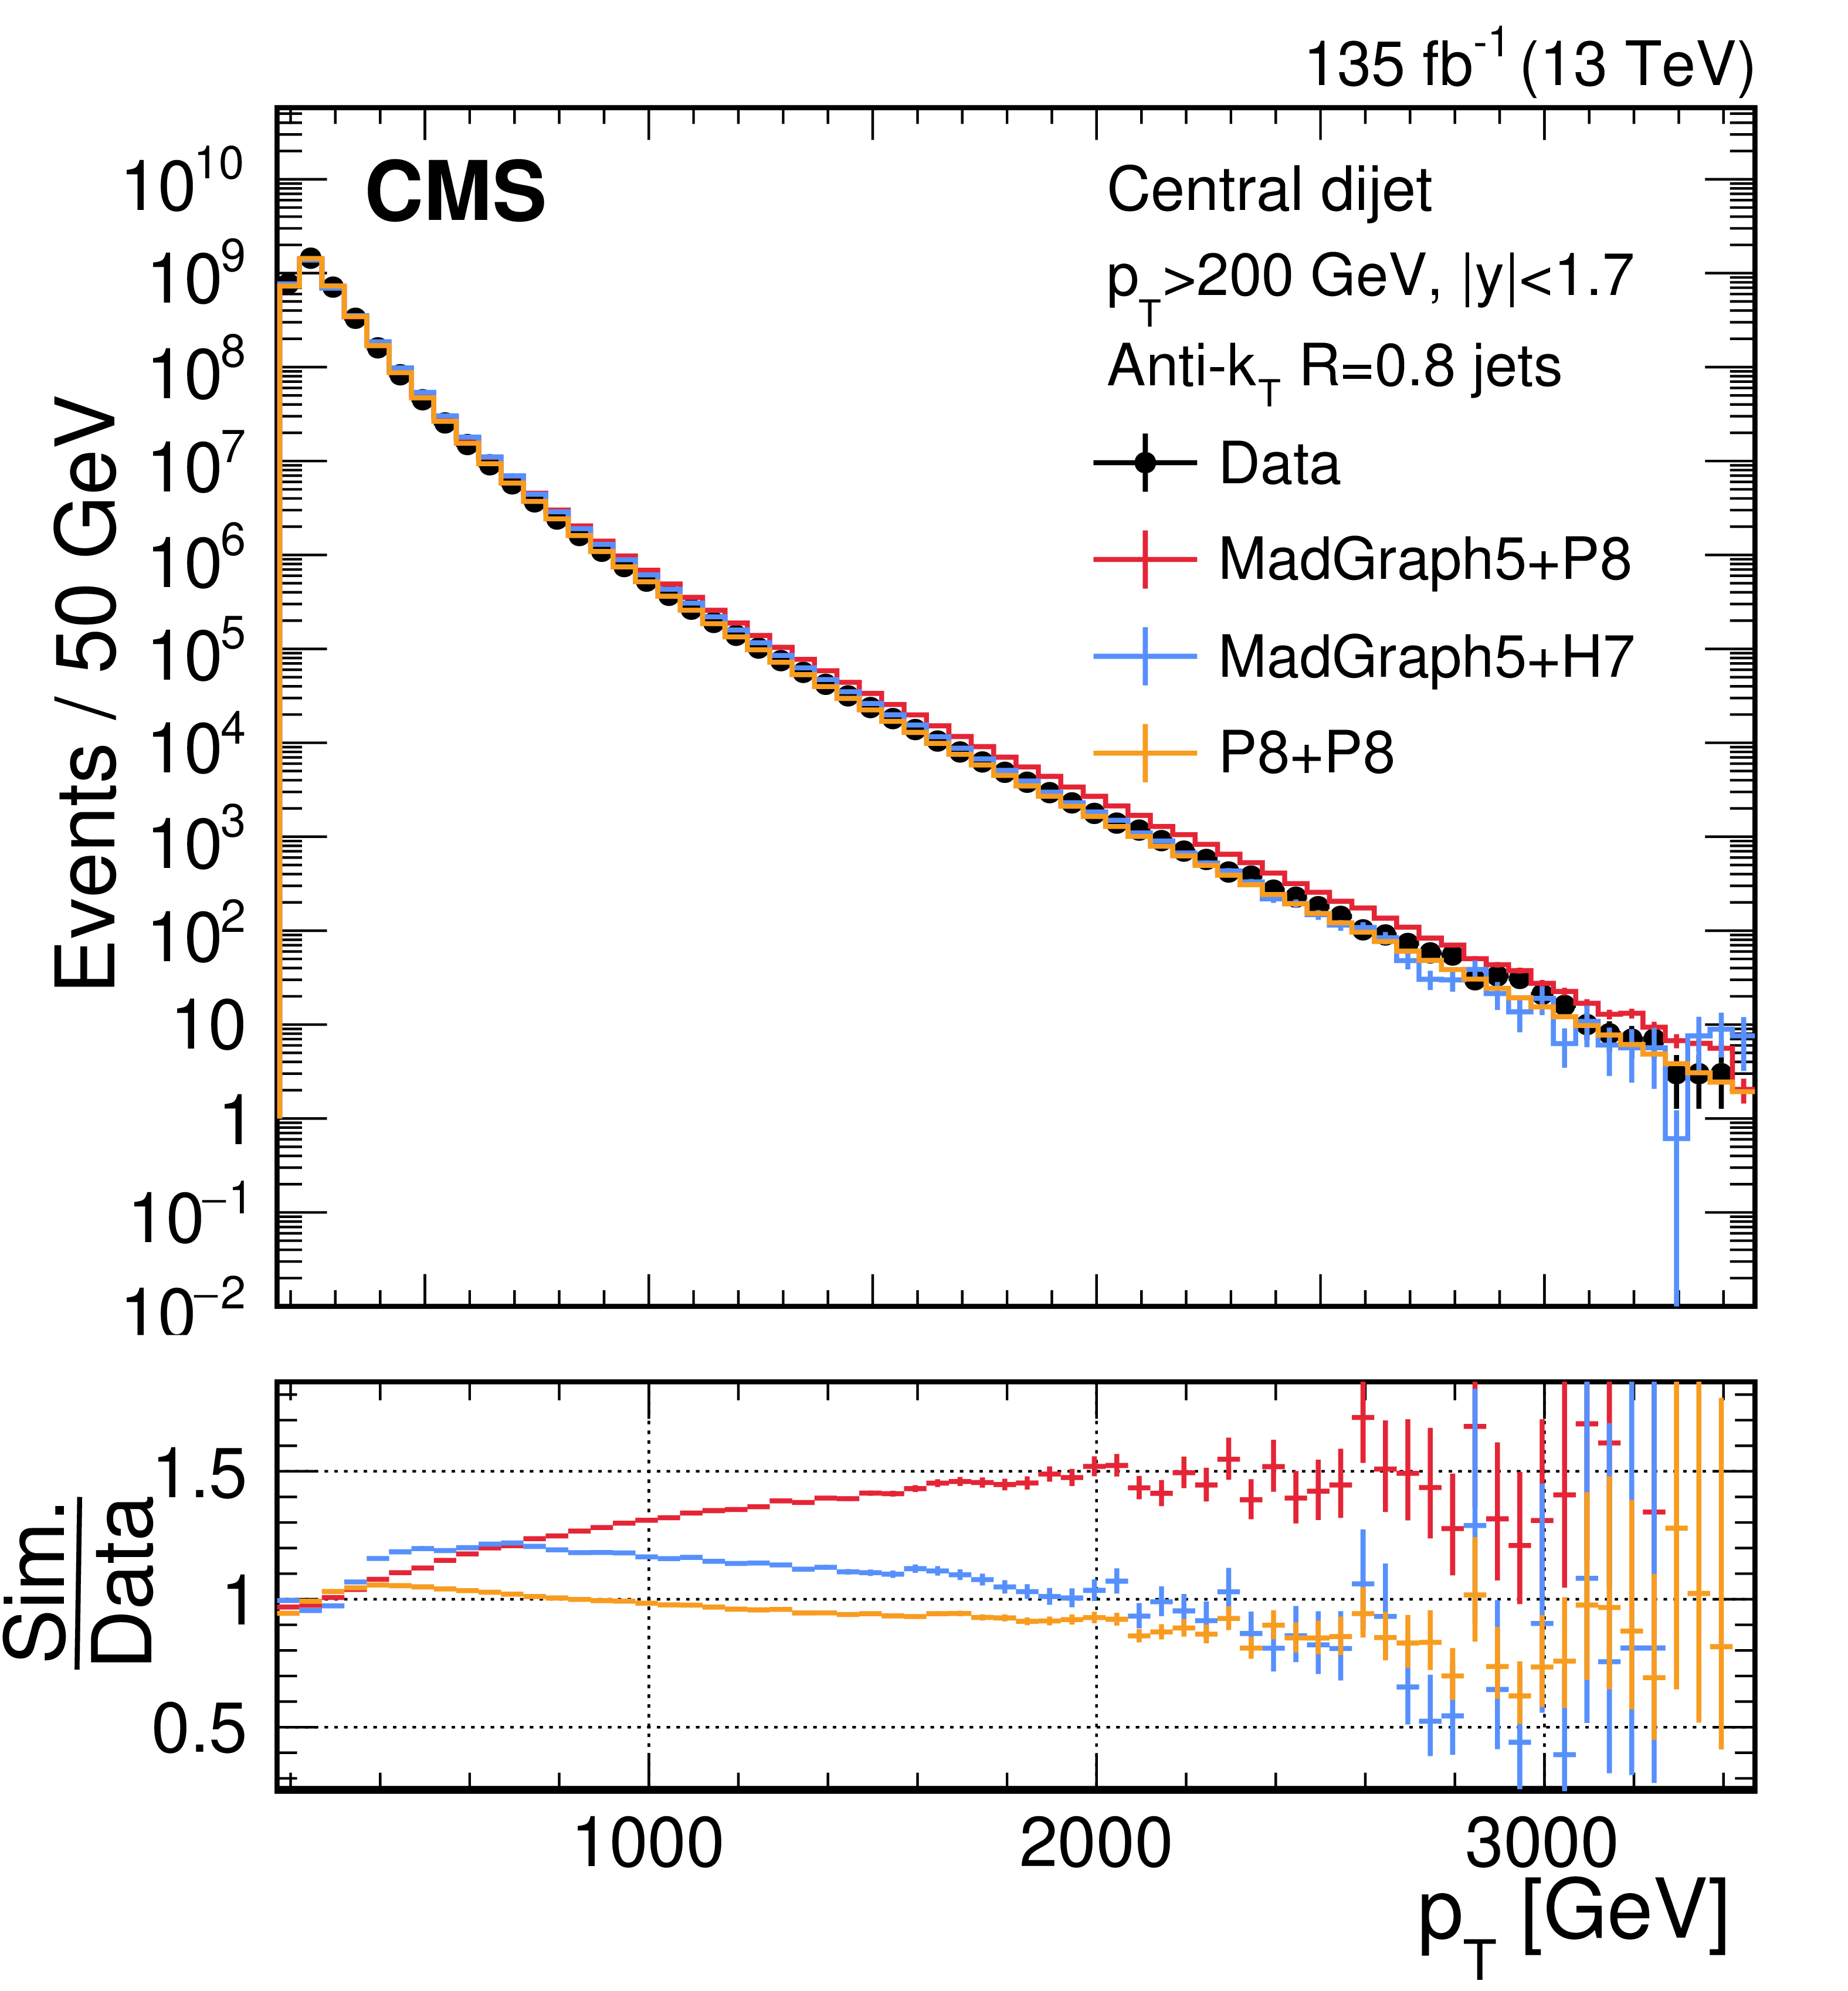
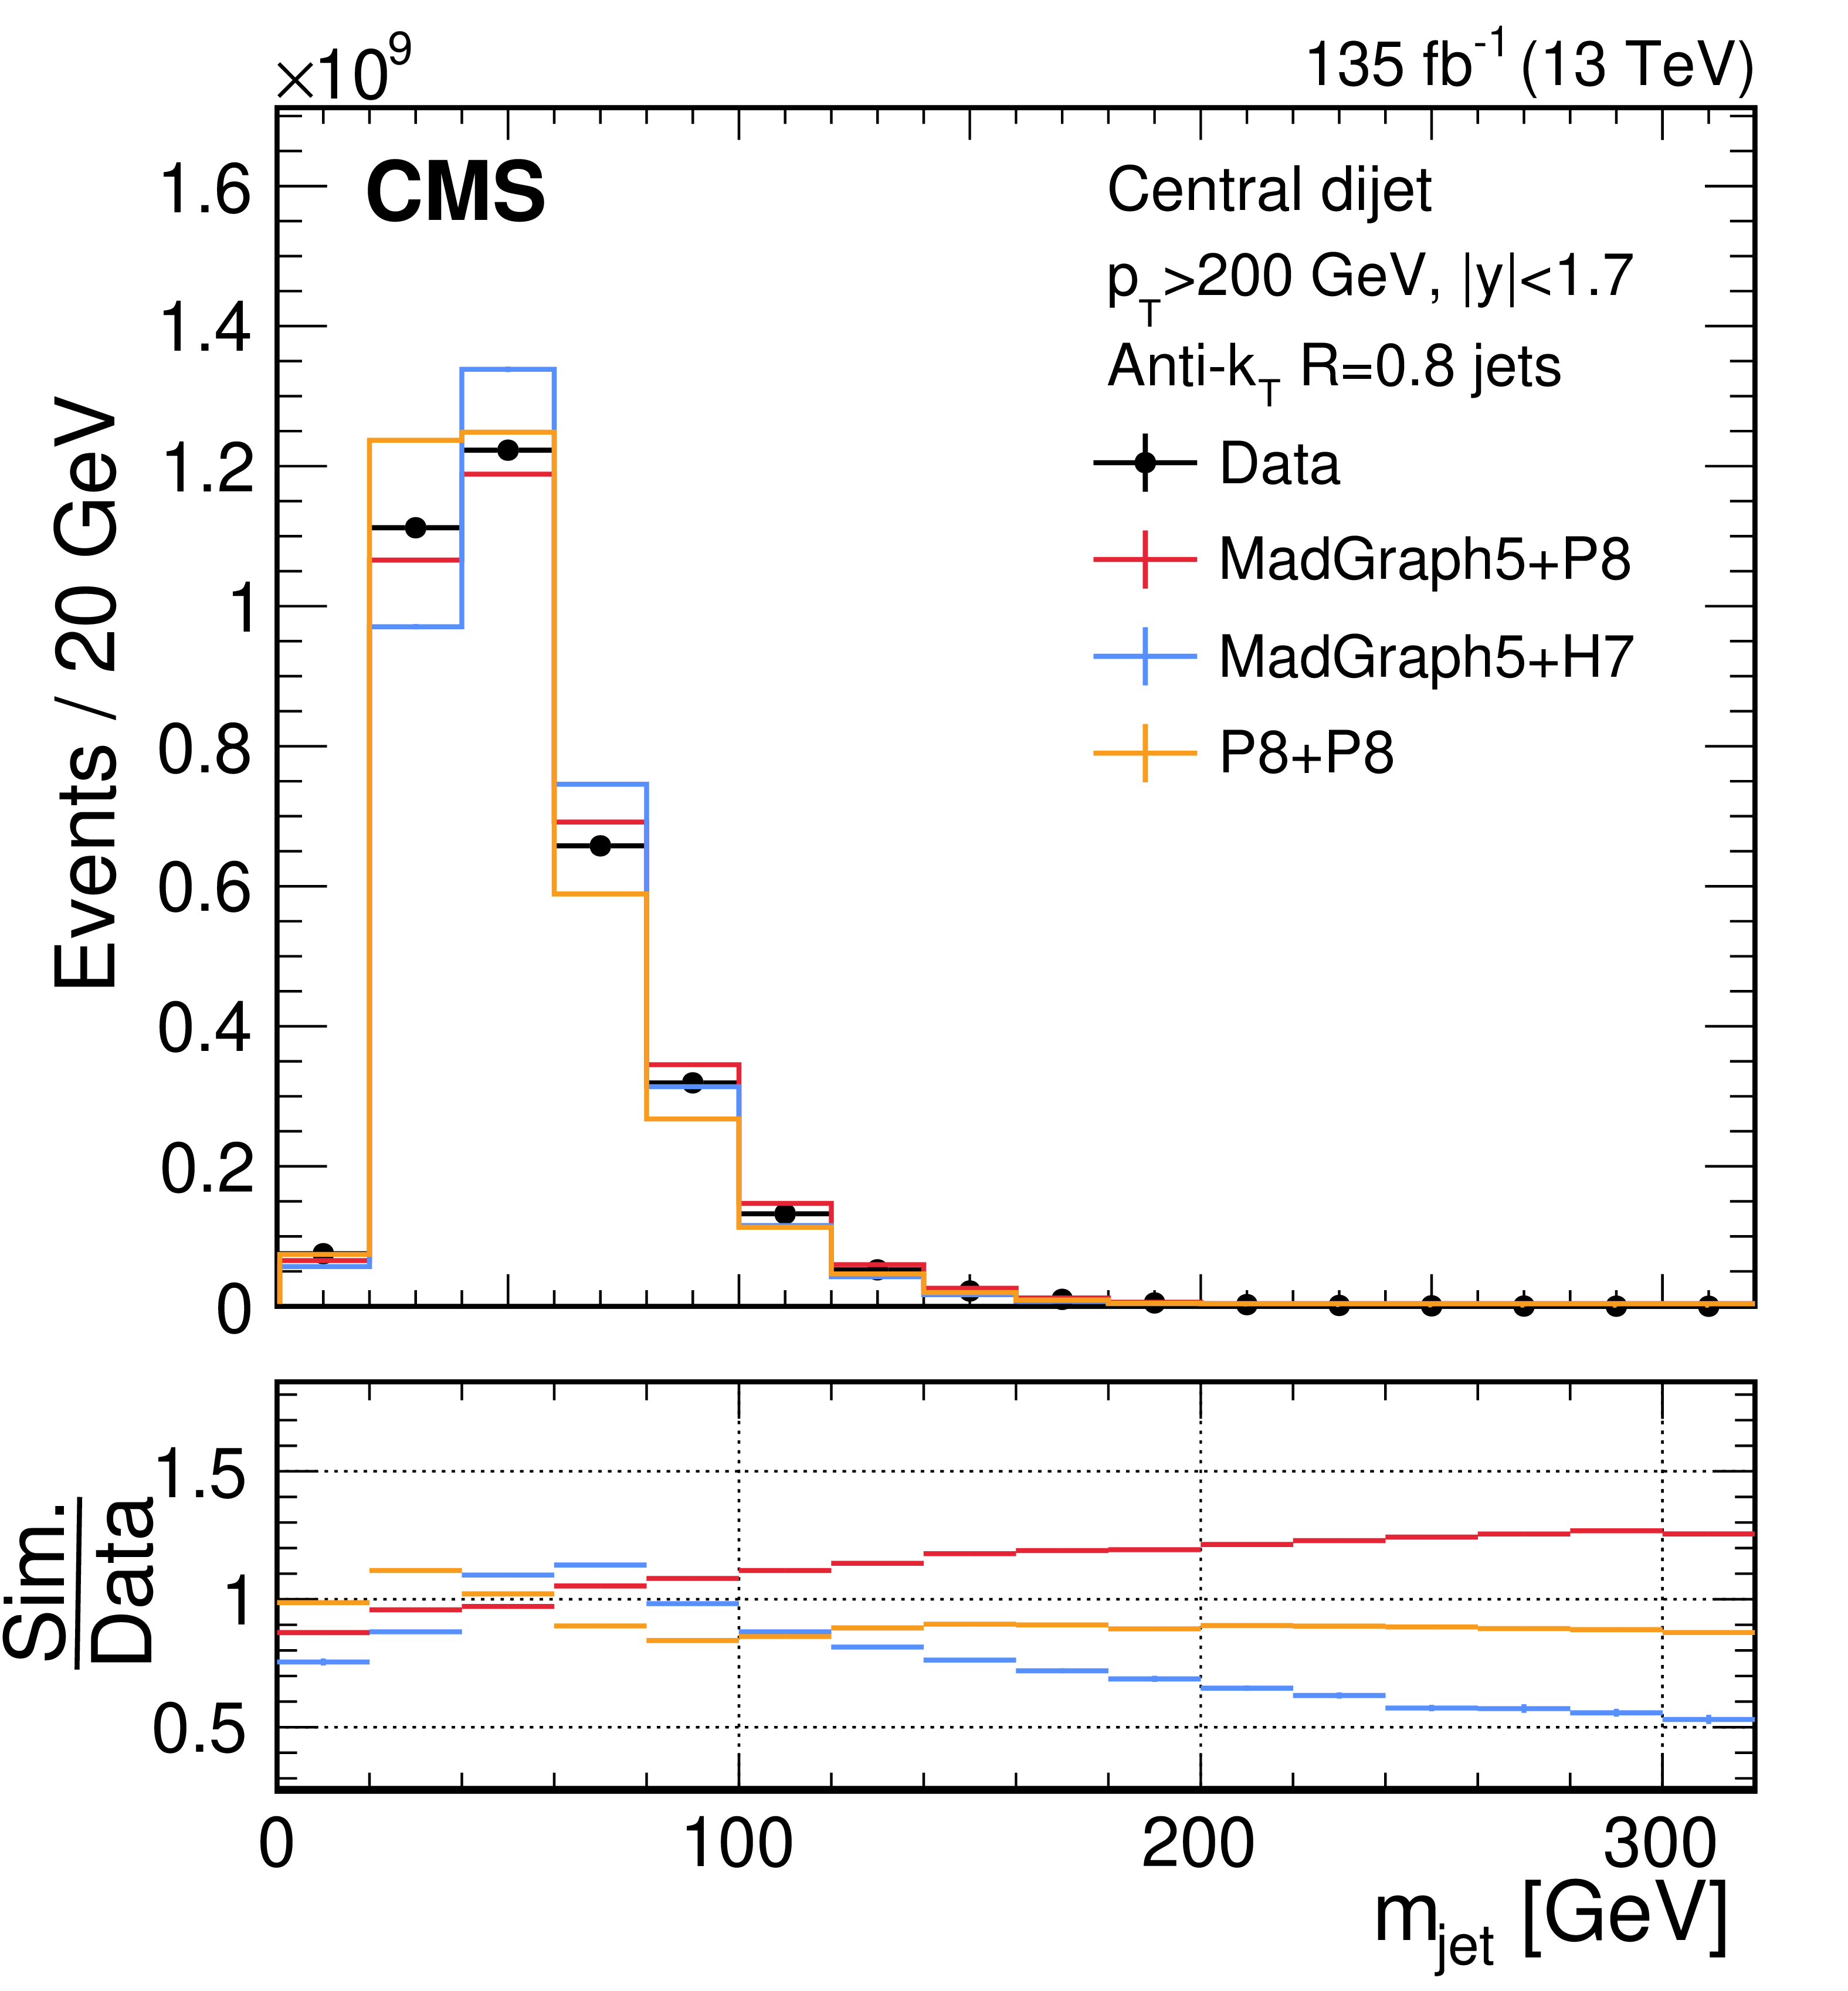
Distributions of the AK8 jet $ p_{\mathrm{T}} $ (left) and $ m_{\text{jet}} $ (right) after the dijet selection, based on the combined 2016--2018 data set. The error bars in the upper panels indicate the statistical uncertainties in the data and simulation. The lower panels of the figures show the ratio of simulation to data with statistical uncertainties following the same colour code as the upper panel. The event yields in the simulated QCD samples are normalised to the yield in data. |
png pdf |
Figure 2-a:
Distributions of the AK8 jet $ p_{\mathrm{T}} $ (left) and $ m_{\text{jet}} $ (right) after the dijet selection, based on the combined 2016--2018 data set. The error bars in the upper panels indicate the statistical uncertainties in the data and simulation. The lower panels of the figures show the ratio of simulation to data with statistical uncertainties following the same colour code as the upper panel. The event yields in the simulated QCD samples are normalised to the yield in data. |
png pdf |
Figure 2-b:
Distributions of the AK8 jet $ p_{\mathrm{T}} $ (left) and $ m_{\text{jet}} $ (right) after the dijet selection, based on the combined 2016--2018 data set. The error bars in the upper panels indicate the statistical uncertainties in the data and simulation. The lower panels of the figures show the ratio of simulation to data with statistical uncertainties following the same colour code as the upper panel. The event yields in the simulated QCD samples are normalised to the yield in data. |
png pdf |
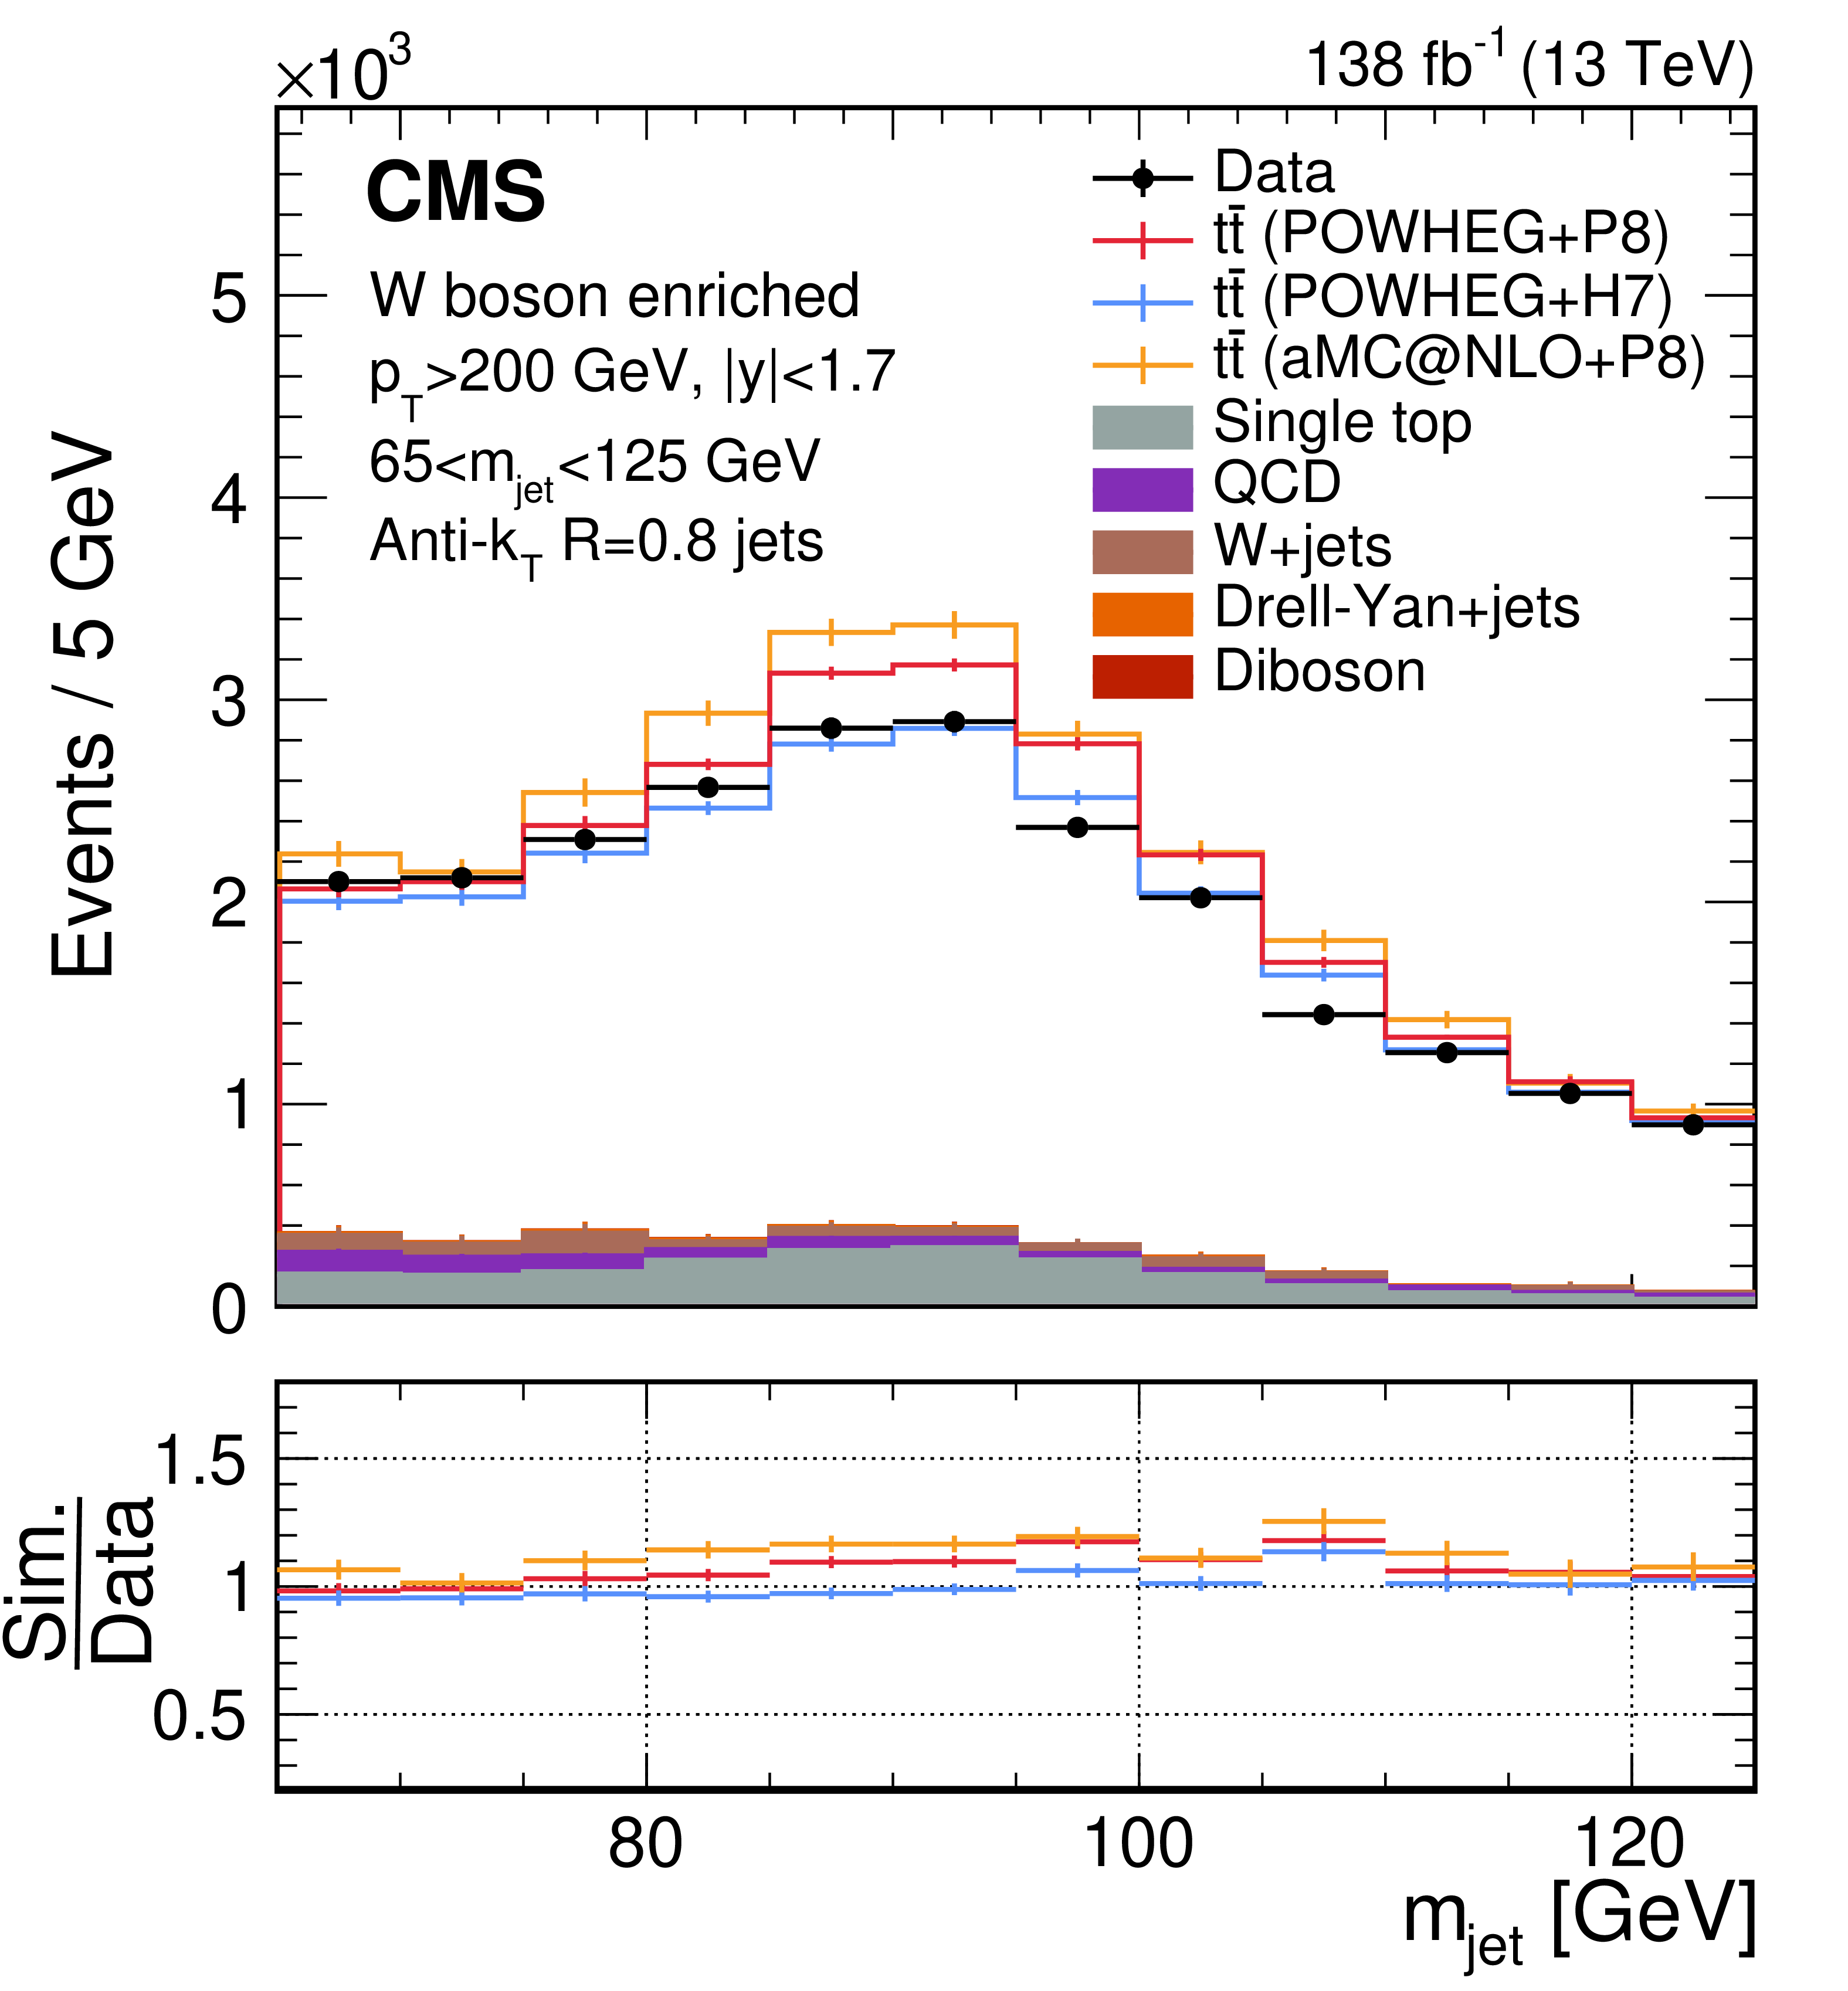
Figure 3:
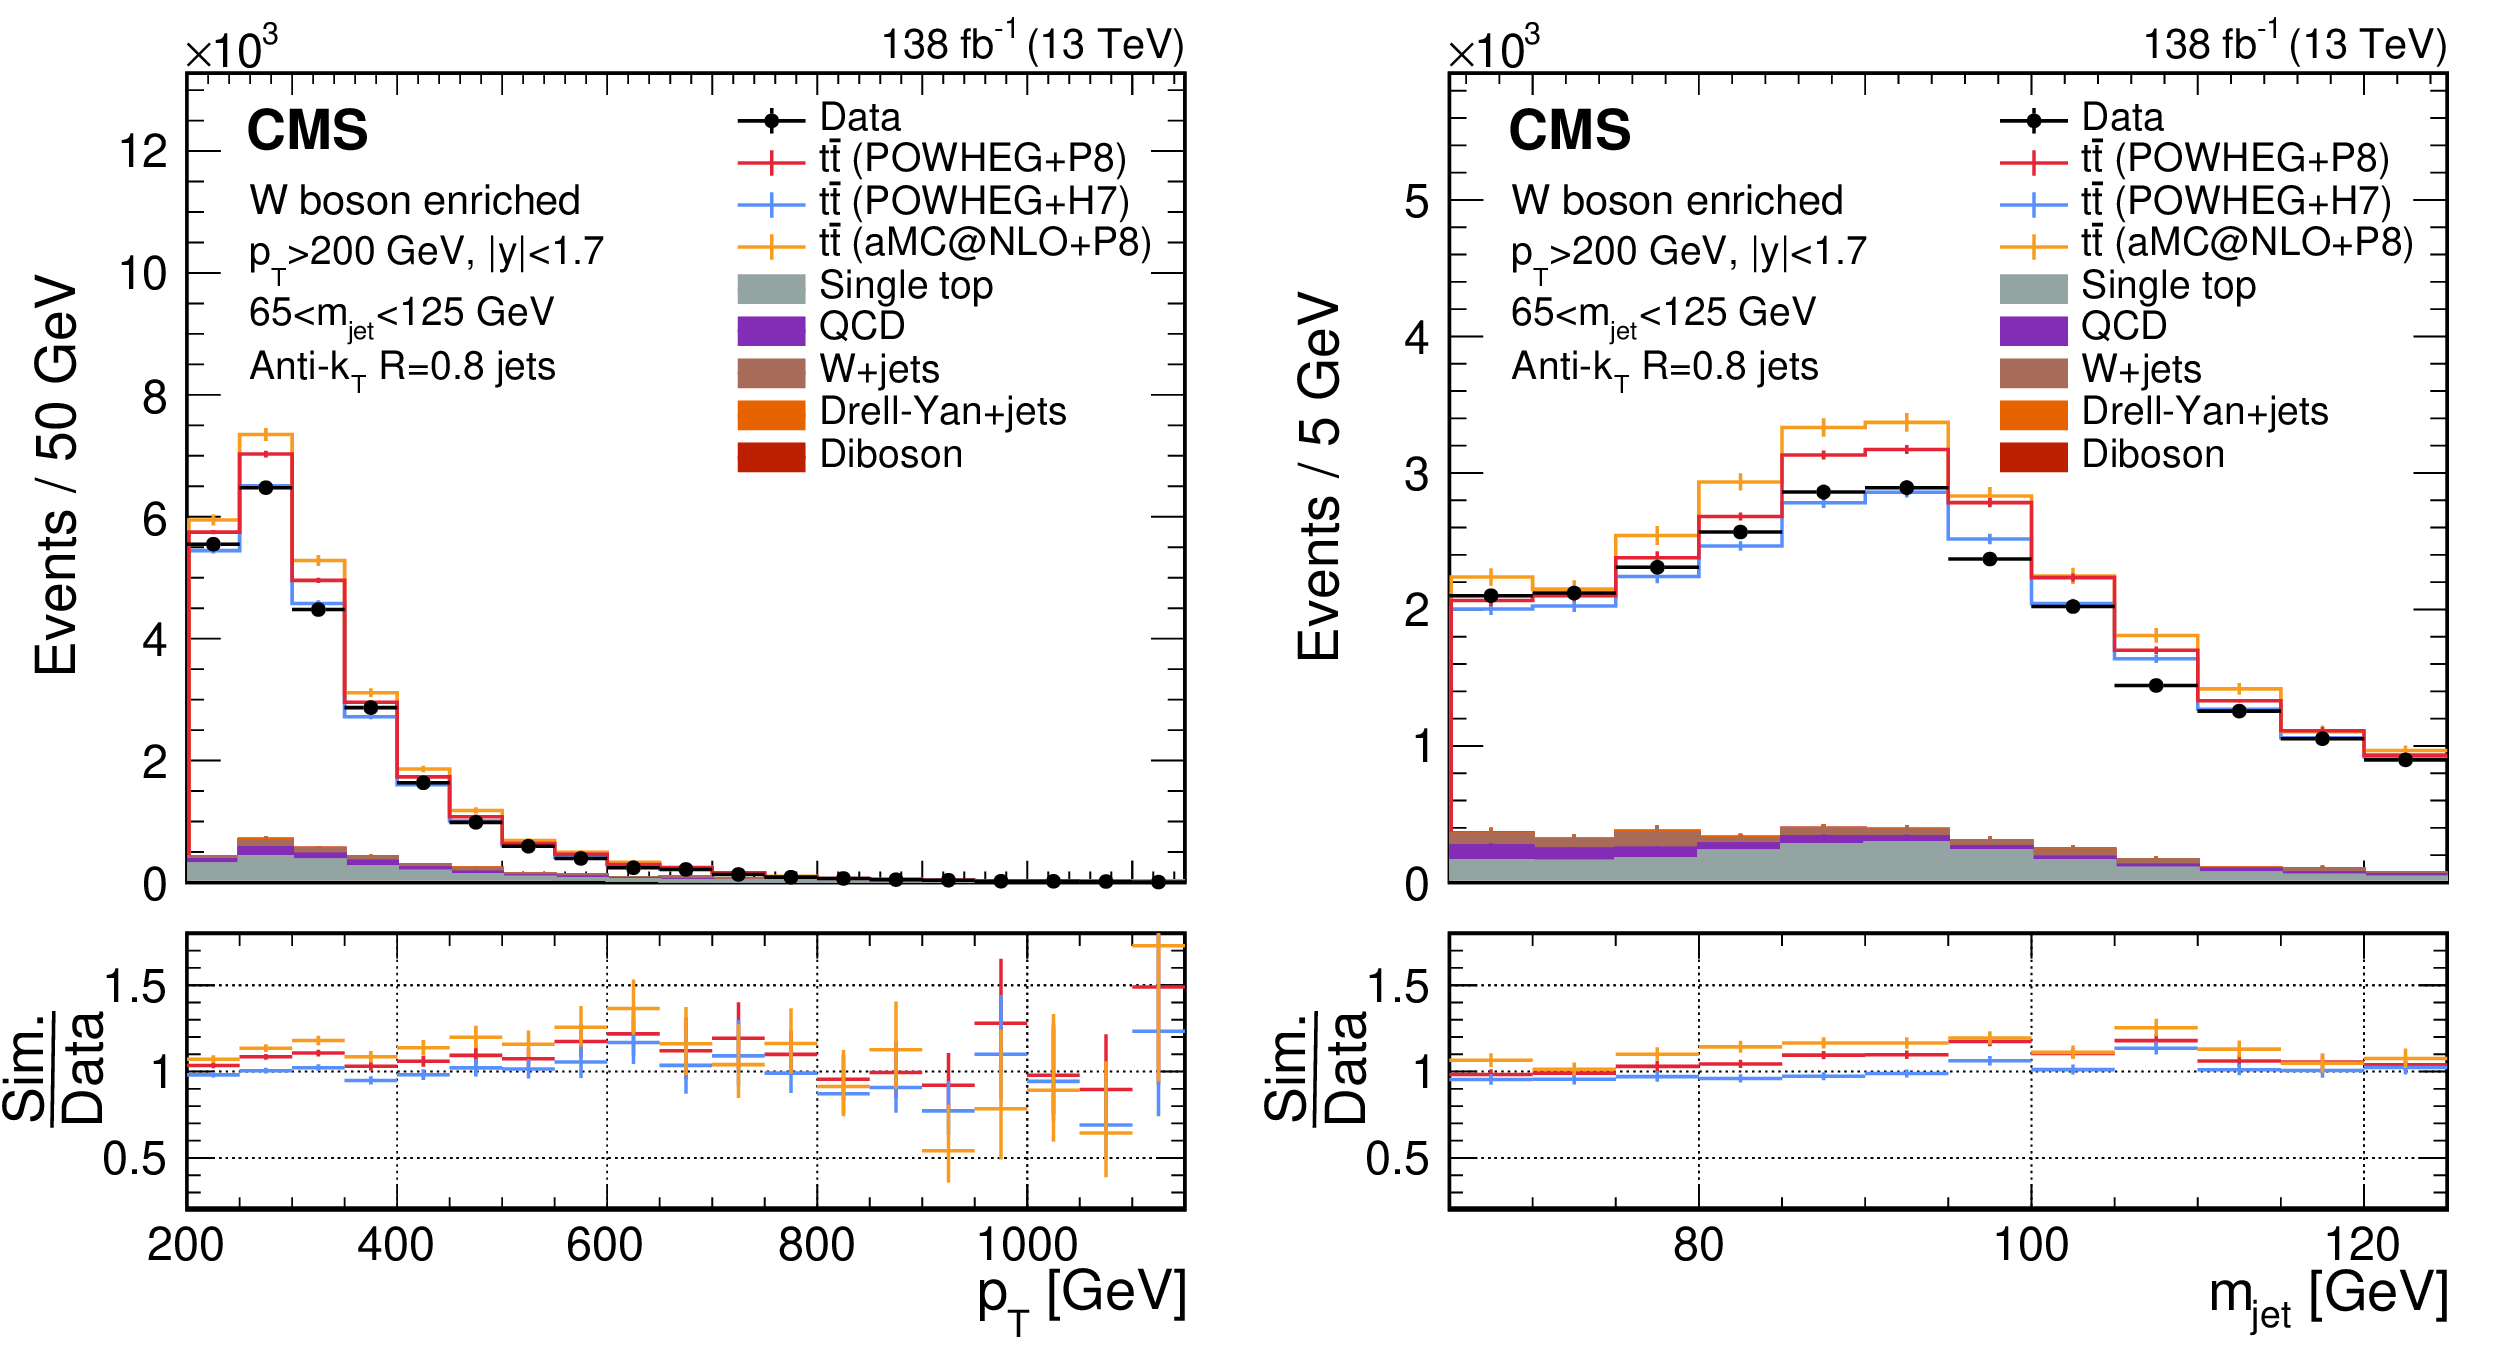
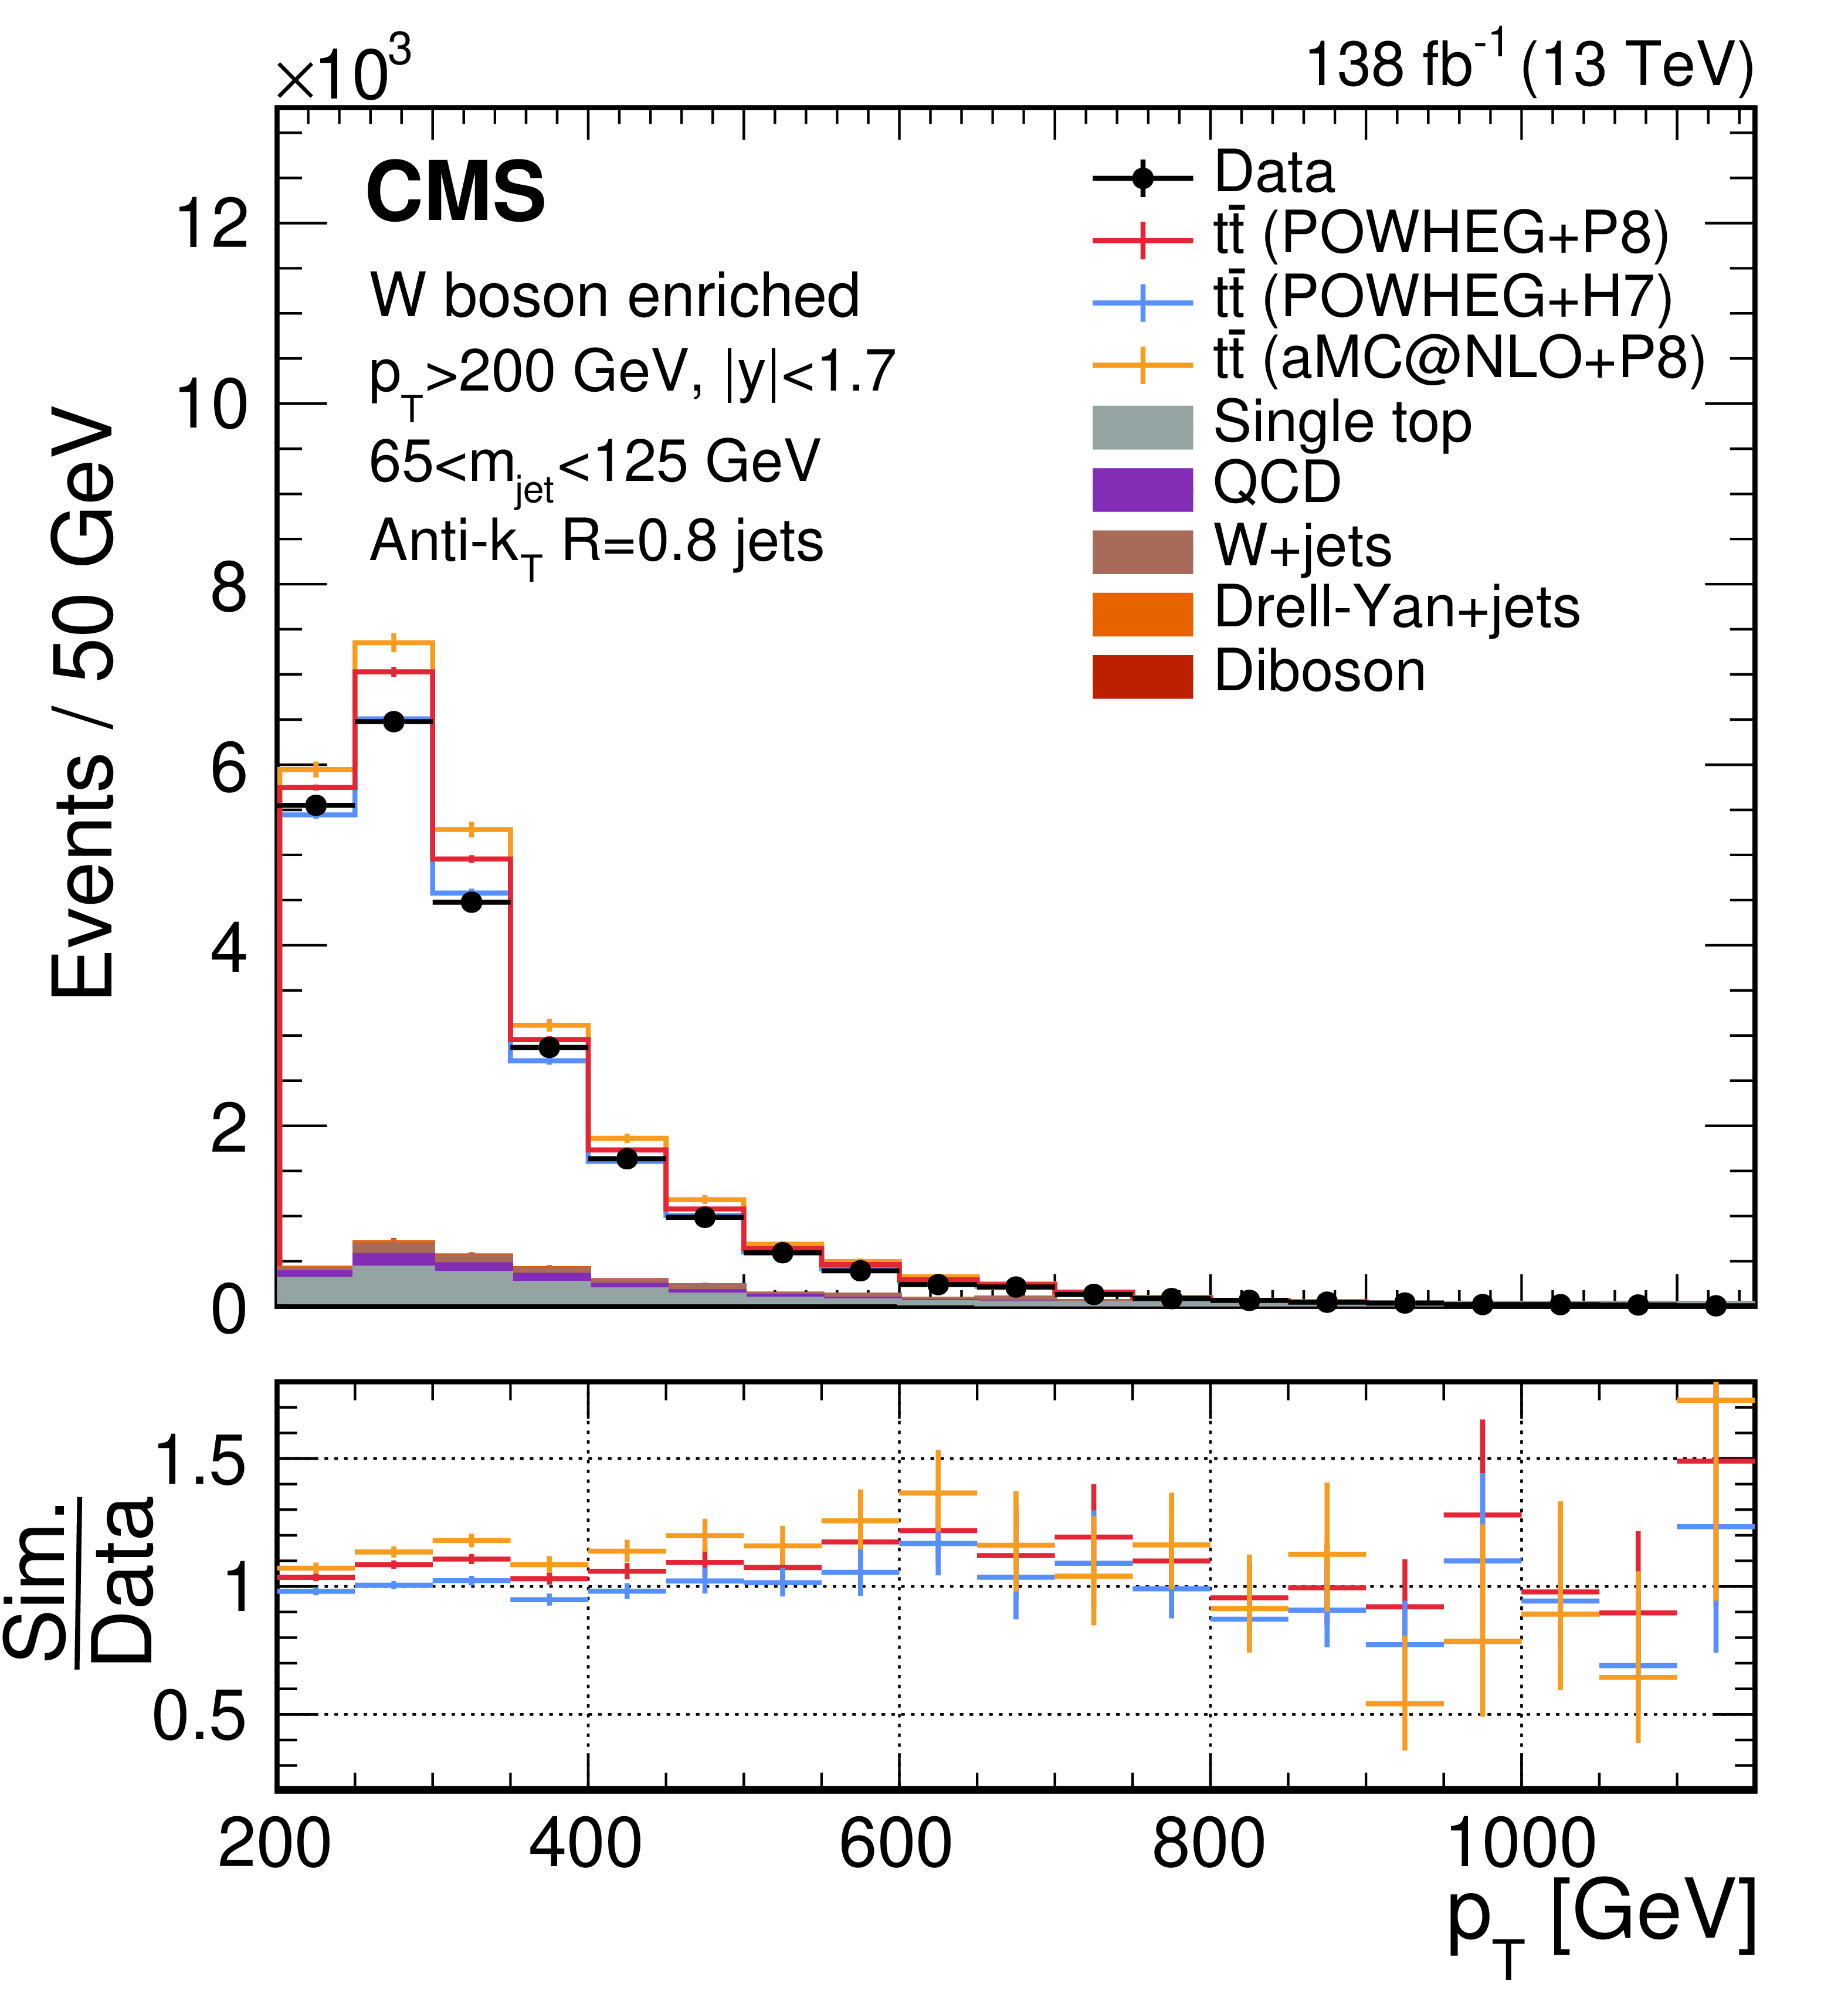
Distribution of the leading AK8 jet $ p_{\mathrm{T}} $ (left) and $ m_{\text{jet}} $ (right) after the boosted W boson selection, for the combined 2016--2018 data set. The error bars in the upper panels indicate the statistical uncertainties in the data and simulation. The lower panels of the figures show the ratio of simulation to data with statistical uncertainties following the same colour code as the upper panel. The contributions of $ \mathrm{t} \overline{\mathrm{t}} $ events in the data, estimated by subtracting contributions from simulated physics background processes, is found to be approximately 85%. |
png pdf |
Figure 3-a:
Distribution of the leading AK8 jet $ p_{\mathrm{T}} $ (left) and $ m_{\text{jet}} $ (right) after the boosted W boson selection, for the combined 2016--2018 data set. The error bars in the upper panels indicate the statistical uncertainties in the data and simulation. The lower panels of the figures show the ratio of simulation to data with statistical uncertainties following the same colour code as the upper panel. The contributions of $ \mathrm{t} \overline{\mathrm{t}} $ events in the data, estimated by subtracting contributions from simulated physics background processes, is found to be approximately 85%. |
png pdf |
Figure 3-b:
Distribution of the leading AK8 jet $ p_{\mathrm{T}} $ (left) and $ m_{\text{jet}} $ (right) after the boosted W boson selection, for the combined 2016--2018 data set. The error bars in the upper panels indicate the statistical uncertainties in the data and simulation. The lower panels of the figures show the ratio of simulation to data with statistical uncertainties following the same colour code as the upper panel. The contributions of $ \mathrm{t} \overline{\mathrm{t}} $ events in the data, estimated by subtracting contributions from simulated physics background processes, is found to be approximately 85%. |
png pdf |
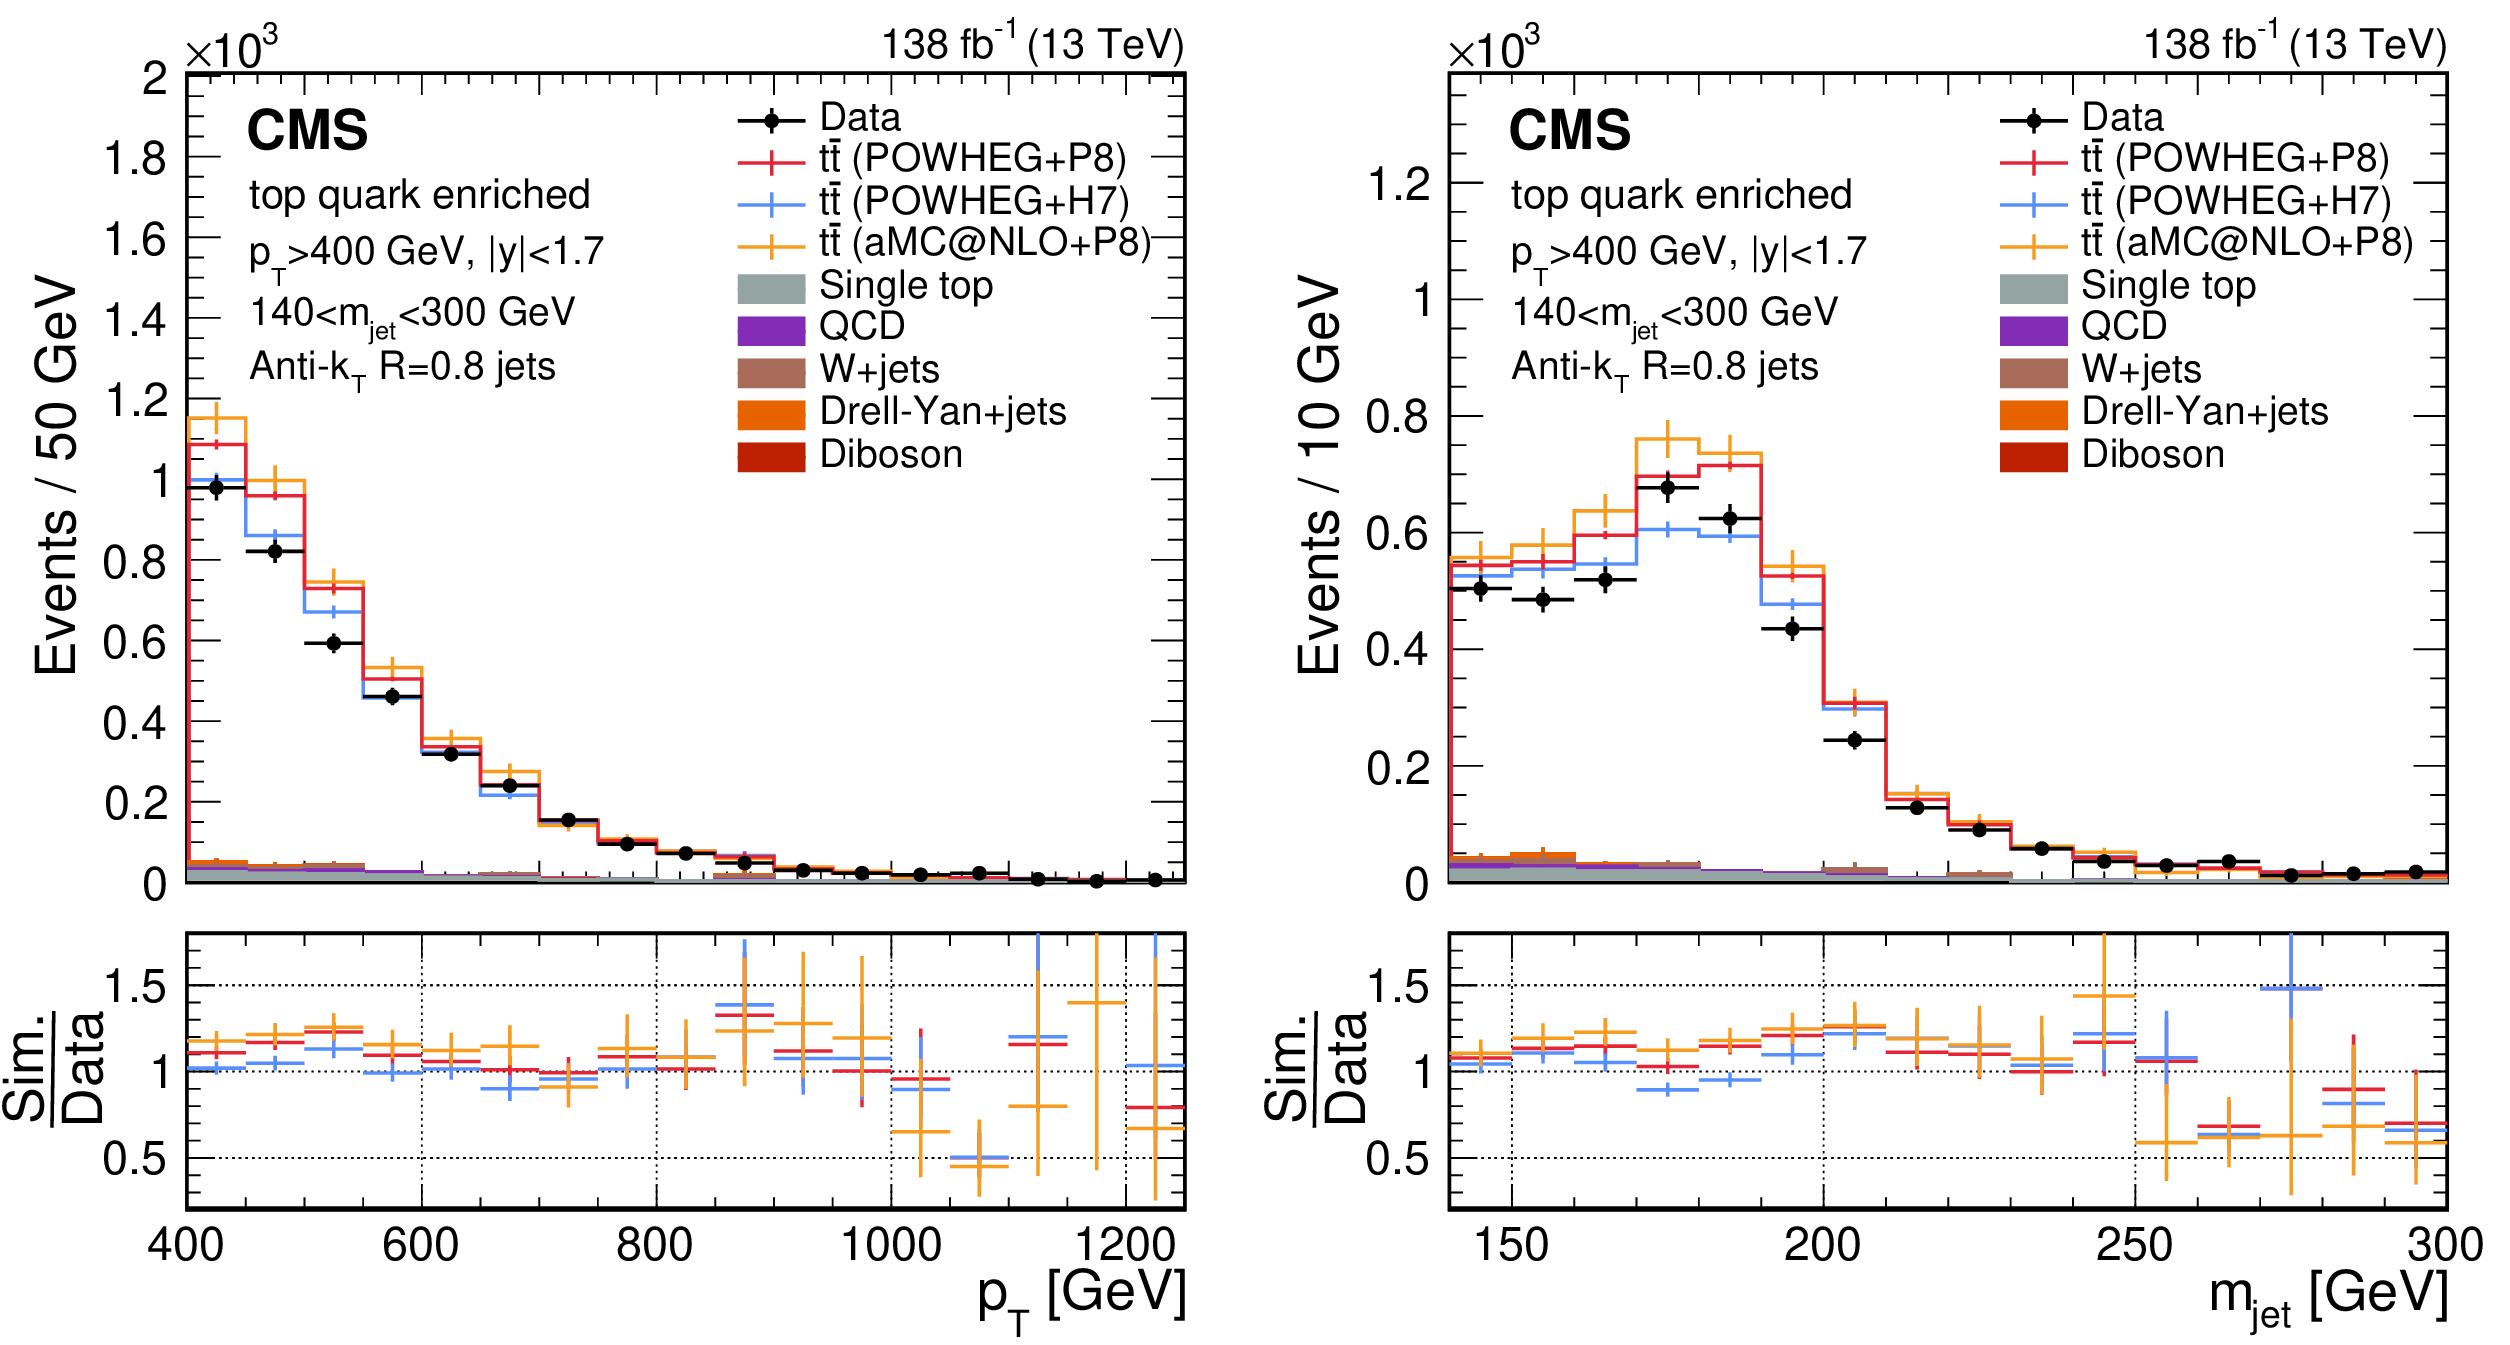
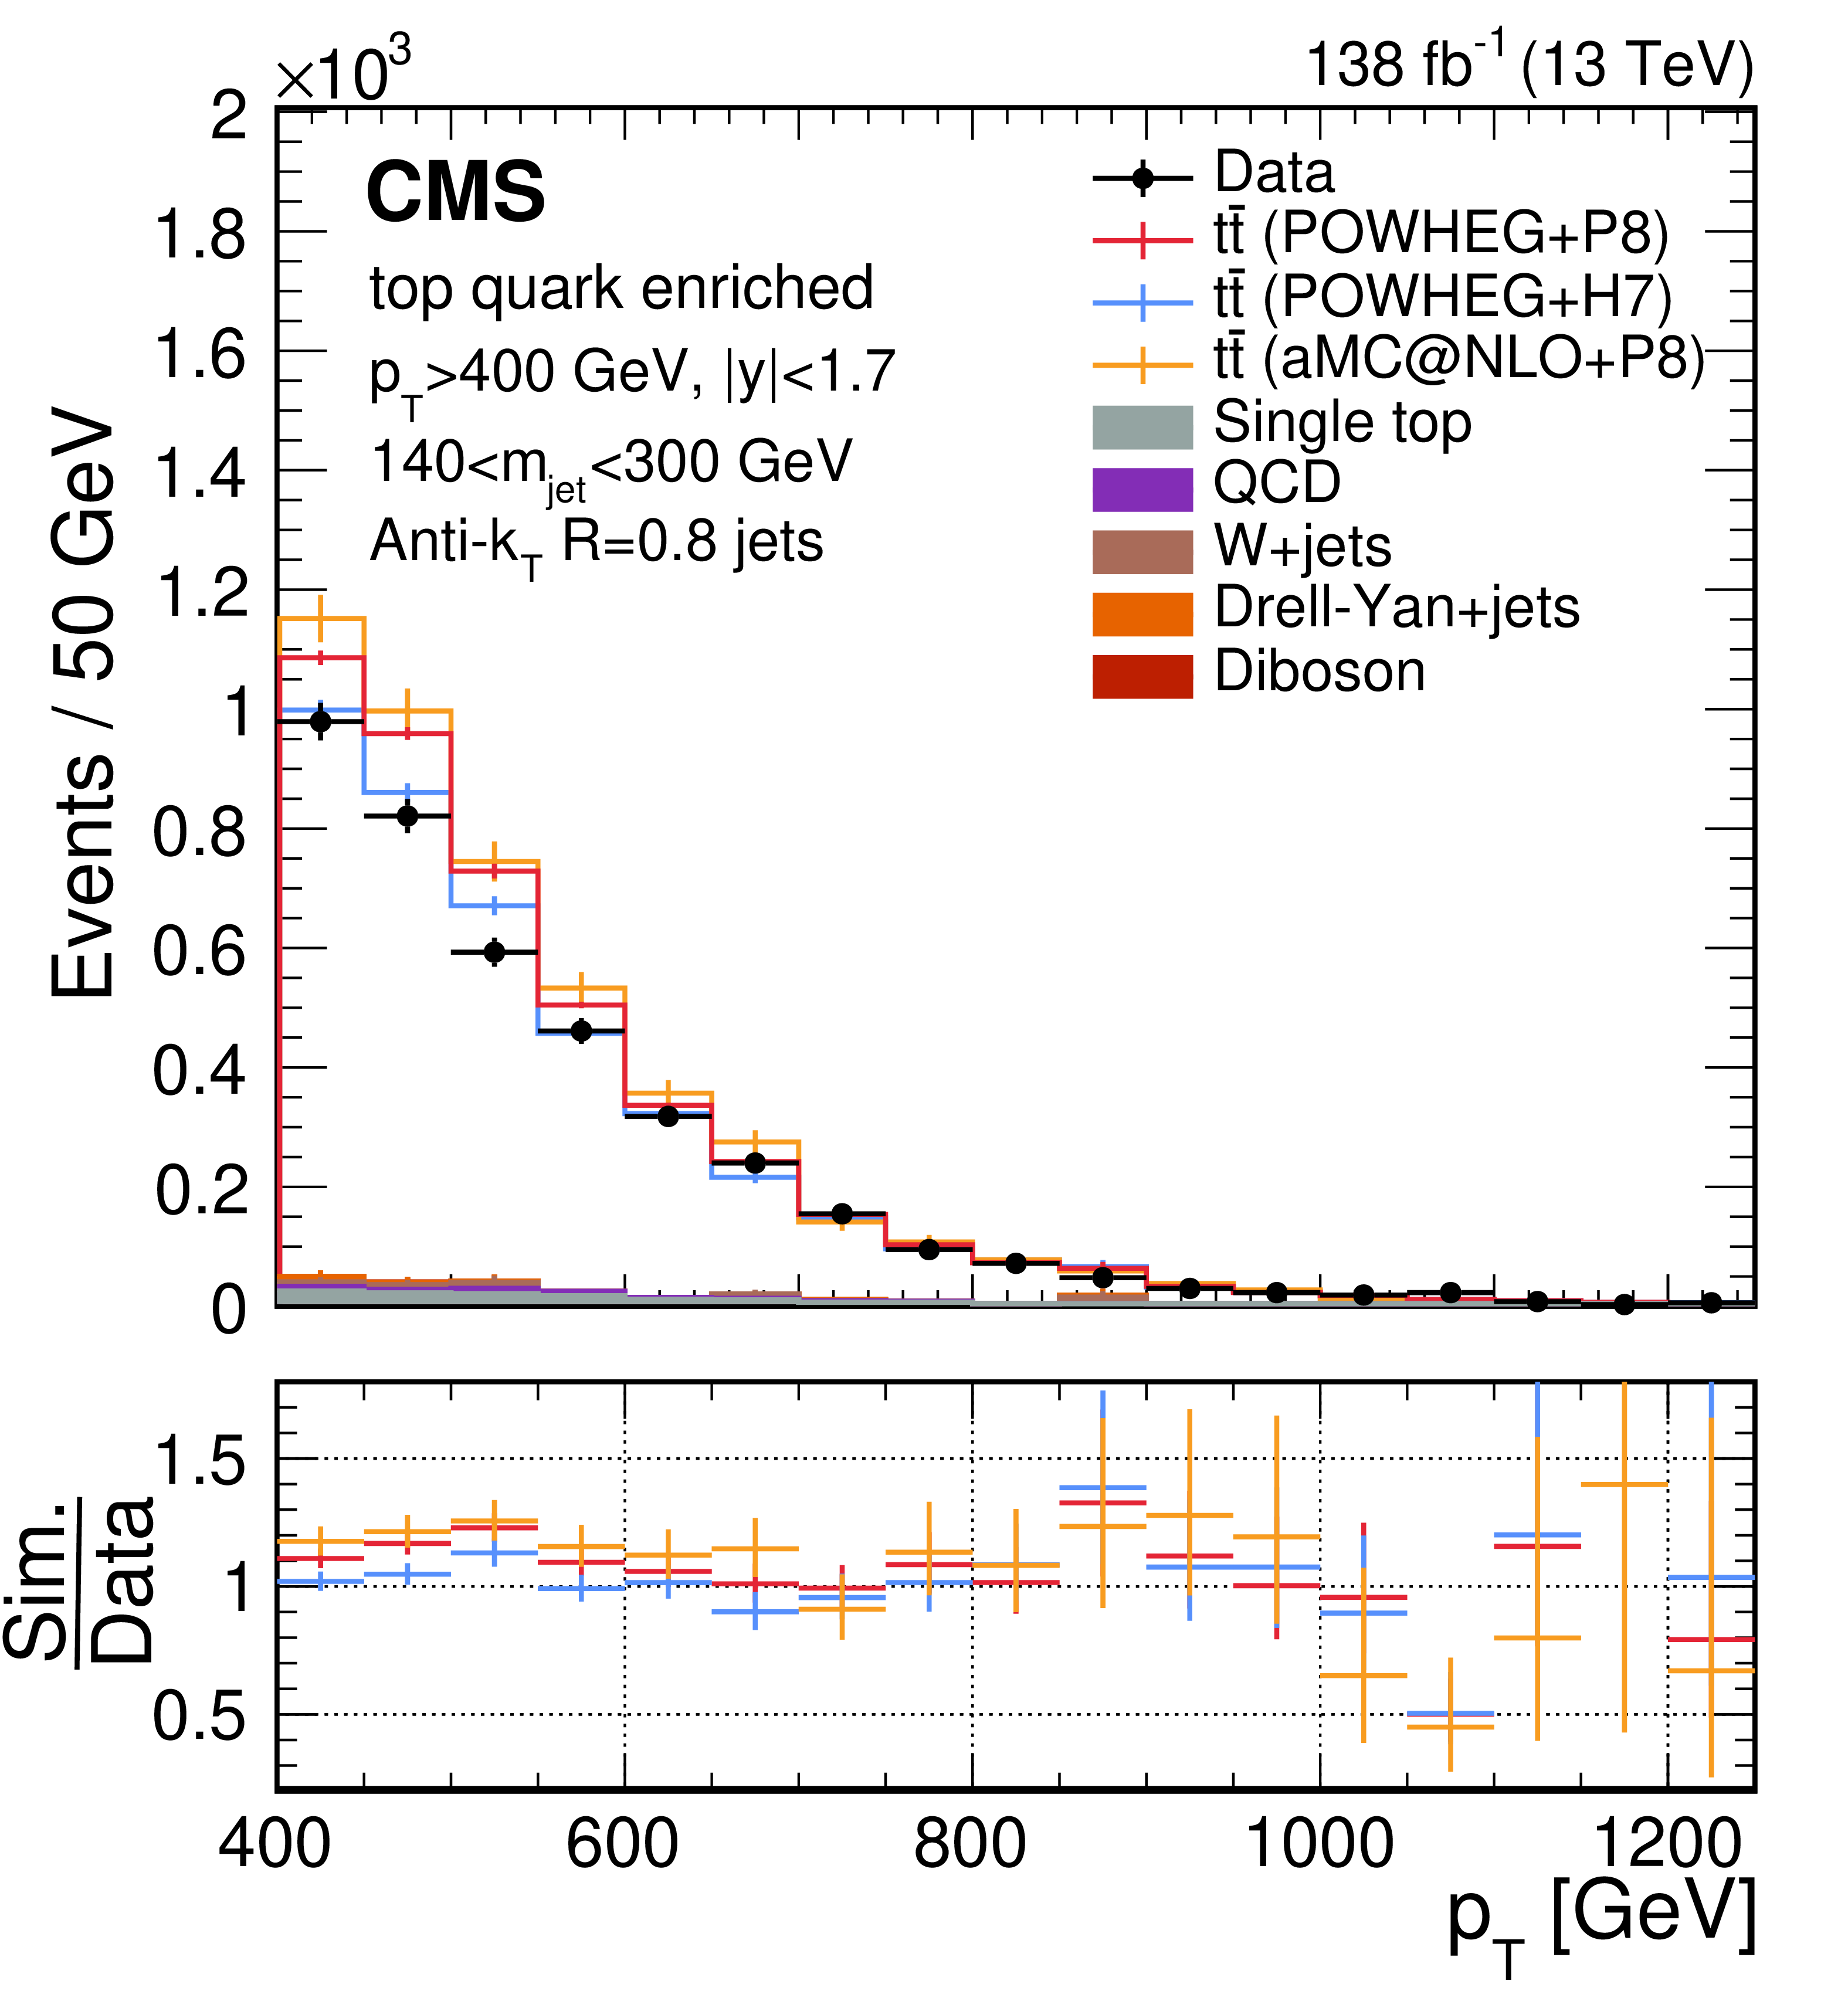
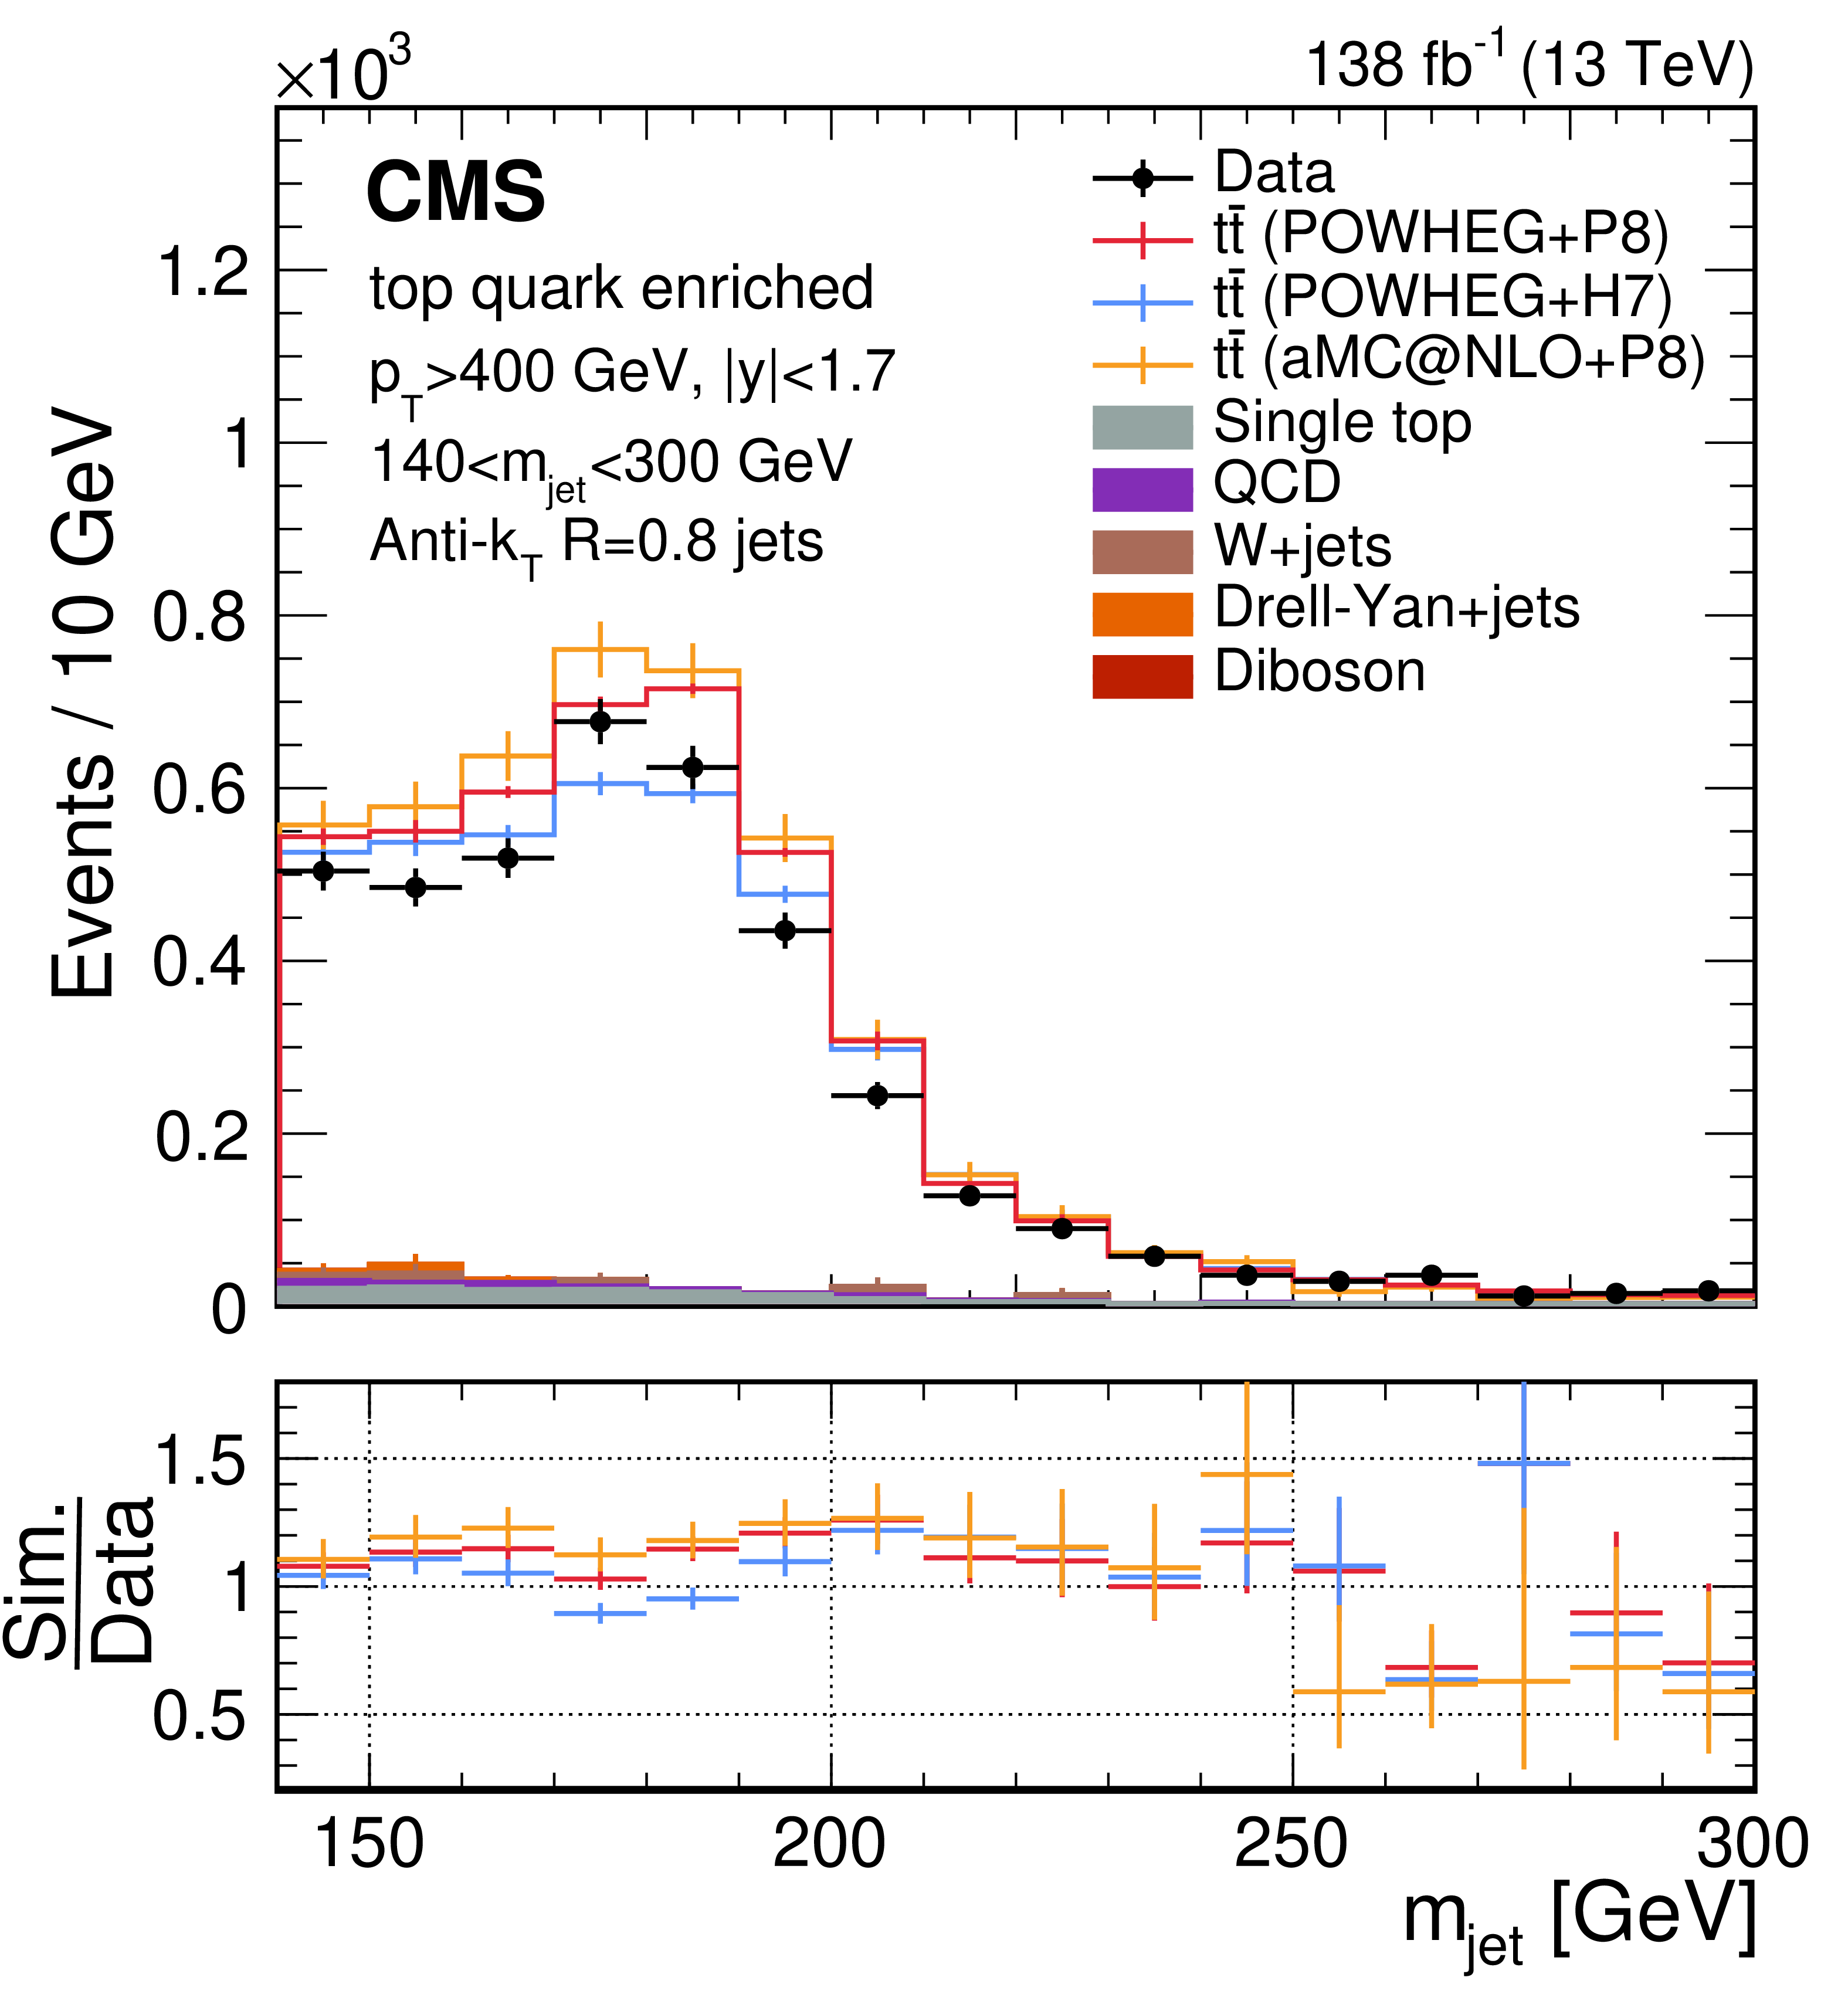
Figure 4:
Distribution of the leading AK8 jet $ p_{\mathrm{T}} $ (left) and $ m_{\text{jet}} $ (right) after the boosted top quark selection for the combined 2016--2018 data set. The error bars in the upper panels indicate the statistical uncertainties in the data and simulation. The lower panels of the figures show the ratio of simulation to data with statistical uncertainties following the same colour code as the upper panel. The contributions of $ \mathrm{t} \overline{\mathrm{t}} $ events in the data, estimated by subtracting contributions from simulated physics background processes, is found to be approximately 94%. |
png pdf |
Figure 4-a:
Distribution of the leading AK8 jet $ p_{\mathrm{T}} $ (left) and $ m_{\text{jet}} $ (right) after the boosted top quark selection for the combined 2016--2018 data set. The error bars in the upper panels indicate the statistical uncertainties in the data and simulation. The lower panels of the figures show the ratio of simulation to data with statistical uncertainties following the same colour code as the upper panel. The contributions of $ \mathrm{t} \overline{\mathrm{t}} $ events in the data, estimated by subtracting contributions from simulated physics background processes, is found to be approximately 94%. |
png pdf |
Figure 4-b:
Distribution of the leading AK8 jet $ p_{\mathrm{T}} $ (left) and $ m_{\text{jet}} $ (right) after the boosted top quark selection for the combined 2016--2018 data set. The error bars in the upper panels indicate the statistical uncertainties in the data and simulation. The lower panels of the figures show the ratio of simulation to data with statistical uncertainties following the same colour code as the upper panel. The contributions of $ \mathrm{t} \overline{\mathrm{t}} $ events in the data, estimated by subtracting contributions from simulated physics background processes, is found to be approximately 94%. |
png pdf |
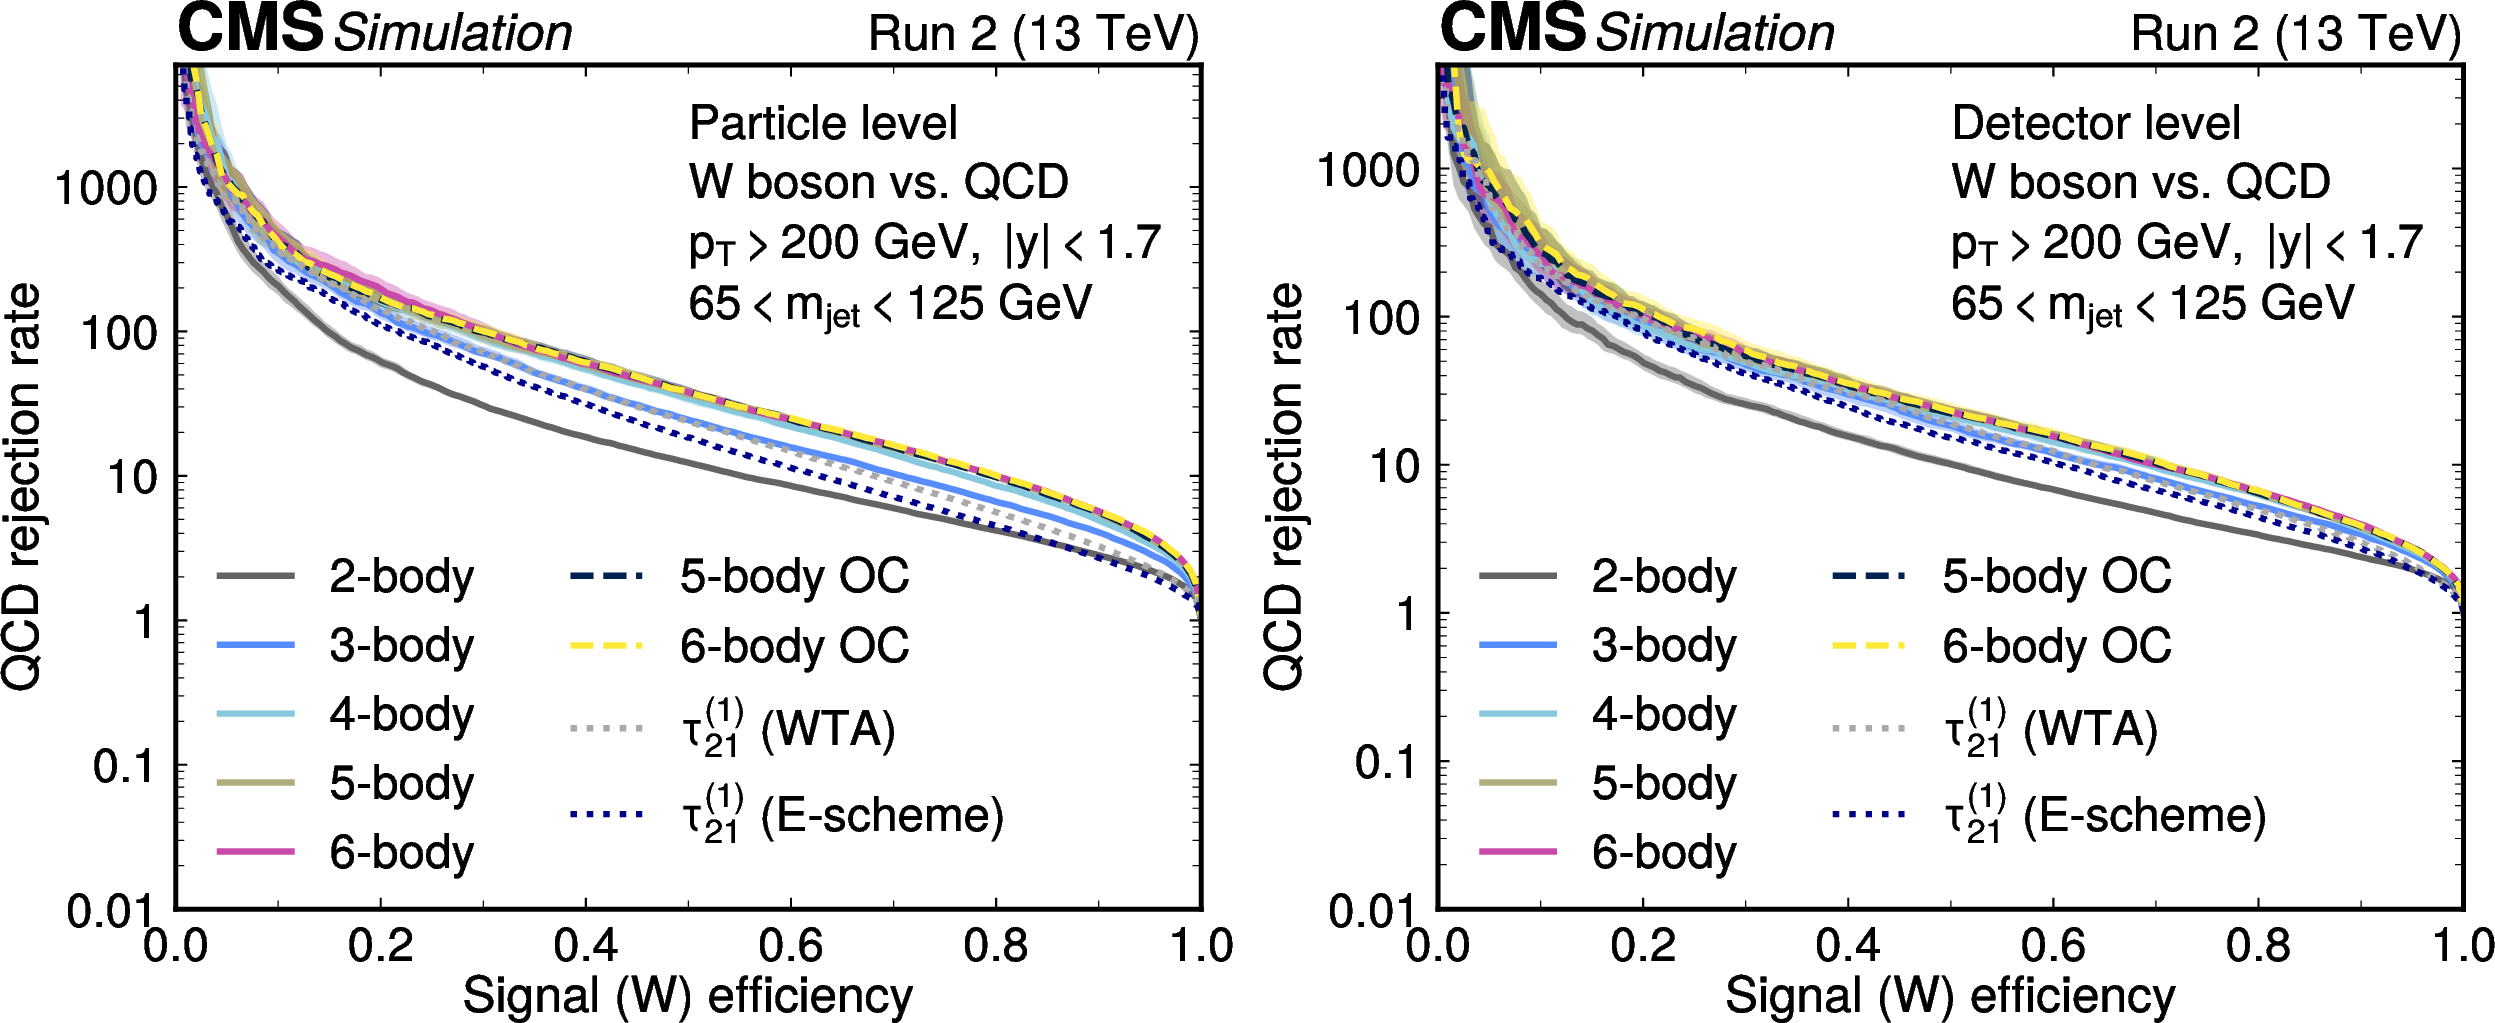
Figure 5:
Background rejection rate as a function of signal efficiency for boosted W boson discrimination using deep neural networks trained on minimal and complete $ M $-body bases (solid lines), overcomplete 5-/6-body bases (dashed lines), and $ \tau_{2,1}^{(1)} $ (dotted lines) calculated with winner-take-all (WTA) and E-scheme recombination schemes. Shaded bands around each curve show the pointwise 95% confidence interval on the ROC curves, obtained by a nonparametric bootstrap. |
png pdf |
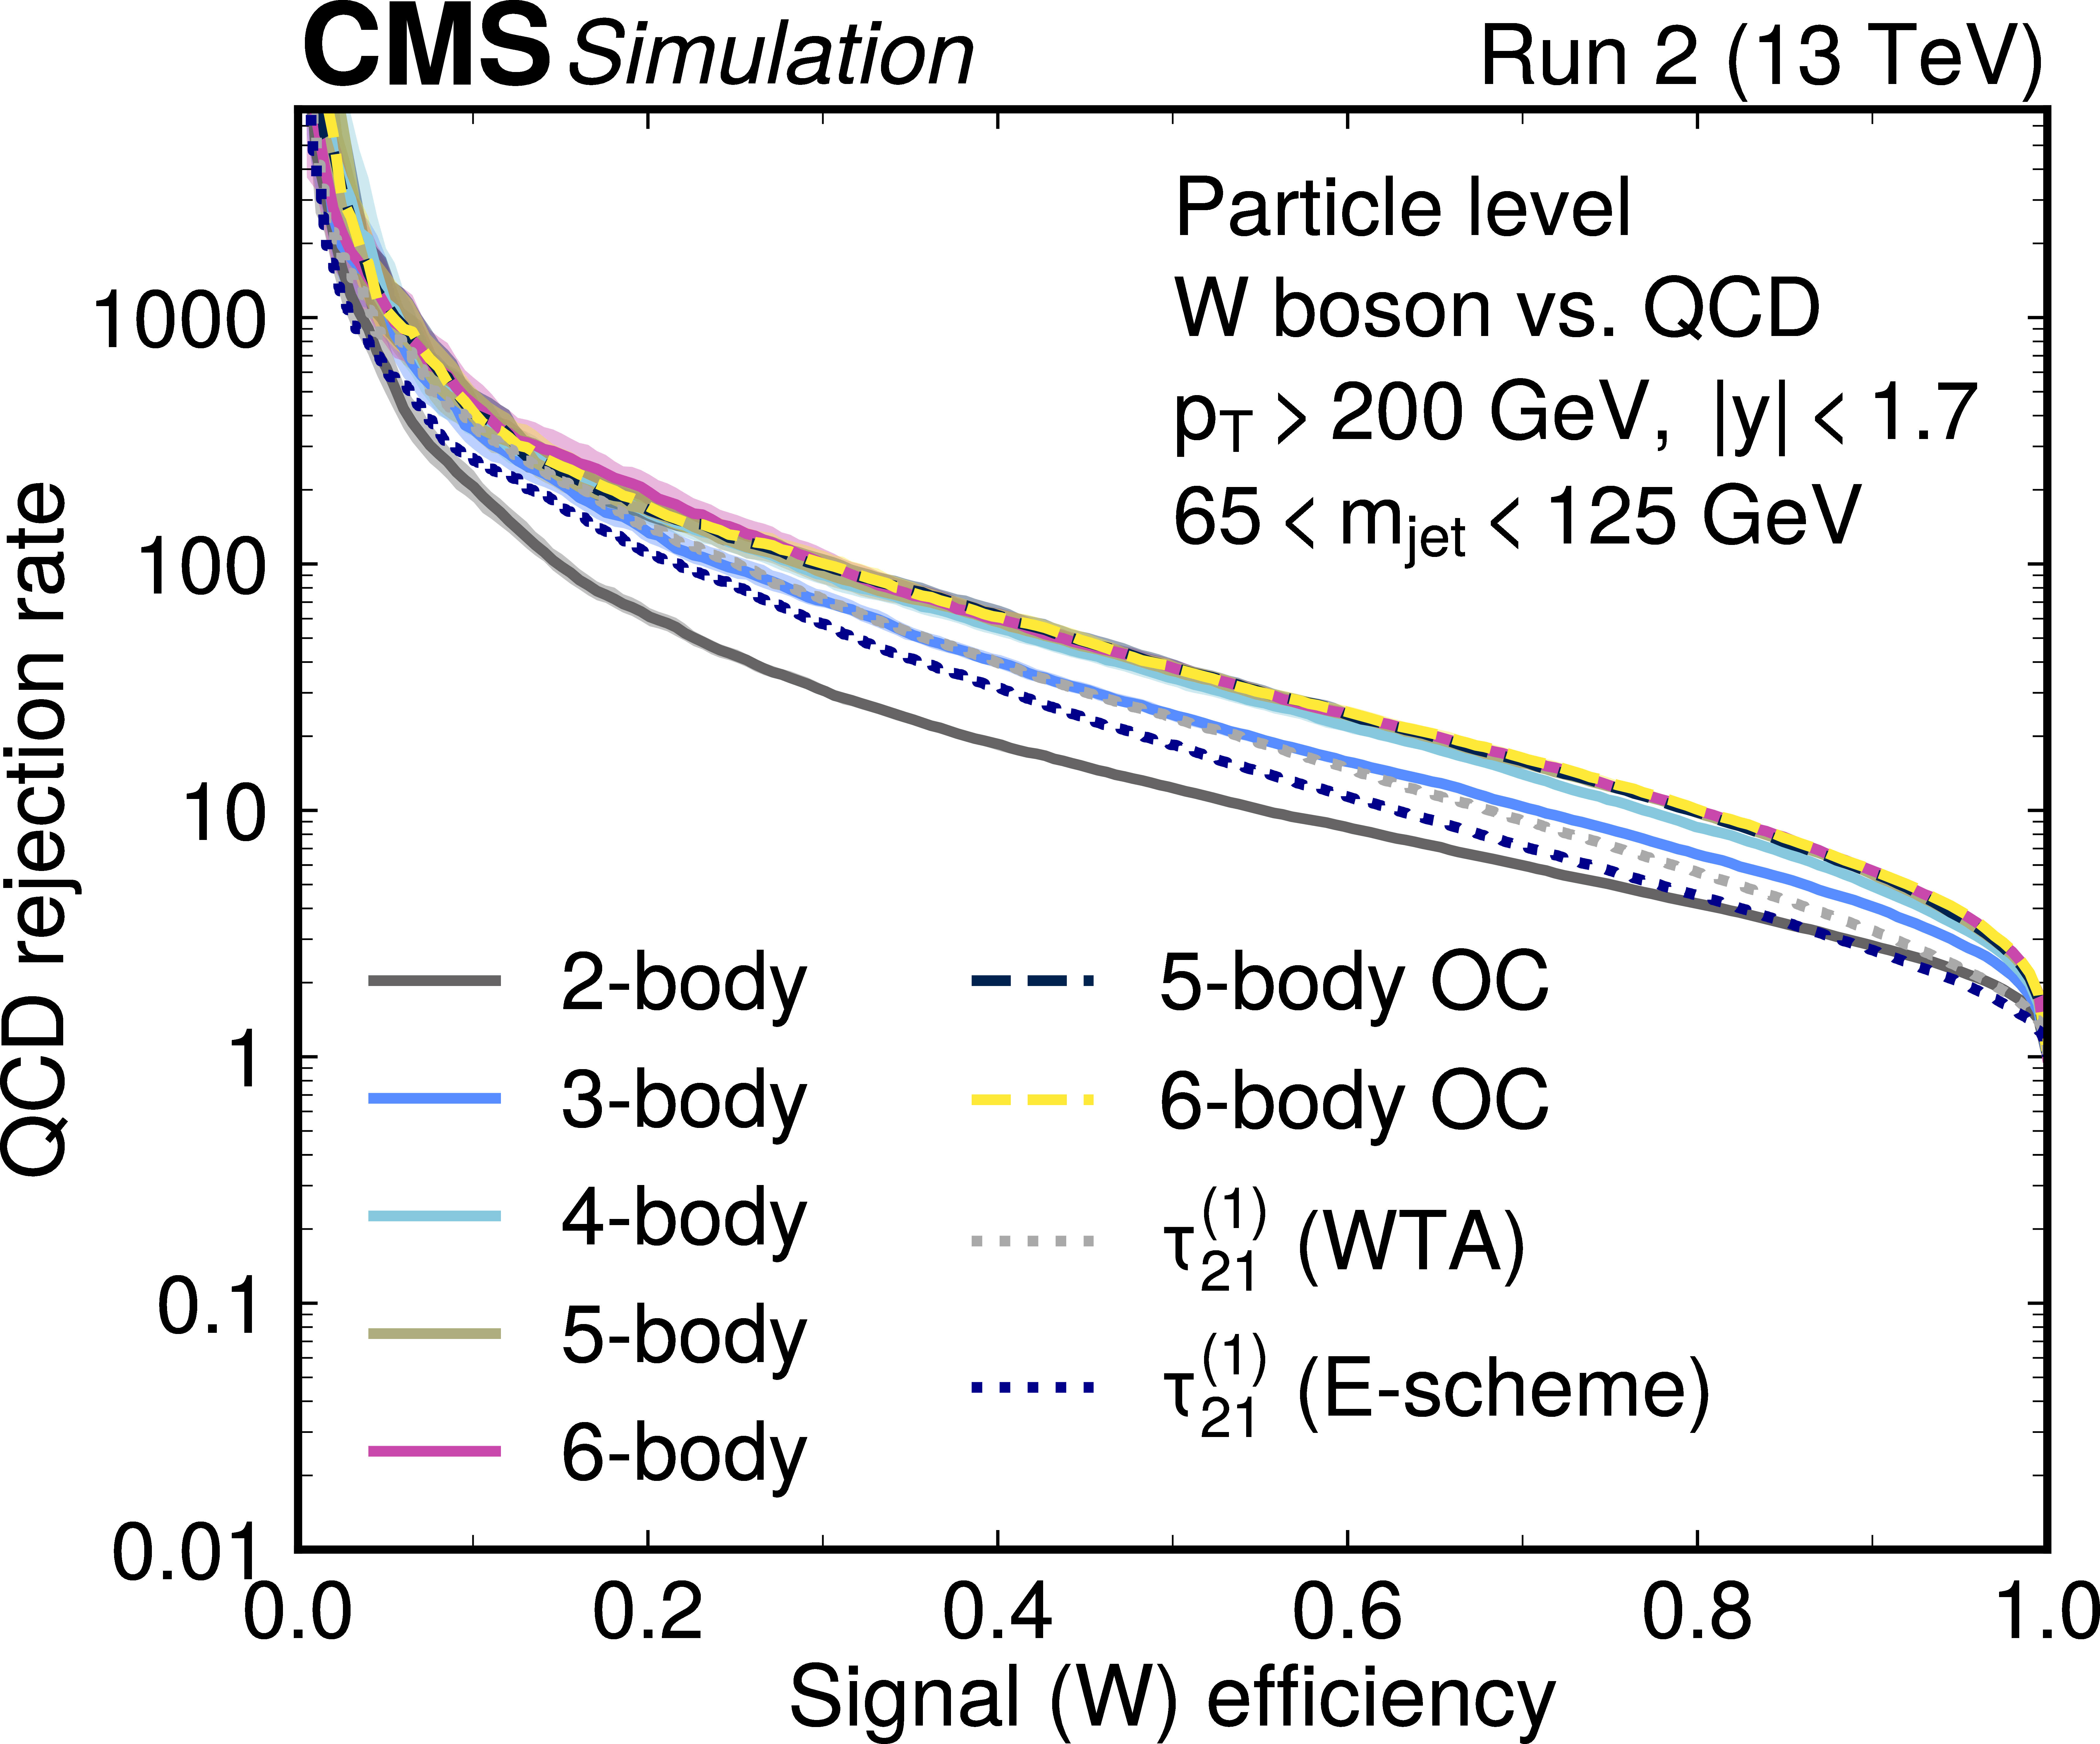
Figure 5-a:
Background rejection rate as a function of signal efficiency for boosted W boson discrimination using deep neural networks trained on minimal and complete $ M $-body bases (solid lines), overcomplete 5-/6-body bases (dashed lines), and $ \tau_{2,1}^{(1)} $ (dotted lines) calculated with winner-take-all (WTA) and E-scheme recombination schemes. Shaded bands around each curve show the pointwise 95% confidence interval on the ROC curves, obtained by a nonparametric bootstrap. |
png pdf |
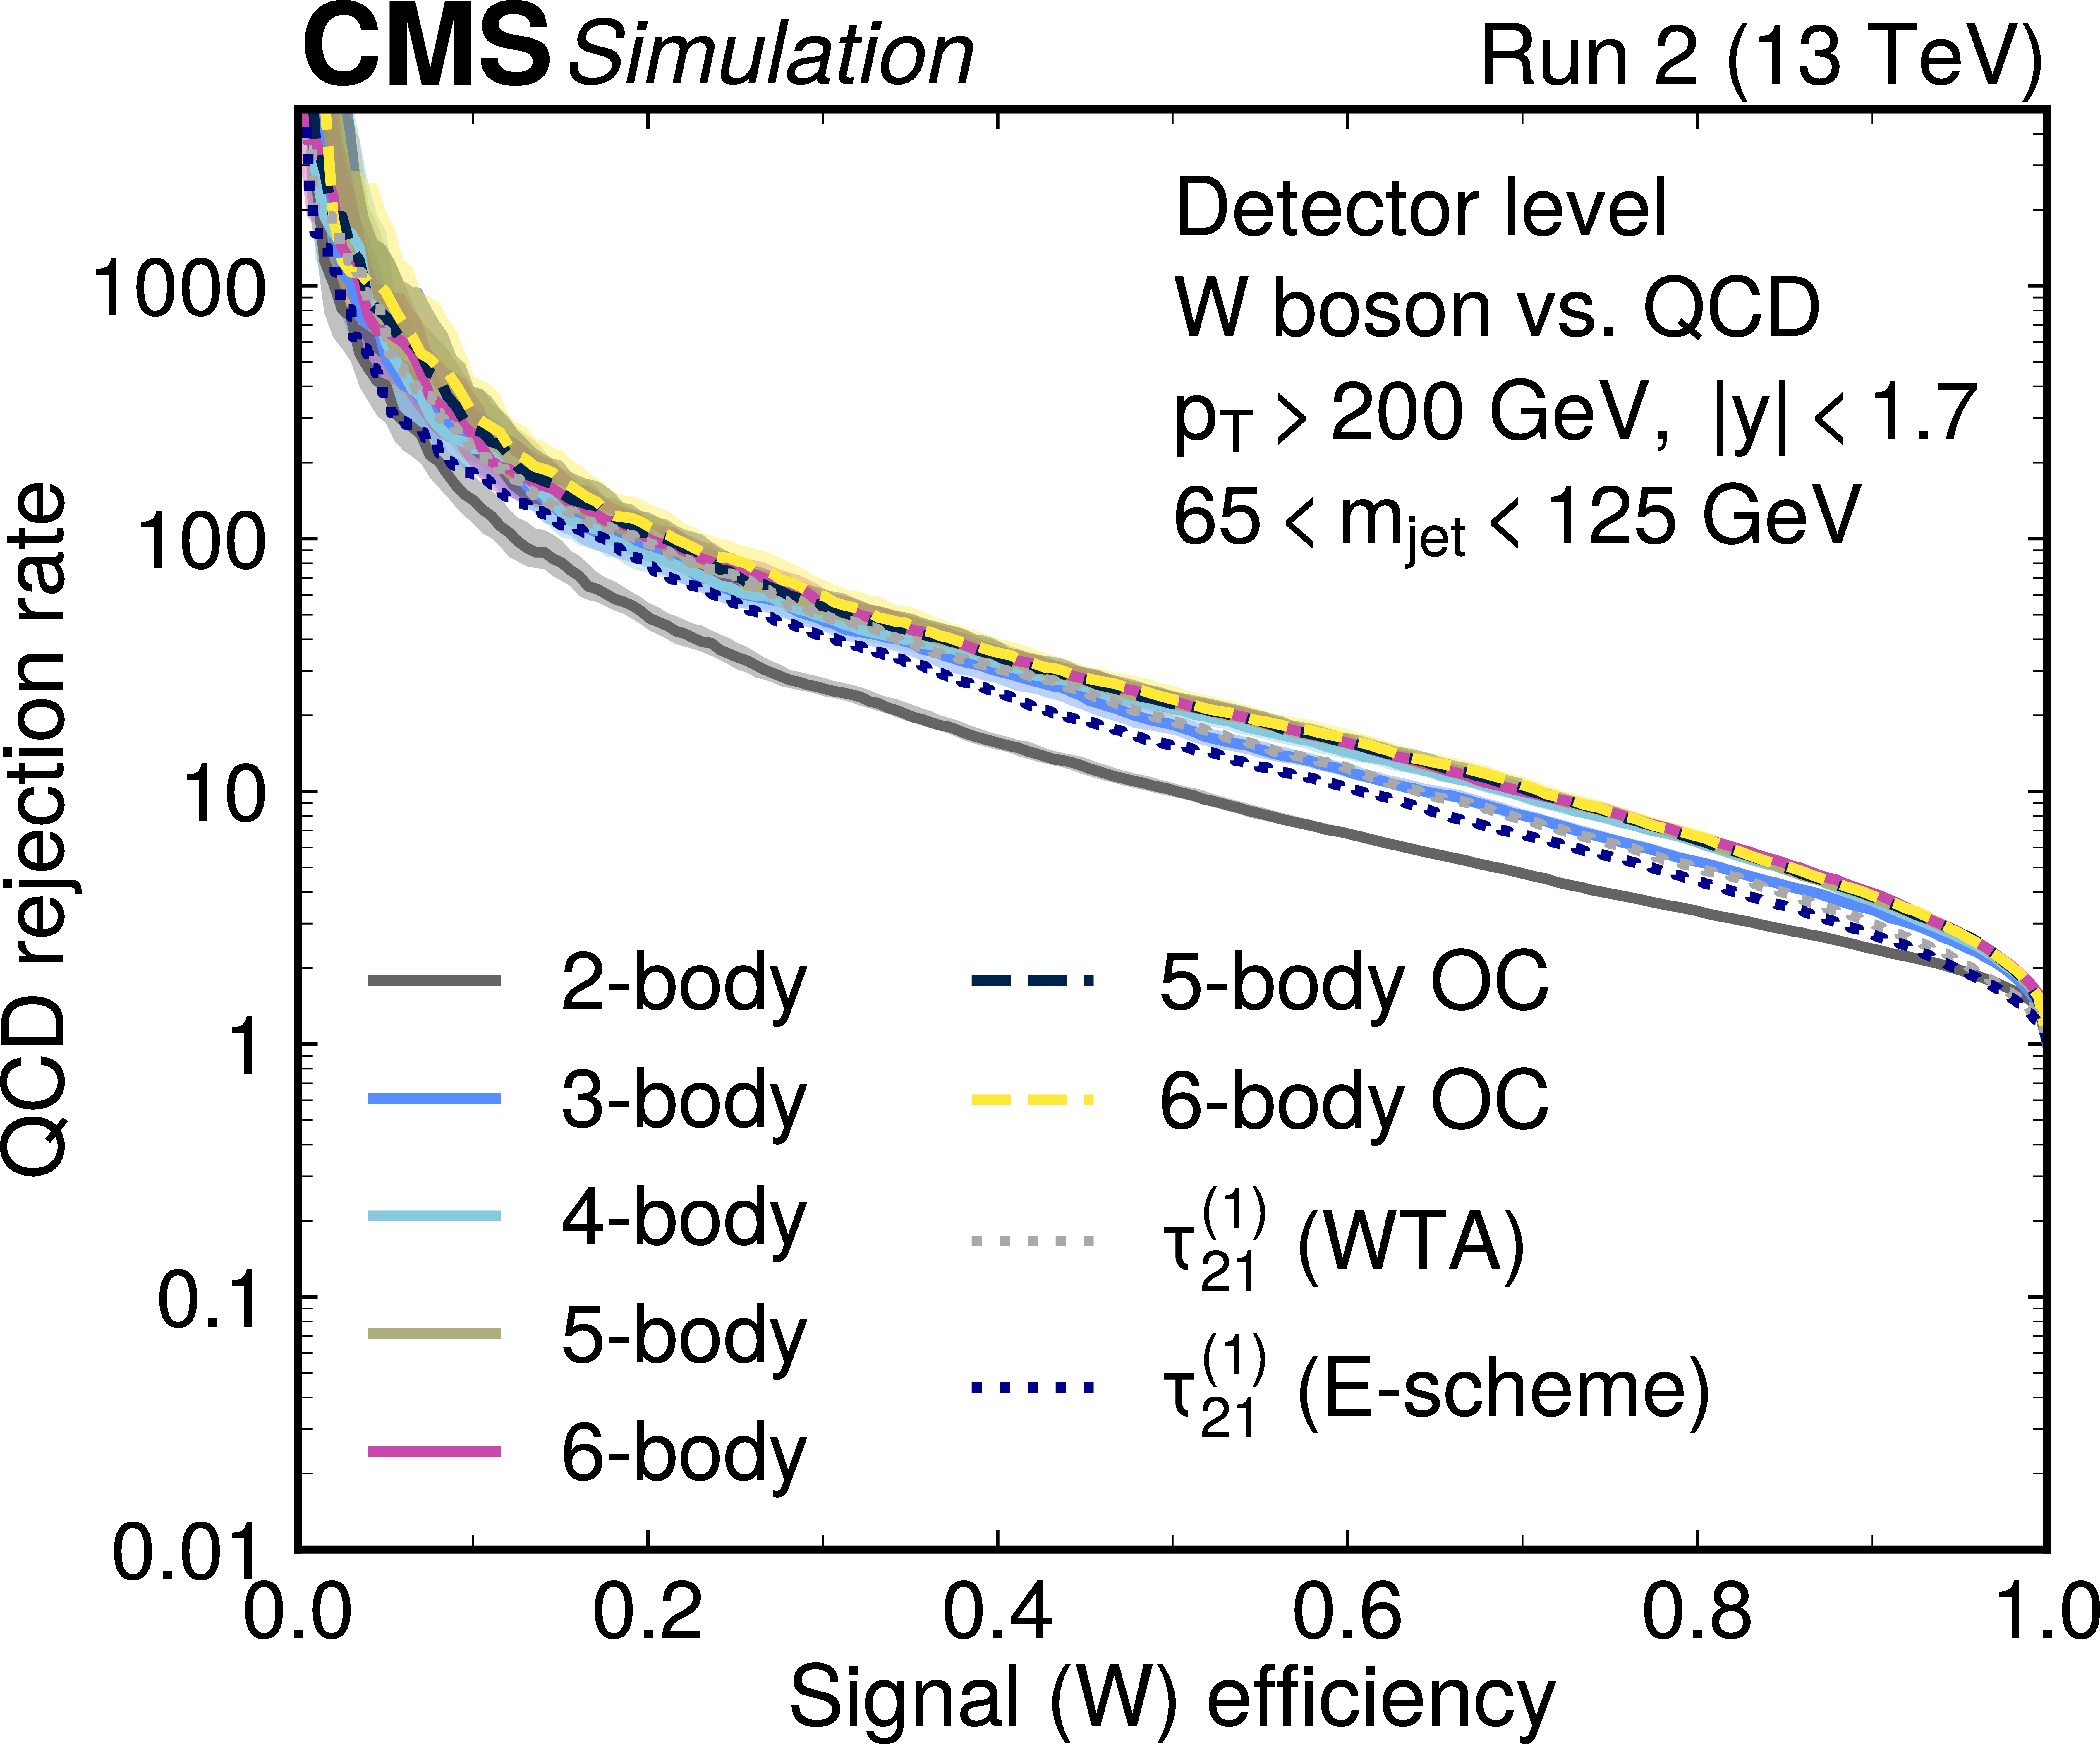
Figure 5-b:
Background rejection rate as a function of signal efficiency for boosted W boson discrimination using deep neural networks trained on minimal and complete $ M $-body bases (solid lines), overcomplete 5-/6-body bases (dashed lines), and $ \tau_{2,1}^{(1)} $ (dotted lines) calculated with winner-take-all (WTA) and E-scheme recombination schemes. Shaded bands around each curve show the pointwise 95% confidence interval on the ROC curves, obtained by a nonparametric bootstrap. |
png pdf |
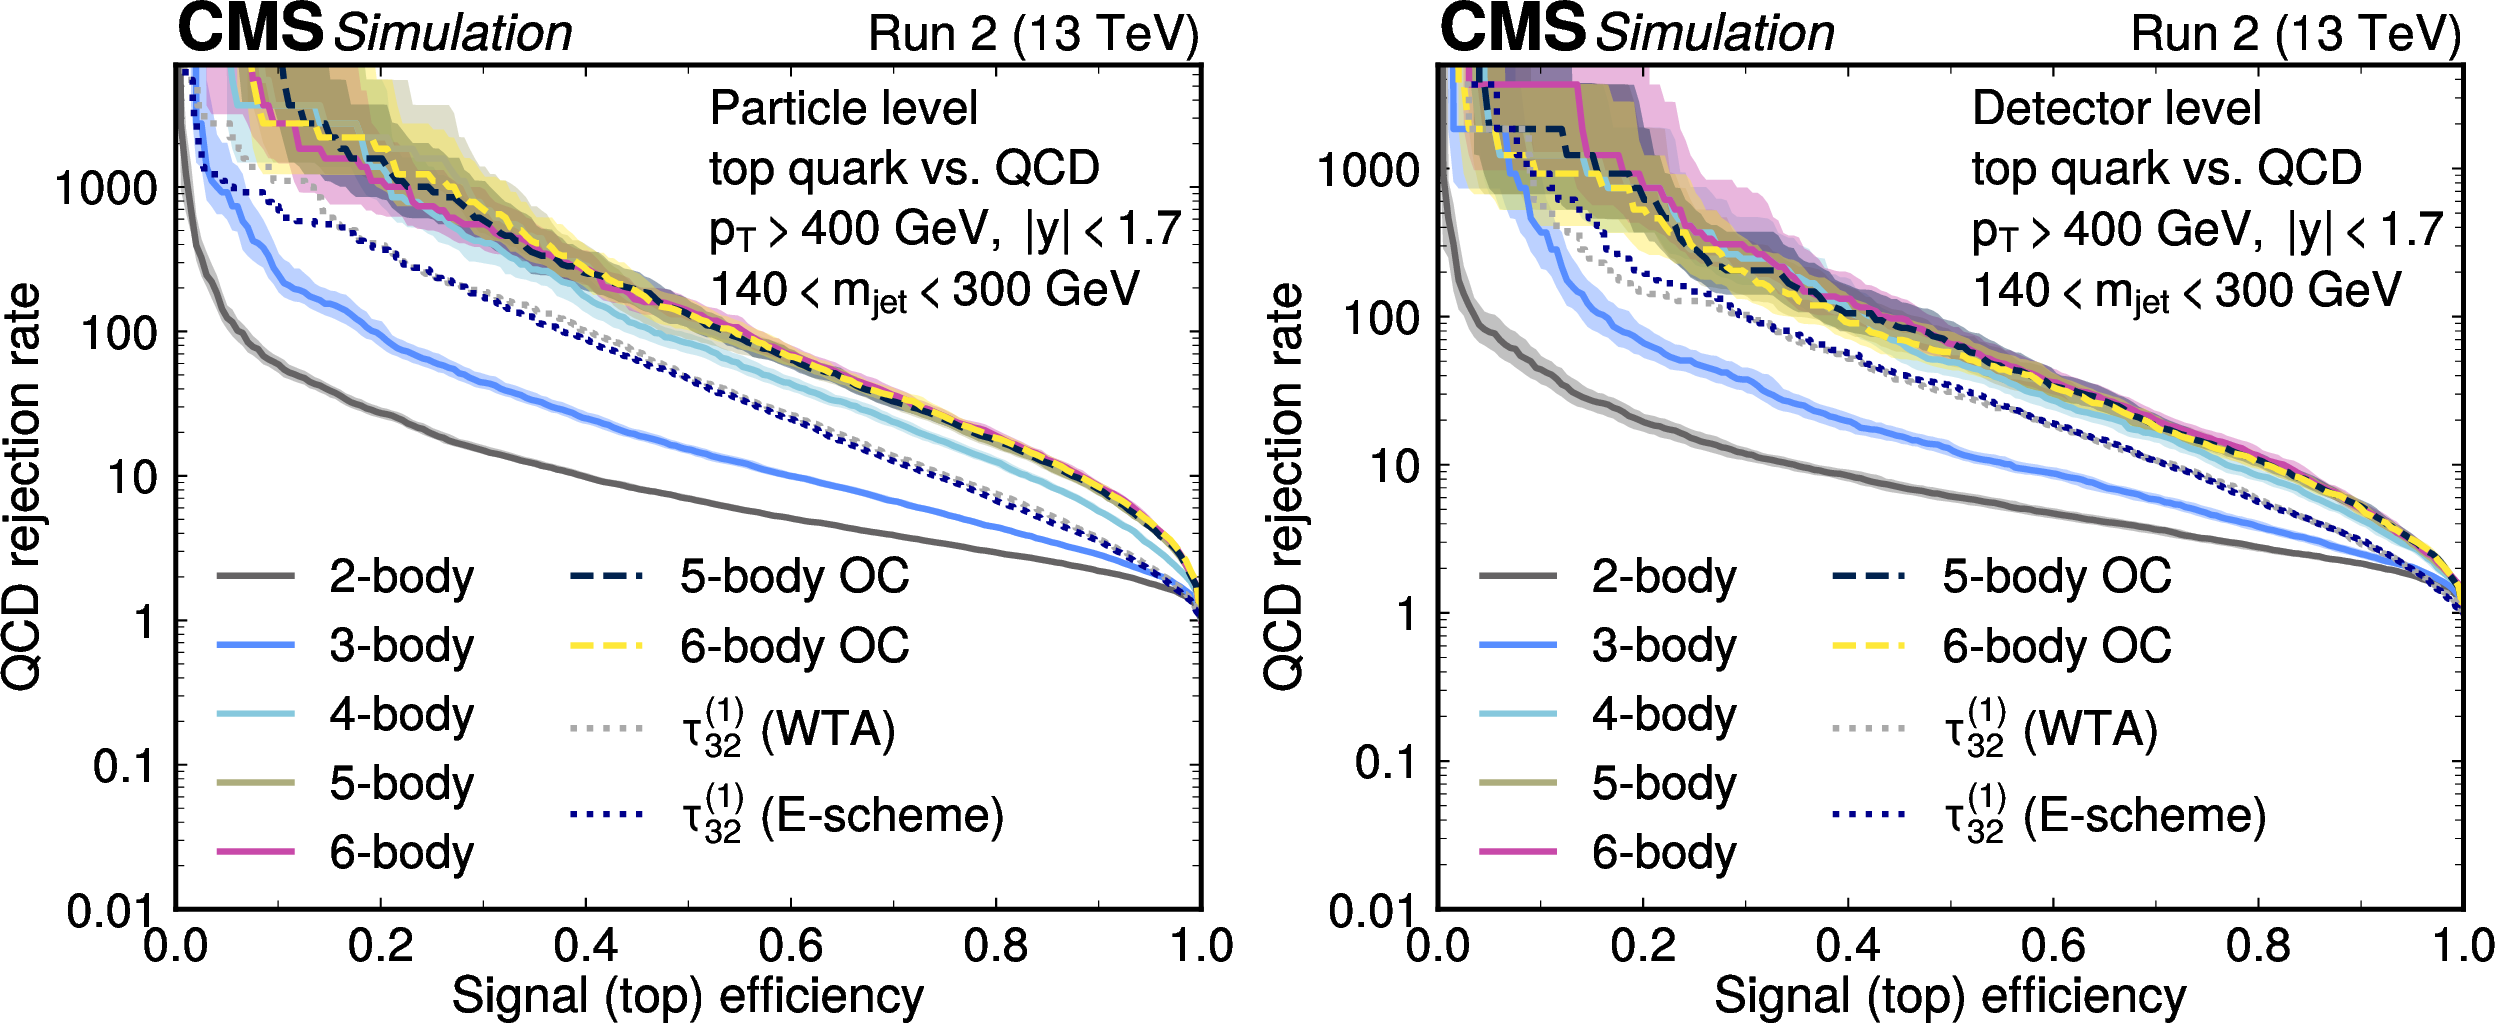
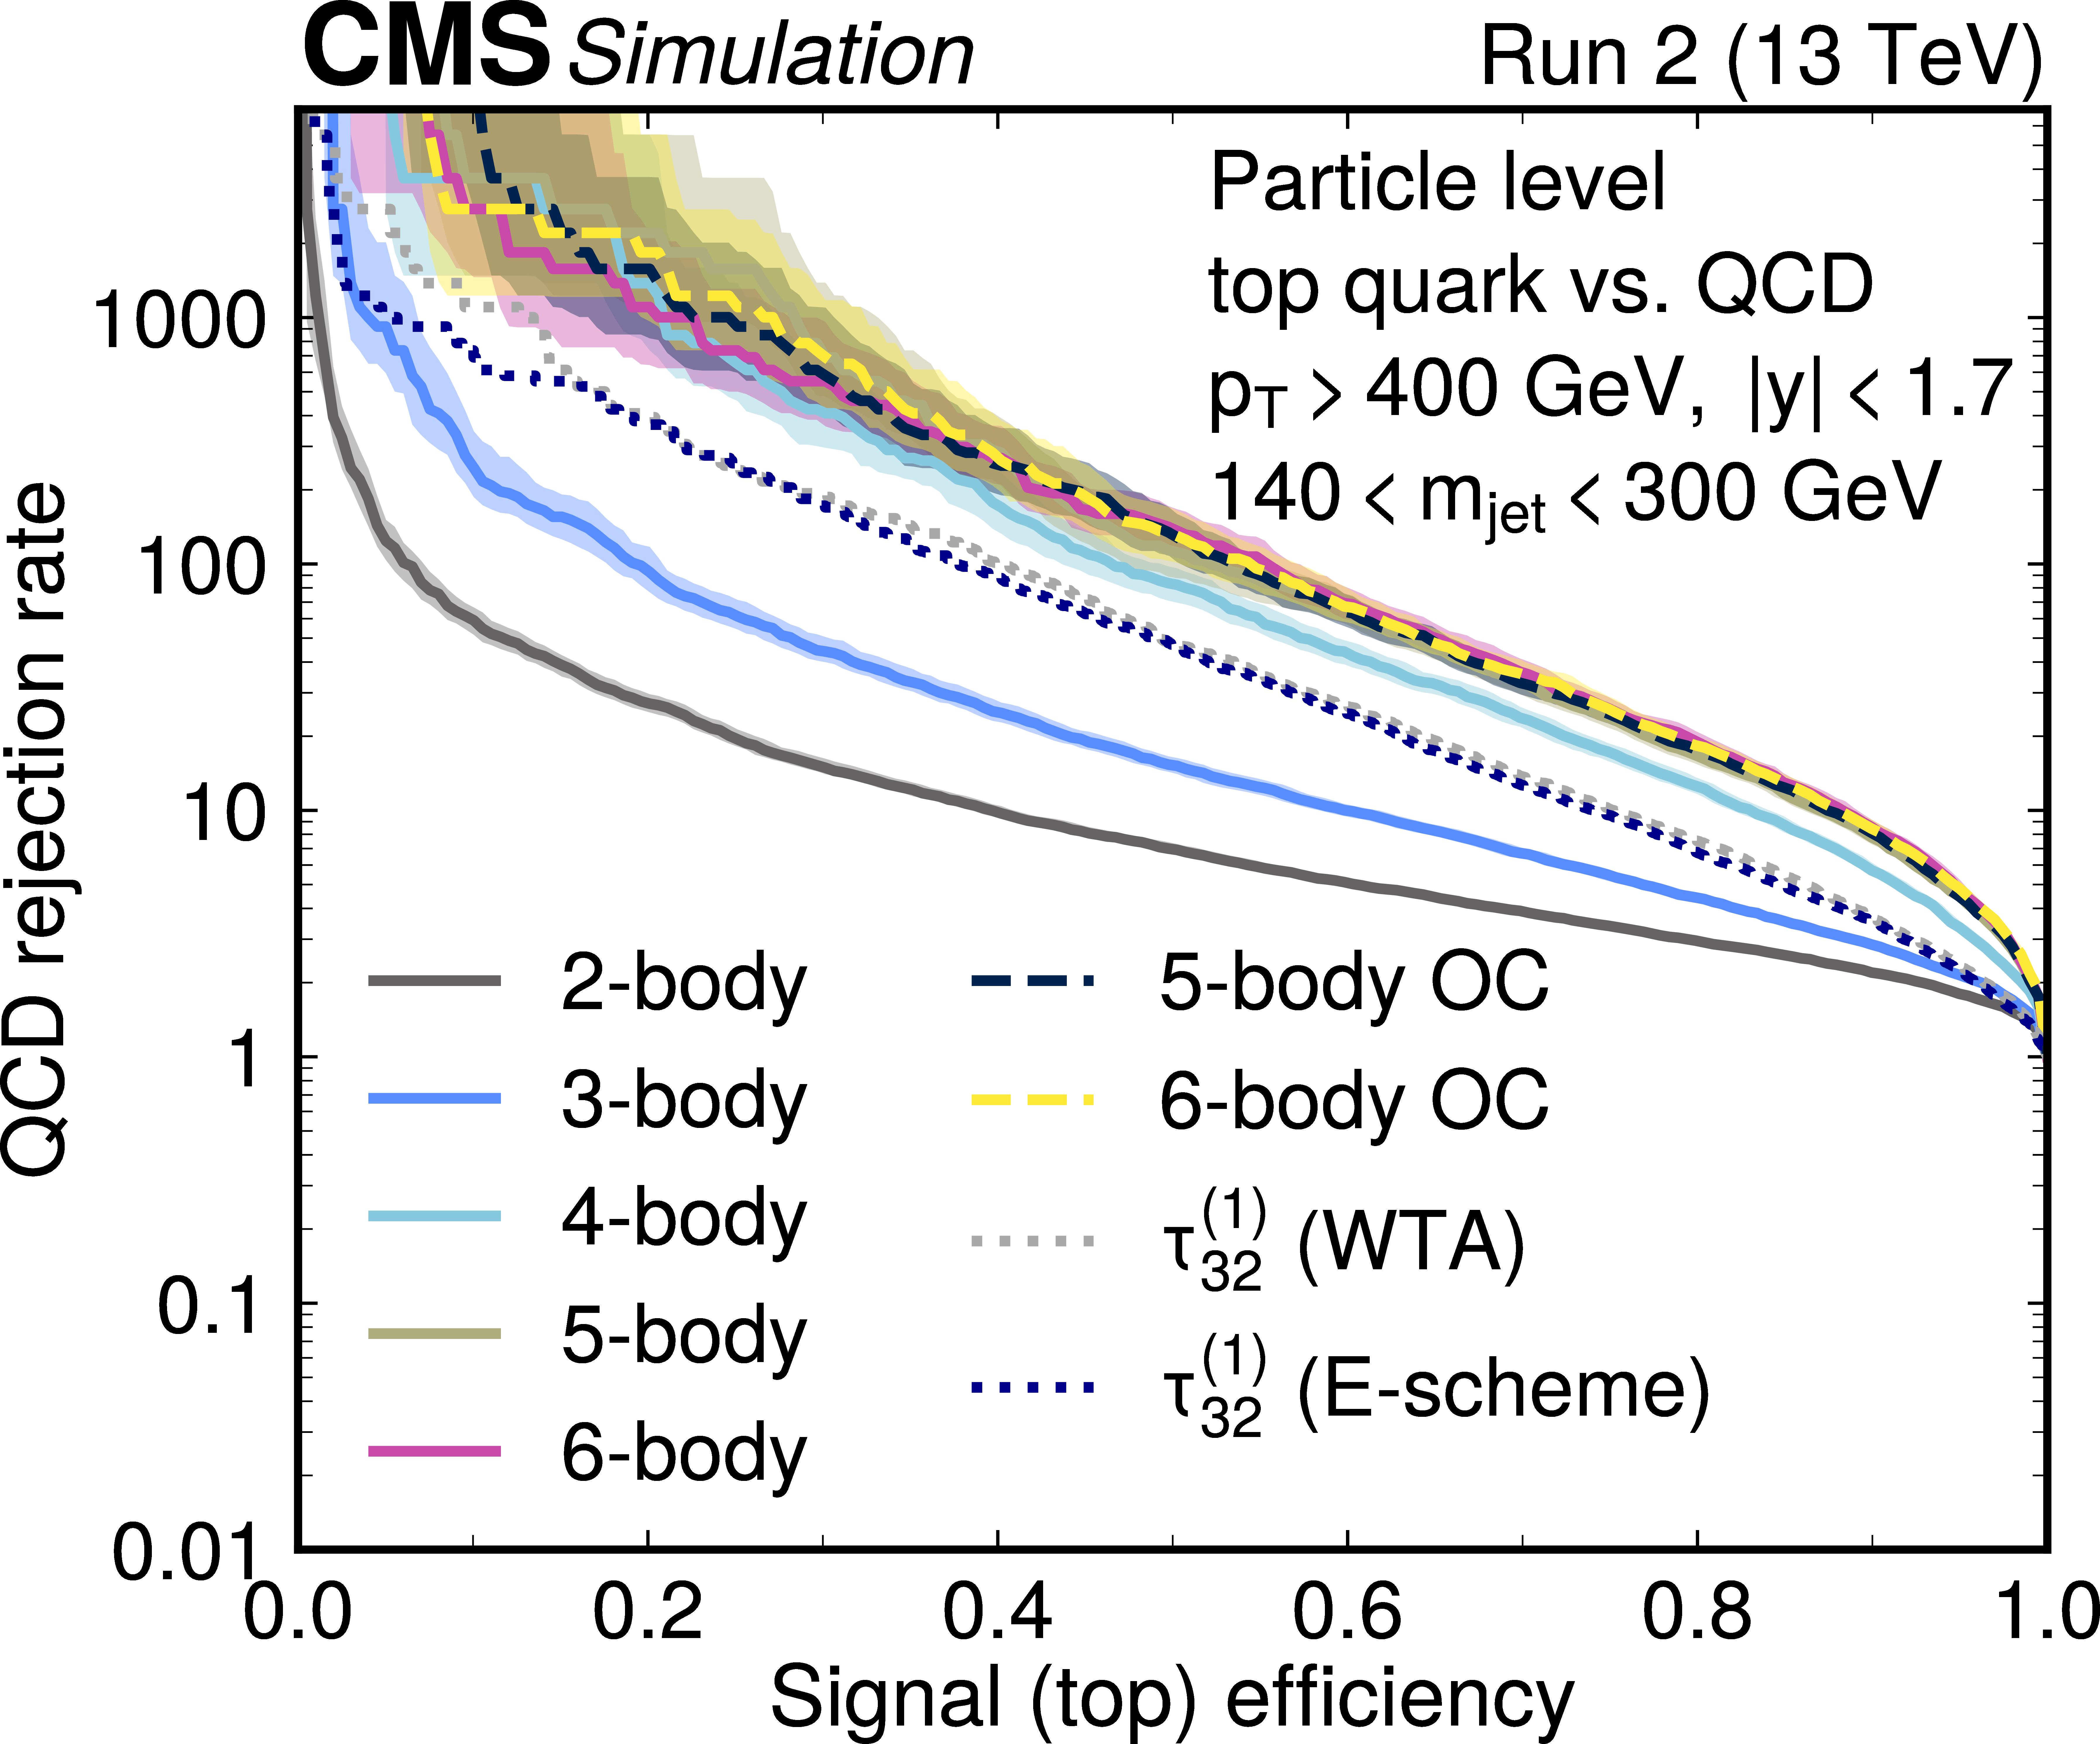
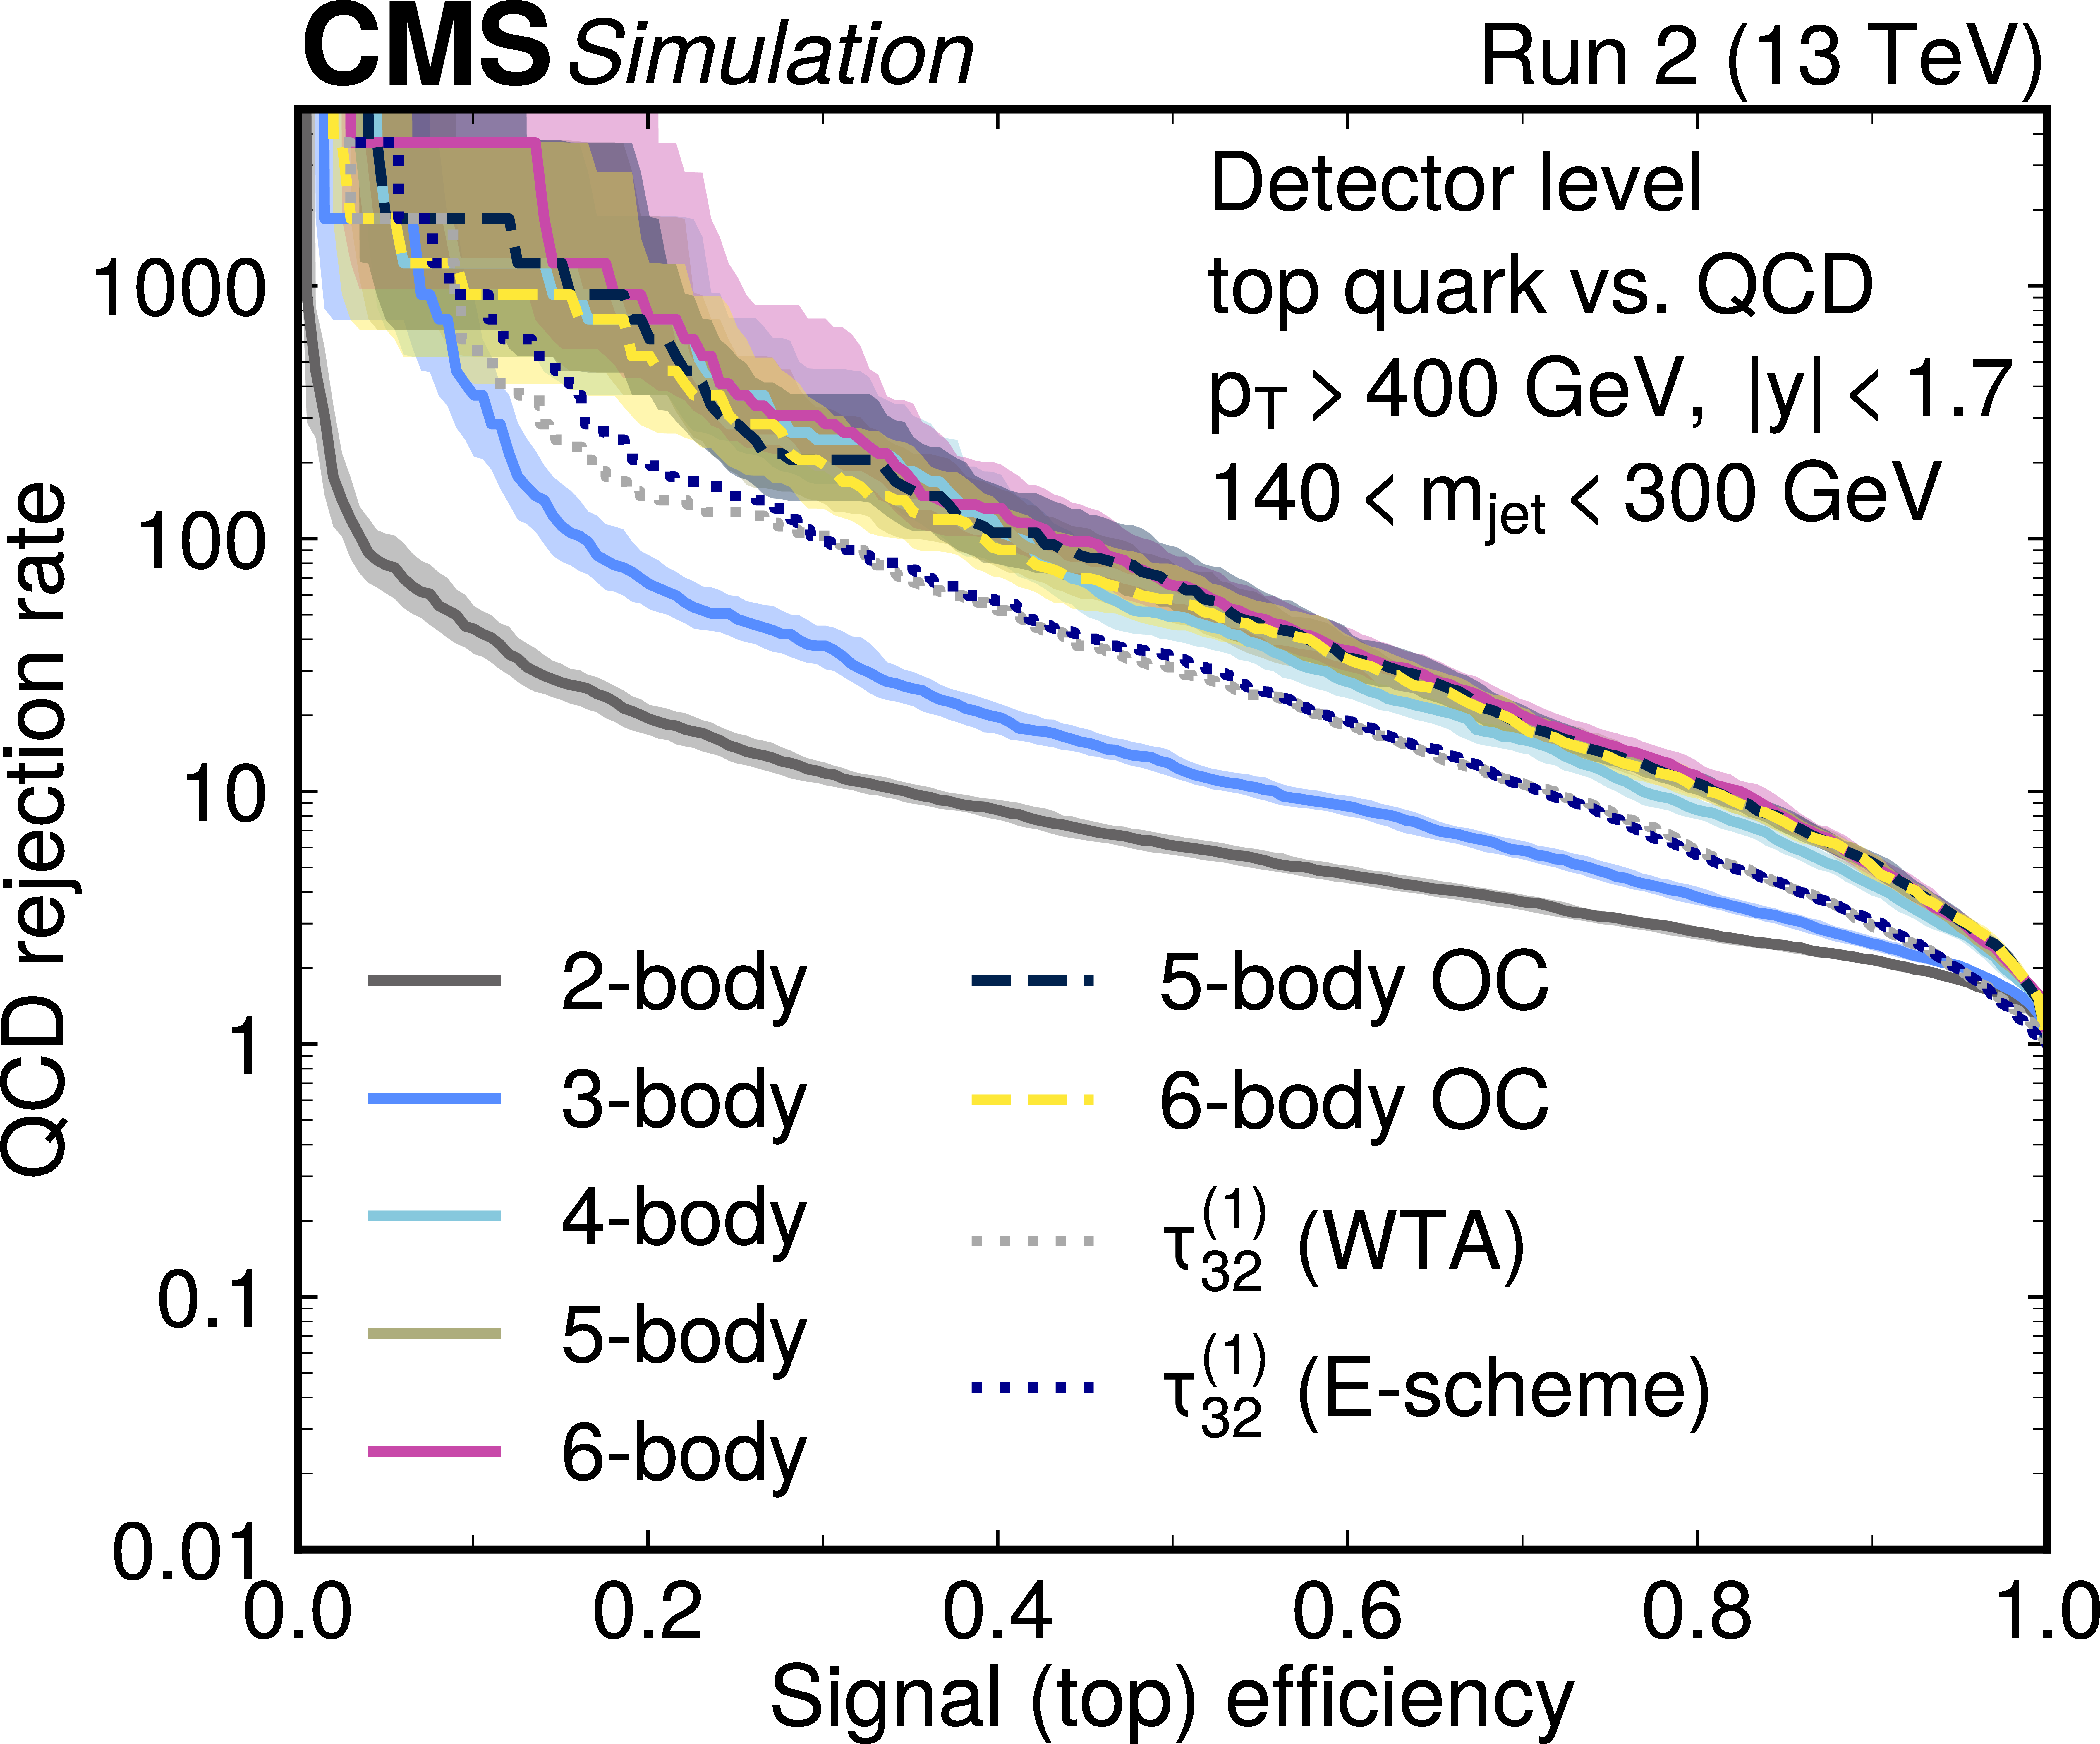
Figure 6:
Background rejection rate as a function of signal efficiency for boosted top quark discrimination using deep neural networks trained on minimal and complete $ M $-body bases (solid lines), overcomplete 5-/6-body bases (dashed lines), and $ \tau_{3,2}^{(1)} $ (dotted lines) calculated with winner-take-all (WTA) and E-scheme recombination schemes. Shaded bands around each curve show the pointwise 95% confidence interval on the ROC curves, obtained by a nonparametric bootstrap. |
png pdf |
Figure 6-a:
Background rejection rate as a function of signal efficiency for boosted top quark discrimination using deep neural networks trained on minimal and complete $ M $-body bases (solid lines), overcomplete 5-/6-body bases (dashed lines), and $ \tau_{3,2}^{(1)} $ (dotted lines) calculated with winner-take-all (WTA) and E-scheme recombination schemes. Shaded bands around each curve show the pointwise 95% confidence interval on the ROC curves, obtained by a nonparametric bootstrap. |
png pdf |
Figure 6-b:
Background rejection rate as a function of signal efficiency for boosted top quark discrimination using deep neural networks trained on minimal and complete $ M $-body bases (solid lines), overcomplete 5-/6-body bases (dashed lines), and $ \tau_{3,2}^{(1)} $ (dotted lines) calculated with winner-take-all (WTA) and E-scheme recombination schemes. Shaded bands around each curve show the pointwise 95% confidence interval on the ROC curves, obtained by a nonparametric bootstrap. |
png pdf |
Figure 7:
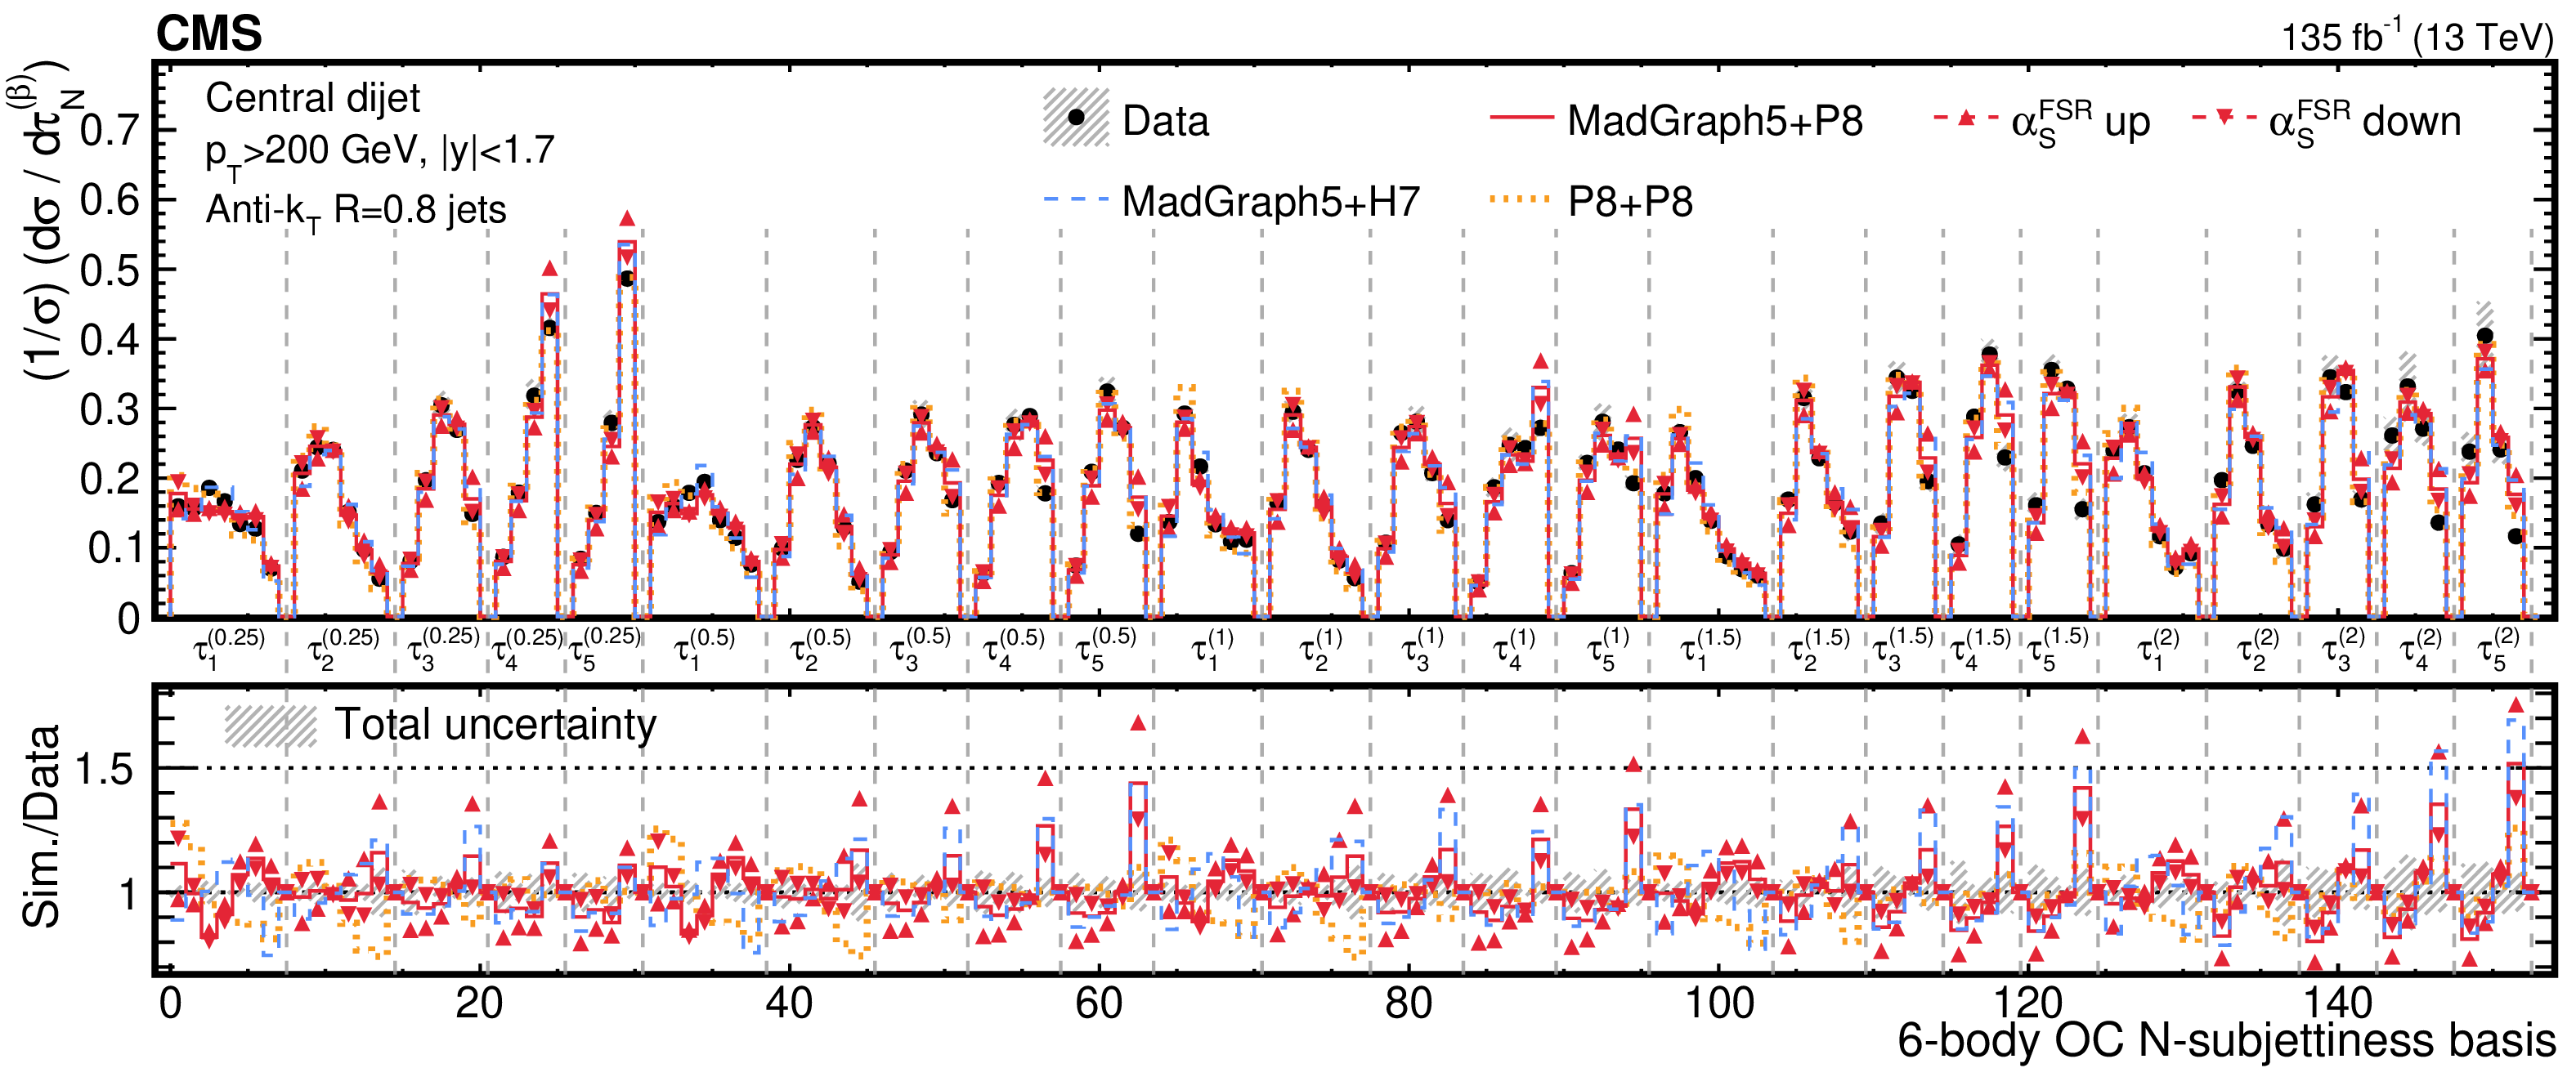
The unfolded combined distribution of the overcomplete 6-body basis of $ N $-subjettiness observables measured with AK8 jets in the QCD dijet selection (upper panel). The unfolded data (black) are compared with the nominal simulation (red), FSR scale variations of the nominal simulation (red, filled triangles), and predictions from the alternative (blue, yellow) simulations, at the particle level. The ratio of the simulated predictions to the unfolded data are shown in the lower panel. The shaded bands (dark grey) for the data markers indicate the total unfolding uncertainties. |
png pdf |
Figure 8:
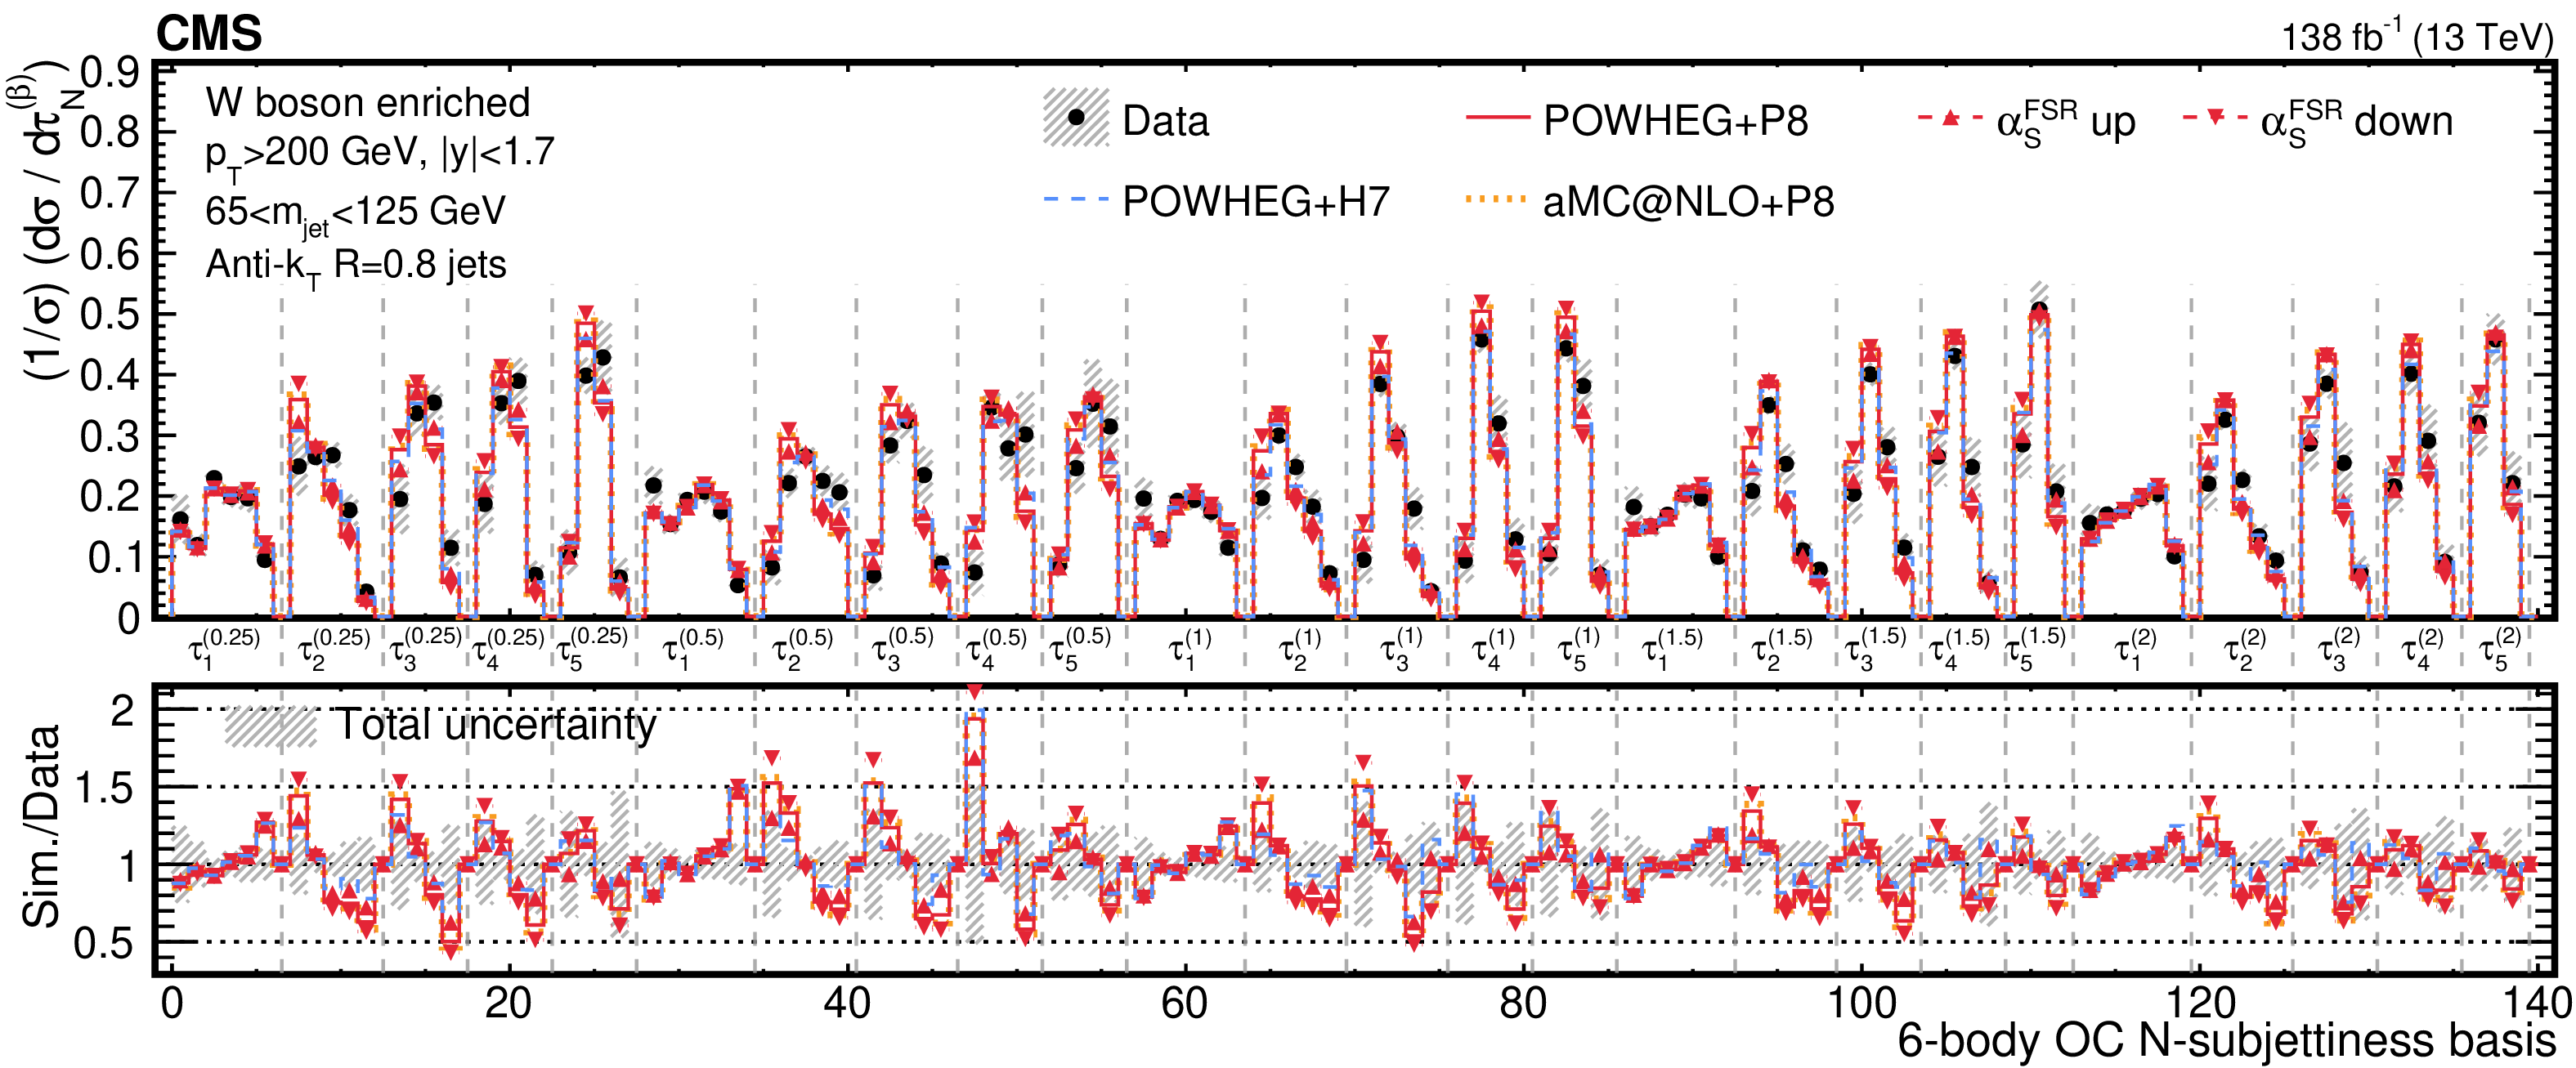
The unfolded, combined distribution of the overcomplete 6-body basis of $ N $-subjettiness observables measured with the selected AK8 jet for $ \mu $+jets $ \mathrm{t} \overline{\mathrm{t}} $ events enriched in boosted W boson jets (upper panel). The unfolded data (black) are compared with the nominal simulation (red), FSR scale variations of the nominal simulation (red, filled triangles), and predictions from the alternative signal (blue, yellow) simulations, at the particle level. The ratio of the simulated predictions to the unfolded data are shown in the lower panel. The shaded bands (dark grey) for the data markers indicate the total unfolding uncertainties. |
png pdf |
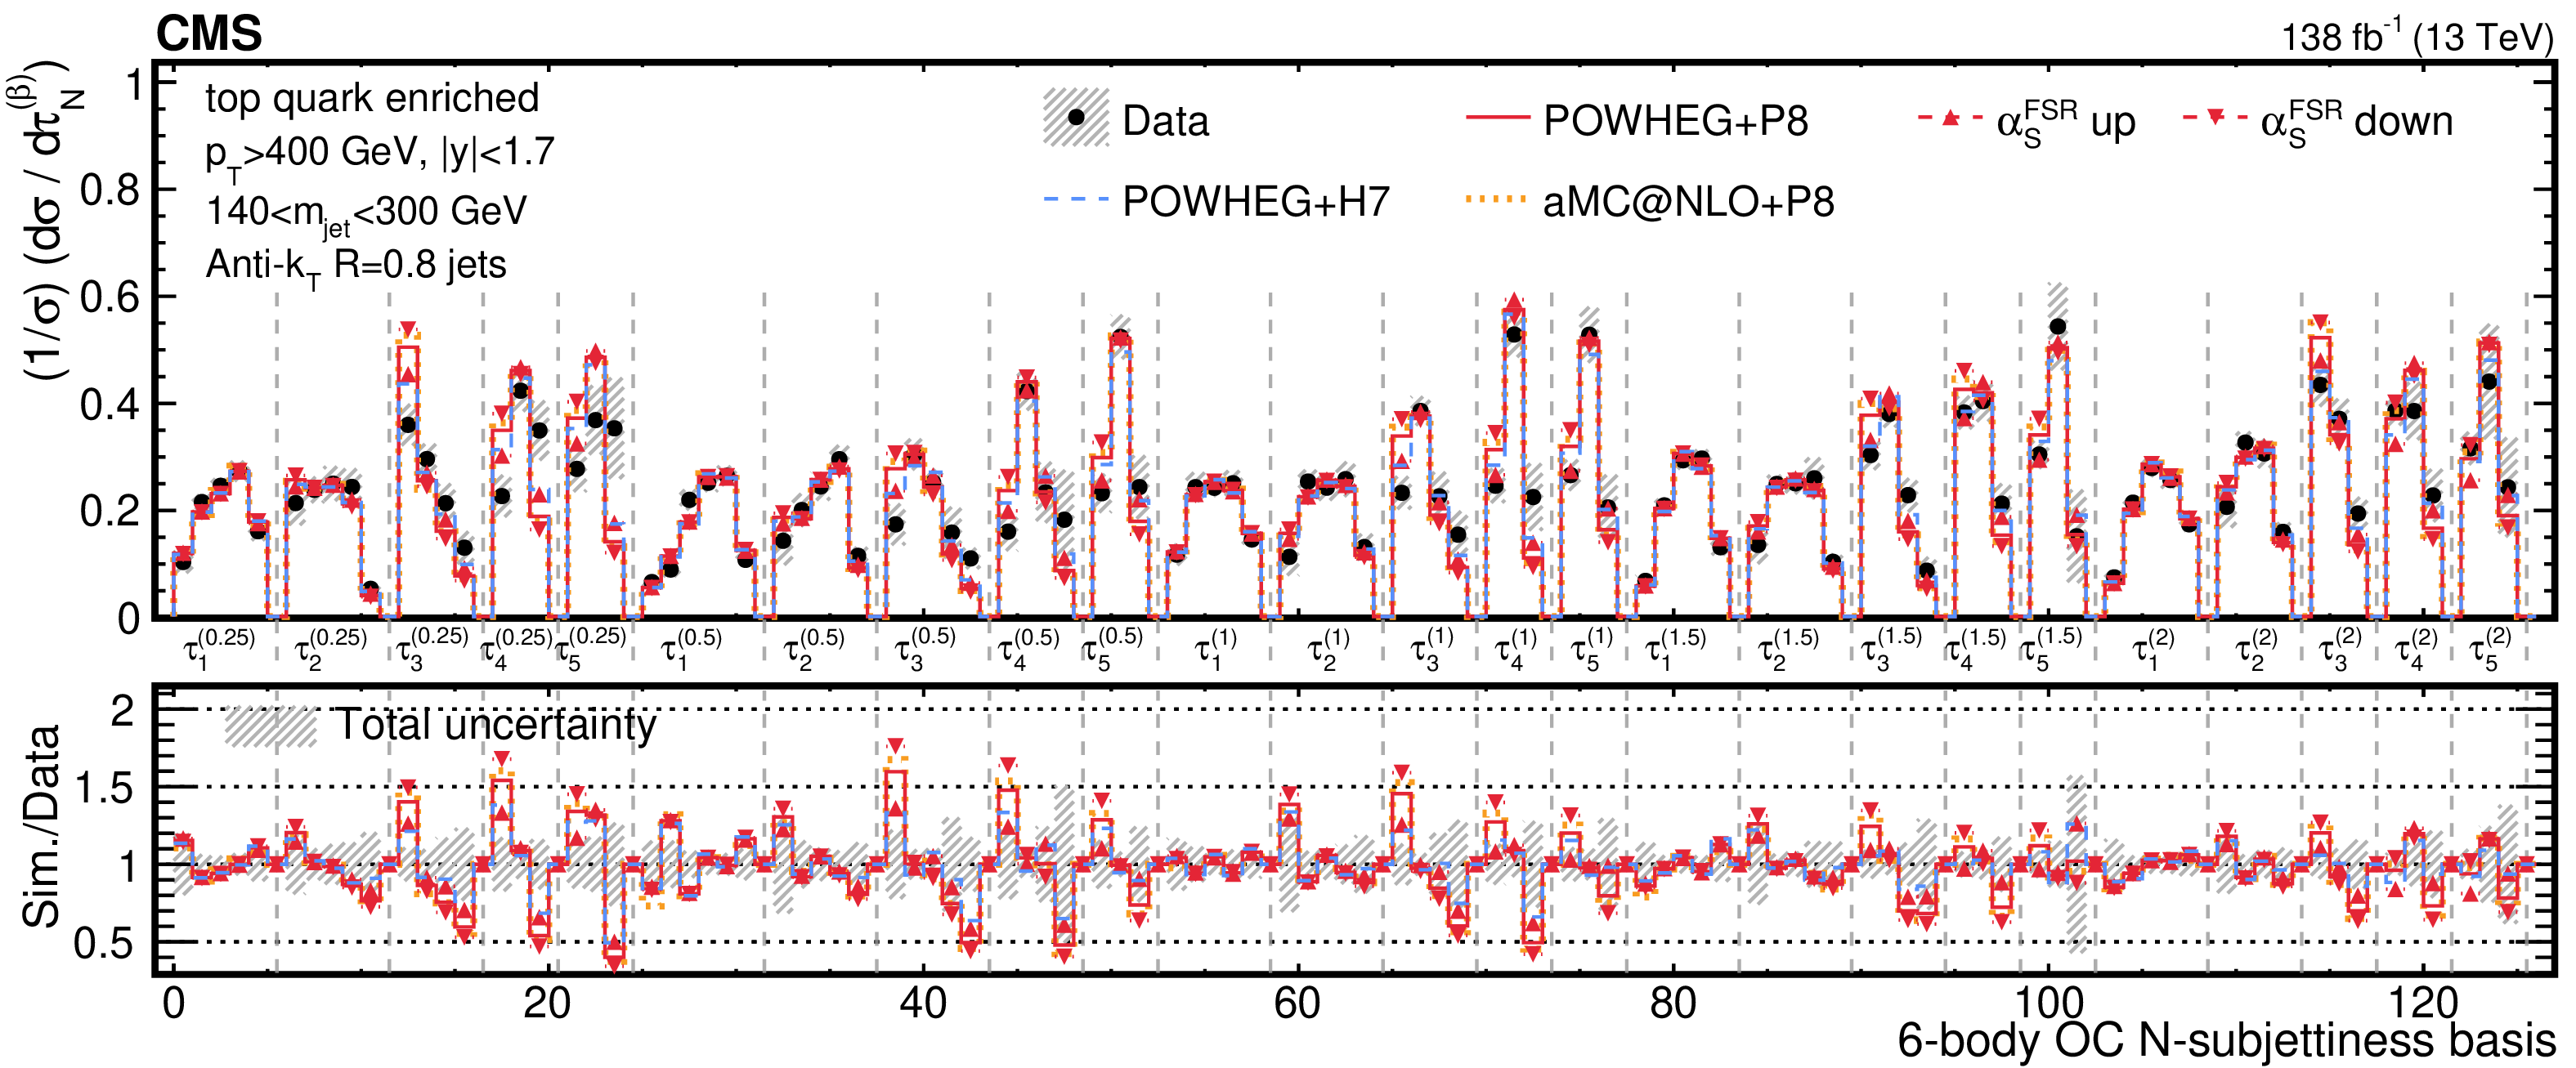
Figure 9:
The unfolded, combined distribution of the overcomplete 6-body basis of $ N $-subjettiness observables measured with the selected AK8 jet for $ \mu $+jets $ \mathrm{t} \overline{\mathrm{t}} $ events enriched in jets from boosted top quark decays (upper panel). The unfolded data (black) are compared with the nominal simulation (red), FSR scale variations of the nominal simulation (red, filled triangles), and predictions from the alternative signal (blue, yellow) simulations, at the particle level. The ratio of the simulated predictions to the unfolded data are shown in the lower panel. The shaded bands (dark grey) for the data markers indicate the total unfolding uncertainties. |
png pdf |
Figure 10:
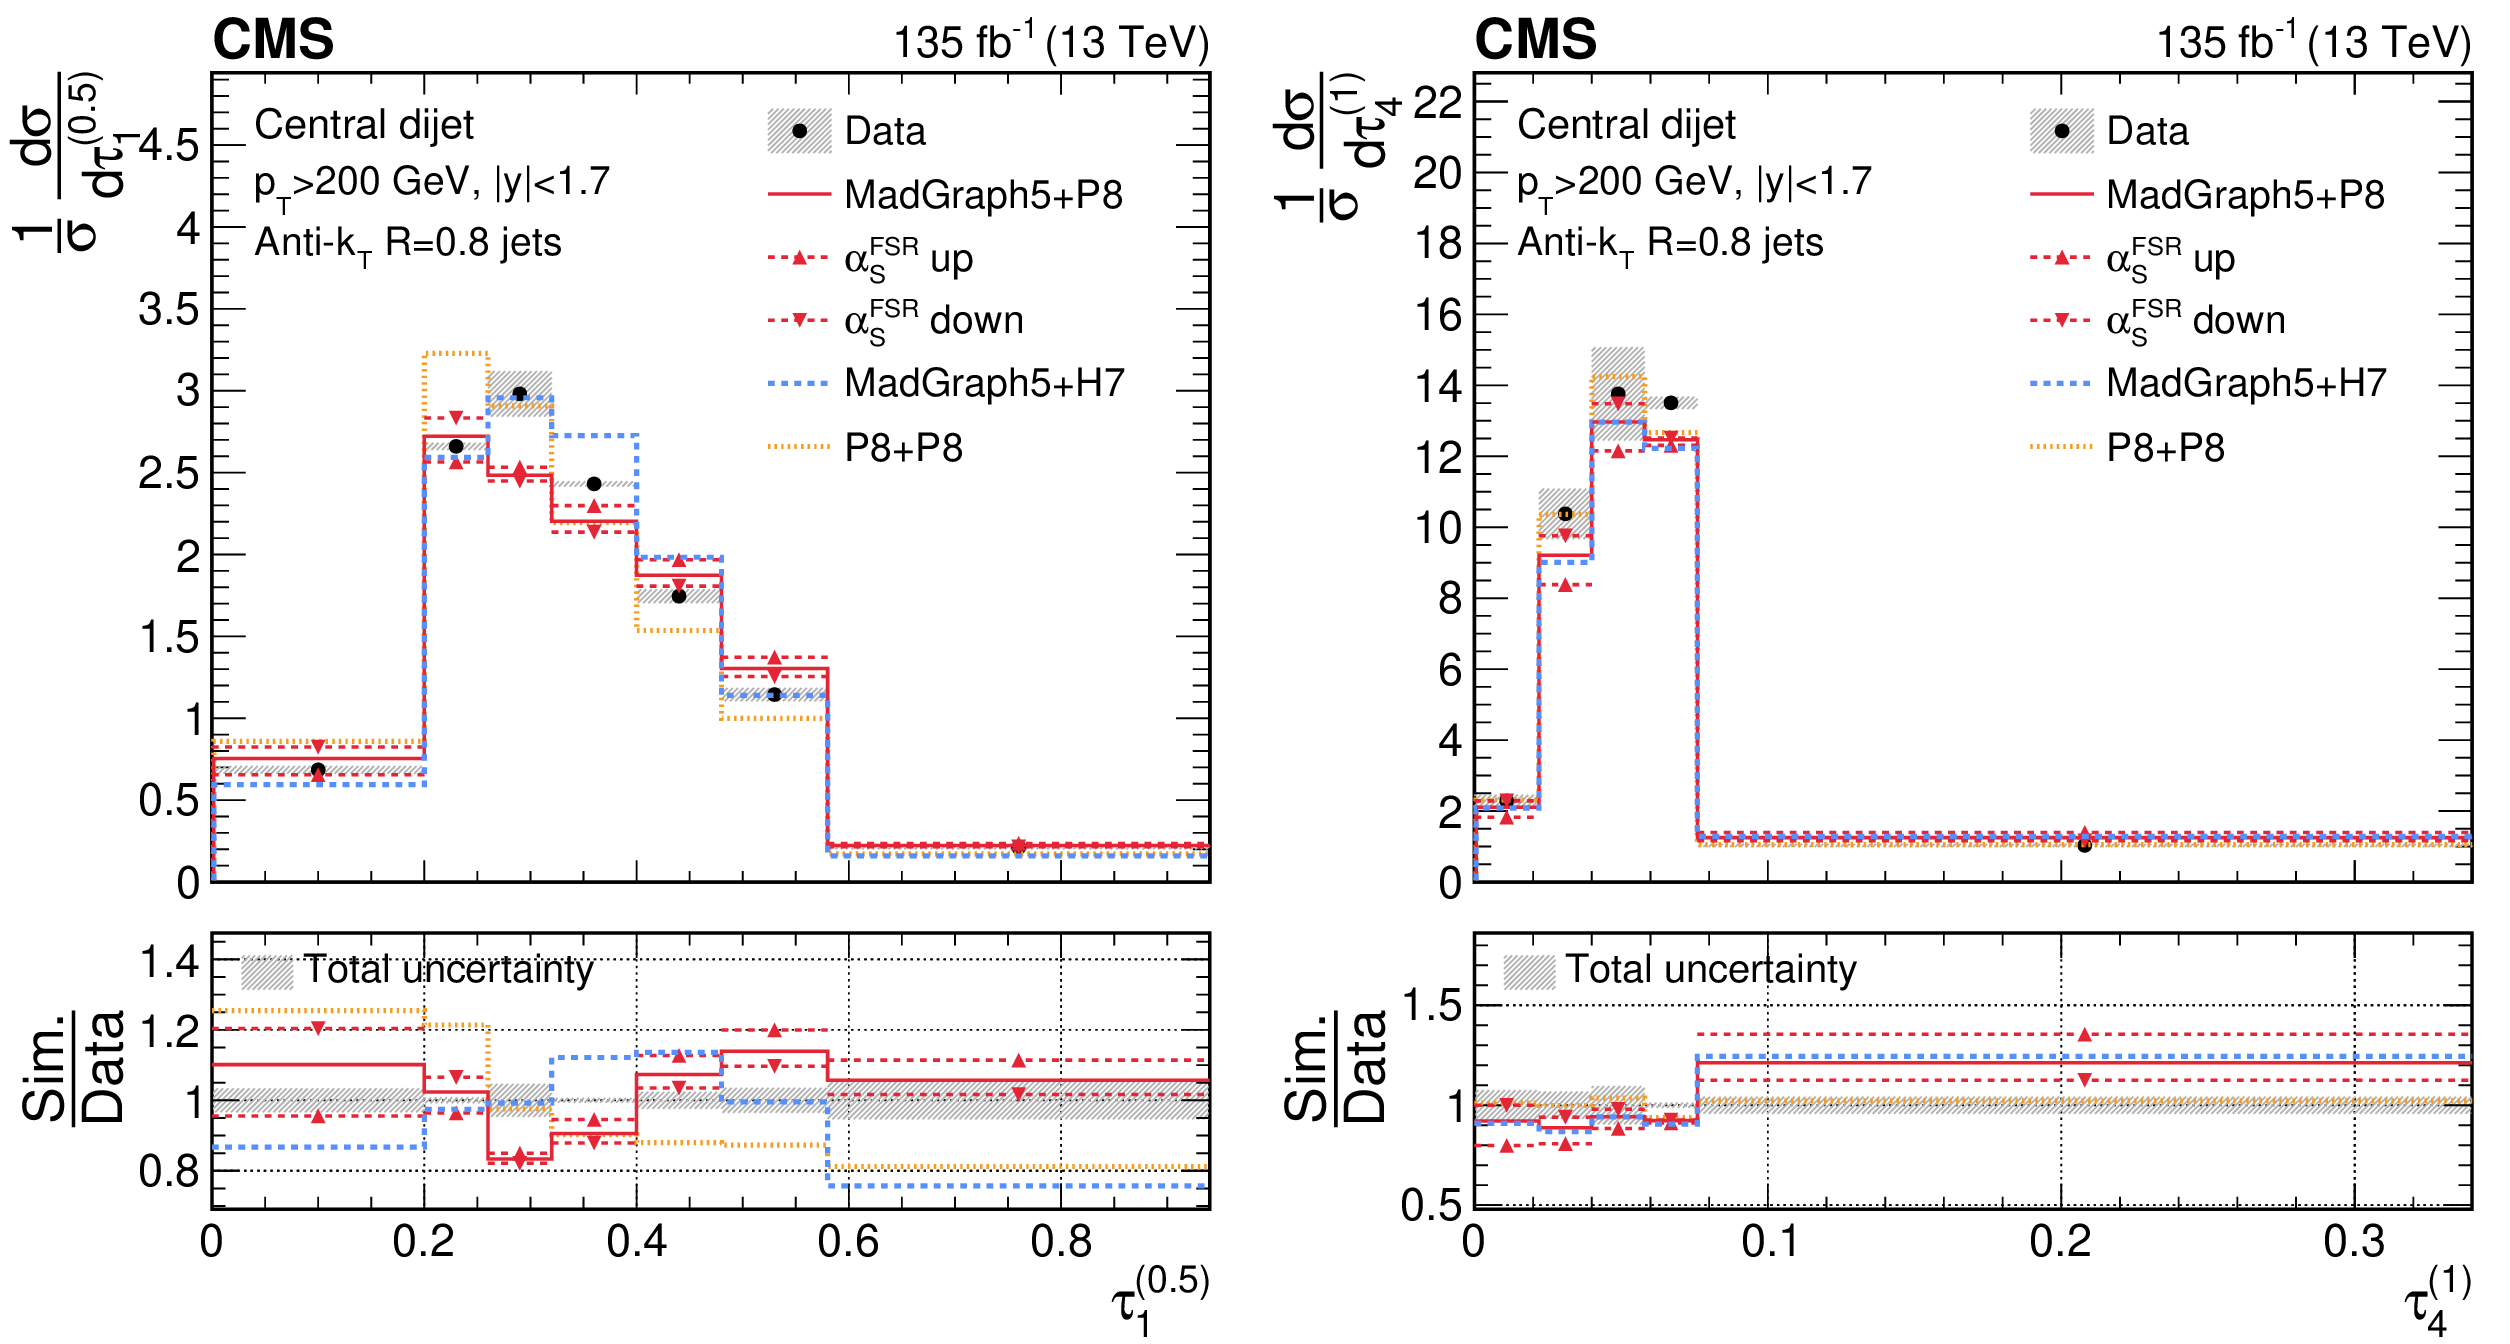
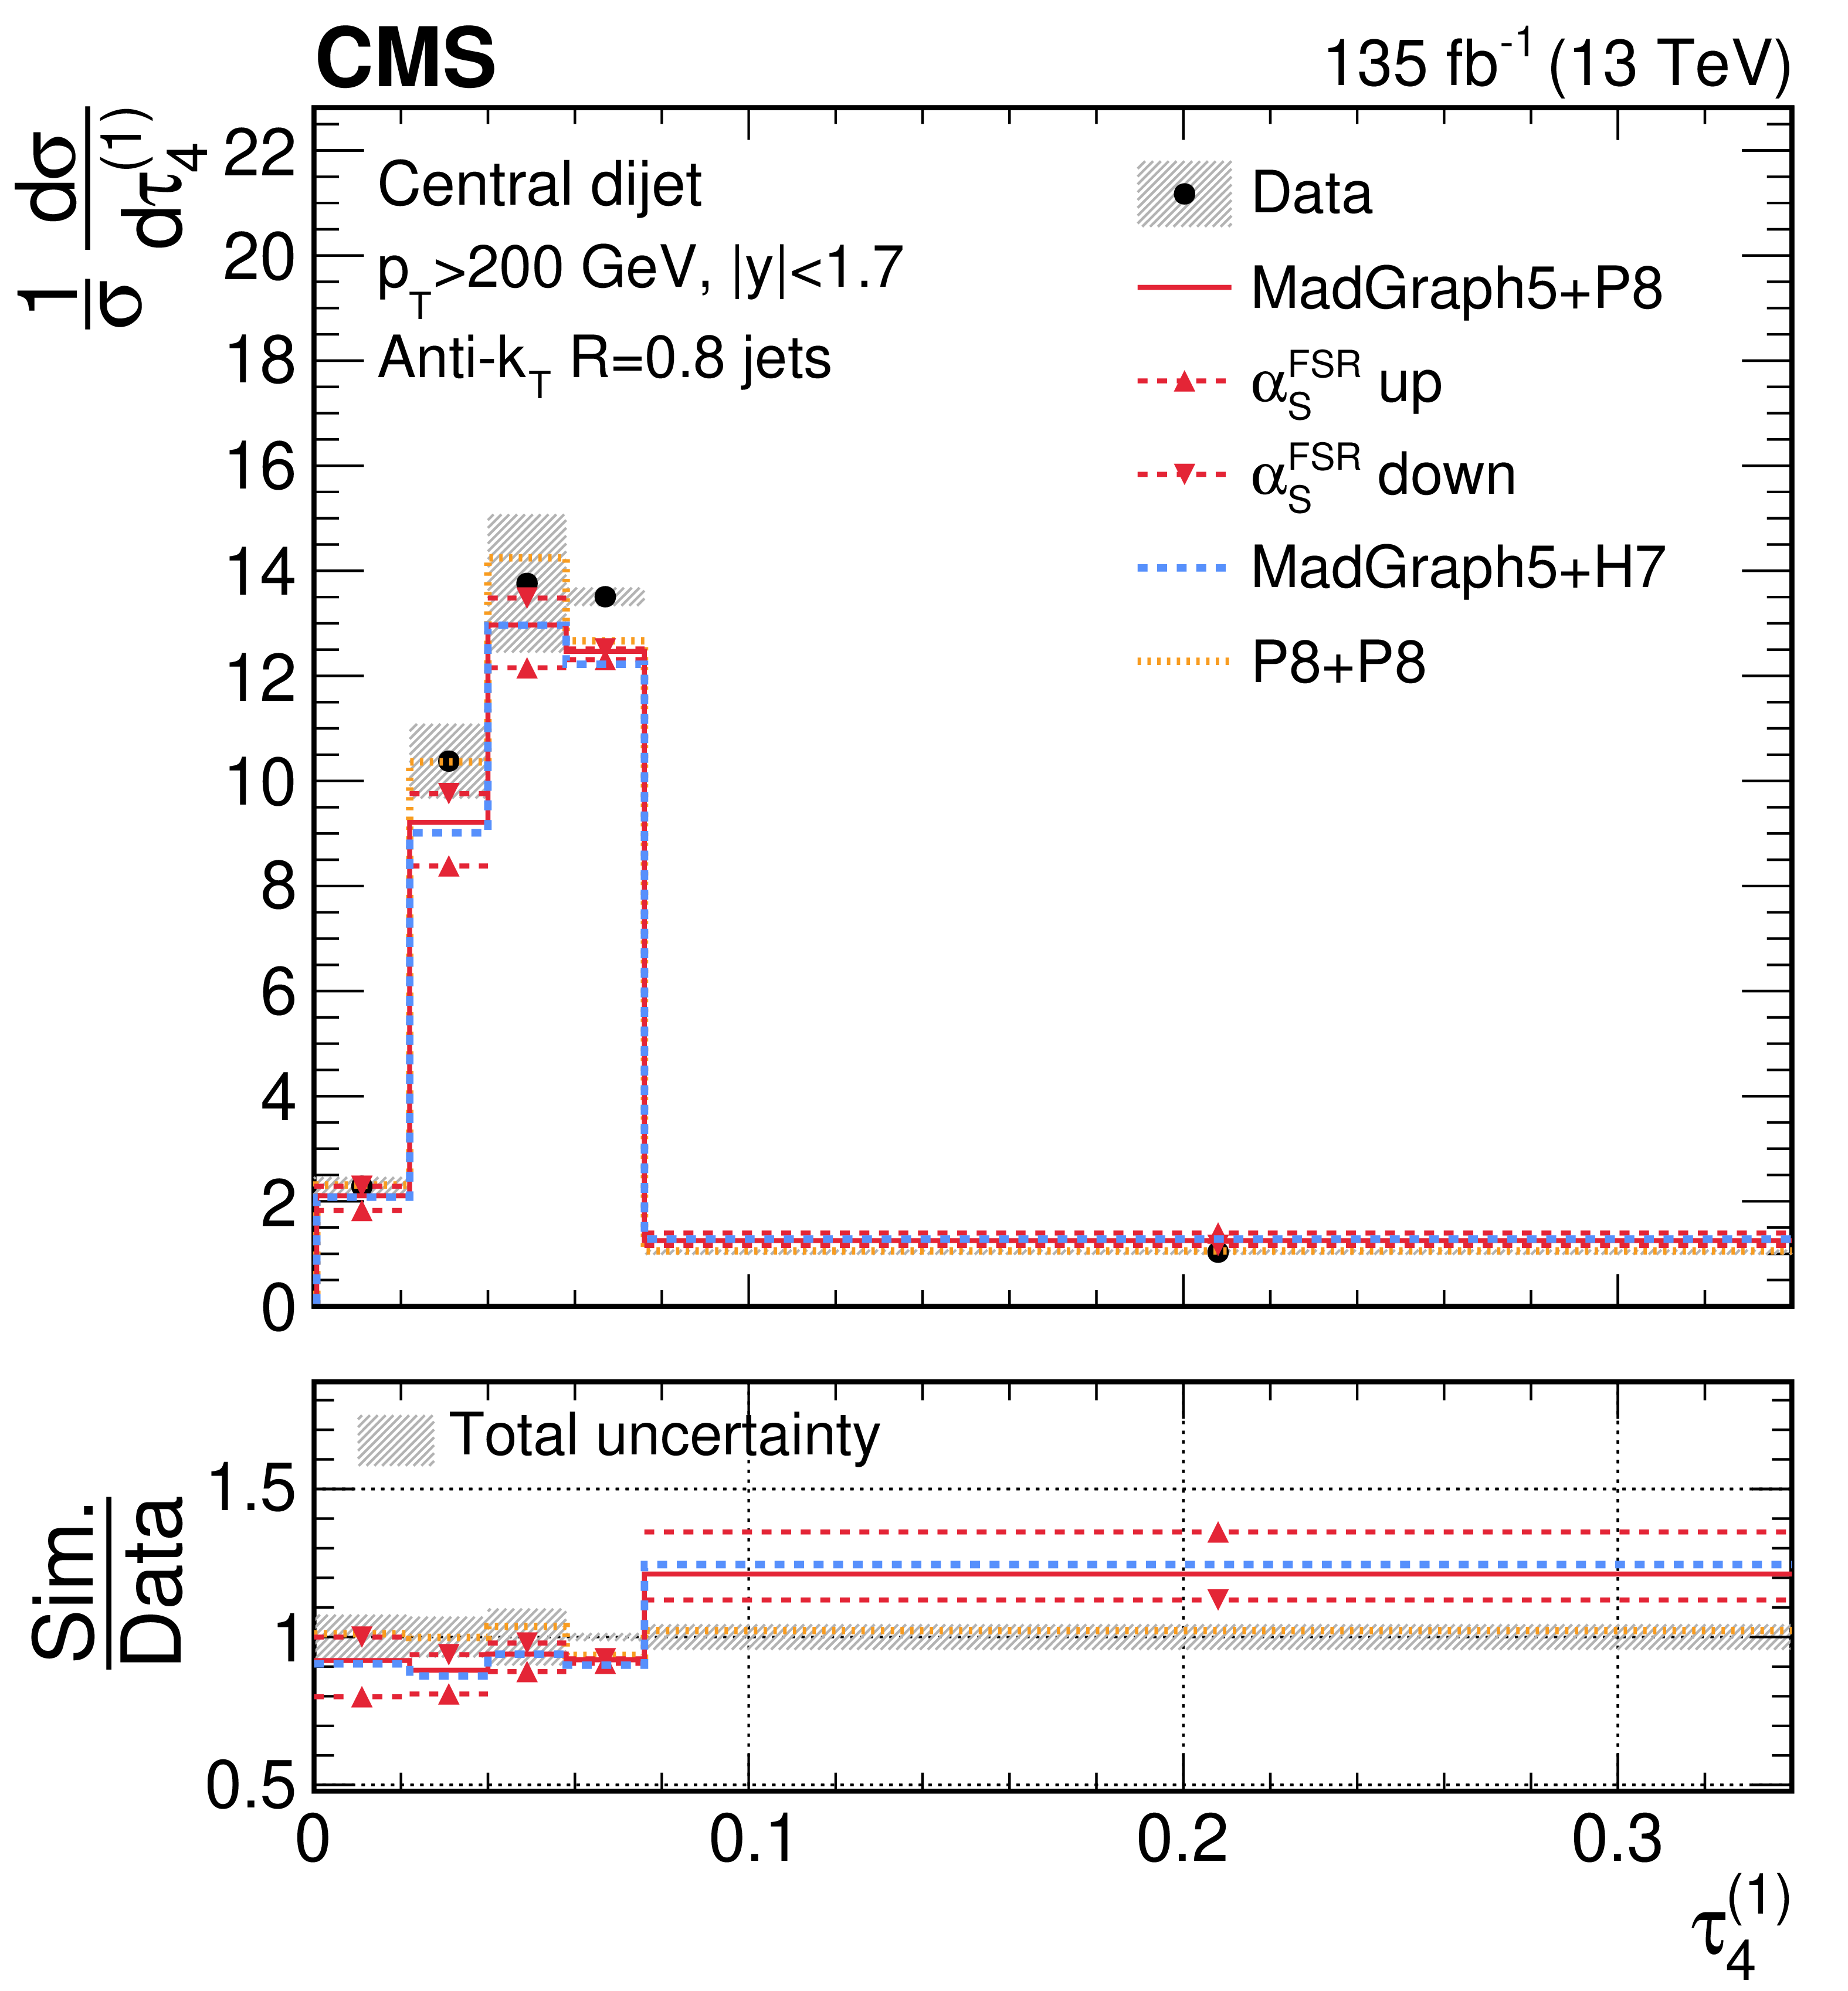
Representative unfolded distributions from the simultaneous unfolding are shown for $\tau_{1}^{(0.5)}$ and $\tau_{4}^{(1)}$ in the QCD dijet selection. The results are extracted from the normalized simultaneous unfolding, and the bin contents and the error bars are scaled by the corresponding bin widths. In the unfolded results, shown in the upper panel, the data (black) are compared with the nominal simulation (red), FSR scale variations of the nominal simulation (red, filled triangles), and predictions from the alternative signal (blue, yellow) simulations at the particle level. The ratio of the particle-level predictions to the unfolded data are shown in the lower panel. Shaded bands indicate the total uncertainties (dark grey). |

png pdf |
Figure 10-a:
Representative unfolded distributions from the simultaneous unfolding are shown for $\tau_{1}^{(0.5)}$ and $\tau_{4}^{(1)}$ in the QCD dijet selection. The results are extracted from the normalized simultaneous unfolding, and the bin contents and the error bars are scaled by the corresponding bin widths. In the unfolded results, shown in the upper panel, the data (black) are compared with the nominal simulation (red), FSR scale variations of the nominal simulation (red, filled triangles), and predictions from the alternative signal (blue, yellow) simulations at the particle level. The ratio of the particle-level predictions to the unfolded data are shown in the lower panel. Shaded bands indicate the total uncertainties (dark grey). |
png pdf |
Figure 10-b:
Representative unfolded distributions from the simultaneous unfolding are shown for $\tau_{1}^{(0.5)}$ and $\tau_{4}^{(1)}$ in the QCD dijet selection. The results are extracted from the normalized simultaneous unfolding, and the bin contents and the error bars are scaled by the corresponding bin widths. In the unfolded results, shown in the upper panel, the data (black) are compared with the nominal simulation (red), FSR scale variations of the nominal simulation (red, filled triangles), and predictions from the alternative signal (blue, yellow) simulations at the particle level. The ratio of the particle-level predictions to the unfolded data are shown in the lower panel. Shaded bands indicate the total uncertainties (dark grey). |
png pdf |
Figure 11:
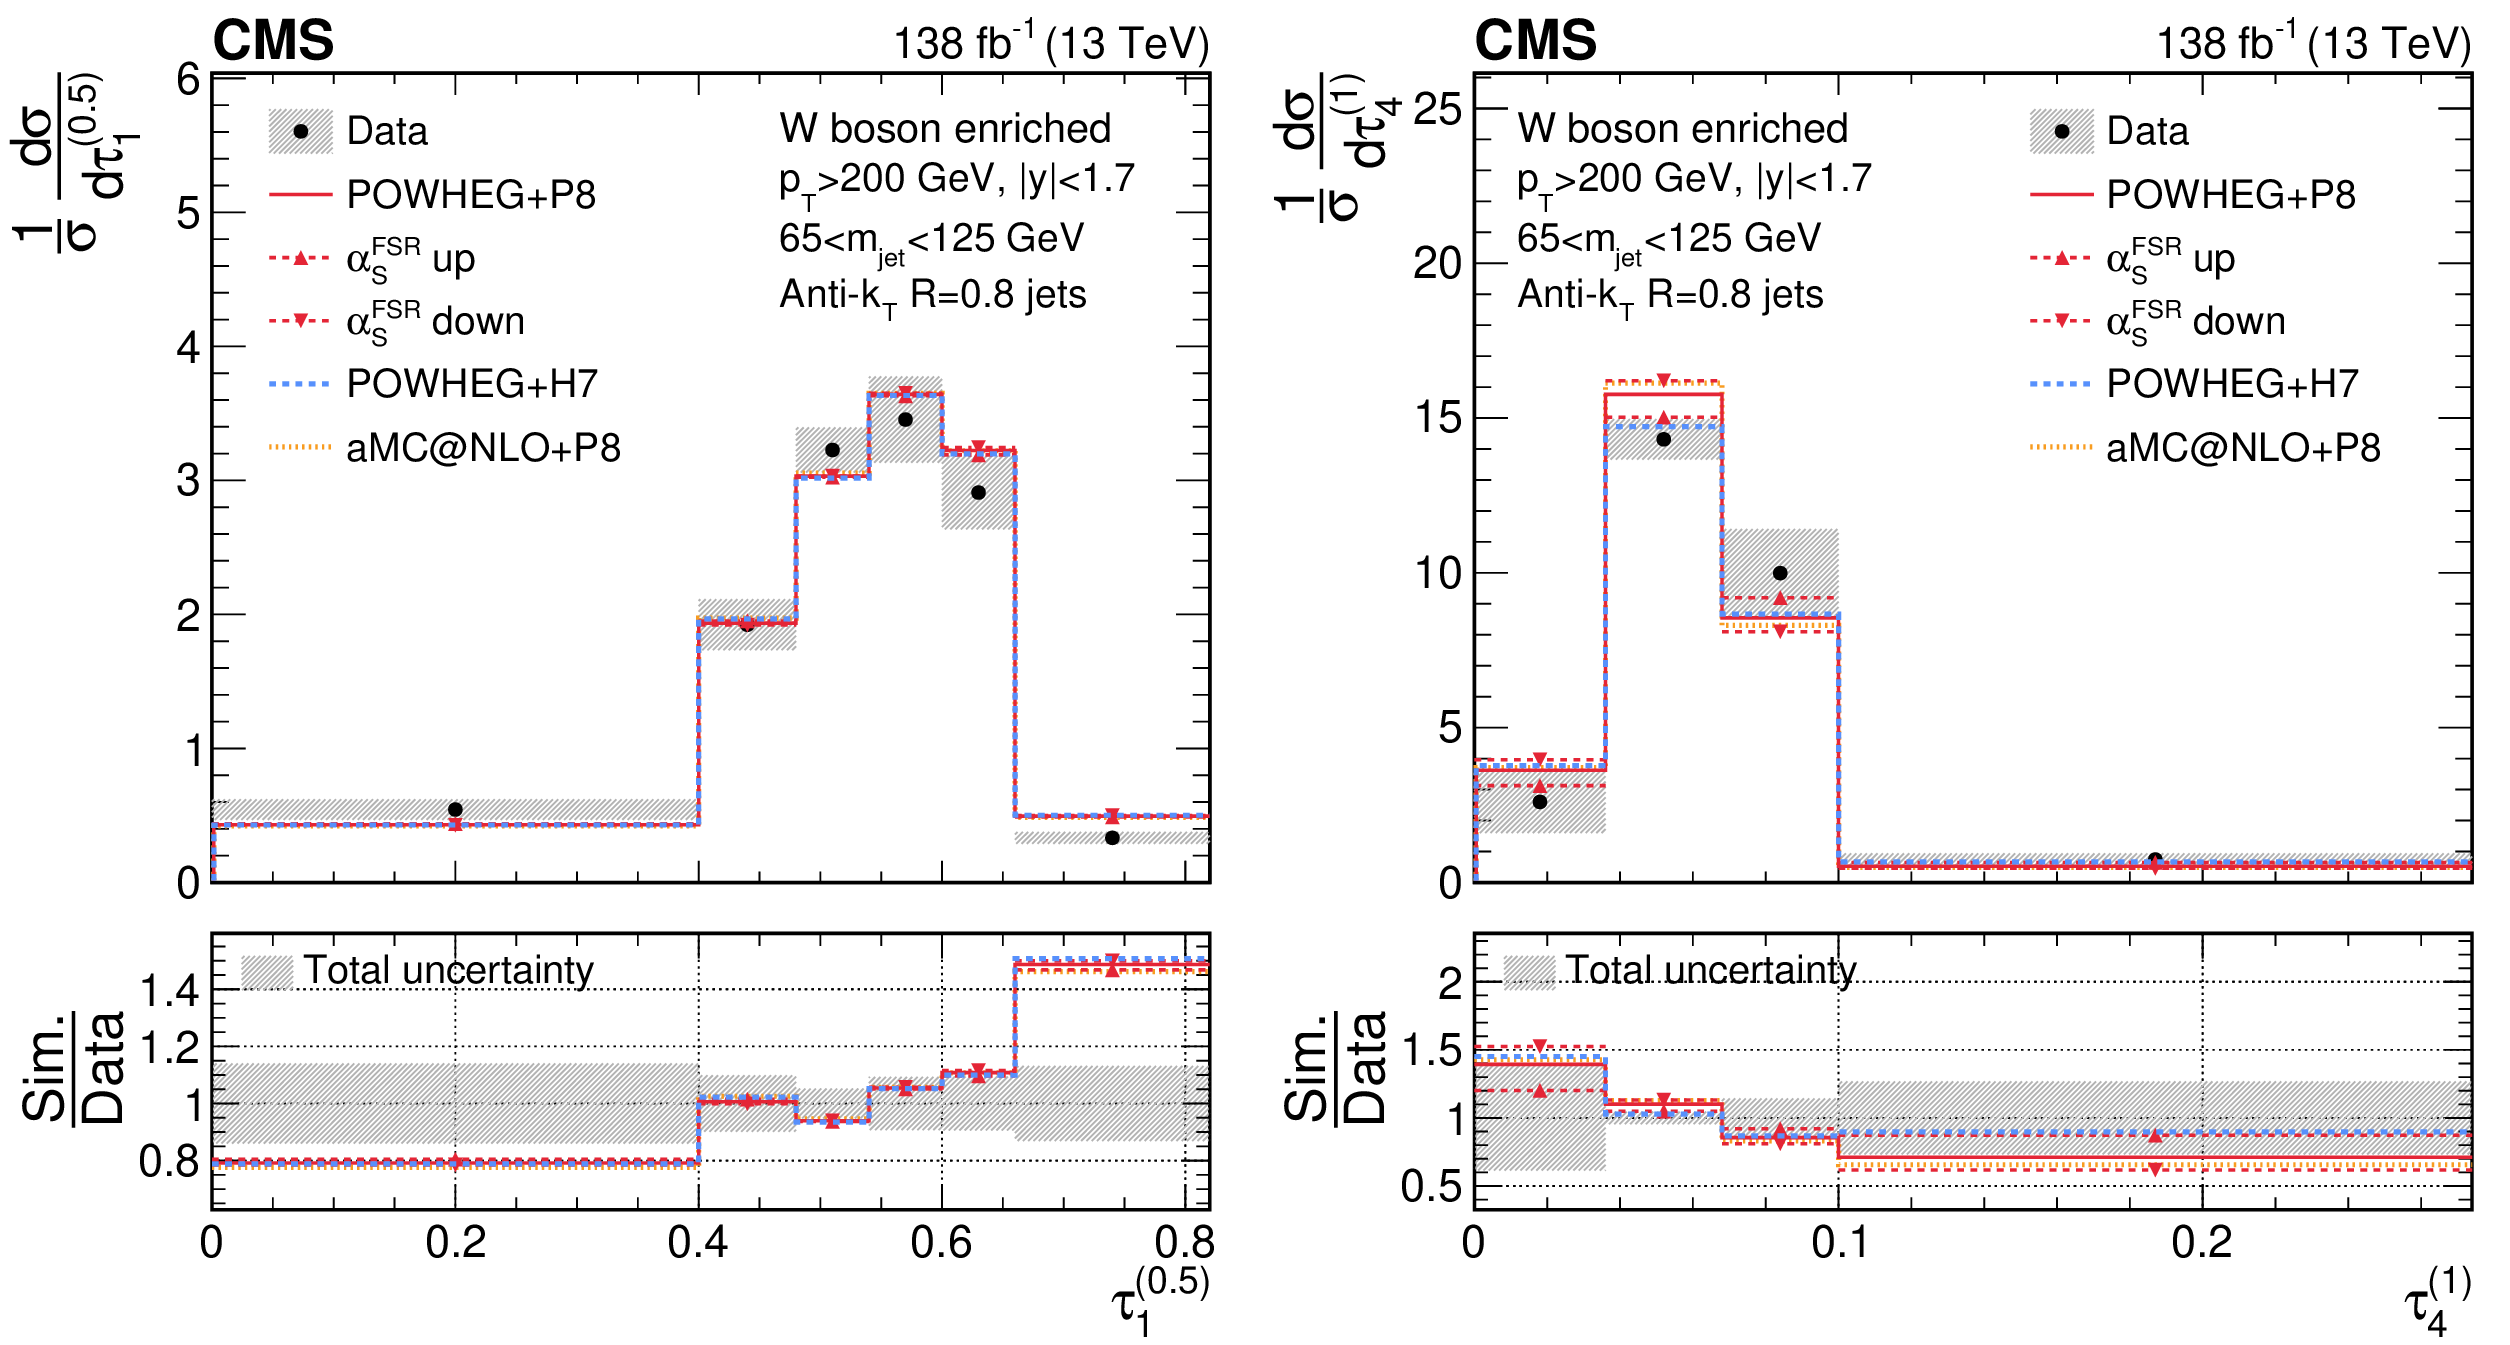
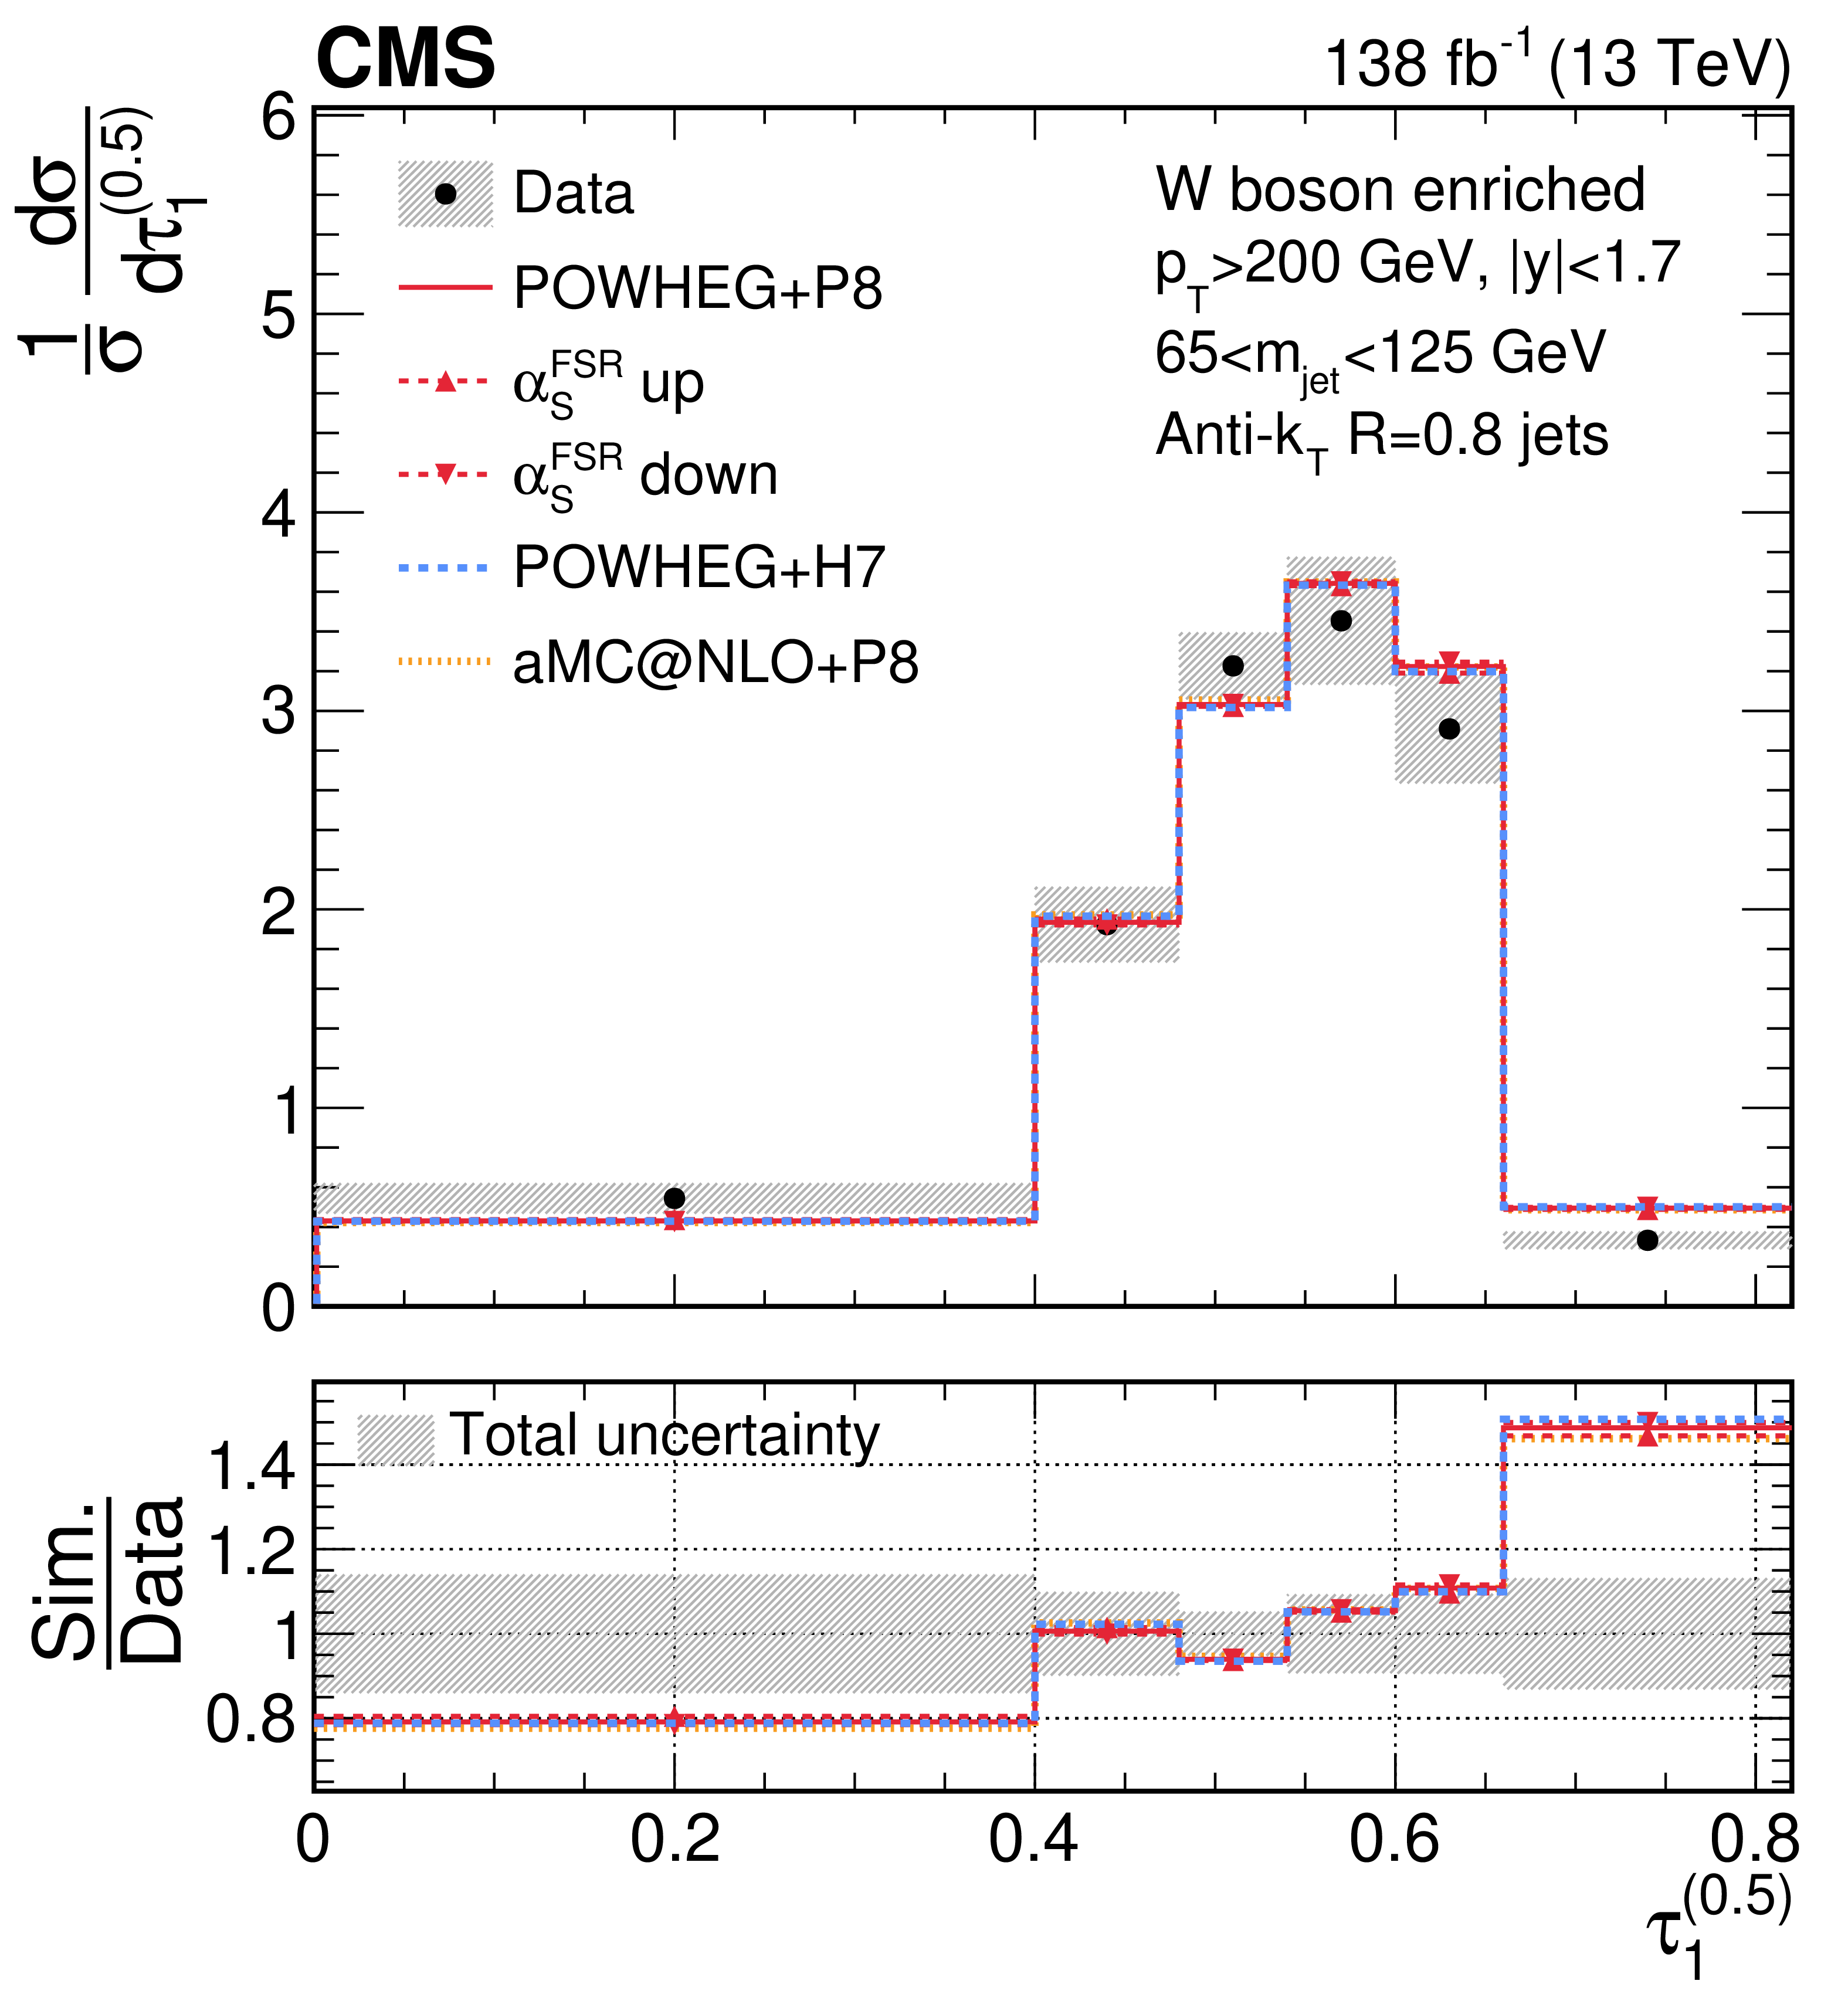
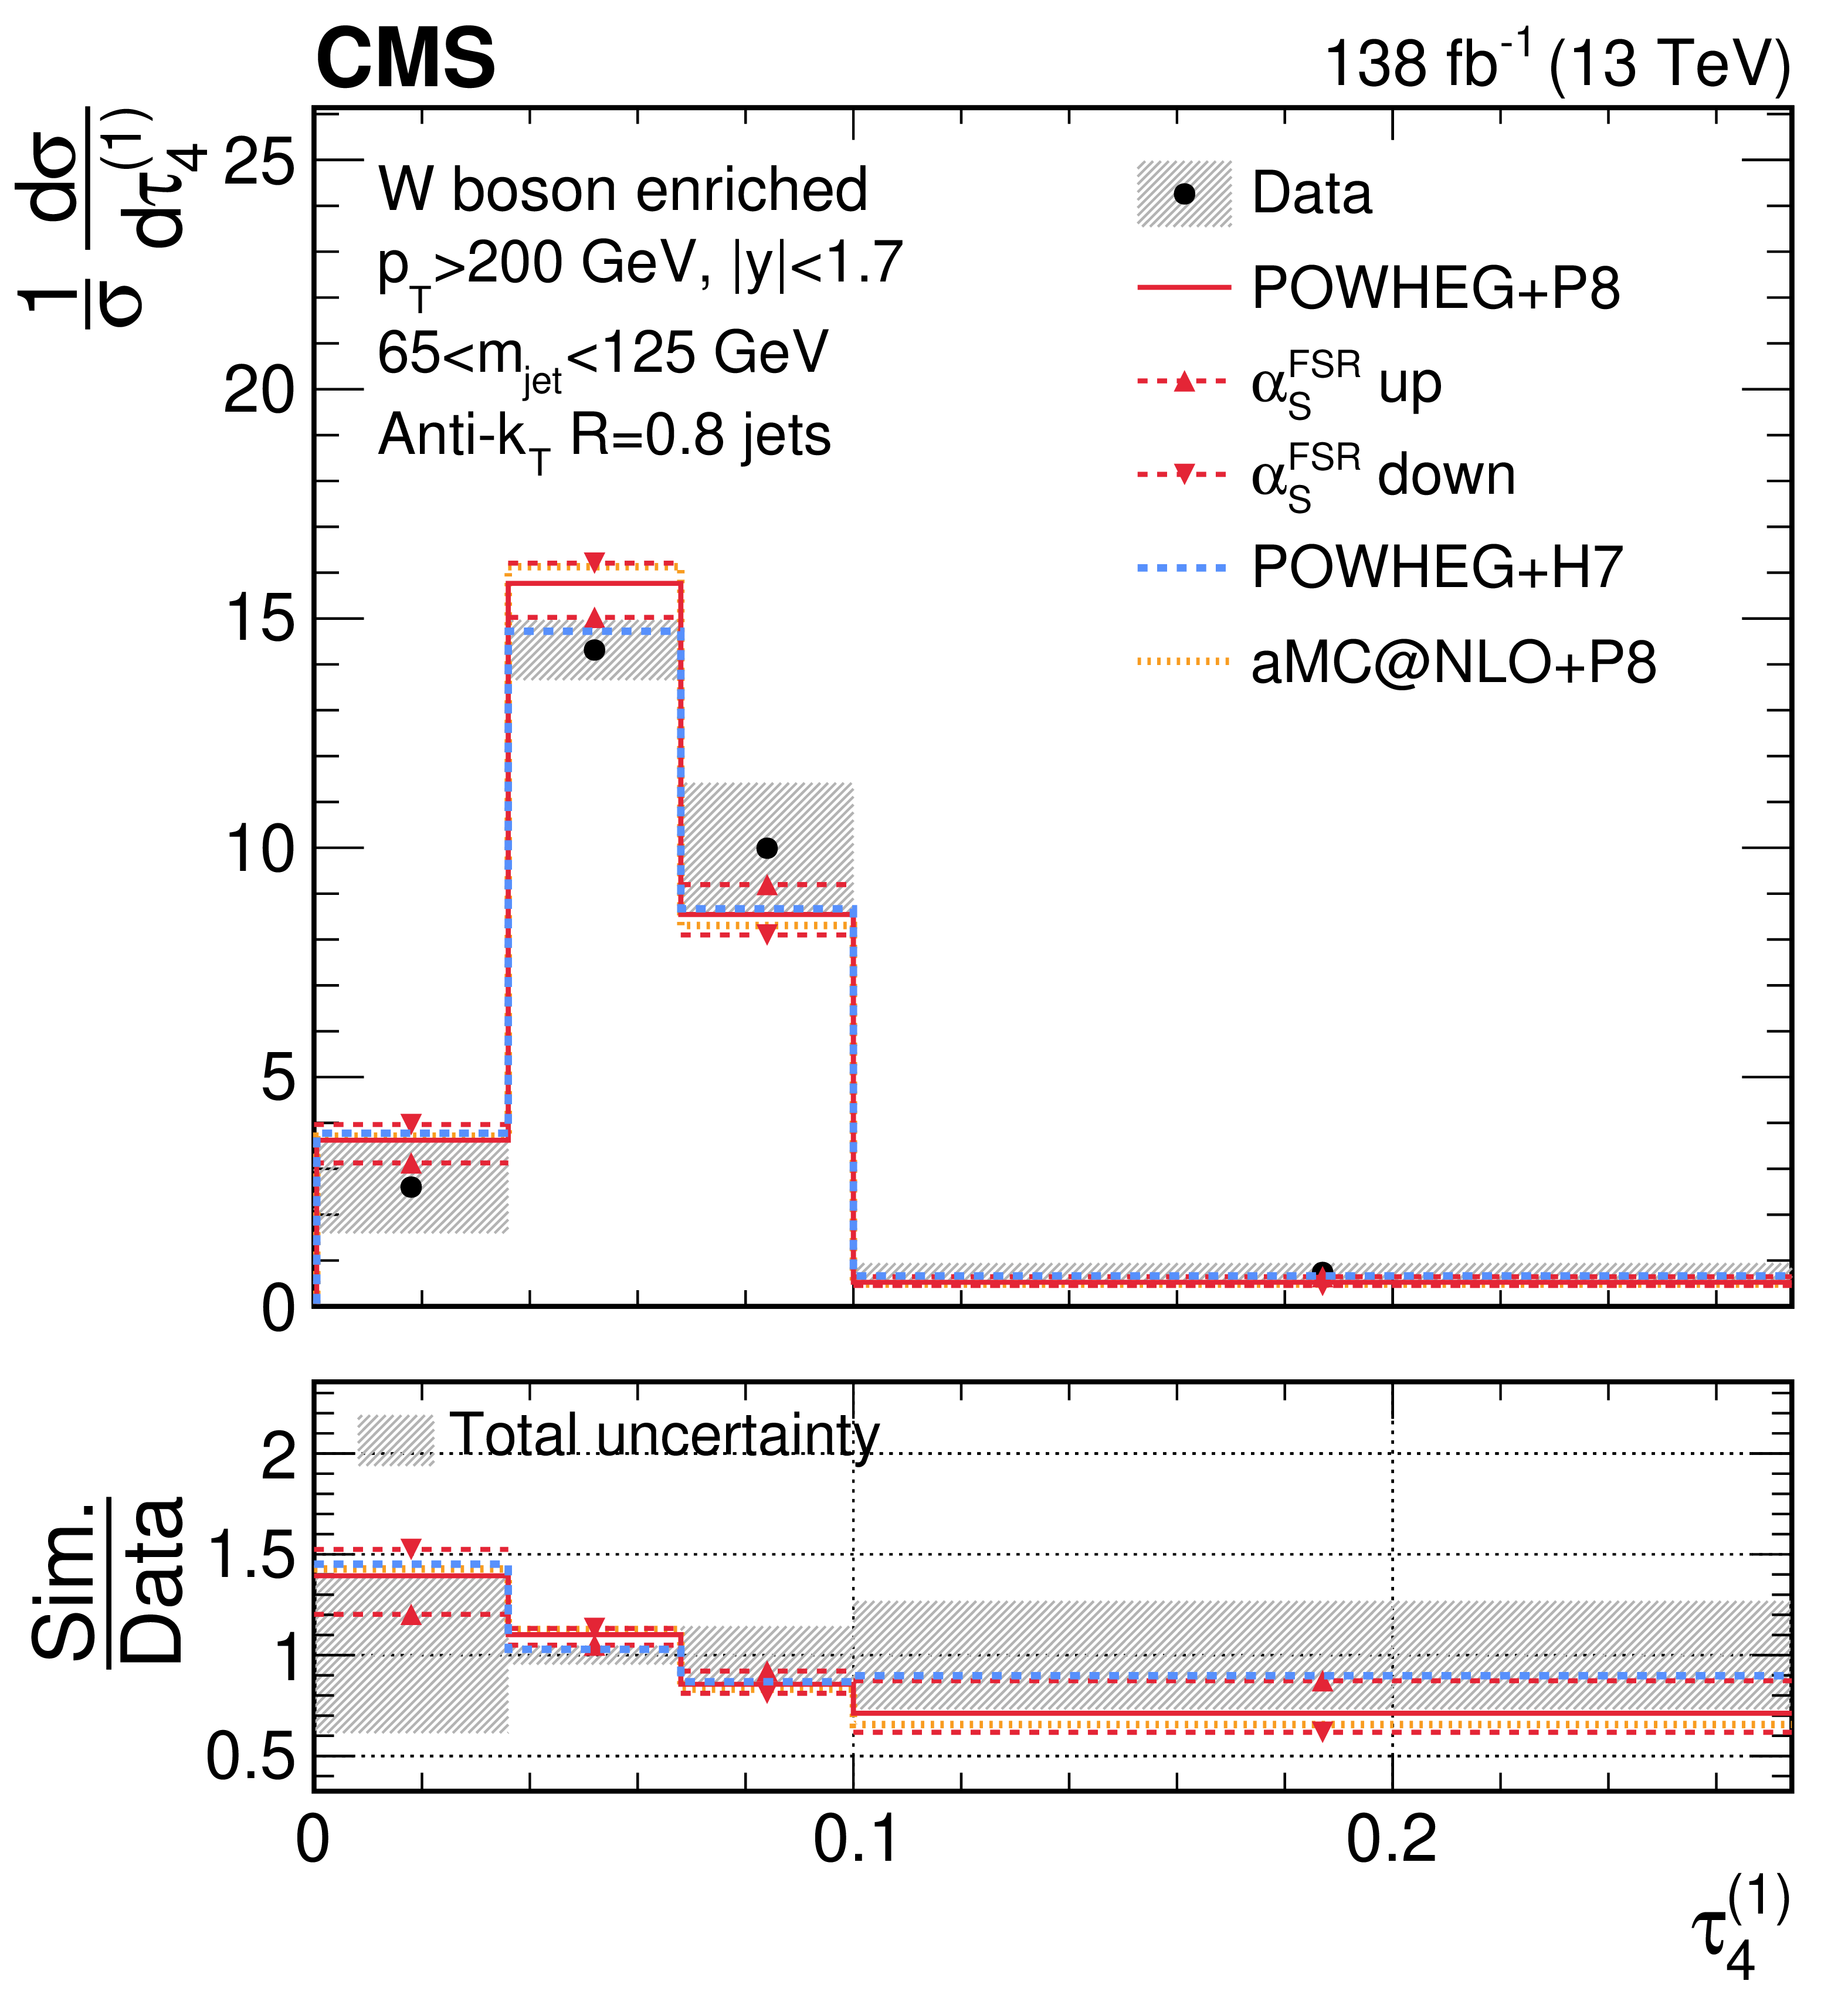
Representative unfolded distributions from the simultaneous unfolding are shown for $\tau_{1}^{(0.5)}$ and $\tau_{4}^{(1)}$ in the boosted W boson-enriched selection. The results are extracted from the normalized simultaneous unfolding, and the bin contents and the error bars are scaled by their corresponding bin widths. More details are provided in the caption of Fig. 10. |
png pdf |
Figure 11-a:
Representative unfolded distributions from the simultaneous unfolding are shown for $\tau_{1}^{(0.5)}$ and $\tau_{4}^{(1)}$ in the boosted W boson-enriched selection. The results are extracted from the normalized simultaneous unfolding, and the bin contents and the error bars are scaled by their corresponding bin widths. More details are provided in the caption of Fig. 10. |
png pdf |
Figure 11-b:
Representative unfolded distributions from the simultaneous unfolding are shown for $\tau_{1}^{(0.5)}$ and $\tau_{4}^{(1)}$ in the boosted W boson-enriched selection. The results are extracted from the normalized simultaneous unfolding, and the bin contents and the error bars are scaled by their corresponding bin widths. More details are provided in the caption of Fig. 10. |
png pdf |
Figure 12:
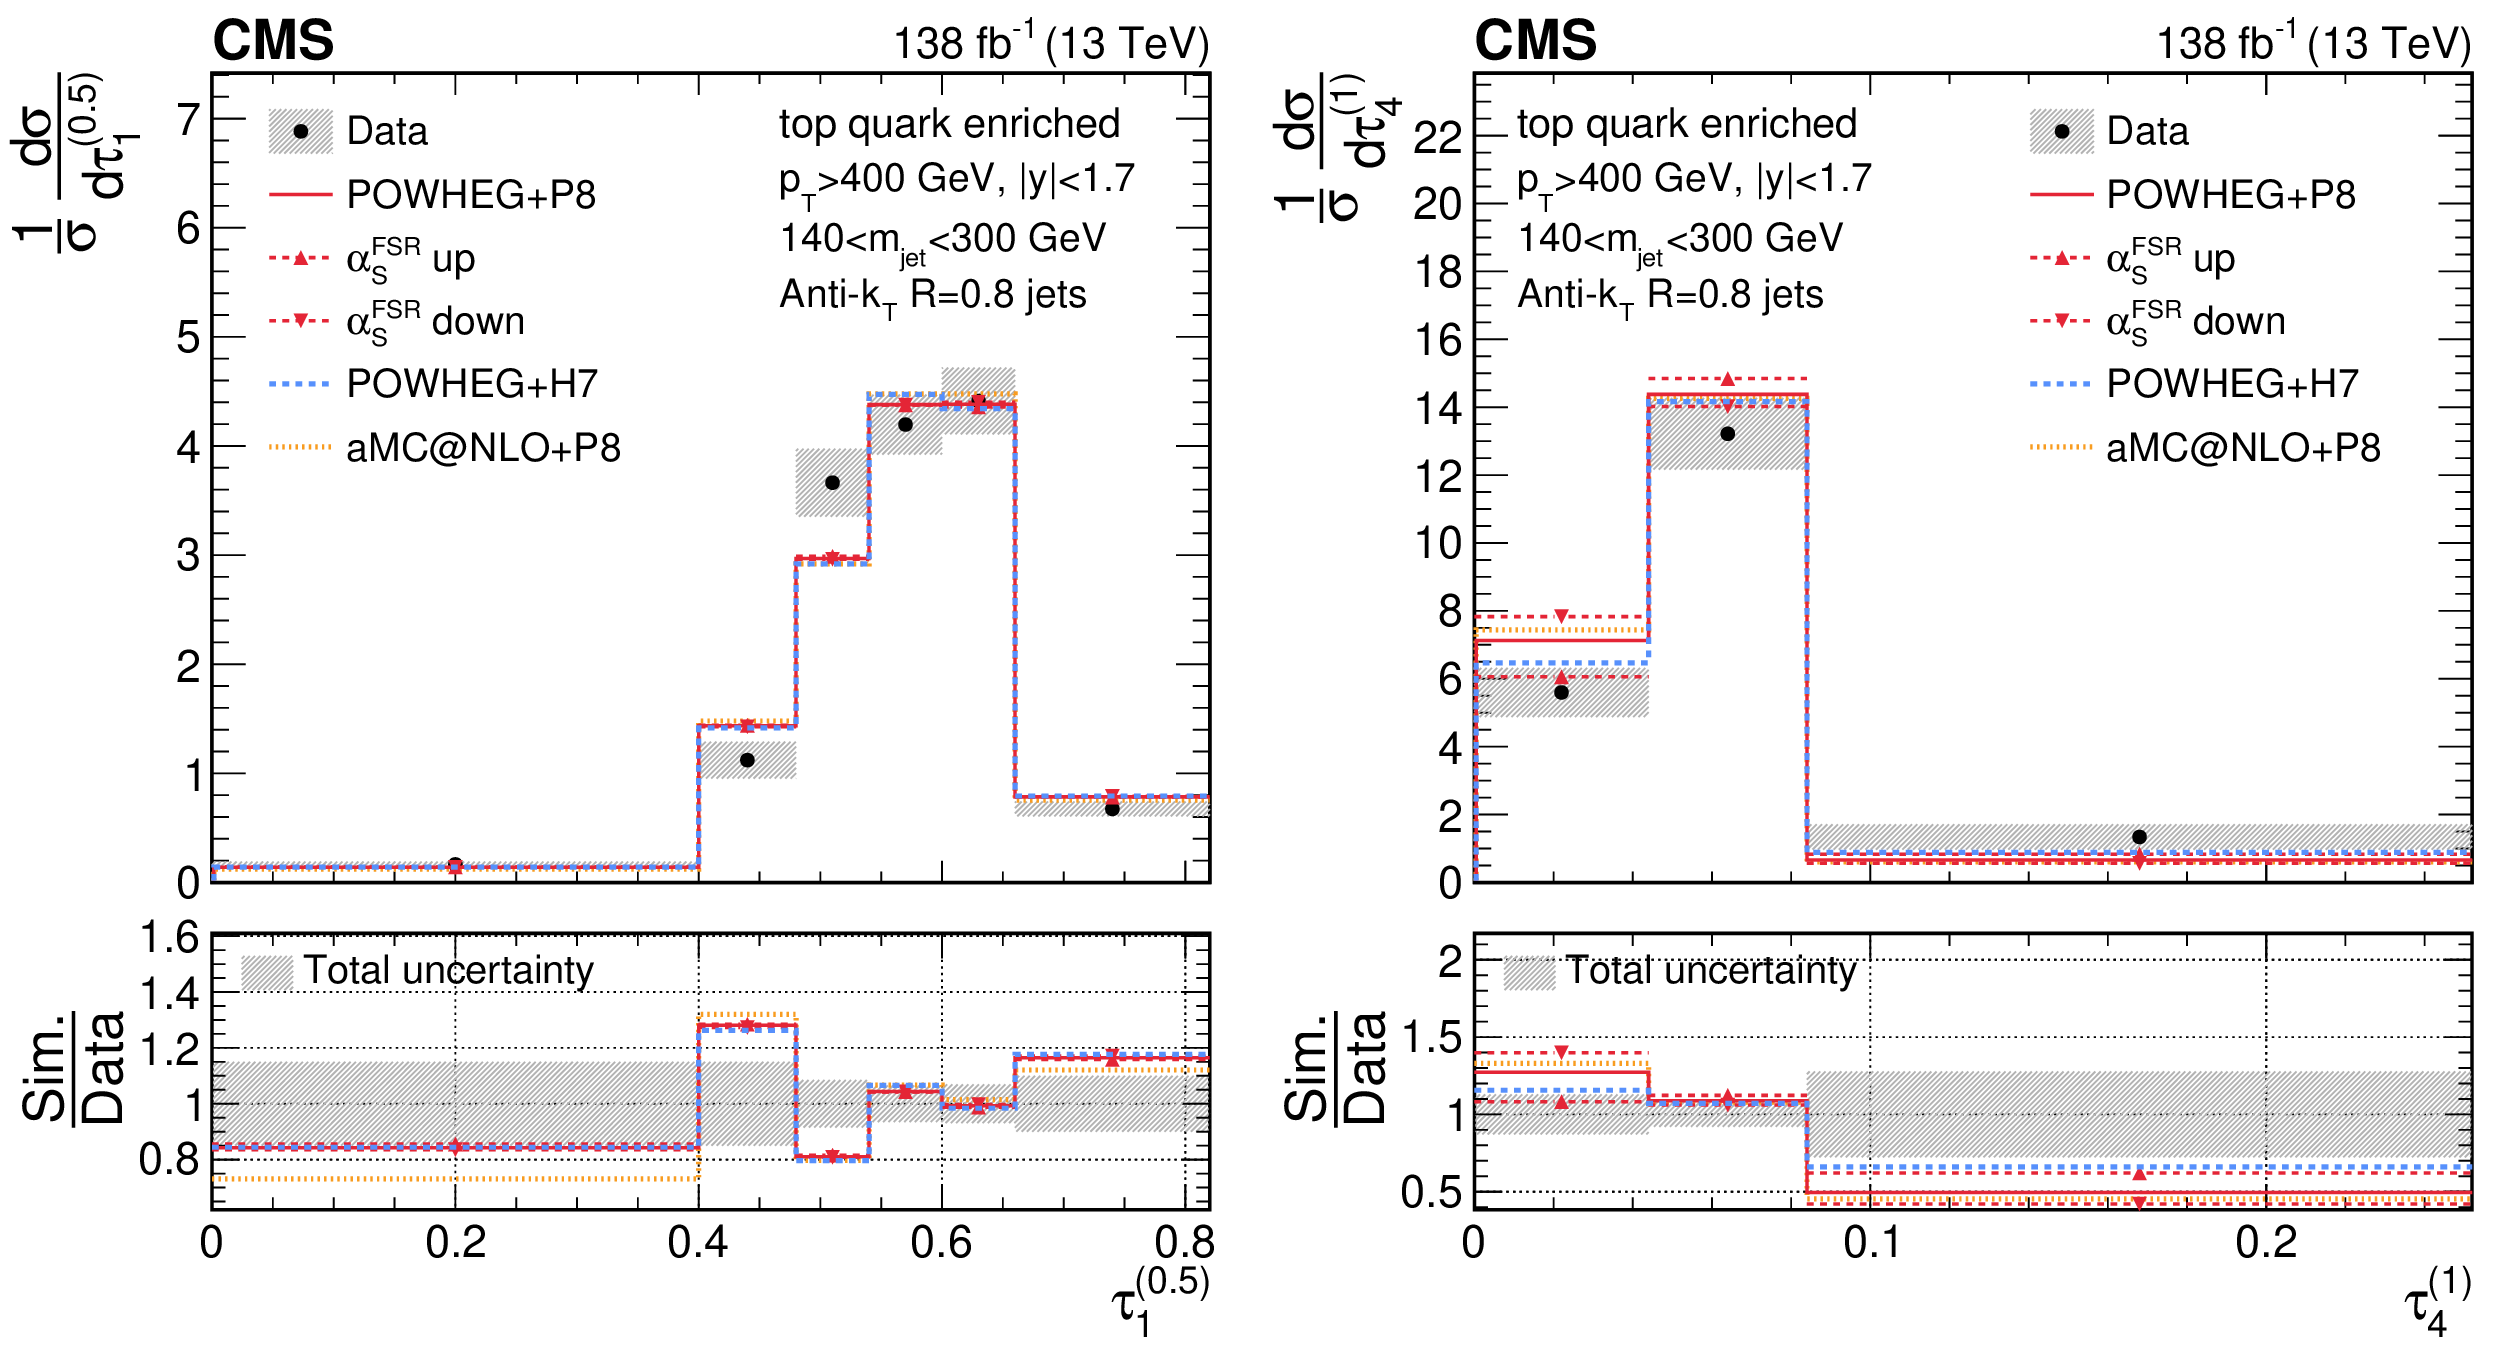
Representative unfolded distributions of individual observables, $\tau_{1}^{(0.5)}$ and $\tau_{4}^{(1)}$, are shown for measurements in the boosted top quark-enriched selection. The results are extracted from the normalized simultaneous unfolding, and the bin contents and the error bars are scaled by their corresponding bin widths. More details are provided in the caption of Fig. 10. |

png pdf |
Figure 12-a:
Representative unfolded distributions of individual observables, $\tau_{1}^{(0.5)}$ and $\tau_{4}^{(1)}$, are shown for measurements in the boosted top quark-enriched selection. The results are extracted from the normalized simultaneous unfolding, and the bin contents and the error bars are scaled by their corresponding bin widths. More details are provided in the caption of Fig. 10. |

png pdf |
Figure 12-b:
Representative unfolded distributions of individual observables, $\tau_{1}^{(0.5)}$ and $\tau_{4}^{(1)}$, are shown for measurements in the boosted top quark-enriched selection. The results are extracted from the normalized simultaneous unfolding, and the bin contents and the error bars are scaled by their corresponding bin widths. More details are provided in the caption of Fig. 10. |
png pdf |
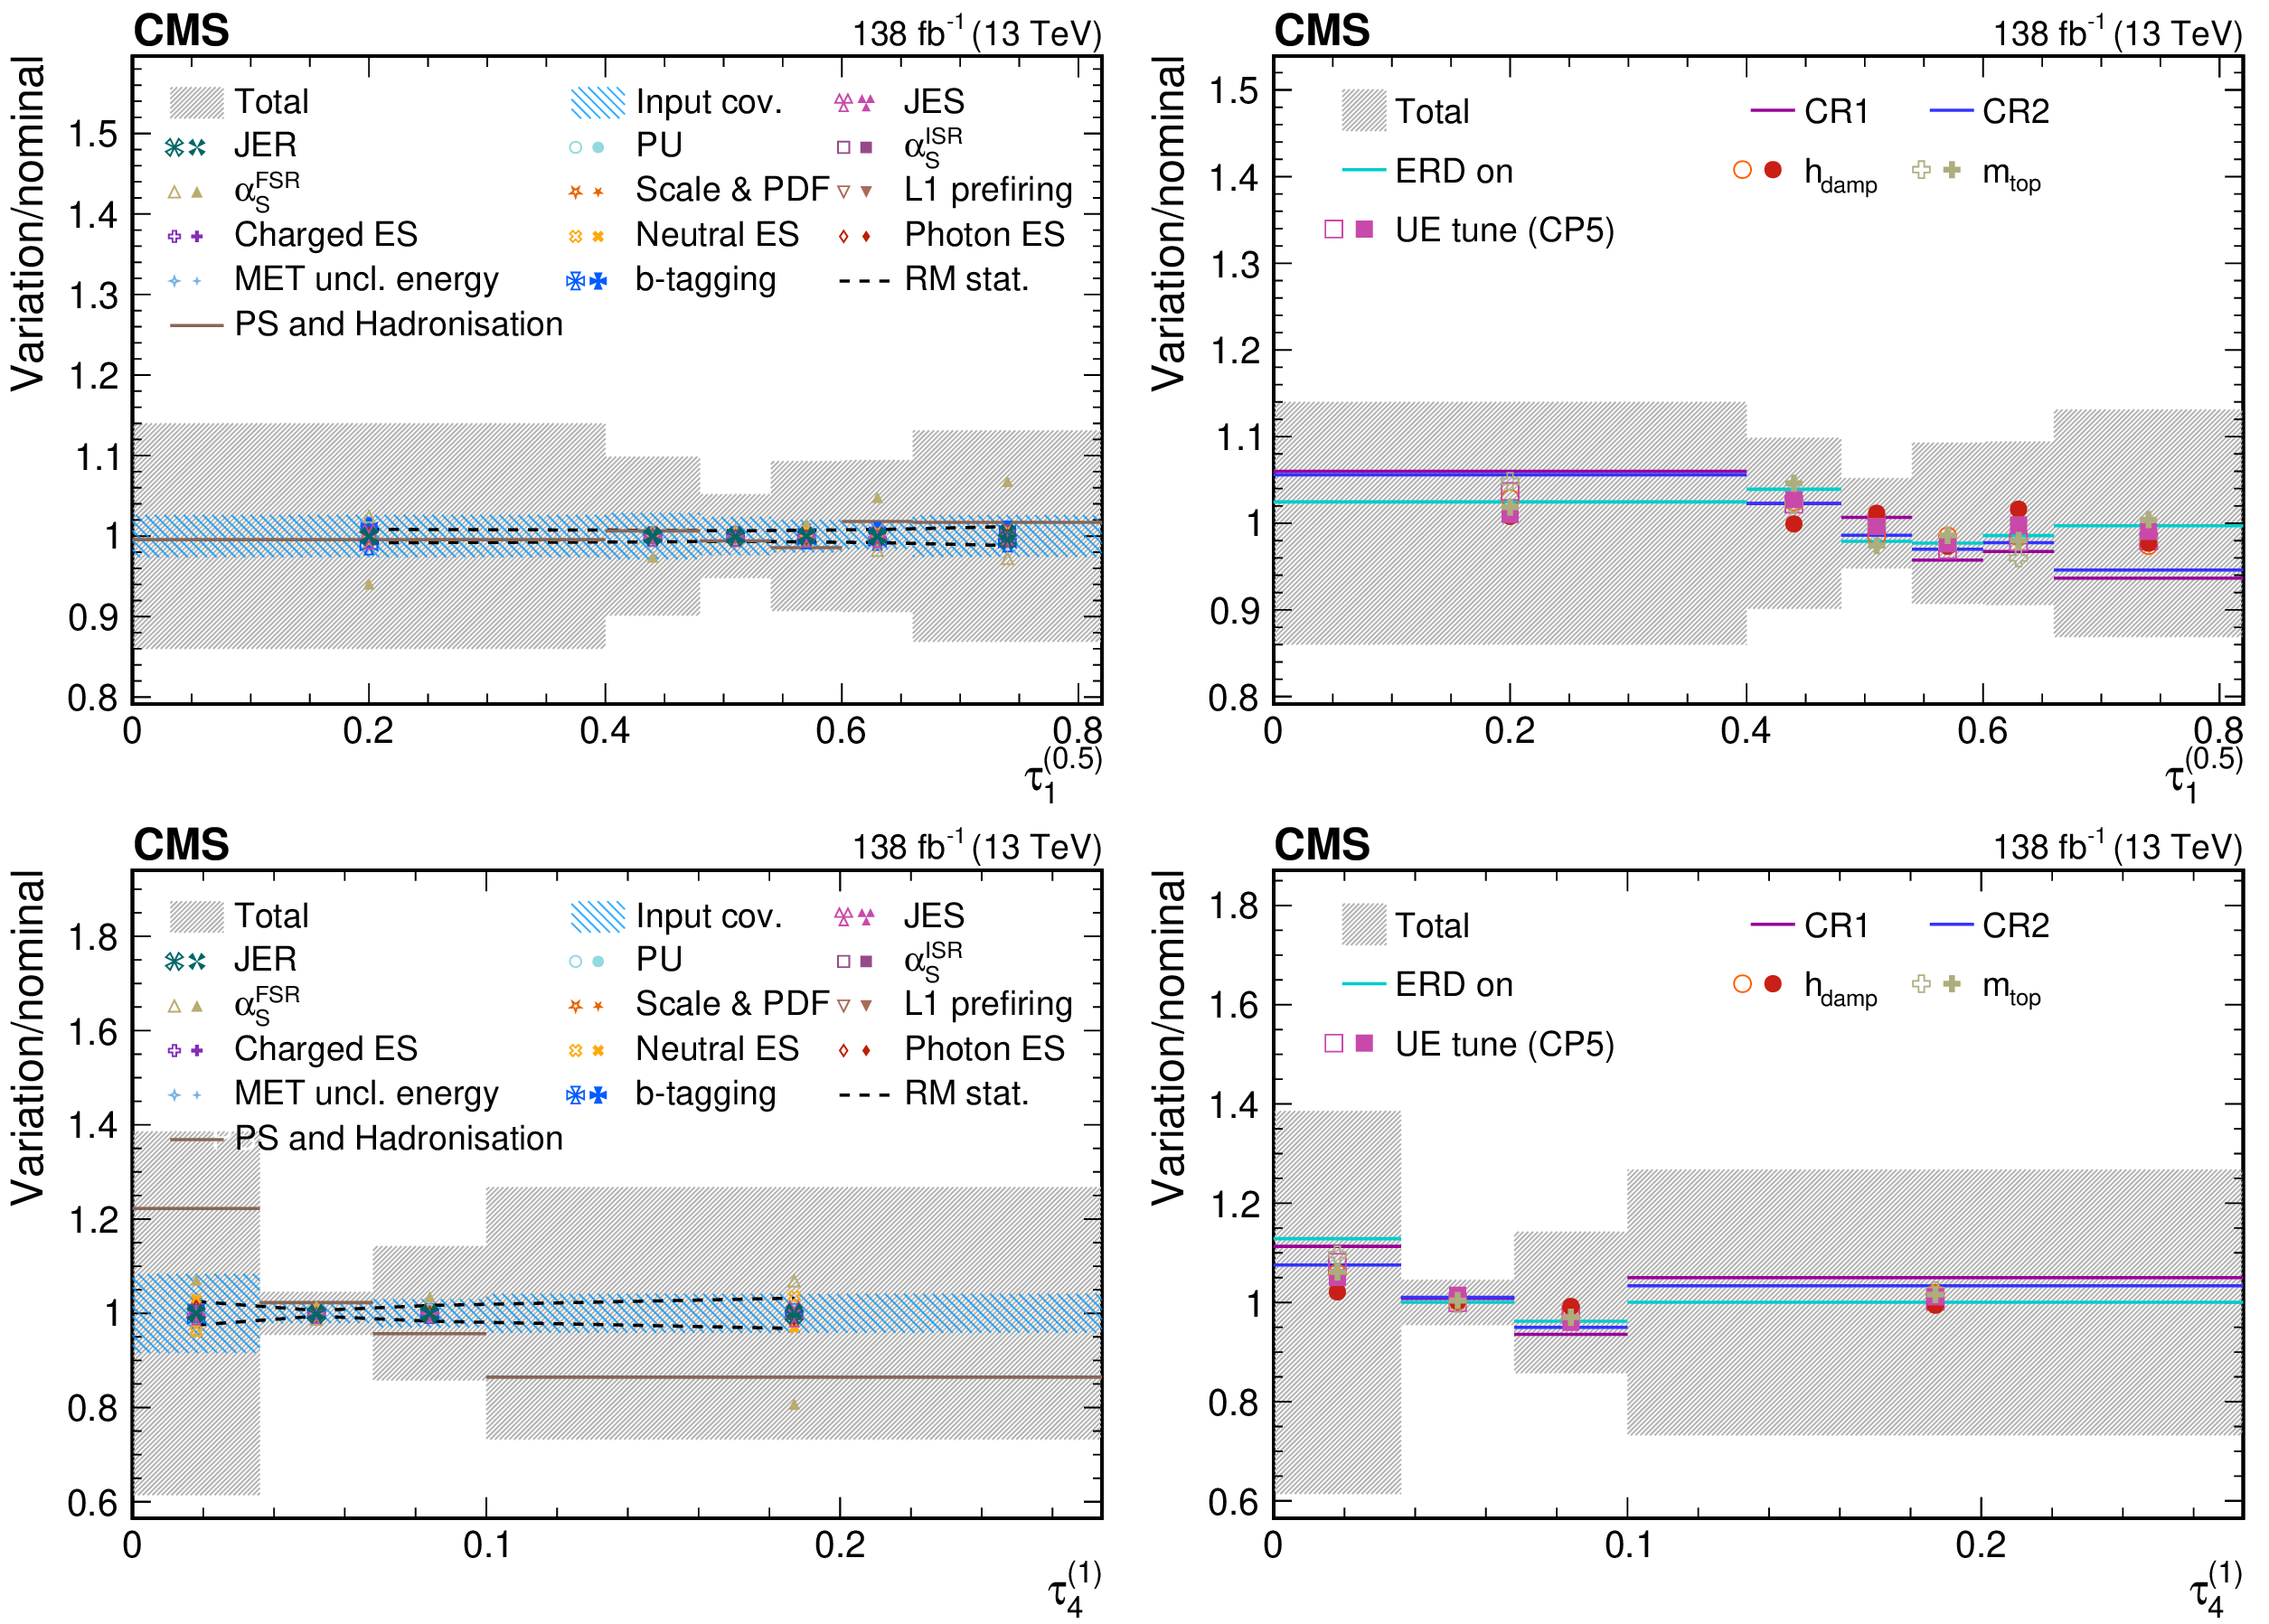
Figure 13:
Uncertainty breakdown estimates for the measurements of $\tau_{1}^{(0.5)}$ and $\tau_{4}^{(1)}$ in QCD dijets. These include all sources of experimental and modelling uncertainties that are common between the QCD dijet and W boson or top quark measurements. The shaded bands indicate the total (dark grey), and data statistical and background subtraction (blue) uncertainties for the unfolded distribution, uncertainties from the number of events in simulated samples for the nominal response matrix and background contributions are illustrated with dashed lines, and up (down) variations of relevant systematics are shown with filled (open) markers of the same colour and shape. Contributions from the showering and hadronization uncertainty are estimated using HERWIG 7 and are illustrated with a solid line as a one-sided shift. |

png pdf |
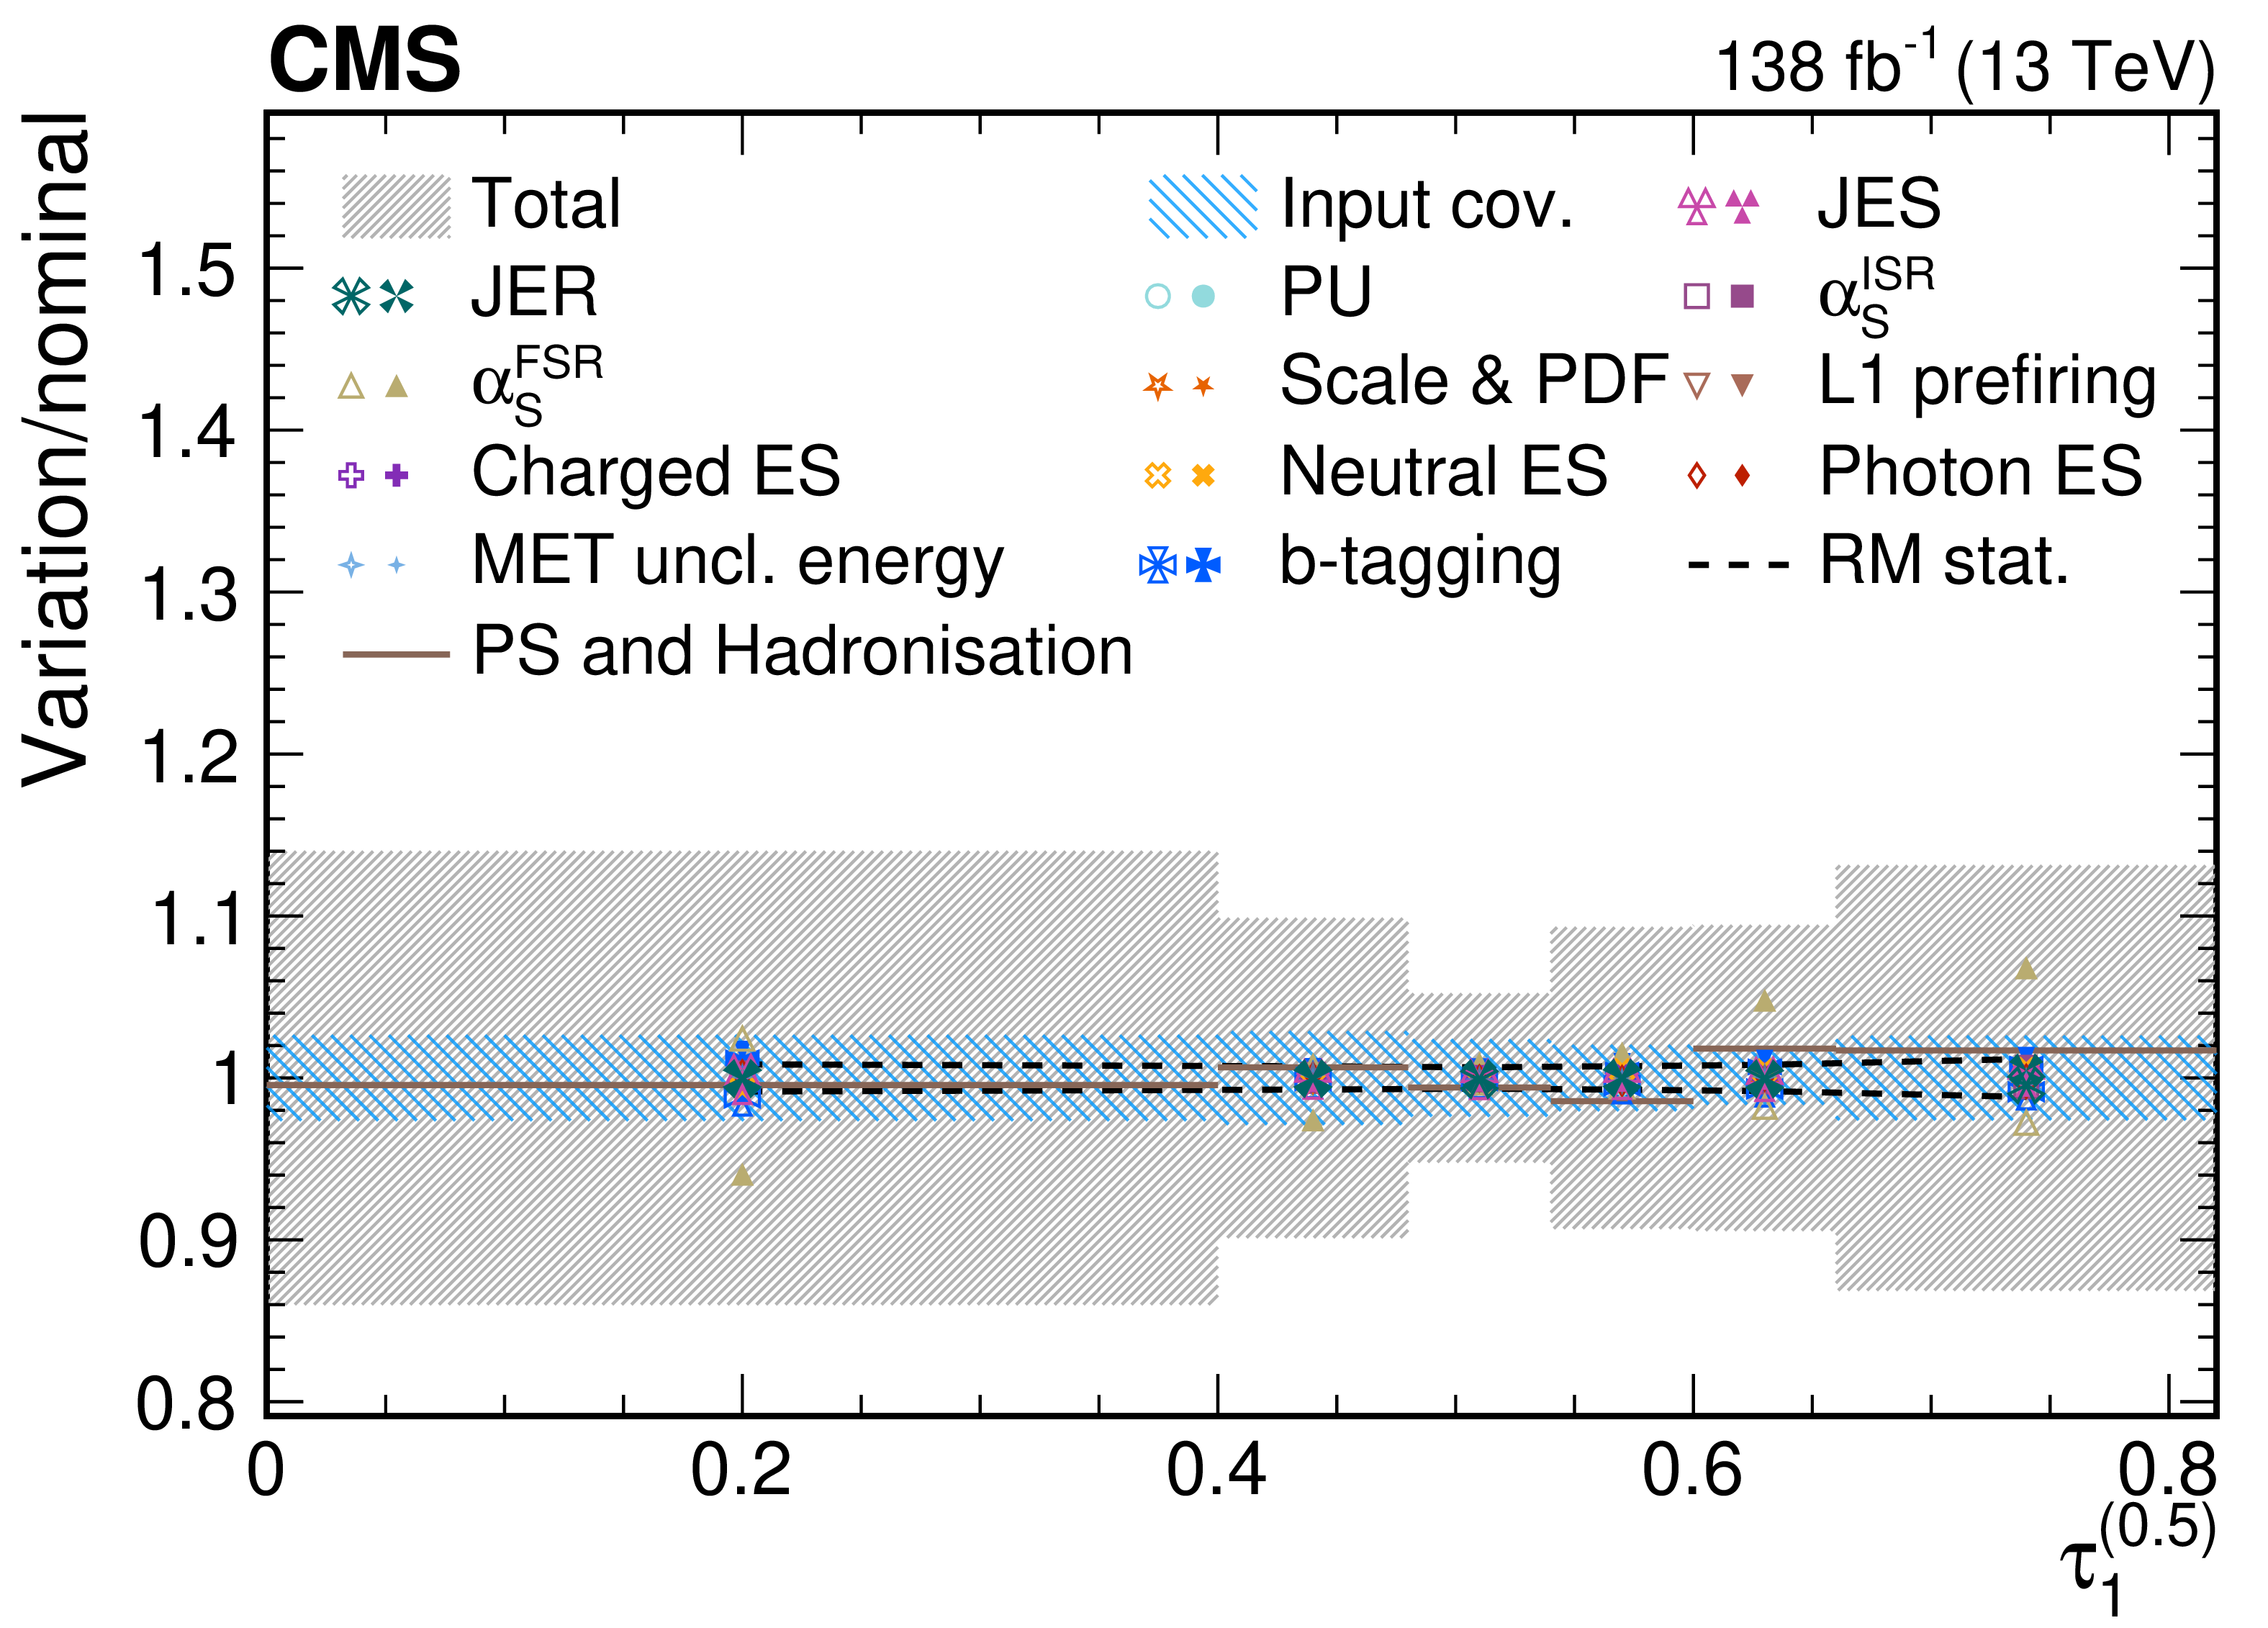
Figure 13-a:
Uncertainty breakdown estimates for the measurements of $\tau_{1}^{(0.5)}$ and $\tau_{4}^{(1)}$ in QCD dijets. These include all sources of experimental and modelling uncertainties that are common between the QCD dijet and W boson or top quark measurements. The shaded bands indicate the total (dark grey), and data statistical and background subtraction (blue) uncertainties for the unfolded distribution, uncertainties from the number of events in simulated samples for the nominal response matrix and background contributions are illustrated with dashed lines, and up (down) variations of relevant systematics are shown with filled (open) markers of the same colour and shape. Contributions from the showering and hadronization uncertainty are estimated using HERWIG 7 and are illustrated with a solid line as a one-sided shift. |

png pdf |
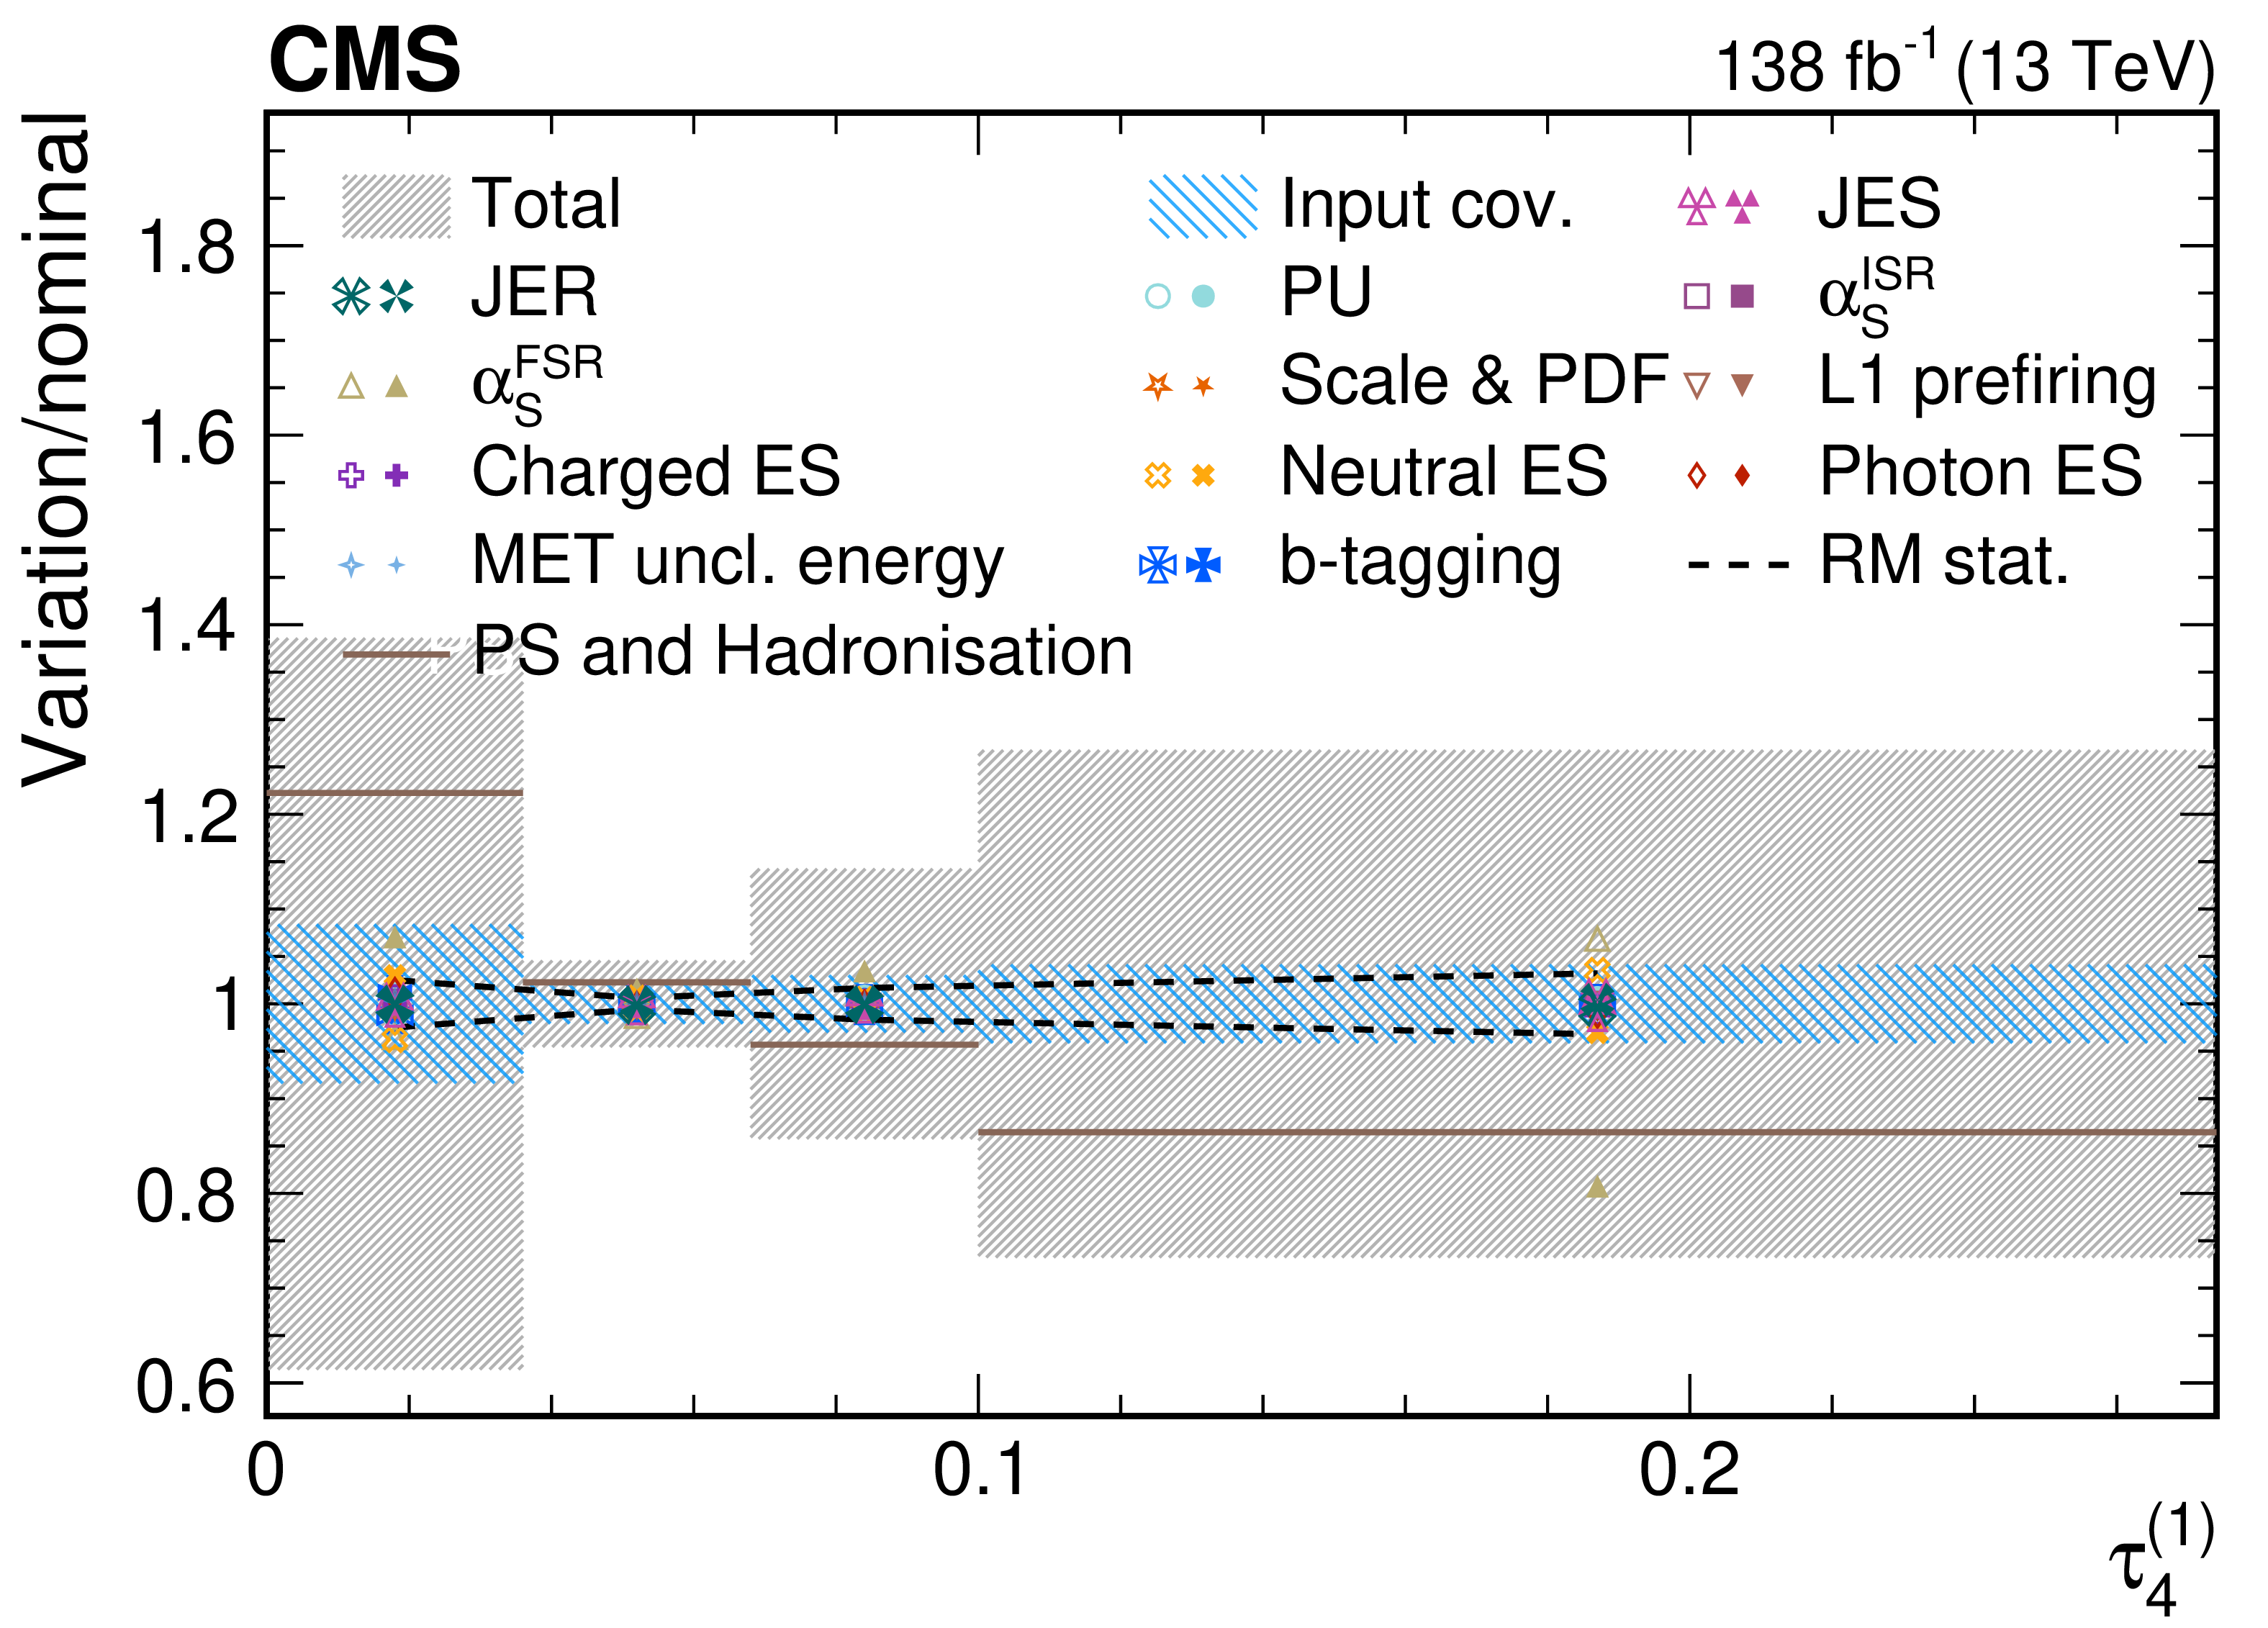
Figure 13-b:
Uncertainty breakdown estimates for the measurements of $\tau_{1}^{(0.5)}$ and $\tau_{4}^{(1)}$ in QCD dijets. These include all sources of experimental and modelling uncertainties that are common between the QCD dijet and W boson or top quark measurements. The shaded bands indicate the total (dark grey), and data statistical and background subtraction (blue) uncertainties for the unfolded distribution, uncertainties from the number of events in simulated samples for the nominal response matrix and background contributions are illustrated with dashed lines, and up (down) variations of relevant systematics are shown with filled (open) markers of the same colour and shape. Contributions from the showering and hadronization uncertainty are estimated using HERWIG 7 and are illustrated with a solid line as a one-sided shift. |
png pdf |
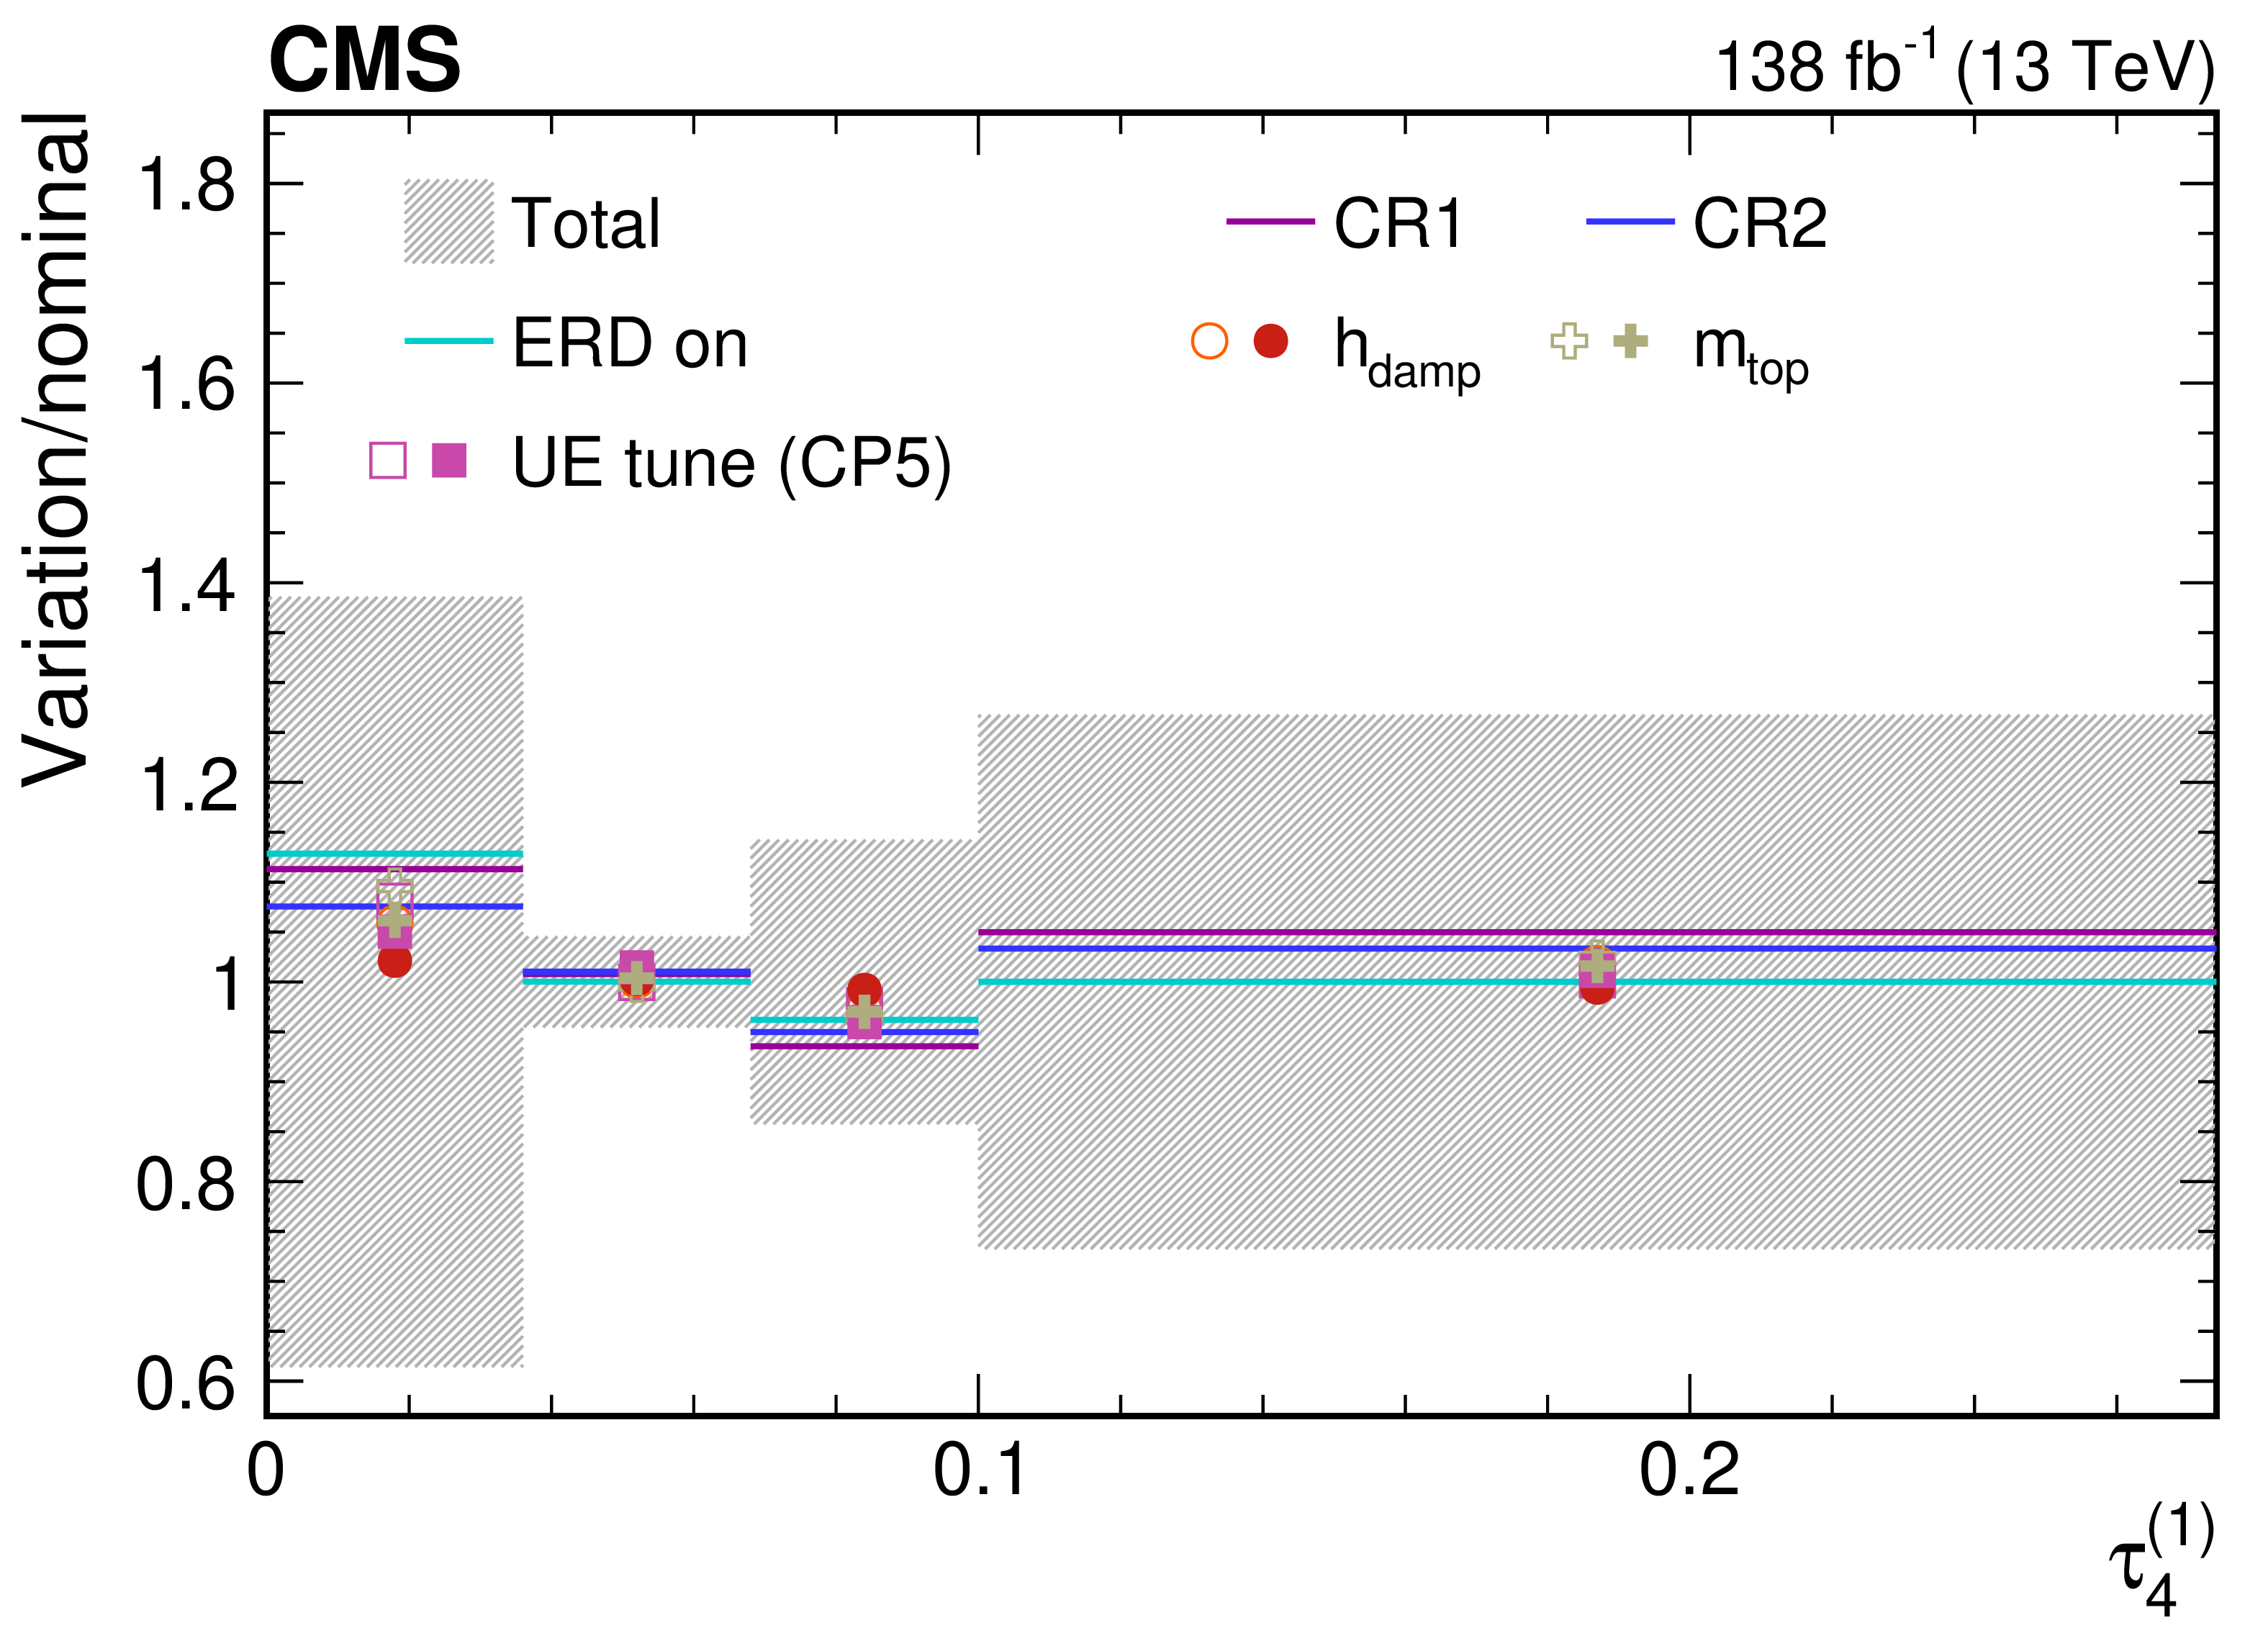
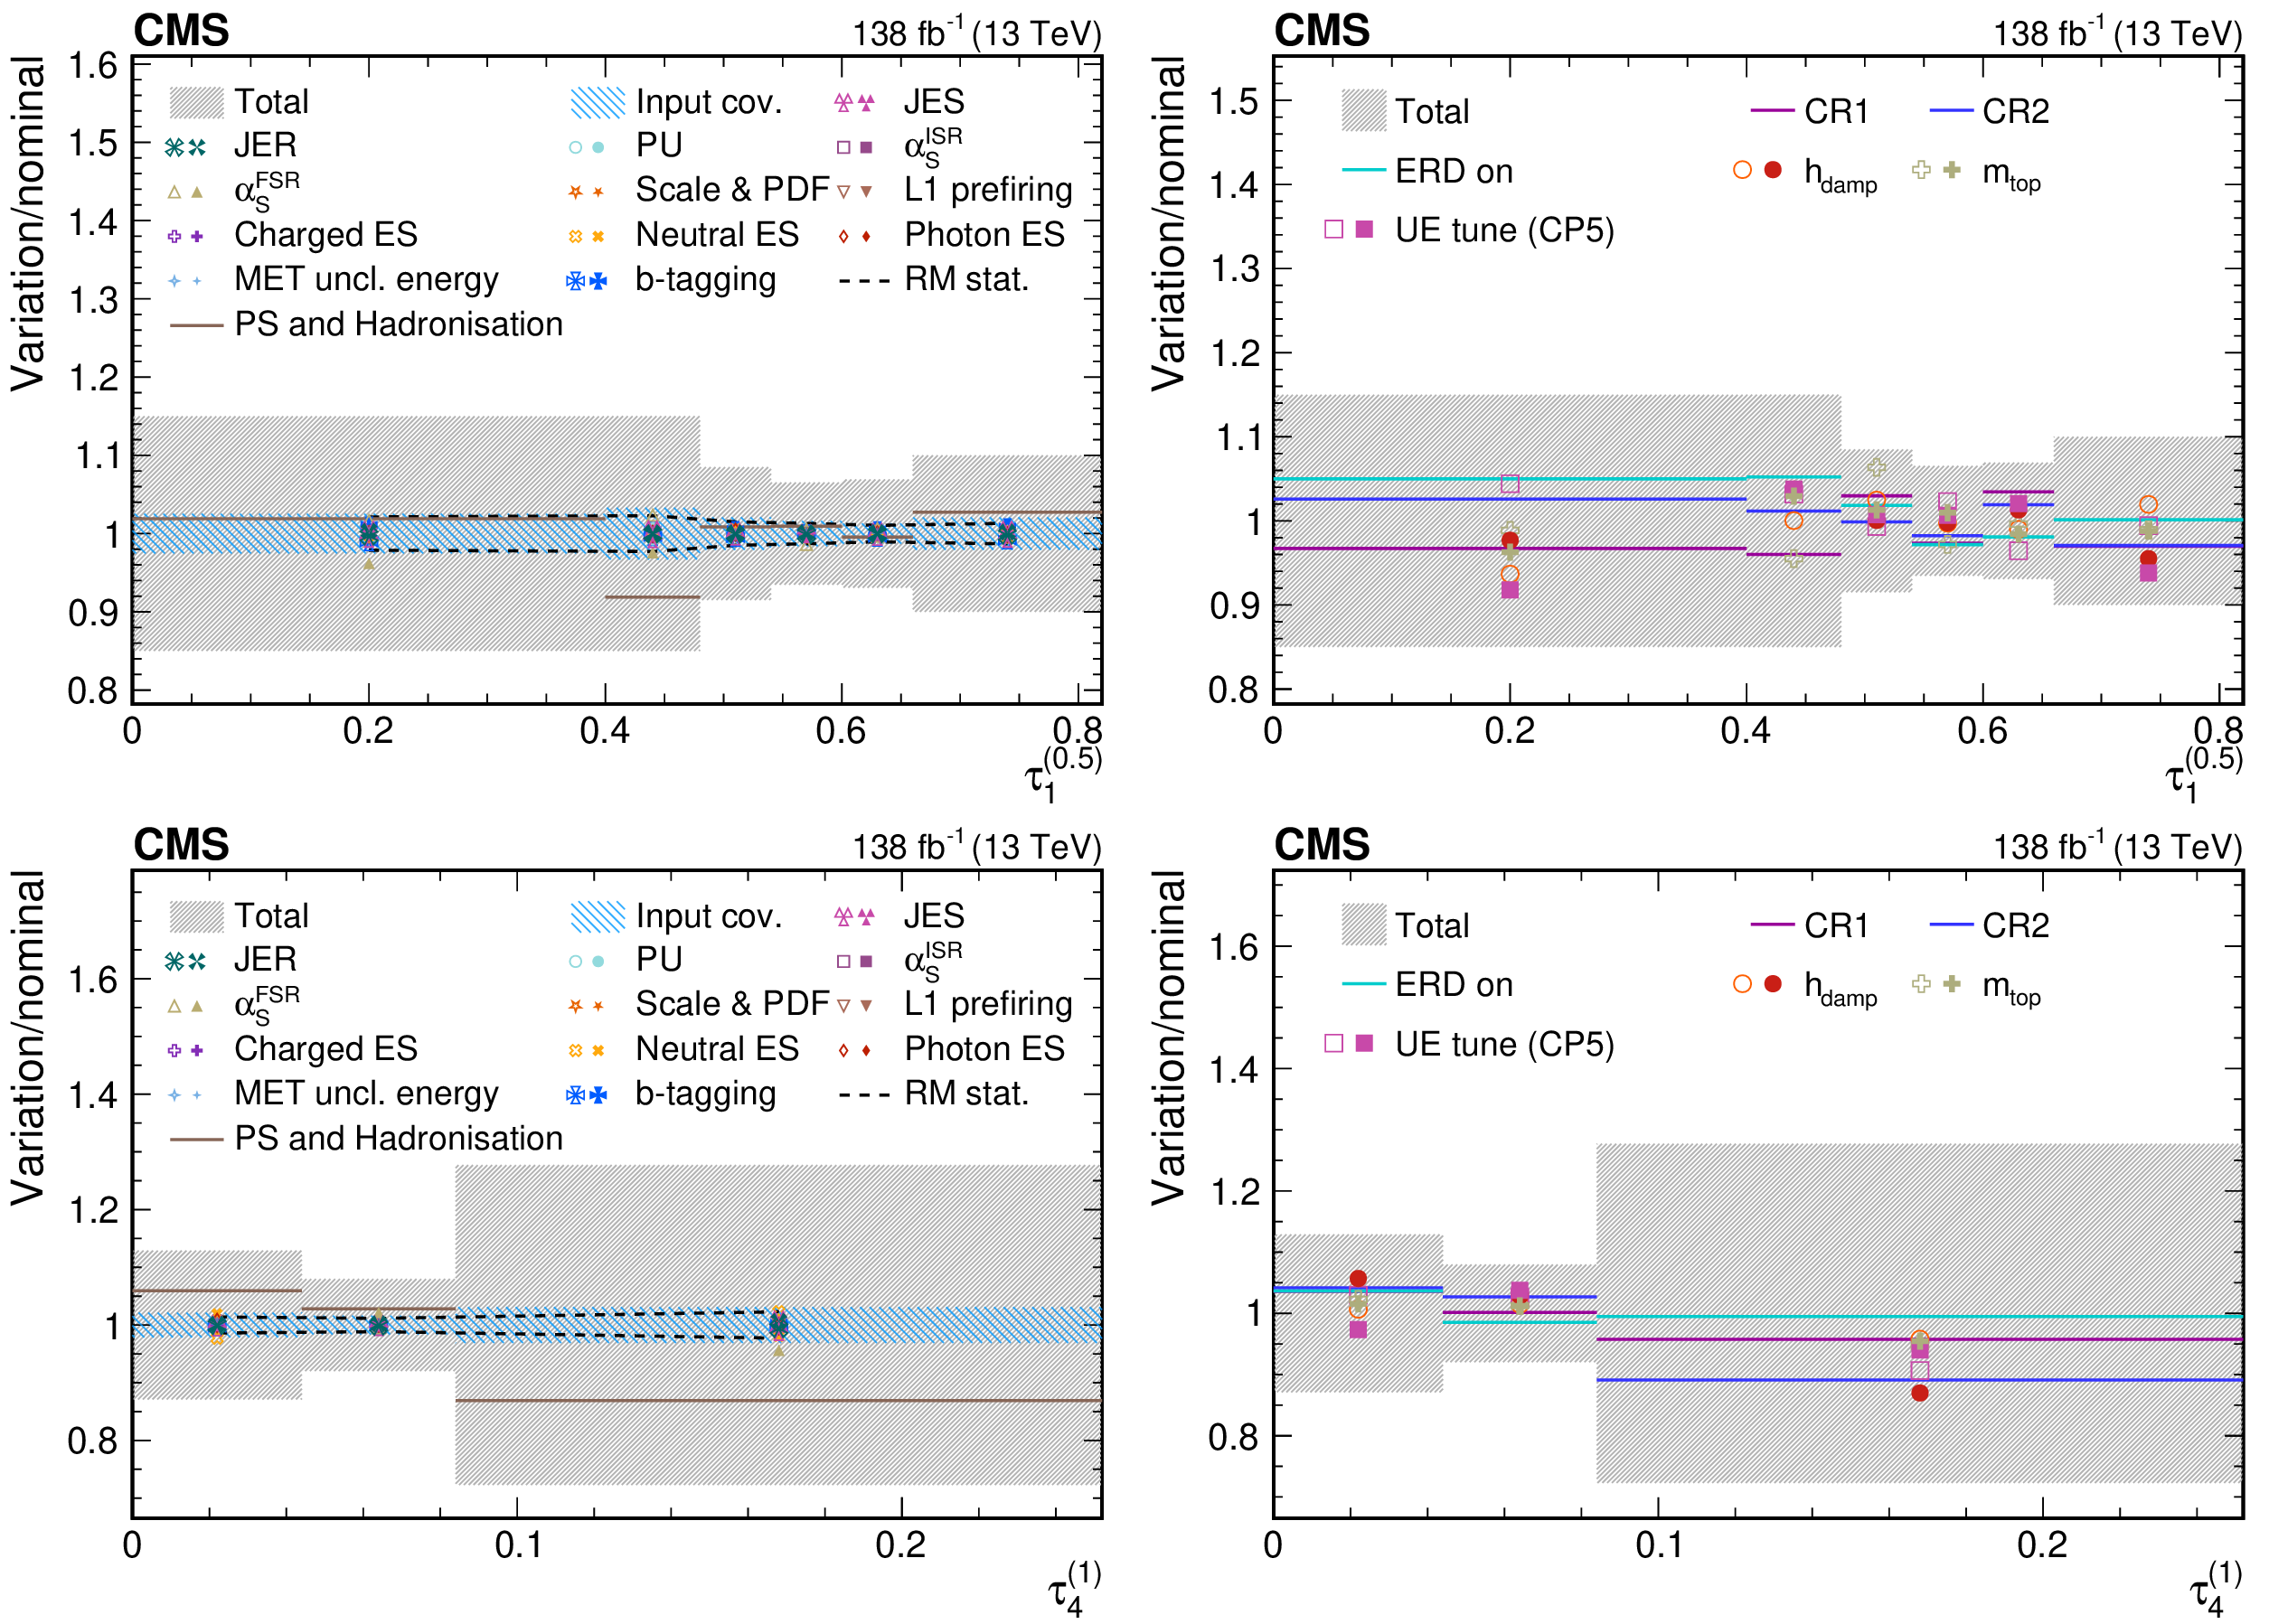
Figure 14:
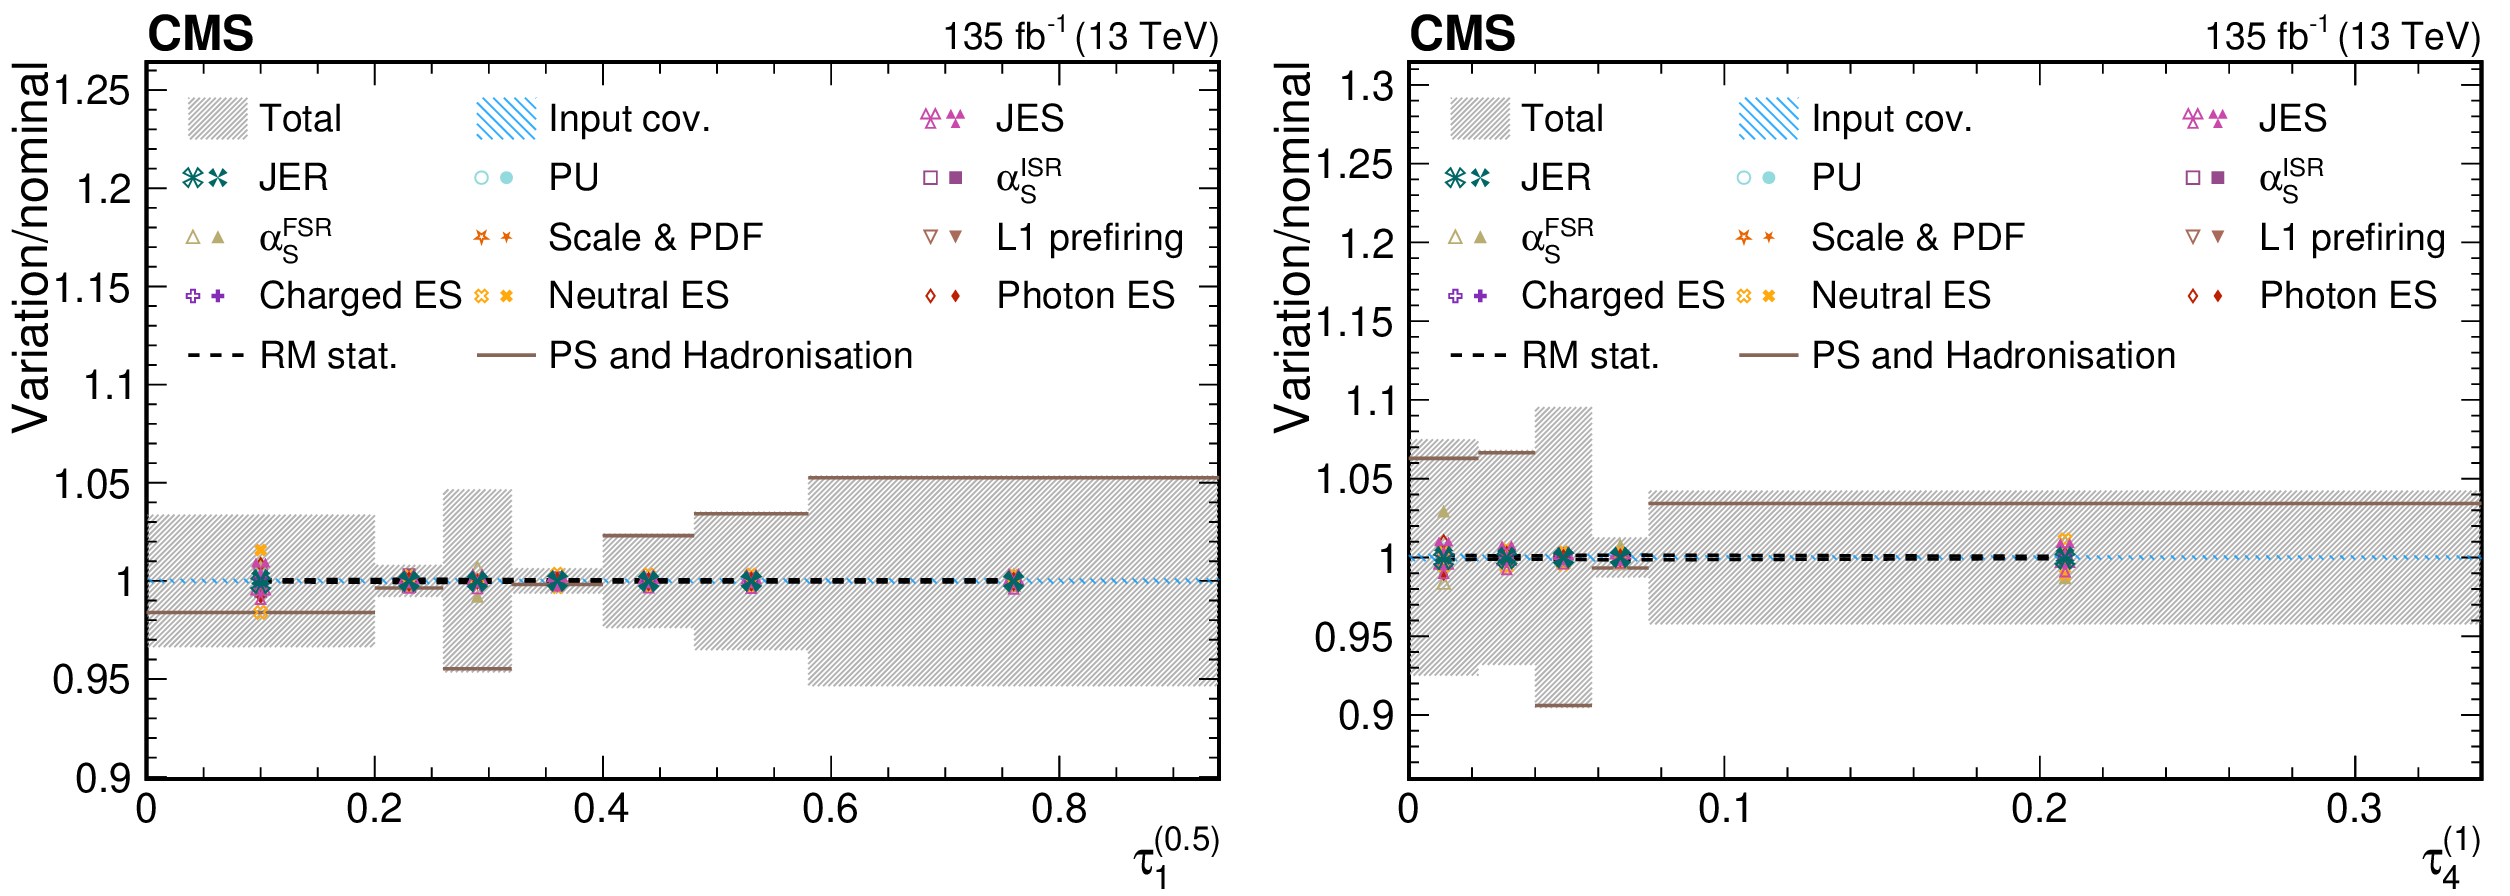
A representative set of uncertainty breakdown estimates for the unfolded measurement of $\tau_{1}^{(0.5)}$ and of $\tau_{4}^{(1)}$ in the boosted W boson-enriched selection. The breakdowns are split into two separate figures: including all sources of experimental uncertainty, and additional uncertainties that are common between the dijet and W boson or top quark measurements (left), and for variations of parameters used to generate events in POWHEG v2, or in the parton showering and hadronization in PYTHIAviii with the CP5 tune, for exclusively the W boson and top quark measurements (right). The shaded bands indicate the total (dark grey), and data statistical and background subtraction (blue) uncertainties in the unfolded distribution, uncertainties from the number of events in simulated samples for the nominal response matrix and background contributions are illustrated with dashed lines, and up (down) variations of relevant systematics are shown with filled (open) markers of the same colour and shape. Contributions from the showering and hadronization uncertainty estimated using HERWIG 7, as well as for the various CR models, are illustrated with the solid lines as one-sided shifts. |
png pdf |
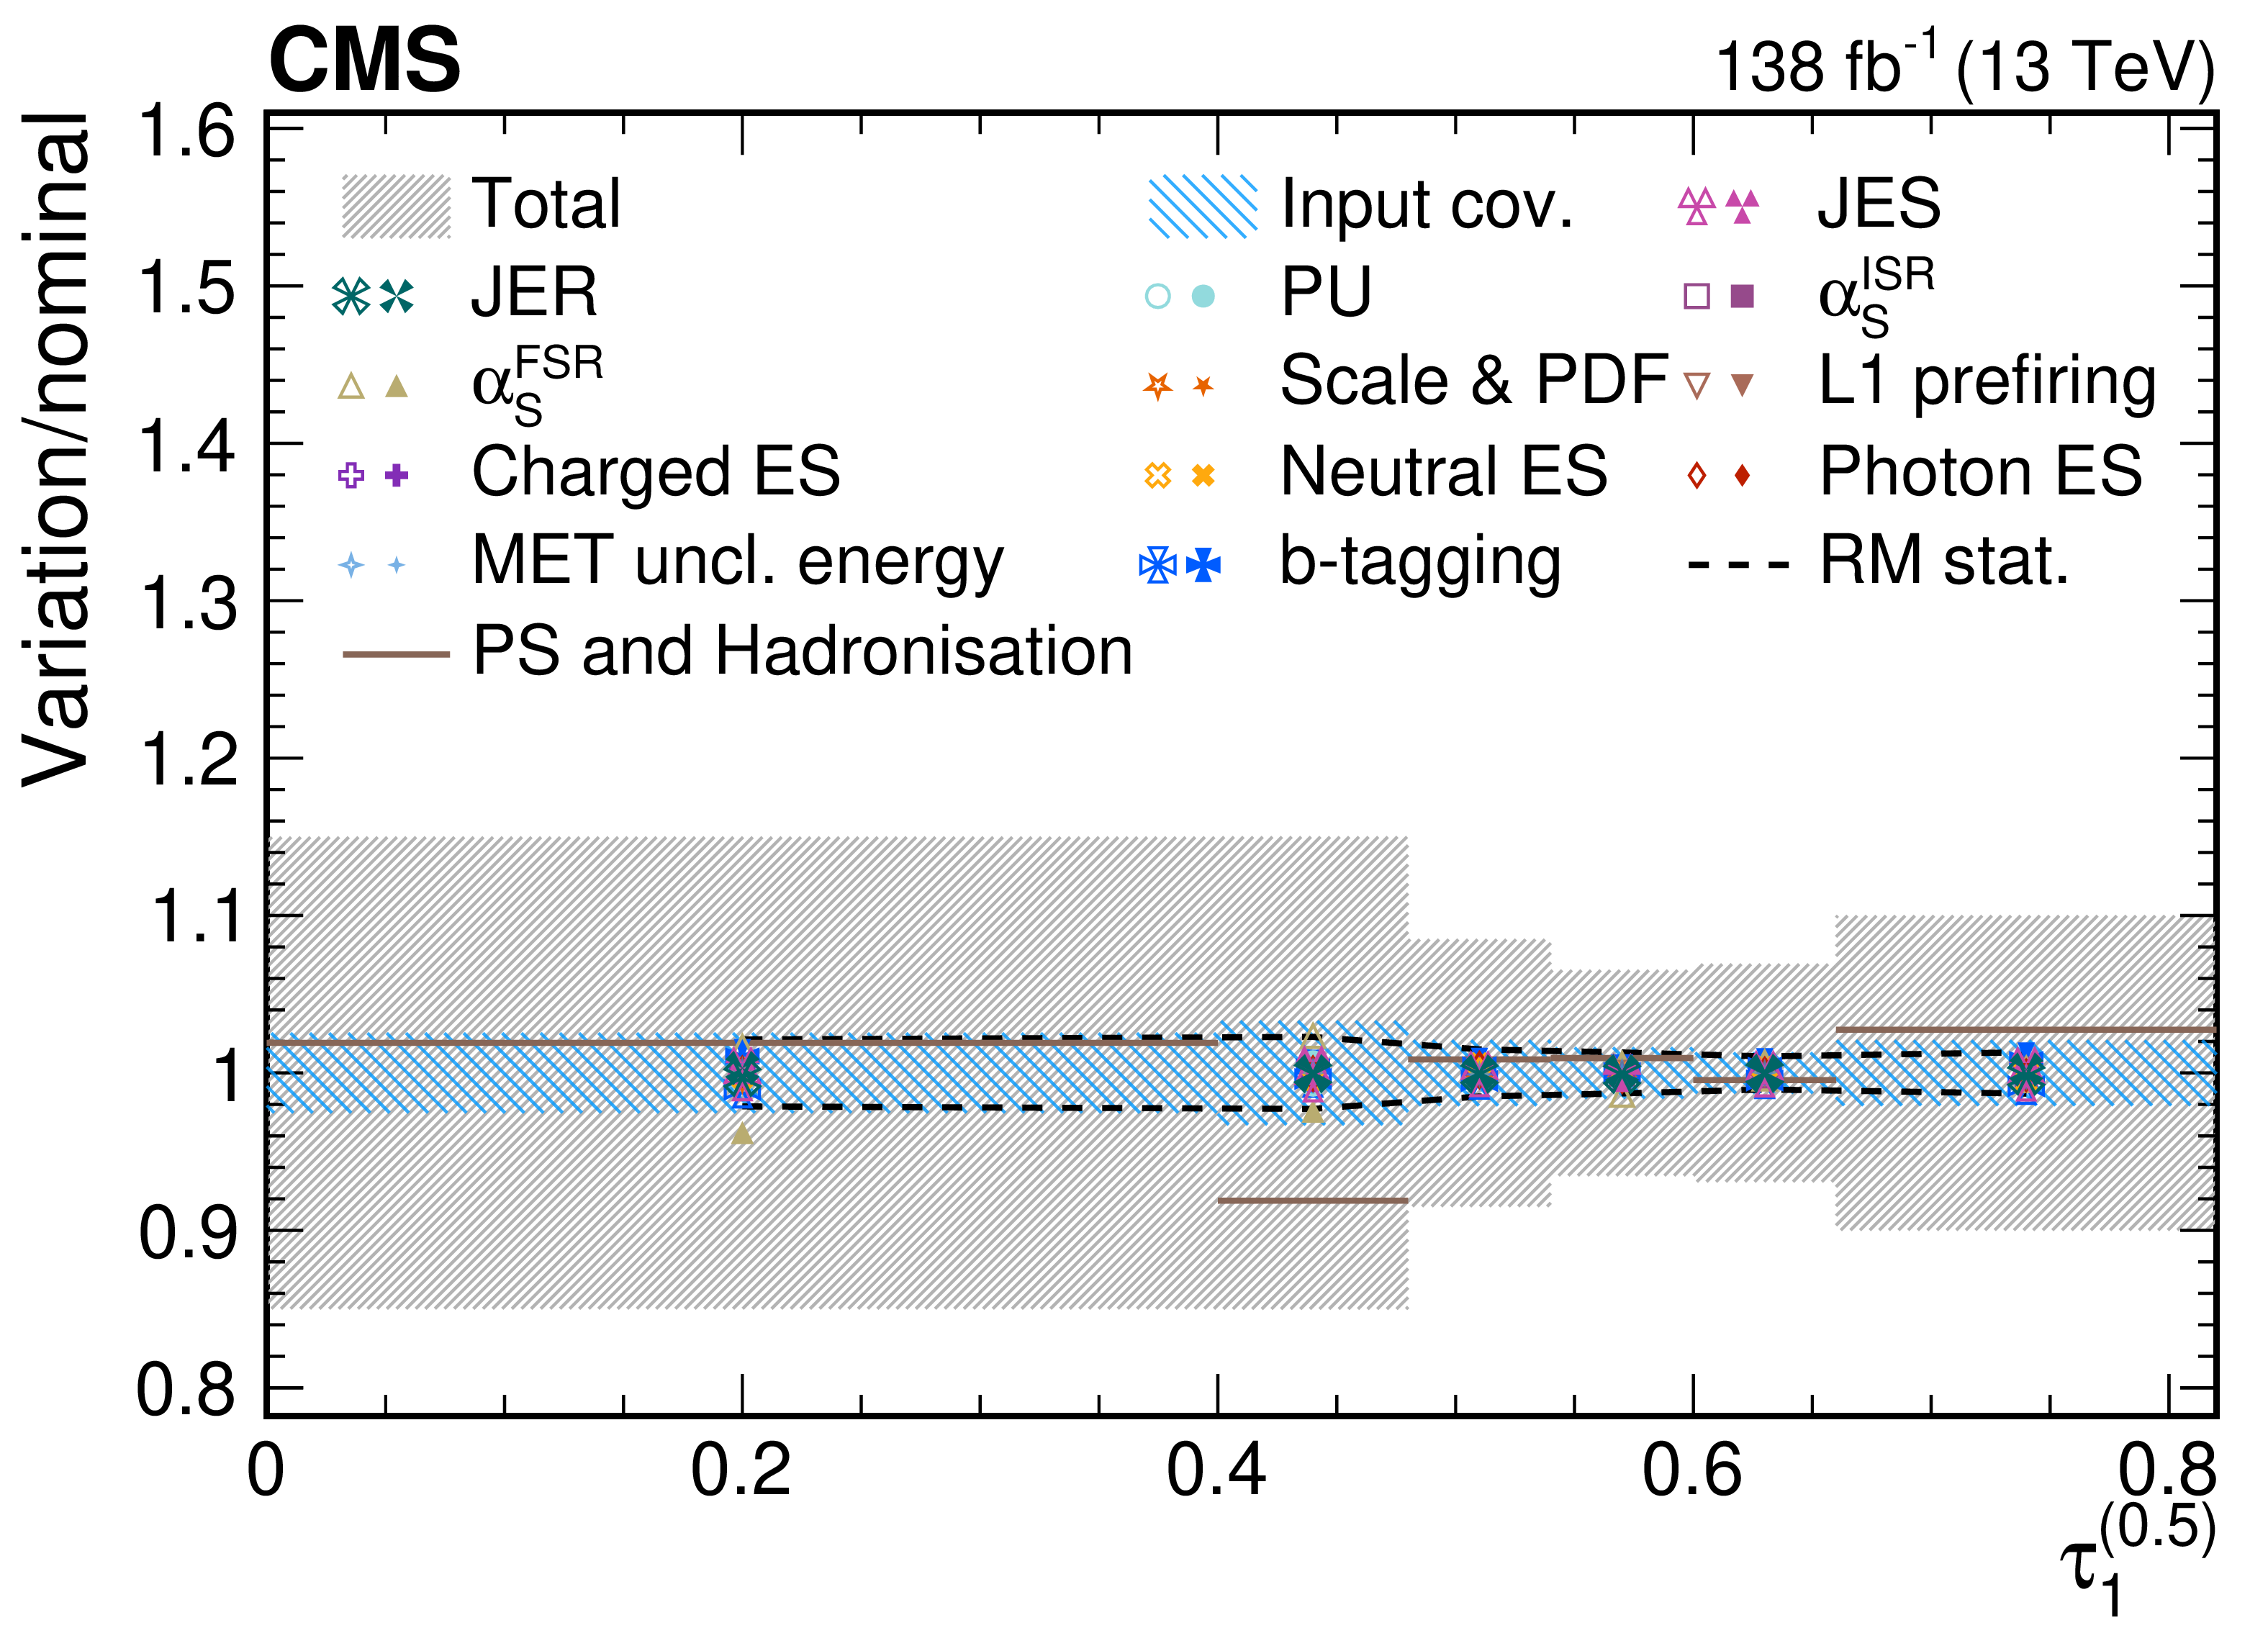
Figure 14-a:
A representative set of uncertainty breakdown estimates for the unfolded measurement of $\tau_{1}^{(0.5)}$ and of $\tau_{4}^{(1)}$ in the boosted W boson-enriched selection. The breakdowns are split into two separate figures: including all sources of experimental uncertainty, and additional uncertainties that are common between the dijet and W boson or top quark measurements (left), and for variations of parameters used to generate events in POWHEG v2, or in the parton showering and hadronization in PYTHIAviii with the CP5 tune, for exclusively the W boson and top quark measurements (right). The shaded bands indicate the total (dark grey), and data statistical and background subtraction (blue) uncertainties in the unfolded distribution, uncertainties from the number of events in simulated samples for the nominal response matrix and background contributions are illustrated with dashed lines, and up (down) variations of relevant systematics are shown with filled (open) markers of the same colour and shape. Contributions from the showering and hadronization uncertainty estimated using HERWIG 7, as well as for the various CR models, are illustrated with the solid lines as one-sided shifts. |

png pdf |
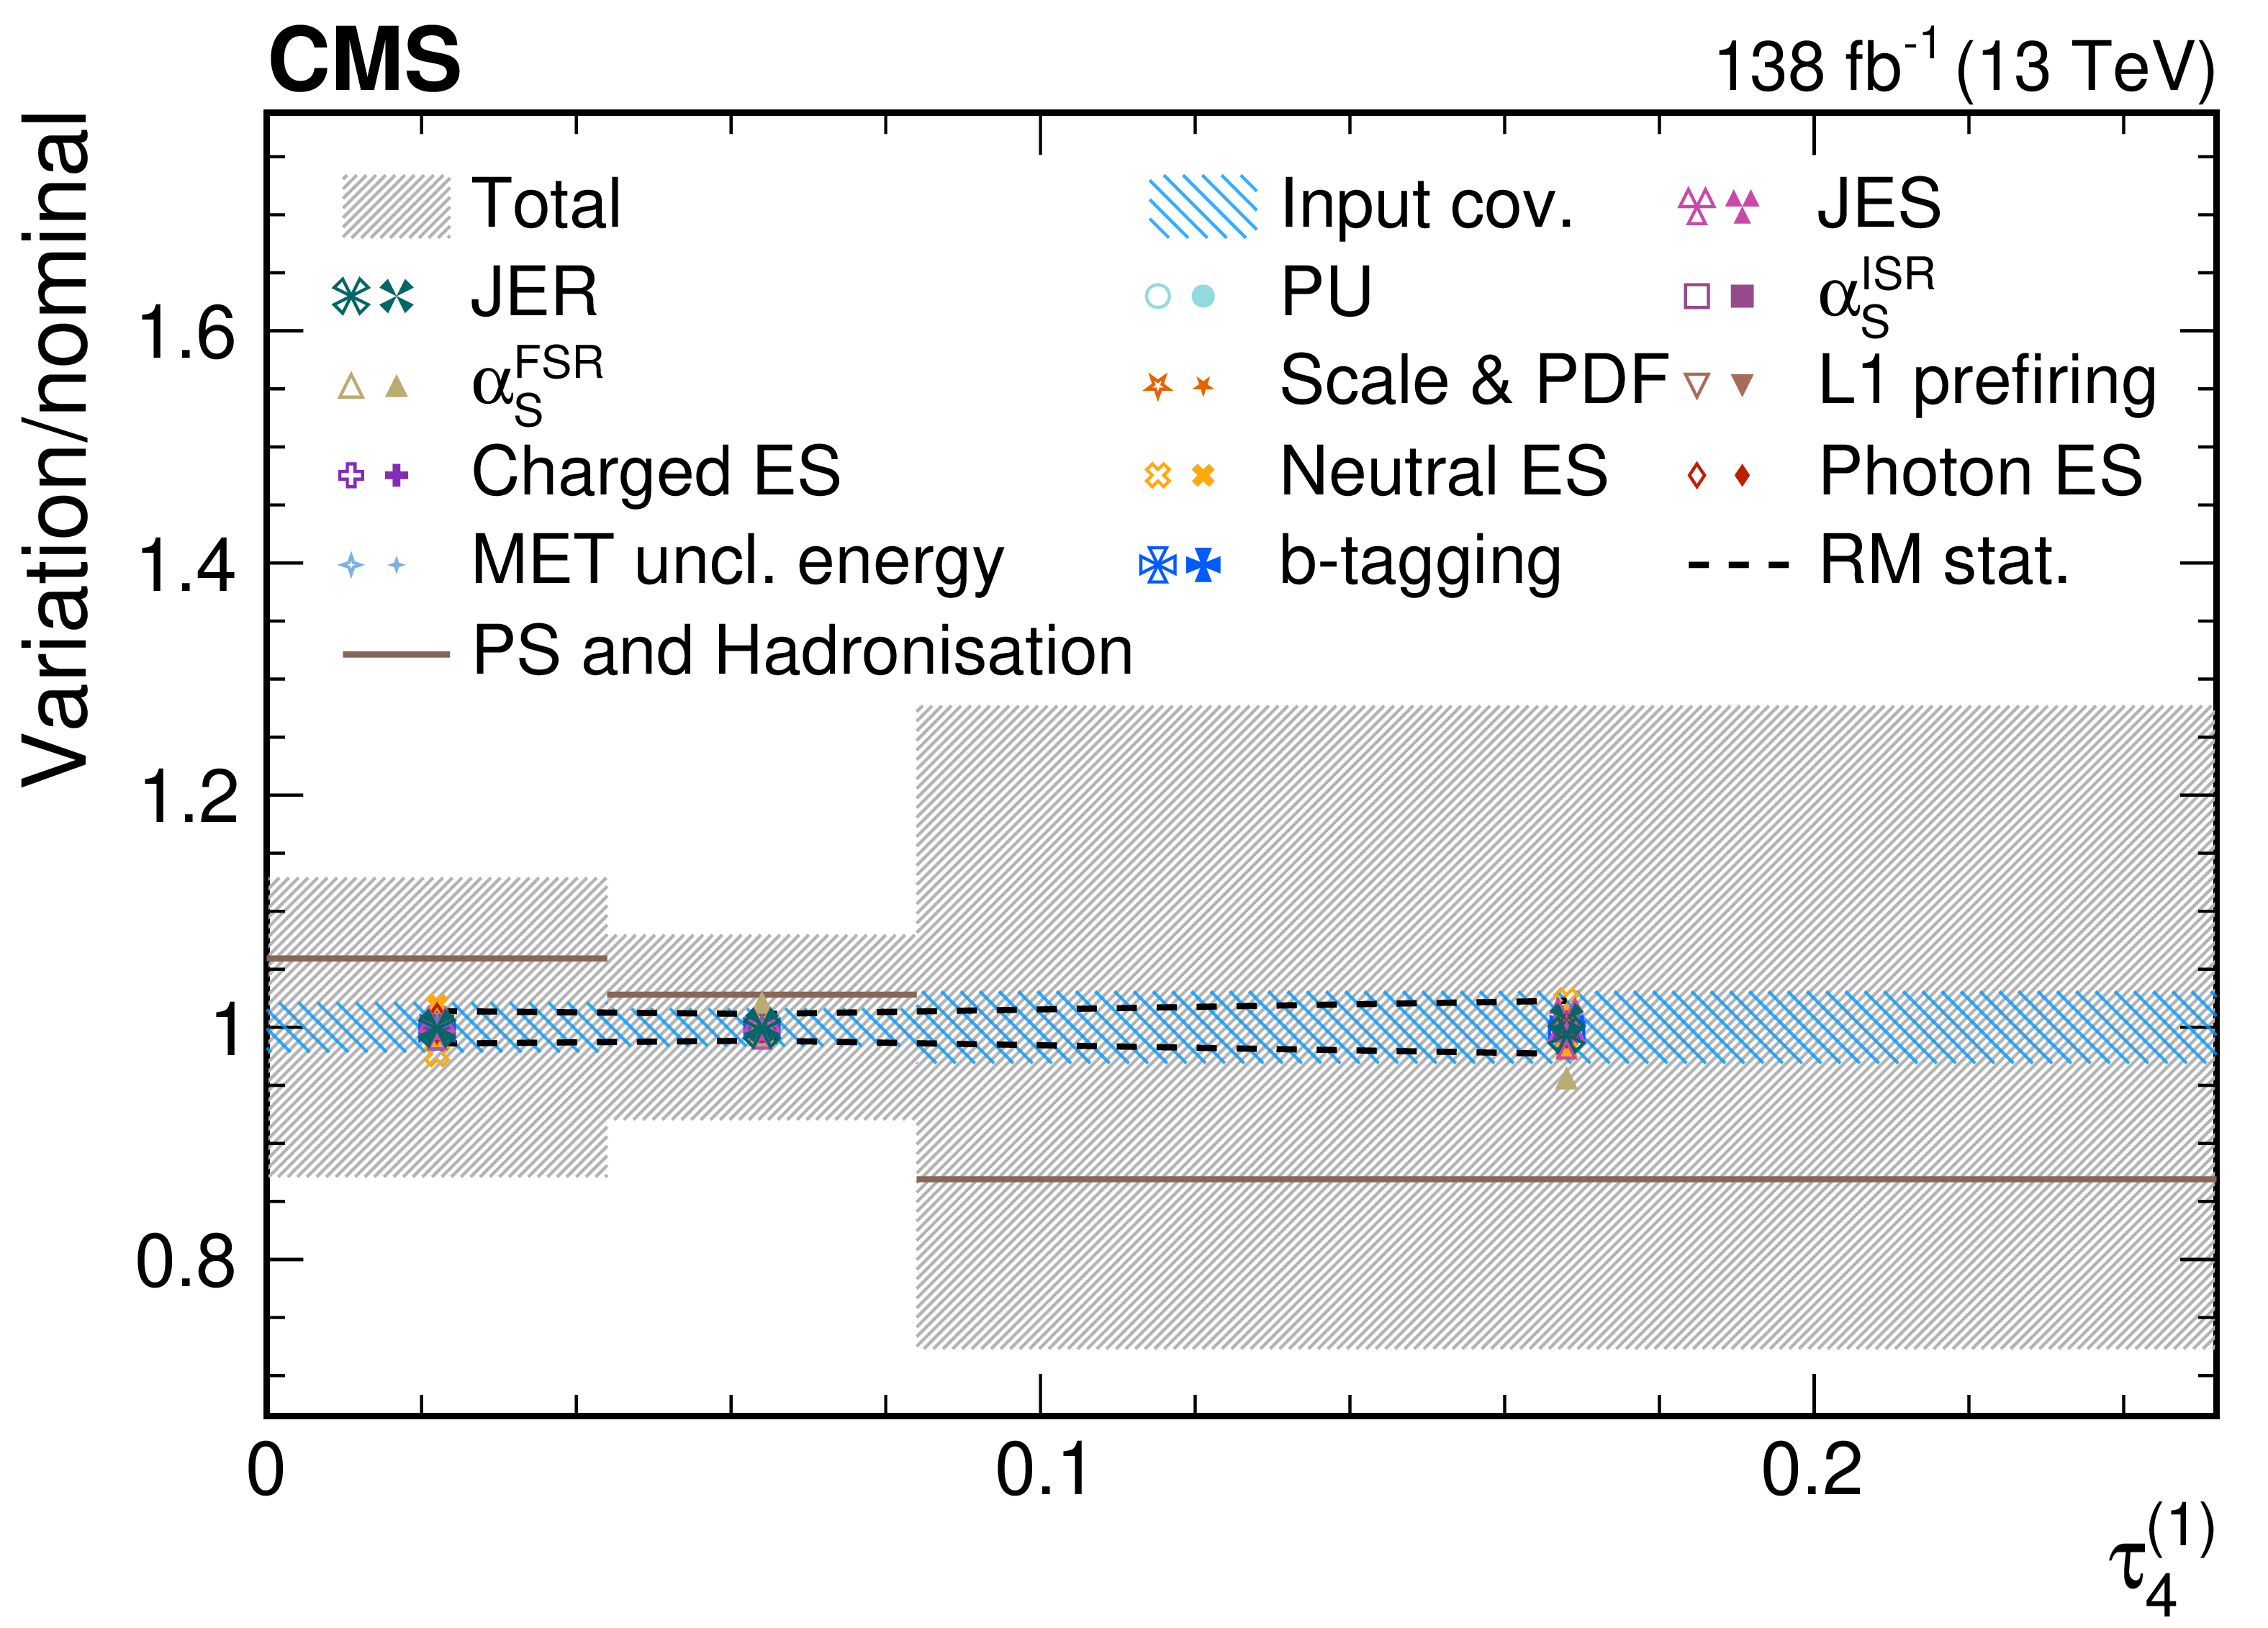
Figure 14-b:
A representative set of uncertainty breakdown estimates for the unfolded measurement of $\tau_{1}^{(0.5)}$ and of $\tau_{4}^{(1)}$ in the boosted W boson-enriched selection. The breakdowns are split into two separate figures: including all sources of experimental uncertainty, and additional uncertainties that are common between the dijet and W boson or top quark measurements (left), and for variations of parameters used to generate events in POWHEG v2, or in the parton showering and hadronization in PYTHIAviii with the CP5 tune, for exclusively the W boson and top quark measurements (right). The shaded bands indicate the total (dark grey), and data statistical and background subtraction (blue) uncertainties in the unfolded distribution, uncertainties from the number of events in simulated samples for the nominal response matrix and background contributions are illustrated with dashed lines, and up (down) variations of relevant systematics are shown with filled (open) markers of the same colour and shape. Contributions from the showering and hadronization uncertainty estimated using HERWIG 7, as well as for the various CR models, are illustrated with the solid lines as one-sided shifts. |
png pdf |
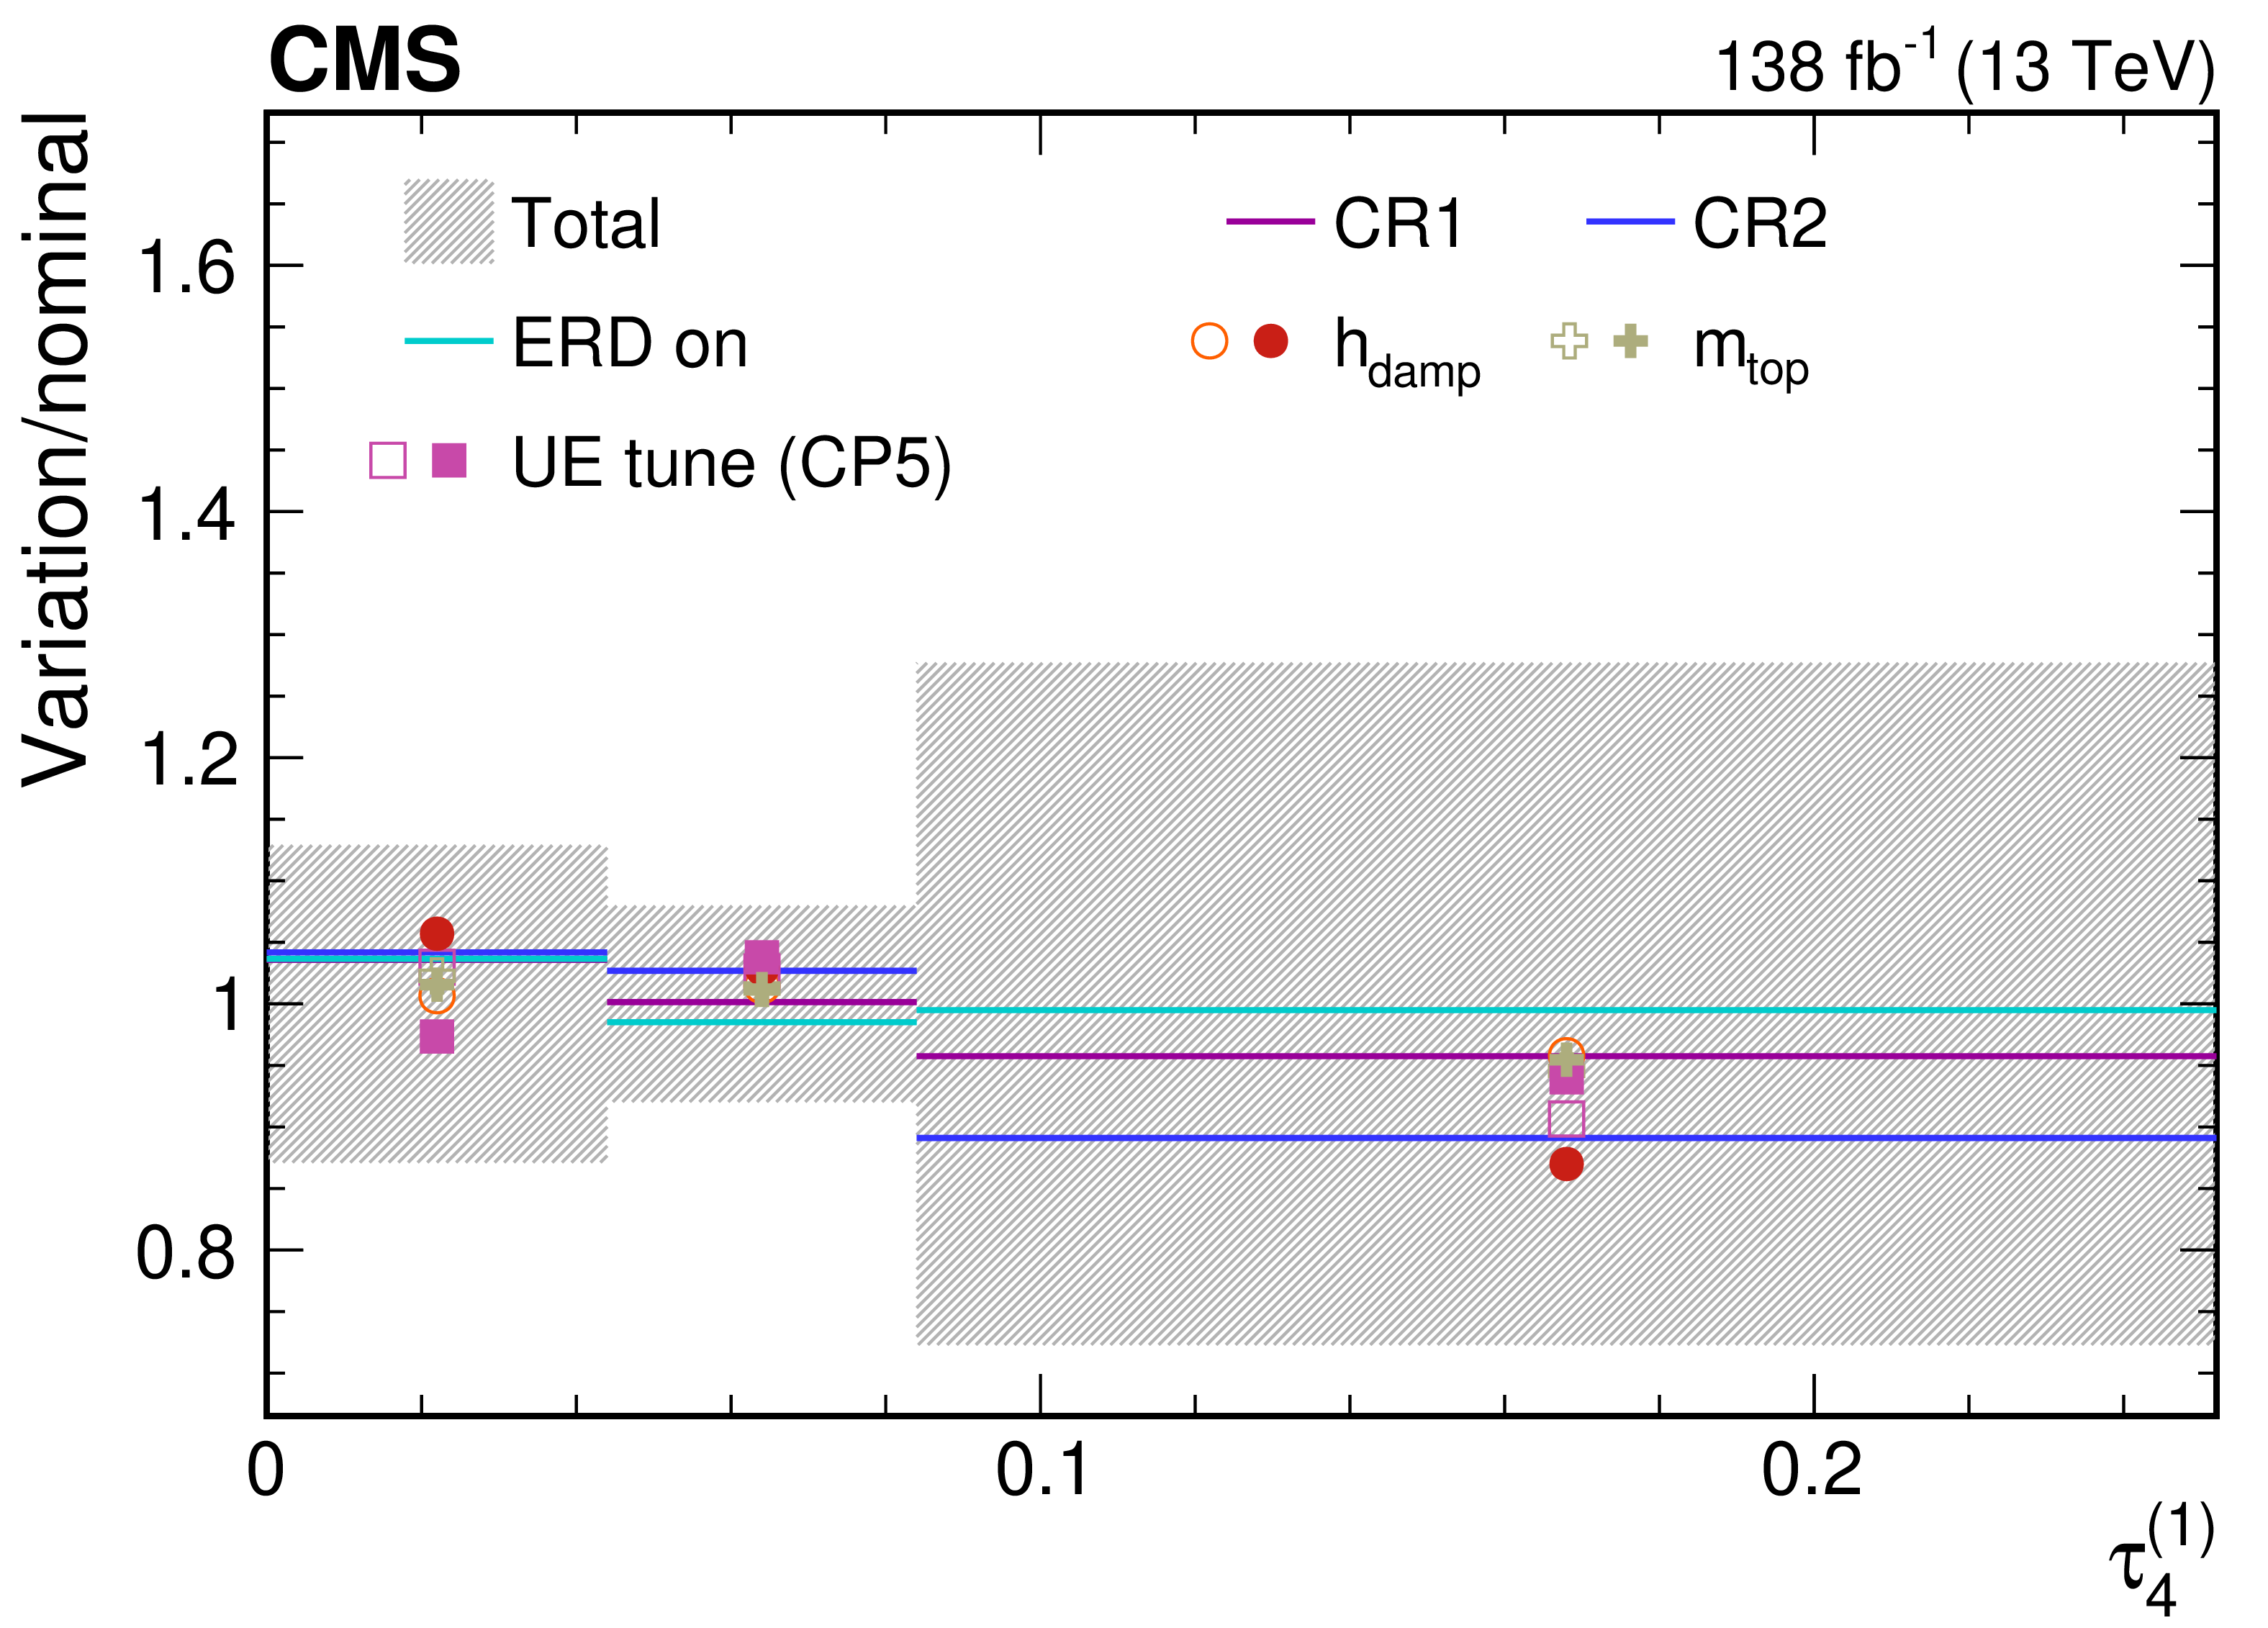
Figure 14-c:
A representative set of uncertainty breakdown estimates for the unfolded measurement of $\tau_{1}^{(0.5)}$ and of $\tau_{4}^{(1)}$ in the boosted W boson-enriched selection. The breakdowns are split into two separate figures: including all sources of experimental uncertainty, and additional uncertainties that are common between the dijet and W boson or top quark measurements (left), and for variations of parameters used to generate events in POWHEG v2, or in the parton showering and hadronization in PYTHIAviii with the CP5 tune, for exclusively the W boson and top quark measurements (right). The shaded bands indicate the total (dark grey), and data statistical and background subtraction (blue) uncertainties in the unfolded distribution, uncertainties from the number of events in simulated samples for the nominal response matrix and background contributions are illustrated with dashed lines, and up (down) variations of relevant systematics are shown with filled (open) markers of the same colour and shape. Contributions from the showering and hadronization uncertainty estimated using HERWIG 7, as well as for the various CR models, are illustrated with the solid lines as one-sided shifts. |
png pdf |
Figure 14-d:
A representative set of uncertainty breakdown estimates for the unfolded measurement of $\tau_{1}^{(0.5)}$ and of $\tau_{4}^{(1)}$ in the boosted W boson-enriched selection. The breakdowns are split into two separate figures: including all sources of experimental uncertainty, and additional uncertainties that are common between the dijet and W boson or top quark measurements (left), and for variations of parameters used to generate events in POWHEG v2, or in the parton showering and hadronization in PYTHIAviii with the CP5 tune, for exclusively the W boson and top quark measurements (right). The shaded bands indicate the total (dark grey), and data statistical and background subtraction (blue) uncertainties in the unfolded distribution, uncertainties from the number of events in simulated samples for the nominal response matrix and background contributions are illustrated with dashed lines, and up (down) variations of relevant systematics are shown with filled (open) markers of the same colour and shape. Contributions from the showering and hadronization uncertainty estimated using HERWIG 7, as well as for the various CR models, are illustrated with the solid lines as one-sided shifts. |
png pdf |
Figure 15:
A representative set of uncertainty breakdown estimates for the unfolded measurements of $\tau_{1}^{(0.5)}$ and of $\tau_{4}^{(1)}$ in the boosted top quark-enriched selection. The breakdowns are split into two separate figures per the details given in the caption of Fig. 14. |
png pdf |
Figure 15-a:
A representative set of uncertainty breakdown estimates for the unfolded measurements of $\tau_{1}^{(0.5)}$ and of $\tau_{4}^{(1)}$ in the boosted top quark-enriched selection. The breakdowns are split into two separate figures per the details given in the caption of Fig. 14. |

png pdf |
Figure 15-b:
A representative set of uncertainty breakdown estimates for the unfolded measurements of $\tau_{1}^{(0.5)}$ and of $\tau_{4}^{(1)}$ in the boosted top quark-enriched selection. The breakdowns are split into two separate figures per the details given in the caption of Fig. 14. |
png pdf |
Figure 15-c:
A representative set of uncertainty breakdown estimates for the unfolded measurements of $\tau_{1}^{(0.5)}$ and of $\tau_{4}^{(1)}$ in the boosted top quark-enriched selection. The breakdowns are split into two separate figures per the details given in the caption of Fig. 14. |
png pdf |
Figure 15-d:
A representative set of uncertainty breakdown estimates for the unfolded measurements of $\tau_{1}^{(0.5)}$ and of $\tau_{4}^{(1)}$ in the boosted top quark-enriched selection. The breakdowns are split into two separate figures per the details given in the caption of Fig. 14. |
png pdf |
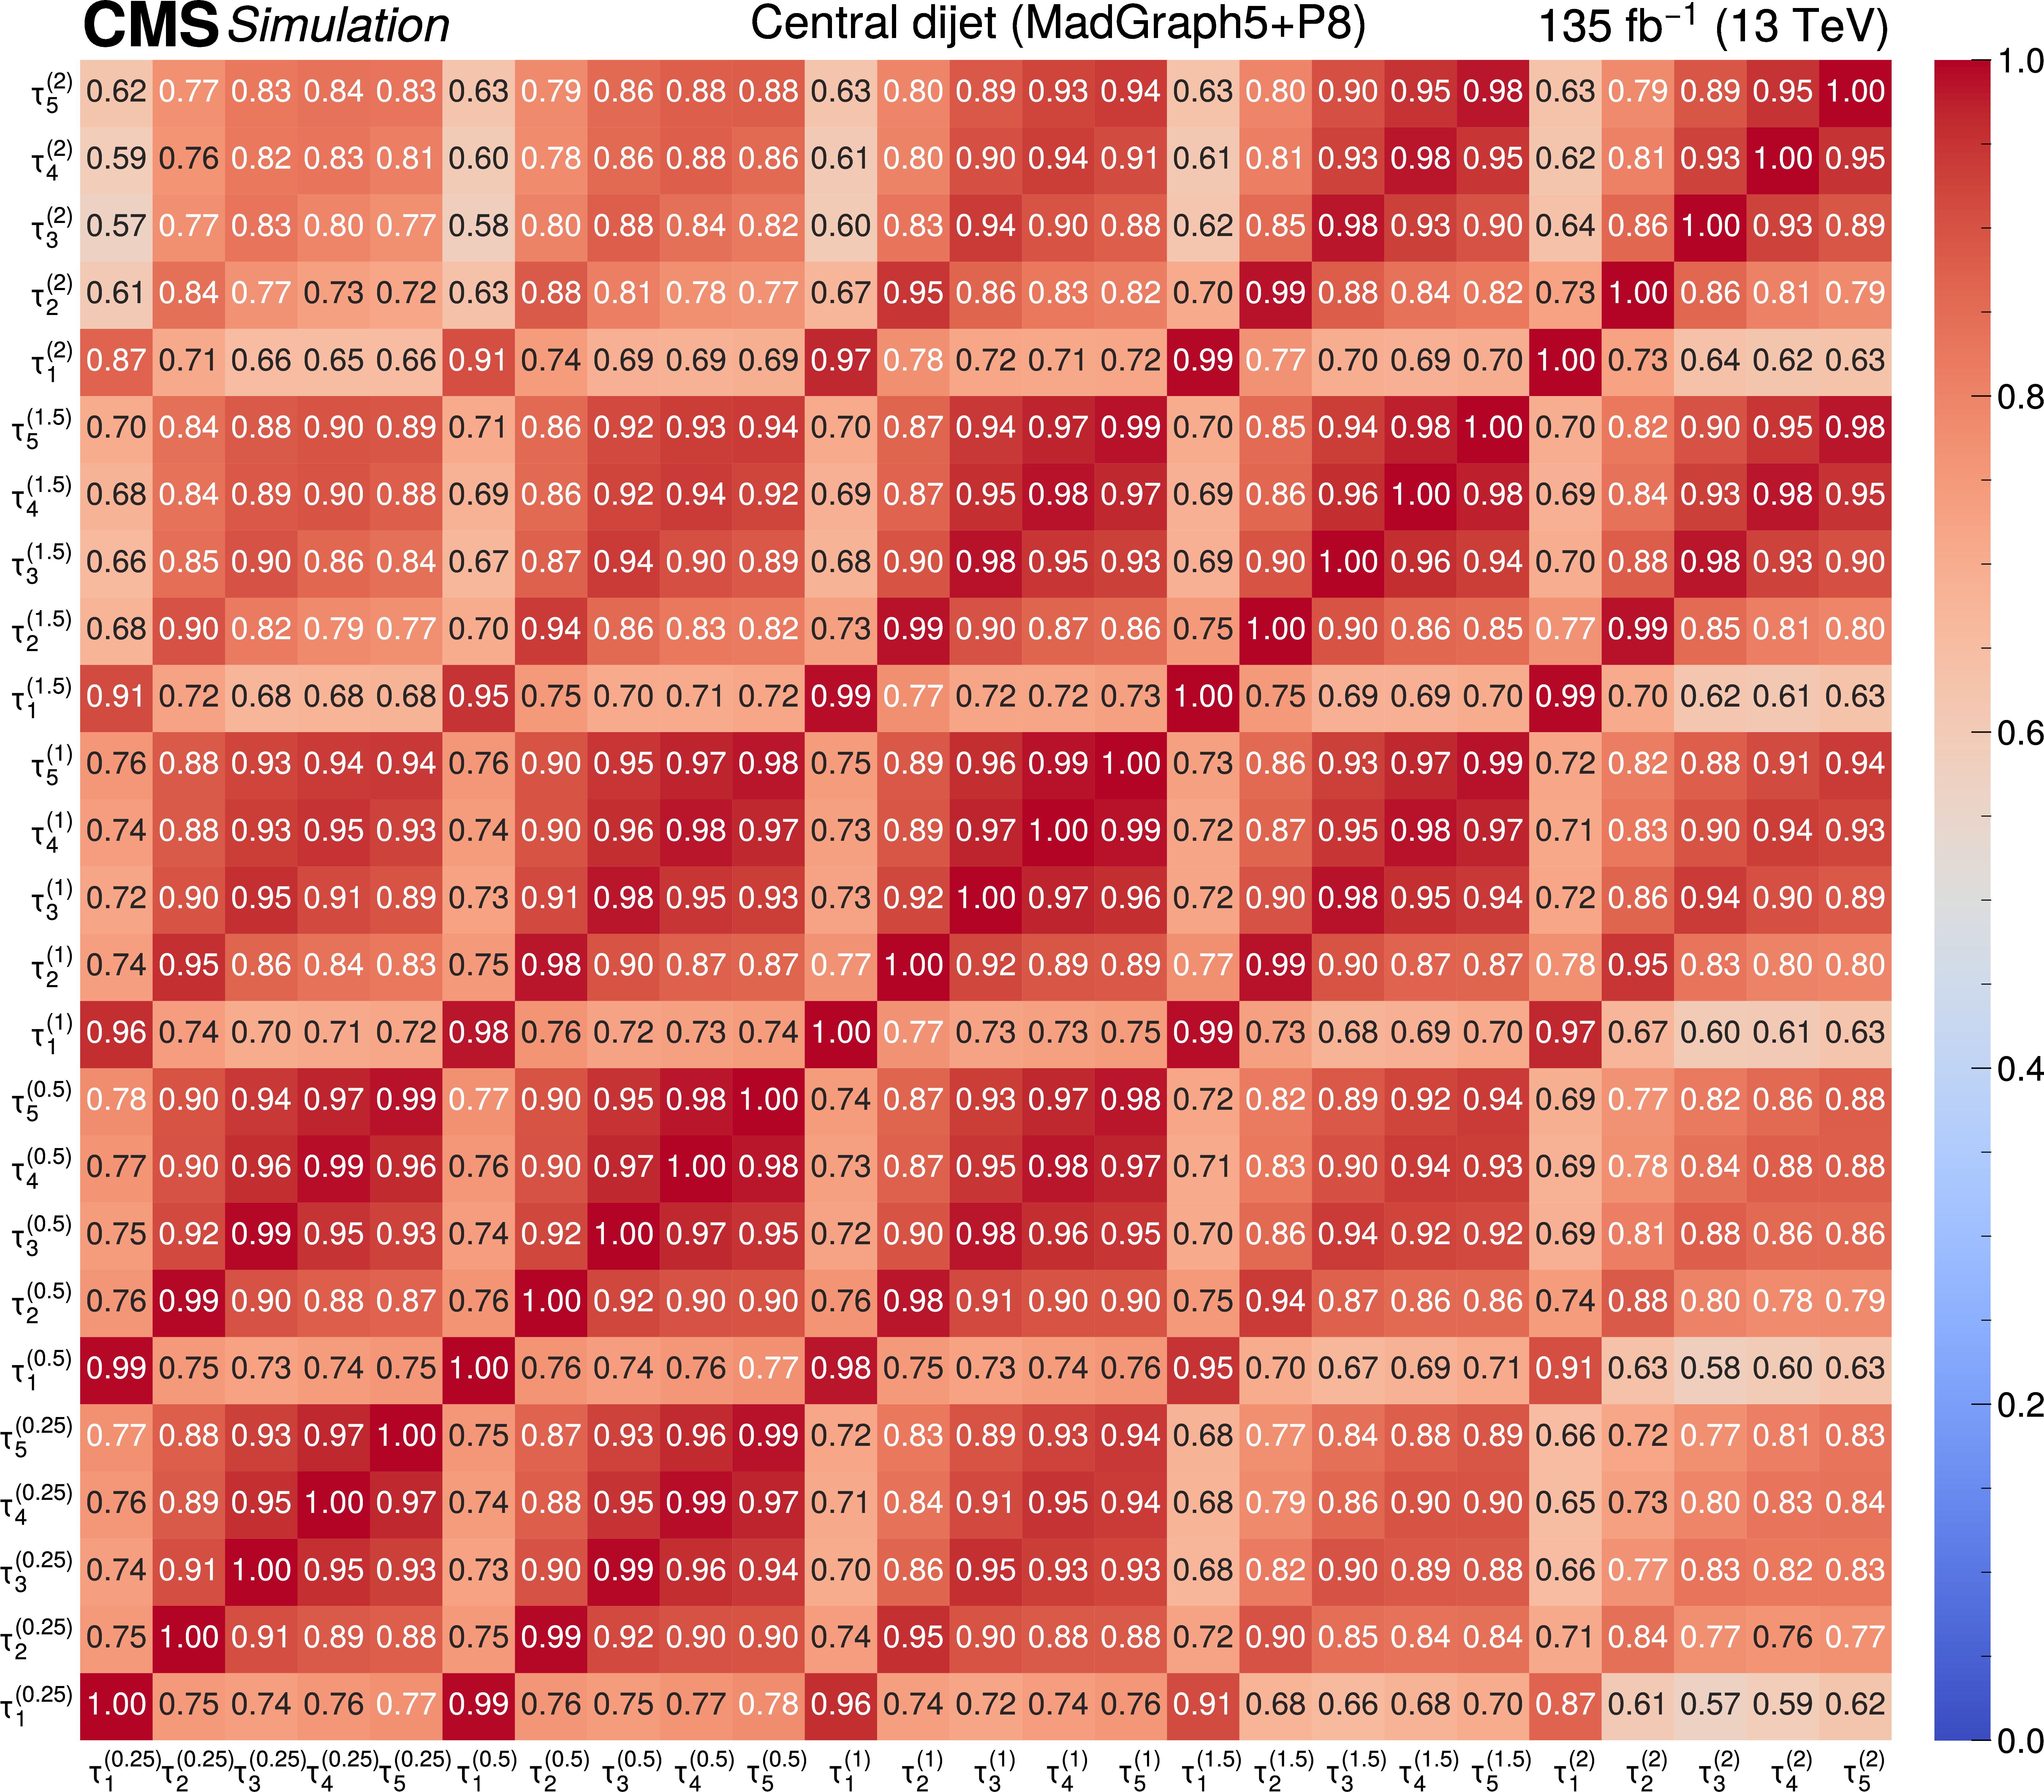
Figure 16:
Pairwise Pearson correlations between $ N $-subjettiness observables constituting the overcomplete 6-body basis, in the nominal MadGraph-5\_aMC@NLO+PYTHIAviii simulation, at the particle level, for the QCD dijet selection. All particle-level events passing selections are considered. |
png pdf |
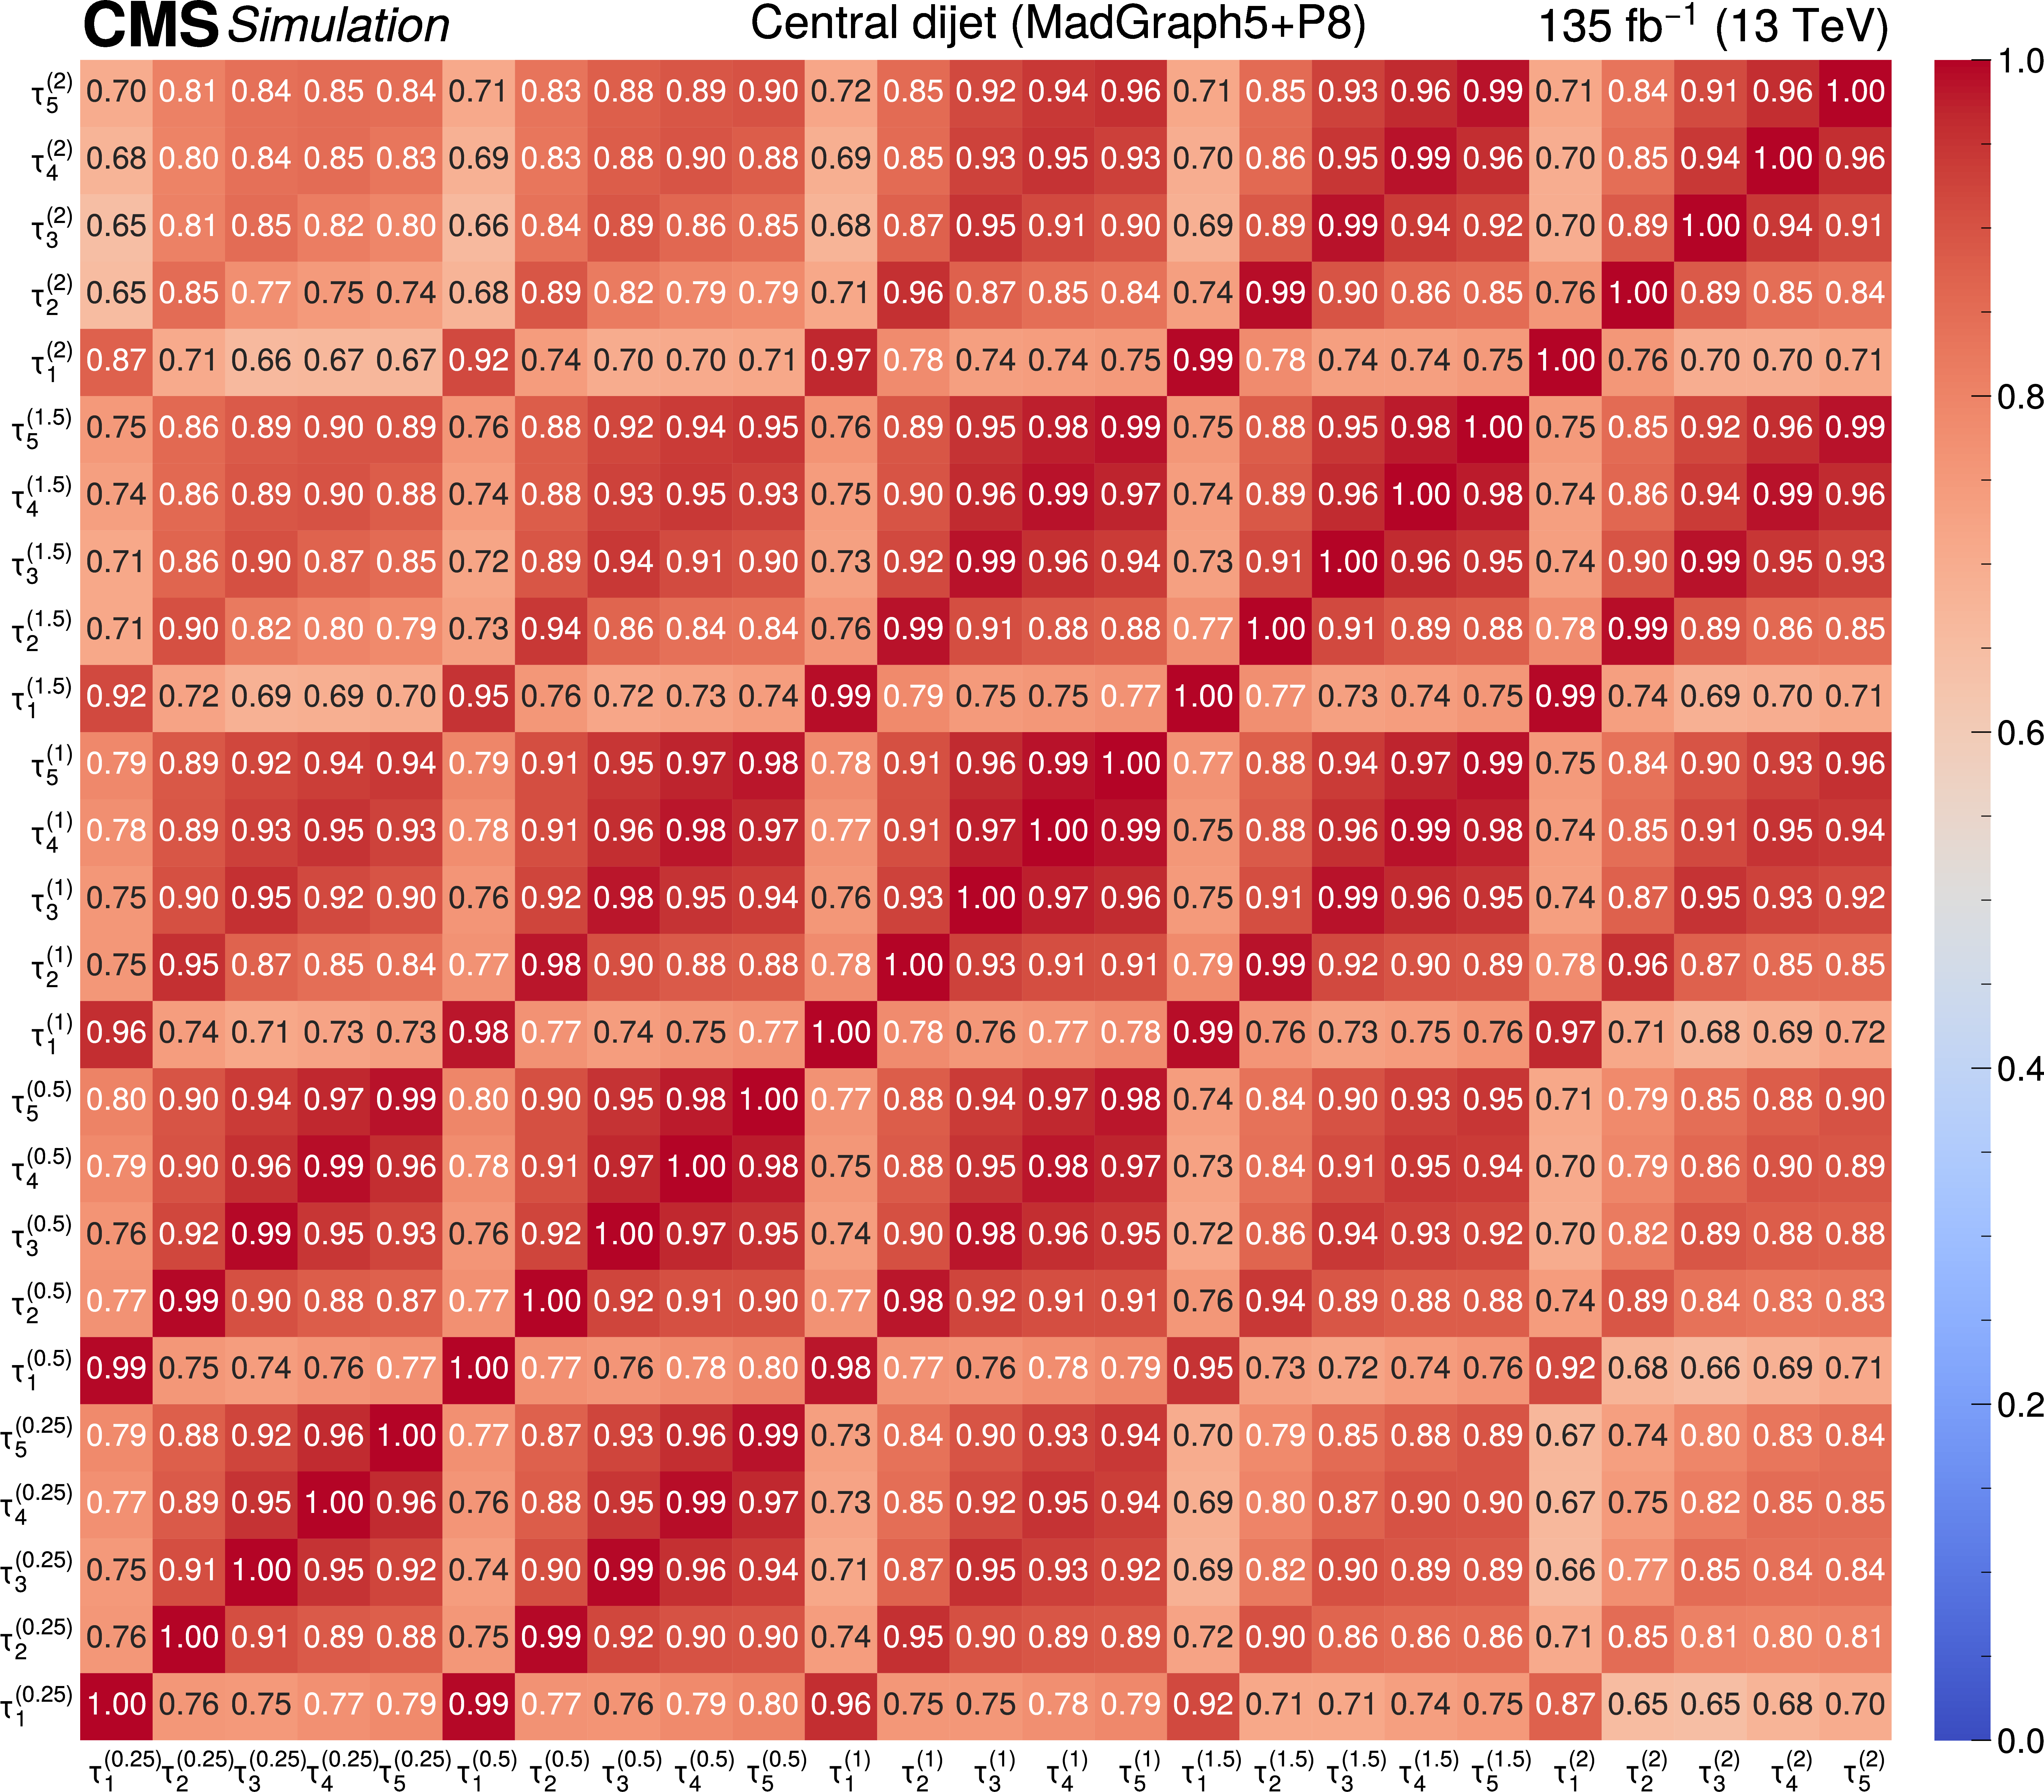
Figure 17:
Pairwise Pearson correlations between $ N $-subjettiness observables constituting the overcomplete 6-body basis, in the nominal MadGraph-5\_aMC@NLO+PYTHIAviii simulation, at the detector level, for the QCD dijet selection. Only detector-level events with a matched jet in the corresponding particle-level event are considered. |
png pdf |
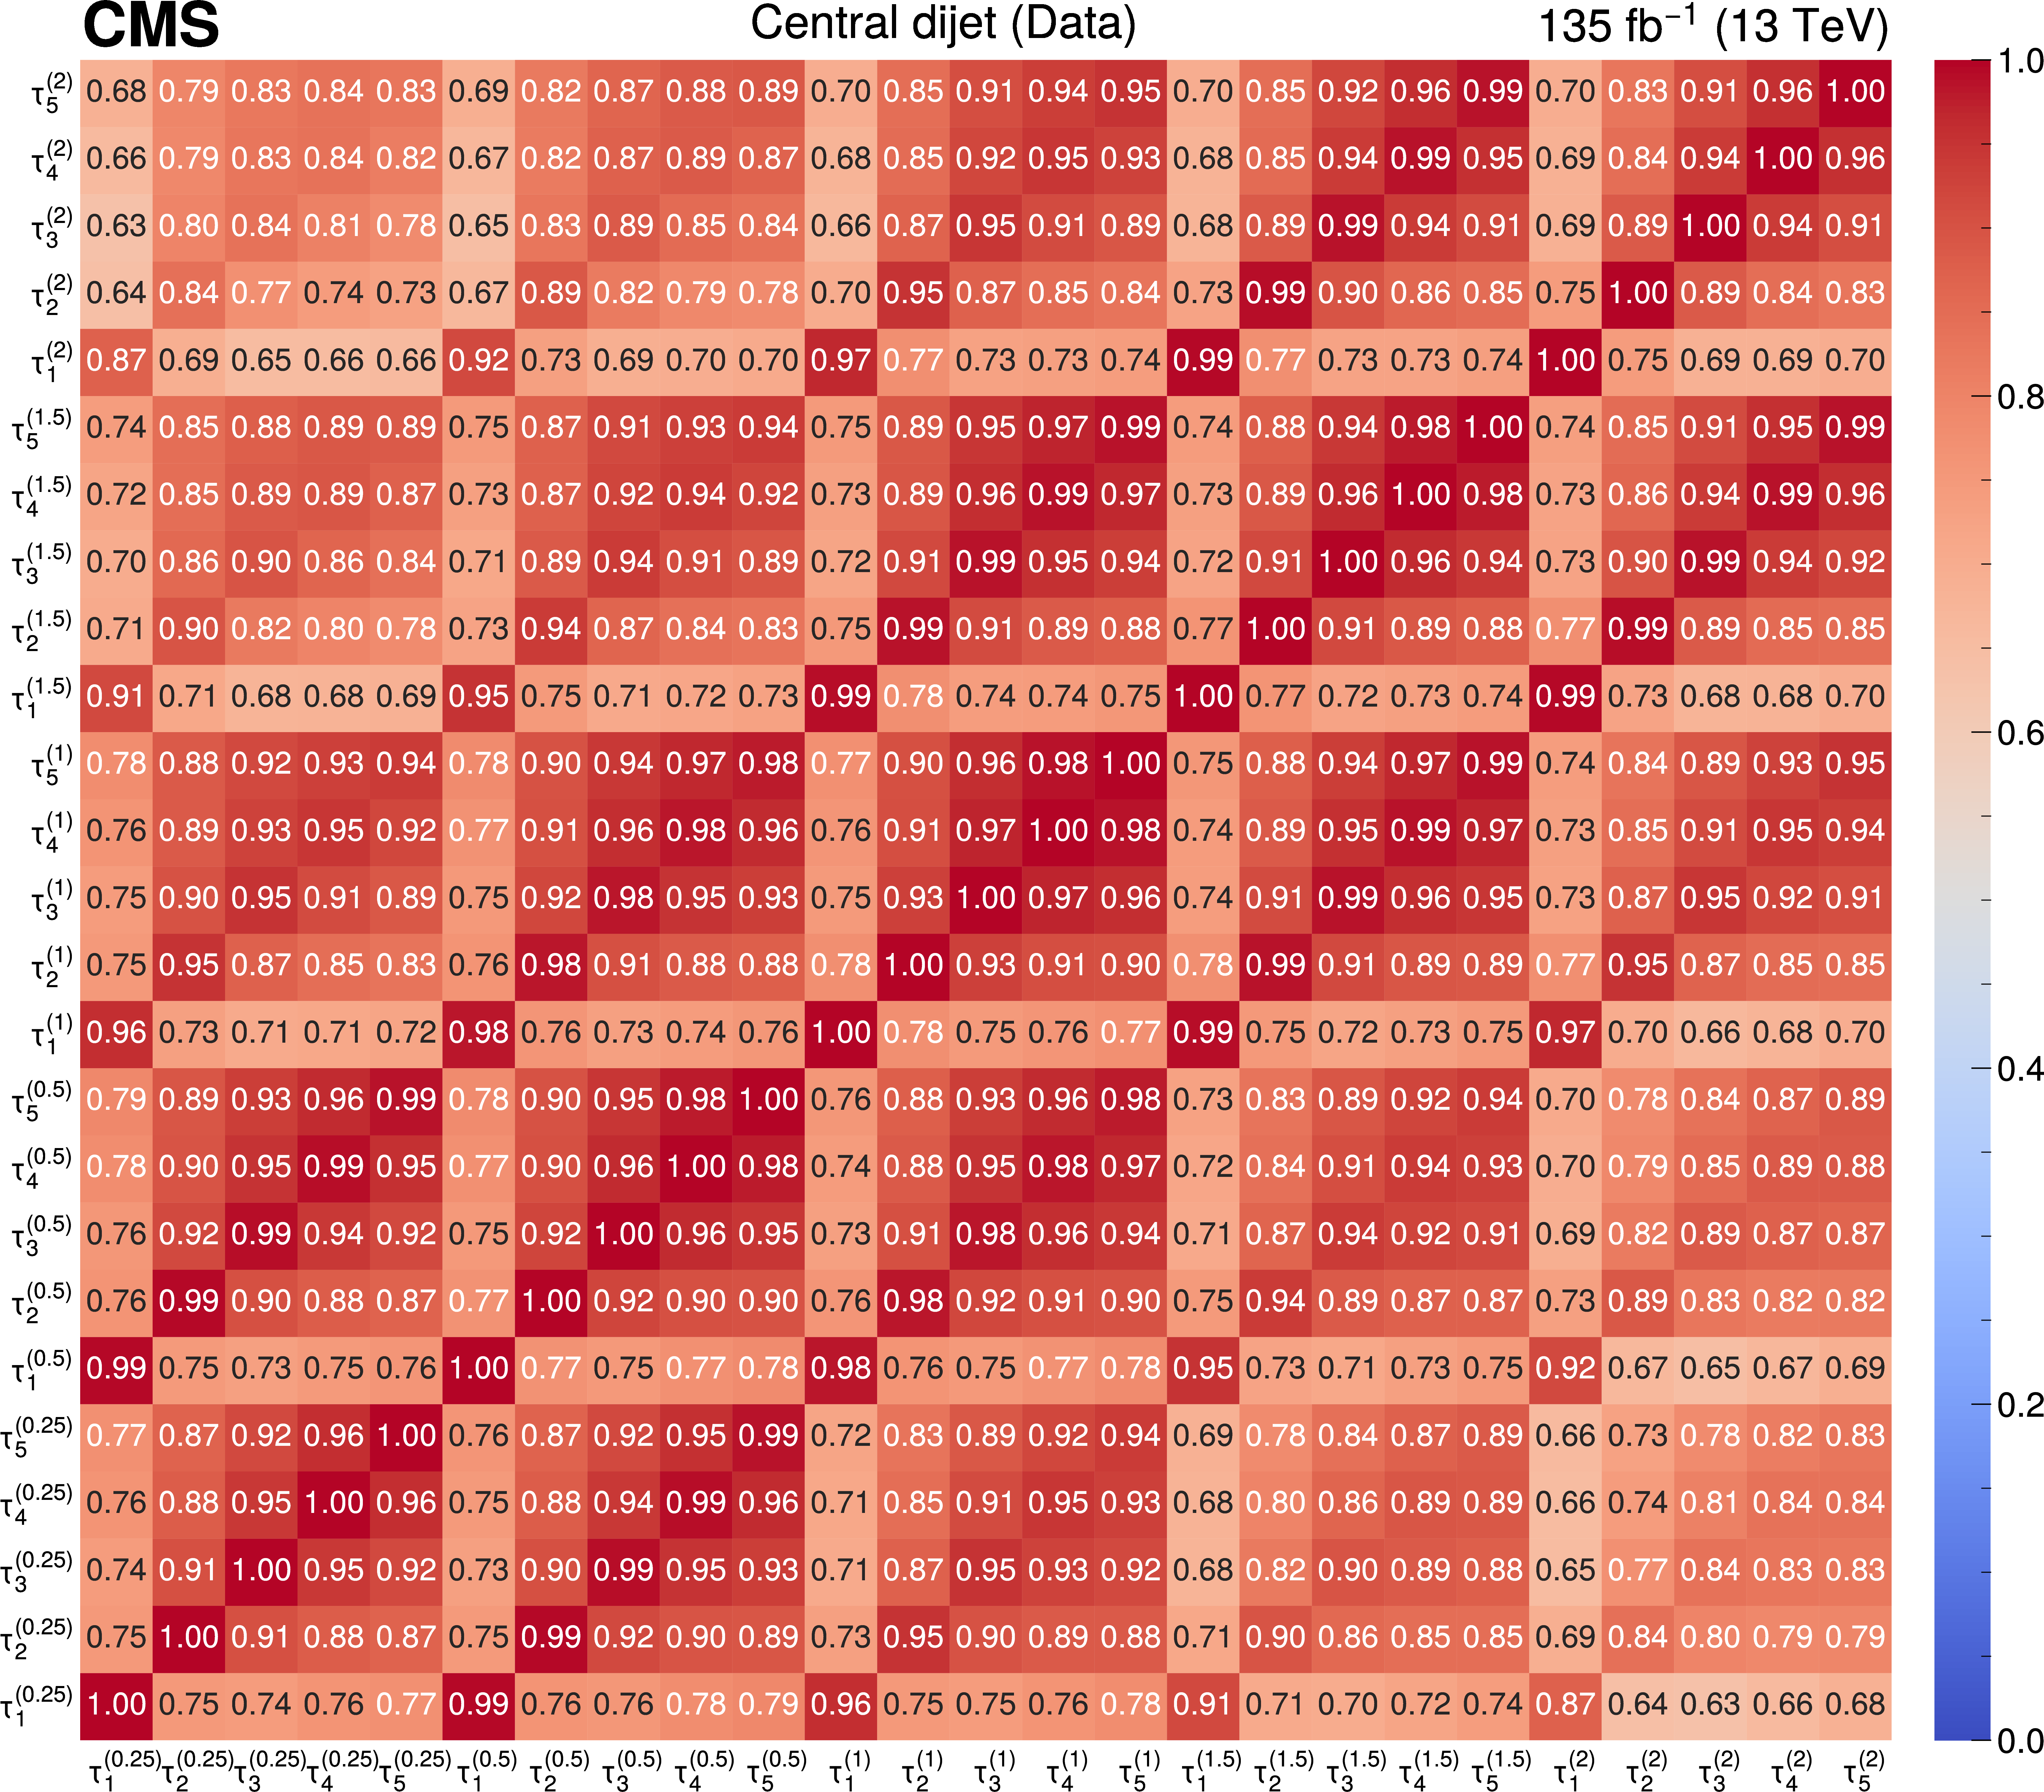
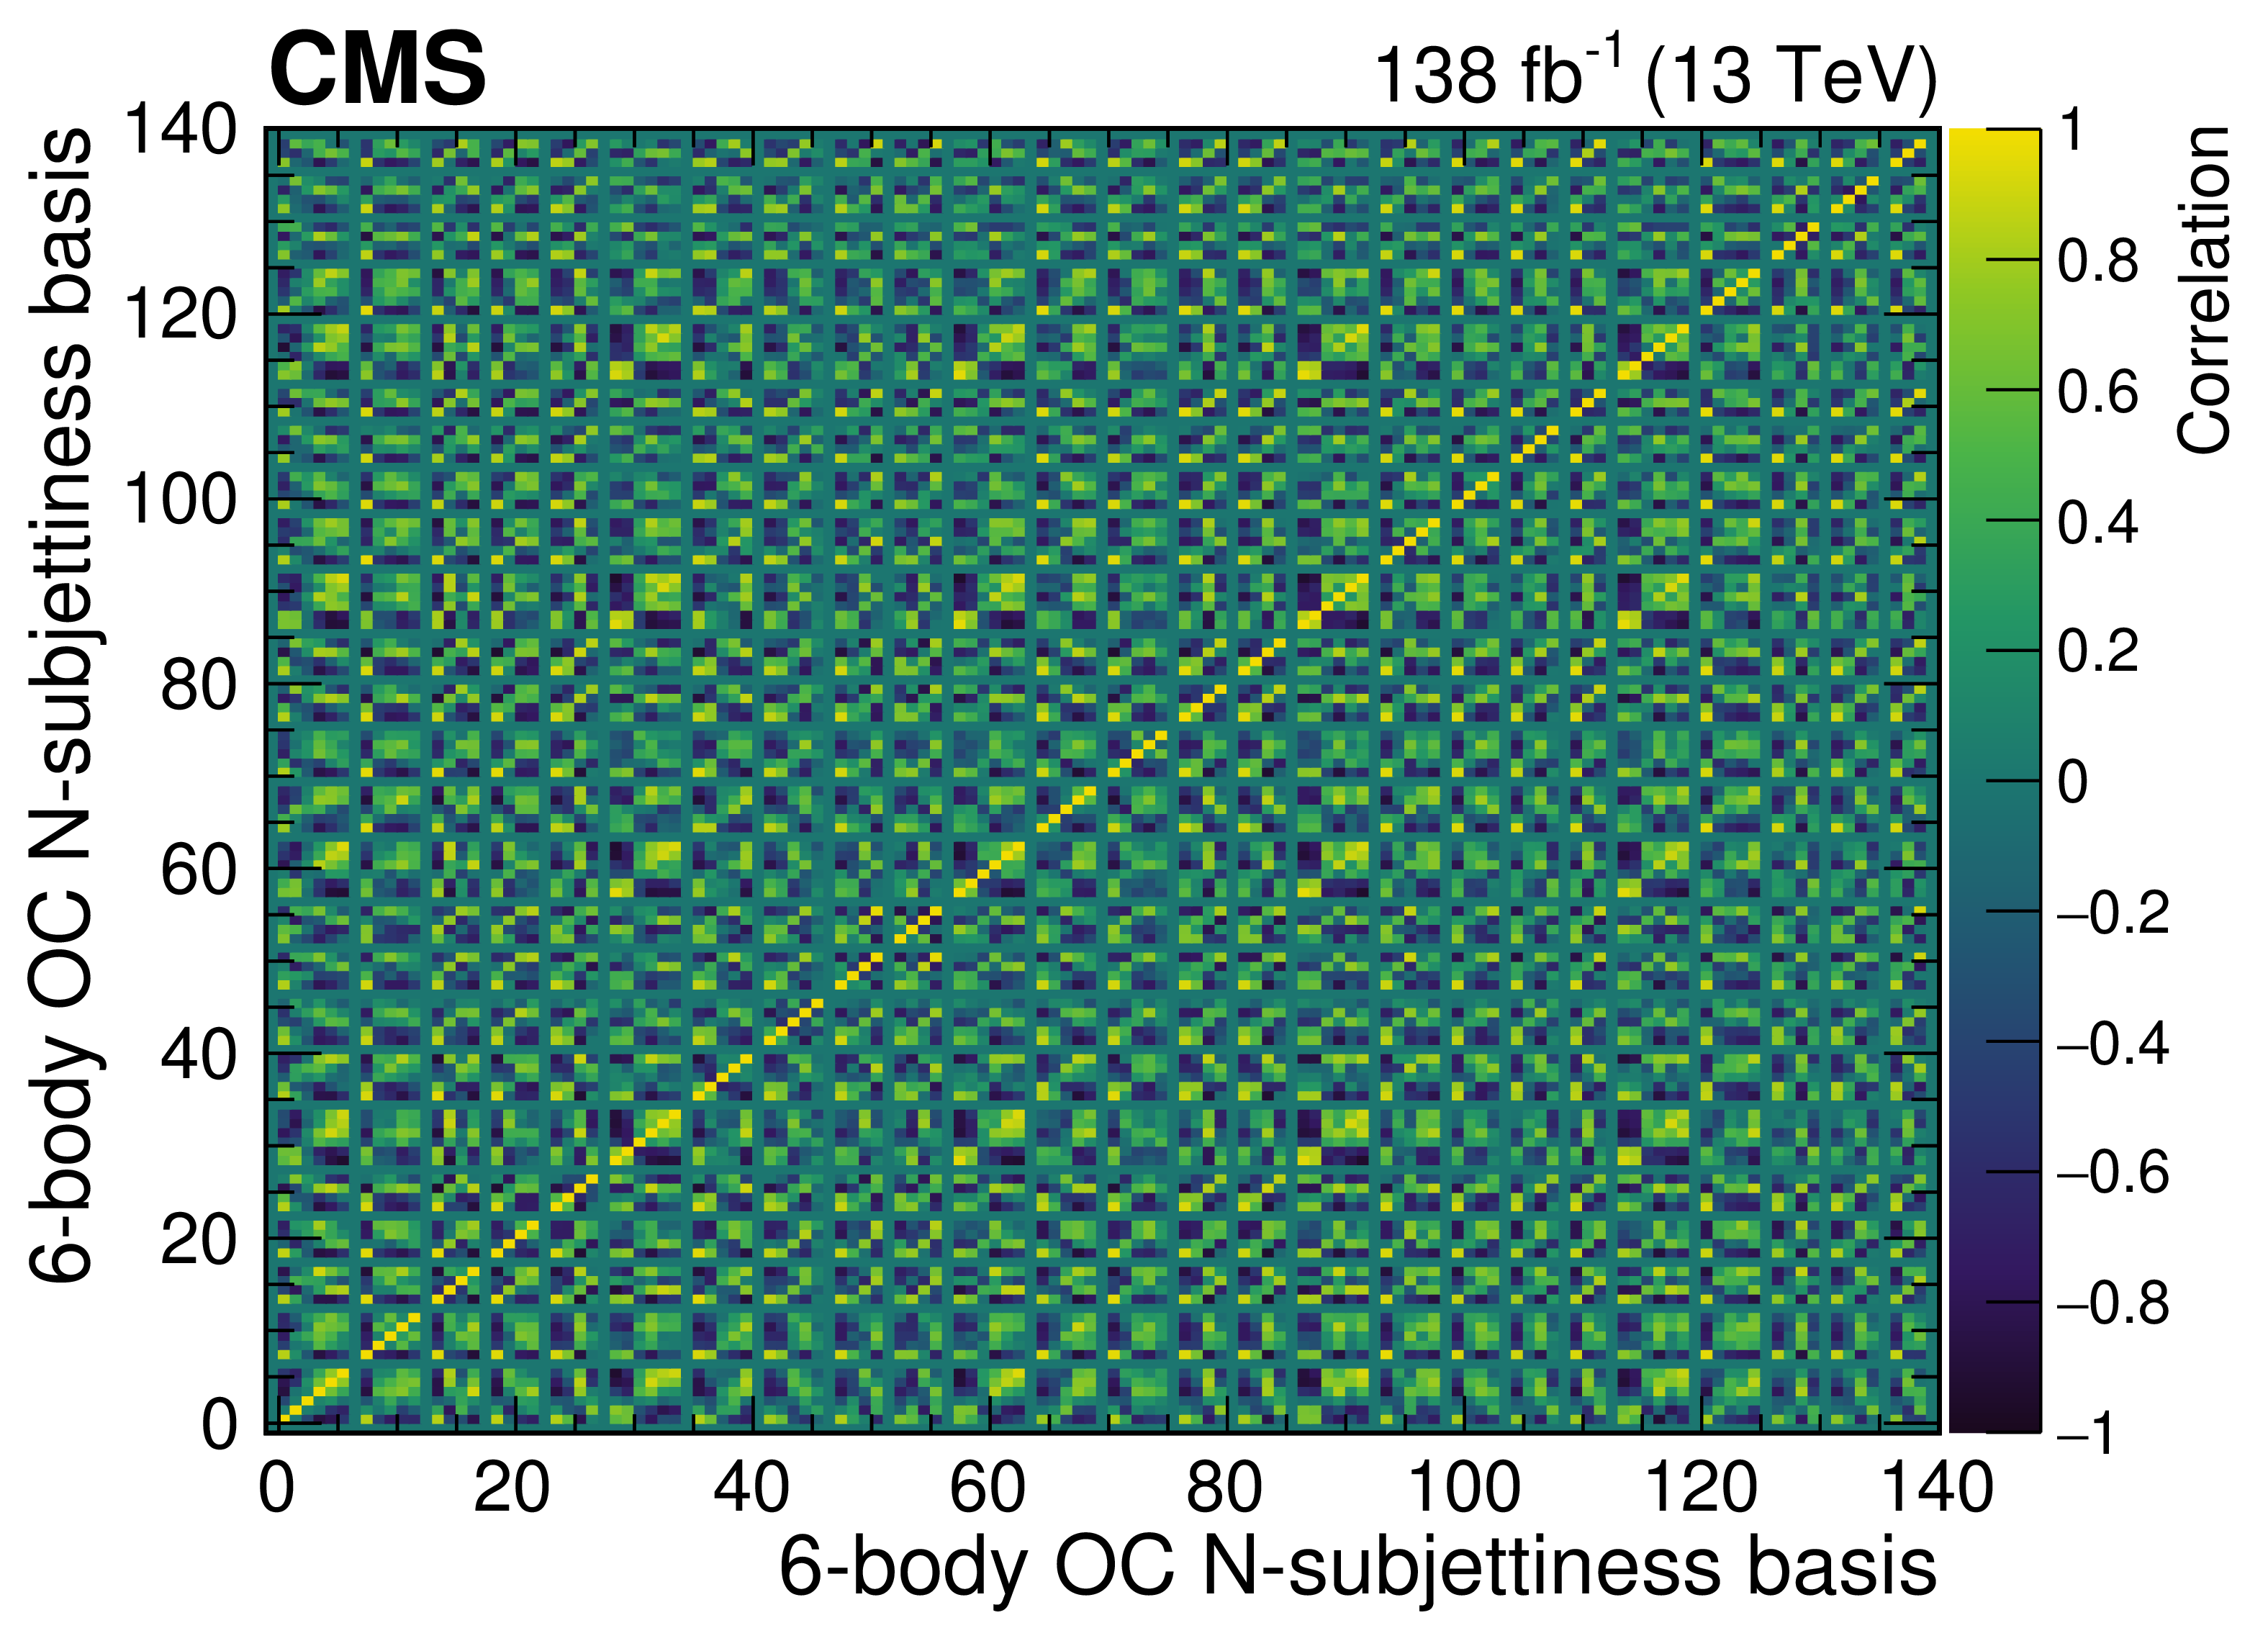
Figure 18:
Pairwise Pearson correlations between $ N $-subjettiness observables constituting the overcomplete 6-body basis, using the full Run 2 data set recorded by the CMS detector, for the QCD dijet selection. |
png pdf |
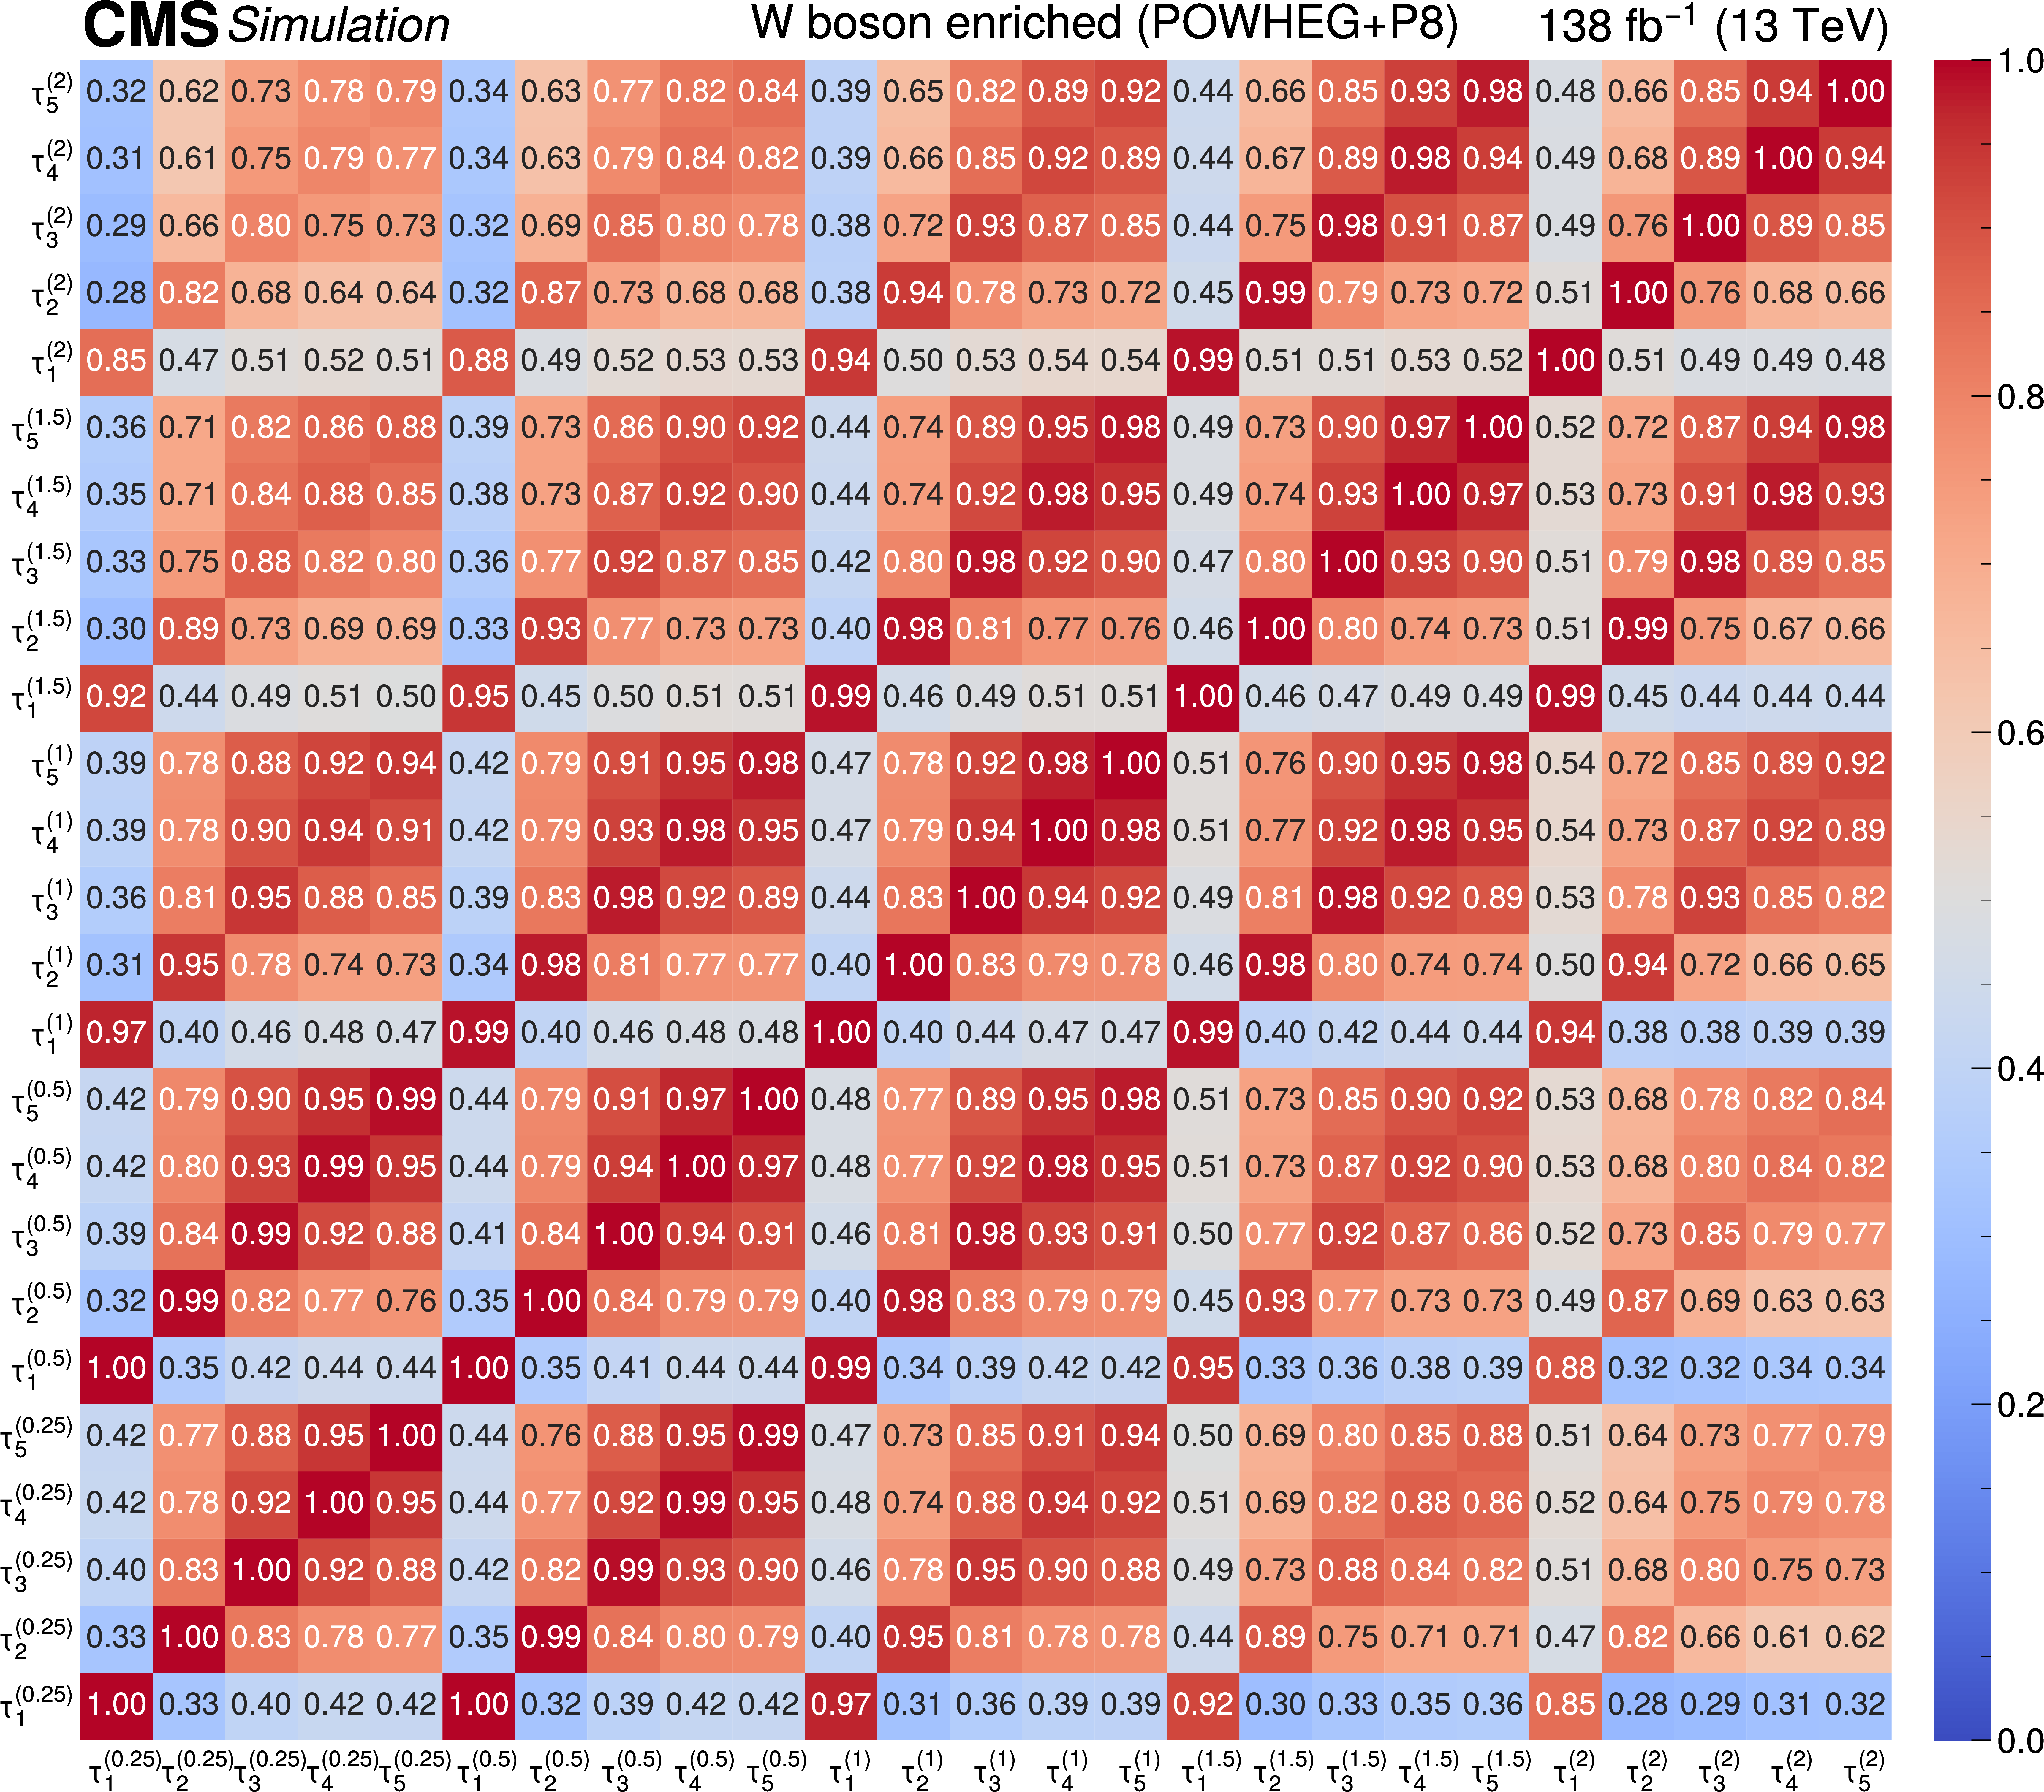
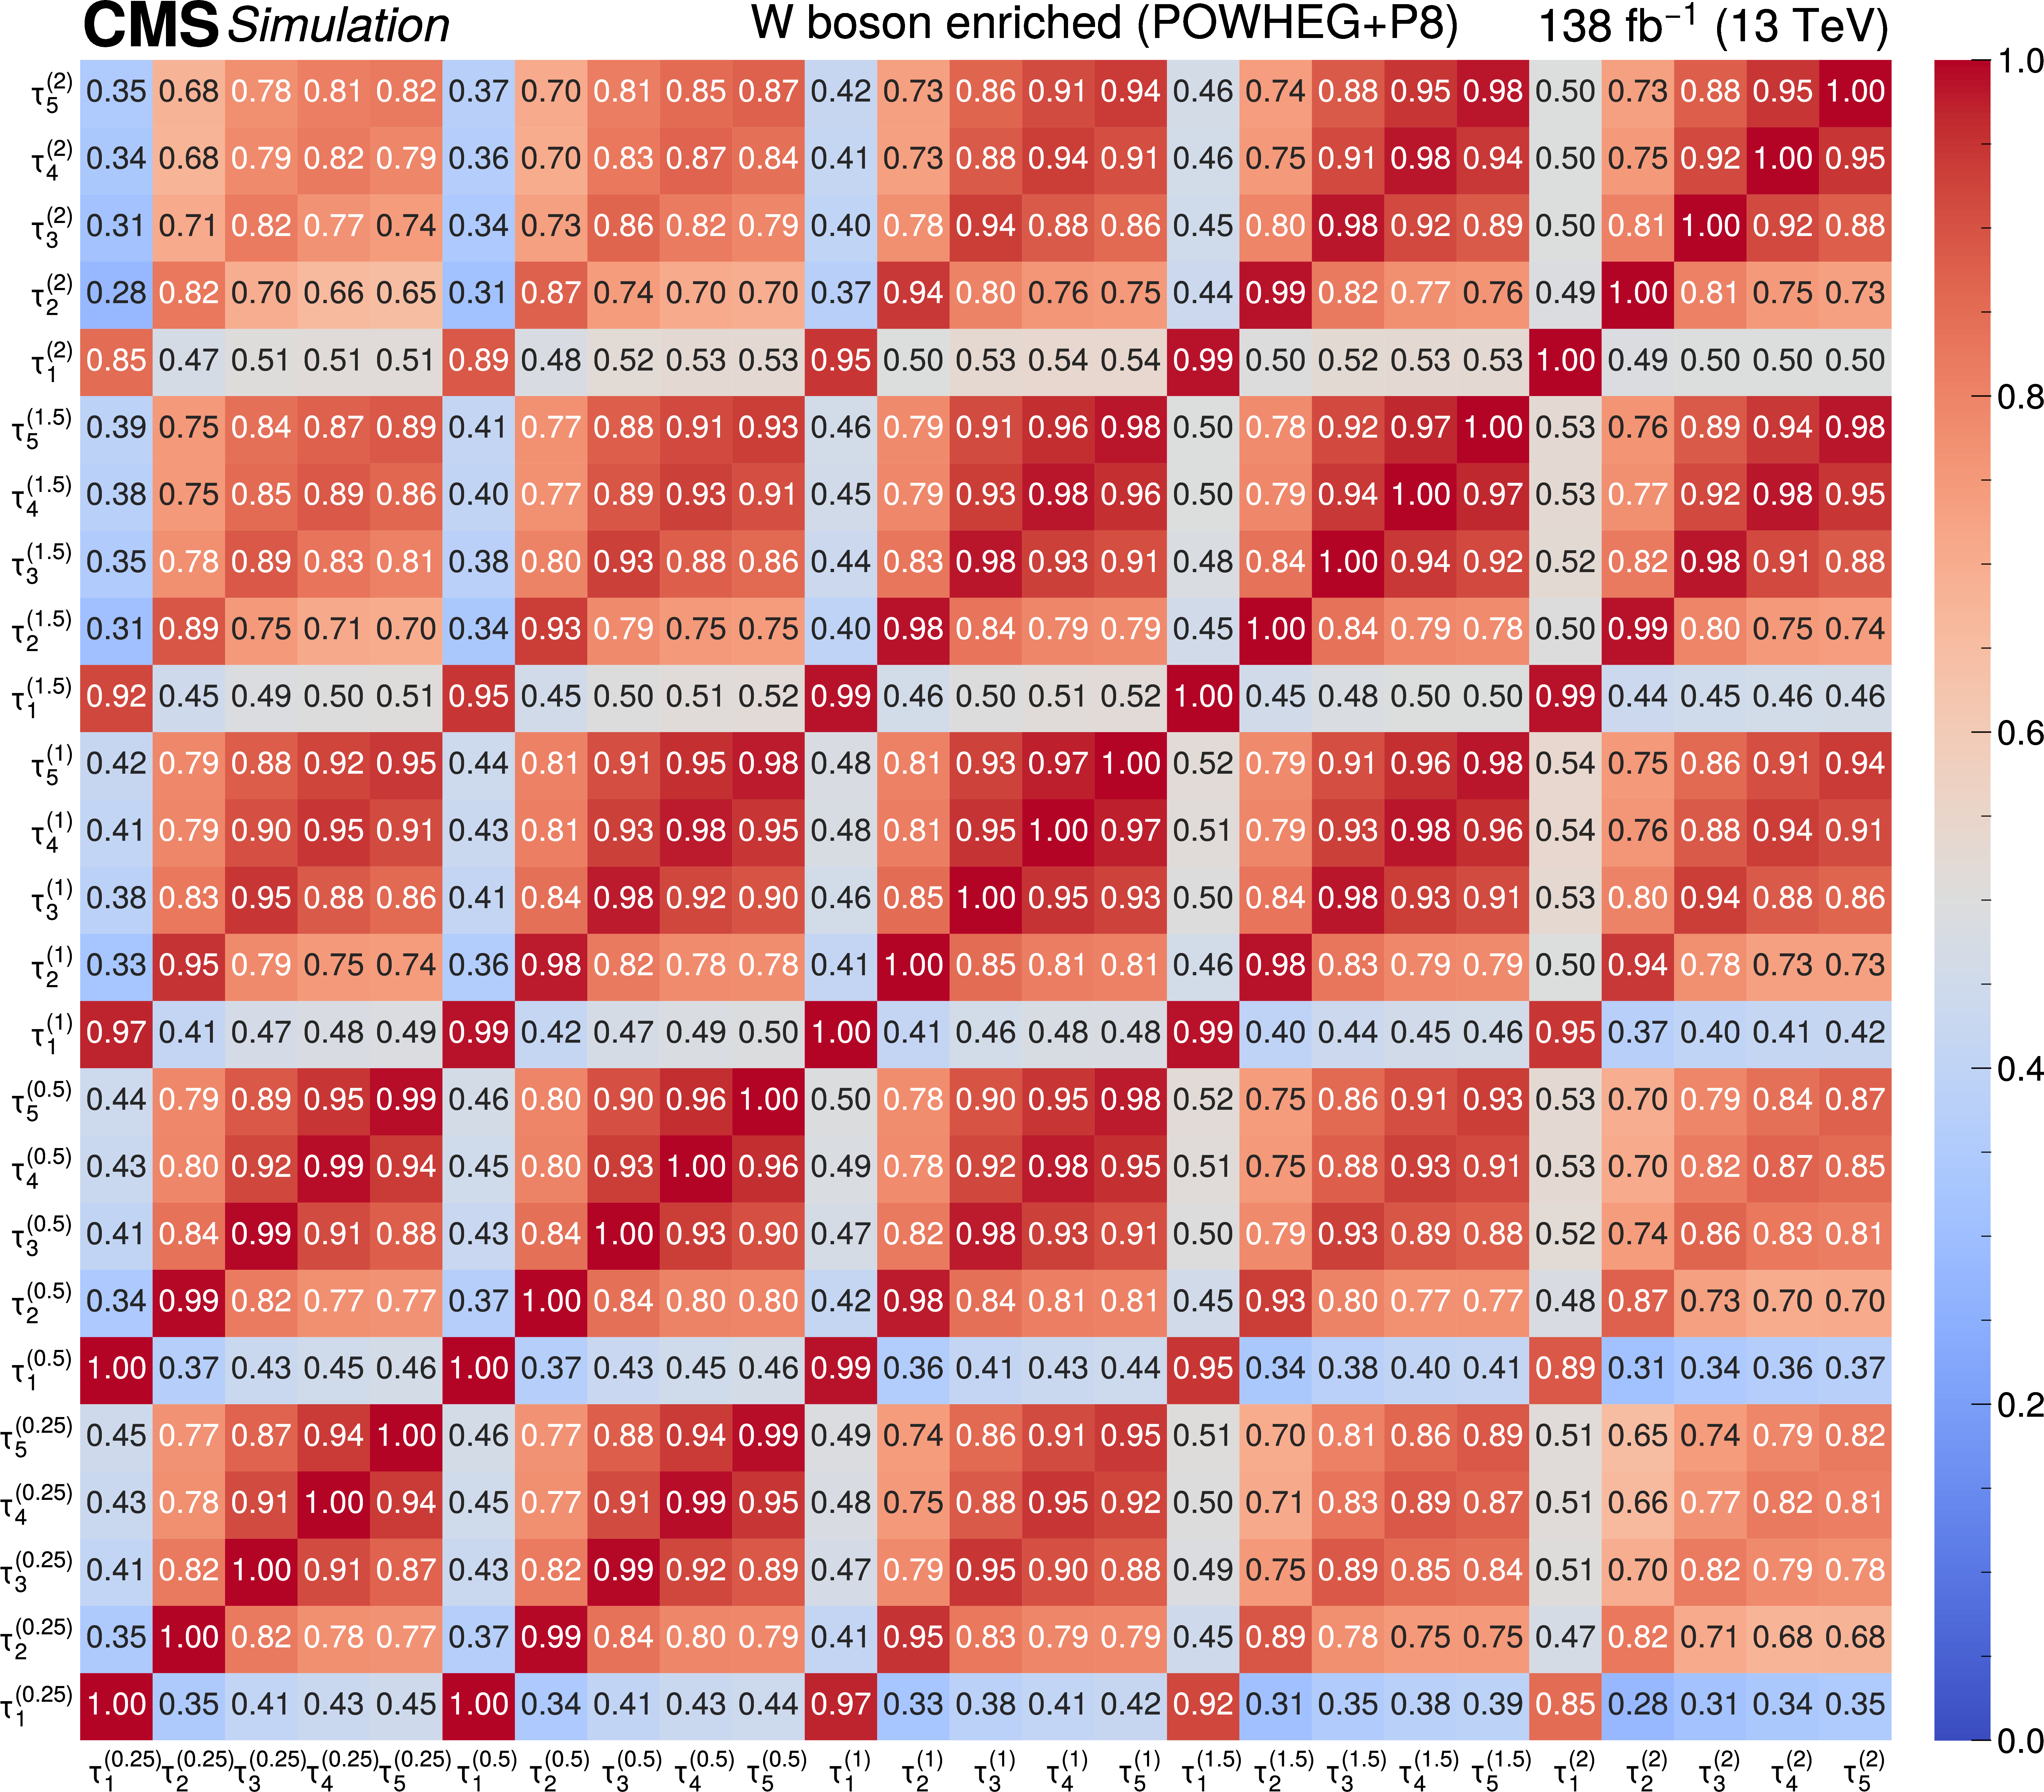
Figure 19:
Pairwise Pearson correlations between $ N $-subjettiness observables constituting the overcomplete 6-body basis, in the nominal POWHEG +PYTHIAviii signal sample, at the particle level, in the boosted W boson-enriched region. All particle-level events with fully-merged jets passing the event selections are considered. |
png pdf |
Figure 20:
Pairwise Pearson correlations between $ N $-subjettiness observables constituting the overcomplete 6-body basis, in the nominal POWHEG +PYTHIAviii signal sample, at the detector level, in the boosted W boson-enriched region. Only detector-level events with a matched jet in the corresponding fully-merged particle-level event are considered. |
png pdf |
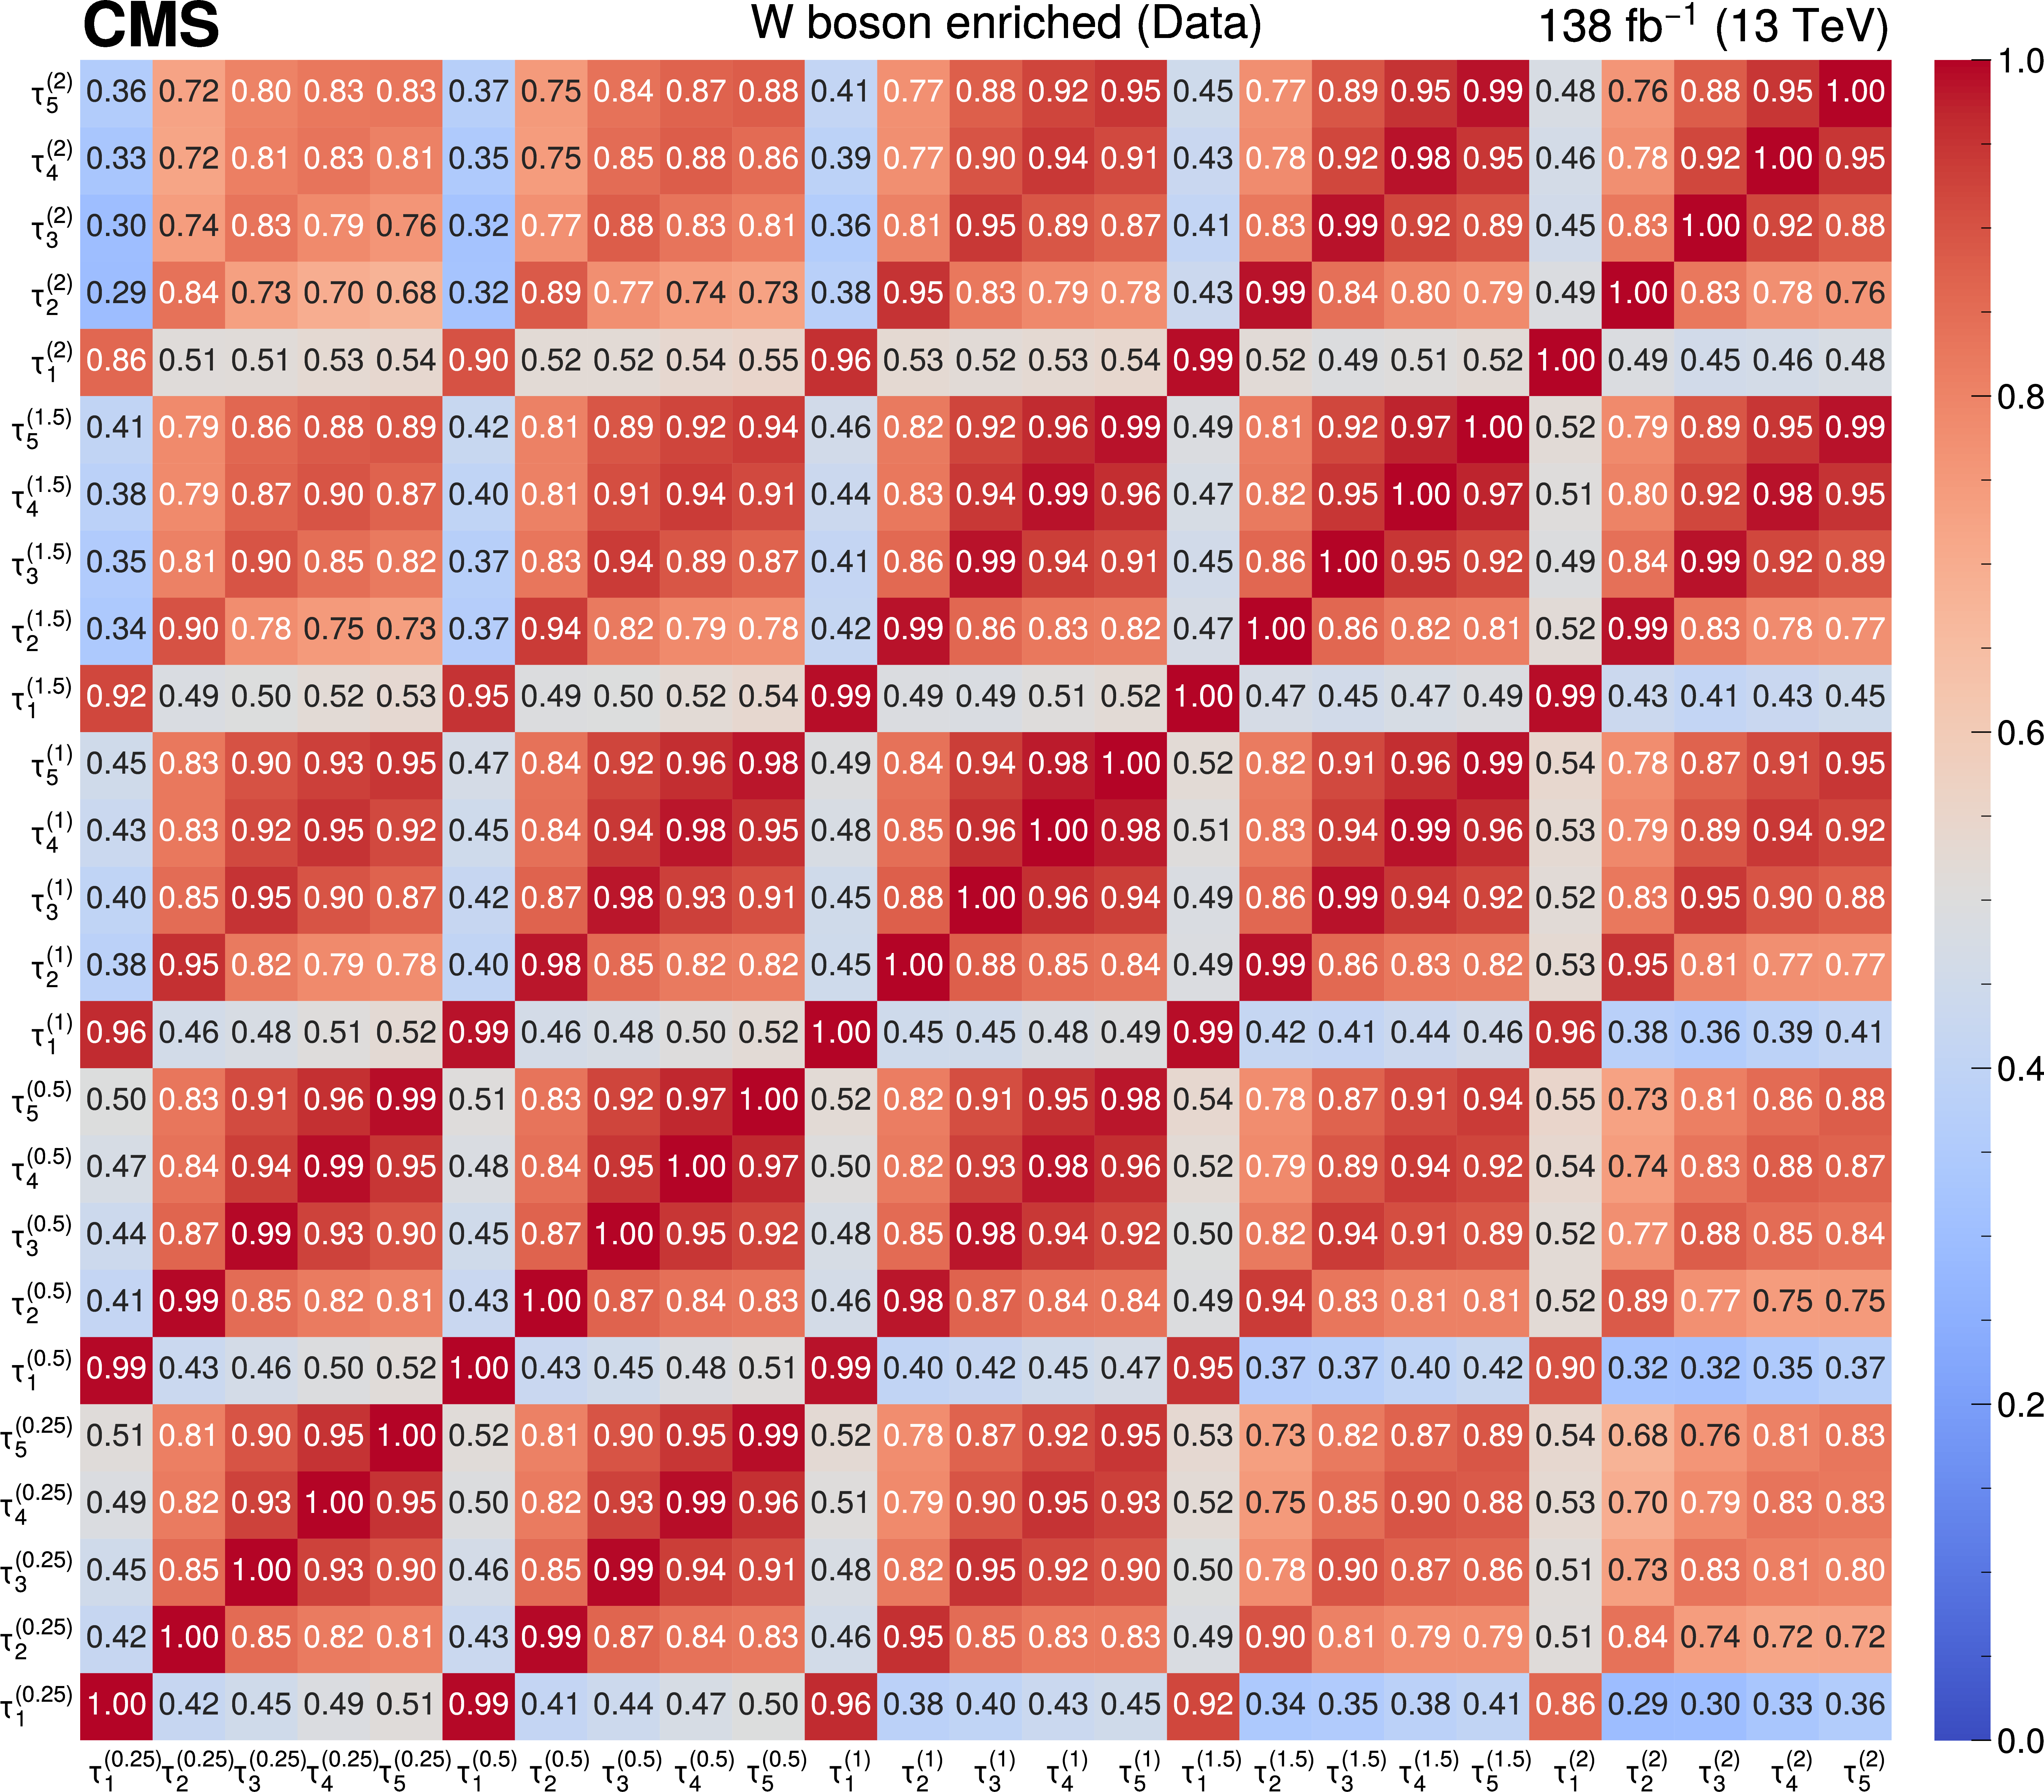
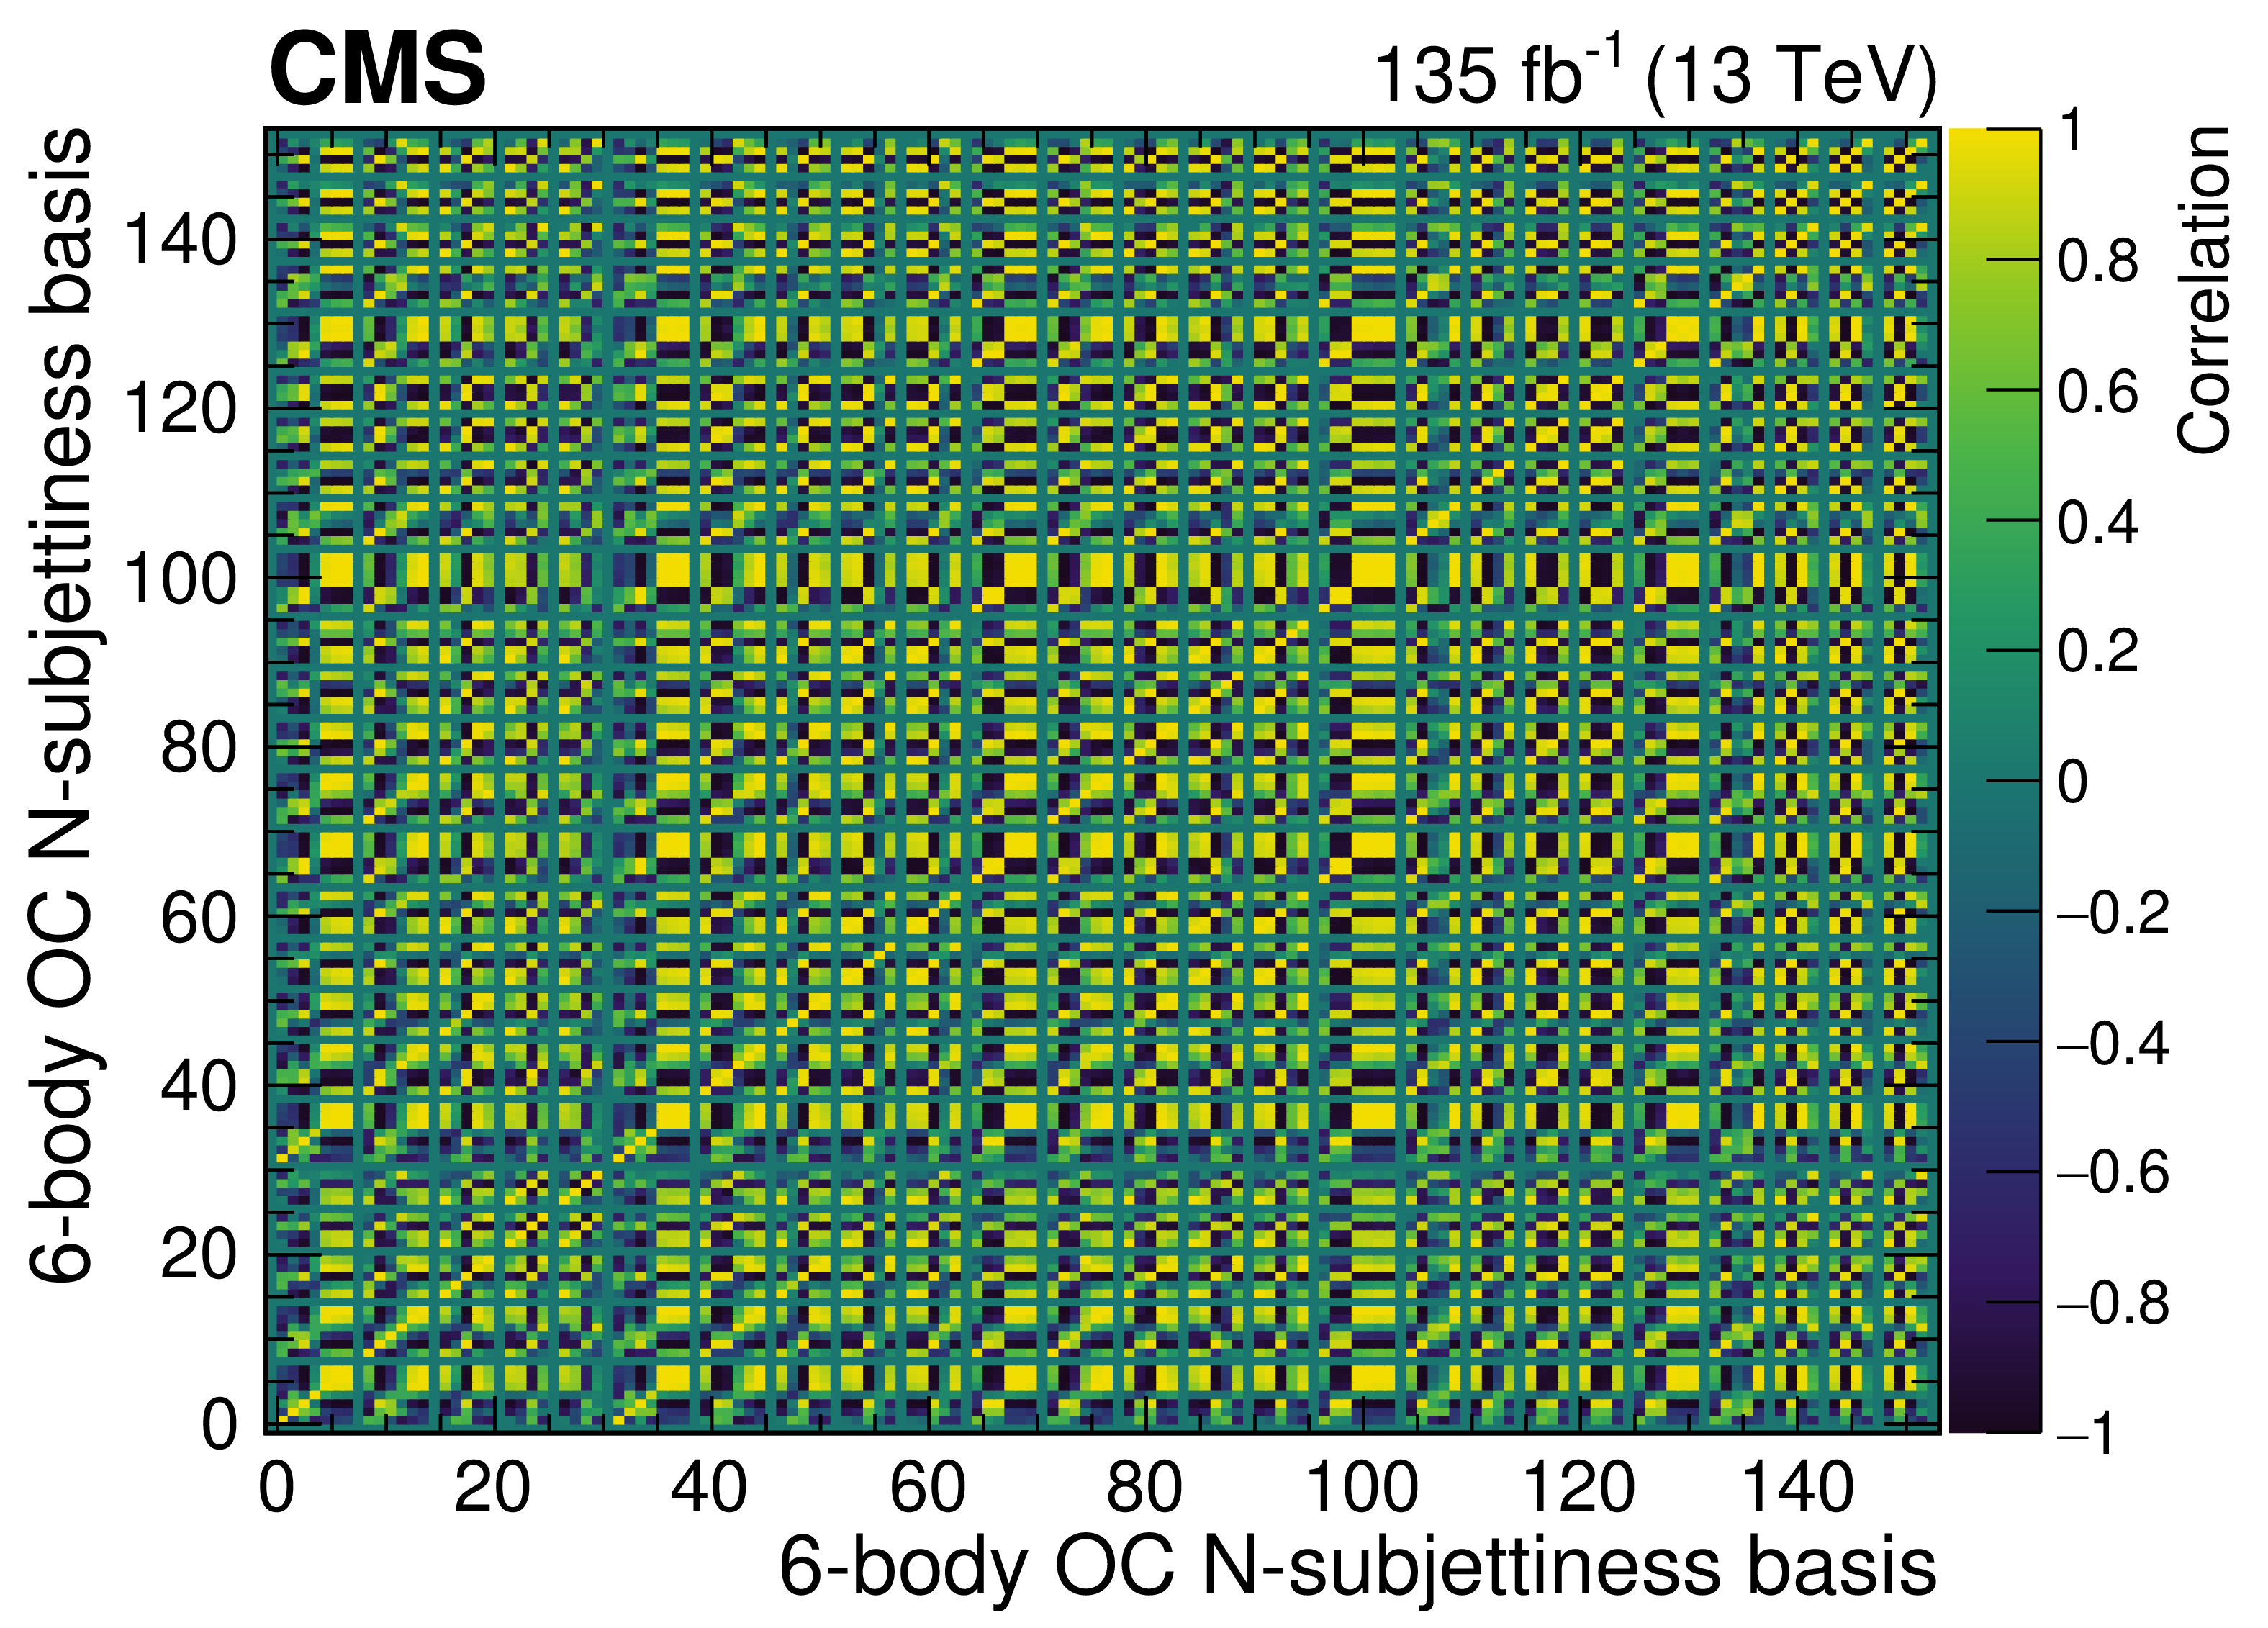
Figure 21:
Pairwise Pearson correlations between $ N $-subjettiness observables constituting the overcomplete 6-body basis, using the full Run 2 data set recorded by the CMS detector, in the boosted W boson-enriched region. |
png pdf |
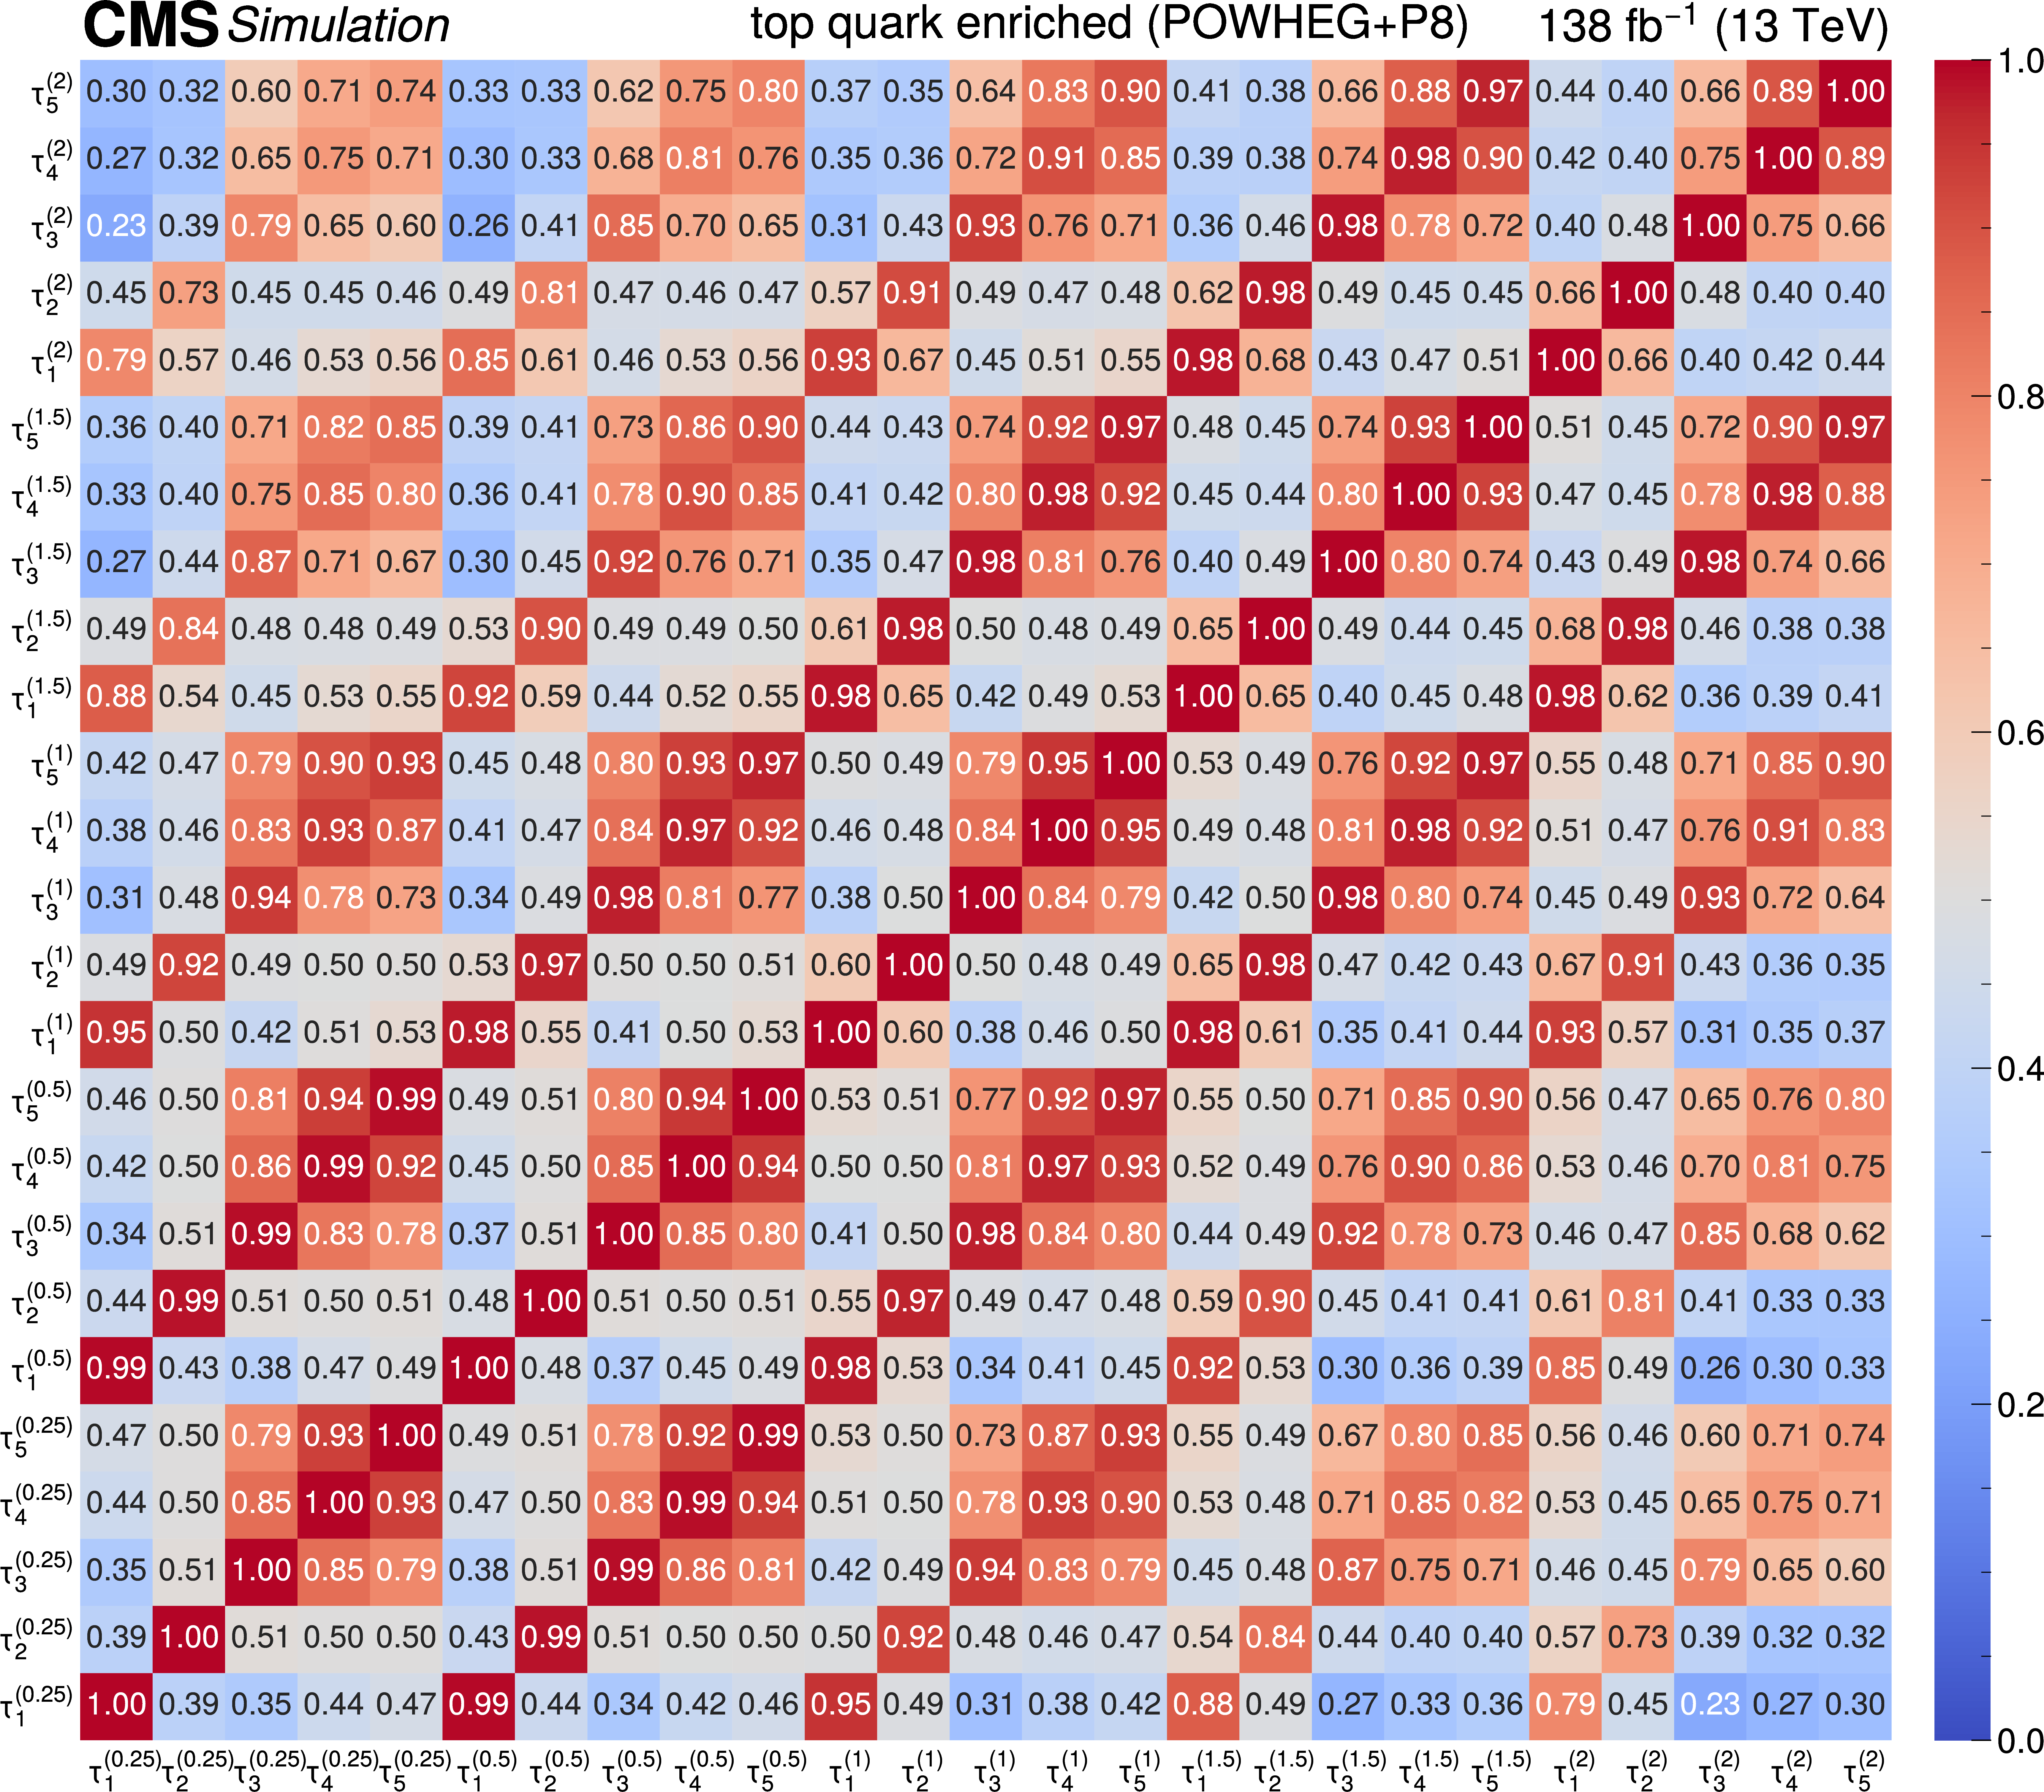
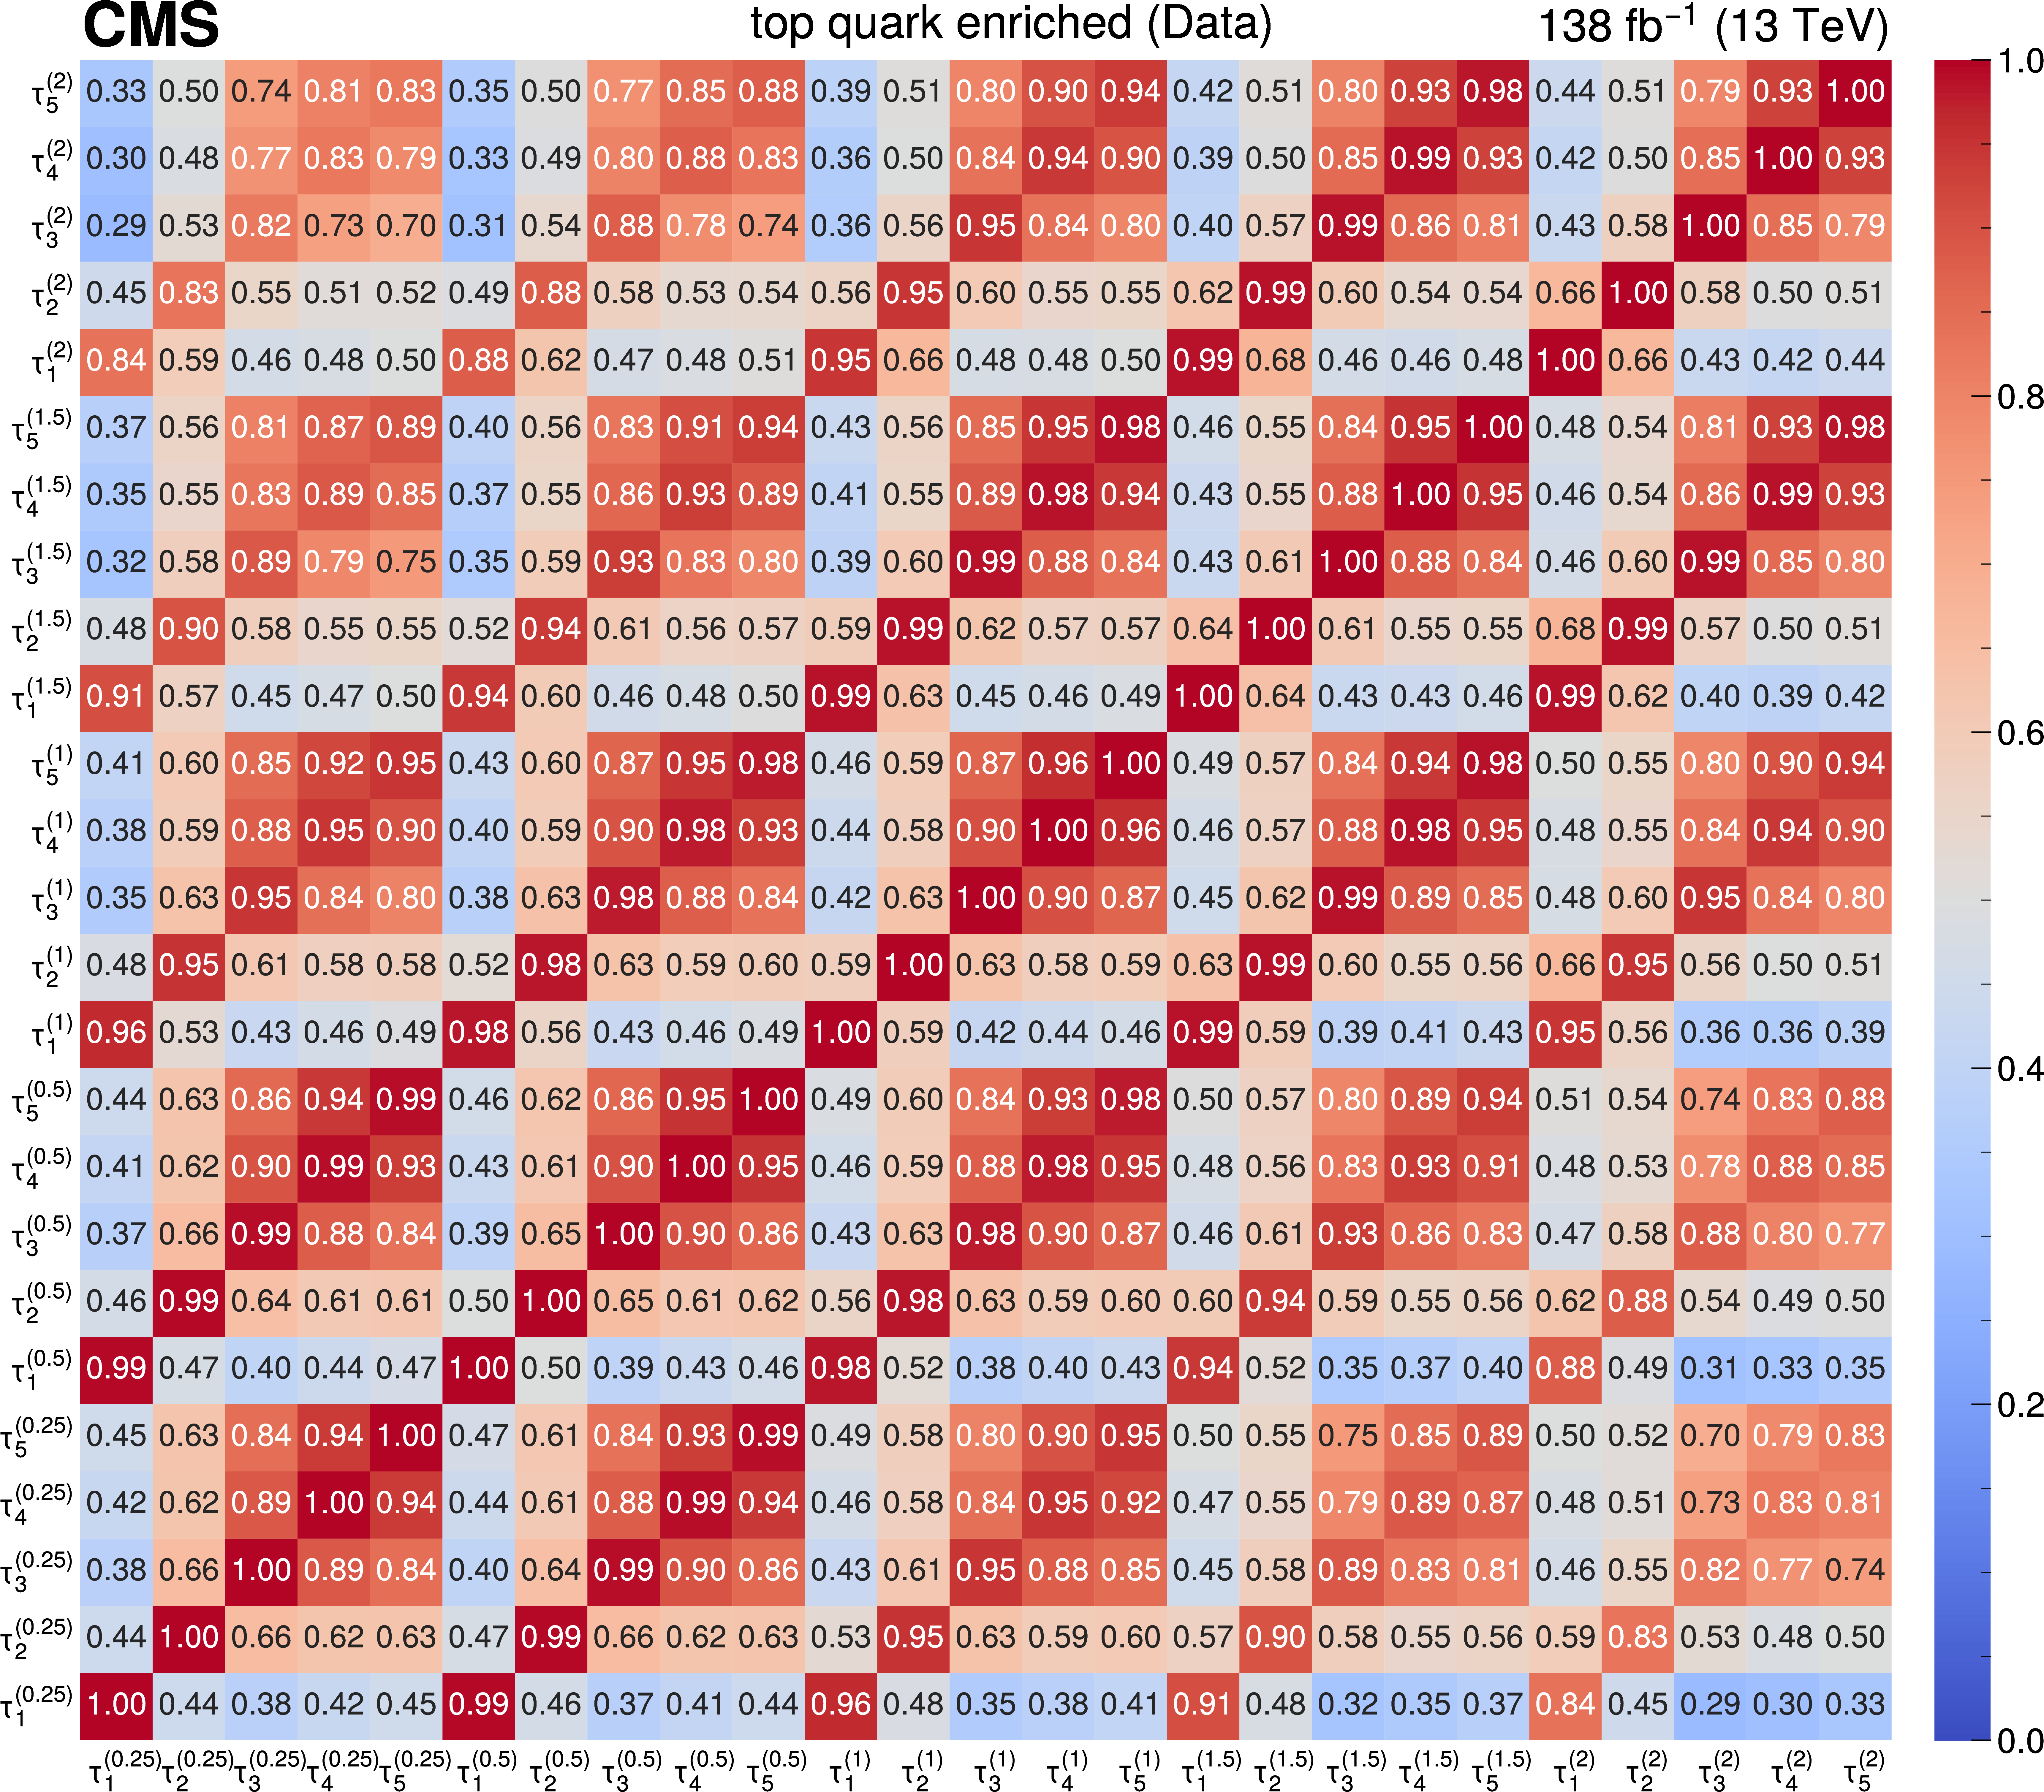
Figure 22:
Pairwise Pearson correlations between $ N $-subjettiness observables constituting the overcomplete 6-body basis, in the nominal POWHEG +PYTHIAviii signal sample, at the particle level, in the boosted top quark-enriched region. All particle-level events with fully-merged jets passing the event selections are considered. |
png pdf |
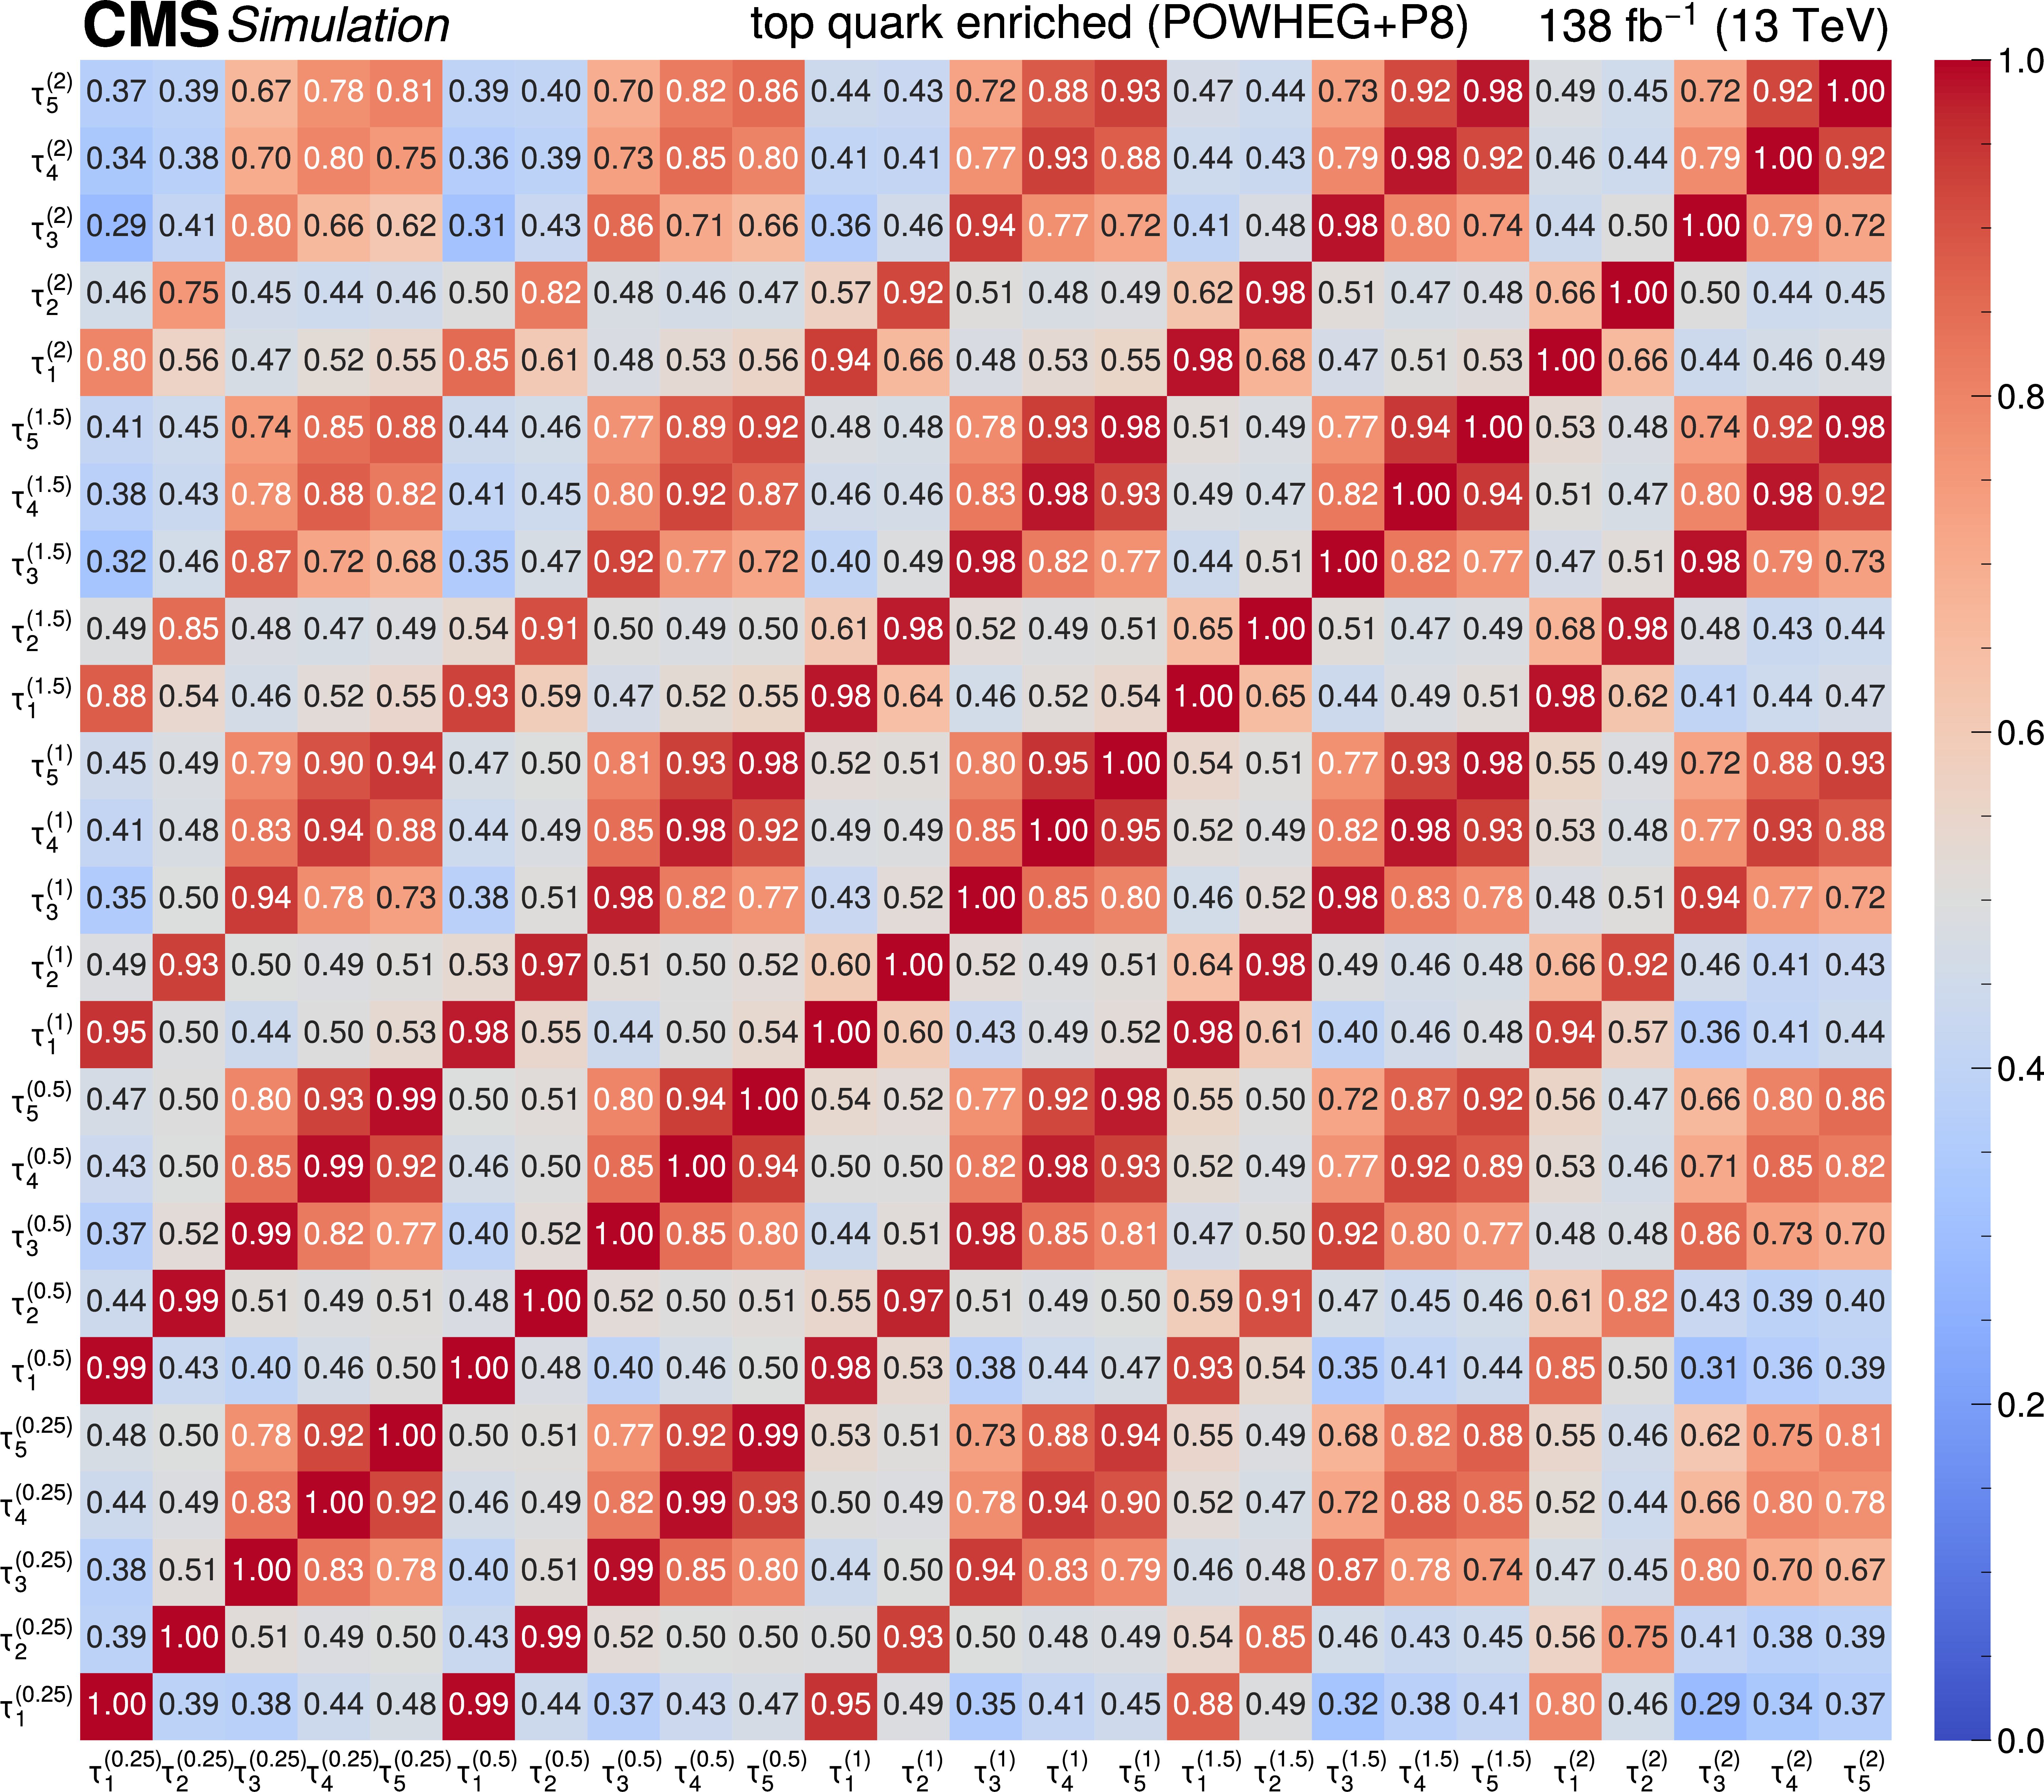
Figure 23:
Pairwise Pearson correlations between $ N $-subjettiness observables constituting the overcomplete 6-body basis, in the nominal POWHEG +PYTHIAviii signal sample, at the detector level, in the boosted top quark-enriched region. Only detector-level events with a matched jet in the corresponding fully-merged particle-level event are considered. |
png pdf |
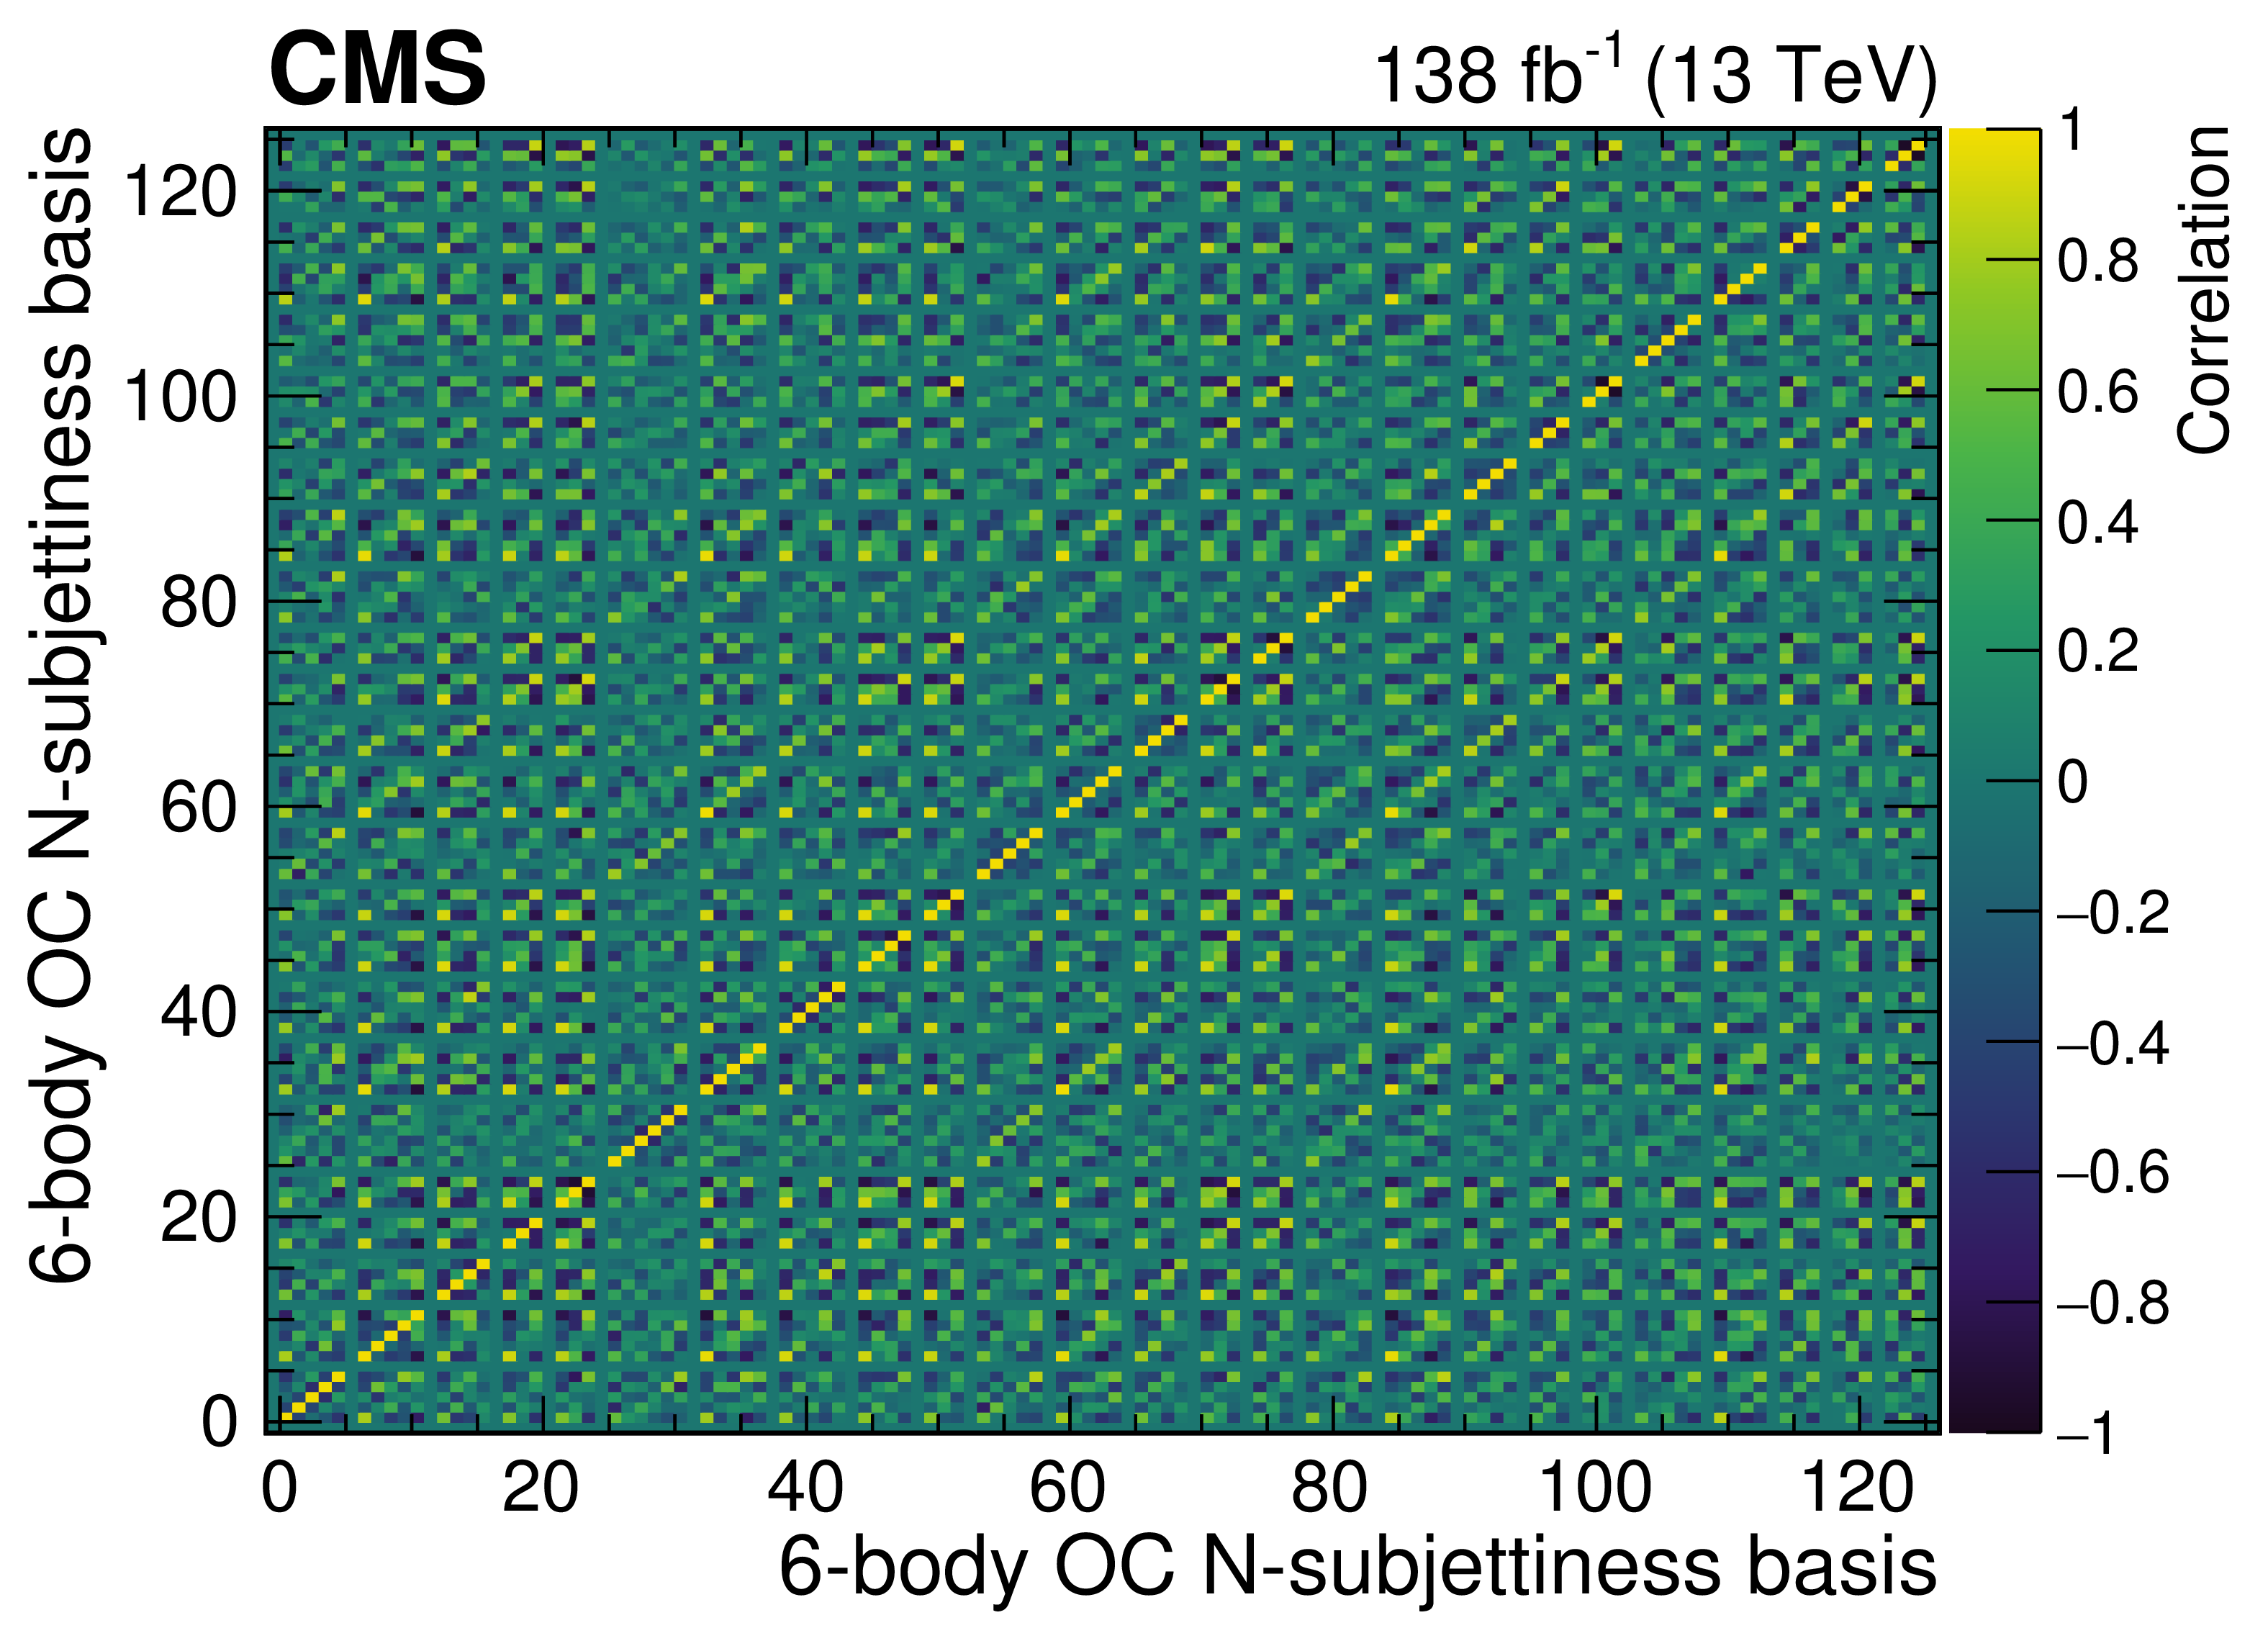
Figure 24:
Pairwise Pearson correlations between $ N $-subjettiness observables constituting the overcomplete 6-body basis, using the full Run 2 data set recorded by the CMS detector, in the boosted top quark-enriched region. |
png pdf |
Figure 25:
Correlations between bins in the normalized, unfolded data in the QCD dijet selection. The correlations are computed from the total covariance matrix of the normalized, combined unfolded distribution. |
png pdf |
Figure 26:
Correlations between the bins of the normalized, unfolded data in the boosted W boson-enriched region. The correlations are computed from the total covariance matrix of the normalized, combined unfolded distribution. |
png pdf |
Figure 27:
Correlations between the bins of the normalized, unfolded data in the boosted top quark-enriched selection. The correlations are computed from the total covariance matrix of the normalized, combined unfolded distribution. |
png pdf |
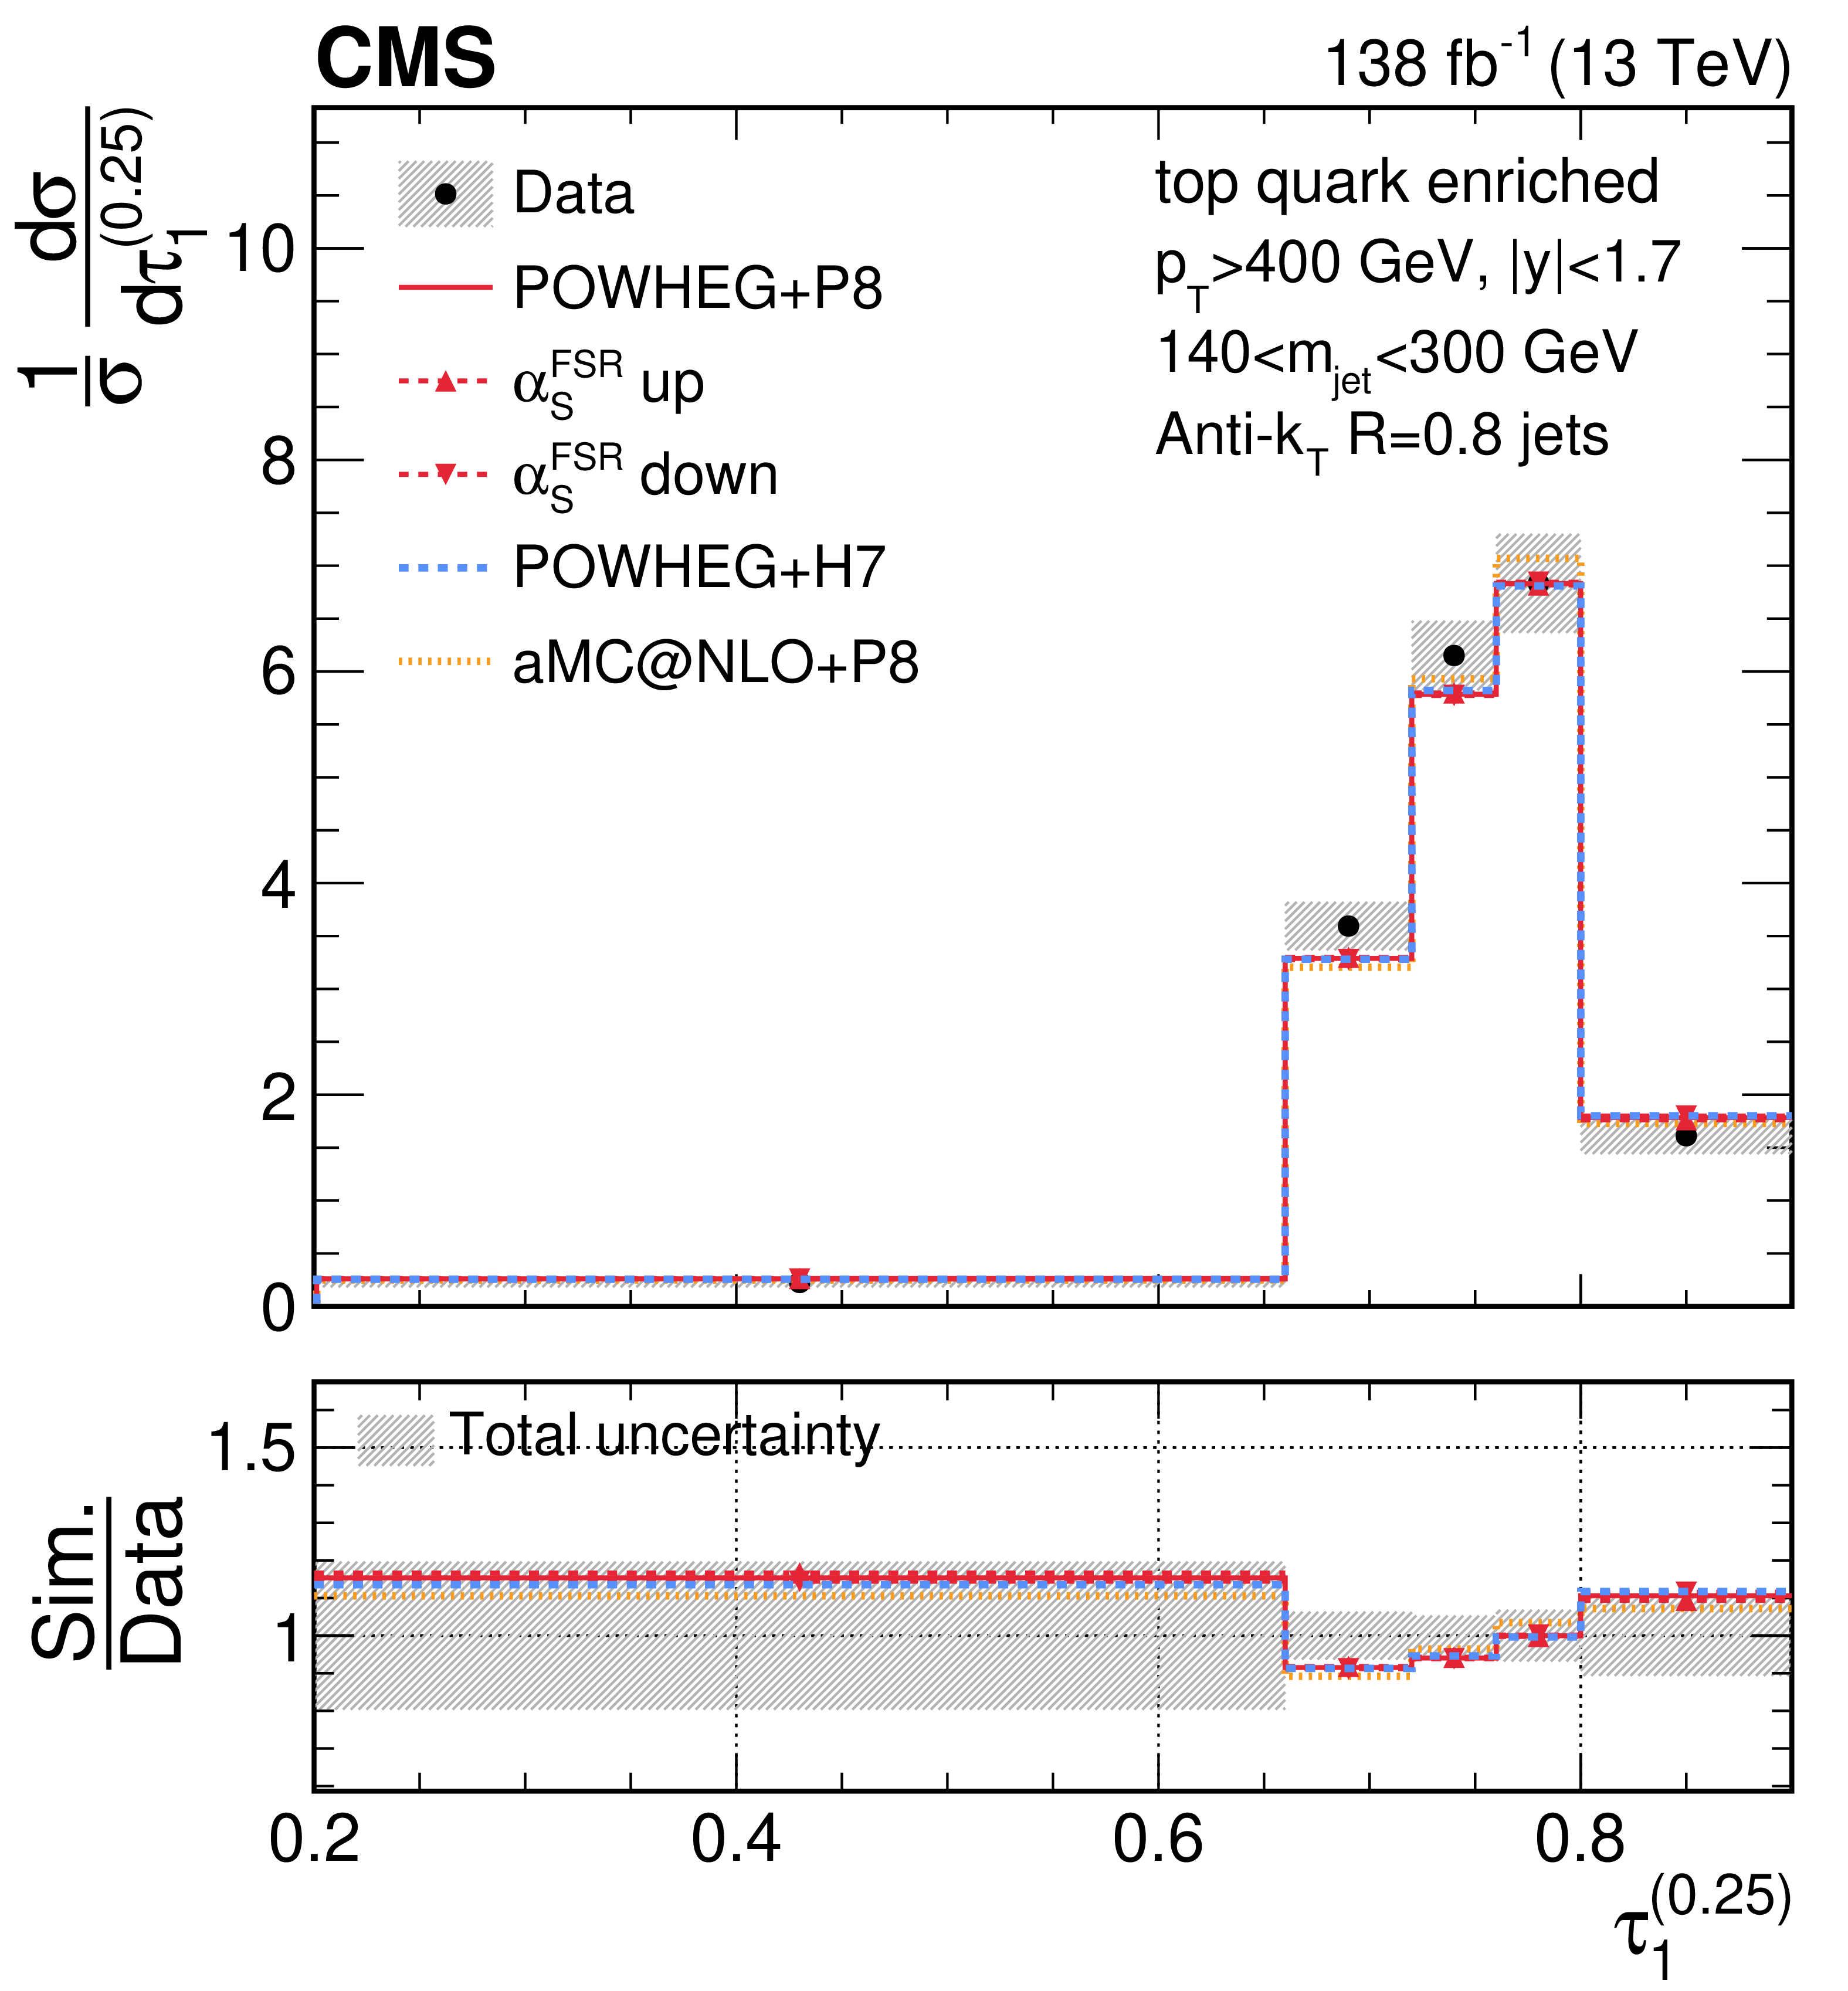
Figure 28:
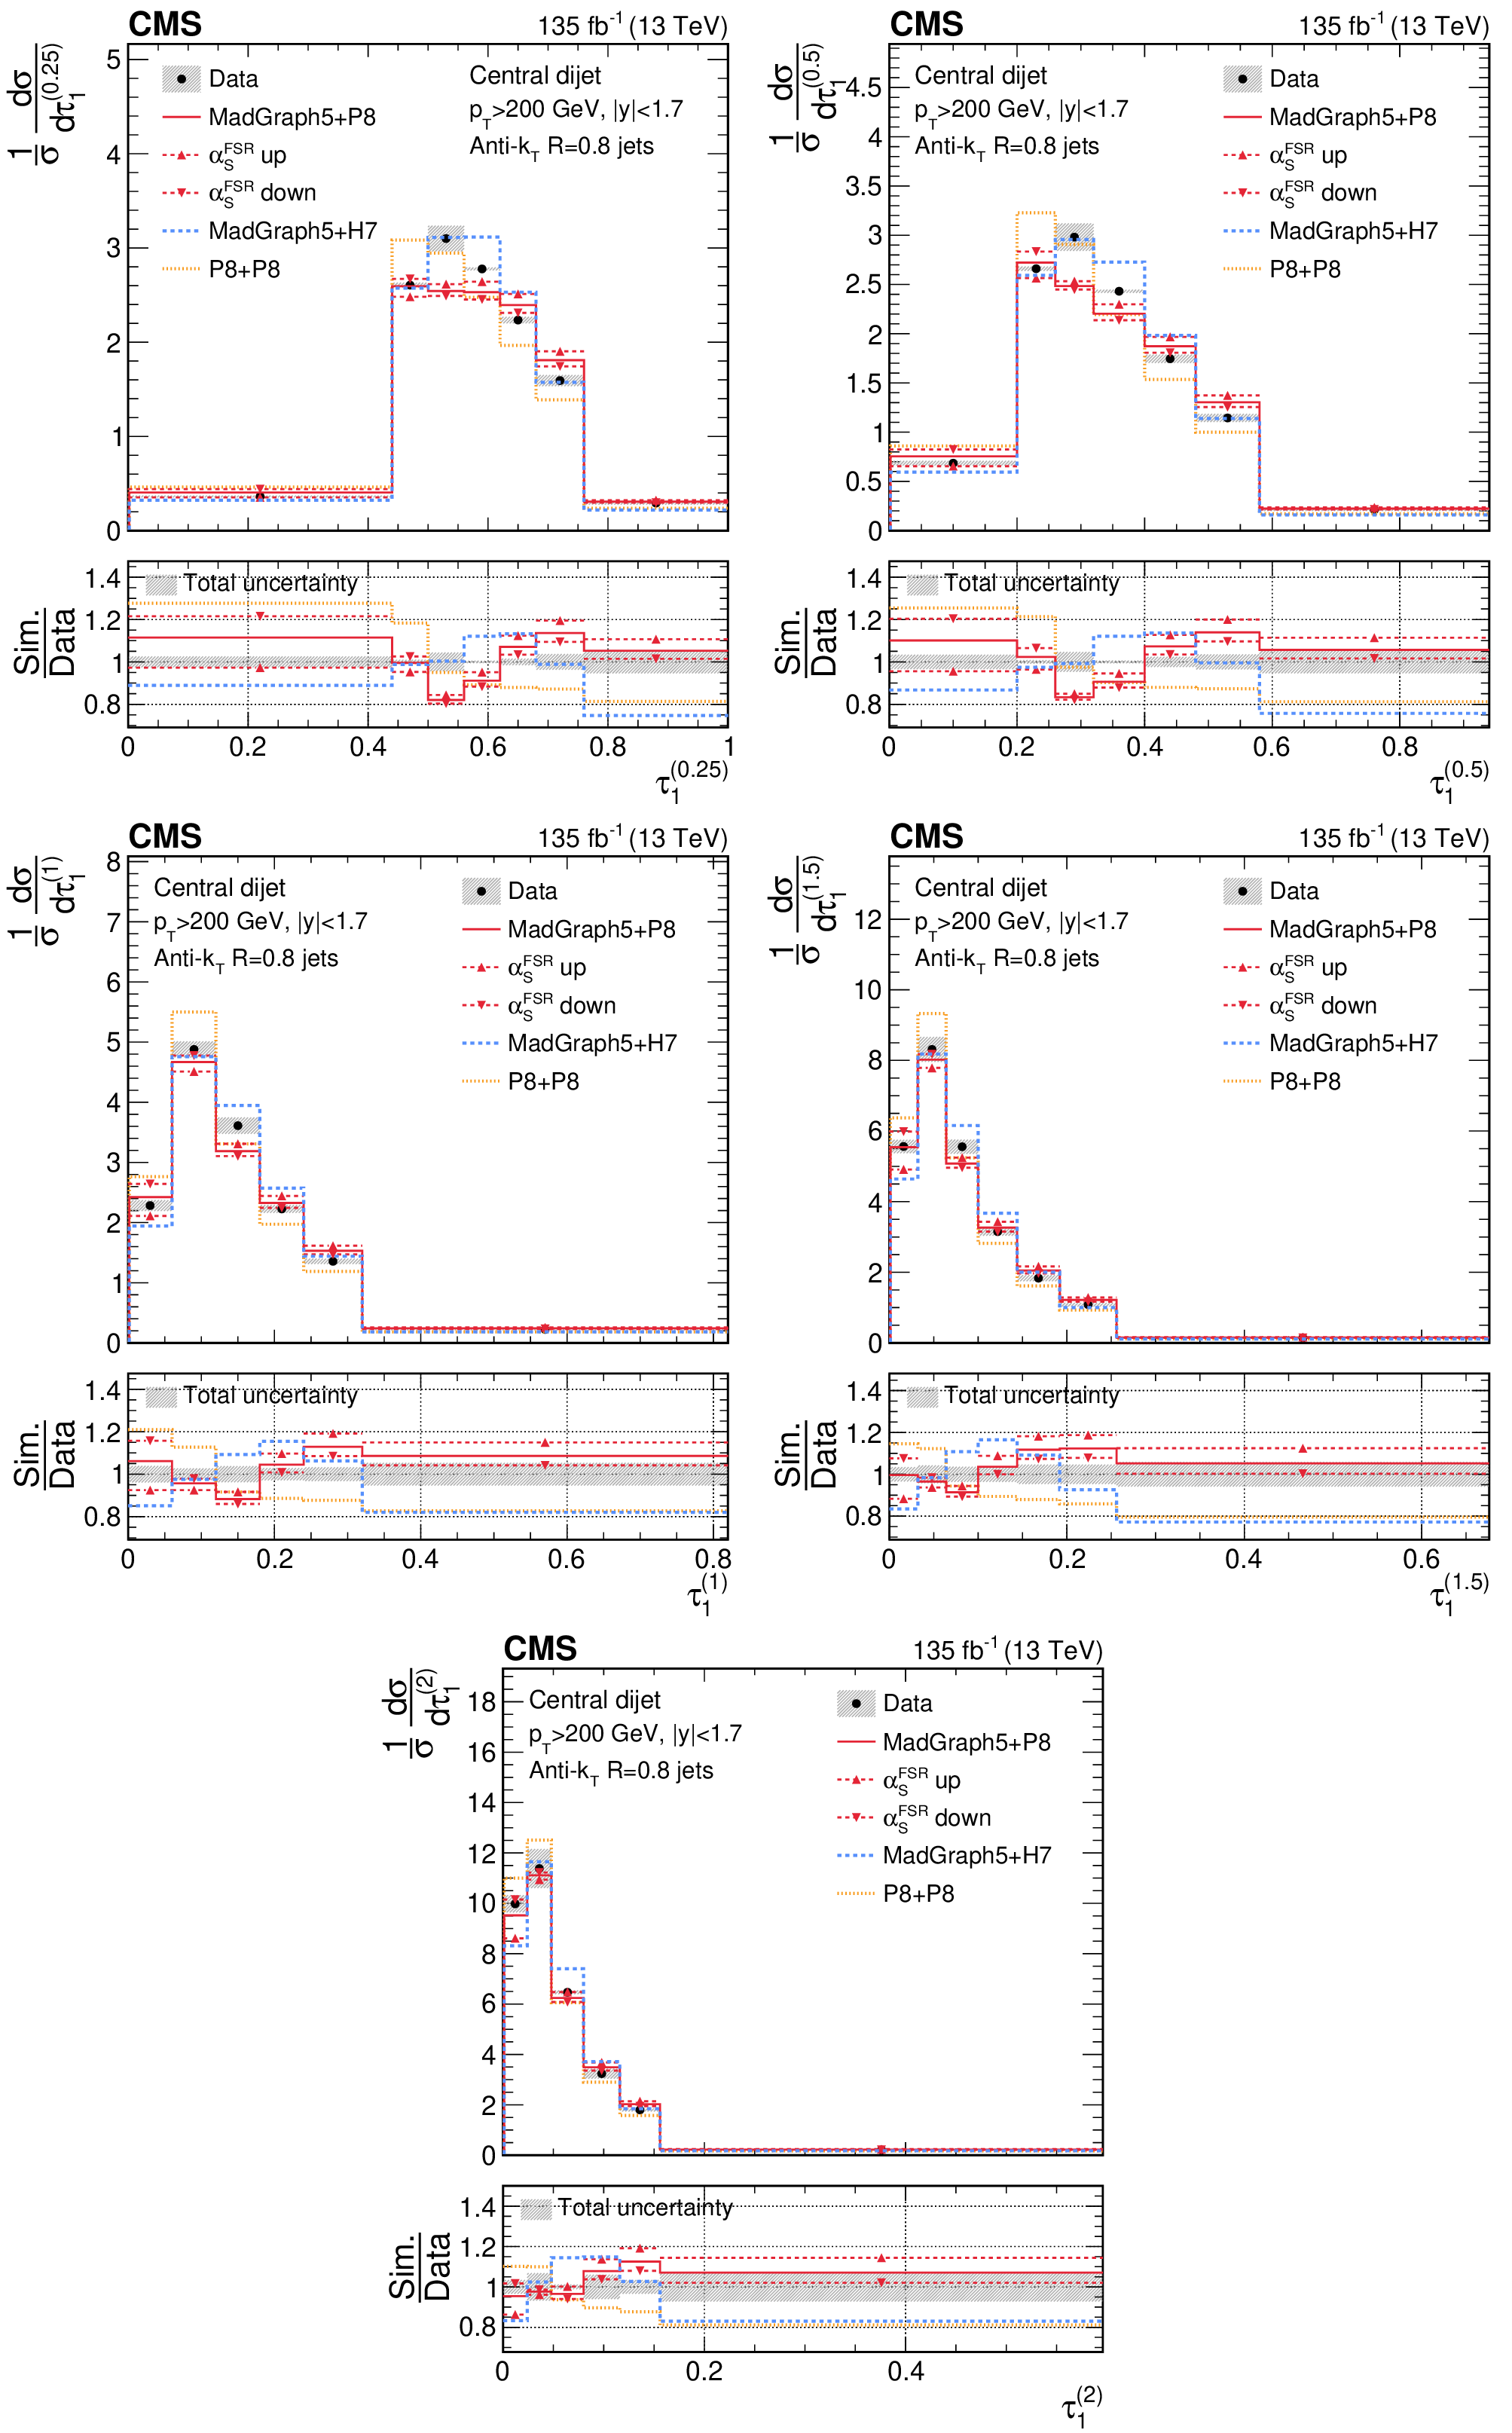
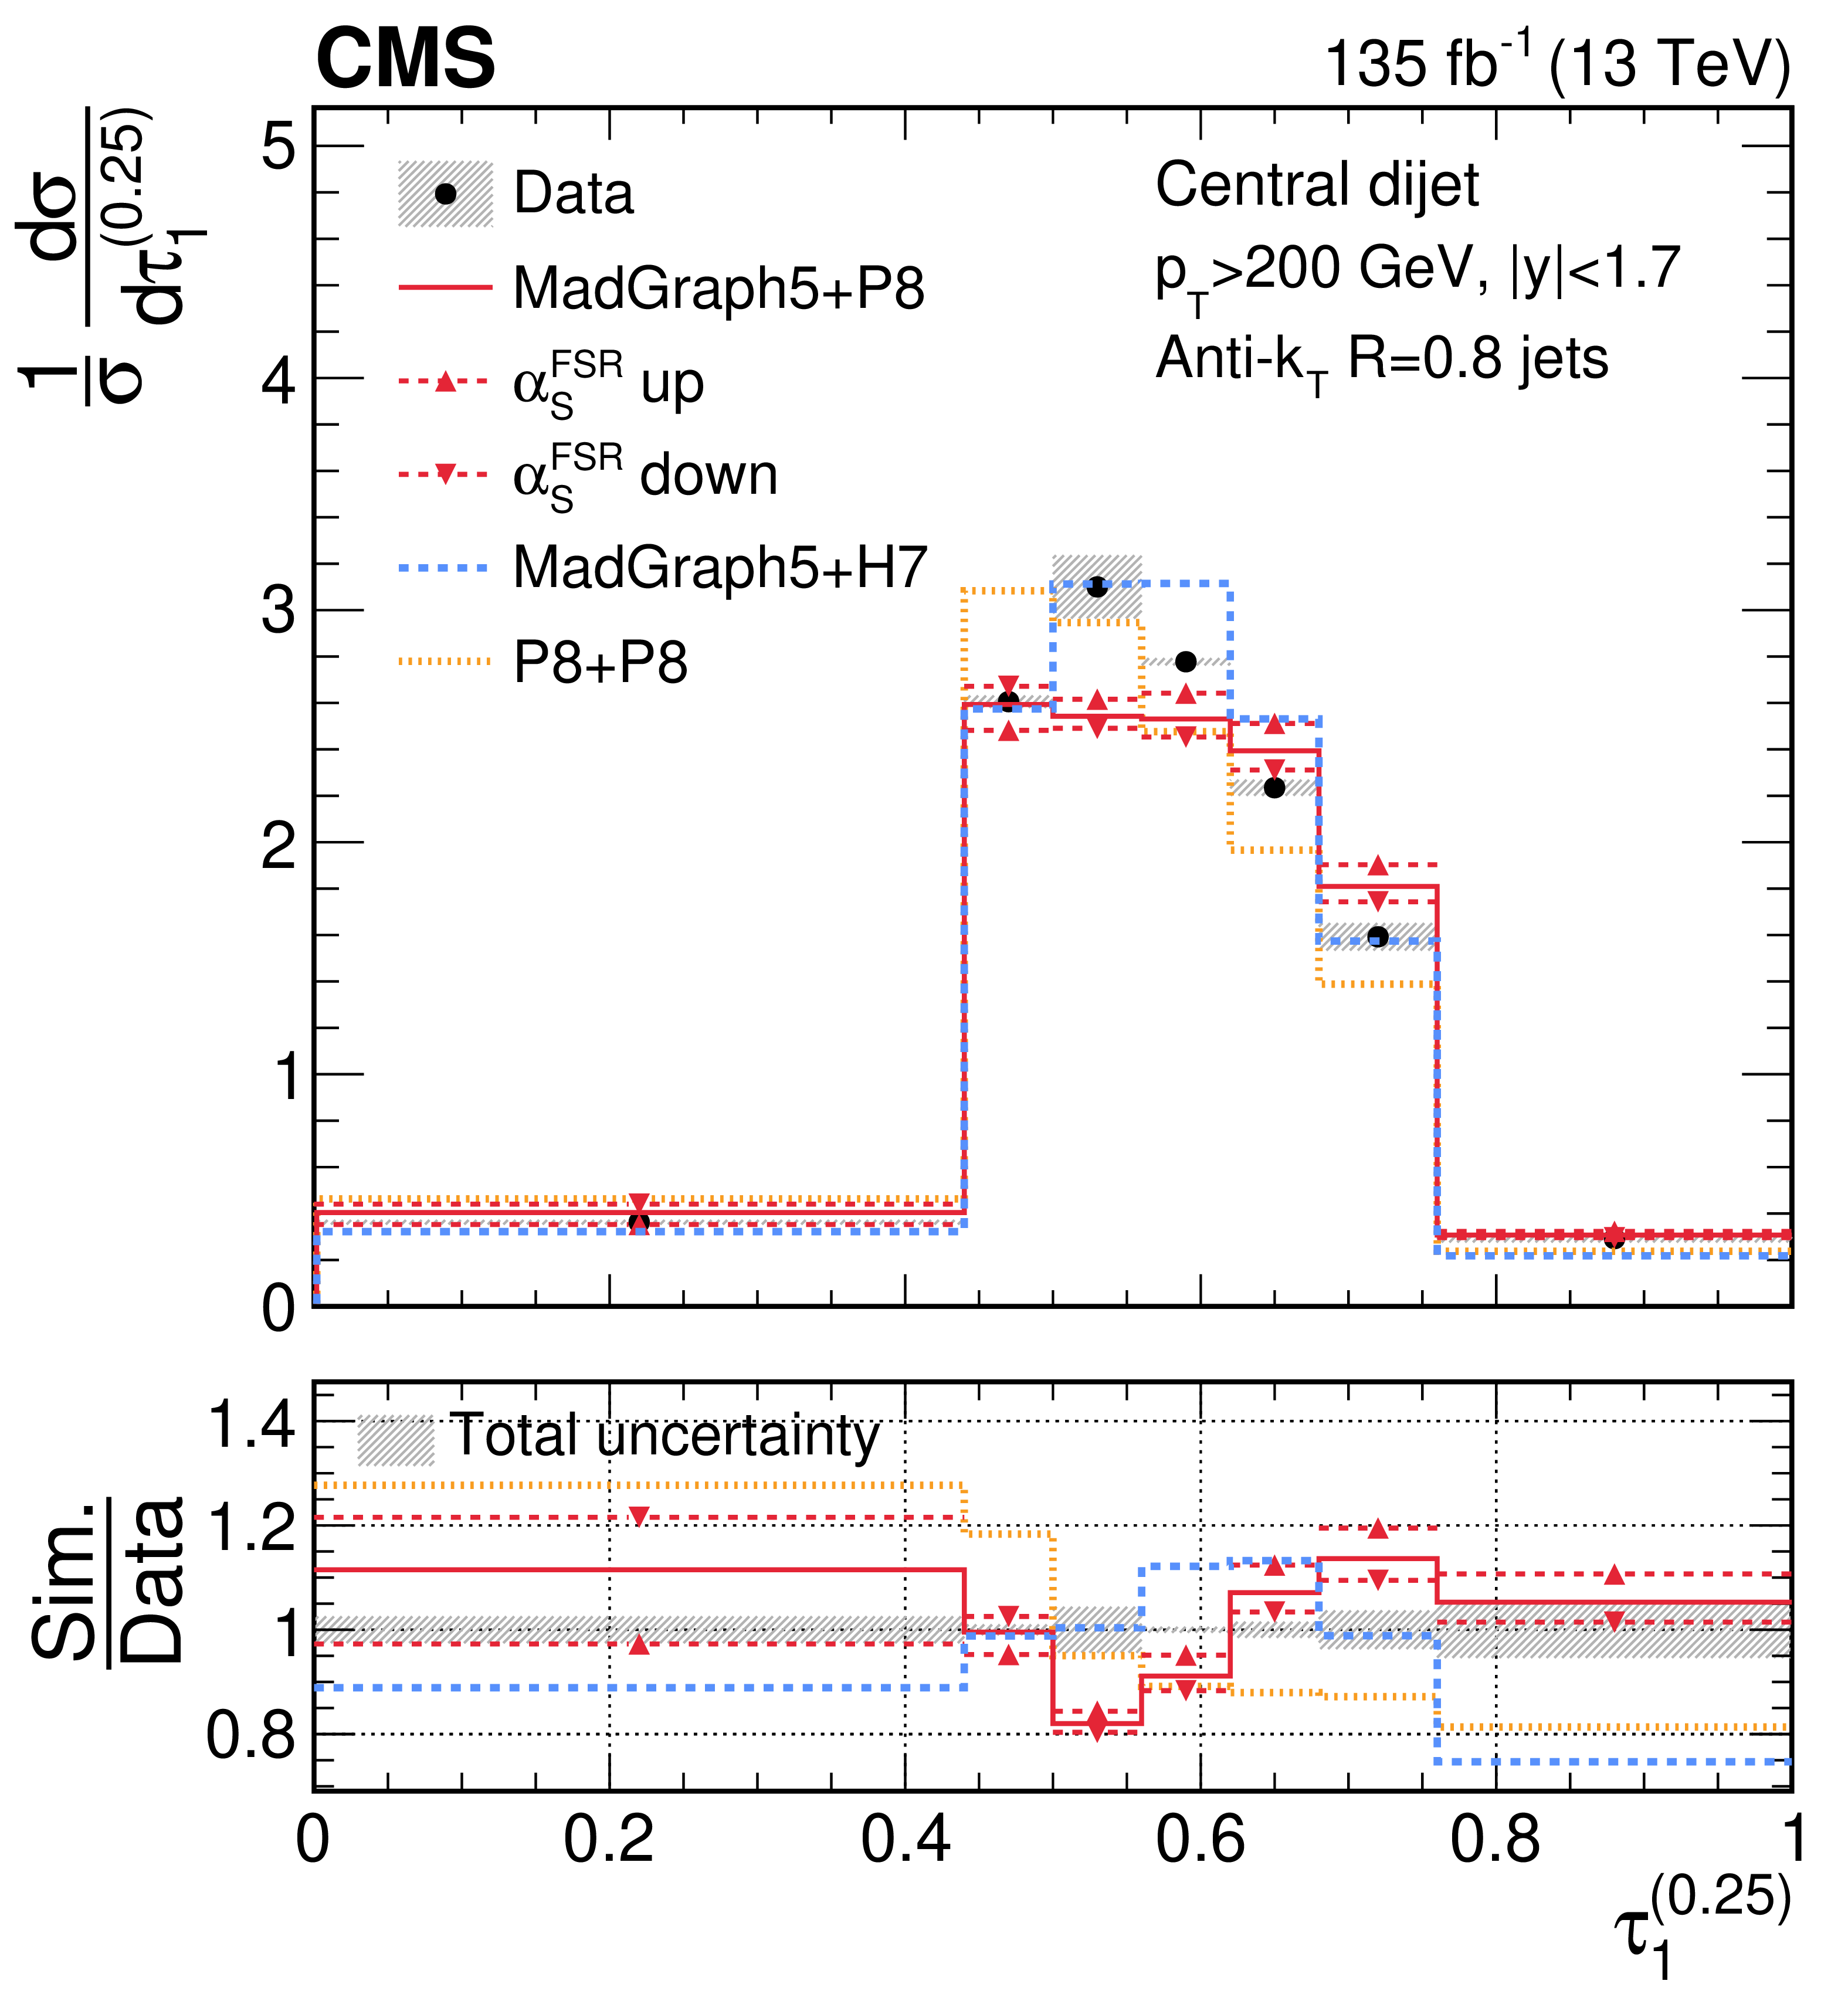
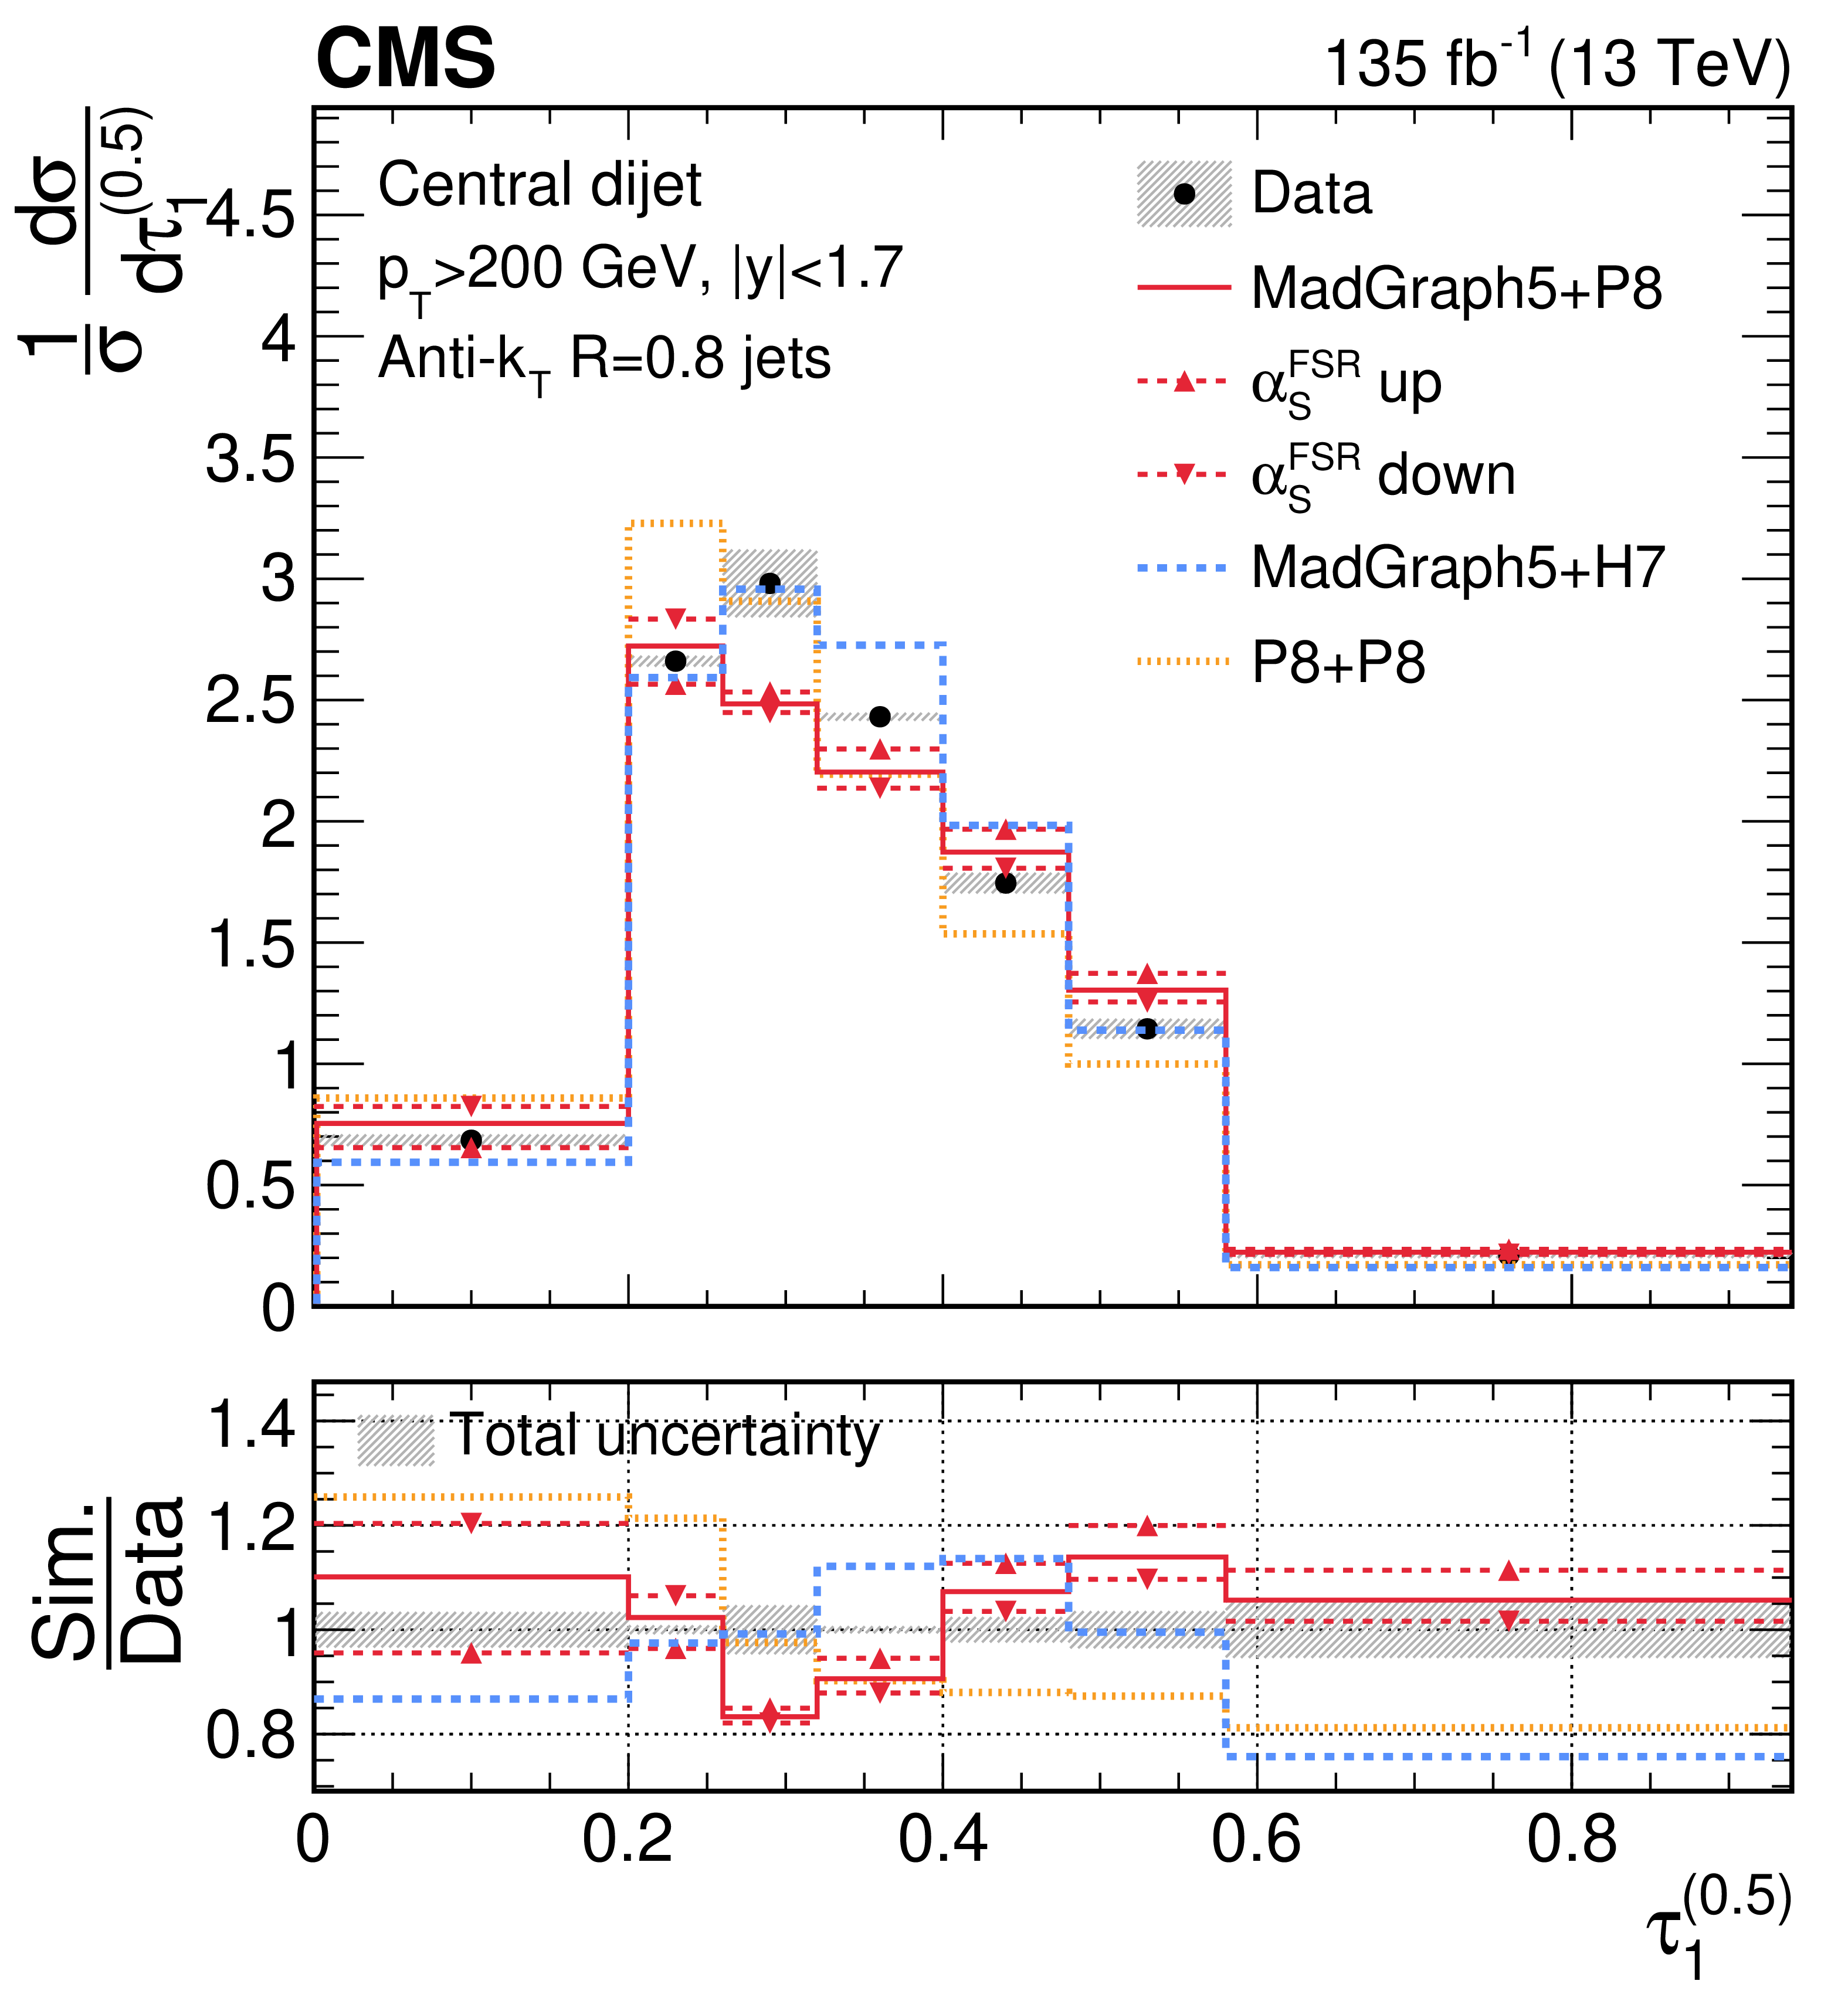
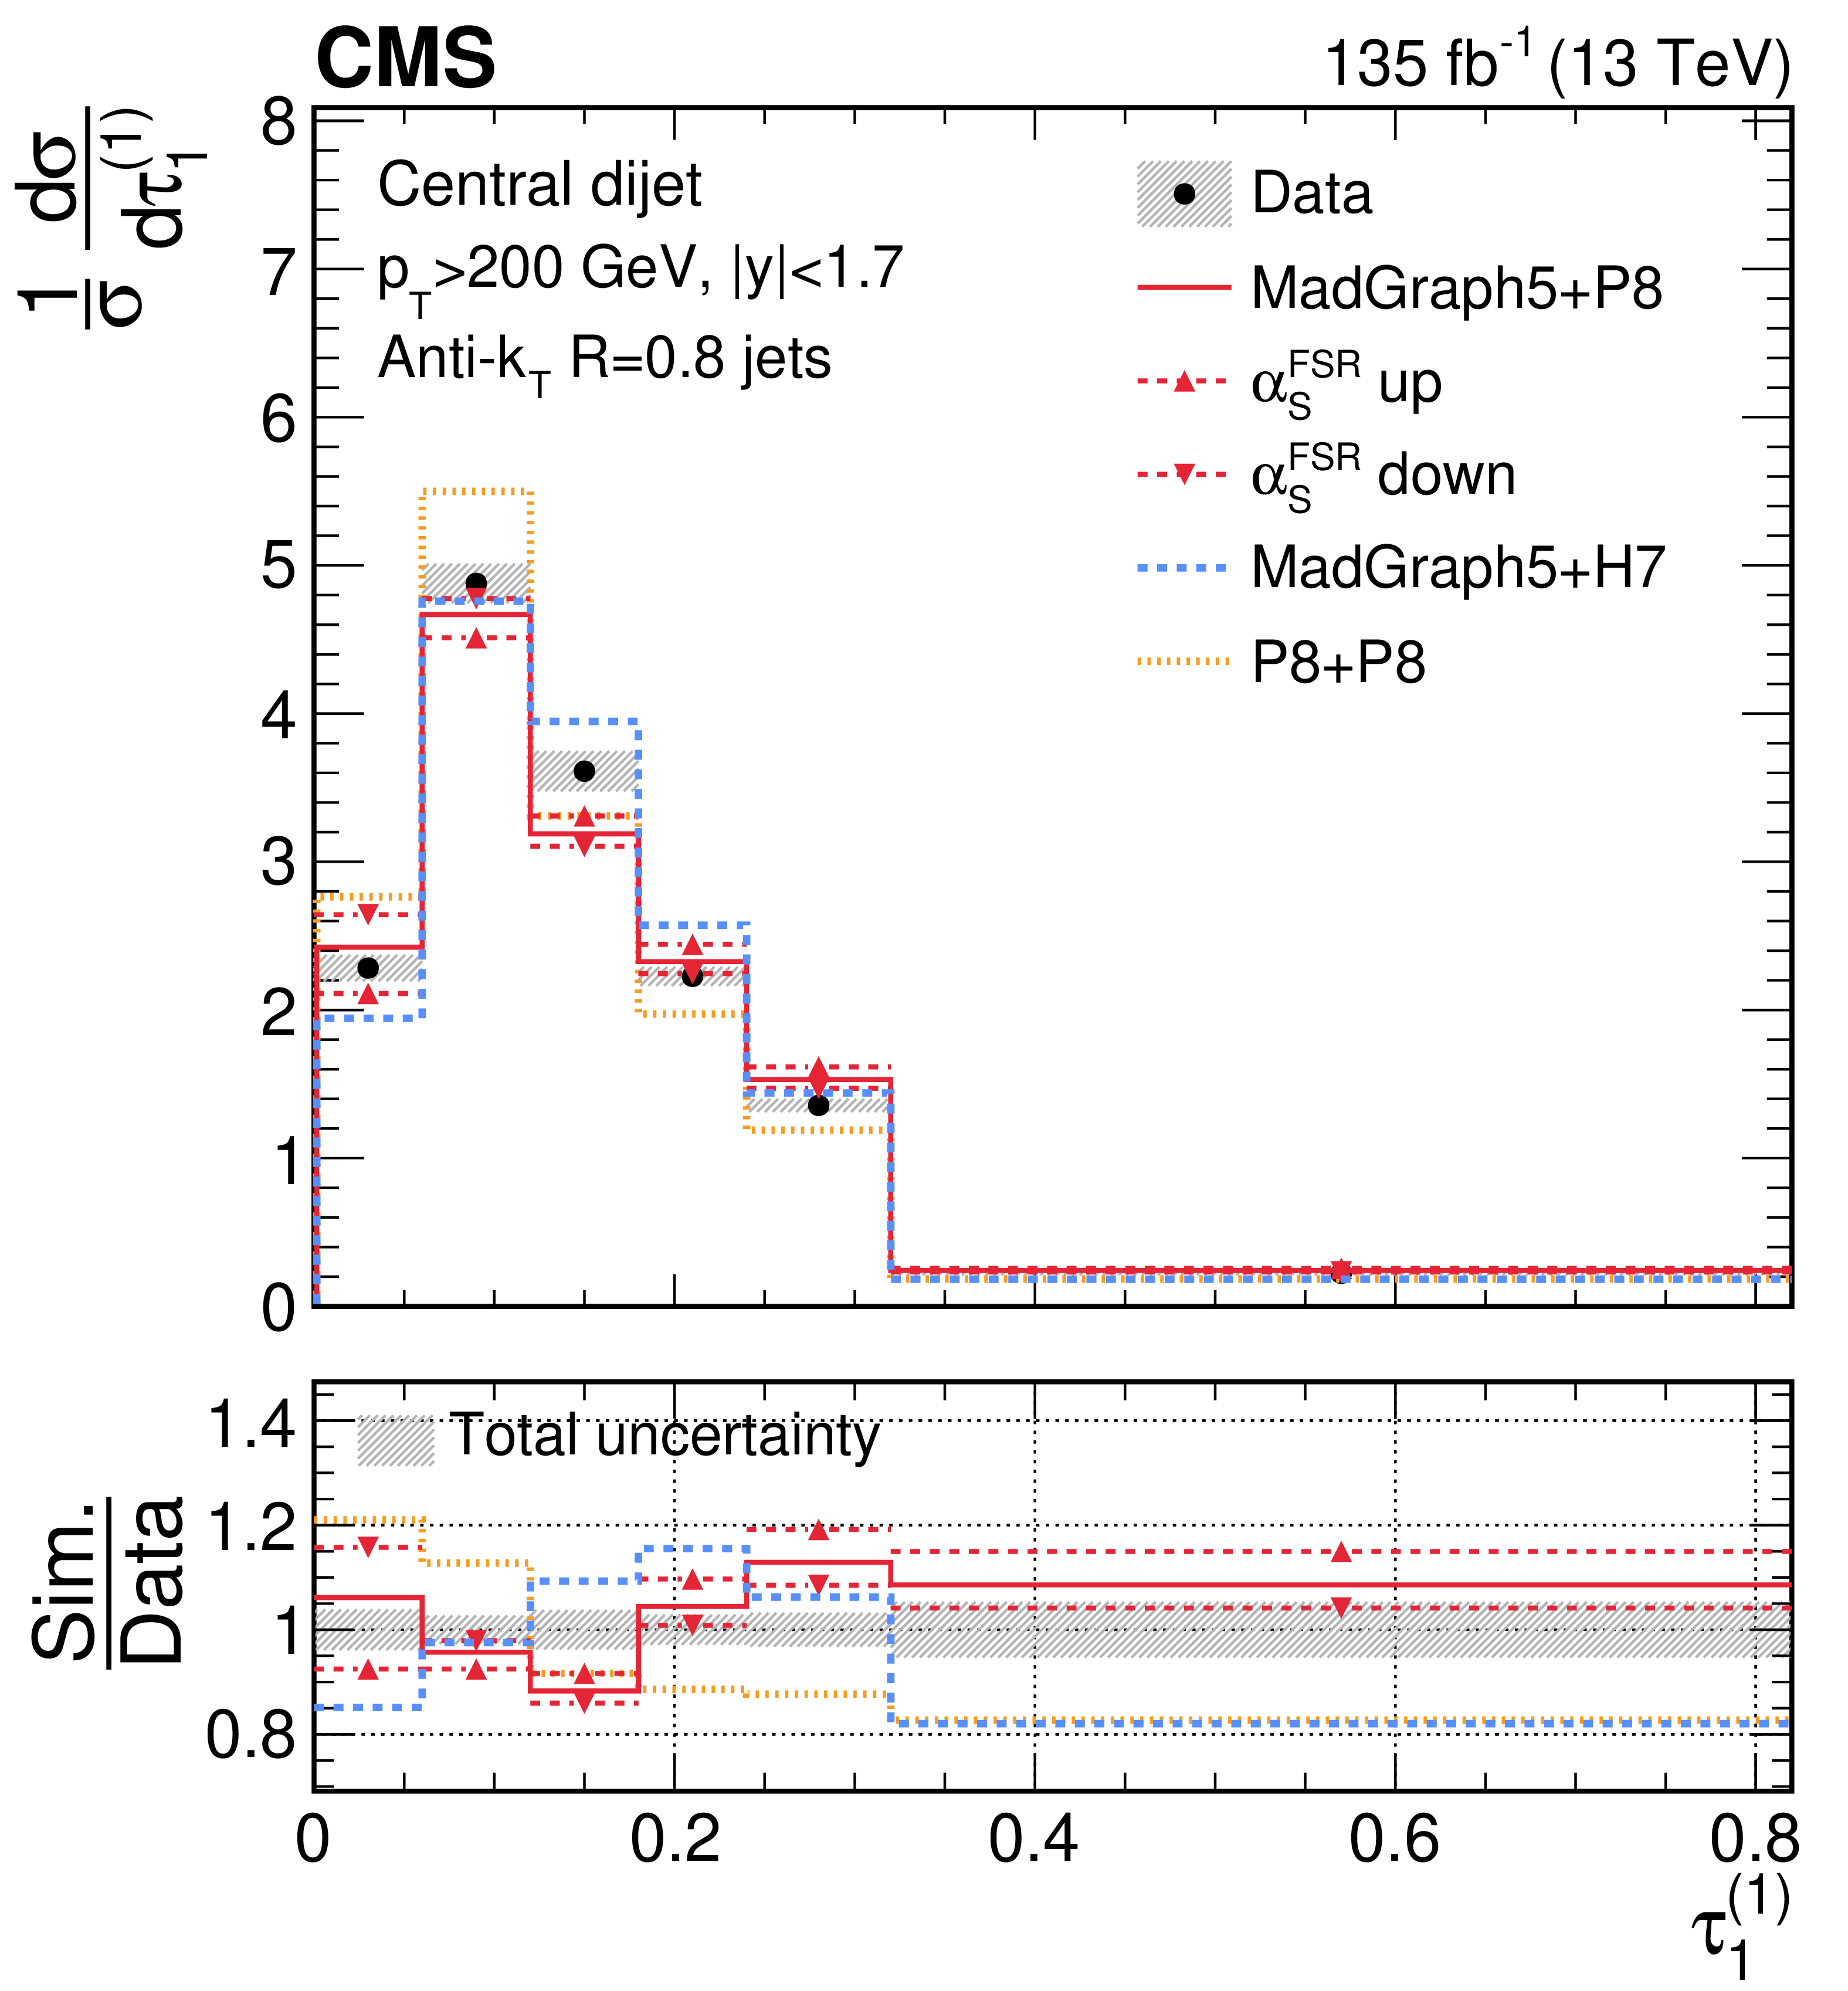
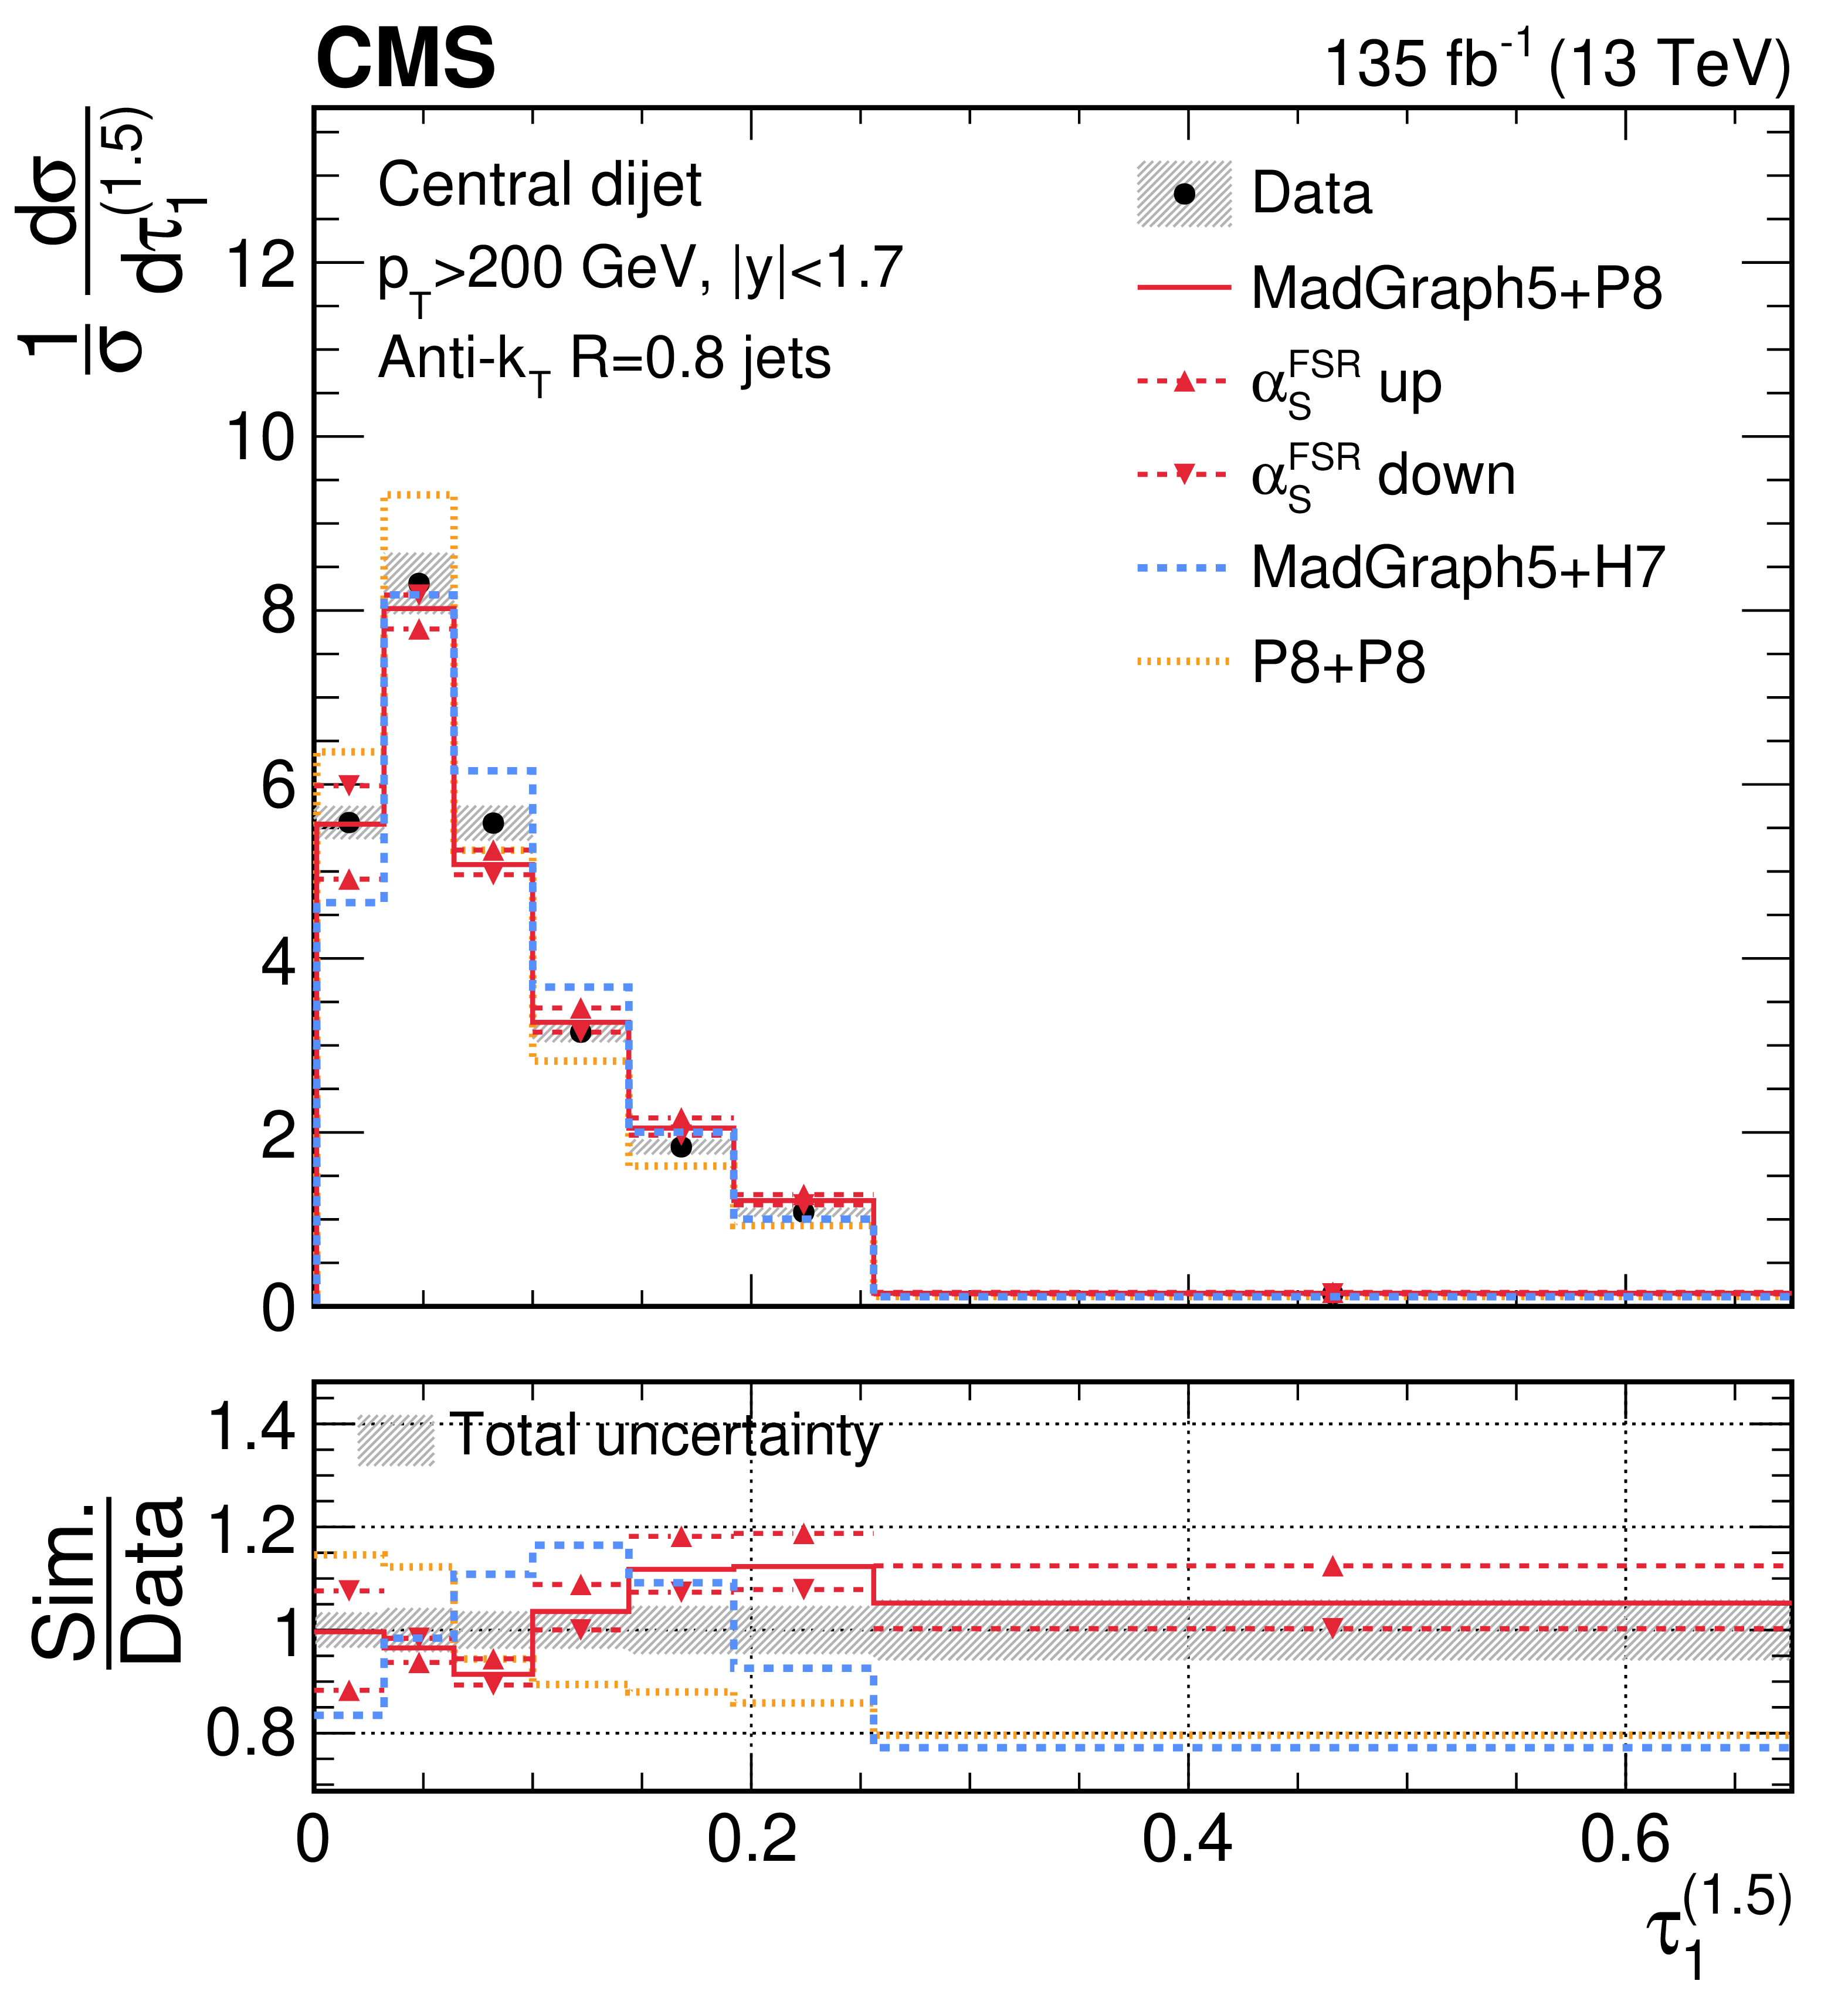
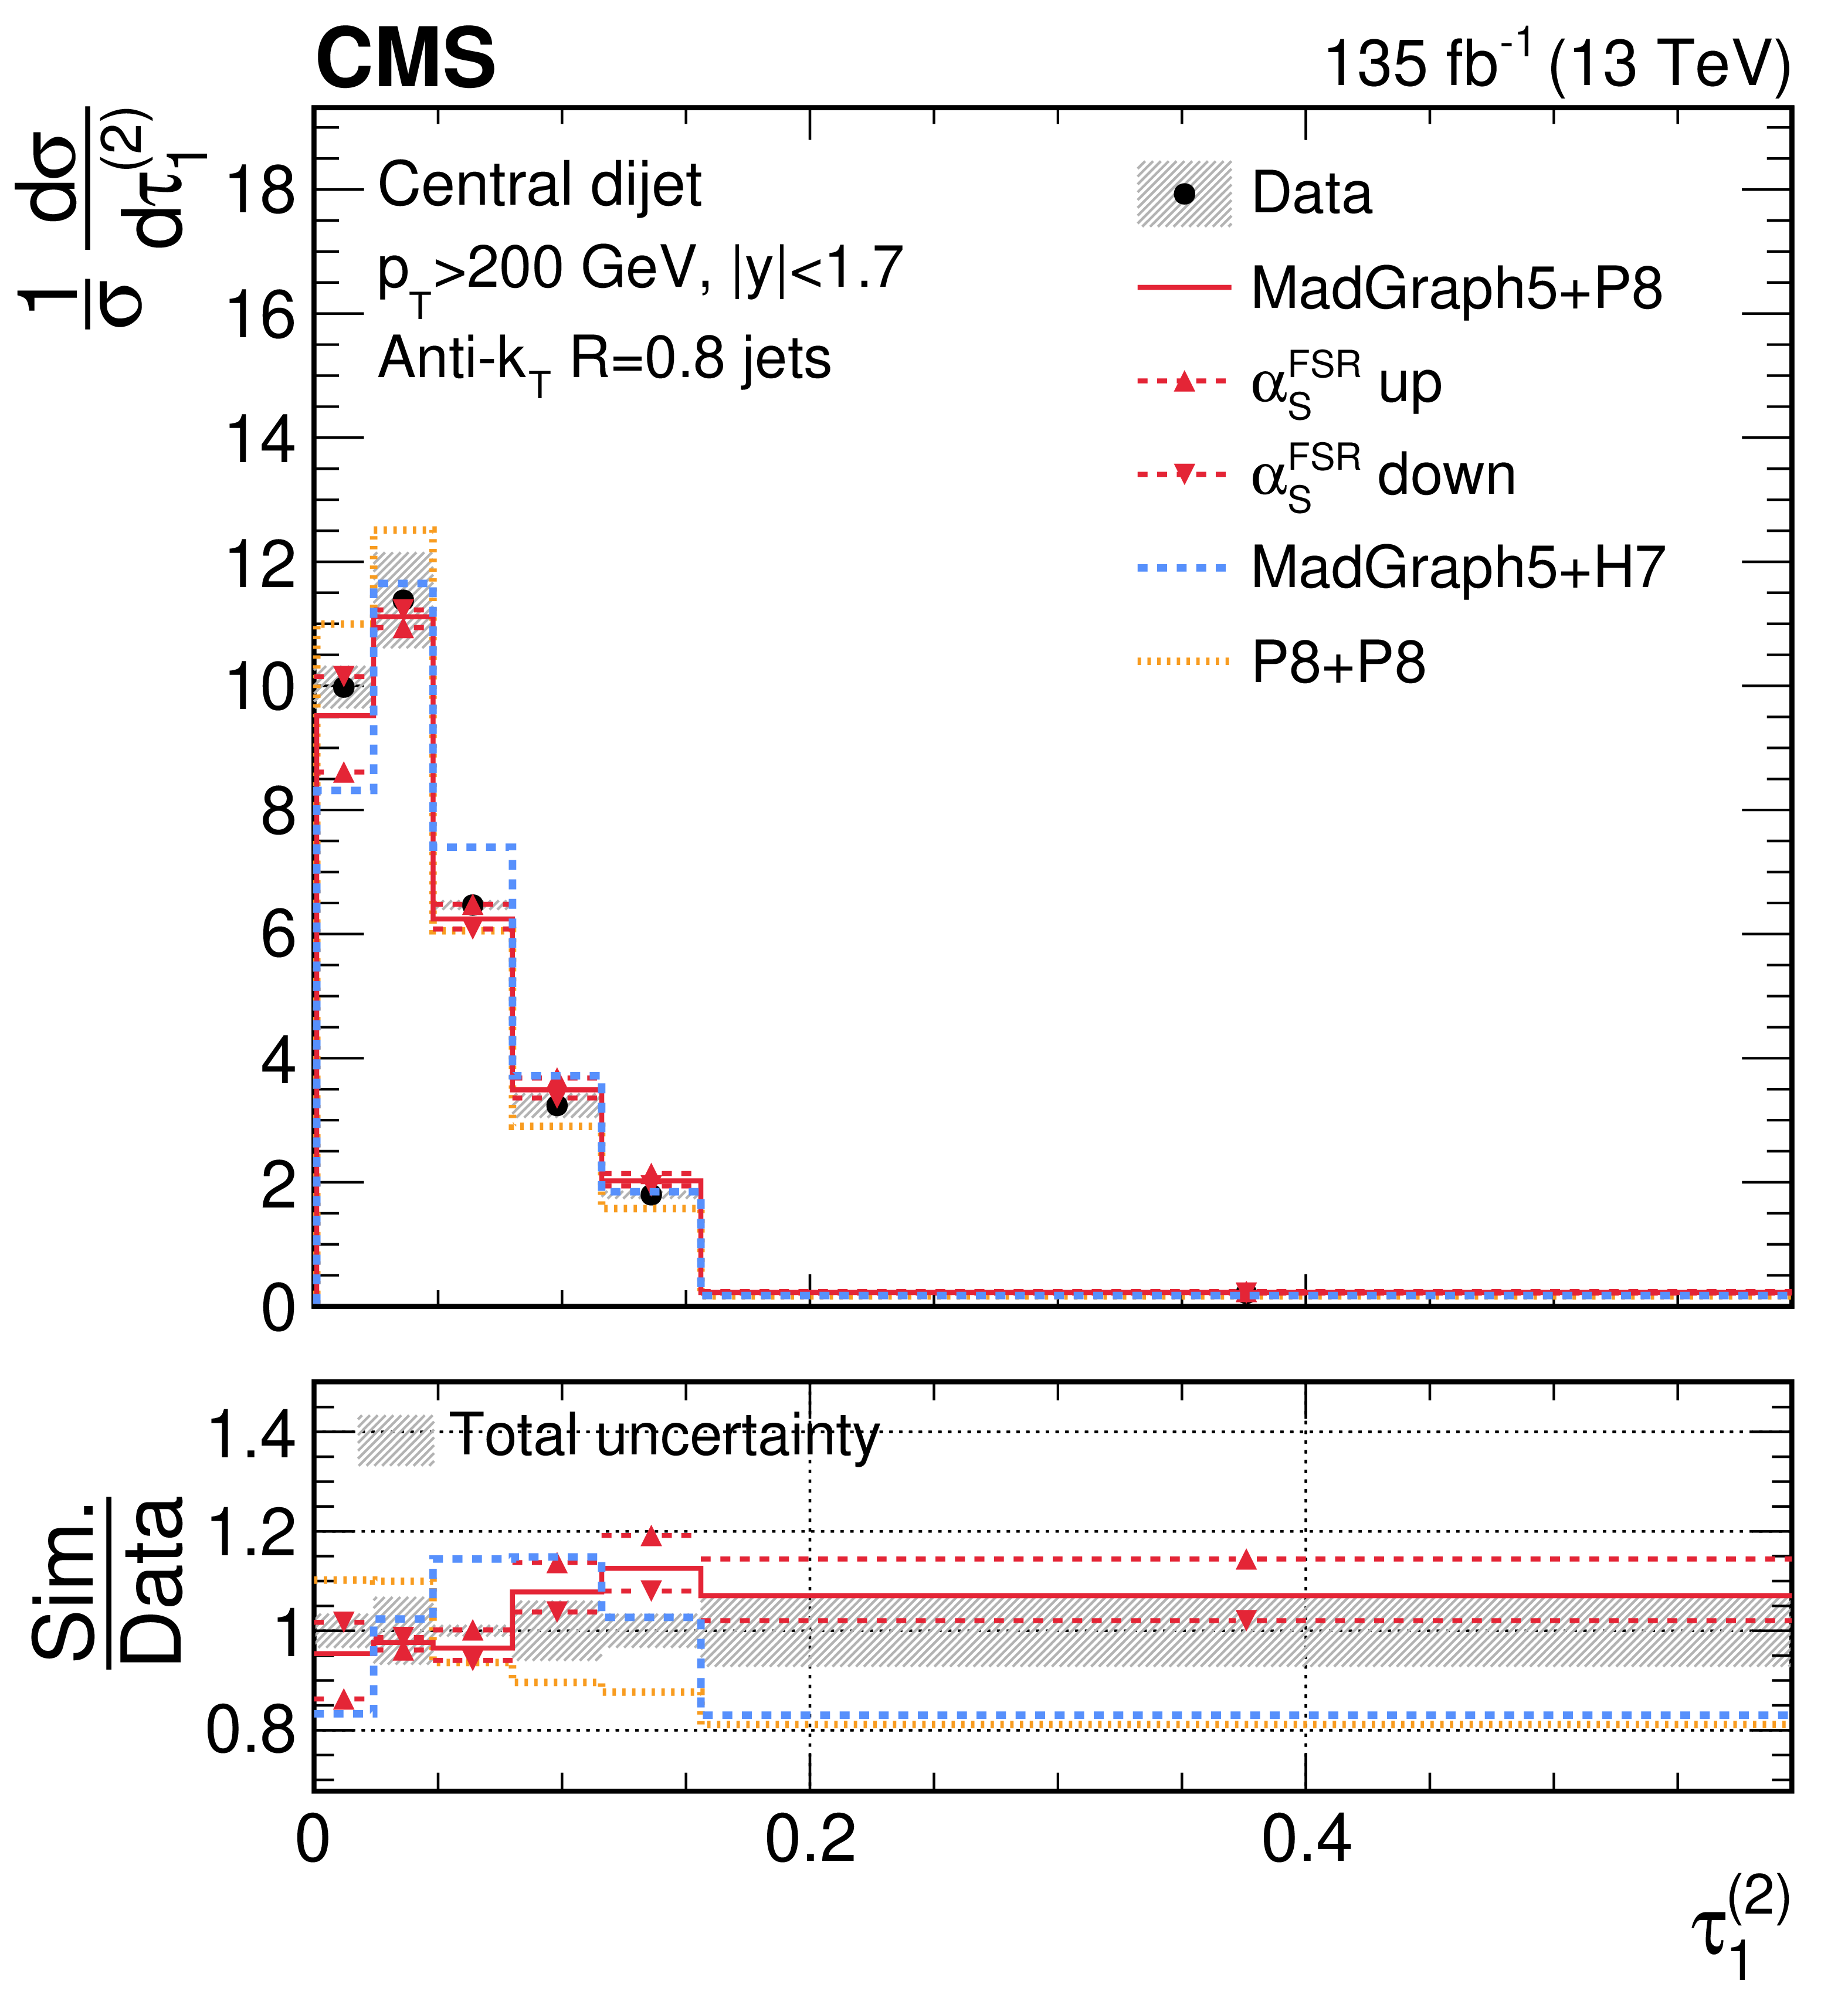
Unfolded distributions of 1-subjettiness observables, $\tau_{1}^{(0.25)}$, $\tau_{1}^{(0.5)}$,$\tau_{1}^{(1)}$,$\tau_{1}^{(1.5)}$, and $\tau_{1}^{(2)}$, measured for AK8 jets in the QCD dijet event selection, extracted from the normalized, combined distribution after unfolding; the bin contents and the error bars are scaled by the bin widths for the distributions of the individual observables. For comparisons with particle-level predictions, the error bars in data correspond to the total unfolding uncertainties, and the lower panels present the ratio of particle-level predictions to the unfolded data. The dark grey hashed region illustrates the total uncertainties per bin in the unfolded result. |
png pdf |
Figure 28-a:
Unfolded distributions of 1-subjettiness observables, $\tau_{1}^{(0.25)}$, $\tau_{1}^{(0.5)}$,$\tau_{1}^{(1)}$,$\tau_{1}^{(1.5)}$, and $\tau_{1}^{(2)}$, measured for AK8 jets in the QCD dijet event selection, extracted from the normalized, combined distribution after unfolding; the bin contents and the error bars are scaled by the bin widths for the distributions of the individual observables. For comparisons with particle-level predictions, the error bars in data correspond to the total unfolding uncertainties, and the lower panels present the ratio of particle-level predictions to the unfolded data. The dark grey hashed region illustrates the total uncertainties per bin in the unfolded result. |
png pdf |
Figure 28-b:
Unfolded distributions of 1-subjettiness observables, $\tau_{1}^{(0.25)}$, $\tau_{1}^{(0.5)}$,$\tau_{1}^{(1)}$,$\tau_{1}^{(1.5)}$, and $\tau_{1}^{(2)}$, measured for AK8 jets in the QCD dijet event selection, extracted from the normalized, combined distribution after unfolding; the bin contents and the error bars are scaled by the bin widths for the distributions of the individual observables. For comparisons with particle-level predictions, the error bars in data correspond to the total unfolding uncertainties, and the lower panels present the ratio of particle-level predictions to the unfolded data. The dark grey hashed region illustrates the total uncertainties per bin in the unfolded result. |
png pdf |
Figure 28-c:
Unfolded distributions of 1-subjettiness observables, $\tau_{1}^{(0.25)}$, $\tau_{1}^{(0.5)}$,$\tau_{1}^{(1)}$,$\tau_{1}^{(1.5)}$, and $\tau_{1}^{(2)}$, measured for AK8 jets in the QCD dijet event selection, extracted from the normalized, combined distribution after unfolding; the bin contents and the error bars are scaled by the bin widths for the distributions of the individual observables. For comparisons with particle-level predictions, the error bars in data correspond to the total unfolding uncertainties, and the lower panels present the ratio of particle-level predictions to the unfolded data. The dark grey hashed region illustrates the total uncertainties per bin in the unfolded result. |
png pdf |
Figure 28-d:
Unfolded distributions of 1-subjettiness observables, $\tau_{1}^{(0.25)}$, $\tau_{1}^{(0.5)}$,$\tau_{1}^{(1)}$,$\tau_{1}^{(1.5)}$, and $\tau_{1}^{(2)}$, measured for AK8 jets in the QCD dijet event selection, extracted from the normalized, combined distribution after unfolding; the bin contents and the error bars are scaled by the bin widths for the distributions of the individual observables. For comparisons with particle-level predictions, the error bars in data correspond to the total unfolding uncertainties, and the lower panels present the ratio of particle-level predictions to the unfolded data. The dark grey hashed region illustrates the total uncertainties per bin in the unfolded result. |
png pdf |
Figure 28-e:
Unfolded distributions of 1-subjettiness observables, $\tau_{1}^{(0.25)}$, $\tau_{1}^{(0.5)}$,$\tau_{1}^{(1)}$,$\tau_{1}^{(1.5)}$, and $\tau_{1}^{(2)}$, measured for AK8 jets in the QCD dijet event selection, extracted from the normalized, combined distribution after unfolding; the bin contents and the error bars are scaled by the bin widths for the distributions of the individual observables. For comparisons with particle-level predictions, the error bars in data correspond to the total unfolding uncertainties, and the lower panels present the ratio of particle-level predictions to the unfolded data. The dark grey hashed region illustrates the total uncertainties per bin in the unfolded result. |
png pdf |
Figure 29:
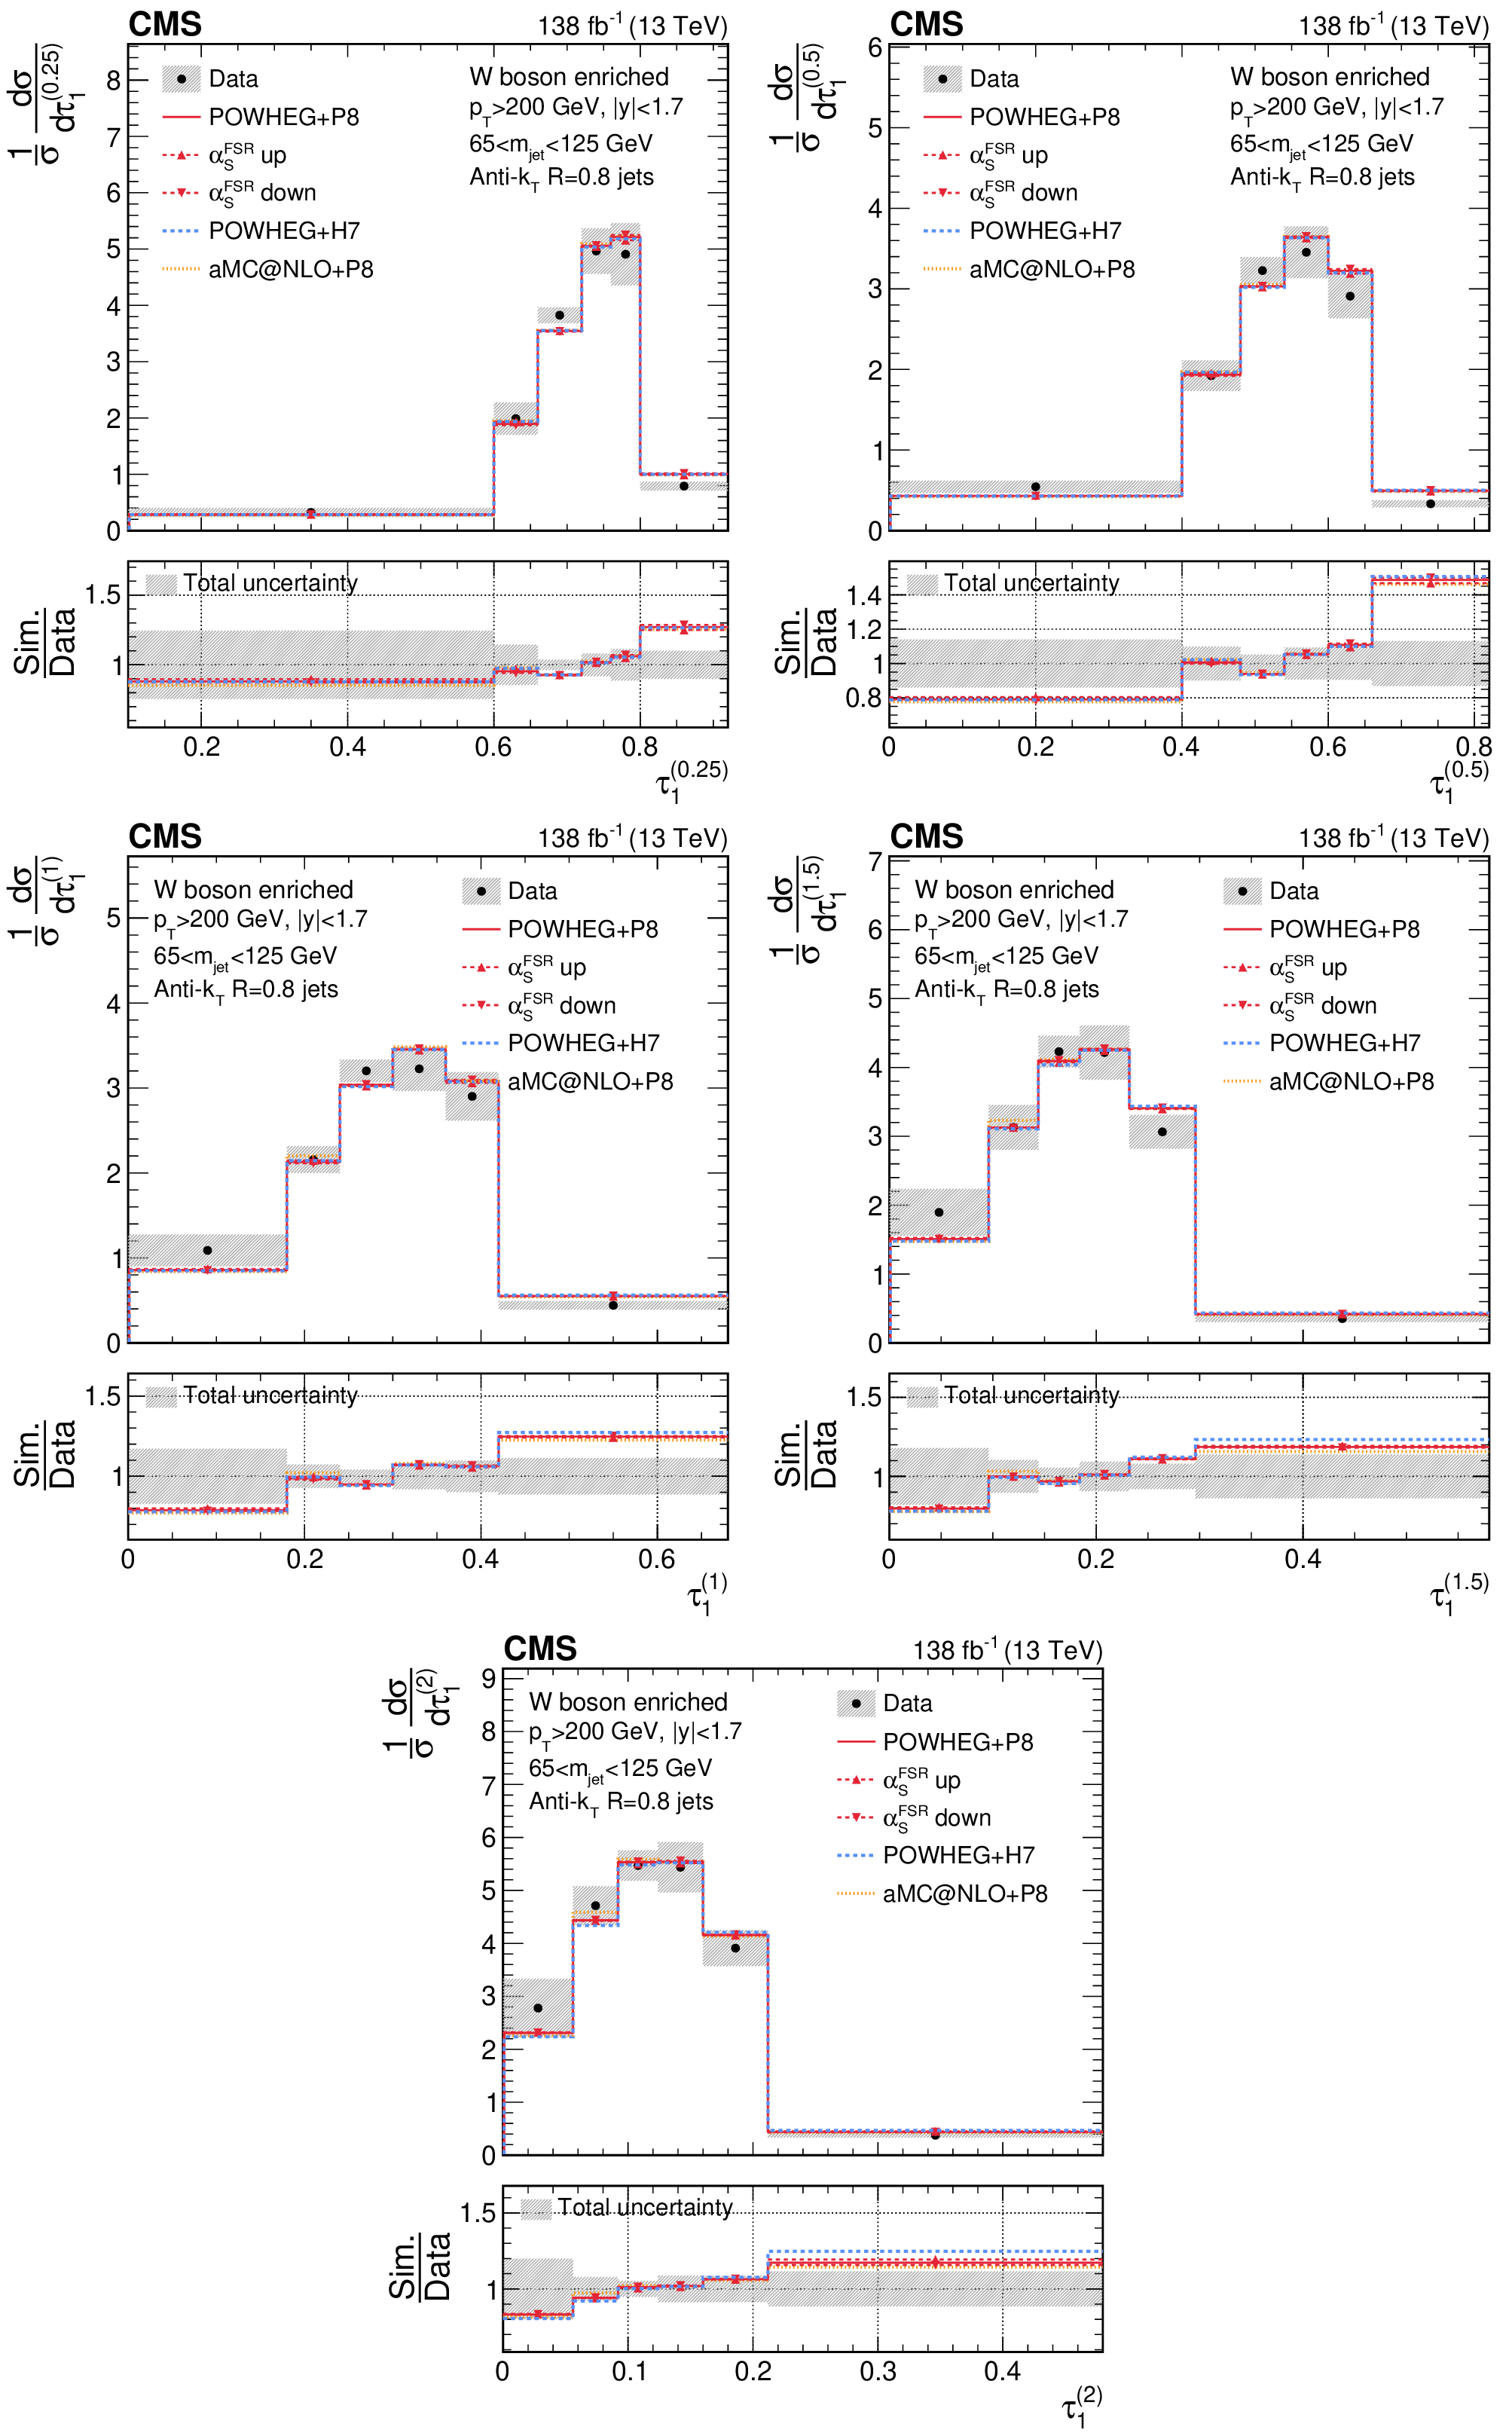
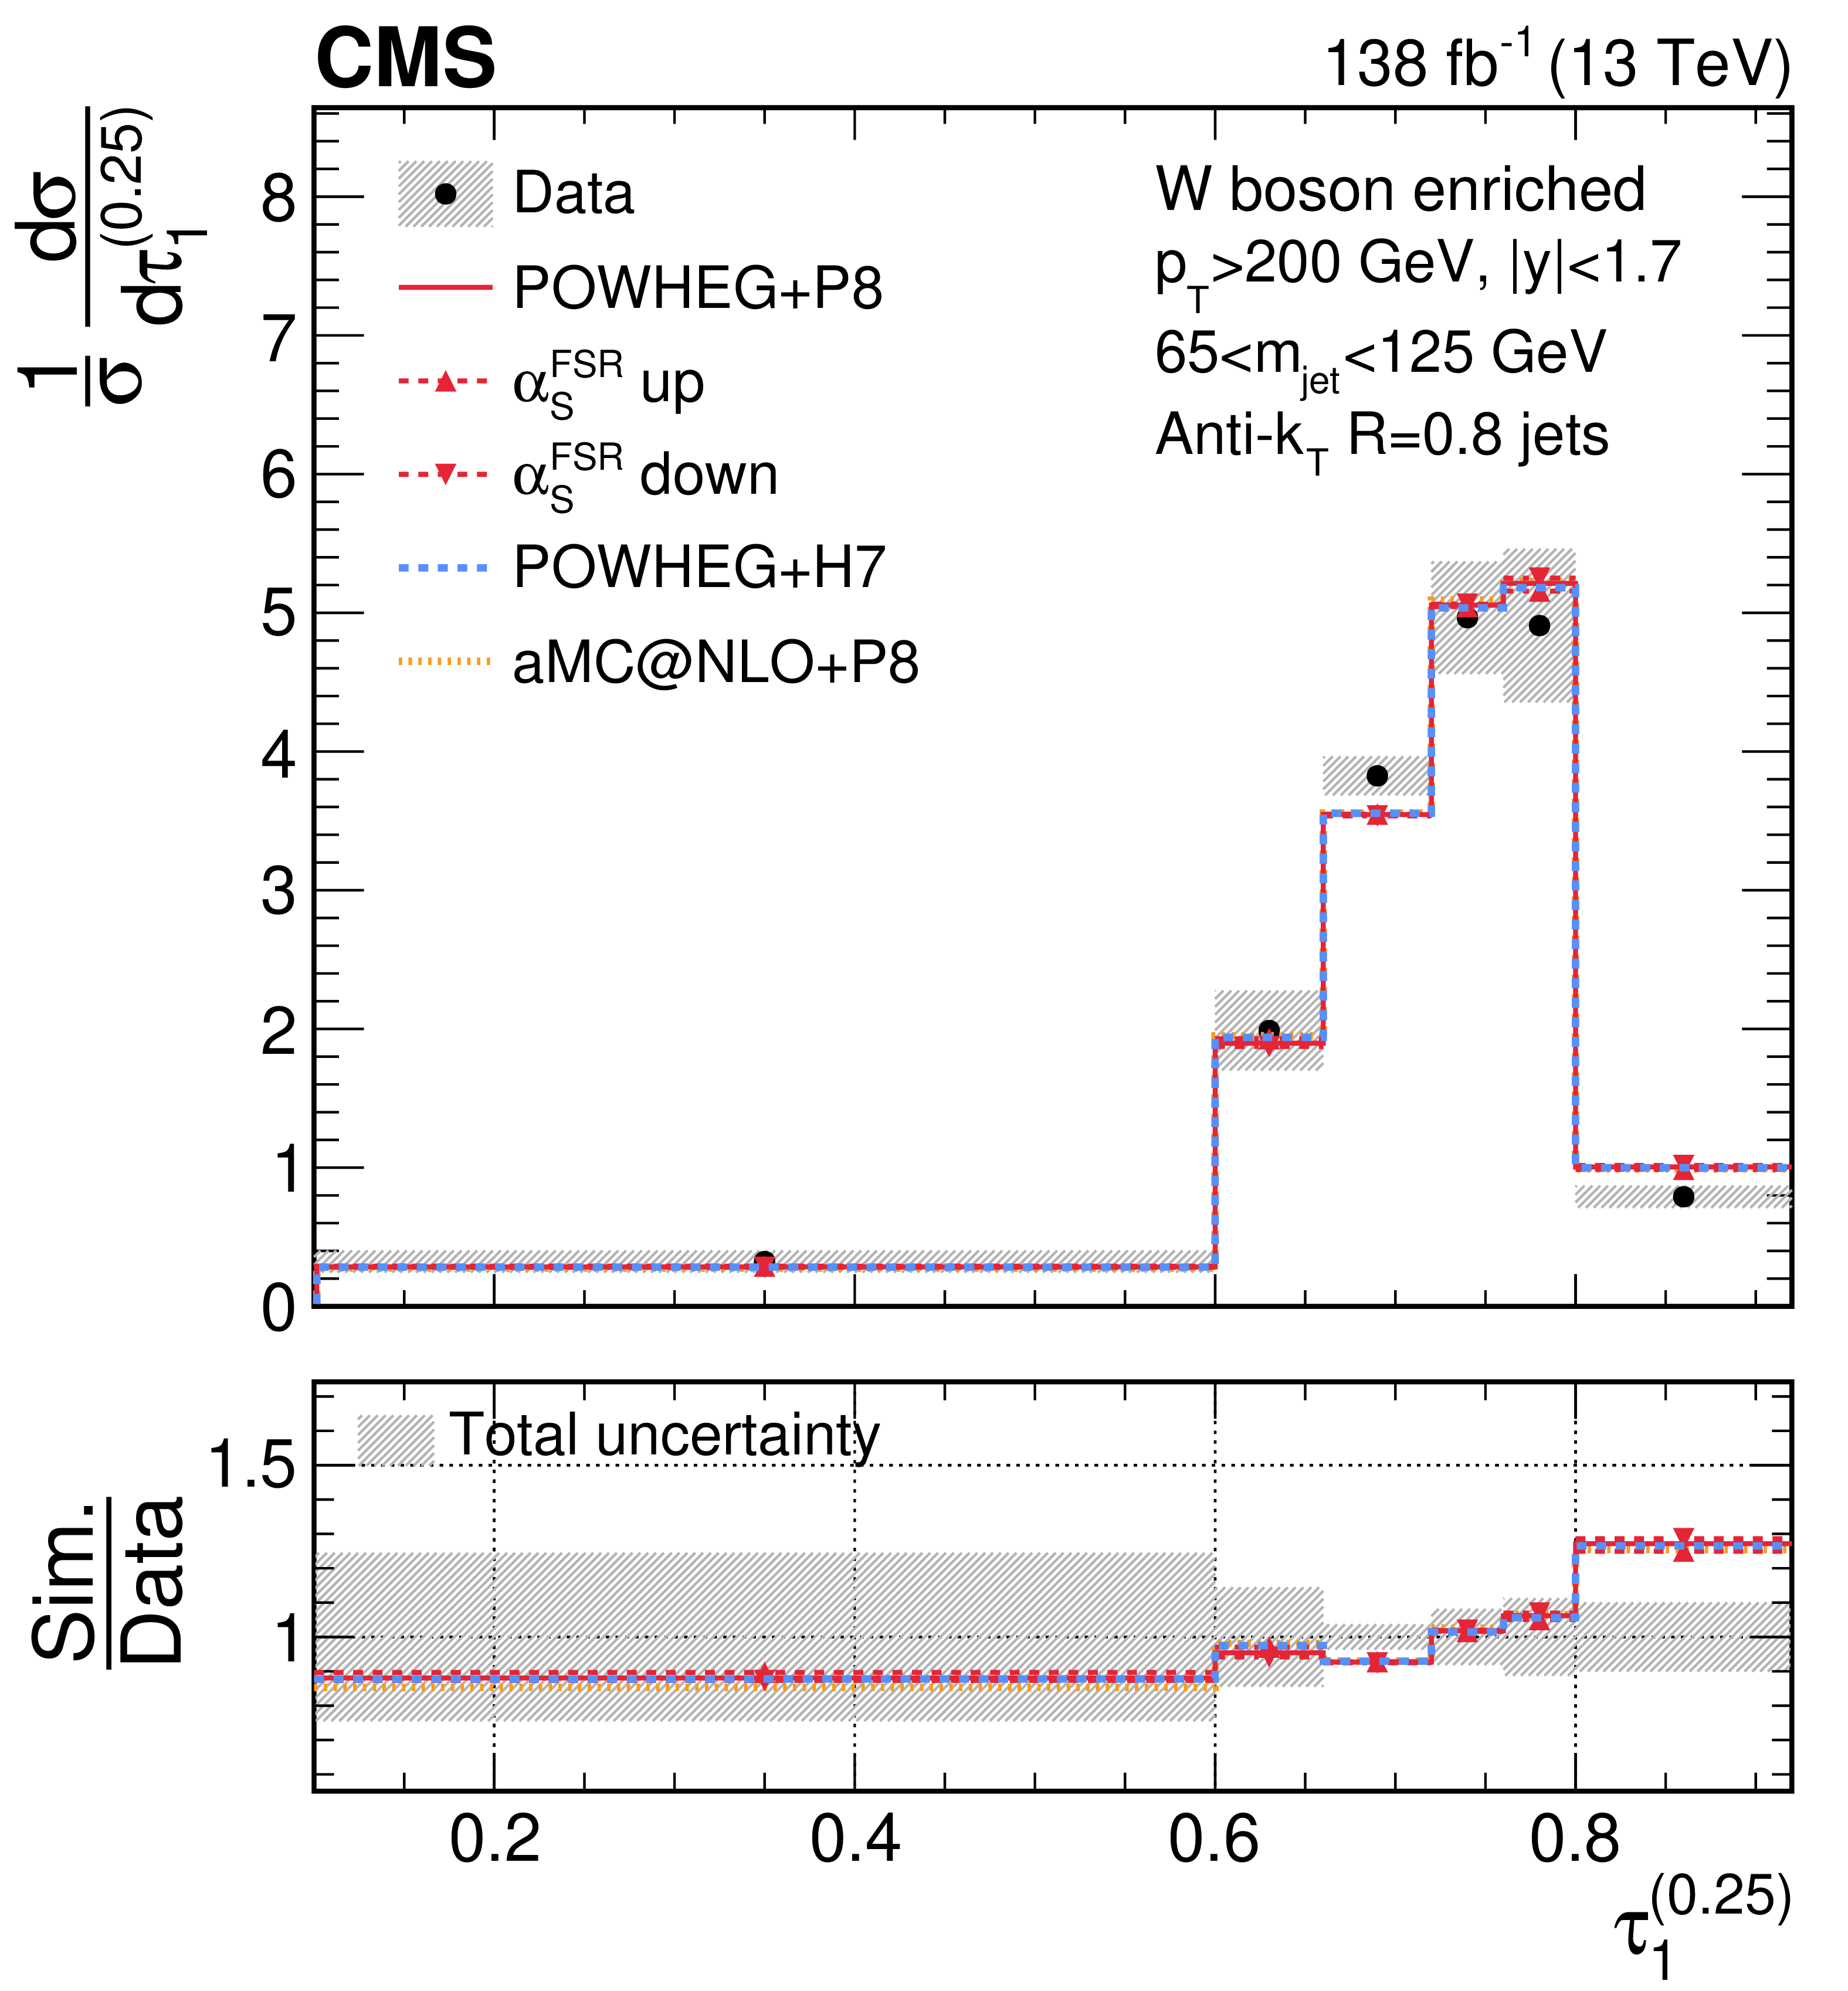
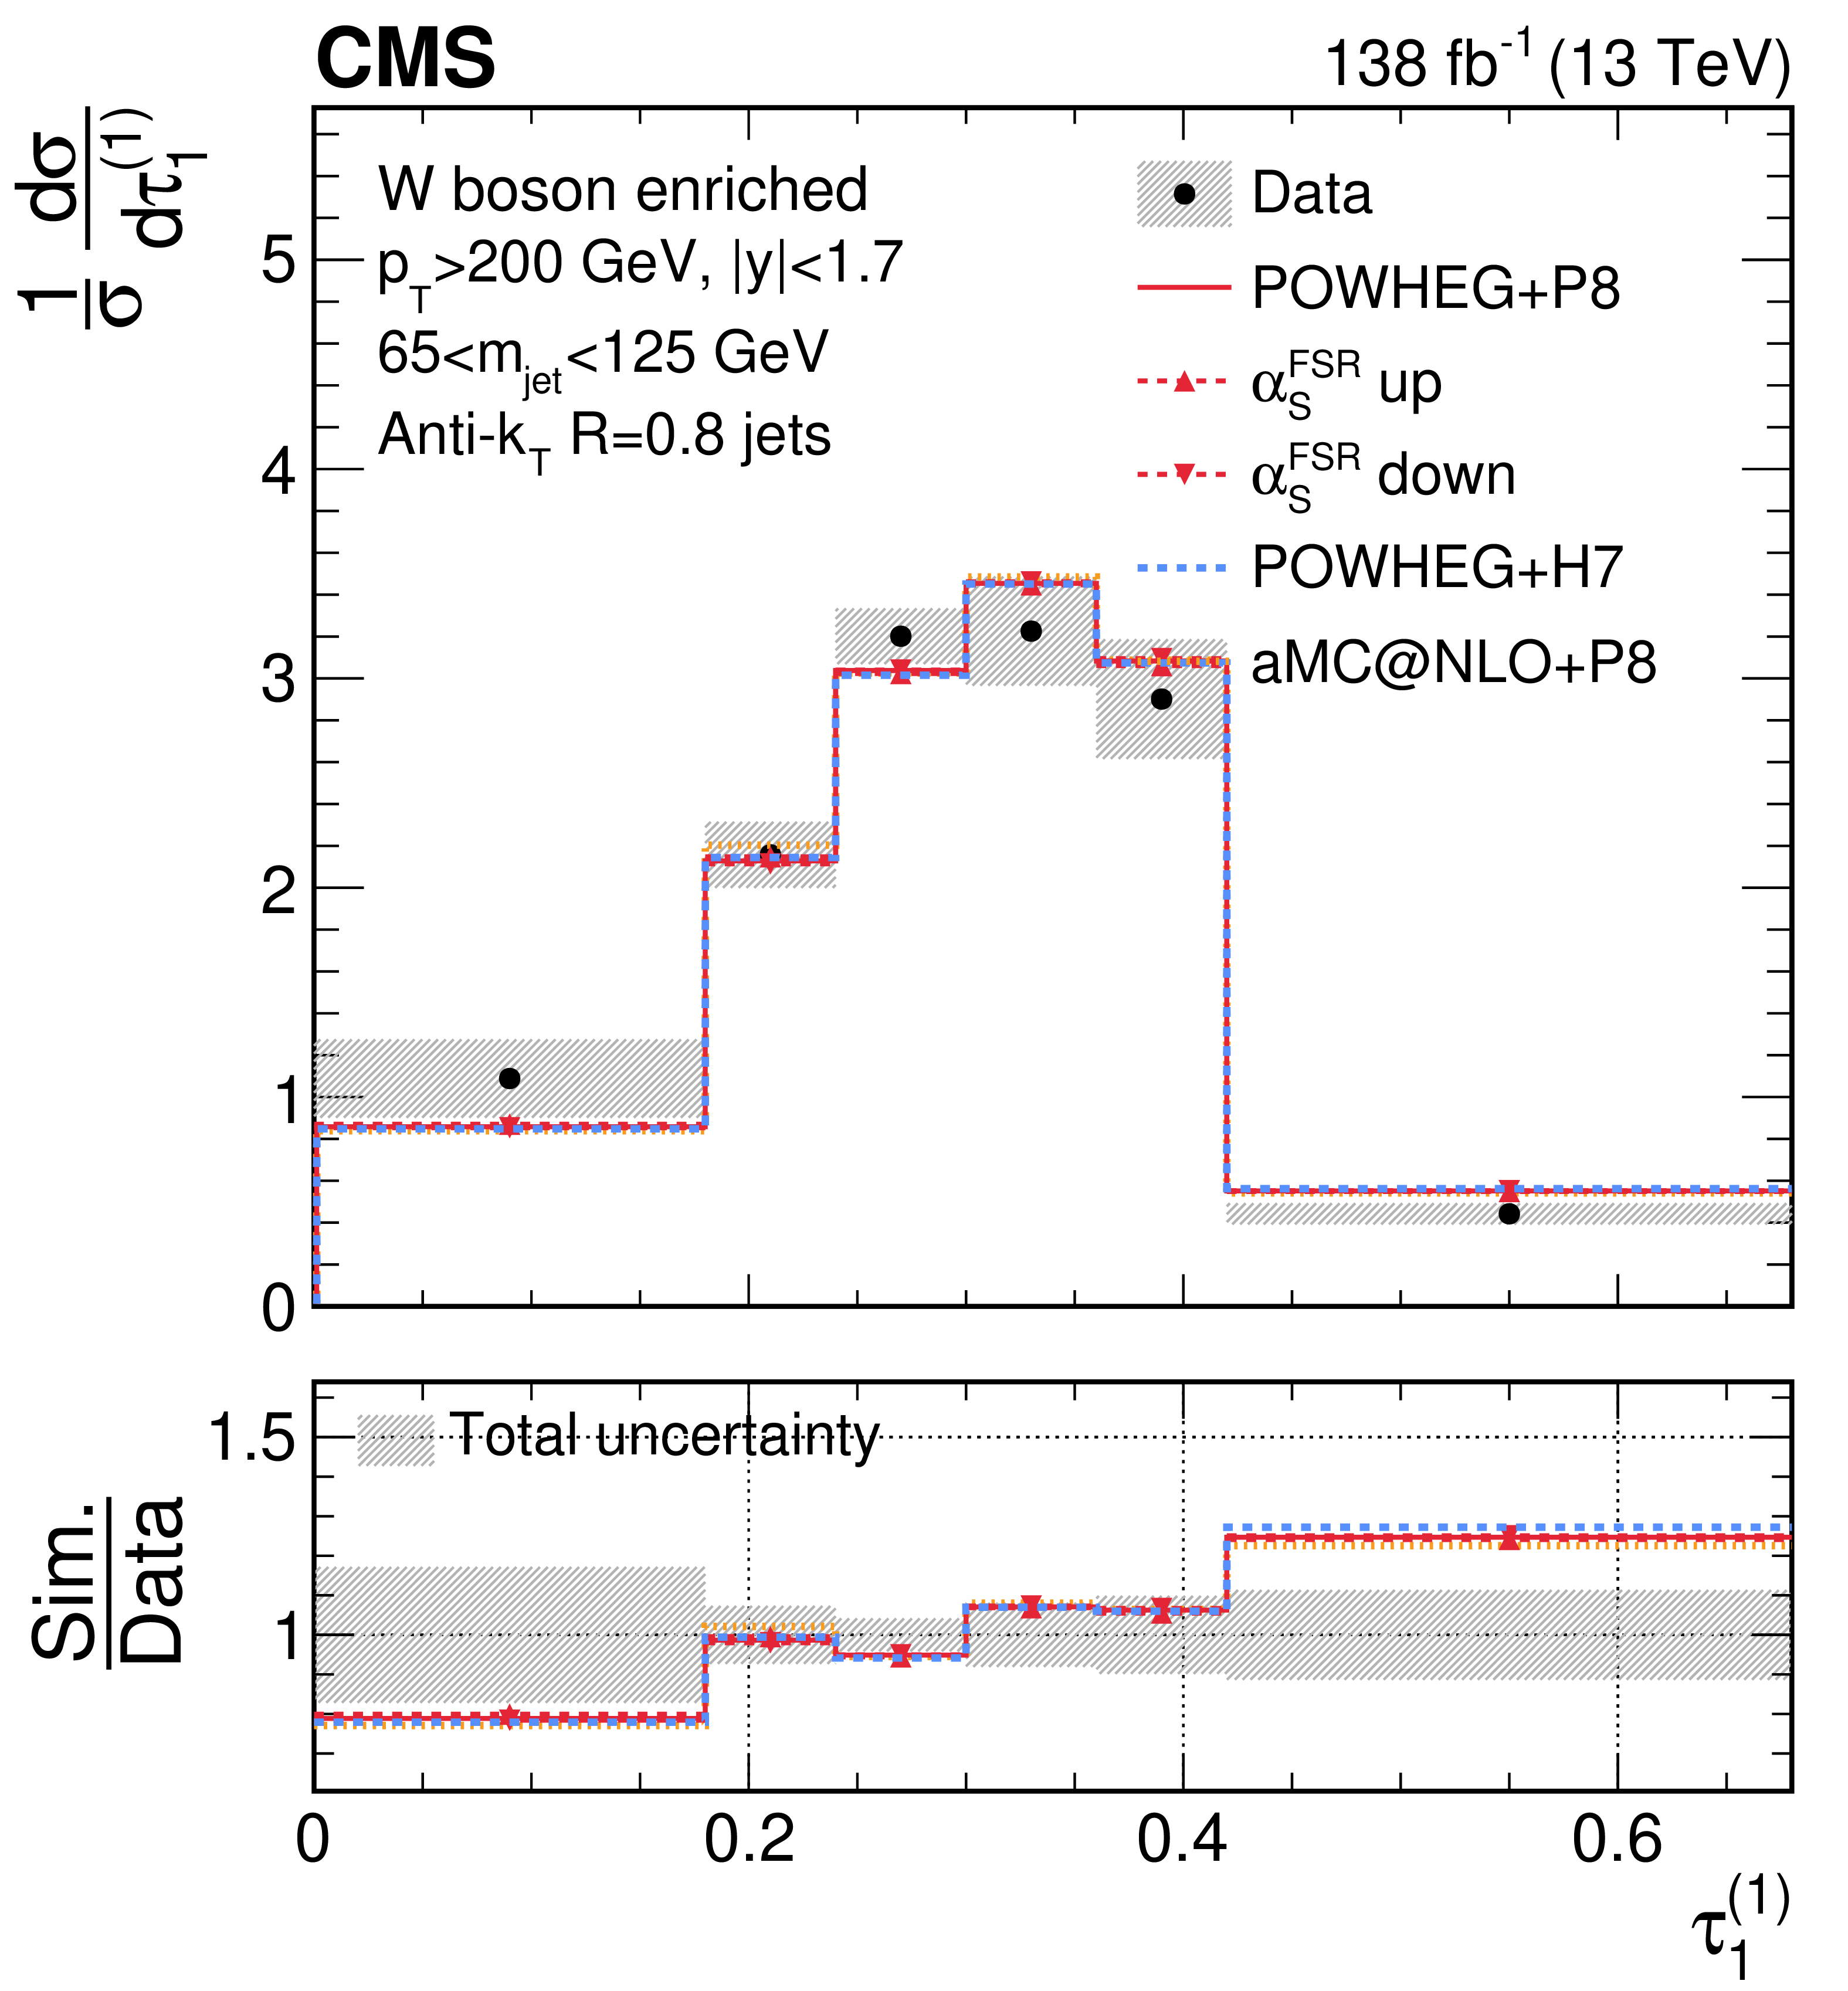
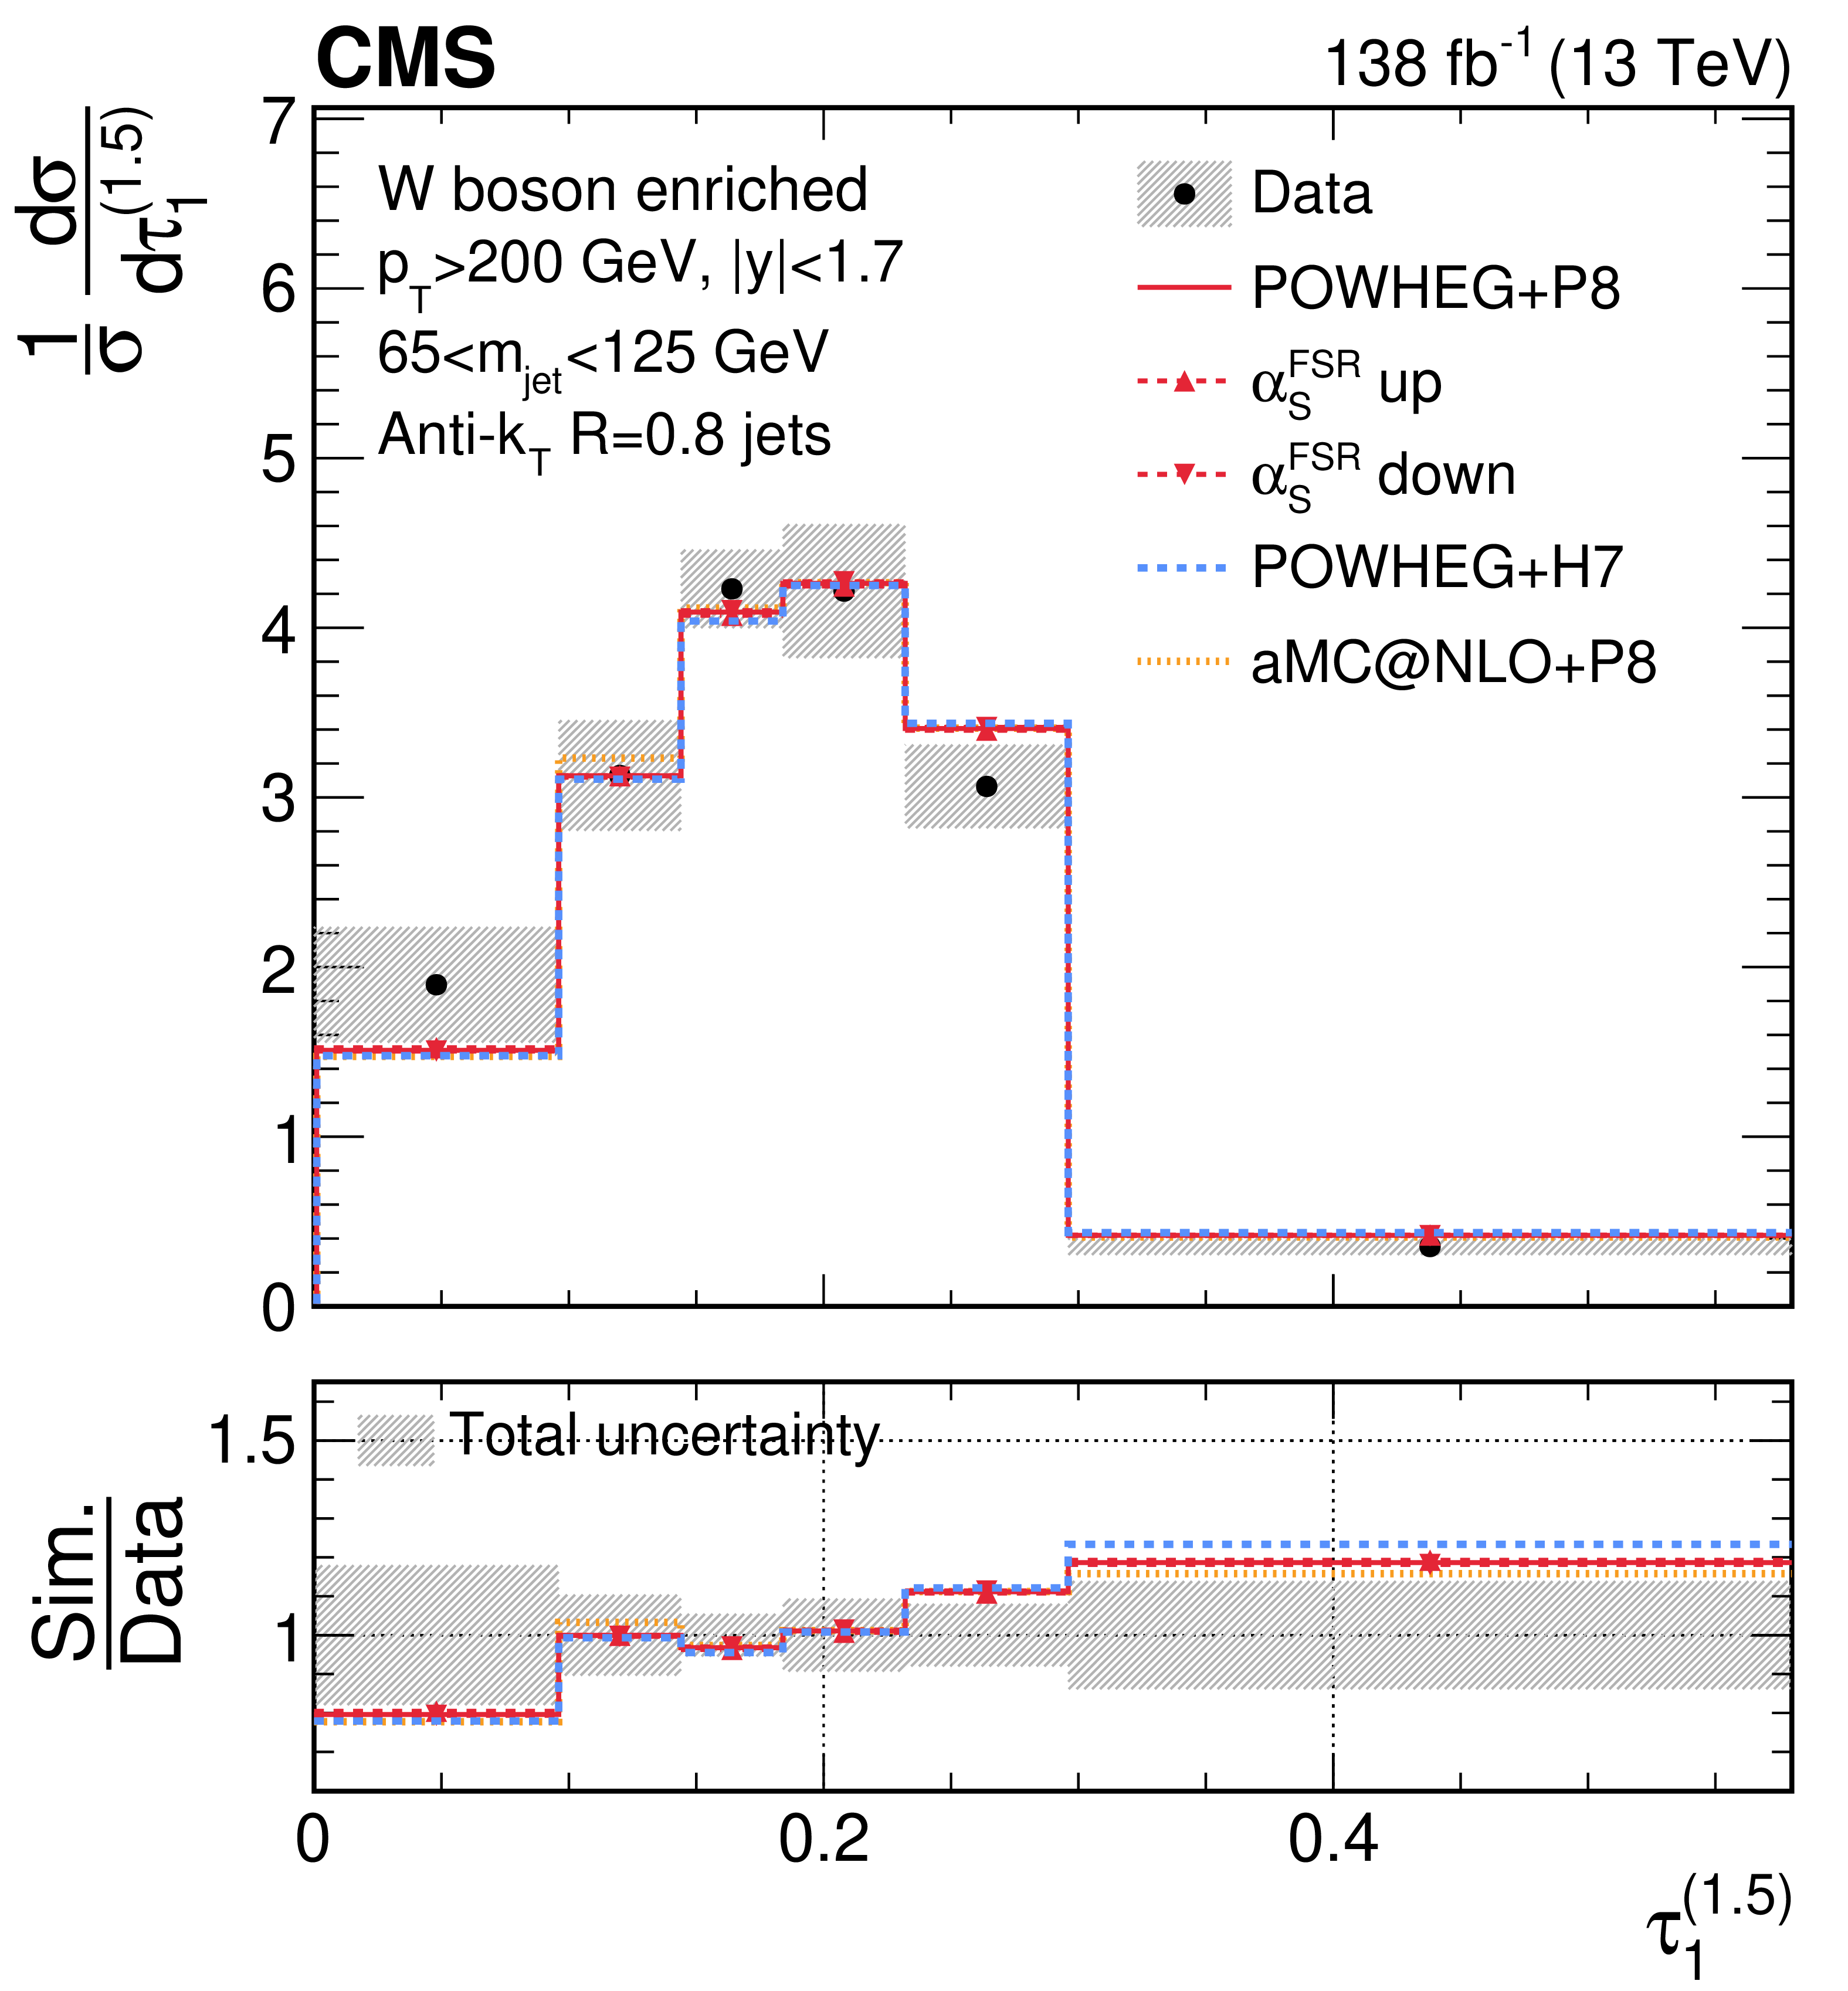
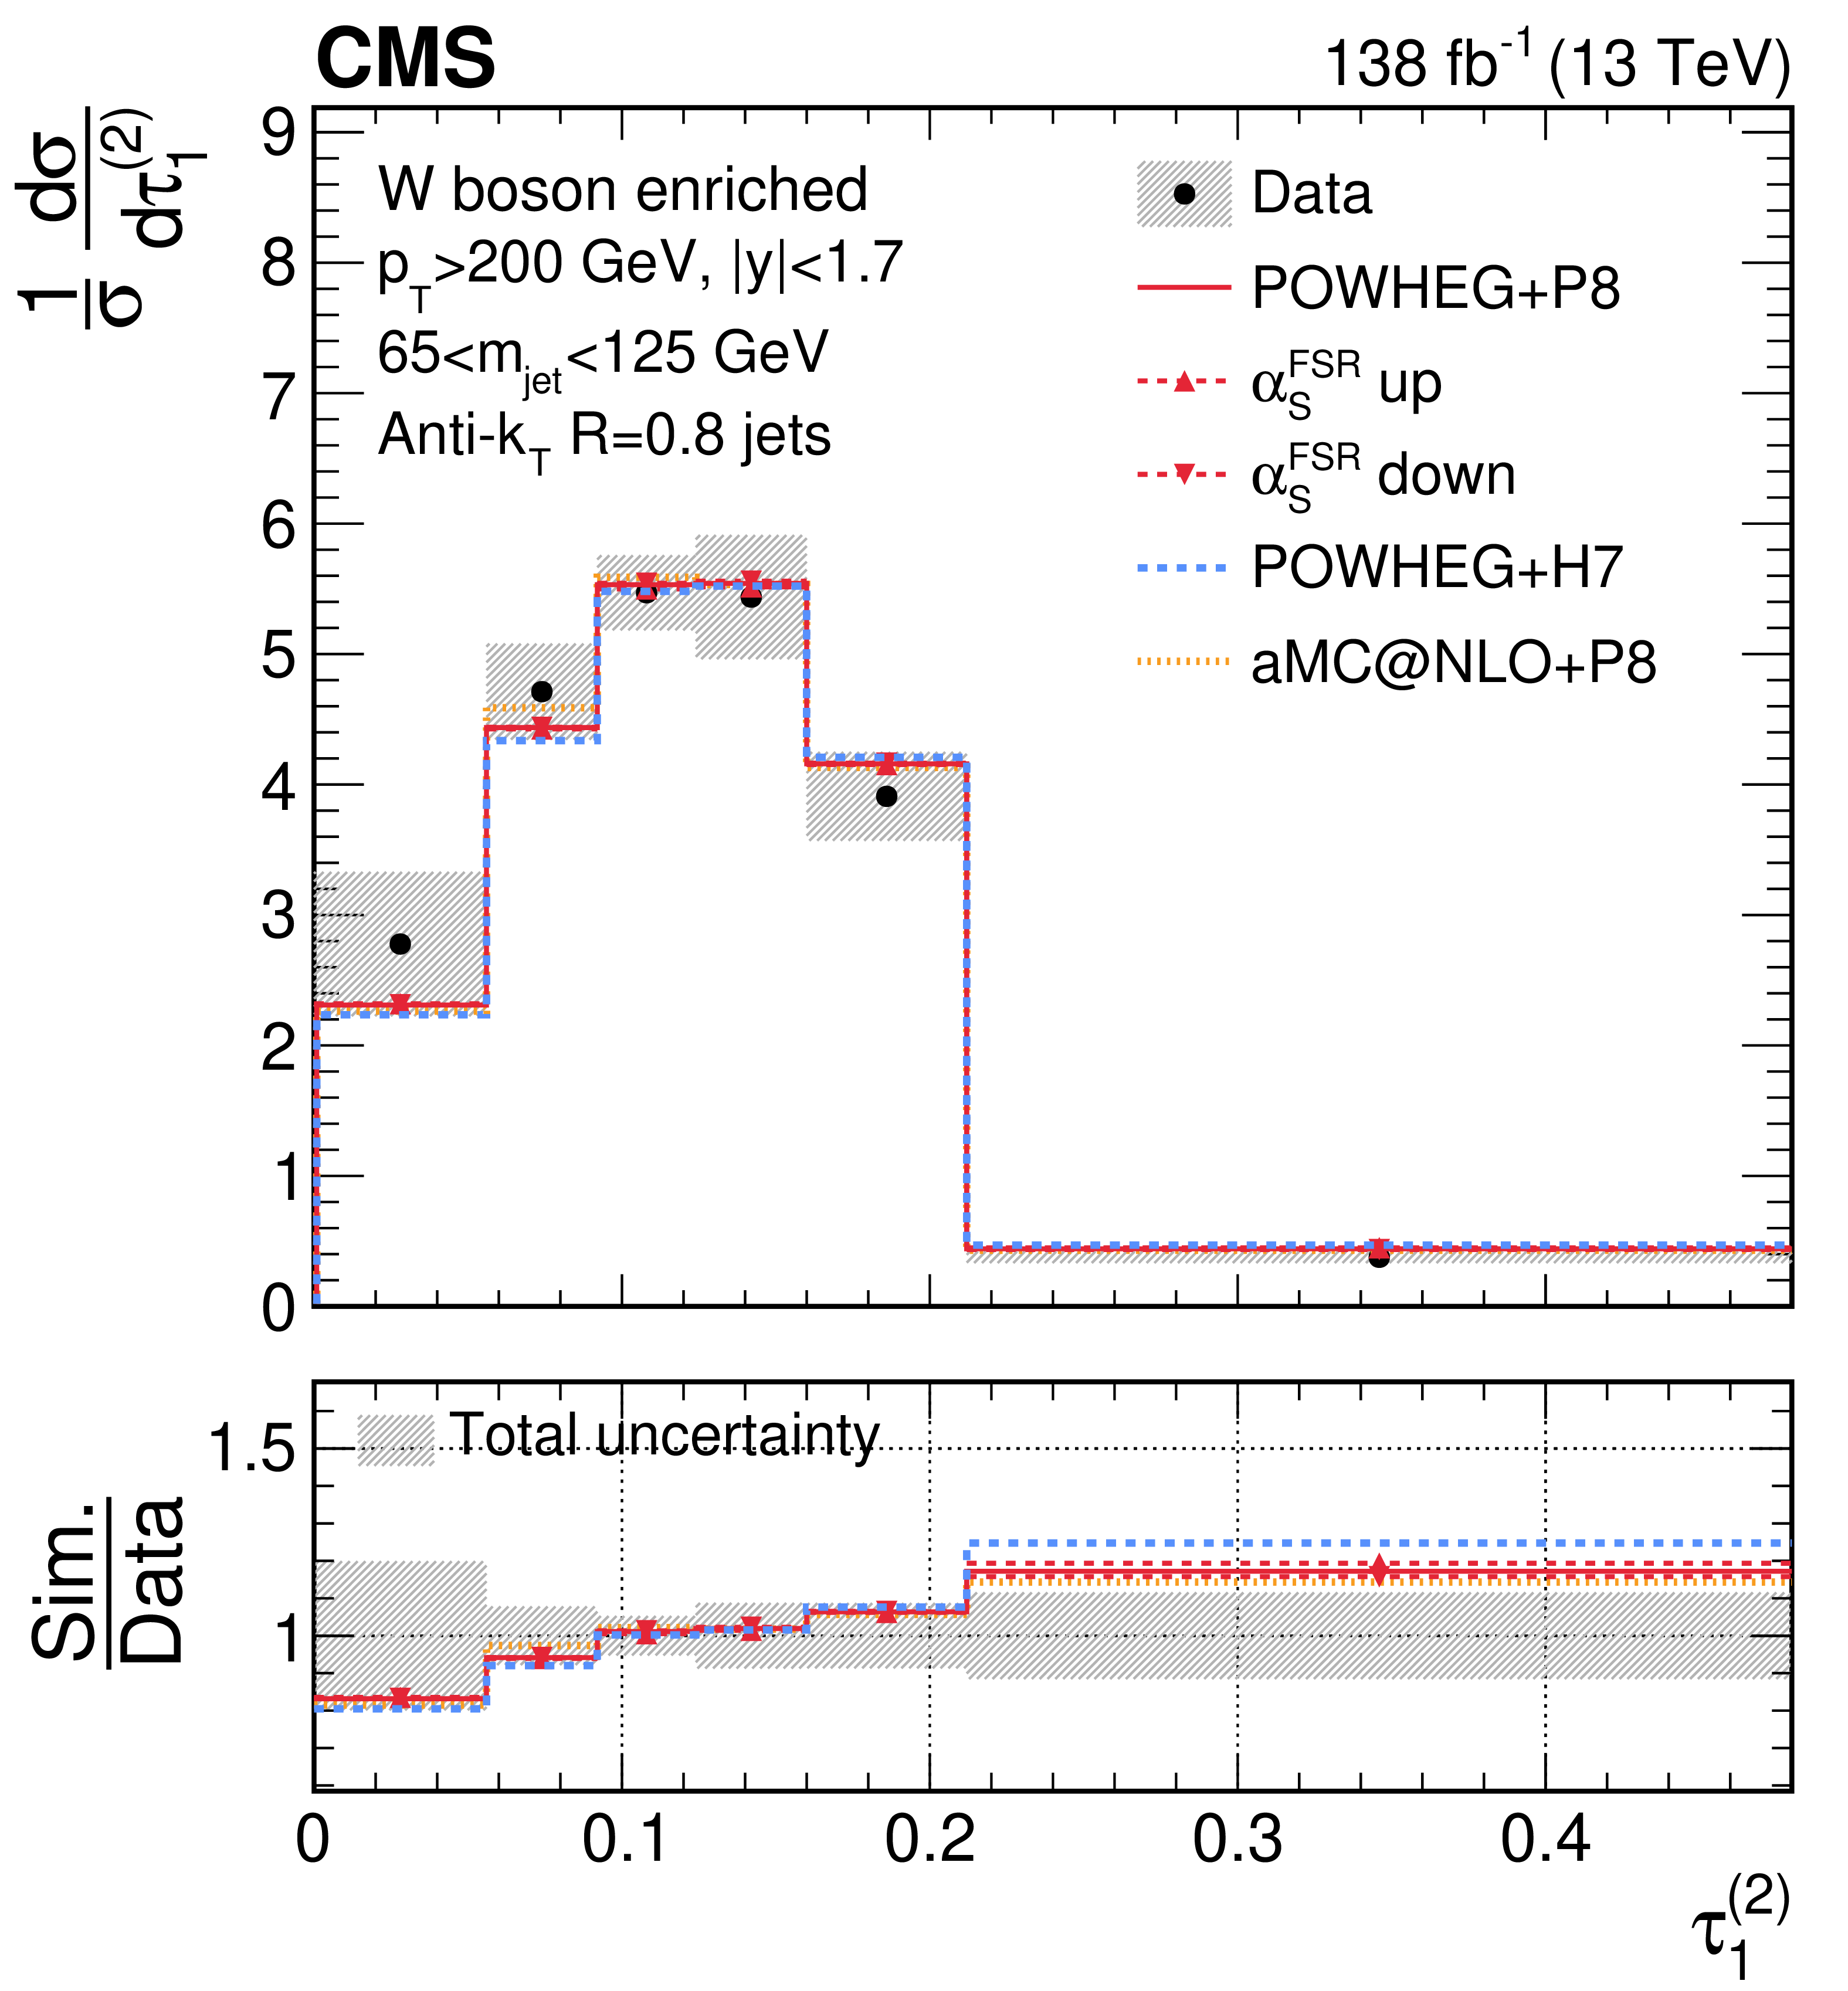
Unfolded distributions of 1-subjettiness observables, $\tau_{1}^{(0.25)}$, $\tau_{1}^{(0.5)}$,$\tau_{1}^{(1)}$,$\tau_{1}^{(1.5)}$, and $\tau_{1}^{(2)}$, measured for AK8 jets in boosted W boson-enriched events, extracted from the normalized, combined distribution after unfolding; the bin contents and the error bars are scaled by the bin widths for the distributions of the individual observables. For comparisons with particle-level predictions, the error bars in data correspond to the total unfolding uncertainties, and the lower panels present the ratio of particle-level predictions to the unfolded data. The dark grey hashed region illustrates the total uncertainties per bin in the unfolded result. |
png pdf |
Figure 29-a:
Unfolded distributions of 1-subjettiness observables, $\tau_{1}^{(0.25)}$, $\tau_{1}^{(0.5)}$,$\tau_{1}^{(1)}$,$\tau_{1}^{(1.5)}$, and $\tau_{1}^{(2)}$, measured for AK8 jets in boosted W boson-enriched events, extracted from the normalized, combined distribution after unfolding; the bin contents and the error bars are scaled by the bin widths for the distributions of the individual observables. For comparisons with particle-level predictions, the error bars in data correspond to the total unfolding uncertainties, and the lower panels present the ratio of particle-level predictions to the unfolded data. The dark grey hashed region illustrates the total uncertainties per bin in the unfolded result. |

png pdf |
Figure 29-b:
Unfolded distributions of 1-subjettiness observables, $\tau_{1}^{(0.25)}$, $\tau_{1}^{(0.5)}$,$\tau_{1}^{(1)}$,$\tau_{1}^{(1.5)}$, and $\tau_{1}^{(2)}$, measured for AK8 jets in boosted W boson-enriched events, extracted from the normalized, combined distribution after unfolding; the bin contents and the error bars are scaled by the bin widths for the distributions of the individual observables. For comparisons with particle-level predictions, the error bars in data correspond to the total unfolding uncertainties, and the lower panels present the ratio of particle-level predictions to the unfolded data. The dark grey hashed region illustrates the total uncertainties per bin in the unfolded result. |
png pdf |
Figure 29-c:
Unfolded distributions of 1-subjettiness observables, $\tau_{1}^{(0.25)}$, $\tau_{1}^{(0.5)}$,$\tau_{1}^{(1)}$,$\tau_{1}^{(1.5)}$, and $\tau_{1}^{(2)}$, measured for AK8 jets in boosted W boson-enriched events, extracted from the normalized, combined distribution after unfolding; the bin contents and the error bars are scaled by the bin widths for the distributions of the individual observables. For comparisons with particle-level predictions, the error bars in data correspond to the total unfolding uncertainties, and the lower panels present the ratio of particle-level predictions to the unfolded data. The dark grey hashed region illustrates the total uncertainties per bin in the unfolded result. |
png pdf |
Figure 29-d:
Unfolded distributions of 1-subjettiness observables, $\tau_{1}^{(0.25)}$, $\tau_{1}^{(0.5)}$,$\tau_{1}^{(1)}$,$\tau_{1}^{(1.5)}$, and $\tau_{1}^{(2)}$, measured for AK8 jets in boosted W boson-enriched events, extracted from the normalized, combined distribution after unfolding; the bin contents and the error bars are scaled by the bin widths for the distributions of the individual observables. For comparisons with particle-level predictions, the error bars in data correspond to the total unfolding uncertainties, and the lower panels present the ratio of particle-level predictions to the unfolded data. The dark grey hashed region illustrates the total uncertainties per bin in the unfolded result. |
png pdf |
Figure 29-e:
Unfolded distributions of 1-subjettiness observables, $\tau_{1}^{(0.25)}$, $\tau_{1}^{(0.5)}$,$\tau_{1}^{(1)}$,$\tau_{1}^{(1.5)}$, and $\tau_{1}^{(2)}$, measured for AK8 jets in boosted W boson-enriched events, extracted from the normalized, combined distribution after unfolding; the bin contents and the error bars are scaled by the bin widths for the distributions of the individual observables. For comparisons with particle-level predictions, the error bars in data correspond to the total unfolding uncertainties, and the lower panels present the ratio of particle-level predictions to the unfolded data. The dark grey hashed region illustrates the total uncertainties per bin in the unfolded result. |
png pdf |
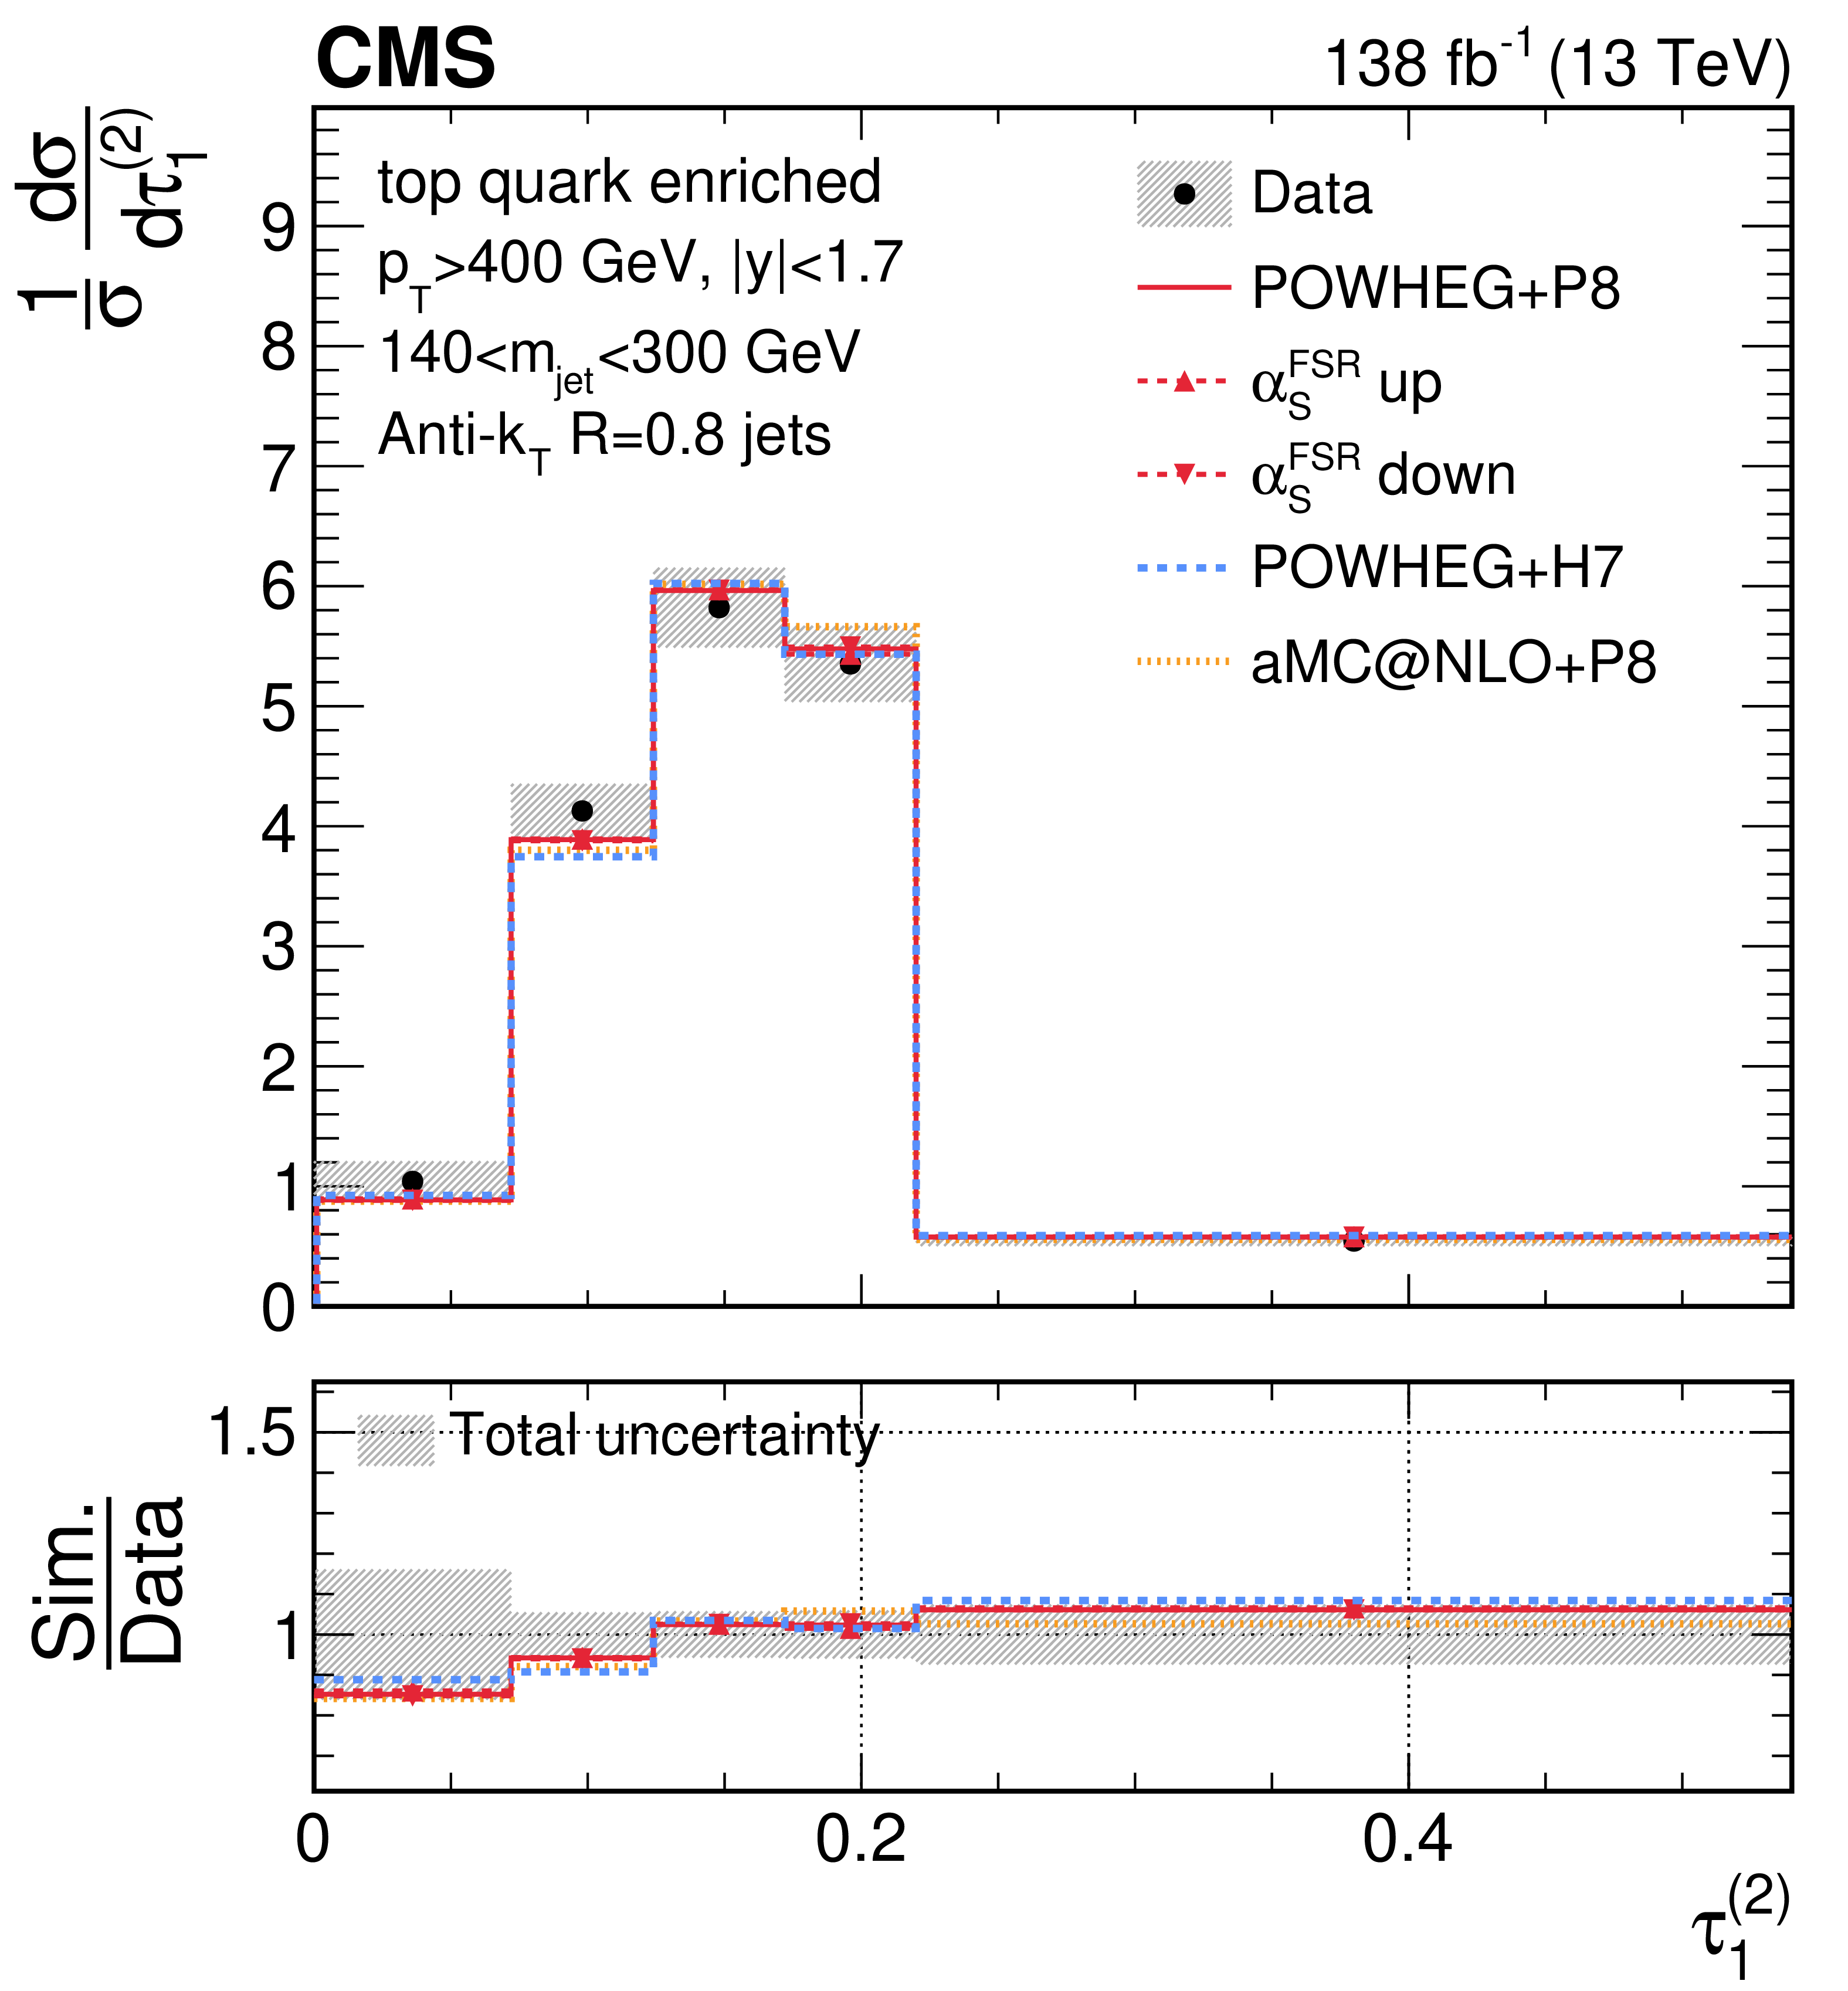
Figure 30:
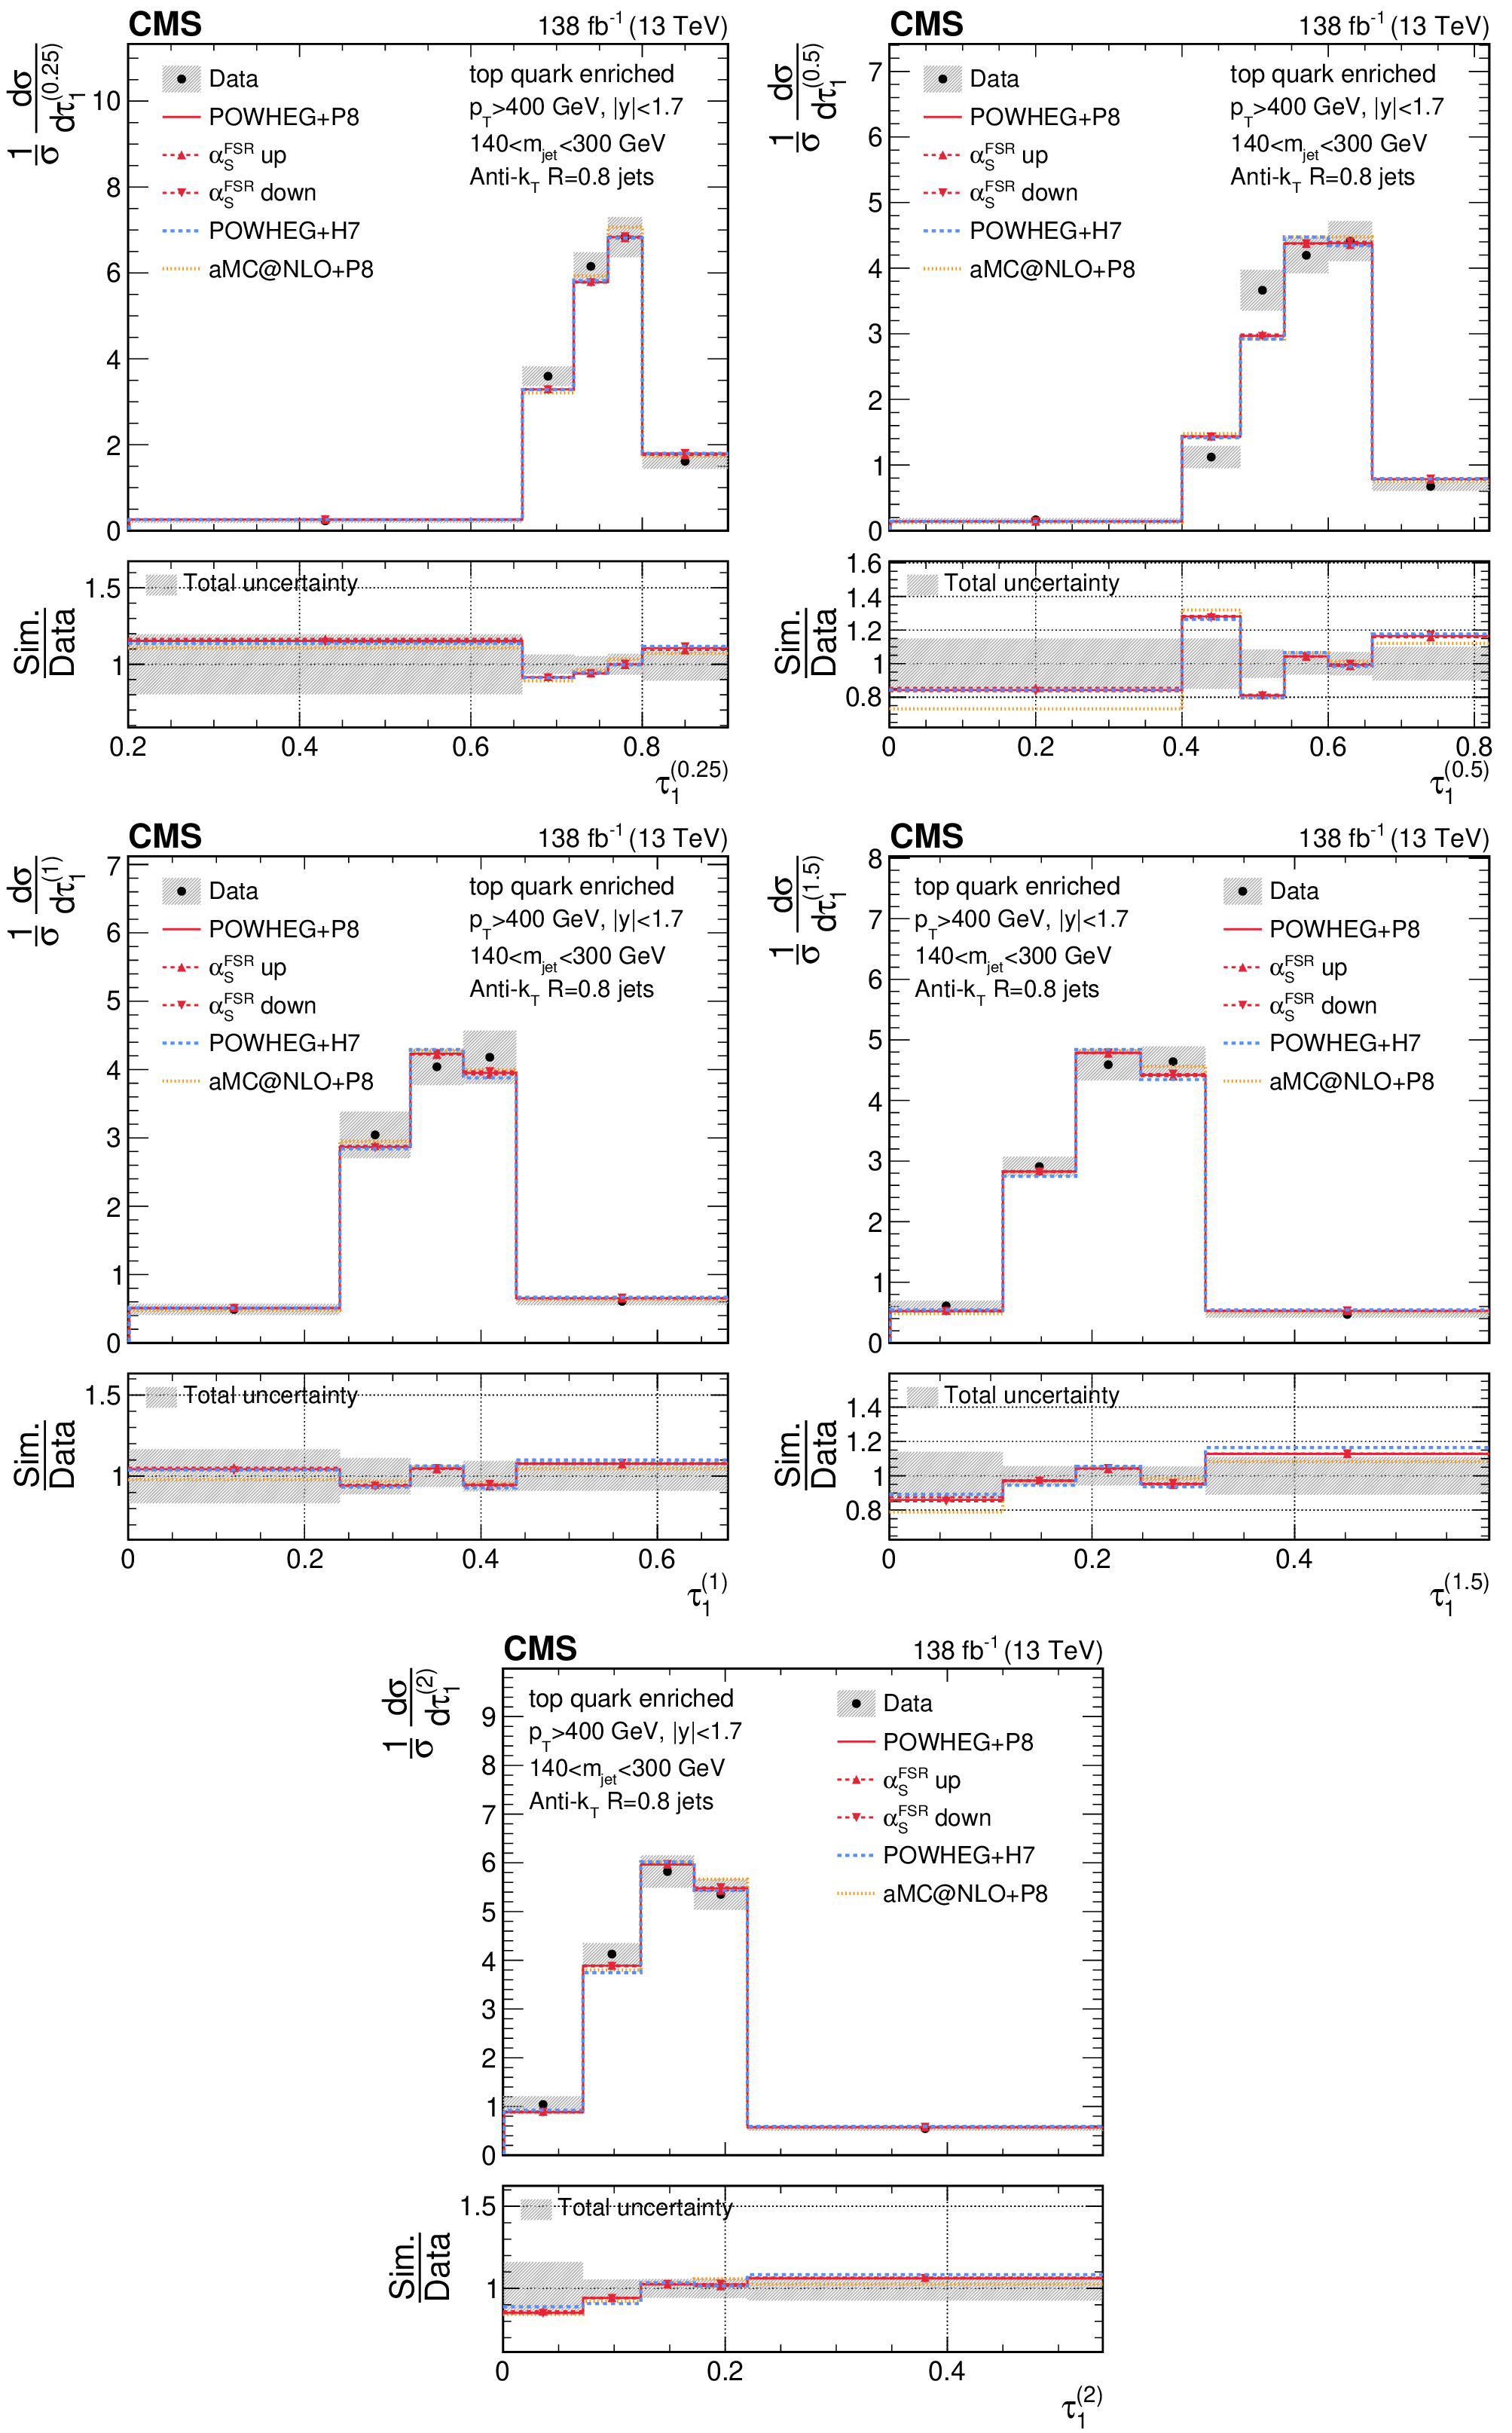
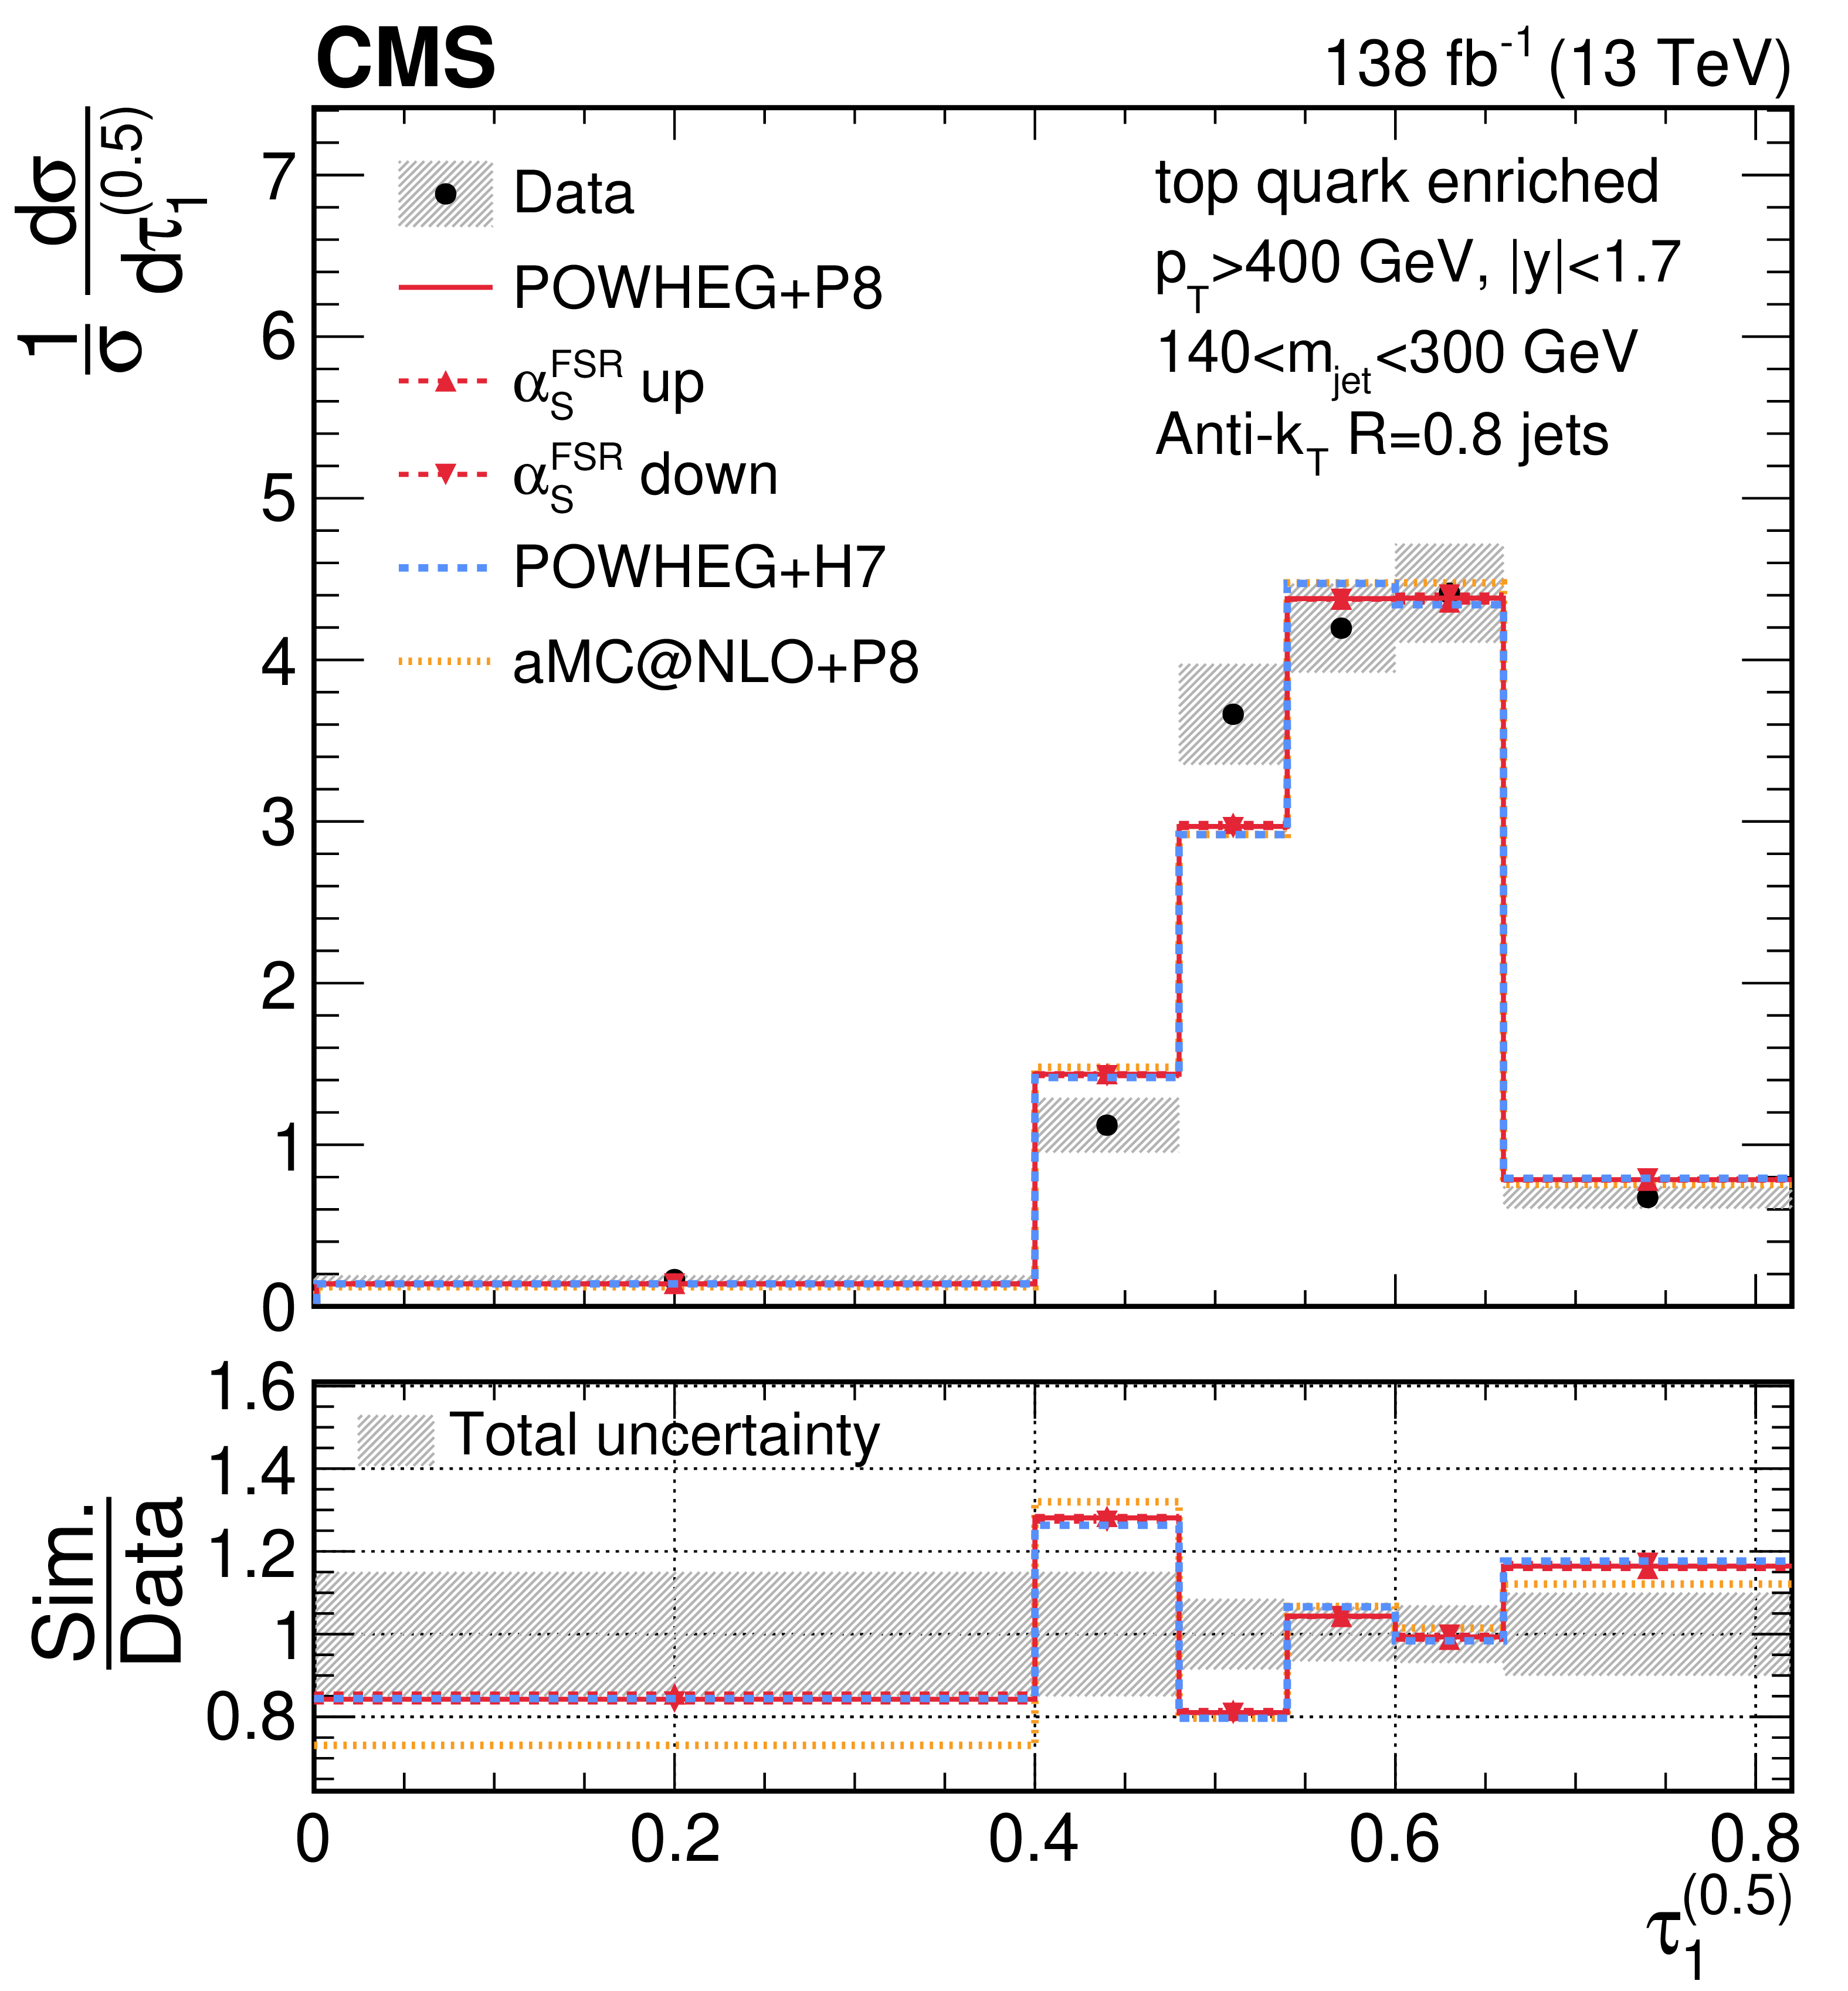
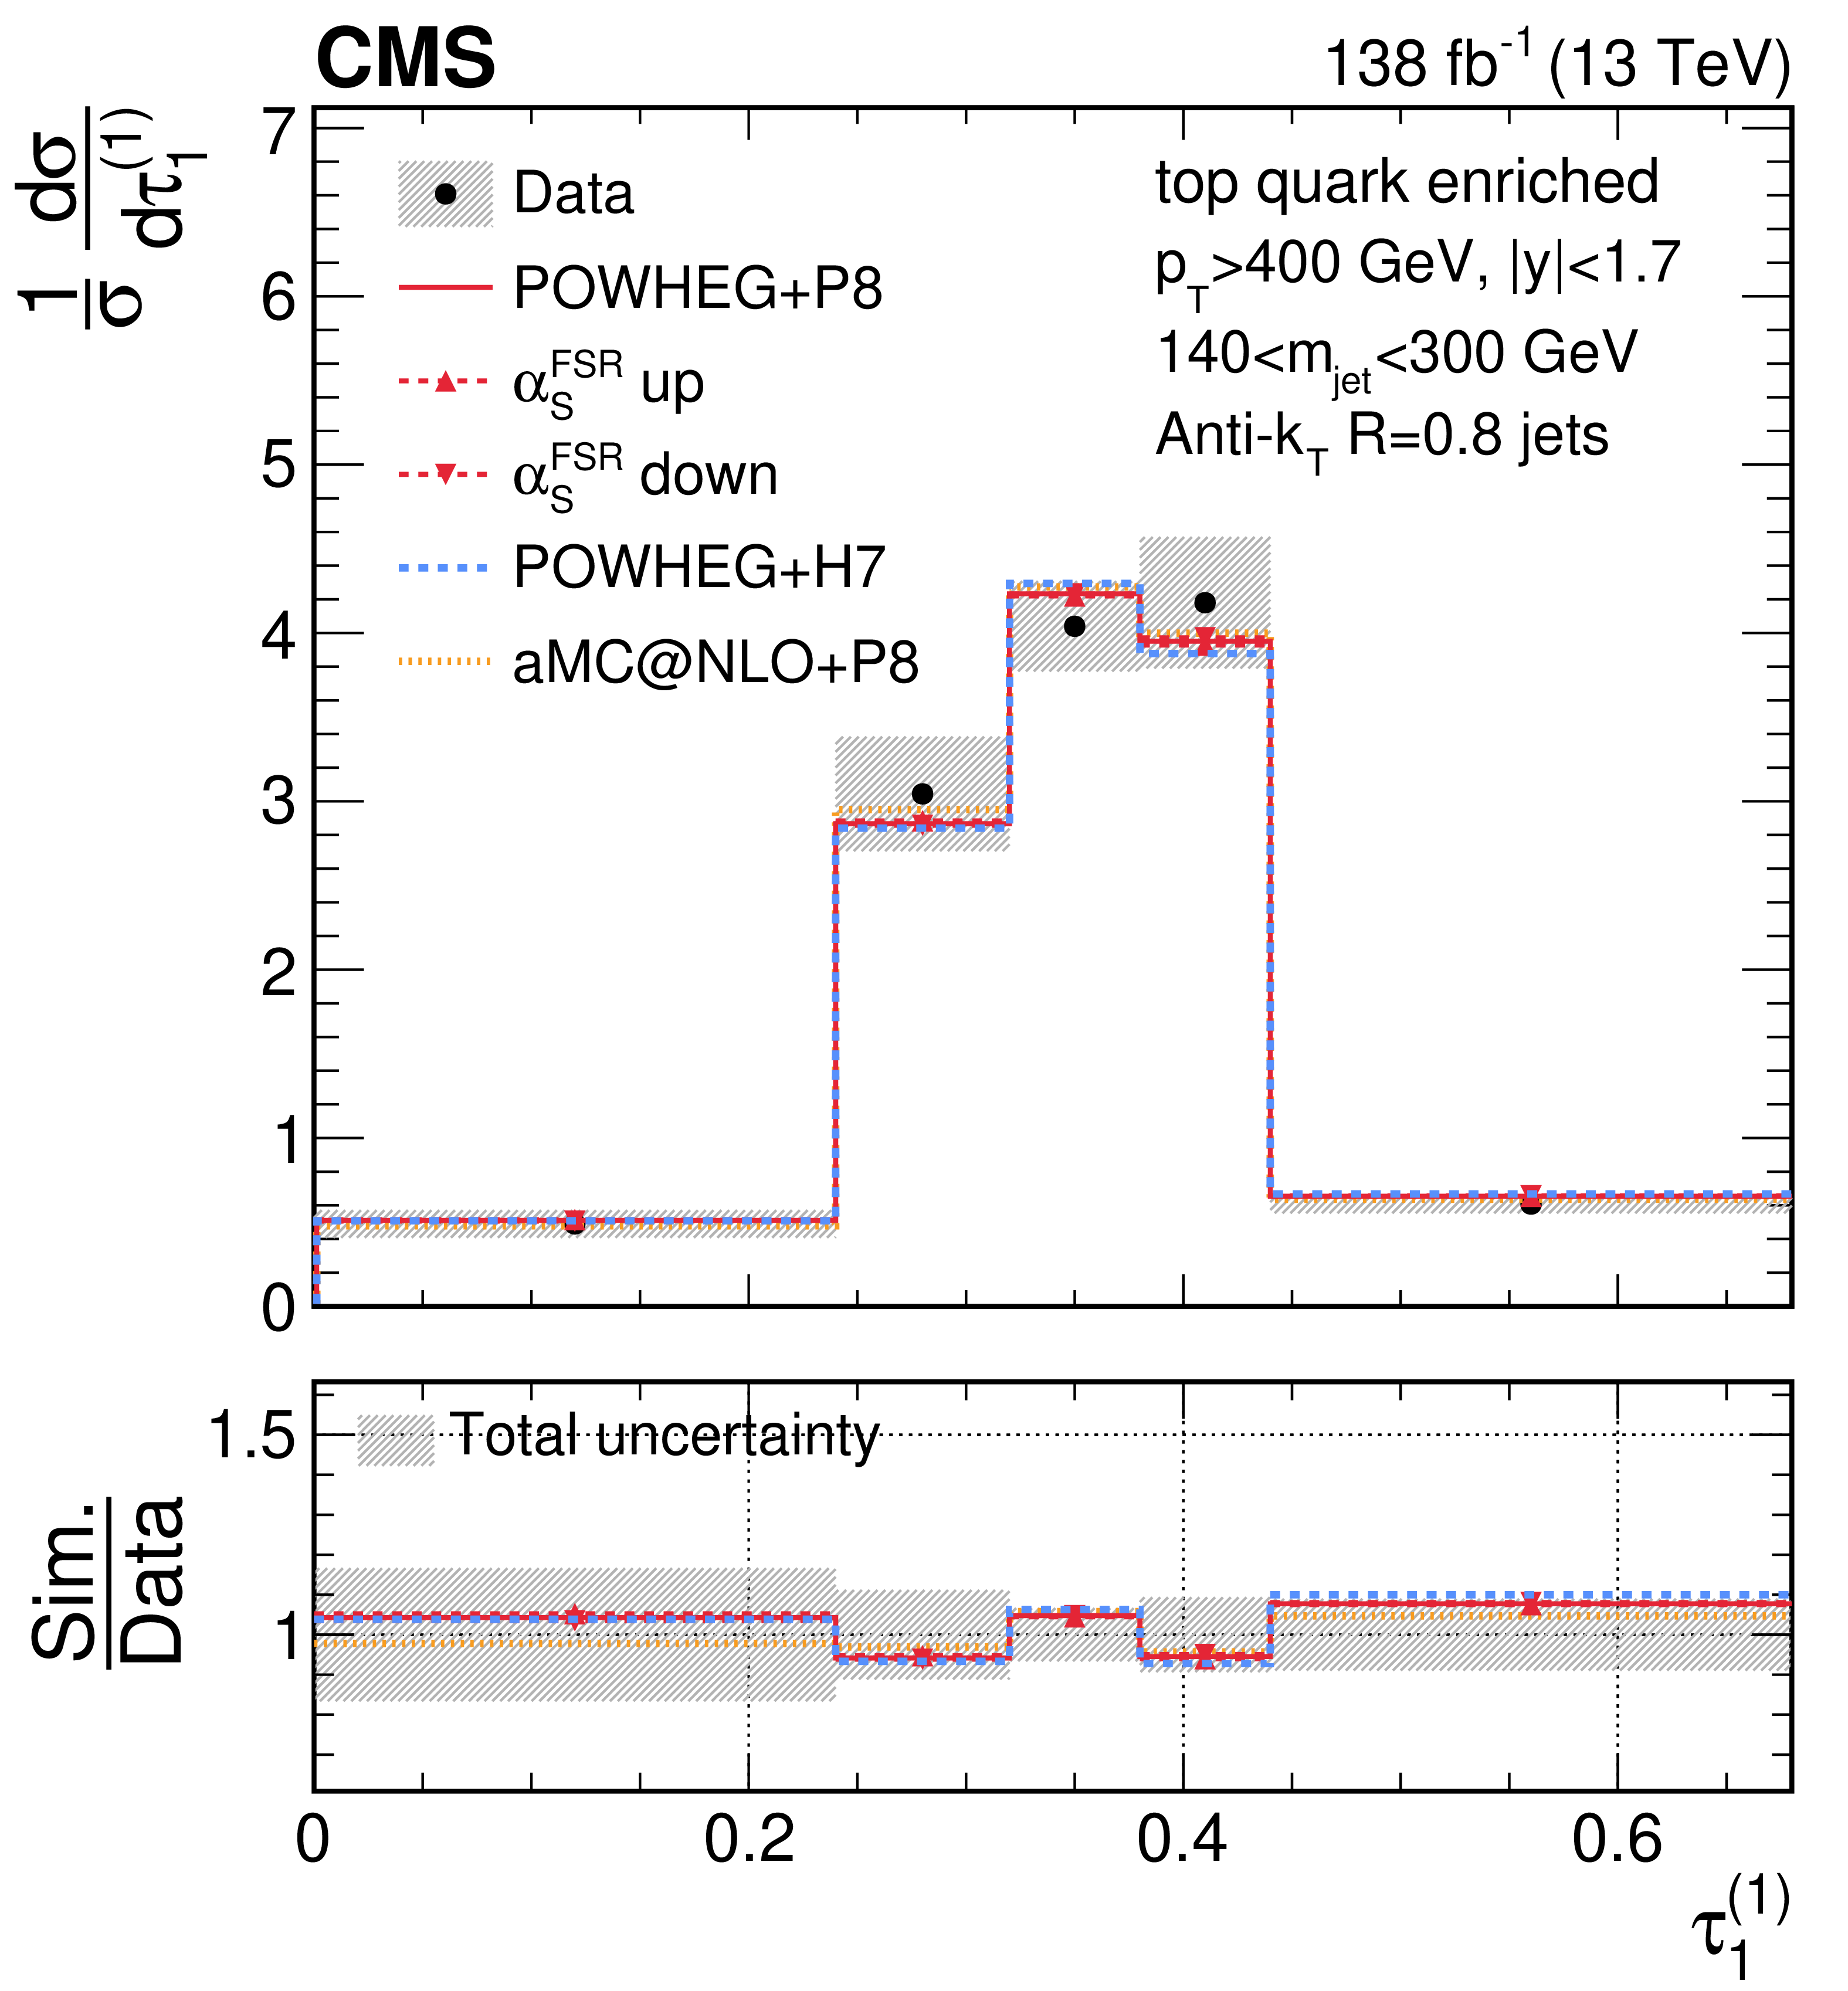
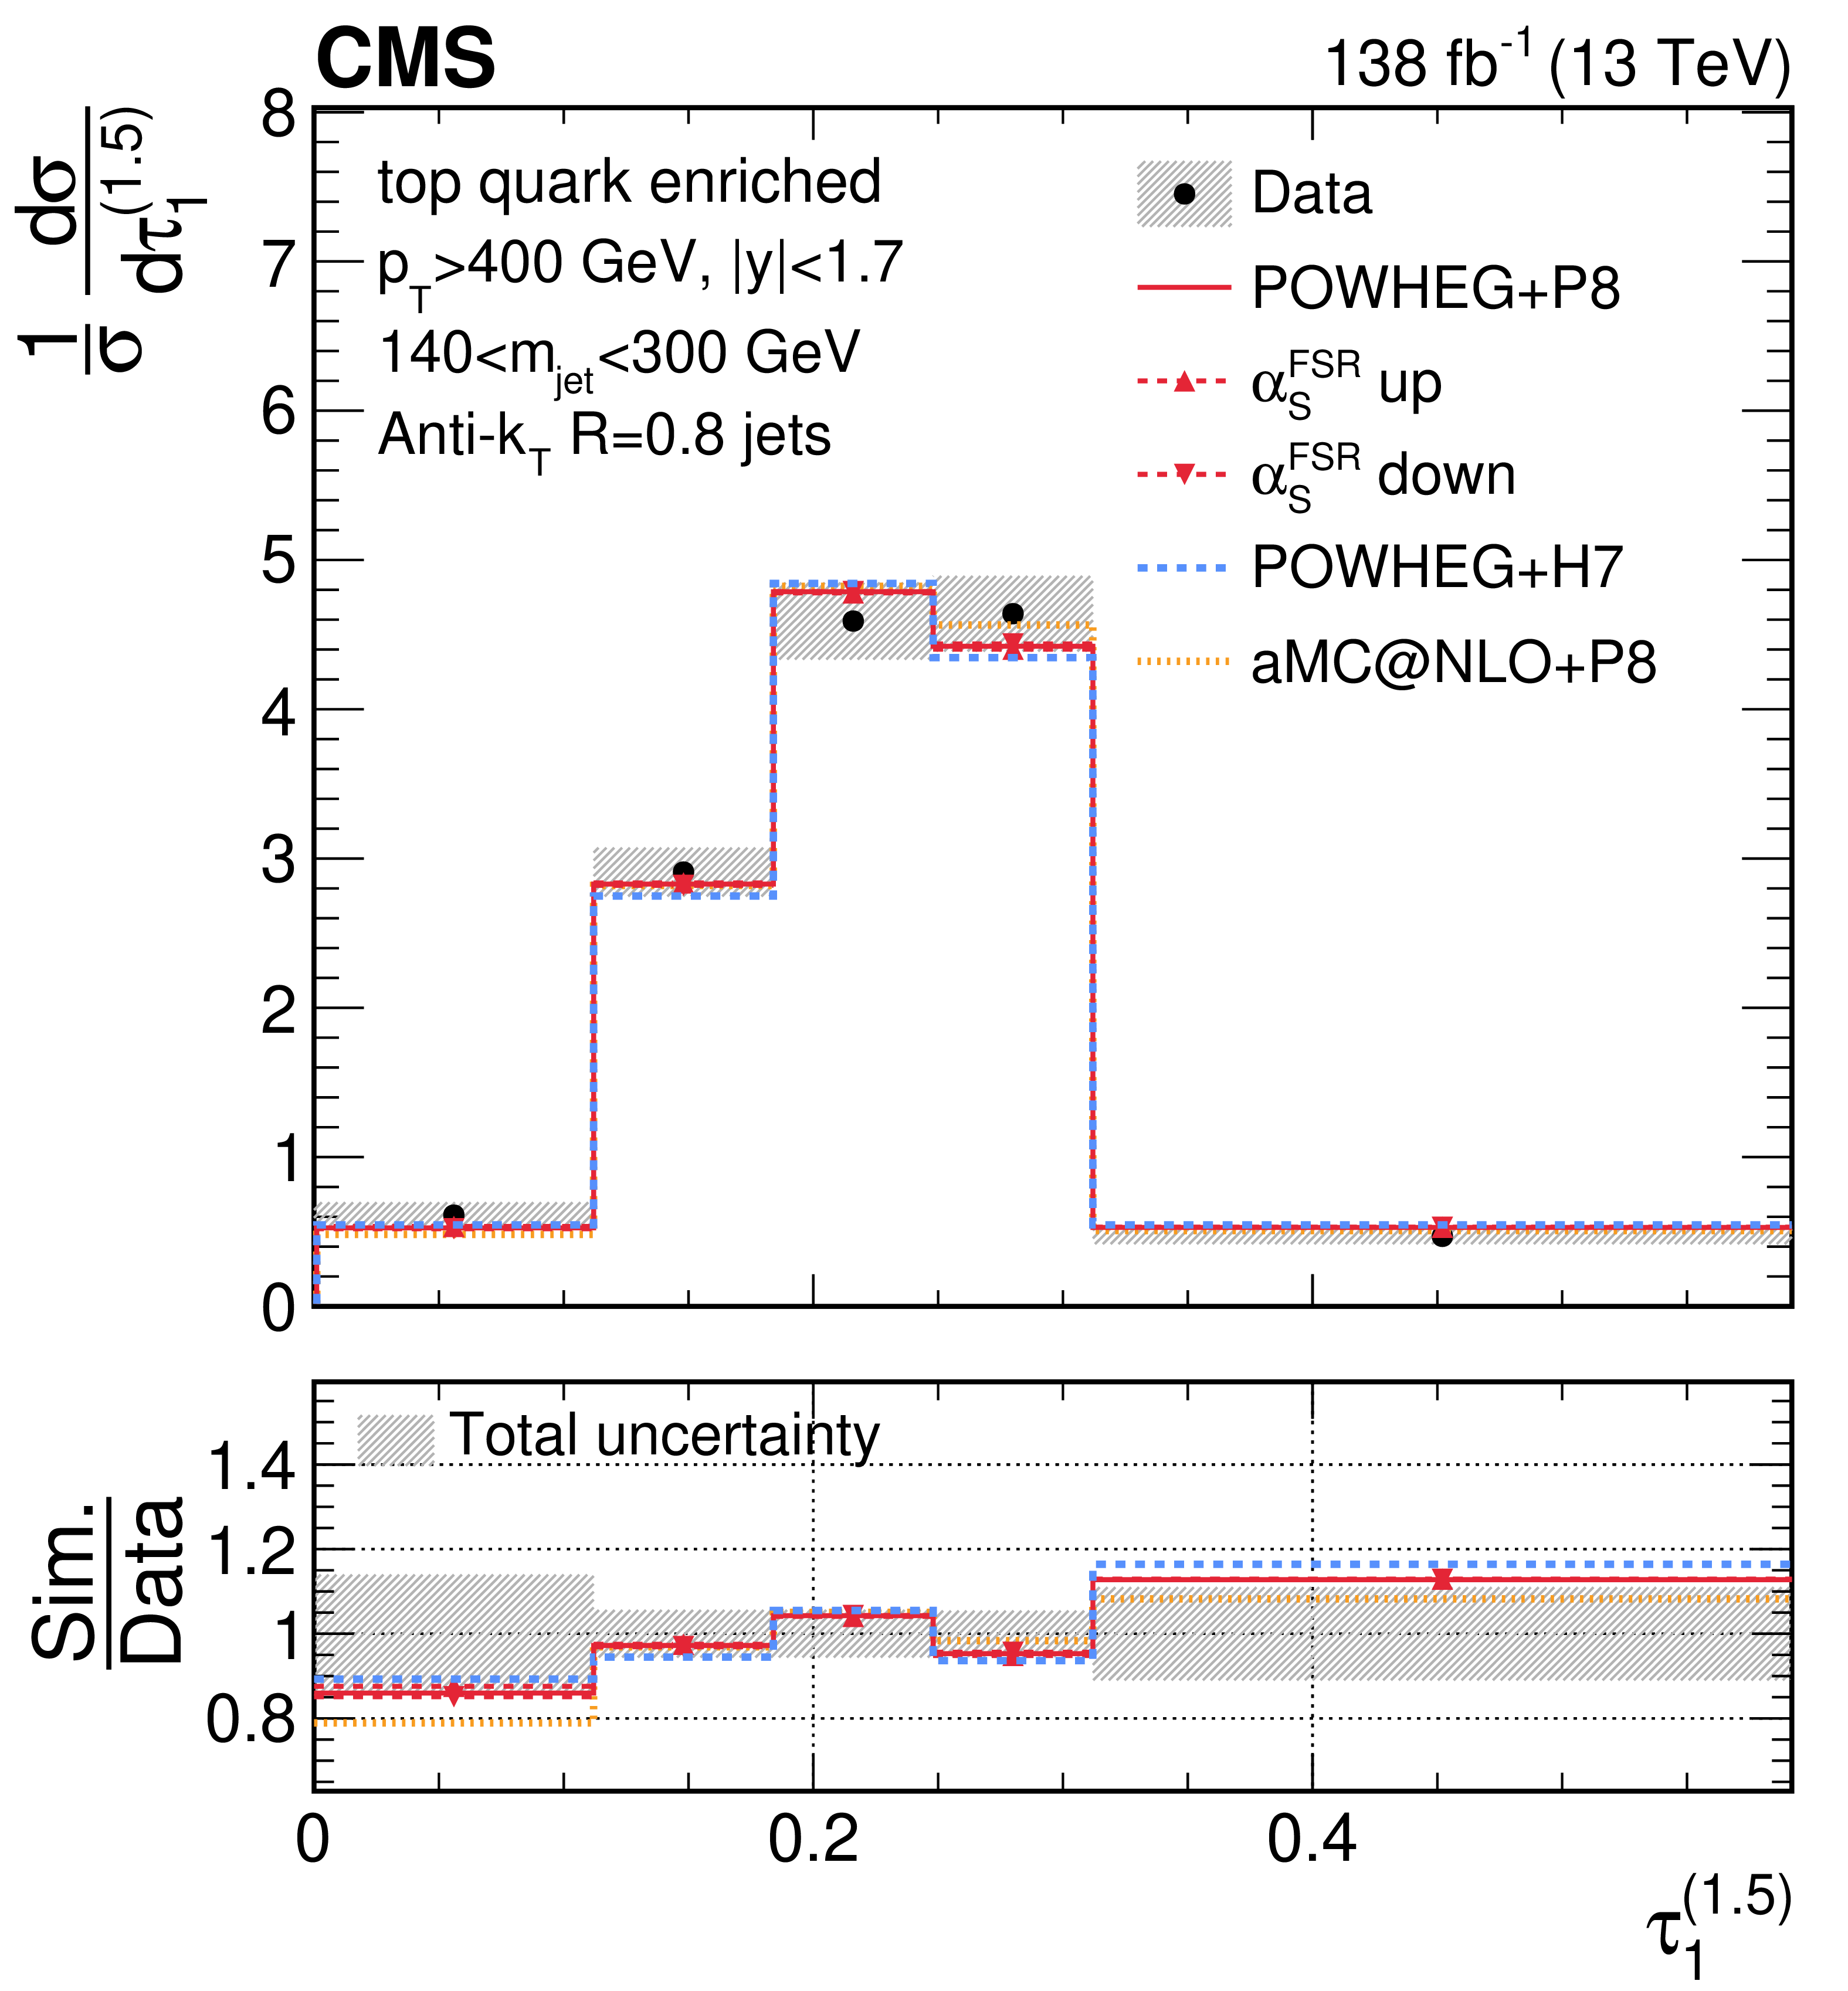
Unfolded distributions of 1-subjettiness observables, $\tau_{1}^{(0.25)}$, $\tau_{1}^{(0.5)}$,$\tau_{1}^{(1)}$,$\tau_{1}^{(1.5)}$, and $\tau_{1}^{(2)}$, measured for AK8 jets in the boosted top quark-enriched region, extracted from the normalized, combined distribution after unfolding; the bin contents and the error bars are scaled by the bin widths for the distributions of the individual observables. For comparisons with particle-level predictions, the error bars in data correspond to the total unfolding uncertainties, and the lower panels present the ratio of particle-level predictions to the unfolded data. The dark grey hashed region illustrates the total uncertainties per bin in the unfolded result. |
png pdf |
Figure 30-a:
Unfolded distributions of 1-subjettiness observables, $\tau_{1}^{(0.25)}$, $\tau_{1}^{(0.5)}$,$\tau_{1}^{(1)}$,$\tau_{1}^{(1.5)}$, and $\tau_{1}^{(2)}$, measured for AK8 jets in the boosted top quark-enriched region, extracted from the normalized, combined distribution after unfolding; the bin contents and the error bars are scaled by the bin widths for the distributions of the individual observables. For comparisons with particle-level predictions, the error bars in data correspond to the total unfolding uncertainties, and the lower panels present the ratio of particle-level predictions to the unfolded data. The dark grey hashed region illustrates the total uncertainties per bin in the unfolded result. |
png pdf |
Figure 30-b:
Unfolded distributions of 1-subjettiness observables, $\tau_{1}^{(0.25)}$, $\tau_{1}^{(0.5)}$,$\tau_{1}^{(1)}$,$\tau_{1}^{(1.5)}$, and $\tau_{1}^{(2)}$, measured for AK8 jets in the boosted top quark-enriched region, extracted from the normalized, combined distribution after unfolding; the bin contents and the error bars are scaled by the bin widths for the distributions of the individual observables. For comparisons with particle-level predictions, the error bars in data correspond to the total unfolding uncertainties, and the lower panels present the ratio of particle-level predictions to the unfolded data. The dark grey hashed region illustrates the total uncertainties per bin in the unfolded result. |
png pdf |
Figure 30-c:
Unfolded distributions of 1-subjettiness observables, $\tau_{1}^{(0.25)}$, $\tau_{1}^{(0.5)}$,$\tau_{1}^{(1)}$,$\tau_{1}^{(1.5)}$, and $\tau_{1}^{(2)}$, measured for AK8 jets in the boosted top quark-enriched region, extracted from the normalized, combined distribution after unfolding; the bin contents and the error bars are scaled by the bin widths for the distributions of the individual observables. For comparisons with particle-level predictions, the error bars in data correspond to the total unfolding uncertainties, and the lower panels present the ratio of particle-level predictions to the unfolded data. The dark grey hashed region illustrates the total uncertainties per bin in the unfolded result. |
png pdf |
Figure 30-d:
Unfolded distributions of 1-subjettiness observables, $\tau_{1}^{(0.25)}$, $\tau_{1}^{(0.5)}$,$\tau_{1}^{(1)}$,$\tau_{1}^{(1.5)}$, and $\tau_{1}^{(2)}$, measured for AK8 jets in the boosted top quark-enriched region, extracted from the normalized, combined distribution after unfolding; the bin contents and the error bars are scaled by the bin widths for the distributions of the individual observables. For comparisons with particle-level predictions, the error bars in data correspond to the total unfolding uncertainties, and the lower panels present the ratio of particle-level predictions to the unfolded data. The dark grey hashed region illustrates the total uncertainties per bin in the unfolded result. |
png pdf |
Figure 30-e:
Unfolded distributions of 1-subjettiness observables, $\tau_{1}^{(0.25)}$, $\tau_{1}^{(0.5)}$,$\tau_{1}^{(1)}$,$\tau_{1}^{(1.5)}$, and $\tau_{1}^{(2)}$, measured for AK8 jets in the boosted top quark-enriched region, extracted from the normalized, combined distribution after unfolding; the bin contents and the error bars are scaled by the bin widths for the distributions of the individual observables. For comparisons with particle-level predictions, the error bars in data correspond to the total unfolding uncertainties, and the lower panels present the ratio of particle-level predictions to the unfolded data. The dark grey hashed region illustrates the total uncertainties per bin in the unfolded result. |
png pdf |
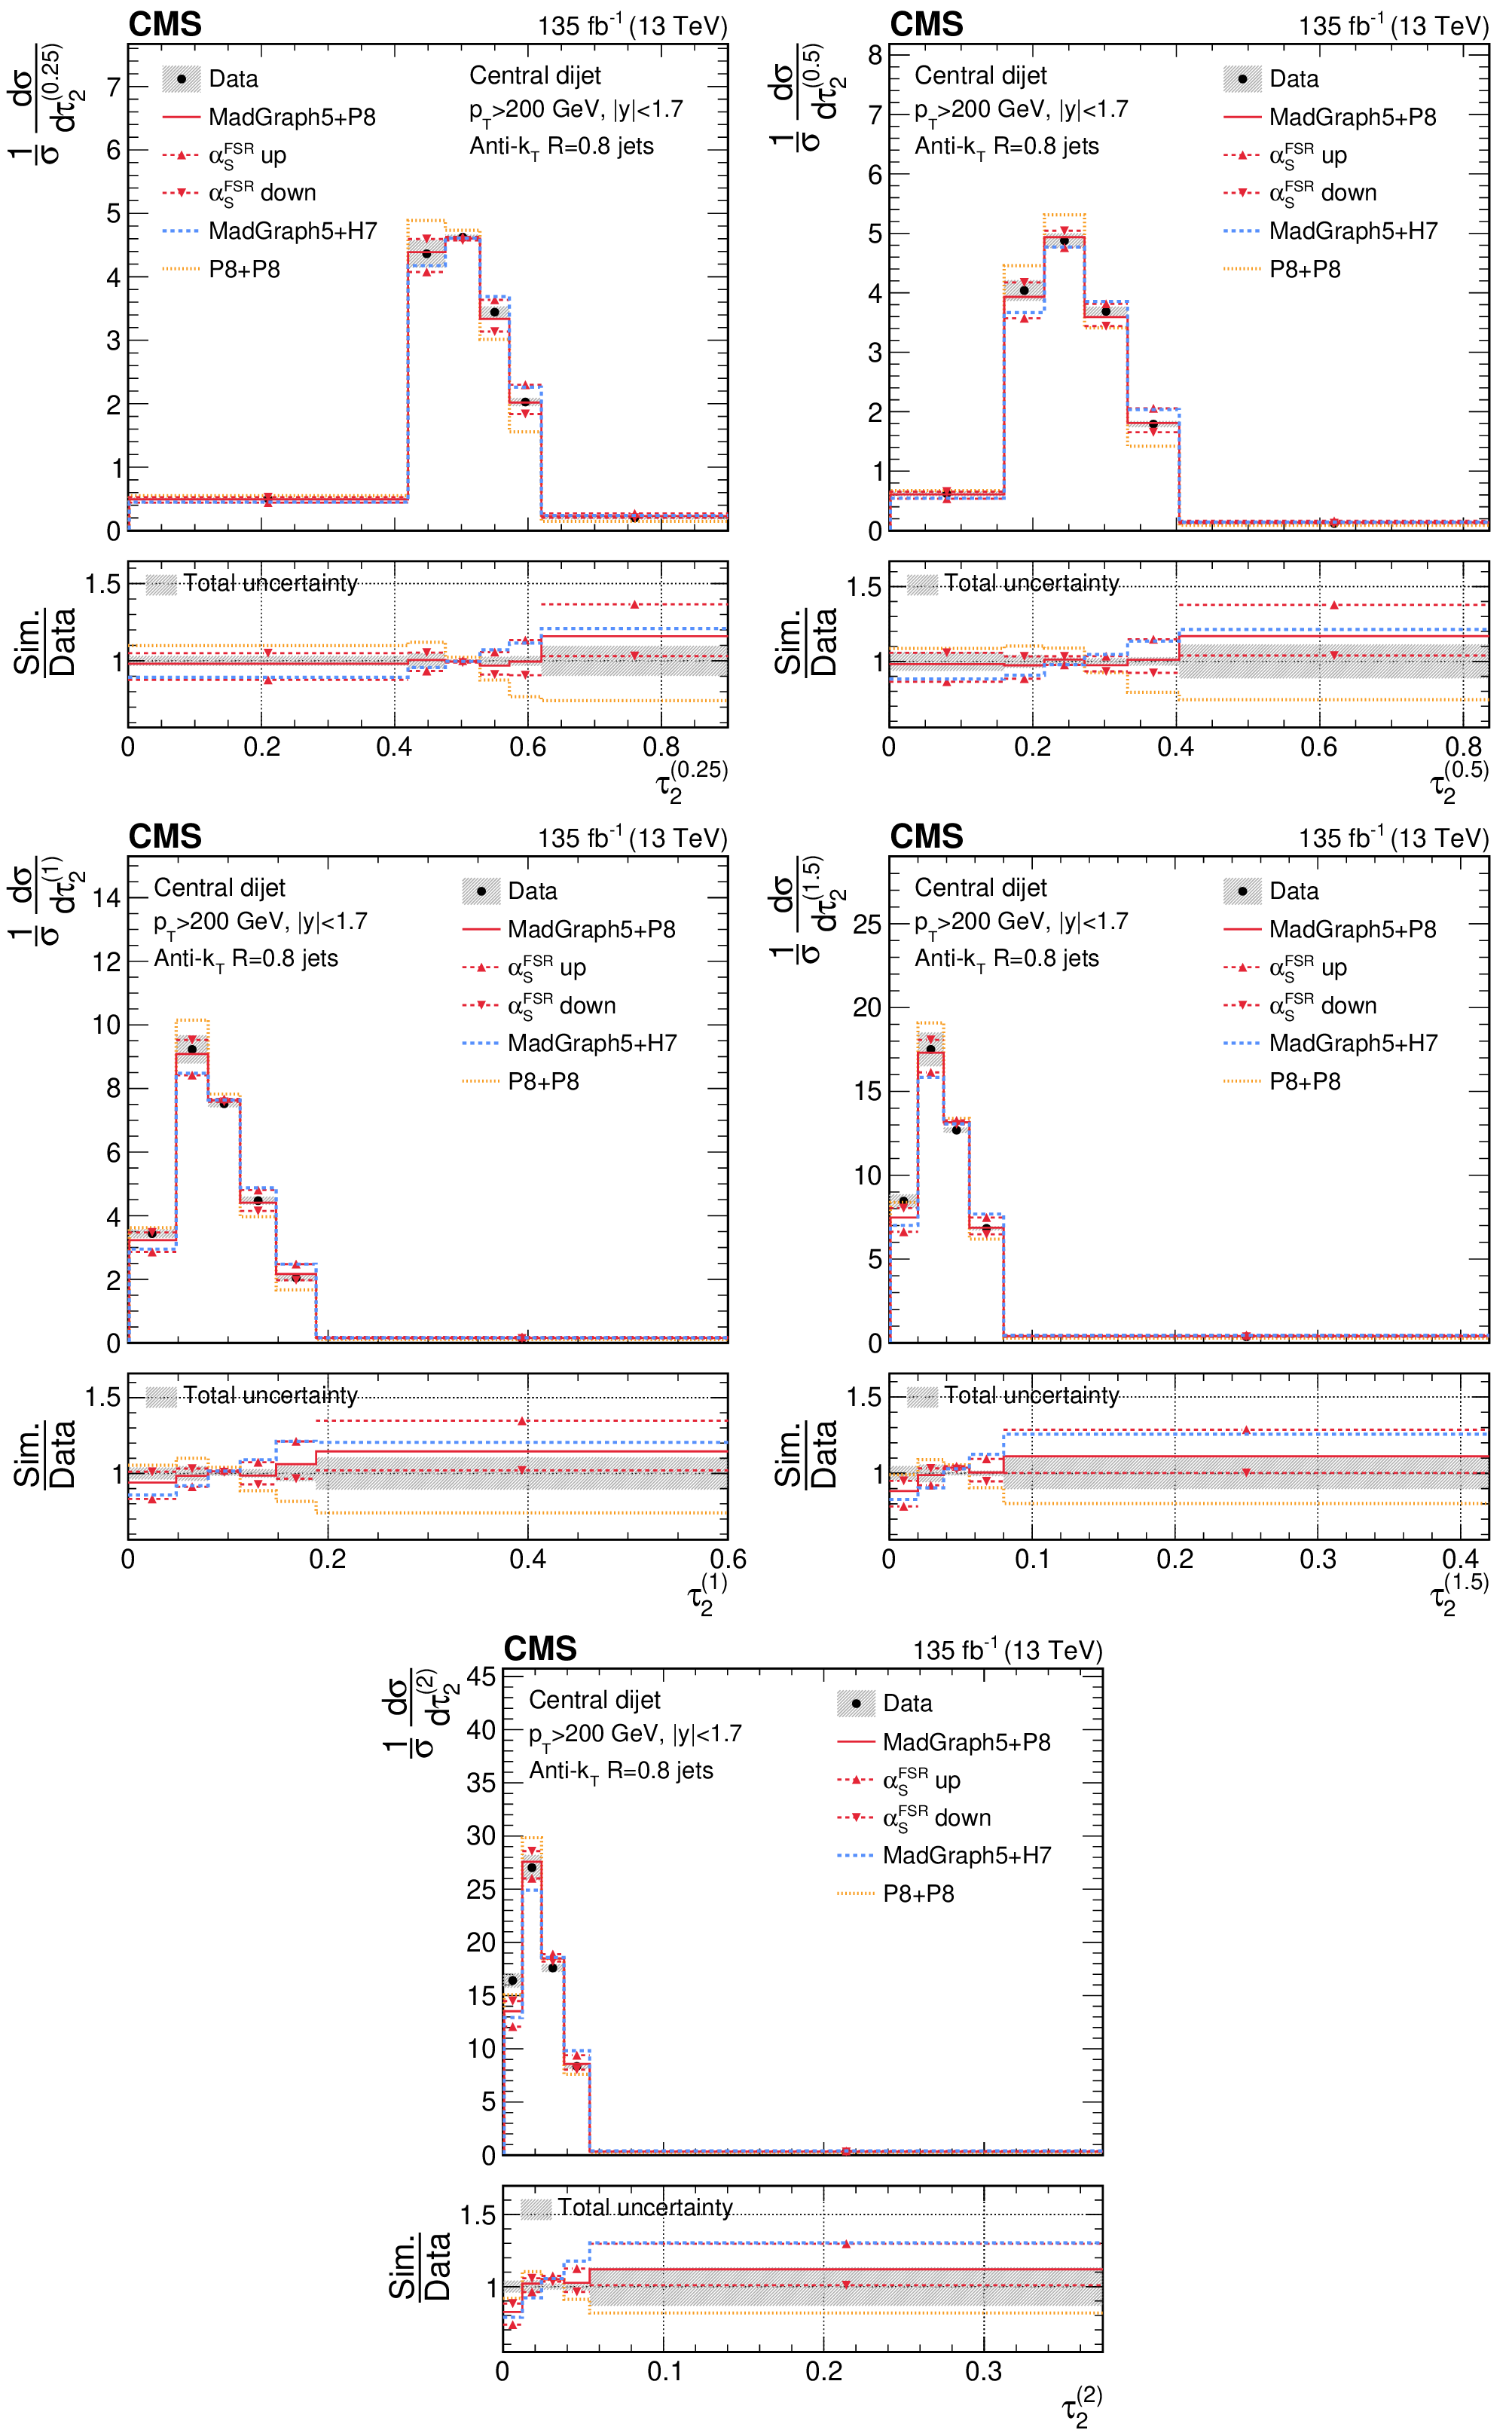
Figure 31:
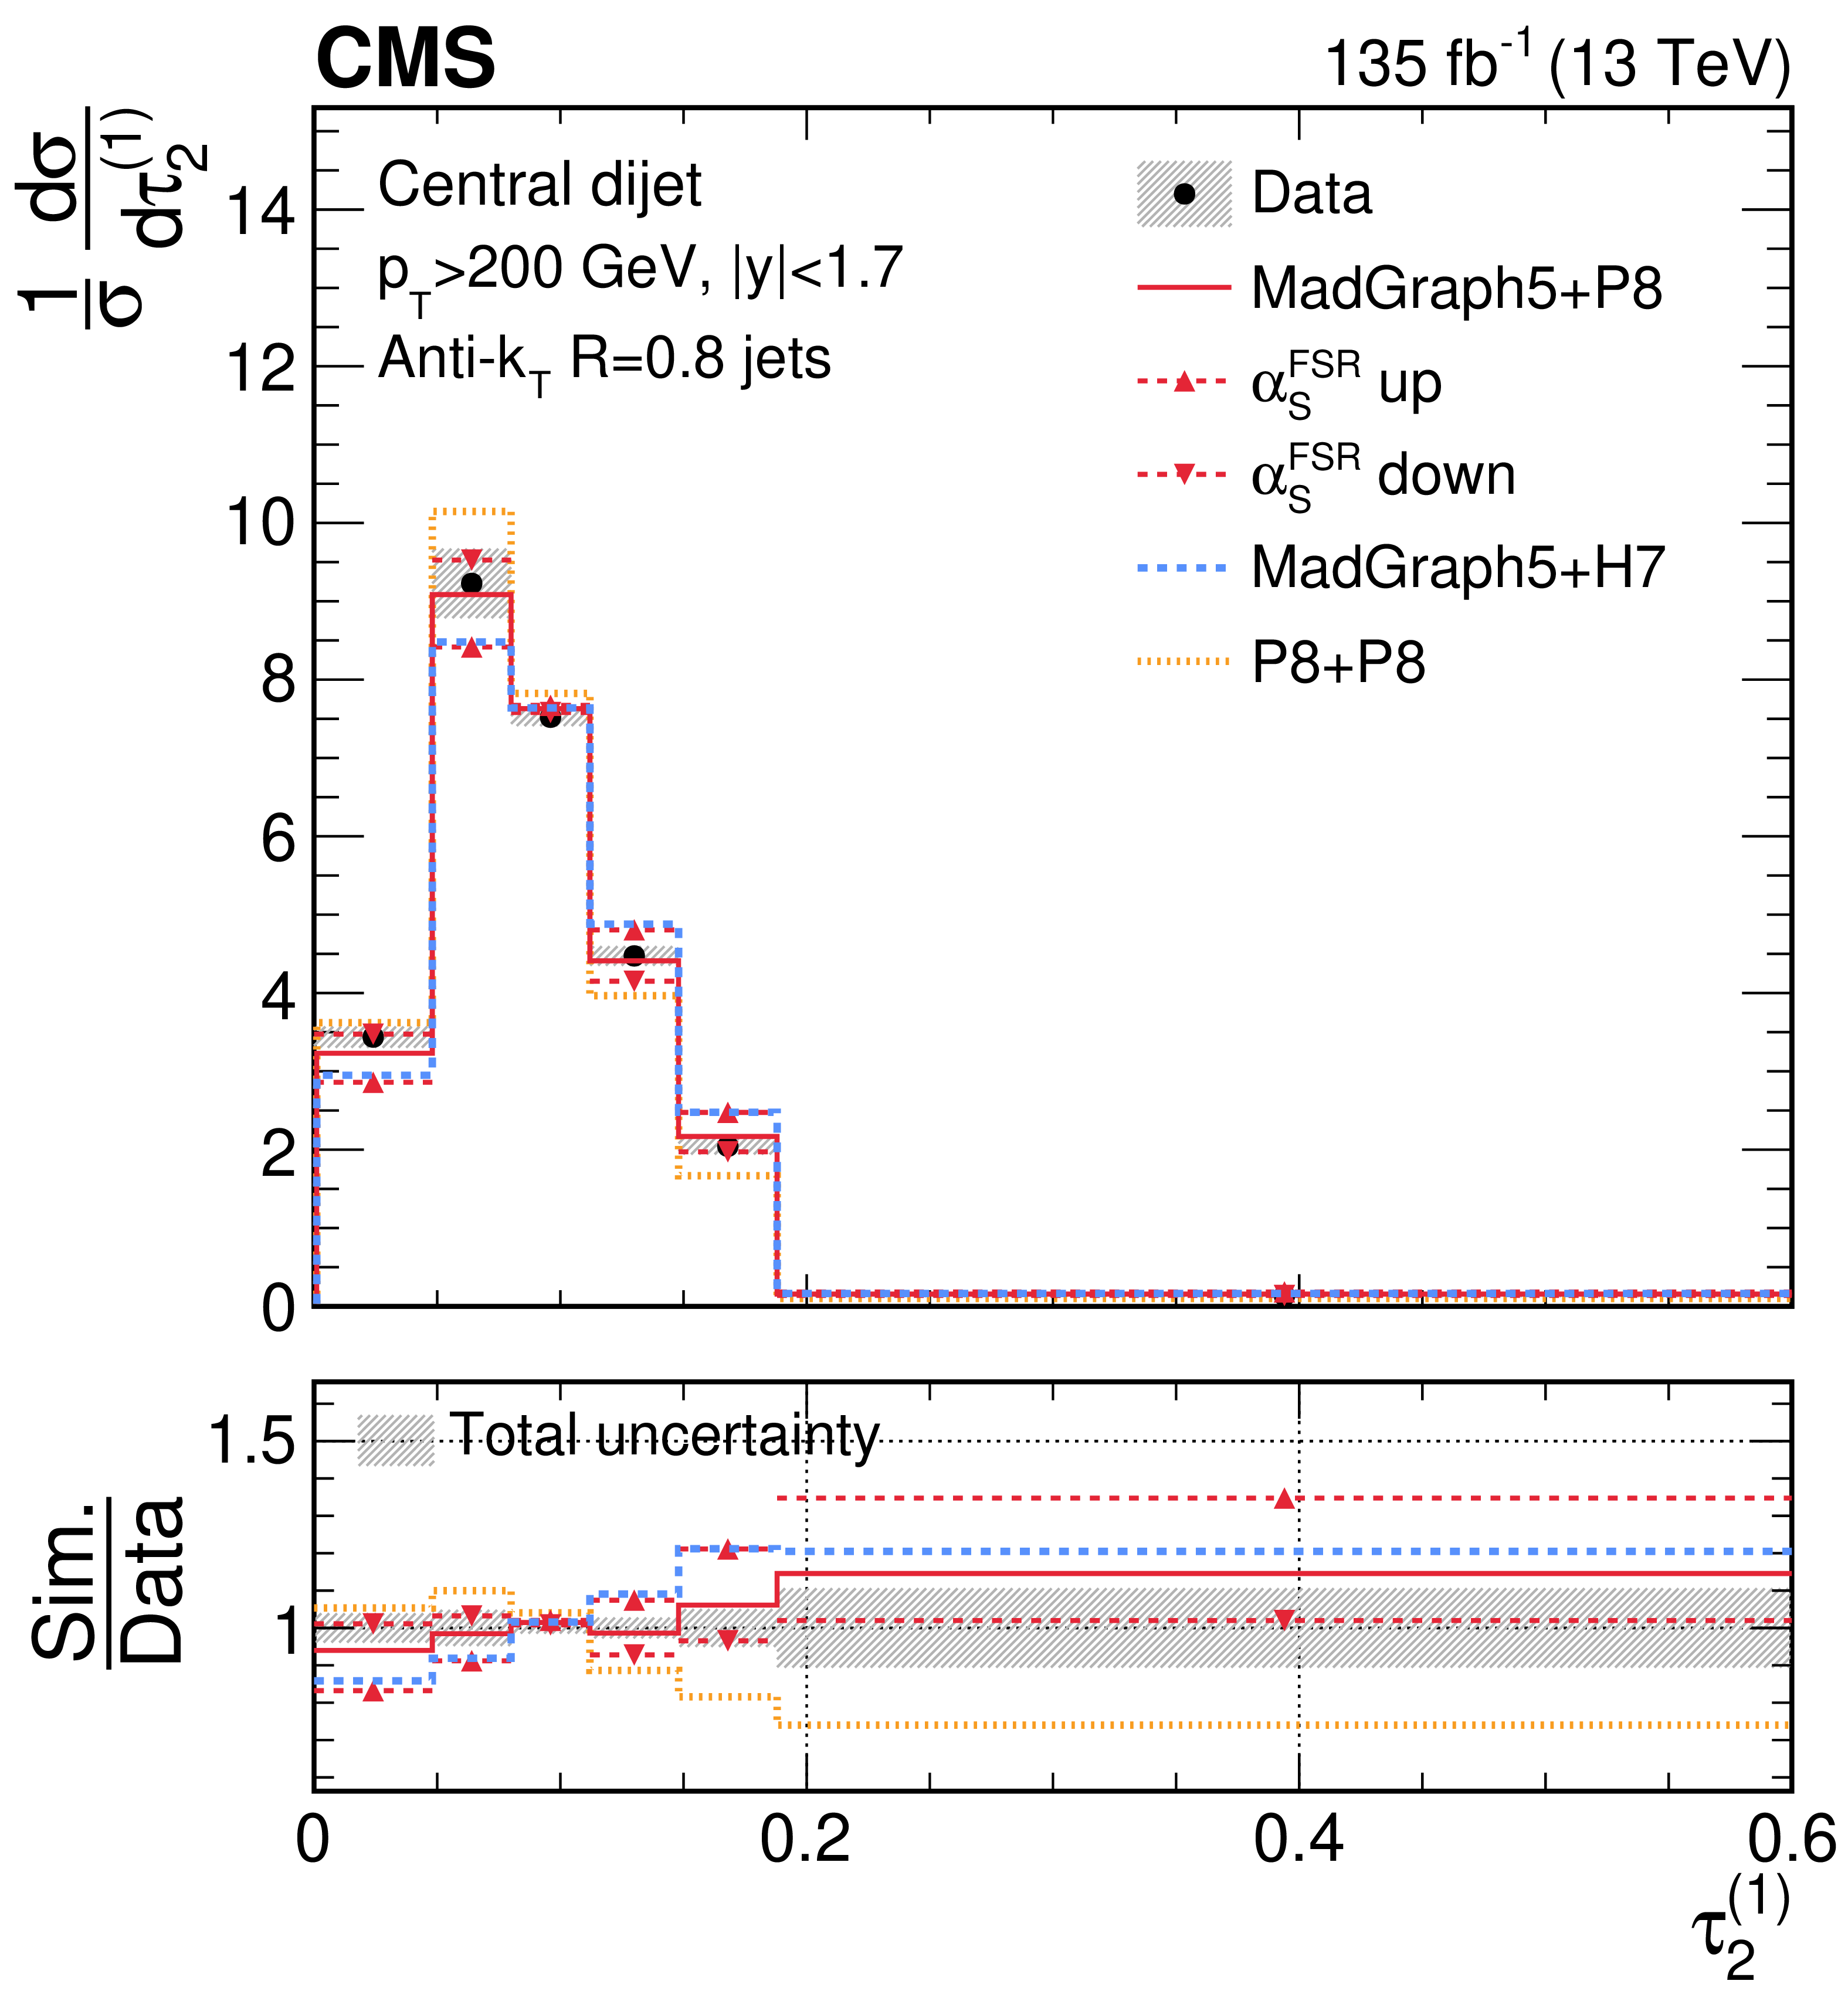
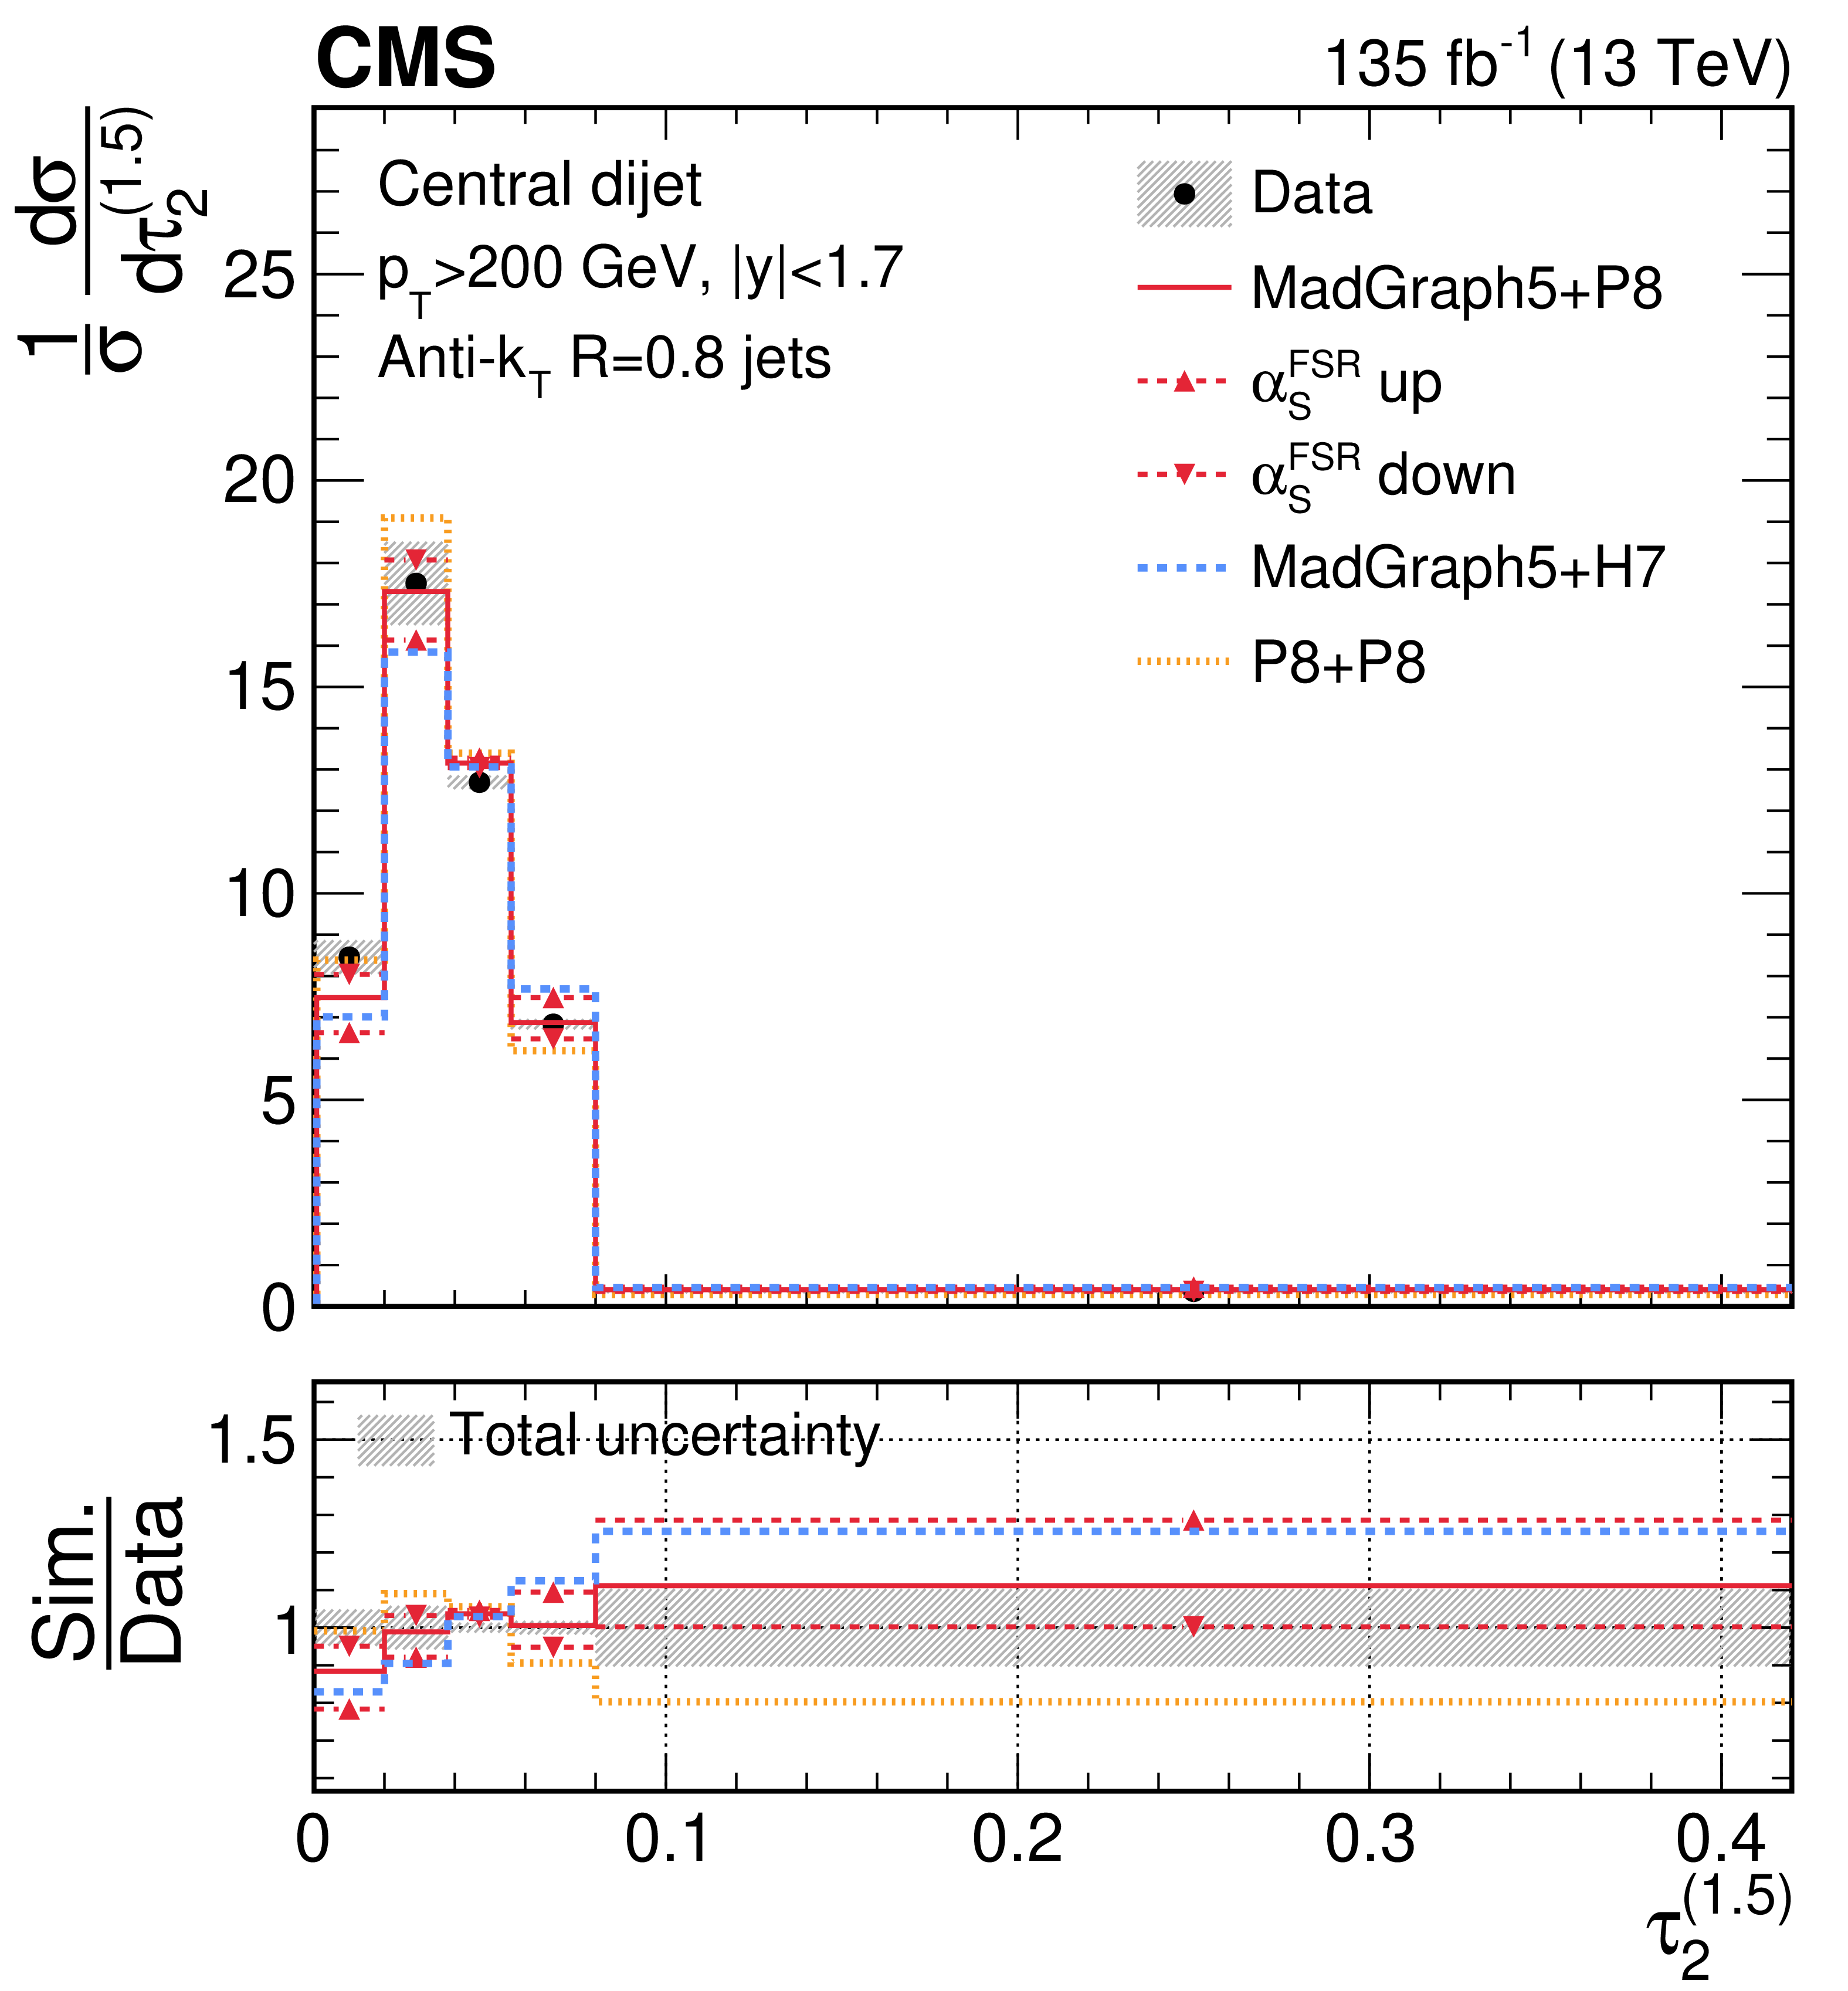
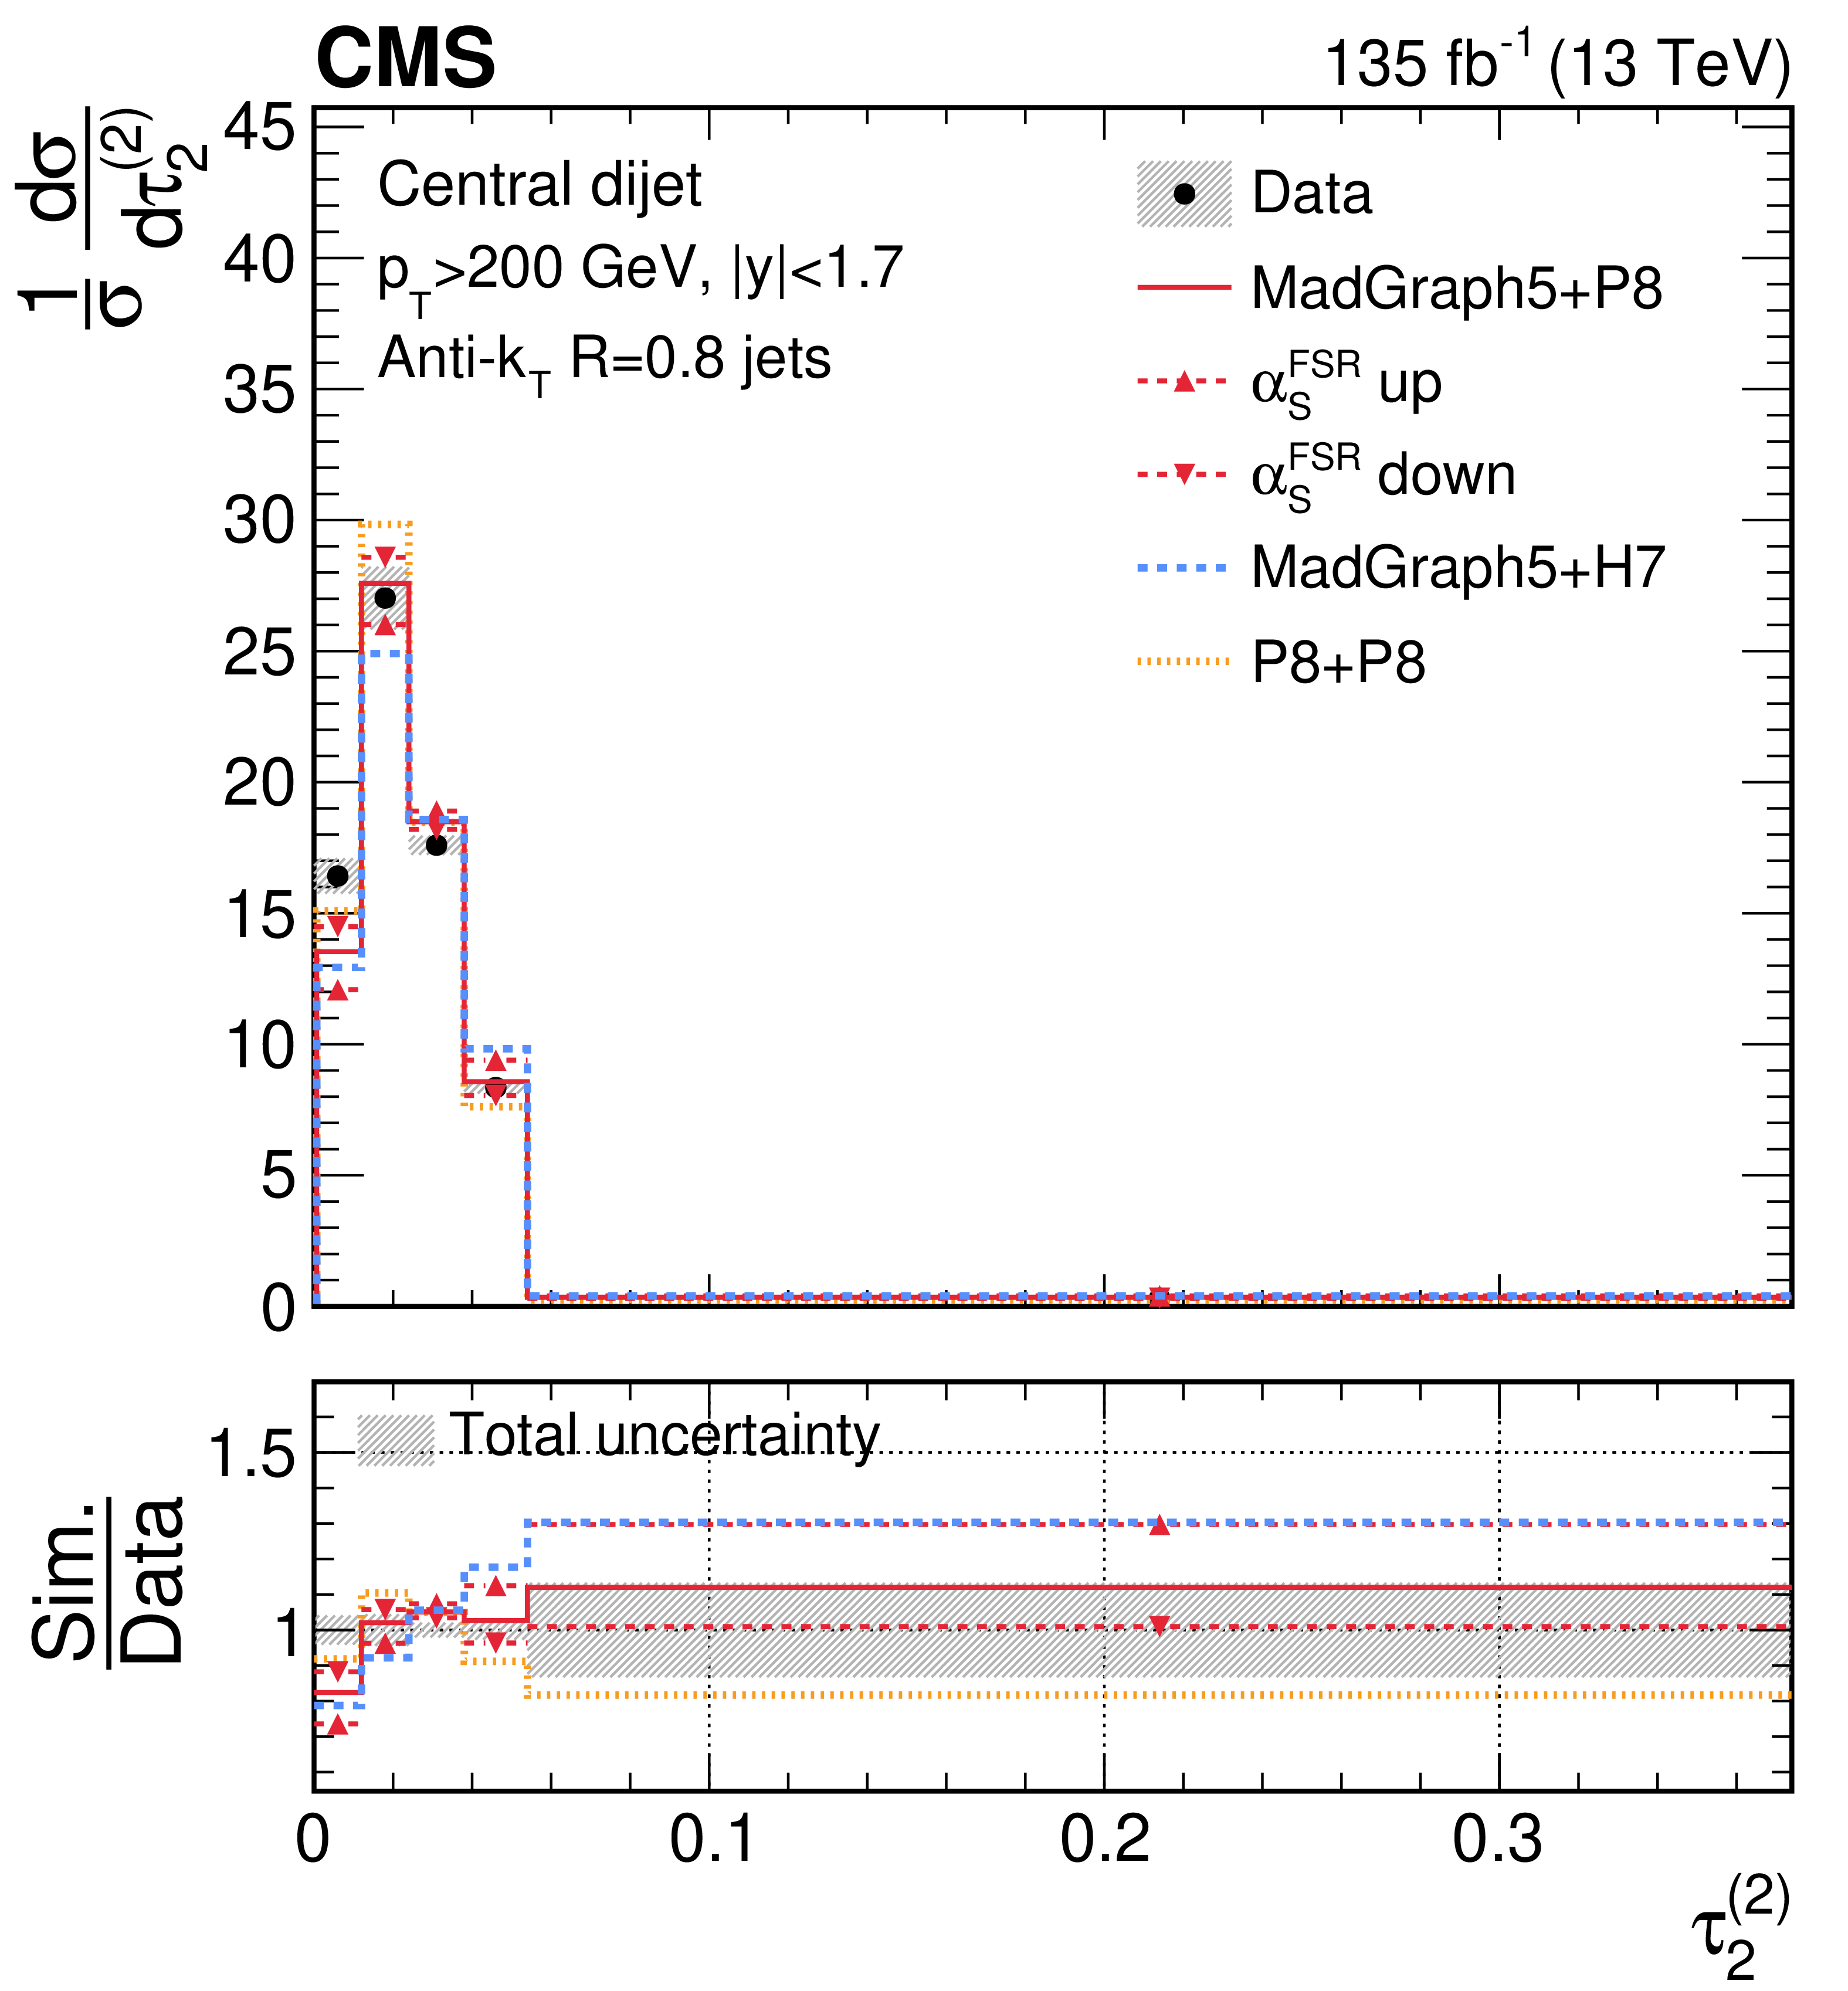
Unfolded distributions of 2-subjettiness observables,$\tau_{2}^{(0.25)}$,$\tau_{2}^{(0.5)}$,$\tau_{2}^{(1)}$,$\tau_{2}^{(1.5)}$, and$\tau_{2}^{(2)}$, measured for AK8 jets in the QCD dijet event selection, extracted from the normalized, combined distribution after unfolding; the bin contents and the error bars are scaled by the bin widths for the distributions of the individual observables. For comparisons with particle-level predictions, the error bars in data correspond to the total unfolding uncertainties, and the lower panels present the ratio of particle-level predictions to the unfolded data. The dark grey hashed region illustrates the total uncertainties per bin in the unfolded result. |
png pdf |
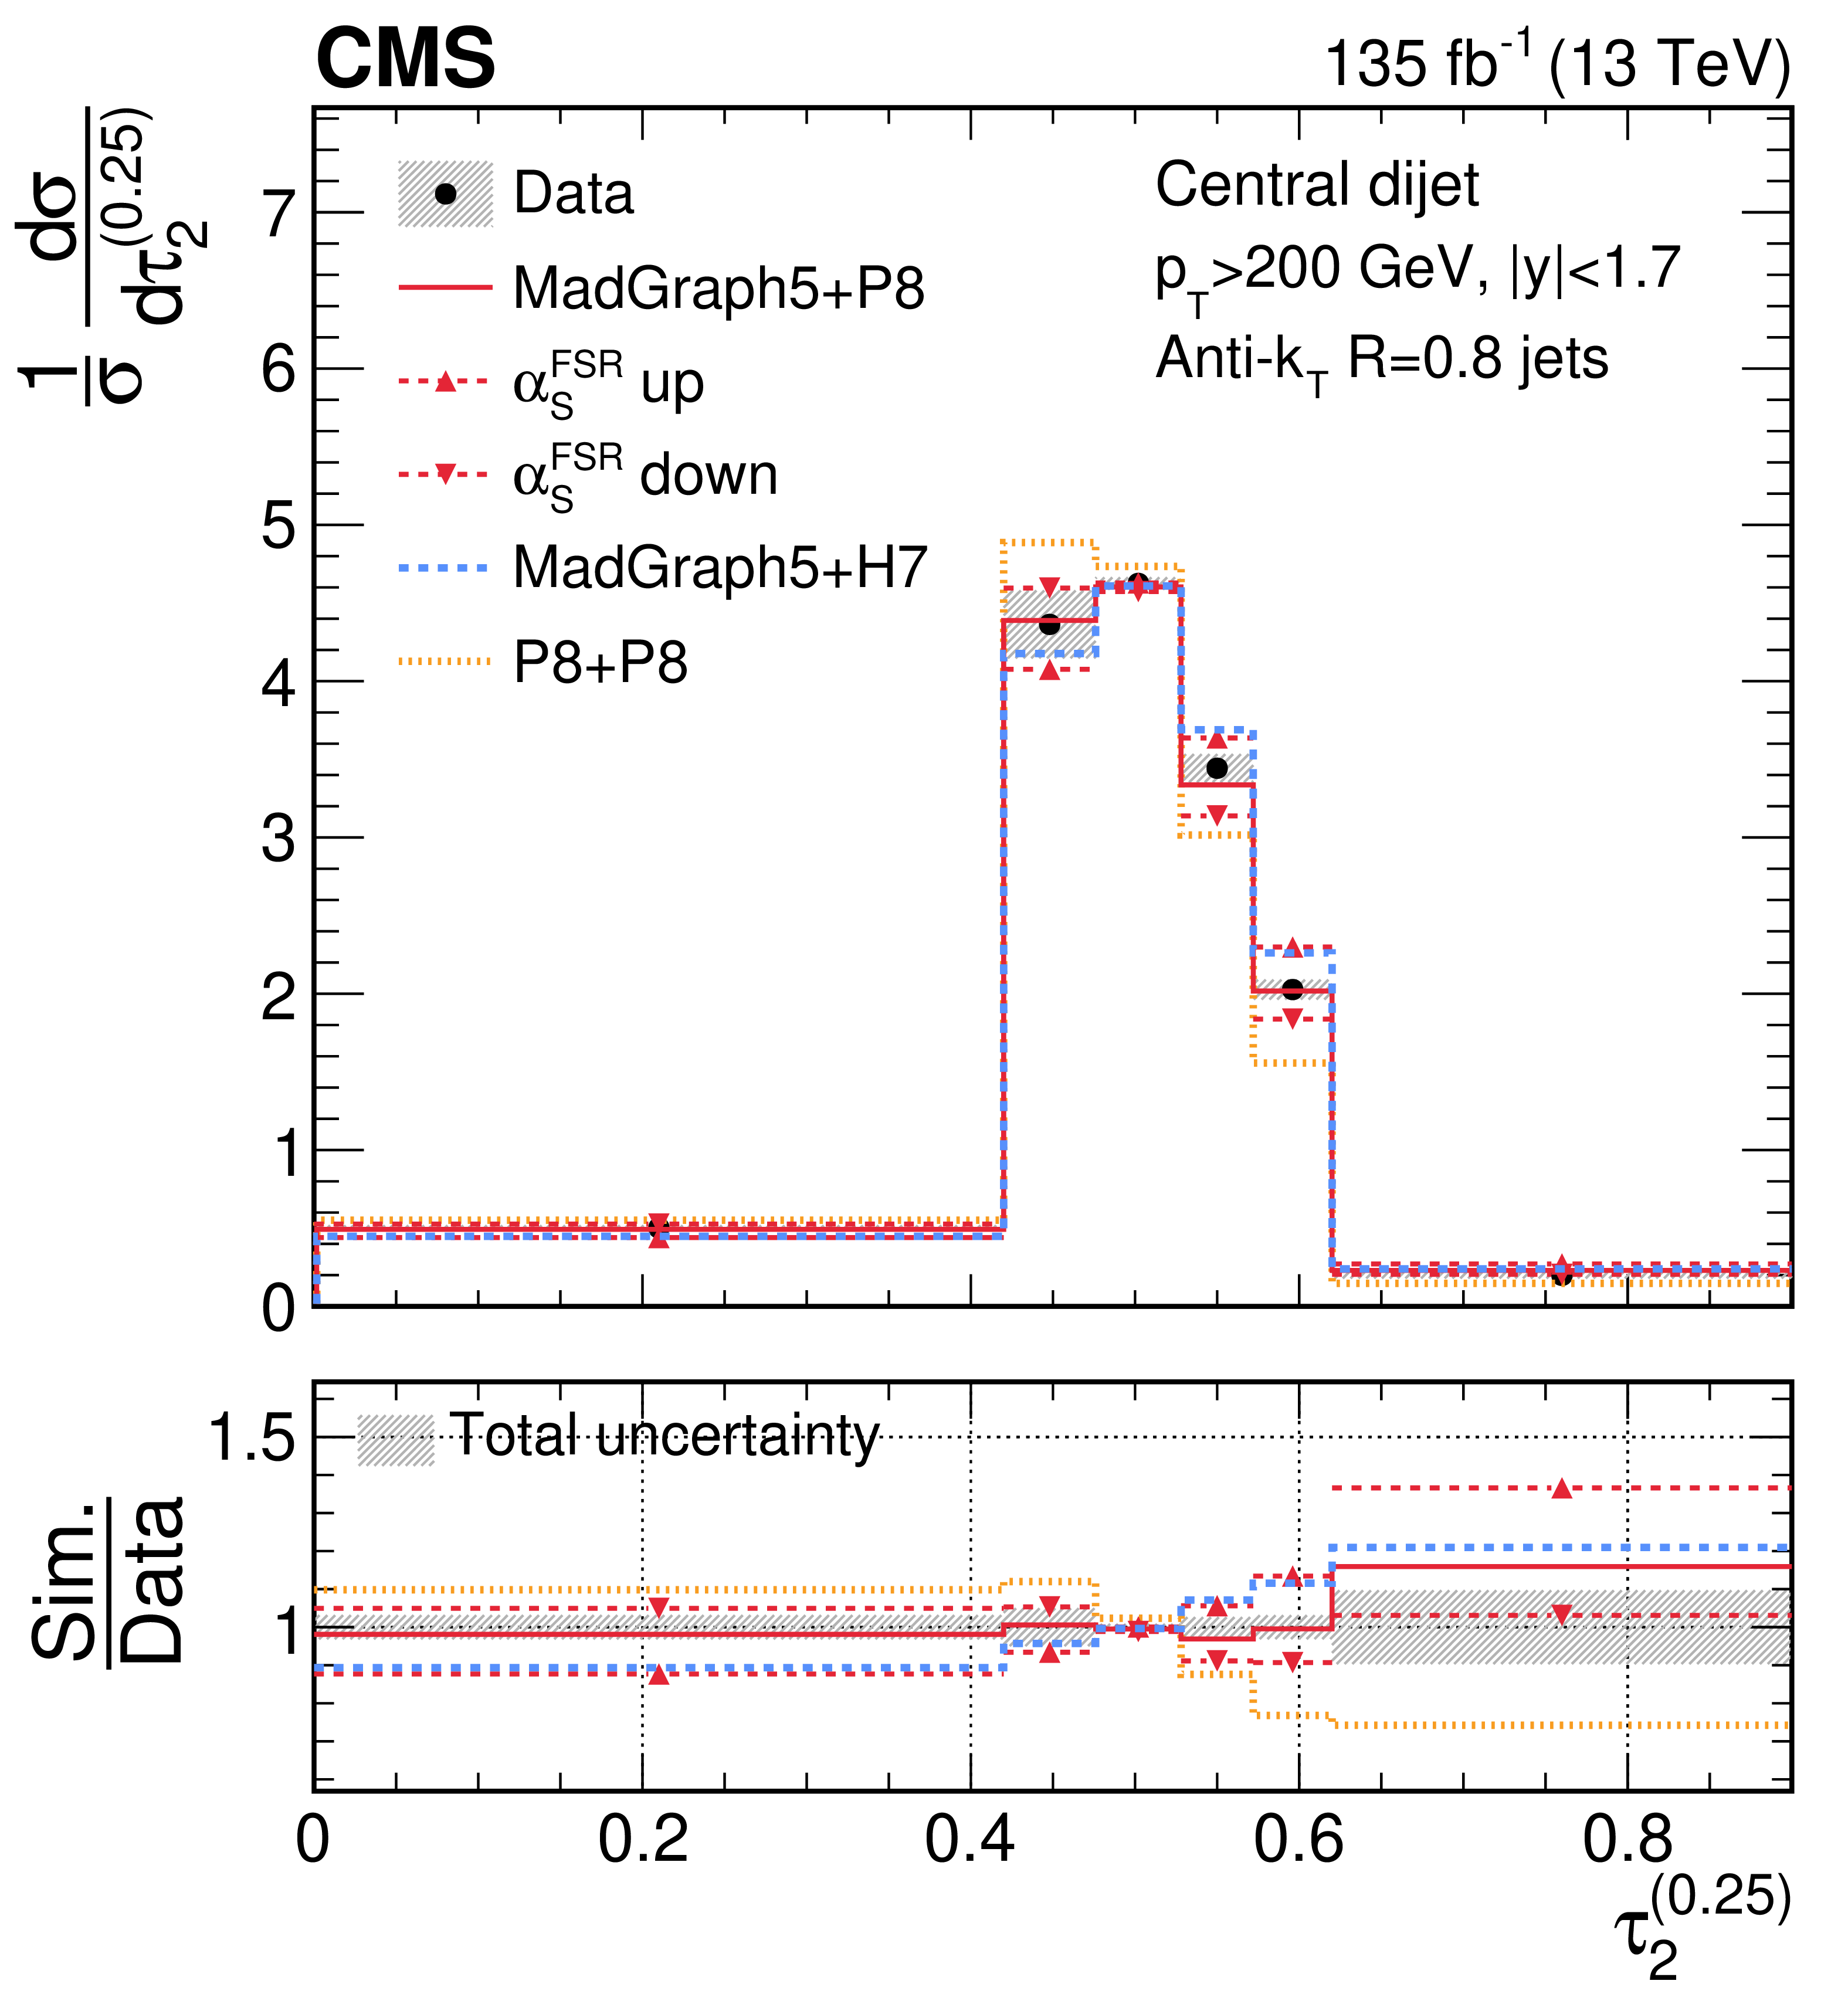
Figure 31-a:
Unfolded distributions of 2-subjettiness observables,$\tau_{2}^{(0.25)}$,$\tau_{2}^{(0.5)}$,$\tau_{2}^{(1)}$,$\tau_{2}^{(1.5)}$, and$\tau_{2}^{(2)}$, measured for AK8 jets in the QCD dijet event selection, extracted from the normalized, combined distribution after unfolding; the bin contents and the error bars are scaled by the bin widths for the distributions of the individual observables. For comparisons with particle-level predictions, the error bars in data correspond to the total unfolding uncertainties, and the lower panels present the ratio of particle-level predictions to the unfolded data. The dark grey hashed region illustrates the total uncertainties per bin in the unfolded result. |
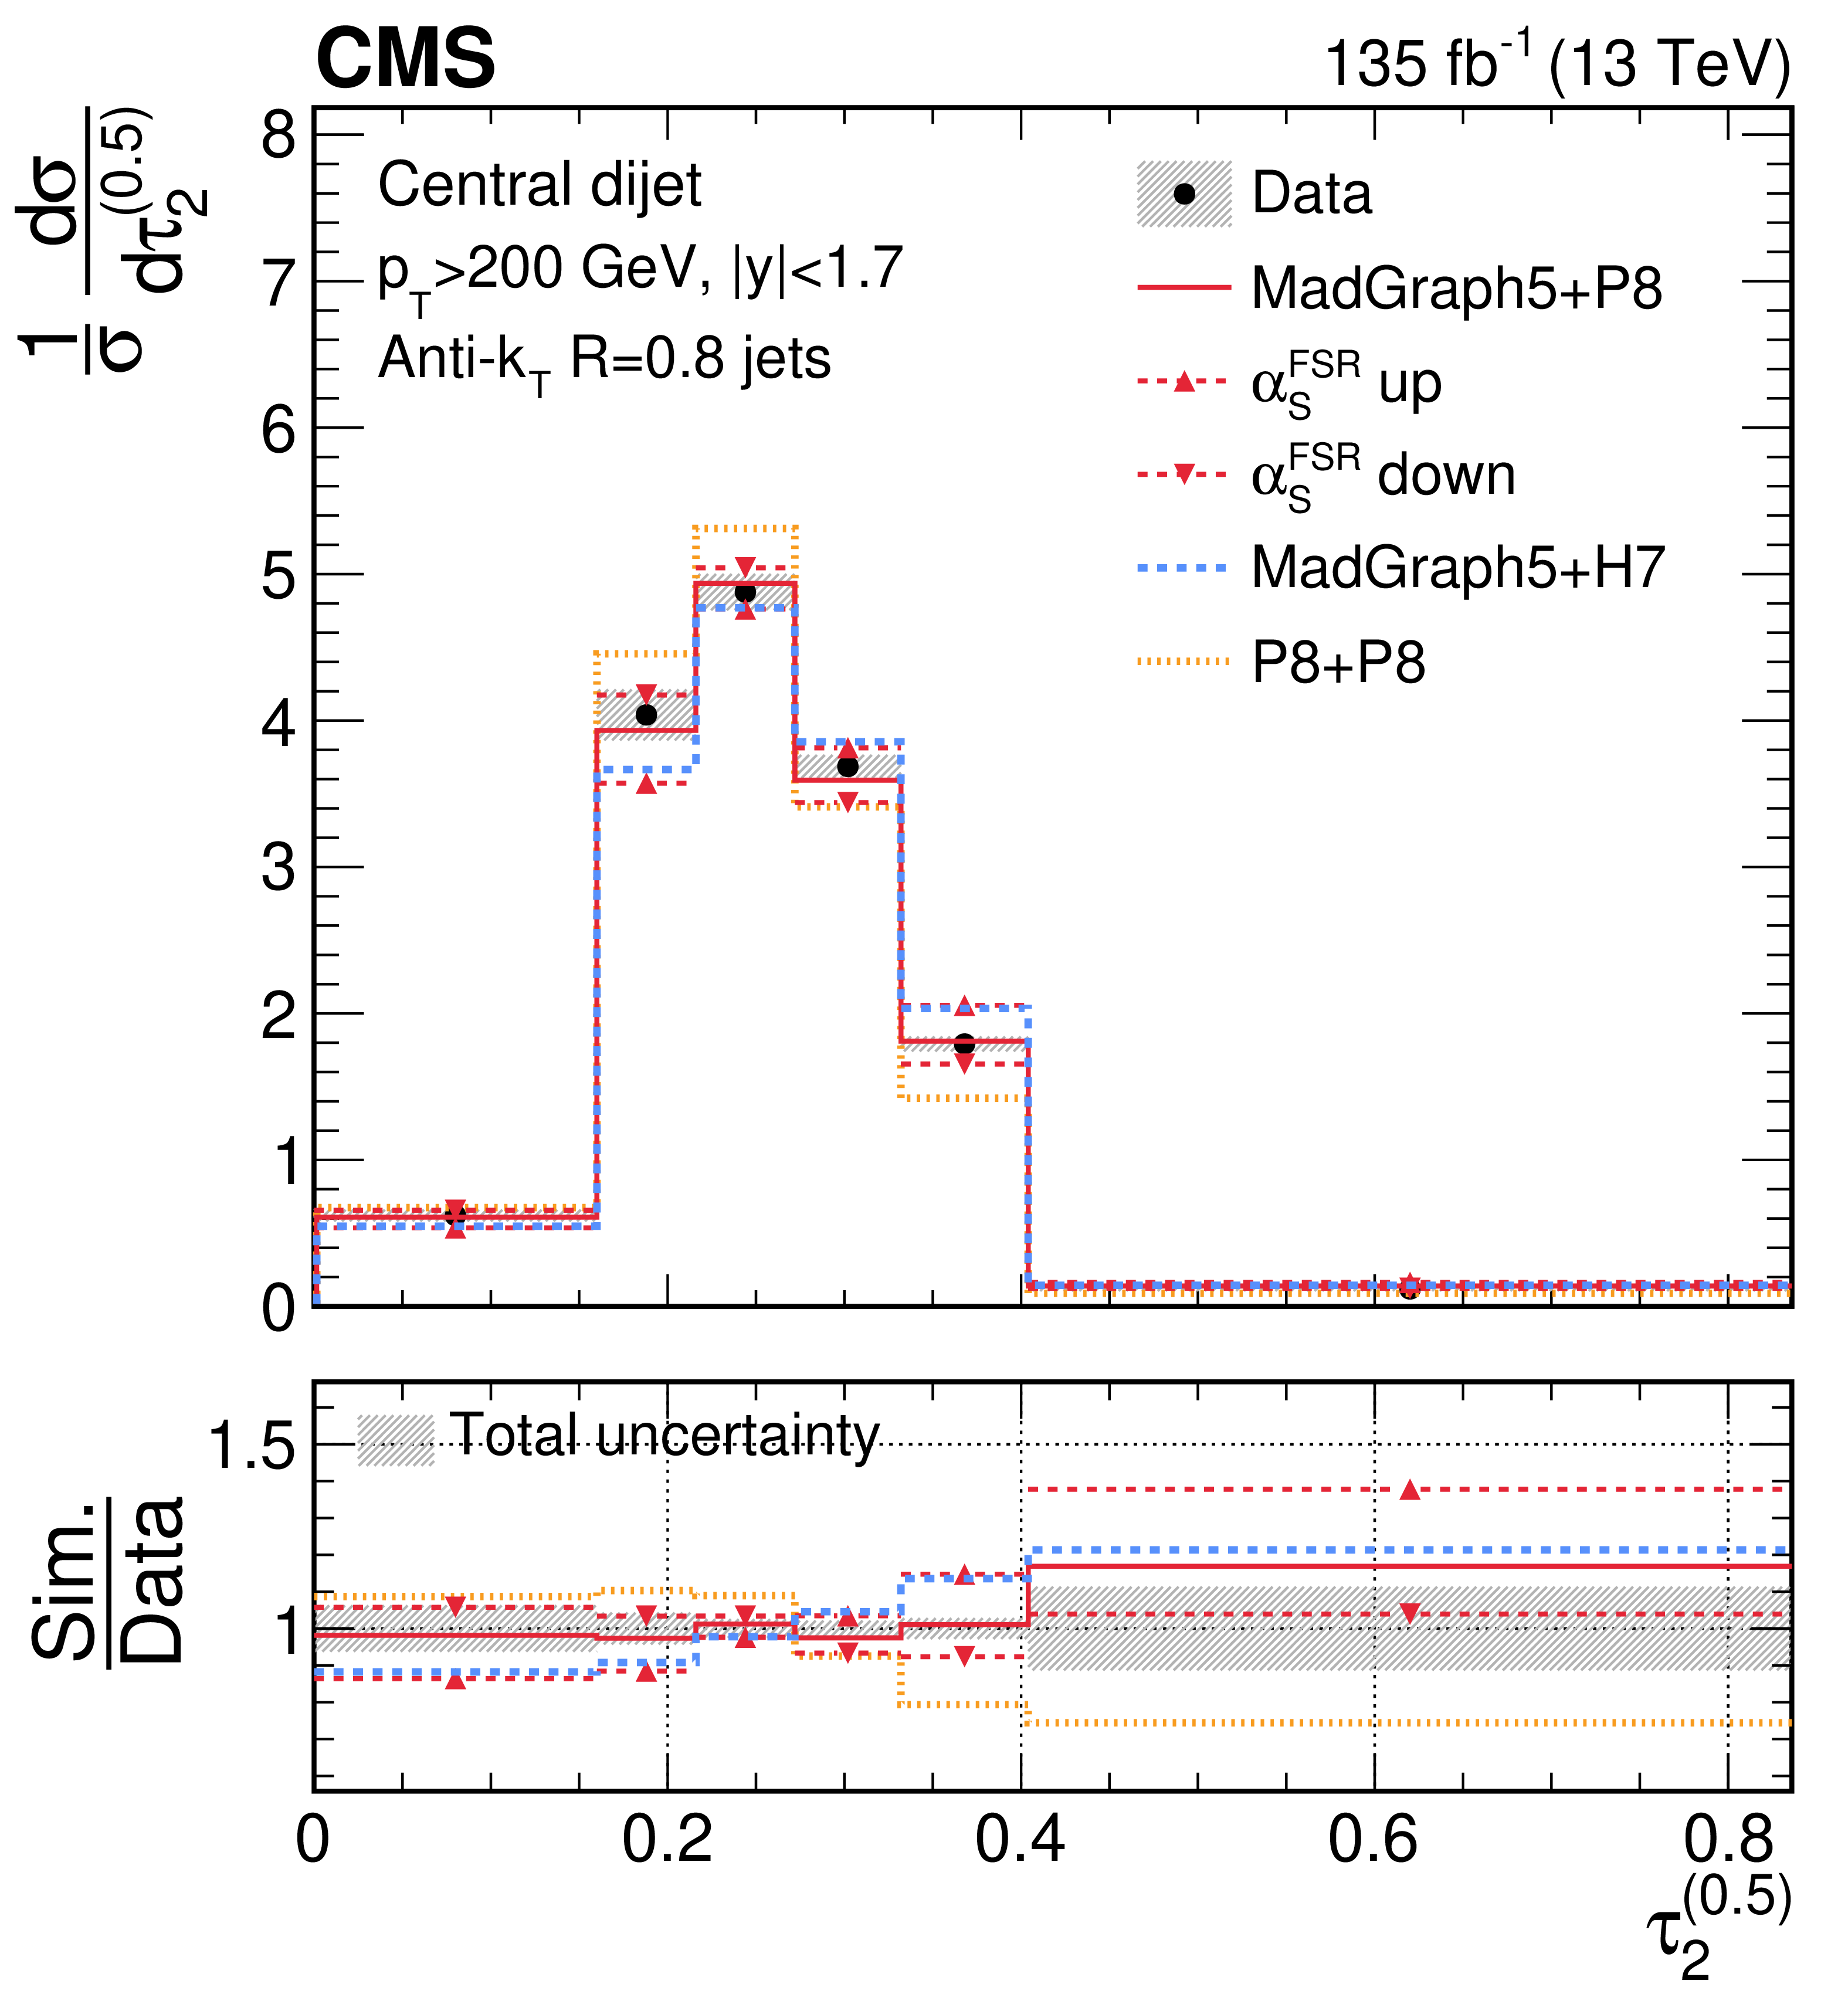
png pdf |
Figure 31-b:
Unfolded distributions of 2-subjettiness observables,$\tau_{2}^{(0.25)}$,$\tau_{2}^{(0.5)}$,$\tau_{2}^{(1)}$,$\tau_{2}^{(1.5)}$, and$\tau_{2}^{(2)}$, measured for AK8 jets in the QCD dijet event selection, extracted from the normalized, combined distribution after unfolding; the bin contents and the error bars are scaled by the bin widths for the distributions of the individual observables. For comparisons with particle-level predictions, the error bars in data correspond to the total unfolding uncertainties, and the lower panels present the ratio of particle-level predictions to the unfolded data. The dark grey hashed region illustrates the total uncertainties per bin in the unfolded result. |
png pdf |
Figure 31-c:
Unfolded distributions of 2-subjettiness observables,$\tau_{2}^{(0.25)}$,$\tau_{2}^{(0.5)}$,$\tau_{2}^{(1)}$,$\tau_{2}^{(1.5)}$, and$\tau_{2}^{(2)}$, measured for AK8 jets in the QCD dijet event selection, extracted from the normalized, combined distribution after unfolding; the bin contents and the error bars are scaled by the bin widths for the distributions of the individual observables. For comparisons with particle-level predictions, the error bars in data correspond to the total unfolding uncertainties, and the lower panels present the ratio of particle-level predictions to the unfolded data. The dark grey hashed region illustrates the total uncertainties per bin in the unfolded result. |
png pdf |
Figure 31-d:
Unfolded distributions of 2-subjettiness observables,$\tau_{2}^{(0.25)}$,$\tau_{2}^{(0.5)}$,$\tau_{2}^{(1)}$,$\tau_{2}^{(1.5)}$, and$\tau_{2}^{(2)}$, measured for AK8 jets in the QCD dijet event selection, extracted from the normalized, combined distribution after unfolding; the bin contents and the error bars are scaled by the bin widths for the distributions of the individual observables. For comparisons with particle-level predictions, the error bars in data correspond to the total unfolding uncertainties, and the lower panels present the ratio of particle-level predictions to the unfolded data. The dark grey hashed region illustrates the total uncertainties per bin in the unfolded result. |
png pdf |
Figure 31-e:
Unfolded distributions of 2-subjettiness observables,$\tau_{2}^{(0.25)}$,$\tau_{2}^{(0.5)}$,$\tau_{2}^{(1)}$,$\tau_{2}^{(1.5)}$, and$\tau_{2}^{(2)}$, measured for AK8 jets in the QCD dijet event selection, extracted from the normalized, combined distribution after unfolding; the bin contents and the error bars are scaled by the bin widths for the distributions of the individual observables. For comparisons with particle-level predictions, the error bars in data correspond to the total unfolding uncertainties, and the lower panels present the ratio of particle-level predictions to the unfolded data. The dark grey hashed region illustrates the total uncertainties per bin in the unfolded result. |
png pdf |
Figure 32:
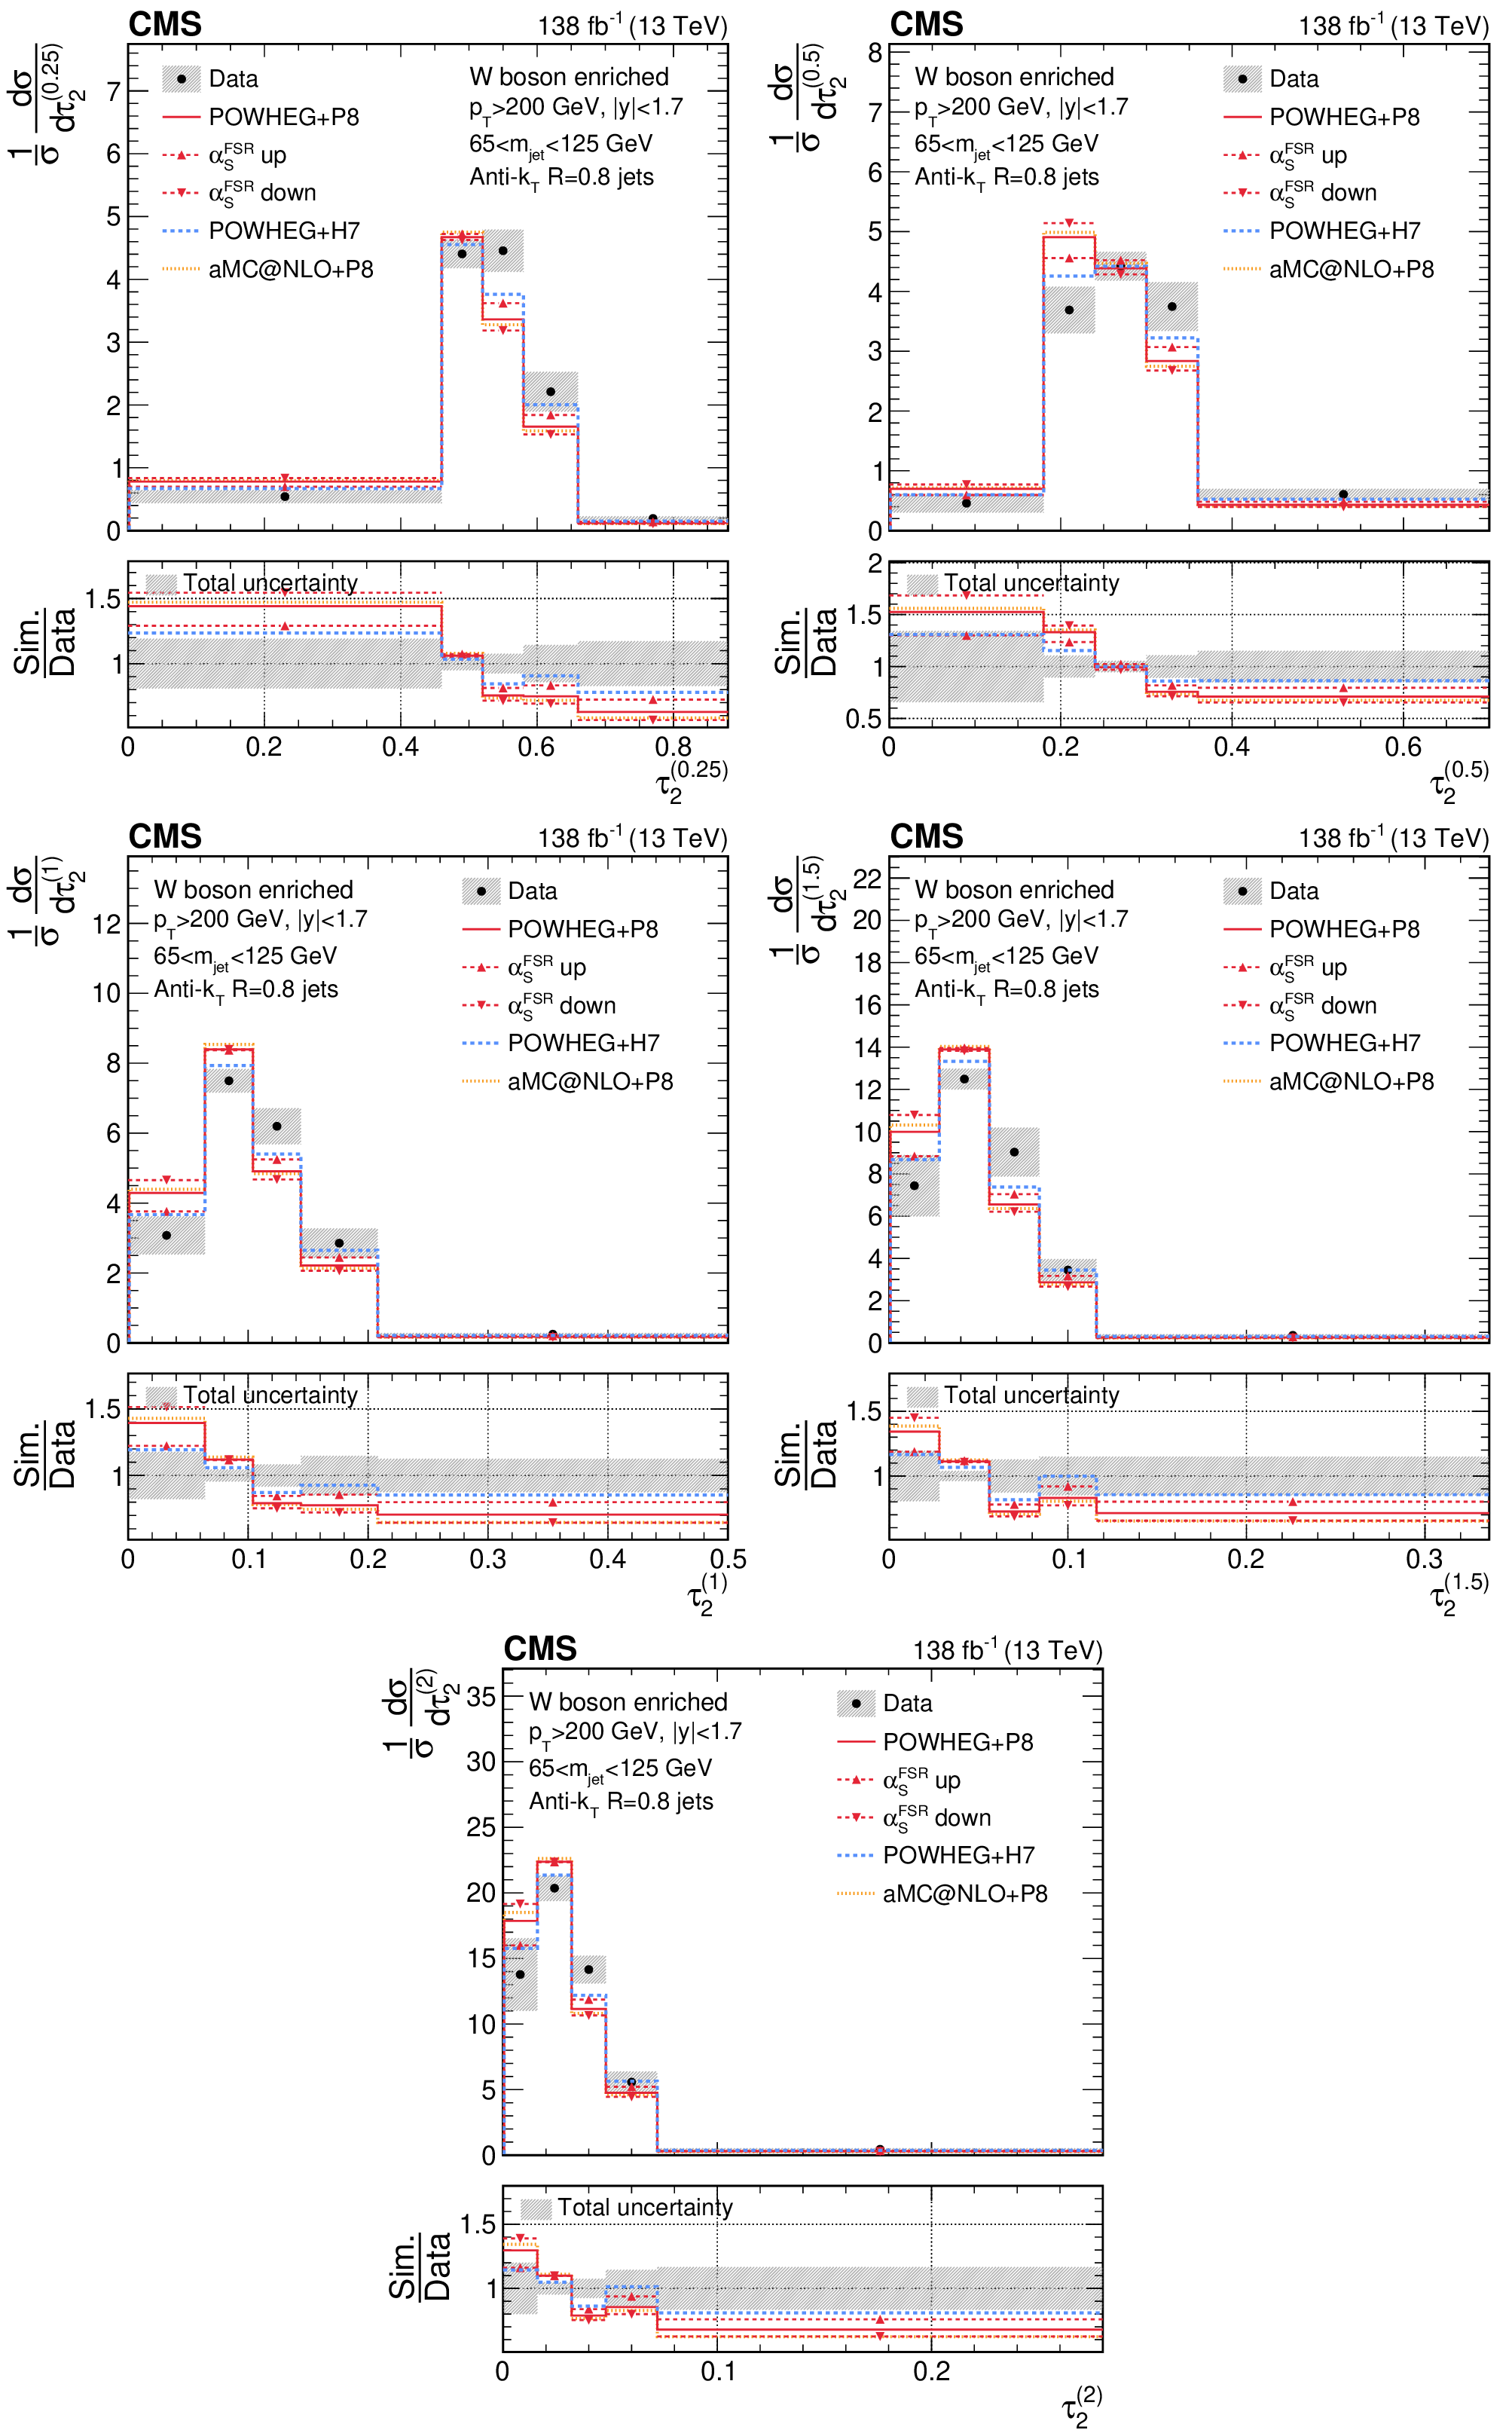
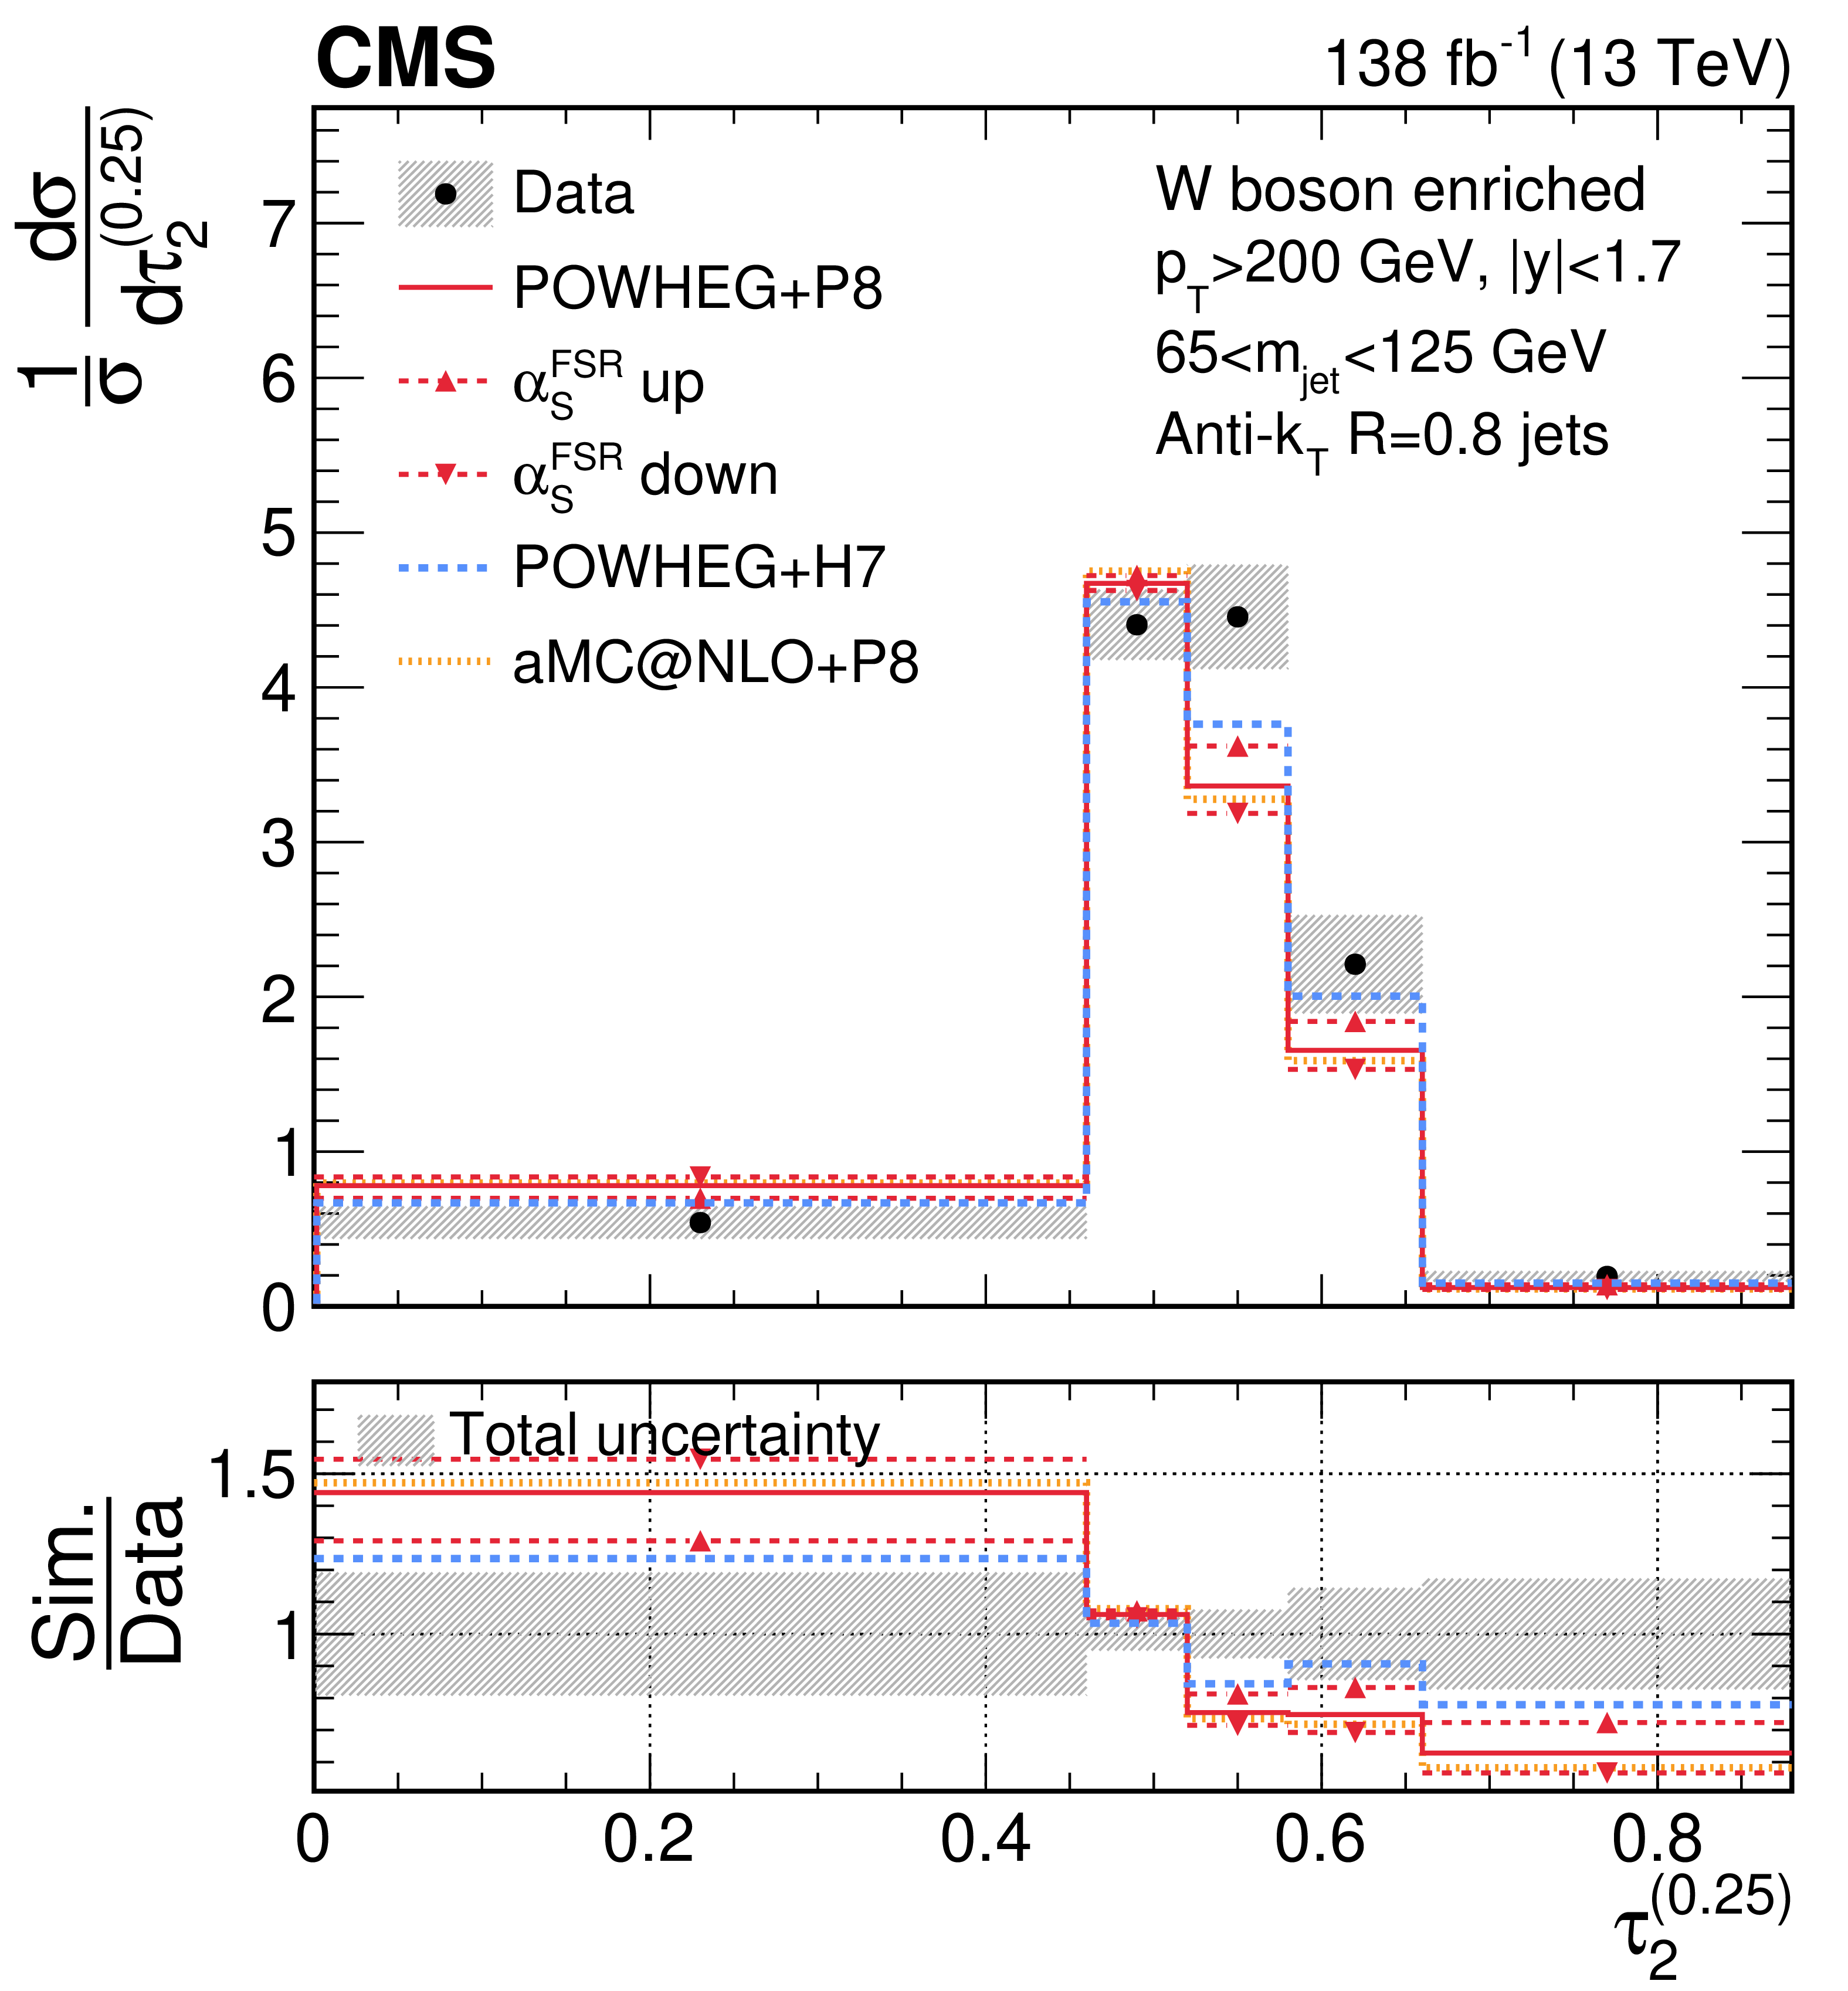
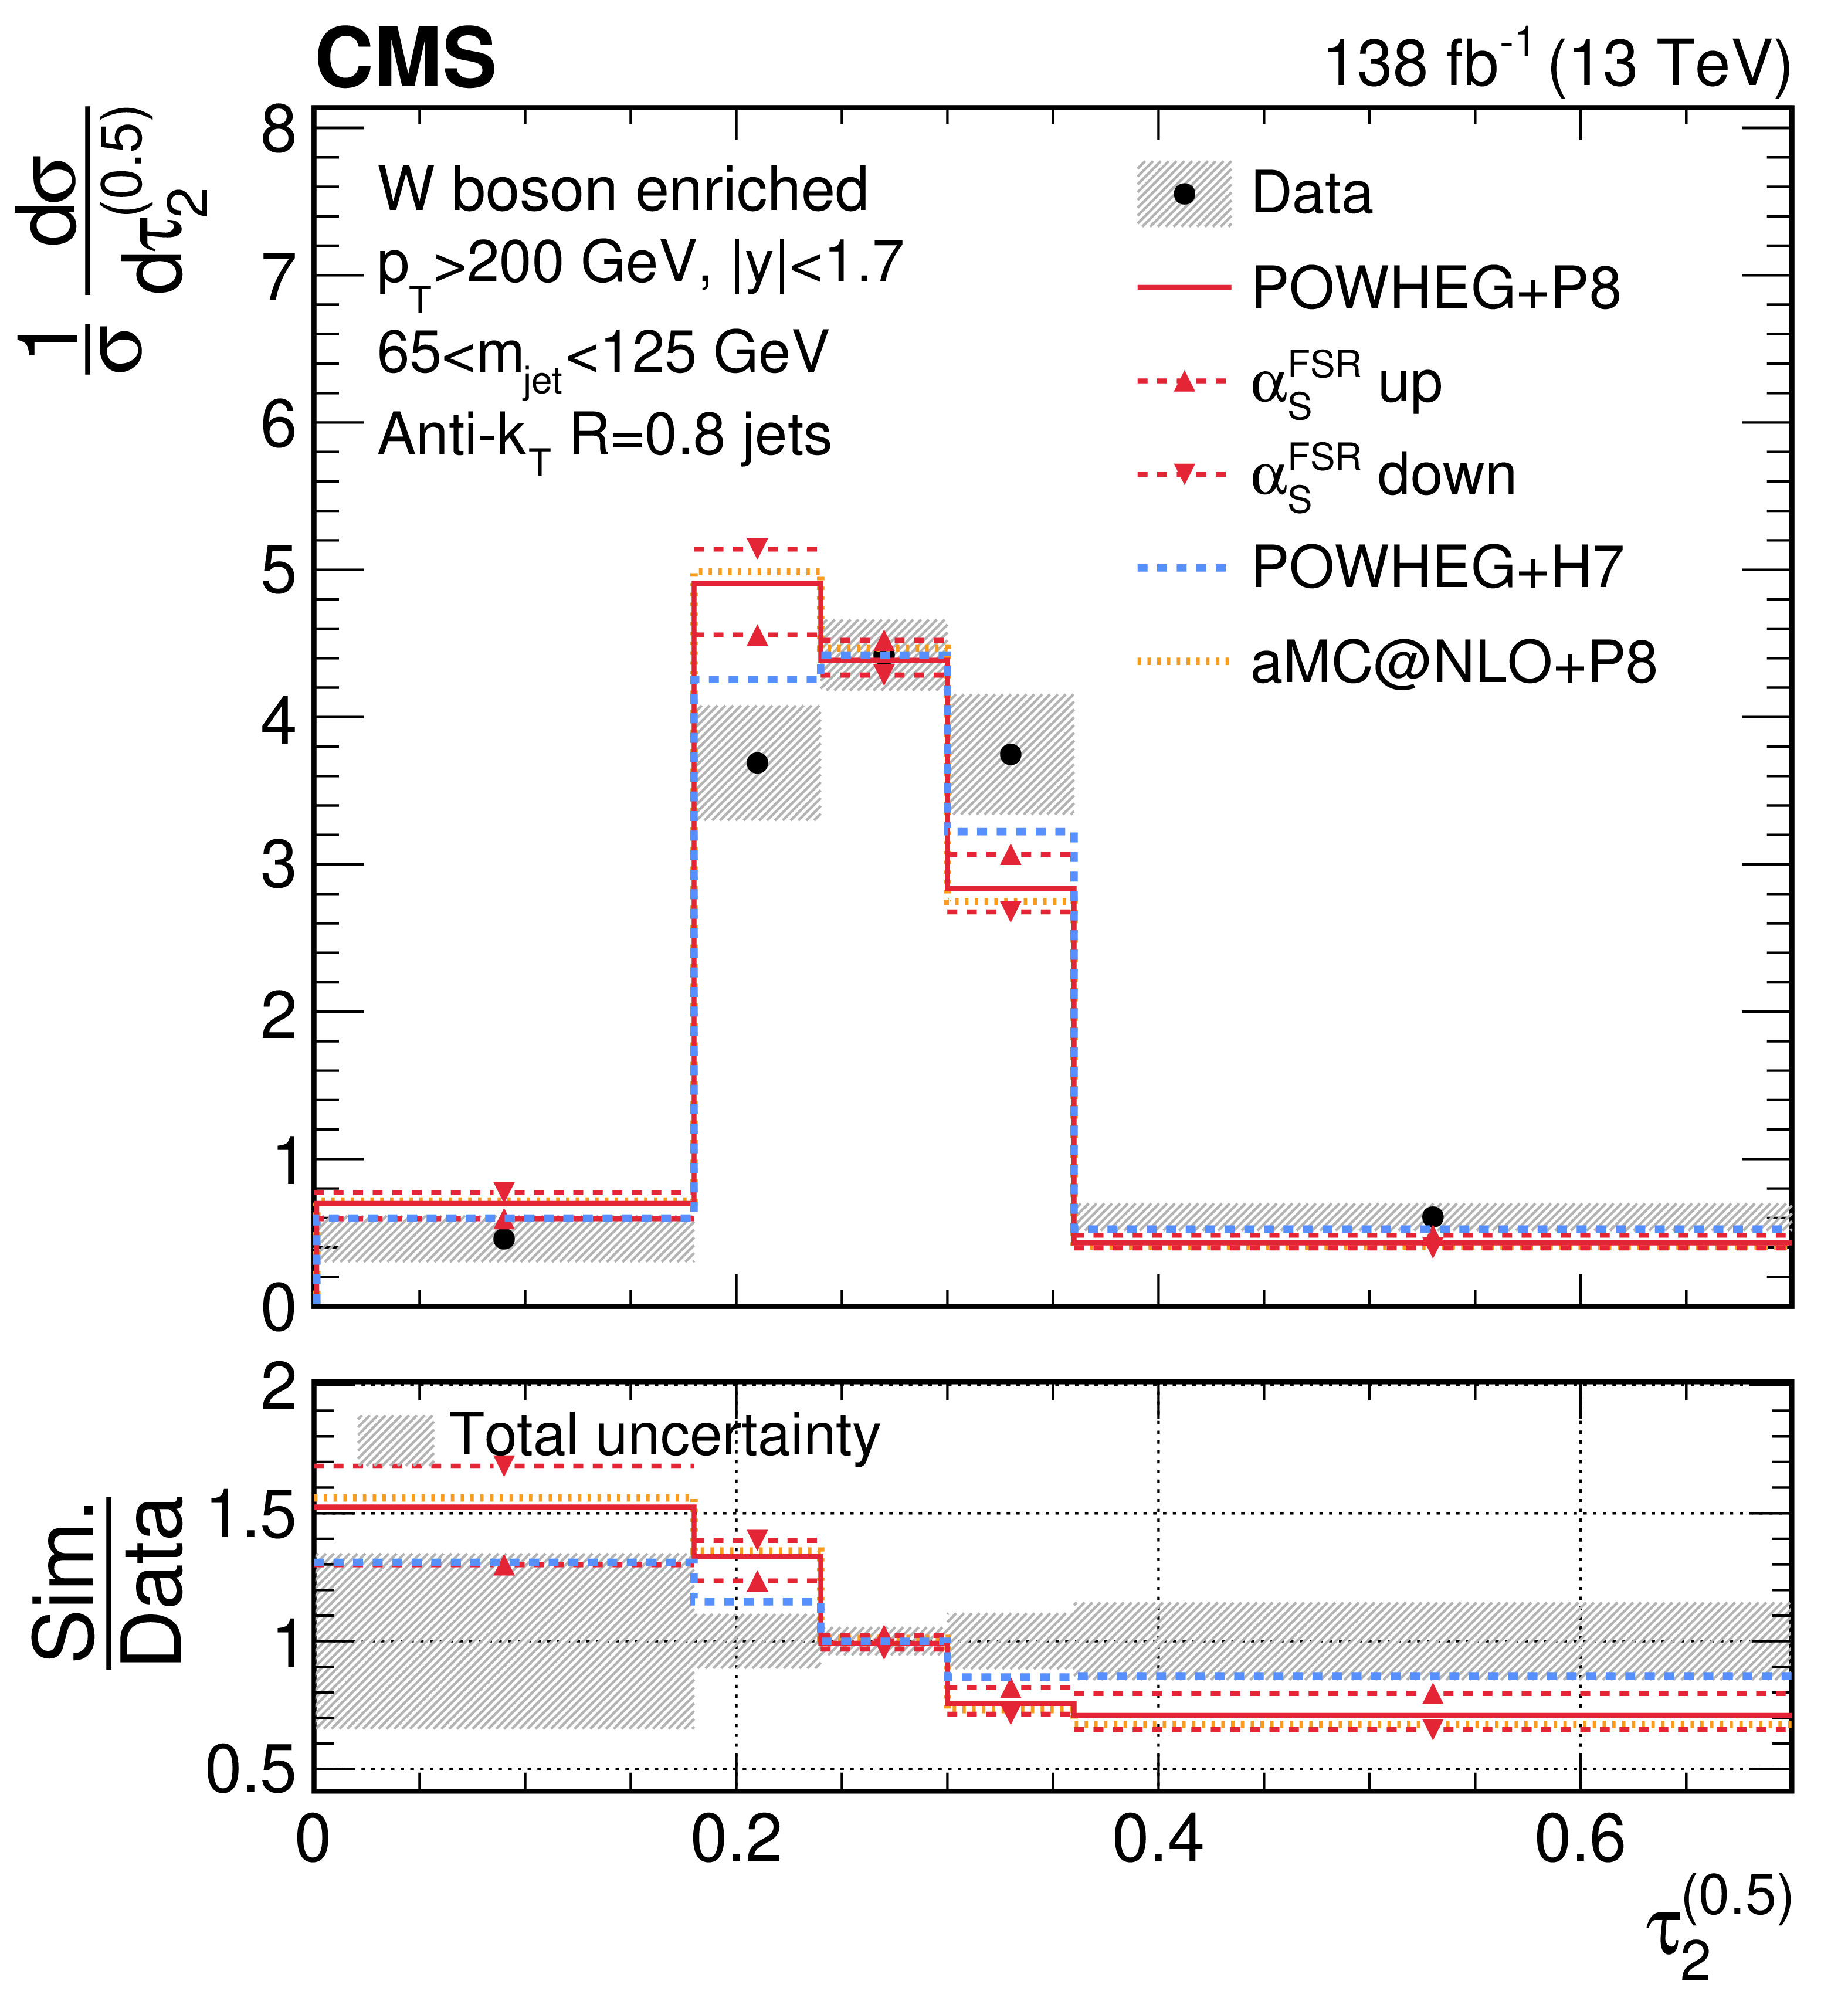
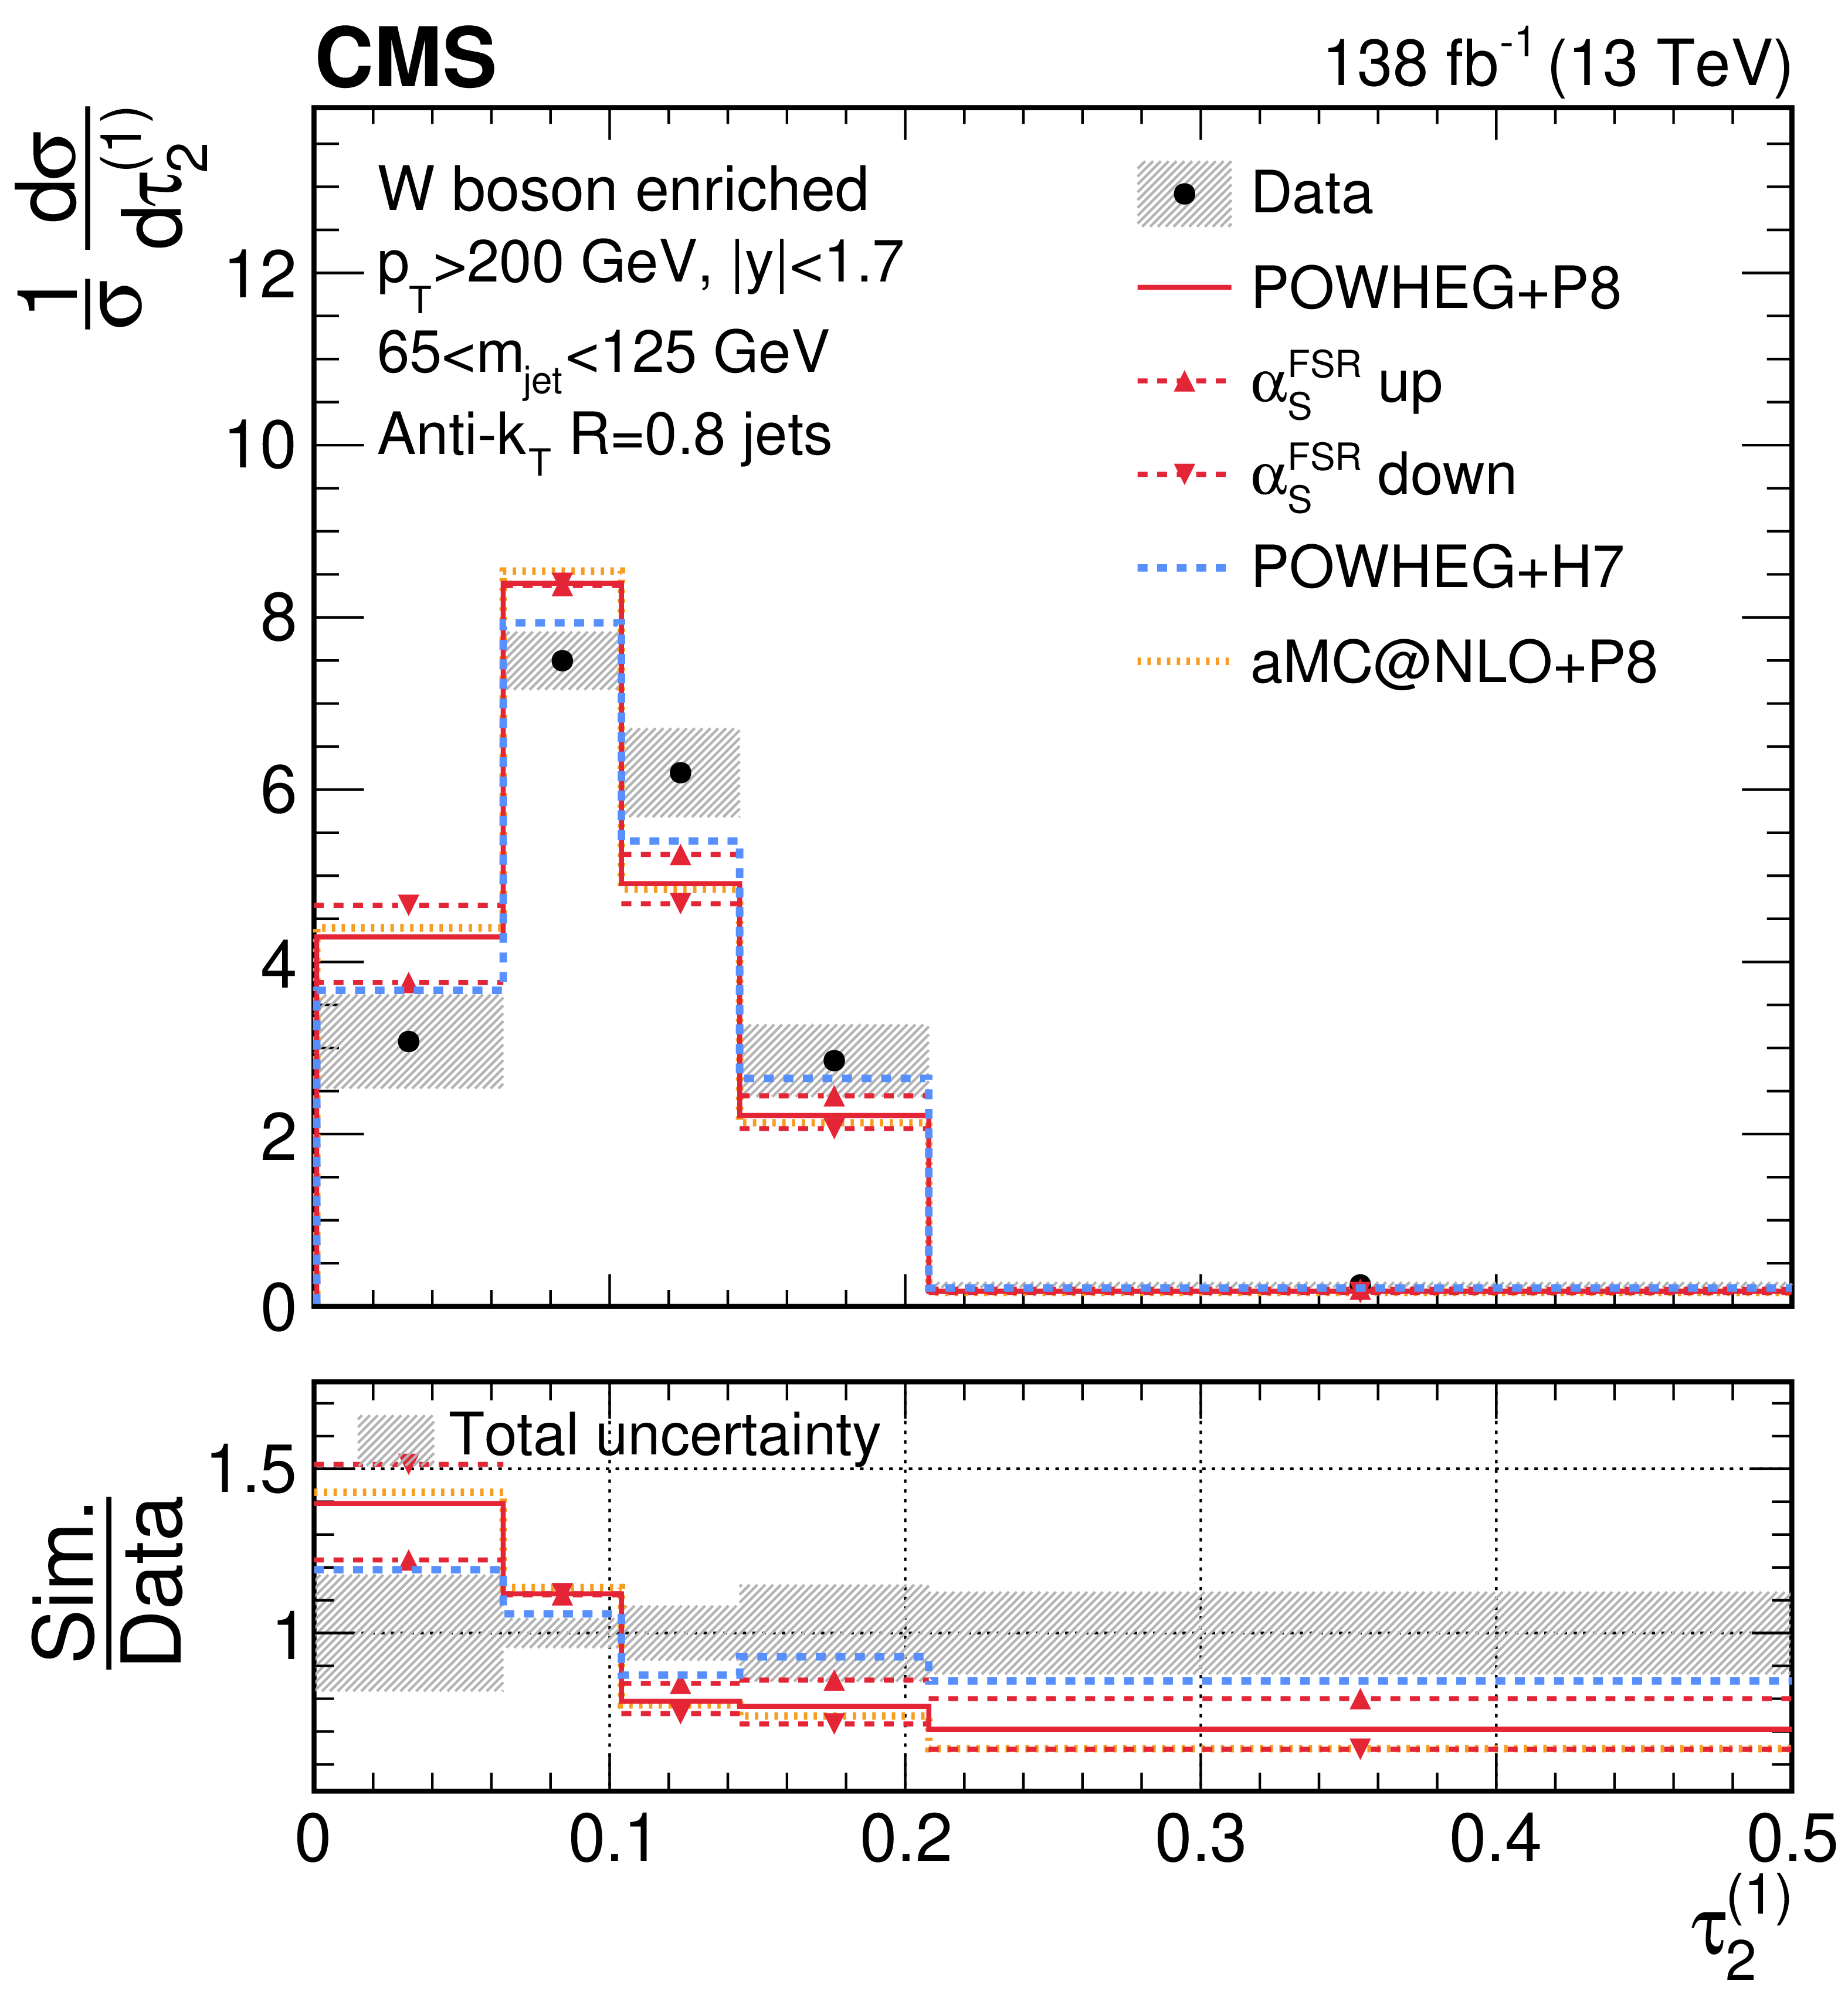
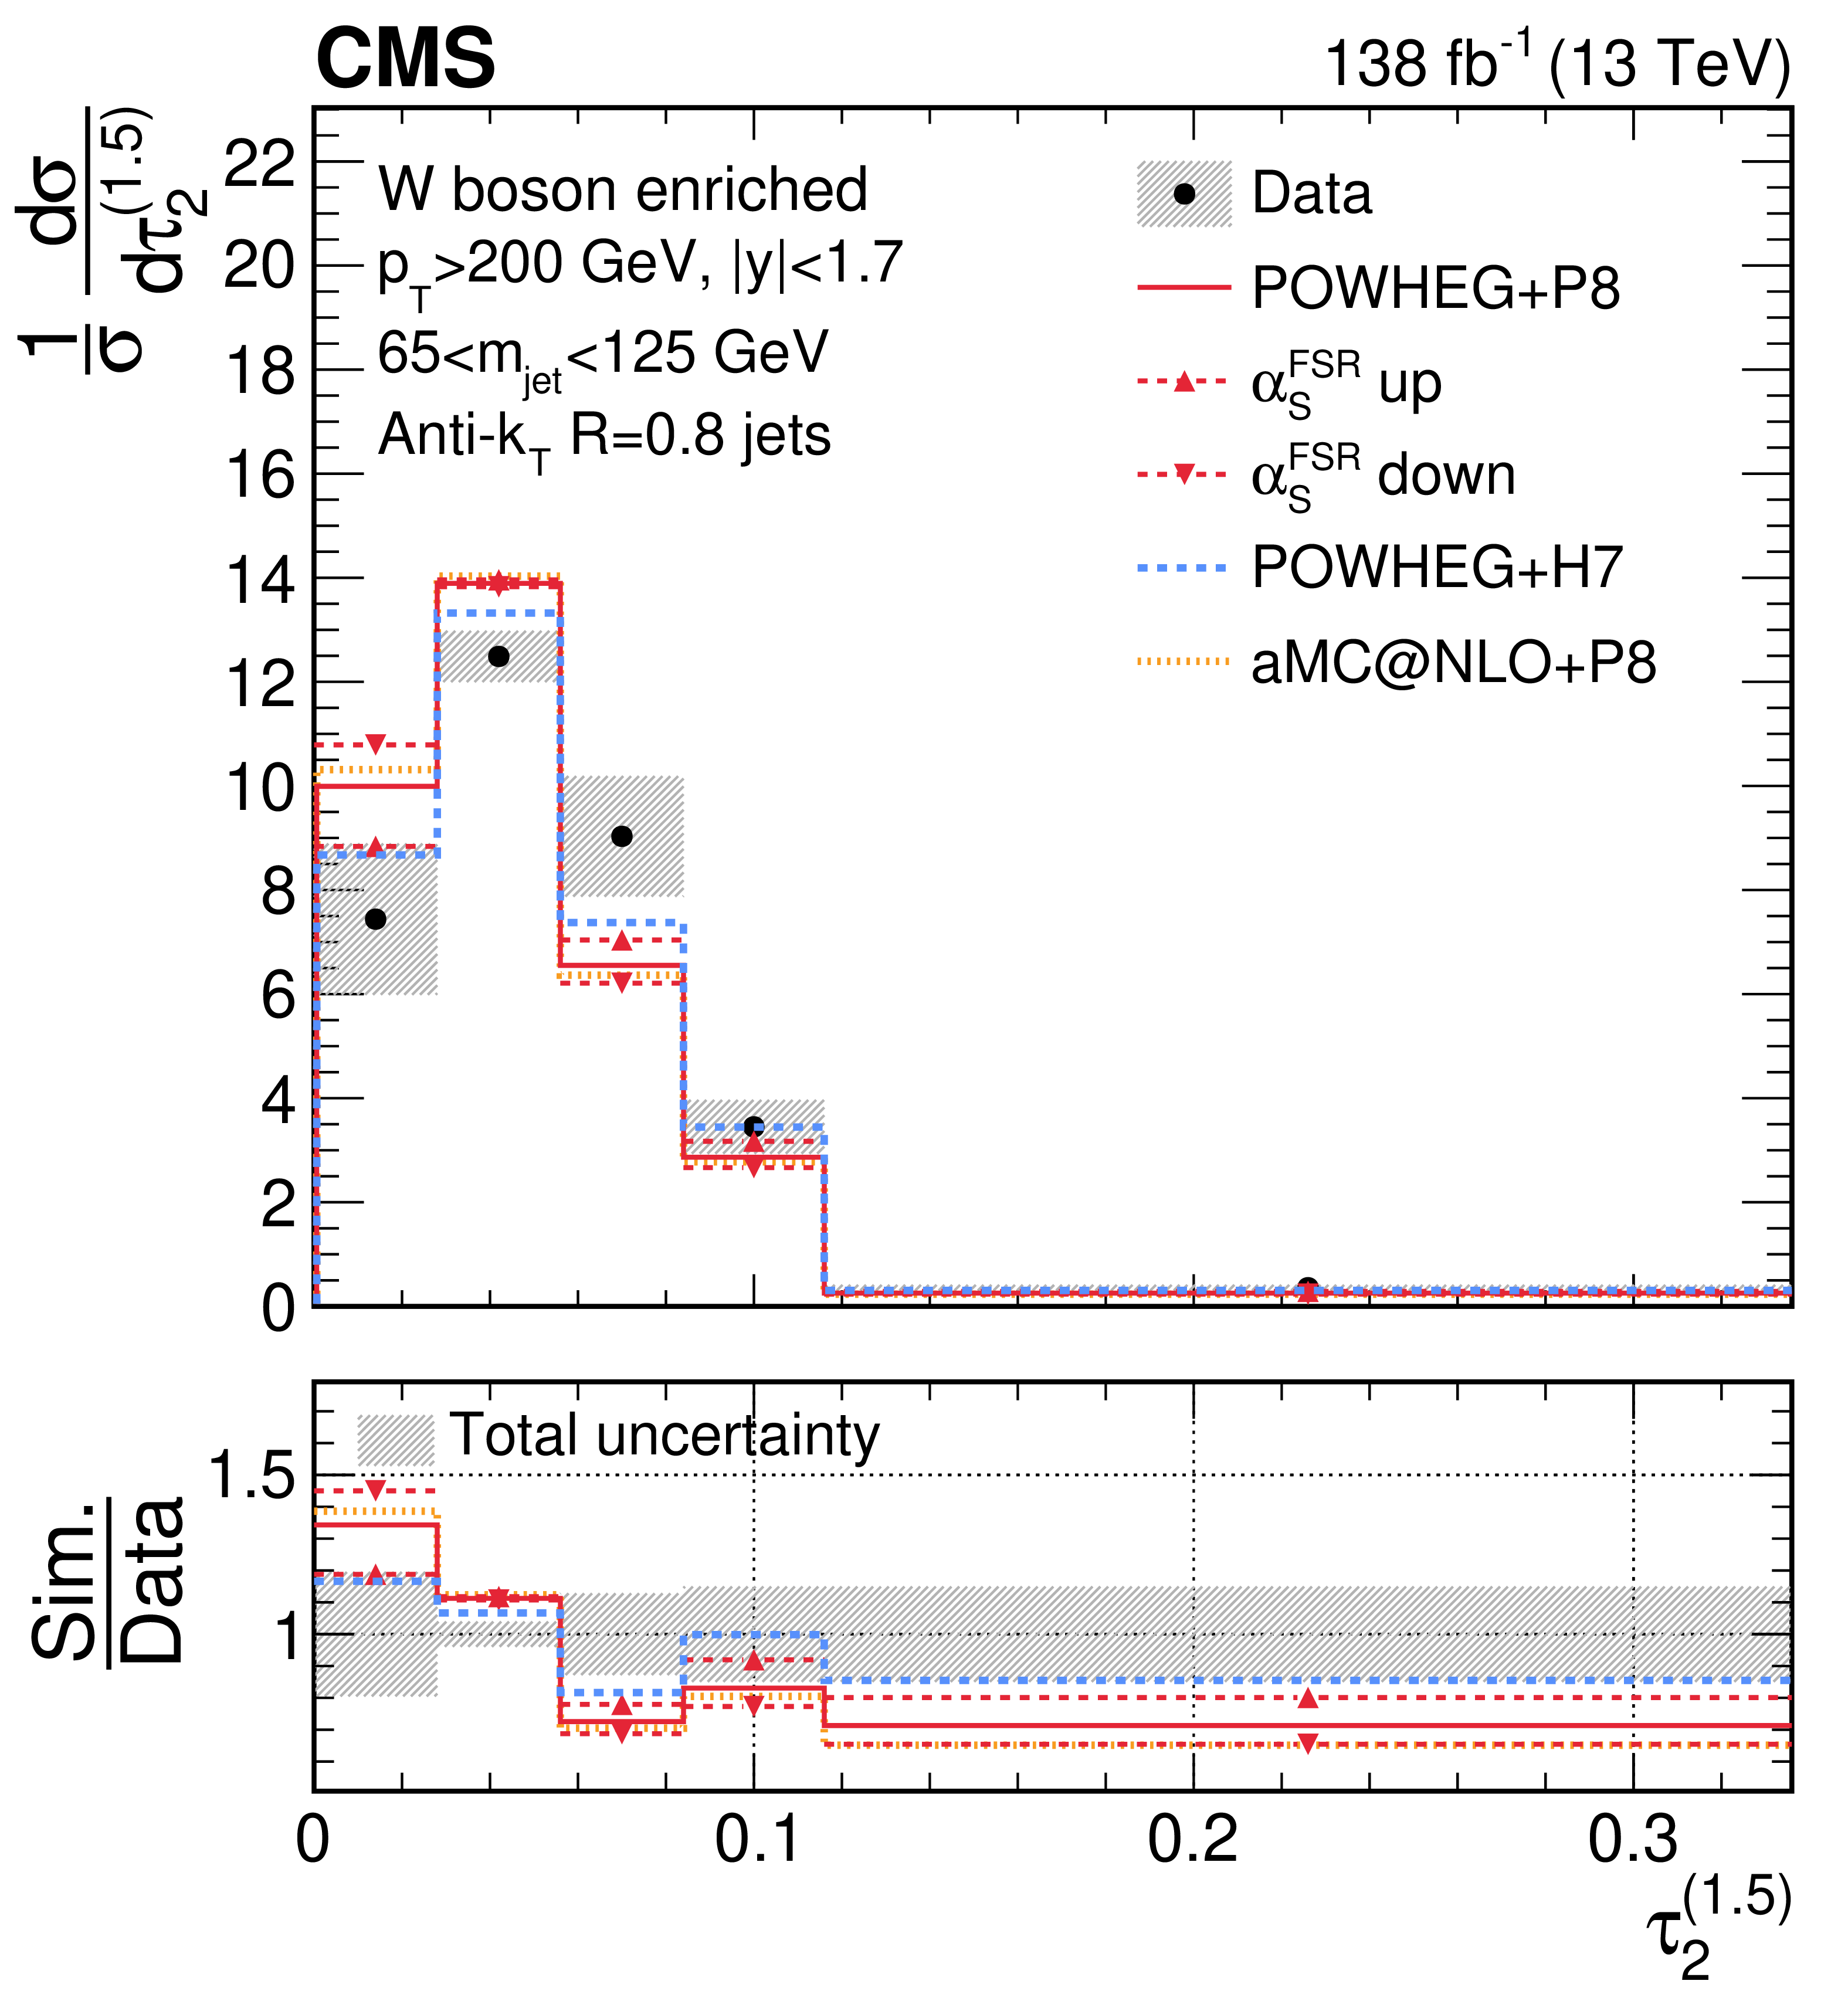
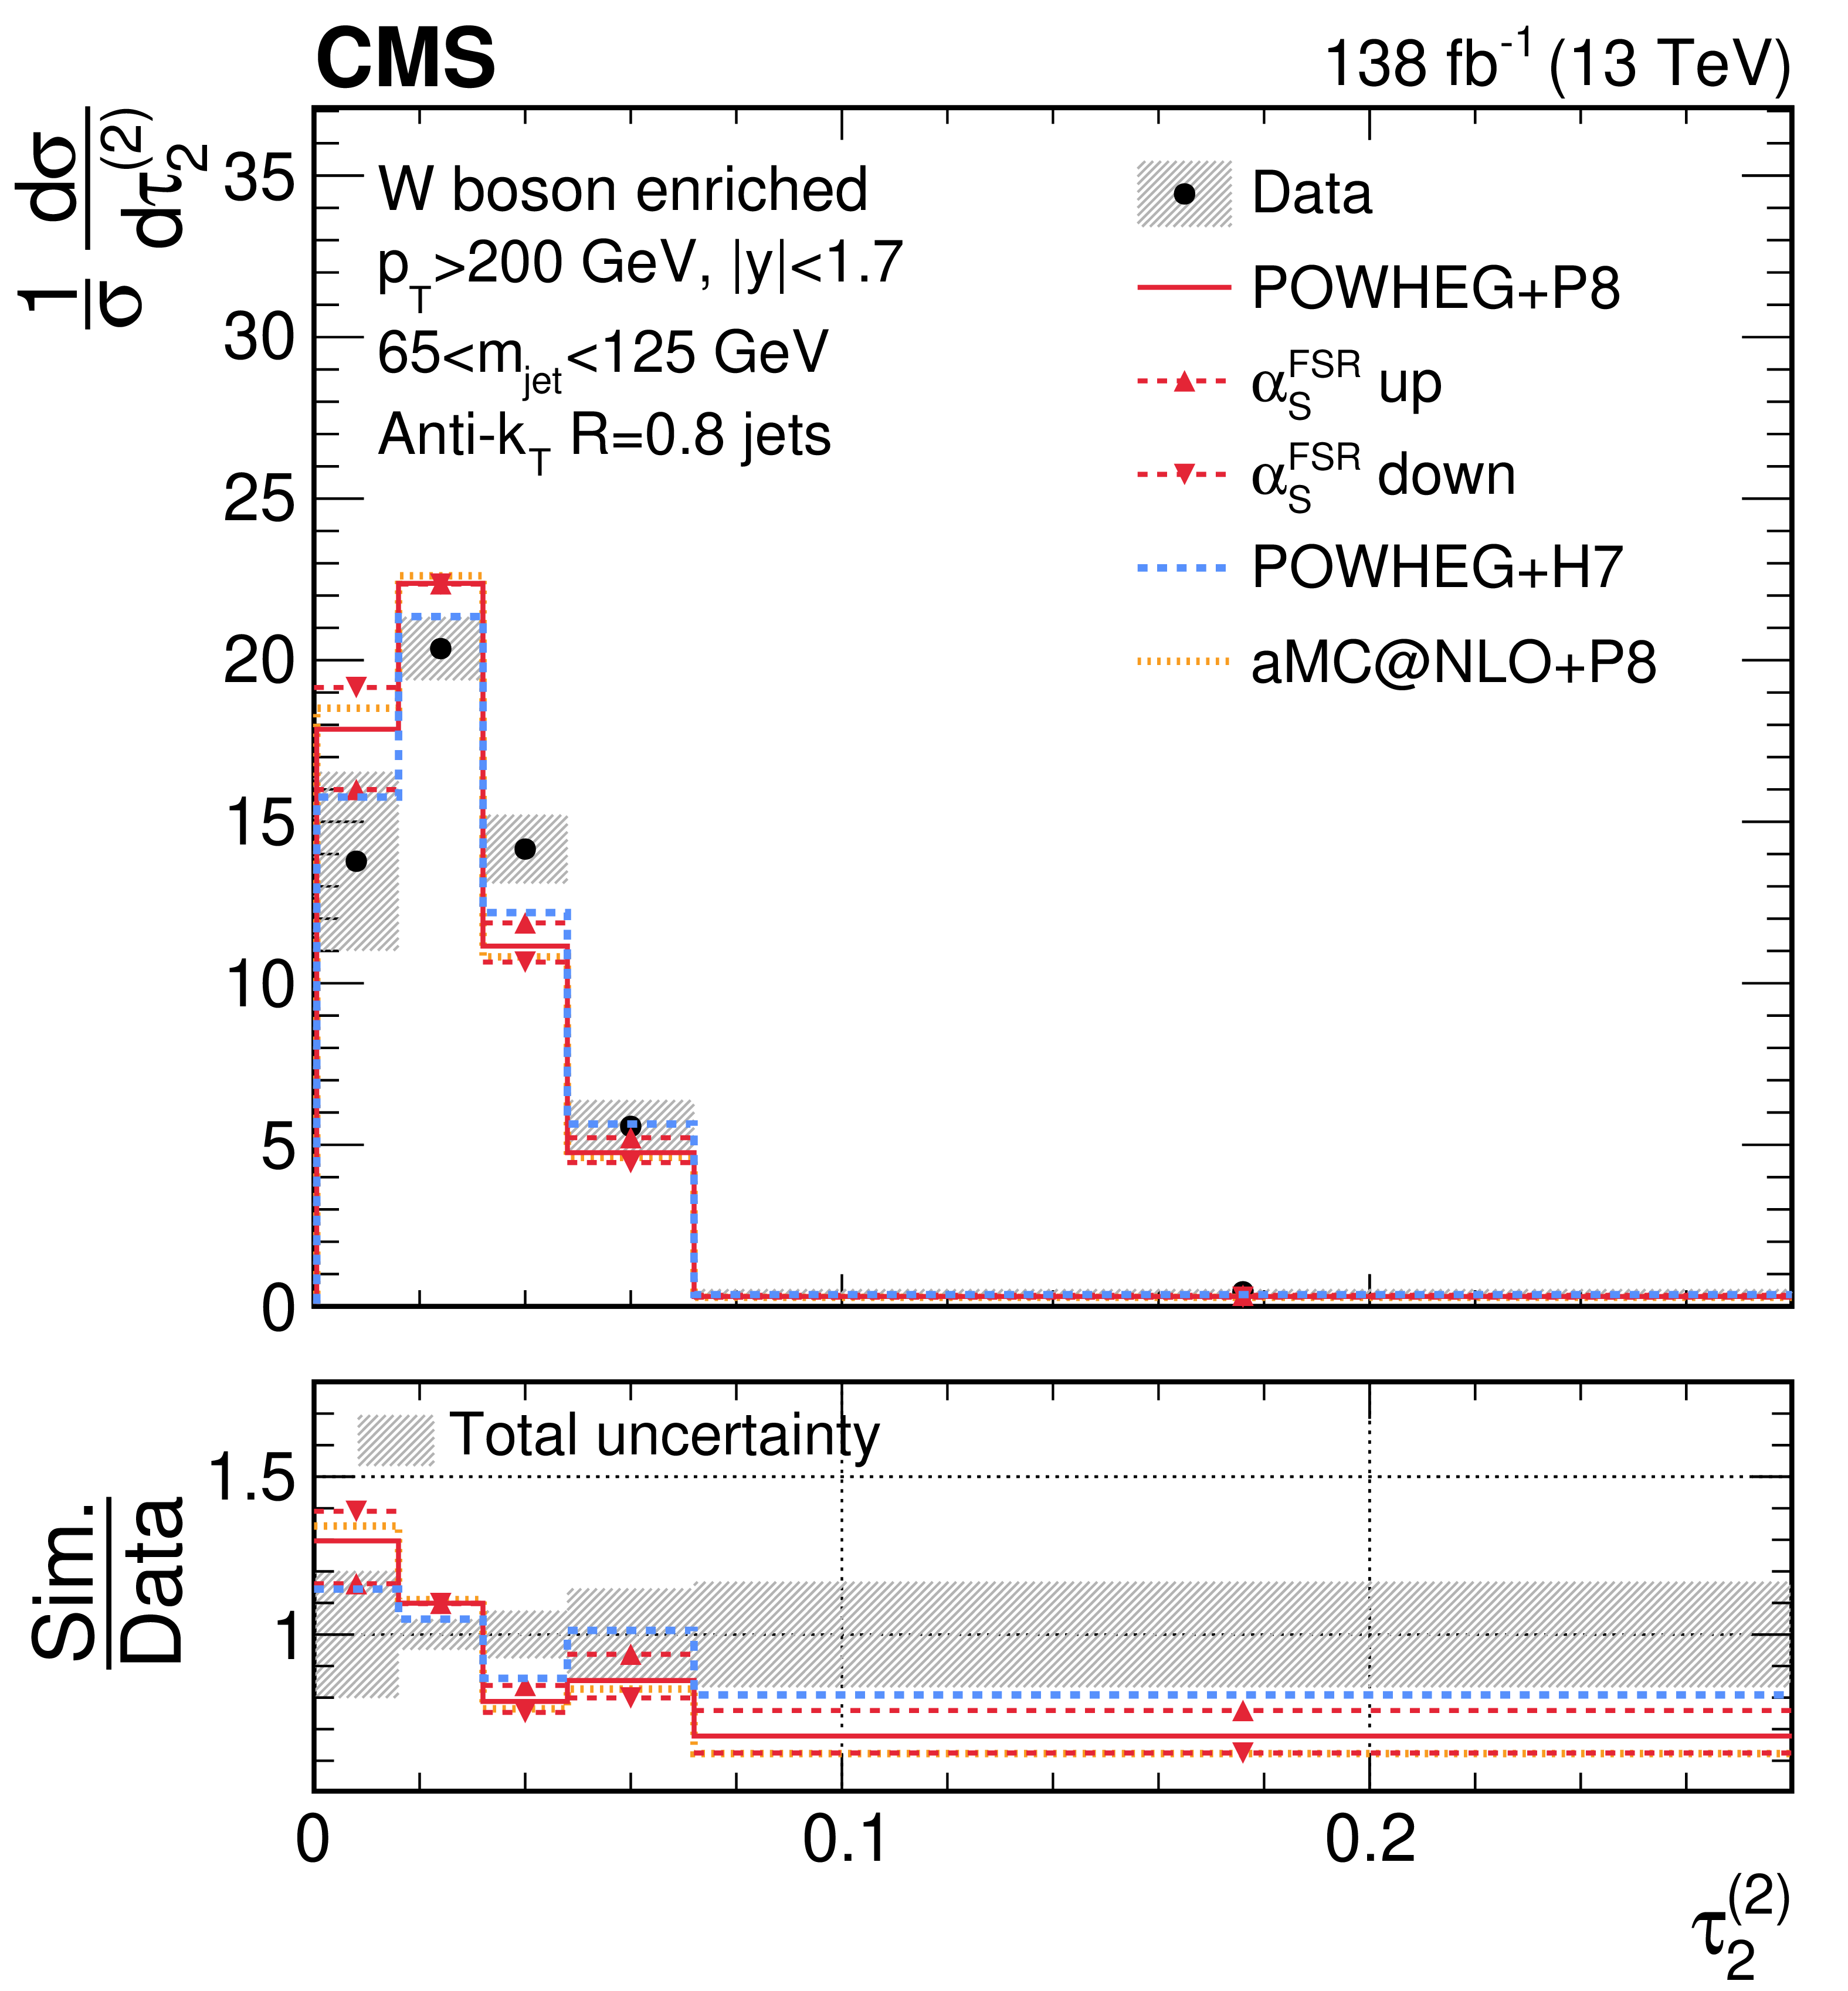
Unfolded distributions of 2-subjettiness observables,$\tau_{2}^{(0.25)}$,$\tau_{2}^{(0.5)}$,$\tau_{2}^{(1)}$,$\tau_{2}^{(1.5)}$, and$\tau_{2}^{(2)}$, measured for AK8 jets in boosted W boson-enriched events, extracted from the normalized, combined distribution after unfolding; the bin contents and the error bars are scaled by the bin widths for the distributions of the individual observables. For comparisons with particle-level predictions, the error bars in data correspond to the total unfolding uncertainties, and the lower panels present the ratio of particle-level predictions to the unfolded data. The dark grey hashed region illustrates the total uncertainties per bin in the unfolded result. |
png pdf |
Figure 32-a:
Unfolded distributions of 2-subjettiness observables,$\tau_{2}^{(0.25)}$,$\tau_{2}^{(0.5)}$,$\tau_{2}^{(1)}$,$\tau_{2}^{(1.5)}$, and$\tau_{2}^{(2)}$, measured for AK8 jets in boosted W boson-enriched events, extracted from the normalized, combined distribution after unfolding; the bin contents and the error bars are scaled by the bin widths for the distributions of the individual observables. For comparisons with particle-level predictions, the error bars in data correspond to the total unfolding uncertainties, and the lower panels present the ratio of particle-level predictions to the unfolded data. The dark grey hashed region illustrates the total uncertainties per bin in the unfolded result. |
png pdf |
Figure 32-b:
Unfolded distributions of 2-subjettiness observables,$\tau_{2}^{(0.25)}$,$\tau_{2}^{(0.5)}$,$\tau_{2}^{(1)}$,$\tau_{2}^{(1.5)}$, and$\tau_{2}^{(2)}$, measured for AK8 jets in boosted W boson-enriched events, extracted from the normalized, combined distribution after unfolding; the bin contents and the error bars are scaled by the bin widths for the distributions of the individual observables. For comparisons with particle-level predictions, the error bars in data correspond to the total unfolding uncertainties, and the lower panels present the ratio of particle-level predictions to the unfolded data. The dark grey hashed region illustrates the total uncertainties per bin in the unfolded result. |
png pdf |
Figure 32-c:
Unfolded distributions of 2-subjettiness observables,$\tau_{2}^{(0.25)}$,$\tau_{2}^{(0.5)}$,$\tau_{2}^{(1)}$,$\tau_{2}^{(1.5)}$, and$\tau_{2}^{(2)}$, measured for AK8 jets in boosted W boson-enriched events, extracted from the normalized, combined distribution after unfolding; the bin contents and the error bars are scaled by the bin widths for the distributions of the individual observables. For comparisons with particle-level predictions, the error bars in data correspond to the total unfolding uncertainties, and the lower panels present the ratio of particle-level predictions to the unfolded data. The dark grey hashed region illustrates the total uncertainties per bin in the unfolded result. |
png pdf |
Figure 32-d:
Unfolded distributions of 2-subjettiness observables,$\tau_{2}^{(0.25)}$,$\tau_{2}^{(0.5)}$,$\tau_{2}^{(1)}$,$\tau_{2}^{(1.5)}$, and$\tau_{2}^{(2)}$, measured for AK8 jets in boosted W boson-enriched events, extracted from the normalized, combined distribution after unfolding; the bin contents and the error bars are scaled by the bin widths for the distributions of the individual observables. For comparisons with particle-level predictions, the error bars in data correspond to the total unfolding uncertainties, and the lower panels present the ratio of particle-level predictions to the unfolded data. The dark grey hashed region illustrates the total uncertainties per bin in the unfolded result. |
png pdf |
Figure 32-e:
Unfolded distributions of 2-subjettiness observables,$\tau_{2}^{(0.25)}$,$\tau_{2}^{(0.5)}$,$\tau_{2}^{(1)}$,$\tau_{2}^{(1.5)}$, and$\tau_{2}^{(2)}$, measured for AK8 jets in boosted W boson-enriched events, extracted from the normalized, combined distribution after unfolding; the bin contents and the error bars are scaled by the bin widths for the distributions of the individual observables. For comparisons with particle-level predictions, the error bars in data correspond to the total unfolding uncertainties, and the lower panels present the ratio of particle-level predictions to the unfolded data. The dark grey hashed region illustrates the total uncertainties per bin in the unfolded result. |
png pdf |
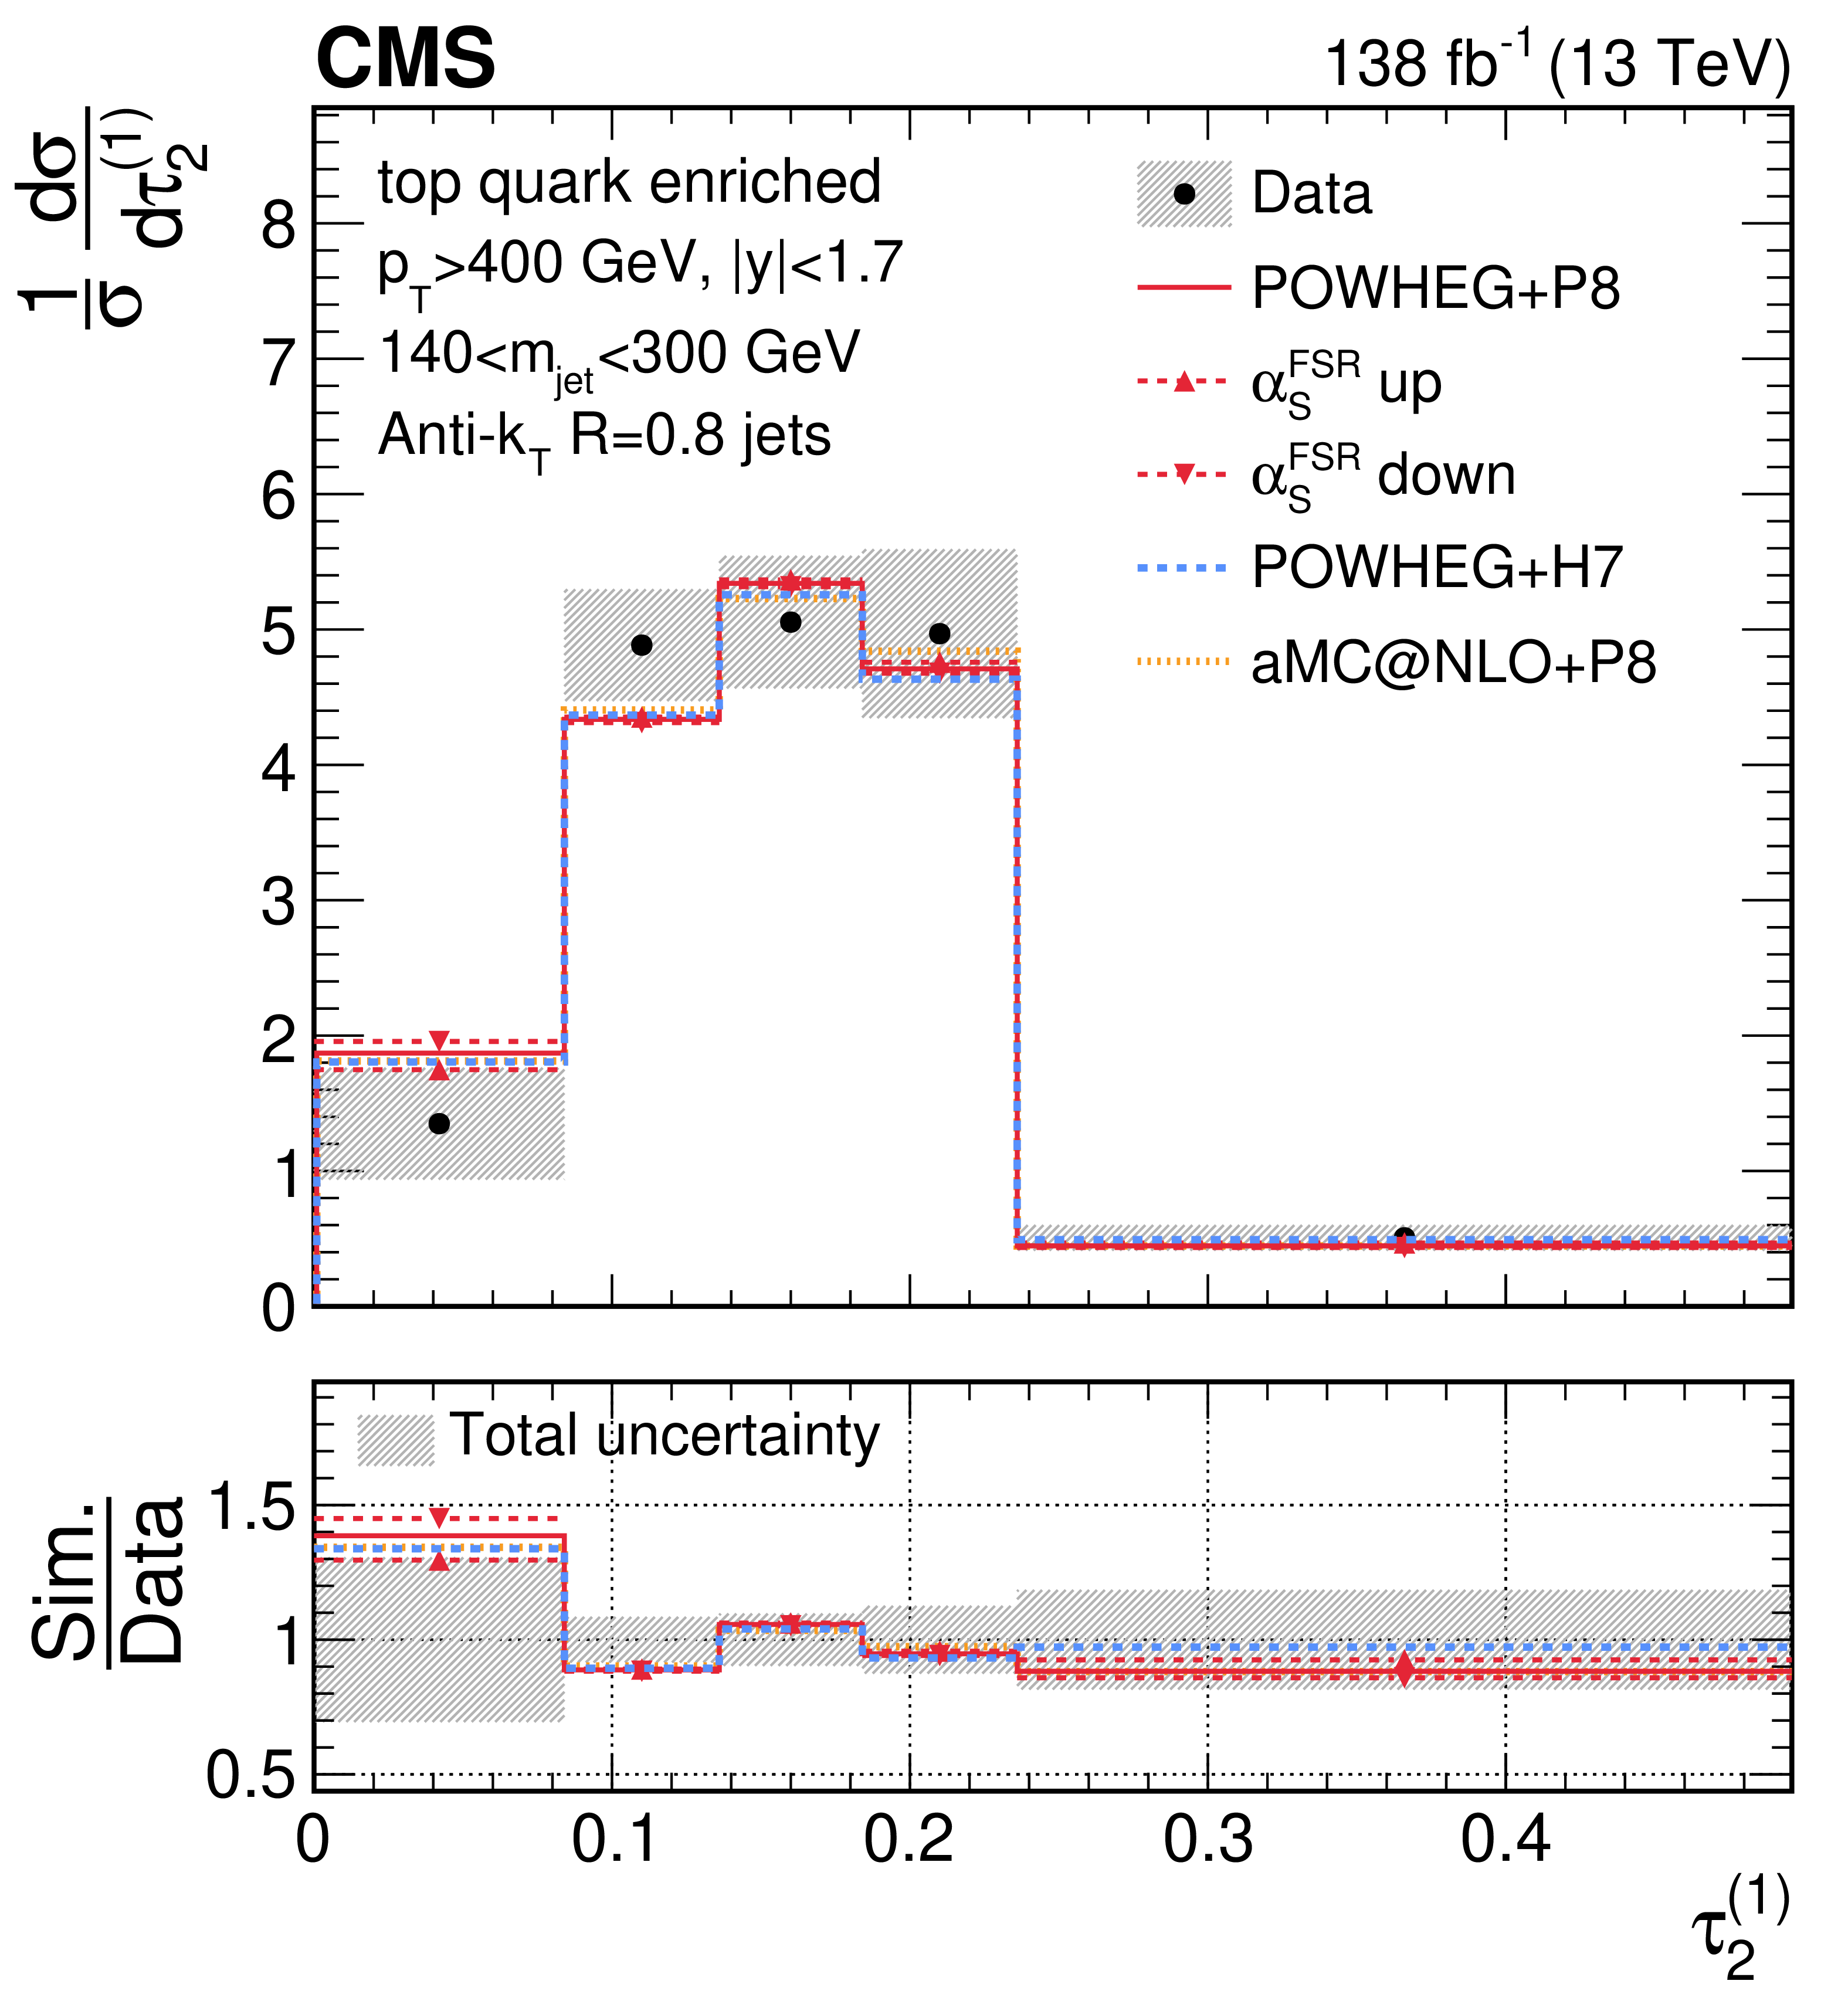
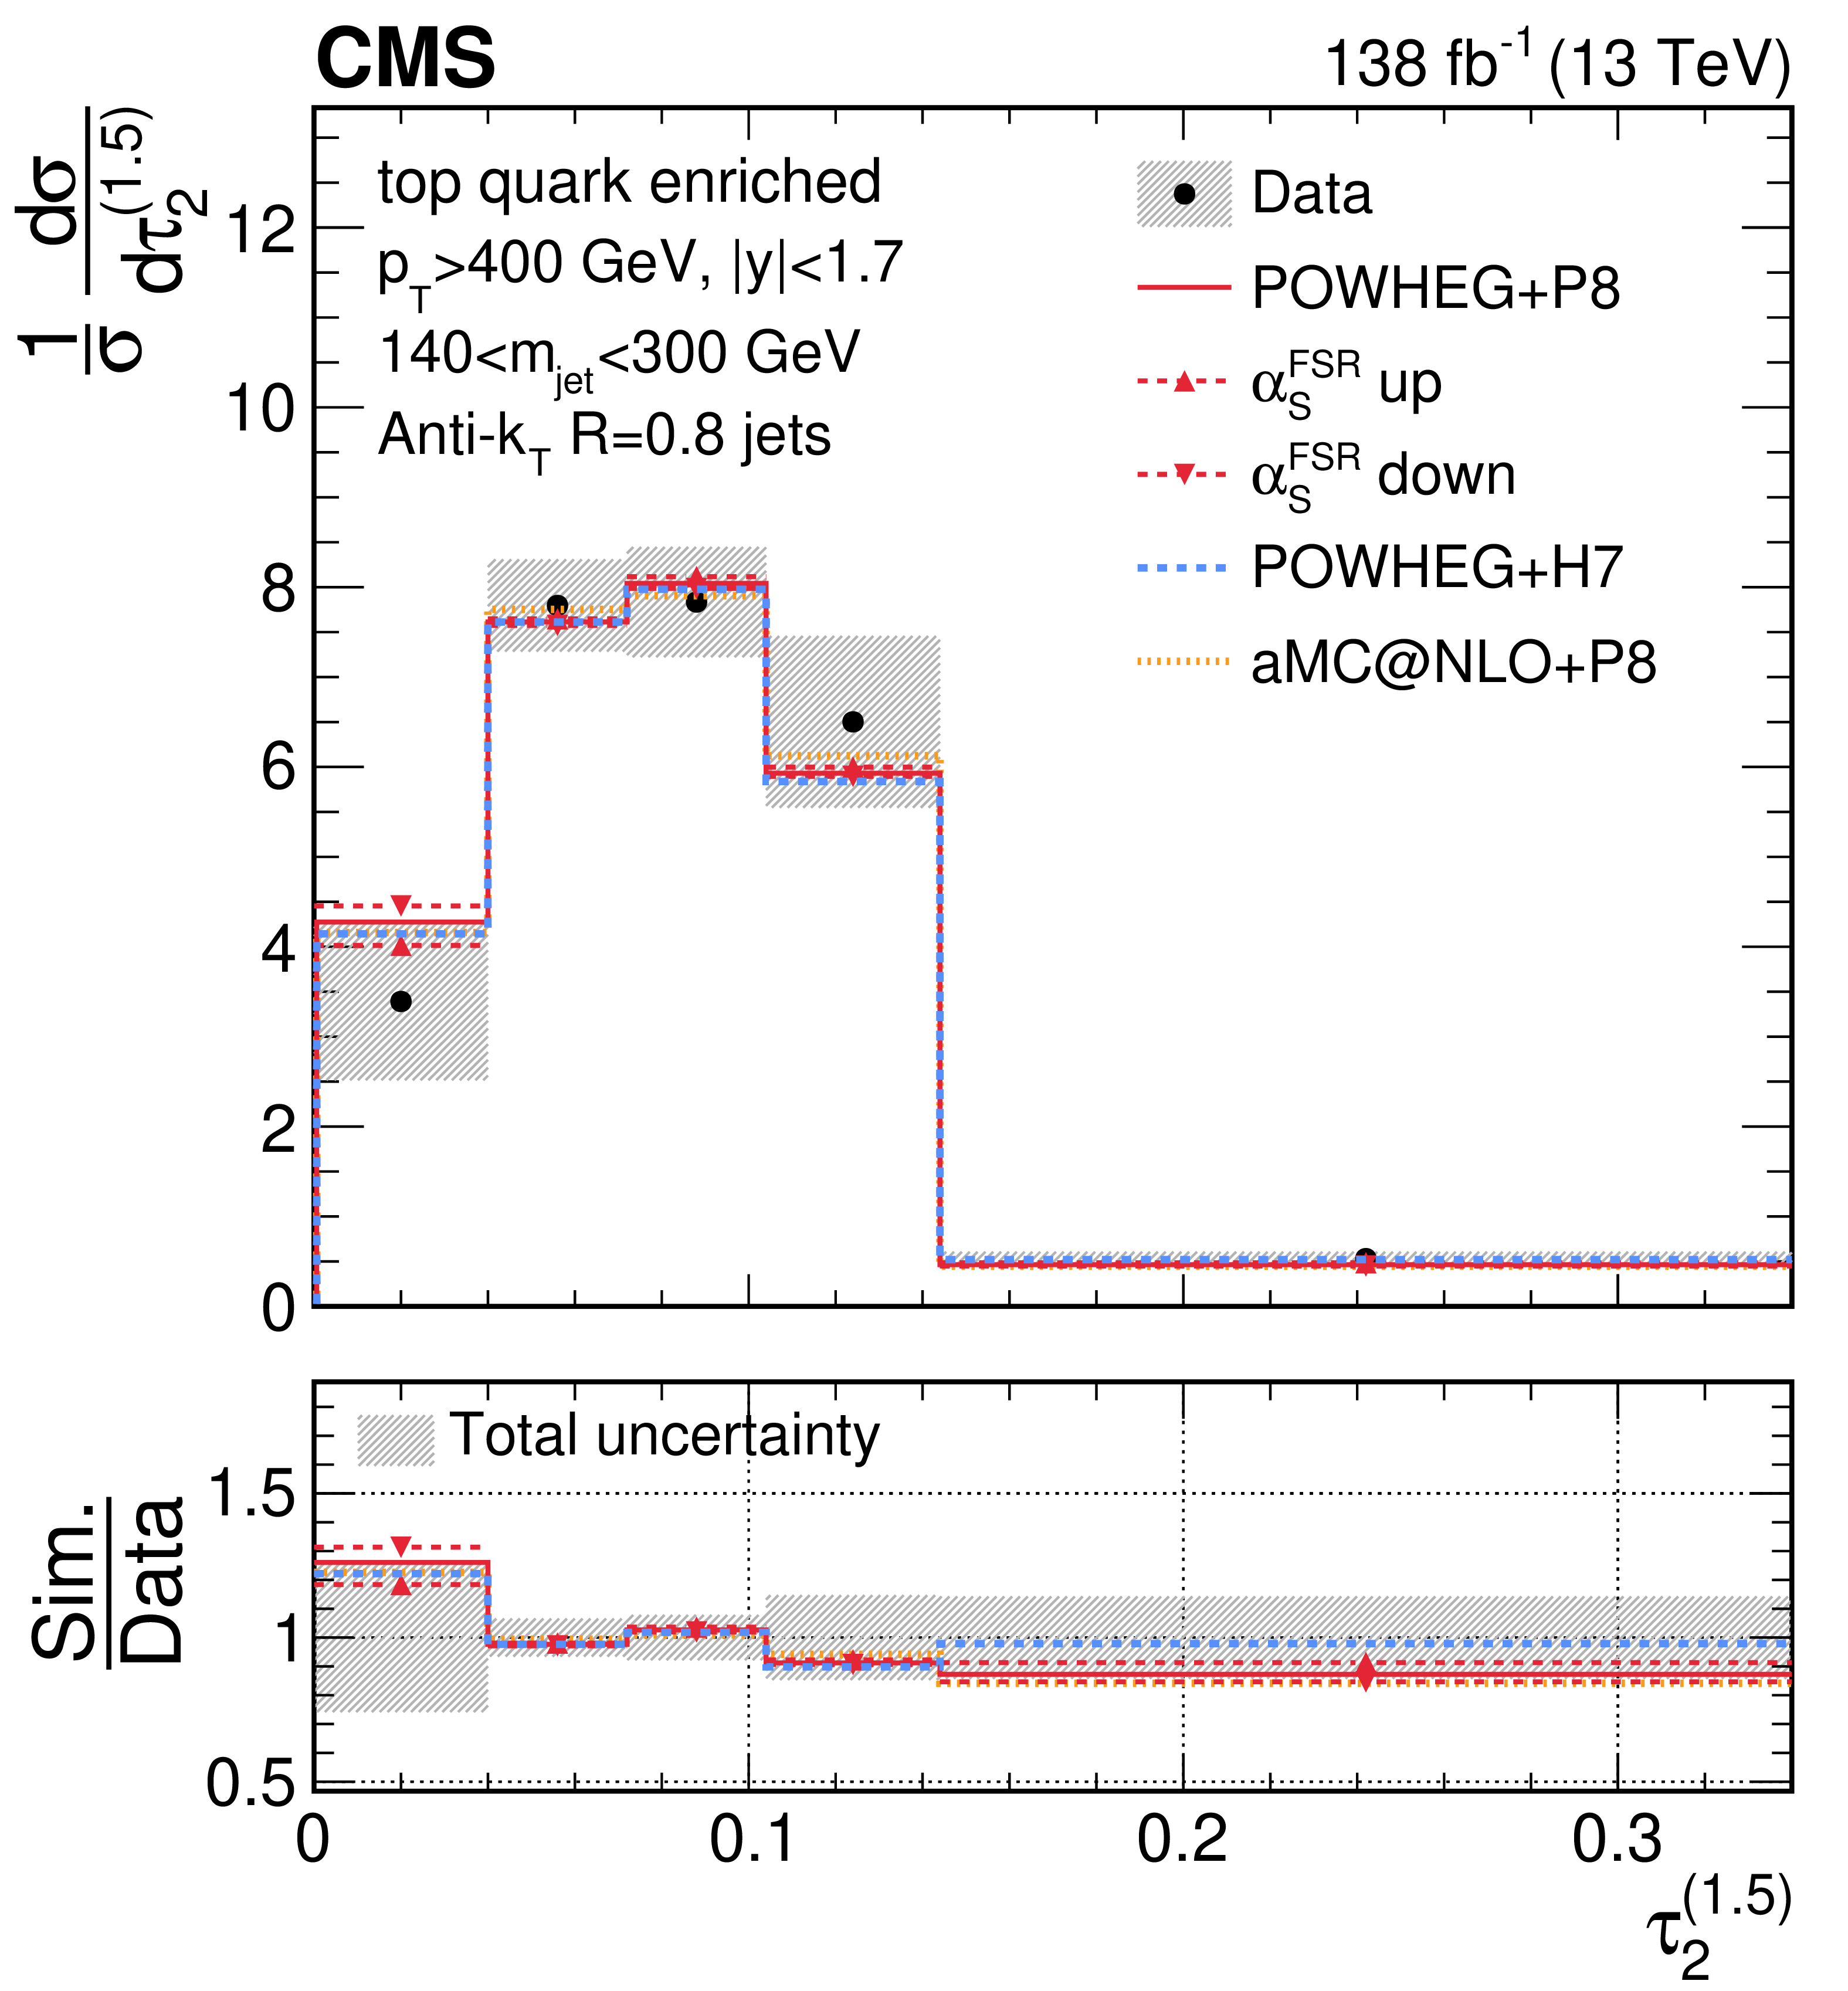
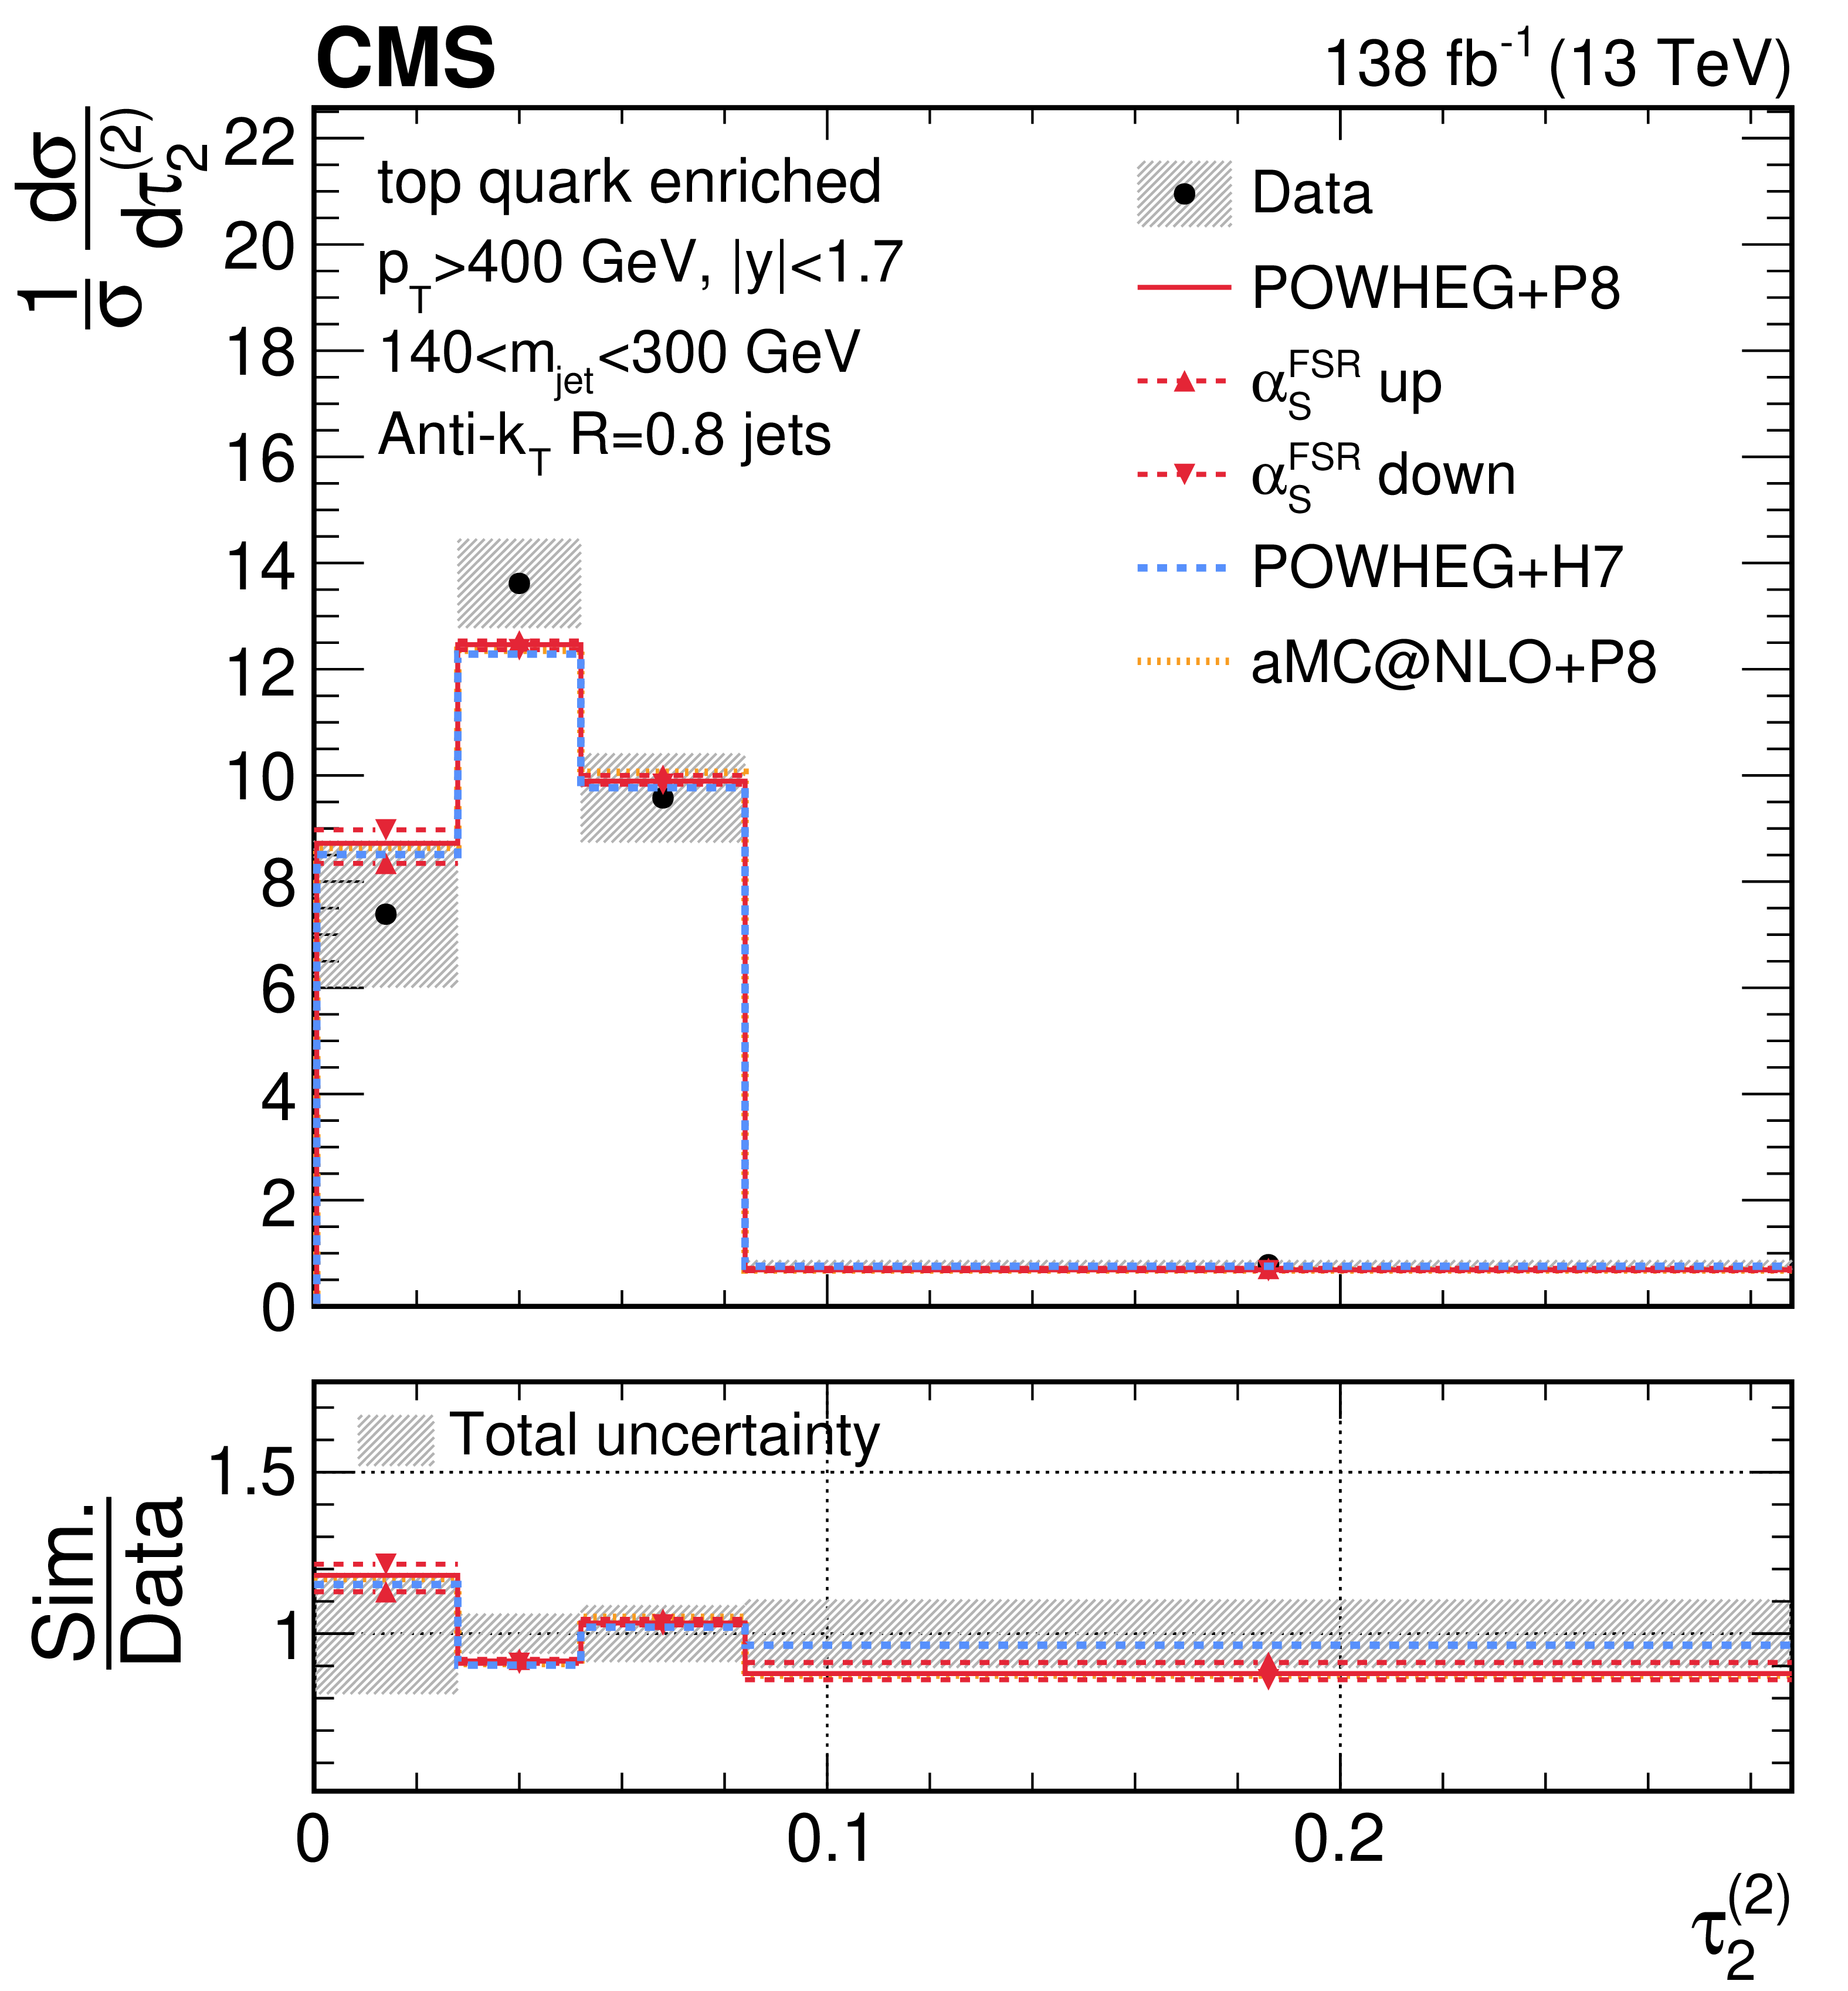
Figure 33:
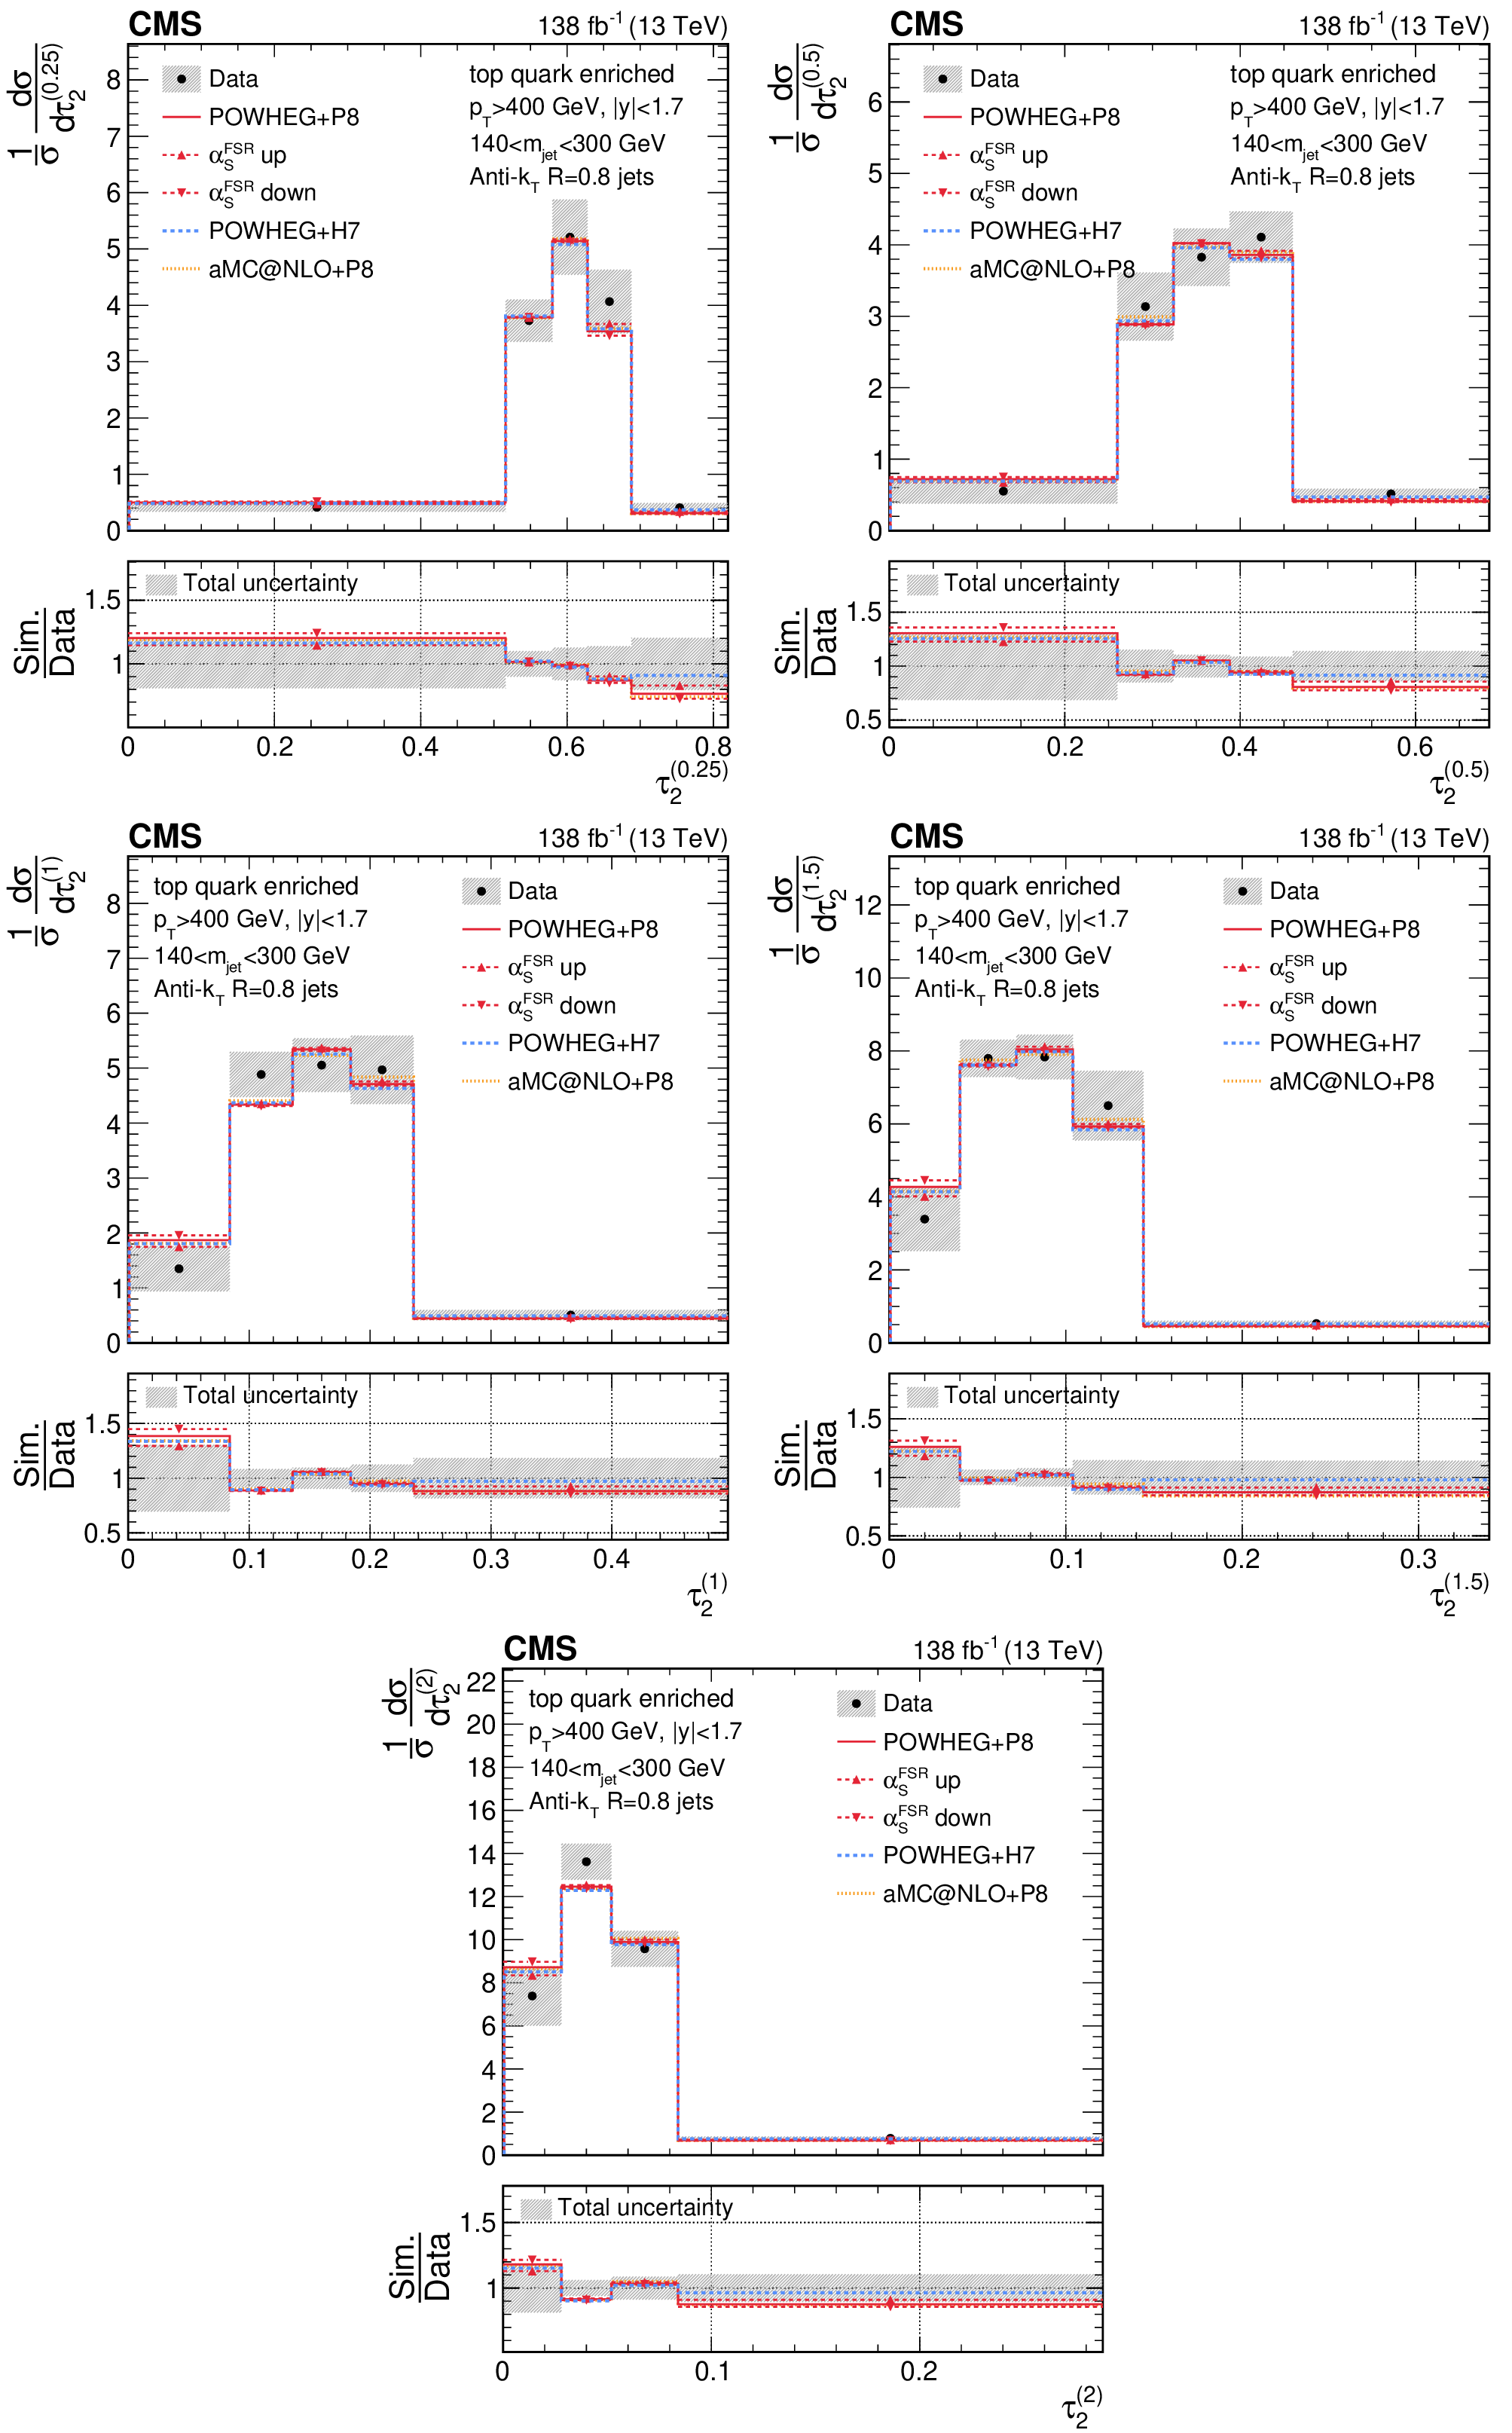
Unfolded distributions of 2-subjettiness observables,$\tau_{2}^{(0.25)}$,$\tau_{2}^{(0.5)}$,$\tau_{2}^{(1)}$,$\tau_{2}^{(1.5)}$, and$\tau_{2}^{(2)}$, measured for AK8 jets in the boosted top quark-enriched region, extracted from the normalized, combined distribution after unfolding; the bin contents and the error bars are scaled by the bin widths for the distributions of the individual observables. For comparisons with particle-level predictions, the error bars in data correspond to the total unfolding uncertainties, and the lower panels present the ratio of particle-level predictions to the unfolded data. The dark grey hashed region illustrates the total uncertainties per bin in the unfolded result. |
png pdf |
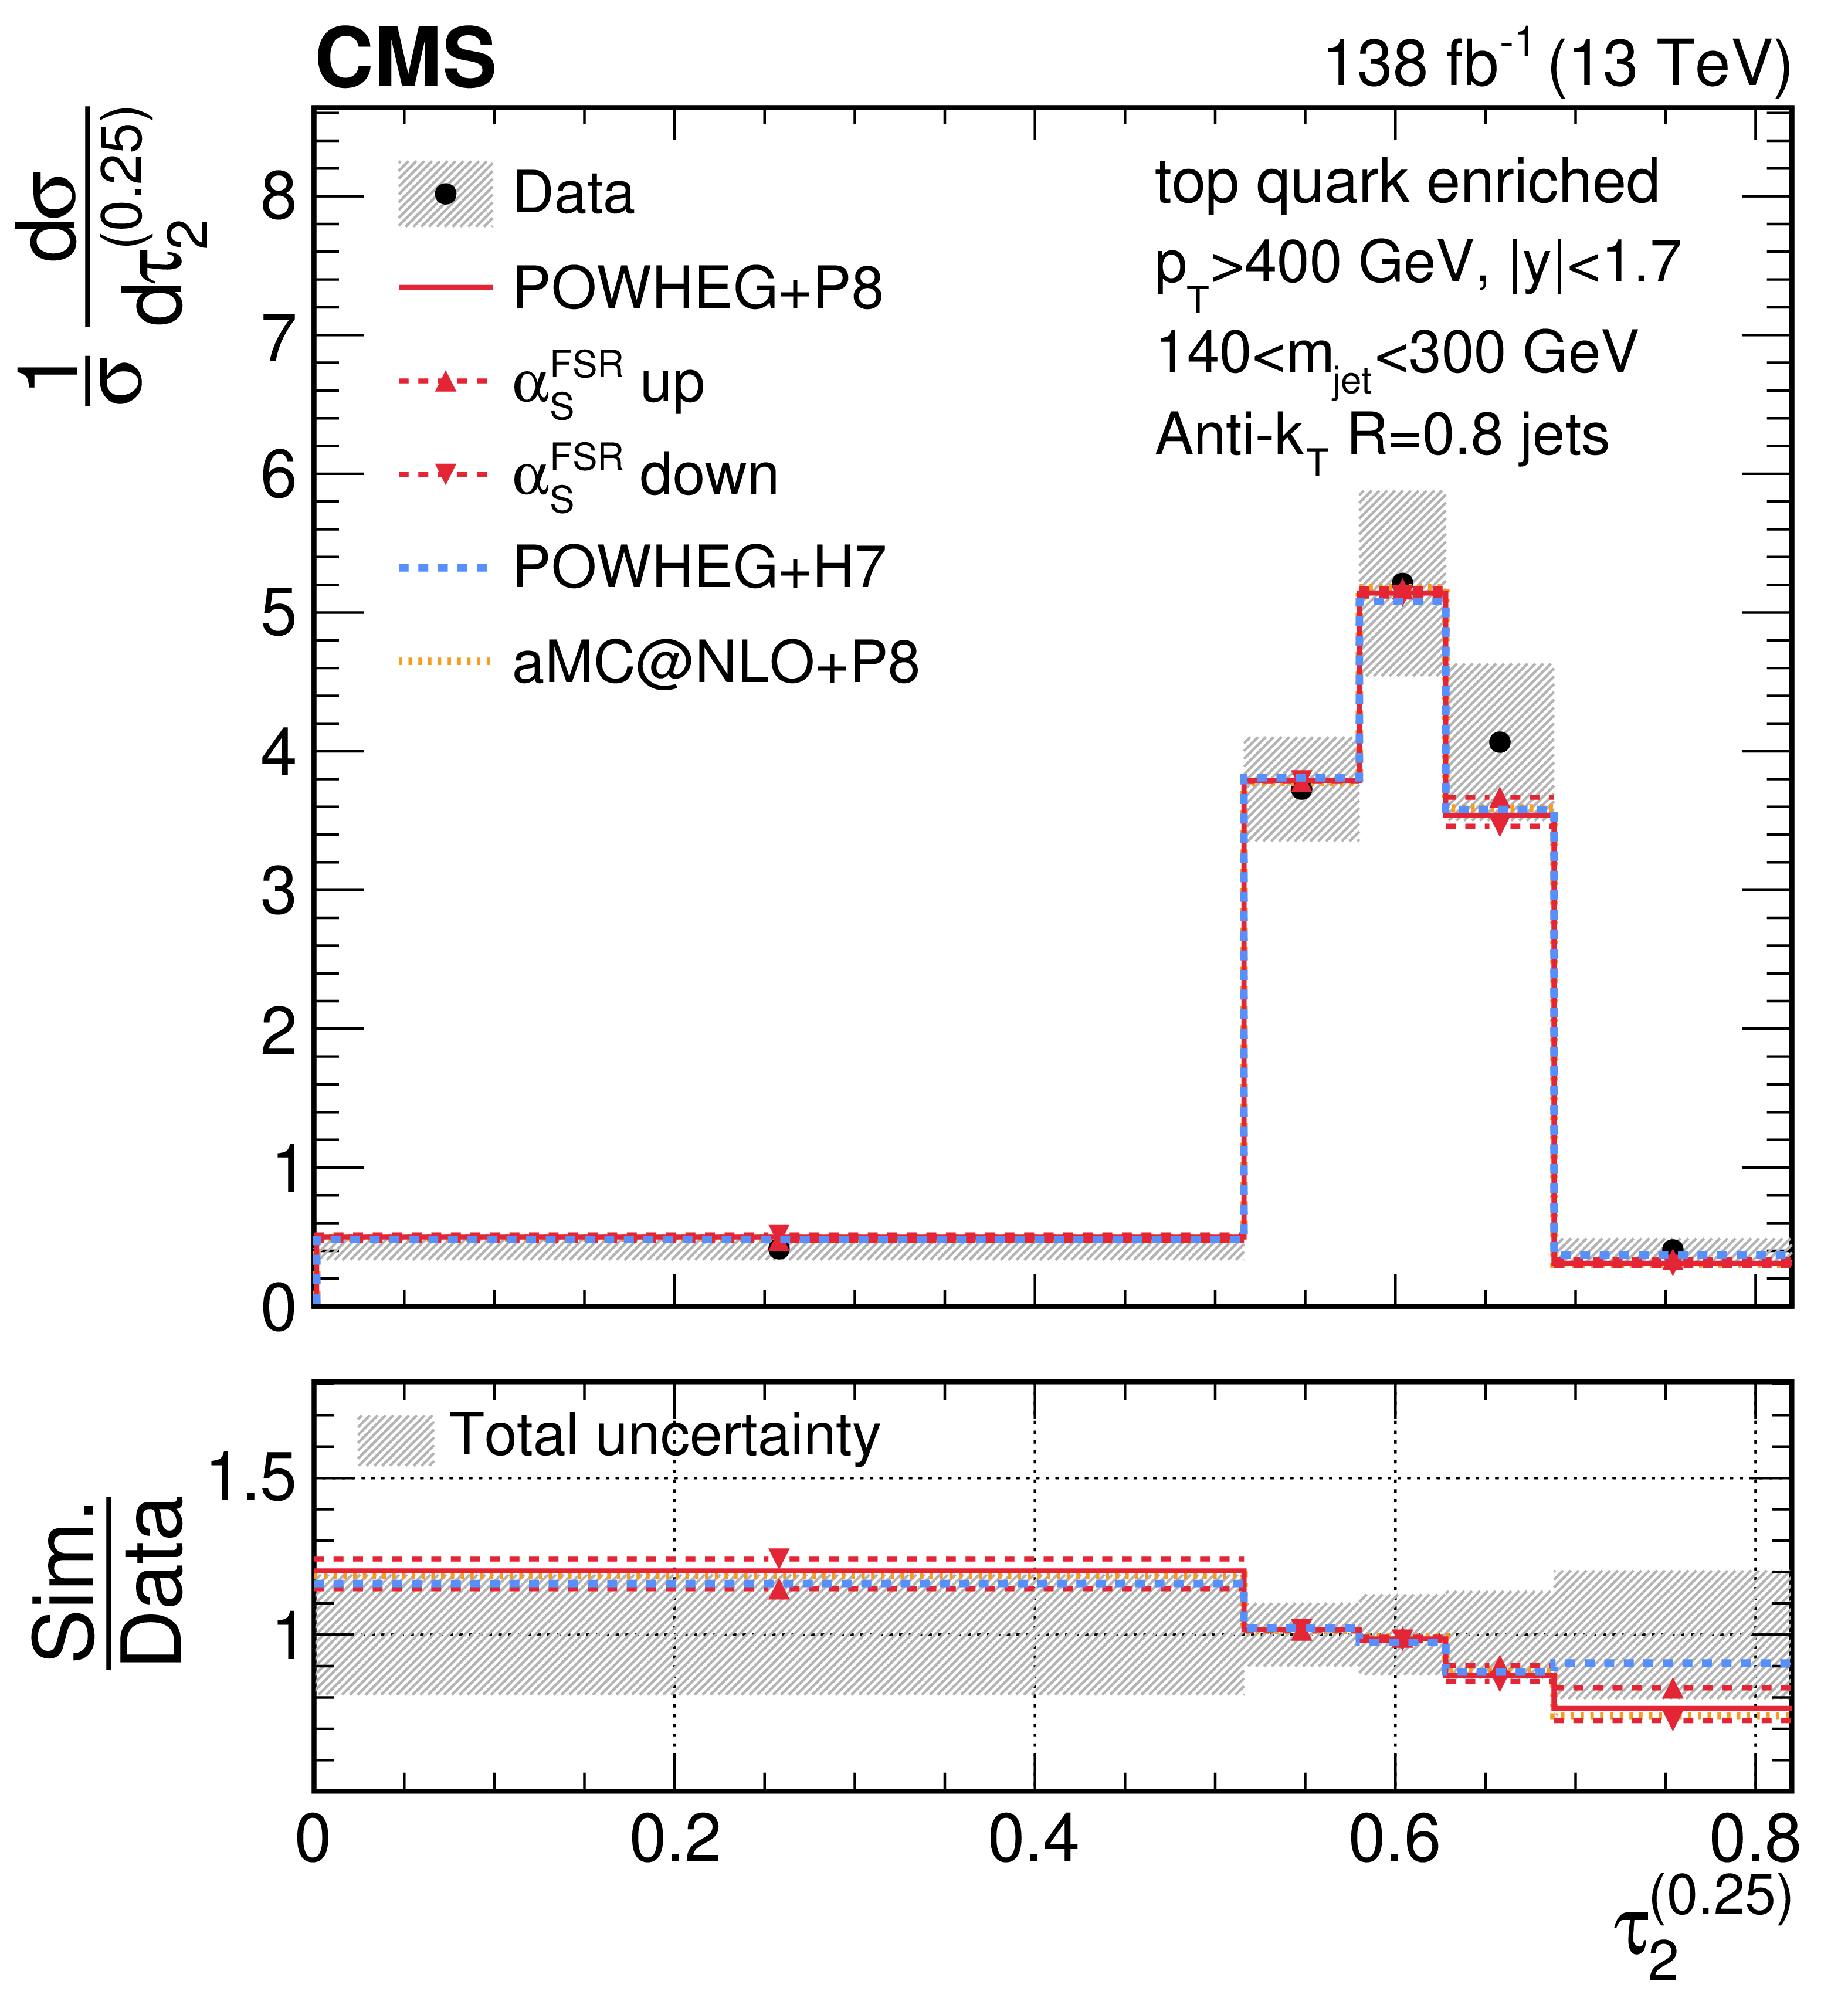
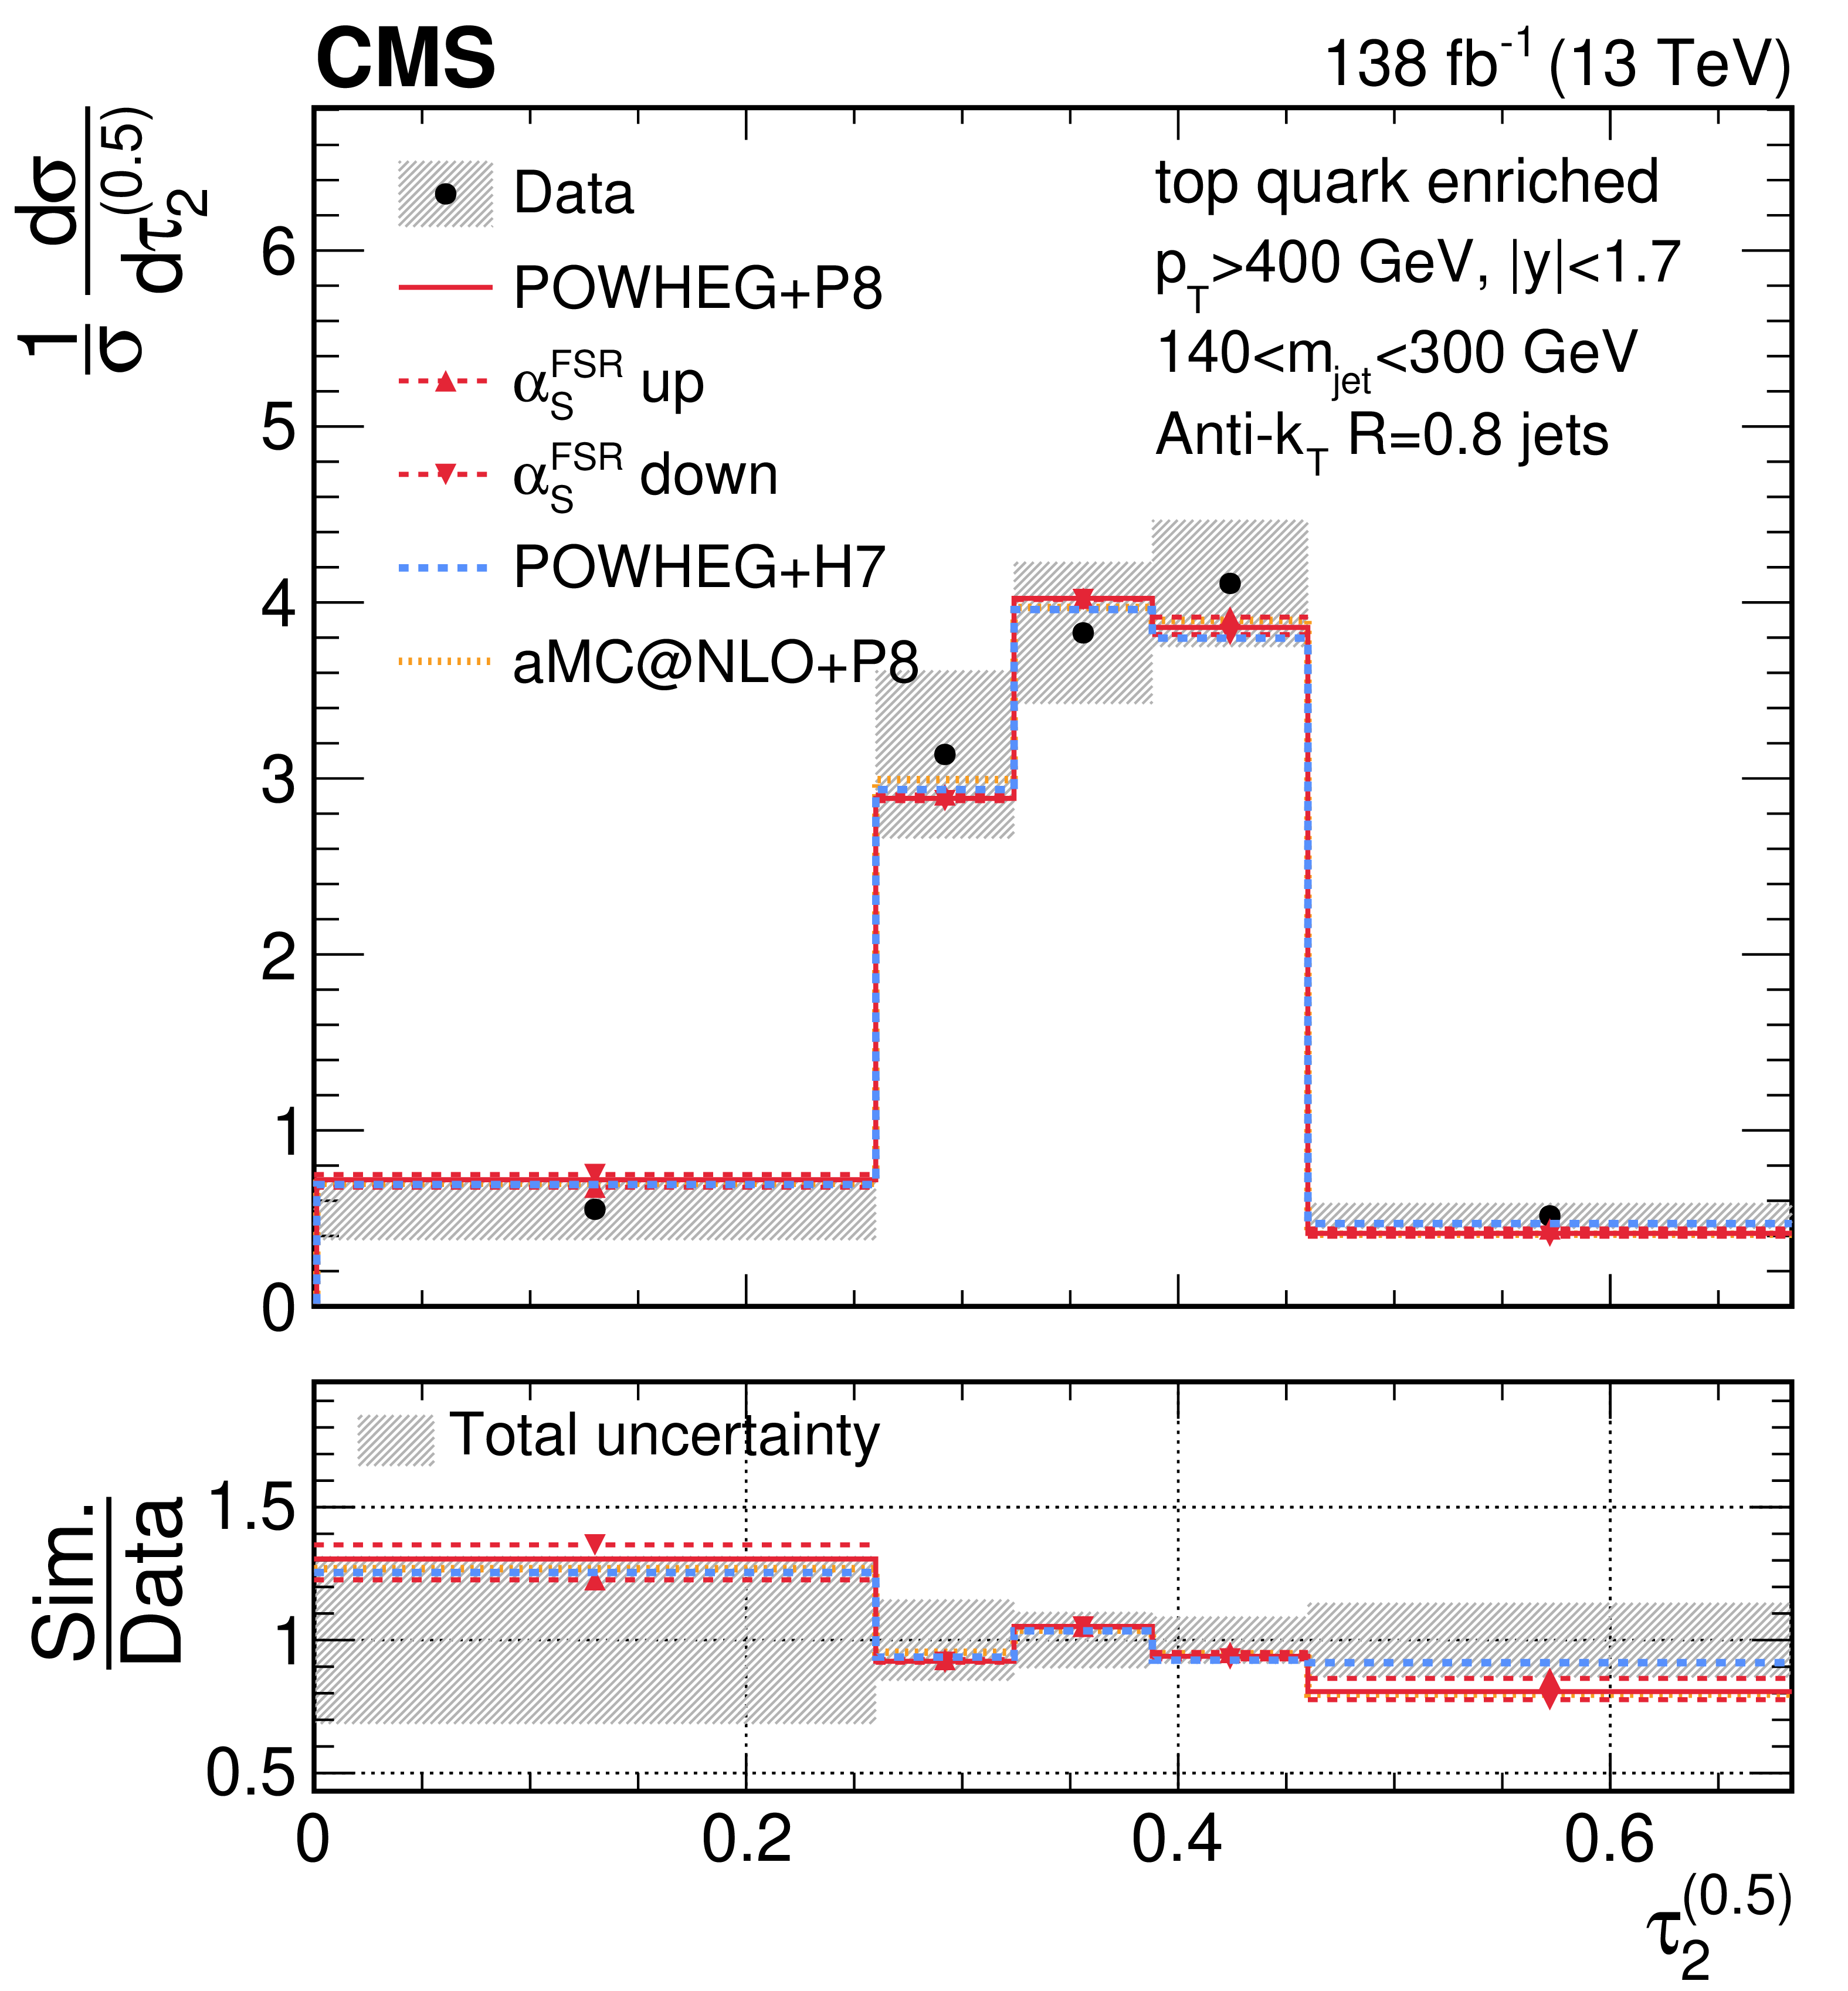
Figure 33-a:
Unfolded distributions of 2-subjettiness observables,$\tau_{2}^{(0.25)}$,$\tau_{2}^{(0.5)}$,$\tau_{2}^{(1)}$,$\tau_{2}^{(1.5)}$, and$\tau_{2}^{(2)}$, measured for AK8 jets in the boosted top quark-enriched region, extracted from the normalized, combined distribution after unfolding; the bin contents and the error bars are scaled by the bin widths for the distributions of the individual observables. For comparisons with particle-level predictions, the error bars in data correspond to the total unfolding uncertainties, and the lower panels present the ratio of particle-level predictions to the unfolded data. The dark grey hashed region illustrates the total uncertainties per bin in the unfolded result. |
png pdf |
Figure 33-b:
Unfolded distributions of 2-subjettiness observables,$\tau_{2}^{(0.25)}$,$\tau_{2}^{(0.5)}$,$\tau_{2}^{(1)}$,$\tau_{2}^{(1.5)}$, and$\tau_{2}^{(2)}$, measured for AK8 jets in the boosted top quark-enriched region, extracted from the normalized, combined distribution after unfolding; the bin contents and the error bars are scaled by the bin widths for the distributions of the individual observables. For comparisons with particle-level predictions, the error bars in data correspond to the total unfolding uncertainties, and the lower panels present the ratio of particle-level predictions to the unfolded data. The dark grey hashed region illustrates the total uncertainties per bin in the unfolded result. |
png pdf |
Figure 33-c:
Unfolded distributions of 2-subjettiness observables,$\tau_{2}^{(0.25)}$,$\tau_{2}^{(0.5)}$,$\tau_{2}^{(1)}$,$\tau_{2}^{(1.5)}$, and$\tau_{2}^{(2)}$, measured for AK8 jets in the boosted top quark-enriched region, extracted from the normalized, combined distribution after unfolding; the bin contents and the error bars are scaled by the bin widths for the distributions of the individual observables. For comparisons with particle-level predictions, the error bars in data correspond to the total unfolding uncertainties, and the lower panels present the ratio of particle-level predictions to the unfolded data. The dark grey hashed region illustrates the total uncertainties per bin in the unfolded result. |
png pdf |
Figure 33-d:
Unfolded distributions of 2-subjettiness observables,$\tau_{2}^{(0.25)}$,$\tau_{2}^{(0.5)}$,$\tau_{2}^{(1)}$,$\tau_{2}^{(1.5)}$, and$\tau_{2}^{(2)}$, measured for AK8 jets in the boosted top quark-enriched region, extracted from the normalized, combined distribution after unfolding; the bin contents and the error bars are scaled by the bin widths for the distributions of the individual observables. For comparisons with particle-level predictions, the error bars in data correspond to the total unfolding uncertainties, and the lower panels present the ratio of particle-level predictions to the unfolded data. The dark grey hashed region illustrates the total uncertainties per bin in the unfolded result. |
png pdf |
Figure 33-e:
Unfolded distributions of 2-subjettiness observables,$\tau_{2}^{(0.25)}$,$\tau_{2}^{(0.5)}$,$\tau_{2}^{(1)}$,$\tau_{2}^{(1.5)}$, and$\tau_{2}^{(2)}$, measured for AK8 jets in the boosted top quark-enriched region, extracted from the normalized, combined distribution after unfolding; the bin contents and the error bars are scaled by the bin widths for the distributions of the individual observables. For comparisons with particle-level predictions, the error bars in data correspond to the total unfolding uncertainties, and the lower panels present the ratio of particle-level predictions to the unfolded data. The dark grey hashed region illustrates the total uncertainties per bin in the unfolded result. |
png pdf |
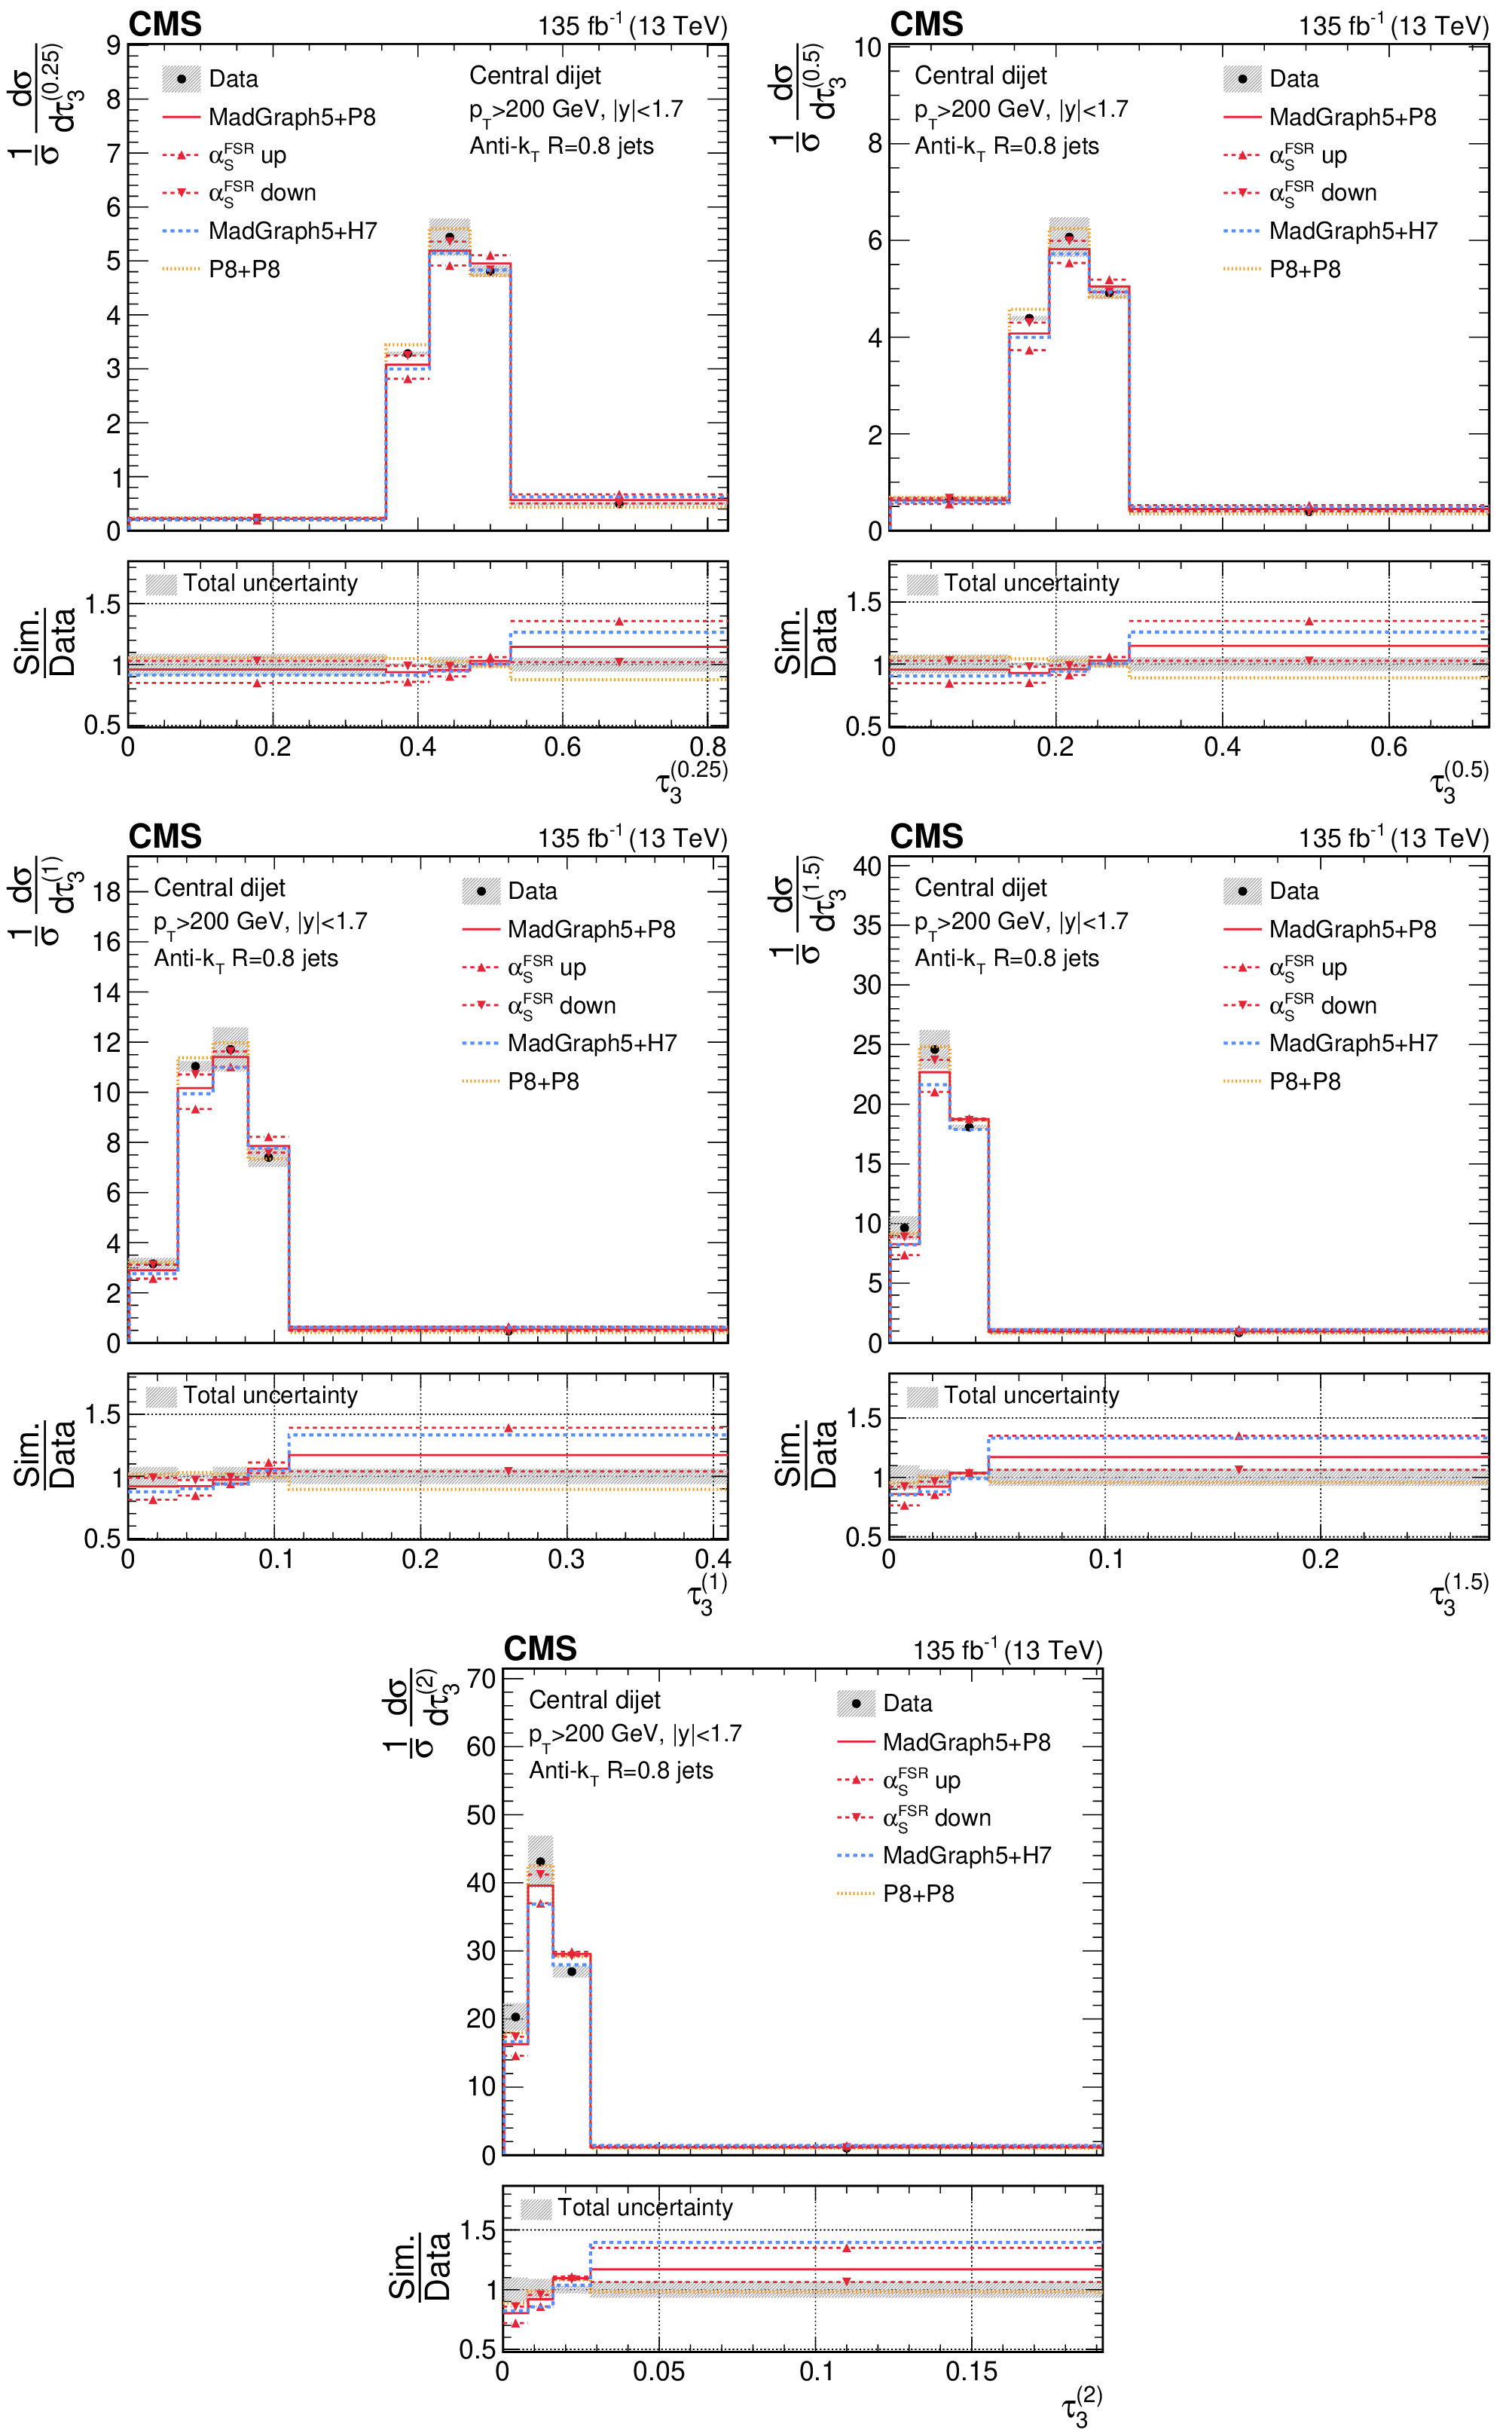
Figure 34:
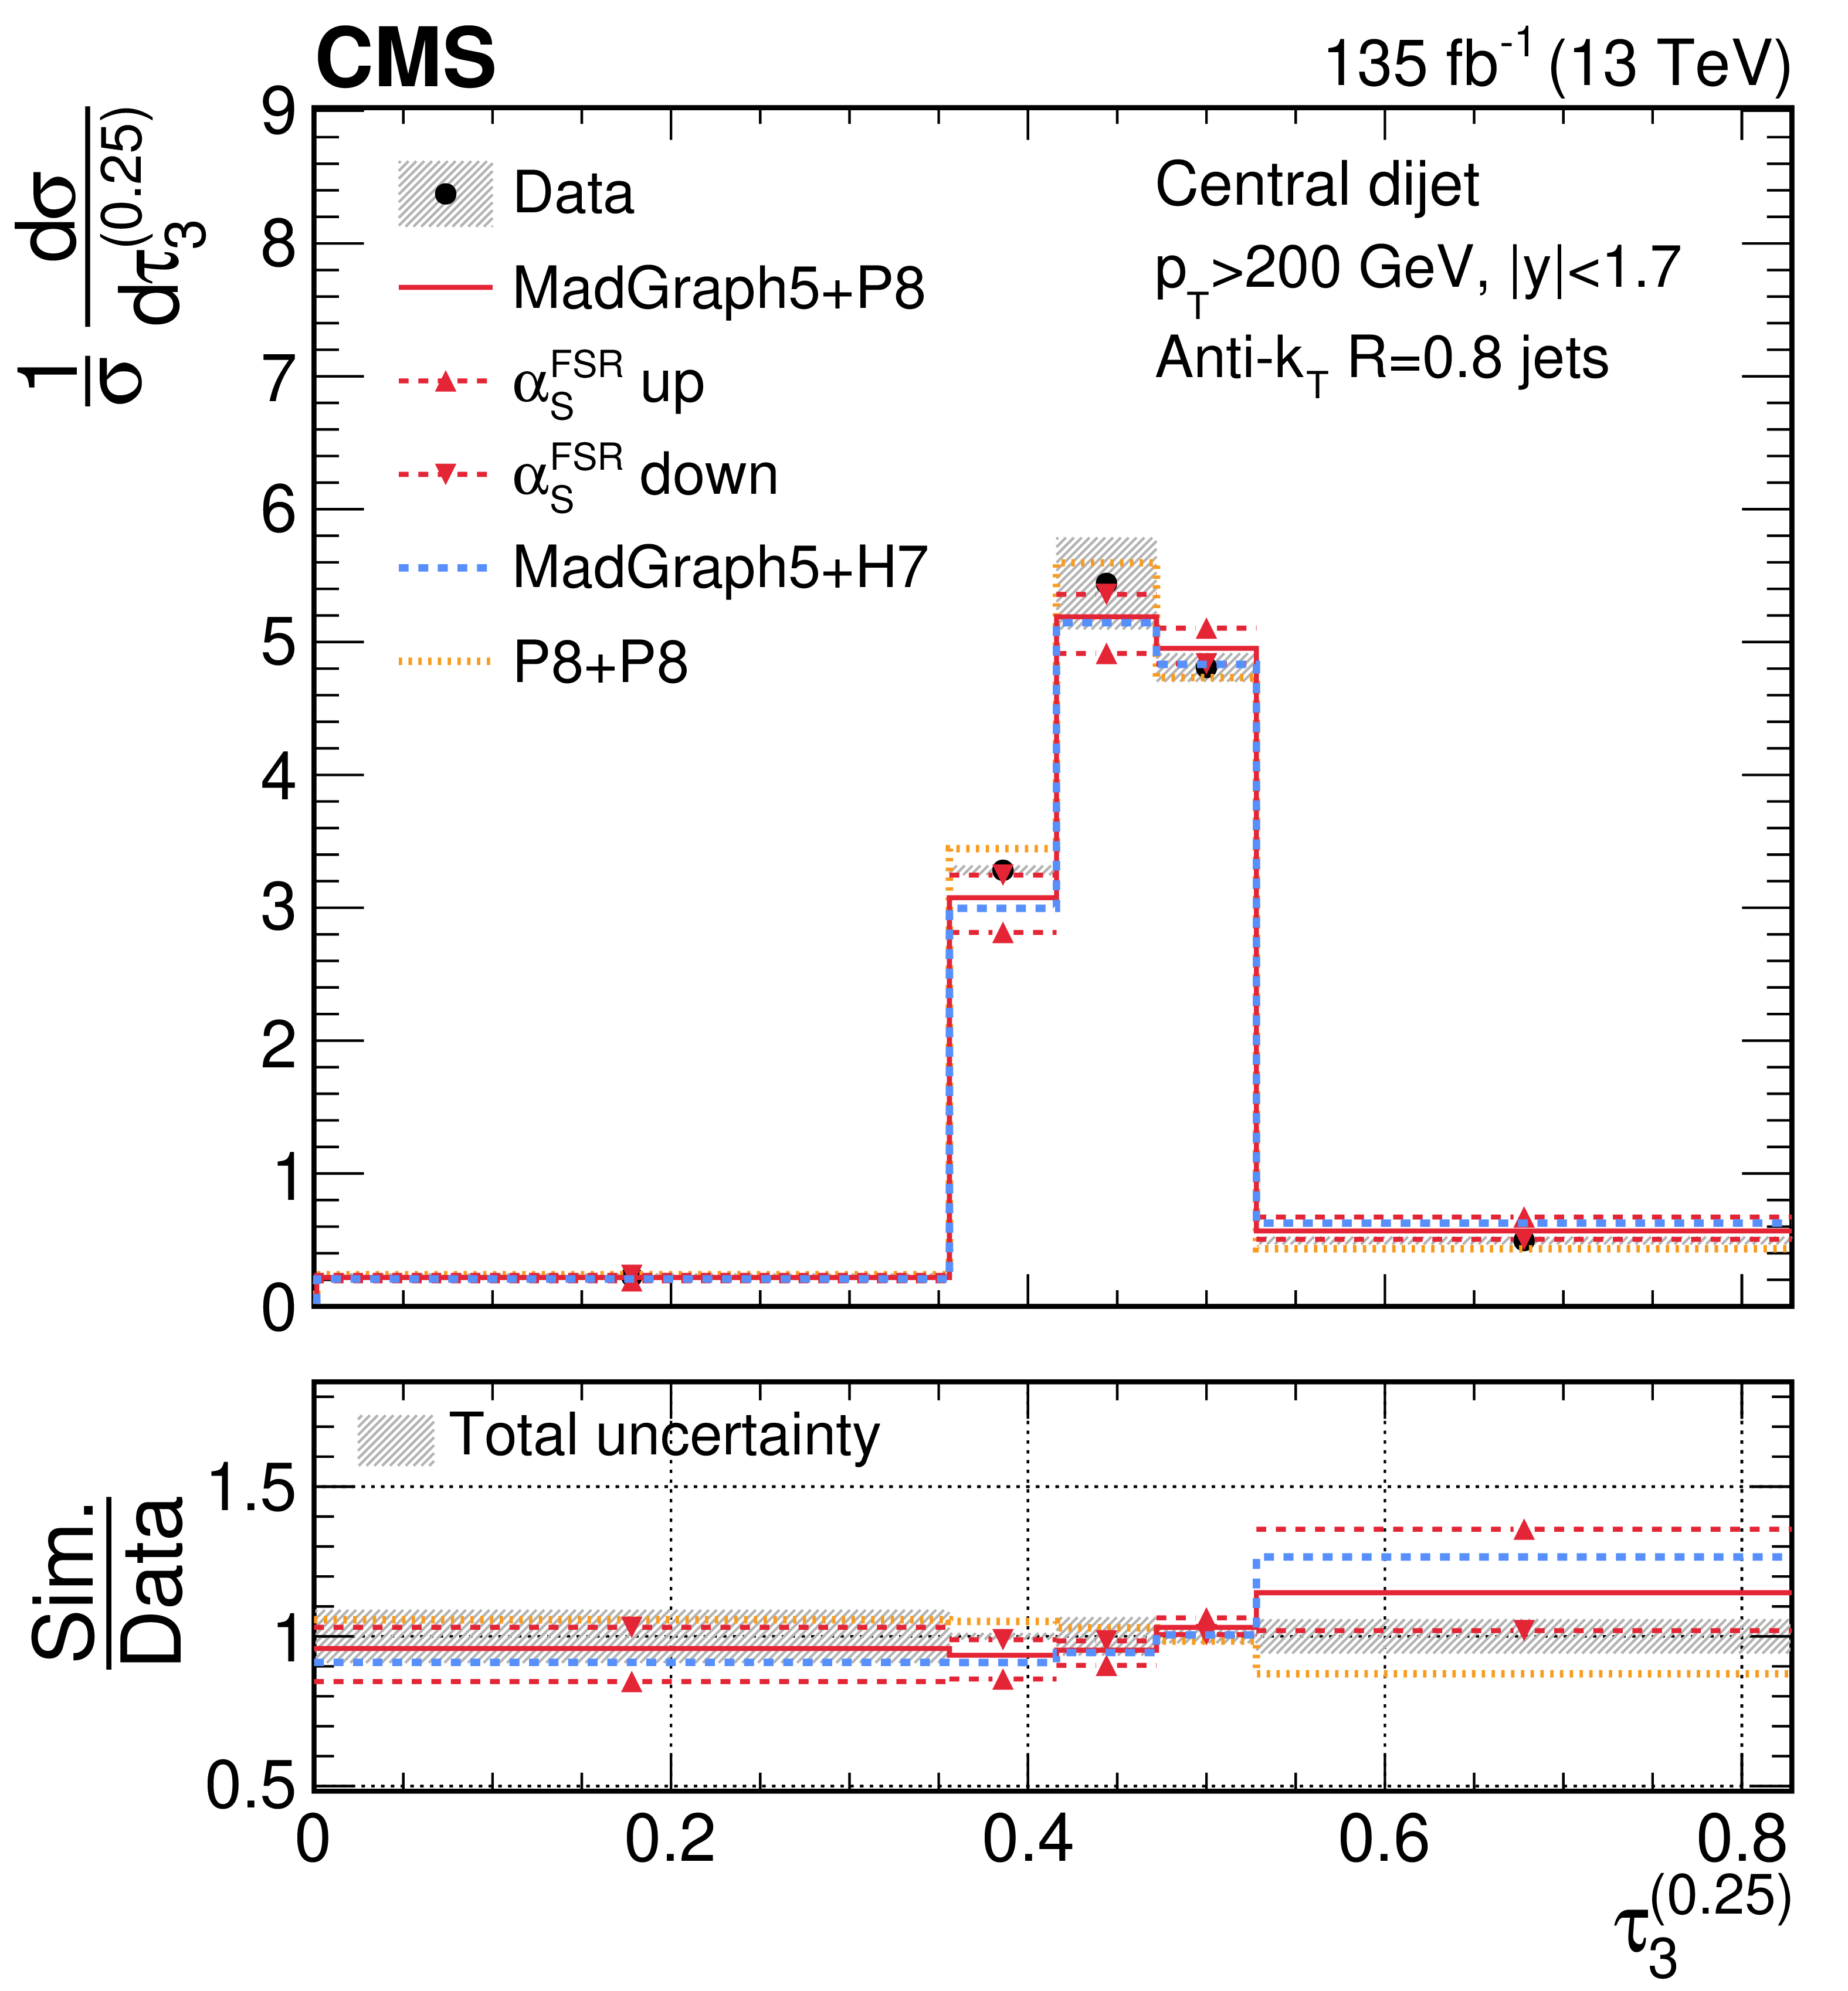
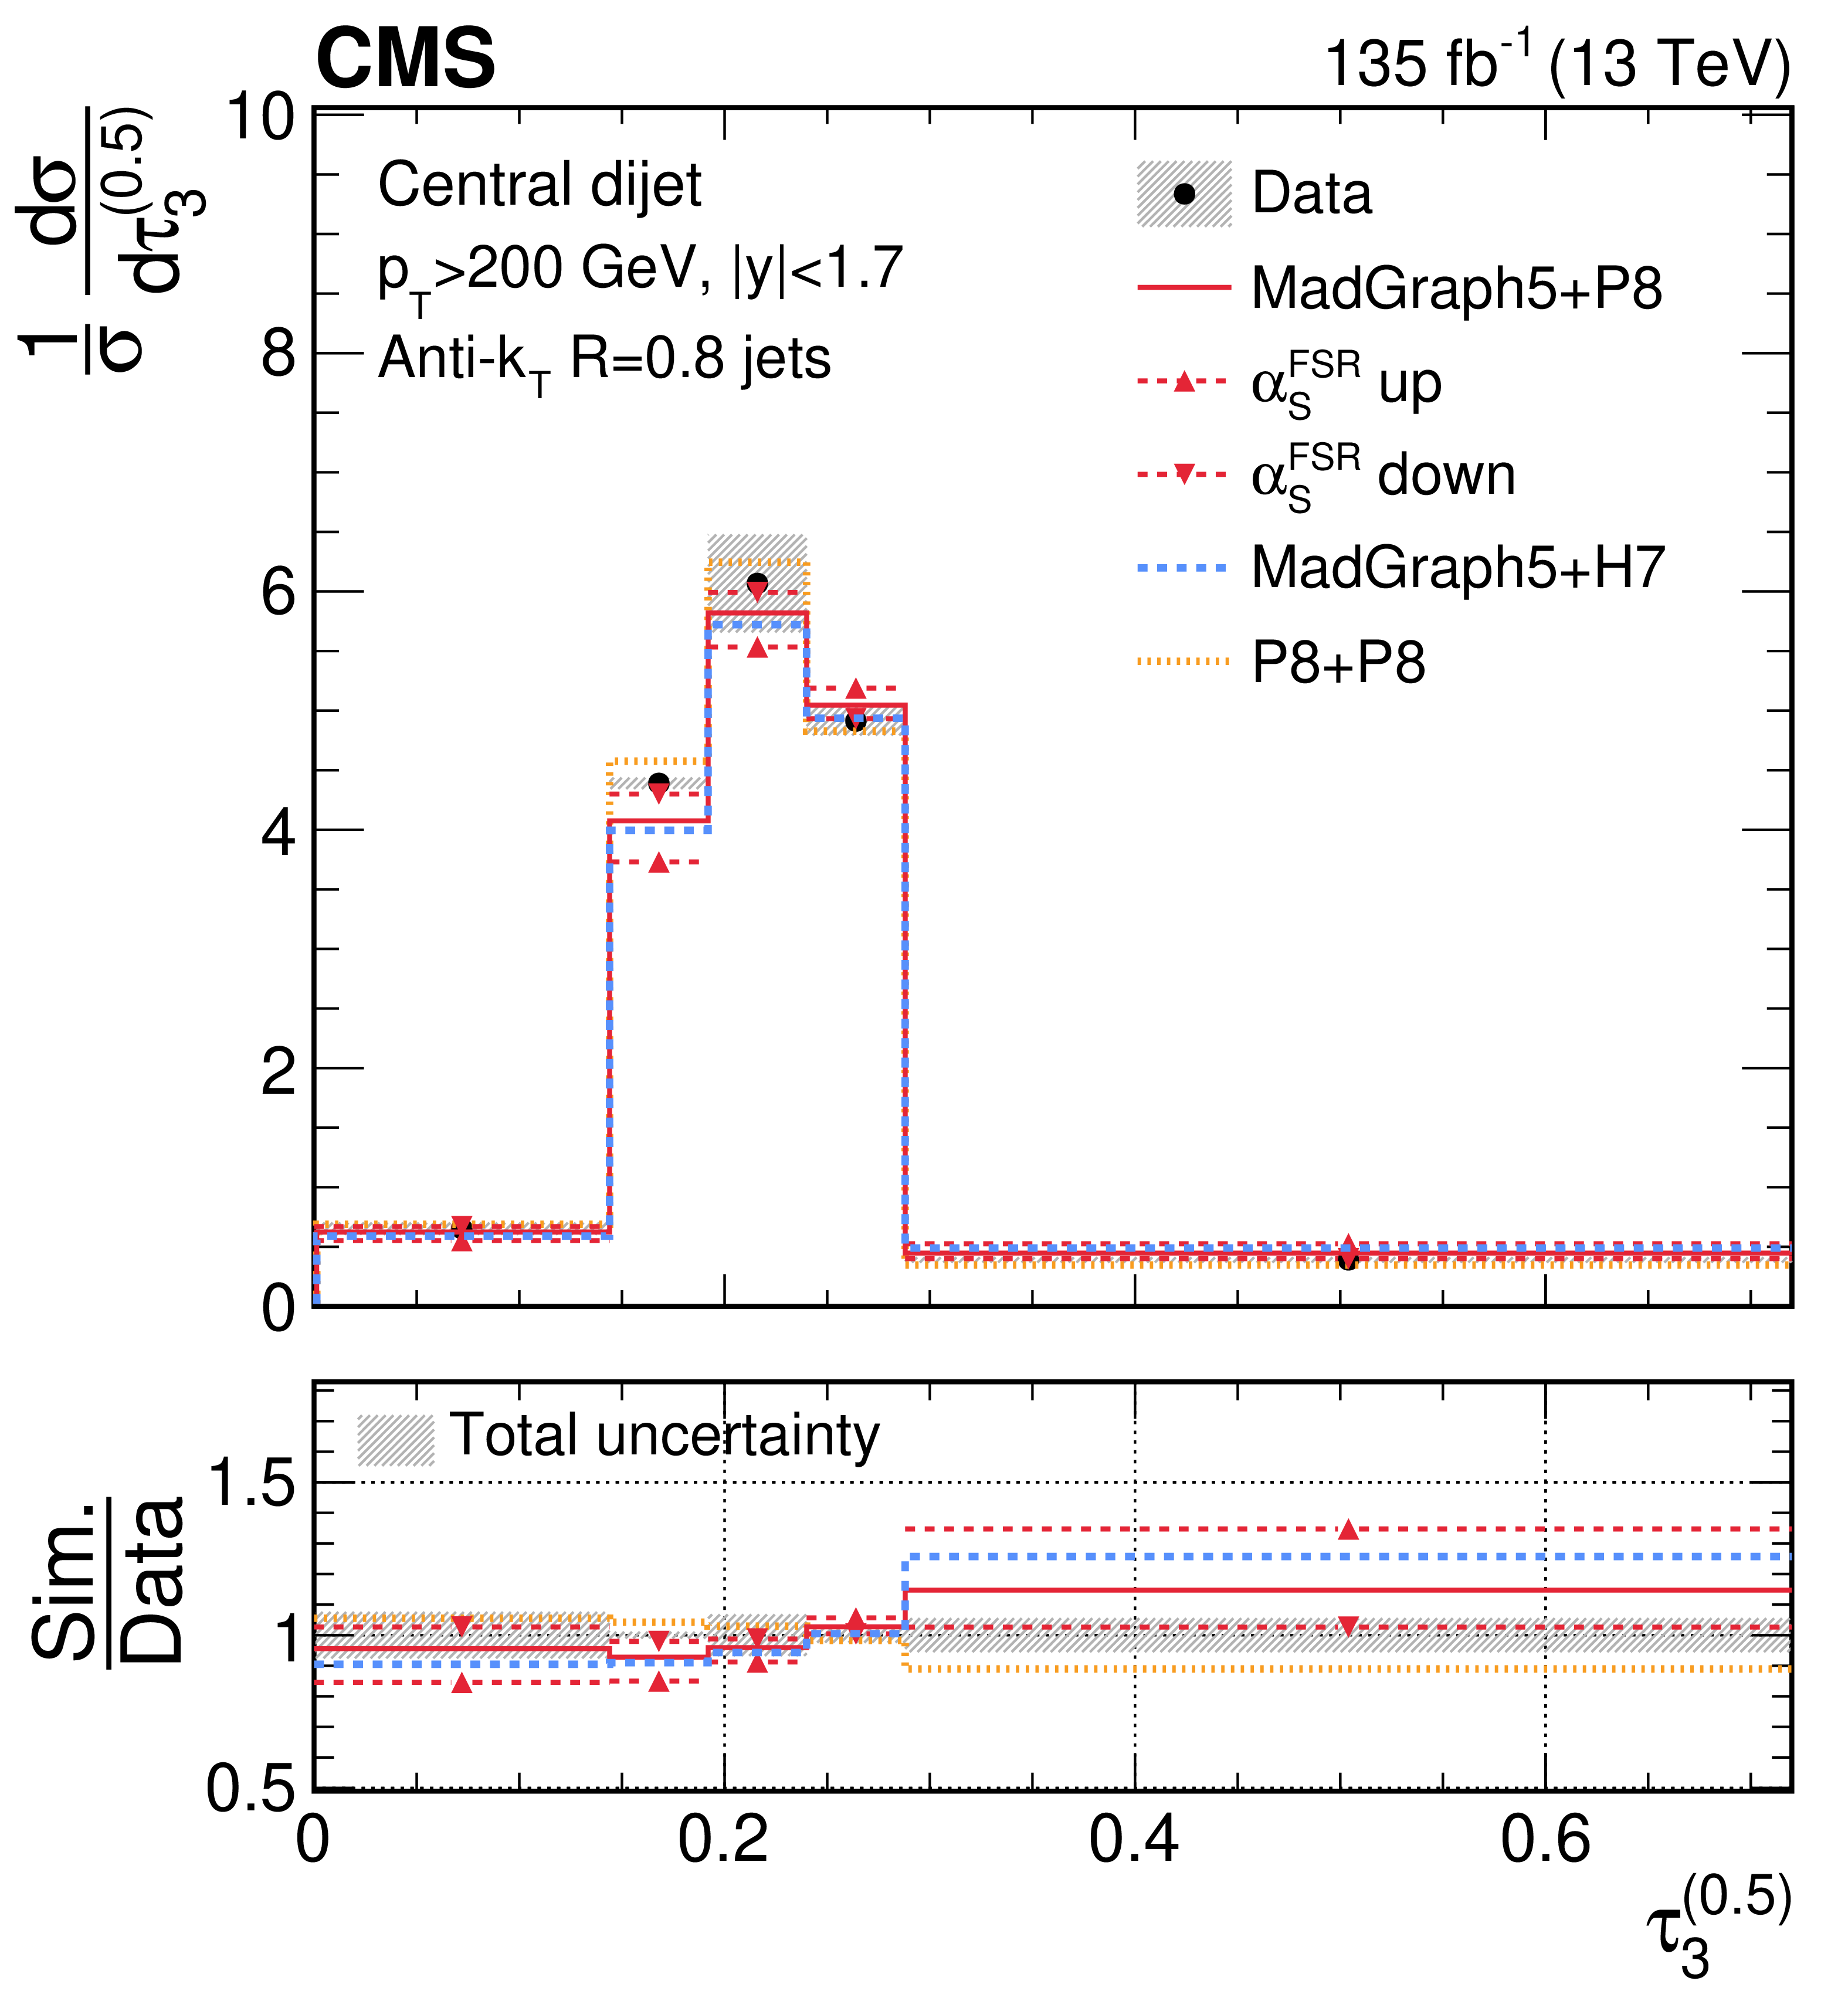
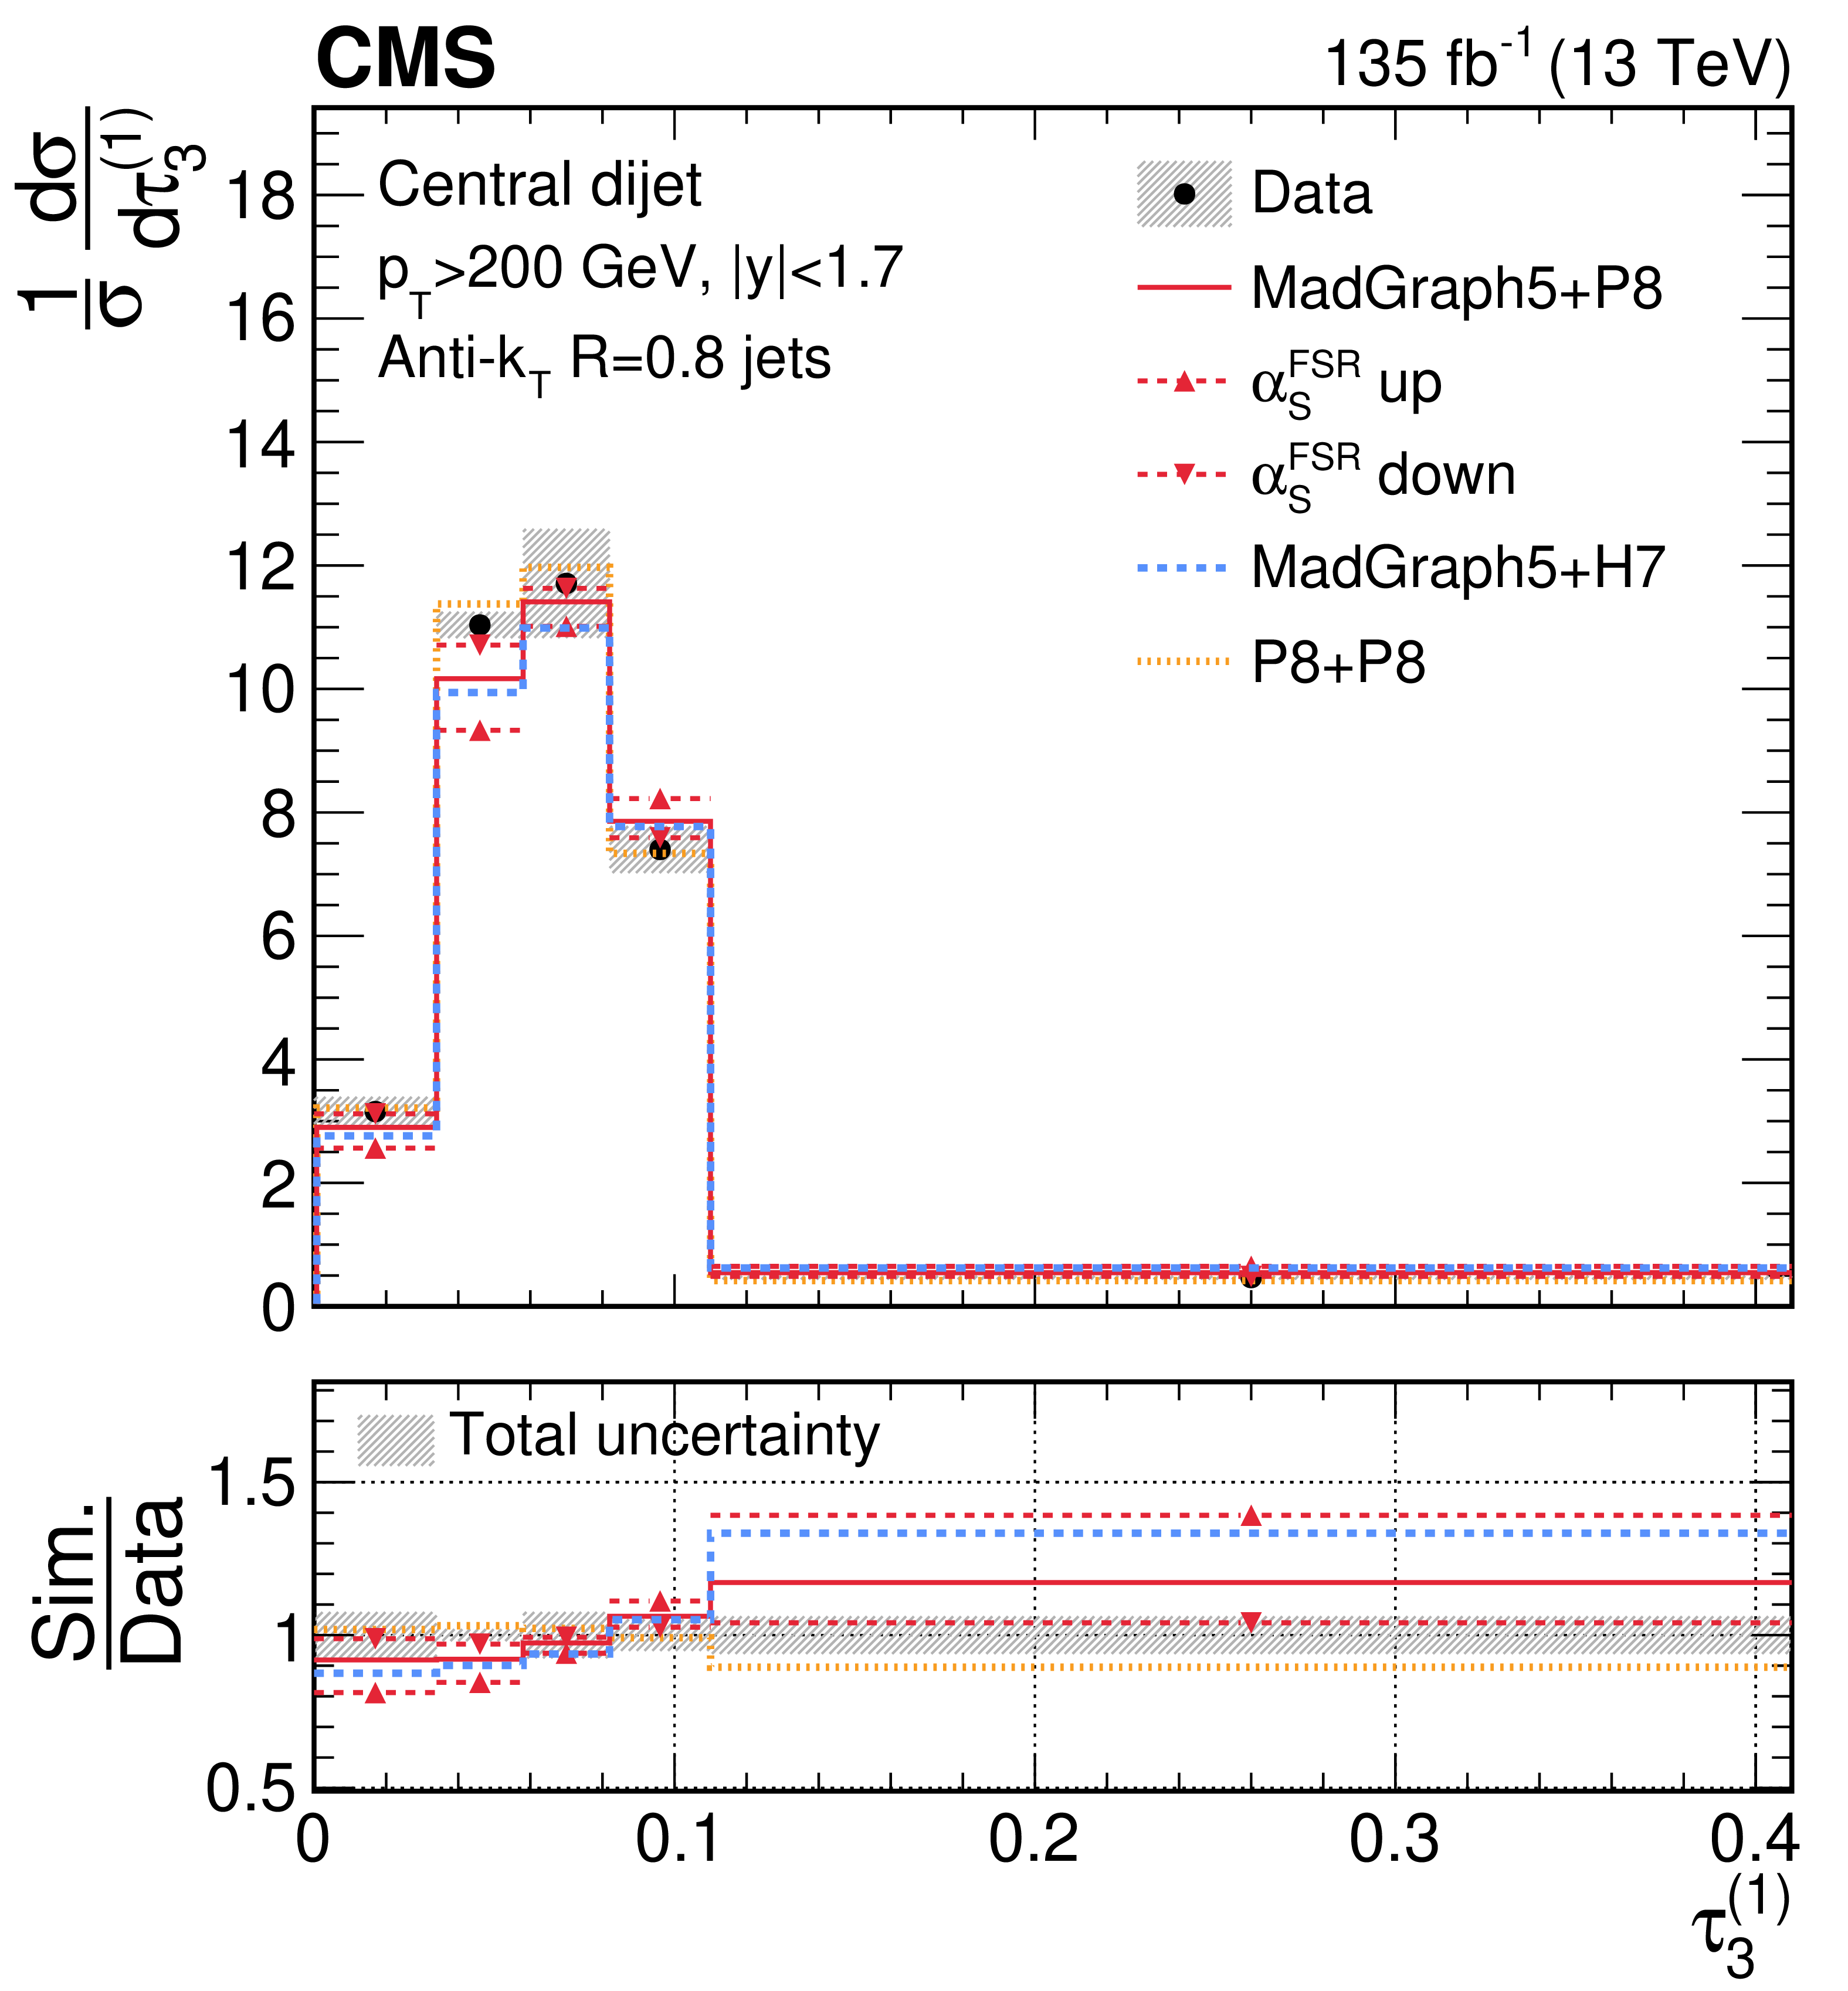
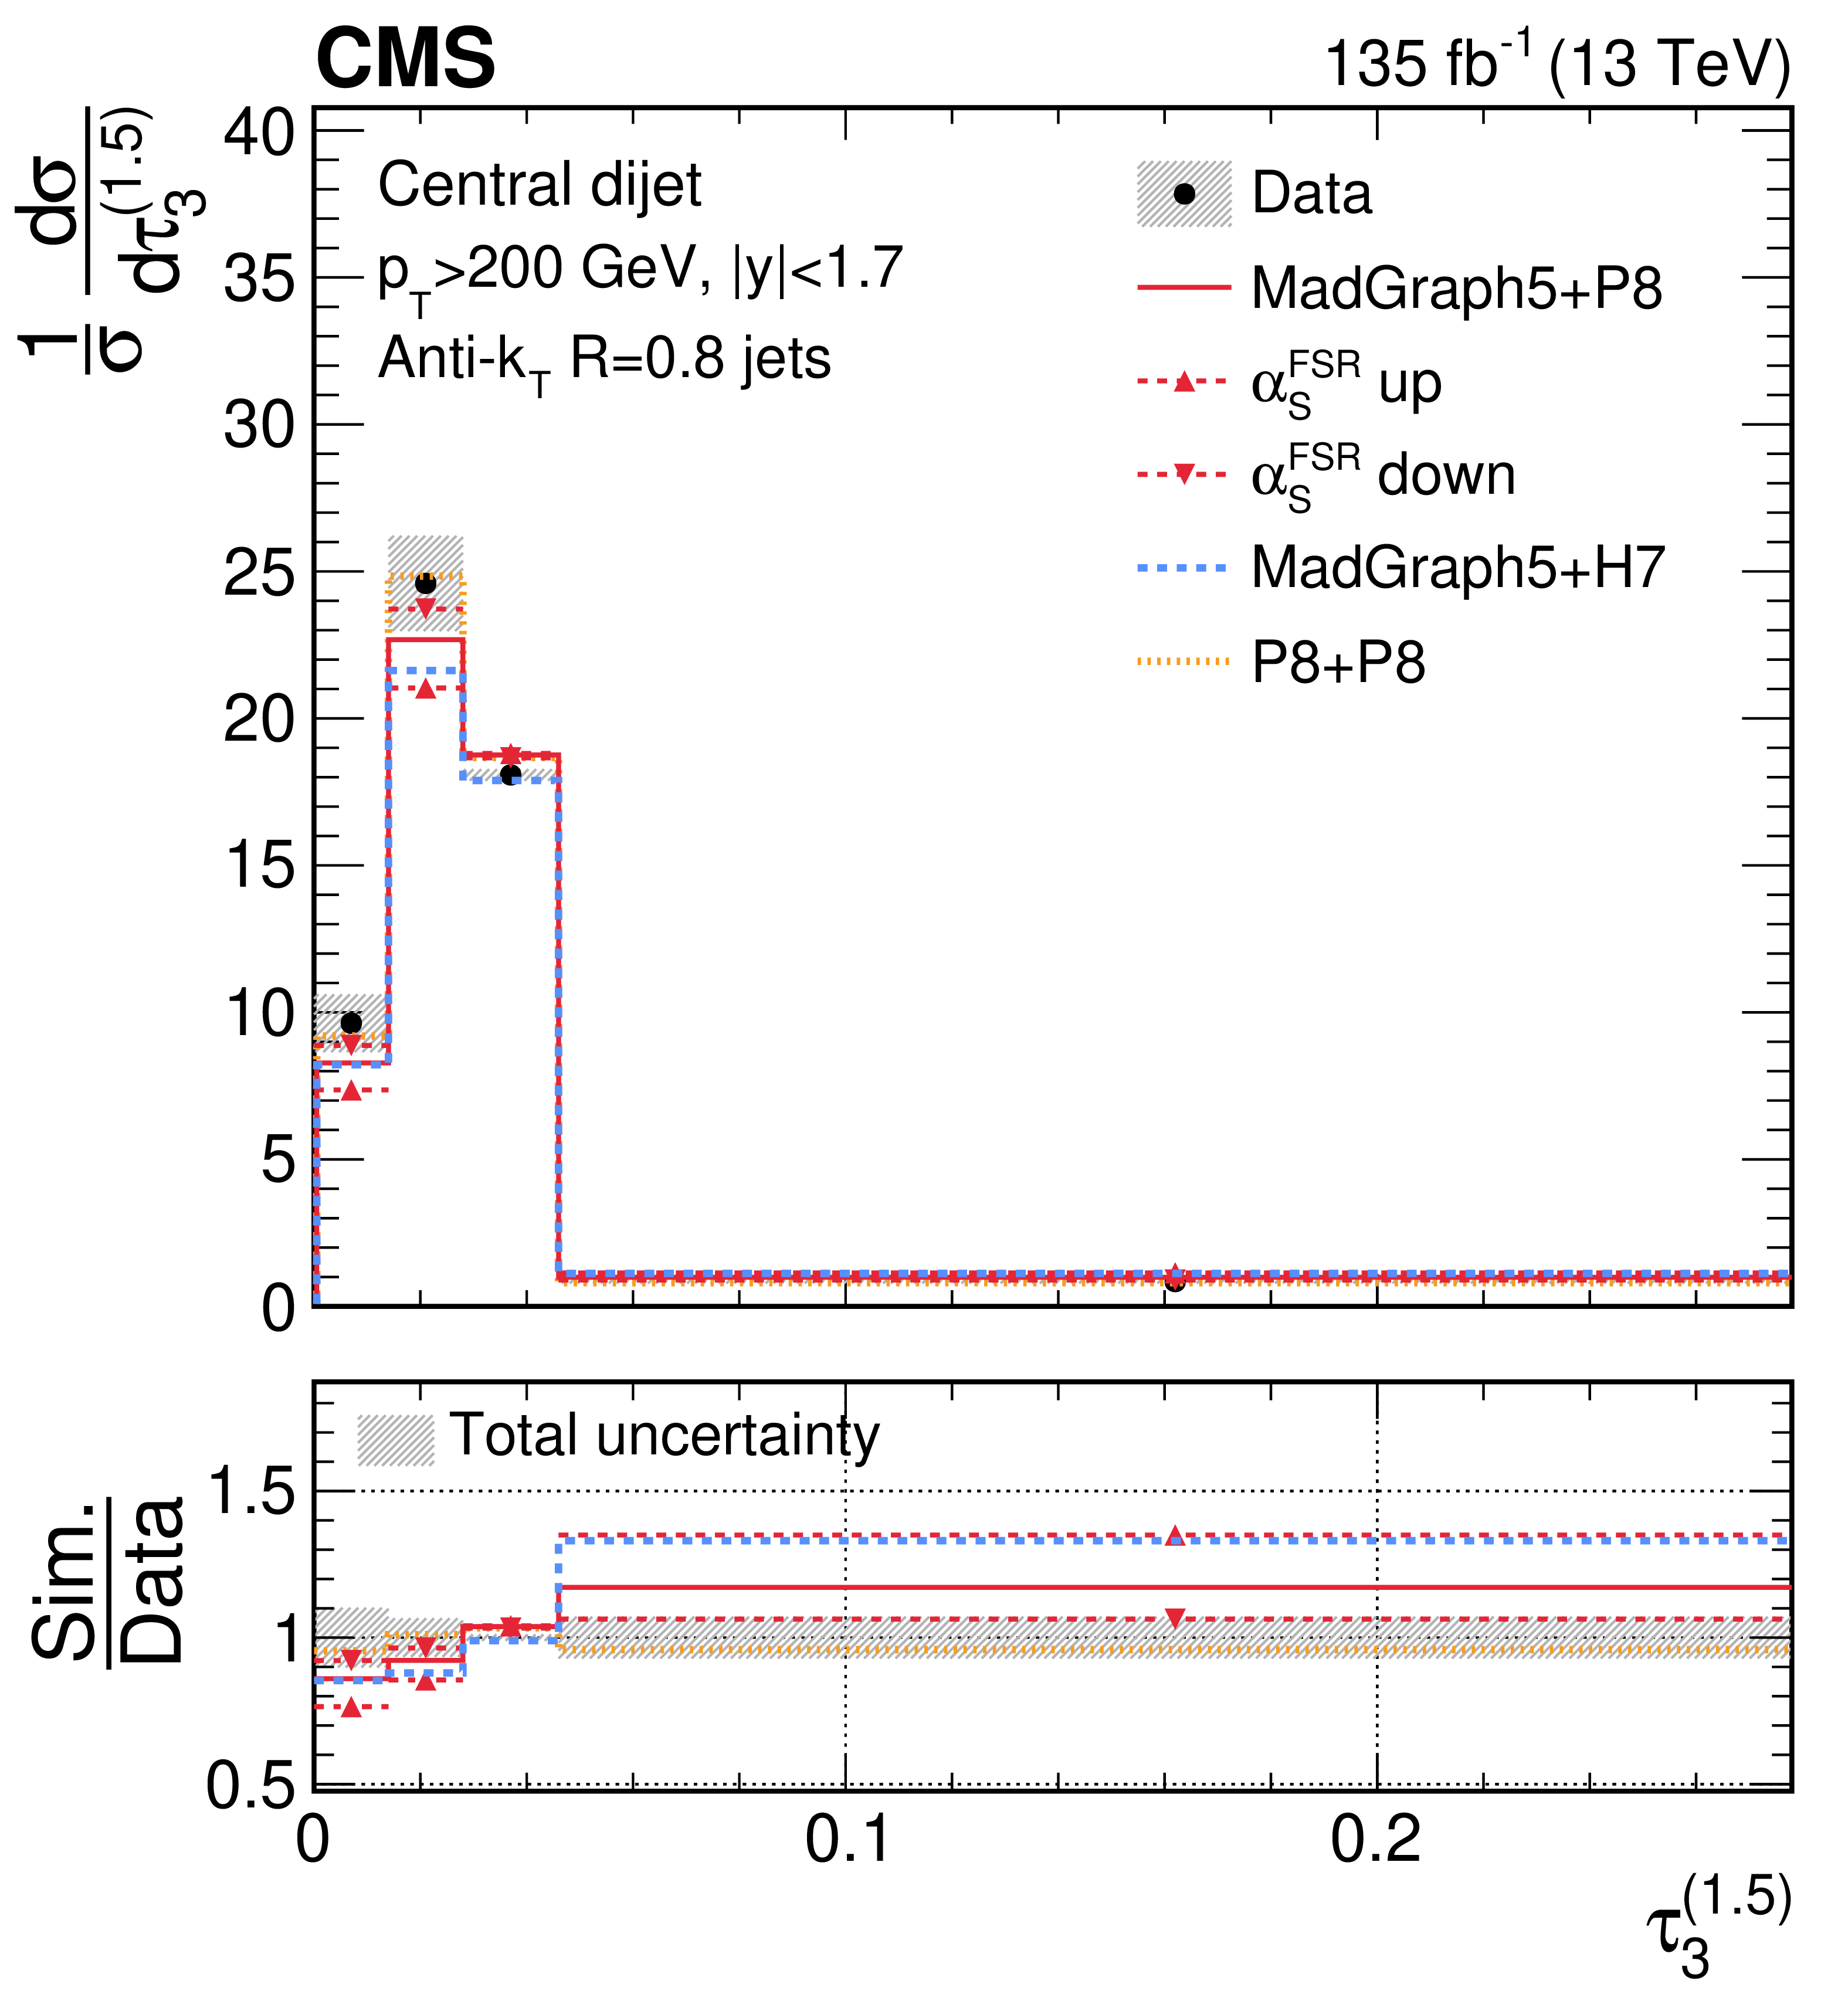
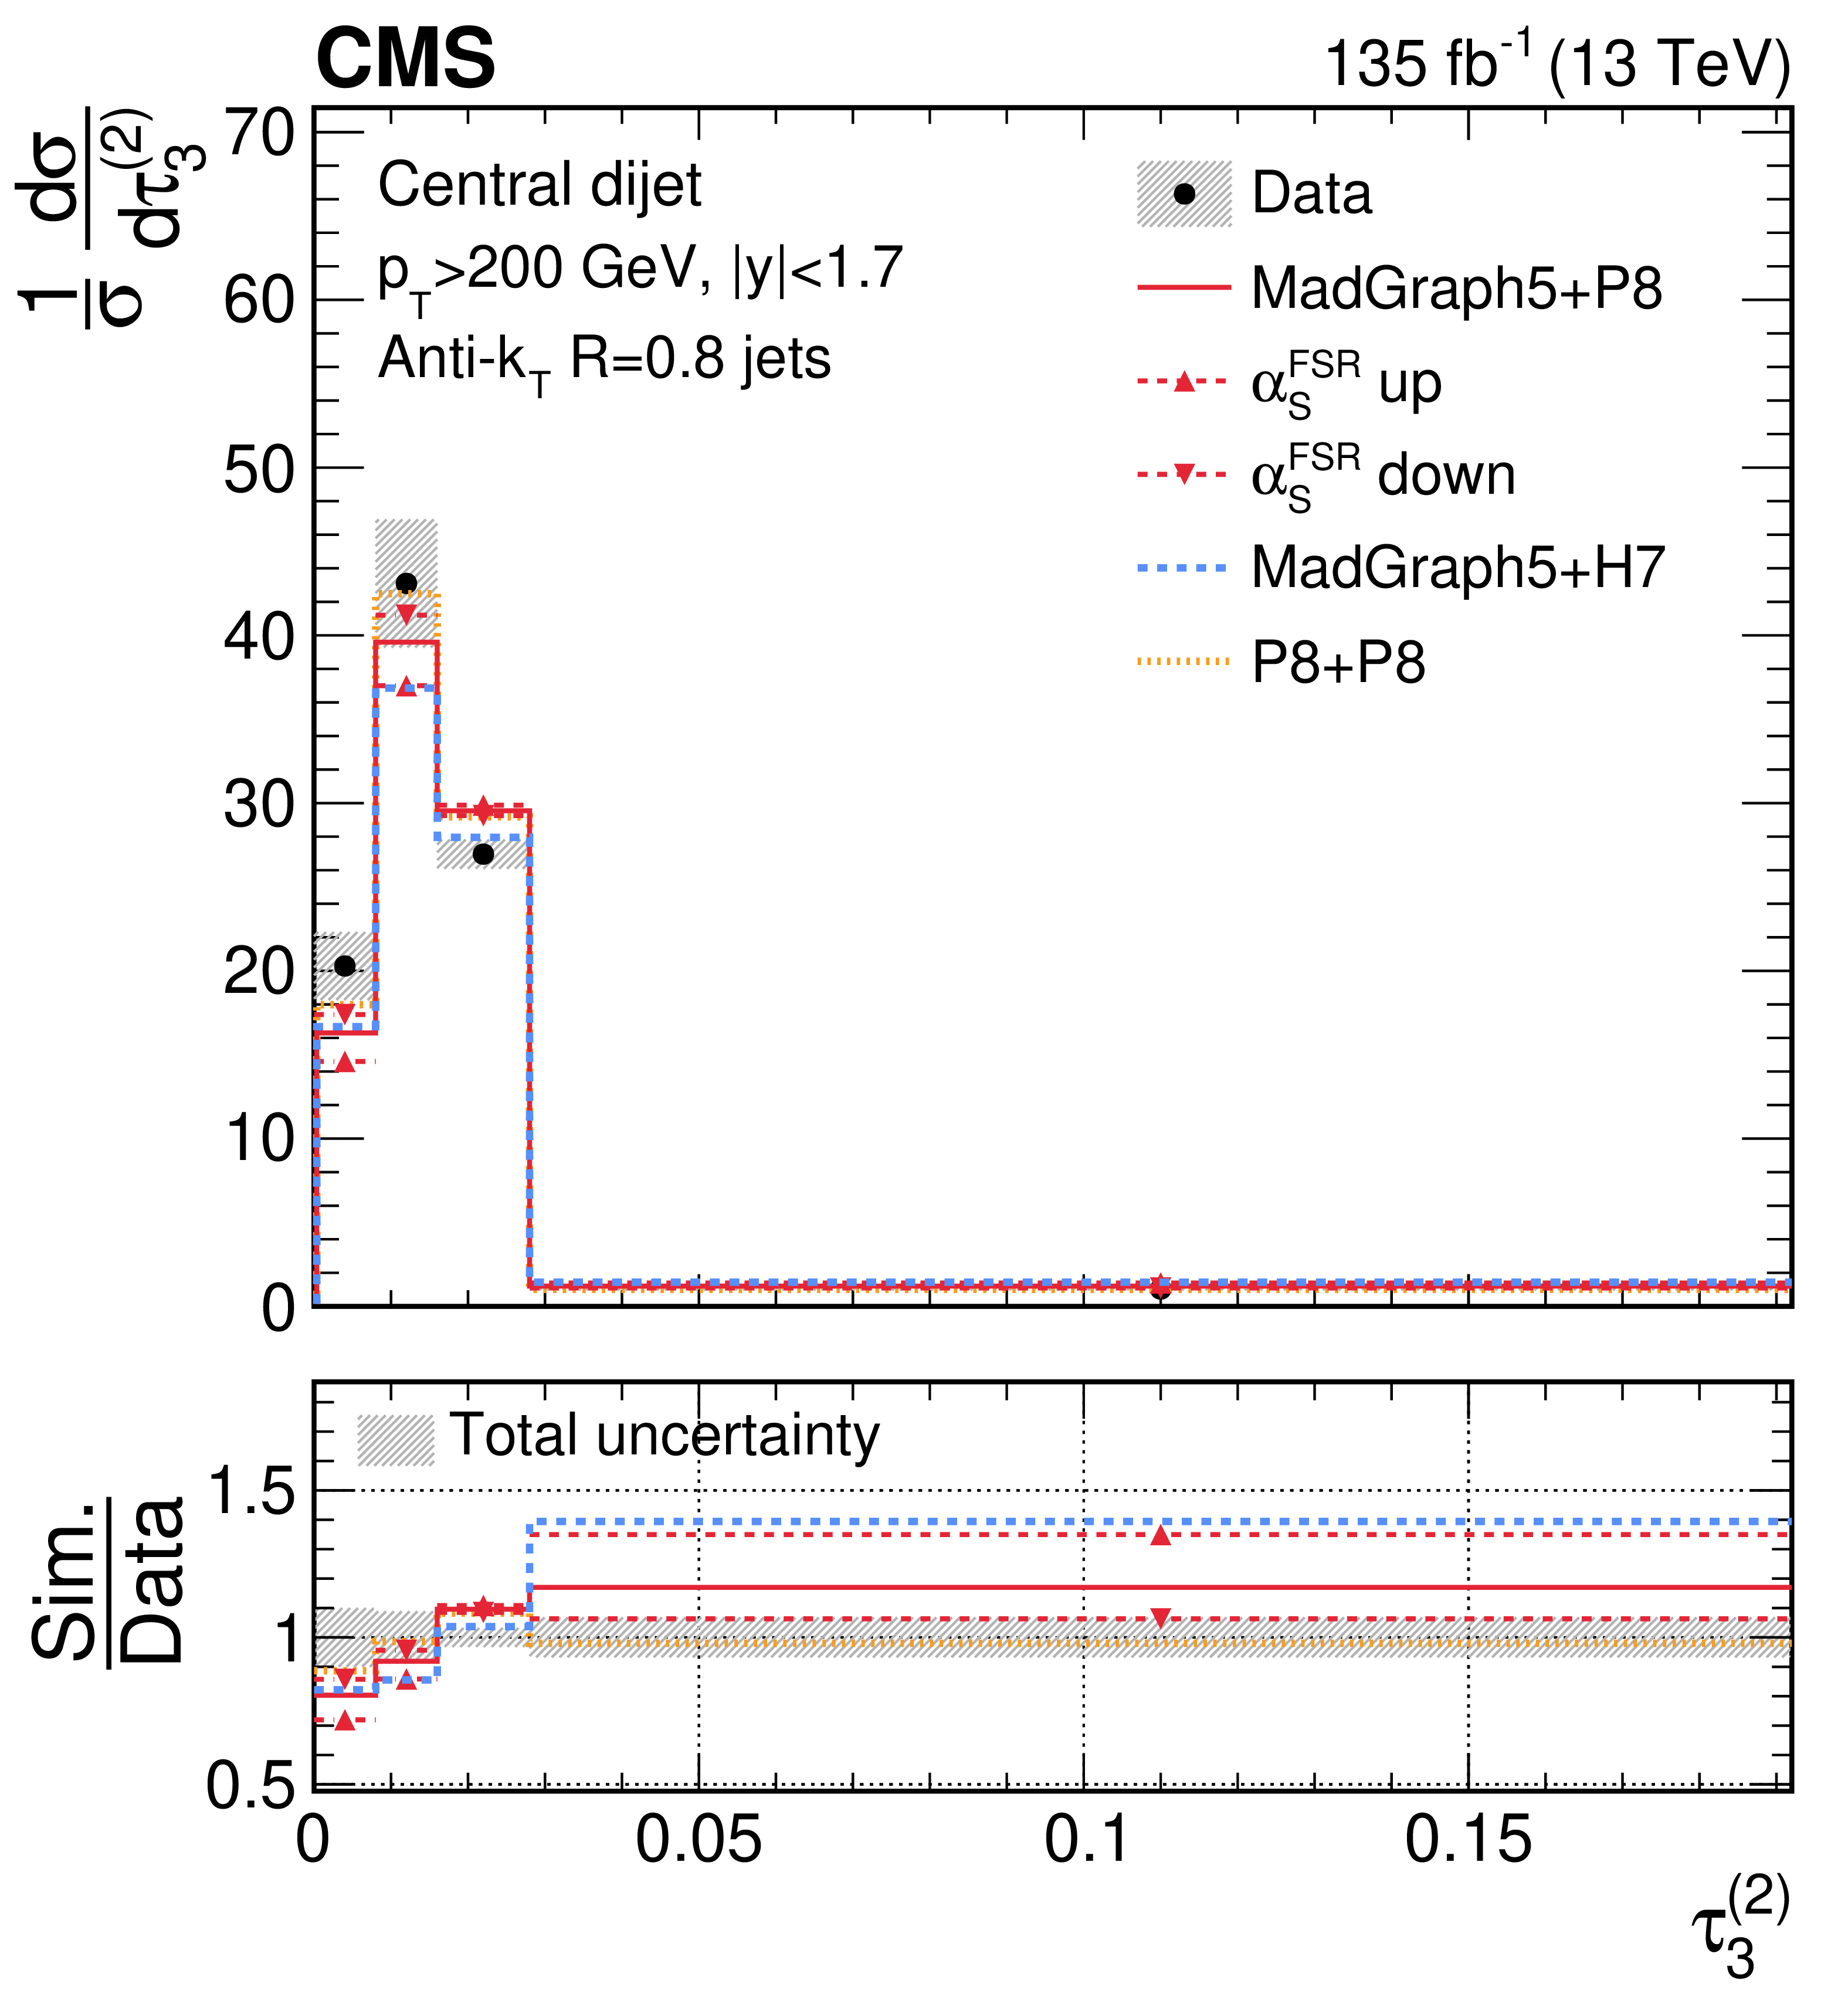
Unfolded distributions of 3-subjettiness observables,$\tau_{3}^{(0.25)}$,$\tau_{3}^{(0.5)}$, $\tau_{3}^{(1)}$, $\tau_{3}^{(1.5)}$, and $\tau_{3}^{(2)}$, measured for AK8 jets in the QCD dijet event selection, extracted from the normalized, combined distribution after unfolding; the bin contents and the error bars are scaled by the bin widths for the distributions of the individual observables. For comparisons with particle-level predictions, the error bars in data correspond to the total unfolding uncertainties, and the lower panels present the ratio of particle-level predictions to the unfolded data. The dark grey hashed region illustrates the total uncertainties per bin in the unfolded result. |
png pdf |
Figure 34-a:
Unfolded distributions of 3-subjettiness observables,$\tau_{3}^{(0.25)}$,$\tau_{3}^{(0.5)}$, $\tau_{3}^{(1)}$, $\tau_{3}^{(1.5)}$, and $\tau_{3}^{(2)}$, measured for AK8 jets in the QCD dijet event selection, extracted from the normalized, combined distribution after unfolding; the bin contents and the error bars are scaled by the bin widths for the distributions of the individual observables. For comparisons with particle-level predictions, the error bars in data correspond to the total unfolding uncertainties, and the lower panels present the ratio of particle-level predictions to the unfolded data. The dark grey hashed region illustrates the total uncertainties per bin in the unfolded result. |
png pdf |
Figure 34-b:
Unfolded distributions of 3-subjettiness observables,$\tau_{3}^{(0.25)}$,$\tau_{3}^{(0.5)}$, $\tau_{3}^{(1)}$, $\tau_{3}^{(1.5)}$, and $\tau_{3}^{(2)}$, measured for AK8 jets in the QCD dijet event selection, extracted from the normalized, combined distribution after unfolding; the bin contents and the error bars are scaled by the bin widths for the distributions of the individual observables. For comparisons with particle-level predictions, the error bars in data correspond to the total unfolding uncertainties, and the lower panels present the ratio of particle-level predictions to the unfolded data. The dark grey hashed region illustrates the total uncertainties per bin in the unfolded result. |
png pdf |
Figure 34-c:
Unfolded distributions of 3-subjettiness observables,$\tau_{3}^{(0.25)}$,$\tau_{3}^{(0.5)}$, $\tau_{3}^{(1)}$, $\tau_{3}^{(1.5)}$, and $\tau_{3}^{(2)}$, measured for AK8 jets in the QCD dijet event selection, extracted from the normalized, combined distribution after unfolding; the bin contents and the error bars are scaled by the bin widths for the distributions of the individual observables. For comparisons with particle-level predictions, the error bars in data correspond to the total unfolding uncertainties, and the lower panels present the ratio of particle-level predictions to the unfolded data. The dark grey hashed region illustrates the total uncertainties per bin in the unfolded result. |
png pdf |
Figure 34-d:
Unfolded distributions of 3-subjettiness observables,$\tau_{3}^{(0.25)}$,$\tau_{3}^{(0.5)}$, $\tau_{3}^{(1)}$, $\tau_{3}^{(1.5)}$, and $\tau_{3}^{(2)}$, measured for AK8 jets in the QCD dijet event selection, extracted from the normalized, combined distribution after unfolding; the bin contents and the error bars are scaled by the bin widths for the distributions of the individual observables. For comparisons with particle-level predictions, the error bars in data correspond to the total unfolding uncertainties, and the lower panels present the ratio of particle-level predictions to the unfolded data. The dark grey hashed region illustrates the total uncertainties per bin in the unfolded result. |
png pdf |
Figure 34-e:
Unfolded distributions of 3-subjettiness observables,$\tau_{3}^{(0.25)}$,$\tau_{3}^{(0.5)}$, $\tau_{3}^{(1)}$, $\tau_{3}^{(1.5)}$, and $\tau_{3}^{(2)}$, measured for AK8 jets in the QCD dijet event selection, extracted from the normalized, combined distribution after unfolding; the bin contents and the error bars are scaled by the bin widths for the distributions of the individual observables. For comparisons with particle-level predictions, the error bars in data correspond to the total unfolding uncertainties, and the lower panels present the ratio of particle-level predictions to the unfolded data. The dark grey hashed region illustrates the total uncertainties per bin in the unfolded result. |
png pdf |
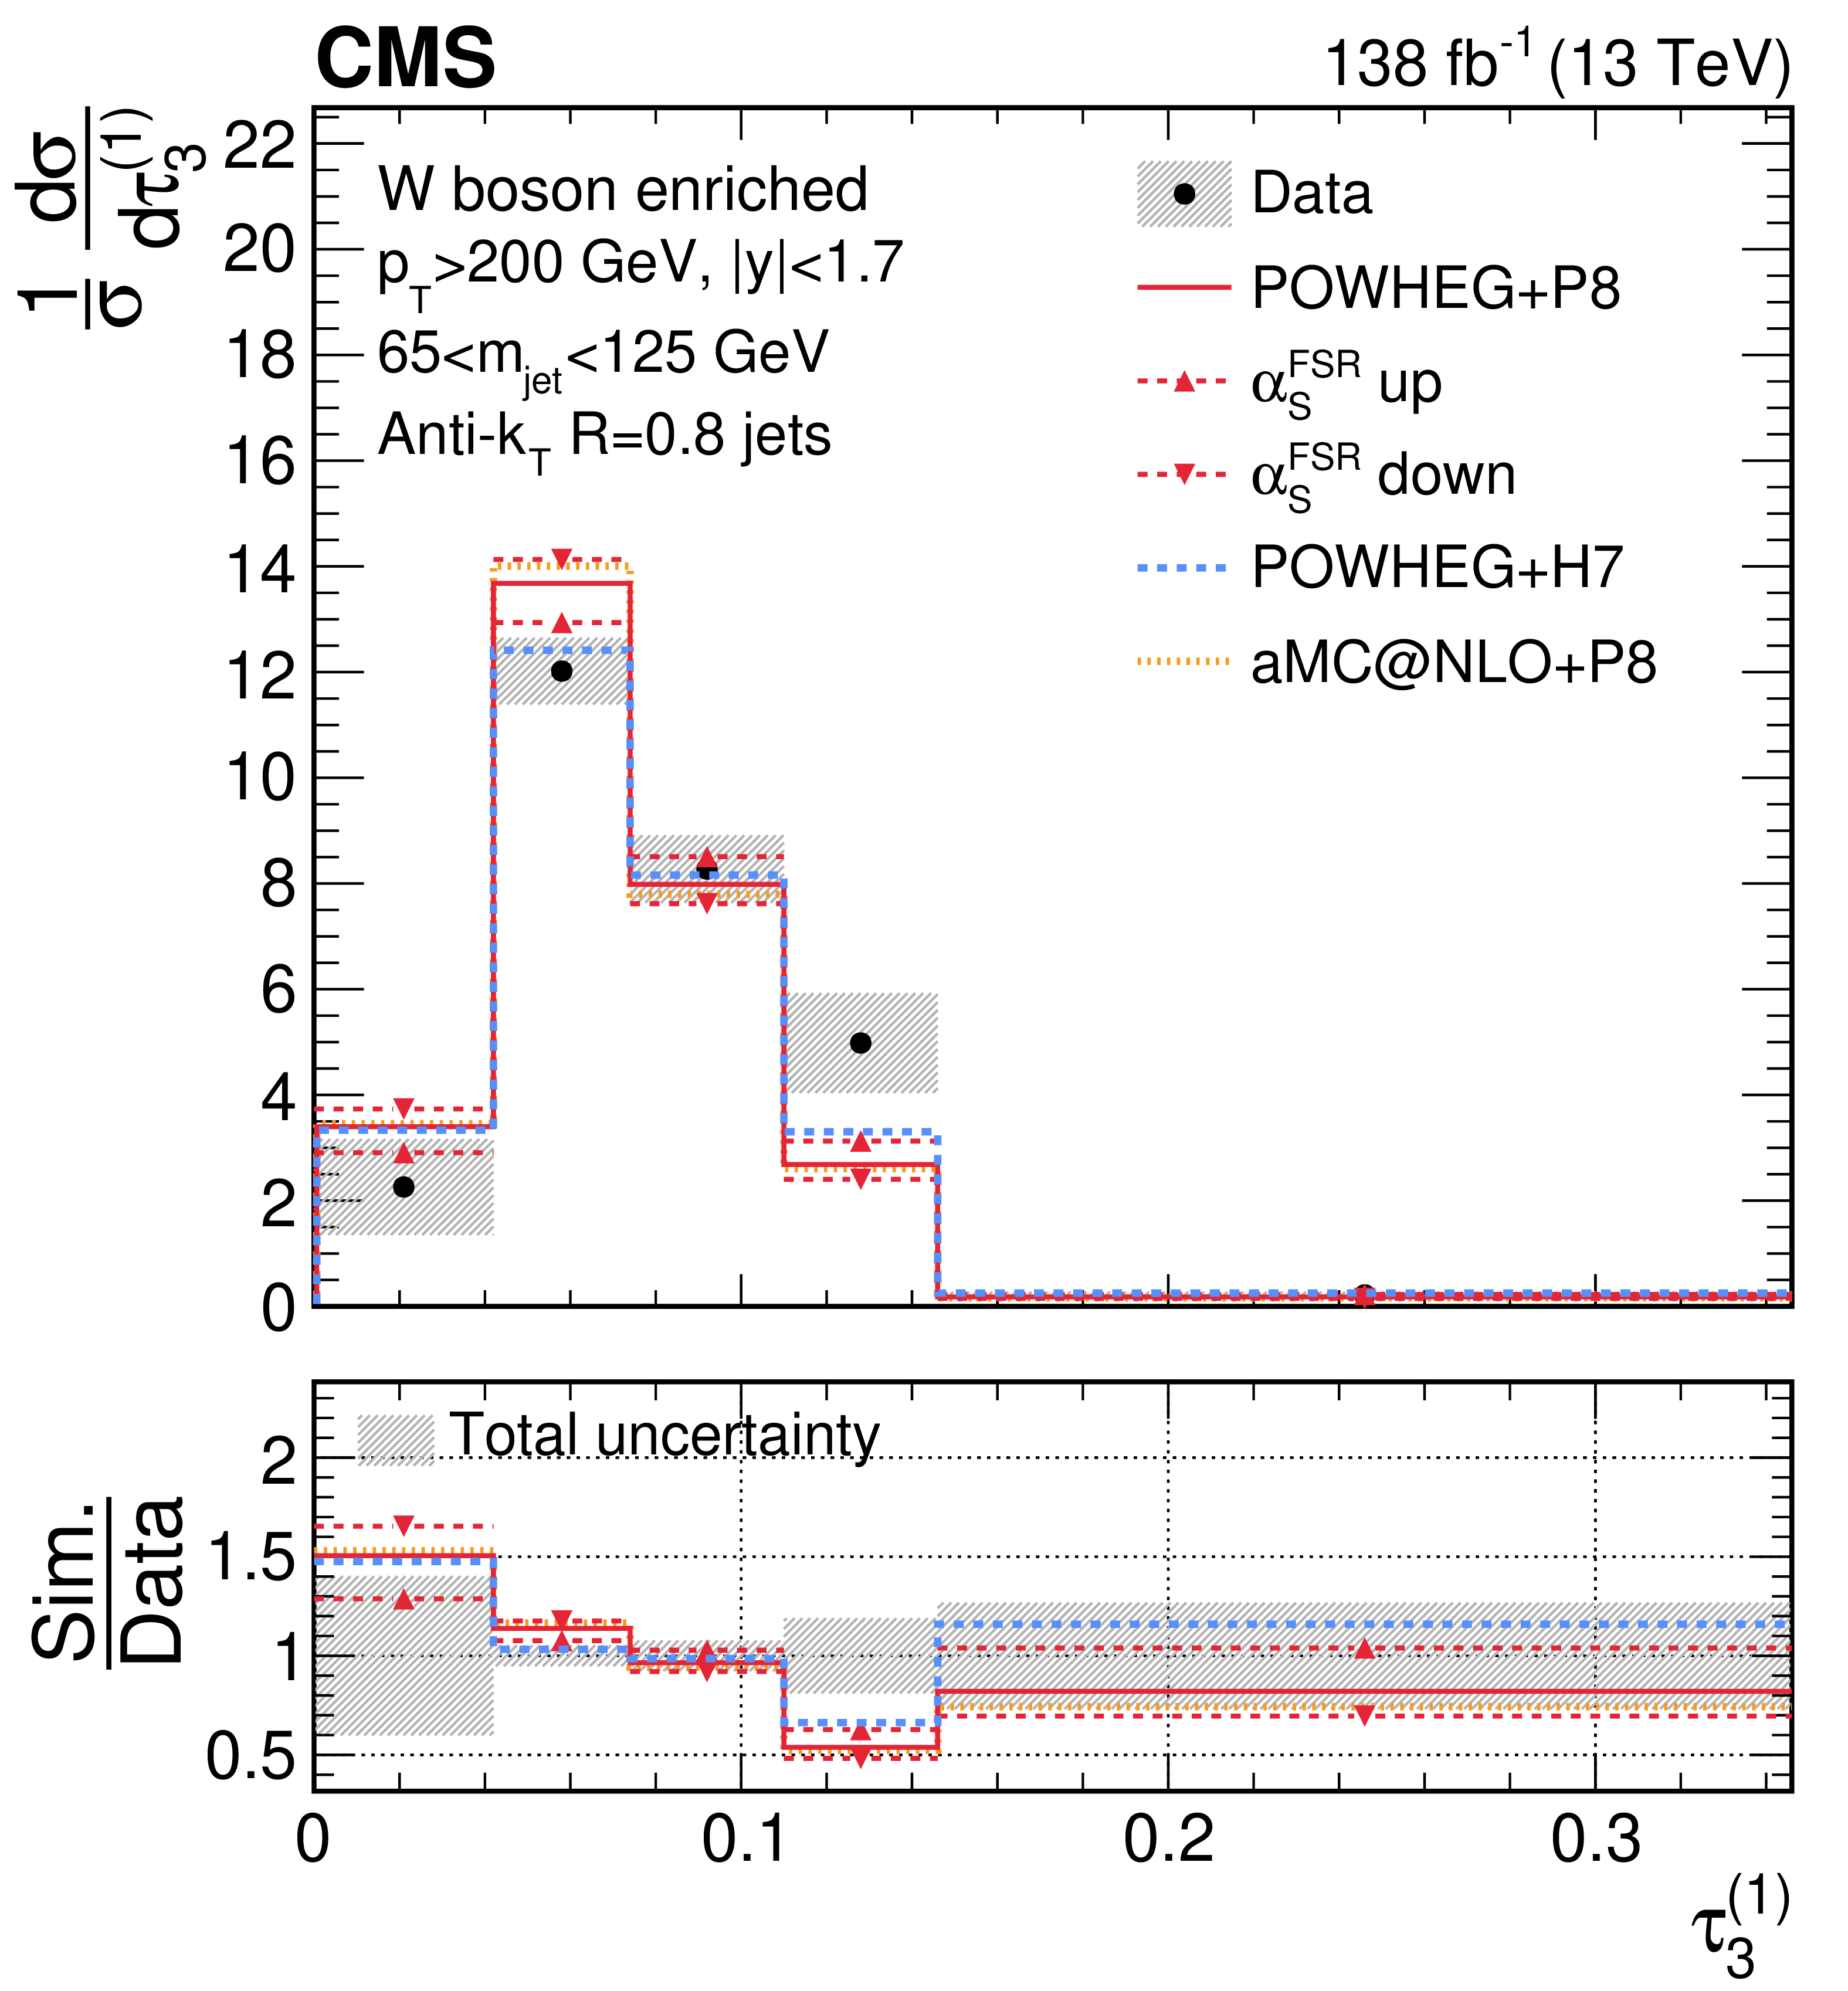
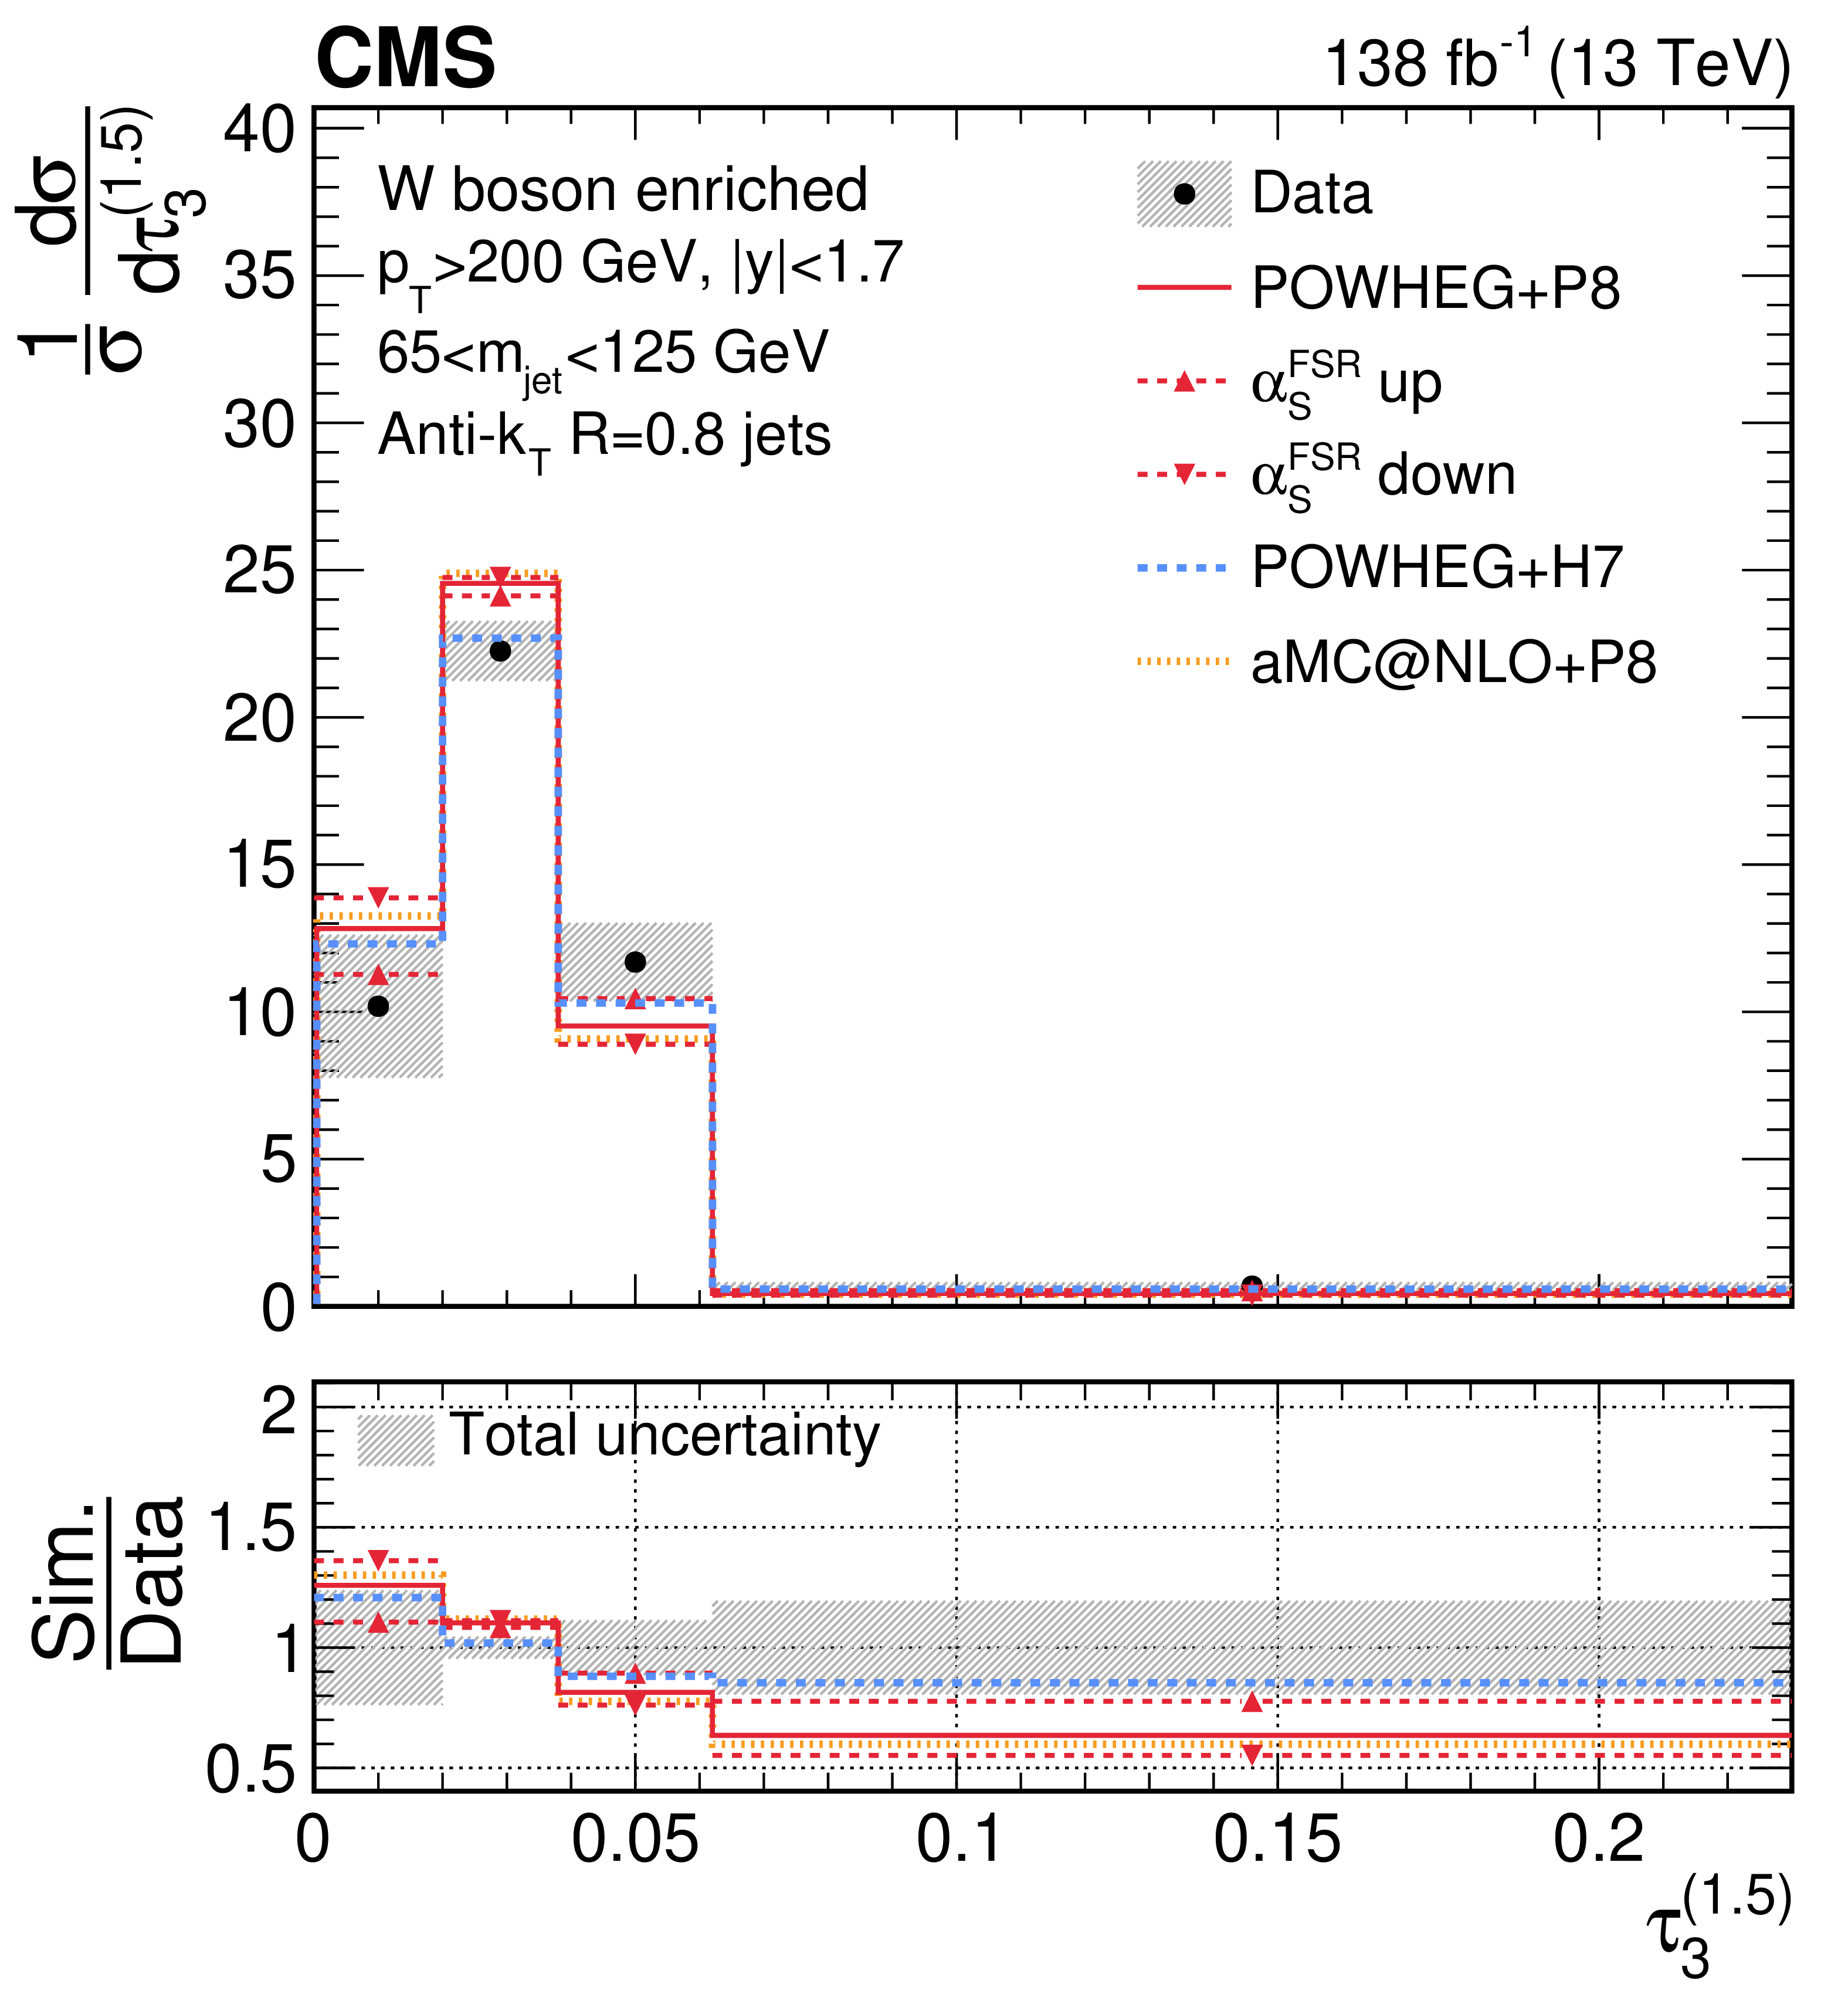
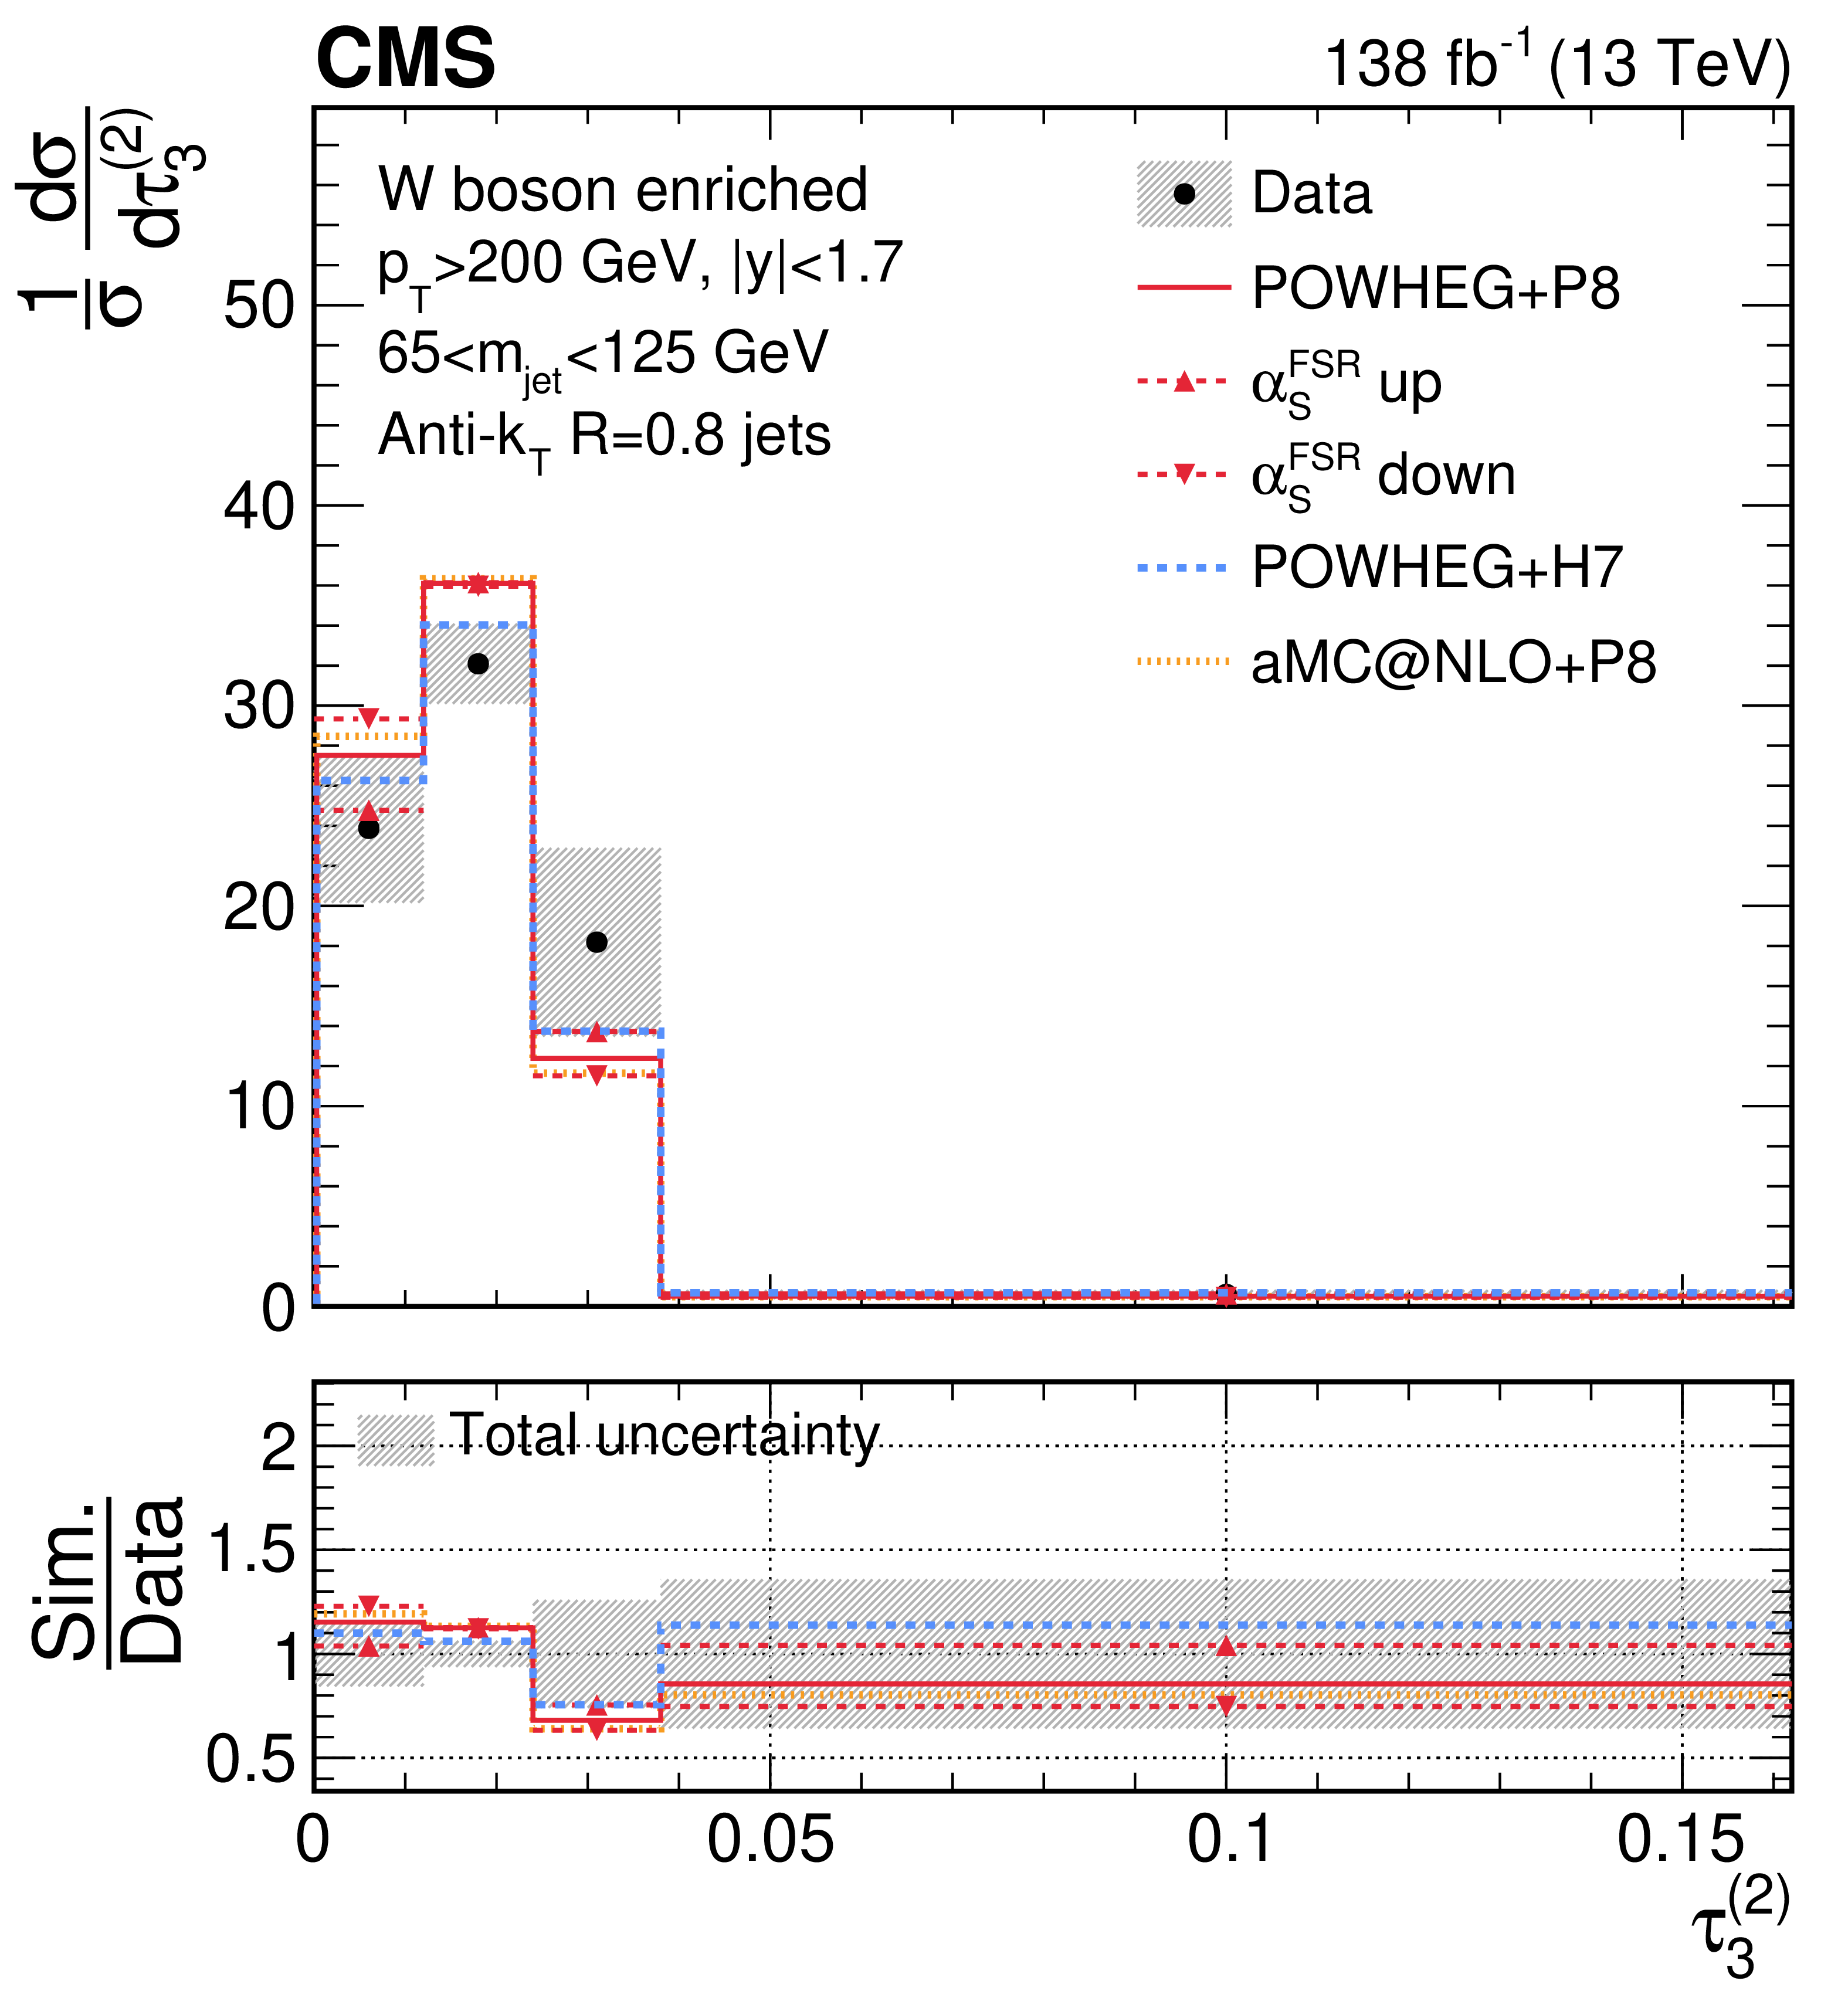
Figure 35:
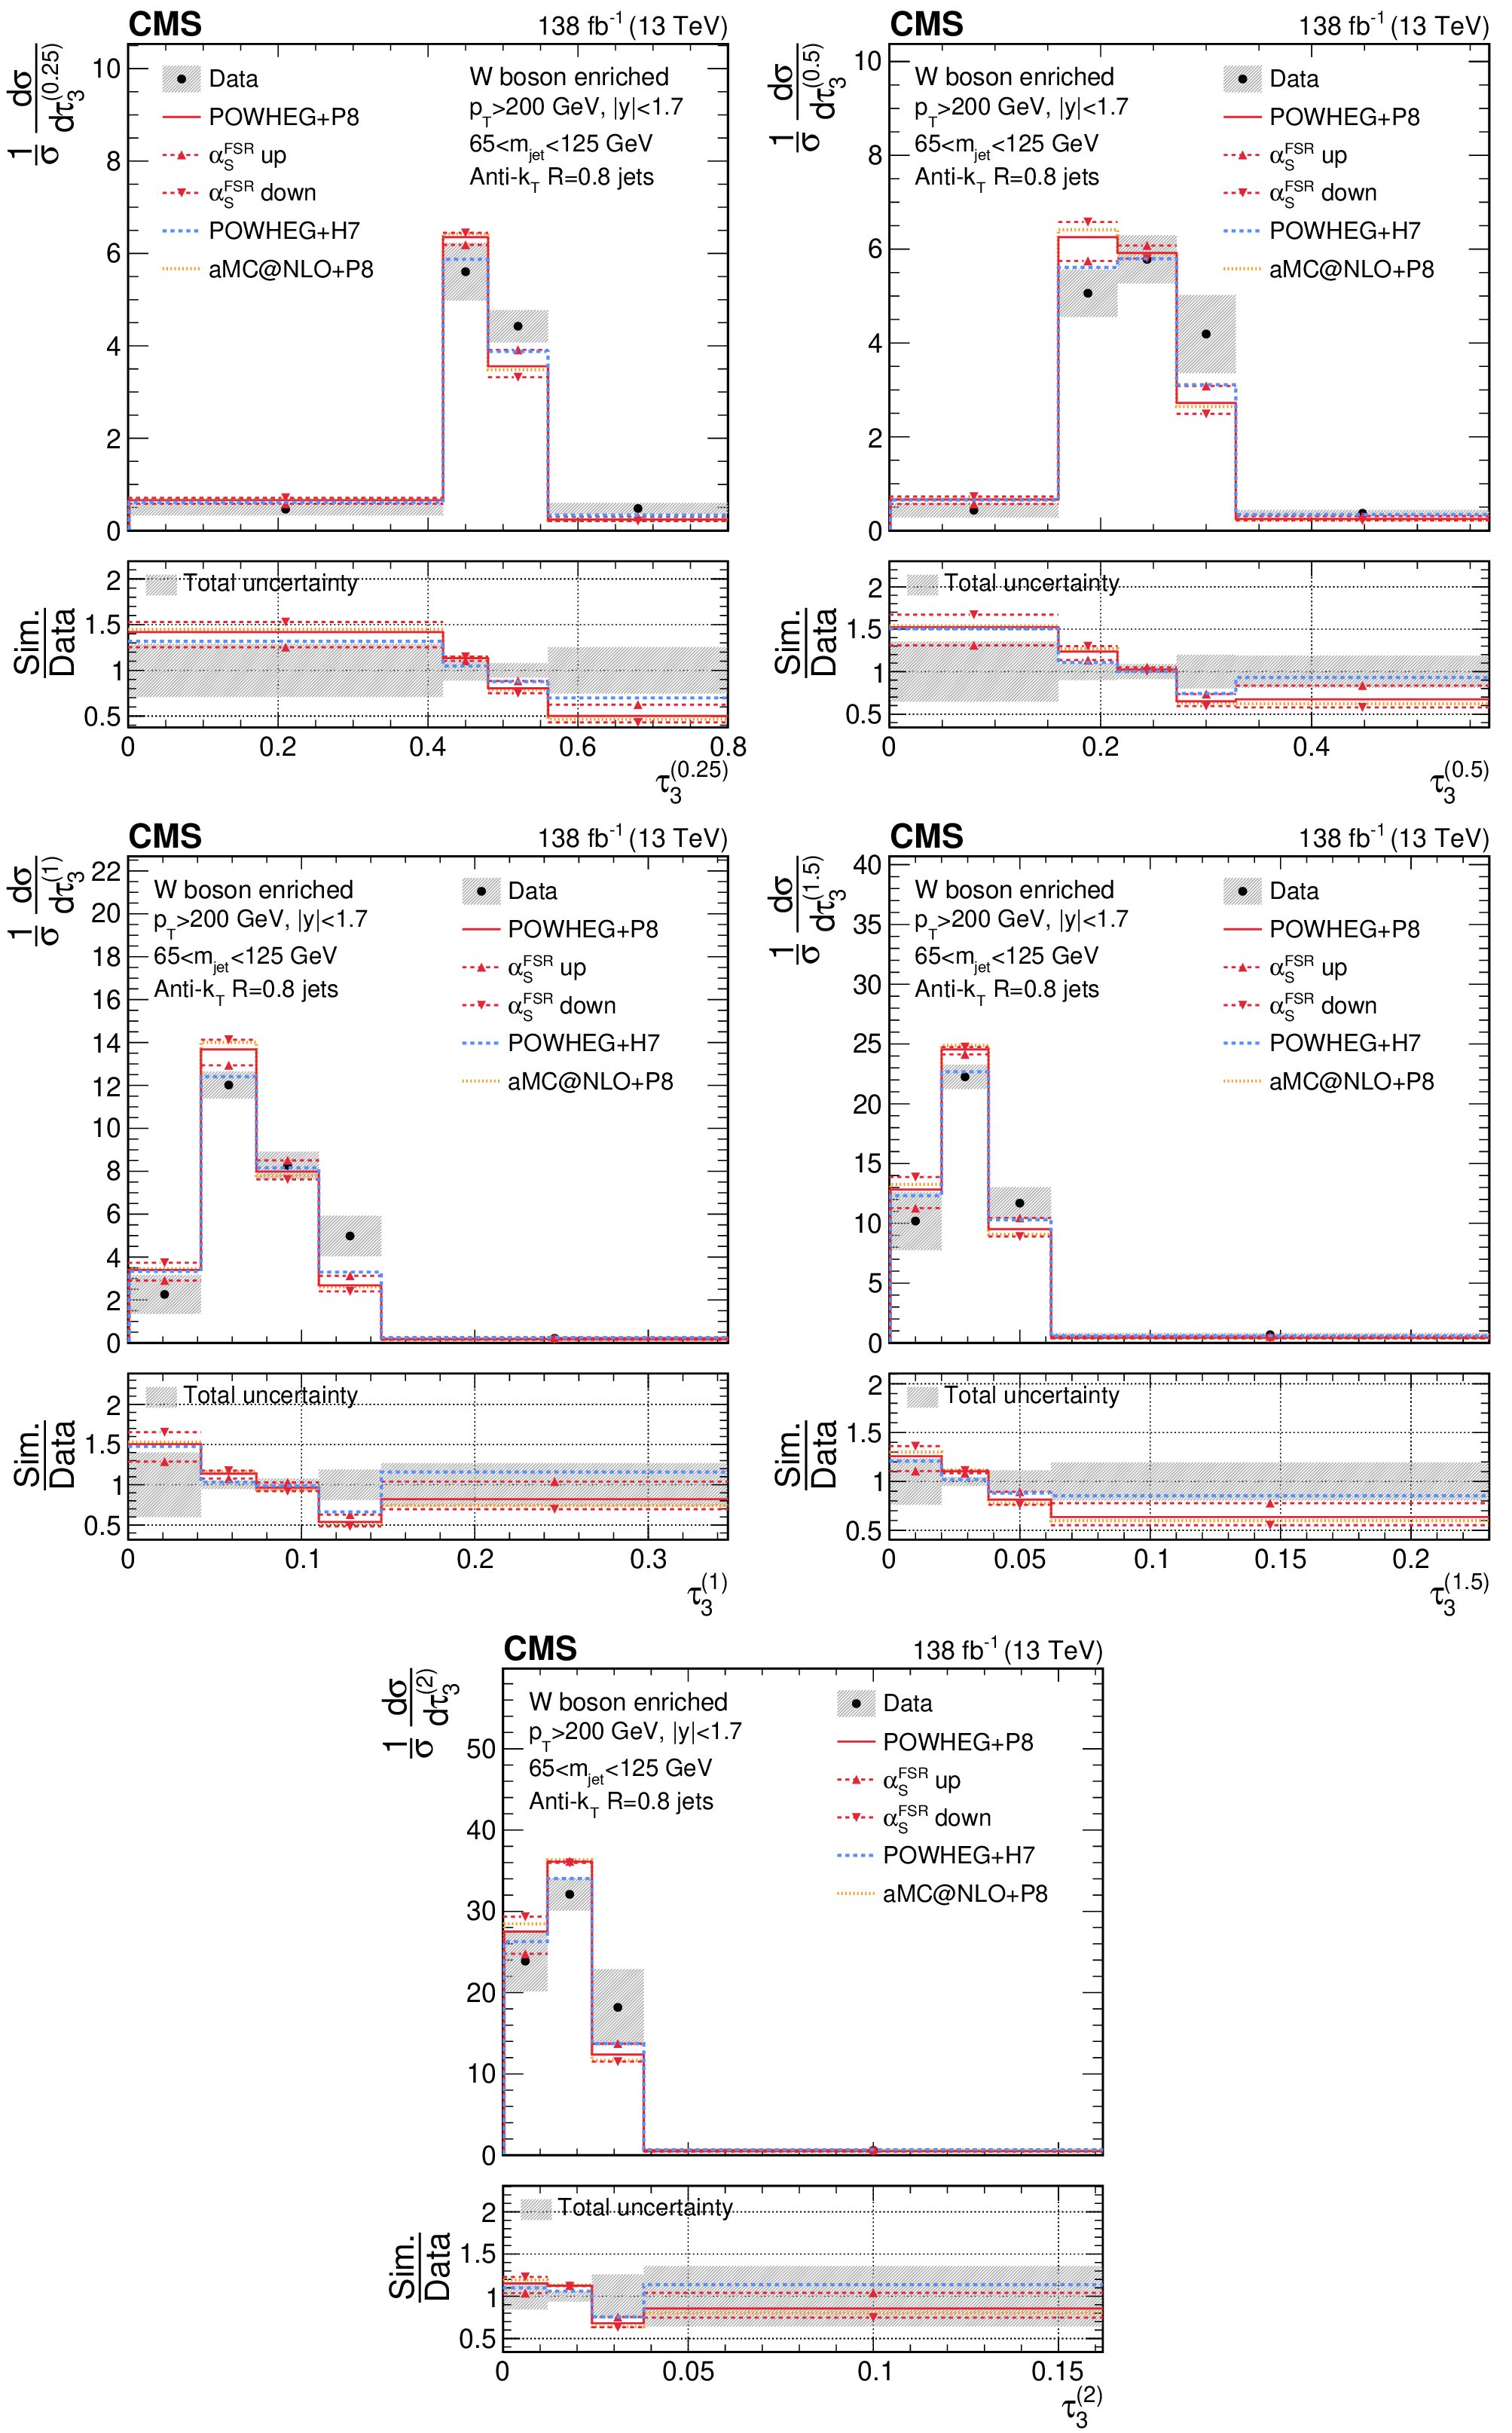
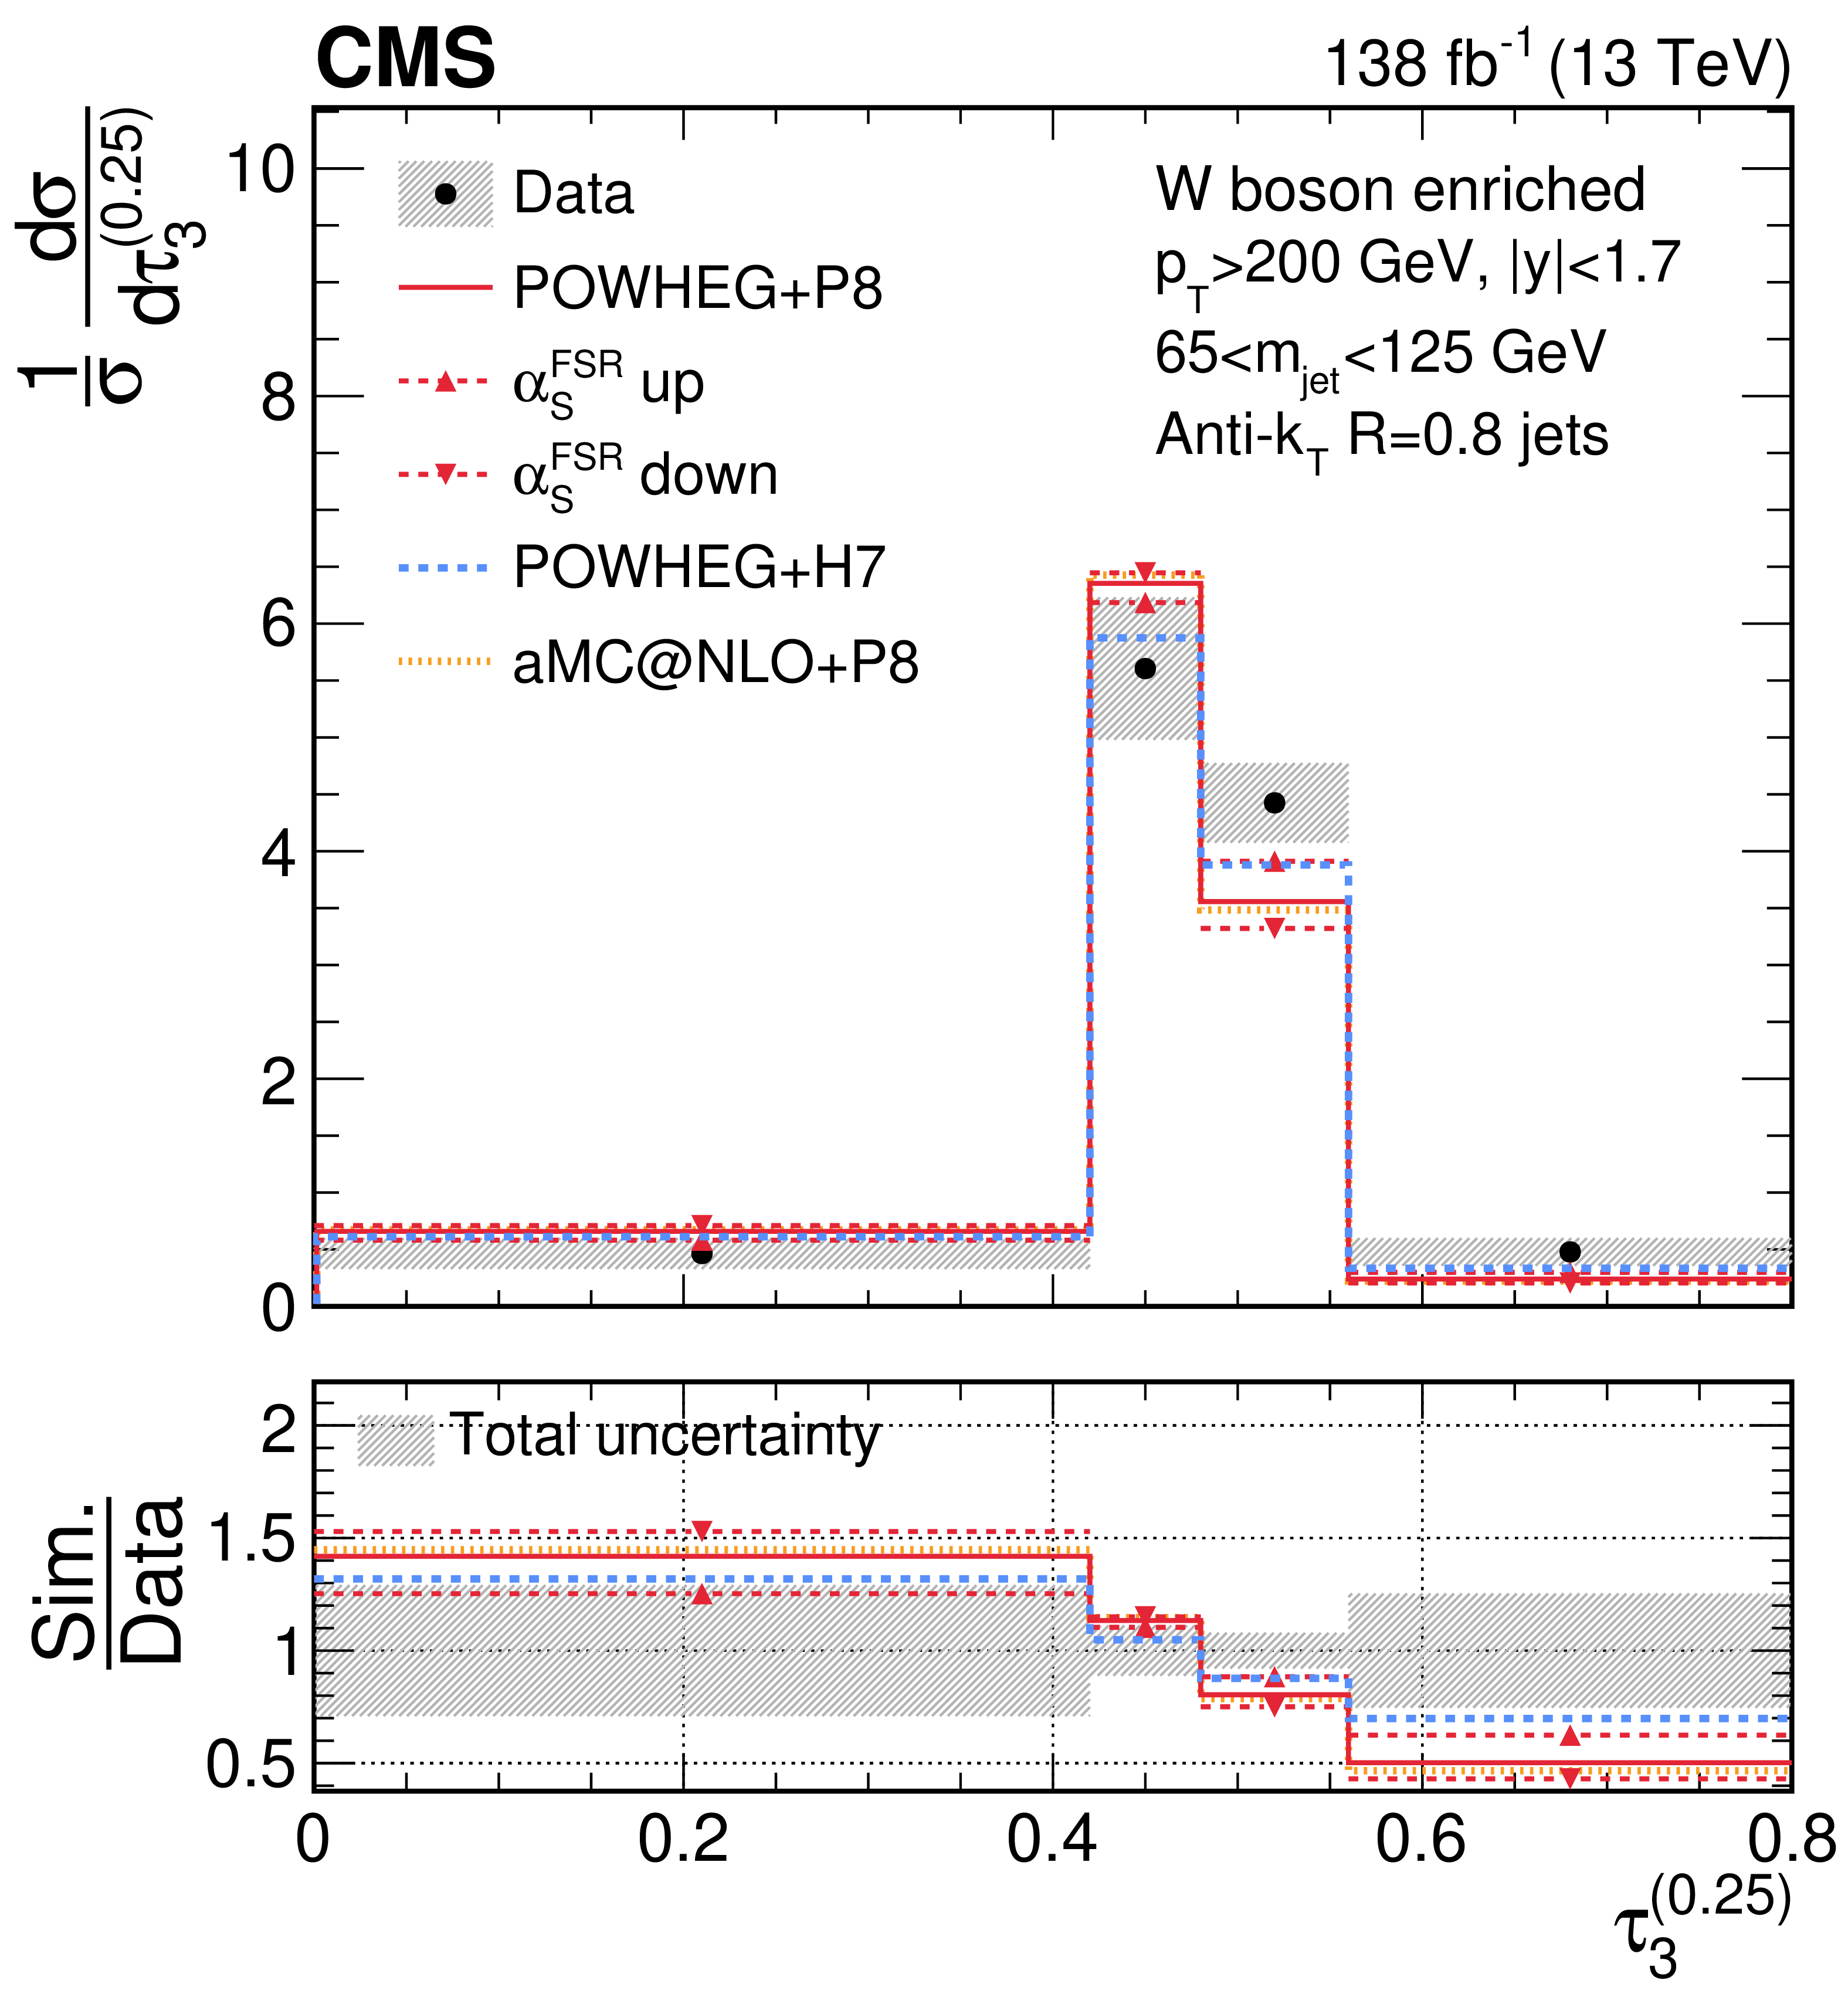
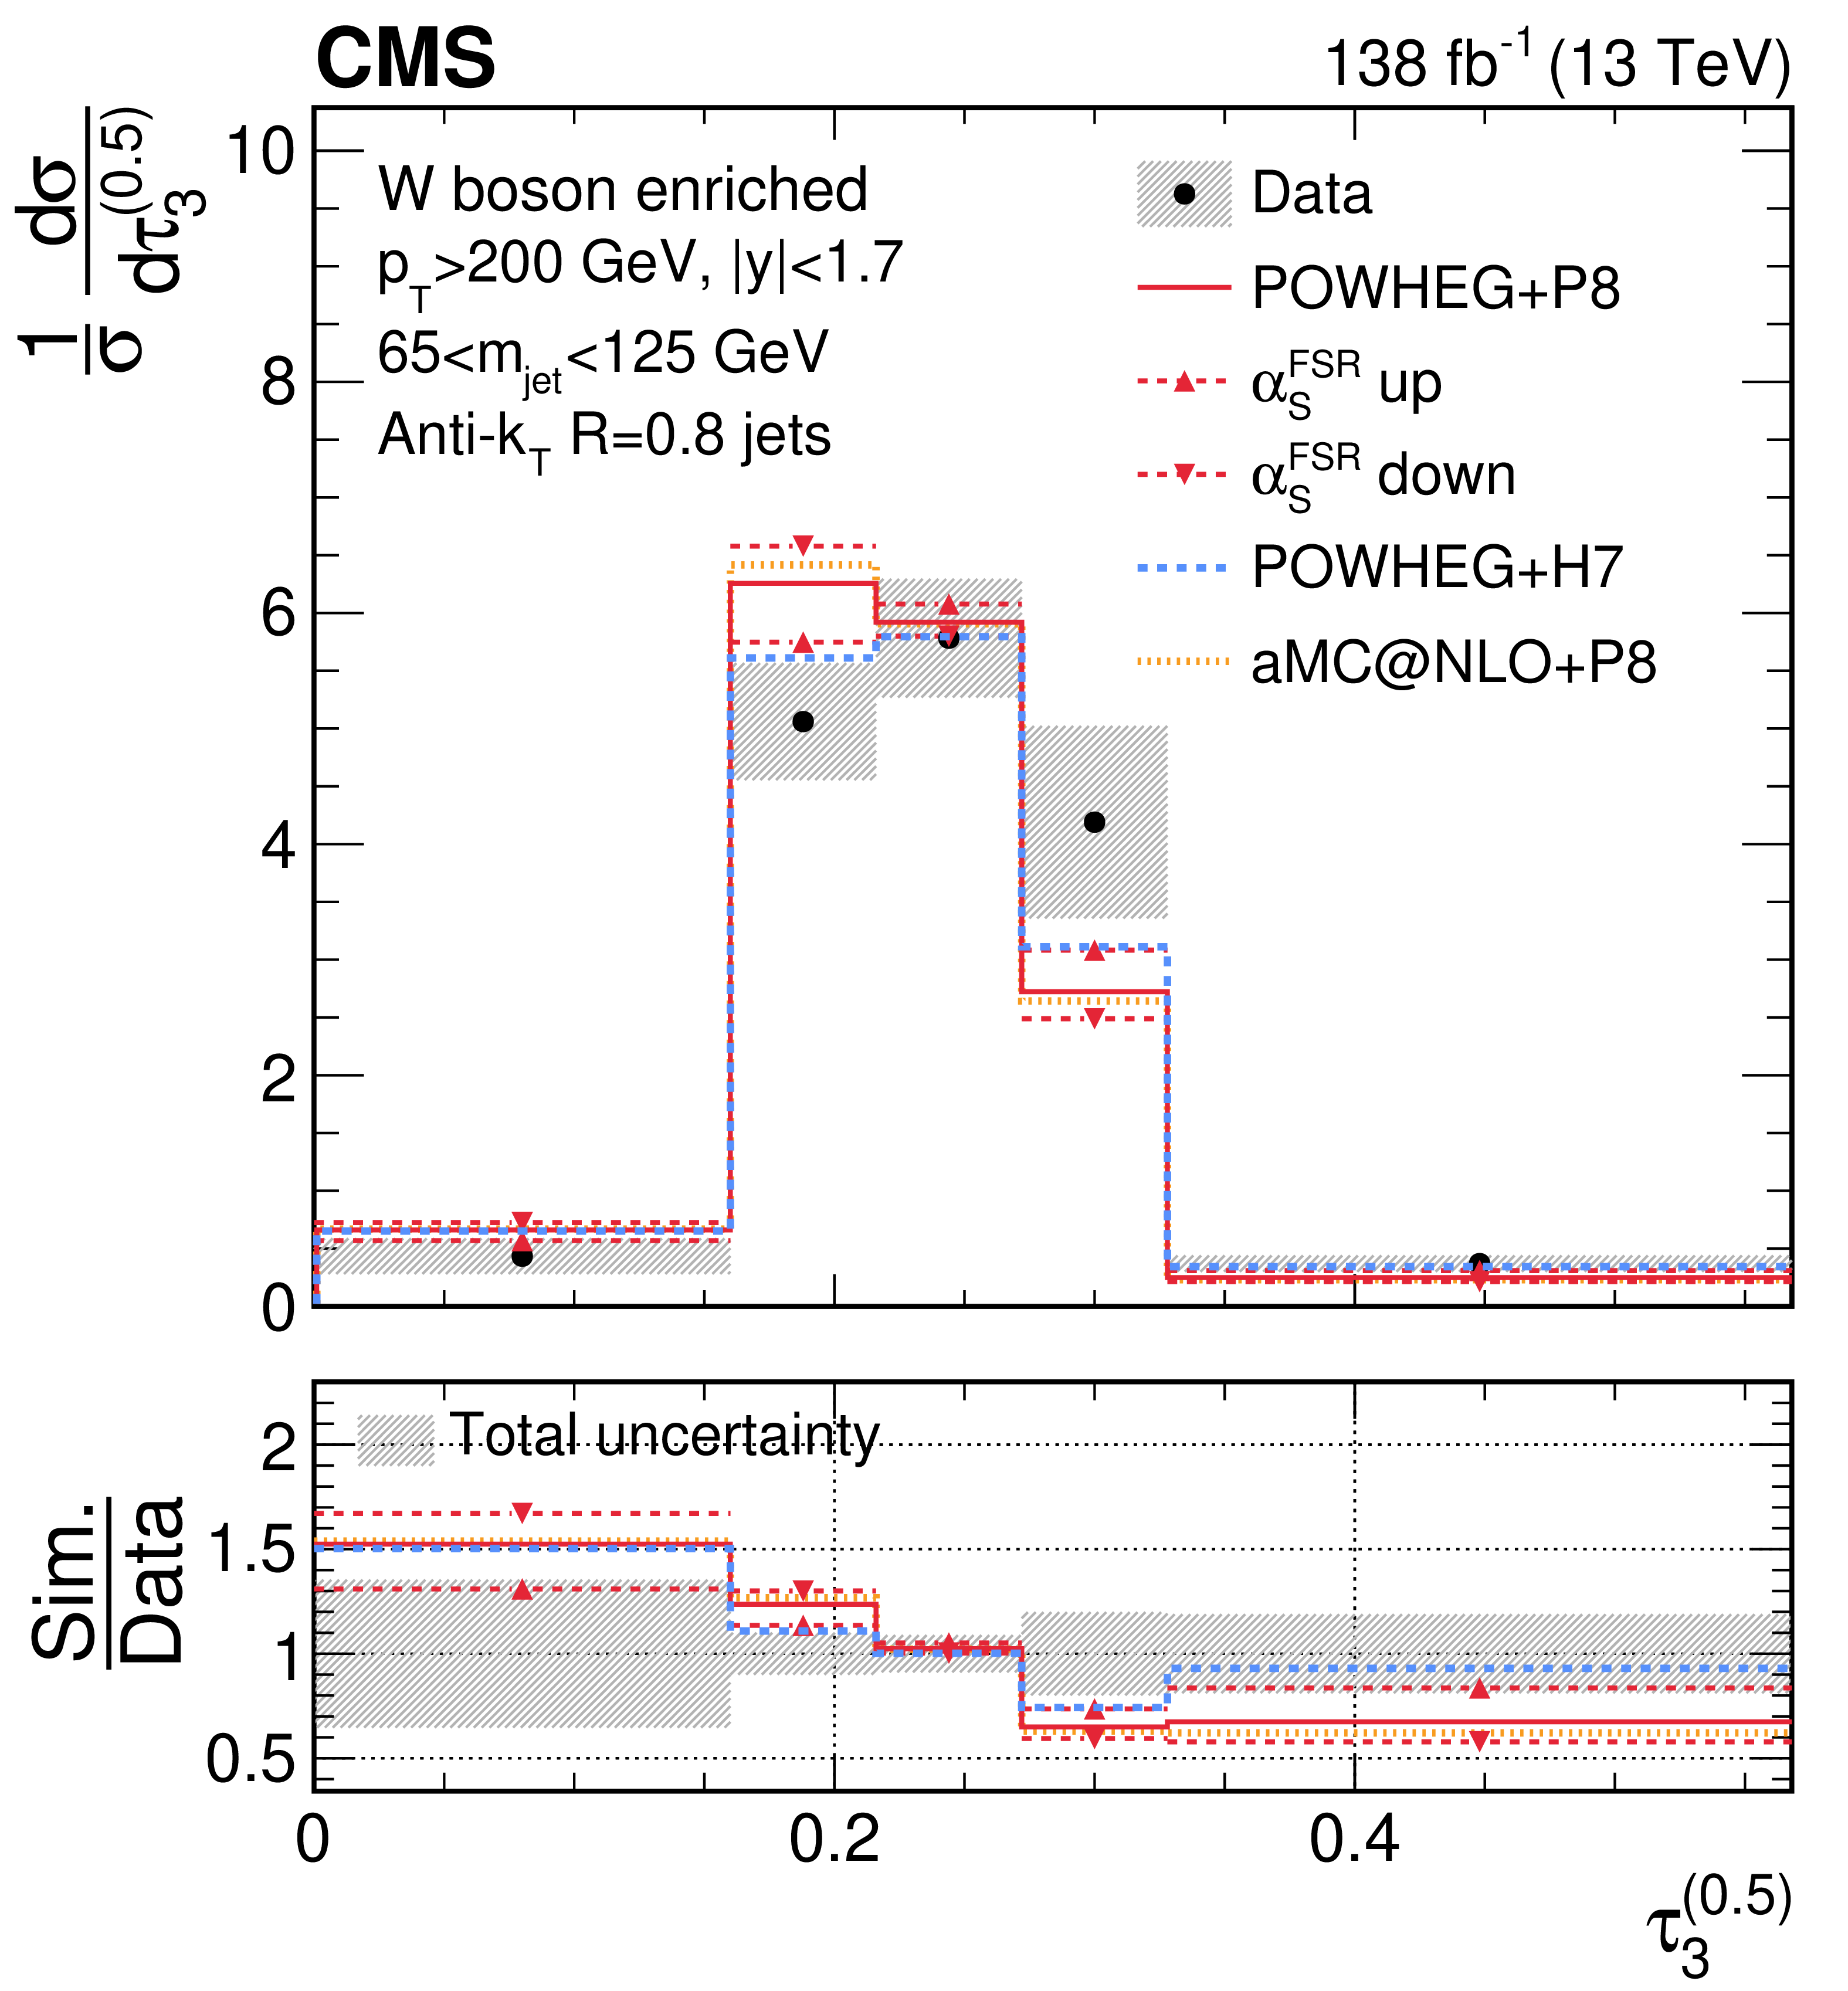
Unfolded distributions of 3-subjettiness observables,$\tau_{3}^{(0.25)}$,$\tau_{3}^{(0.5)}$, $\tau_{3}^{(1)}$, $\tau_{3}^{(1.5)}$, and $\tau_{3}^{(2)}$, measured for AK8 jets in boosted W boson-enriched events, extracted from the normalized, combined distribution after unfolding; the bin contents and the error bars are scaled by the bin widths for the distributions of the individual observables. For comparisons with particle-level predictions, the error bars in data correspond to the total unfolding uncertainties, and the lower panels present the ratio of particle-level predictions to the unfolded data. The dark grey hashed region illustrates the total uncertainties per bin in the unfolded result. |
png pdf |
Figure 35-a:
Unfolded distributions of 3-subjettiness observables,$\tau_{3}^{(0.25)}$,$\tau_{3}^{(0.5)}$, $\tau_{3}^{(1)}$, $\tau_{3}^{(1.5)}$, and $\tau_{3}^{(2)}$, measured for AK8 jets in boosted W boson-enriched events, extracted from the normalized, combined distribution after unfolding; the bin contents and the error bars are scaled by the bin widths for the distributions of the individual observables. For comparisons with particle-level predictions, the error bars in data correspond to the total unfolding uncertainties, and the lower panels present the ratio of particle-level predictions to the unfolded data. The dark grey hashed region illustrates the total uncertainties per bin in the unfolded result. |
png pdf |
Figure 35-b:
Unfolded distributions of 3-subjettiness observables,$\tau_{3}^{(0.25)}$,$\tau_{3}^{(0.5)}$, $\tau_{3}^{(1)}$, $\tau_{3}^{(1.5)}$, and $\tau_{3}^{(2)}$, measured for AK8 jets in boosted W boson-enriched events, extracted from the normalized, combined distribution after unfolding; the bin contents and the error bars are scaled by the bin widths for the distributions of the individual observables. For comparisons with particle-level predictions, the error bars in data correspond to the total unfolding uncertainties, and the lower panels present the ratio of particle-level predictions to the unfolded data. The dark grey hashed region illustrates the total uncertainties per bin in the unfolded result. |
png pdf |
Figure 35-c:
Unfolded distributions of 3-subjettiness observables,$\tau_{3}^{(0.25)}$,$\tau_{3}^{(0.5)}$, $\tau_{3}^{(1)}$, $\tau_{3}^{(1.5)}$, and $\tau_{3}^{(2)}$, measured for AK8 jets in boosted W boson-enriched events, extracted from the normalized, combined distribution after unfolding; the bin contents and the error bars are scaled by the bin widths for the distributions of the individual observables. For comparisons with particle-level predictions, the error bars in data correspond to the total unfolding uncertainties, and the lower panels present the ratio of particle-level predictions to the unfolded data. The dark grey hashed region illustrates the total uncertainties per bin in the unfolded result. |
png pdf |
Figure 35-d:
Unfolded distributions of 3-subjettiness observables,$\tau_{3}^{(0.25)}$,$\tau_{3}^{(0.5)}$, $\tau_{3}^{(1)}$, $\tau_{3}^{(1.5)}$, and $\tau_{3}^{(2)}$, measured for AK8 jets in boosted W boson-enriched events, extracted from the normalized, combined distribution after unfolding; the bin contents and the error bars are scaled by the bin widths for the distributions of the individual observables. For comparisons with particle-level predictions, the error bars in data correspond to the total unfolding uncertainties, and the lower panels present the ratio of particle-level predictions to the unfolded data. The dark grey hashed region illustrates the total uncertainties per bin in the unfolded result. |
png pdf |
Figure 35-e:
Unfolded distributions of 3-subjettiness observables,$\tau_{3}^{(0.25)}$,$\tau_{3}^{(0.5)}$, $\tau_{3}^{(1)}$, $\tau_{3}^{(1.5)}$, and $\tau_{3}^{(2)}$, measured for AK8 jets in boosted W boson-enriched events, extracted from the normalized, combined distribution after unfolding; the bin contents and the error bars are scaled by the bin widths for the distributions of the individual observables. For comparisons with particle-level predictions, the error bars in data correspond to the total unfolding uncertainties, and the lower panels present the ratio of particle-level predictions to the unfolded data. The dark grey hashed region illustrates the total uncertainties per bin in the unfolded result. |
png pdf |
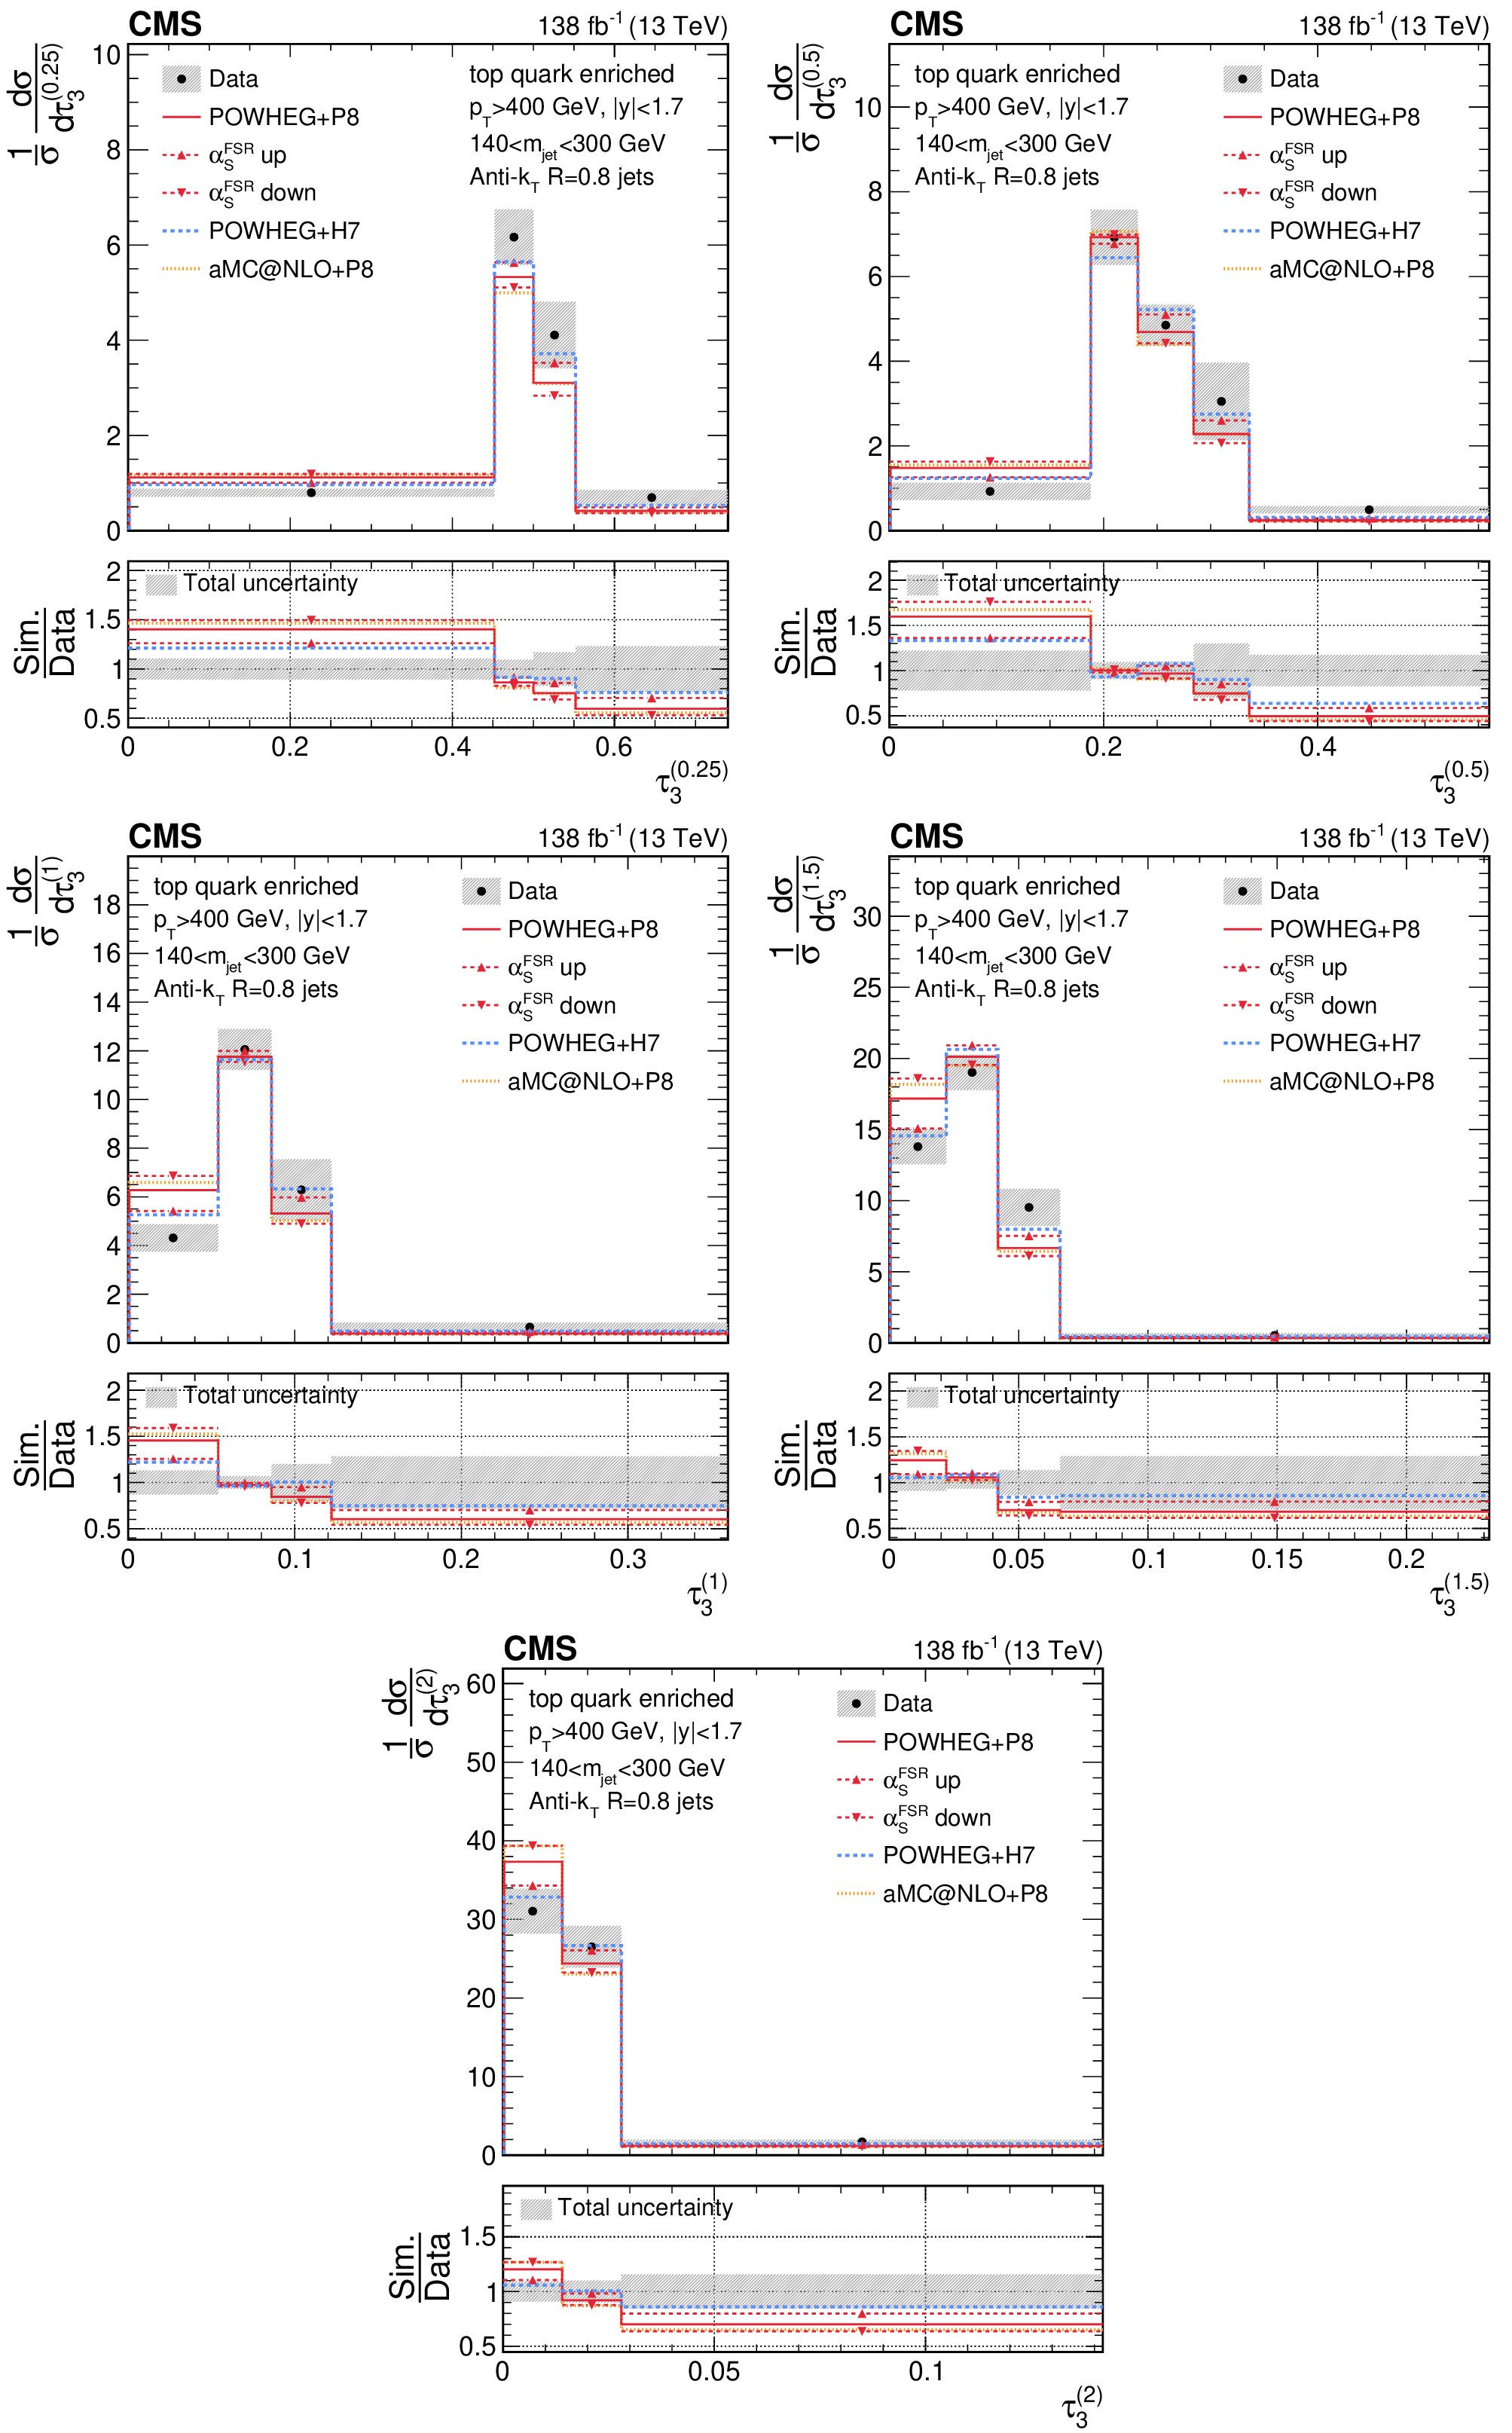
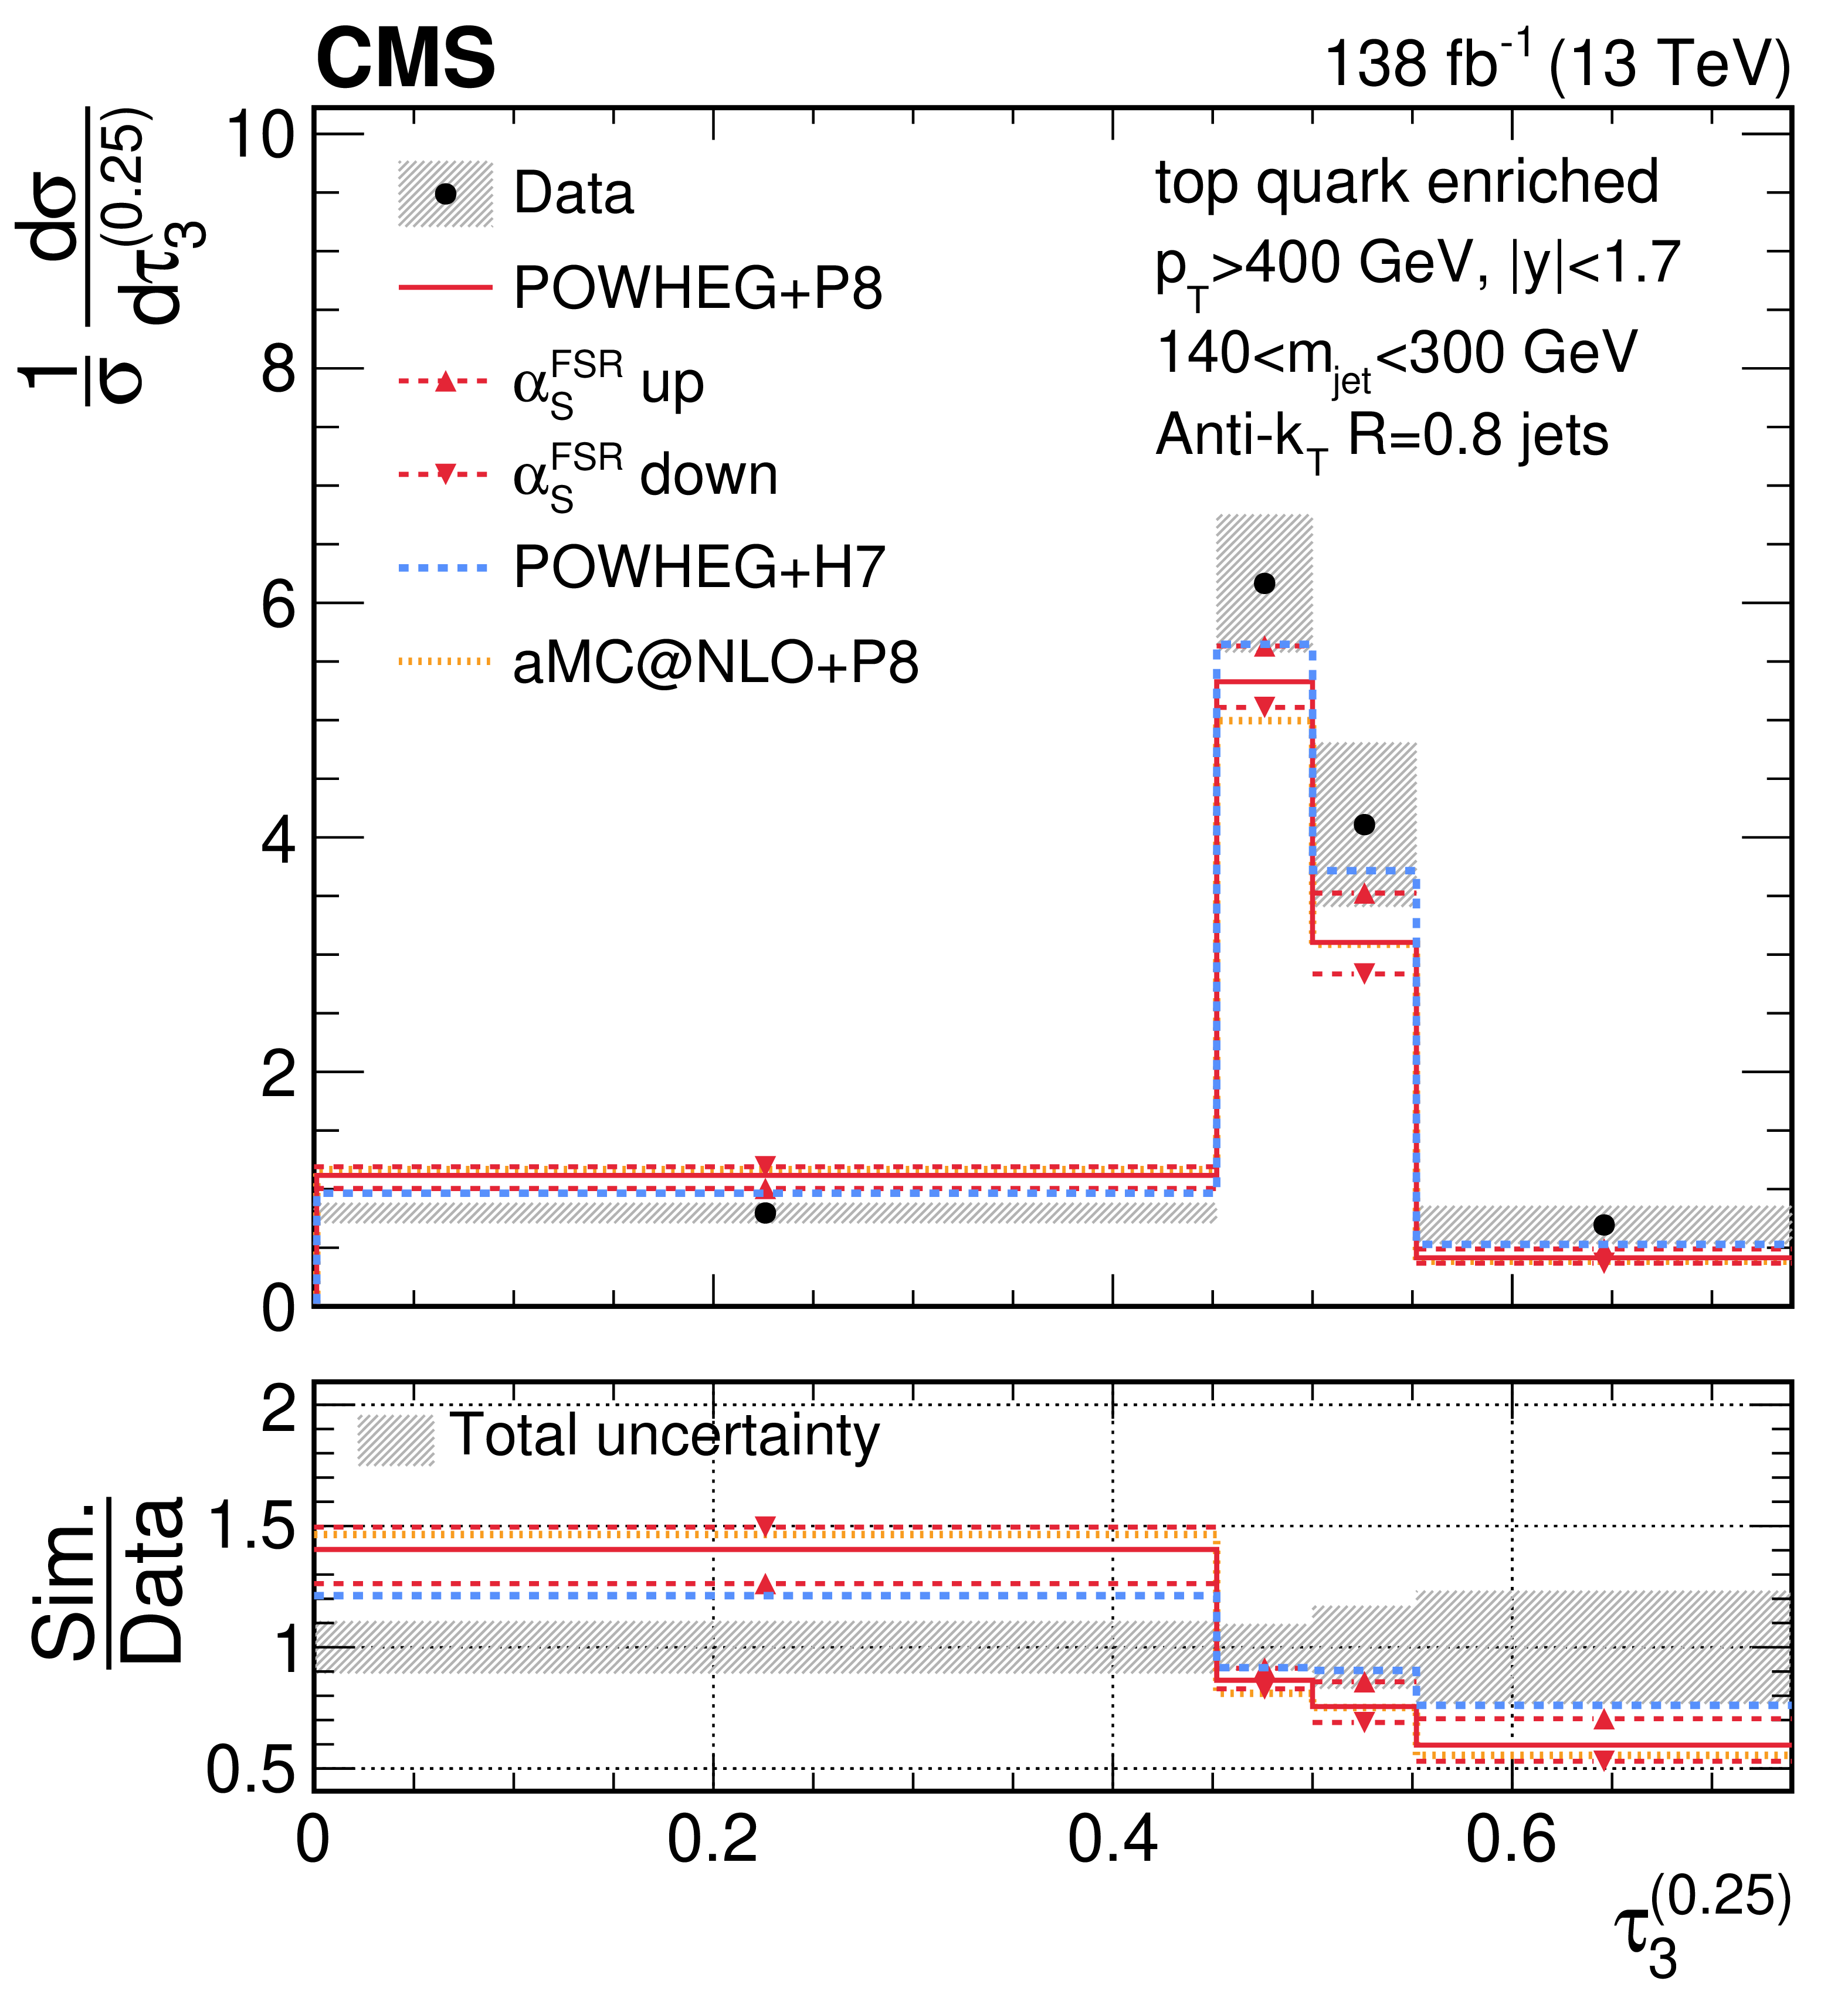
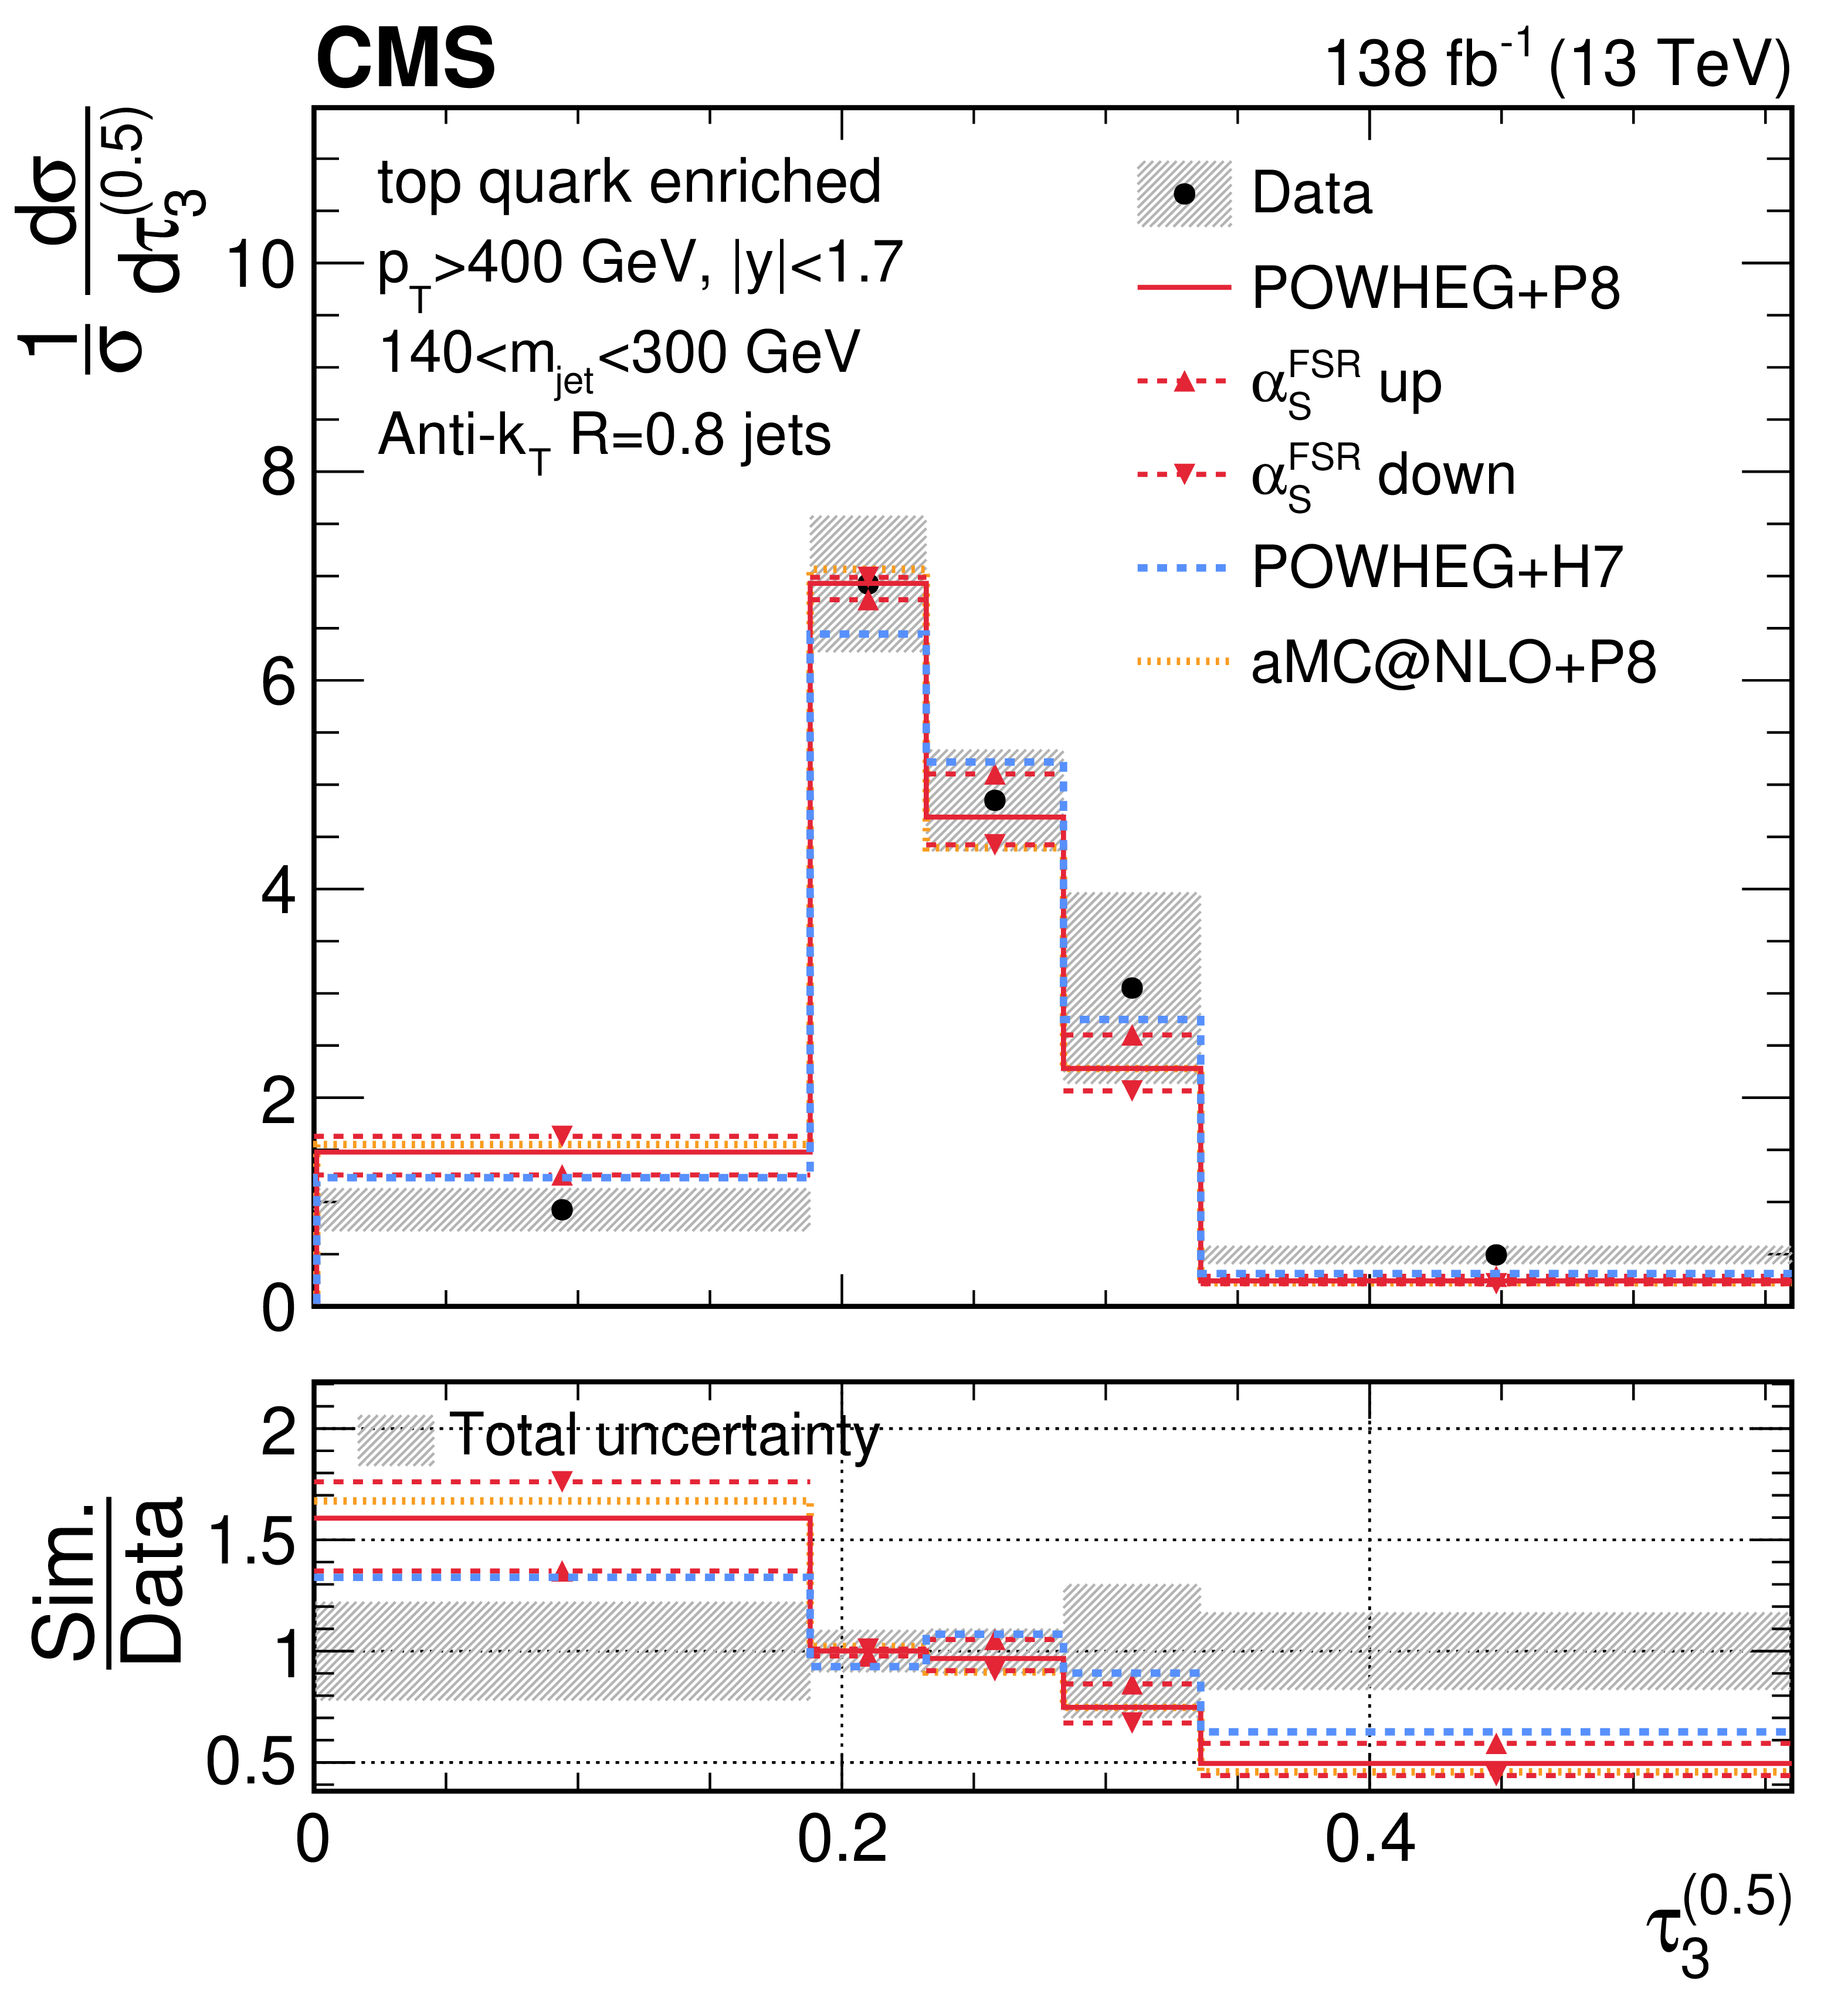
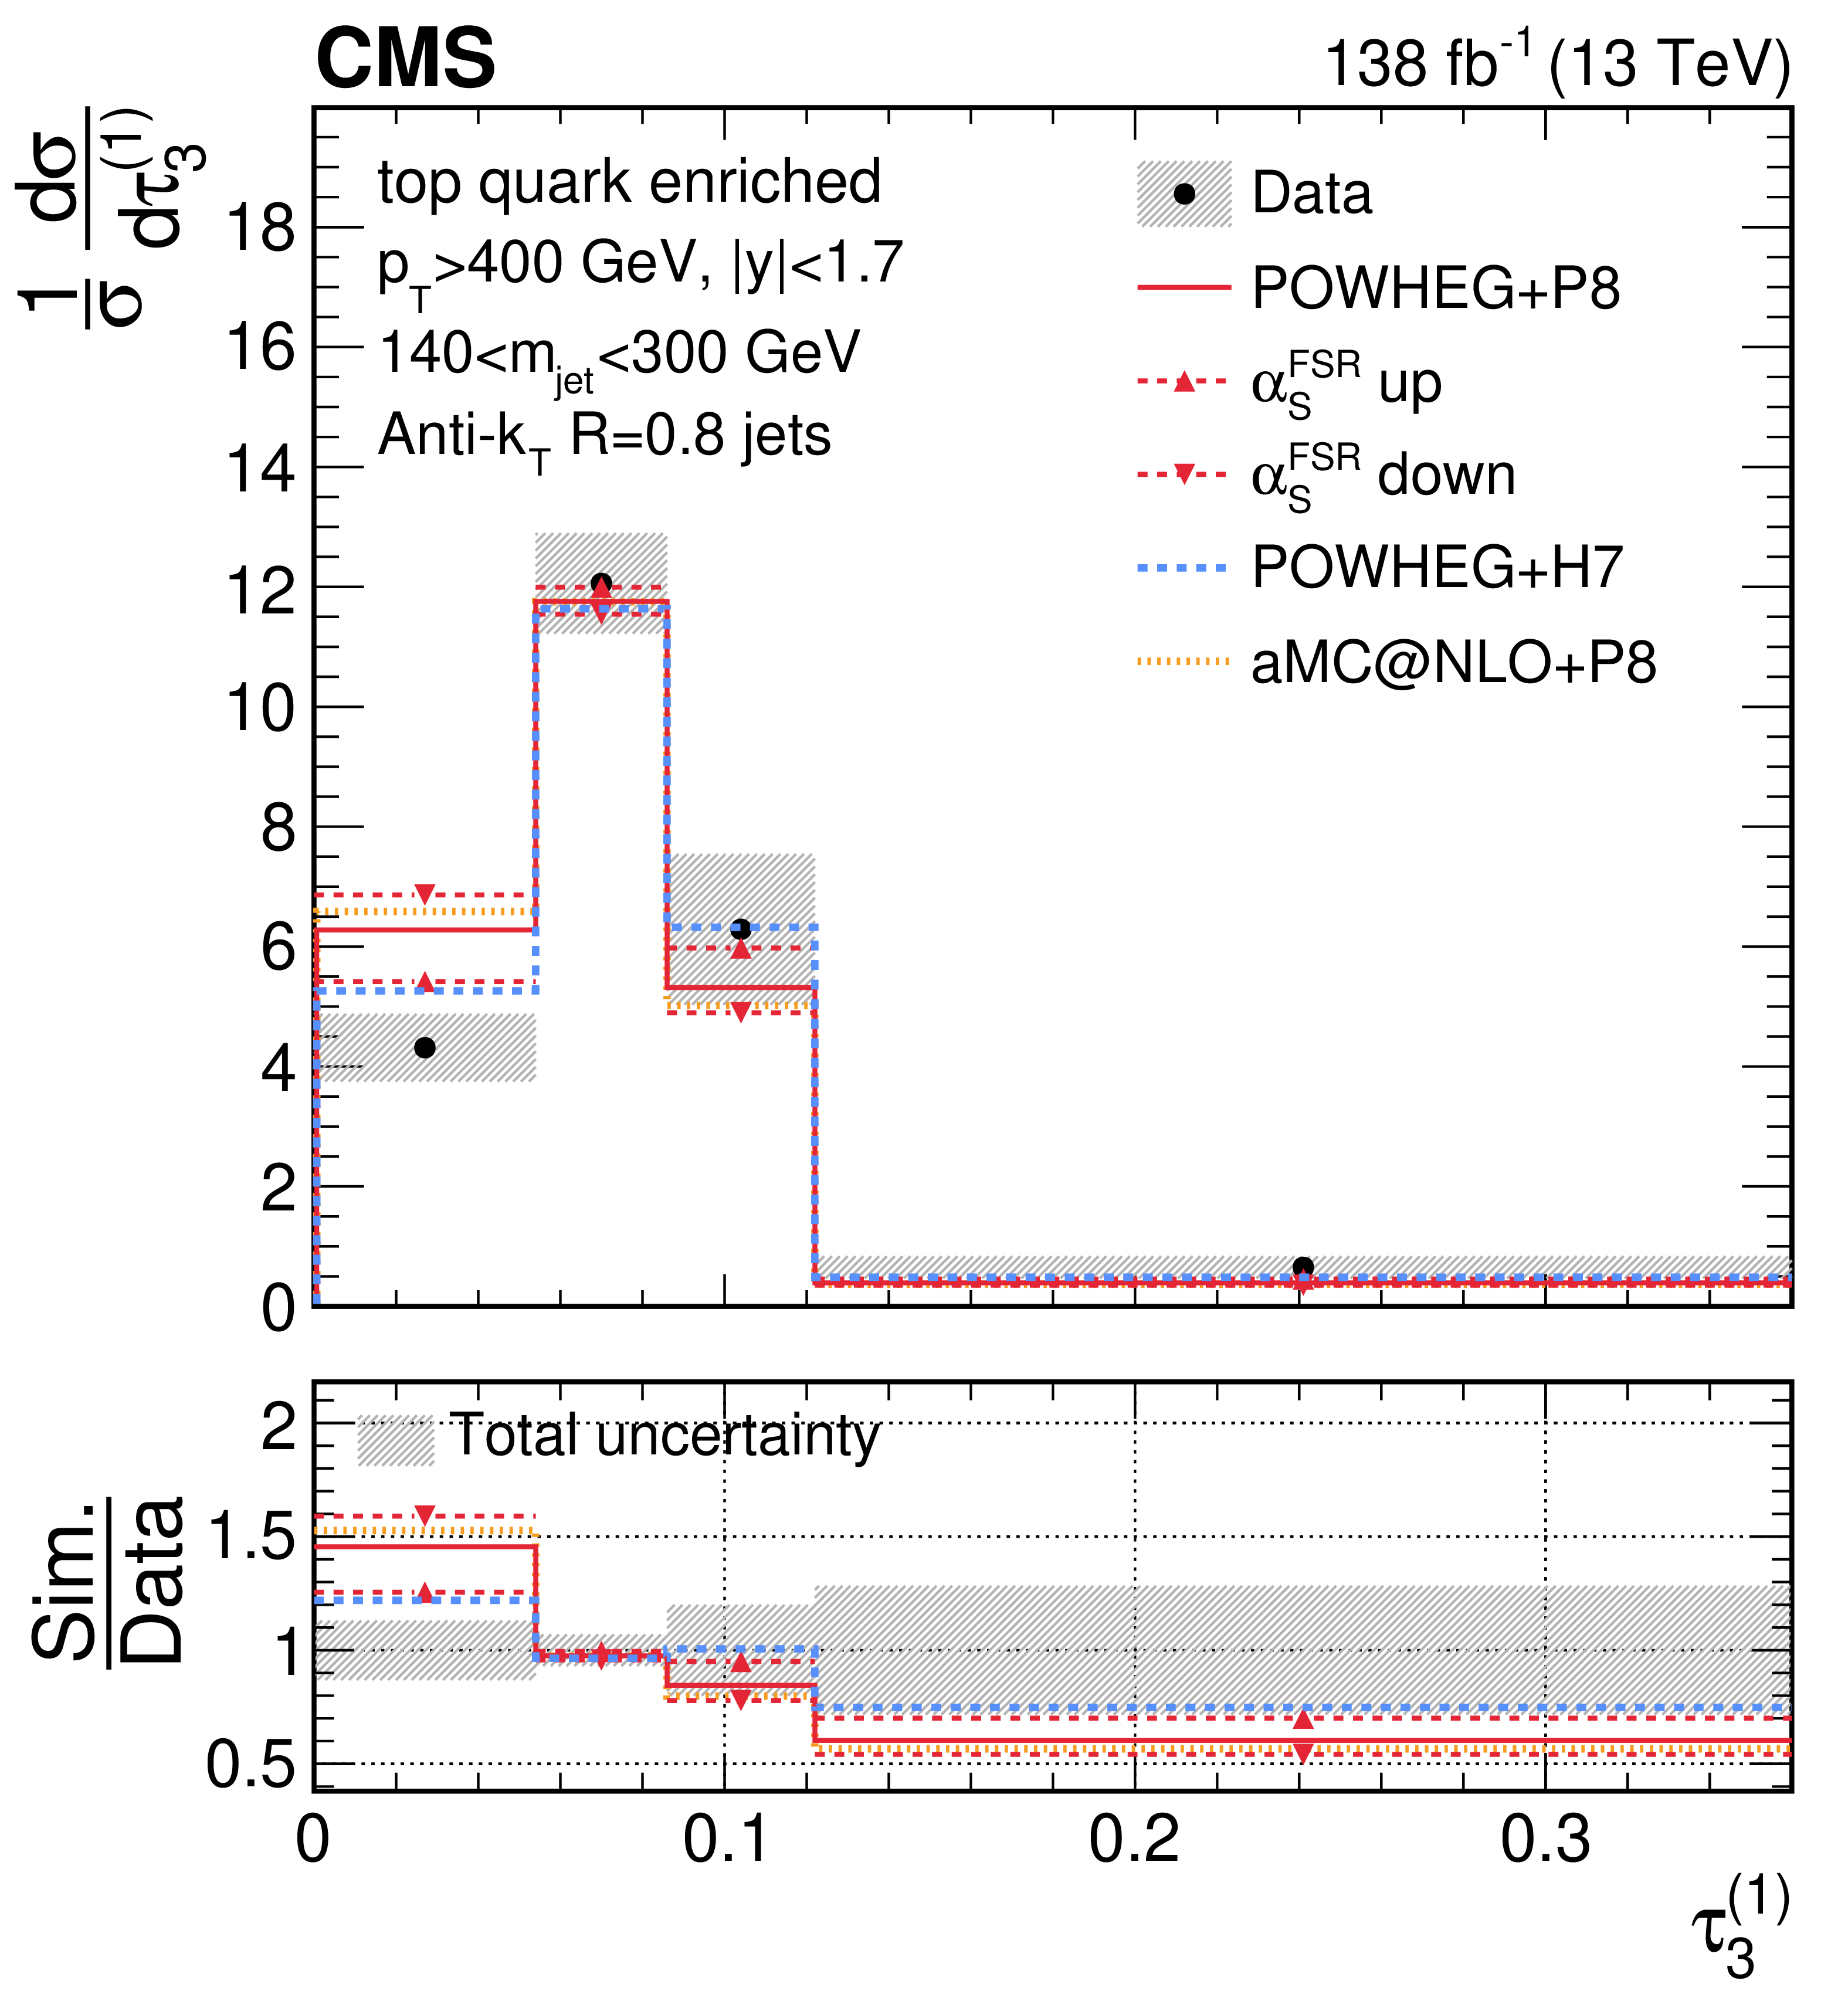
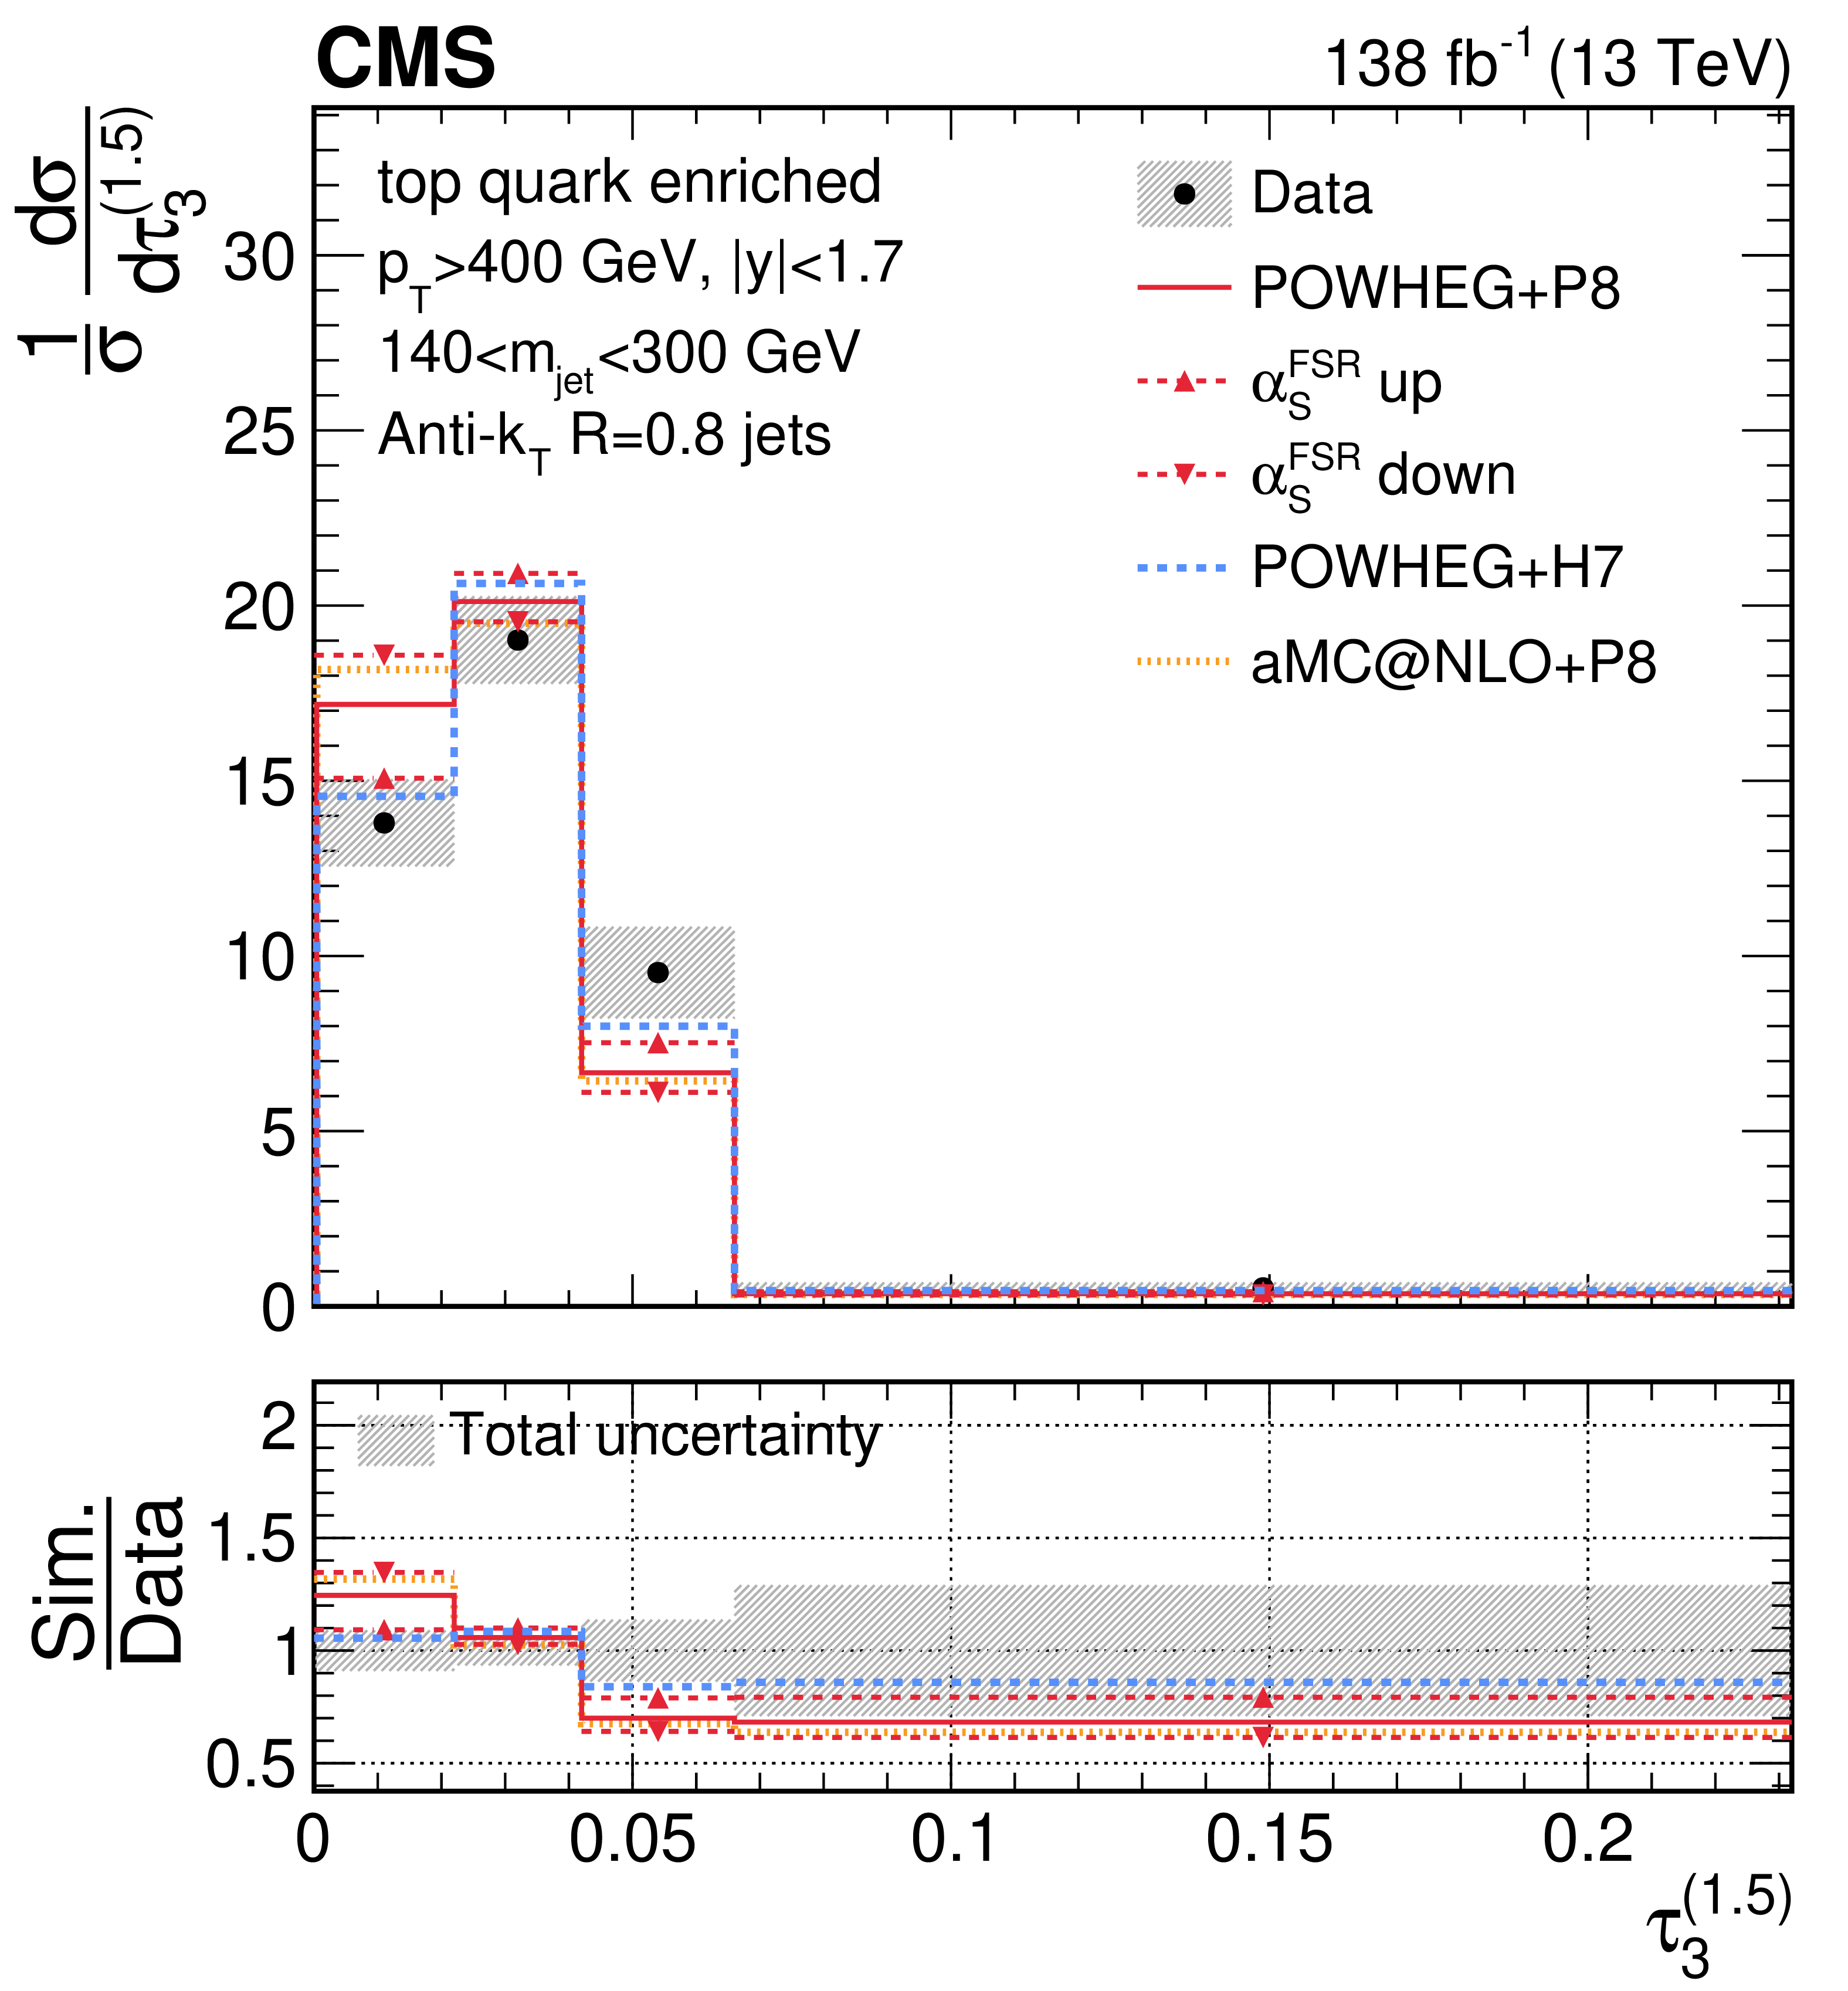
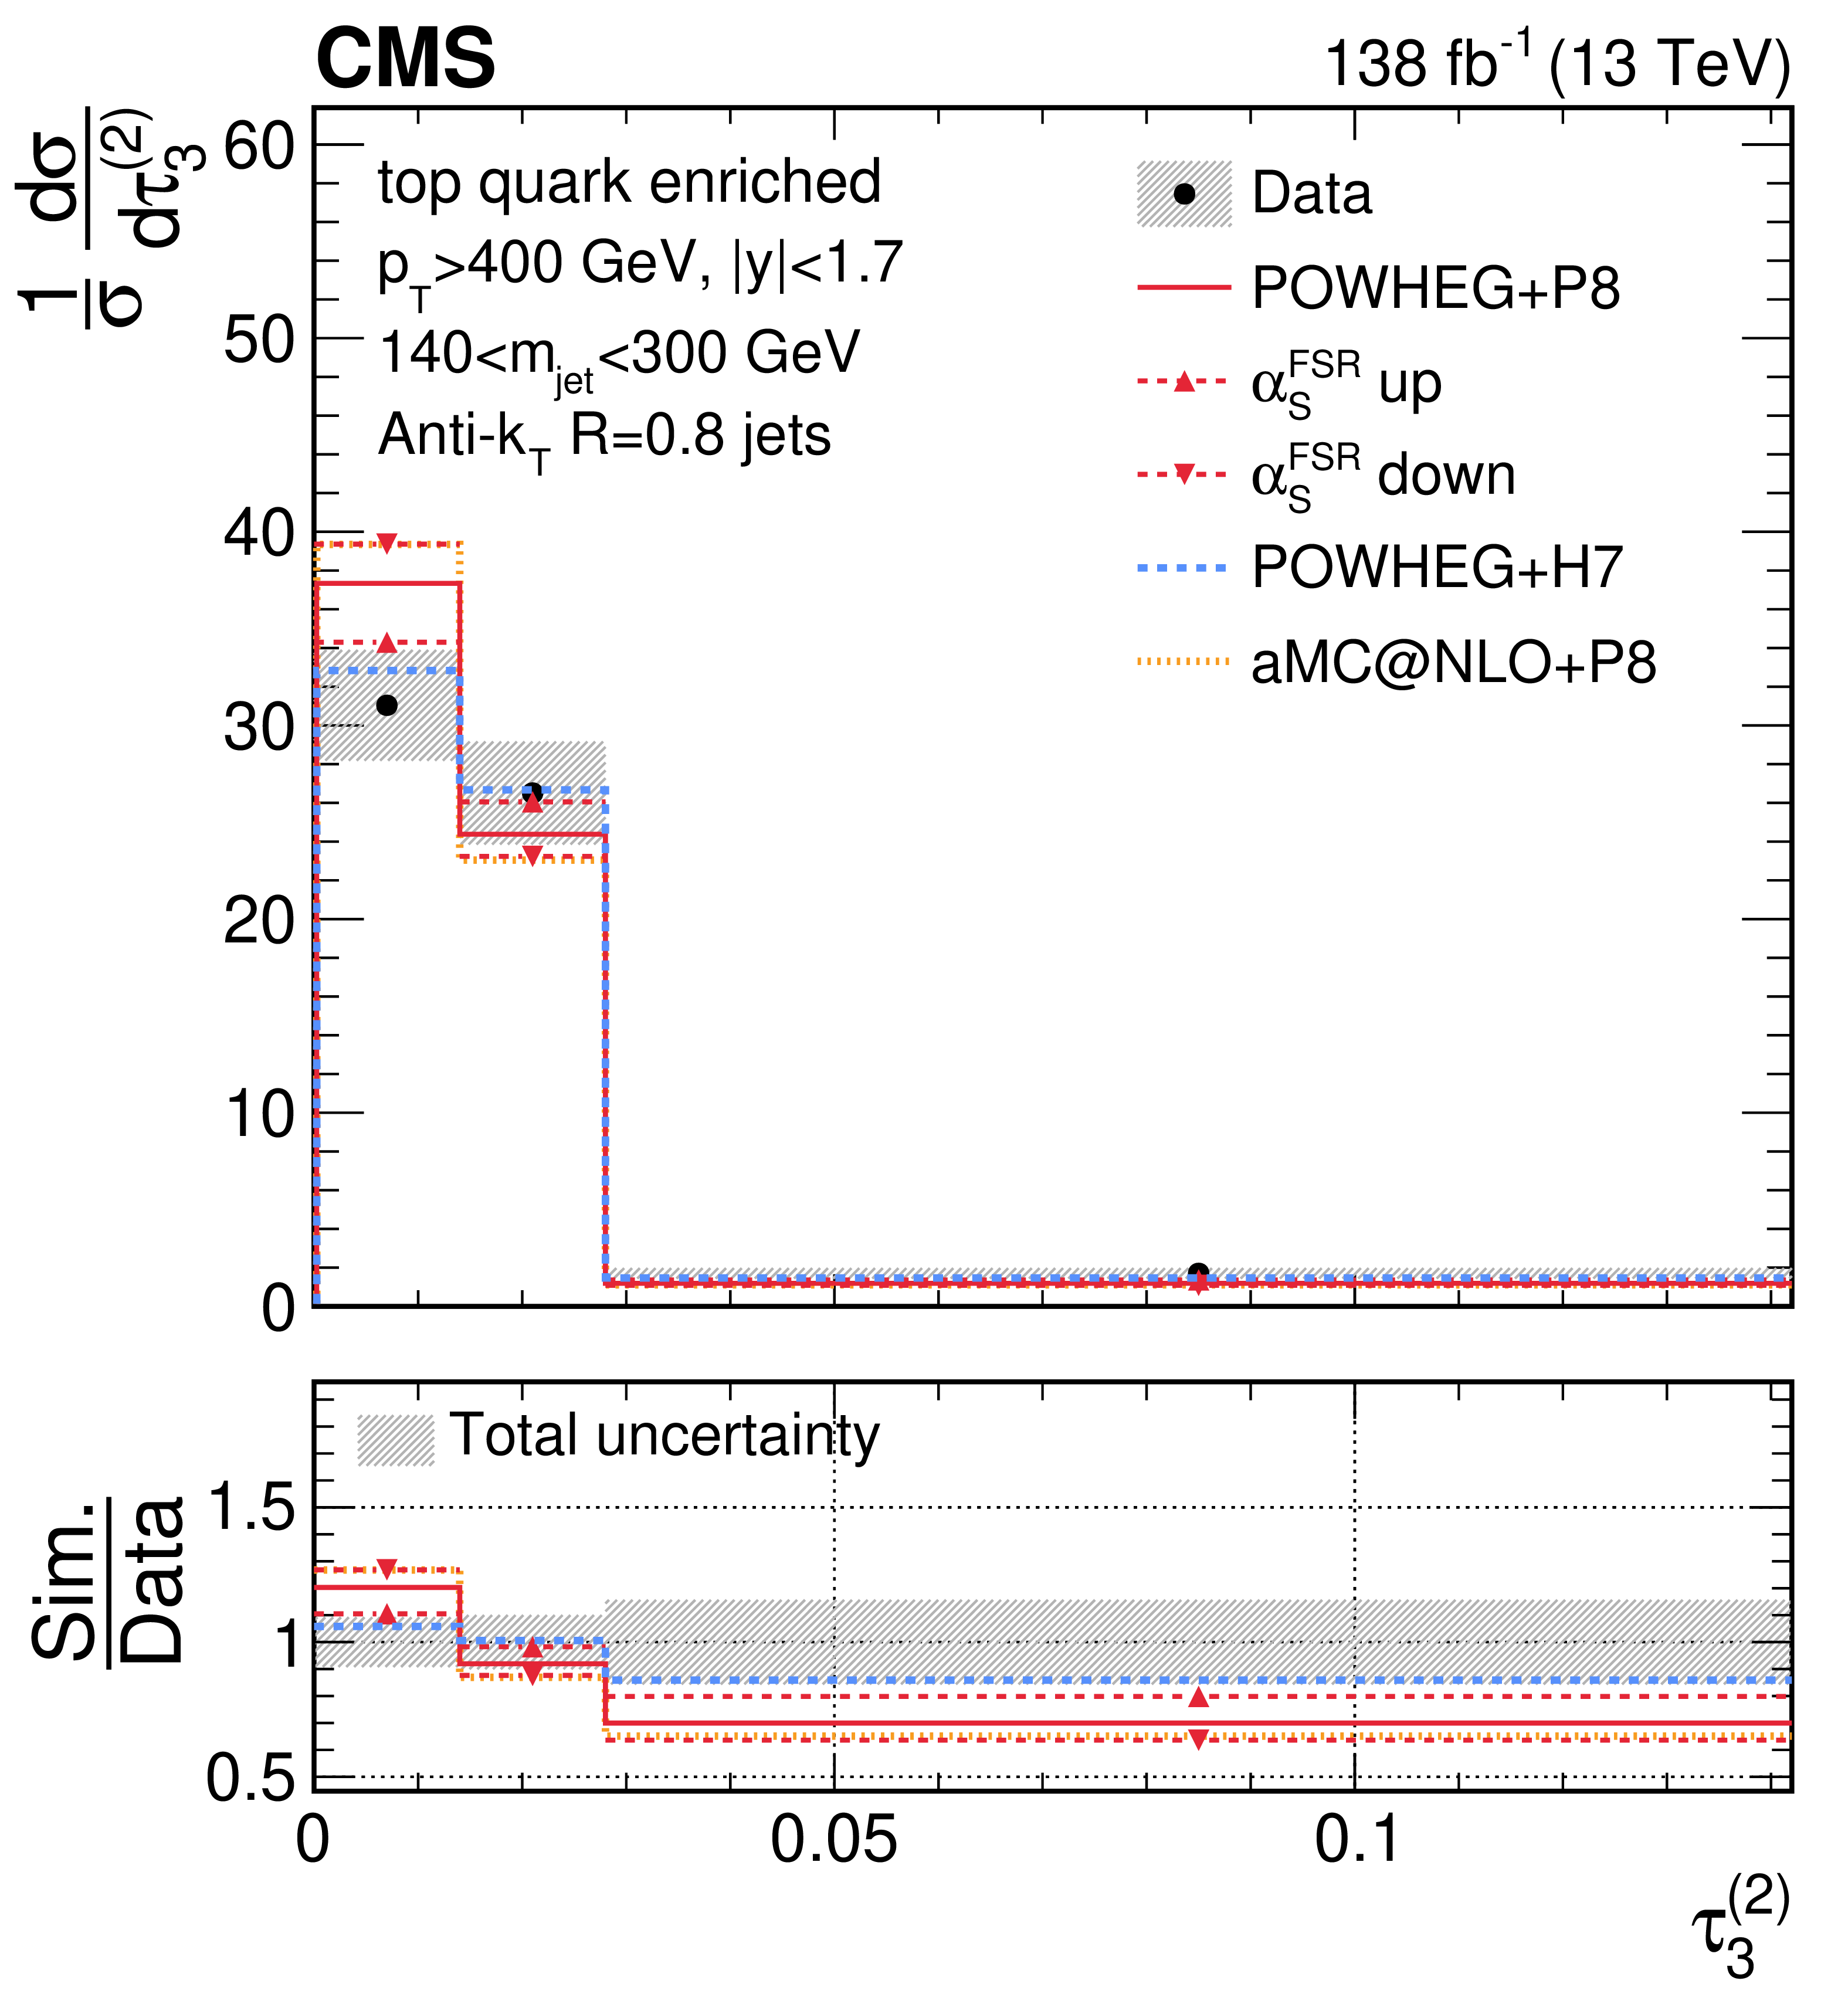
Figure 36:
Unfolded distributions of 3-subjettiness observables,$\tau_{3}^{(0.25)}$,$\tau_{3}^{(0.5)}$, $\tau_{3}^{(1)}$, $\tau_{3}^{(1.5)}$, and $\tau_{3}^{(2)}$, measured for AK8 jets in the boosted top quark-enriched region, extracted from the normalized, combined distribution after unfolding; the bin contents and the error bars are scaled by the bin widths for the distributions of the individual observables. For comparisons with particle-level predictions, the error bars in data correspond to the total unfolding uncertainties, and the lower panels present the ratio of particle-level predictions to the unfolded data. The dark grey hashed region illustrates the total uncertainties per bin in the unfolded result. |
png pdf |
Figure 36-a:
Unfolded distributions of 3-subjettiness observables,$\tau_{3}^{(0.25)}$,$\tau_{3}^{(0.5)}$, $\tau_{3}^{(1)}$, $\tau_{3}^{(1.5)}$, and $\tau_{3}^{(2)}$, measured for AK8 jets in the boosted top quark-enriched region, extracted from the normalized, combined distribution after unfolding; the bin contents and the error bars are scaled by the bin widths for the distributions of the individual observables. For comparisons with particle-level predictions, the error bars in data correspond to the total unfolding uncertainties, and the lower panels present the ratio of particle-level predictions to the unfolded data. The dark grey hashed region illustrates the total uncertainties per bin in the unfolded result. |
png pdf |
Figure 36-b:
Unfolded distributions of 3-subjettiness observables,$\tau_{3}^{(0.25)}$,$\tau_{3}^{(0.5)}$, $\tau_{3}^{(1)}$, $\tau_{3}^{(1.5)}$, and $\tau_{3}^{(2)}$, measured for AK8 jets in the boosted top quark-enriched region, extracted from the normalized, combined distribution after unfolding; the bin contents and the error bars are scaled by the bin widths for the distributions of the individual observables. For comparisons with particle-level predictions, the error bars in data correspond to the total unfolding uncertainties, and the lower panels present the ratio of particle-level predictions to the unfolded data. The dark grey hashed region illustrates the total uncertainties per bin in the unfolded result. |
png pdf |
Figure 36-c:
Unfolded distributions of 3-subjettiness observables,$\tau_{3}^{(0.25)}$,$\tau_{3}^{(0.5)}$, $\tau_{3}^{(1)}$, $\tau_{3}^{(1.5)}$, and $\tau_{3}^{(2)}$, measured for AK8 jets in the boosted top quark-enriched region, extracted from the normalized, combined distribution after unfolding; the bin contents and the error bars are scaled by the bin widths for the distributions of the individual observables. For comparisons with particle-level predictions, the error bars in data correspond to the total unfolding uncertainties, and the lower panels present the ratio of particle-level predictions to the unfolded data. The dark grey hashed region illustrates the total uncertainties per bin in the unfolded result. |
png pdf |
Figure 36-d:
Unfolded distributions of 3-subjettiness observables,$\tau_{3}^{(0.25)}$,$\tau_{3}^{(0.5)}$, $\tau_{3}^{(1)}$, $\tau_{3}^{(1.5)}$, and $\tau_{3}^{(2)}$, measured for AK8 jets in the boosted top quark-enriched region, extracted from the normalized, combined distribution after unfolding; the bin contents and the error bars are scaled by the bin widths for the distributions of the individual observables. For comparisons with particle-level predictions, the error bars in data correspond to the total unfolding uncertainties, and the lower panels present the ratio of particle-level predictions to the unfolded data. The dark grey hashed region illustrates the total uncertainties per bin in the unfolded result. |
png pdf |
Figure 36-e:
Unfolded distributions of 3-subjettiness observables,$\tau_{3}^{(0.25)}$,$\tau_{3}^{(0.5)}$, $\tau_{3}^{(1)}$, $\tau_{3}^{(1.5)}$, and $\tau_{3}^{(2)}$, measured for AK8 jets in the boosted top quark-enriched region, extracted from the normalized, combined distribution after unfolding; the bin contents and the error bars are scaled by the bin widths for the distributions of the individual observables. For comparisons with particle-level predictions, the error bars in data correspond to the total unfolding uncertainties, and the lower panels present the ratio of particle-level predictions to the unfolded data. The dark grey hashed region illustrates the total uncertainties per bin in the unfolded result. |
png pdf |
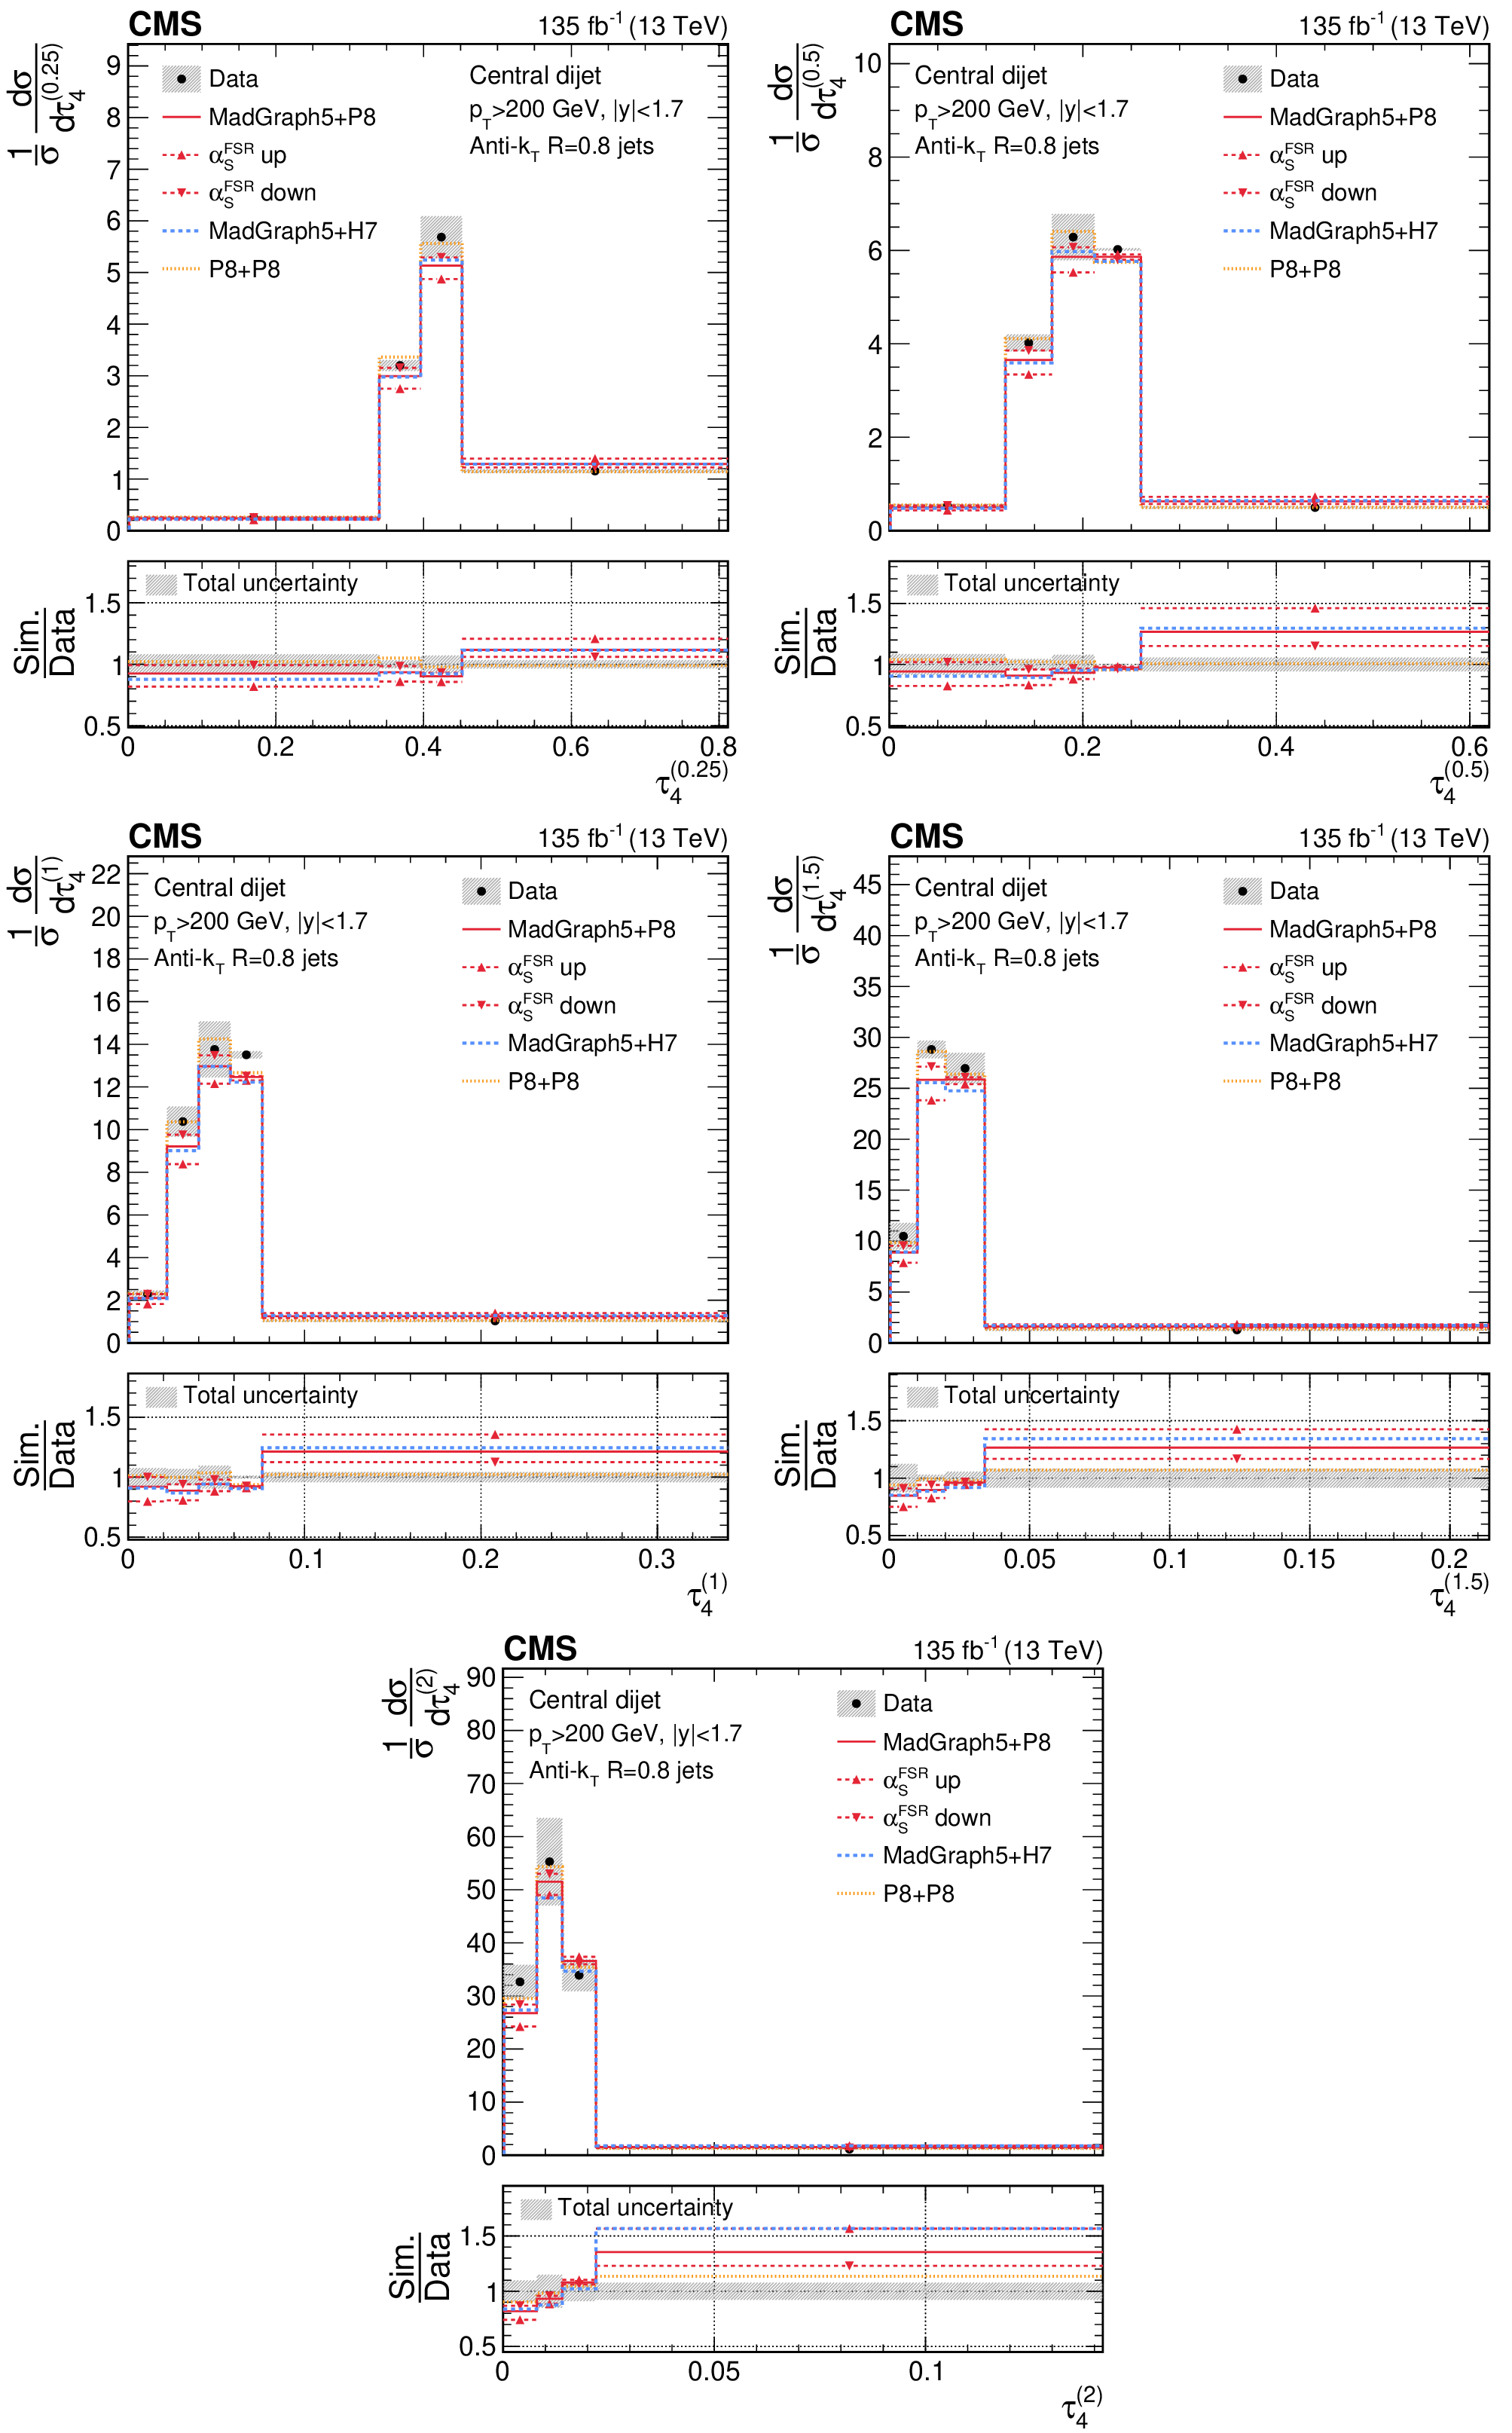
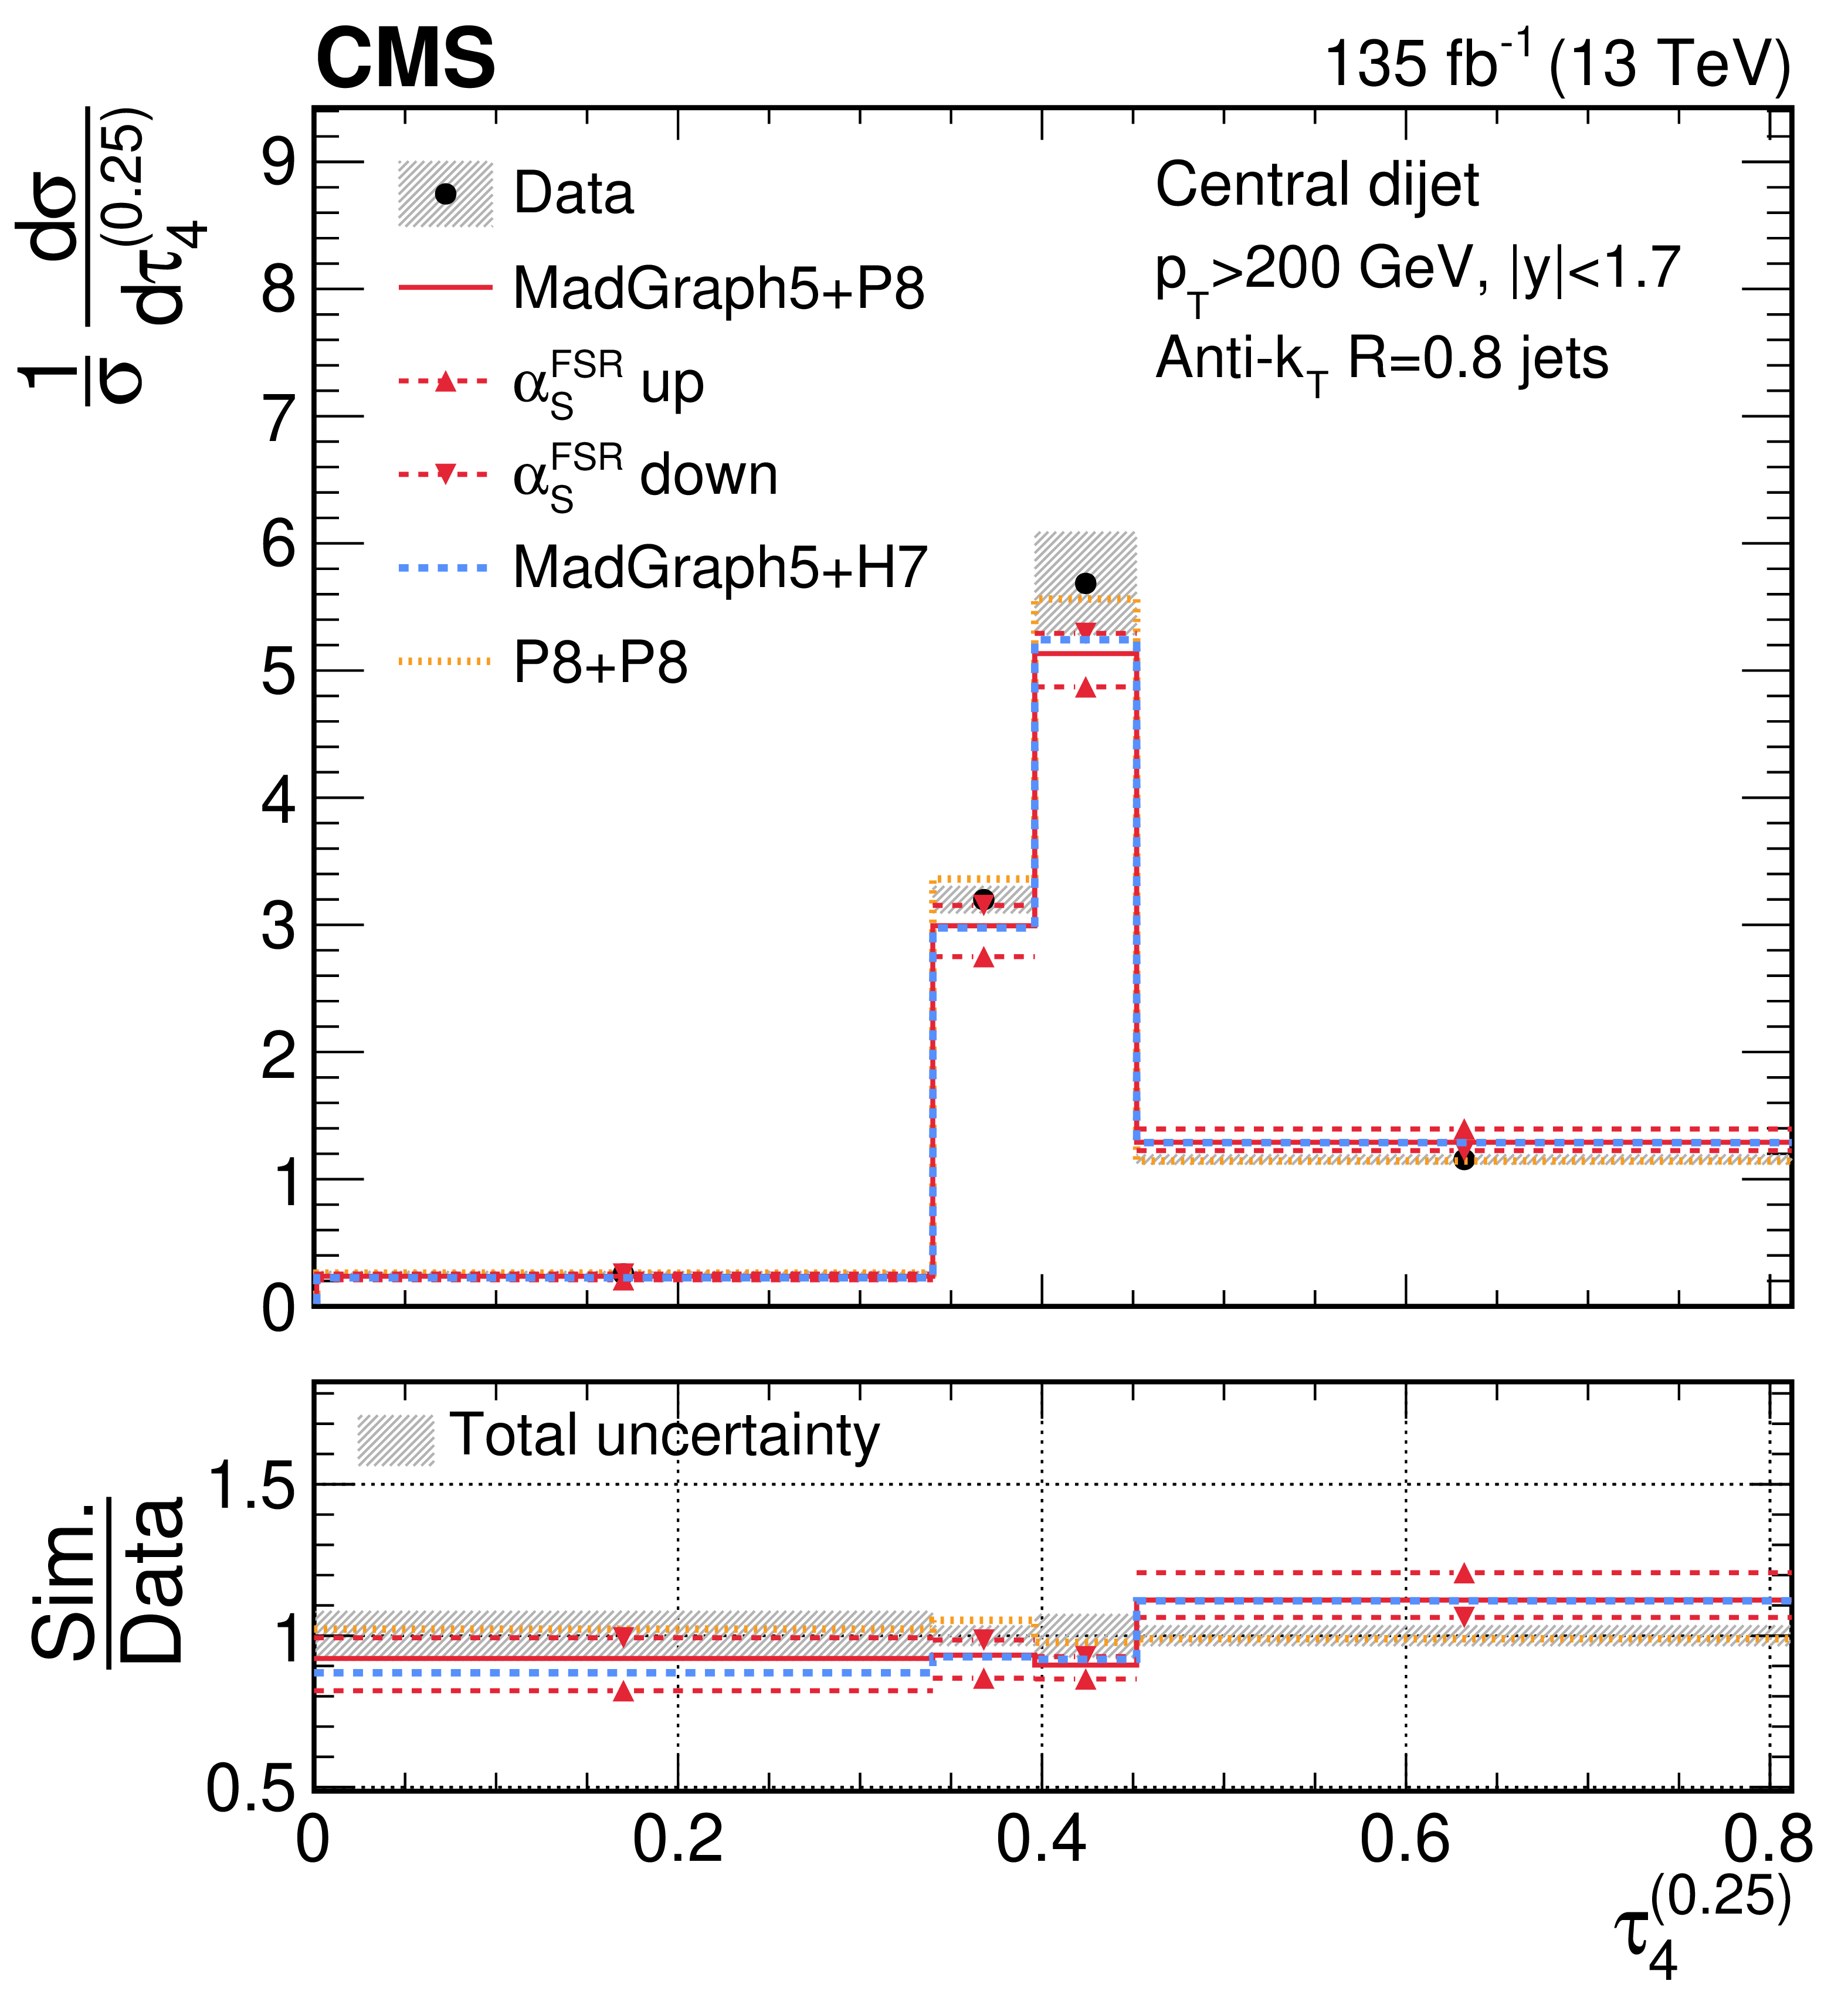
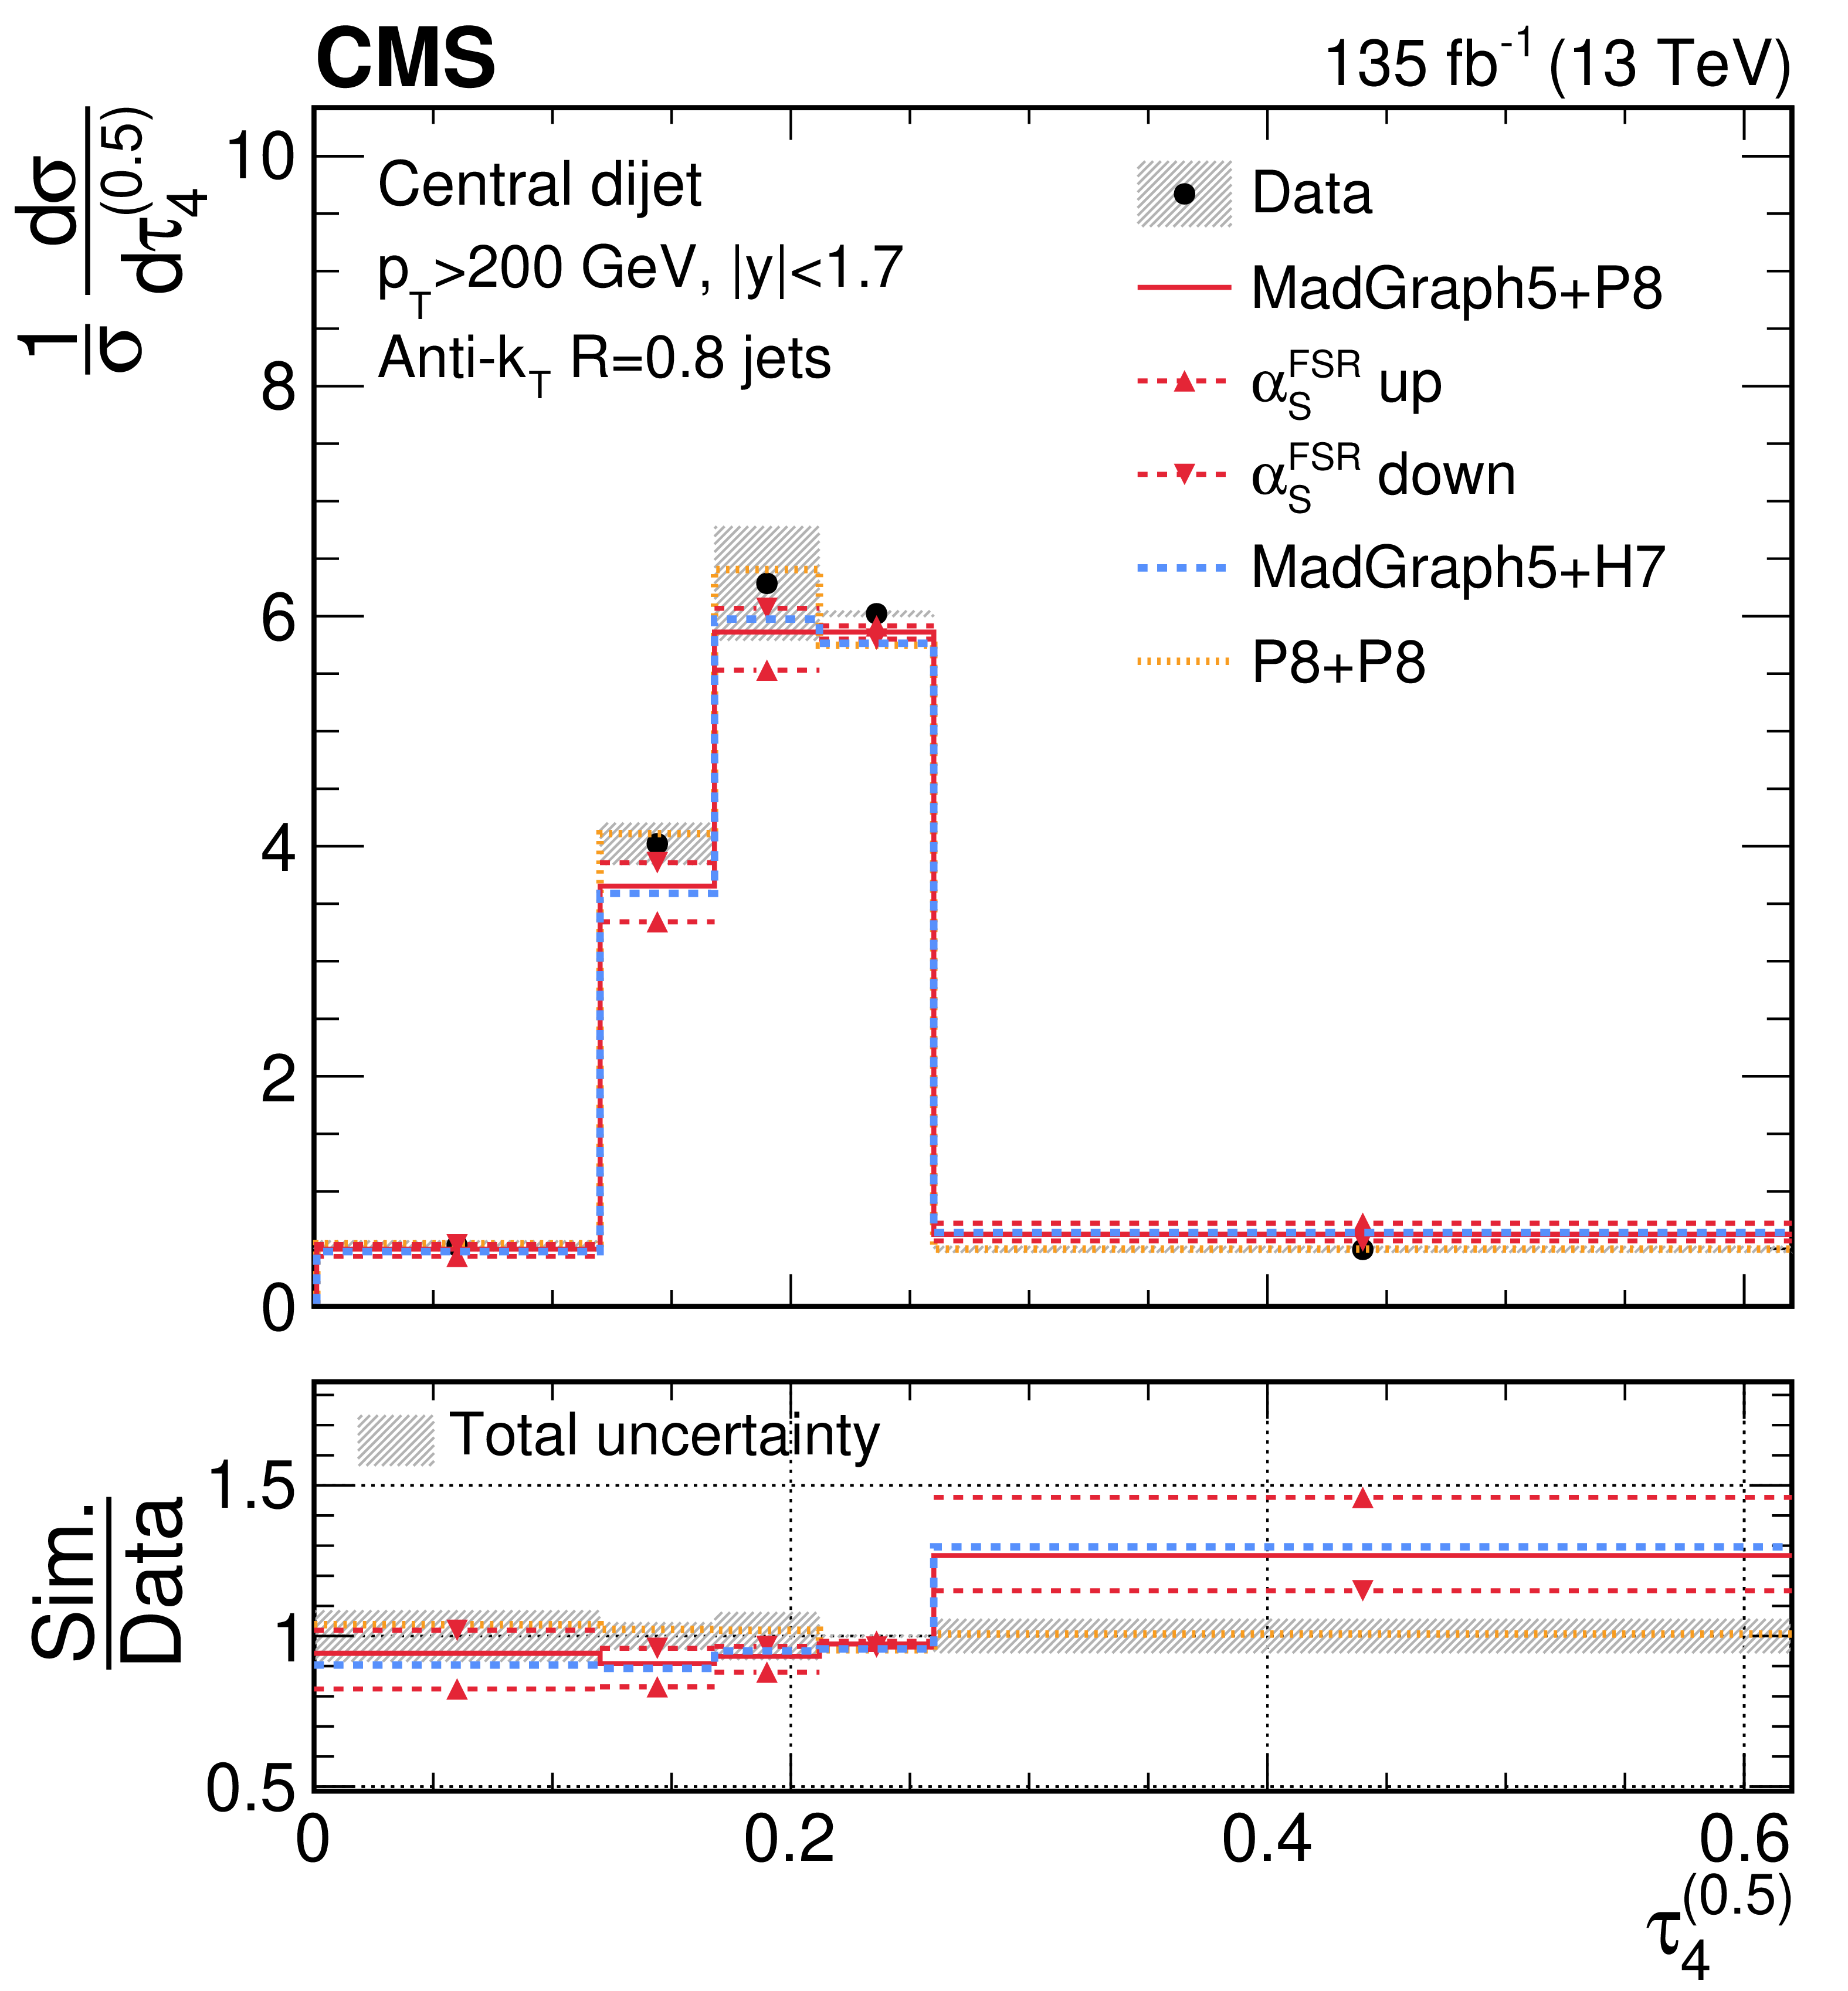
Figure 37:
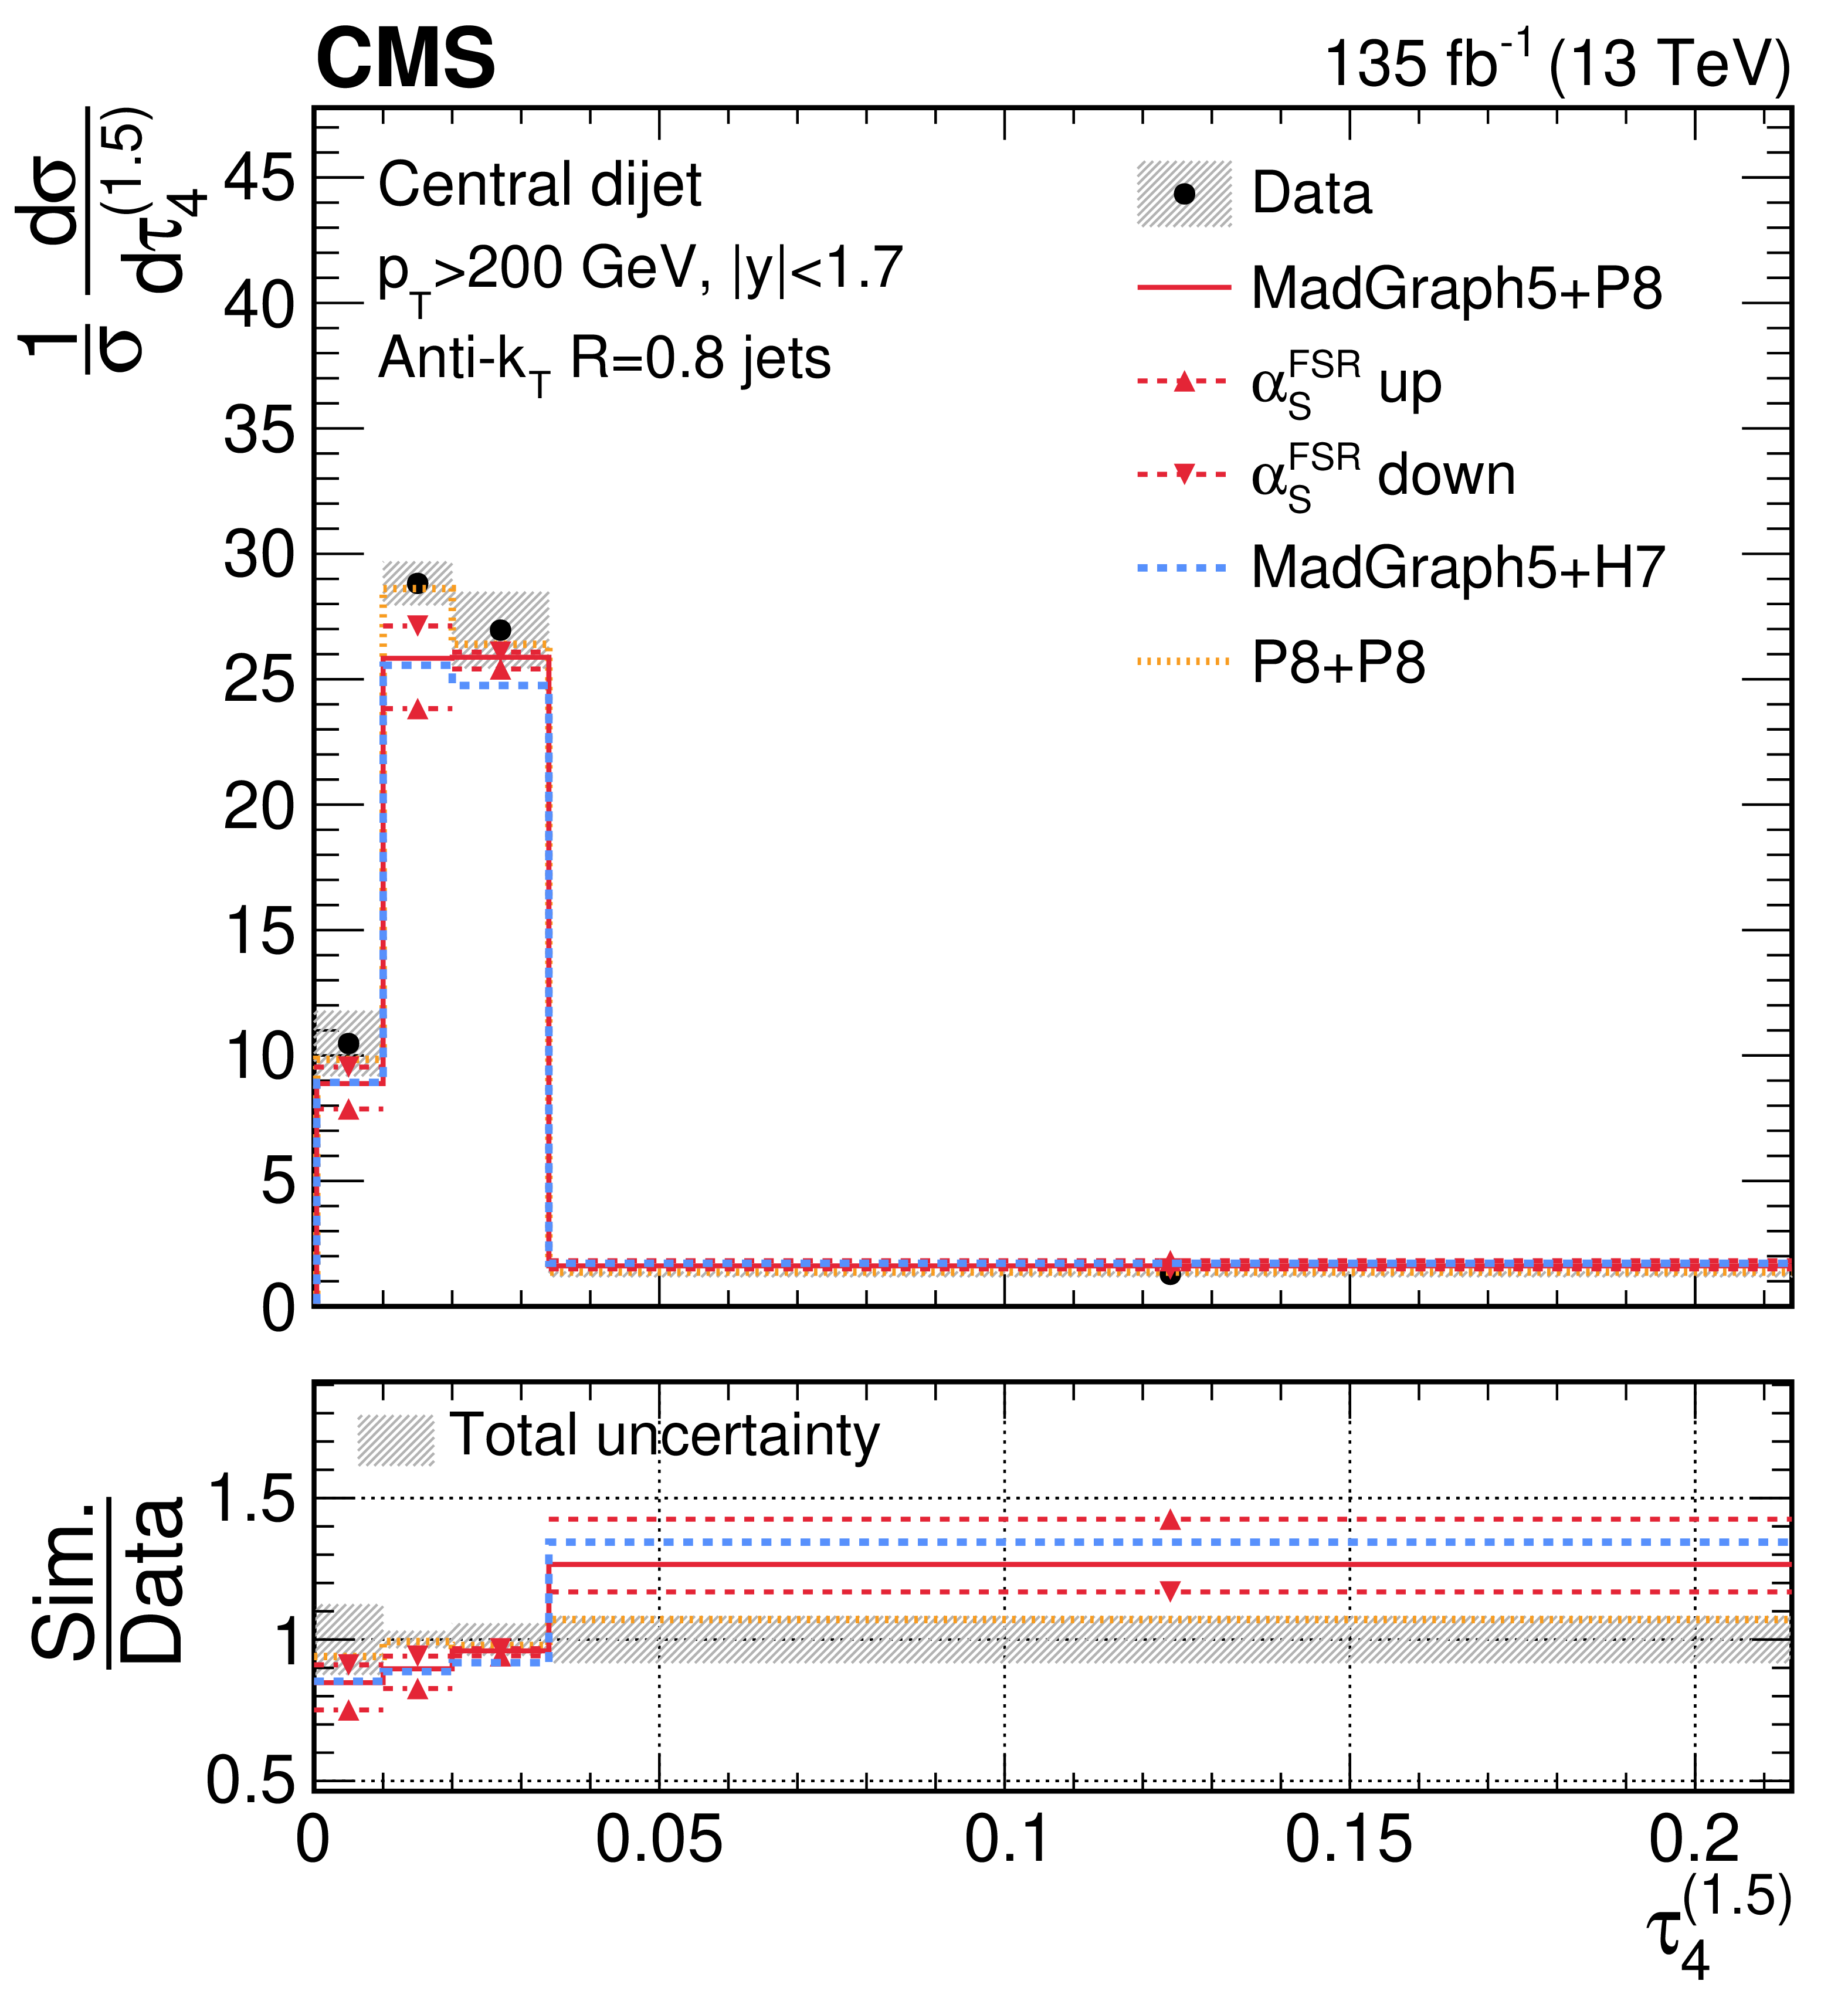
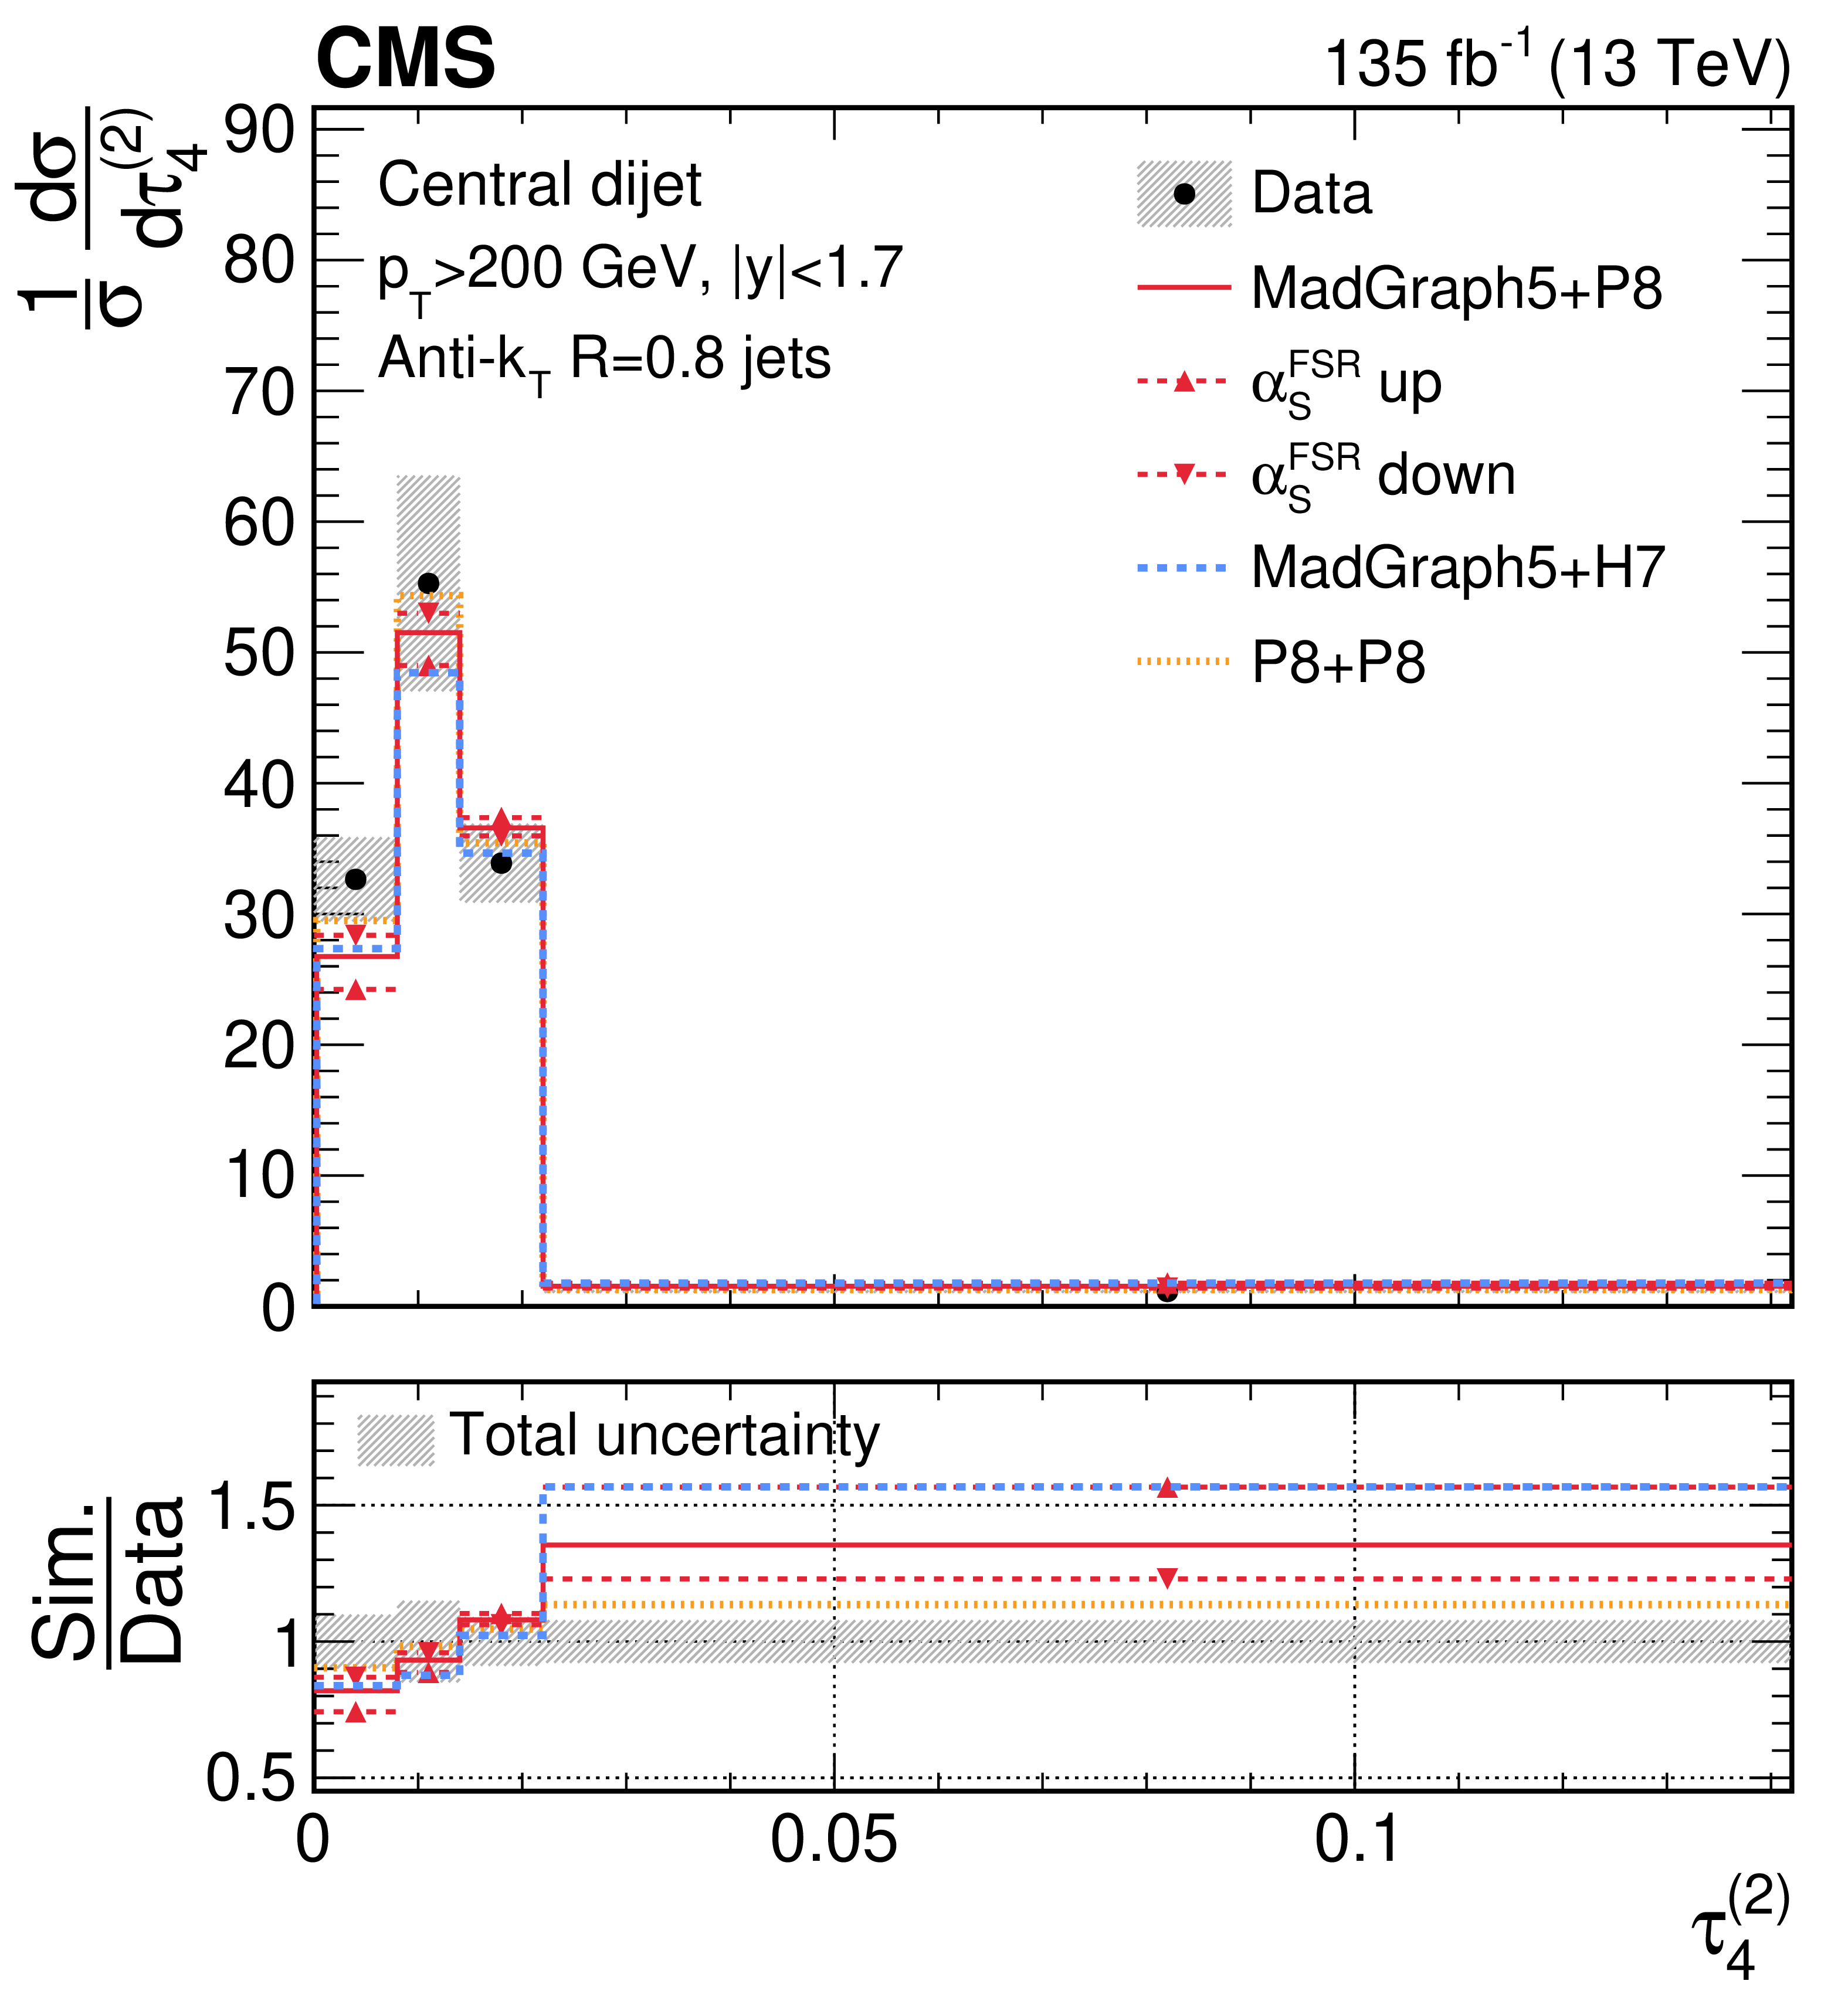
Unfolded distributions of 4-subjettiness observables, $\tau_{4}^{(0.25)}$, $\tau_{4}^{(0.5)}$, $\tau_{4}^{(1)}$, $\tau_{4}^{(1.5)}$, and \Nsub42, measured for AK8 jets in the QCD dijet event selection, extracted from the normalized, combined distribution after unfolding; the bin contents and the error bars are scaled by the bin widths for the distributions of the individual observables. For comparisons with particle-level predictions, the error bars in data correspond to the total unfolding uncertainties, and the lower panels present the ratio of particle-level predictions to the unfolded data. The dark grey hashed region illustrates the total uncertainties per bin in the unfolded result. |
png pdf |
Figure 37-a:
Unfolded distributions of 4-subjettiness observables, $\tau_{4}^{(0.25)}$, $\tau_{4}^{(0.5)}$, $\tau_{4}^{(1)}$, $\tau_{4}^{(1.5)}$, and \Nsub42, measured for AK8 jets in the QCD dijet event selection, extracted from the normalized, combined distribution after unfolding; the bin contents and the error bars are scaled by the bin widths for the distributions of the individual observables. For comparisons with particle-level predictions, the error bars in data correspond to the total unfolding uncertainties, and the lower panels present the ratio of particle-level predictions to the unfolded data. The dark grey hashed region illustrates the total uncertainties per bin in the unfolded result. |
png pdf |
Figure 37-b:
Unfolded distributions of 4-subjettiness observables, $\tau_{4}^{(0.25)}$, $\tau_{4}^{(0.5)}$, $\tau_{4}^{(1)}$, $\tau_{4}^{(1.5)}$, and \Nsub42, measured for AK8 jets in the QCD dijet event selection, extracted from the normalized, combined distribution after unfolding; the bin contents and the error bars are scaled by the bin widths for the distributions of the individual observables. For comparisons with particle-level predictions, the error bars in data correspond to the total unfolding uncertainties, and the lower panels present the ratio of particle-level predictions to the unfolded data. The dark grey hashed region illustrates the total uncertainties per bin in the unfolded result. |

png pdf |
Figure 37-c:
Unfolded distributions of 4-subjettiness observables, $\tau_{4}^{(0.25)}$, $\tau_{4}^{(0.5)}$, $\tau_{4}^{(1)}$, $\tau_{4}^{(1.5)}$, and \Nsub42, measured for AK8 jets in the QCD dijet event selection, extracted from the normalized, combined distribution after unfolding; the bin contents and the error bars are scaled by the bin widths for the distributions of the individual observables. For comparisons with particle-level predictions, the error bars in data correspond to the total unfolding uncertainties, and the lower panels present the ratio of particle-level predictions to the unfolded data. The dark grey hashed region illustrates the total uncertainties per bin in the unfolded result. |
png pdf |
Figure 37-d:
Unfolded distributions of 4-subjettiness observables, $\tau_{4}^{(0.25)}$, $\tau_{4}^{(0.5)}$, $\tau_{4}^{(1)}$, $\tau_{4}^{(1.5)}$, and \Nsub42, measured for AK8 jets in the QCD dijet event selection, extracted from the normalized, combined distribution after unfolding; the bin contents and the error bars are scaled by the bin widths for the distributions of the individual observables. For comparisons with particle-level predictions, the error bars in data correspond to the total unfolding uncertainties, and the lower panels present the ratio of particle-level predictions to the unfolded data. The dark grey hashed region illustrates the total uncertainties per bin in the unfolded result. |
png pdf |
Figure 37-e:
Unfolded distributions of 4-subjettiness observables, $\tau_{4}^{(0.25)}$, $\tau_{4}^{(0.5)}$, $\tau_{4}^{(1)}$, $\tau_{4}^{(1.5)}$, and \Nsub42, measured for AK8 jets in the QCD dijet event selection, extracted from the normalized, combined distribution after unfolding; the bin contents and the error bars are scaled by the bin widths for the distributions of the individual observables. For comparisons with particle-level predictions, the error bars in data correspond to the total unfolding uncertainties, and the lower panels present the ratio of particle-level predictions to the unfolded data. The dark grey hashed region illustrates the total uncertainties per bin in the unfolded result. |
png pdf |
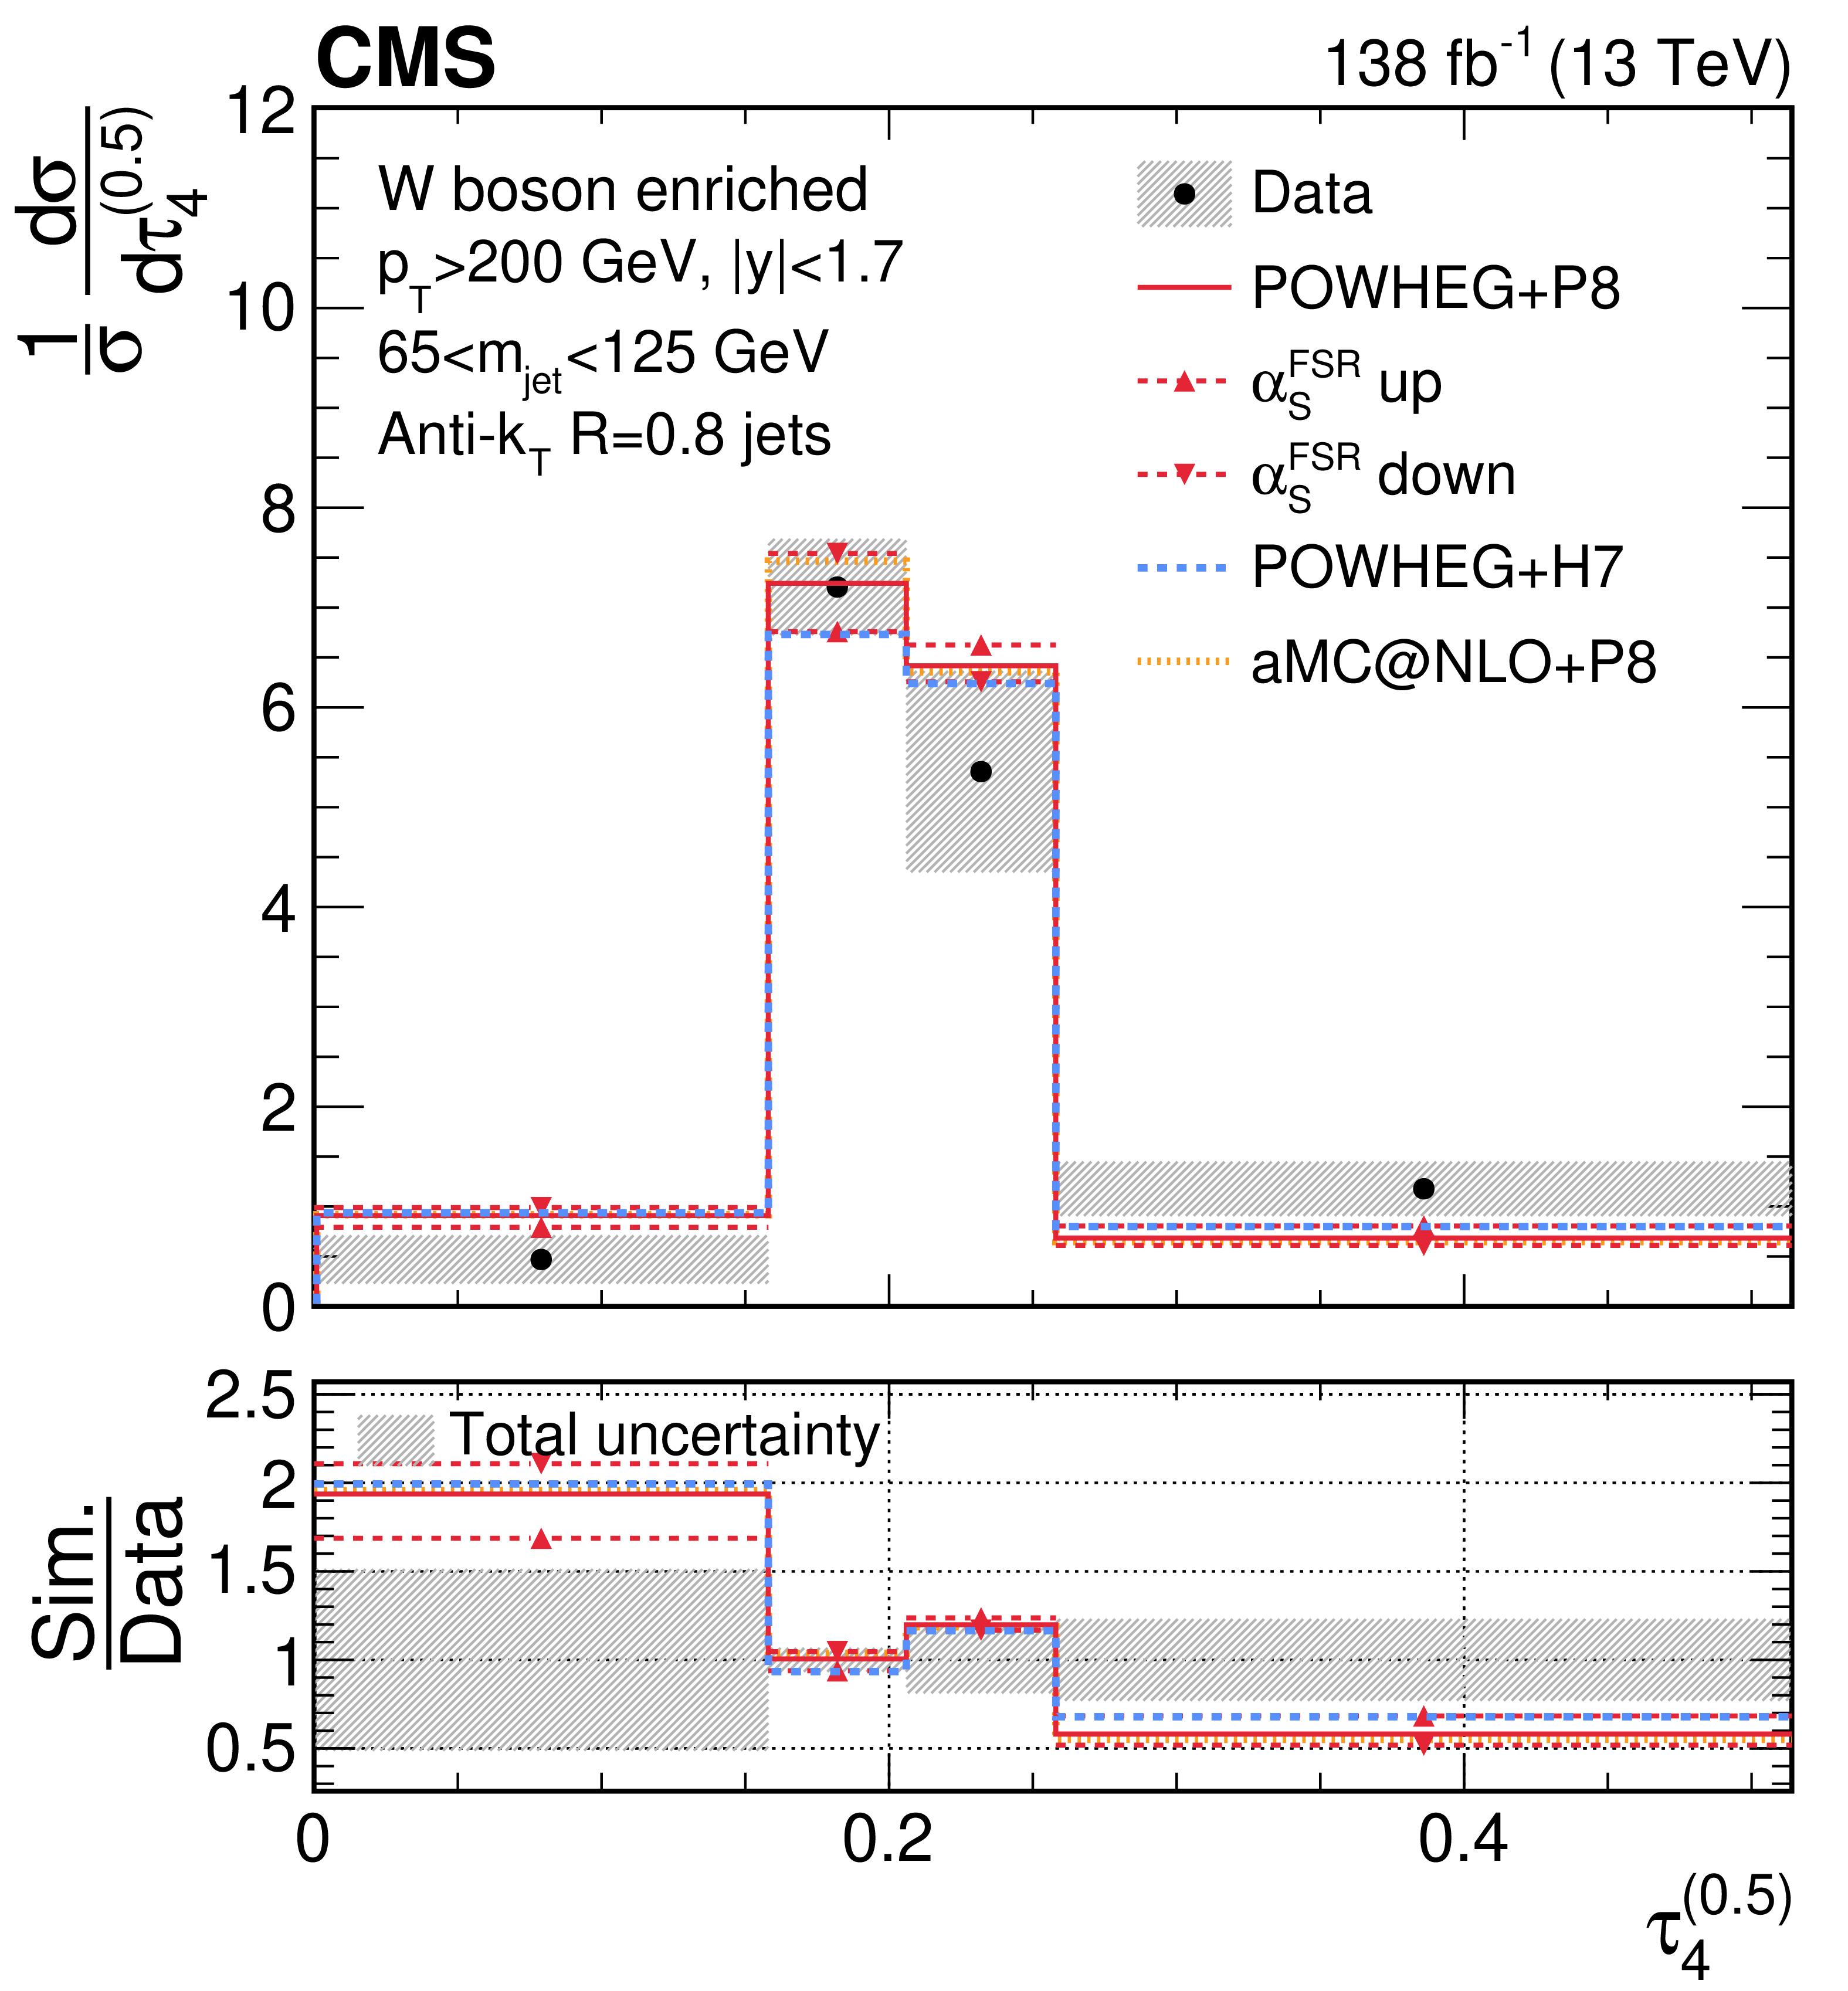
Figure 38:
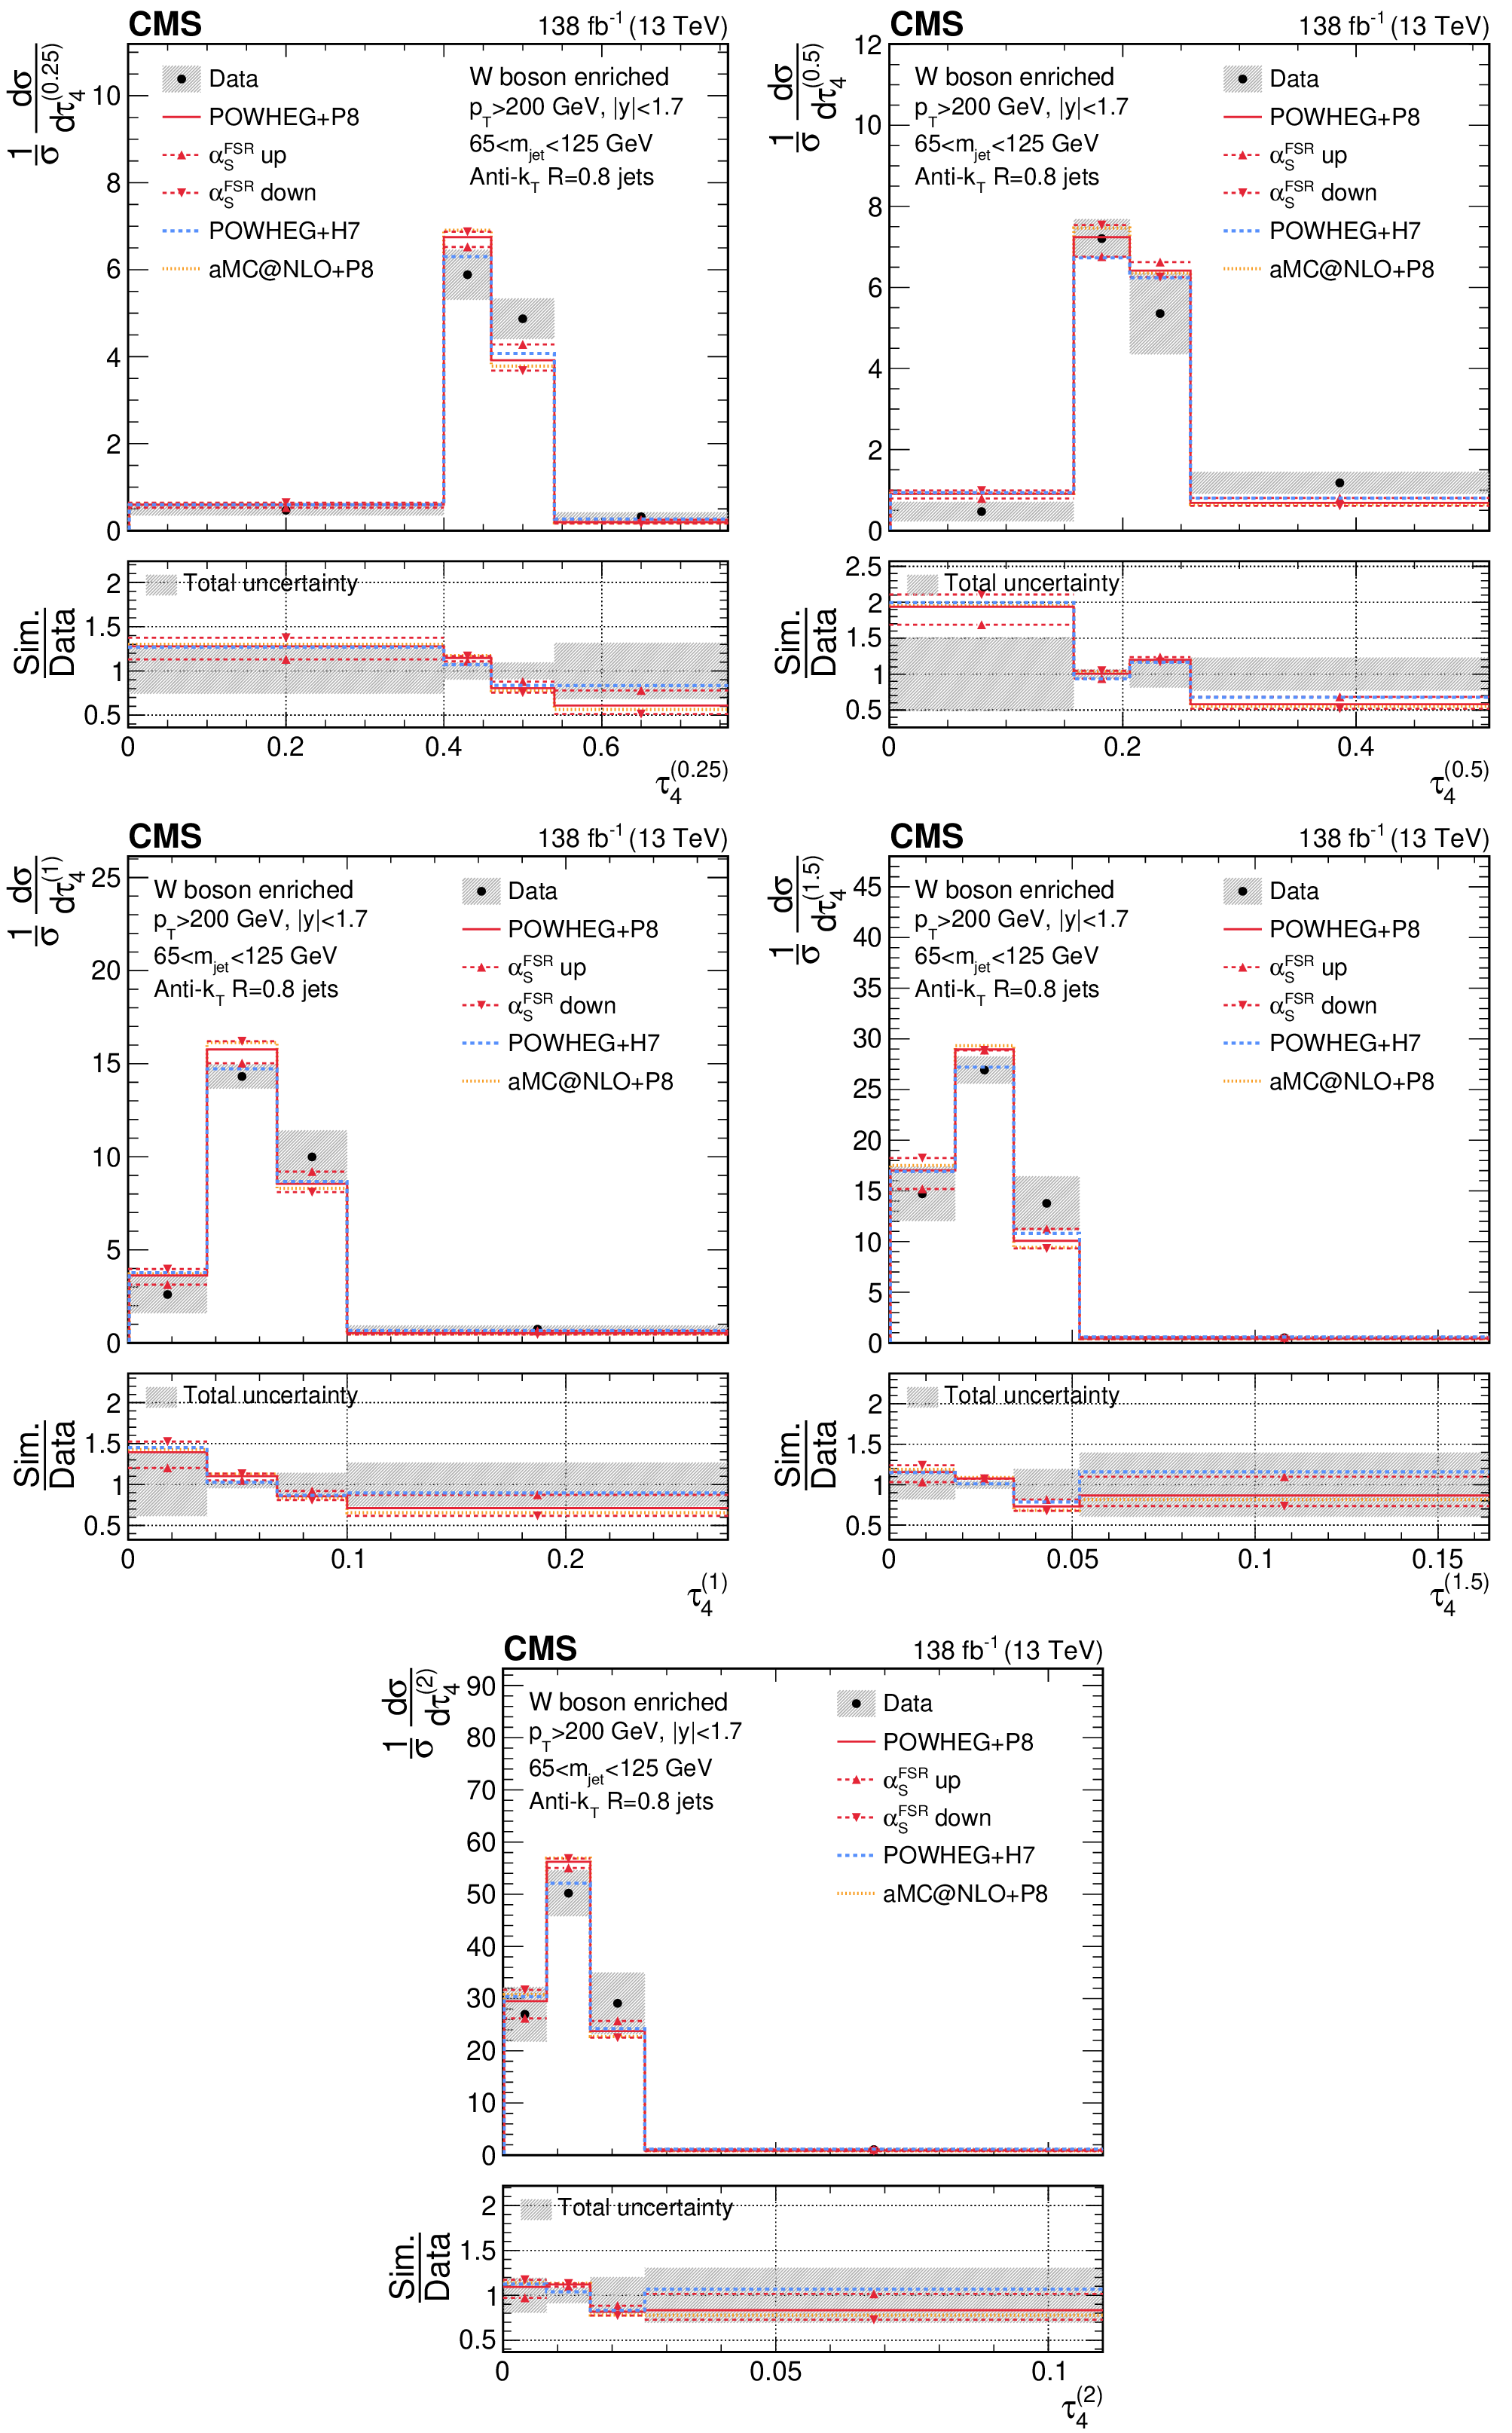
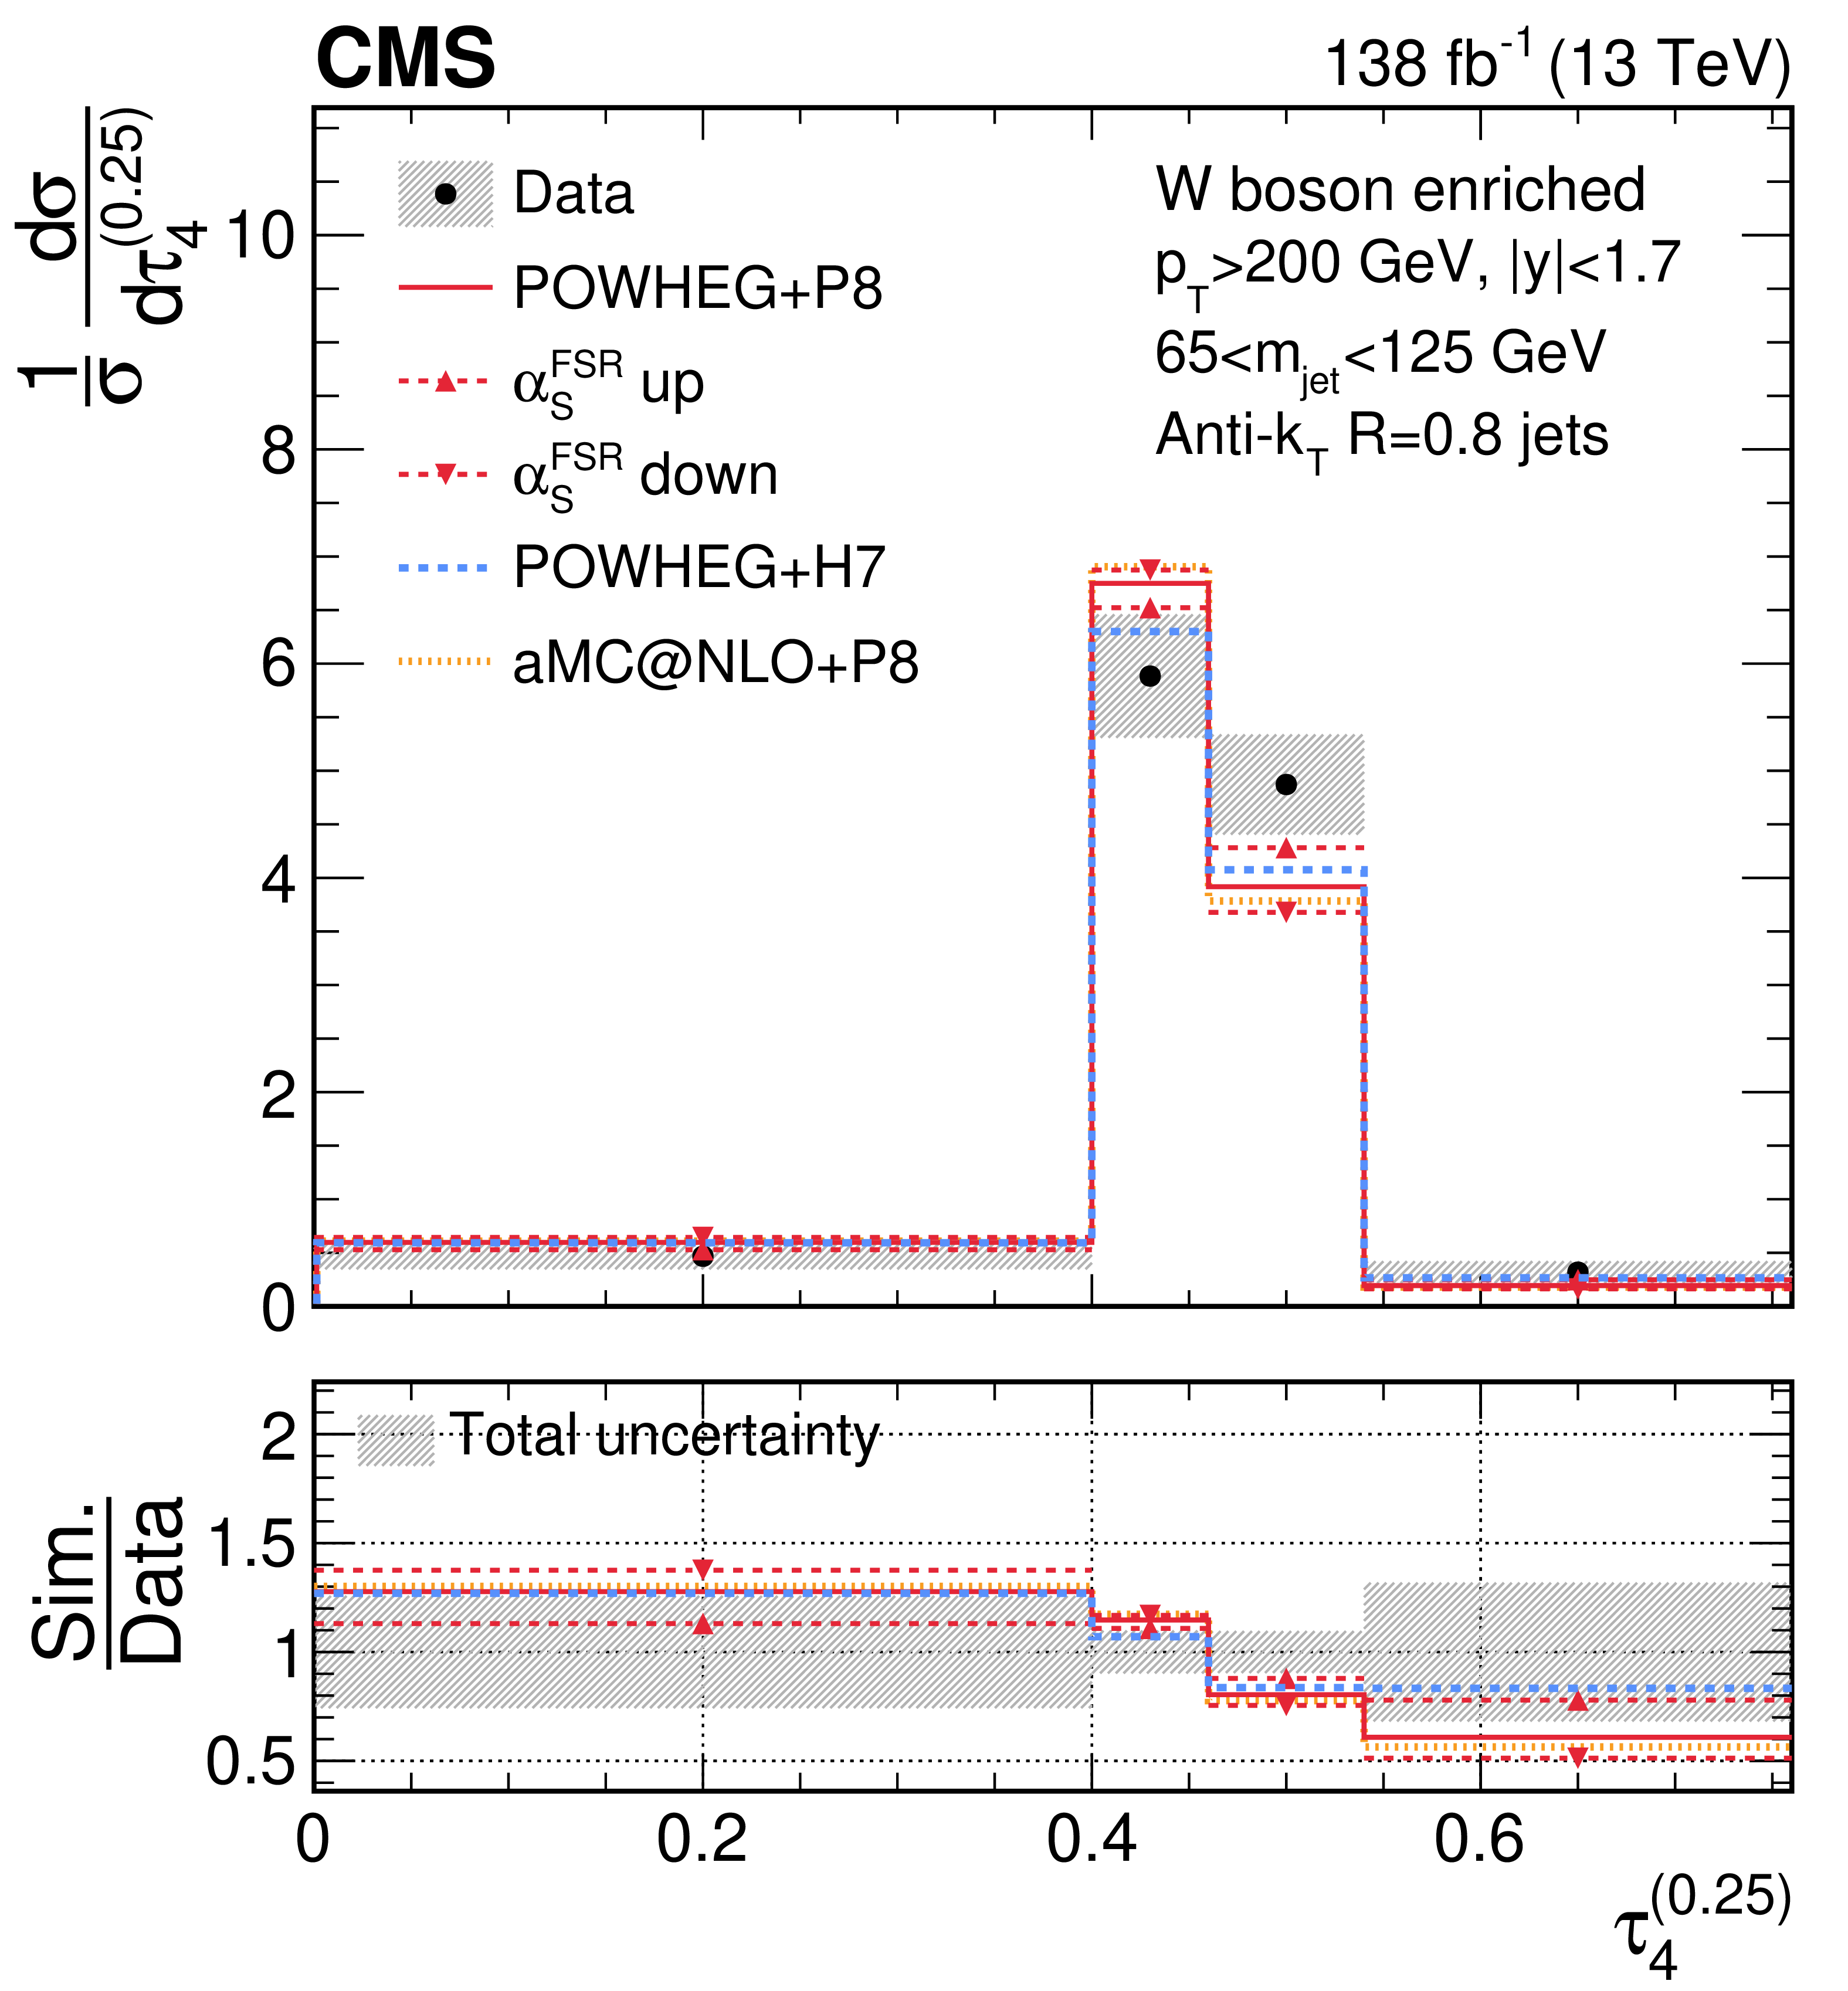
Unfolded distributions of 4-subjettiness observables, $\tau_{4}^{(0.25)}$, $\tau_{4}^{(0.5)}$, $\tau_{4}^{(1)}$, $\tau_{4}^{(1.5)}$, and \Nsub42, measured for AK8 jets in boosted W boson-enriched events, extracted from the normalized, combined distribution after unfolding; the bin contents and the error bars are scaled by the bin widths for the distributions of the individual observables. For comparisons with particle-level predictions, the error bars in data correspond to the total unfolding uncertainties, and the lower panels present the ratio of particle-level predictions to the unfolded data. The dark grey hashed region illustrates the total uncertainties per bin in the unfolded result. |
png pdf |
Figure 38-a:
Unfolded distributions of 4-subjettiness observables, $\tau_{4}^{(0.25)}$, $\tau_{4}^{(0.5)}$, $\tau_{4}^{(1)}$, $\tau_{4}^{(1.5)}$, and \Nsub42, measured for AK8 jets in boosted W boson-enriched events, extracted from the normalized, combined distribution after unfolding; the bin contents and the error bars are scaled by the bin widths for the distributions of the individual observables. For comparisons with particle-level predictions, the error bars in data correspond to the total unfolding uncertainties, and the lower panels present the ratio of particle-level predictions to the unfolded data. The dark grey hashed region illustrates the total uncertainties per bin in the unfolded result. |
png pdf |
Figure 38-b:
Unfolded distributions of 4-subjettiness observables, $\tau_{4}^{(0.25)}$, $\tau_{4}^{(0.5)}$, $\tau_{4}^{(1)}$, $\tau_{4}^{(1.5)}$, and \Nsub42, measured for AK8 jets in boosted W boson-enriched events, extracted from the normalized, combined distribution after unfolding; the bin contents and the error bars are scaled by the bin widths for the distributions of the individual observables. For comparisons with particle-level predictions, the error bars in data correspond to the total unfolding uncertainties, and the lower panels present the ratio of particle-level predictions to the unfolded data. The dark grey hashed region illustrates the total uncertainties per bin in the unfolded result. |

png pdf |
Figure 38-c:
Unfolded distributions of 4-subjettiness observables, $\tau_{4}^{(0.25)}$, $\tau_{4}^{(0.5)}$, $\tau_{4}^{(1)}$, $\tau_{4}^{(1.5)}$, and \Nsub42, measured for AK8 jets in boosted W boson-enriched events, extracted from the normalized, combined distribution after unfolding; the bin contents and the error bars are scaled by the bin widths for the distributions of the individual observables. For comparisons with particle-level predictions, the error bars in data correspond to the total unfolding uncertainties, and the lower panels present the ratio of particle-level predictions to the unfolded data. The dark grey hashed region illustrates the total uncertainties per bin in the unfolded result. |
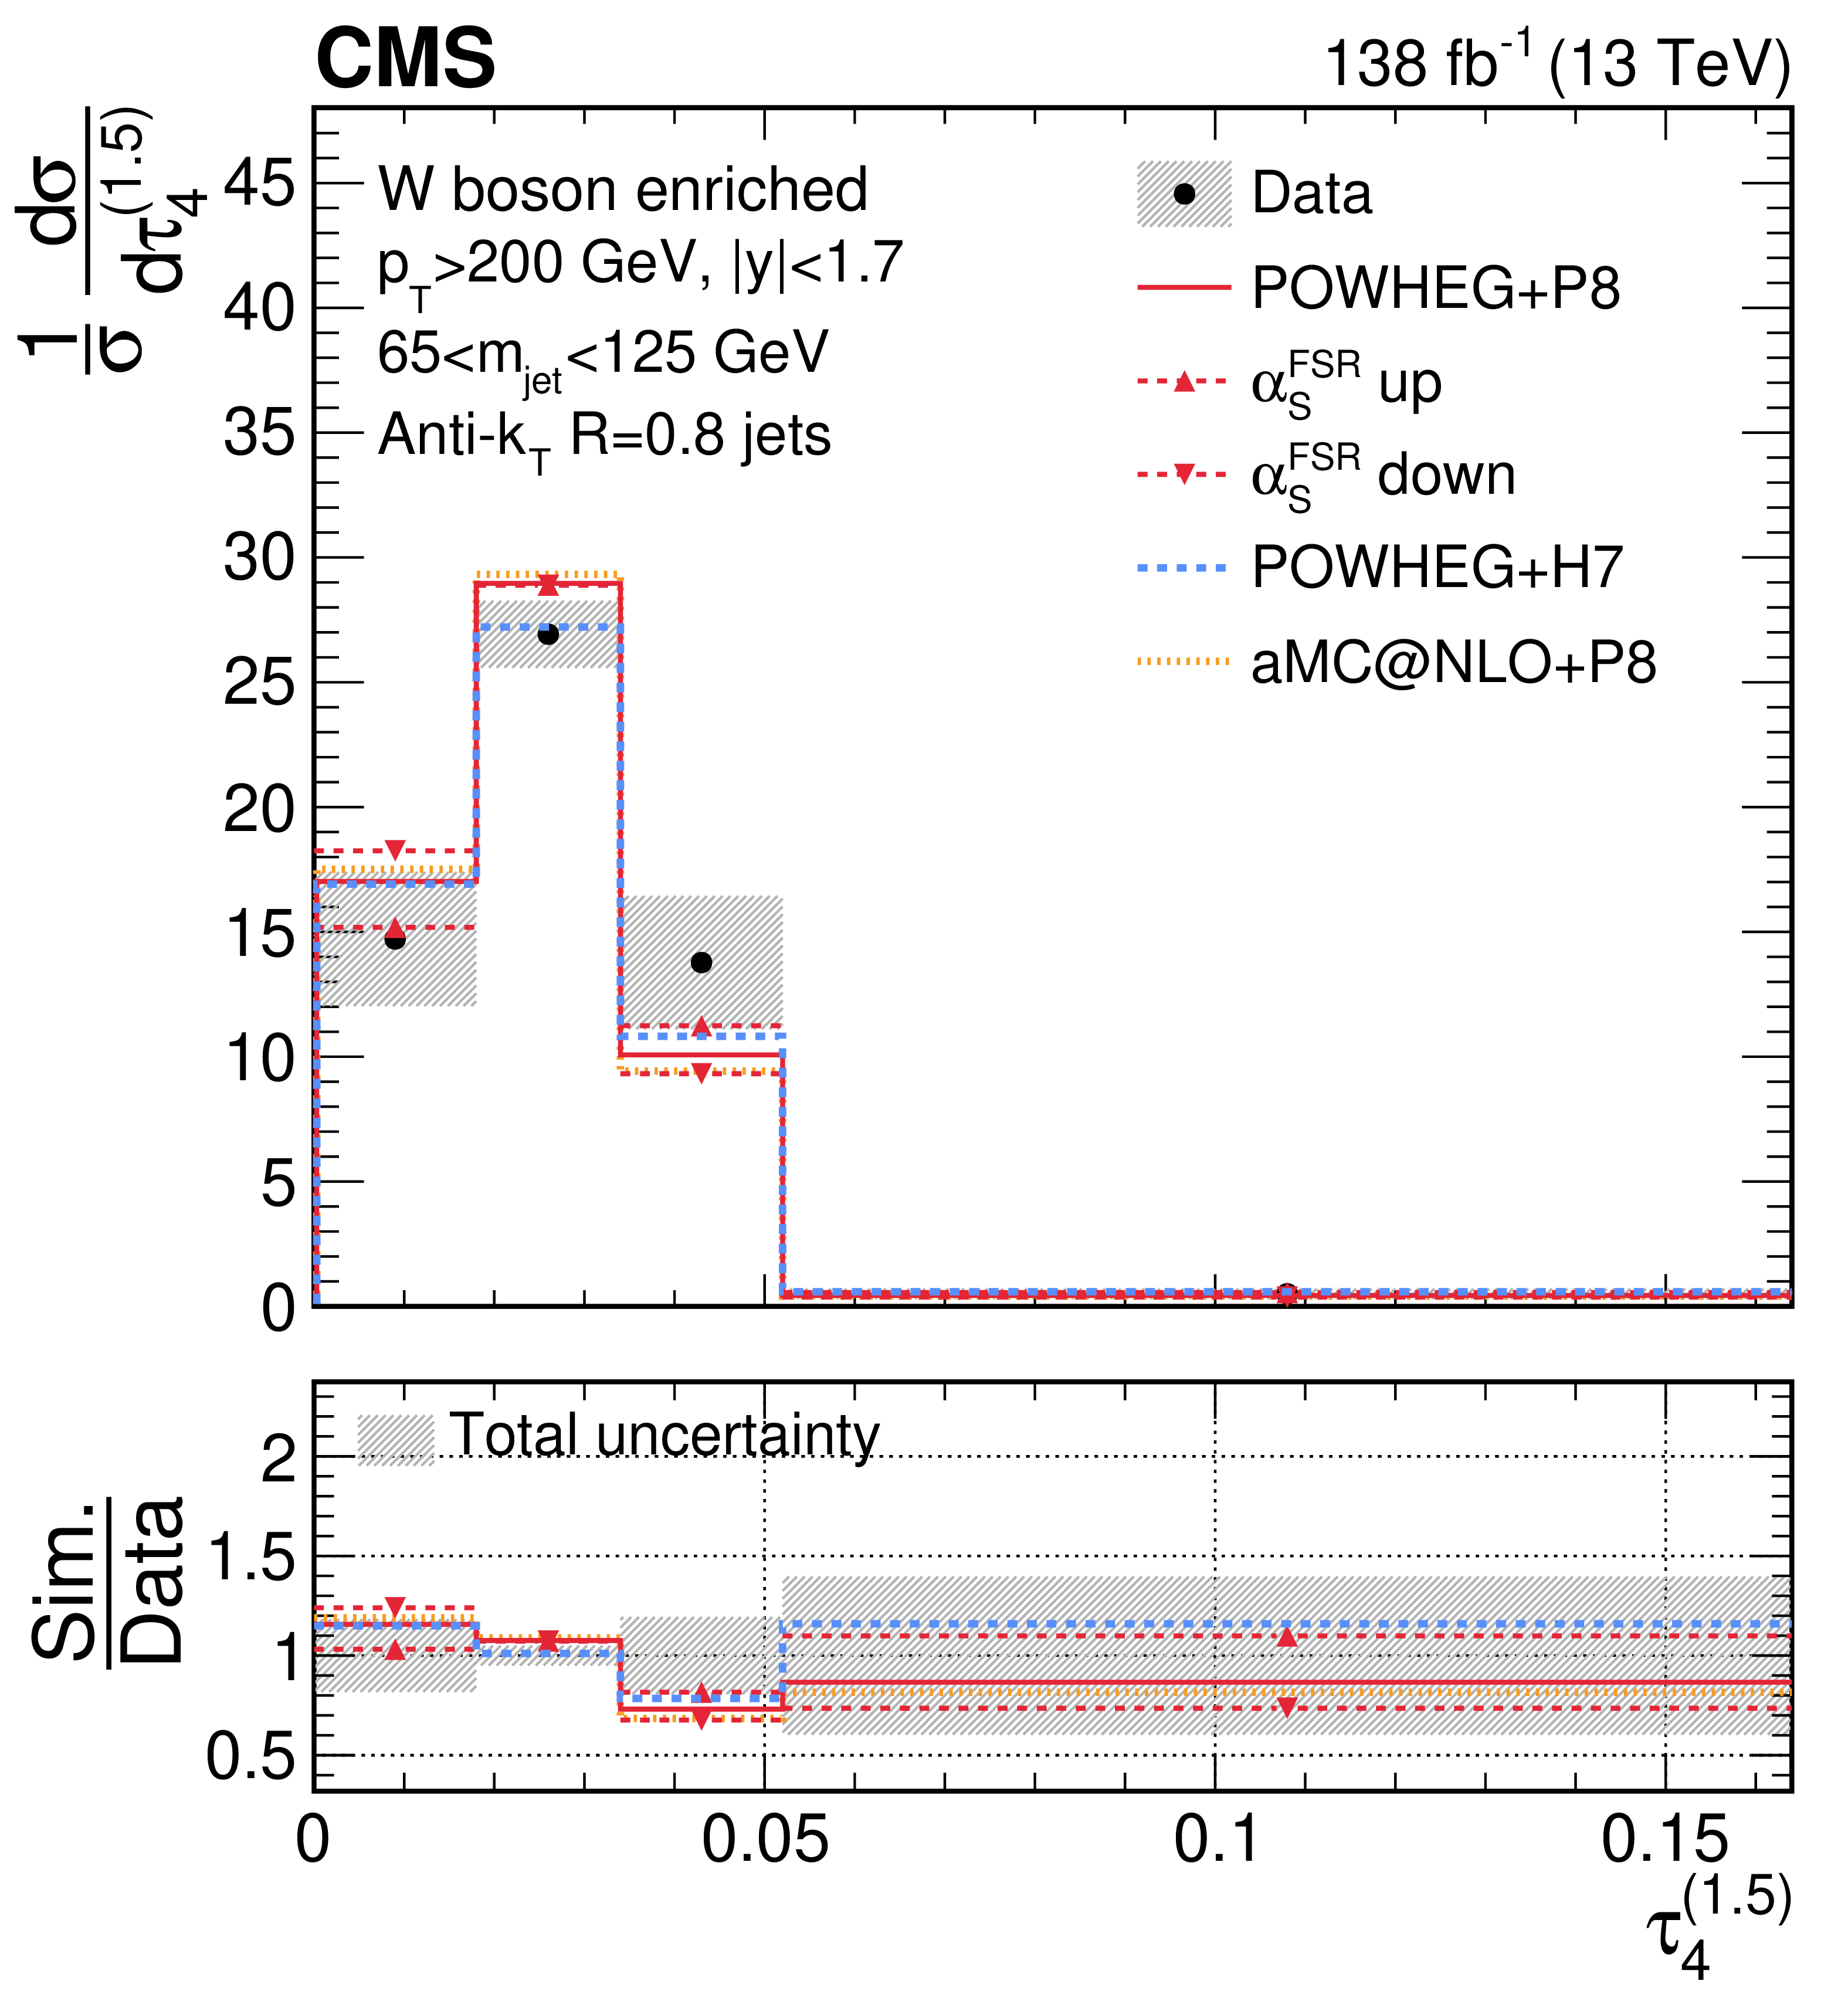
png pdf |
Figure 38-d:
Unfolded distributions of 4-subjettiness observables, $\tau_{4}^{(0.25)}$, $\tau_{4}^{(0.5)}$, $\tau_{4}^{(1)}$, $\tau_{4}^{(1.5)}$, and \Nsub42, measured for AK8 jets in boosted W boson-enriched events, extracted from the normalized, combined distribution after unfolding; the bin contents and the error bars are scaled by the bin widths for the distributions of the individual observables. For comparisons with particle-level predictions, the error bars in data correspond to the total unfolding uncertainties, and the lower panels present the ratio of particle-level predictions to the unfolded data. The dark grey hashed region illustrates the total uncertainties per bin in the unfolded result. |
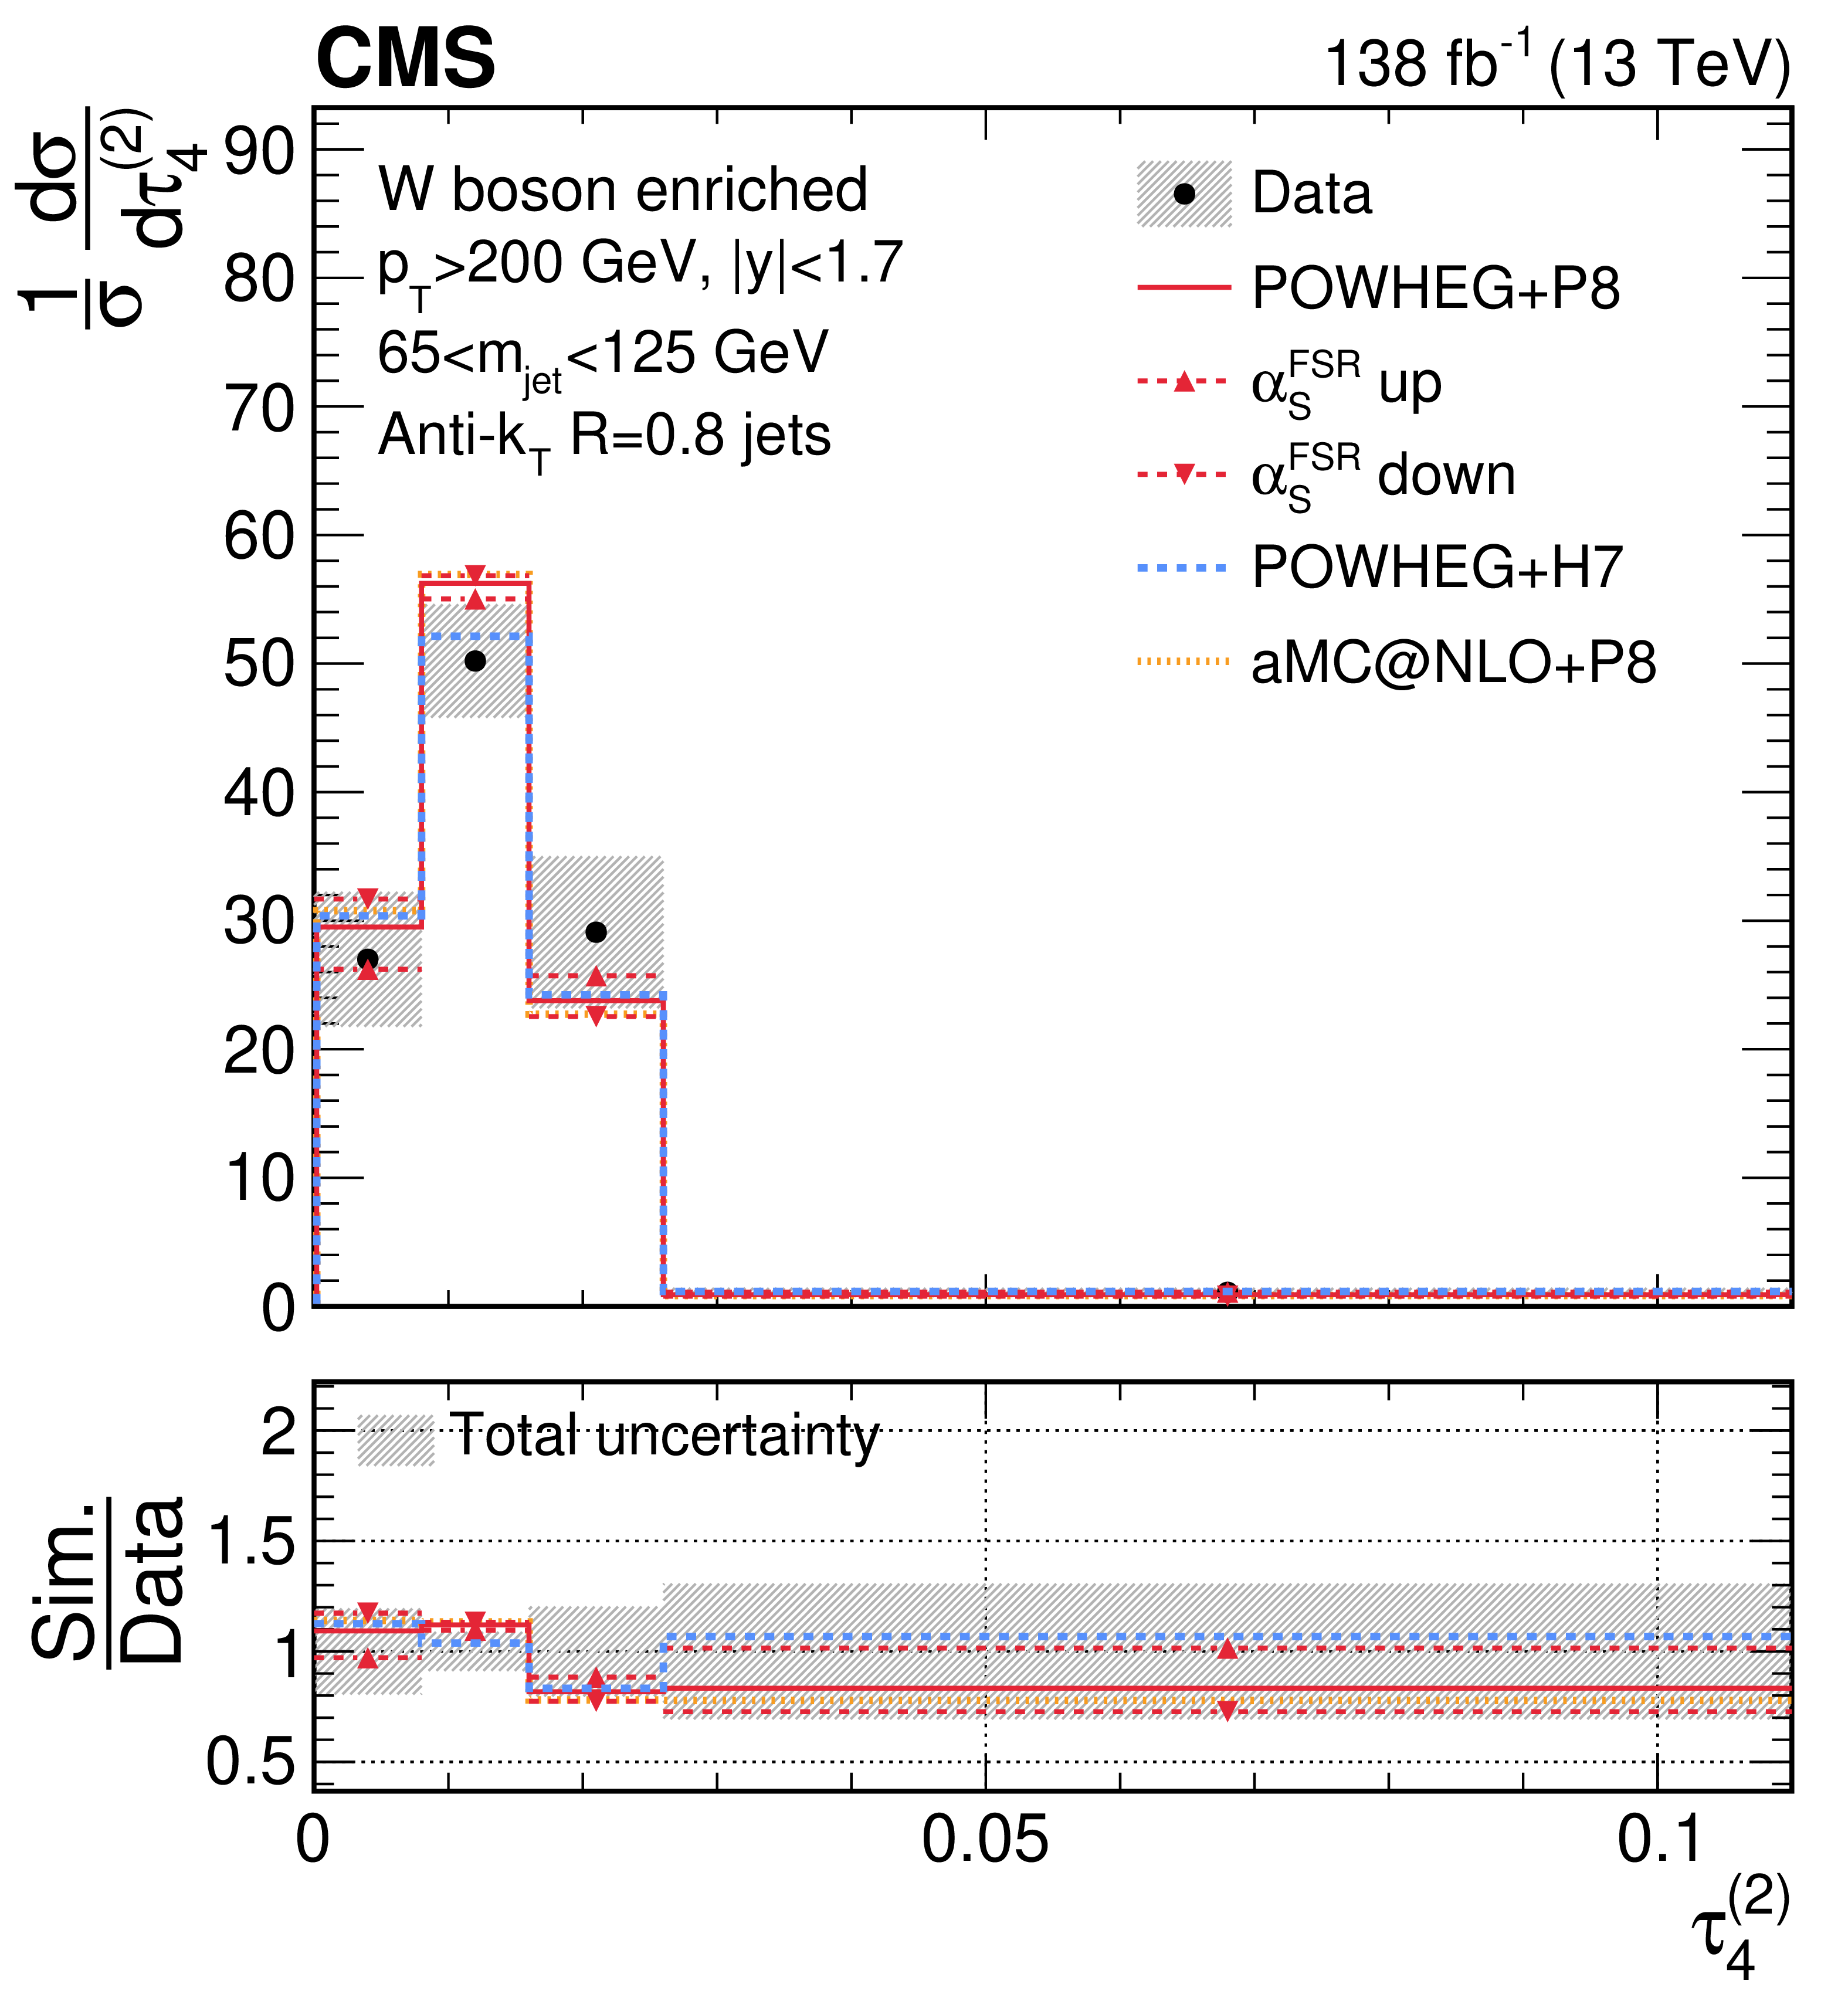
png pdf |
Figure 38-e:
Unfolded distributions of 4-subjettiness observables, $\tau_{4}^{(0.25)}$, $\tau_{4}^{(0.5)}$, $\tau_{4}^{(1)}$, $\tau_{4}^{(1.5)}$, and \Nsub42, measured for AK8 jets in boosted W boson-enriched events, extracted from the normalized, combined distribution after unfolding; the bin contents and the error bars are scaled by the bin widths for the distributions of the individual observables. For comparisons with particle-level predictions, the error bars in data correspond to the total unfolding uncertainties, and the lower panels present the ratio of particle-level predictions to the unfolded data. The dark grey hashed region illustrates the total uncertainties per bin in the unfolded result. |
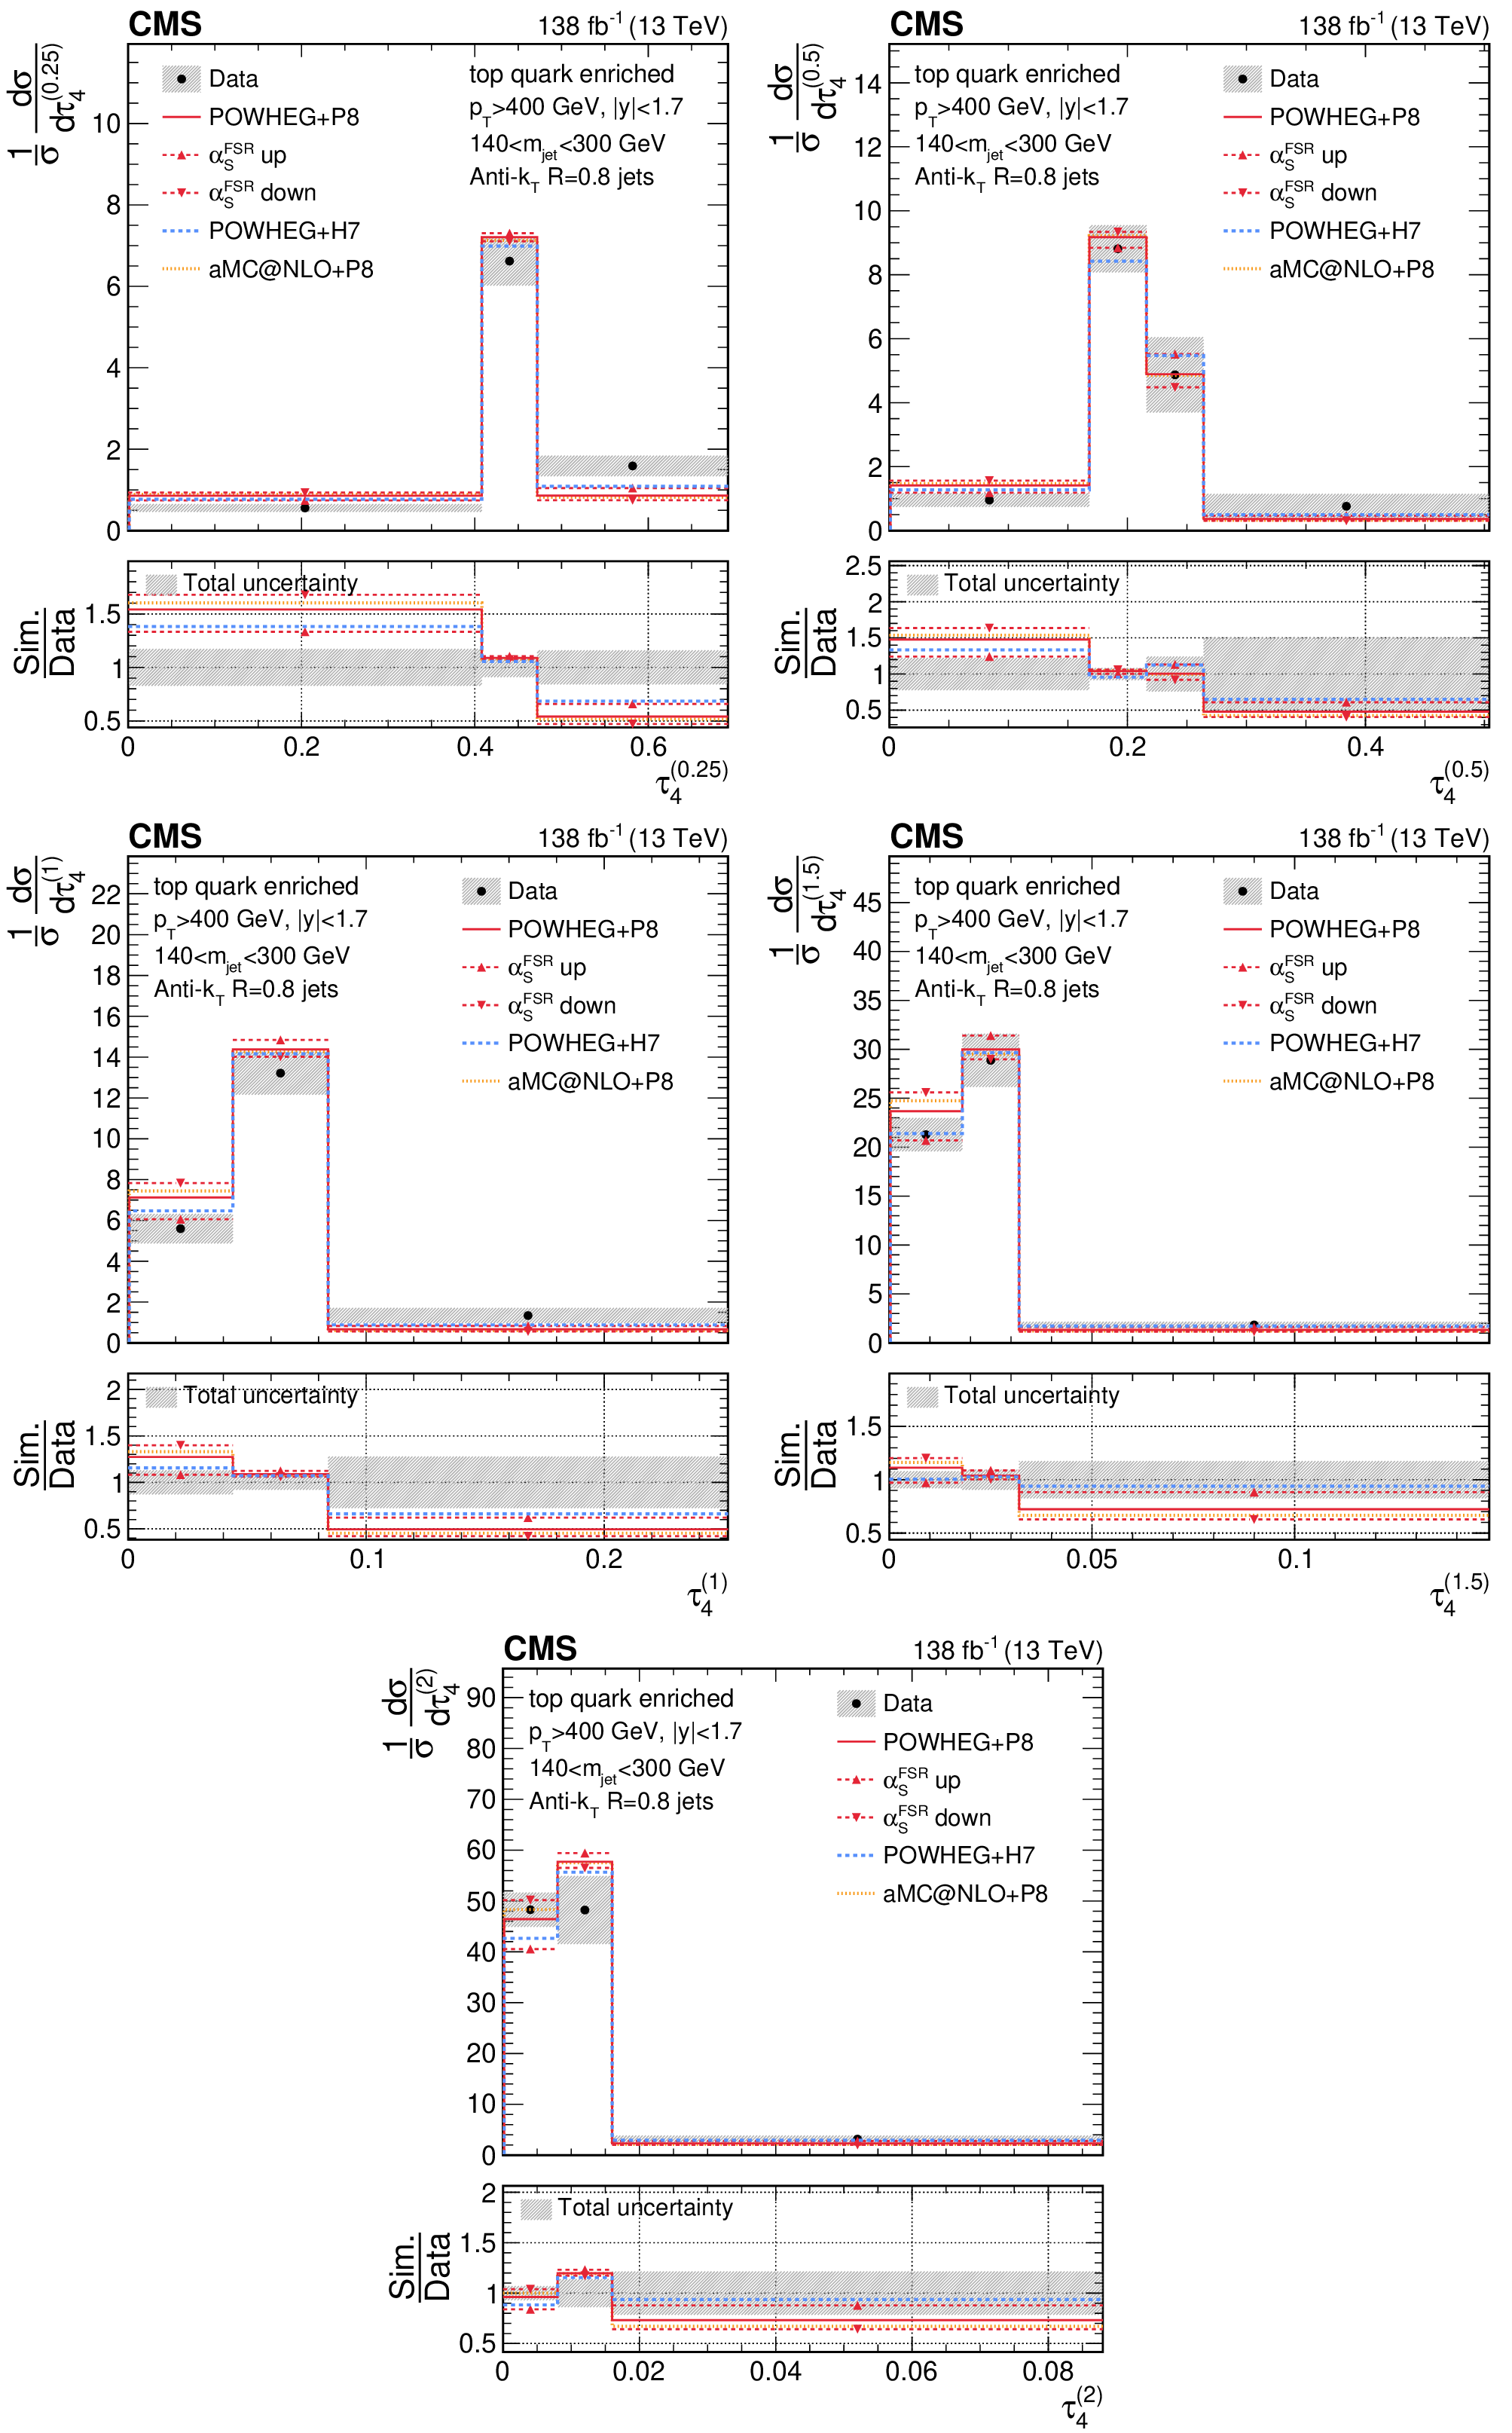
png pdf |
Figure 39:
Unfolded distributions of 4-subjettiness observables, $\tau_{4}^{(0.25)}$, $\tau_{4}^{(0.5)}$, $\tau_{4}^{(1)}$, $\tau_{4}^{(1.5)}$, and \Nsub42, measured for AK8 jets in the boosted top quark-enriched region, extracted from the normalized, combined distribution after unfolding; the bin contents and the error bars are scaled by the bin widths for the distributions of the individual observables. For comparisons with particle-level predictions, the error bars in data correspond to the total unfolding uncertainties, and the lower panels present the ratio of particle-level predictions to the unfolded data. The dark grey hashed region illustrates the total uncertainties per bin in the unfolded result. |
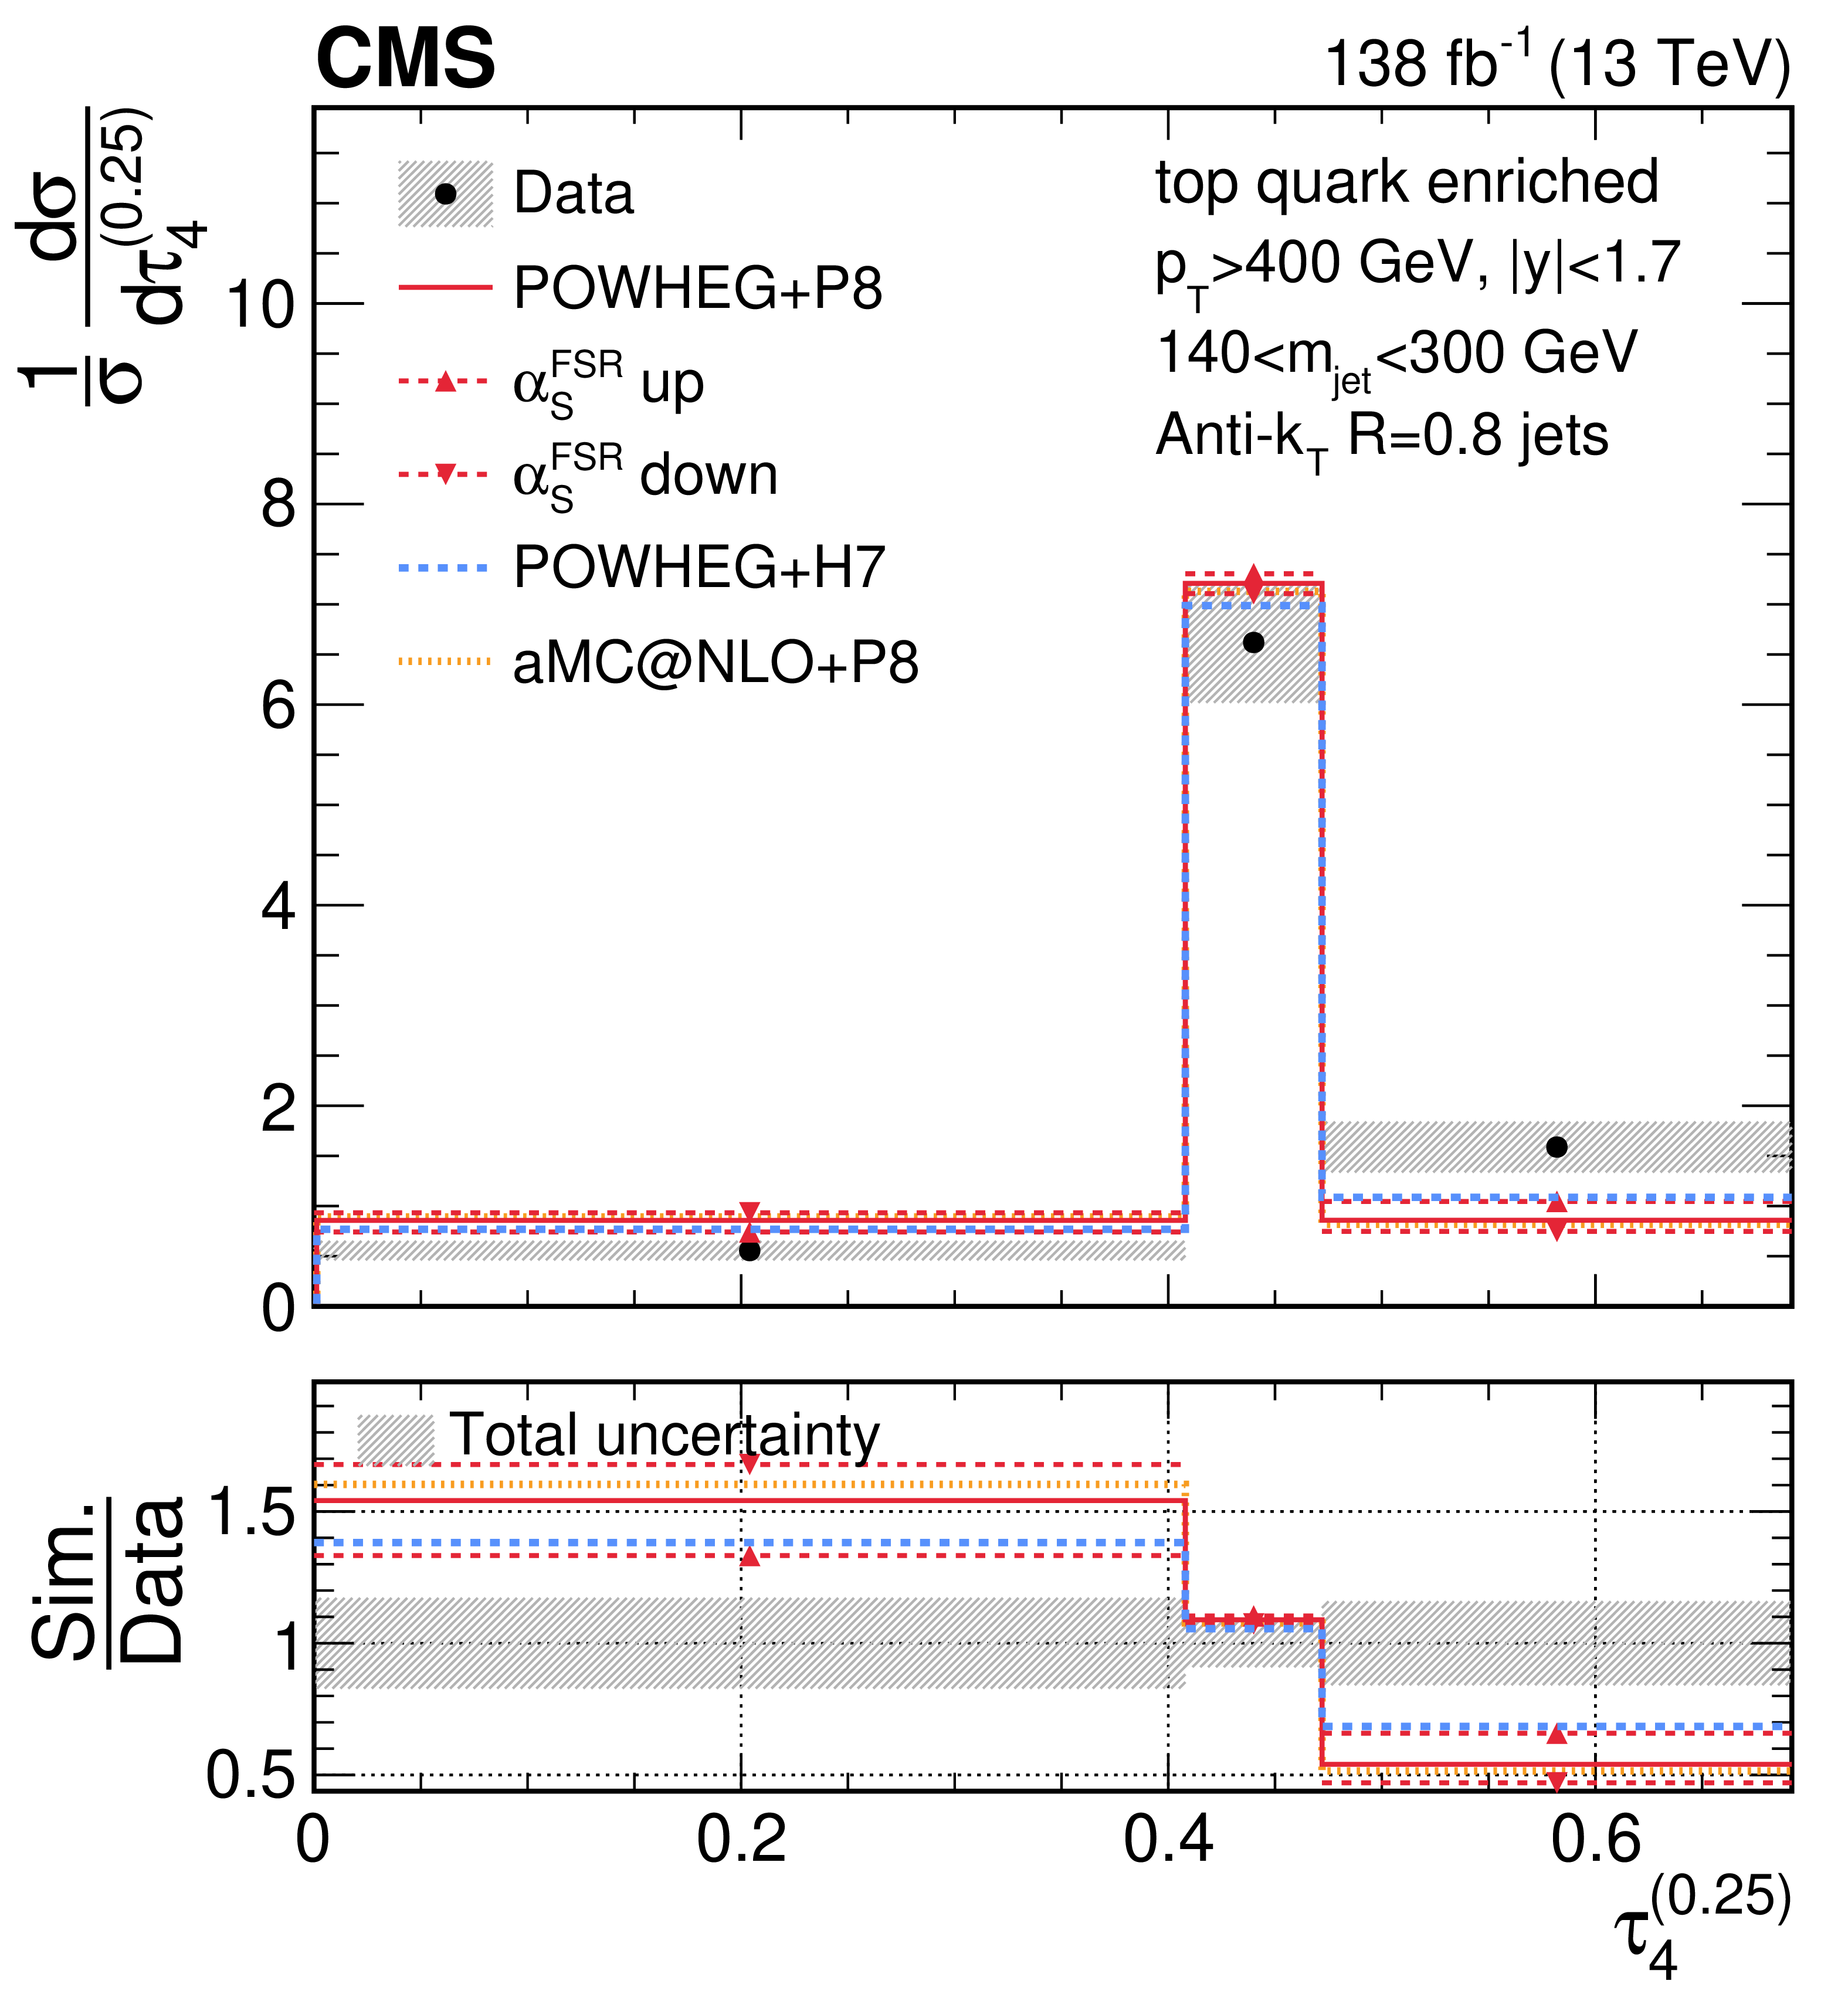
png pdf |
Figure 39-a:
Unfolded distributions of 4-subjettiness observables, $\tau_{4}^{(0.25)}$, $\tau_{4}^{(0.5)}$, $\tau_{4}^{(1)}$, $\tau_{4}^{(1.5)}$, and \Nsub42, measured for AK8 jets in the boosted top quark-enriched region, extracted from the normalized, combined distribution after unfolding; the bin contents and the error bars are scaled by the bin widths for the distributions of the individual observables. For comparisons with particle-level predictions, the error bars in data correspond to the total unfolding uncertainties, and the lower panels present the ratio of particle-level predictions to the unfolded data. The dark grey hashed region illustrates the total uncertainties per bin in the unfolded result. |
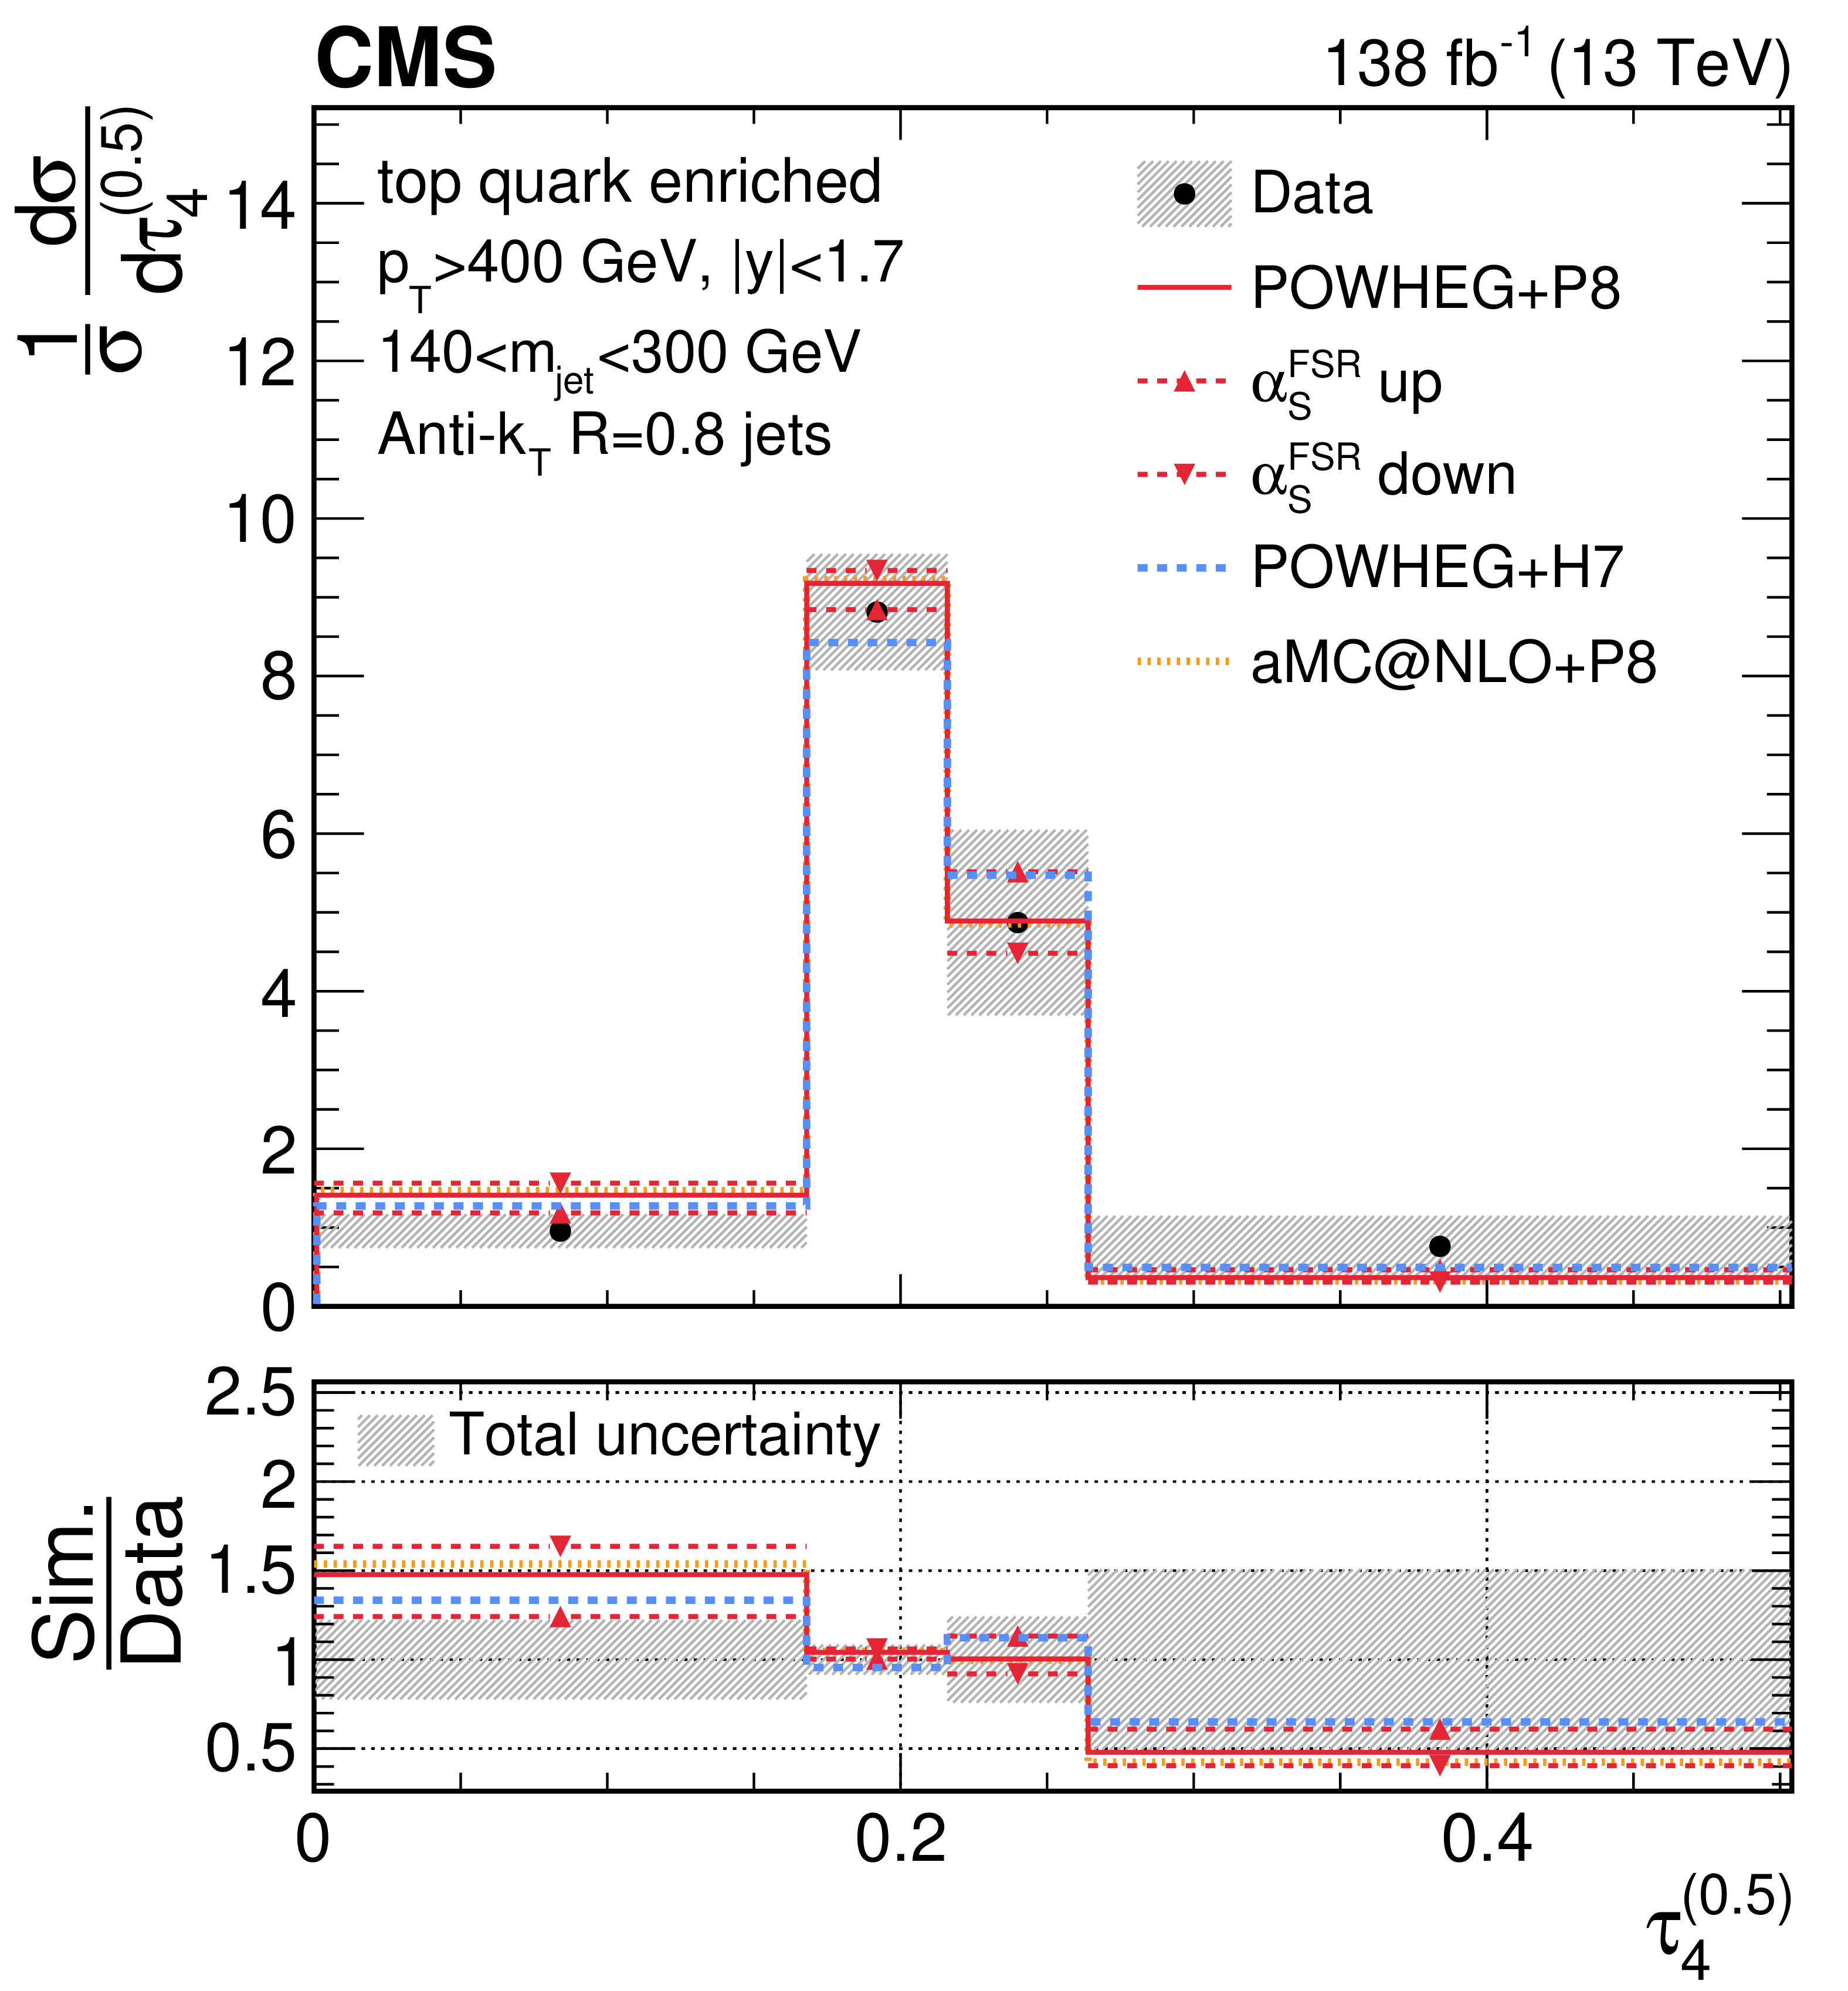
png pdf |
Figure 39-b:
Unfolded distributions of 4-subjettiness observables, $\tau_{4}^{(0.25)}$, $\tau_{4}^{(0.5)}$, $\tau_{4}^{(1)}$, $\tau_{4}^{(1.5)}$, and \Nsub42, measured for AK8 jets in the boosted top quark-enriched region, extracted from the normalized, combined distribution after unfolding; the bin contents and the error bars are scaled by the bin widths for the distributions of the individual observables. For comparisons with particle-level predictions, the error bars in data correspond to the total unfolding uncertainties, and the lower panels present the ratio of particle-level predictions to the unfolded data. The dark grey hashed region illustrates the total uncertainties per bin in the unfolded result. |
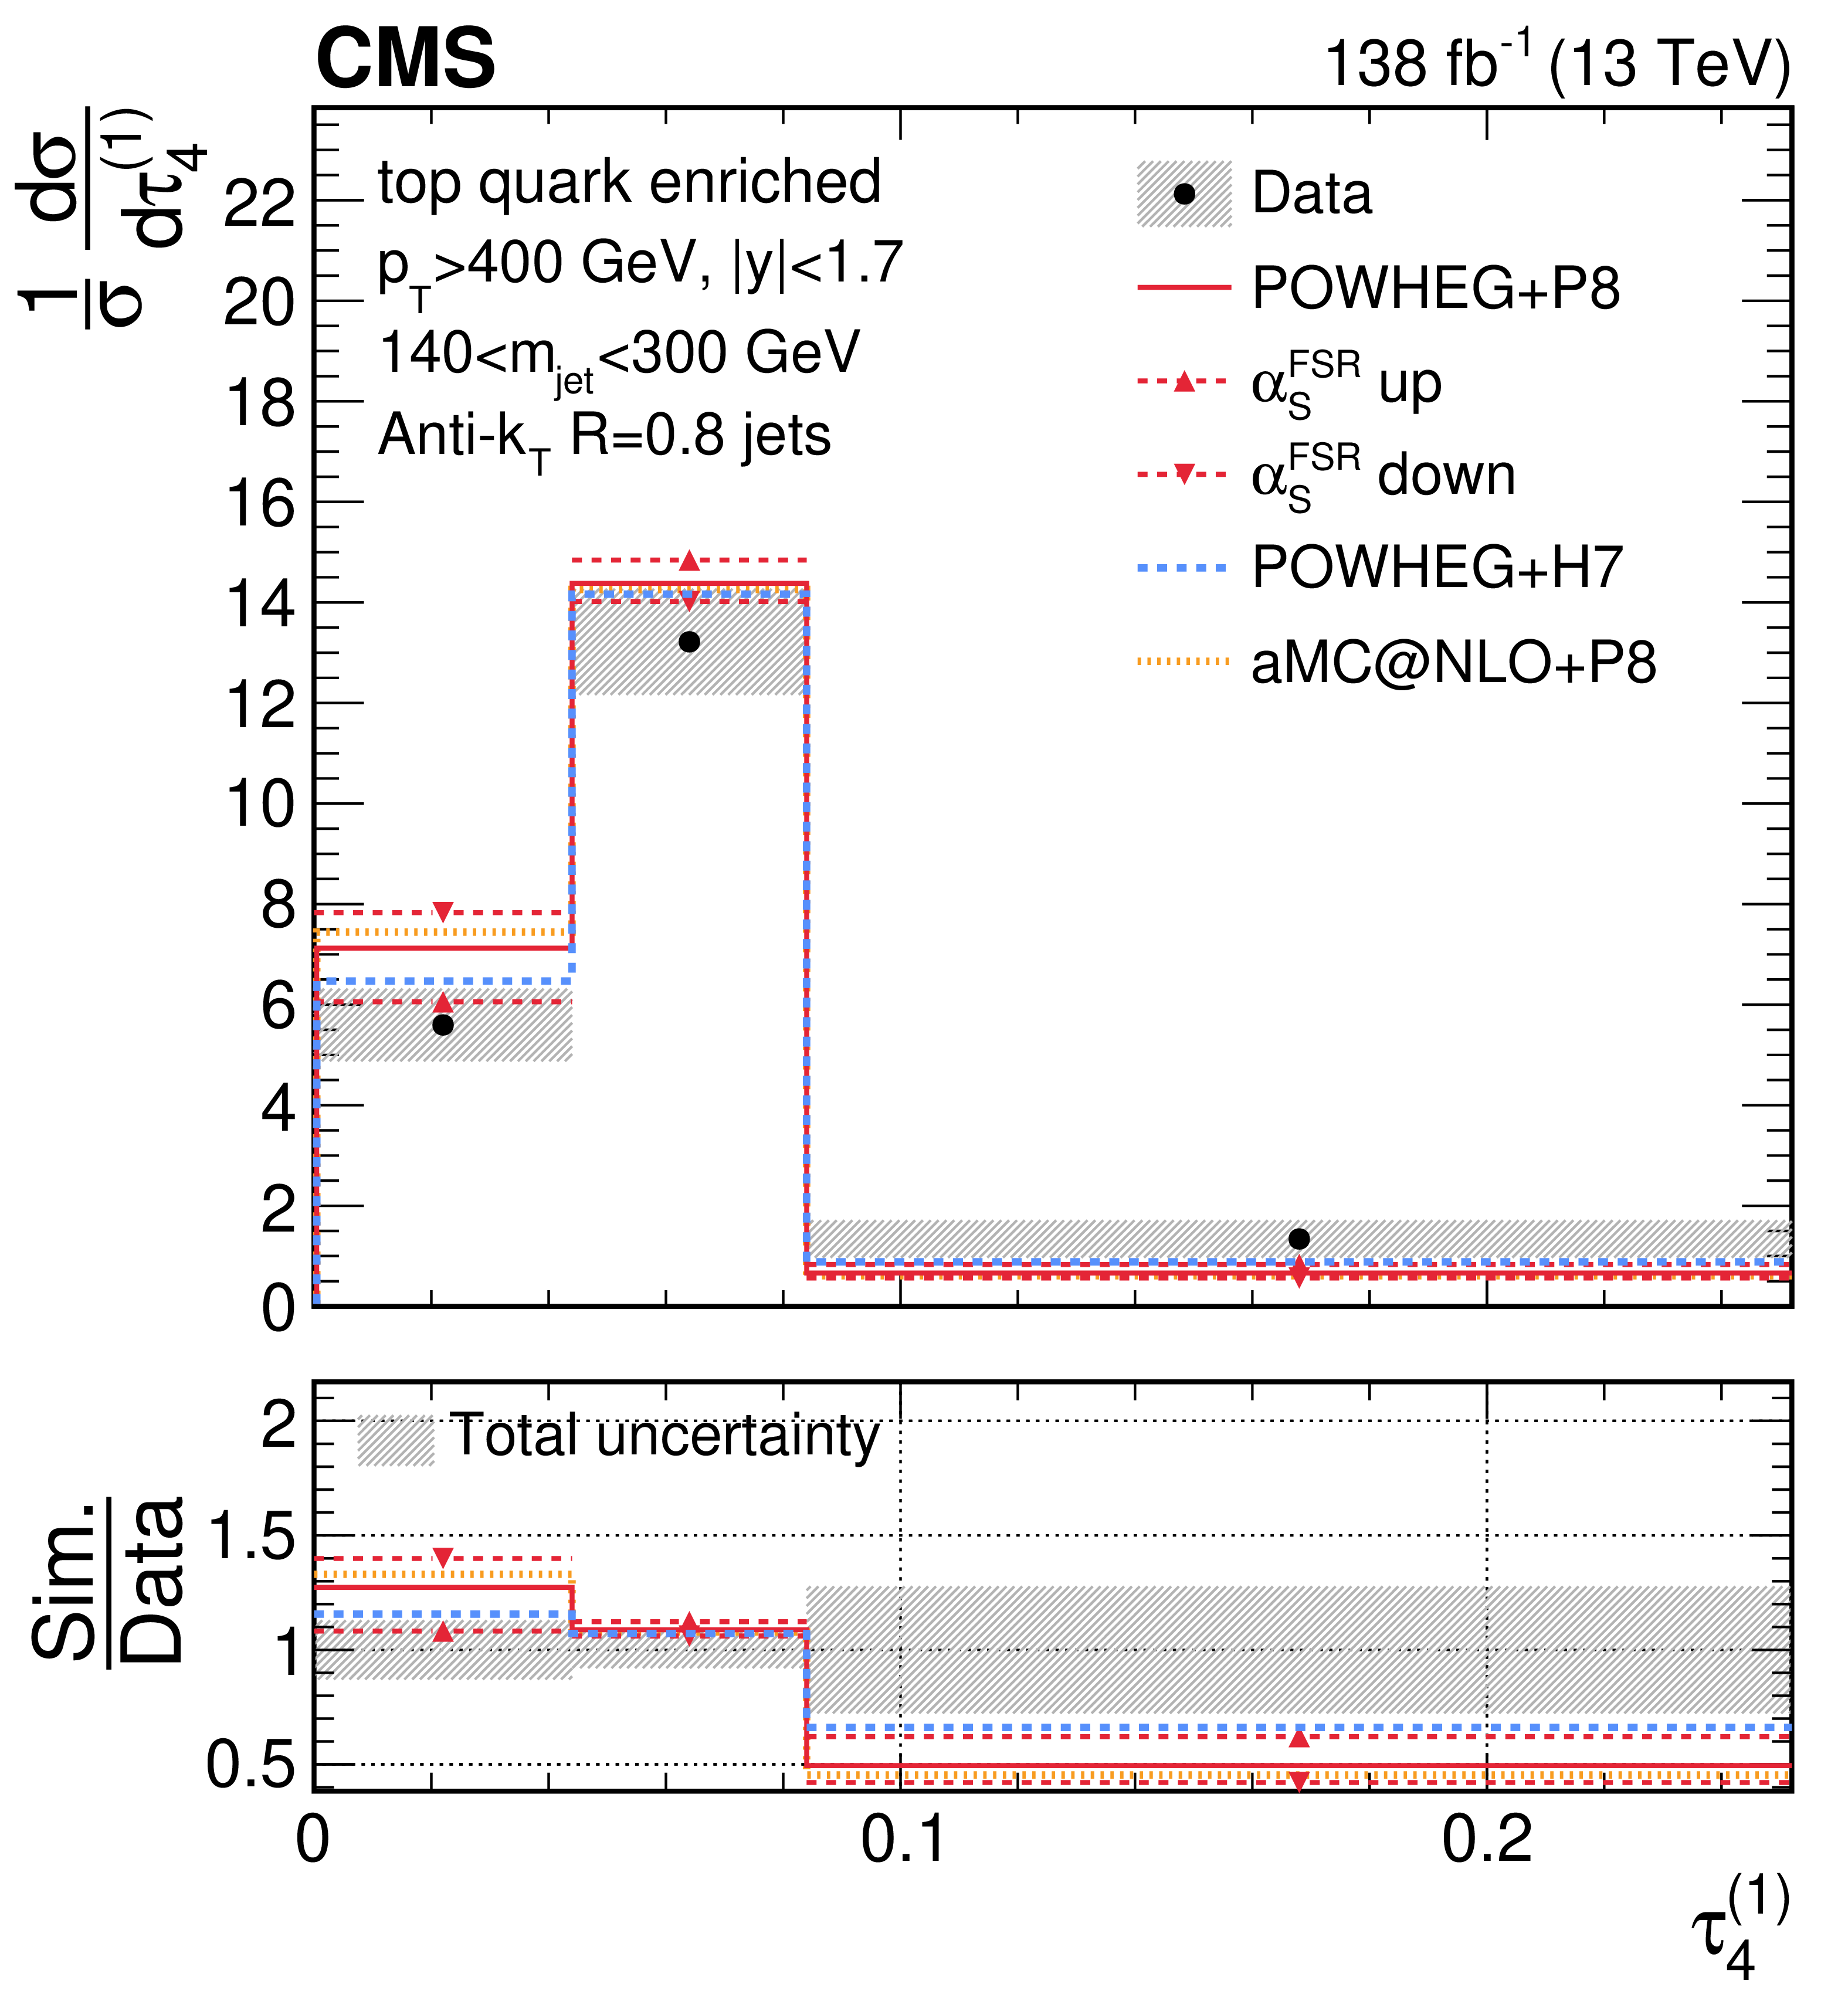
png pdf |
Figure 39-c:
Unfolded distributions of 4-subjettiness observables, $\tau_{4}^{(0.25)}$, $\tau_{4}^{(0.5)}$, $\tau_{4}^{(1)}$, $\tau_{4}^{(1.5)}$, and \Nsub42, measured for AK8 jets in the boosted top quark-enriched region, extracted from the normalized, combined distribution after unfolding; the bin contents and the error bars are scaled by the bin widths for the distributions of the individual observables. For comparisons with particle-level predictions, the error bars in data correspond to the total unfolding uncertainties, and the lower panels present the ratio of particle-level predictions to the unfolded data. The dark grey hashed region illustrates the total uncertainties per bin in the unfolded result. |
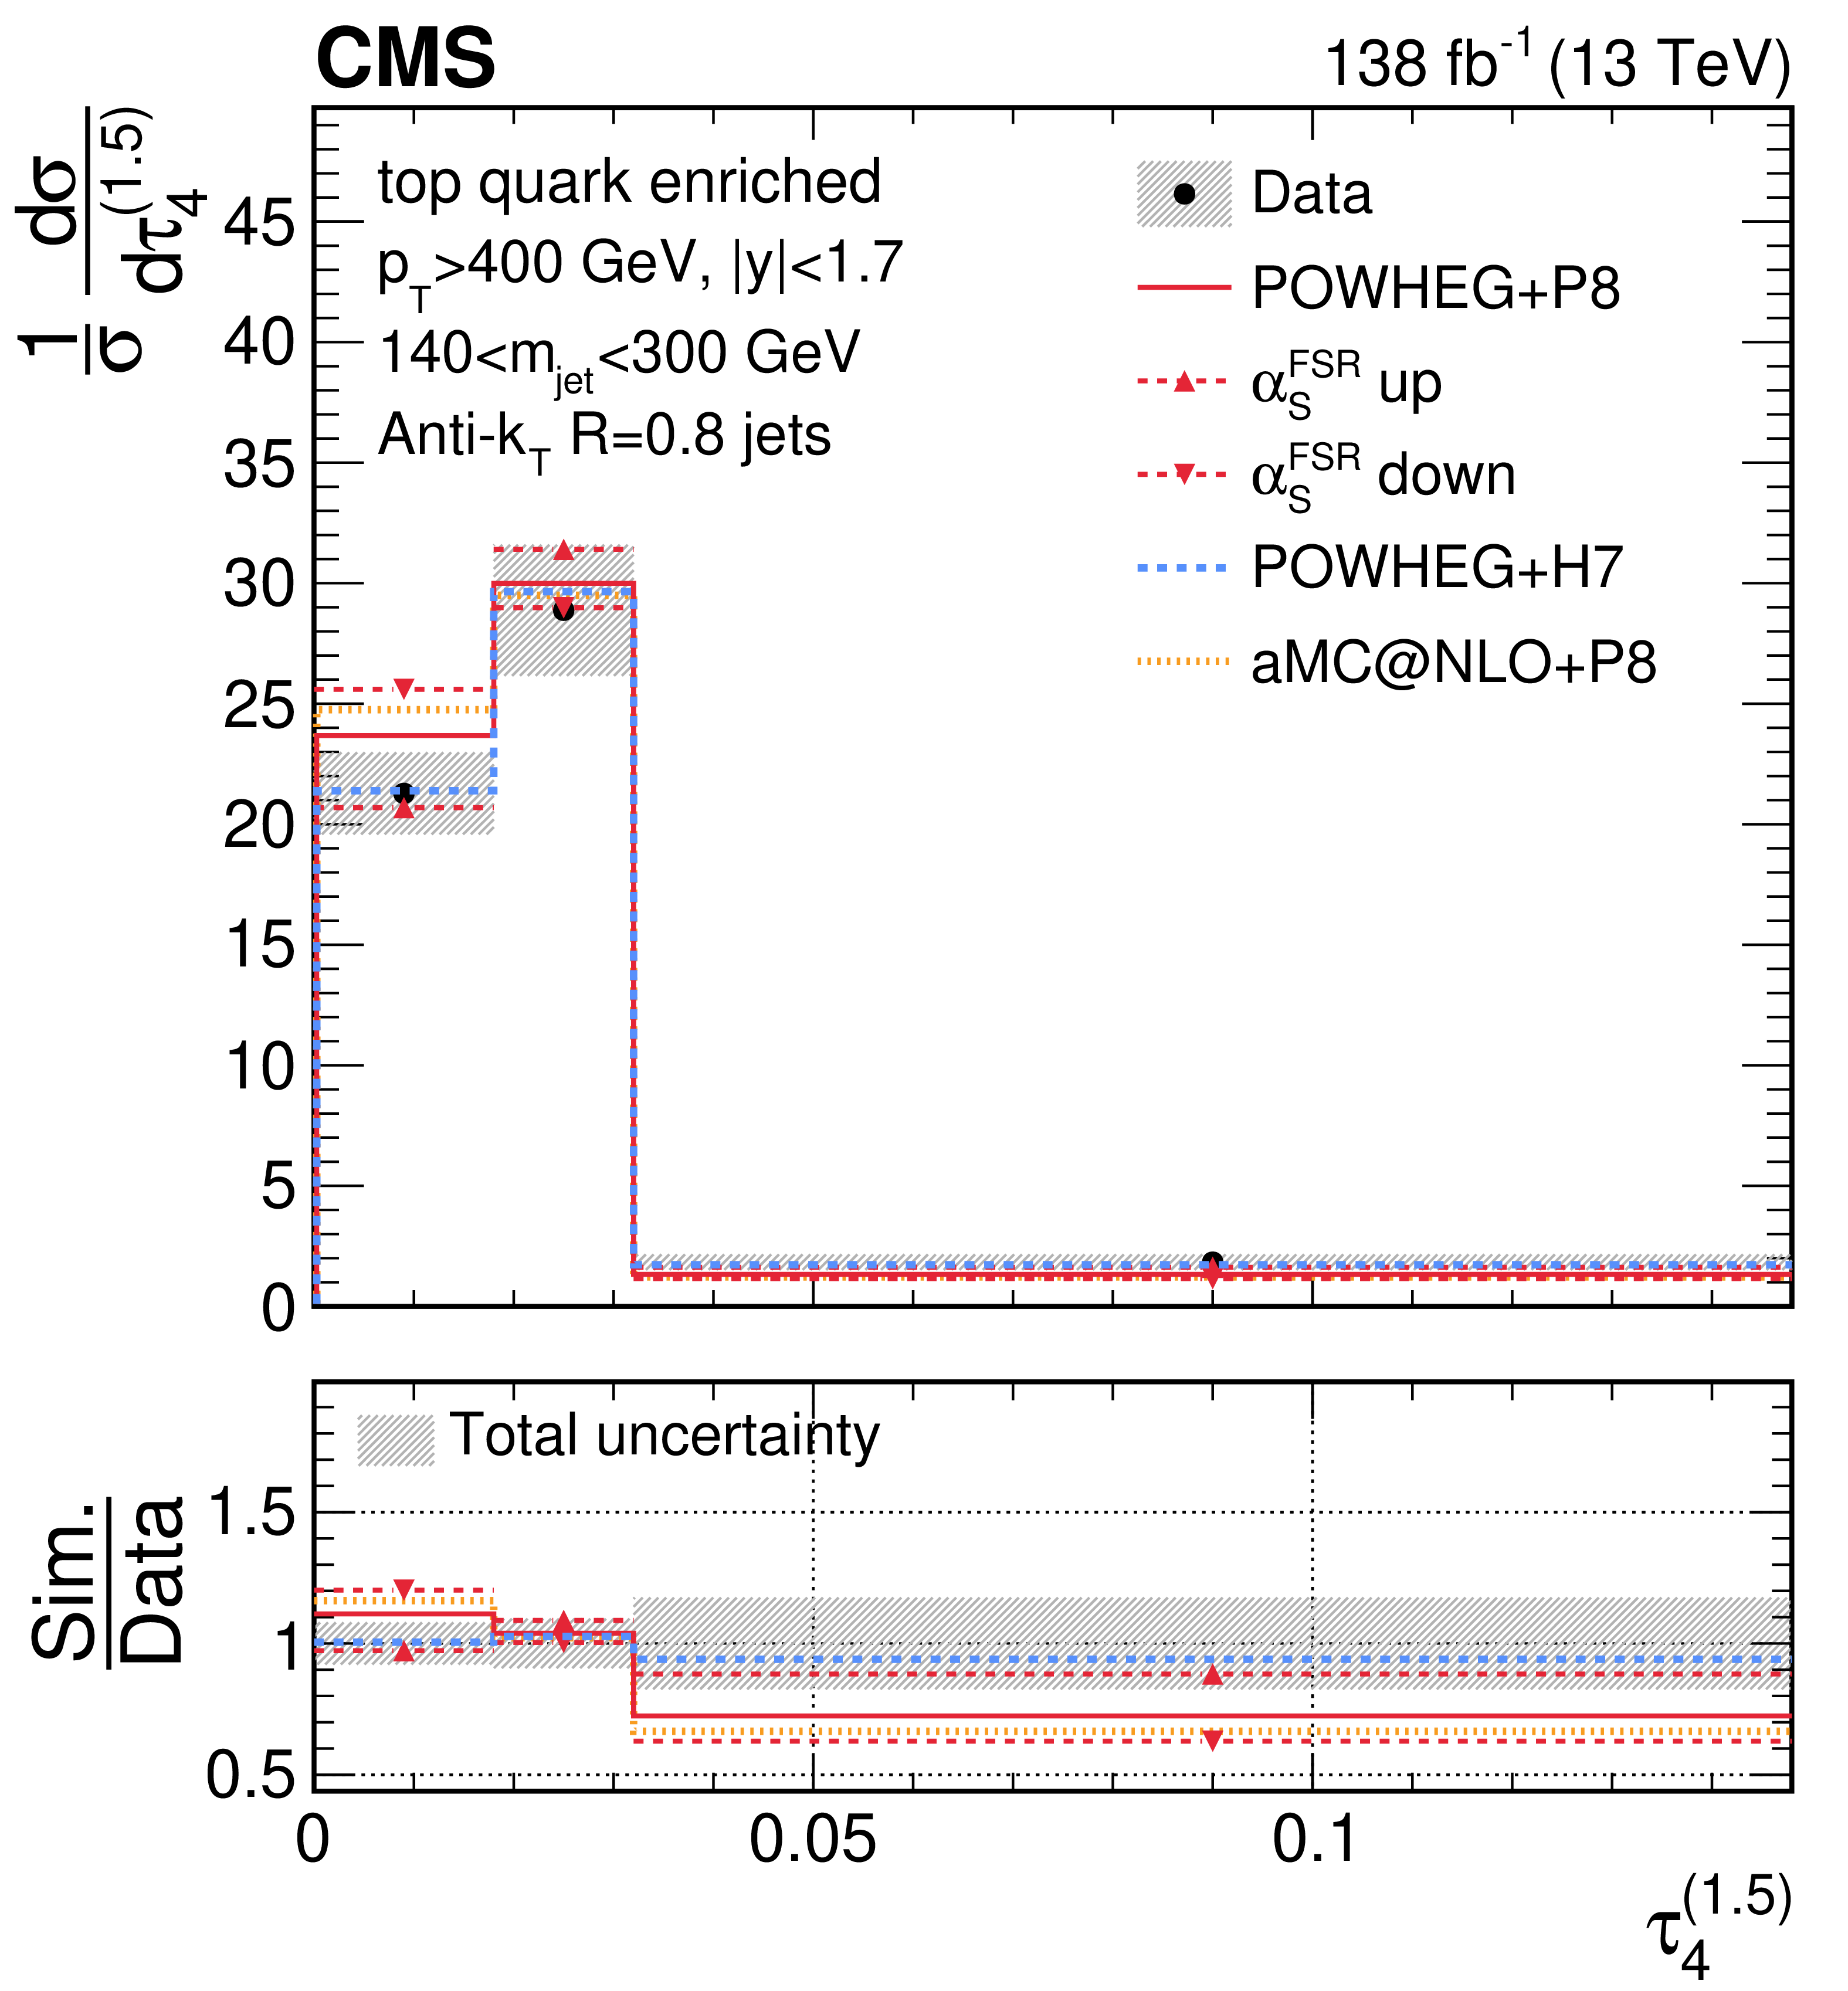
png pdf |
Figure 39-d:
Unfolded distributions of 4-subjettiness observables, $\tau_{4}^{(0.25)}$, $\tau_{4}^{(0.5)}$, $\tau_{4}^{(1)}$, $\tau_{4}^{(1.5)}$, and \Nsub42, measured for AK8 jets in the boosted top quark-enriched region, extracted from the normalized, combined distribution after unfolding; the bin contents and the error bars are scaled by the bin widths for the distributions of the individual observables. For comparisons with particle-level predictions, the error bars in data correspond to the total unfolding uncertainties, and the lower panels present the ratio of particle-level predictions to the unfolded data. The dark grey hashed region illustrates the total uncertainties per bin in the unfolded result. |
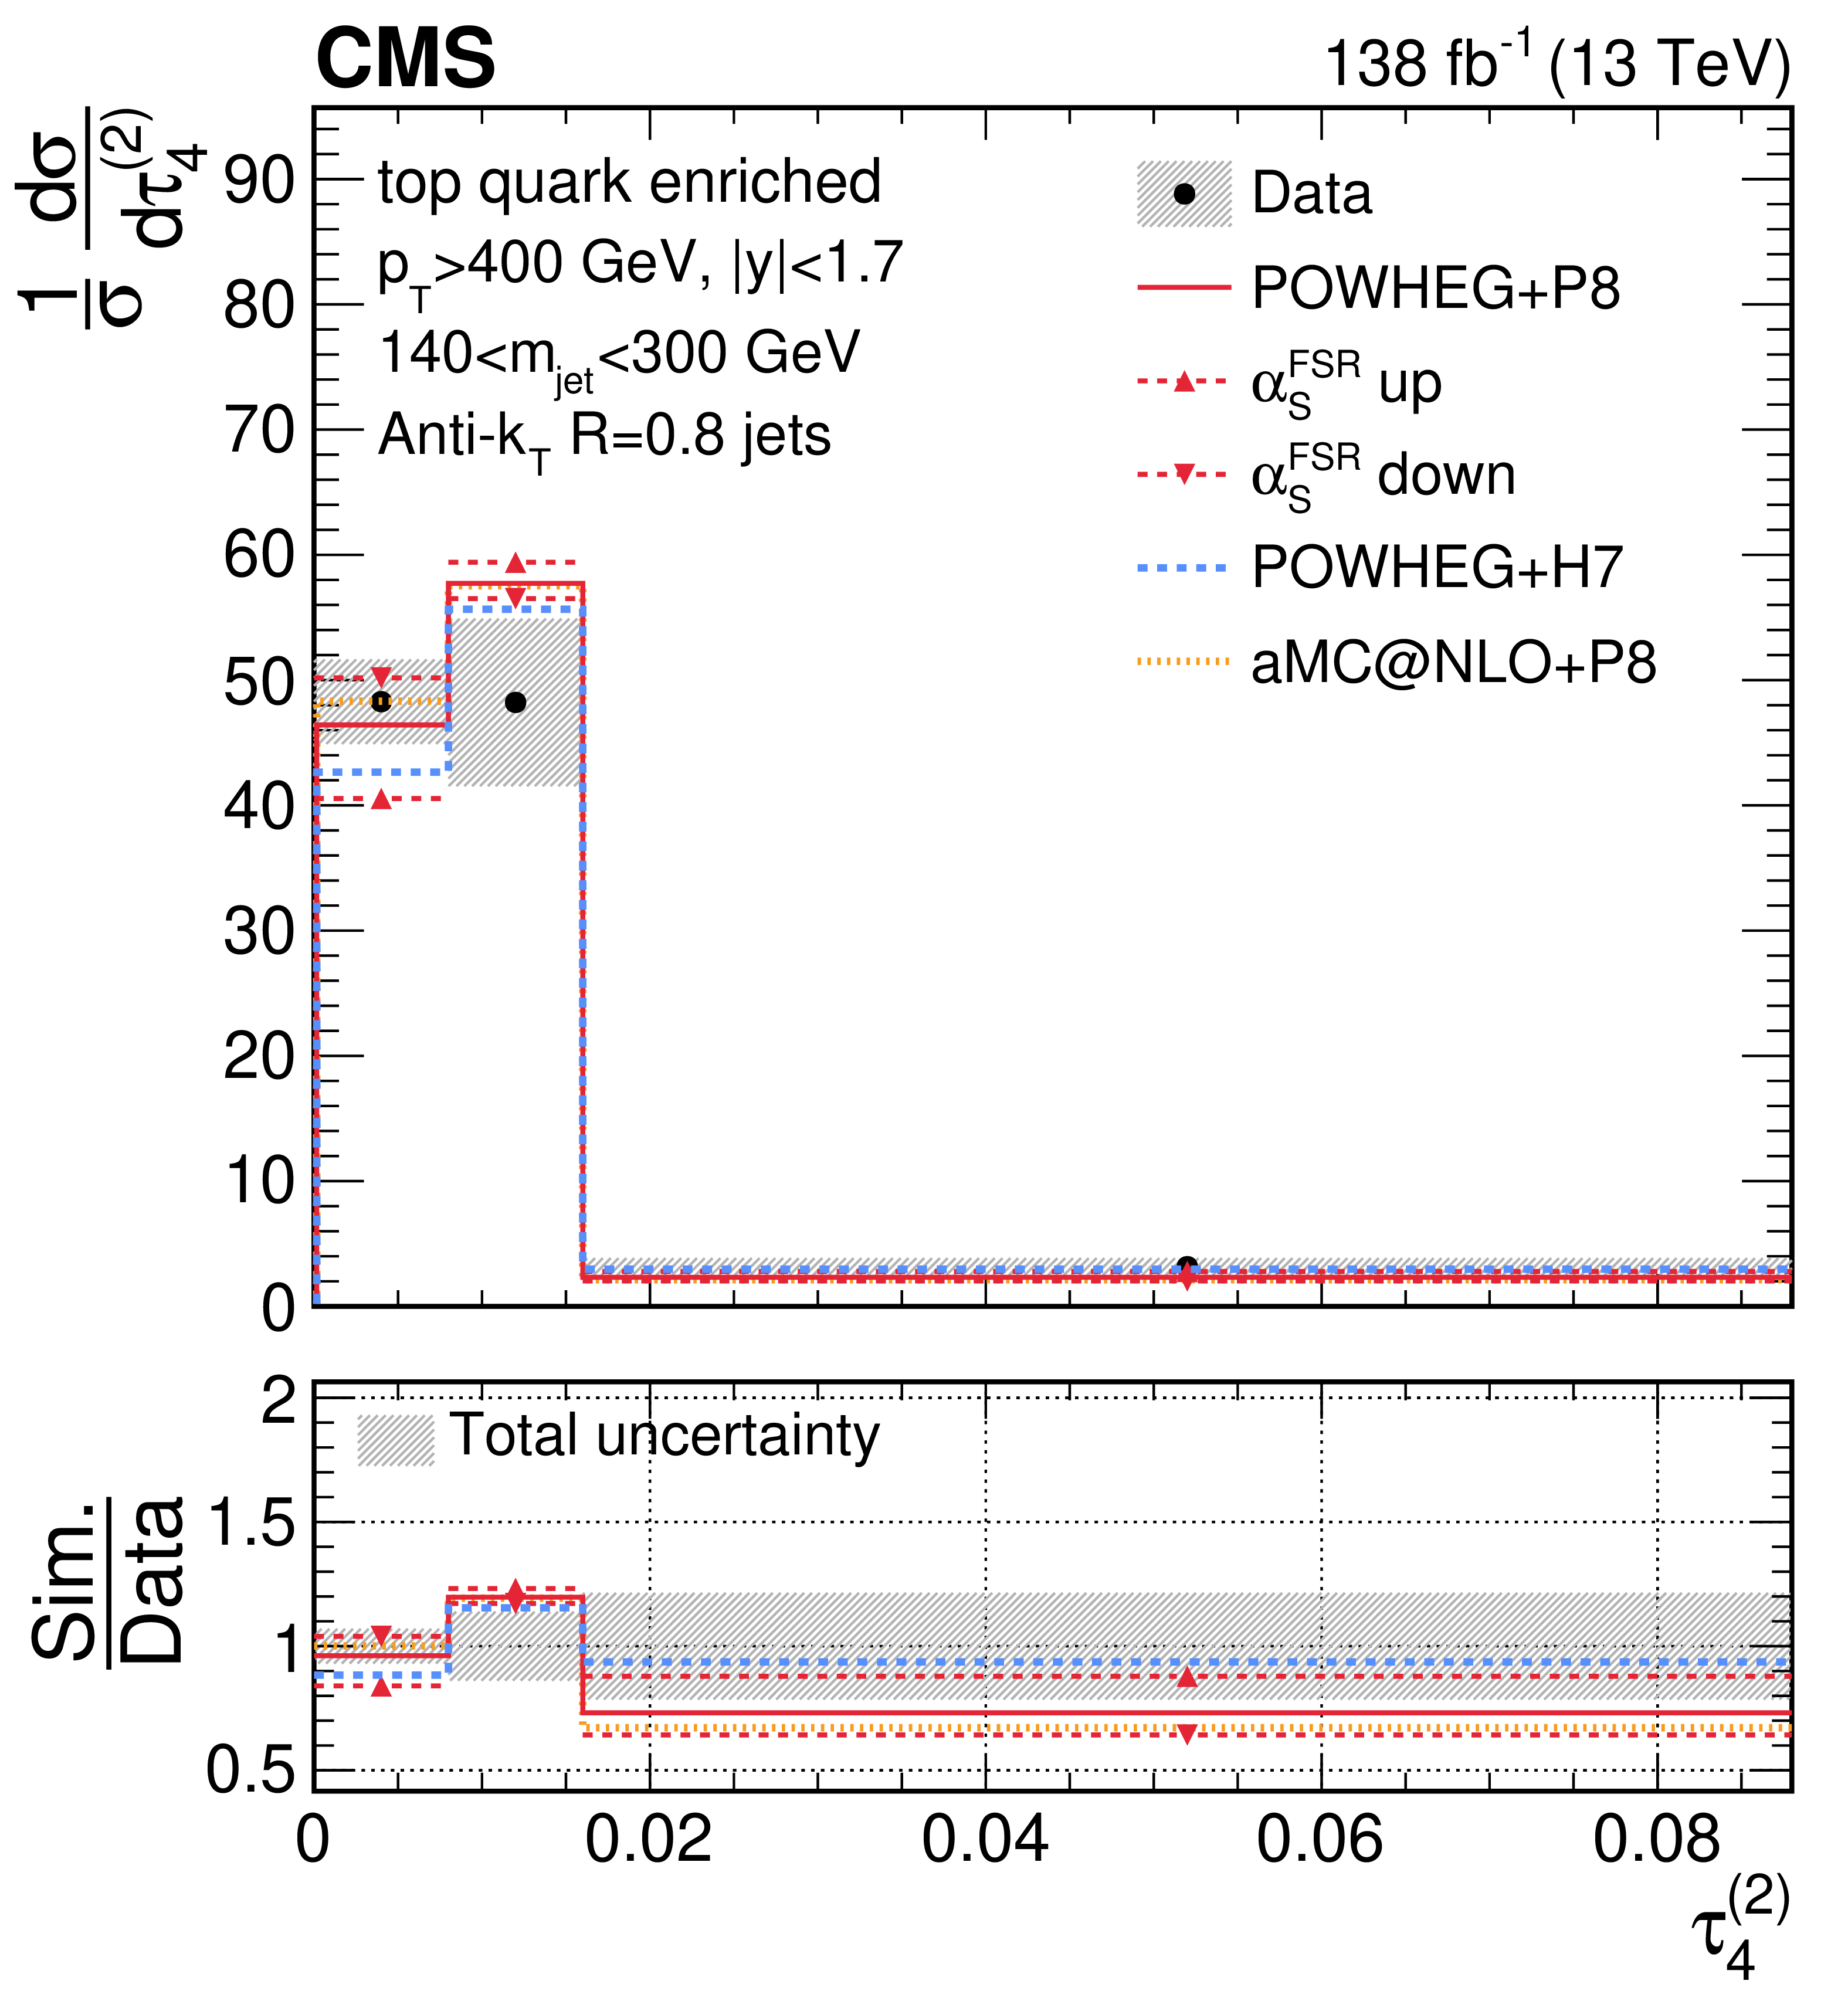
png pdf |
Figure 39-e:
Unfolded distributions of 4-subjettiness observables, $\tau_{4}^{(0.25)}$, $\tau_{4}^{(0.5)}$, $\tau_{4}^{(1)}$, $\tau_{4}^{(1.5)}$, and \Nsub42, measured for AK8 jets in the boosted top quark-enriched region, extracted from the normalized, combined distribution after unfolding; the bin contents and the error bars are scaled by the bin widths for the distributions of the individual observables. For comparisons with particle-level predictions, the error bars in data correspond to the total unfolding uncertainties, and the lower panels present the ratio of particle-level predictions to the unfolded data. The dark grey hashed region illustrates the total uncertainties per bin in the unfolded result. |
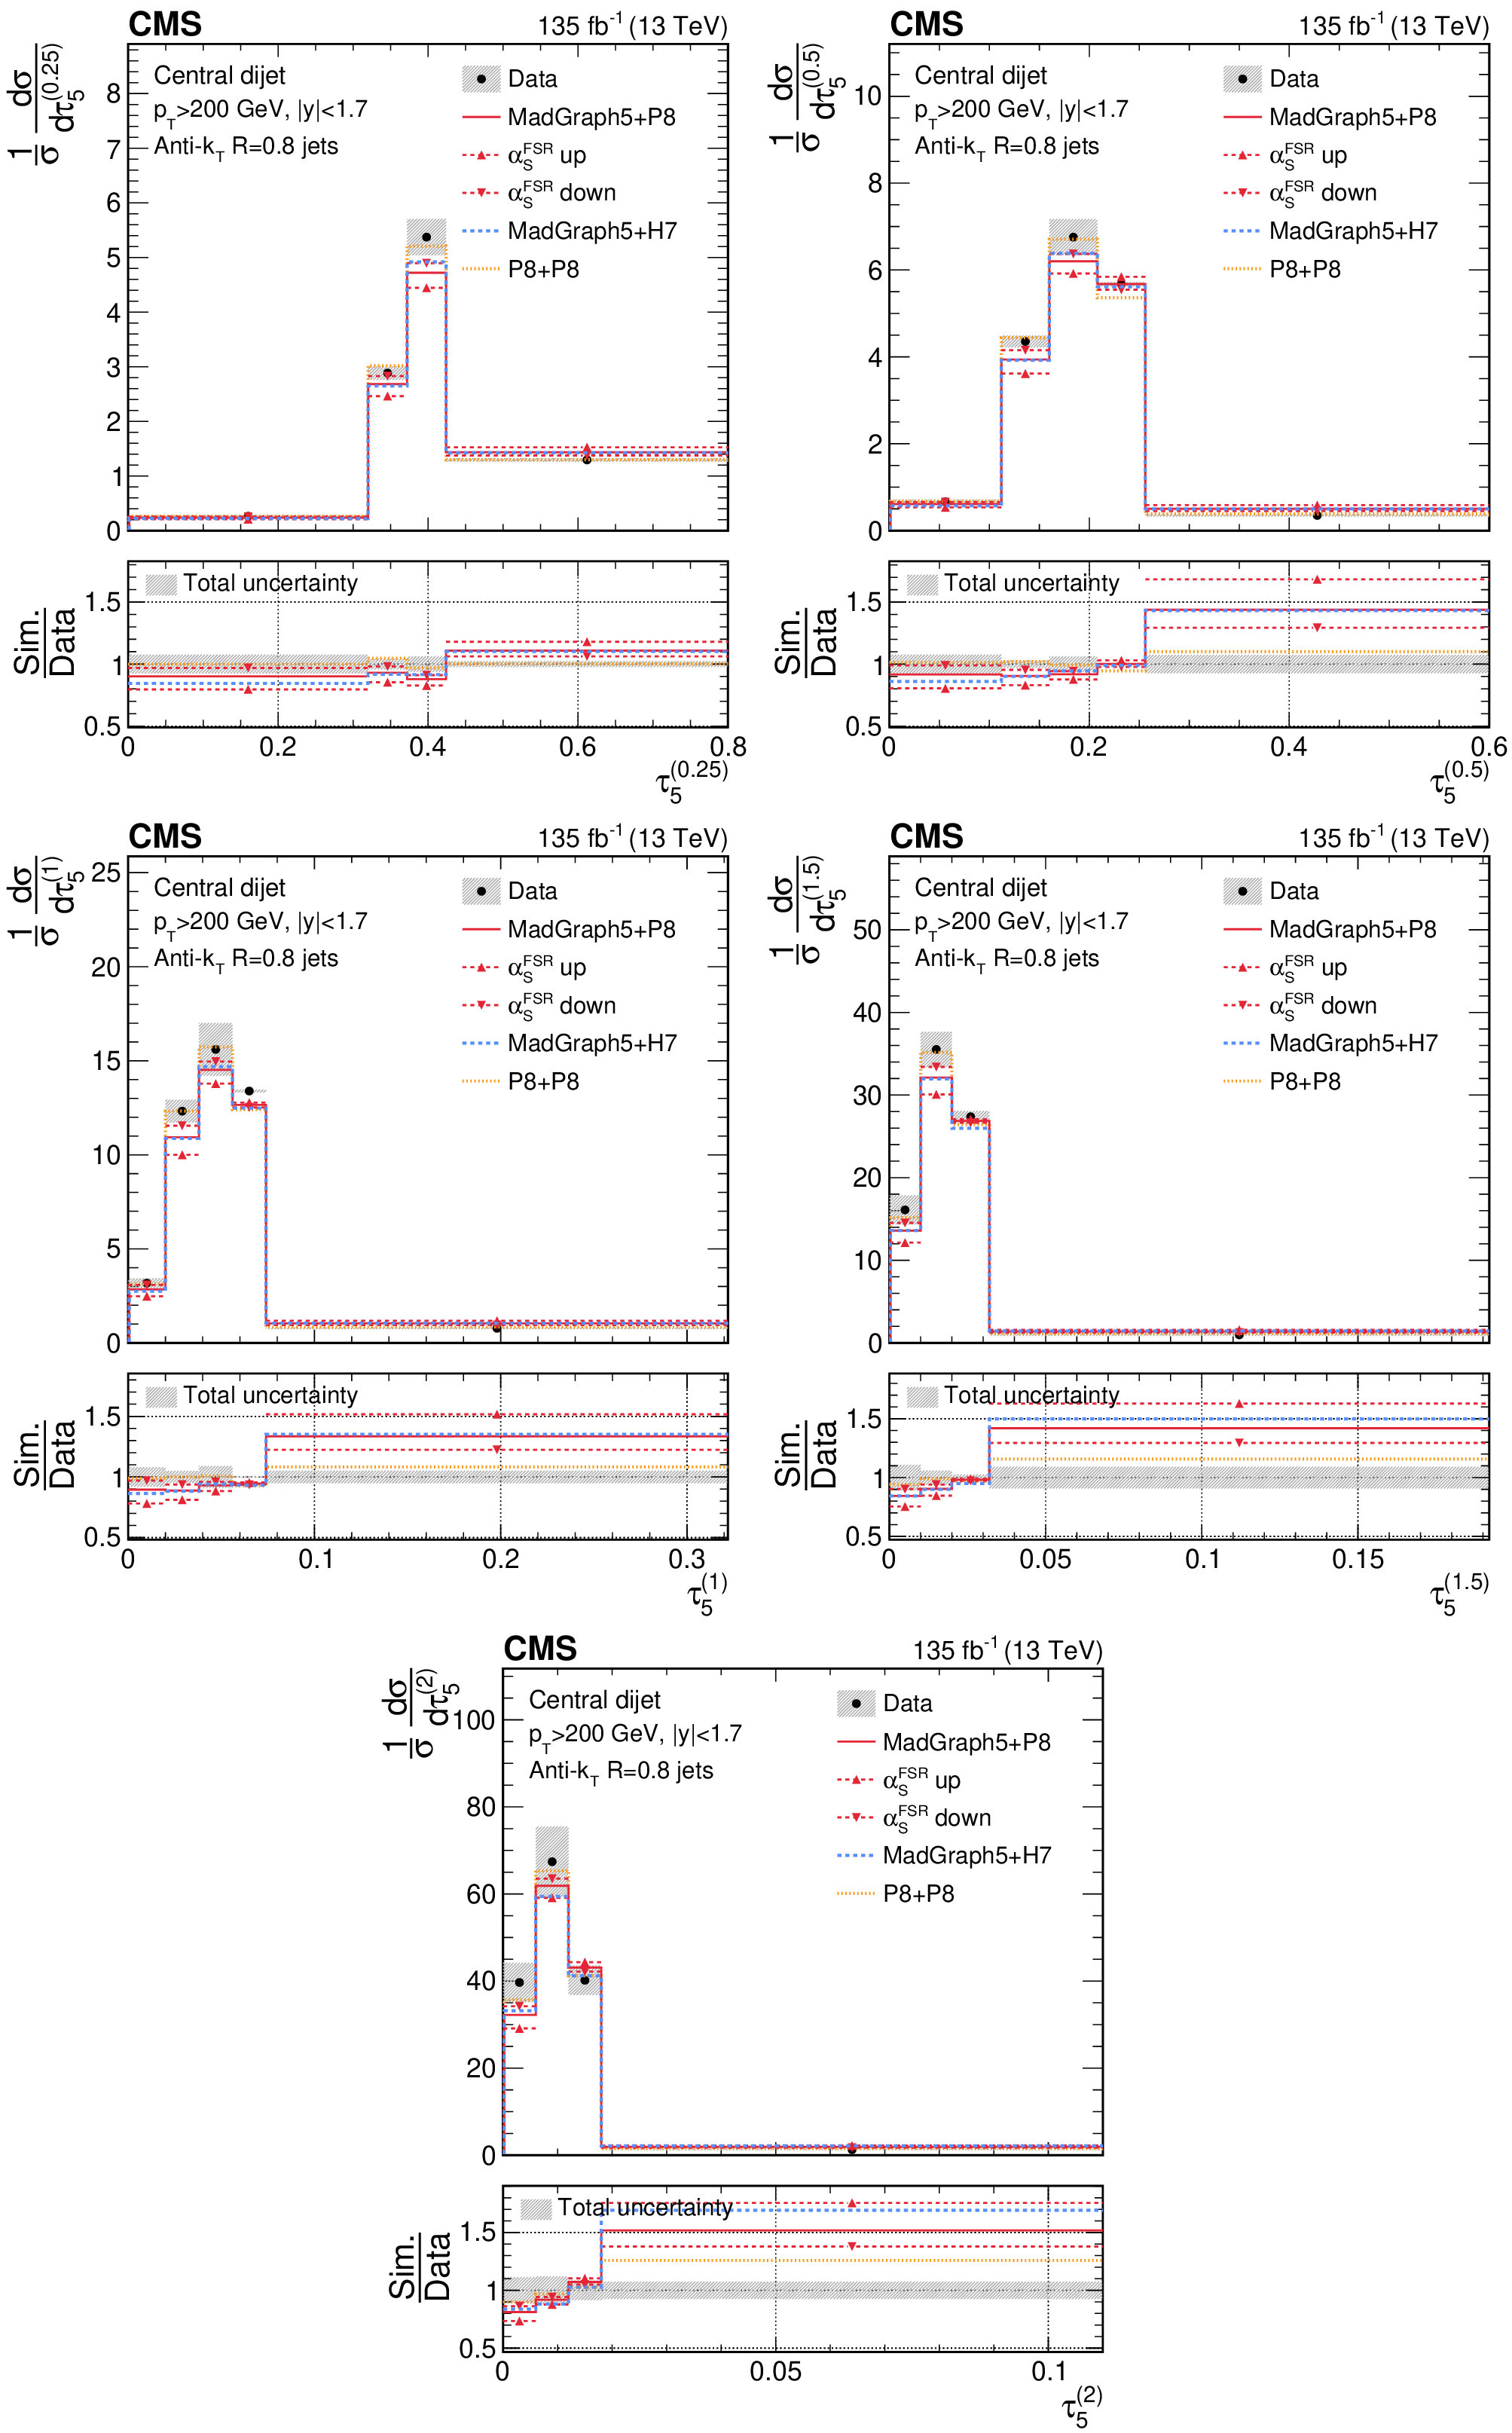
png pdf |
Figure 40:
Unfolded distributions of 5-subjettiness observables, $\tau_{5}^{(0.25)}$, $\tau_{5}^{(0.5)}$, $\tau_{5}^{(1)}$, $\tau_{5}^{(1.5)}$, and \Nsub52, measured for AK8 jets in the QCD dijet event selection, extracted from the normalized, combined distribution after unfolding; the bin contents and the error bars are scaled by the bin widths for the distributions of the individual observables. For comparisons with particle-level predictions, the error bars in data correspond to the total unfolding uncertainties, and the lower panels present the ratio of particle-level predictions to the unfolded data. The dark grey hashed region illustrates the total uncertainties per bin in the unfolded result. |
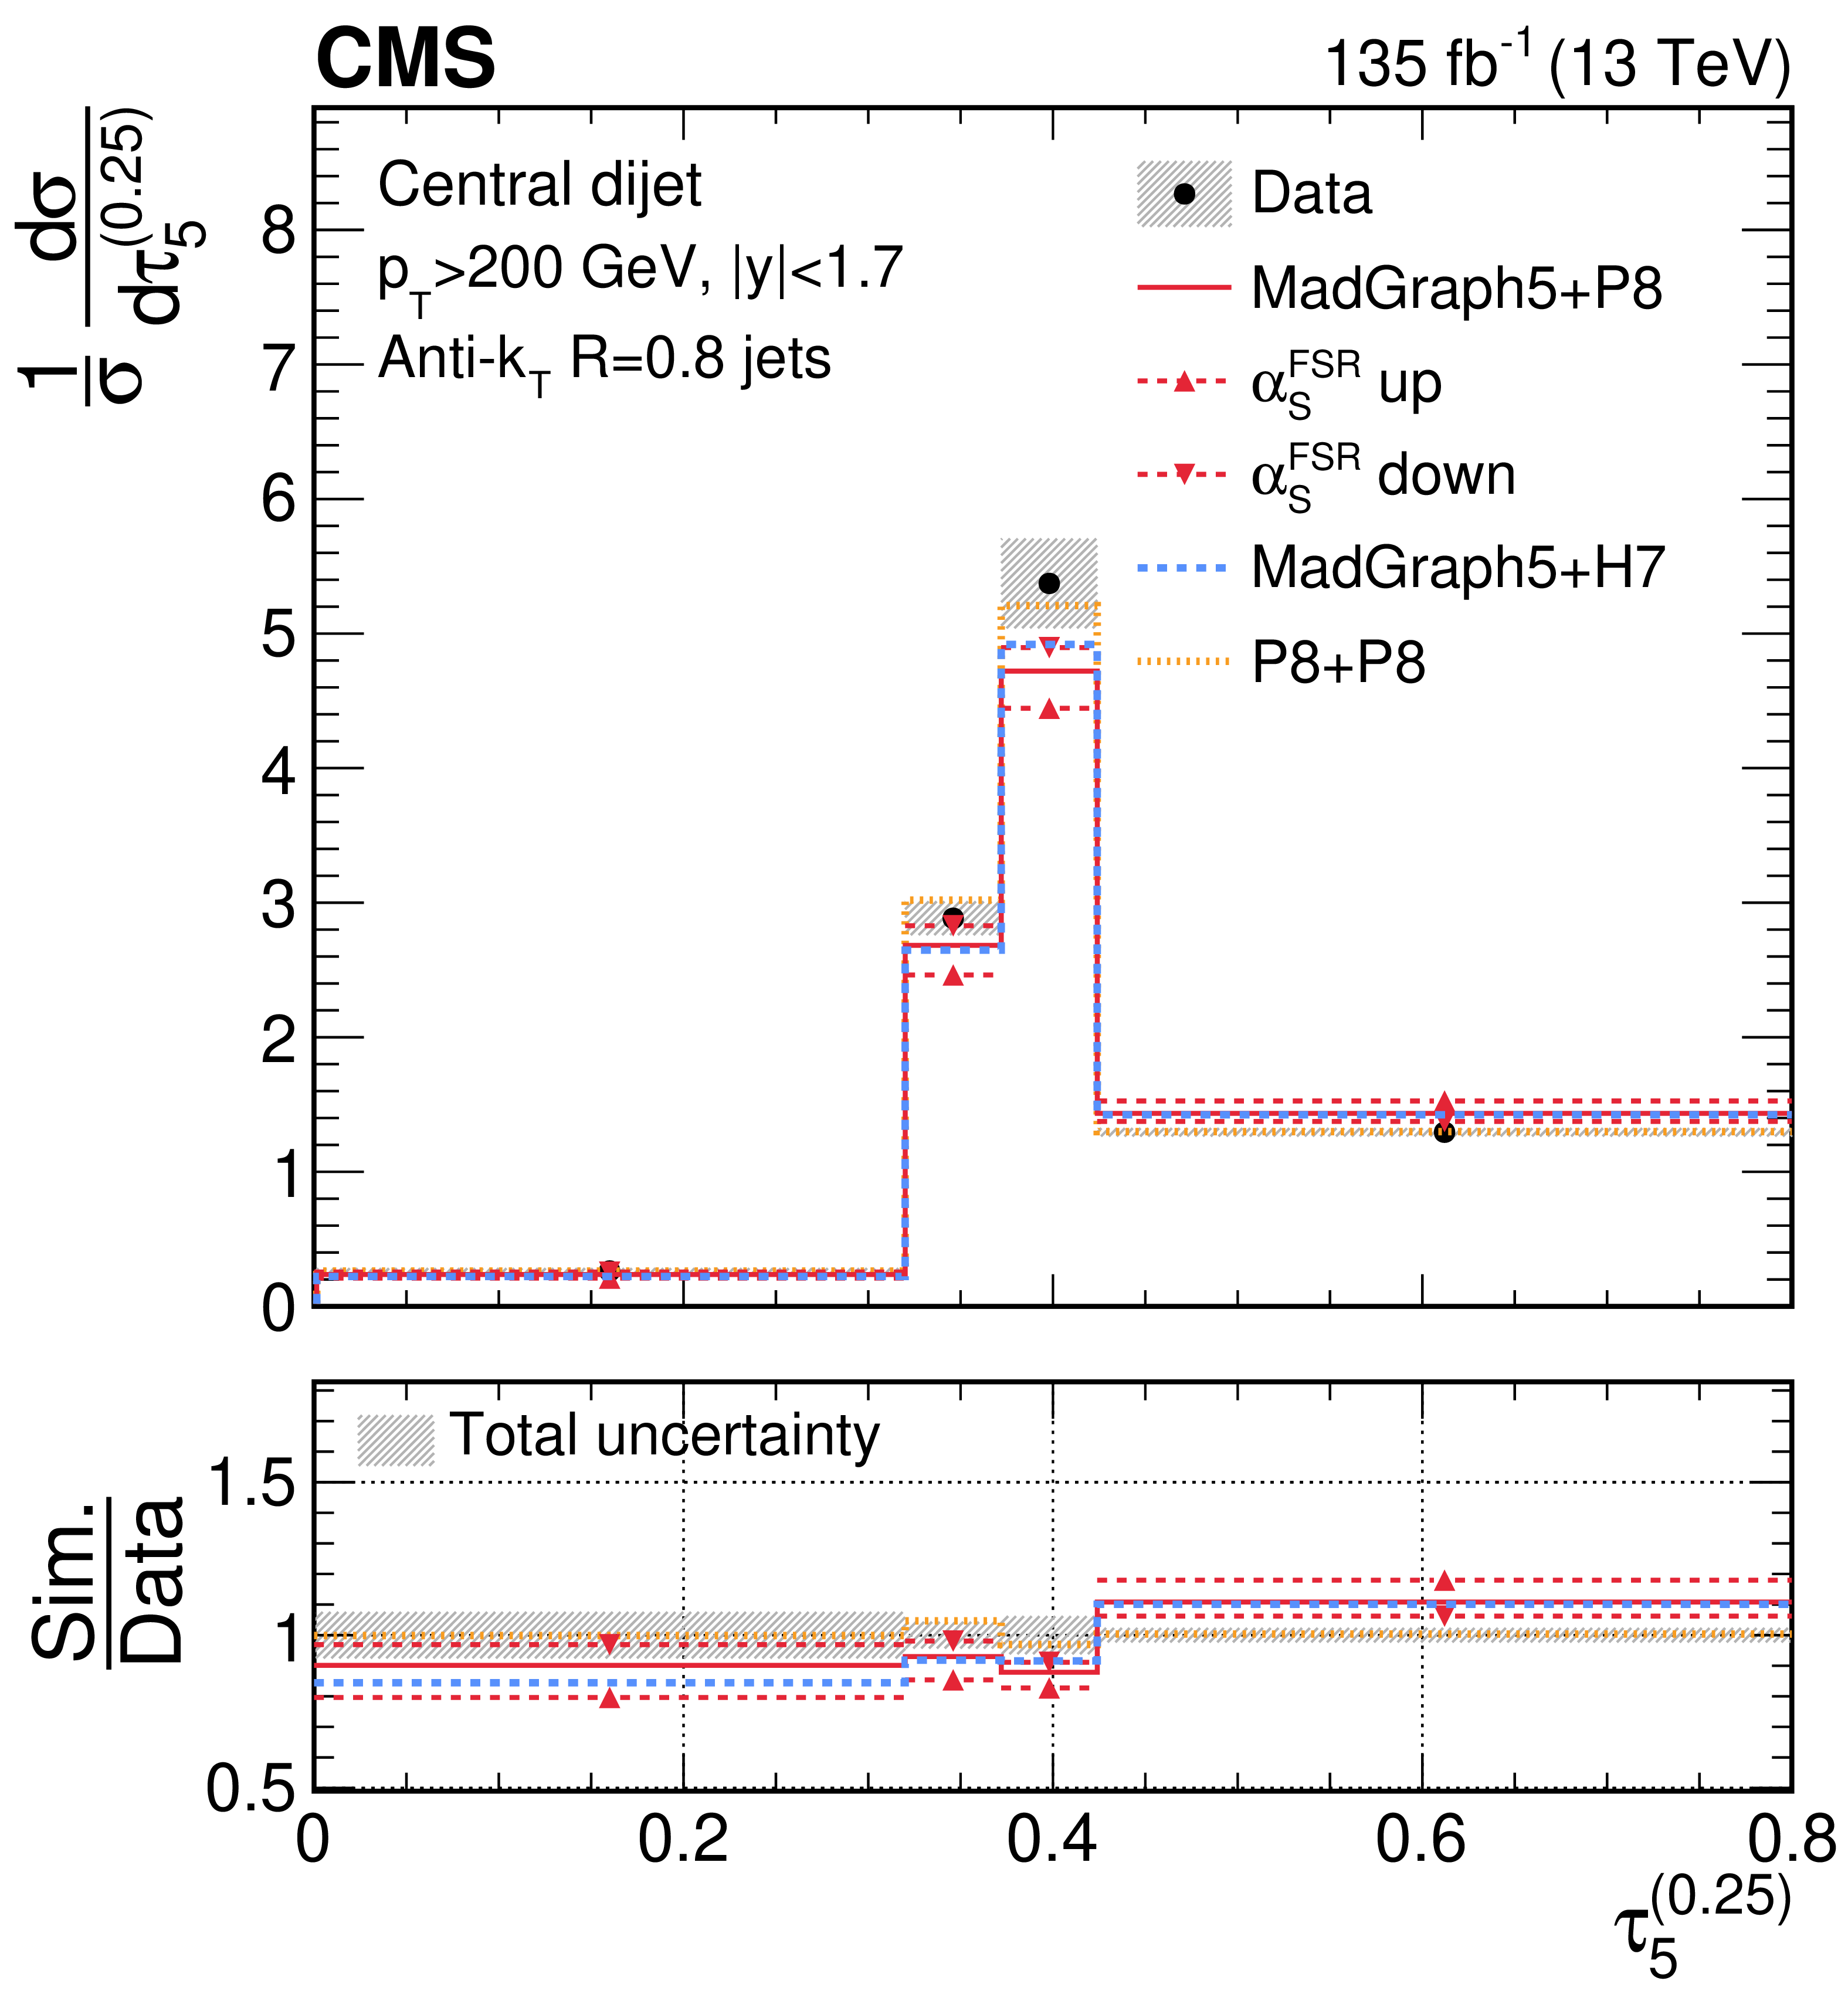
png pdf |
Figure 40-a:
Unfolded distributions of 5-subjettiness observables, $\tau_{5}^{(0.25)}$, $\tau_{5}^{(0.5)}$, $\tau_{5}^{(1)}$, $\tau_{5}^{(1.5)}$, and \Nsub52, measured for AK8 jets in the QCD dijet event selection, extracted from the normalized, combined distribution after unfolding; the bin contents and the error bars are scaled by the bin widths for the distributions of the individual observables. For comparisons with particle-level predictions, the error bars in data correspond to the total unfolding uncertainties, and the lower panels present the ratio of particle-level predictions to the unfolded data. The dark grey hashed region illustrates the total uncertainties per bin in the unfolded result. |
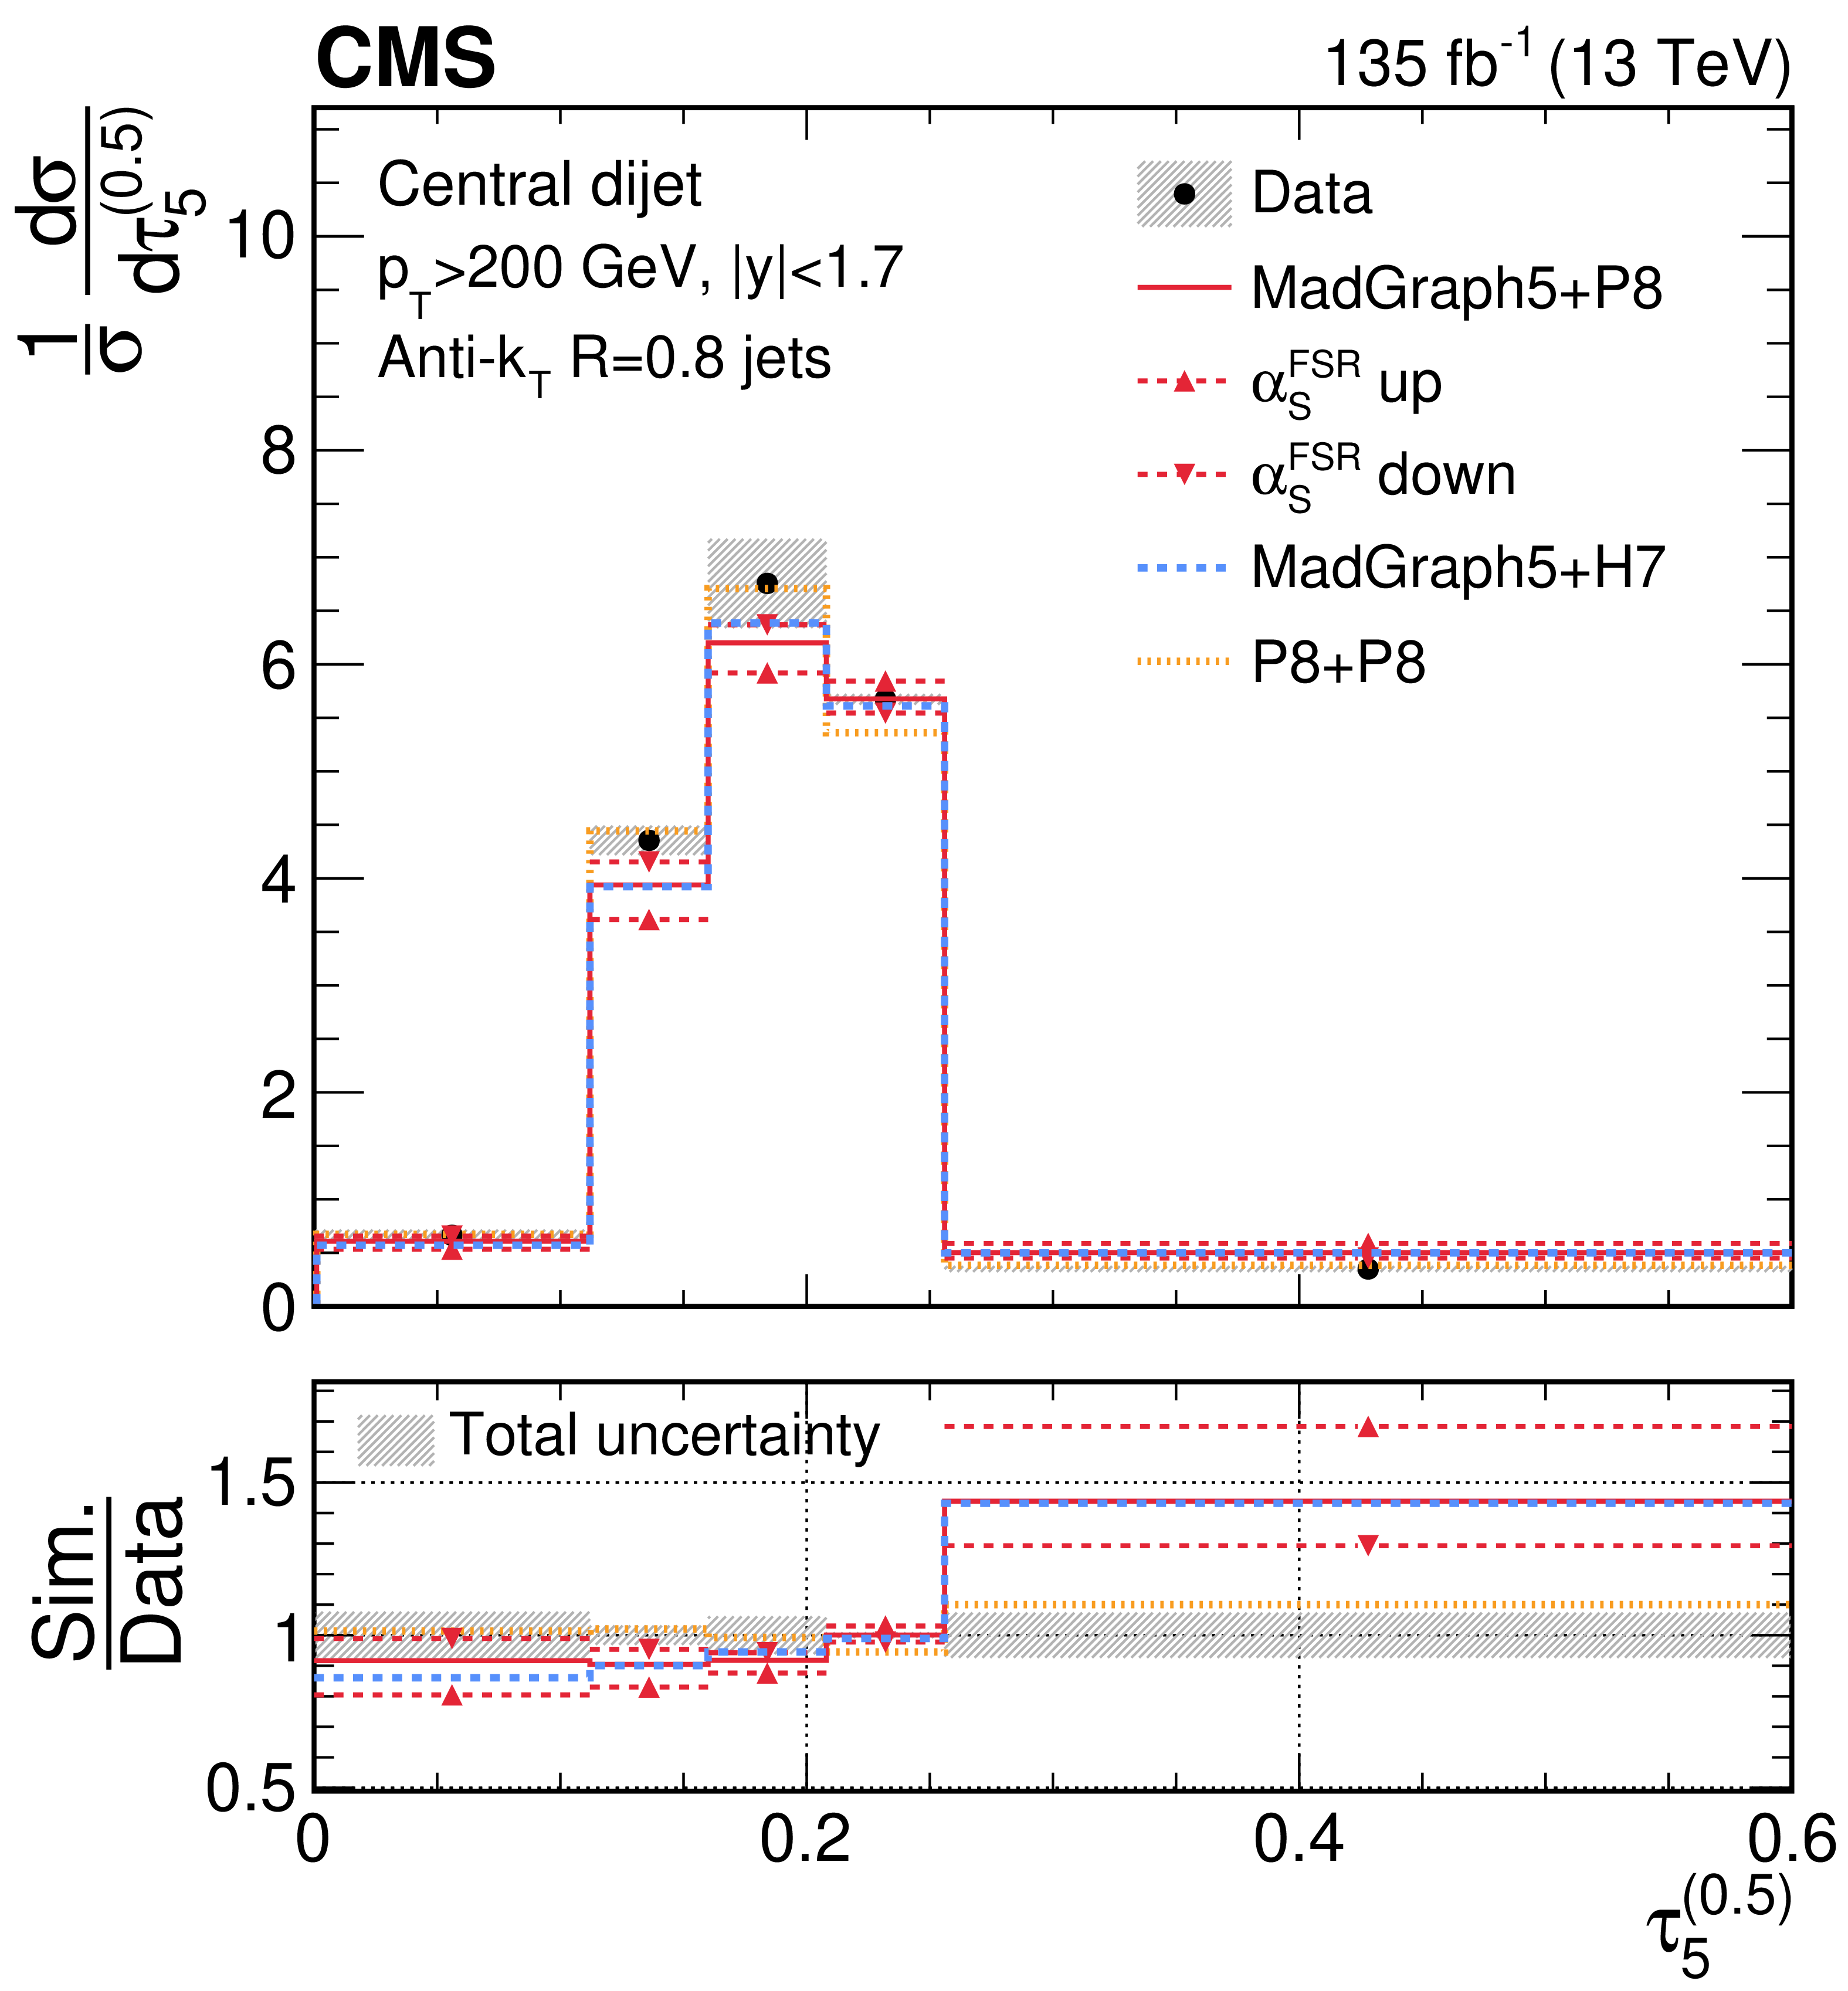
png pdf |
Figure 40-b:
Unfolded distributions of 5-subjettiness observables, $\tau_{5}^{(0.25)}$, $\tau_{5}^{(0.5)}$, $\tau_{5}^{(1)}$, $\tau_{5}^{(1.5)}$, and \Nsub52, measured for AK8 jets in the QCD dijet event selection, extracted from the normalized, combined distribution after unfolding; the bin contents and the error bars are scaled by the bin widths for the distributions of the individual observables. For comparisons with particle-level predictions, the error bars in data correspond to the total unfolding uncertainties, and the lower panels present the ratio of particle-level predictions to the unfolded data. The dark grey hashed region illustrates the total uncertainties per bin in the unfolded result. |
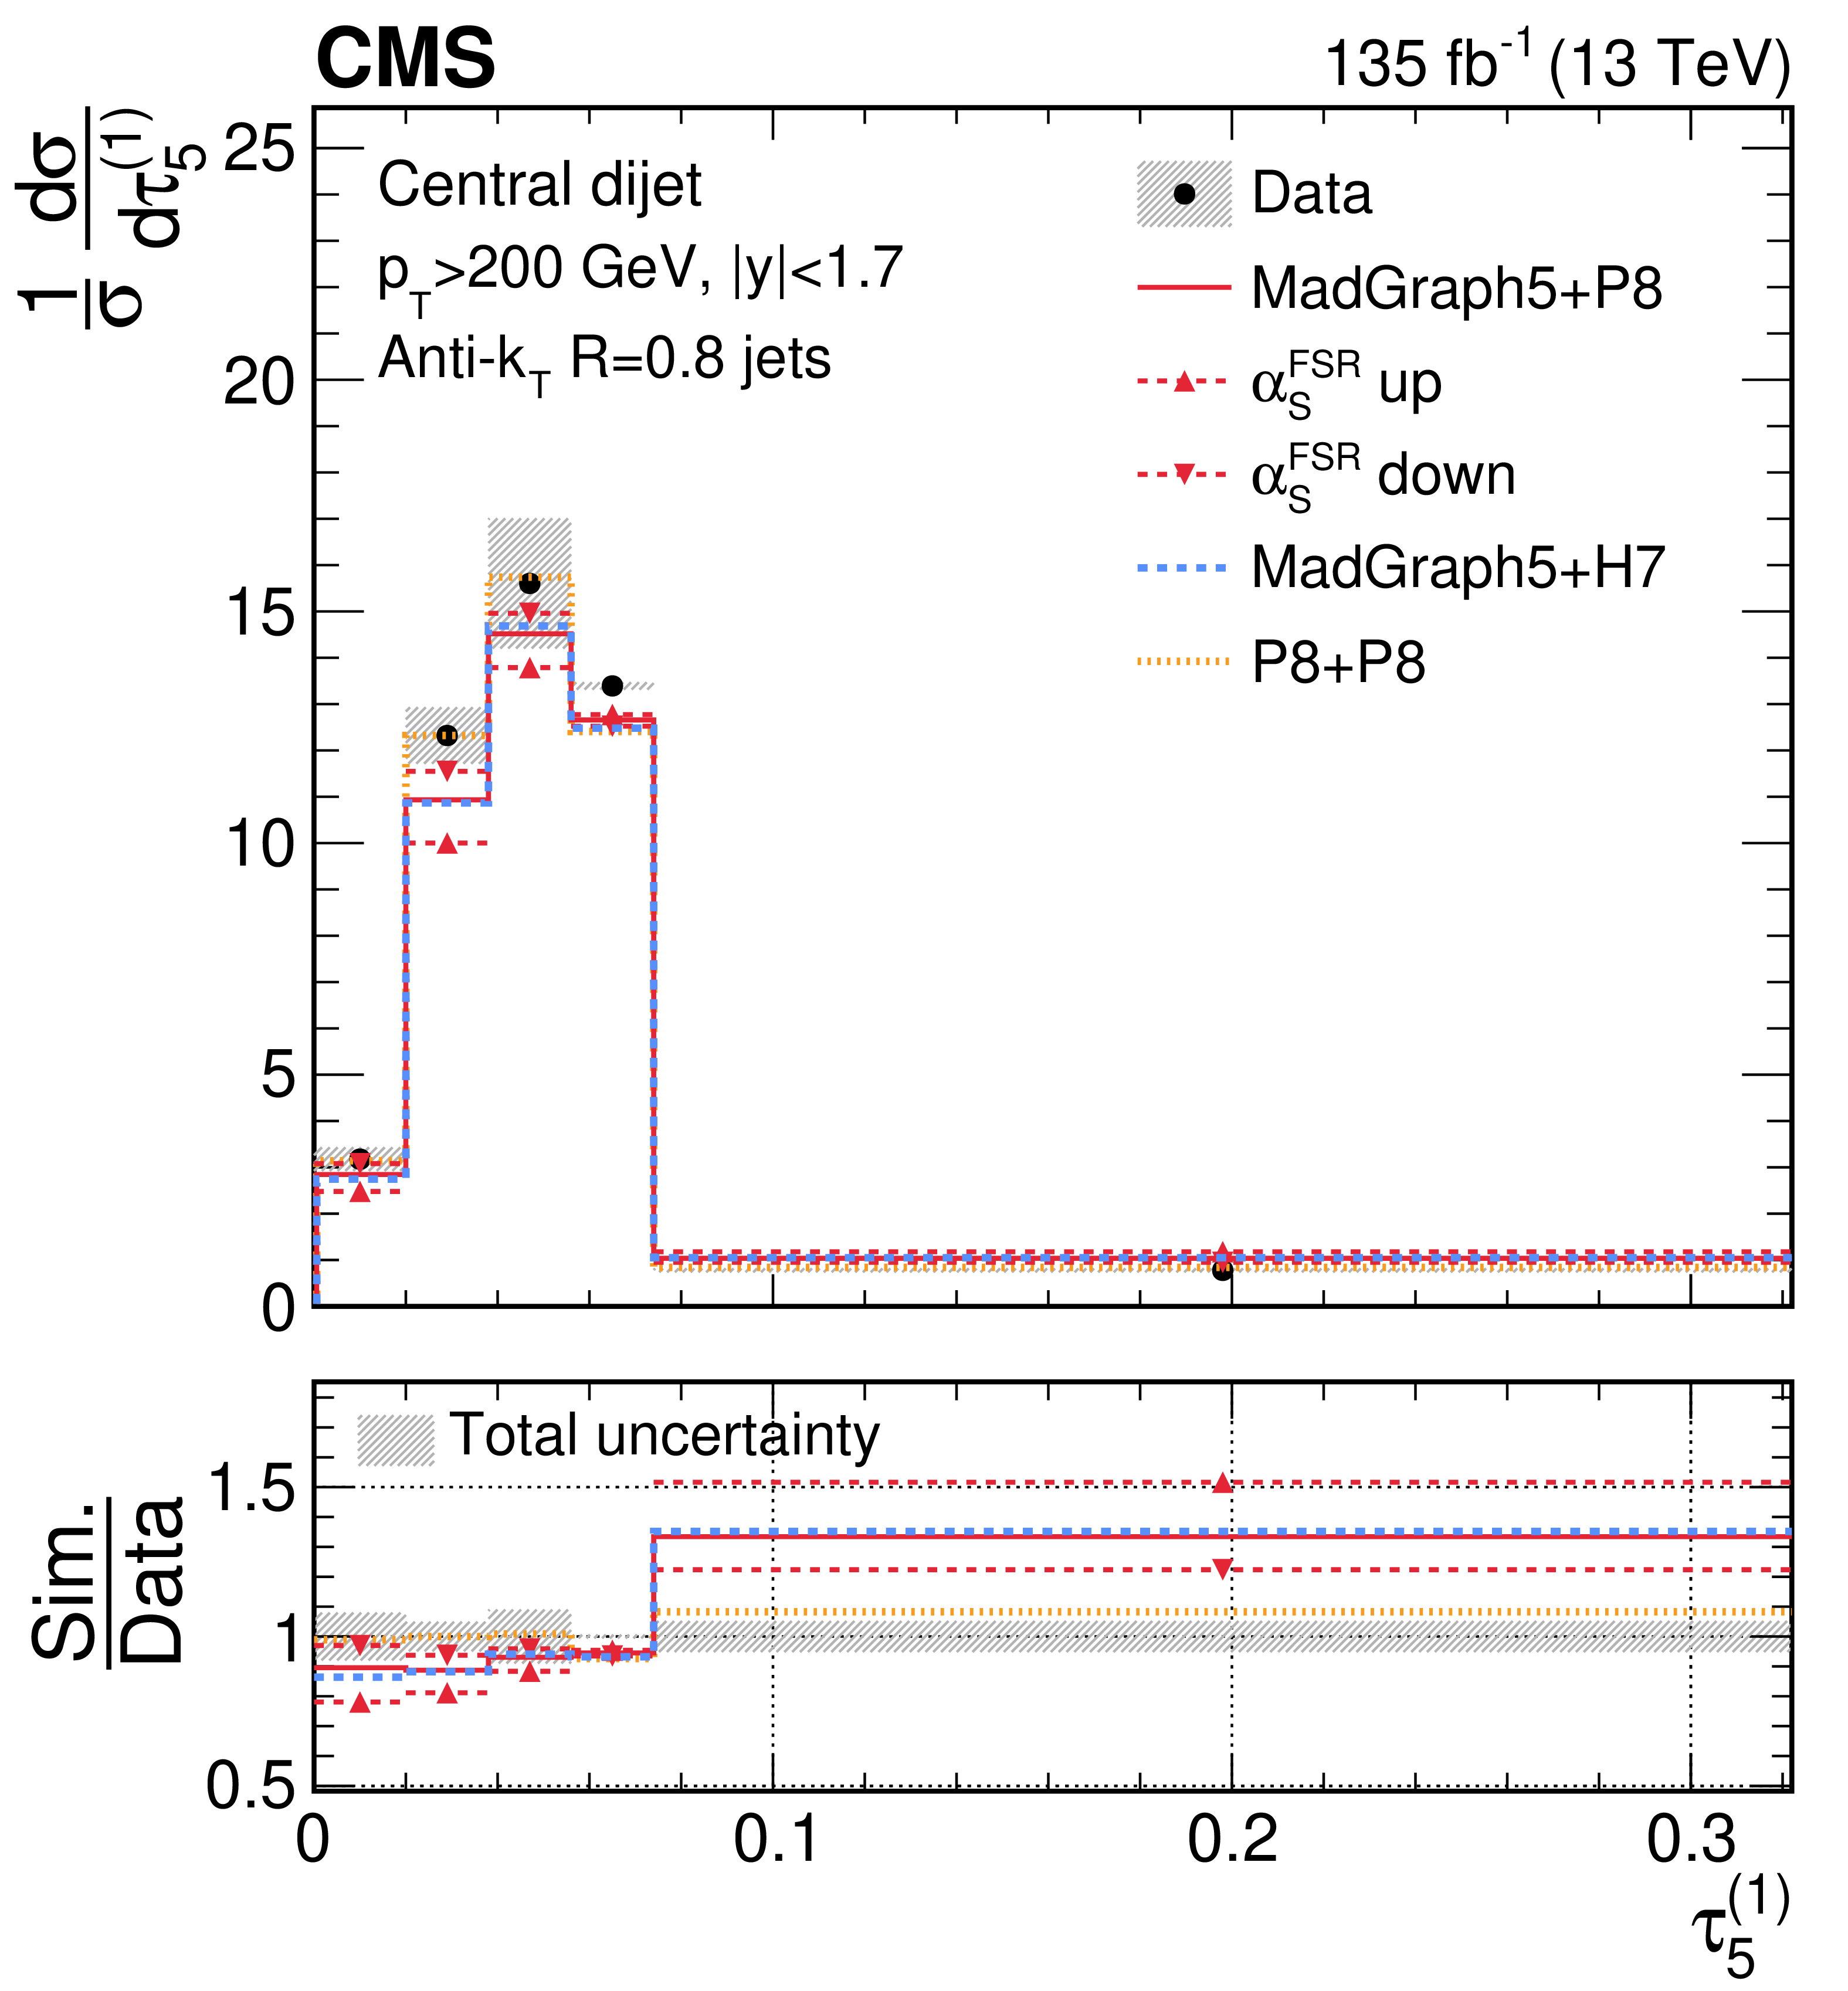
png pdf |
Figure 40-c:
Unfolded distributions of 5-subjettiness observables, $\tau_{5}^{(0.25)}$, $\tau_{5}^{(0.5)}$, $\tau_{5}^{(1)}$, $\tau_{5}^{(1.5)}$, and \Nsub52, measured for AK8 jets in the QCD dijet event selection, extracted from the normalized, combined distribution after unfolding; the bin contents and the error bars are scaled by the bin widths for the distributions of the individual observables. For comparisons with particle-level predictions, the error bars in data correspond to the total unfolding uncertainties, and the lower panels present the ratio of particle-level predictions to the unfolded data. The dark grey hashed region illustrates the total uncertainties per bin in the unfolded result. |
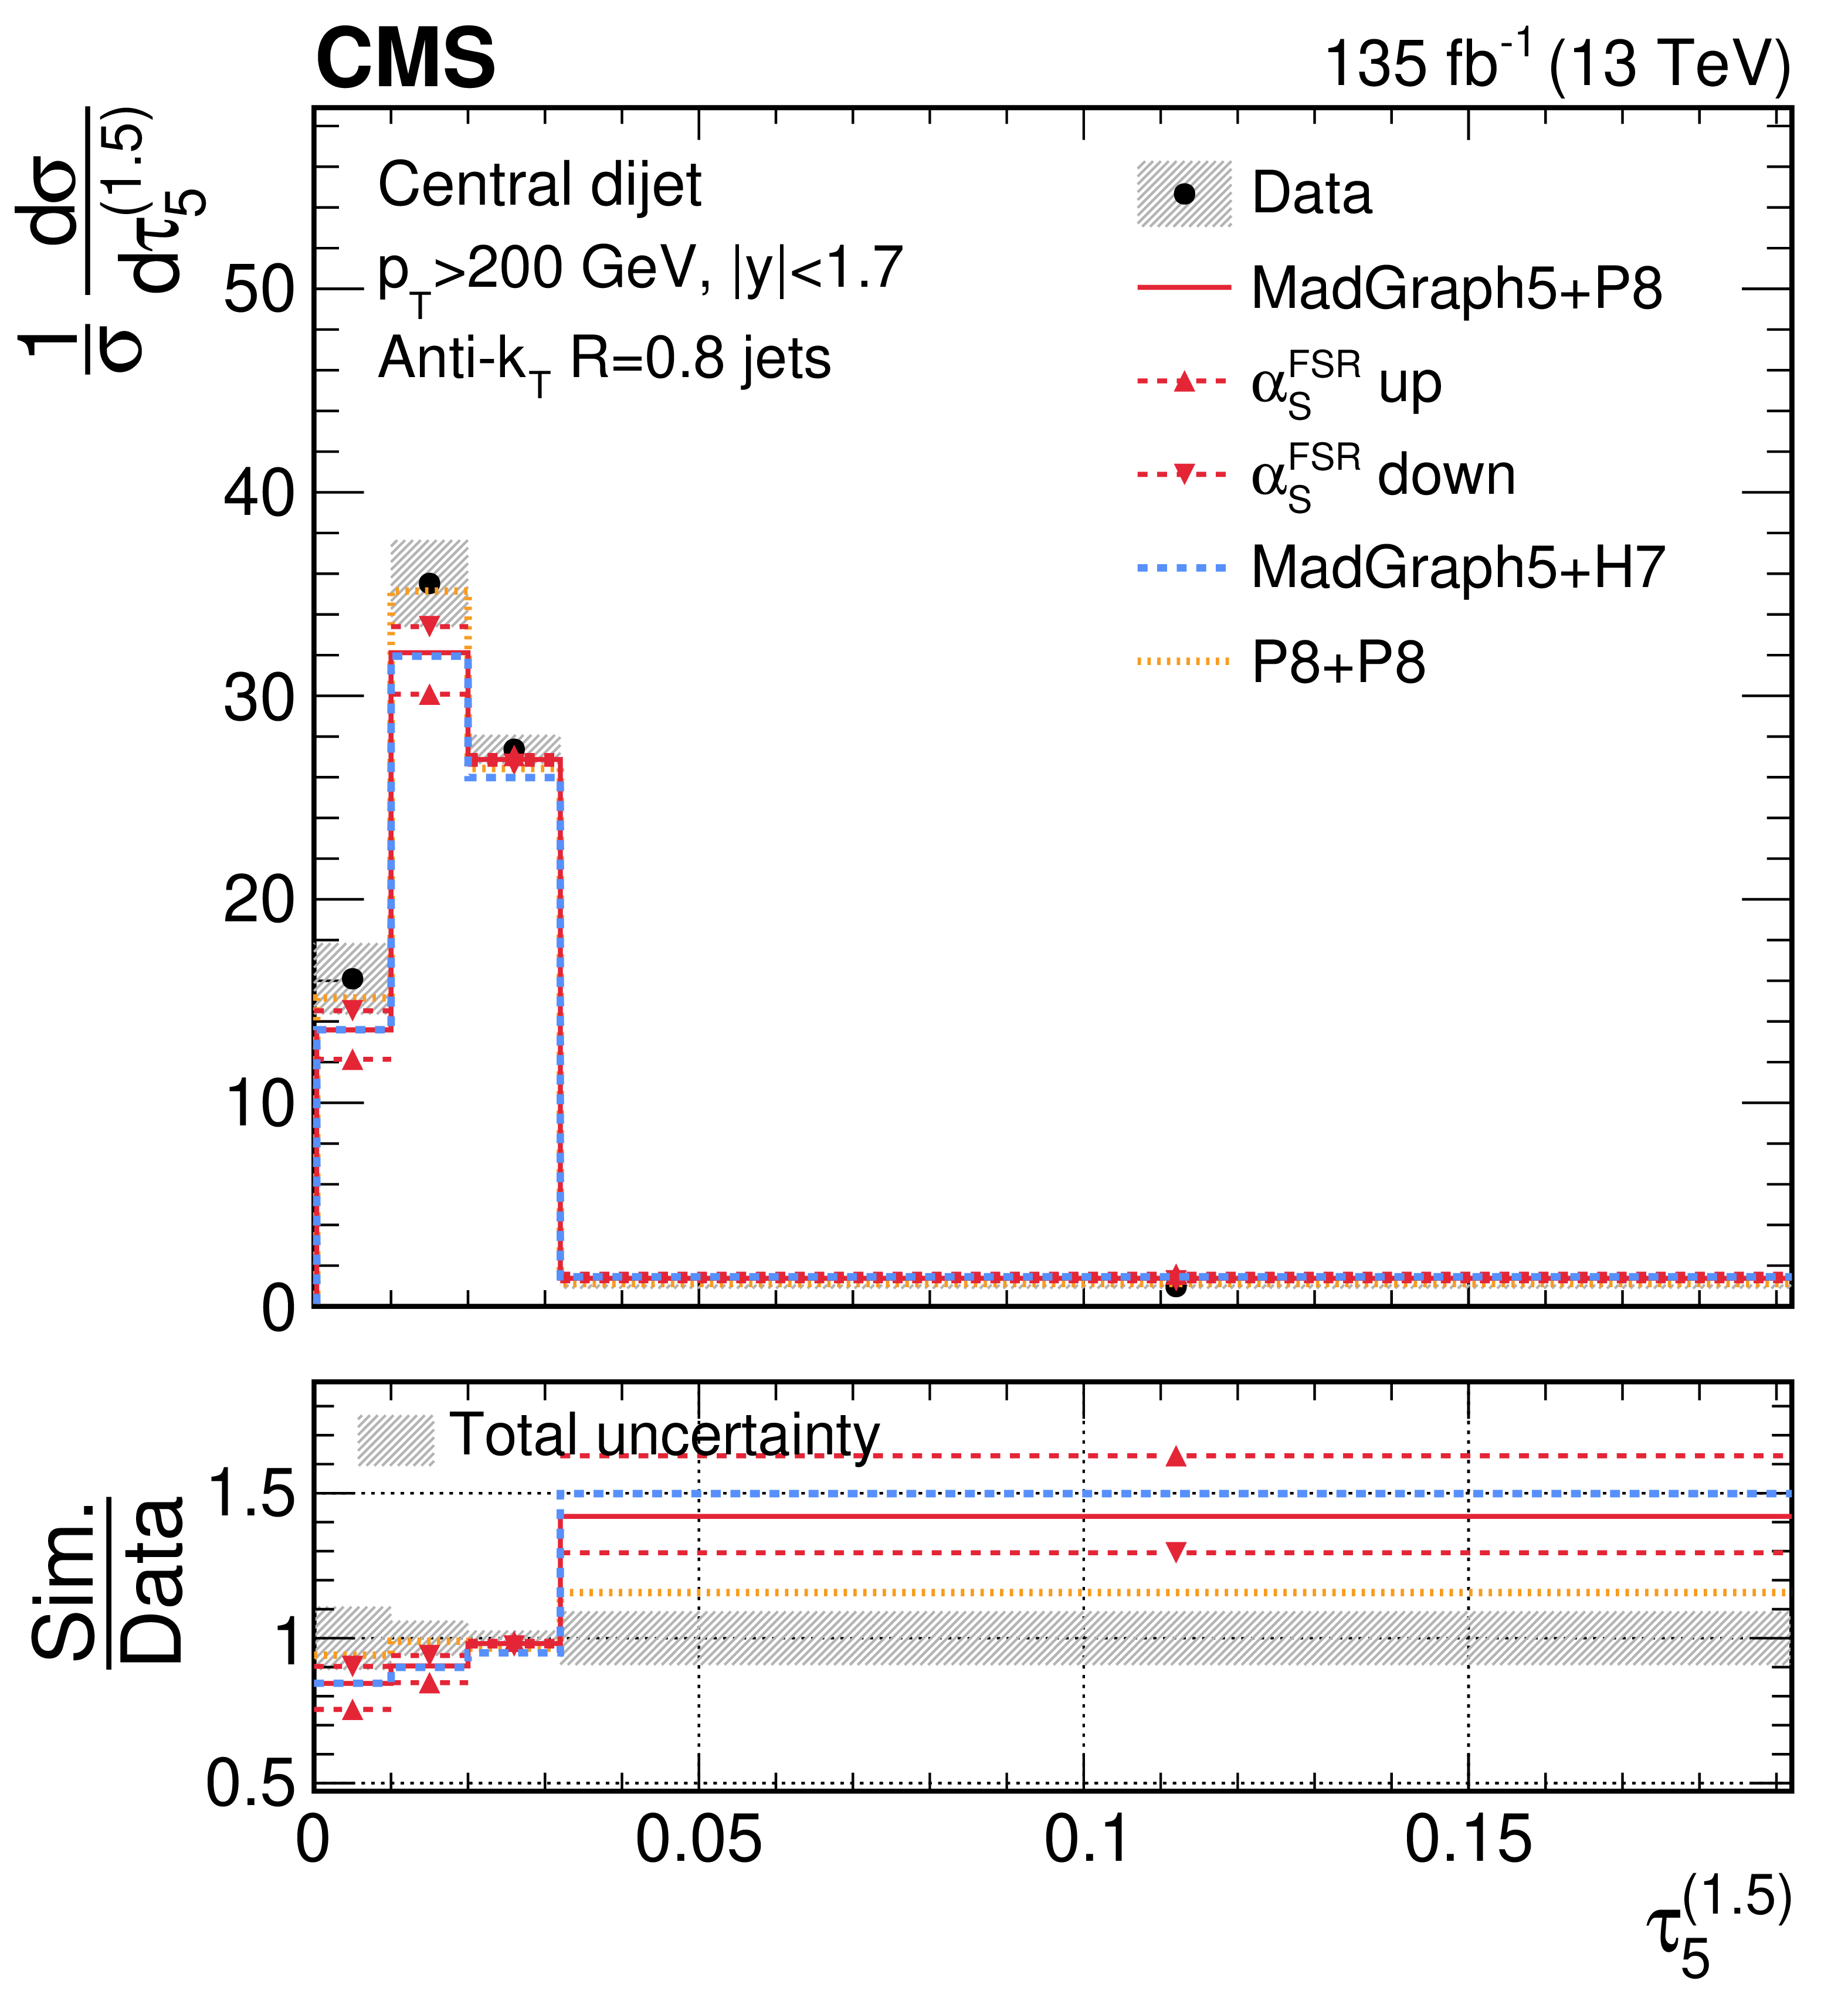
png pdf |
Figure 40-d:
Unfolded distributions of 5-subjettiness observables, $\tau_{5}^{(0.25)}$, $\tau_{5}^{(0.5)}$, $\tau_{5}^{(1)}$, $\tau_{5}^{(1.5)}$, and \Nsub52, measured for AK8 jets in the QCD dijet event selection, extracted from the normalized, combined distribution after unfolding; the bin contents and the error bars are scaled by the bin widths for the distributions of the individual observables. For comparisons with particle-level predictions, the error bars in data correspond to the total unfolding uncertainties, and the lower panels present the ratio of particle-level predictions to the unfolded data. The dark grey hashed region illustrates the total uncertainties per bin in the unfolded result. |
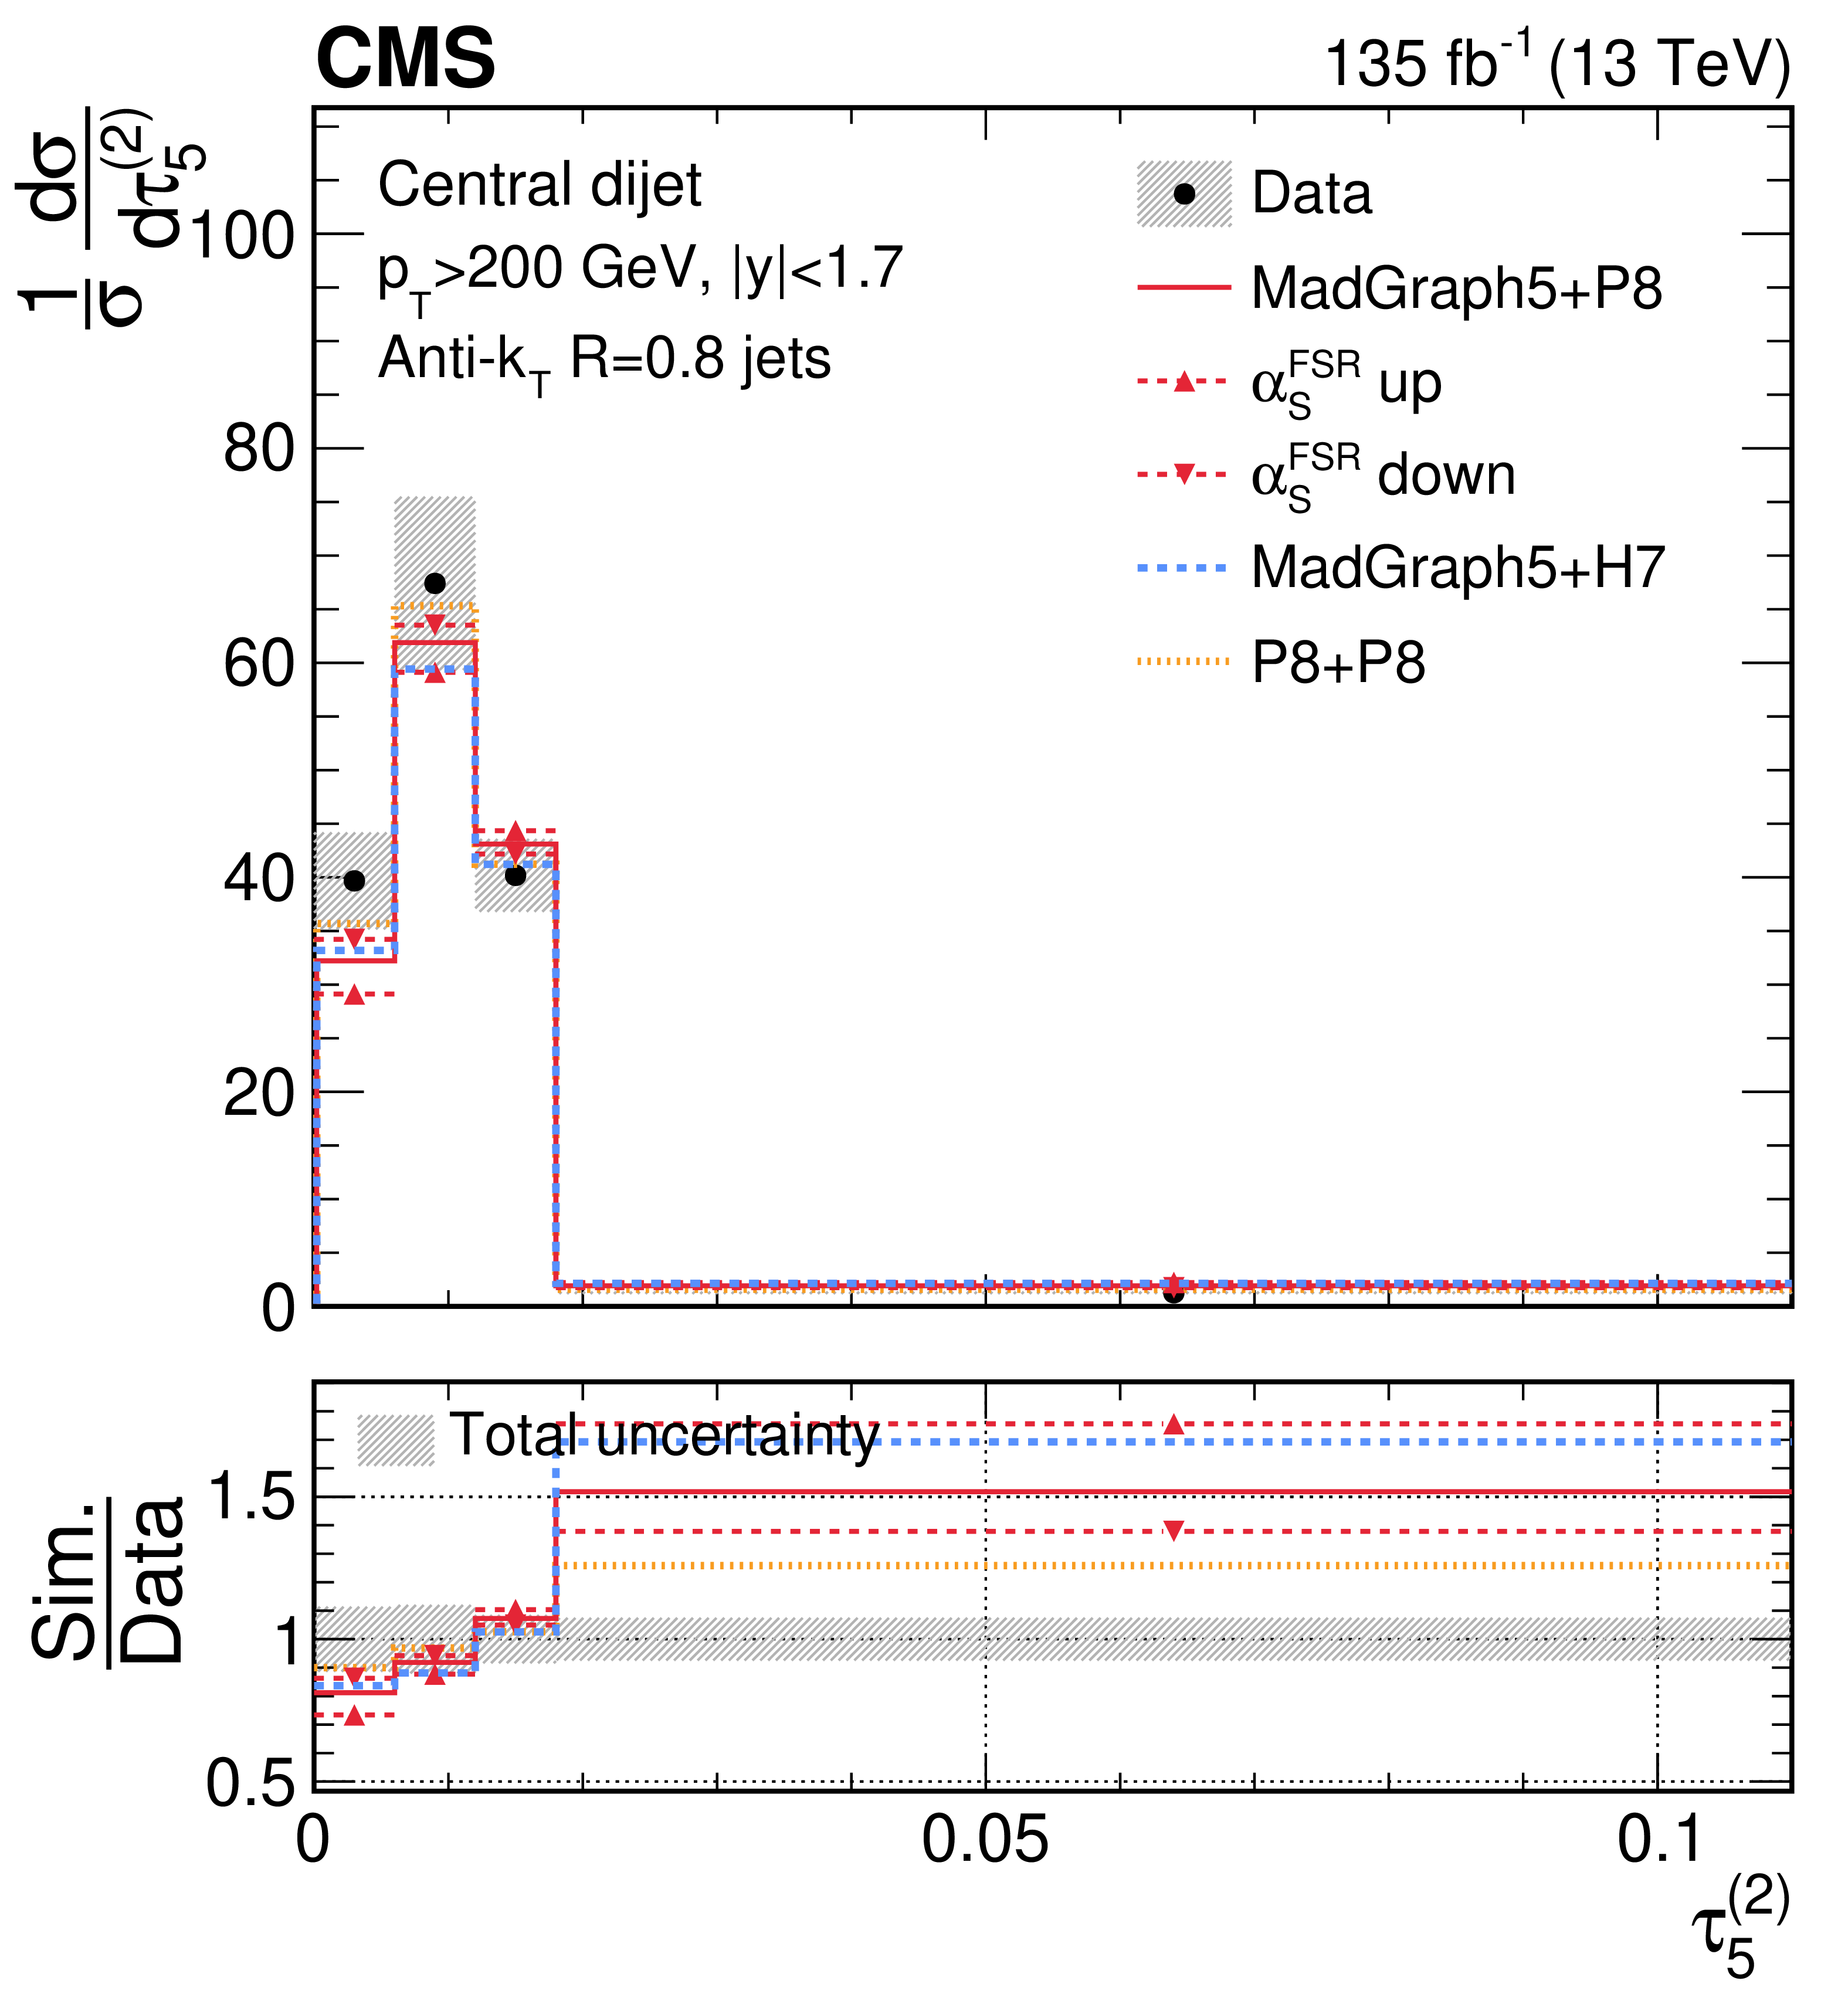
png pdf |
Figure 40-e:
Unfolded distributions of 5-subjettiness observables, $\tau_{5}^{(0.25)}$, $\tau_{5}^{(0.5)}$, $\tau_{5}^{(1)}$, $\tau_{5}^{(1.5)}$, and \Nsub52, measured for AK8 jets in the QCD dijet event selection, extracted from the normalized, combined distribution after unfolding; the bin contents and the error bars are scaled by the bin widths for the distributions of the individual observables. For comparisons with particle-level predictions, the error bars in data correspond to the total unfolding uncertainties, and the lower panels present the ratio of particle-level predictions to the unfolded data. The dark grey hashed region illustrates the total uncertainties per bin in the unfolded result. |
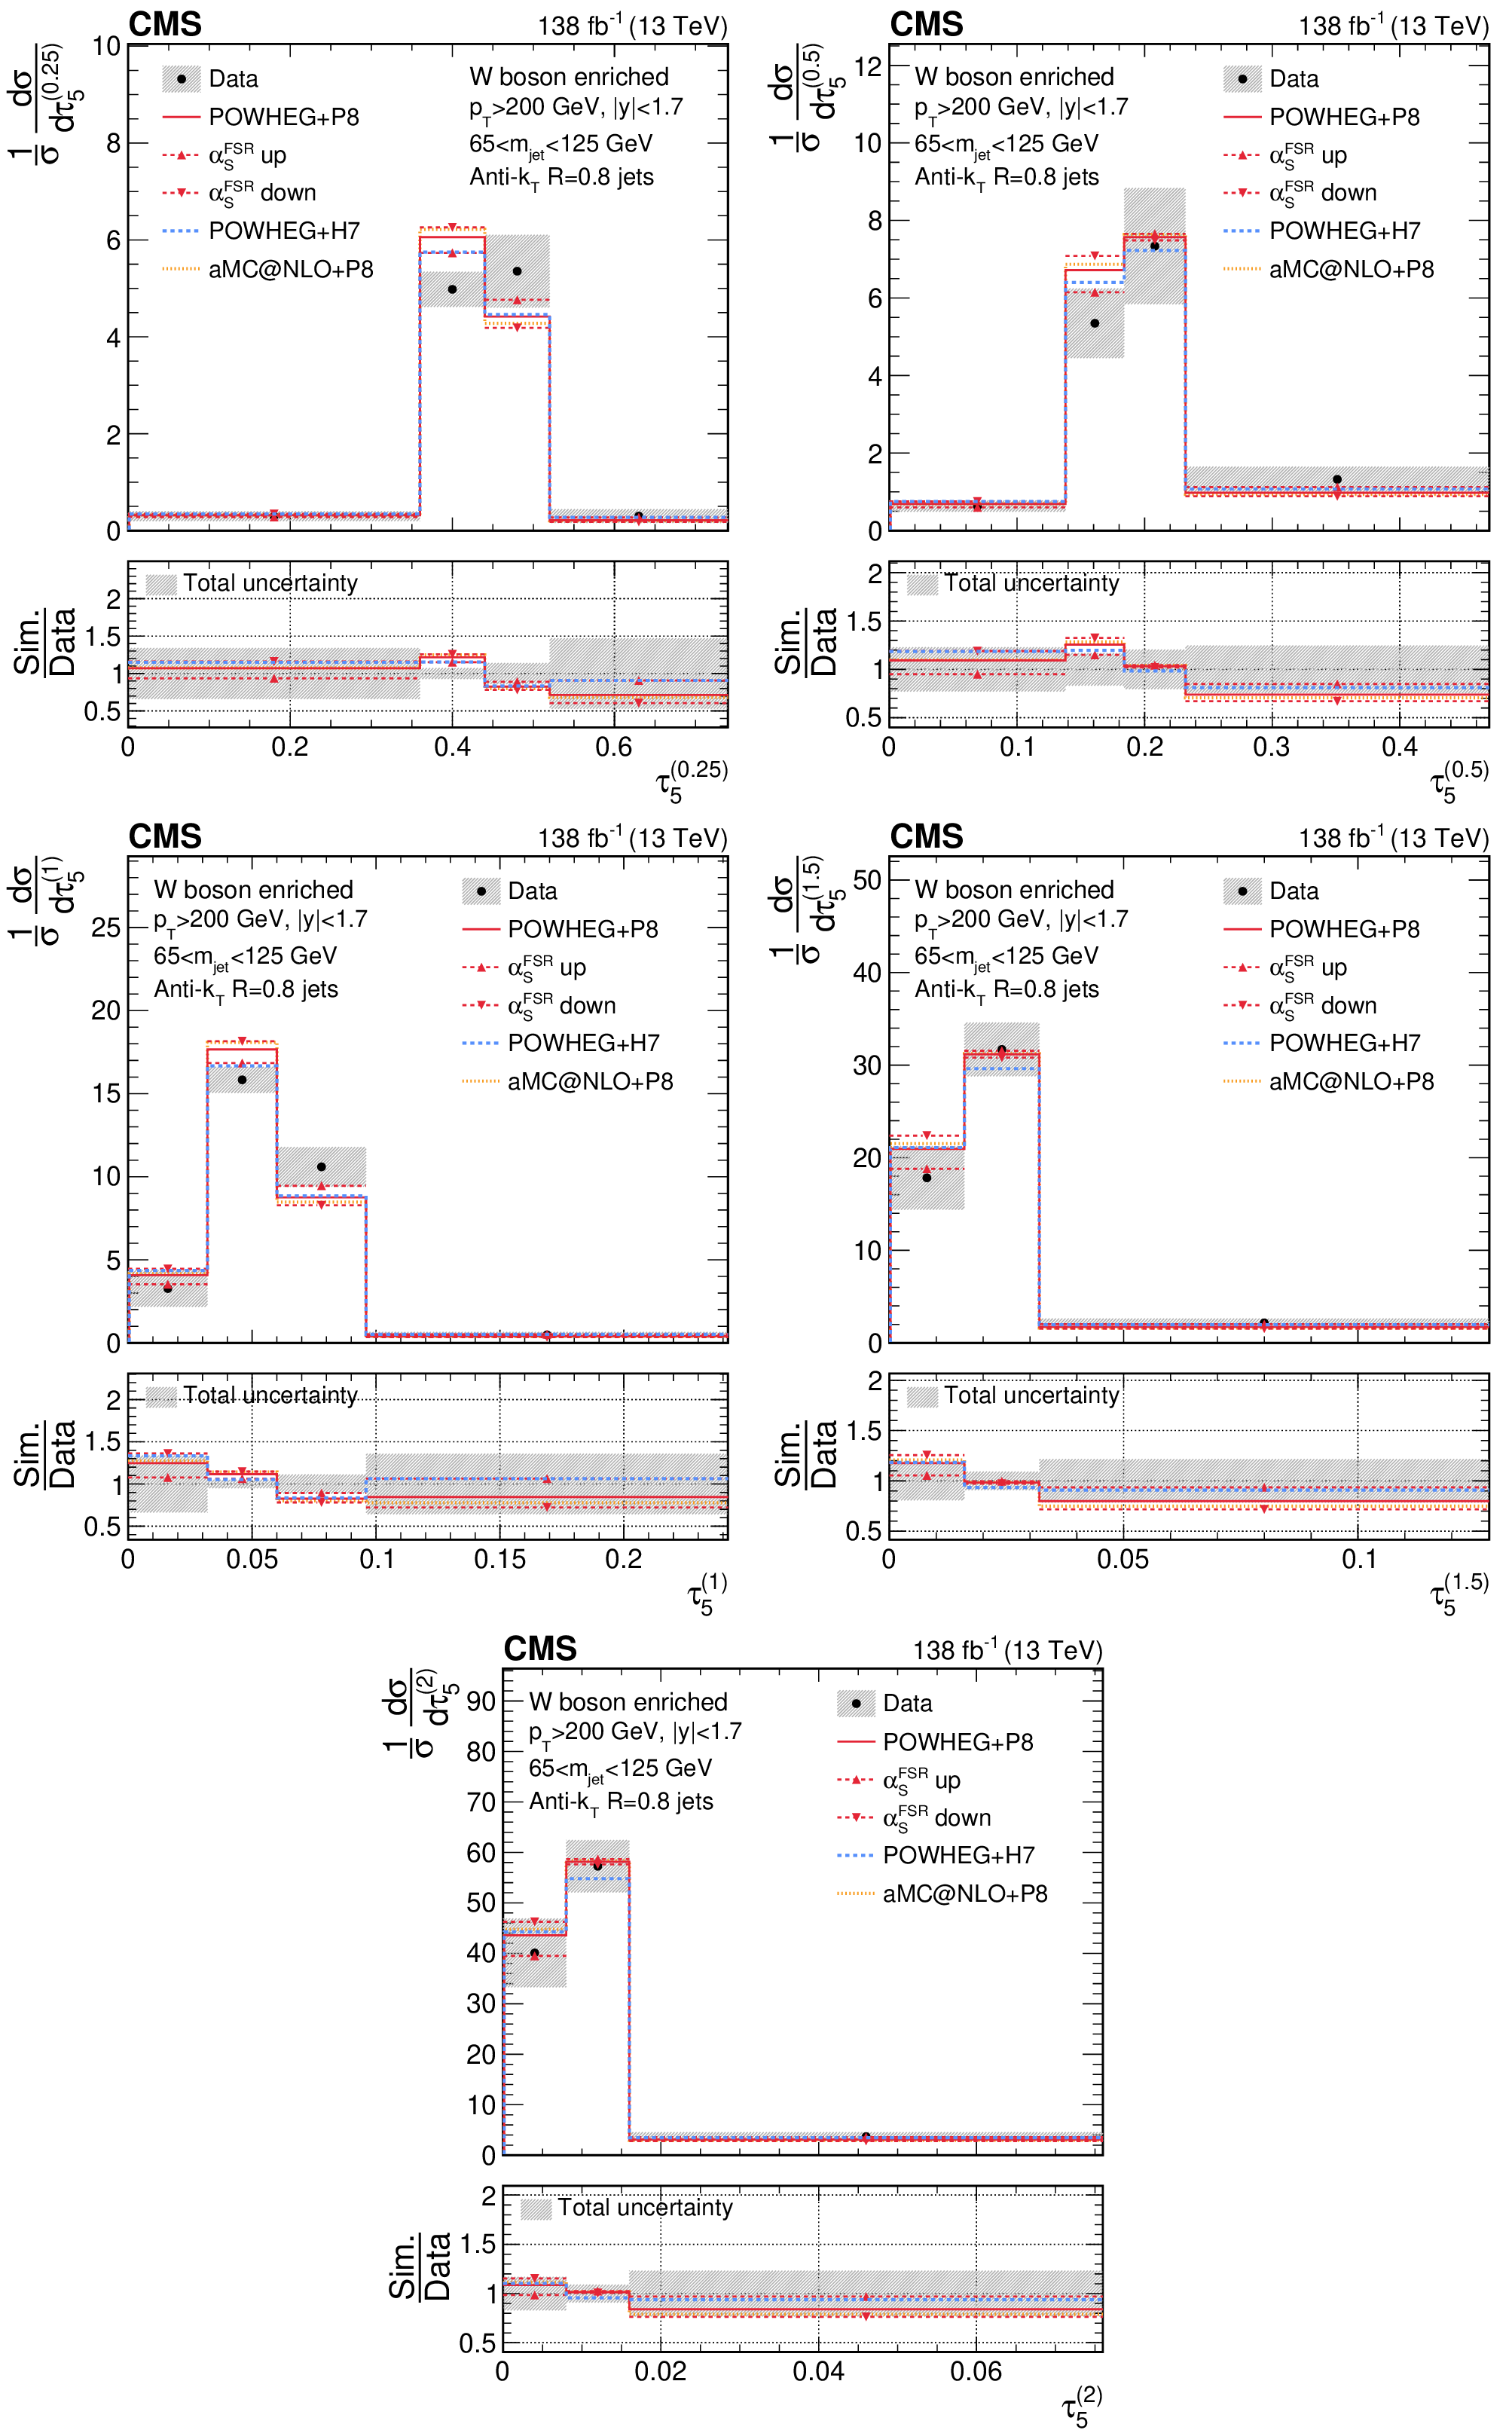
png pdf |
Figure 41:
Unfolded distributions of 5-subjettiness observables, $\tau_{5}^{(0.25)}$, $\tau_{5}^{(0.5)}$, $\tau_{5}^{(1)}$, $\tau_{5}^{(1.5)}$, and \Nsub52, measured for AK8 jets in boosted W boson-enriched events, extracted from the normalized, combined distribution after unfolding; the bin contents and the error bars are scaled by the bin widths for the distributions of the individual observables. For comparisons with particle-level predictions, the error bars in data correspond to the total unfolding uncertainties, and the lower panels present the ratio of particle-level predictions to the unfolded data. The dark grey hashed region illustrates the total uncertainties per bin in the unfolded result. |
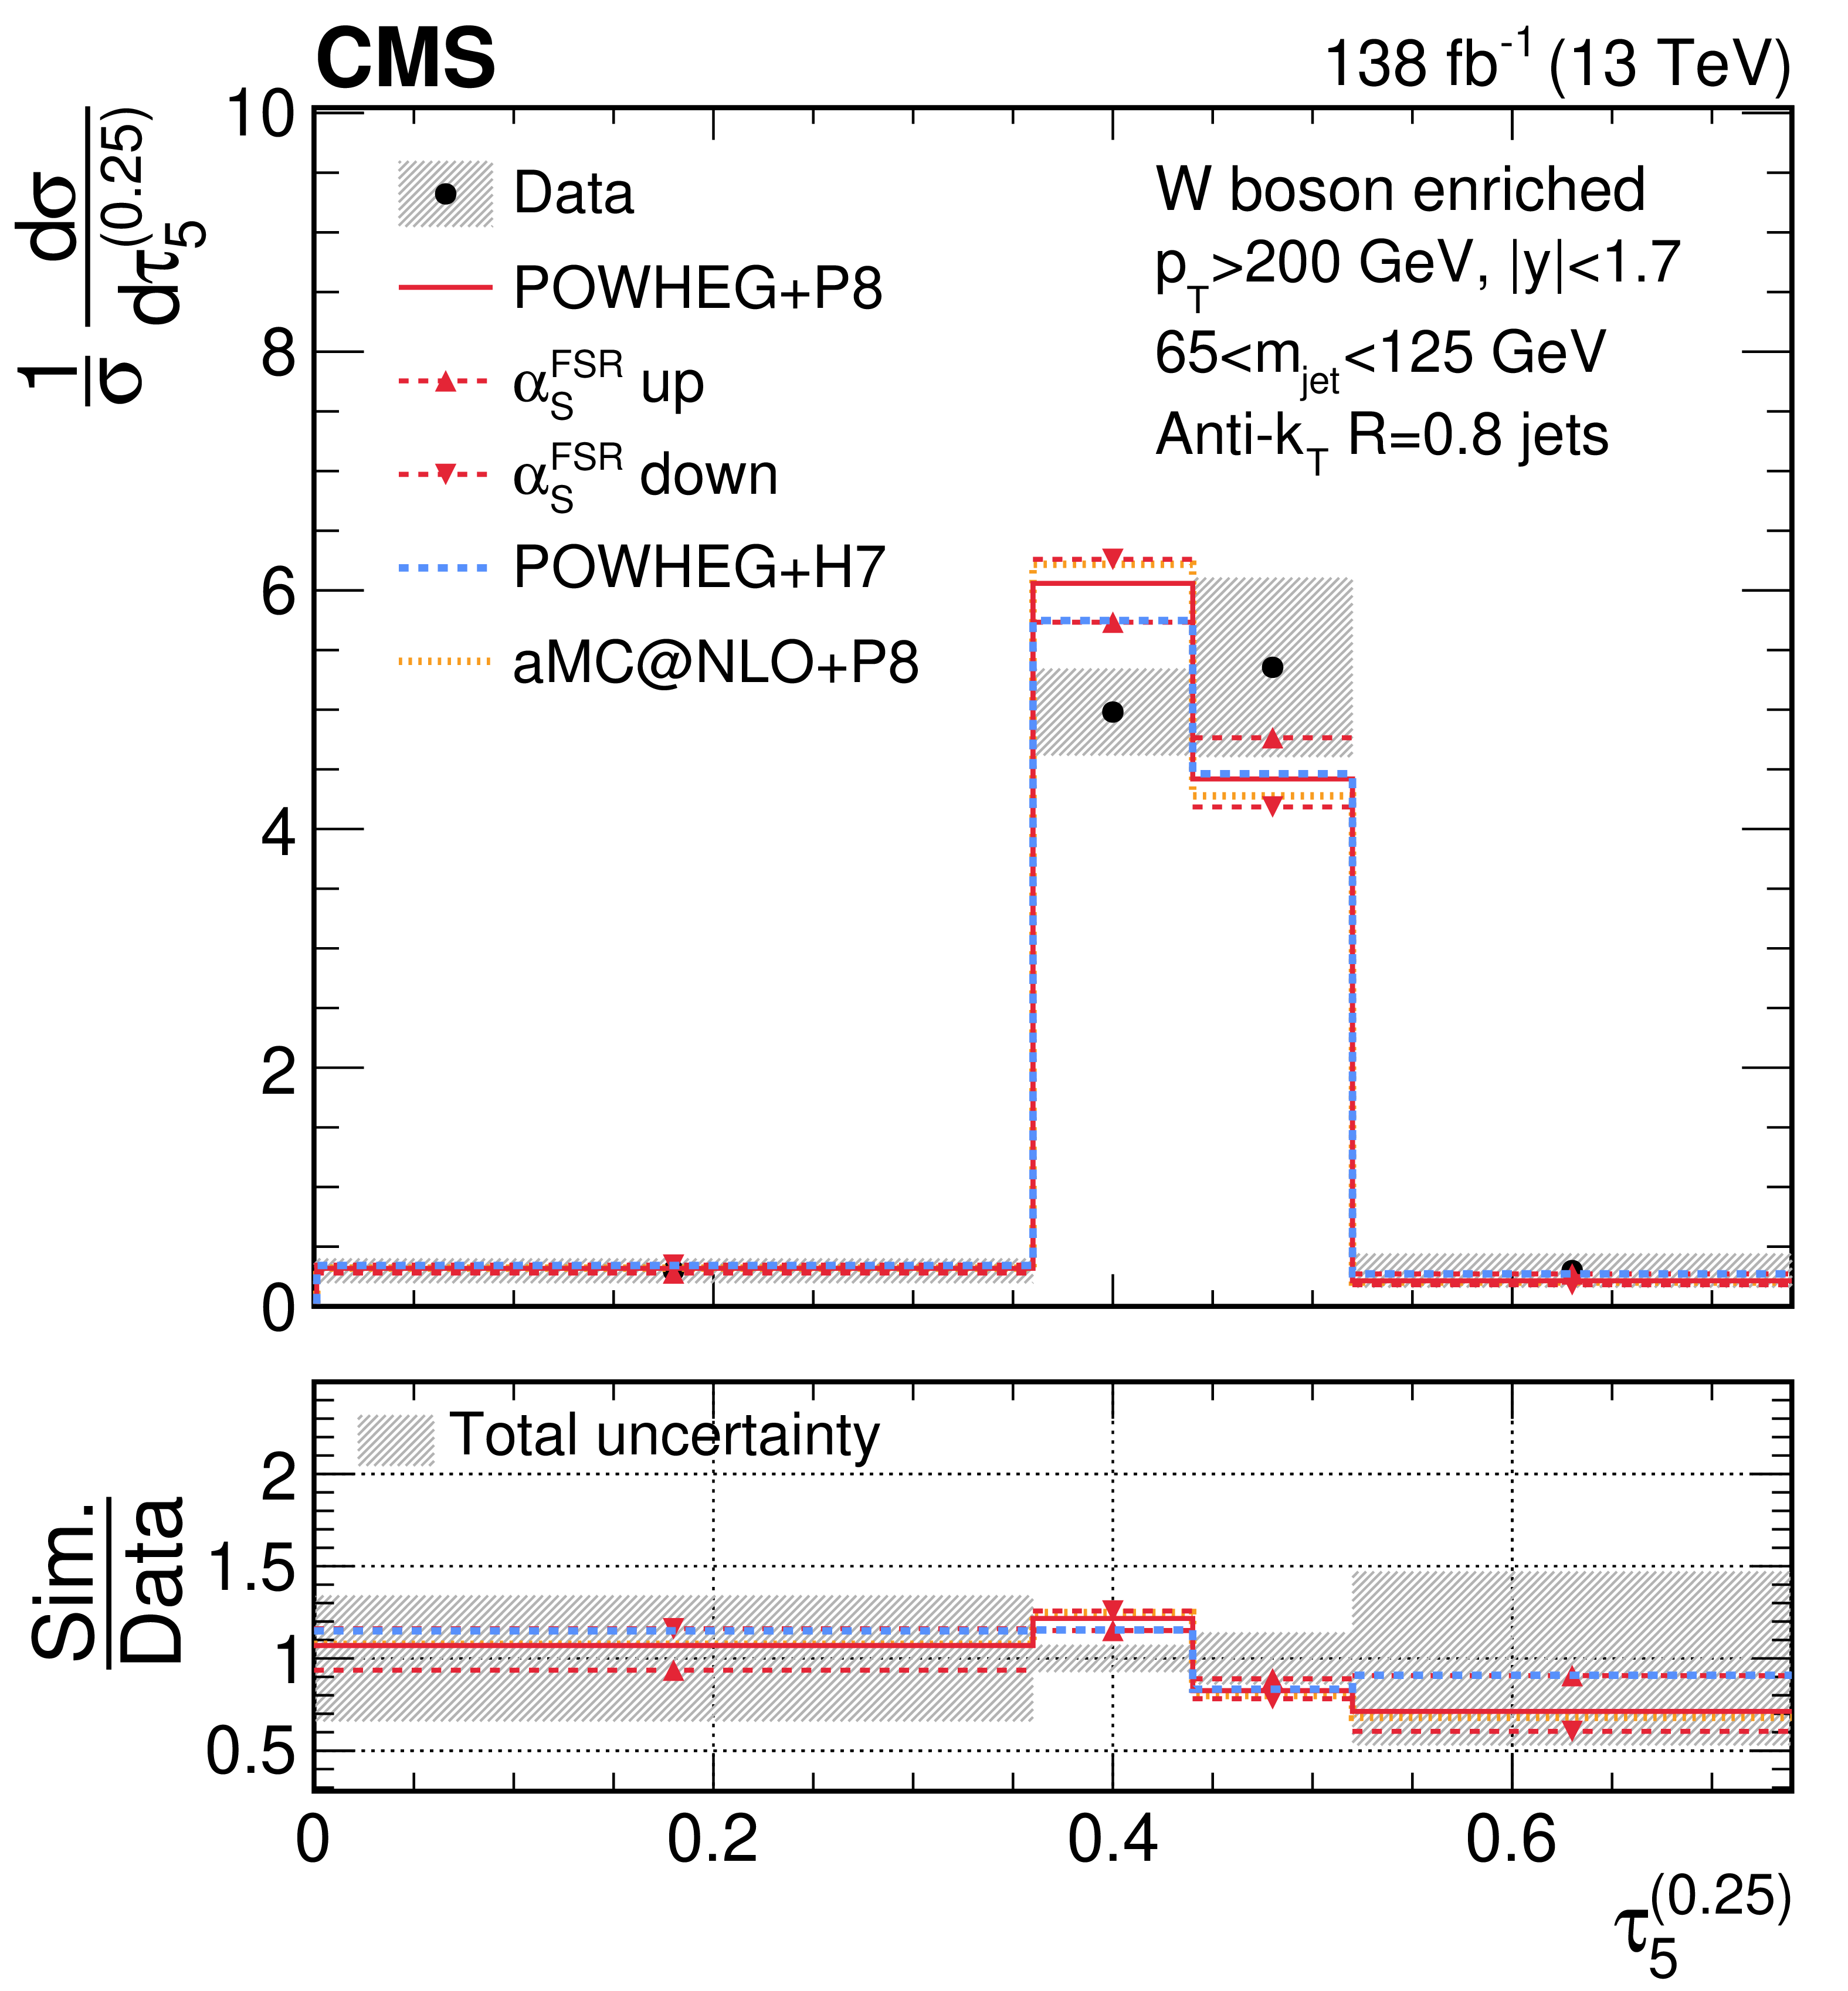
png pdf |
Figure 41-a:
Unfolded distributions of 5-subjettiness observables, $\tau_{5}^{(0.25)}$, $\tau_{5}^{(0.5)}$, $\tau_{5}^{(1)}$, $\tau_{5}^{(1.5)}$, and \Nsub52, measured for AK8 jets in boosted W boson-enriched events, extracted from the normalized, combined distribution after unfolding; the bin contents and the error bars are scaled by the bin widths for the distributions of the individual observables. For comparisons with particle-level predictions, the error bars in data correspond to the total unfolding uncertainties, and the lower panels present the ratio of particle-level predictions to the unfolded data. The dark grey hashed region illustrates the total uncertainties per bin in the unfolded result. |
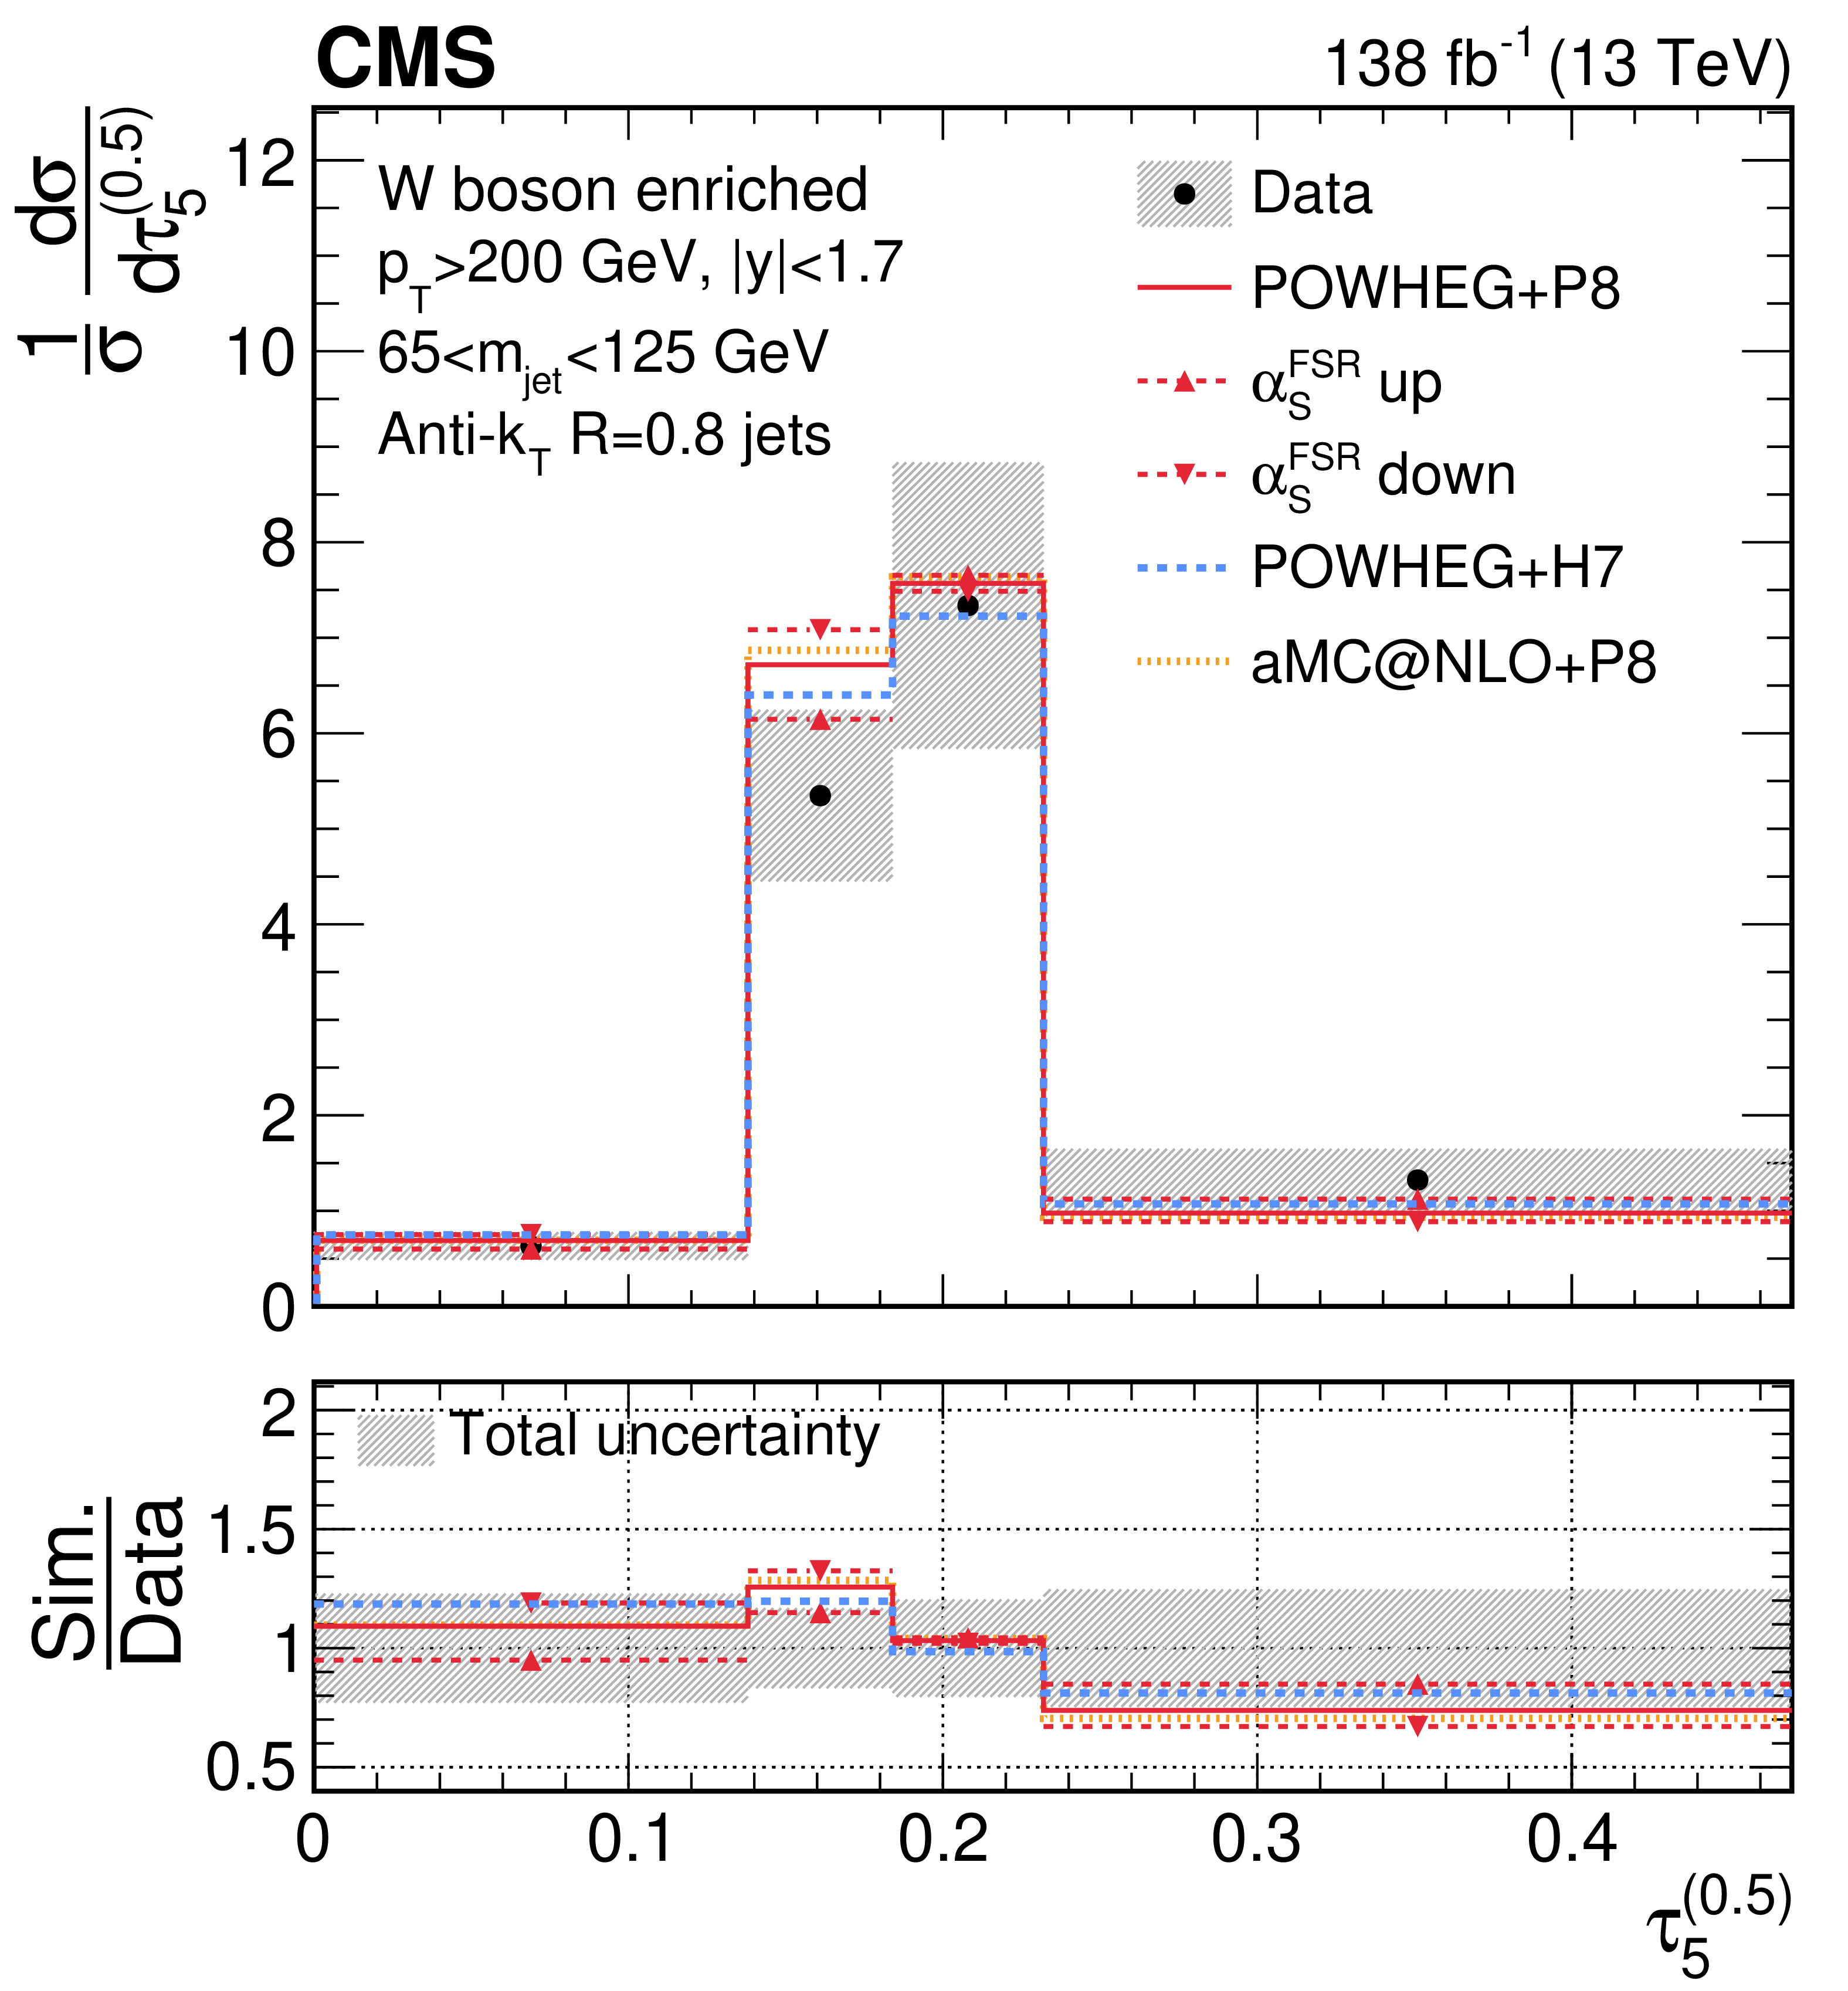
png pdf |
Figure 41-b:
Unfolded distributions of 5-subjettiness observables, $\tau_{5}^{(0.25)}$, $\tau_{5}^{(0.5)}$, $\tau_{5}^{(1)}$, $\tau_{5}^{(1.5)}$, and \Nsub52, measured for AK8 jets in boosted W boson-enriched events, extracted from the normalized, combined distribution after unfolding; the bin contents and the error bars are scaled by the bin widths for the distributions of the individual observables. For comparisons with particle-level predictions, the error bars in data correspond to the total unfolding uncertainties, and the lower panels present the ratio of particle-level predictions to the unfolded data. The dark grey hashed region illustrates the total uncertainties per bin in the unfolded result. |
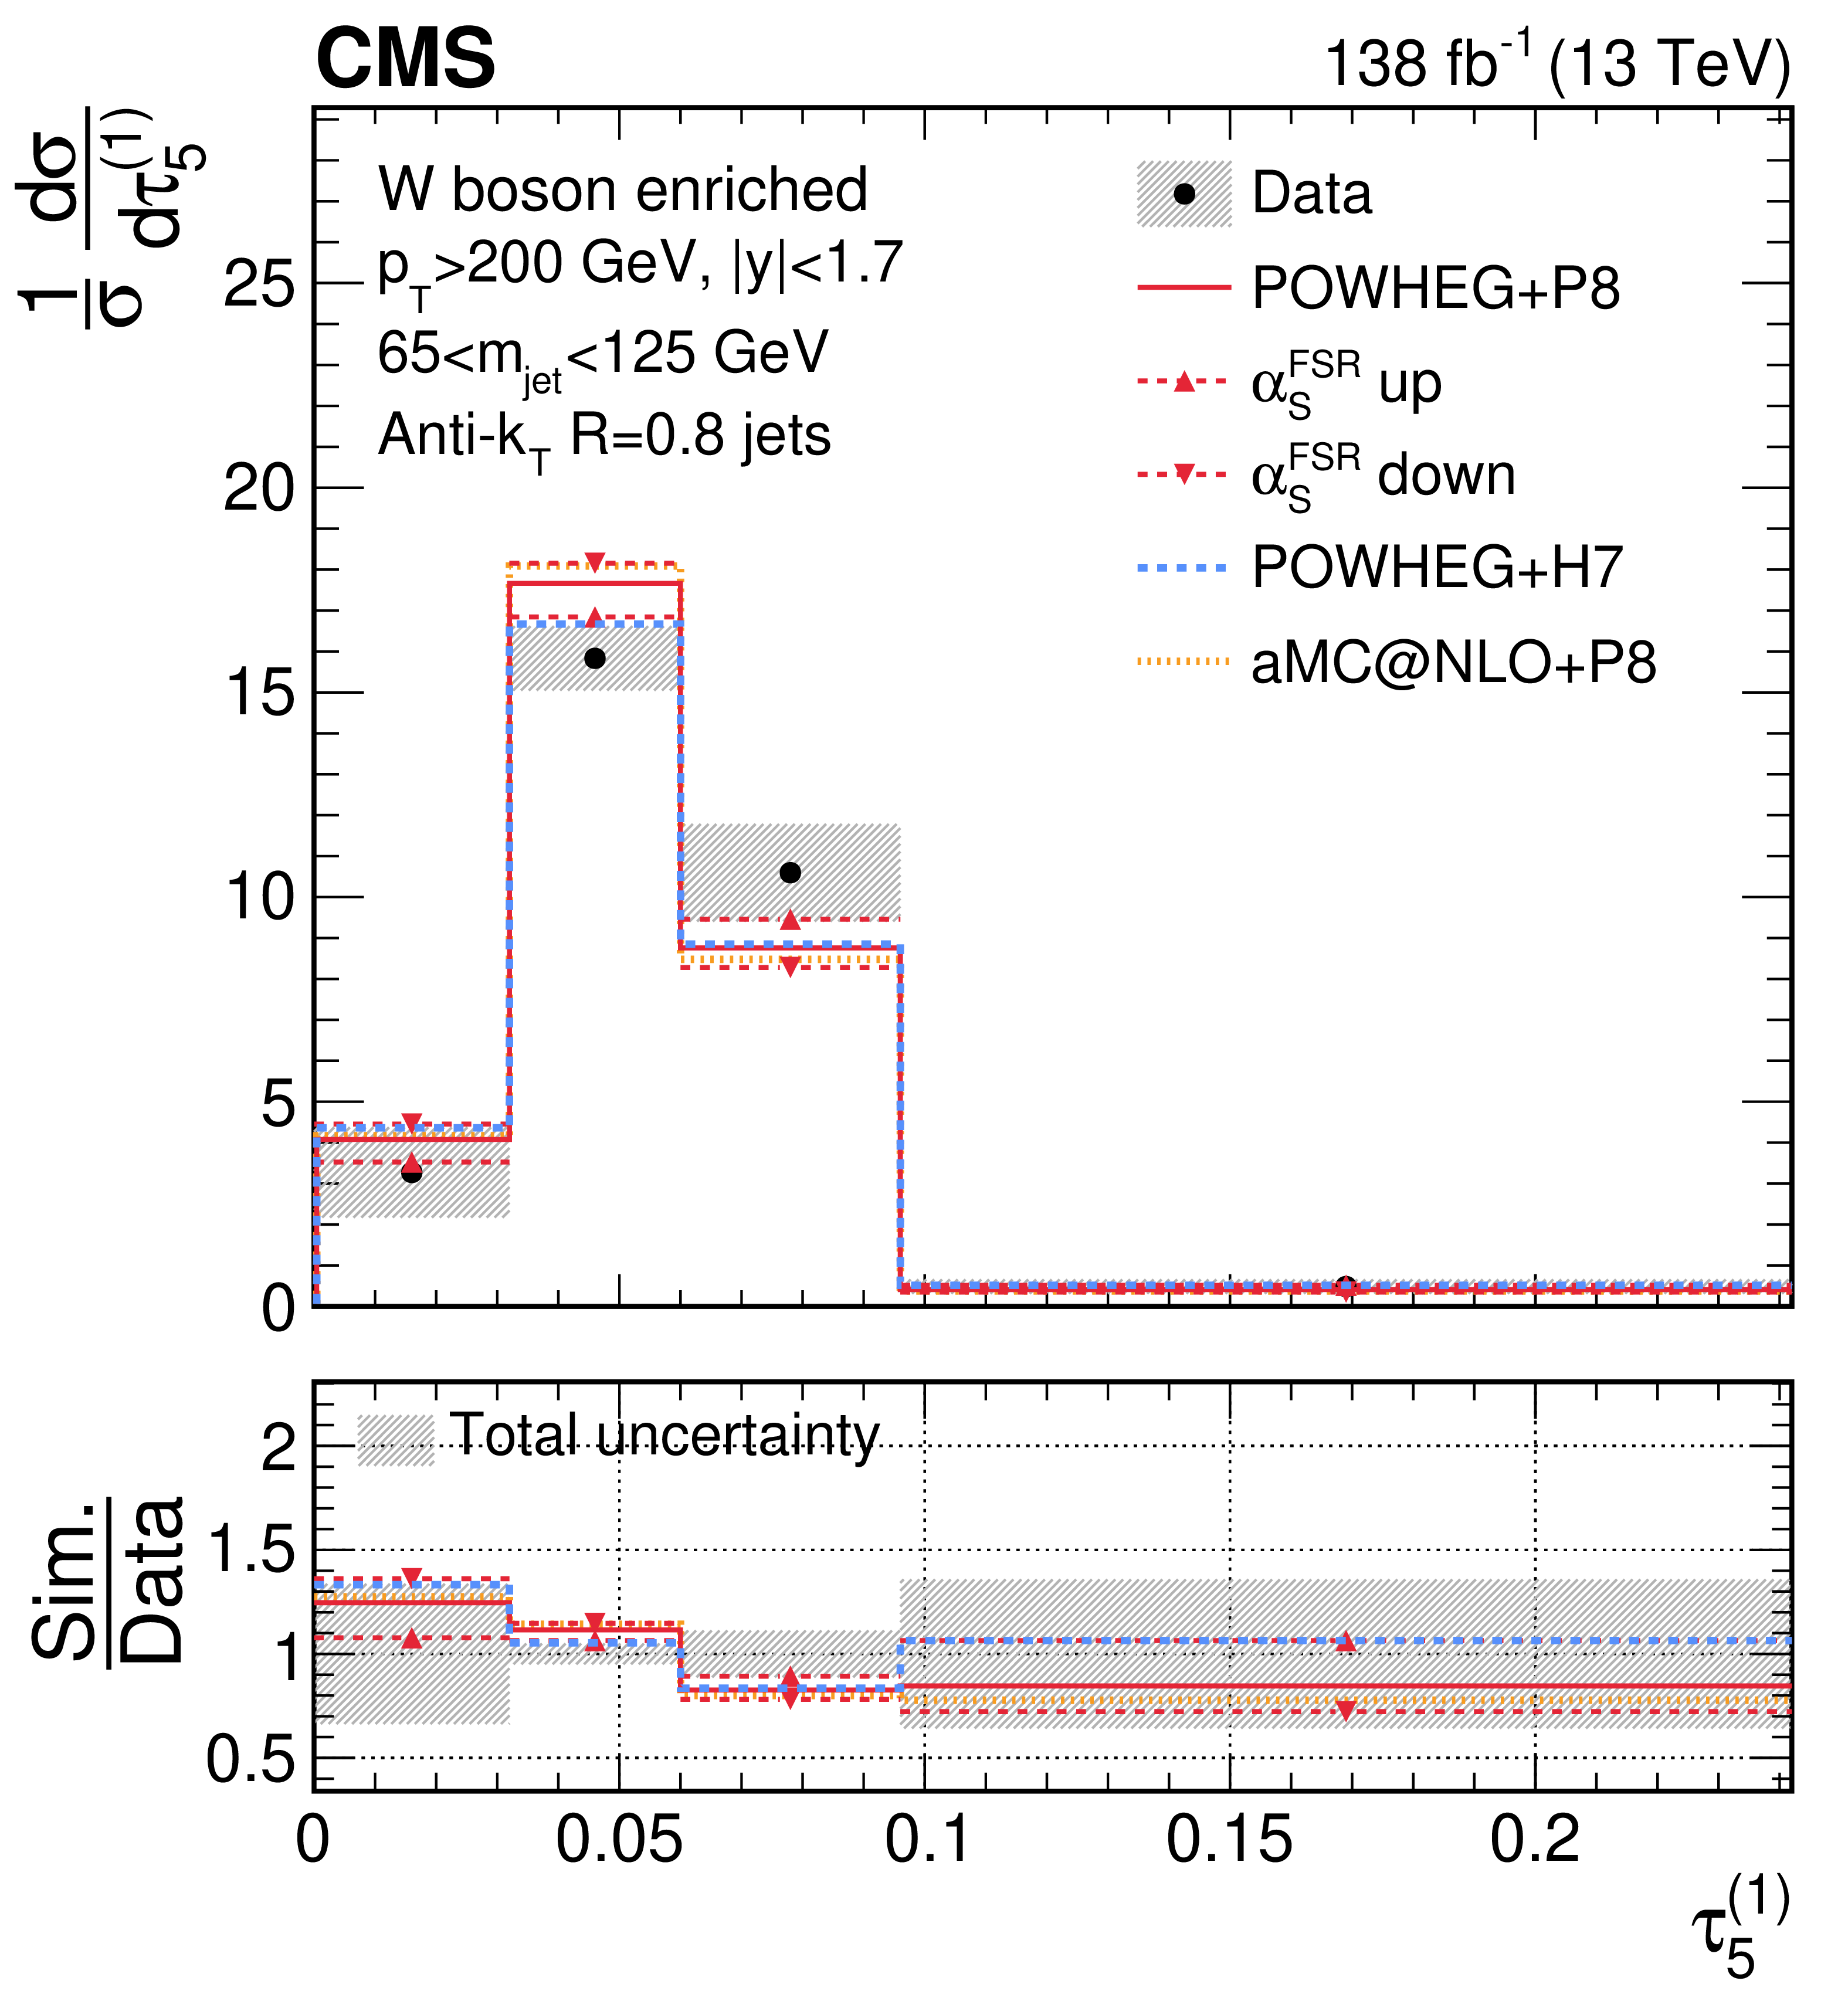
png pdf |
Figure 41-c:
Unfolded distributions of 5-subjettiness observables, $\tau_{5}^{(0.25)}$, $\tau_{5}^{(0.5)}$, $\tau_{5}^{(1)}$, $\tau_{5}^{(1.5)}$, and \Nsub52, measured for AK8 jets in boosted W boson-enriched events, extracted from the normalized, combined distribution after unfolding; the bin contents and the error bars are scaled by the bin widths for the distributions of the individual observables. For comparisons with particle-level predictions, the error bars in data correspond to the total unfolding uncertainties, and the lower panels present the ratio of particle-level predictions to the unfolded data. The dark grey hashed region illustrates the total uncertainties per bin in the unfolded result. |
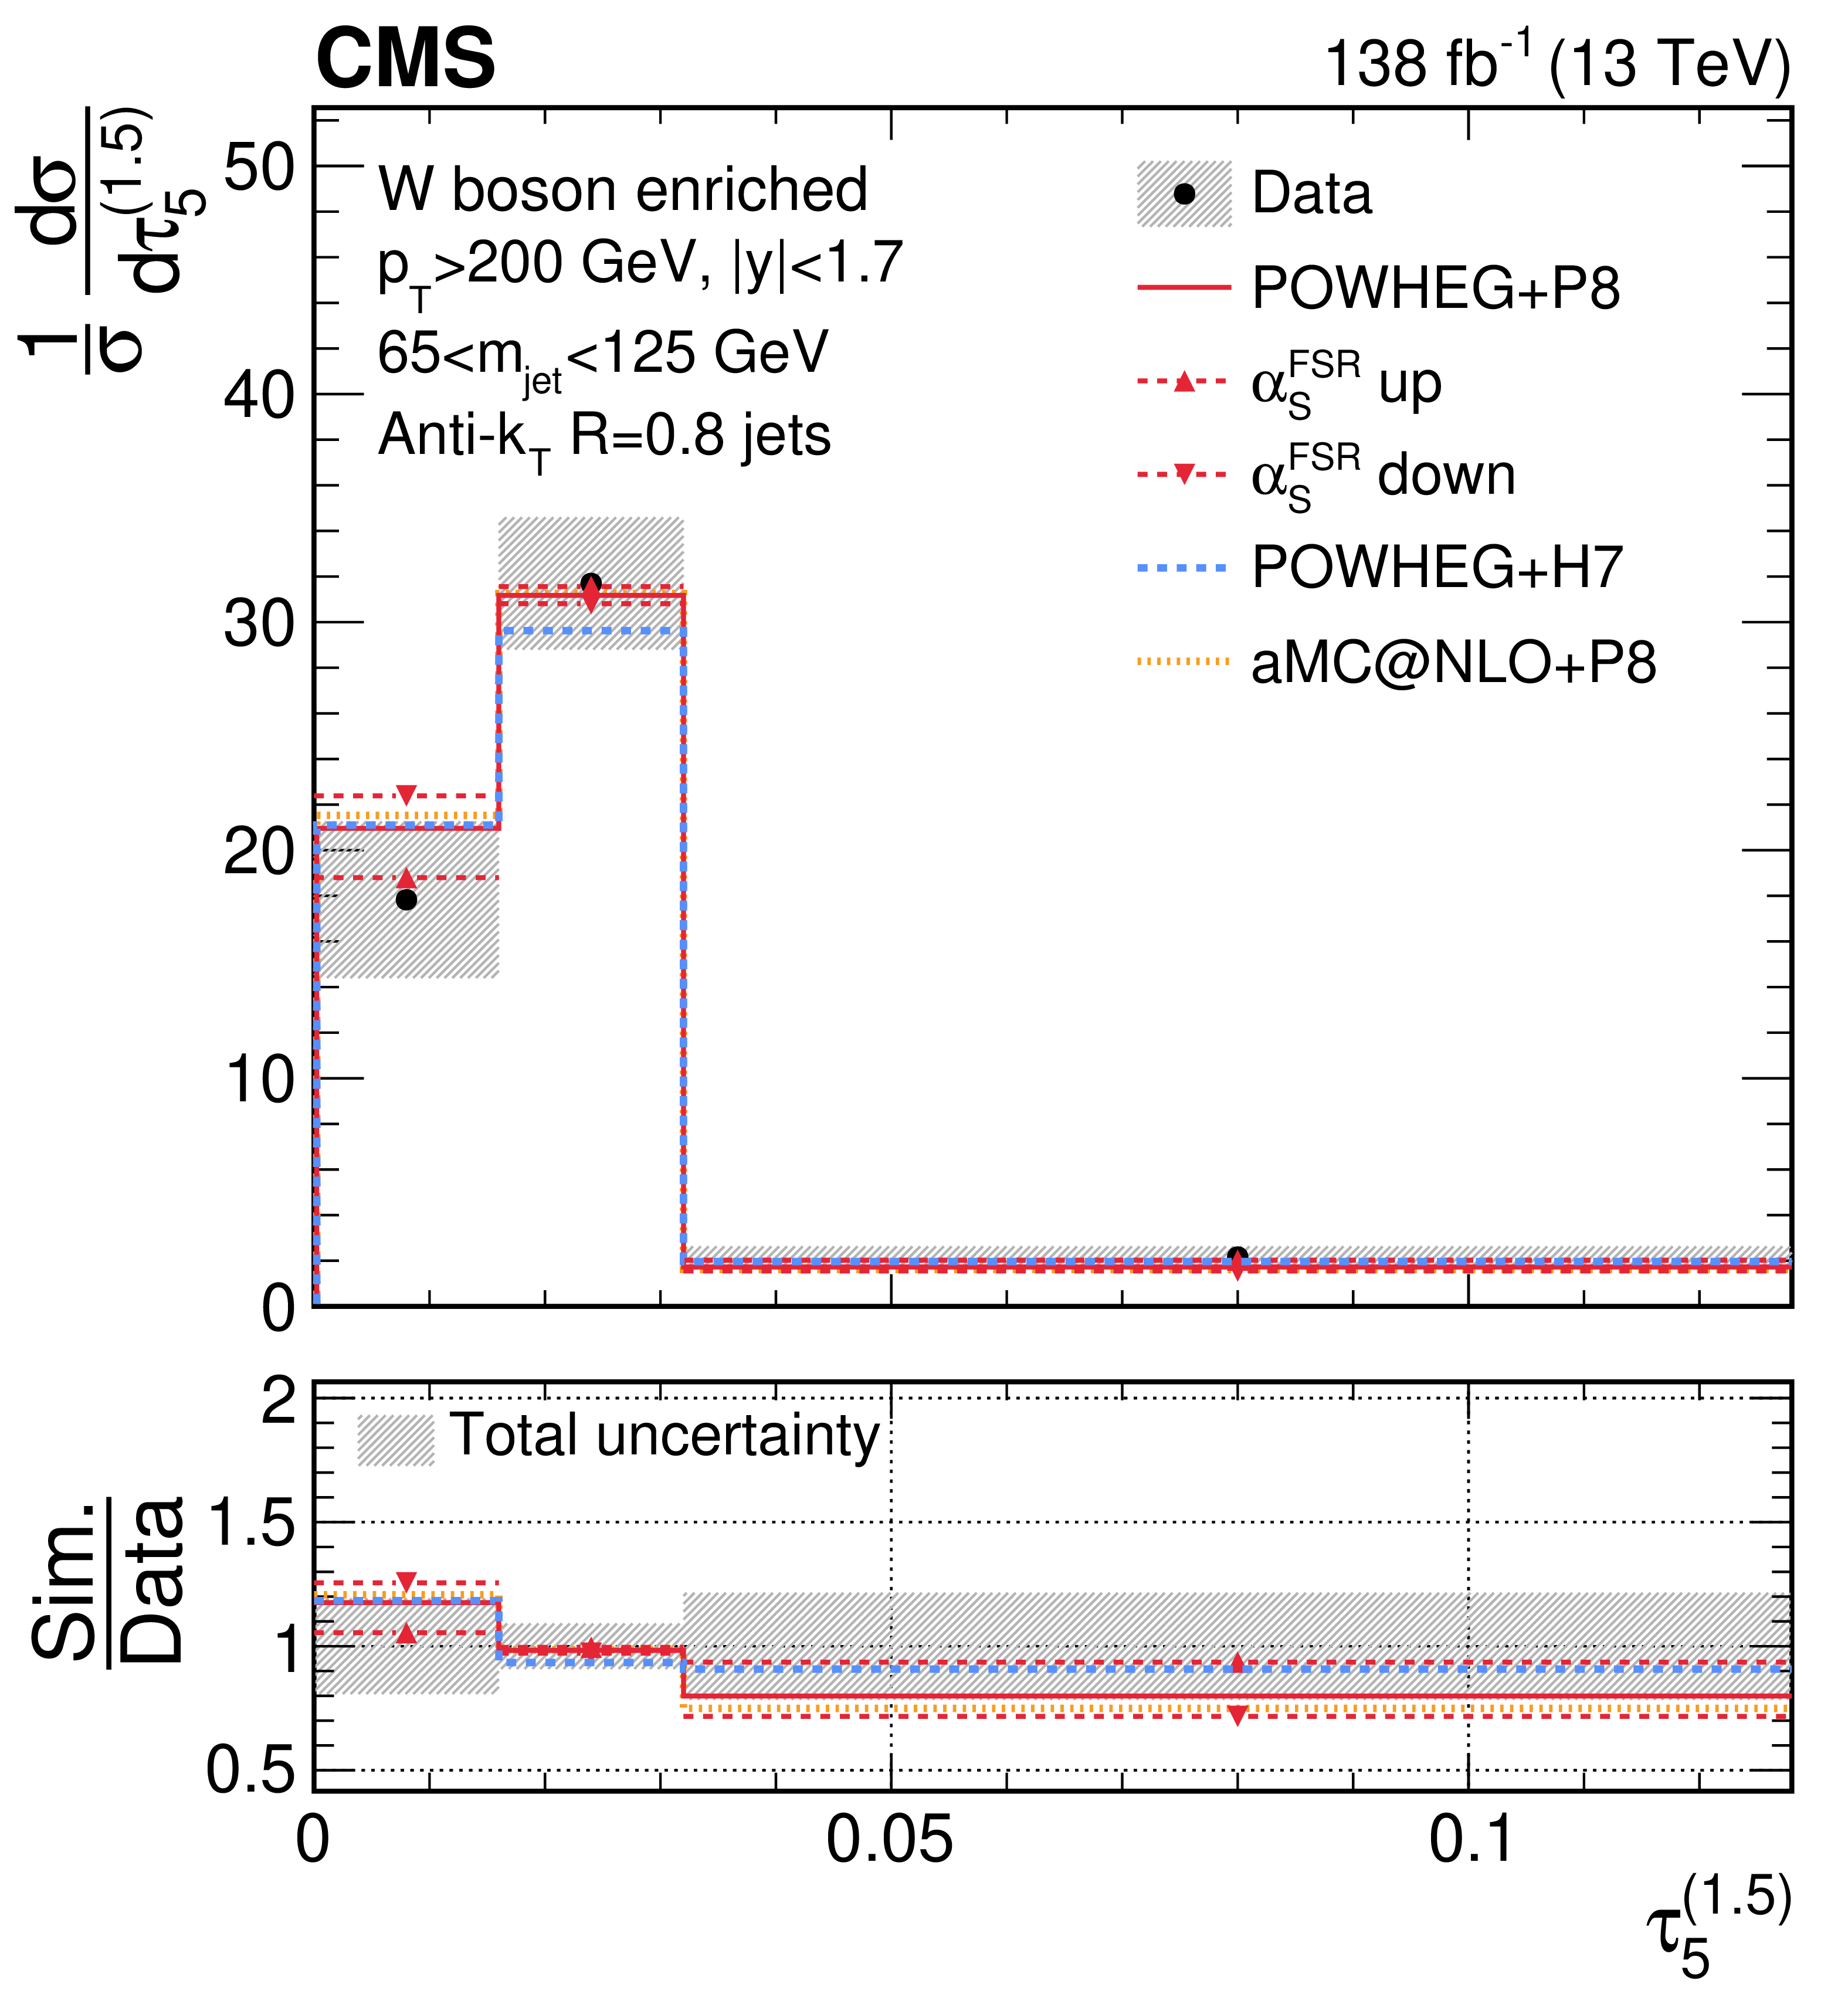
png pdf |
Figure 41-d:
Unfolded distributions of 5-subjettiness observables, $\tau_{5}^{(0.25)}$, $\tau_{5}^{(0.5)}$, $\tau_{5}^{(1)}$, $\tau_{5}^{(1.5)}$, and \Nsub52, measured for AK8 jets in boosted W boson-enriched events, extracted from the normalized, combined distribution after unfolding; the bin contents and the error bars are scaled by the bin widths for the distributions of the individual observables. For comparisons with particle-level predictions, the error bars in data correspond to the total unfolding uncertainties, and the lower panels present the ratio of particle-level predictions to the unfolded data. The dark grey hashed region illustrates the total uncertainties per bin in the unfolded result. |
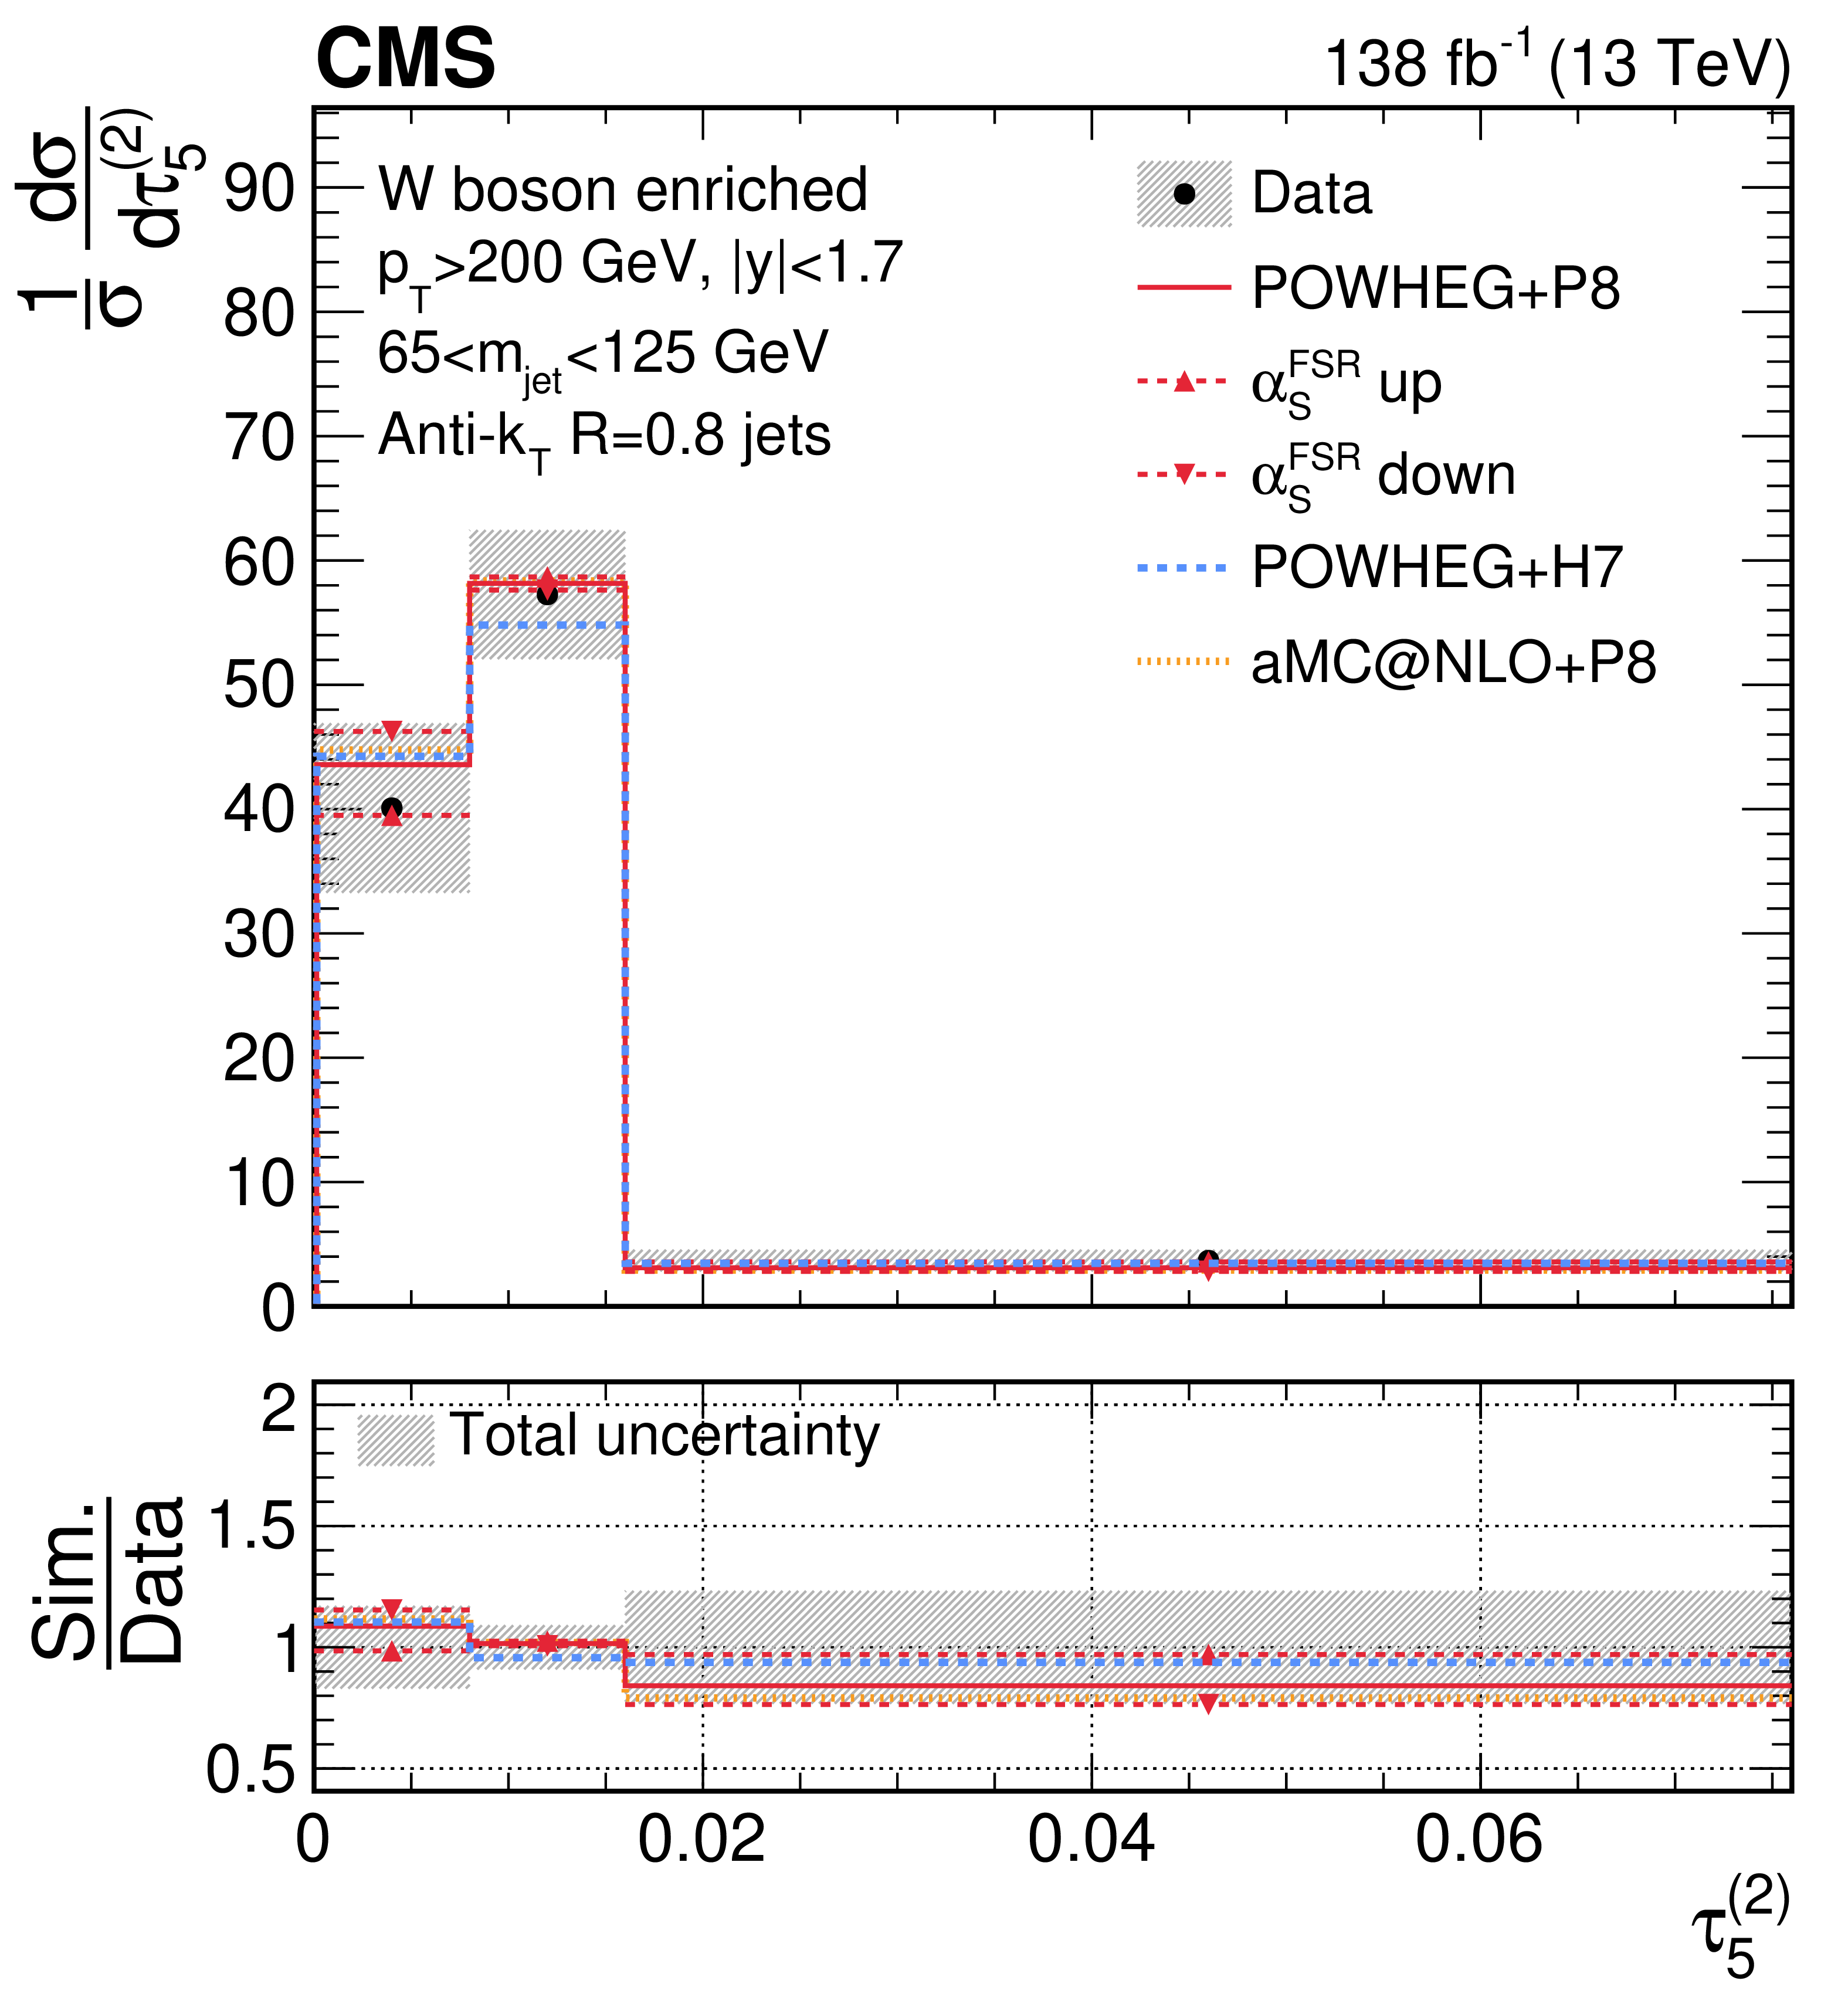
png pdf |
Figure 41-e:
Unfolded distributions of 5-subjettiness observables, $\tau_{5}^{(0.25)}$, $\tau_{5}^{(0.5)}$, $\tau_{5}^{(1)}$, $\tau_{5}^{(1.5)}$, and \Nsub52, measured for AK8 jets in boosted W boson-enriched events, extracted from the normalized, combined distribution after unfolding; the bin contents and the error bars are scaled by the bin widths for the distributions of the individual observables. For comparisons with particle-level predictions, the error bars in data correspond to the total unfolding uncertainties, and the lower panels present the ratio of particle-level predictions to the unfolded data. The dark grey hashed region illustrates the total uncertainties per bin in the unfolded result. |
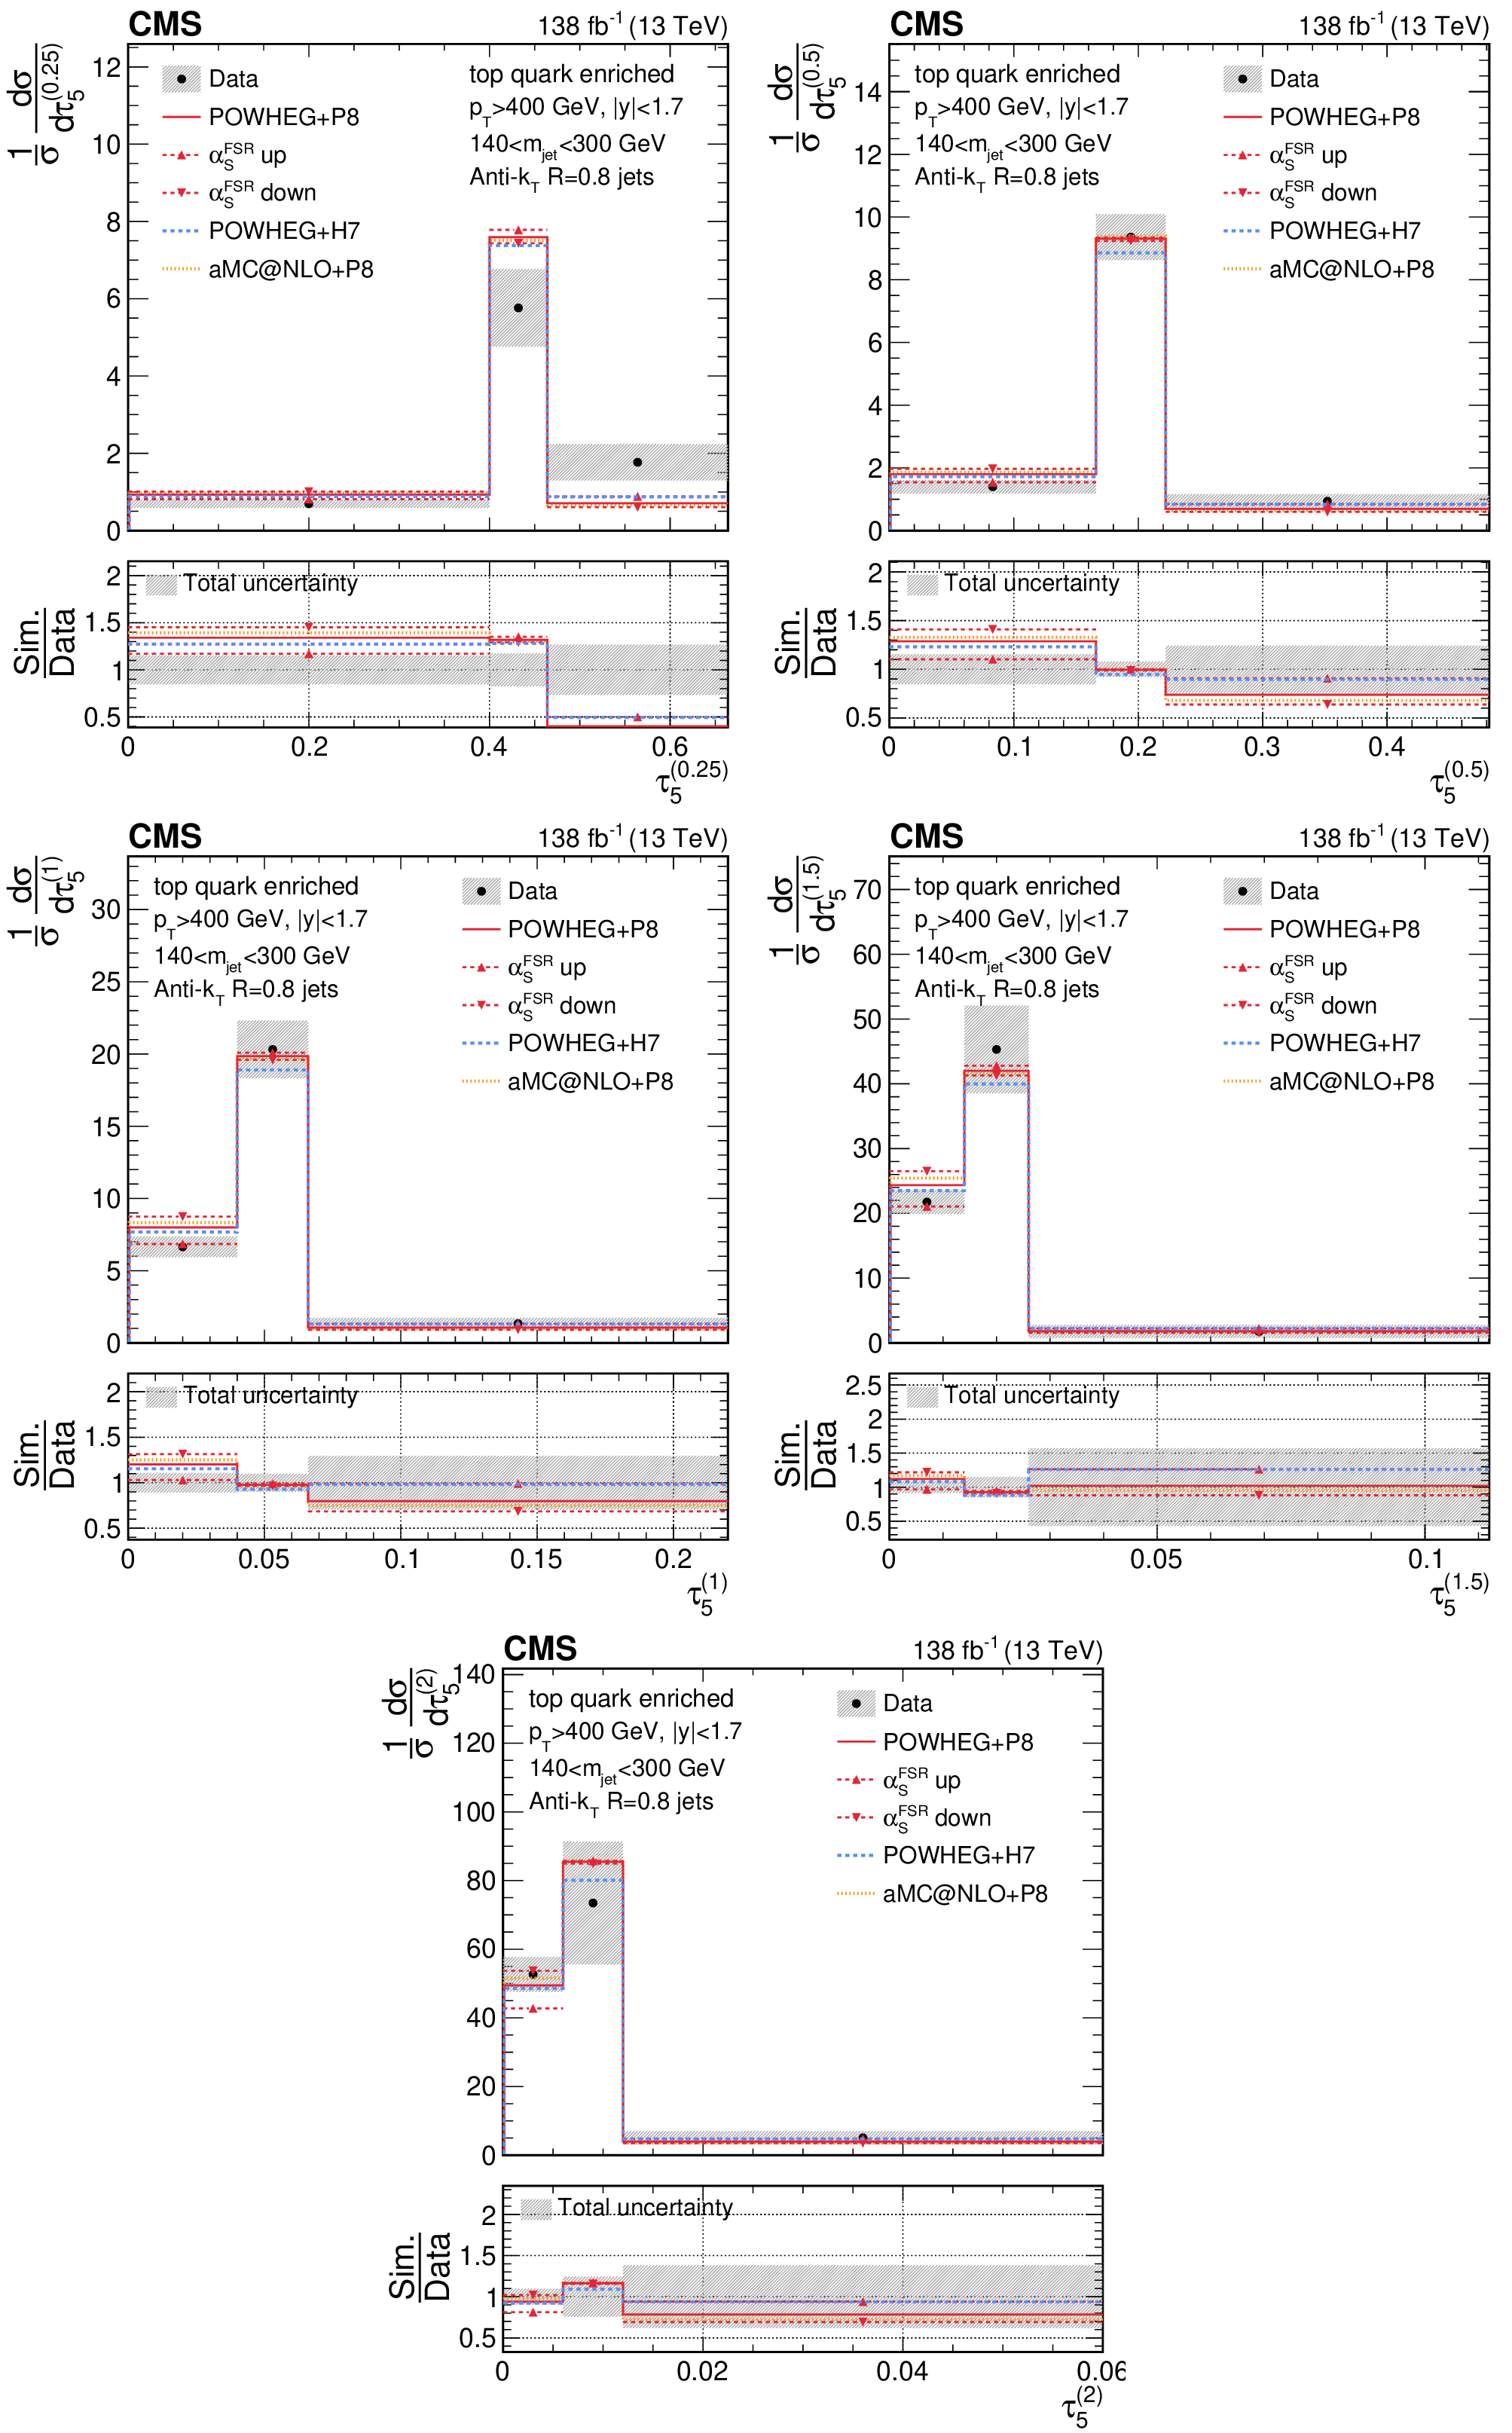
png pdf |
Figure 42:
Unfolded distributions of 5-subjettiness observables, $\tau_{5}^{(0.25)}$, $\tau_{5}^{(0.5)}$, $\tau_{5}^{(1)}$, $\tau_{5}^{(1.5)}$, and \Nsub52, measured for AK8 jets in the boosted top quark-enriched region, extracted from the normalized, combined distribution after unfolding; the bin contents and the error bars are scaled by the bin widths for the distributions of the individual observables. For comparisons with particle-level predictions, the error bars in data correspond to the total unfolding uncertainties, and the lower panels present the ratio of particle-level predictions to the unfolded data. The dark grey hashed region illustrates the total uncertainties per bin in the unfolded result. |
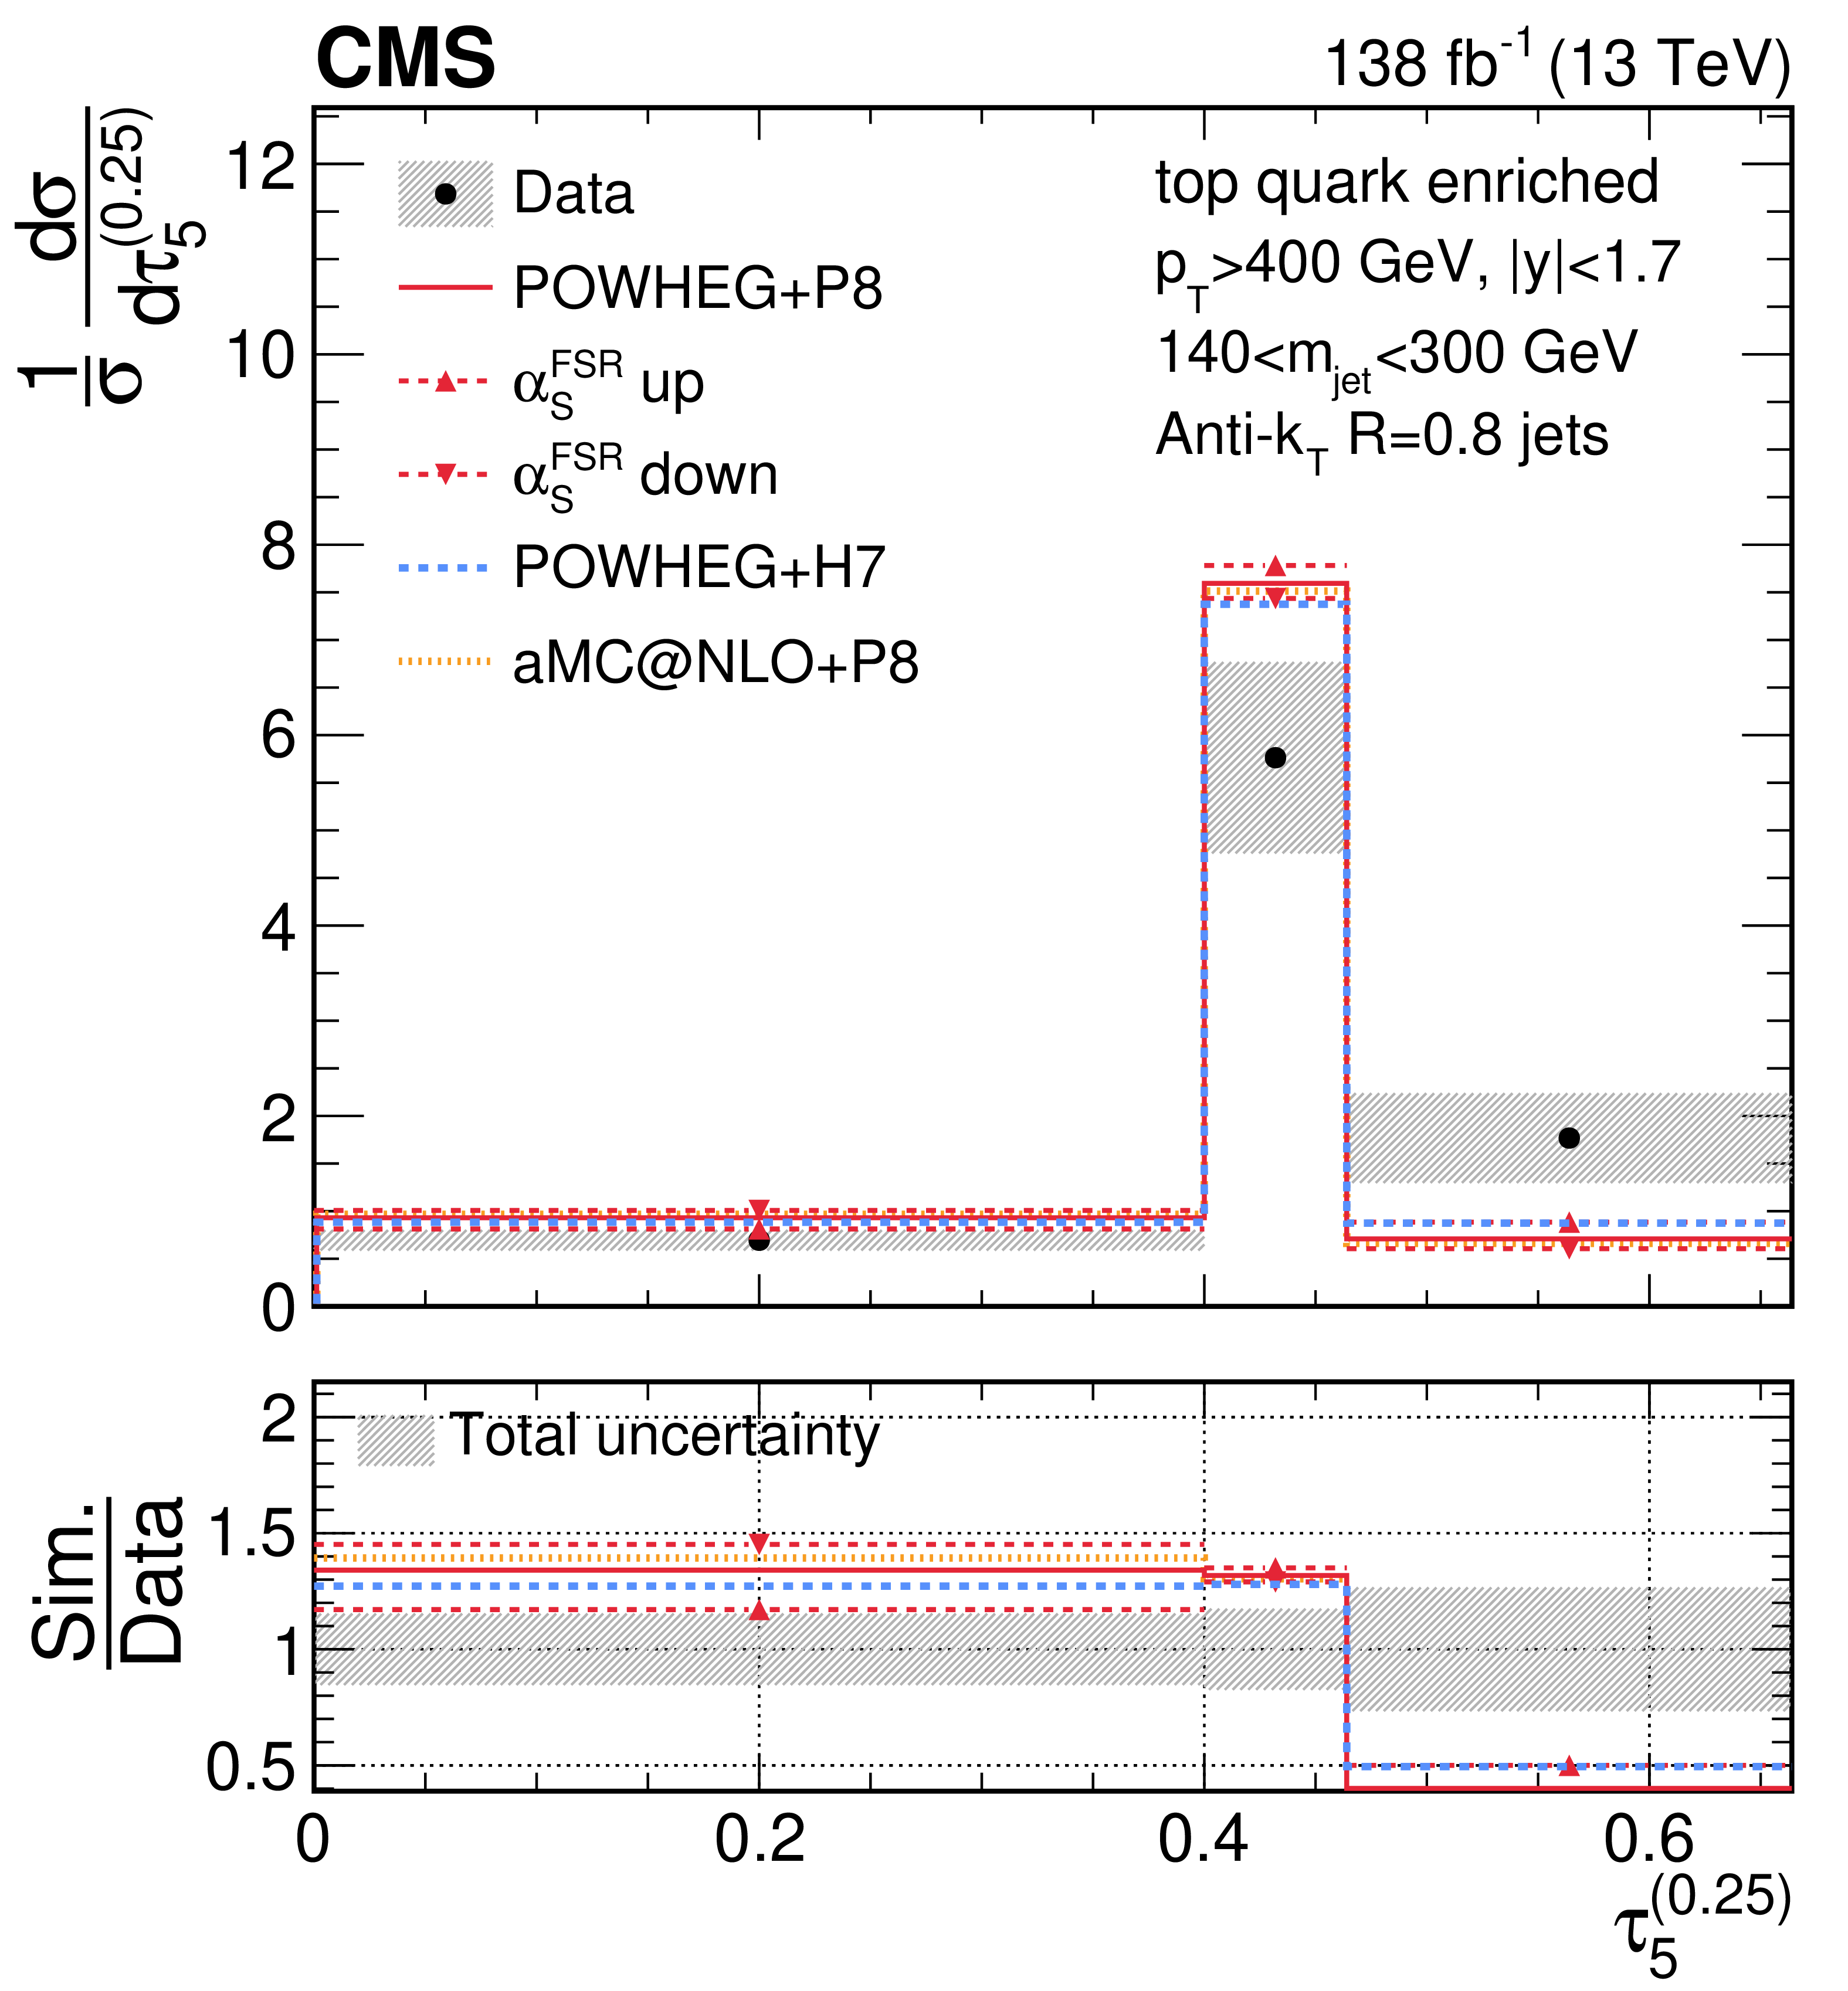
png pdf |
Figure 42-a:
Unfolded distributions of 5-subjettiness observables, $\tau_{5}^{(0.25)}$, $\tau_{5}^{(0.5)}$, $\tau_{5}^{(1)}$, $\tau_{5}^{(1.5)}$, and \Nsub52, measured for AK8 jets in the boosted top quark-enriched region, extracted from the normalized, combined distribution after unfolding; the bin contents and the error bars are scaled by the bin widths for the distributions of the individual observables. For comparisons with particle-level predictions, the error bars in data correspond to the total unfolding uncertainties, and the lower panels present the ratio of particle-level predictions to the unfolded data. The dark grey hashed region illustrates the total uncertainties per bin in the unfolded result. |
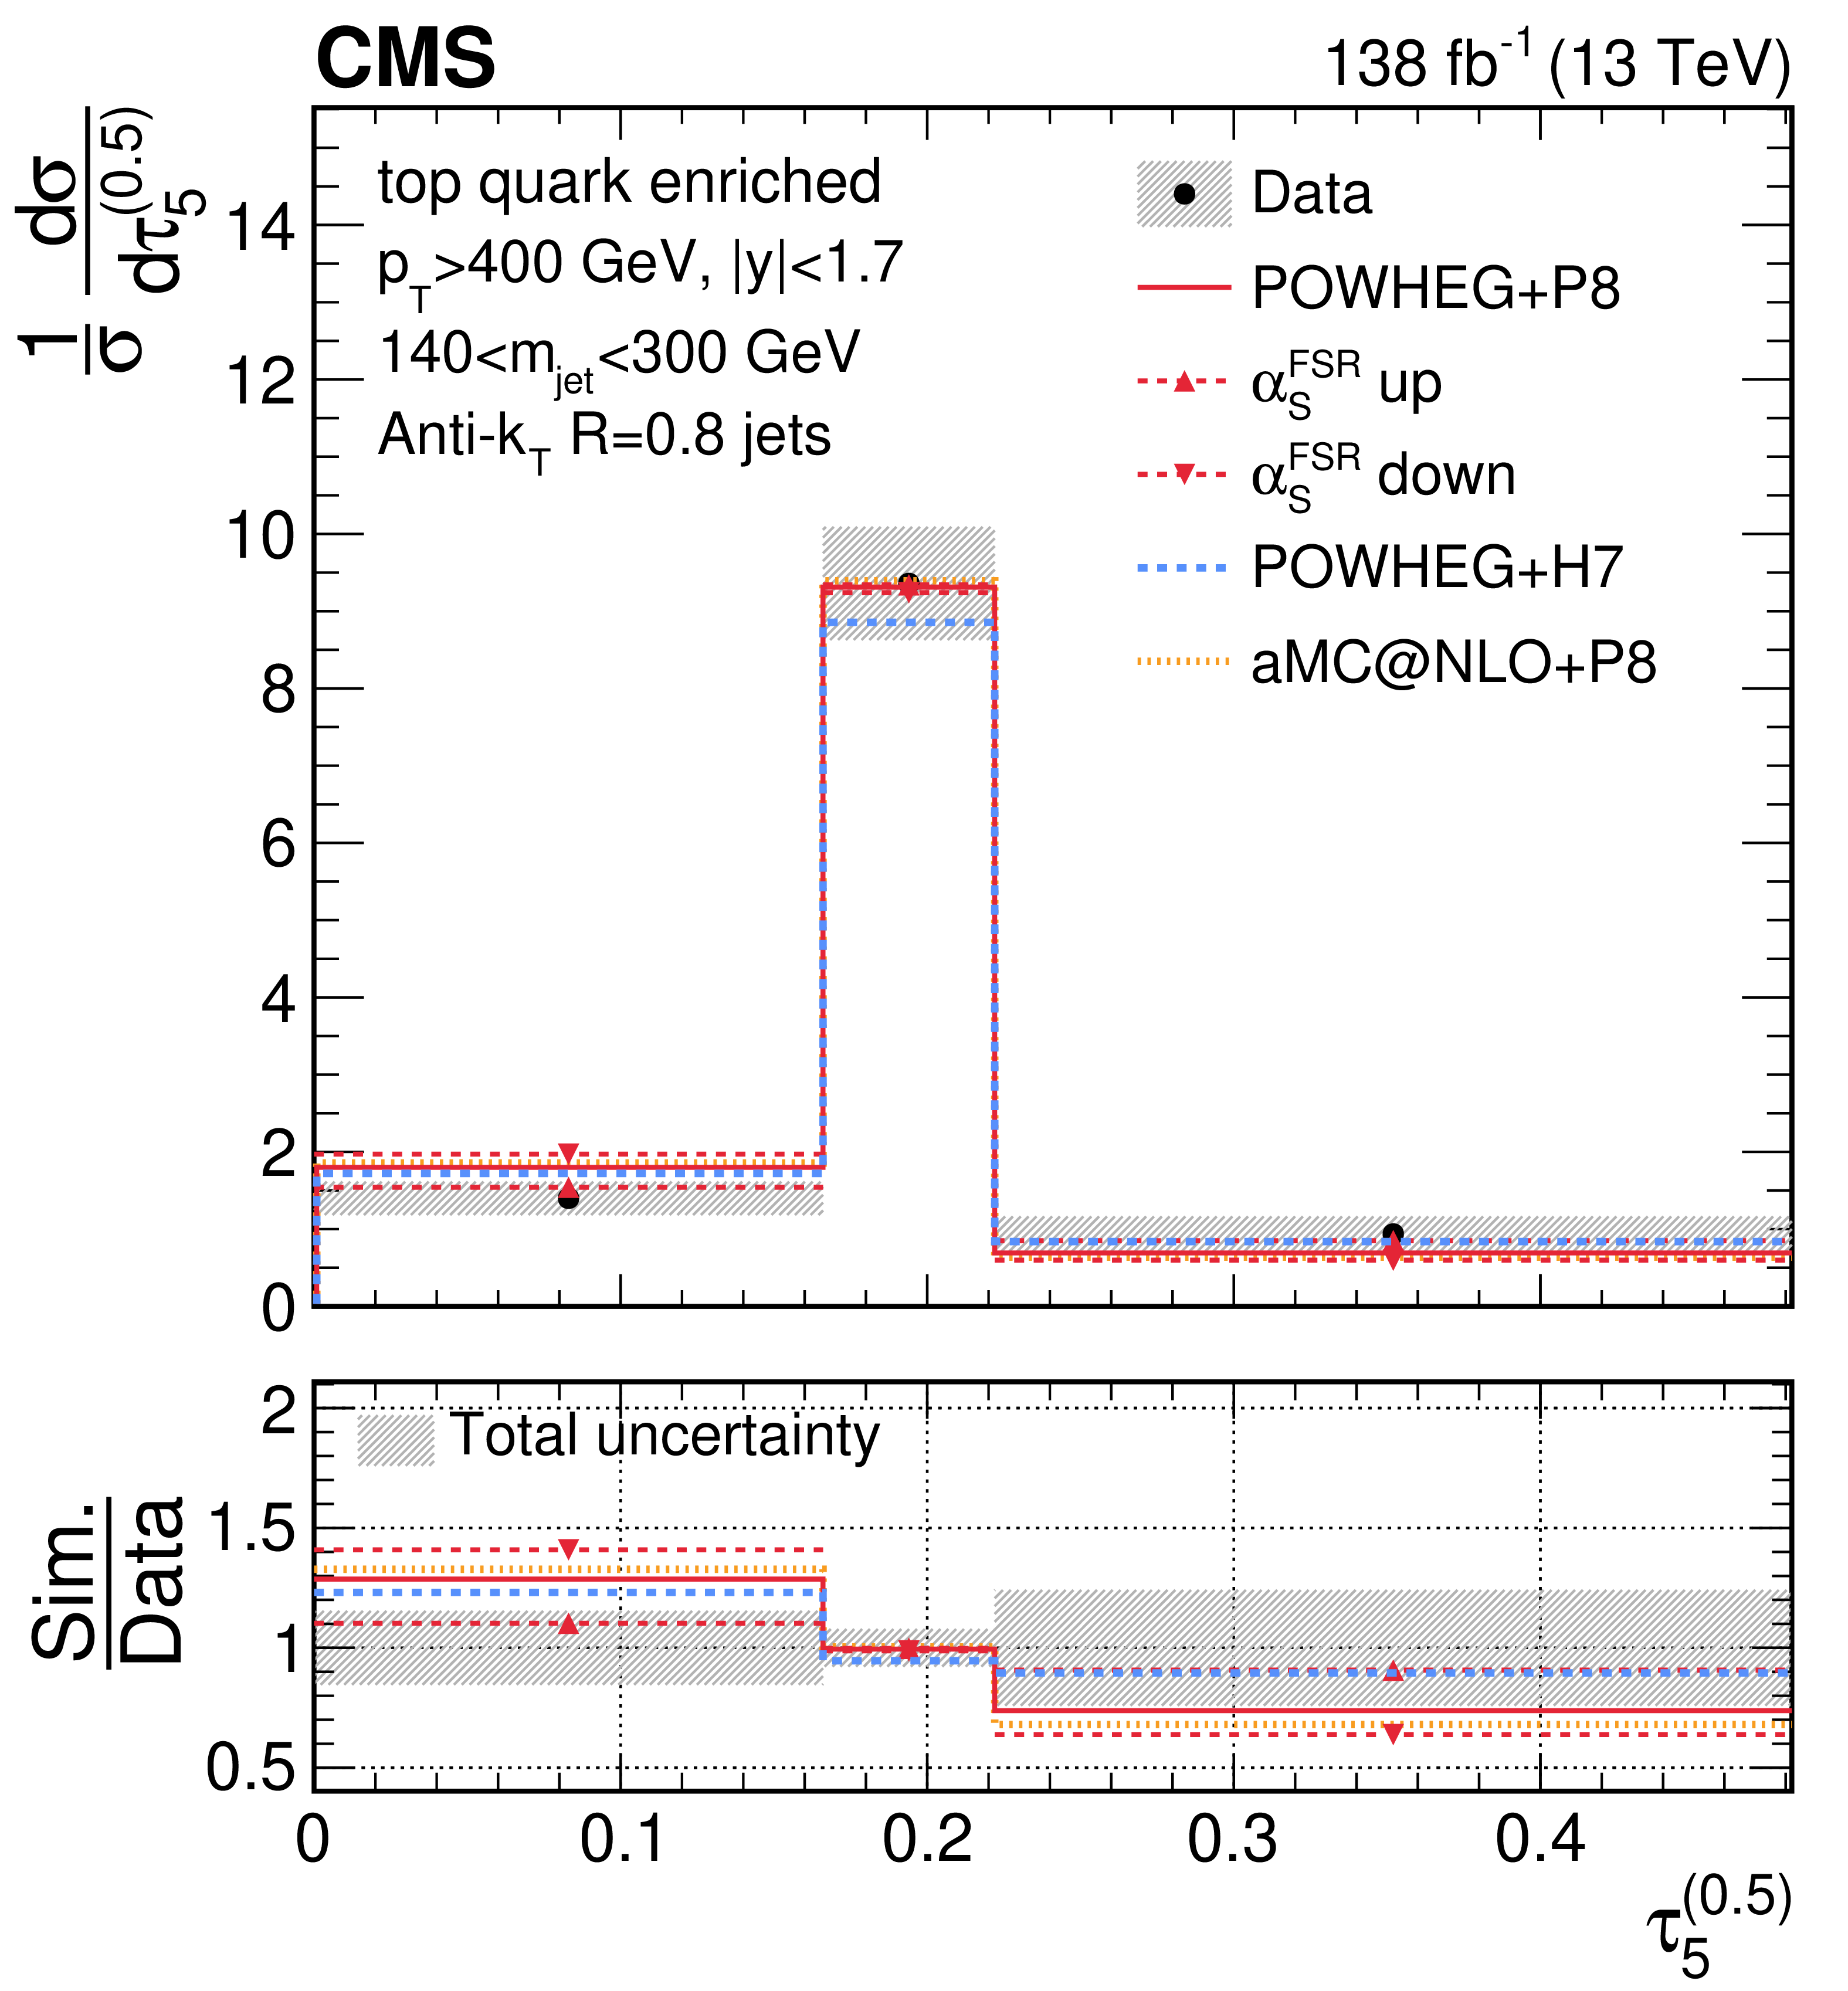
png pdf |
Figure 42-b:
Unfolded distributions of 5-subjettiness observables, $\tau_{5}^{(0.25)}$, $\tau_{5}^{(0.5)}$, $\tau_{5}^{(1)}$, $\tau_{5}^{(1.5)}$, and \Nsub52, measured for AK8 jets in the boosted top quark-enriched region, extracted from the normalized, combined distribution after unfolding; the bin contents and the error bars are scaled by the bin widths for the distributions of the individual observables. For comparisons with particle-level predictions, the error bars in data correspond to the total unfolding uncertainties, and the lower panels present the ratio of particle-level predictions to the unfolded data. The dark grey hashed region illustrates the total uncertainties per bin in the unfolded result. |
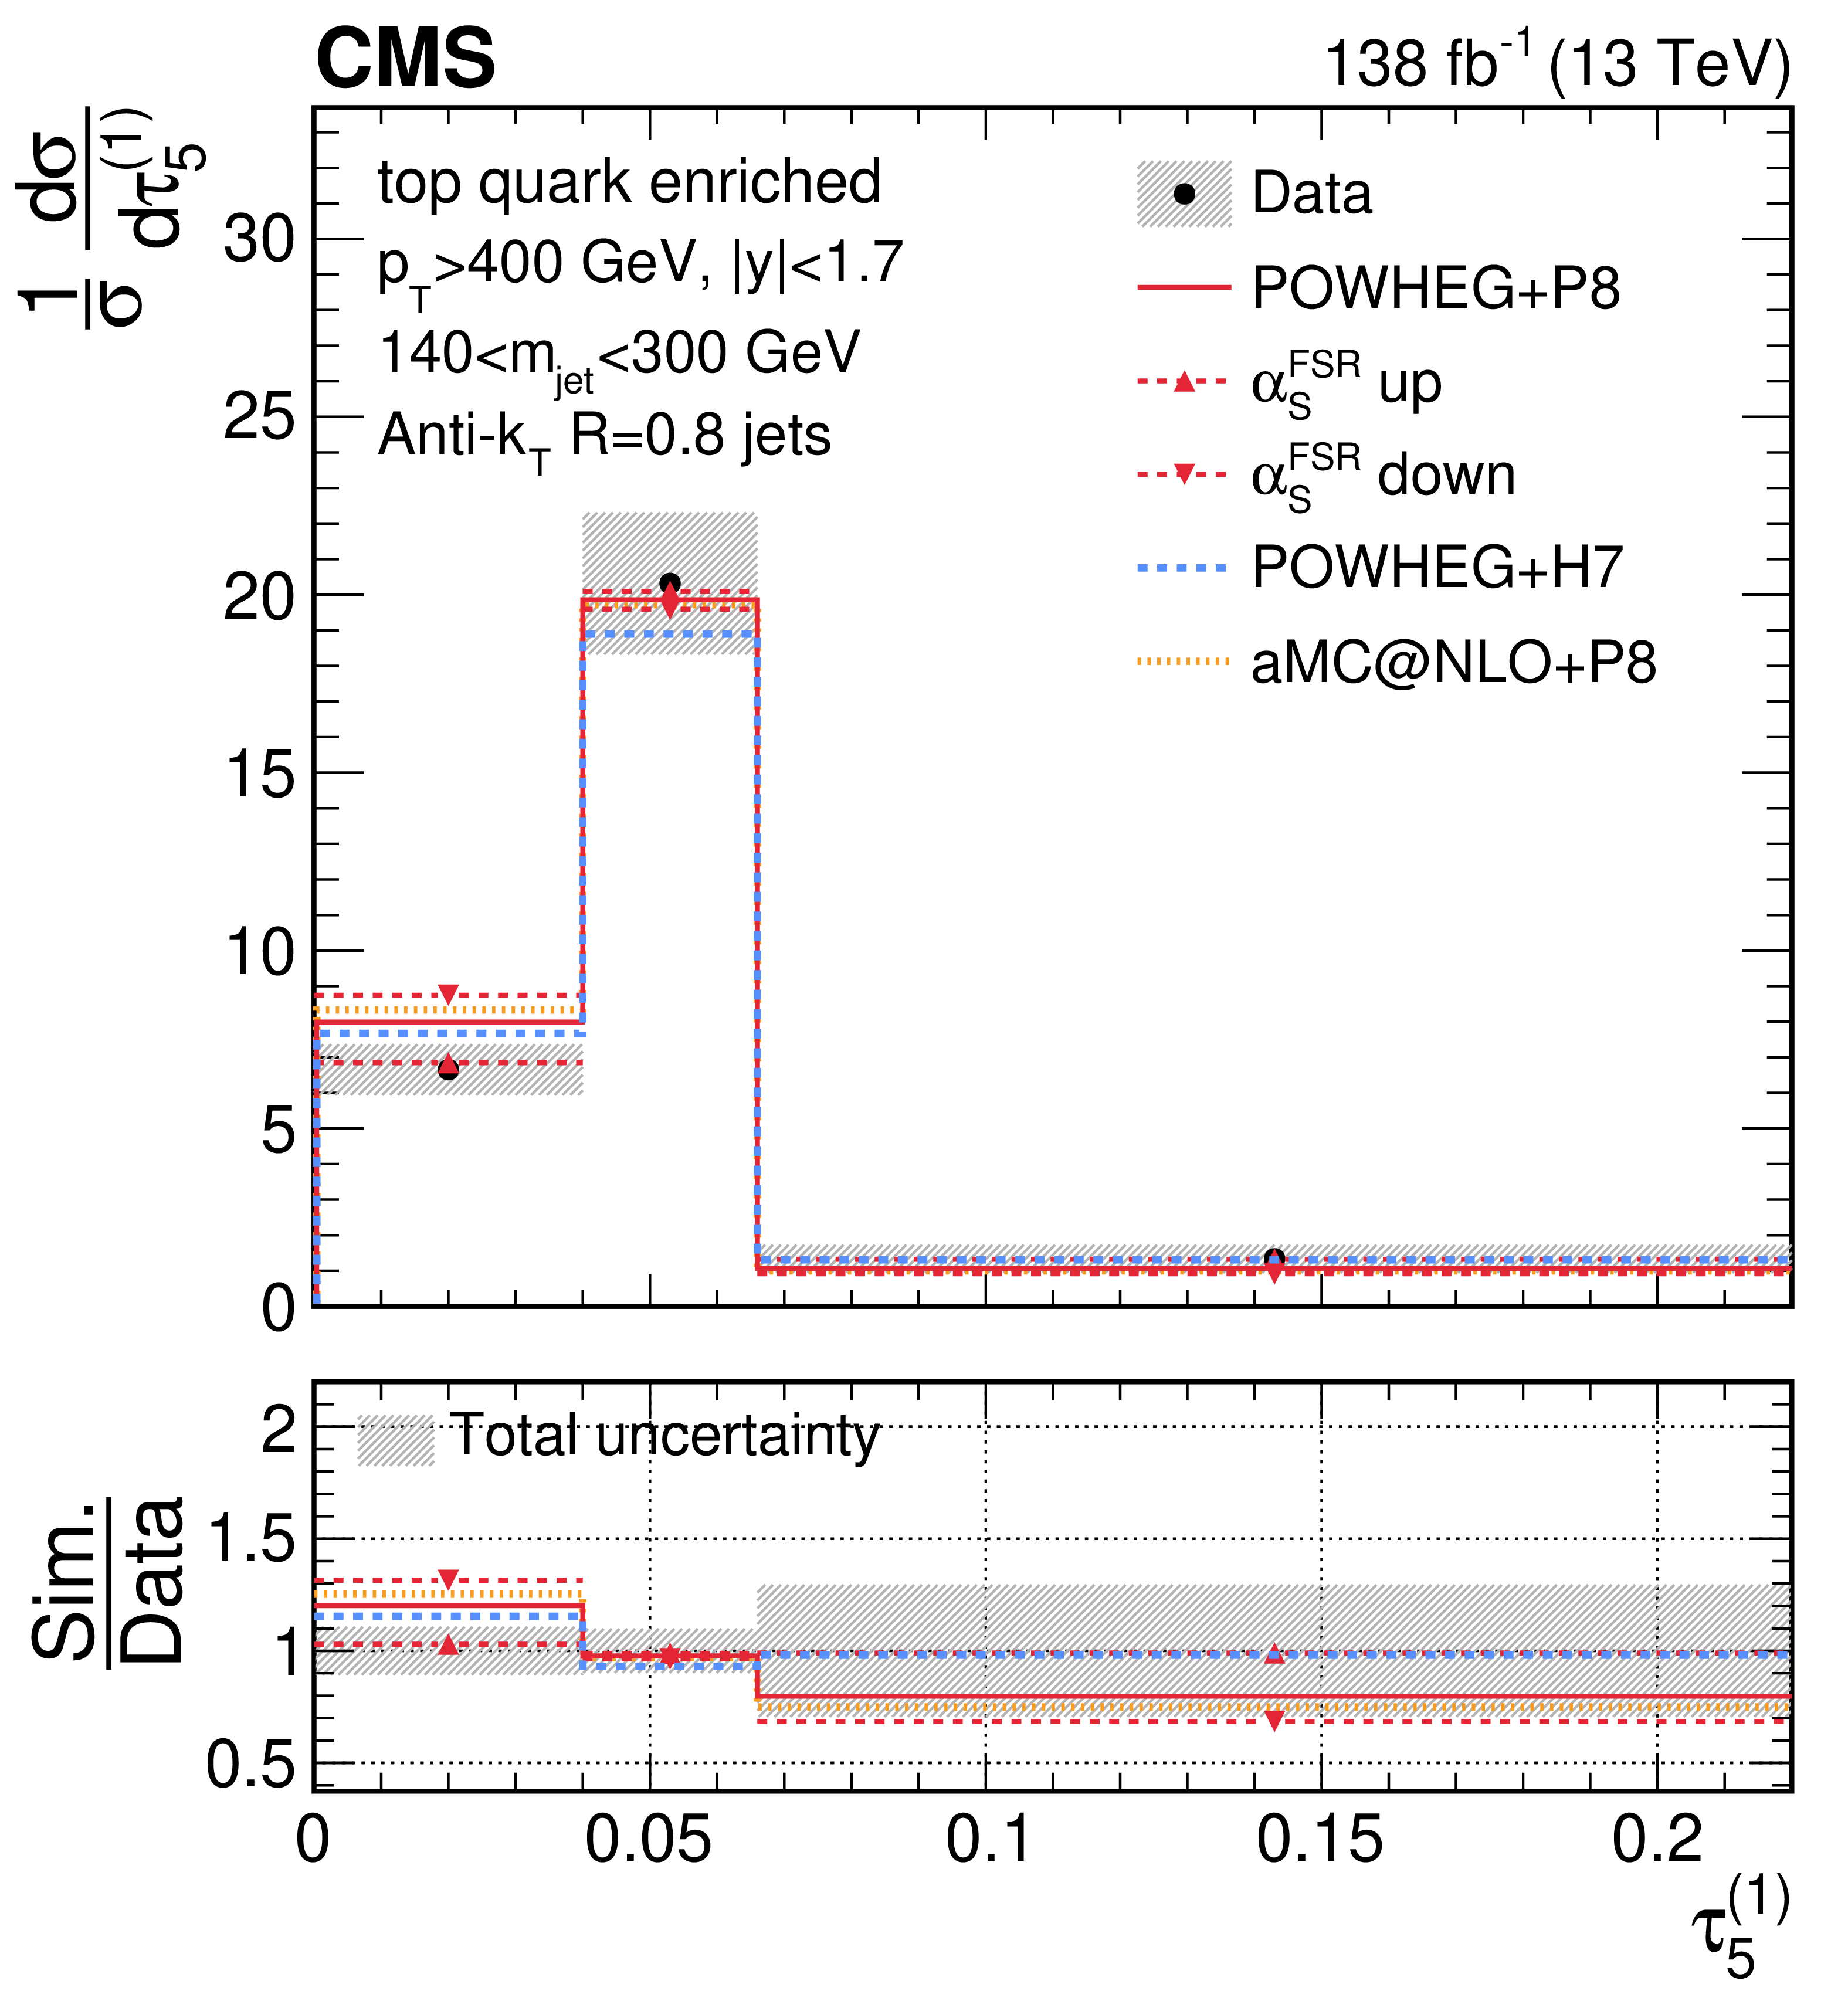
png pdf |
Figure 42-c:
Unfolded distributions of 5-subjettiness observables, $\tau_{5}^{(0.25)}$, $\tau_{5}^{(0.5)}$, $\tau_{5}^{(1)}$, $\tau_{5}^{(1.5)}$, and \Nsub52, measured for AK8 jets in the boosted top quark-enriched region, extracted from the normalized, combined distribution after unfolding; the bin contents and the error bars are scaled by the bin widths for the distributions of the individual observables. For comparisons with particle-level predictions, the error bars in data correspond to the total unfolding uncertainties, and the lower panels present the ratio of particle-level predictions to the unfolded data. The dark grey hashed region illustrates the total uncertainties per bin in the unfolded result. |
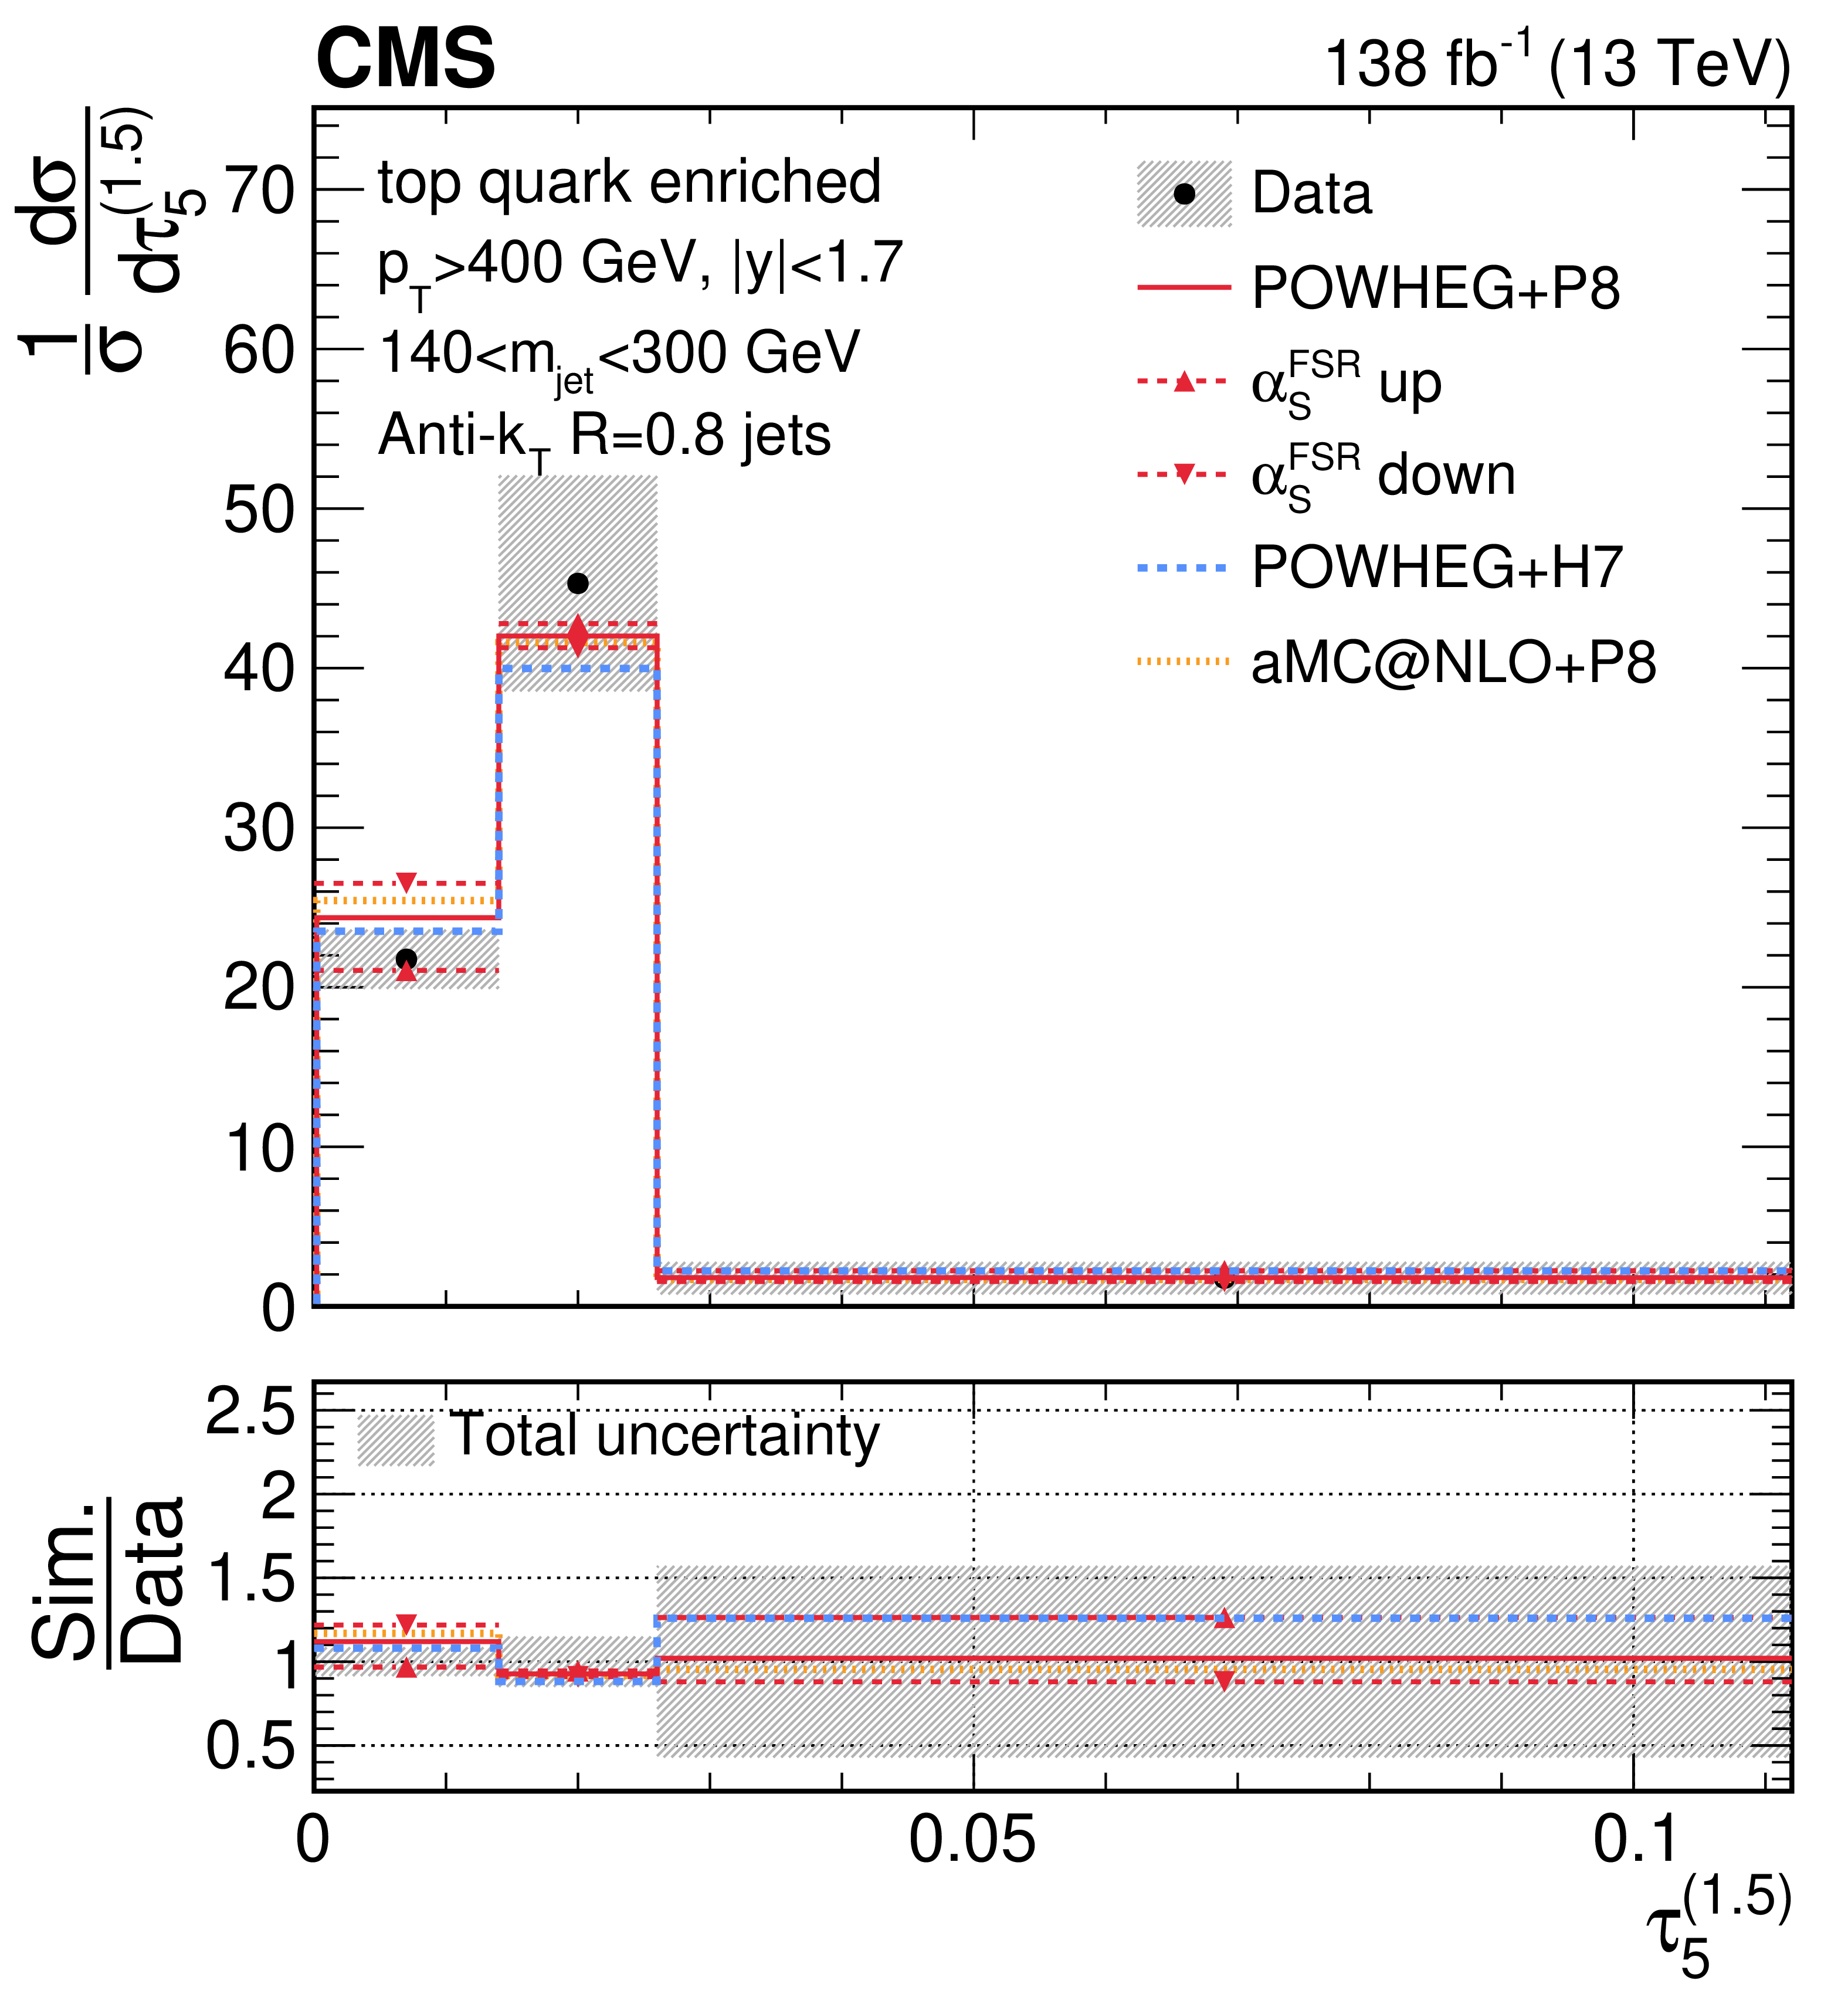
png pdf |
Figure 42-d:
Unfolded distributions of 5-subjettiness observables, $\tau_{5}^{(0.25)}$, $\tau_{5}^{(0.5)}$, $\tau_{5}^{(1)}$, $\tau_{5}^{(1.5)}$, and \Nsub52, measured for AK8 jets in the boosted top quark-enriched region, extracted from the normalized, combined distribution after unfolding; the bin contents and the error bars are scaled by the bin widths for the distributions of the individual observables. For comparisons with particle-level predictions, the error bars in data correspond to the total unfolding uncertainties, and the lower panels present the ratio of particle-level predictions to the unfolded data. The dark grey hashed region illustrates the total uncertainties per bin in the unfolded result. |
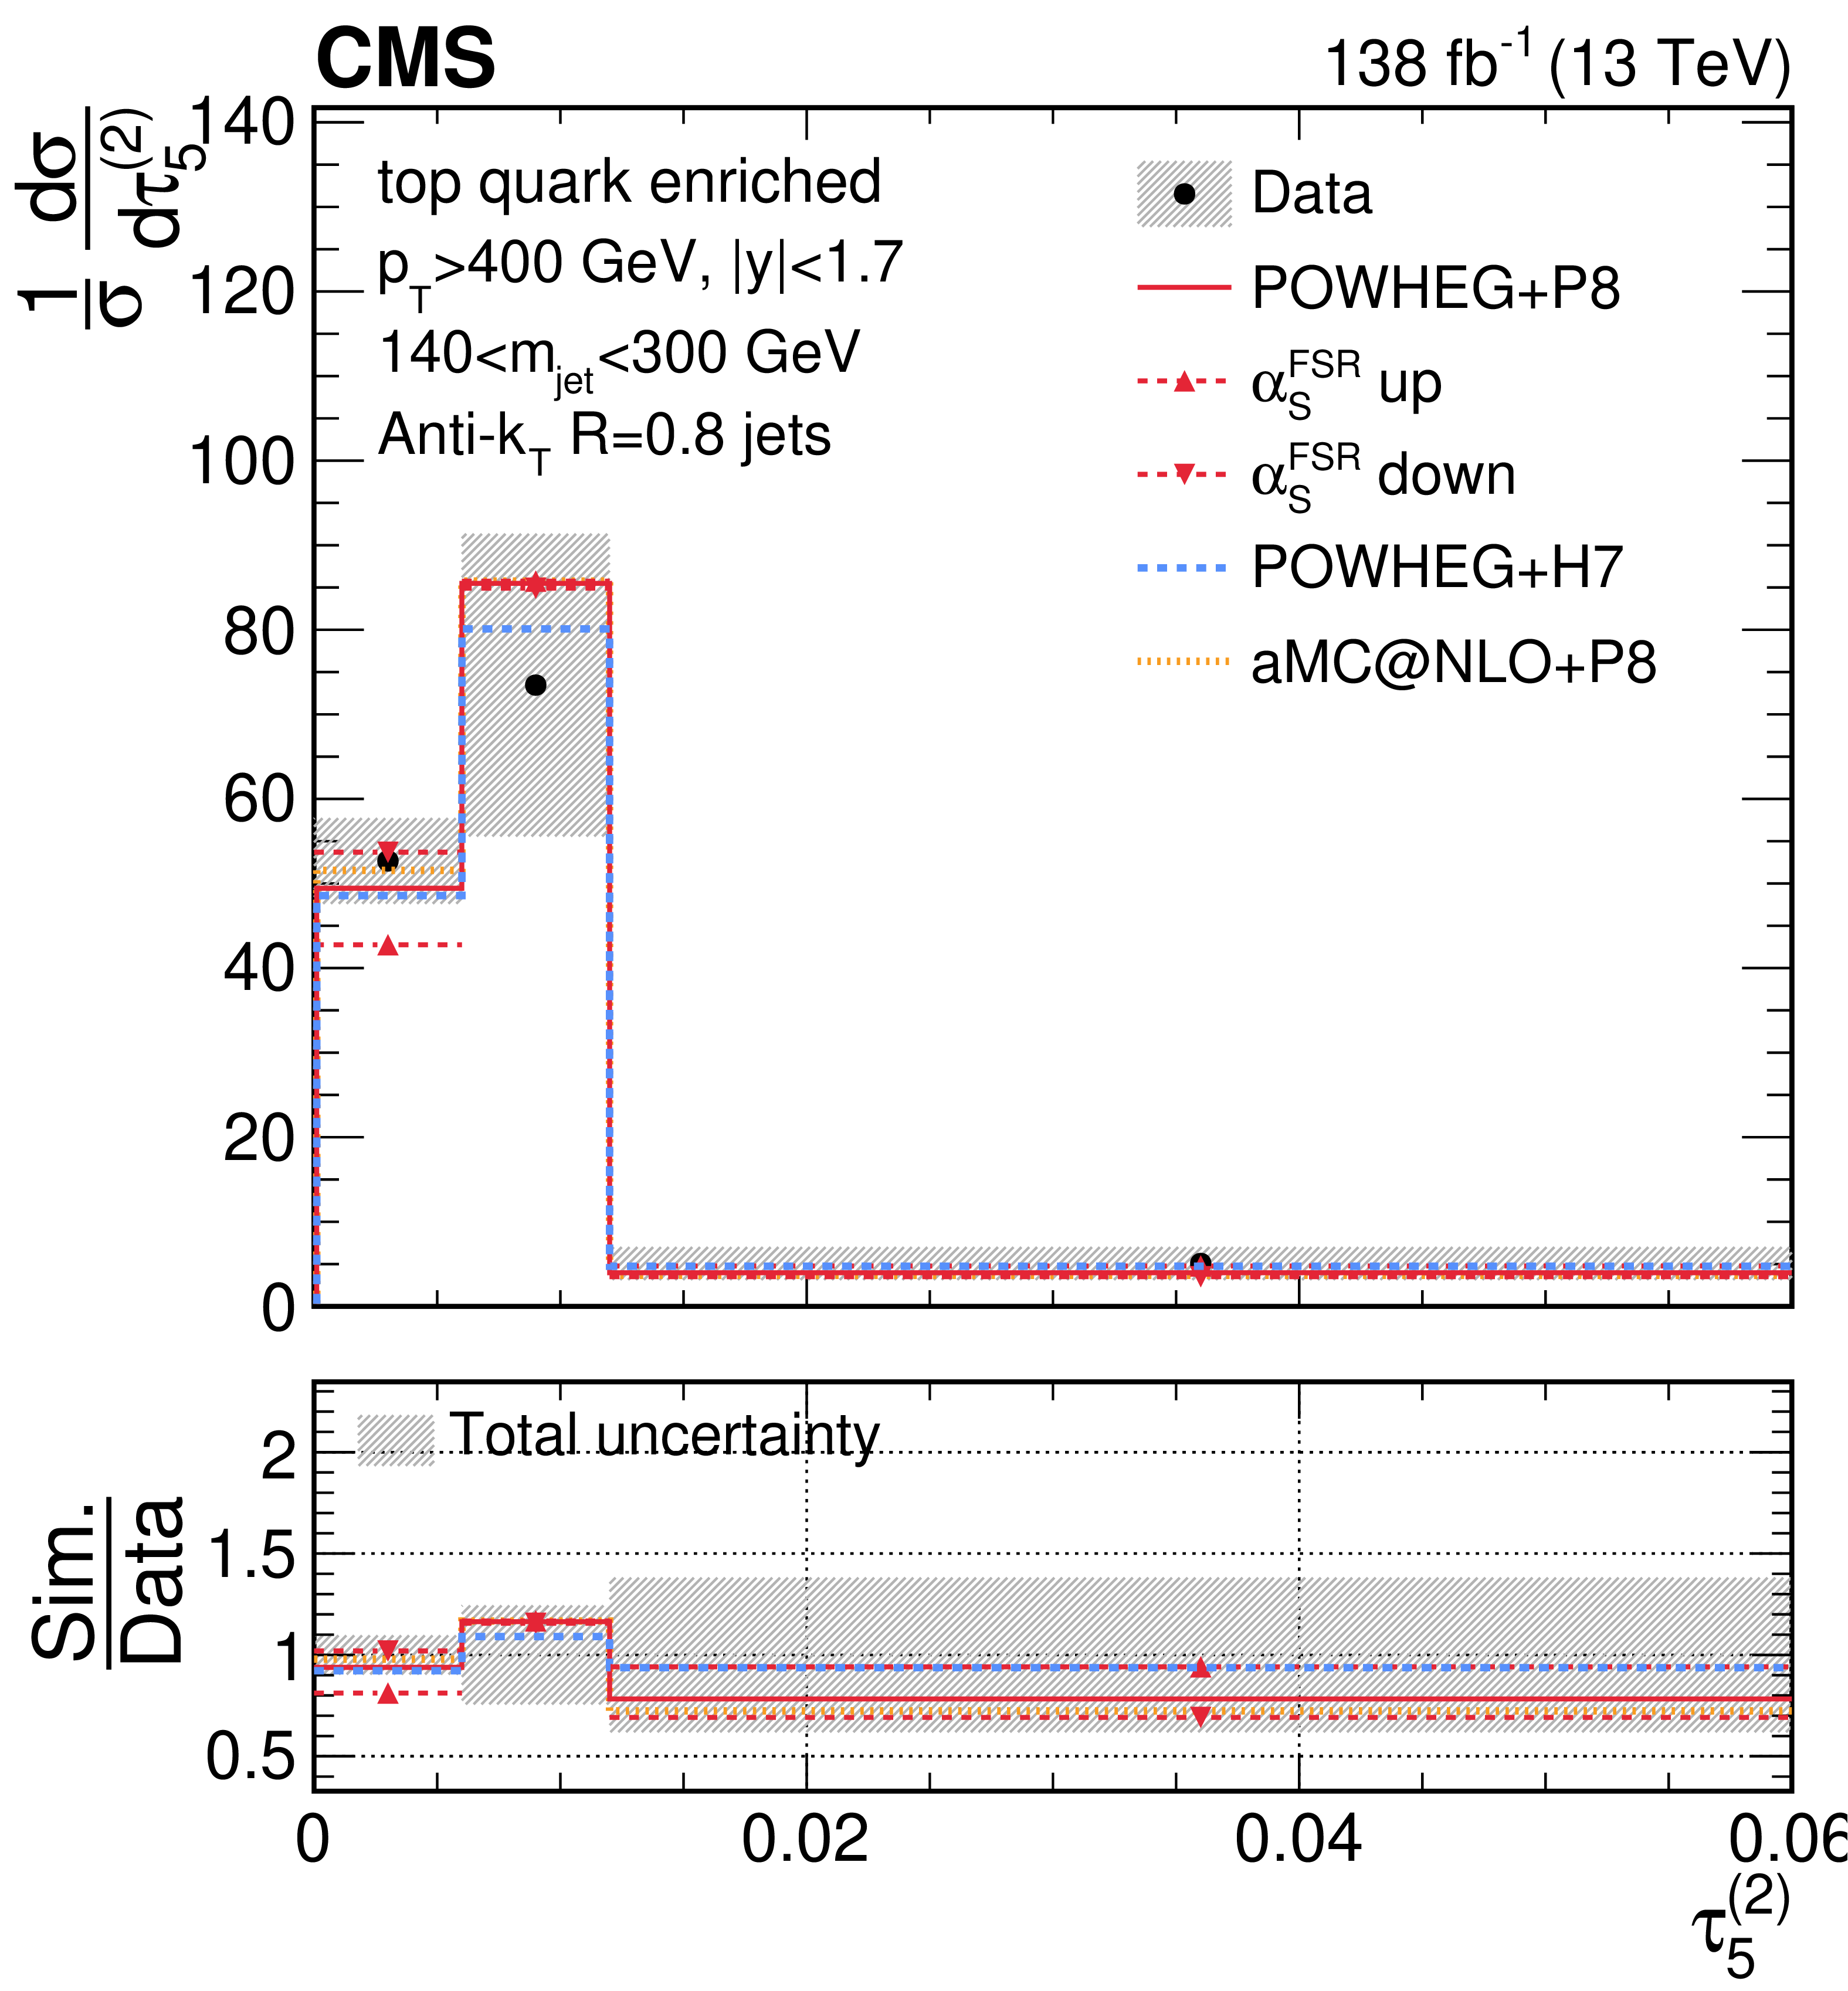
png pdf |
Figure 42-e:
Unfolded distributions of 5-subjettiness observables, $\tau_{5}^{(0.25)}$, $\tau_{5}^{(0.5)}$, $\tau_{5}^{(1)}$, $\tau_{5}^{(1.5)}$, and \Nsub52, measured for AK8 jets in the boosted top quark-enriched region, extracted from the normalized, combined distribution after unfolding; the bin contents and the error bars are scaled by the bin widths for the distributions of the individual observables. For comparisons with particle-level predictions, the error bars in data correspond to the total unfolding uncertainties, and the lower panels present the ratio of particle-level predictions to the unfolded data. The dark grey hashed region illustrates the total uncertainties per bin in the unfolded result. |
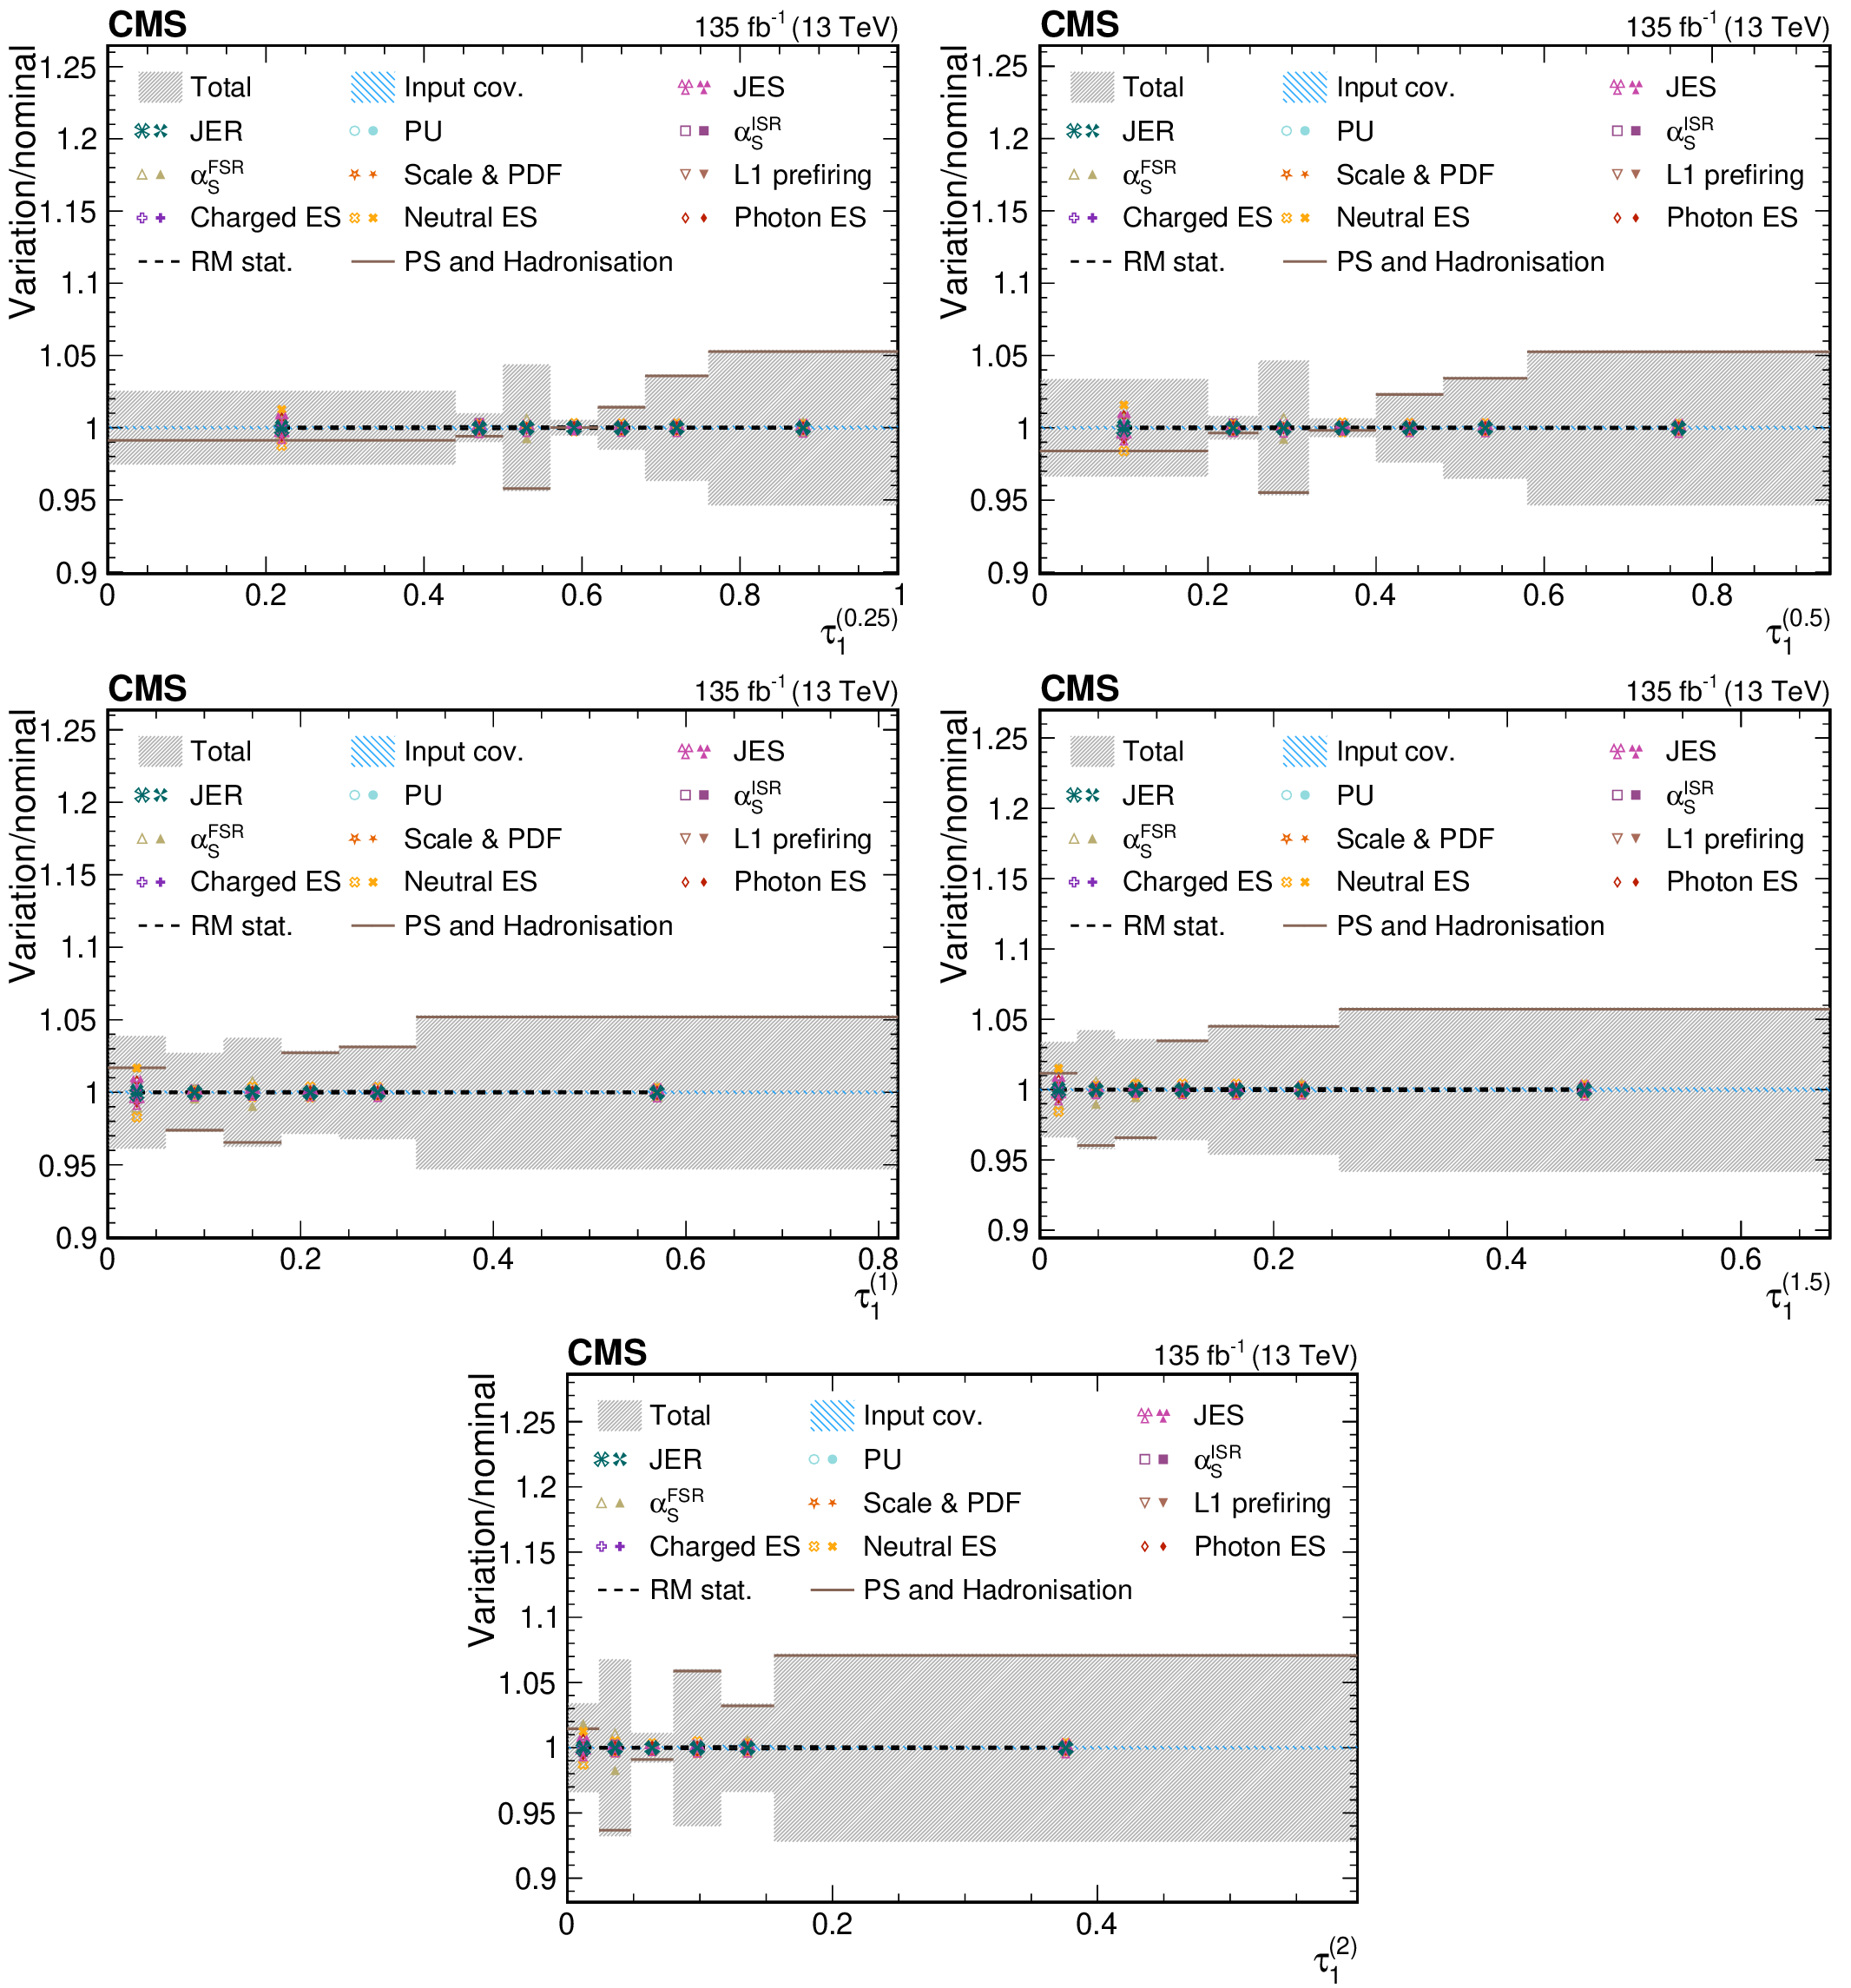
png pdf |
Figure 43:
Contributions from various systematic variations to the normalized, unfolded distribution for $ \tau_1^{(\beta)} $ observables measured for AK8 jets in the QCD dijet selection. The total unfolding uncertainty is indicated with the dark grey, hashed region, while the blue hashed region indicates the contributions from the input covariance matrix, which includes the propagated effects of the statistical uncertainties of the input data after background subtraction. Contributions from statistical uncertainties of the simulated sample used to construct the nominal response matrix are indicated with the dashed black line. The physics model uncertainty is computed as a one-sided shift compared to the nominal unfolding, and up (down) contributions from other sources are indicated with filled (open) markers of the same type and colour. |
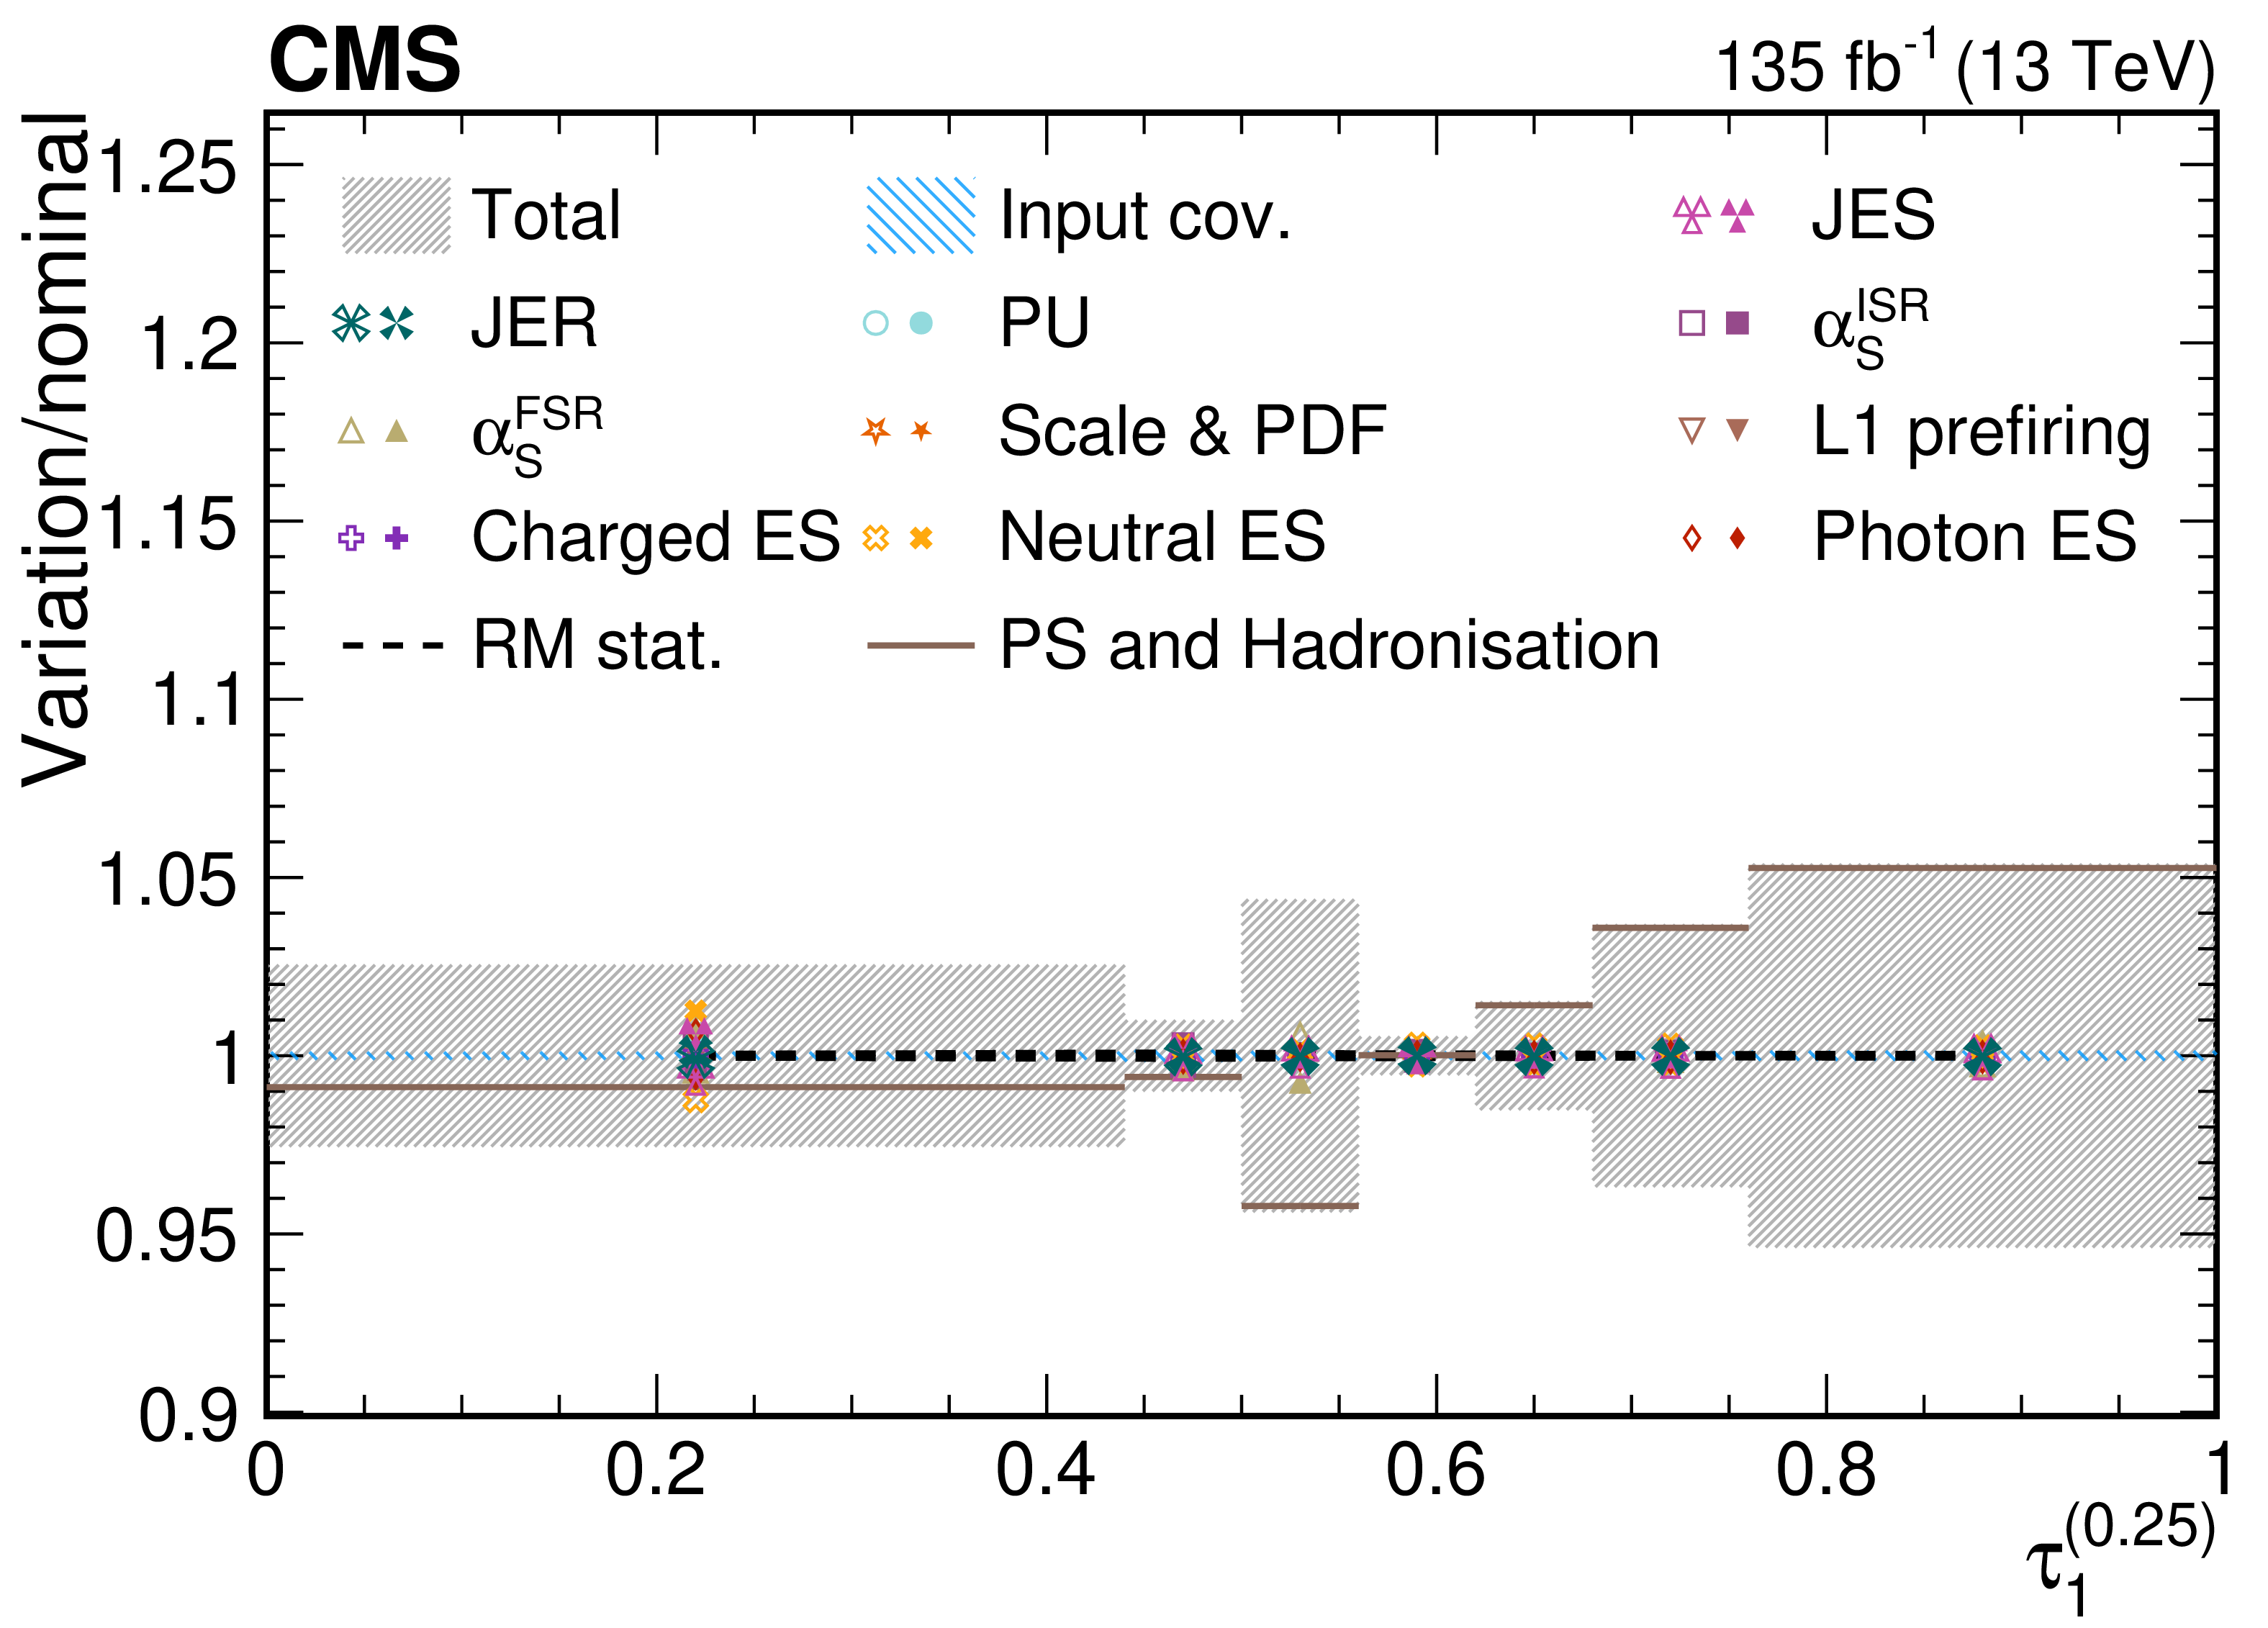
png pdf |
Figure 43-a:
Contributions from various systematic variations to the normalized, unfolded distribution for $ \tau_1^{(\beta)} $ observables measured for AK8 jets in the QCD dijet selection. The total unfolding uncertainty is indicated with the dark grey, hashed region, while the blue hashed region indicates the contributions from the input covariance matrix, which includes the propagated effects of the statistical uncertainties of the input data after background subtraction. Contributions from statistical uncertainties of the simulated sample used to construct the nominal response matrix are indicated with the dashed black line. The physics model uncertainty is computed as a one-sided shift compared to the nominal unfolding, and up (down) contributions from other sources are indicated with filled (open) markers of the same type and colour. |
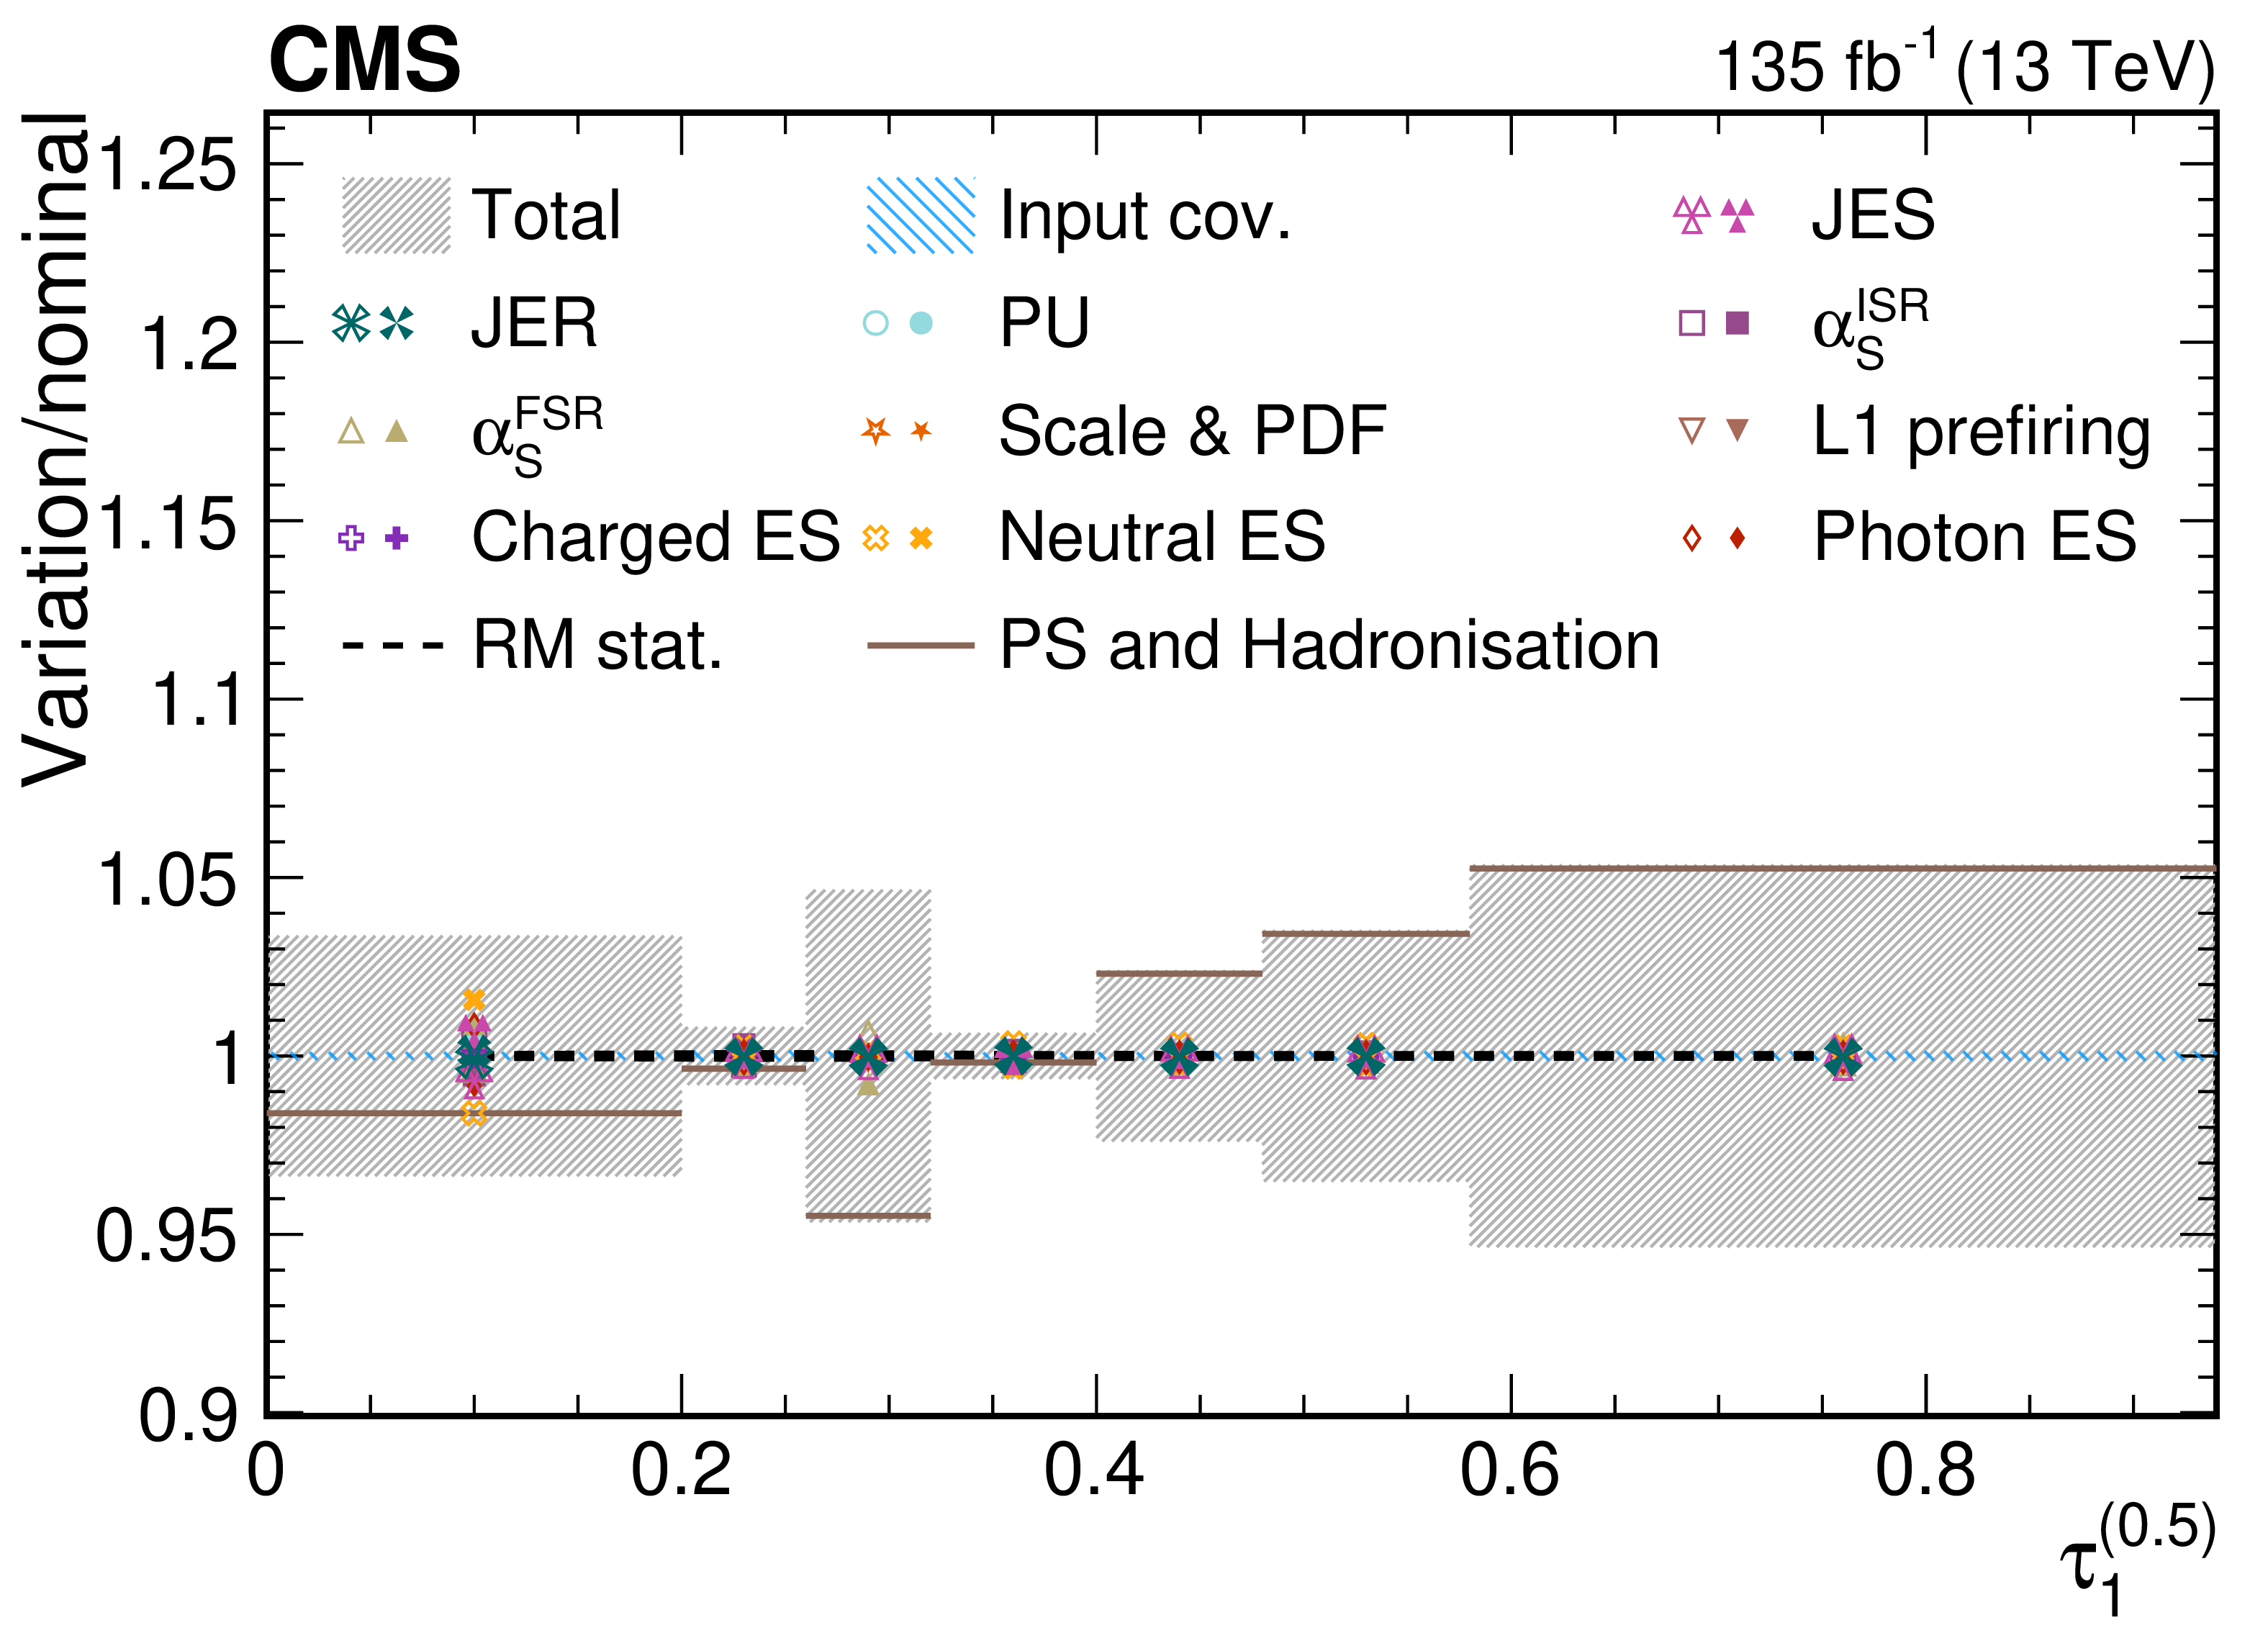
png pdf |
Figure 43-b:
Contributions from various systematic variations to the normalized, unfolded distribution for $ \tau_1^{(\beta)} $ observables measured for AK8 jets in the QCD dijet selection. The total unfolding uncertainty is indicated with the dark grey, hashed region, while the blue hashed region indicates the contributions from the input covariance matrix, which includes the propagated effects of the statistical uncertainties of the input data after background subtraction. Contributions from statistical uncertainties of the simulated sample used to construct the nominal response matrix are indicated with the dashed black line. The physics model uncertainty is computed as a one-sided shift compared to the nominal unfolding, and up (down) contributions from other sources are indicated with filled (open) markers of the same type and colour. |
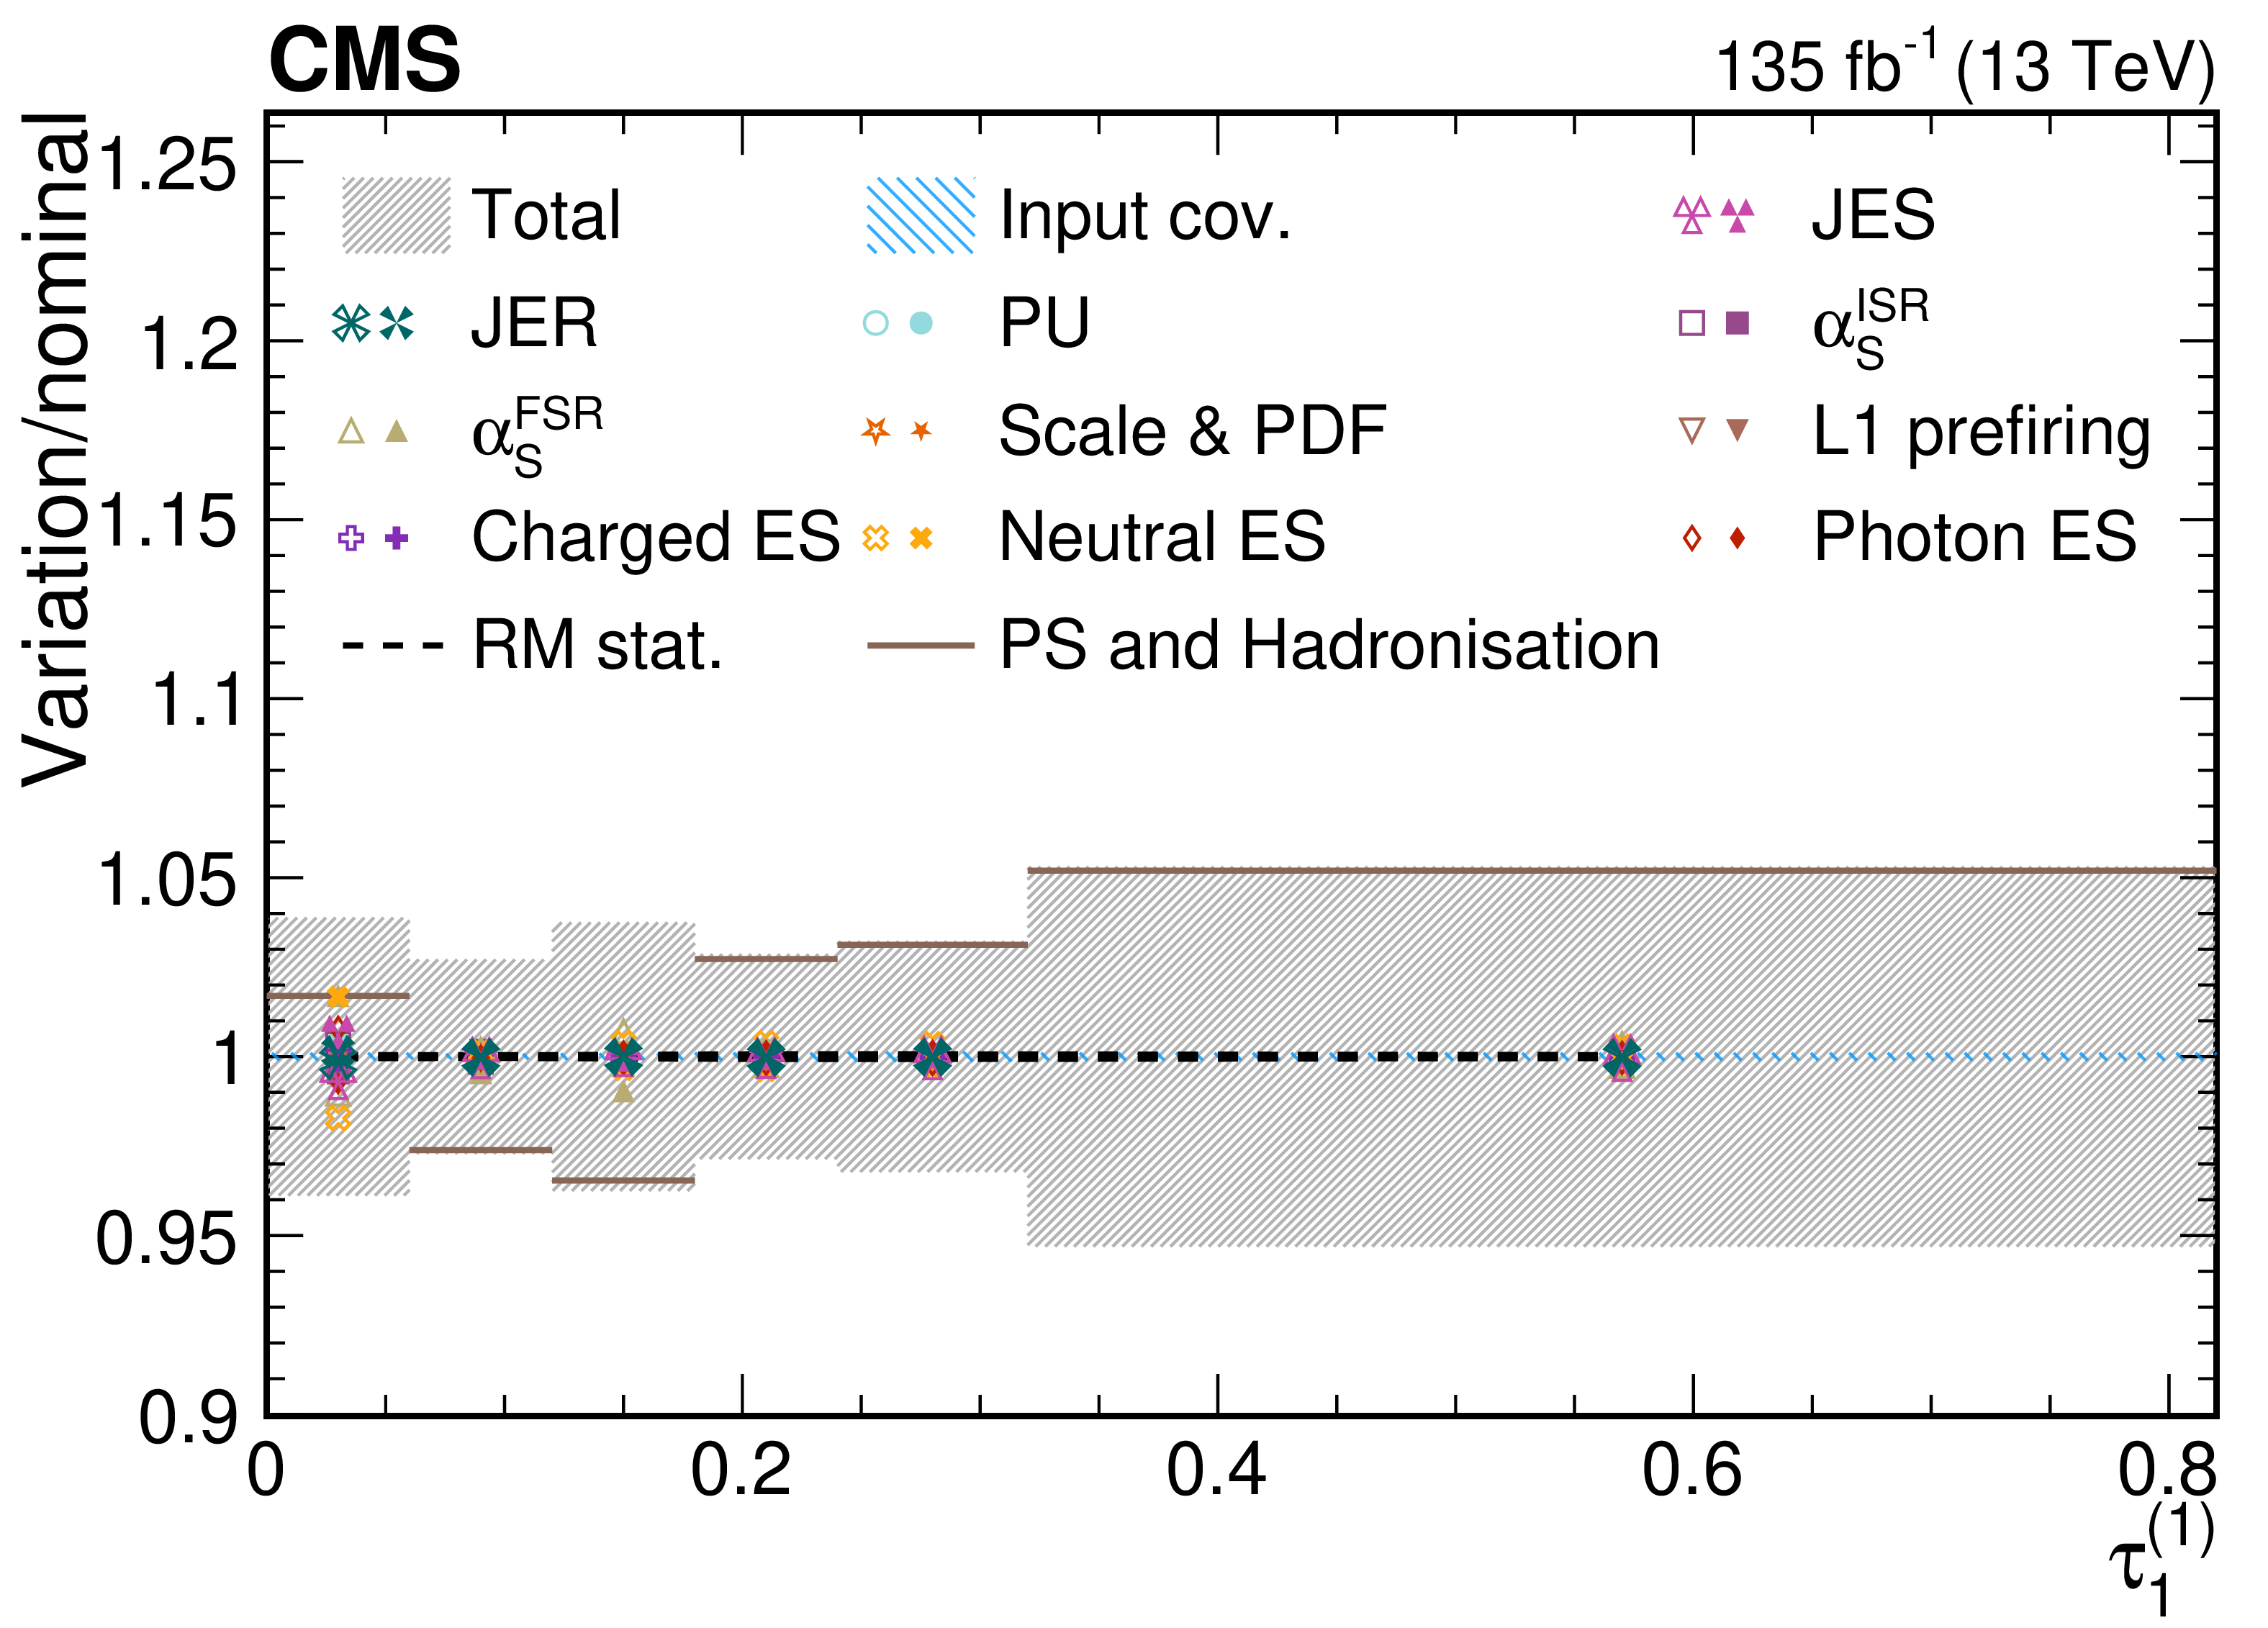
png pdf |
Figure 43-c:
Contributions from various systematic variations to the normalized, unfolded distribution for $ \tau_1^{(\beta)} $ observables measured for AK8 jets in the QCD dijet selection. The total unfolding uncertainty is indicated with the dark grey, hashed region, while the blue hashed region indicates the contributions from the input covariance matrix, which includes the propagated effects of the statistical uncertainties of the input data after background subtraction. Contributions from statistical uncertainties of the simulated sample used to construct the nominal response matrix are indicated with the dashed black line. The physics model uncertainty is computed as a one-sided shift compared to the nominal unfolding, and up (down) contributions from other sources are indicated with filled (open) markers of the same type and colour. |
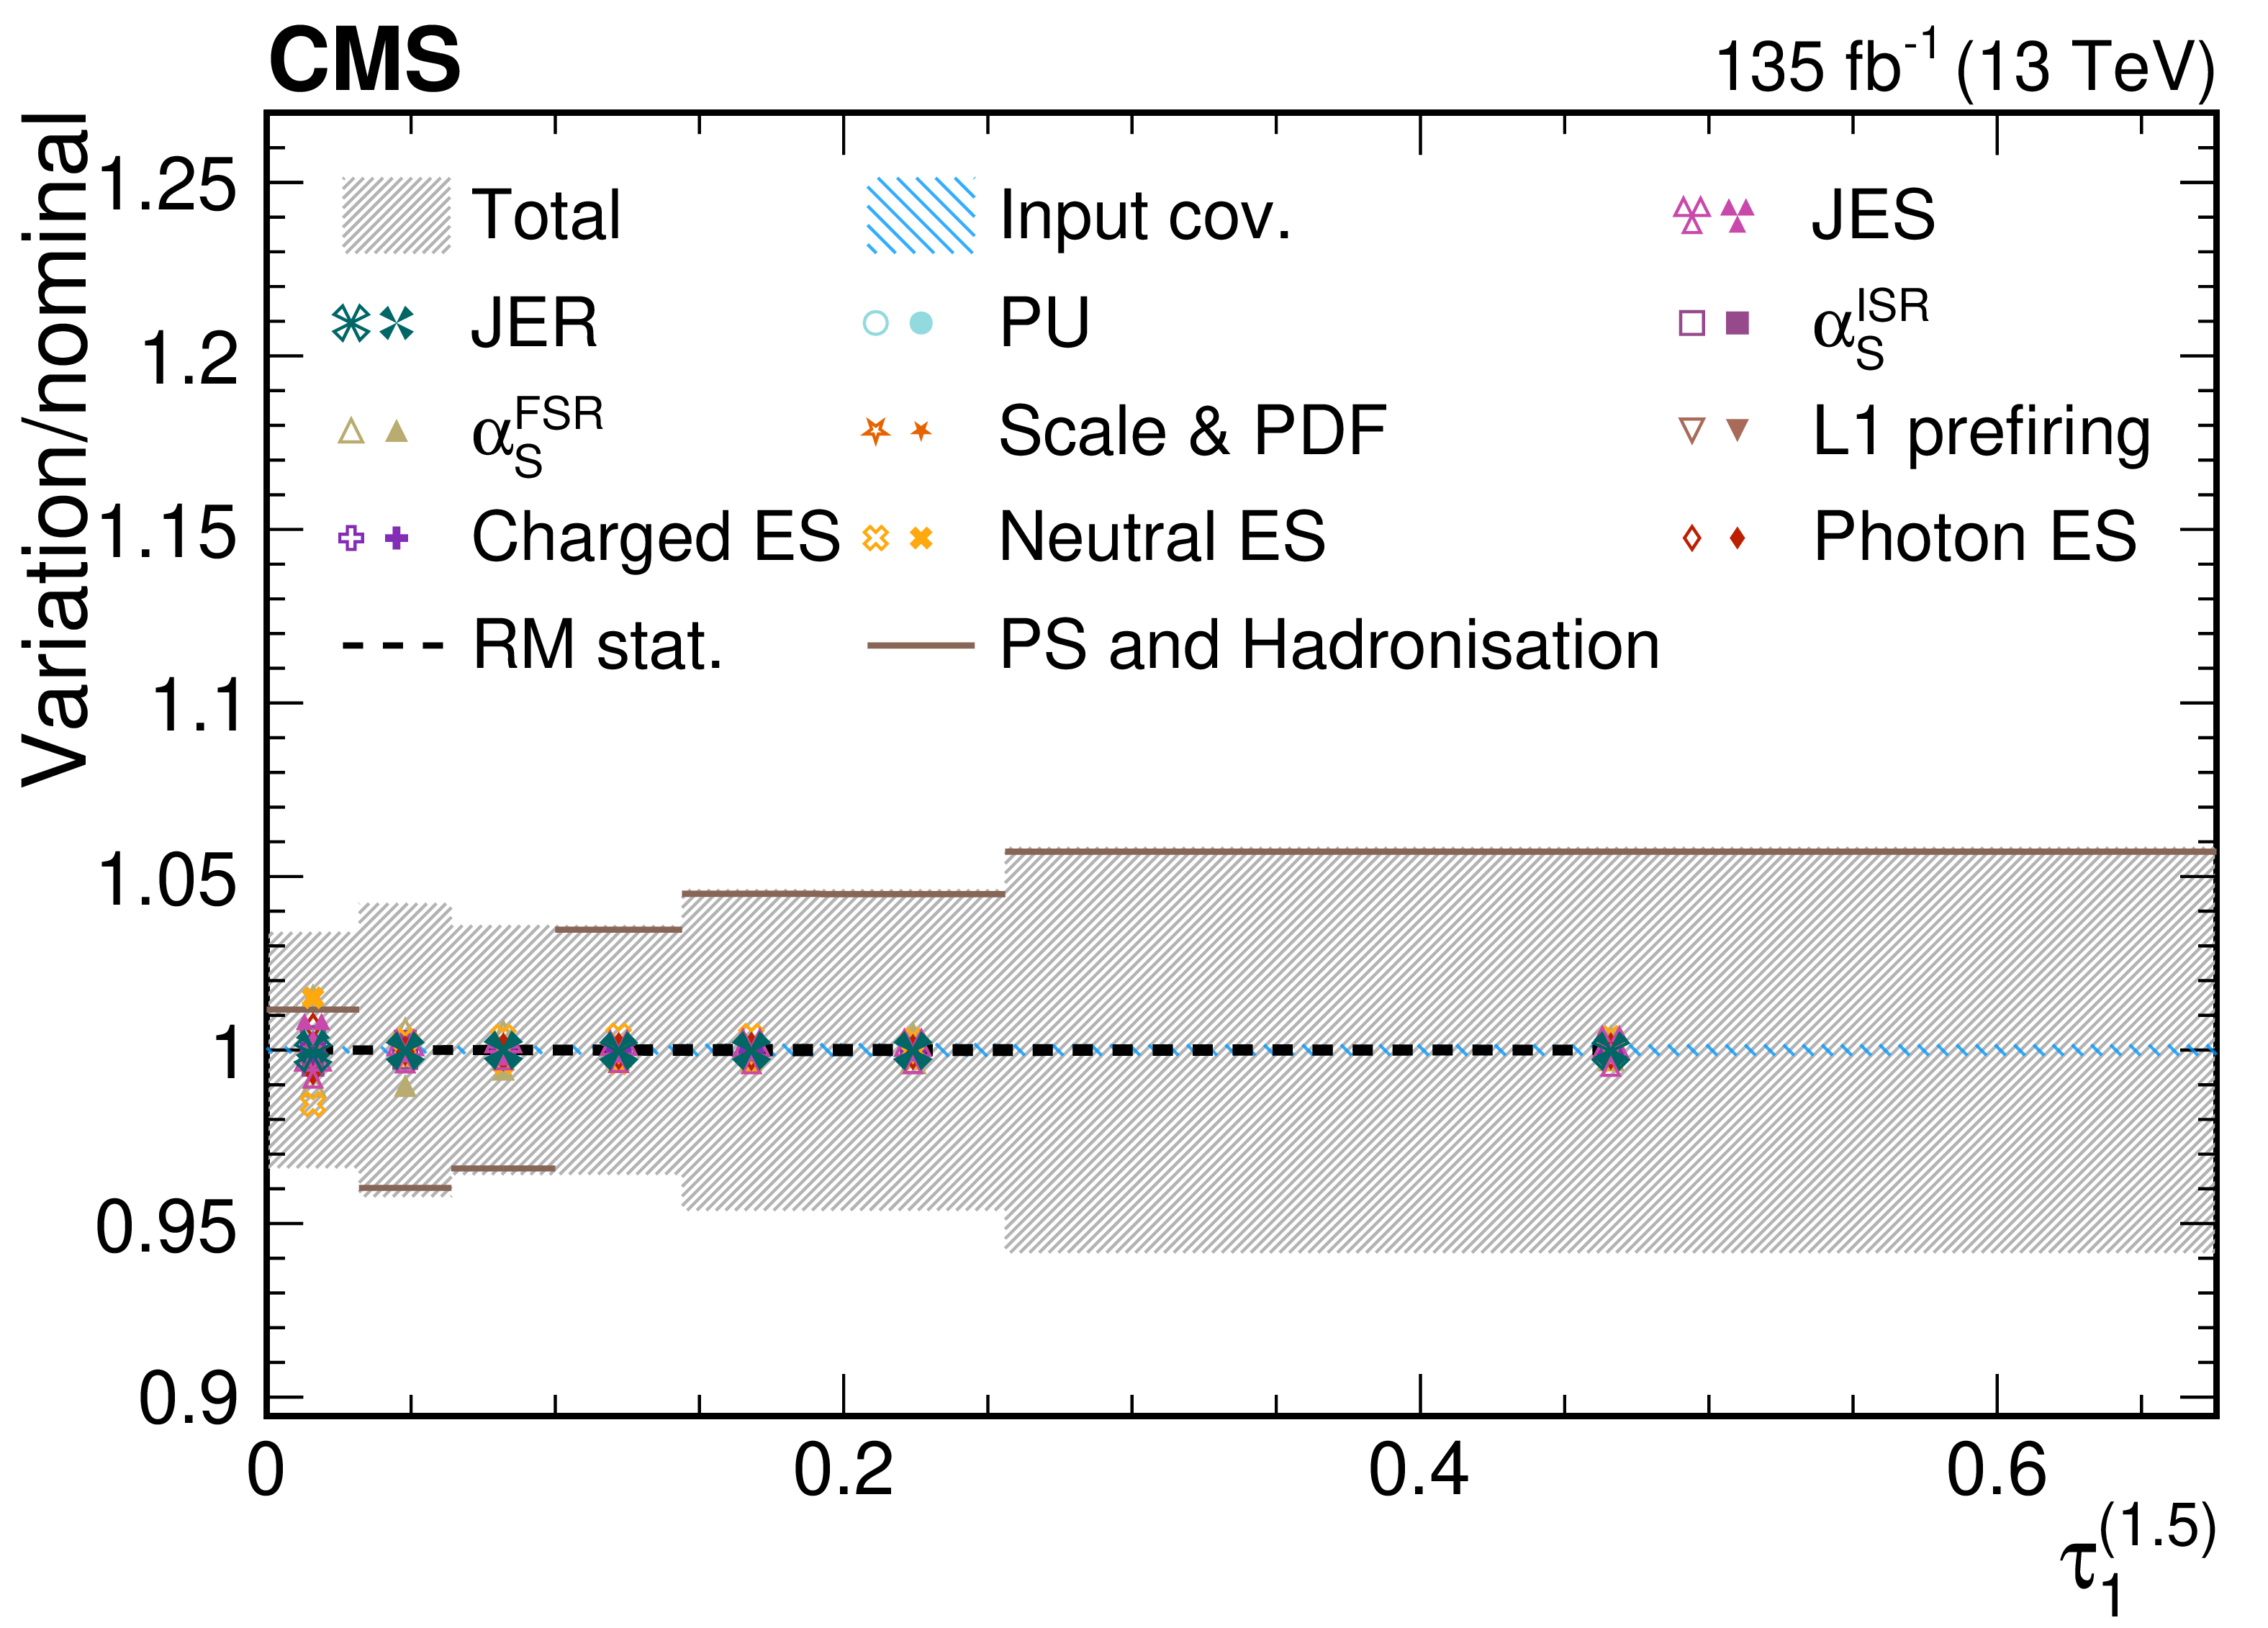
png pdf |
Figure 43-d:
Contributions from various systematic variations to the normalized, unfolded distribution for $ \tau_1^{(\beta)} $ observables measured for AK8 jets in the QCD dijet selection. The total unfolding uncertainty is indicated with the dark grey, hashed region, while the blue hashed region indicates the contributions from the input covariance matrix, which includes the propagated effects of the statistical uncertainties of the input data after background subtraction. Contributions from statistical uncertainties of the simulated sample used to construct the nominal response matrix are indicated with the dashed black line. The physics model uncertainty is computed as a one-sided shift compared to the nominal unfolding, and up (down) contributions from other sources are indicated with filled (open) markers of the same type and colour. |
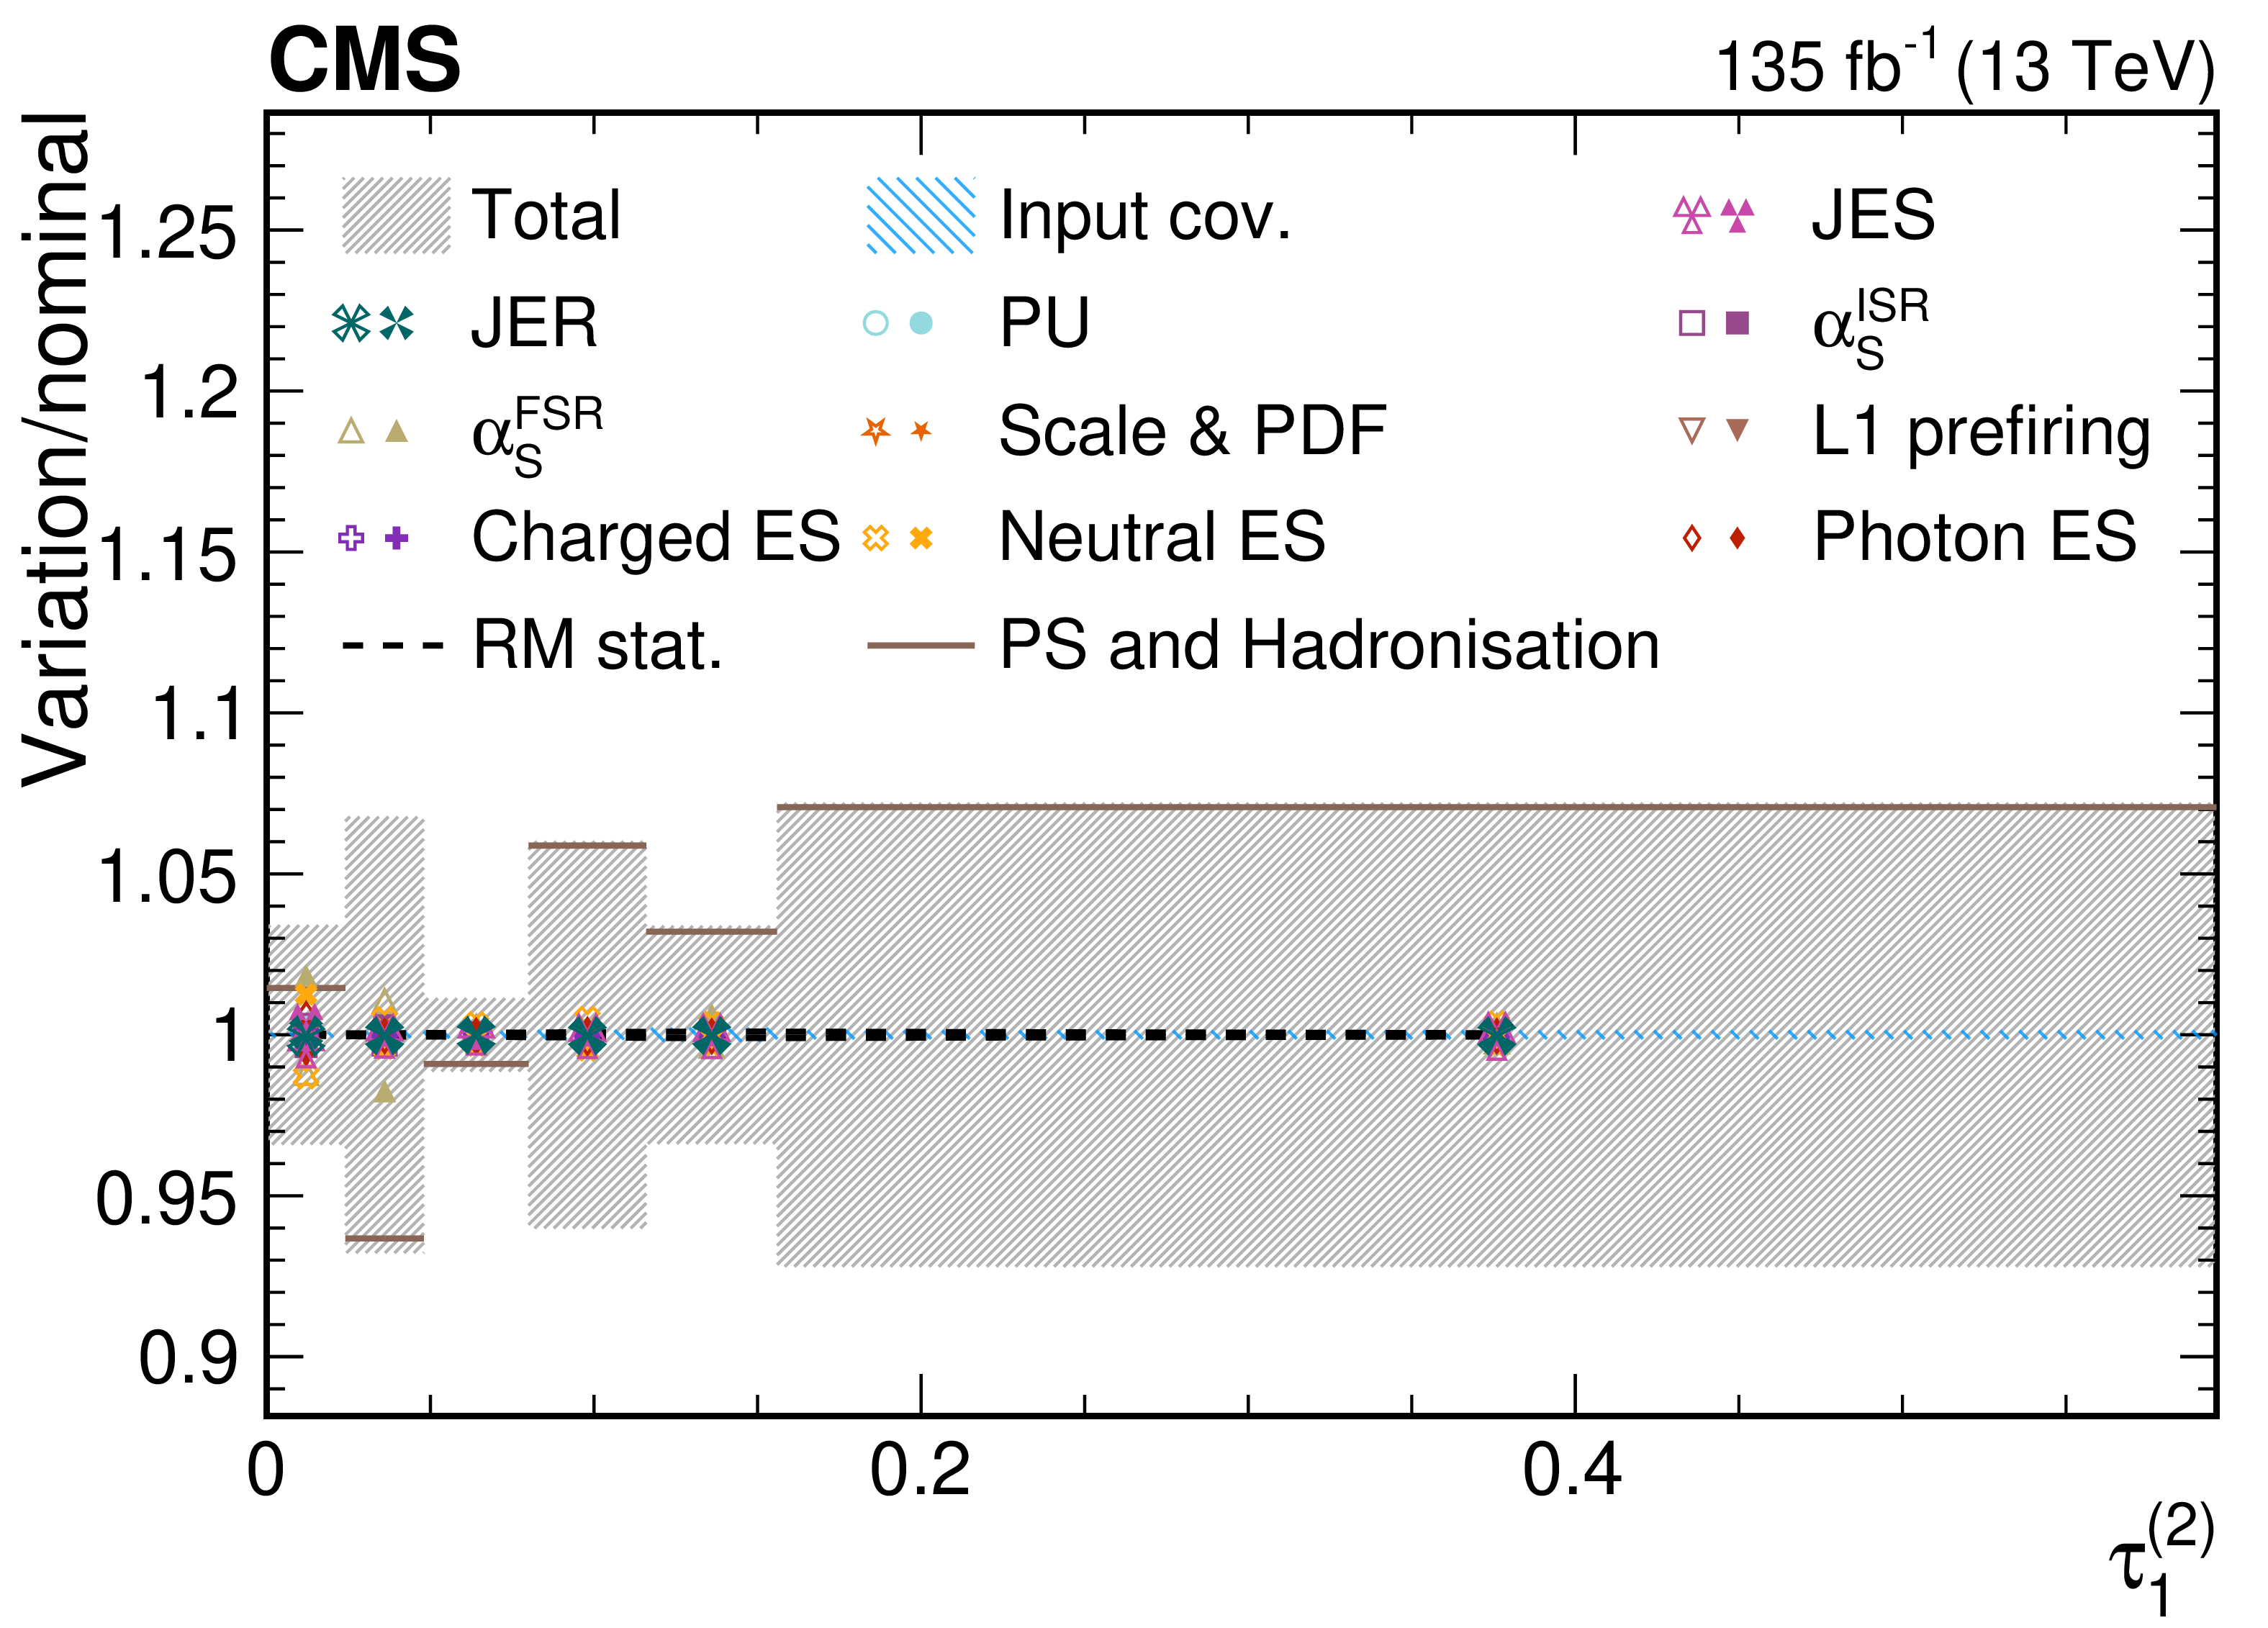
png pdf |
Figure 43-e:
Contributions from various systematic variations to the normalized, unfolded distribution for $ \tau_1^{(\beta)} $ observables measured for AK8 jets in the QCD dijet selection. The total unfolding uncertainty is indicated with the dark grey, hashed region, while the blue hashed region indicates the contributions from the input covariance matrix, which includes the propagated effects of the statistical uncertainties of the input data after background subtraction. Contributions from statistical uncertainties of the simulated sample used to construct the nominal response matrix are indicated with the dashed black line. The physics model uncertainty is computed as a one-sided shift compared to the nominal unfolding, and up (down) contributions from other sources are indicated with filled (open) markers of the same type and colour. |
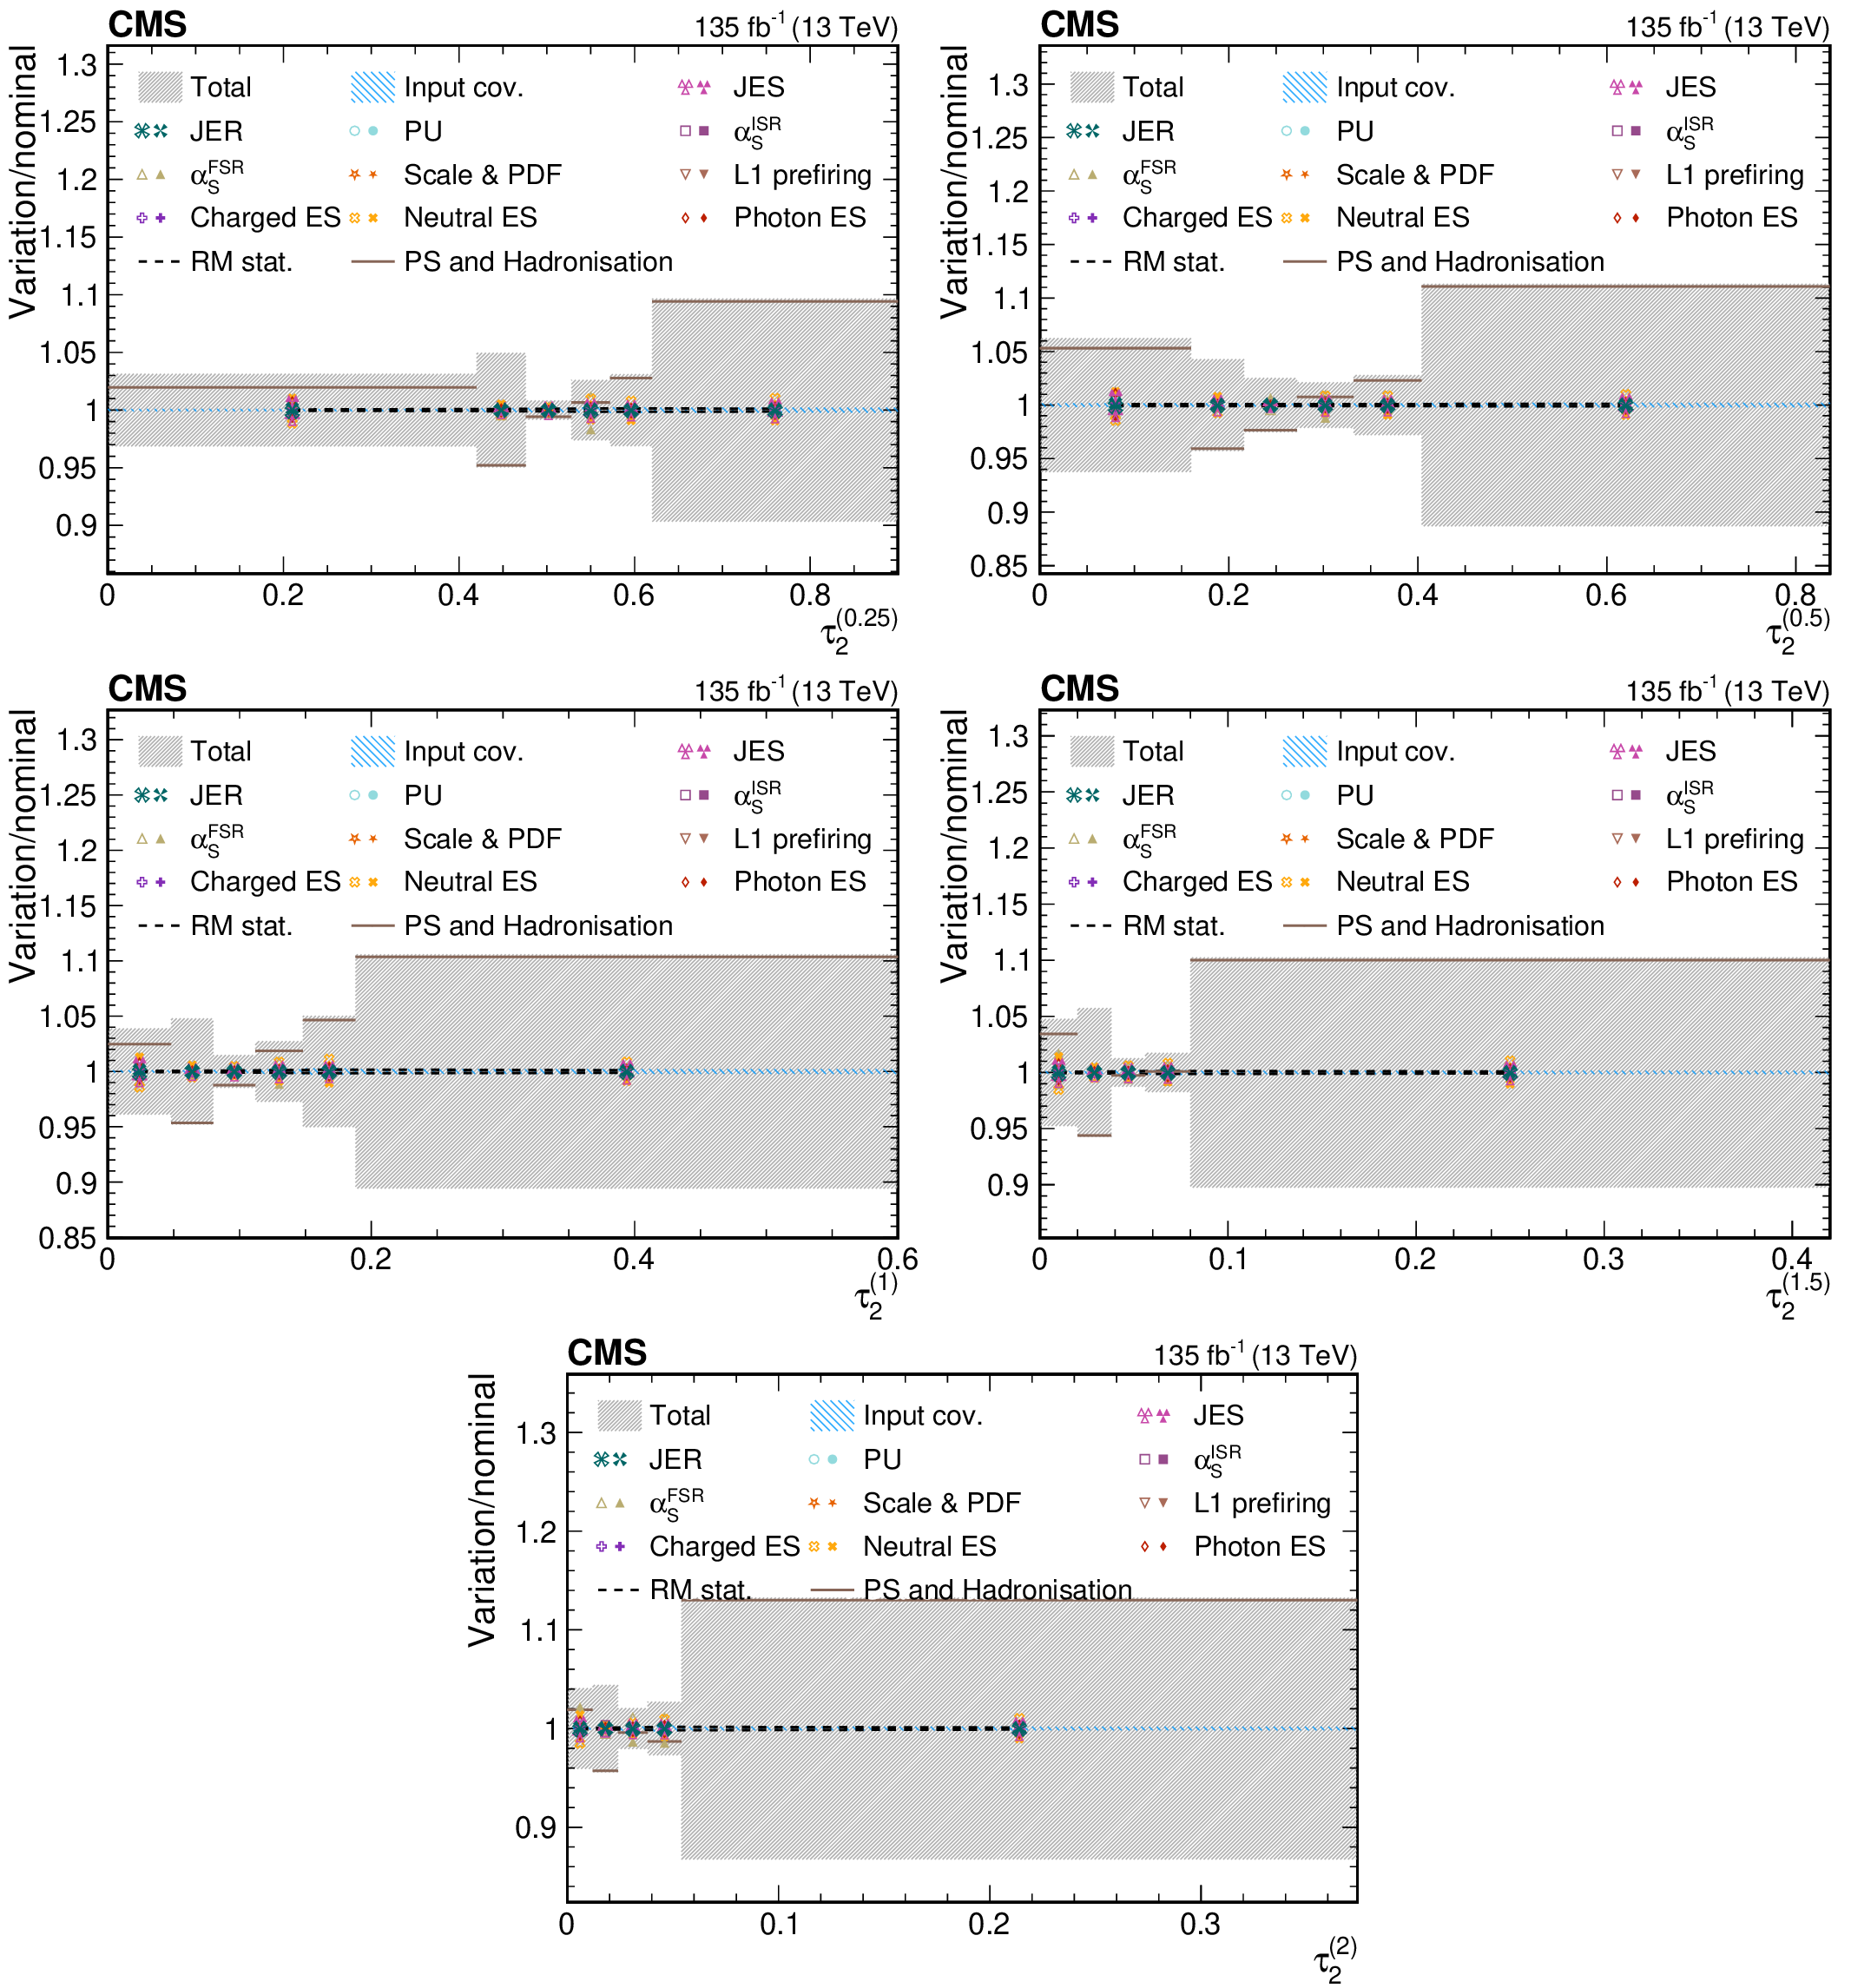
png pdf |
Figure 44:
Contributions from various systematic variations to the normalized, unfolded distribution for $ \tau_2^{(\beta)} $ observables measured for AK8 jets in the QCD dijet selection. The total unfolding uncertainty is indicated with the dark grey, hashed region, while the blue hashed region indicates the contributions from the input covariance matrix, which includes the propagated effects of the statistical uncertainties of the input data after background subtraction. Contributions from statistical uncertainties of the simulated sample used to construct the nominal response matrix are indicated with the dashed black line. The physics model uncertainty is computed as a one-sided shift compared to the nominal unfolding, and up (down) contributions from other sources are indicated with filled (open) markers of the same type and colour. |
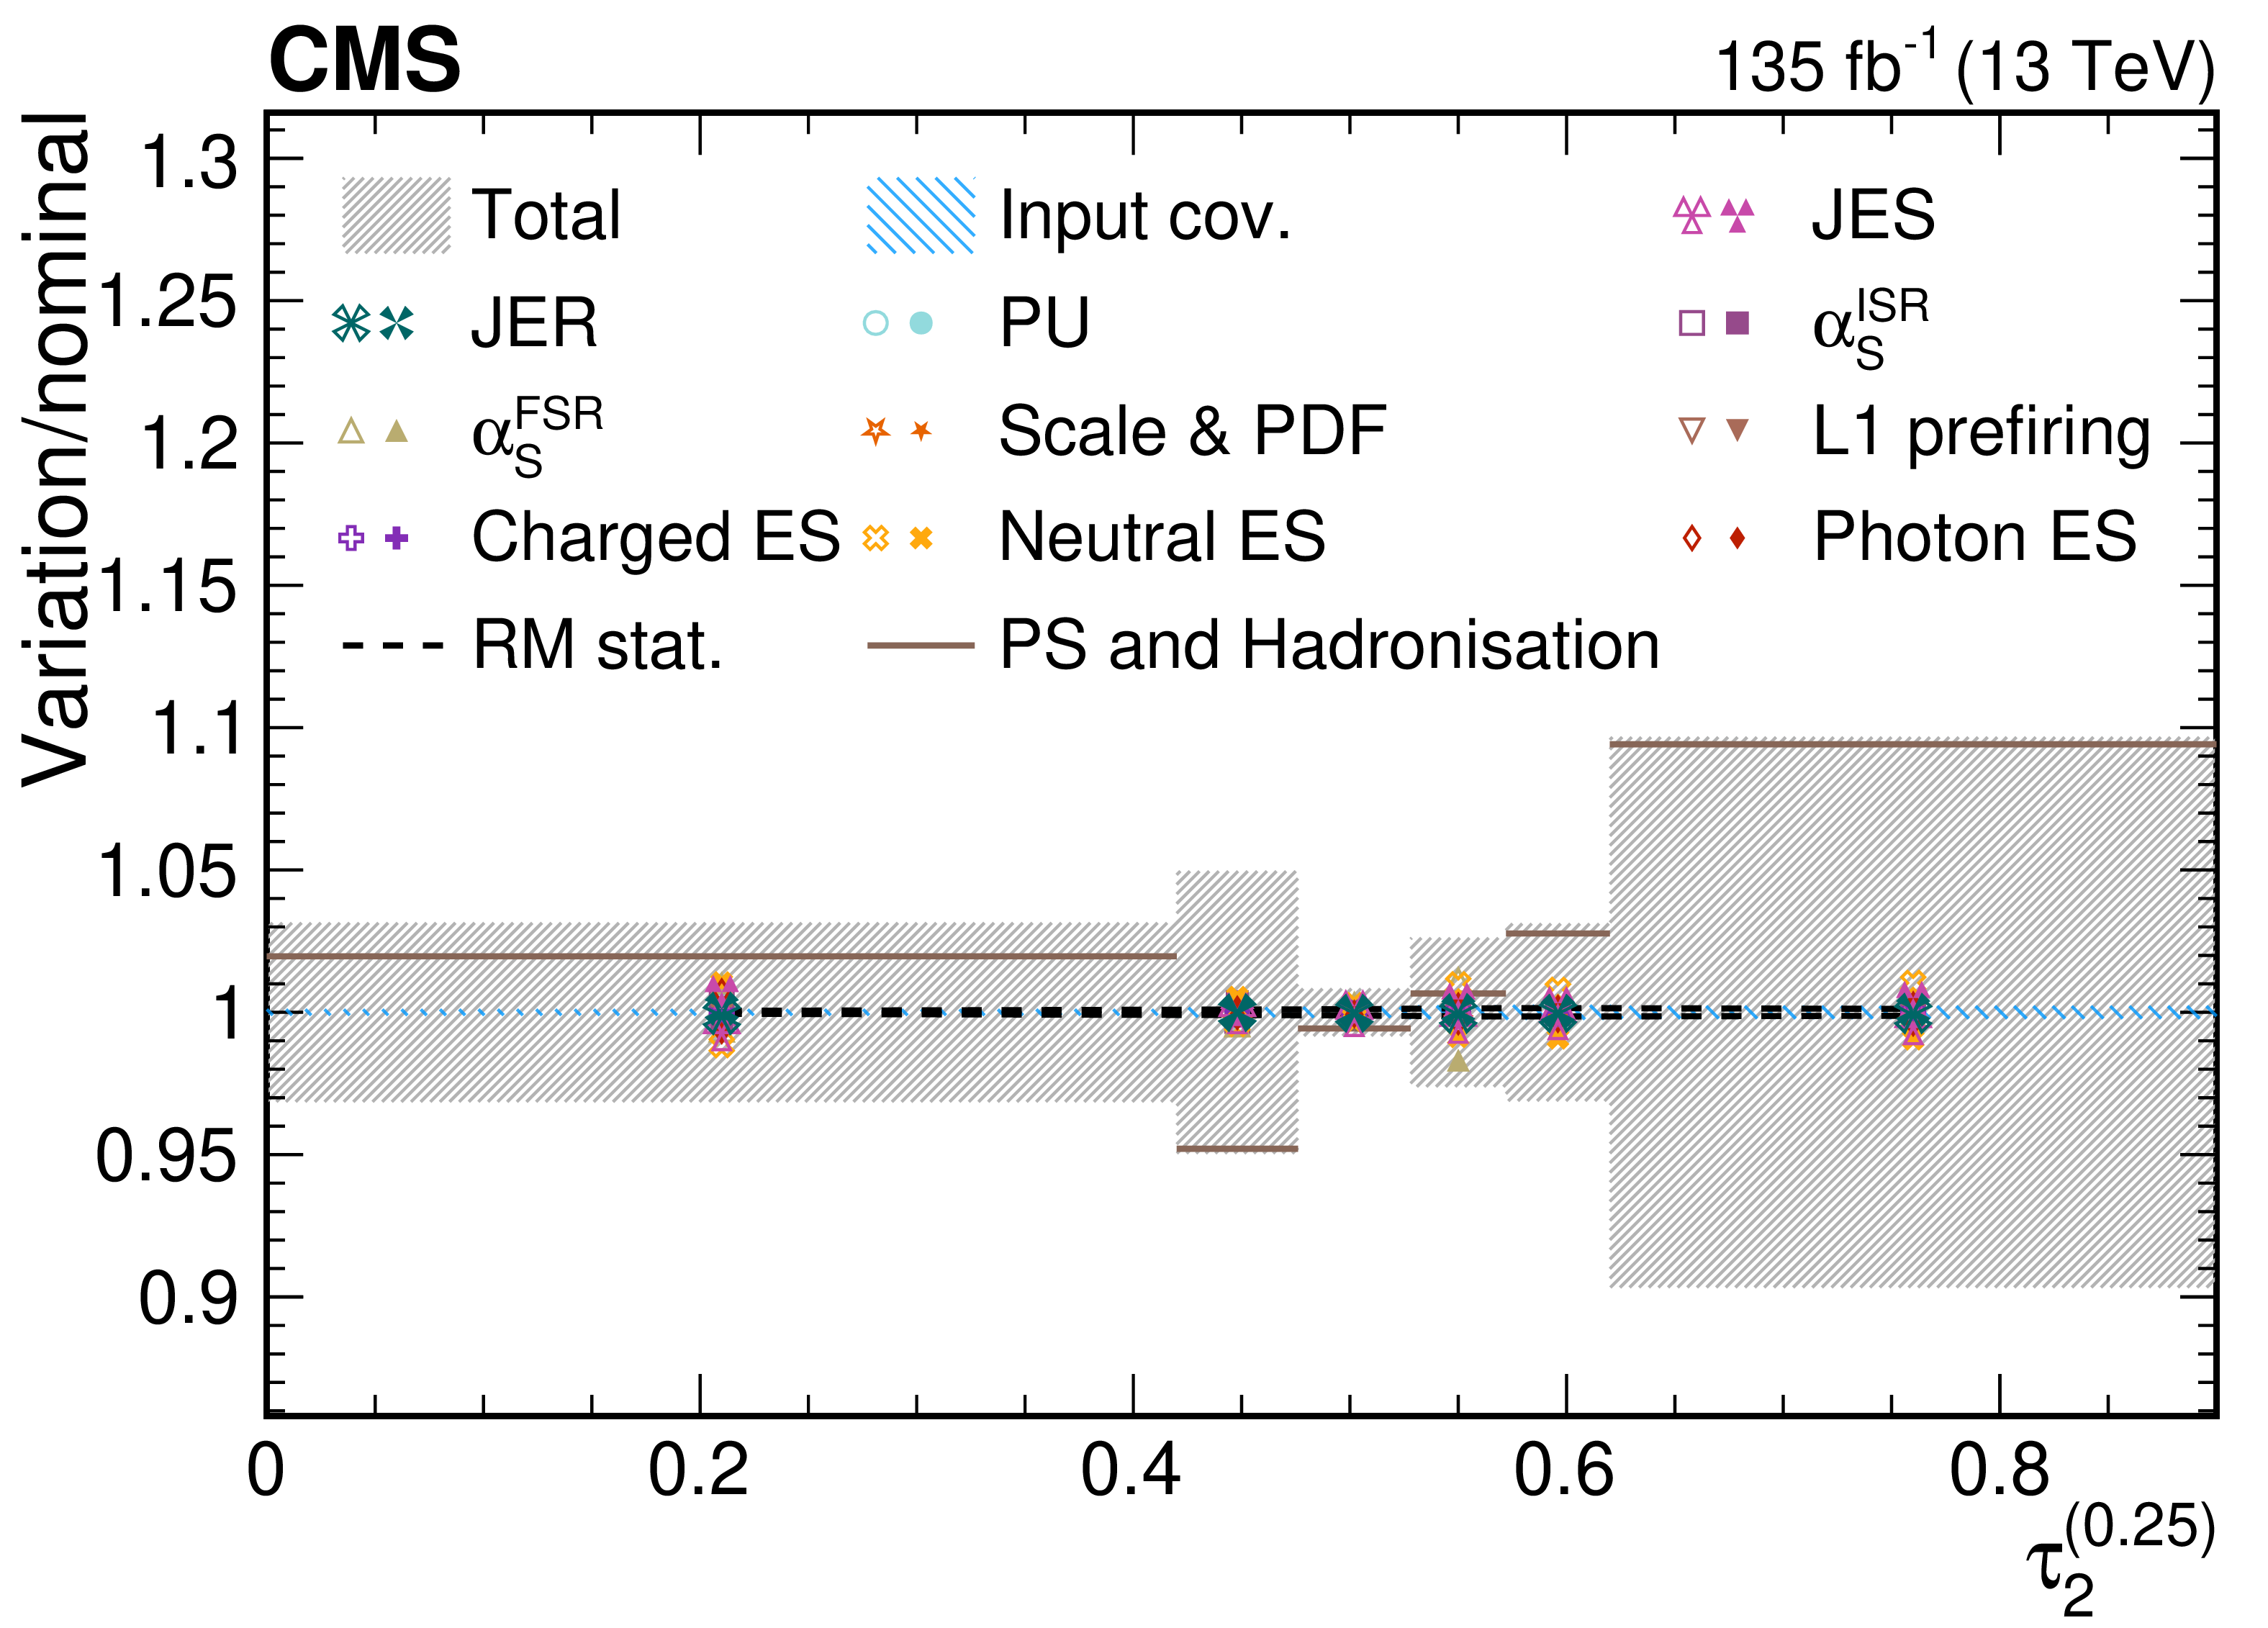
png pdf |
Figure 44-a:
Contributions from various systematic variations to the normalized, unfolded distribution for $ \tau_2^{(\beta)} $ observables measured for AK8 jets in the QCD dijet selection. The total unfolding uncertainty is indicated with the dark grey, hashed region, while the blue hashed region indicates the contributions from the input covariance matrix, which includes the propagated effects of the statistical uncertainties of the input data after background subtraction. Contributions from statistical uncertainties of the simulated sample used to construct the nominal response matrix are indicated with the dashed black line. The physics model uncertainty is computed as a one-sided shift compared to the nominal unfolding, and up (down) contributions from other sources are indicated with filled (open) markers of the same type and colour. |
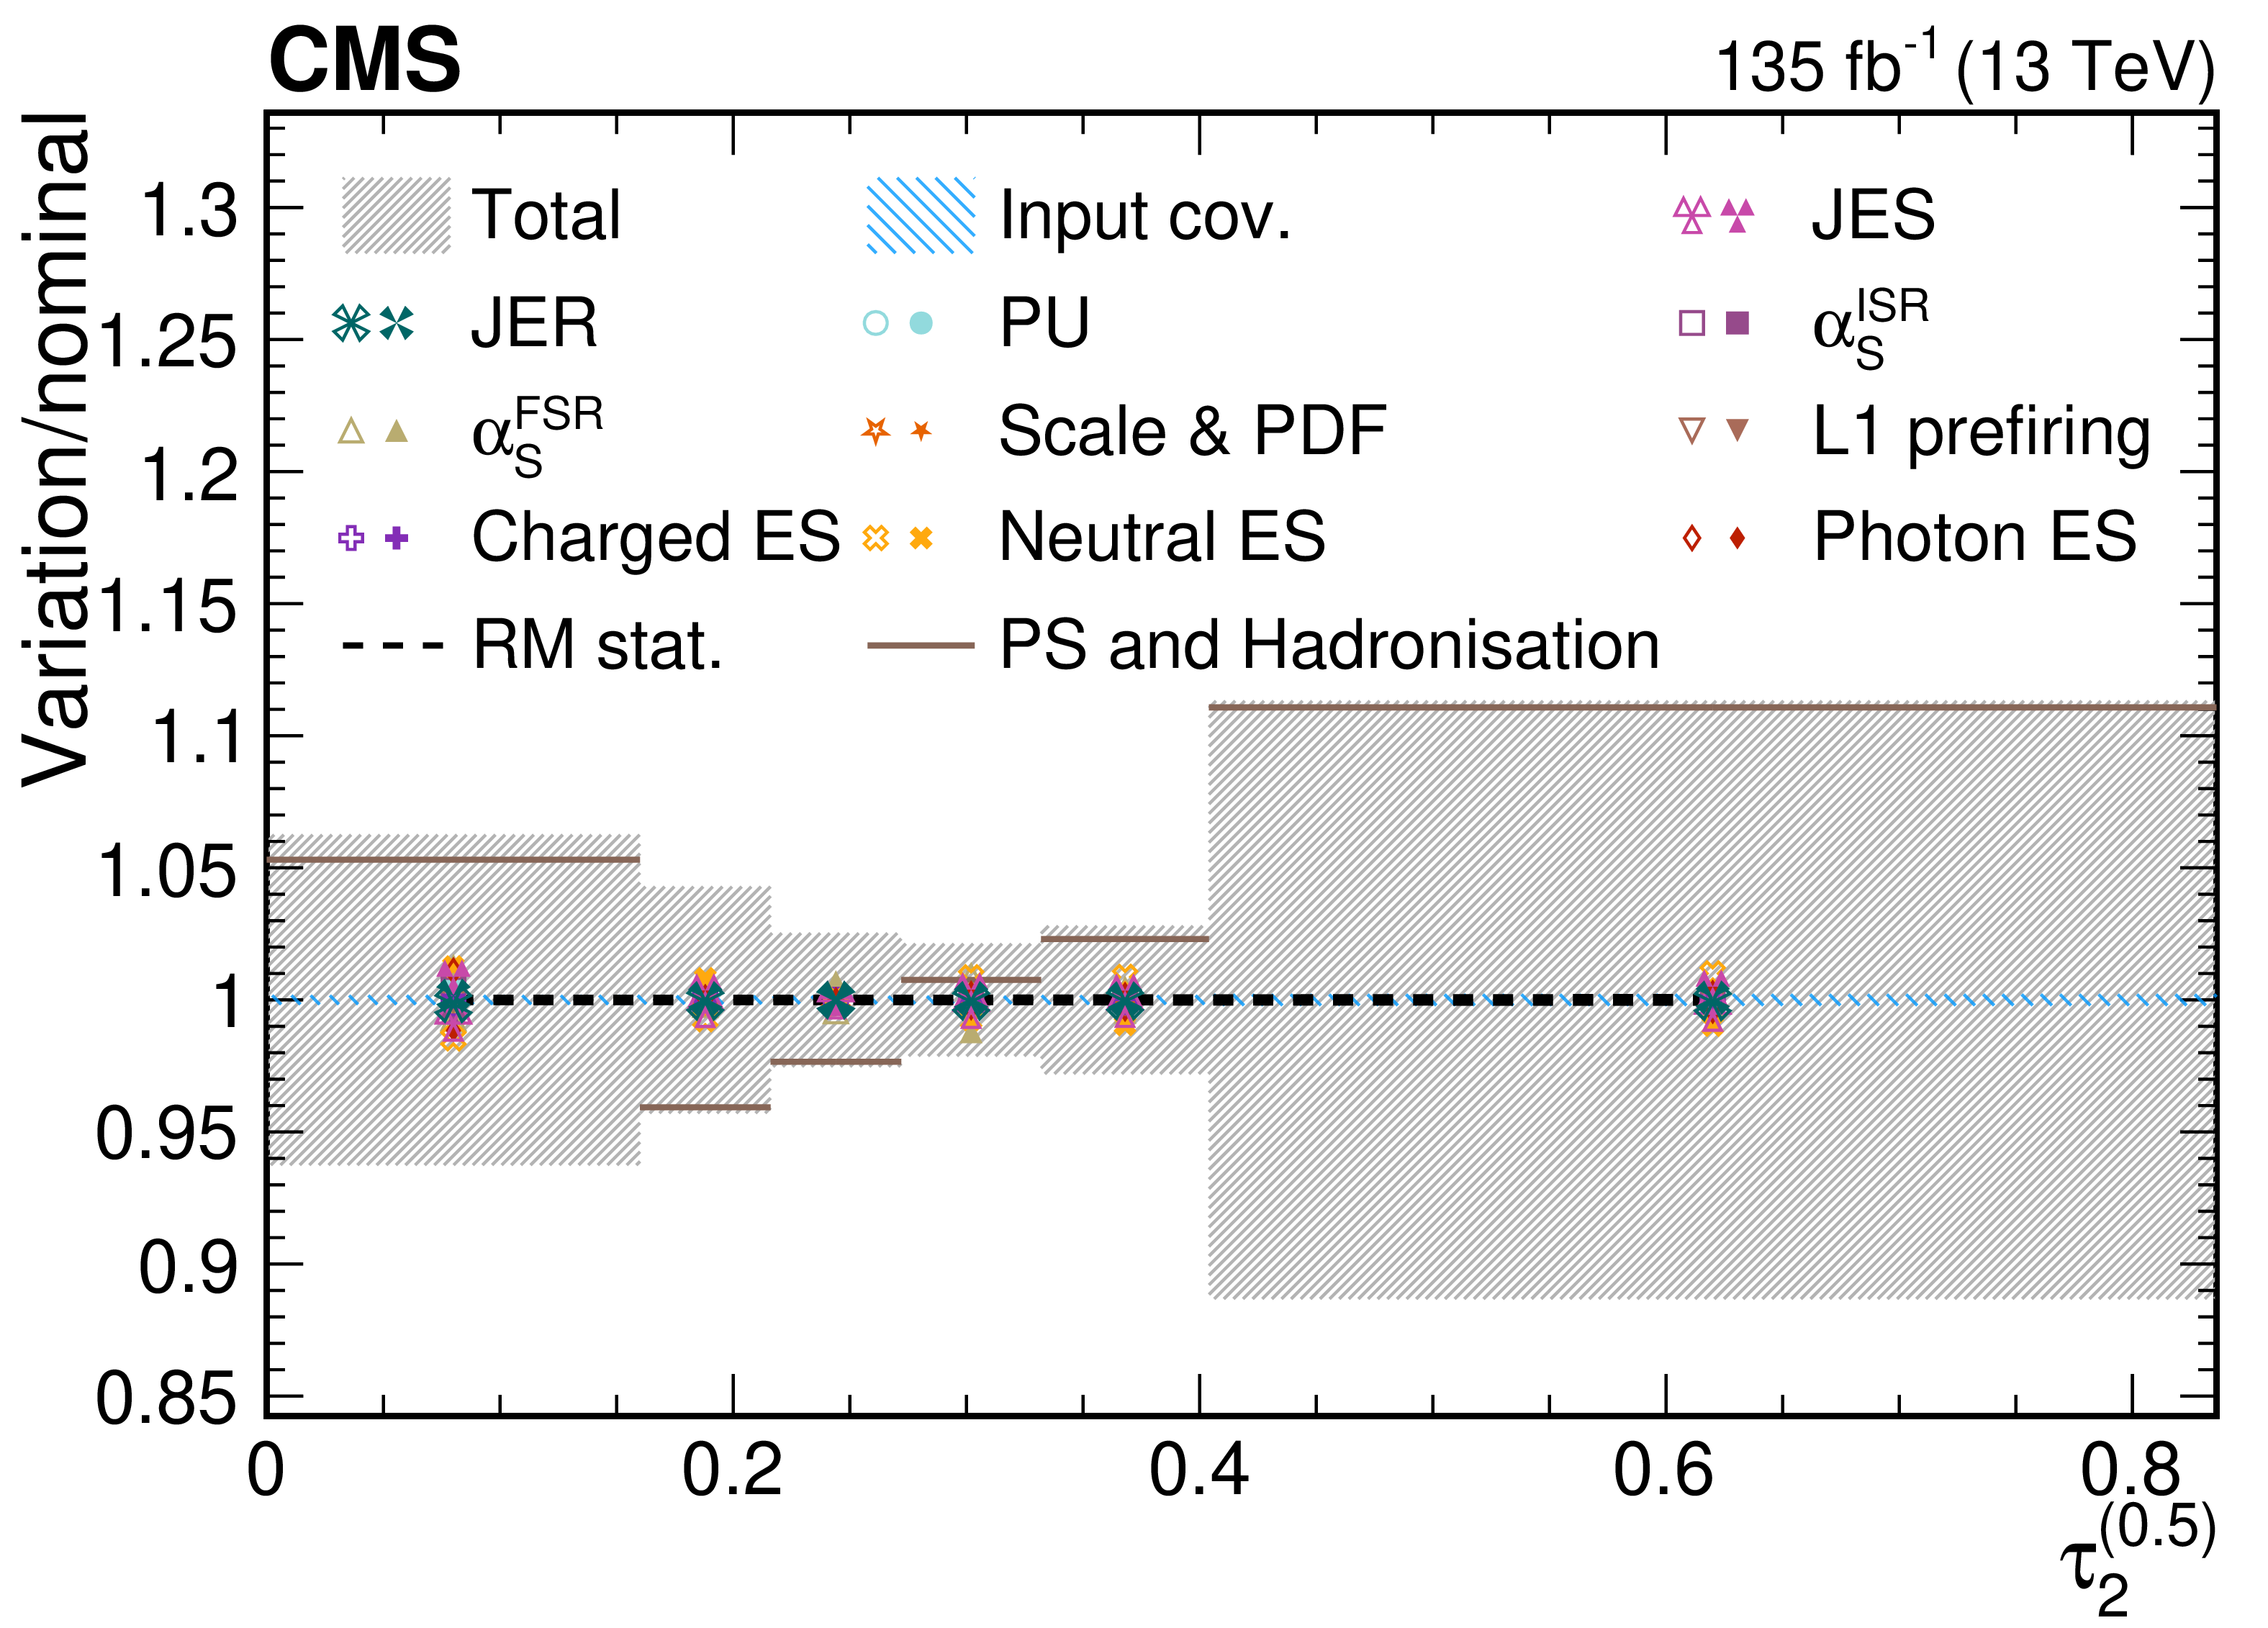
png pdf |
Figure 44-b:
Contributions from various systematic variations to the normalized, unfolded distribution for $ \tau_2^{(\beta)} $ observables measured for AK8 jets in the QCD dijet selection. The total unfolding uncertainty is indicated with the dark grey, hashed region, while the blue hashed region indicates the contributions from the input covariance matrix, which includes the propagated effects of the statistical uncertainties of the input data after background subtraction. Contributions from statistical uncertainties of the simulated sample used to construct the nominal response matrix are indicated with the dashed black line. The physics model uncertainty is computed as a one-sided shift compared to the nominal unfolding, and up (down) contributions from other sources are indicated with filled (open) markers of the same type and colour. |
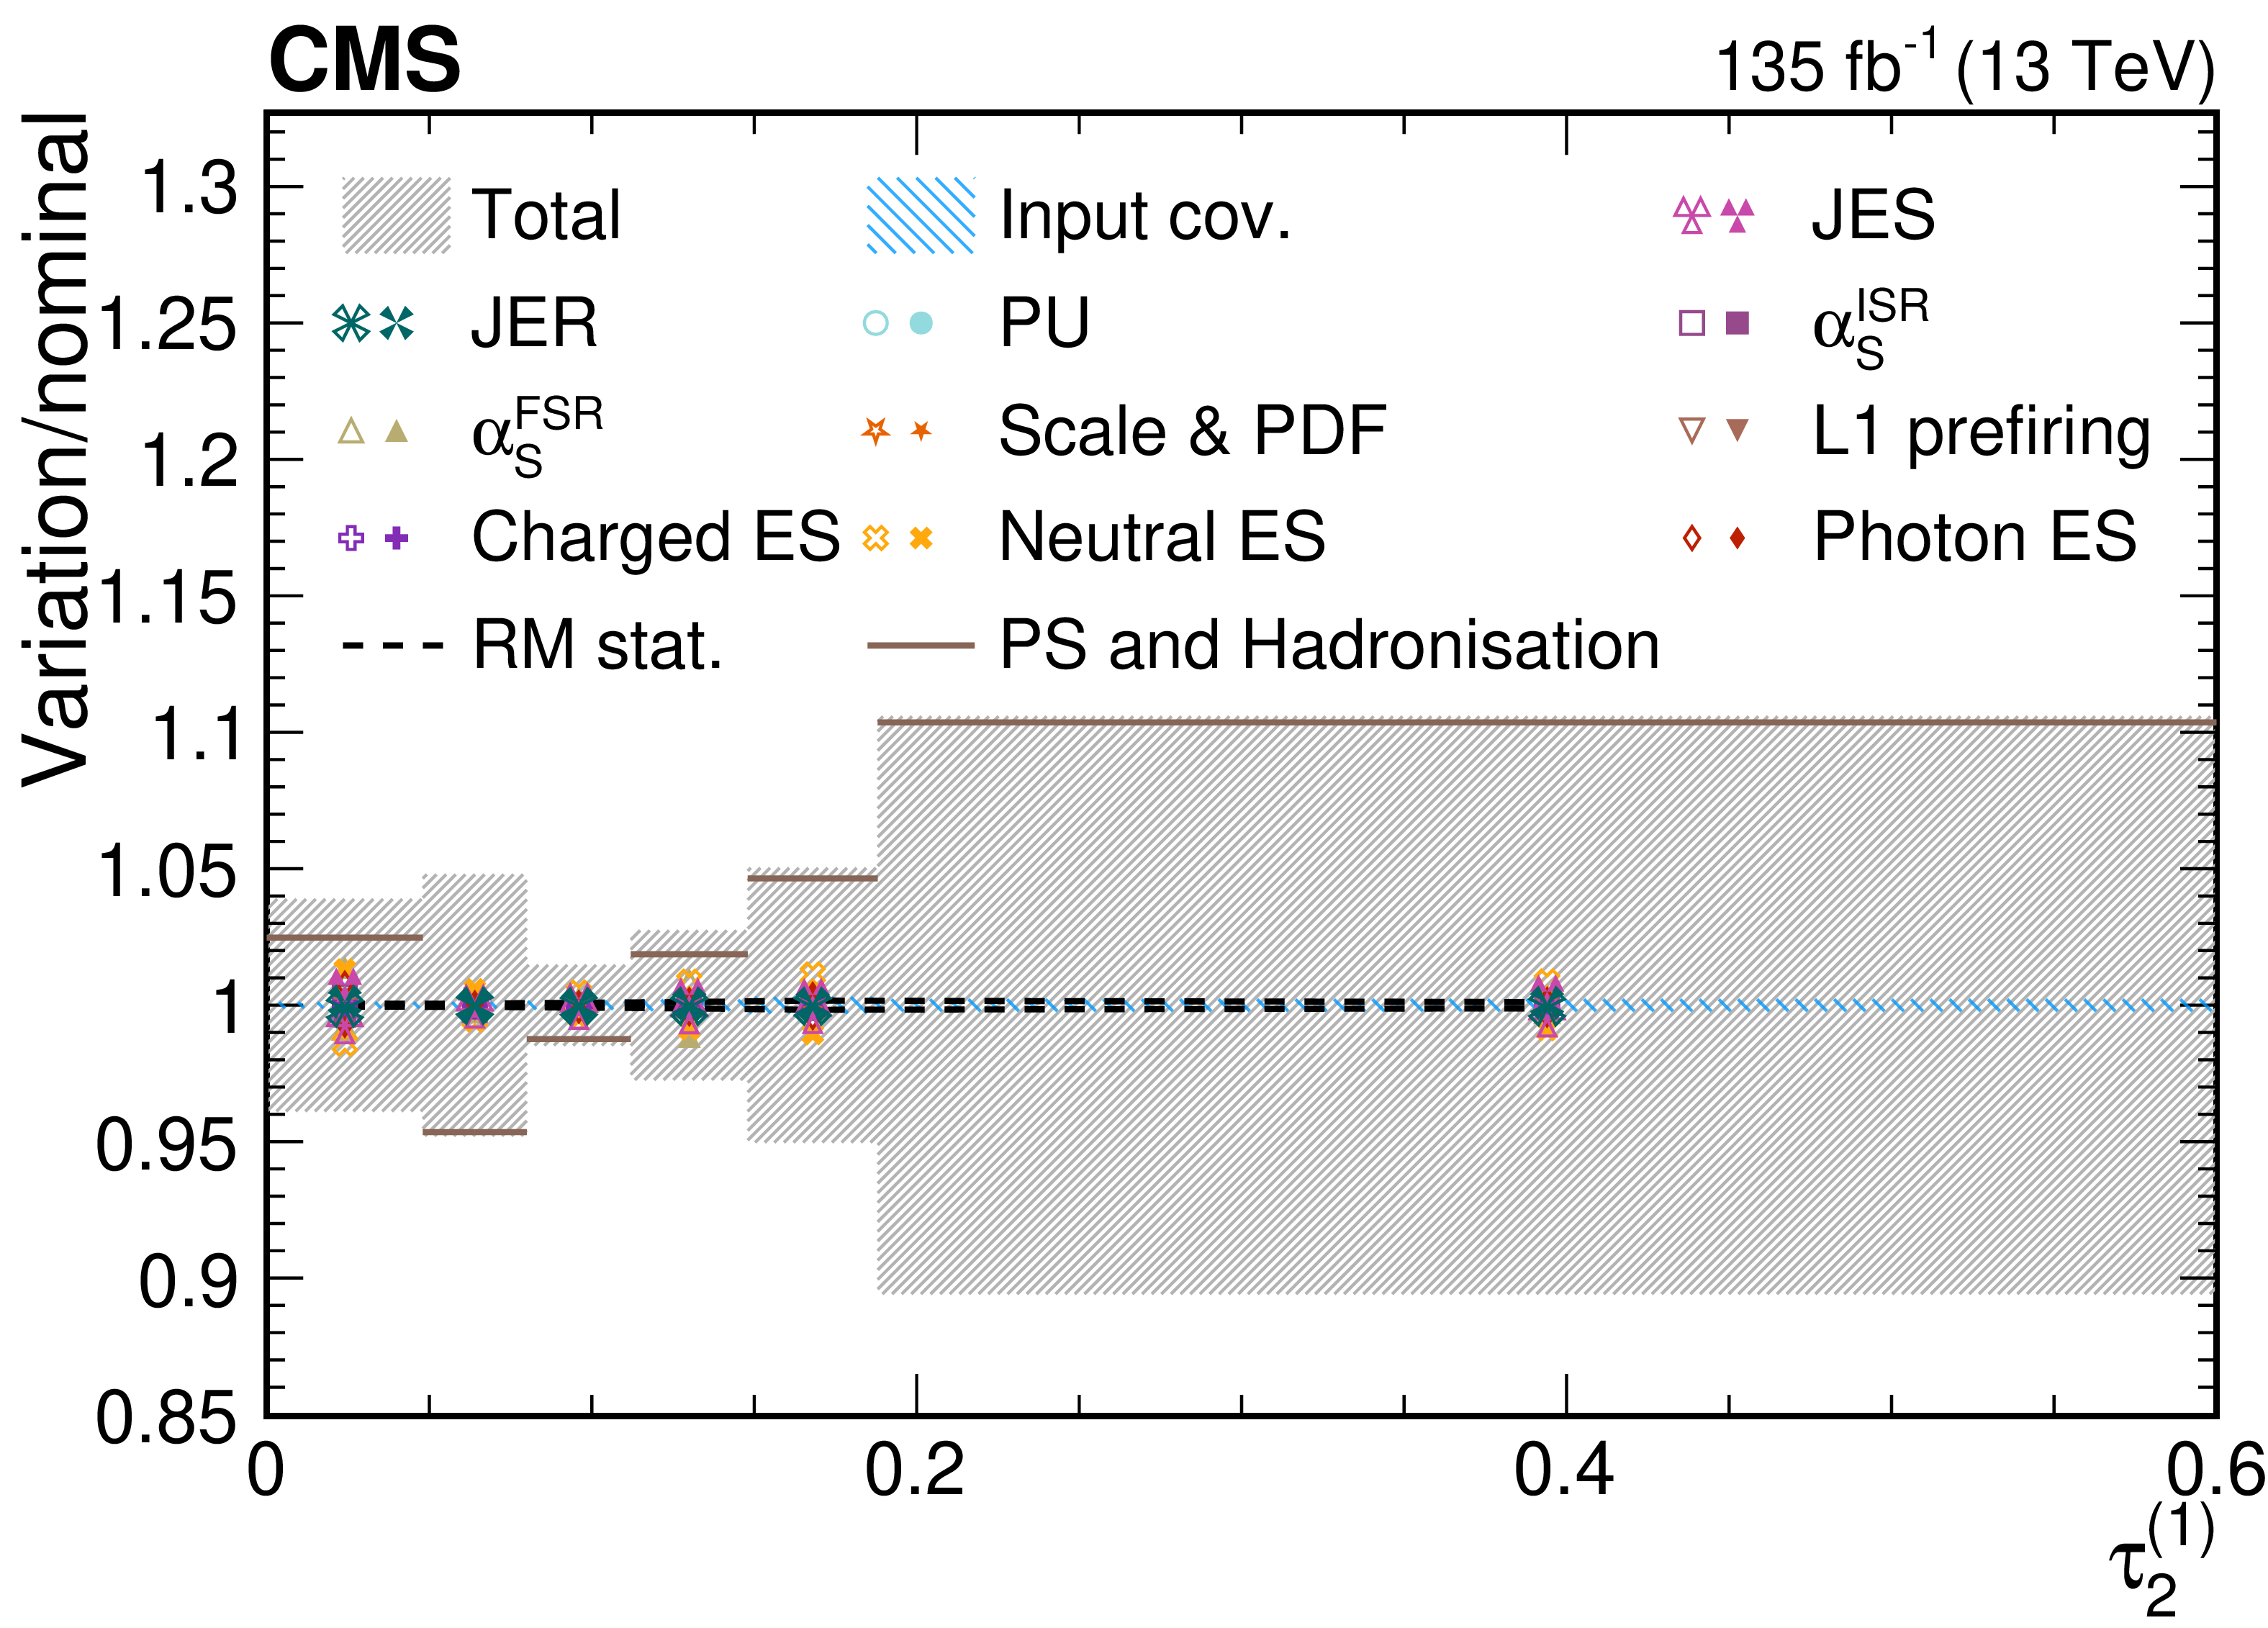
png pdf |
Figure 44-c:
Contributions from various systematic variations to the normalized, unfolded distribution for $ \tau_2^{(\beta)} $ observables measured for AK8 jets in the QCD dijet selection. The total unfolding uncertainty is indicated with the dark grey, hashed region, while the blue hashed region indicates the contributions from the input covariance matrix, which includes the propagated effects of the statistical uncertainties of the input data after background subtraction. Contributions from statistical uncertainties of the simulated sample used to construct the nominal response matrix are indicated with the dashed black line. The physics model uncertainty is computed as a one-sided shift compared to the nominal unfolding, and up (down) contributions from other sources are indicated with filled (open) markers of the same type and colour. |
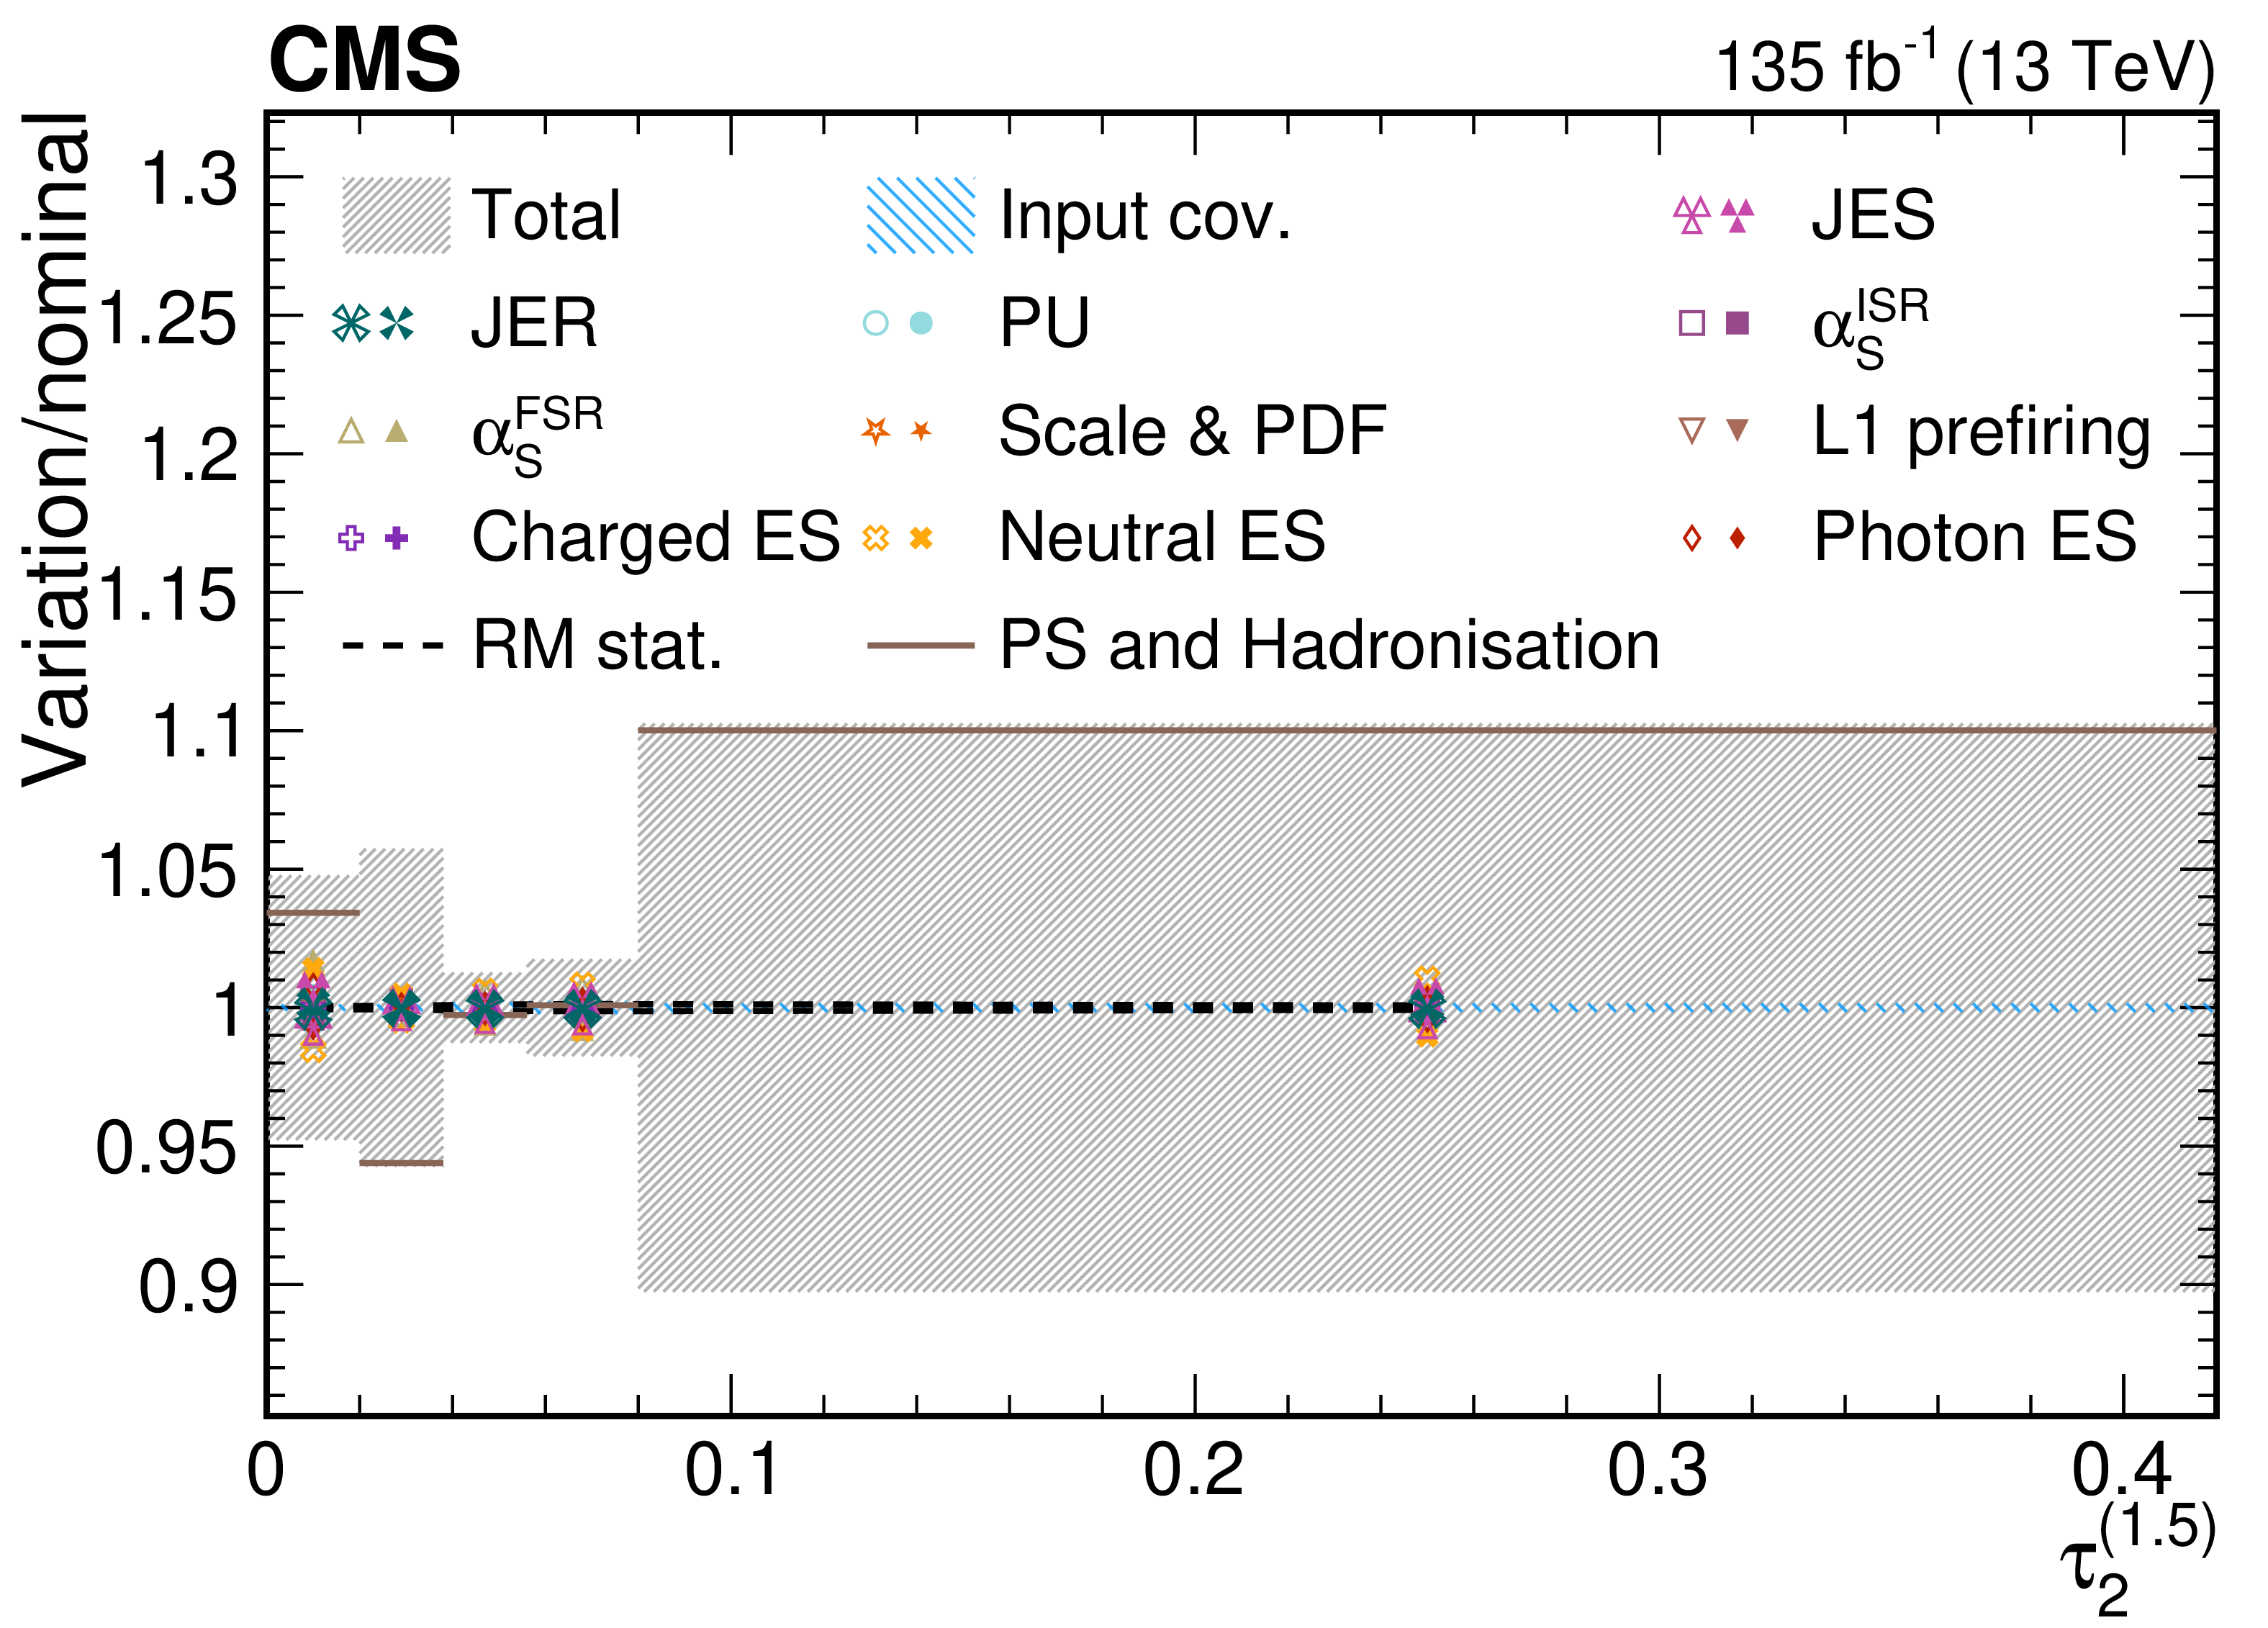
png pdf |
Figure 44-d:
Contributions from various systematic variations to the normalized, unfolded distribution for $ \tau_2^{(\beta)} $ observables measured for AK8 jets in the QCD dijet selection. The total unfolding uncertainty is indicated with the dark grey, hashed region, while the blue hashed region indicates the contributions from the input covariance matrix, which includes the propagated effects of the statistical uncertainties of the input data after background subtraction. Contributions from statistical uncertainties of the simulated sample used to construct the nominal response matrix are indicated with the dashed black line. The physics model uncertainty is computed as a one-sided shift compared to the nominal unfolding, and up (down) contributions from other sources are indicated with filled (open) markers of the same type and colour. |
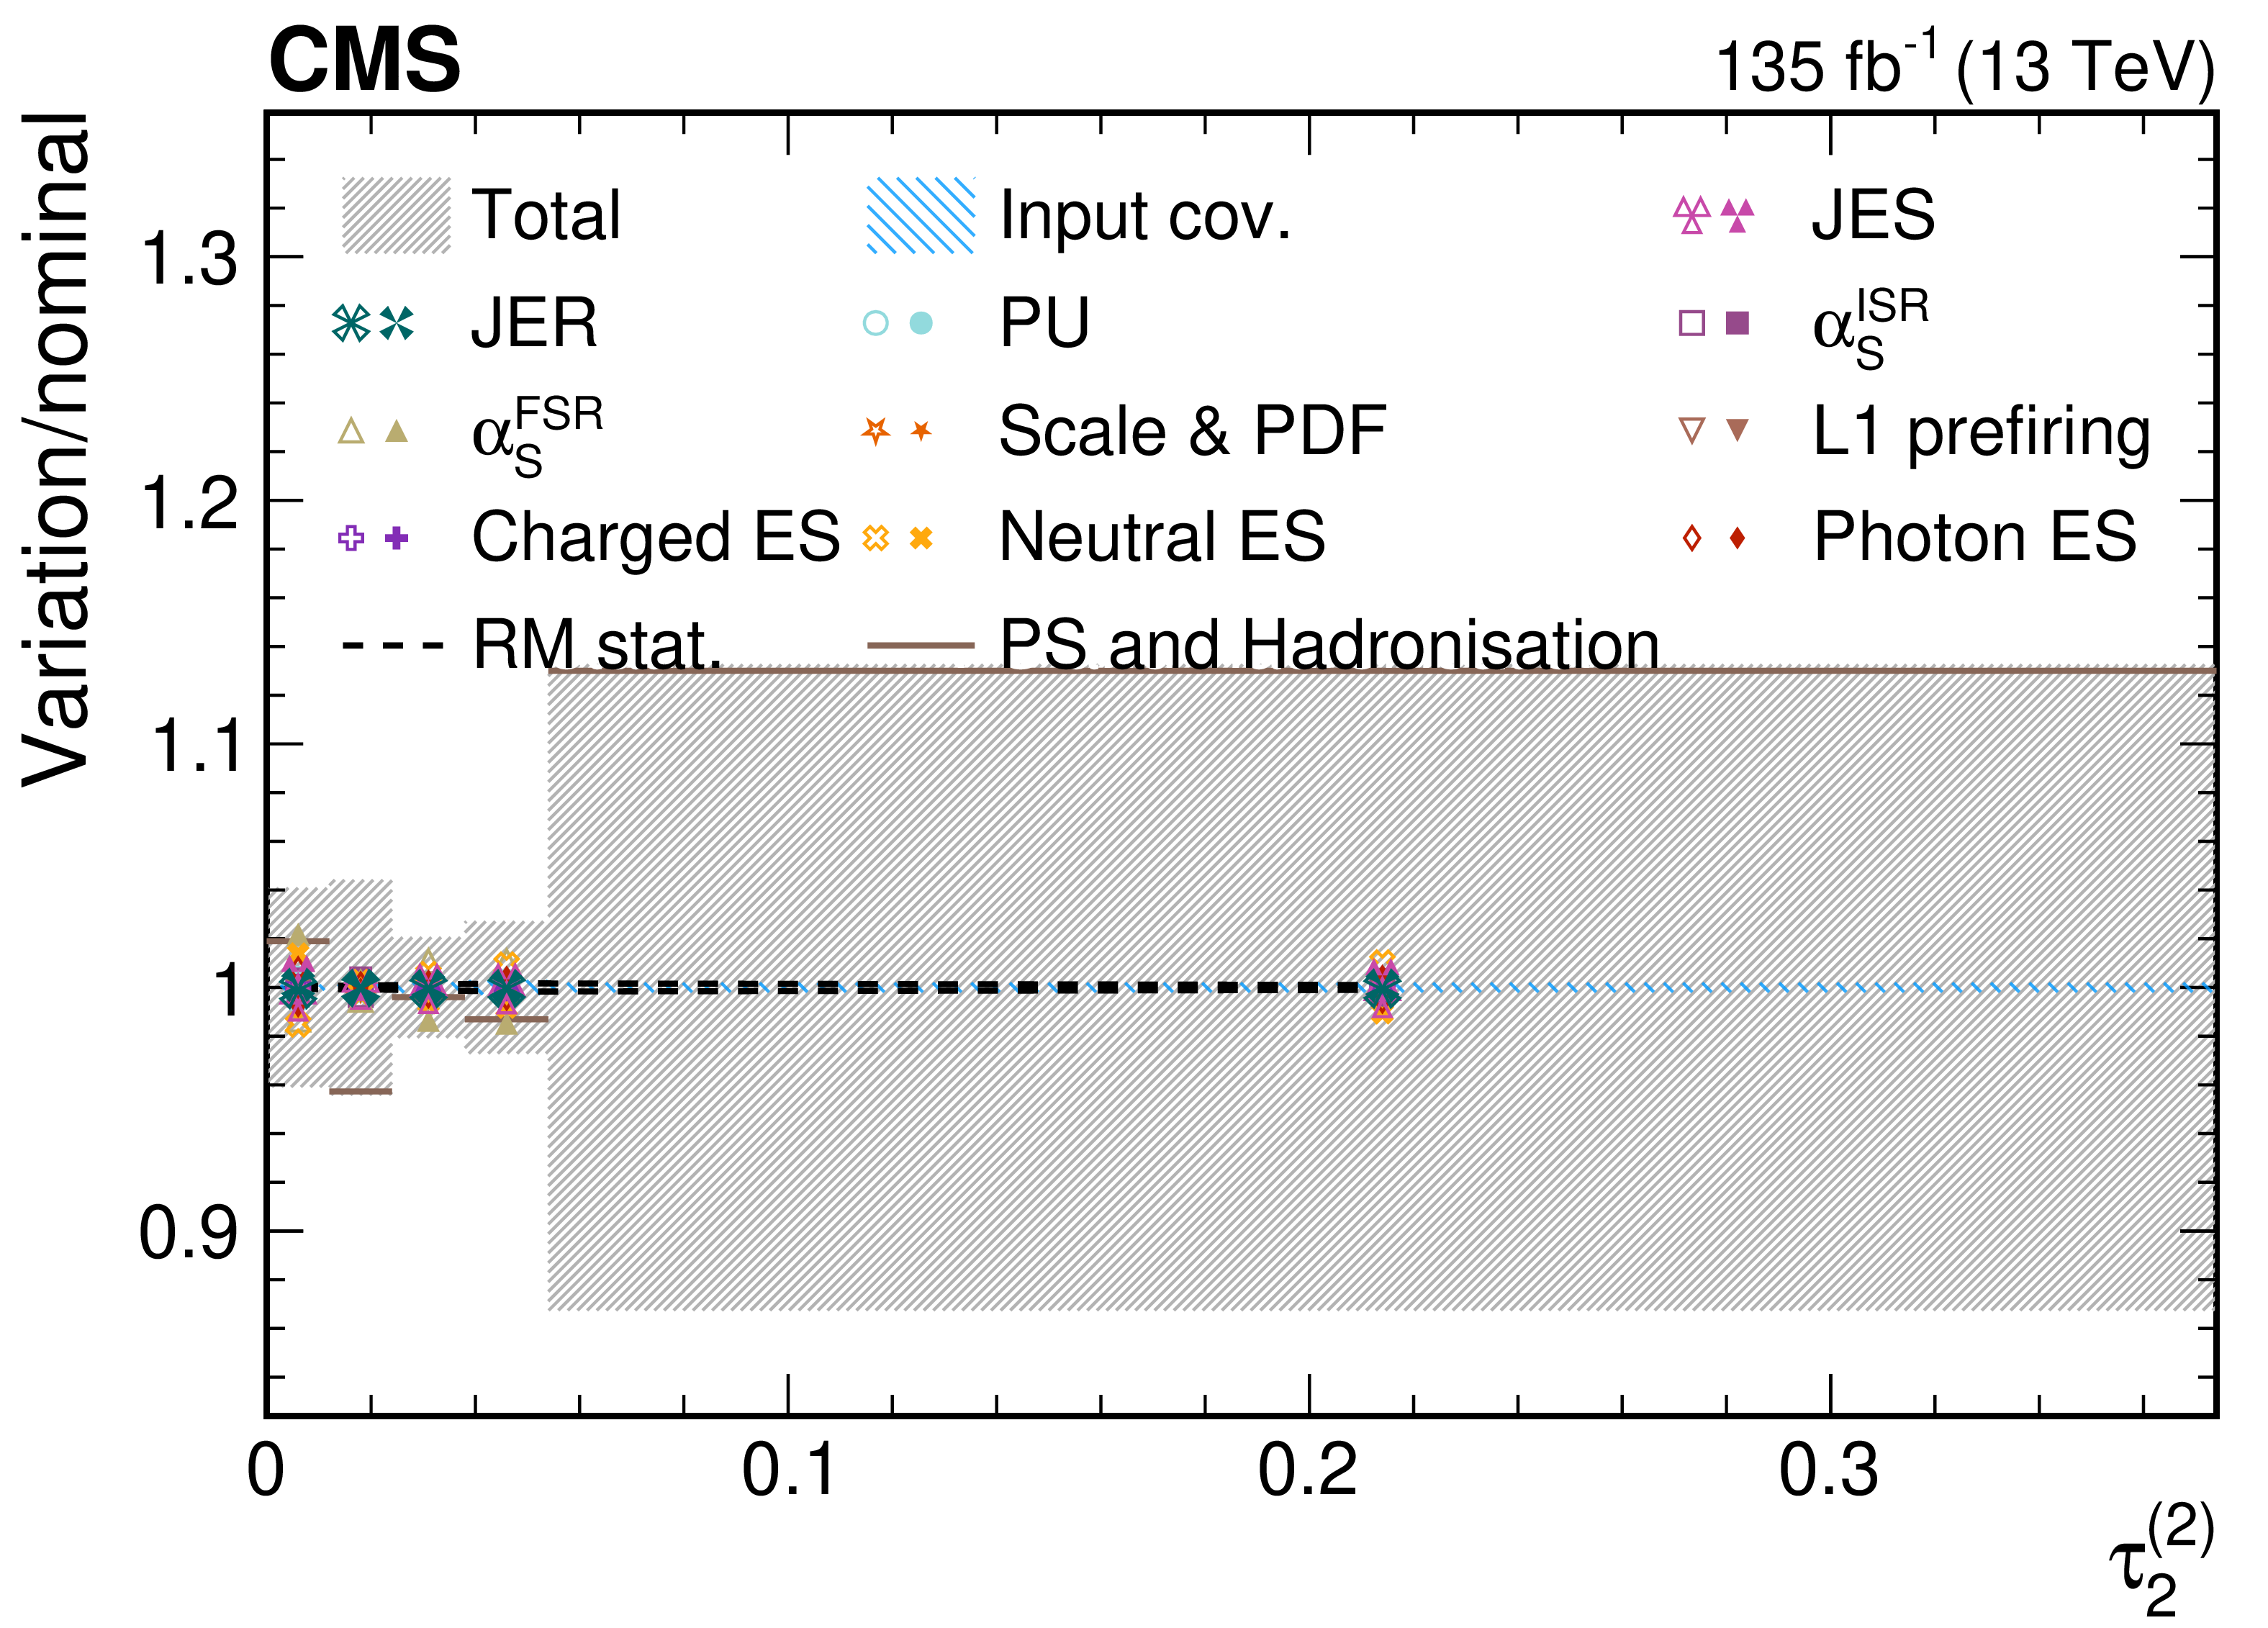
png pdf |
Figure 44-e:
Contributions from various systematic variations to the normalized, unfolded distribution for $ \tau_2^{(\beta)} $ observables measured for AK8 jets in the QCD dijet selection. The total unfolding uncertainty is indicated with the dark grey, hashed region, while the blue hashed region indicates the contributions from the input covariance matrix, which includes the propagated effects of the statistical uncertainties of the input data after background subtraction. Contributions from statistical uncertainties of the simulated sample used to construct the nominal response matrix are indicated with the dashed black line. The physics model uncertainty is computed as a one-sided shift compared to the nominal unfolding, and up (down) contributions from other sources are indicated with filled (open) markers of the same type and colour. |
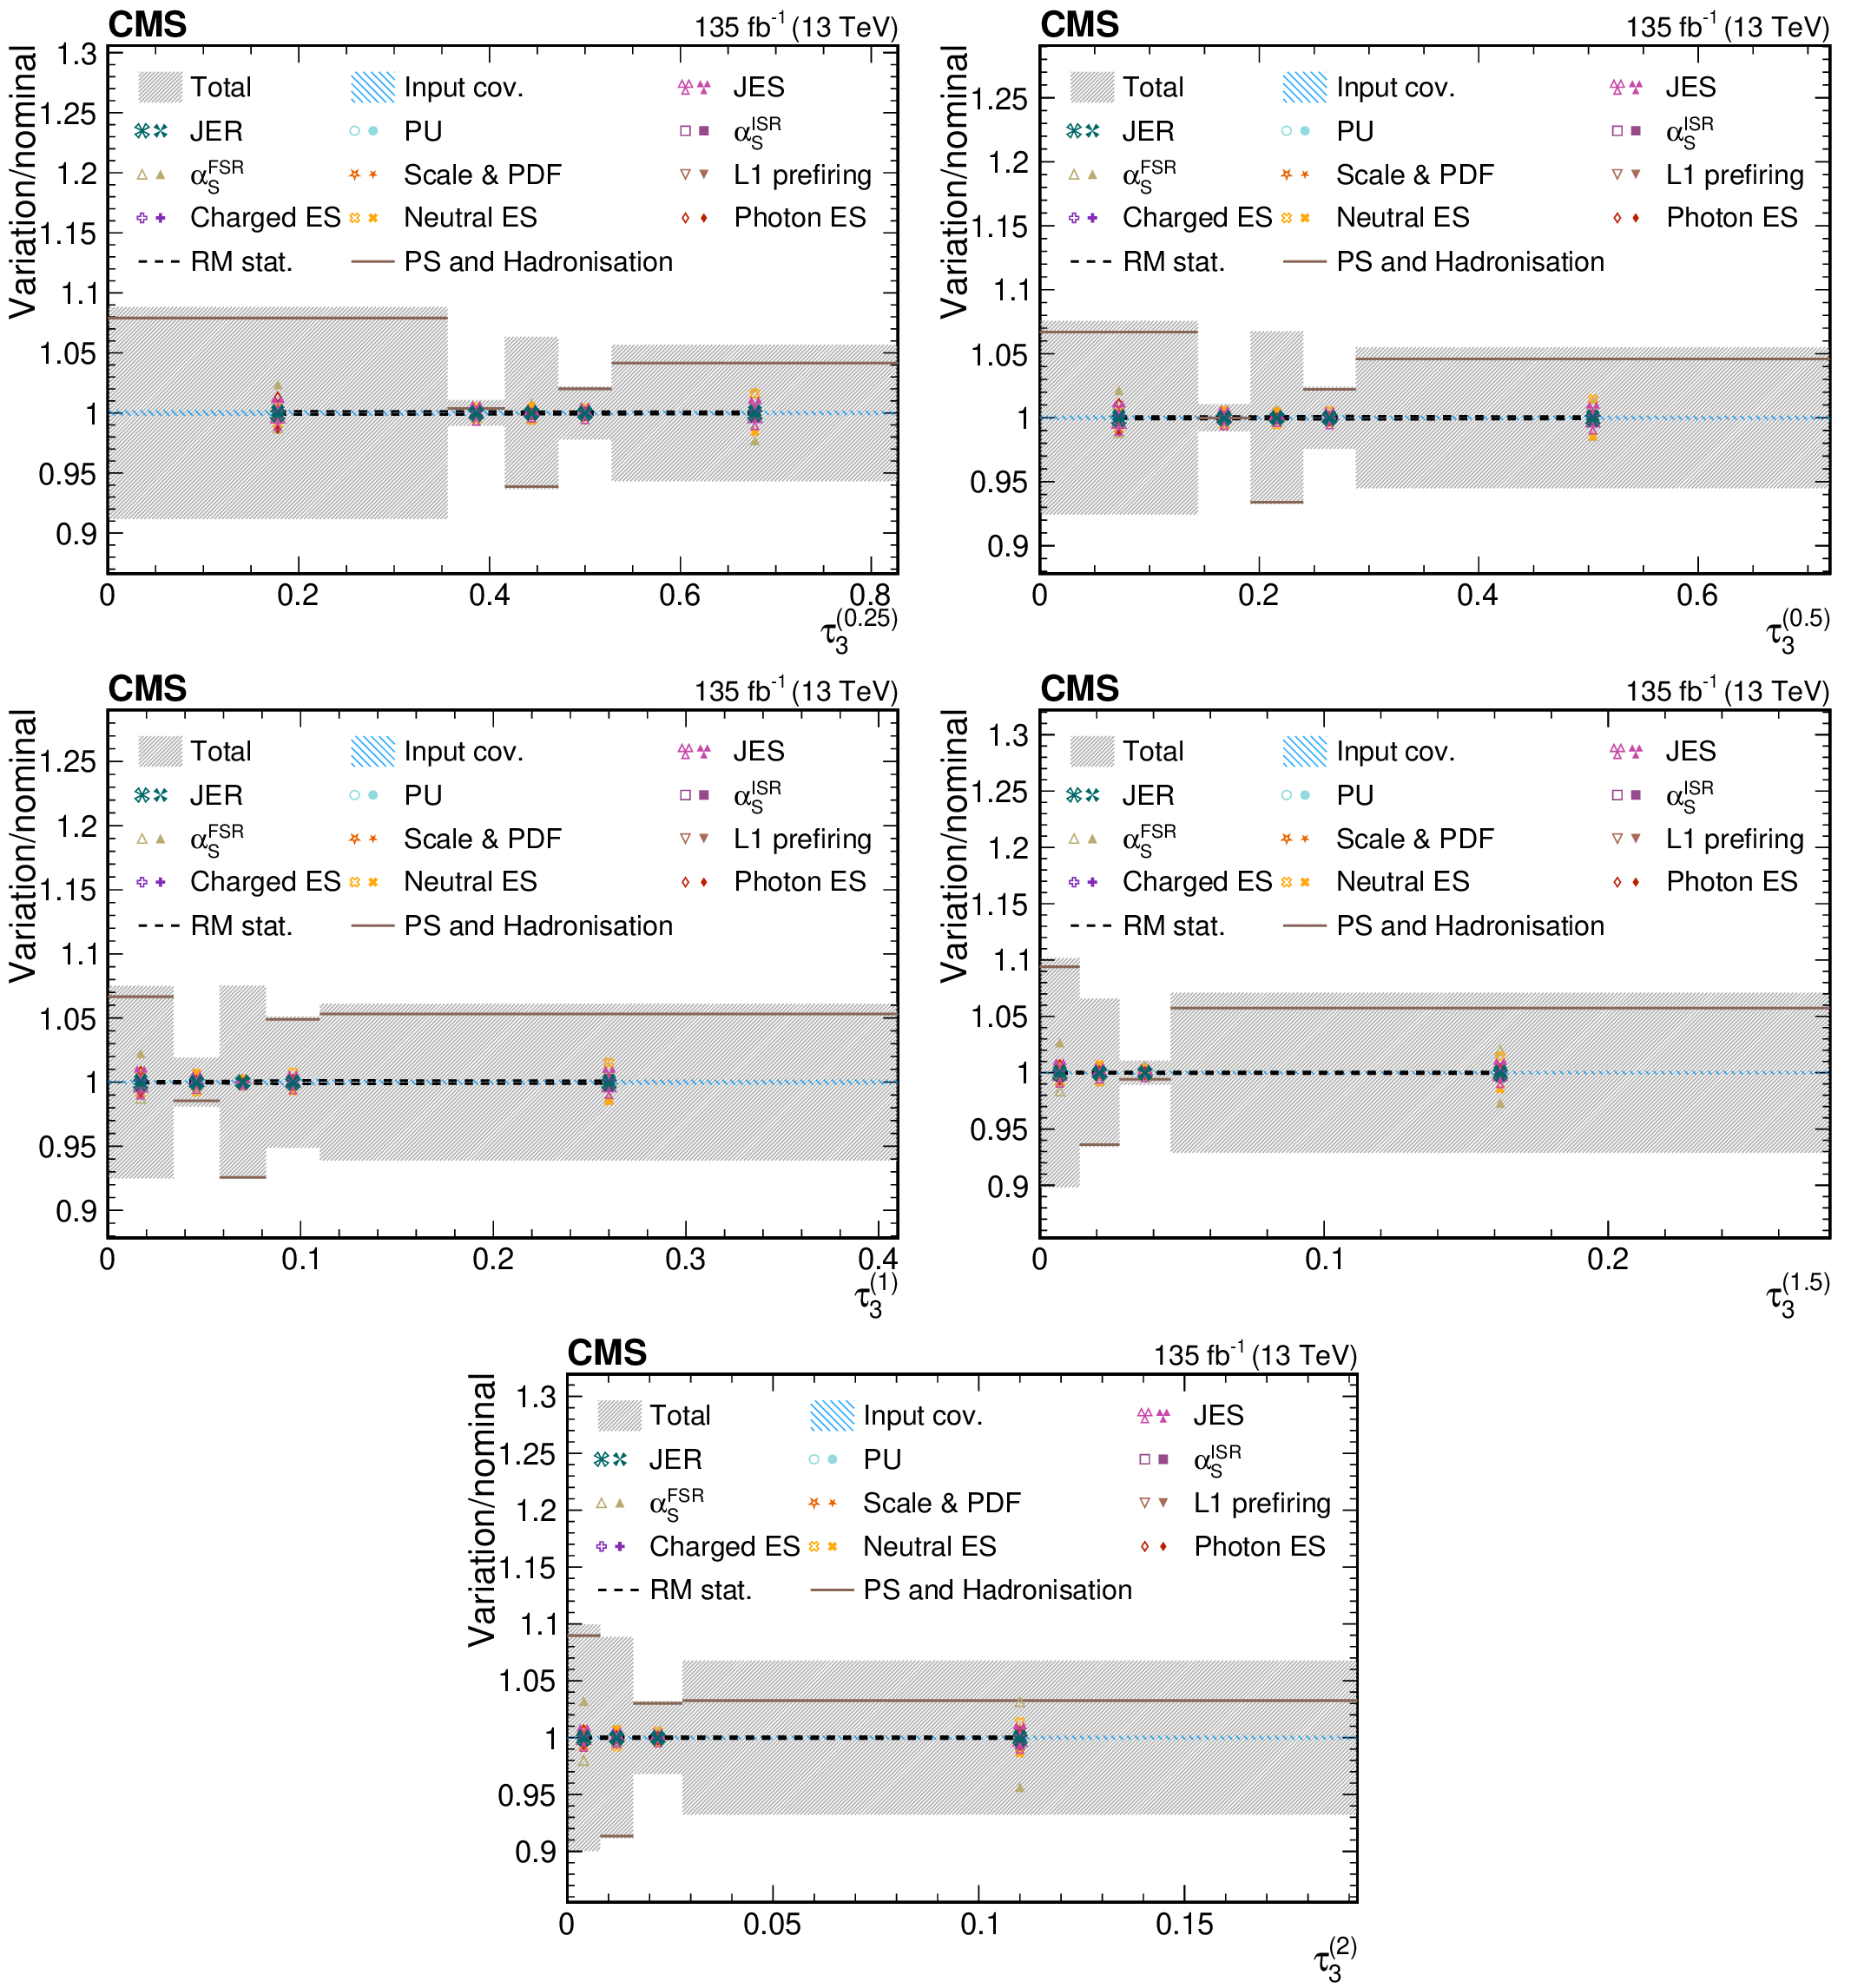
png pdf |
Figure 45:
Contributions from various systematic variations to the normalized, unfolded distribution for $ \tau_3^{(\beta)} $ observables measured for AK8 jets in the QCD dijet selection. The total unfolding uncertainty is indicated with the dark grey, hashed region, while the blue hashed region indicates the contributions from the input covariance matrix, which includes the propagated effects of the statistical uncertainties of the input data after background subtraction. Contributions from statistical uncertainties of the simulated sample used to construct the nominal response matrix are indicated with the dashed black line. The physics model uncertainty is computed as a one-sided shift compared to the nominal unfolding, and up (down) contributions from other sources are indicated with filled (open) markers of the same type and colour. |
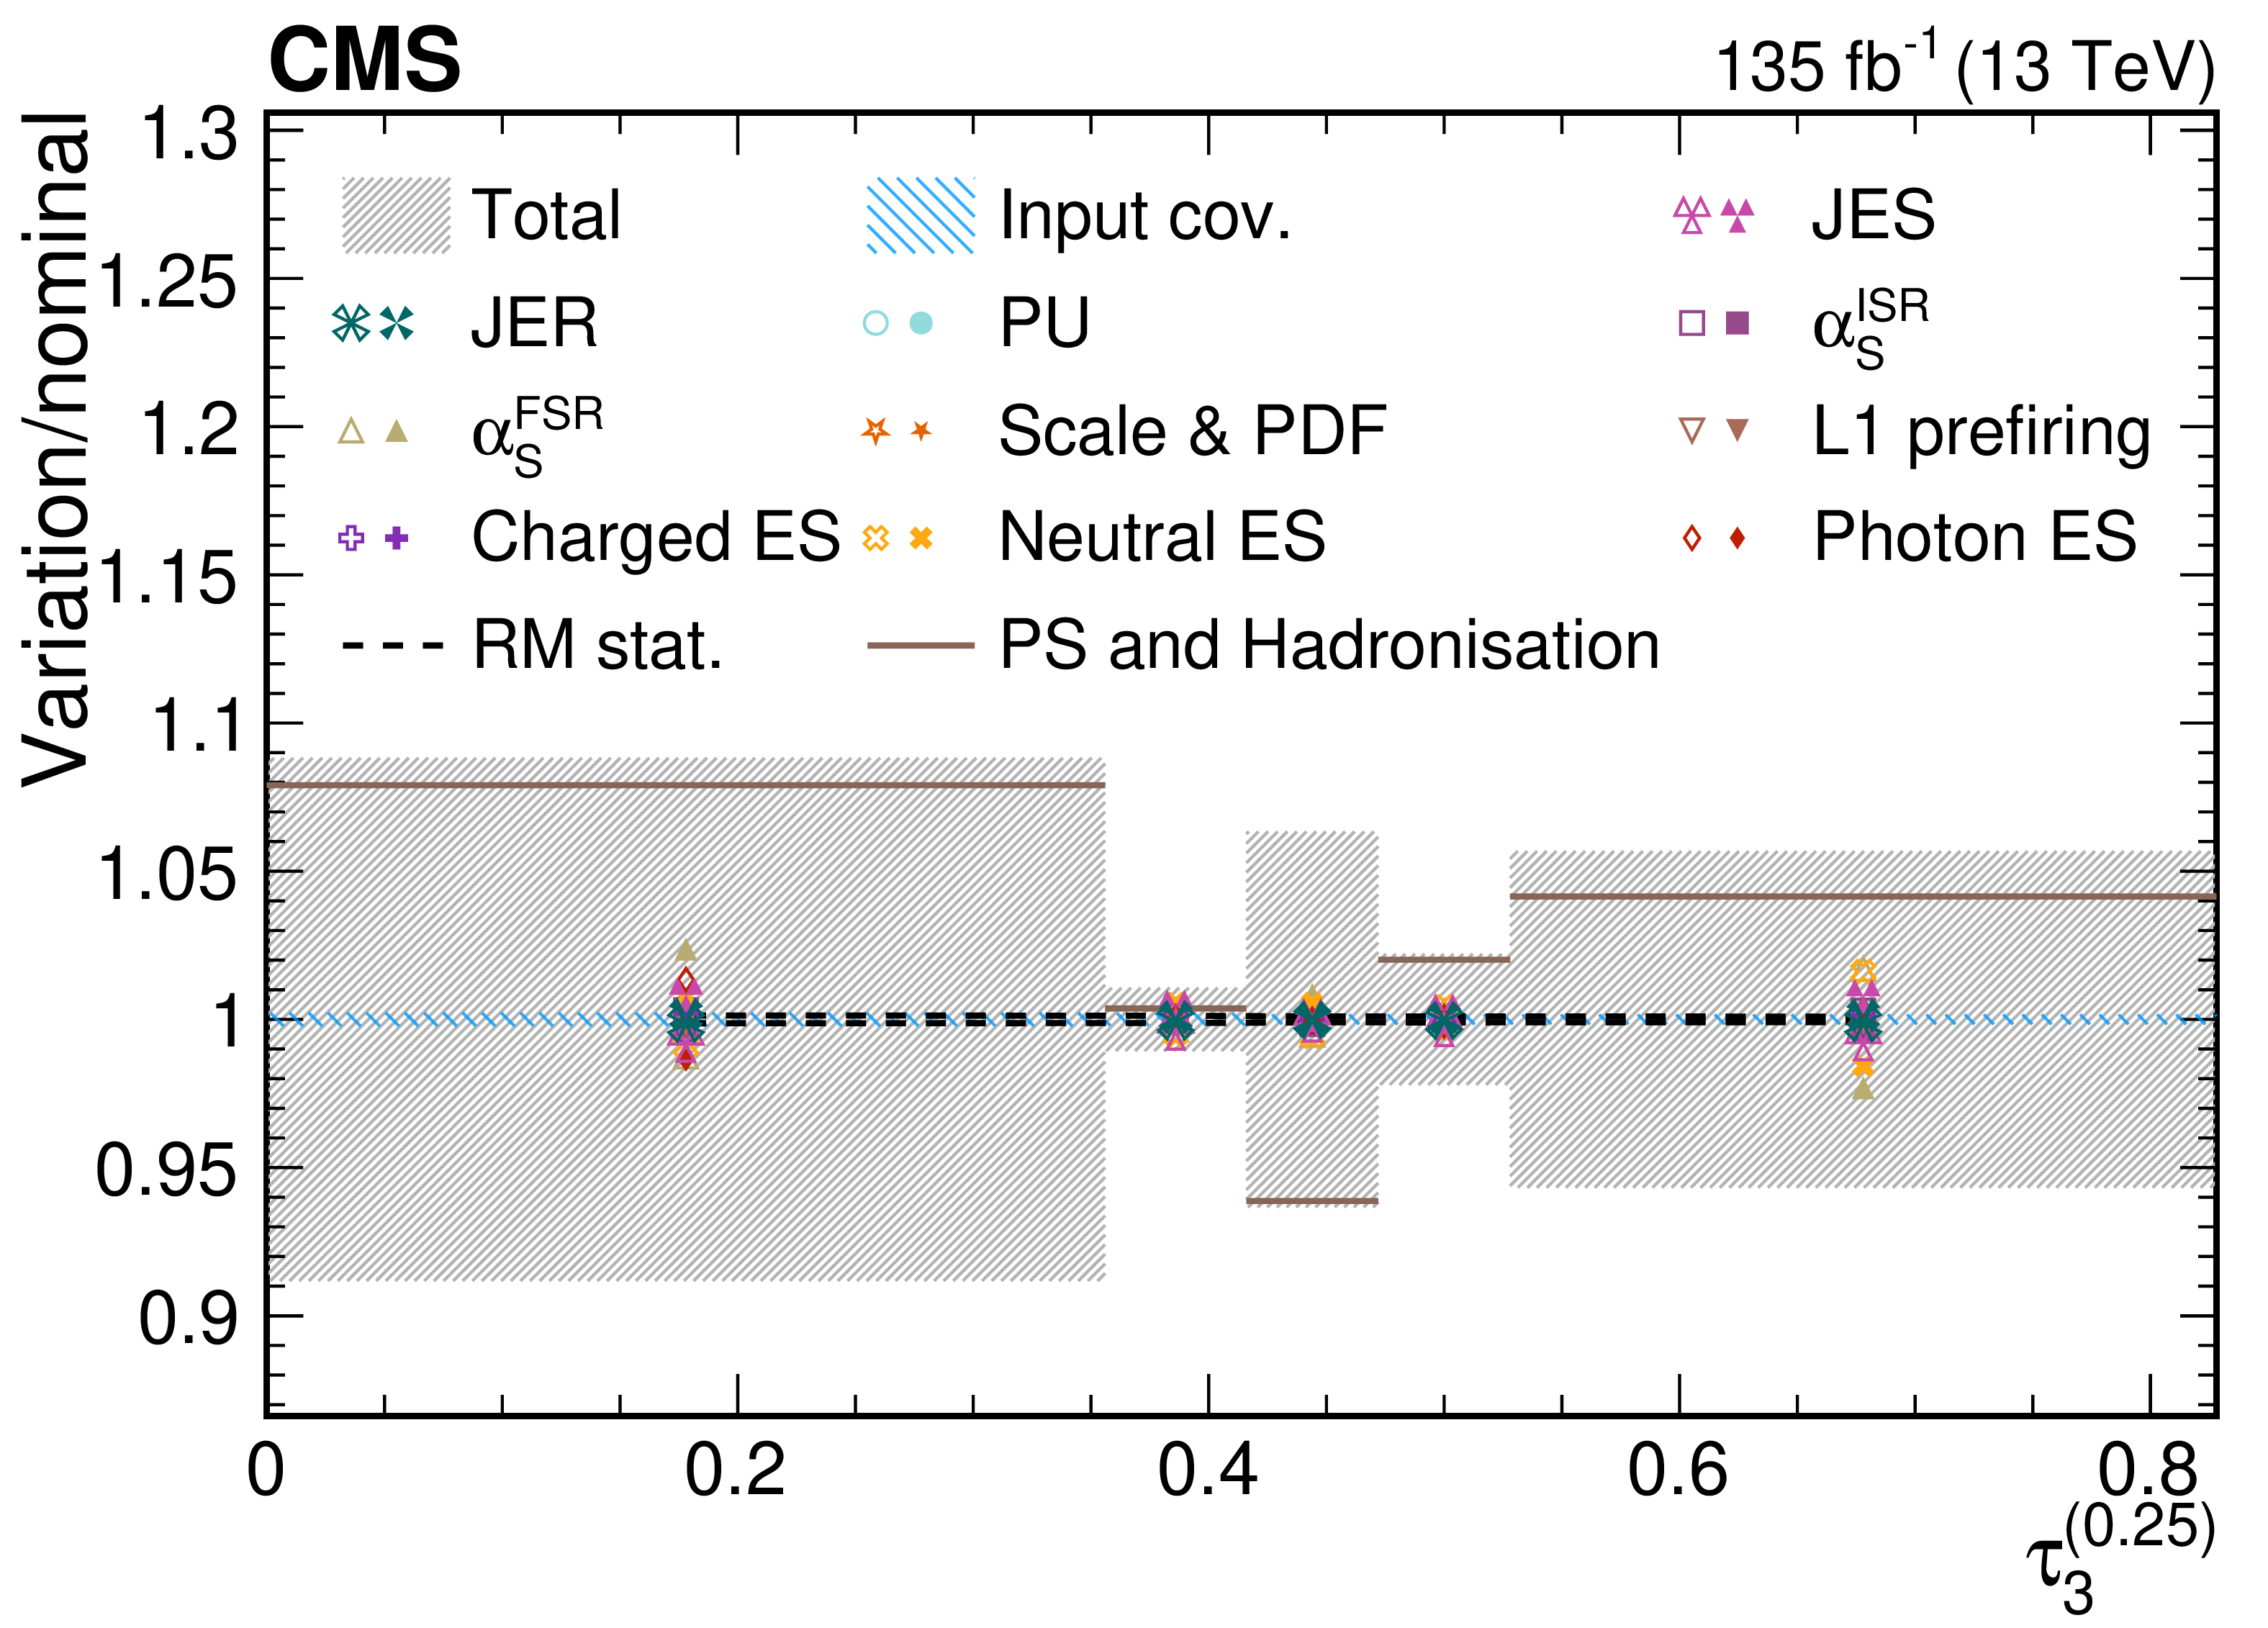
png pdf |
Figure 45-a:
Contributions from various systematic variations to the normalized, unfolded distribution for $ \tau_3^{(\beta)} $ observables measured for AK8 jets in the QCD dijet selection. The total unfolding uncertainty is indicated with the dark grey, hashed region, while the blue hashed region indicates the contributions from the input covariance matrix, which includes the propagated effects of the statistical uncertainties of the input data after background subtraction. Contributions from statistical uncertainties of the simulated sample used to construct the nominal response matrix are indicated with the dashed black line. The physics model uncertainty is computed as a one-sided shift compared to the nominal unfolding, and up (down) contributions from other sources are indicated with filled (open) markers of the same type and colour. |
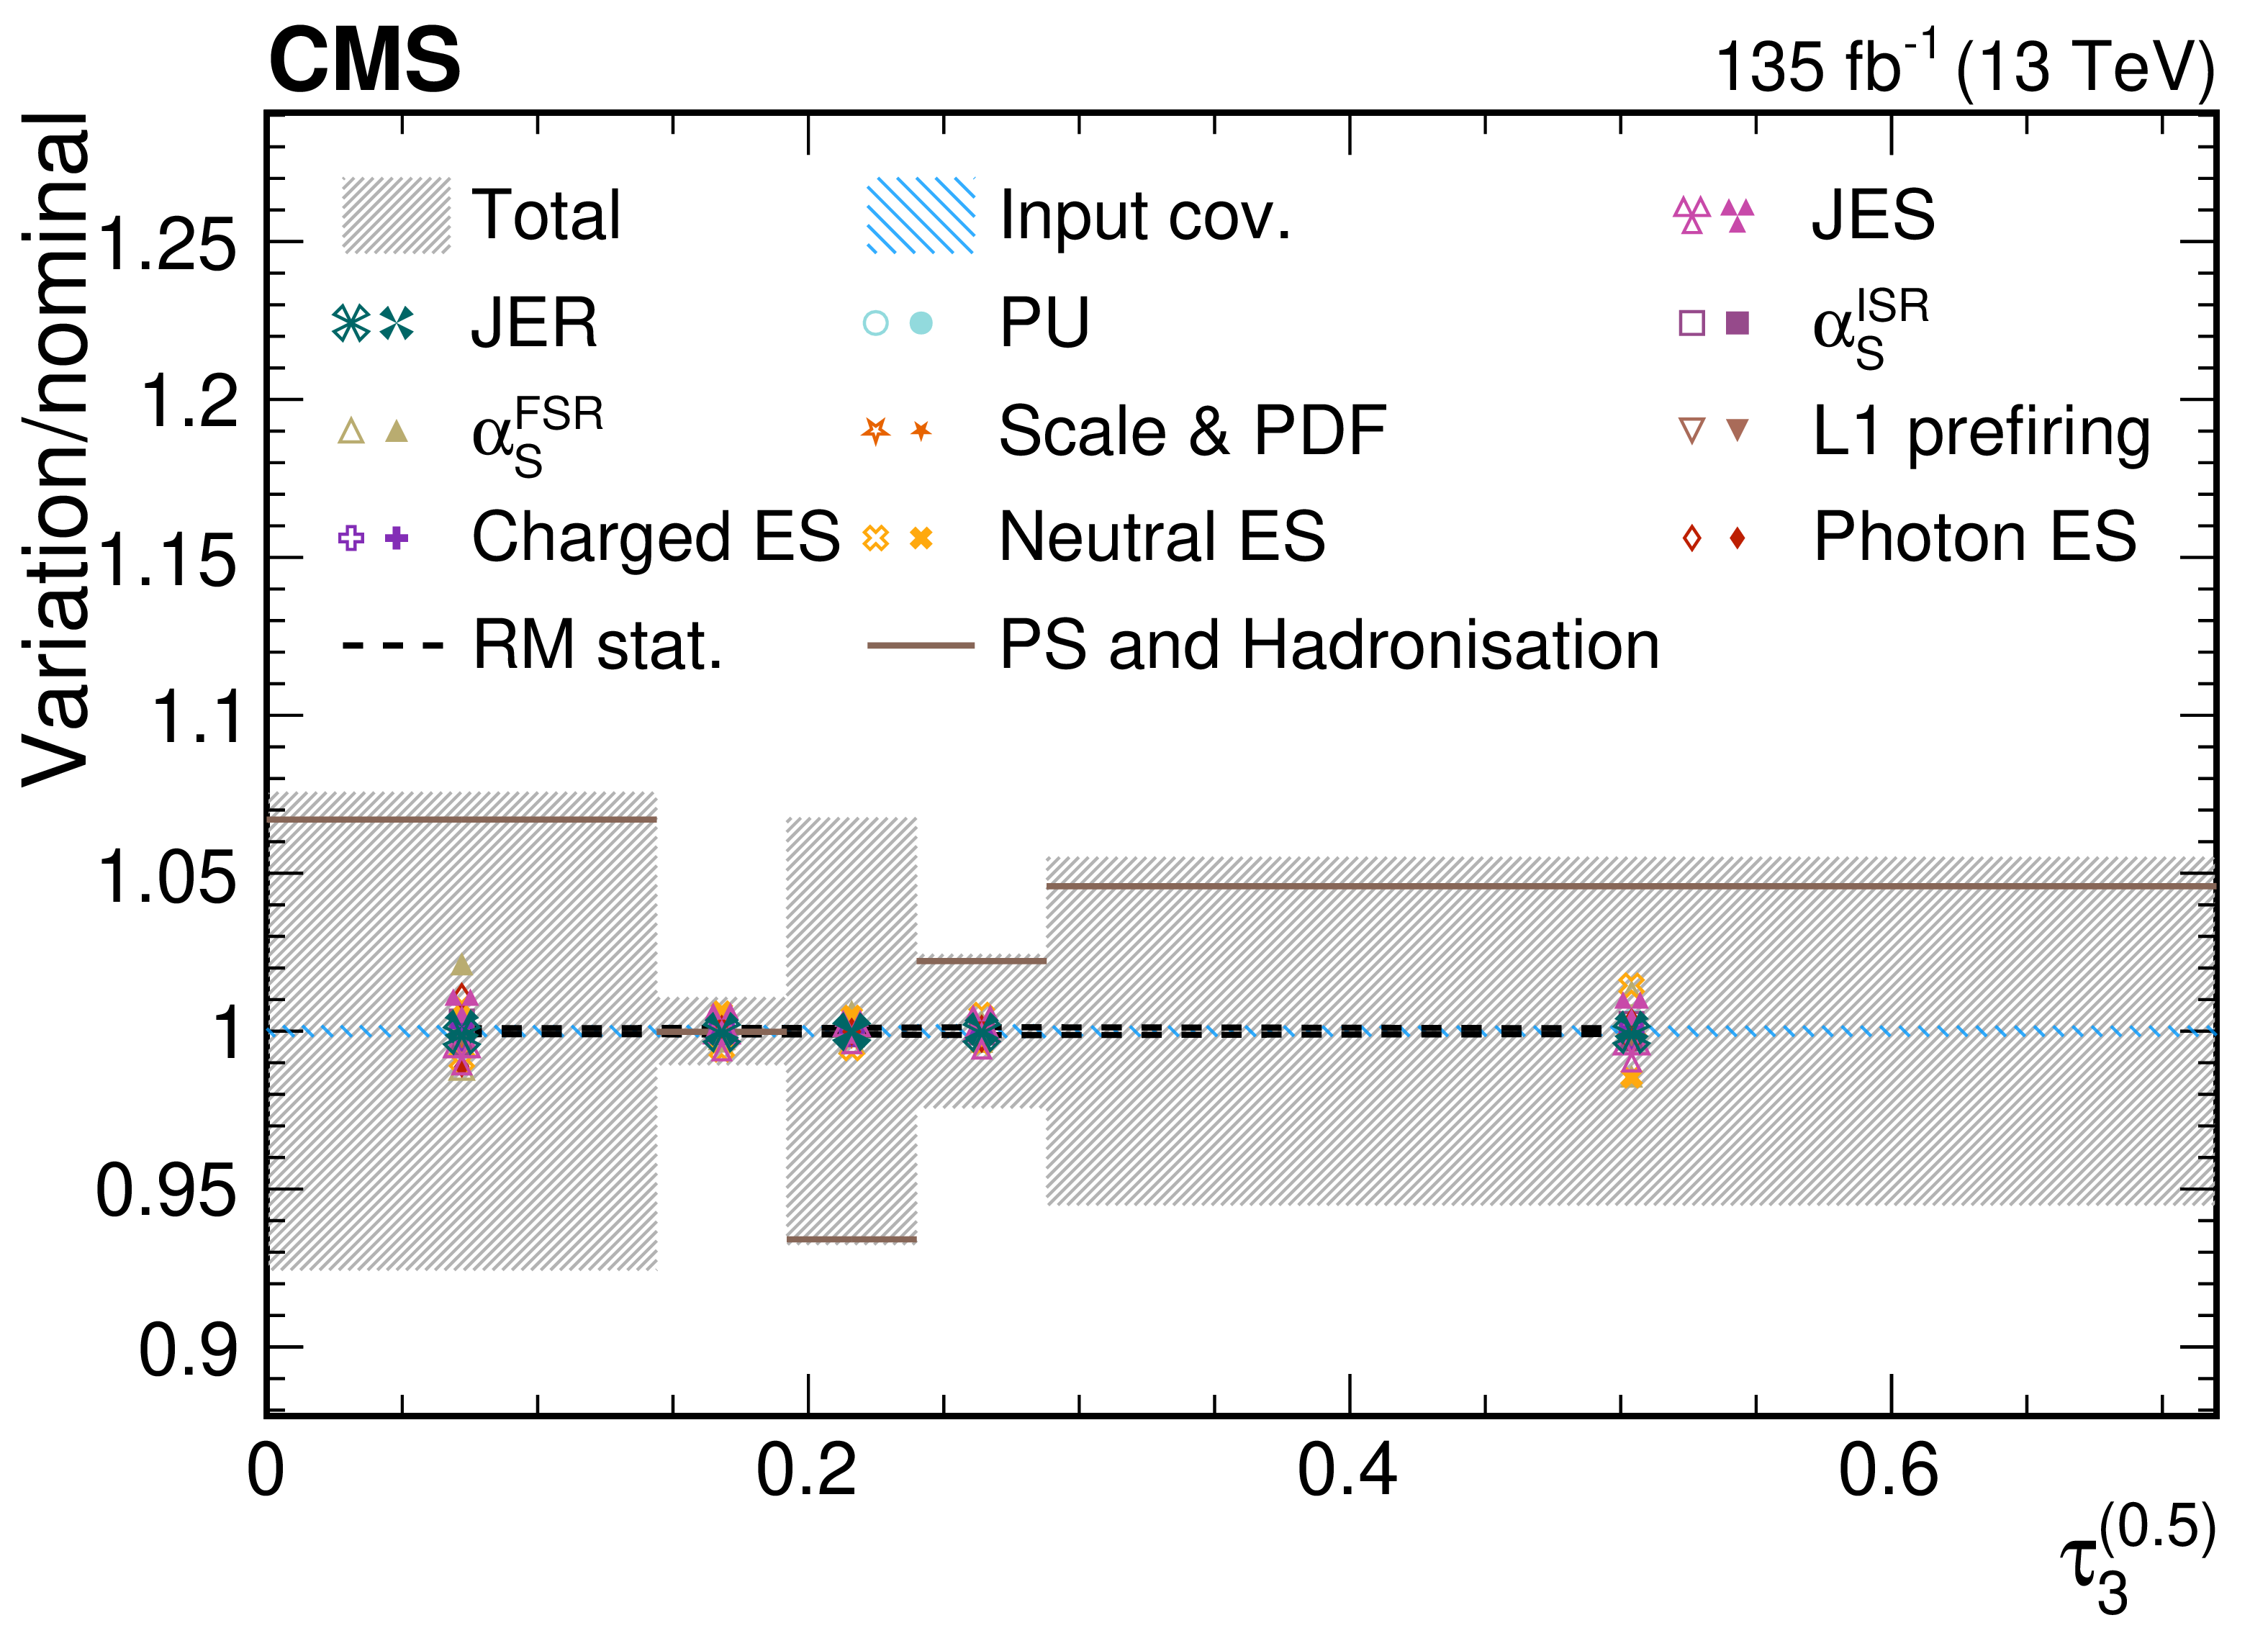
png pdf |
Figure 45-b:
Contributions from various systematic variations to the normalized, unfolded distribution for $ \tau_3^{(\beta)} $ observables measured for AK8 jets in the QCD dijet selection. The total unfolding uncertainty is indicated with the dark grey, hashed region, while the blue hashed region indicates the contributions from the input covariance matrix, which includes the propagated effects of the statistical uncertainties of the input data after background subtraction. Contributions from statistical uncertainties of the simulated sample used to construct the nominal response matrix are indicated with the dashed black line. The physics model uncertainty is computed as a one-sided shift compared to the nominal unfolding, and up (down) contributions from other sources are indicated with filled (open) markers of the same type and colour. |
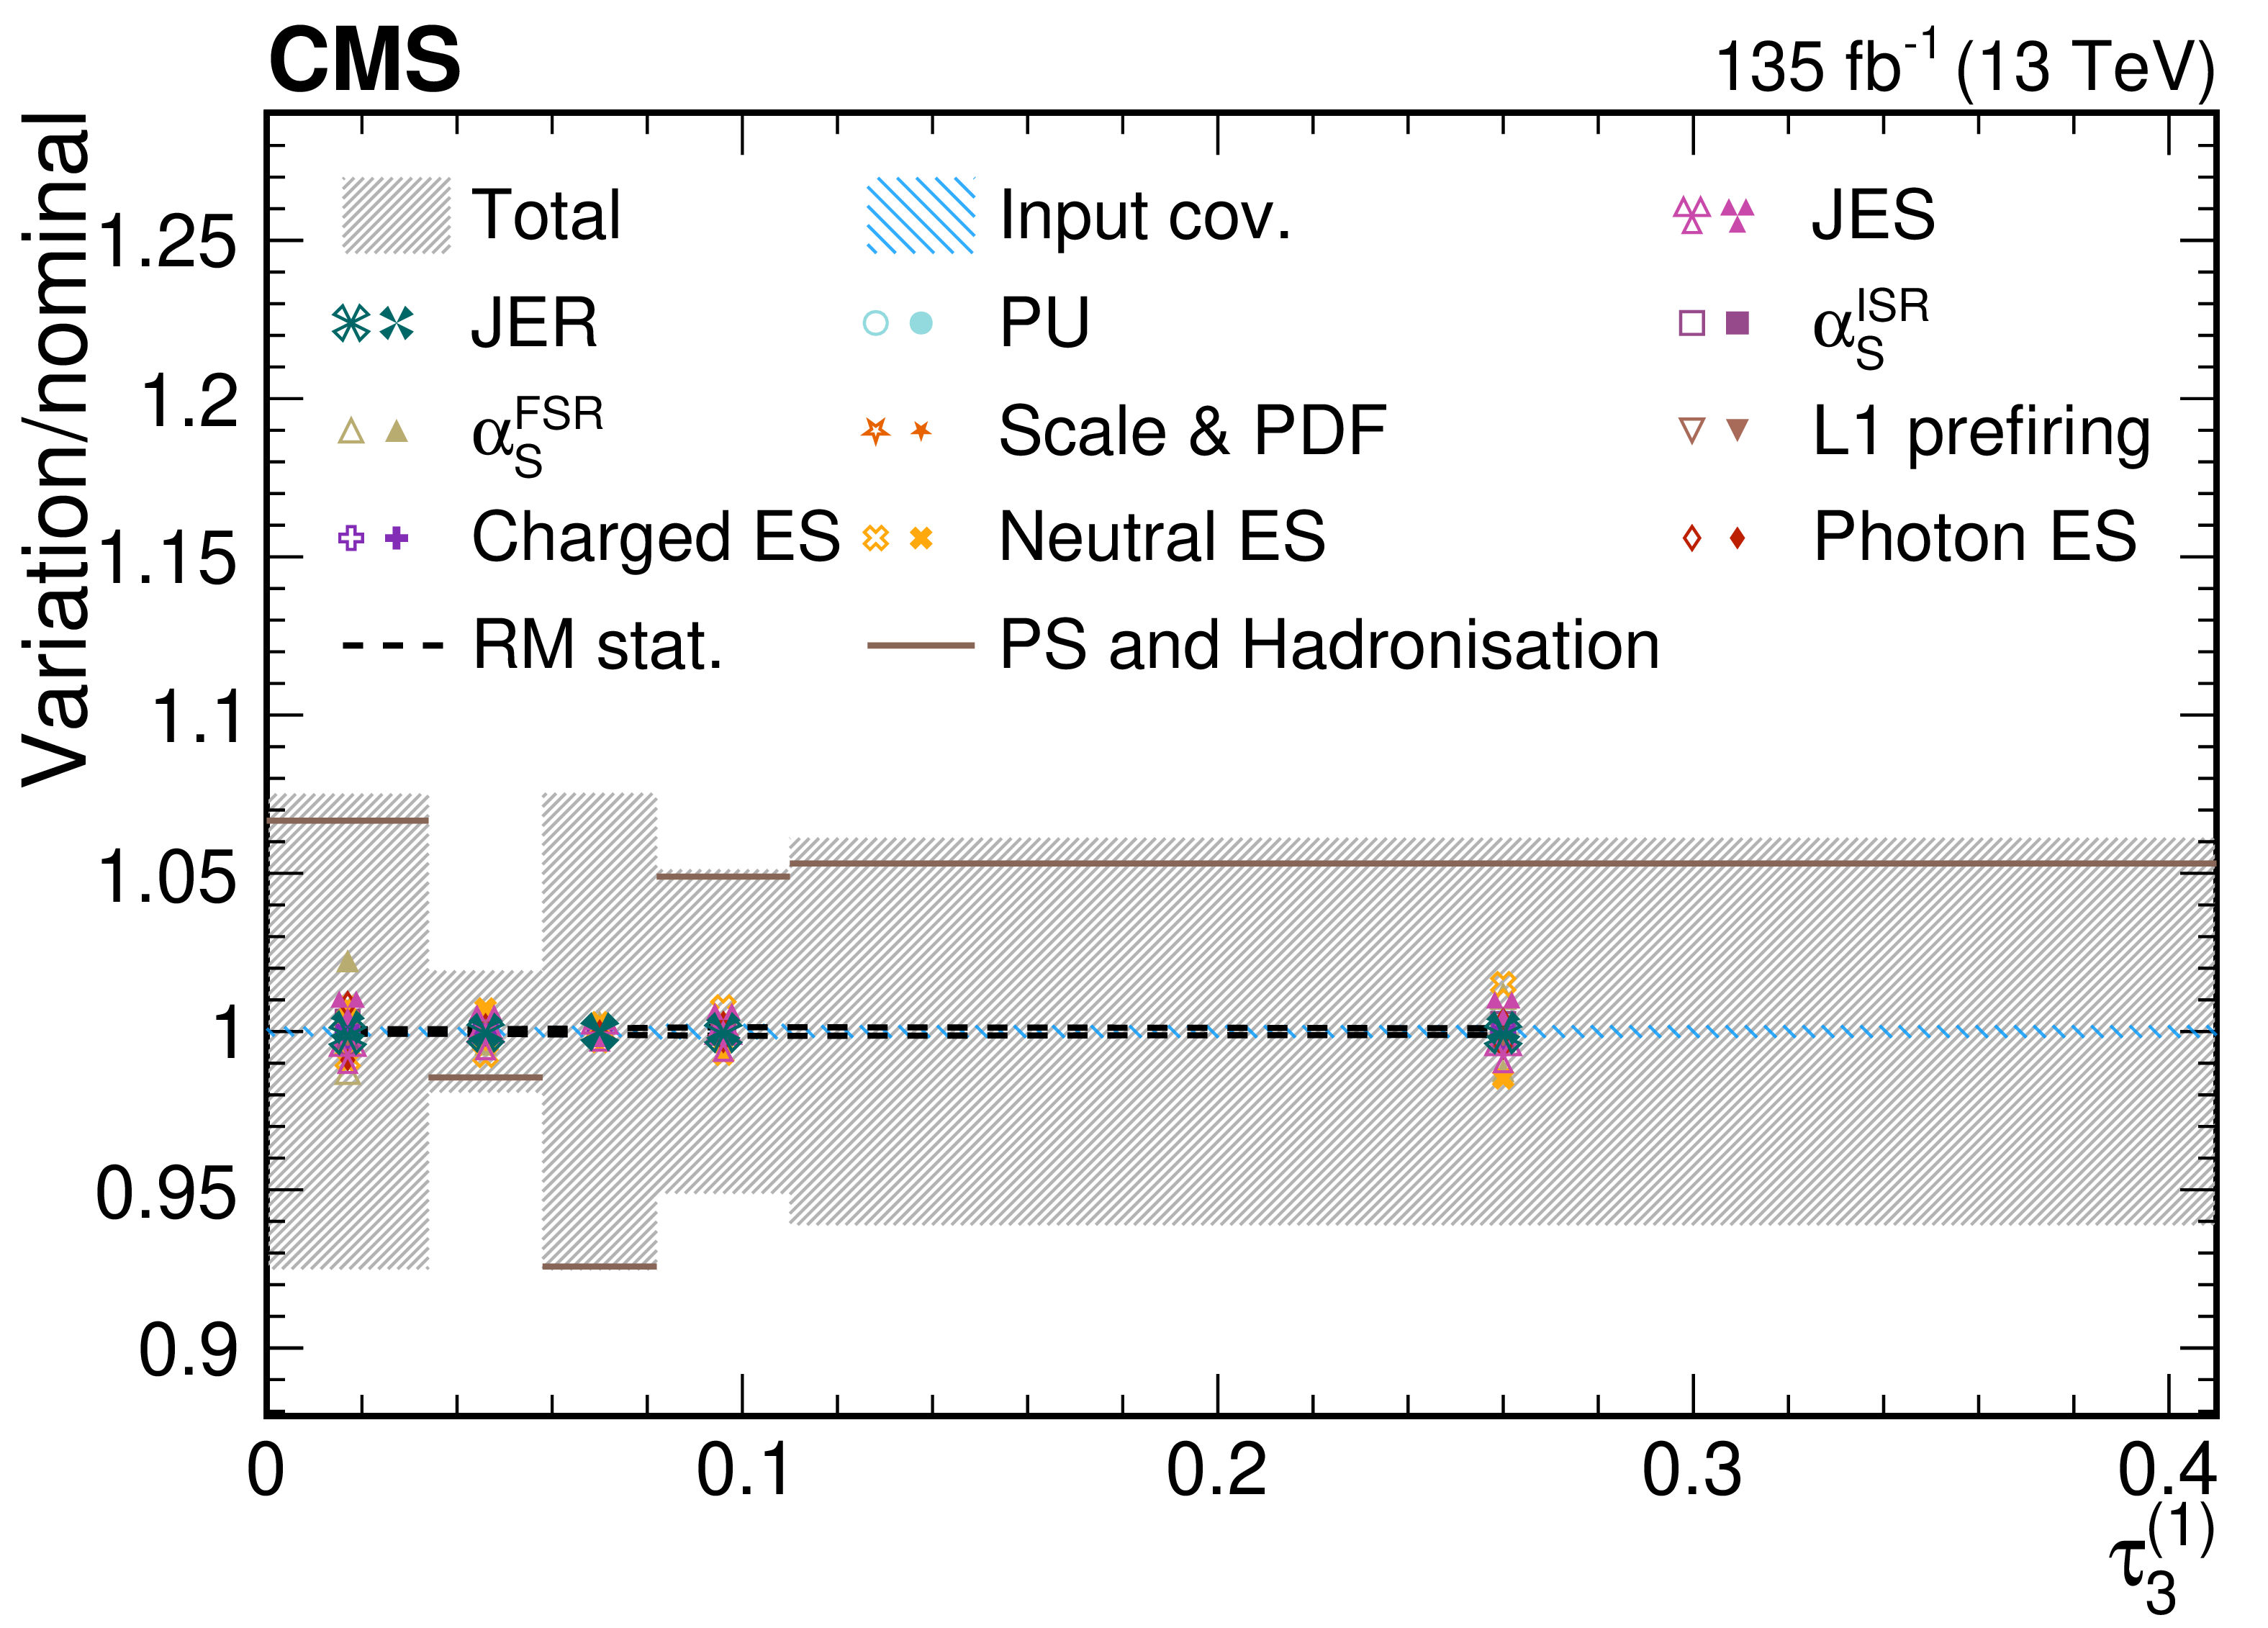
png pdf |
Figure 45-c:
Contributions from various systematic variations to the normalized, unfolded distribution for $ \tau_3^{(\beta)} $ observables measured for AK8 jets in the QCD dijet selection. The total unfolding uncertainty is indicated with the dark grey, hashed region, while the blue hashed region indicates the contributions from the input covariance matrix, which includes the propagated effects of the statistical uncertainties of the input data after background subtraction. Contributions from statistical uncertainties of the simulated sample used to construct the nominal response matrix are indicated with the dashed black line. The physics model uncertainty is computed as a one-sided shift compared to the nominal unfolding, and up (down) contributions from other sources are indicated with filled (open) markers of the same type and colour. |
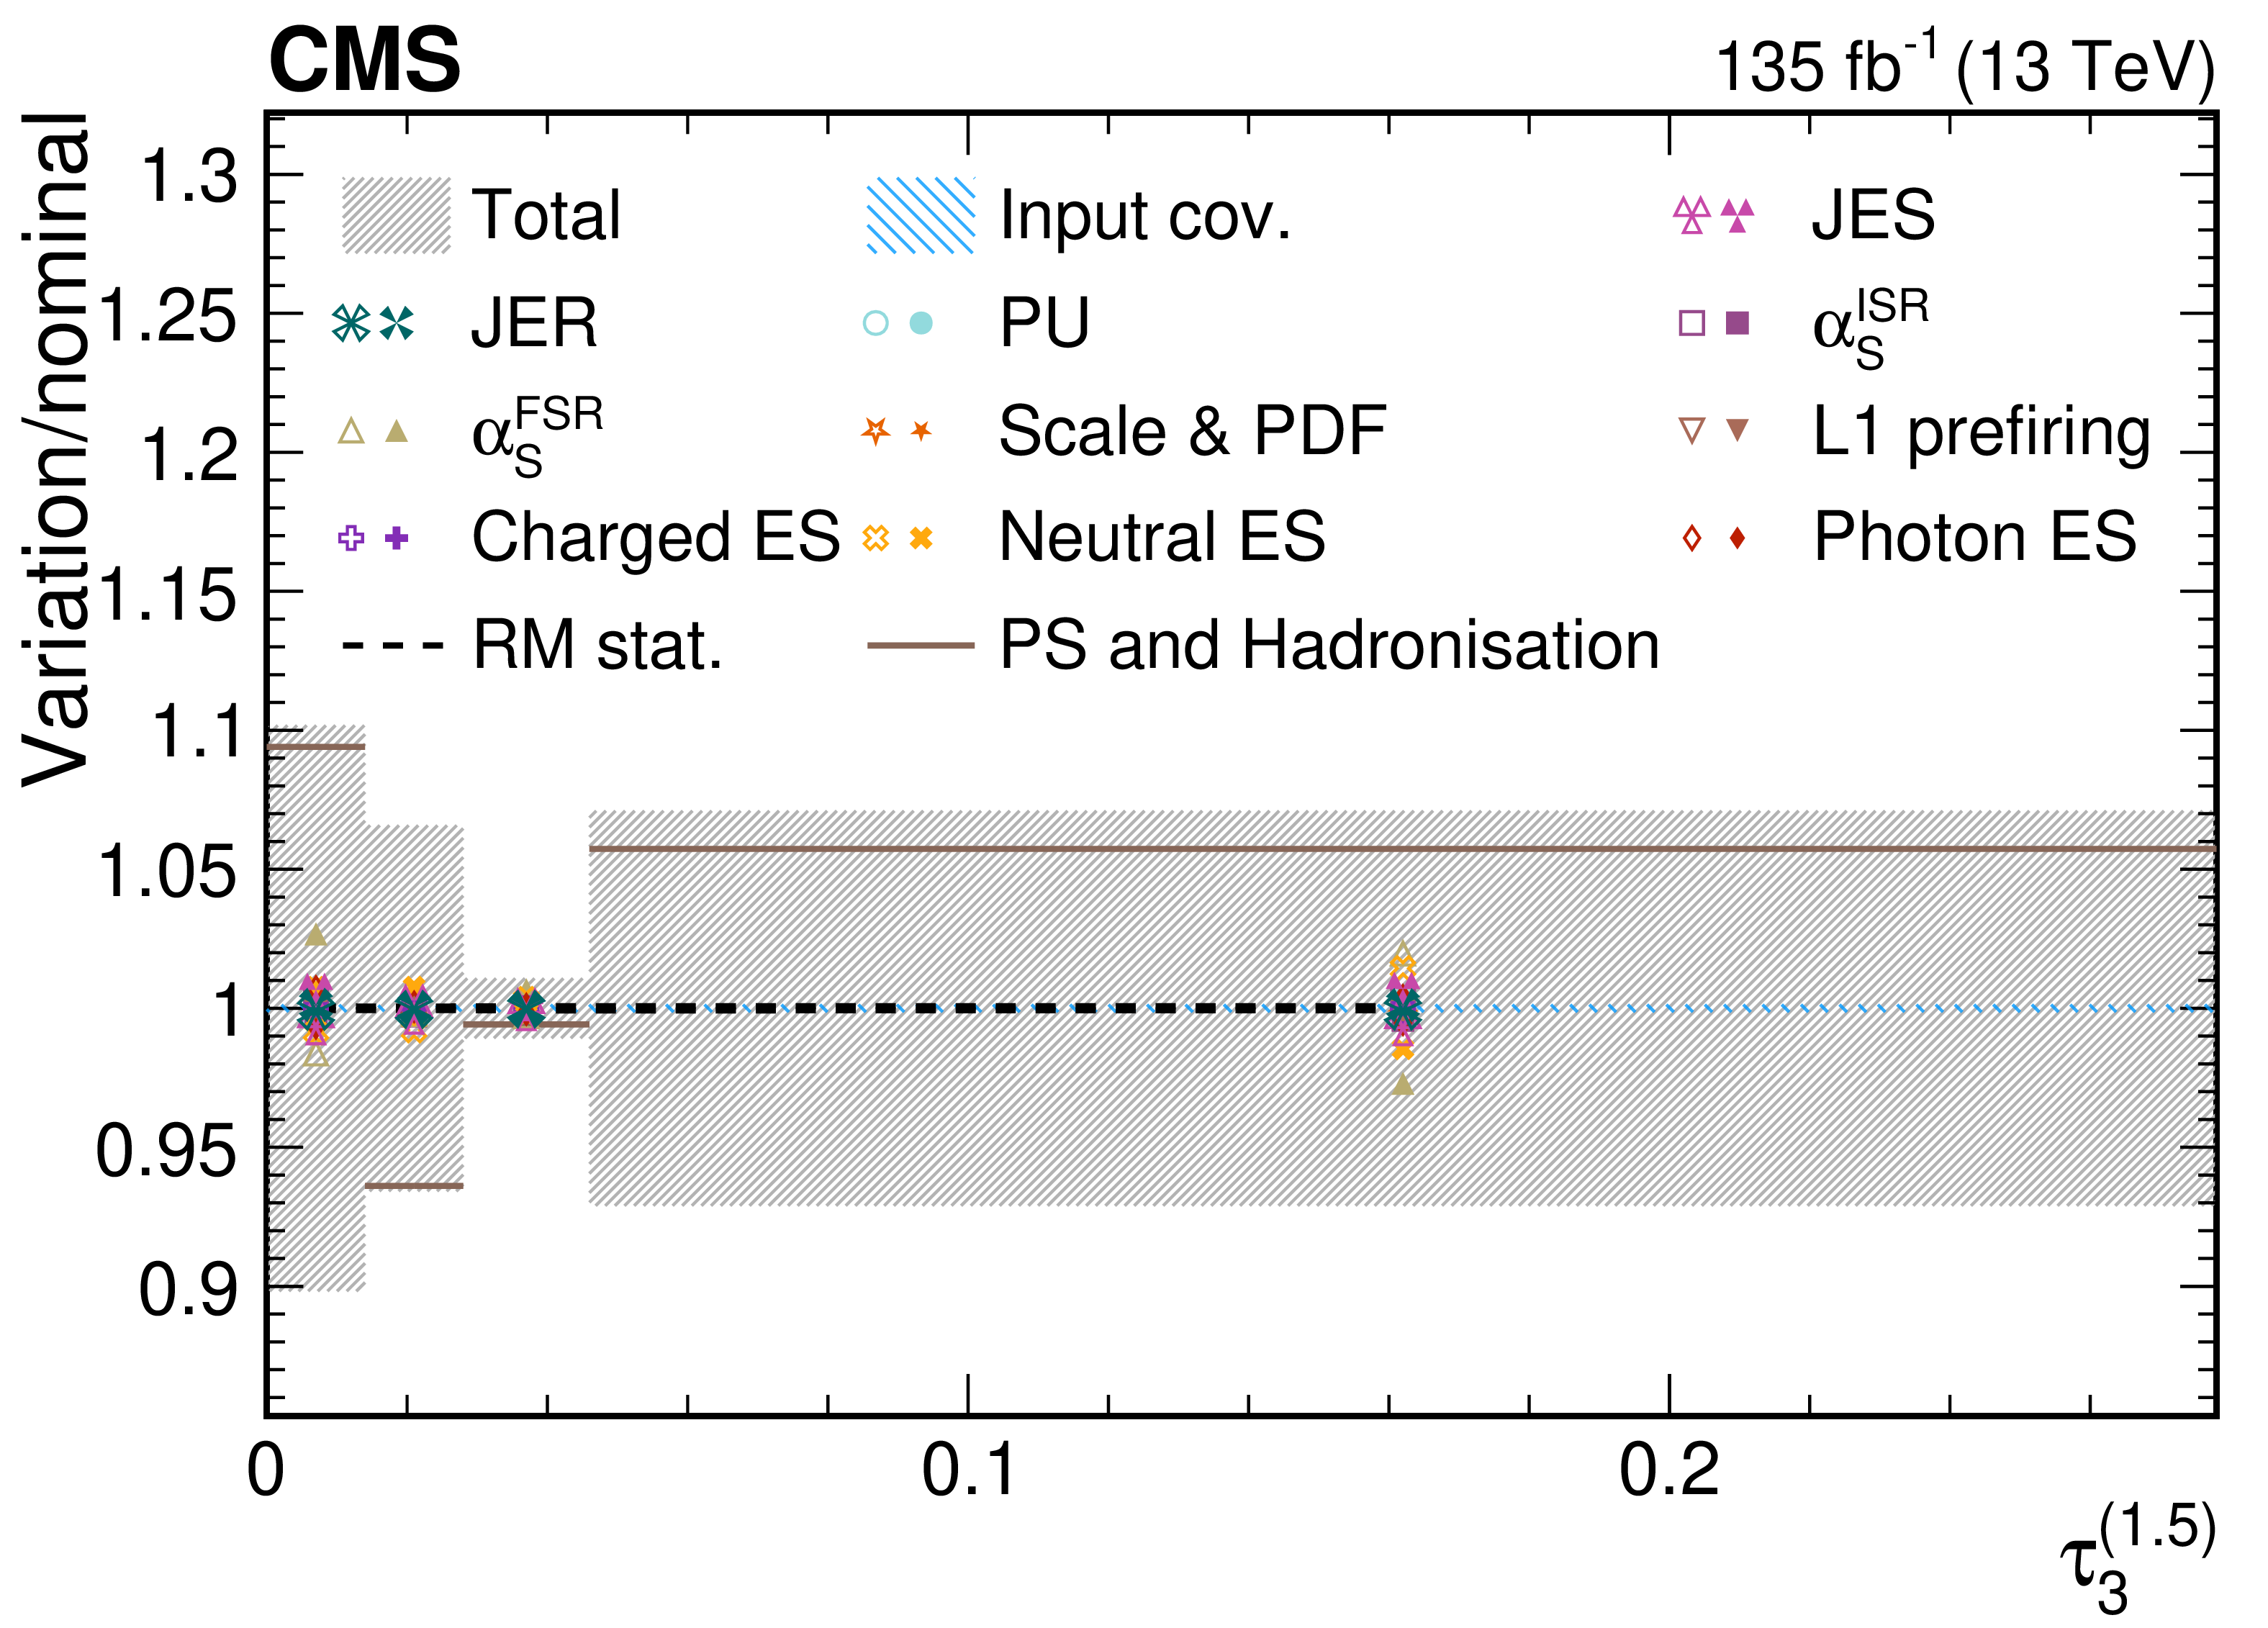
png pdf |
Figure 45-d:
Contributions from various systematic variations to the normalized, unfolded distribution for $ \tau_3^{(\beta)} $ observables measured for AK8 jets in the QCD dijet selection. The total unfolding uncertainty is indicated with the dark grey, hashed region, while the blue hashed region indicates the contributions from the input covariance matrix, which includes the propagated effects of the statistical uncertainties of the input data after background subtraction. Contributions from statistical uncertainties of the simulated sample used to construct the nominal response matrix are indicated with the dashed black line. The physics model uncertainty is computed as a one-sided shift compared to the nominal unfolding, and up (down) contributions from other sources are indicated with filled (open) markers of the same type and colour. |
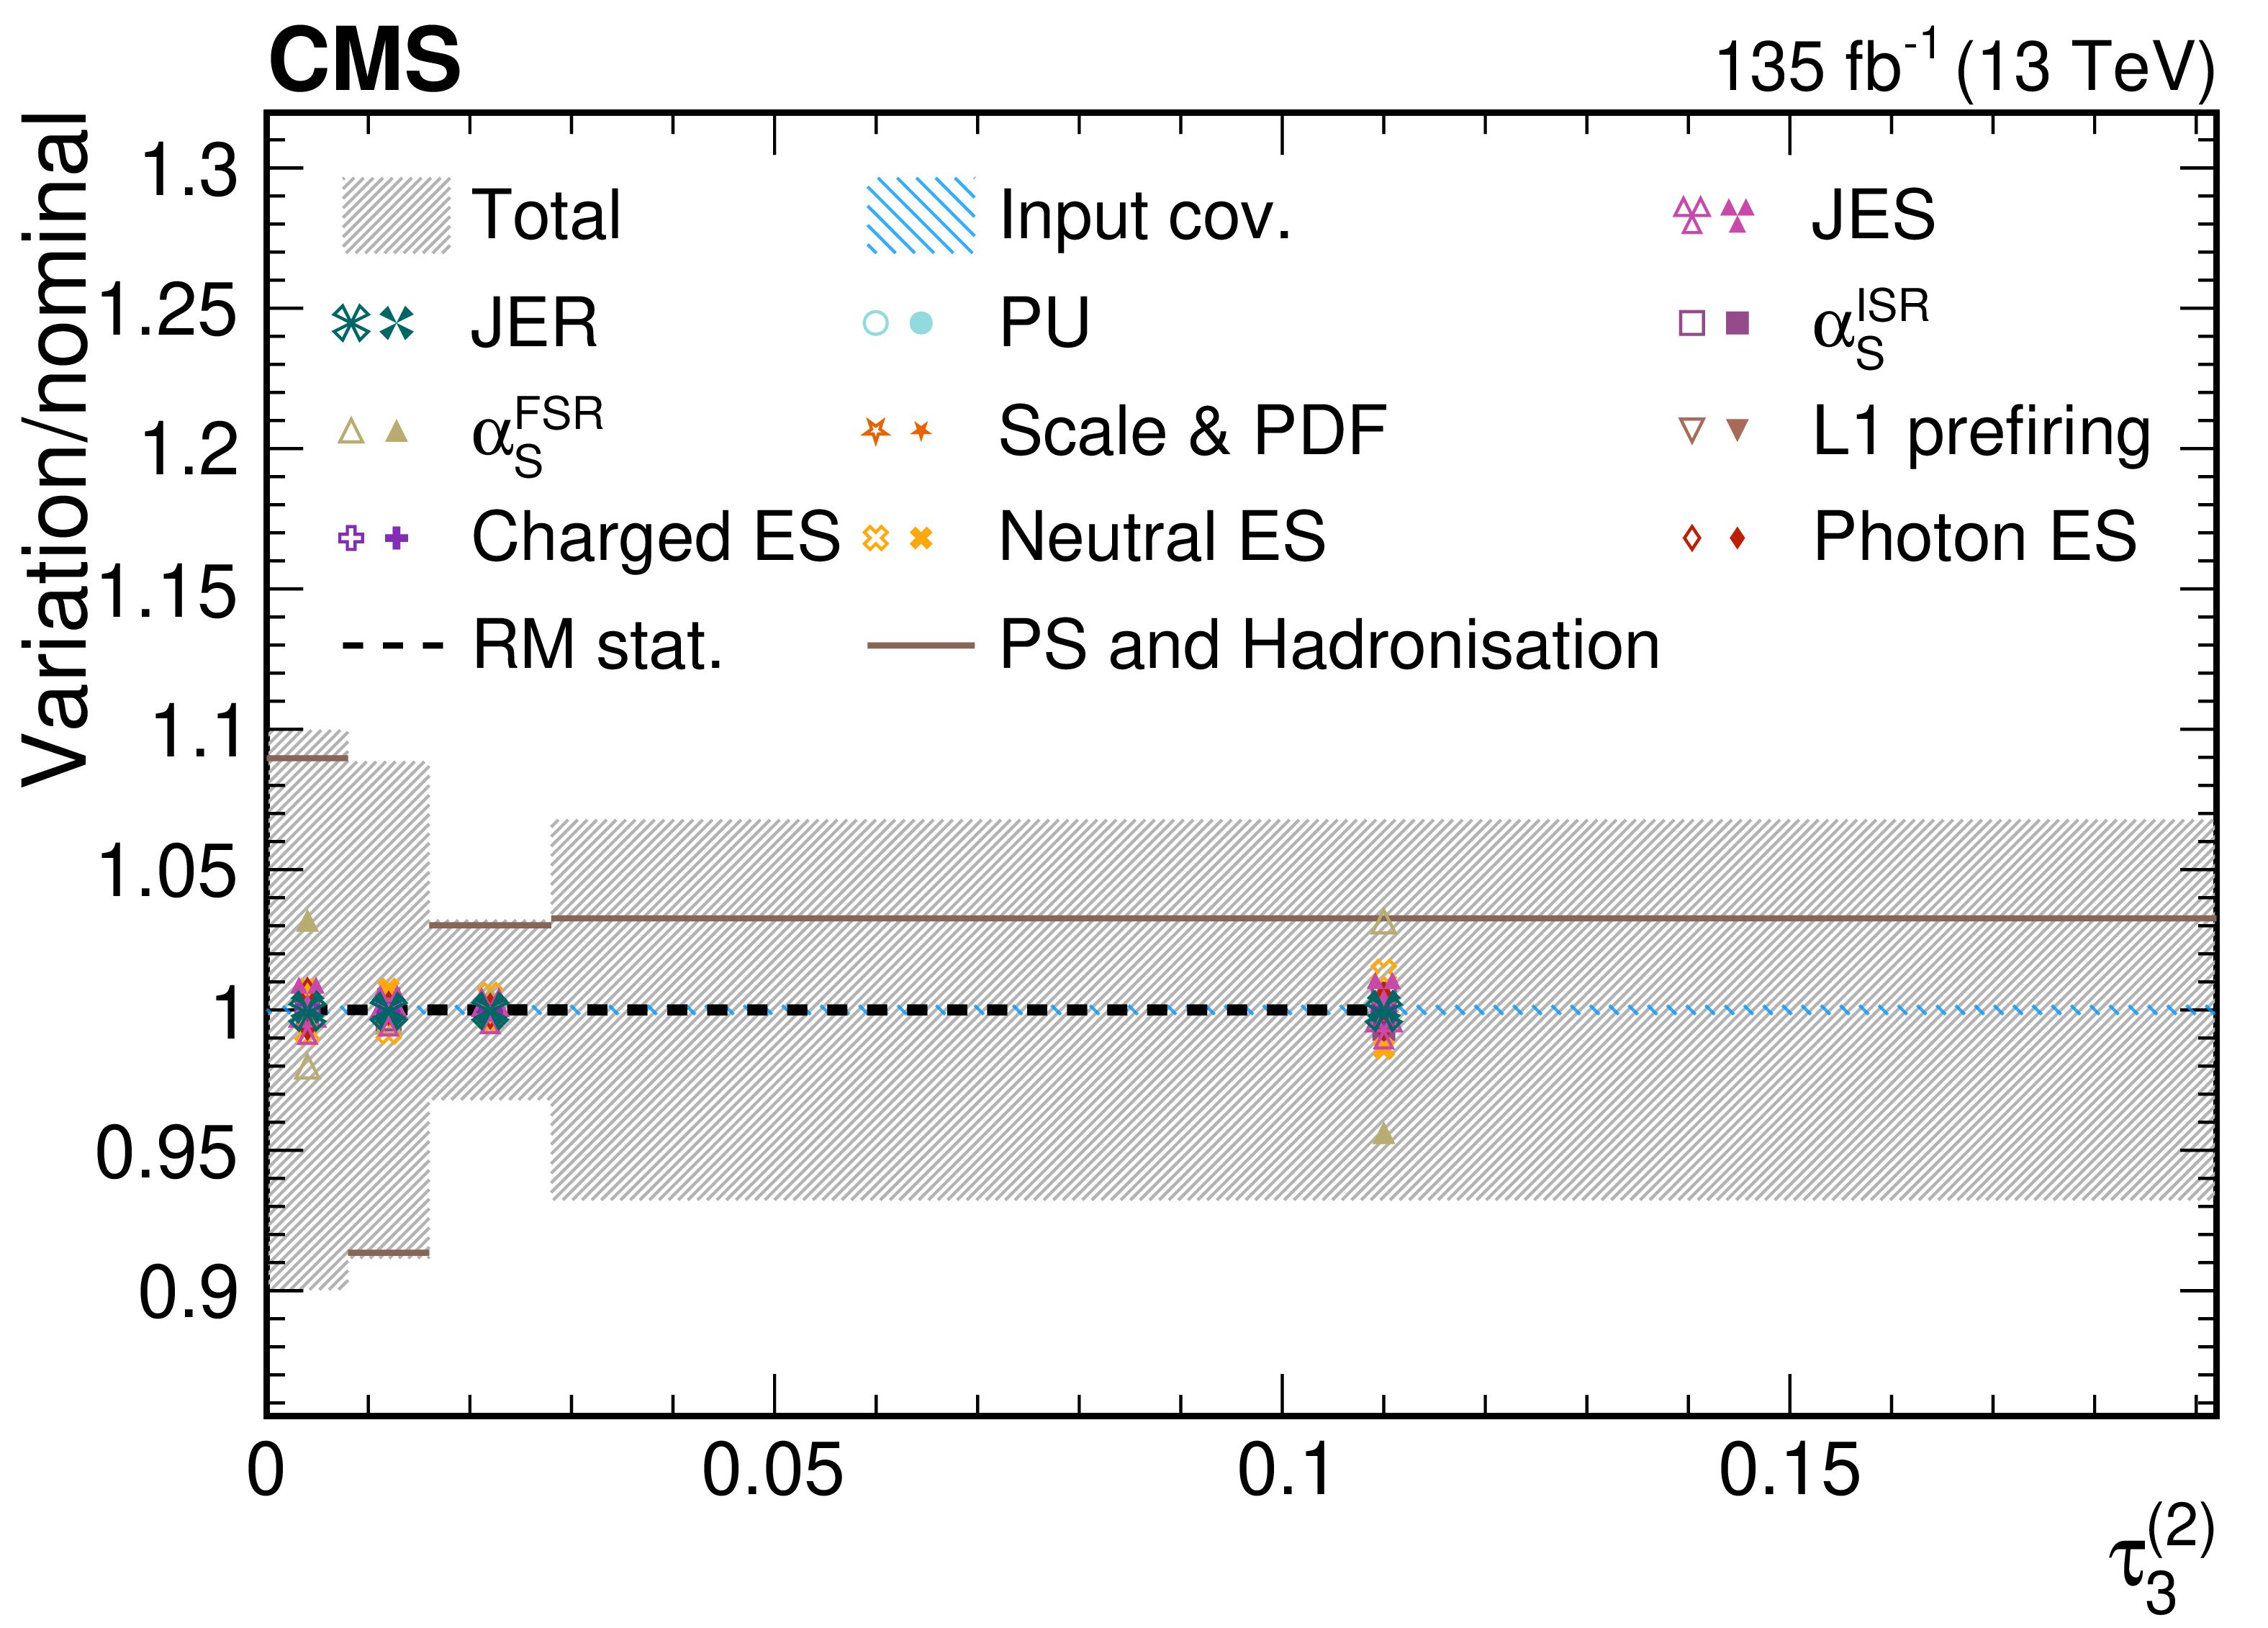
png pdf |
Figure 45-e:
Contributions from various systematic variations to the normalized, unfolded distribution for $ \tau_3^{(\beta)} $ observables measured for AK8 jets in the QCD dijet selection. The total unfolding uncertainty is indicated with the dark grey, hashed region, while the blue hashed region indicates the contributions from the input covariance matrix, which includes the propagated effects of the statistical uncertainties of the input data after background subtraction. Contributions from statistical uncertainties of the simulated sample used to construct the nominal response matrix are indicated with the dashed black line. The physics model uncertainty is computed as a one-sided shift compared to the nominal unfolding, and up (down) contributions from other sources are indicated with filled (open) markers of the same type and colour. |
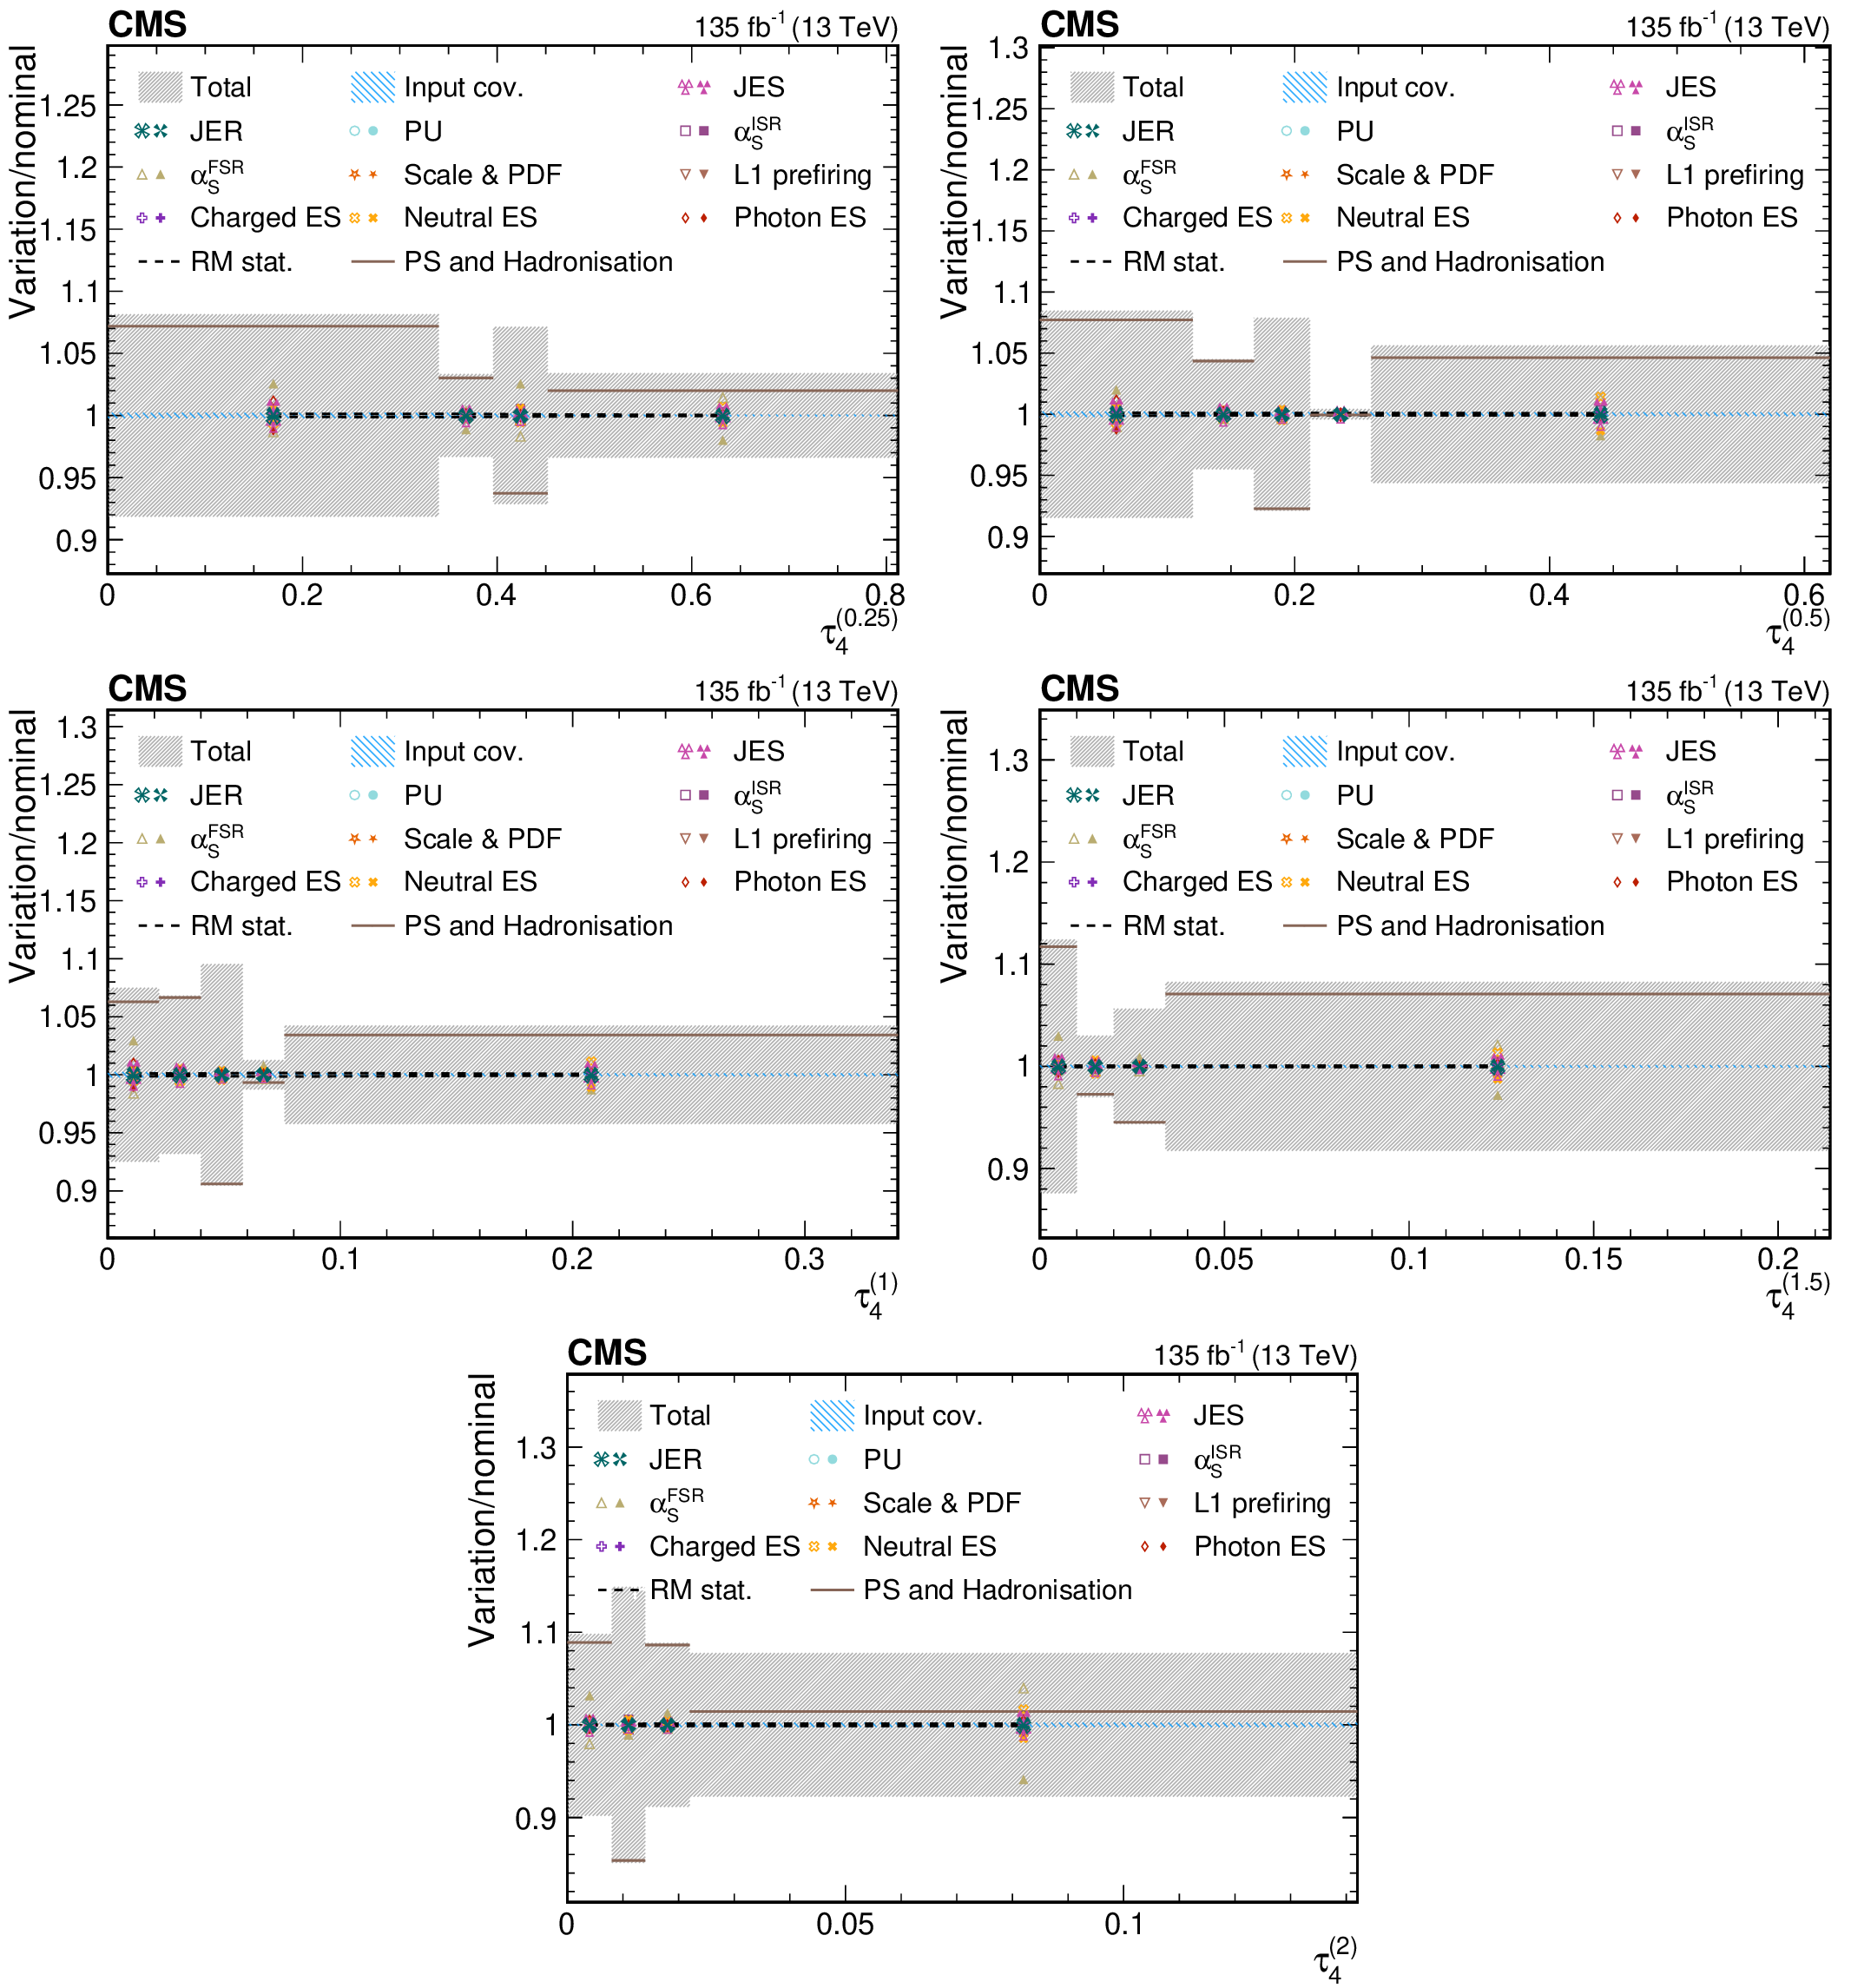
png pdf |
Figure 46:
Contributions from various systematic variations to the normalized, unfolded distribution for $ \tau_4^{(\beta)} $ observables measured for AK8 jets in the QCD dijet selection. The total unfolding uncertainty is indicated with the dark grey, hashed region, while the blue hashed region indicates the contributions from the input covariance matrix, which includes the propagated effects of the statistical uncertainties of the input data after background subtraction. Contributions from statistical uncertainties of the simulated sample used to construct the nominal response matrix are indicated with the dashed black line. The physics model uncertainty is computed as a one-sided shift compared to the nominal unfolding, and up (down) contributions from other sources are indicated with filled (open) markers of the same type and colour. |
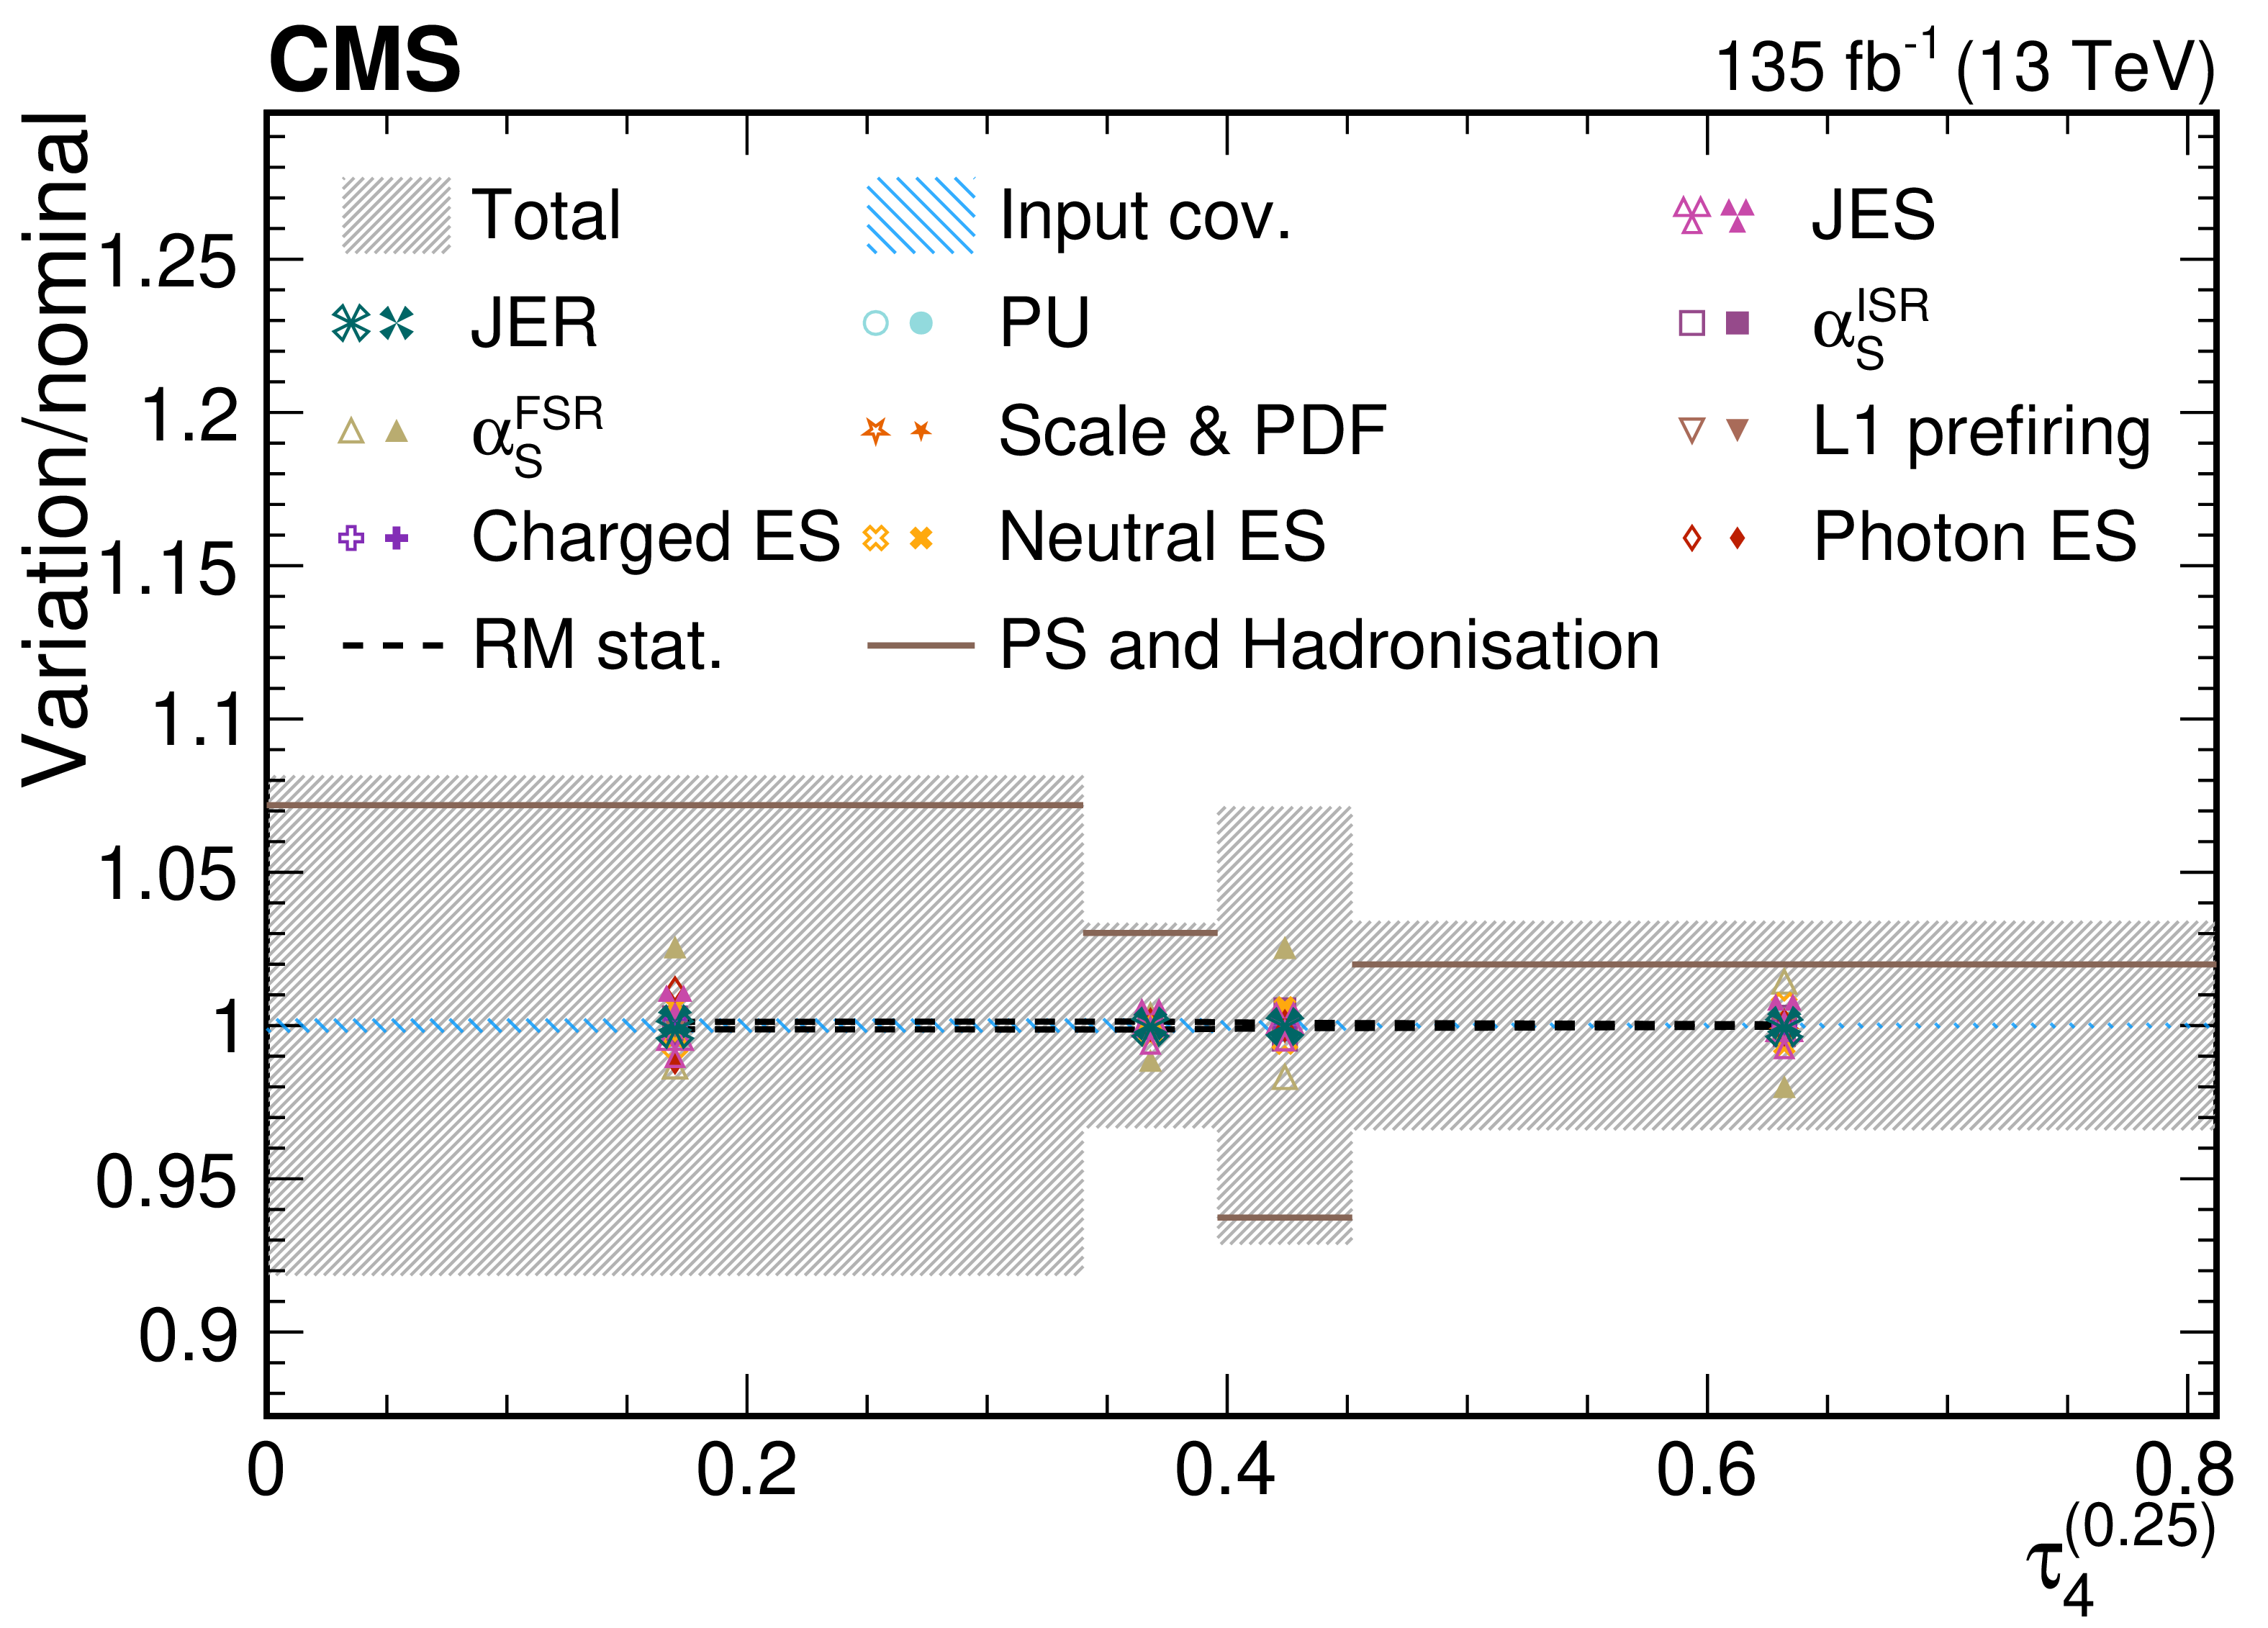
png pdf |
Figure 46-a:
Contributions from various systematic variations to the normalized, unfolded distribution for $ \tau_4^{(\beta)} $ observables measured for AK8 jets in the QCD dijet selection. The total unfolding uncertainty is indicated with the dark grey, hashed region, while the blue hashed region indicates the contributions from the input covariance matrix, which includes the propagated effects of the statistical uncertainties of the input data after background subtraction. Contributions from statistical uncertainties of the simulated sample used to construct the nominal response matrix are indicated with the dashed black line. The physics model uncertainty is computed as a one-sided shift compared to the nominal unfolding, and up (down) contributions from other sources are indicated with filled (open) markers of the same type and colour. |
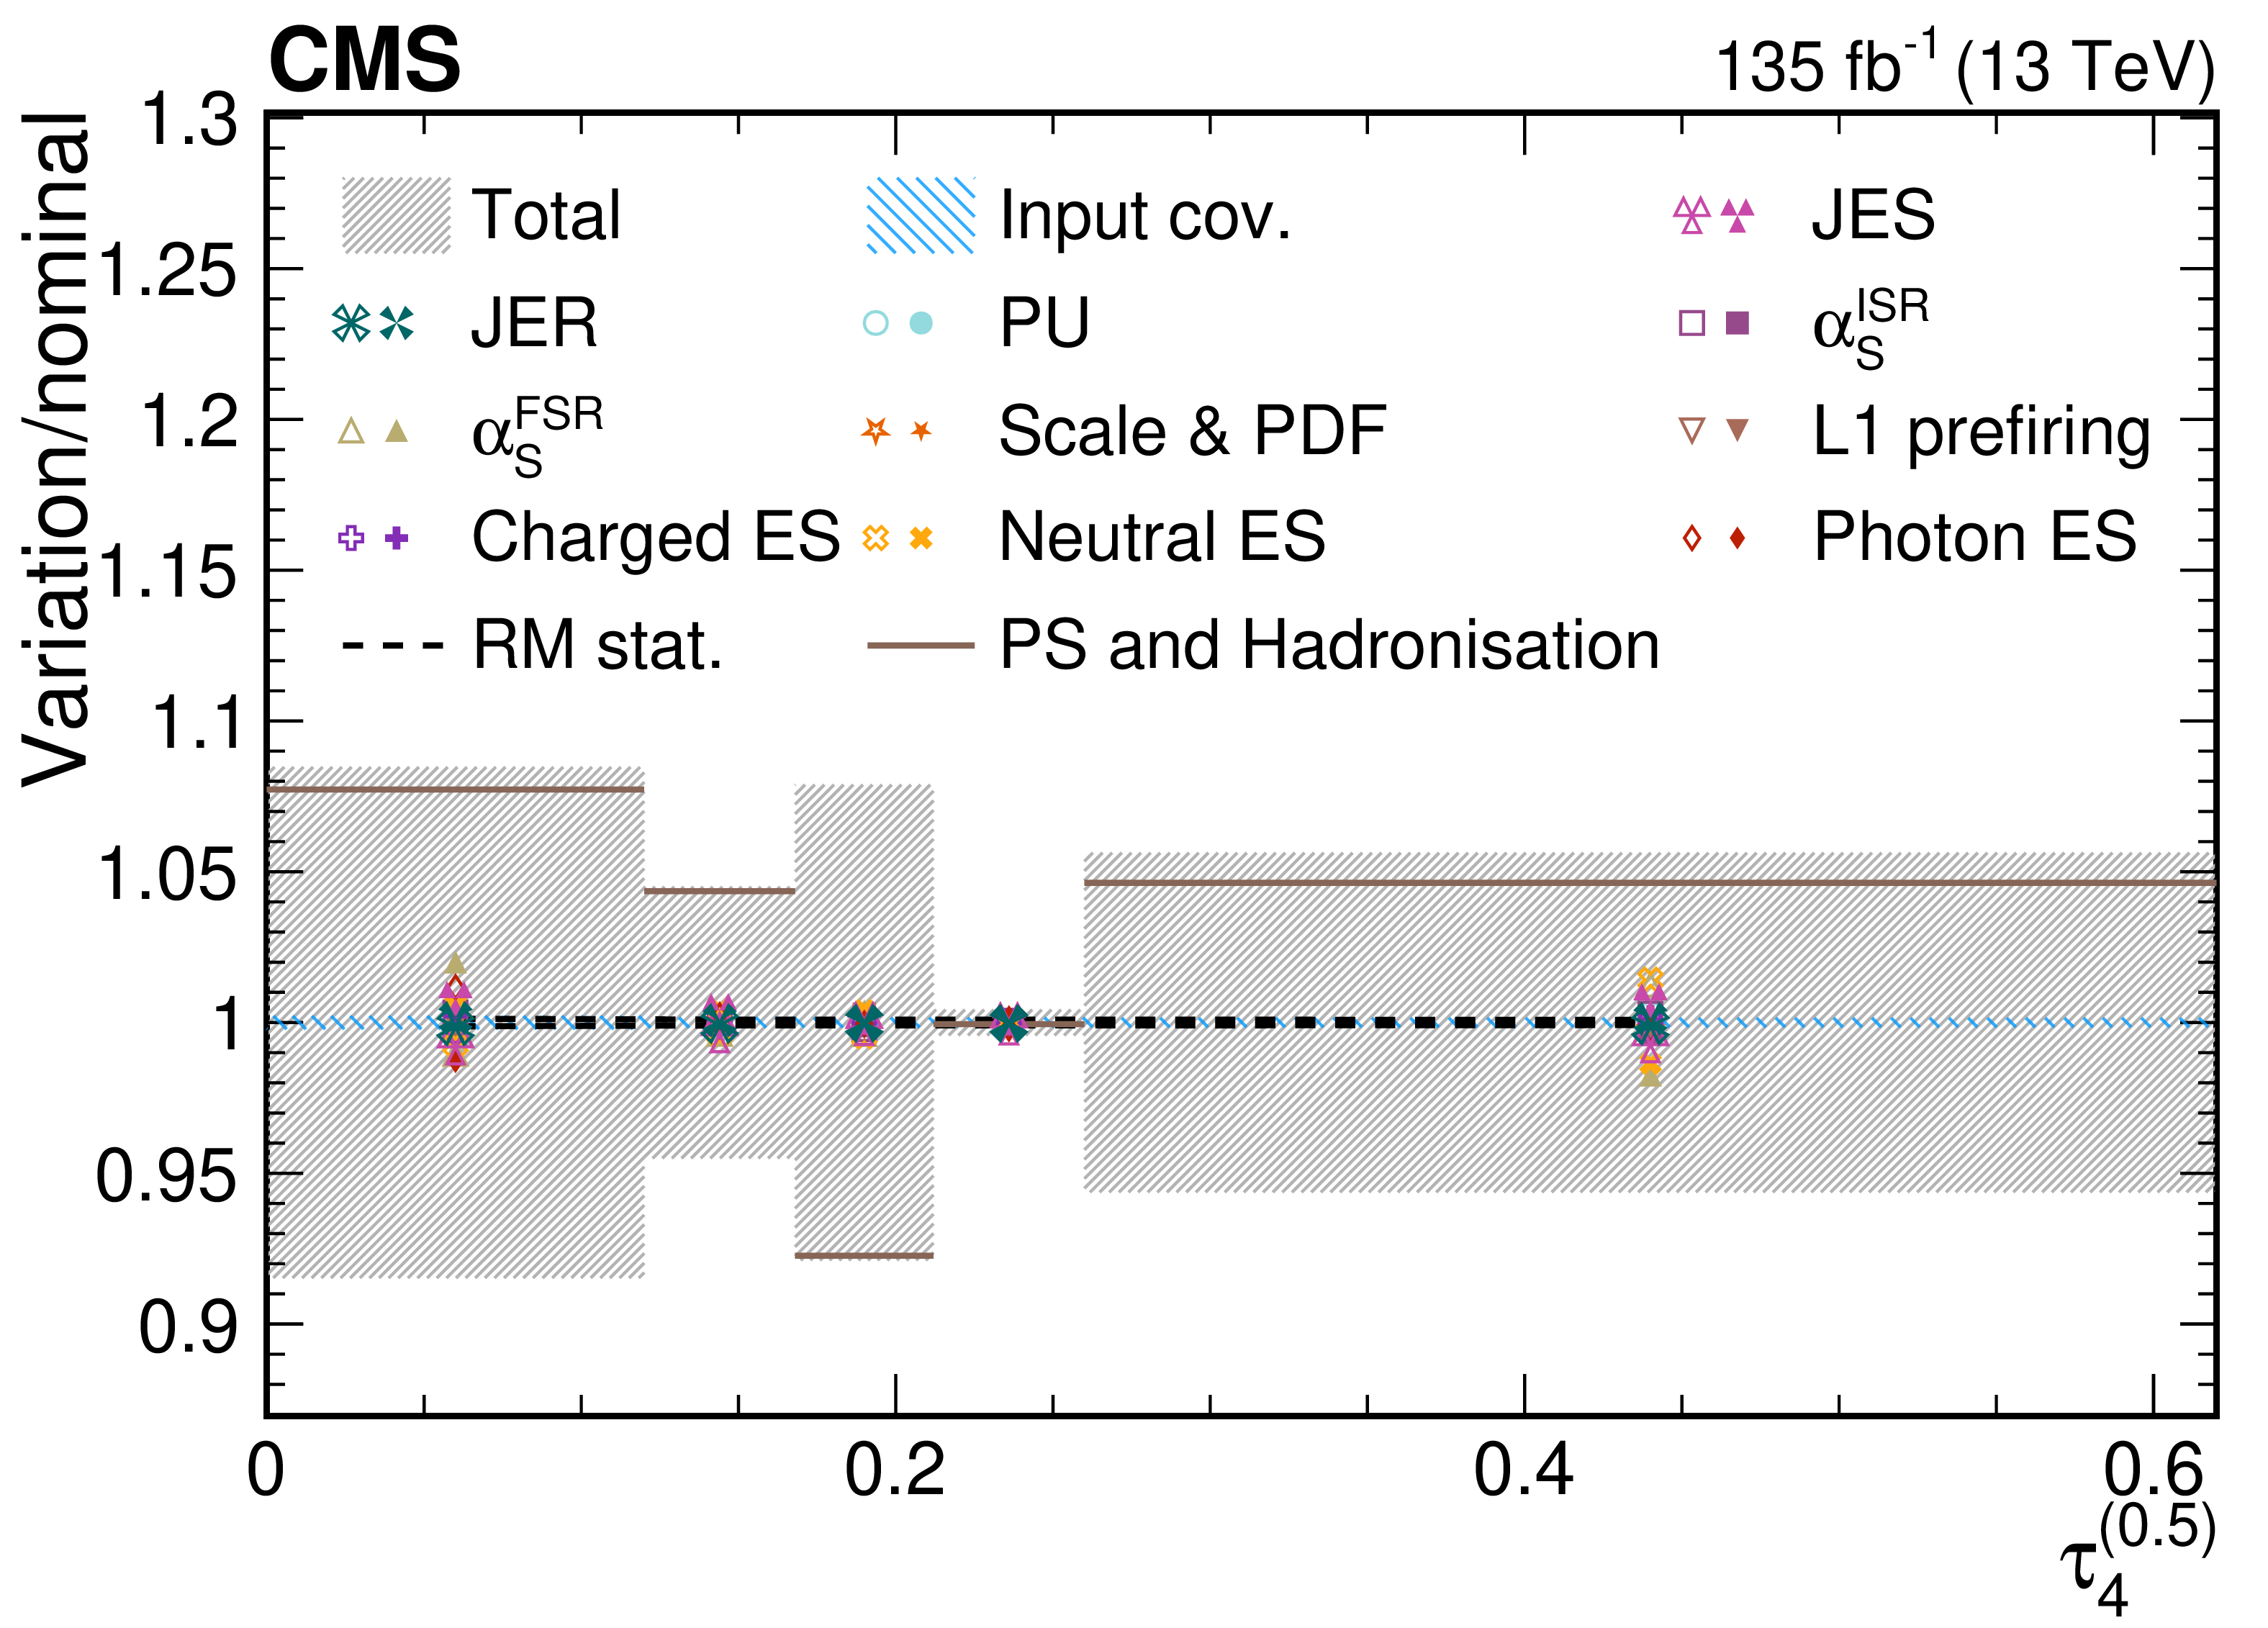
png pdf |
Figure 46-b:
Contributions from various systematic variations to the normalized, unfolded distribution for $ \tau_4^{(\beta)} $ observables measured for AK8 jets in the QCD dijet selection. The total unfolding uncertainty is indicated with the dark grey, hashed region, while the blue hashed region indicates the contributions from the input covariance matrix, which includes the propagated effects of the statistical uncertainties of the input data after background subtraction. Contributions from statistical uncertainties of the simulated sample used to construct the nominal response matrix are indicated with the dashed black line. The physics model uncertainty is computed as a one-sided shift compared to the nominal unfolding, and up (down) contributions from other sources are indicated with filled (open) markers of the same type and colour. |
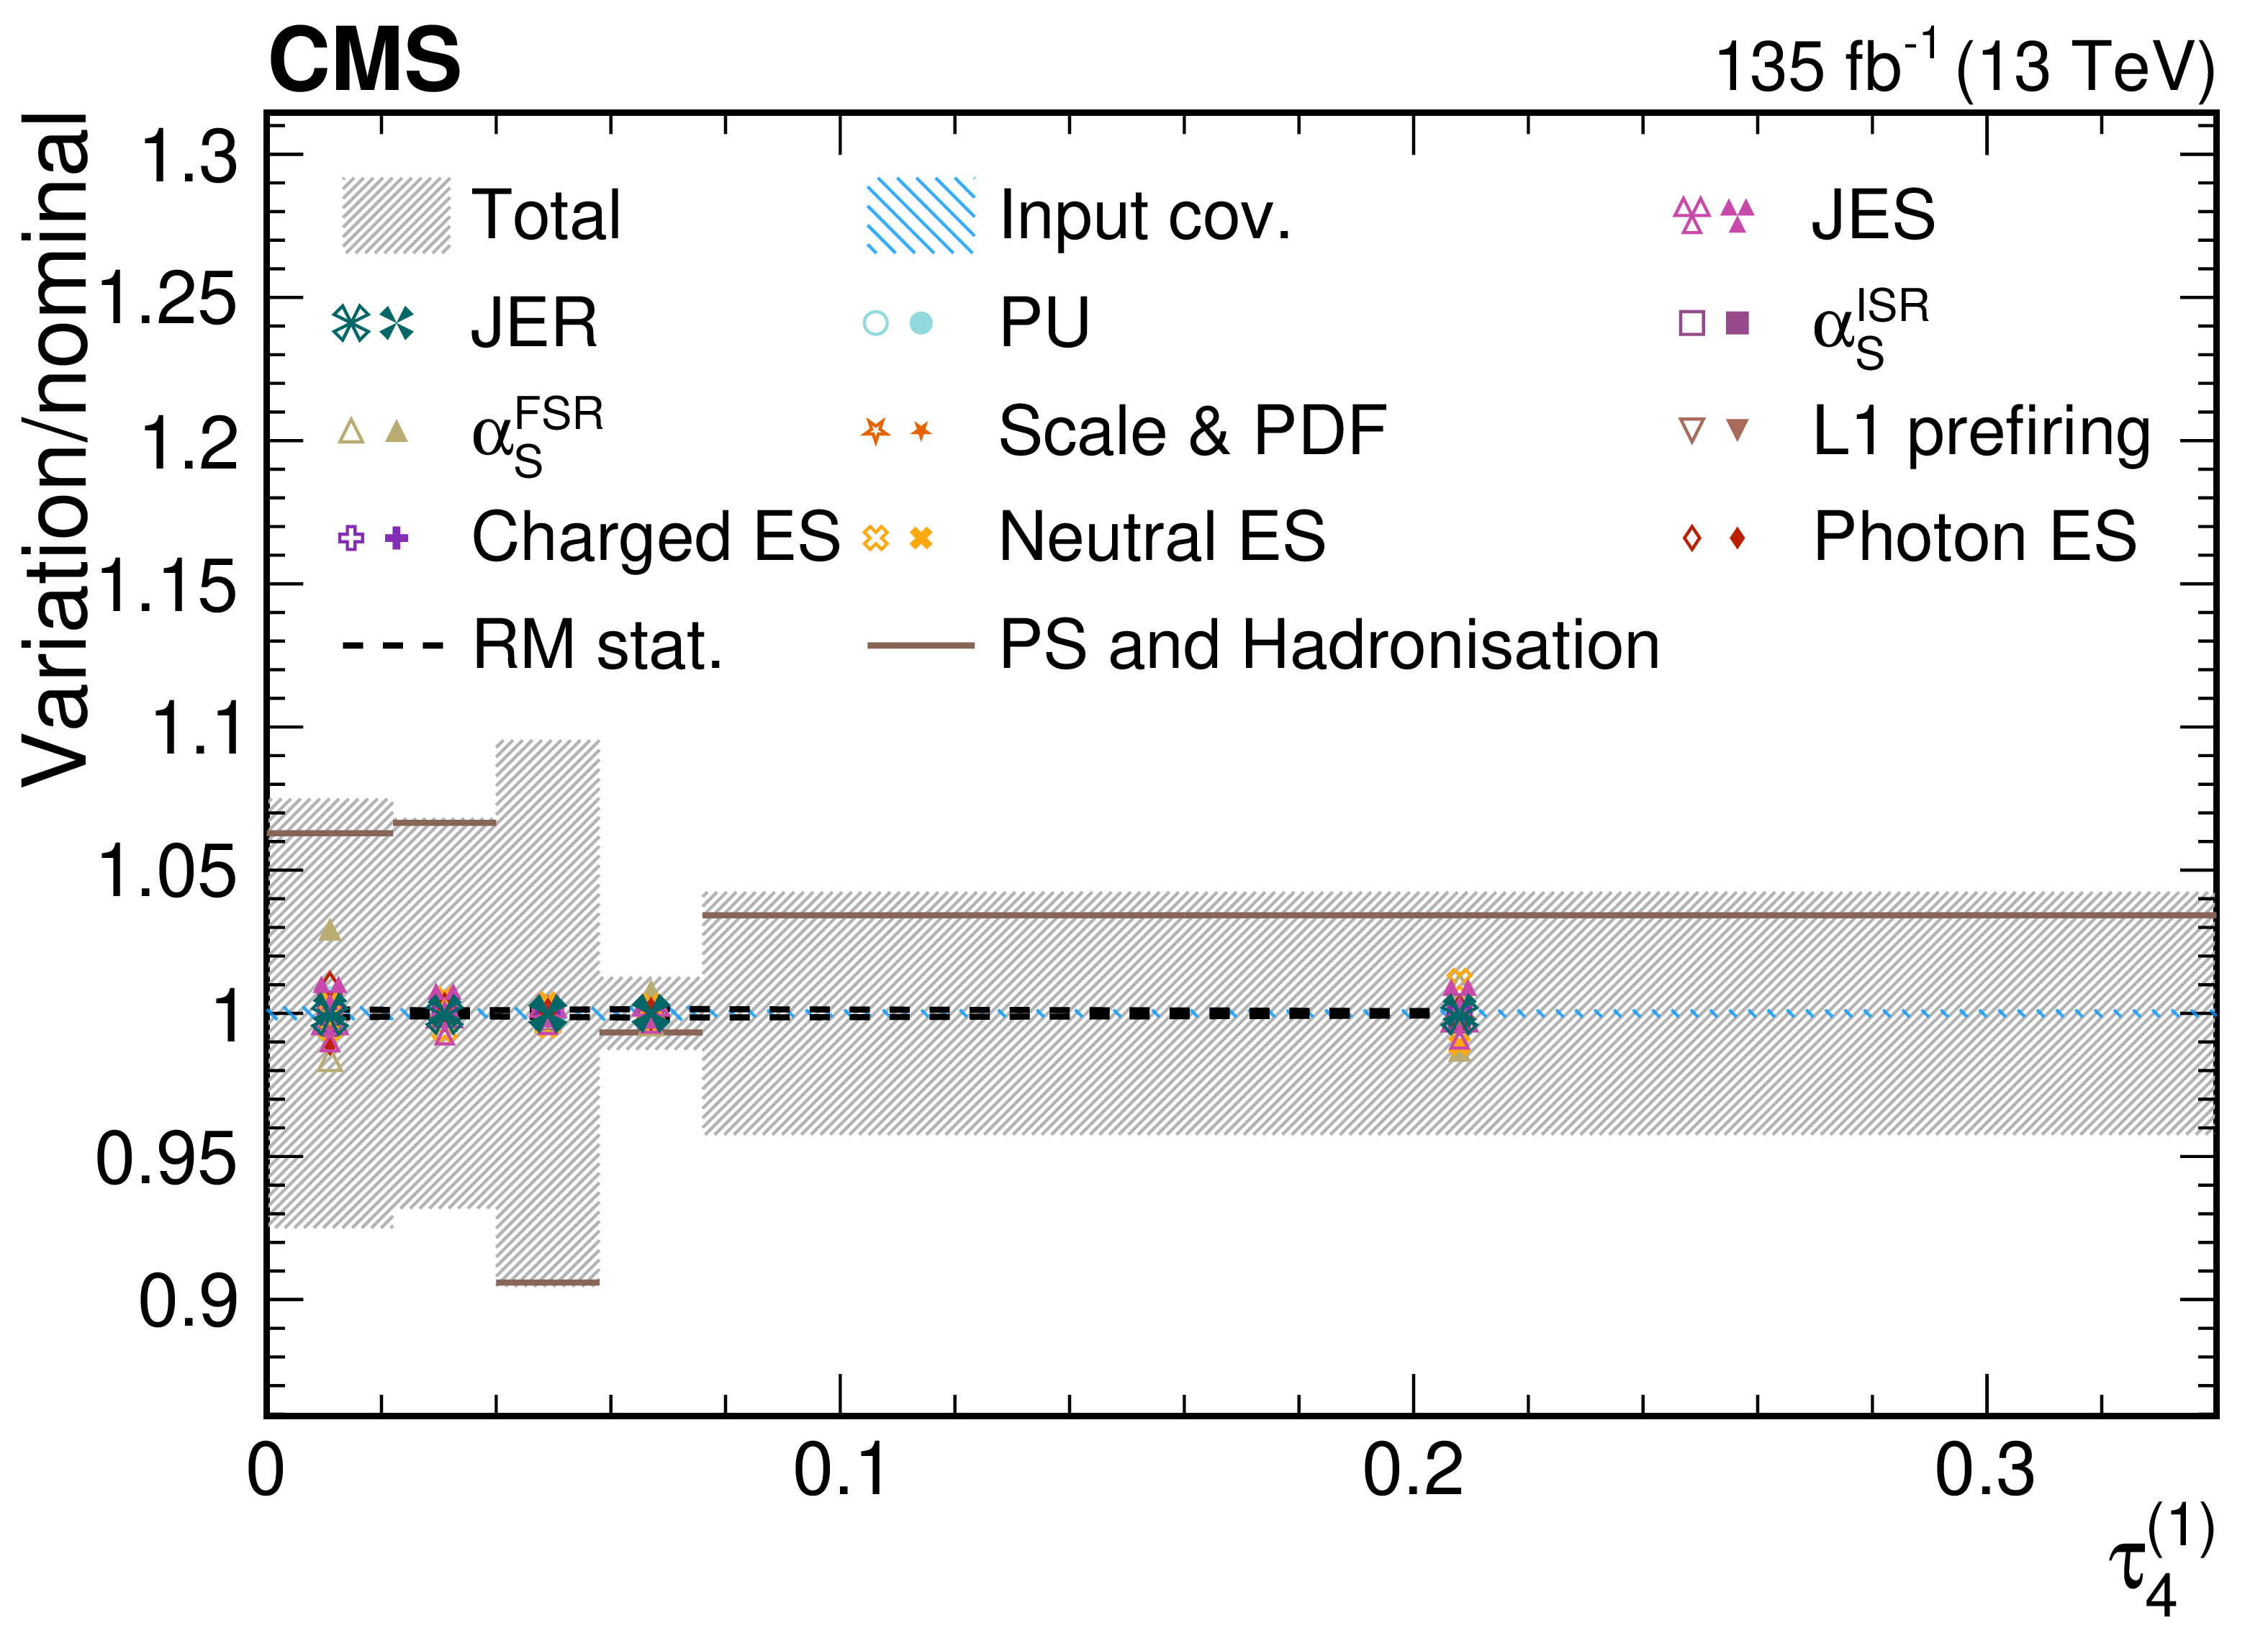
png pdf |
Figure 46-c:
Contributions from various systematic variations to the normalized, unfolded distribution for $ \tau_4^{(\beta)} $ observables measured for AK8 jets in the QCD dijet selection. The total unfolding uncertainty is indicated with the dark grey, hashed region, while the blue hashed region indicates the contributions from the input covariance matrix, which includes the propagated effects of the statistical uncertainties of the input data after background subtraction. Contributions from statistical uncertainties of the simulated sample used to construct the nominal response matrix are indicated with the dashed black line. The physics model uncertainty is computed as a one-sided shift compared to the nominal unfolding, and up (down) contributions from other sources are indicated with filled (open) markers of the same type and colour. |
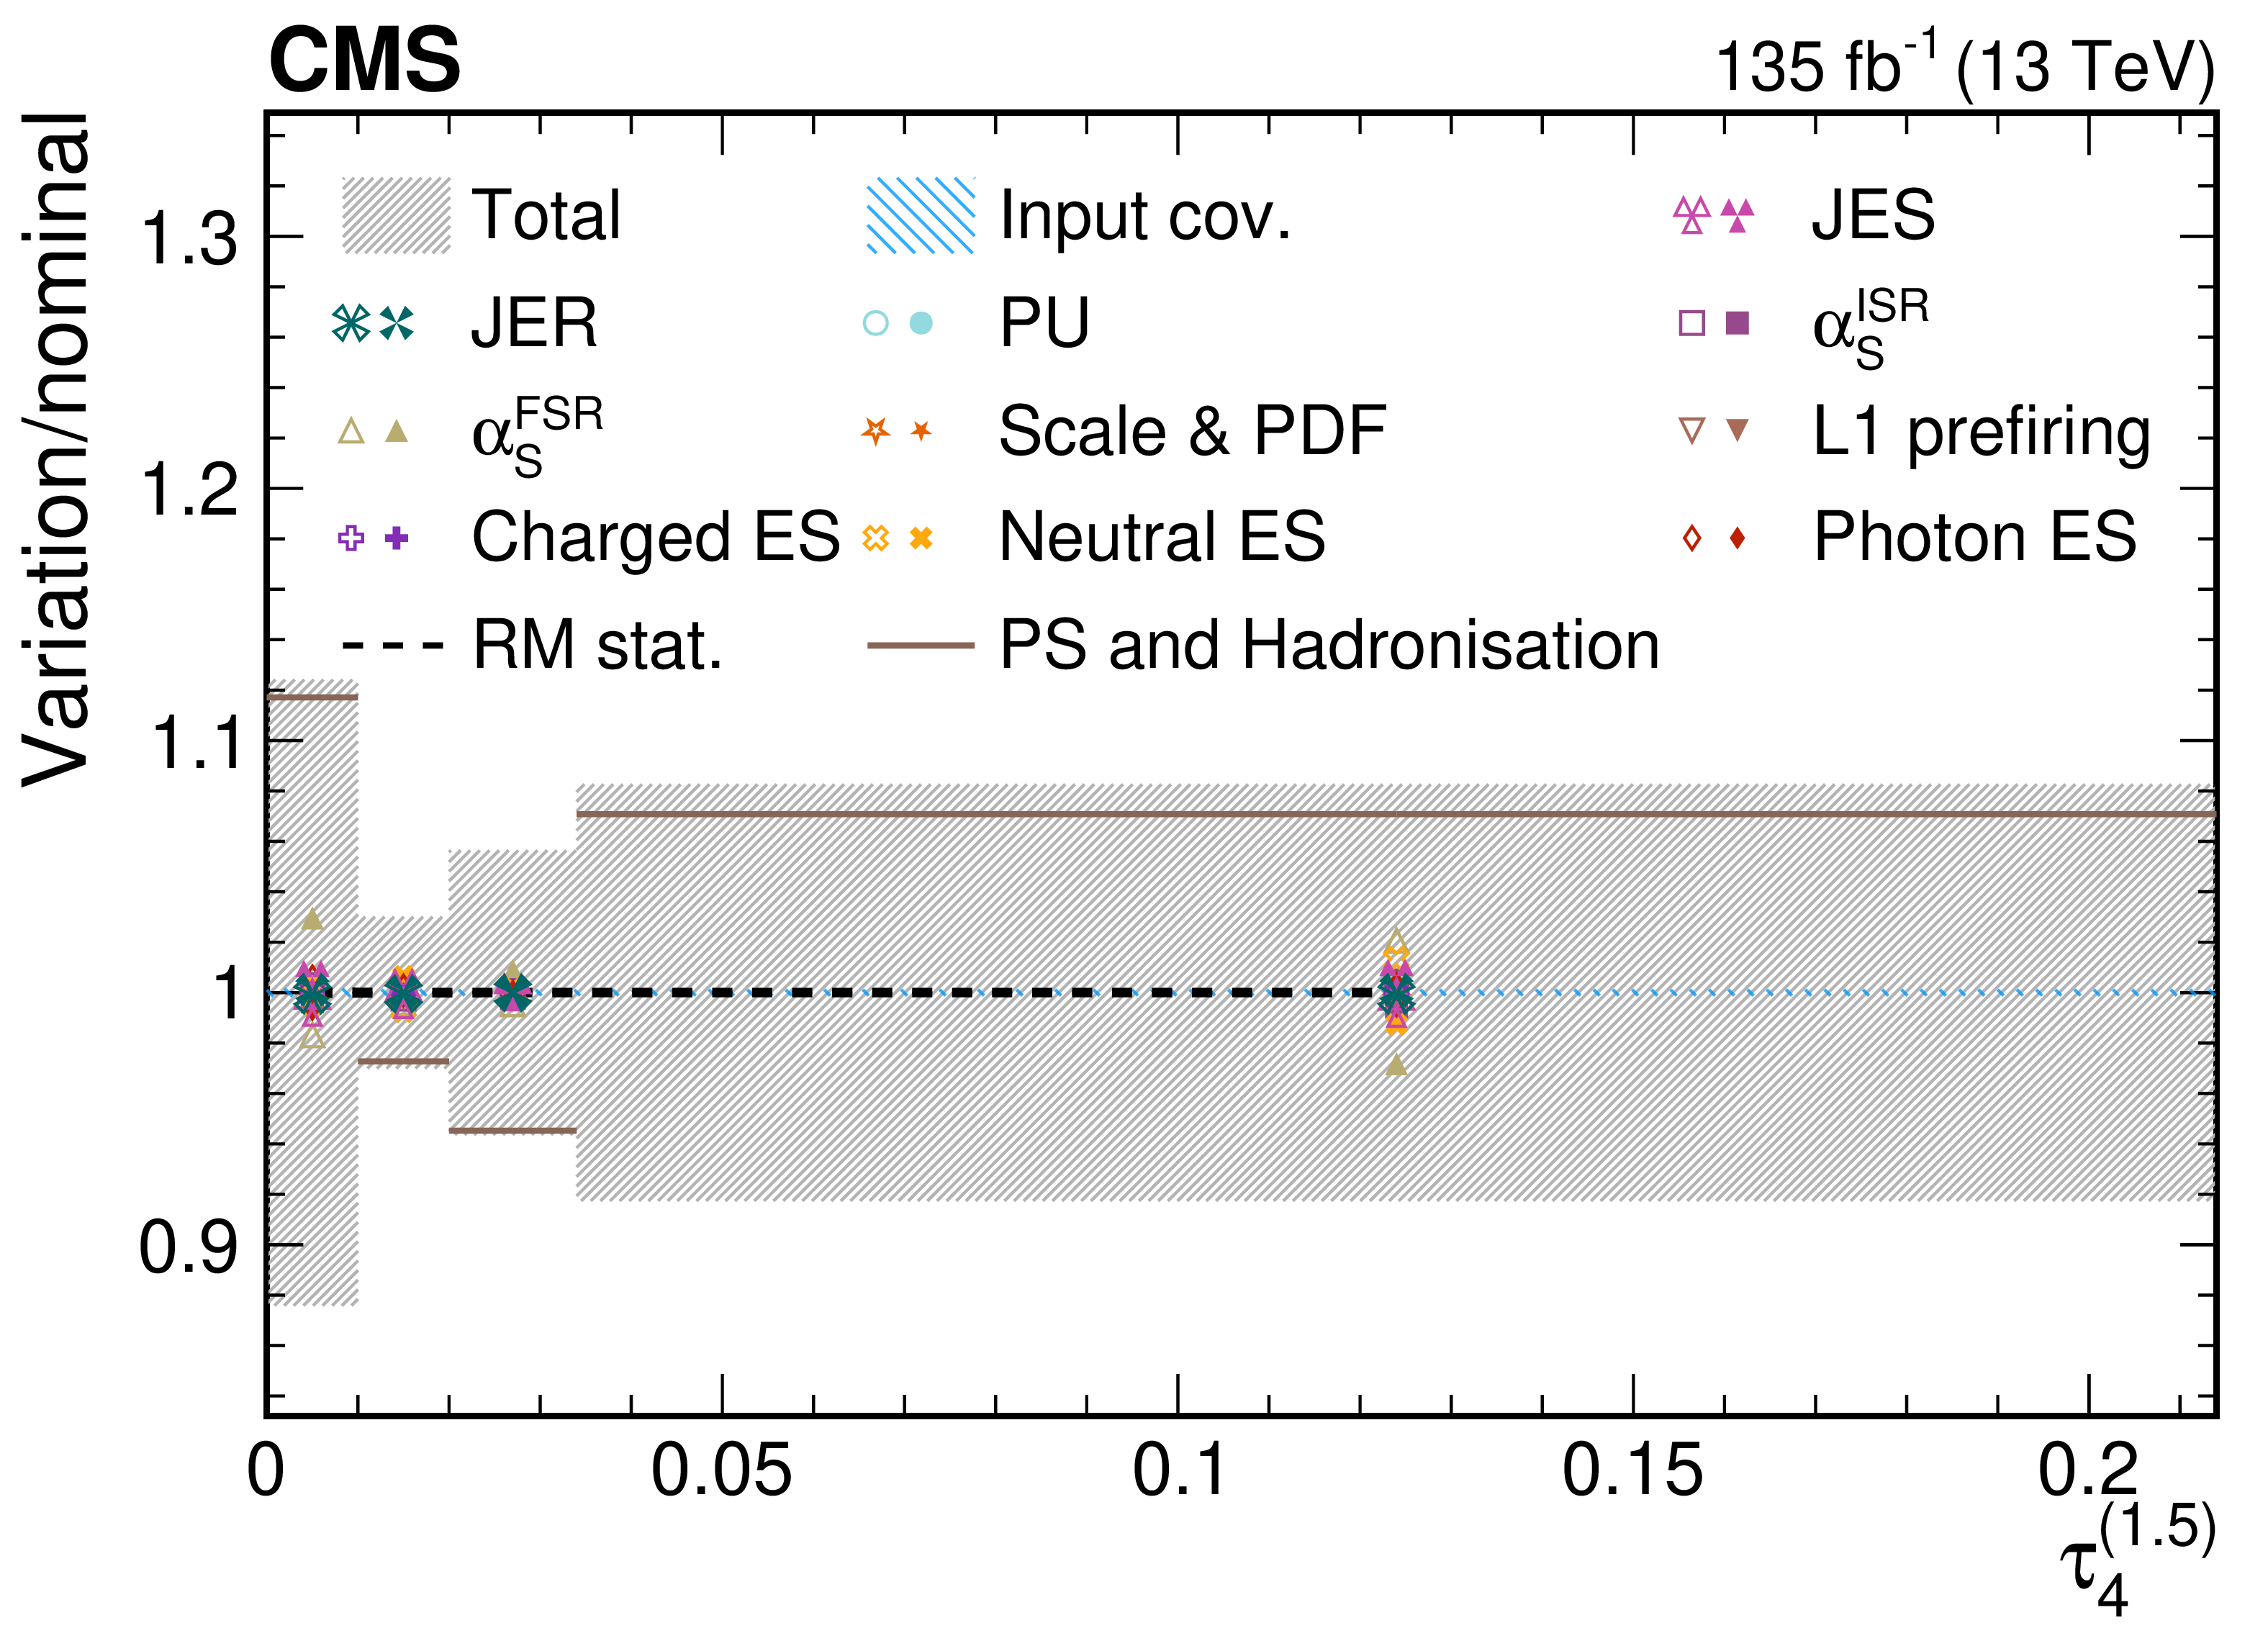
png pdf |
Figure 46-d:
Contributions from various systematic variations to the normalized, unfolded distribution for $ \tau_4^{(\beta)} $ observables measured for AK8 jets in the QCD dijet selection. The total unfolding uncertainty is indicated with the dark grey, hashed region, while the blue hashed region indicates the contributions from the input covariance matrix, which includes the propagated effects of the statistical uncertainties of the input data after background subtraction. Contributions from statistical uncertainties of the simulated sample used to construct the nominal response matrix are indicated with the dashed black line. The physics model uncertainty is computed as a one-sided shift compared to the nominal unfolding, and up (down) contributions from other sources are indicated with filled (open) markers of the same type and colour. |
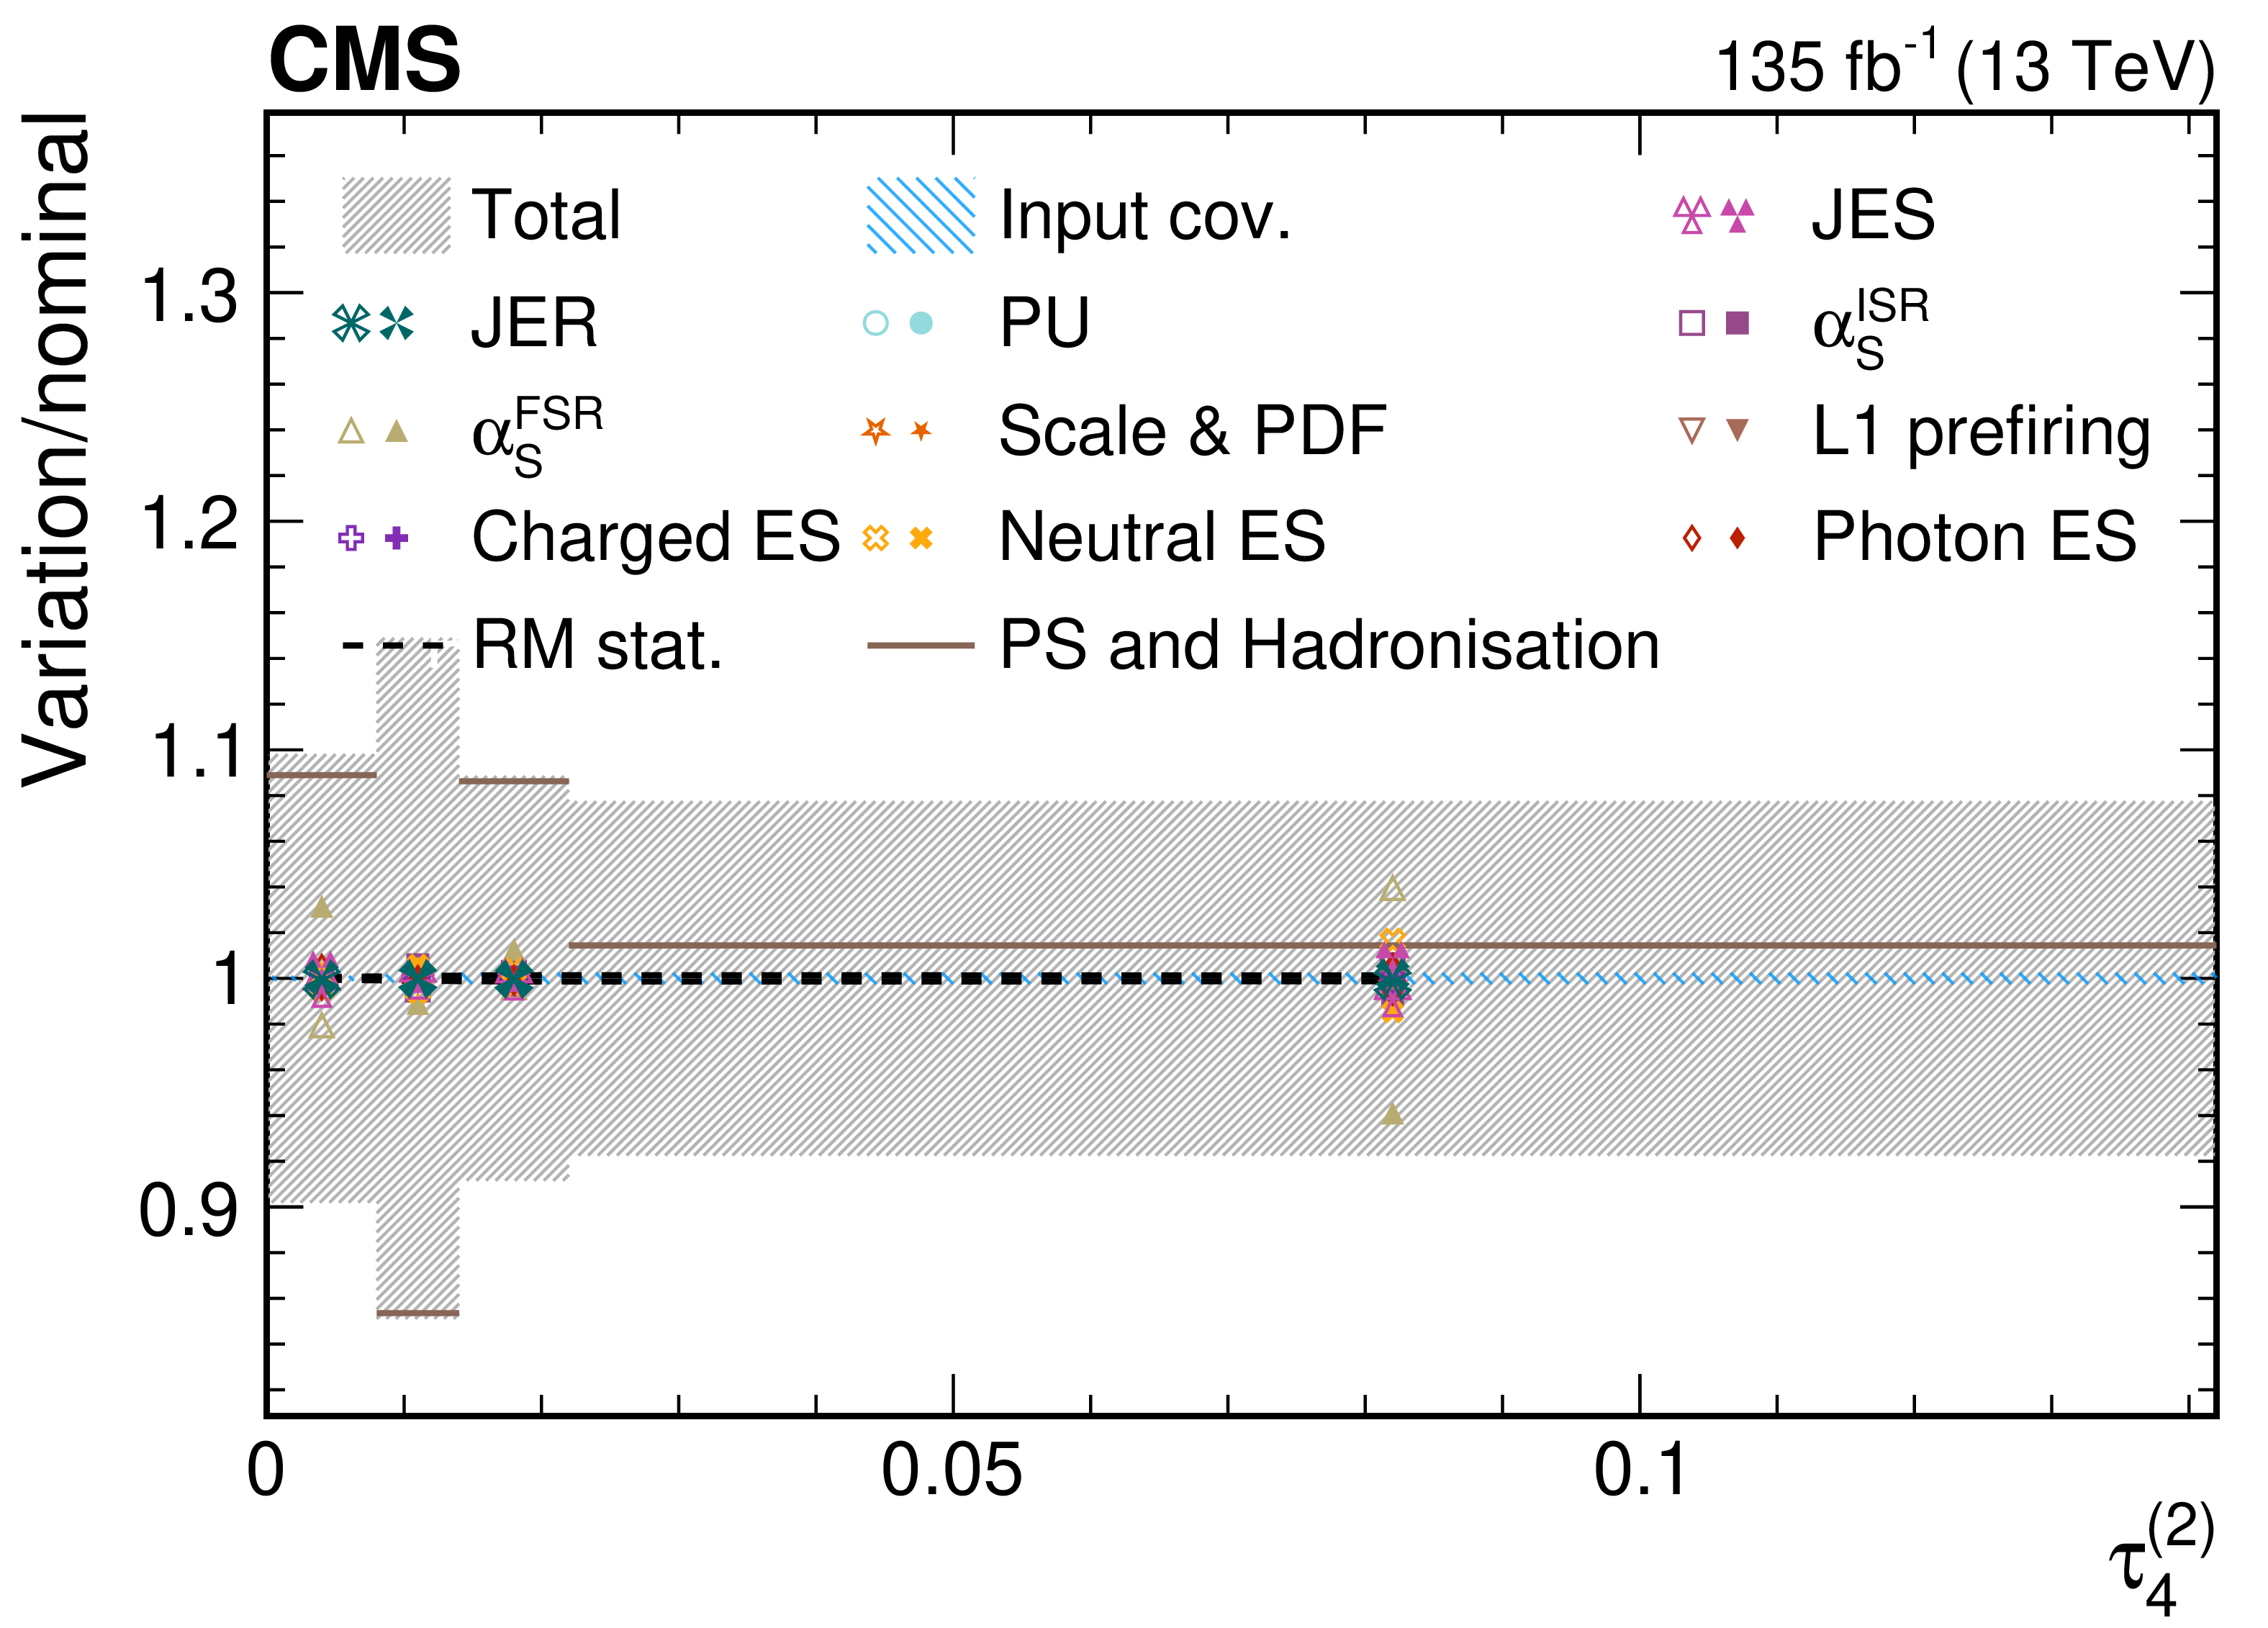
png pdf |
Figure 46-e:
Contributions from various systematic variations to the normalized, unfolded distribution for $ \tau_4^{(\beta)} $ observables measured for AK8 jets in the QCD dijet selection. The total unfolding uncertainty is indicated with the dark grey, hashed region, while the blue hashed region indicates the contributions from the input covariance matrix, which includes the propagated effects of the statistical uncertainties of the input data after background subtraction. Contributions from statistical uncertainties of the simulated sample used to construct the nominal response matrix are indicated with the dashed black line. The physics model uncertainty is computed as a one-sided shift compared to the nominal unfolding, and up (down) contributions from other sources are indicated with filled (open) markers of the same type and colour. |
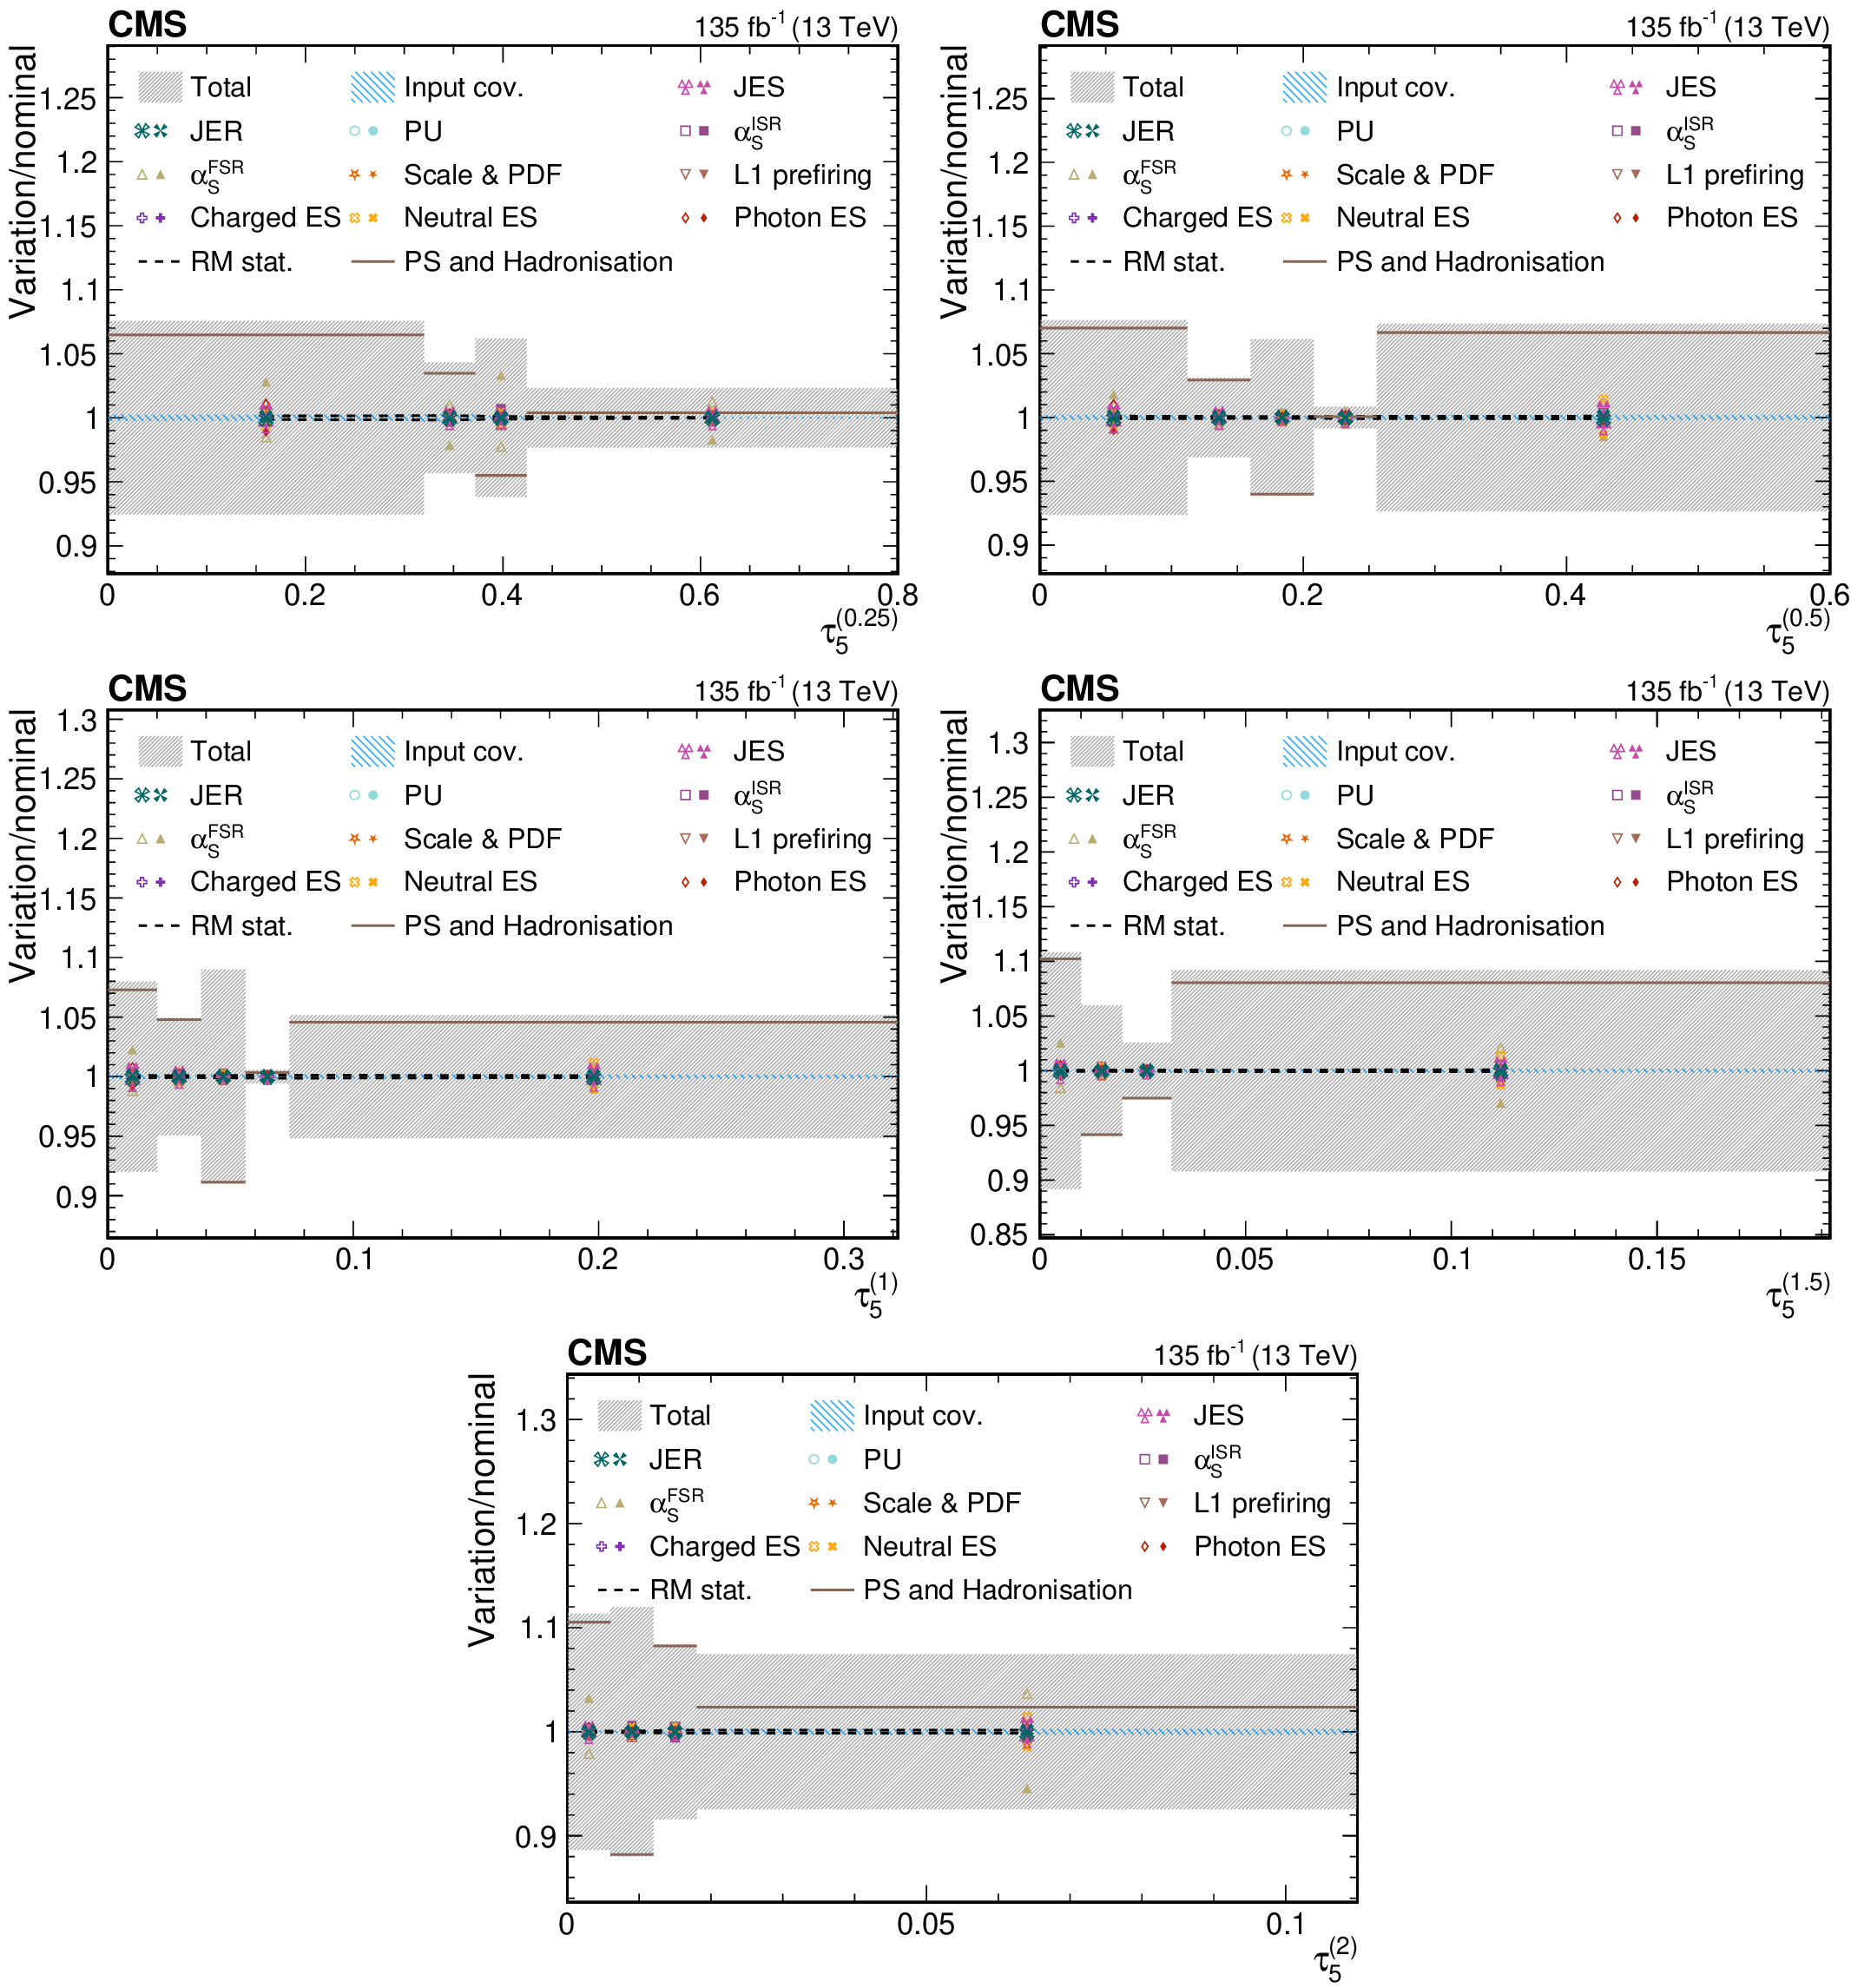
png pdf |
Figure 47:
Contributions from various systematic variations to the normalized, unfolded distribution for $ \tau_5^{(\beta)} $ observables measured for AK8 jets in the QCD dijet selection. The total unfolding uncertainty is indicated with the dark grey, hashed region, while the blue hashed region indicates the contributions from the input covariance matrix, which includes the propagated effects of the statistical uncertainties of the input data after background subtraction. Contributions from statistical uncertainties of the simulated sample used to construct the nominal response matrix are indicated with the dashed black line. The physics model uncertainty is computed as a one-sided shift compared to the nominal unfolding, and up (down) contributions from other sources are indicated with filled (open) markers of the same type and colour. |
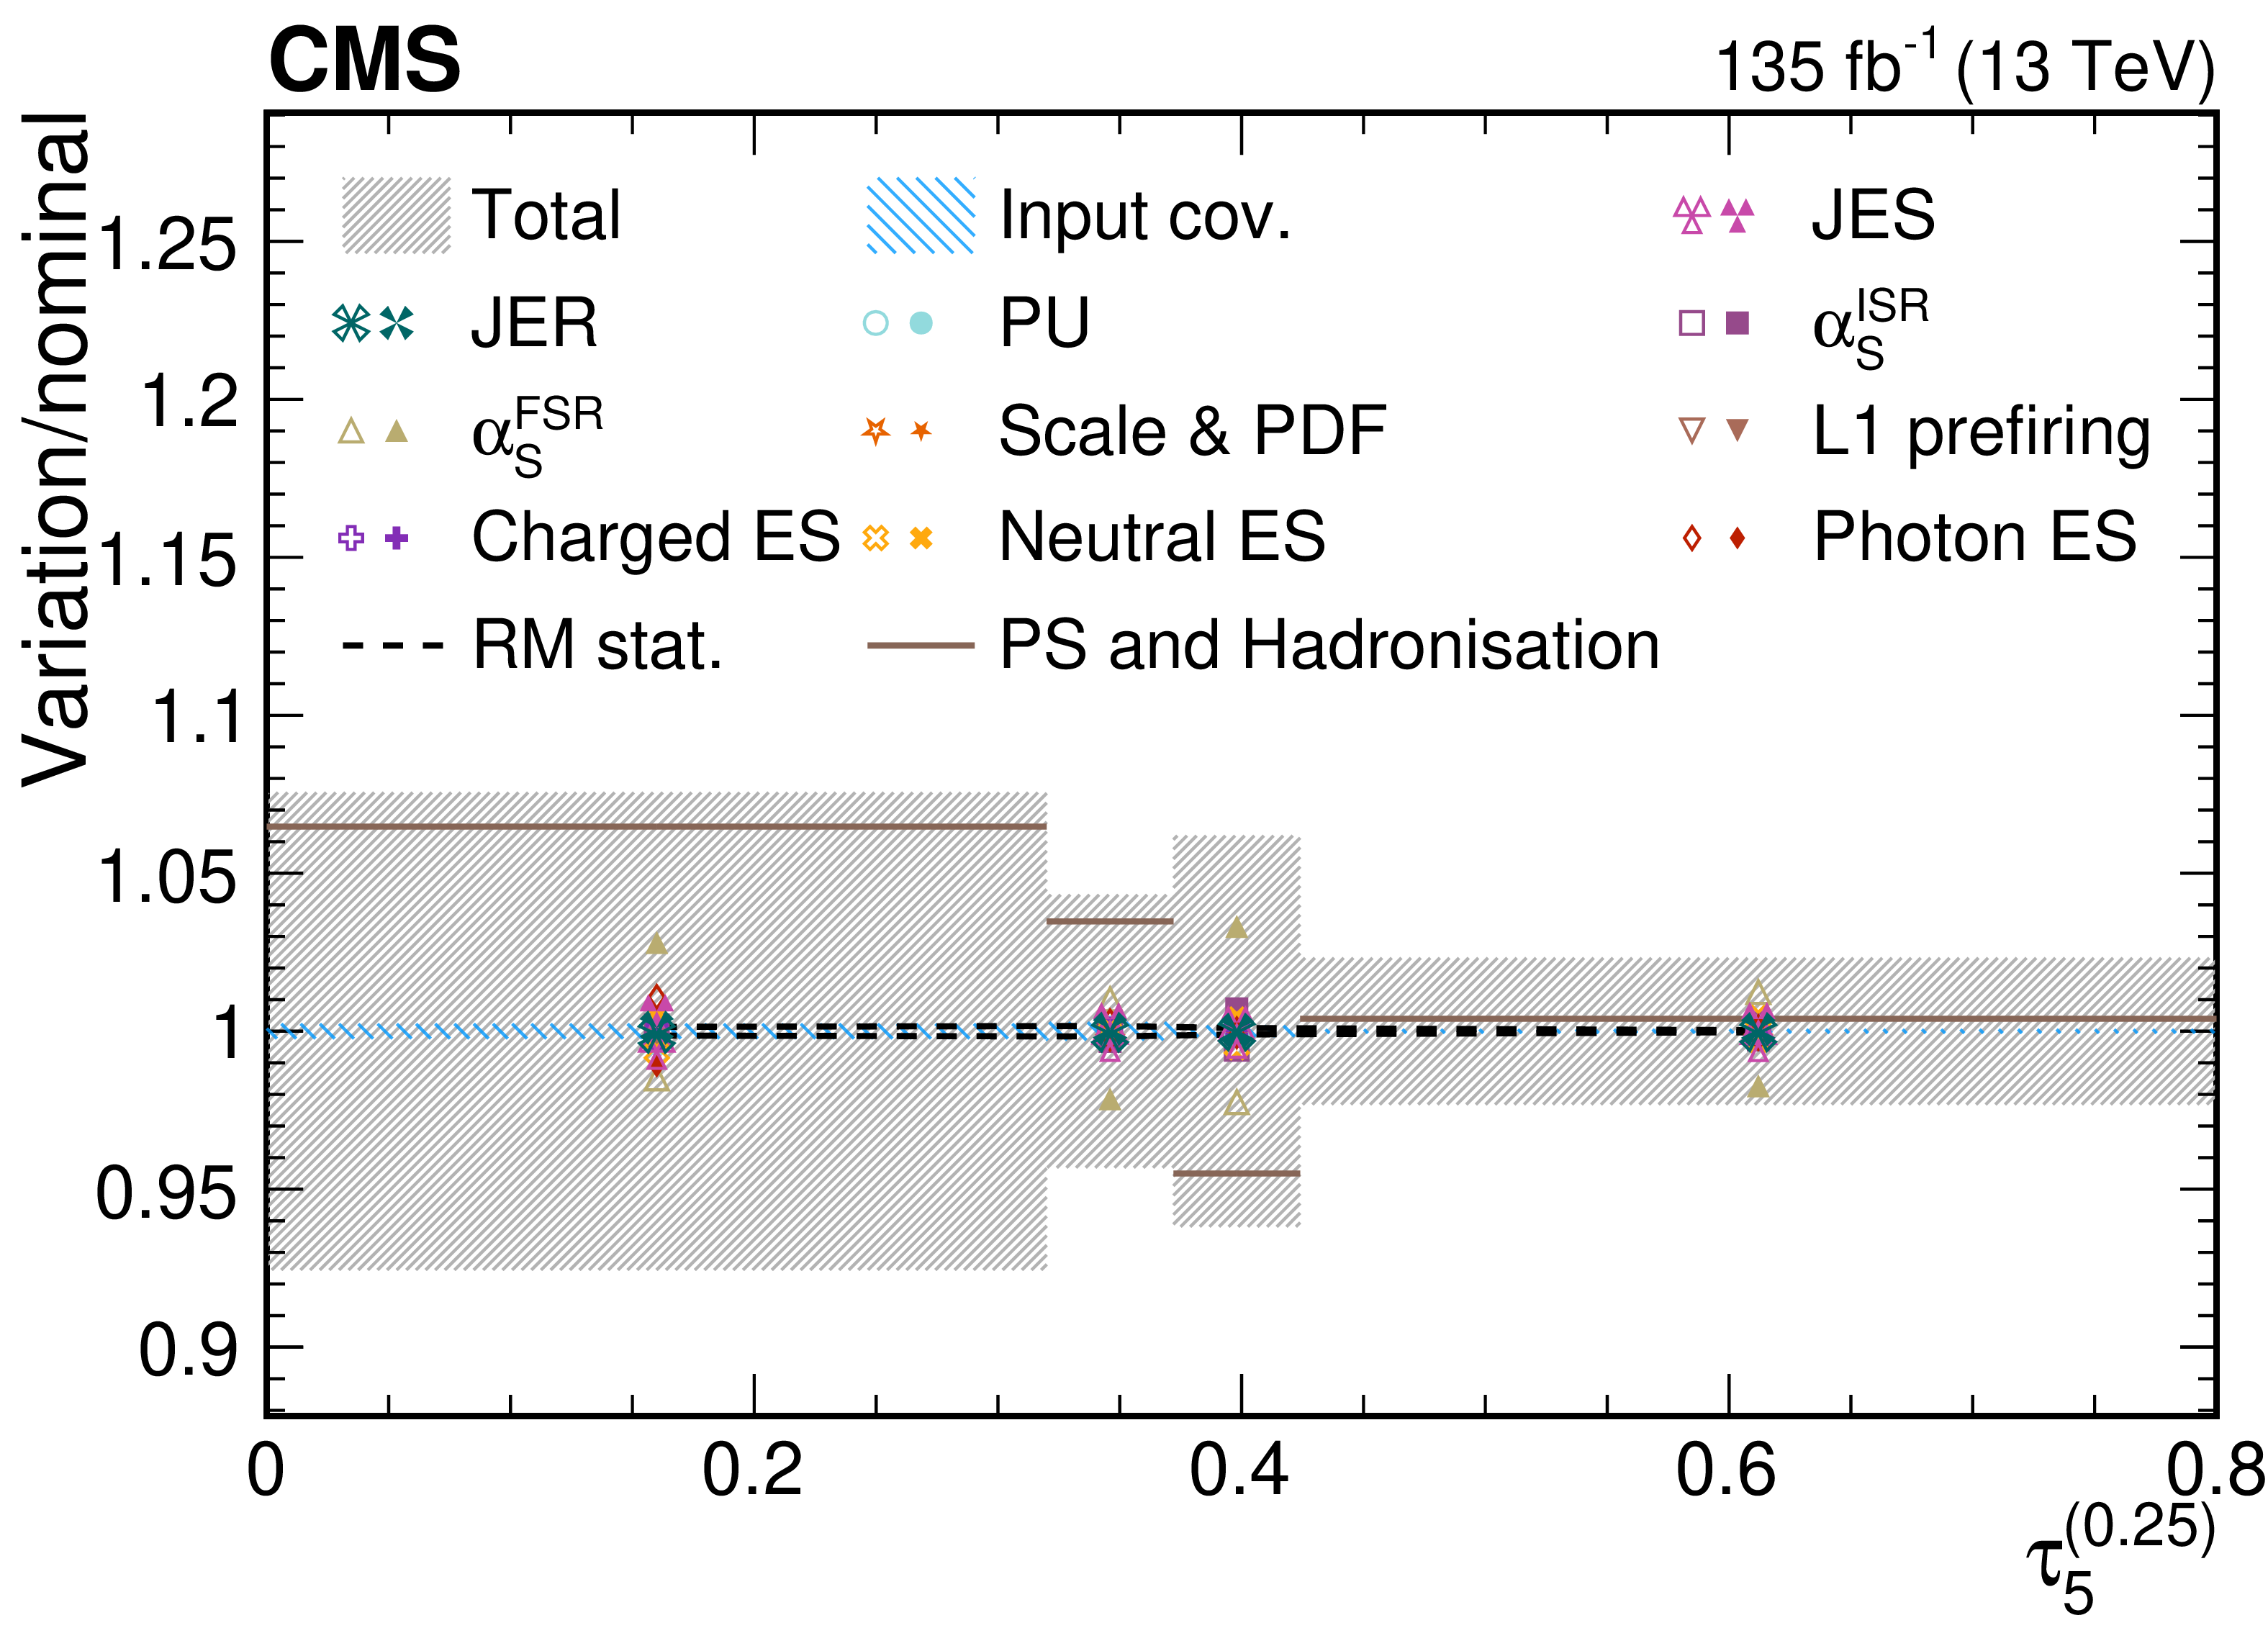
png pdf |
Figure 47-a:
Contributions from various systematic variations to the normalized, unfolded distribution for $ \tau_5^{(\beta)} $ observables measured for AK8 jets in the QCD dijet selection. The total unfolding uncertainty is indicated with the dark grey, hashed region, while the blue hashed region indicates the contributions from the input covariance matrix, which includes the propagated effects of the statistical uncertainties of the input data after background subtraction. Contributions from statistical uncertainties of the simulated sample used to construct the nominal response matrix are indicated with the dashed black line. The physics model uncertainty is computed as a one-sided shift compared to the nominal unfolding, and up (down) contributions from other sources are indicated with filled (open) markers of the same type and colour. |
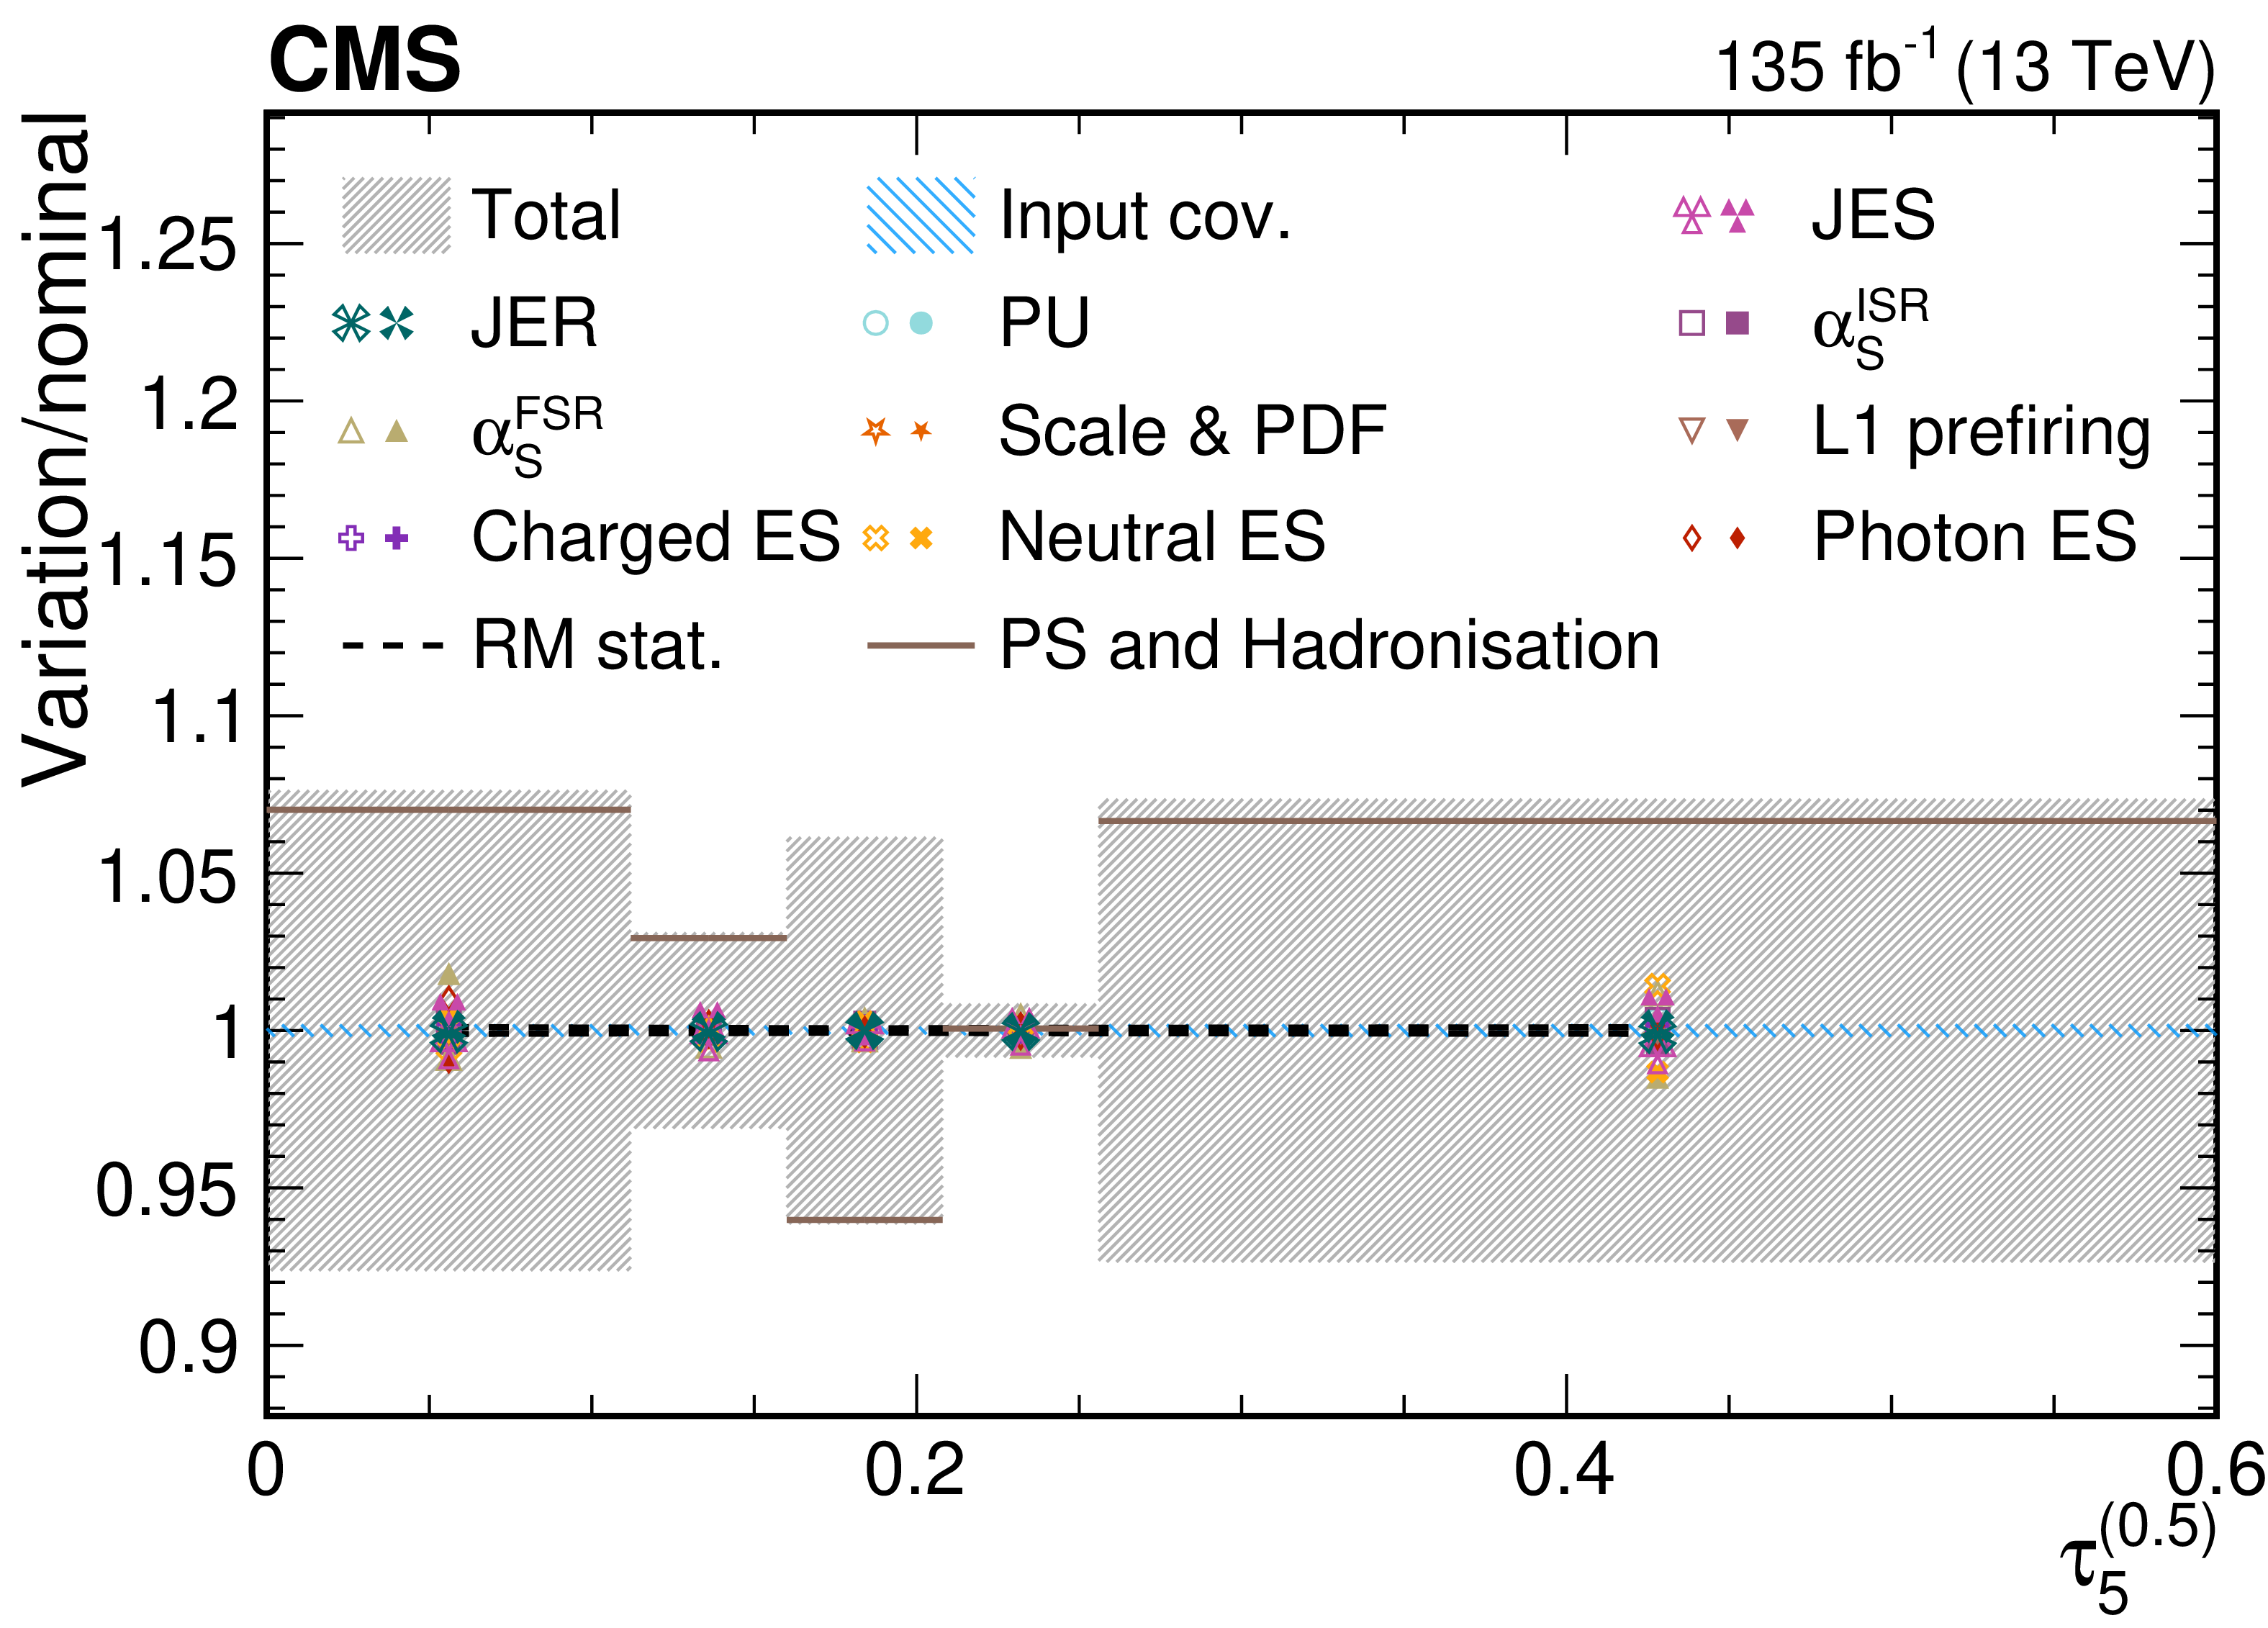
png pdf |
Figure 47-b:
Contributions from various systematic variations to the normalized, unfolded distribution for $ \tau_5^{(\beta)} $ observables measured for AK8 jets in the QCD dijet selection. The total unfolding uncertainty is indicated with the dark grey, hashed region, while the blue hashed region indicates the contributions from the input covariance matrix, which includes the propagated effects of the statistical uncertainties of the input data after background subtraction. Contributions from statistical uncertainties of the simulated sample used to construct the nominal response matrix are indicated with the dashed black line. The physics model uncertainty is computed as a one-sided shift compared to the nominal unfolding, and up (down) contributions from other sources are indicated with filled (open) markers of the same type and colour. |
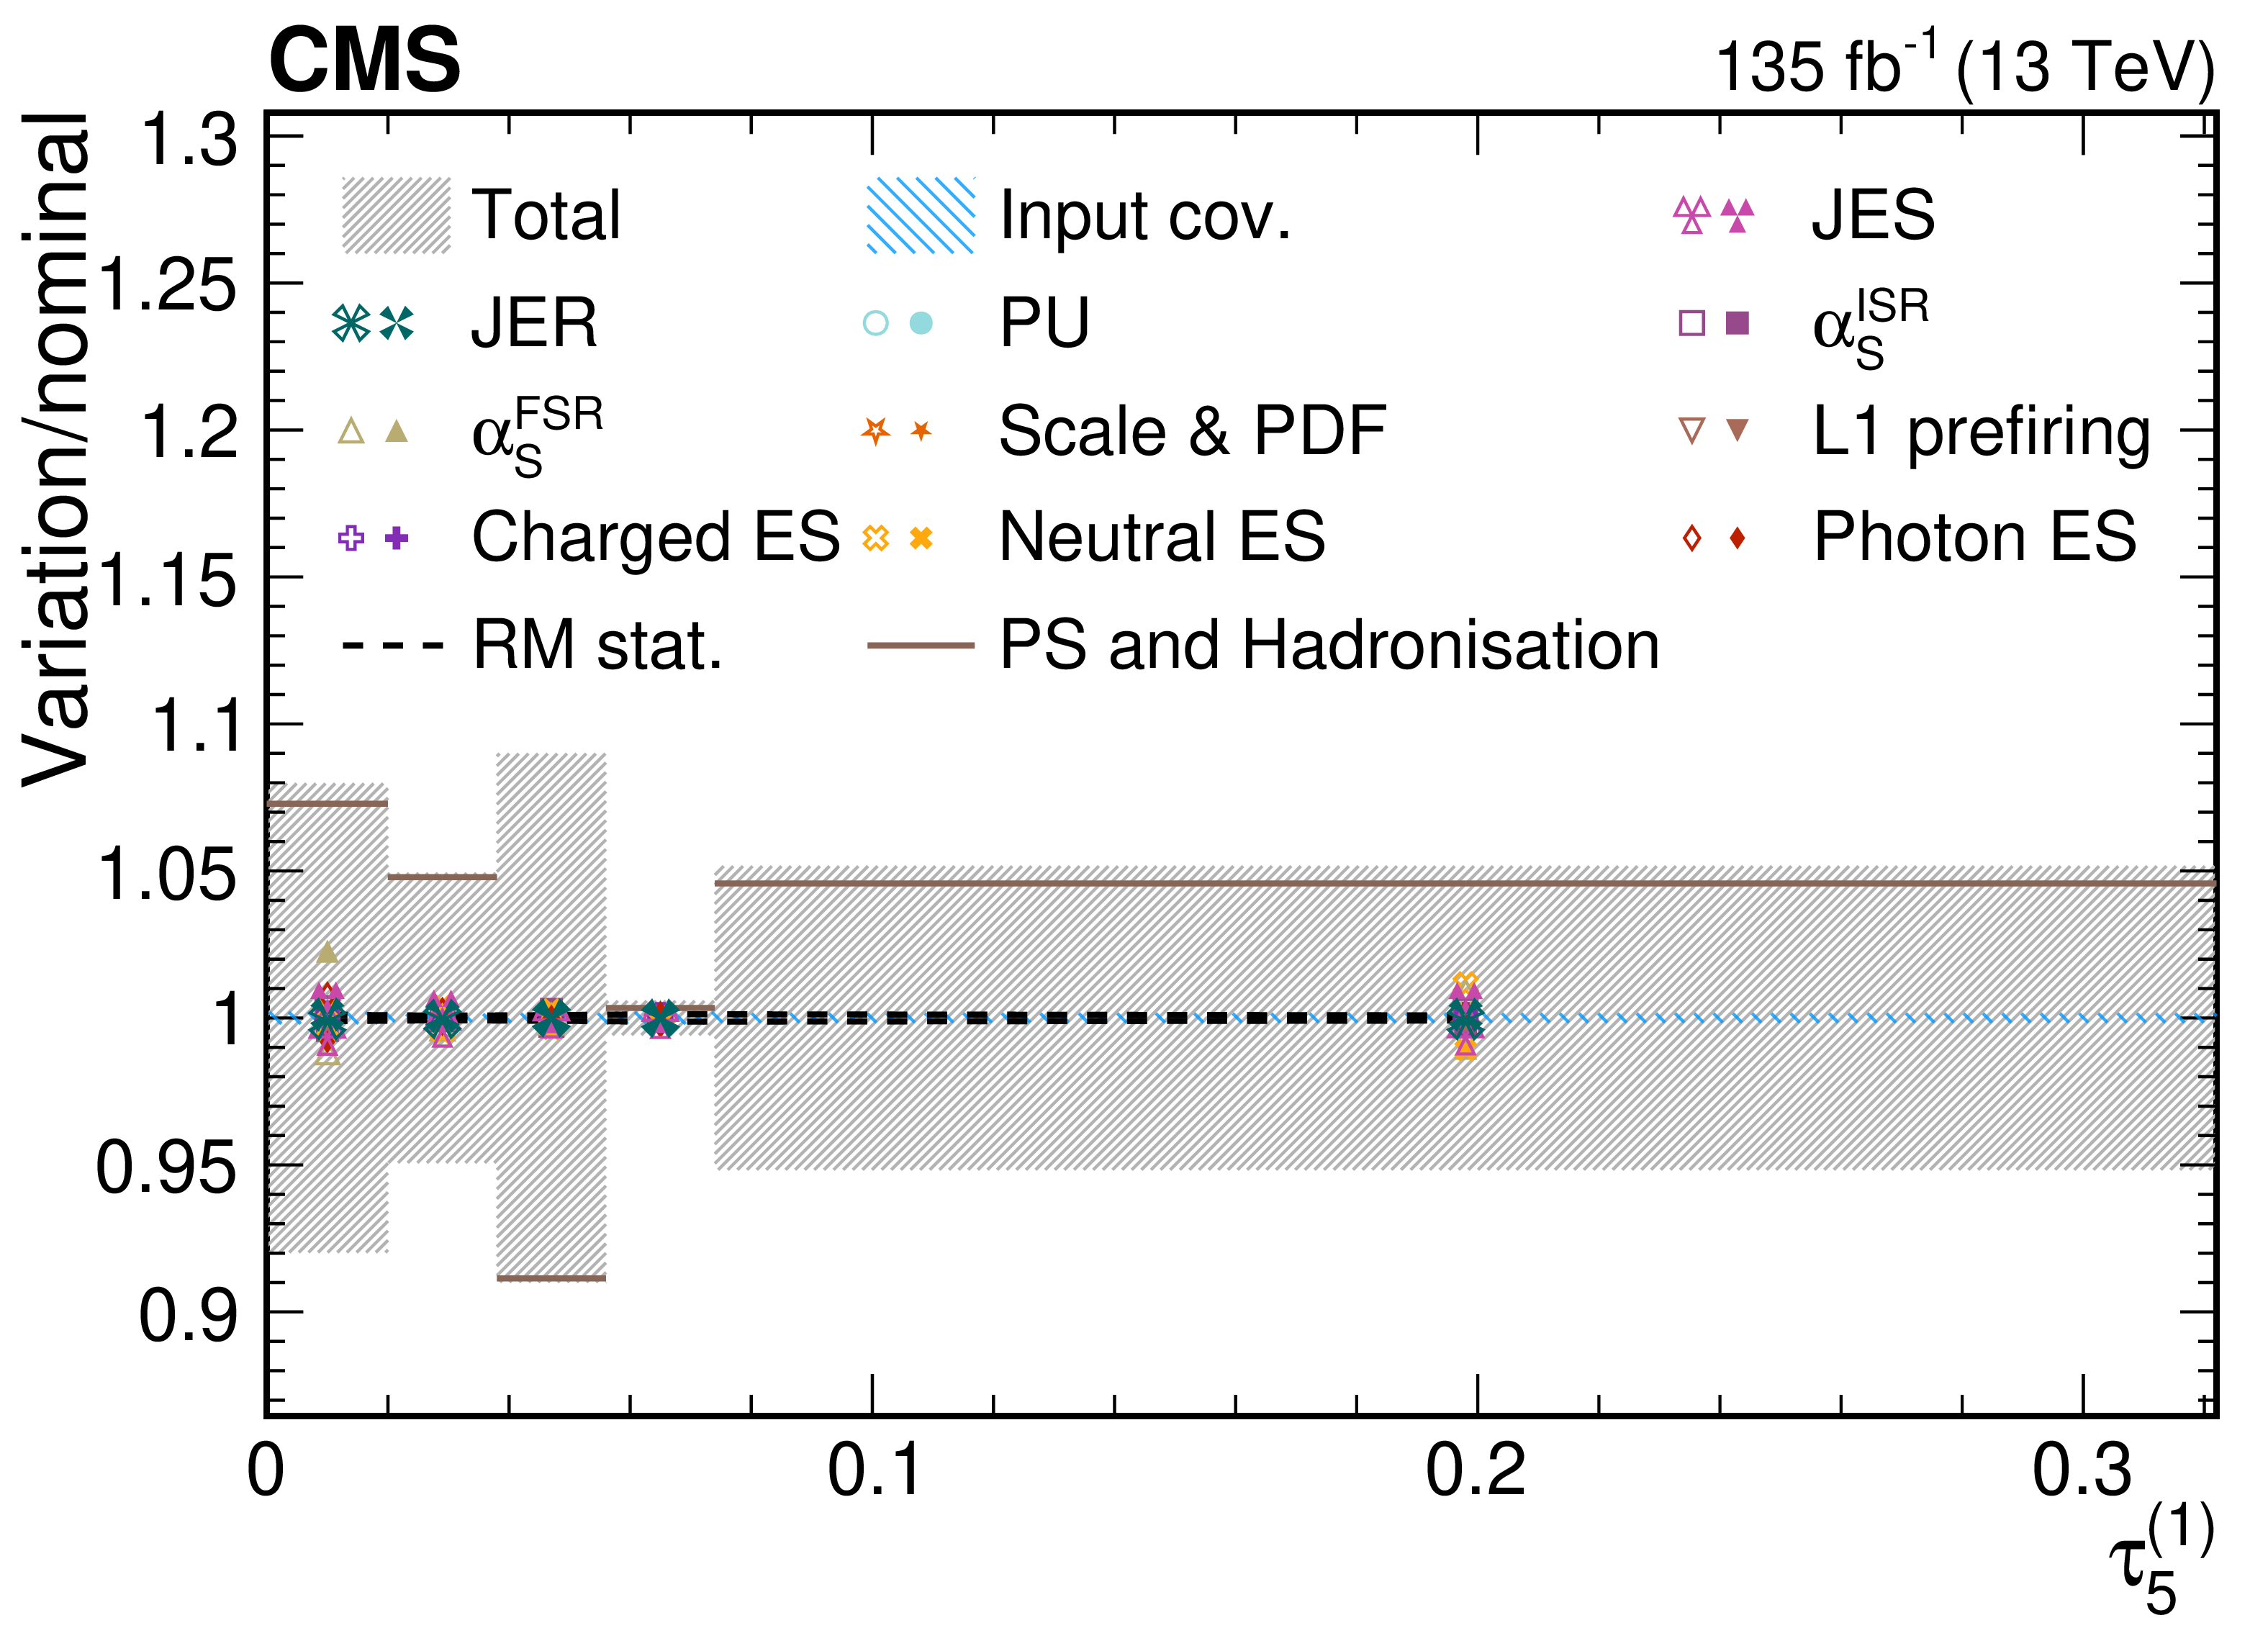
png pdf |
Figure 47-c:
Contributions from various systematic variations to the normalized, unfolded distribution for $ \tau_5^{(\beta)} $ observables measured for AK8 jets in the QCD dijet selection. The total unfolding uncertainty is indicated with the dark grey, hashed region, while the blue hashed region indicates the contributions from the input covariance matrix, which includes the propagated effects of the statistical uncertainties of the input data after background subtraction. Contributions from statistical uncertainties of the simulated sample used to construct the nominal response matrix are indicated with the dashed black line. The physics model uncertainty is computed as a one-sided shift compared to the nominal unfolding, and up (down) contributions from other sources are indicated with filled (open) markers of the same type and colour. |
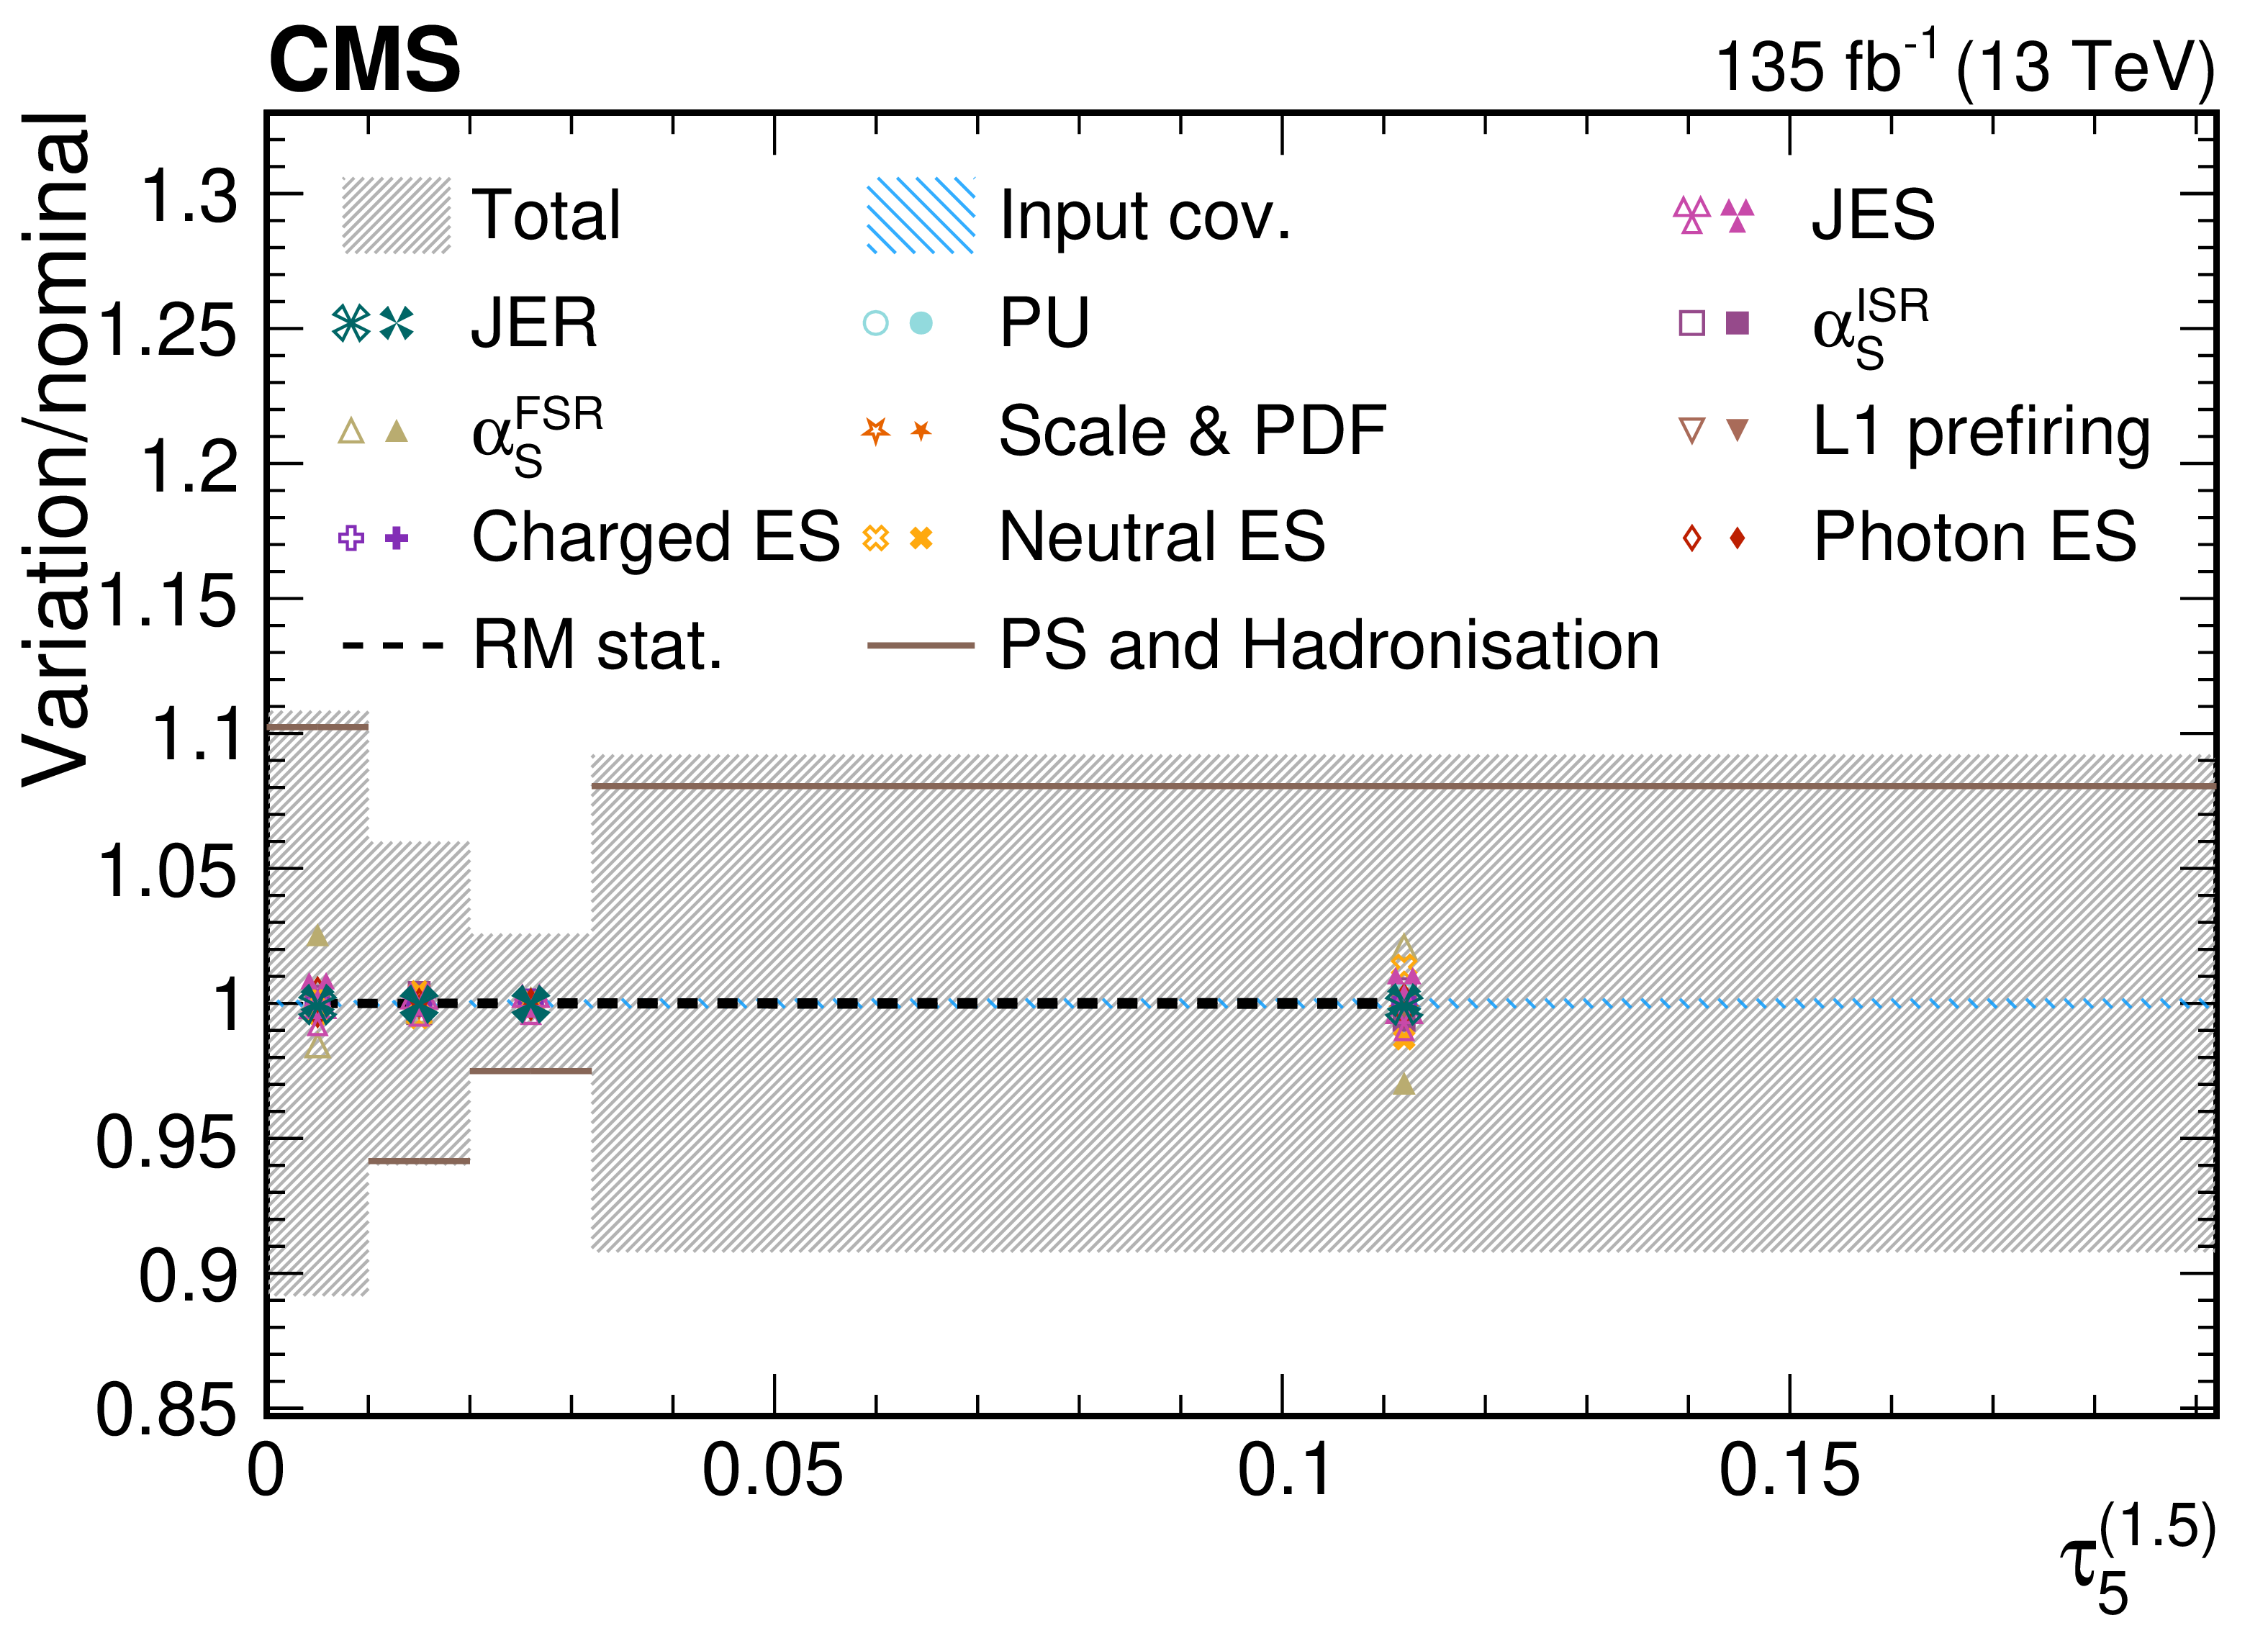
png pdf |
Figure 47-d:
Contributions from various systematic variations to the normalized, unfolded distribution for $ \tau_5^{(\beta)} $ observables measured for AK8 jets in the QCD dijet selection. The total unfolding uncertainty is indicated with the dark grey, hashed region, while the blue hashed region indicates the contributions from the input covariance matrix, which includes the propagated effects of the statistical uncertainties of the input data after background subtraction. Contributions from statistical uncertainties of the simulated sample used to construct the nominal response matrix are indicated with the dashed black line. The physics model uncertainty is computed as a one-sided shift compared to the nominal unfolding, and up (down) contributions from other sources are indicated with filled (open) markers of the same type and colour. |
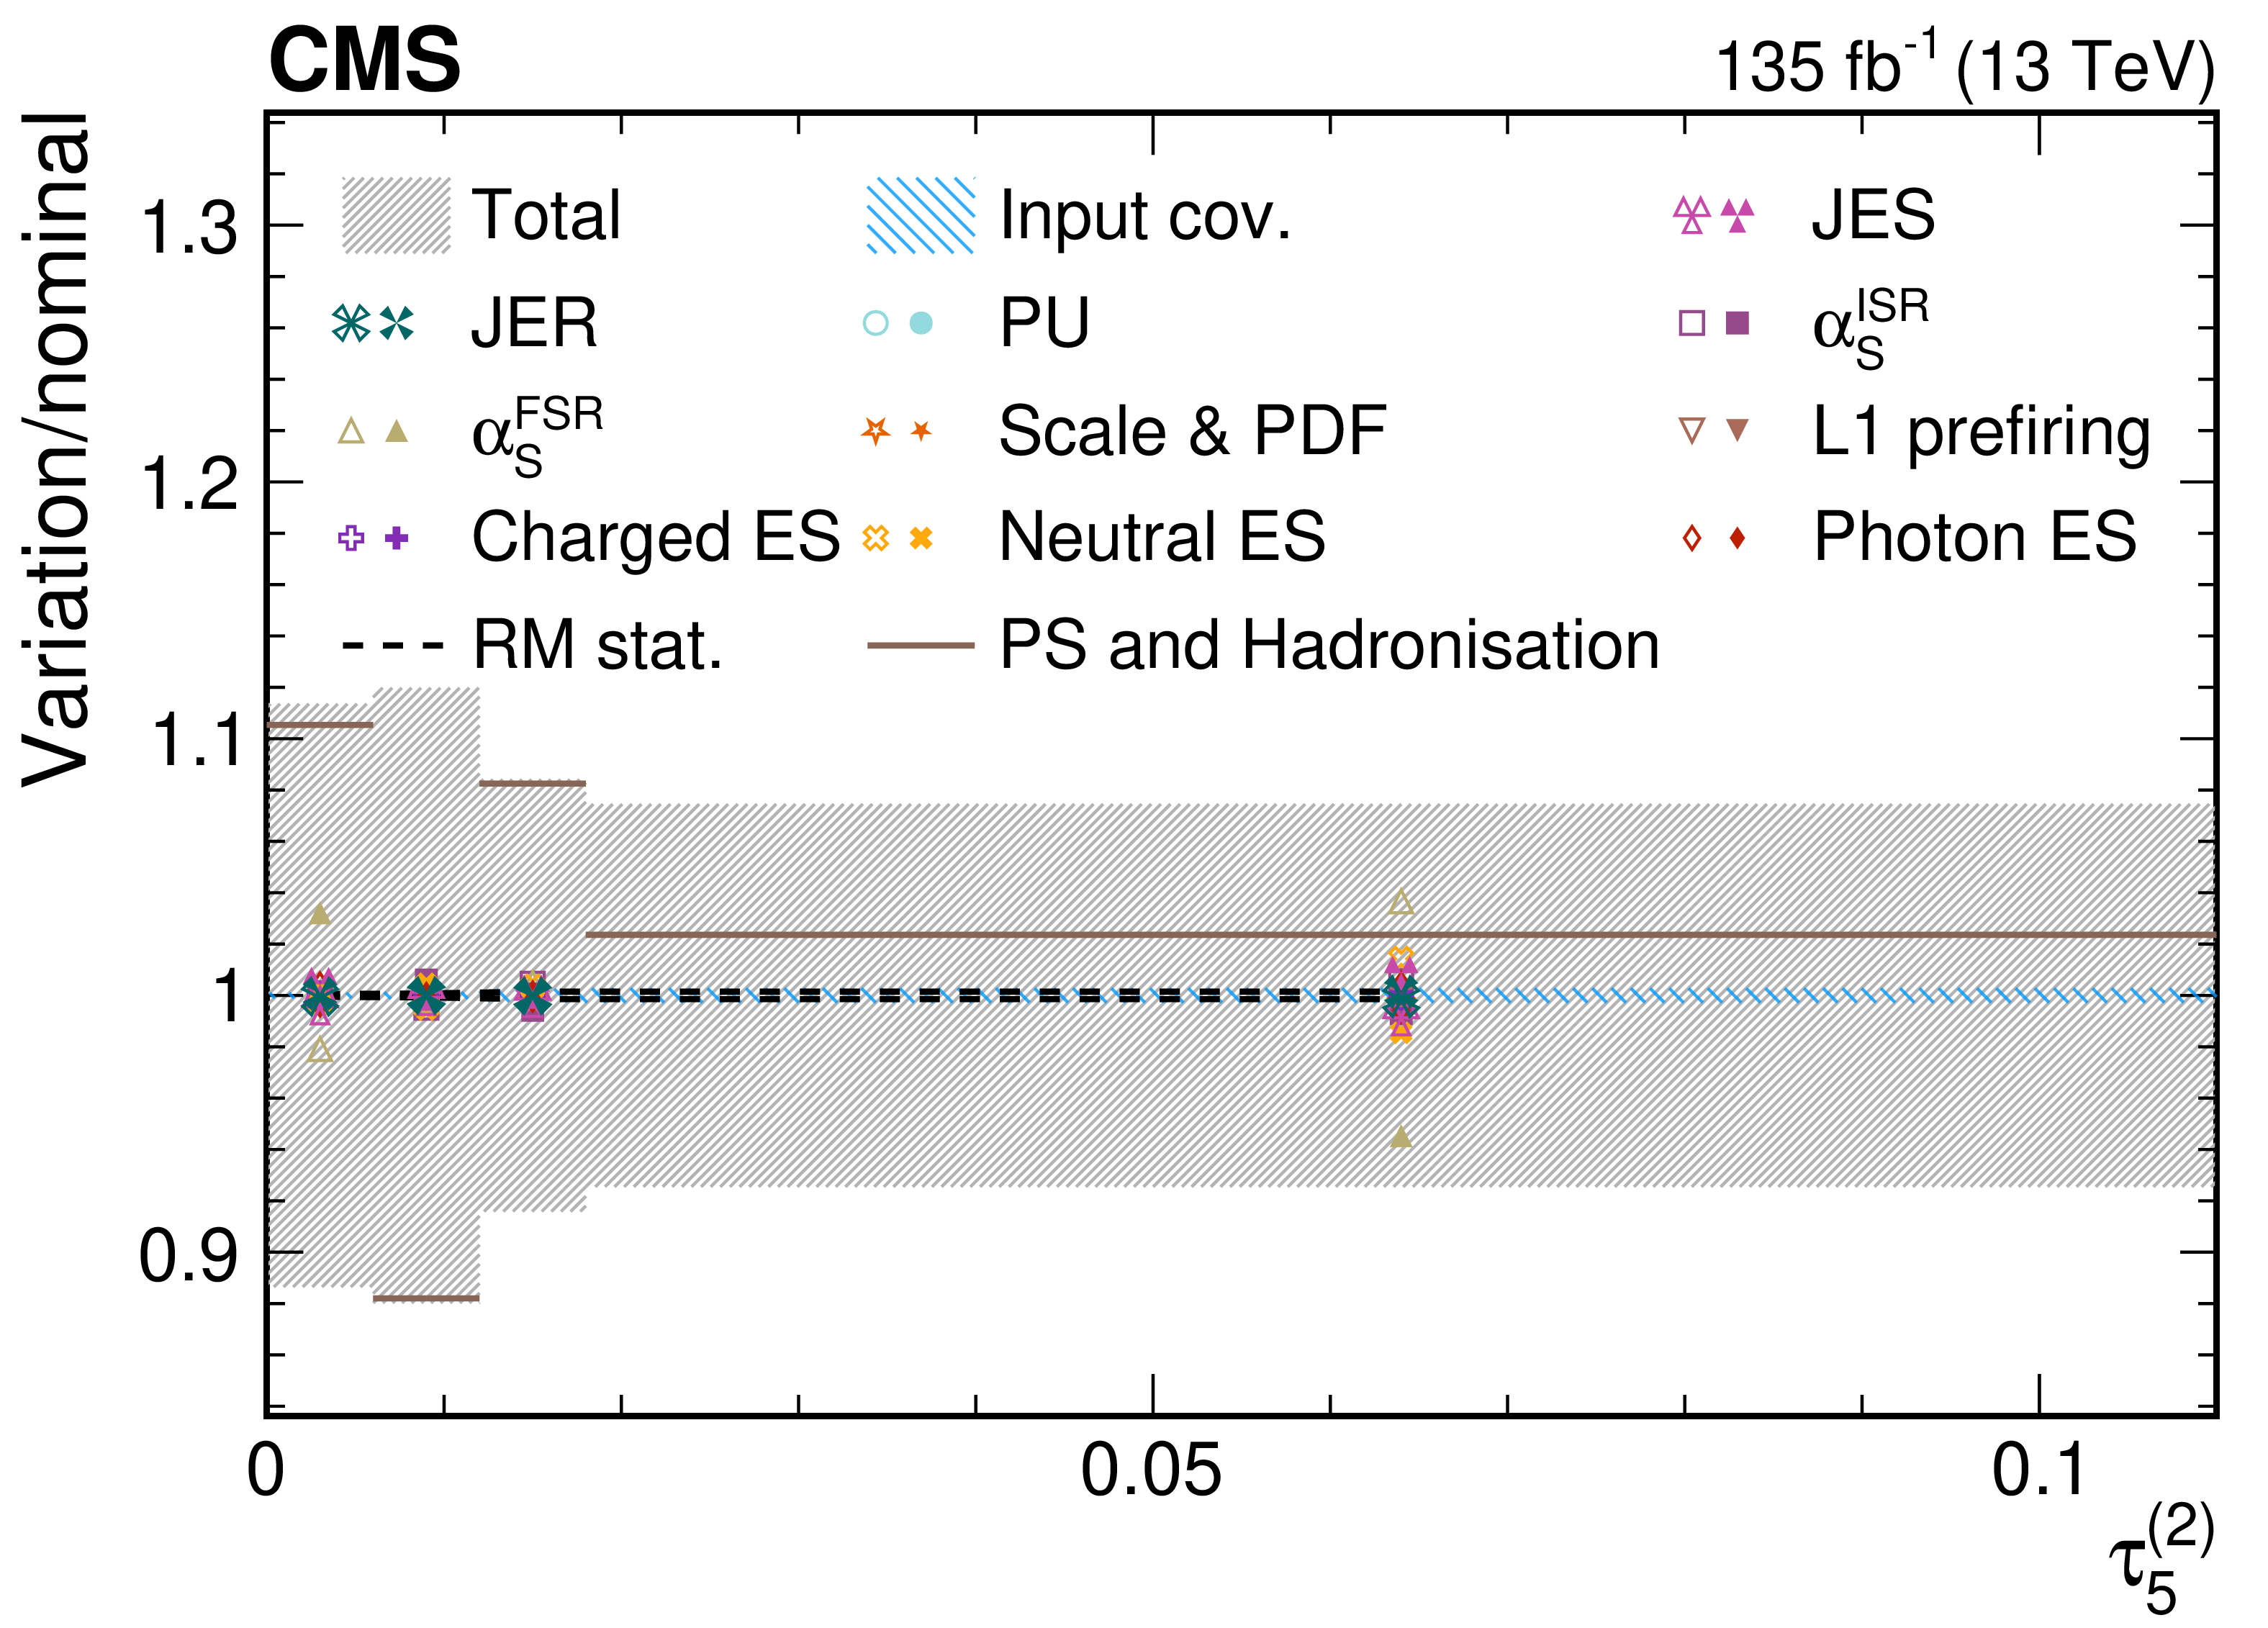
png pdf |
Figure 47-e:
Contributions from various systematic variations to the normalized, unfolded distribution for $ \tau_5^{(\beta)} $ observables measured for AK8 jets in the QCD dijet selection. The total unfolding uncertainty is indicated with the dark grey, hashed region, while the blue hashed region indicates the contributions from the input covariance matrix, which includes the propagated effects of the statistical uncertainties of the input data after background subtraction. Contributions from statistical uncertainties of the simulated sample used to construct the nominal response matrix are indicated with the dashed black line. The physics model uncertainty is computed as a one-sided shift compared to the nominal unfolding, and up (down) contributions from other sources are indicated with filled (open) markers of the same type and colour. |
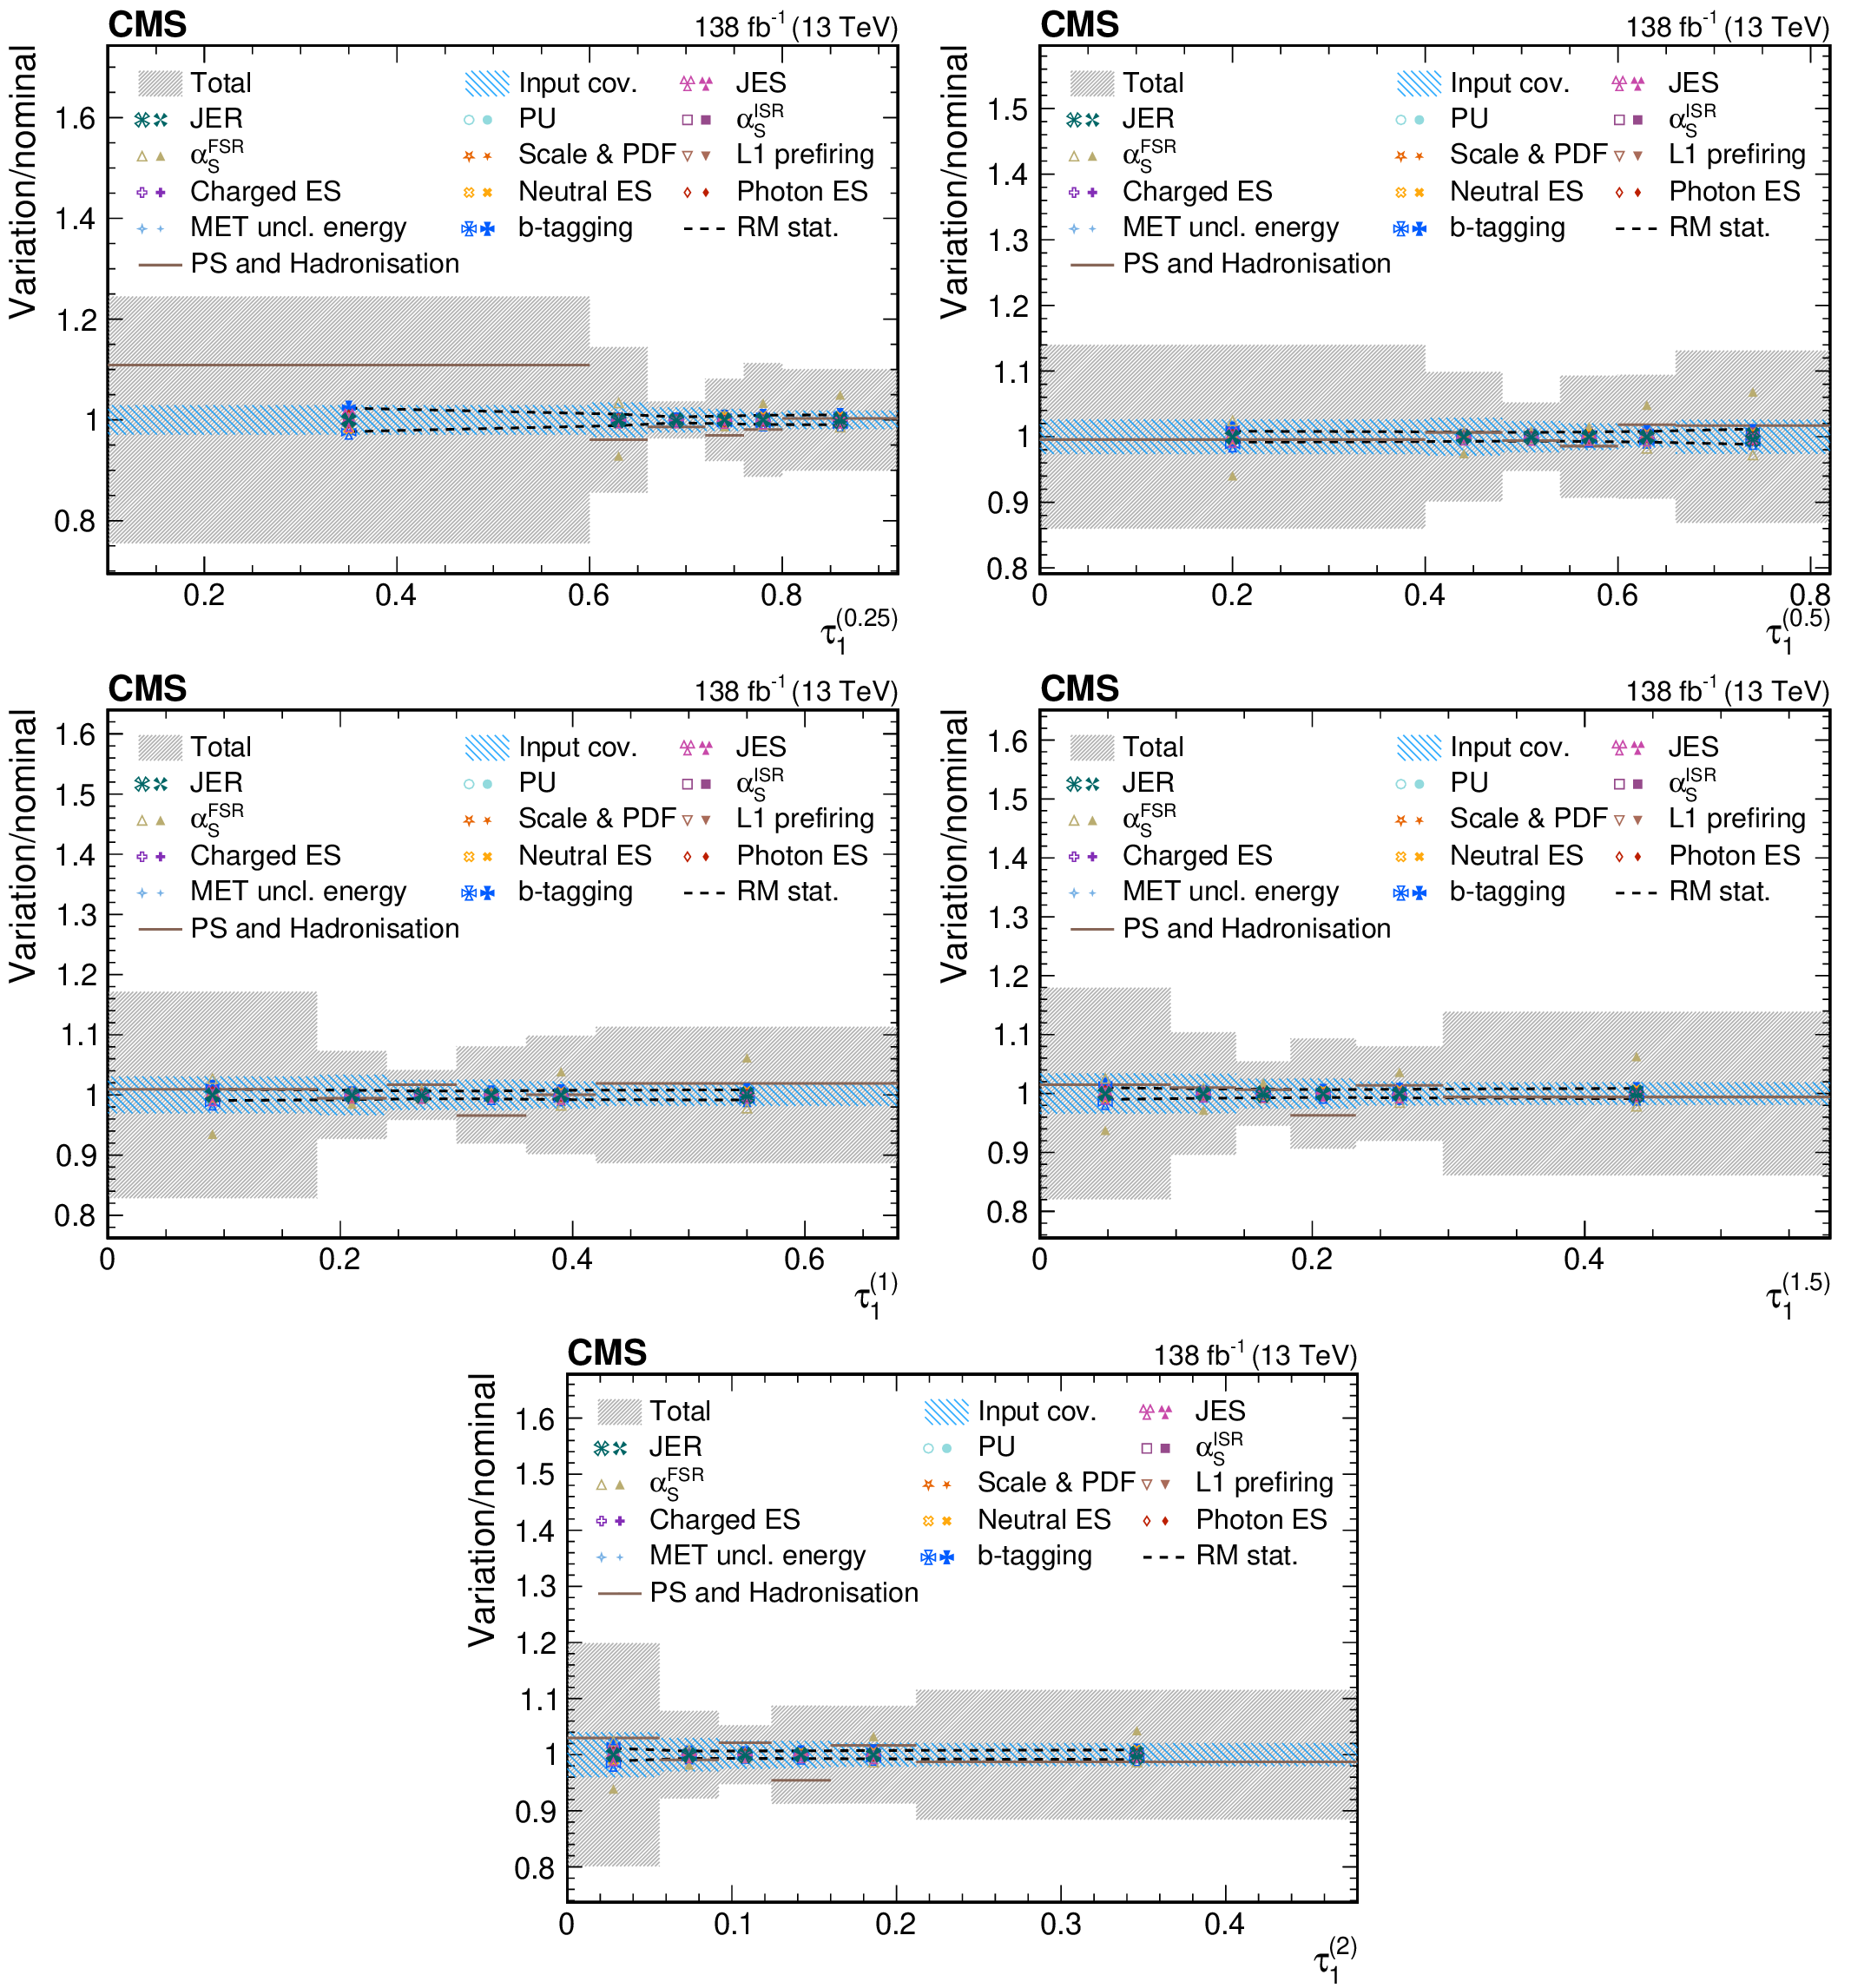
png pdf |
Figure 48:
Contributions from various systematic variations to the normalized, unfolded distribution for $ \tau_1^{(\beta)} $ observables measured for AK8 jets passing the boosted W boson-enriched selection in $ \mu $+jets $ \mathrm{t} \overline{\mathrm{t}} $ events. The total unfolding uncertainty is indicated with the dark grey, hashed region, while the blue hashed region indicates the contributions from the input covariance matrix, which includes the propagated effects of the statistical uncertainties of the input data after background subtraction. Contributions from statistical uncertainties of the simulated sample used to construct the nominal response matrix are indicated with the dashed black line. The physics model uncertainty is computed as a one-sided shift compared to the nominal unfolding, and up (down) contributions from other sources are indicated with filled (open) markers of the same type and colour. |
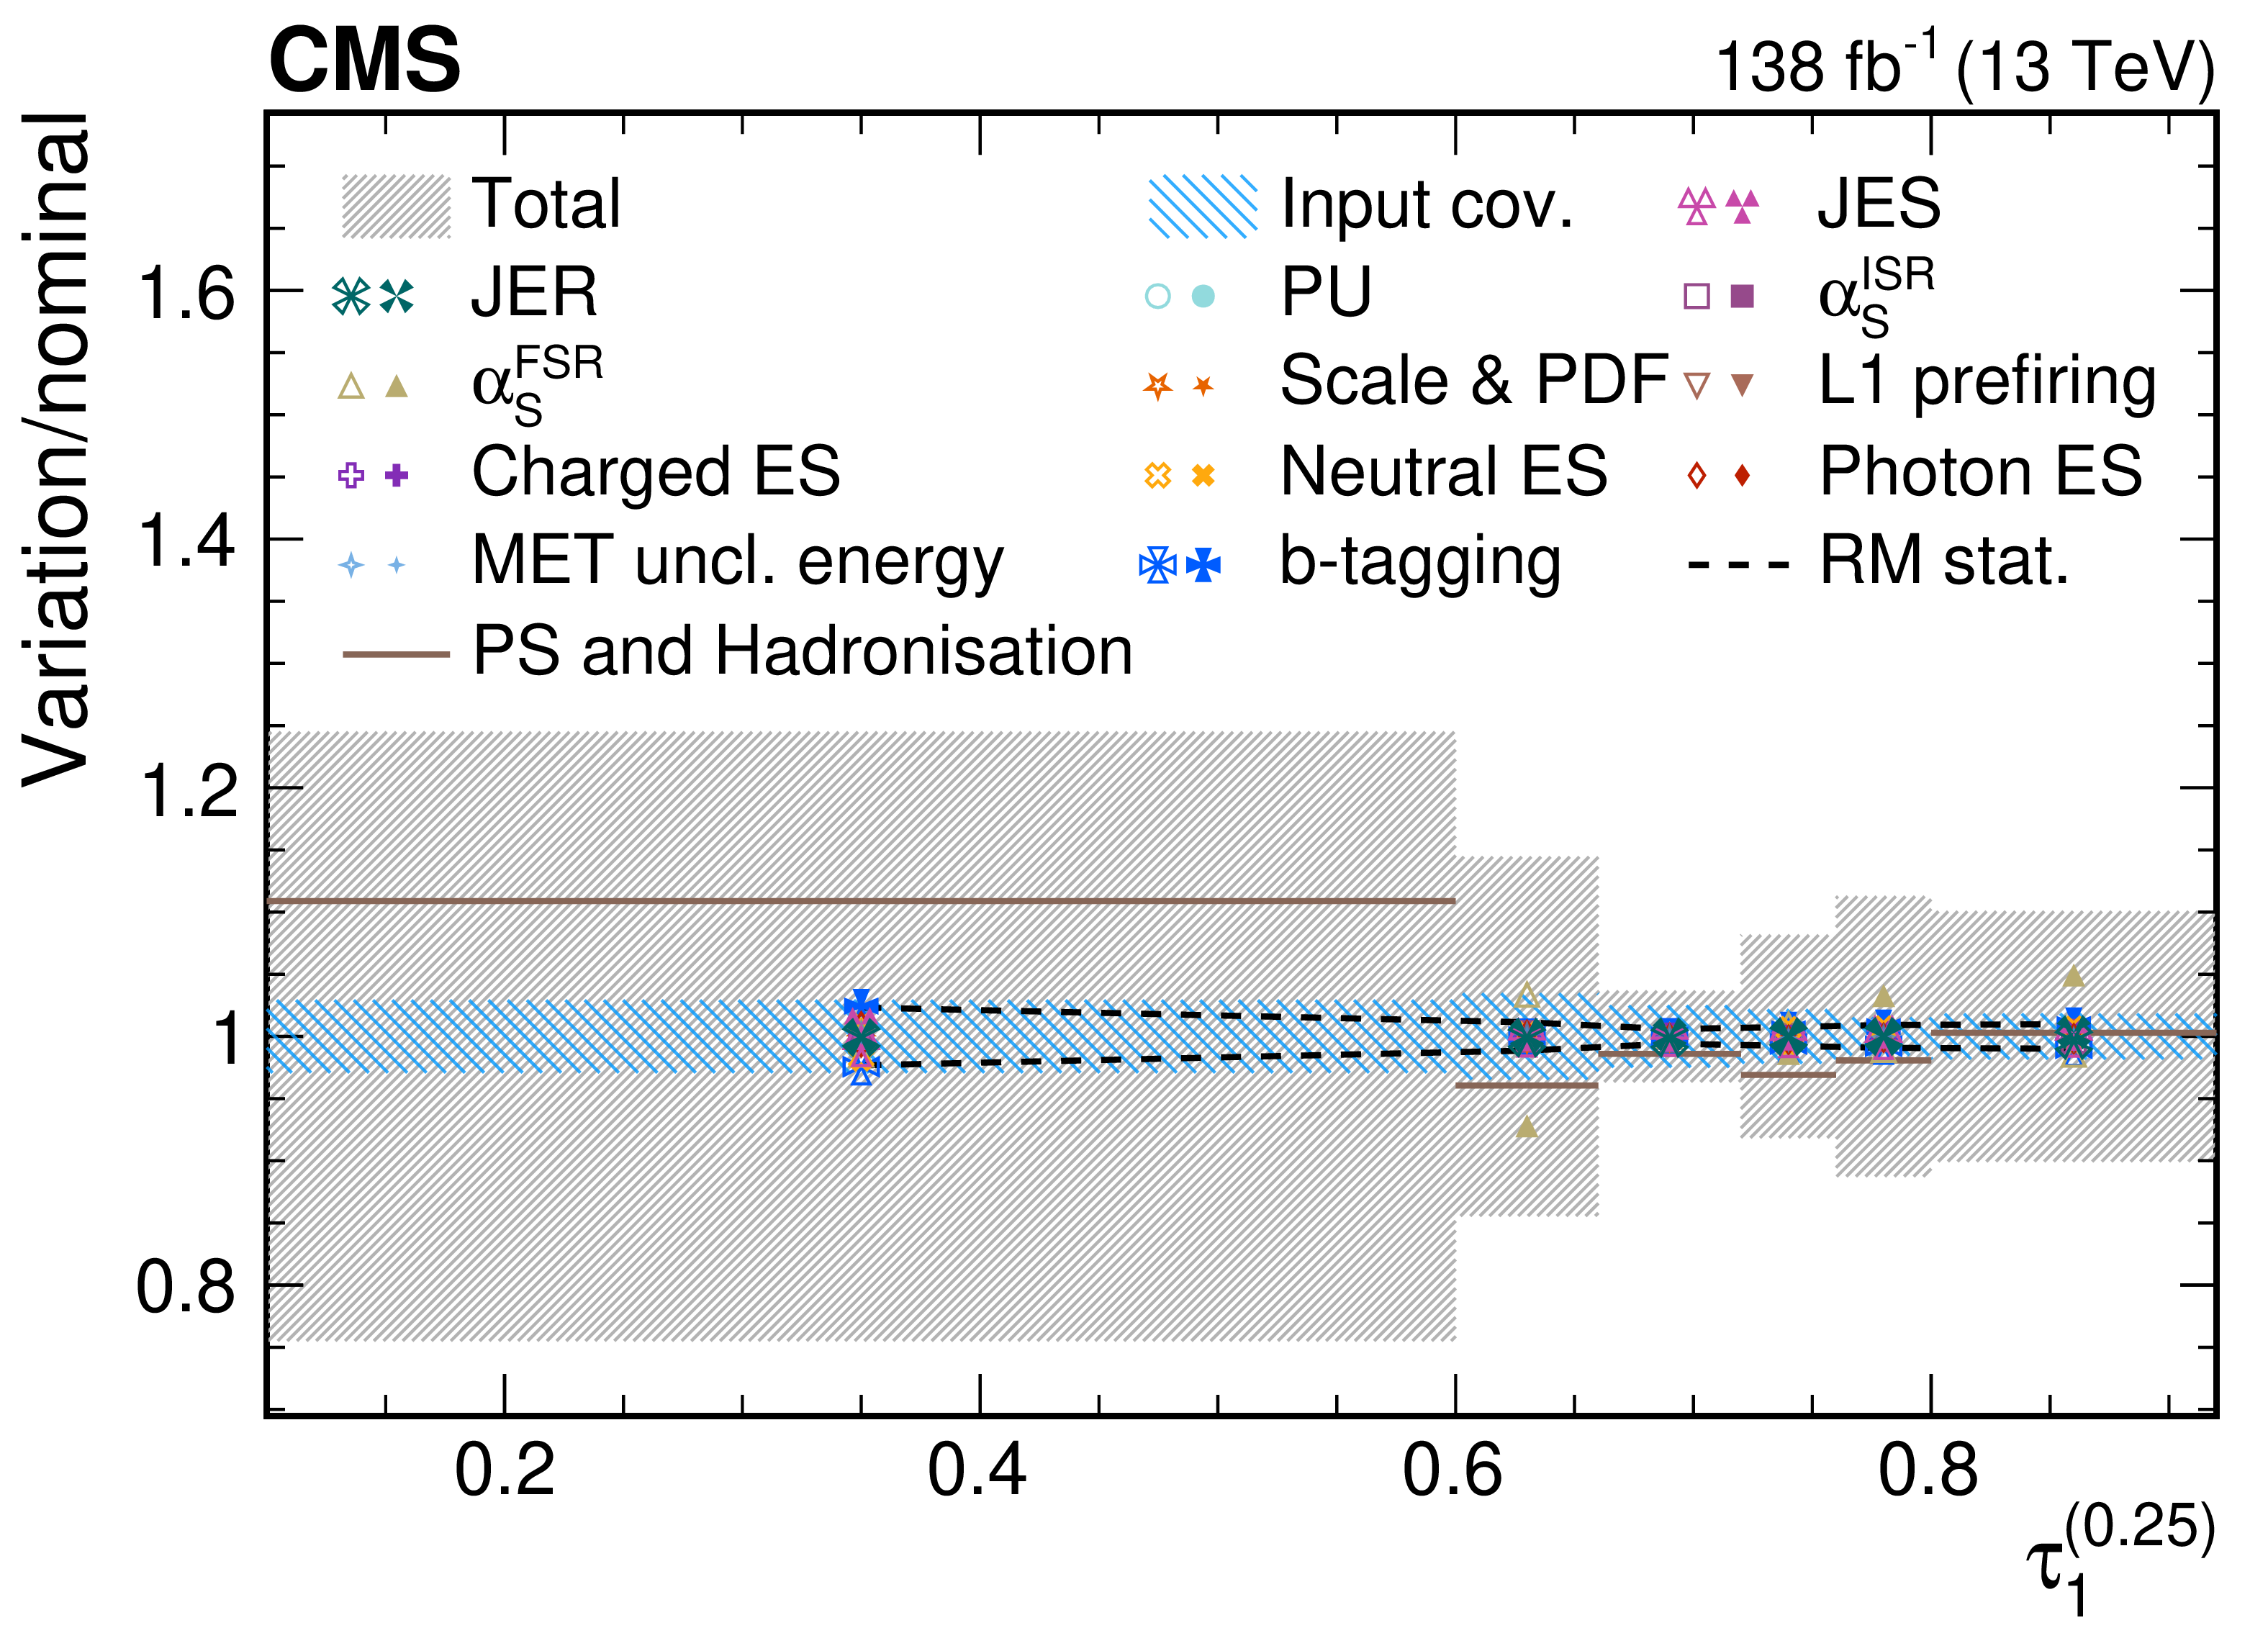
png pdf |
Figure 48-a:
Contributions from various systematic variations to the normalized, unfolded distribution for $ \tau_1^{(\beta)} $ observables measured for AK8 jets passing the boosted W boson-enriched selection in $ \mu $+jets $ \mathrm{t} \overline{\mathrm{t}} $ events. The total unfolding uncertainty is indicated with the dark grey, hashed region, while the blue hashed region indicates the contributions from the input covariance matrix, which includes the propagated effects of the statistical uncertainties of the input data after background subtraction. Contributions from statistical uncertainties of the simulated sample used to construct the nominal response matrix are indicated with the dashed black line. The physics model uncertainty is computed as a one-sided shift compared to the nominal unfolding, and up (down) contributions from other sources are indicated with filled (open) markers of the same type and colour. |

png pdf |
Figure 48-b:
Contributions from various systematic variations to the normalized, unfolded distribution for $ \tau_1^{(\beta)} $ observables measured for AK8 jets passing the boosted W boson-enriched selection in $ \mu $+jets $ \mathrm{t} \overline{\mathrm{t}} $ events. The total unfolding uncertainty is indicated with the dark grey, hashed region, while the blue hashed region indicates the contributions from the input covariance matrix, which includes the propagated effects of the statistical uncertainties of the input data after background subtraction. Contributions from statistical uncertainties of the simulated sample used to construct the nominal response matrix are indicated with the dashed black line. The physics model uncertainty is computed as a one-sided shift compared to the nominal unfolding, and up (down) contributions from other sources are indicated with filled (open) markers of the same type and colour. |
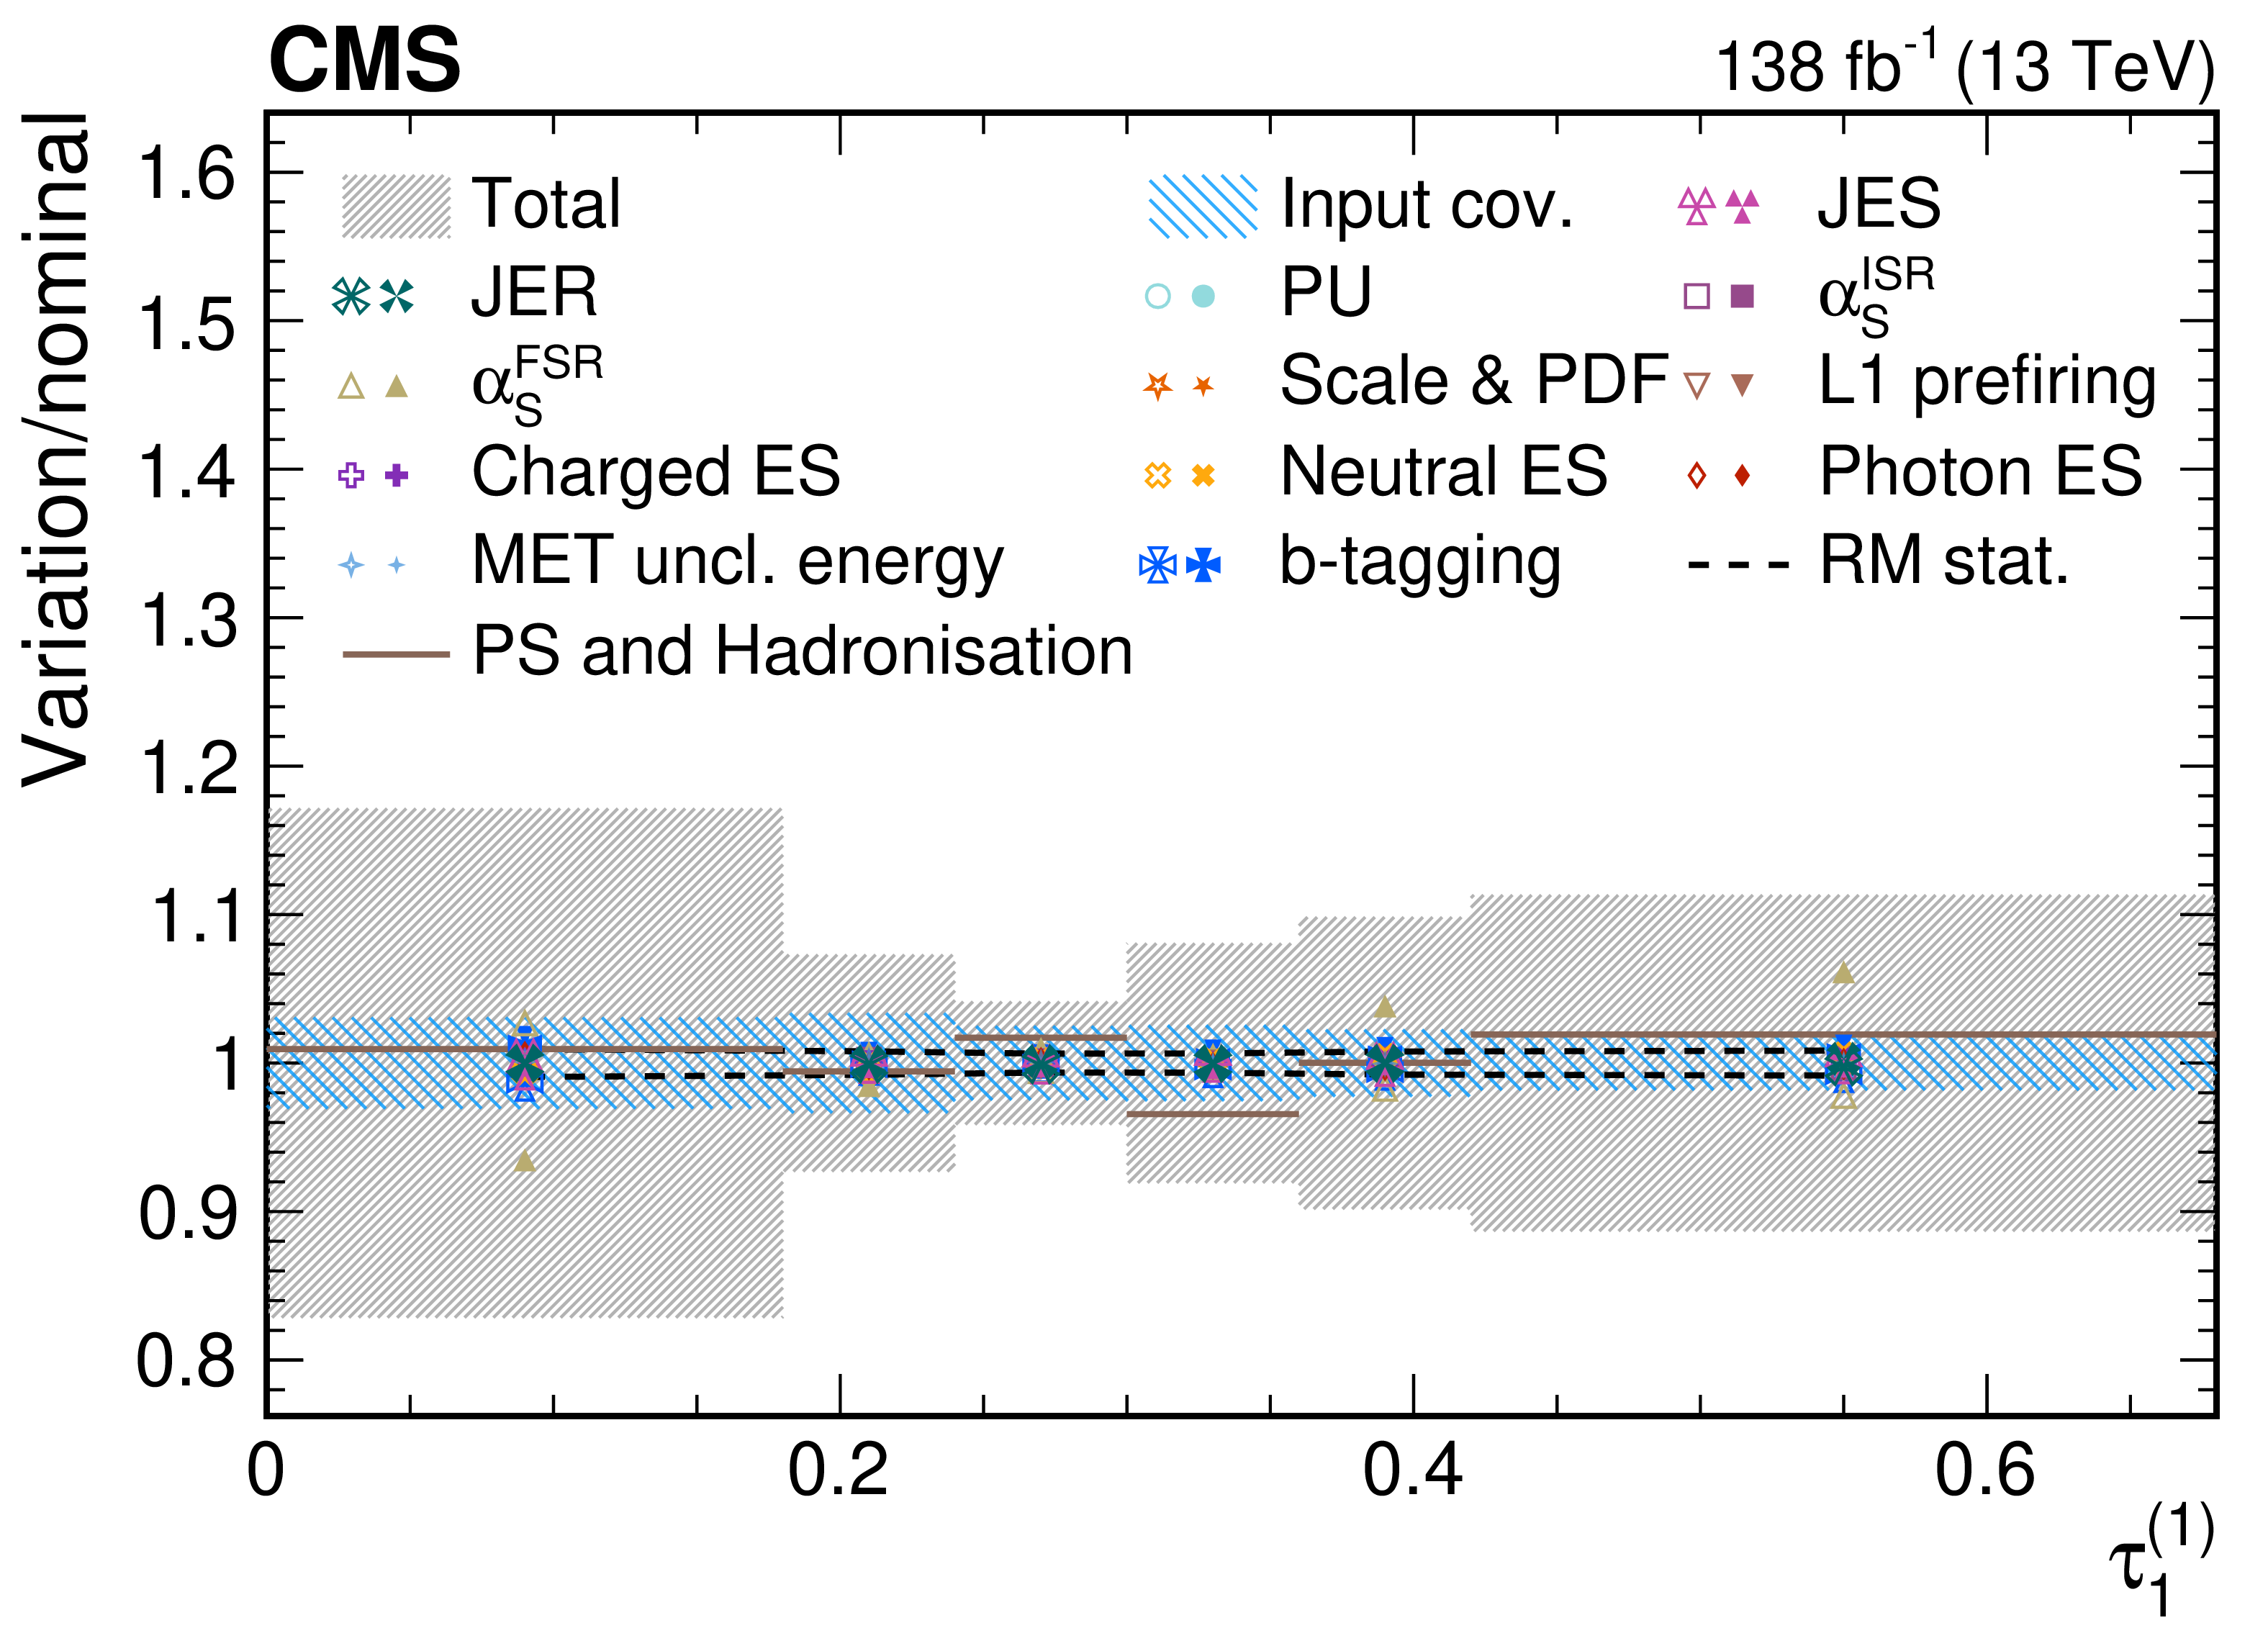
png pdf |
Figure 48-c:
Contributions from various systematic variations to the normalized, unfolded distribution for $ \tau_1^{(\beta)} $ observables measured for AK8 jets passing the boosted W boson-enriched selection in $ \mu $+jets $ \mathrm{t} \overline{\mathrm{t}} $ events. The total unfolding uncertainty is indicated with the dark grey, hashed region, while the blue hashed region indicates the contributions from the input covariance matrix, which includes the propagated effects of the statistical uncertainties of the input data after background subtraction. Contributions from statistical uncertainties of the simulated sample used to construct the nominal response matrix are indicated with the dashed black line. The physics model uncertainty is computed as a one-sided shift compared to the nominal unfolding, and up (down) contributions from other sources are indicated with filled (open) markers of the same type and colour. |
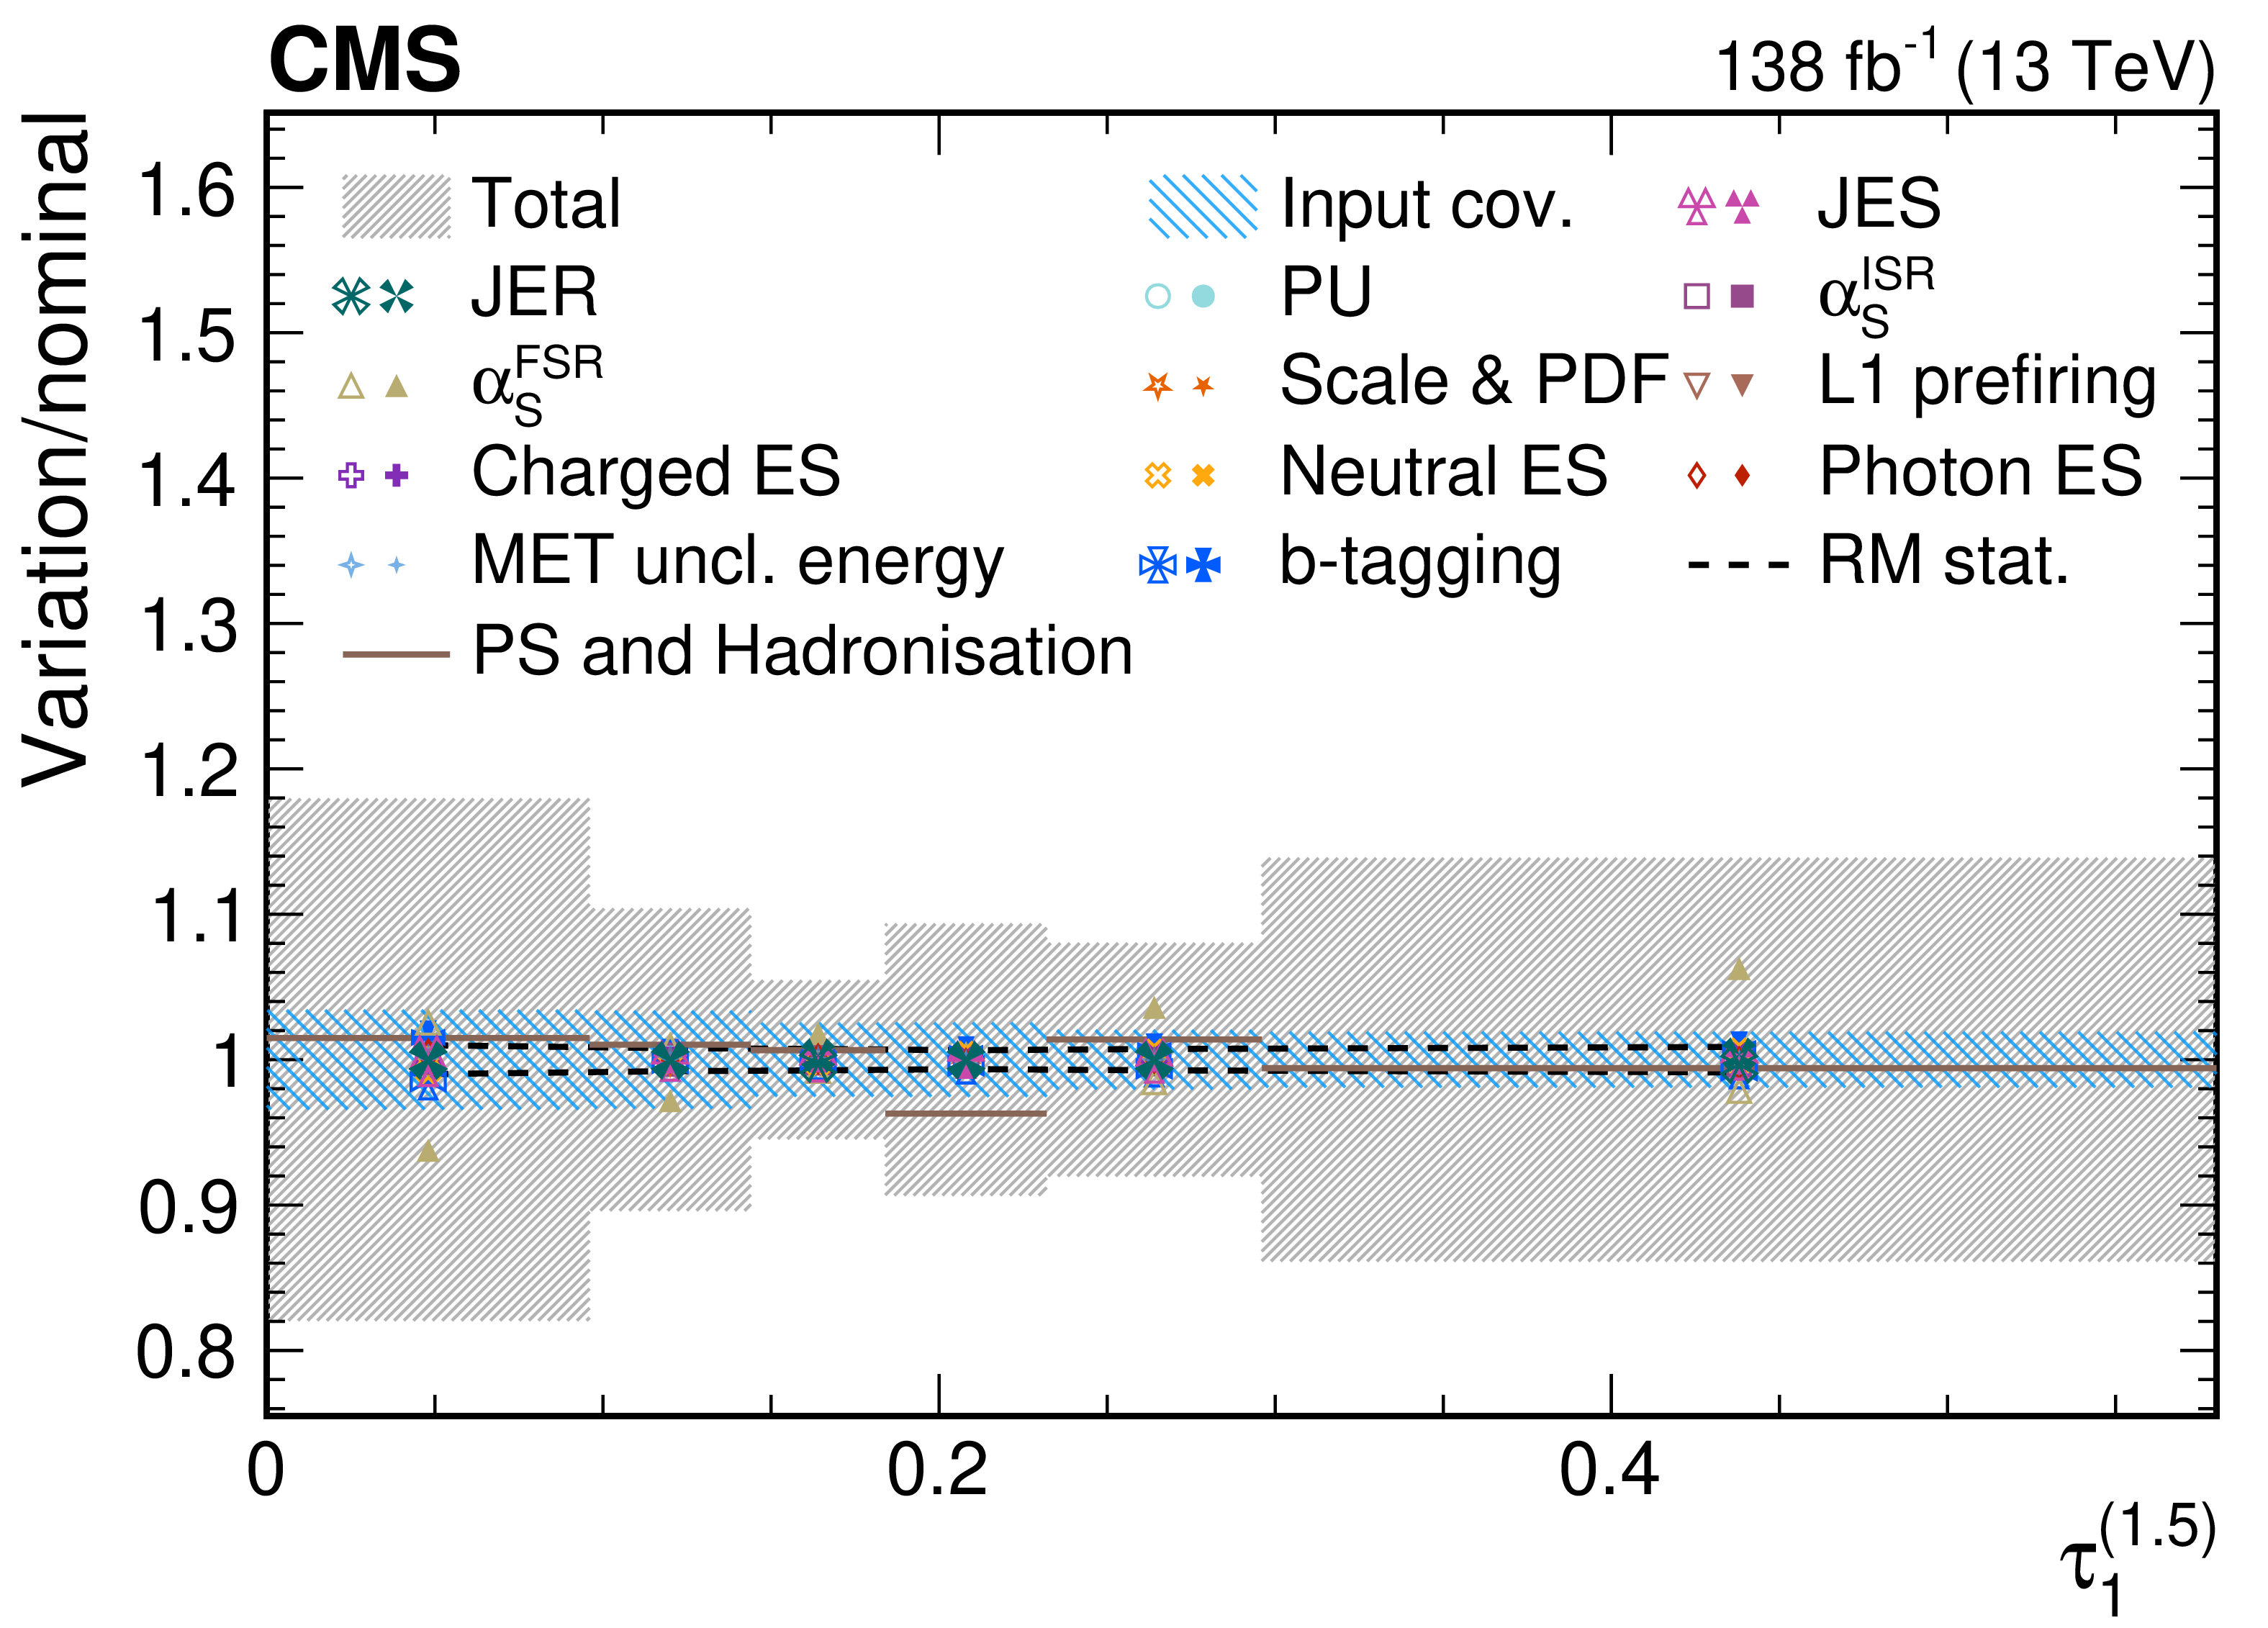
png pdf |
Figure 48-d:
Contributions from various systematic variations to the normalized, unfolded distribution for $ \tau_1^{(\beta)} $ observables measured for AK8 jets passing the boosted W boson-enriched selection in $ \mu $+jets $ \mathrm{t} \overline{\mathrm{t}} $ events. The total unfolding uncertainty is indicated with the dark grey, hashed region, while the blue hashed region indicates the contributions from the input covariance matrix, which includes the propagated effects of the statistical uncertainties of the input data after background subtraction. Contributions from statistical uncertainties of the simulated sample used to construct the nominal response matrix are indicated with the dashed black line. The physics model uncertainty is computed as a one-sided shift compared to the nominal unfolding, and up (down) contributions from other sources are indicated with filled (open) markers of the same type and colour. |
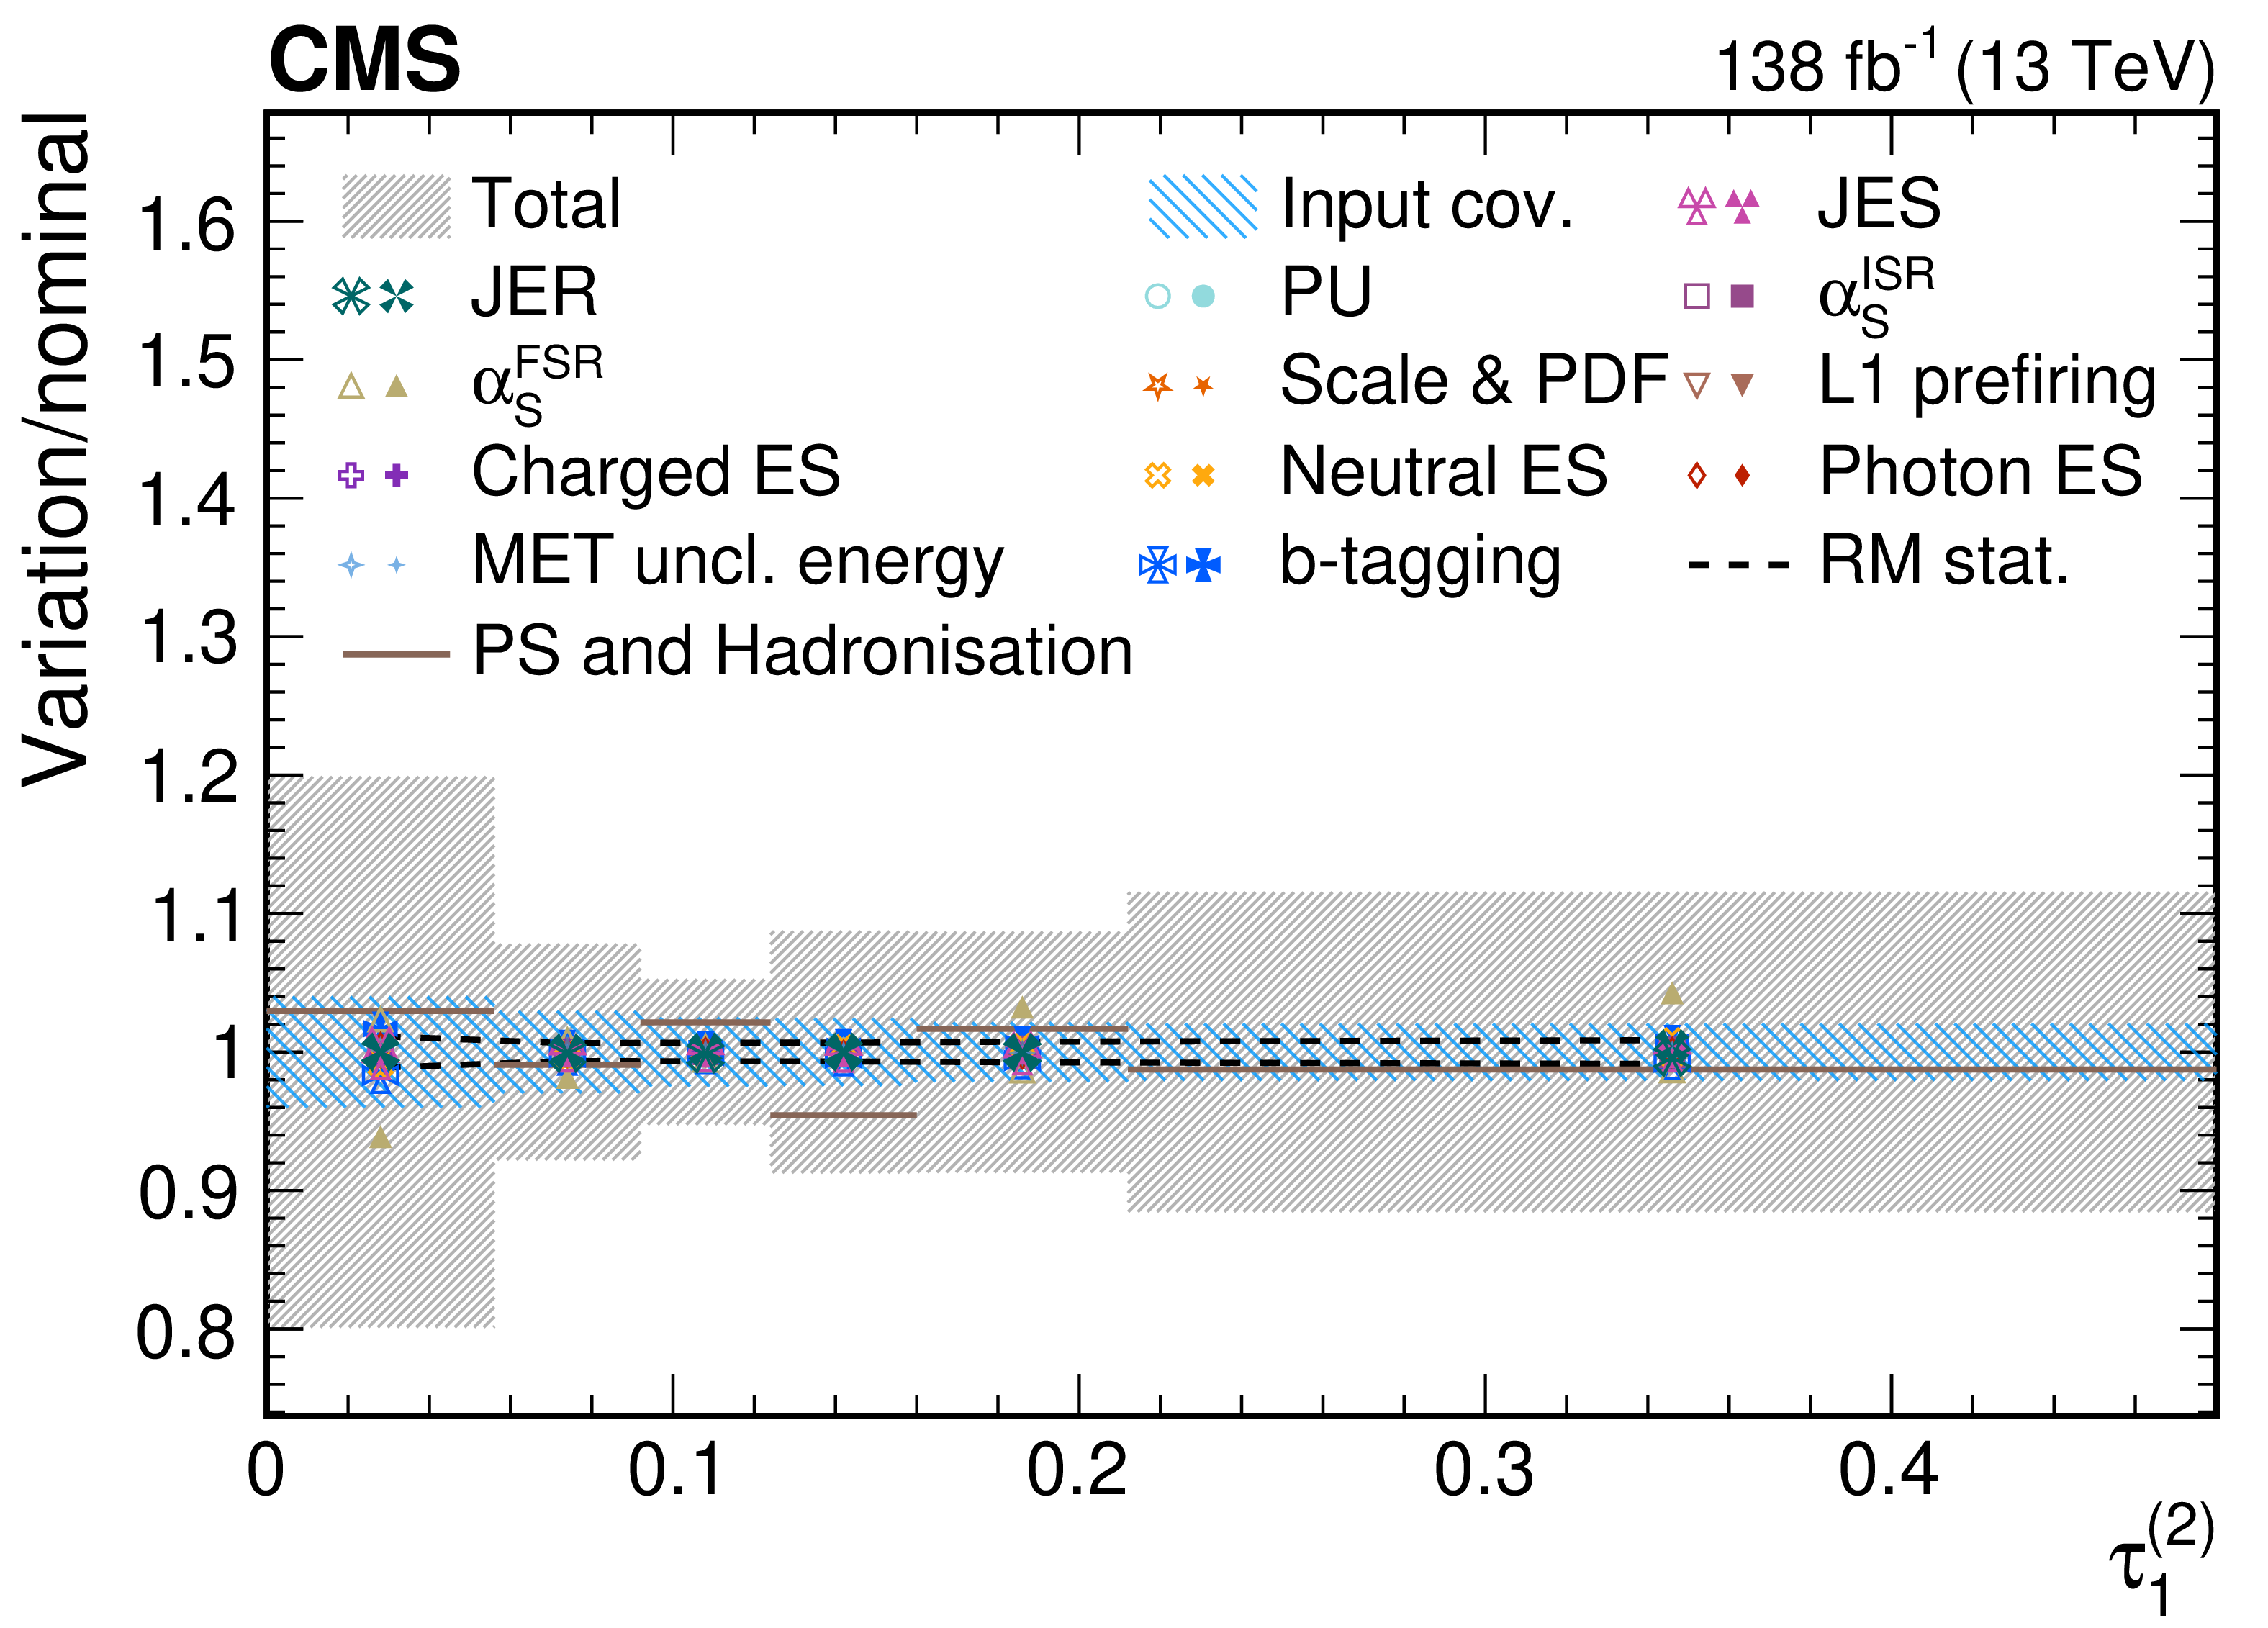
png pdf |
Figure 48-e:
Contributions from various systematic variations to the normalized, unfolded distribution for $ \tau_1^{(\beta)} $ observables measured for AK8 jets passing the boosted W boson-enriched selection in $ \mu $+jets $ \mathrm{t} \overline{\mathrm{t}} $ events. The total unfolding uncertainty is indicated with the dark grey, hashed region, while the blue hashed region indicates the contributions from the input covariance matrix, which includes the propagated effects of the statistical uncertainties of the input data after background subtraction. Contributions from statistical uncertainties of the simulated sample used to construct the nominal response matrix are indicated with the dashed black line. The physics model uncertainty is computed as a one-sided shift compared to the nominal unfolding, and up (down) contributions from other sources are indicated with filled (open) markers of the same type and colour. |
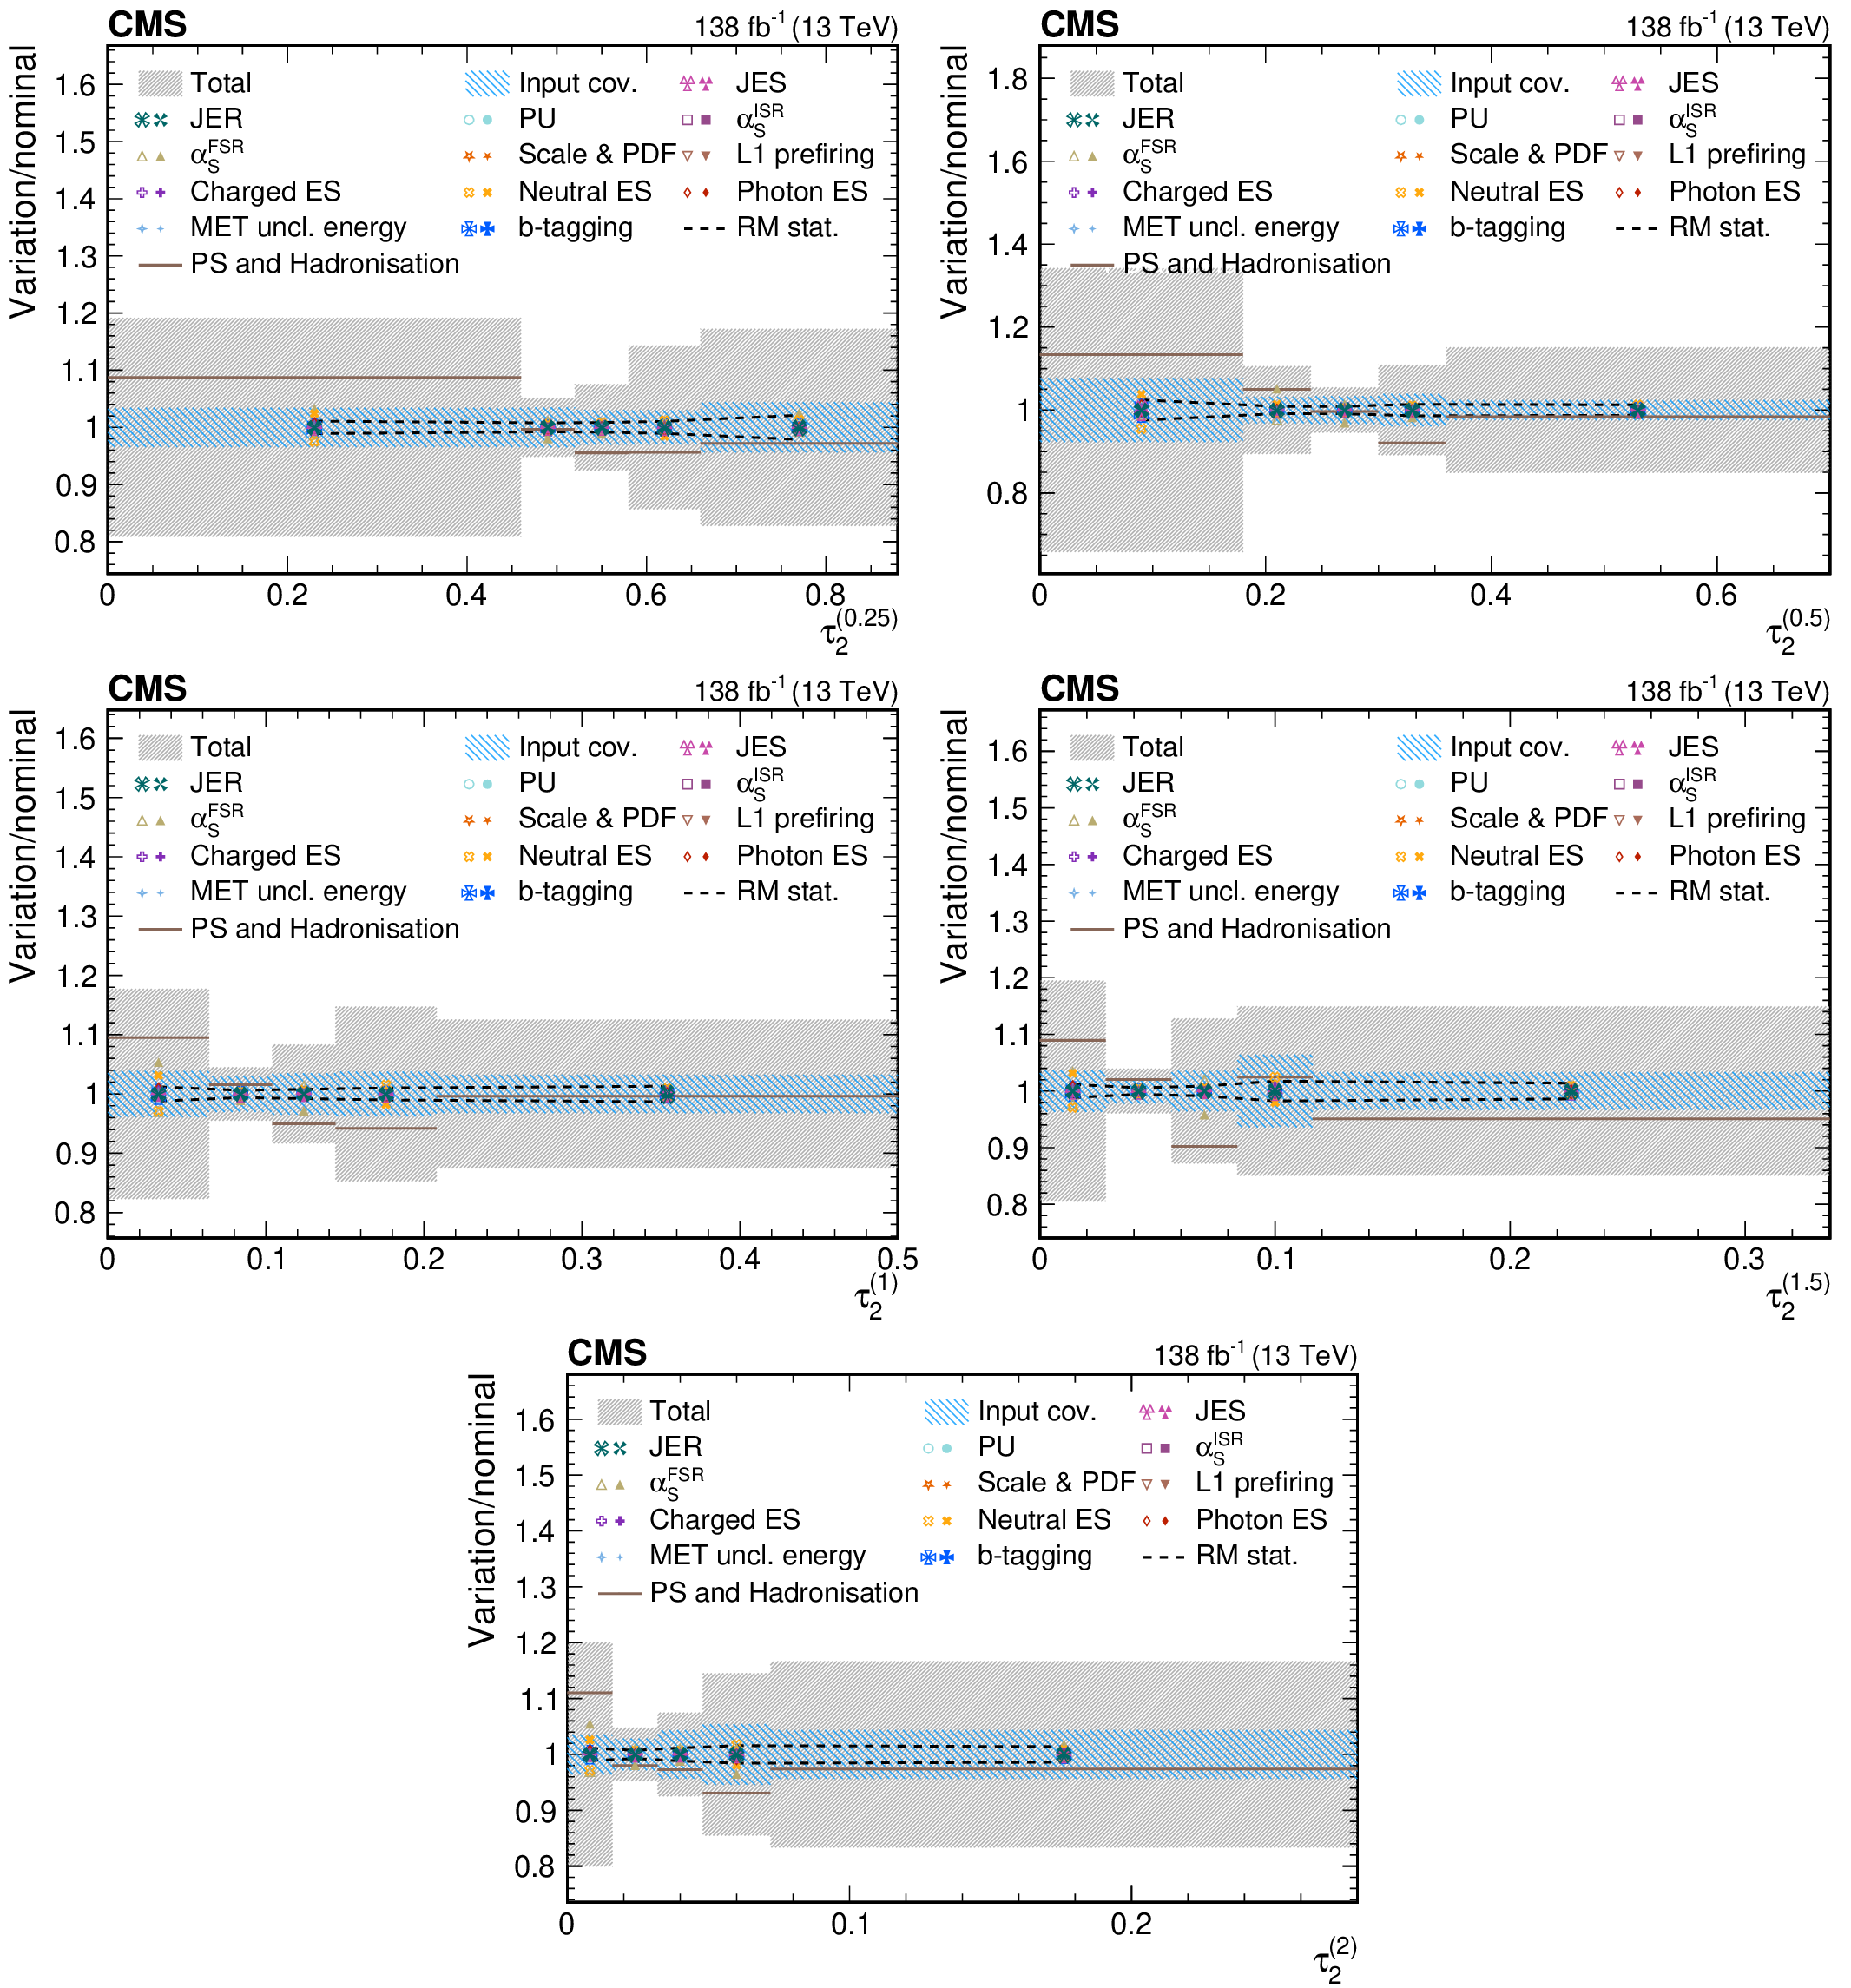
png pdf |
Figure 49:
Contributions from various systematic variations to the normalized, unfolded distribution for $ \tau_2^{(\beta)} $ observables measured for AK8 jets passing the boosted W boson-enriched selection in $ \mu $+jets $ \mathrm{t} \overline{\mathrm{t}} $ events. The total unfolding uncertainty is indicated with the dark grey, hashed region, while the blue hashed region indicates the contributions from the input covariance matrix, which includes the propagated effects of the statistical uncertainties of the input data after background subtraction. Contributions from statistical uncertainties of the simulated sample used to construct the nominal response matrix are indicated with the dashed black line. The physics model uncertainty is computed as a one-sided shift compared to the nominal unfolding, and up (down) contributions from other sources are indicated with filled (open) markers of the same type and colour. |
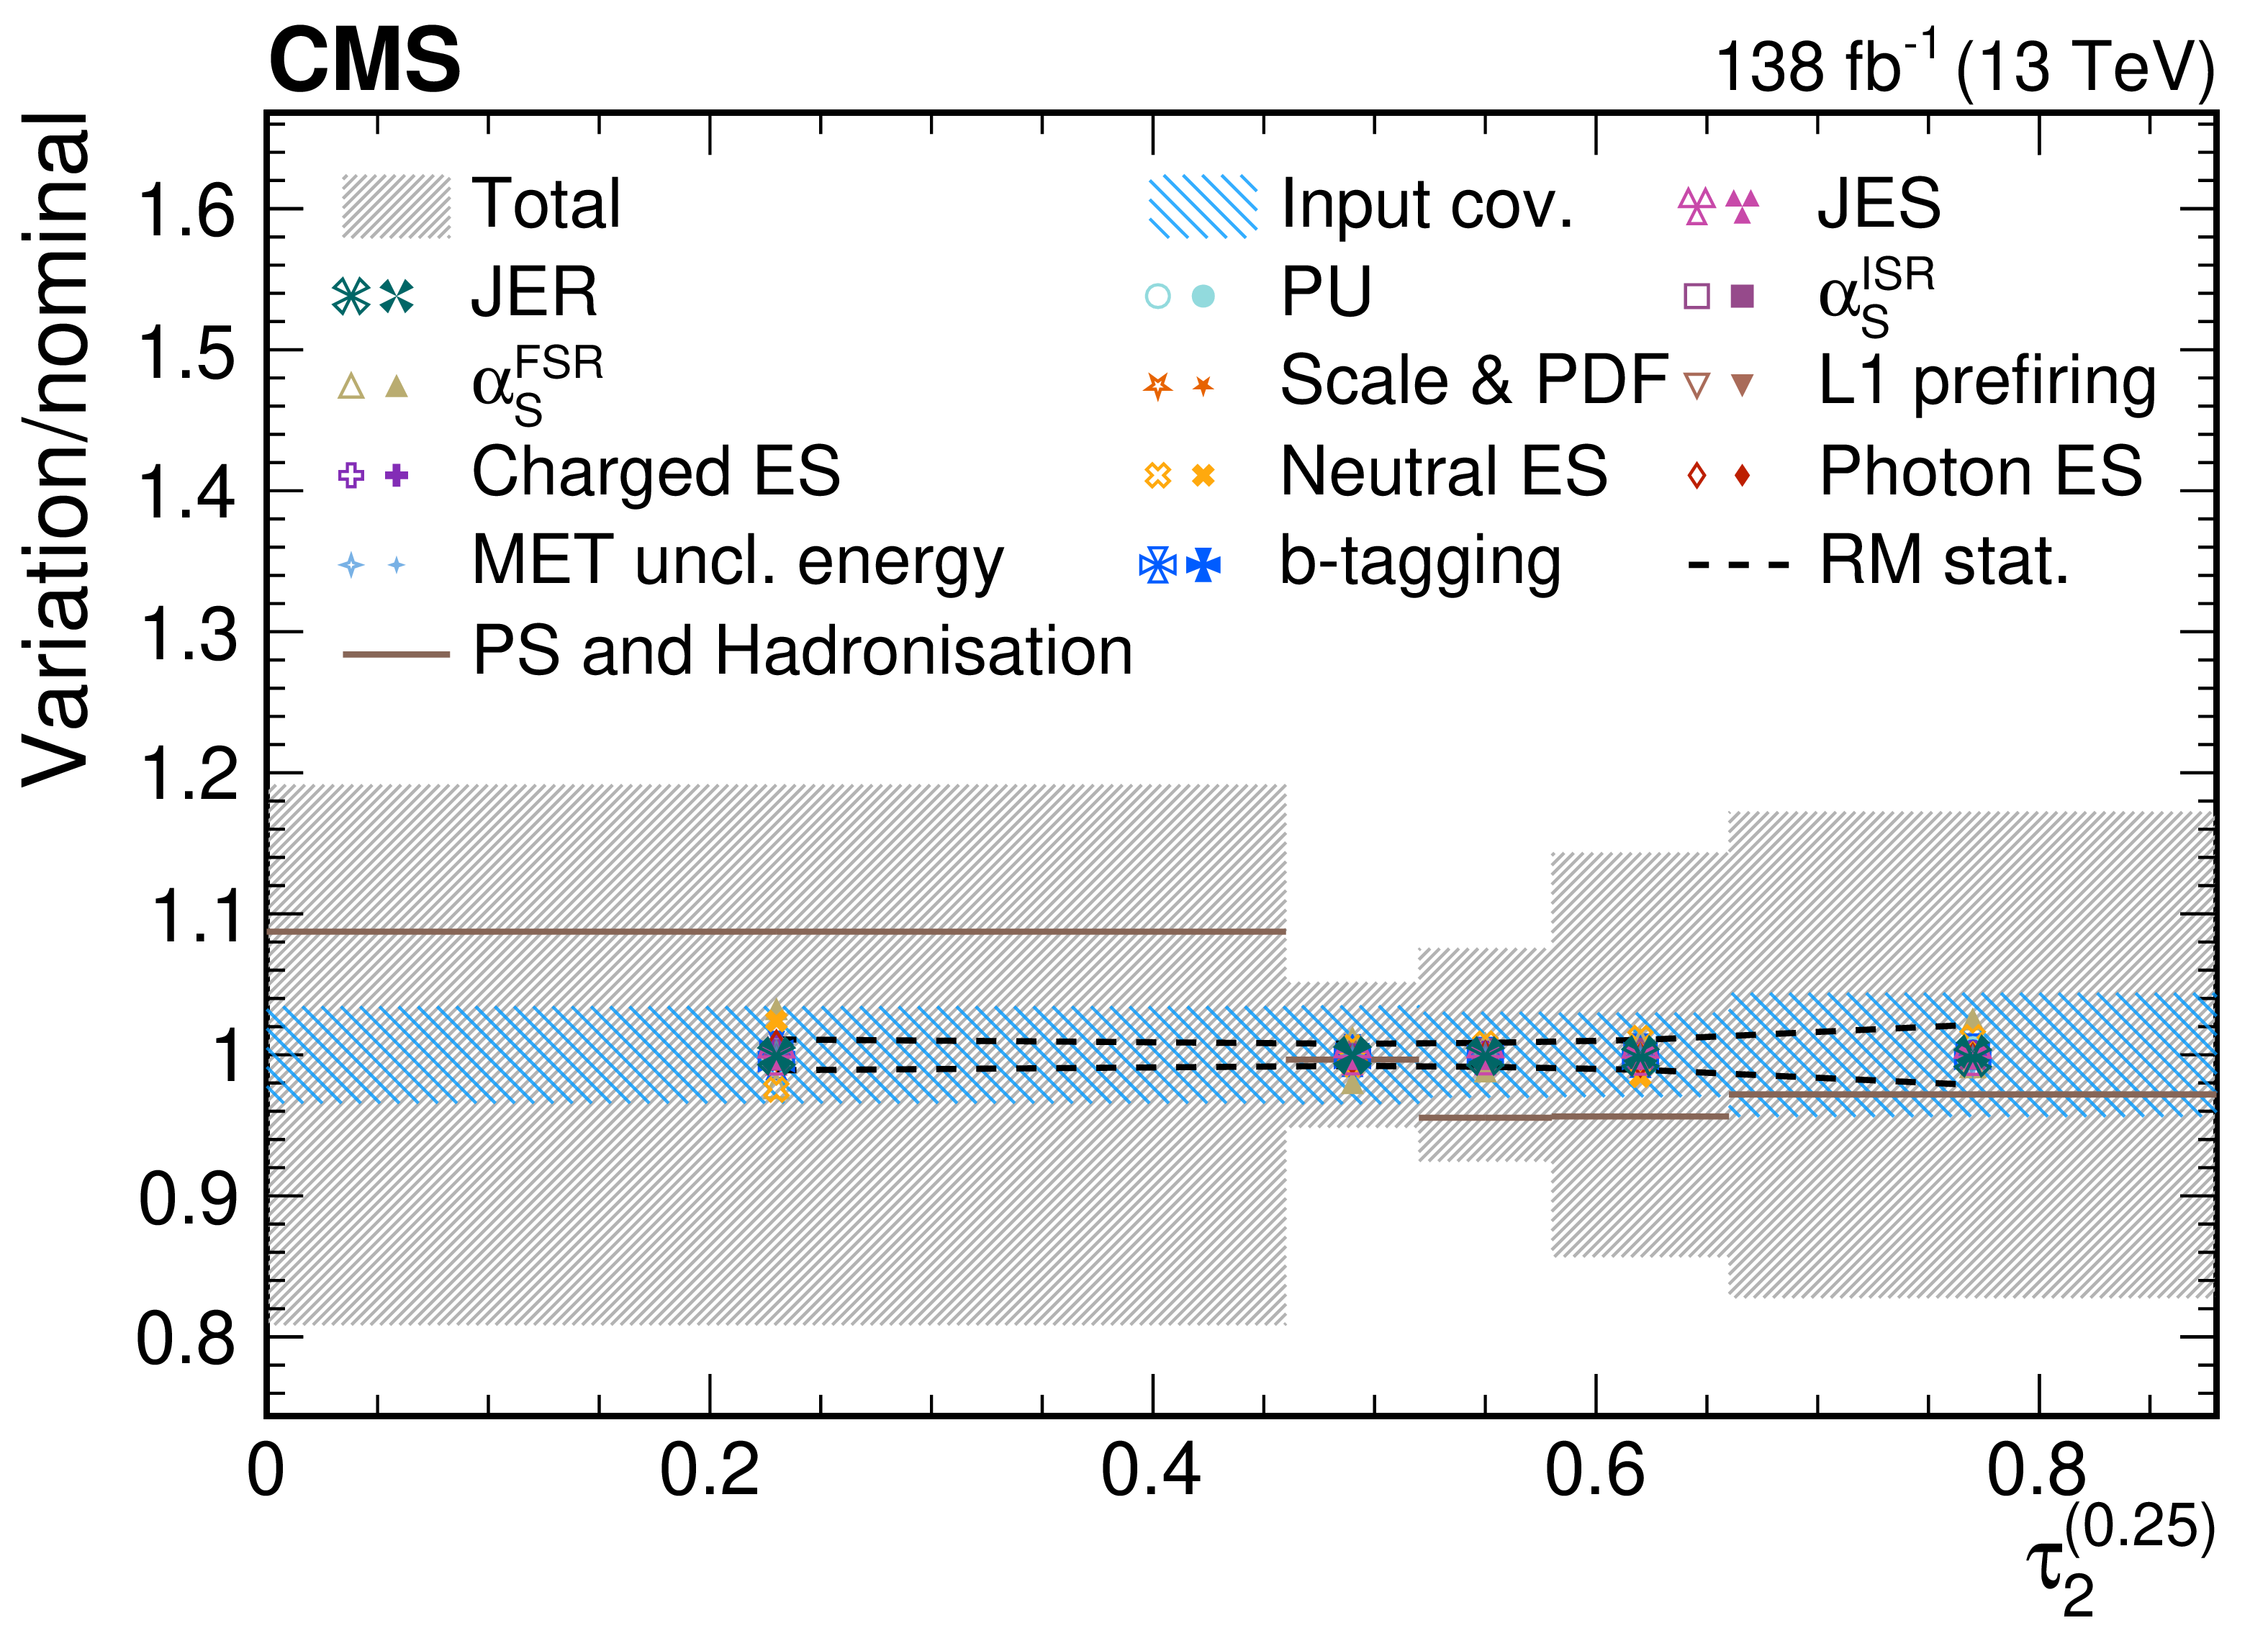
png pdf |
Figure 49-a:
Contributions from various systematic variations to the normalized, unfolded distribution for $ \tau_2^{(\beta)} $ observables measured for AK8 jets passing the boosted W boson-enriched selection in $ \mu $+jets $ \mathrm{t} \overline{\mathrm{t}} $ events. The total unfolding uncertainty is indicated with the dark grey, hashed region, while the blue hashed region indicates the contributions from the input covariance matrix, which includes the propagated effects of the statistical uncertainties of the input data after background subtraction. Contributions from statistical uncertainties of the simulated sample used to construct the nominal response matrix are indicated with the dashed black line. The physics model uncertainty is computed as a one-sided shift compared to the nominal unfolding, and up (down) contributions from other sources are indicated with filled (open) markers of the same type and colour. |
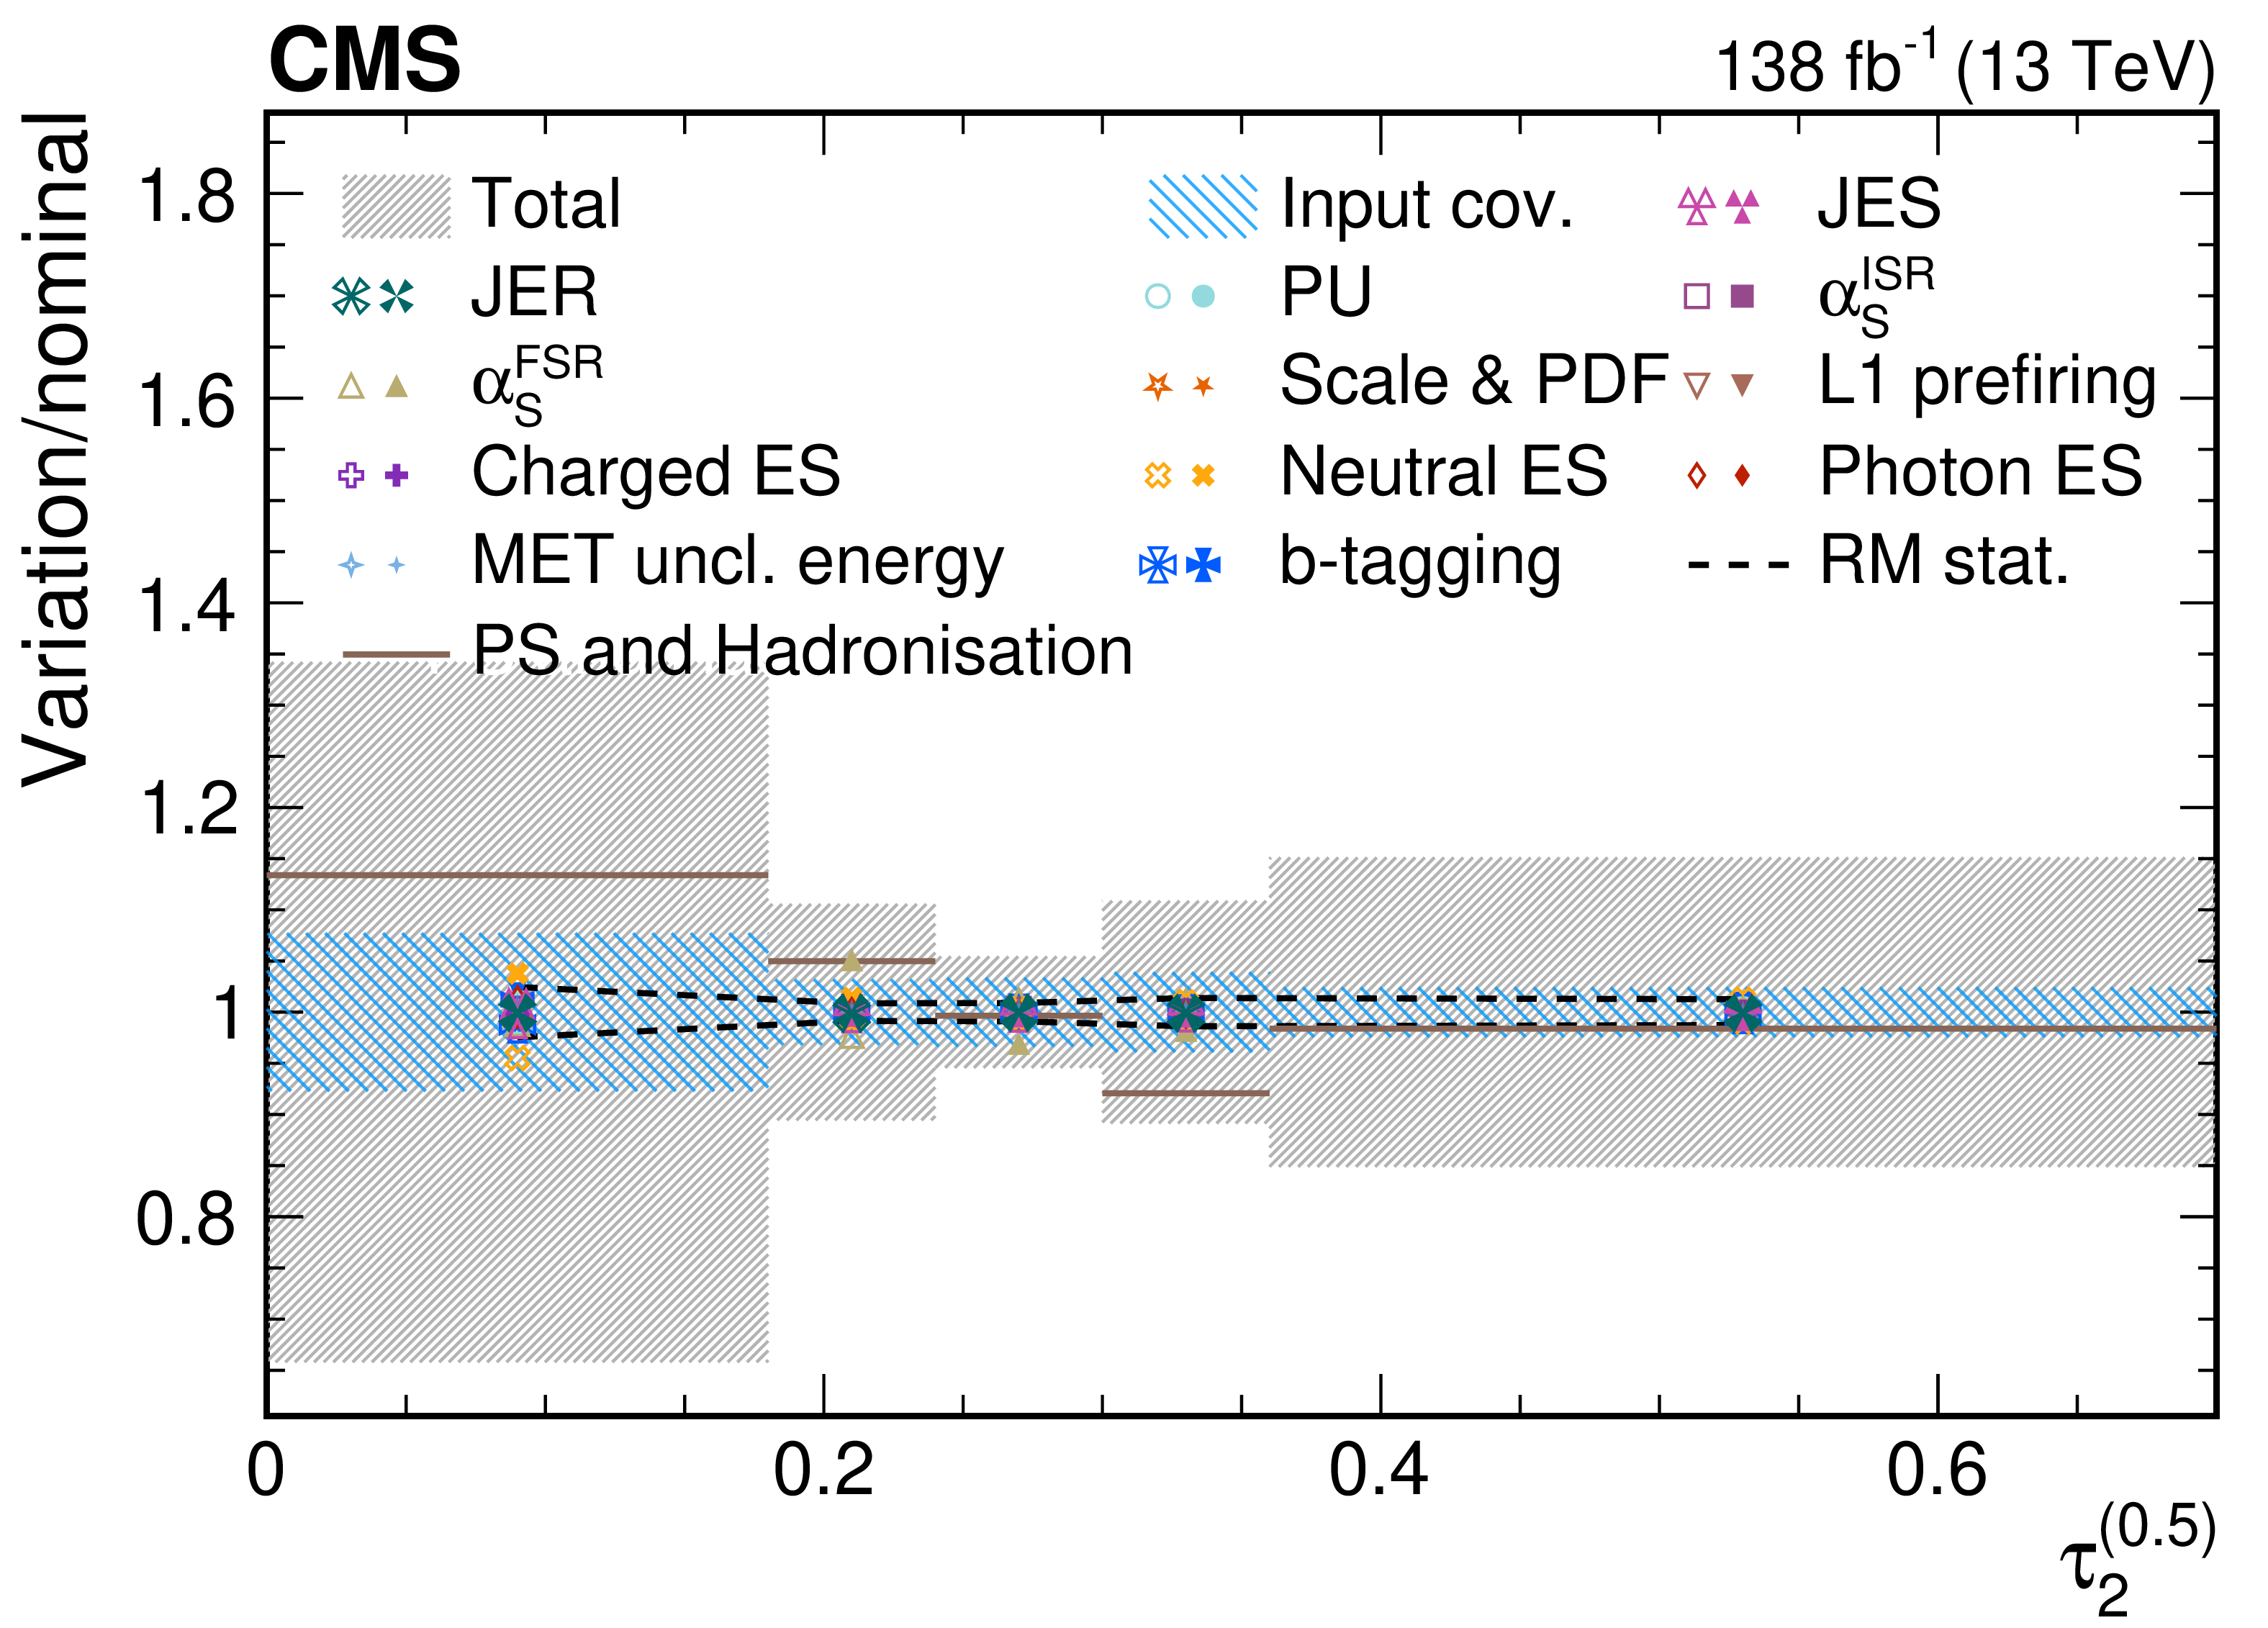
png pdf |
Figure 49-b:
Contributions from various systematic variations to the normalized, unfolded distribution for $ \tau_2^{(\beta)} $ observables measured for AK8 jets passing the boosted W boson-enriched selection in $ \mu $+jets $ \mathrm{t} \overline{\mathrm{t}} $ events. The total unfolding uncertainty is indicated with the dark grey, hashed region, while the blue hashed region indicates the contributions from the input covariance matrix, which includes the propagated effects of the statistical uncertainties of the input data after background subtraction. Contributions from statistical uncertainties of the simulated sample used to construct the nominal response matrix are indicated with the dashed black line. The physics model uncertainty is computed as a one-sided shift compared to the nominal unfolding, and up (down) contributions from other sources are indicated with filled (open) markers of the same type and colour. |
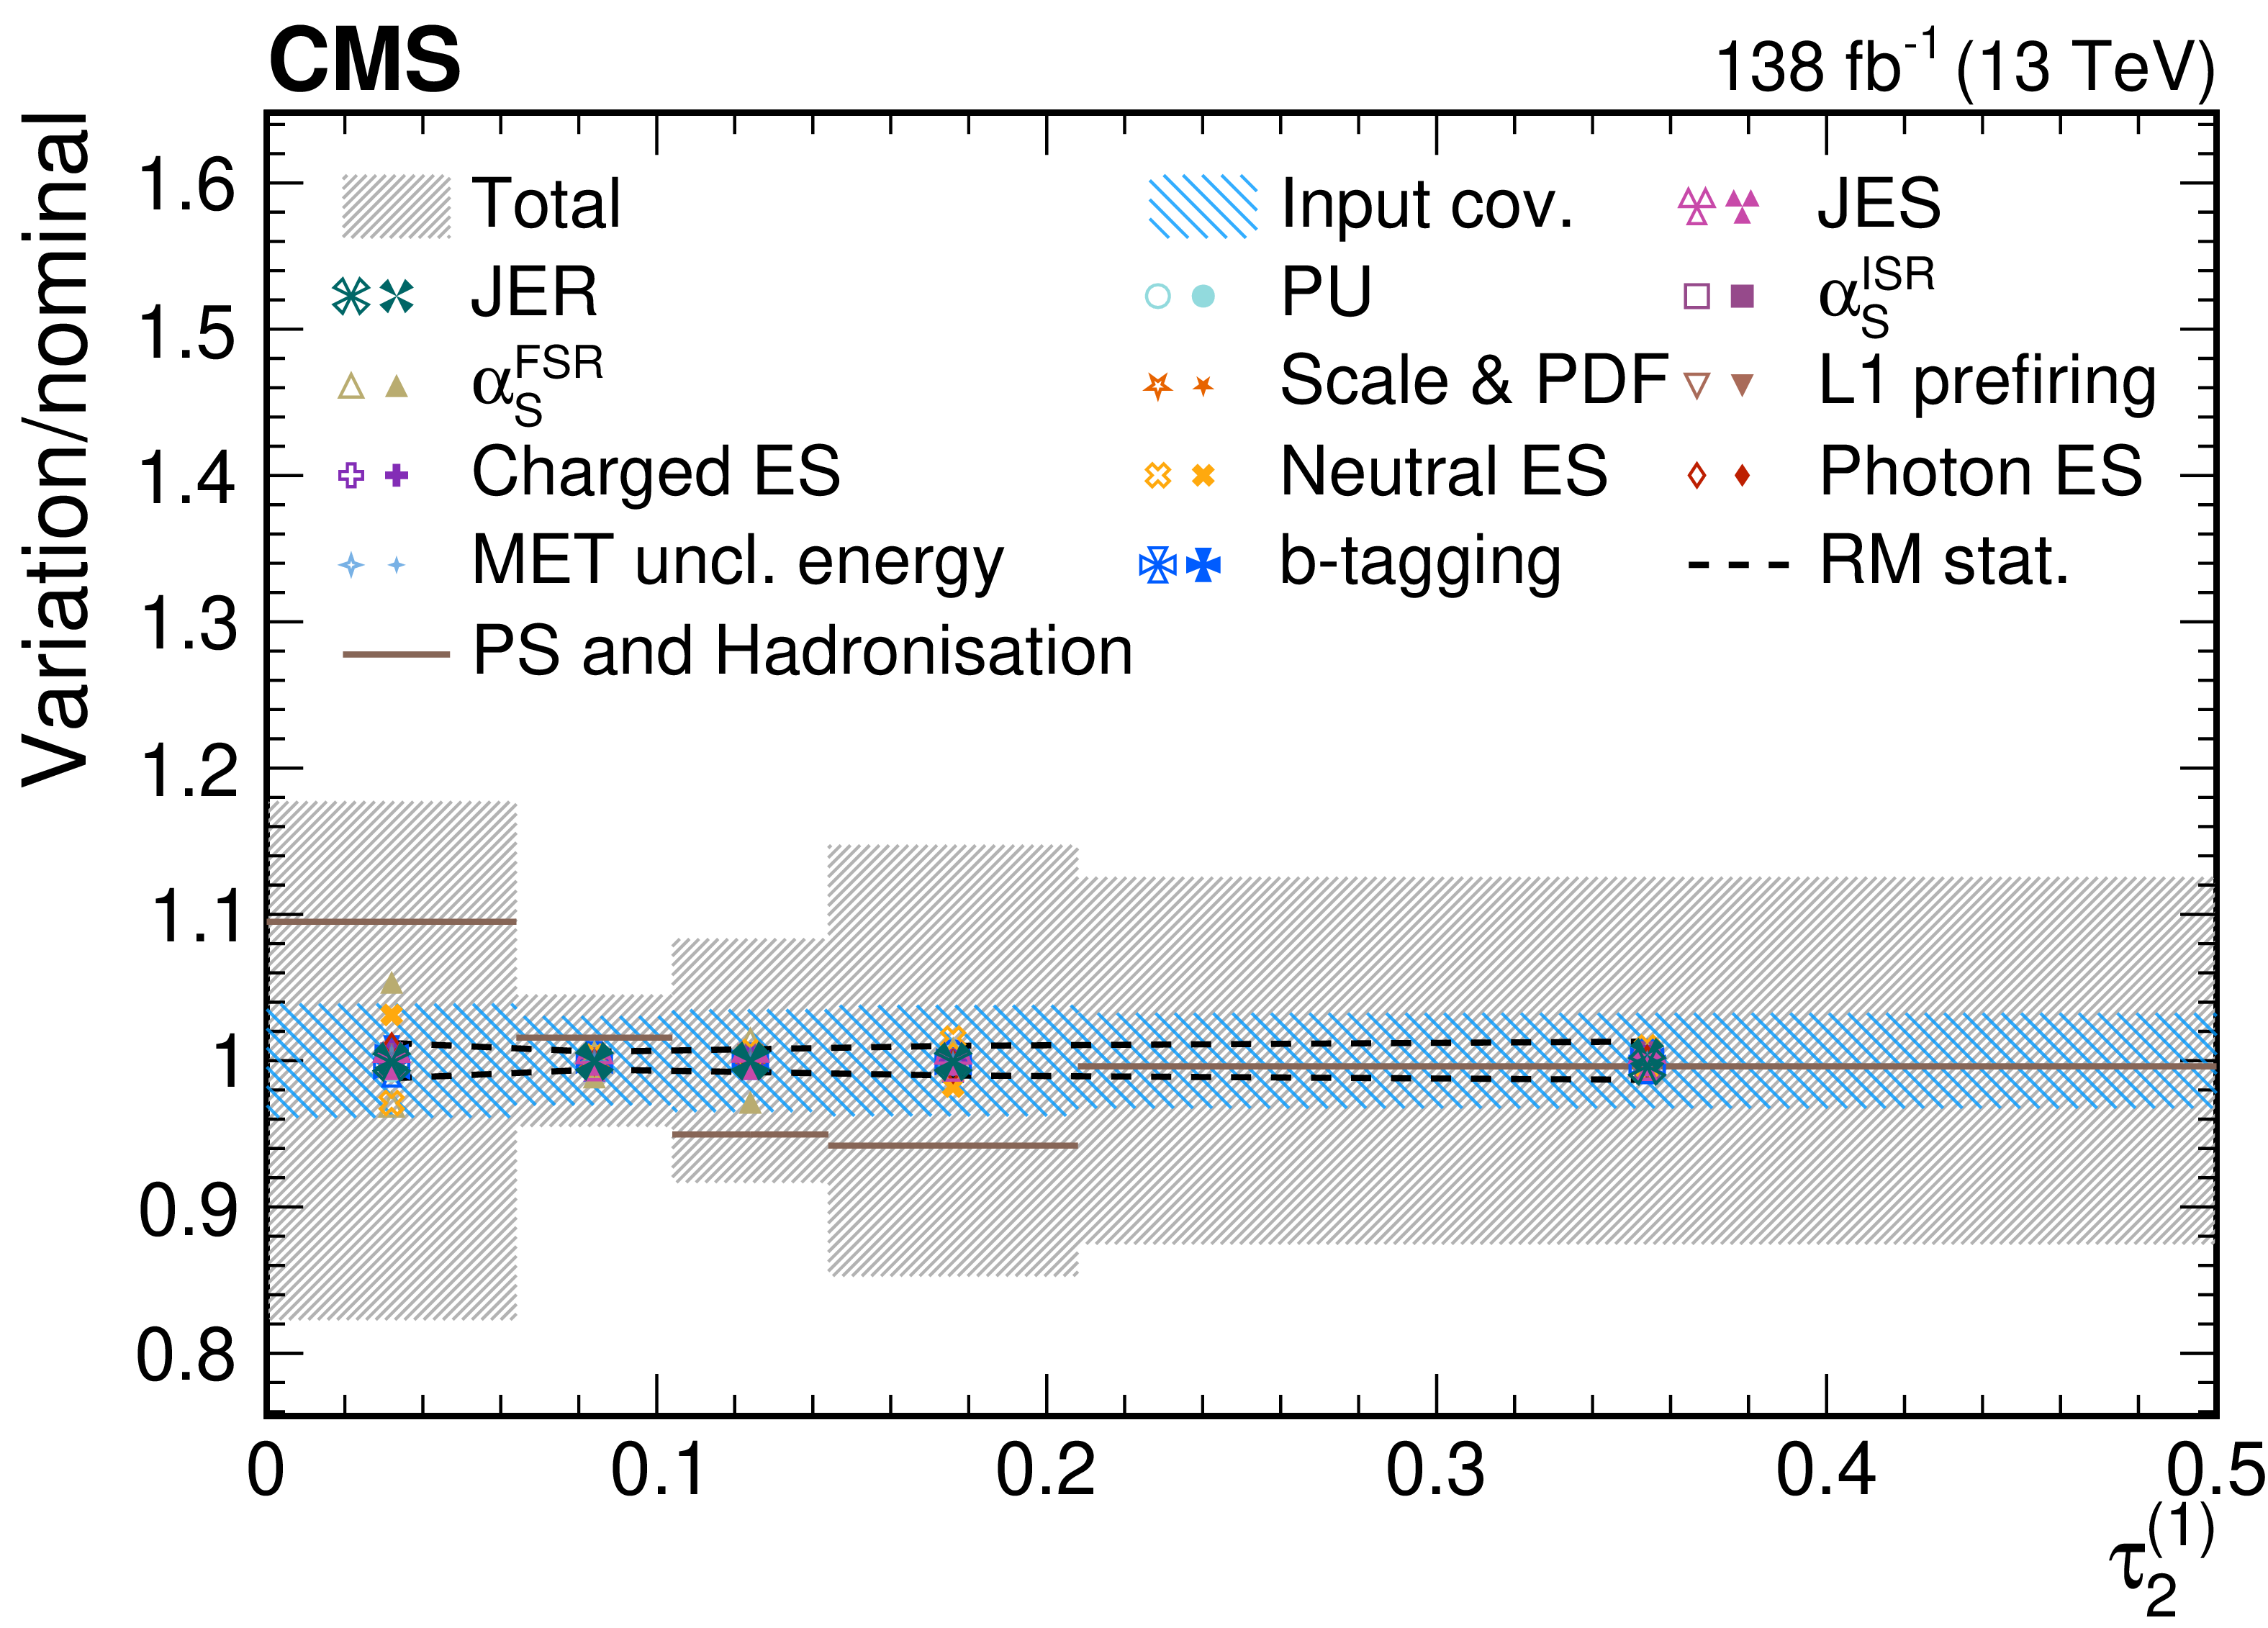
png pdf |
Figure 49-c:
Contributions from various systematic variations to the normalized, unfolded distribution for $ \tau_2^{(\beta)} $ observables measured for AK8 jets passing the boosted W boson-enriched selection in $ \mu $+jets $ \mathrm{t} \overline{\mathrm{t}} $ events. The total unfolding uncertainty is indicated with the dark grey, hashed region, while the blue hashed region indicates the contributions from the input covariance matrix, which includes the propagated effects of the statistical uncertainties of the input data after background subtraction. Contributions from statistical uncertainties of the simulated sample used to construct the nominal response matrix are indicated with the dashed black line. The physics model uncertainty is computed as a one-sided shift compared to the nominal unfolding, and up (down) contributions from other sources are indicated with filled (open) markers of the same type and colour. |
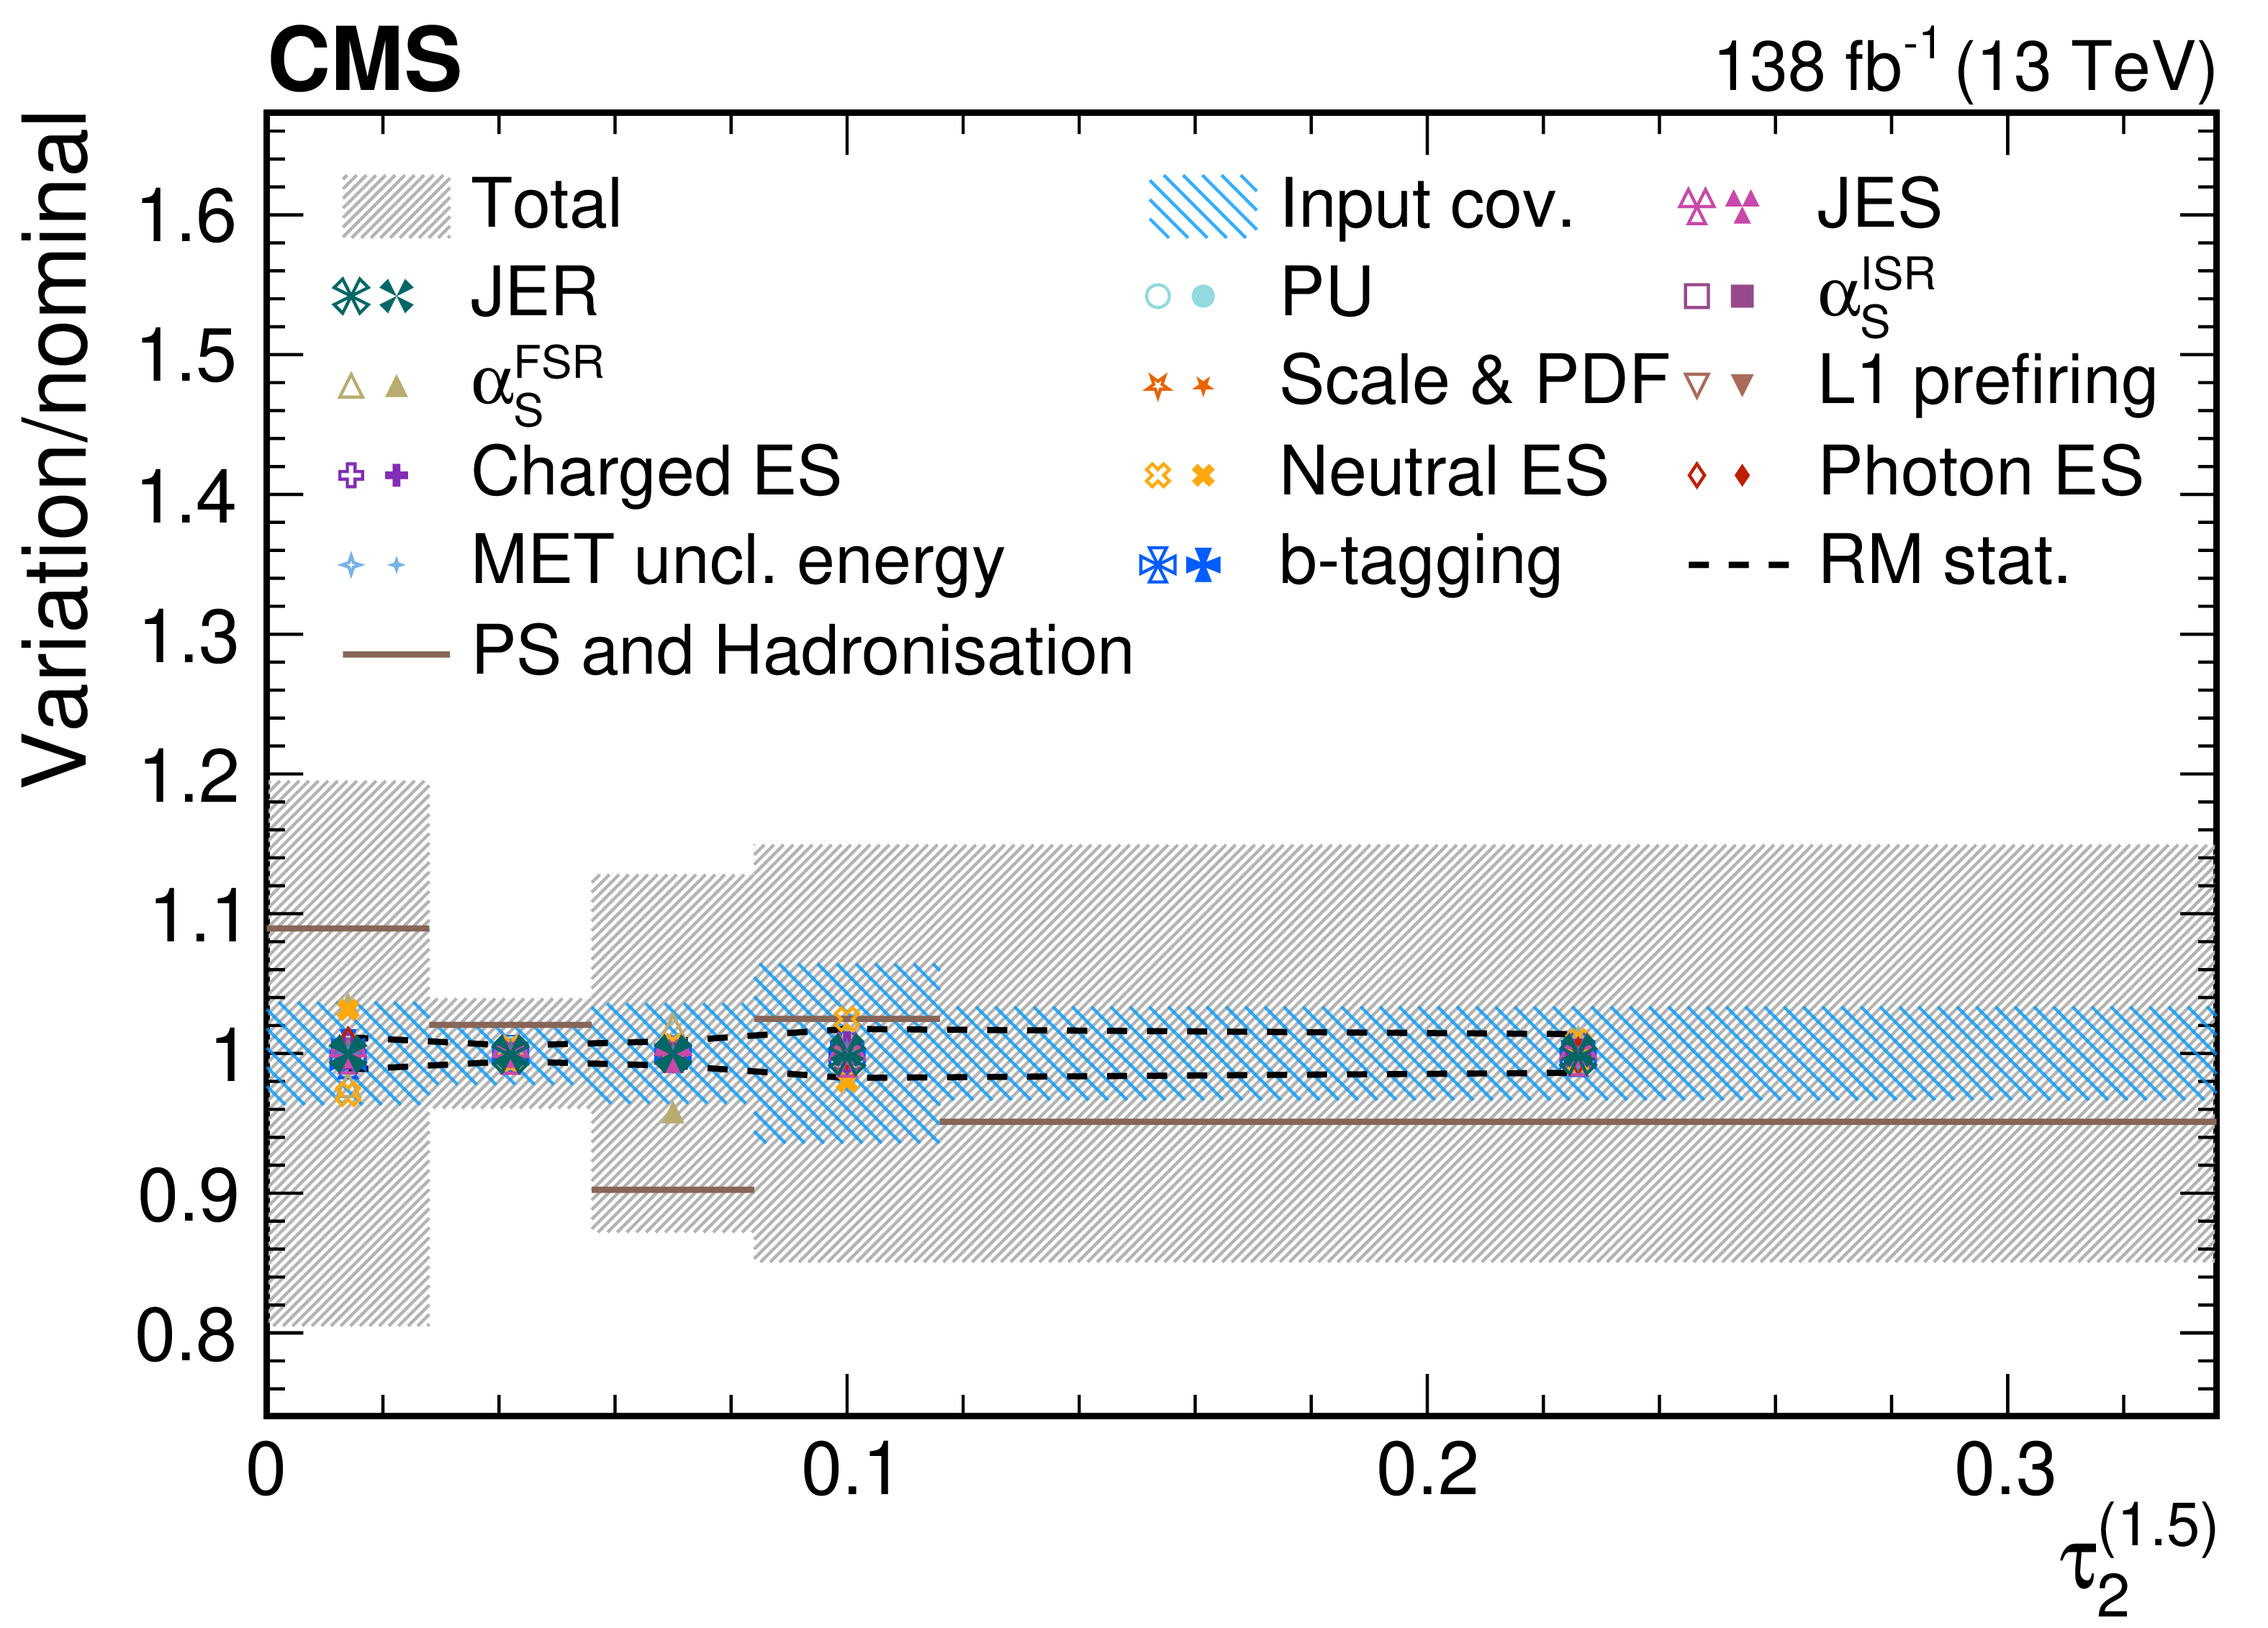
png pdf |
Figure 49-d:
Contributions from various systematic variations to the normalized, unfolded distribution for $ \tau_2^{(\beta)} $ observables measured for AK8 jets passing the boosted W boson-enriched selection in $ \mu $+jets $ \mathrm{t} \overline{\mathrm{t}} $ events. The total unfolding uncertainty is indicated with the dark grey, hashed region, while the blue hashed region indicates the contributions from the input covariance matrix, which includes the propagated effects of the statistical uncertainties of the input data after background subtraction. Contributions from statistical uncertainties of the simulated sample used to construct the nominal response matrix are indicated with the dashed black line. The physics model uncertainty is computed as a one-sided shift compared to the nominal unfolding, and up (down) contributions from other sources are indicated with filled (open) markers of the same type and colour. |
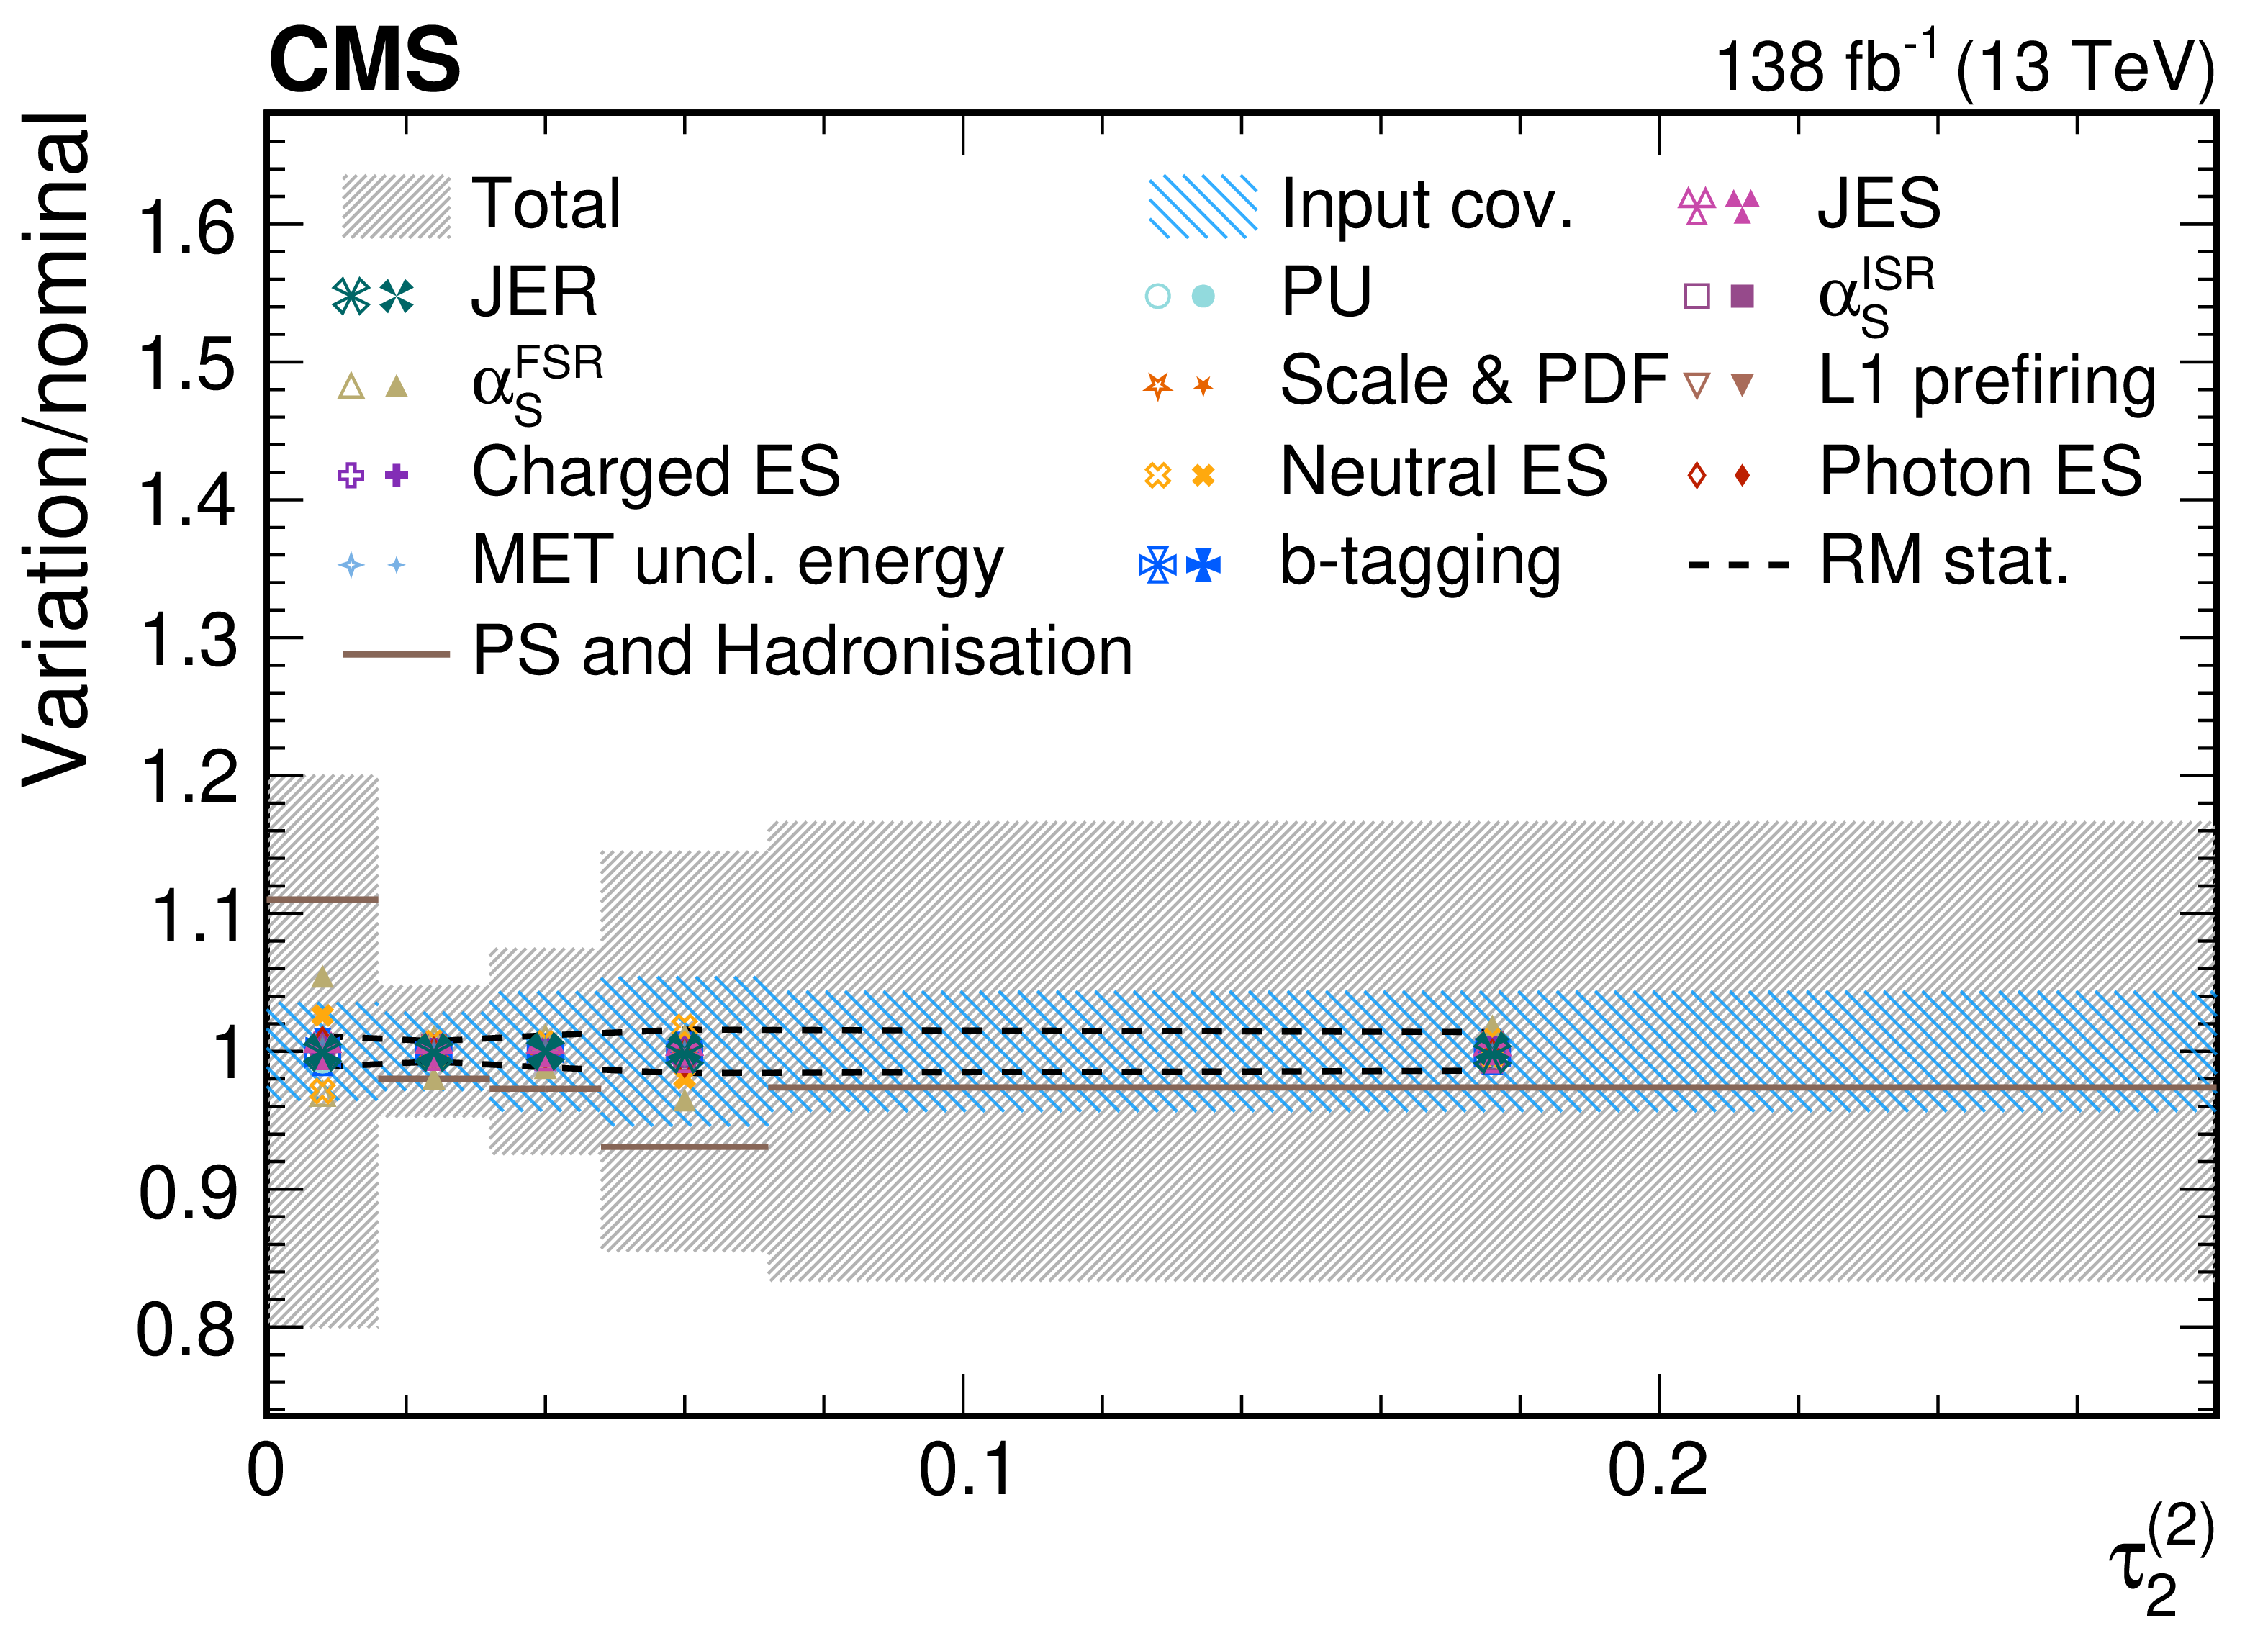
png pdf |
Figure 49-e:
Contributions from various systematic variations to the normalized, unfolded distribution for $ \tau_2^{(\beta)} $ observables measured for AK8 jets passing the boosted W boson-enriched selection in $ \mu $+jets $ \mathrm{t} \overline{\mathrm{t}} $ events. The total unfolding uncertainty is indicated with the dark grey, hashed region, while the blue hashed region indicates the contributions from the input covariance matrix, which includes the propagated effects of the statistical uncertainties of the input data after background subtraction. Contributions from statistical uncertainties of the simulated sample used to construct the nominal response matrix are indicated with the dashed black line. The physics model uncertainty is computed as a one-sided shift compared to the nominal unfolding, and up (down) contributions from other sources are indicated with filled (open) markers of the same type and colour. |
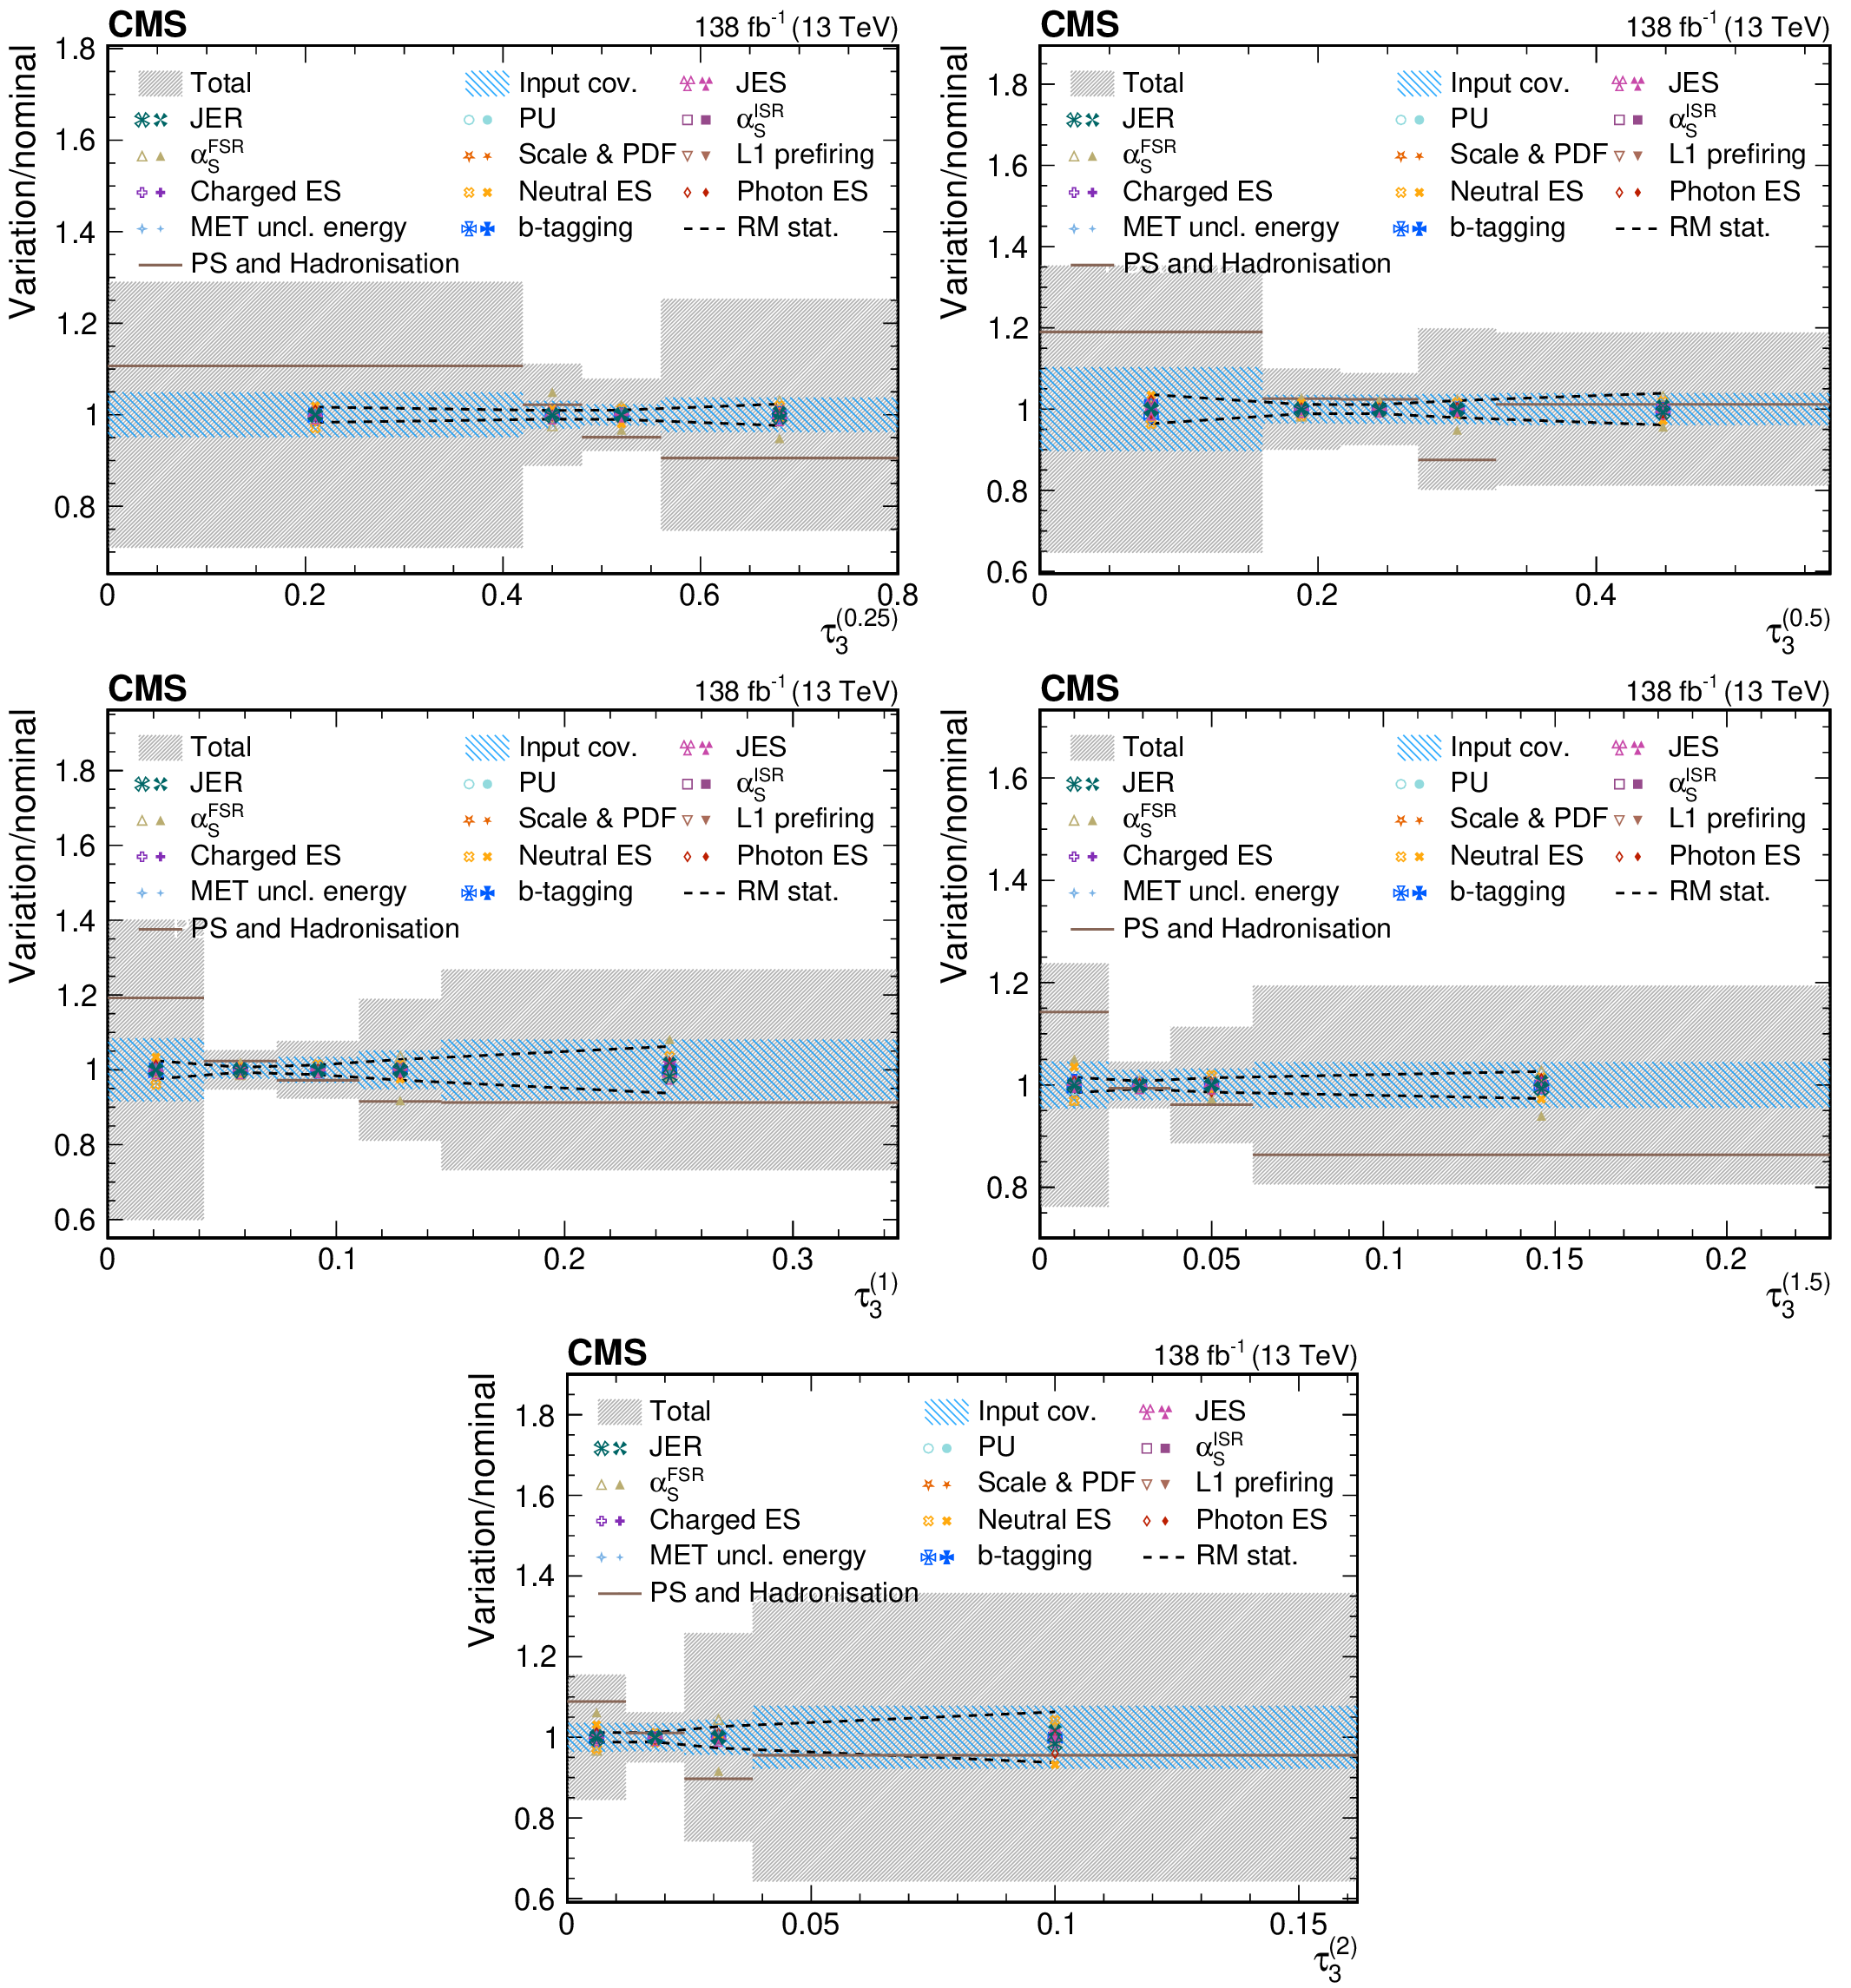
png pdf |
Figure 50:
Contributions from various systematic variations to the normalized, unfolded distribution for $ \tau_3^{(\beta)} $ observables measured for AK8 jets passing the boosted W boson-enriched selection in $ \mu $+jets $ \mathrm{t} \overline{\mathrm{t}} $ events. The total unfolding uncertainty is indicated with the dark grey, hashed region, while the blue hashed region indicates the contributions from the input covariance matrix, which includes the propagated effects of the statistical uncertainties of the input data after background subtraction. Contributions from statistical uncertainties of the simulated sample used to construct the nominal response matrix are indicated with the dashed black line. The physics model uncertainty is computed as a one-sided shift compared to the nominal unfolding, and up (down) contributions from other sources are indicated with filled (open) markers of the same type and colour. |
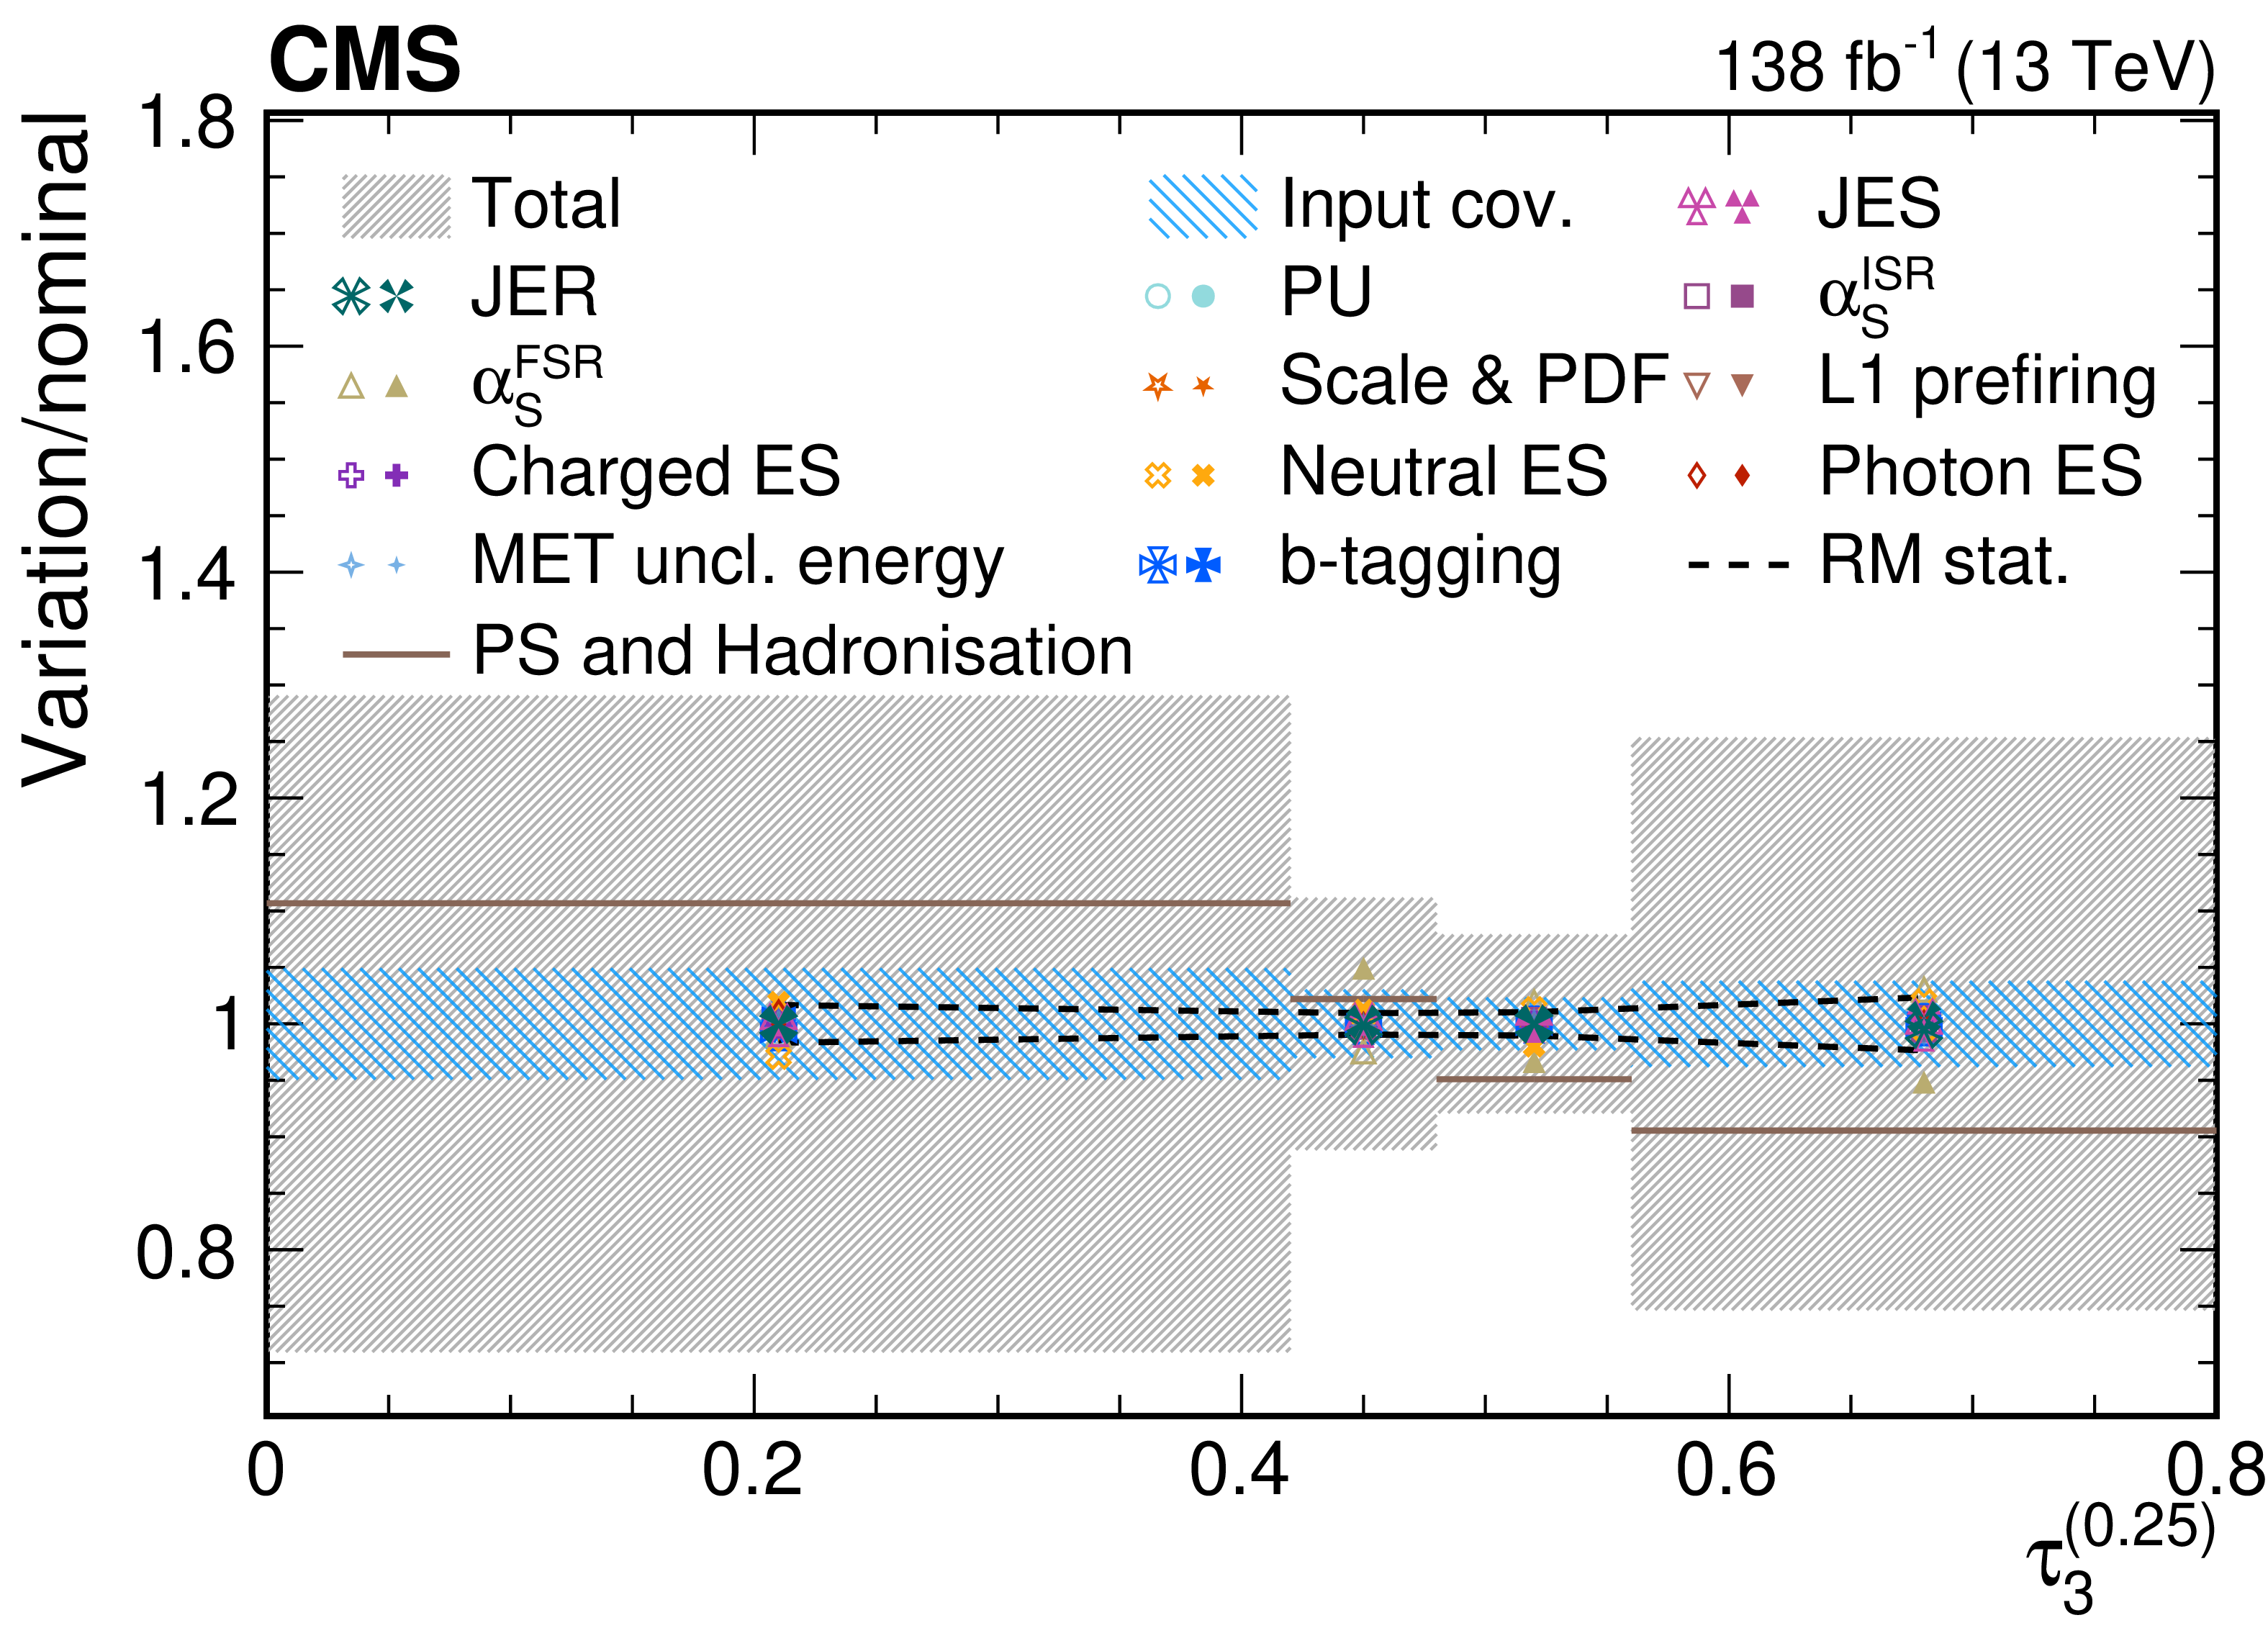
png pdf |
Figure 50-a:
Contributions from various systematic variations to the normalized, unfolded distribution for $ \tau_3^{(\beta)} $ observables measured for AK8 jets passing the boosted W boson-enriched selection in $ \mu $+jets $ \mathrm{t} \overline{\mathrm{t}} $ events. The total unfolding uncertainty is indicated with the dark grey, hashed region, while the blue hashed region indicates the contributions from the input covariance matrix, which includes the propagated effects of the statistical uncertainties of the input data after background subtraction. Contributions from statistical uncertainties of the simulated sample used to construct the nominal response matrix are indicated with the dashed black line. The physics model uncertainty is computed as a one-sided shift compared to the nominal unfolding, and up (down) contributions from other sources are indicated with filled (open) markers of the same type and colour. |
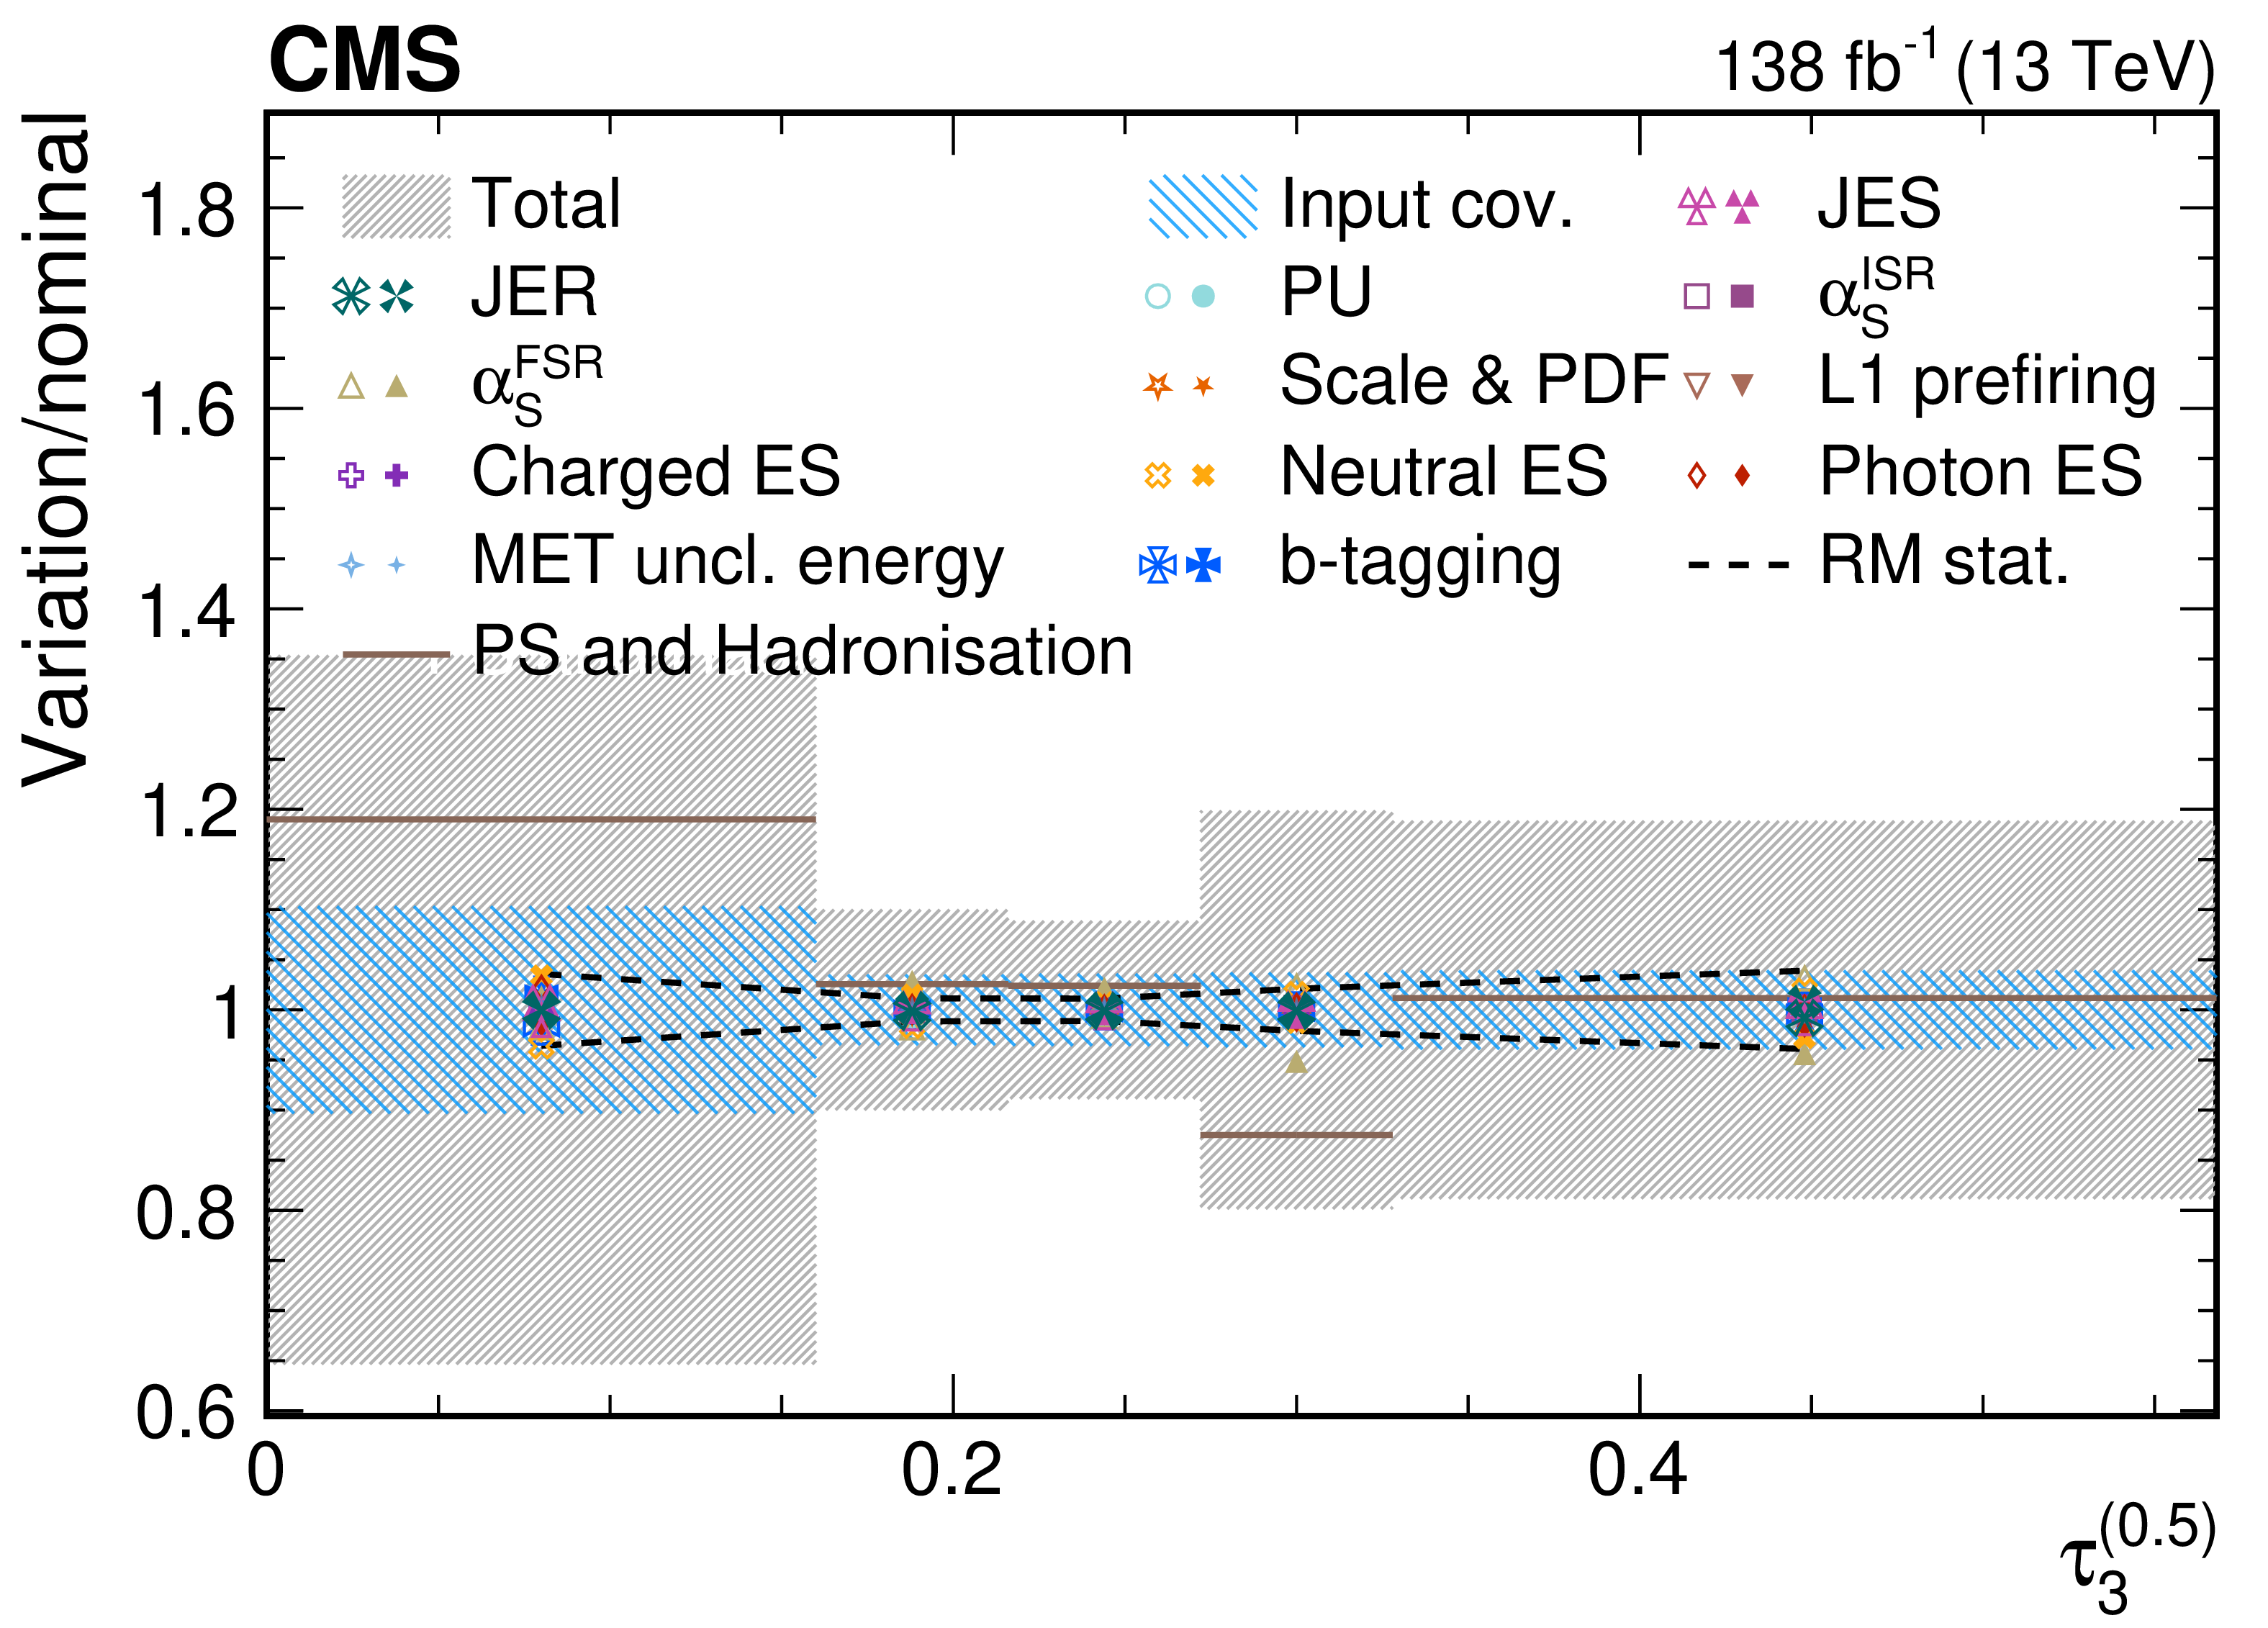
png pdf |
Figure 50-b:
Contributions from various systematic variations to the normalized, unfolded distribution for $ \tau_3^{(\beta)} $ observables measured for AK8 jets passing the boosted W boson-enriched selection in $ \mu $+jets $ \mathrm{t} \overline{\mathrm{t}} $ events. The total unfolding uncertainty is indicated with the dark grey, hashed region, while the blue hashed region indicates the contributions from the input covariance matrix, which includes the propagated effects of the statistical uncertainties of the input data after background subtraction. Contributions from statistical uncertainties of the simulated sample used to construct the nominal response matrix are indicated with the dashed black line. The physics model uncertainty is computed as a one-sided shift compared to the nominal unfolding, and up (down) contributions from other sources are indicated with filled (open) markers of the same type and colour. |
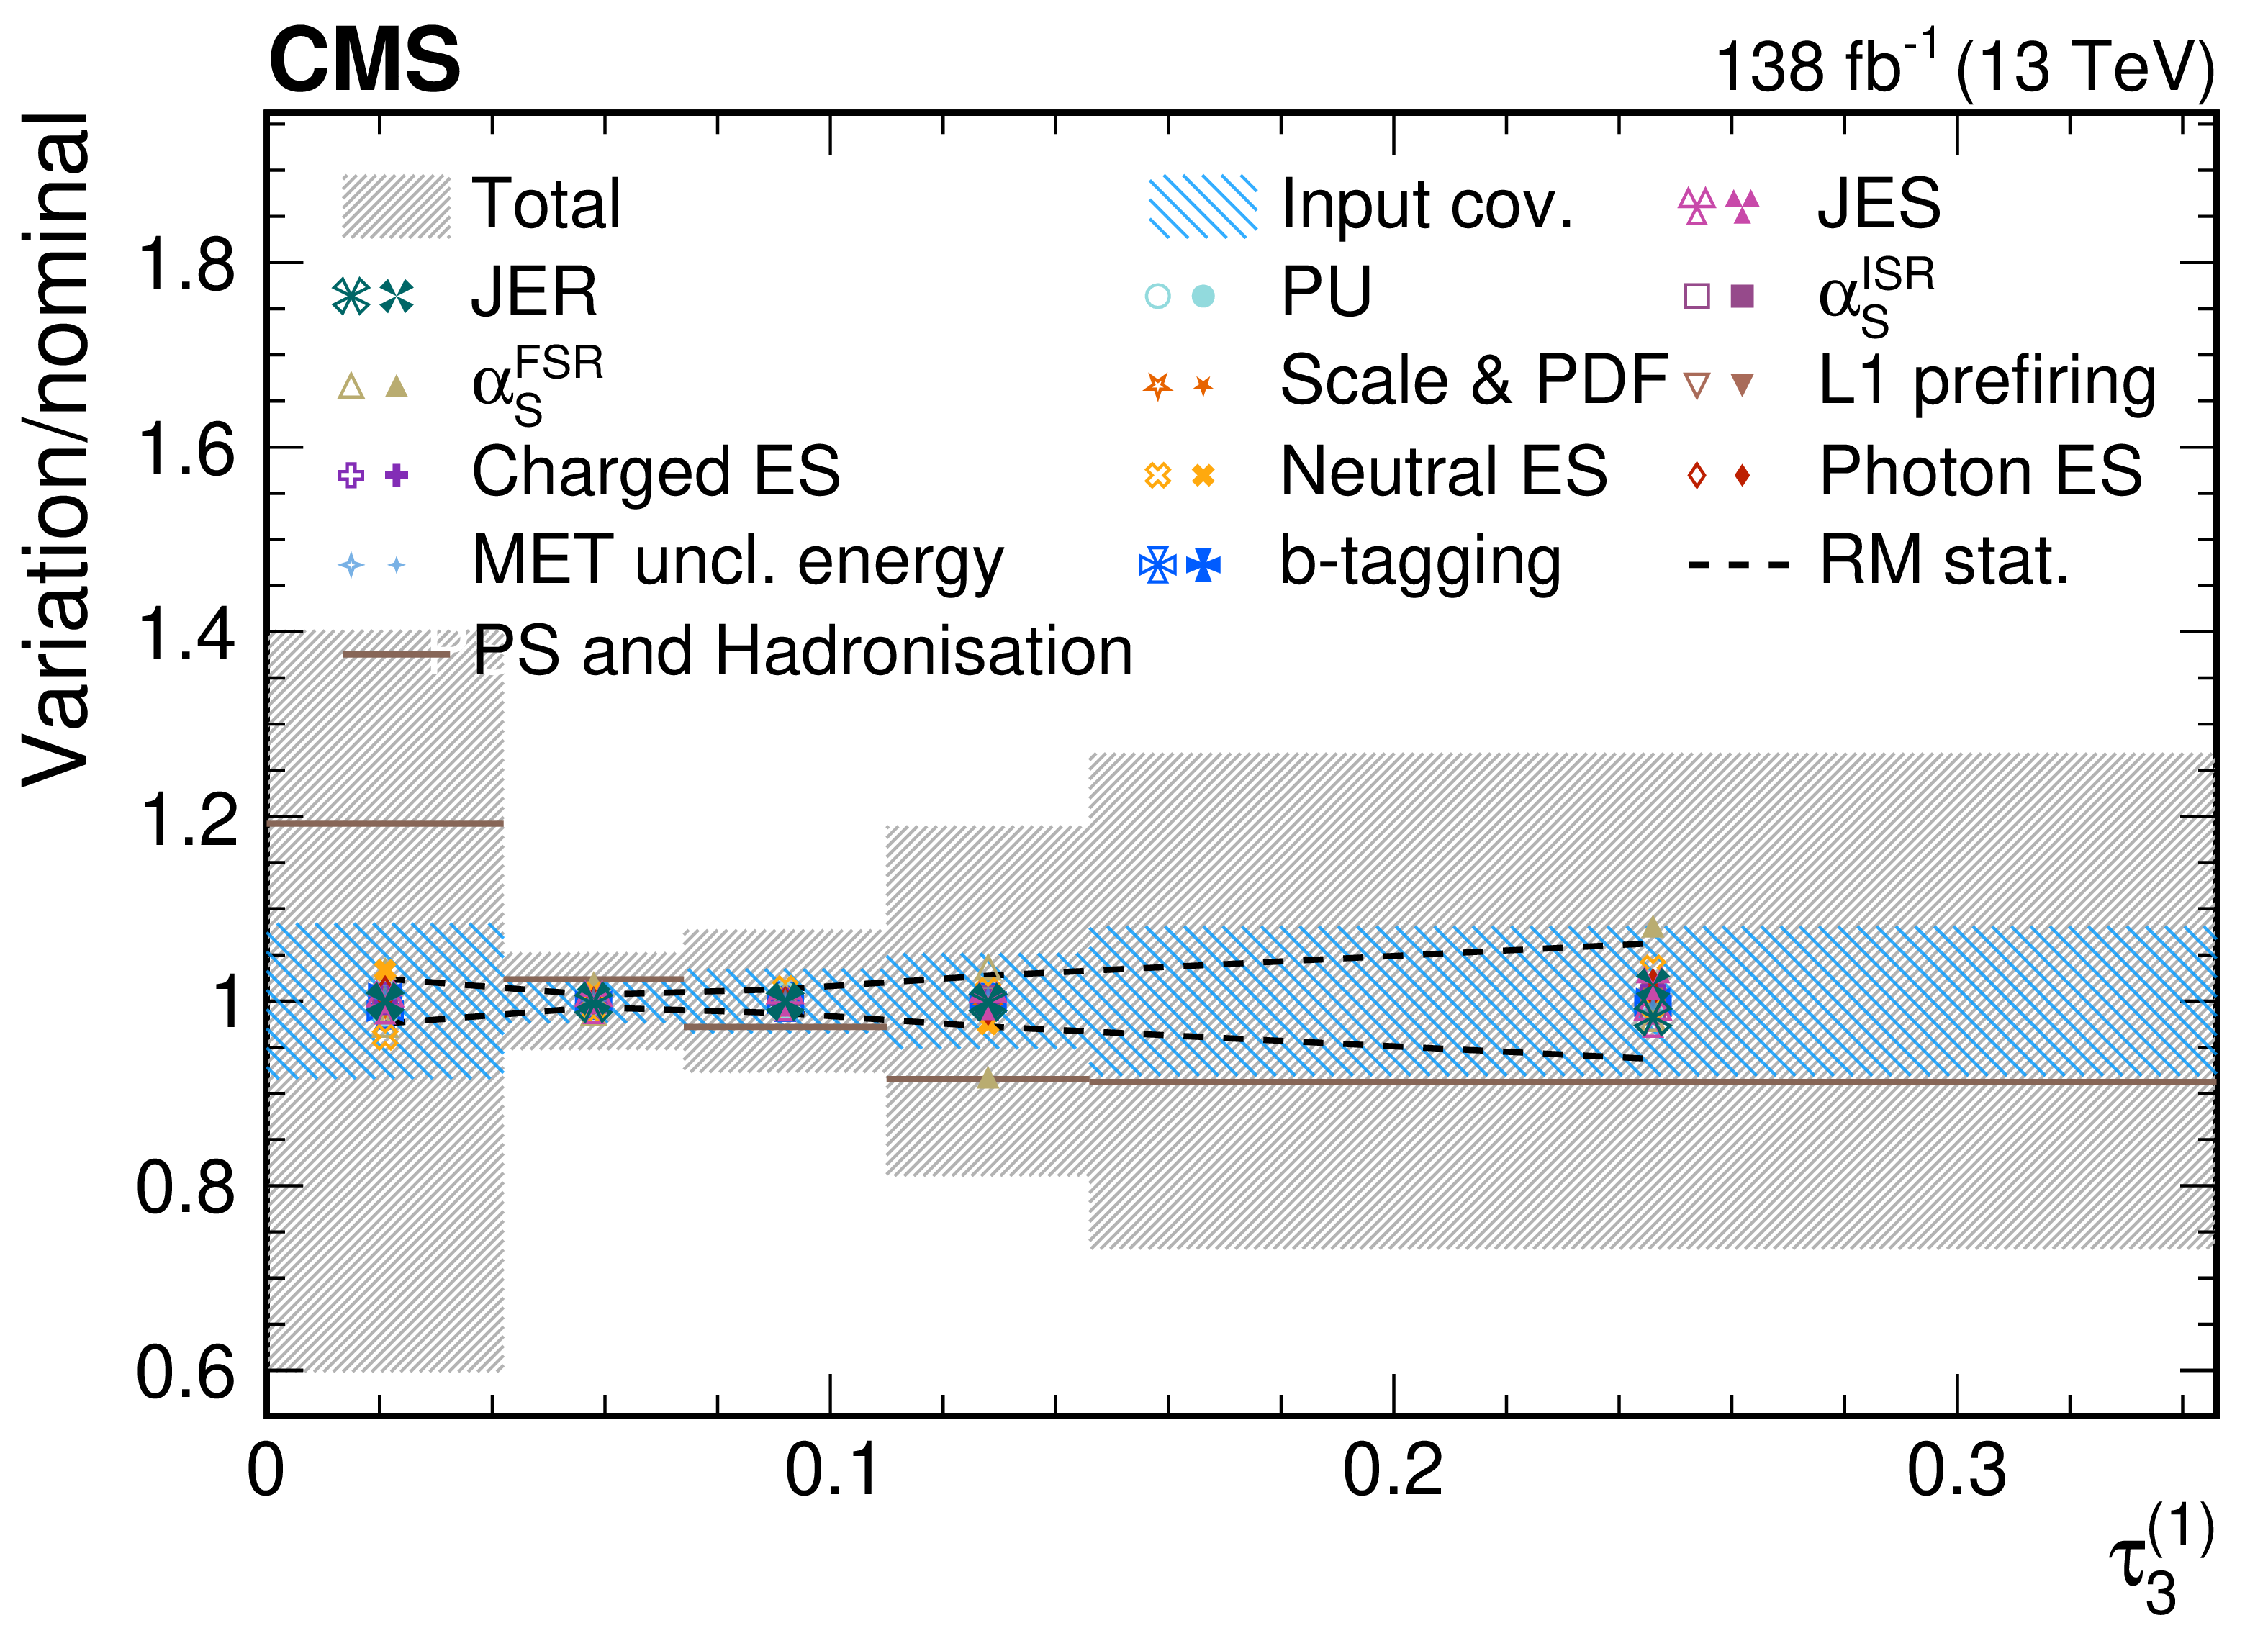
png pdf |
Figure 50-c:
Contributions from various systematic variations to the normalized, unfolded distribution for $ \tau_3^{(\beta)} $ observables measured for AK8 jets passing the boosted W boson-enriched selection in $ \mu $+jets $ \mathrm{t} \overline{\mathrm{t}} $ events. The total unfolding uncertainty is indicated with the dark grey, hashed region, while the blue hashed region indicates the contributions from the input covariance matrix, which includes the propagated effects of the statistical uncertainties of the input data after background subtraction. Contributions from statistical uncertainties of the simulated sample used to construct the nominal response matrix are indicated with the dashed black line. The physics model uncertainty is computed as a one-sided shift compared to the nominal unfolding, and up (down) contributions from other sources are indicated with filled (open) markers of the same type and colour. |
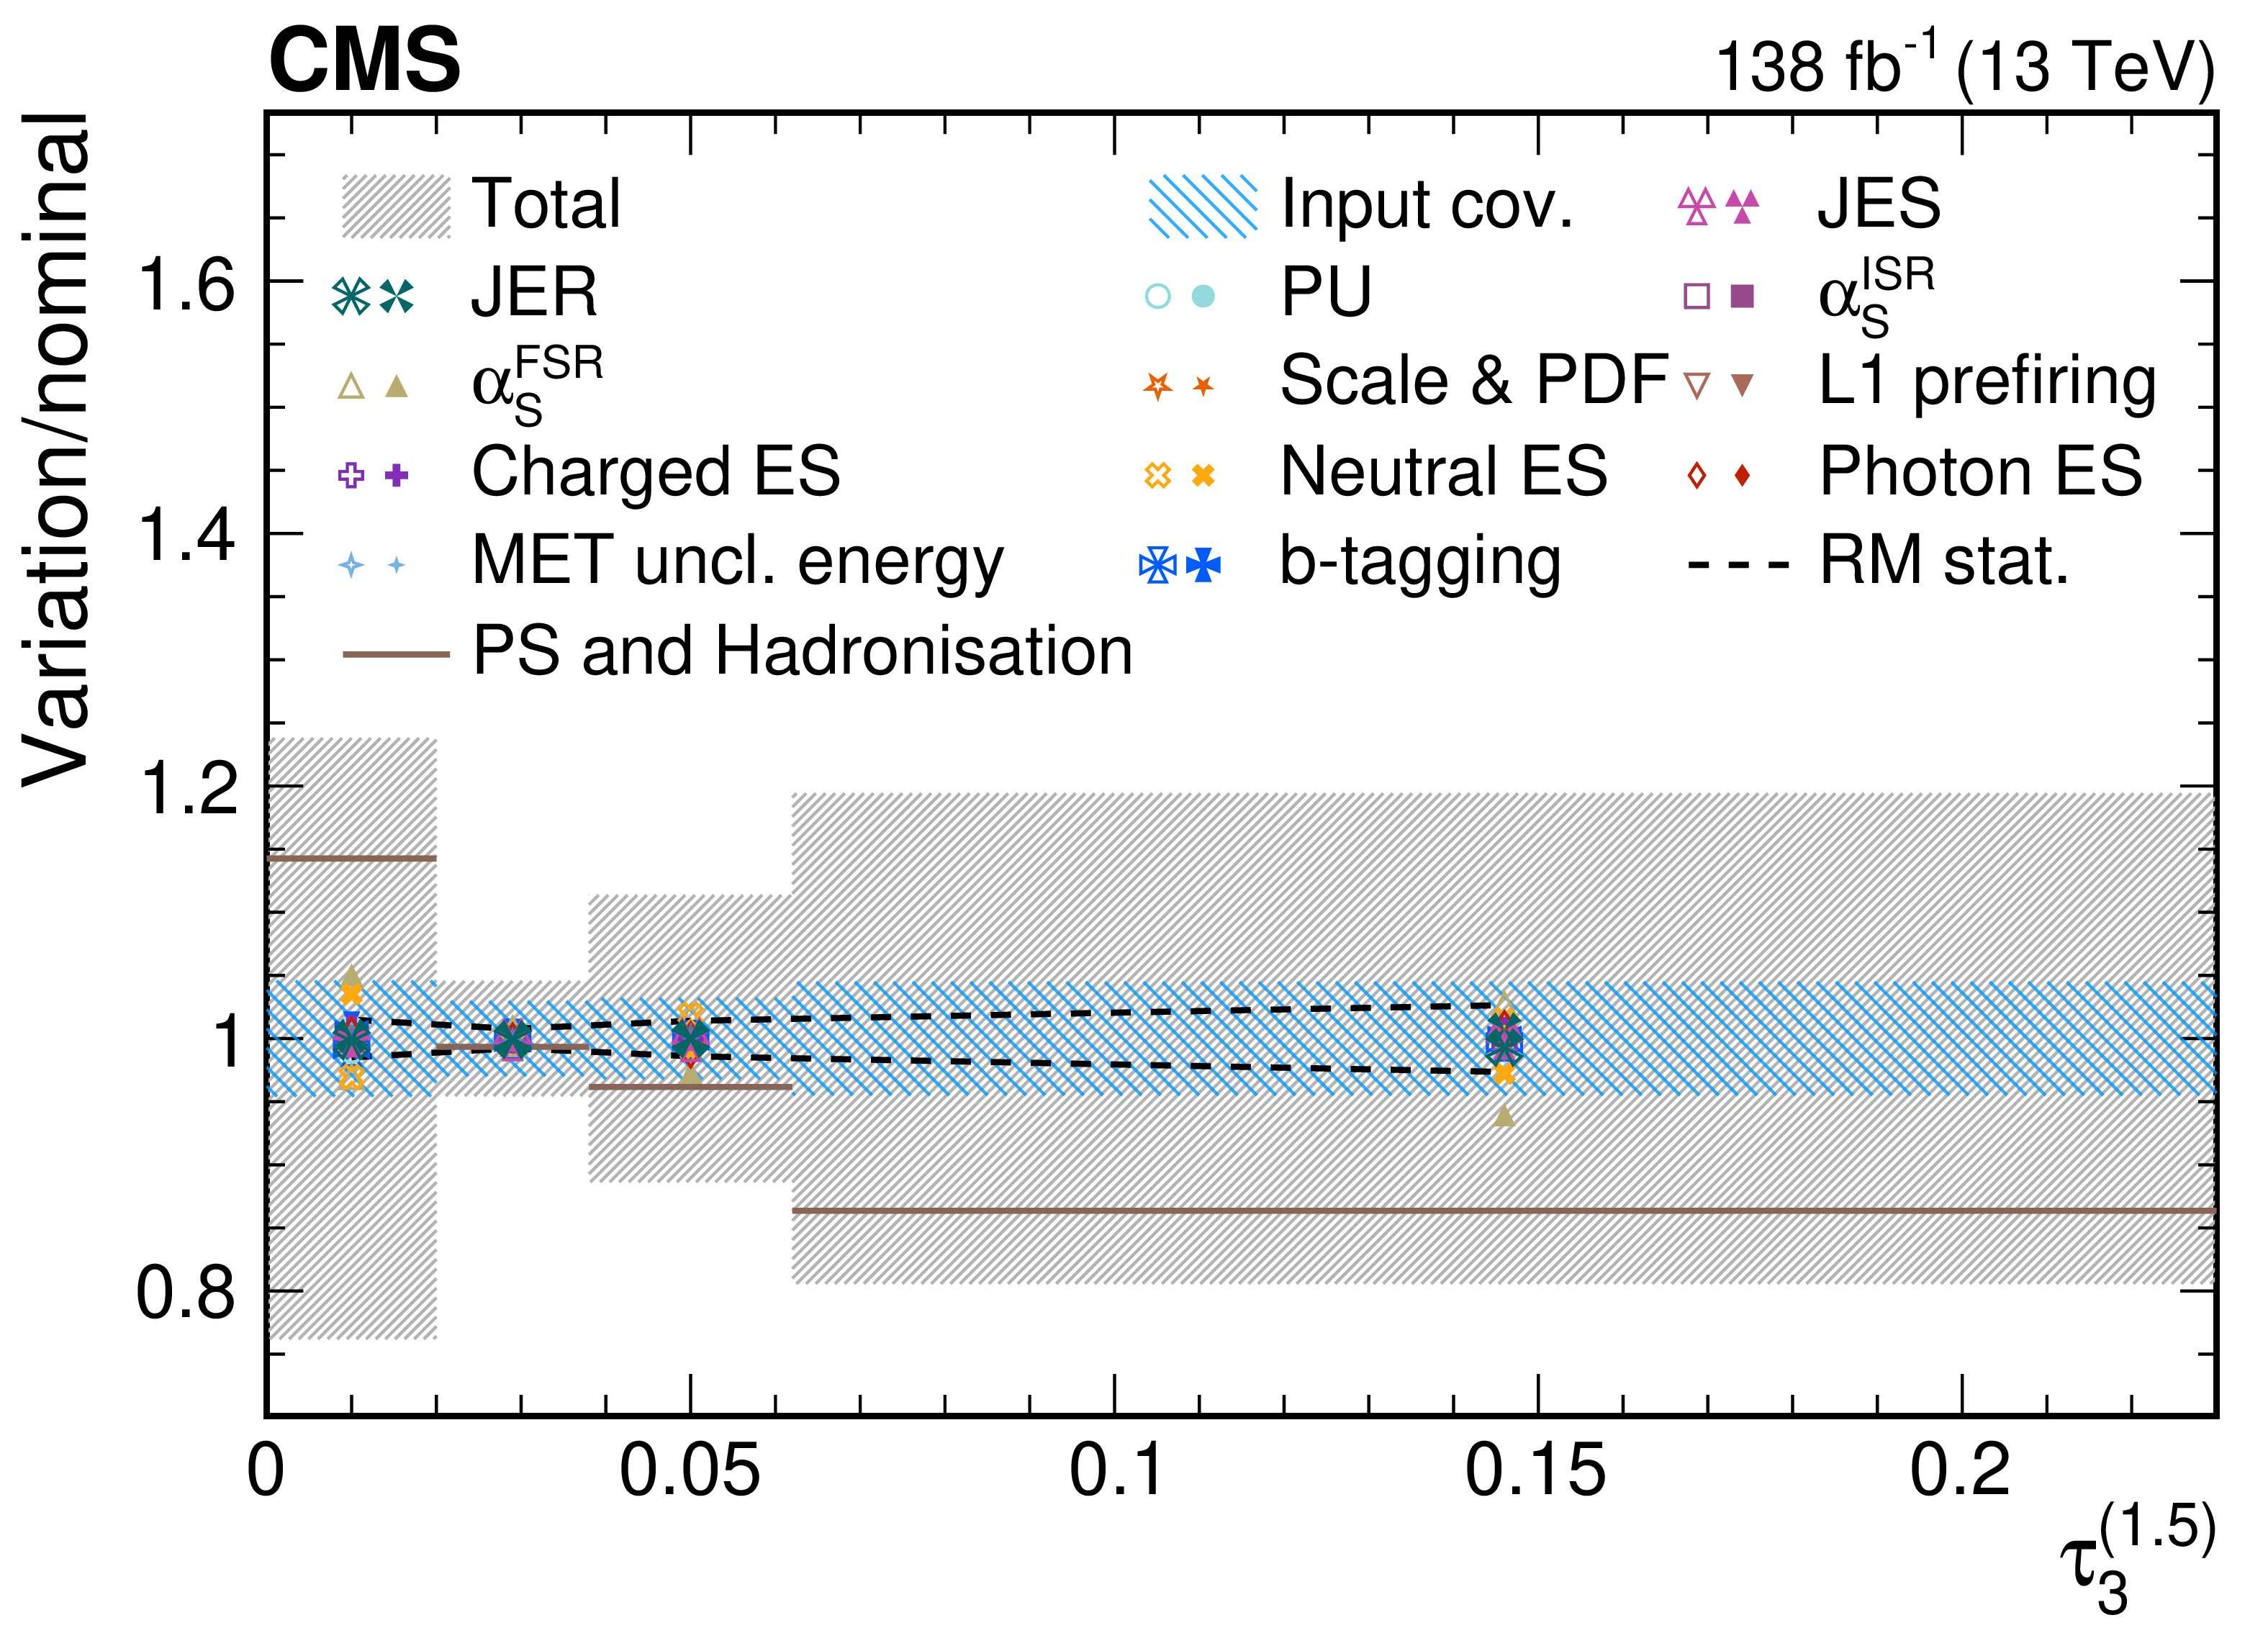
png pdf |
Figure 50-d:
Contributions from various systematic variations to the normalized, unfolded distribution for $ \tau_3^{(\beta)} $ observables measured for AK8 jets passing the boosted W boson-enriched selection in $ \mu $+jets $ \mathrm{t} \overline{\mathrm{t}} $ events. The total unfolding uncertainty is indicated with the dark grey, hashed region, while the blue hashed region indicates the contributions from the input covariance matrix, which includes the propagated effects of the statistical uncertainties of the input data after background subtraction. Contributions from statistical uncertainties of the simulated sample used to construct the nominal response matrix are indicated with the dashed black line. The physics model uncertainty is computed as a one-sided shift compared to the nominal unfolding, and up (down) contributions from other sources are indicated with filled (open) markers of the same type and colour. |
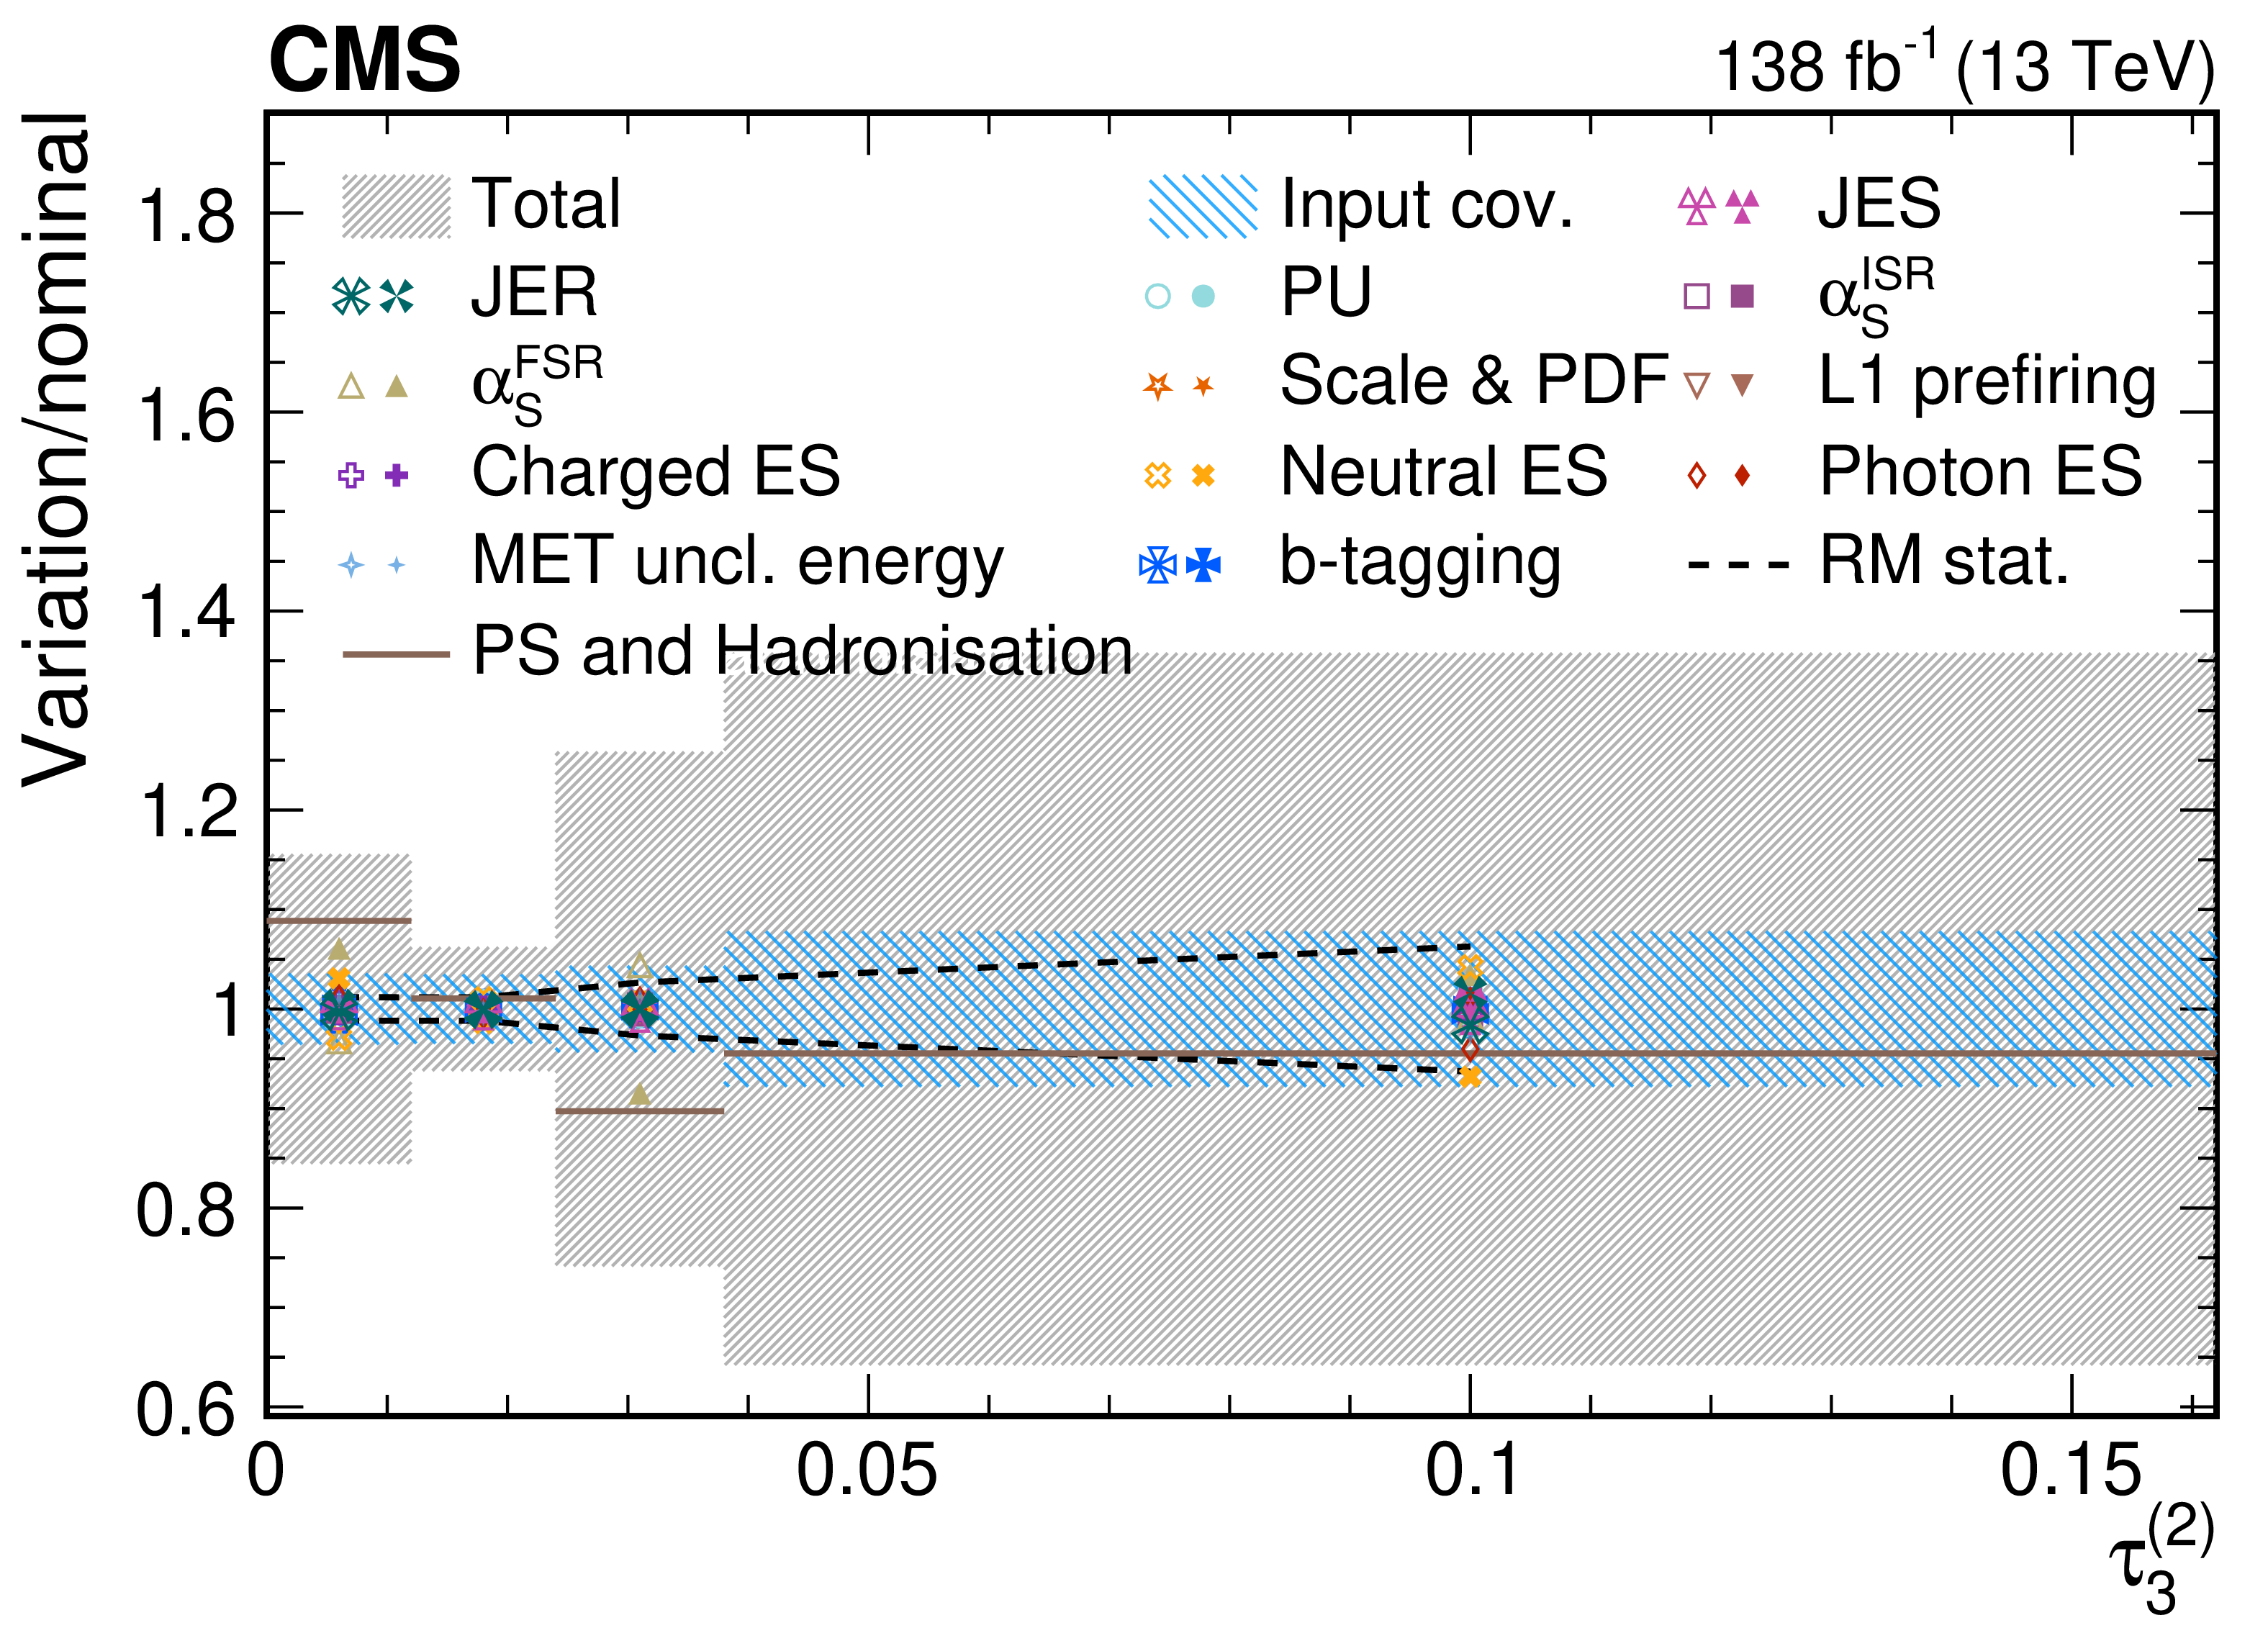
png pdf |
Figure 50-e:
Contributions from various systematic variations to the normalized, unfolded distribution for $ \tau_3^{(\beta)} $ observables measured for AK8 jets passing the boosted W boson-enriched selection in $ \mu $+jets $ \mathrm{t} \overline{\mathrm{t}} $ events. The total unfolding uncertainty is indicated with the dark grey, hashed region, while the blue hashed region indicates the contributions from the input covariance matrix, which includes the propagated effects of the statistical uncertainties of the input data after background subtraction. Contributions from statistical uncertainties of the simulated sample used to construct the nominal response matrix are indicated with the dashed black line. The physics model uncertainty is computed as a one-sided shift compared to the nominal unfolding, and up (down) contributions from other sources are indicated with filled (open) markers of the same type and colour. |
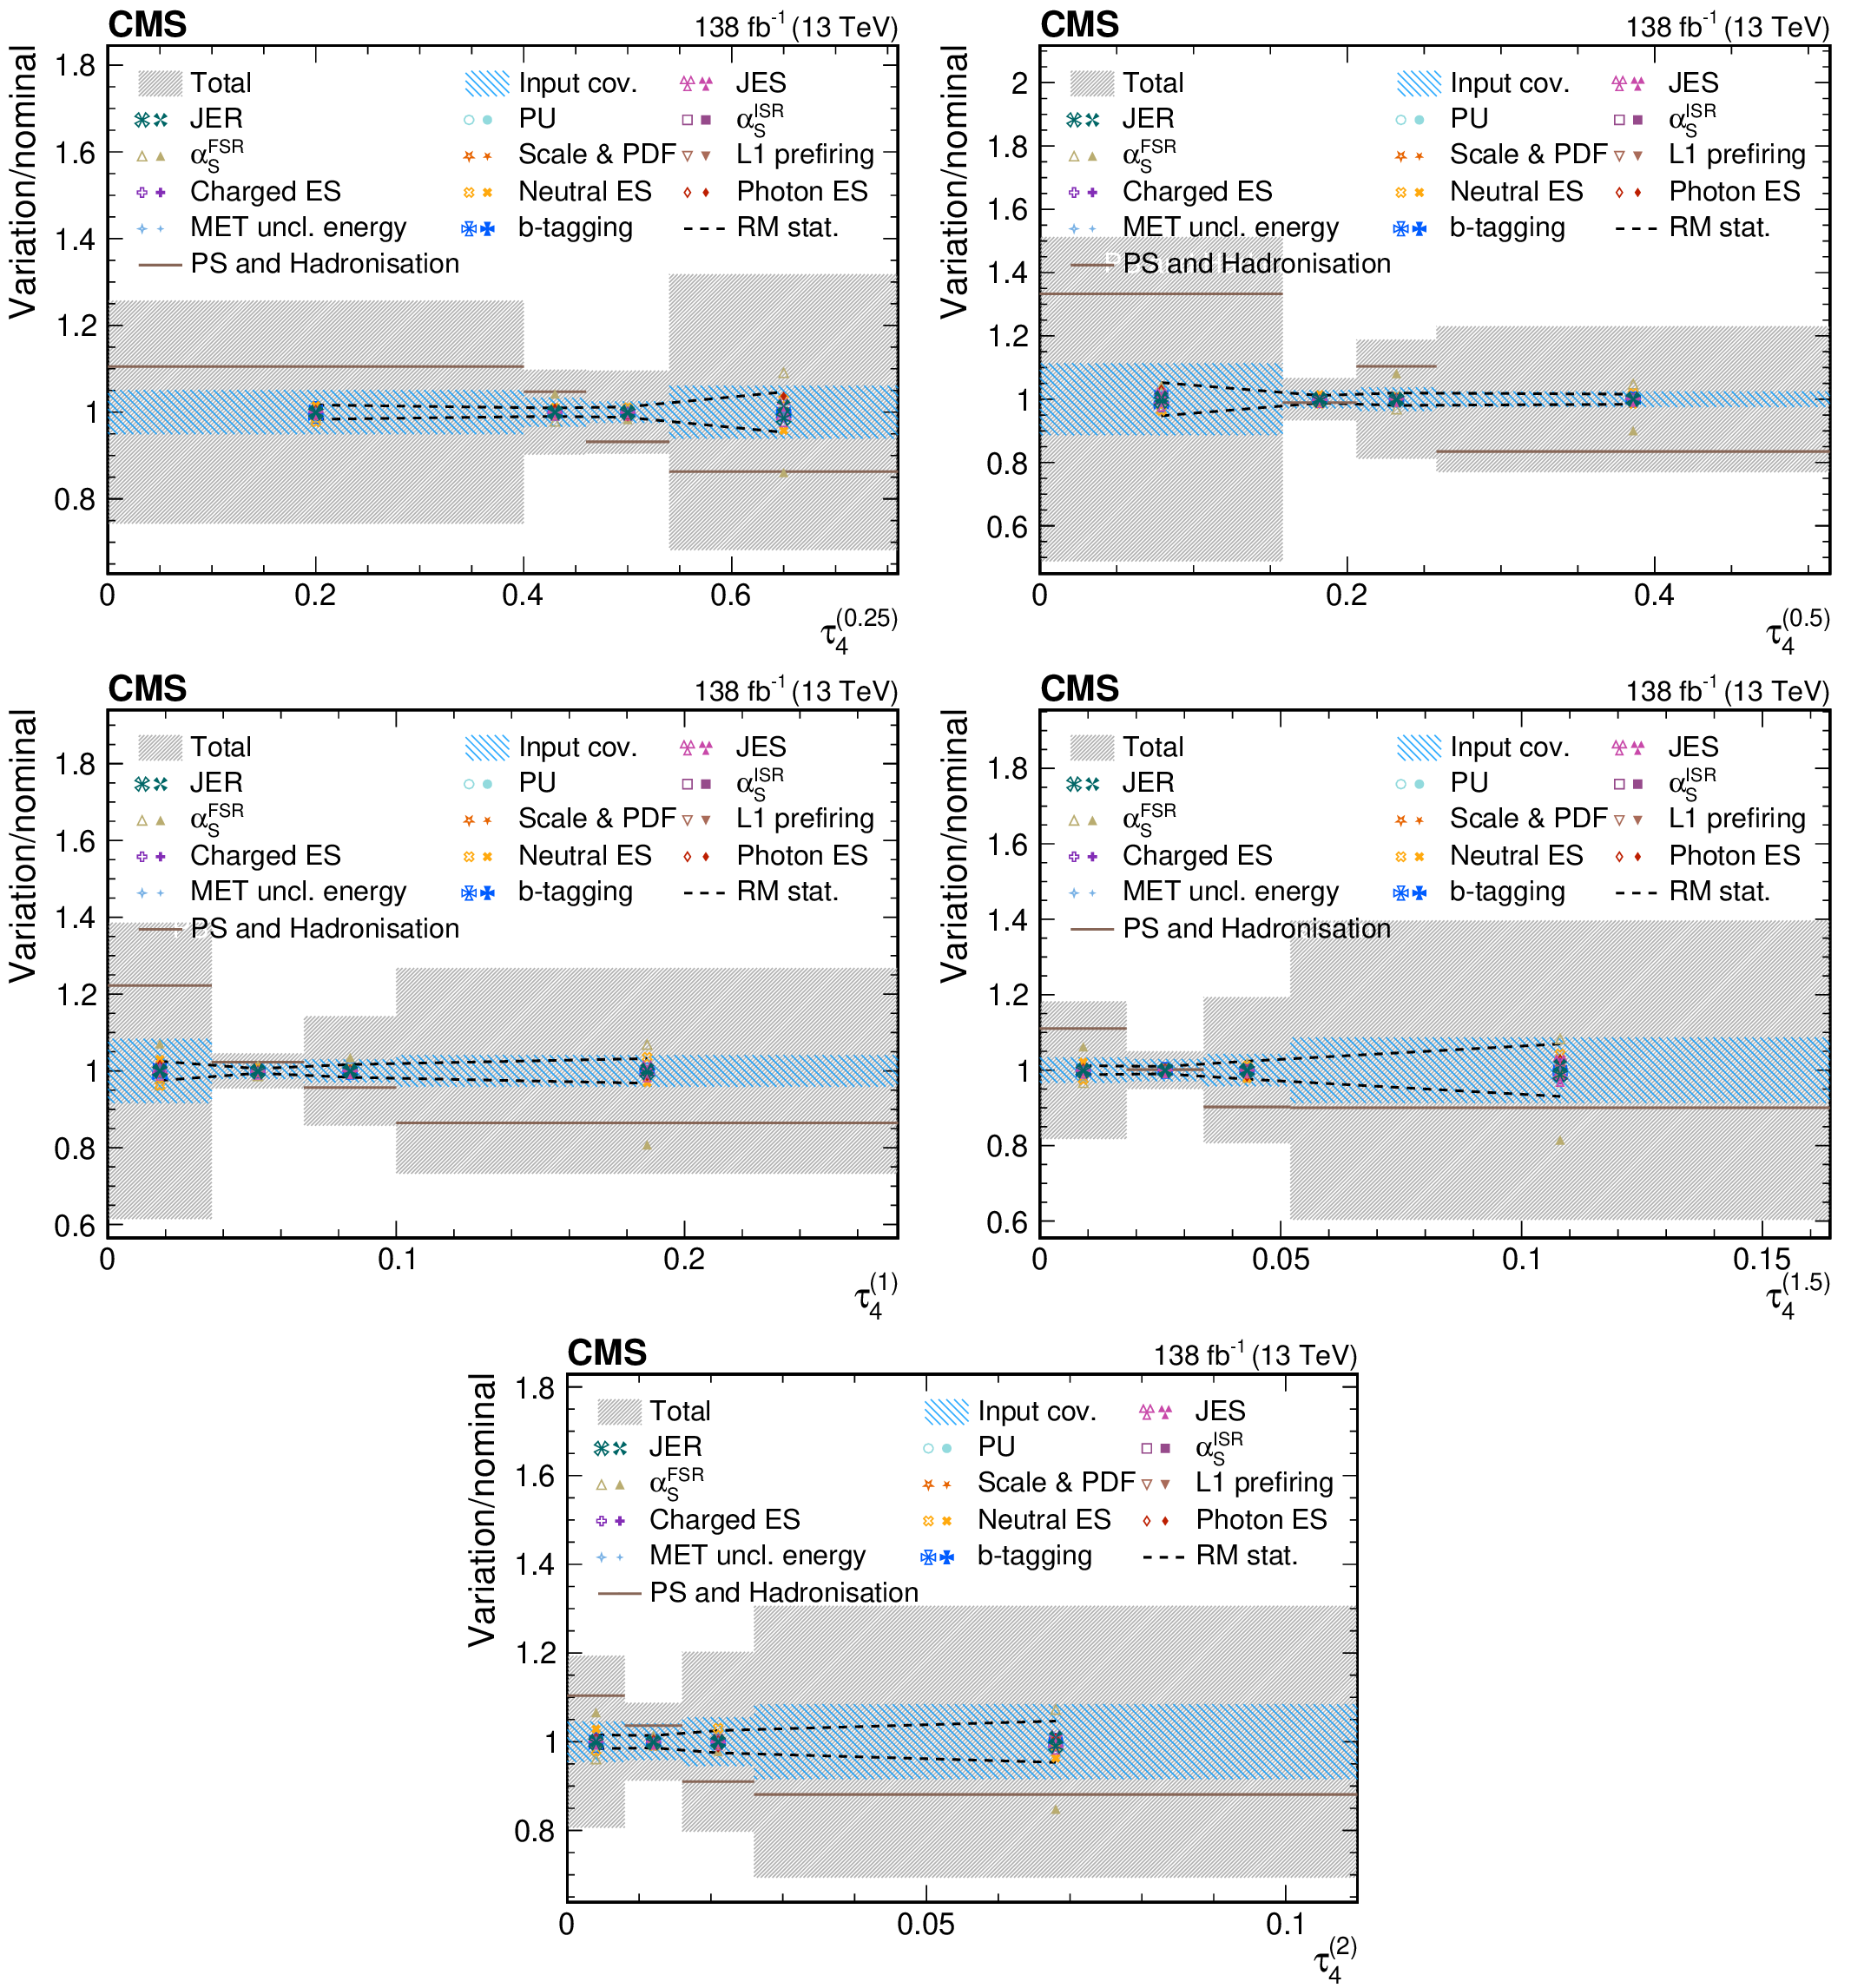
png pdf |
Figure 51:
Contributions from various systematic variations to the normalized, unfolded distribution for $ \tau_4^{(\beta)} $ observables measured for AK8 jets passing the boosted W boson-enriched selection in $ \mu $+jets $ \mathrm{t} \overline{\mathrm{t}} $ events. The total unfolding uncertainty is indicated with the dark grey, hashed region, while the blue hashed region indicates the contributions from the input covariance matrix, which includes the propagated effects of the statistical uncertainties of the input data after background subtraction. Contributions from statistical uncertainties of the simulated sample used to construct the nominal response matrix are indicated with the dashed black line. The physics model uncertainty is computed as a one-sided shift compared to the nominal unfolding, and up (down) contributions from other sources are indicated with filled (open) markers of the same type and colour. |
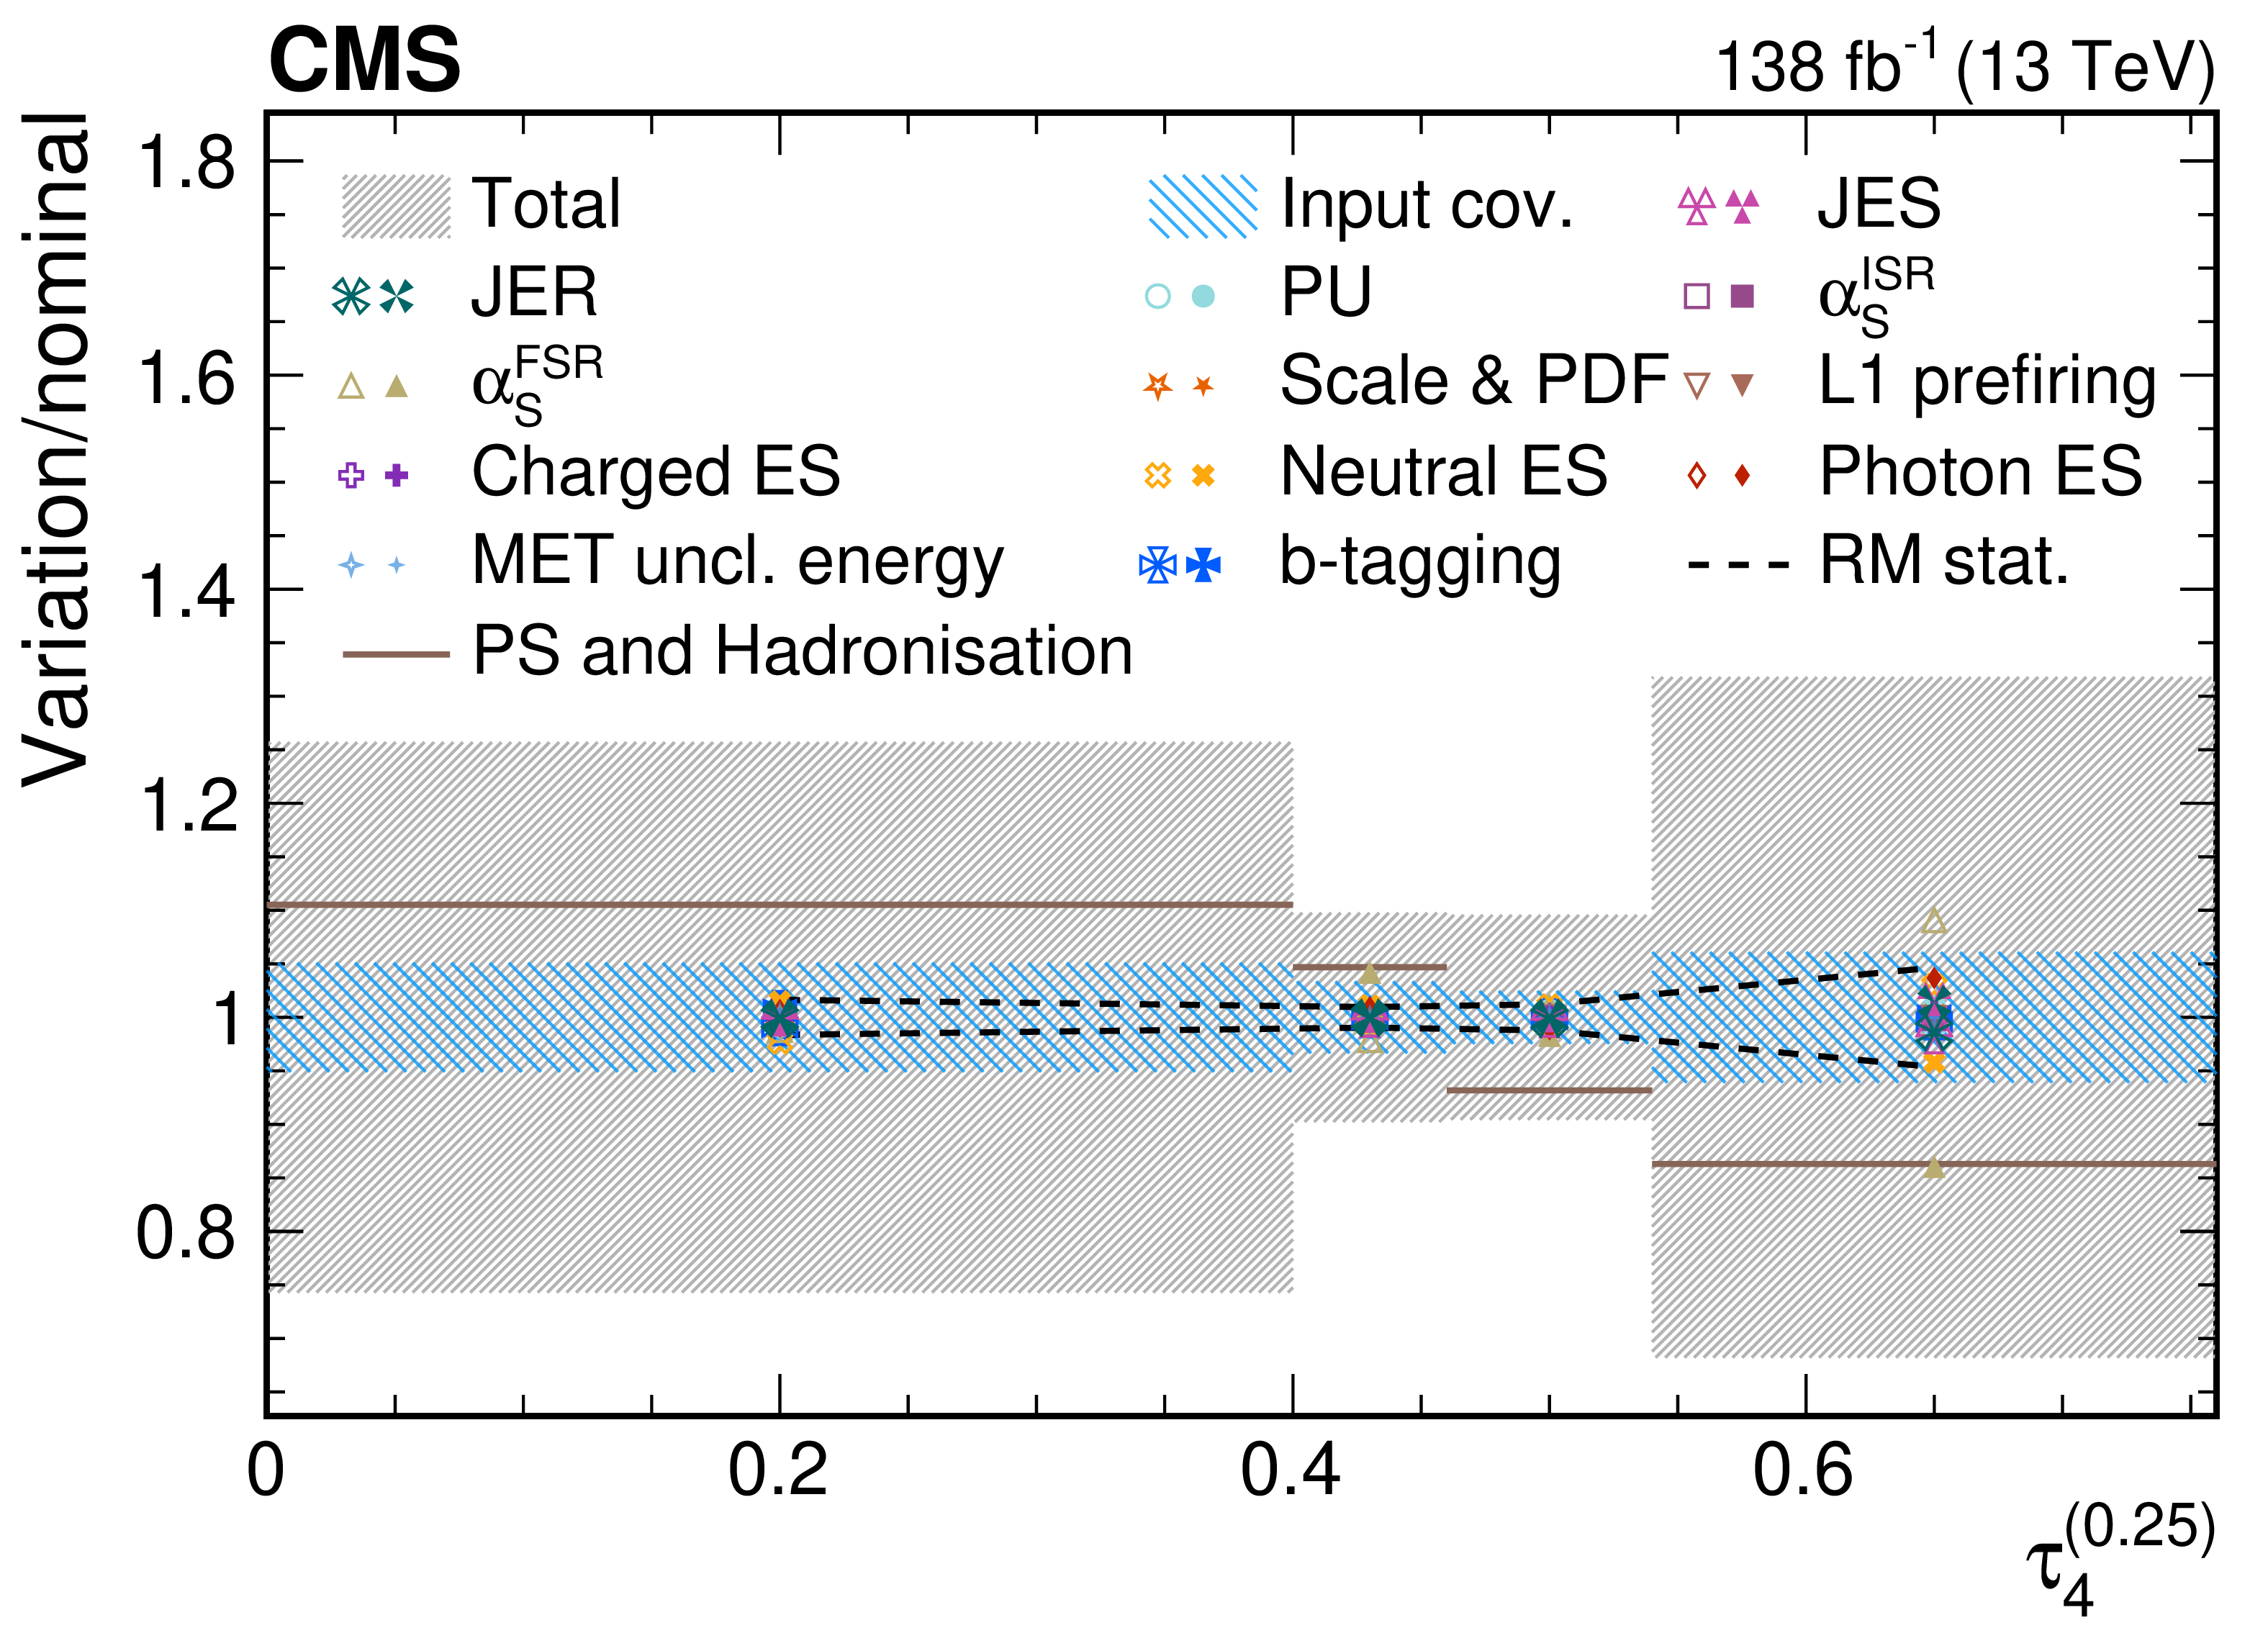
png pdf |
Figure 51-a:
Contributions from various systematic variations to the normalized, unfolded distribution for $ \tau_4^{(\beta)} $ observables measured for AK8 jets passing the boosted W boson-enriched selection in $ \mu $+jets $ \mathrm{t} \overline{\mathrm{t}} $ events. The total unfolding uncertainty is indicated with the dark grey, hashed region, while the blue hashed region indicates the contributions from the input covariance matrix, which includes the propagated effects of the statistical uncertainties of the input data after background subtraction. Contributions from statistical uncertainties of the simulated sample used to construct the nominal response matrix are indicated with the dashed black line. The physics model uncertainty is computed as a one-sided shift compared to the nominal unfolding, and up (down) contributions from other sources are indicated with filled (open) markers of the same type and colour. |
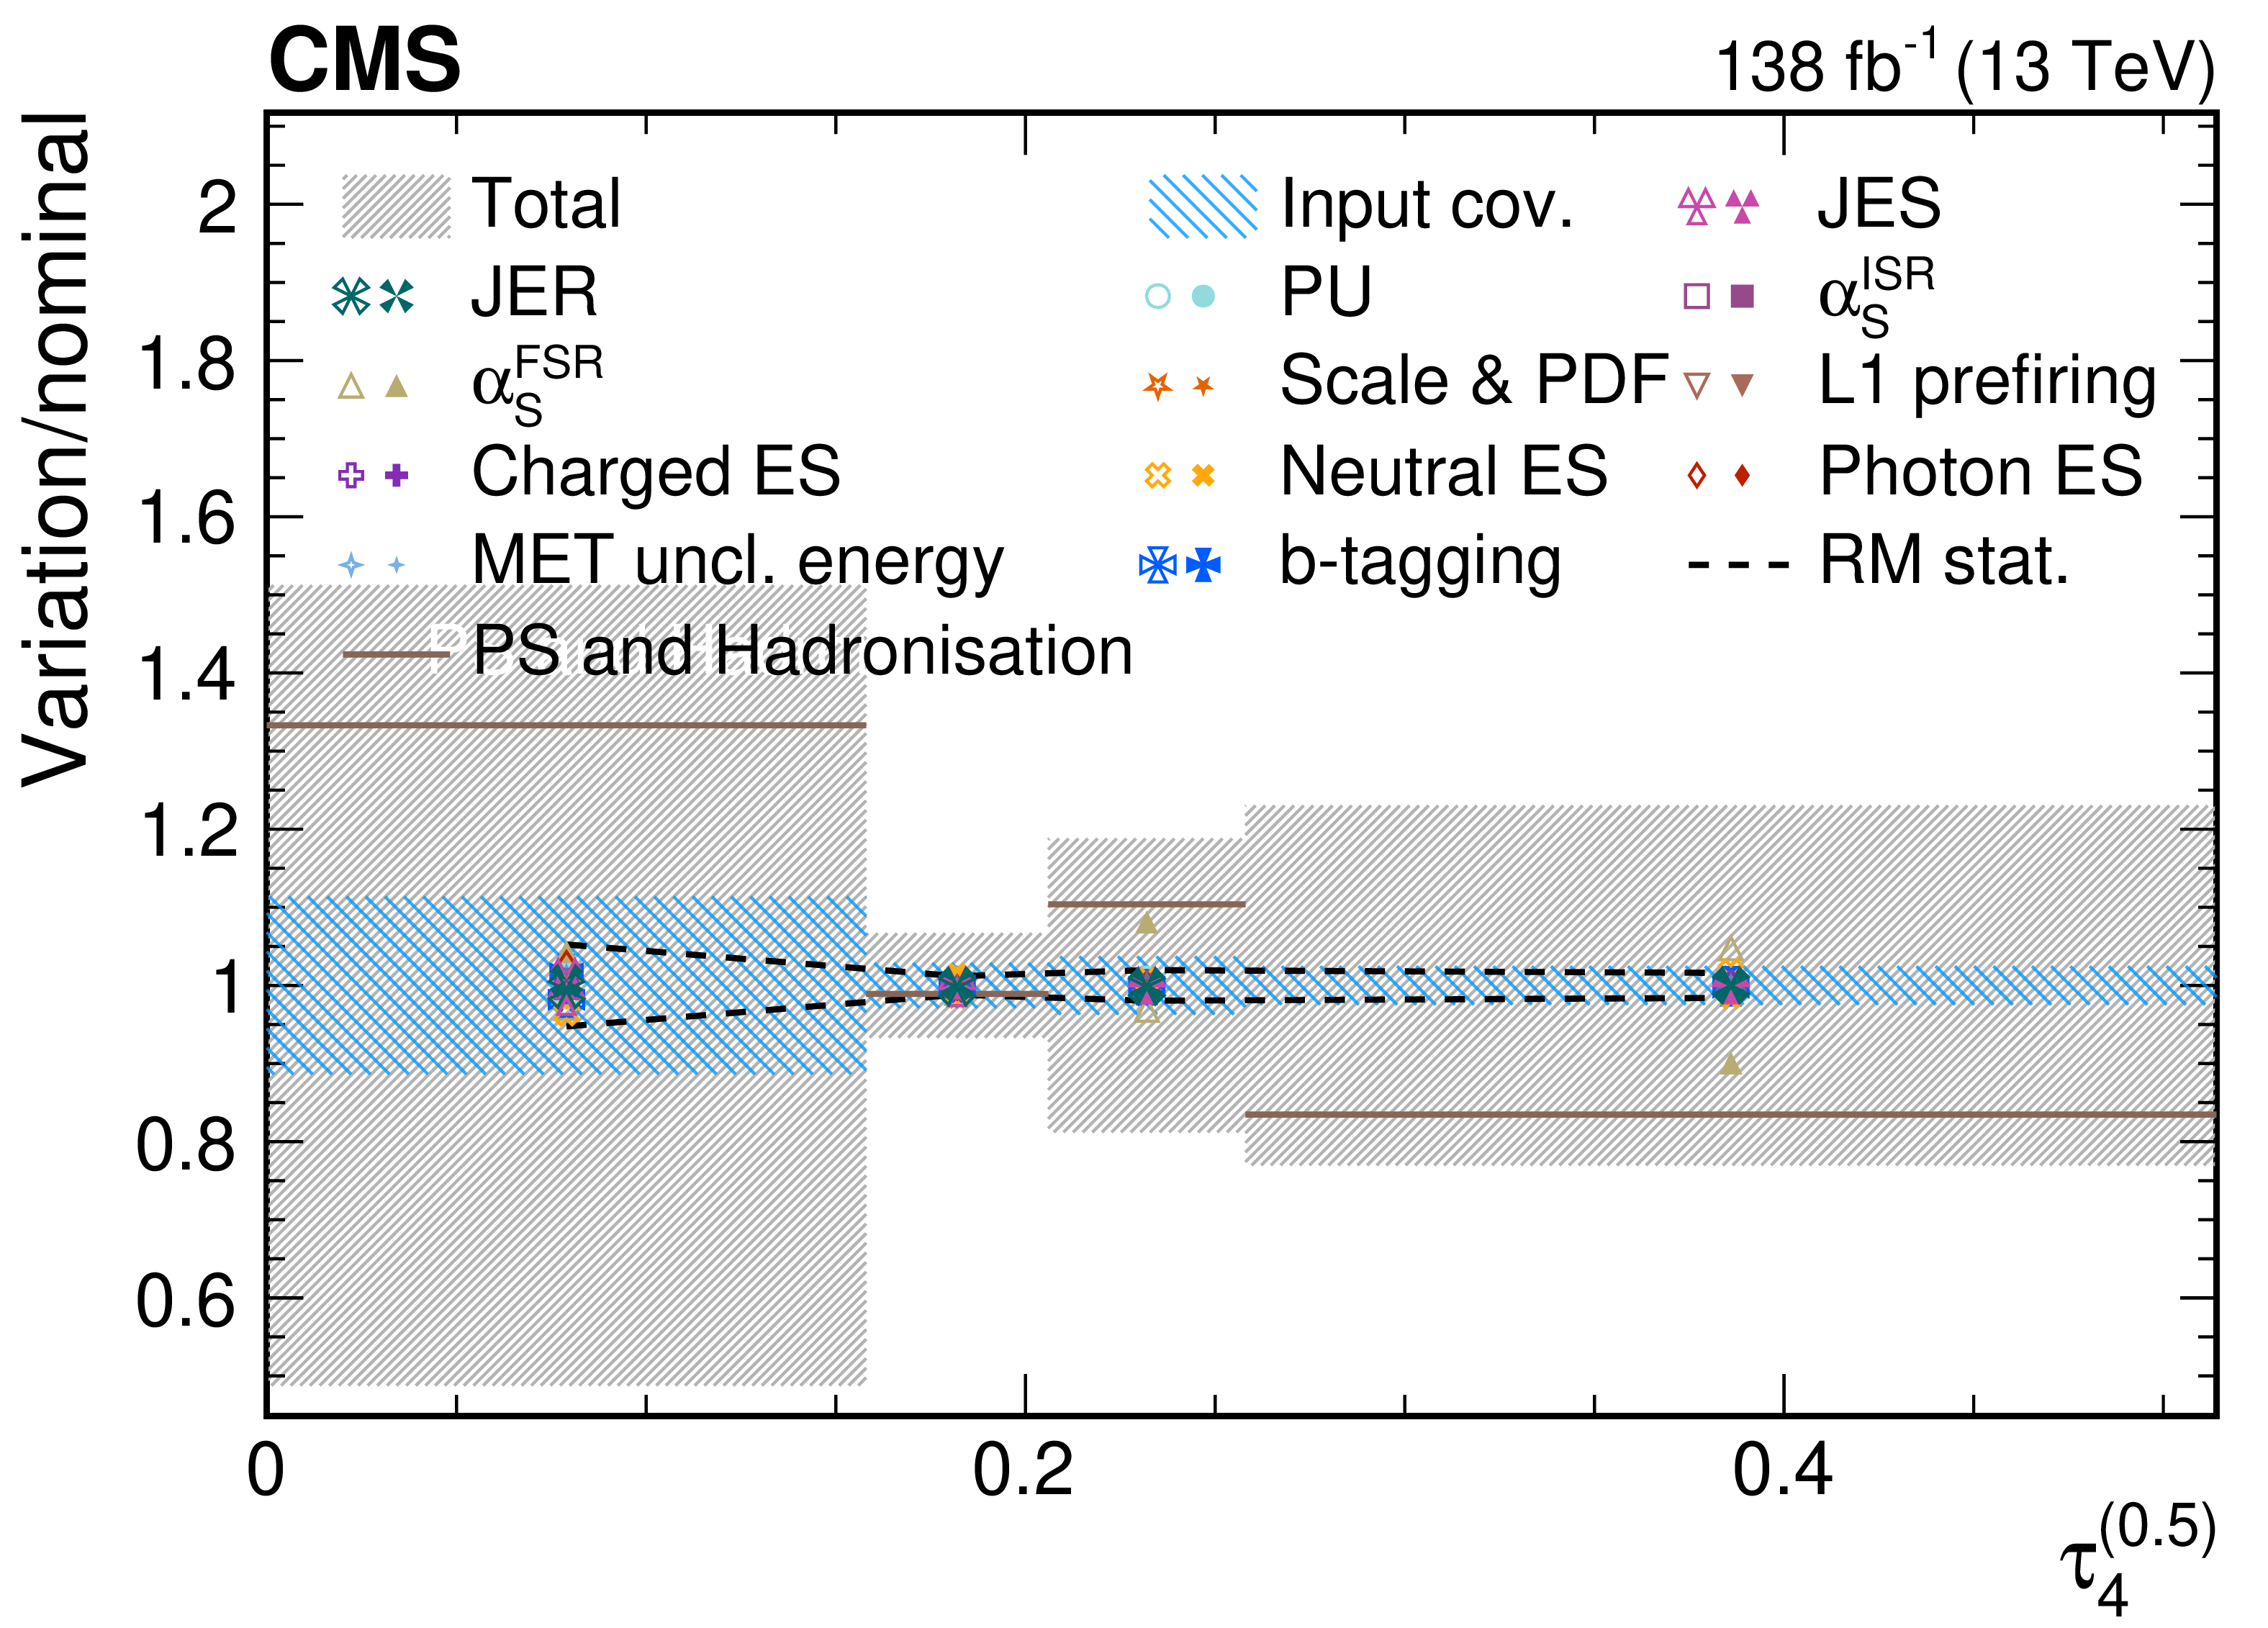
png pdf |
Figure 51-b:
Contributions from various systematic variations to the normalized, unfolded distribution for $ \tau_4^{(\beta)} $ observables measured for AK8 jets passing the boosted W boson-enriched selection in $ \mu $+jets $ \mathrm{t} \overline{\mathrm{t}} $ events. The total unfolding uncertainty is indicated with the dark grey, hashed region, while the blue hashed region indicates the contributions from the input covariance matrix, which includes the propagated effects of the statistical uncertainties of the input data after background subtraction. Contributions from statistical uncertainties of the simulated sample used to construct the nominal response matrix are indicated with the dashed black line. The physics model uncertainty is computed as a one-sided shift compared to the nominal unfolding, and up (down) contributions from other sources are indicated with filled (open) markers of the same type and colour. |

png pdf |
Figure 51-c:
Contributions from various systematic variations to the normalized, unfolded distribution for $ \tau_4^{(\beta)} $ observables measured for AK8 jets passing the boosted W boson-enriched selection in $ \mu $+jets $ \mathrm{t} \overline{\mathrm{t}} $ events. The total unfolding uncertainty is indicated with the dark grey, hashed region, while the blue hashed region indicates the contributions from the input covariance matrix, which includes the propagated effects of the statistical uncertainties of the input data after background subtraction. Contributions from statistical uncertainties of the simulated sample used to construct the nominal response matrix are indicated with the dashed black line. The physics model uncertainty is computed as a one-sided shift compared to the nominal unfolding, and up (down) contributions from other sources are indicated with filled (open) markers of the same type and colour. |
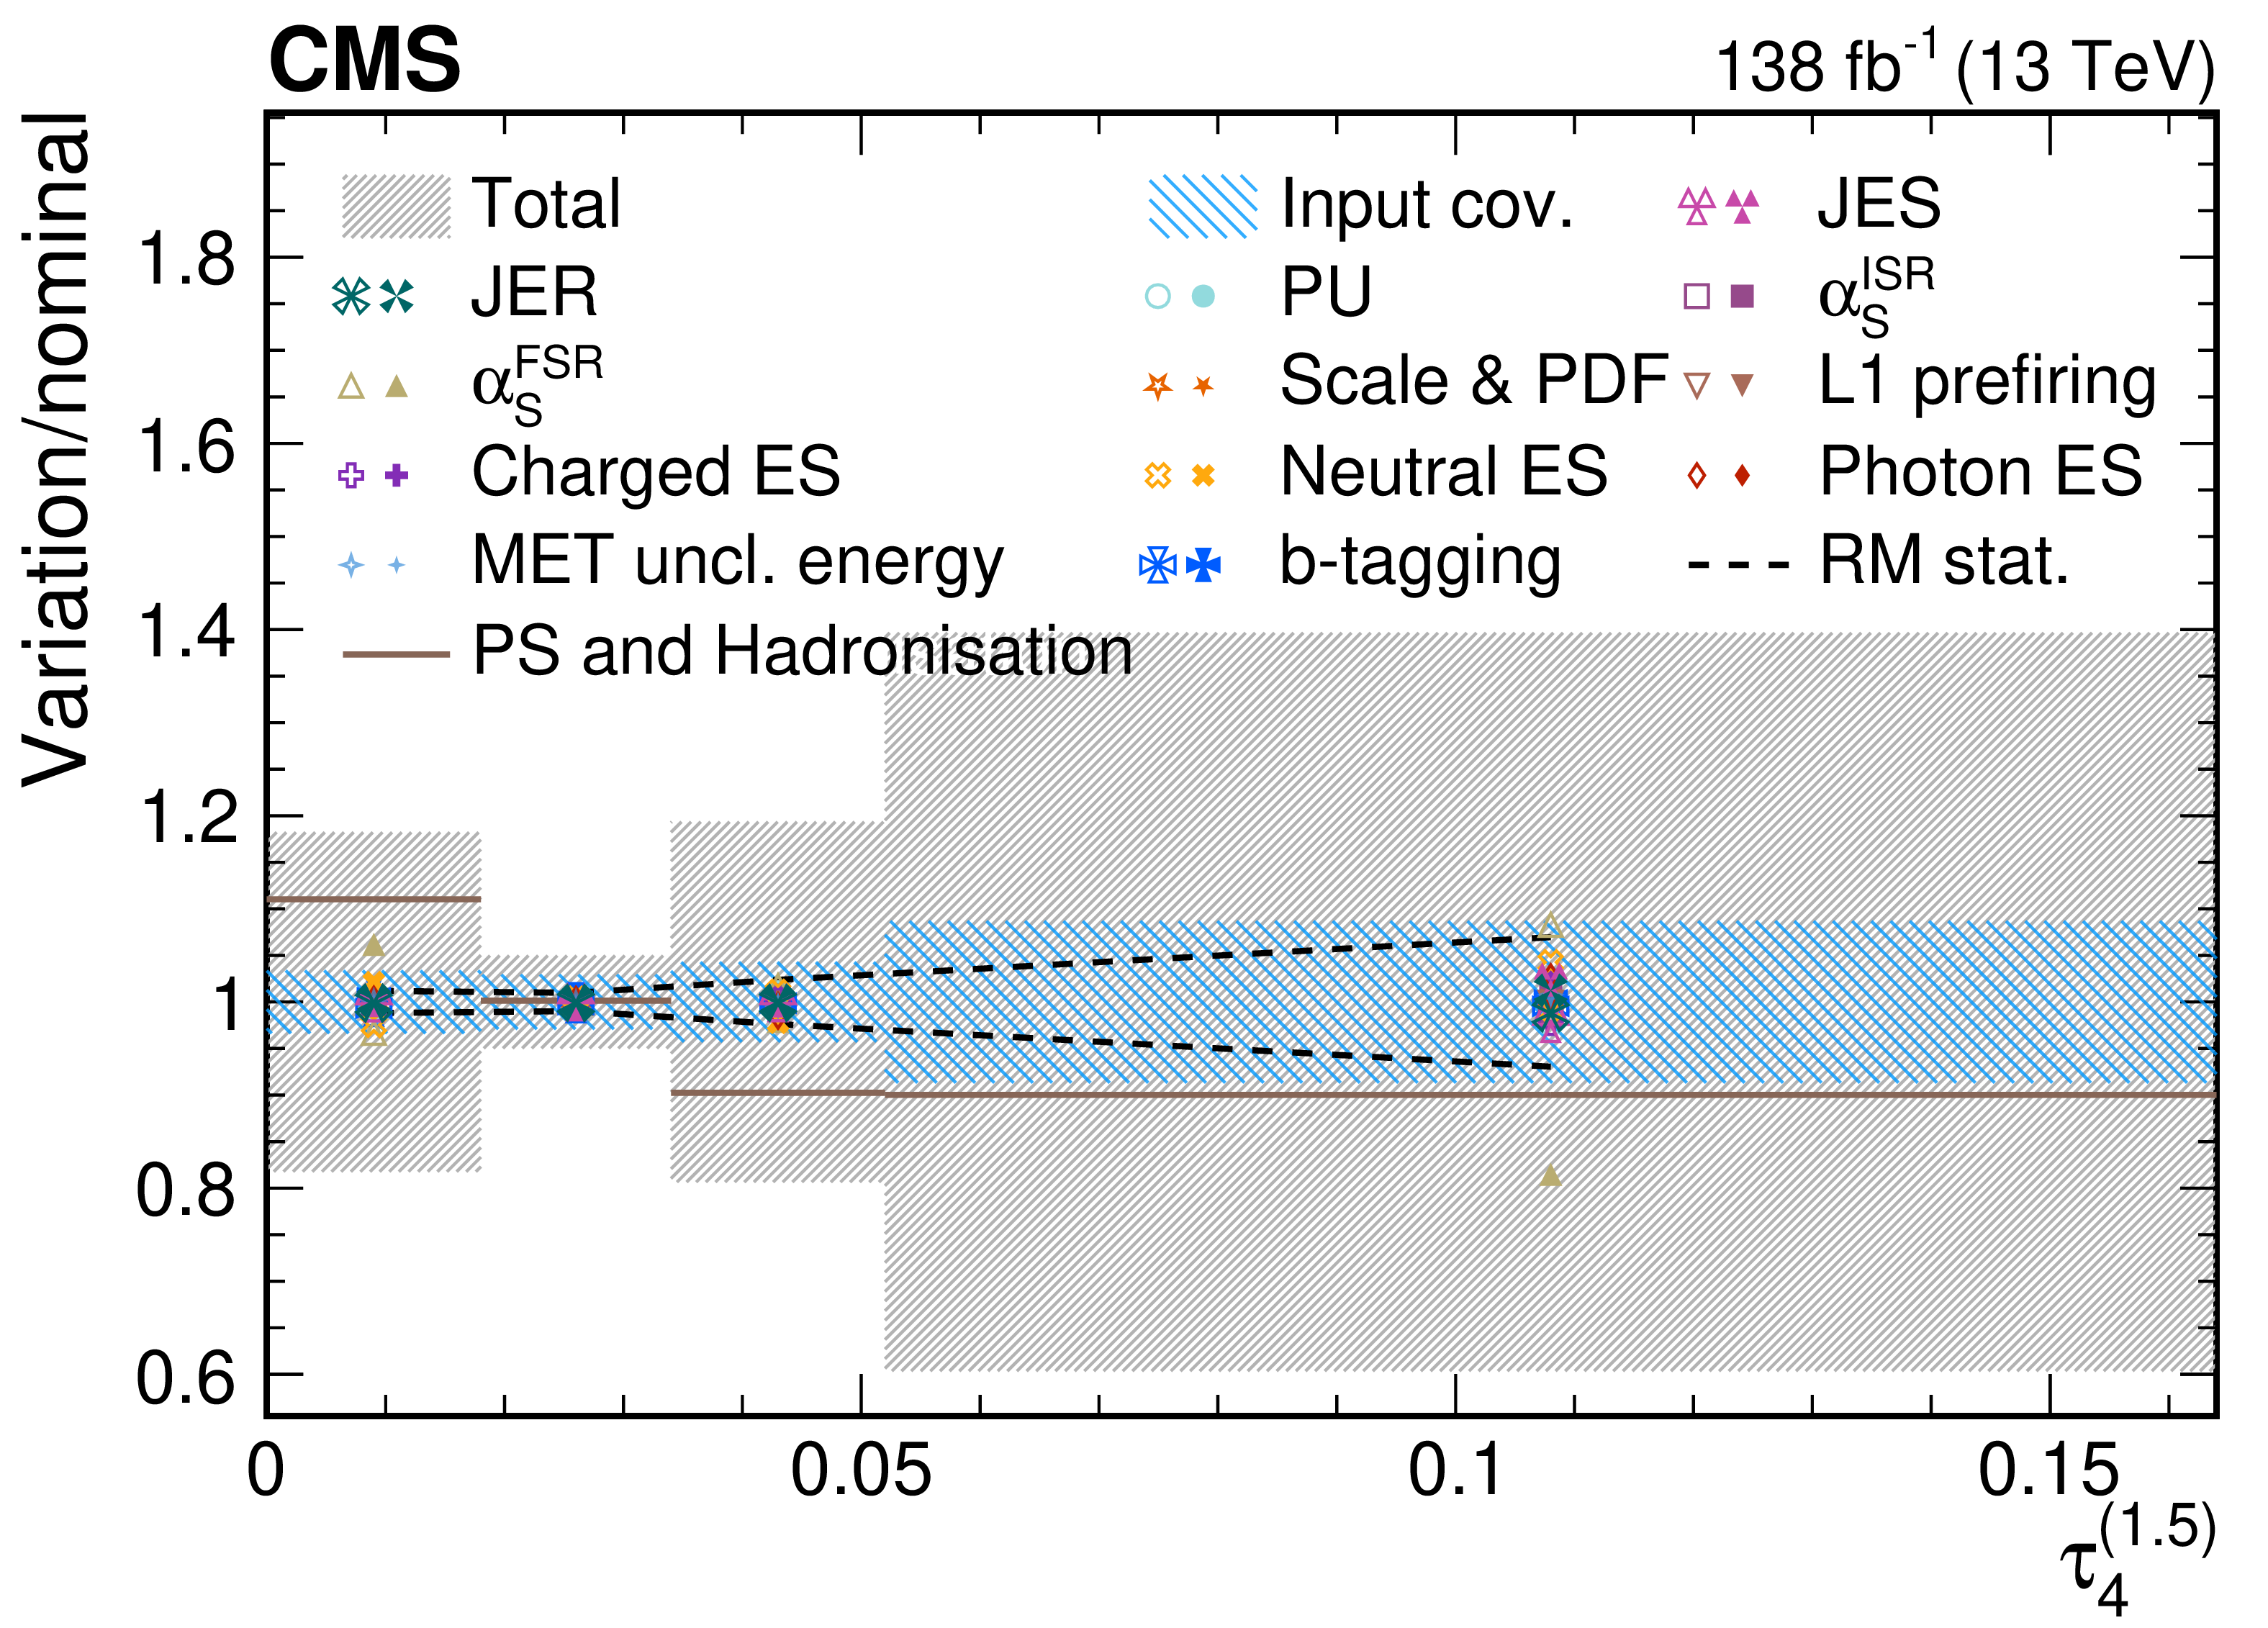
png pdf |
Figure 51-d:
Contributions from various systematic variations to the normalized, unfolded distribution for $ \tau_4^{(\beta)} $ observables measured for AK8 jets passing the boosted W boson-enriched selection in $ \mu $+jets $ \mathrm{t} \overline{\mathrm{t}} $ events. The total unfolding uncertainty is indicated with the dark grey, hashed region, while the blue hashed region indicates the contributions from the input covariance matrix, which includes the propagated effects of the statistical uncertainties of the input data after background subtraction. Contributions from statistical uncertainties of the simulated sample used to construct the nominal response matrix are indicated with the dashed black line. The physics model uncertainty is computed as a one-sided shift compared to the nominal unfolding, and up (down) contributions from other sources are indicated with filled (open) markers of the same type and colour. |
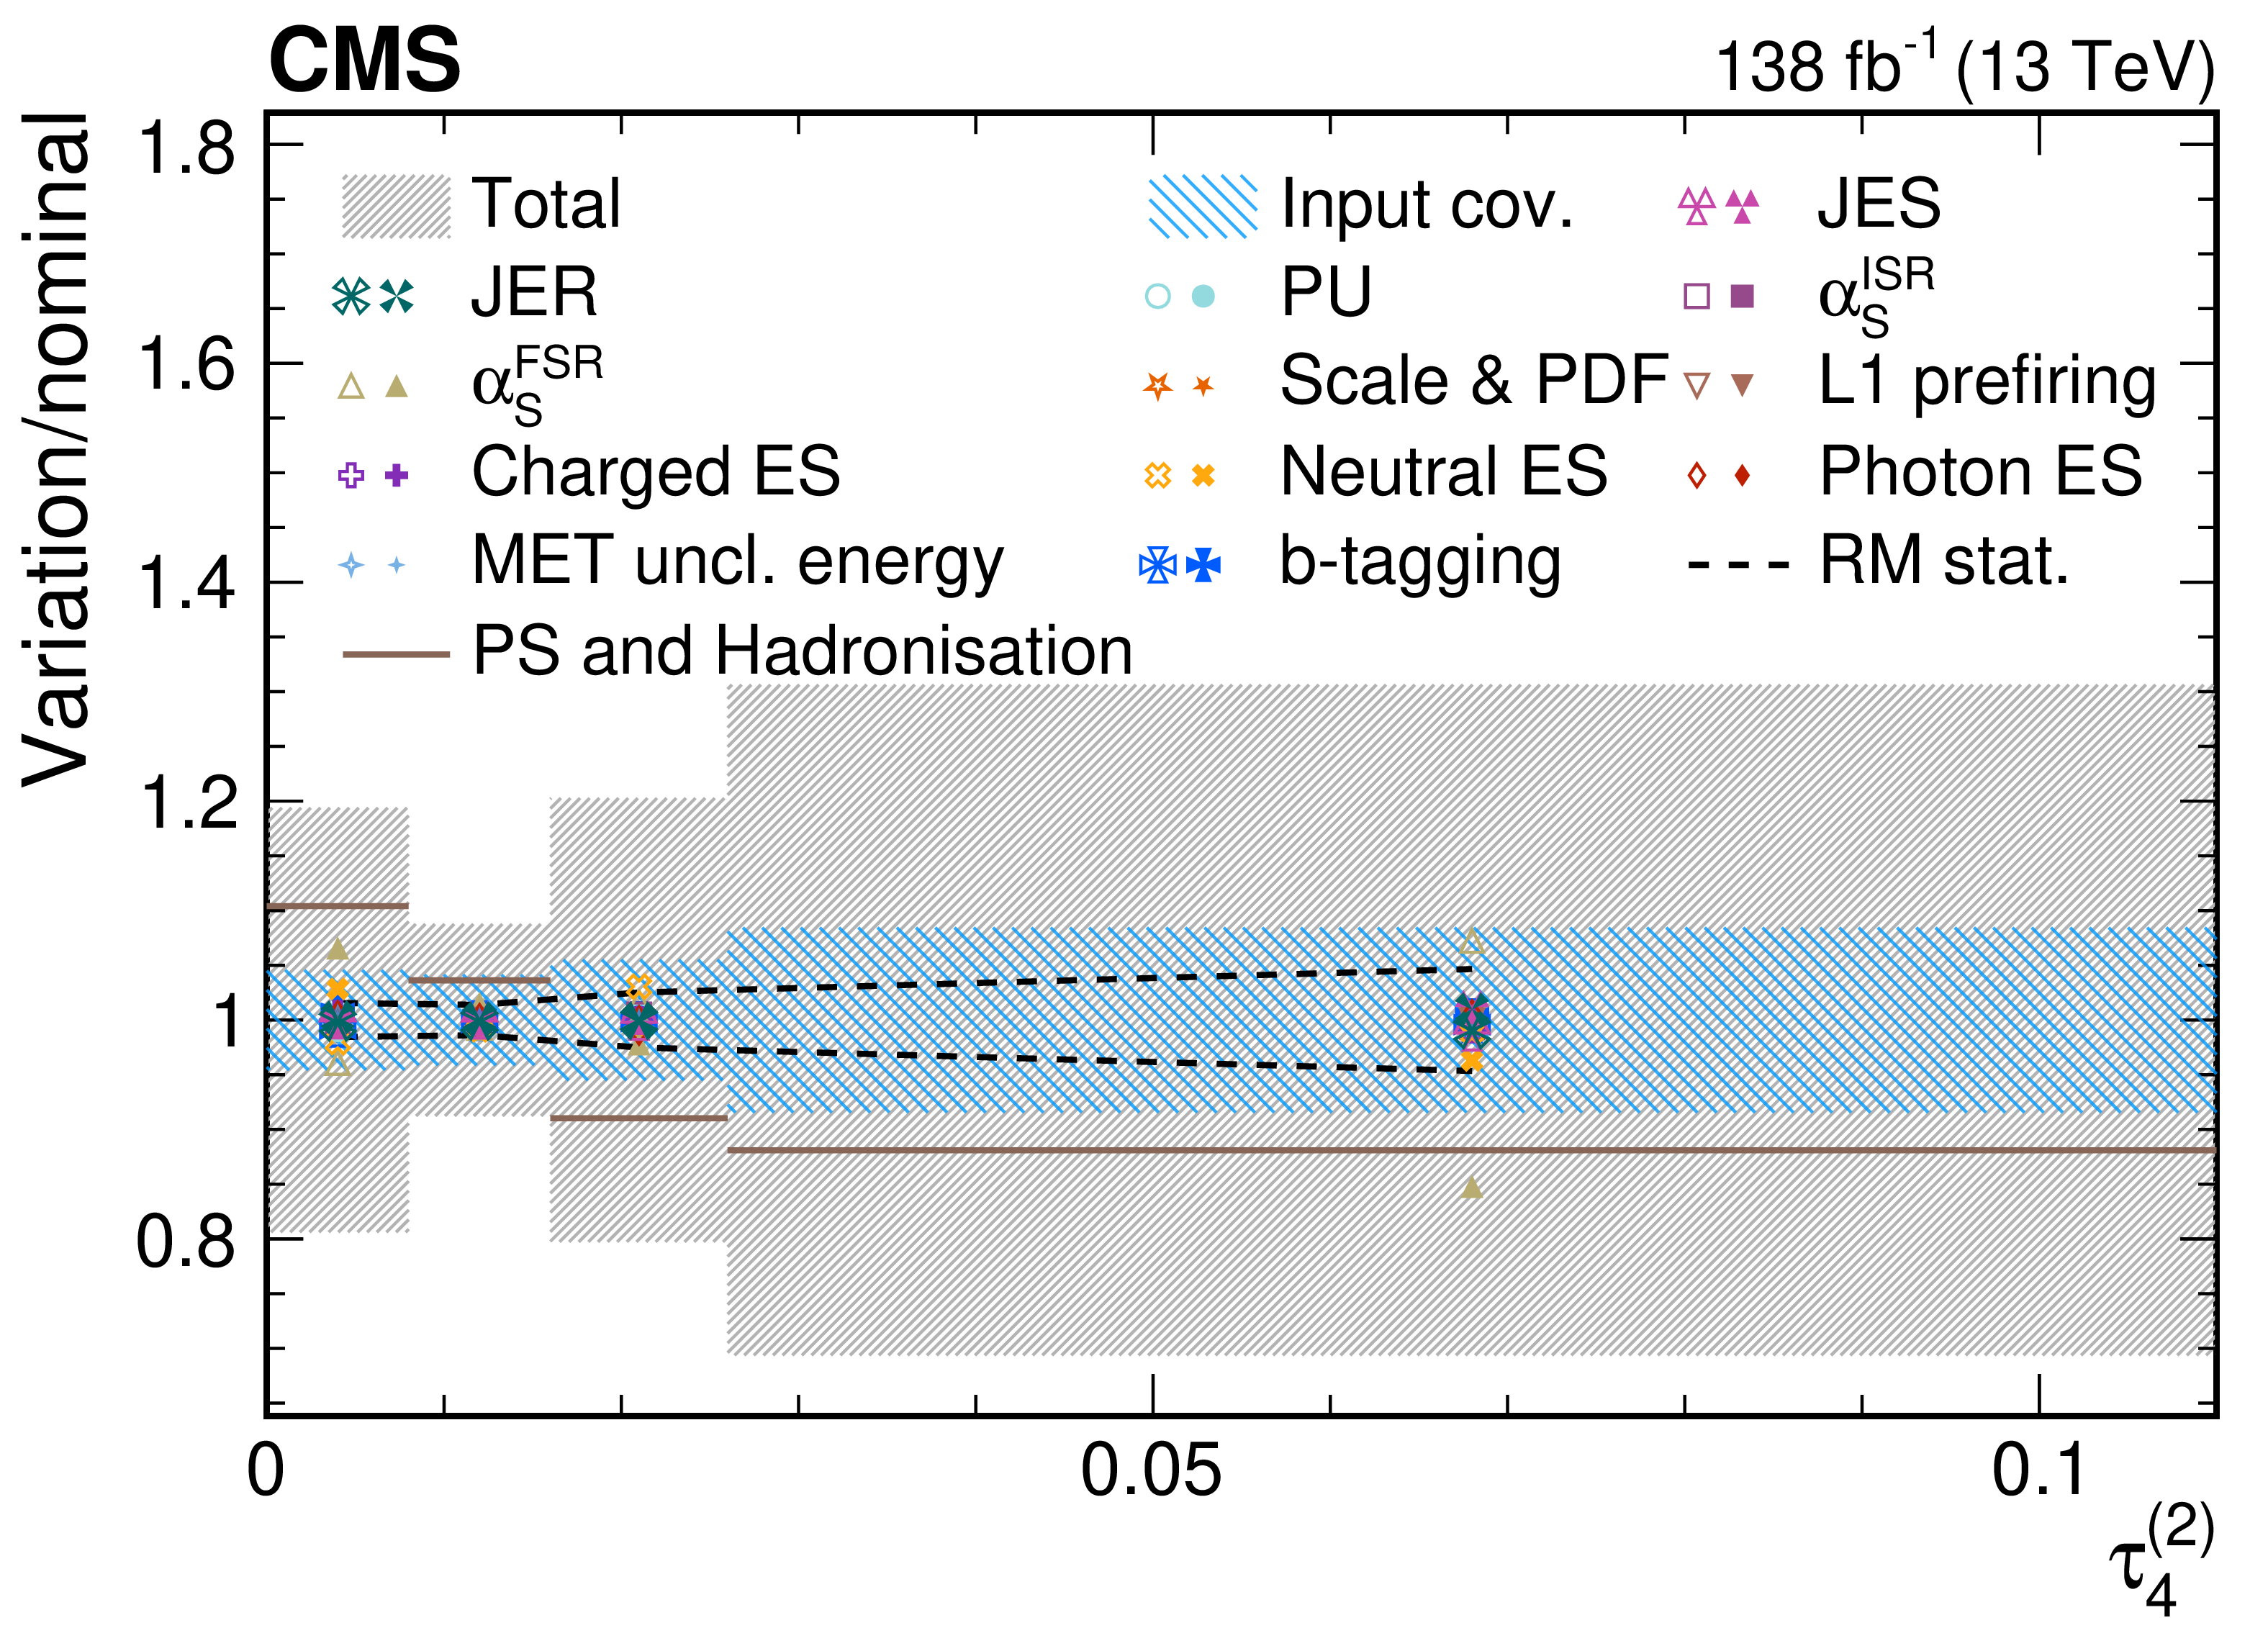
png pdf |
Figure 51-e:
Contributions from various systematic variations to the normalized, unfolded distribution for $ \tau_4^{(\beta)} $ observables measured for AK8 jets passing the boosted W boson-enriched selection in $ \mu $+jets $ \mathrm{t} \overline{\mathrm{t}} $ events. The total unfolding uncertainty is indicated with the dark grey, hashed region, while the blue hashed region indicates the contributions from the input covariance matrix, which includes the propagated effects of the statistical uncertainties of the input data after background subtraction. Contributions from statistical uncertainties of the simulated sample used to construct the nominal response matrix are indicated with the dashed black line. The physics model uncertainty is computed as a one-sided shift compared to the nominal unfolding, and up (down) contributions from other sources are indicated with filled (open) markers of the same type and colour. |
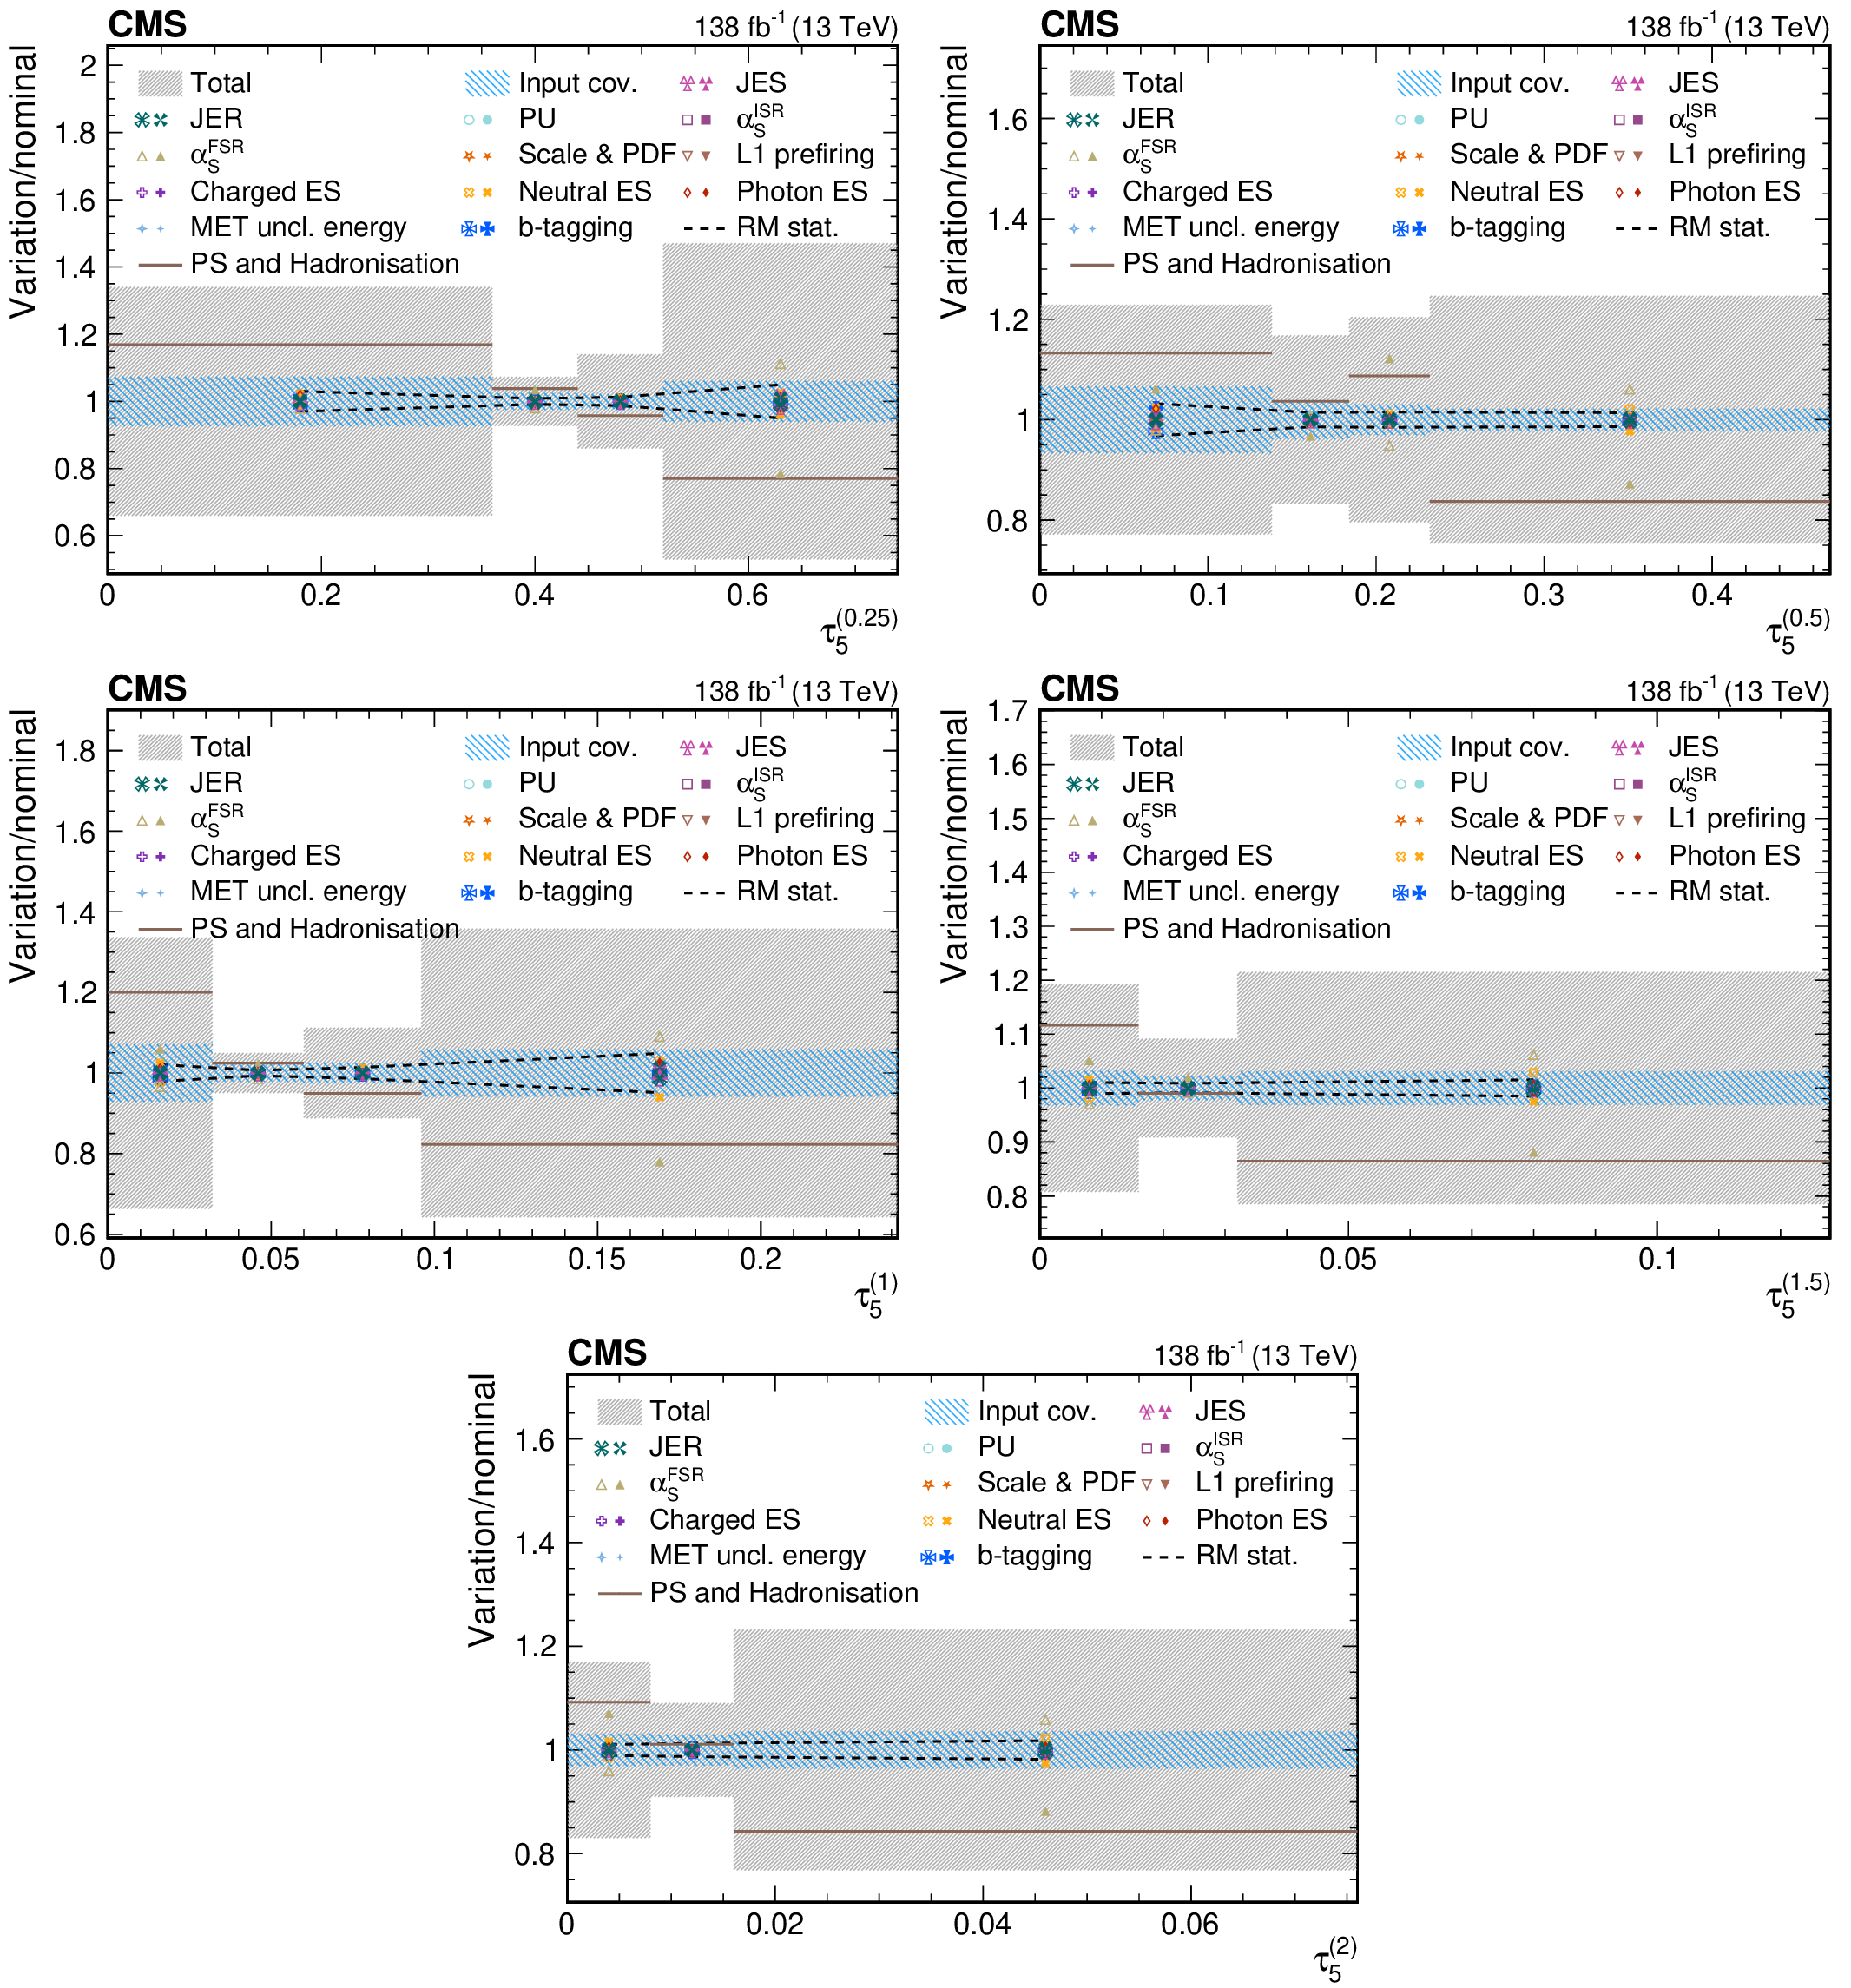
png pdf |
Figure 52:
Contributions from various systematic variations to the normalized, unfolded distribution for $ \tau_5^{(\beta)} $ observables measured for AK8 jets passing the boosted W boson-enriched selection in $ \mu $+jets $ \mathrm{t} \overline{\mathrm{t}} $ events. The total unfolding uncertainty is indicated with the dark grey, hashed region, while the blue hashed region indicates the contributions from the input covariance matrix, which includes the propagated effects of the statistical uncertainties of the input data after background subtraction. Contributions from statistical uncertainties of the simulated sample used to construct the nominal response matrix are indicated with the dashed black line. The physics model uncertainty is computed as a one-sided shift compared to the nominal unfolding, and up (down) contributions from other sources are indicated with filled (open) markers of the same type and colour. |
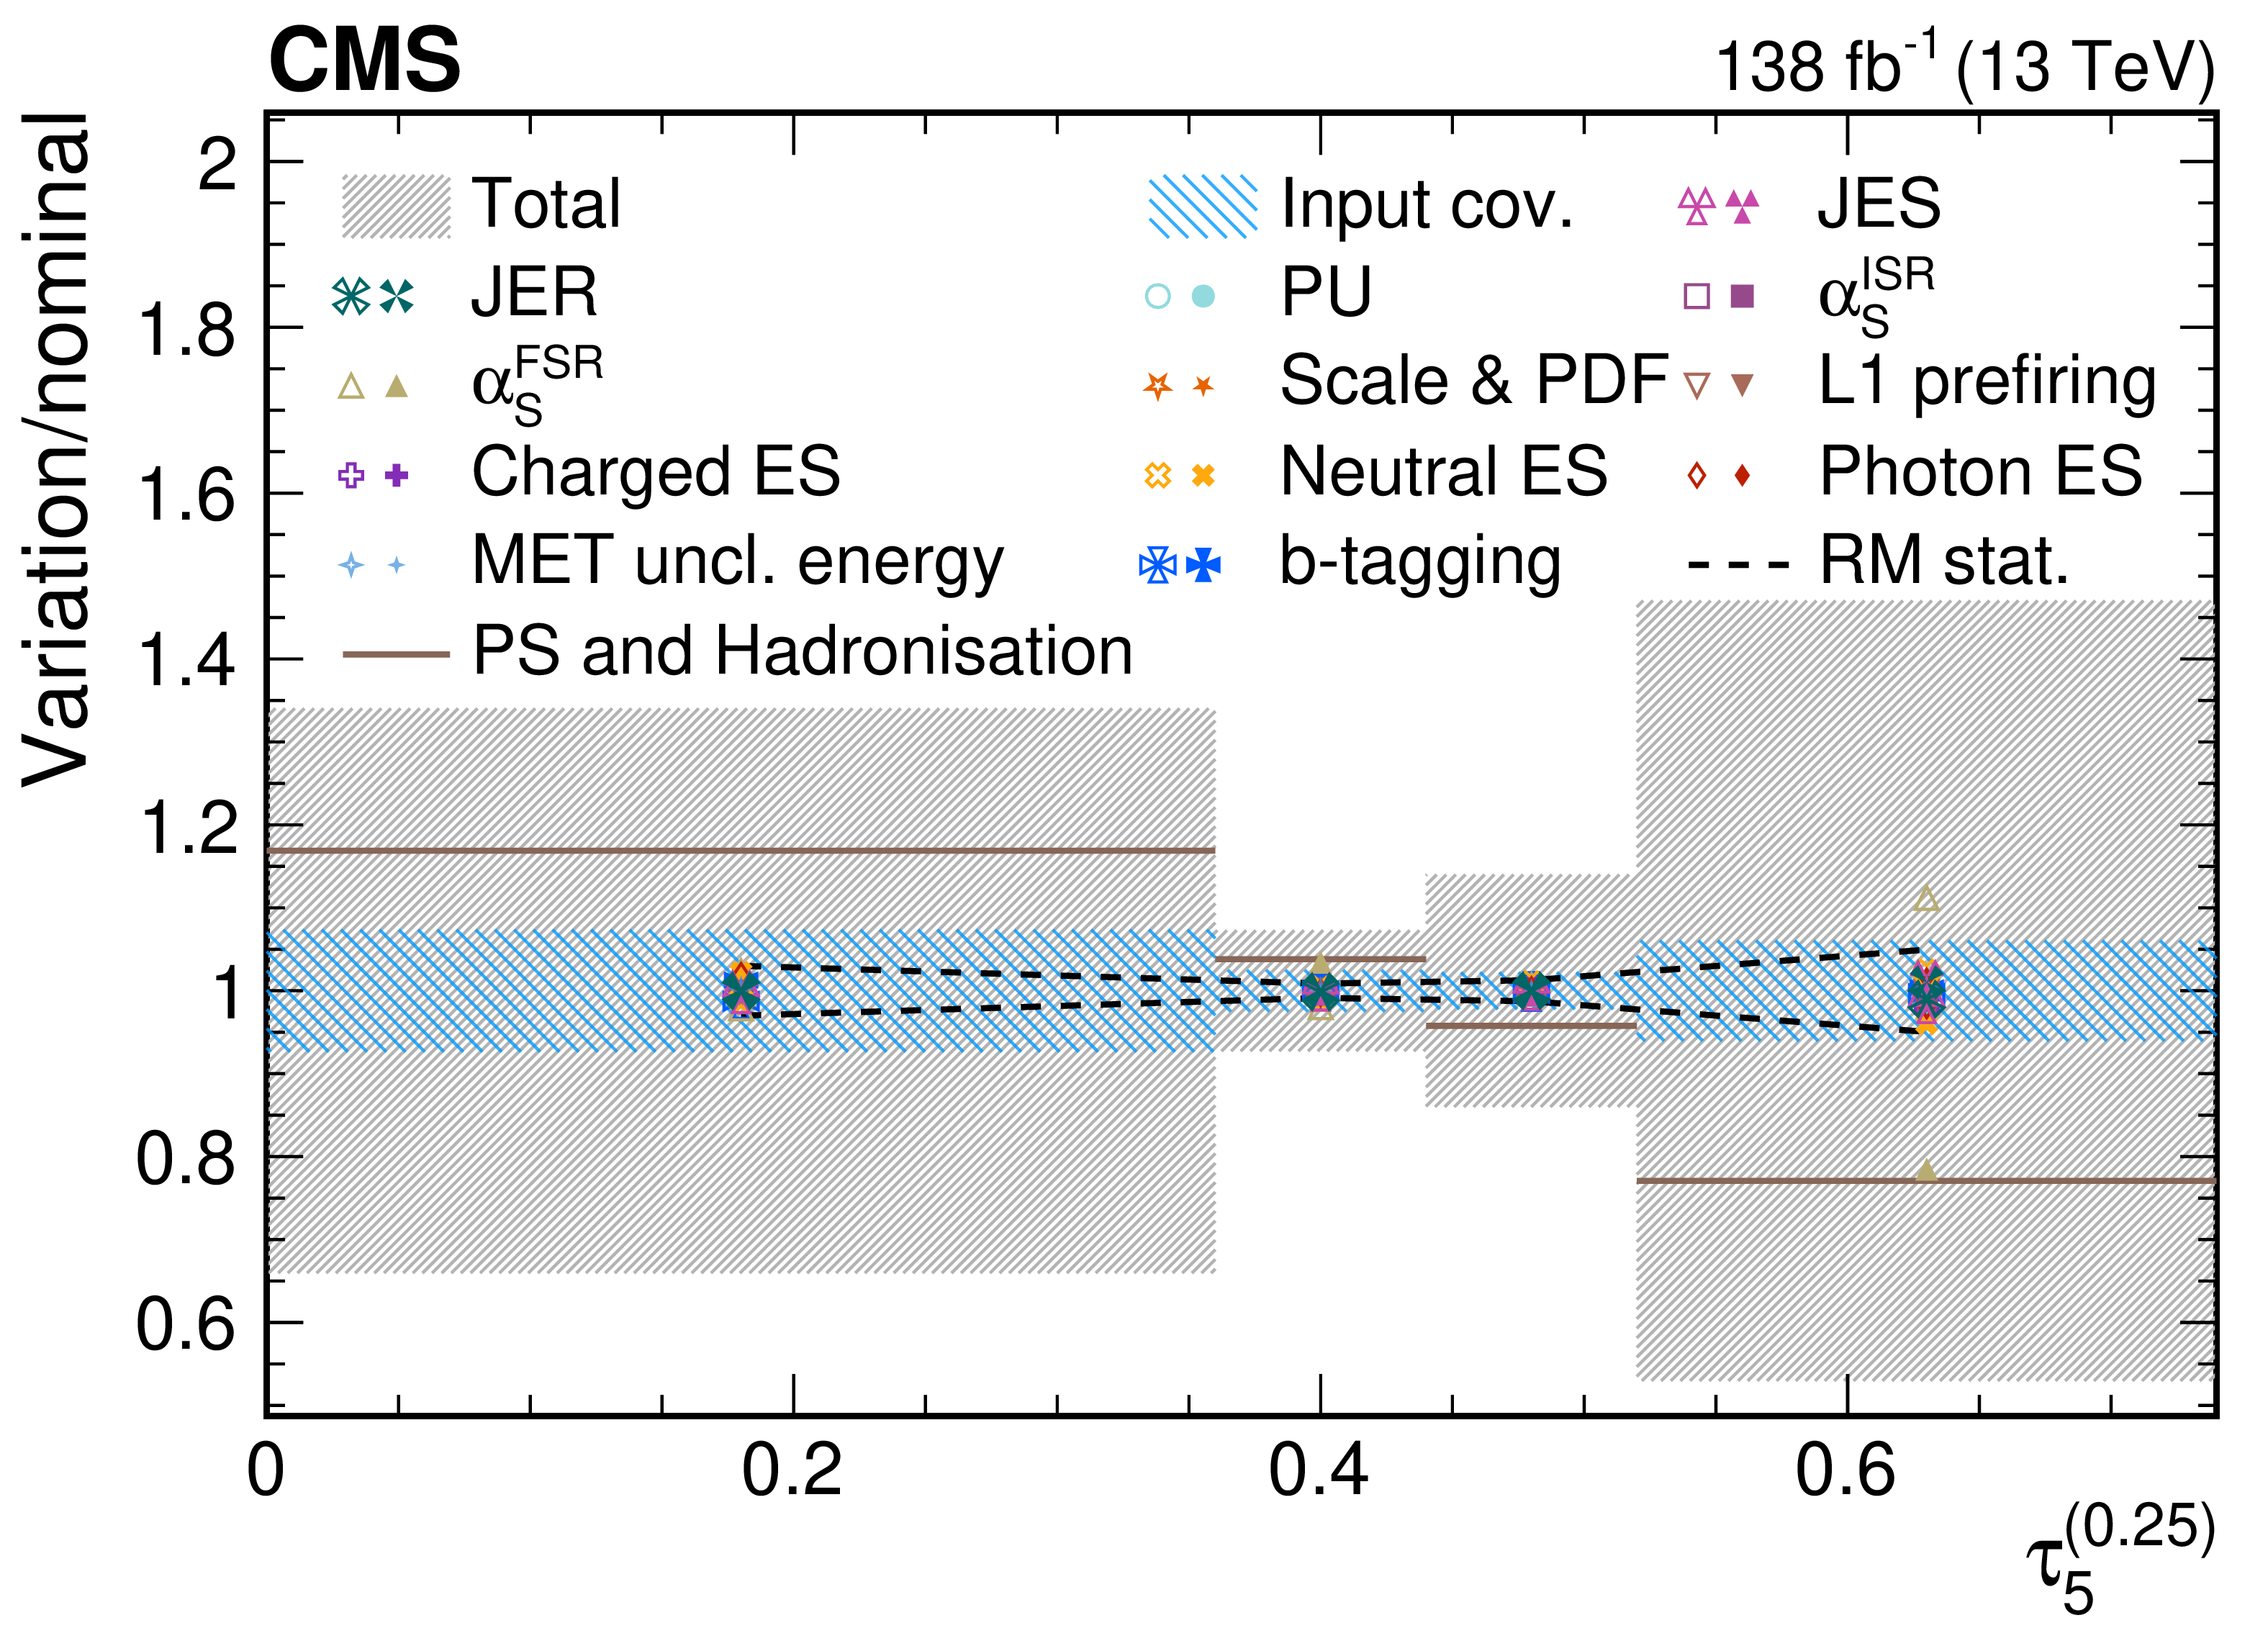
png pdf |
Figure 52-a:
Contributions from various systematic variations to the normalized, unfolded distribution for $ \tau_5^{(\beta)} $ observables measured for AK8 jets passing the boosted W boson-enriched selection in $ \mu $+jets $ \mathrm{t} \overline{\mathrm{t}} $ events. The total unfolding uncertainty is indicated with the dark grey, hashed region, while the blue hashed region indicates the contributions from the input covariance matrix, which includes the propagated effects of the statistical uncertainties of the input data after background subtraction. Contributions from statistical uncertainties of the simulated sample used to construct the nominal response matrix are indicated with the dashed black line. The physics model uncertainty is computed as a one-sided shift compared to the nominal unfolding, and up (down) contributions from other sources are indicated with filled (open) markers of the same type and colour. |
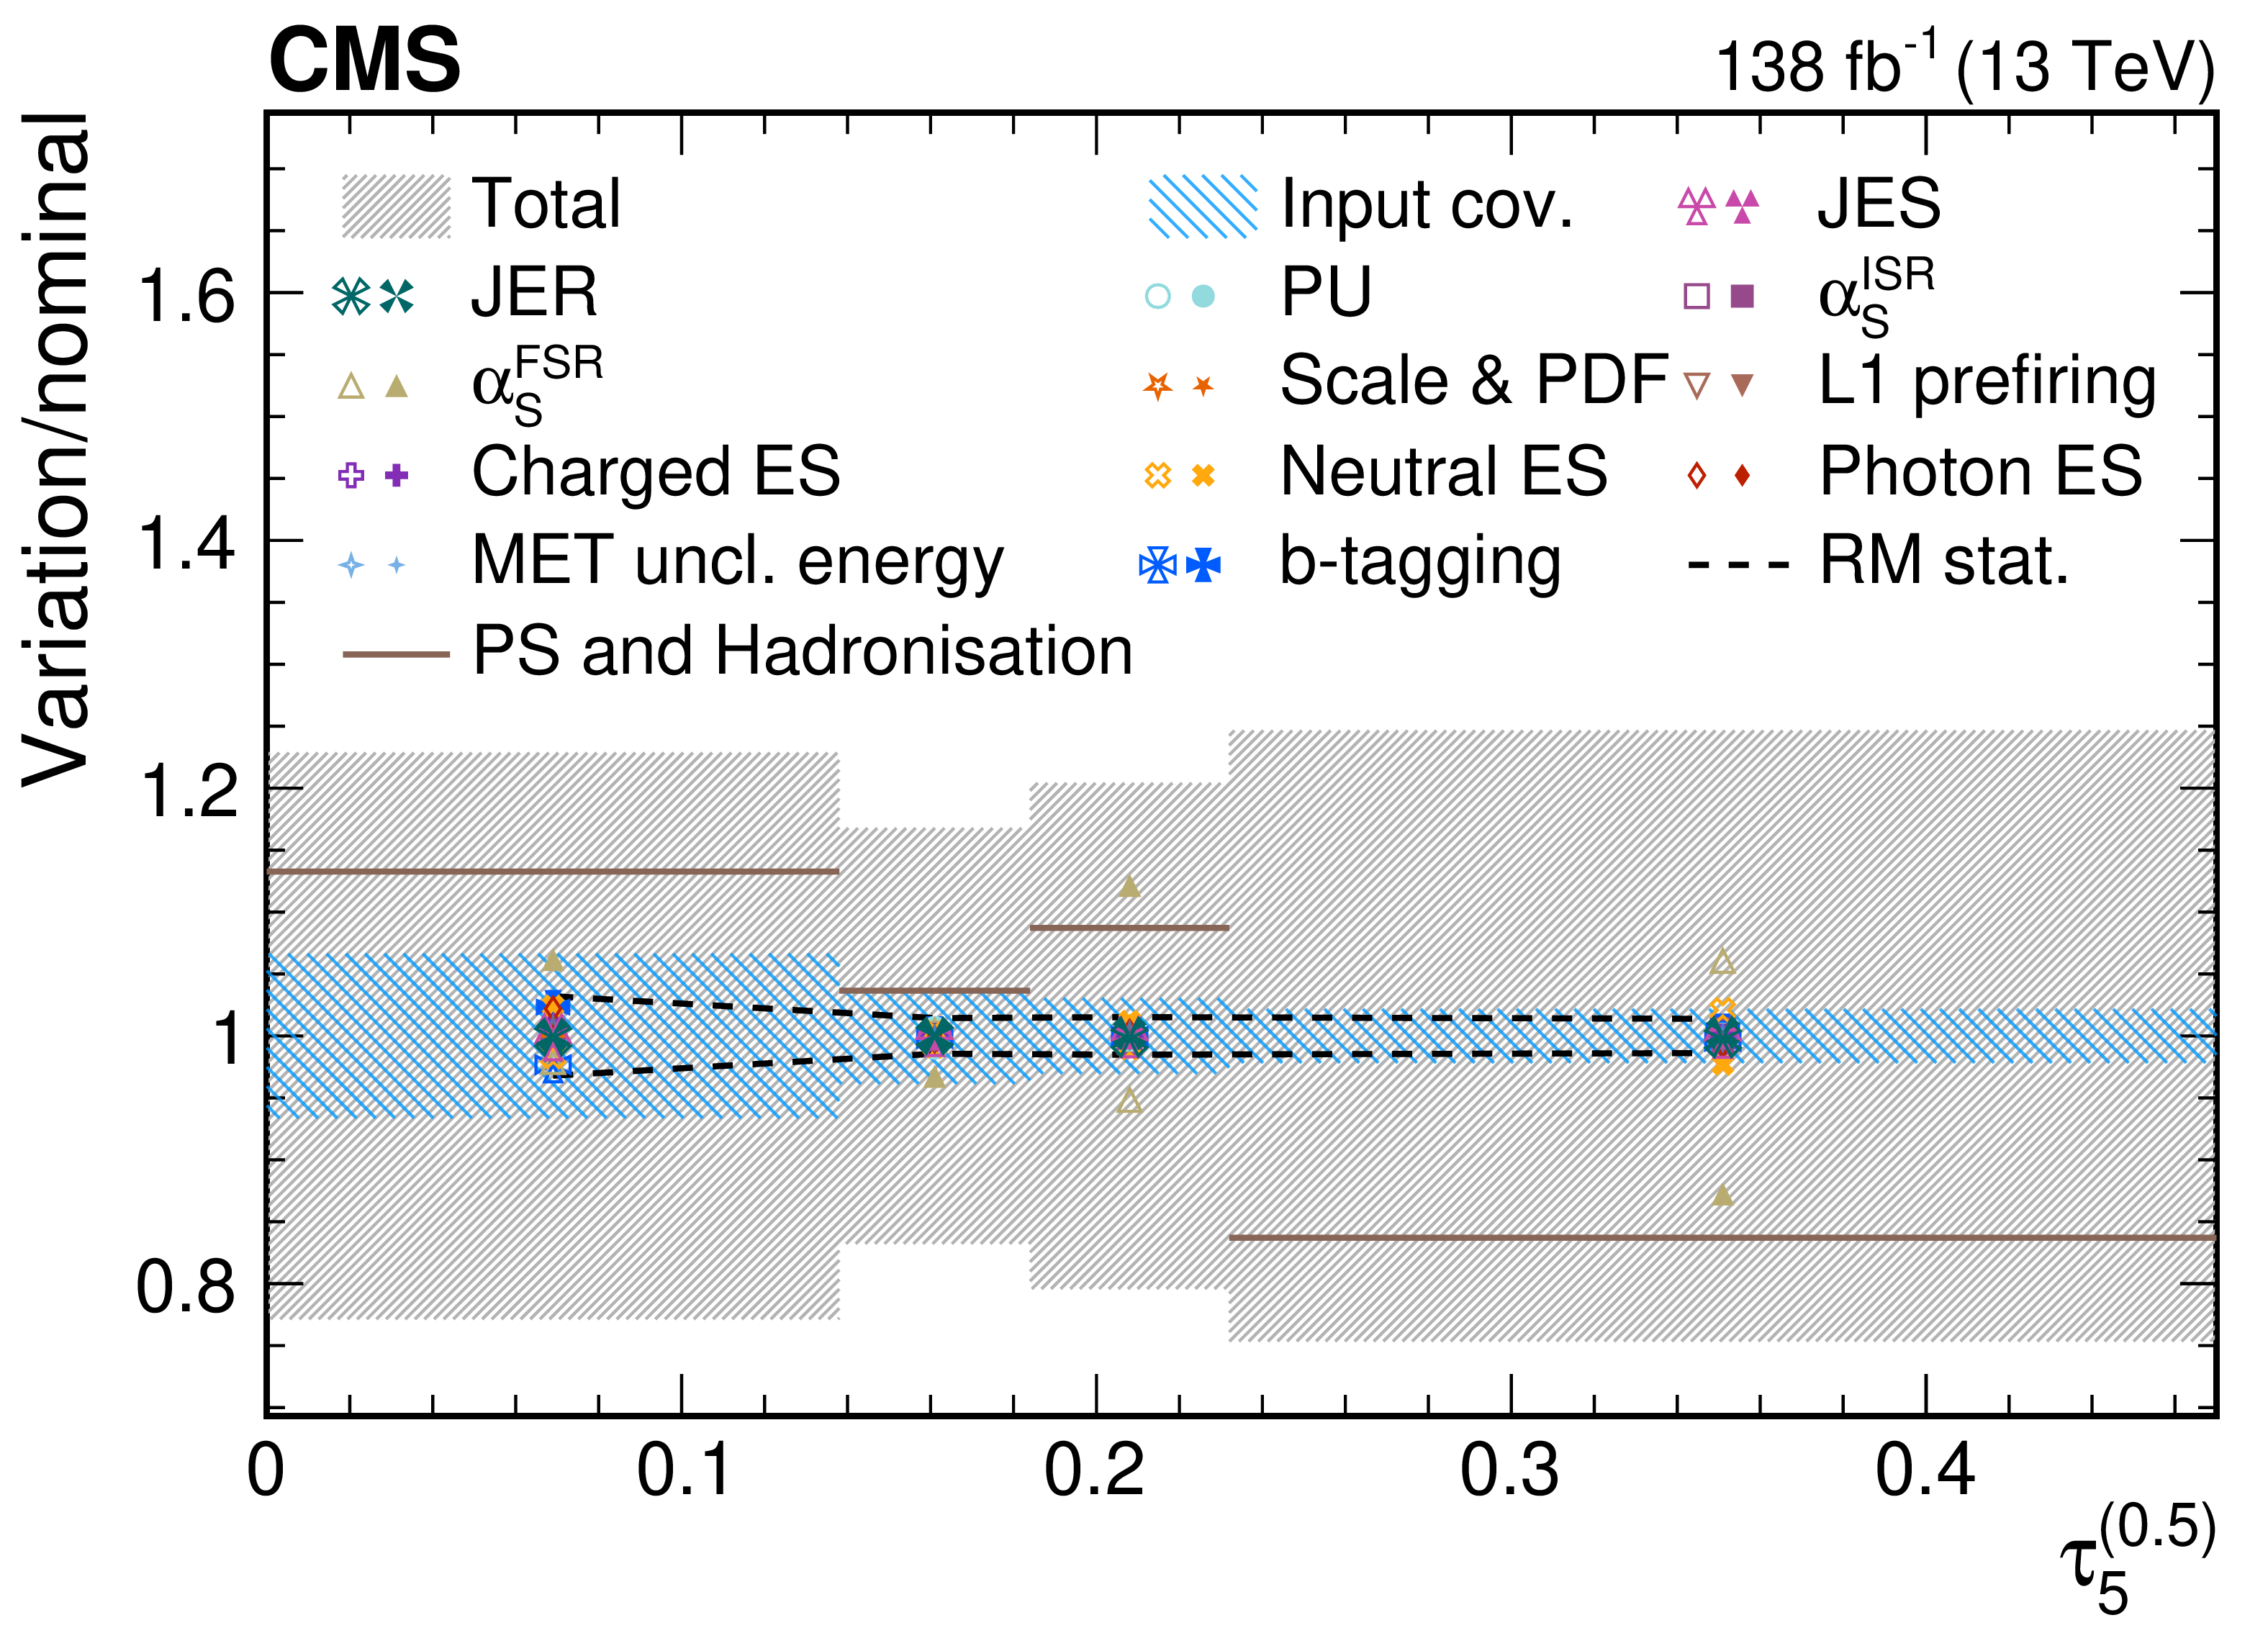
png pdf |
Figure 52-b:
Contributions from various systematic variations to the normalized, unfolded distribution for $ \tau_5^{(\beta)} $ observables measured for AK8 jets passing the boosted W boson-enriched selection in $ \mu $+jets $ \mathrm{t} \overline{\mathrm{t}} $ events. The total unfolding uncertainty is indicated with the dark grey, hashed region, while the blue hashed region indicates the contributions from the input covariance matrix, which includes the propagated effects of the statistical uncertainties of the input data after background subtraction. Contributions from statistical uncertainties of the simulated sample used to construct the nominal response matrix are indicated with the dashed black line. The physics model uncertainty is computed as a one-sided shift compared to the nominal unfolding, and up (down) contributions from other sources are indicated with filled (open) markers of the same type and colour. |
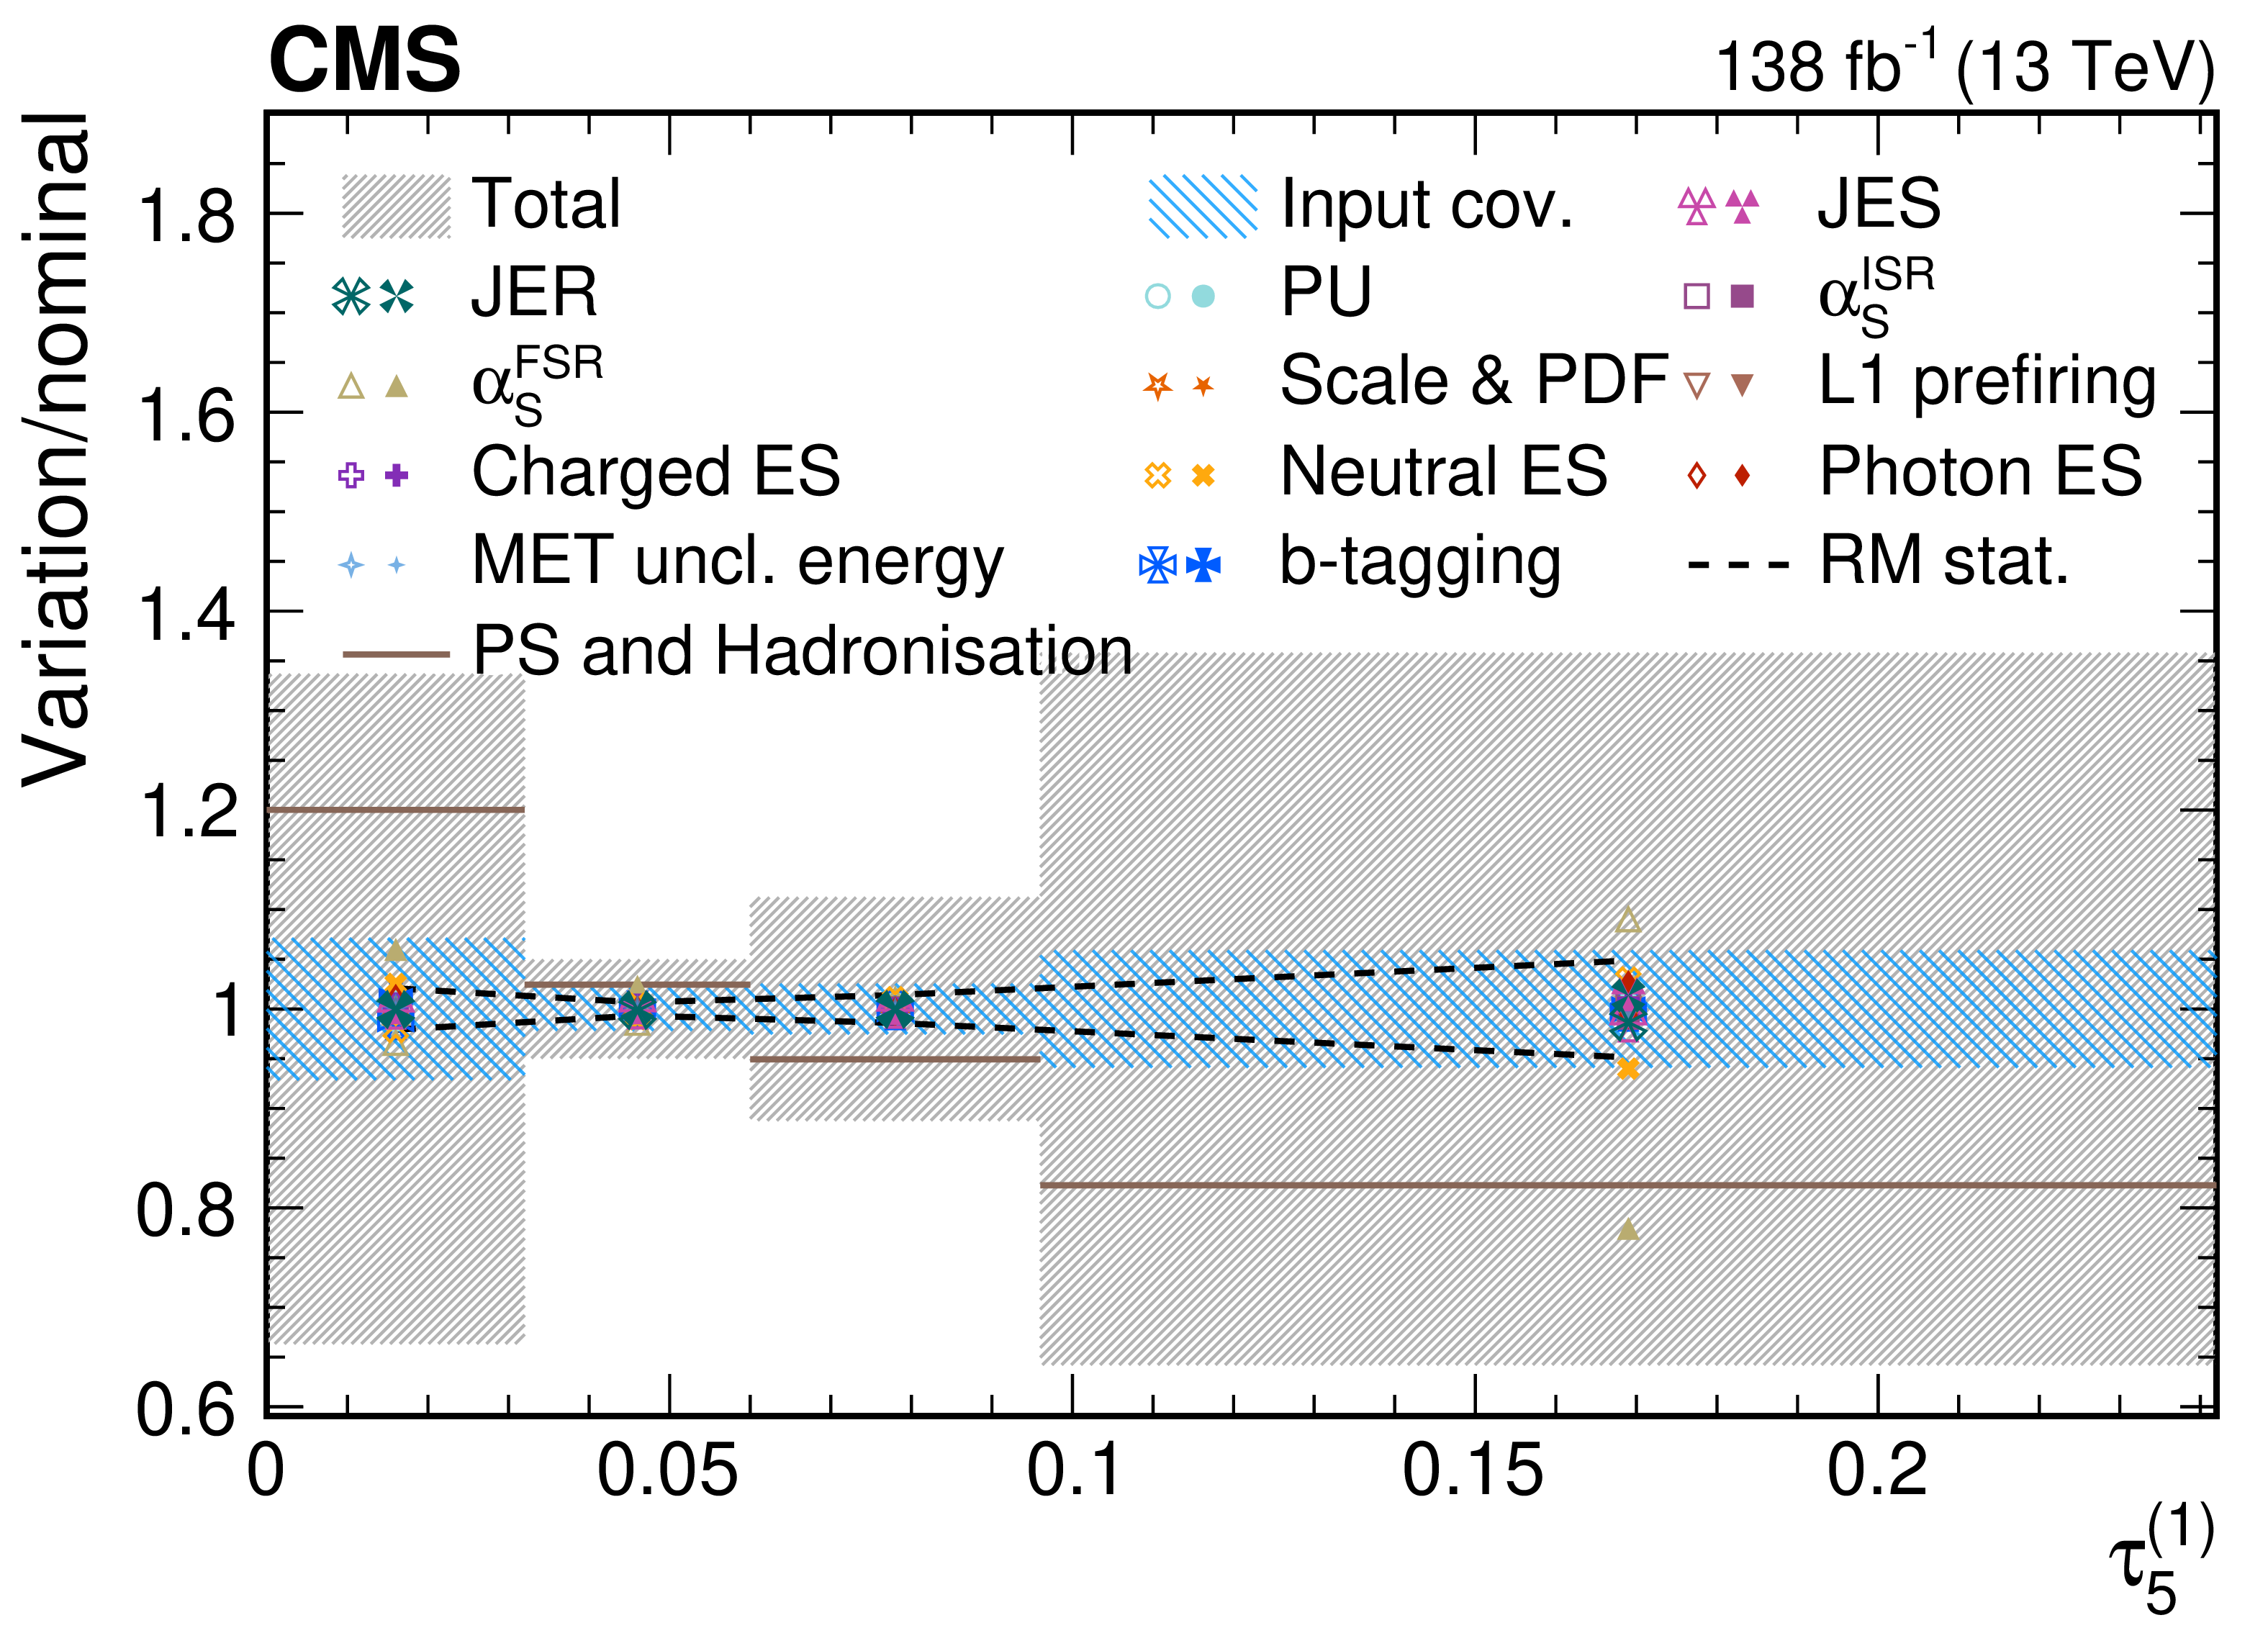
png pdf |
Figure 52-c:
Contributions from various systematic variations to the normalized, unfolded distribution for $ \tau_5^{(\beta)} $ observables measured for AK8 jets passing the boosted W boson-enriched selection in $ \mu $+jets $ \mathrm{t} \overline{\mathrm{t}} $ events. The total unfolding uncertainty is indicated with the dark grey, hashed region, while the blue hashed region indicates the contributions from the input covariance matrix, which includes the propagated effects of the statistical uncertainties of the input data after background subtraction. Contributions from statistical uncertainties of the simulated sample used to construct the nominal response matrix are indicated with the dashed black line. The physics model uncertainty is computed as a one-sided shift compared to the nominal unfolding, and up (down) contributions from other sources are indicated with filled (open) markers of the same type and colour. |
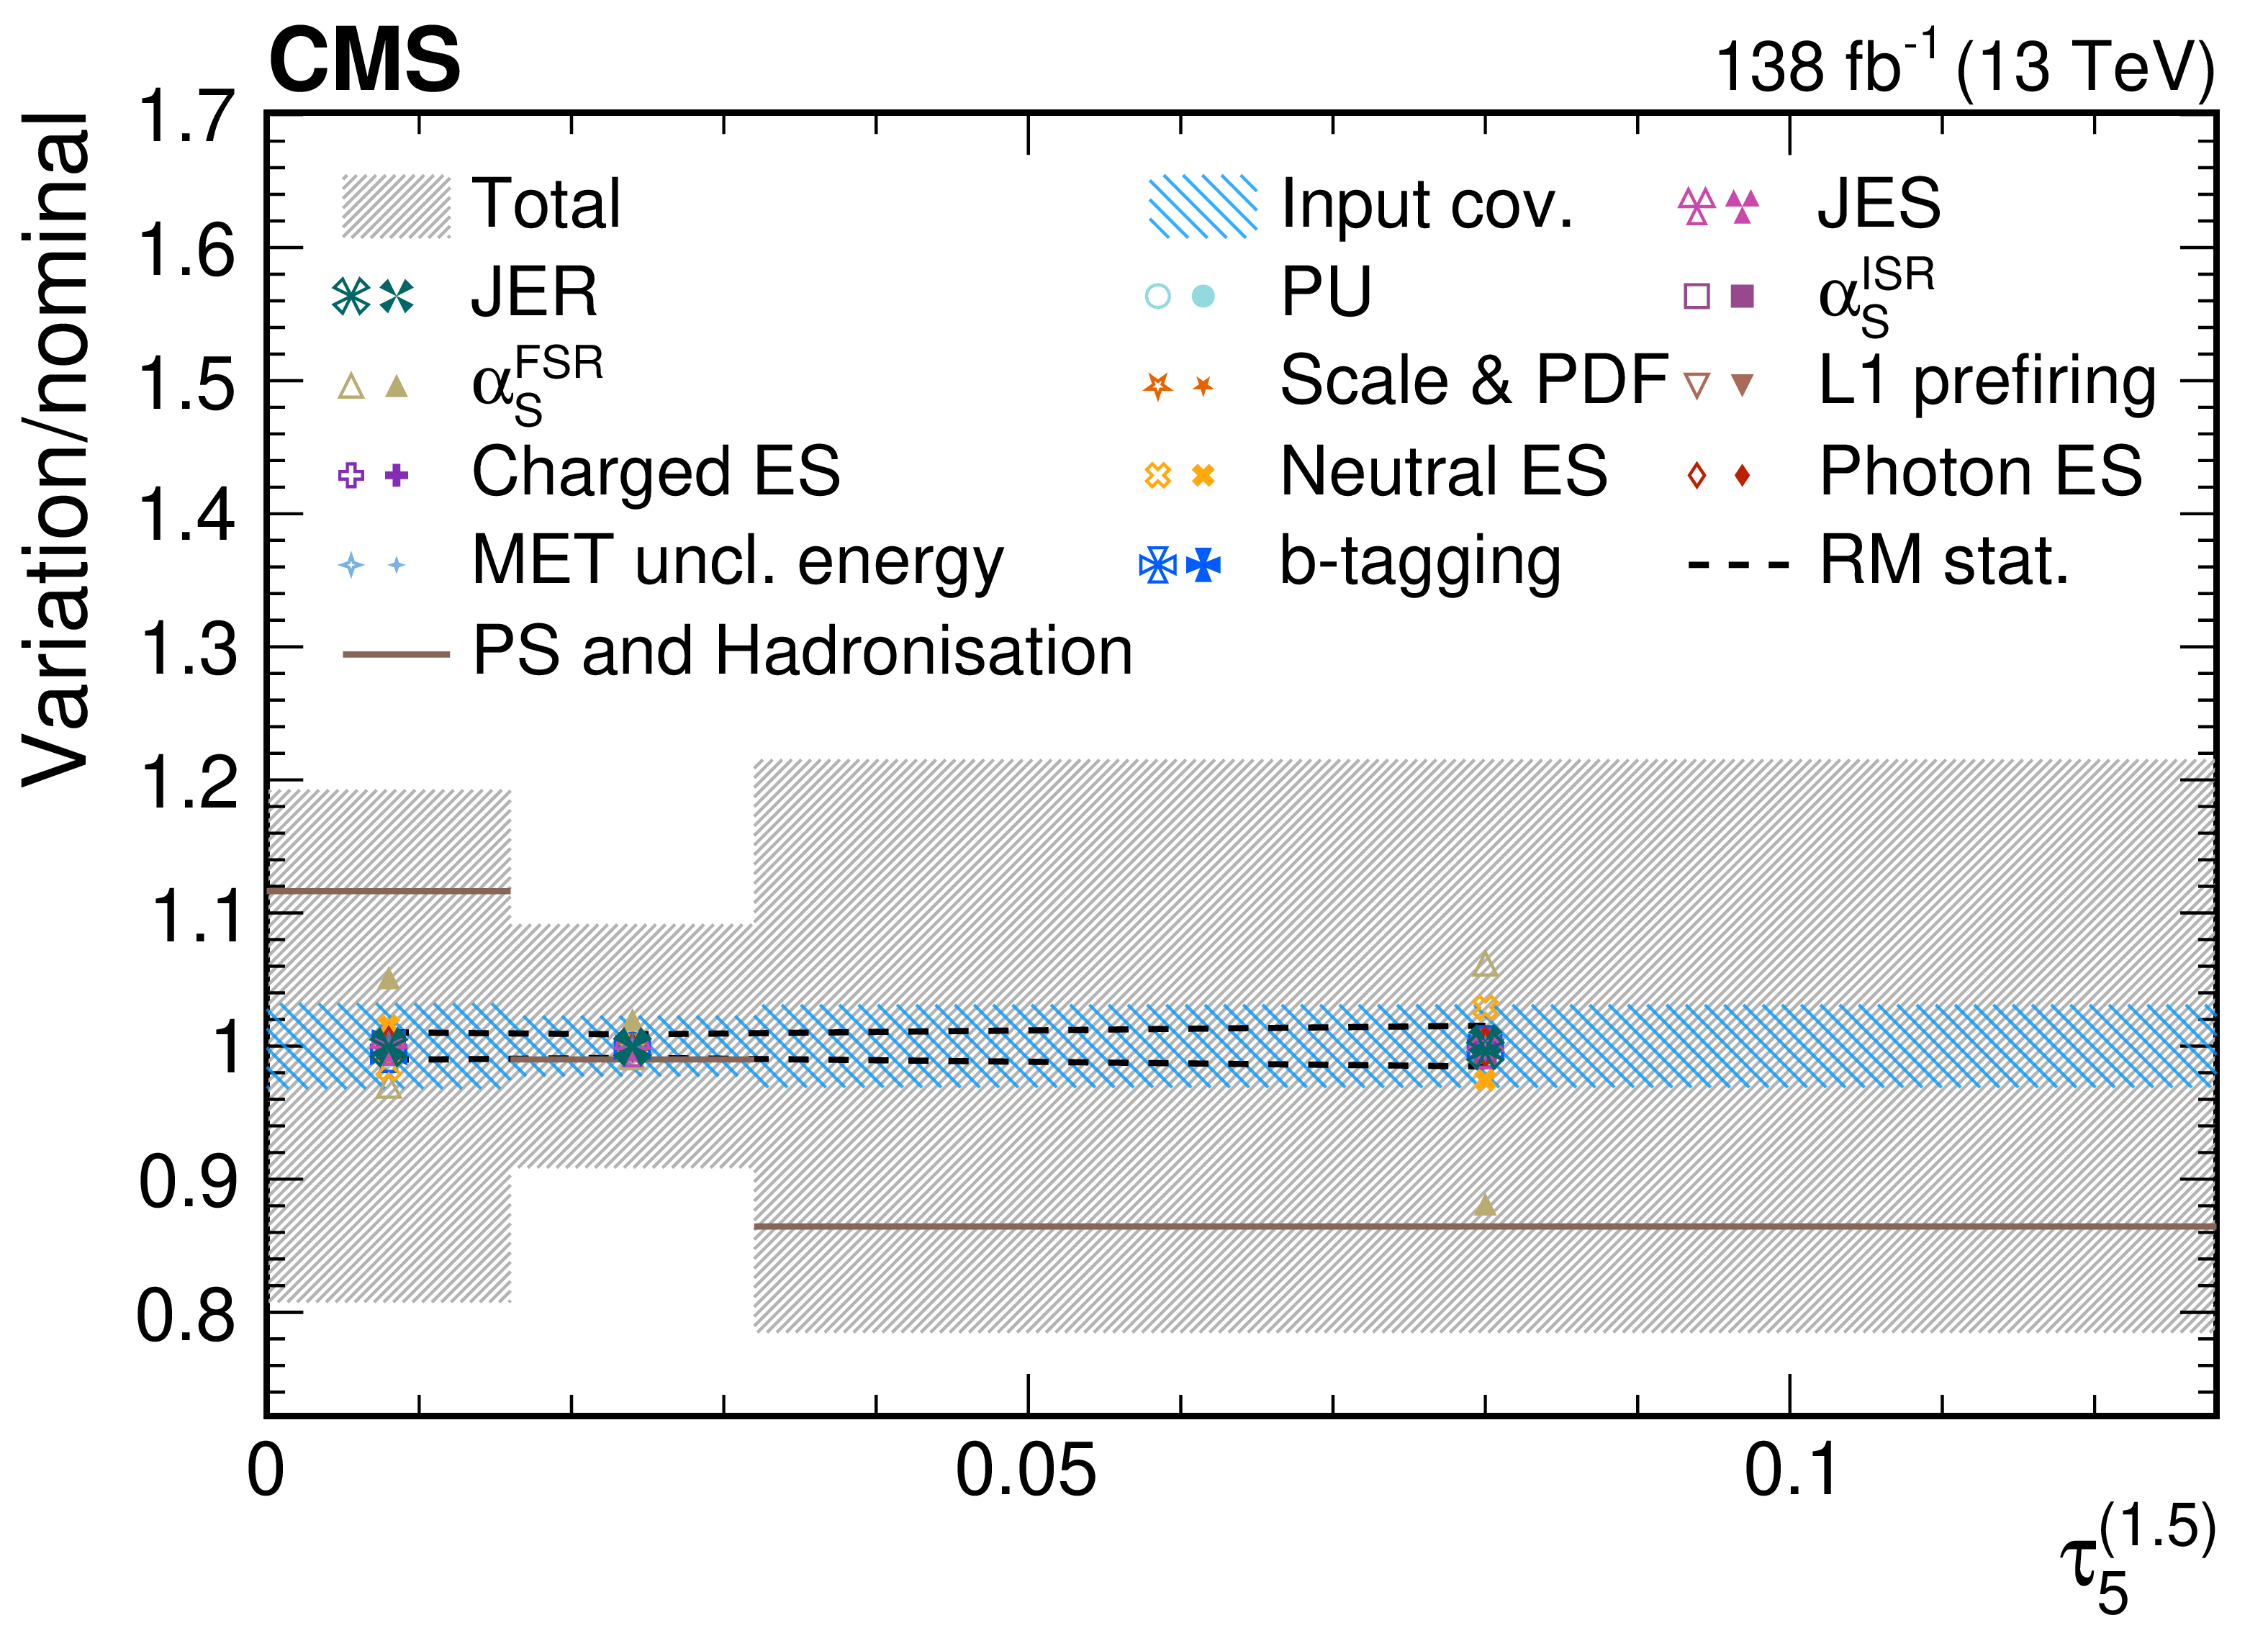
png pdf |
Figure 52-d:
Contributions from various systematic variations to the normalized, unfolded distribution for $ \tau_5^{(\beta)} $ observables measured for AK8 jets passing the boosted W boson-enriched selection in $ \mu $+jets $ \mathrm{t} \overline{\mathrm{t}} $ events. The total unfolding uncertainty is indicated with the dark grey, hashed region, while the blue hashed region indicates the contributions from the input covariance matrix, which includes the propagated effects of the statistical uncertainties of the input data after background subtraction. Contributions from statistical uncertainties of the simulated sample used to construct the nominal response matrix are indicated with the dashed black line. The physics model uncertainty is computed as a one-sided shift compared to the nominal unfolding, and up (down) contributions from other sources are indicated with filled (open) markers of the same type and colour. |
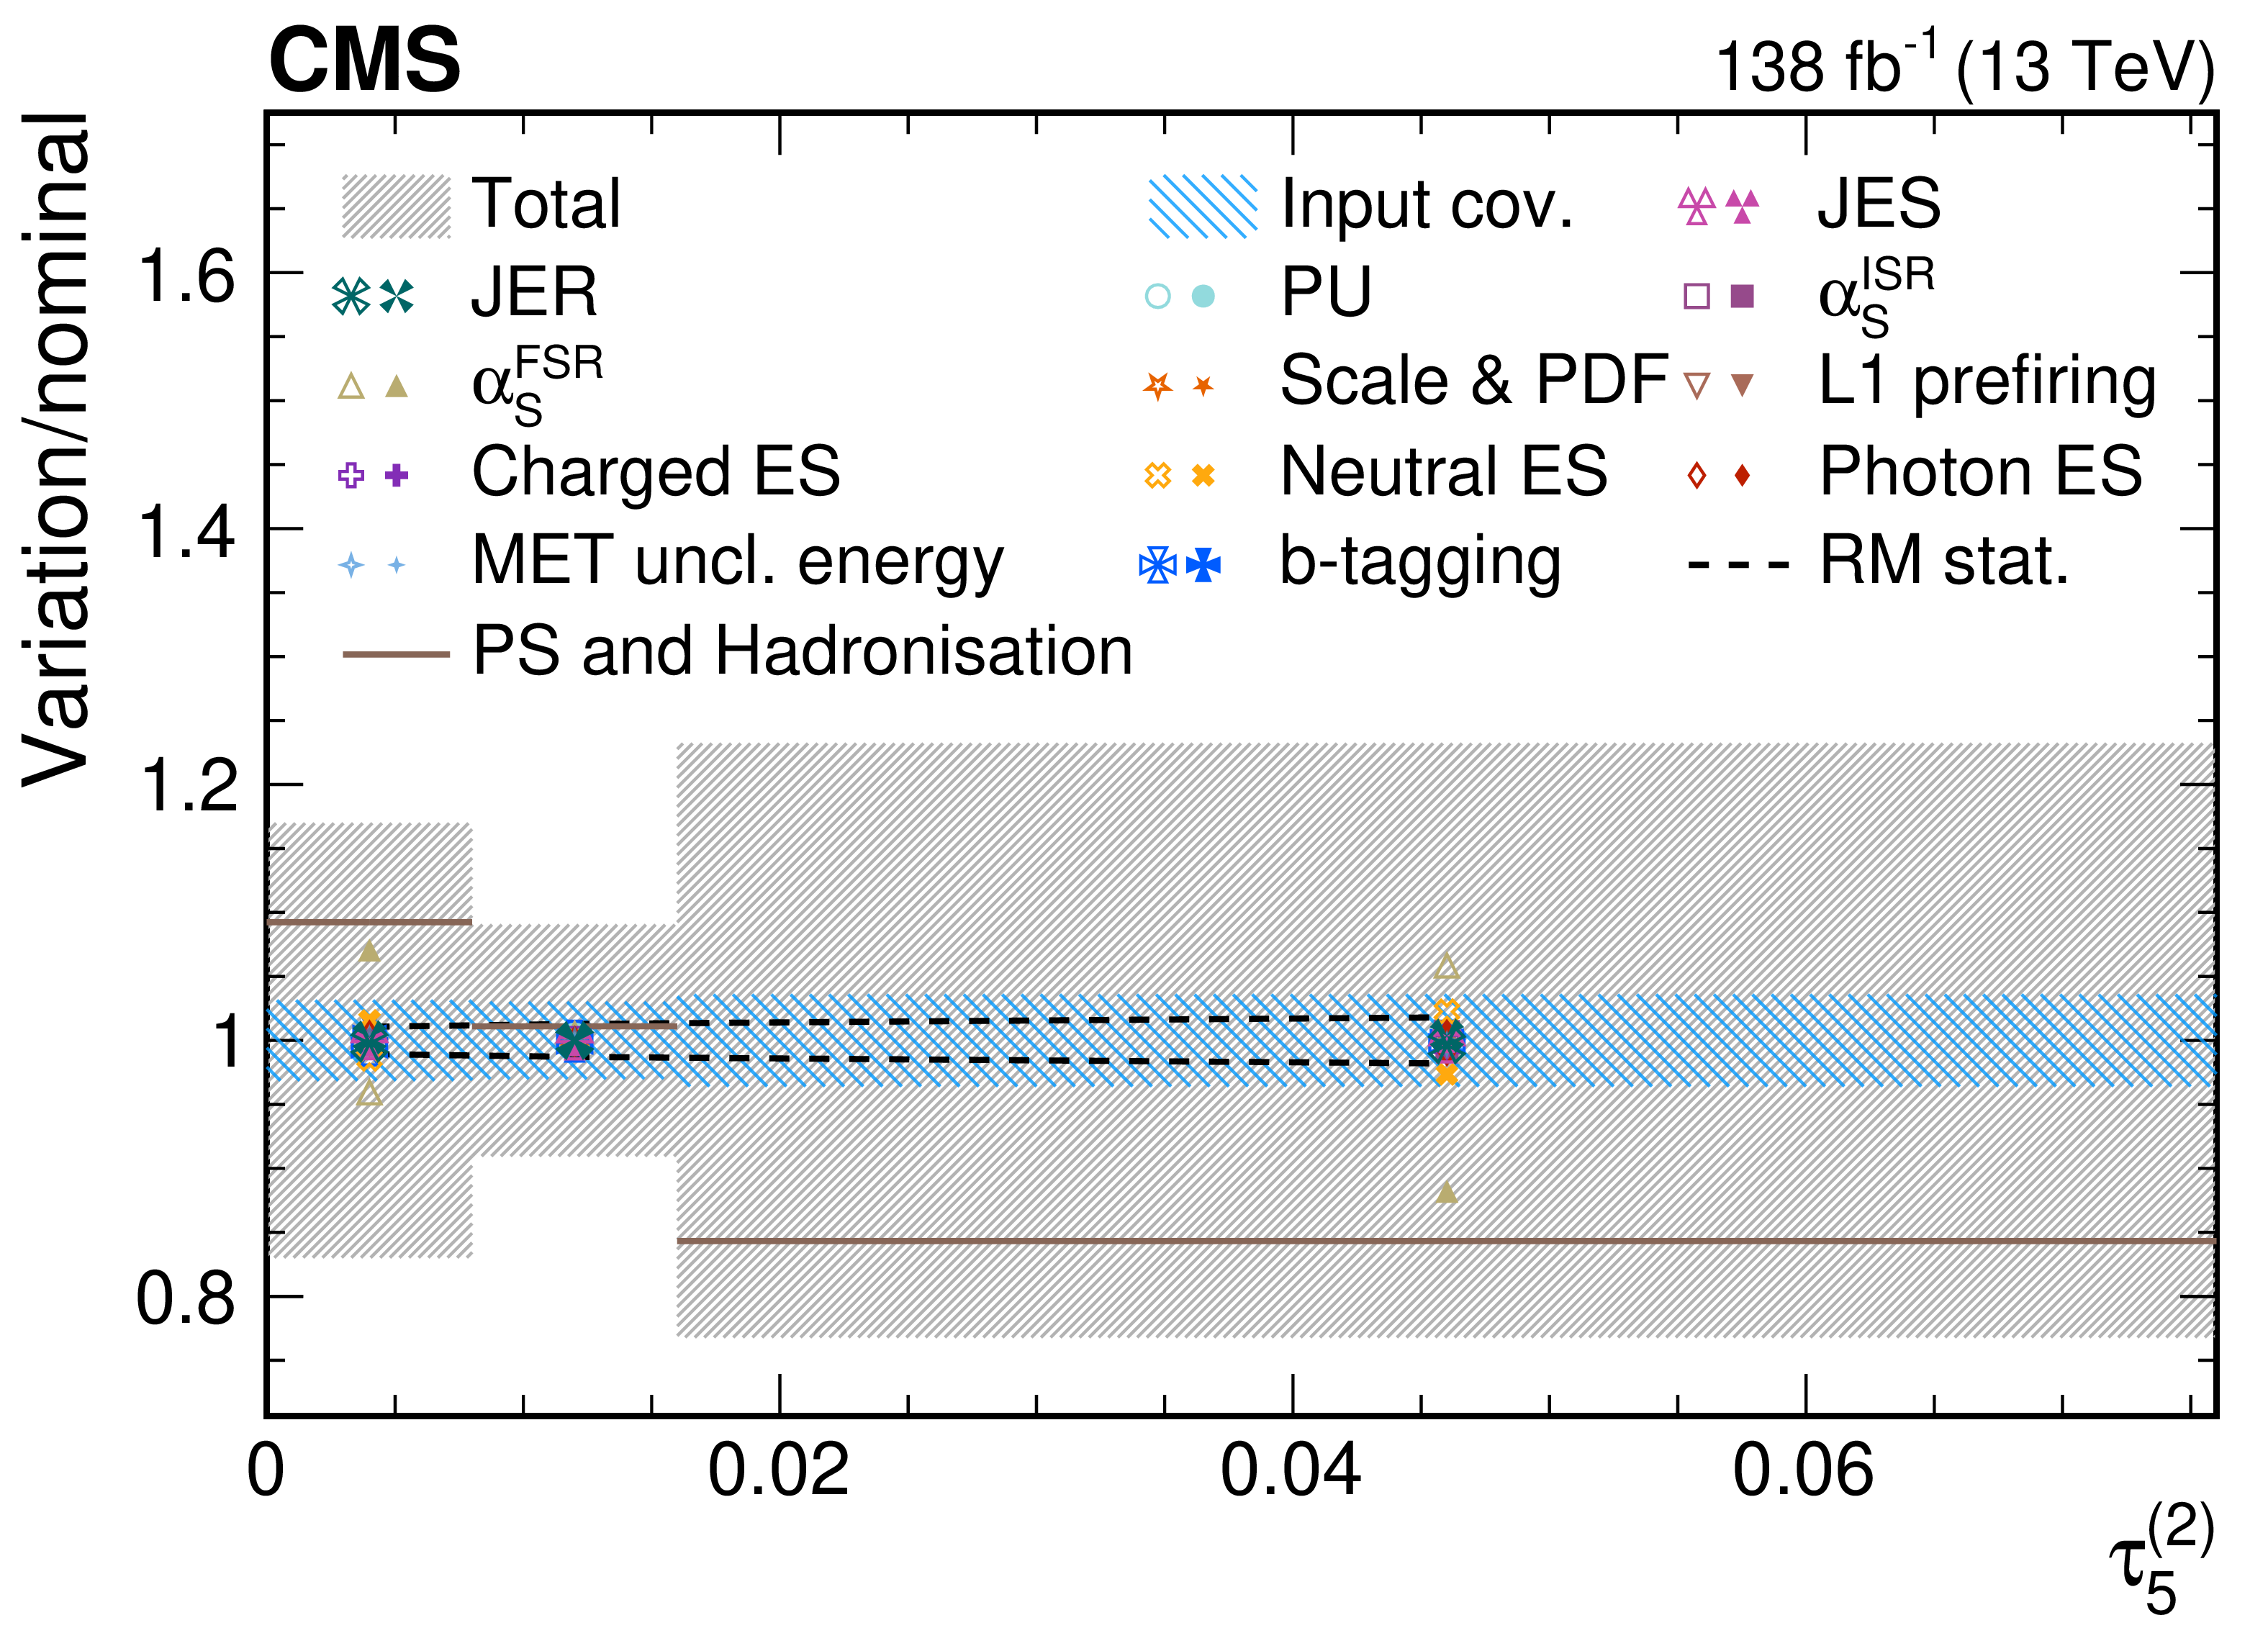
png pdf |
Figure 52-e:
Contributions from various systematic variations to the normalized, unfolded distribution for $ \tau_5^{(\beta)} $ observables measured for AK8 jets passing the boosted W boson-enriched selection in $ \mu $+jets $ \mathrm{t} \overline{\mathrm{t}} $ events. The total unfolding uncertainty is indicated with the dark grey, hashed region, while the blue hashed region indicates the contributions from the input covariance matrix, which includes the propagated effects of the statistical uncertainties of the input data after background subtraction. Contributions from statistical uncertainties of the simulated sample used to construct the nominal response matrix are indicated with the dashed black line. The physics model uncertainty is computed as a one-sided shift compared to the nominal unfolding, and up (down) contributions from other sources are indicated with filled (open) markers of the same type and colour. |
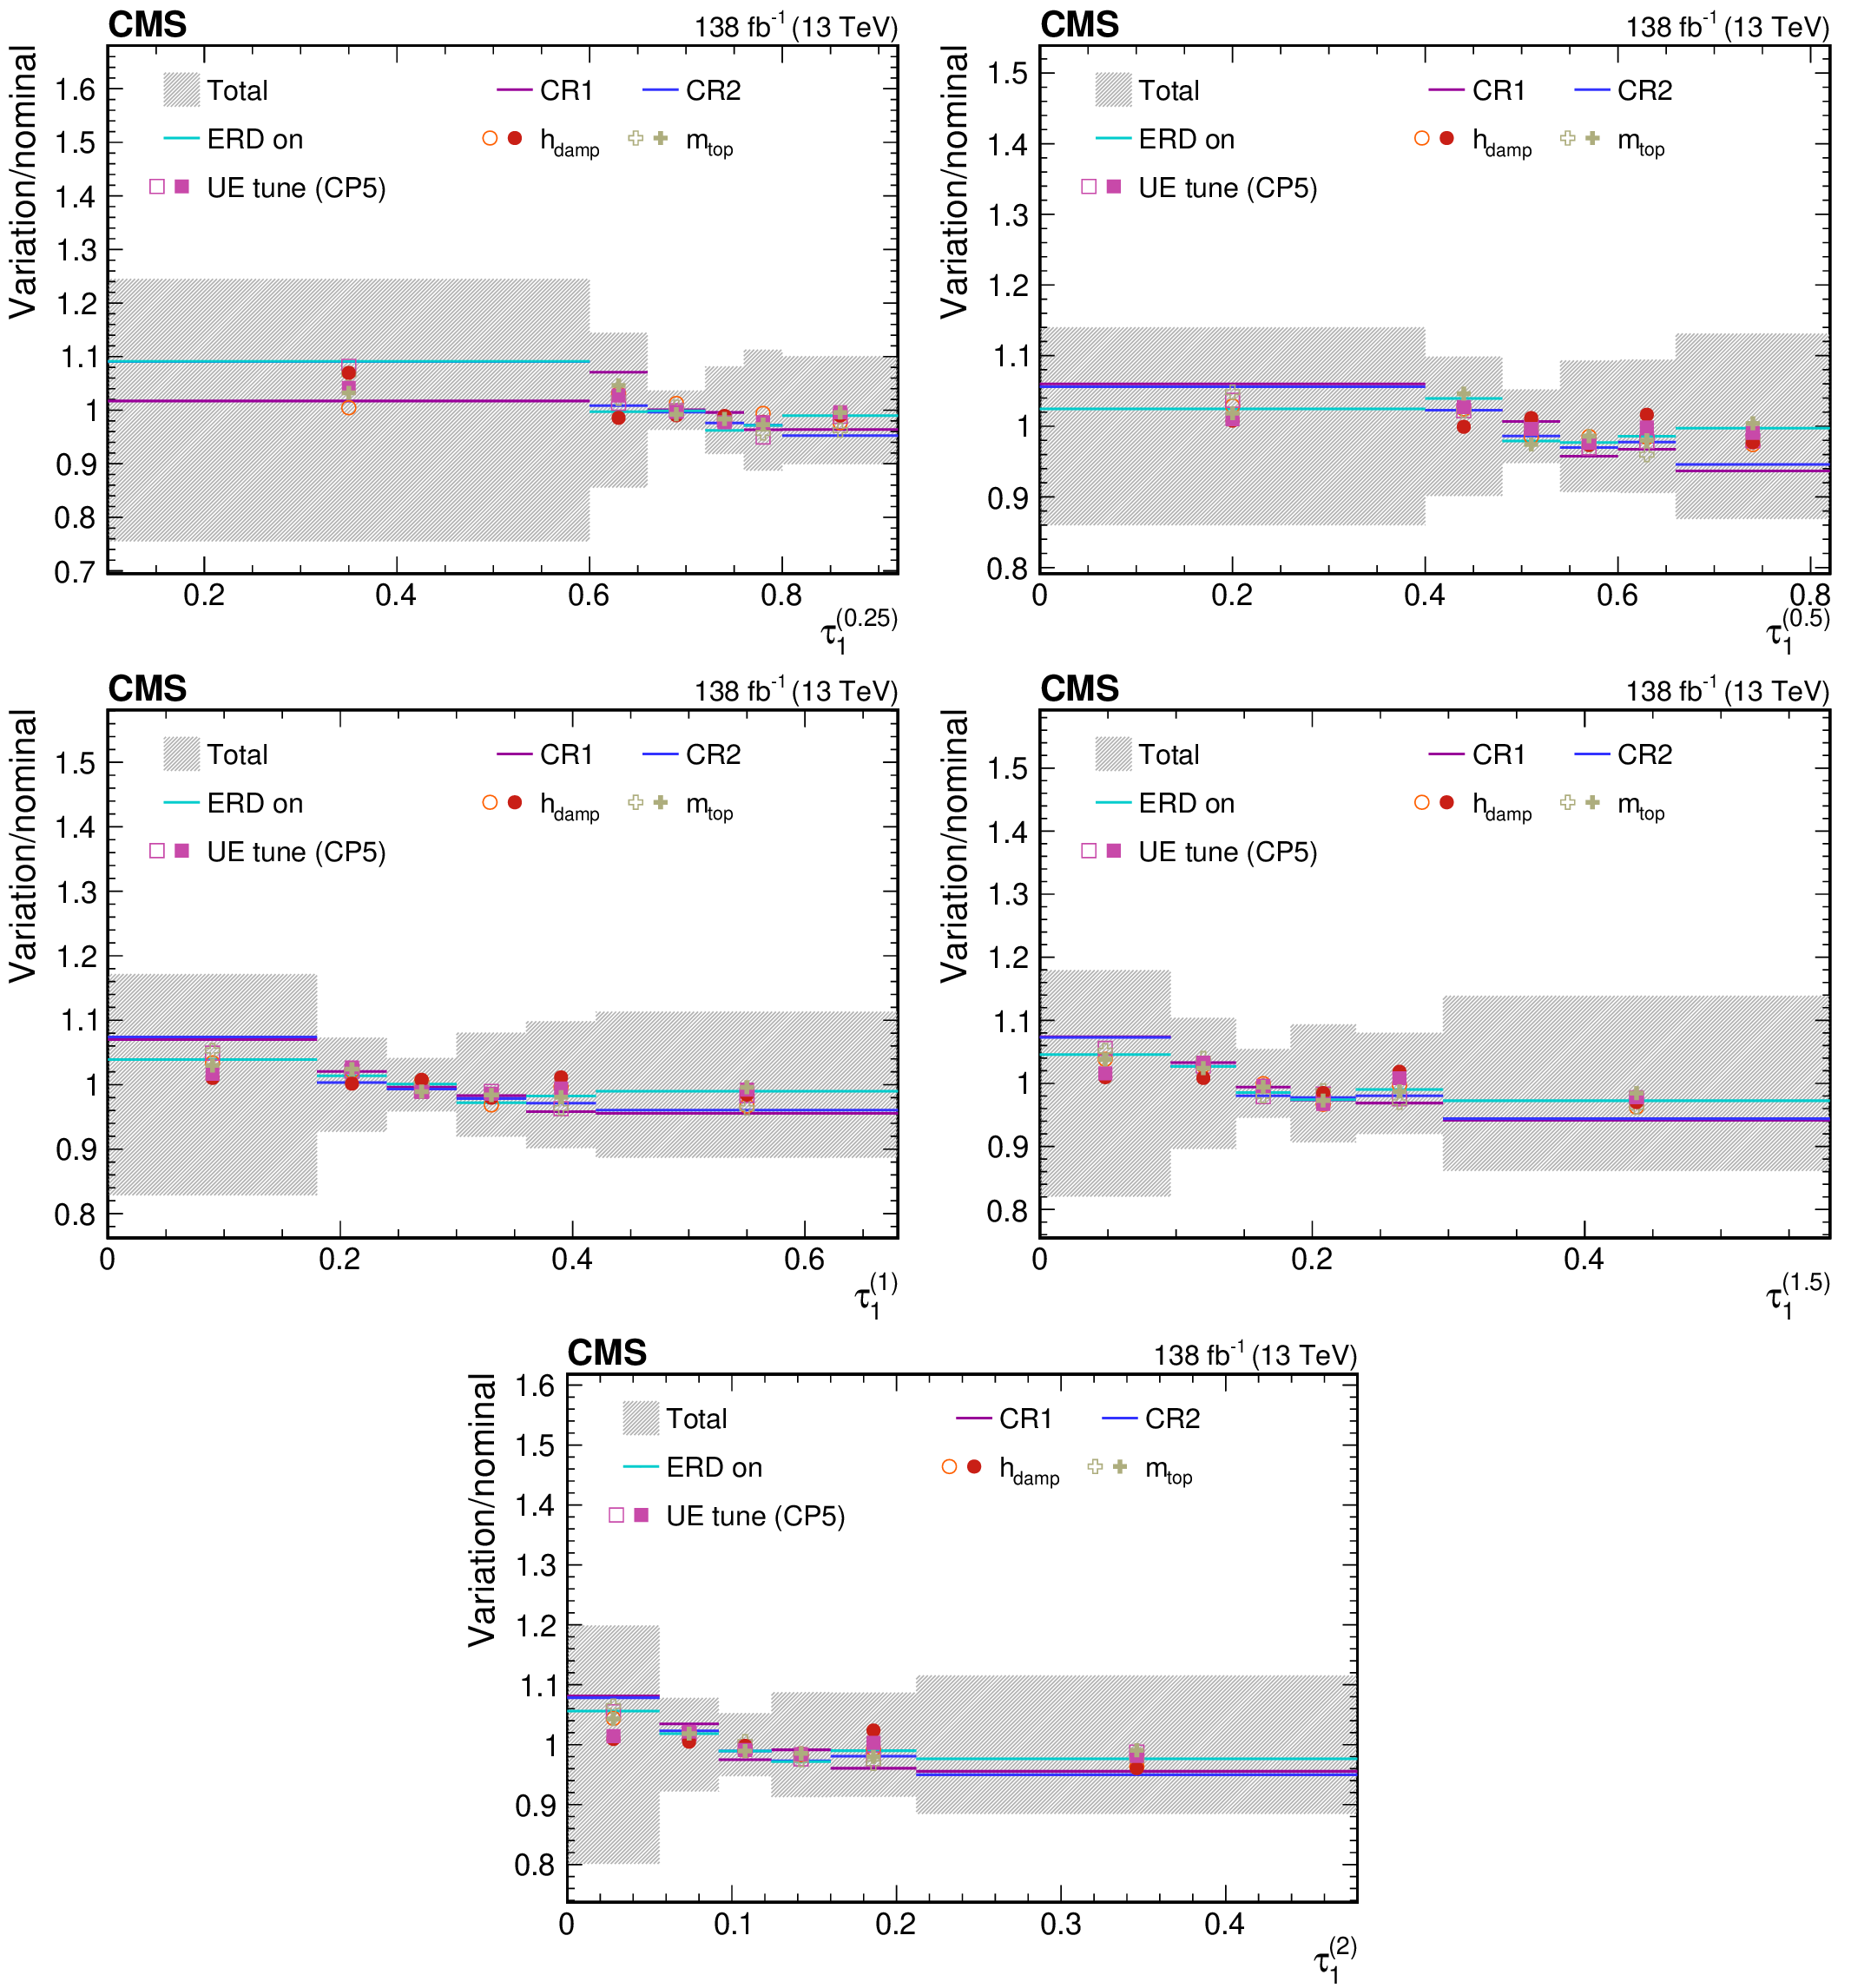
png pdf |
Figure 53:
Contributions from various theory model systematic variations to the normalized, unfolded distribution for $ \tau_1^{(\beta)} $ observables measured for AK8 jets passing the boosted W boson-enriched selection in $ \mu $+jets $ \mathrm{t} \overline{\mathrm{t}} $ events. The total unfolding uncertainty is indicated with the dark grey, hashed region, while the blue hashed region indicates the contributions from the input covariance matrix, which includes the propagated effects of the statistical uncertainties of the input data after background subtraction. Contributions from statistical uncertainties of the simulated sample used to construct the nominal response matrix are indicated with the dashed black line. The uncertainty contributions for different choices of colour reconnection models are illustrated as one-sided shifts compared to the nominal unfolding, and up (down) contributions from other sources are indicated with filled (open) markers of the same type and colour. |
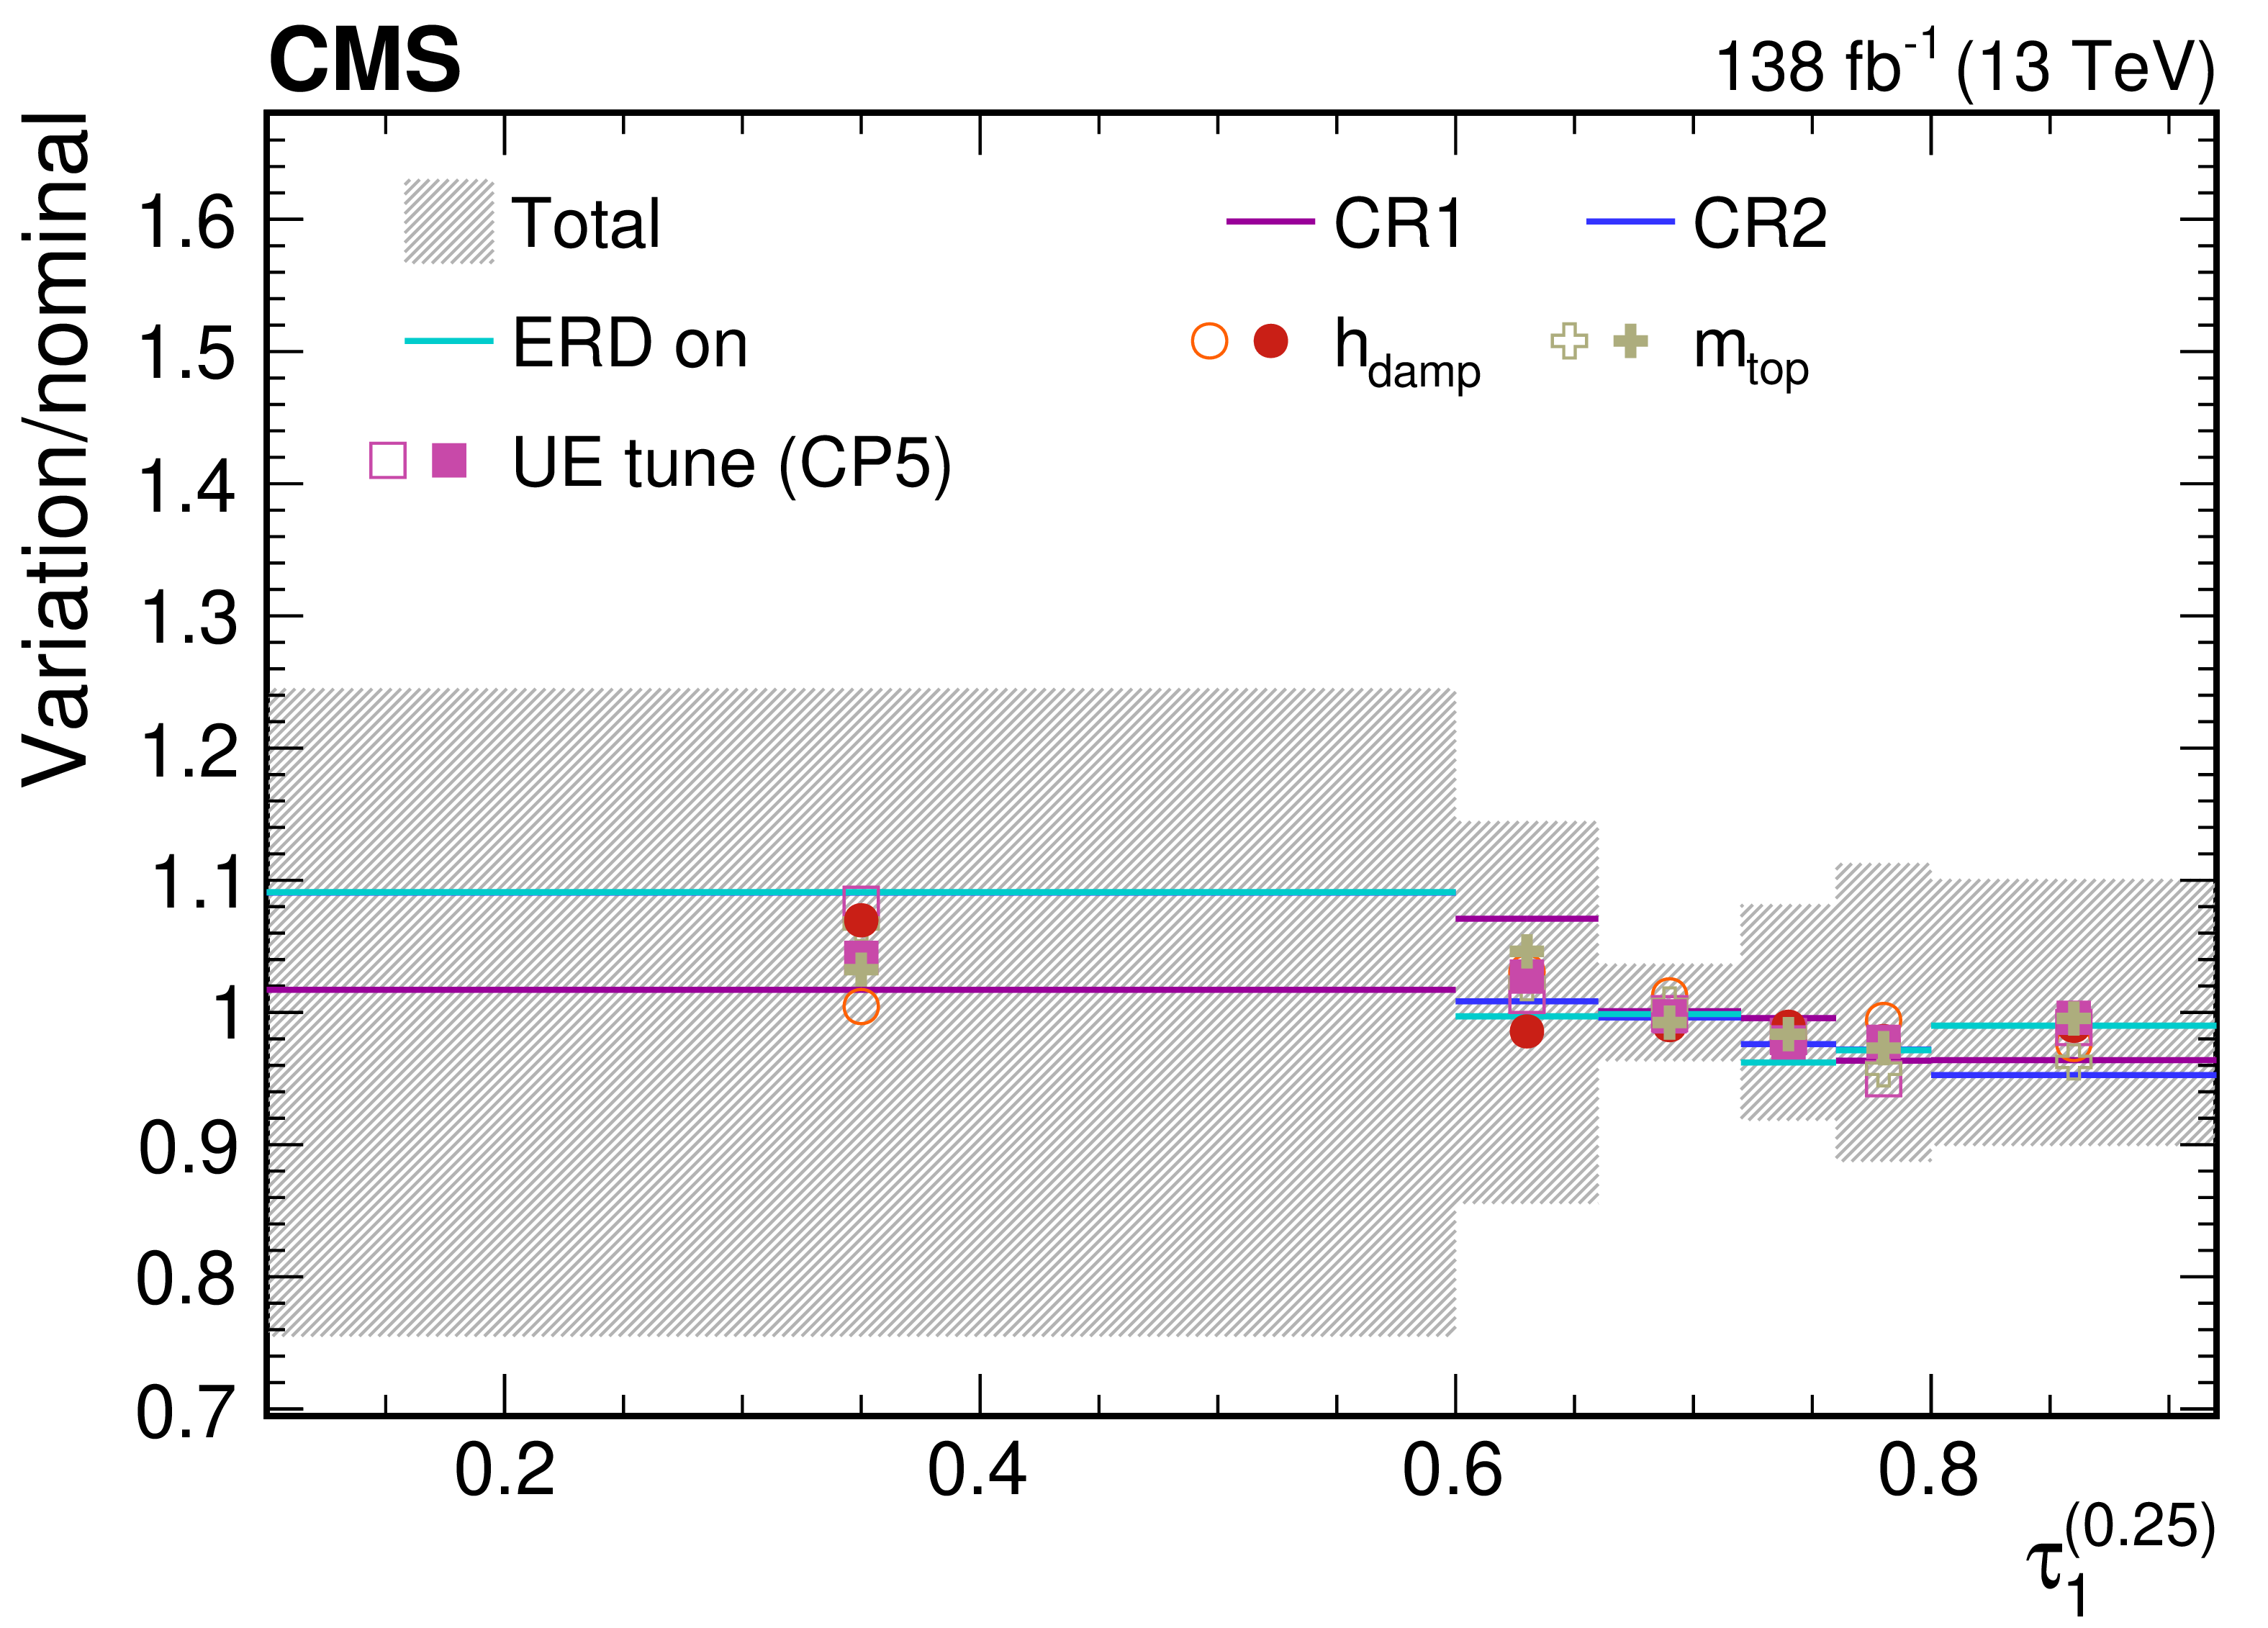
png pdf |
Figure 53-a:
Contributions from various theory model systematic variations to the normalized, unfolded distribution for $ \tau_1^{(\beta)} $ observables measured for AK8 jets passing the boosted W boson-enriched selection in $ \mu $+jets $ \mathrm{t} \overline{\mathrm{t}} $ events. The total unfolding uncertainty is indicated with the dark grey, hashed region, while the blue hashed region indicates the contributions from the input covariance matrix, which includes the propagated effects of the statistical uncertainties of the input data after background subtraction. Contributions from statistical uncertainties of the simulated sample used to construct the nominal response matrix are indicated with the dashed black line. The uncertainty contributions for different choices of colour reconnection models are illustrated as one-sided shifts compared to the nominal unfolding, and up (down) contributions from other sources are indicated with filled (open) markers of the same type and colour. |
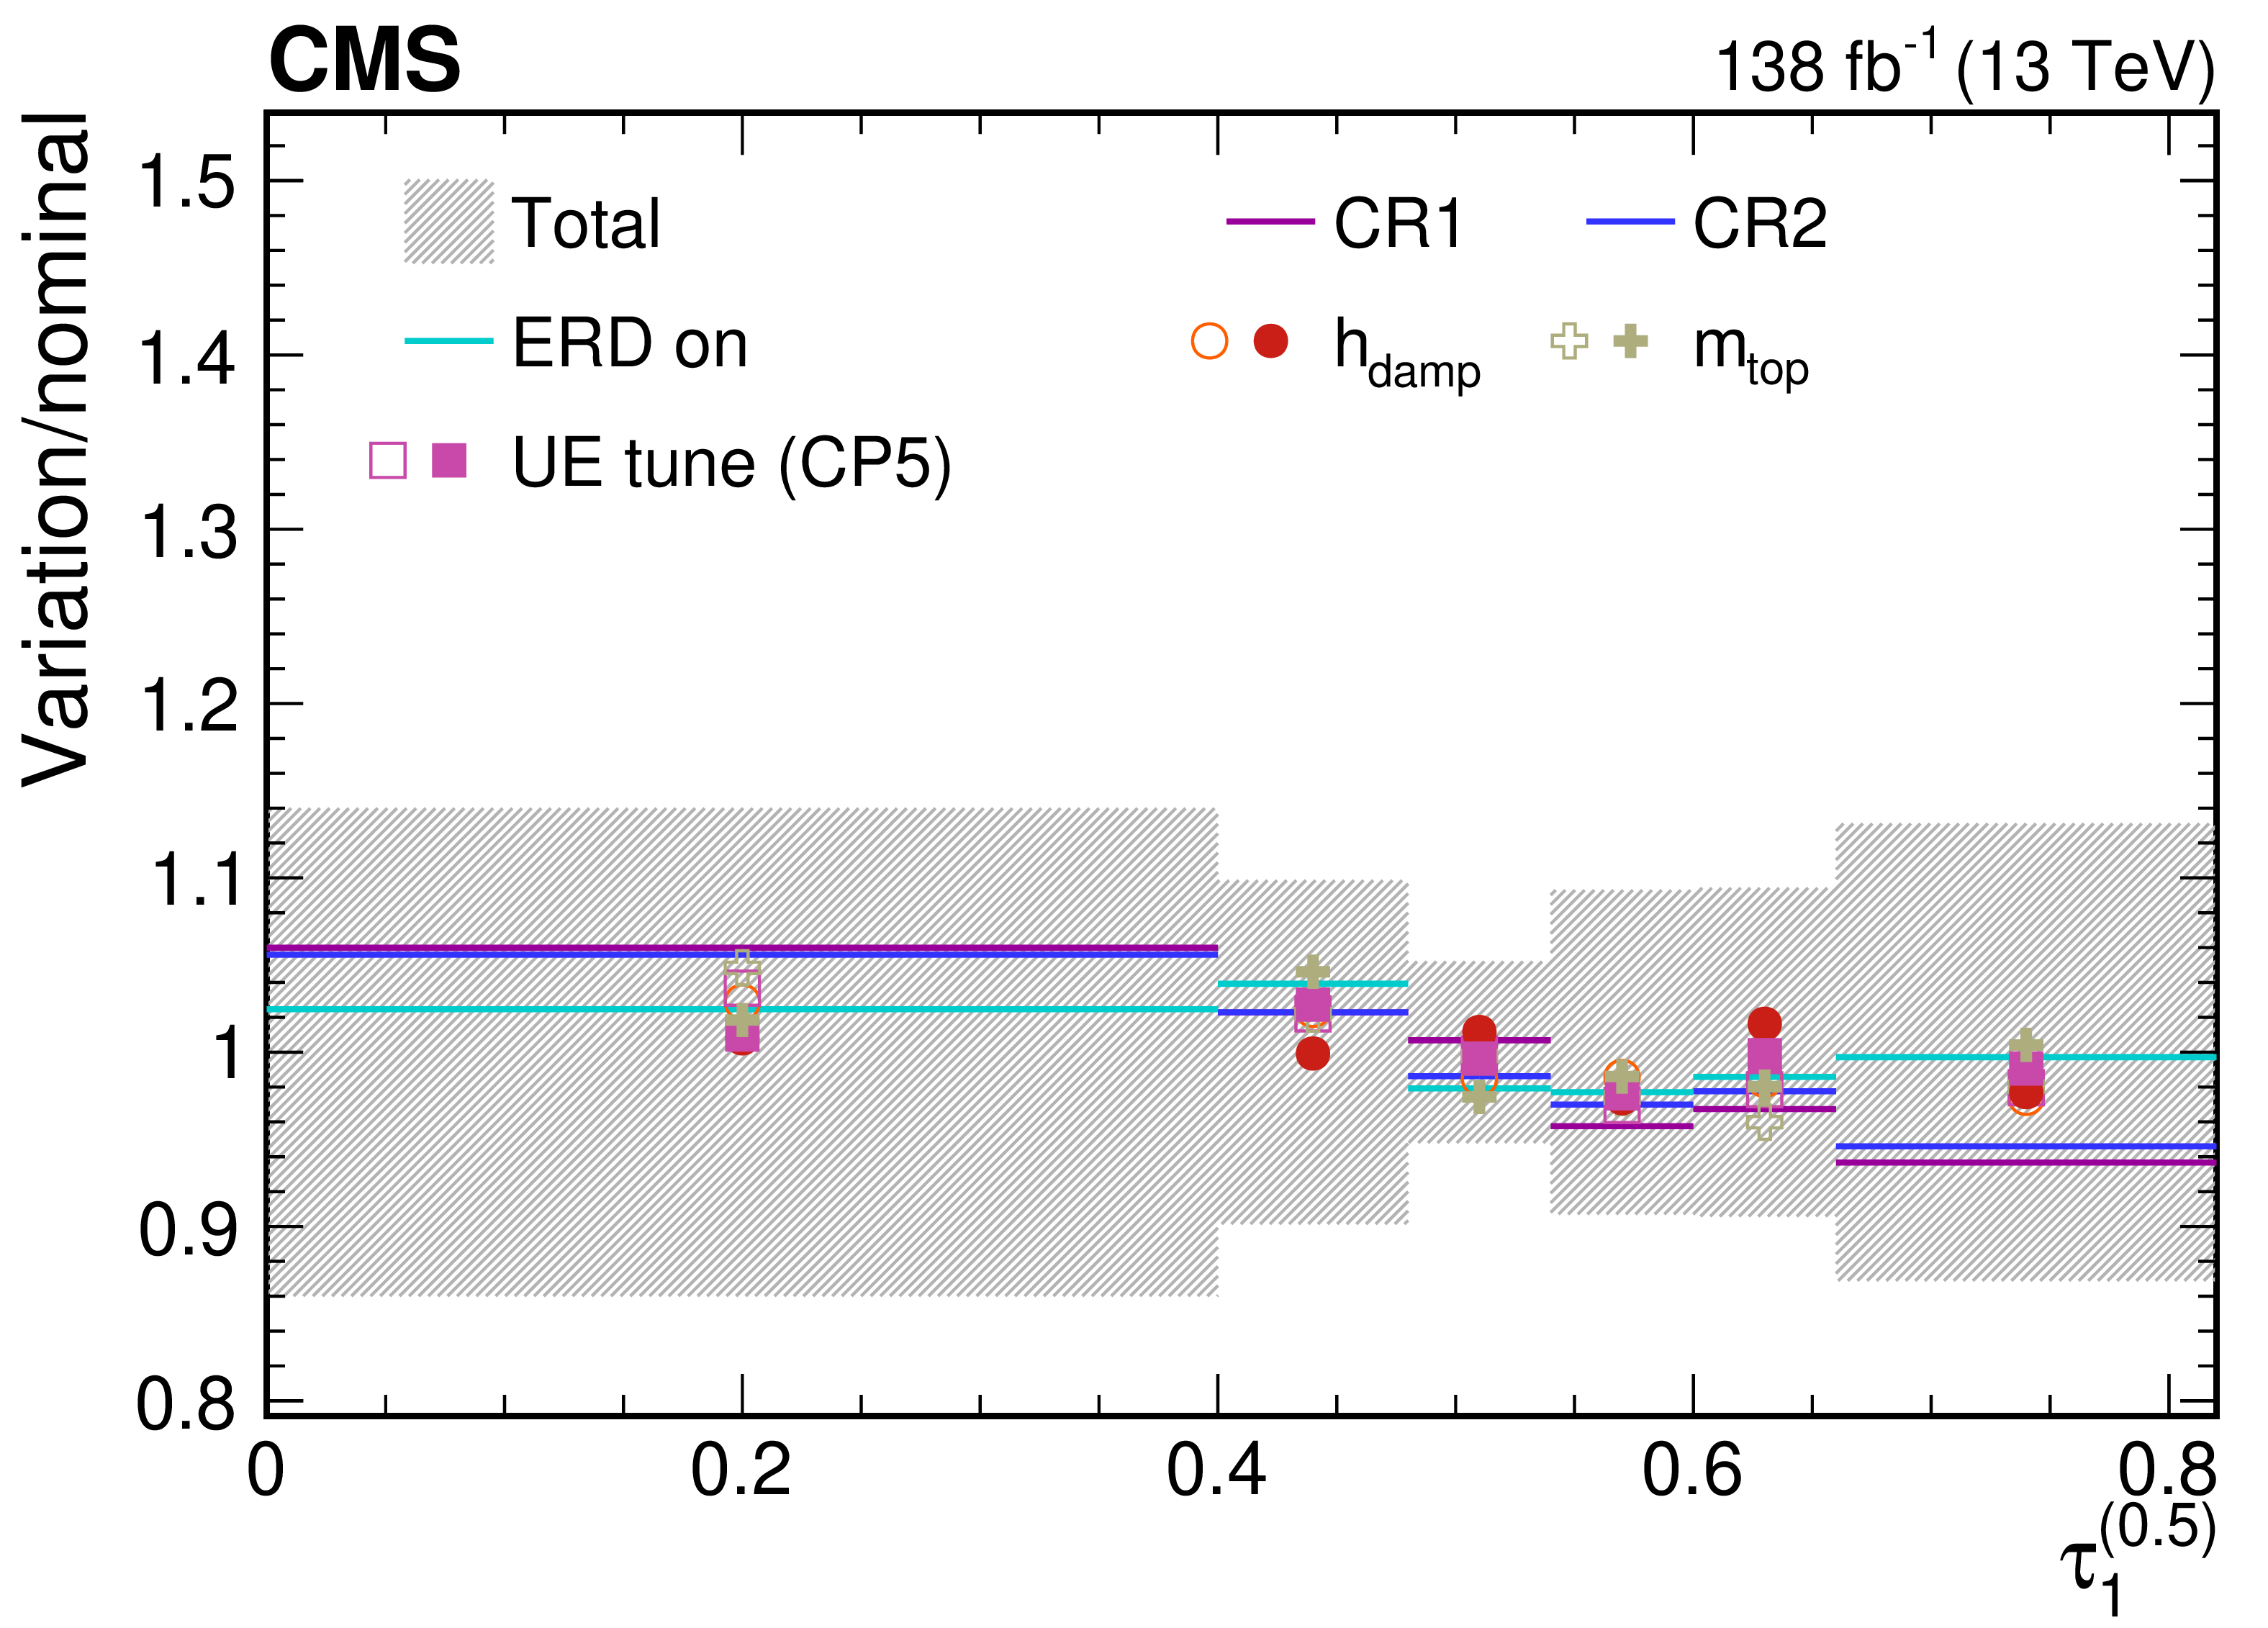
png pdf |
Figure 53-b:
Contributions from various theory model systematic variations to the normalized, unfolded distribution for $ \tau_1^{(\beta)} $ observables measured for AK8 jets passing the boosted W boson-enriched selection in $ \mu $+jets $ \mathrm{t} \overline{\mathrm{t}} $ events. The total unfolding uncertainty is indicated with the dark grey, hashed region, while the blue hashed region indicates the contributions from the input covariance matrix, which includes the propagated effects of the statistical uncertainties of the input data after background subtraction. Contributions from statistical uncertainties of the simulated sample used to construct the nominal response matrix are indicated with the dashed black line. The uncertainty contributions for different choices of colour reconnection models are illustrated as one-sided shifts compared to the nominal unfolding, and up (down) contributions from other sources are indicated with filled (open) markers of the same type and colour. |
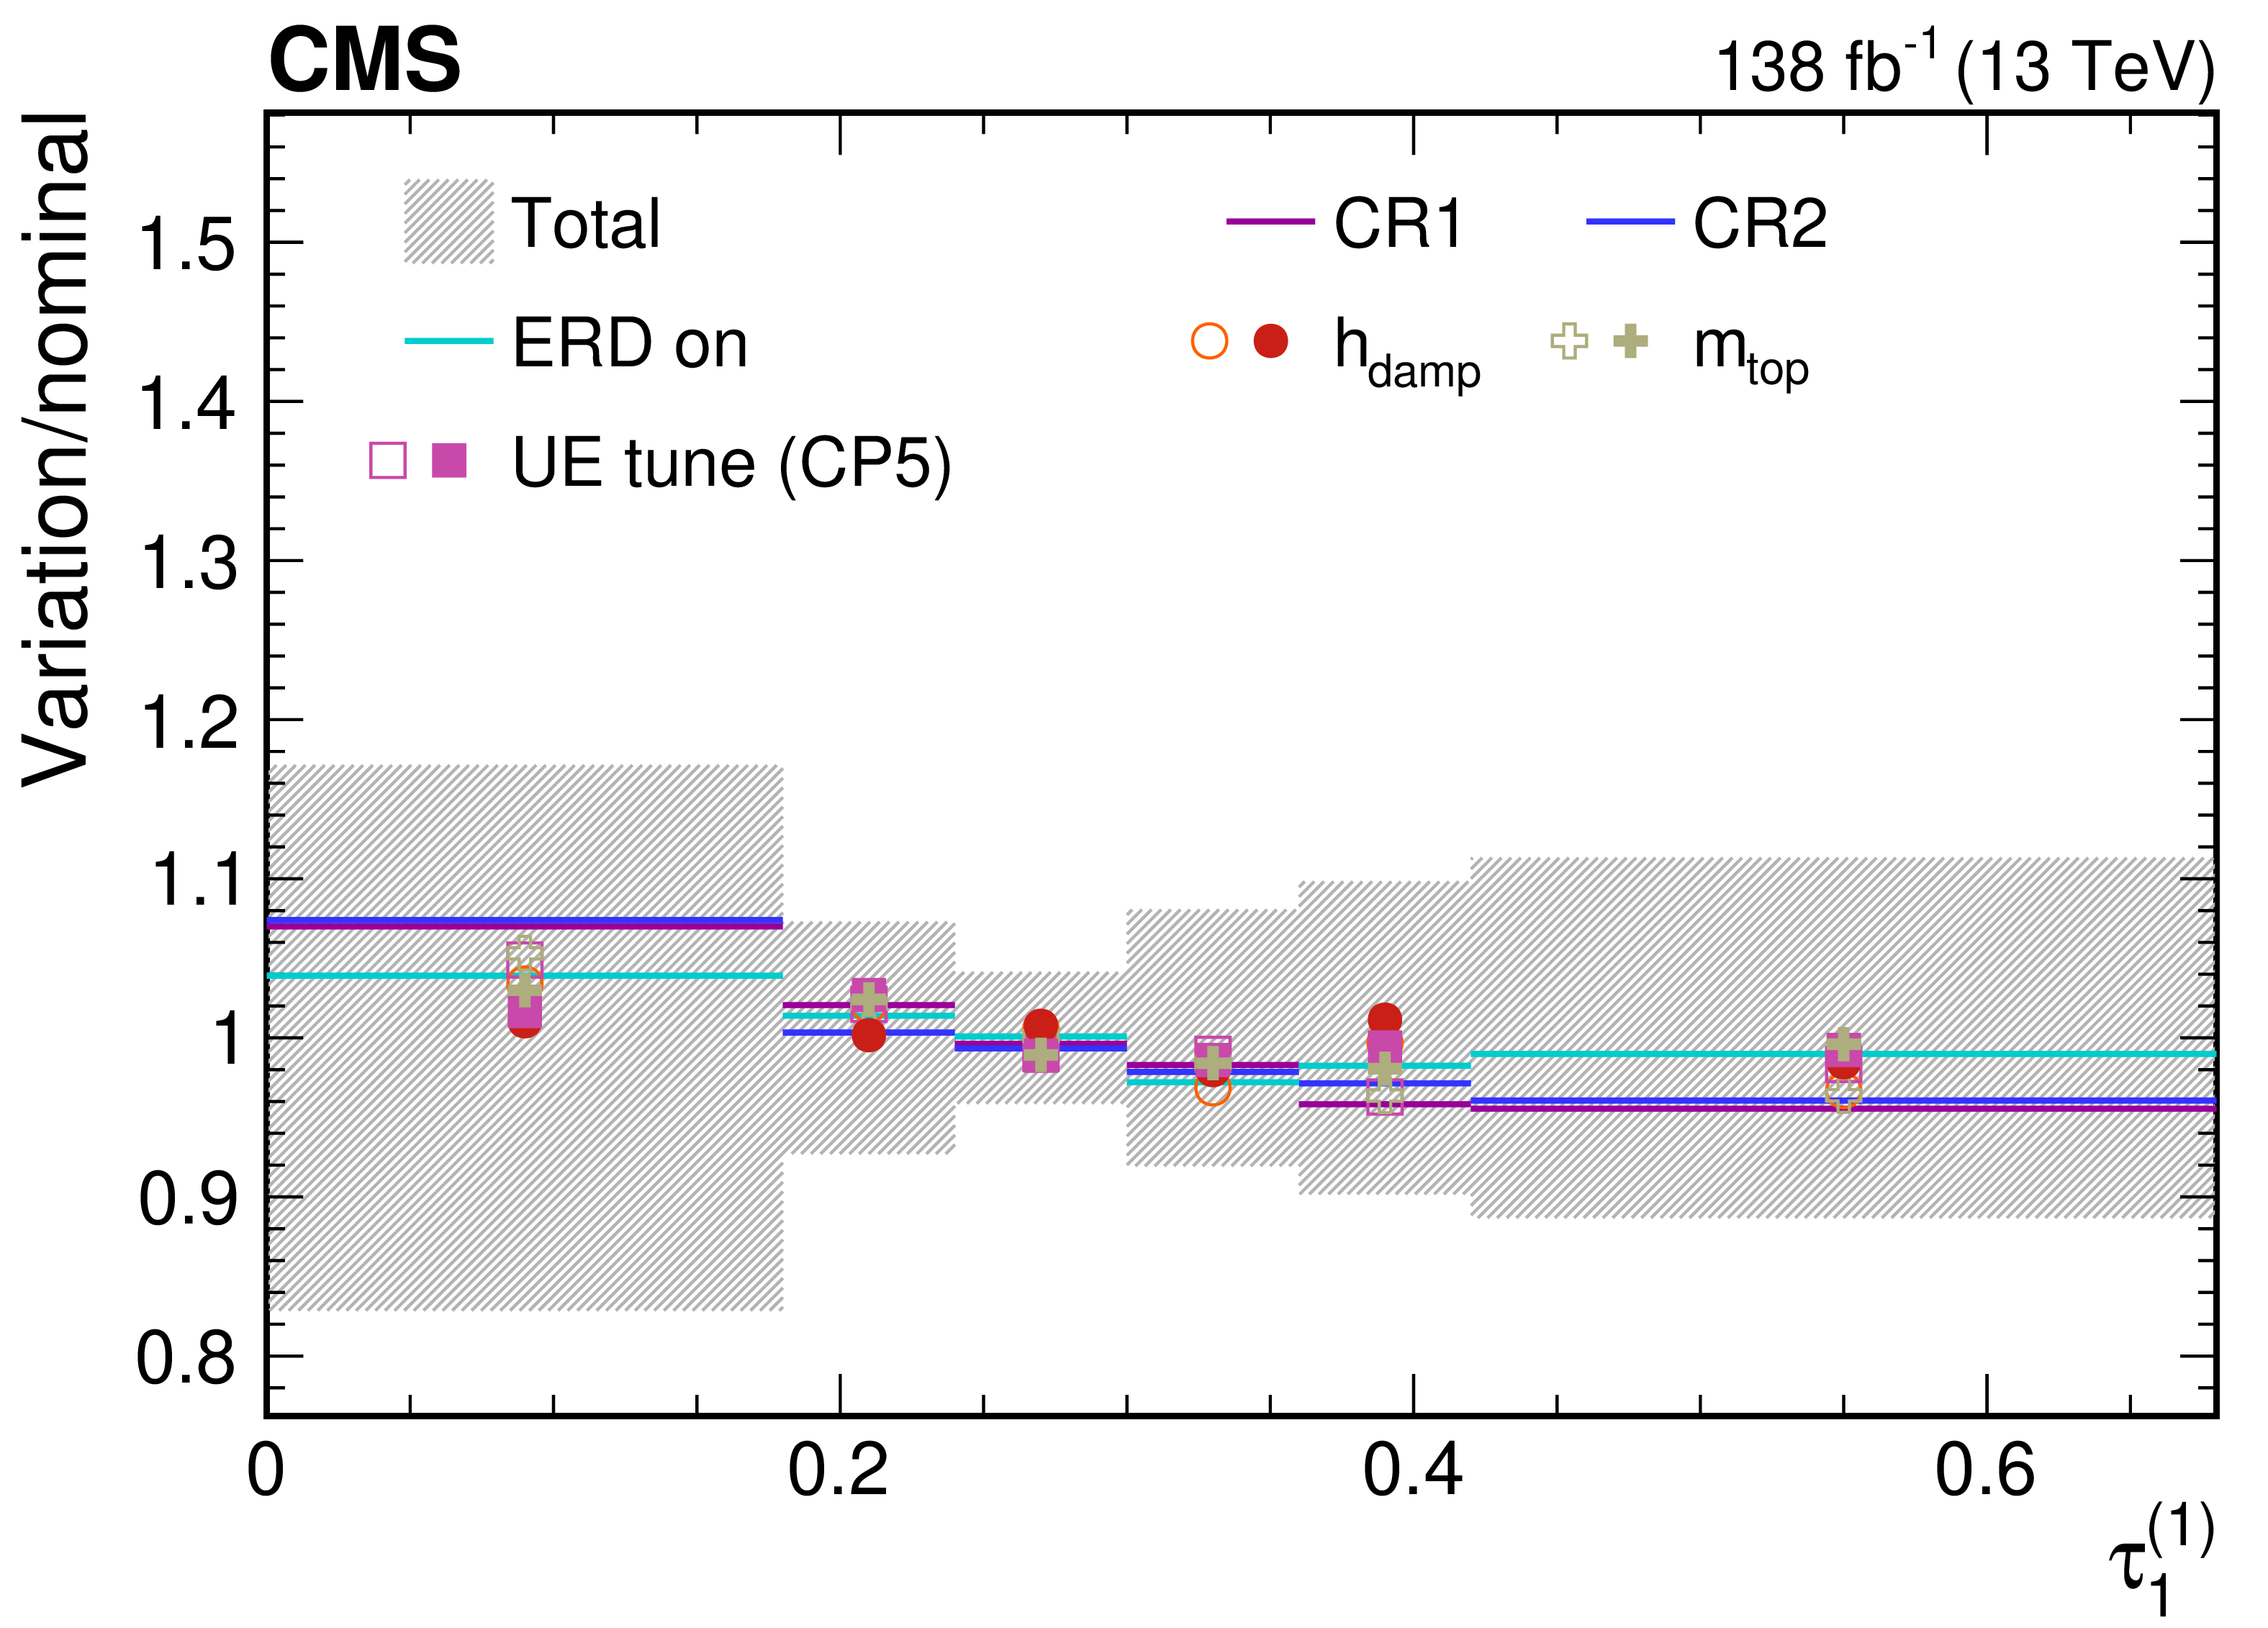
png pdf |
Figure 53-c:
Contributions from various theory model systematic variations to the normalized, unfolded distribution for $ \tau_1^{(\beta)} $ observables measured for AK8 jets passing the boosted W boson-enriched selection in $ \mu $+jets $ \mathrm{t} \overline{\mathrm{t}} $ events. The total unfolding uncertainty is indicated with the dark grey, hashed region, while the blue hashed region indicates the contributions from the input covariance matrix, which includes the propagated effects of the statistical uncertainties of the input data after background subtraction. Contributions from statistical uncertainties of the simulated sample used to construct the nominal response matrix are indicated with the dashed black line. The uncertainty contributions for different choices of colour reconnection models are illustrated as one-sided shifts compared to the nominal unfolding, and up (down) contributions from other sources are indicated with filled (open) markers of the same type and colour. |
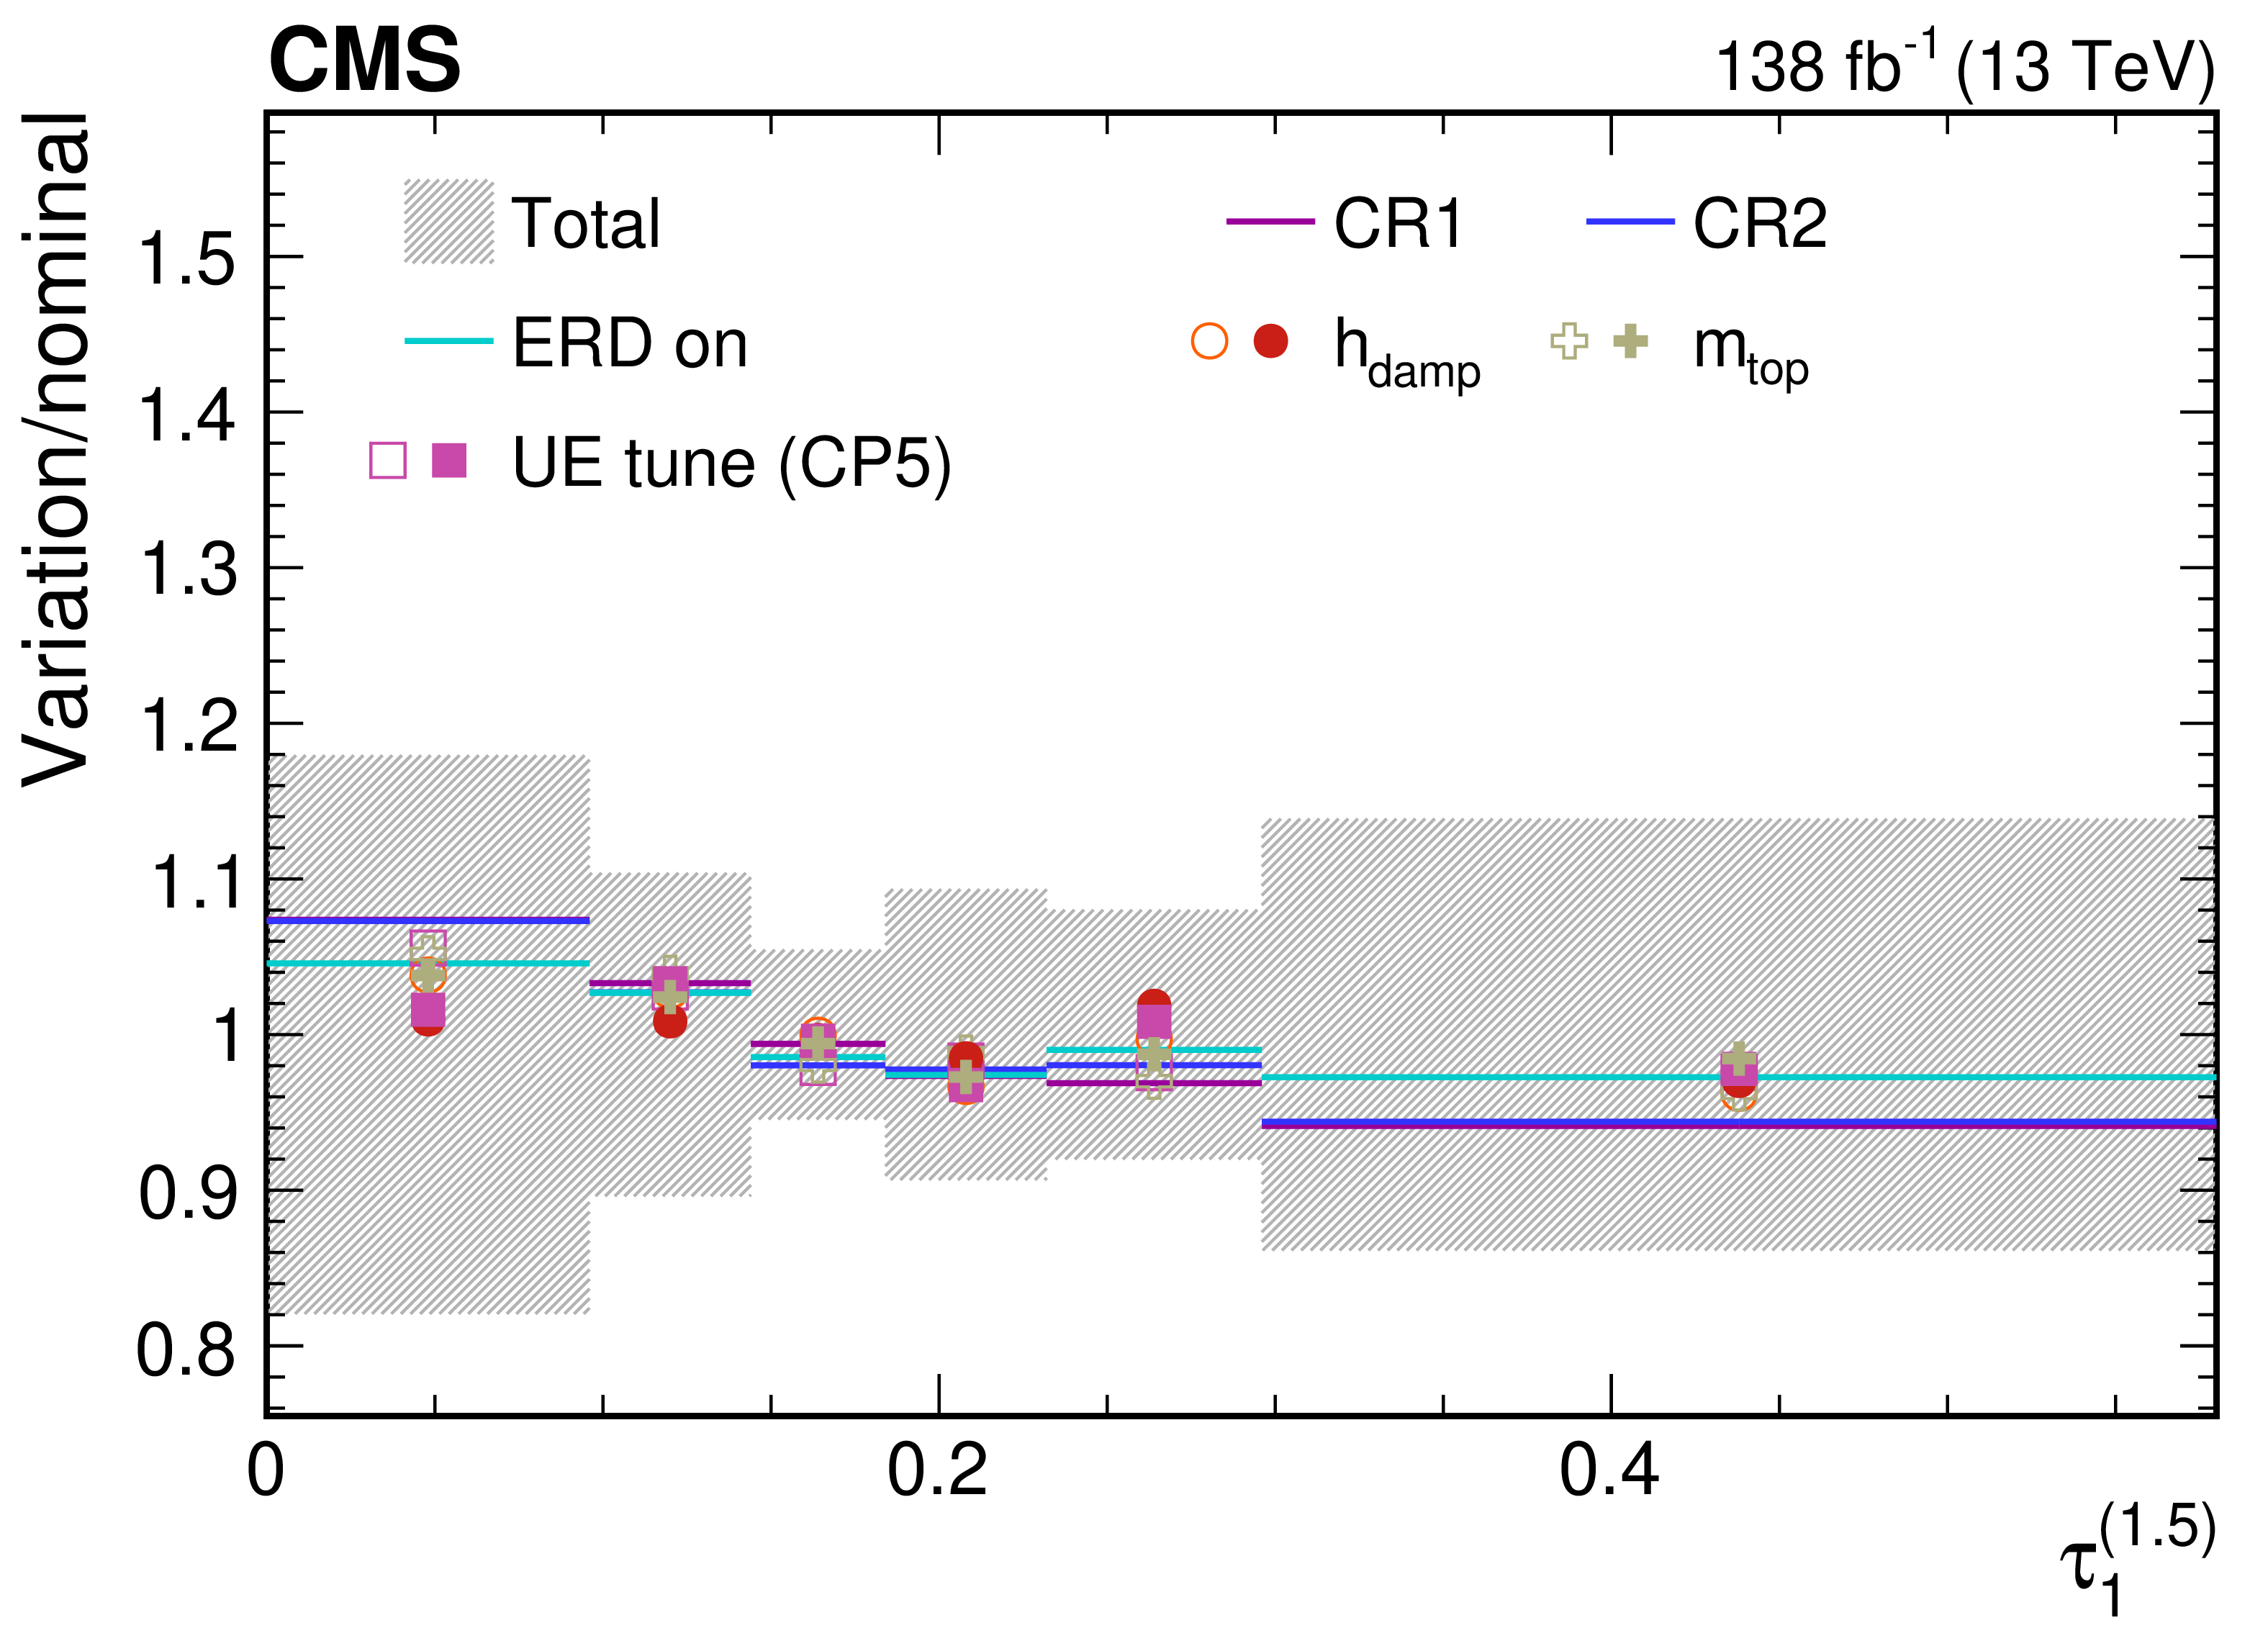
png pdf |
Figure 53-d:
Contributions from various theory model systematic variations to the normalized, unfolded distribution for $ \tau_1^{(\beta)} $ observables measured for AK8 jets passing the boosted W boson-enriched selection in $ \mu $+jets $ \mathrm{t} \overline{\mathrm{t}} $ events. The total unfolding uncertainty is indicated with the dark grey, hashed region, while the blue hashed region indicates the contributions from the input covariance matrix, which includes the propagated effects of the statistical uncertainties of the input data after background subtraction. Contributions from statistical uncertainties of the simulated sample used to construct the nominal response matrix are indicated with the dashed black line. The uncertainty contributions for different choices of colour reconnection models are illustrated as one-sided shifts compared to the nominal unfolding, and up (down) contributions from other sources are indicated with filled (open) markers of the same type and colour. |
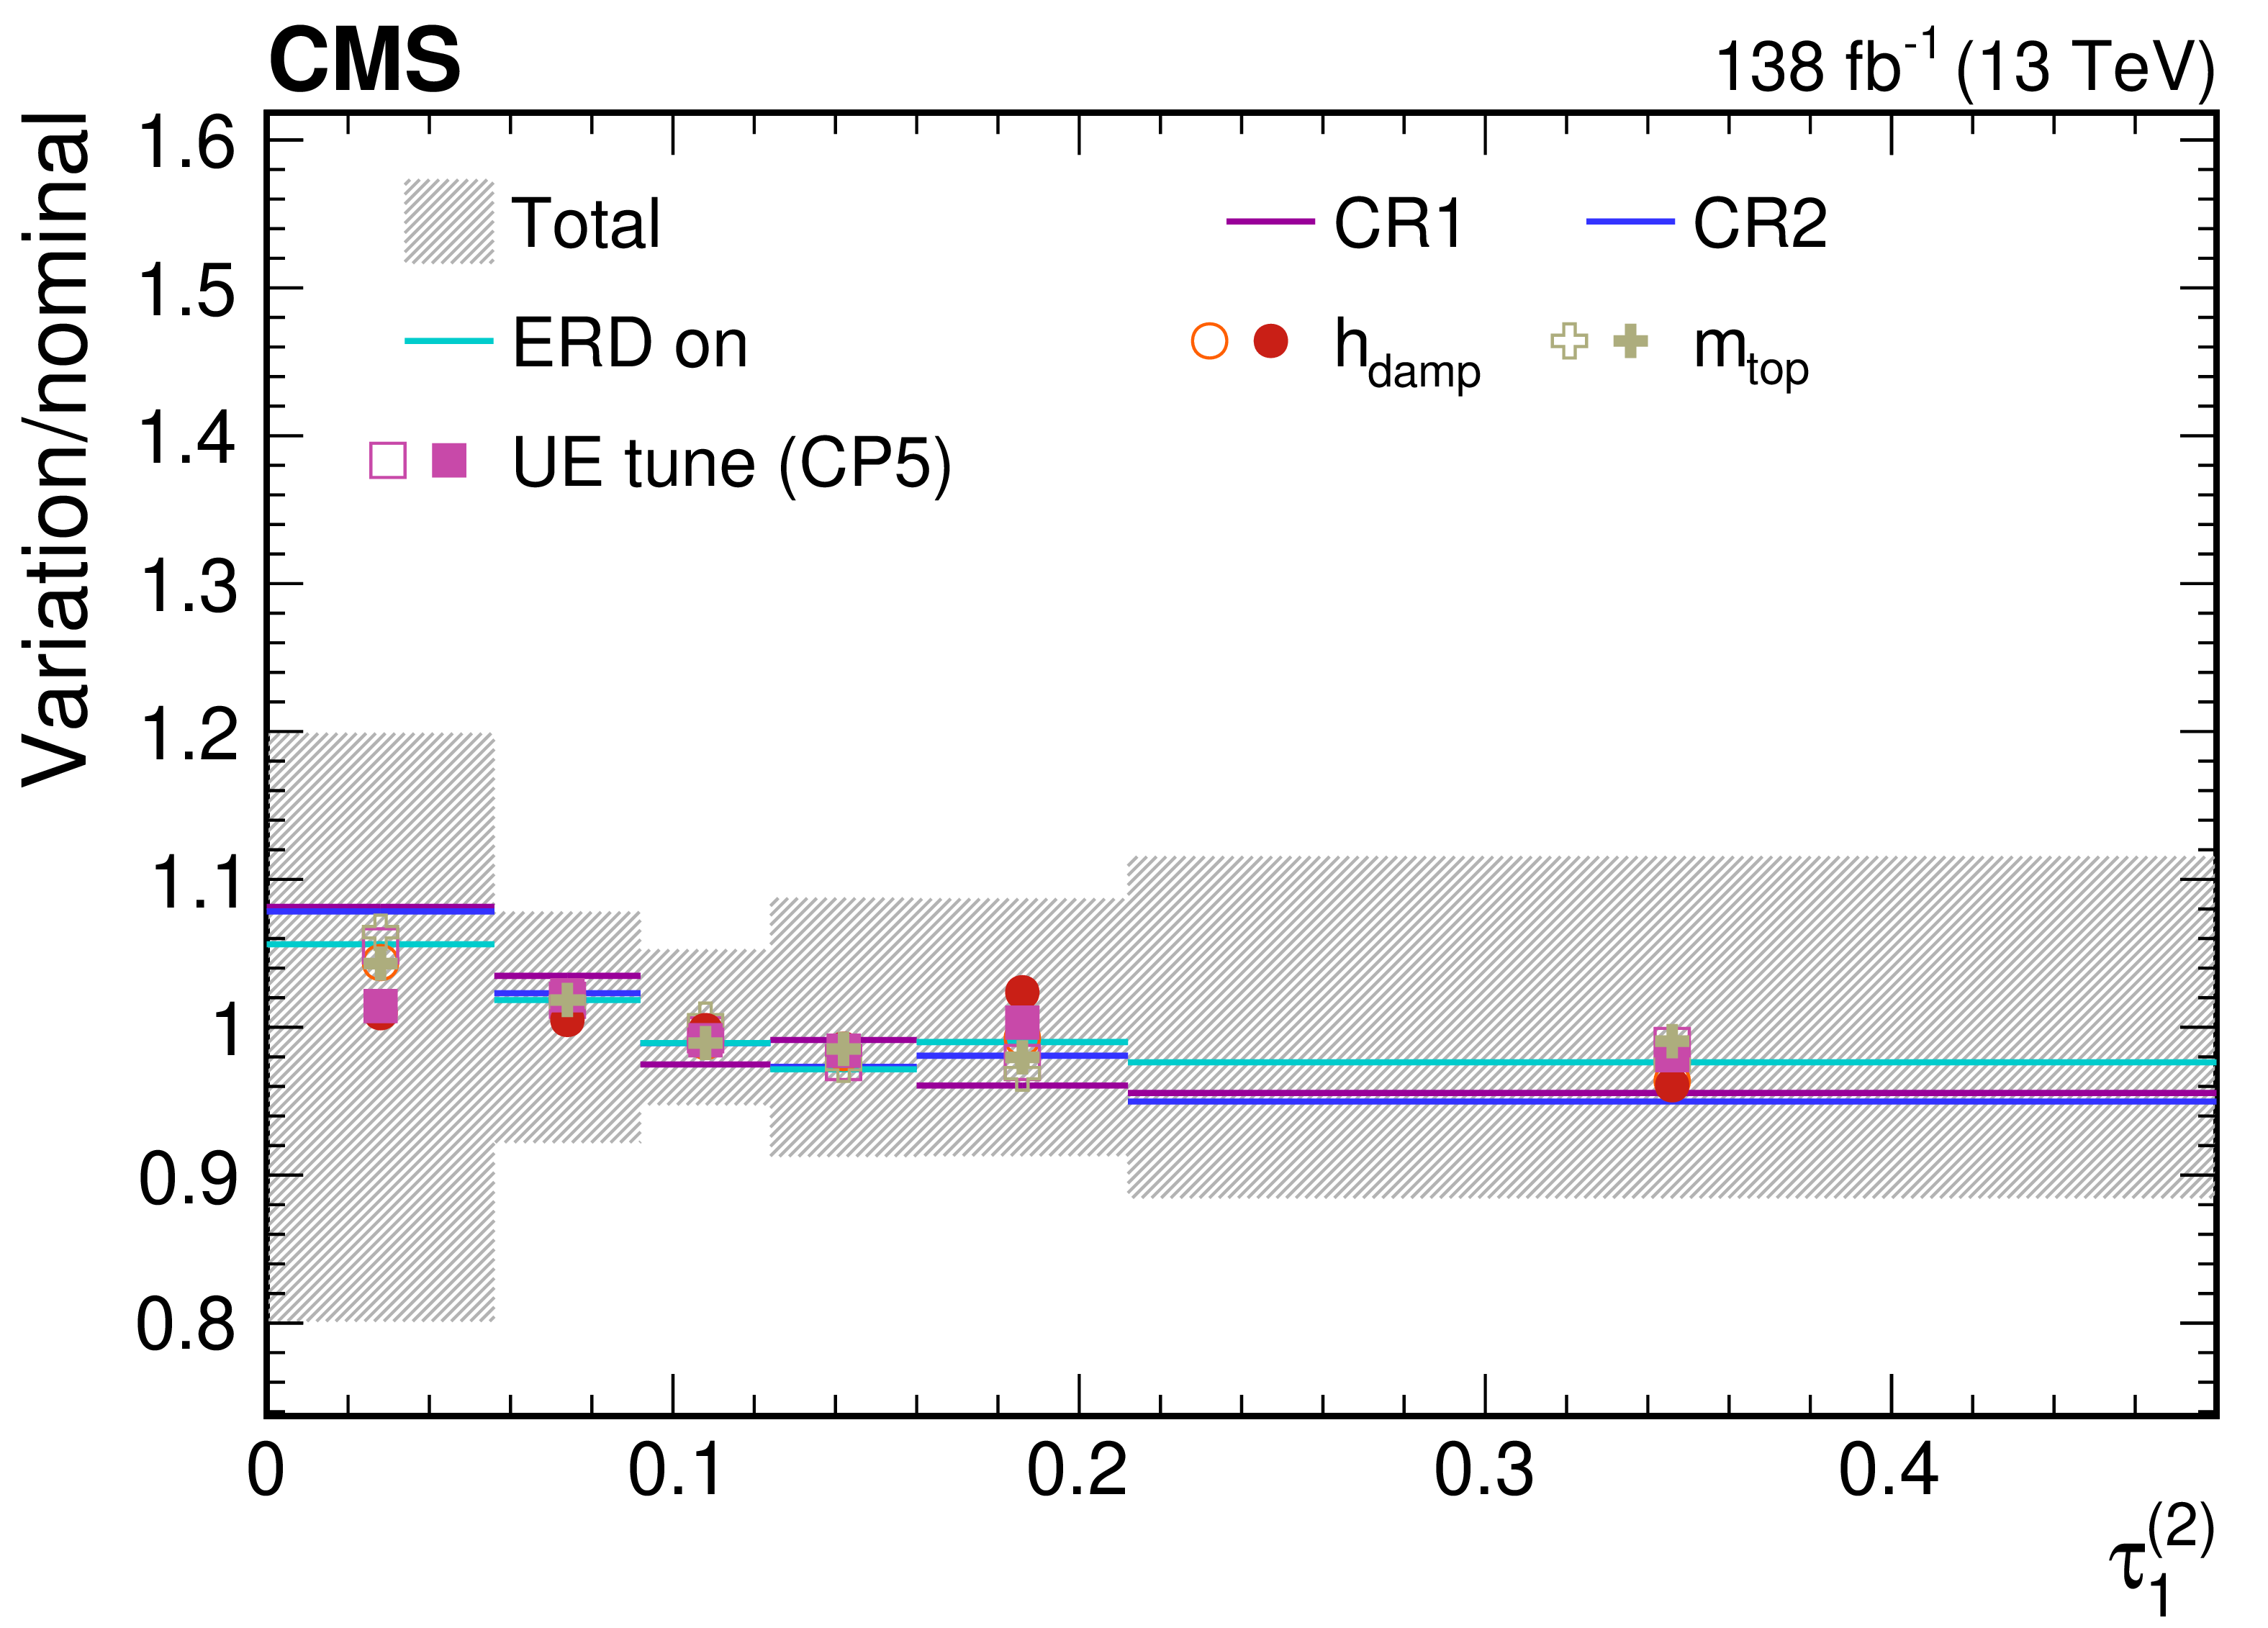
png pdf |
Figure 53-e:
Contributions from various theory model systematic variations to the normalized, unfolded distribution for $ \tau_1^{(\beta)} $ observables measured for AK8 jets passing the boosted W boson-enriched selection in $ \mu $+jets $ \mathrm{t} \overline{\mathrm{t}} $ events. The total unfolding uncertainty is indicated with the dark grey, hashed region, while the blue hashed region indicates the contributions from the input covariance matrix, which includes the propagated effects of the statistical uncertainties of the input data after background subtraction. Contributions from statistical uncertainties of the simulated sample used to construct the nominal response matrix are indicated with the dashed black line. The uncertainty contributions for different choices of colour reconnection models are illustrated as one-sided shifts compared to the nominal unfolding, and up (down) contributions from other sources are indicated with filled (open) markers of the same type and colour. |
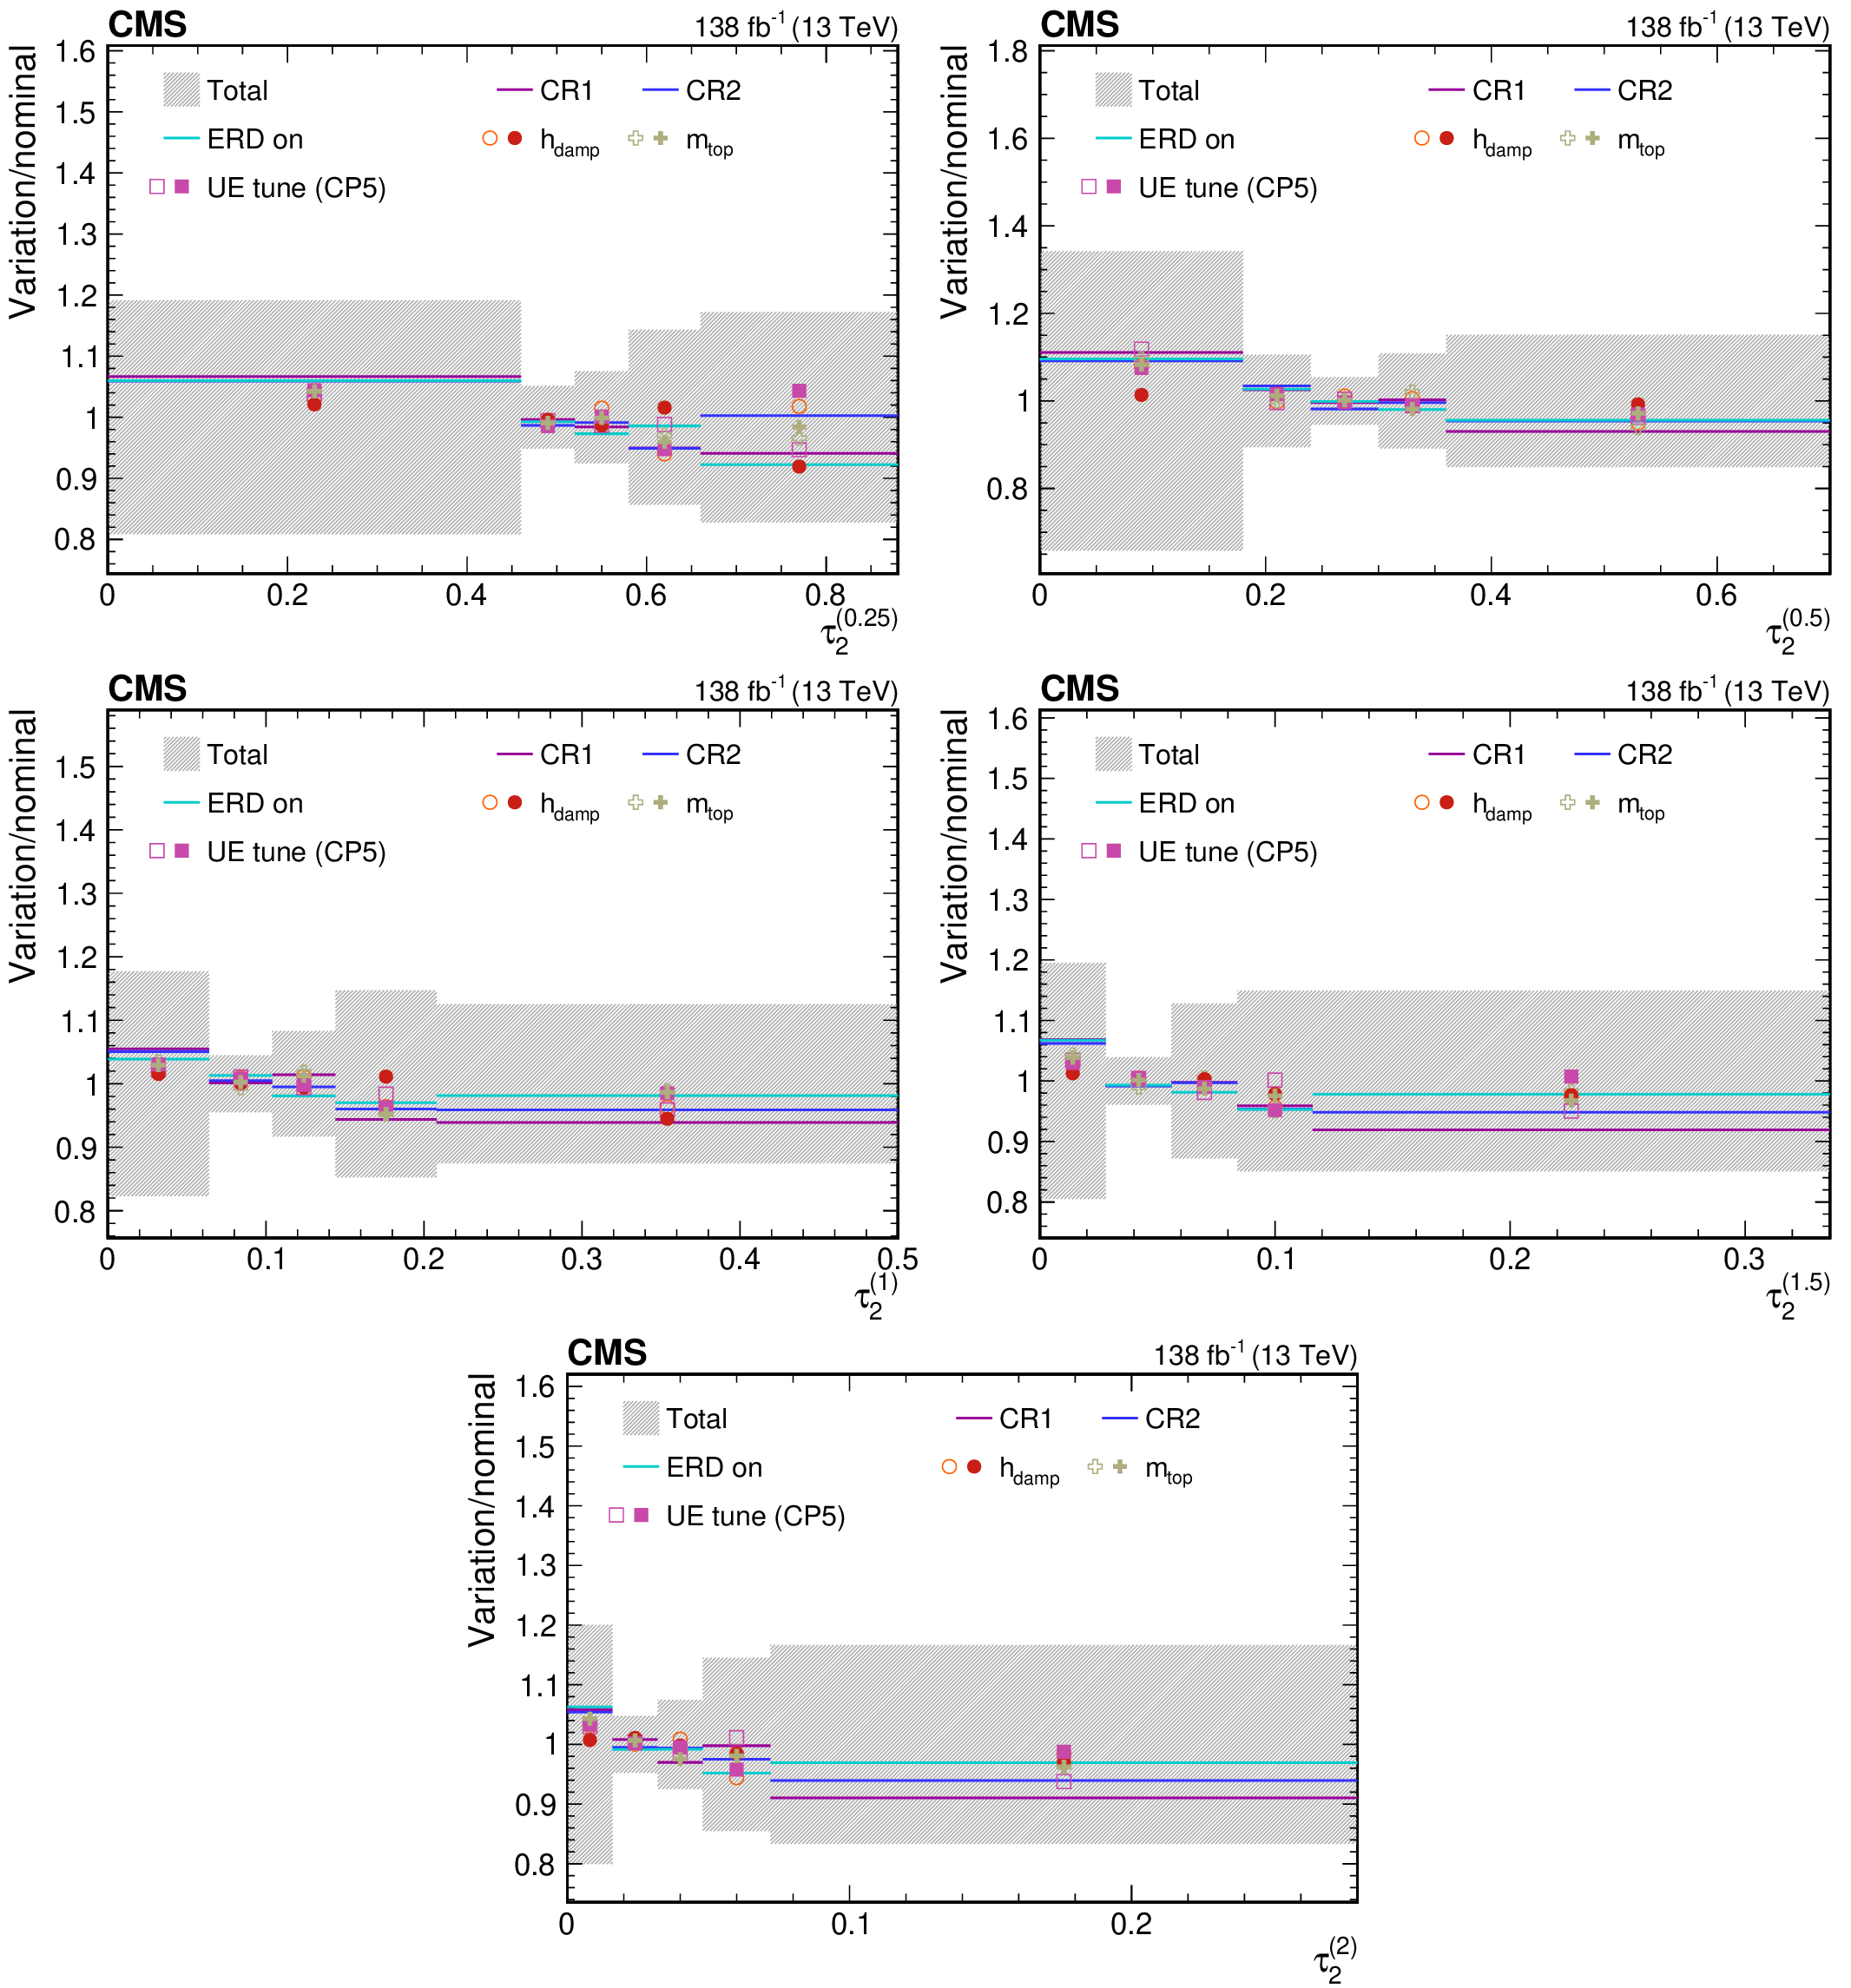
png pdf |
Figure 54:
Contributions from various theory model systematic variations to the normalized, unfolded distribution for $ \tau_2^{(\beta)} $ observables measured for AK8 jets passing the boosted W boson-enriched selection in $ \mu $+jets $ \mathrm{t} \overline{\mathrm{t}} $ events. The total unfolding uncertainty is indicated with the dark grey, hashed region, while the blue hashed region indicates the contributions from the input covariance matrix, which includes the propagated effects of the statistical uncertainties of the input data after background subtraction. Contributions from statistical uncertainties of the simulated sample used to construct the nominal response matrix are indicated with the dashed black line. The uncertainty contributions for different choices of colour reconnection models are illustrated as one-sided shifts compared to the nominal unfolding, and up (down) contributions from other sources are indicated with filled (open) markers of the same type and colour. |
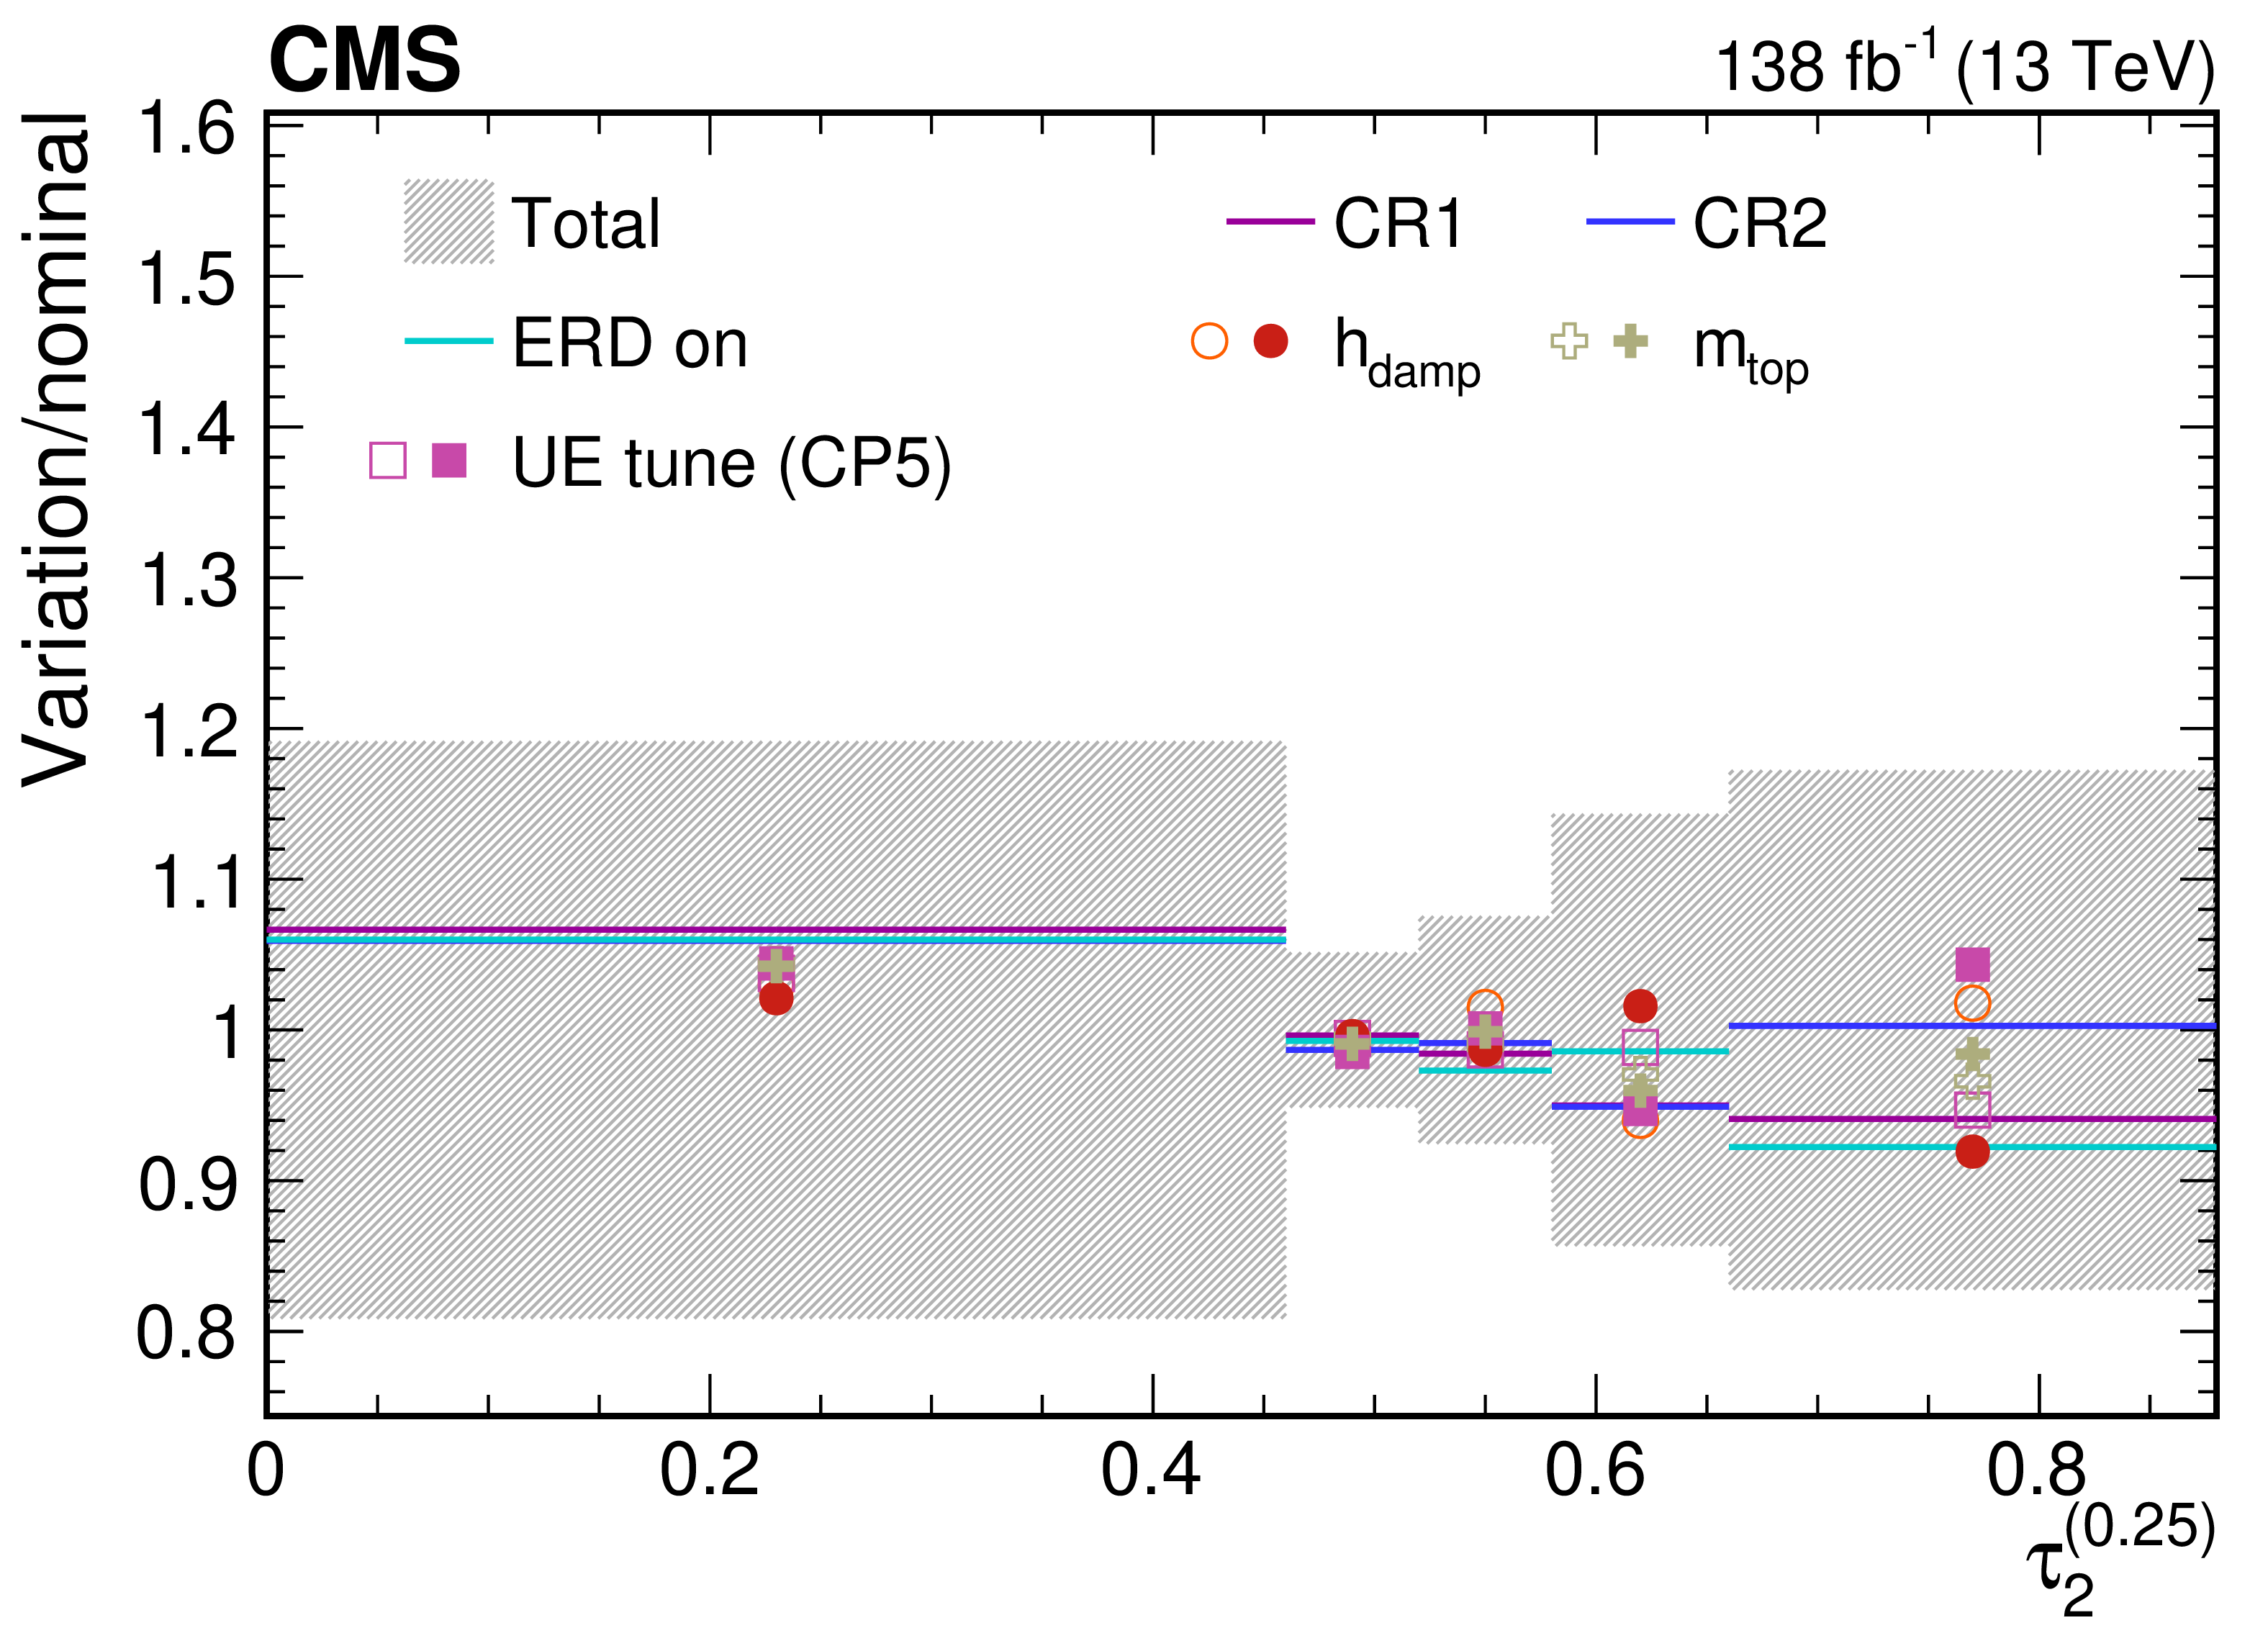
png pdf |
Figure 54-a:
Contributions from various theory model systematic variations to the normalized, unfolded distribution for $ \tau_2^{(\beta)} $ observables measured for AK8 jets passing the boosted W boson-enriched selection in $ \mu $+jets $ \mathrm{t} \overline{\mathrm{t}} $ events. The total unfolding uncertainty is indicated with the dark grey, hashed region, while the blue hashed region indicates the contributions from the input covariance matrix, which includes the propagated effects of the statistical uncertainties of the input data after background subtraction. Contributions from statistical uncertainties of the simulated sample used to construct the nominal response matrix are indicated with the dashed black line. The uncertainty contributions for different choices of colour reconnection models are illustrated as one-sided shifts compared to the nominal unfolding, and up (down) contributions from other sources are indicated with filled (open) markers of the same type and colour. |
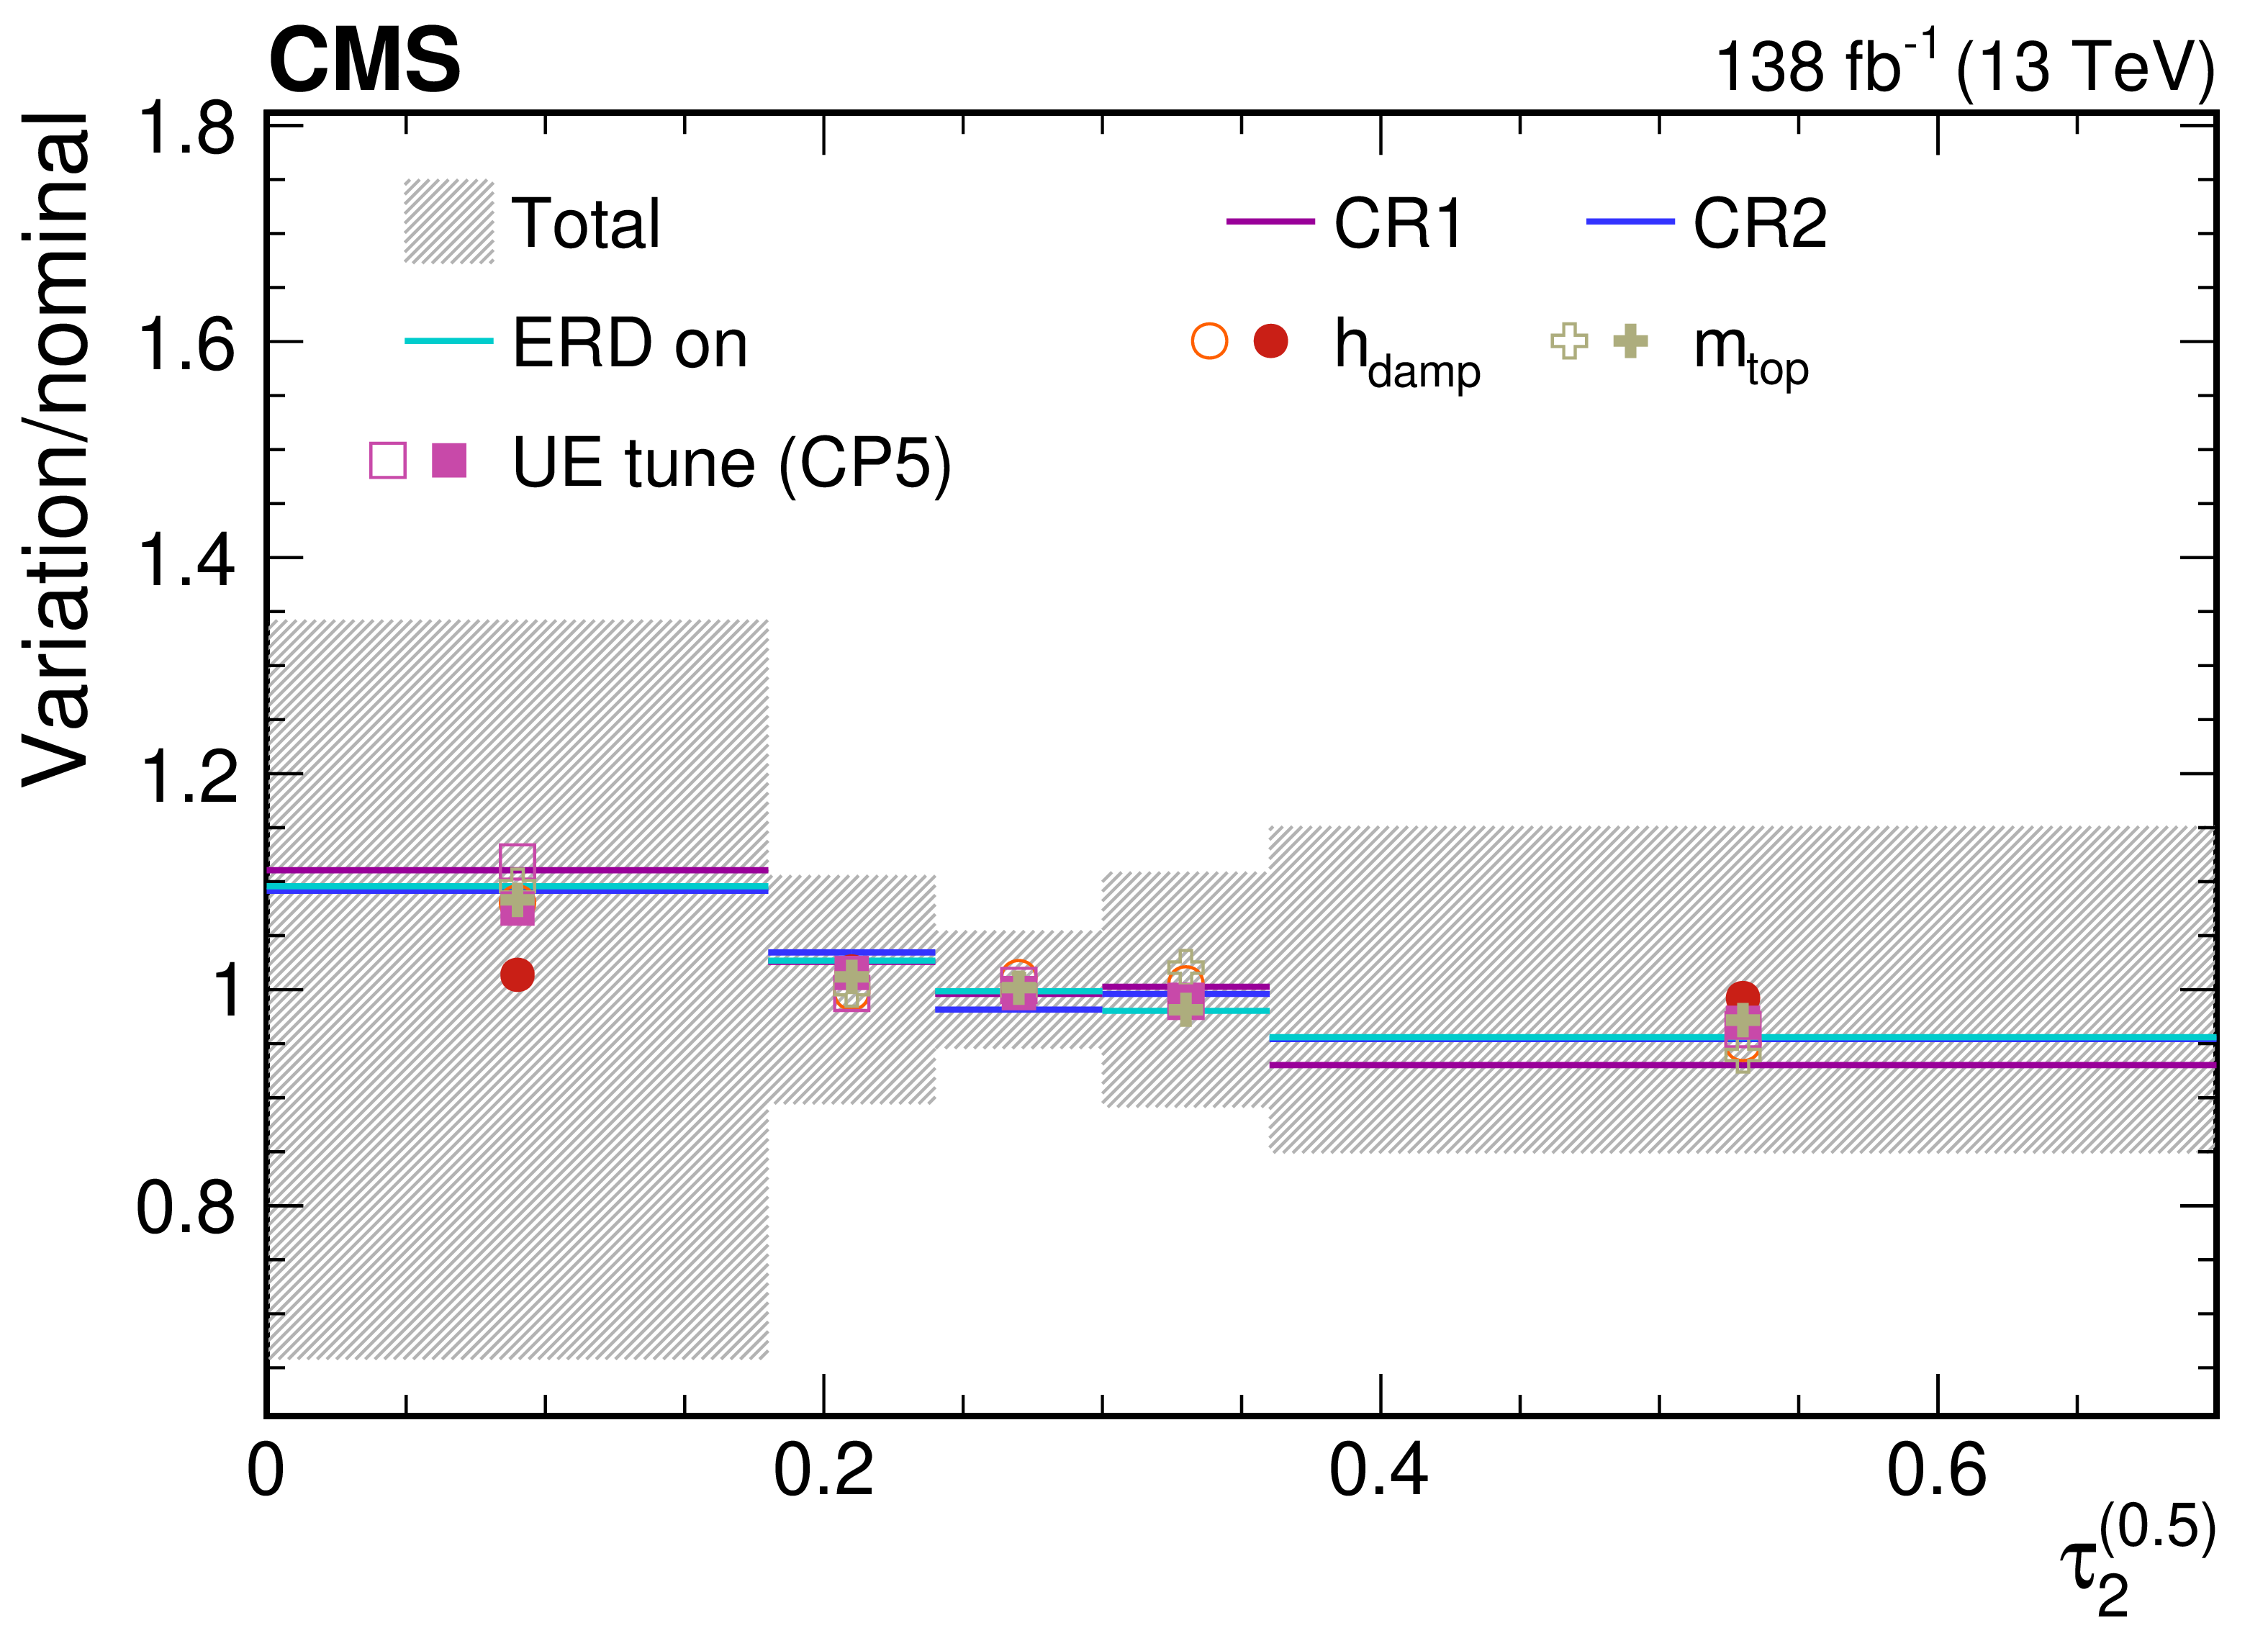
png pdf |
Figure 54-b:
Contributions from various theory model systematic variations to the normalized, unfolded distribution for $ \tau_2^{(\beta)} $ observables measured for AK8 jets passing the boosted W boson-enriched selection in $ \mu $+jets $ \mathrm{t} \overline{\mathrm{t}} $ events. The total unfolding uncertainty is indicated with the dark grey, hashed region, while the blue hashed region indicates the contributions from the input covariance matrix, which includes the propagated effects of the statistical uncertainties of the input data after background subtraction. Contributions from statistical uncertainties of the simulated sample used to construct the nominal response matrix are indicated with the dashed black line. The uncertainty contributions for different choices of colour reconnection models are illustrated as one-sided shifts compared to the nominal unfolding, and up (down) contributions from other sources are indicated with filled (open) markers of the same type and colour. |
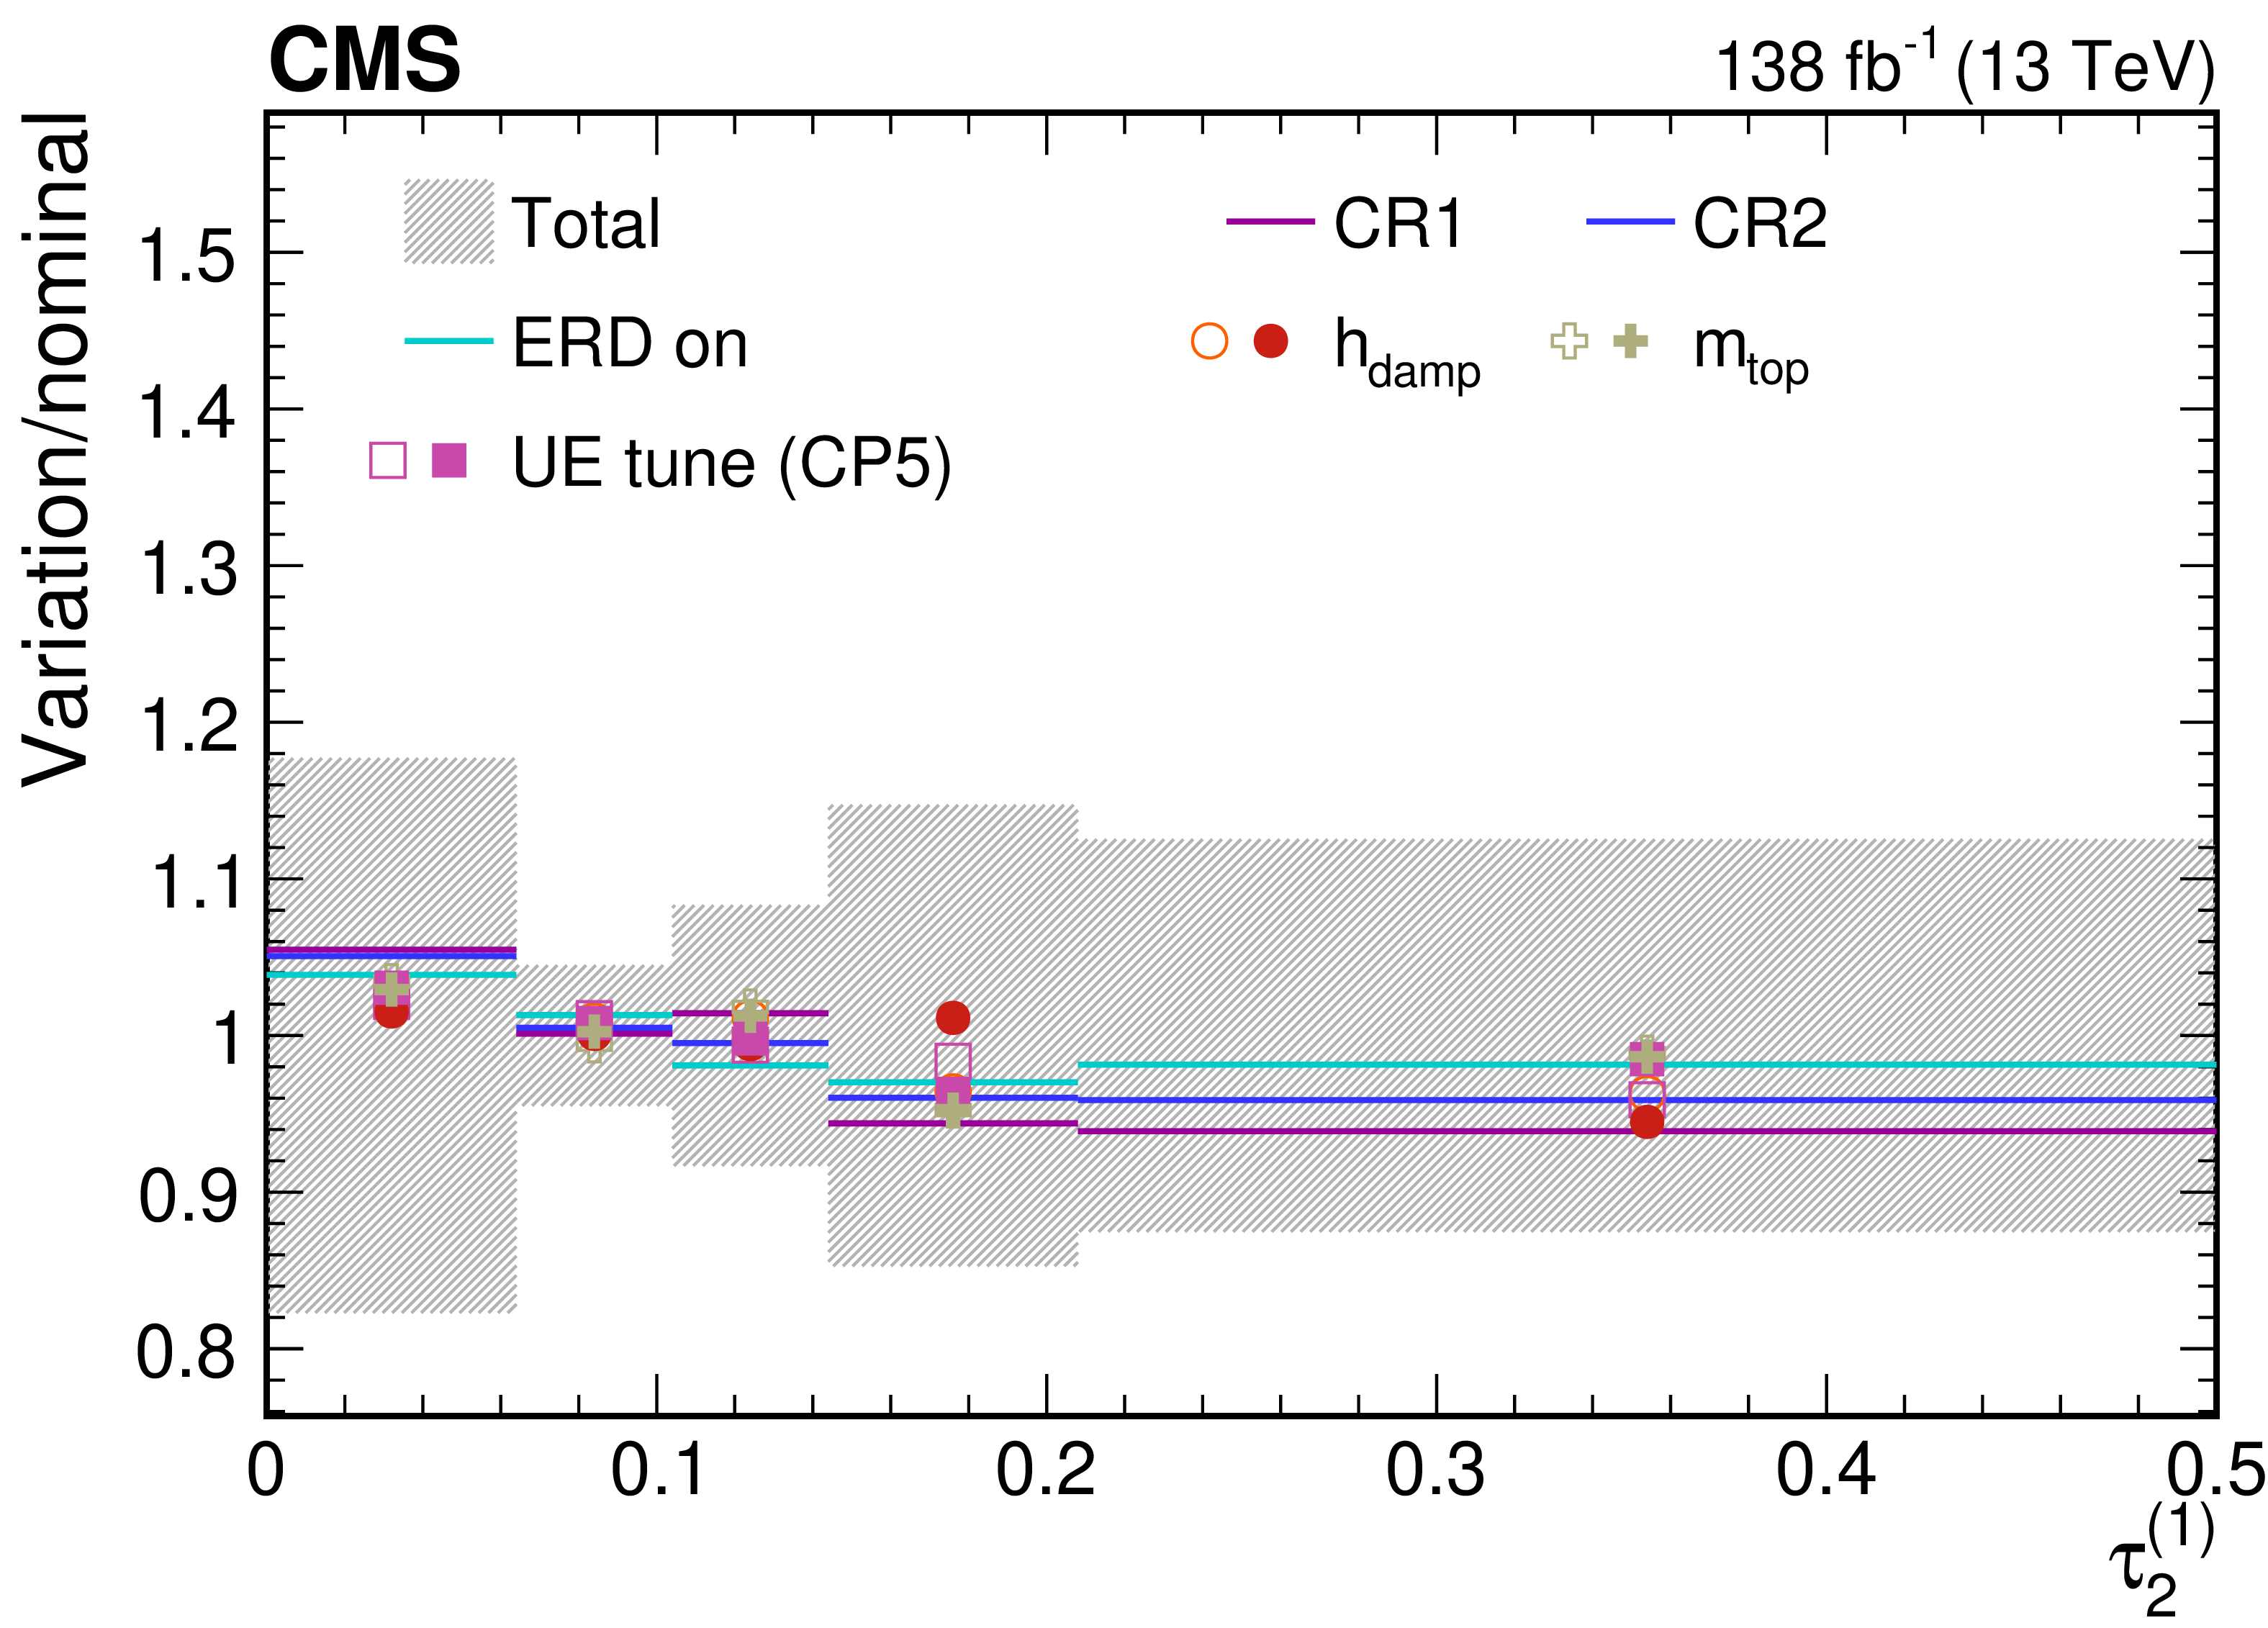
png pdf |
Figure 54-c:
Contributions from various theory model systematic variations to the normalized, unfolded distribution for $ \tau_2^{(\beta)} $ observables measured for AK8 jets passing the boosted W boson-enriched selection in $ \mu $+jets $ \mathrm{t} \overline{\mathrm{t}} $ events. The total unfolding uncertainty is indicated with the dark grey, hashed region, while the blue hashed region indicates the contributions from the input covariance matrix, which includes the propagated effects of the statistical uncertainties of the input data after background subtraction. Contributions from statistical uncertainties of the simulated sample used to construct the nominal response matrix are indicated with the dashed black line. The uncertainty contributions for different choices of colour reconnection models are illustrated as one-sided shifts compared to the nominal unfolding, and up (down) contributions from other sources are indicated with filled (open) markers of the same type and colour. |
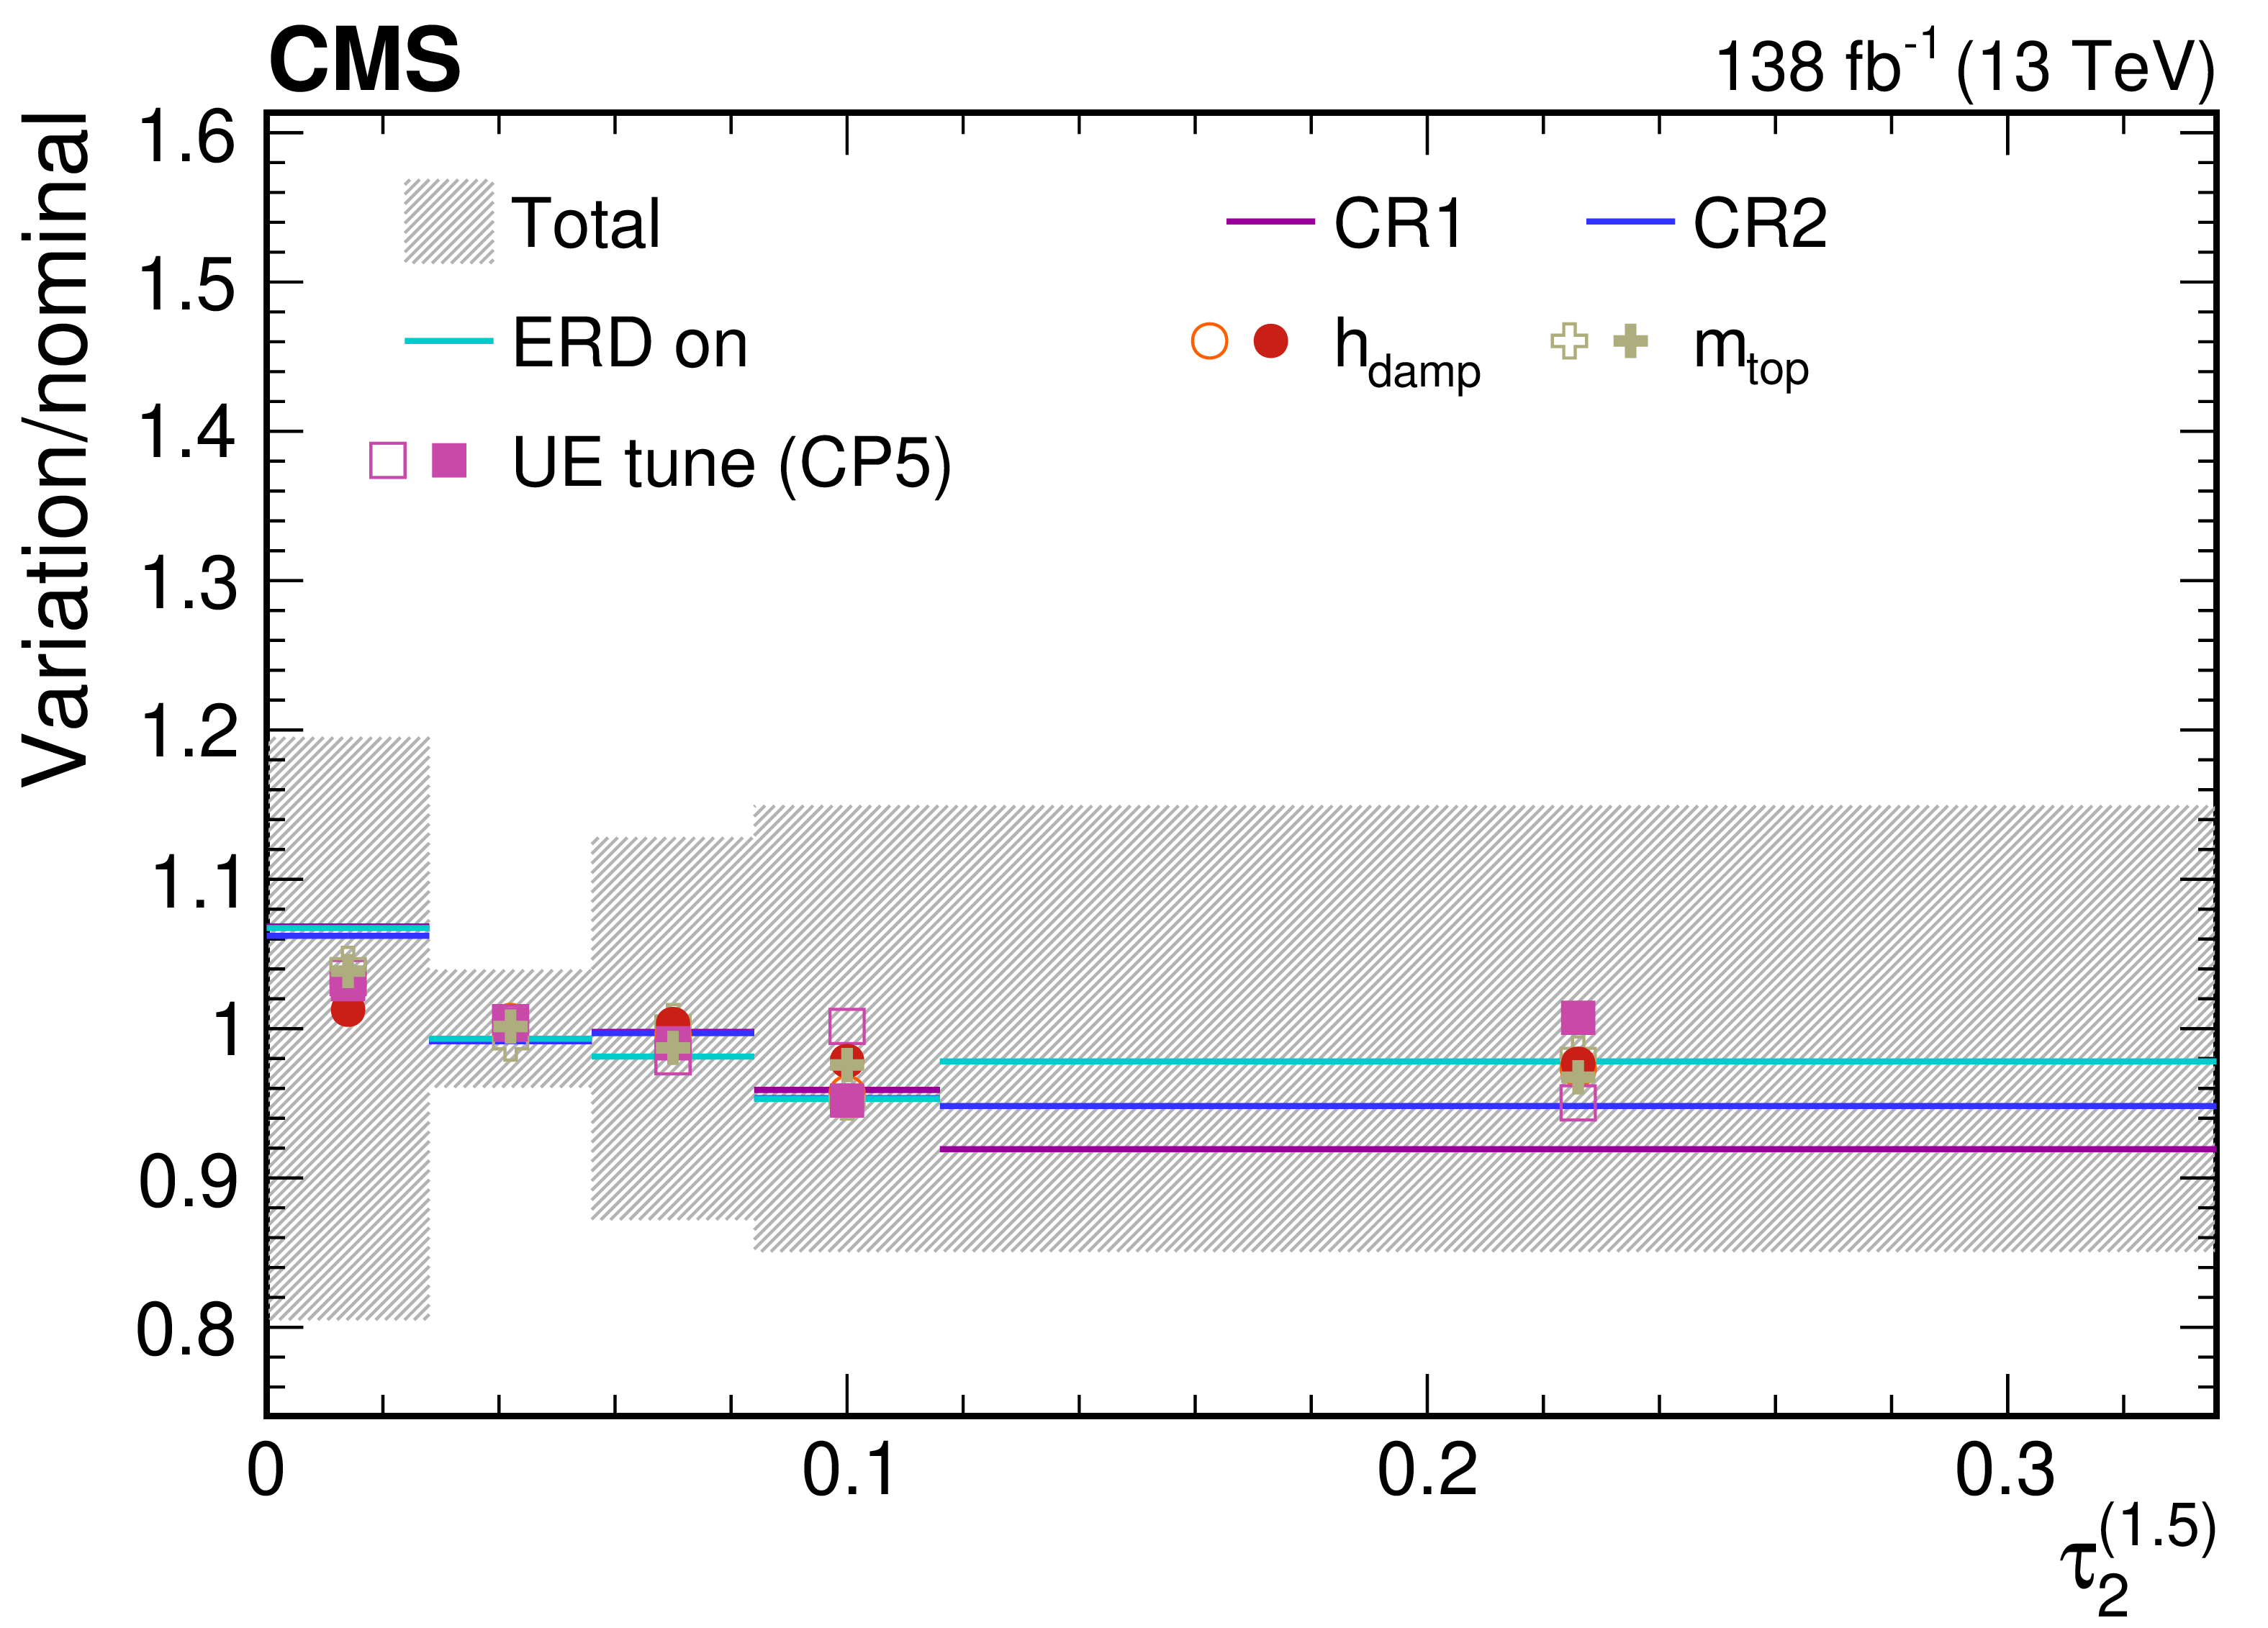
png pdf |
Figure 54-d:
Contributions from various theory model systematic variations to the normalized, unfolded distribution for $ \tau_2^{(\beta)} $ observables measured for AK8 jets passing the boosted W boson-enriched selection in $ \mu $+jets $ \mathrm{t} \overline{\mathrm{t}} $ events. The total unfolding uncertainty is indicated with the dark grey, hashed region, while the blue hashed region indicates the contributions from the input covariance matrix, which includes the propagated effects of the statistical uncertainties of the input data after background subtraction. Contributions from statistical uncertainties of the simulated sample used to construct the nominal response matrix are indicated with the dashed black line. The uncertainty contributions for different choices of colour reconnection models are illustrated as one-sided shifts compared to the nominal unfolding, and up (down) contributions from other sources are indicated with filled (open) markers of the same type and colour. |
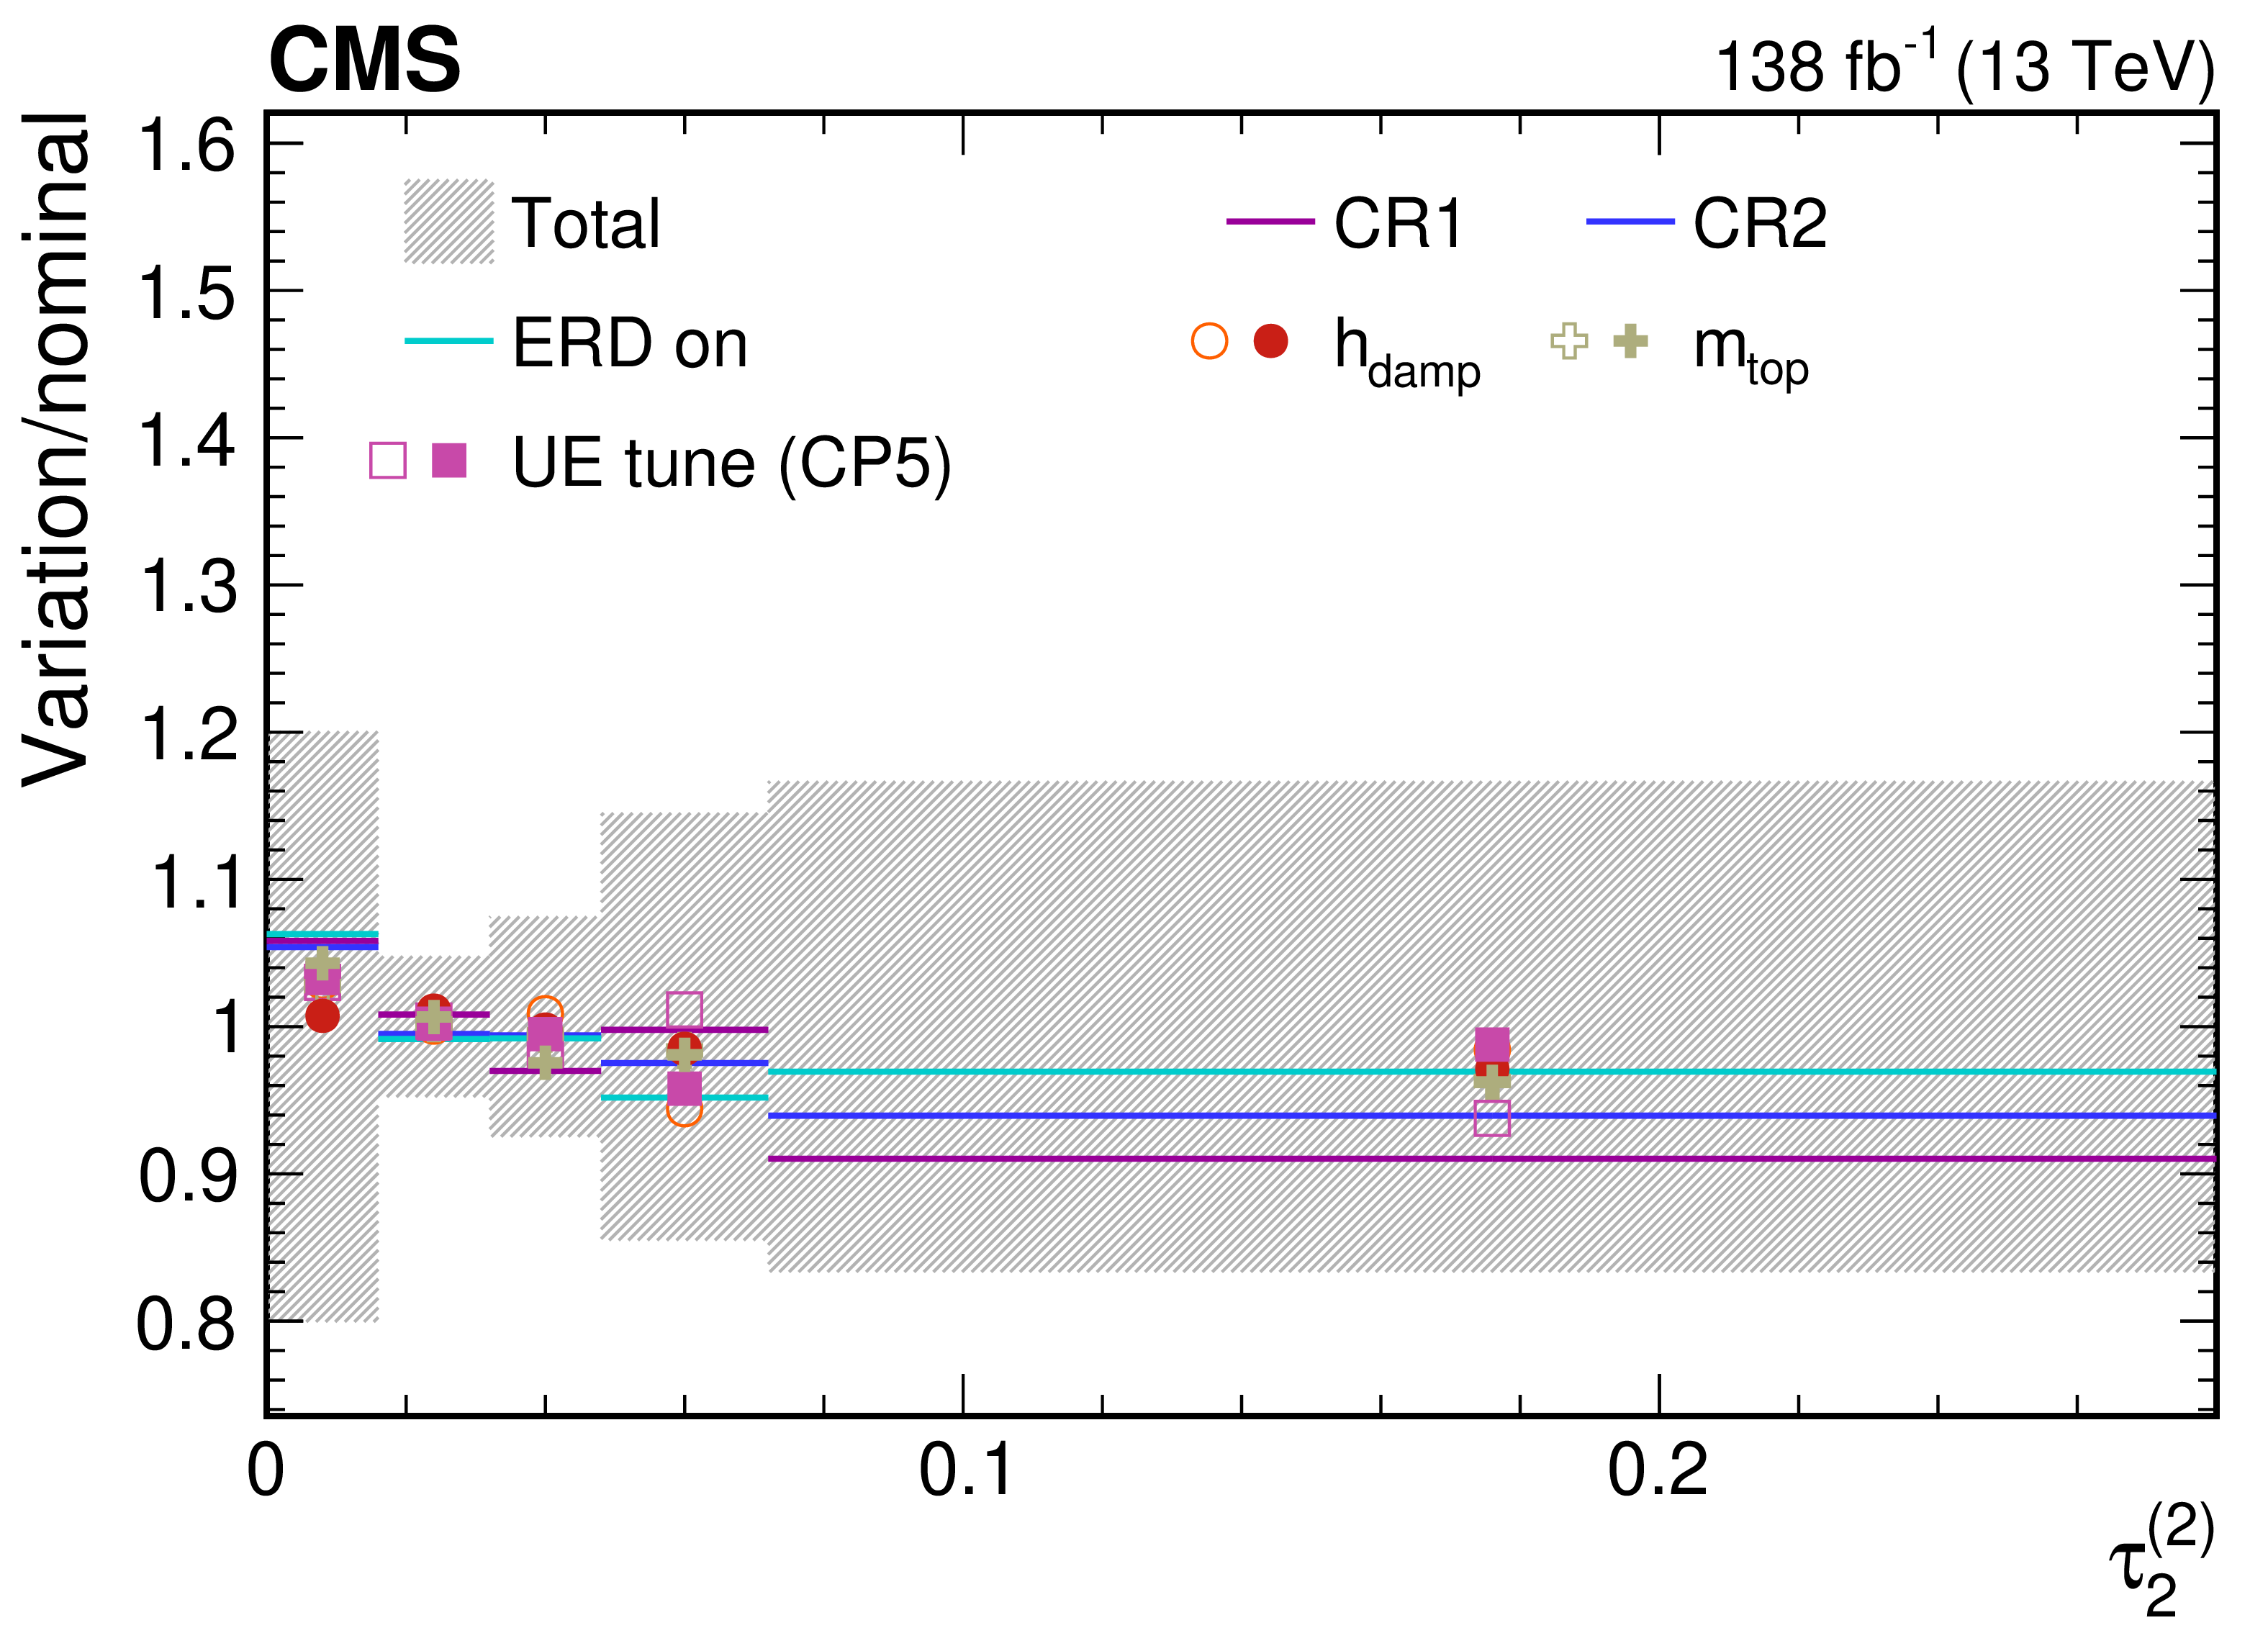
png pdf |
Figure 54-e:
Contributions from various theory model systematic variations to the normalized, unfolded distribution for $ \tau_2^{(\beta)} $ observables measured for AK8 jets passing the boosted W boson-enriched selection in $ \mu $+jets $ \mathrm{t} \overline{\mathrm{t}} $ events. The total unfolding uncertainty is indicated with the dark grey, hashed region, while the blue hashed region indicates the contributions from the input covariance matrix, which includes the propagated effects of the statistical uncertainties of the input data after background subtraction. Contributions from statistical uncertainties of the simulated sample used to construct the nominal response matrix are indicated with the dashed black line. The uncertainty contributions for different choices of colour reconnection models are illustrated as one-sided shifts compared to the nominal unfolding, and up (down) contributions from other sources are indicated with filled (open) markers of the same type and colour. |
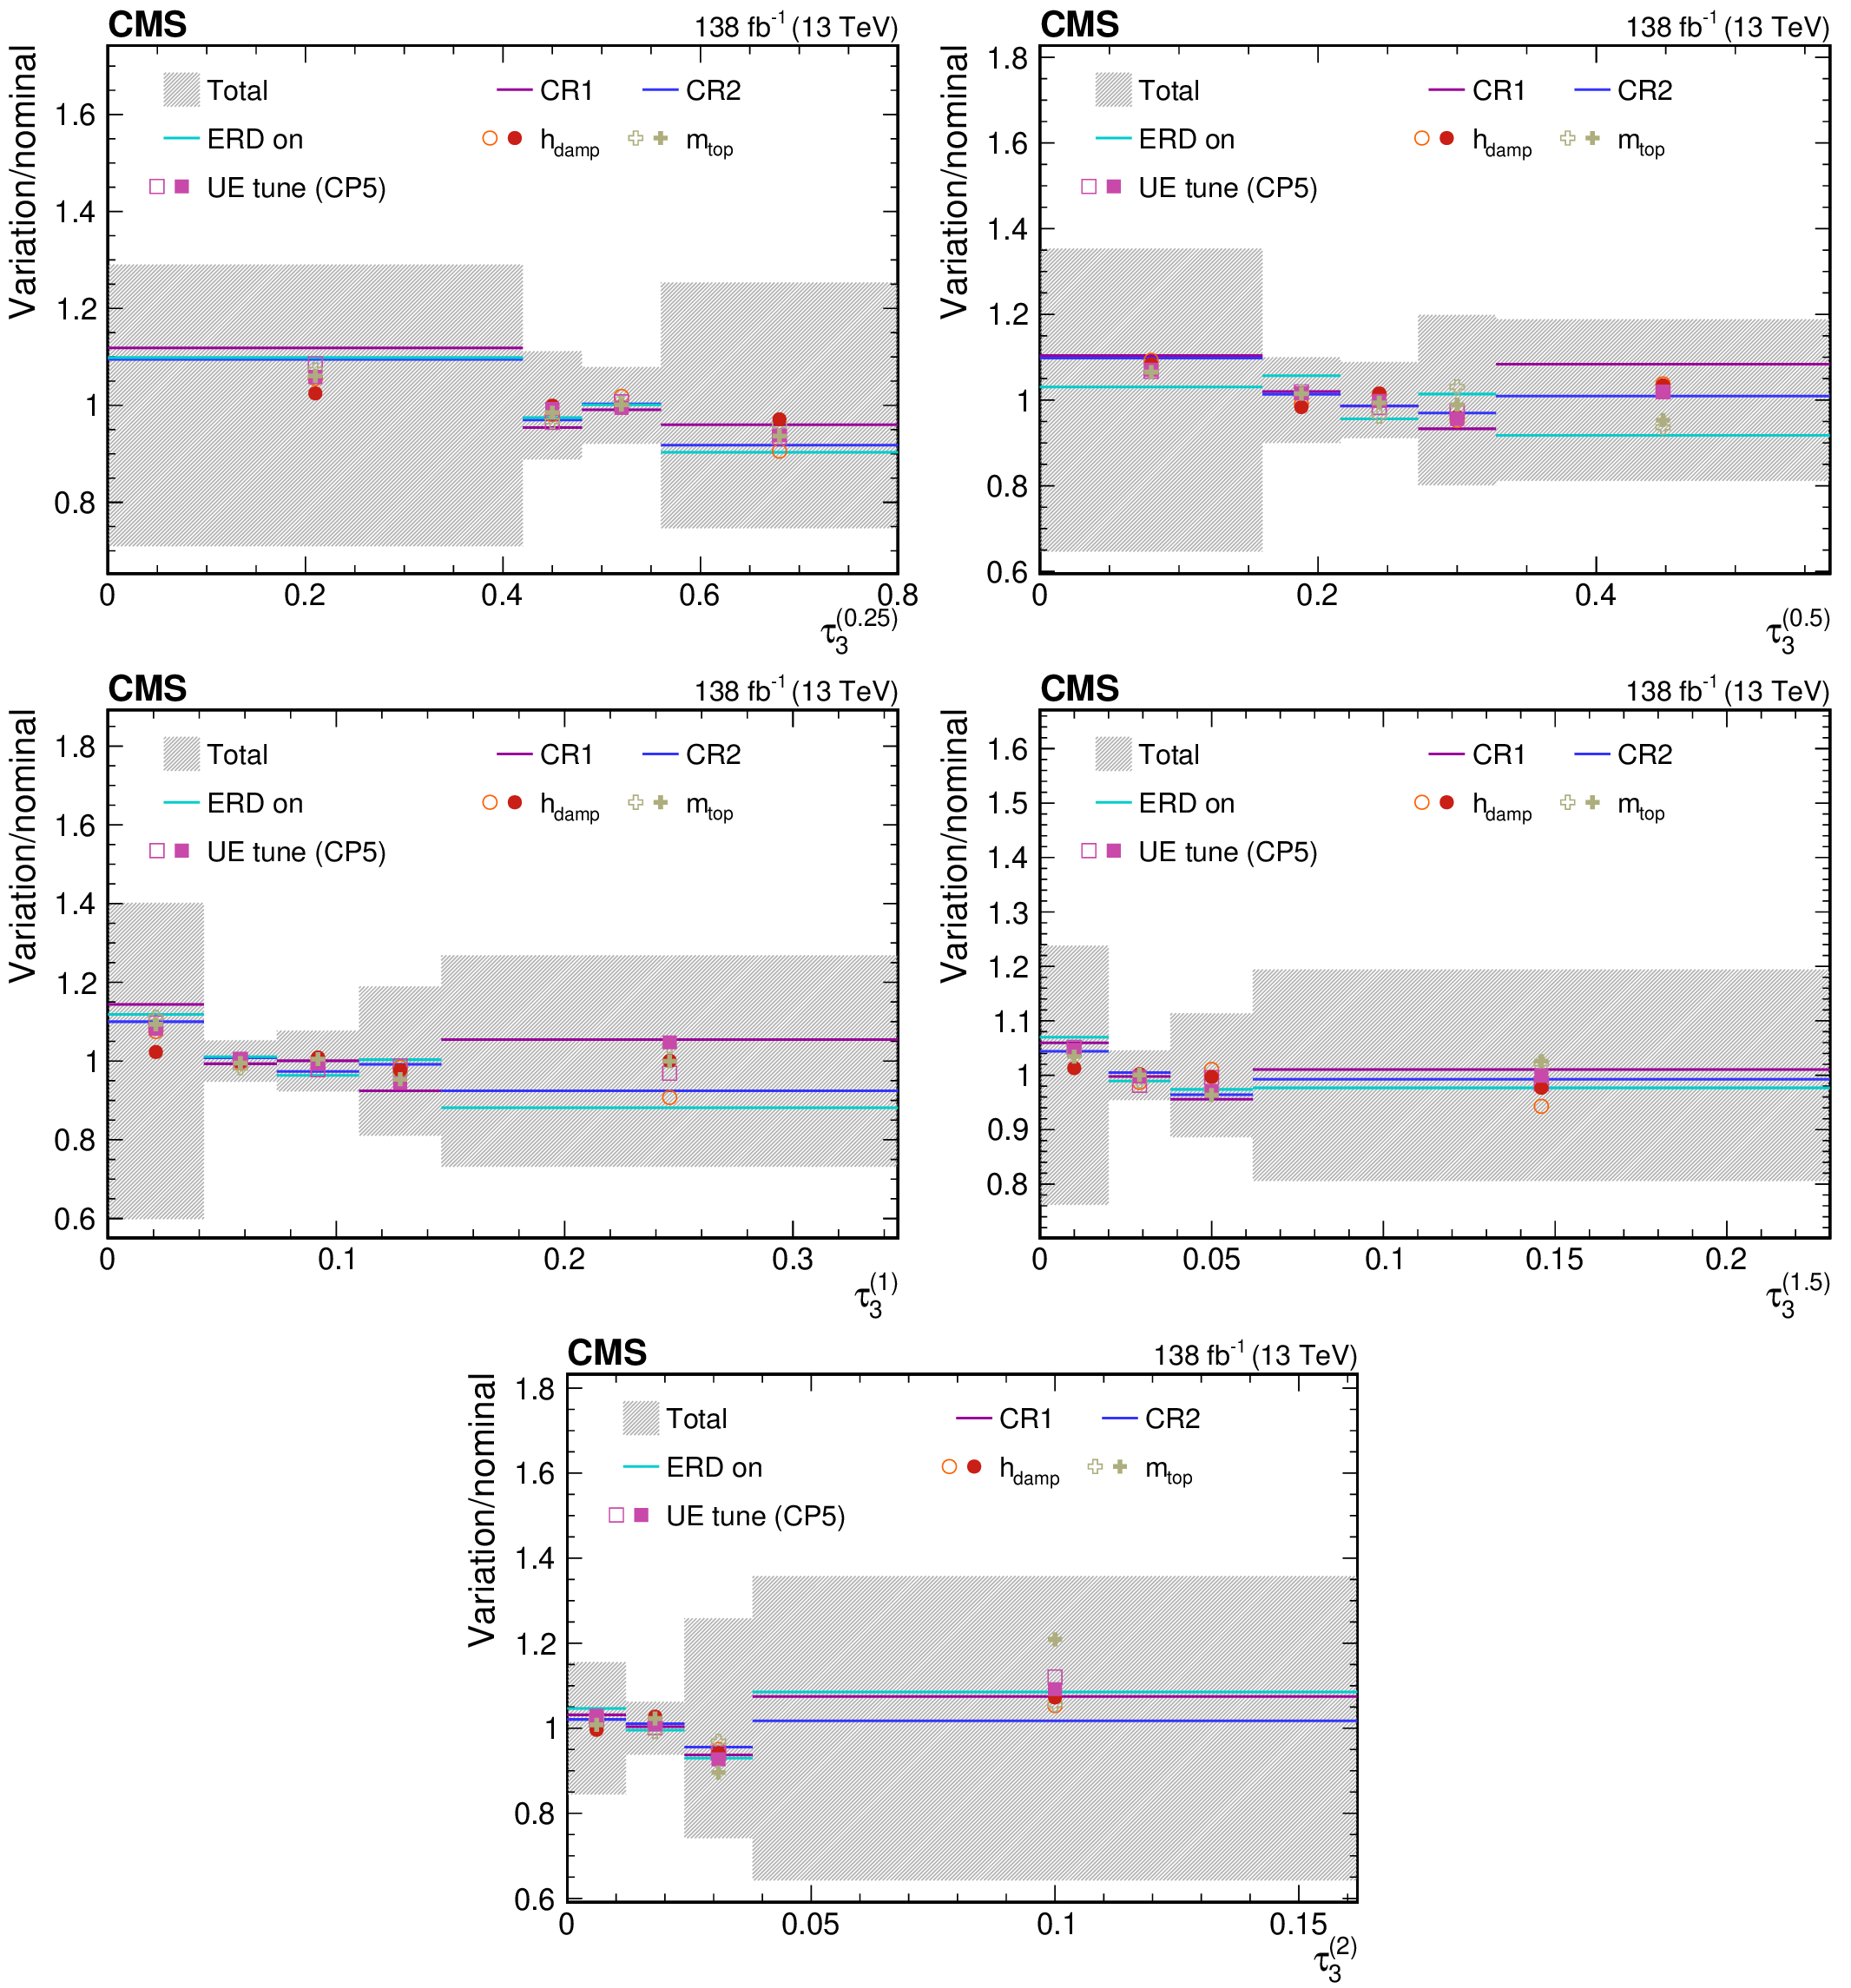
png pdf |
Figure 55:
Contributions from various theory model systematic variations to the normalized, unfolded distribution for $ \tau_3^{(\beta)} $ observables measured for AK8 jets passing the boosted W boson-enriched selection in $ \mu $+jets $ \mathrm{t} \overline{\mathrm{t}} $ events. The total unfolding uncertainty is indicated with the dark grey, hashed region, while the blue hashed region indicates the contributions from the input covariance matrix, which includes the propagated effects of the statistical uncertainties of the input data after background subtraction. Contributions from statistical uncertainties of the simulated sample used to construct the nominal response matrix are indicated with the dashed black line. The uncertainty contributions for different choices of colour reconnection models are illustrated as one-sided shifts compared to the nominal unfolding, and up (down) contributions from other sources are indicated with filled (open) markers of the same type and colour. |
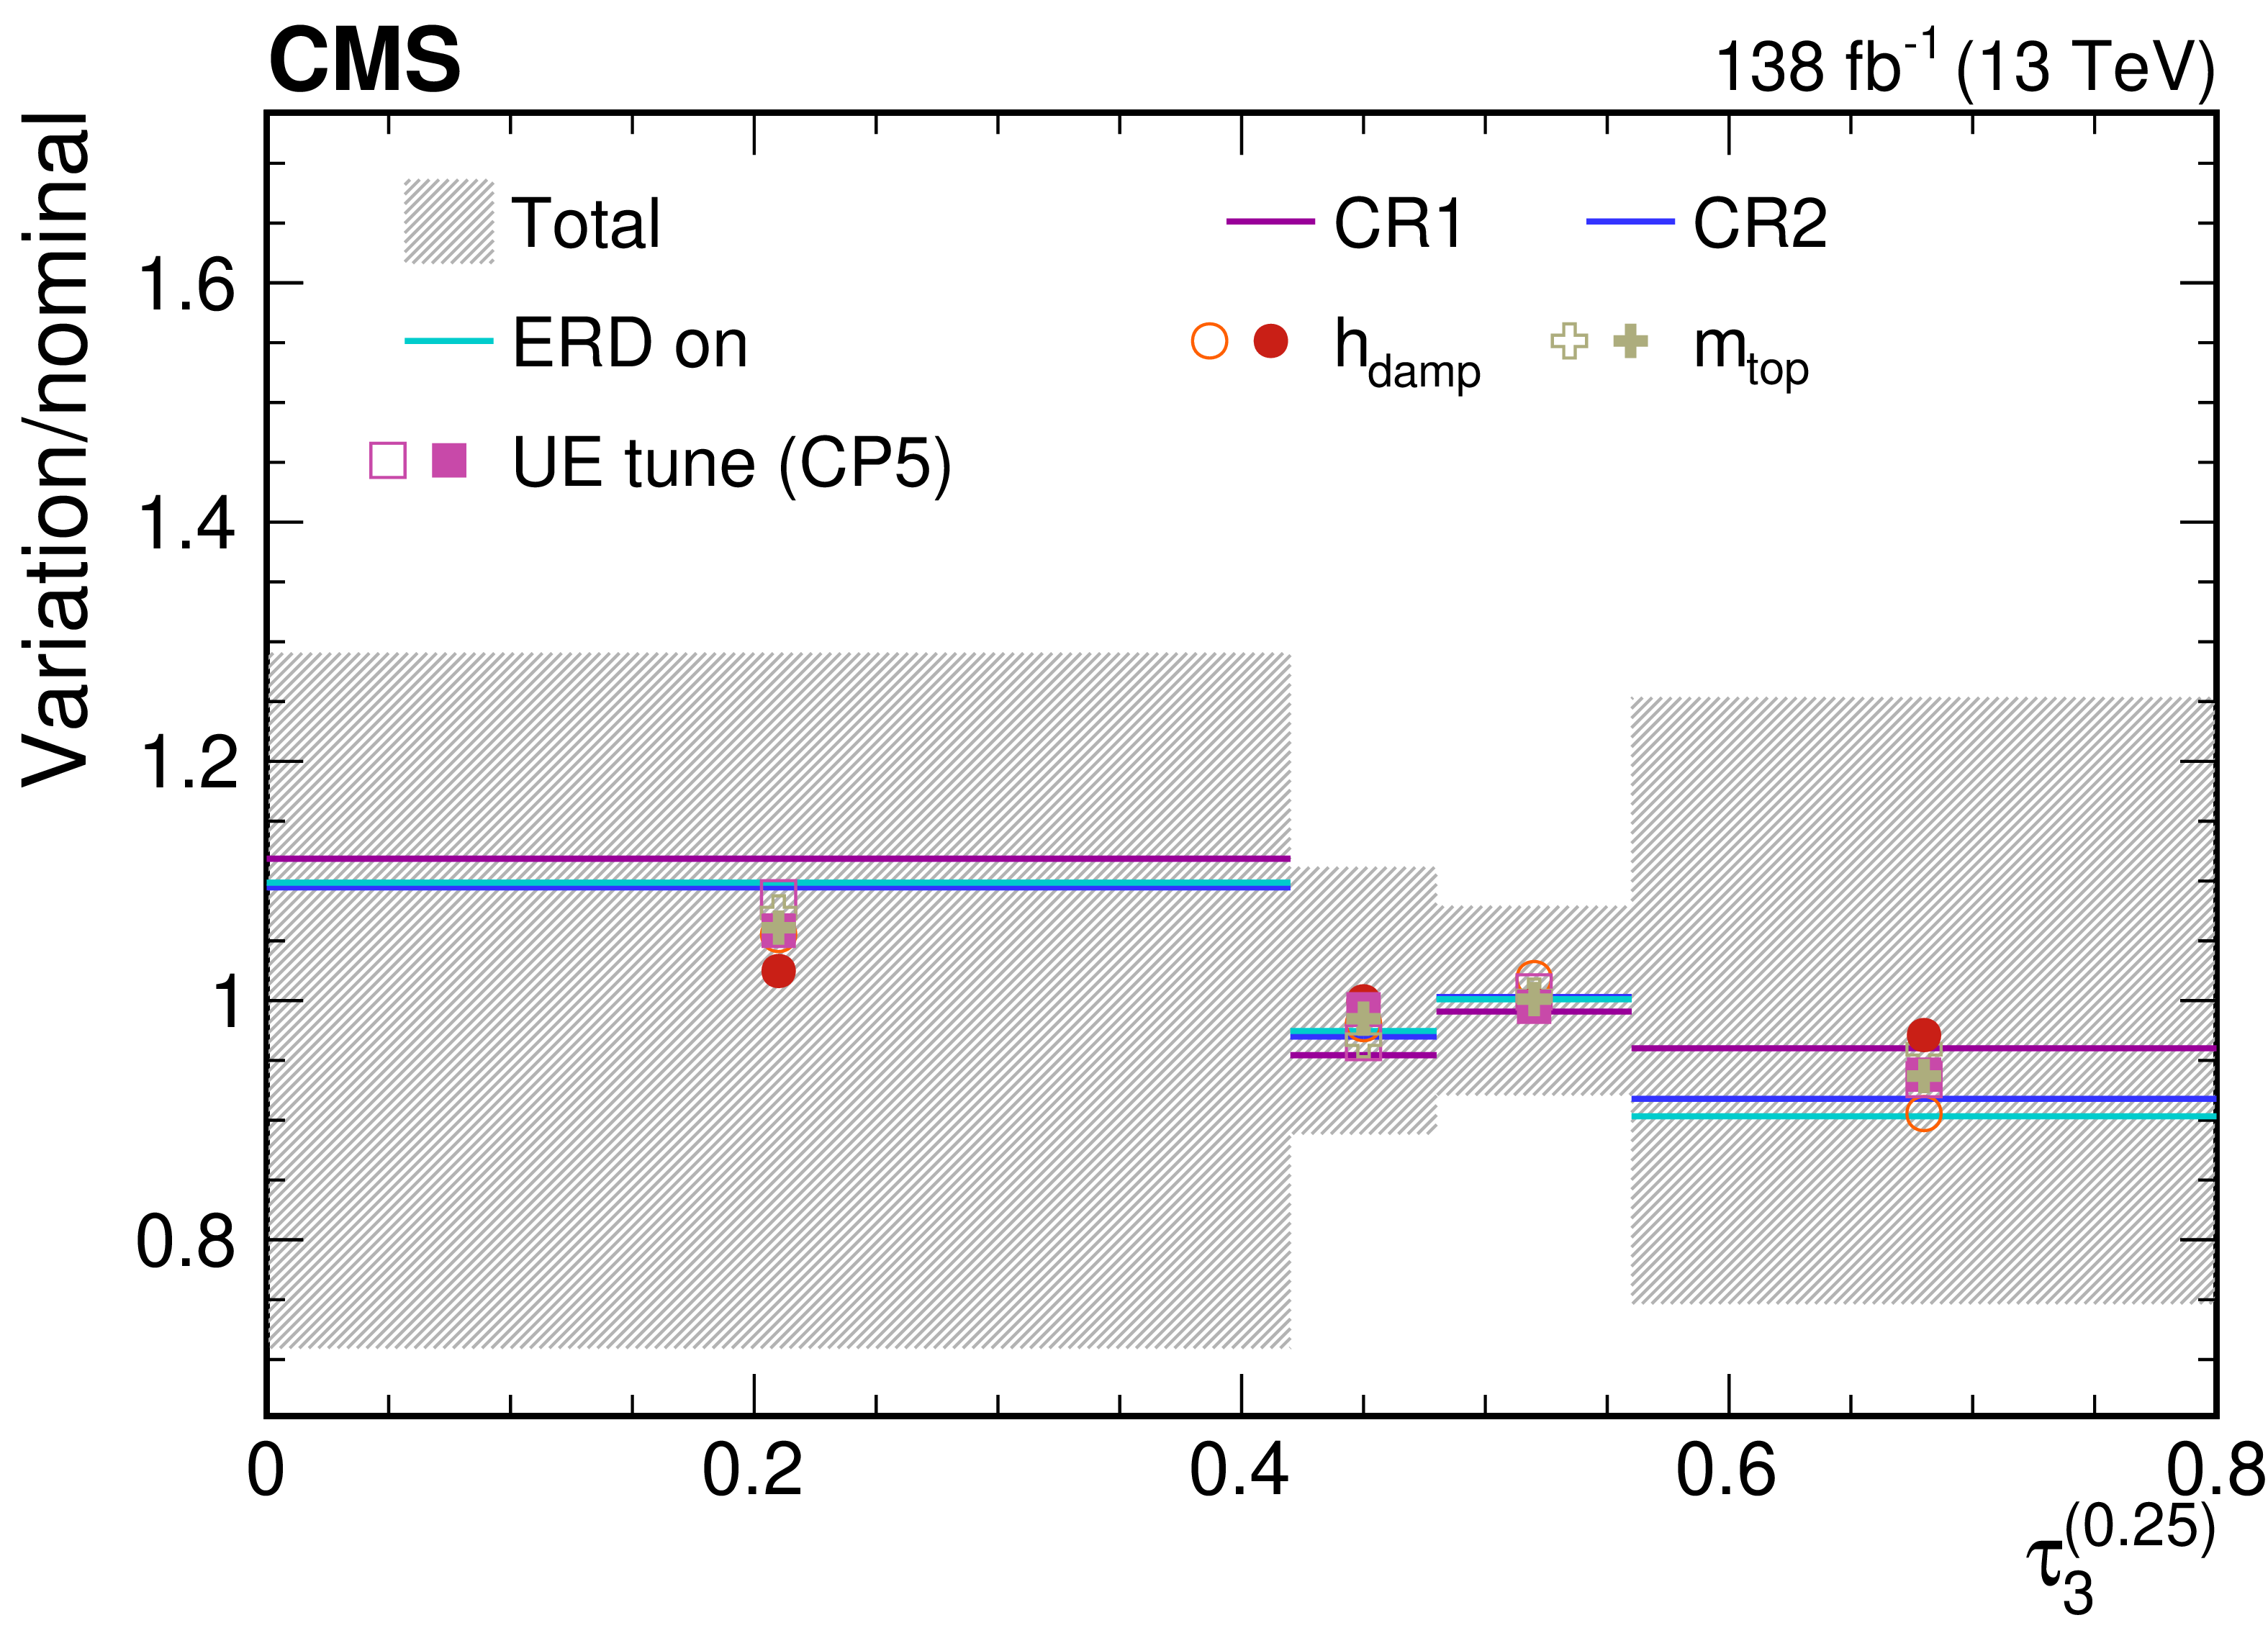
png pdf |
Figure 55-a:
Contributions from various theory model systematic variations to the normalized, unfolded distribution for $ \tau_3^{(\beta)} $ observables measured for AK8 jets passing the boosted W boson-enriched selection in $ \mu $+jets $ \mathrm{t} \overline{\mathrm{t}} $ events. The total unfolding uncertainty is indicated with the dark grey, hashed region, while the blue hashed region indicates the contributions from the input covariance matrix, which includes the propagated effects of the statistical uncertainties of the input data after background subtraction. Contributions from statistical uncertainties of the simulated sample used to construct the nominal response matrix are indicated with the dashed black line. The uncertainty contributions for different choices of colour reconnection models are illustrated as one-sided shifts compared to the nominal unfolding, and up (down) contributions from other sources are indicated with filled (open) markers of the same type and colour. |
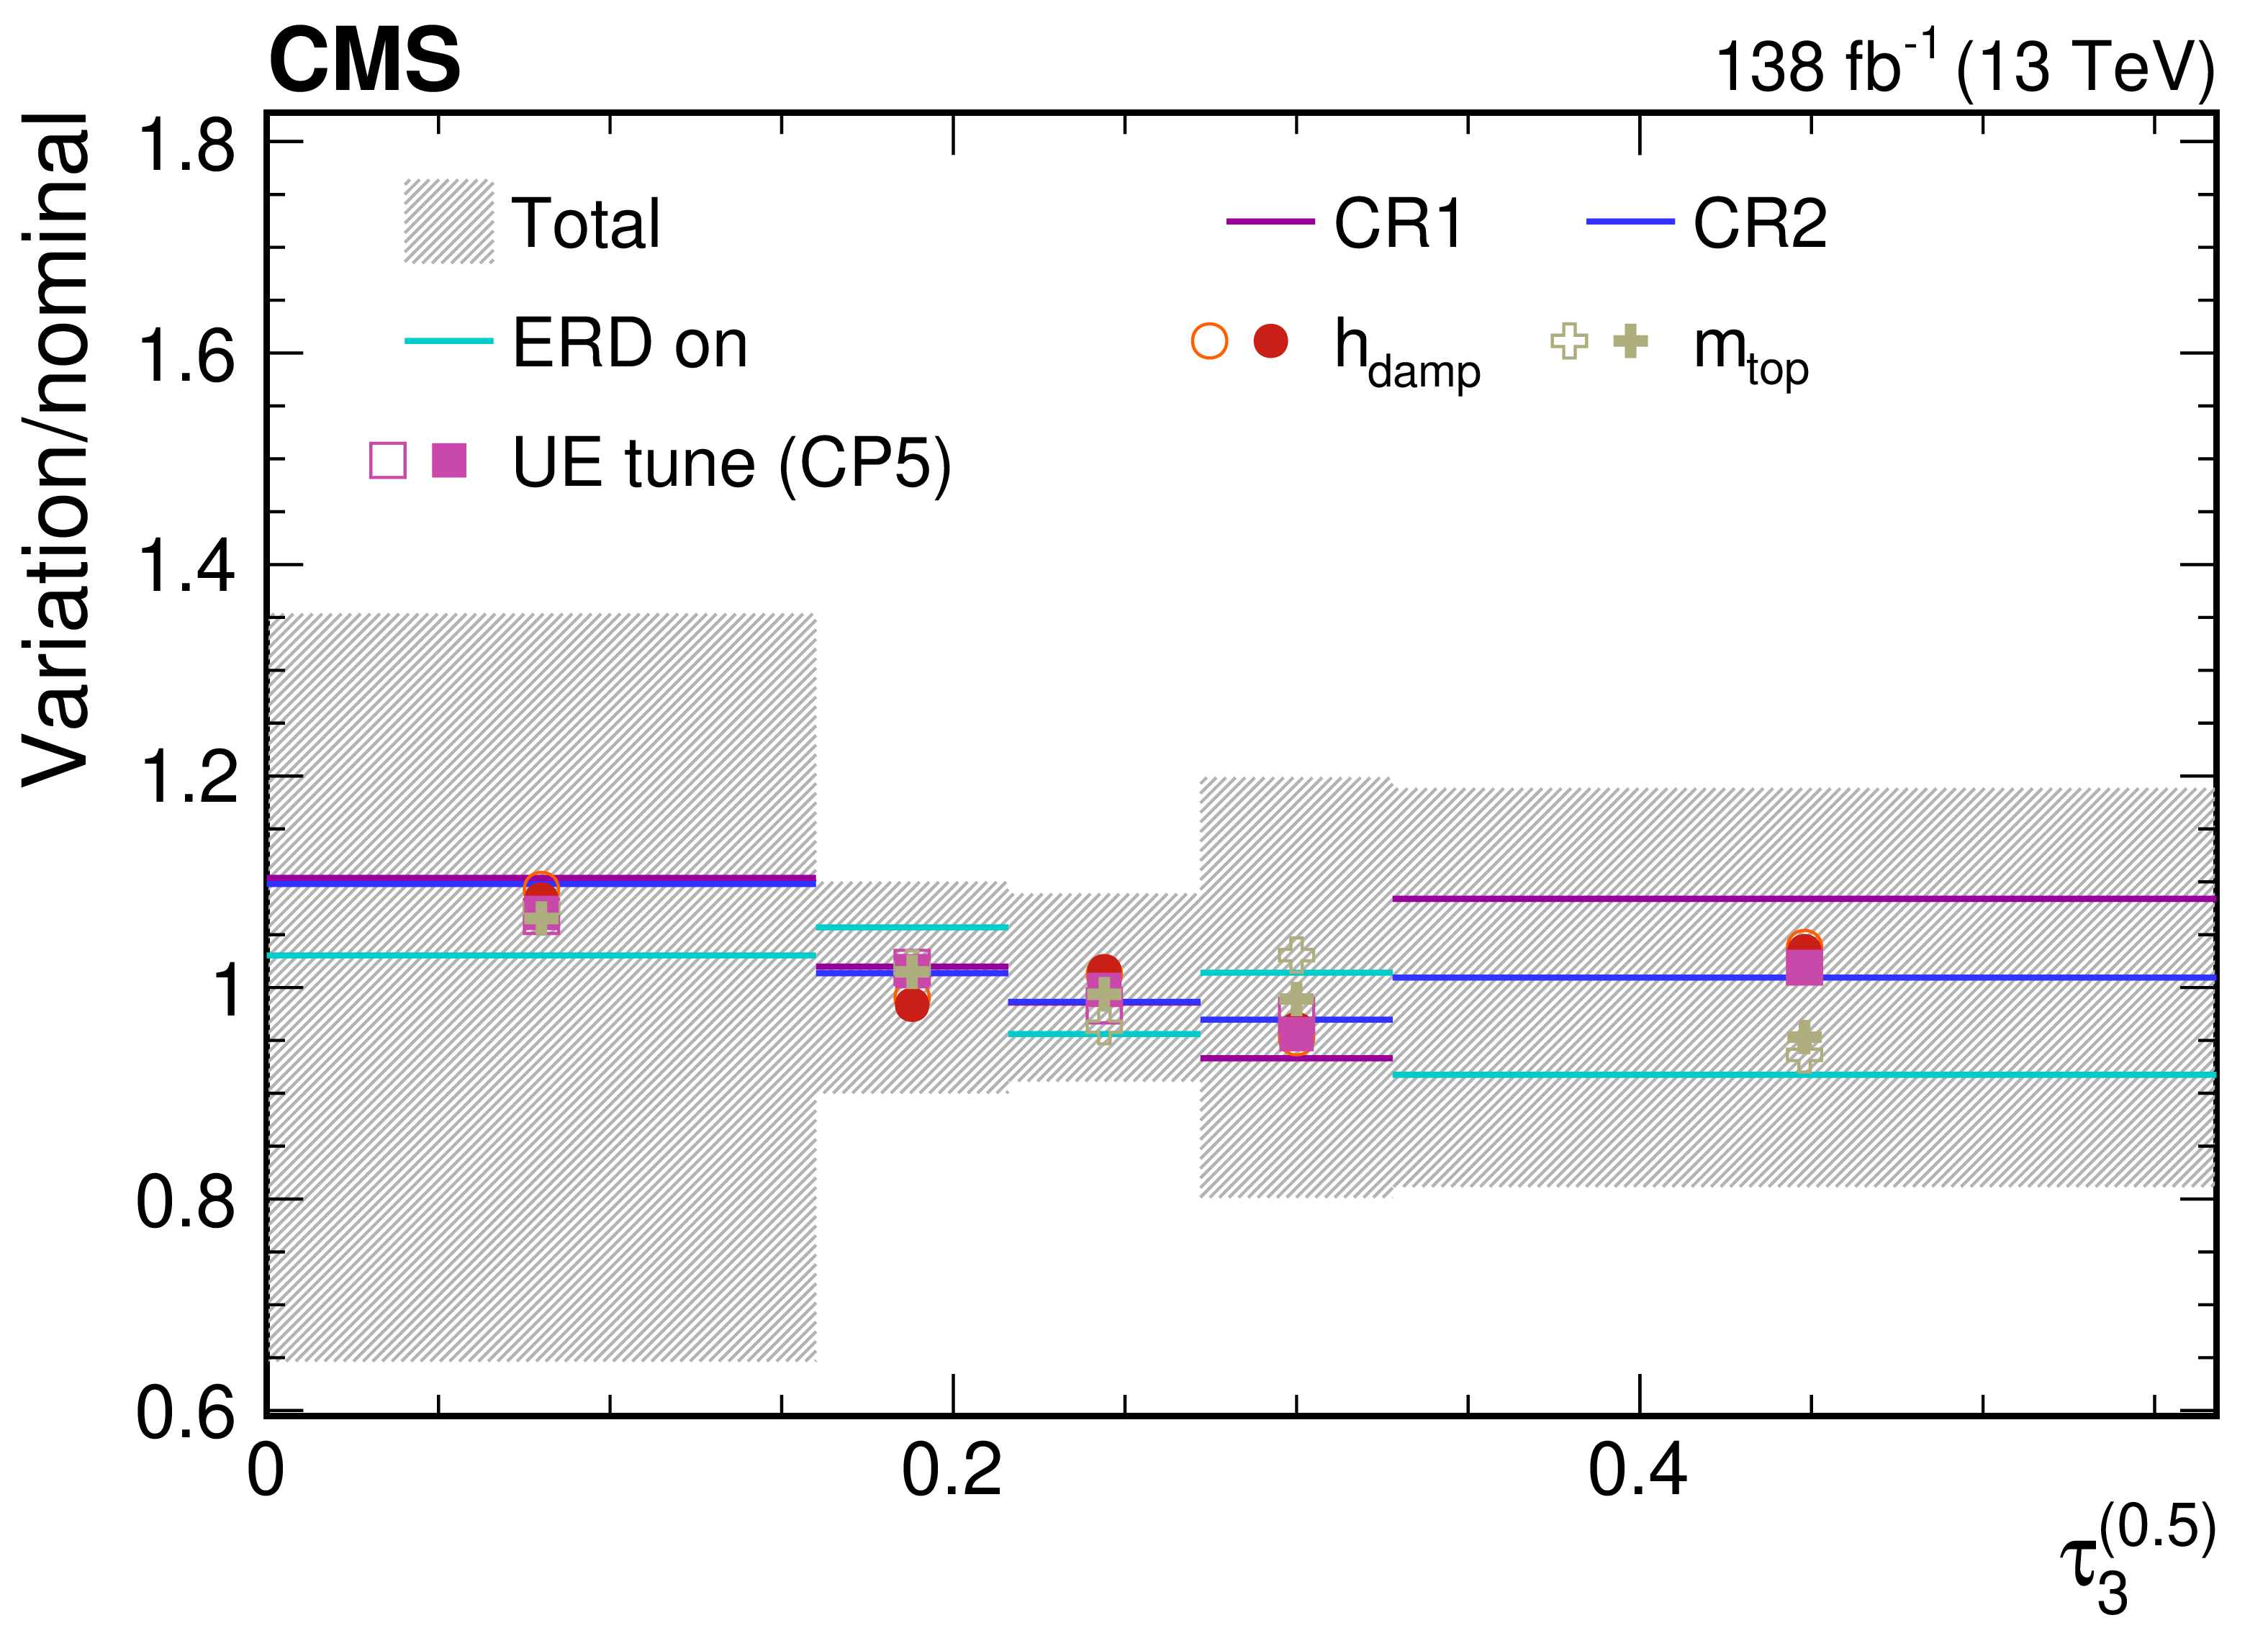
png pdf |
Figure 55-b:
Contributions from various theory model systematic variations to the normalized, unfolded distribution for $ \tau_3^{(\beta)} $ observables measured for AK8 jets passing the boosted W boson-enriched selection in $ \mu $+jets $ \mathrm{t} \overline{\mathrm{t}} $ events. The total unfolding uncertainty is indicated with the dark grey, hashed region, while the blue hashed region indicates the contributions from the input covariance matrix, which includes the propagated effects of the statistical uncertainties of the input data after background subtraction. Contributions from statistical uncertainties of the simulated sample used to construct the nominal response matrix are indicated with the dashed black line. The uncertainty contributions for different choices of colour reconnection models are illustrated as one-sided shifts compared to the nominal unfolding, and up (down) contributions from other sources are indicated with filled (open) markers of the same type and colour. |
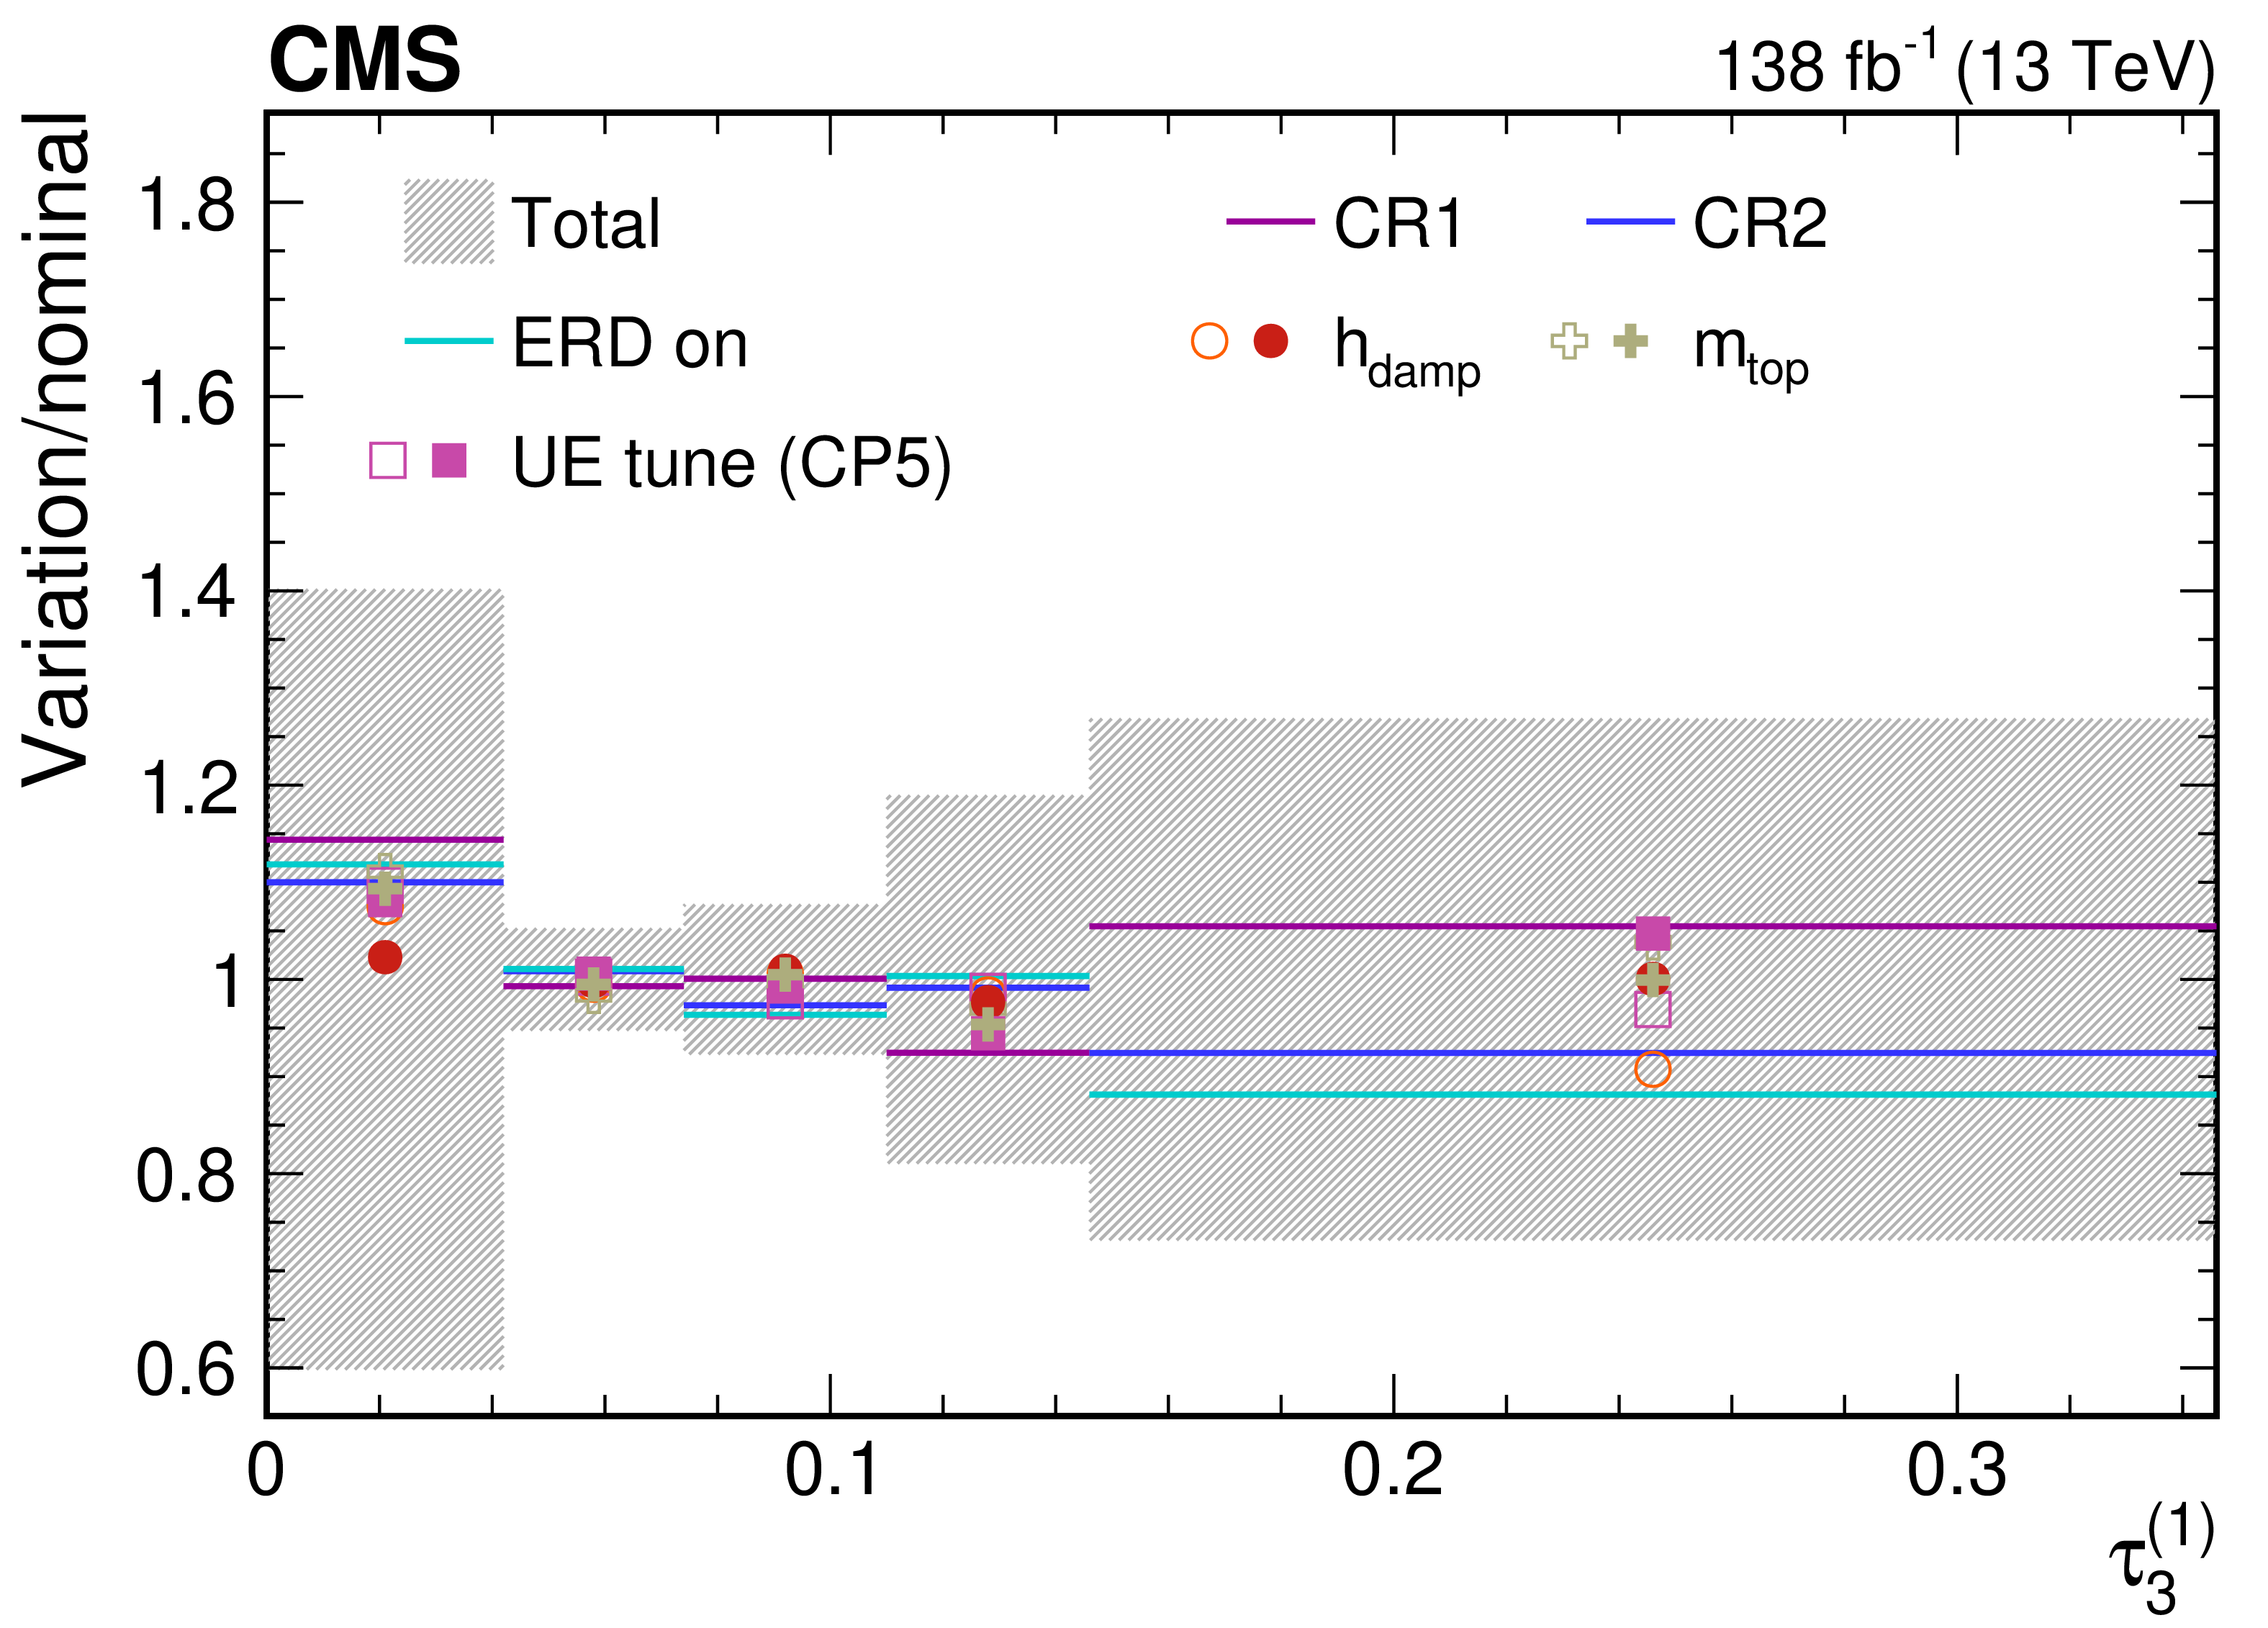
png pdf |
Figure 55-c:
Contributions from various theory model systematic variations to the normalized, unfolded distribution for $ \tau_3^{(\beta)} $ observables measured for AK8 jets passing the boosted W boson-enriched selection in $ \mu $+jets $ \mathrm{t} \overline{\mathrm{t}} $ events. The total unfolding uncertainty is indicated with the dark grey, hashed region, while the blue hashed region indicates the contributions from the input covariance matrix, which includes the propagated effects of the statistical uncertainties of the input data after background subtraction. Contributions from statistical uncertainties of the simulated sample used to construct the nominal response matrix are indicated with the dashed black line. The uncertainty contributions for different choices of colour reconnection models are illustrated as one-sided shifts compared to the nominal unfolding, and up (down) contributions from other sources are indicated with filled (open) markers of the same type and colour. |
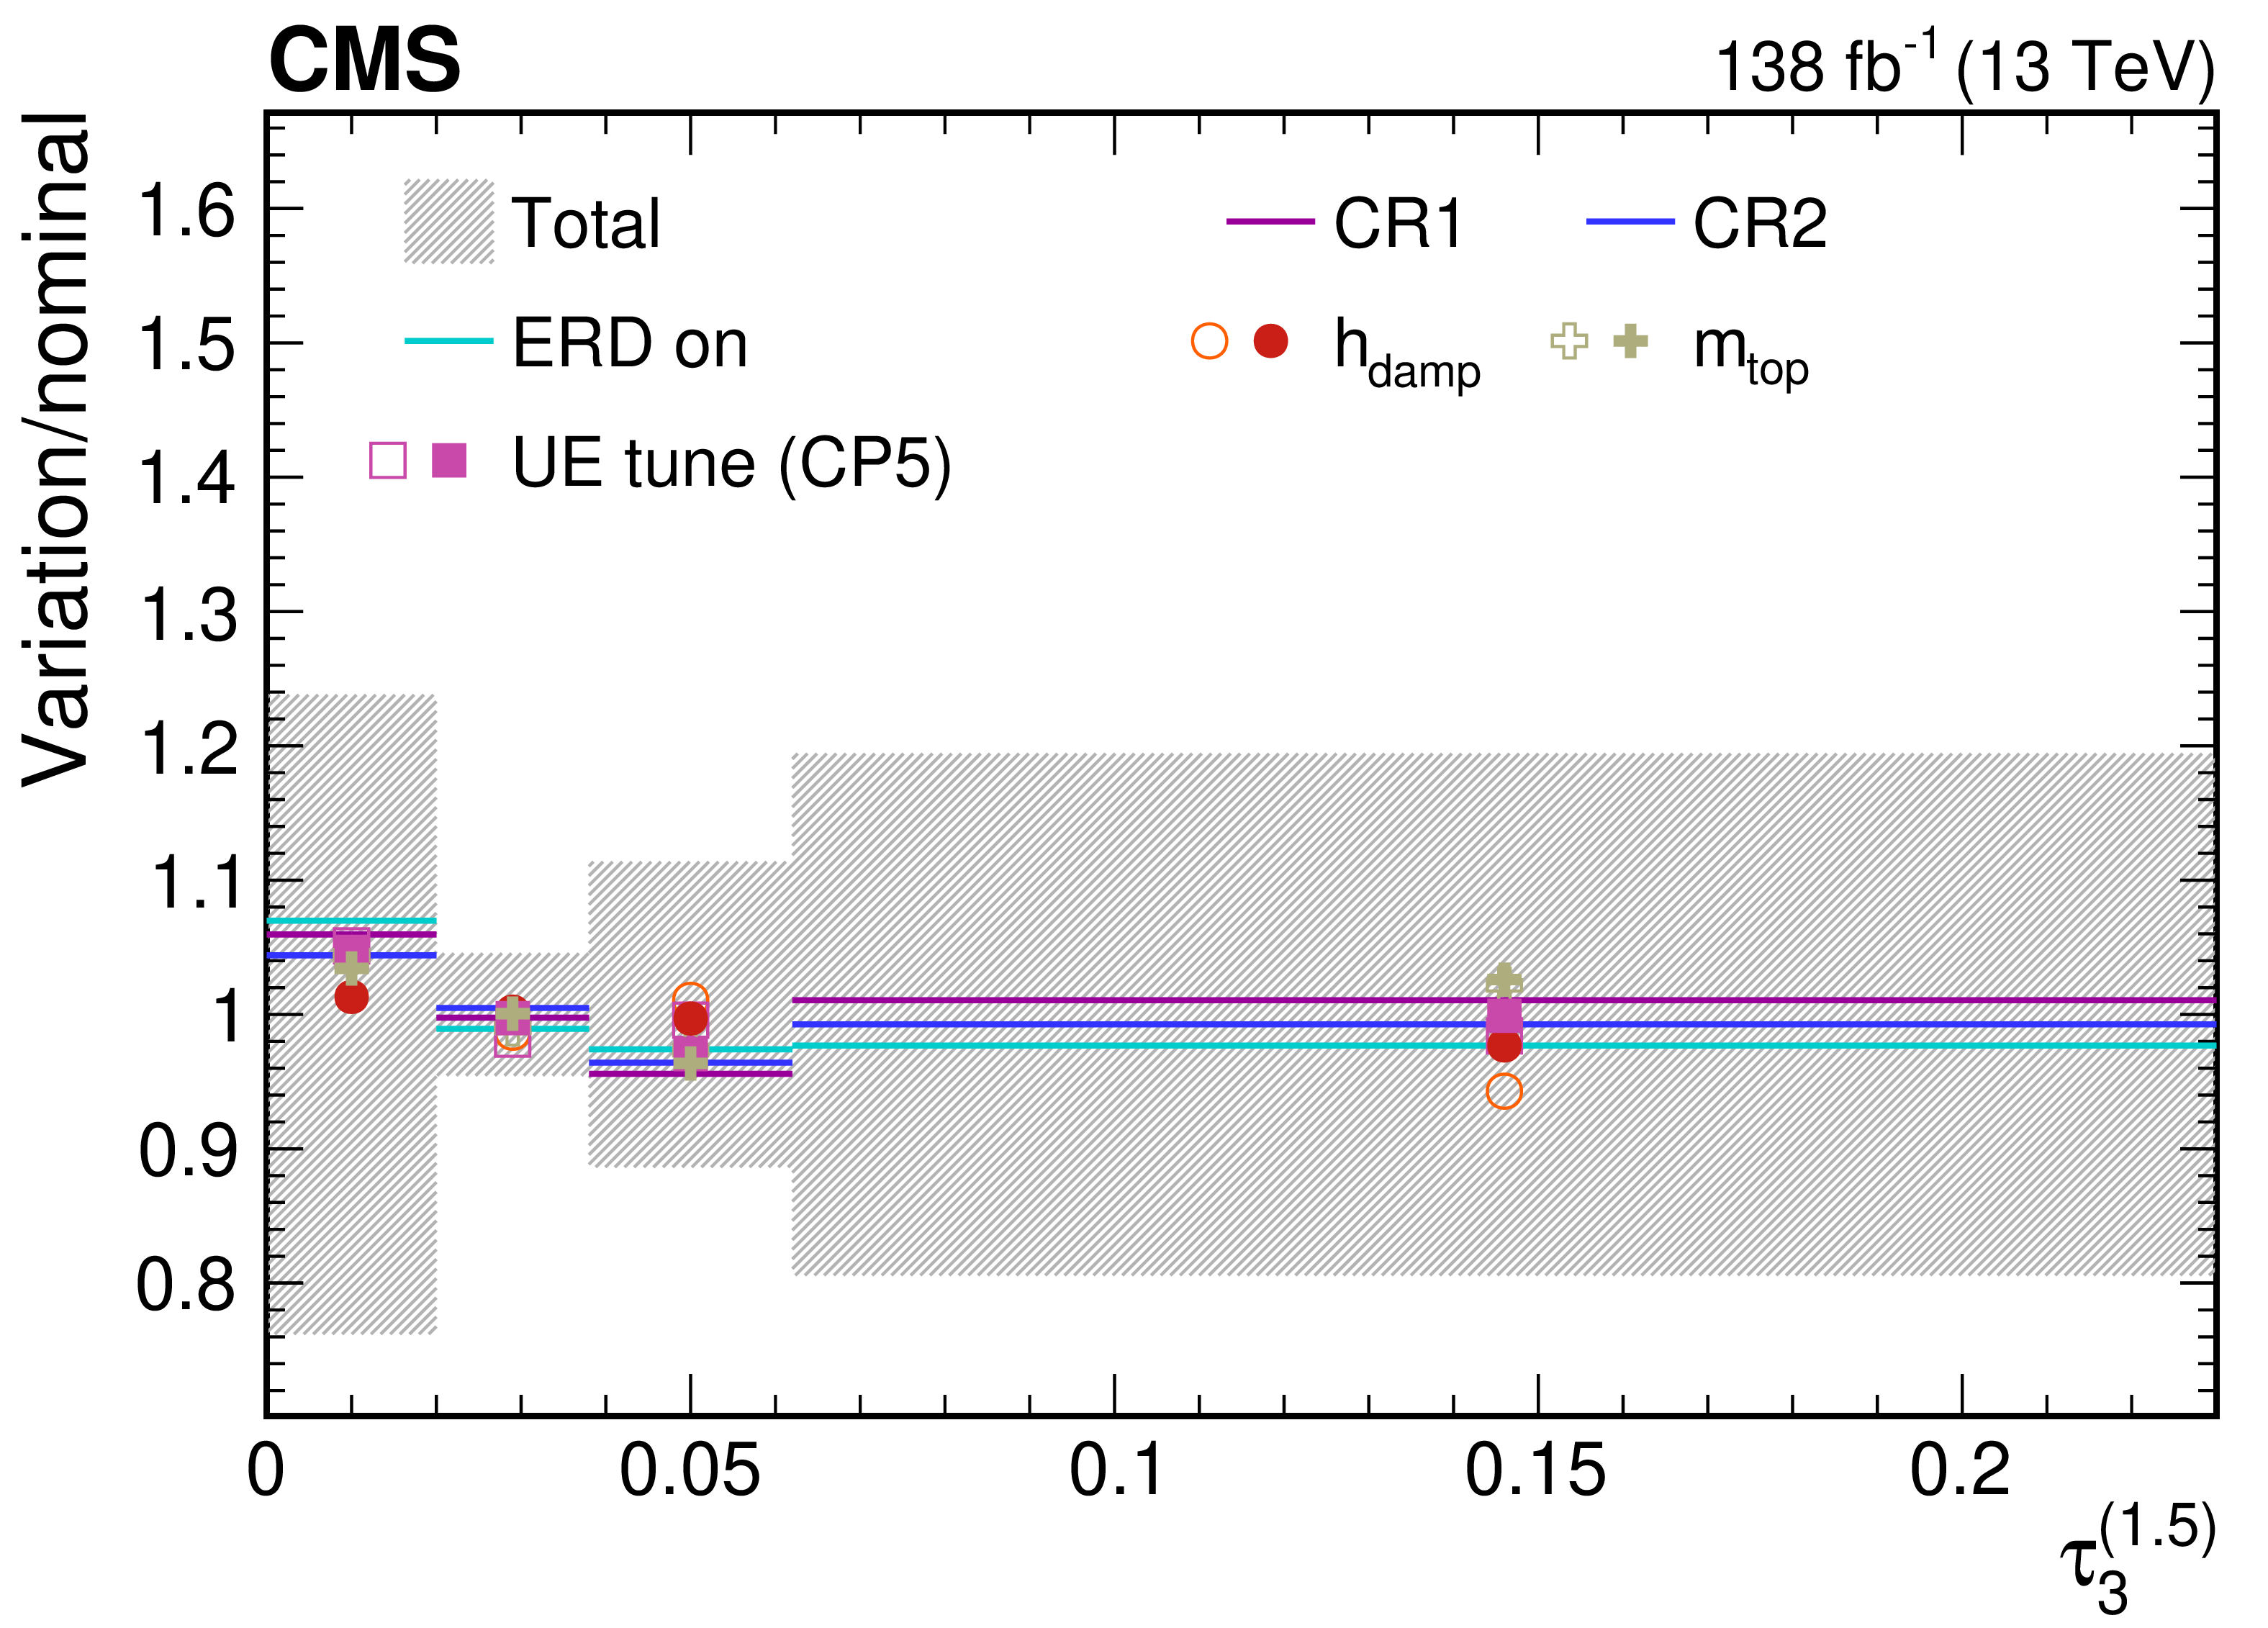
png pdf |
Figure 55-d:
Contributions from various theory model systematic variations to the normalized, unfolded distribution for $ \tau_3^{(\beta)} $ observables measured for AK8 jets passing the boosted W boson-enriched selection in $ \mu $+jets $ \mathrm{t} \overline{\mathrm{t}} $ events. The total unfolding uncertainty is indicated with the dark grey, hashed region, while the blue hashed region indicates the contributions from the input covariance matrix, which includes the propagated effects of the statistical uncertainties of the input data after background subtraction. Contributions from statistical uncertainties of the simulated sample used to construct the nominal response matrix are indicated with the dashed black line. The uncertainty contributions for different choices of colour reconnection models are illustrated as one-sided shifts compared to the nominal unfolding, and up (down) contributions from other sources are indicated with filled (open) markers of the same type and colour. |
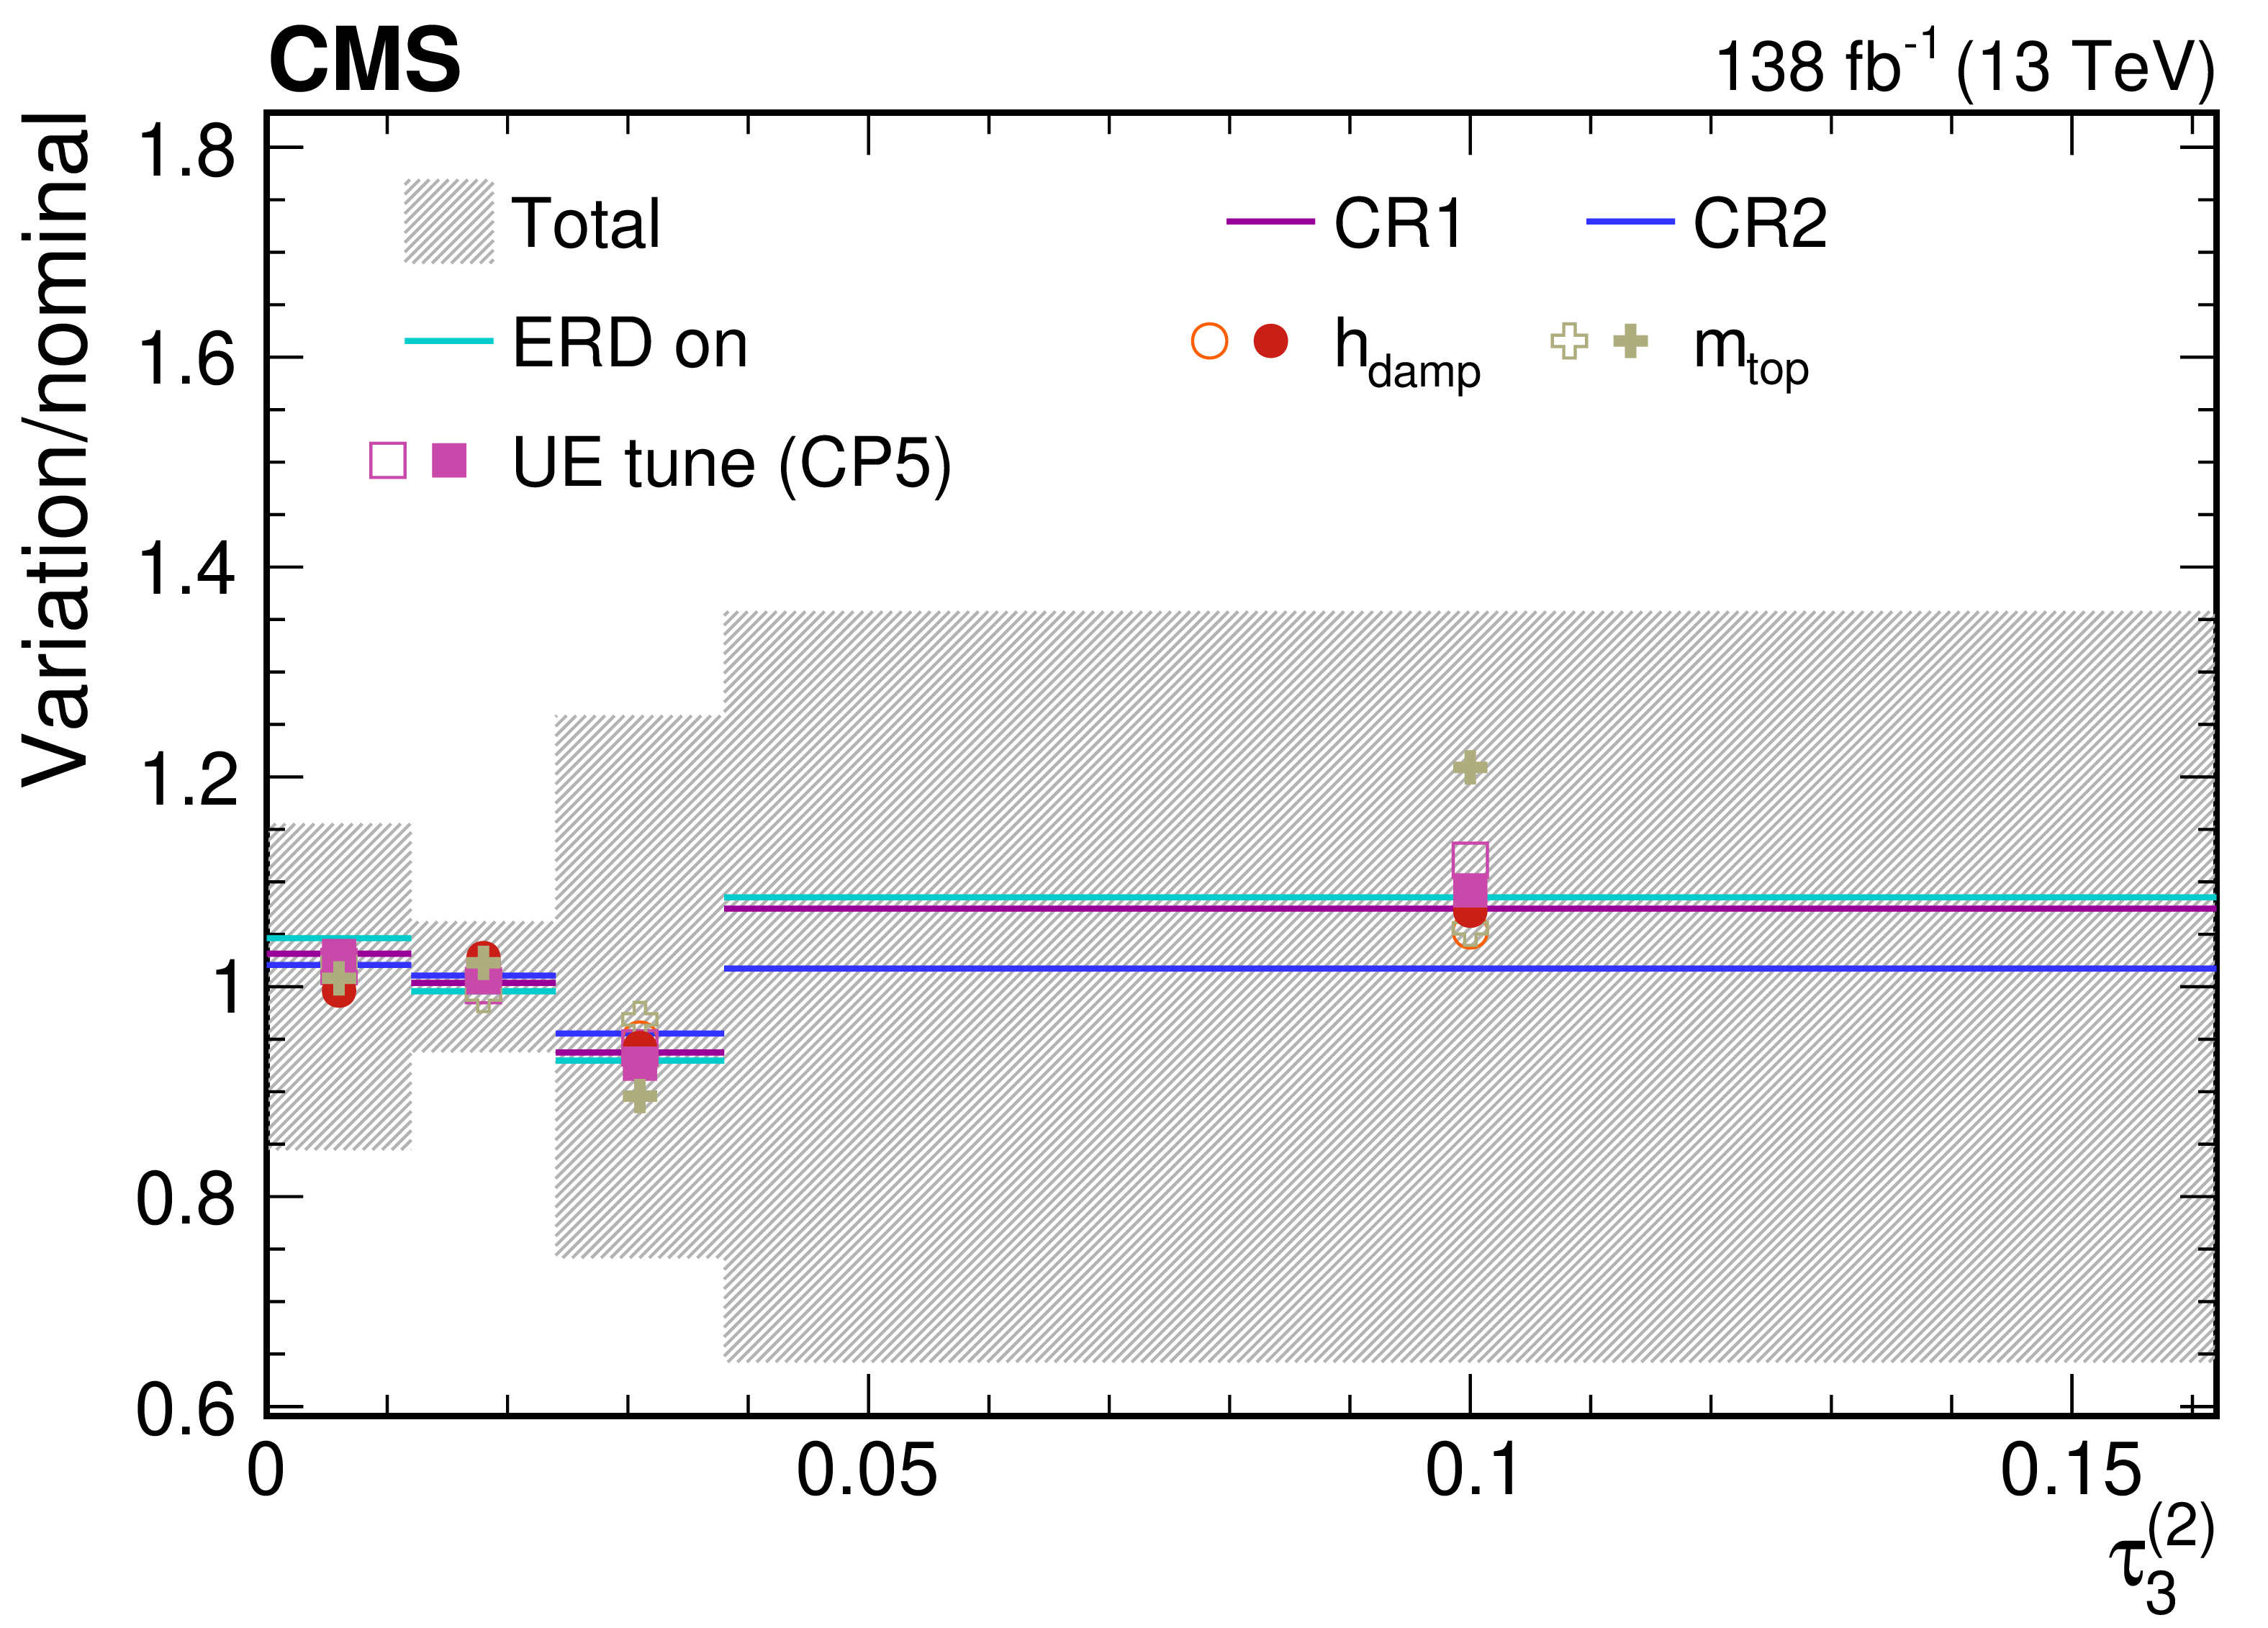
png pdf |
Figure 55-e:
Contributions from various theory model systematic variations to the normalized, unfolded distribution for $ \tau_3^{(\beta)} $ observables measured for AK8 jets passing the boosted W boson-enriched selection in $ \mu $+jets $ \mathrm{t} \overline{\mathrm{t}} $ events. The total unfolding uncertainty is indicated with the dark grey, hashed region, while the blue hashed region indicates the contributions from the input covariance matrix, which includes the propagated effects of the statistical uncertainties of the input data after background subtraction. Contributions from statistical uncertainties of the simulated sample used to construct the nominal response matrix are indicated with the dashed black line. The uncertainty contributions for different choices of colour reconnection models are illustrated as one-sided shifts compared to the nominal unfolding, and up (down) contributions from other sources are indicated with filled (open) markers of the same type and colour. |
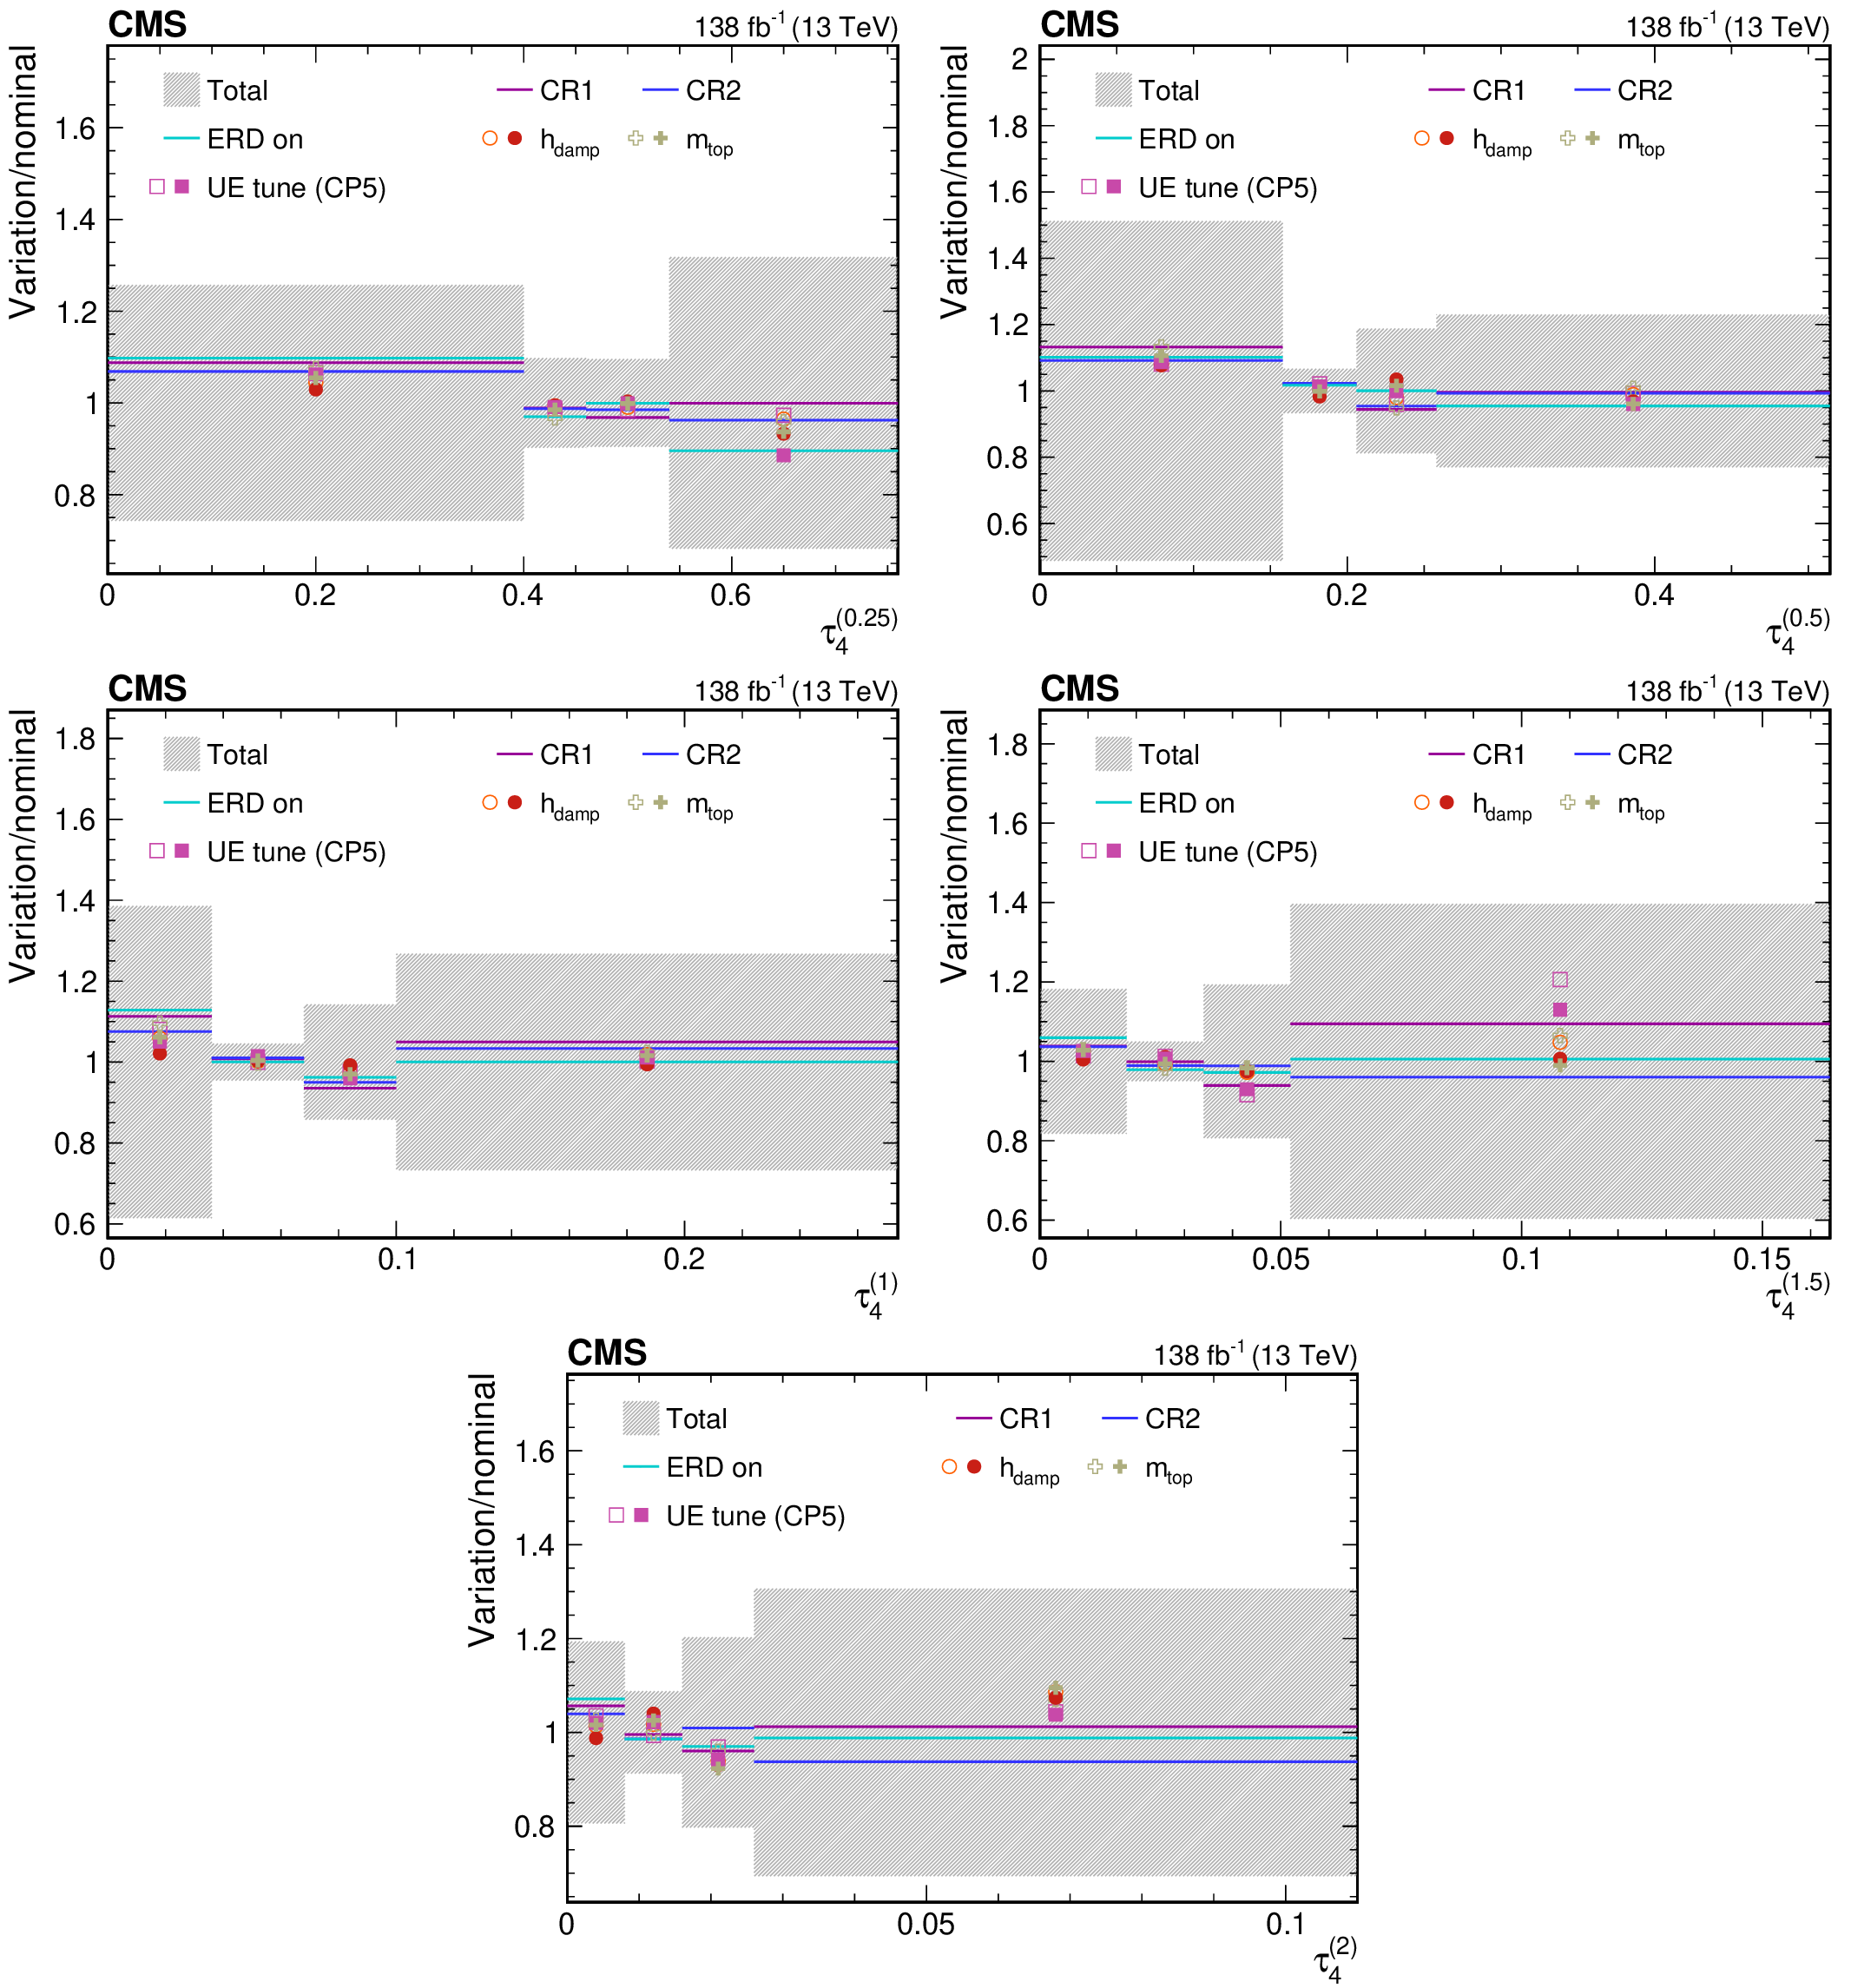
png pdf |
Figure 56:
Contributions from various theory model systematic variations to the normalized, unfolded distribution for $ \tau_4^{(\beta)} $ observables measured for AK8 jets passing the boosted W boson-enriched selection in $ \mu $+jets $ \mathrm{t} \overline{\mathrm{t}} $ events. The total unfolding uncertainty is indicated with the dark grey, hashed region, while the blue hashed region indicates the contributions from the input covariance matrix, which includes the propagated effects of the statistical uncertainties of the input data after background subtraction. Contributions from statistical uncertainties of the simulated sample used to construct the nominal response matrix are indicated with the dashed black line. The uncertainty contributions for different choices of colour reconnection models are illustrated as one-sided shifts compared to the nominal unfolding, and up (down) contributions from other sources are indicated with filled (open) markers of the same type and colour. |
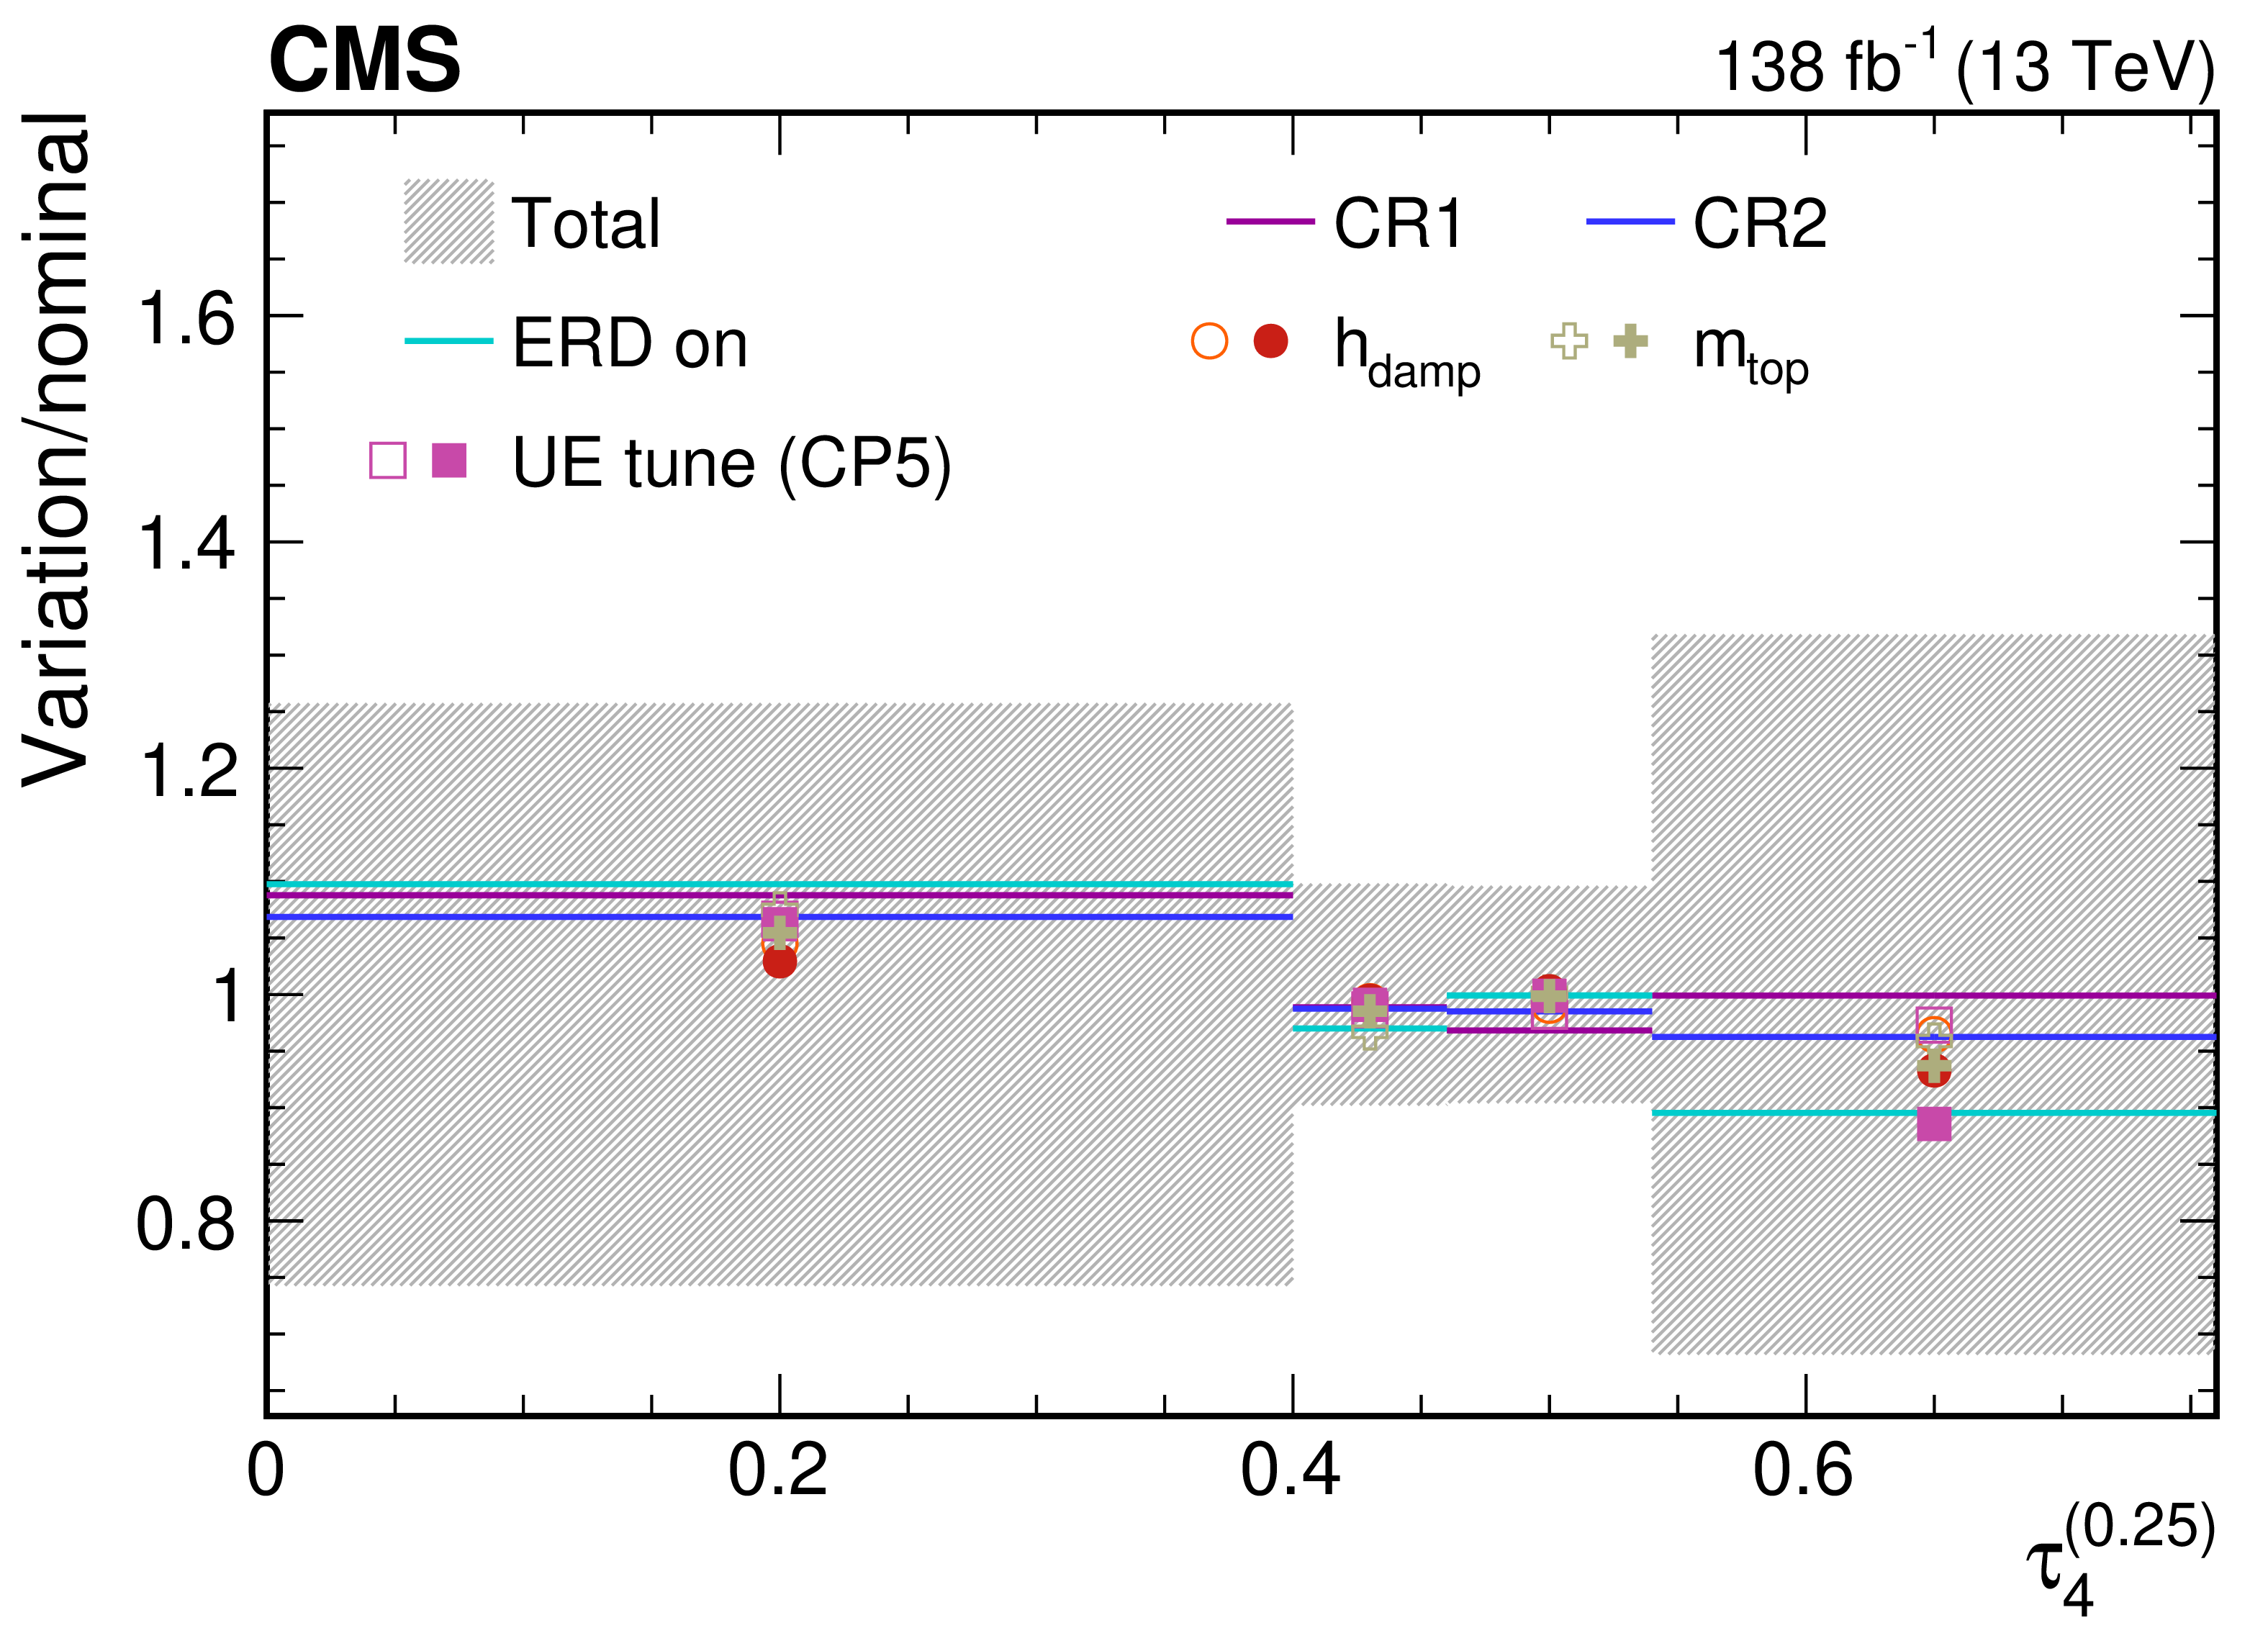
png pdf |
Figure 56-a:
Contributions from various theory model systematic variations to the normalized, unfolded distribution for $ \tau_4^{(\beta)} $ observables measured for AK8 jets passing the boosted W boson-enriched selection in $ \mu $+jets $ \mathrm{t} \overline{\mathrm{t}} $ events. The total unfolding uncertainty is indicated with the dark grey, hashed region, while the blue hashed region indicates the contributions from the input covariance matrix, which includes the propagated effects of the statistical uncertainties of the input data after background subtraction. Contributions from statistical uncertainties of the simulated sample used to construct the nominal response matrix are indicated with the dashed black line. The uncertainty contributions for different choices of colour reconnection models are illustrated as one-sided shifts compared to the nominal unfolding, and up (down) contributions from other sources are indicated with filled (open) markers of the same type and colour. |
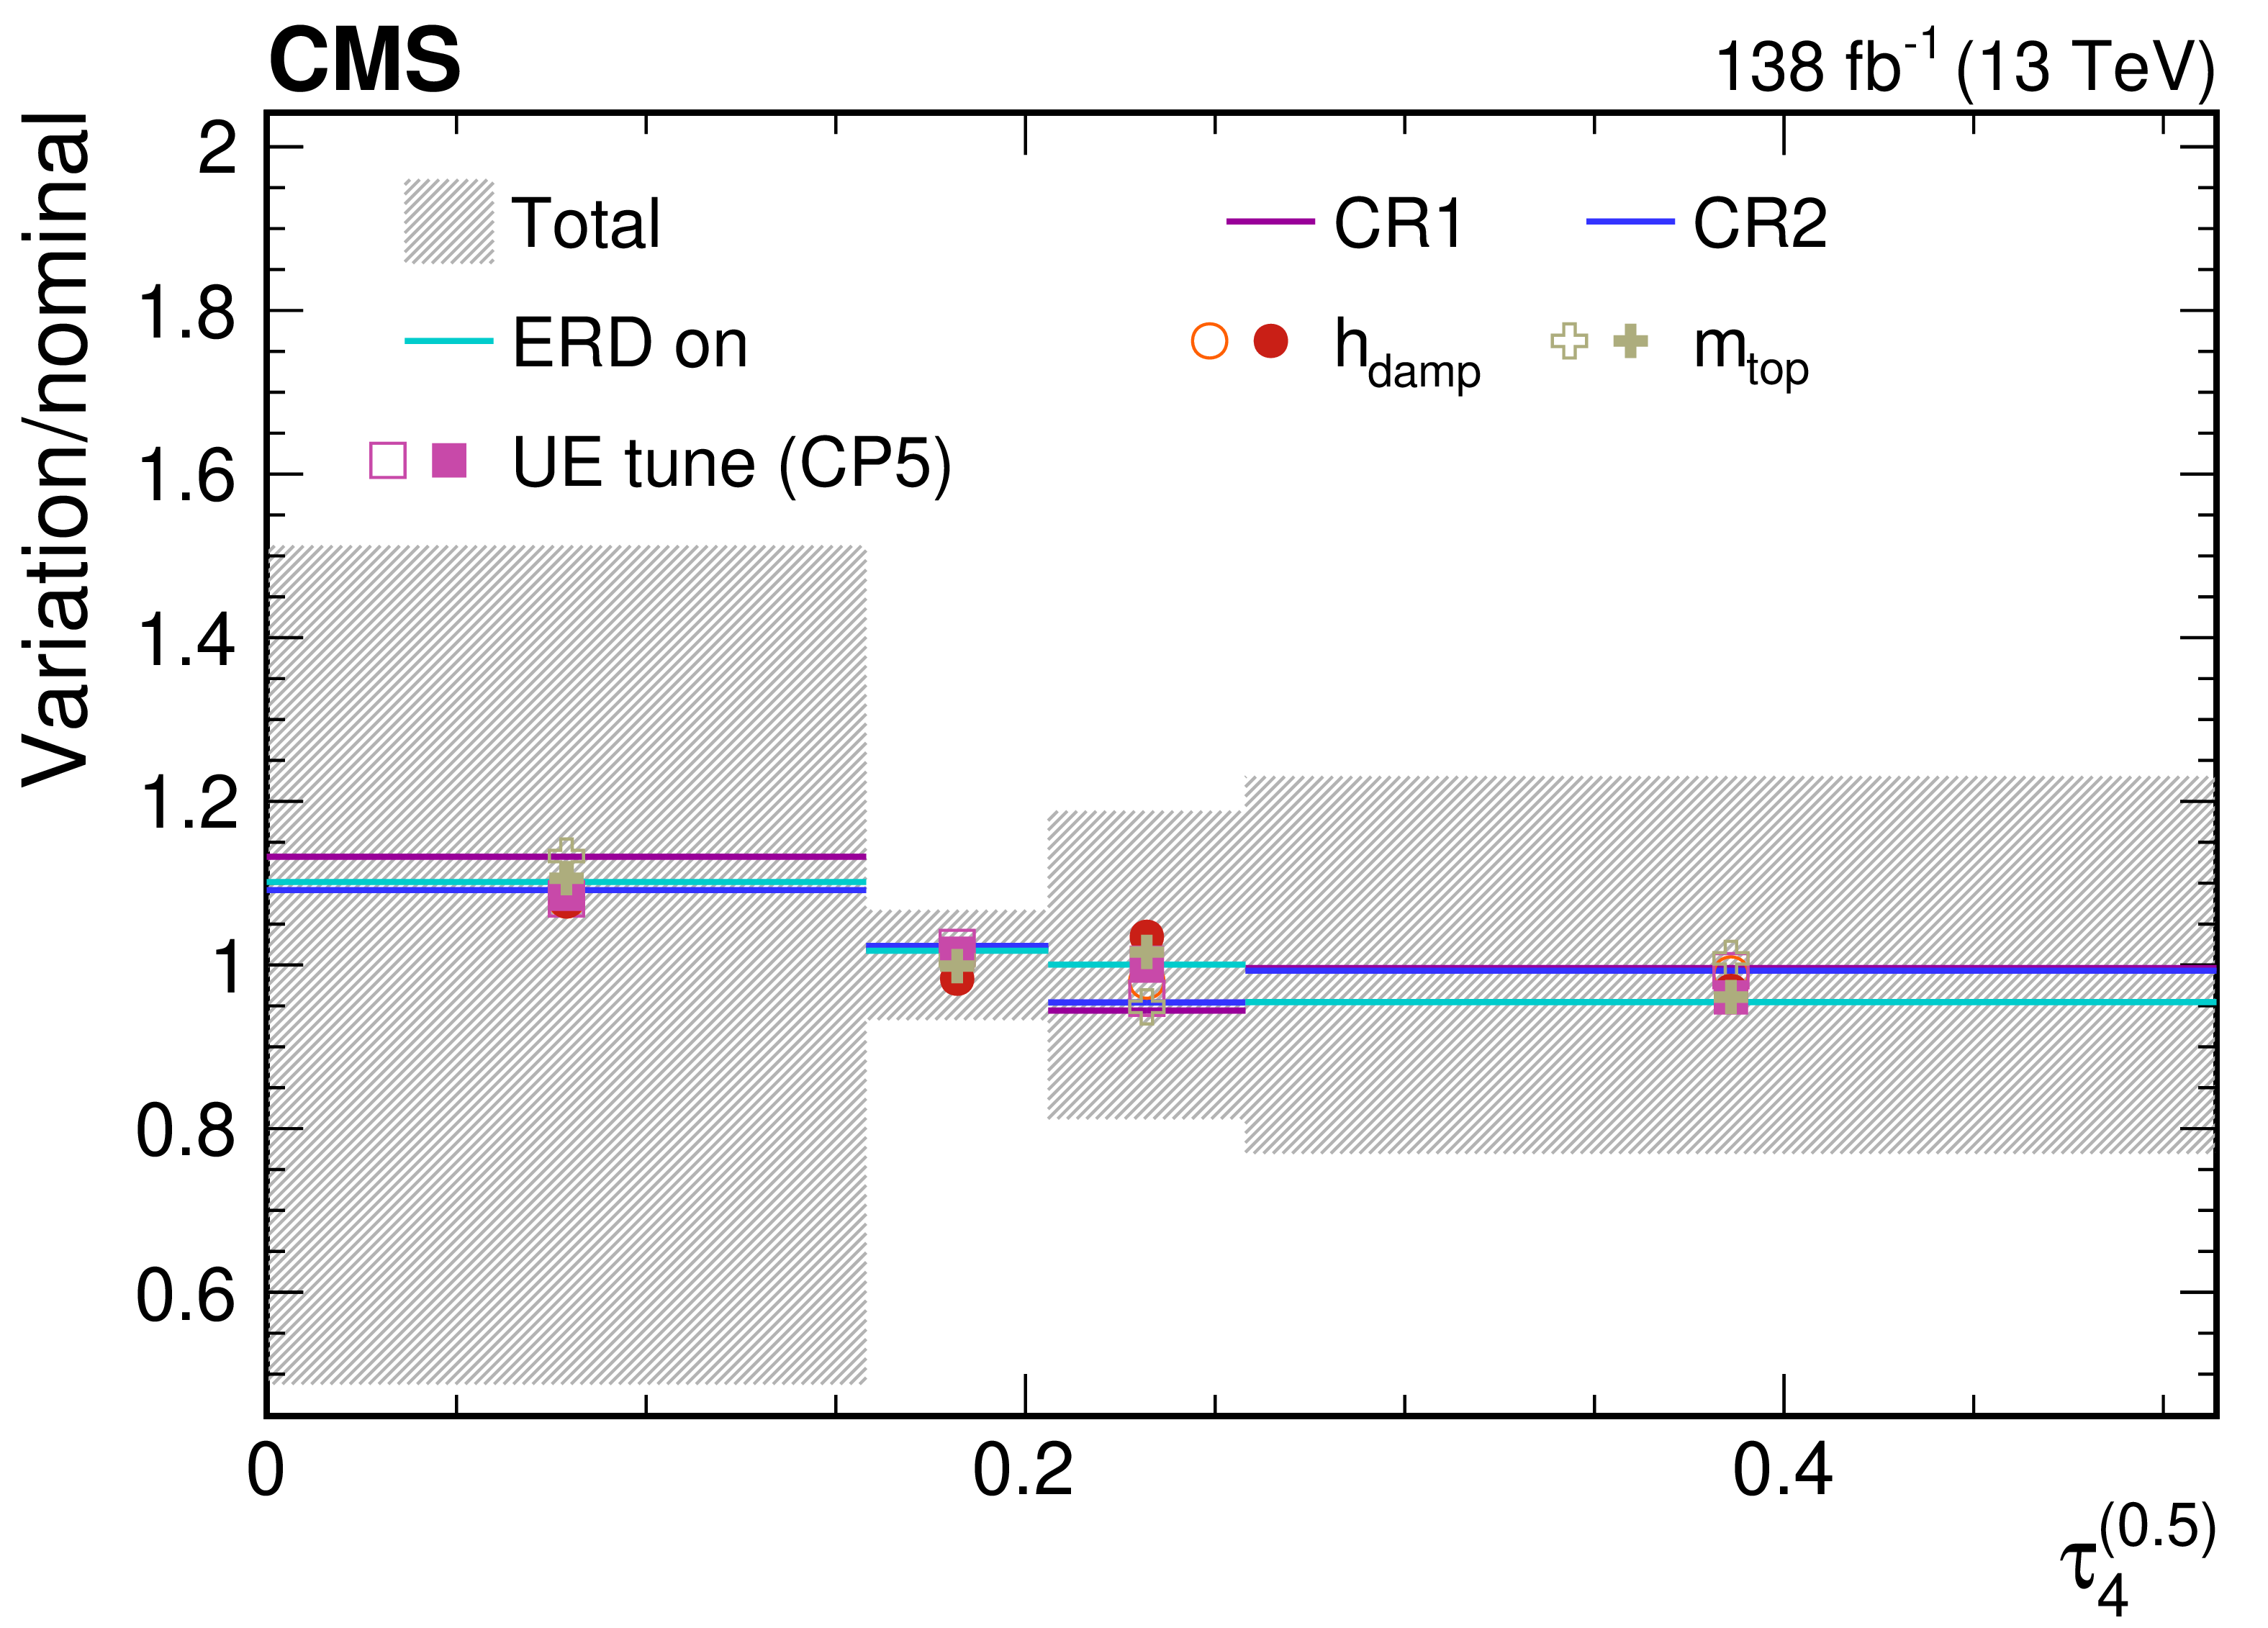
png pdf |
Figure 56-b:
Contributions from various theory model systematic variations to the normalized, unfolded distribution for $ \tau_4^{(\beta)} $ observables measured for AK8 jets passing the boosted W boson-enriched selection in $ \mu $+jets $ \mathrm{t} \overline{\mathrm{t}} $ events. The total unfolding uncertainty is indicated with the dark grey, hashed region, while the blue hashed region indicates the contributions from the input covariance matrix, which includes the propagated effects of the statistical uncertainties of the input data after background subtraction. Contributions from statistical uncertainties of the simulated sample used to construct the nominal response matrix are indicated with the dashed black line. The uncertainty contributions for different choices of colour reconnection models are illustrated as one-sided shifts compared to the nominal unfolding, and up (down) contributions from other sources are indicated with filled (open) markers of the same type and colour. |

png pdf |
Figure 56-c:
Contributions from various theory model systematic variations to the normalized, unfolded distribution for $ \tau_4^{(\beta)} $ observables measured for AK8 jets passing the boosted W boson-enriched selection in $ \mu $+jets $ \mathrm{t} \overline{\mathrm{t}} $ events. The total unfolding uncertainty is indicated with the dark grey, hashed region, while the blue hashed region indicates the contributions from the input covariance matrix, which includes the propagated effects of the statistical uncertainties of the input data after background subtraction. Contributions from statistical uncertainties of the simulated sample used to construct the nominal response matrix are indicated with the dashed black line. The uncertainty contributions for different choices of colour reconnection models are illustrated as one-sided shifts compared to the nominal unfolding, and up (down) contributions from other sources are indicated with filled (open) markers of the same type and colour. |
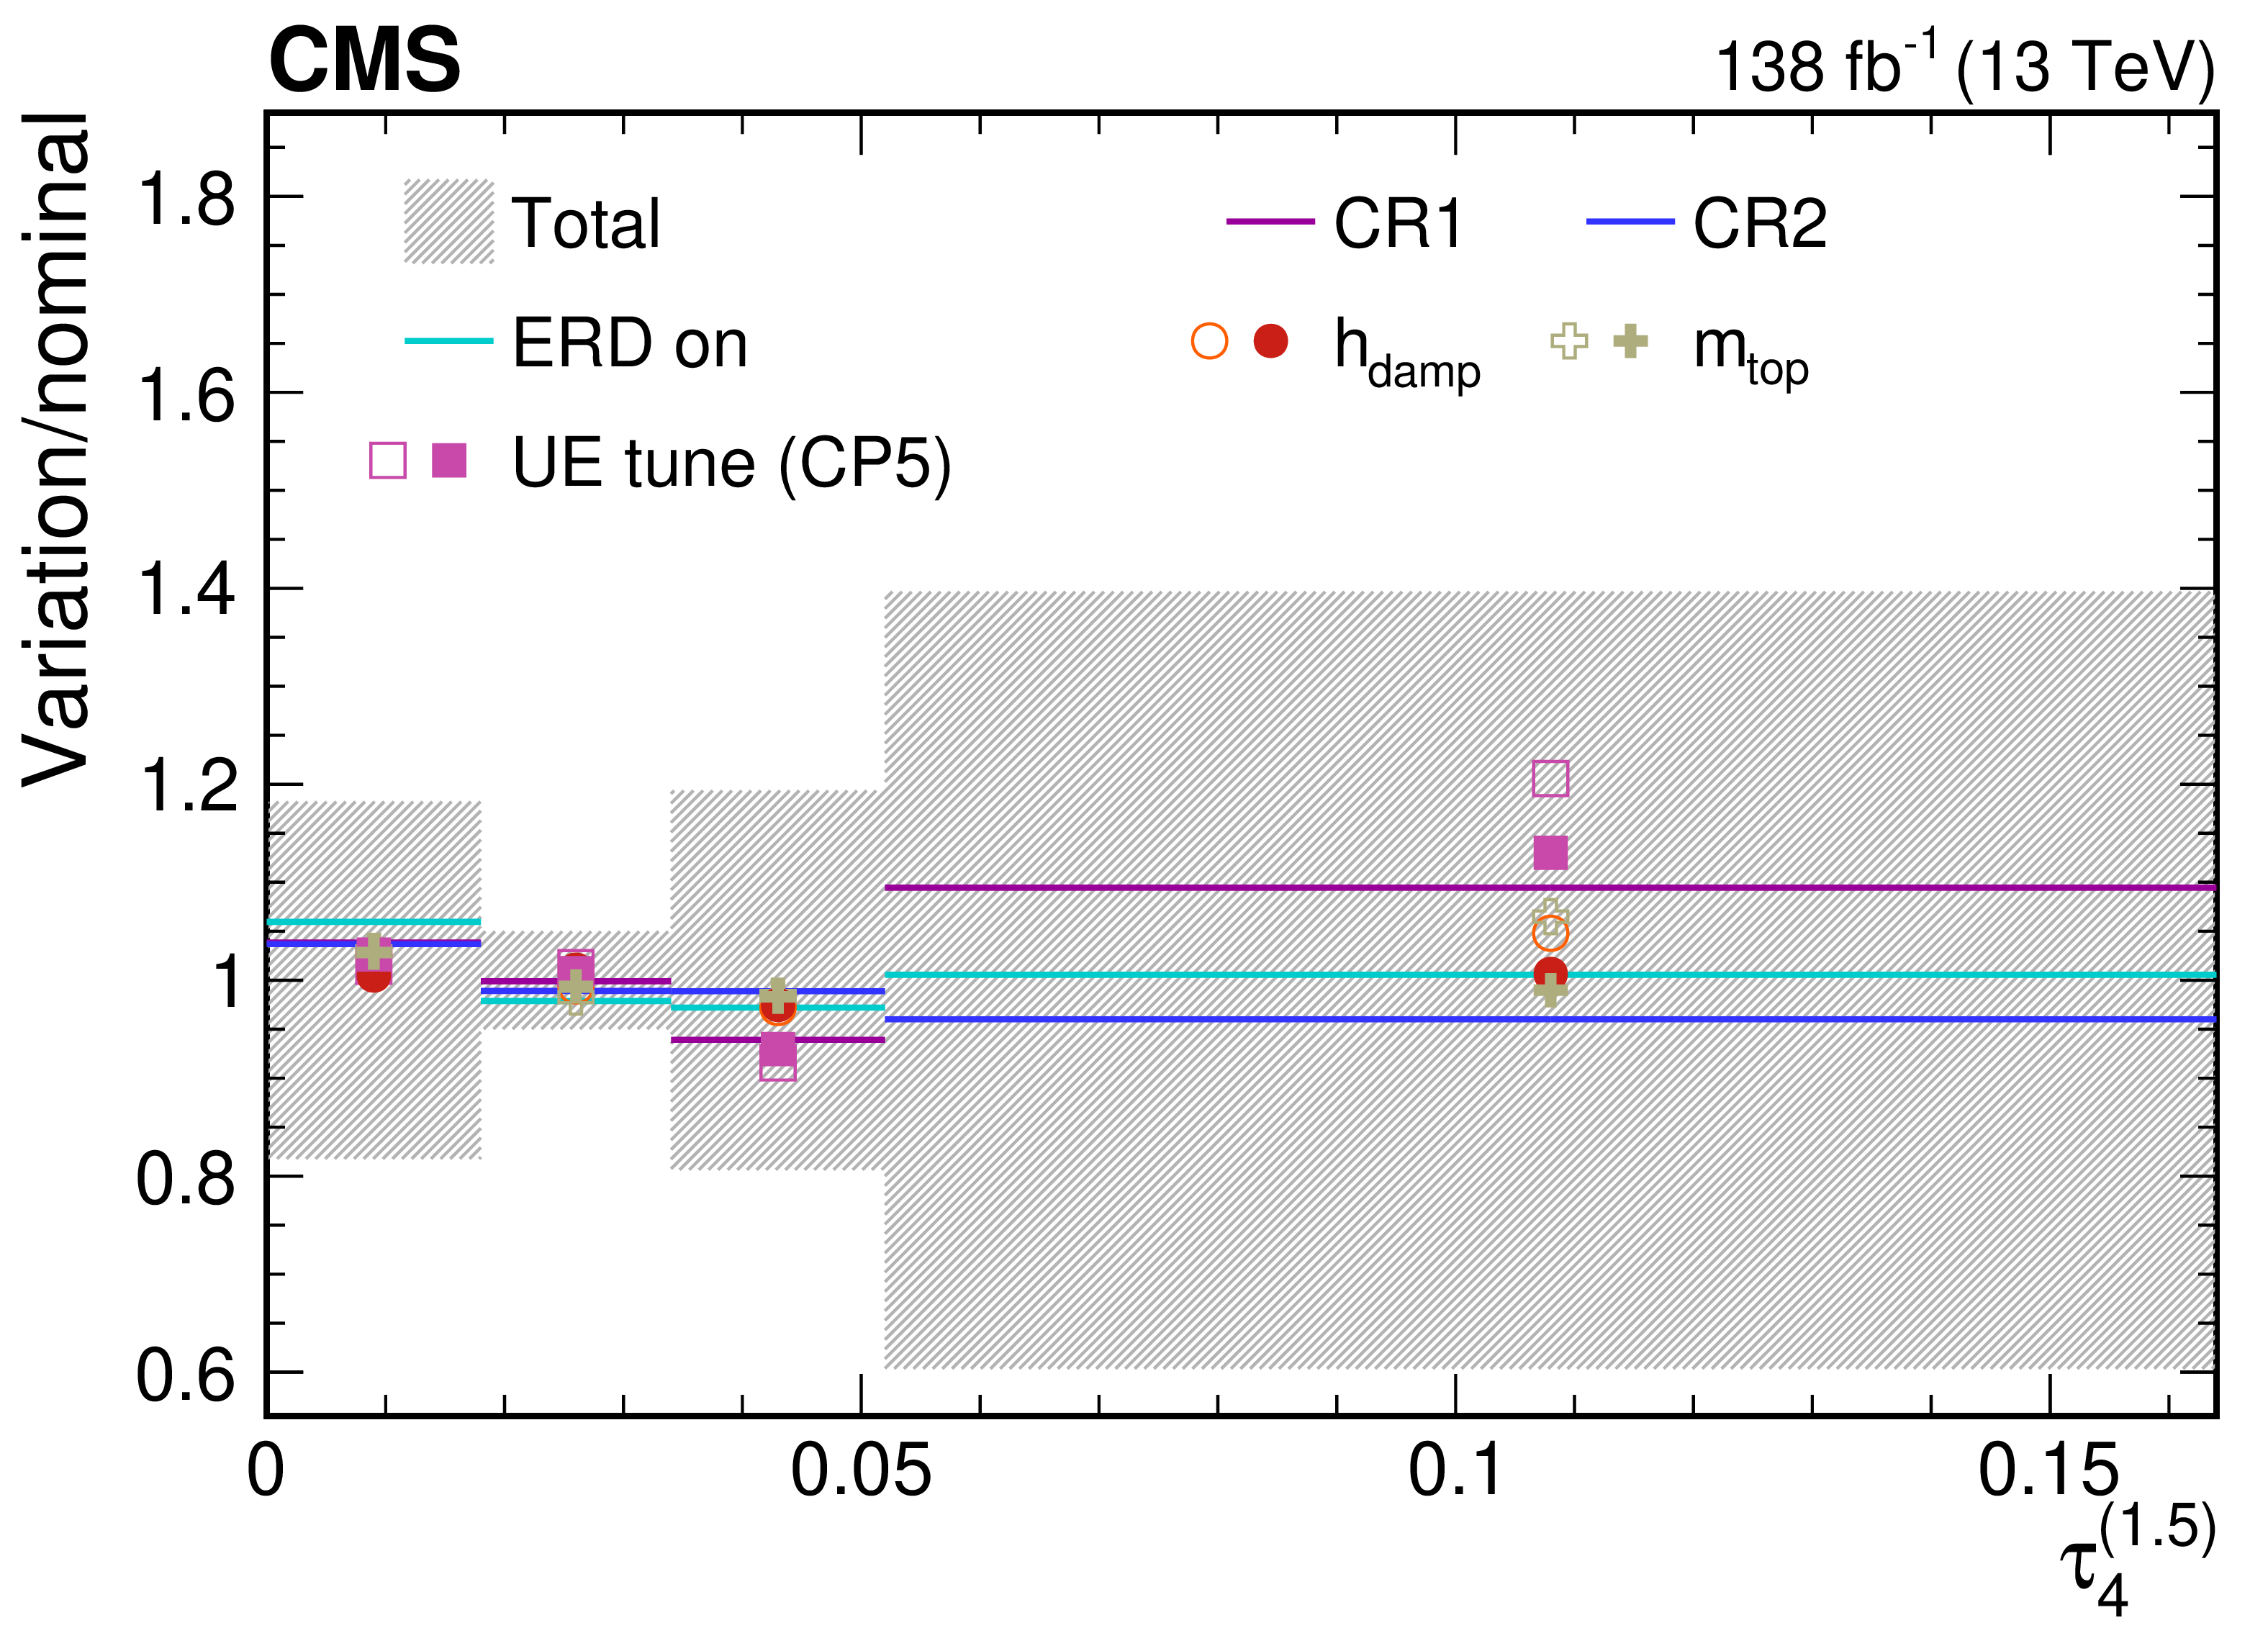
png pdf |
Figure 56-d:
Contributions from various theory model systematic variations to the normalized, unfolded distribution for $ \tau_4^{(\beta)} $ observables measured for AK8 jets passing the boosted W boson-enriched selection in $ \mu $+jets $ \mathrm{t} \overline{\mathrm{t}} $ events. The total unfolding uncertainty is indicated with the dark grey, hashed region, while the blue hashed region indicates the contributions from the input covariance matrix, which includes the propagated effects of the statistical uncertainties of the input data after background subtraction. Contributions from statistical uncertainties of the simulated sample used to construct the nominal response matrix are indicated with the dashed black line. The uncertainty contributions for different choices of colour reconnection models are illustrated as one-sided shifts compared to the nominal unfolding, and up (down) contributions from other sources are indicated with filled (open) markers of the same type and colour. |
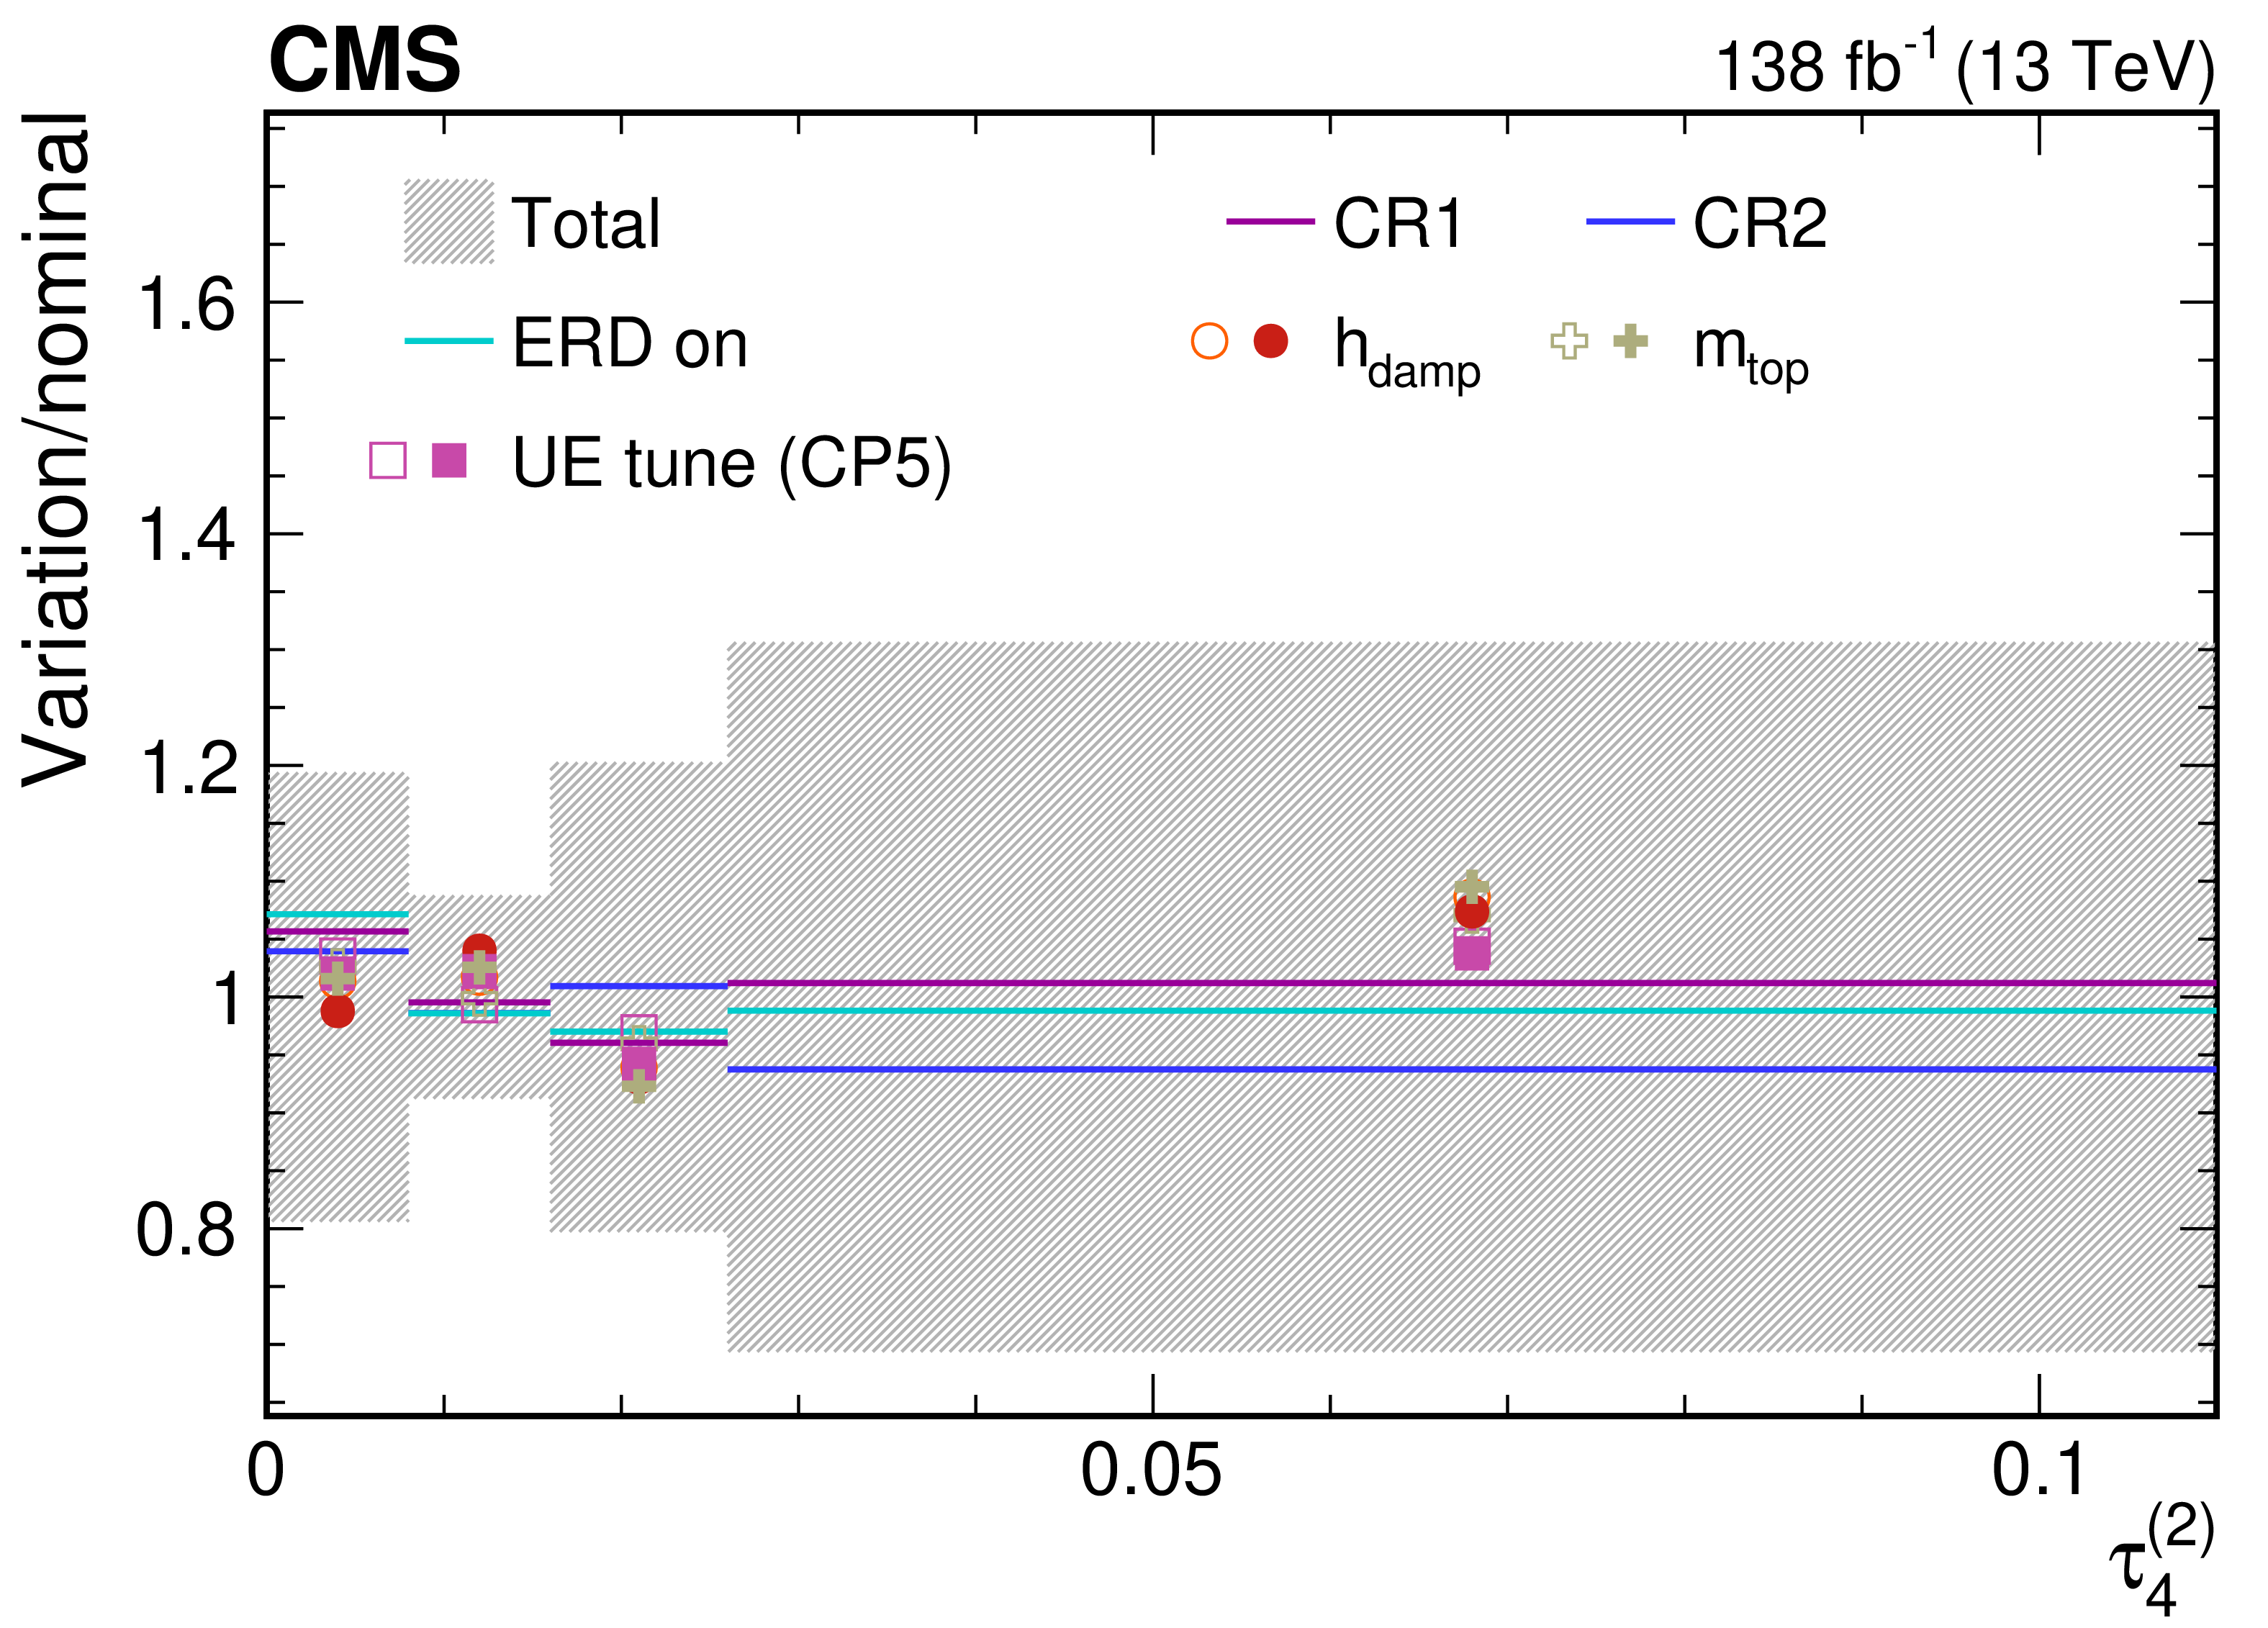
png pdf |
Figure 56-e:
Contributions from various theory model systematic variations to the normalized, unfolded distribution for $ \tau_4^{(\beta)} $ observables measured for AK8 jets passing the boosted W boson-enriched selection in $ \mu $+jets $ \mathrm{t} \overline{\mathrm{t}} $ events. The total unfolding uncertainty is indicated with the dark grey, hashed region, while the blue hashed region indicates the contributions from the input covariance matrix, which includes the propagated effects of the statistical uncertainties of the input data after background subtraction. Contributions from statistical uncertainties of the simulated sample used to construct the nominal response matrix are indicated with the dashed black line. The uncertainty contributions for different choices of colour reconnection models are illustrated as one-sided shifts compared to the nominal unfolding, and up (down) contributions from other sources are indicated with filled (open) markers of the same type and colour. |
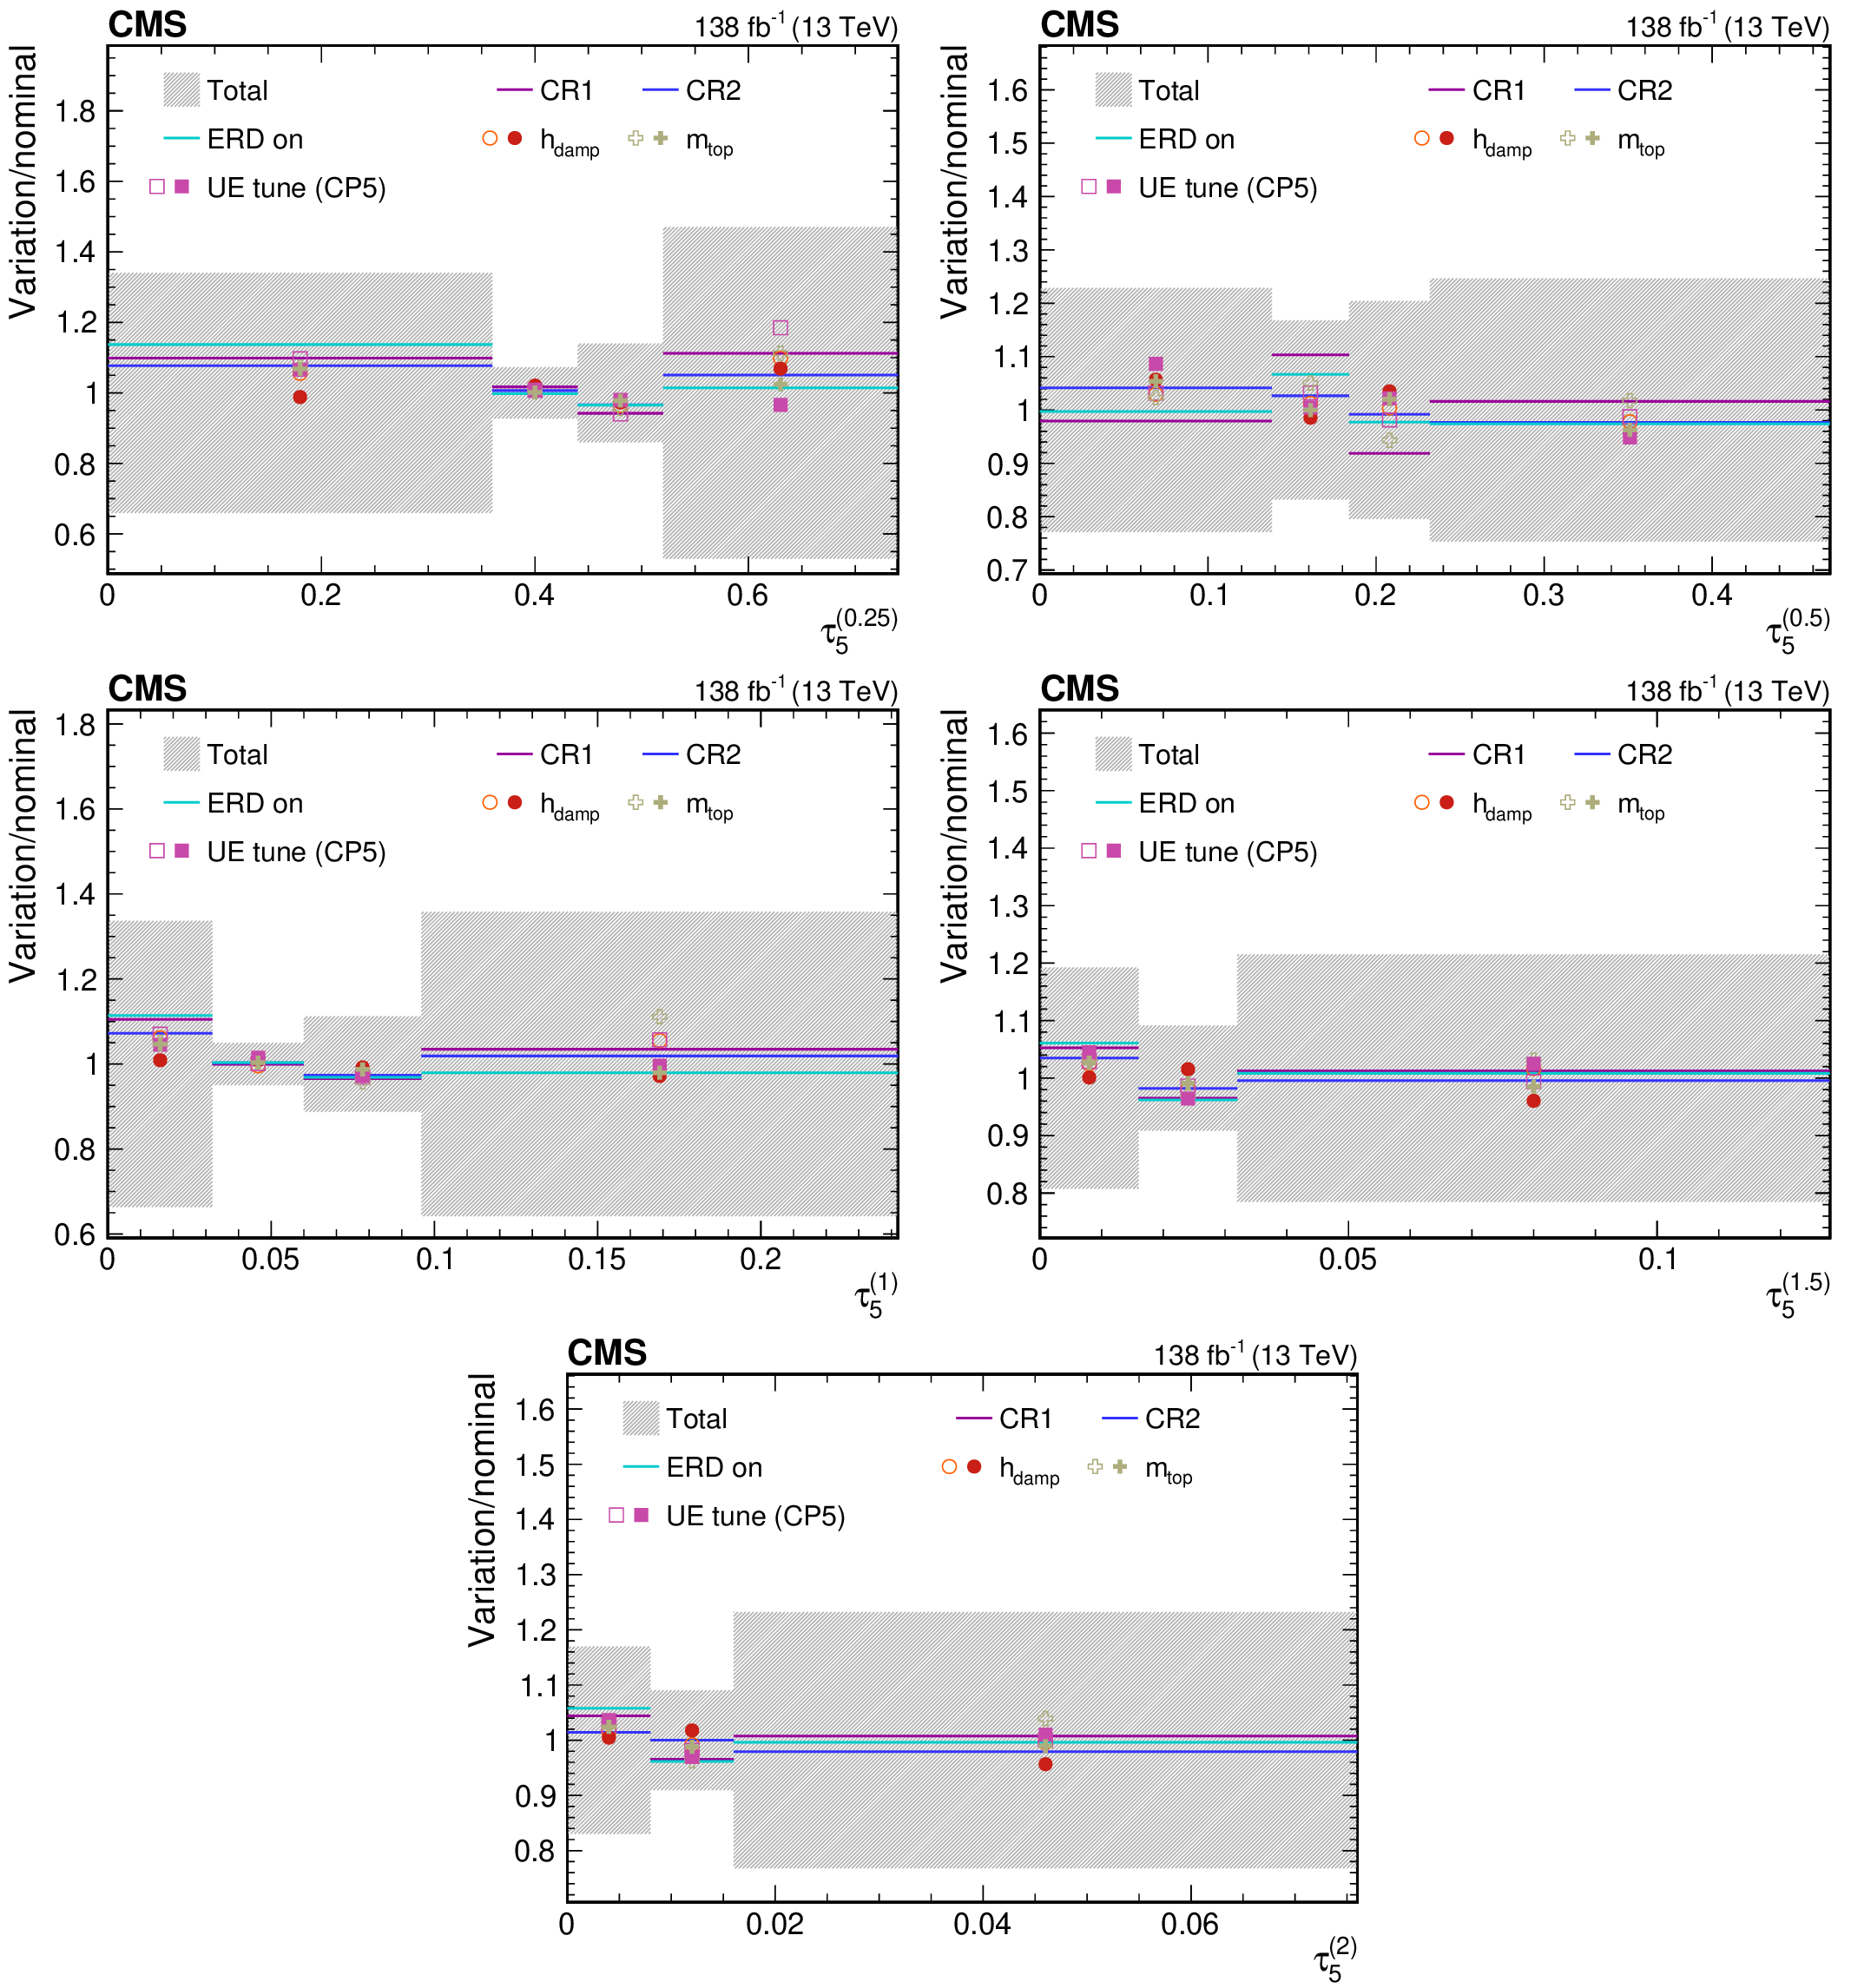
png pdf |
Figure 57:
Contributions from various theory model systematic variations to the normalized, unfolded distribution for $ \tau_5^{(\beta)} $ observables measured for AK8 jets passing the boosted W boson-enriched selection in $ \mu $+jets $ \mathrm{t} \overline{\mathrm{t}} $ events. The total unfolding uncertainty is indicated with the dark grey, hashed region, while the blue hashed region indicates the contributions from the input covariance matrix, which includes the propagated effects of the statistical uncertainties of the input data after background subtraction. Contributions from statistical uncertainties of the simulated sample used to construct the nominal response matrix are indicated with the dashed black line. The uncertainty contributions for different choices of colour reconnection models are illustrated as one-sided shifts compared to the nominal unfolding, and up (down) contributions from other sources are indicated with filled (open) markers of the same type and colour. |
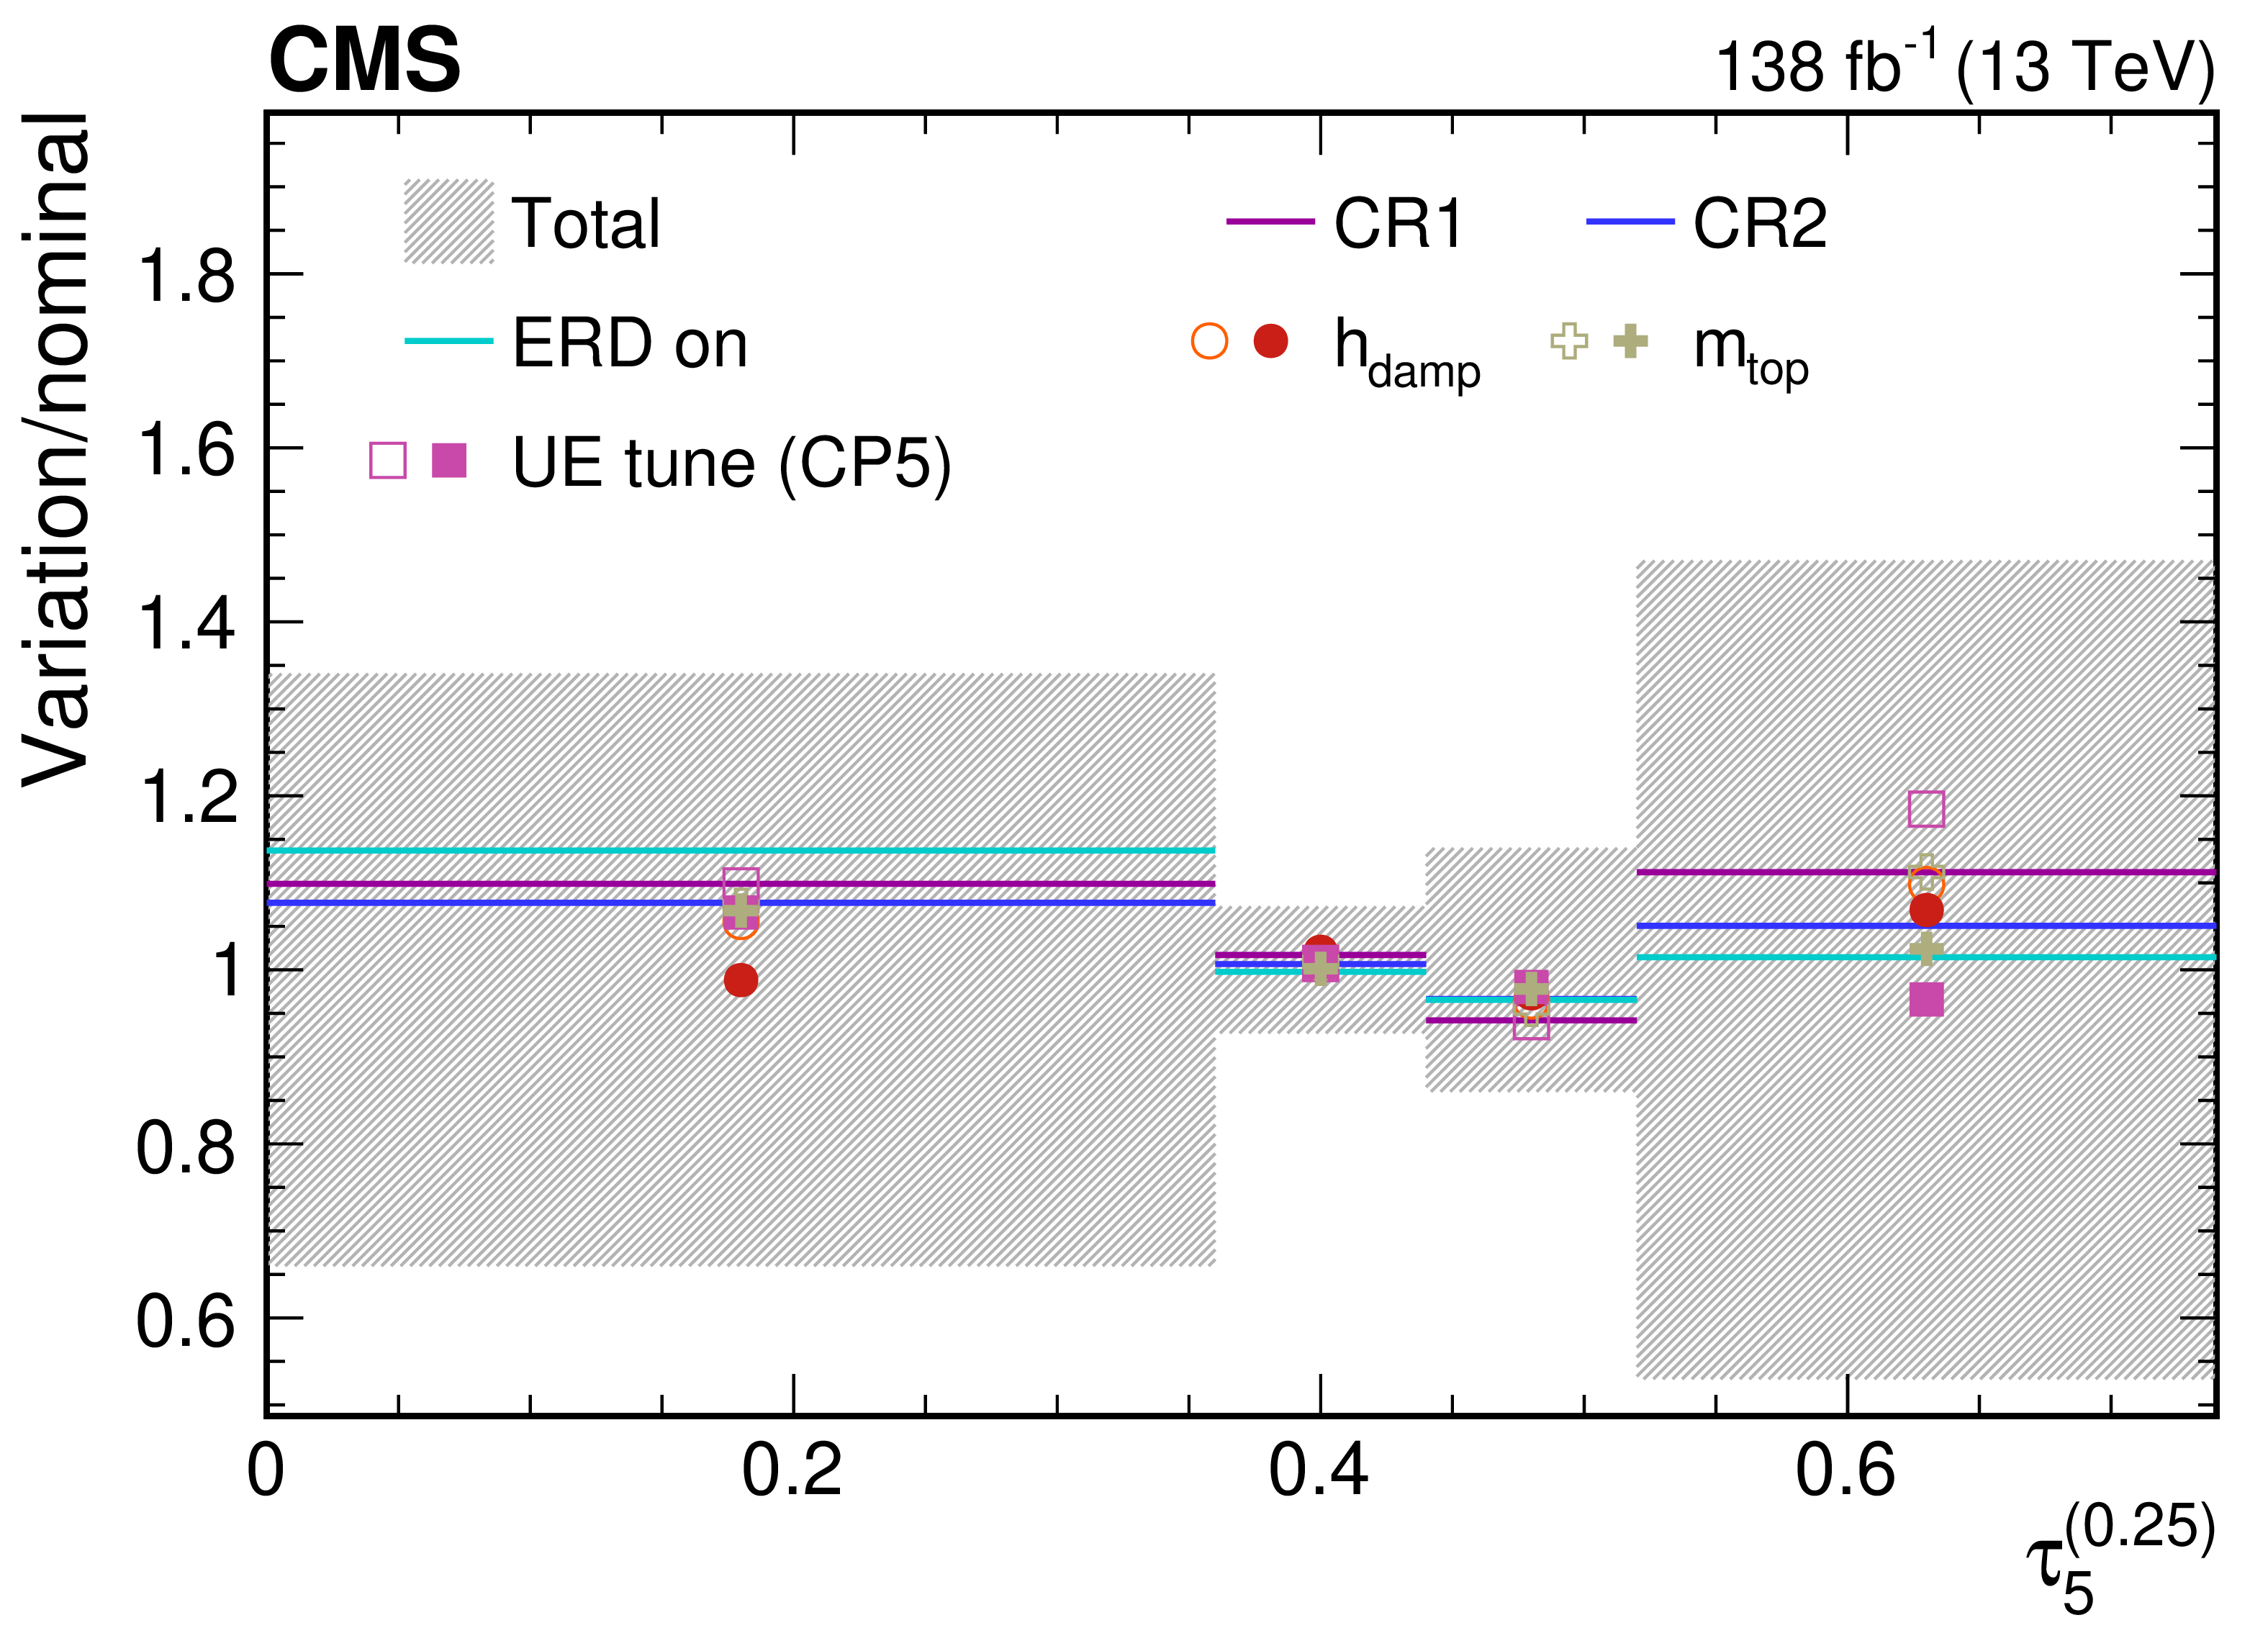
png pdf |
Figure 57-a:
Contributions from various theory model systematic variations to the normalized, unfolded distribution for $ \tau_5^{(\beta)} $ observables measured for AK8 jets passing the boosted W boson-enriched selection in $ \mu $+jets $ \mathrm{t} \overline{\mathrm{t}} $ events. The total unfolding uncertainty is indicated with the dark grey, hashed region, while the blue hashed region indicates the contributions from the input covariance matrix, which includes the propagated effects of the statistical uncertainties of the input data after background subtraction. Contributions from statistical uncertainties of the simulated sample used to construct the nominal response matrix are indicated with the dashed black line. The uncertainty contributions for different choices of colour reconnection models are illustrated as one-sided shifts compared to the nominal unfolding, and up (down) contributions from other sources are indicated with filled (open) markers of the same type and colour. |
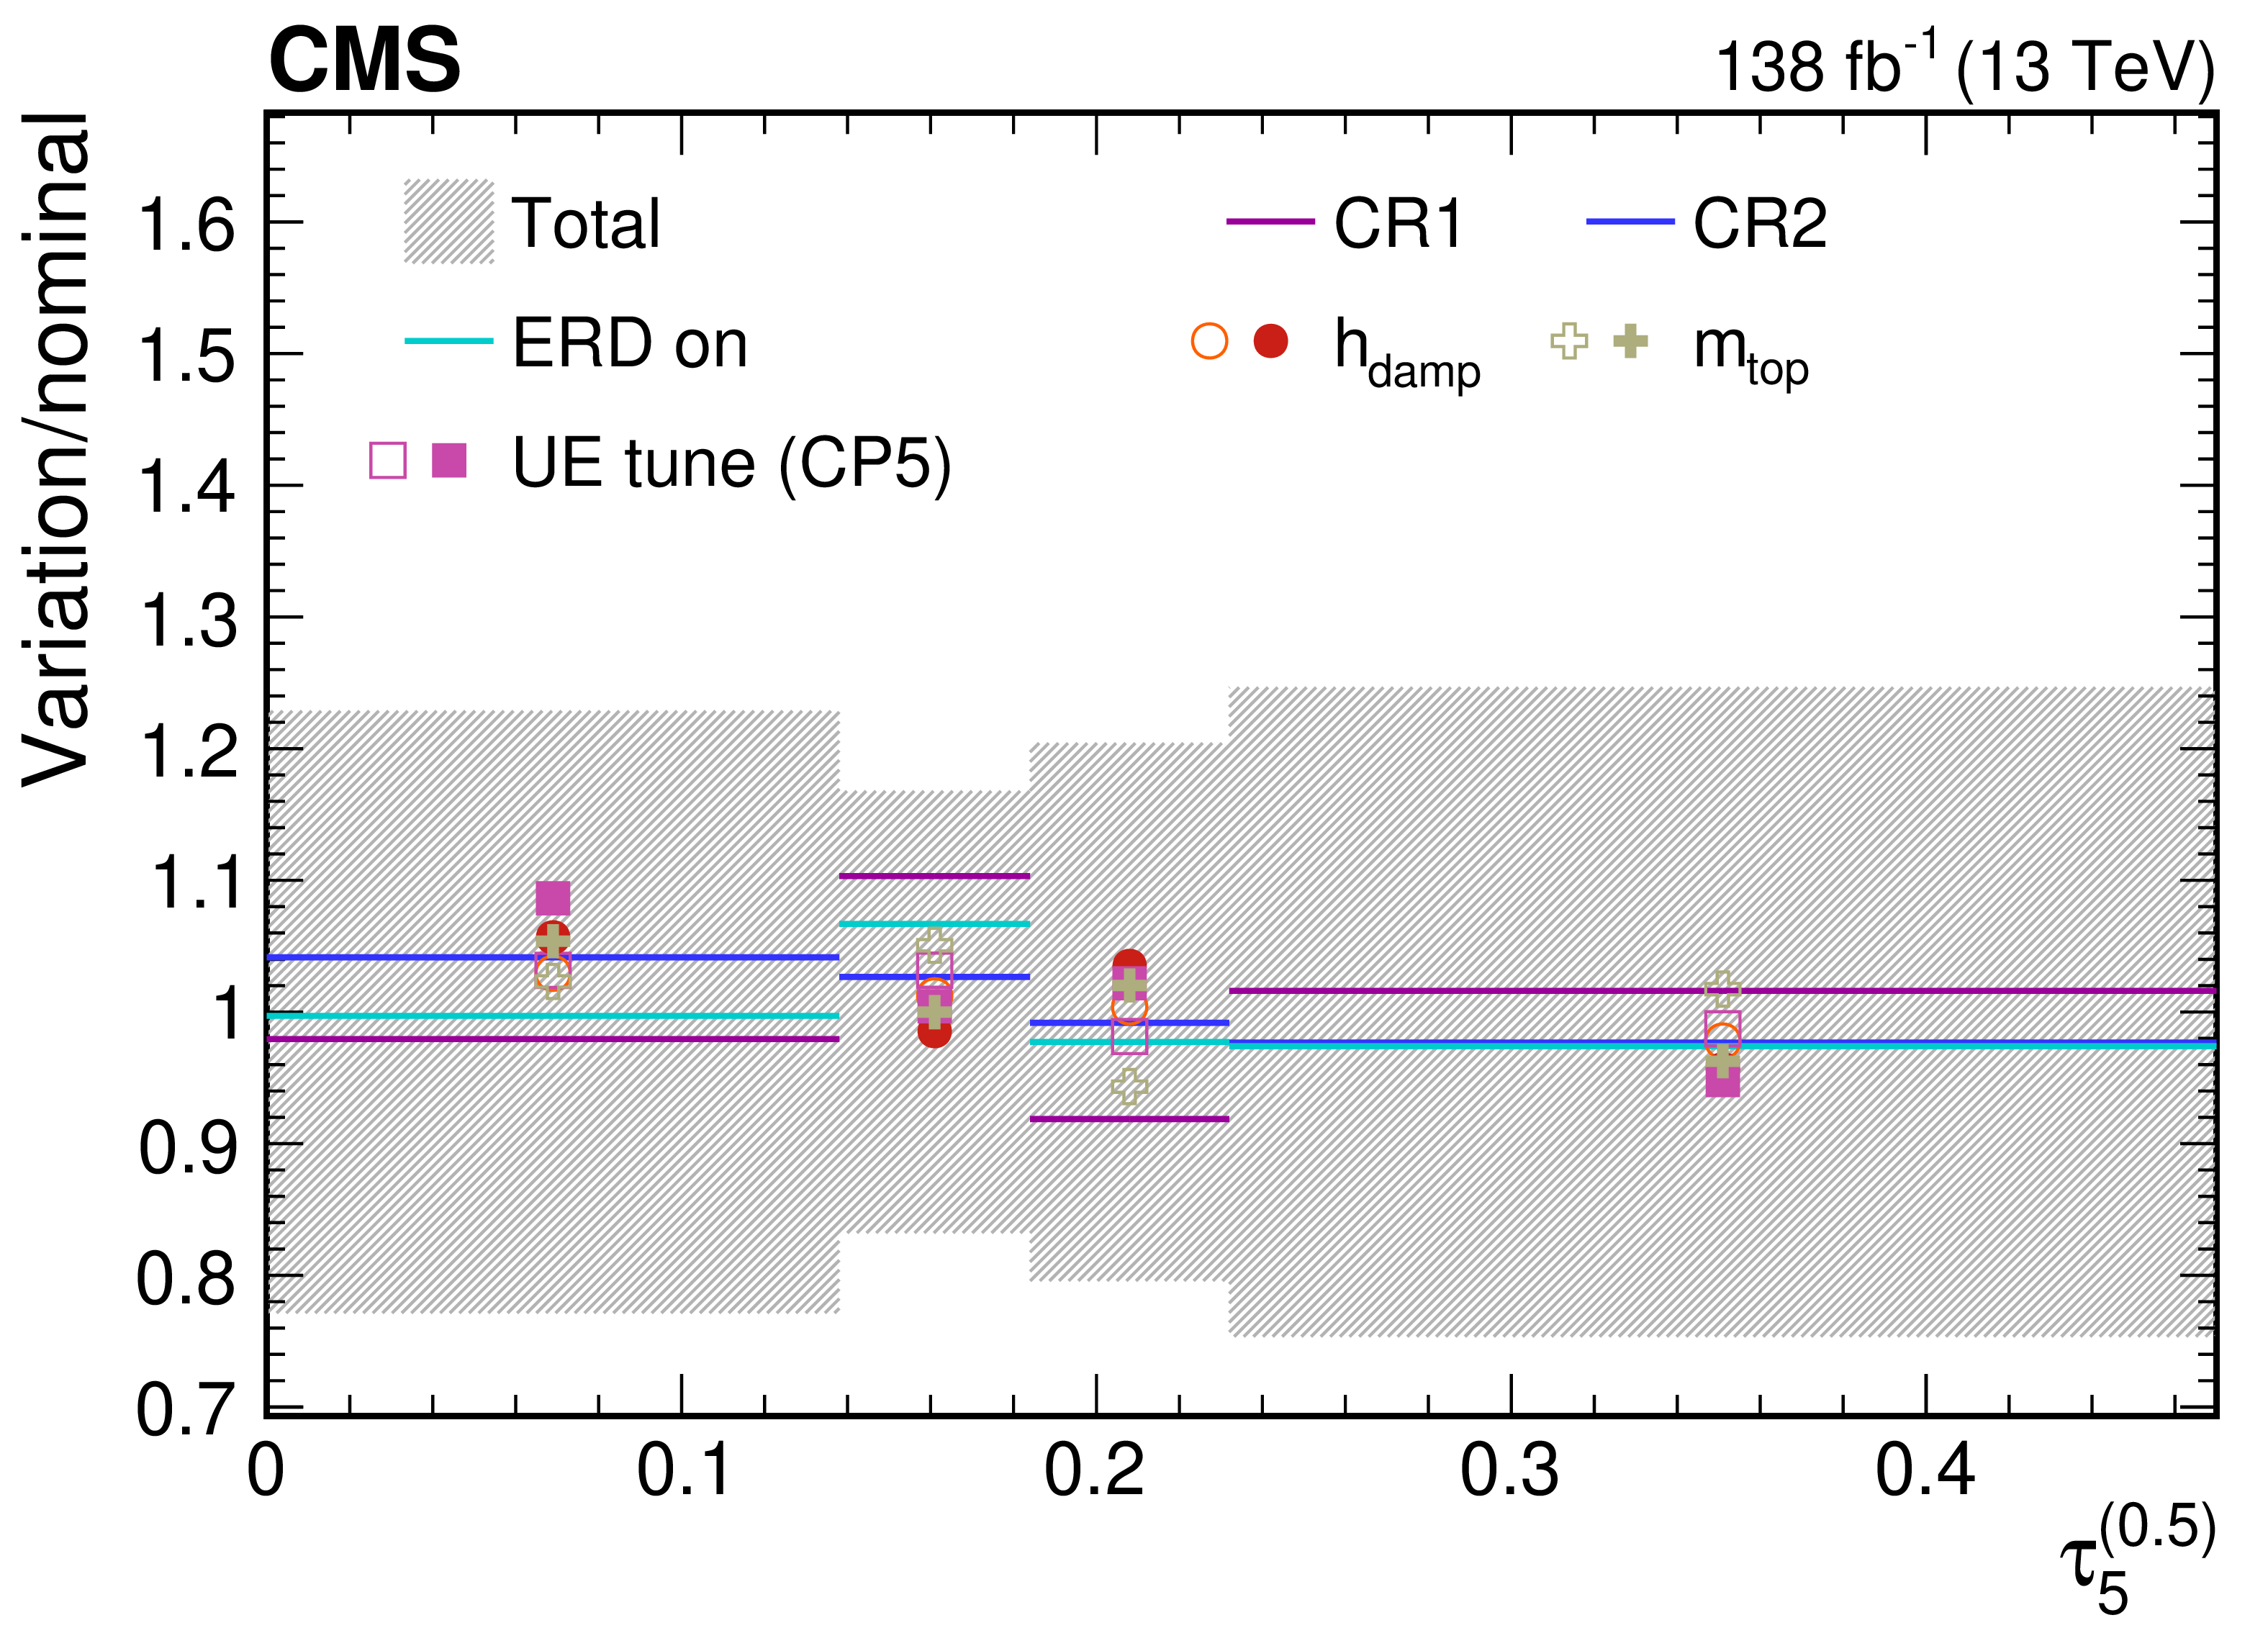
png pdf |
Figure 57-b:
Contributions from various theory model systematic variations to the normalized, unfolded distribution for $ \tau_5^{(\beta)} $ observables measured for AK8 jets passing the boosted W boson-enriched selection in $ \mu $+jets $ \mathrm{t} \overline{\mathrm{t}} $ events. The total unfolding uncertainty is indicated with the dark grey, hashed region, while the blue hashed region indicates the contributions from the input covariance matrix, which includes the propagated effects of the statistical uncertainties of the input data after background subtraction. Contributions from statistical uncertainties of the simulated sample used to construct the nominal response matrix are indicated with the dashed black line. The uncertainty contributions for different choices of colour reconnection models are illustrated as one-sided shifts compared to the nominal unfolding, and up (down) contributions from other sources are indicated with filled (open) markers of the same type and colour. |
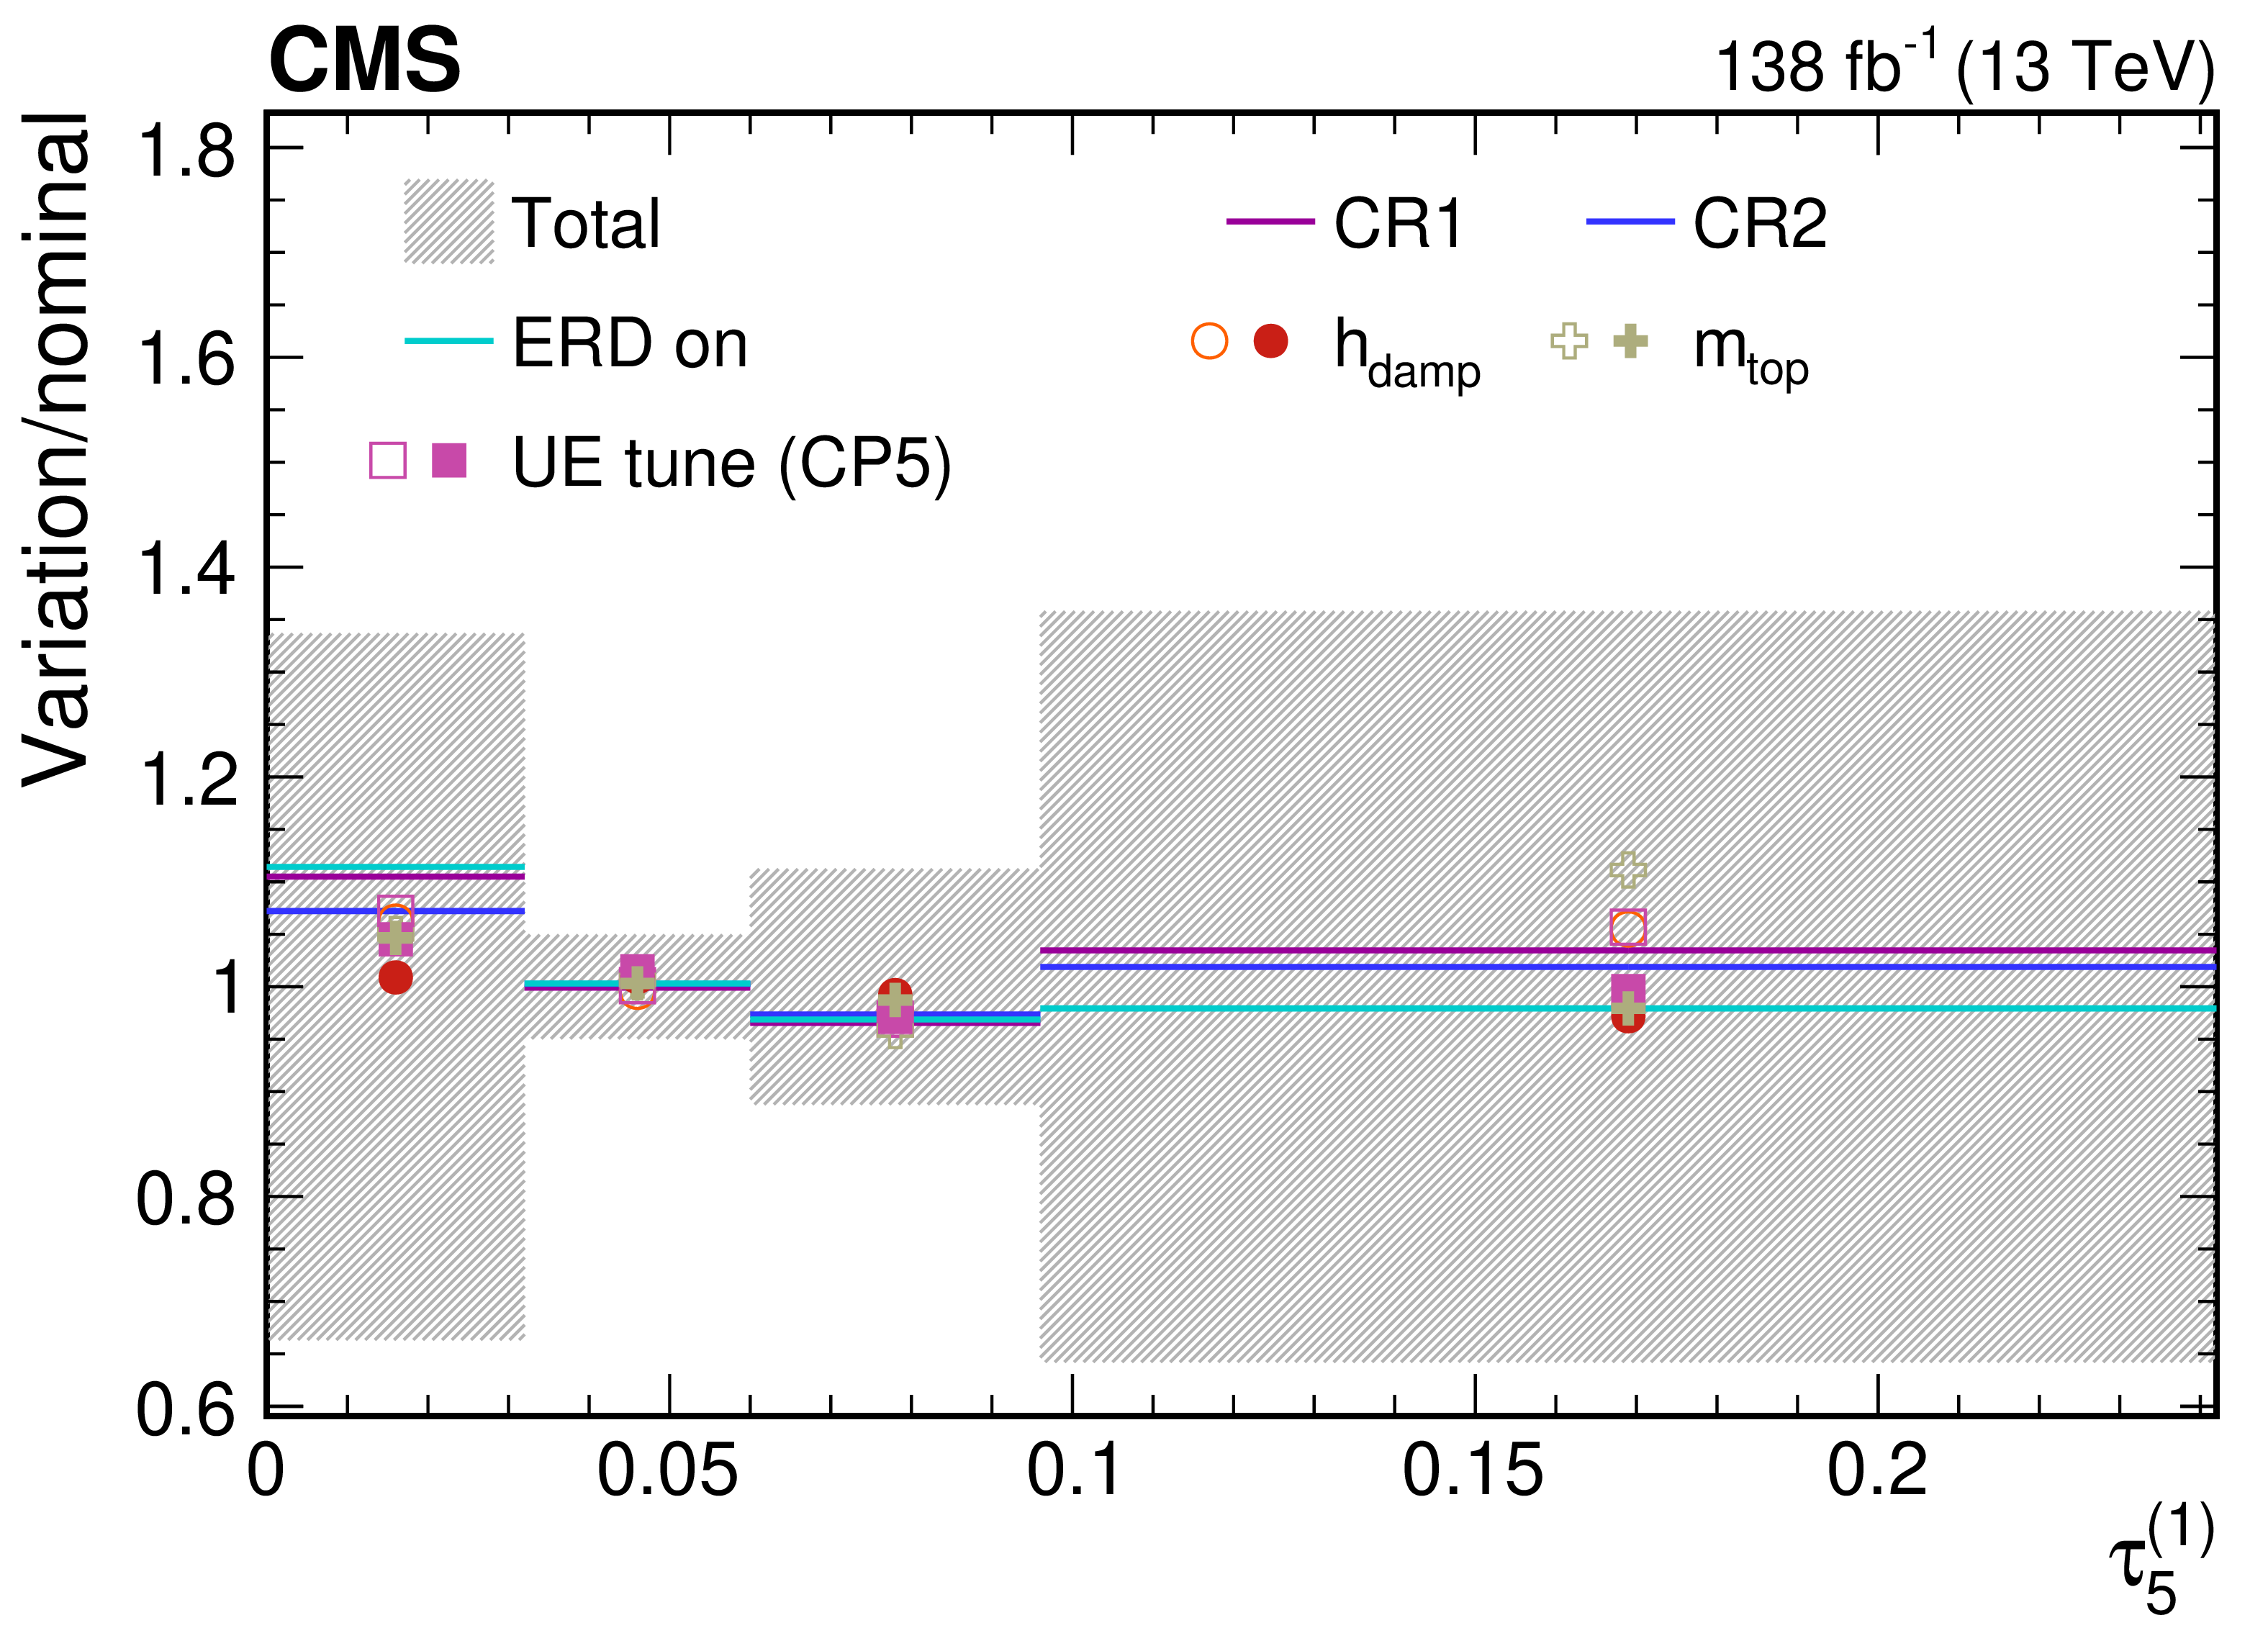
png pdf |
Figure 57-c:
Contributions from various theory model systematic variations to the normalized, unfolded distribution for $ \tau_5^{(\beta)} $ observables measured for AK8 jets passing the boosted W boson-enriched selection in $ \mu $+jets $ \mathrm{t} \overline{\mathrm{t}} $ events. The total unfolding uncertainty is indicated with the dark grey, hashed region, while the blue hashed region indicates the contributions from the input covariance matrix, which includes the propagated effects of the statistical uncertainties of the input data after background subtraction. Contributions from statistical uncertainties of the simulated sample used to construct the nominal response matrix are indicated with the dashed black line. The uncertainty contributions for different choices of colour reconnection models are illustrated as one-sided shifts compared to the nominal unfolding, and up (down) contributions from other sources are indicated with filled (open) markers of the same type and colour. |
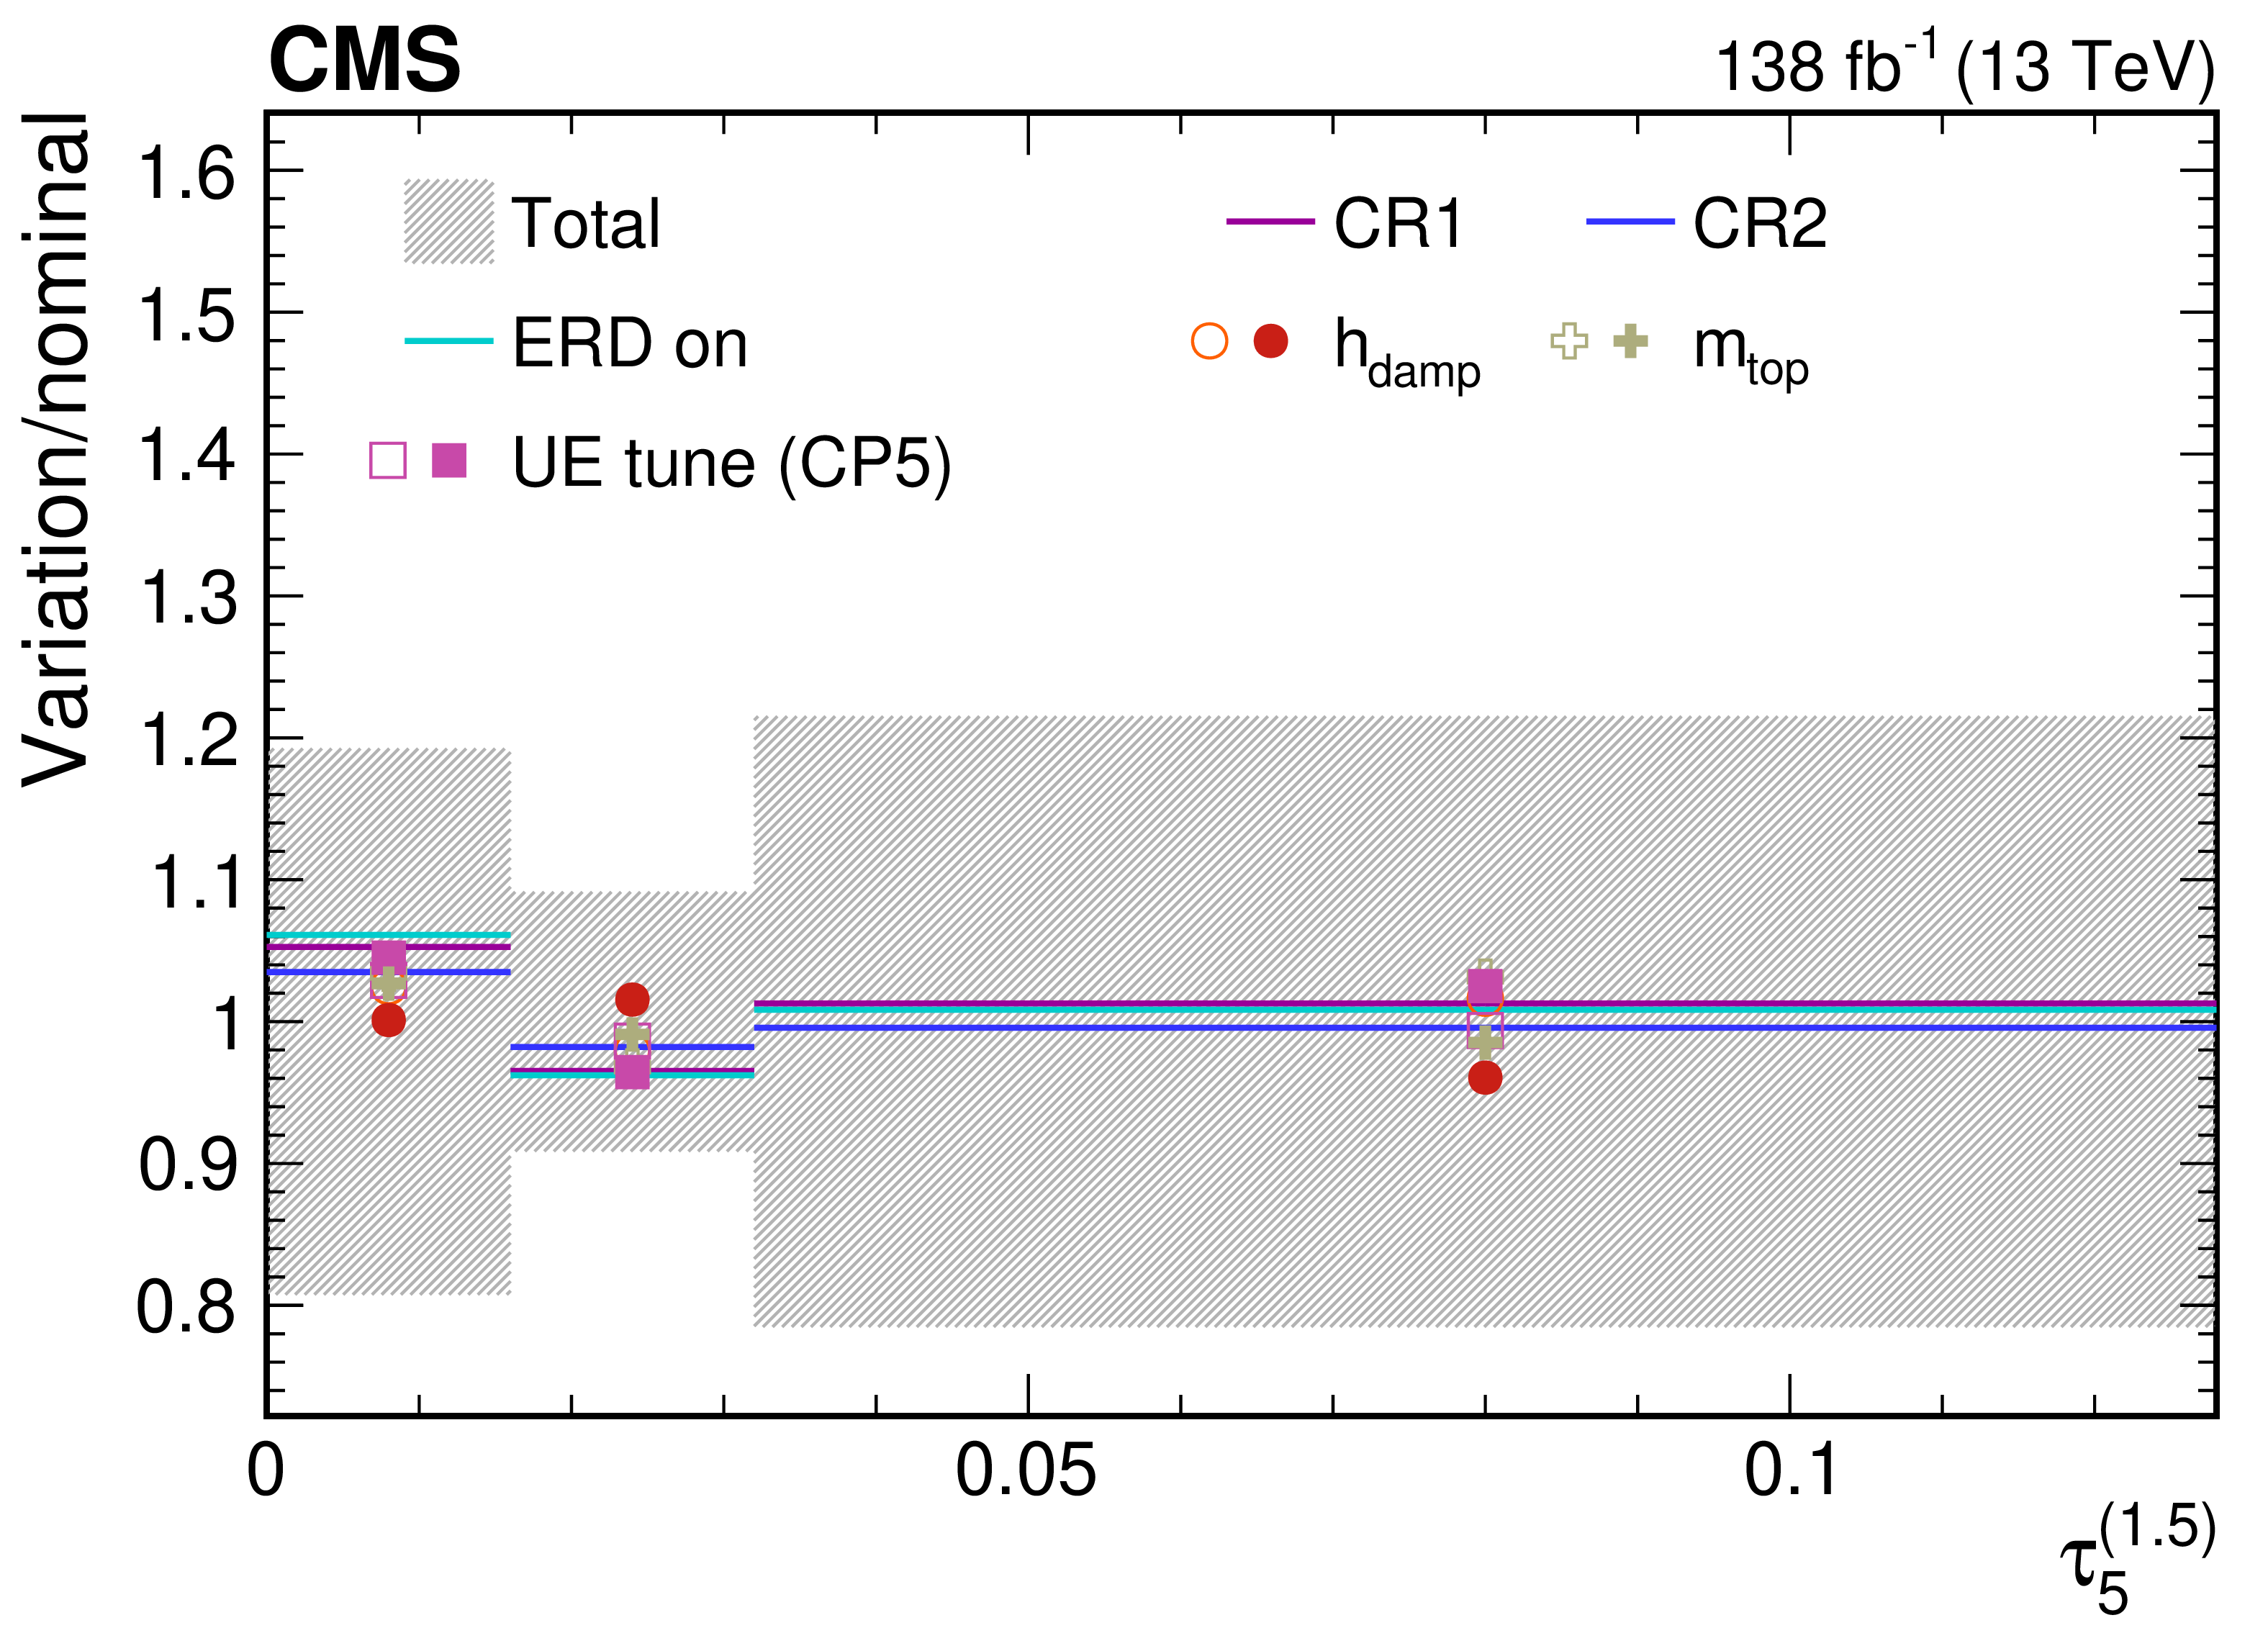
png pdf |
Figure 57-d:
Contributions from various theory model systematic variations to the normalized, unfolded distribution for $ \tau_5^{(\beta)} $ observables measured for AK8 jets passing the boosted W boson-enriched selection in $ \mu $+jets $ \mathrm{t} \overline{\mathrm{t}} $ events. The total unfolding uncertainty is indicated with the dark grey, hashed region, while the blue hashed region indicates the contributions from the input covariance matrix, which includes the propagated effects of the statistical uncertainties of the input data after background subtraction. Contributions from statistical uncertainties of the simulated sample used to construct the nominal response matrix are indicated with the dashed black line. The uncertainty contributions for different choices of colour reconnection models are illustrated as one-sided shifts compared to the nominal unfolding, and up (down) contributions from other sources are indicated with filled (open) markers of the same type and colour. |
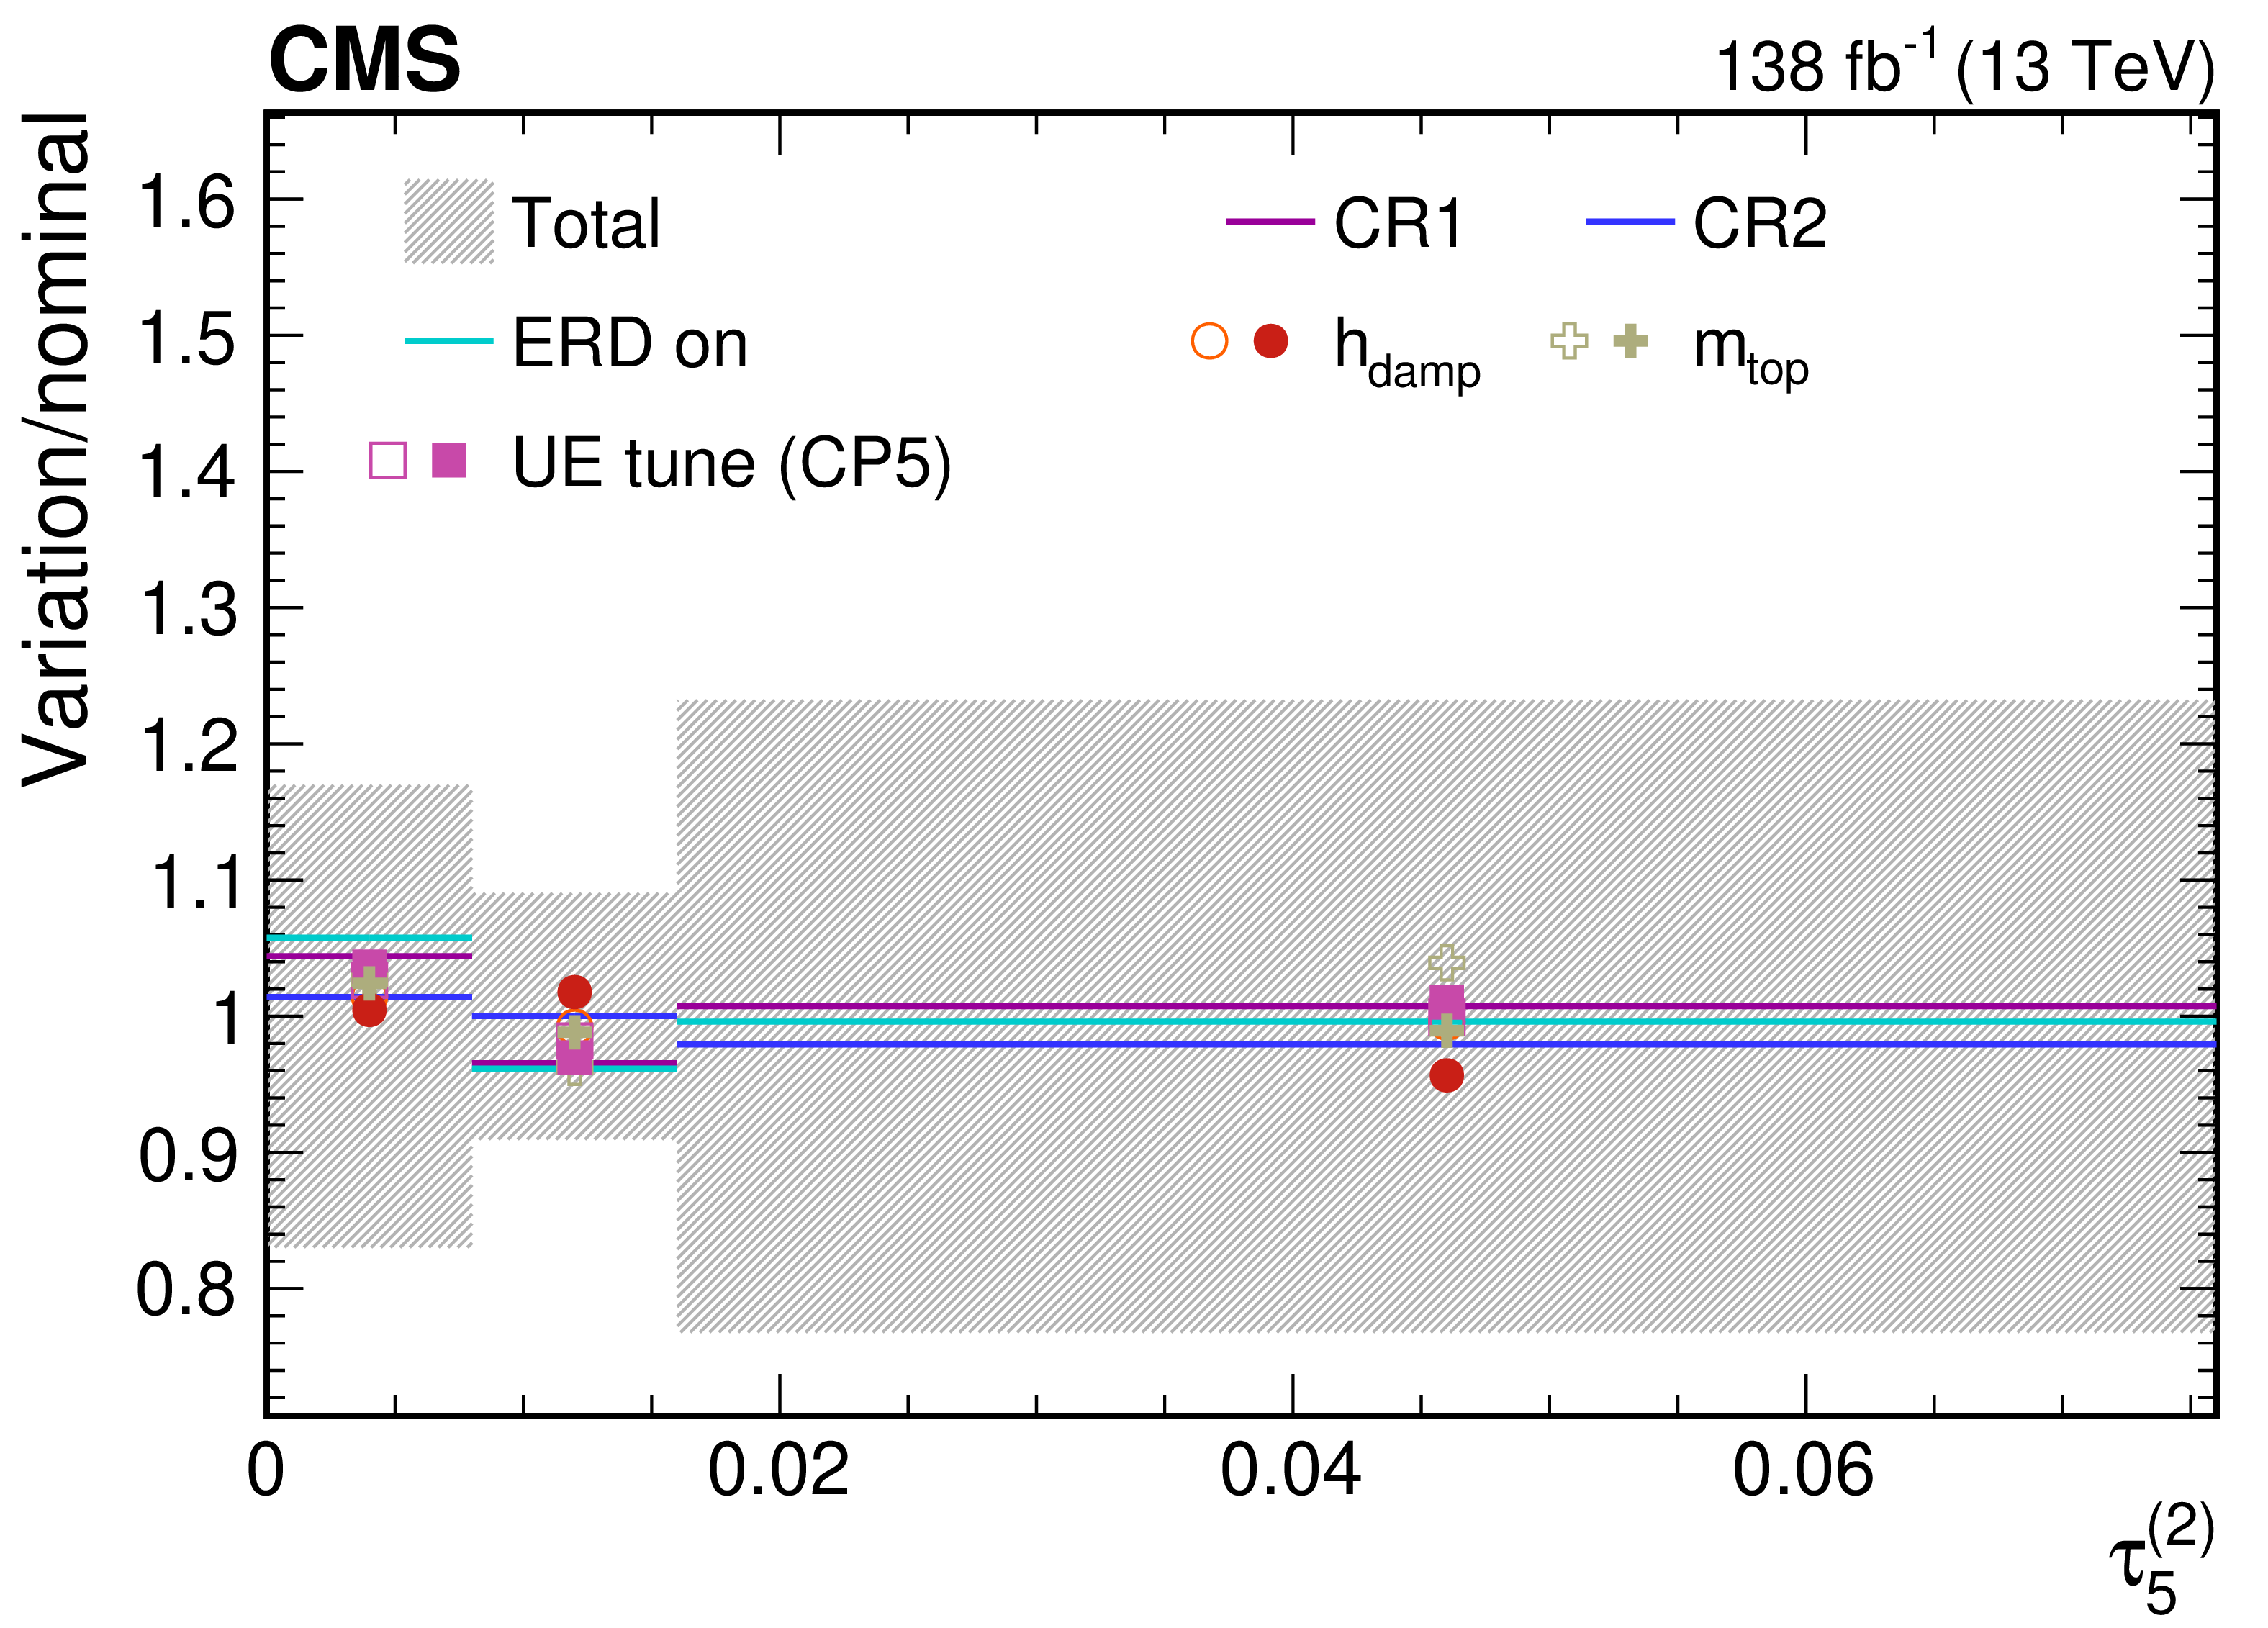
png pdf |
Figure 57-e:
Contributions from various theory model systematic variations to the normalized, unfolded distribution for $ \tau_5^{(\beta)} $ observables measured for AK8 jets passing the boosted W boson-enriched selection in $ \mu $+jets $ \mathrm{t} \overline{\mathrm{t}} $ events. The total unfolding uncertainty is indicated with the dark grey, hashed region, while the blue hashed region indicates the contributions from the input covariance matrix, which includes the propagated effects of the statistical uncertainties of the input data after background subtraction. Contributions from statistical uncertainties of the simulated sample used to construct the nominal response matrix are indicated with the dashed black line. The uncertainty contributions for different choices of colour reconnection models are illustrated as one-sided shifts compared to the nominal unfolding, and up (down) contributions from other sources are indicated with filled (open) markers of the same type and colour. |
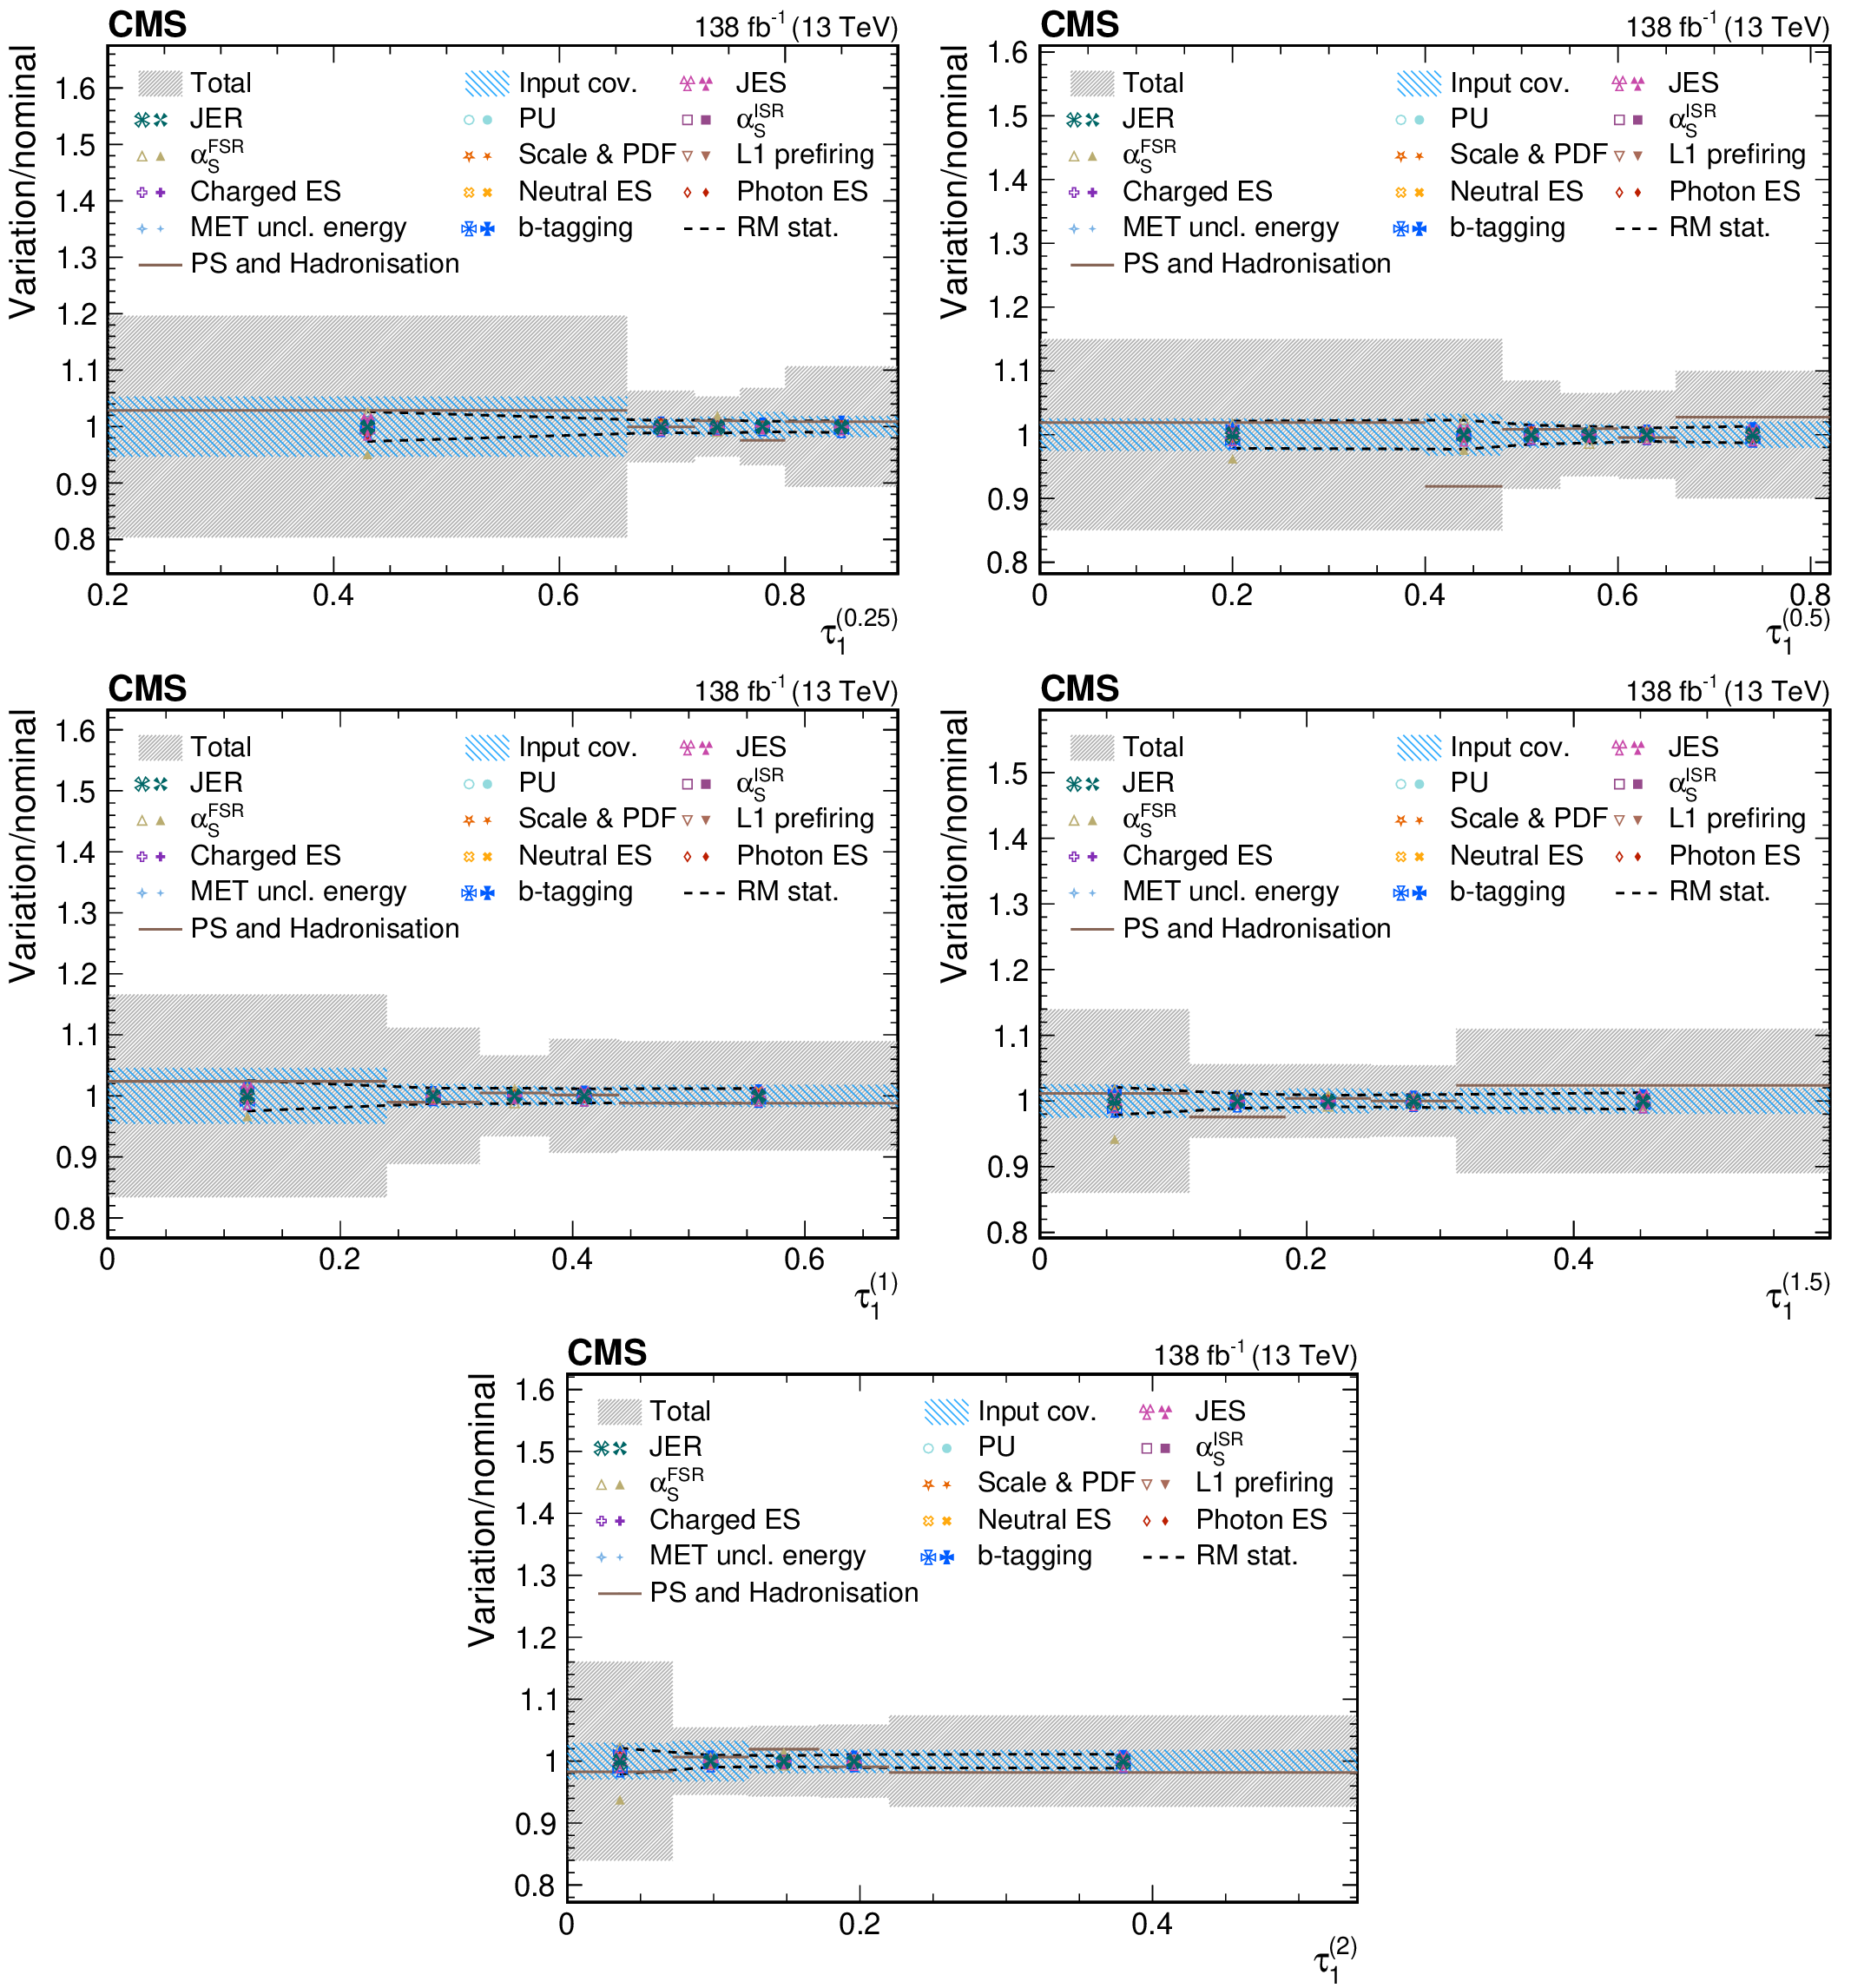
png pdf |
Figure 58:
Contributions from various systematic variations to the normalized, unfolded distribution for $ \tau_1^{(\beta)} $ observables measured for AK8 jets passing the boosted top quark-enriched selection in $ \mu $+jets $ \mathrm{t} \overline{\mathrm{t}} $ events. The total unfolding uncertainty is indicated with the dark grey, hashed region, while the blue hashed region indicates the contributions from the input covariance matrix, which includes the propagated effects of the statistical uncertainties of the input data after background subtraction. Contributions from statistical uncertainties of the simulated sample used to construct the nominal response matrix are indicated with the dashed black line. The physics model uncertainty is computed as a one-sided shift compared to the nominal unfolding, and up (down) contributions from other sources are indicated with filled (open) markers of the same type and colour. |
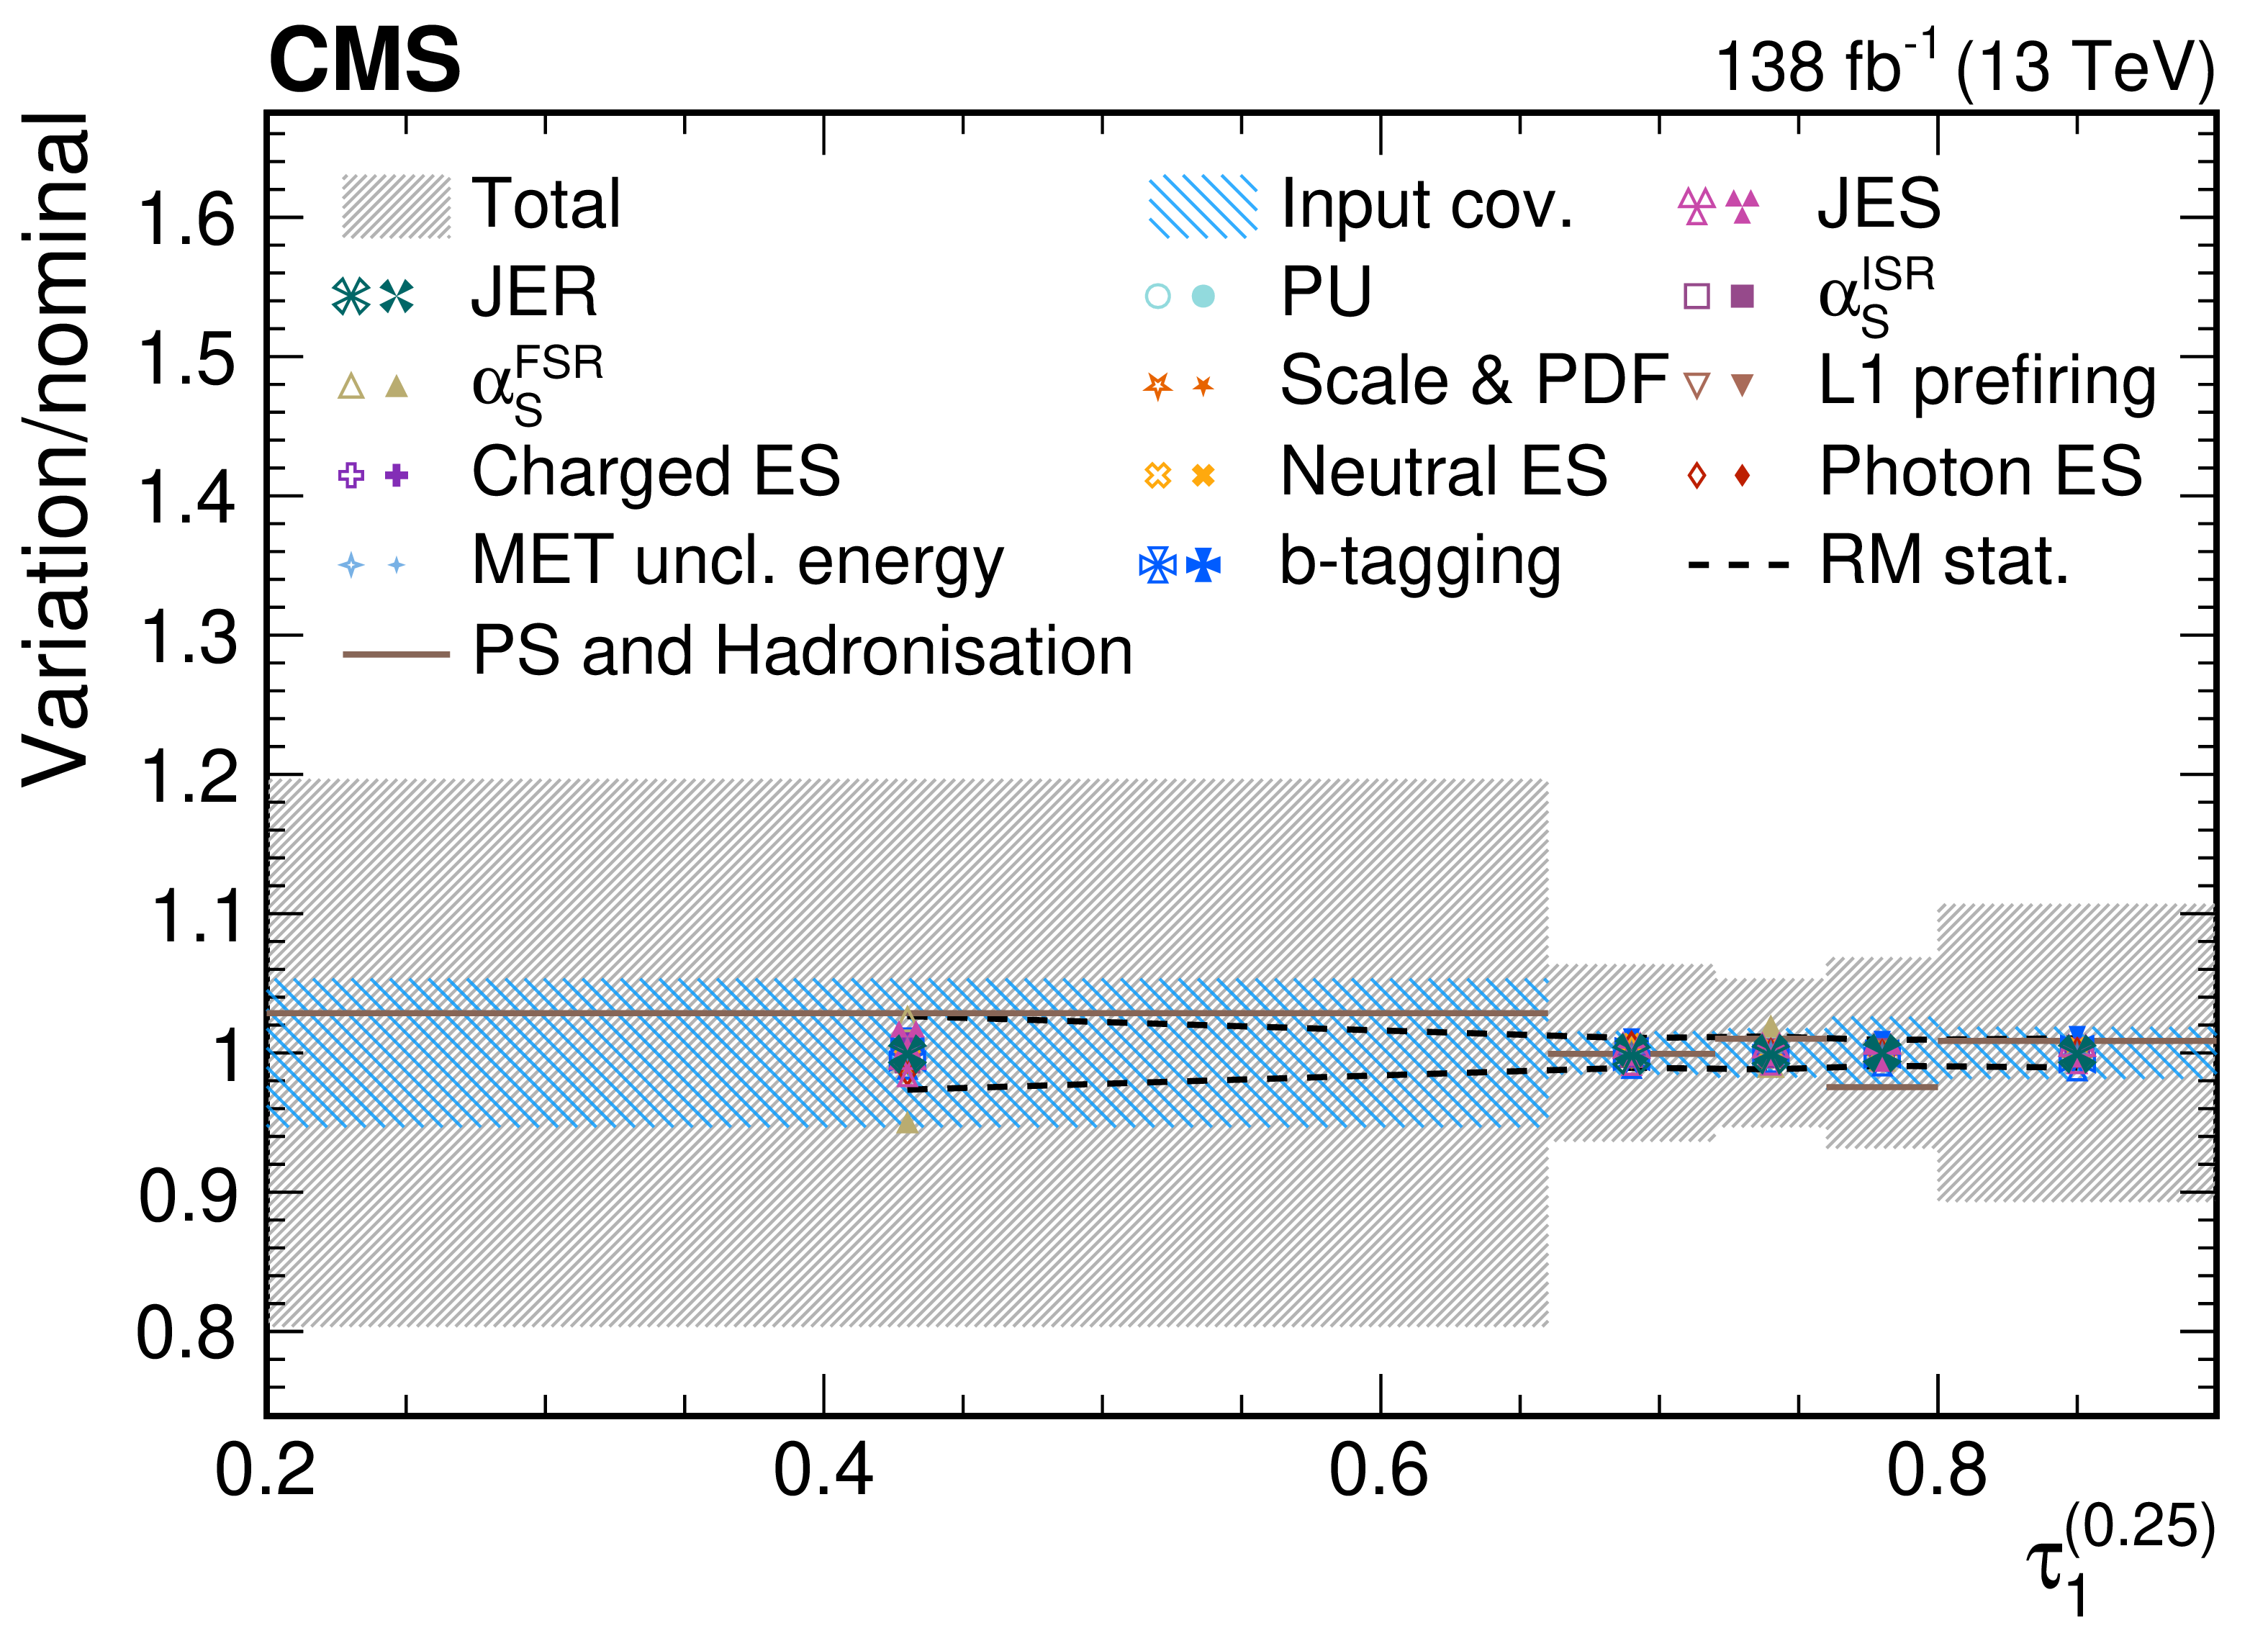
png pdf |
Figure 58-a:
Contributions from various systematic variations to the normalized, unfolded distribution for $ \tau_1^{(\beta)} $ observables measured for AK8 jets passing the boosted top quark-enriched selection in $ \mu $+jets $ \mathrm{t} \overline{\mathrm{t}} $ events. The total unfolding uncertainty is indicated with the dark grey, hashed region, while the blue hashed region indicates the contributions from the input covariance matrix, which includes the propagated effects of the statistical uncertainties of the input data after background subtraction. Contributions from statistical uncertainties of the simulated sample used to construct the nominal response matrix are indicated with the dashed black line. The physics model uncertainty is computed as a one-sided shift compared to the nominal unfolding, and up (down) contributions from other sources are indicated with filled (open) markers of the same type and colour. |

png pdf |
Figure 58-b:
Contributions from various systematic variations to the normalized, unfolded distribution for $ \tau_1^{(\beta)} $ observables measured for AK8 jets passing the boosted top quark-enriched selection in $ \mu $+jets $ \mathrm{t} \overline{\mathrm{t}} $ events. The total unfolding uncertainty is indicated with the dark grey, hashed region, while the blue hashed region indicates the contributions from the input covariance matrix, which includes the propagated effects of the statistical uncertainties of the input data after background subtraction. Contributions from statistical uncertainties of the simulated sample used to construct the nominal response matrix are indicated with the dashed black line. The physics model uncertainty is computed as a one-sided shift compared to the nominal unfolding, and up (down) contributions from other sources are indicated with filled (open) markers of the same type and colour. |
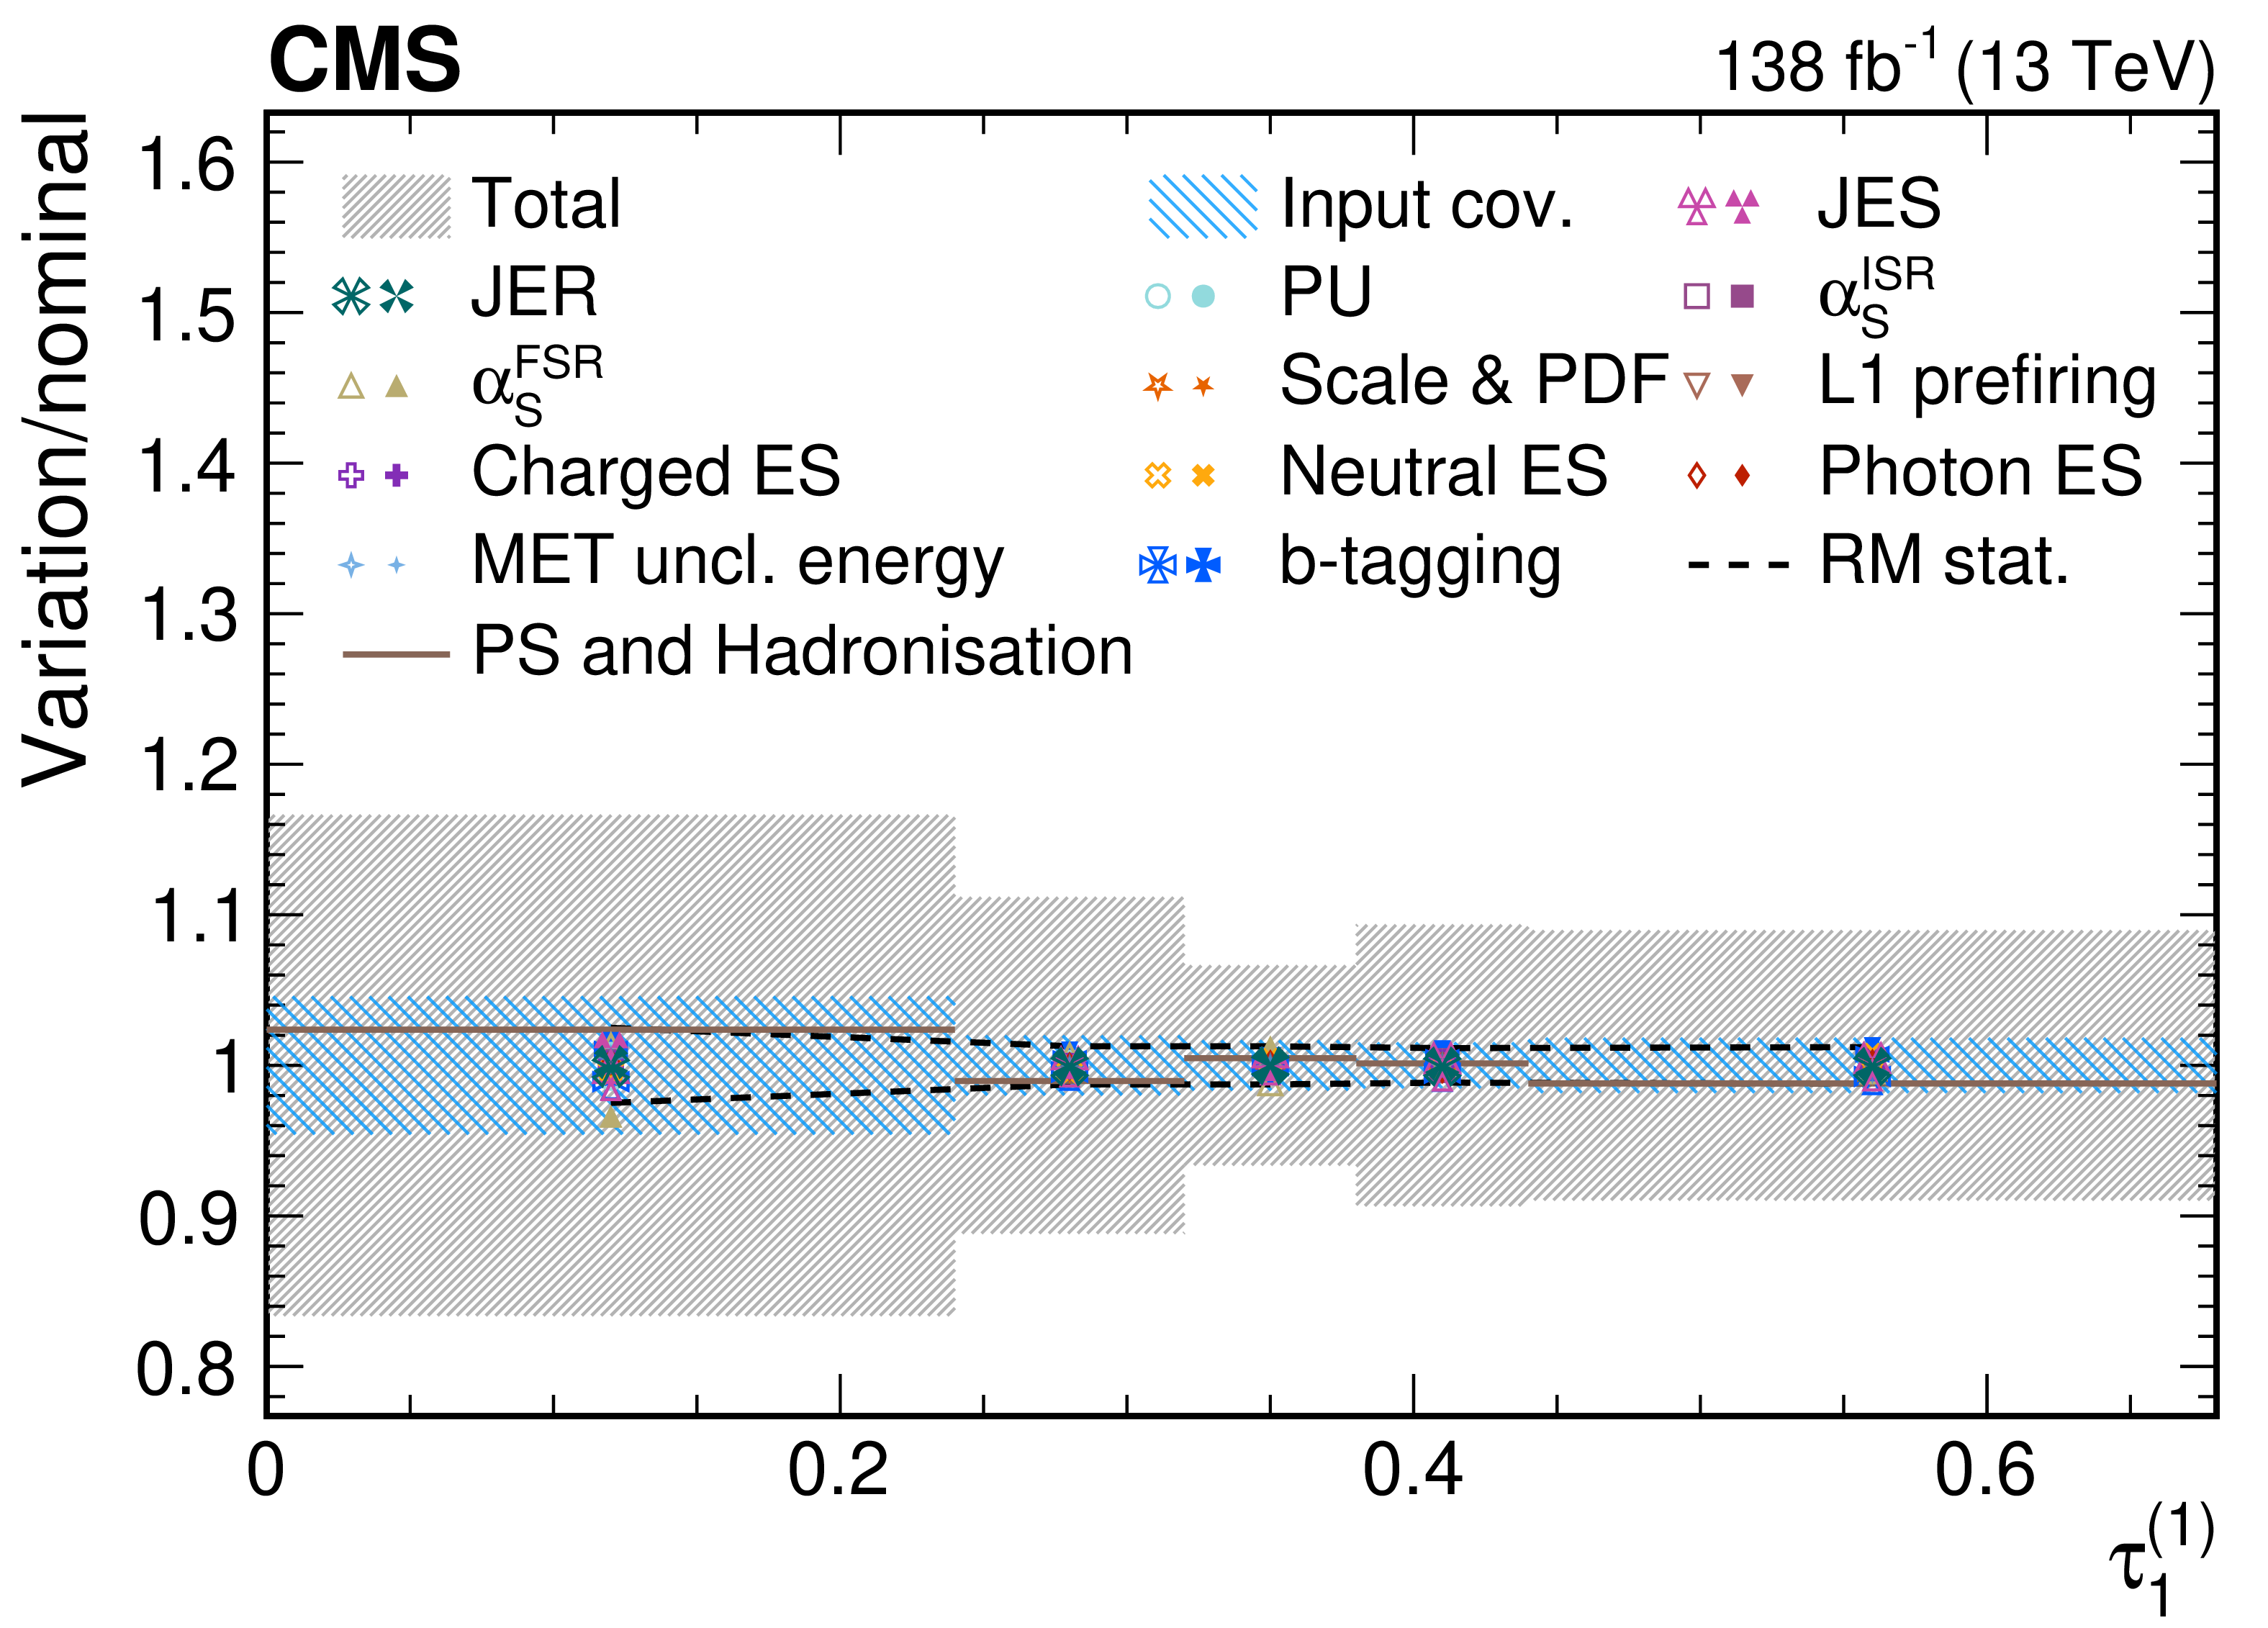
png pdf |
Figure 58-c:
Contributions from various systematic variations to the normalized, unfolded distribution for $ \tau_1^{(\beta)} $ observables measured for AK8 jets passing the boosted top quark-enriched selection in $ \mu $+jets $ \mathrm{t} \overline{\mathrm{t}} $ events. The total unfolding uncertainty is indicated with the dark grey, hashed region, while the blue hashed region indicates the contributions from the input covariance matrix, which includes the propagated effects of the statistical uncertainties of the input data after background subtraction. Contributions from statistical uncertainties of the simulated sample used to construct the nominal response matrix are indicated with the dashed black line. The physics model uncertainty is computed as a one-sided shift compared to the nominal unfolding, and up (down) contributions from other sources are indicated with filled (open) markers of the same type and colour. |
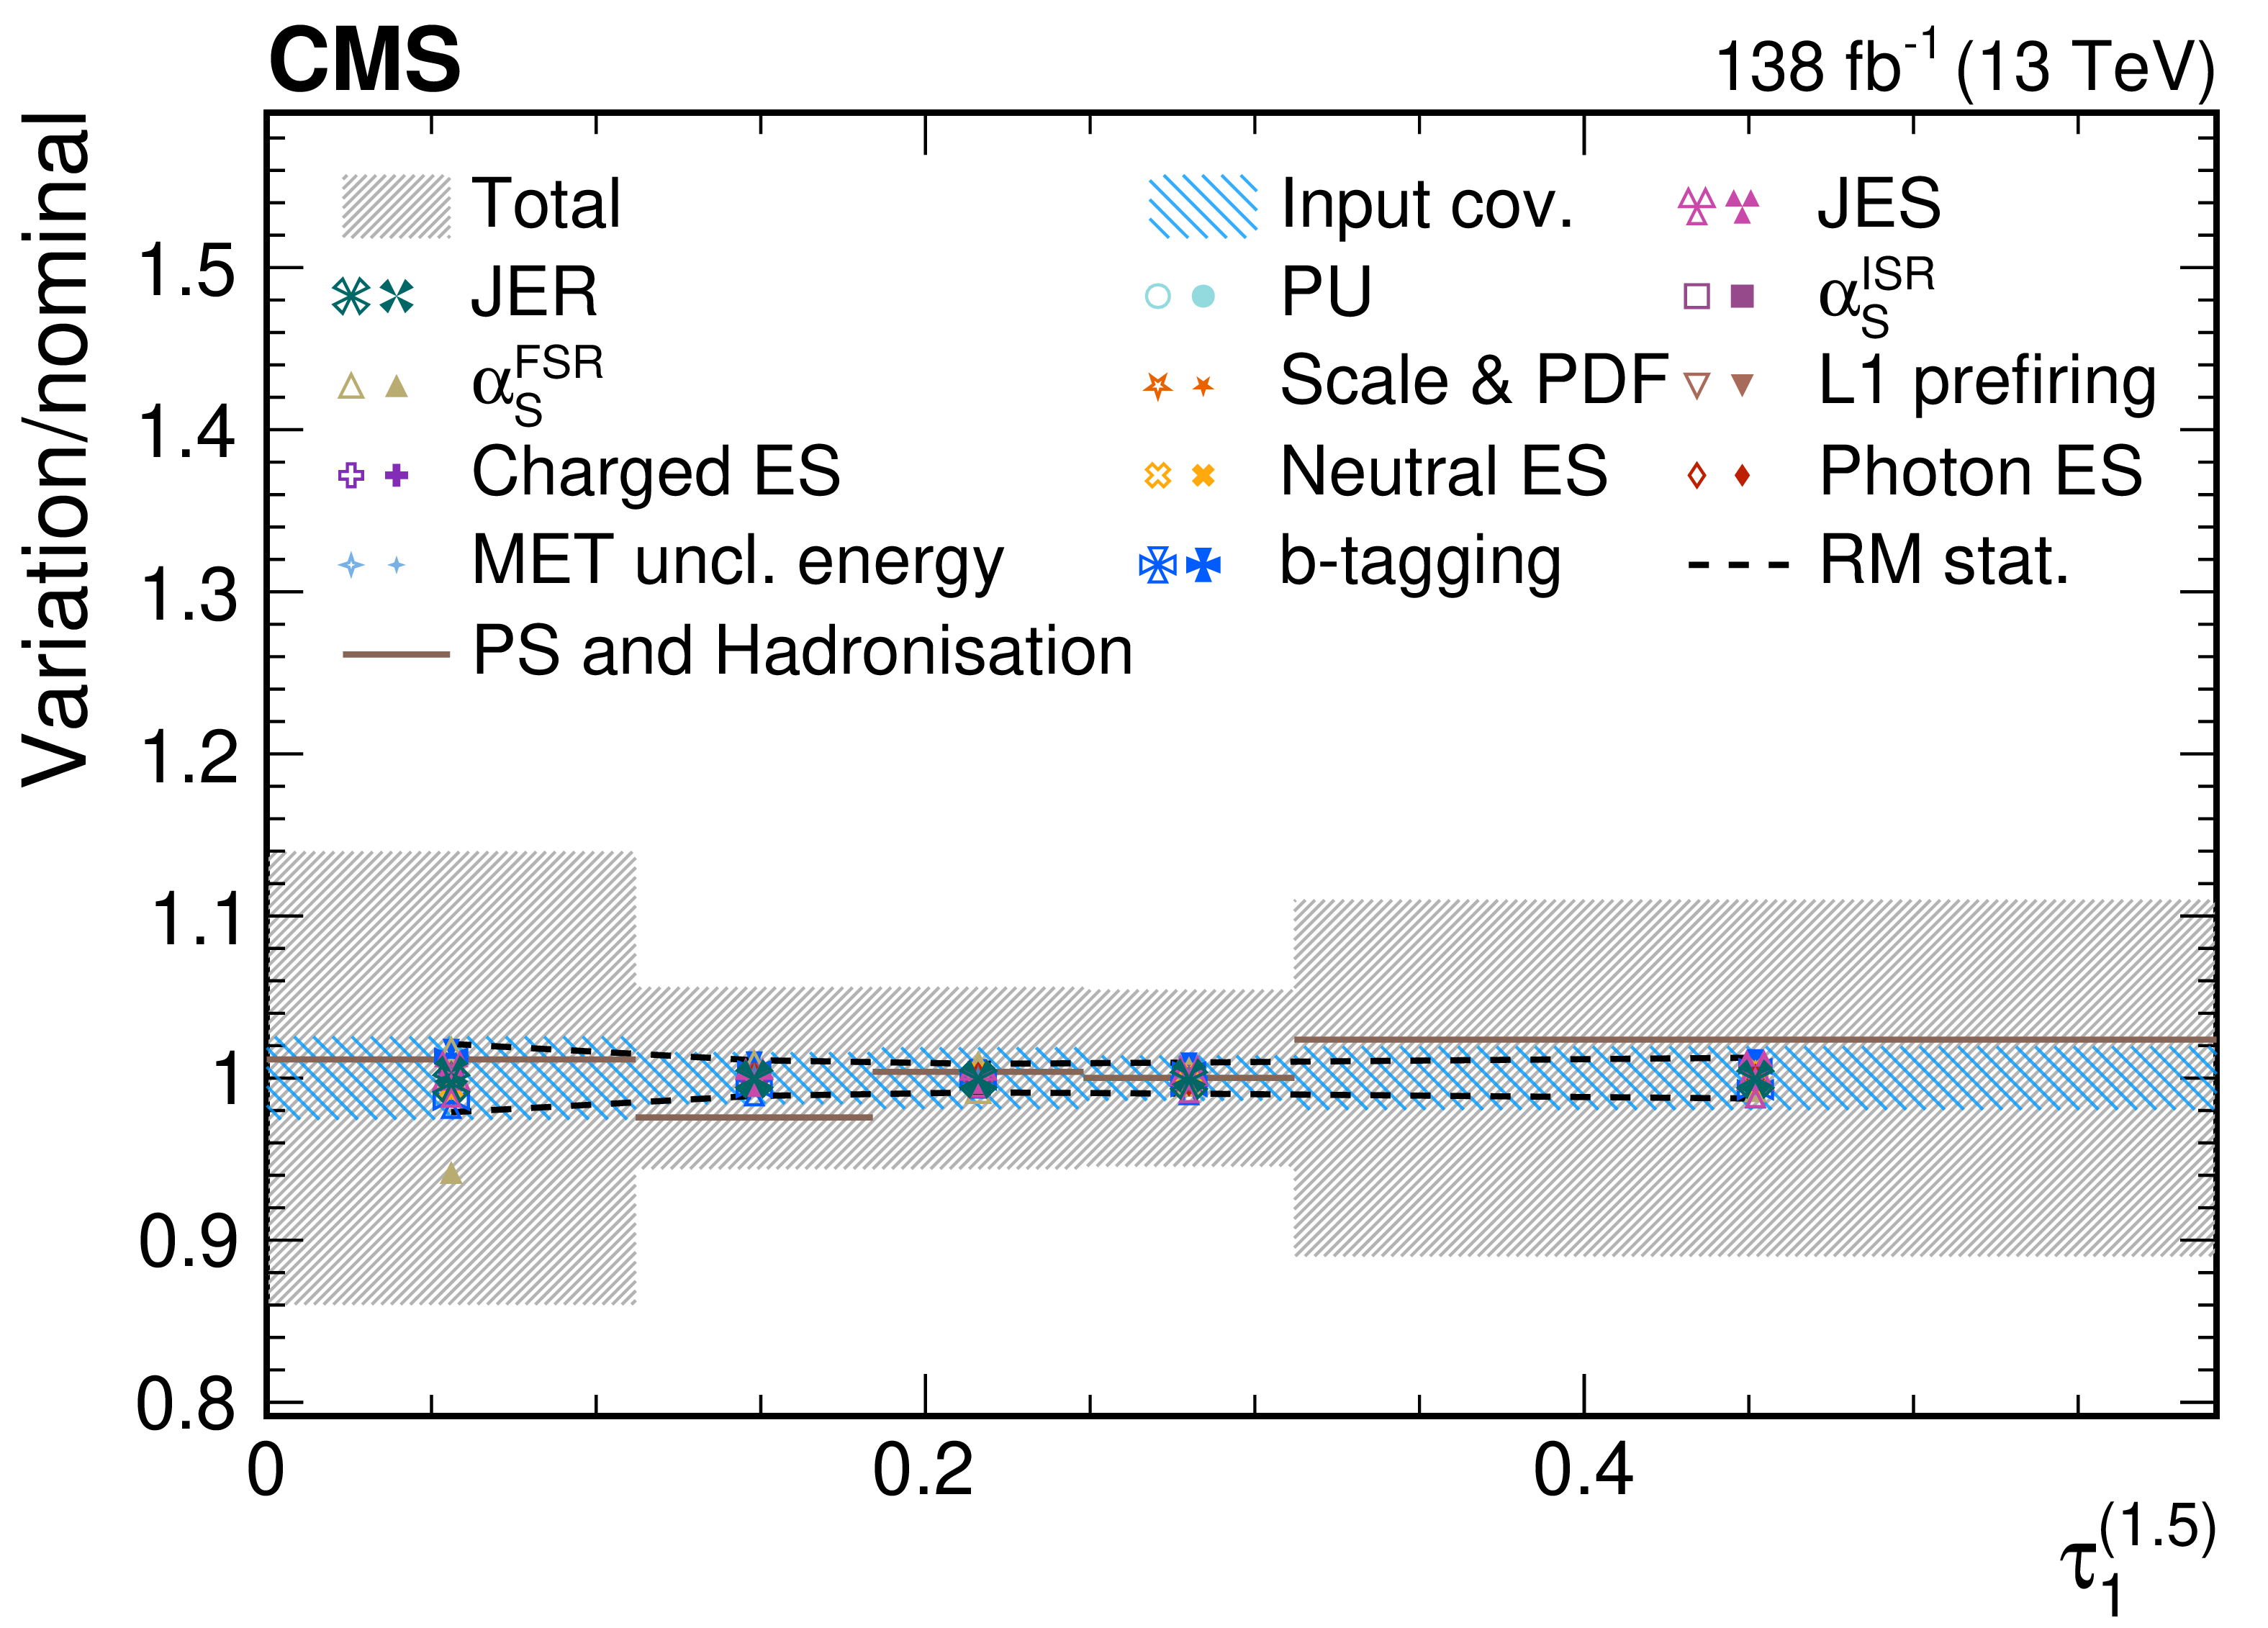
png pdf |
Figure 58-d:
Contributions from various systematic variations to the normalized, unfolded distribution for $ \tau_1^{(\beta)} $ observables measured for AK8 jets passing the boosted top quark-enriched selection in $ \mu $+jets $ \mathrm{t} \overline{\mathrm{t}} $ events. The total unfolding uncertainty is indicated with the dark grey, hashed region, while the blue hashed region indicates the contributions from the input covariance matrix, which includes the propagated effects of the statistical uncertainties of the input data after background subtraction. Contributions from statistical uncertainties of the simulated sample used to construct the nominal response matrix are indicated with the dashed black line. The physics model uncertainty is computed as a one-sided shift compared to the nominal unfolding, and up (down) contributions from other sources are indicated with filled (open) markers of the same type and colour. |
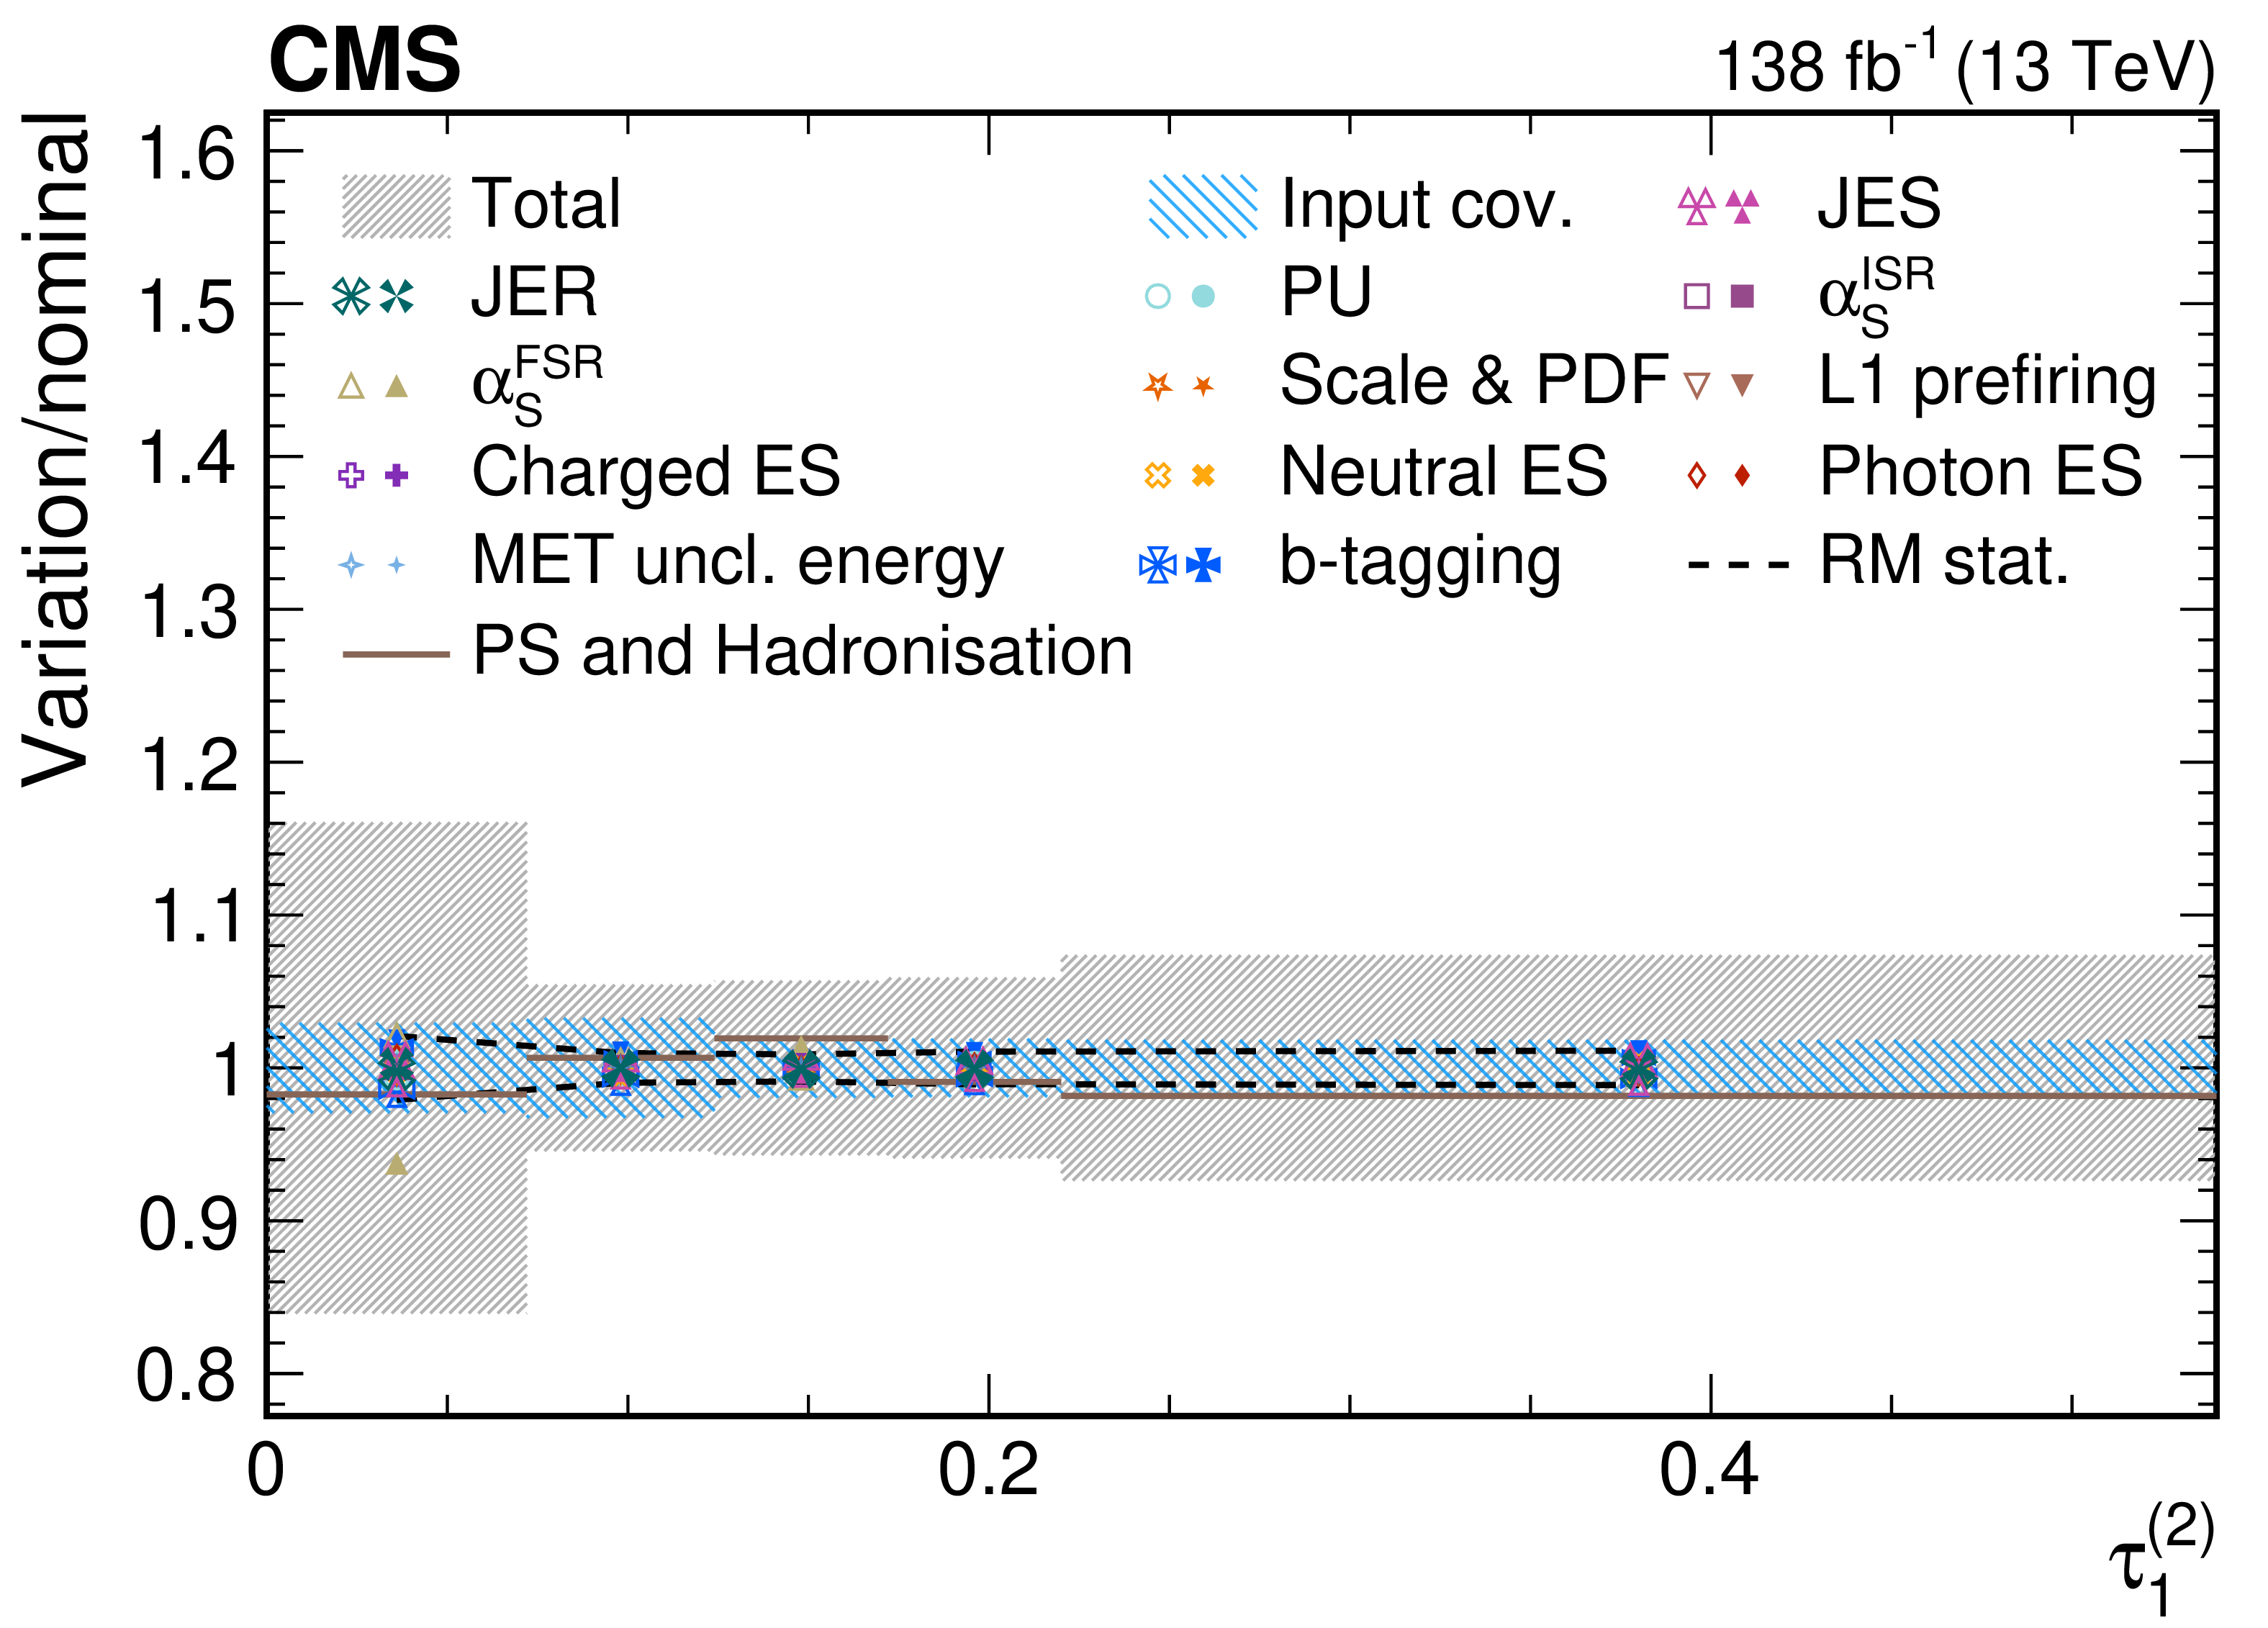
png pdf |
Figure 58-e:
Contributions from various systematic variations to the normalized, unfolded distribution for $ \tau_1^{(\beta)} $ observables measured for AK8 jets passing the boosted top quark-enriched selection in $ \mu $+jets $ \mathrm{t} \overline{\mathrm{t}} $ events. The total unfolding uncertainty is indicated with the dark grey, hashed region, while the blue hashed region indicates the contributions from the input covariance matrix, which includes the propagated effects of the statistical uncertainties of the input data after background subtraction. Contributions from statistical uncertainties of the simulated sample used to construct the nominal response matrix are indicated with the dashed black line. The physics model uncertainty is computed as a one-sided shift compared to the nominal unfolding, and up (down) contributions from other sources are indicated with filled (open) markers of the same type and colour. |
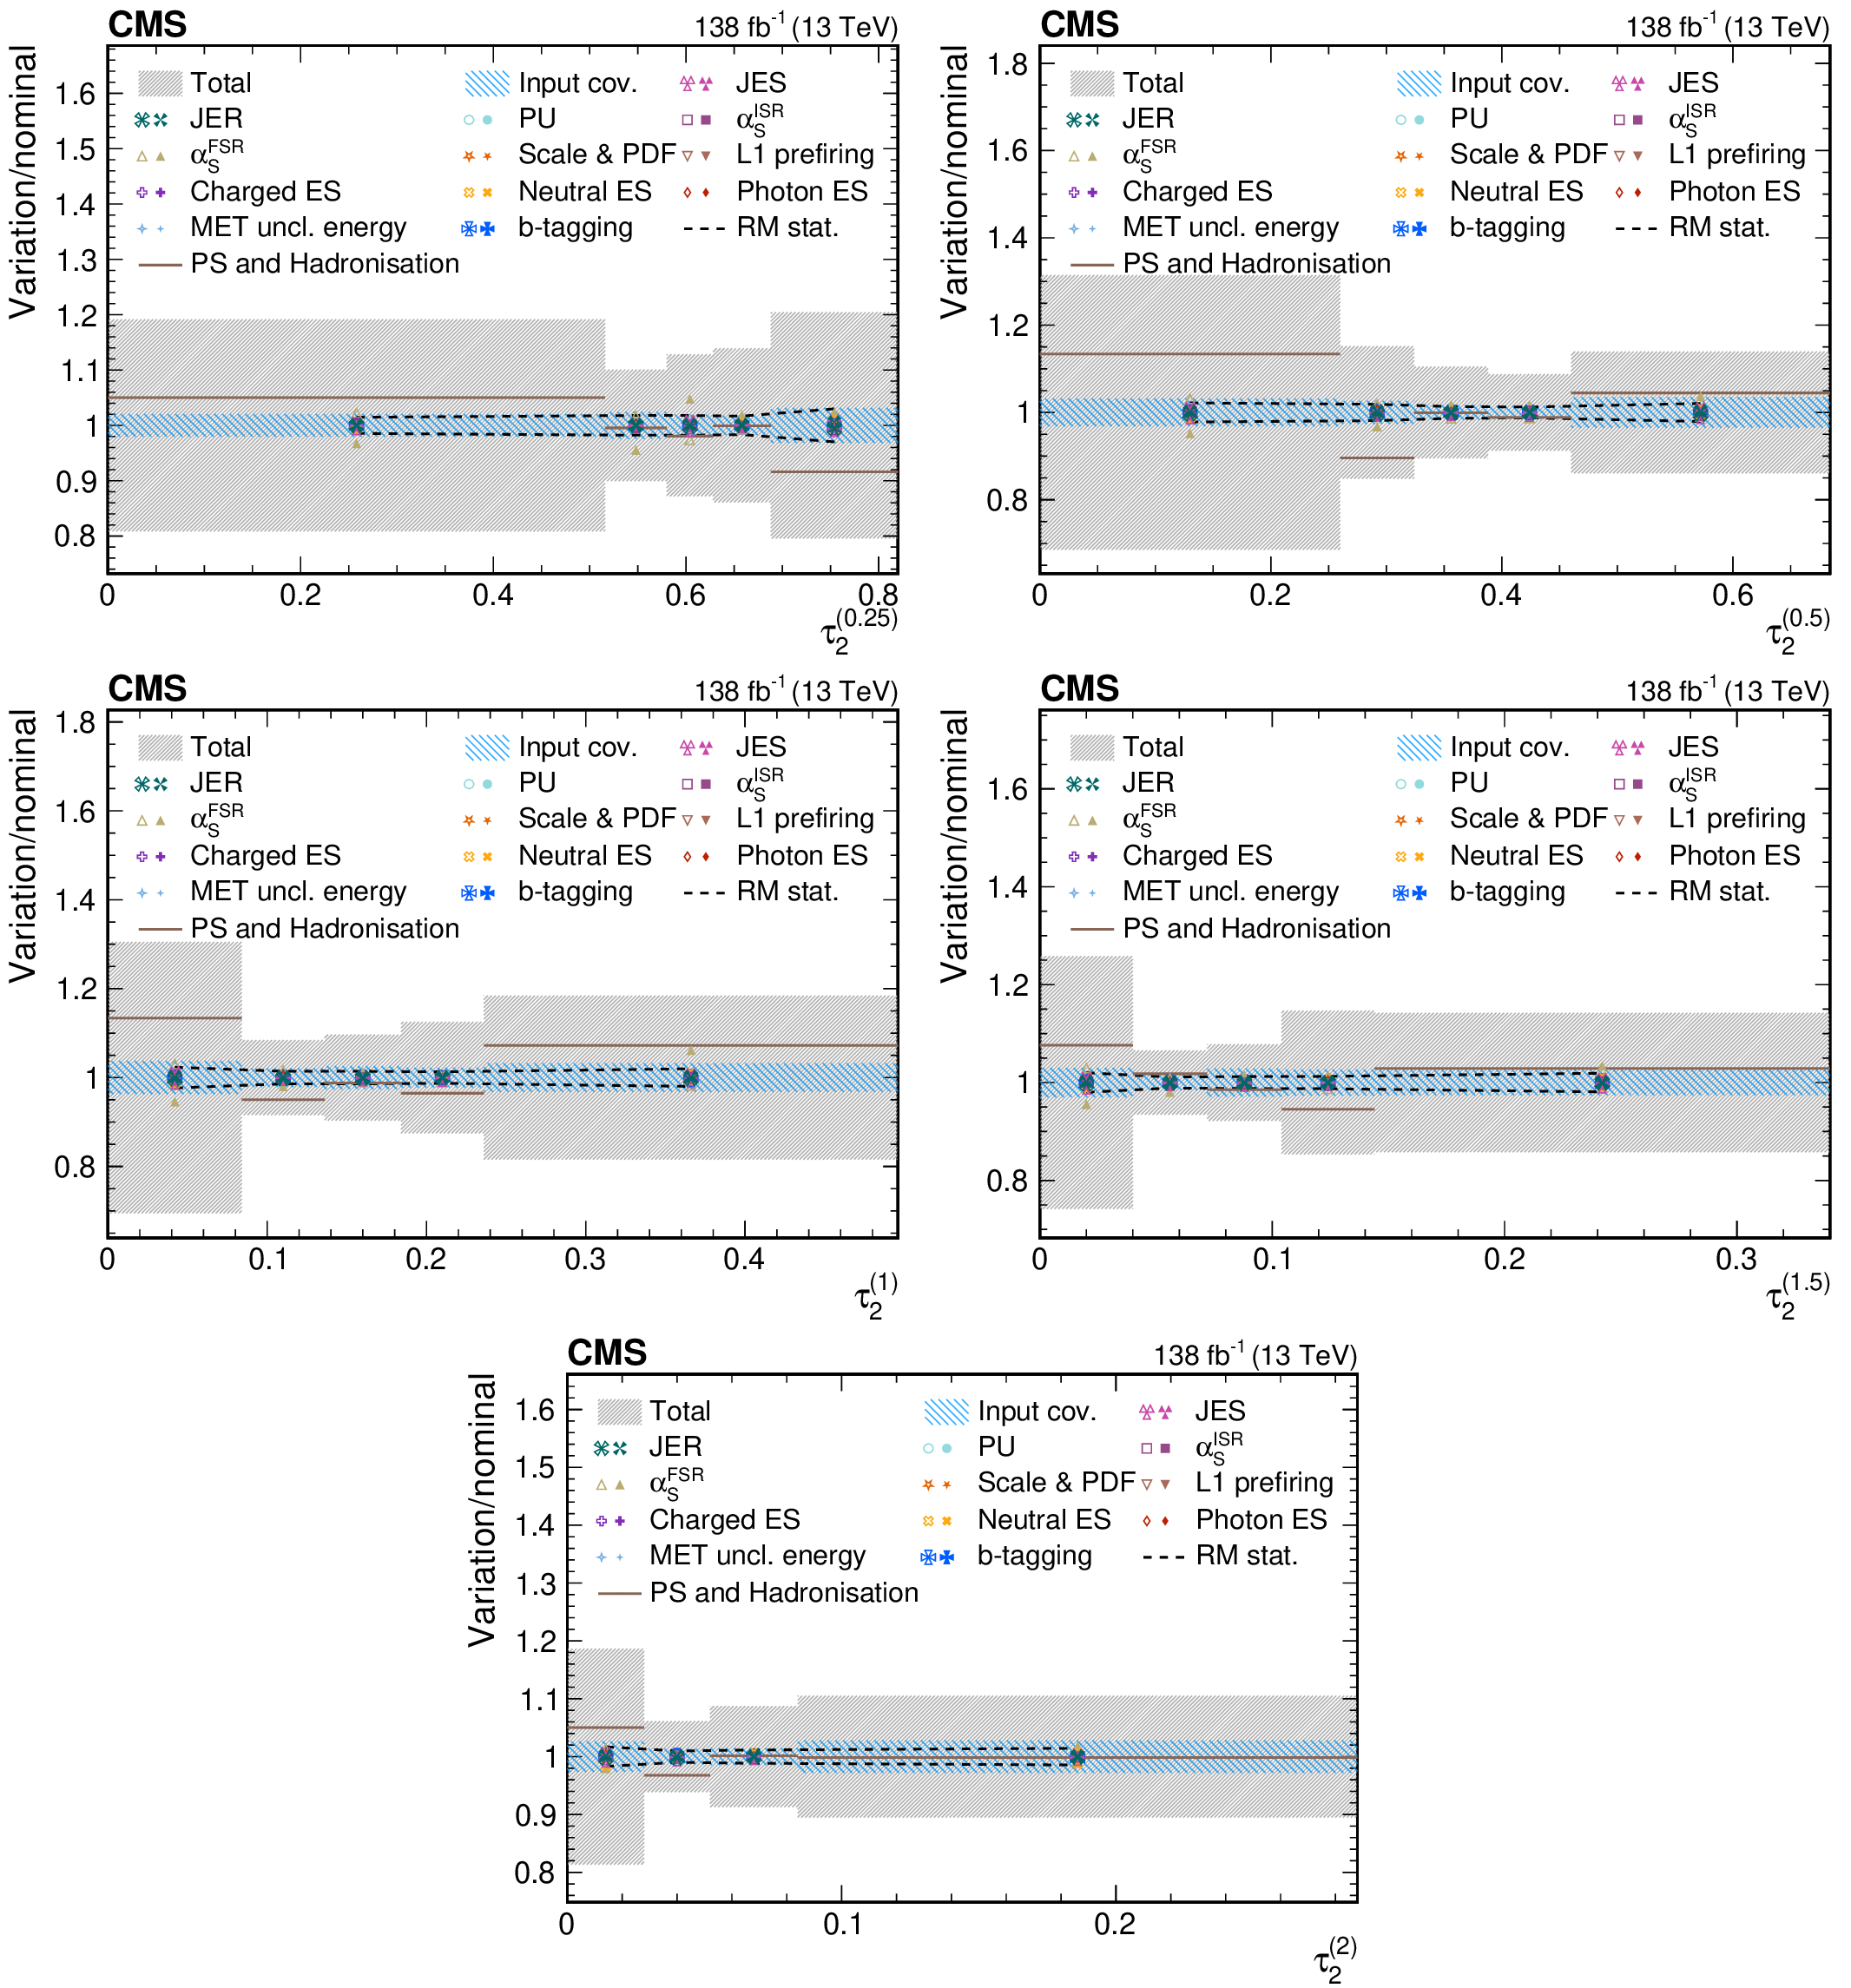
png pdf |
Figure 59:
Contributions from various systematic variations to the normalized, unfolded distribution for $ \tau_2^{(\beta)} $ observables measured for AK8 jets passing the boosted top quark-enriched selection in $ \mu $+jets $ \mathrm{t} \overline{\mathrm{t}} $ events. The total unfolding uncertainty is indicated with the dark grey, hashed region, while the blue hashed region indicates the contributions from the input covariance matrix, which includes the propagated effects of the statistical uncertainties of the input data after background subtraction. Contributions from statistical uncertainties of the simulated sample used to construct the nominal response matrix are indicated with the dashed black line. The physics model uncertainty is computed as a one-sided shift compared to the nominal unfolding, and up (down) contributions from other sources are indicated with filled (open) markers of the same type and colour. |
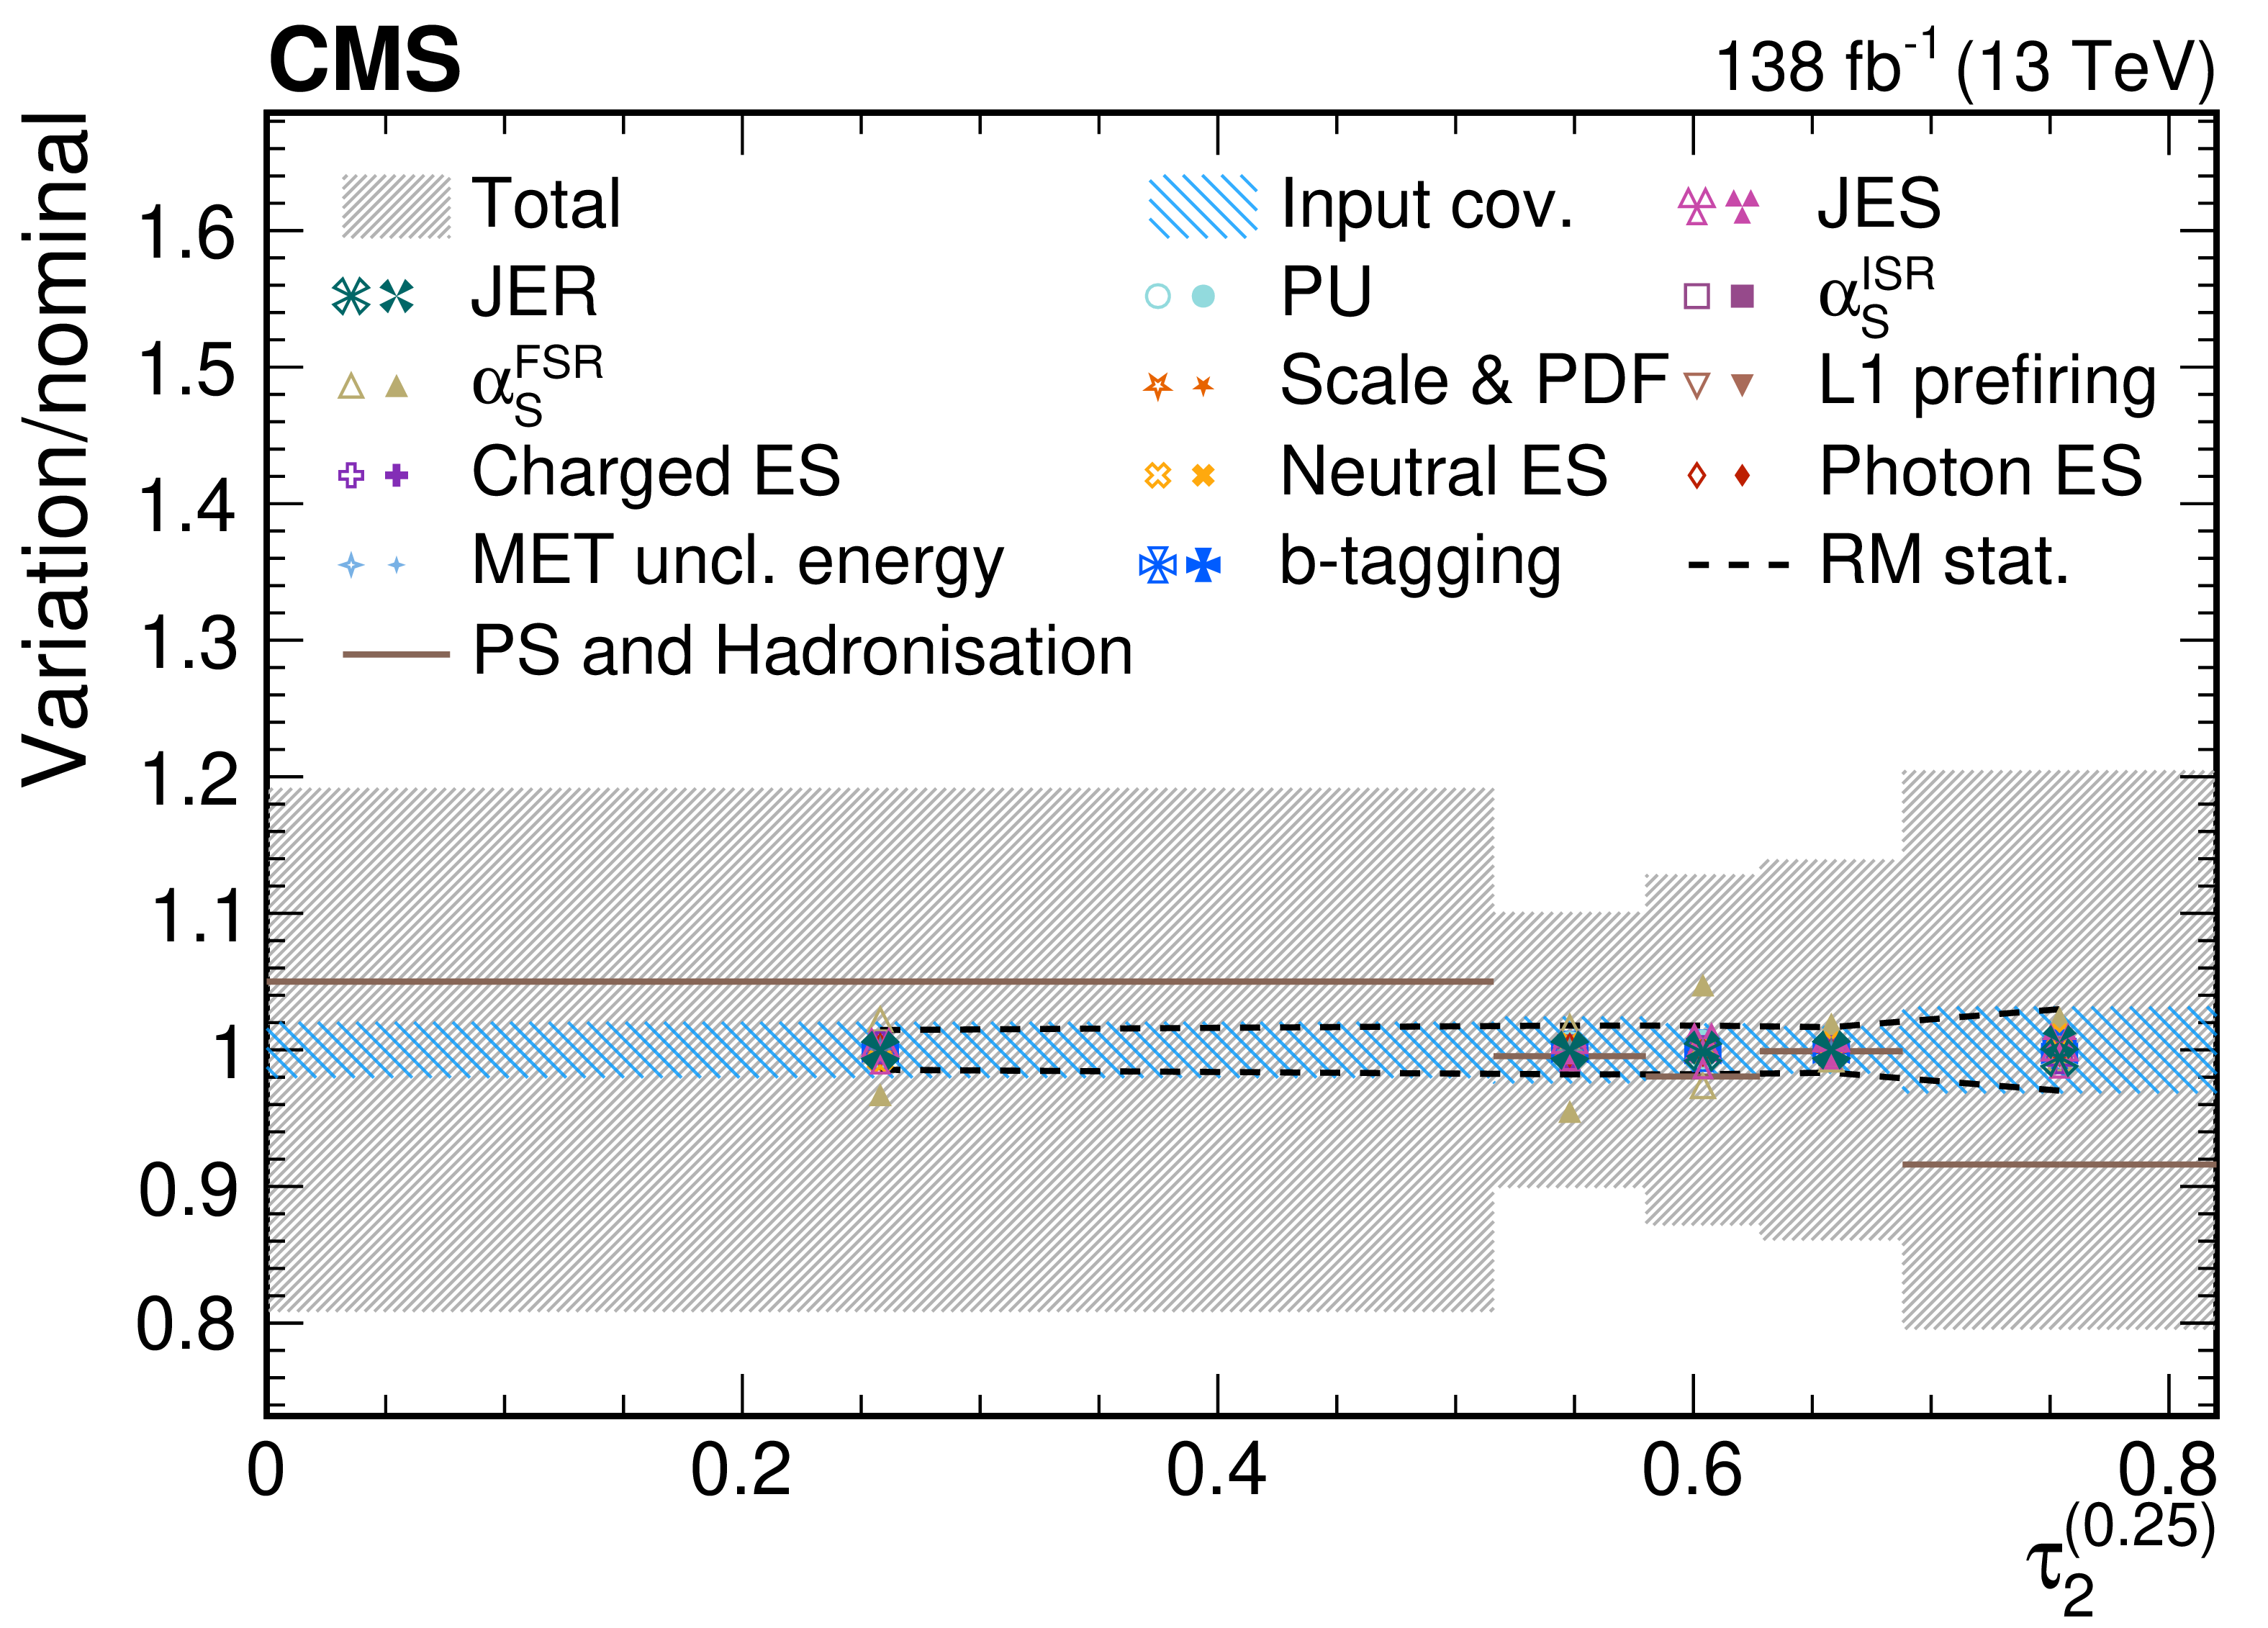
png pdf |
Figure 59-a:
Contributions from various systematic variations to the normalized, unfolded distribution for $ \tau_2^{(\beta)} $ observables measured for AK8 jets passing the boosted top quark-enriched selection in $ \mu $+jets $ \mathrm{t} \overline{\mathrm{t}} $ events. The total unfolding uncertainty is indicated with the dark grey, hashed region, while the blue hashed region indicates the contributions from the input covariance matrix, which includes the propagated effects of the statistical uncertainties of the input data after background subtraction. Contributions from statistical uncertainties of the simulated sample used to construct the nominal response matrix are indicated with the dashed black line. The physics model uncertainty is computed as a one-sided shift compared to the nominal unfolding, and up (down) contributions from other sources are indicated with filled (open) markers of the same type and colour. |
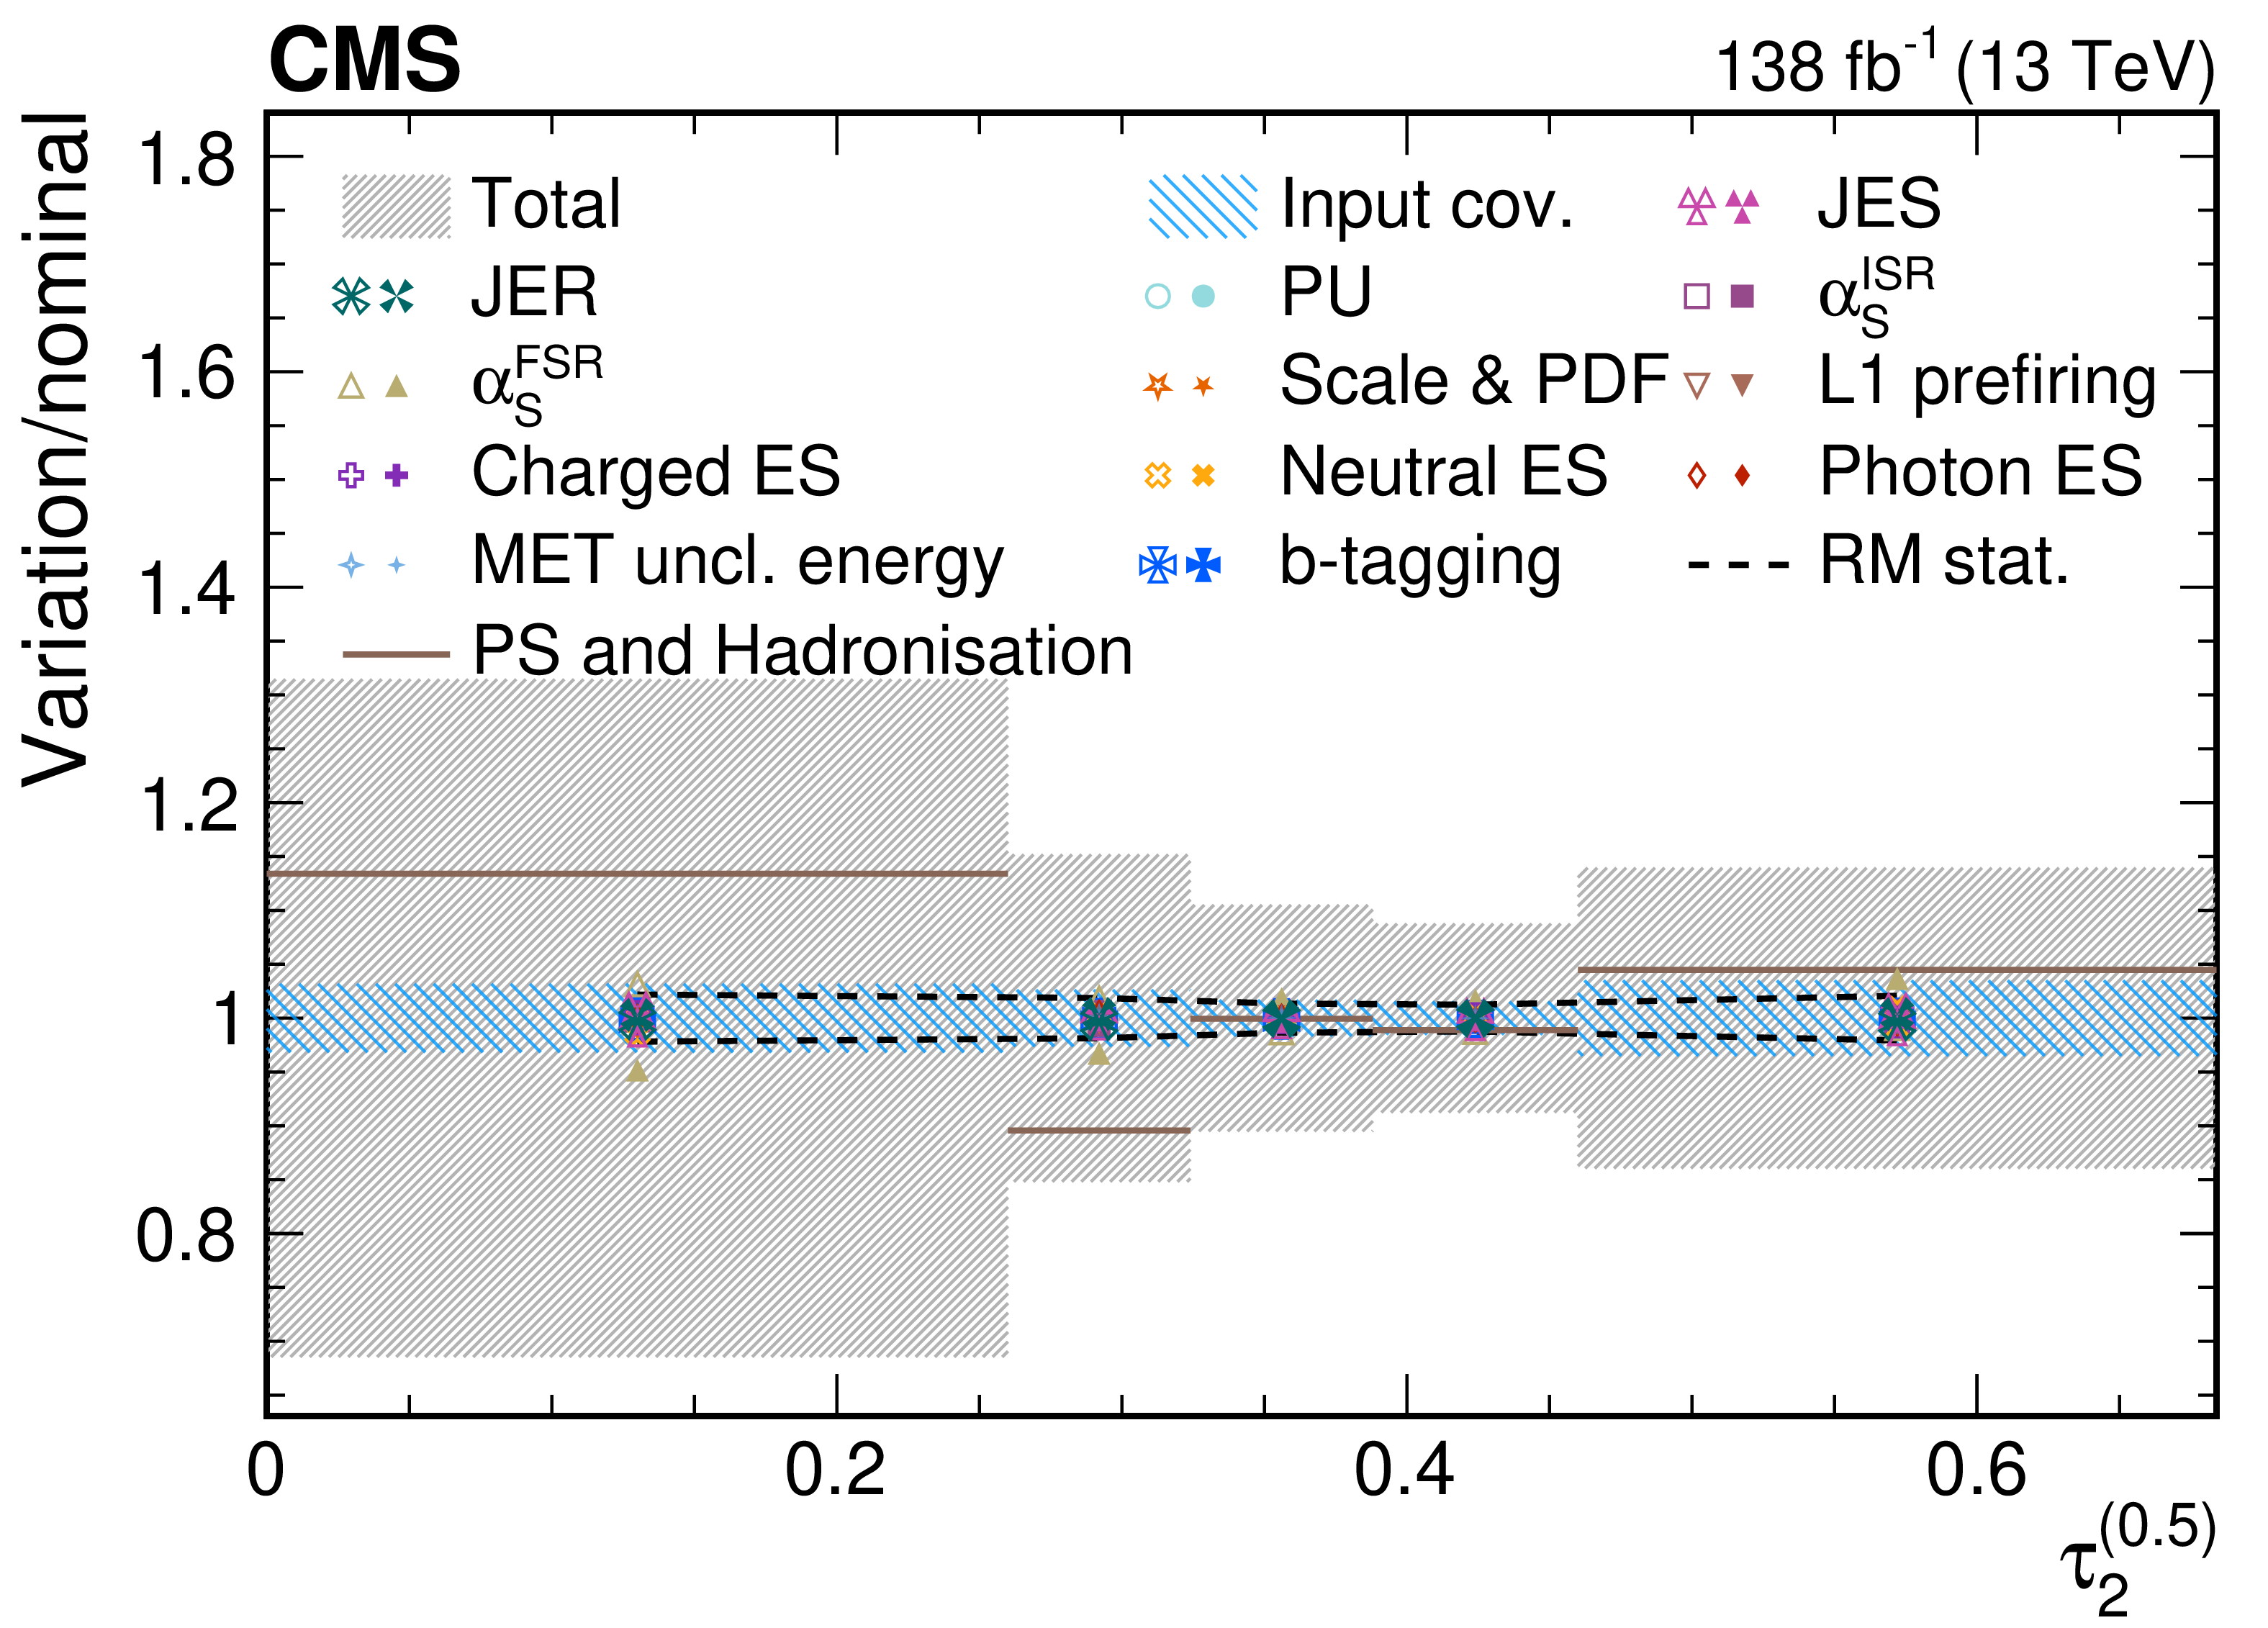
png pdf |
Figure 59-b:
Contributions from various systematic variations to the normalized, unfolded distribution for $ \tau_2^{(\beta)} $ observables measured for AK8 jets passing the boosted top quark-enriched selection in $ \mu $+jets $ \mathrm{t} \overline{\mathrm{t}} $ events. The total unfolding uncertainty is indicated with the dark grey, hashed region, while the blue hashed region indicates the contributions from the input covariance matrix, which includes the propagated effects of the statistical uncertainties of the input data after background subtraction. Contributions from statistical uncertainties of the simulated sample used to construct the nominal response matrix are indicated with the dashed black line. The physics model uncertainty is computed as a one-sided shift compared to the nominal unfolding, and up (down) contributions from other sources are indicated with filled (open) markers of the same type and colour. |
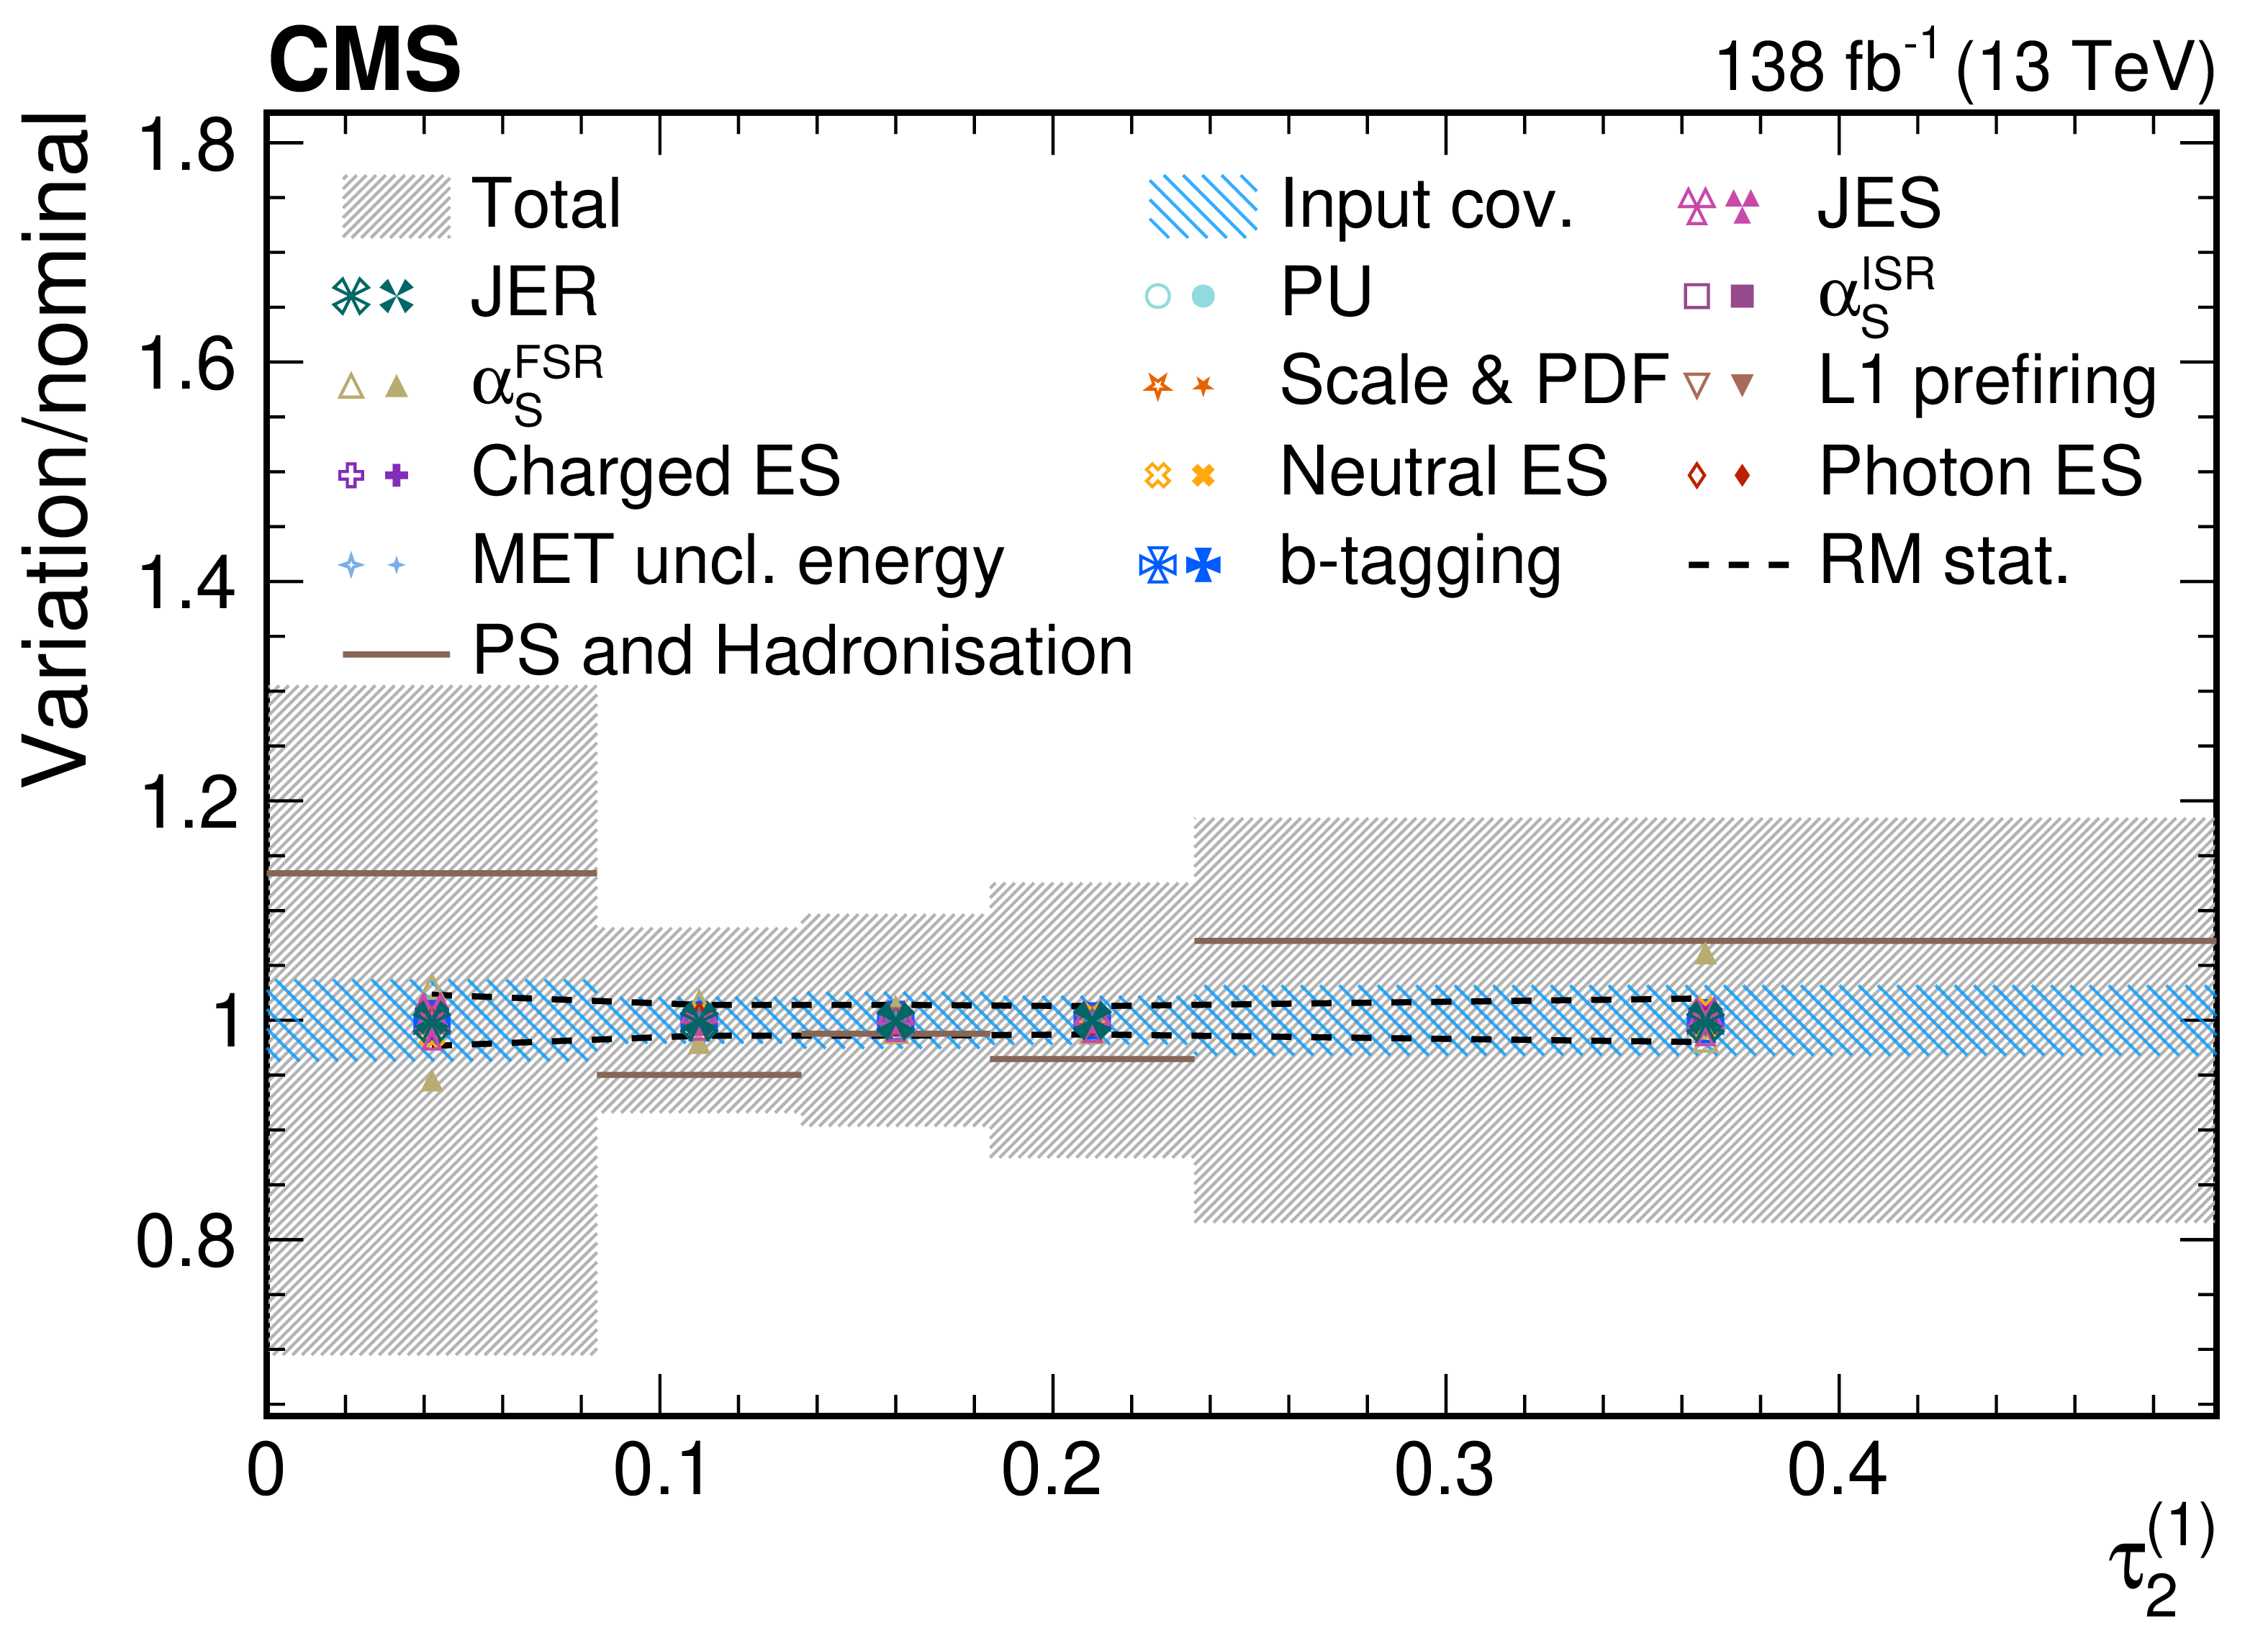
png pdf |
Figure 59-c:
Contributions from various systematic variations to the normalized, unfolded distribution for $ \tau_2^{(\beta)} $ observables measured for AK8 jets passing the boosted top quark-enriched selection in $ \mu $+jets $ \mathrm{t} \overline{\mathrm{t}} $ events. The total unfolding uncertainty is indicated with the dark grey, hashed region, while the blue hashed region indicates the contributions from the input covariance matrix, which includes the propagated effects of the statistical uncertainties of the input data after background subtraction. Contributions from statistical uncertainties of the simulated sample used to construct the nominal response matrix are indicated with the dashed black line. The physics model uncertainty is computed as a one-sided shift compared to the nominal unfolding, and up (down) contributions from other sources are indicated with filled (open) markers of the same type and colour. |
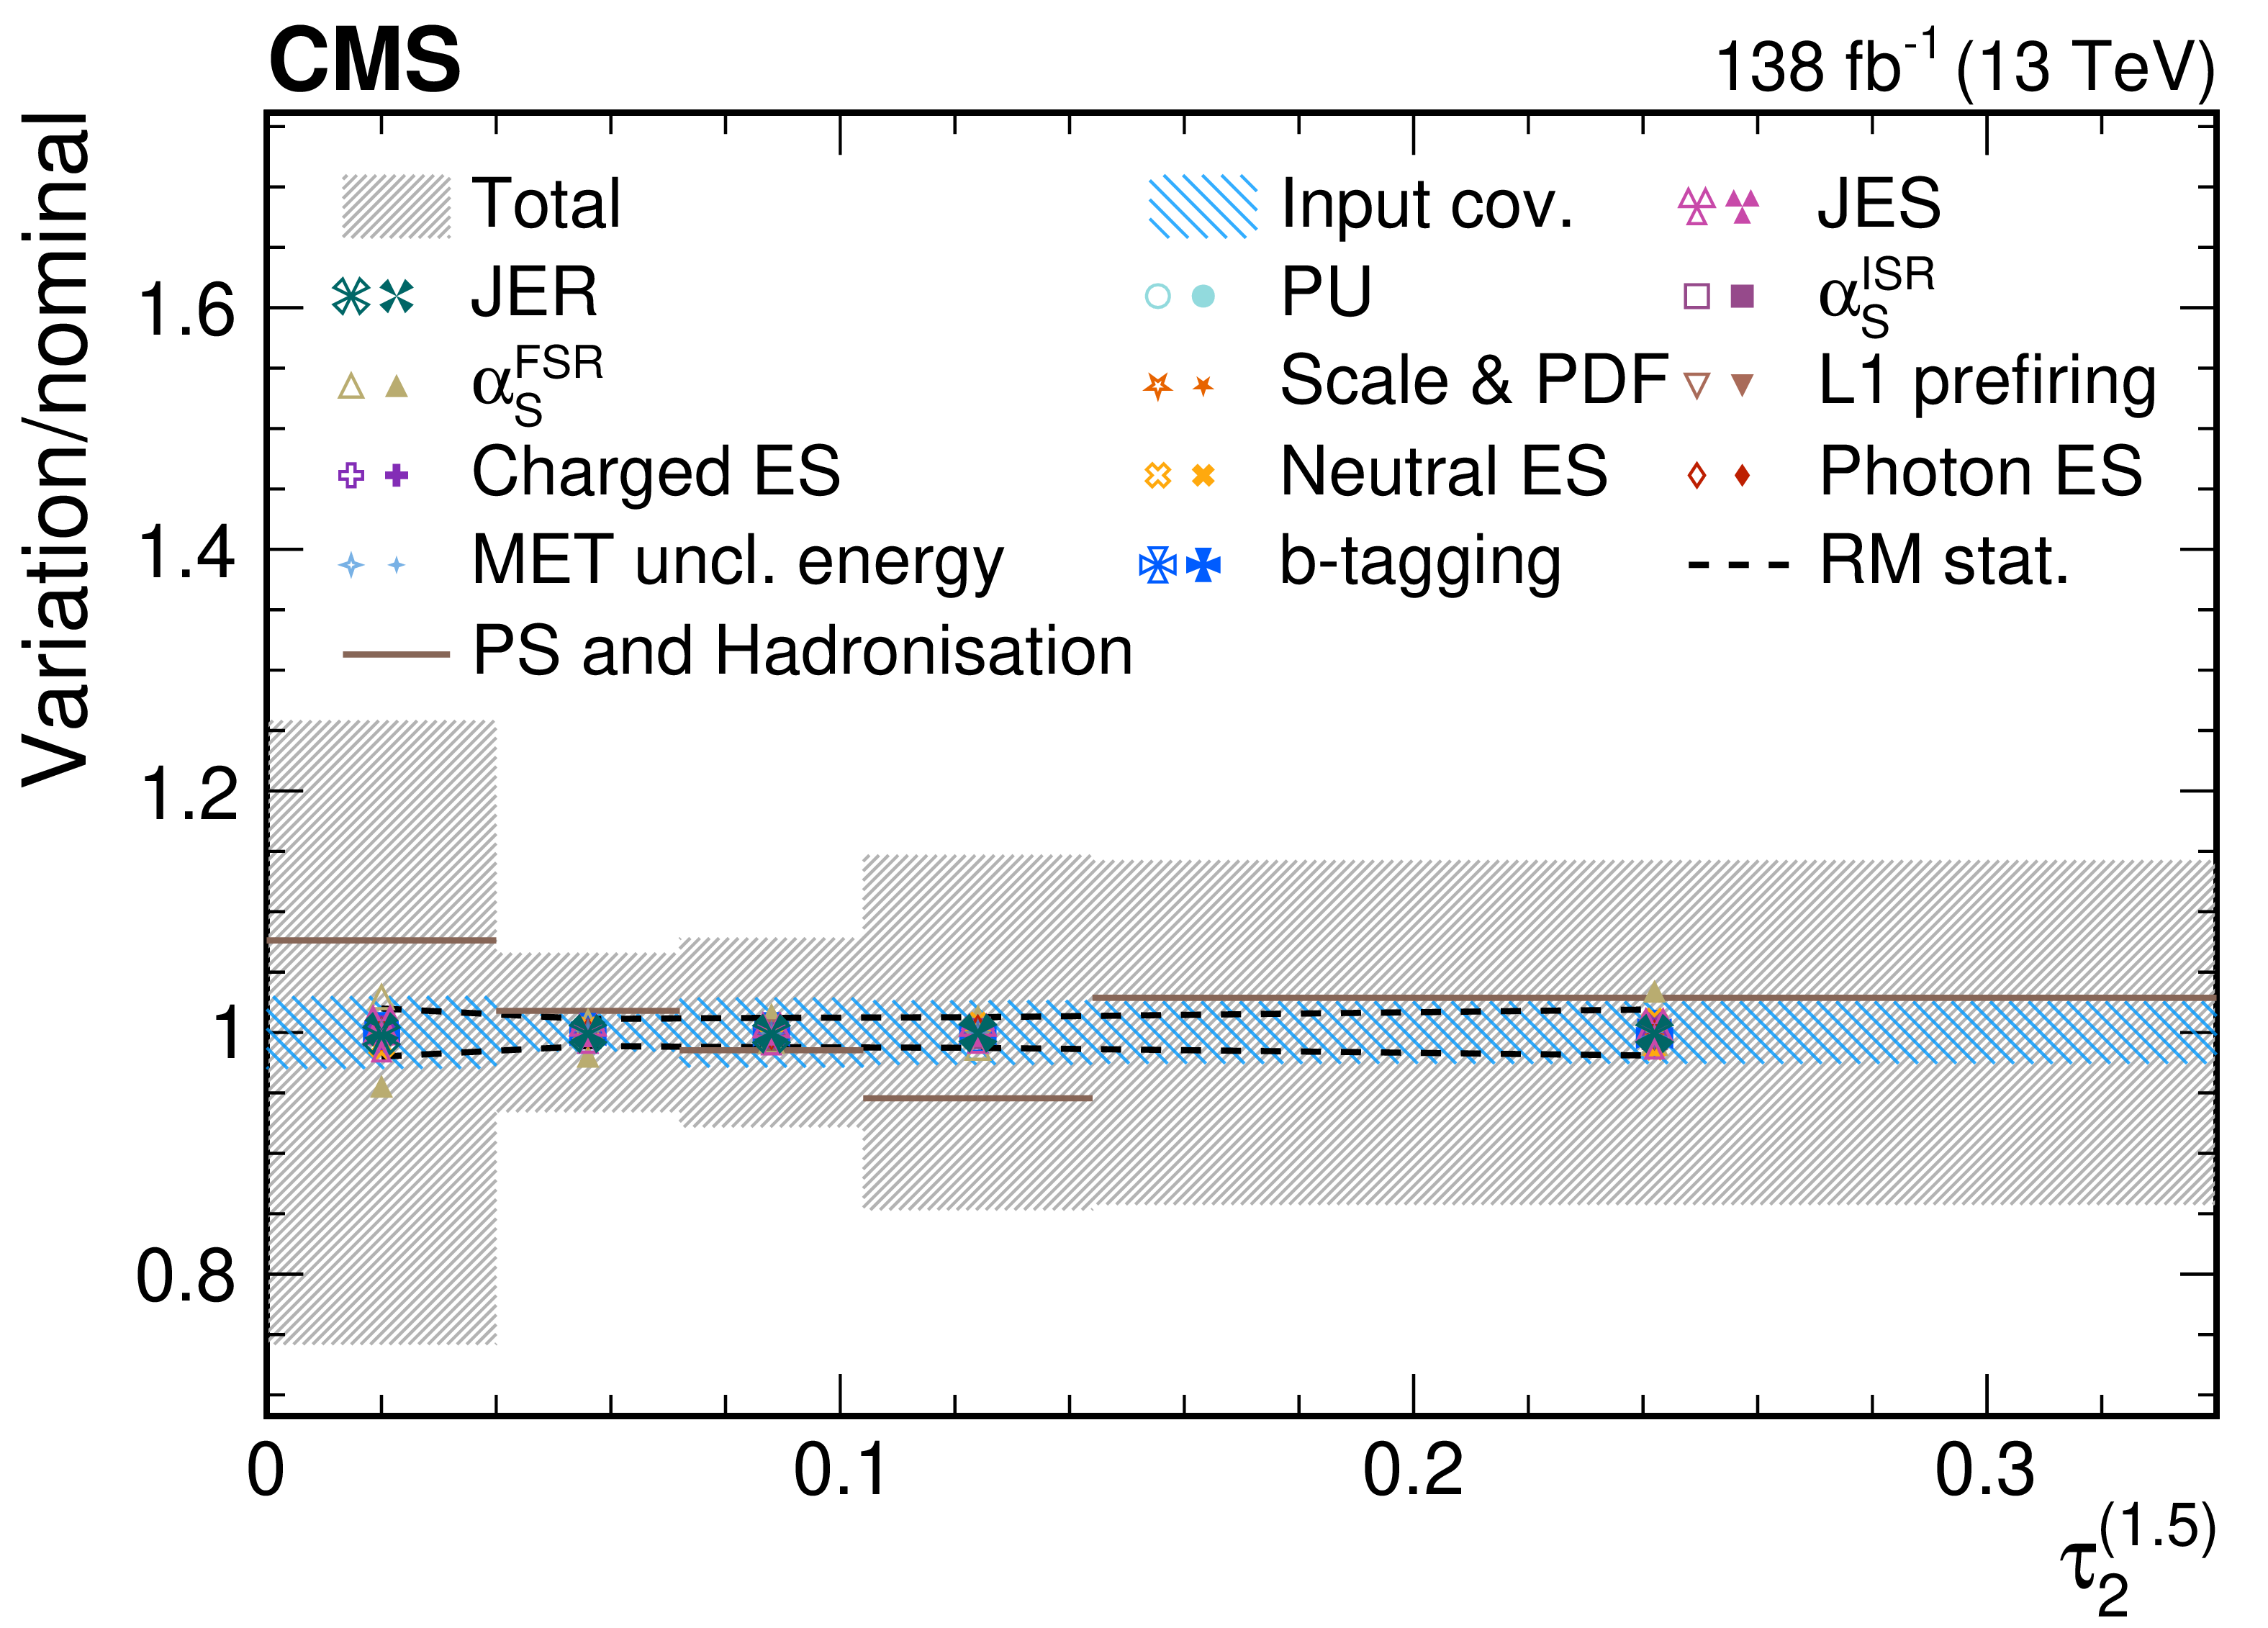
png pdf |
Figure 59-d:
Contributions from various systematic variations to the normalized, unfolded distribution for $ \tau_2^{(\beta)} $ observables measured for AK8 jets passing the boosted top quark-enriched selection in $ \mu $+jets $ \mathrm{t} \overline{\mathrm{t}} $ events. The total unfolding uncertainty is indicated with the dark grey, hashed region, while the blue hashed region indicates the contributions from the input covariance matrix, which includes the propagated effects of the statistical uncertainties of the input data after background subtraction. Contributions from statistical uncertainties of the simulated sample used to construct the nominal response matrix are indicated with the dashed black line. The physics model uncertainty is computed as a one-sided shift compared to the nominal unfolding, and up (down) contributions from other sources are indicated with filled (open) markers of the same type and colour. |
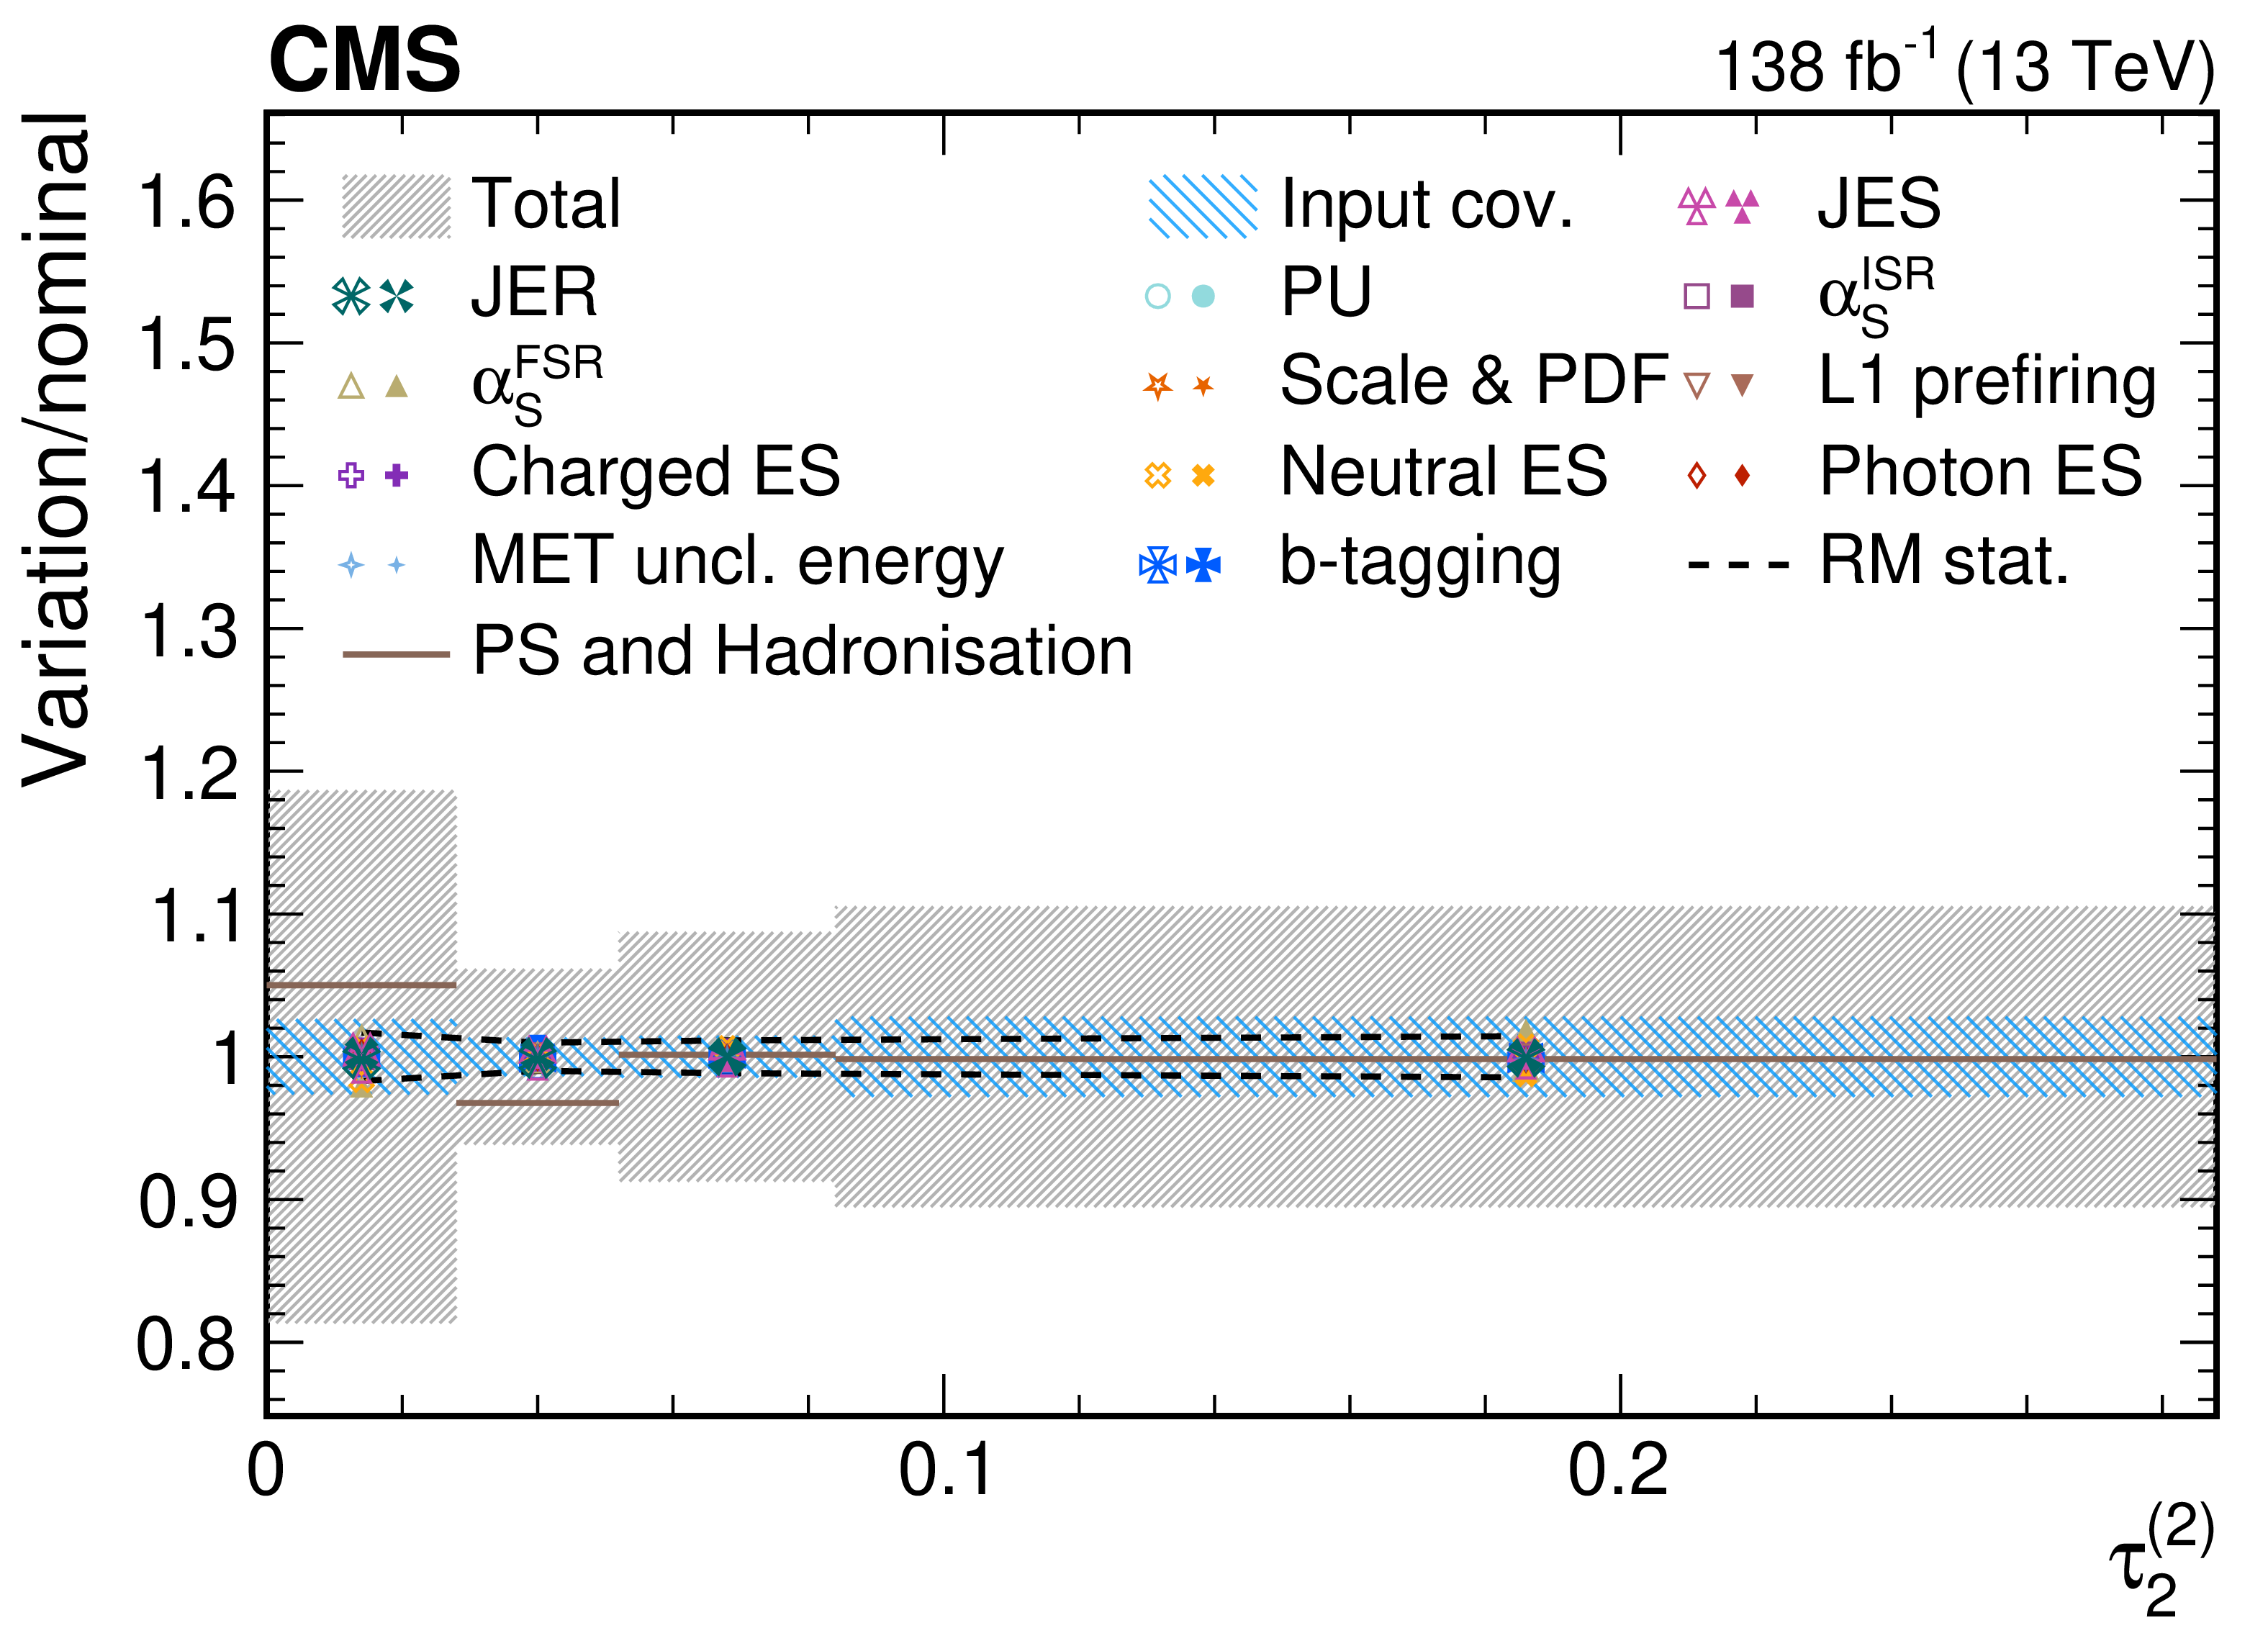
png pdf |
Figure 59-e:
Contributions from various systematic variations to the normalized, unfolded distribution for $ \tau_2^{(\beta)} $ observables measured for AK8 jets passing the boosted top quark-enriched selection in $ \mu $+jets $ \mathrm{t} \overline{\mathrm{t}} $ events. The total unfolding uncertainty is indicated with the dark grey, hashed region, while the blue hashed region indicates the contributions from the input covariance matrix, which includes the propagated effects of the statistical uncertainties of the input data after background subtraction. Contributions from statistical uncertainties of the simulated sample used to construct the nominal response matrix are indicated with the dashed black line. The physics model uncertainty is computed as a one-sided shift compared to the nominal unfolding, and up (down) contributions from other sources are indicated with filled (open) markers of the same type and colour. |
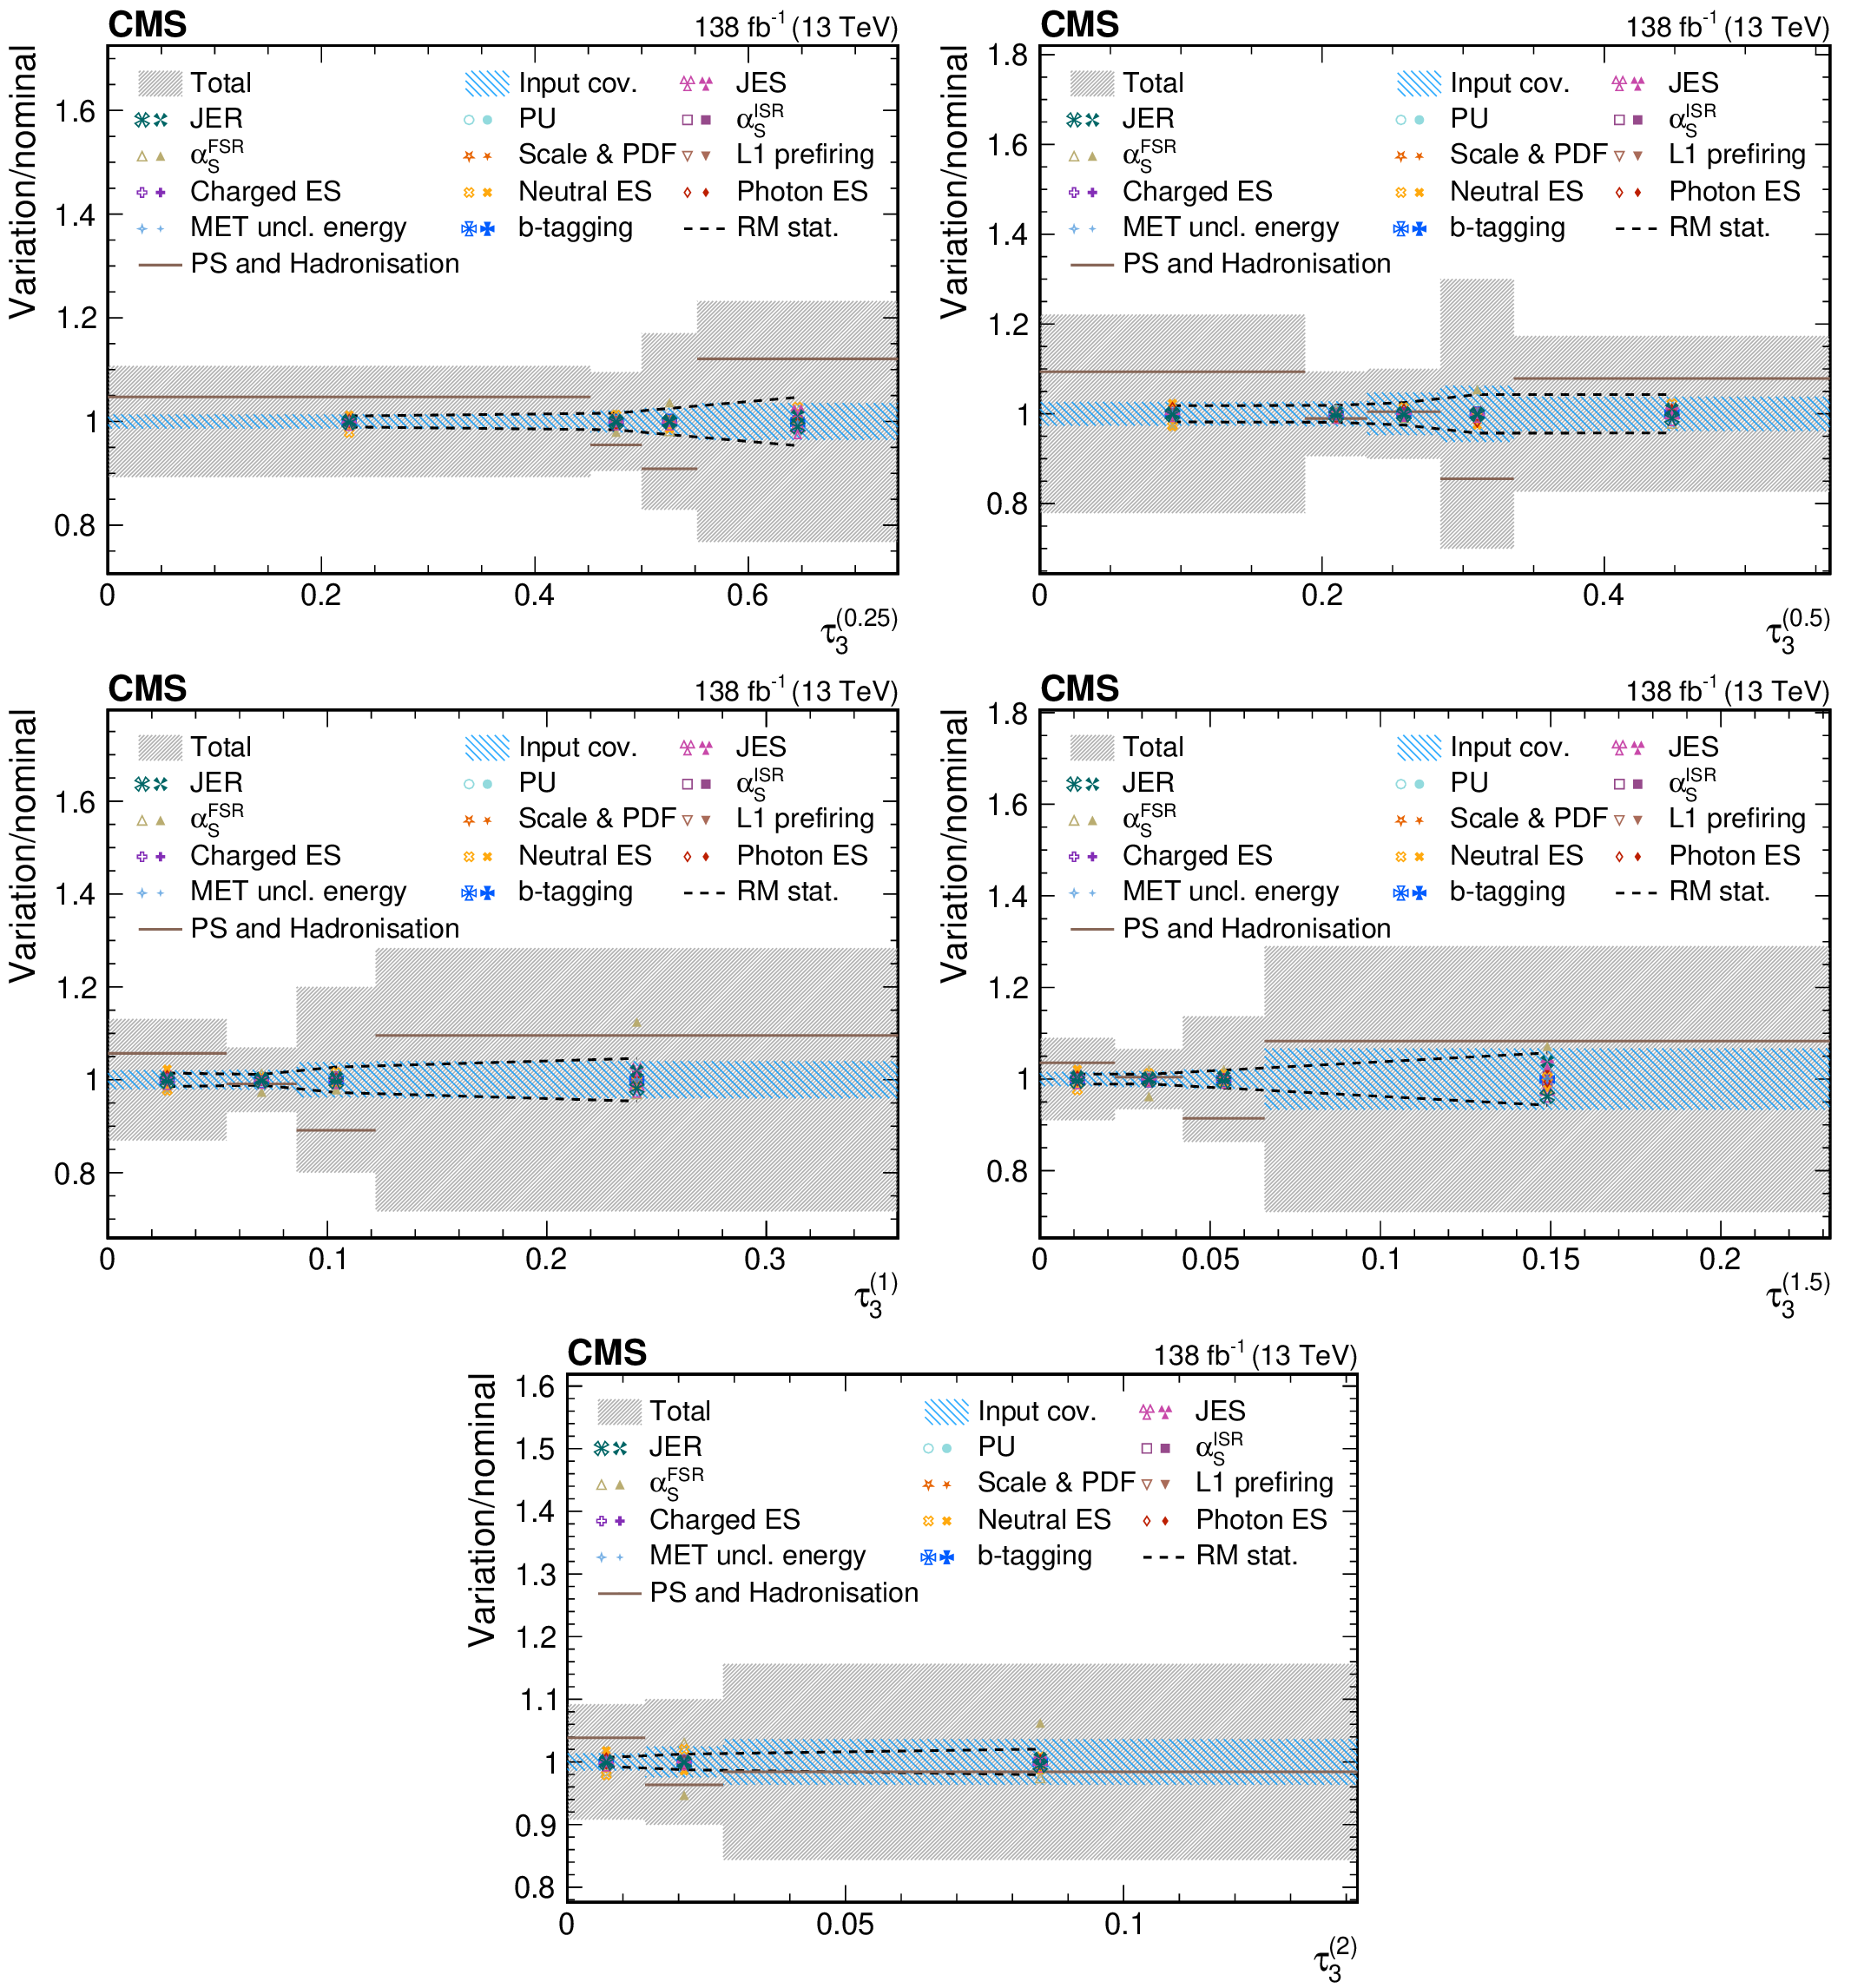
png pdf |
Figure 60:
Contributions from various systematic variations to the normalized, unfolded distribution for $ \tau_3^{(\beta)} $ observables measured for AK8 jets passing the boosted top quark-enriched selection in $ \mu $+jets $ \mathrm{t} \overline{\mathrm{t}} $ events. The total unfolding uncertainty is indicated with the dark grey, hashed region, while the blue hashed region indicates the contributions from the input covariance matrix, which includes the propagated effects of the statistical uncertainties of the input data after background subtraction. Contributions from statistical uncertainties of the simulated sample used to construct the nominal response matrix are indicated with the dashed black line. The physics model uncertainty is computed as a one-sided shift compared to the nominal unfolding, and up (down) contributions from other sources are indicated with filled (open) markers of the same type and colour. |
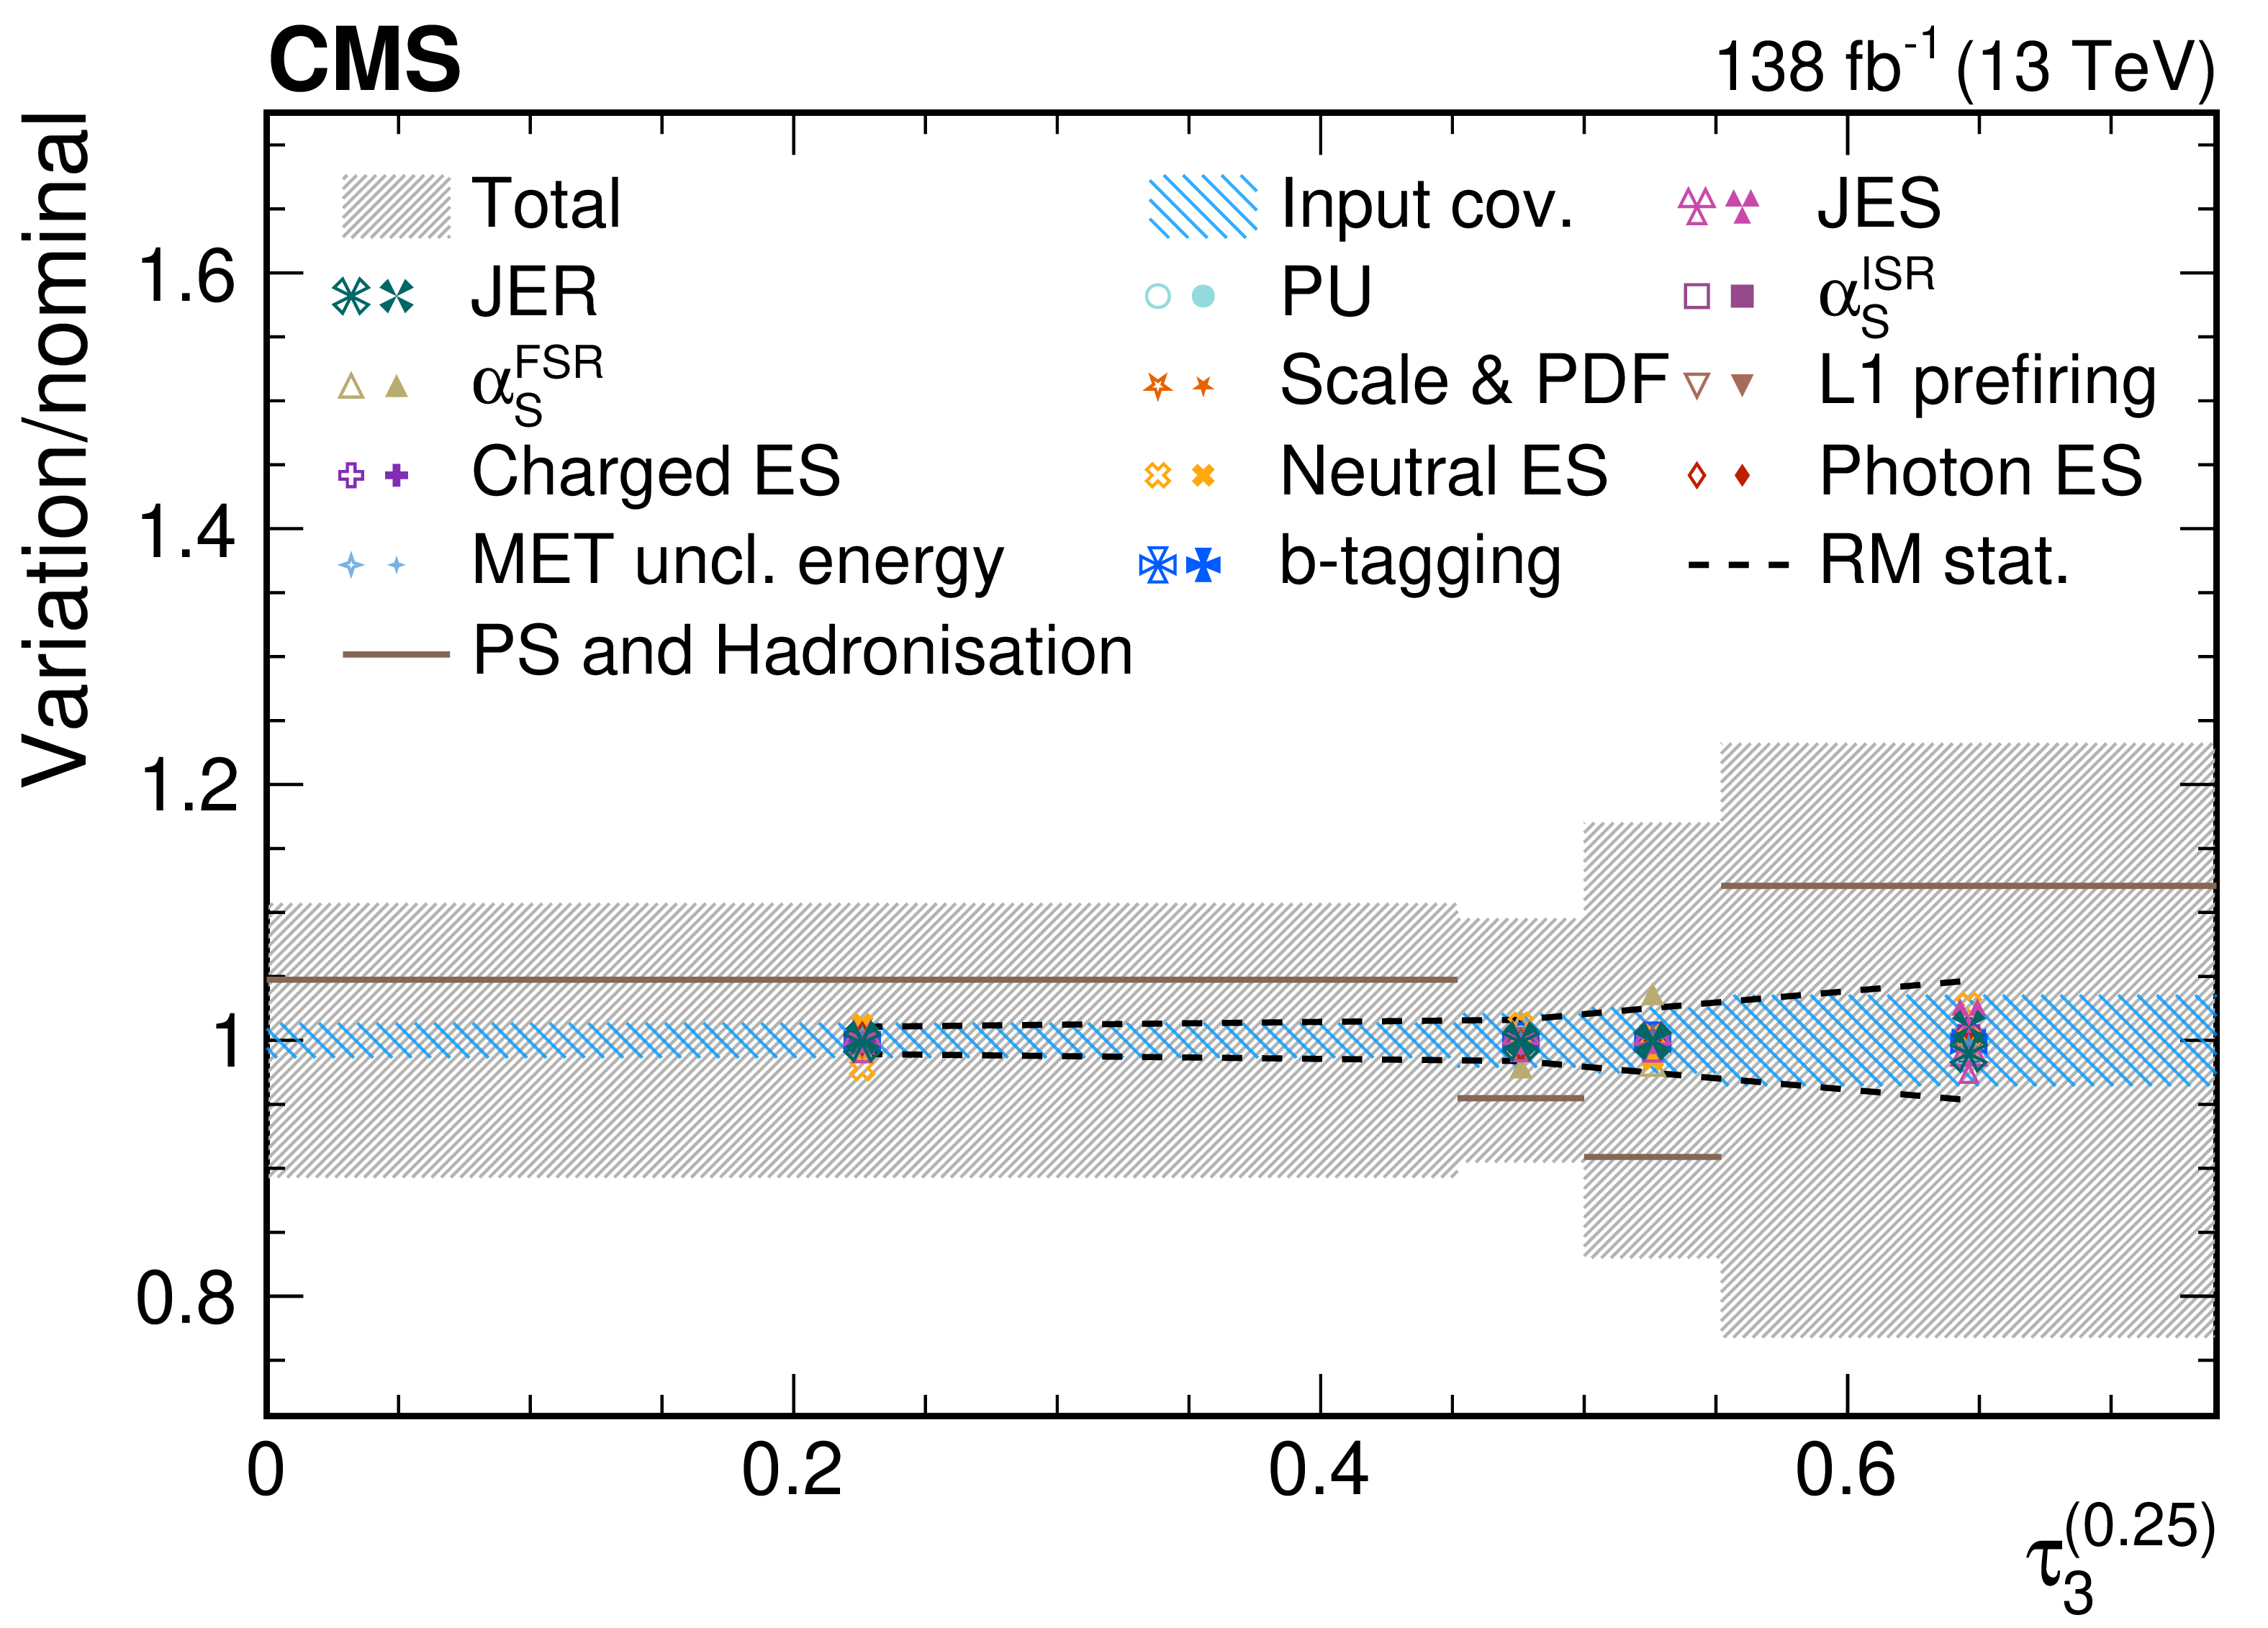
png pdf |
Figure 60-a:
Contributions from various systematic variations to the normalized, unfolded distribution for $ \tau_3^{(\beta)} $ observables measured for AK8 jets passing the boosted top quark-enriched selection in $ \mu $+jets $ \mathrm{t} \overline{\mathrm{t}} $ events. The total unfolding uncertainty is indicated with the dark grey, hashed region, while the blue hashed region indicates the contributions from the input covariance matrix, which includes the propagated effects of the statistical uncertainties of the input data after background subtraction. Contributions from statistical uncertainties of the simulated sample used to construct the nominal response matrix are indicated with the dashed black line. The physics model uncertainty is computed as a one-sided shift compared to the nominal unfolding, and up (down) contributions from other sources are indicated with filled (open) markers of the same type and colour. |
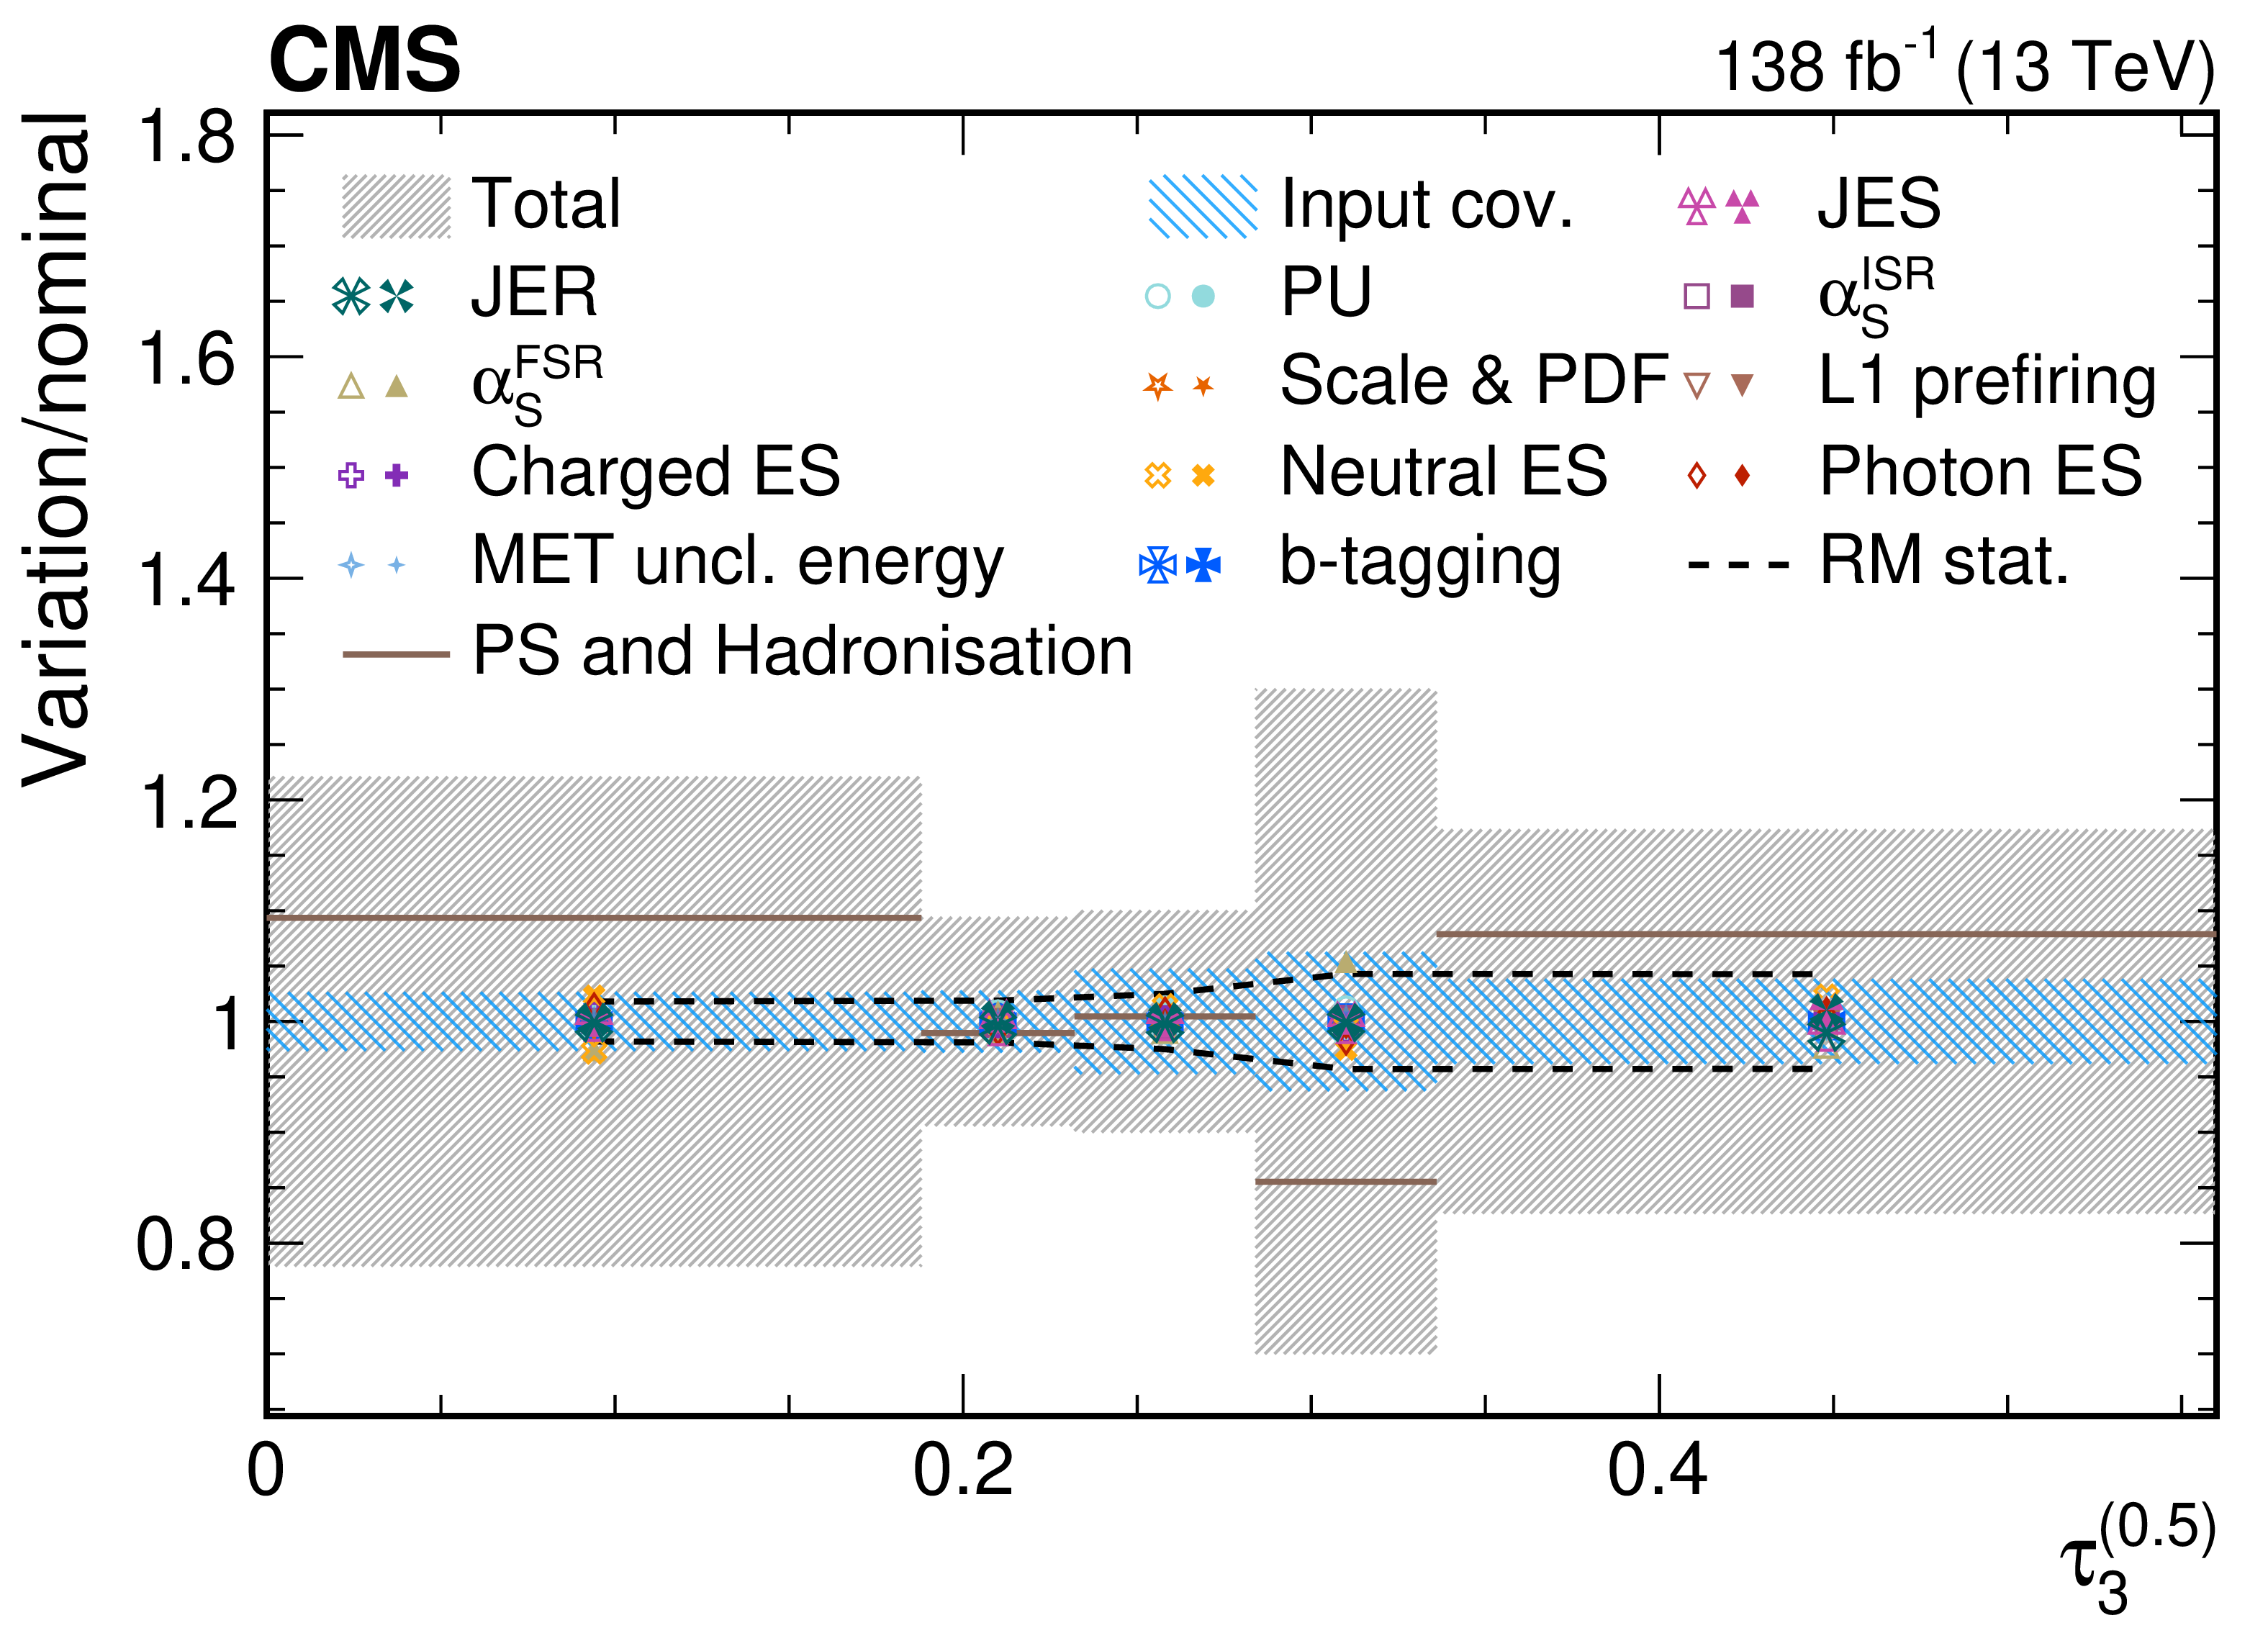
png pdf |
Figure 60-b:
Contributions from various systematic variations to the normalized, unfolded distribution for $ \tau_3^{(\beta)} $ observables measured for AK8 jets passing the boosted top quark-enriched selection in $ \mu $+jets $ \mathrm{t} \overline{\mathrm{t}} $ events. The total unfolding uncertainty is indicated with the dark grey, hashed region, while the blue hashed region indicates the contributions from the input covariance matrix, which includes the propagated effects of the statistical uncertainties of the input data after background subtraction. Contributions from statistical uncertainties of the simulated sample used to construct the nominal response matrix are indicated with the dashed black line. The physics model uncertainty is computed as a one-sided shift compared to the nominal unfolding, and up (down) contributions from other sources are indicated with filled (open) markers of the same type and colour. |
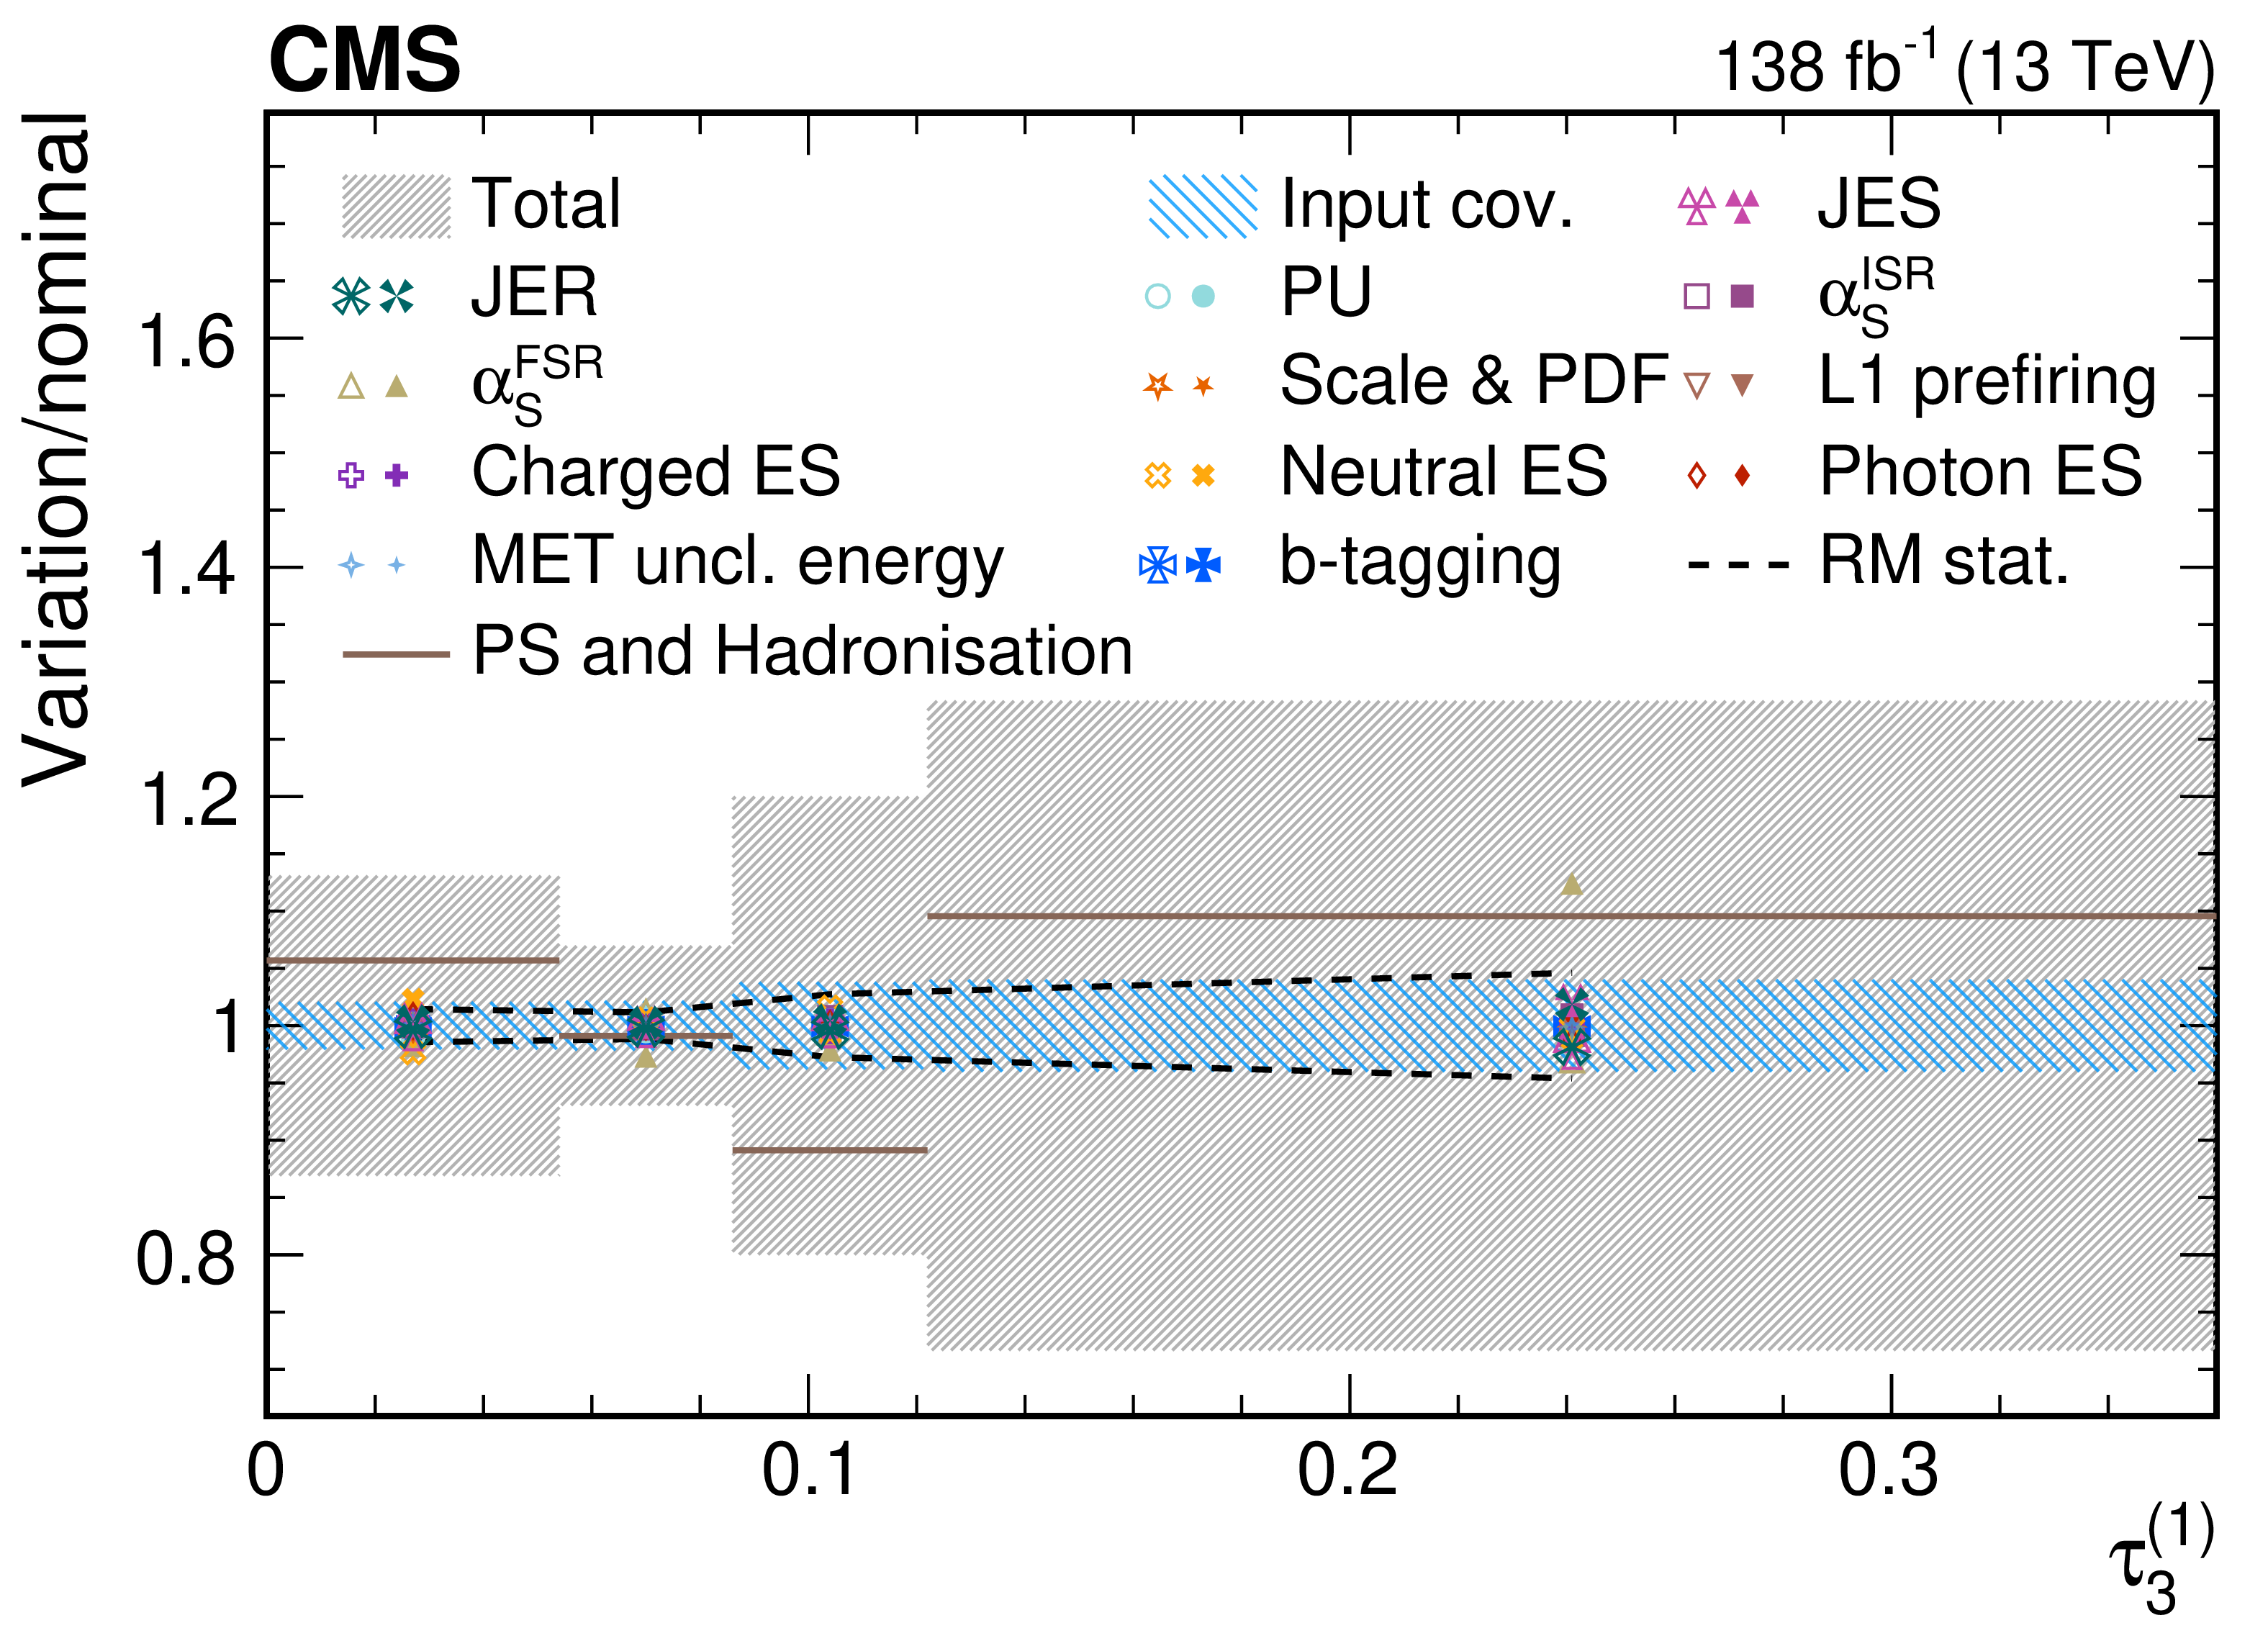
png pdf |
Figure 60-c:
Contributions from various systematic variations to the normalized, unfolded distribution for $ \tau_3^{(\beta)} $ observables measured for AK8 jets passing the boosted top quark-enriched selection in $ \mu $+jets $ \mathrm{t} \overline{\mathrm{t}} $ events. The total unfolding uncertainty is indicated with the dark grey, hashed region, while the blue hashed region indicates the contributions from the input covariance matrix, which includes the propagated effects of the statistical uncertainties of the input data after background subtraction. Contributions from statistical uncertainties of the simulated sample used to construct the nominal response matrix are indicated with the dashed black line. The physics model uncertainty is computed as a one-sided shift compared to the nominal unfolding, and up (down) contributions from other sources are indicated with filled (open) markers of the same type and colour. |
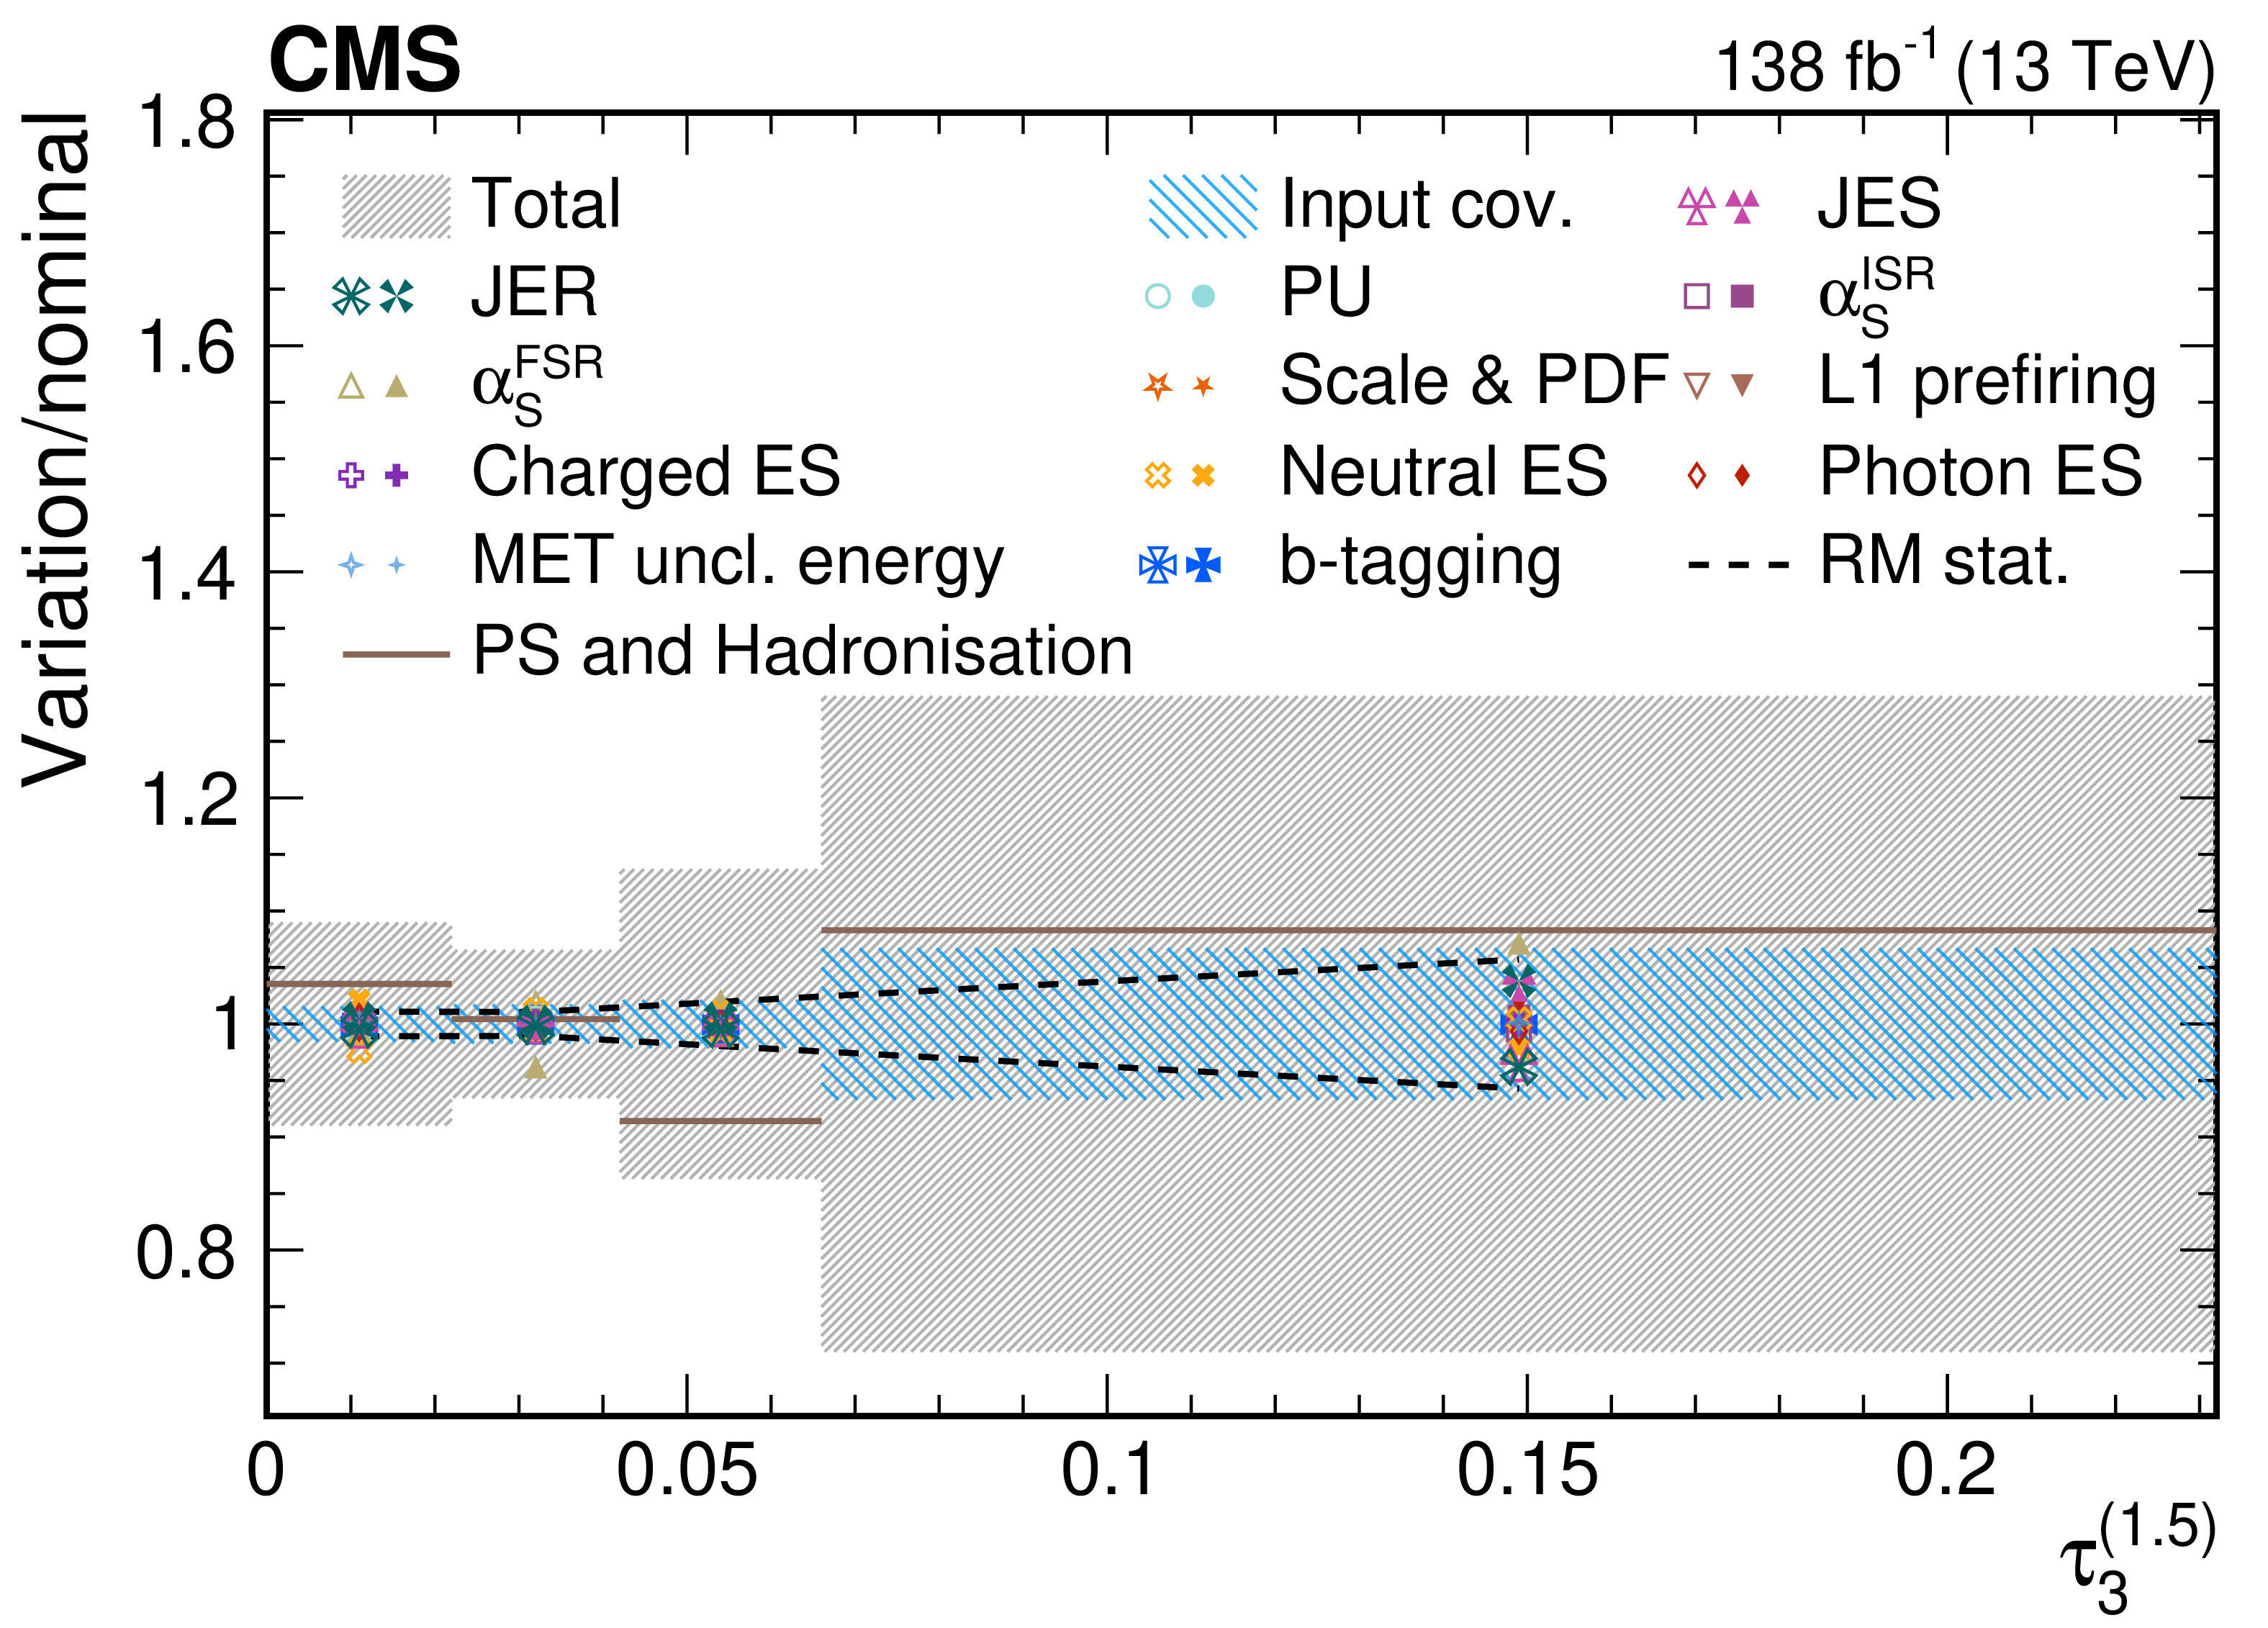
png pdf |
Figure 60-d:
Contributions from various systematic variations to the normalized, unfolded distribution for $ \tau_3^{(\beta)} $ observables measured for AK8 jets passing the boosted top quark-enriched selection in $ \mu $+jets $ \mathrm{t} \overline{\mathrm{t}} $ events. The total unfolding uncertainty is indicated with the dark grey, hashed region, while the blue hashed region indicates the contributions from the input covariance matrix, which includes the propagated effects of the statistical uncertainties of the input data after background subtraction. Contributions from statistical uncertainties of the simulated sample used to construct the nominal response matrix are indicated with the dashed black line. The physics model uncertainty is computed as a one-sided shift compared to the nominal unfolding, and up (down) contributions from other sources are indicated with filled (open) markers of the same type and colour. |
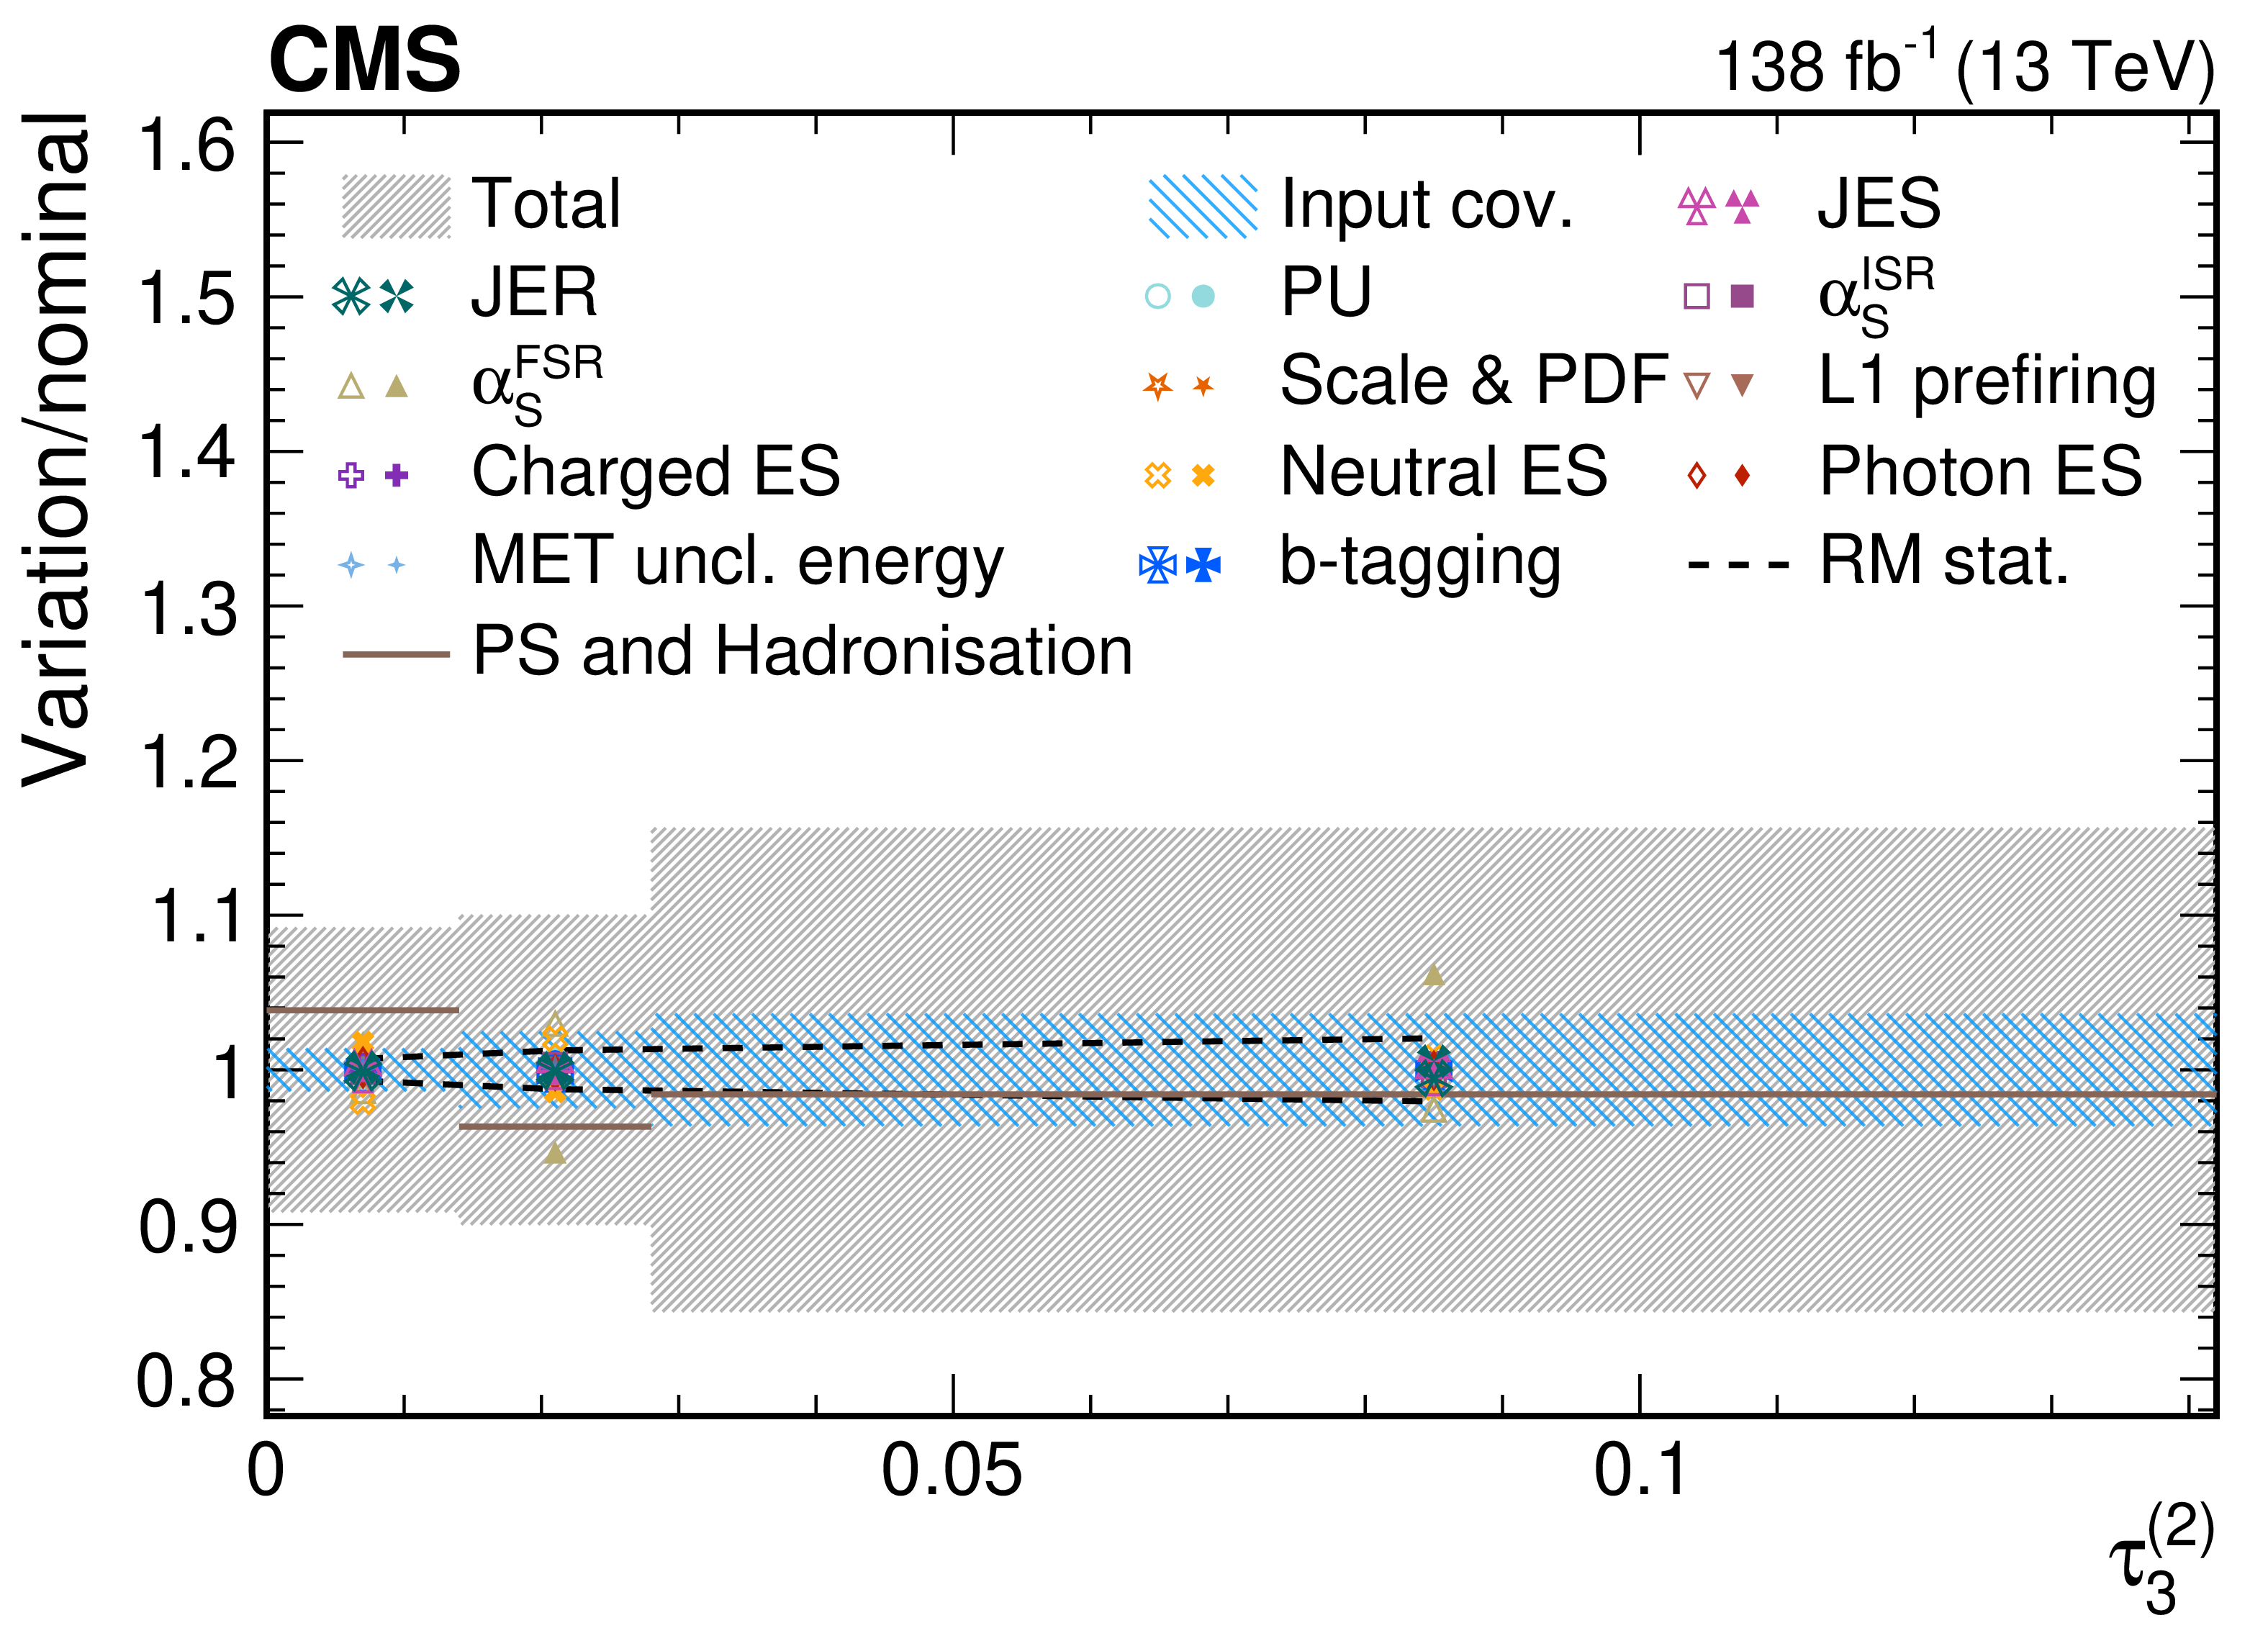
png pdf |
Figure 60-e:
Contributions from various systematic variations to the normalized, unfolded distribution for $ \tau_3^{(\beta)} $ observables measured for AK8 jets passing the boosted top quark-enriched selection in $ \mu $+jets $ \mathrm{t} \overline{\mathrm{t}} $ events. The total unfolding uncertainty is indicated with the dark grey, hashed region, while the blue hashed region indicates the contributions from the input covariance matrix, which includes the propagated effects of the statistical uncertainties of the input data after background subtraction. Contributions from statistical uncertainties of the simulated sample used to construct the nominal response matrix are indicated with the dashed black line. The physics model uncertainty is computed as a one-sided shift compared to the nominal unfolding, and up (down) contributions from other sources are indicated with filled (open) markers of the same type and colour. |
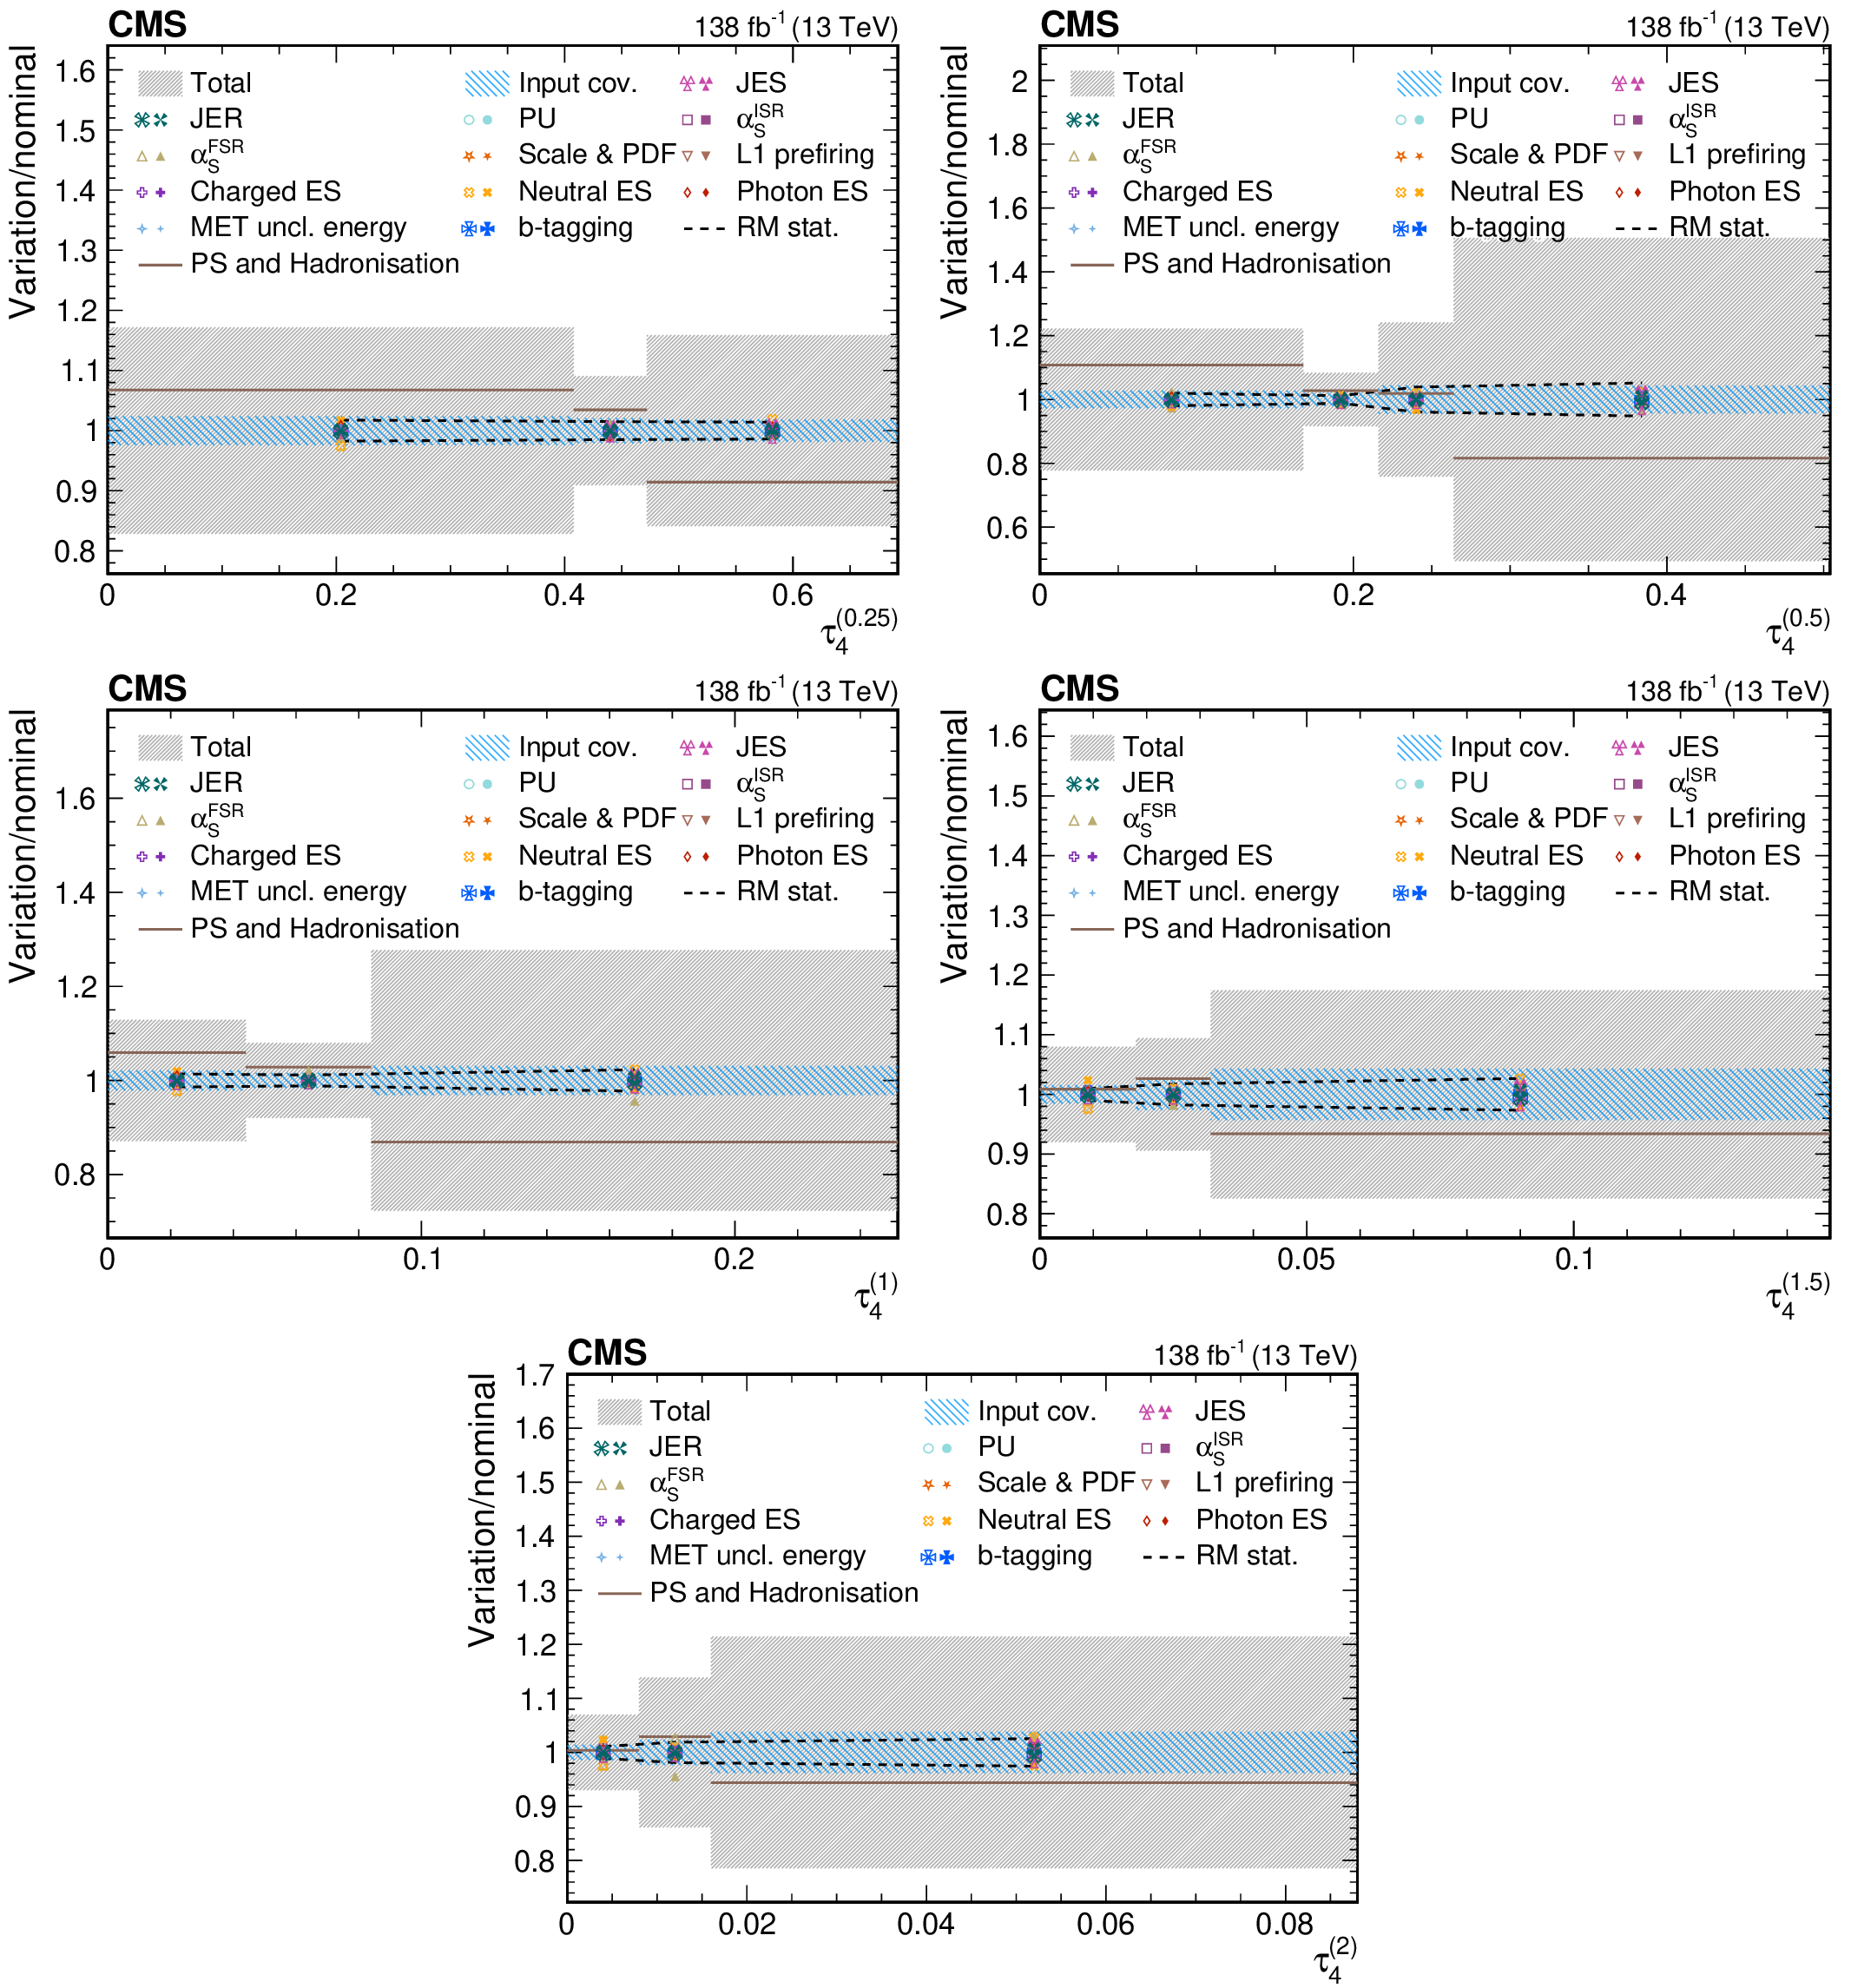
png pdf |
Figure 61:
Contributions from various systematic variations to the normalized, unfolded distribution for $ \tau_4^{(\beta)} $ observables measured for AK8 jets passing the boosted top quark-enriched selection in $ \mu $+jets $ \mathrm{t} \overline{\mathrm{t}} $ events. The total unfolding uncertainty is indicated with the dark grey, hashed region, while the blue hashed region indicates the contributions from the input covariance matrix, which includes the propagated effects of the statistical uncertainties of the input data after background subtraction. Contributions from statistical uncertainties of the simulated sample used to construct the nominal response matrix are indicated with the dashed black line. The physics model uncertainty is computed as a one-sided shift compared to the nominal unfolding, and up (down) contributions from other sources are indicated with filled (open) markers of the same type and colour. |
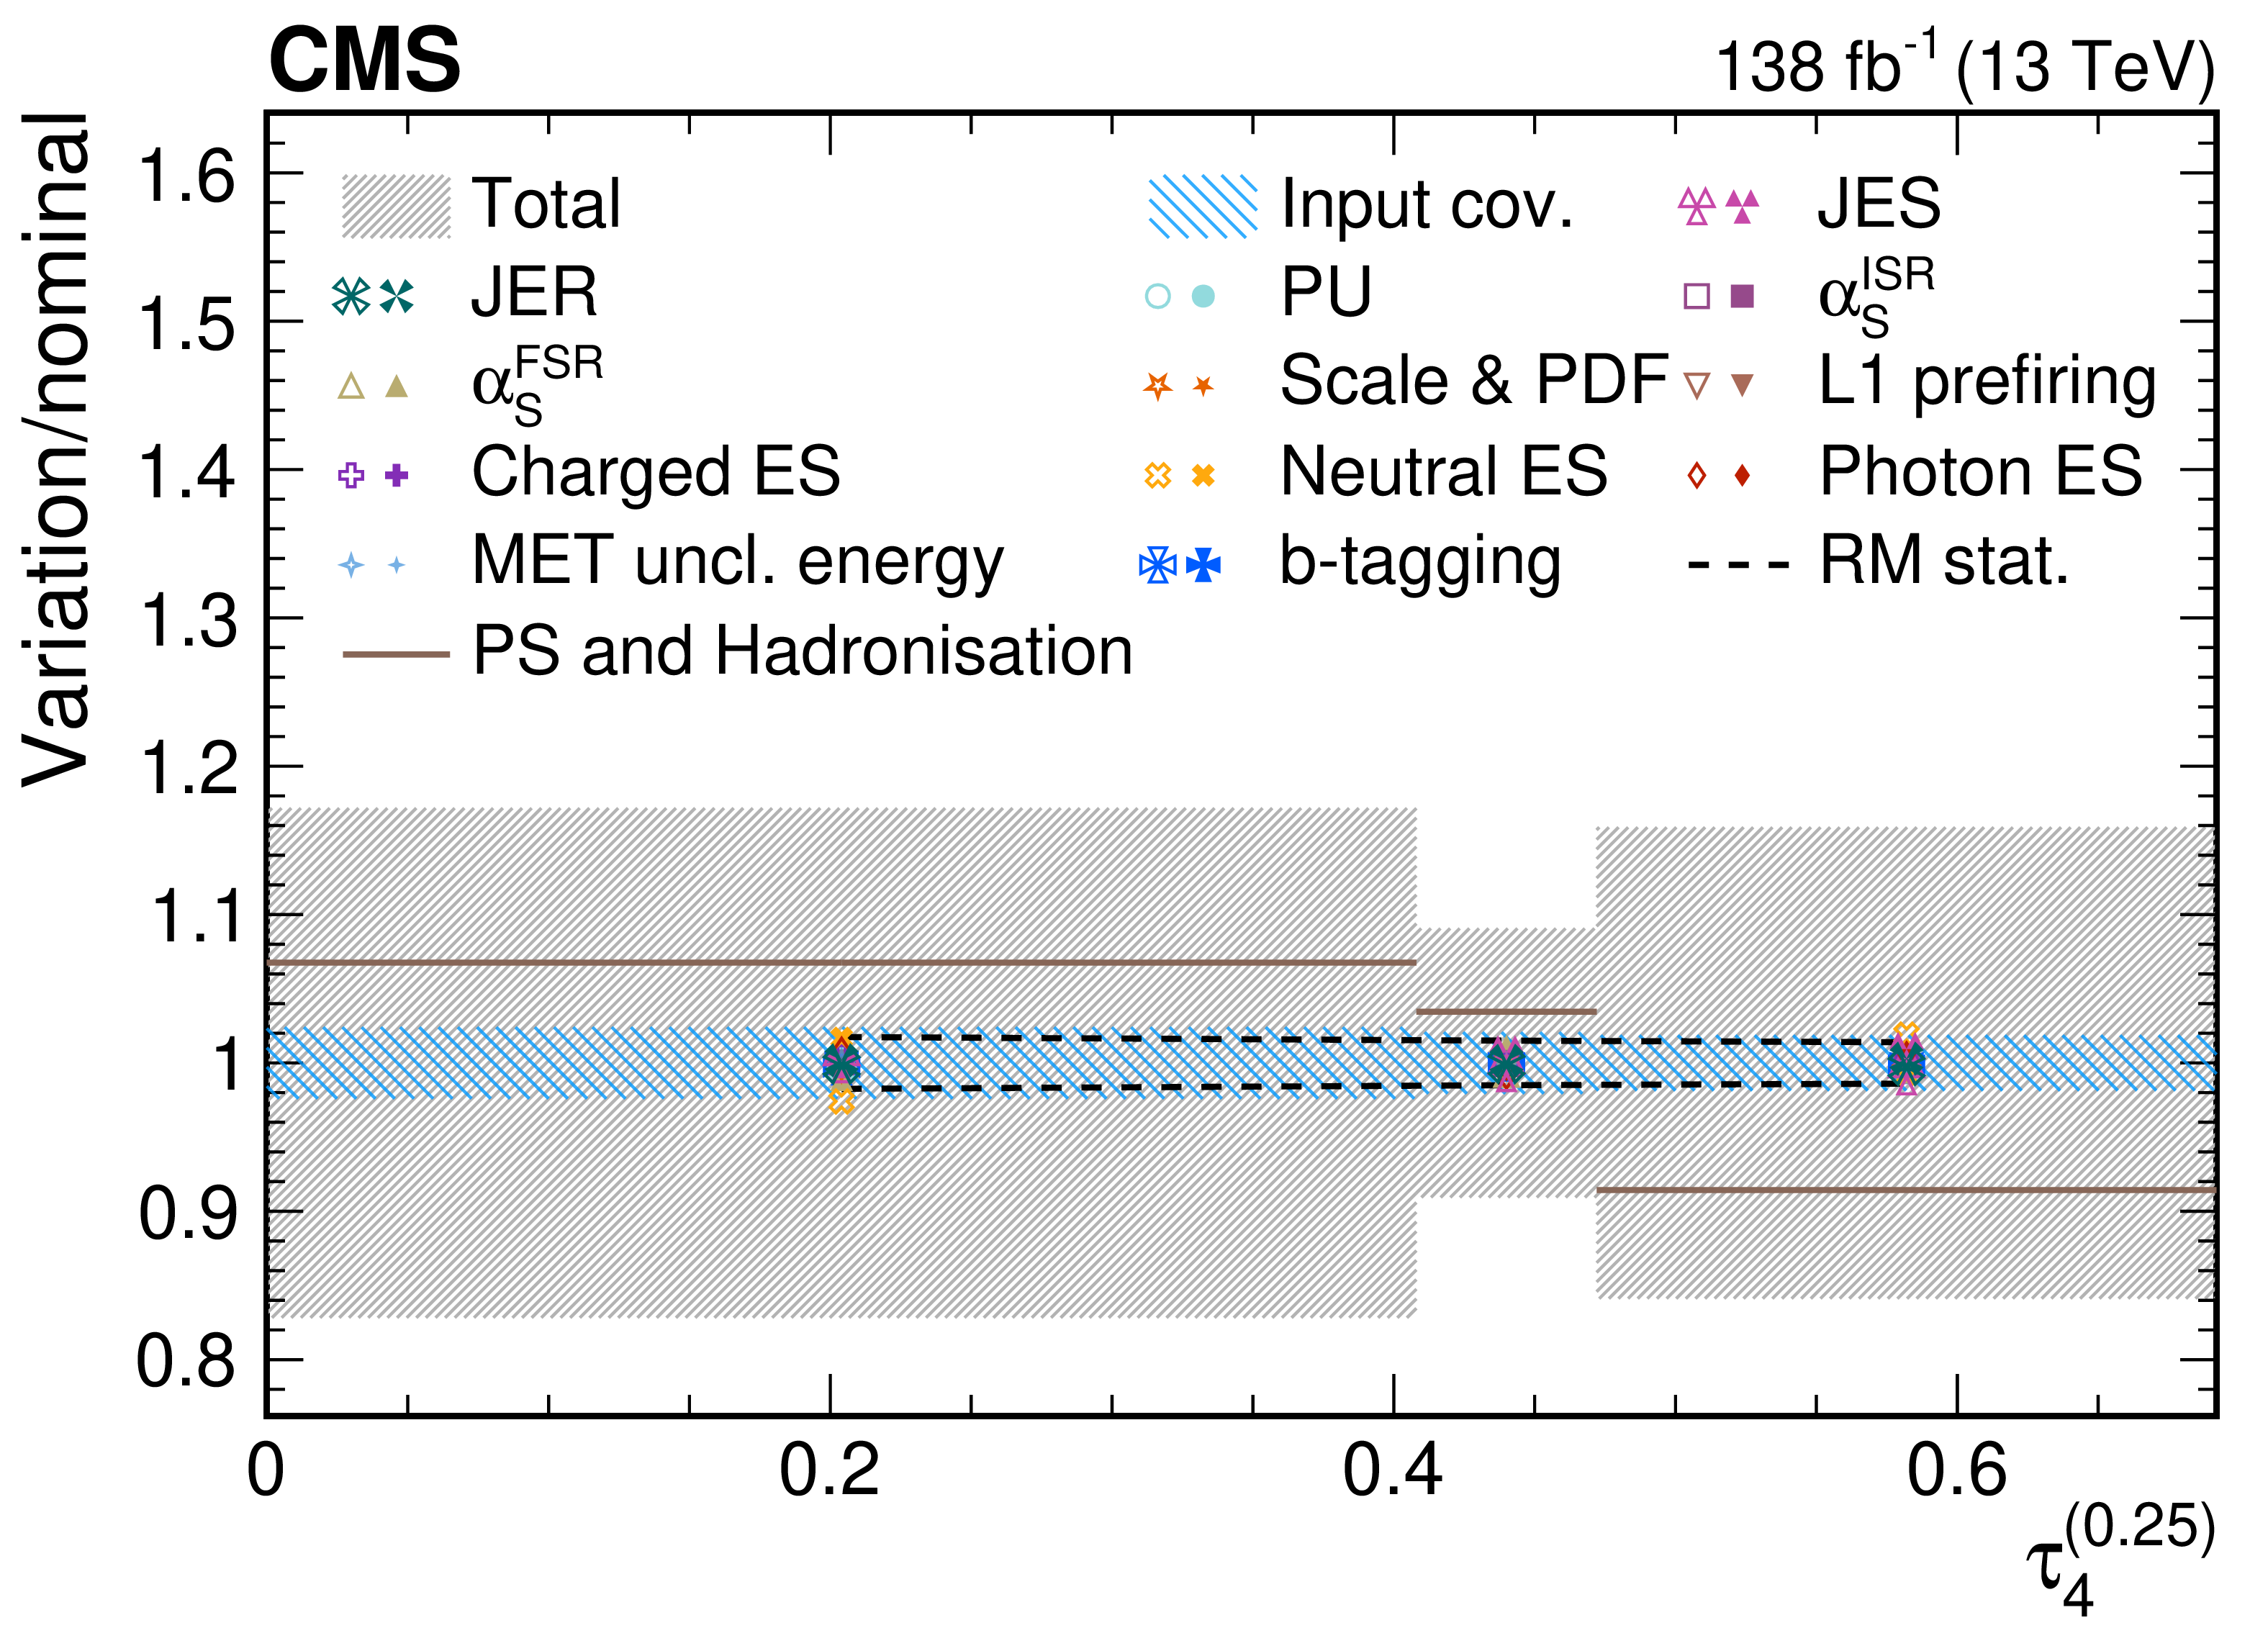
png pdf |
Figure 61-a:
Contributions from various systematic variations to the normalized, unfolded distribution for $ \tau_4^{(\beta)} $ observables measured for AK8 jets passing the boosted top quark-enriched selection in $ \mu $+jets $ \mathrm{t} \overline{\mathrm{t}} $ events. The total unfolding uncertainty is indicated with the dark grey, hashed region, while the blue hashed region indicates the contributions from the input covariance matrix, which includes the propagated effects of the statistical uncertainties of the input data after background subtraction. Contributions from statistical uncertainties of the simulated sample used to construct the nominal response matrix are indicated with the dashed black line. The physics model uncertainty is computed as a one-sided shift compared to the nominal unfolding, and up (down) contributions from other sources are indicated with filled (open) markers of the same type and colour. |
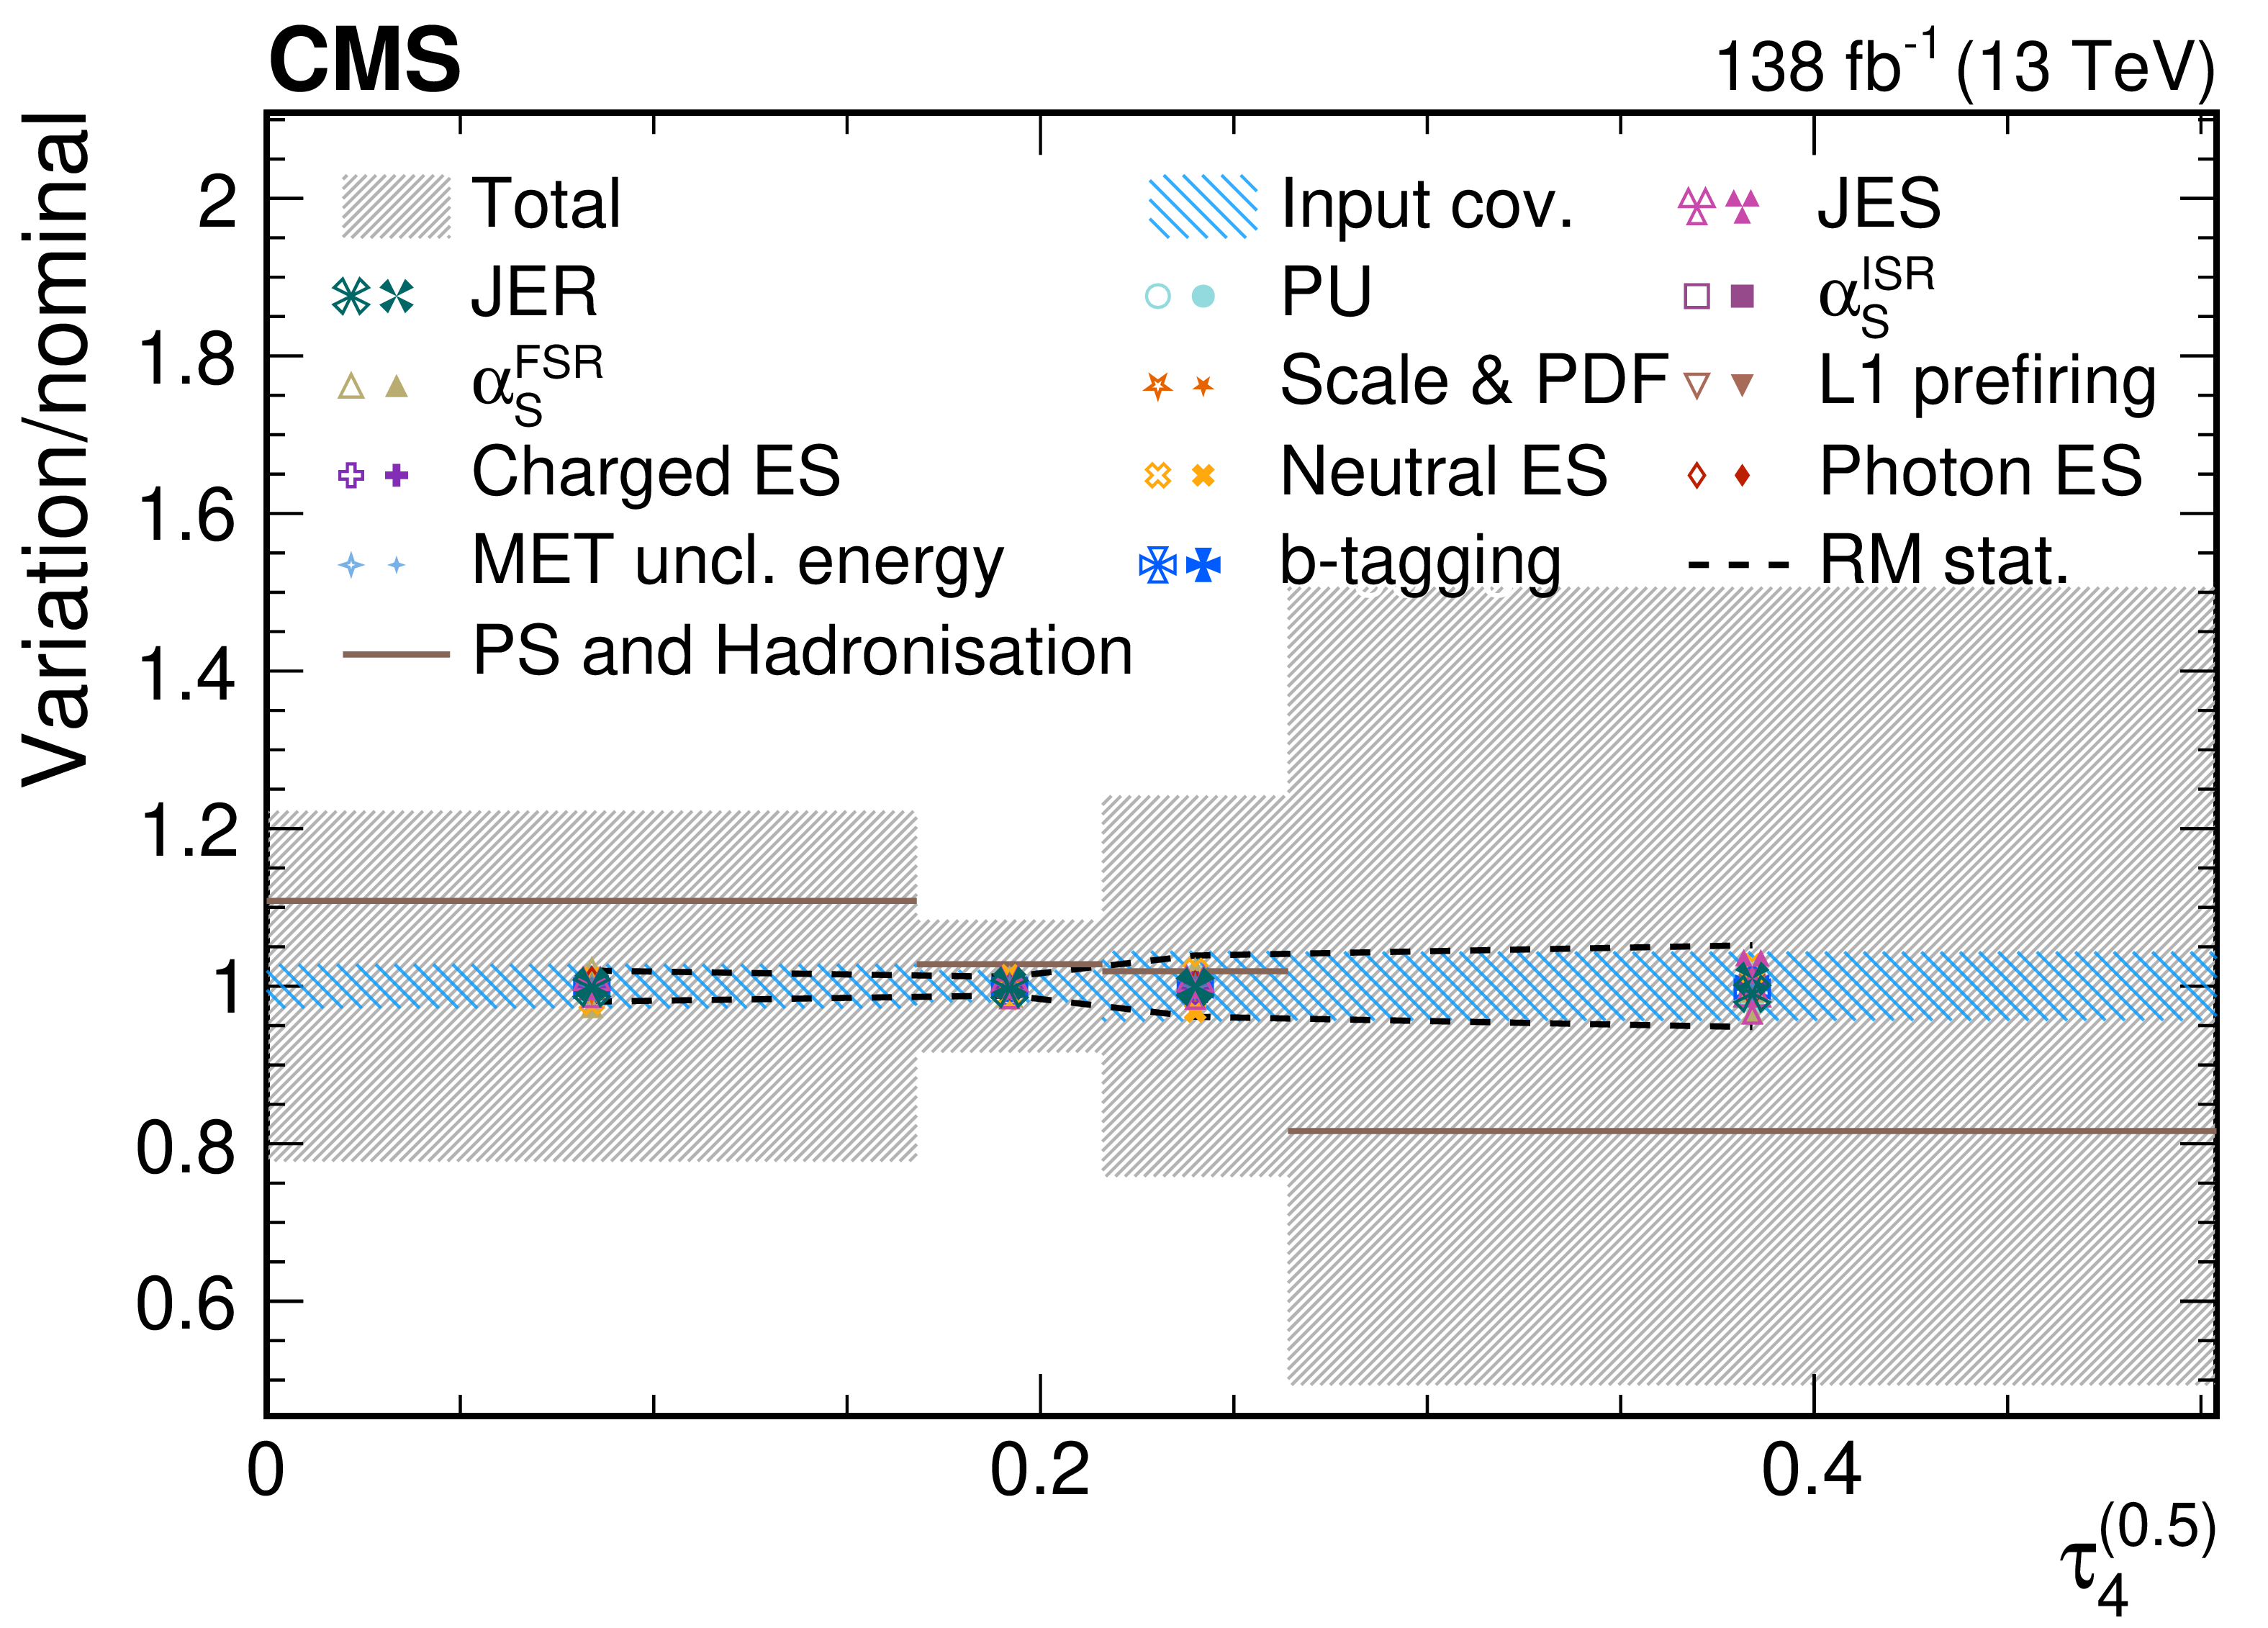
png pdf |
Figure 61-b:
Contributions from various systematic variations to the normalized, unfolded distribution for $ \tau_4^{(\beta)} $ observables measured for AK8 jets passing the boosted top quark-enriched selection in $ \mu $+jets $ \mathrm{t} \overline{\mathrm{t}} $ events. The total unfolding uncertainty is indicated with the dark grey, hashed region, while the blue hashed region indicates the contributions from the input covariance matrix, which includes the propagated effects of the statistical uncertainties of the input data after background subtraction. Contributions from statistical uncertainties of the simulated sample used to construct the nominal response matrix are indicated with the dashed black line. The physics model uncertainty is computed as a one-sided shift compared to the nominal unfolding, and up (down) contributions from other sources are indicated with filled (open) markers of the same type and colour. |

png pdf |
Figure 61-c:
Contributions from various systematic variations to the normalized, unfolded distribution for $ \tau_4^{(\beta)} $ observables measured for AK8 jets passing the boosted top quark-enriched selection in $ \mu $+jets $ \mathrm{t} \overline{\mathrm{t}} $ events. The total unfolding uncertainty is indicated with the dark grey, hashed region, while the blue hashed region indicates the contributions from the input covariance matrix, which includes the propagated effects of the statistical uncertainties of the input data after background subtraction. Contributions from statistical uncertainties of the simulated sample used to construct the nominal response matrix are indicated with the dashed black line. The physics model uncertainty is computed as a one-sided shift compared to the nominal unfolding, and up (down) contributions from other sources are indicated with filled (open) markers of the same type and colour. |
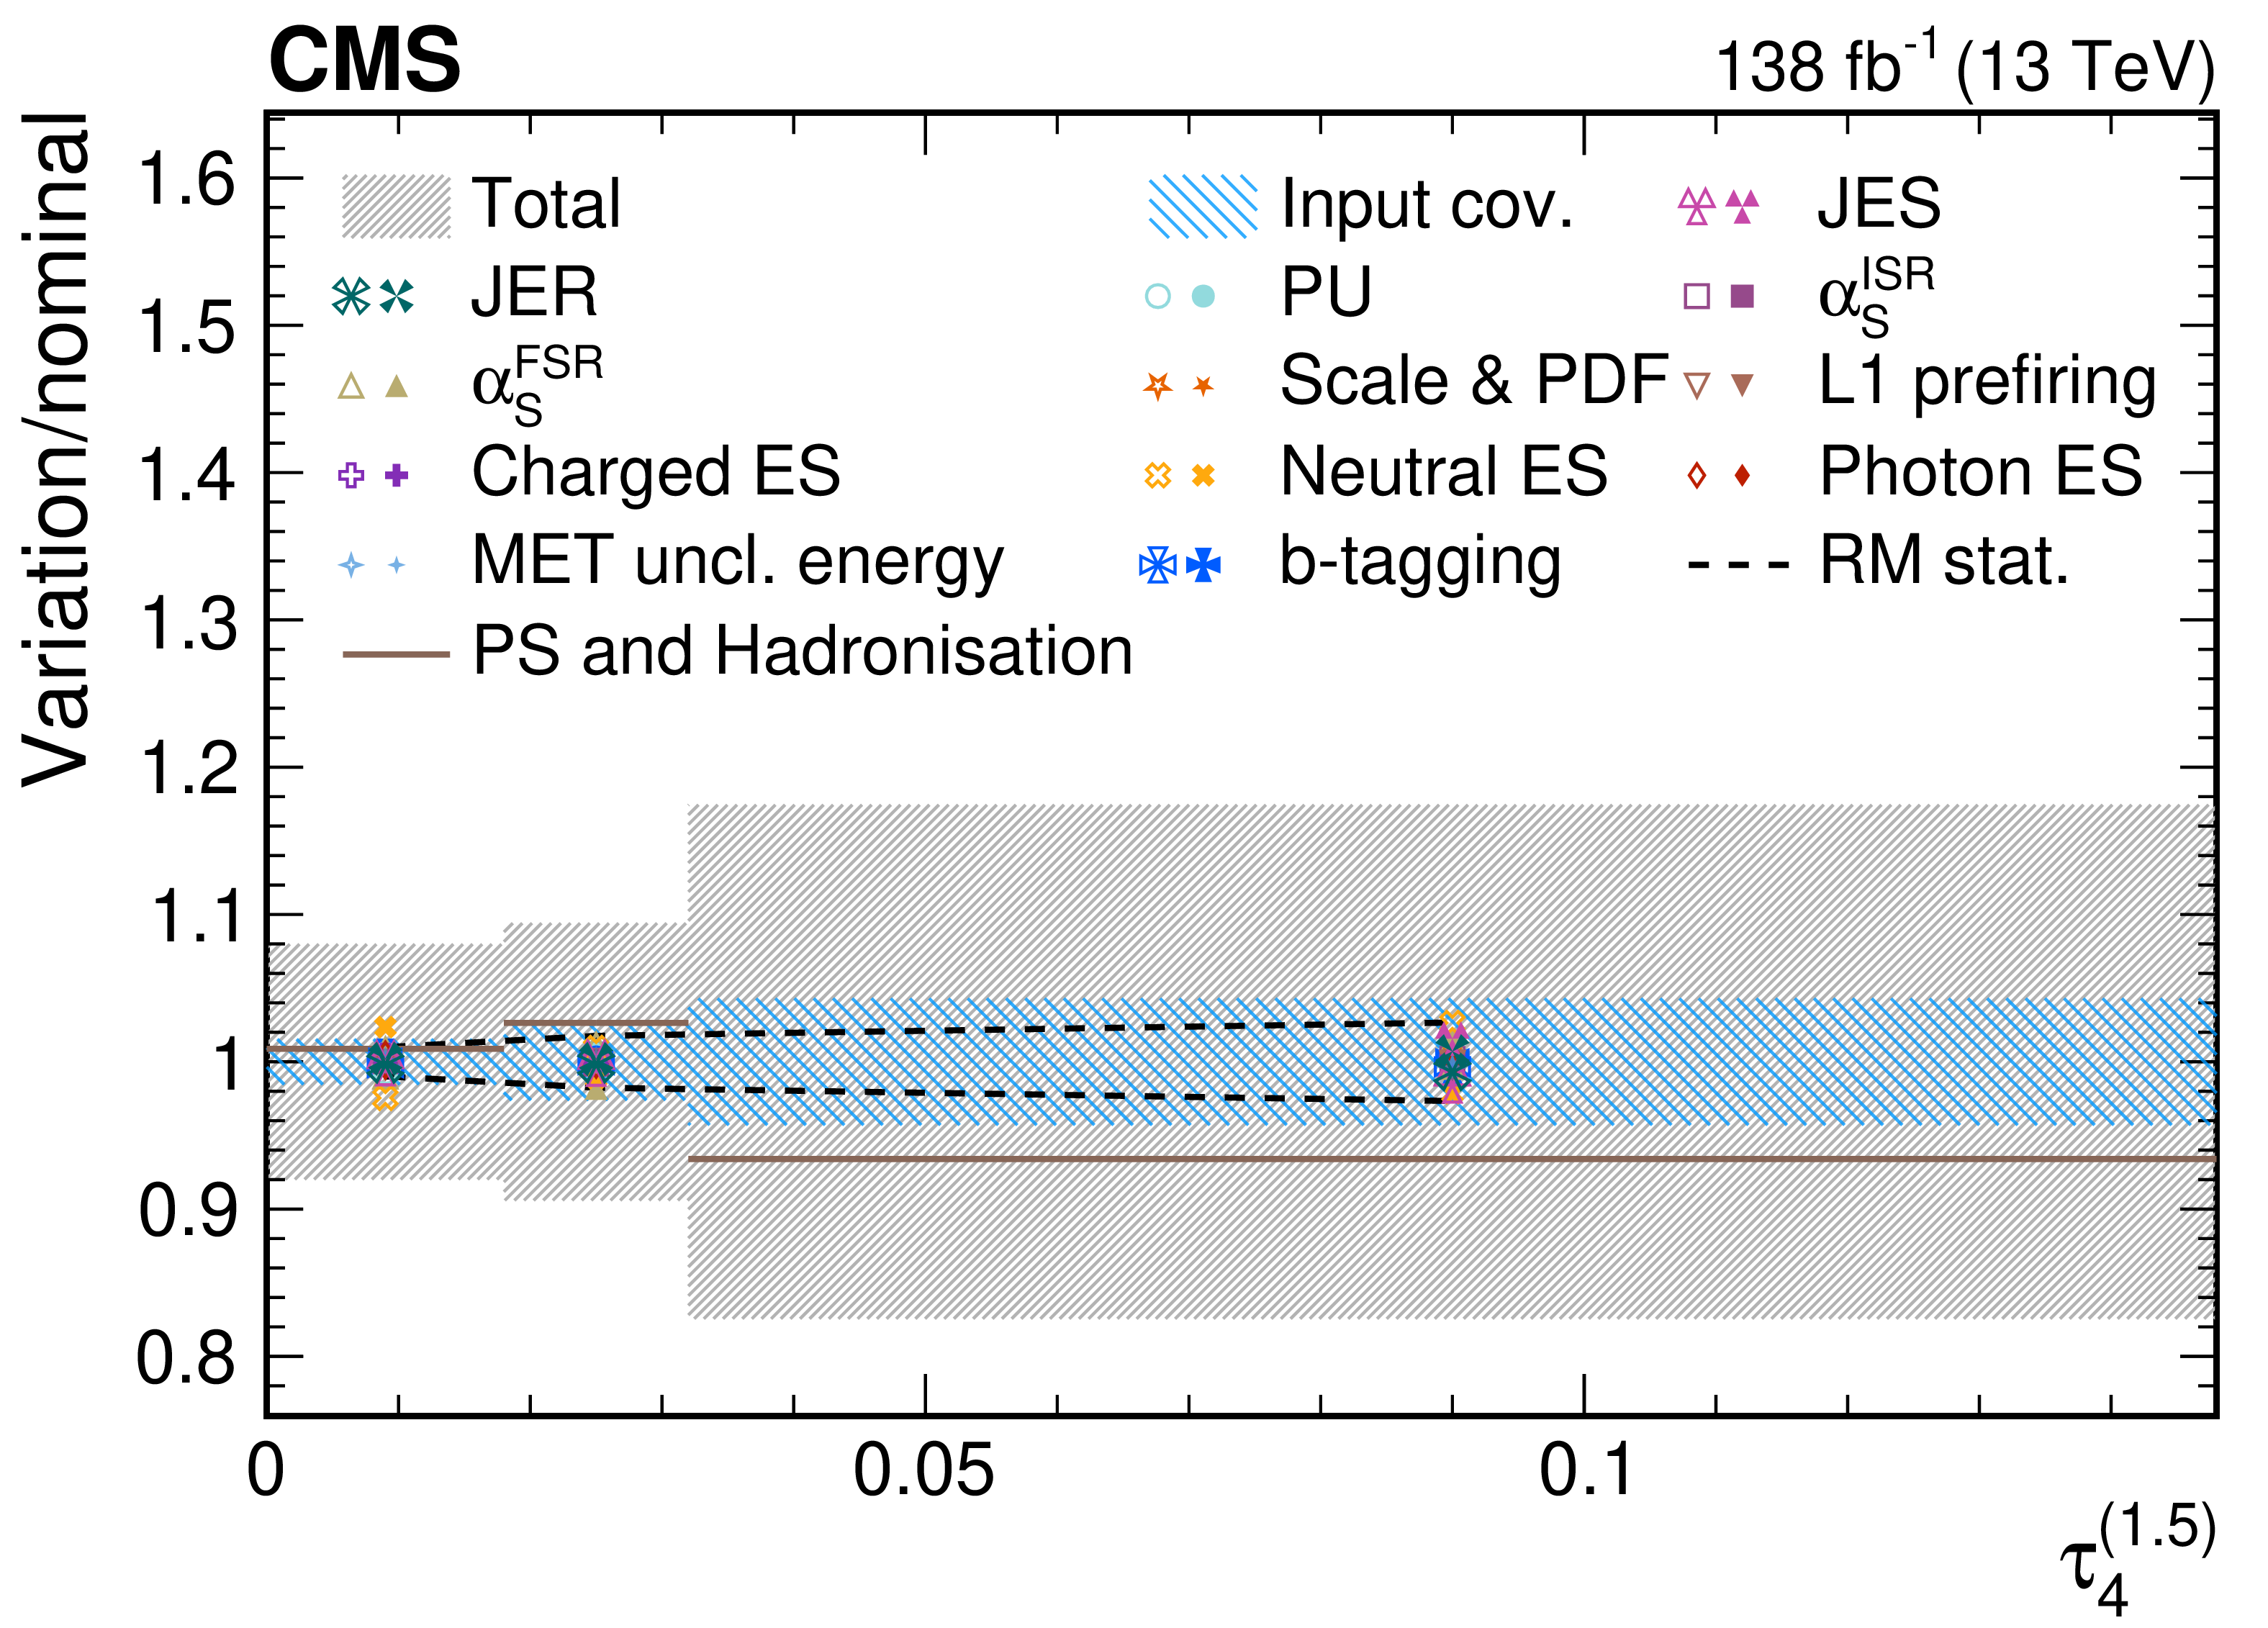
png pdf |
Figure 61-d:
Contributions from various systematic variations to the normalized, unfolded distribution for $ \tau_4^{(\beta)} $ observables measured for AK8 jets passing the boosted top quark-enriched selection in $ \mu $+jets $ \mathrm{t} \overline{\mathrm{t}} $ events. The total unfolding uncertainty is indicated with the dark grey, hashed region, while the blue hashed region indicates the contributions from the input covariance matrix, which includes the propagated effects of the statistical uncertainties of the input data after background subtraction. Contributions from statistical uncertainties of the simulated sample used to construct the nominal response matrix are indicated with the dashed black line. The physics model uncertainty is computed as a one-sided shift compared to the nominal unfolding, and up (down) contributions from other sources are indicated with filled (open) markers of the same type and colour. |
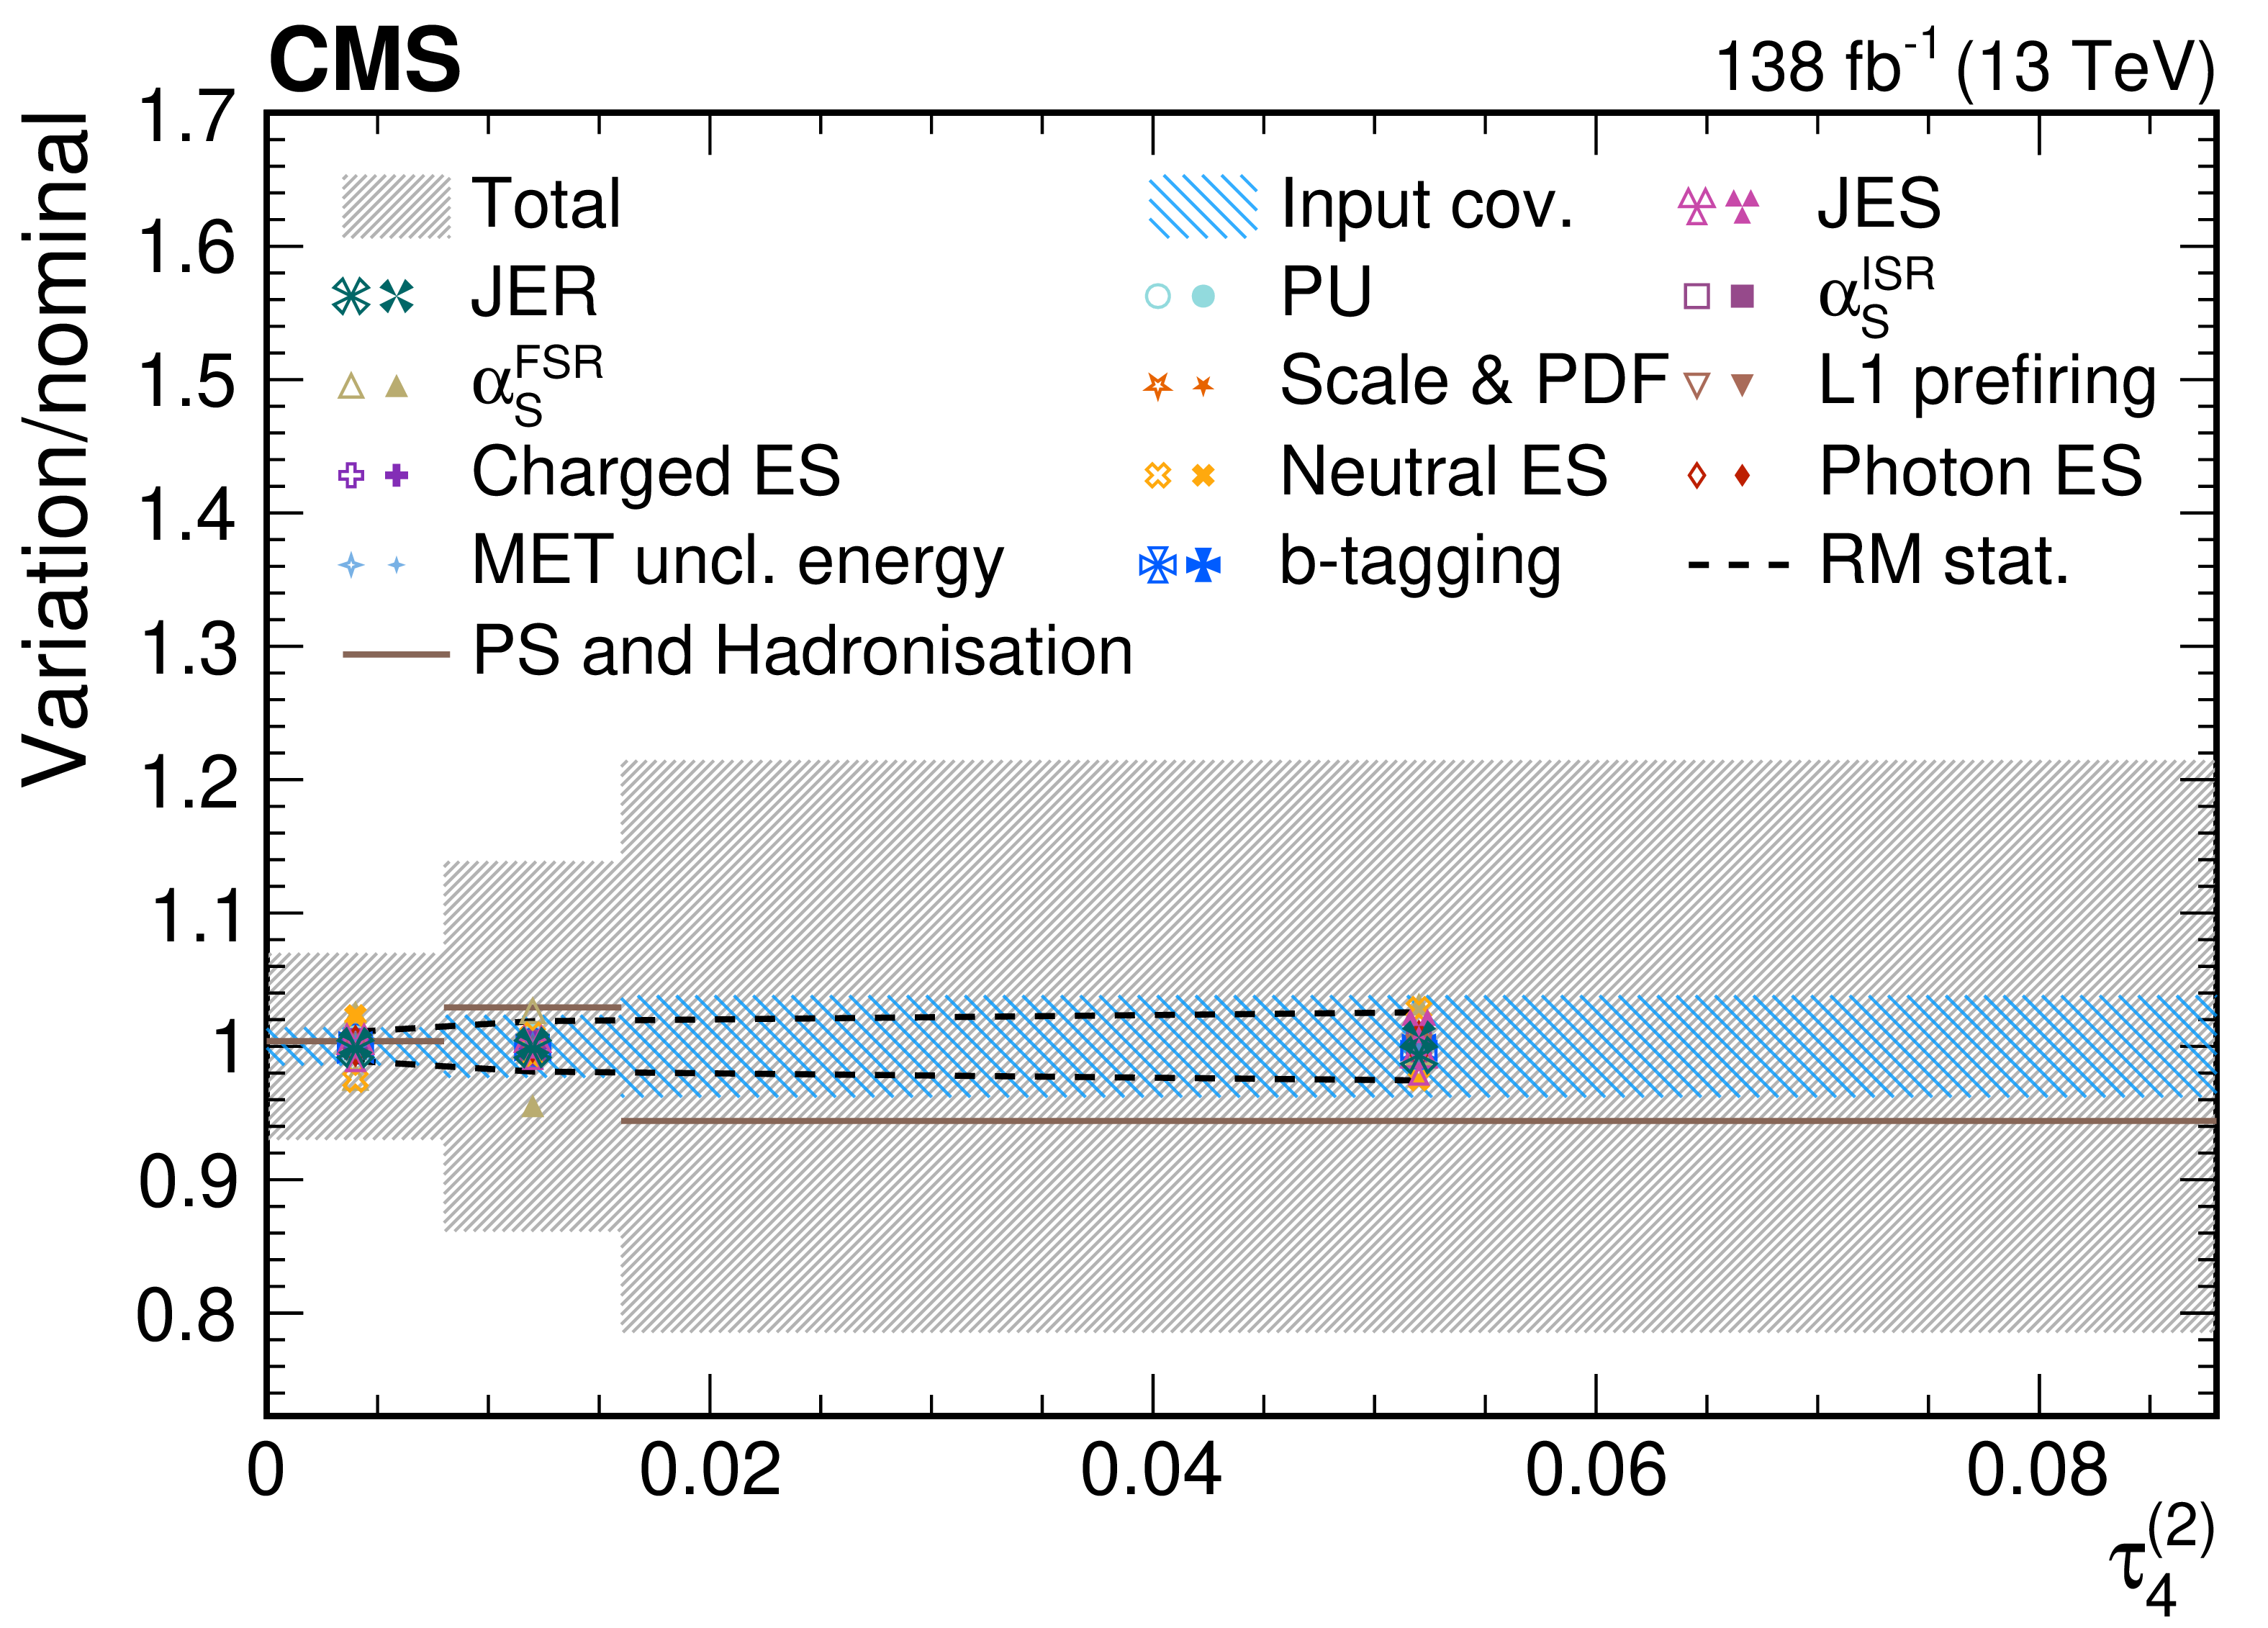
png pdf |
Figure 61-e:
Contributions from various systematic variations to the normalized, unfolded distribution for $ \tau_4^{(\beta)} $ observables measured for AK8 jets passing the boosted top quark-enriched selection in $ \mu $+jets $ \mathrm{t} \overline{\mathrm{t}} $ events. The total unfolding uncertainty is indicated with the dark grey, hashed region, while the blue hashed region indicates the contributions from the input covariance matrix, which includes the propagated effects of the statistical uncertainties of the input data after background subtraction. Contributions from statistical uncertainties of the simulated sample used to construct the nominal response matrix are indicated with the dashed black line. The physics model uncertainty is computed as a one-sided shift compared to the nominal unfolding, and up (down) contributions from other sources are indicated with filled (open) markers of the same type and colour. |
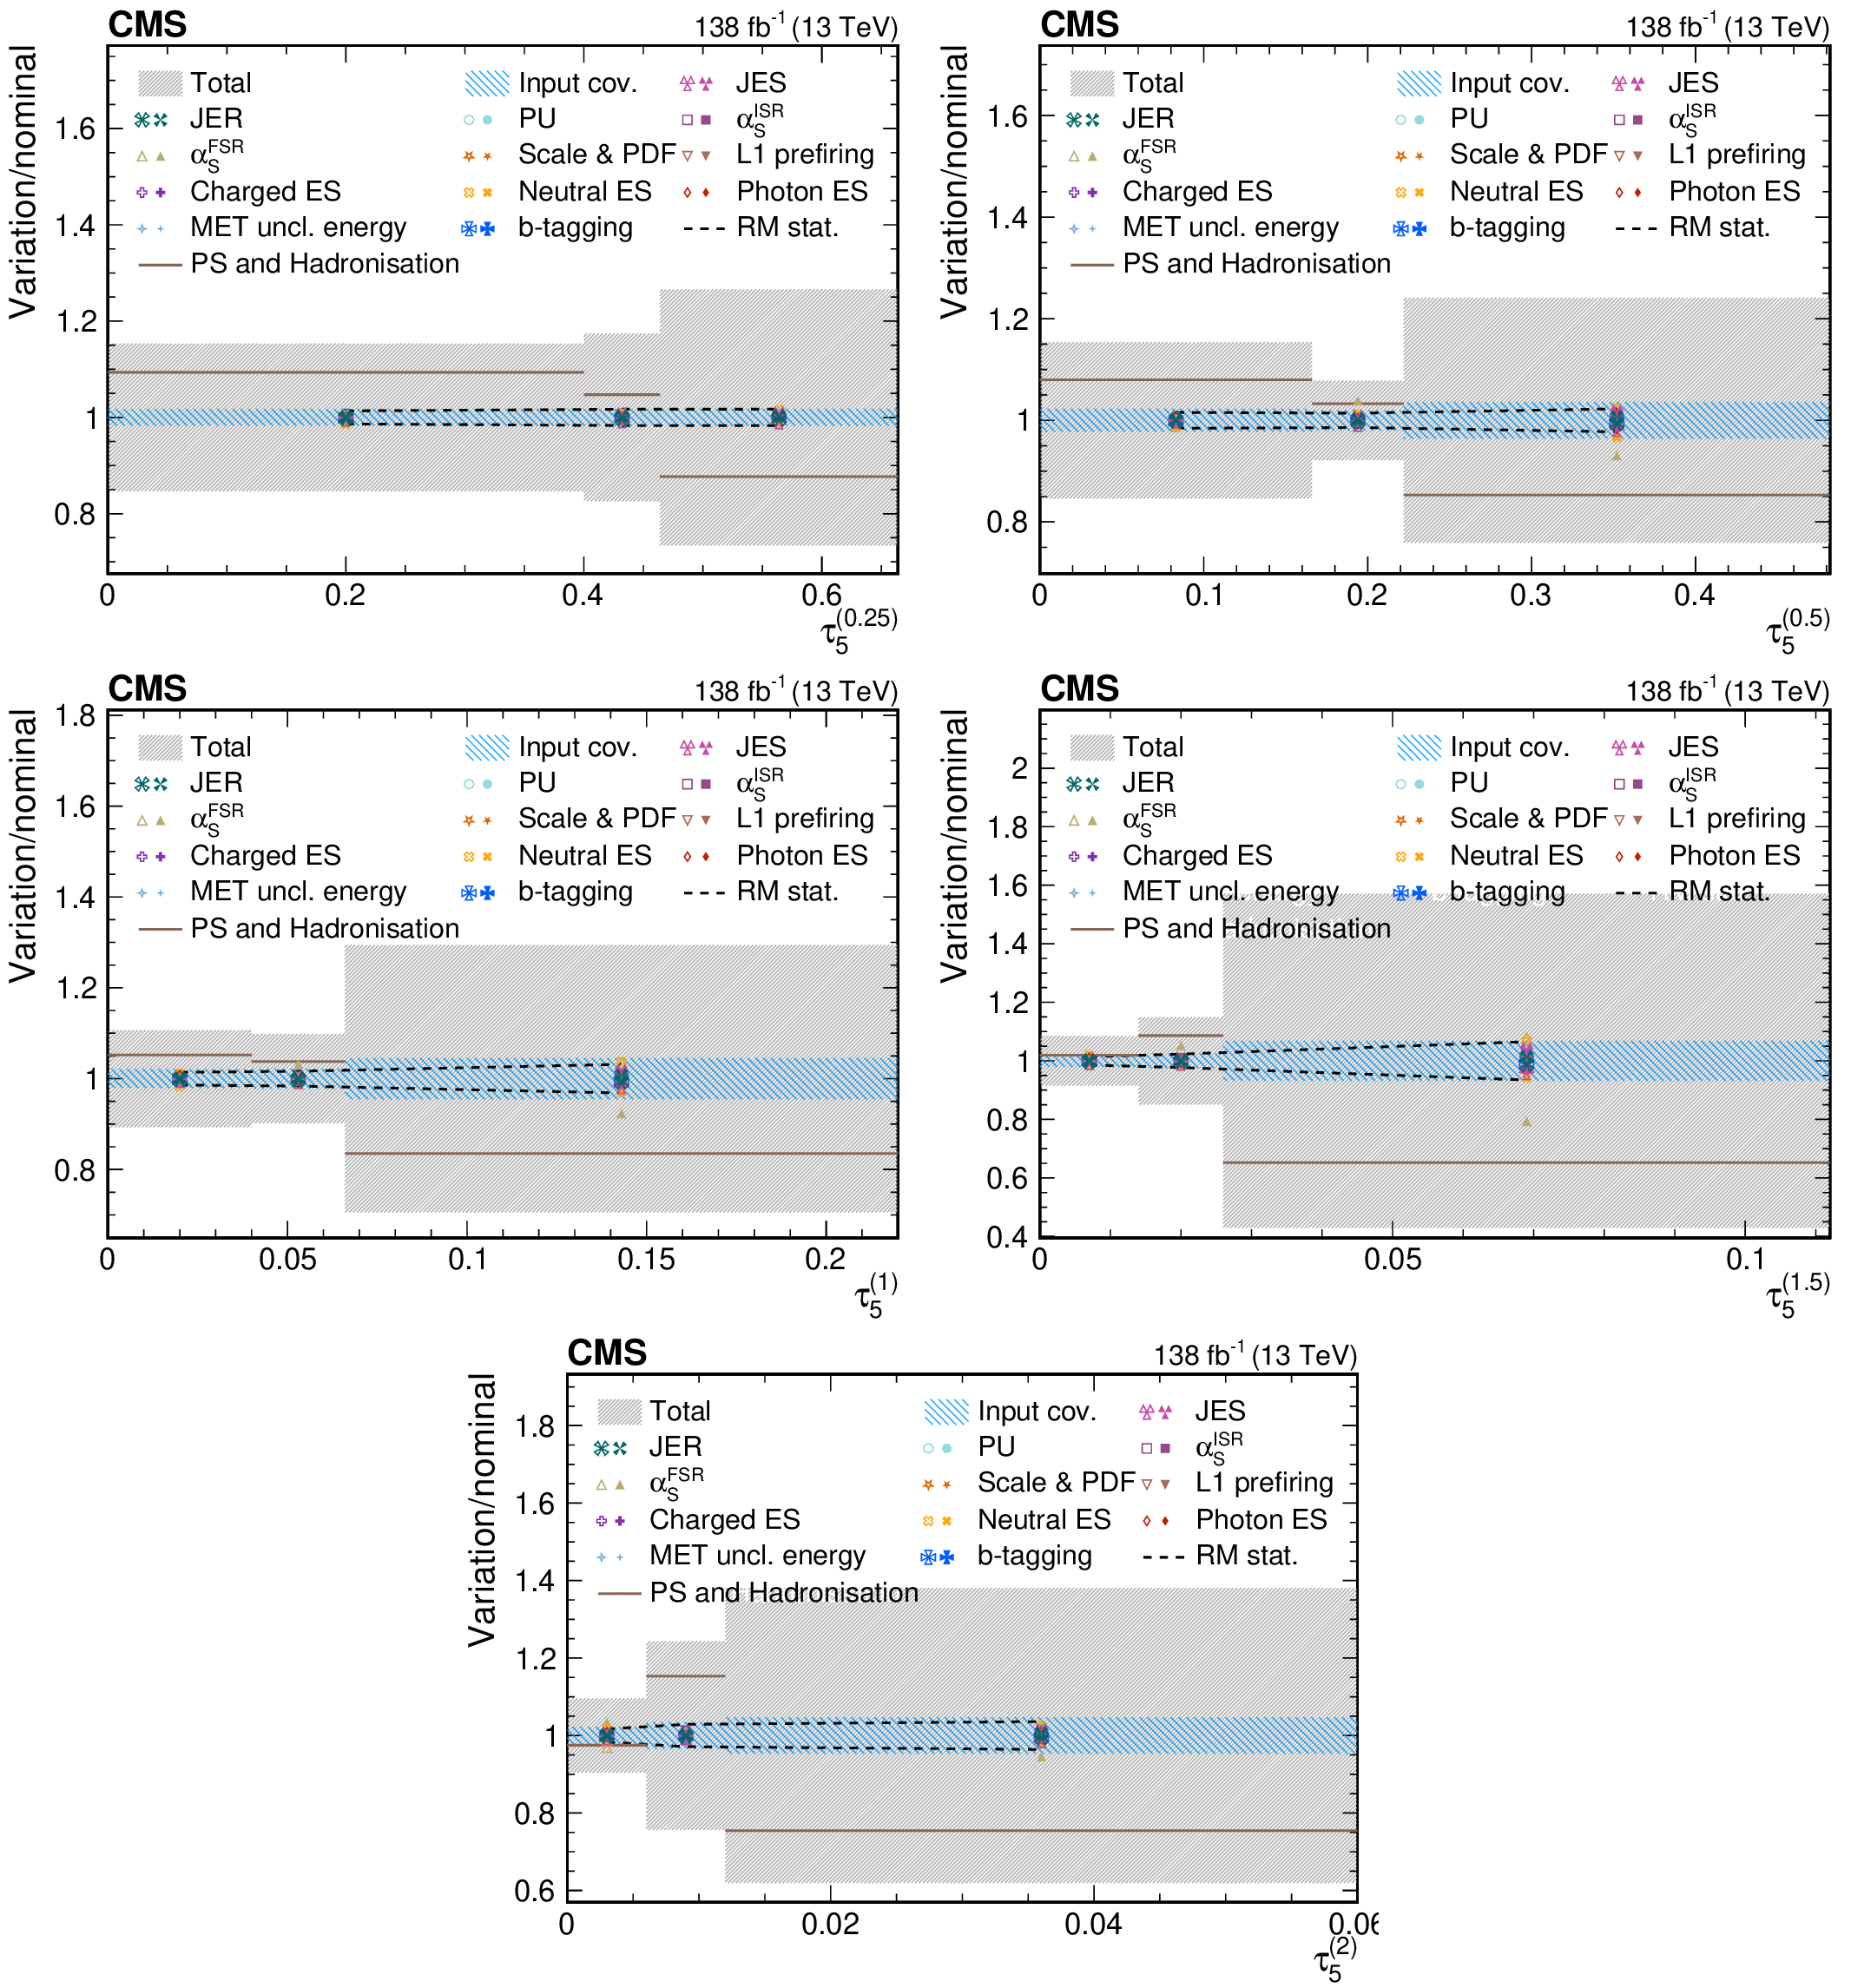
png pdf |
Figure 62:
Contributions from various systematic variations to the normalized, unfolded distribution for $ \tau_5^{(\beta)} $ observables measured for AK8 jets passing the boosted top quark-enriched selection in $ \mu $+jets $ \mathrm{t} \overline{\mathrm{t}} $ events. The total unfolding uncertainty is indicated with the dark grey, hashed region, while the blue hashed region indicates the contributions from the input covariance matrix, which includes the propagated effects of the statistical uncertainties of the input data after background subtraction. Contributions from statistical uncertainties of the simulated sample used to construct the nominal response matrix are indicated with the dashed black line. The physics model uncertainty is computed as a one-sided shift compared to the nominal unfolding, and up (down) contributions from other sources are indicated with filled (open) markers of the same type and colour. |
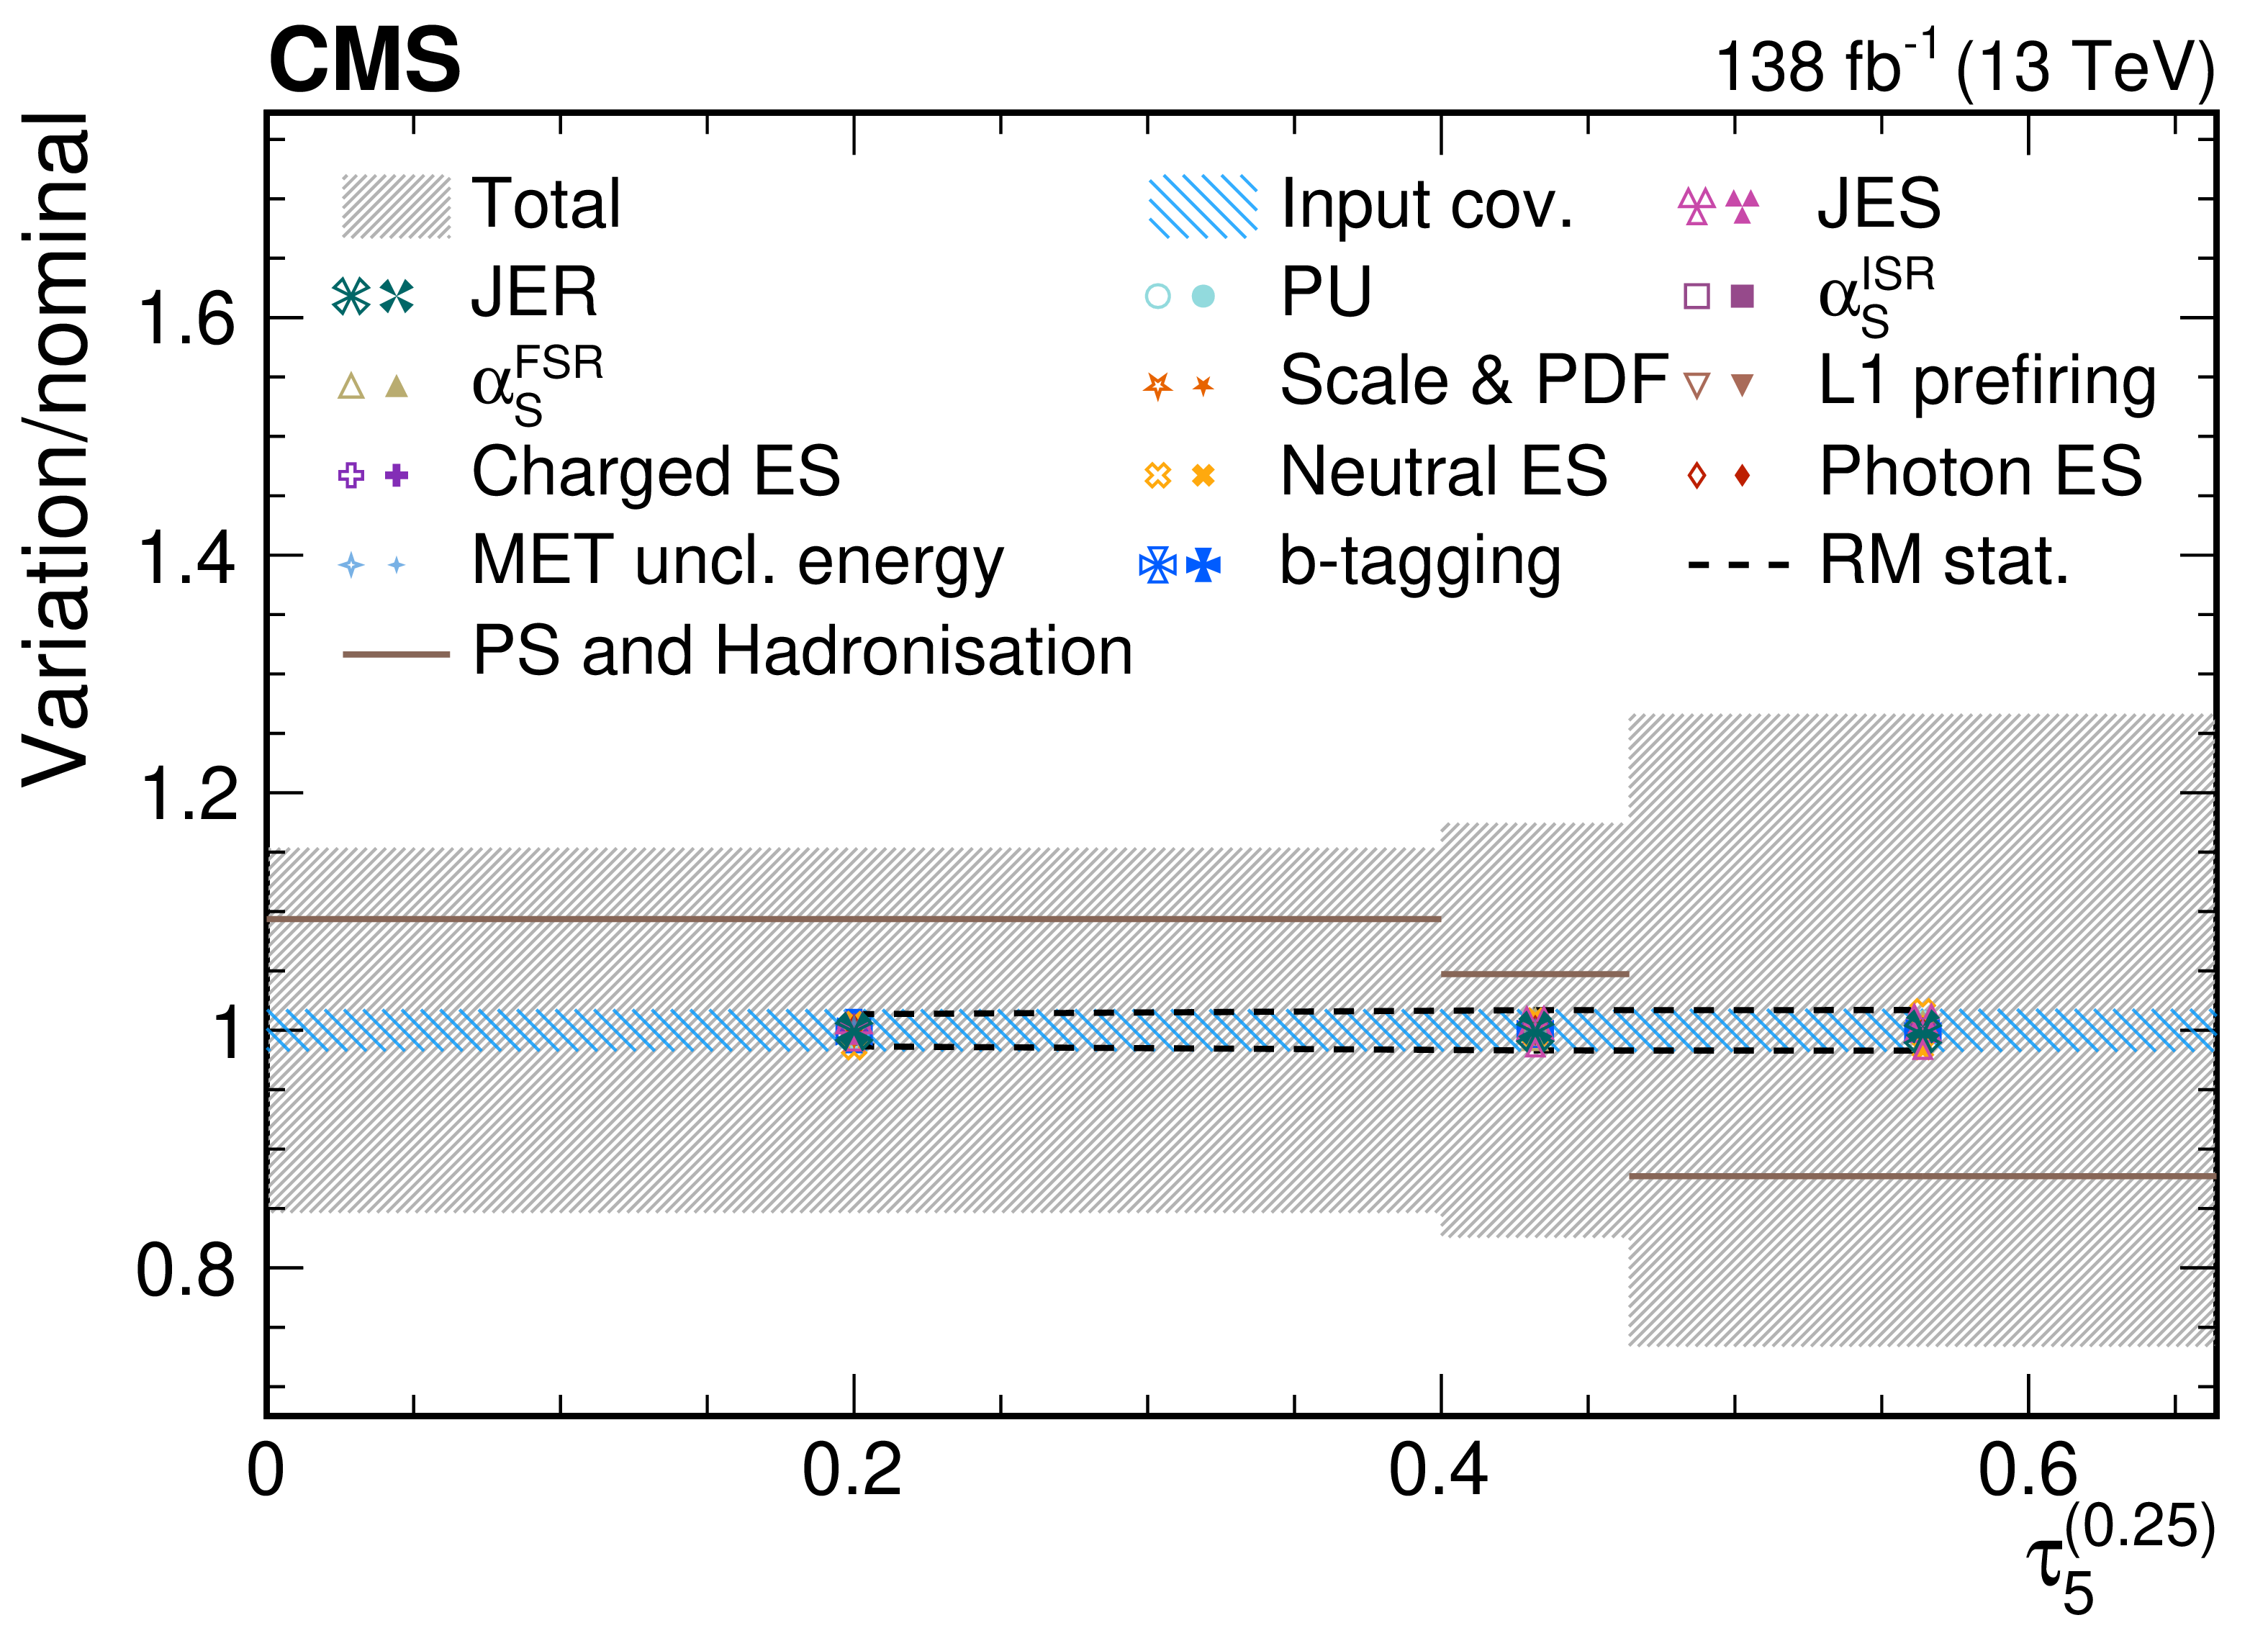
png pdf |
Figure 62-a:
Contributions from various systematic variations to the normalized, unfolded distribution for $ \tau_5^{(\beta)} $ observables measured for AK8 jets passing the boosted top quark-enriched selection in $ \mu $+jets $ \mathrm{t} \overline{\mathrm{t}} $ events. The total unfolding uncertainty is indicated with the dark grey, hashed region, while the blue hashed region indicates the contributions from the input covariance matrix, which includes the propagated effects of the statistical uncertainties of the input data after background subtraction. Contributions from statistical uncertainties of the simulated sample used to construct the nominal response matrix are indicated with the dashed black line. The physics model uncertainty is computed as a one-sided shift compared to the nominal unfolding, and up (down) contributions from other sources are indicated with filled (open) markers of the same type and colour. |
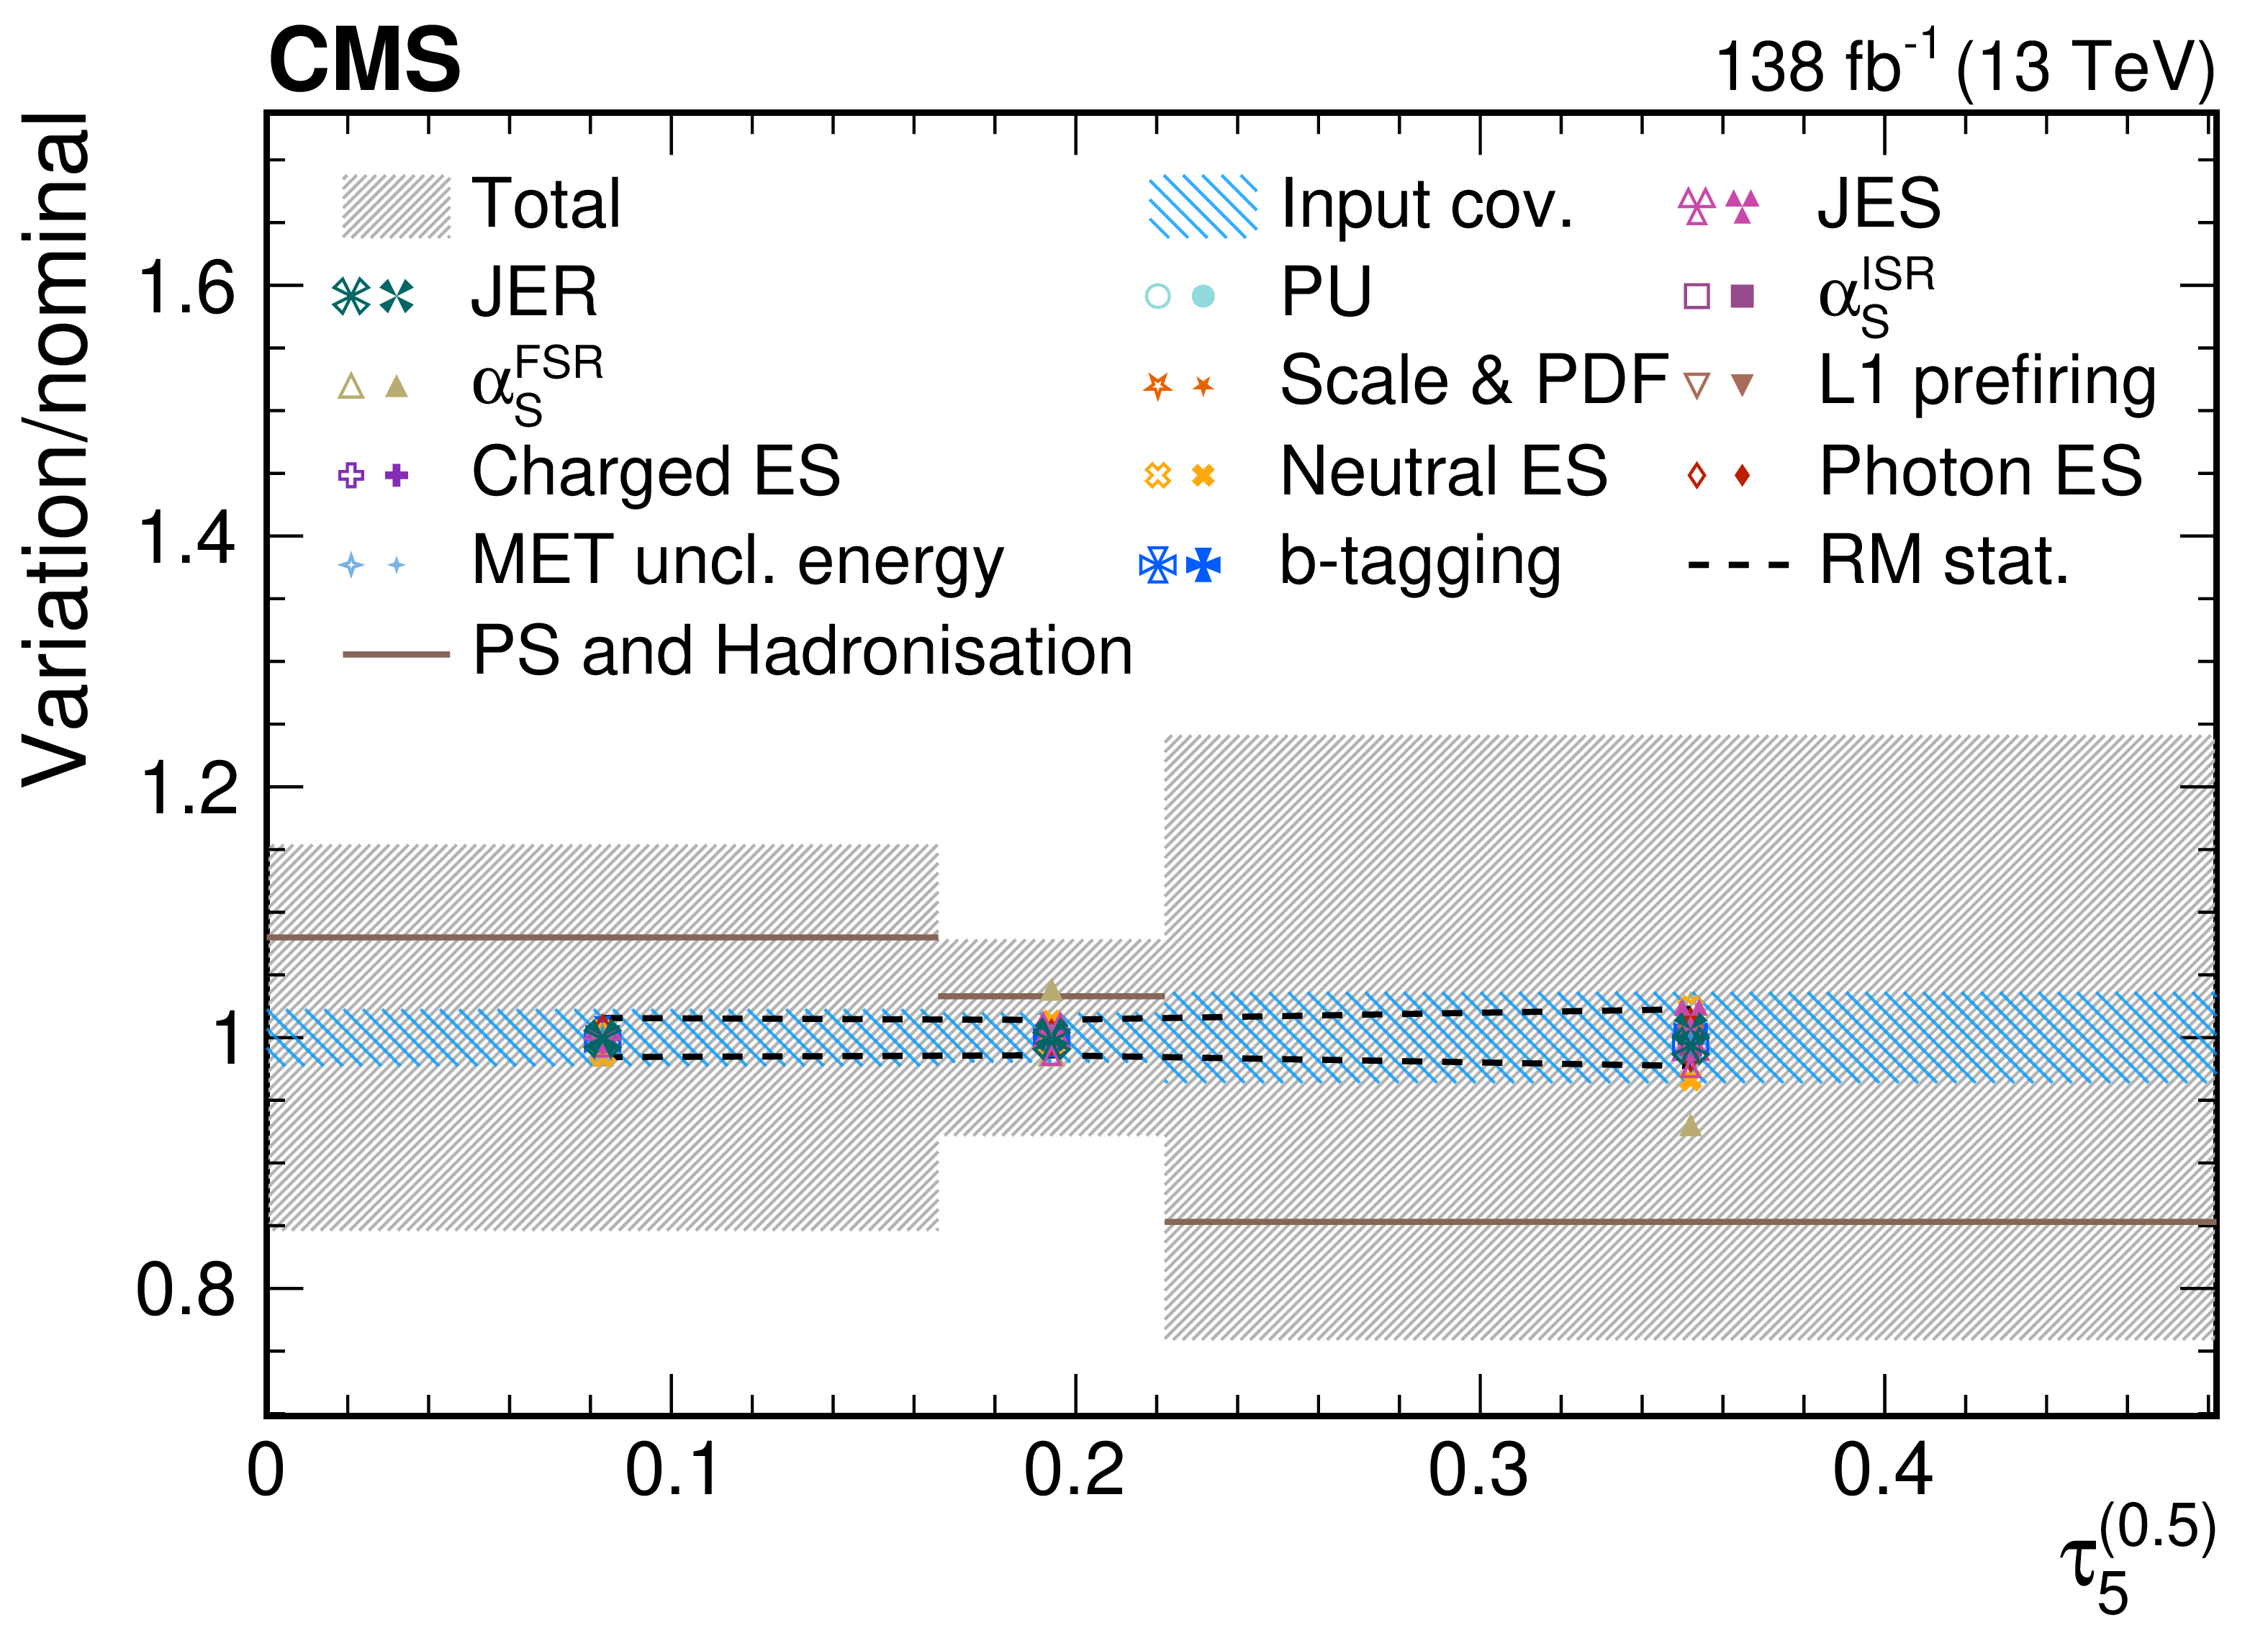
png pdf |
Figure 62-b:
Contributions from various systematic variations to the normalized, unfolded distribution for $ \tau_5^{(\beta)} $ observables measured for AK8 jets passing the boosted top quark-enriched selection in $ \mu $+jets $ \mathrm{t} \overline{\mathrm{t}} $ events. The total unfolding uncertainty is indicated with the dark grey, hashed region, while the blue hashed region indicates the contributions from the input covariance matrix, which includes the propagated effects of the statistical uncertainties of the input data after background subtraction. Contributions from statistical uncertainties of the simulated sample used to construct the nominal response matrix are indicated with the dashed black line. The physics model uncertainty is computed as a one-sided shift compared to the nominal unfolding, and up (down) contributions from other sources are indicated with filled (open) markers of the same type and colour. |
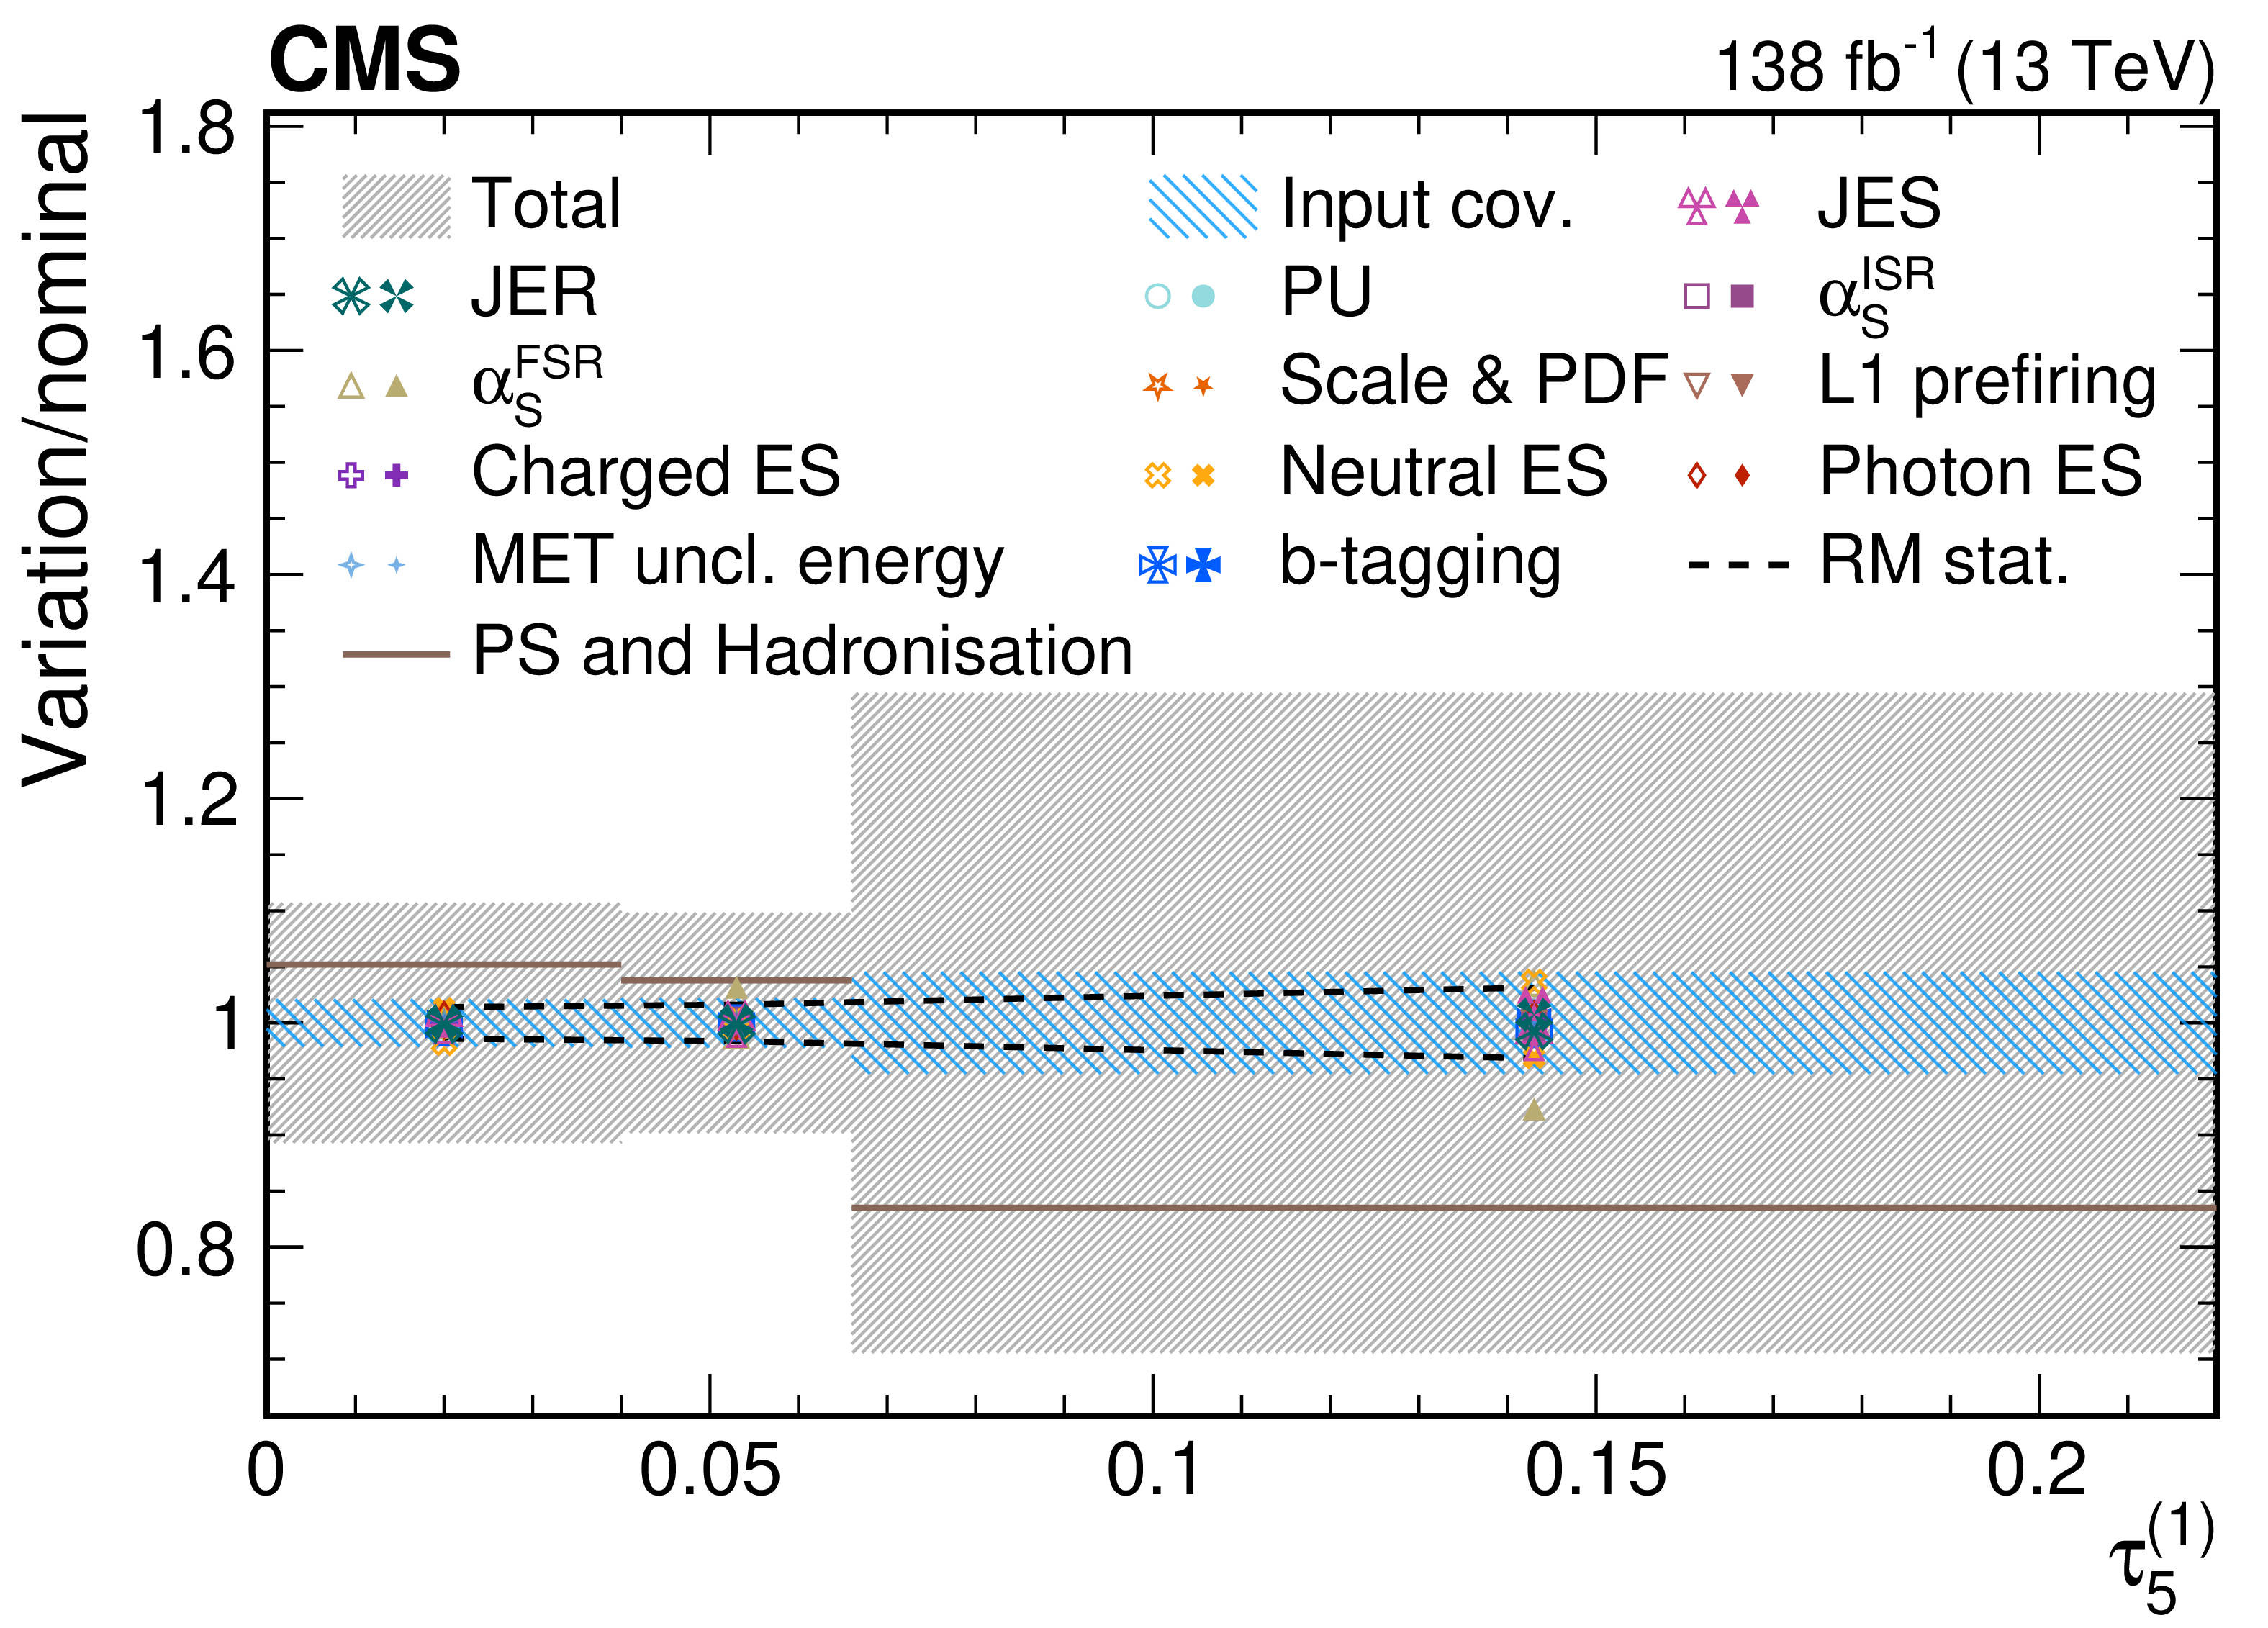
png pdf |
Figure 62-c:
Contributions from various systematic variations to the normalized, unfolded distribution for $ \tau_5^{(\beta)} $ observables measured for AK8 jets passing the boosted top quark-enriched selection in $ \mu $+jets $ \mathrm{t} \overline{\mathrm{t}} $ events. The total unfolding uncertainty is indicated with the dark grey, hashed region, while the blue hashed region indicates the contributions from the input covariance matrix, which includes the propagated effects of the statistical uncertainties of the input data after background subtraction. Contributions from statistical uncertainties of the simulated sample used to construct the nominal response matrix are indicated with the dashed black line. The physics model uncertainty is computed as a one-sided shift compared to the nominal unfolding, and up (down) contributions from other sources are indicated with filled (open) markers of the same type and colour. |
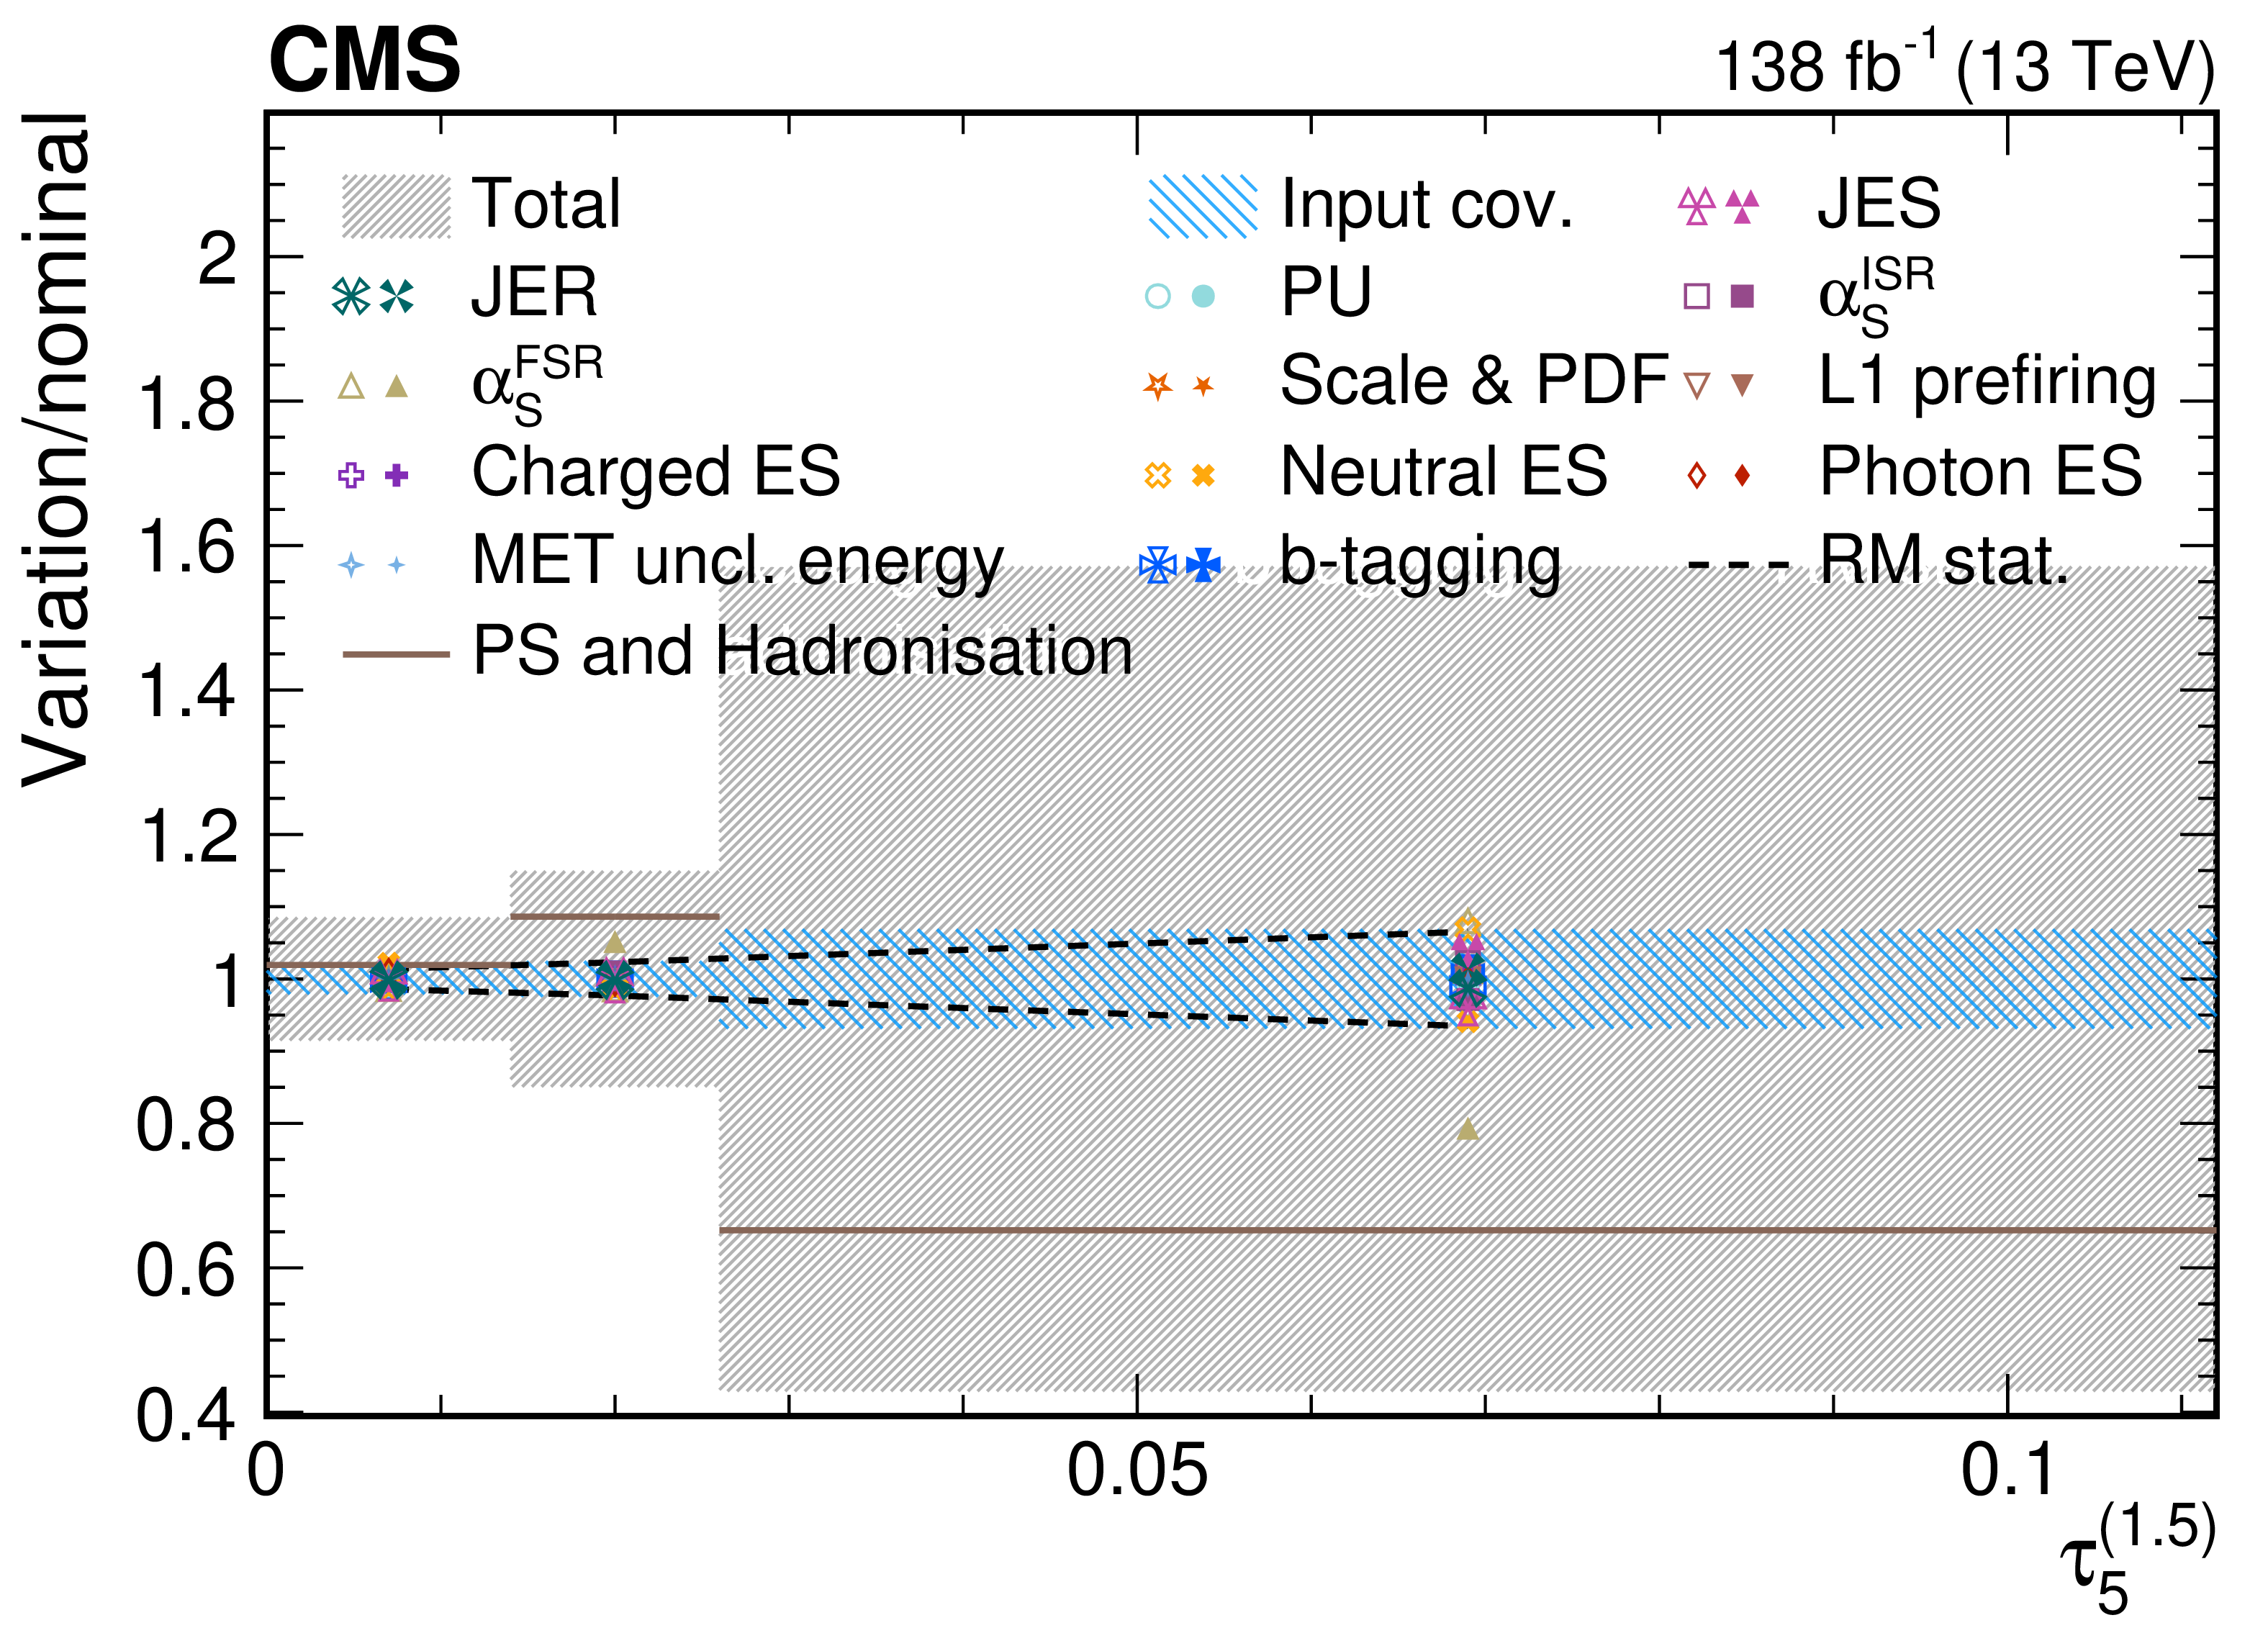
png pdf |
Figure 62-d:
Contributions from various systematic variations to the normalized, unfolded distribution for $ \tau_5^{(\beta)} $ observables measured for AK8 jets passing the boosted top quark-enriched selection in $ \mu $+jets $ \mathrm{t} \overline{\mathrm{t}} $ events. The total unfolding uncertainty is indicated with the dark grey, hashed region, while the blue hashed region indicates the contributions from the input covariance matrix, which includes the propagated effects of the statistical uncertainties of the input data after background subtraction. Contributions from statistical uncertainties of the simulated sample used to construct the nominal response matrix are indicated with the dashed black line. The physics model uncertainty is computed as a one-sided shift compared to the nominal unfolding, and up (down) contributions from other sources are indicated with filled (open) markers of the same type and colour. |
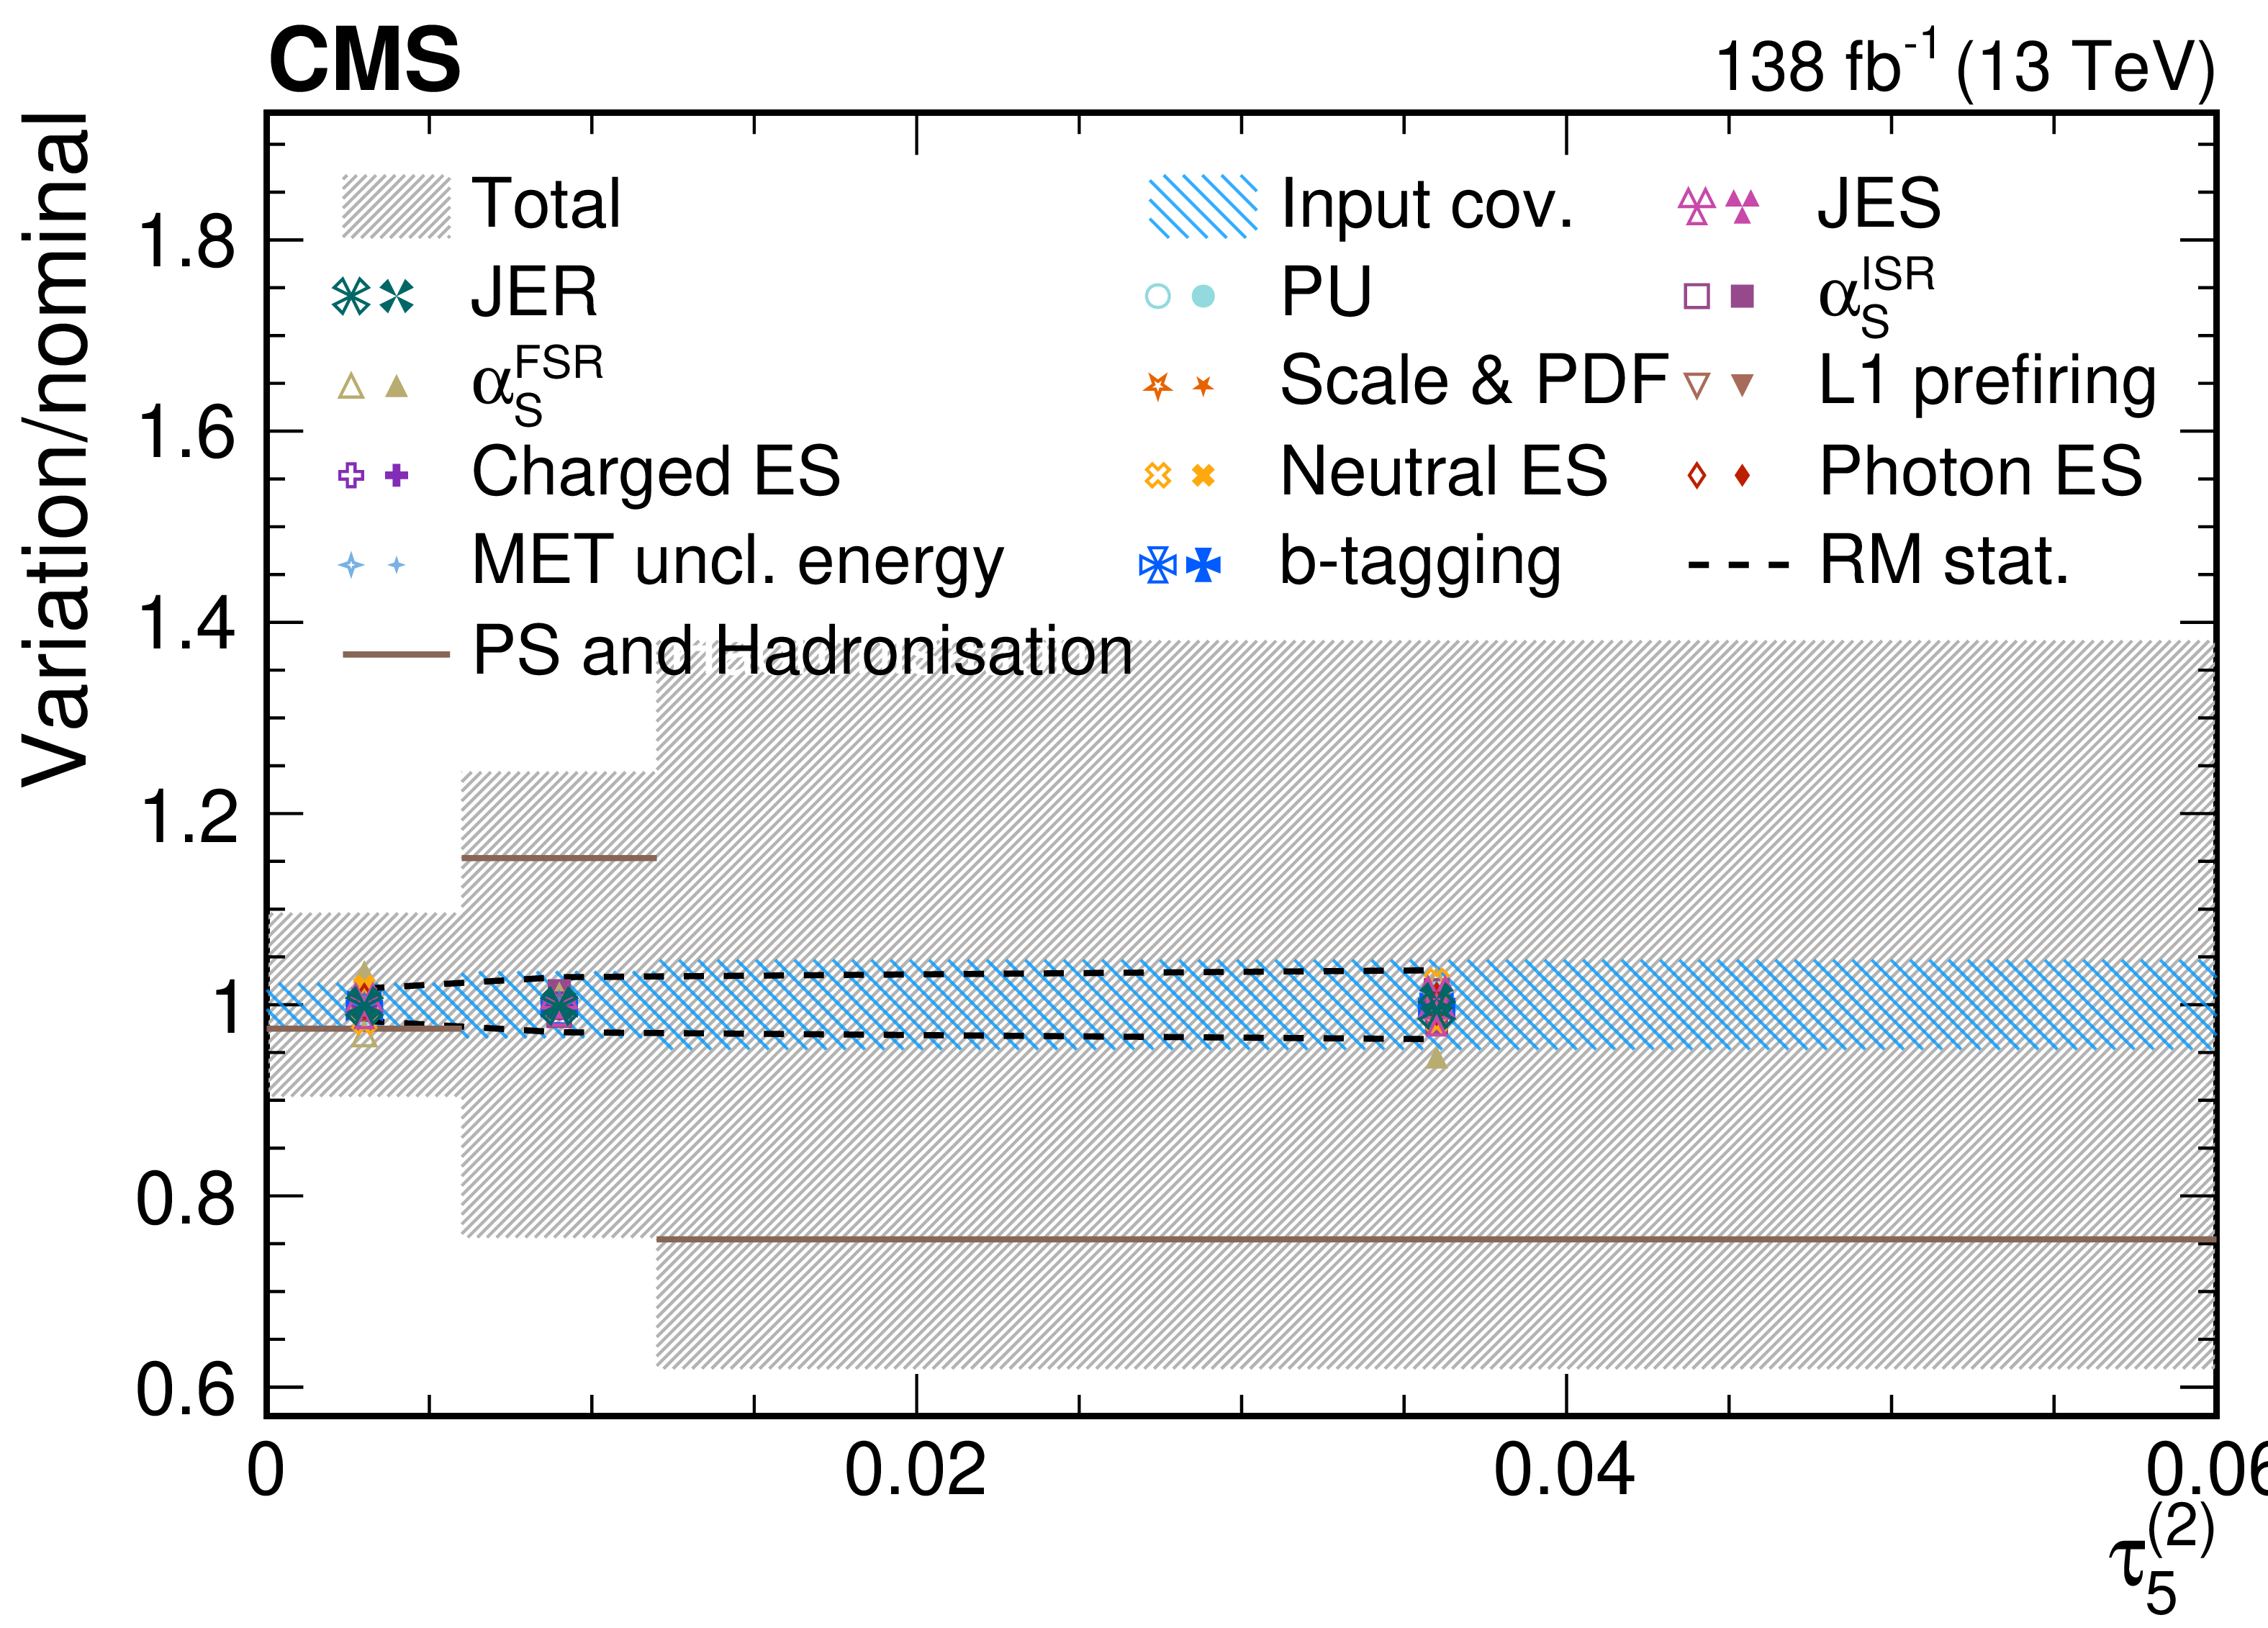
png pdf |
Figure 62-e:
Contributions from various systematic variations to the normalized, unfolded distribution for $ \tau_5^{(\beta)} $ observables measured for AK8 jets passing the boosted top quark-enriched selection in $ \mu $+jets $ \mathrm{t} \overline{\mathrm{t}} $ events. The total unfolding uncertainty is indicated with the dark grey, hashed region, while the blue hashed region indicates the contributions from the input covariance matrix, which includes the propagated effects of the statistical uncertainties of the input data after background subtraction. Contributions from statistical uncertainties of the simulated sample used to construct the nominal response matrix are indicated with the dashed black line. The physics model uncertainty is computed as a one-sided shift compared to the nominal unfolding, and up (down) contributions from other sources are indicated with filled (open) markers of the same type and colour. |
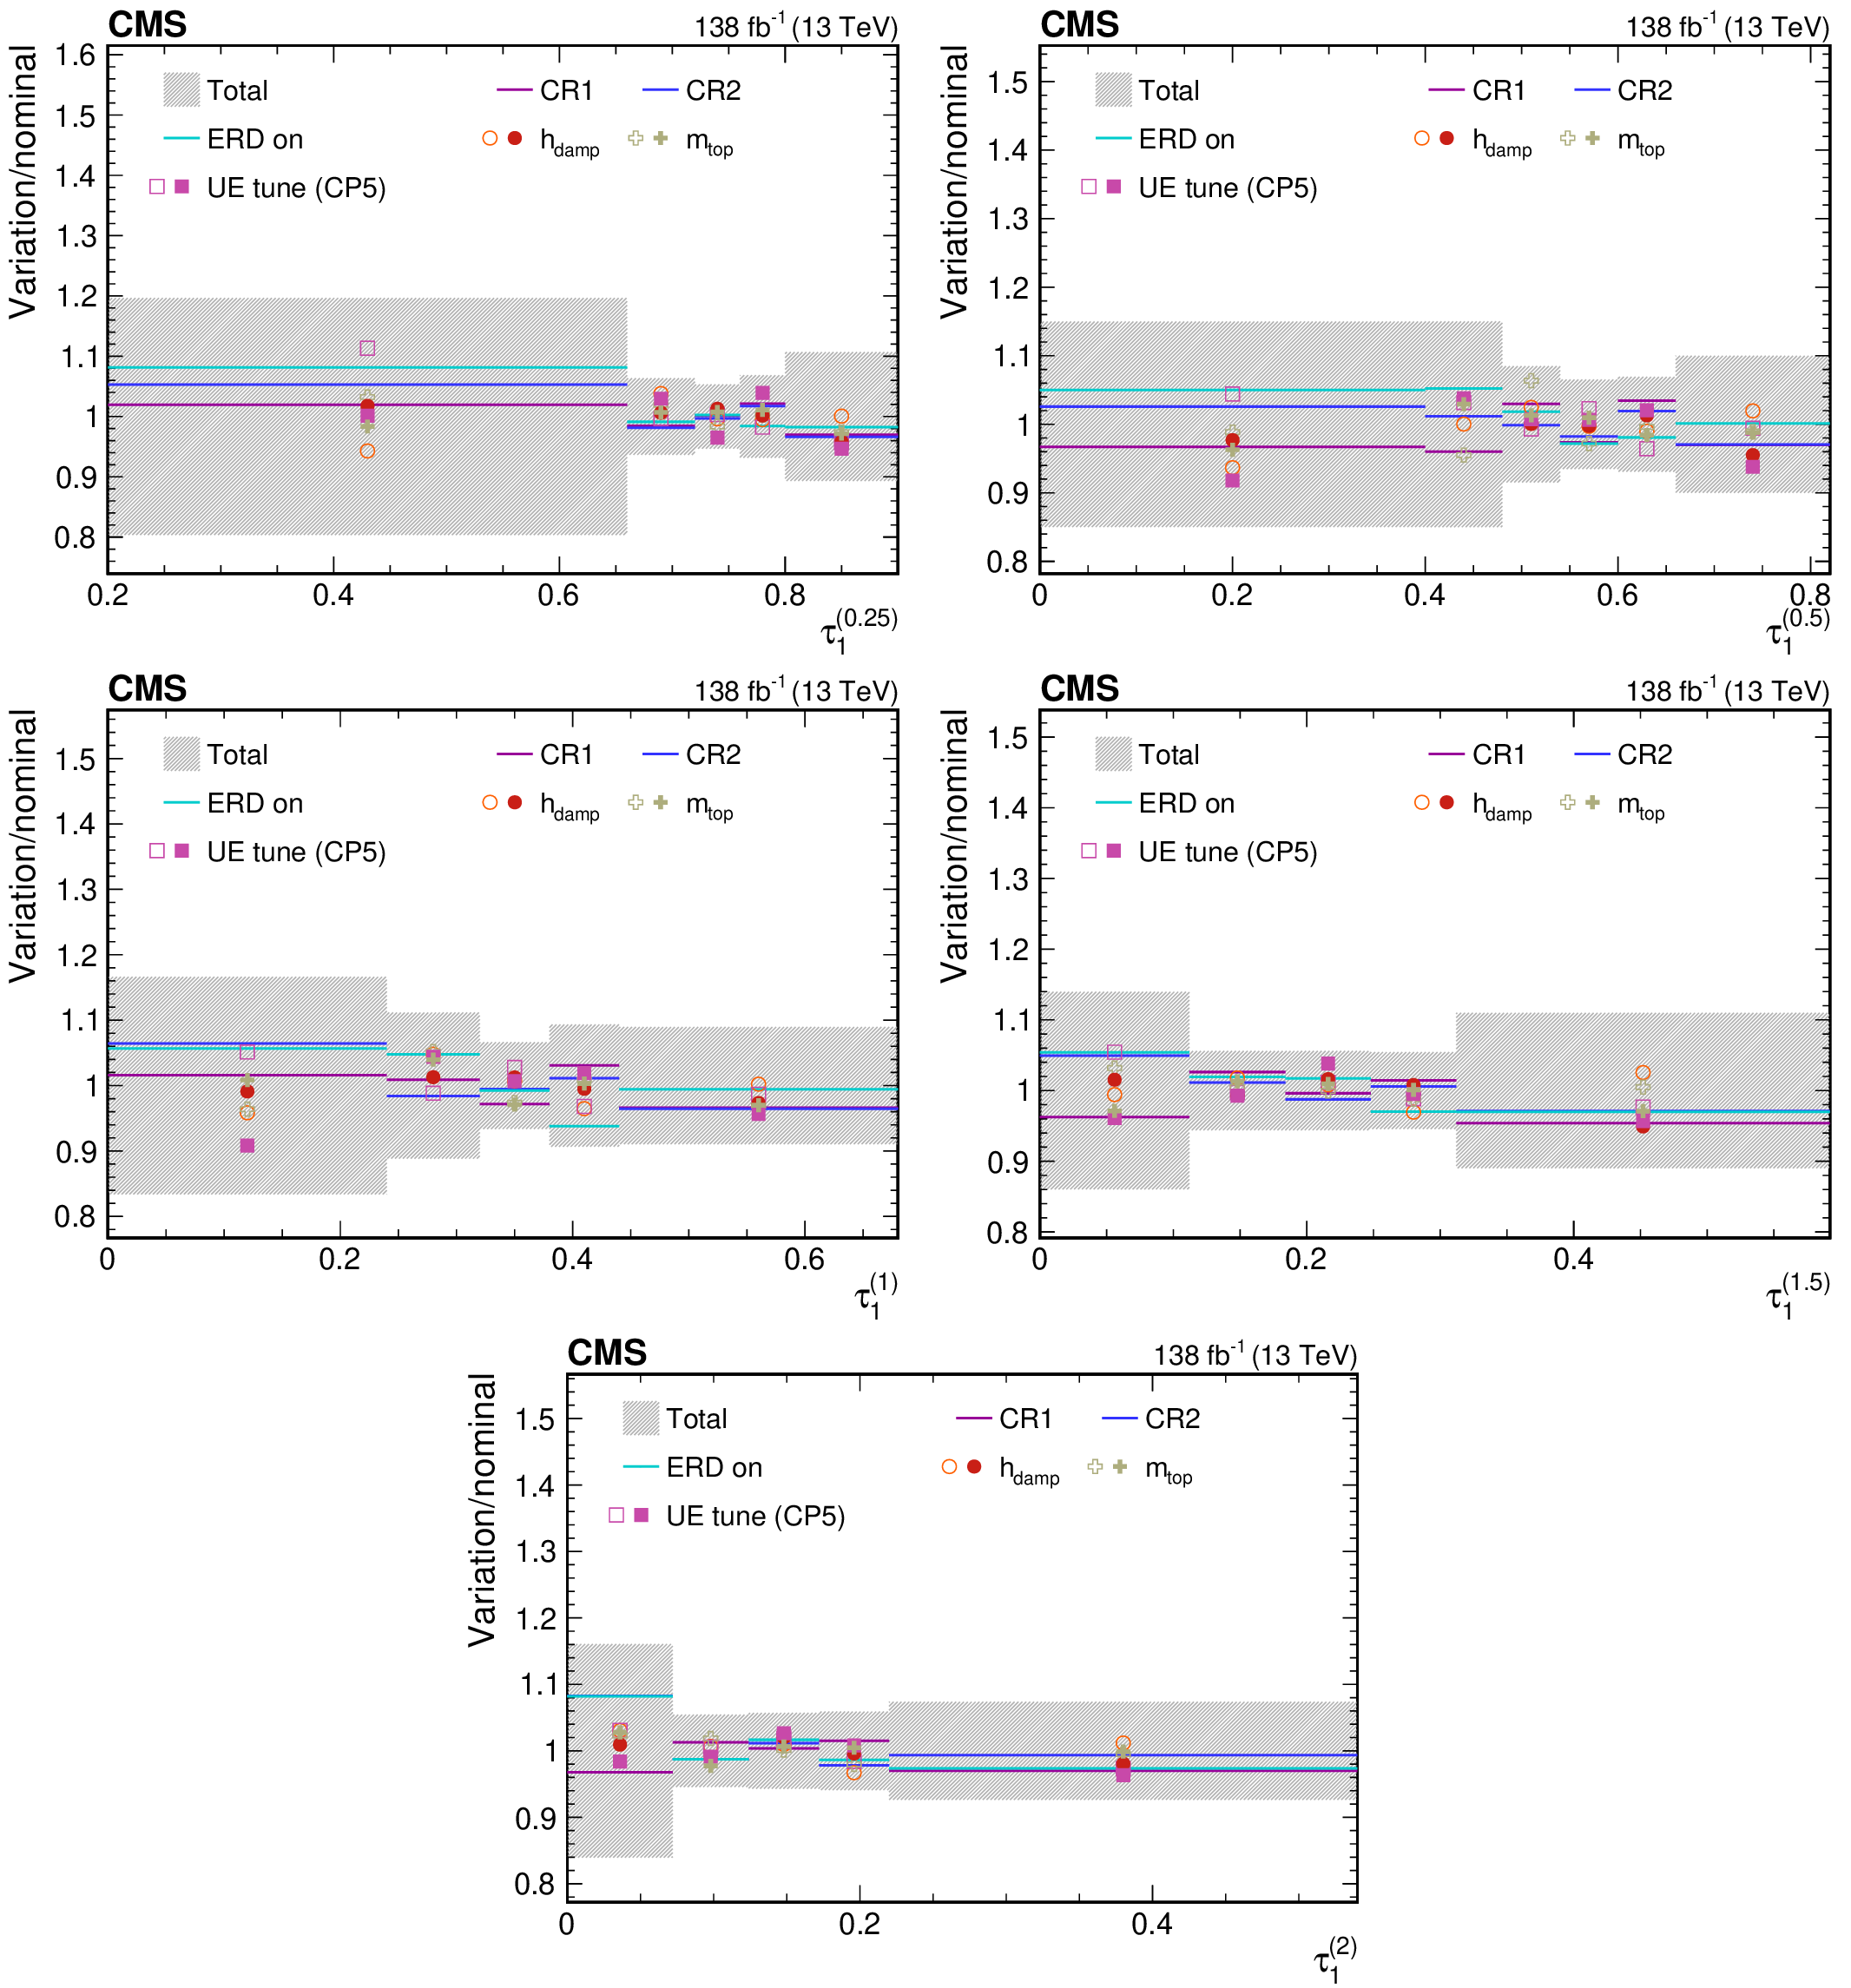
png pdf |
Figure 63:
Contributions from various theory model systematic variations to the normalized, unfolded distribution for $ \tau_1^{(\beta)} $ observables measured for AK8 jets passing the boosted top quark-enriched selection in $ \mu $+jets $ \mathrm{t} \overline{\mathrm{t}} $ events. The total unfolding uncertainty is indicated with the dark grey, hashed region, while the blue hashed region indicates the contributions from the input covariance matrix, which includes the propagated effects of the statistical uncertainties of the input data after background subtraction. Contributions from statistical uncertainties of the simulated sample used to construct the nominal response matrix are indicated with the dashed black line. The uncertainty contributions for different choices of colour reconnection models are illustrated as one-sided shifts compared to the nominal unfolding, and up (down) contributions from other sources are indicated with filled (open) markers of the same type and colour. |
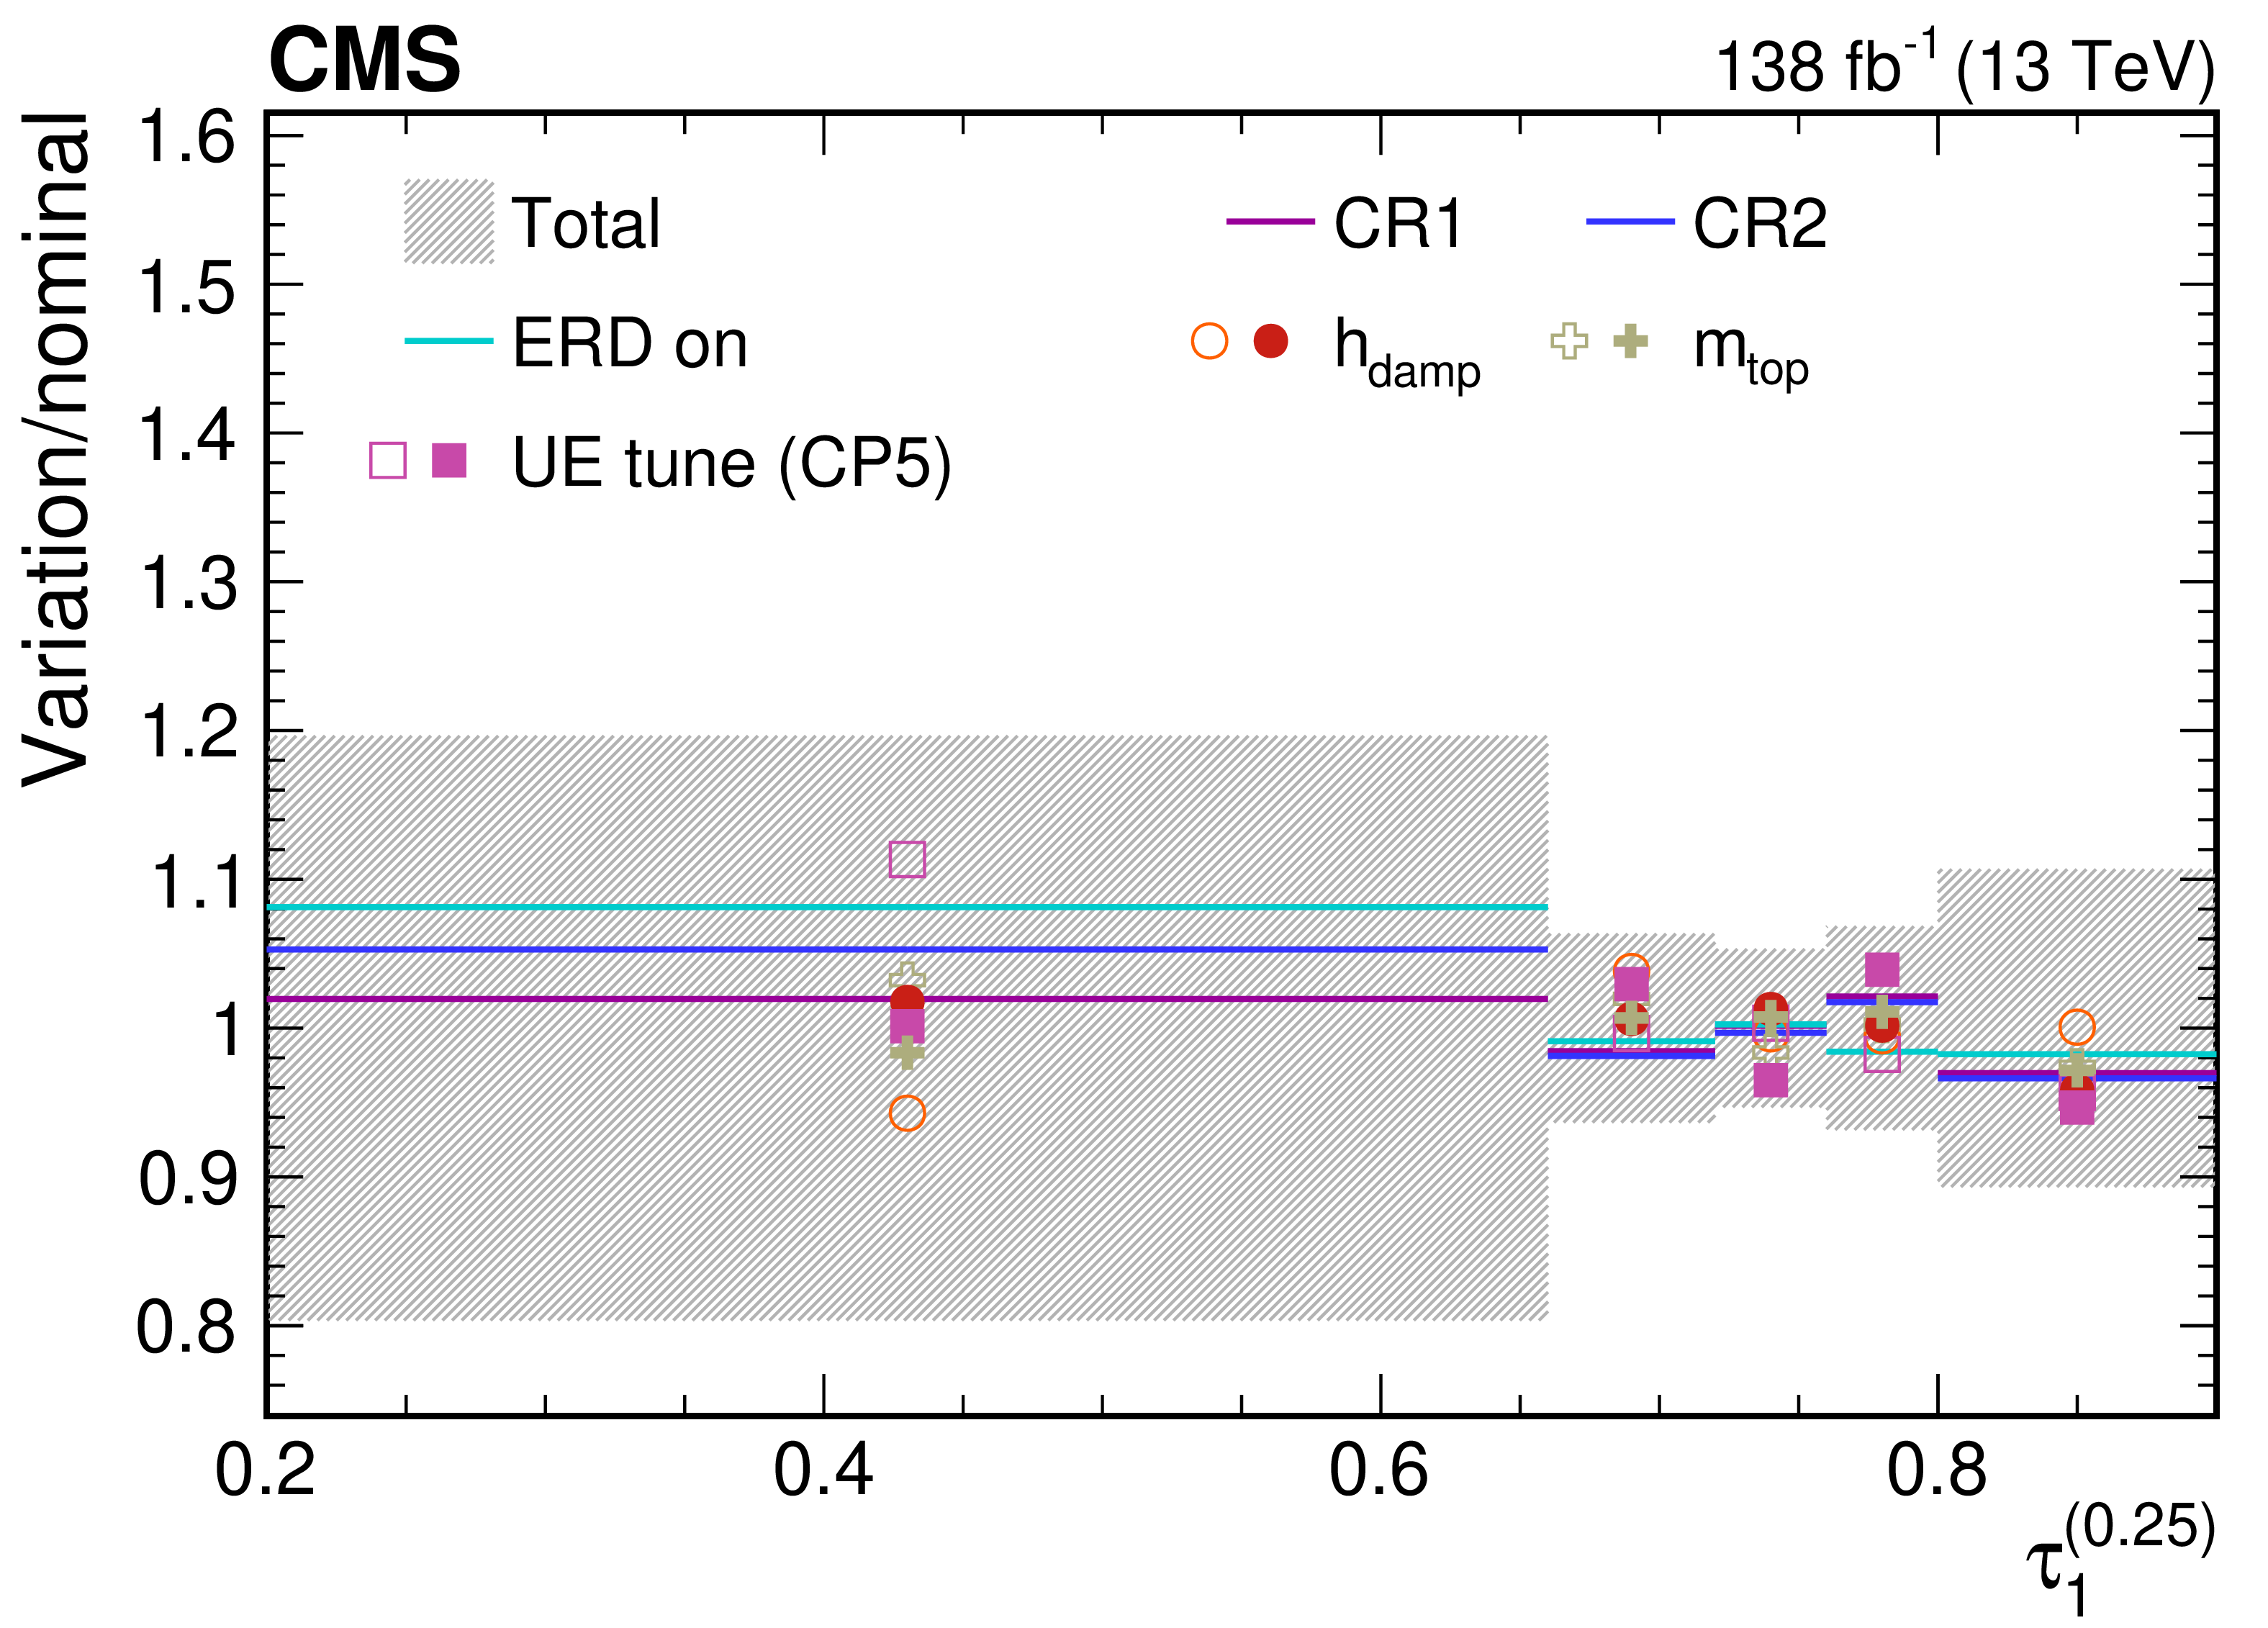
png pdf |
Figure 63-a:
Contributions from various theory model systematic variations to the normalized, unfolded distribution for $ \tau_1^{(\beta)} $ observables measured for AK8 jets passing the boosted top quark-enriched selection in $ \mu $+jets $ \mathrm{t} \overline{\mathrm{t}} $ events. The total unfolding uncertainty is indicated with the dark grey, hashed region, while the blue hashed region indicates the contributions from the input covariance matrix, which includes the propagated effects of the statistical uncertainties of the input data after background subtraction. Contributions from statistical uncertainties of the simulated sample used to construct the nominal response matrix are indicated with the dashed black line. The uncertainty contributions for different choices of colour reconnection models are illustrated as one-sided shifts compared to the nominal unfolding, and up (down) contributions from other sources are indicated with filled (open) markers of the same type and colour. |
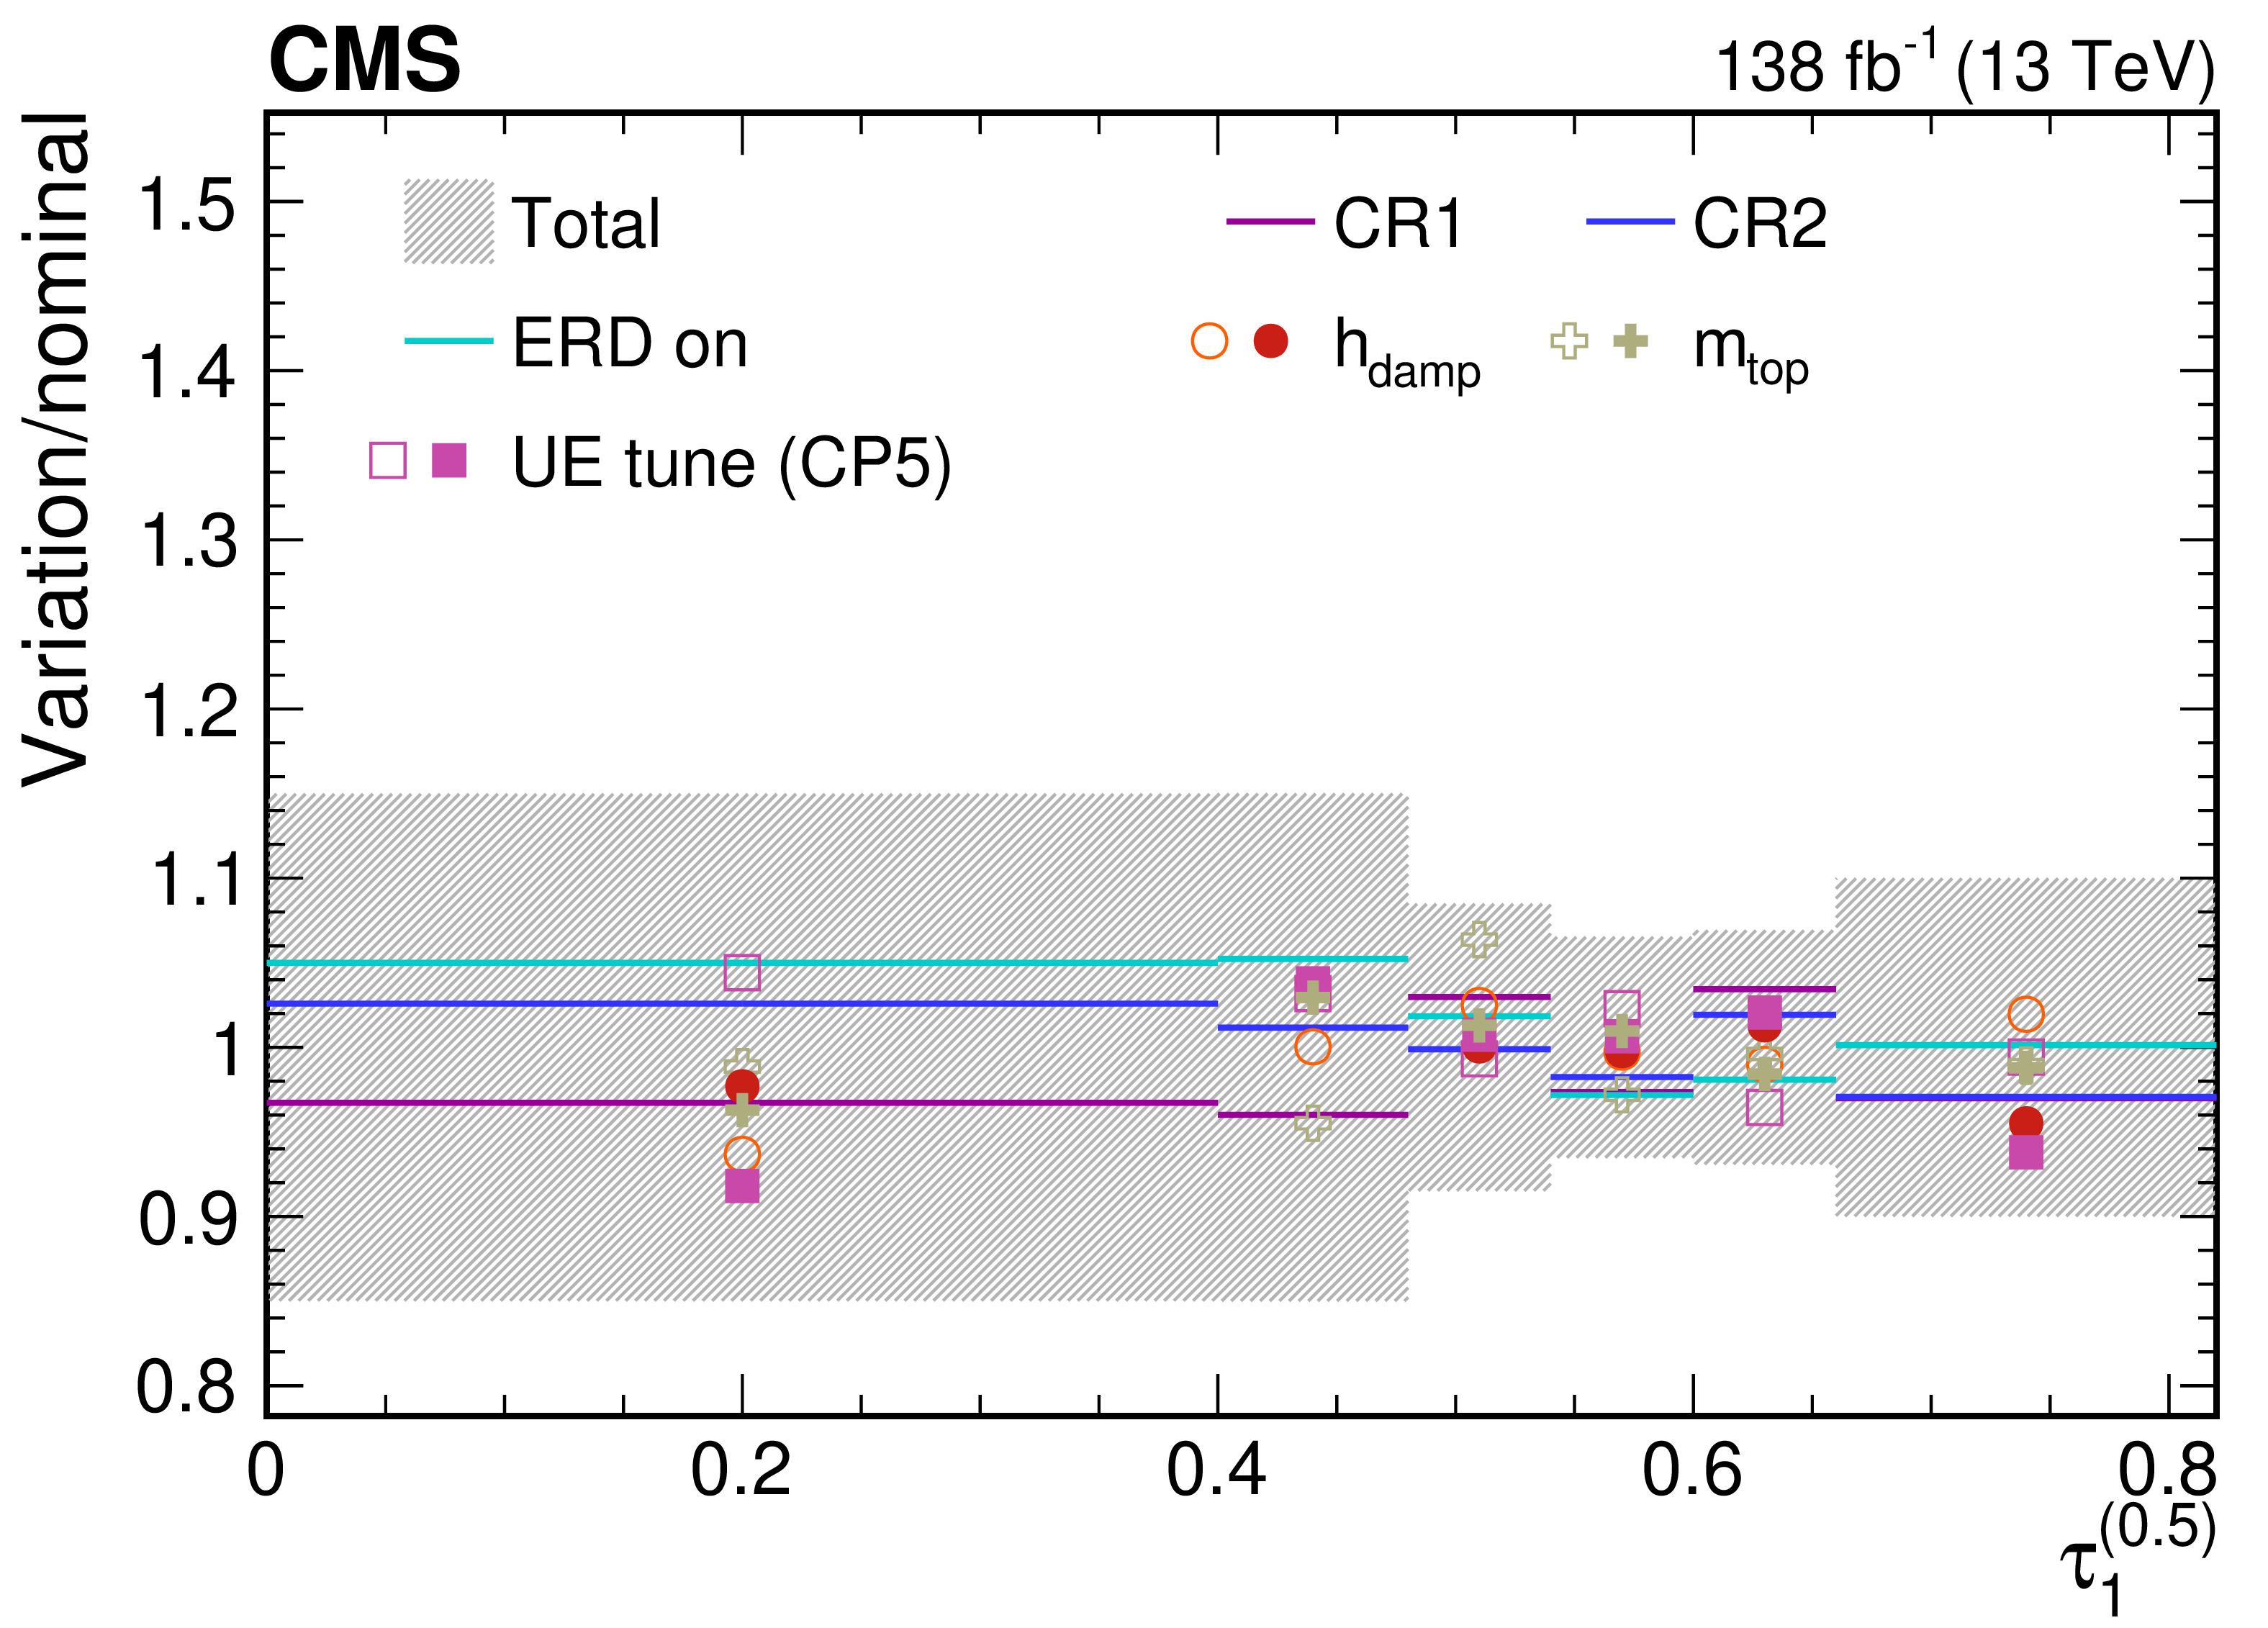
png pdf |
Figure 63-b:
Contributions from various theory model systematic variations to the normalized, unfolded distribution for $ \tau_1^{(\beta)} $ observables measured for AK8 jets passing the boosted top quark-enriched selection in $ \mu $+jets $ \mathrm{t} \overline{\mathrm{t}} $ events. The total unfolding uncertainty is indicated with the dark grey, hashed region, while the blue hashed region indicates the contributions from the input covariance matrix, which includes the propagated effects of the statistical uncertainties of the input data after background subtraction. Contributions from statistical uncertainties of the simulated sample used to construct the nominal response matrix are indicated with the dashed black line. The uncertainty contributions for different choices of colour reconnection models are illustrated as one-sided shifts compared to the nominal unfolding, and up (down) contributions from other sources are indicated with filled (open) markers of the same type and colour. |
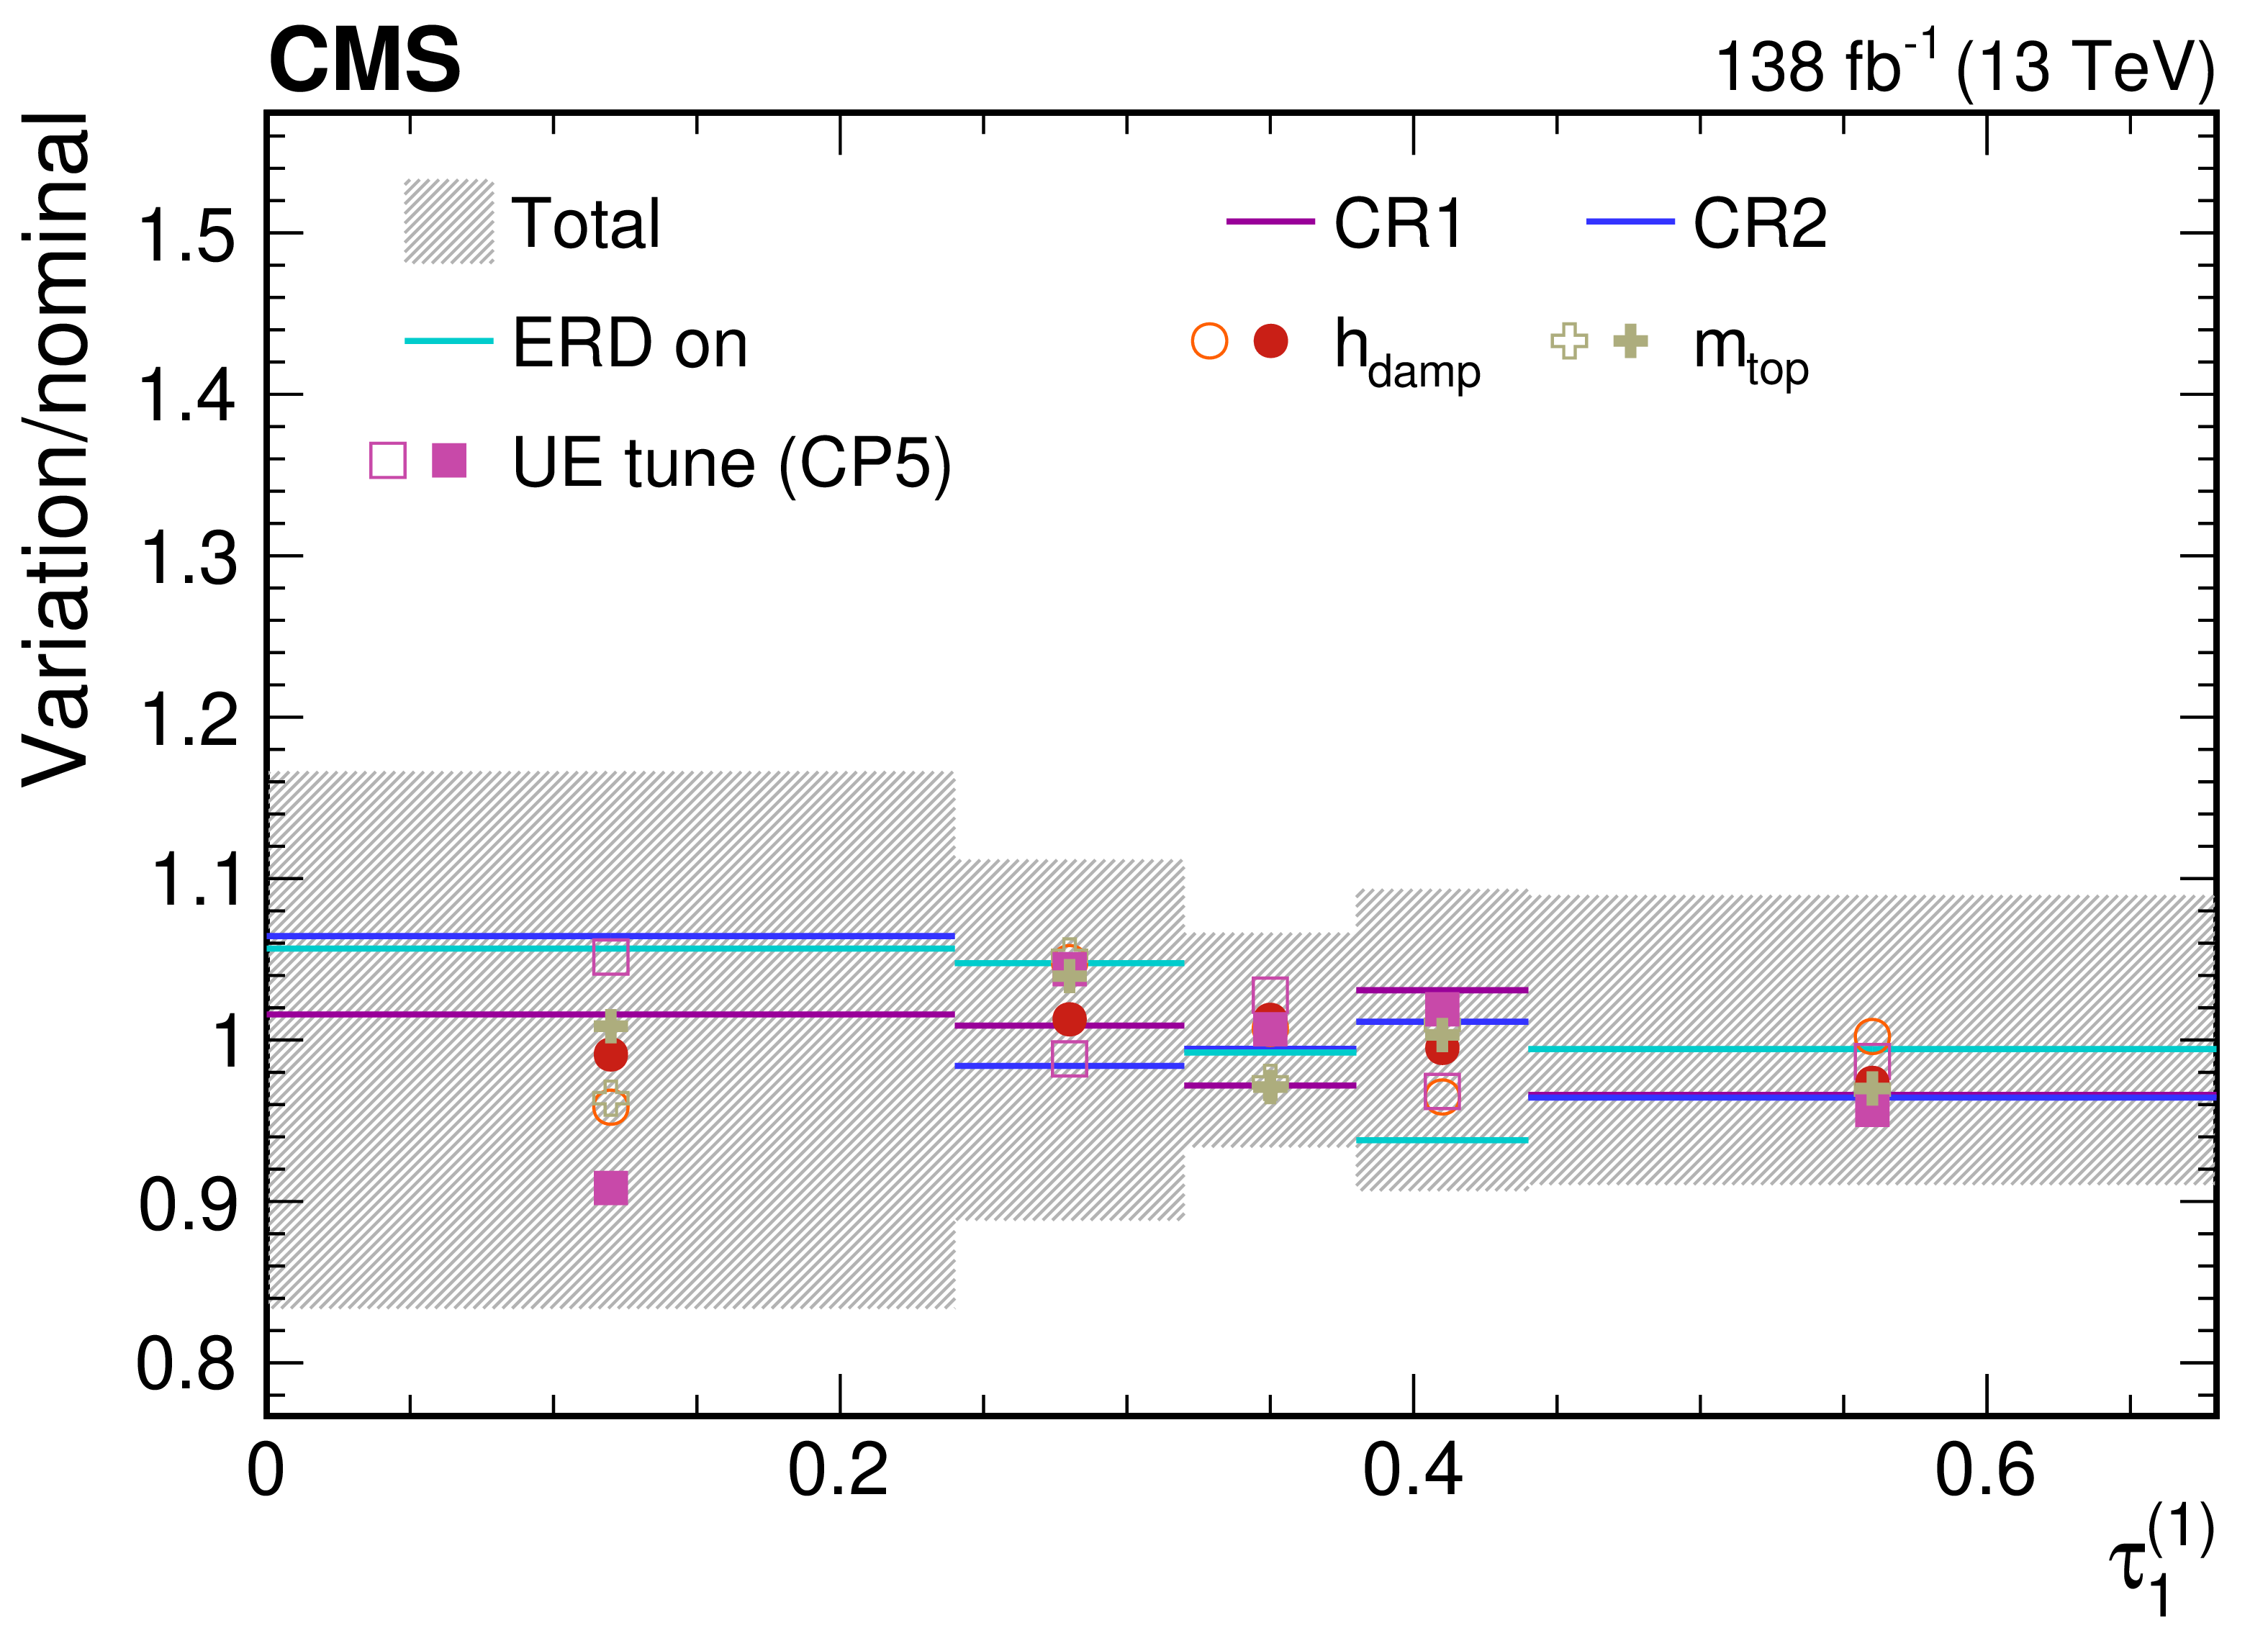
png pdf |
Figure 63-c:
Contributions from various theory model systematic variations to the normalized, unfolded distribution for $ \tau_1^{(\beta)} $ observables measured for AK8 jets passing the boosted top quark-enriched selection in $ \mu $+jets $ \mathrm{t} \overline{\mathrm{t}} $ events. The total unfolding uncertainty is indicated with the dark grey, hashed region, while the blue hashed region indicates the contributions from the input covariance matrix, which includes the propagated effects of the statistical uncertainties of the input data after background subtraction. Contributions from statistical uncertainties of the simulated sample used to construct the nominal response matrix are indicated with the dashed black line. The uncertainty contributions for different choices of colour reconnection models are illustrated as one-sided shifts compared to the nominal unfolding, and up (down) contributions from other sources are indicated with filled (open) markers of the same type and colour. |
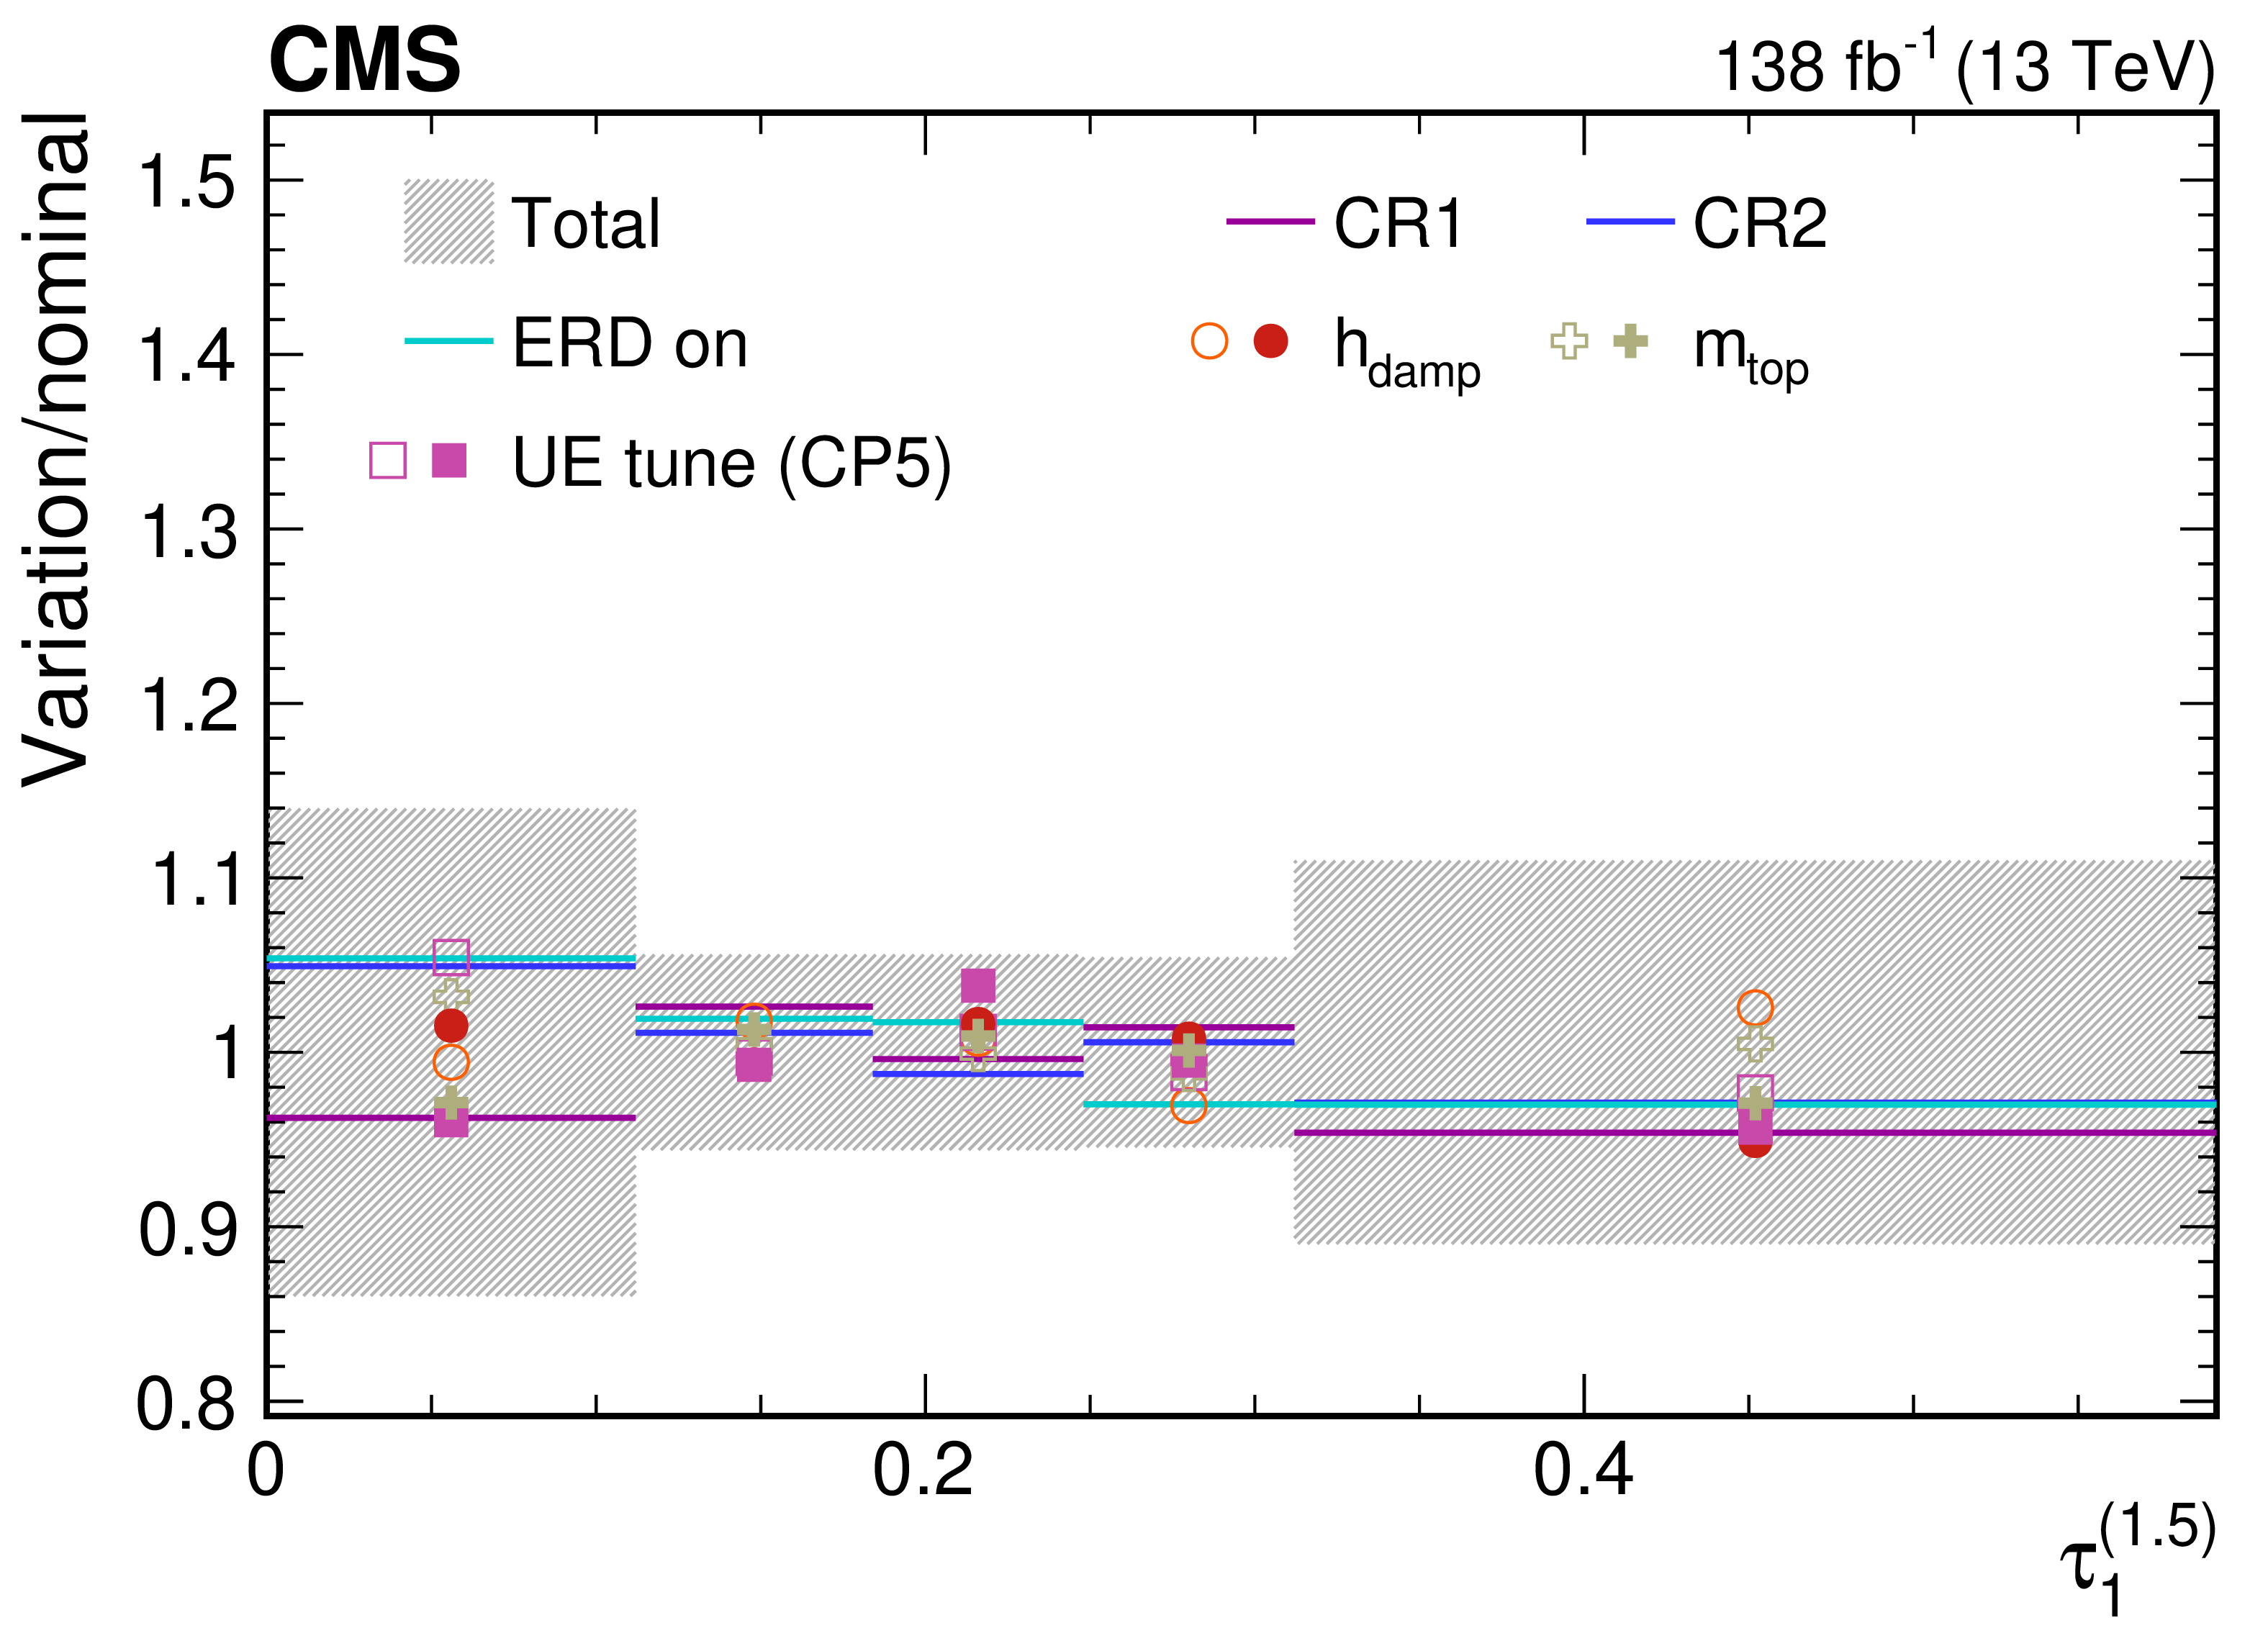
png pdf |
Figure 63-d:
Contributions from various theory model systematic variations to the normalized, unfolded distribution for $ \tau_1^{(\beta)} $ observables measured for AK8 jets passing the boosted top quark-enriched selection in $ \mu $+jets $ \mathrm{t} \overline{\mathrm{t}} $ events. The total unfolding uncertainty is indicated with the dark grey, hashed region, while the blue hashed region indicates the contributions from the input covariance matrix, which includes the propagated effects of the statistical uncertainties of the input data after background subtraction. Contributions from statistical uncertainties of the simulated sample used to construct the nominal response matrix are indicated with the dashed black line. The uncertainty contributions for different choices of colour reconnection models are illustrated as one-sided shifts compared to the nominal unfolding, and up (down) contributions from other sources are indicated with filled (open) markers of the same type and colour. |
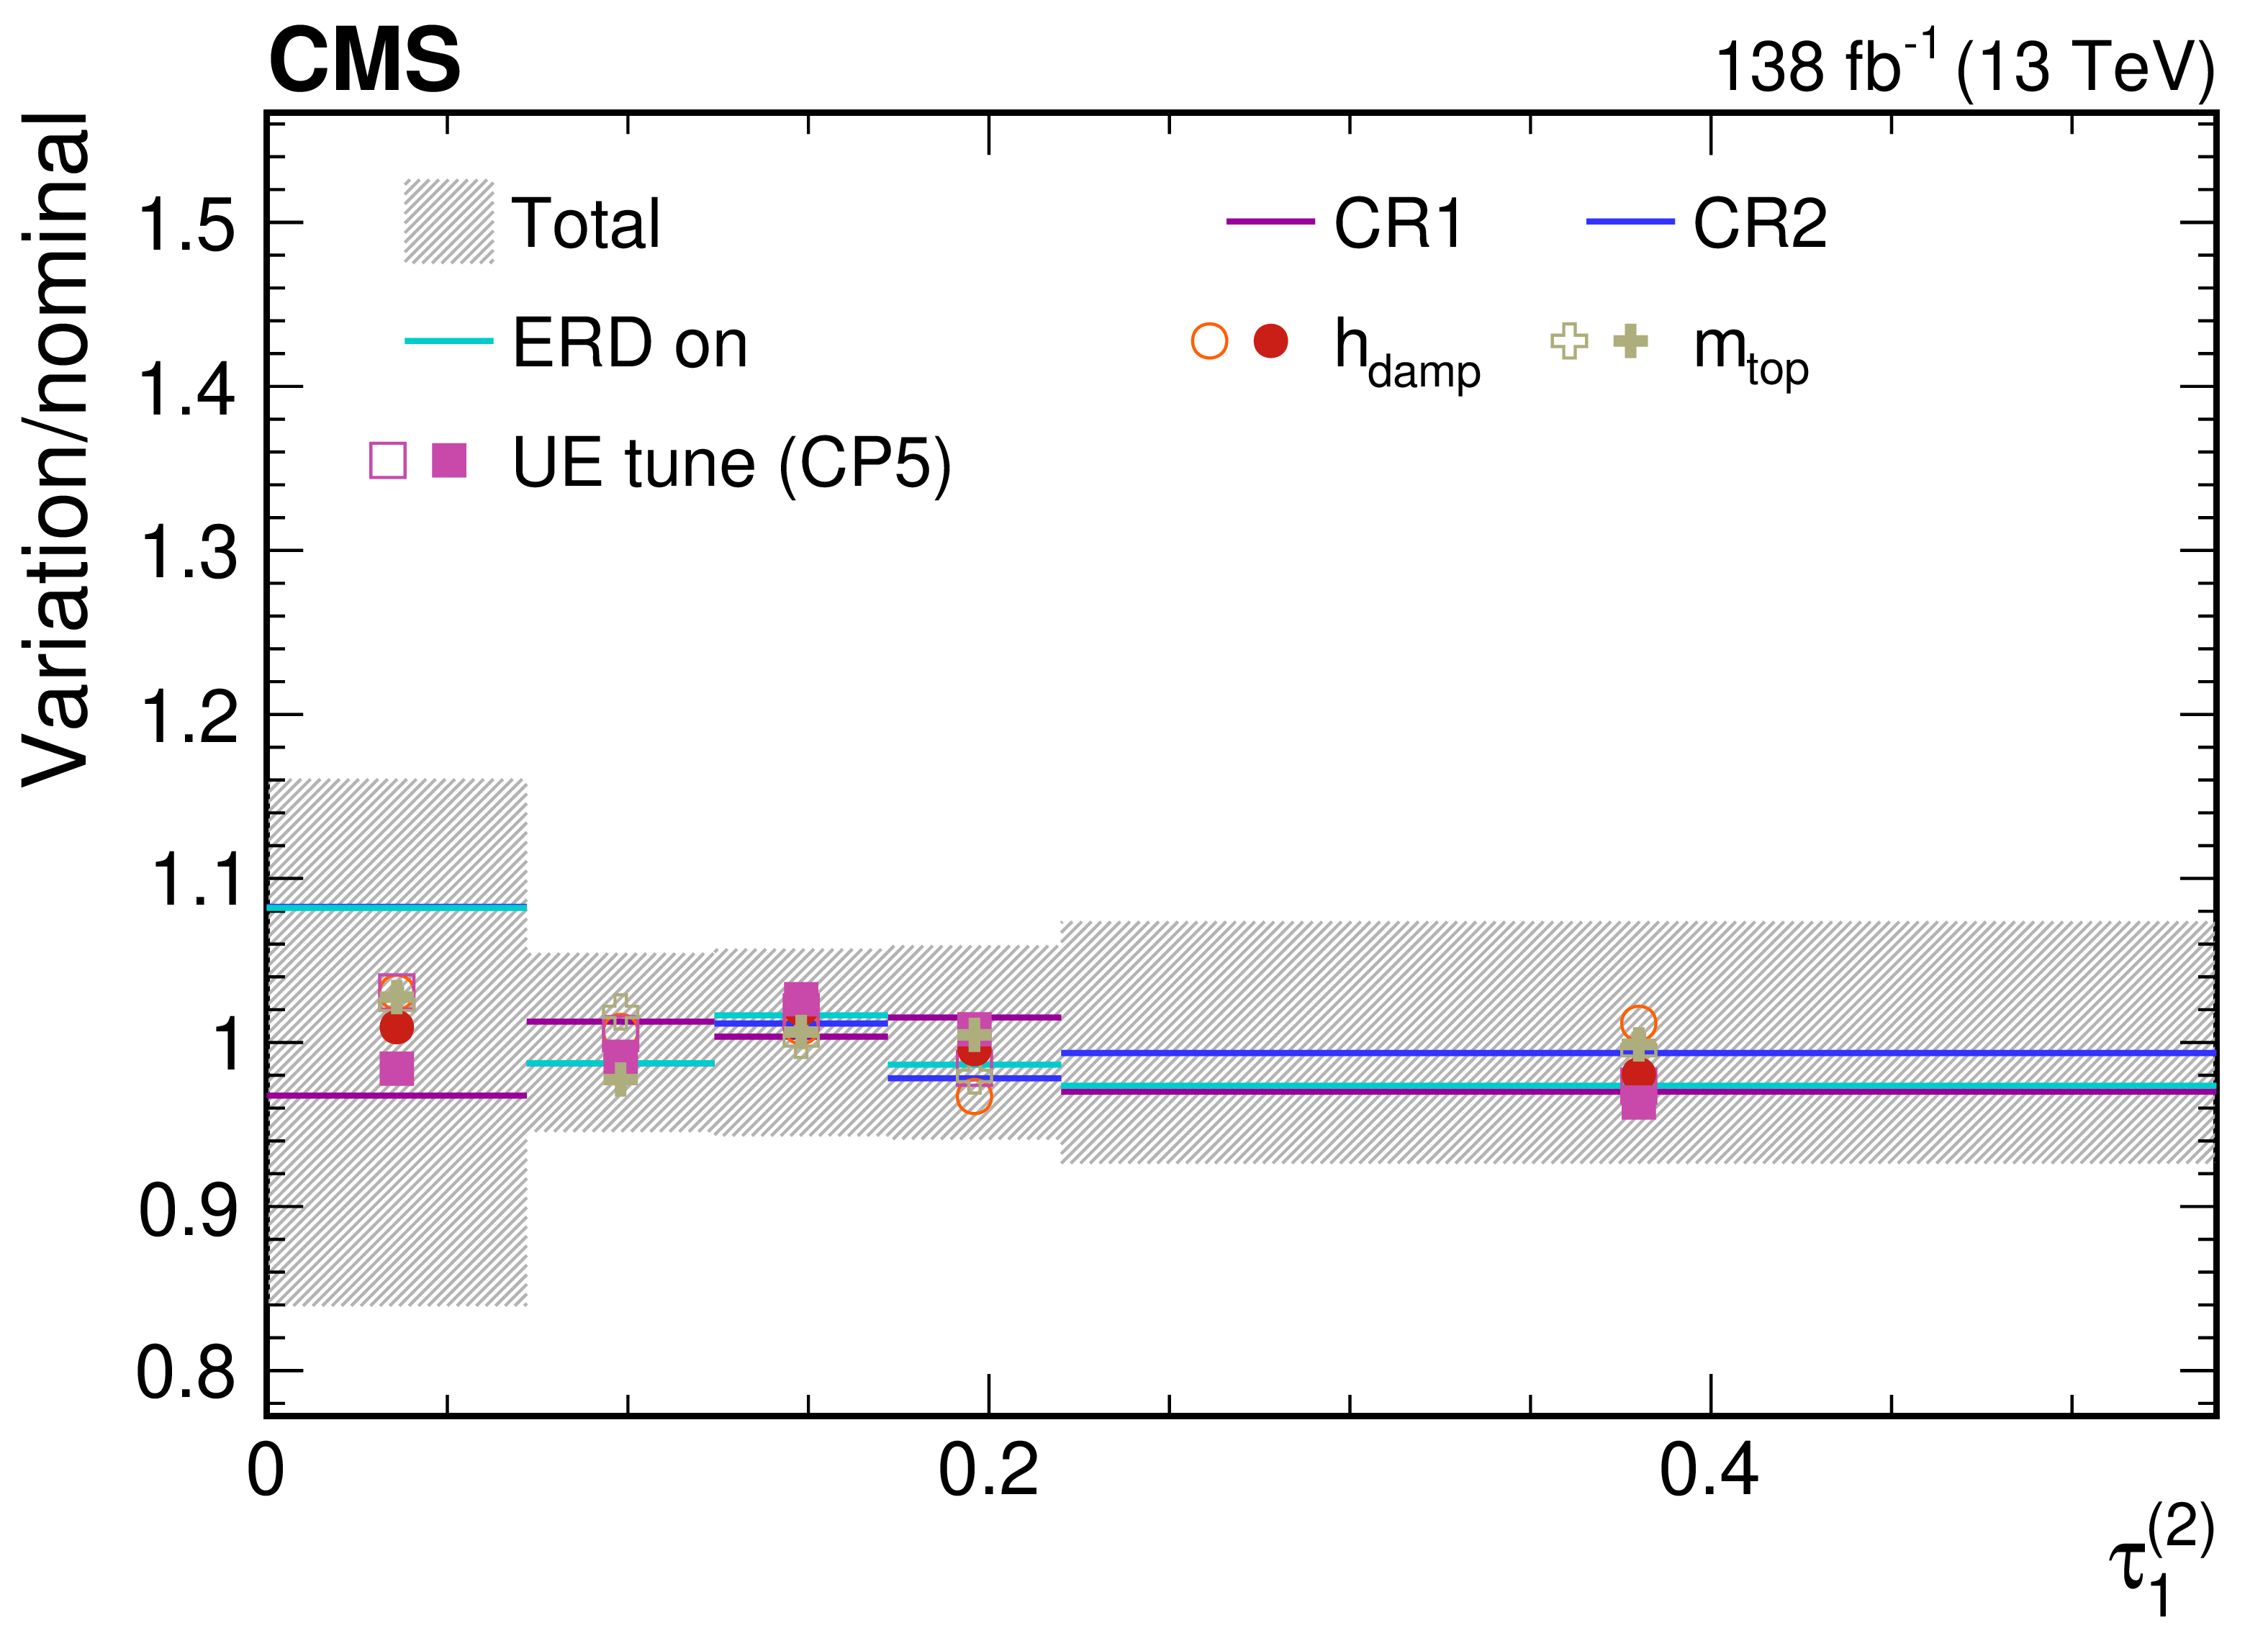
png pdf |
Figure 63-e:
Contributions from various theory model systematic variations to the normalized, unfolded distribution for $ \tau_1^{(\beta)} $ observables measured for AK8 jets passing the boosted top quark-enriched selection in $ \mu $+jets $ \mathrm{t} \overline{\mathrm{t}} $ events. The total unfolding uncertainty is indicated with the dark grey, hashed region, while the blue hashed region indicates the contributions from the input covariance matrix, which includes the propagated effects of the statistical uncertainties of the input data after background subtraction. Contributions from statistical uncertainties of the simulated sample used to construct the nominal response matrix are indicated with the dashed black line. The uncertainty contributions for different choices of colour reconnection models are illustrated as one-sided shifts compared to the nominal unfolding, and up (down) contributions from other sources are indicated with filled (open) markers of the same type and colour. |
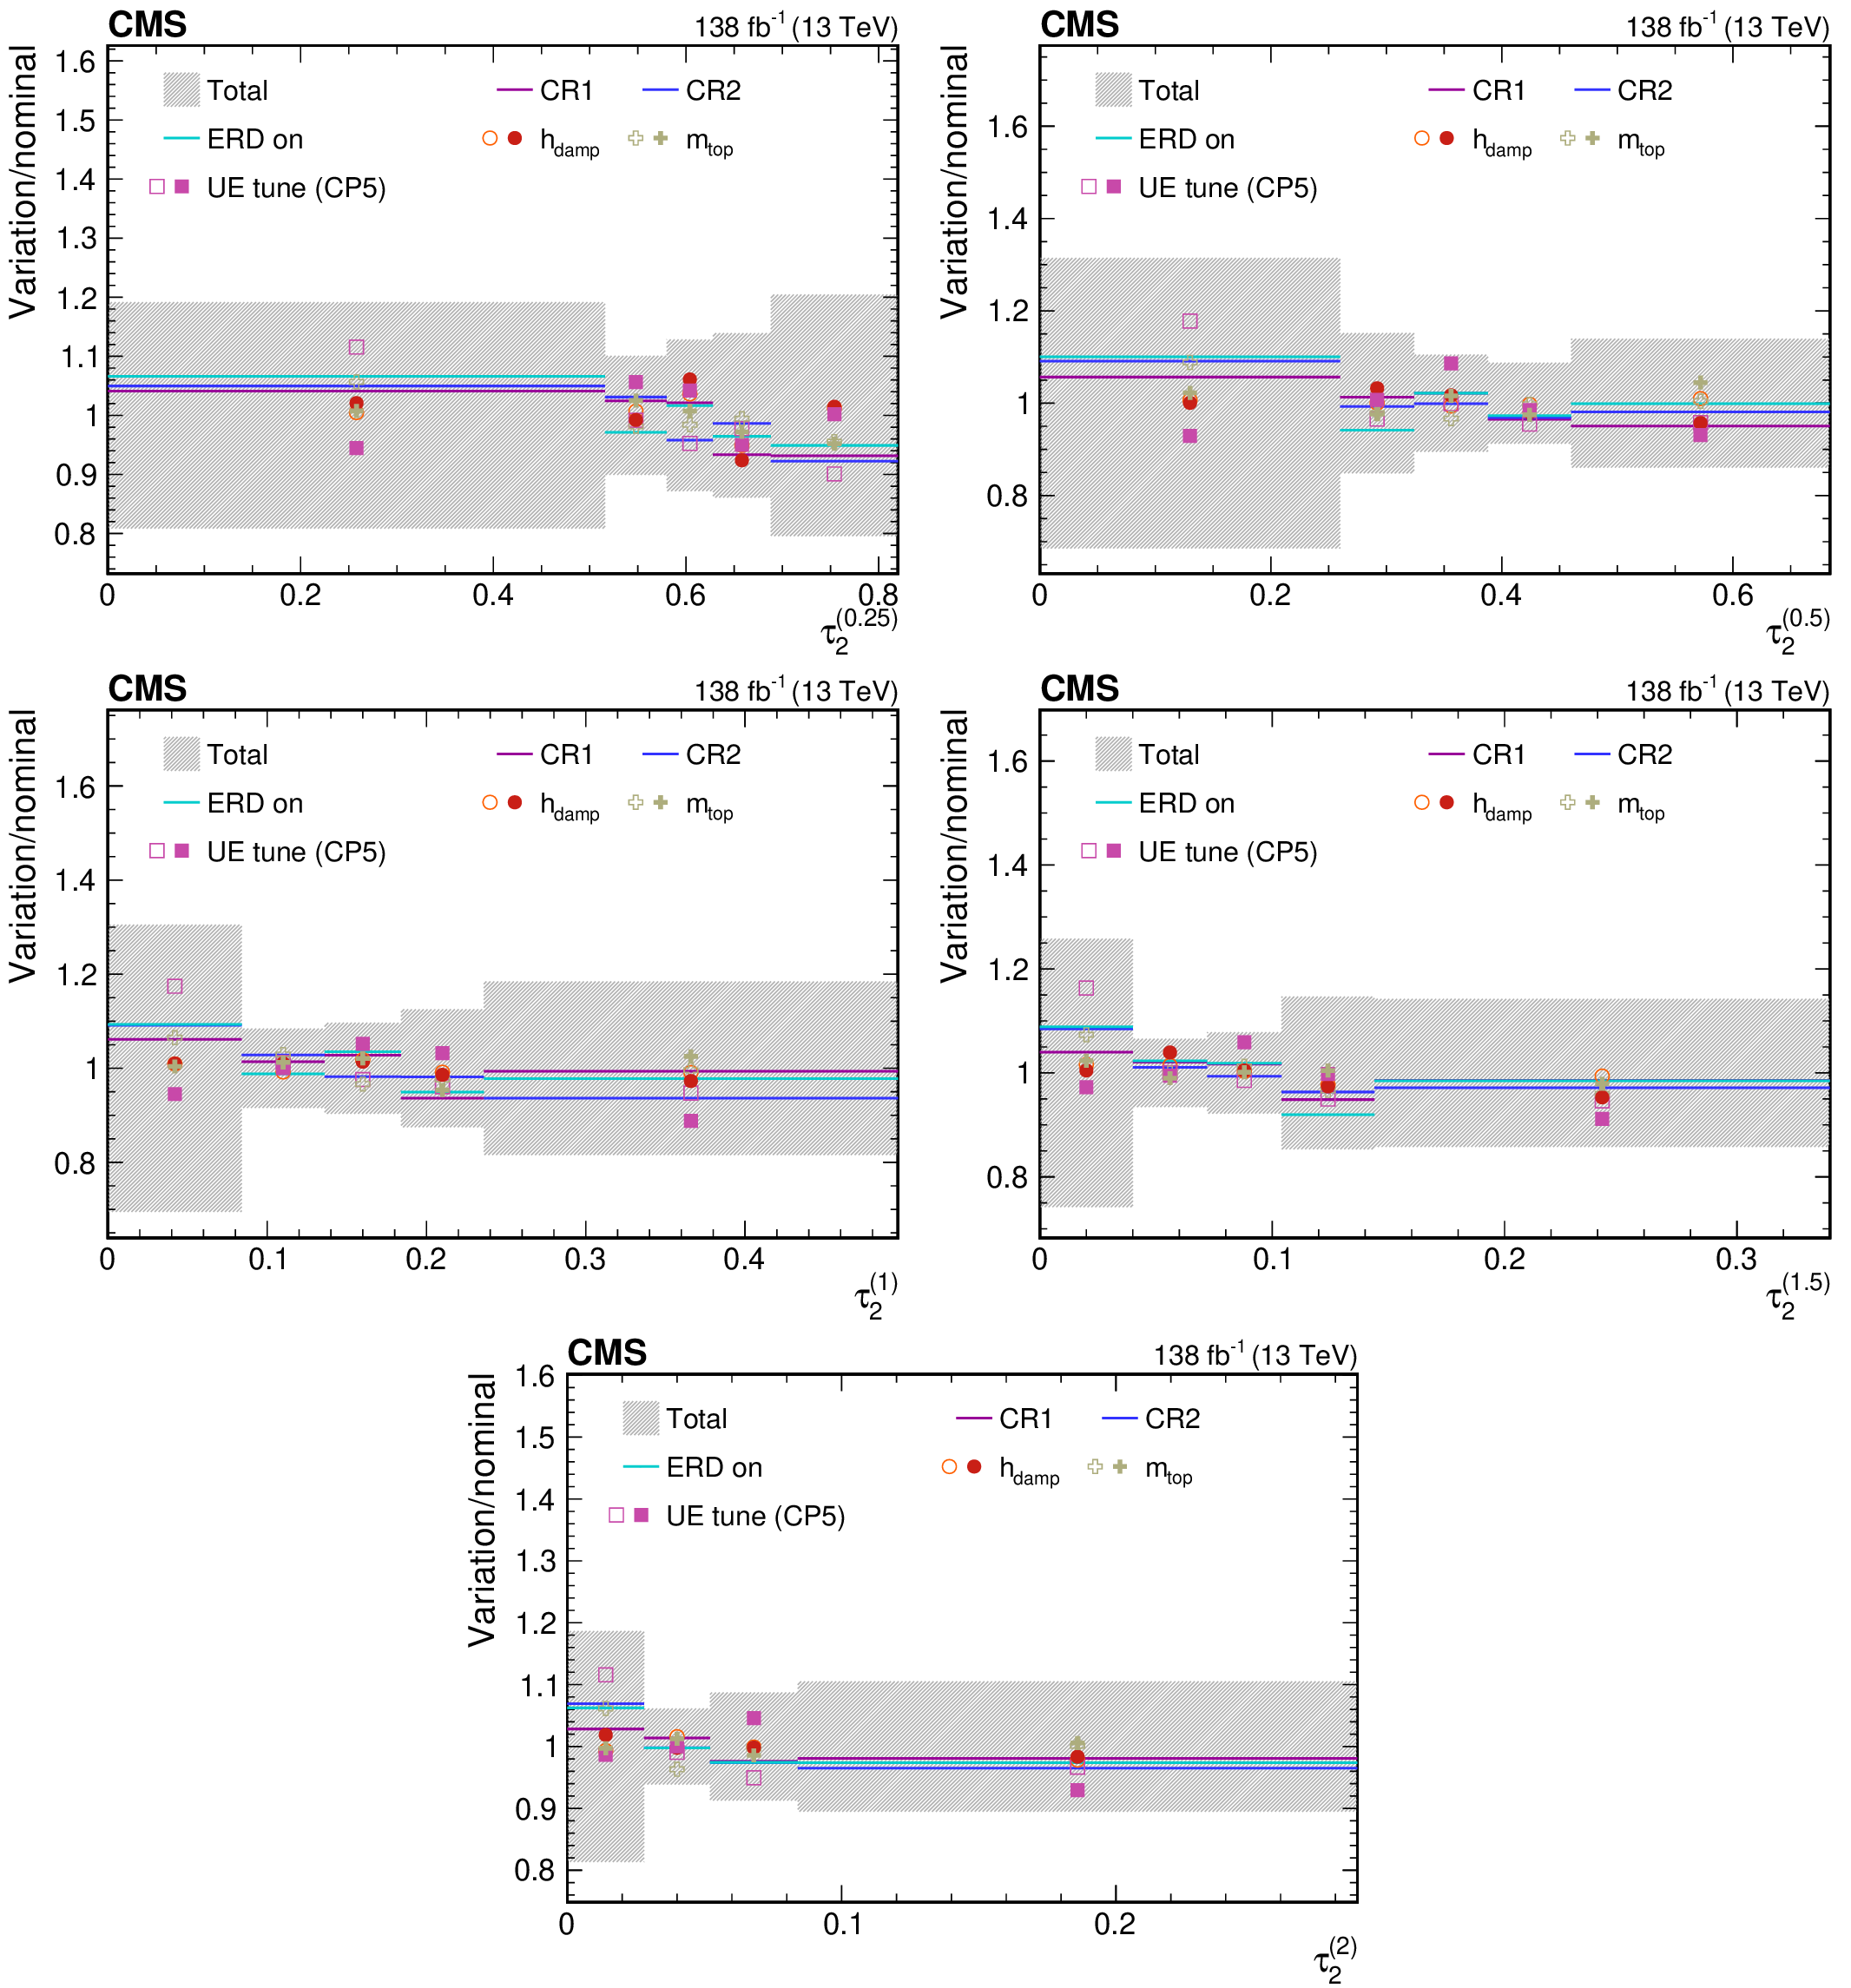
png pdf |
Figure 64:
Contributions from various theory model systematic variations to the normalized, unfolded distribution for $ \tau_2^{(\beta)} $ observables measured for AK8 jets passing the boosted top quark-enriched selection in $ \mu $+jets $ \mathrm{t} \overline{\mathrm{t}} $ events. The total unfolding uncertainty is indicated with the dark grey, hashed region, while the blue hashed region indicates the contributions from the input covariance matrix, which includes the propagated effects of the statistical uncertainties of the input data after background subtraction. Contributions from statistical uncertainties of the simulated sample used to construct the nominal response matrix are indicated with the dashed black line. The uncertainty contributions for different choices of colour reconnection models are illustrated as one-sided shifts compared to the nominal unfolding, and up (down) contributions from other sources are indicated with filled (open) markers of the same type and colour. |
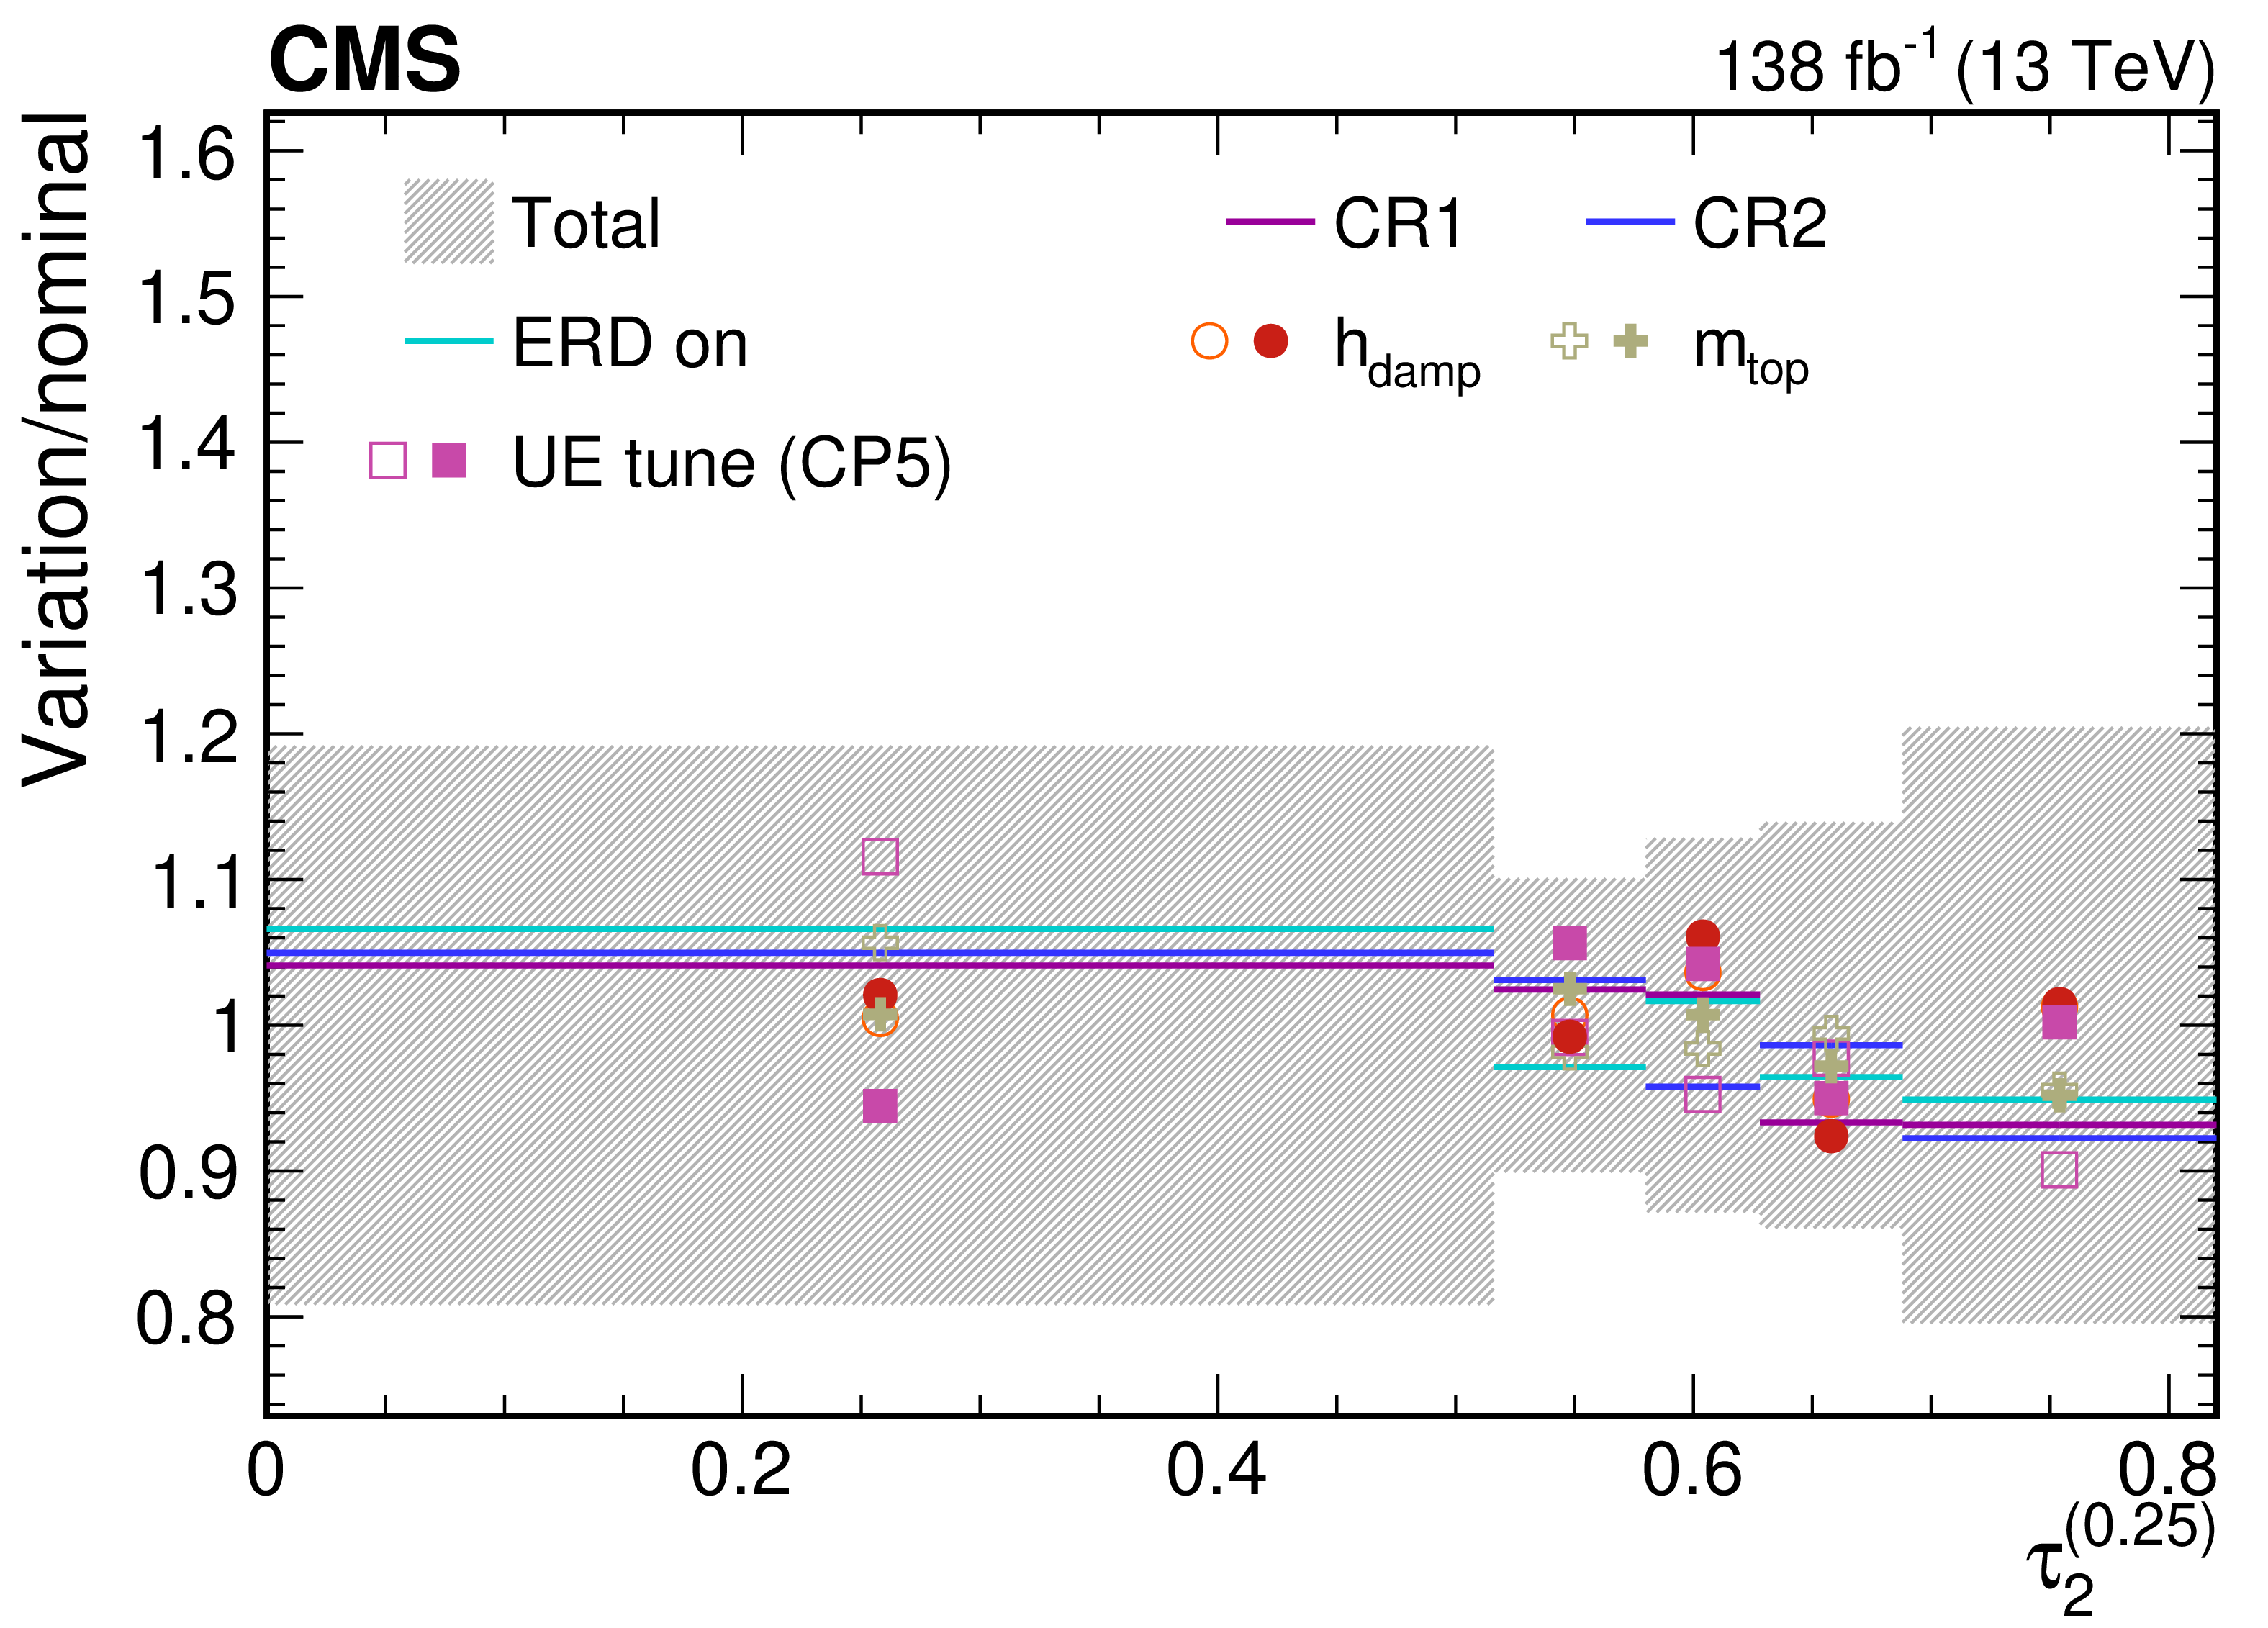
png pdf |
Figure 64-a:
Contributions from various theory model systematic variations to the normalized, unfolded distribution for $ \tau_2^{(\beta)} $ observables measured for AK8 jets passing the boosted top quark-enriched selection in $ \mu $+jets $ \mathrm{t} \overline{\mathrm{t}} $ events. The total unfolding uncertainty is indicated with the dark grey, hashed region, while the blue hashed region indicates the contributions from the input covariance matrix, which includes the propagated effects of the statistical uncertainties of the input data after background subtraction. Contributions from statistical uncertainties of the simulated sample used to construct the nominal response matrix are indicated with the dashed black line. The uncertainty contributions for different choices of colour reconnection models are illustrated as one-sided shifts compared to the nominal unfolding, and up (down) contributions from other sources are indicated with filled (open) markers of the same type and colour. |
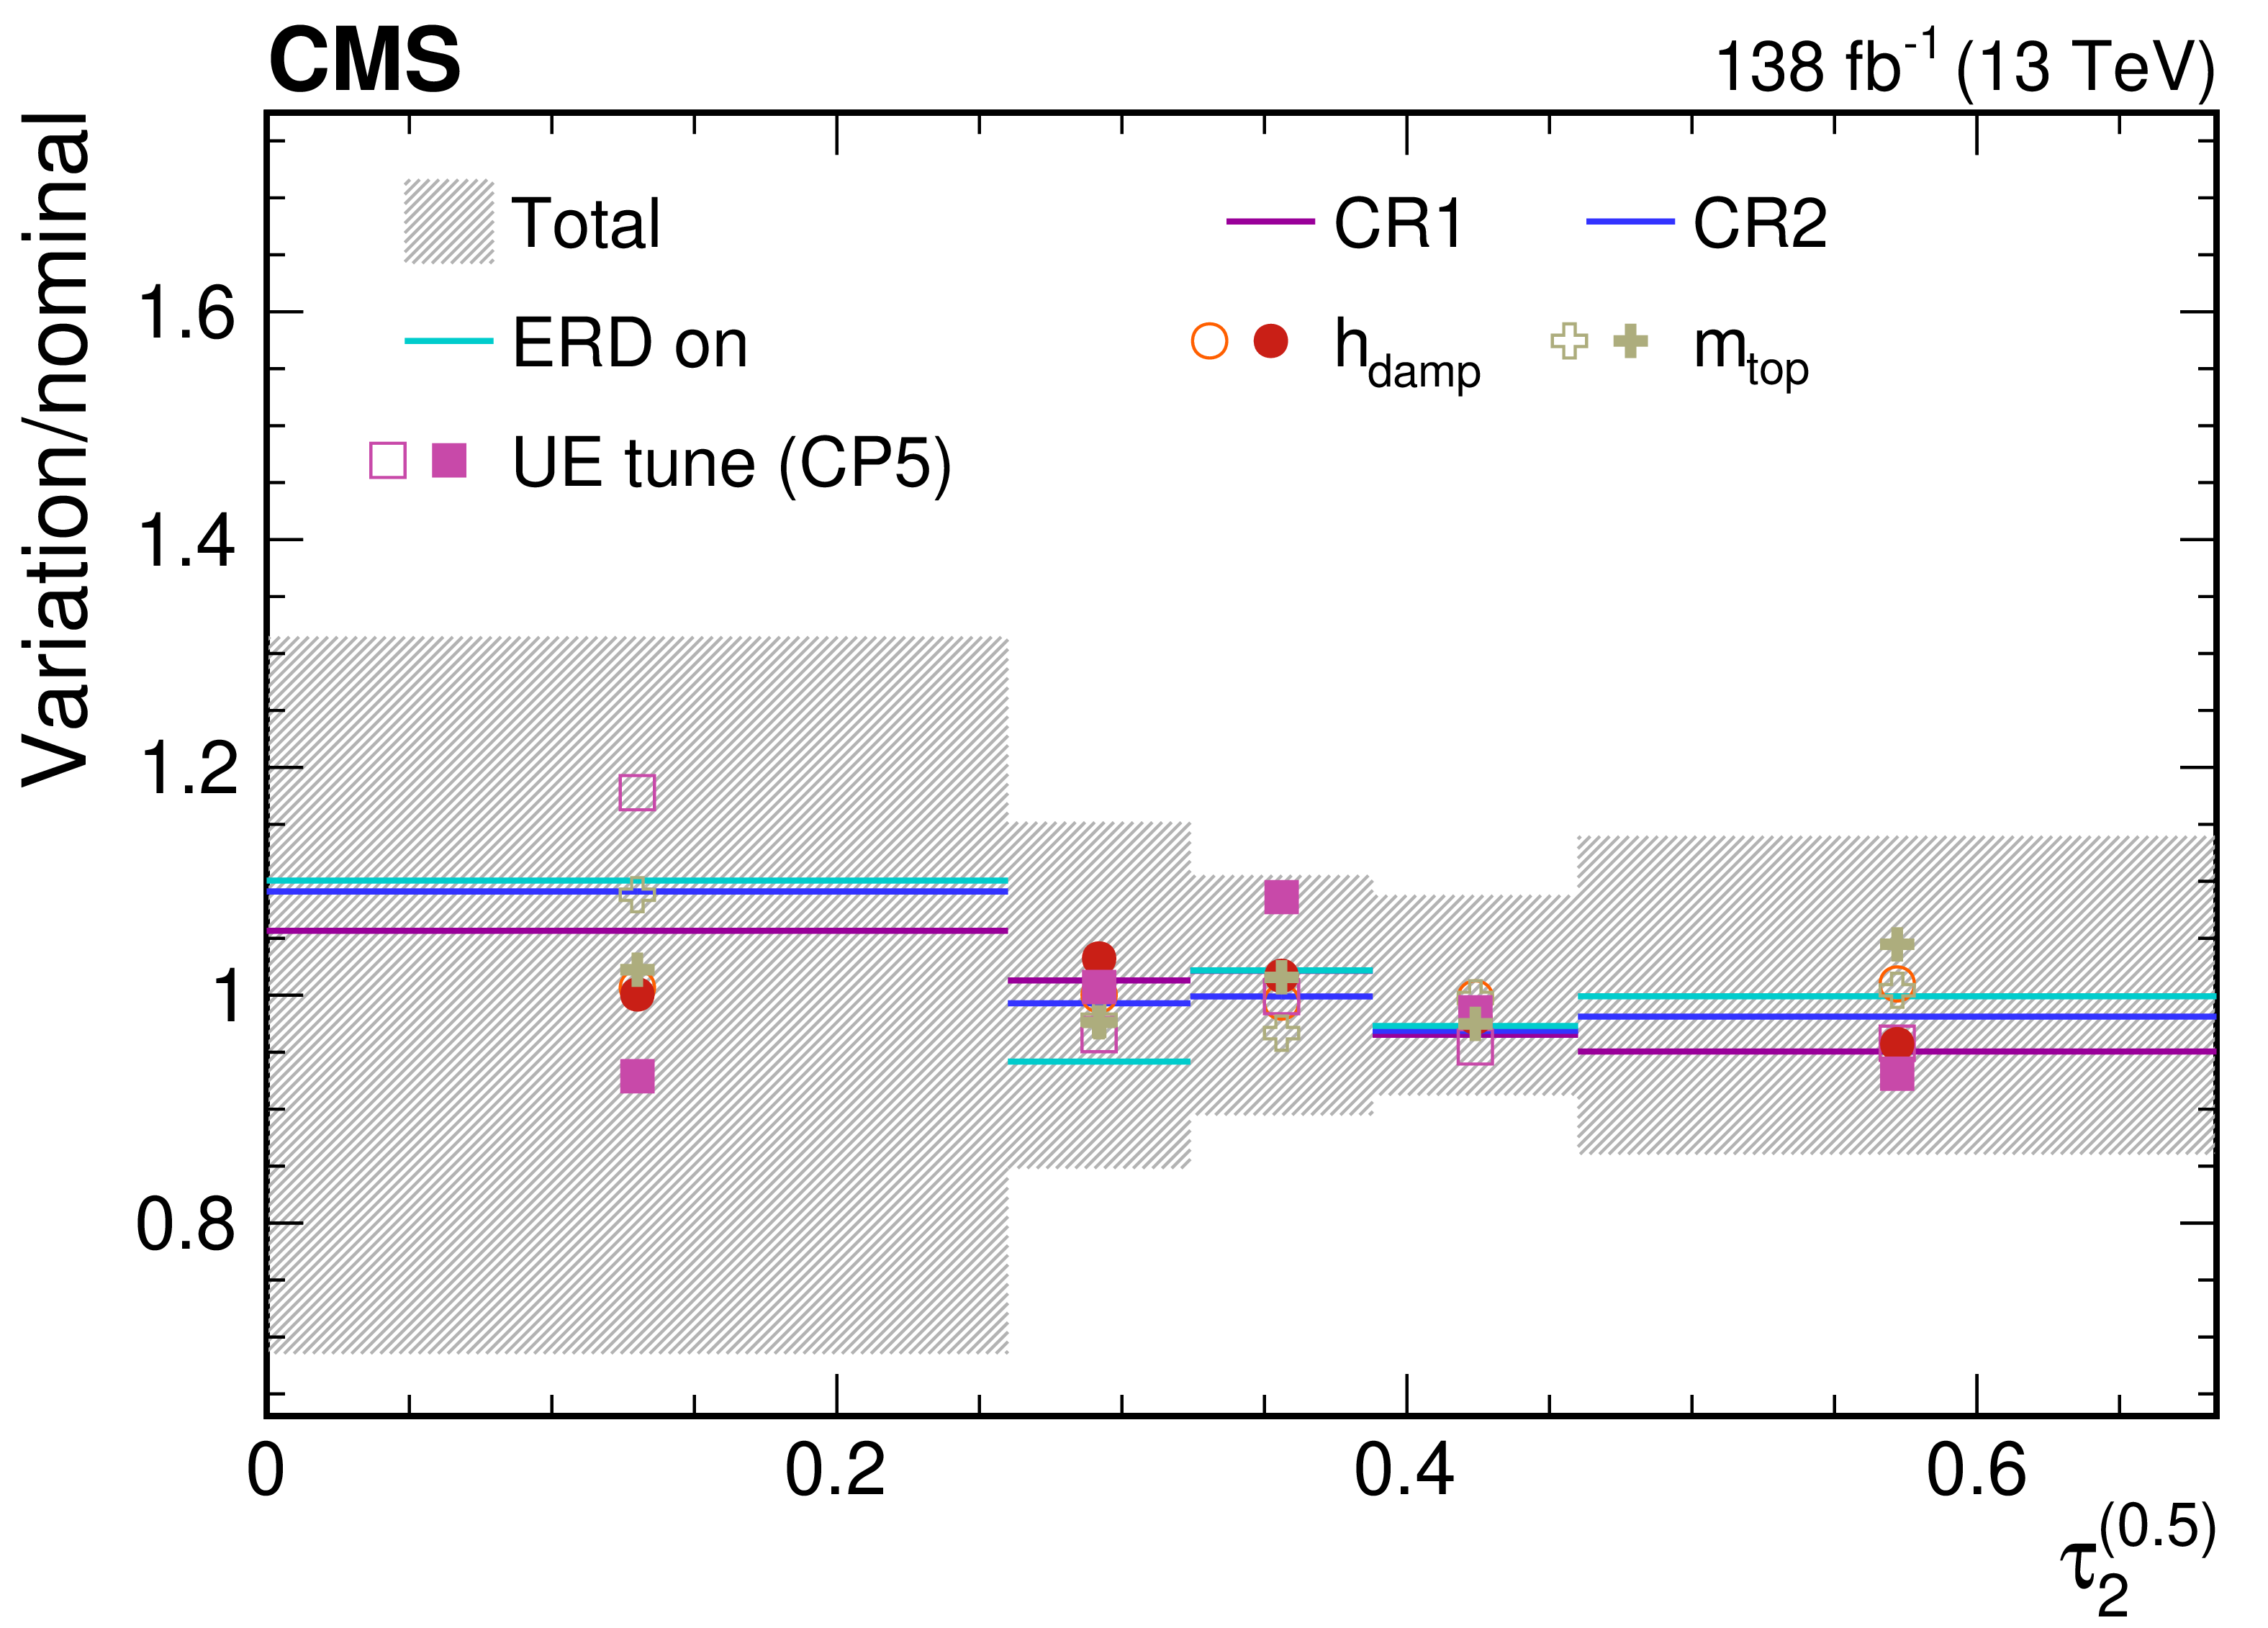
png pdf |
Figure 64-b:
Contributions from various theory model systematic variations to the normalized, unfolded distribution for $ \tau_2^{(\beta)} $ observables measured for AK8 jets passing the boosted top quark-enriched selection in $ \mu $+jets $ \mathrm{t} \overline{\mathrm{t}} $ events. The total unfolding uncertainty is indicated with the dark grey, hashed region, while the blue hashed region indicates the contributions from the input covariance matrix, which includes the propagated effects of the statistical uncertainties of the input data after background subtraction. Contributions from statistical uncertainties of the simulated sample used to construct the nominal response matrix are indicated with the dashed black line. The uncertainty contributions for different choices of colour reconnection models are illustrated as one-sided shifts compared to the nominal unfolding, and up (down) contributions from other sources are indicated with filled (open) markers of the same type and colour. |
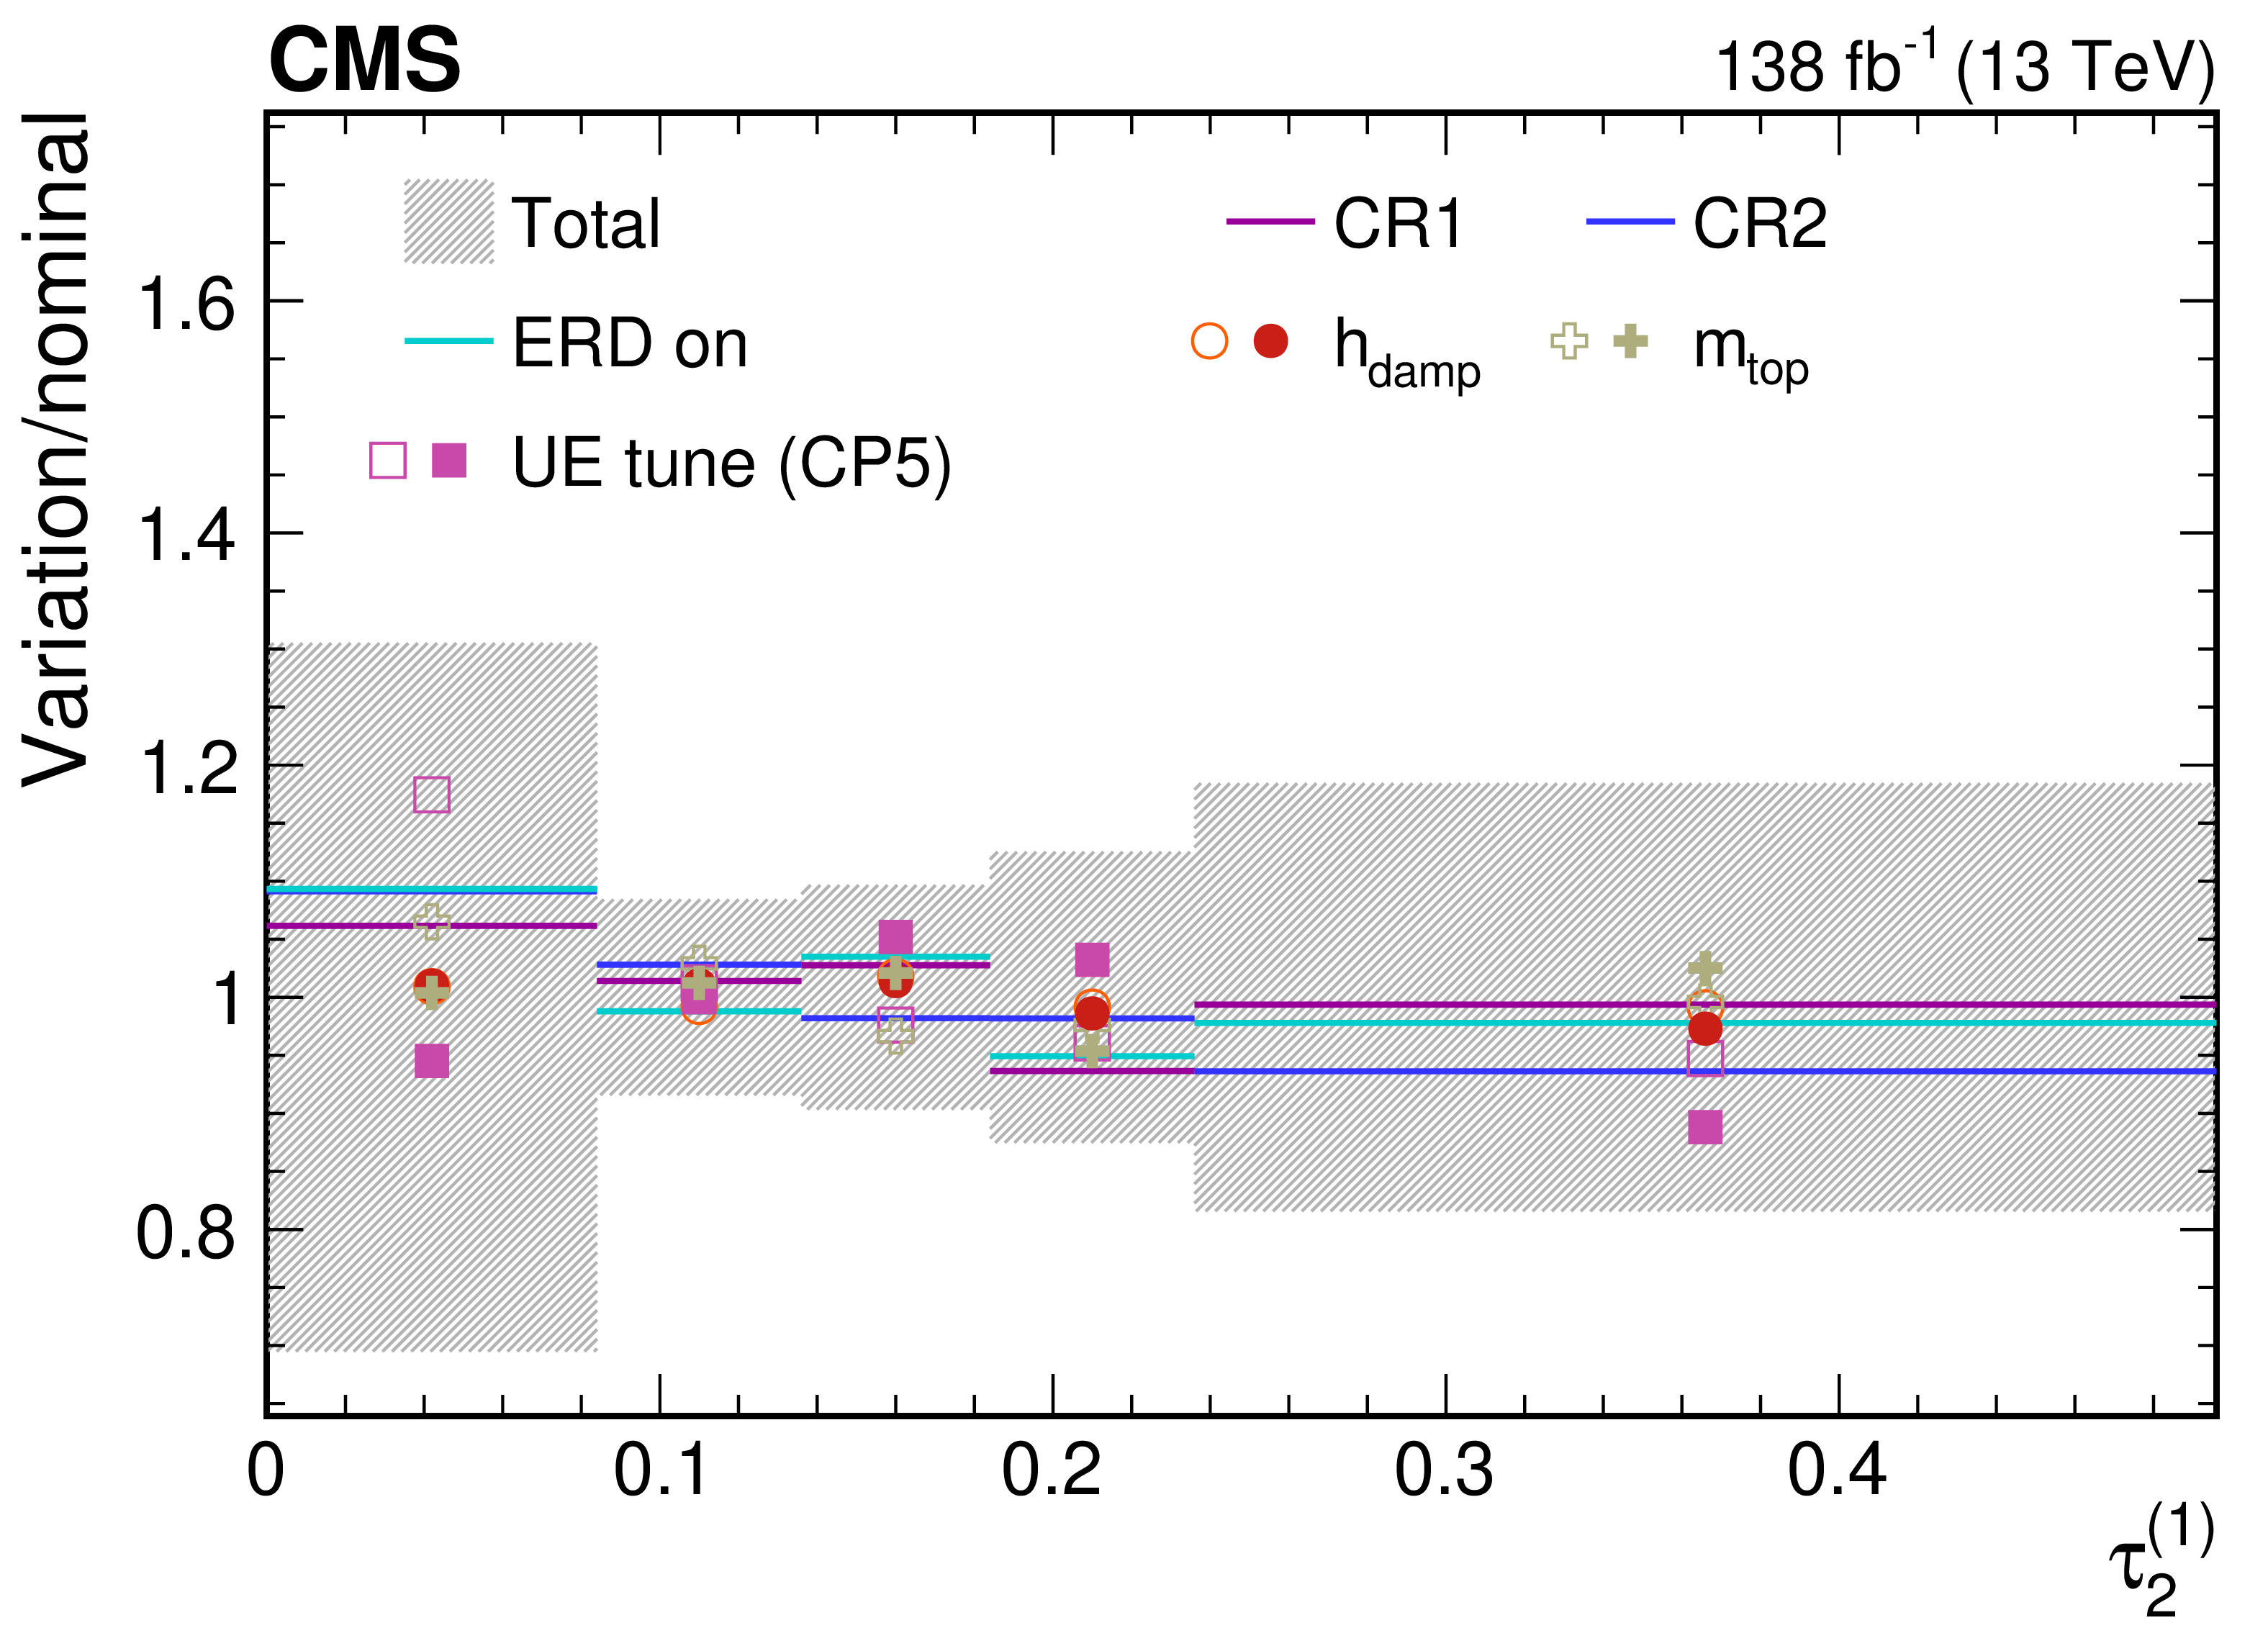
png pdf |
Figure 64-c:
Contributions from various theory model systematic variations to the normalized, unfolded distribution for $ \tau_2^{(\beta)} $ observables measured for AK8 jets passing the boosted top quark-enriched selection in $ \mu $+jets $ \mathrm{t} \overline{\mathrm{t}} $ events. The total unfolding uncertainty is indicated with the dark grey, hashed region, while the blue hashed region indicates the contributions from the input covariance matrix, which includes the propagated effects of the statistical uncertainties of the input data after background subtraction. Contributions from statistical uncertainties of the simulated sample used to construct the nominal response matrix are indicated with the dashed black line. The uncertainty contributions for different choices of colour reconnection models are illustrated as one-sided shifts compared to the nominal unfolding, and up (down) contributions from other sources are indicated with filled (open) markers of the same type and colour. |
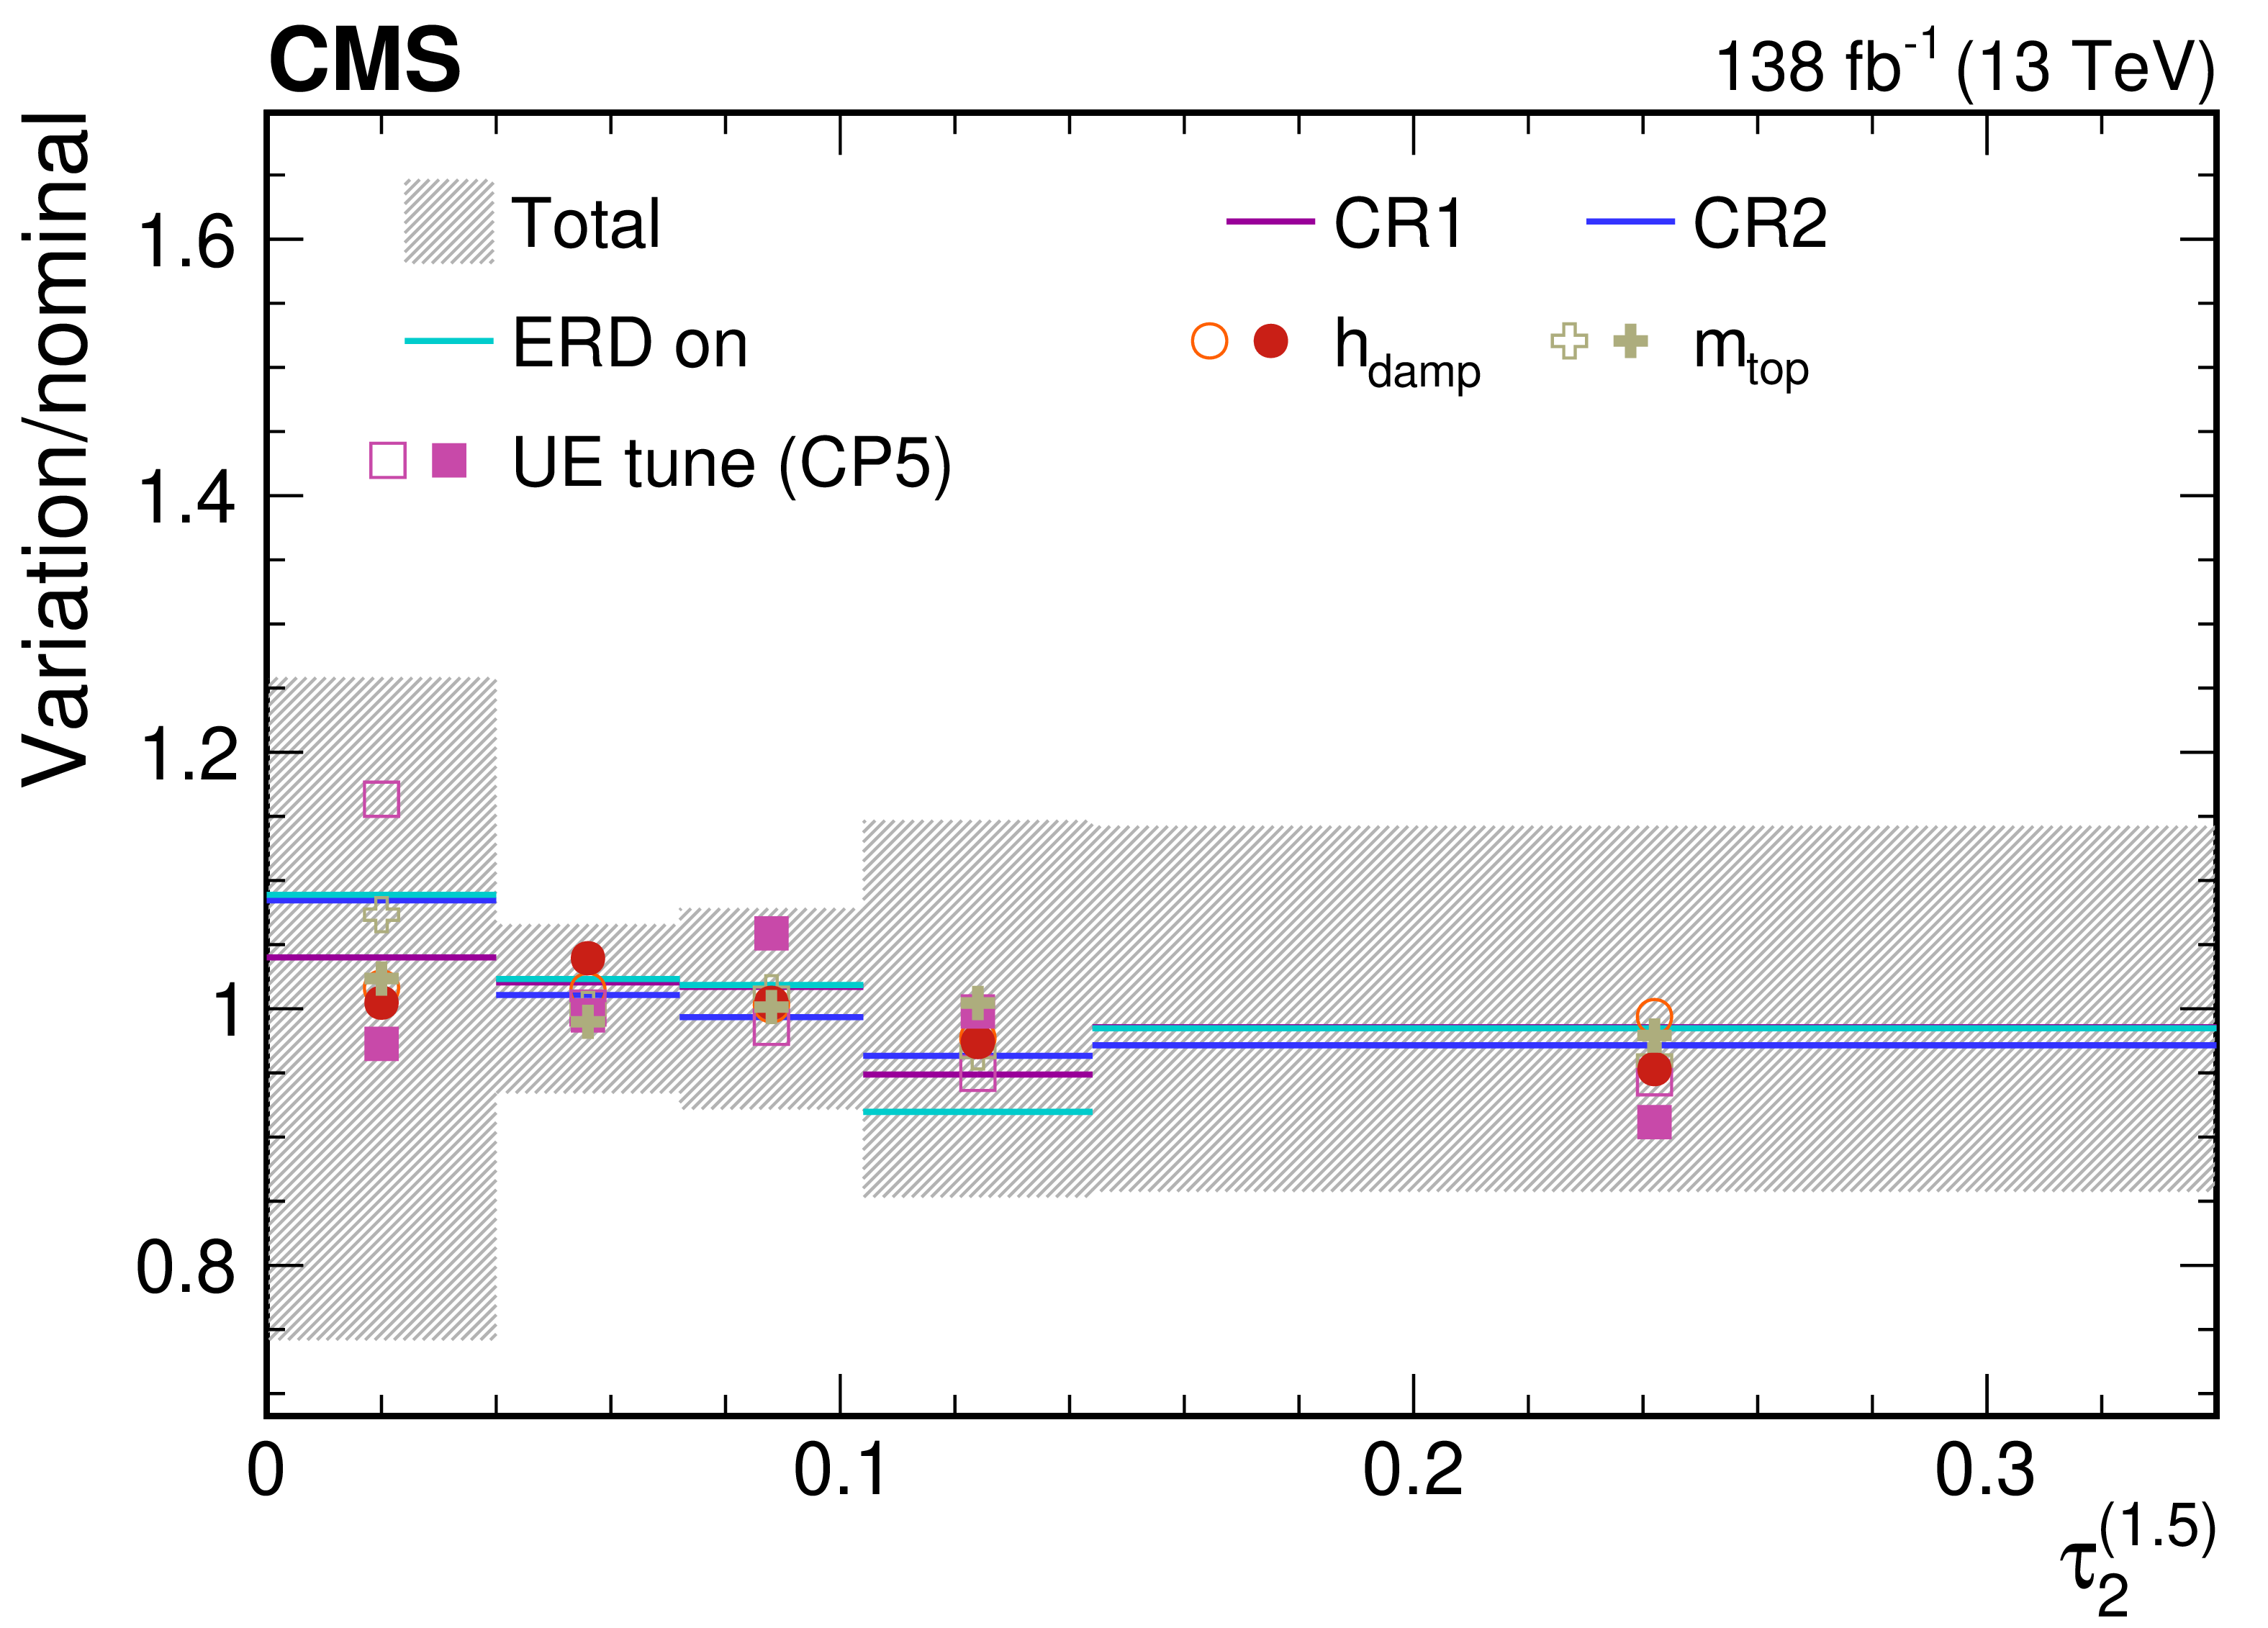
png pdf |
Figure 64-d:
Contributions from various theory model systematic variations to the normalized, unfolded distribution for $ \tau_2^{(\beta)} $ observables measured for AK8 jets passing the boosted top quark-enriched selection in $ \mu $+jets $ \mathrm{t} \overline{\mathrm{t}} $ events. The total unfolding uncertainty is indicated with the dark grey, hashed region, while the blue hashed region indicates the contributions from the input covariance matrix, which includes the propagated effects of the statistical uncertainties of the input data after background subtraction. Contributions from statistical uncertainties of the simulated sample used to construct the nominal response matrix are indicated with the dashed black line. The uncertainty contributions for different choices of colour reconnection models are illustrated as one-sided shifts compared to the nominal unfolding, and up (down) contributions from other sources are indicated with filled (open) markers of the same type and colour. |
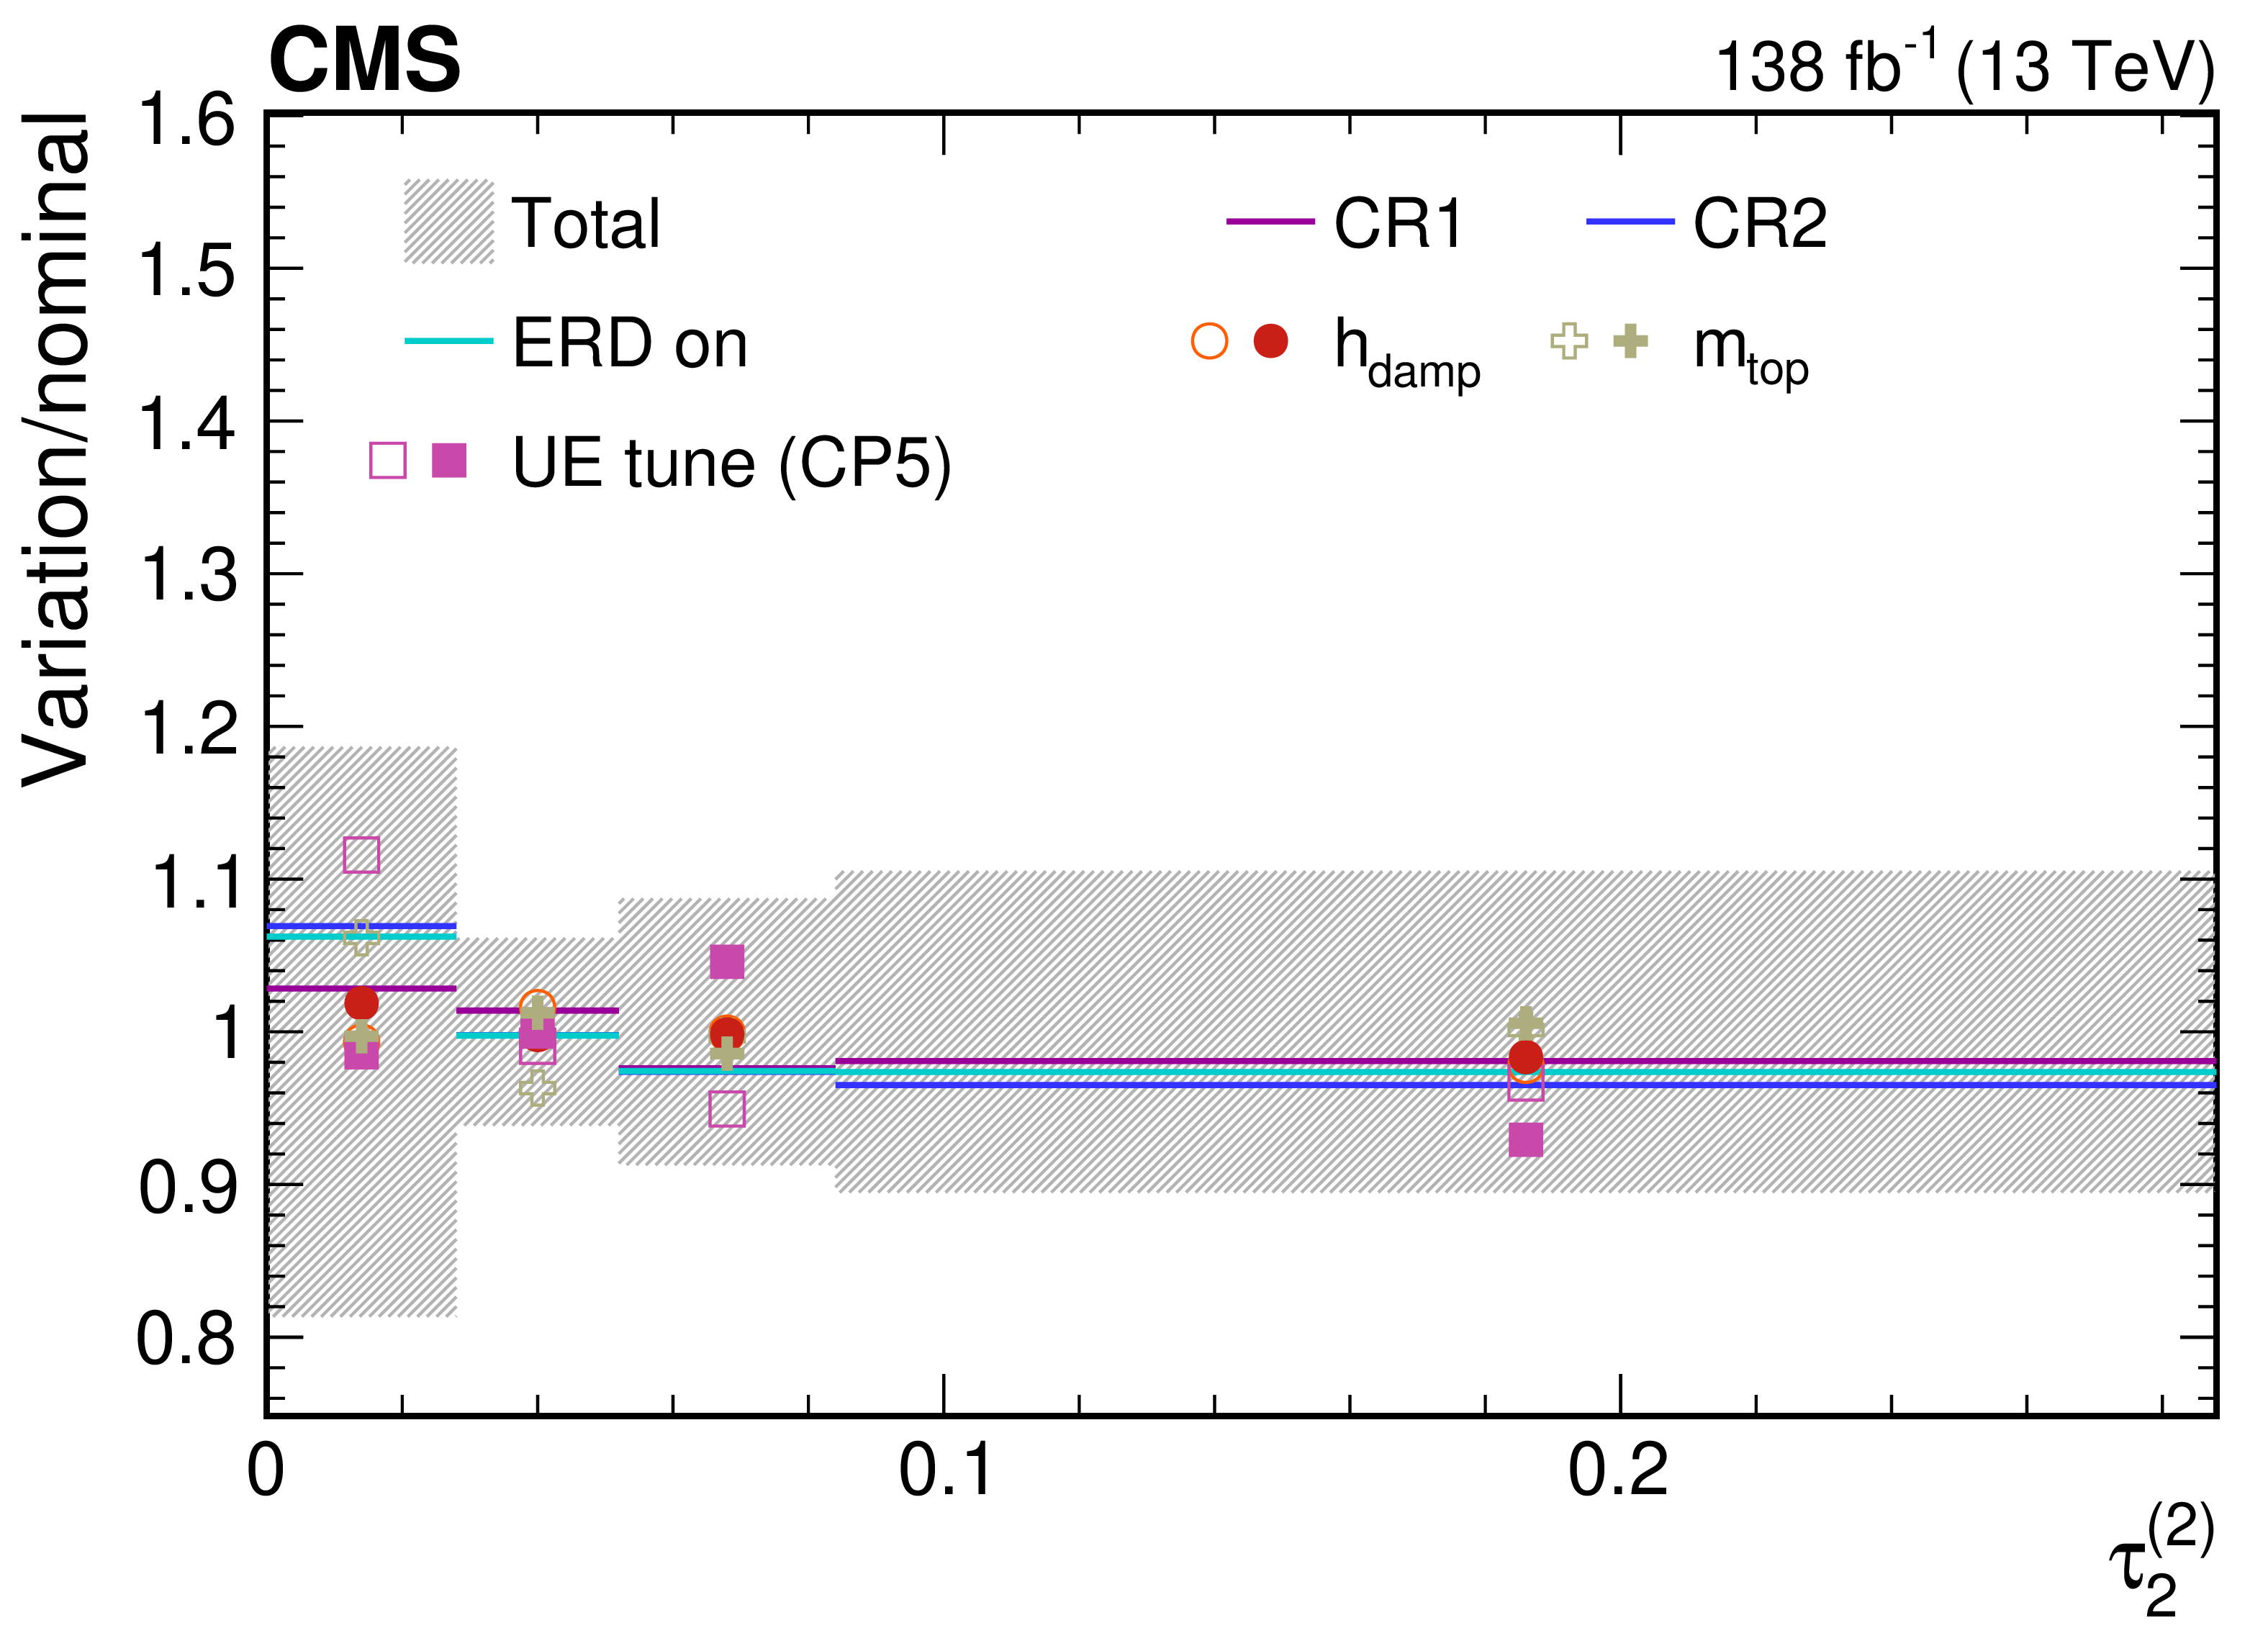
png pdf |
Figure 64-e:
Contributions from various theory model systematic variations to the normalized, unfolded distribution for $ \tau_2^{(\beta)} $ observables measured for AK8 jets passing the boosted top quark-enriched selection in $ \mu $+jets $ \mathrm{t} \overline{\mathrm{t}} $ events. The total unfolding uncertainty is indicated with the dark grey, hashed region, while the blue hashed region indicates the contributions from the input covariance matrix, which includes the propagated effects of the statistical uncertainties of the input data after background subtraction. Contributions from statistical uncertainties of the simulated sample used to construct the nominal response matrix are indicated with the dashed black line. The uncertainty contributions for different choices of colour reconnection models are illustrated as one-sided shifts compared to the nominal unfolding, and up (down) contributions from other sources are indicated with filled (open) markers of the same type and colour. |
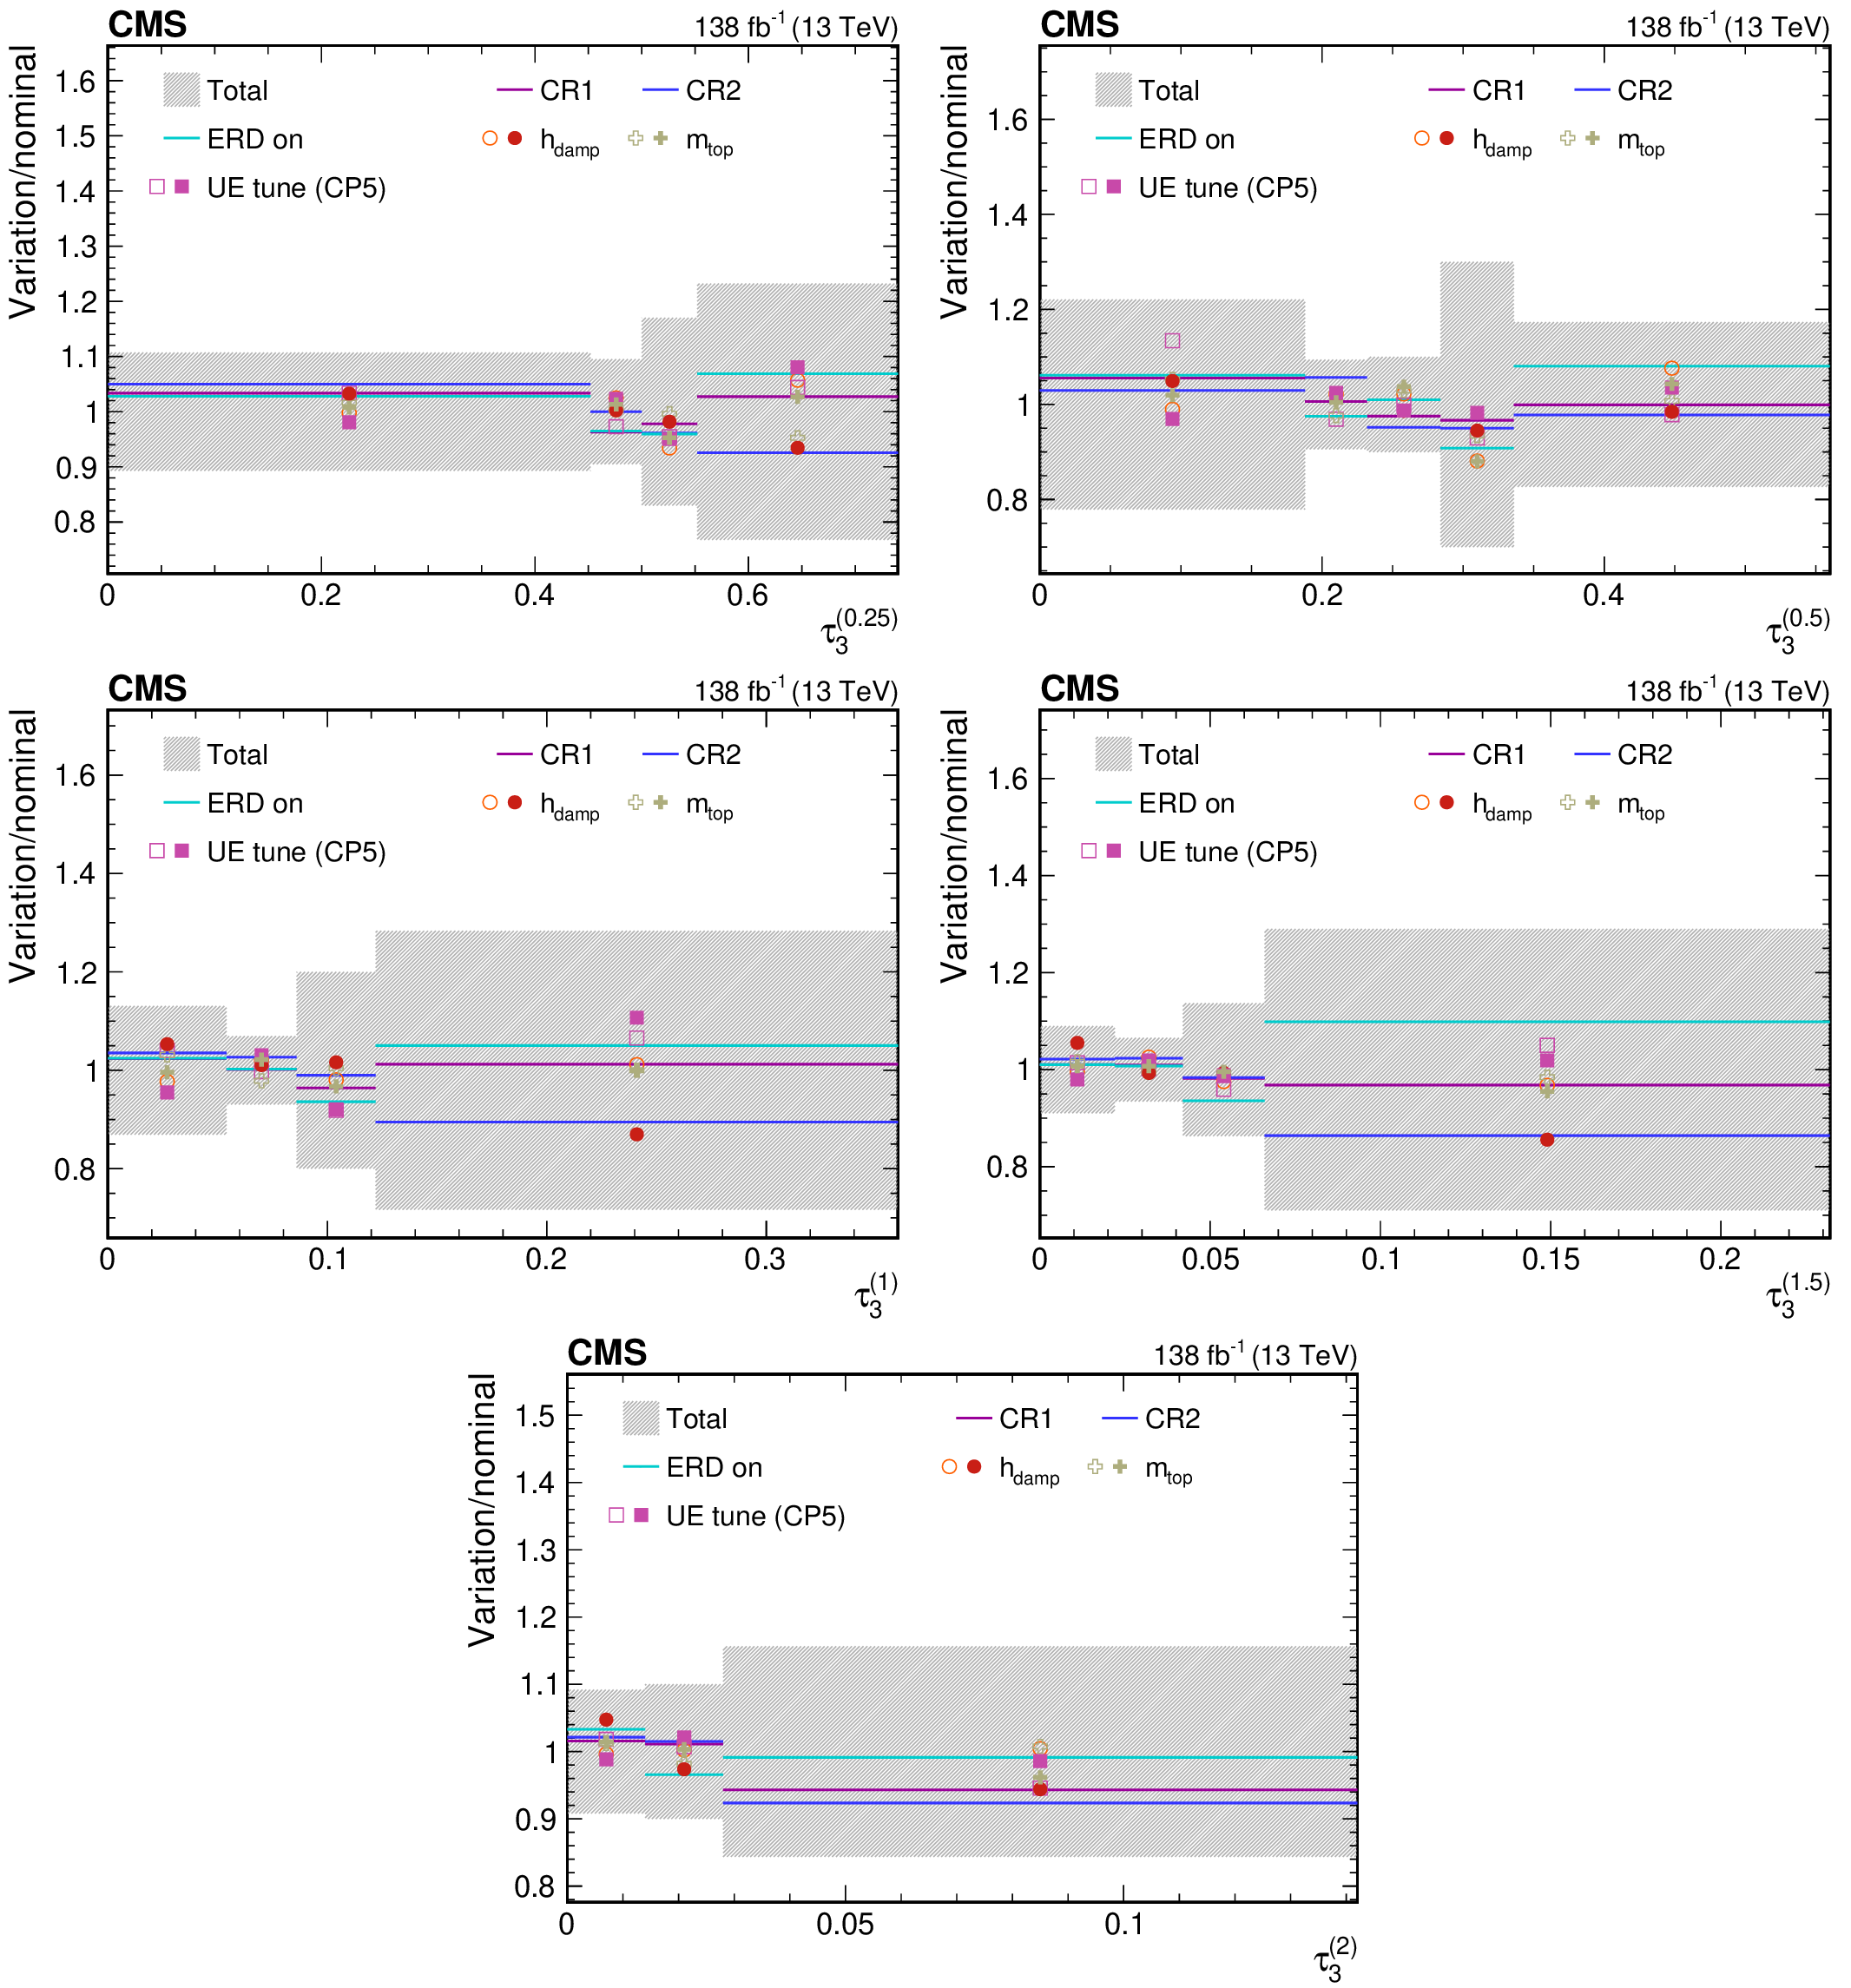
png pdf |
Figure 65:
Contributions from various theory model systematic variations to the normalized, unfolded distribution for $ \tau_3^{(\beta)} $ observables measured for AK8 jets passing the boosted top quark-enriched selection in $ \mu $+jets $ \mathrm{t} \overline{\mathrm{t}} $ events. The total unfolding uncertainty is indicated with the dark grey, hashed region, while the blue hashed region indicates the contributions from the input covariance matrix, which includes the propagated effects of the statistical uncertainties of the input data after background subtraction. Contributions from statistical uncertainties of the simulated sample used to construct the nominal response matrix are indicated with the dashed black line. The uncertainty contributions for different choices of colour reconnection models are illustrated as one-sided shifts compared to the nominal unfolding, and up (down) contributions from other sources are indicated with filled (open) markers of the same type and colour. |
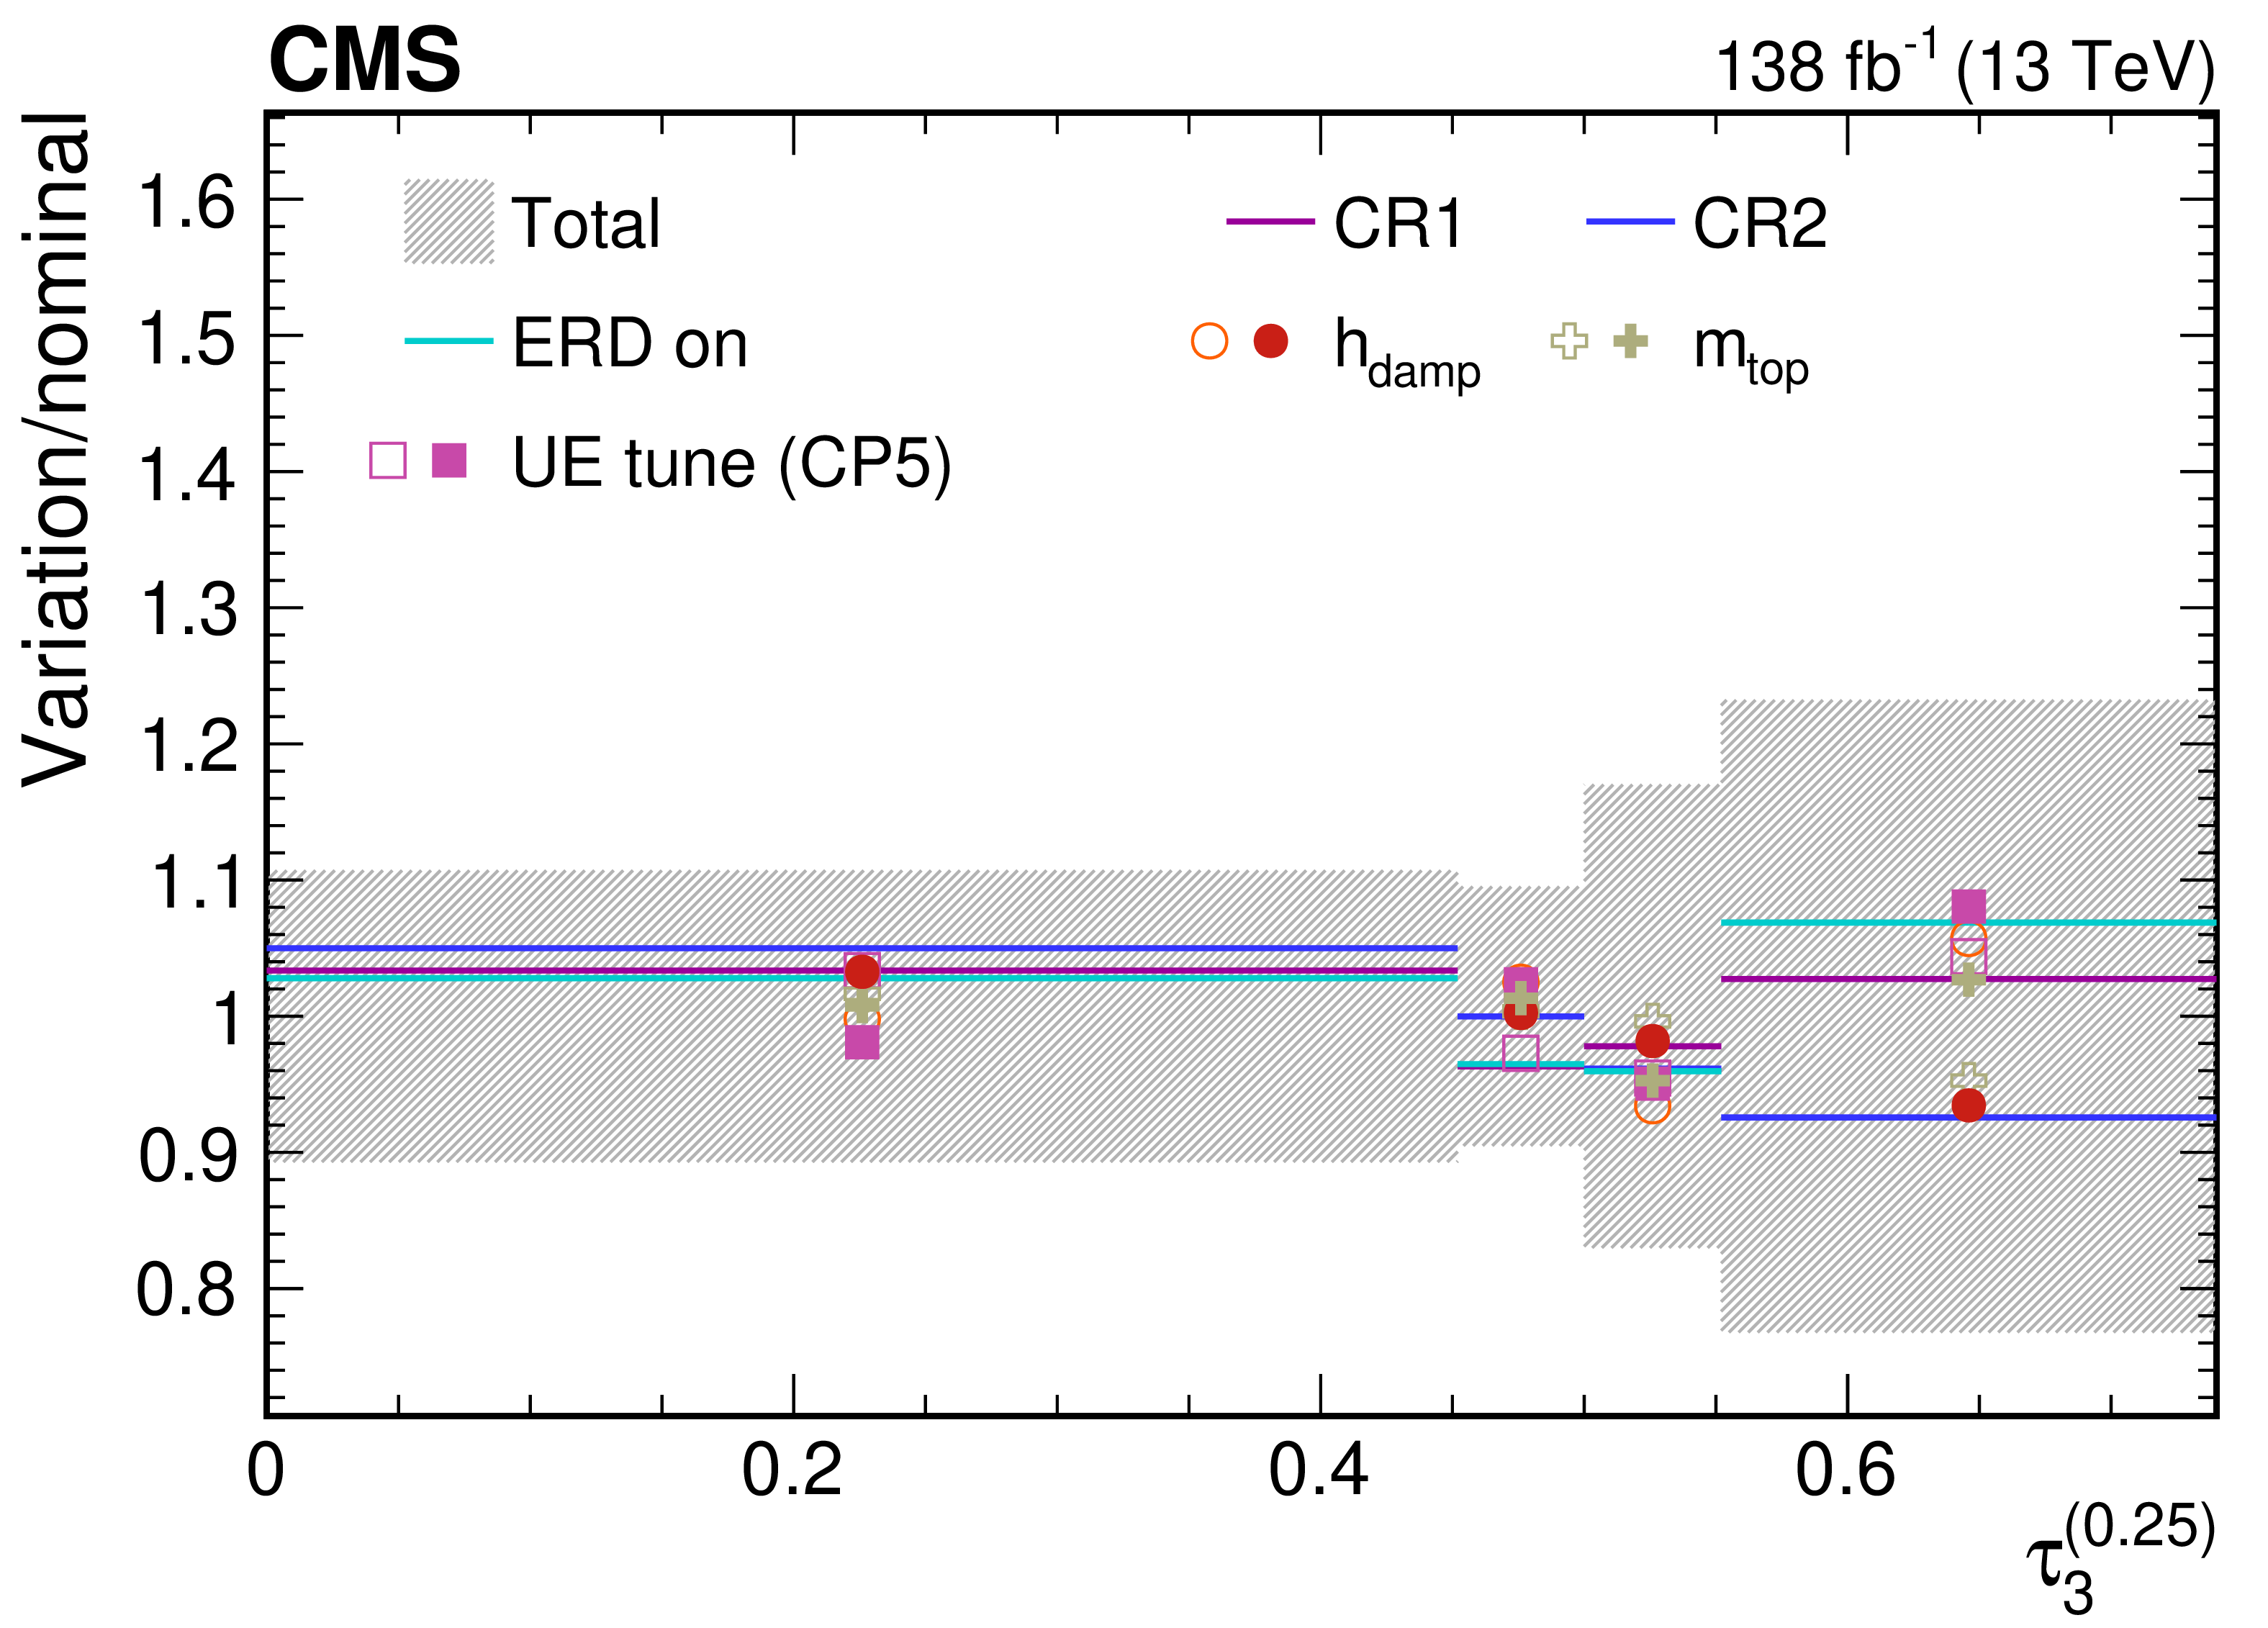
png pdf |
Figure 65-a:
Contributions from various theory model systematic variations to the normalized, unfolded distribution for $ \tau_3^{(\beta)} $ observables measured for AK8 jets passing the boosted top quark-enriched selection in $ \mu $+jets $ \mathrm{t} \overline{\mathrm{t}} $ events. The total unfolding uncertainty is indicated with the dark grey, hashed region, while the blue hashed region indicates the contributions from the input covariance matrix, which includes the propagated effects of the statistical uncertainties of the input data after background subtraction. Contributions from statistical uncertainties of the simulated sample used to construct the nominal response matrix are indicated with the dashed black line. The uncertainty contributions for different choices of colour reconnection models are illustrated as one-sided shifts compared to the nominal unfolding, and up (down) contributions from other sources are indicated with filled (open) markers of the same type and colour. |
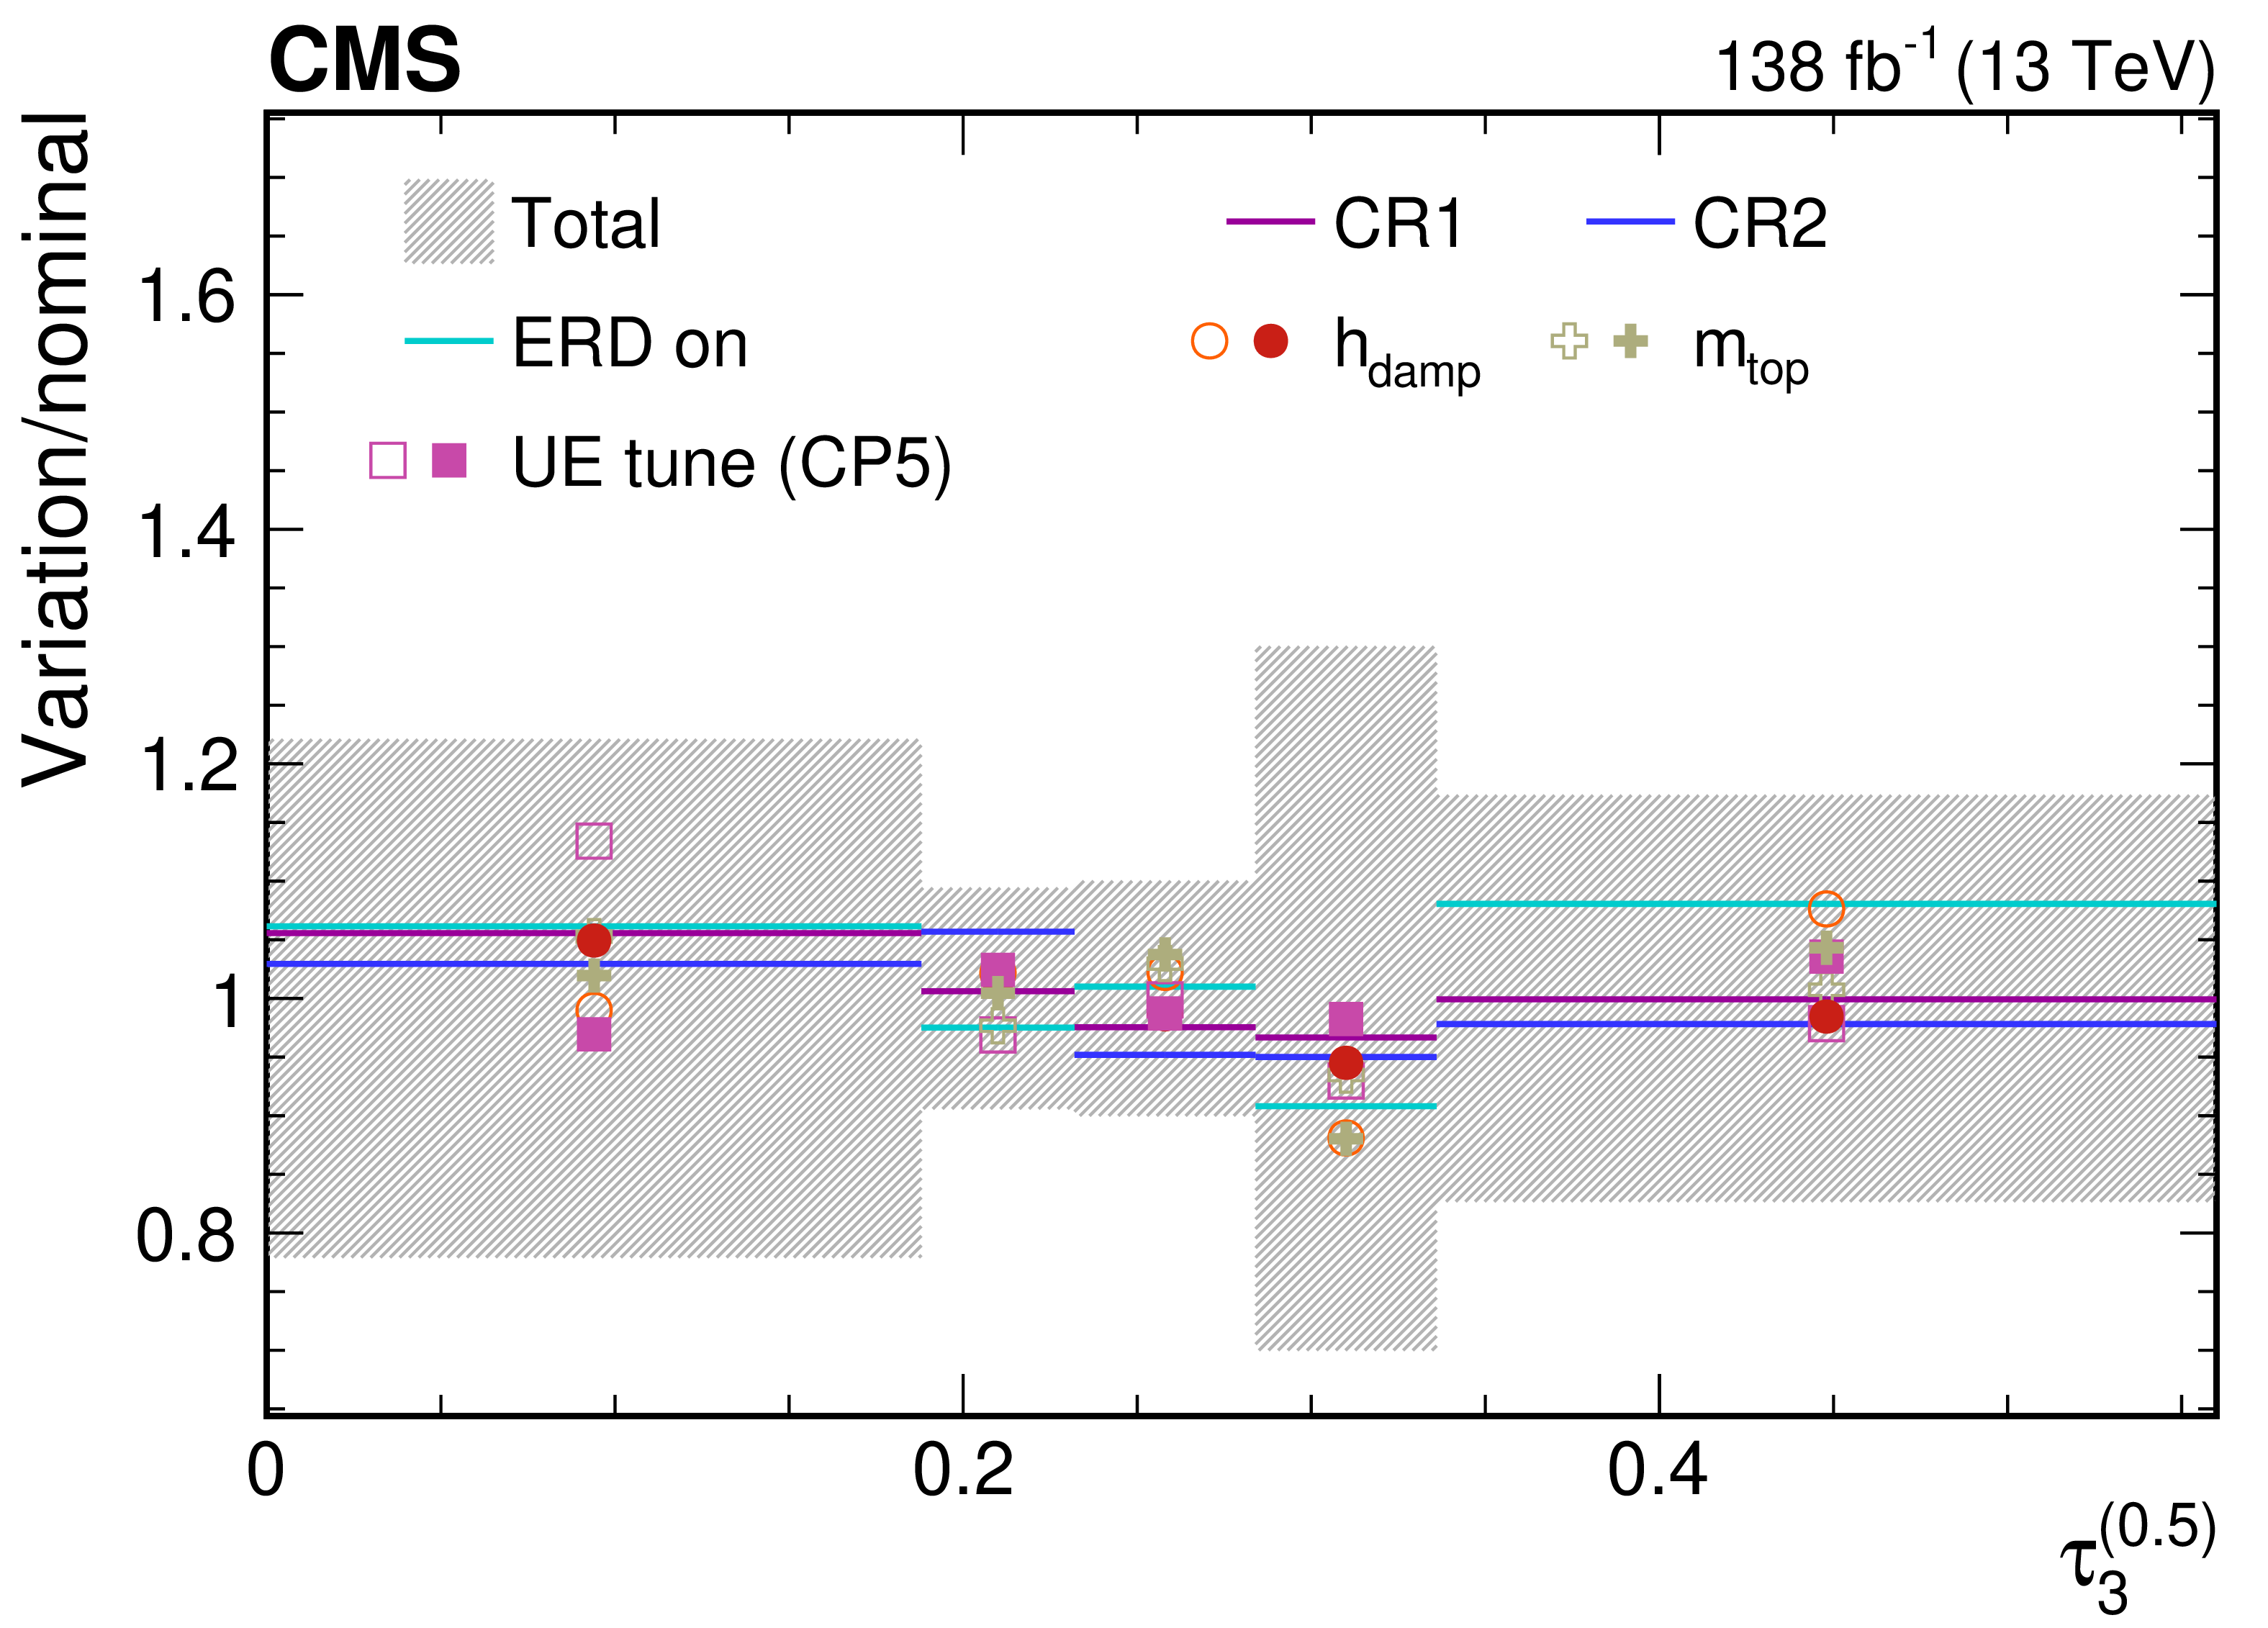
png pdf |
Figure 65-b:
Contributions from various theory model systematic variations to the normalized, unfolded distribution for $ \tau_3^{(\beta)} $ observables measured for AK8 jets passing the boosted top quark-enriched selection in $ \mu $+jets $ \mathrm{t} \overline{\mathrm{t}} $ events. The total unfolding uncertainty is indicated with the dark grey, hashed region, while the blue hashed region indicates the contributions from the input covariance matrix, which includes the propagated effects of the statistical uncertainties of the input data after background subtraction. Contributions from statistical uncertainties of the simulated sample used to construct the nominal response matrix are indicated with the dashed black line. The uncertainty contributions for different choices of colour reconnection models are illustrated as one-sided shifts compared to the nominal unfolding, and up (down) contributions from other sources are indicated with filled (open) markers of the same type and colour. |
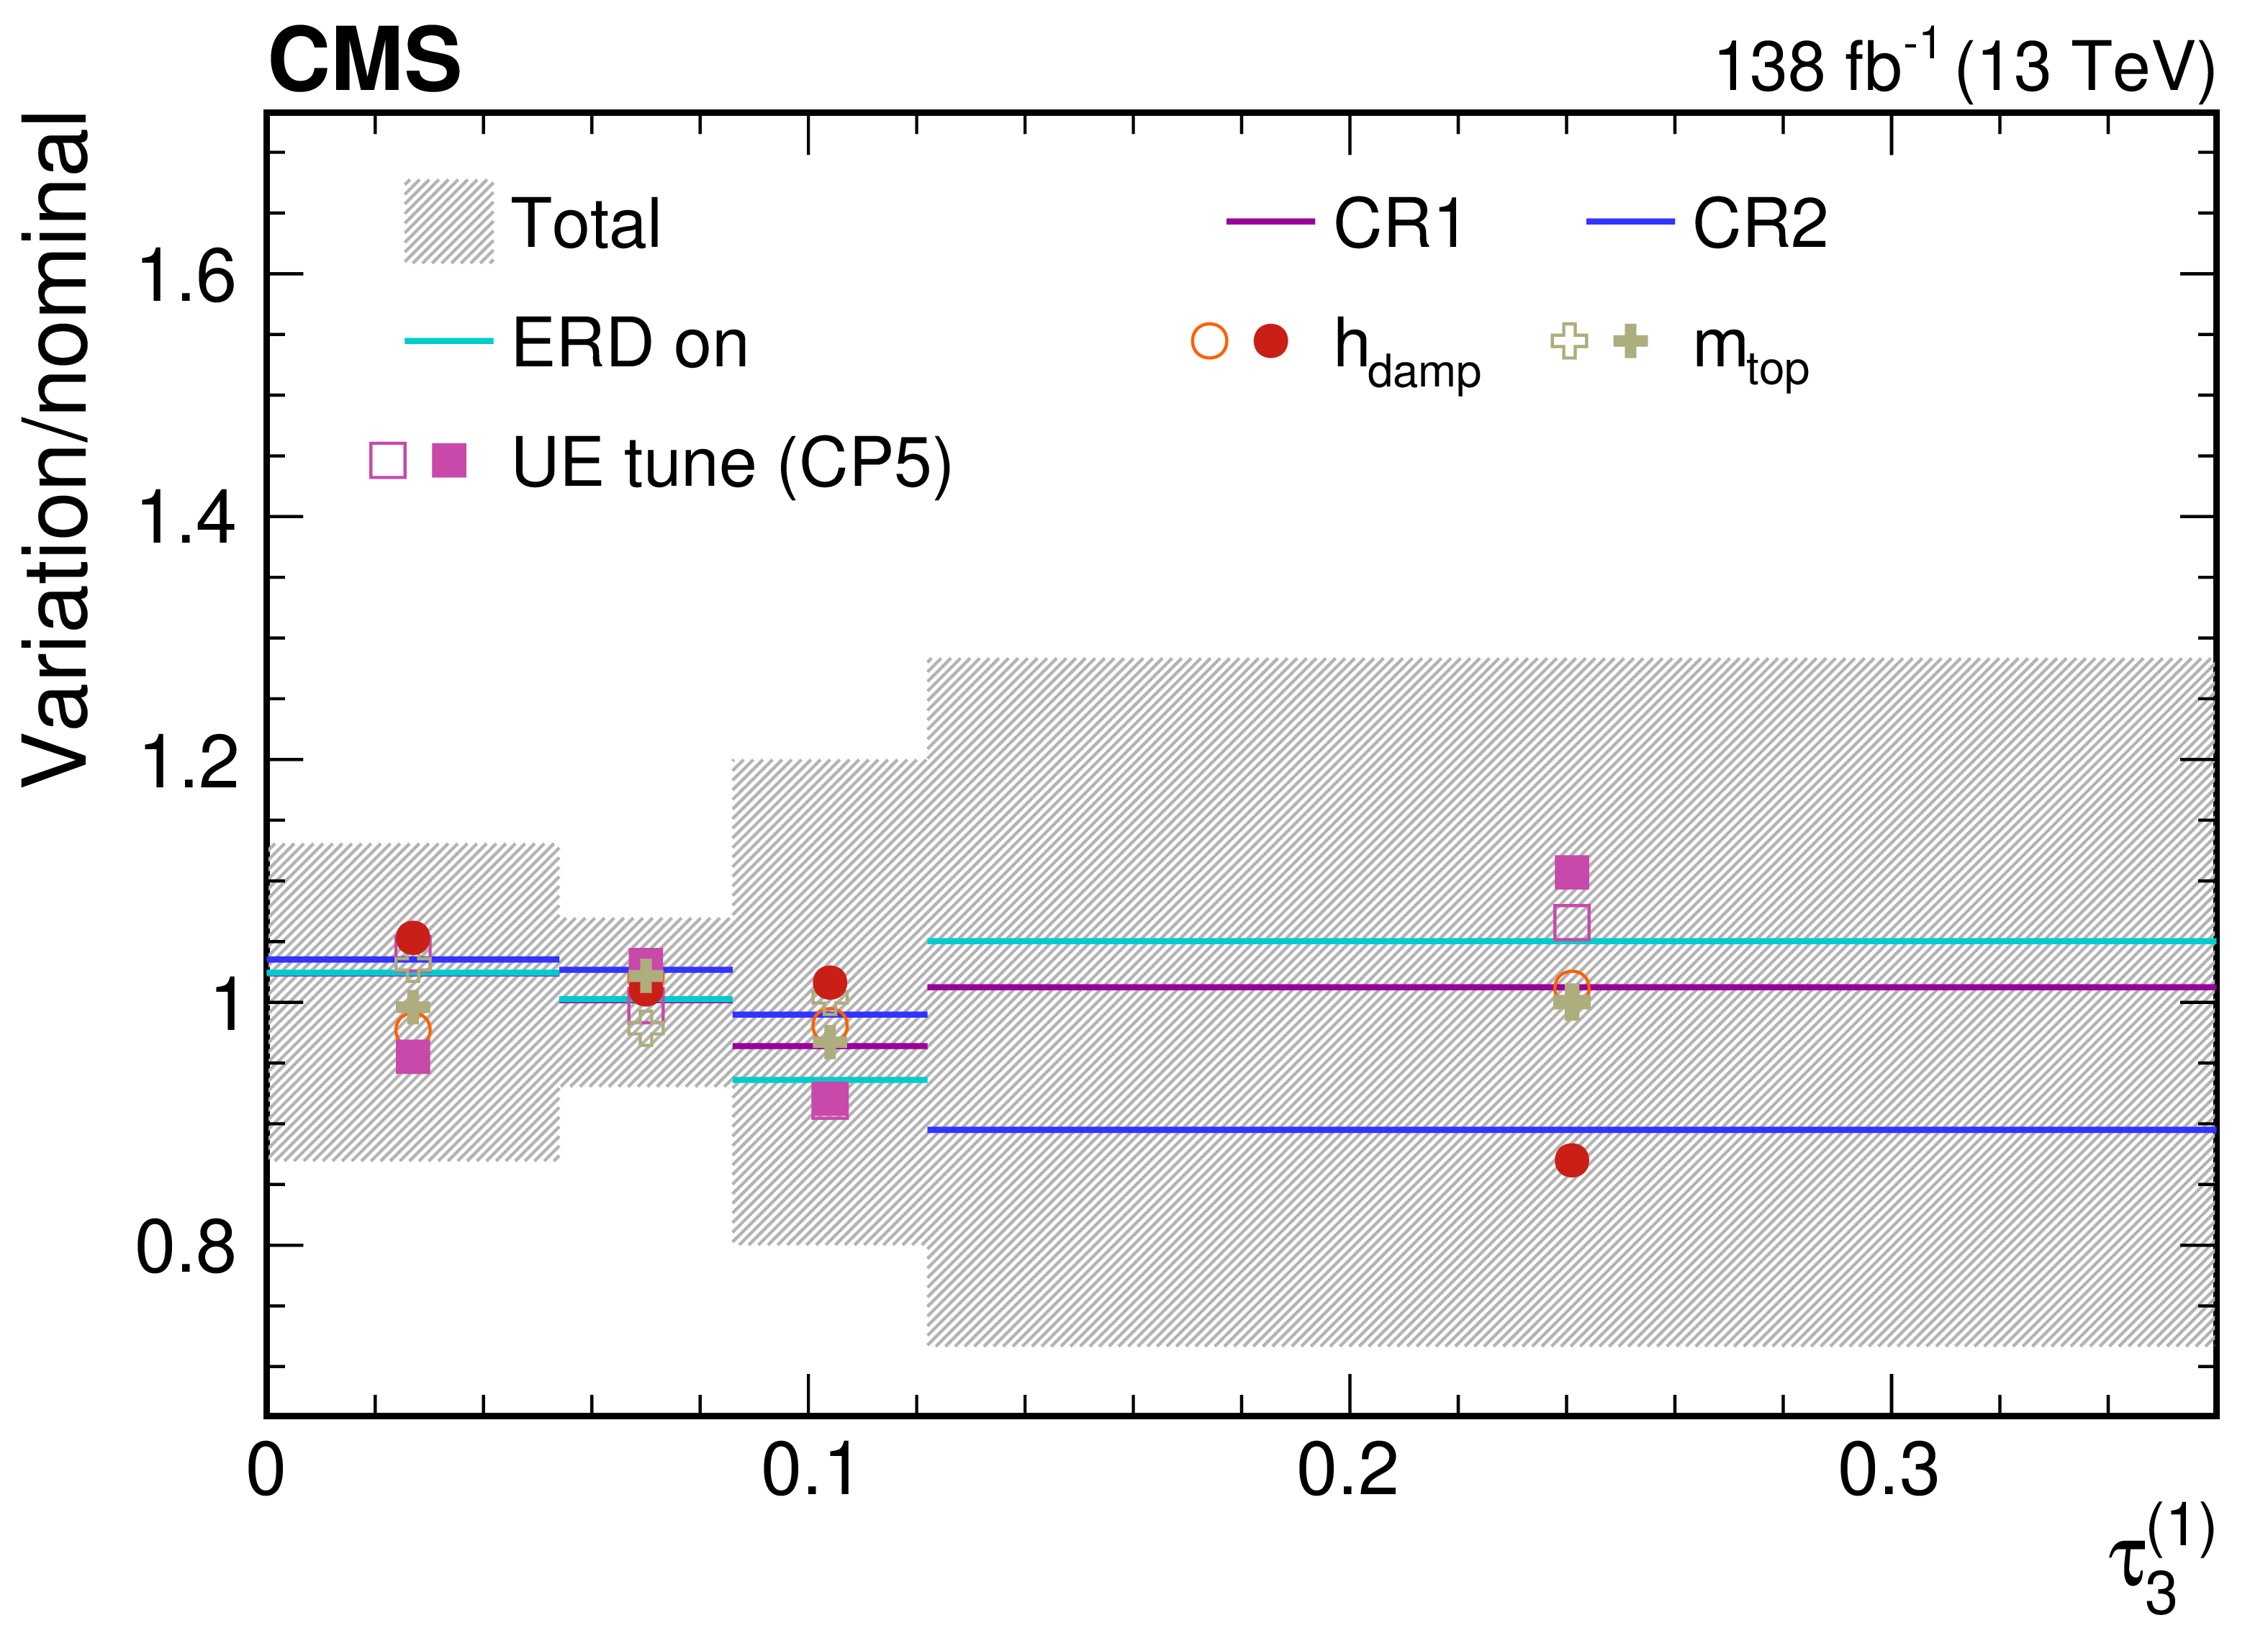
png pdf |
Figure 65-c:
Contributions from various theory model systematic variations to the normalized, unfolded distribution for $ \tau_3^{(\beta)} $ observables measured for AK8 jets passing the boosted top quark-enriched selection in $ \mu $+jets $ \mathrm{t} \overline{\mathrm{t}} $ events. The total unfolding uncertainty is indicated with the dark grey, hashed region, while the blue hashed region indicates the contributions from the input covariance matrix, which includes the propagated effects of the statistical uncertainties of the input data after background subtraction. Contributions from statistical uncertainties of the simulated sample used to construct the nominal response matrix are indicated with the dashed black line. The uncertainty contributions for different choices of colour reconnection models are illustrated as one-sided shifts compared to the nominal unfolding, and up (down) contributions from other sources are indicated with filled (open) markers of the same type and colour. |
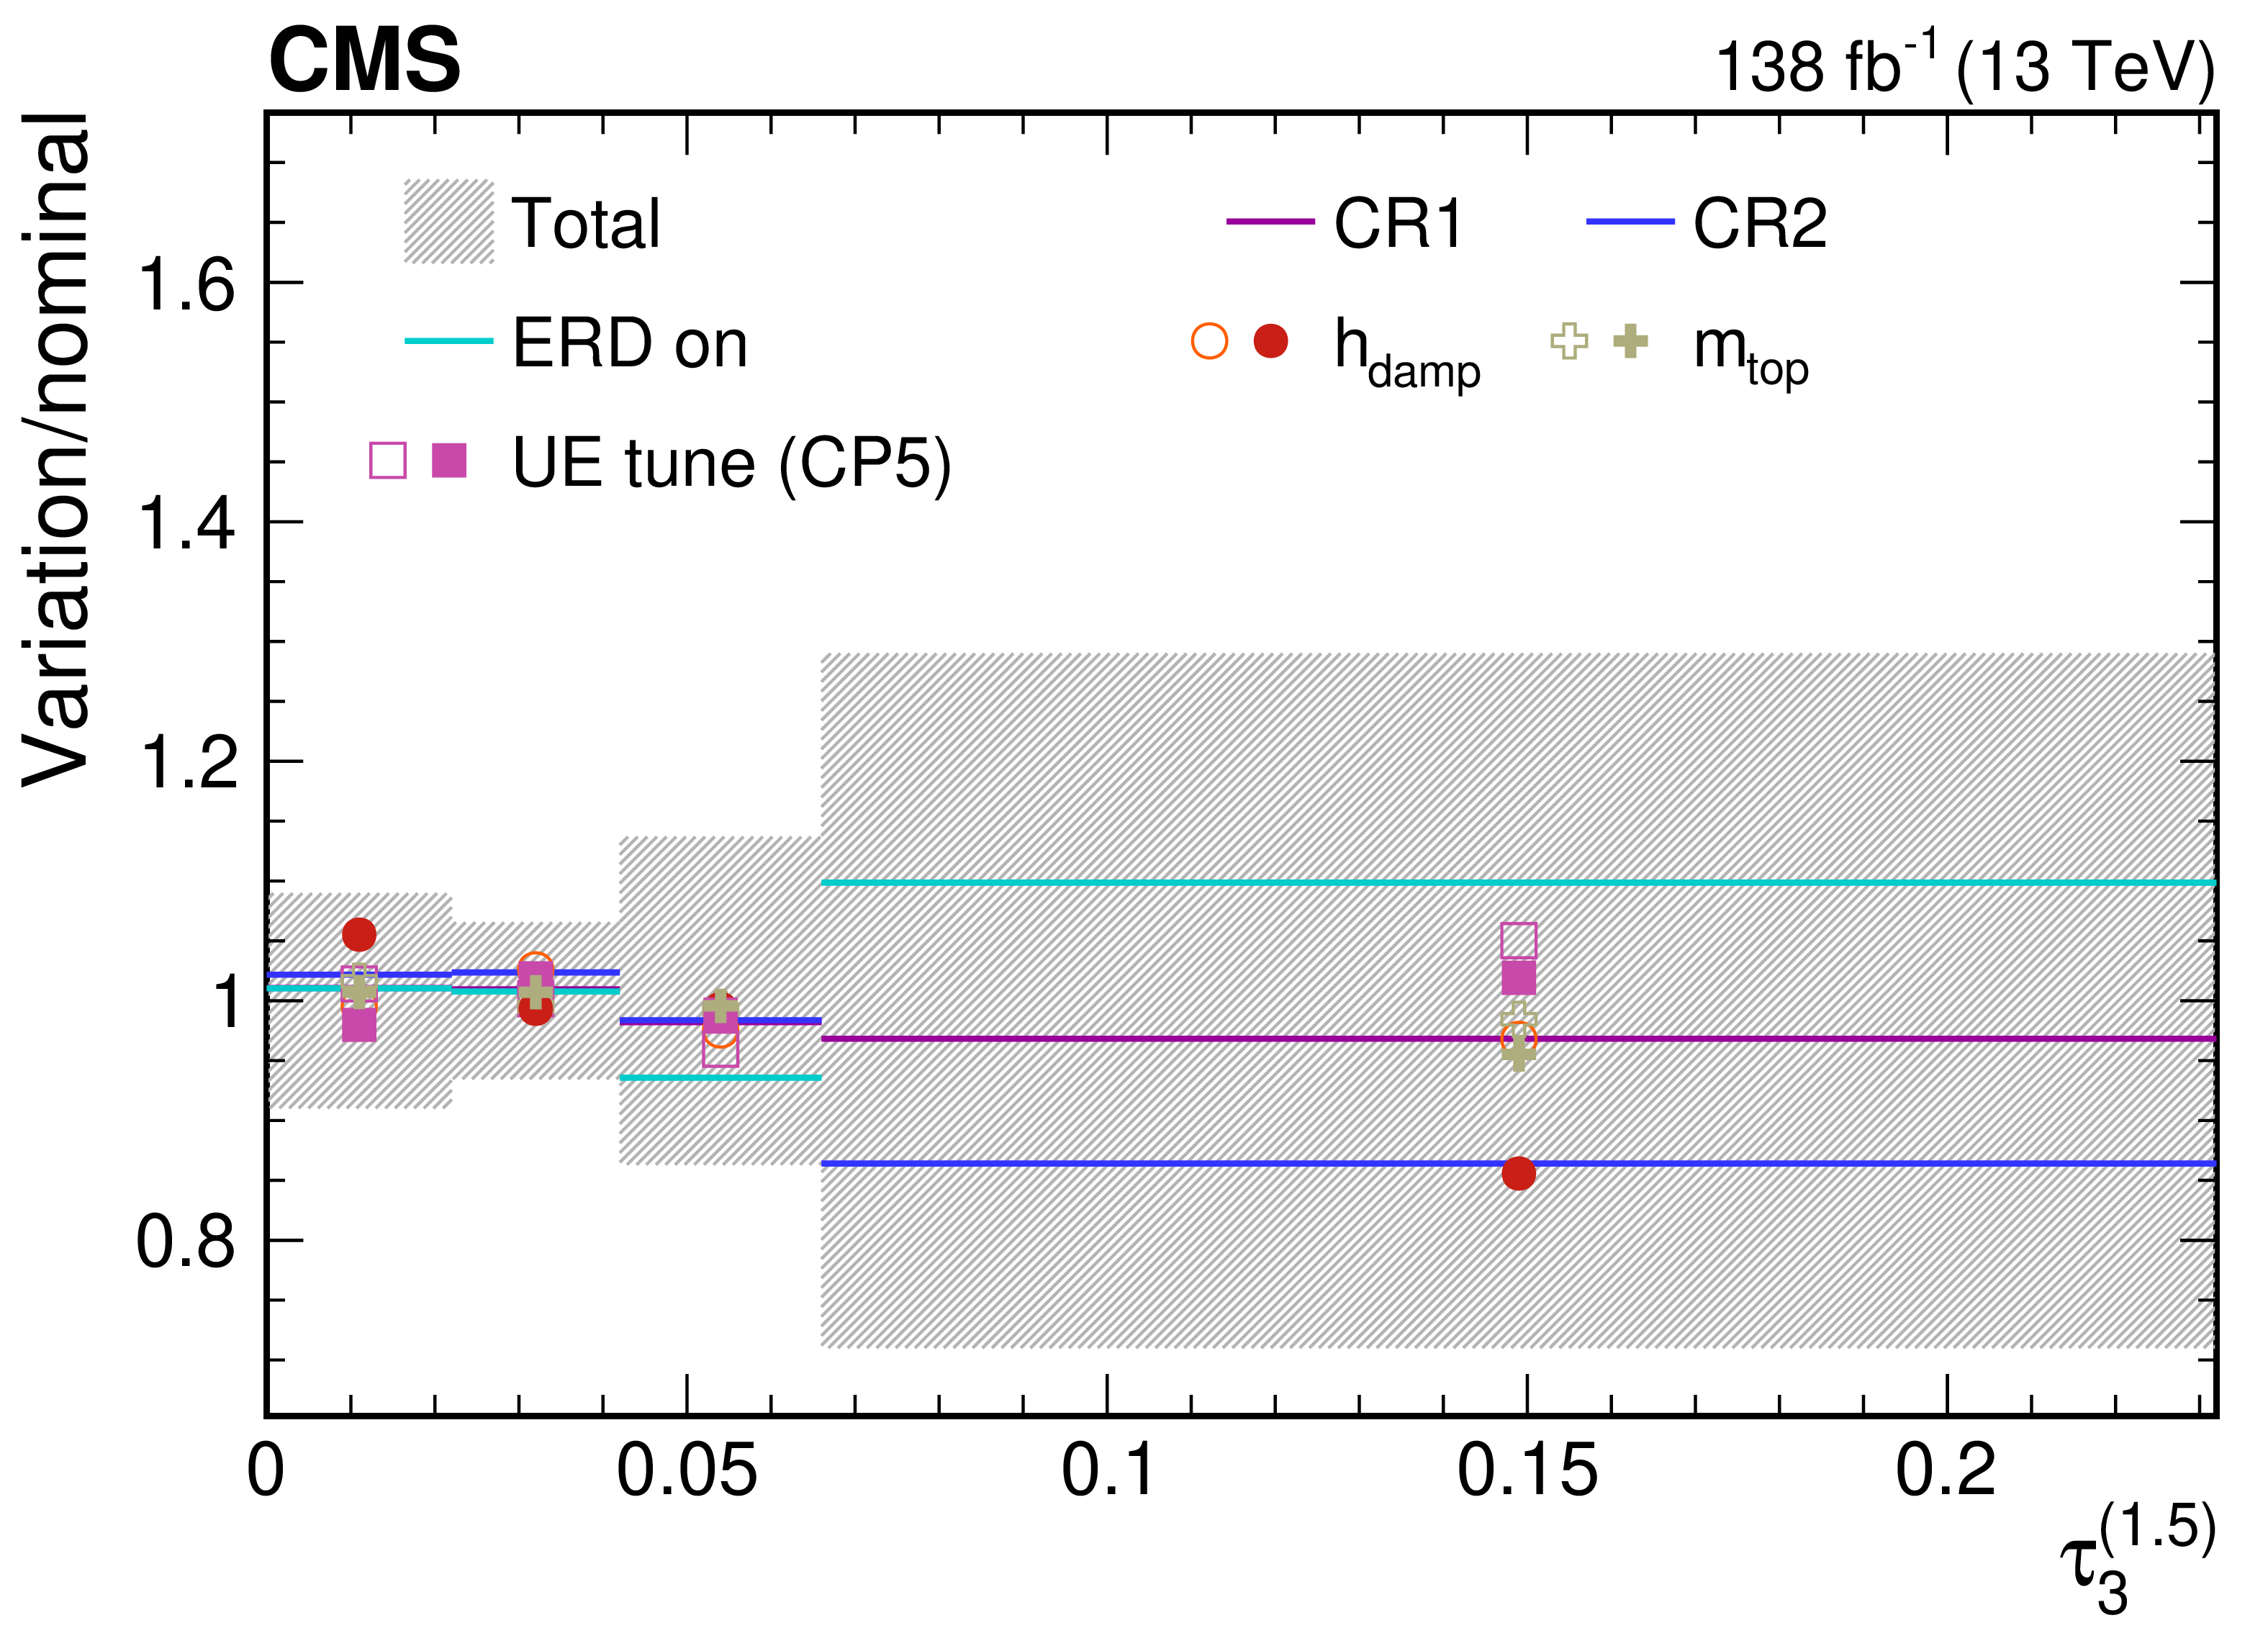
png pdf |
Figure 65-d:
Contributions from various theory model systematic variations to the normalized, unfolded distribution for $ \tau_3^{(\beta)} $ observables measured for AK8 jets passing the boosted top quark-enriched selection in $ \mu $+jets $ \mathrm{t} \overline{\mathrm{t}} $ events. The total unfolding uncertainty is indicated with the dark grey, hashed region, while the blue hashed region indicates the contributions from the input covariance matrix, which includes the propagated effects of the statistical uncertainties of the input data after background subtraction. Contributions from statistical uncertainties of the simulated sample used to construct the nominal response matrix are indicated with the dashed black line. The uncertainty contributions for different choices of colour reconnection models are illustrated as one-sided shifts compared to the nominal unfolding, and up (down) contributions from other sources are indicated with filled (open) markers of the same type and colour. |
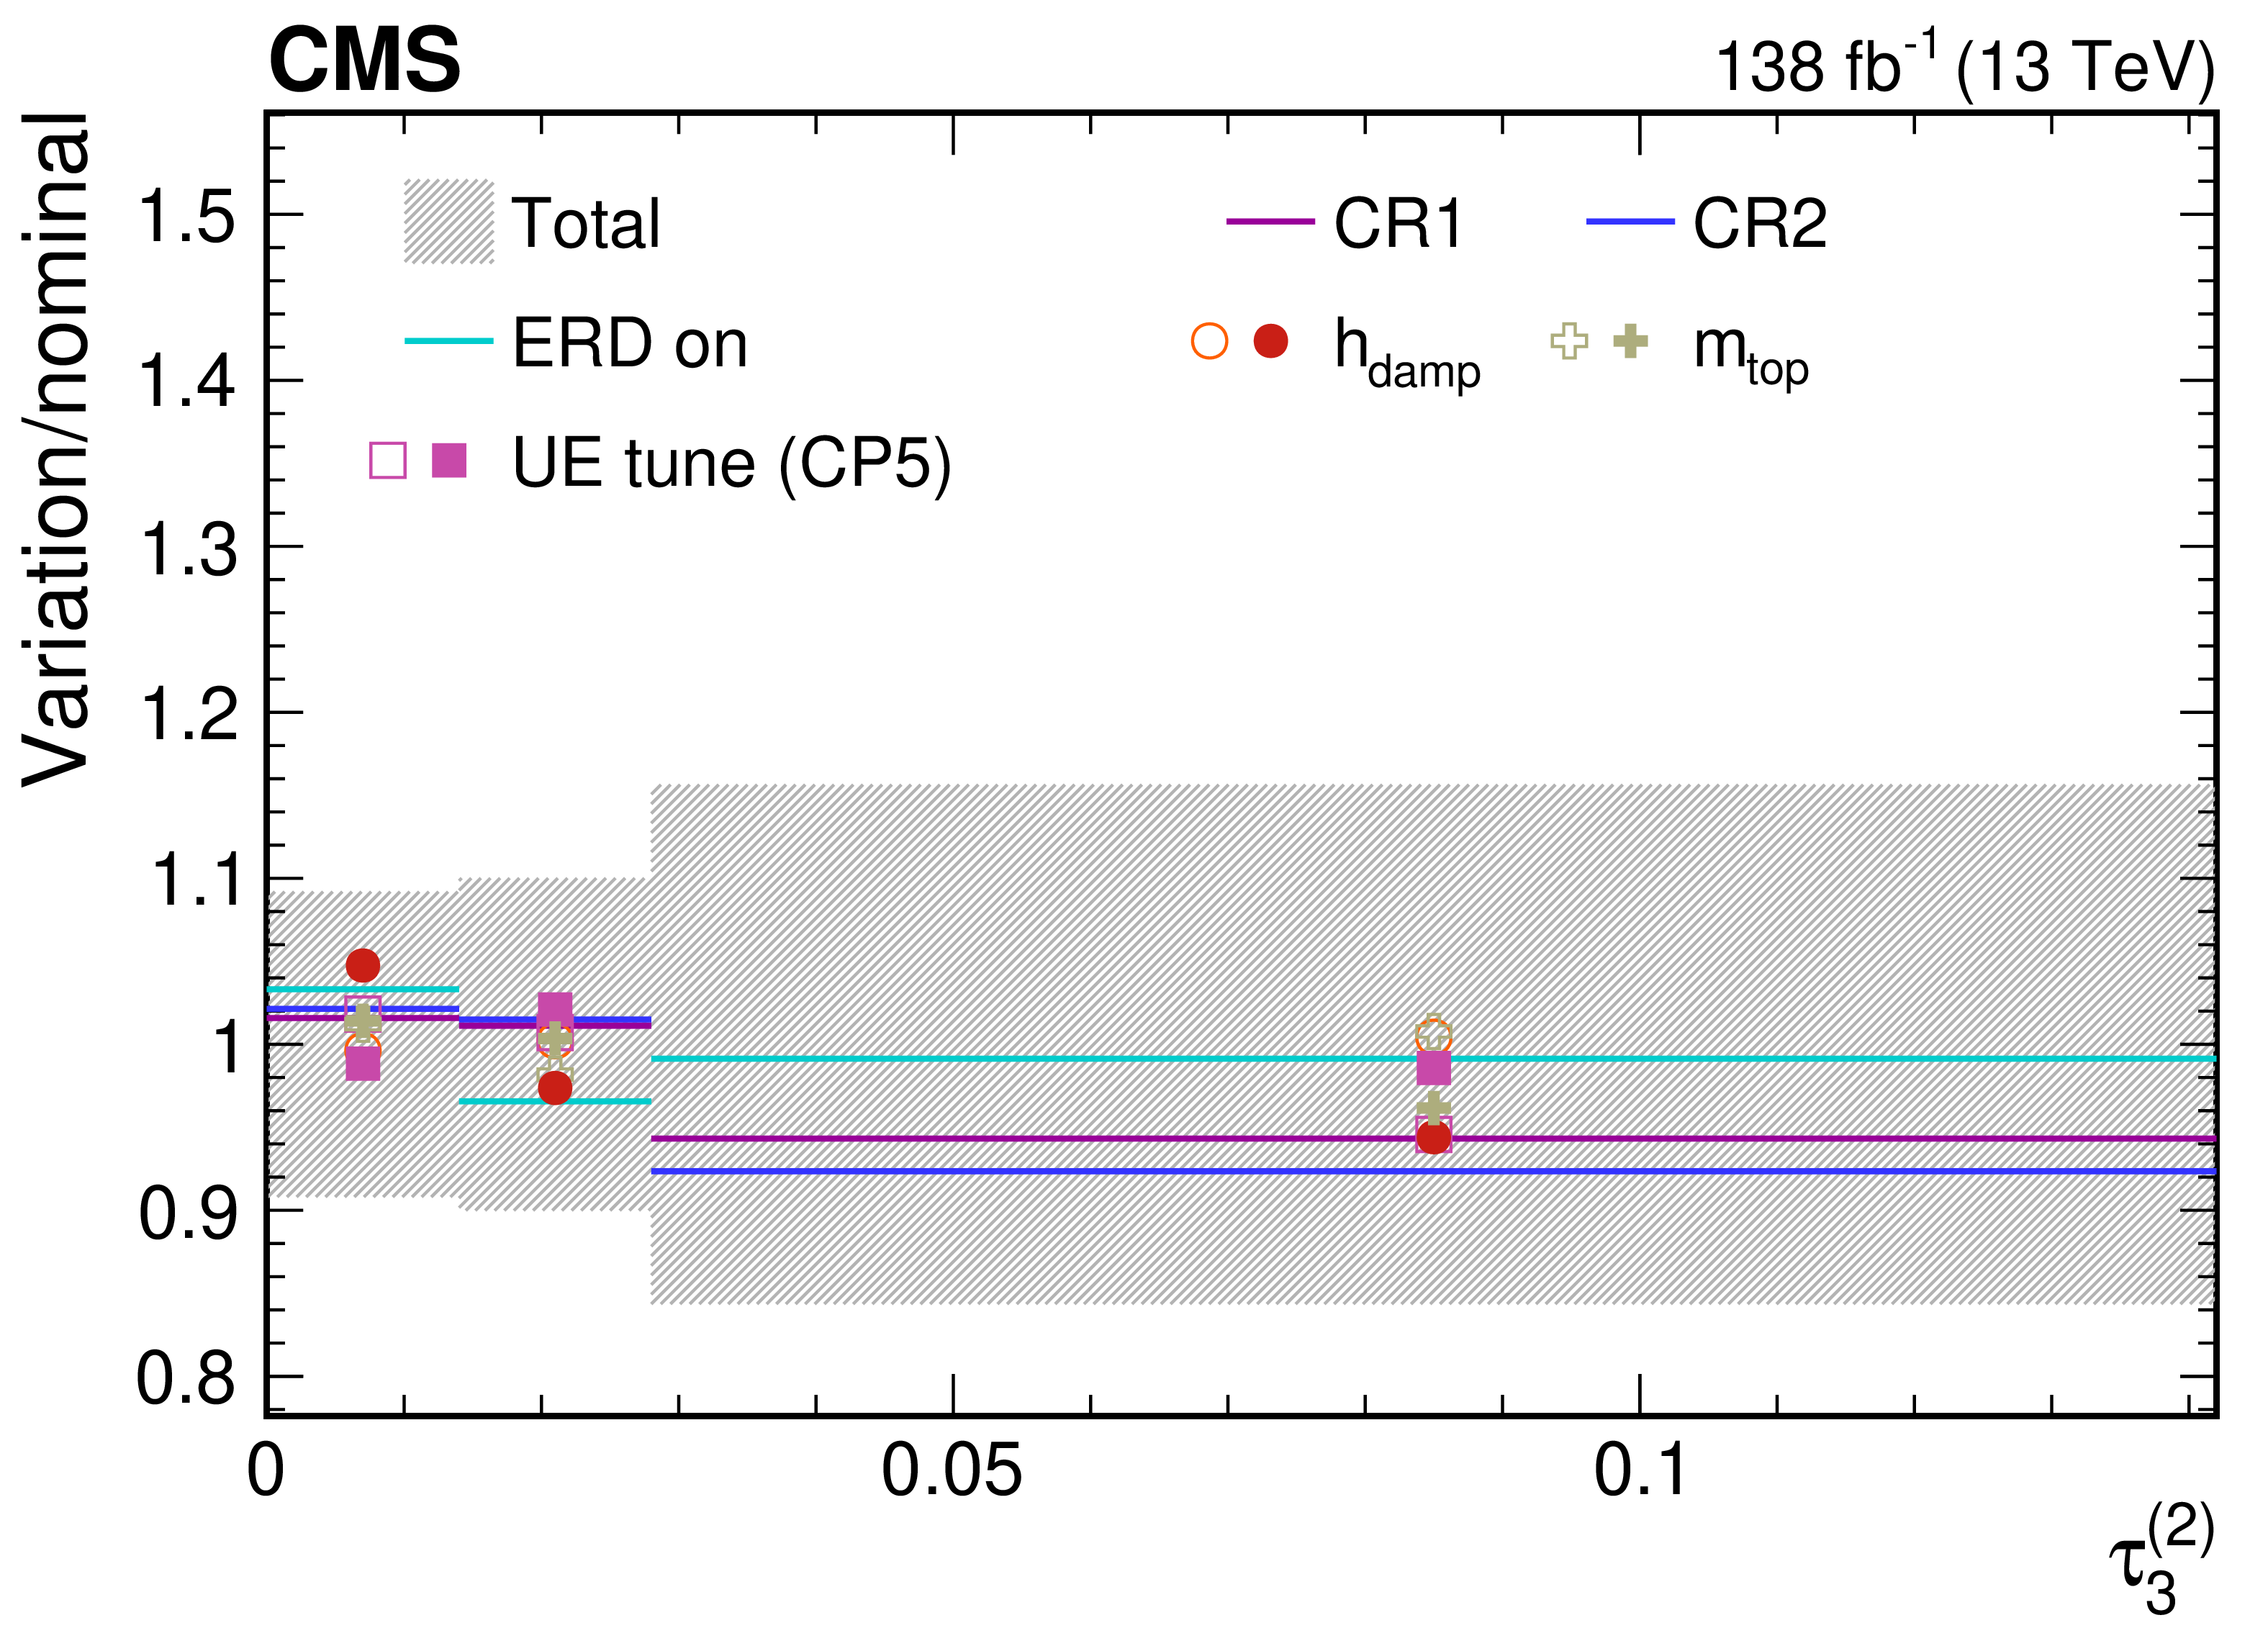
png pdf |
Figure 65-e:
Contributions from various theory model systematic variations to the normalized, unfolded distribution for $ \tau_3^{(\beta)} $ observables measured for AK8 jets passing the boosted top quark-enriched selection in $ \mu $+jets $ \mathrm{t} \overline{\mathrm{t}} $ events. The total unfolding uncertainty is indicated with the dark grey, hashed region, while the blue hashed region indicates the contributions from the input covariance matrix, which includes the propagated effects of the statistical uncertainties of the input data after background subtraction. Contributions from statistical uncertainties of the simulated sample used to construct the nominal response matrix are indicated with the dashed black line. The uncertainty contributions for different choices of colour reconnection models are illustrated as one-sided shifts compared to the nominal unfolding, and up (down) contributions from other sources are indicated with filled (open) markers of the same type and colour. |
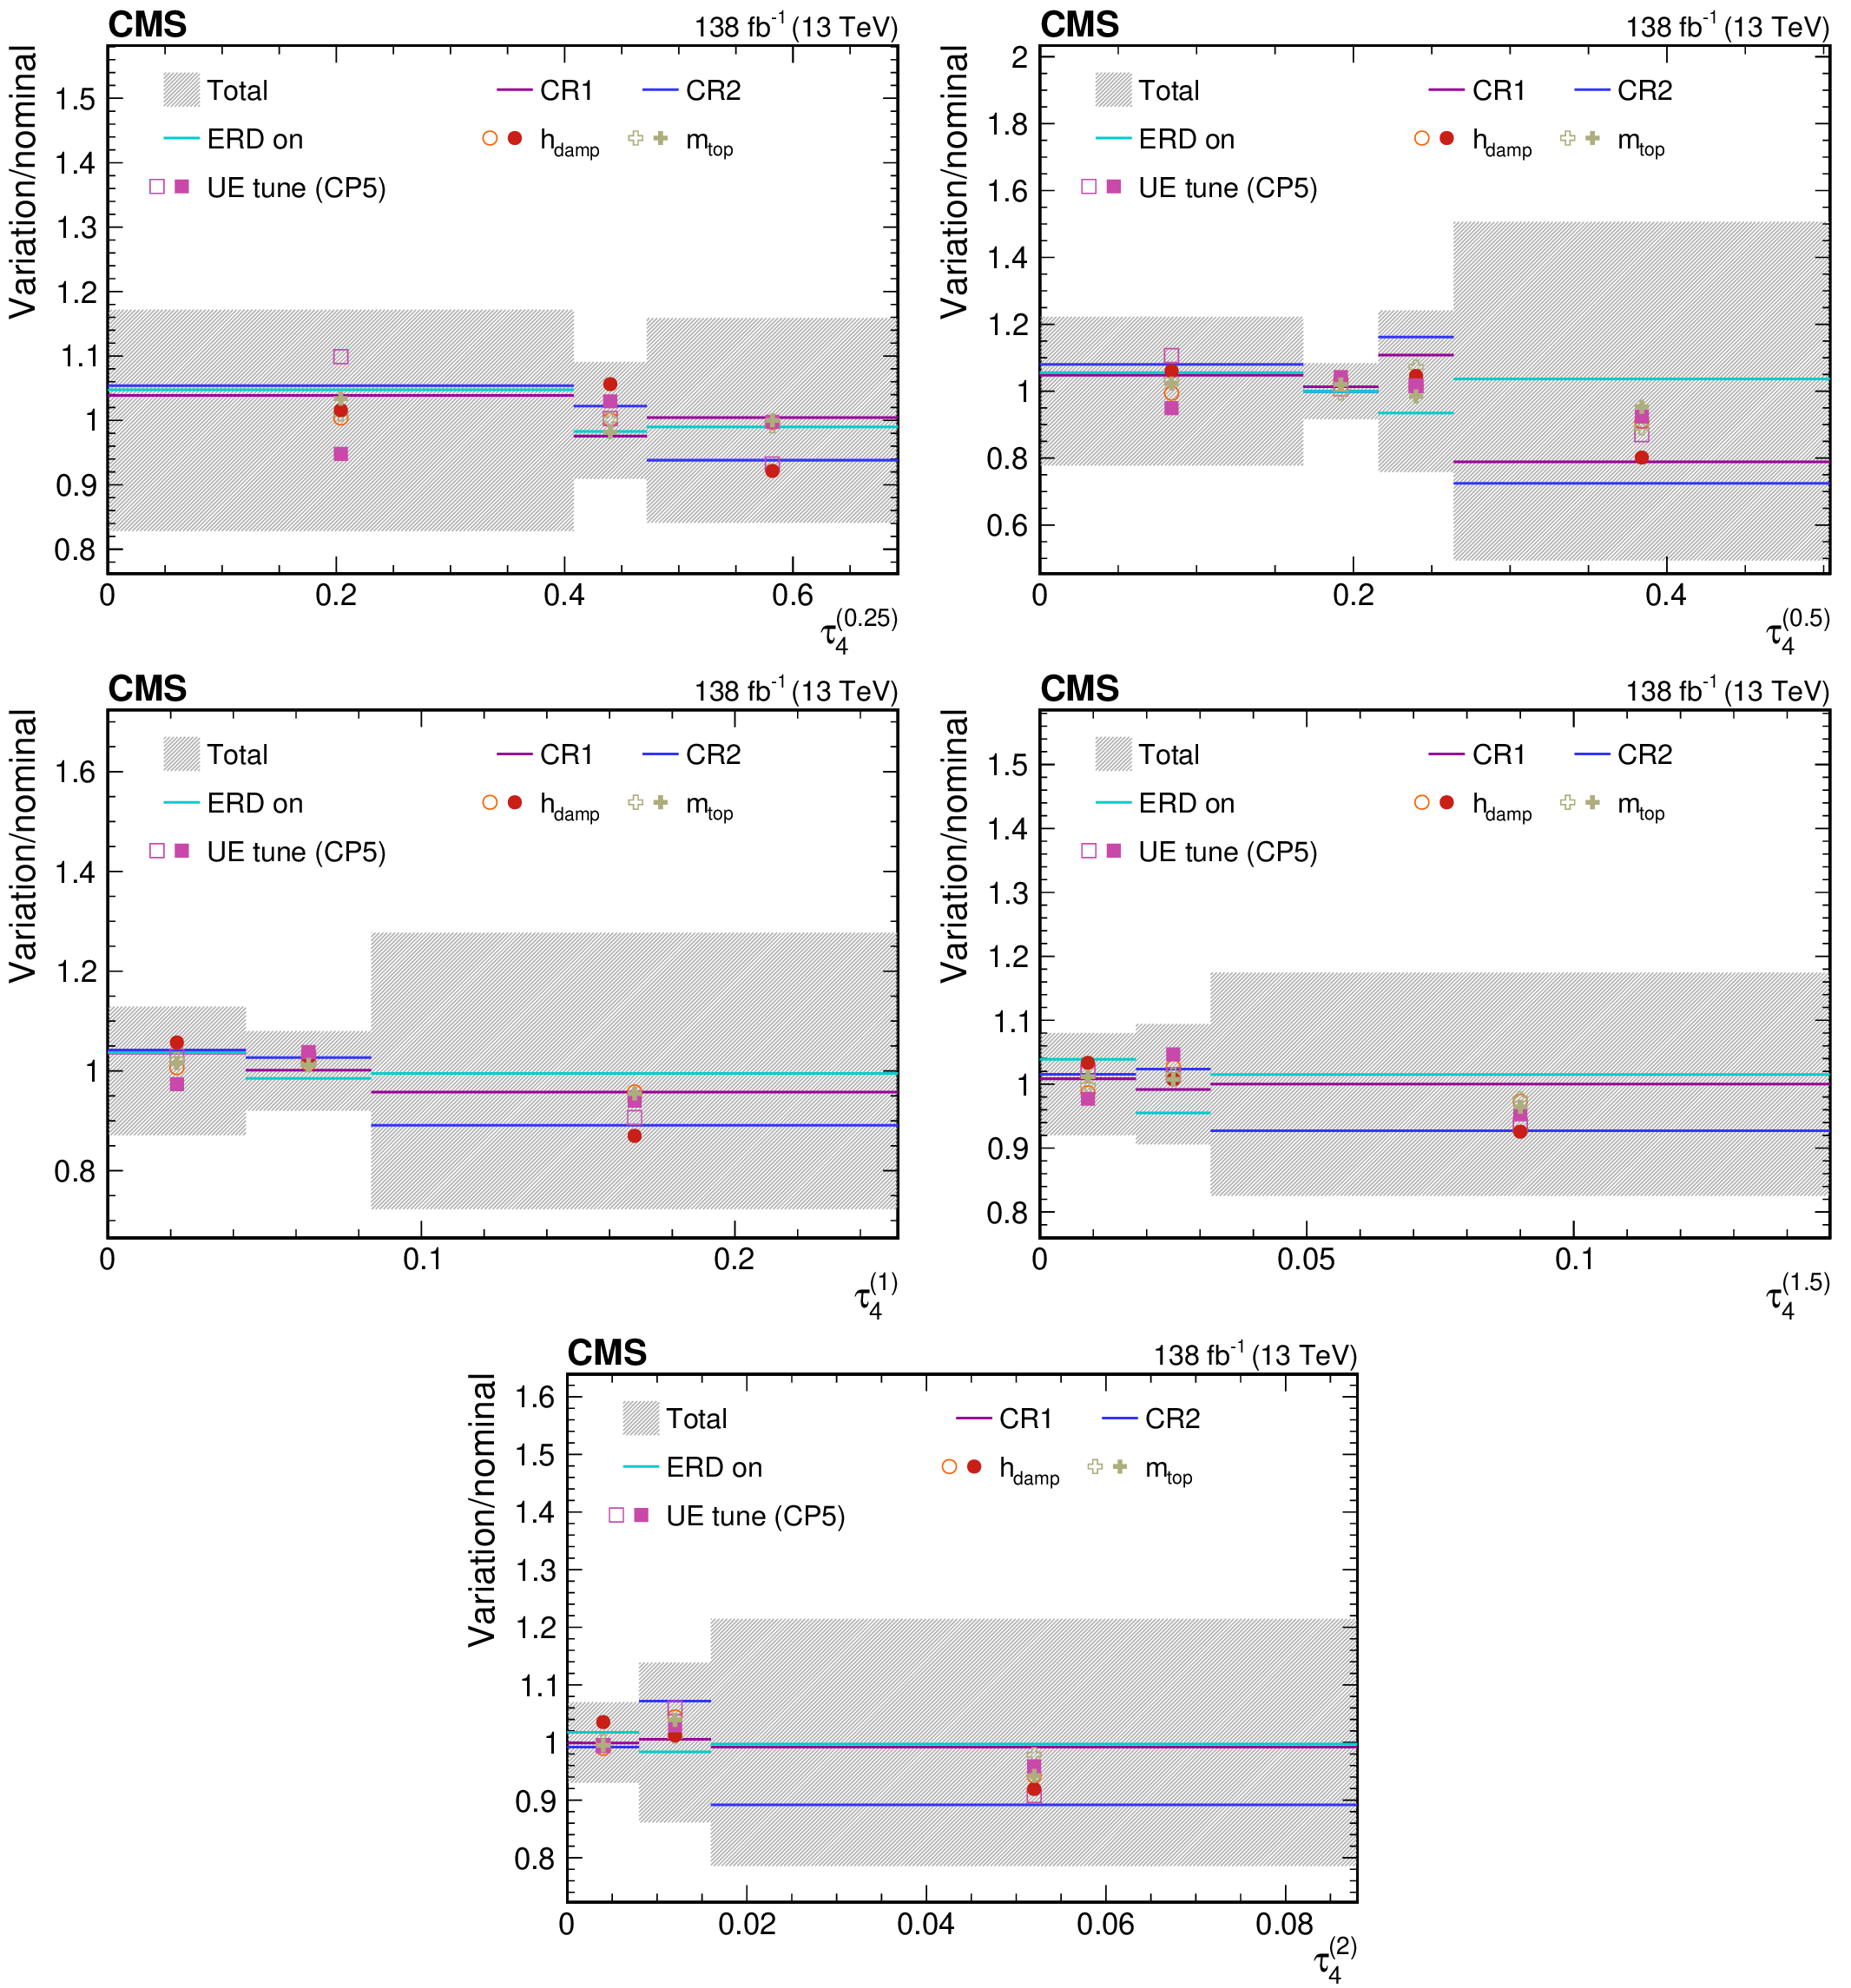
png pdf |
Figure 66:
Contributions from various theory model systematic variations to the normalized, unfolded distribution for $ \tau_4^{(\beta)} $ observables measured for AK8 jets passing the boosted top quark-enriched selection in $ \mu $+jets $ \mathrm{t} \overline{\mathrm{t}} $ events. The total unfolding uncertainty is indicated with the dark grey, hashed region, while the blue hashed region indicates the contributions from the input covariance matrix, which includes the propagated effects of the statistical uncertainties of the input data after background subtraction. Contributions from statistical uncertainties of the simulated sample used to construct the nominal response matrix are indicated with the dashed black line. The uncertainty contributions for different choices of colour reconnection models are illustrated as one-sided shifts compared to the nominal unfolding, and up (down) contributions from other sources are indicated with filled (open) markers of the same type and colour. |
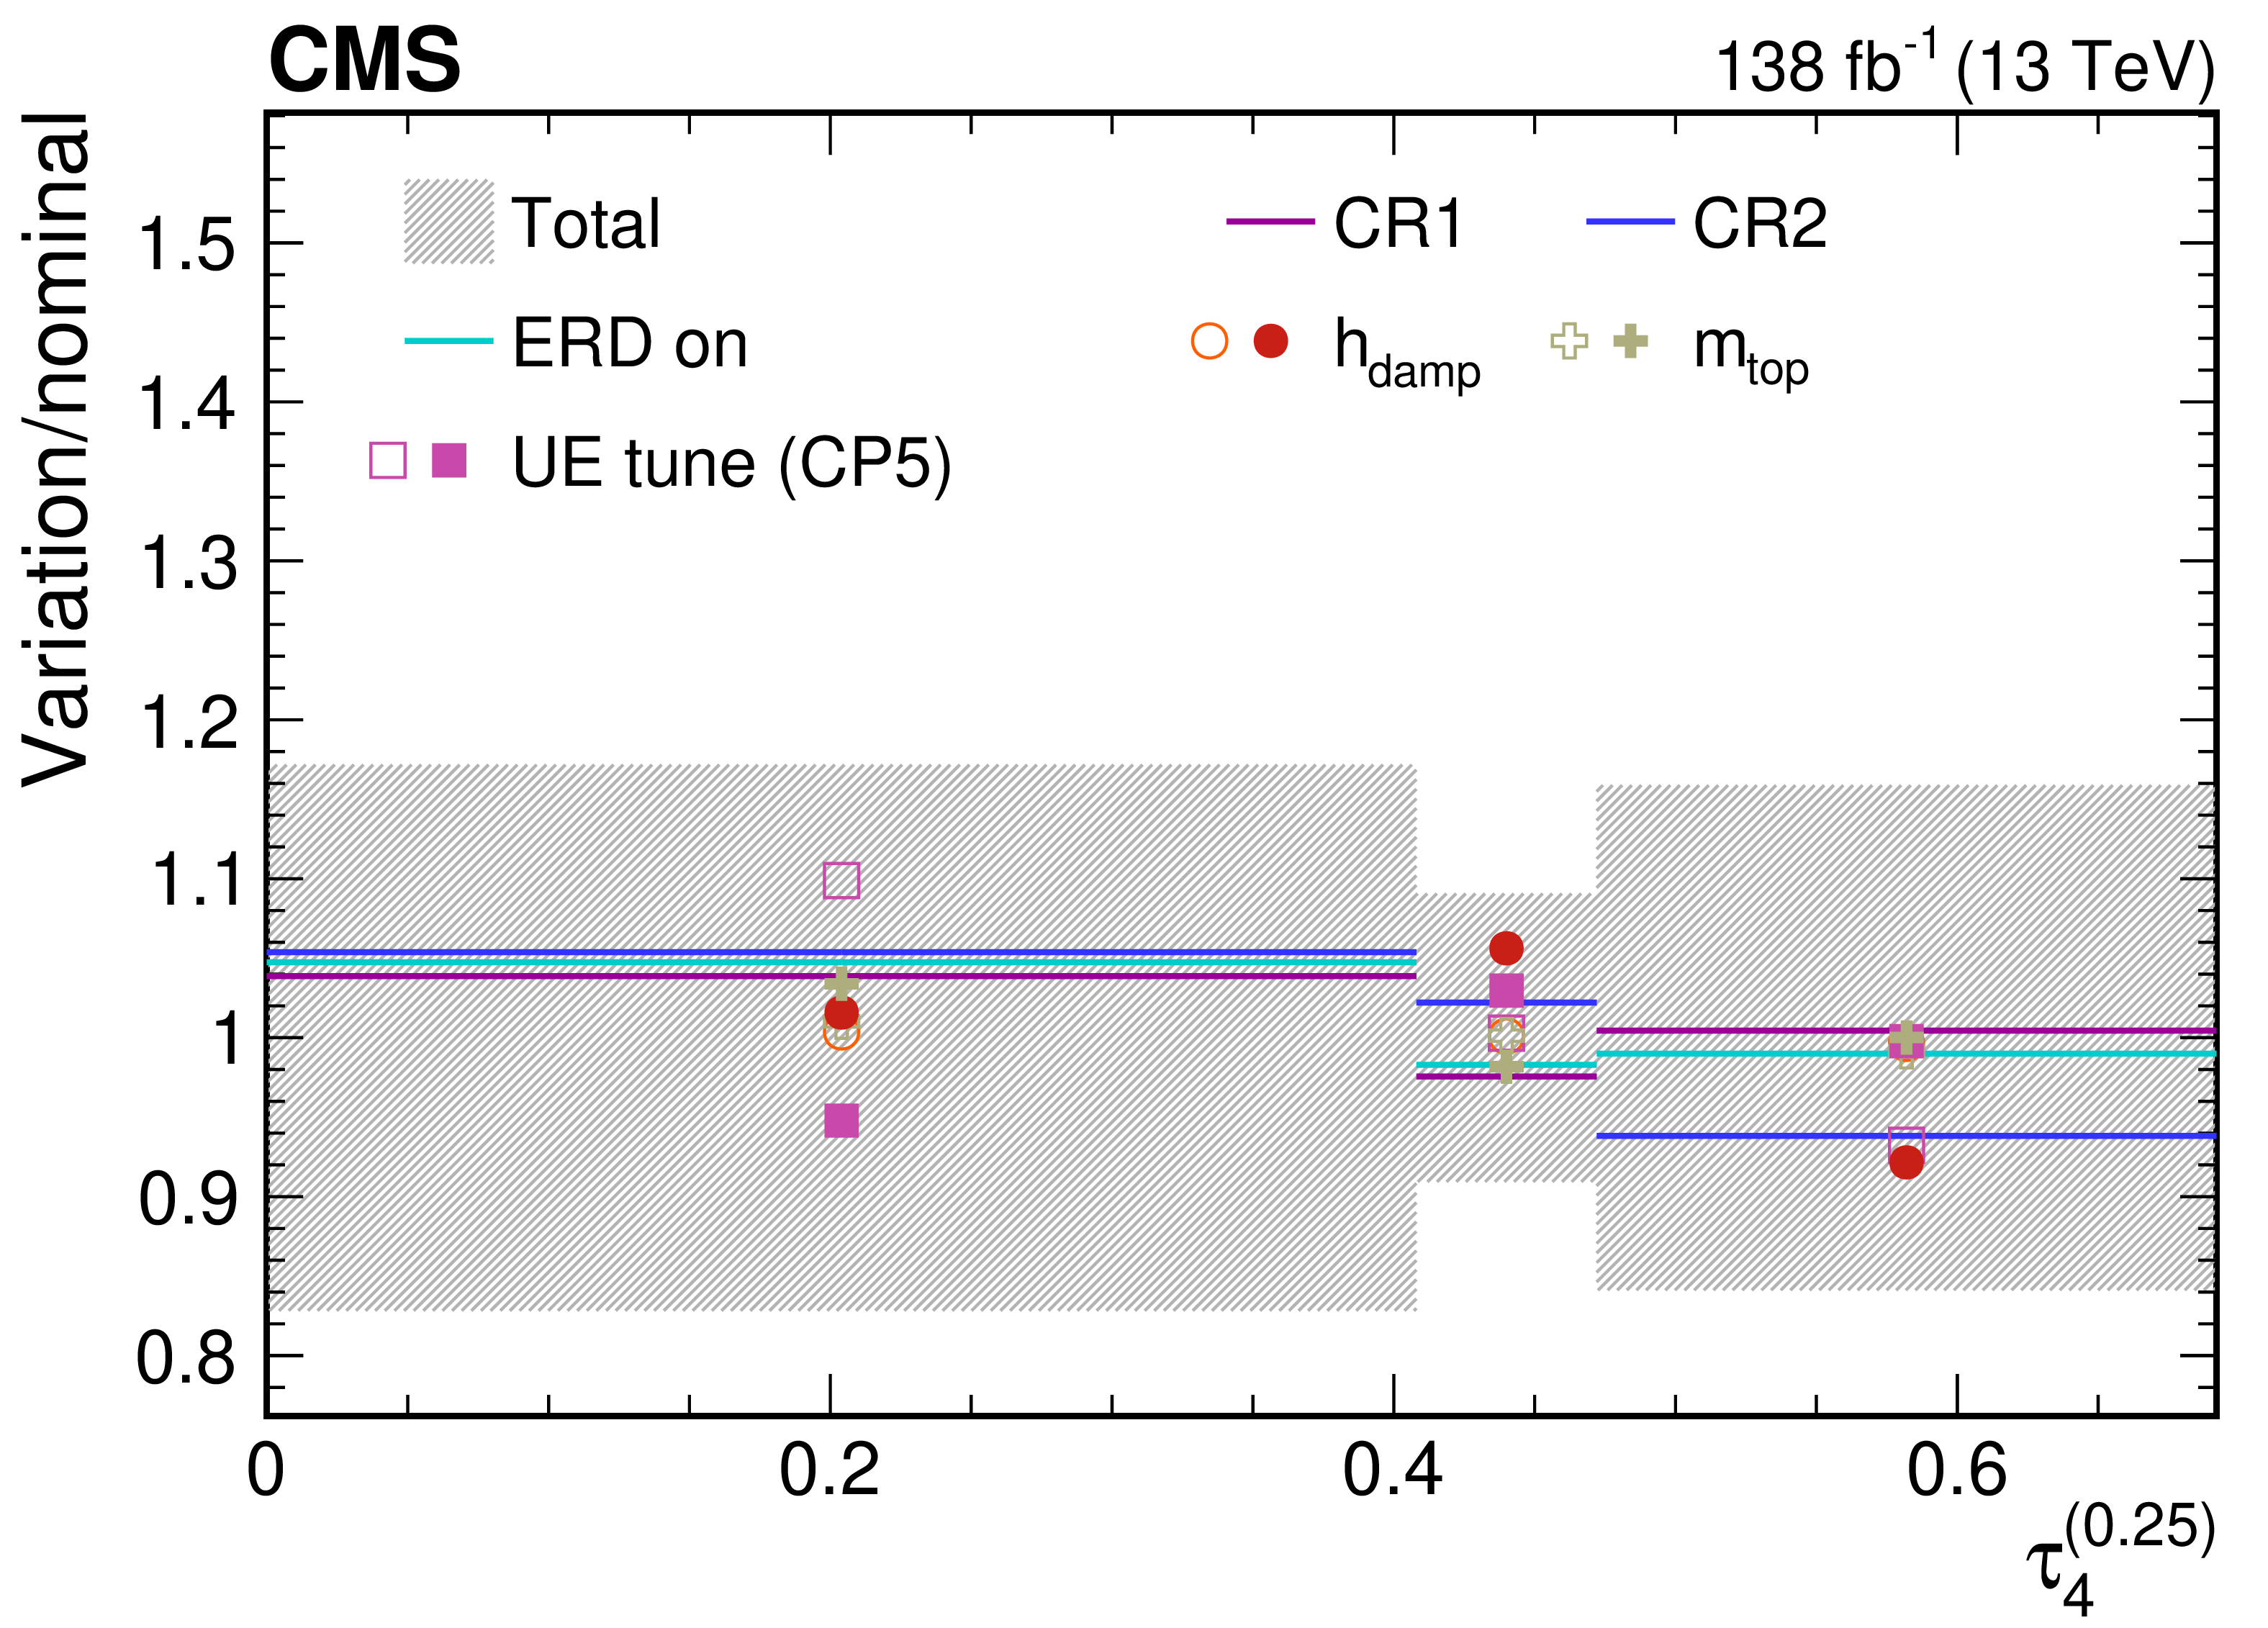
png pdf |
Figure 66-a:
Contributions from various theory model systematic variations to the normalized, unfolded distribution for $ \tau_4^{(\beta)} $ observables measured for AK8 jets passing the boosted top quark-enriched selection in $ \mu $+jets $ \mathrm{t} \overline{\mathrm{t}} $ events. The total unfolding uncertainty is indicated with the dark grey, hashed region, while the blue hashed region indicates the contributions from the input covariance matrix, which includes the propagated effects of the statistical uncertainties of the input data after background subtraction. Contributions from statistical uncertainties of the simulated sample used to construct the nominal response matrix are indicated with the dashed black line. The uncertainty contributions for different choices of colour reconnection models are illustrated as one-sided shifts compared to the nominal unfolding, and up (down) contributions from other sources are indicated with filled (open) markers of the same type and colour. |
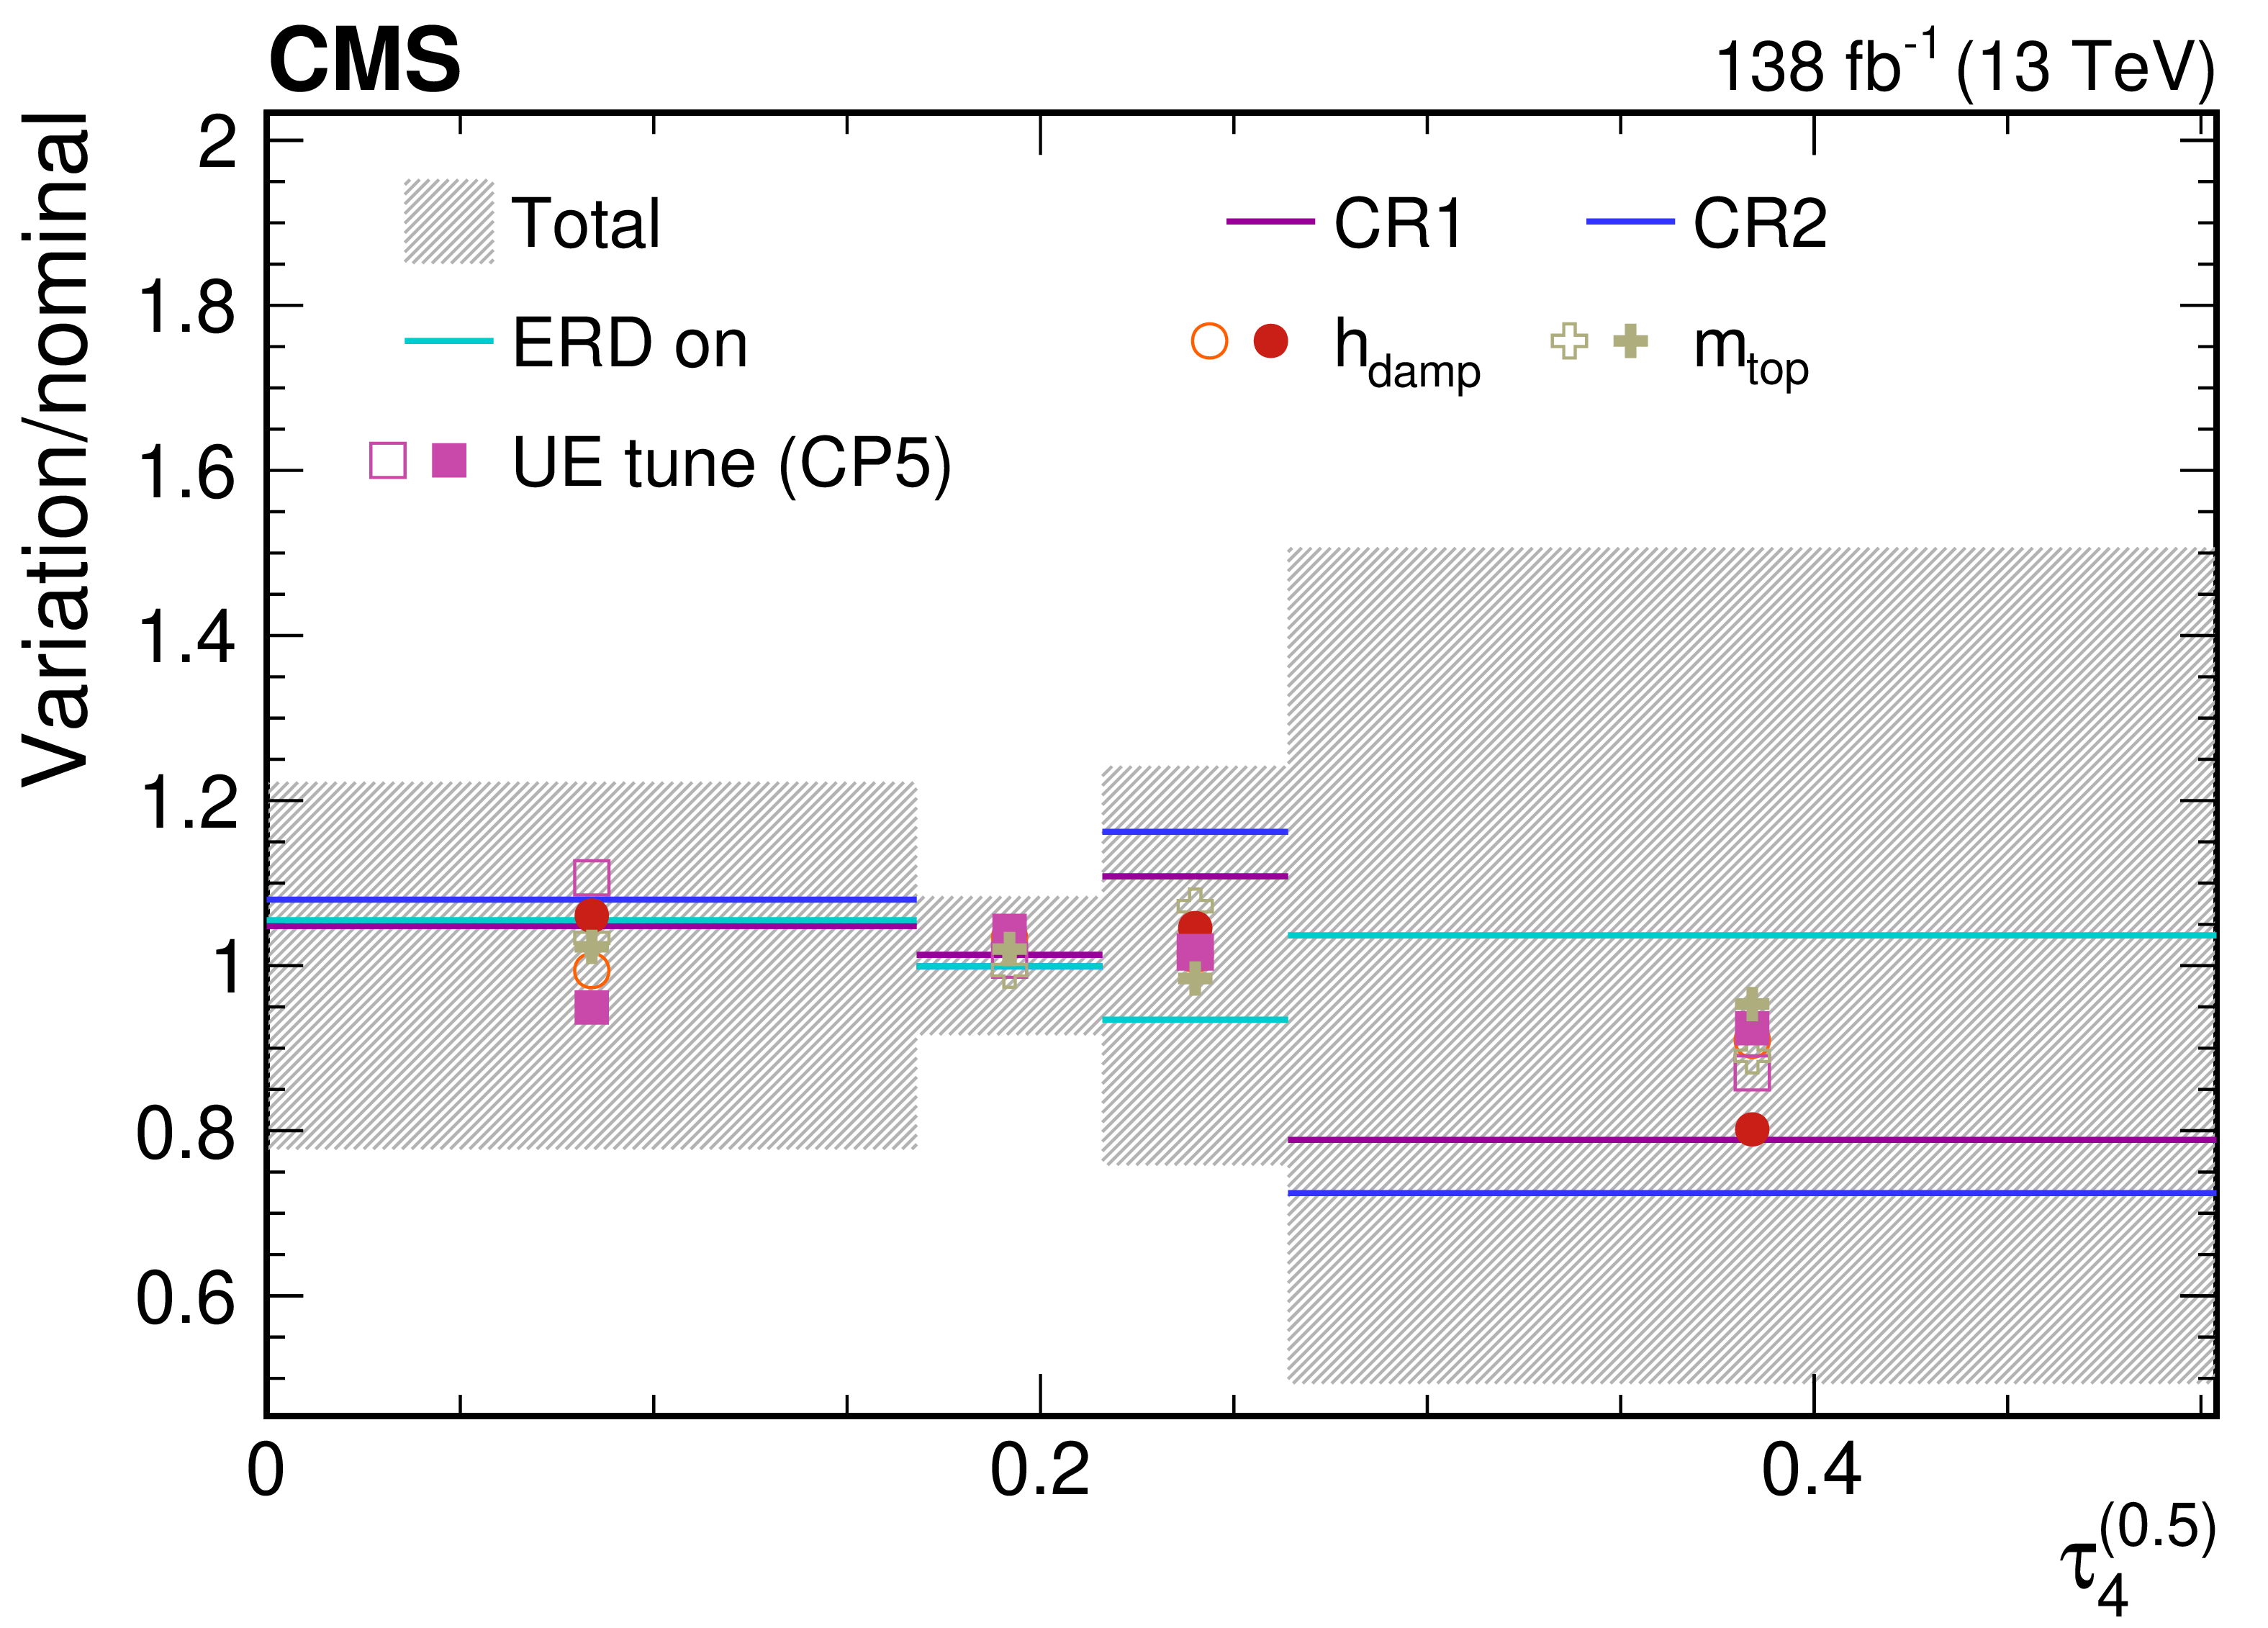
png pdf |
Figure 66-b:
Contributions from various theory model systematic variations to the normalized, unfolded distribution for $ \tau_4^{(\beta)} $ observables measured for AK8 jets passing the boosted top quark-enriched selection in $ \mu $+jets $ \mathrm{t} \overline{\mathrm{t}} $ events. The total unfolding uncertainty is indicated with the dark grey, hashed region, while the blue hashed region indicates the contributions from the input covariance matrix, which includes the propagated effects of the statistical uncertainties of the input data after background subtraction. Contributions from statistical uncertainties of the simulated sample used to construct the nominal response matrix are indicated with the dashed black line. The uncertainty contributions for different choices of colour reconnection models are illustrated as one-sided shifts compared to the nominal unfolding, and up (down) contributions from other sources are indicated with filled (open) markers of the same type and colour. |

png pdf |
Figure 66-c:
Contributions from various theory model systematic variations to the normalized, unfolded distribution for $ \tau_4^{(\beta)} $ observables measured for AK8 jets passing the boosted top quark-enriched selection in $ \mu $+jets $ \mathrm{t} \overline{\mathrm{t}} $ events. The total unfolding uncertainty is indicated with the dark grey, hashed region, while the blue hashed region indicates the contributions from the input covariance matrix, which includes the propagated effects of the statistical uncertainties of the input data after background subtraction. Contributions from statistical uncertainties of the simulated sample used to construct the nominal response matrix are indicated with the dashed black line. The uncertainty contributions for different choices of colour reconnection models are illustrated as one-sided shifts compared to the nominal unfolding, and up (down) contributions from other sources are indicated with filled (open) markers of the same type and colour. |
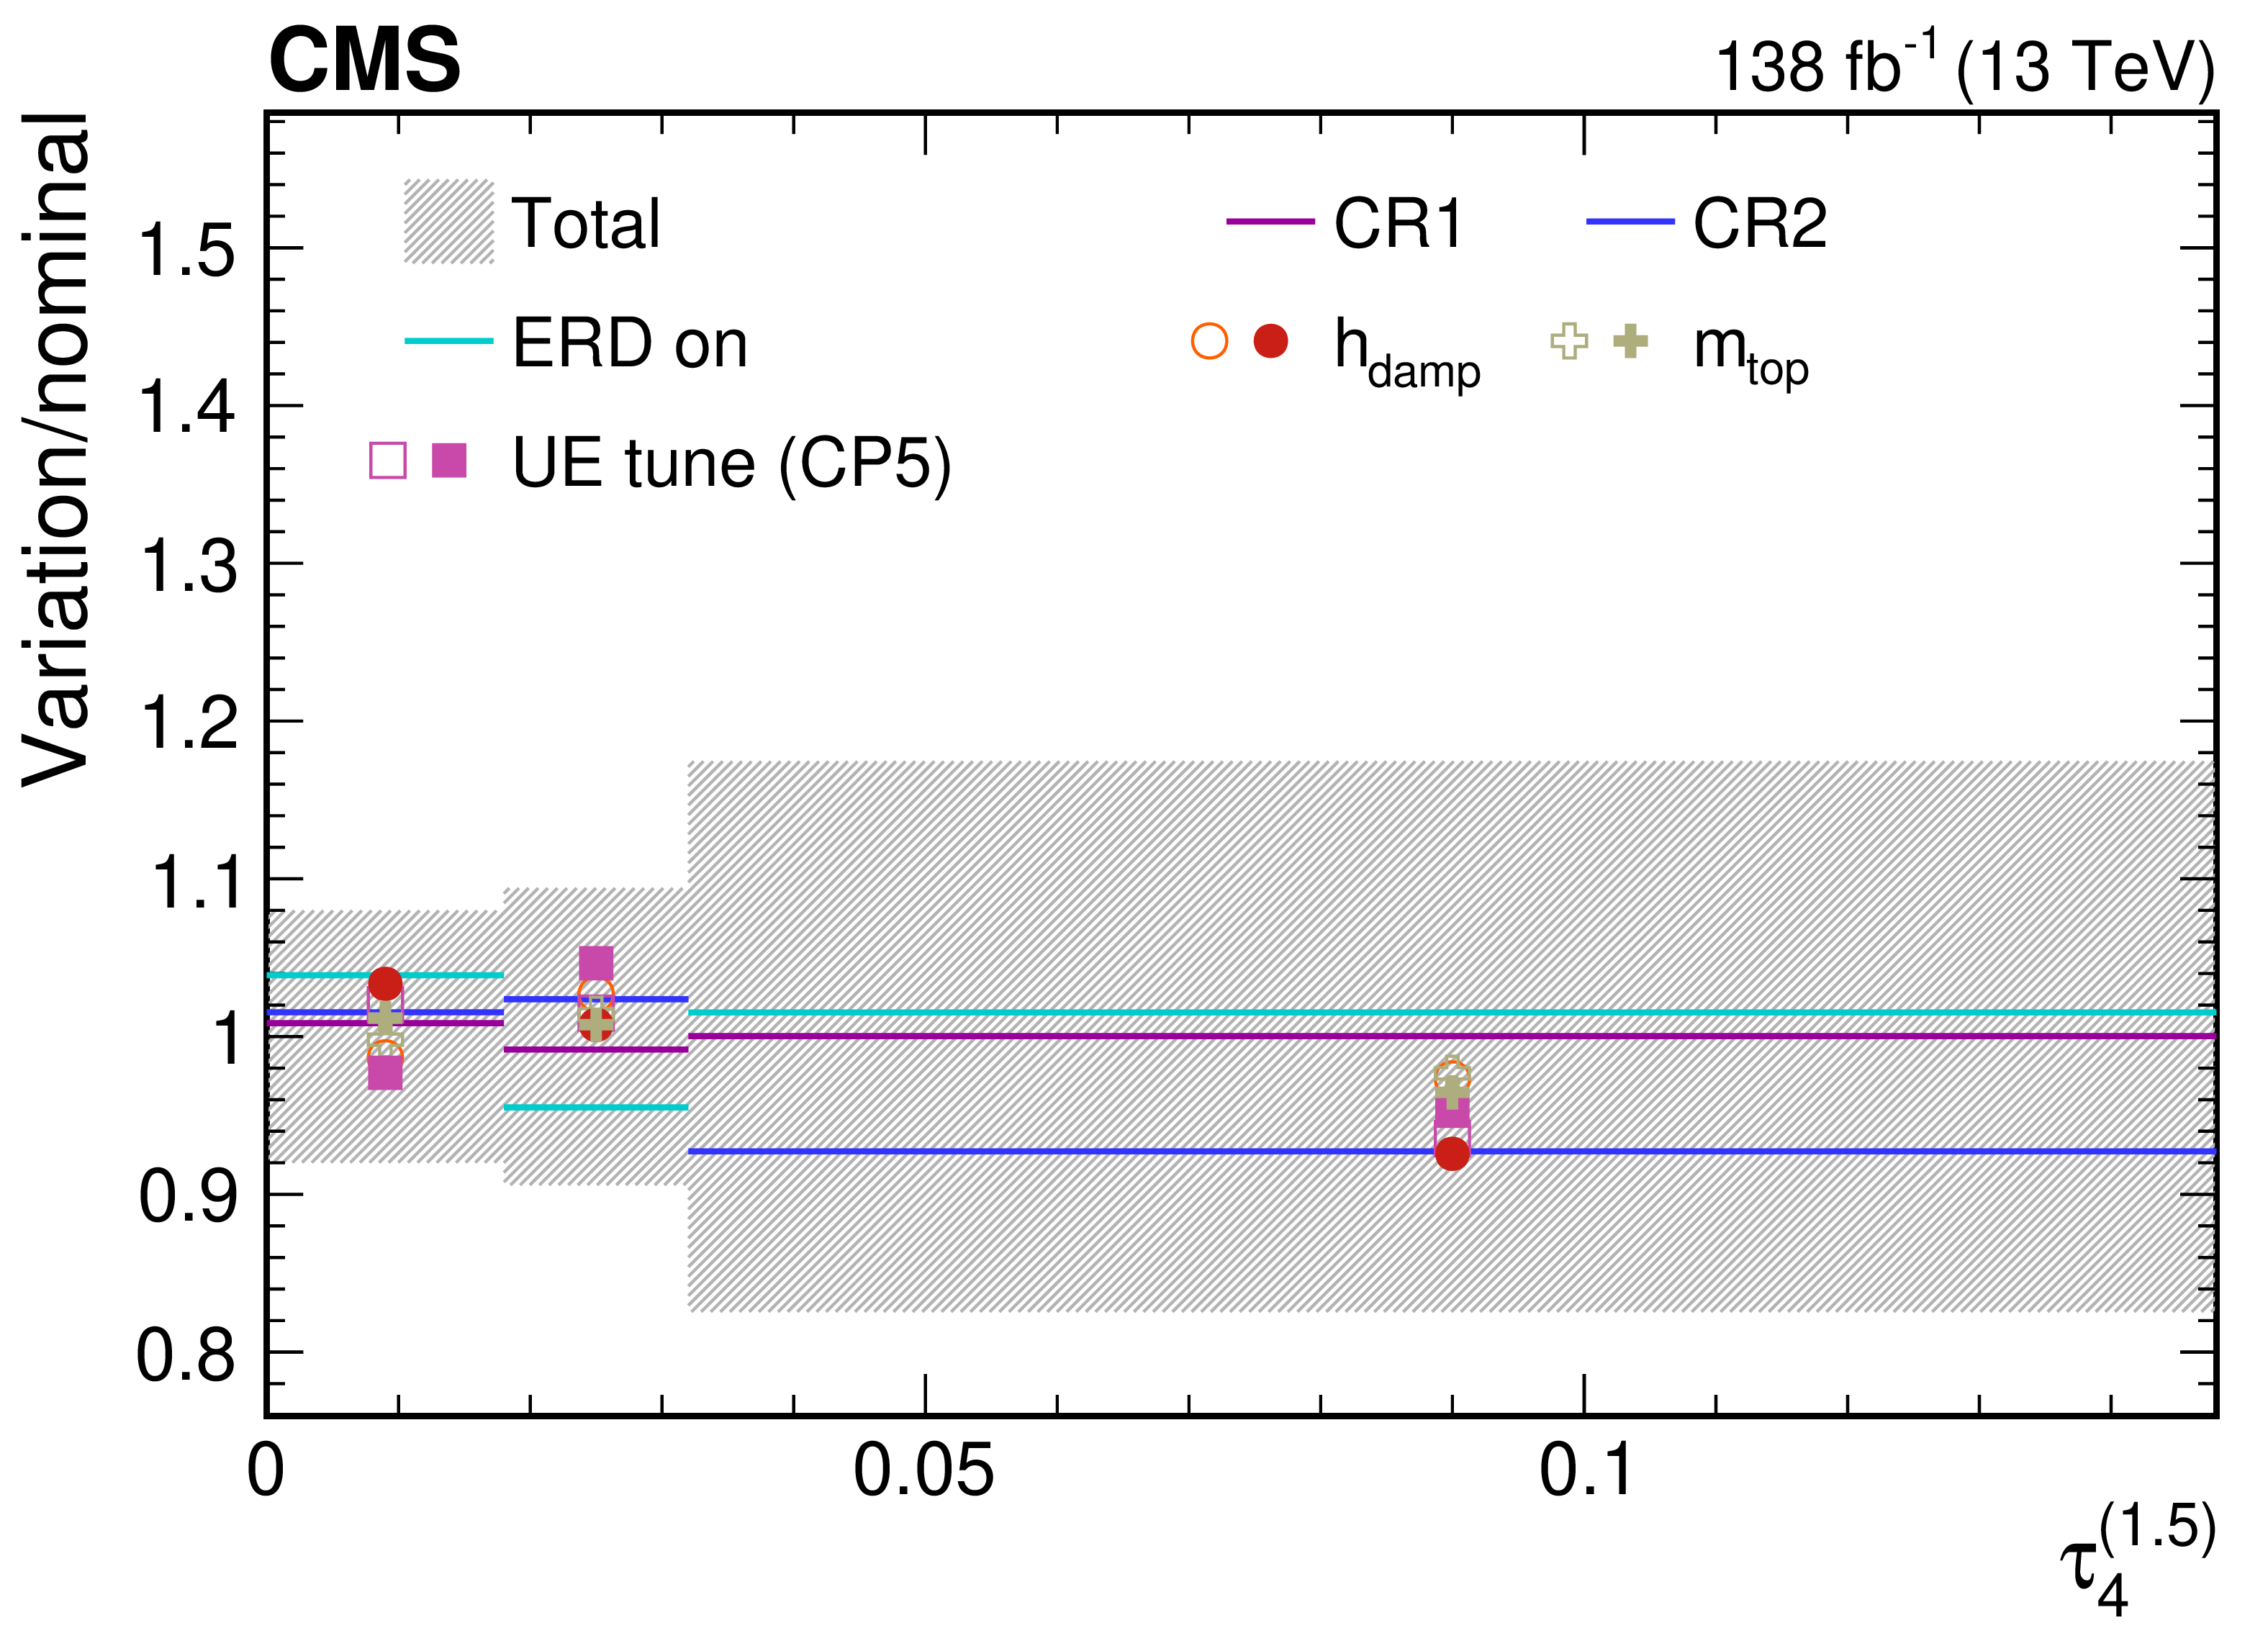
png pdf |
Figure 66-d:
Contributions from various theory model systematic variations to the normalized, unfolded distribution for $ \tau_4^{(\beta)} $ observables measured for AK8 jets passing the boosted top quark-enriched selection in $ \mu $+jets $ \mathrm{t} \overline{\mathrm{t}} $ events. The total unfolding uncertainty is indicated with the dark grey, hashed region, while the blue hashed region indicates the contributions from the input covariance matrix, which includes the propagated effects of the statistical uncertainties of the input data after background subtraction. Contributions from statistical uncertainties of the simulated sample used to construct the nominal response matrix are indicated with the dashed black line. The uncertainty contributions for different choices of colour reconnection models are illustrated as one-sided shifts compared to the nominal unfolding, and up (down) contributions from other sources are indicated with filled (open) markers of the same type and colour. |
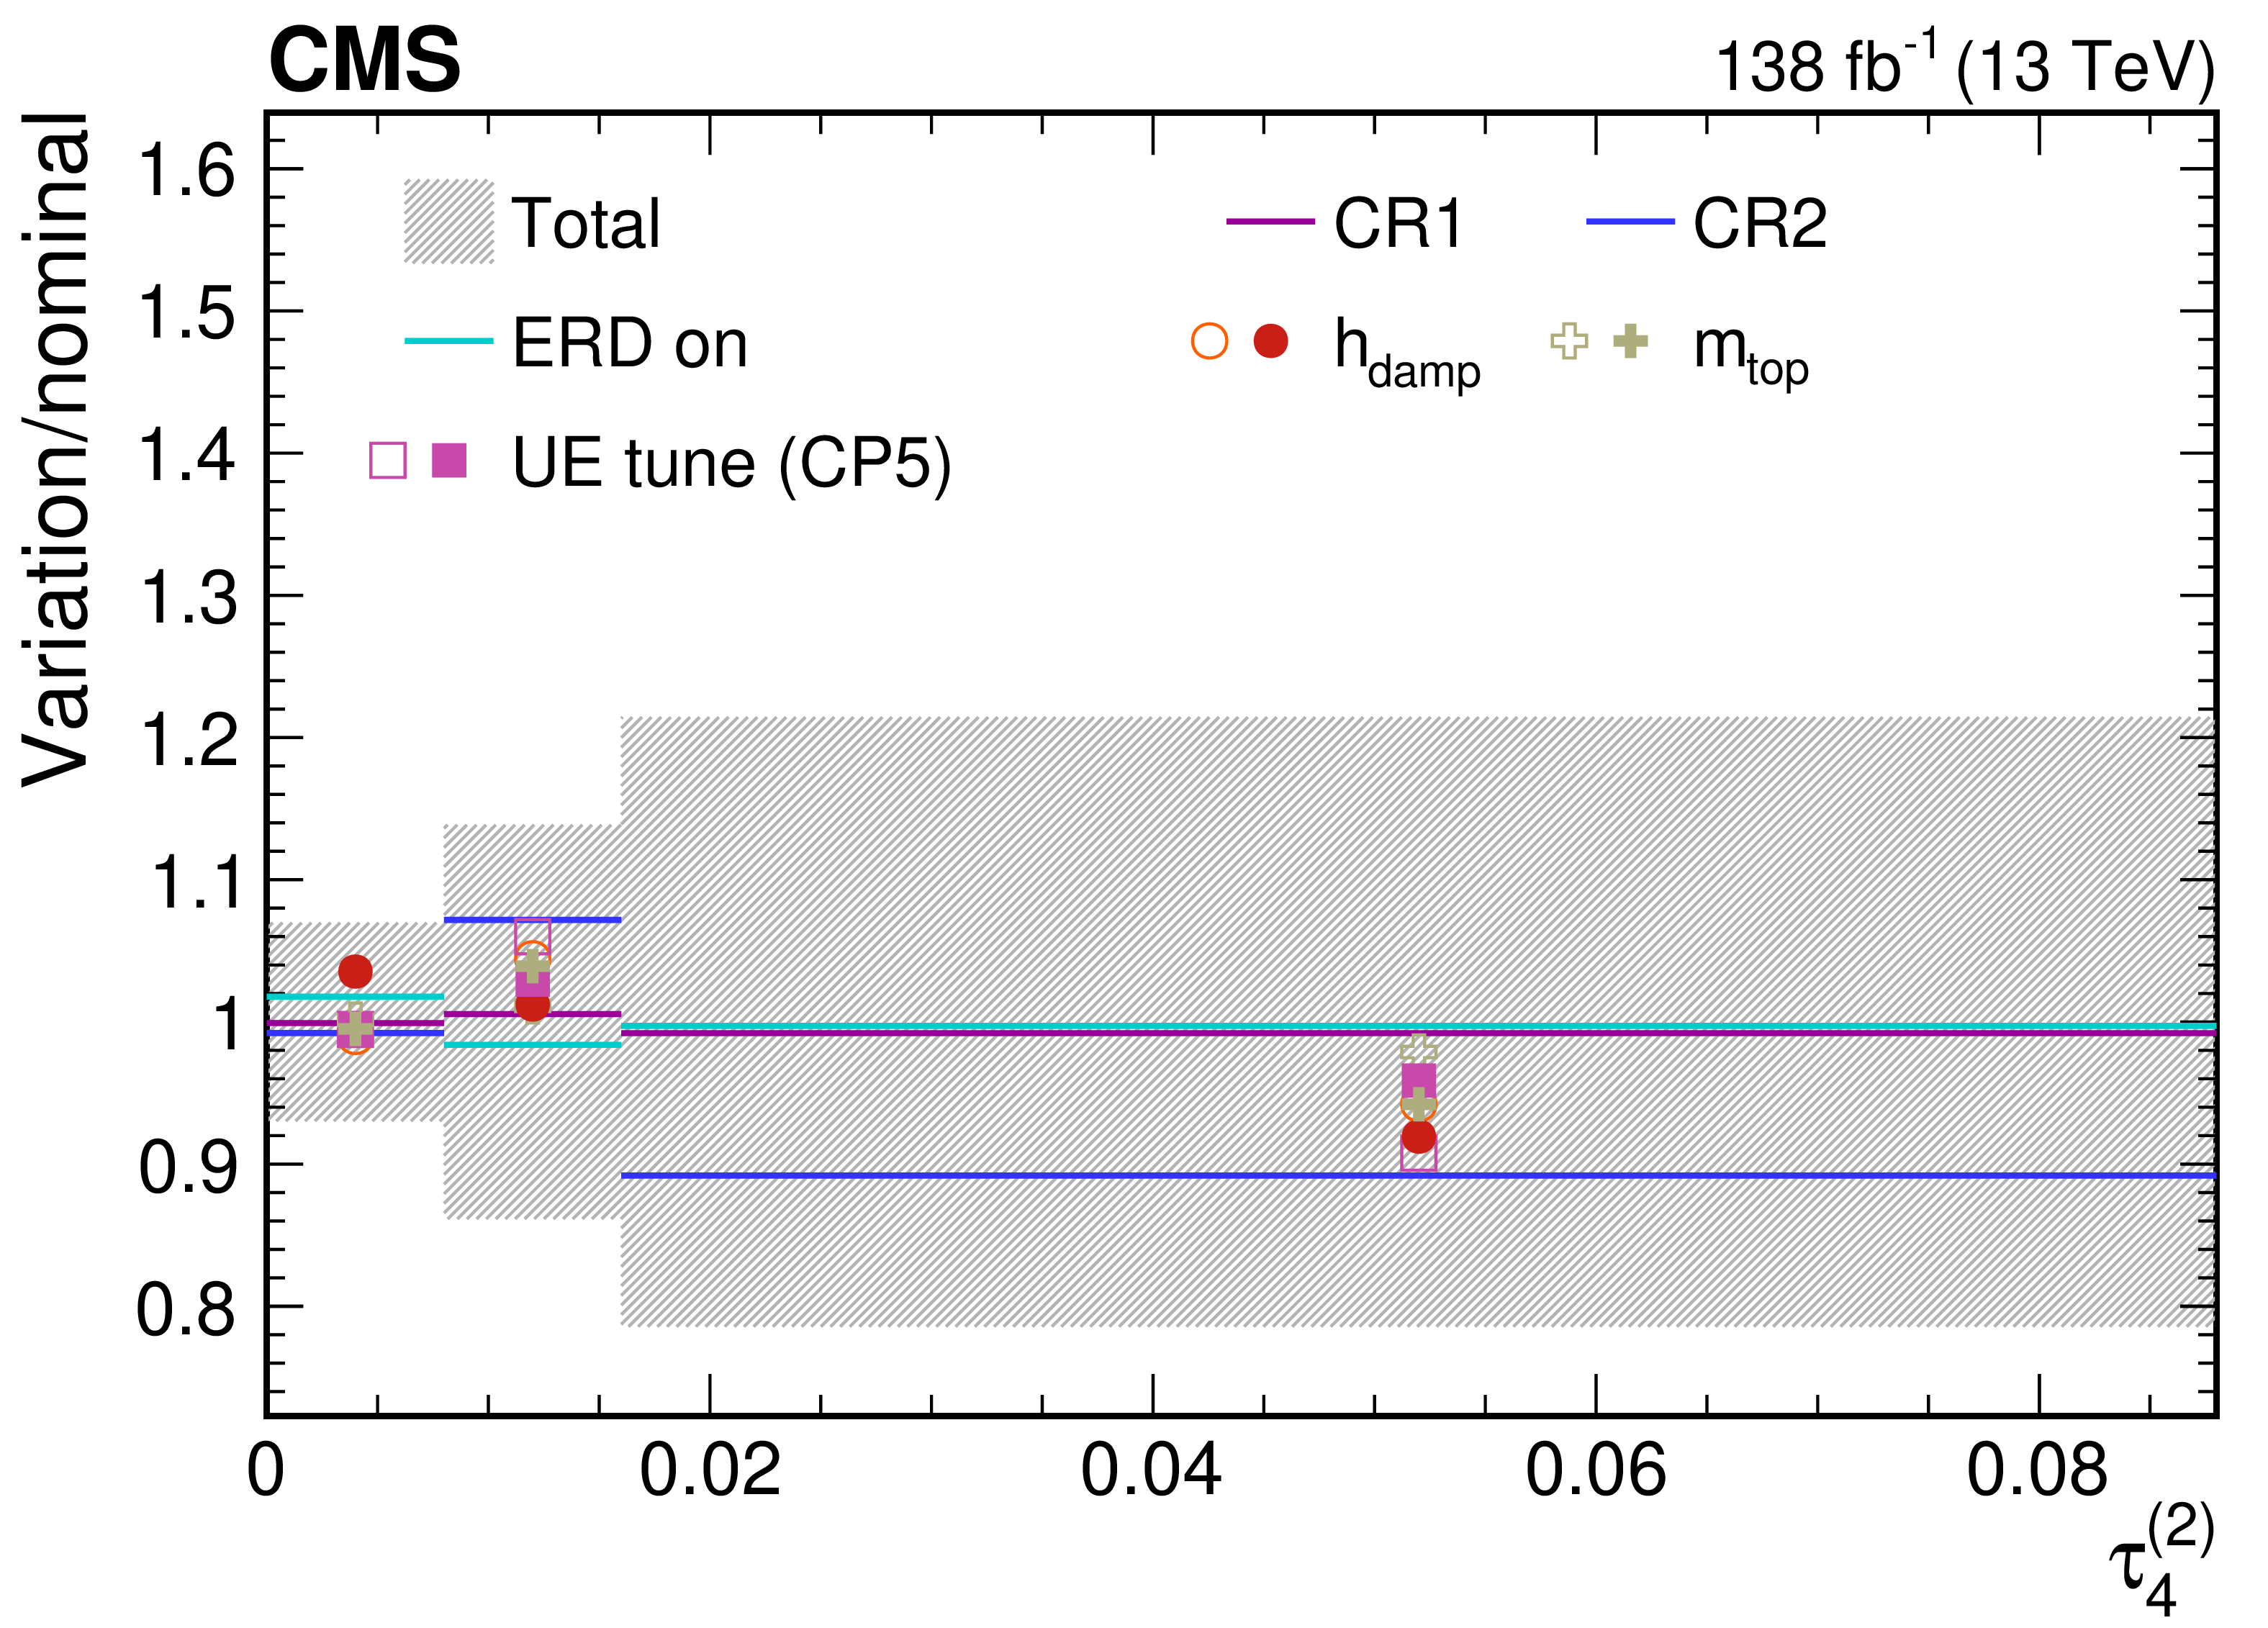
png pdf |
Figure 66-e:
Contributions from various theory model systematic variations to the normalized, unfolded distribution for $ \tau_4^{(\beta)} $ observables measured for AK8 jets passing the boosted top quark-enriched selection in $ \mu $+jets $ \mathrm{t} \overline{\mathrm{t}} $ events. The total unfolding uncertainty is indicated with the dark grey, hashed region, while the blue hashed region indicates the contributions from the input covariance matrix, which includes the propagated effects of the statistical uncertainties of the input data after background subtraction. Contributions from statistical uncertainties of the simulated sample used to construct the nominal response matrix are indicated with the dashed black line. The uncertainty contributions for different choices of colour reconnection models are illustrated as one-sided shifts compared to the nominal unfolding, and up (down) contributions from other sources are indicated with filled (open) markers of the same type and colour. |
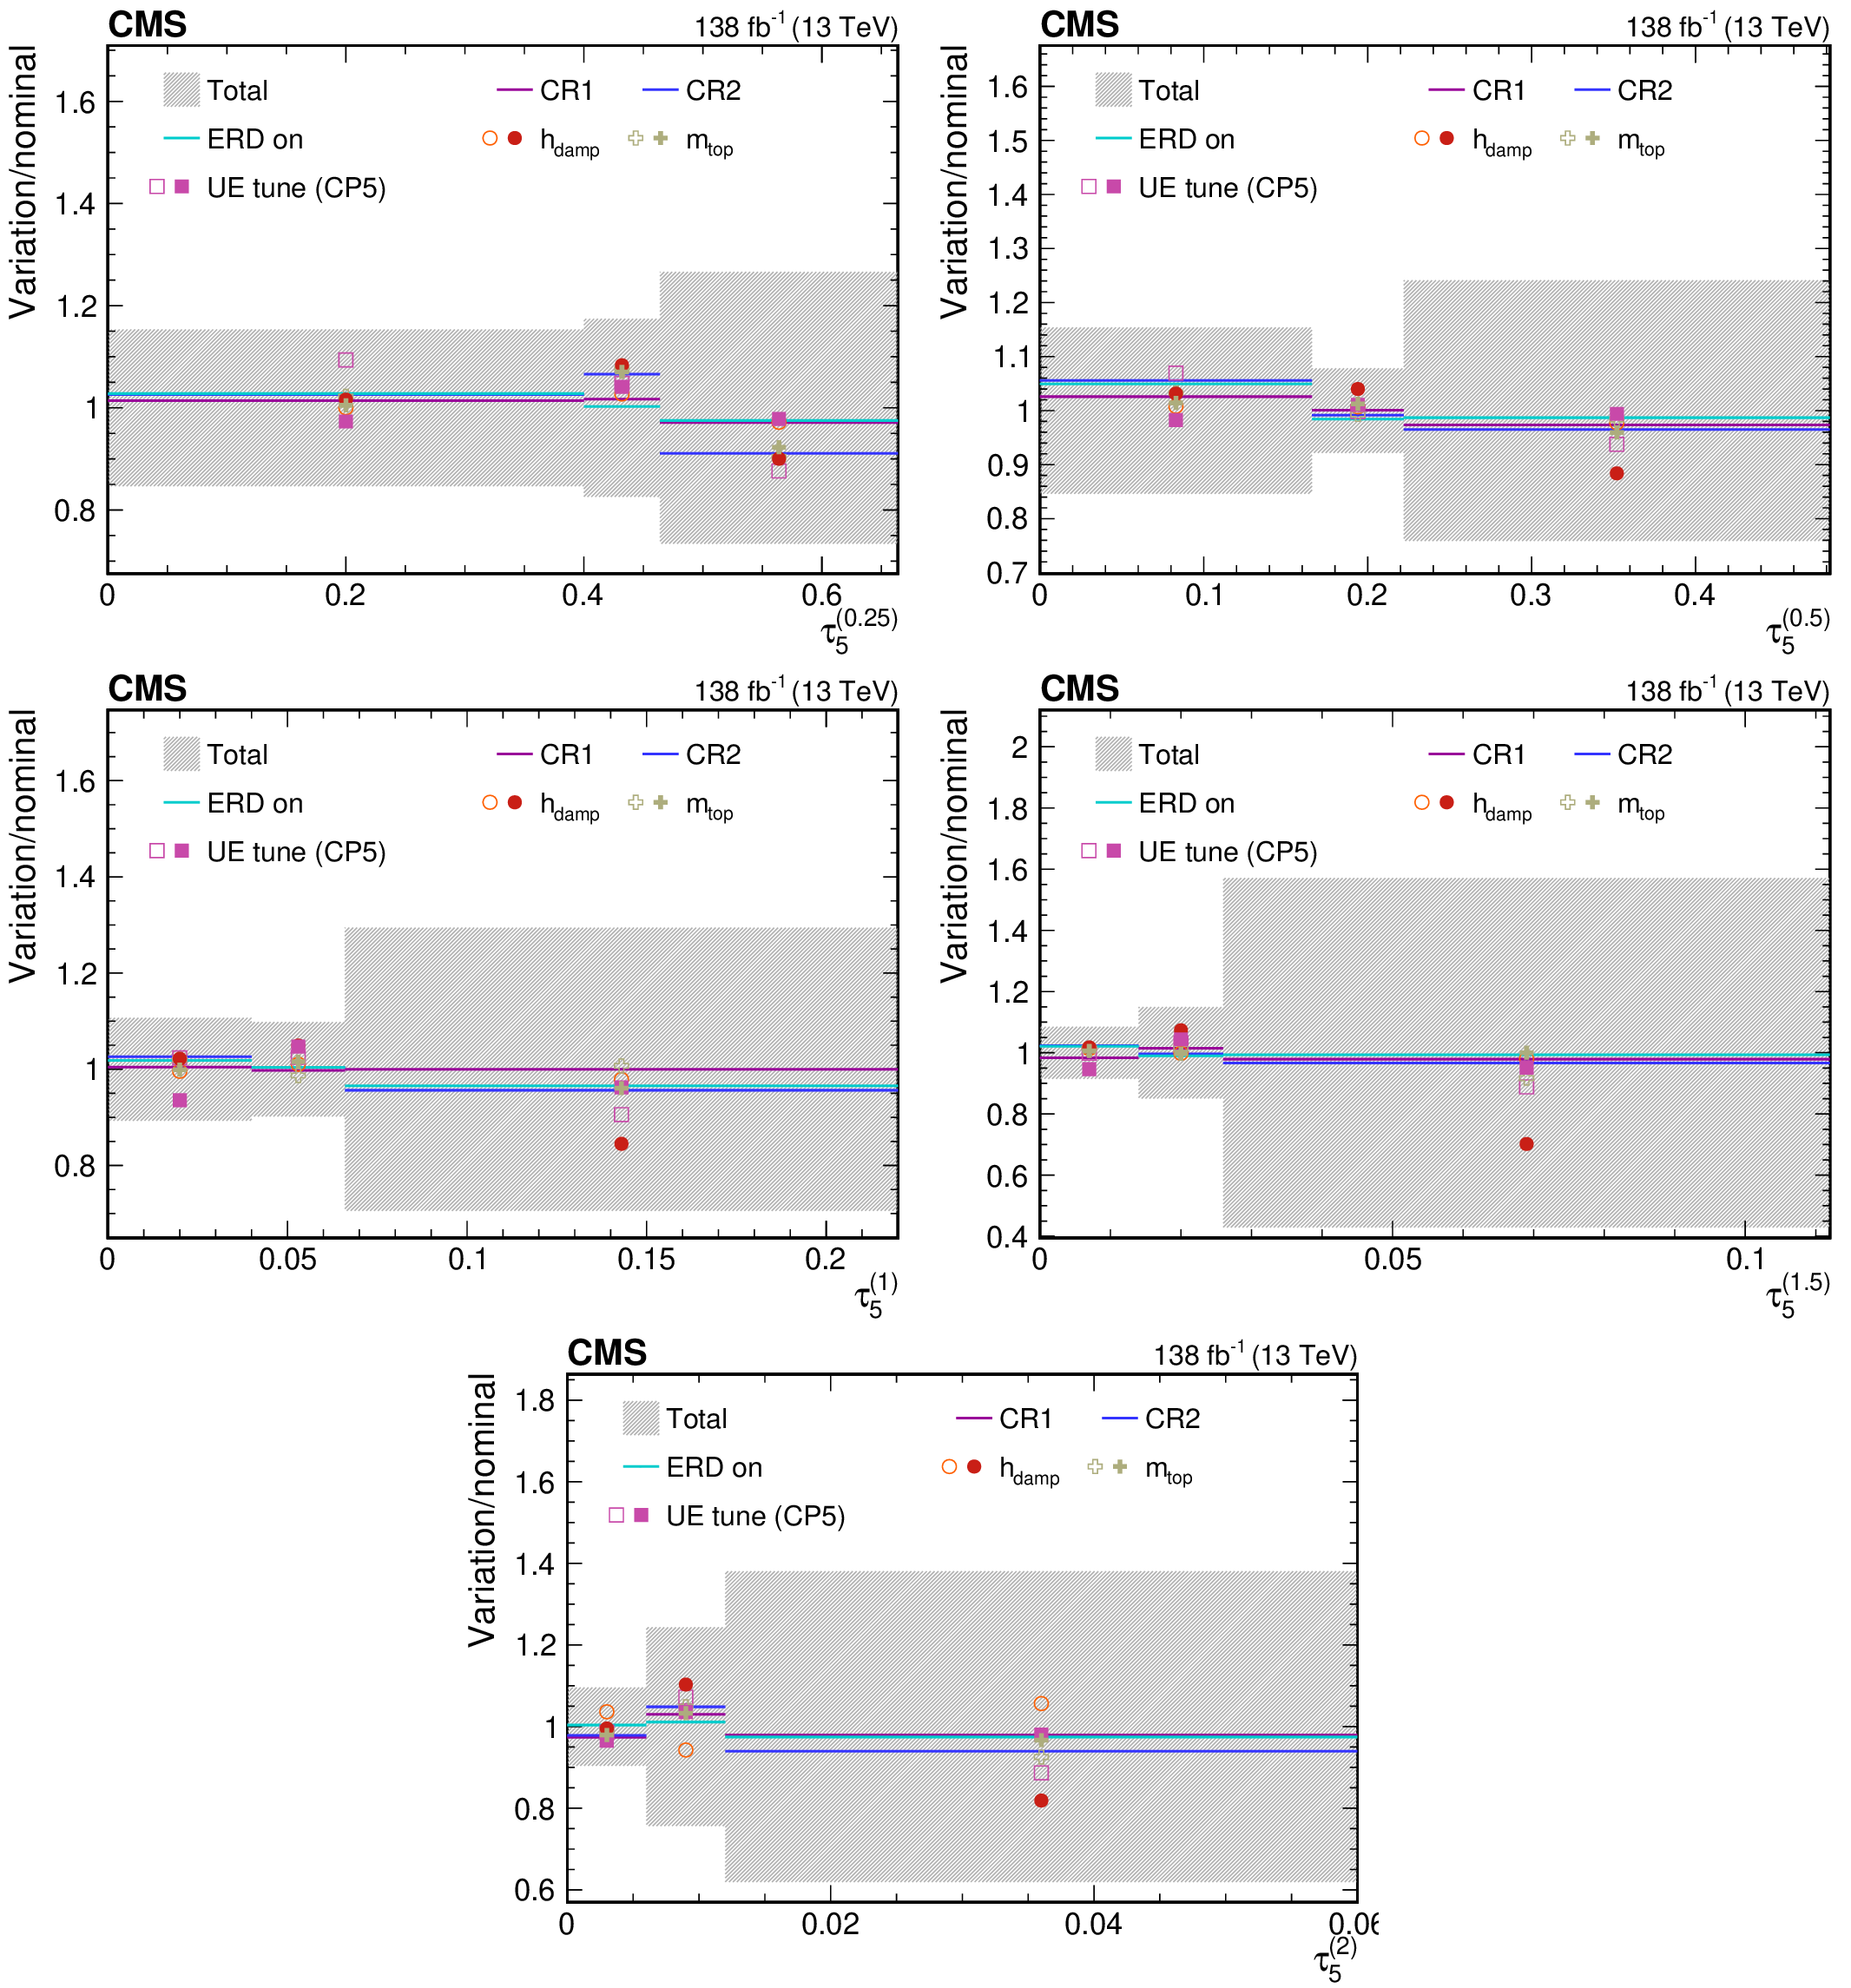
png pdf |
Figure 67:
Contributions from various theory model systematic variations to the normalized, unfolded distribution for $ \tau_5^{(\beta)} $ observables measured for AK8 jets passing the boosted top quark-enriched selection in $ \mu $+jets $ \mathrm{t} \overline{\mathrm{t}} $ events. The total unfolding uncertainty is indicated with the dark grey, hashed region, while the blue hashed region indicates the contributions from the input covariance matrix, which includes the propagated effects of the statistical uncertainties of the input data after background subtraction. Contributions from statistical uncertainties of the simulated sample used to construct the nominal response matrix are indicated with the dashed black line. The uncertainty contributions for different choices of colour reconnection models are illustrated as one-sided shifts compared to the nominal unfolding, and up (down) contributions from other sources are indicated with filled (open) markers of the same type and colour. |
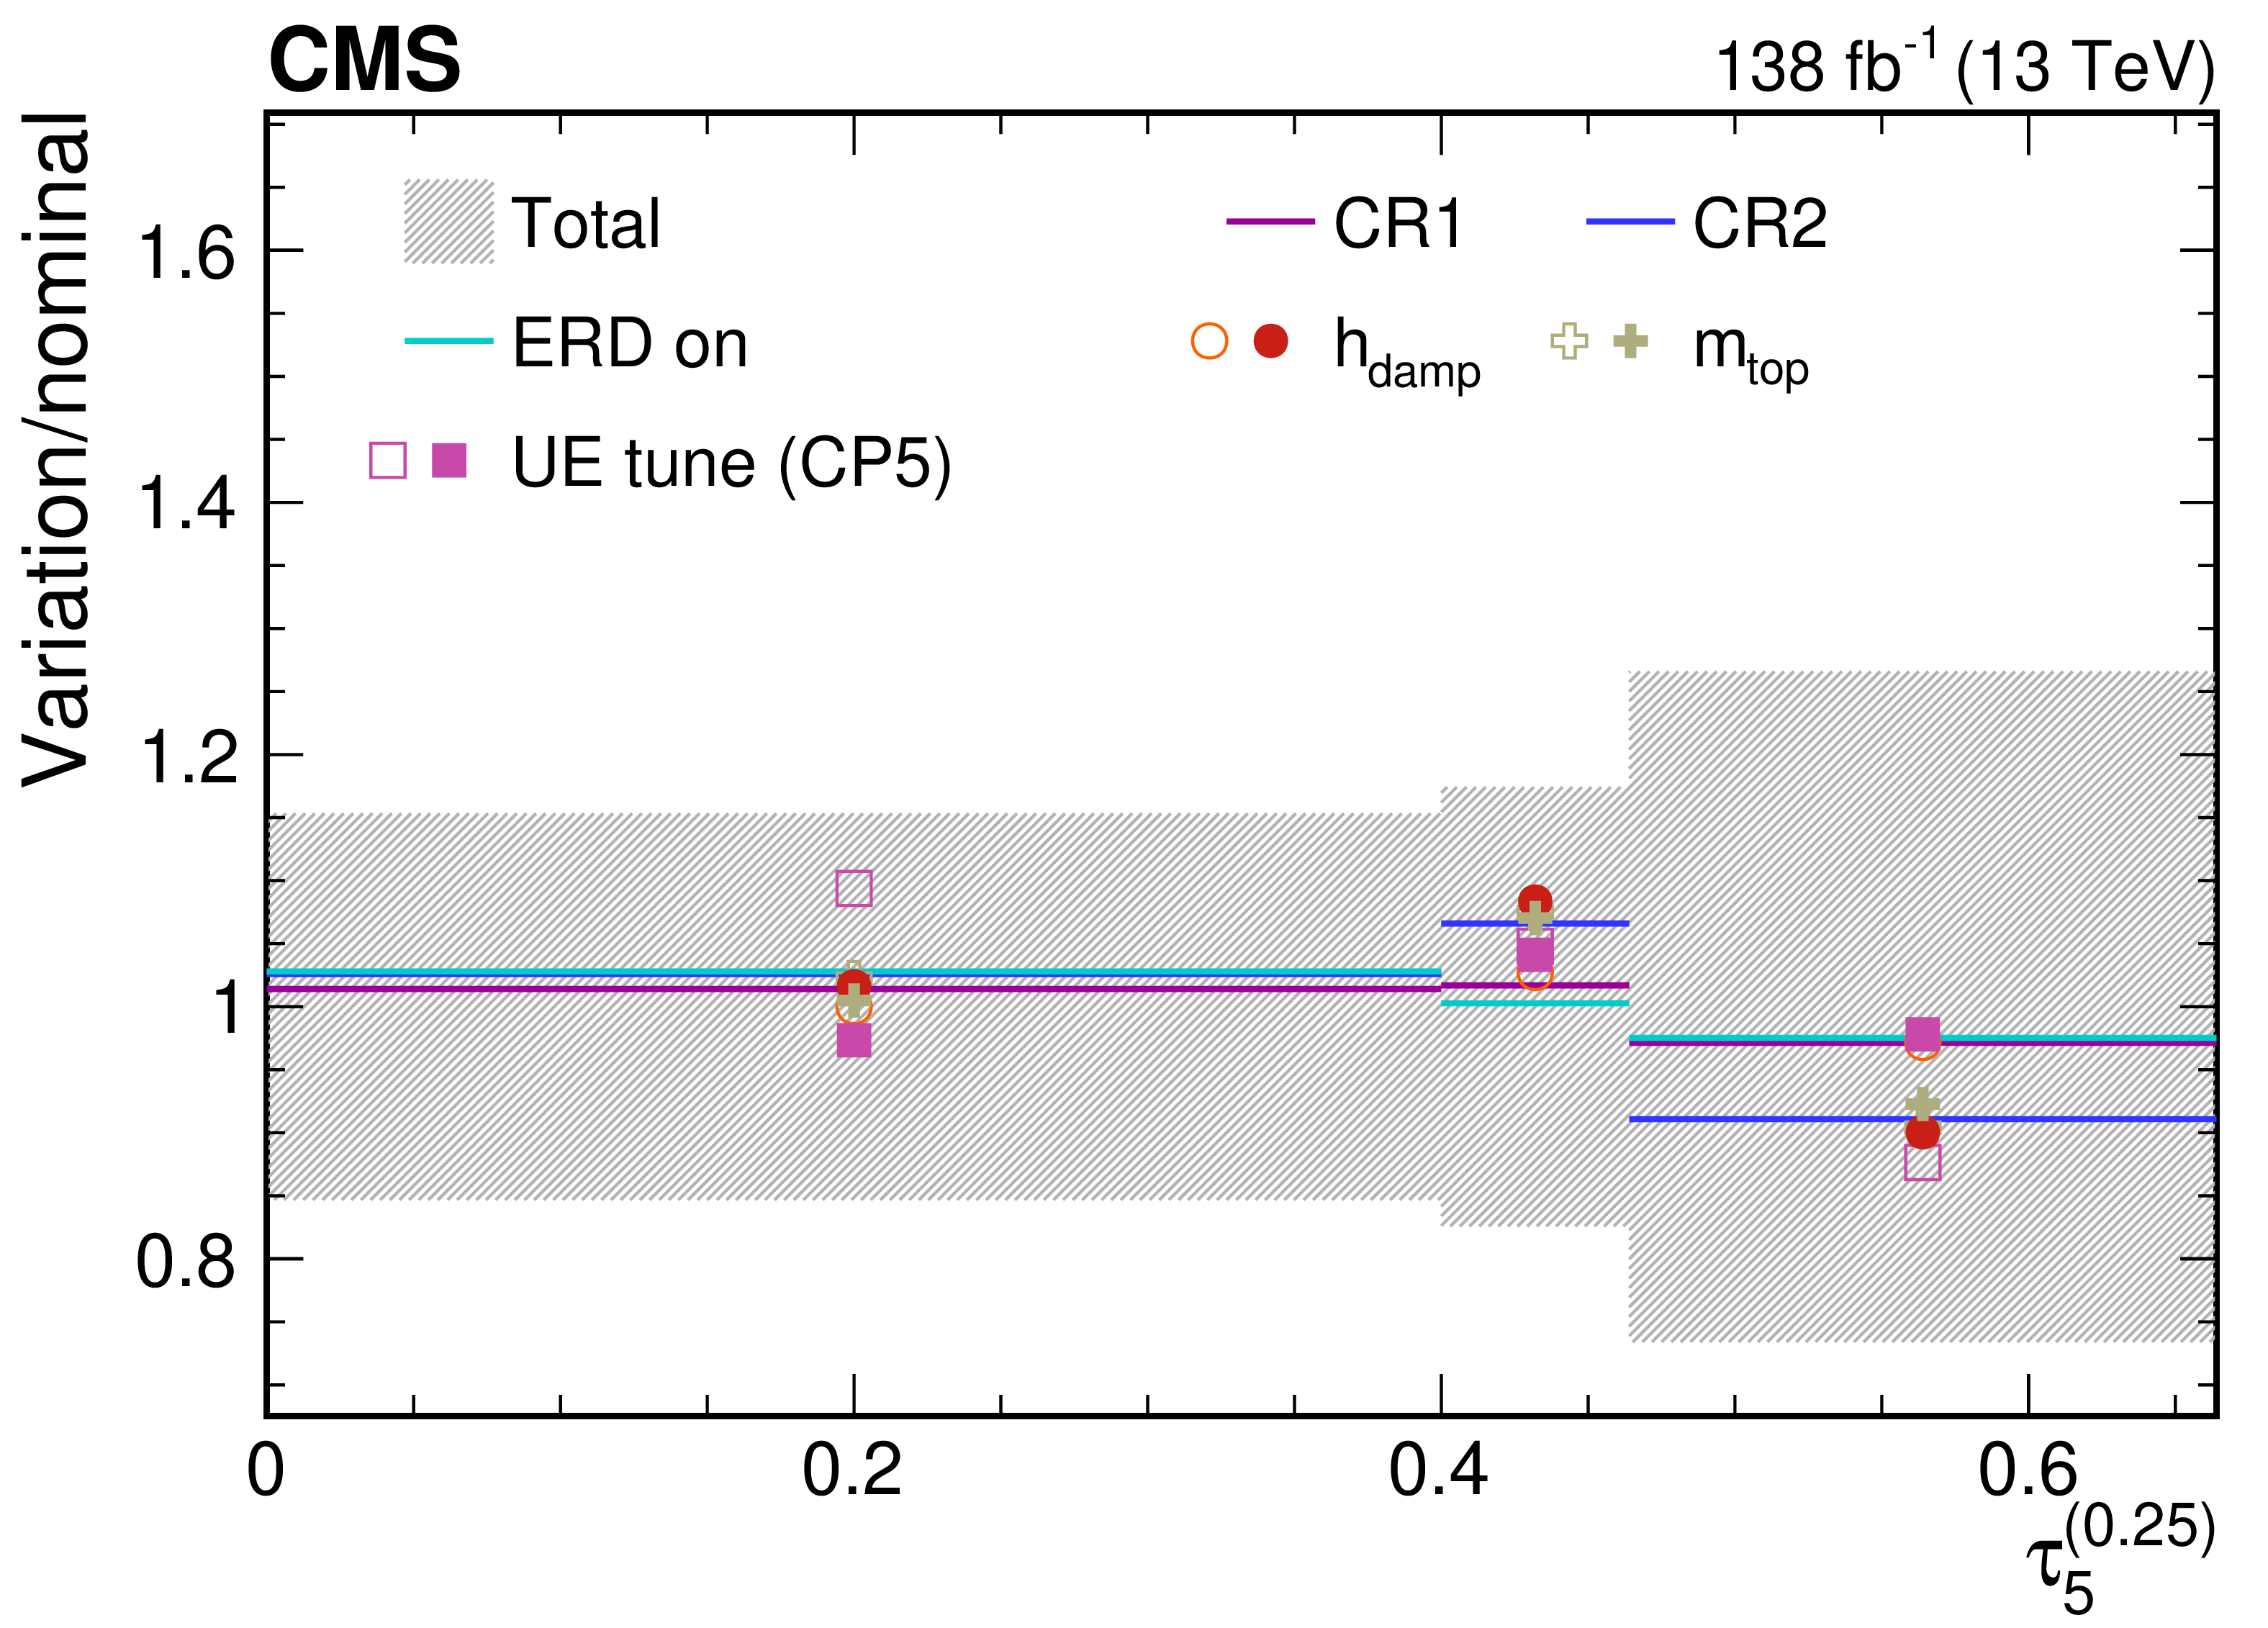
png pdf |
Figure 67-a:
Contributions from various theory model systematic variations to the normalized, unfolded distribution for $ \tau_5^{(\beta)} $ observables measured for AK8 jets passing the boosted top quark-enriched selection in $ \mu $+jets $ \mathrm{t} \overline{\mathrm{t}} $ events. The total unfolding uncertainty is indicated with the dark grey, hashed region, while the blue hashed region indicates the contributions from the input covariance matrix, which includes the propagated effects of the statistical uncertainties of the input data after background subtraction. Contributions from statistical uncertainties of the simulated sample used to construct the nominal response matrix are indicated with the dashed black line. The uncertainty contributions for different choices of colour reconnection models are illustrated as one-sided shifts compared to the nominal unfolding, and up (down) contributions from other sources are indicated with filled (open) markers of the same type and colour. |
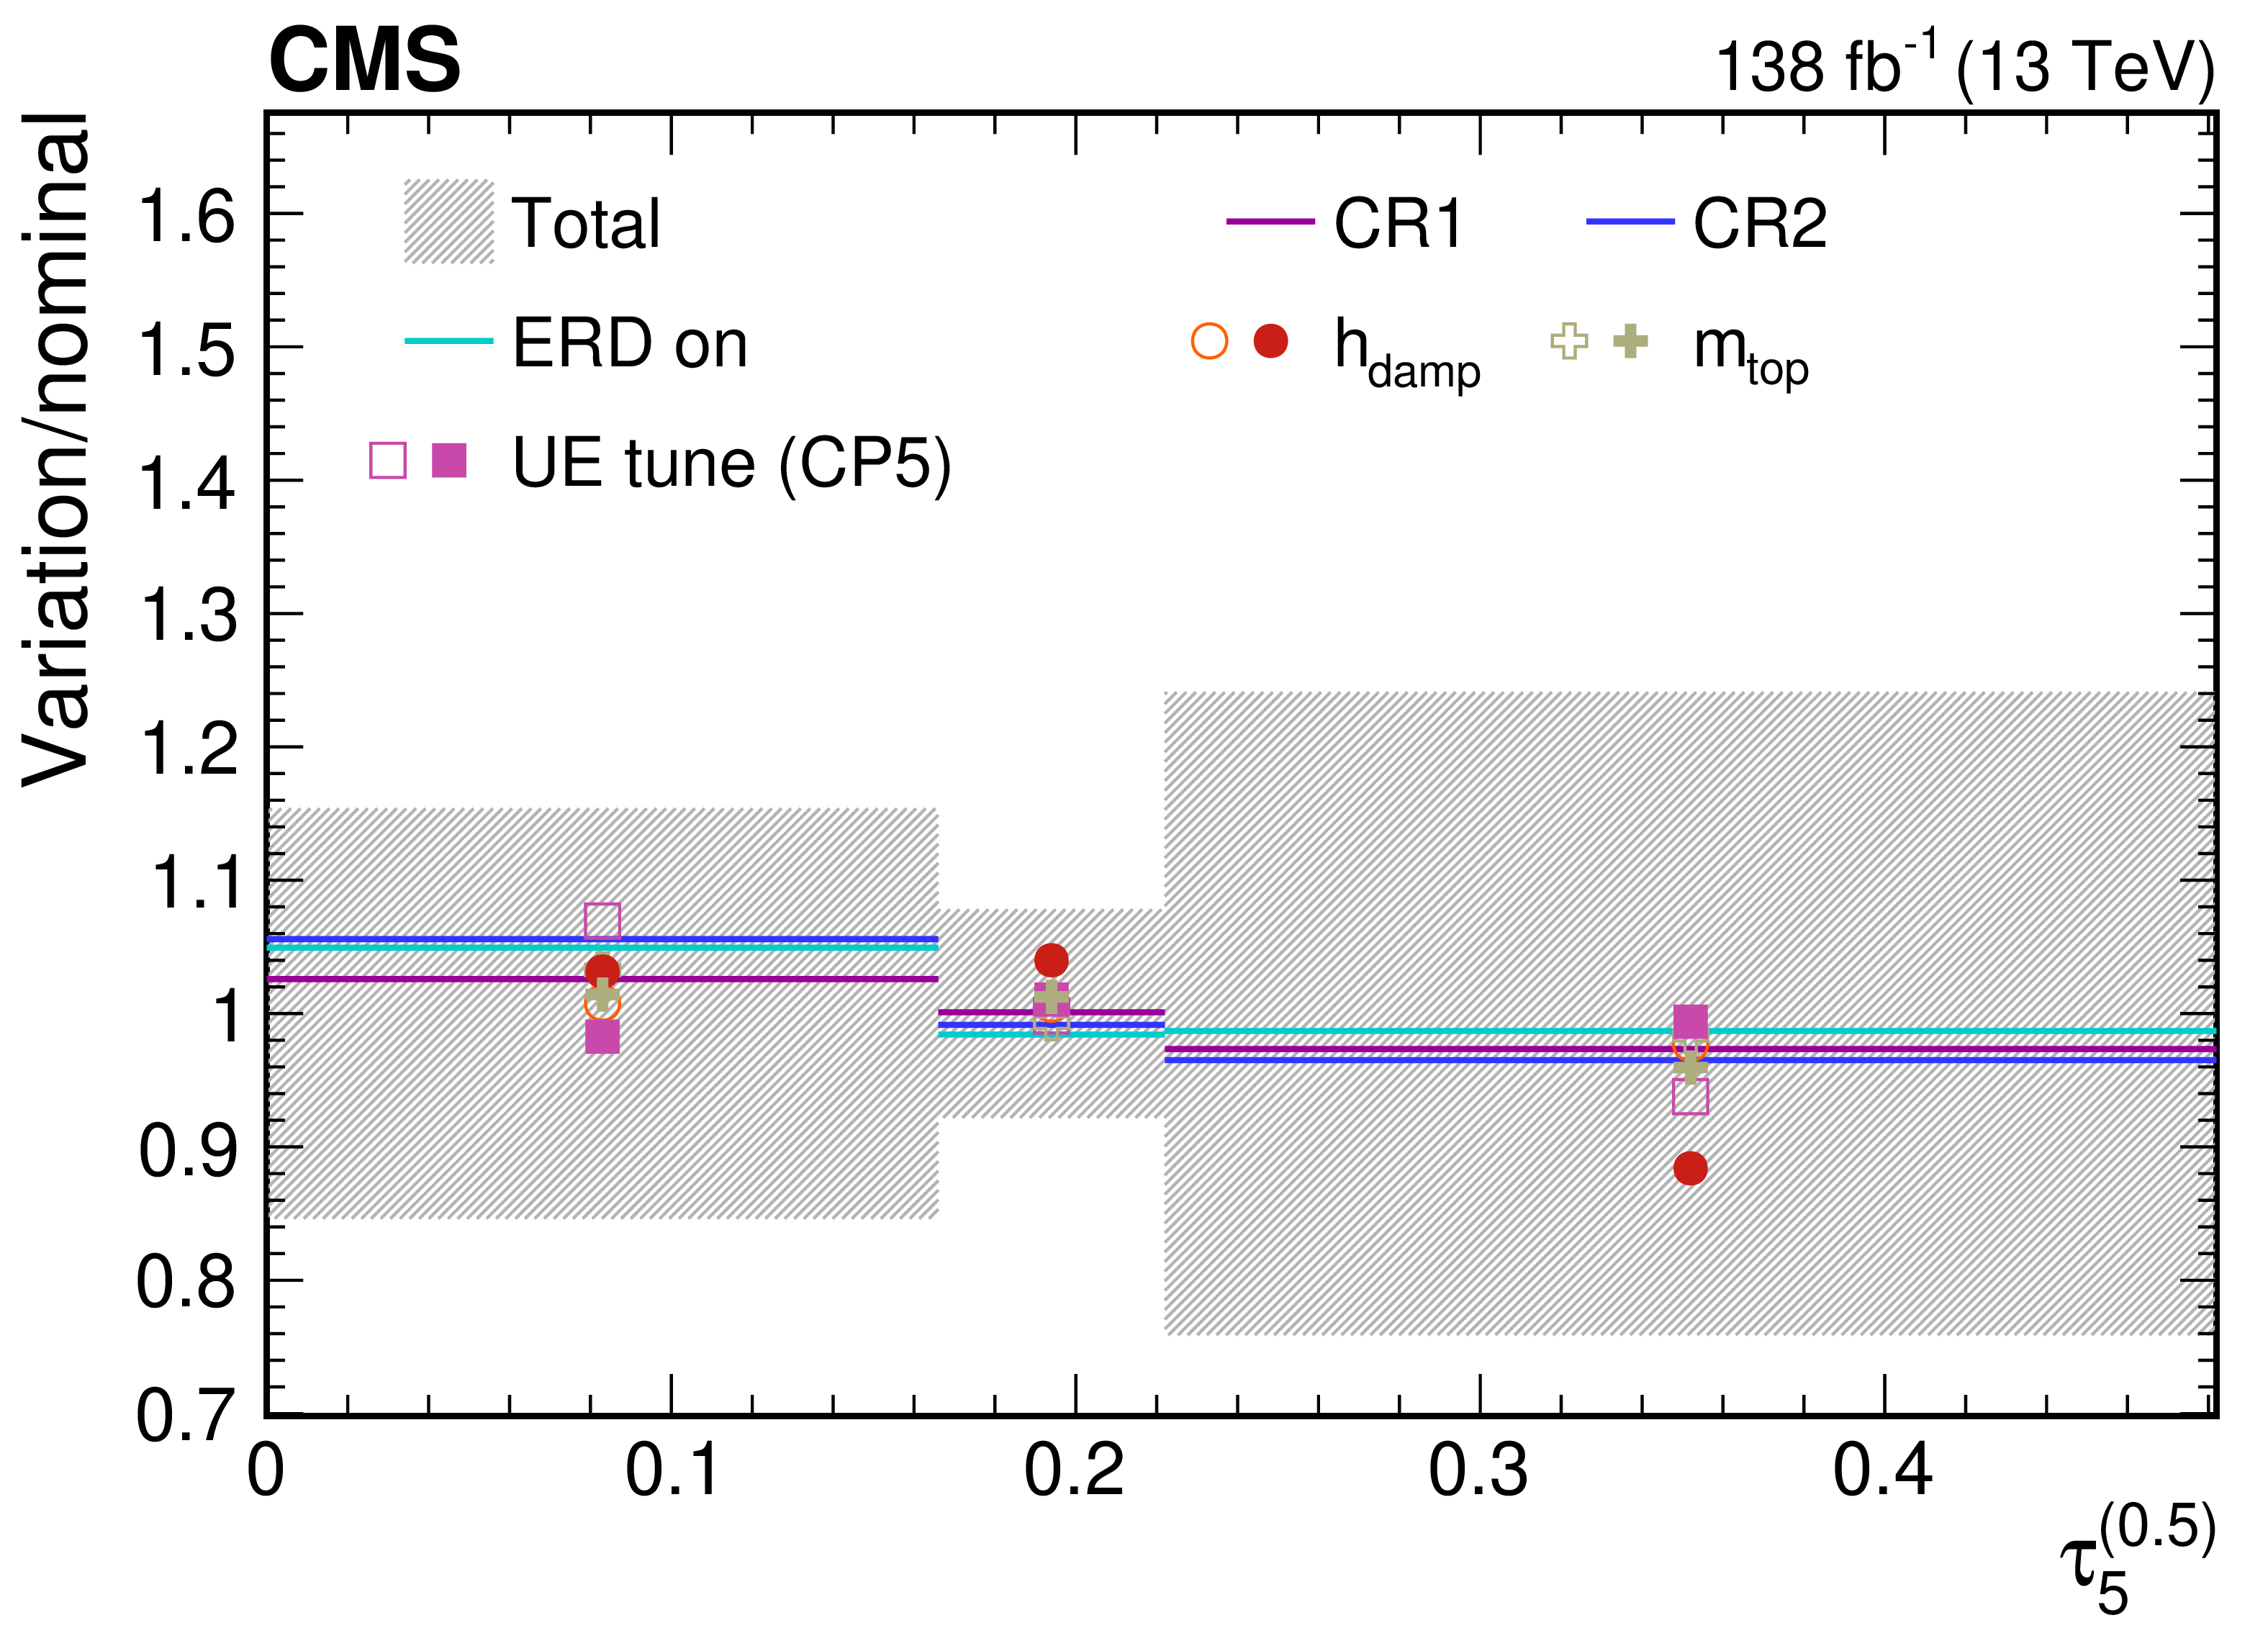
png pdf |
Figure 67-b:
Contributions from various theory model systematic variations to the normalized, unfolded distribution for $ \tau_5^{(\beta)} $ observables measured for AK8 jets passing the boosted top quark-enriched selection in $ \mu $+jets $ \mathrm{t} \overline{\mathrm{t}} $ events. The total unfolding uncertainty is indicated with the dark grey, hashed region, while the blue hashed region indicates the contributions from the input covariance matrix, which includes the propagated effects of the statistical uncertainties of the input data after background subtraction. Contributions from statistical uncertainties of the simulated sample used to construct the nominal response matrix are indicated with the dashed black line. The uncertainty contributions for different choices of colour reconnection models are illustrated as one-sided shifts compared to the nominal unfolding, and up (down) contributions from other sources are indicated with filled (open) markers of the same type and colour. |
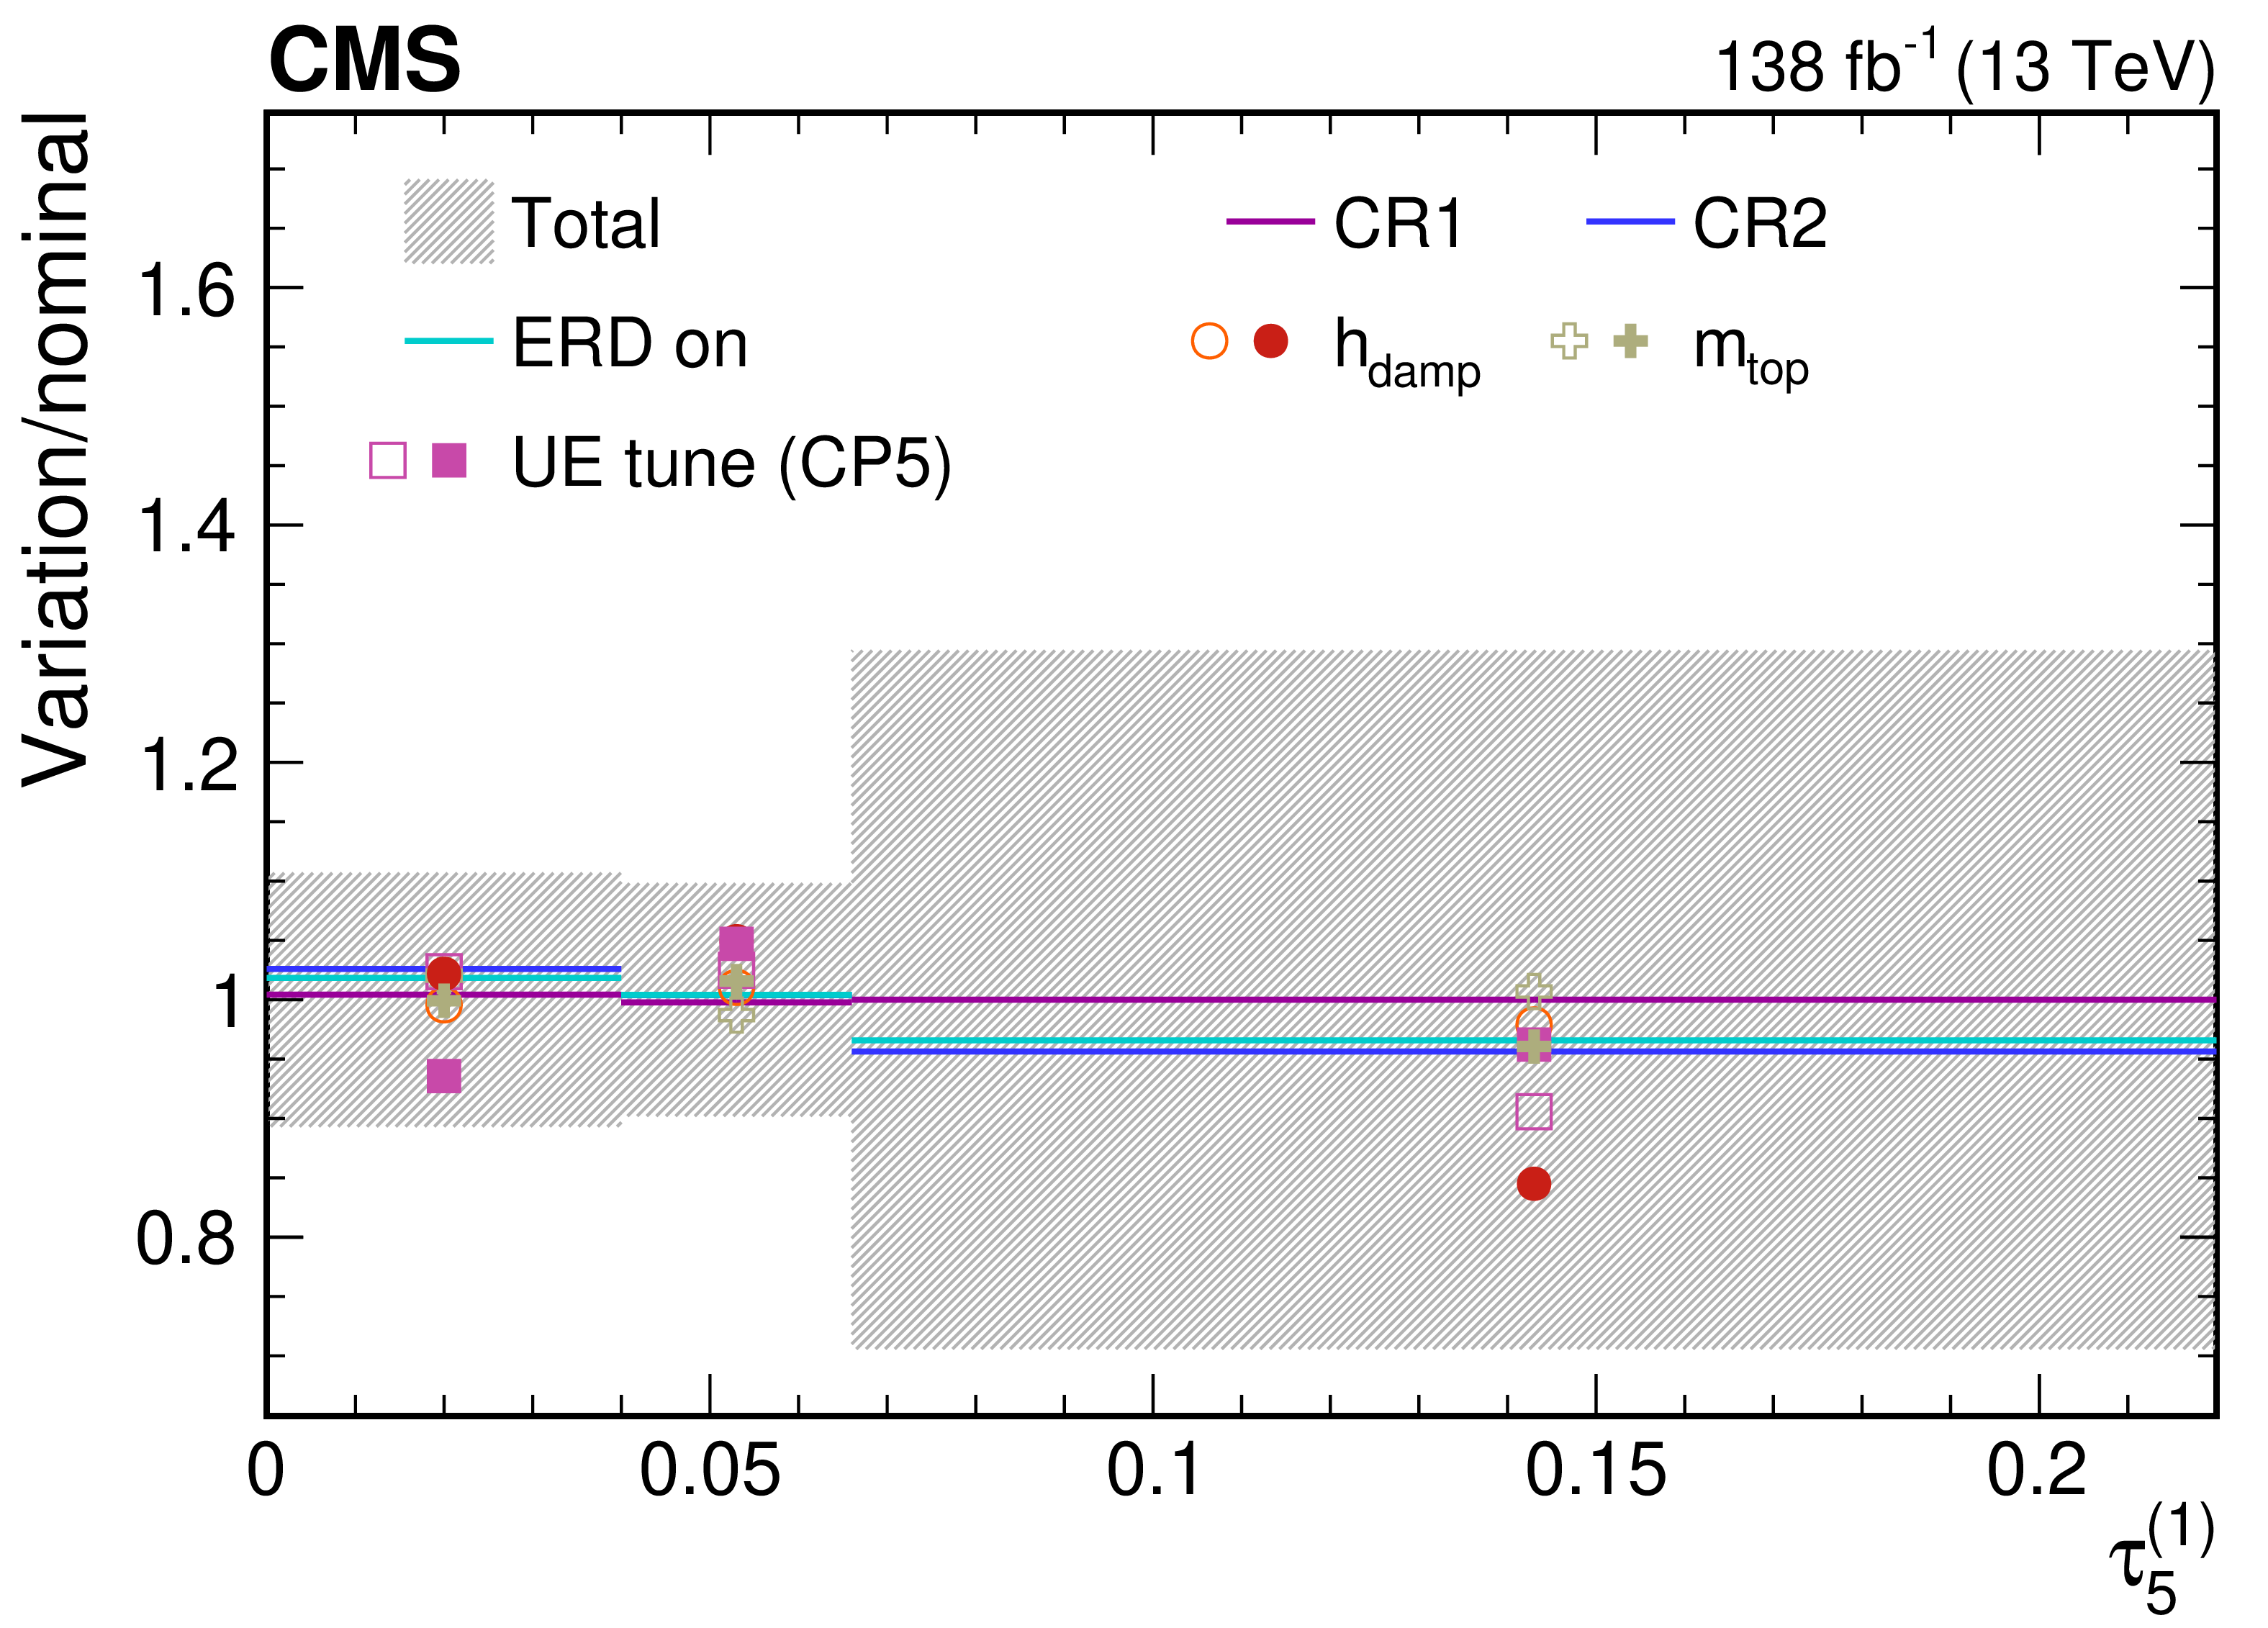
png pdf |
Figure 67-c:
Contributions from various theory model systematic variations to the normalized, unfolded distribution for $ \tau_5^{(\beta)} $ observables measured for AK8 jets passing the boosted top quark-enriched selection in $ \mu $+jets $ \mathrm{t} \overline{\mathrm{t}} $ events. The total unfolding uncertainty is indicated with the dark grey, hashed region, while the blue hashed region indicates the contributions from the input covariance matrix, which includes the propagated effects of the statistical uncertainties of the input data after background subtraction. Contributions from statistical uncertainties of the simulated sample used to construct the nominal response matrix are indicated with the dashed black line. The uncertainty contributions for different choices of colour reconnection models are illustrated as one-sided shifts compared to the nominal unfolding, and up (down) contributions from other sources are indicated with filled (open) markers of the same type and colour. |
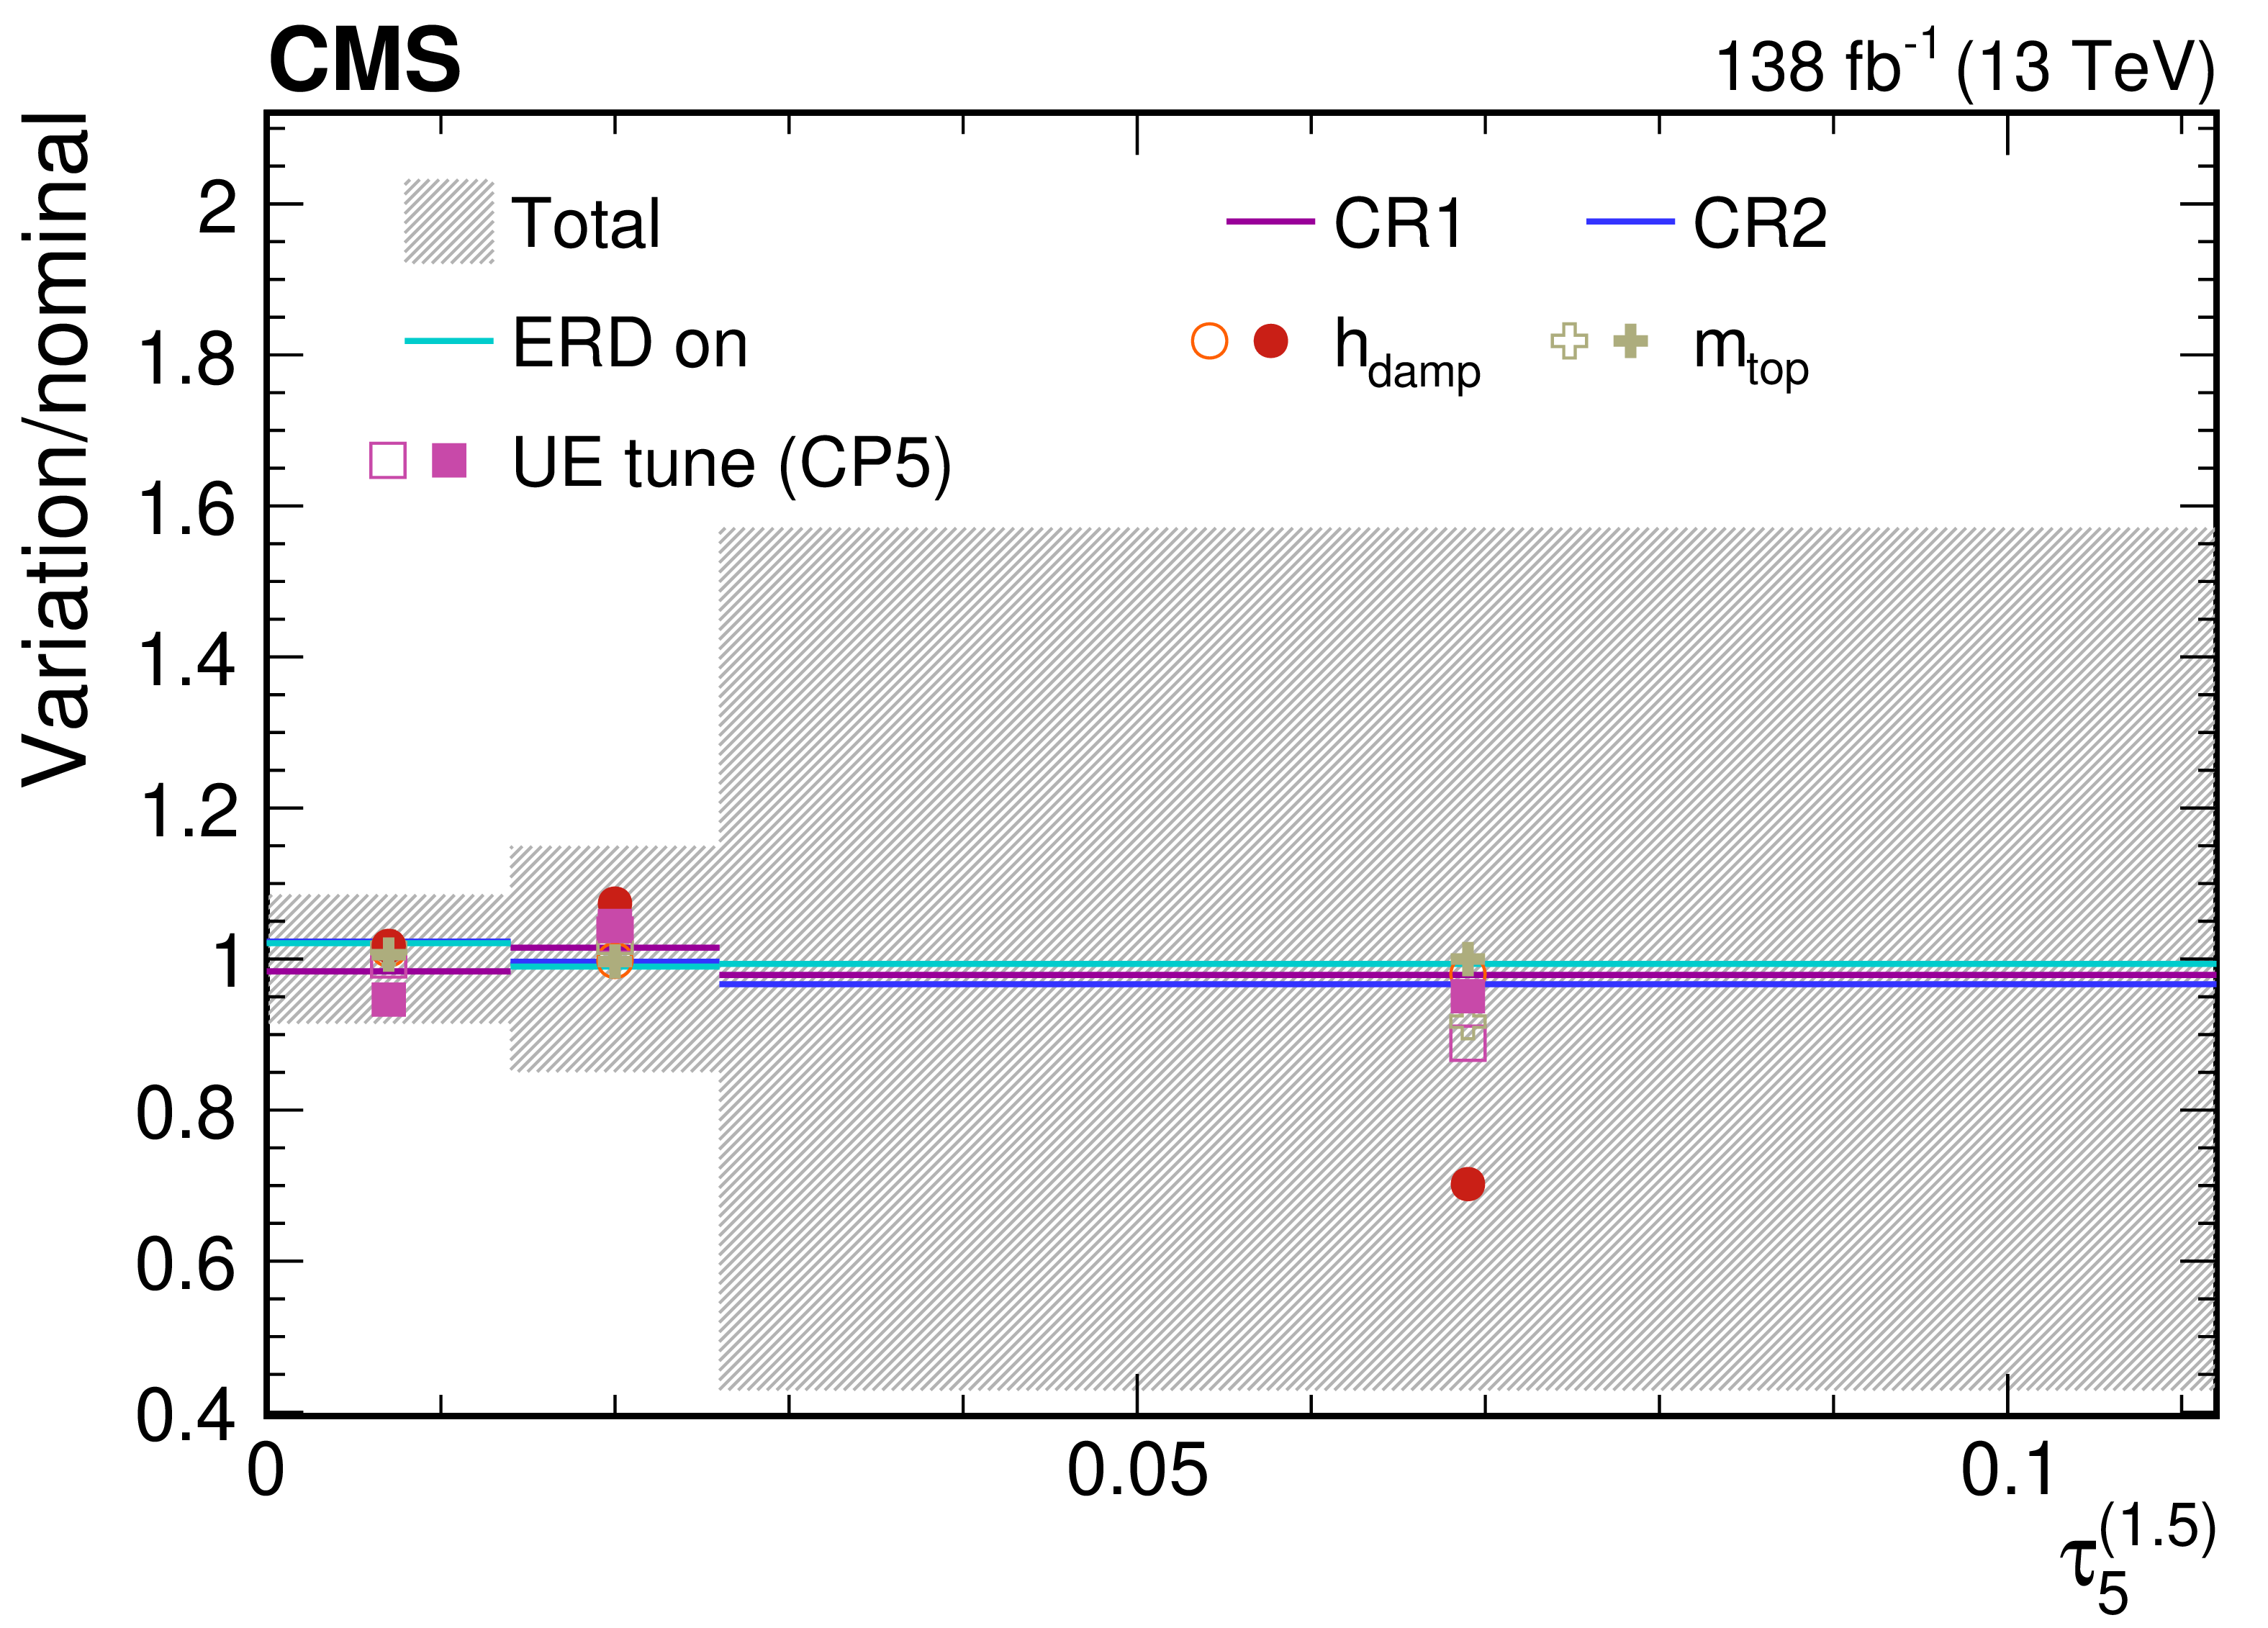
png pdf |
Figure 67-d:
Contributions from various theory model systematic variations to the normalized, unfolded distribution for $ \tau_5^{(\beta)} $ observables measured for AK8 jets passing the boosted top quark-enriched selection in $ \mu $+jets $ \mathrm{t} \overline{\mathrm{t}} $ events. The total unfolding uncertainty is indicated with the dark grey, hashed region, while the blue hashed region indicates the contributions from the input covariance matrix, which includes the propagated effects of the statistical uncertainties of the input data after background subtraction. Contributions from statistical uncertainties of the simulated sample used to construct the nominal response matrix are indicated with the dashed black line. The uncertainty contributions for different choices of colour reconnection models are illustrated as one-sided shifts compared to the nominal unfolding, and up (down) contributions from other sources are indicated with filled (open) markers of the same type and colour. |
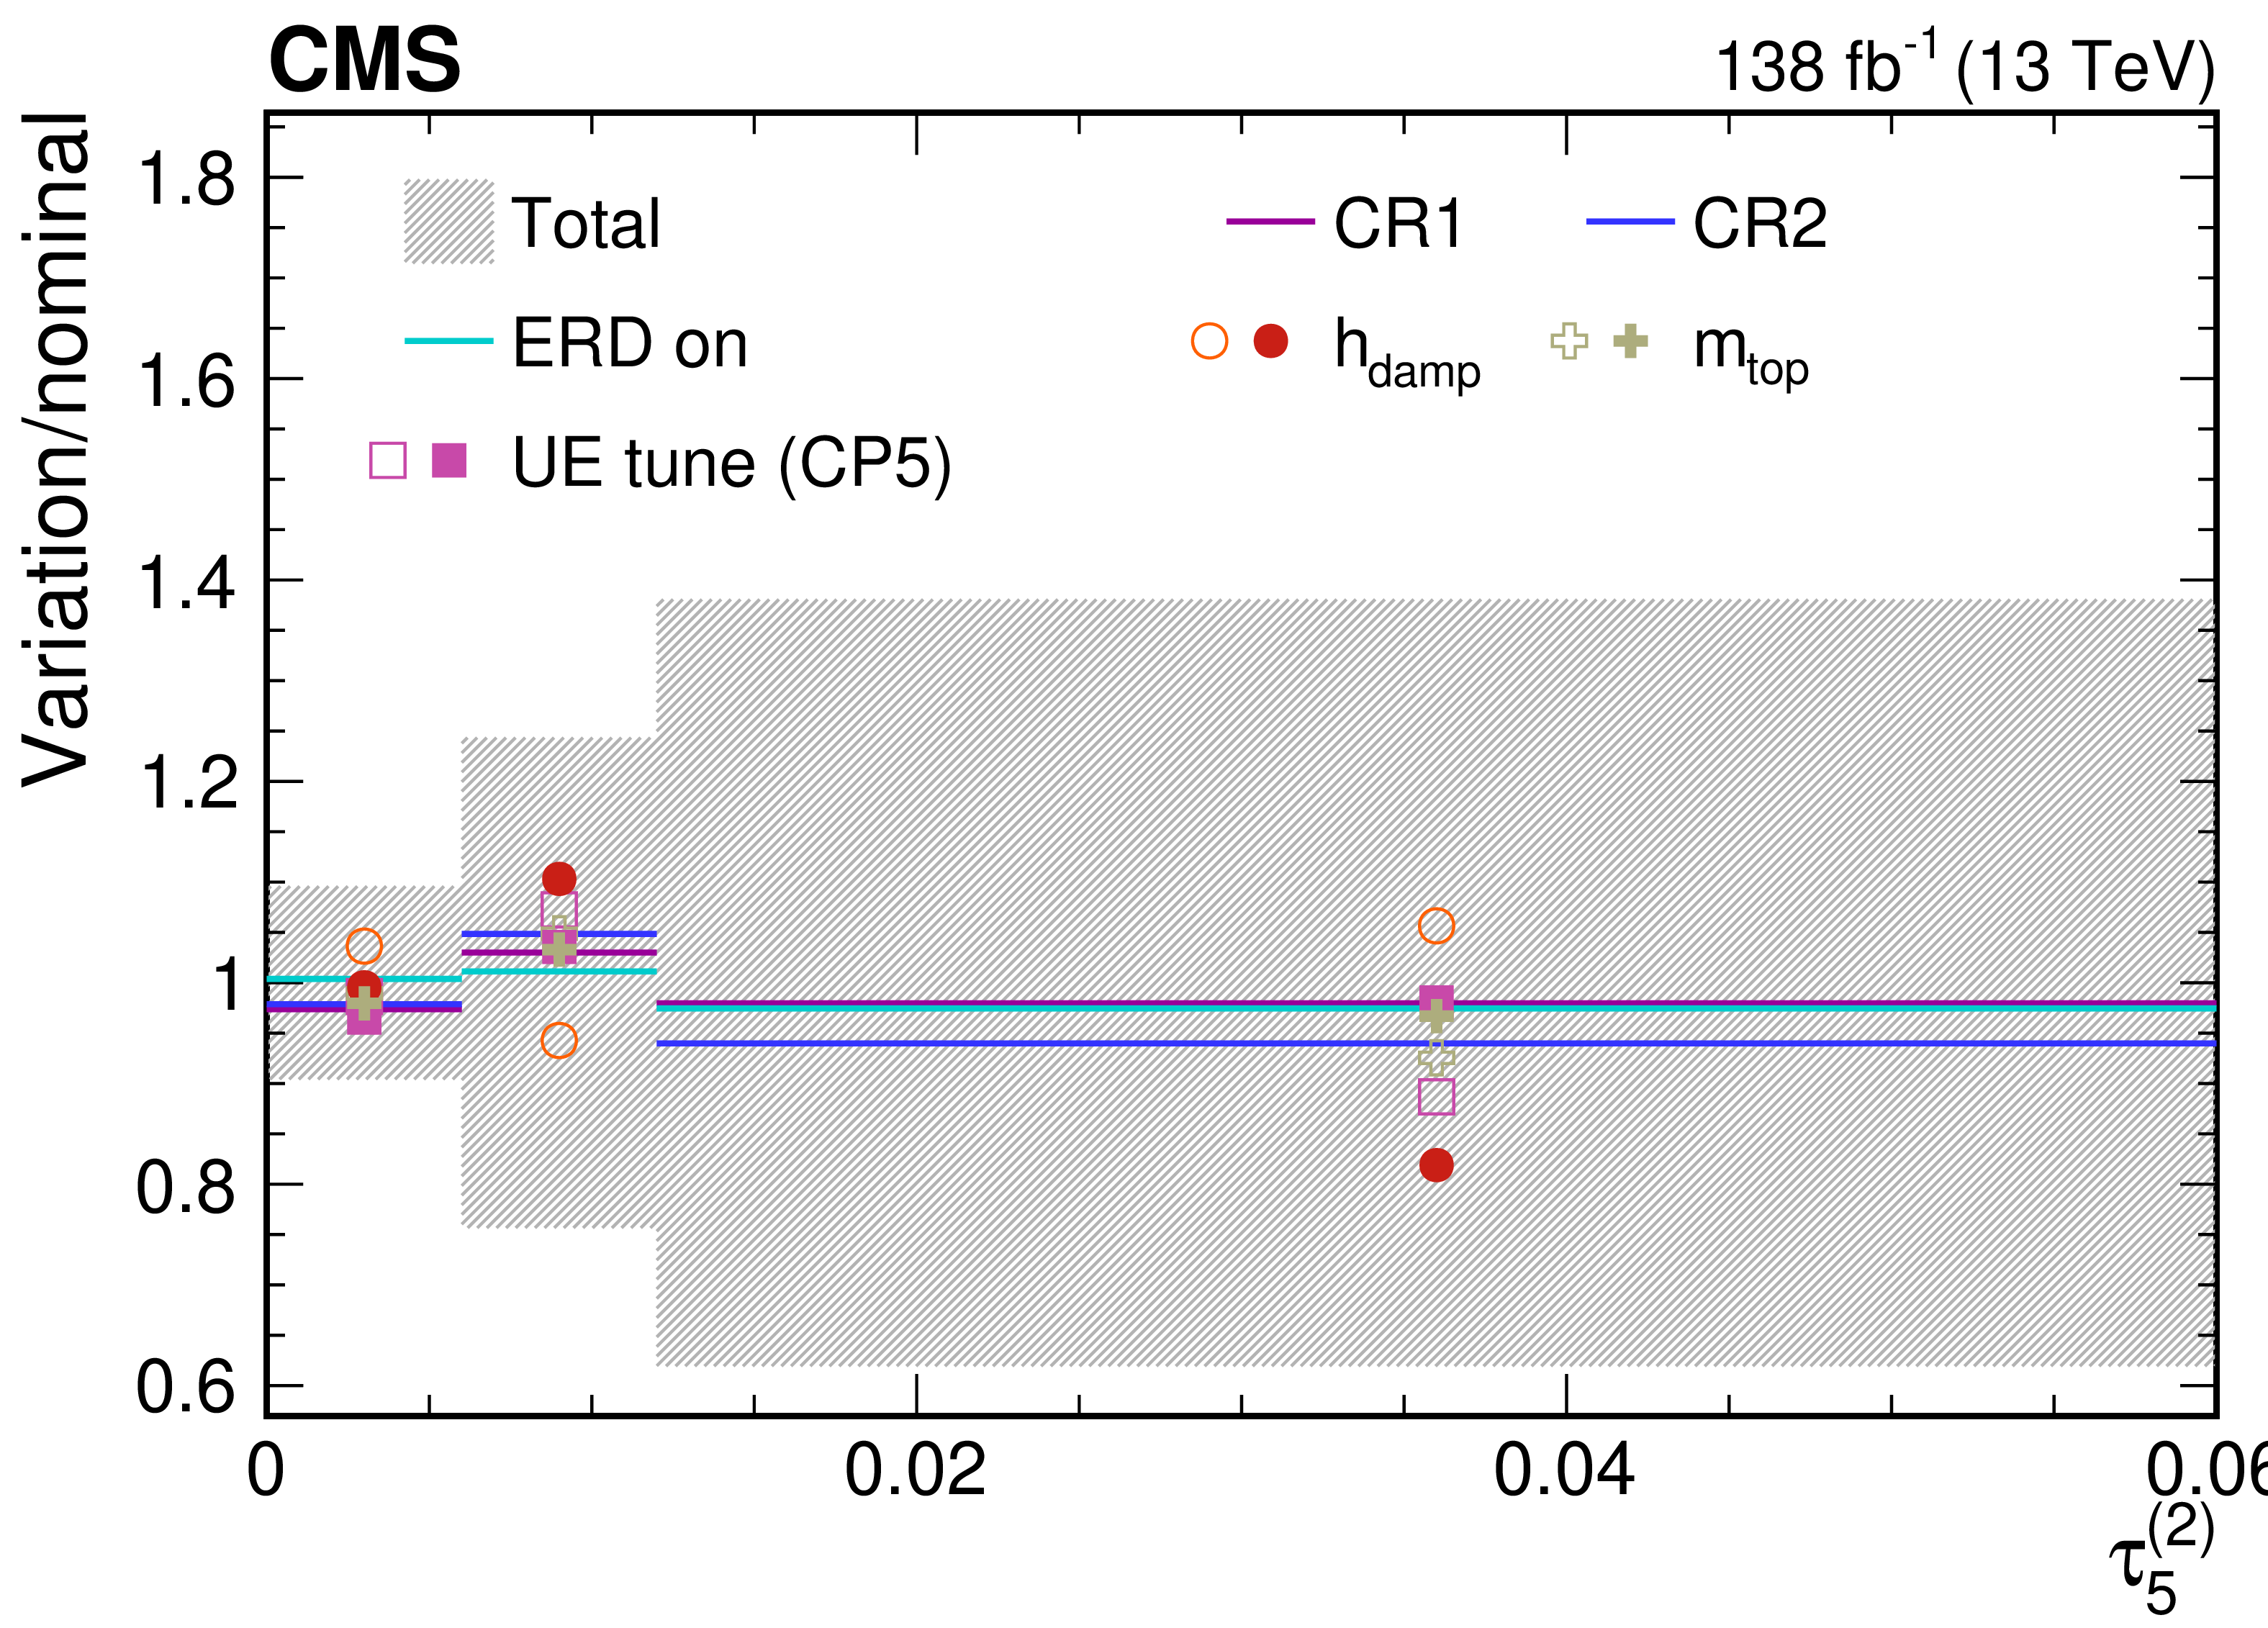
png pdf |
Figure 67-e:
Contributions from various theory model systematic variations to the normalized, unfolded distribution for $ \tau_5^{(\beta)} $ observables measured for AK8 jets passing the boosted top quark-enriched selection in $ \mu $+jets $ \mathrm{t} \overline{\mathrm{t}} $ events. The total unfolding uncertainty is indicated with the dark grey, hashed region, while the blue hashed region indicates the contributions from the input covariance matrix, which includes the propagated effects of the statistical uncertainties of the input data after background subtraction. Contributions from statistical uncertainties of the simulated sample used to construct the nominal response matrix are indicated with the dashed black line. The uncertainty contributions for different choices of colour reconnection models are illustrated as one-sided shifts compared to the nominal unfolding, and up (down) contributions from other sources are indicated with filled (open) markers of the same type and colour. |
| Summary |
| Simultaneous measurements have been presented of $ N $-subjettiness observables that form a basis that overconstrains the phase space of up to six emissions in a jet. The measurements are performed in various hadronic environments: jets originating from gluons and light-flavour quarks in QCD dijet events, and in selections enriched in hadronic decays of boosted W bosons and top quarks. The use of a basis of $ N $-subjettiness observables enables the analysis to provide a detailed picture of the structure of jets, for a fixed jet description corresponding to the resolved 6-body phase space. Multiple handles are provided to robustly overconstrain the sensitivity of the measurements to all the IRC-safe information in the jet substructure that is relevant to distinguish the substructure of light quark- and gluon-initiated jets from jets originating in decays of Lorentz-boosted W bosons and top quarks. By simultaneously unfolding all observables, normalized particle-level spectra for the individual observables are provided, along with complete covariance information including correlations between the unfolded distributions. These unfolded measurements furnish a comprehensive set of inputs for future tuning and validation of simulations, aiming to refine the modelling of QCD radiation in jets originating from decays of boosted massive electroweak-scale particles and from gluons or light-flavour quarks. |
| References | ||||
| 1 | G. P. Salam | Towards jetography | EPJC 67 (2010) 637 | 0906.1833 |
| 2 | A. J. Larkoski, I. Moult, and B. Nachman | Jet substructure at the Large Hadron Collider: A review of recent advances in theory and machine learning | Phys. Rept. 841 (2020) 1 | 1709.04464 |
| 3 | R. Kogler et al. | Jet substructure at the Large Hadron Collider | Rev. Mod. Phys. 91 (2019) 045003 | 1803.06991 |
| 4 | S. Marzani, G. Soyez, and M. Spannowsky | Looking inside jets: an introduction to jet substructure and boosted-object phenomenology | Lect. Notes Phys. 958 (2019) 1 | 1901.10342 |
| 5 | J. Thaler and K. Van Tilburg | Identifying boosted objects with $ {N} $-subjettiness | JHEP 03 (2011) 015 | 1011.2268 |
| 6 | J. Thaler and K. Van Tilburg | Maximizing boosted top identification by minimizing $ {N} $-subjettiness | JHEP 02 (2012) 093 | 1108.2701 |
| 7 | S. Mondal and L. Mastrolorenzo | Machine learning in high energy physics: A review of heavy-flavor jet tagging at the LHC | Eur. Phys. J. Spec. Top. 233 (2024) 2657 | 2404.01071 |
| 8 | K. Datta and A. Larkoski | How much information is in a jet? | JHEP 06 (2017) 073 | 1704.08249 |
| 9 | ATLAS Collaboration | Measurement of jet fragmentation in 5.02 TeV proton-lead and proton-proton collisions with the ATLAS detector | Nucl. Phys. A 978 (2018) 65 | 1706.02859 |
| 10 | ATLAS Collaboration | Measurement of the soft-drop jet mass in pp collisions at $ \sqrt{s} = $ 13 TeV with the ATLAS detector | PRL 121 (2018) 092001 | 1711.08341 |
| 11 | ATLAS Collaboration | Measurement of jet fragmentation in Pb+Pb and pp collisions at $ \sqrt {\smash [b]{s_{_{\mathrm {NN}}}}} = $ 5.02 TeV with the ATLAS detector | Phys. Rev. C 98 (2018) 024908 | 1805.05424 |
| 12 | ATLAS Collaboration | Measurement of colour flow using jet-pull observables in $ \mathrm{t}\overline{\mathrm{t}} $ events with the ATLAS experiment at $ \sqrt{s} = $ 13 TeV | EPJC 78 (2018) 847 | 1805.02935 |
| 13 | ATLAS Collaboration | Properties of $ g\to \mathrm{b}\overline{\mathrm{b}} $ at small opening angles in pp collisions with the ATLAS detector at $ \sqrt{s}= $ 13 TeV | PRD 99 (2019) 052004 | 1812.09283 |
| 14 | ATLAS Collaboration | Measurement of soft-drop jet observables in pp collisions with the ATLAS detector at $ \sqrt{s} = $ 13 TeV | PRD 101 (2020) 052007 | 1912.09837 |
| 15 | ATLAS Collaboration | Properties of jet fragmentation using charged particles measured with the ATLAS detector in pp collisions at $ \sqrt{s}= $ 13 TeV | PRD 100 (2019) 052011 | 1906.09254 |
| 16 | ATLAS Collaboration | Measurement of jet-substructure observables in top quark, W boson and light jet production in proton-proton collisions at $ \sqrt{s} = $ 13 TeV with the ATLAS detector | JHEP 08 (2019) 033 | 1903.02942 |
| 17 | ATLAS Collaboration | Measurement of the jet mass in high transverse momentum $ \mathrm{Z}(\to \mathrm{b}\overline{\mathrm{b}})\gamma $ production at $ \sqrt{s} = $ 13 TeV using the ATLAS detector | PLB 812 (2021) 135991 | 1907.07093 |
| 18 | ATLAS Collaboration | Comparison of fragmentation functions for jets dominated by light quarks and gluons from pp and Pb+Pb collisions in ATLAS | PRL 123 (2019) 042001 | 1902.10007 |
| 19 | ATLAS Collaboration | Measurement of the Lund jet plane using charged particles in 13 TeV proton-proton collisions with the ATLAS detector | PRL 124 (2020) 222002 | 2004.03540 |
| 20 | ATLAS Collaboration | Measurement of b-quark fragmentation properties in jets using the decay $ \mathrm{B}^{\pm} \to \mathrm{J}/\psi \mathrm{K}^{\pm} $ in pp collisions at $ \sqrt{s}= $ 13 TeV with the ATLAS detector | JHEP 12 (2021) 131 | 2108.11650 |
| 21 | ATLAS Collaboration | Measurement of jet substructure in boosted $ \mathrm{t}\overline{\mathrm{t}} $ events with the ATLAS detector using 140 fb$ ^{-1} $ of 13 TeV pp collisions | PRD 109 (2024) 112016 | 2312.03797 |
| 22 | ATLAS Collaboration | Measurement of the lund jet plane in hadronic decays of top quarks and W bosons with the ATLAS detector | EPJC 85 (2025) 416 | 2407.10879 |
| 23 | CMS Collaboration | Measurement of the splitting function in pp and PbPb collisions at $ {\sqrt{\smash[b]{s_{_{\mathrm{NN}}}}}= $ 5.02 TeV | PRL 120 (2018) 142302 | CMS-HIN-16-006 1708.09429 |
| 24 | CMS Collaboration | Measurement of jet substructure observables in $ \mathrm{t} \overline{\mathrm{t}} $ events from proton-proton collisions at $ \sqrt{s}= $ 13 TeV | PRD 98 (2018) 092014 | CMS-TOP-17-013 1808.07340 |
| 25 | CMS Collaboration | Measurements of the differential jet cross section as a function of the jet mass in dijet events from proton-proton collisions at $ \sqrt{s}= $ 13 TeV | JHEP 11 (2018) 113 | CMS-SMP-16-010 1807.05974 |
| 26 | CMS Collaboration | Measurement of the groomed jet mass in PbPb and pp collisions at $ {\sqrt{\smash[b]{s_{_{\mathrm{NN}}}}}= $ 5.02 TeV | JHEP 10 (2018) 161 | CMS-HIN-16-024 1805.05145 |
| 27 | CMS Collaboration | Jet shapes of isolated photon-tagged jets in PbPb and pp collisions at $ {\sqrt{\smash[b]{s_{_{\mathrm{NN}}}}}= $ 5.02 TeV | PRL 122 (2019) 152001 | CMS-HIN-18-006 1809.08602 |
| 28 | CMS Collaboration | Study of quark and gluon jet substructure in Z+jet and dijet events from pp collisions | JHEP 01 (2022) 188 | CMS-SMP-20-010 2109.03340 |
| 29 | CMS Collaboration | Measurement of energy correlators inside jets and determination of the strong coupling $ {\alpha_\mathrm{S}(m_{\mathrm{Z}})} $ | PRL 133 (2024) 071903 | CMS-SMP-22-015 2402.13864 |
| 30 | CMS Collaboration | Measurement of the primary Lund jet plane density in proton-proton collisions at $ \sqrt{s}= $ 13 TeV | JHEP 05 (2024) 116 | CMS-SMP-22-007 2312.16343 |
| 31 | ALICE Collaboration | First measurement of jet mass in Pb--Pb and $ \mathrm{p} $--Pb collisions at the LHC | PLB 776 (2018) 249 | 1702.00804 |
| 32 | ALICE Collaboration | Exploration of jet substructure using iterative declustering in pp and Pb--Pb collisions at LHC energies | PLB 802 (2020) 135227 | 1905.02512 |
| 33 | ALICE Collaboration | Jet fragmentation transverse momentum distributions in pp and $ \mathrm{p} $--Pb collisions at $ \sqrt{s_{\mathrm{NN}}} = $ 5.02 TeV | JHEP 09 (2021) 211 | 2011.05904 |
| 34 | ALICE Collaboration | Measurements of the groomed and ungroomed jet angularities in pp collisions at $ \sqrt{s} = $ 5.02 TeV | JHEP 05 (2022) 061 | 2107.11303 |
| 35 | ALICE Collaboration | Measurement of the groomed jet radius and momentum splitting fraction in pp and Pb--Pb collisions at $ \sqrt {\smash [b]{s_{_{\mathrm {NN}}}}} = $ 5.02 TeV | PRL 128 (2022) 102001 | 2107.12984 |
| 36 | ALICE Collaboration | Direct observation of the dead-cone effect in quantum chromodynamics | Nature 605 (2022) 440 | 2106.05713 |
| 37 | ALICE Collaboration | First measurements of $ N $-subjettiness in central Pb--Pb collisions at $ \sqrt{s_{\mathrm{NN}}} = $ 2.76 TeV | JHEP 10 (2021) 003 | 2105.04936 |
| 38 | LHCb Collaboration | Study of $ \mathrm{J}/{\psi} $ production in jets | PRL 118 (2017) 192001 | 1701.05116 |
| 39 | LHCb Collaboration | Measurement of charged hadron production in Z-tagged jets in proton-proton collisions at $ \sqrt{s} = $ 8 TeV | PRL 123 (2019) 232001 | 1904.08878 |
| 40 | CMS Collaboration | Precision luminosity measurement in proton-proton collisions at $ \sqrt{s} = $ 13 TeV in 2015 and 2016 at CMS | EPJC 81 (2021) 800 | CMS-LUM-17-003 2104.01927 |
| 41 | CMS Collaboration | CMS luminosity measurement for the 2017 data-taking period at $ \sqrt{s} = $ 13 TeV | CMS Physics Analysis Summary, 2018 CMS-PAS-LUM-17-004 |
CMS-PAS-LUM-17-004 |
| 42 | CMS Collaboration | CMS luminosity measurement for the 2018 data-taking period at $ \sqrt{s} = $ 13 TeV | CMS Physics Analysis Summary, 2019 CMS-PAS-LUM-18-002 |
CMS-PAS-LUM-18-002 |
| 43 | CMS Collaboration | HEPData record for this analysis | link | |
| 44 | I. W. Stewart, F. J. Tackmann, and W. J. Waalewijn | $ {N} $ jettiness: An inclusive event shape to veto jets | PRL 105 (2010) 092002 | 1004.2489 |
| 45 | S. Catani, Y. L. Dokshitzer, M. H. Seymour, and B. R. Webber | Longitudinally invariant $ k_{\mathrm{T}} $ clustering algorithms for hadron hadron collisions | NPB 406 (1993) 187 | |
| 46 | S. D. Ellis and D. E. Soper | Successive combination jet algorithm for hadron collisions | PRD 48 (1993) 3160 | |
| 47 | G. C. Blazey et al. | Run II jet physics | in Physics at Run II: QCD and weak boson physics workshop: Final general meeting, 2000 | hep-ex/0005012 |
| 48 | M. Cacciari, G. P. Salam, and G. Soyez | FASTJET user manual | EPJC 72 (2012) 1896 | 1111.6097 |
| 49 | D. Bertolini, T. Chan, and J. Thaler | Jet observables without jet algorithms | JHEP 04 (2014) 013 | 1310.7584 |
| 50 | A. J. Larkoski, D. Neill, and J. Thaler | Jet shapes with the broadening axis | JHEP 04 (2014) 017 | 1401.2158 |
| 51 | A. J. Larkoski and J. Thaler | Aspects of jets at 100 TeV | PRD 90 (2014) 034010 | 1406.7011 |
| 52 | CMS Collaboration | The CMS experiment at the CERN LHC | JINST 3 (2008) S08004 | |
| 53 | CMS Collaboration | Development of the CMS detector for the CERN LHC \mboxRun 3 | JINST 19 (2024) P05064 | CMS-PRF-21-001 2309.05466 |
| 54 | CMS Collaboration | Performance of the CMS Level-1 trigger in proton-proton collisions at $ \sqrt{s}= $ 13 TeV | JINST 15 (2020) P10017 | CMS-TRG-17-001 2006.10165 |
| 55 | CMS Collaboration | The CMS trigger system | JINST 12 (2017) P01020 | CMS-TRG-12-001 1609.02366 |
| 56 | CMS Collaboration | Performance of the CMS high-level trigger during LHC \mboxRun 2 | JINST 19 (2024) P11021 | CMS-TRG-19-001 2410.17038 |
| 57 | CMS Collaboration | Electron and photon reconstruction and identification with the CMS experiment at the CERN LHC | JINST 16 (2021) P05014 | CMS-EGM-17-001 2012.06888 |
| 58 | CMS Collaboration | Performance of the CMS muon detector and muon reconstruction with proton-proton collisions at $ \sqrt{s}= $ 13 TeV | JINST 13 (2018) P06015 | CMS-MUO-16-001 1804.04528 |
| 59 | CMS Collaboration | Description and performance of track and primary-vertex reconstruction with the CMS tracker | JINST 9 (2014) P10009 | CMS-TRK-11-001 1405.6569 |
| 60 | CMS Tracker Group Collaboration | The CMS Phase-1 pixel detector upgrade | JINST 16 (2021) P02027 | 2012.14304 |
| 61 | CMS Collaboration | Track impact parameter resolution for the full pseudo rapidity coverage in the 2017 dataset with the CMS Phase-1 pixel detector | CMS Detector Performance Note CMS-DP-2020-049, 2020 CDS |
|
| 62 | CMS Collaboration | 2017 tracking performance plots | CMS Detector Performance Note CMS-DP-2017-015, 2017 CDS |
|
| 63 | CMS Collaboration | Particle-flow reconstruction and global event description with the CMS detector | JINST 12 (2017) P10003 | CMS-PRF-14-001 1706.04965 |
| 64 | M. Cacciari, G. P. Salam, and G. Soyez | The anti-$ k_{\mathrm{T}} $ jet clustering algorithm | JHEP 04 (2008) 063 | 0802.1189 |
| 65 | CMS Collaboration | Pileup mitigation at CMS in 13 TeV data | JINST 15 (2020) P09018 | CMS-JME-18-001 2003.00503 |
| 66 | D. Bertolini, P. Harris, M. Low, and N. Tran | Pileup per particle identification | JHEP 10 (2014) 059 | 1407.6013 |
| 67 | CMS Collaboration | Pileup removal algorithms | CMS Physics Analysis Summary, 2014 CMS-PAS-JME-14-001 |
CMS-PAS-JME-14-001 |
| 68 | CMS Collaboration | Jet energy scale and resolution in the CMS experiment in pp collisions at 8 TeV | JINST 12 (2017) P02014 | CMS-JME-13-004 1607.03663 |
| 69 | CMS Collaboration | Technical proposal for the Phase-II upgrade of the Compact Muon Solenoid | CMS Technical Proposal CERN-LHCC-2015-010, CMS-TDR-15-02, 2015 CDS |
|
| 70 | CMS Collaboration | Performance of missing transverse momentum reconstruction in proton-proton collisions at $ \sqrt{s}= $ 13 TeV using the CMS detector | JINST 14 (2019) P07004 | CMS-JME-17-001 1903.06078 |
| 71 | CMS Collaboration | Performance of the CMS muon trigger system in proton-proton collisions at $ \sqrt{s}= $ 13 TeV | JINST 16 (2021) P07001 | CMS-MUO-19-001 2102.04790 |
| 72 | GEANT4 Collaboration | GEANT 4---a simulation toolkit | NIM A 506 (2003) 250 | |
| 73 | J. Allison et al. | GEANT 4 developments and applications | IEEE Trans. Nucl. Sci. 53 (2006) 270 | |
| 74 | T. Sjöstrand et al. | An introduction to PYTHIA8.2 | Comput. Phys. Commun. 191 (2015) 159 | 1410.3012 |
| 75 | CMS Collaboration | Extraction and validation of a new set of CMS PYTHIA8 tunes from underlying-event measurements | EPJC 80 (2020) 4 | CMS-GEN-17-001 1903.12179 |
| 76 | M. B ä hr et al. | HERWIG++ physics and manual | EPJC 58 (2008) 639 | 0803.0883 |
| 77 | J. Bellm et al. | HERWIG 7.0/ HERWIG++ 3.0 release note | EPJC 76 (2016) 196 | 1512.01178 |
| 78 | CMS Collaboration | Development and validation of HERWIG 7 tunes from CMS underlying-event measurements | EPJC 81 (2021) 312 | CMS-GEN-19-001 2011.03422 |
| 79 | J. Alwall et al. | The automated computation of tree-level and next-to-leading order differential cross sections, and their matching to parton shower simulations | JHEP 07 (2014) 079 | 1405.0301 |
| 80 | J. Alwall et al. | Comparative study of various algorithms for the merging of parton showers and matrix elements in hadronic collisions | EPJC 53 (2008) 473 | 0706.2569 |
| 81 | M. L. Mangano, M. Moretti, F. Piccinini, and M. Treccani | Matching matrix elements and shower evolution for top-pair production in hadronic collisions | JHEP 01 (2007) 013 | hep-ph/0611129 |
| 82 | P. Nason | A new method for combining NLO QCD with shower Monte Carlo algorithms | JHEP 11 (2004) 040 | hep-ph/0409146 |
| 83 | S. Frixione, P. Nason, and C. Oleari | Matching NLO QCD computations with parton shower simulations: the POWHEG method | JHEP 11 (2007) 070 | 0709.2092 |
| 84 | S. Alioli, P. Nason, C. Oleari, and E. Re | A general framework for implementing NLO calculations in shower Monte Carlo programs: the POWHEG box | JHEP 06 (2010) 043 | 1002.2581 |
| 85 | S. Frixione, G. Ridolfi, and P. Nason | A positive-weight next-to-leading-order Monte Carlo for heavy flavour hadroproduction | JHEP 09 (2007) 126 | 0707.3088 |
| 86 | S. Alioli, P. Nason, C. Oleari, and E. Re | NLO single-top production matched with shower in POWHEG: $ s $- and $ t $-channel contributions | JHEP 09 (2009) 111 | 0907.4076 |
| 87 | E. Re | Single-top $ {\mathrm{W}\mathrm{t}} $-channel production matched with parton showers using the POWHEG method | EPJC 71 (2011) 1547 | 1009.2450 |
| 88 | R. Frederix and S. Frixione | Merging meets matching in MC@NLO | JHEP 12 (2012) 061 | 1209.6215 |
| 89 | Particle Data Group , S. Navas et al. | Review of particle physics | PRD 110 (2024) 030001 | |
| 90 | CMS Collaboration | CMS PYTHIA8 colour reconnection tunes based on underlying-event data | EPJC 83 (2023) 587 | CMS-GEN-17-002 2205.02905 |
| 91 | M. Cacciari, G. P. Salam, and G. Soyez | The catchment area of jets | JHEP 04 (2008) 005 | 0802.1188 |
| 92 | CMS Collaboration | Jet algorithms performance in 13 TeV data | CMS Physics Analysis Summary, 2017 CMS-PAS-JME-16-003 |
CMS-PAS-JME-16-003 |
| 93 | CMS Collaboration | Performance of the reconstruction and identification of high-momentum muons in proton-proton collisions at $ \sqrt{s}= $ 13 TeV | JINST 15 (2020) P02027 | CMS-MUO-17-001 1912.03516 |
| 94 | M. Stoye | Deep learning in jet reconstruction at CMS | CMS Collaboration, in ACAT,. J. Phys. Conf. Ser.,, 2017 link |
|
| 95 | CMS Collaboration | Performance of the DeepJet b tagging algorithm using 41.9 fb$ ^{-1} $ of data from proton-proton collisions at 13 TeV with \mboxPhase 1 CMS detector | CMS Detector Performance Note CMS-DP-2018-058, 2018 CDS |
|
| 96 | CMS Collaboration | Measurement of differential $ \mathrm{t} \overline{\mathrm{t}} $ production cross sections using top quarks at large transverse momenta in pp collisions at $ \sqrt{s}= $ 13 TeV | PRD 103 (2021) 052008 | CMS-TOP-18-013 2008.07860 |
| 97 | K. Datta, A. Larkoski, and B. Nachman | Automating the construction of jet observables with machine learning | PRD 100 (2019) 095016 | 1902.07180 |
| 98 | K. Datta and A. Larkoski | Novel jet observables from machine learning | JHEP 03 (2018) 086 | 1710.01305 |
| 99 | L. Moore, K. Nordström, S. Varma, and M. Fairbairn | Reports of my demise are greatly exaggerated: $ N $-subjettiness taggers take on jet images | SciPost Phys. 7 (2019) 036 | 1807.04769 |
| 100 | G.~E. Hinton et al. | Improving neural networks by preventing co-adaptation of feature detectors | link E. Hinton 201 (1900) 2 |
1207.0580 |
| 101 | V. Nair and G. E. Hinton | Rectified linear units improve restricted boltzmann machines | in the International Conference on Machine Learning, 2010 Proceedings of the 2 (2010) 7 |
|
| 102 | A. L. Maas, A. Y. Hannun, and A. Y. Ng | Rectifier nonlinearities improve neural network acoustic models | in the International Conference on Machine Learning, 2013 Proceedings of the 3 (2013) 0 |
|
| 103 | S. Schmitt | TUnfold, an algorithm for correcting migration effects in high energy physics | JINST 7 (2012) T10003 | 1205.6201 |
| 104 | CMS Collaboration | Simultaneous determination of several differential observables with statistical correlations | CMS Note CMS-NOTE-2024-001, 2024 CDS |
|
| 105 | CMS Collaboration | Measurement of the differential $ \mathrm{t} \overline{\mathrm{t}} $ production cross section as a function of the jet mass and extraction of the top quark mass in hadronic decays of boosted top quarks | EPJC 83 (2023) 560 | CMS-TOP-21-012 2211.01456 |
| 106 | S. Mrenna and P. Skands | Automated parton-shower variations in PYTHIA8 | PRD 94 (2016) 074005 | 1605.08352 |
| 107 | J. Butterworth et al. | PDF4LHC recommendations for LHC \mboxRun 2 | JPG 43 (2016) 023001 | 1510.03865 |
| 108 | NNPDF Collaboration | Parton distributions from high-precision collider data | EPJC 77 (2017) 663 | 1706.00428 |
| 109 | CMS Collaboration | Investigations of the impact of the parton shower tuning in PYTHIA8 in the modelling of $ \mathrm{t} \overline{\mathrm{t}} $ at $ \sqrt{s}= $ 8 and 13 TeV | CMS Physics Analysis Summary, 2016 CMS-PAS-TOP-16-021 |
CMS-PAS-TOP-16-021 |
|
|
Compact Muon Solenoid LHC, CERN |
|

|

|

|

|

|