

Compact Muon Solenoid
LHC, CERN
| CMS-SMP-22-015 ; CERN-EP-2024-010 | ||
| Measurement of energy correlators inside jets and determination of the strong coupling $ \alpha_\mathrm{S} (m_\mathrm{Z}) $ | ||
| CMS Collaboration | ||
| 21 February 2024 | ||
| Phys. Rev. Lett. 133 (2024) 071903 | ||
| Abstract: Energy correlators that describe energy-weighted distances between two or three particles in a jet are measured using an event sample of $ \sqrt{s} = $ 13 TeV proton-proton collisions collected by the CMS experiment and corresponding to an integrated luminosity of 36.3 fb$ ^{-1} $. The measured distributions reveal two key features of the strong interaction: confinement and asymptotic freedom. By comparing the ratio of the two measured distributions with theoretical calculations that resum collinear emissions at approximate next-to-next-to-leading logarithmic accuracy matched to a next-to-leading order calculation, the strong coupling is determined at the Z boson mass: $ \alpha_\mathrm{S} (m_\mathrm{Z}) = $ 0.1229 $ ^{+0.0040}_{-0.0050} $, the most precise $ \alpha_\mathrm{S} (m_\mathrm{Z}) $ value obtained using jet substructure observables. | ||
| Links: e-print arXiv:2402.13864 [hep-ex] (PDF) ; CDS record ; inSPIRE record ; HepData record ; Physics Briefing ; CADI line (restricted) ; | ||
| Figures | |
png pdf |
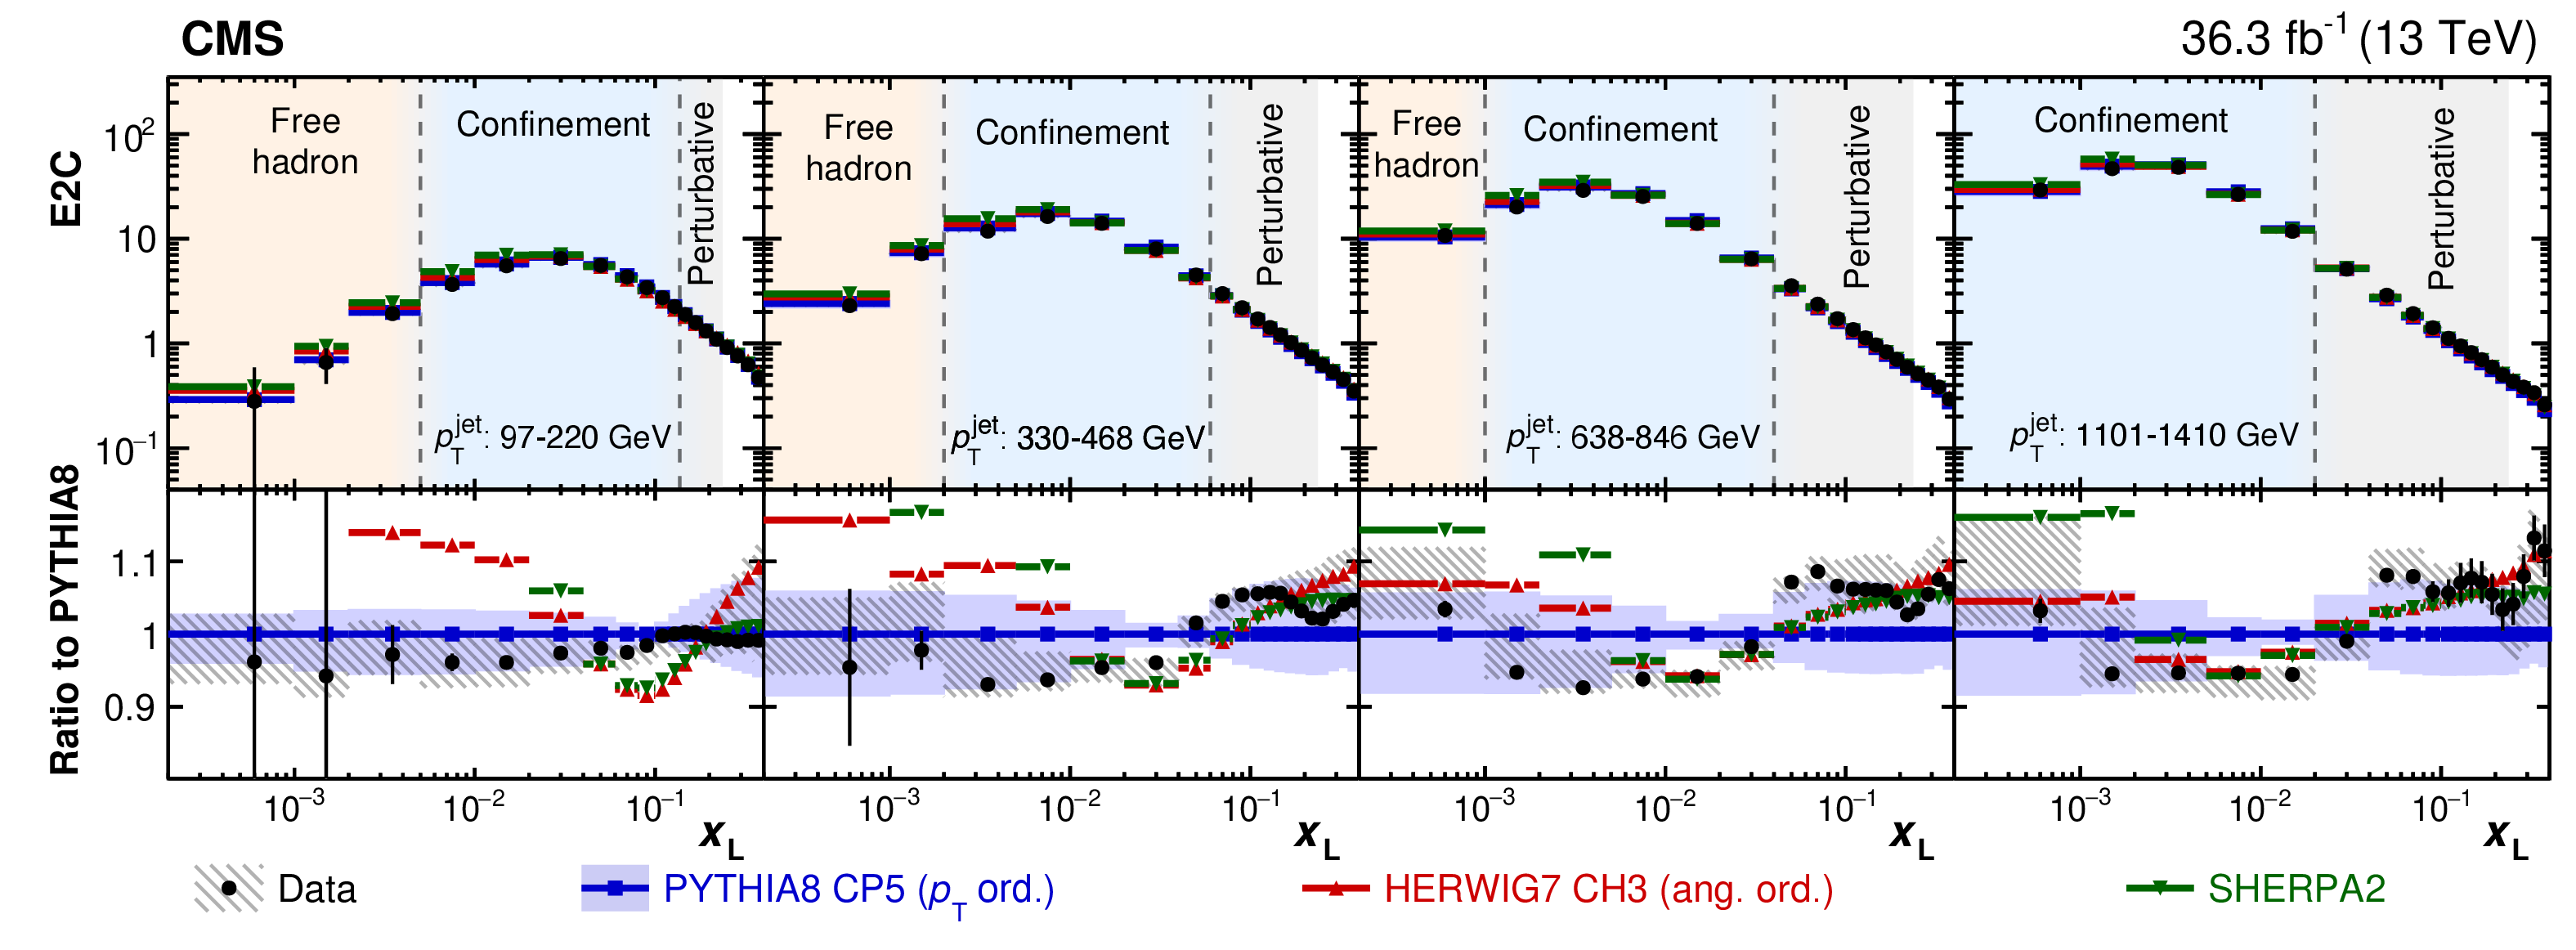
Figure 1:
Measured (unfolded) E2C distributions, compared with three MC predictions in the jet $ p_{\mathrm{T}} $ regions mentioned in the legends. The lower panels show the ratios to the PYTHIA8 CP5 ($ p_{\mathrm{T}} $-ordered showers) reference. The data statistical and systematic uncertainties are shown by vertical bars and hatched boxes, respectively; the PYTHIA8 uncertainty is shown by the blue band. The three $ x_\text{L} $ regions are described in the text. |
png pdf |
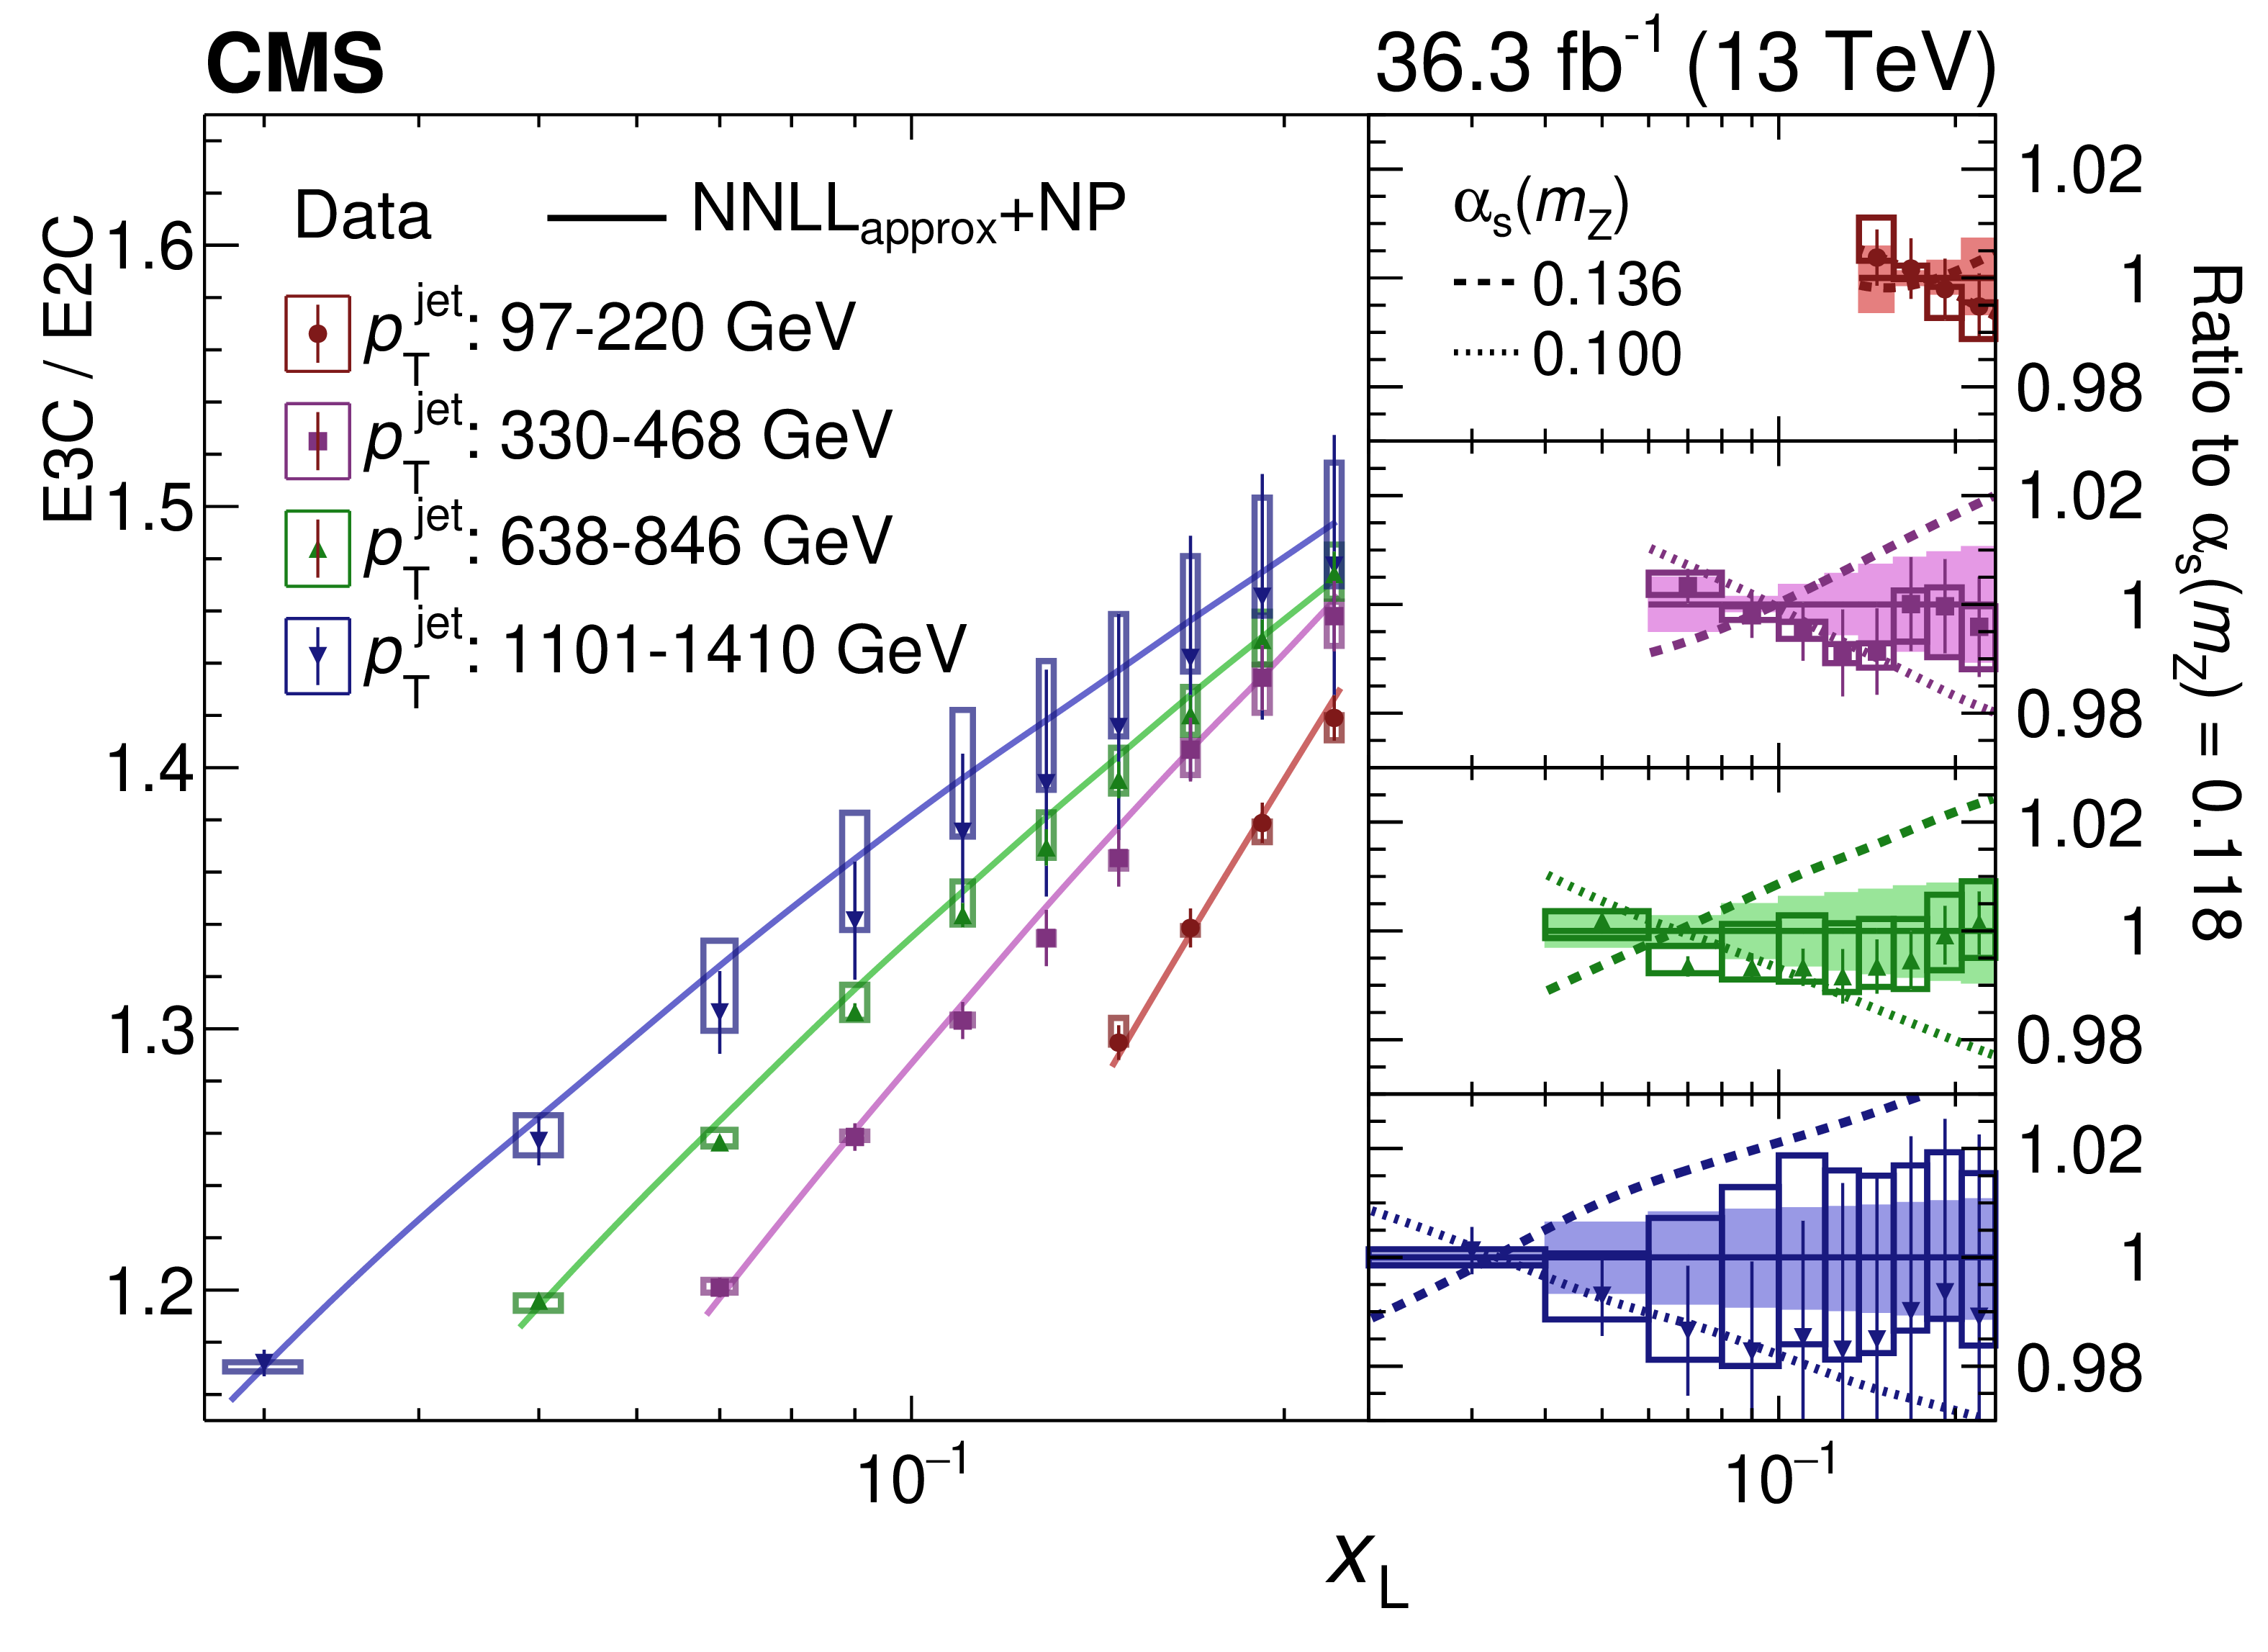
Figure 2:
Measured E3C/E2C ratio (left) and their ratio to predictions (right) in the perturbative $ x_\text{L} $ region, in the jet $ p_{\mathrm{T}} $ regions mentioned in the legends. The $ \text{NLO}+\text{NNLL}_\text{approx} $ theoretical predictions [19] are corrected to hadron-level and normalized to the measured data. The statistical and experimental systematic uncertainties are shown with error bars and boxes, respectively. |

png pdf |
Figure 3:
Fitted slopes of the measured E3C/E2C ratios, in the eight jet $ p_{\mathrm{T}} $ regions, compared to the corresponding theoretical predictions for three different $ \alpha_\mathrm{S} $ values. |
png pdf |
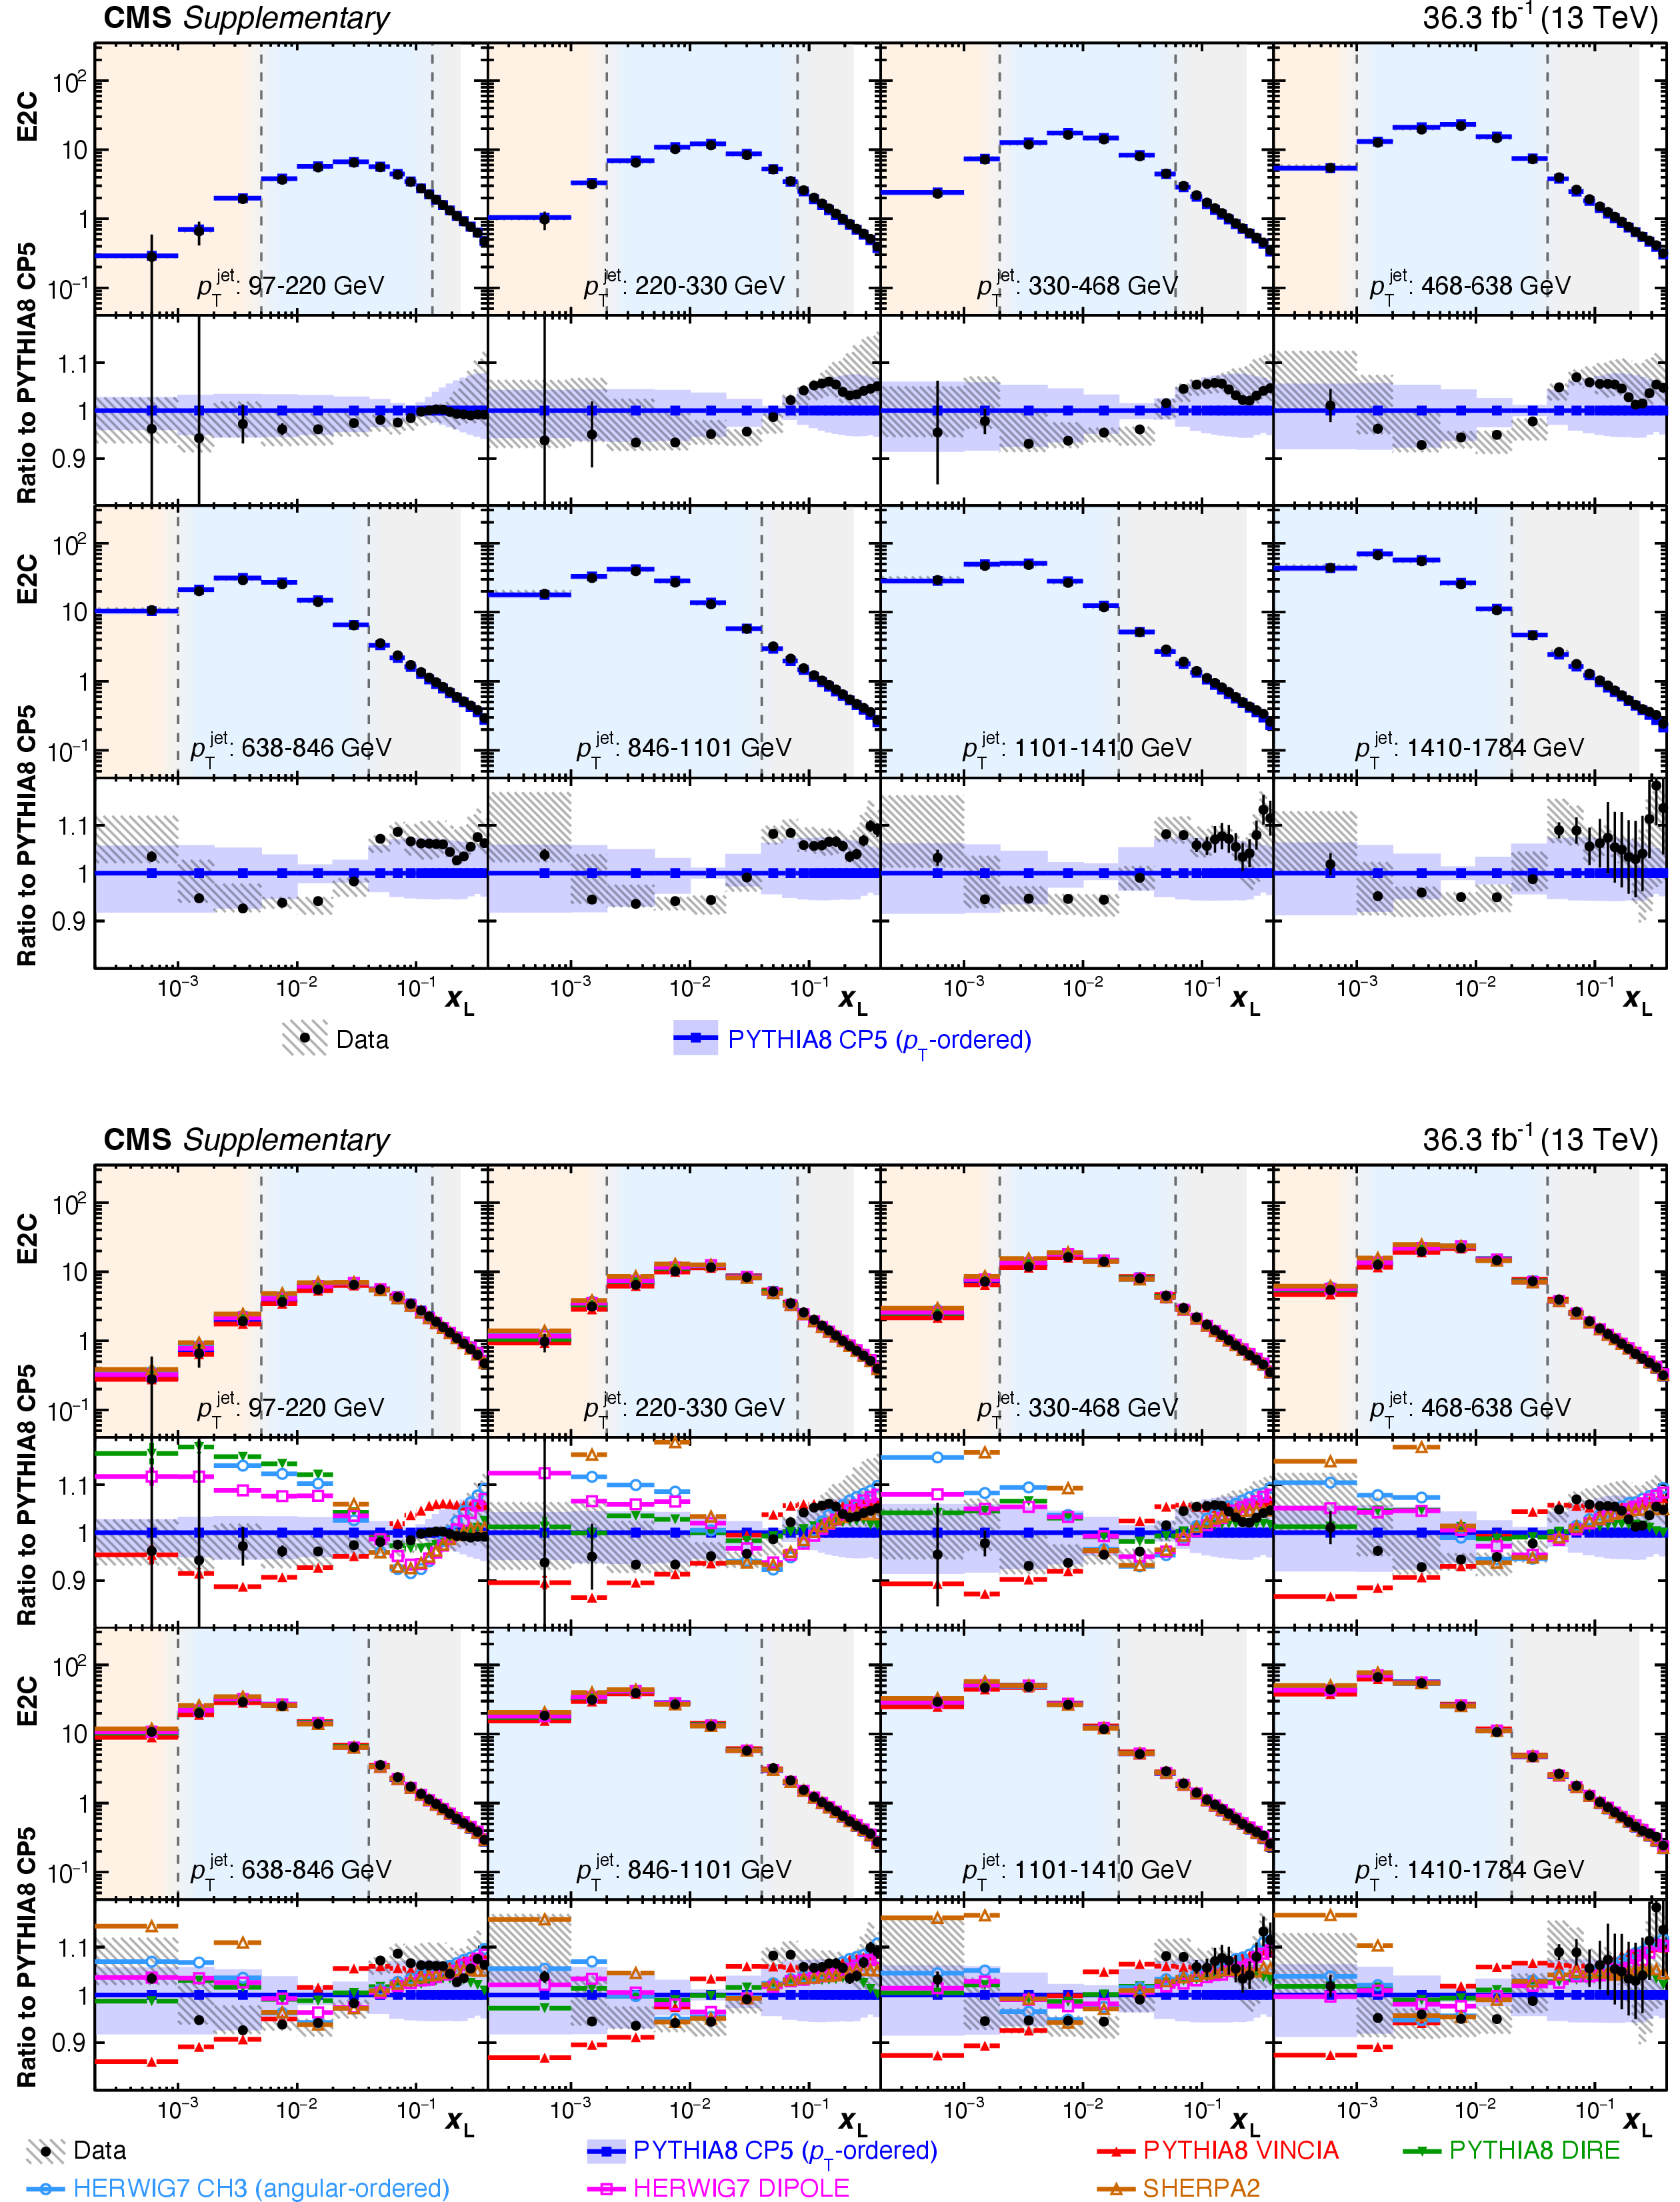
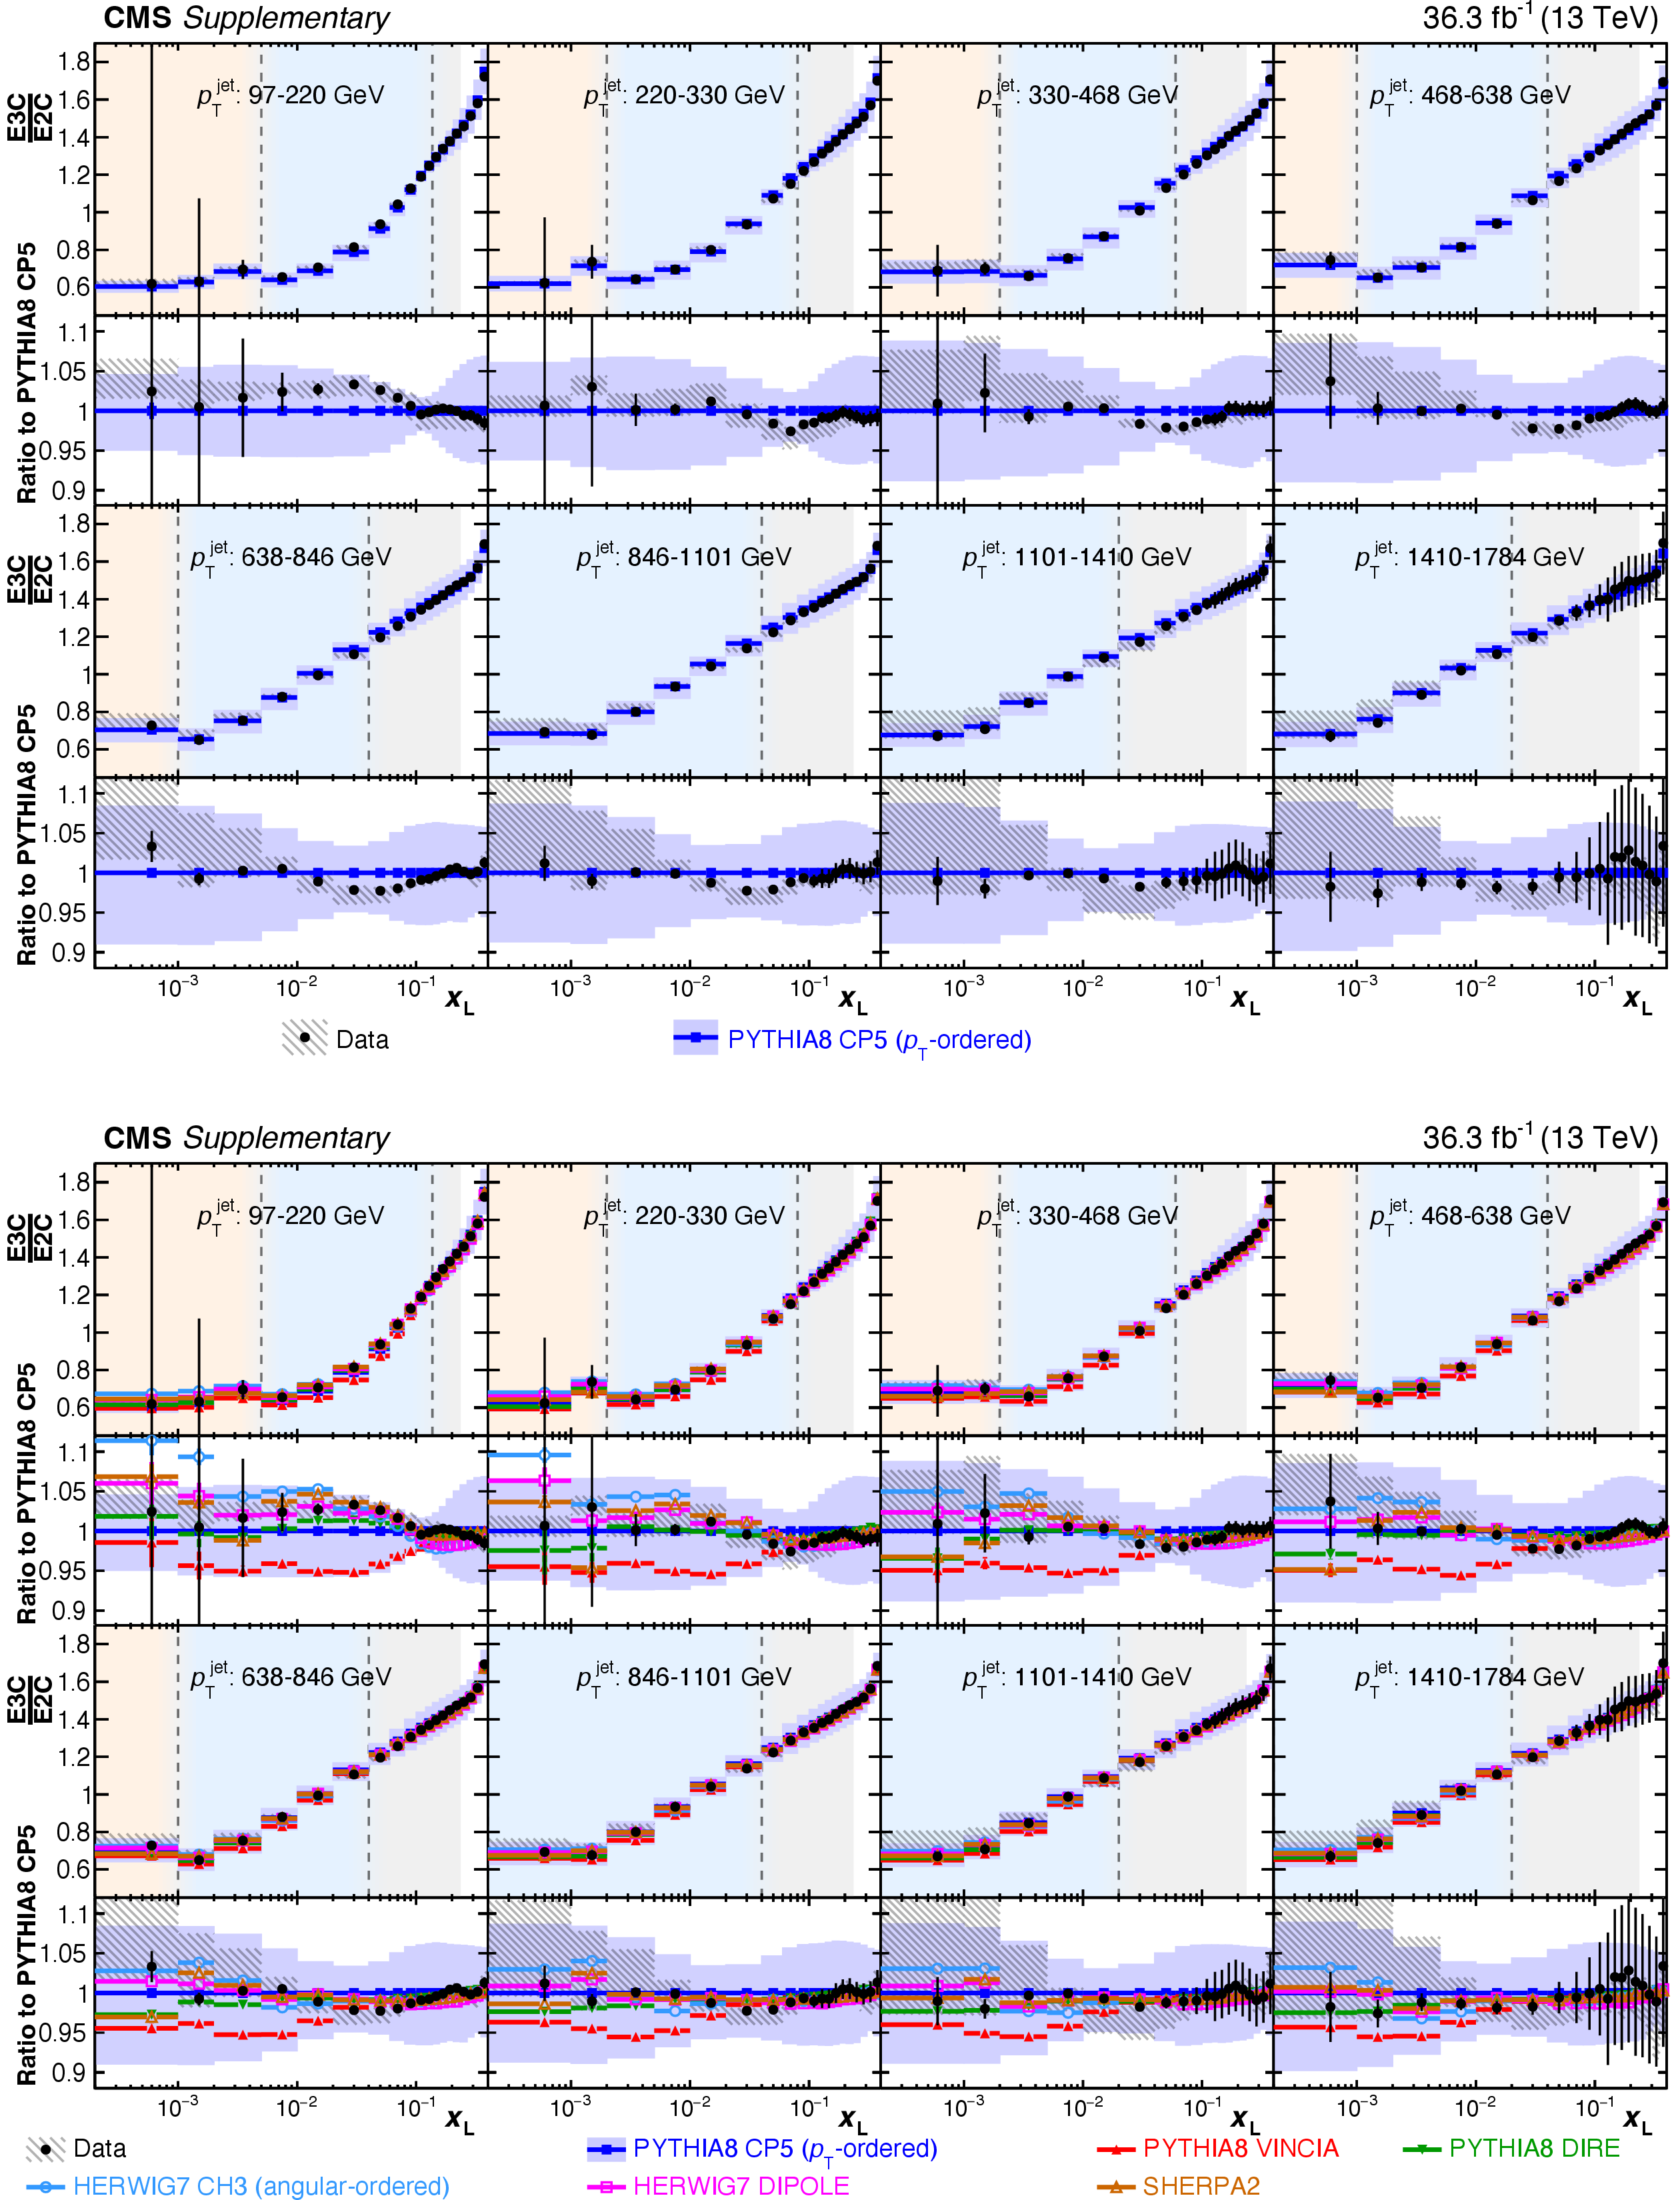
Figure A1:
Measured (unfolded) E2C distributions compared with the PYTHIA8 CP5 prediction (upper) and all the MC predictions (lower) in the eight $ p_{\mathrm{T}} $ regions. Statistical and experimental systematic uncertainties are shown with error bars and hatched bands, respectively. The theory uncertainty in the PYTHIA8 CP5 prediction is shown with the blue bands. |

png pdf |
Figure A1-a:
Measured (unfolded) E2C distributions compared with the PYTHIA8 CP5 prediction (upper) and all the MC predictions (lower) in the eight $ p_{\mathrm{T}} $ regions. Statistical and experimental systematic uncertainties are shown with error bars and hatched bands, respectively. The theory uncertainty in the PYTHIA8 CP5 prediction is shown with the blue bands. |

png pdf |
Figure A1-b:
Measured (unfolded) E2C distributions compared with the PYTHIA8 CP5 prediction (upper) and all the MC predictions (lower) in the eight $ p_{\mathrm{T}} $ regions. Statistical and experimental systematic uncertainties are shown with error bars and hatched bands, respectively. The theory uncertainty in the PYTHIA8 CP5 prediction is shown with the blue bands. |
png pdf |
Figure A2:
Measured (unfolded) E3C distributions compared with the PYTHIA8 CP5 prediction (upper) and all the MC predictions (lower) in the eight $ p_{\mathrm{T}} $ regions. Statistical and experimental systematic uncertainties are shown with error bars and hatched bands, respectively. The theory uncertainty in the PYTHIA8 CP5 prediction is shown with the blue bands. |

png pdf |
Figure A2-a:
Measured (unfolded) E3C distributions compared with the PYTHIA8 CP5 prediction (upper) and all the MC predictions (lower) in the eight $ p_{\mathrm{T}} $ regions. Statistical and experimental systematic uncertainties are shown with error bars and hatched bands, respectively. The theory uncertainty in the PYTHIA8 CP5 prediction is shown with the blue bands. |

png pdf |
Figure A2-b:
Measured (unfolded) E3C distributions compared with the PYTHIA8 CP5 prediction (upper) and all the MC predictions (lower) in the eight $ p_{\mathrm{T}} $ regions. Statistical and experimental systematic uncertainties are shown with error bars and hatched bands, respectively. The theory uncertainty in the PYTHIA8 CP5 prediction is shown with the blue bands. |
png pdf |
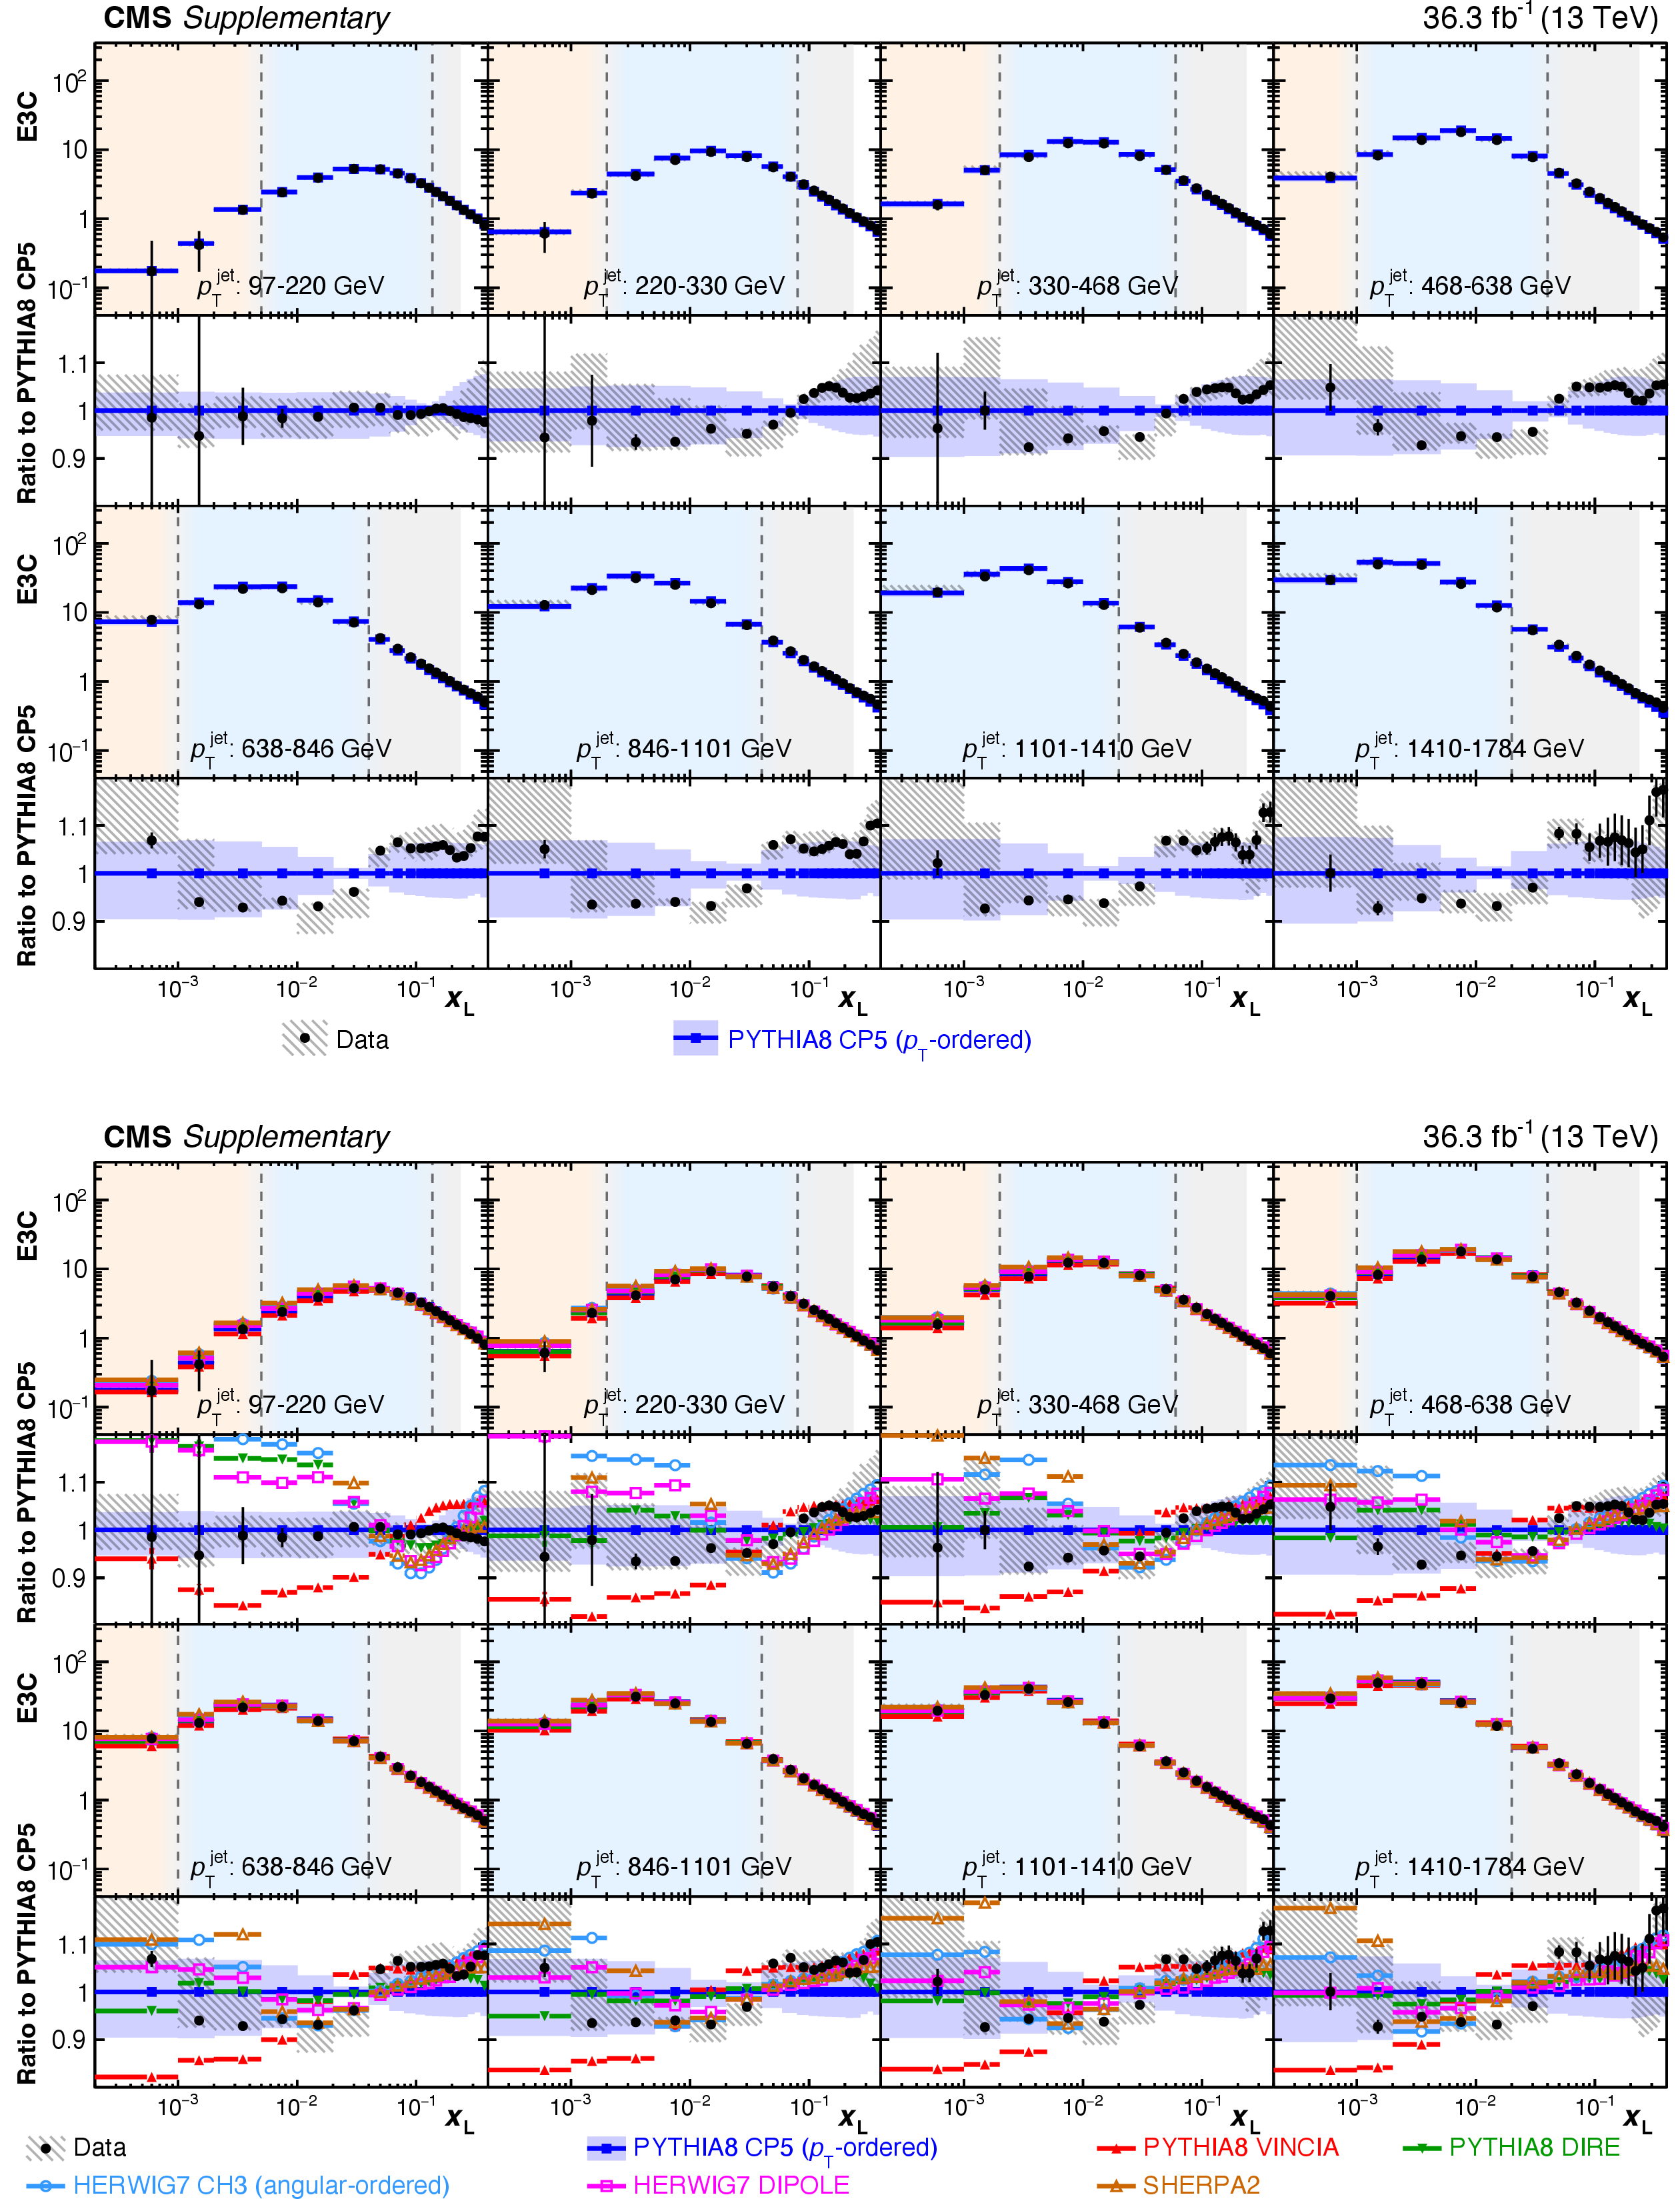
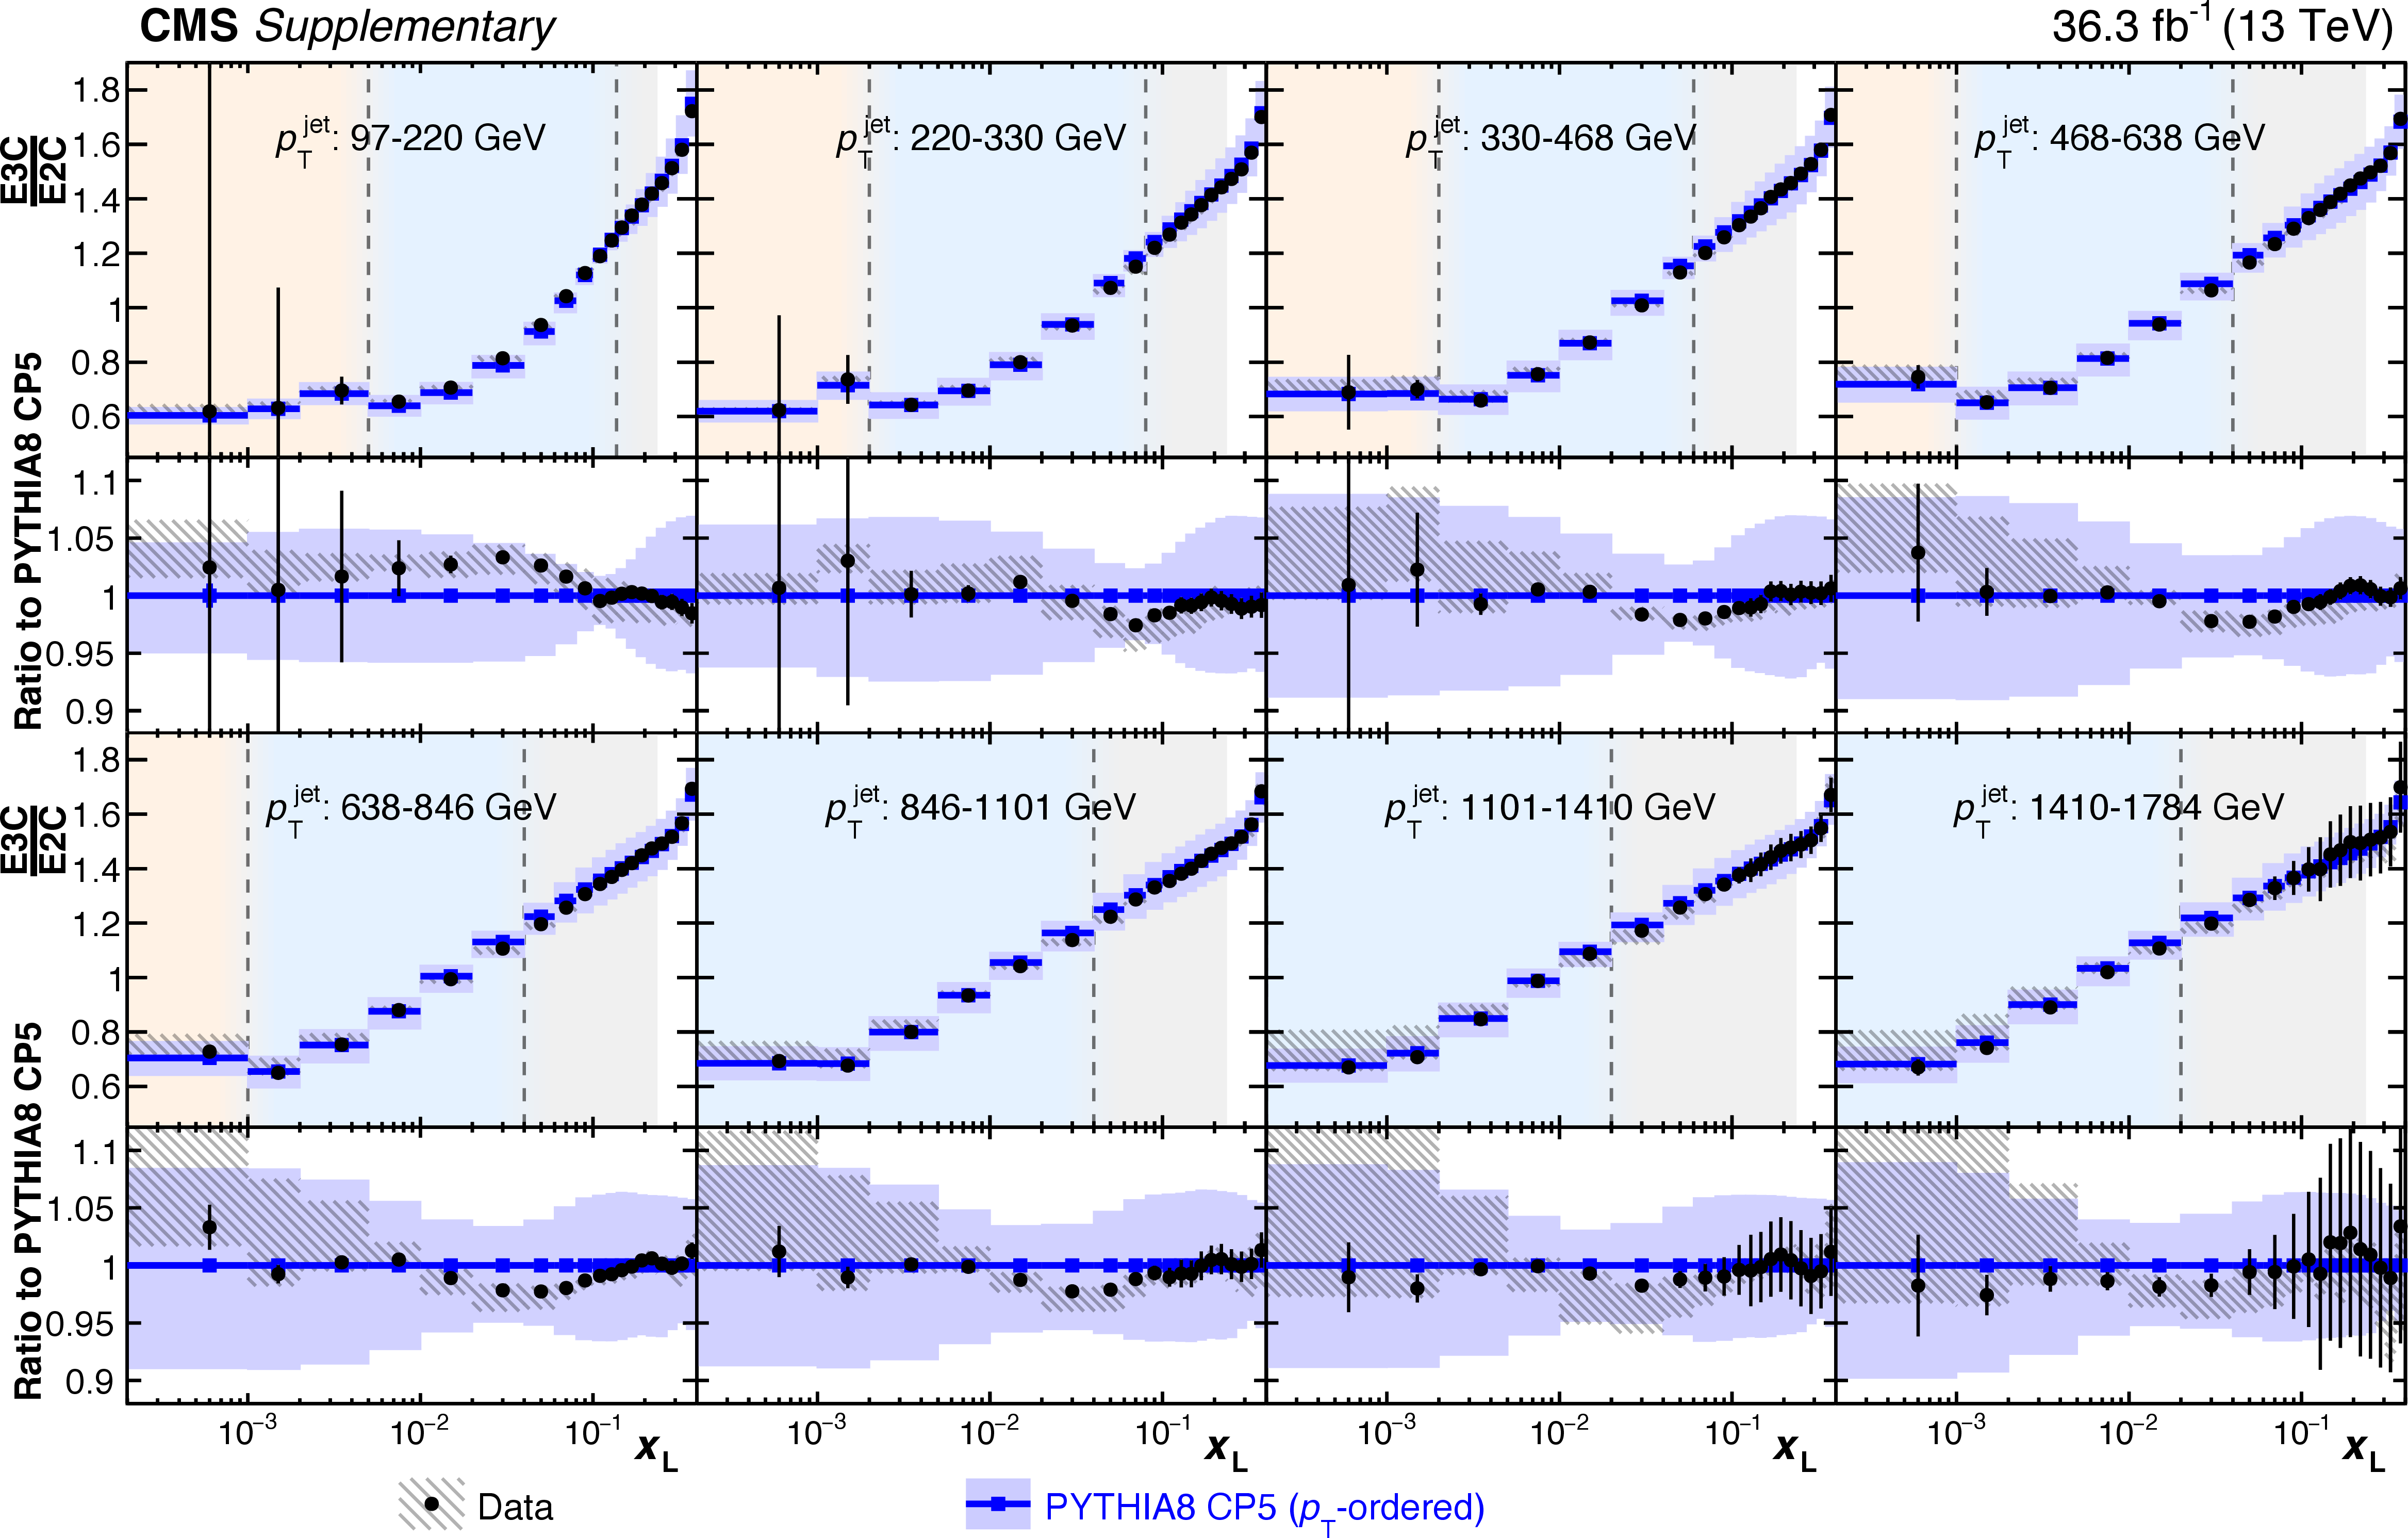
Figure A3:
Ratio of the unfolded E3C and E2C distributions compared with the PYTHIA8 CP5 prediction (upper) and all the MC predictions (lower) in the eight $ p_{\mathrm{T}} $ regions. Statistical and experimental systematic uncertainties are shown with error bars and hatched bands, respectively. The theory uncertainty in the PYTHIA8 CP5 prediction is shown with the blue bands. |
png pdf |
Figure A3-a:
Ratio of the unfolded E3C and E2C distributions compared with the PYTHIA8 CP5 prediction (upper) and all the MC predictions (lower) in the eight $ p_{\mathrm{T}} $ regions. Statistical and experimental systematic uncertainties are shown with error bars and hatched bands, respectively. The theory uncertainty in the PYTHIA8 CP5 prediction is shown with the blue bands. |

png pdf |
Figure A3-b:
Ratio of the unfolded E3C and E2C distributions compared with the PYTHIA8 CP5 prediction (upper) and all the MC predictions (lower) in the eight $ p_{\mathrm{T}} $ regions. Statistical and experimental systematic uncertainties are shown with error bars and hatched bands, respectively. The theory uncertainty in the PYTHIA8 CP5 prediction is shown with the blue bands. |

png pdf |
Figure A4:
Ratio of the unfolded E3C and E2C distributions in the eight $ p_{\mathrm{T}} $ regions. The $ \text{NLO}+\text{NNLL}_\text{approx} $ theoretical predictions [19] and the corresponding uncertainties are corrected to hadron-level and normalized to the measured data. The statistical and experimental systematic uncertainties are shown with error bars and boxes, respectively. |
png pdf |
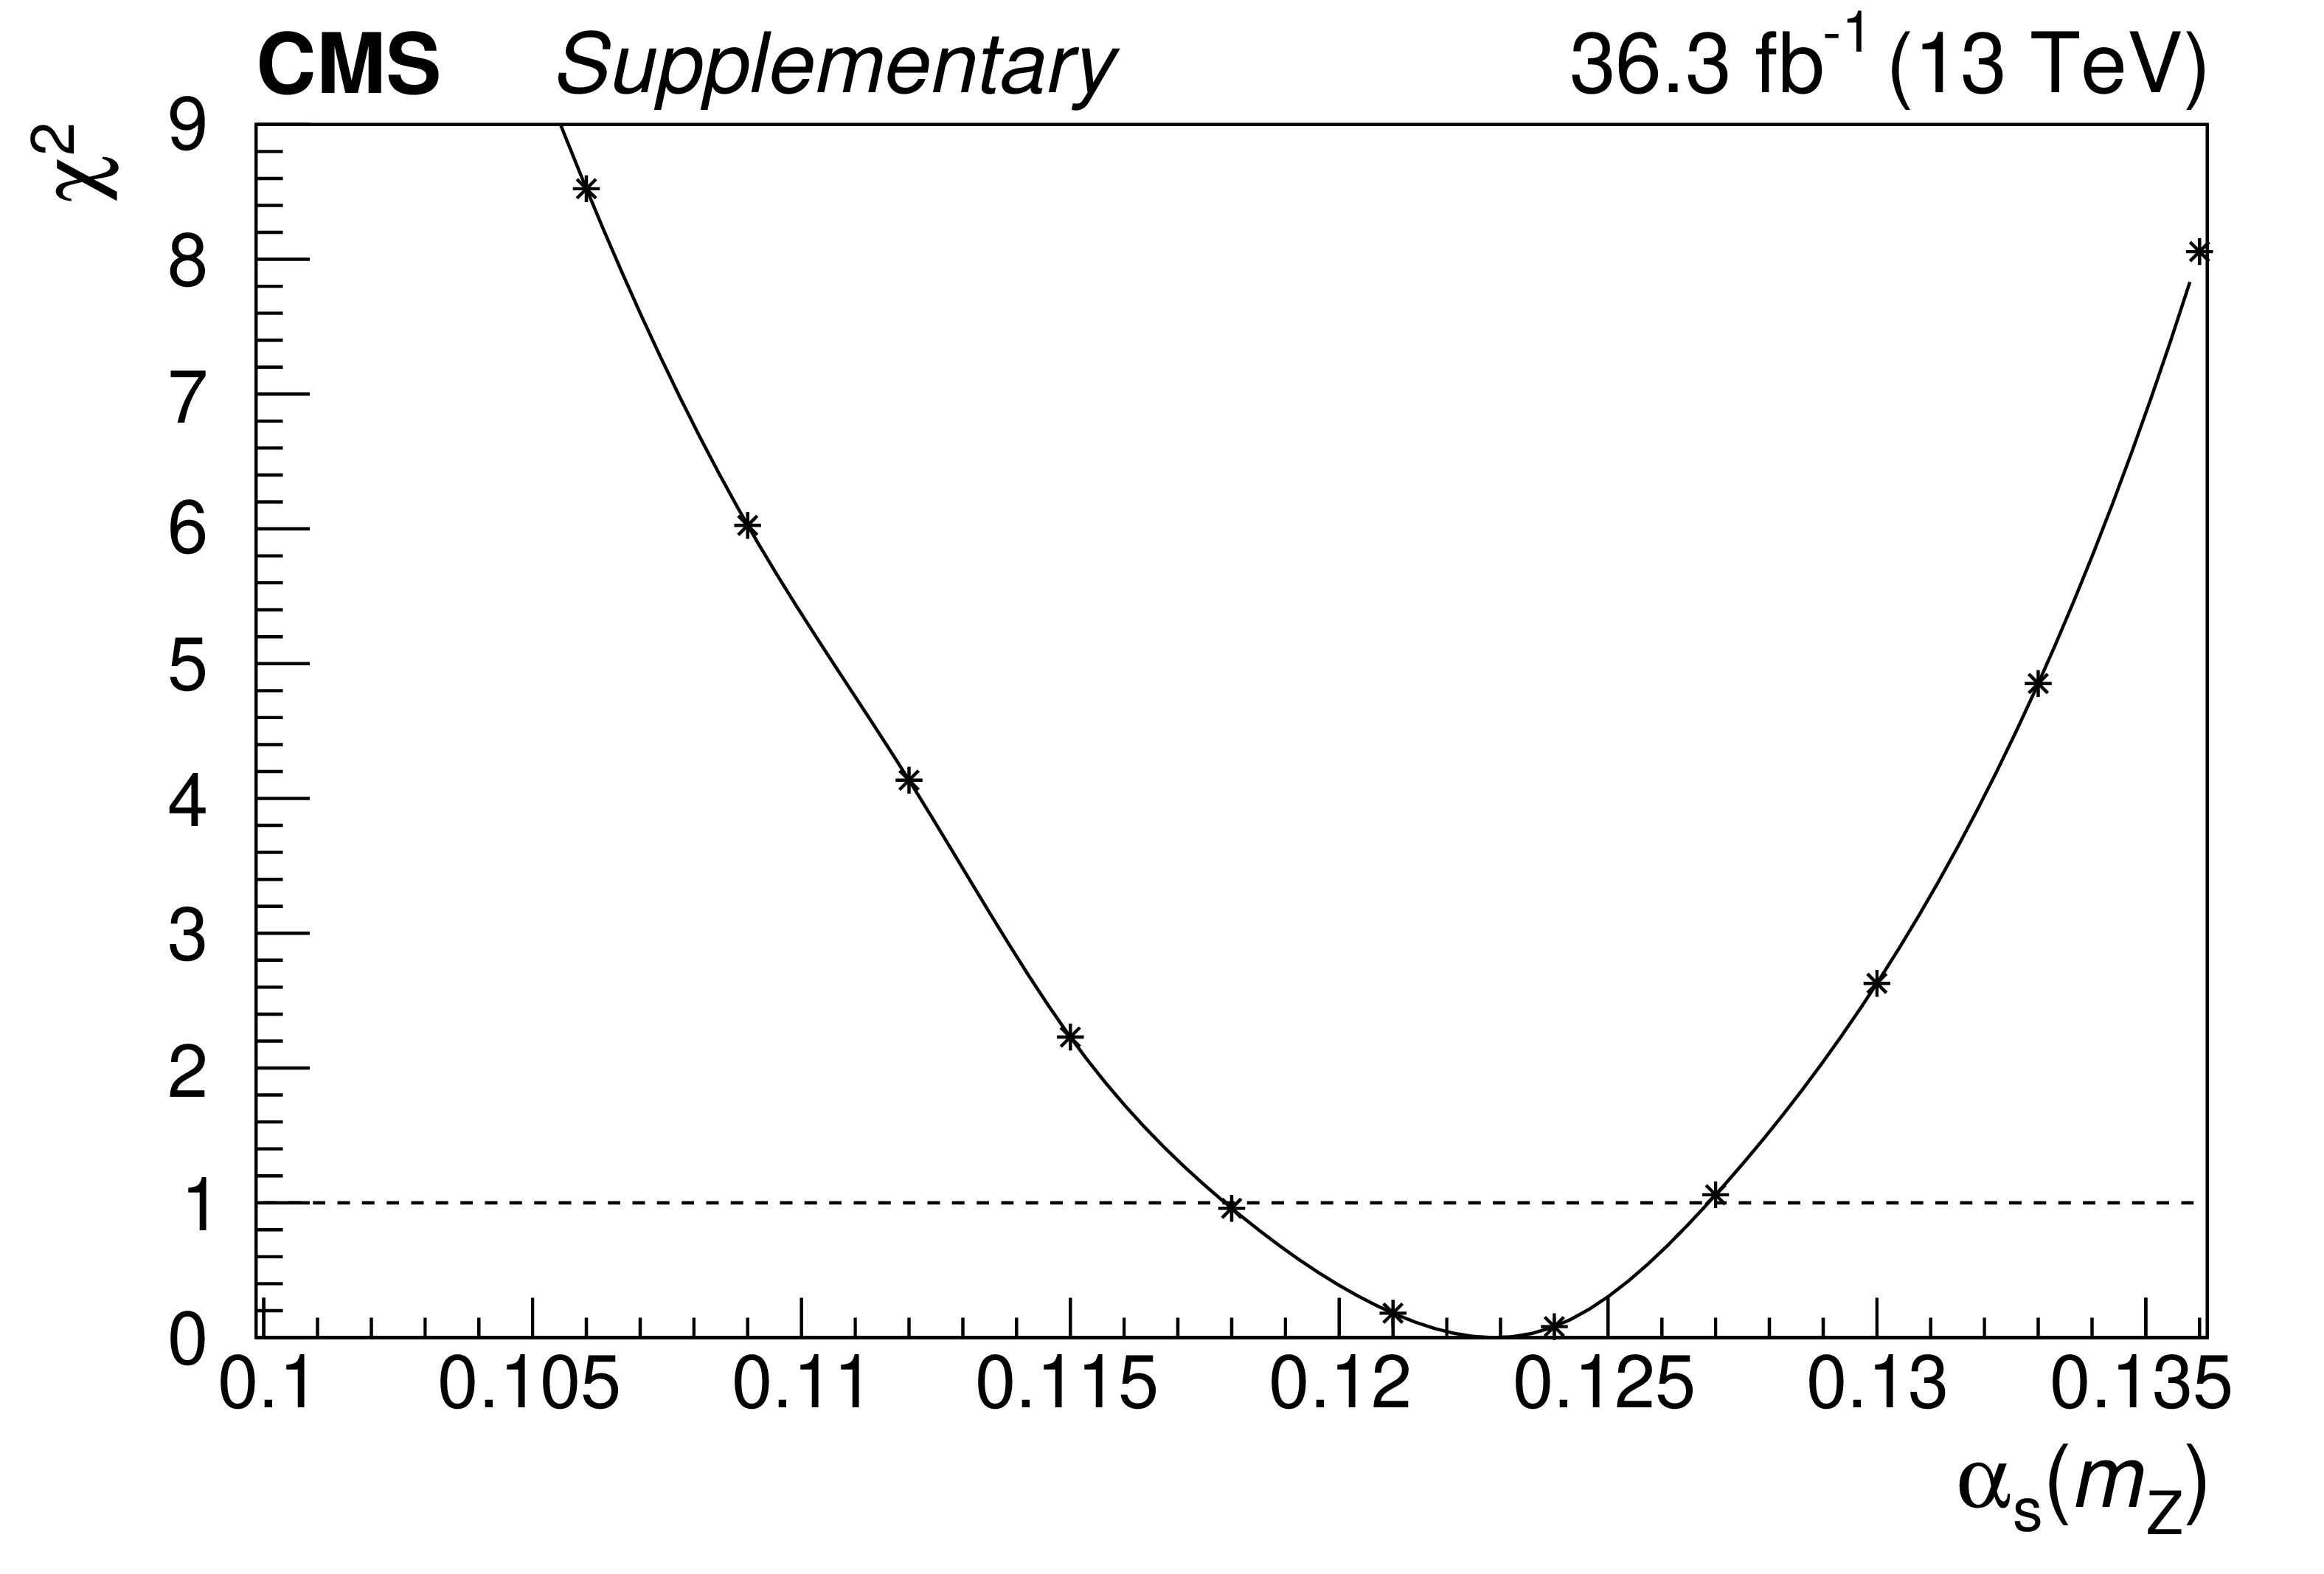
Figure A5:
The $ \chi^2 $ values determined from the fit of the measured data, as a function of $ \alpha_\mathrm{S} (m_\mathrm{Z}) $. |
png pdf |
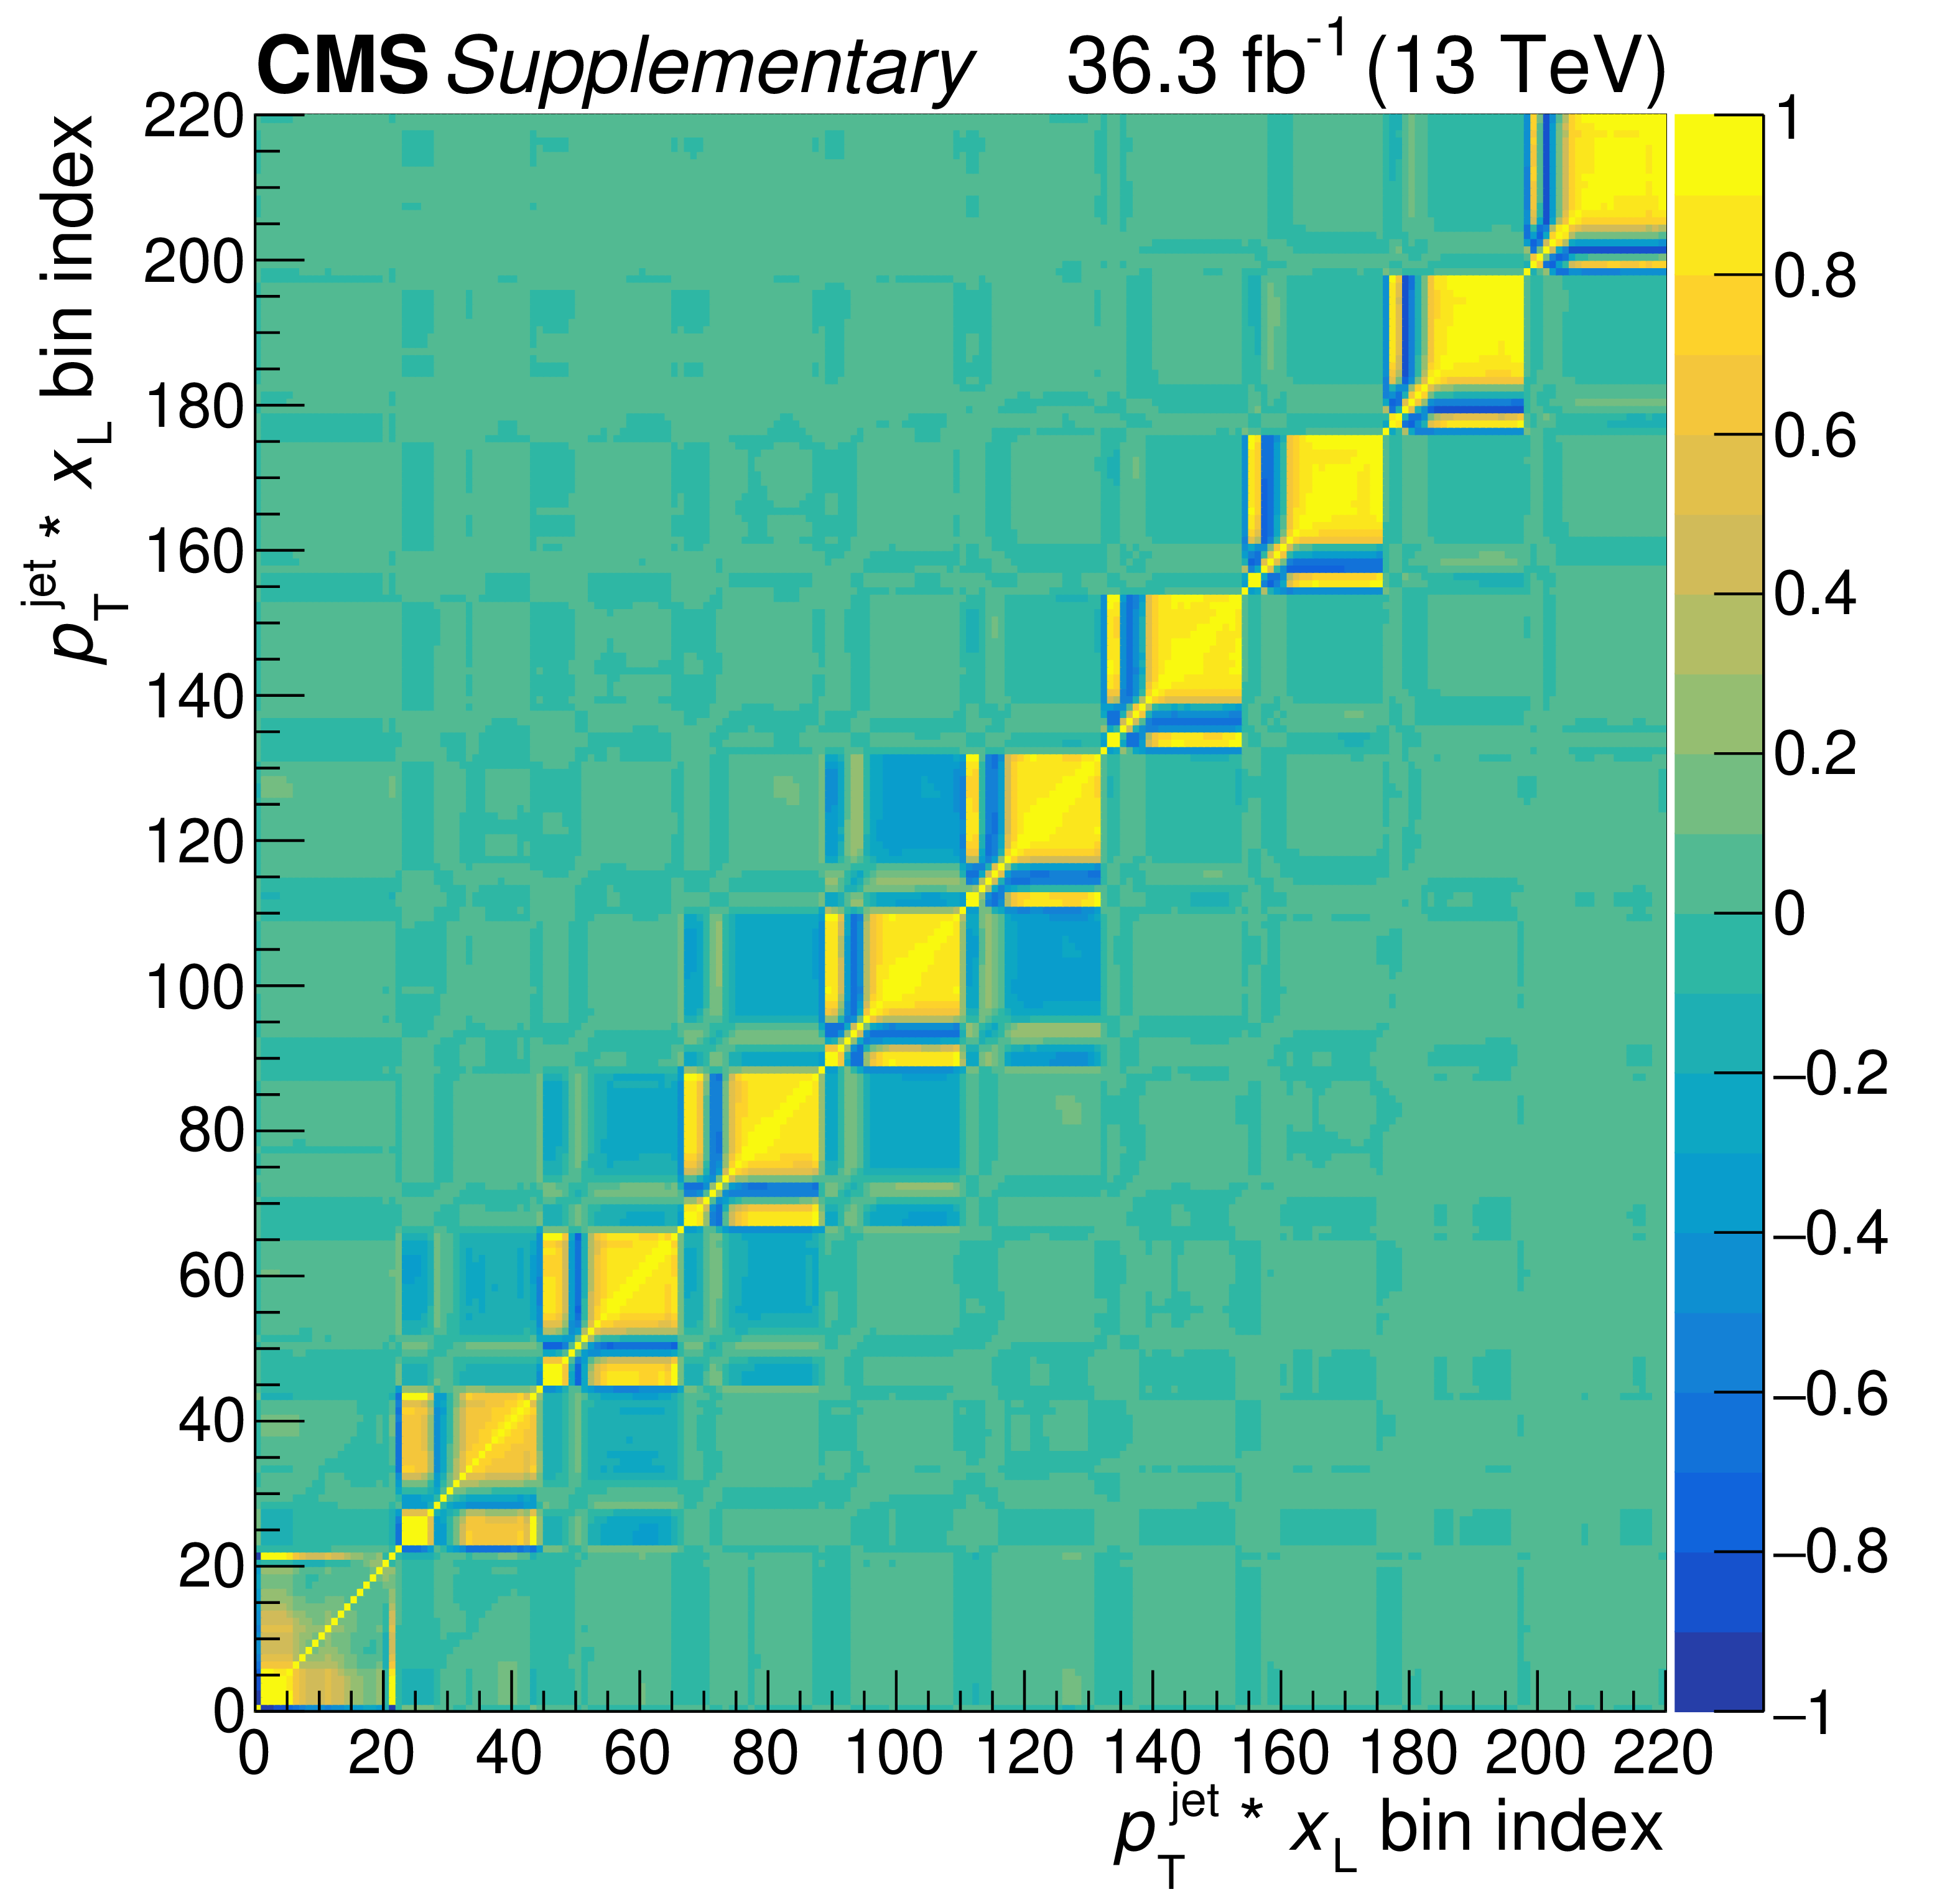
Figure A6:
The statistical correlation matrix of the bins of the unfolded E2C distribution. The bin number $ n $ in this figure is defined by $ n=22 i_{p_{\mathrm{T}}} + i_{x_\text{L}} $, where $ i_{p_{\mathrm{T}}} $ and $ i_{x_\text{L}} $ are the indices of the $ p_{\mathrm{T}} $ and $ x_\text{L} $ bins. In total there are ten $ p_{\mathrm{T}} $ bins, the eight presented in the analysis plus the overflow and underflow bins. The number of $ x_\text{L} $ bins per $ p_{\mathrm{T}} $ region is 22. |

png pdf |
Figure A7:
The statistical correlation matrix of the bins of the unfolded E3C distribution. The bin number $ n $ in this figure is defined by $ n=22 i_{p_{\mathrm{T}}} + i_{x_\text{L}} $, where $ i_{p_{\mathrm{T}}} $ and $ i_{x_\text{L}} $ are the indices of the $ p_{\mathrm{T}} $ and $ x_\text{L} $ bins. In total there are ten $ p_{\mathrm{T}} $ bins, the eight presented in the analysis plus the overflow and underflow bins. The number of $ x_\text{L} $ bins per $ p_{\mathrm{T}} $ region is 22. |
png pdf |
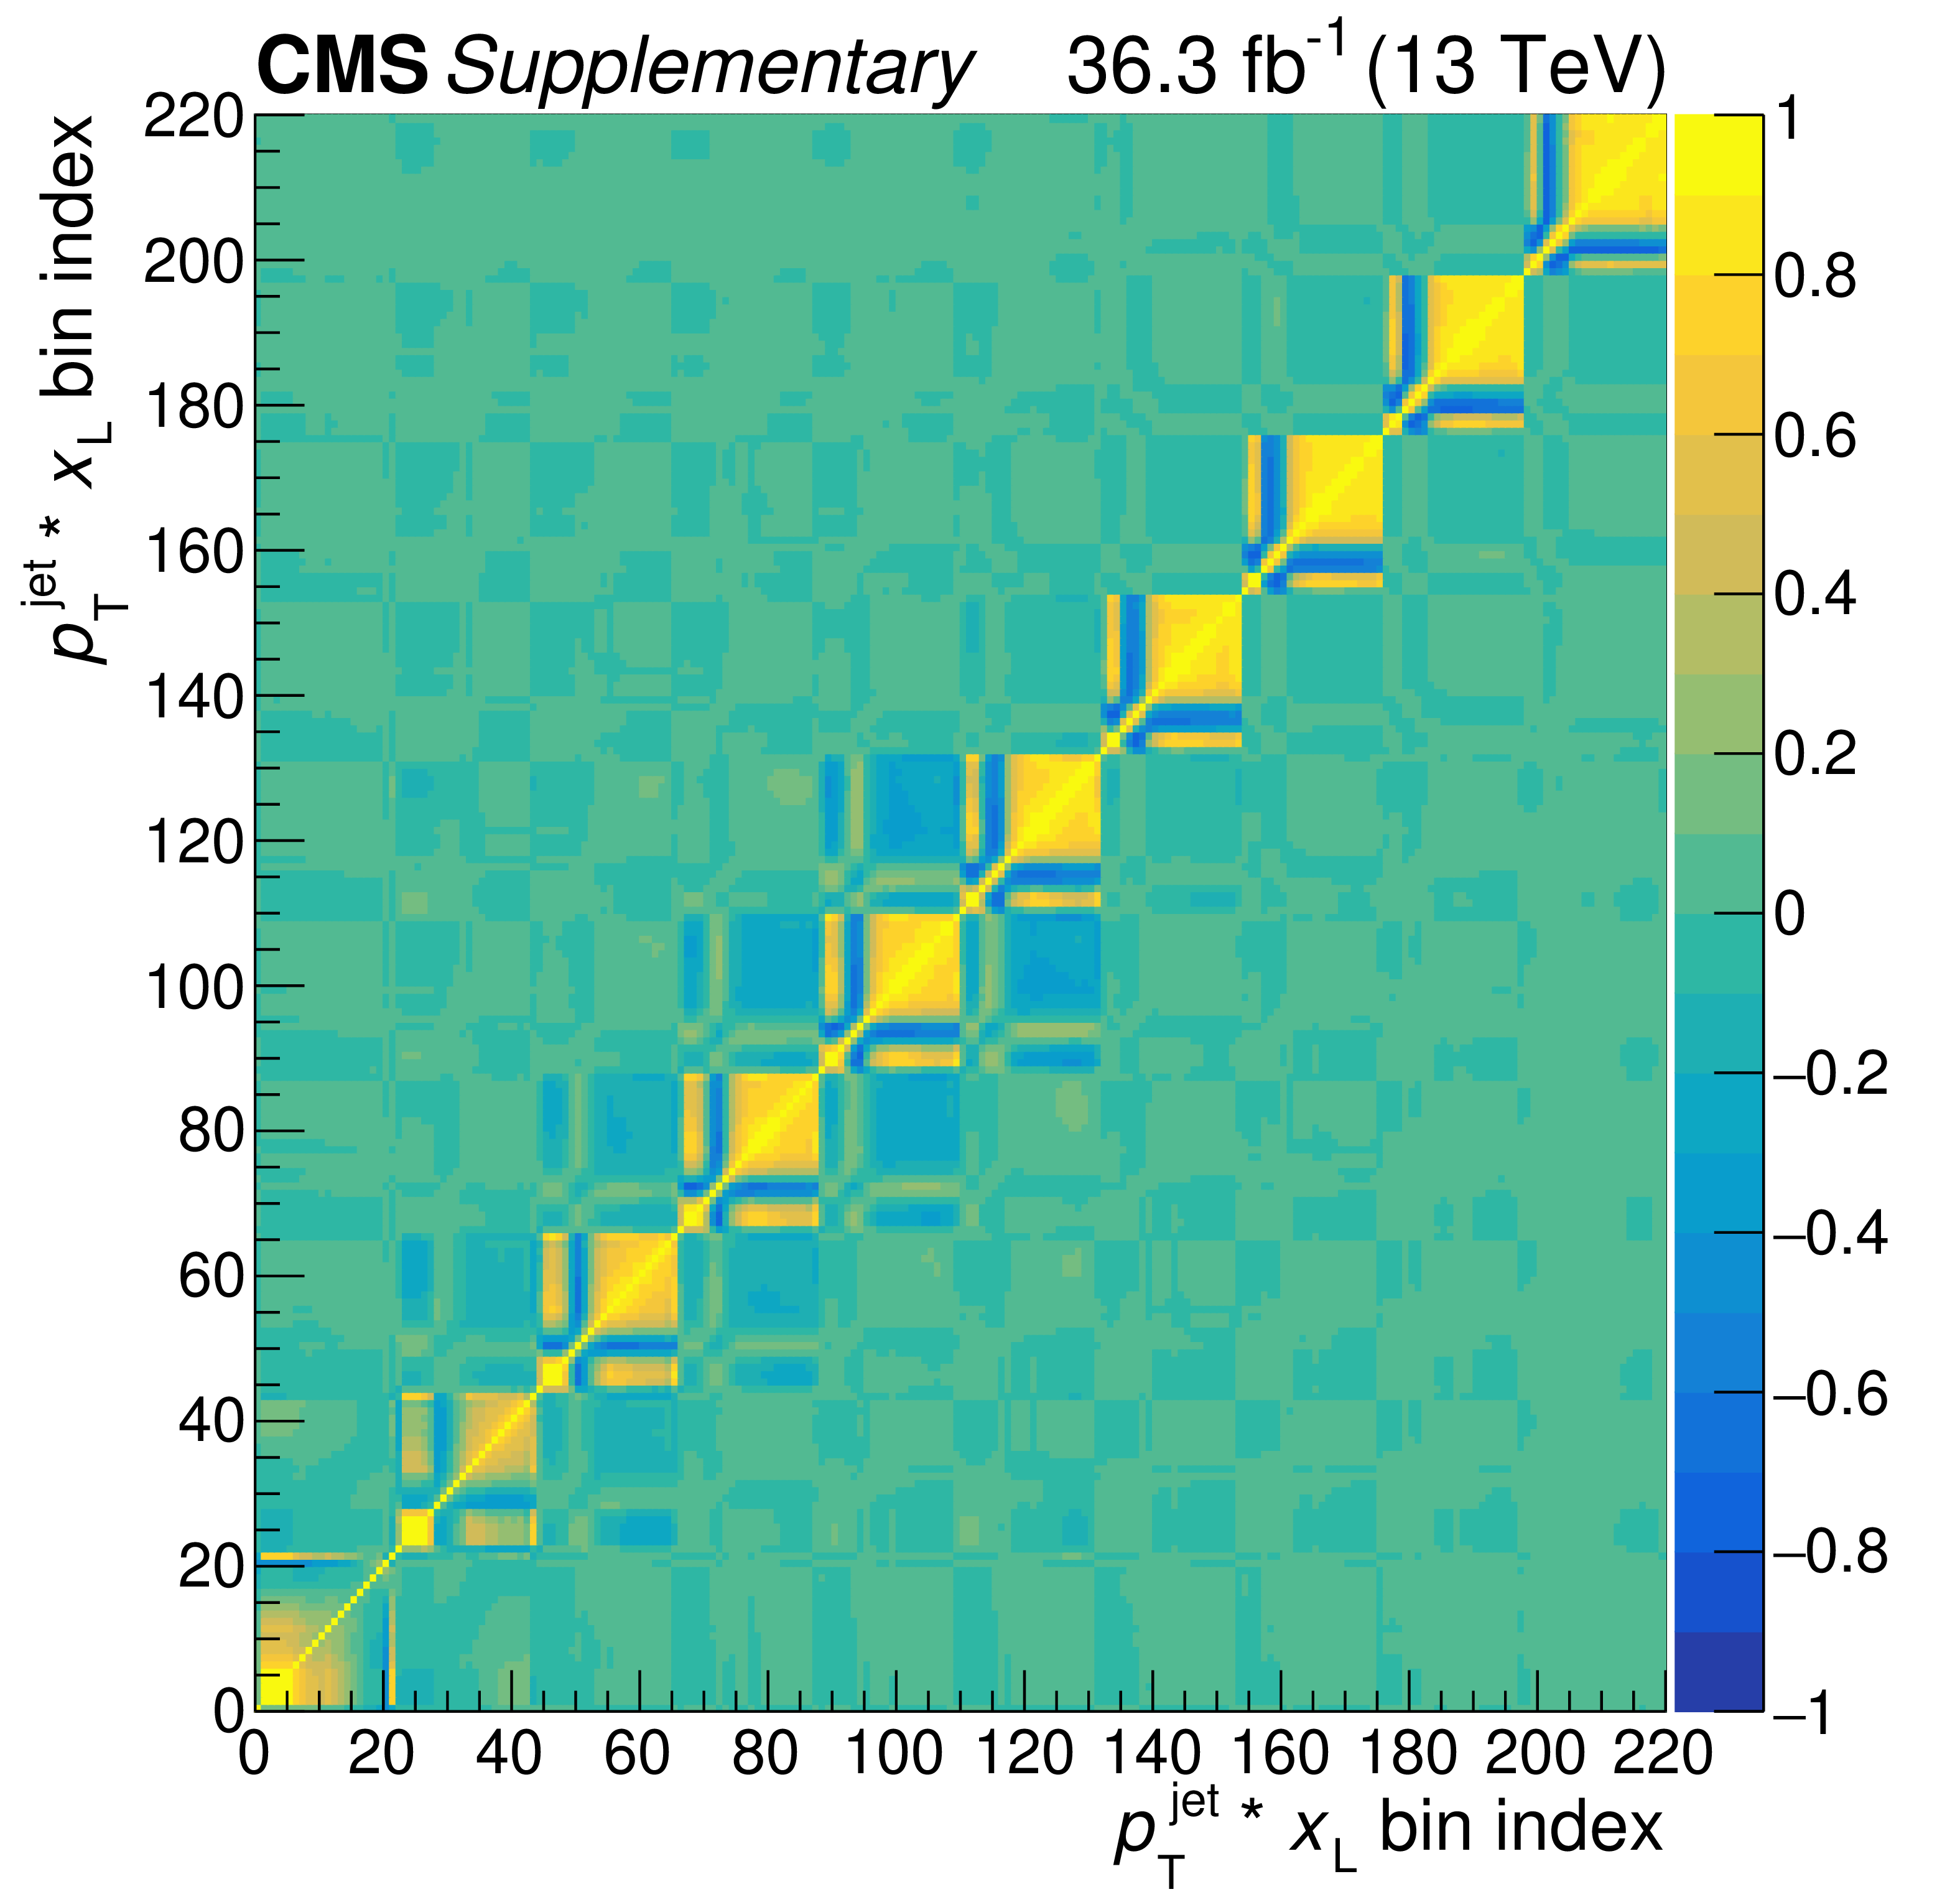
Figure A8:
The statistical correlation matrix of the bins of the unfolded E3C/E2C distribution. The bin number $ n $ in this figure is defined by $ n=22 i_{p_{\mathrm{T}}} + i_{x_\text{L}} $, where $ i_{p_{\mathrm{T}}} $ and $ i_{x_\text{L}} $ are the indices of the $ p_{\mathrm{T}} $ and $ x_\text{L} $ bins. In total there are ten $ p_{\mathrm{T}} $ bins, the eight presented in the analysis plus the overflow and underflow bins. The number of $ x_\text{L} $ bins per $ p_{\mathrm{T}} $ region is 22. |
| Summary |
| In summary, the E2C and E3C (two- and three-particle energy correlators) jet substructure observables, have been measured using a sample of proton-proton collisions at $ \sqrt{s} = $ 13 TeV, collected by the CMS experiment and corresponding to an integrated luminosity of 36.3 fb$ ^{-1} $. A multidimensional unfolding has been performed, of the jet $ p_{\mathrm{T}} $, of the (largest) distance between particles in a pair or a triplet, $ x_\text{L} $, and of the product of their energy weights, to compare the data with samples of events simulated with different parton showering algorithms and hadronization models. The results provide a high-precision measurement of jet properties described by QCD and can help validate future higher-order corrections in parton shower algorithms. The strong coupling at the Z boson mass, $ \alpha_\mathrm{S} (m_\mathrm{Z}) $, is extracted by comparing the measured E3C/E2C ratio with calculations at approximate next-to-next-to-leading logarithmic accuracy matched to a next-to-leading order: $ \alpha_\mathrm{S} (m_\mathrm{Z}) = $ 0.1229 $ ^{+0.0040}_{-0.0050} $. This is the most precise determination of $ \alpha_\mathrm{S} $ using jet substructure techniques. The result benefits greatly from the development of novel jet substructure observables, which reduce the sensitivity to the quark-gluon composition, and from the availability of high-precision theoretical calculations. |
| References | ||||
| 1 | F. Gross et al. | 50 years of quantum chromodynamics | EPJC 83 (2023) 1125 | 2212.11107 |
| 2 | ATLAS Collaboration | Measurement of the Lund jet plane using charged particles in 13 TeV proton-proton collisions with the ATLAS detector | PRL 124 (2020) 222002 | 2004.03540 |
| 3 | ATLAS Collaboration | Measurement of jet fragmentation in 5.02 TeV proton-lead and proton-proton collisions with the ATLAS detector | Nucl. Phys. A 978 (2018) 65 | 1706.02859 |
| 4 | ATLAS Collaboration | Measurement of soft-drop jet observables in pp collisions with the ATLAS detector at $ \sqrt {s} = $ 13 TeV | PRD 101 (2020) 052007 | 1912.09837 |
| 5 | CMS Collaboration | Study of quark and gluon jet substructure in Z+jet and dijet events from pp collisions | JHEP 01 (2022) 188 | CMS-SMP-20-010 2109.03340 |
| 6 | CMS Collaboration | Measurement of the splitting function in pp and Pb-Pb collisions at $ \sqrt {\smash [b]{s_{_{\mathrm {NN}}}}}= $ 5.02 TeV | PRL 120 (2018) 142302 | CMS-HIN-16-006 1708.09429 |
| 7 | CMS Collaboration | Measurements of the differential jet cross section as a function of the jet mass in dijet events from proton-proton collisions at $ \sqrt{s}= $ 13 TeV | JHEP 11 (2018) 113 | CMS-SMP-16-010 1807.05974 |
| 8 | ALICE Collaboration | Measurements of the groomed and ungroomed jet angularities in pp collisions at $ \sqrt{s} $ = 5.02 TeV | JHEP 05 (2022) 061 | 2107.11303 |
| 9 | ALICE Collaboration | Measurement of the groomed jet radius and momentum splitting fraction in pp and Pb-Pb collisions at $ \sqrt {\smash [b]{s_{_{\mathrm {NN}}}}} = $ 5.02 TeV | PRL 128 (2022) 102001 | 2107.12984 |
| 10 | ALICE Collaboration | Direct observation of the dead-cone effect in quantum chromodynamics | Nature 605 (2022) 440 | 2106.05713 |
| 11 | LHCb Collaboration | Measurement of charged hadron production in $ Z $-tagged jets in proton-proton collisions at $ \sqrt{s}= $ 8 TeV | PRL 123 (2019) 232001 | 1904.08878 |
| 12 | H. Chen, I. Moult, X. Y. Zhang, and H. X. Zhu | Rethinking jets with energy correlators: tracks, resummation, and analytic continuation | PRD 102 (2020) 054012 | 2004.11381 |
| 13 | C. L. Basham, L. S. Brown, S. D. Ellis, and S. T. Love | Energy correlations in electron - positron annihilation: Testing QCD | PRL 41 (1978) 1585 | |
| 14 | PLUTO Collaboration | Energy-energy correlations in \EEannihilation into hadrons | PLB 99 (1981) 292 | |
| 15 | L3 Collaboration | Determination of $ \alpha_S $ from hadronic event shapes measured on the $ \mathrm{Z}^0 $ resonance | PLB 284 (1992) 471 | |
| 16 | OPAL Collaboration | An improved measurement of $ \alpha_S(m_{\mathrm{Z}^0}) $ using energy correlations with the OPAL detector at LEP | PLB 276 (1992) 547 | |
| 17 | DELPHI Collaboration | Determination of $ \alpha_S $ in second order QCD from hadronic Z decays | Z. Phys. C 54 (1992) 55 | |
| 18 | D. M. Hofman and J. Maldacena | Conformal collider physics: Energy and charge correlations | JHEP 05 (2008) 012 | 0803.1467 |
| 19 | G. P. Salam | Towards Jetography | EPJC 67 (2010) 637 | 0906.1833 |
| 20 | N. A. Sveshnikov and F. V. Tkachov | Jets and quantum field theory | PLB 382 (1996) 403 | hep-ph/9512370 |
| 21 | A. V. Belitsky et al. | From correlation functions to event shapes | NPB 884 (2014) 305 | 1309.0769 |
| 22 | A. V. Belitsky et al. | Event shapes in $ \mathcal{N} = $ 4 super-Yang-Mills theory | NPB 884 (2014) 206 | 1309.1424 |
| 23 | M. Kologlu, P. Kravchuk, D. Simmons-Duffin, and A. Zhiboedov | The light-ray OPE and conformal colliders | JHEP 01 (2021) 128 | 1905.01311 |
| 24 | L. J. Dixon, I. Moult, and H. X. Zhu | Collinear limit of the energy-energy correlator | PRD 100 (2019) 014009 | 1905.01310 |
| 25 | K. Lee, B. Me ç aj, and I. Moult | Conformal colliders meet the LHC | 2205.03414 | |
| 26 | W. Chen et al. | NNLL resummation for projected three-point energy correlator | 2307.07510 | |
| 27 | J. R. Andersen et al. | Les Houches 2017: Physics at TeV colliders standard model working group report | in es Houches Workshop, 2018 Proc. Standard Model Working Group of the 2017 (2018) L |
1803.07977 |
| 28 | G. P. Salam | The strong coupling: a theoretical perspective | CERN theory report CERN-TH-2017-268, 2017 link |
1712.05165 |
| 29 | S. Moch et al. | High precision fundamental constants at the TeV scale | 1405.4781 | |
| 30 | M. LeBlanc, B. Nachman, and C. Sauer | Going off topics to demix quark and gluon jets in \ensuremath\alpha$ _{S} $ extractions | JHEP 02 (2023) 150 | 2206.10642 |
| 31 | Particle Data Group , R. L. Workman et al. | Review of particle physics | and update, 2022 Prog. Theor. Exp. Phys. 2022 (2022) 083C01 |
|
| 32 | ATLAS Collaboration | A precise determination of the strong-coupling constant from the recoil of $ Z $ bosons with the ATLAS experiment at $ \sqrt{s} = $ 8 TeV | Submitted to Nature Phys, 2023 | 2309.12986 |
| 33 | CMS Collaboration | Measurement and QCD analysis of double-differential inclusive jet cross sections in proton-proton collisions at $ \sqrt{s} $ = 13 TeV | [Addendum: \DOI10./JHEP12()035], 2022 JHEP 02 (2022) 142 |
CMS-SMP-20-011 2111.10431 |
| 34 | ATLAS Collaboration | Determination of the strong coupling constant from transverse energy-energy correlations in multijet events at $ \sqrt{s} = $ 13 TeV with the ATLAS detector | JHEP 07 (2023) 085 | 2301.09351 |
| 35 | CMS Collaboration | Measurement of the $ \mathrm{t}\overline{\mathrm{t}} $ production cross section, the top quark mass, and the strong coupling constant using dilepton events in pp collisions at $ \sqrt{s} = $ 13 TeV | EPJC 79 (2019) 368 | CMS-TOP-17-001 1812.10505 |
| 36 | D. d'Enterria and A. Poldaru | Extraction of the strong coupling $ \alpha_\mathrm{S} (m_\mathrm{Z}) $ from a combined NNLO analysis of inclusive electroweak boson cross sections at hadron colliders | JHEP 06 (2020) 016 | 1912.11733 |
| 37 | T. Klijnsma, S. Bethke, G. Dissertori, and G. P. Salam | Determination of the strong coupling constant $ \alpha_\mathrm{S} (m_\mathrm{Z}) $ from measurements of the total cross section for top-antitop quark production | EPJC 77 (2017) 778 | 1708.07495 |
| 38 | R. Abbate et al. | Thrust at $ \text{N}^{3}\text{LL} $ with power corrections and a precision global fit for $ \alpha_\mathrm{S} (m_\mathrm{Z}) $ | PRD 83 (2011) 074021 | 1006.3080 |
| 39 | T. Gehrmann, G. Luisoni, and P. F. Monni | Power corrections in the dispersive model for a determination of the strong coupling constant from the thrust distribution | EPJC 73 (2013) 2265 | 1210.6945 |
| 40 | A. H. Hoang, D. W. Kolodrubetz, V. Mateu, and I. W. Stewart | Precise determination of $ \alpha_\mathrm{S} $ from the $ C $-parameter distribution | PRD 91 (2015) 094018 | 1501.04111 |
| 41 | CMS Collaboration | Measurement of jet substructure observables in $ \mathrm{t\overline{t}} $ events from proton-proton collisions at $ \sqrt{s}= $ 13 TeV | PRD 98 (2018) 092014 | CMS-TOP-17-013 1808.07340 |
| 42 | V. N. Gribov and L. N. Lipatov | Deep inelastic ep scattering in perturbation theory | Sov. J. Nucl. Phys. 15 (1972) 438 | |
| 43 | Y. L. Dokshitzer | Calculation of the structure functions for deep inelastic scattering and $ \mathrm{e}^+\mathrm{e}^- $ annihilation by perturbation theory in quantum chromodynamics. | Sov. Phys. JETP 46 (1977) 641 | |
| 44 | G. Marchesini | QCD coherence in the structure function and associated distributions at small x | NPB 445 (1995) 49 | hep-ph/9412327 |
| 45 | G. Altarelli and G. Parisi | Asymptotic freedom in parton language | NPB 126 (1977) 298 | |
| 46 | CMS Collaboration | Precision luminosity measurement in proton-proton collisions at $ \sqrt{s} = $ 13 TeV in 2015 and 2016 at CMS | EPJC 81 (2021) 800 | CMS-LUM-17-003 2104.01927 |
| 47 | CMS Collaboration | The CMS experiment at the CERN LHC | JINST 3 (2008) S08004 | |
| 48 | CMS Collaboration | Performance of the CMS Level-1 trigger in proton-proton collisions at $ \sqrt{s} = $ 13\,TeV | JINST 15 (2020) P10017 | CMS-TRG-17-001 2006.10165 |
| 49 | CMS Collaboration | The CMS trigger system | JINST 12 (2017) P01020 | CMS-TRG-12-001 1609.02366 |
| 50 | CMS Collaboration | Electron and photon reconstruction and identification with the CMS experiment at the CERN LHC | JINST 16 (2021) P05014 | CMS-EGM-17-001 2012.06888 |
| 51 | CMS Collaboration | Performance of the CMS muon detector and muon reconstruction with proton-proton collisions at $ \sqrt{s}= $ 13 TeV | JINST 13 (2018) P06015 | CMS-MUO-16-001 1804.04528 |
| 52 | CMS Collaboration | Description and performance of track and primary-vertex reconstruction with the CMS tracker | JINST 9 (2014) P10009 | CMS-TRK-11-001 1405.6569 |
| 53 | CMS Collaboration | Performance of missing transverse momentum reconstruction in proton-proton collisions at $ \sqrt{s} = $ 13\,TeV using the CMS detector | JINST 14 (2019) P07004 | CMS-JME-17-001 1903.06078 |
| 54 | CMS Collaboration | Particle-flow reconstruction and global event description with the CMS detector | JINST 12 (2017) P10003 | CMS-PRF-14-001 1706.04965 |
| 55 | CMS Collaboration | Performance of reconstruction and identification of $ \tau $ leptons decaying to hadrons and $ \nu_\tau $ in pp collisions at $ \sqrt{s}= $ 13 TeV | JINST 13 (2018) P10005 | CMS-TAU-16-003 1809.02816 |
| 56 | CMS Collaboration | Jet energy scale and resolution in the CMS experiment in pp collisions at 8 TeV | JINST 12 (2017) P02014 | CMS-JME-13-004 1607.03663 |
| 57 | M. Cacciari, G. P. Salam, and G. Soyez | The anti-$ k_{\mathrm{T}} $ jet clustering algorithm | JHEP 04 (2008) 063 | 0802.1189 |
| 58 | M. Cacciari, G. P. Salam, and G. Soyez | FastJet user manual | EPJC 72 (2012) 1896 | 1111.6097 |
| 59 | G. D'Agostini | A multidimensional unfolding method based on Bayes' theorem | NIM A 362 (1995) 487 | |
| 60 | T. Adye | Unfolding algorithms and tests using RooUnfold | in , . CERN, Geneva, 2011 PHYSTAT 201 (2011) 313 |
1105.1160 |
| 61 | L. Brenner et al. | Comparison of unfolding methods using RooFitUnfold | Int. J. Mod. Phys. A 35 (2020) 2050145 | 1910.14654 |
| 62 | T. Sjöstrand et al. | An introduction to PYTHIA 8.2 | Comput. Phys. Commun. 191 (2015) 159 | 1410.3012 |
| 63 | M. Bahr et al. | HERWIG ++ physics and manual | EPJC 58 (2008) 639 | 0803.0883 |
| 64 | J. Bellm et al. | HERWIG 7.0/ HERWIG ++ 3.0 release note | EPJC 76 (2016) 196 | 1512.01178 |
| 65 | J. Alwall et al. | The automated computation of tree-level and next-to-leading order differential cross sections, and their matching to parton shower simulations | JHEP 07 (2014) 079 | 1405.0301 |
| 66 | J. Alwall et al. | Comparative study of various algorithms for the merging of parton showers and matrix elements in hadronic collisions | EPJC 53 (2008) 473 | 0706.2569 |
| 67 | NNPDF Collaboration | Parton distributions for the LHC Run II | JHEP 04 (2015) 040 | 1410.8849 |
| 68 | GEANT4 Collaboration | GEANT 4---a simulation toolkit | NIM A 506 (2003) 250 | |
| 69 | CMS Collaboration | Pileup mitigation at CMS in 13 TeV data | JINST 15 (2020) P09018 | CMS-JME-18-001 2003.00503 |
| 70 | CMS Collaboration | Placeholder for supplemental material (Appendix in preprint version): Additional analysis figures and referenced material | [URL will be provided by publisher at publication], 2024 | |
| 71 | CMS Collaboration | HEPData record for this analysis | link | |
| 72 | S. Mrenna and P. Skands | Automated parton-shower variations in PYTHIA 8 | PRD 94 (2016) 074005 | 1605.08352 |
| 73 | P. Skands, S. Carrazza, and J. Rojo | Tuning PYTHIA 8.1: the Monash 2013 tune | EPJC 74 (2014) 3024 | 1404.5630 |
| 74 | P. T. Komiske, I. Moult, J. Thaler, and H. X. Zhu | Analyzing $ N $-point energy correlators inside jets with CMS open data | PRL 130 (2023) 051901 | 2201.07800 |
| 75 | N. Fischer, S. Prestel, M. Ritzmann, and P. Skands | VINCIA for hadron colliders | EPJC 76 (2016) 589 | 1605.06142 |
| 76 | S. Höche and S. Prestel | The midpoint between dipole and parton showers | EPJC 75 (2015) 461 | 1506.05057 |
| 77 | Sherpa Collaboration | Event generation with SHERPA 2.2 | SciPost Phys. 7 (2019) 034 | 1905.09127 |
|
|
Compact Muon Solenoid LHC, CERN |
|

|

|

|

|

|