

Compact Muon Solenoid
LHC, CERN
| CMS-EXO-24-007 ; CERN-EP-2025-213 | ||
| Search for low-mass vector and scalar resonances decaying into a quark-antiquark pair in proton-proton collisions at $ \sqrt{s}= $ 13 TeV | ||
| CMS Collaboration | ||
| 23 March 2026 | ||
| Submitted to Physical Review Letters | ||
| Abstract: A search for resonances with masses from 50 to 300 GeV decaying into a quark-antiquark pair is presented. The search uses proton-proton collision data at $ \sqrt{s}= $ 13 TeV collected by the CMS experiment at the CERN LHC in 2016--2018, corresponding to an integrated luminosity of 138 fb$ ^{-1} $. Two coupling scenarios are considered, with the resonances coupled either equally to all flavors of quarks or preferentially to bottom quarks. The search targets resonances produced in association with hard initial-state radiation, resulting in a large-radius jet with a two-pronged substructure. The PARTICLENET algorithm is used to distinguish resonance decays to bottom quark pairs from lighter quark pairs and to suppress background processes. The invariant jet mass spectrum is scrutinized for peaking excesses over a falling background. No evidence for such resonances is observed. Limits are set on the couplings of new scalar and vector resonances to quarks, representing the most stringent limits to date in the mass range of 50--250 GeV. | ||
| Links: e-print arXiv:2603.21965 [hep-ex] (PDF) ; CDS record ; inSPIRE record ; HepData record ; Physics Briefing ; CADI line (restricted) ; | ||
| Figures | |
png pdf |
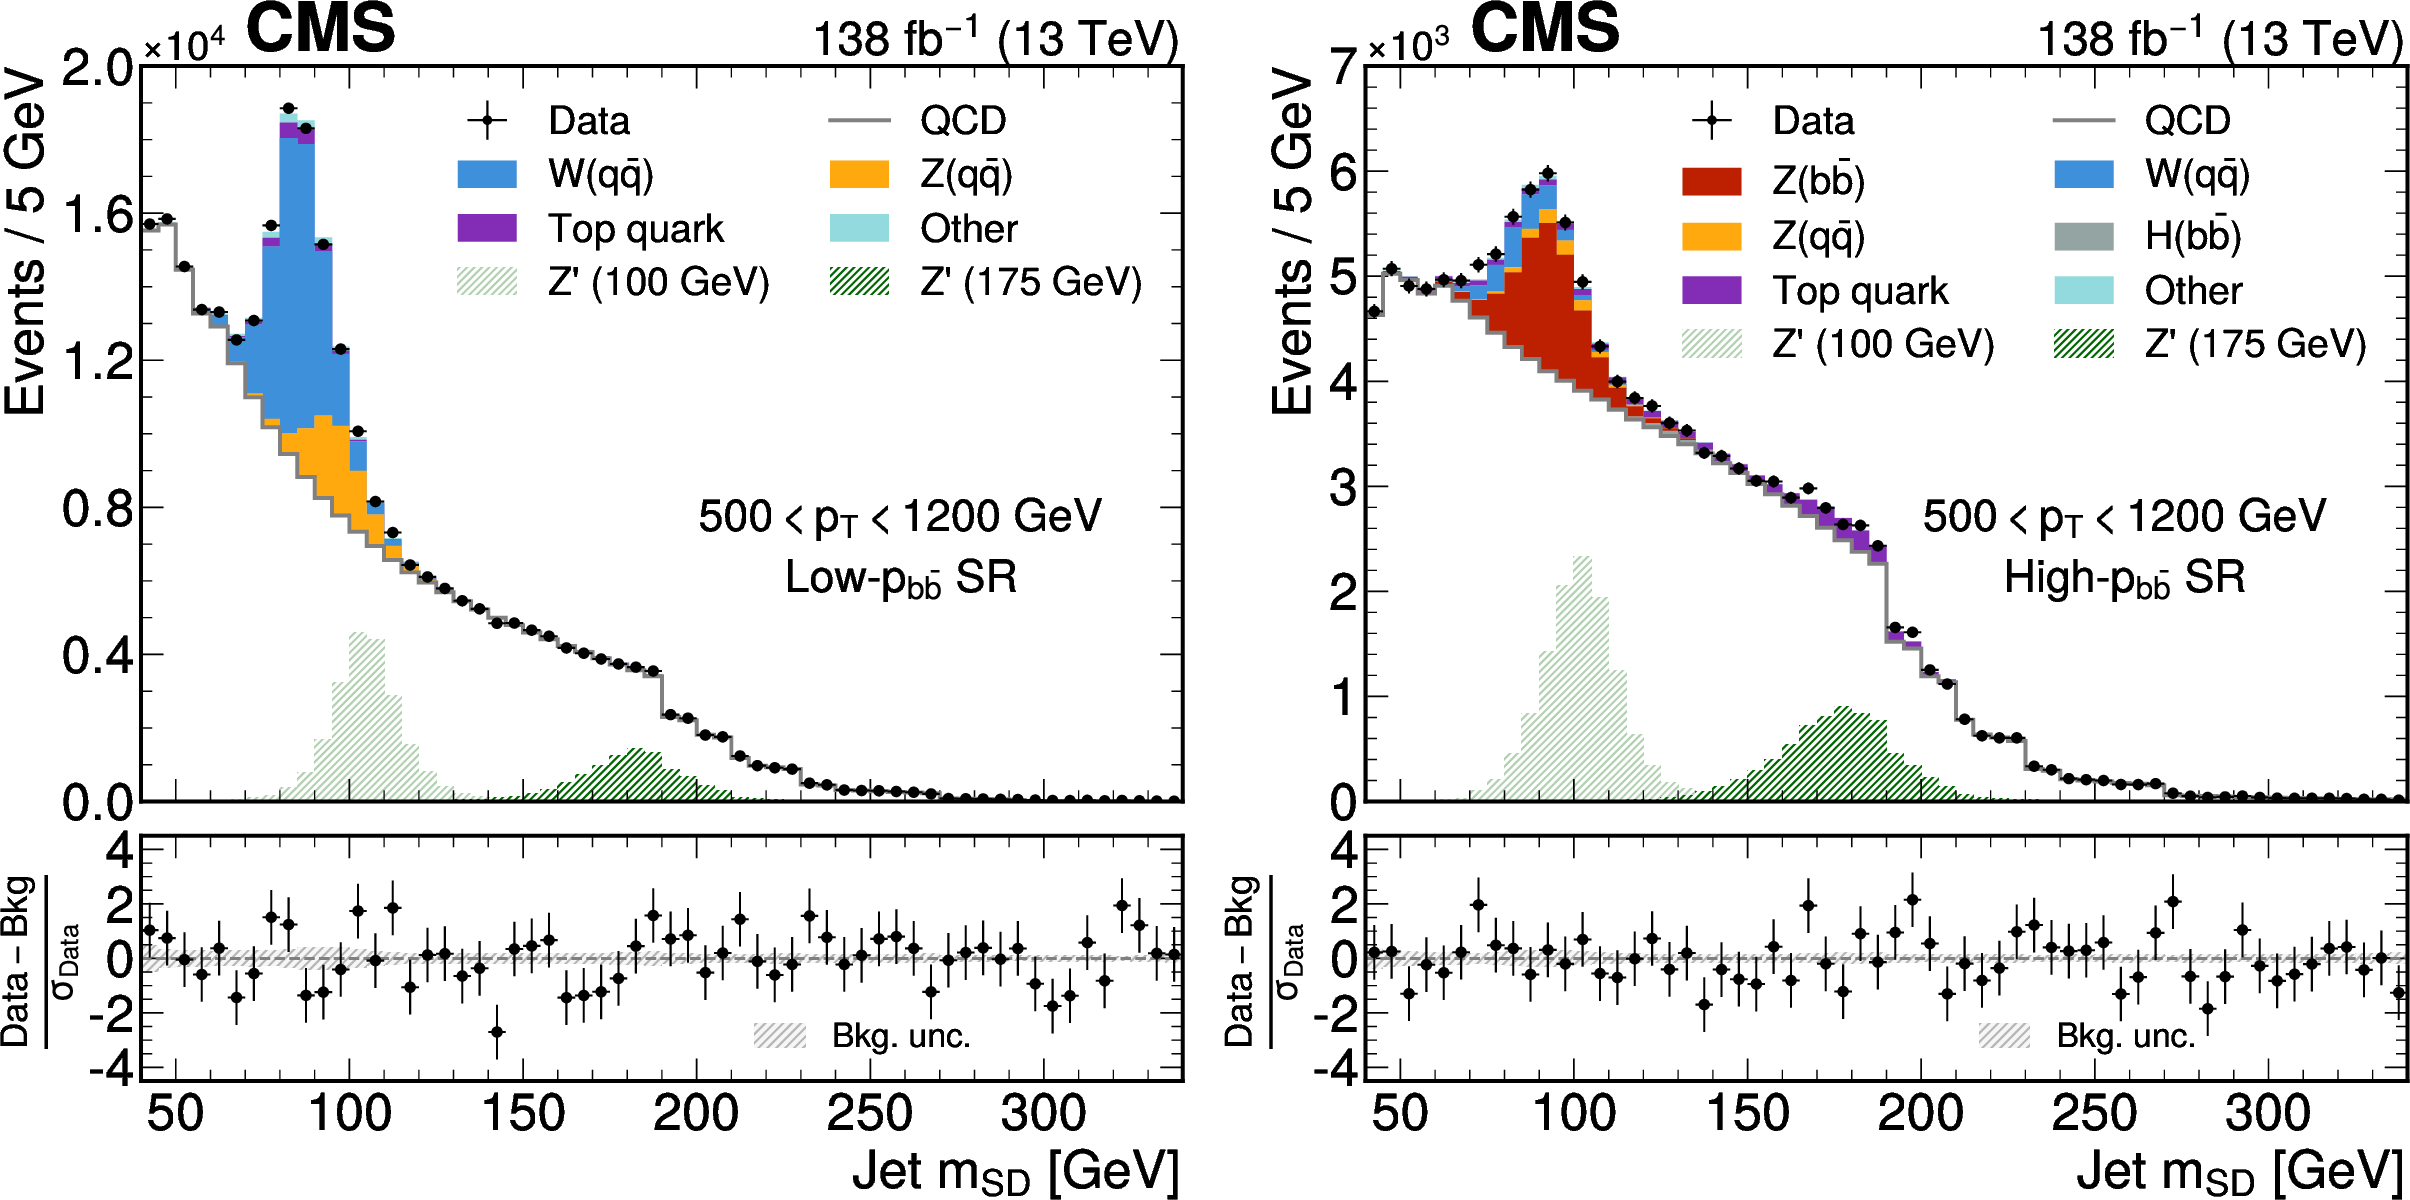
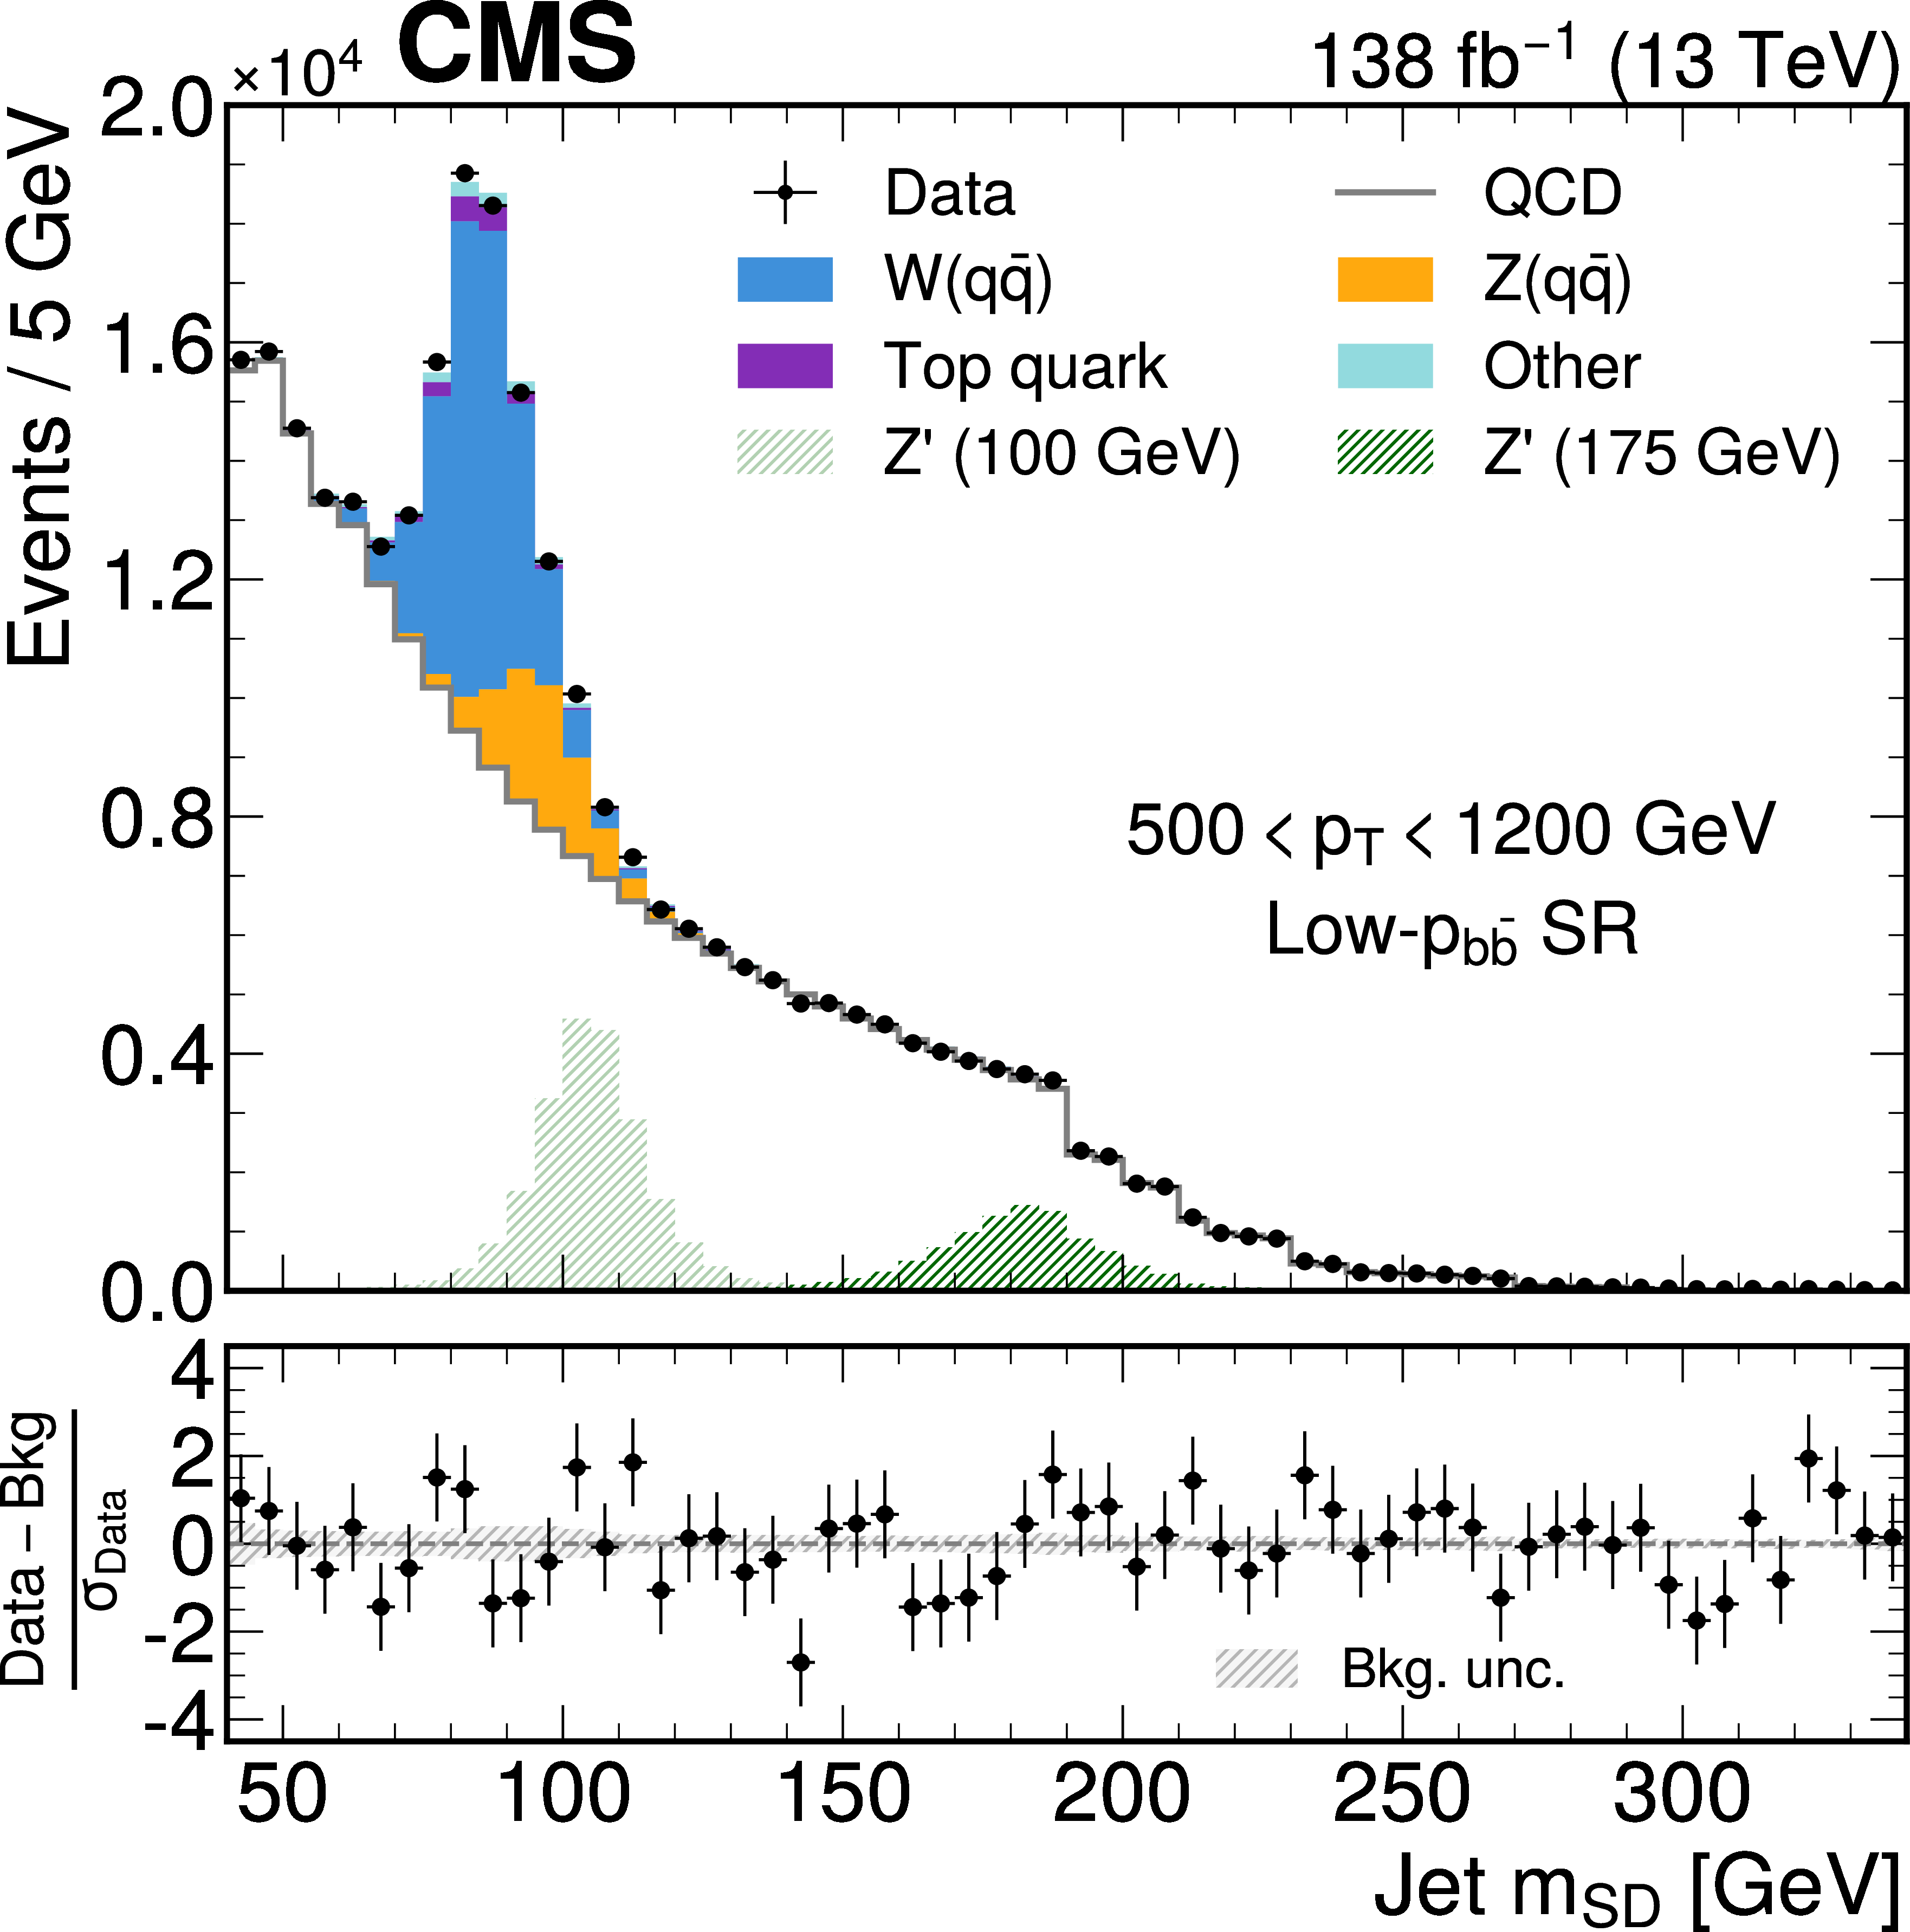
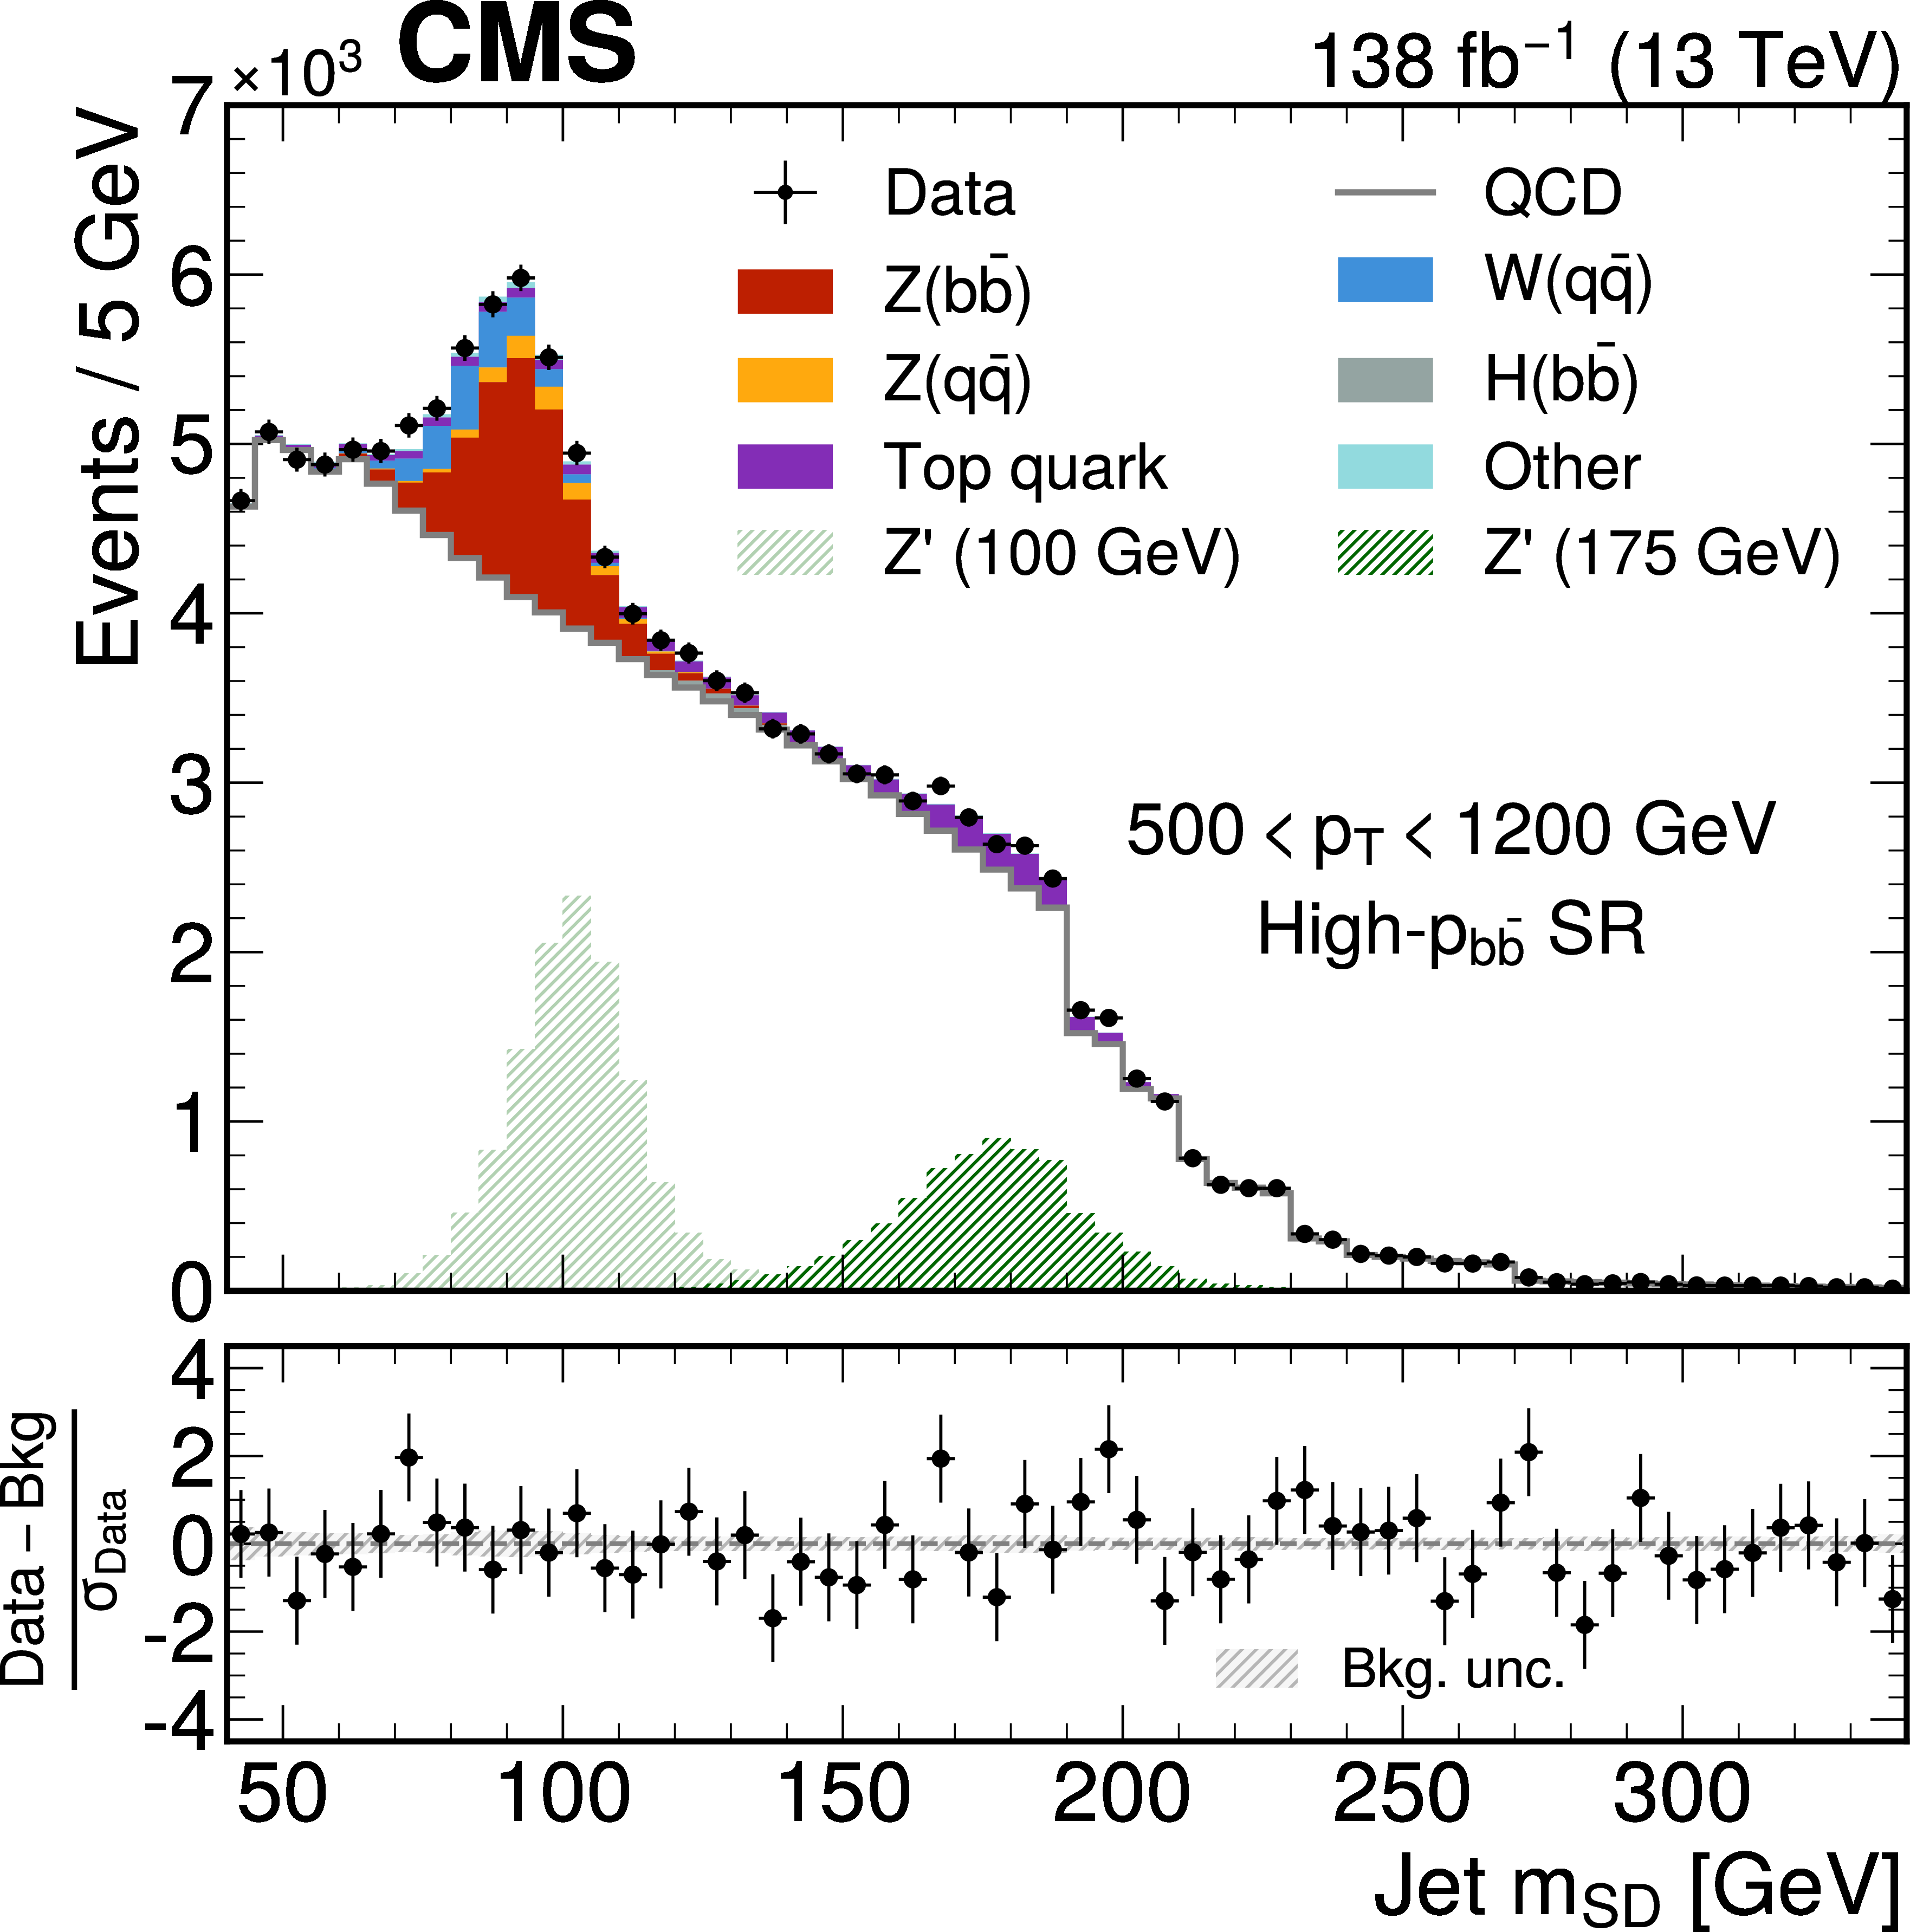
Figure 1:
The jet $ m_{\mathrm{SD}} $ distributions in the low-$ p_{\mathrm{b}\overline{\mathrm{b}}} $ (left) and high-$ p_{\mathrm{b}\overline{\mathrm{b}}} $ (right) SRs, fitted with the background-only hypothesis. The distributions are summed across all five $ p_{\mathrm{T}} $ bins and the four data-taking periods. The steplike features are due to the $ \rho $ requirement, which results in a different $ m_{\mathrm{SD}} $ range for each $ p_{\mathrm{T}} $ bin. The hatched area shows the expected $ \mathrm{Z}^{'} $ signal yields for $ g_{\mathrm{q}}= $ 0.25. The lower panel shows the residual difference between the data and the overall background, divided by the statistical uncertainty of the data; the gray band represents the systematic uncertainty in the background estimation. |
png pdf |
Figure 1-a:
The jet $ m_{\mathrm{SD}} $ distributions in the low-$ p_{\mathrm{b}\overline{\mathrm{b}}} $ (left) and high-$ p_{\mathrm{b}\overline{\mathrm{b}}} $ (right) SRs, fitted with the background-only hypothesis. The distributions are summed across all five $ p_{\mathrm{T}} $ bins and the four data-taking periods. The steplike features are due to the $ \rho $ requirement, which results in a different $ m_{\mathrm{SD}} $ range for each $ p_{\mathrm{T}} $ bin. The hatched area shows the expected $ \mathrm{Z}^{'} $ signal yields for $ g_{\mathrm{q}}= $ 0.25. The lower panel shows the residual difference between the data and the overall background, divided by the statistical uncertainty of the data; the gray band represents the systematic uncertainty in the background estimation. |
png pdf |
Figure 1-b:
The jet $ m_{\mathrm{SD}} $ distributions in the low-$ p_{\mathrm{b}\overline{\mathrm{b}}} $ (left) and high-$ p_{\mathrm{b}\overline{\mathrm{b}}} $ (right) SRs, fitted with the background-only hypothesis. The distributions are summed across all five $ p_{\mathrm{T}} $ bins and the four data-taking periods. The steplike features are due to the $ \rho $ requirement, which results in a different $ m_{\mathrm{SD}} $ range for each $ p_{\mathrm{T}} $ bin. The hatched area shows the expected $ \mathrm{Z}^{'} $ signal yields for $ g_{\mathrm{q}}= $ 0.25. The lower panel shows the residual difference between the data and the overall background, divided by the statistical uncertainty of the data; the gray band represents the systematic uncertainty in the background estimation. |
png pdf |
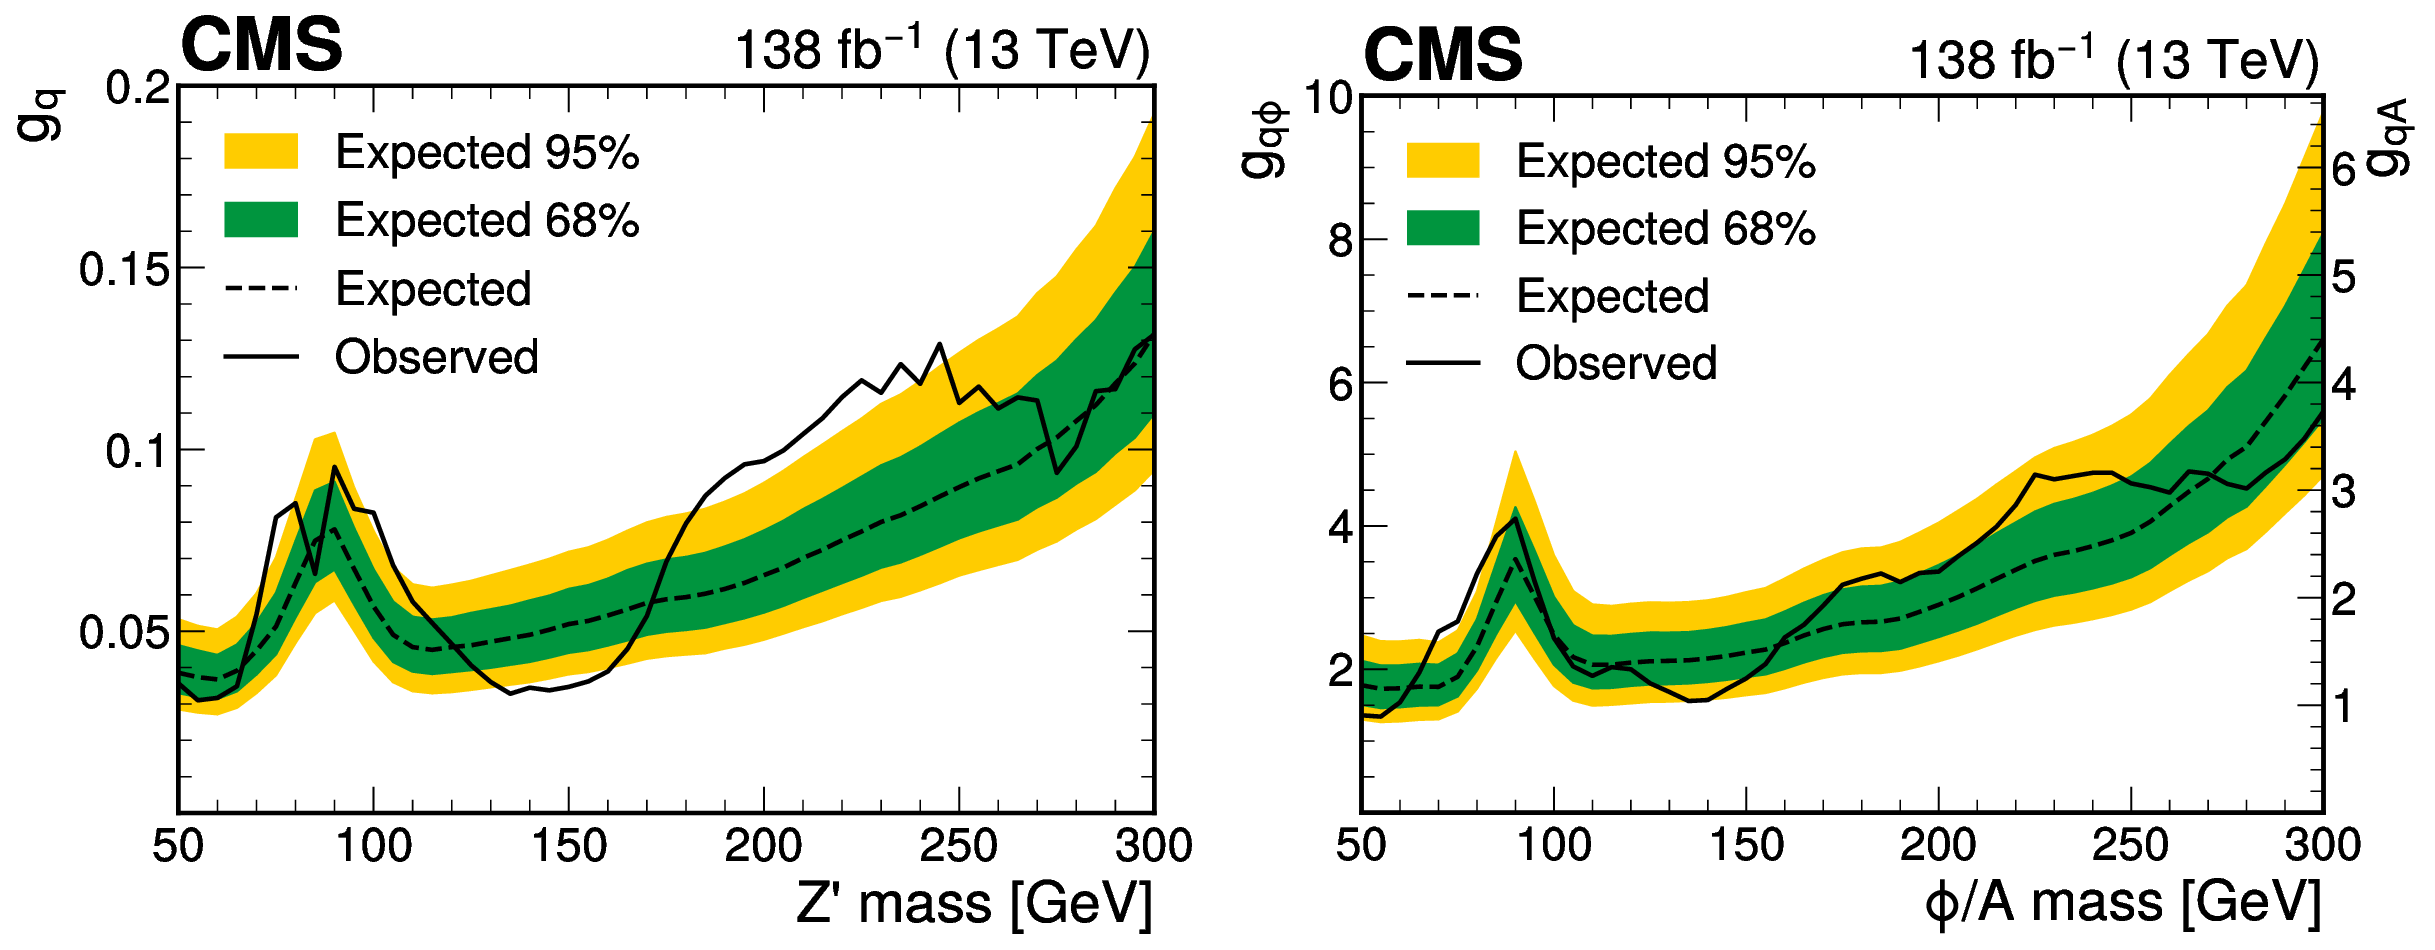
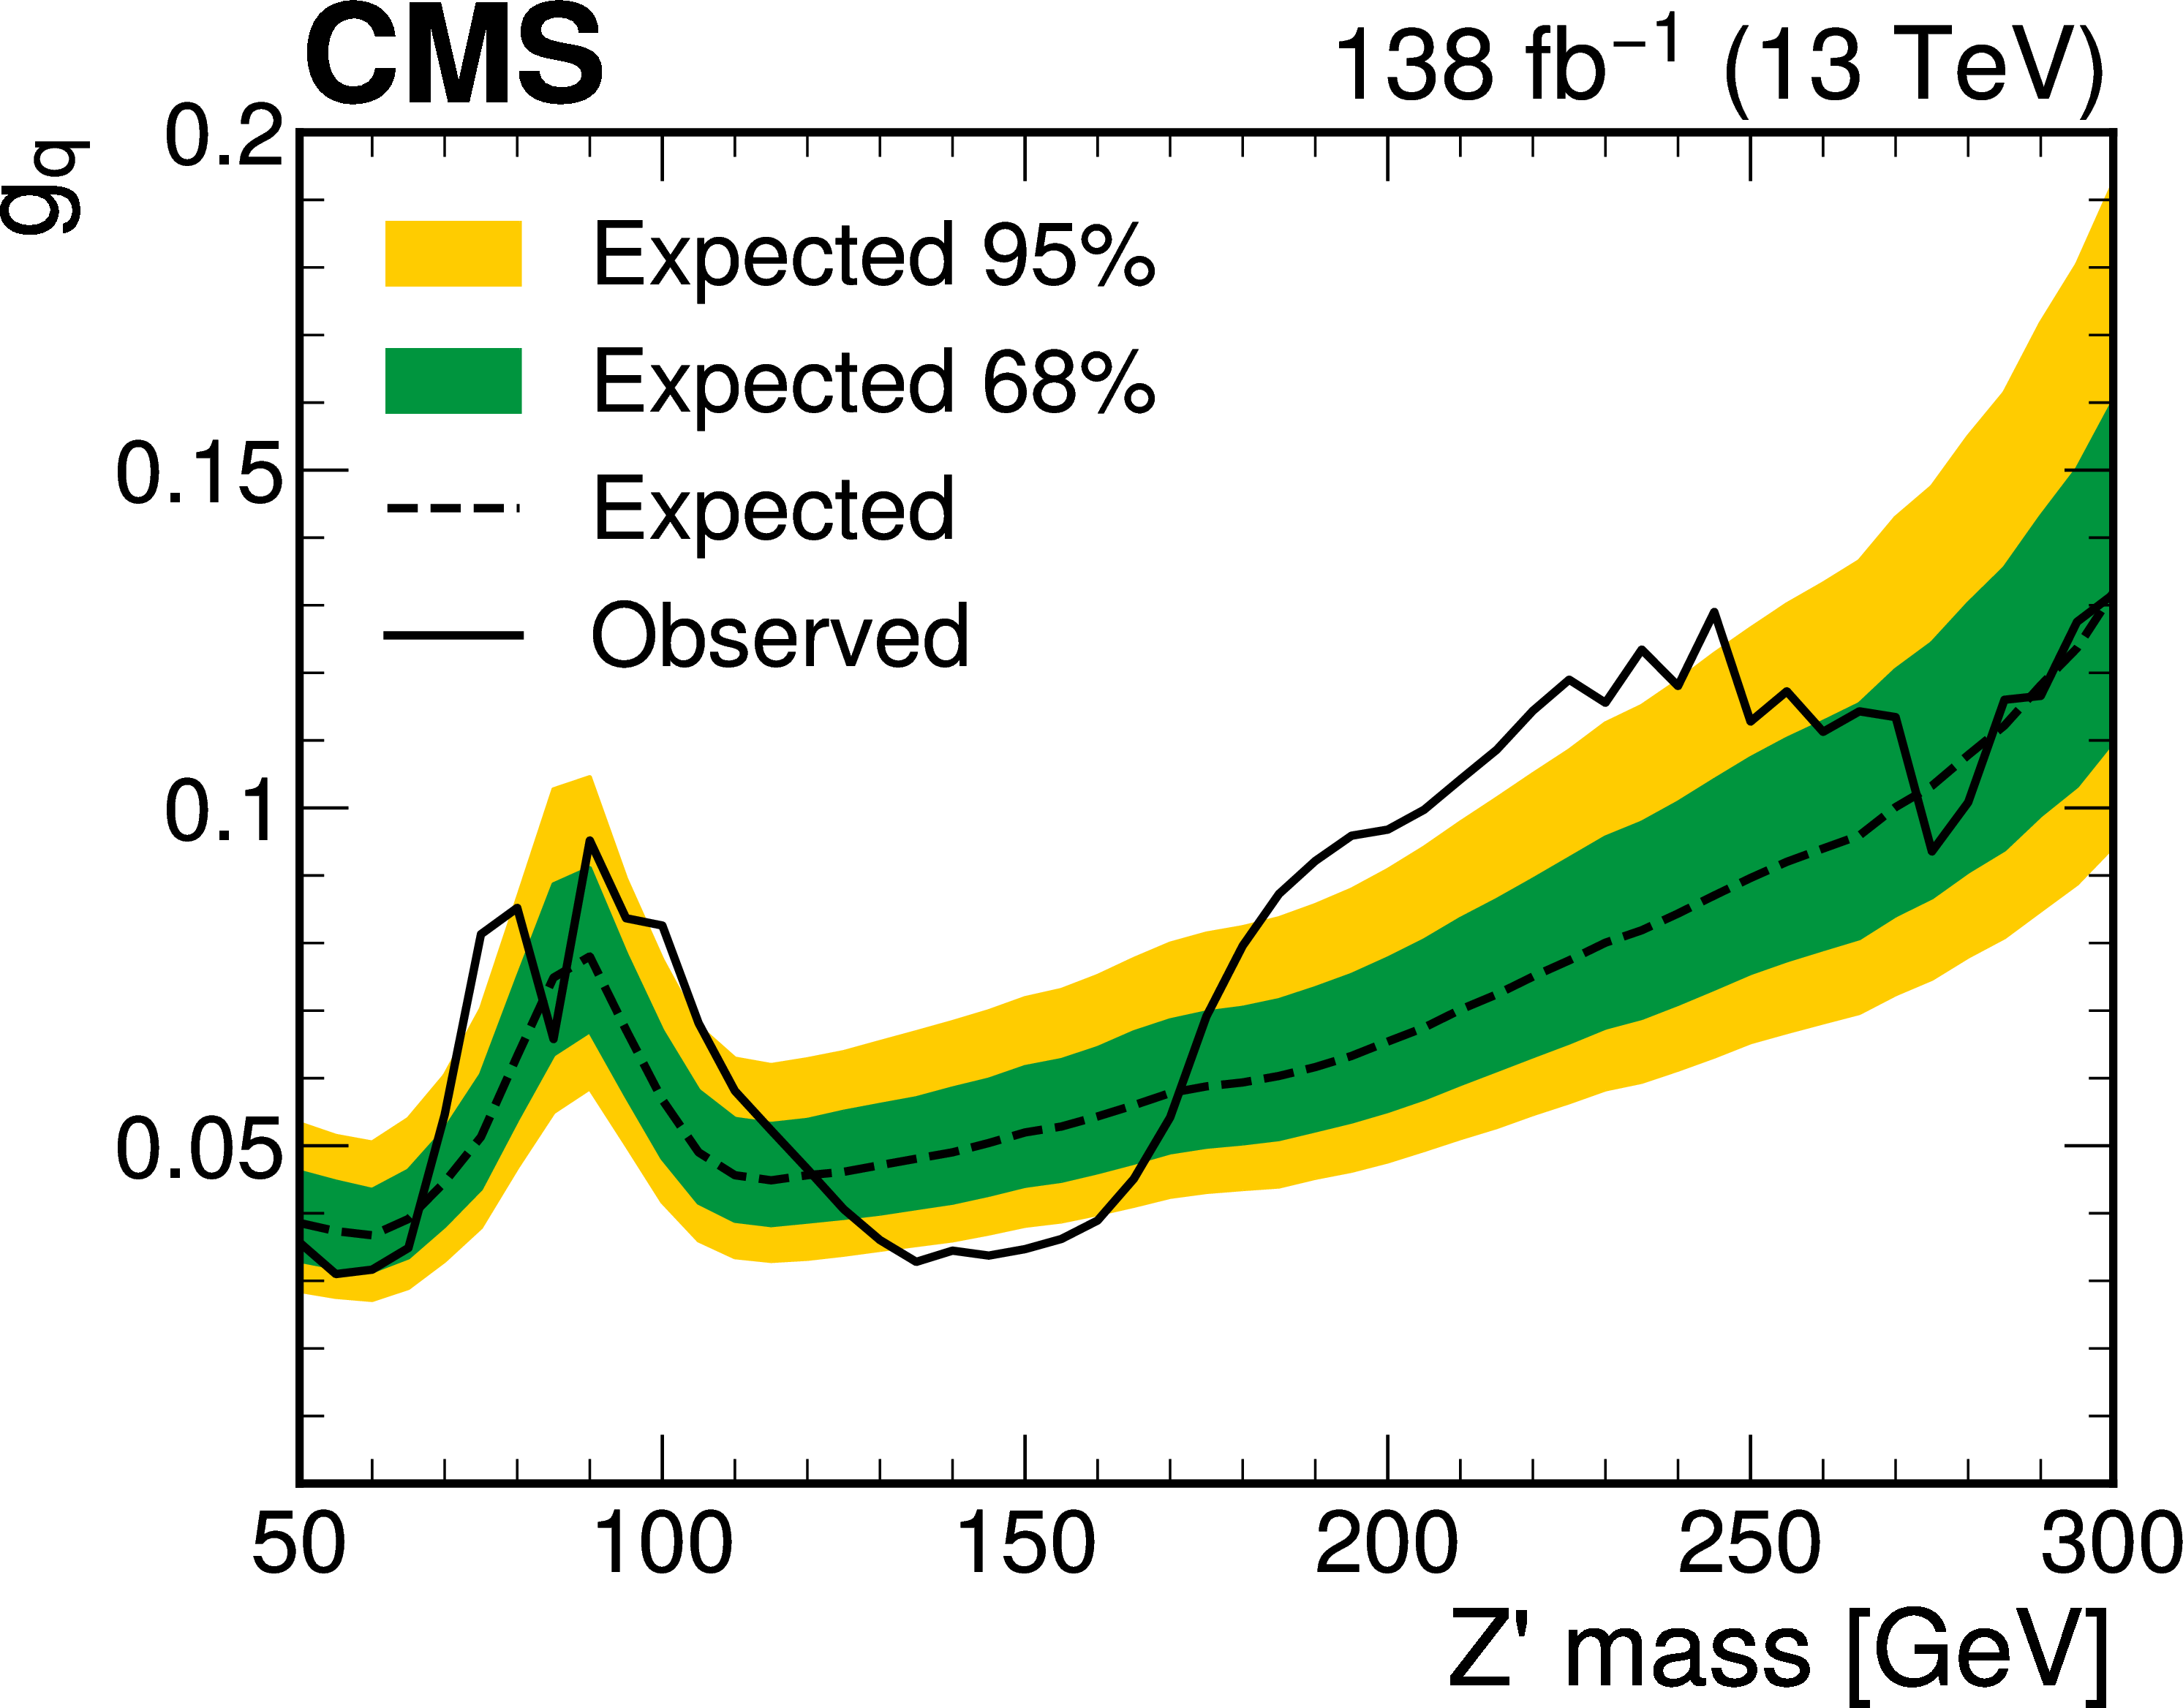
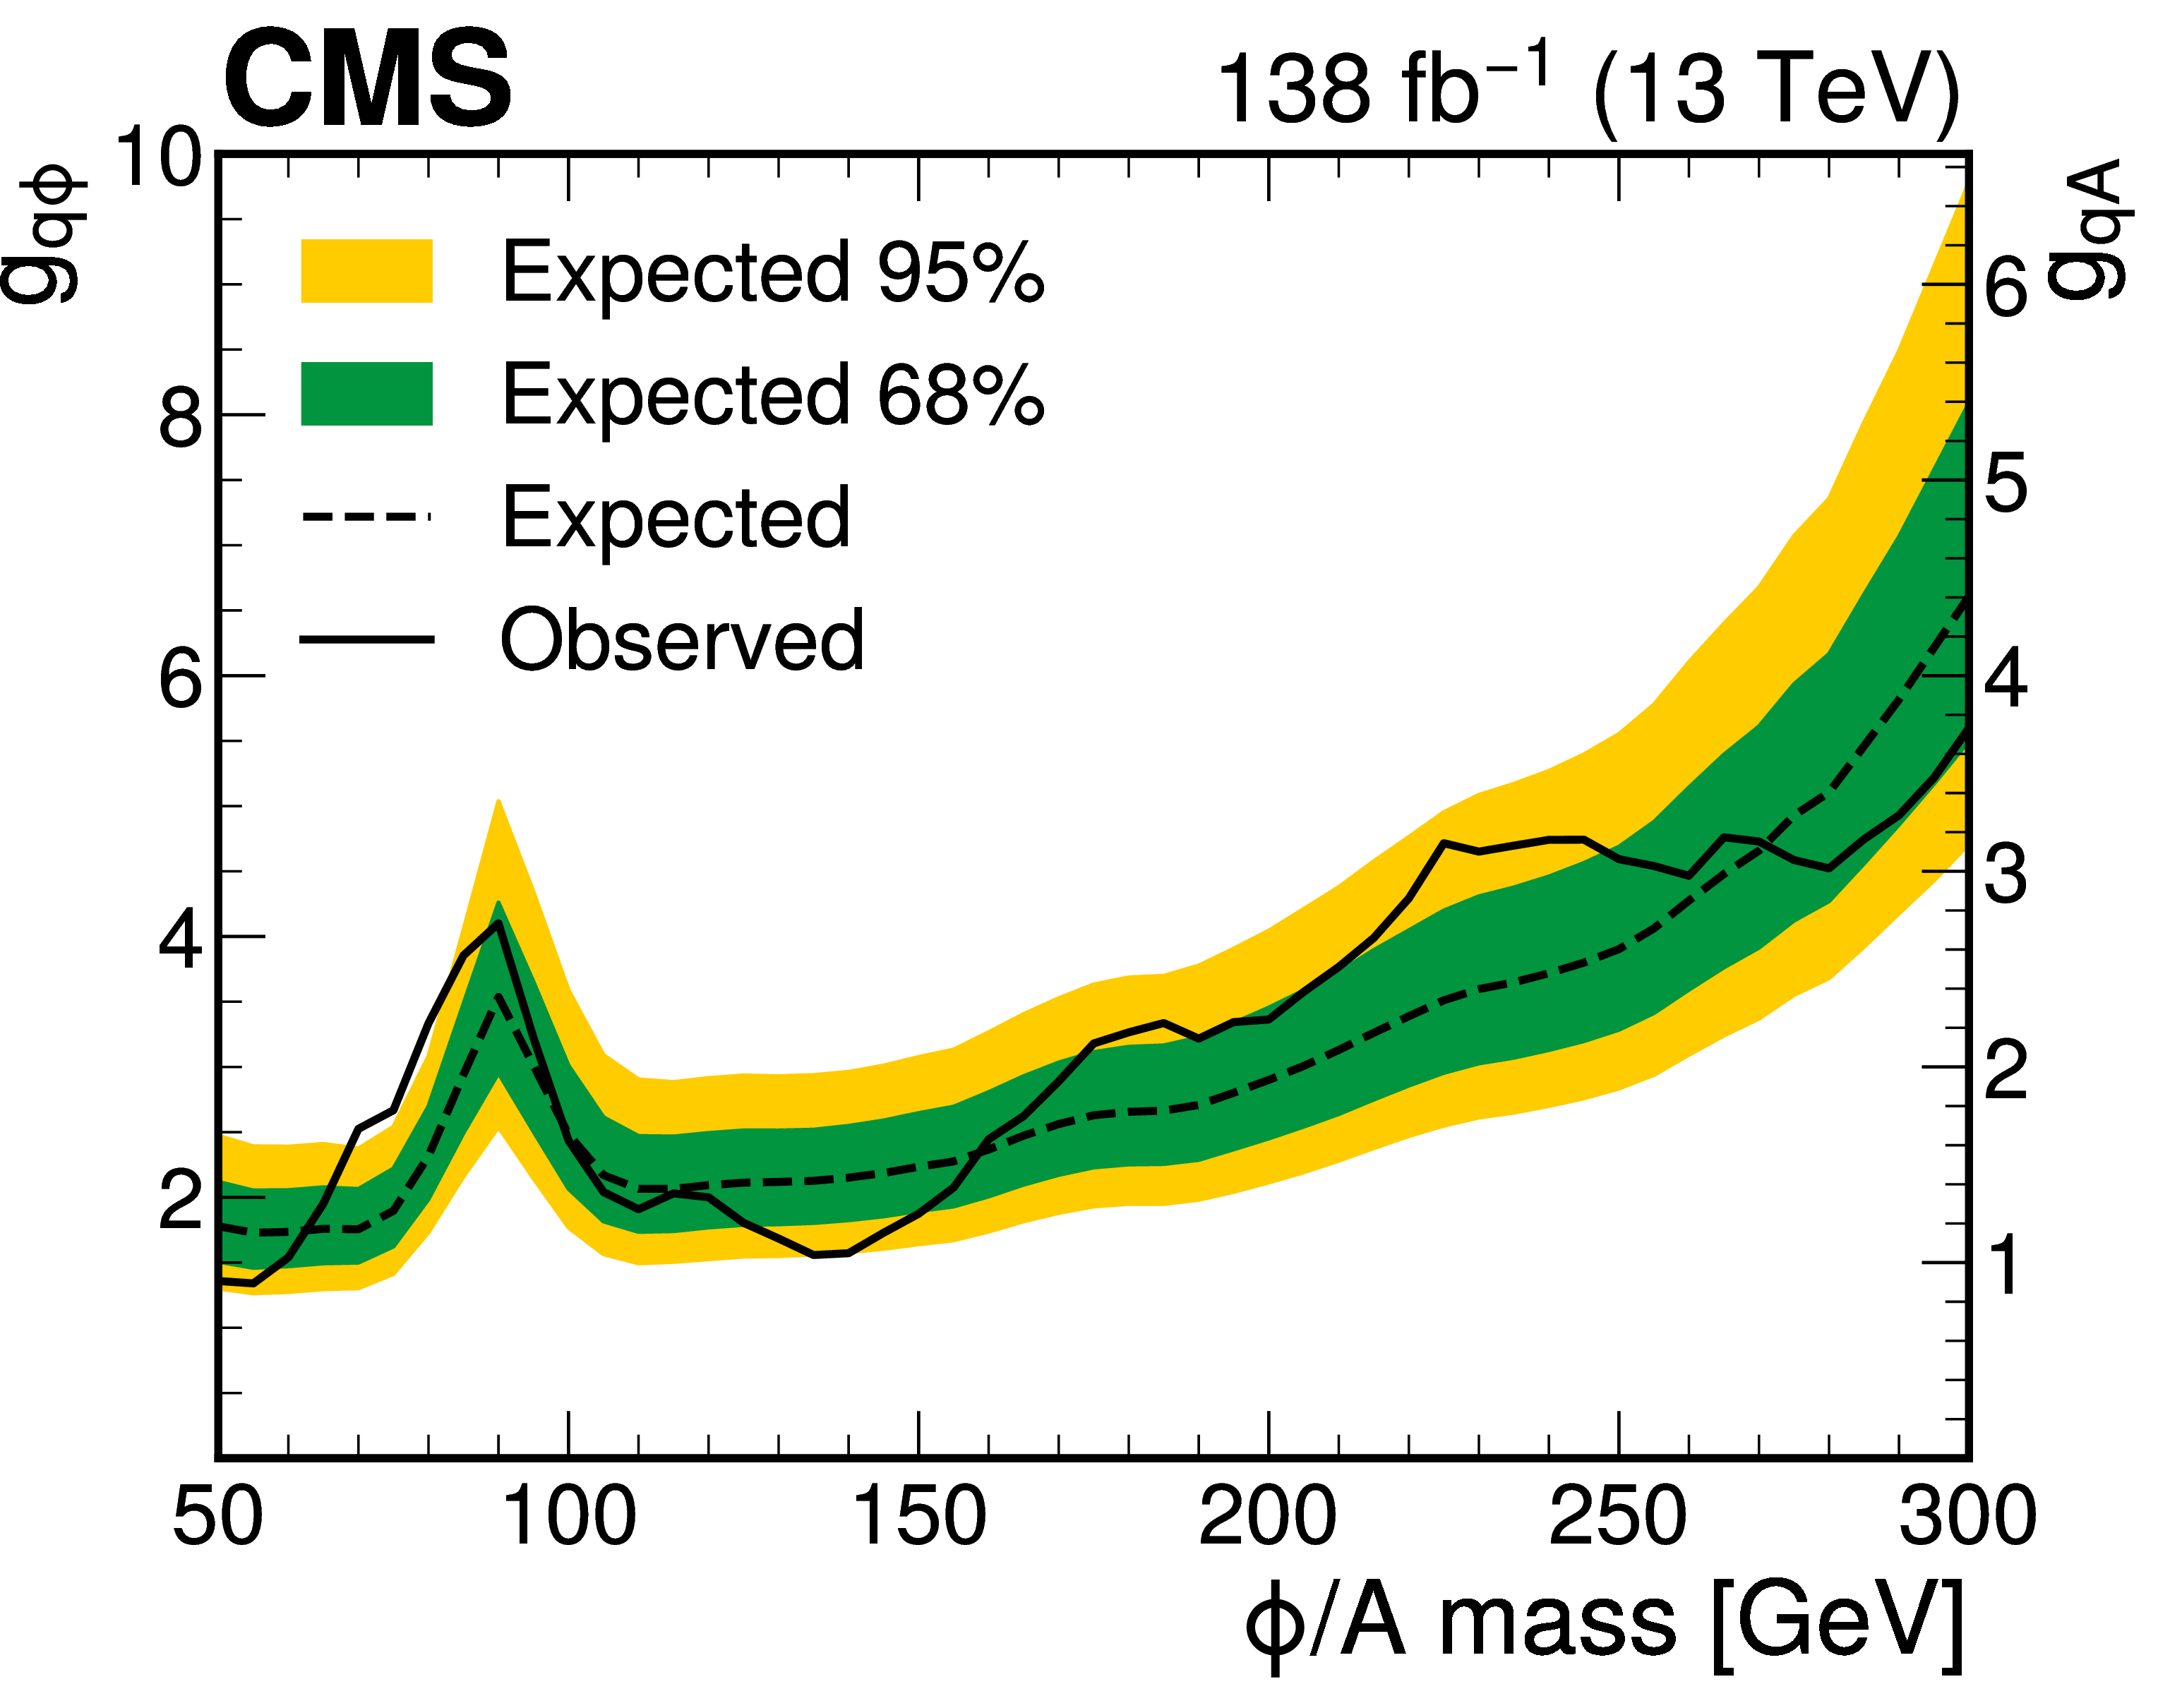
Figure 2:
Upper limits at 95% CL on the universal coupling $ g_{\mathrm{q}} $ between the $ \mathrm{Z}^{'} $ boson and quarks (left) and the coupling parameters $ g_{\mathrm{q}\phi} $ (left vertical axis) and $ g_{\mathrm{q}A } $ (right vertical axis) of the spin-0 model (right). The $ \mathrm{Z}^{'} $ boson is assumed to decay to quark-antiquark pairs with a 100% branching fraction. The $ \phi $ and A bosons couple to quarks with a coupling given by $ g_{\mathrm{q}\phi} $ or $ g_{\mathrm{q}A } $ times the SM Yukawa couplings, respectively, and decay dominantly to bottom quark-antiquark pairs. The solid line represents the observed limits. The dashed line and the inner (yellow) and outer (blue) bands represent the median and the regions containing 68% and 95%, respectively, of the distribution of expected limits under the background-only hypothesis. |
png pdf |
Figure 2-a:
Upper limits at 95% CL on the universal coupling $ g_{\mathrm{q}} $ between the $ \mathrm{Z}^{'} $ boson and quarks (left) and the coupling parameters $ g_{\mathrm{q}\phi} $ (left vertical axis) and $ g_{\mathrm{q}A } $ (right vertical axis) of the spin-0 model (right). The $ \mathrm{Z}^{'} $ boson is assumed to decay to quark-antiquark pairs with a 100% branching fraction. The $ \phi $ and A bosons couple to quarks with a coupling given by $ g_{\mathrm{q}\phi} $ or $ g_{\mathrm{q}A } $ times the SM Yukawa couplings, respectively, and decay dominantly to bottom quark-antiquark pairs. The solid line represents the observed limits. The dashed line and the inner (yellow) and outer (blue) bands represent the median and the regions containing 68% and 95%, respectively, of the distribution of expected limits under the background-only hypothesis. |
png pdf |
Figure 2-b:
Upper limits at 95% CL on the universal coupling $ g_{\mathrm{q}} $ between the $ \mathrm{Z}^{'} $ boson and quarks (left) and the coupling parameters $ g_{\mathrm{q}\phi} $ (left vertical axis) and $ g_{\mathrm{q}A } $ (right vertical axis) of the spin-0 model (right). The $ \mathrm{Z}^{'} $ boson is assumed to decay to quark-antiquark pairs with a 100% branching fraction. The $ \phi $ and A bosons couple to quarks with a coupling given by $ g_{\mathrm{q}\phi} $ or $ g_{\mathrm{q}A } $ times the SM Yukawa couplings, respectively, and decay dominantly to bottom quark-antiquark pairs. The solid line represents the observed limits. The dashed line and the inner (yellow) and outer (blue) bands represent the median and the regions containing 68% and 95%, respectively, of the distribution of expected limits under the background-only hypothesis. |
png pdf |
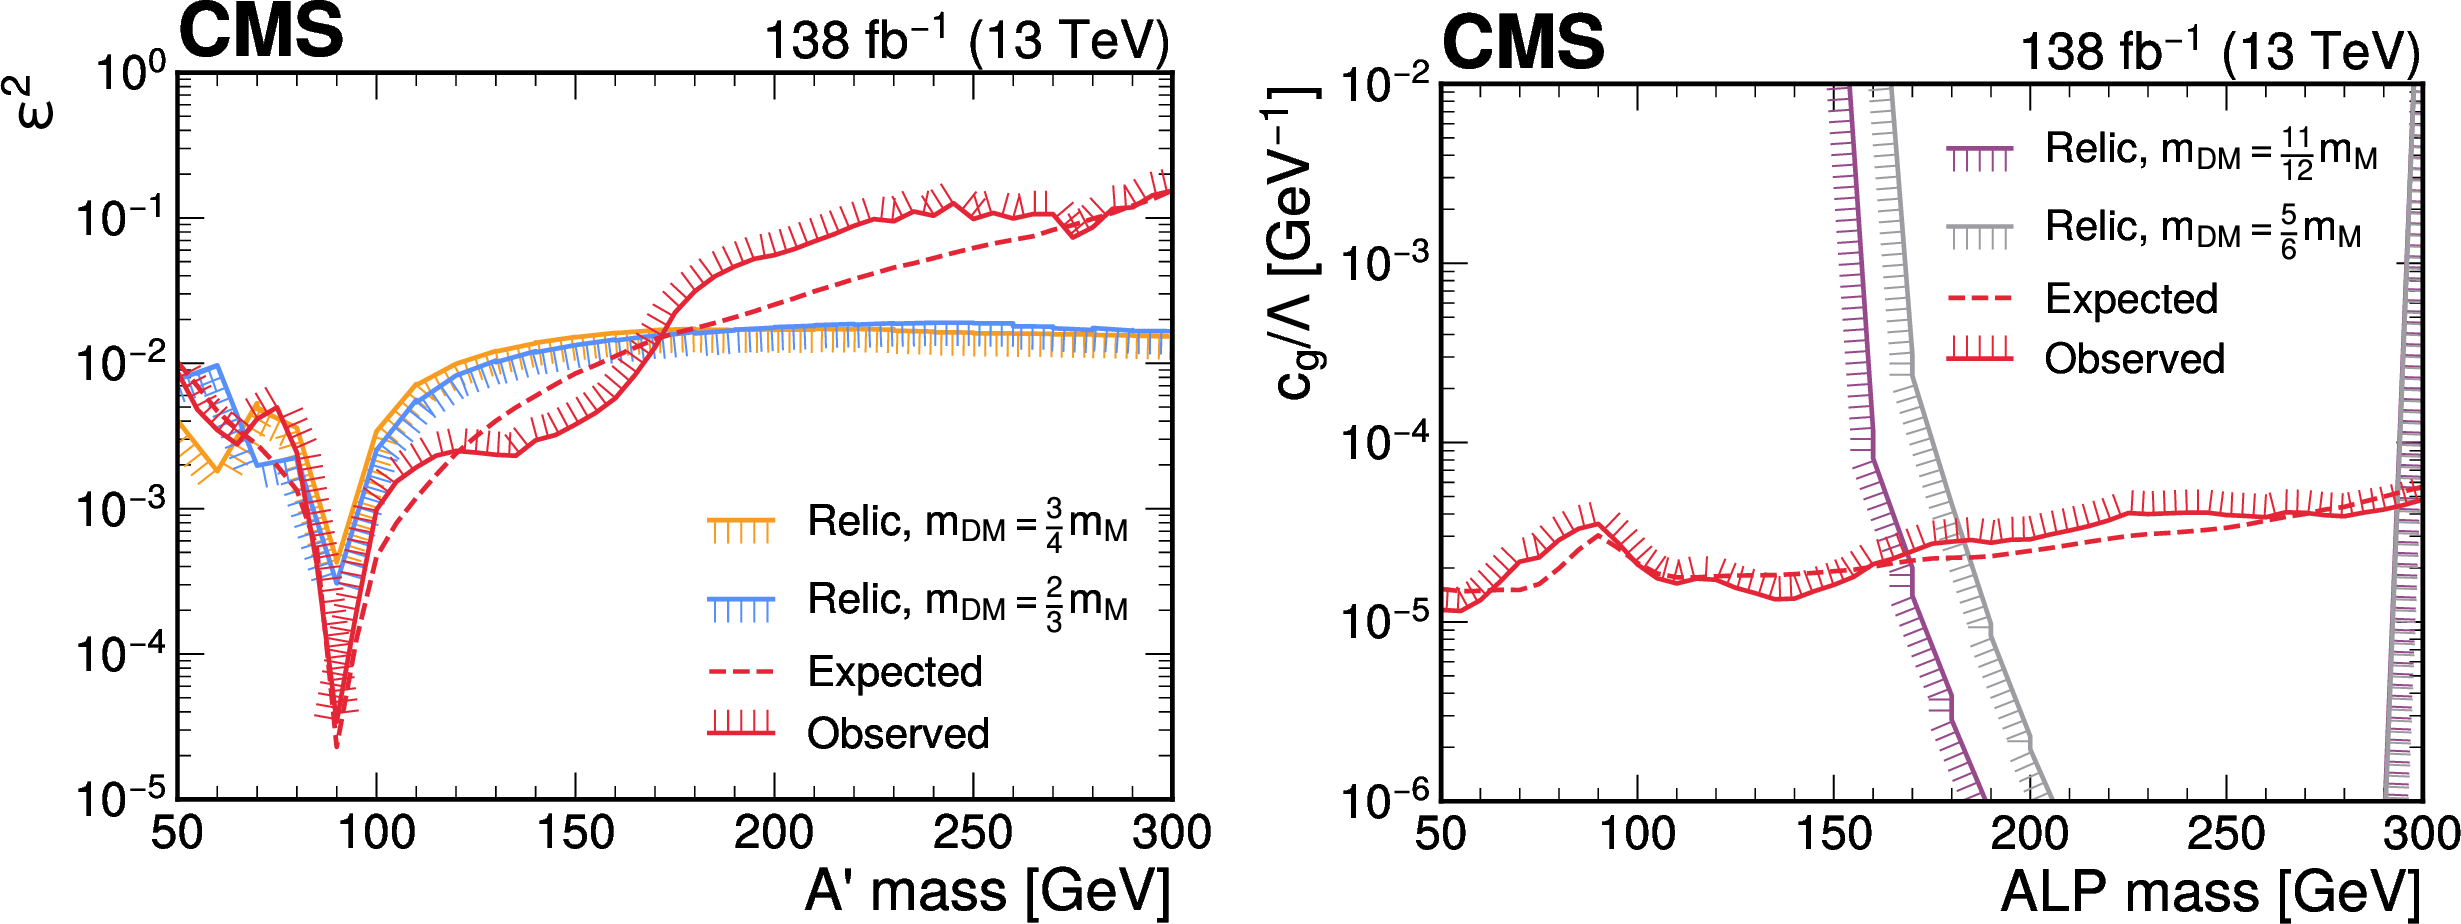
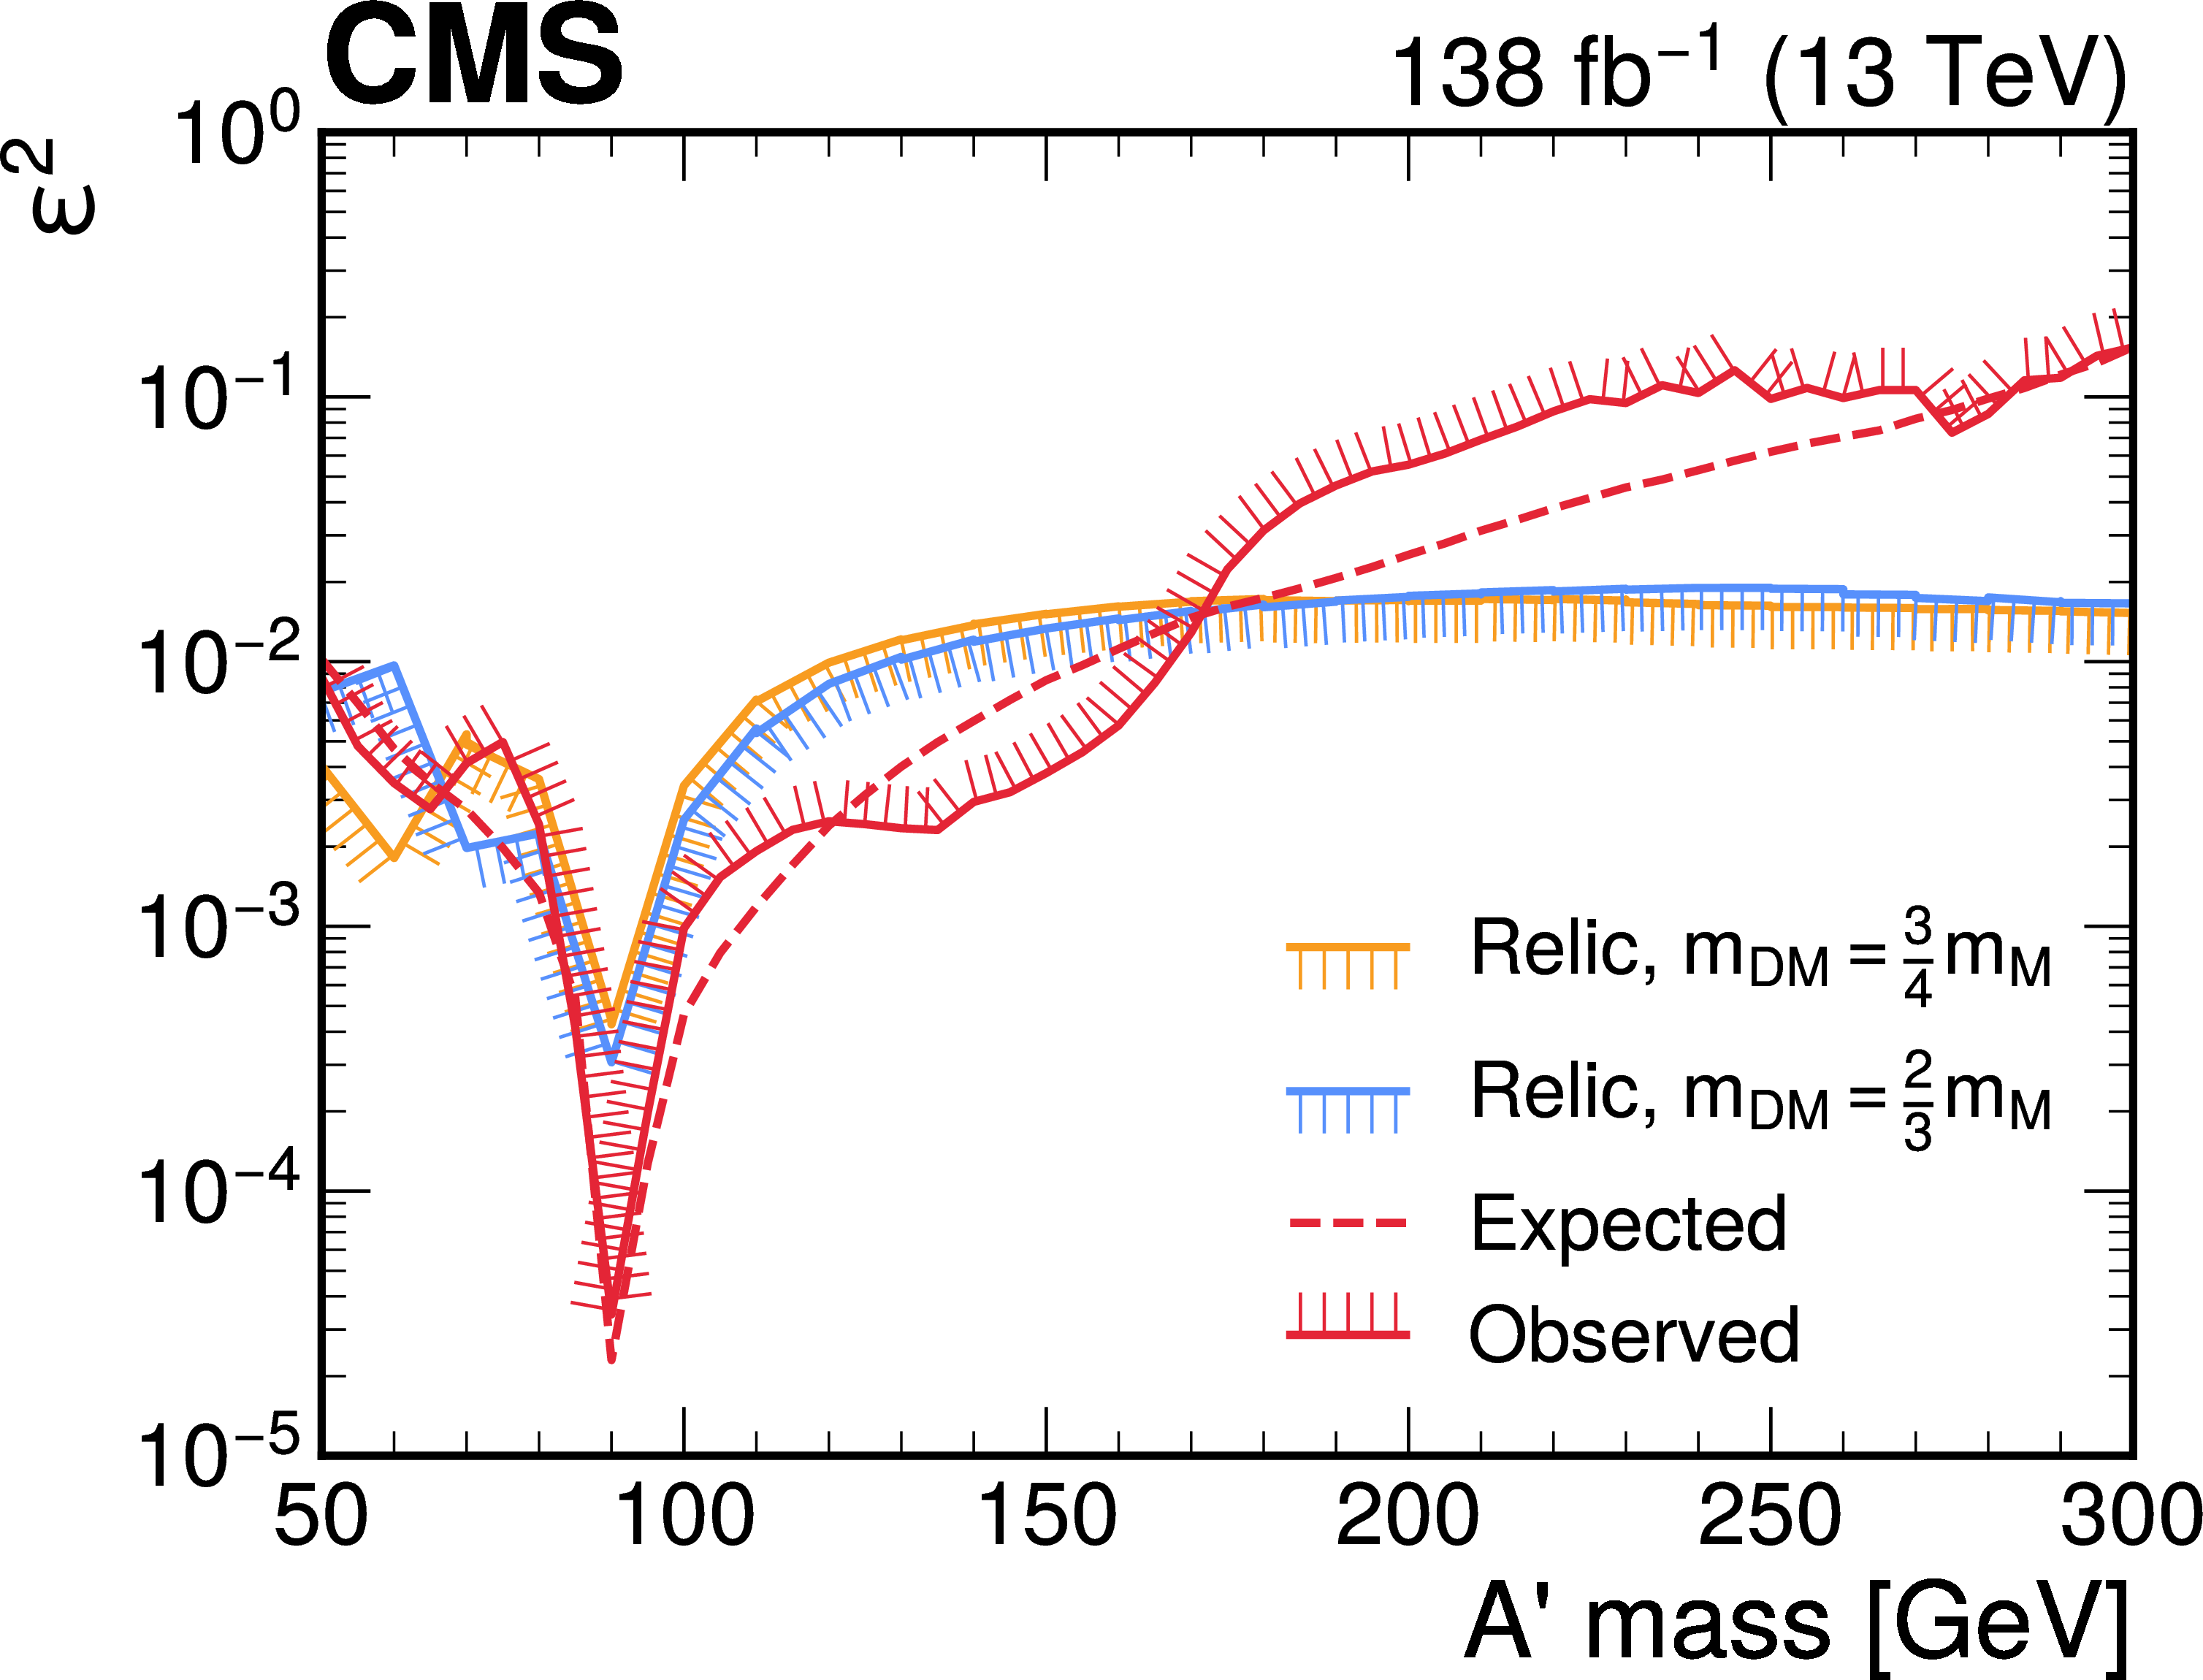
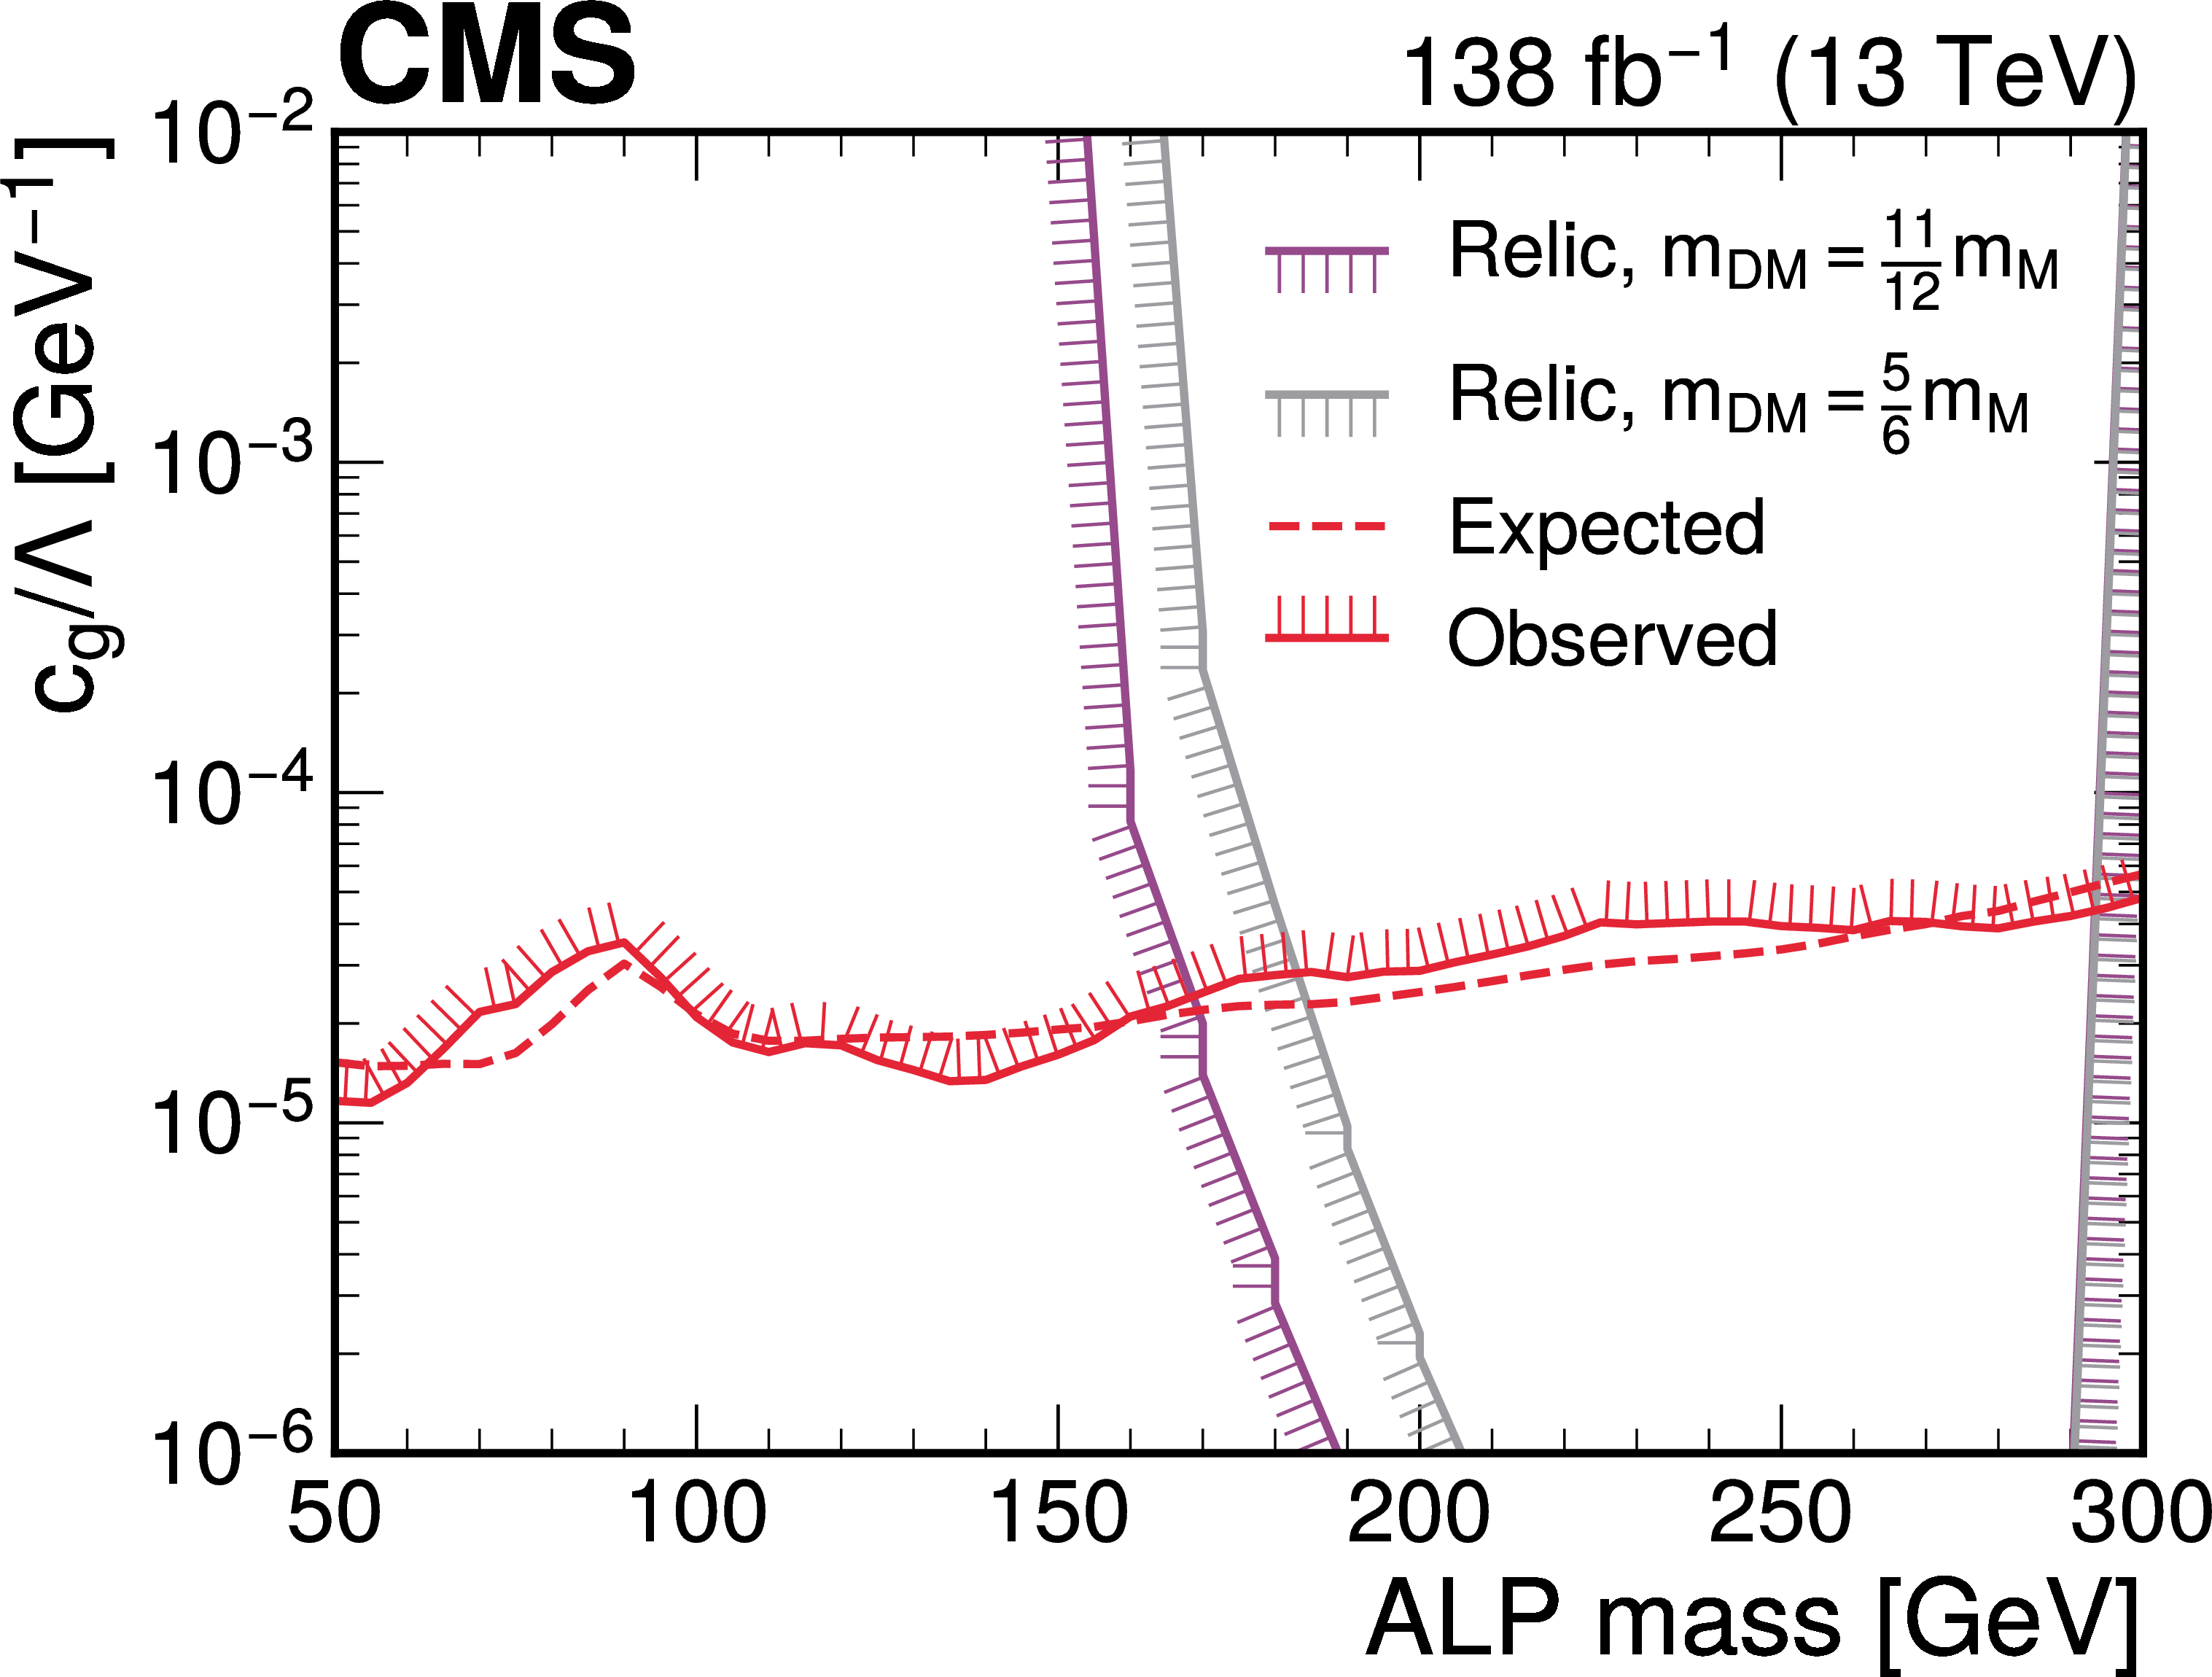
Figure 3:
Recast of the 95% CL exclusion limits into the kinetic mixing parameter, $ \epsilon^2 $, of a dark-photon model ($ A ^{\prime} $, left) and the effective gluon coupling, $ c_{\mathrm{g}}/\Lambda $, of an axion-like particle model (ALP, right). The solid (dashed) red lines represent the observed (expected) upper limits from this analysis. The orange and blue (left), and magenta and gray (right) lines represent the minimum allowed coupling compatible with the observed DM relic density for representative values of $ m_{DM} }/m_{M} $. The hatched lines show the direction of the excluded regions. |
png pdf |
Figure 3-a:
Recast of the 95% CL exclusion limits into the kinetic mixing parameter, $ \epsilon^2 $, of a dark-photon model ($ A ^{\prime} $, left) and the effective gluon coupling, $ c_{\mathrm{g}}/\Lambda $, of an axion-like particle model (ALP, right). The solid (dashed) red lines represent the observed (expected) upper limits from this analysis. The orange and blue (left), and magenta and gray (right) lines represent the minimum allowed coupling compatible with the observed DM relic density for representative values of $ m_{DM} }/m_{M} $. The hatched lines show the direction of the excluded regions. |
png pdf |
Figure 3-b:
Recast of the 95% CL exclusion limits into the kinetic mixing parameter, $ \epsilon^2 $, of a dark-photon model ($ A ^{\prime} $, left) and the effective gluon coupling, $ c_{\mathrm{g}}/\Lambda $, of an axion-like particle model (ALP, right). The solid (dashed) red lines represent the observed (expected) upper limits from this analysis. The orange and blue (left), and magenta and gray (right) lines represent the minimum allowed coupling compatible with the observed DM relic density for representative values of $ m_{DM} }/m_{M} $. The hatched lines show the direction of the excluded regions. |
png pdf |
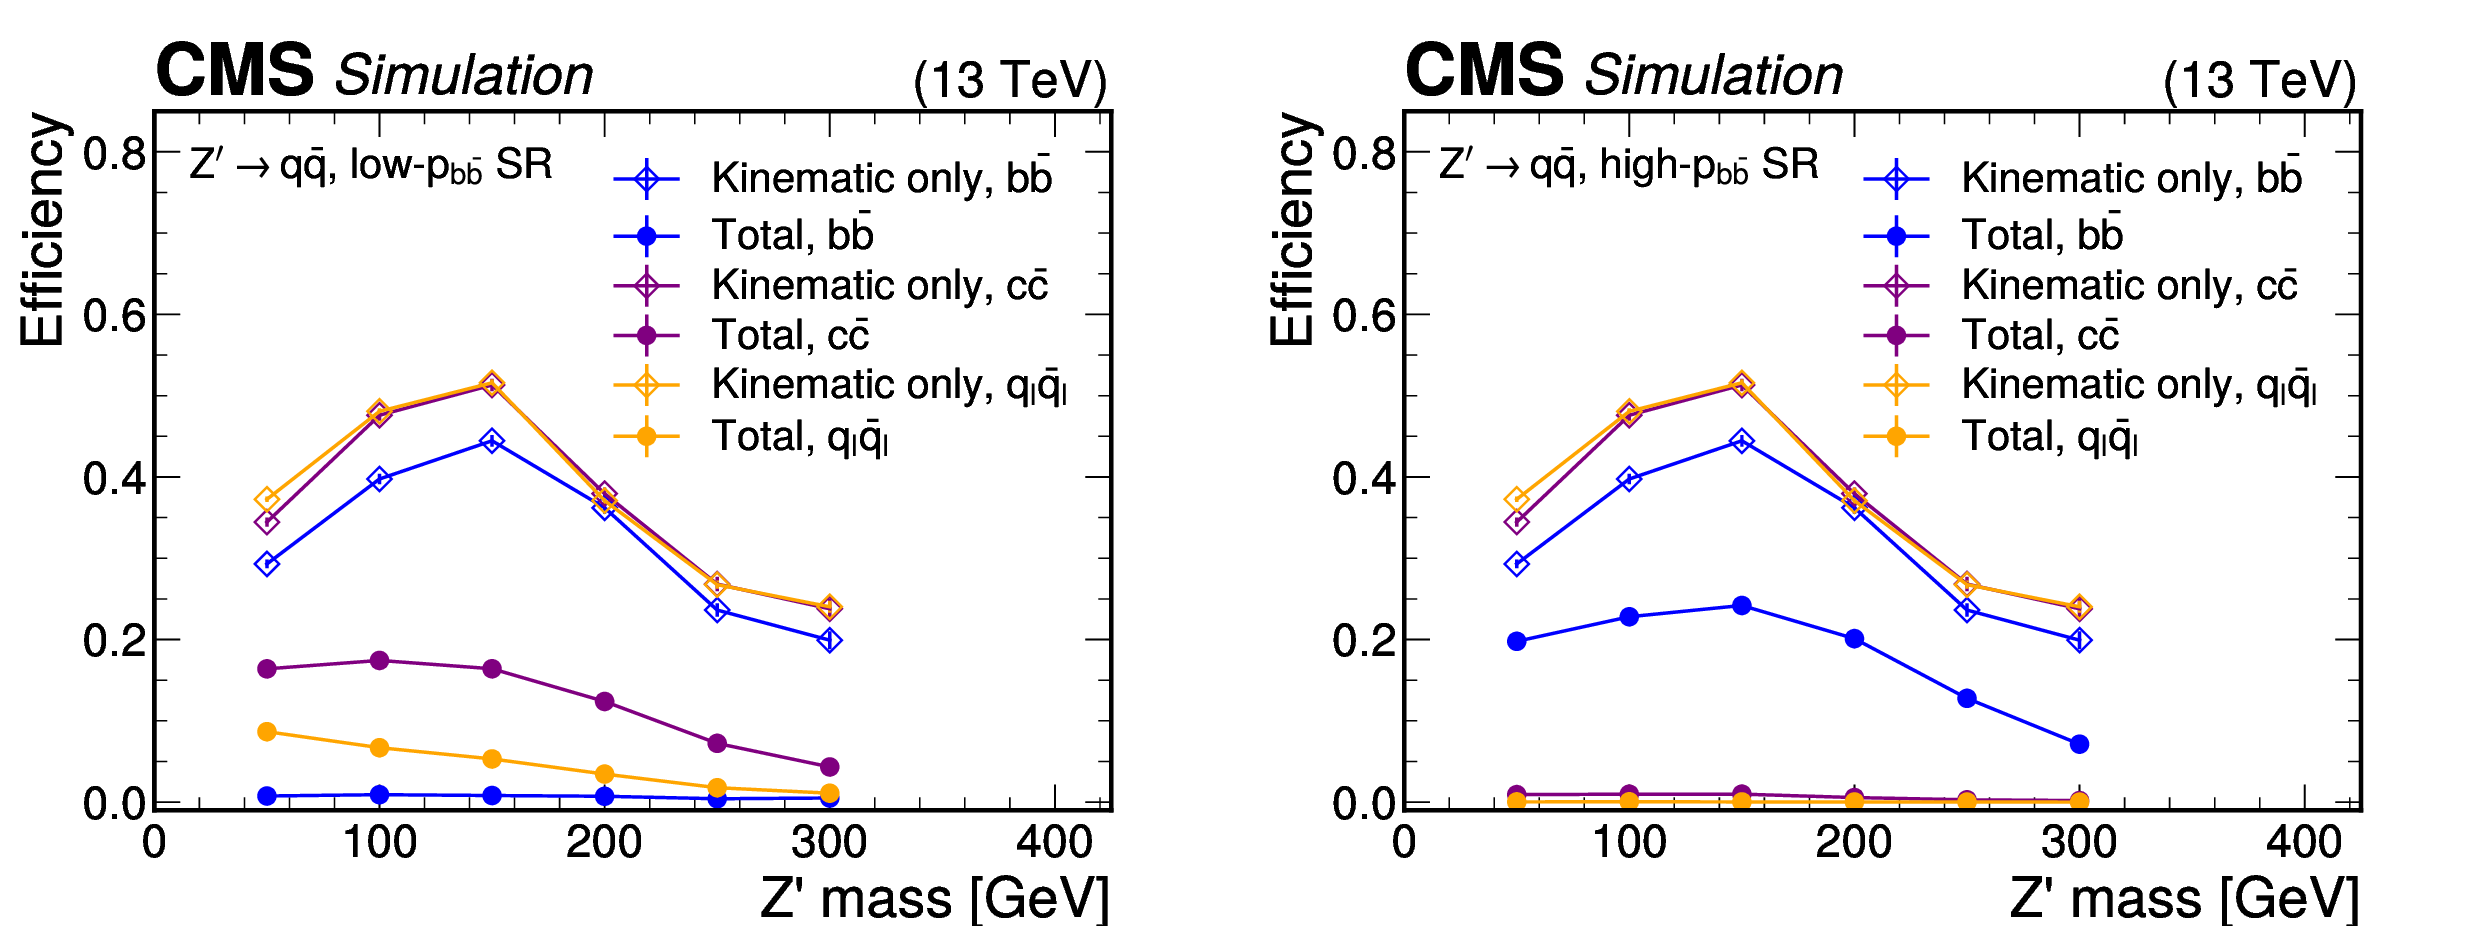
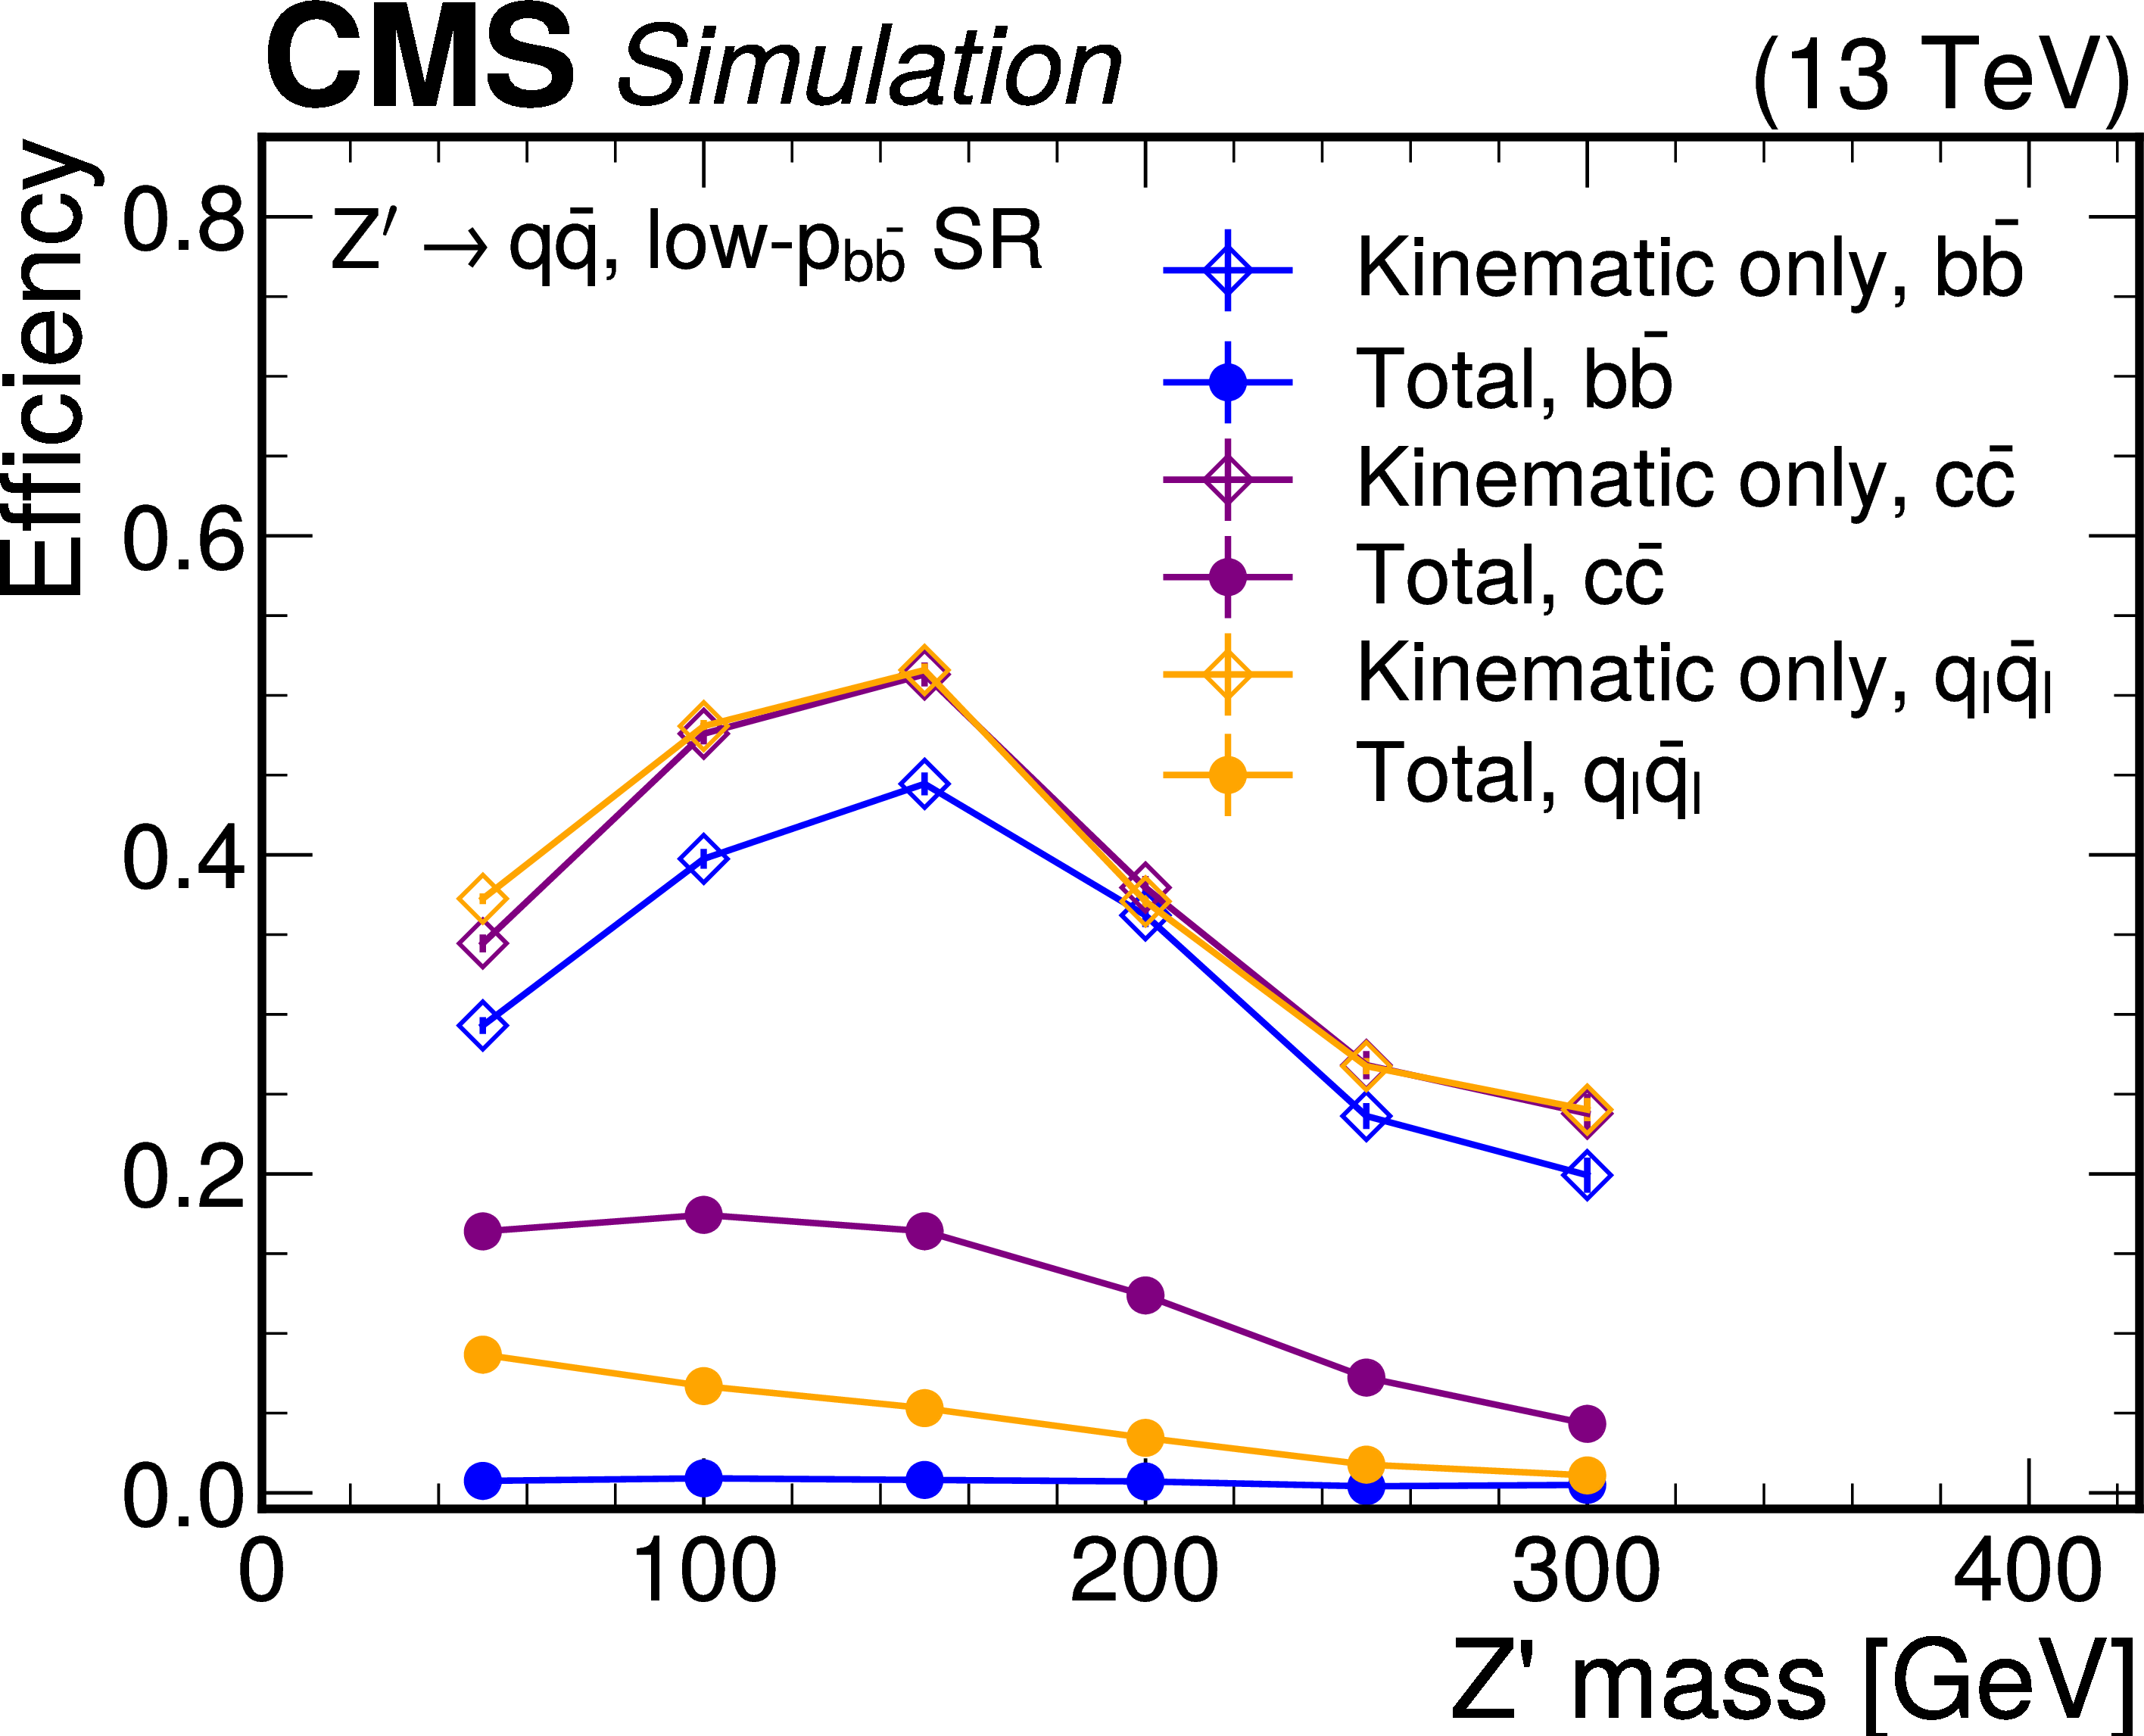
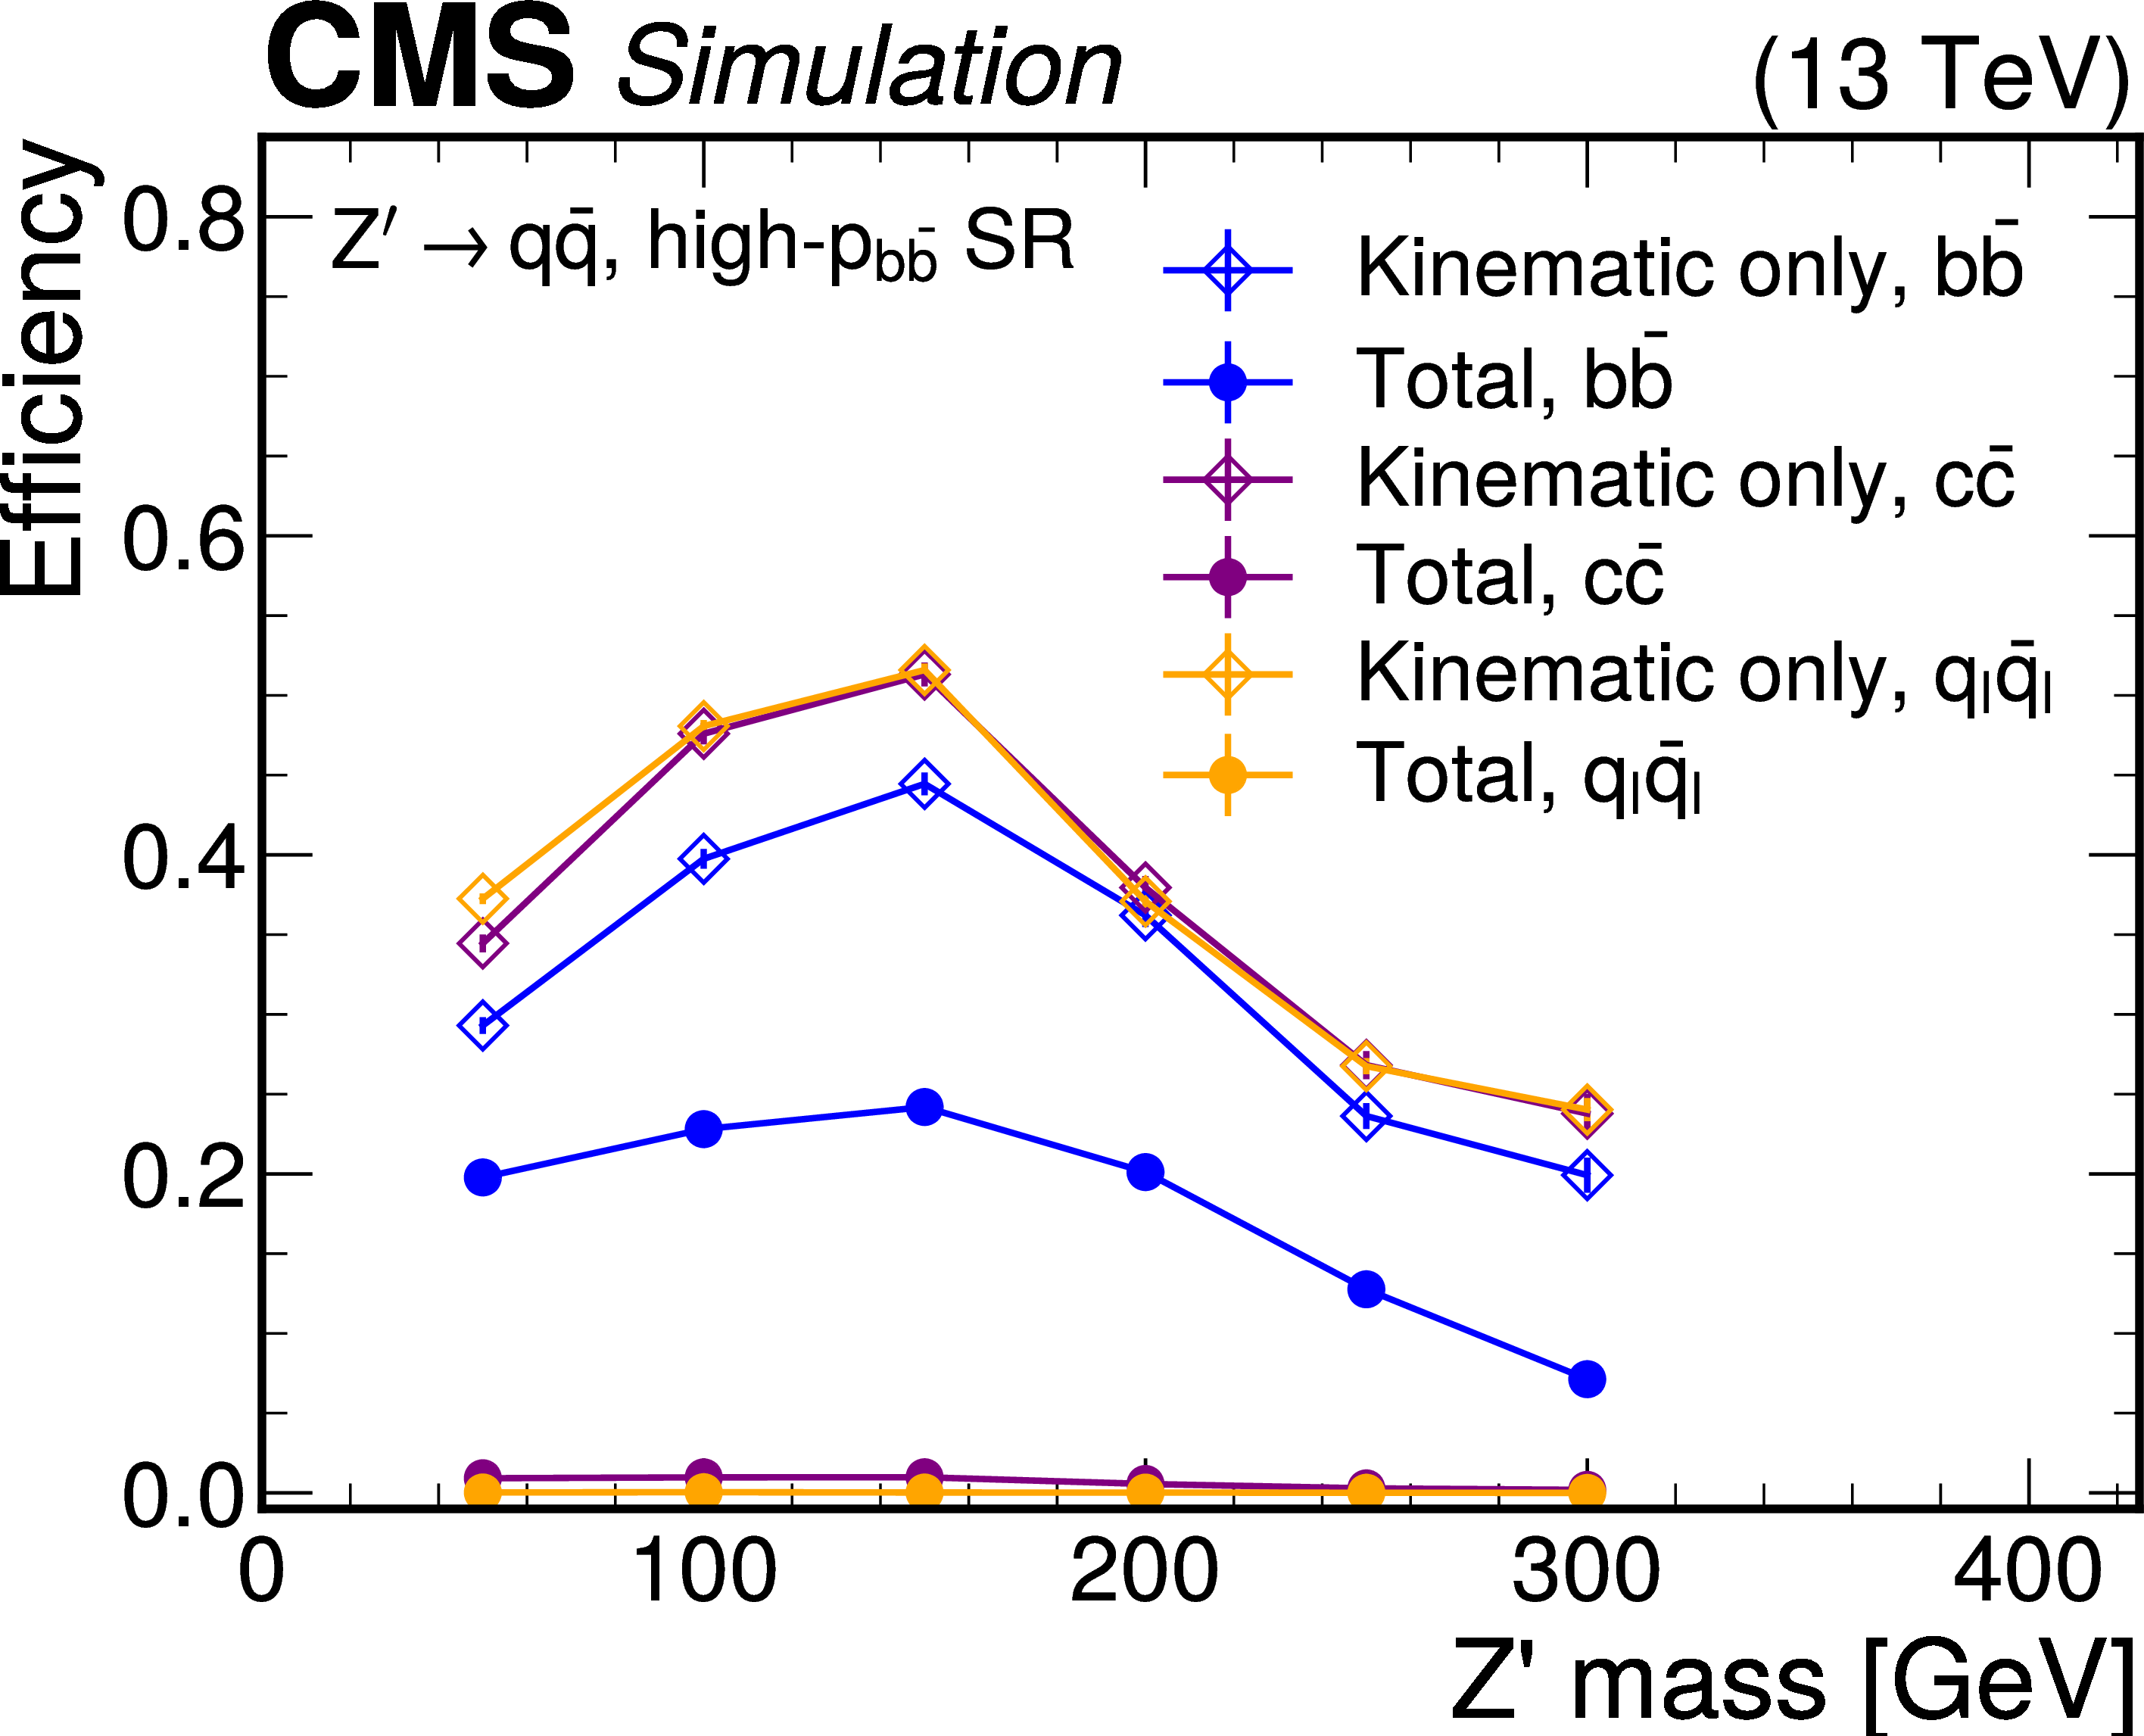
Figure 4:
Efficiencies of the selection criteria in the low-$ p_{\mathrm{b}\overline{\mathrm{b}}} $ (left) and high-$ p_{\mathrm{b}\overline{\mathrm{b}}} $ (right) signal regions, derived from simulated $ \mathrm{Z}^{'} $ events where the $ \mathrm{Z}^{'} $ satisfies $ p_{\mathrm{T}} > $ 500 GeV and $ |\eta| < $ 2.5. The efficiencies are shown separately for different quark flavors (denoted ``total''). The efficiencies for all selection criteria, except for the PARTICLENET requirements (denoted ``kinematic only''), are also shown to illustrate the performance of the jet tagging algorithm. |
png pdf |
Figure 4-a:
Efficiencies of the selection criteria in the low-$ p_{\mathrm{b}\overline{\mathrm{b}}} $ (left) and high-$ p_{\mathrm{b}\overline{\mathrm{b}}} $ (right) signal regions, derived from simulated $ \mathrm{Z}^{'} $ events where the $ \mathrm{Z}^{'} $ satisfies $ p_{\mathrm{T}} > $ 500 GeV and $ |\eta| < $ 2.5. The efficiencies are shown separately for different quark flavors (denoted ``total''). The efficiencies for all selection criteria, except for the PARTICLENET requirements (denoted ``kinematic only''), are also shown to illustrate the performance of the jet tagging algorithm. |
png pdf |
Figure 4-b:
Efficiencies of the selection criteria in the low-$ p_{\mathrm{b}\overline{\mathrm{b}}} $ (left) and high-$ p_{\mathrm{b}\overline{\mathrm{b}}} $ (right) signal regions, derived from simulated $ \mathrm{Z}^{'} $ events where the $ \mathrm{Z}^{'} $ satisfies $ p_{\mathrm{T}} > $ 500 GeV and $ |\eta| < $ 2.5. The efficiencies are shown separately for different quark flavors (denoted ``total''). The efficiencies for all selection criteria, except for the PARTICLENET requirements (denoted ``kinematic only''), are also shown to illustrate the performance of the jet tagging algorithm. |
png pdf |
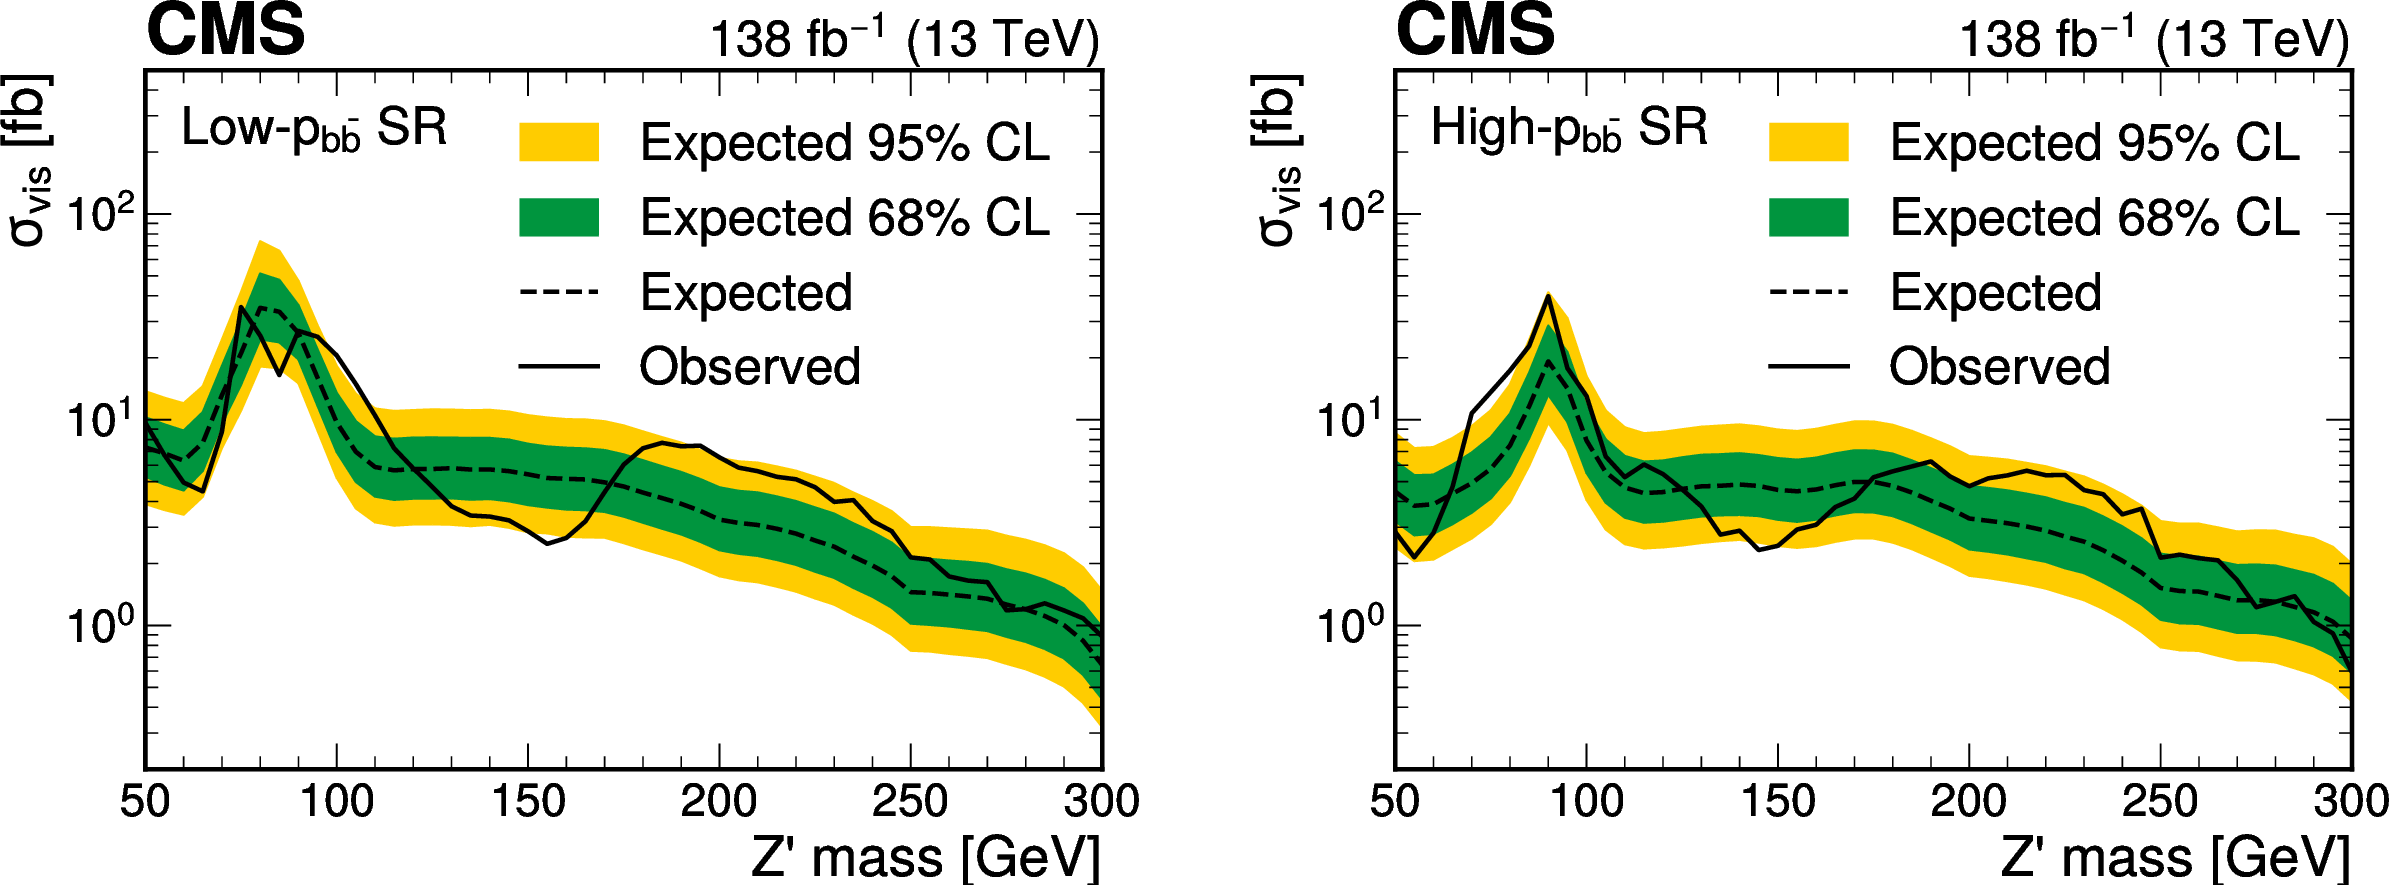
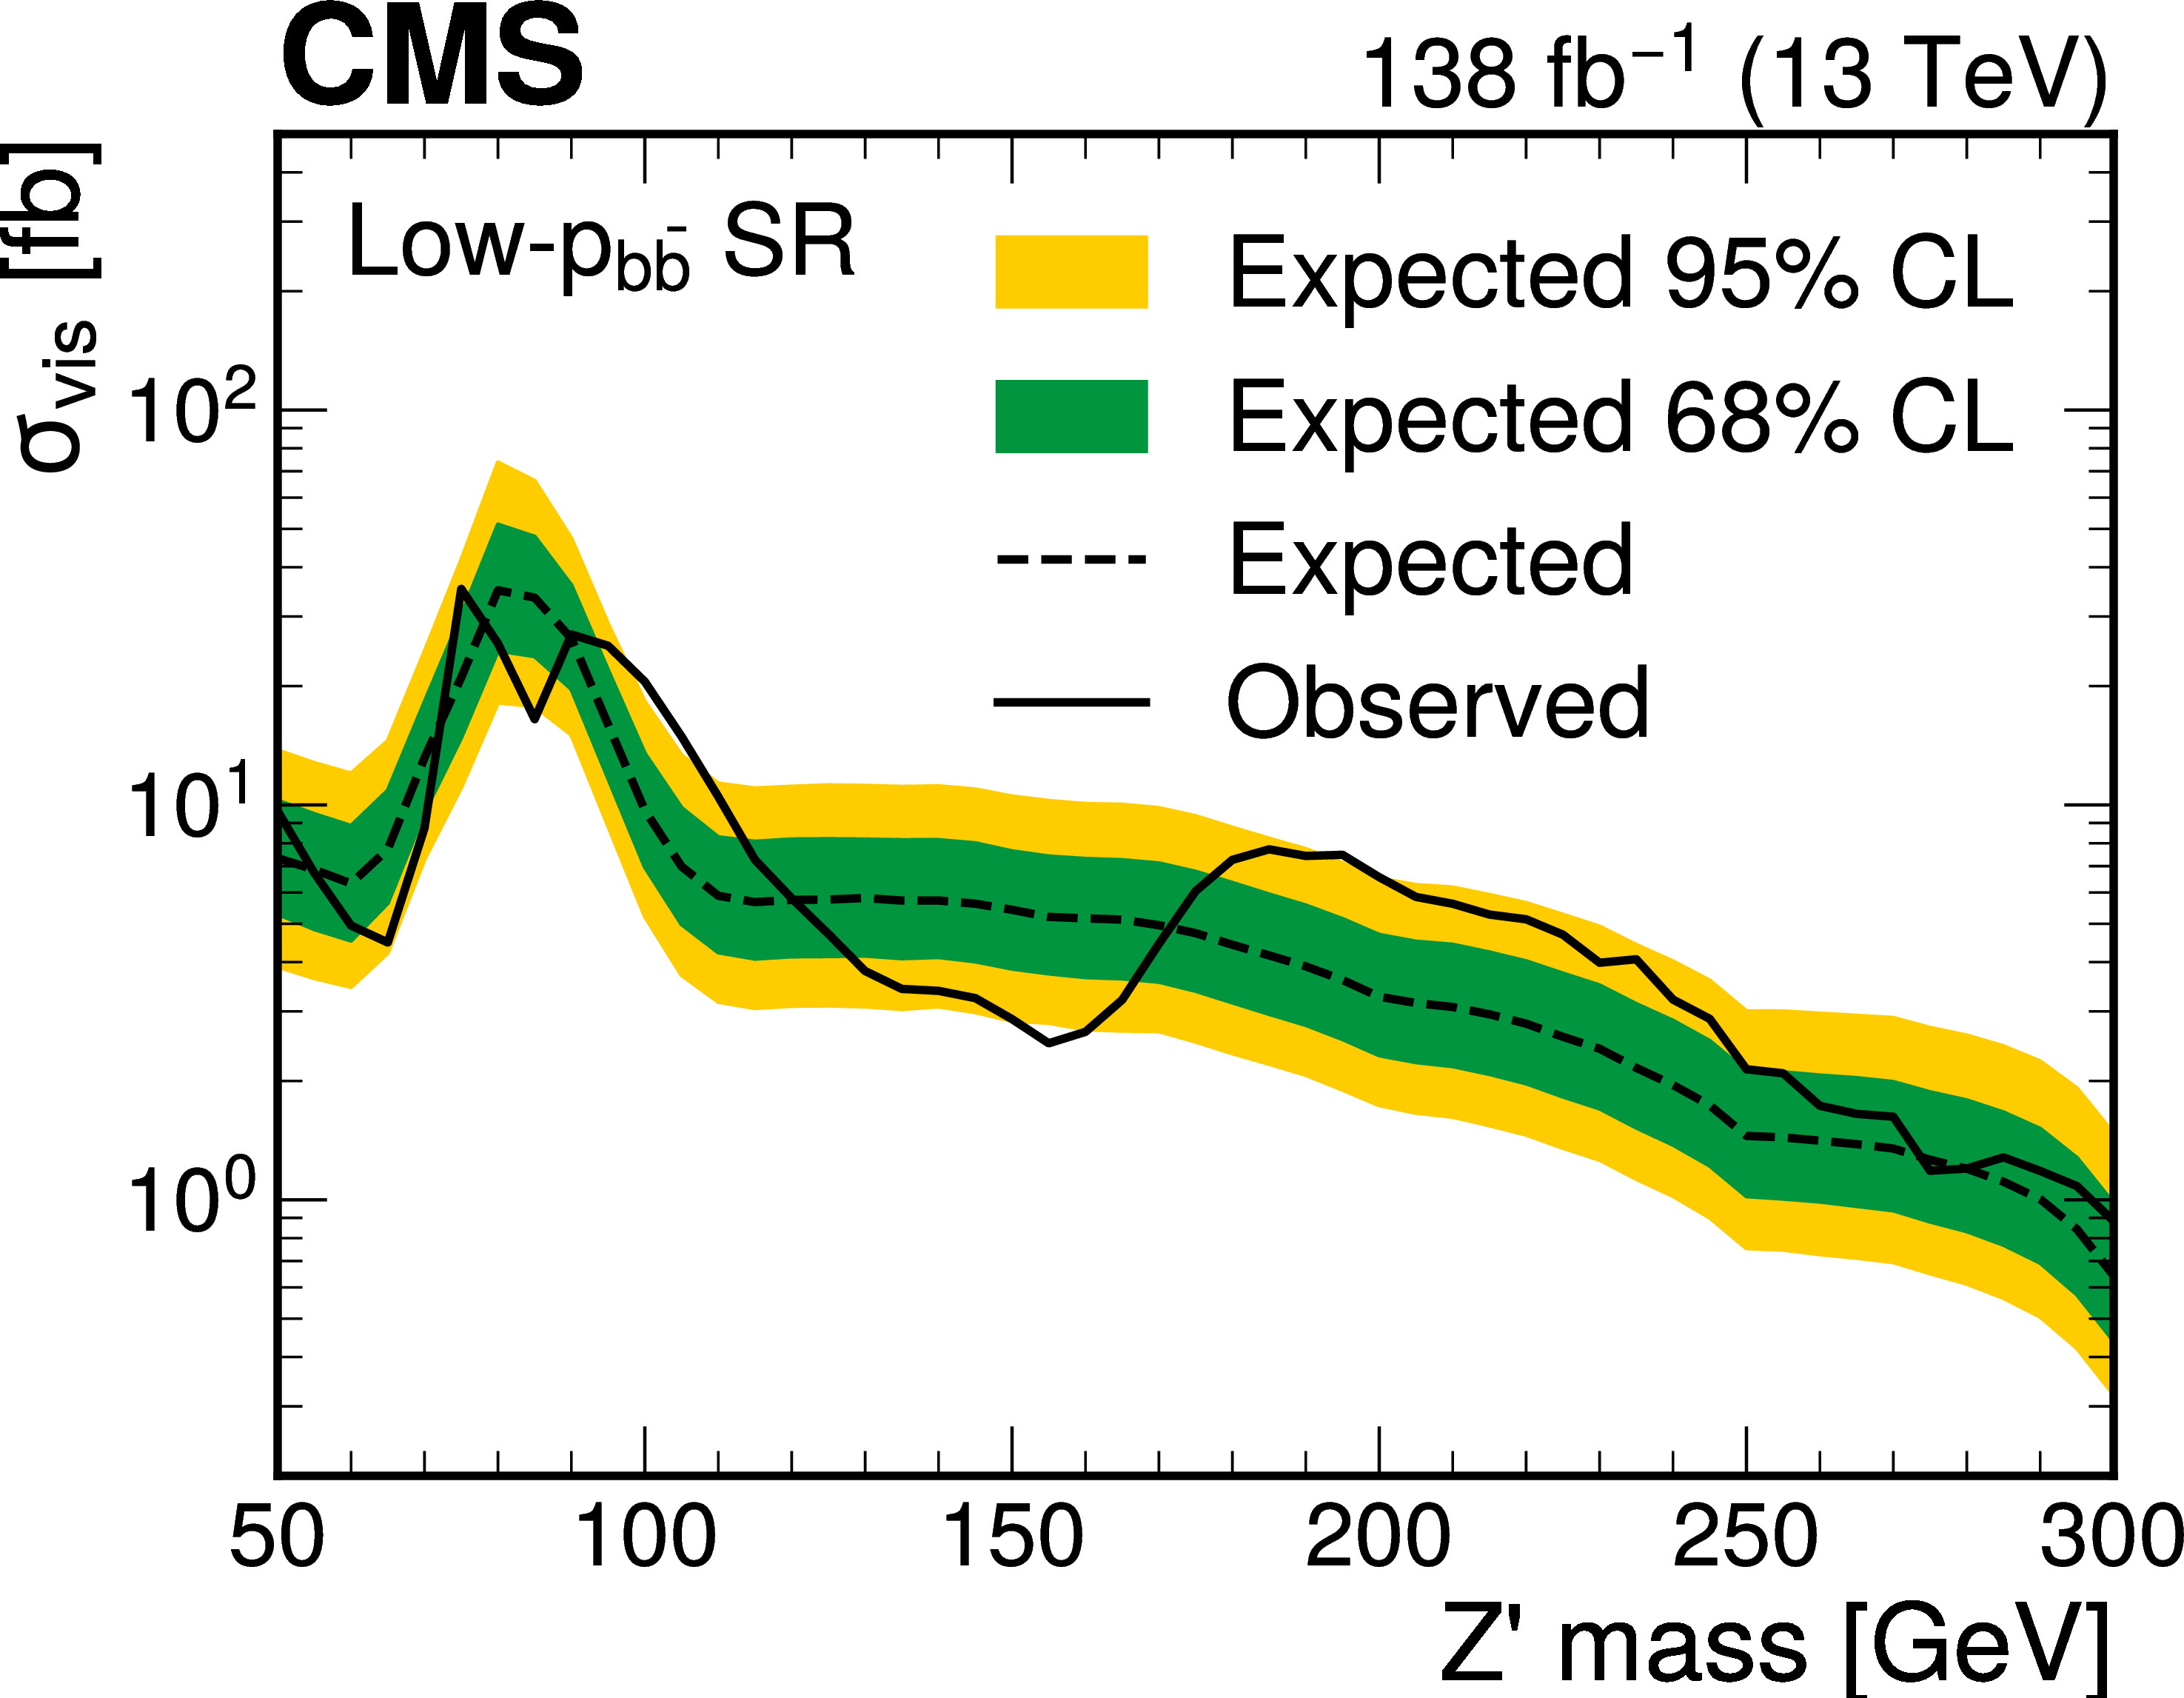
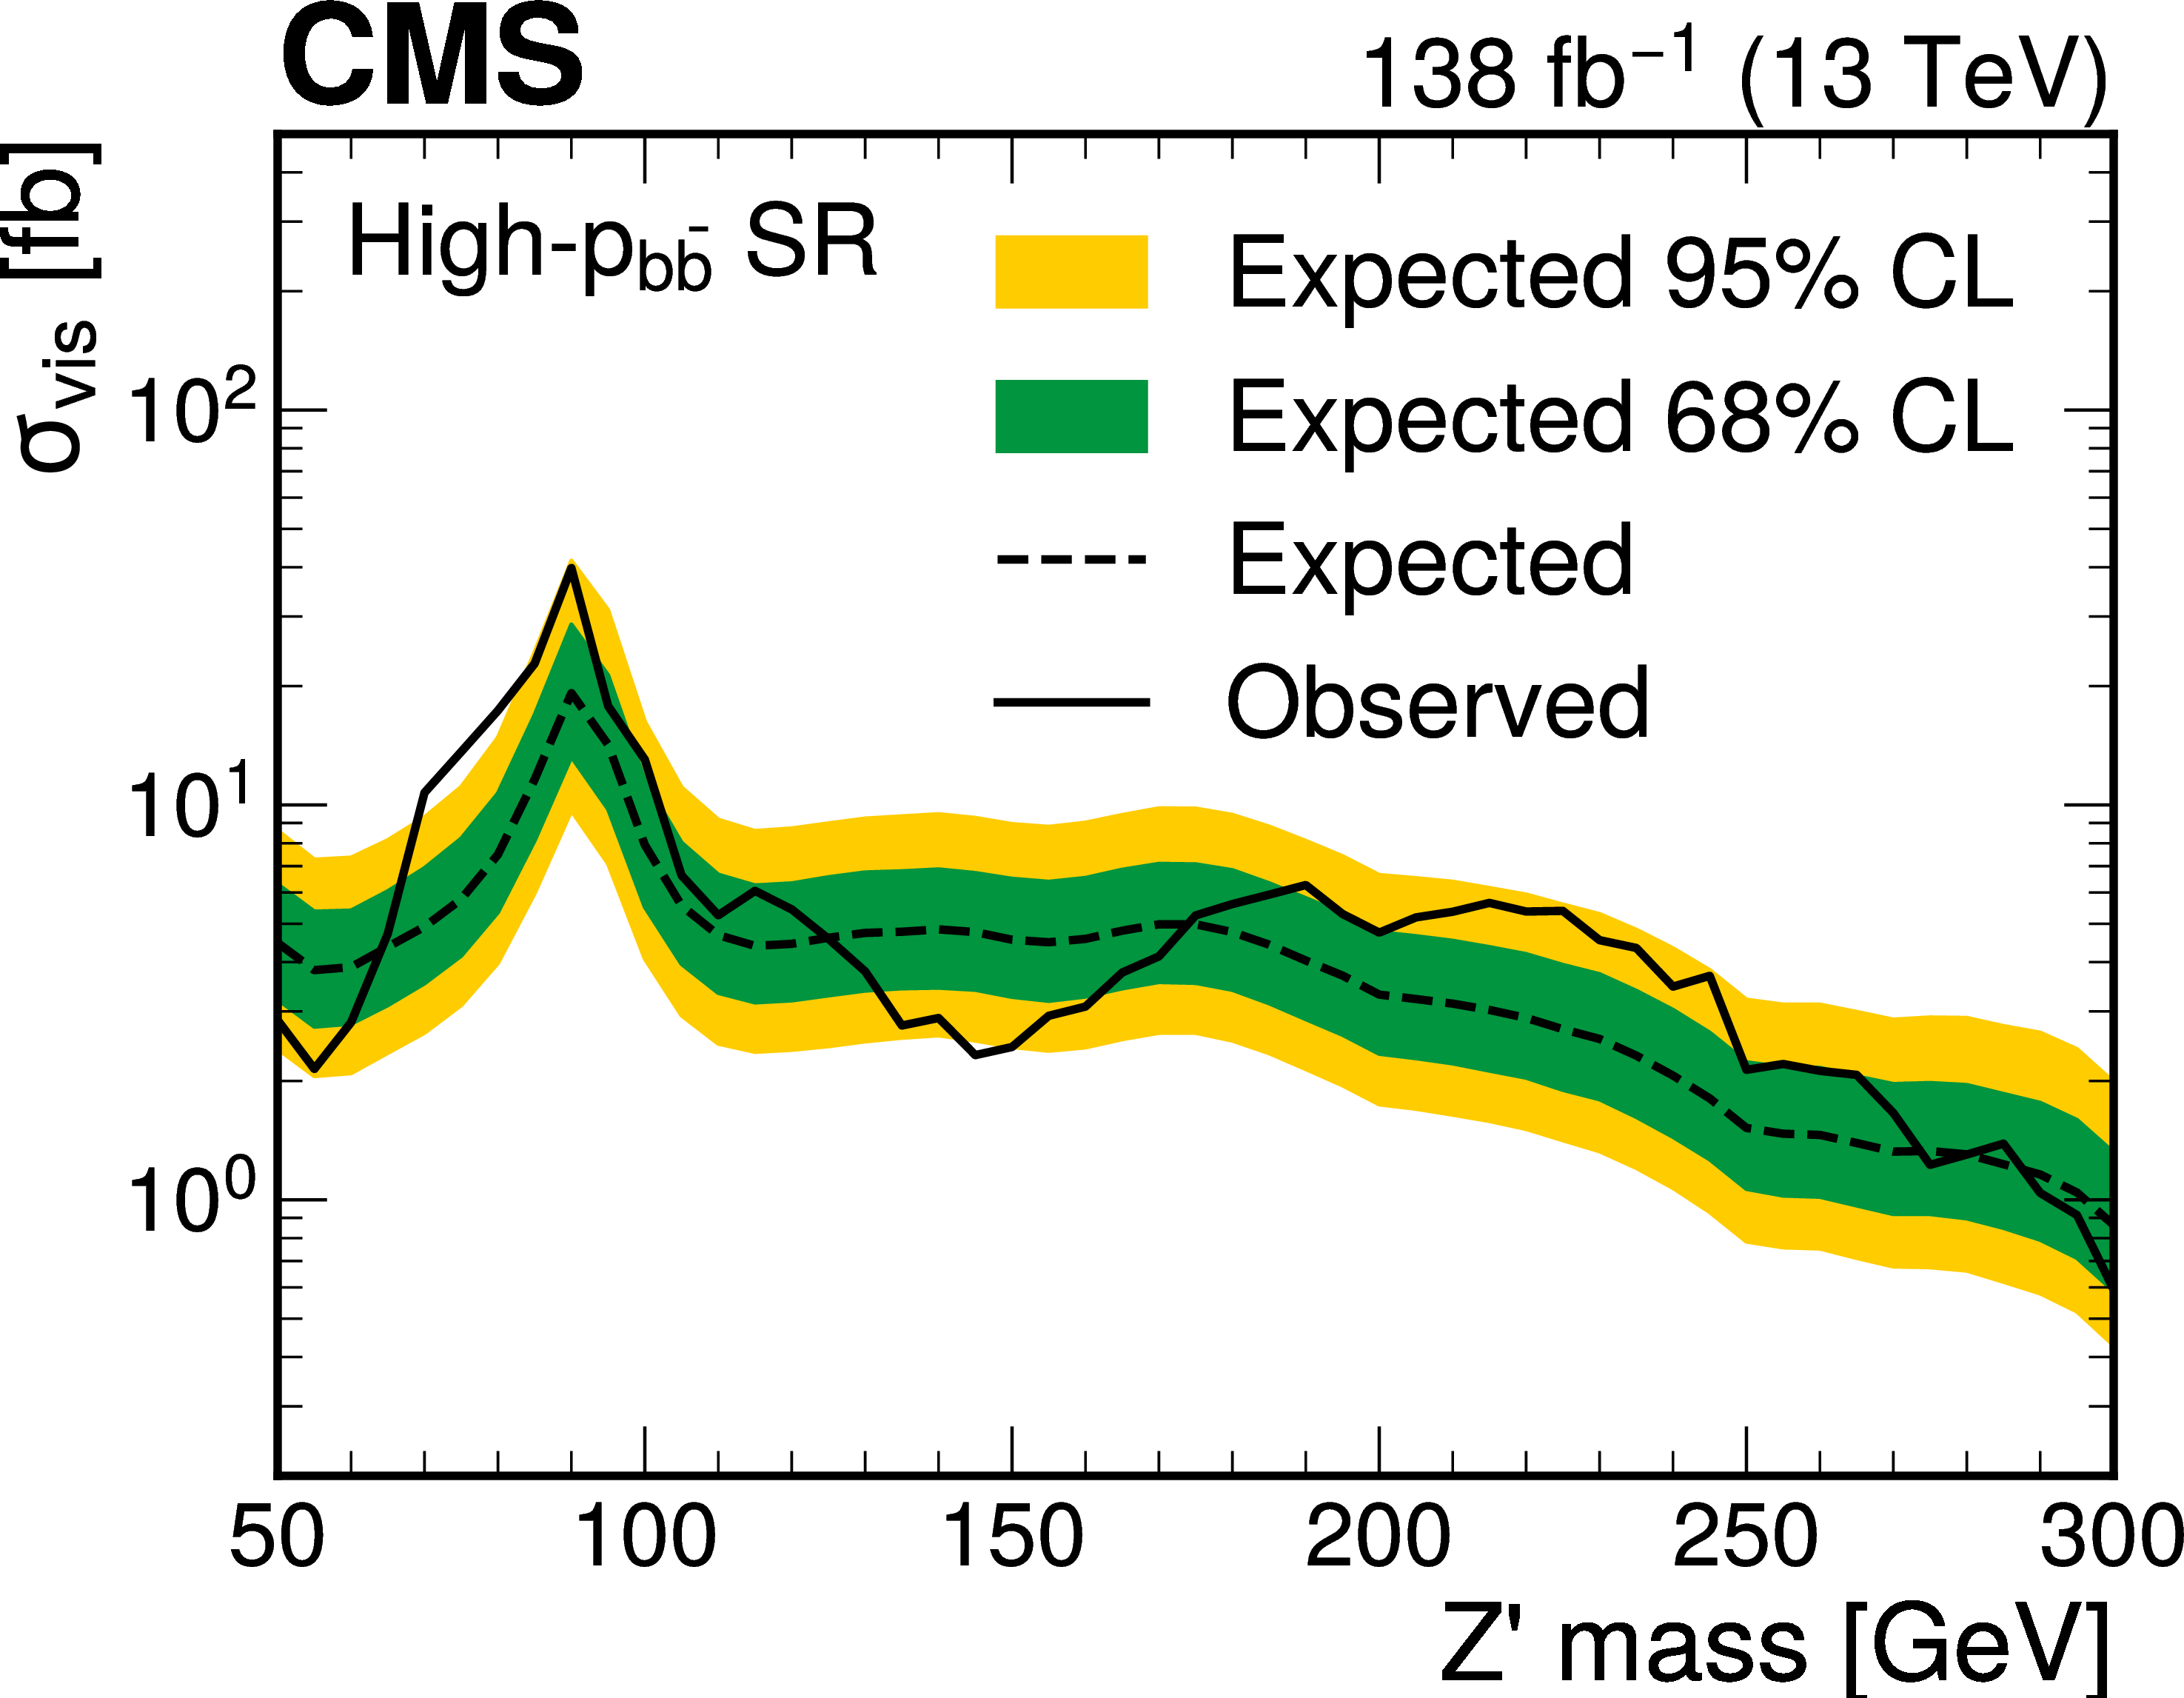
Figure 5:
Upper limits at 95% CL on the visible cross section, $ \sigma_{\text{vis}} $, defined as the number of signal events divided by the integrated luminosity, for the low-$ p_{\mathrm{b}\overline{\mathrm{b}}} $ (left) and high-$ p_{\mathrm{b}\overline{\mathrm{b}}} $ (right) signal regions. The solid line represents the observed limits, and the dashed line and the inner (green) and outer (yellow) bands represent the median and the regions containing 68% and 95%, respectively, of the distribution of expected limits under the background-only hypothesis. |
png pdf |
Figure 5-a:
Upper limits at 95% CL on the visible cross section, $ \sigma_{\text{vis}} $, defined as the number of signal events divided by the integrated luminosity, for the low-$ p_{\mathrm{b}\overline{\mathrm{b}}} $ (left) and high-$ p_{\mathrm{b}\overline{\mathrm{b}}} $ (right) signal regions. The solid line represents the observed limits, and the dashed line and the inner (green) and outer (yellow) bands represent the median and the regions containing 68% and 95%, respectively, of the distribution of expected limits under the background-only hypothesis. |
png pdf |
Figure 5-b:
Upper limits at 95% CL on the visible cross section, $ \sigma_{\text{vis}} $, defined as the number of signal events divided by the integrated luminosity, for the low-$ p_{\mathrm{b}\overline{\mathrm{b}}} $ (left) and high-$ p_{\mathrm{b}\overline{\mathrm{b}}} $ (right) signal regions. The solid line represents the observed limits, and the dashed line and the inner (green) and outer (yellow) bands represent the median and the regions containing 68% and 95%, respectively, of the distribution of expected limits under the background-only hypothesis. |
| Summary |
| In summary, a search for new dijet resonances with masses from 50 to 300 GeV has been presented, using proton-proton collision data at $\sqrt{s}=13$TeV, collected in 2016--2018 and corresponding to an integrated luminosity of 138 fb$ ^{-1} $. The search targets spin-1 resonances decaying to quark-antiquark pairs of all flavors, and spin-0 resonances decaying to bottom quark-antiquark pairs. The resonances are distinguished from the backgrounds using the PARTICLENET algorithm and would result in narrow peaks in the jet soft-drop mass spectra. No significant excesses beyond the standard model expectations are observed. Limits are set on the couplings of the resonances to quarks, assuming that the resonances decay only to quarks. For spin-1 resonances coupled equally to all quark flavors, the upper limits on $g_q$ range from 0.03 to 0.13. For spin-0 resonances coupled dominantly to bottom quarks, the upper limits on $g_{q\phi}$ ($g_{qA}$) range from 1.5 to 5.8 (1.0 to 3.8). These limits improve significantly on the existing ones in the mass range of 50--250 GeV. |
| References | ||||
| 1 | R. N. Mohapatra | Left-right symmetry, grand unification and cosmology | Fortsch. Phys. 31 (1983) 185 | |
| 2 | E. Eichten, I. Hinchliffe, K. D. Lane, and C. Quigg | Supercollider physics | Rev. Mod. Phys. 56 (1984) 579 | |
| 3 | L. Randall and R. Sundrum | An alternative to compactification | PRL 83 (1999) 4690 | hep-th/9906064 |
| 4 | D. Abercrombie et al. | Dark matter benchmark models for early LHC Run-2 searches: Report of the ATLAS/CMS Dark Matter Forum | Phys. Dark Univ. 27 (2020) 100371 | 1507.00966 |
| 5 | A. Boveia et al. | Recommendations on presenting LHC searches for missing transverse energy signals using simplified $ s $-channel models of dark matter | Phys. Dark Univ. 27 (2020) 100365 | 1603.04156 |
| 6 | ATLAS Collaboration | Constraints on simplified dark matter models involving an s-channel mediator with the ATLAS detector in pp collisions at $ \sqrt{s} = $ 13 TeV | EPJC 84 (2024) 1102 | 2404.15930 |
| 7 | Particle Data Group Collaboration | Review of particle physics | PRD 110 (2024) 030001 | |
| 8 | CMS Collaboration | Dark sector searches with the CMS experiment | Phys. Rept. 1115 (2025) 448 | CMS-EXO-23-005 2405.13778 |
| 9 | G. D'Ambrosio, G. F. Giudice, G. Isidori, and A. Strumia | Minimal flavor violation: An effective field theory approach | NPB 645 (2002) 155 | hep-ph/0207036 |
| 10 | H. Qu and L. Gouskos | Jet tagging via particle clouds | PRD 101 (2020) 056019 | 1902.08570 |
| 11 | I. Moult, L. Necib, and J. Thaler | New angles on energy correlation functions | JHEP 12 (2016) 153 | 1609.07483 |
| 12 | CMS Collaboration | Search for low mass vector resonances decaying into quark-antiquark pairs in proton-proton collisions at $ \sqrt{s}= $ 13 TeV | PRD 100 (2019) 112007 | CMS-EXO-18-012 1909.04114 |
| 13 | CMS Collaboration | The CMS experiment at the CERN LHC | JINST 3 (2008) S08004 | |
| 14 | CMS Collaboration | Development of the CMS detector for the CERN LHC Run 3 | JINST 19 (2024) P05064 | CMS-PRF-21-001 2309.05466 |
| 15 | CMS Collaboration | Performance of the CMS Level-1 trigger in proton-proton collisions at $ \sqrt{s} = $ 13 TeV | JINST 15 (2020) P10017 | CMS-TRG-17-001 2006.10165 |
| 16 | CMS Collaboration | The CMS trigger system | JINST 12 (2017) P01020 | CMS-TRG-12-001 1609.02366 |
| 17 | CMS Collaboration | Performance of the CMS high-level trigger during LHC Run 2 | no. 11, P1, 2024 JINST 19 (2024) |
CMS-TRG-19-001 2410.17038 |
| 18 | CMS Collaboration | Electron and photon reconstruction and identification with the CMS experiment at the CERN LHC | JINST 16 (2021) P05014 | CMS-EGM-17-001 2012.06888 |
| 19 | CMS Collaboration | Performance of the CMS muon detector and muon reconstruction with proton-proton collisions at $ \sqrt{s}= $ 13 TeV | JINST 13 (2018) P06015 | CMS-MUO-16-001 1804.04528 |
| 20 | CMS Collaboration | Description and performance of track and primary-vertex reconstruction with the CMS tracker | JINST 9 (2014) P10009 | CMS-TRK-11-001 1405.6569 |
| 21 | CMS Collaboration | Particle-flow reconstruction and global event description with the CMS detector | JINST 12 (2017) P10003 | CMS-PRF-14-001 1706.04965 |
| 22 | CMS Collaboration | Performance of reconstruction and identification of $ \tau $ leptons decaying to hadrons and $ \nu_\tau $ in pp collisions at $ \sqrt{s}= $ 13 TeV | JINST 13 (2018) P10005 | CMS-TAU-16-003 1809.02816 |
| 23 | CMS Collaboration | Jet energy scale and resolution in the CMS experiment in pp collisions at 8 TeV | JINST 12 (2017) P02014 | CMS-JME-13-004 1607.03663 |
| 24 | CMS Collaboration | Performance of missing transverse momentum reconstruction in proton-proton collisions at $ \sqrt{s} = $ 13 TeV using the CMS detector | JINST 14 (2019) P07004 | CMS-JME-17-001 1903.06078 |
| 25 | CMS Collaboration | HEPData record for this analysis | link | |
| 26 | T. Sjöstrand et al. | An introduction to PYTHIA 8.2 | Comput. Phys. Commun. 191 (2015) 159 | 1410.3012 |
| 27 | CMS Collaboration | Extraction and validation of a new set of CMS PYTHIA 8 tunes from underlying-event measurements | EPJC 80 (2020) 4 | CMS-GEN-17-001 1903.12179 |
| 28 | J. Alwall et al. | Comparative study of various algorithms for the merging of parton showers and matrix elements in hadronic collisions | EPJC 53 (2007) 473 | 0706.2569 |
| 29 | R. Frederix and S. Frixione | Merging meets matching in MC@NLO | JHEP 12 (2012) 061 | 1209.6215 |
| 30 | GEANT4 Collaboration | GEANT 4---a simulation toolkit | NIM A 506 (2003) 250 | |
| 31 | S. Kallweit et al. | NLO electroweak automation and precise predictions for W+multijet production at the LHC | JHEP 04 (2015) 012 | 1412.5157 |
| 32 | S. Kallweit et al. | NLO QCD+EW predictions for V+jets including off-shell vector-boson decays and multijet merging | JHEP 04 (2016) 021 | 1511.08692 |
| 33 | S. Kallweit et al. | NLO QCD+EW automation and precise predictions for V+multijet production | in th Rencontres de Moriond on QCD and High Energy Interactions, 2015 Proc. 5 (2015) 0 |
1505.05704 |
| 34 | J. M. Lindert et al. | Precise predictions for $ V+ $ jets dark matter backgrounds | EPJC 77 (2017) 829 | 1705.04664 |
| 35 | S. Frixione, G. Ridolfi, and P. Nason | A positive-weight next-to-leading-order Monte Carlo for heavy flavour hadroproduction | JHEP 09 (2007) 126 | 0707.3088 |
| 36 | S. Frixione, P. Nason, and C. Oleari | Matching NLO QCD computations with parton shower simulations: the POWHEG method | JHEP 11 (2007) 070 | 0709.2092 |
| 37 | S. Alioli, P. Nason, C. Oleari, and E. Re | A general framework for implementing NLO calculations in shower Monte Carlo programs: the POWHEG BOX | JHEP 06 (2010) 043 | 1002.2581 |
| 38 | R. Frederix, E. Re, and P. Torrielli | Single-top $ t $-channel hadroproduction in the four-flavour scheme with POWHEG and aMC@NLO | JHEP 09 (2012) 130 | 1207.5391 |
| 39 | E. Re | Single-top $ \mathrm{W}\mathrm{t} $-channel production matched with parton showers using the POWHEG method | EPJC 71 (2011) 1547 | 1009.2450 |
| 40 | J. M. Campbell and R. K. Ellis | MCFM for the Tevatron and the LHC | -206 10, 2010 Nucl. Phys. Proc. Suppl. 20 (2010) 5 |
1007.3492 |
| 41 | T. Neumann | NLO Higgs+jet production at large transverse momenta including top quark mass effects | J. Phys. Comm. 2 (2018) 095017 | 1802.02981 |
| 42 | P. F. Monni et al. | MiNNLO$ _{\text {PS}} $: a new method to match NNLO QCD to parton showers | JHEP 05 (2020) 143 | 1908.06987 |
| 43 | P. F. Monni, E. Re, and M. Wiesemann | MiNNLO$ _{\text {PS}} $: optimizing 2 $ \rightarrow $ 1 hadronic processes | EPJC 80 (2020) 1075 | 2006.04133 |
| 44 | K. Becker et al. | Precise predictions for boosted Higgs production | SciPost Phys. Core 7 (2024) 001 | 2005.07762 |
| 45 | P. Nason and C. Oleari | NLO Higgs boson production via vector-boson fusion matched with shower in POWHEG | JHEP 02 (2010) 037 | 0911.5299 |
| 46 | G. Luisoni, P. Nason, C. Oleari, and F. Tramontano | $ \mathrm{H}\mathrm{W}^{\pm} $/HZ+0 and 1 jet at NLO with the POWHEG box interfaced to GoSam and their merging within MiNLO | JHEP 10 (2013) 083 | 1306.2542 |
| 47 | H. B. Hartanto, B. Jager, L. Reina, and D. Wackeroth | Higgs boson production in association with top quarks in the POWHEG BOX | PRD 91 (2015) 094003 | 1501.04498 |
| 48 | M. Cacciari, G. P. Salam, and G. Soyez | The anti-$ k_{\mathrm{T}} $ jet clustering algorithm | JHEP 04 (2008) 063 | 0802.1189 |
| 49 | M. Cacciari, G. P. Salam, and G. Soyez | FastJet user manual | EPJC 72 (2012) 1896 | 1111.6097 |
| 50 | D. Bertolini, P. Harris, M. Low, and N. Tran | Pileup per particle identification | JHEP 10 (2014) 059 | 1407.6013 |
| 51 | CMS Collaboration | Pileup mitigation at CMS in 13 TeV data | JINST 15 (2020) P09018 | CMS-JME-18-001 2003.00503 |
| 52 | A. J. Larkoski, S. Marzani, G. Soyez, and J. Thaler | Soft drop | JHEP 05 (2014) 146 | 1402.2657 |
| 53 | D. Krohn, J. Thaler, and L.-T. Wang | Jet trimming | JHEP 02 (2010) 084 | 0912.1342 |
| 54 | CMS Collaboration | Identification of hadronic tau lepton decays using a deep neural network | JINST 17 (2022) P07023 | CMS-TAU-20-001 2201.08458 |
| 55 | E. Bols et al. | Jet flavour classification using DeepJet | JINST 15 (2020) P12012 | 2008.10519 |
| 56 | CMS Collaboration | Performance summary of AK4 jet b tagging with data from proton-proton collisions at 13 TeV with the CMS detector | CMS Detector Performance Summary CMS-DP-2023-005, 2023 CDS |
|
| 57 | ATLAS Collaboration | Measurement of soft-drop jet observables in $ \mathrm{pp} $ collisions with the ATLAS detector at $ \sqrt {s} = $ 13 TeV | PRD 101 (2020) 052007 | 1912.09837 |
| 58 | M. Baak, S. Gadatsch, R. Harrington, and W. Verkerke | Interpolation between multi-dimensional histograms using a new non-linear moment morphing method | NIM A 771 (2015) 39 | 1410.7388 |
| 59 | CMS Collaboration | Performance of heavy-flavour jet identification in boosted topologies in proton-proton collisions at $ \sqrt{s} = $ 13 TeV | CMS Physics Analysis Summary, 2023 CMS-PAS-BTV-22-001 |
CMS-PAS-BTV-22-001 |
| 60 | CMS Collaboration | Measurement of boosted Higgs bosons produced via vector boson fusion or gluon fusion in the $ \mathrm{H}\to \mathrm{b\bar{b}} $ decay mode using LHC proton-proton collision data at $ \sqrt{s} = $ 13 TeV | JHEP 12 (2024) 035 | CMS-HIG-21-020 2407.08012 |
| 61 | R. A. Fisher | On the interpretation of $ \chi^{2} $ from contingency tables, and the calculation of P | J. R. Stat. Soc. 85 (1922) 87 | |
| 62 | CMS Collaboration | Precision luminosity measurement in proton-proton collisions at $ \sqrt{s} = $ 13 TeV in 2015 and 2016 at CMS | EPJC 81 (2021) 800 | CMS-LUM-17-003 2104.01927 |
| 63 | CMS Collaboration | CMS luminosity measurement for the 2017 data-taking period at $ \sqrt{s} = $ 13 TeV | CMS Physics Analysis Summary, 2018 link |
CMS-PAS-LUM-17-004 |
| 64 | CMS Collaboration | CMS luminosity measurement for the 2018 data-taking period at $ \sqrt{s} = $ 13 TeV | CMS Physics Analysis Summary, 2019 link |
CMS-PAS-LUM-18-002 |
| 65 | CMS Collaboration | The CMS statistical analysis and combination tool: Combine | Comput. Softw. Big Sci. 8 (2024) 19 | CMS-CAT-23-001 2404.06614 |
| 66 | R. D. Cousins | Lectures on statistics in theory: Prelude to statistics in practice | 1807.05996 | |
| 67 | T. Junk | Confidence level computation for combining searches with small statistics | NIM A 434 (1999) 435 | hep-ex/9902006 |
| 68 | A. L. Read | Presentation of search results: The $ \text{CL}_\text{s} $ technique | JPG 28 (2002) 2693 | |
| 69 | G. Cowan, K. Cranmer, E. Gross, and O. Vitells | Asymptotic formulae for likelihood-based tests of new physics | EPJC 71 (2011) 1554 | 1007.1727 |
| 70 | CMS Collaboration | Search for low-mass resonances decaying into bottom quark-antiquark pairs in proton-proton collisions at $ \sqrt{s} = $ 13 TeV | PRD 99 (2019) 012005 | CMS-EXO-17-024 1810.11822 |
| 71 | ATLAS Collaboration | Search for boosted low-mass resonances decaying into hadrons produced in association with a photon in pp collisions at $ \sqrt{s} = $ 13 TeV with the ATLAS detector | JHEP 01 (2025) 099 | 2408.00049 |
| 72 | A. Albert et al. | Recommendations of the LHC Dark Matter Working Group: Comparing LHC searches for dark matter mediators in visible and invisible decay channels and calculations of the thermal relic density | Phys. Dark Univ. 26 (2019) 100377 | 1703.05703 |
| 73 | R. Essig et al. | Working group report: New light weakly coupled particles | in: Snowmass on the Mississippi, 2013 Proc. Snowmass 201 (2013) 3 |
1311.0029 |
|
|
Compact Muon Solenoid LHC, CERN |
|

|

|

|

|

|