
Compact Muon Solenoid
LHC, CERN
 Visit us: CMS Public Website, CMS Physics ;
Contact us: CMS Publications Committee
| CMS-SUS-23-017 ; CERN-EP-2026-161 | ||
| Search for dark matter produced in association with a low-multiplicity jet in proton-proton collisions at $ \sqrt{s} = $ 13 TeV | ||
| CMS Collaboration | ||
| 30 September 2026 | ||
| Submitted to Physical Review D | ||
| Abstract: A search for dark matter particles is presented using events with large missing transverse momentum and a single energetic jet containing few constituents. The analysis uses proton-proton collision data recorded by the CMS experiment at a center-of-mass energy of 13 TeV. This corresponds to an integrated luminosity of 138 fb$ ^{-1} $, recorded during the 2016--2018 LHC data-taking period. This is the first search at the LHC to employ the low-multiplicity jet signature. Supervised machine learning is used to maximize sensitivity to potential signals in this challenging final state. No excess of events over the standard model background prediction is observed. The results are used to set upper limits on the dark matter production cross section at 95% confidence level (CL) within simplified models featuring vector and axial-vector mediators. For a dark matter particle mass of approximately 150 (550) GeV, mediator masses up to 4250 (3500) GeV are excluded at 95% CL. | ||
| Links: e-print arXiv:2610.00995 [hep-ex] (PDF) ; CDS record ; inSPIRE record ; HepData record ; CADI line (restricted) ; | ||
| Figures | |
png pdf |
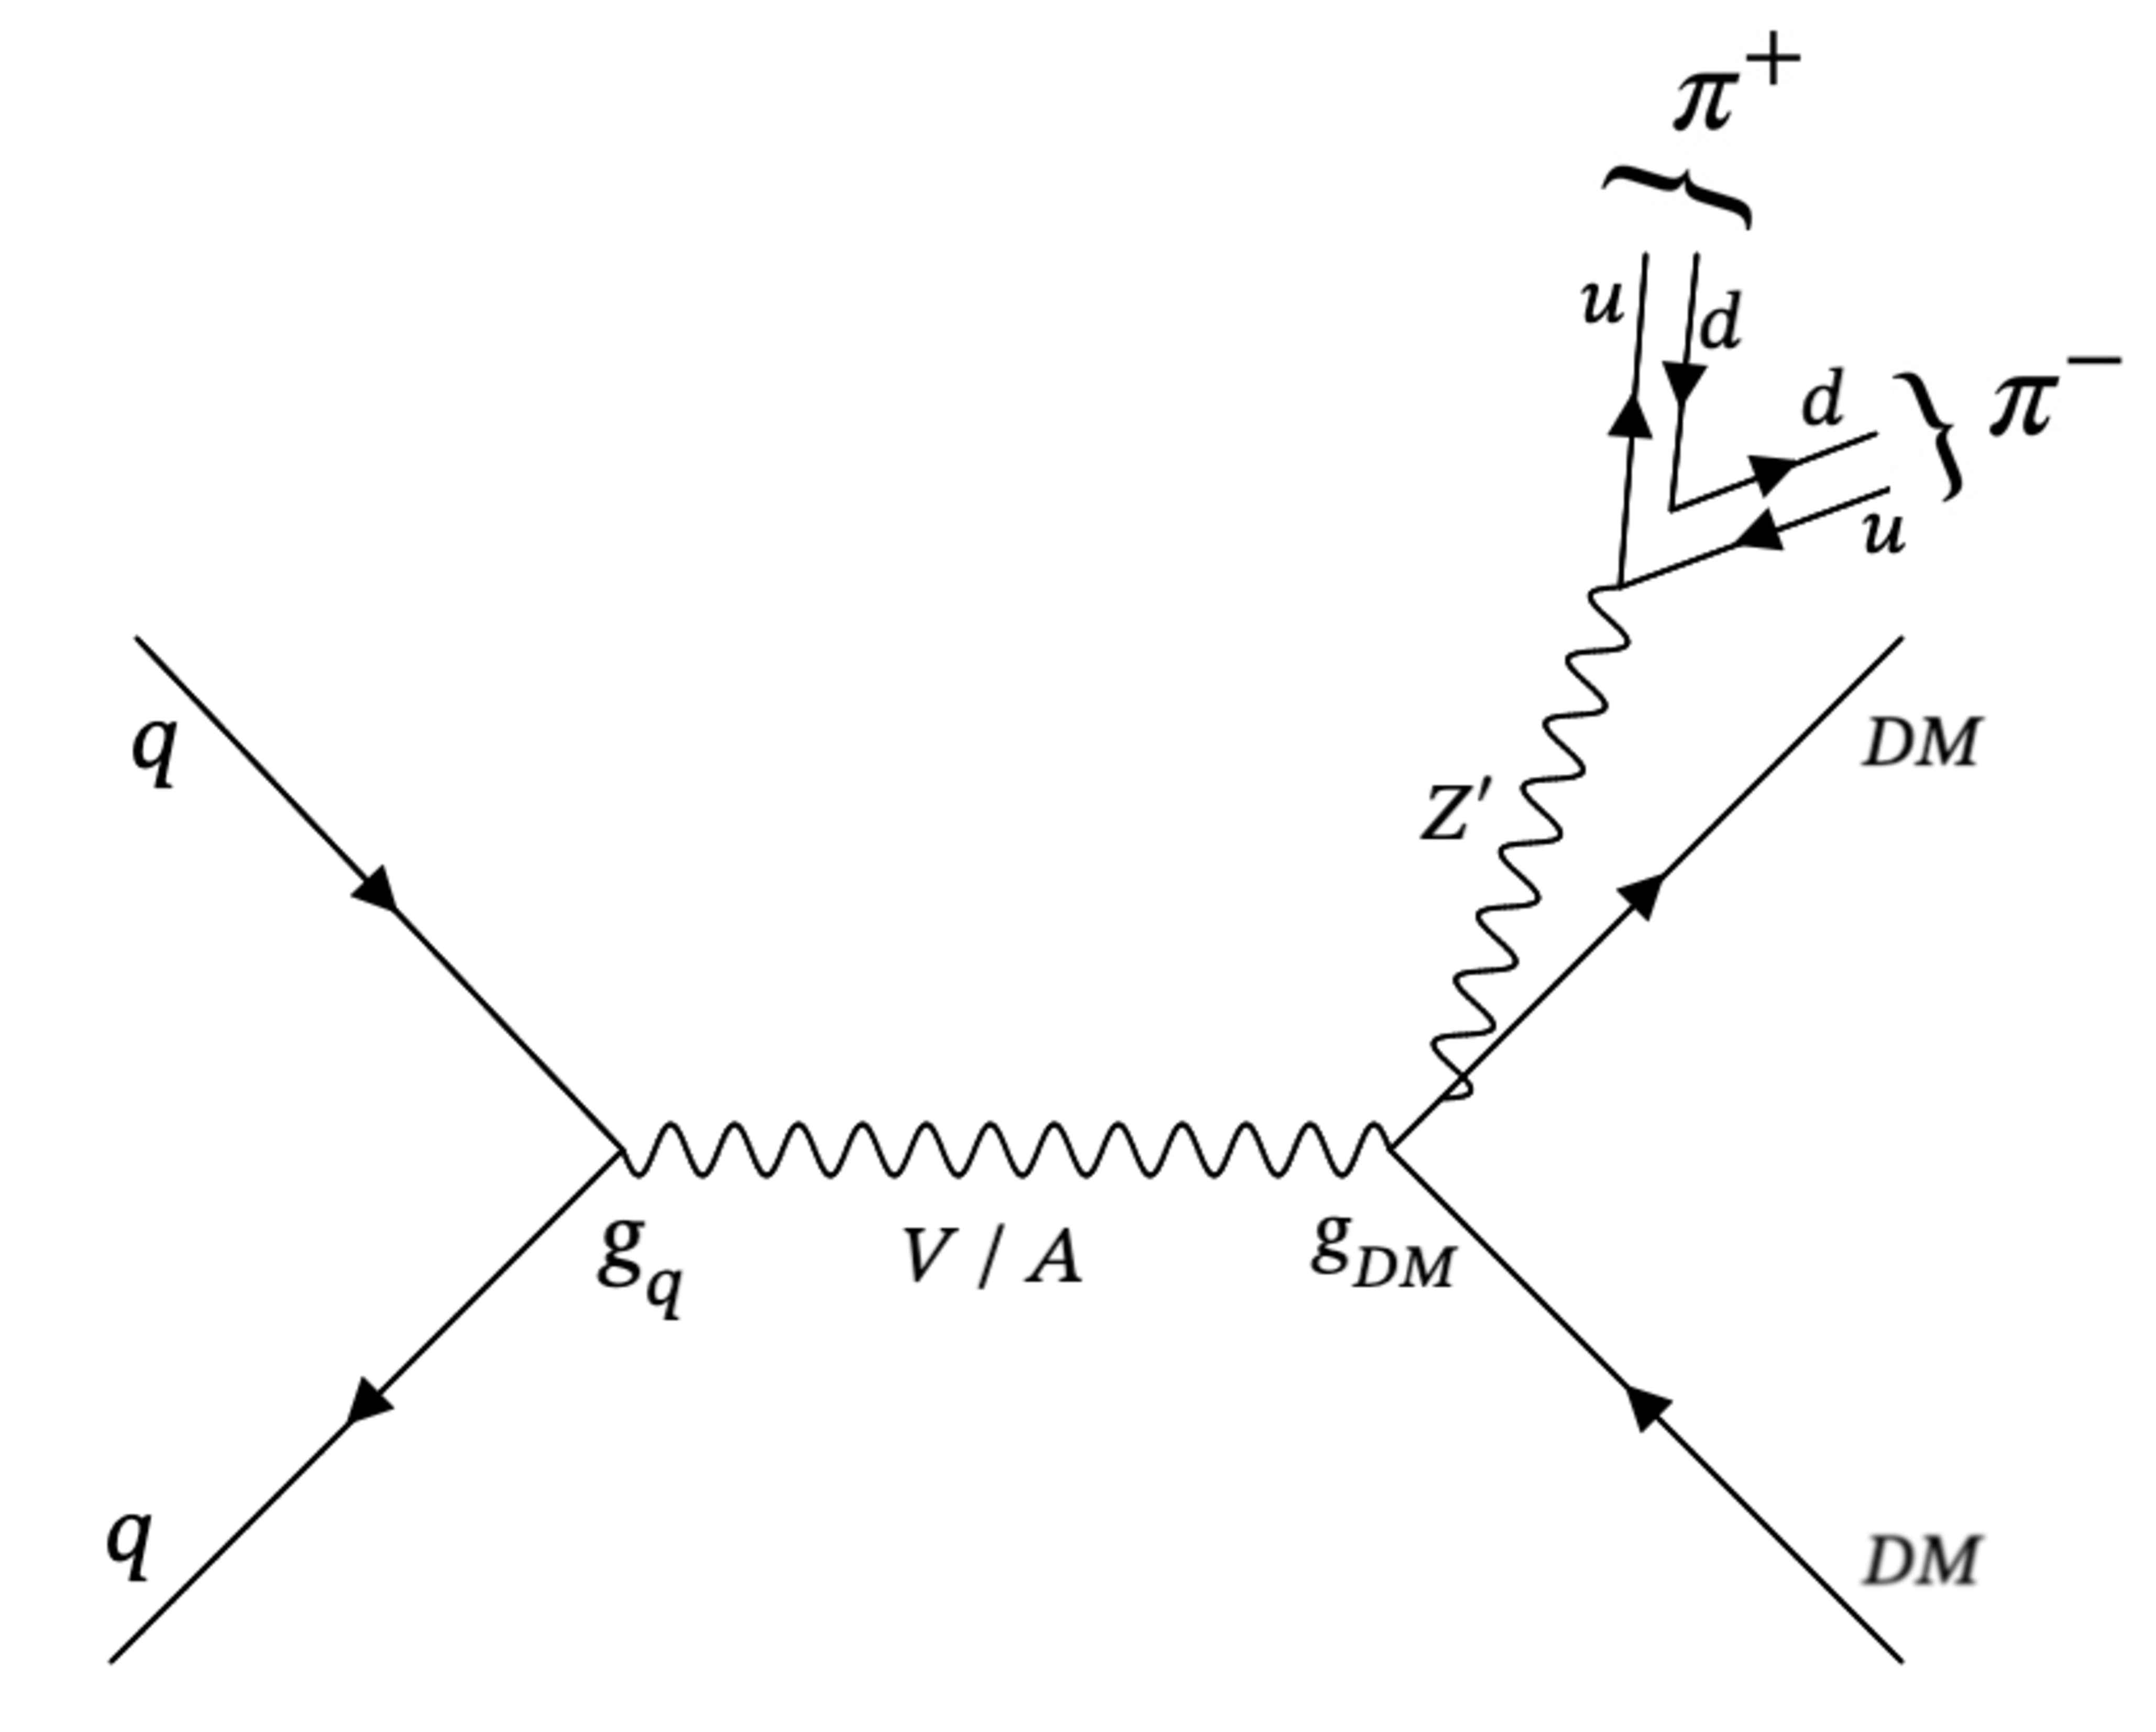
Figure 1:
Representative leading order Feynman diagram of the signal process, where DM is the dark matter candidate, V/A represents the vector or axial-vector mediator, $ g_{\mathrm{q}} $ and $ g_{\mathrm{DM}} $ represents the mediator coupling to the quarks and DM respectively. Due to the low mass of the $ \mathrm{Z}^{'} $ boson ($ {\approx} $ 1 GeV), it primarily decays to a low-multiplicity final state, typically two pions, and is expected to be reconstructed in the detector as a jet with very narrow cone of radiation, called the pencil-jet. |
png pdf |
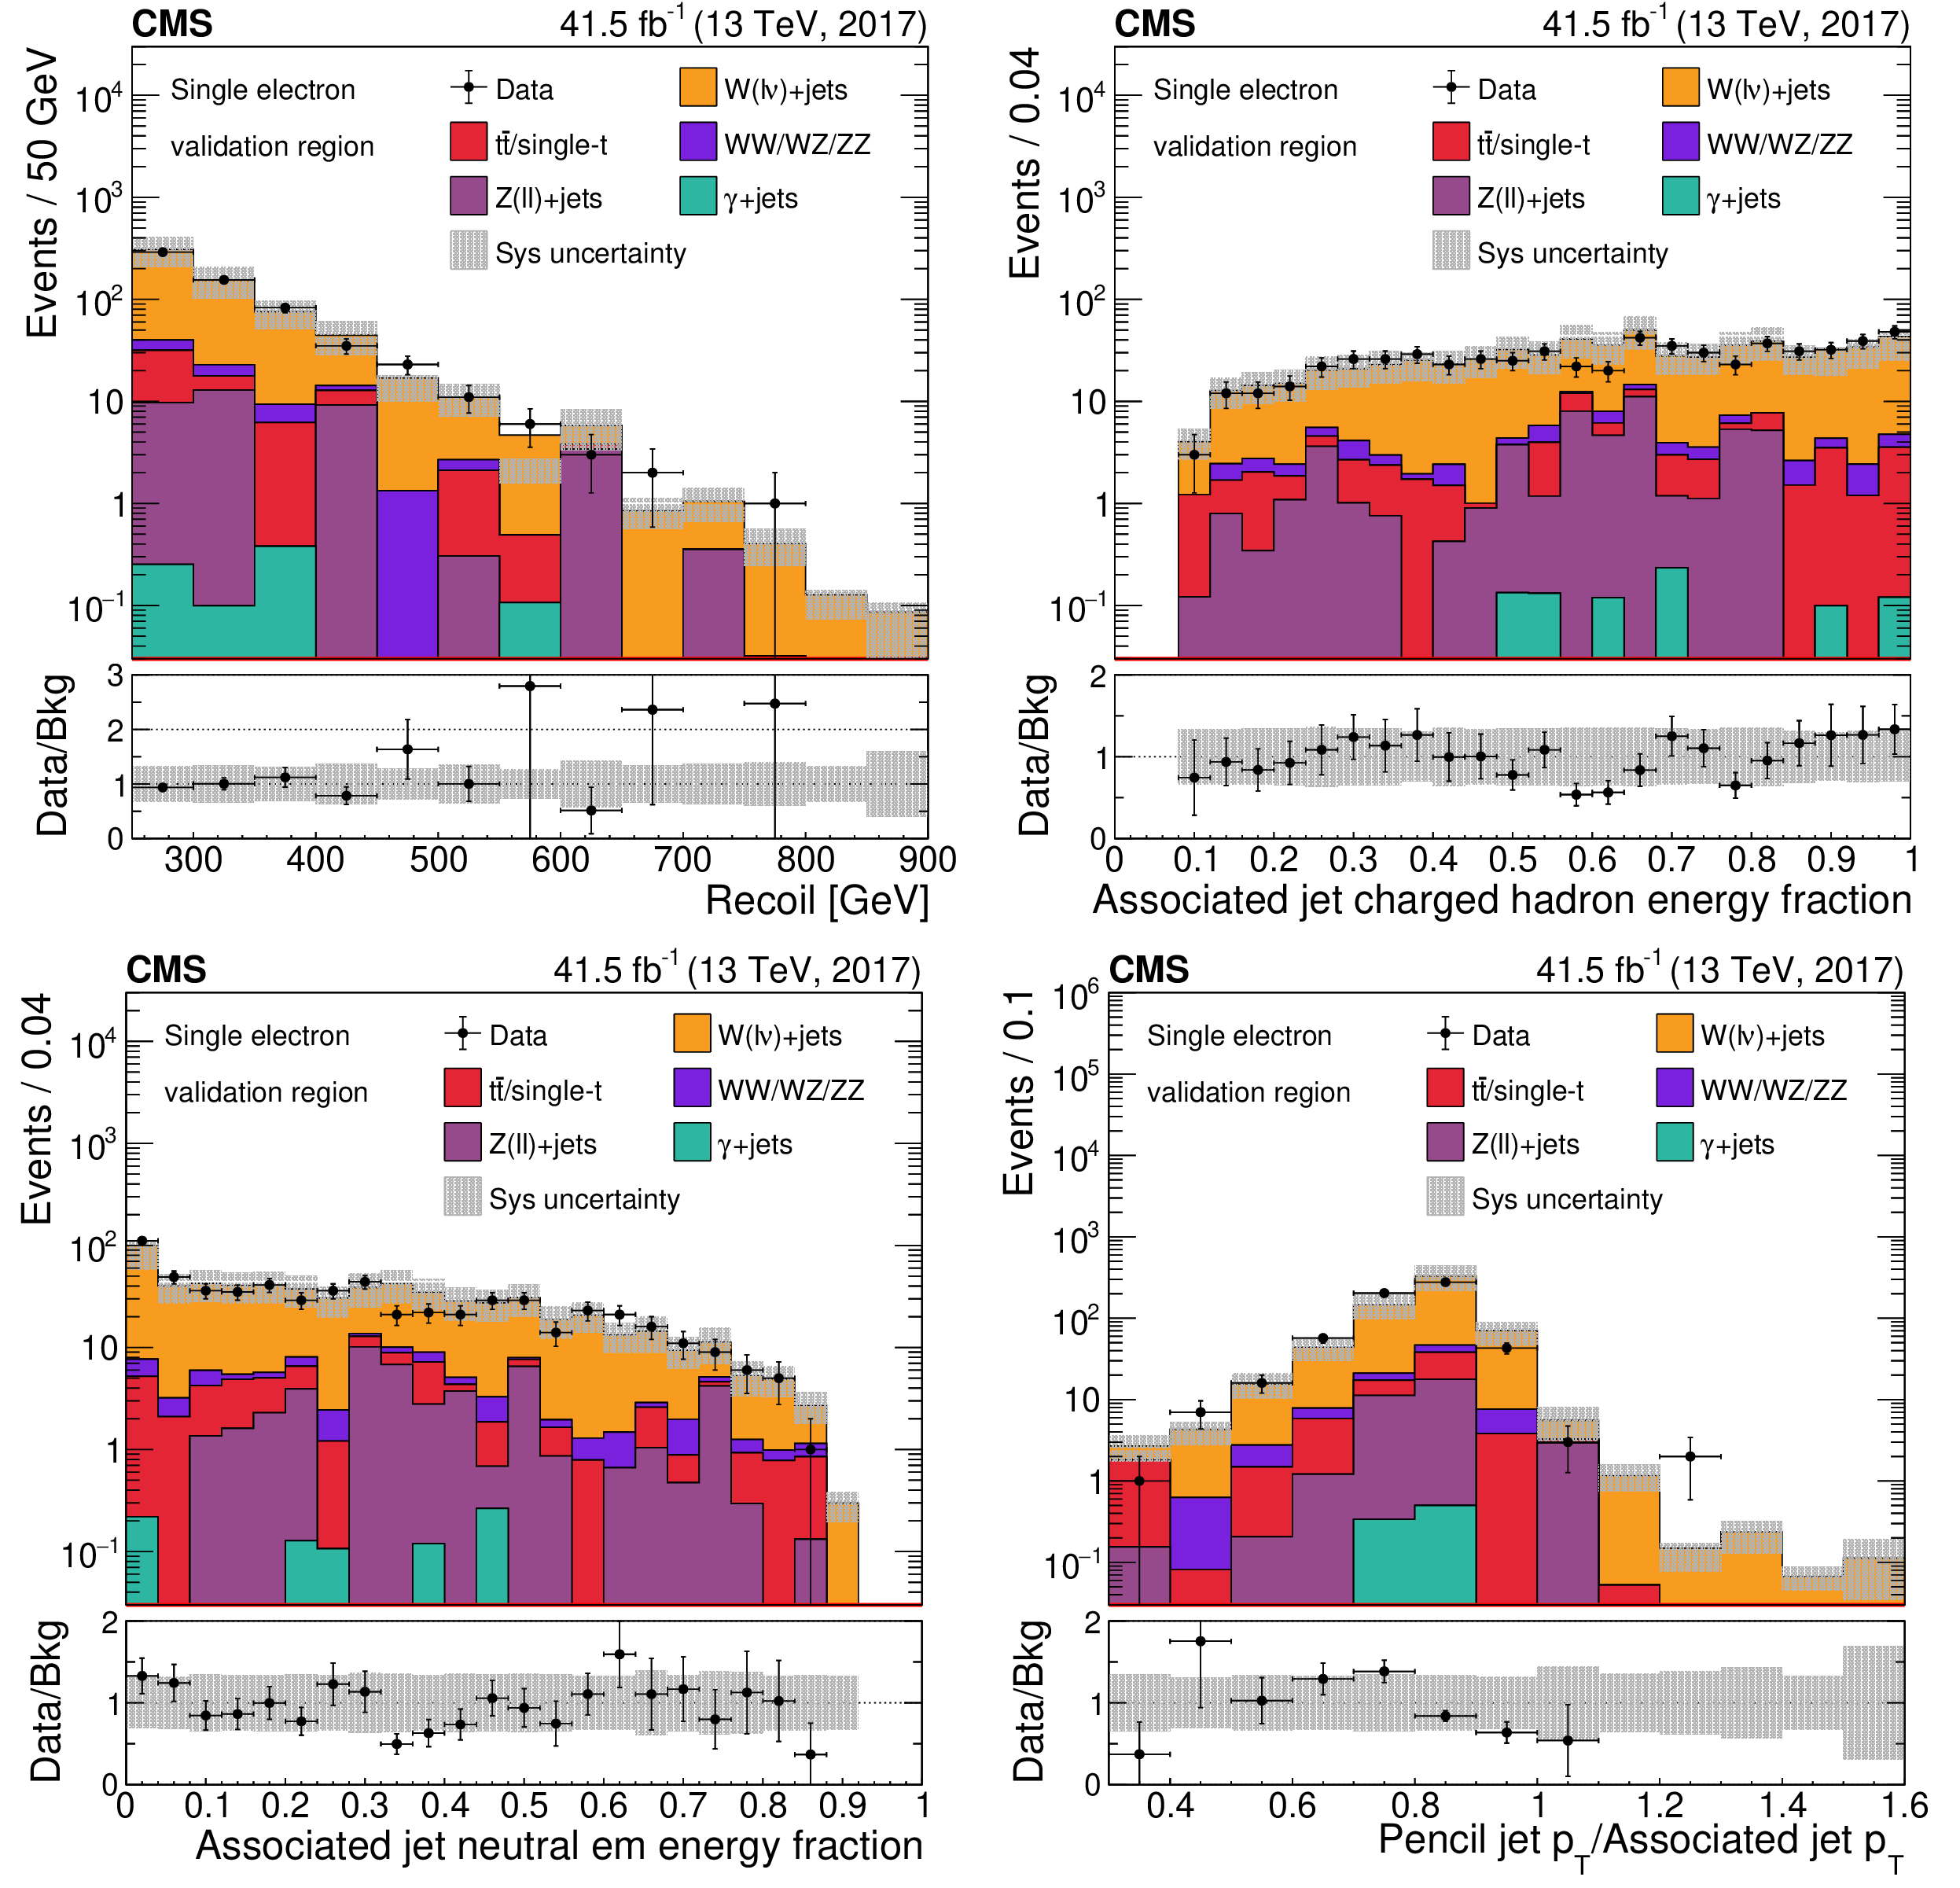
Figure 2:
Comparison between observed data and simulated backgrounds in the single electron validation region for the recoil (upper-left), the charged hadron energy fraction of the associated jet (upper-right), the neutral electromagnetic energy fraction of the associated jet (lower-left), and the ratio of pencil-jet $ p_{\mathrm{T}} $ to the associated jet $ p_{\mathrm{T}} $ (lower-right). This region is orthogonal to the signal region, resulting in a negligible expected signal contribution. Total systematic uncertainties are labeled as ``Sys uncertainity" in the legend box. The ratio of data to the pre-fit background prediction is shown in the bottom pads, with the grey band indicating the total systematic uncertainty. |
png pdf |
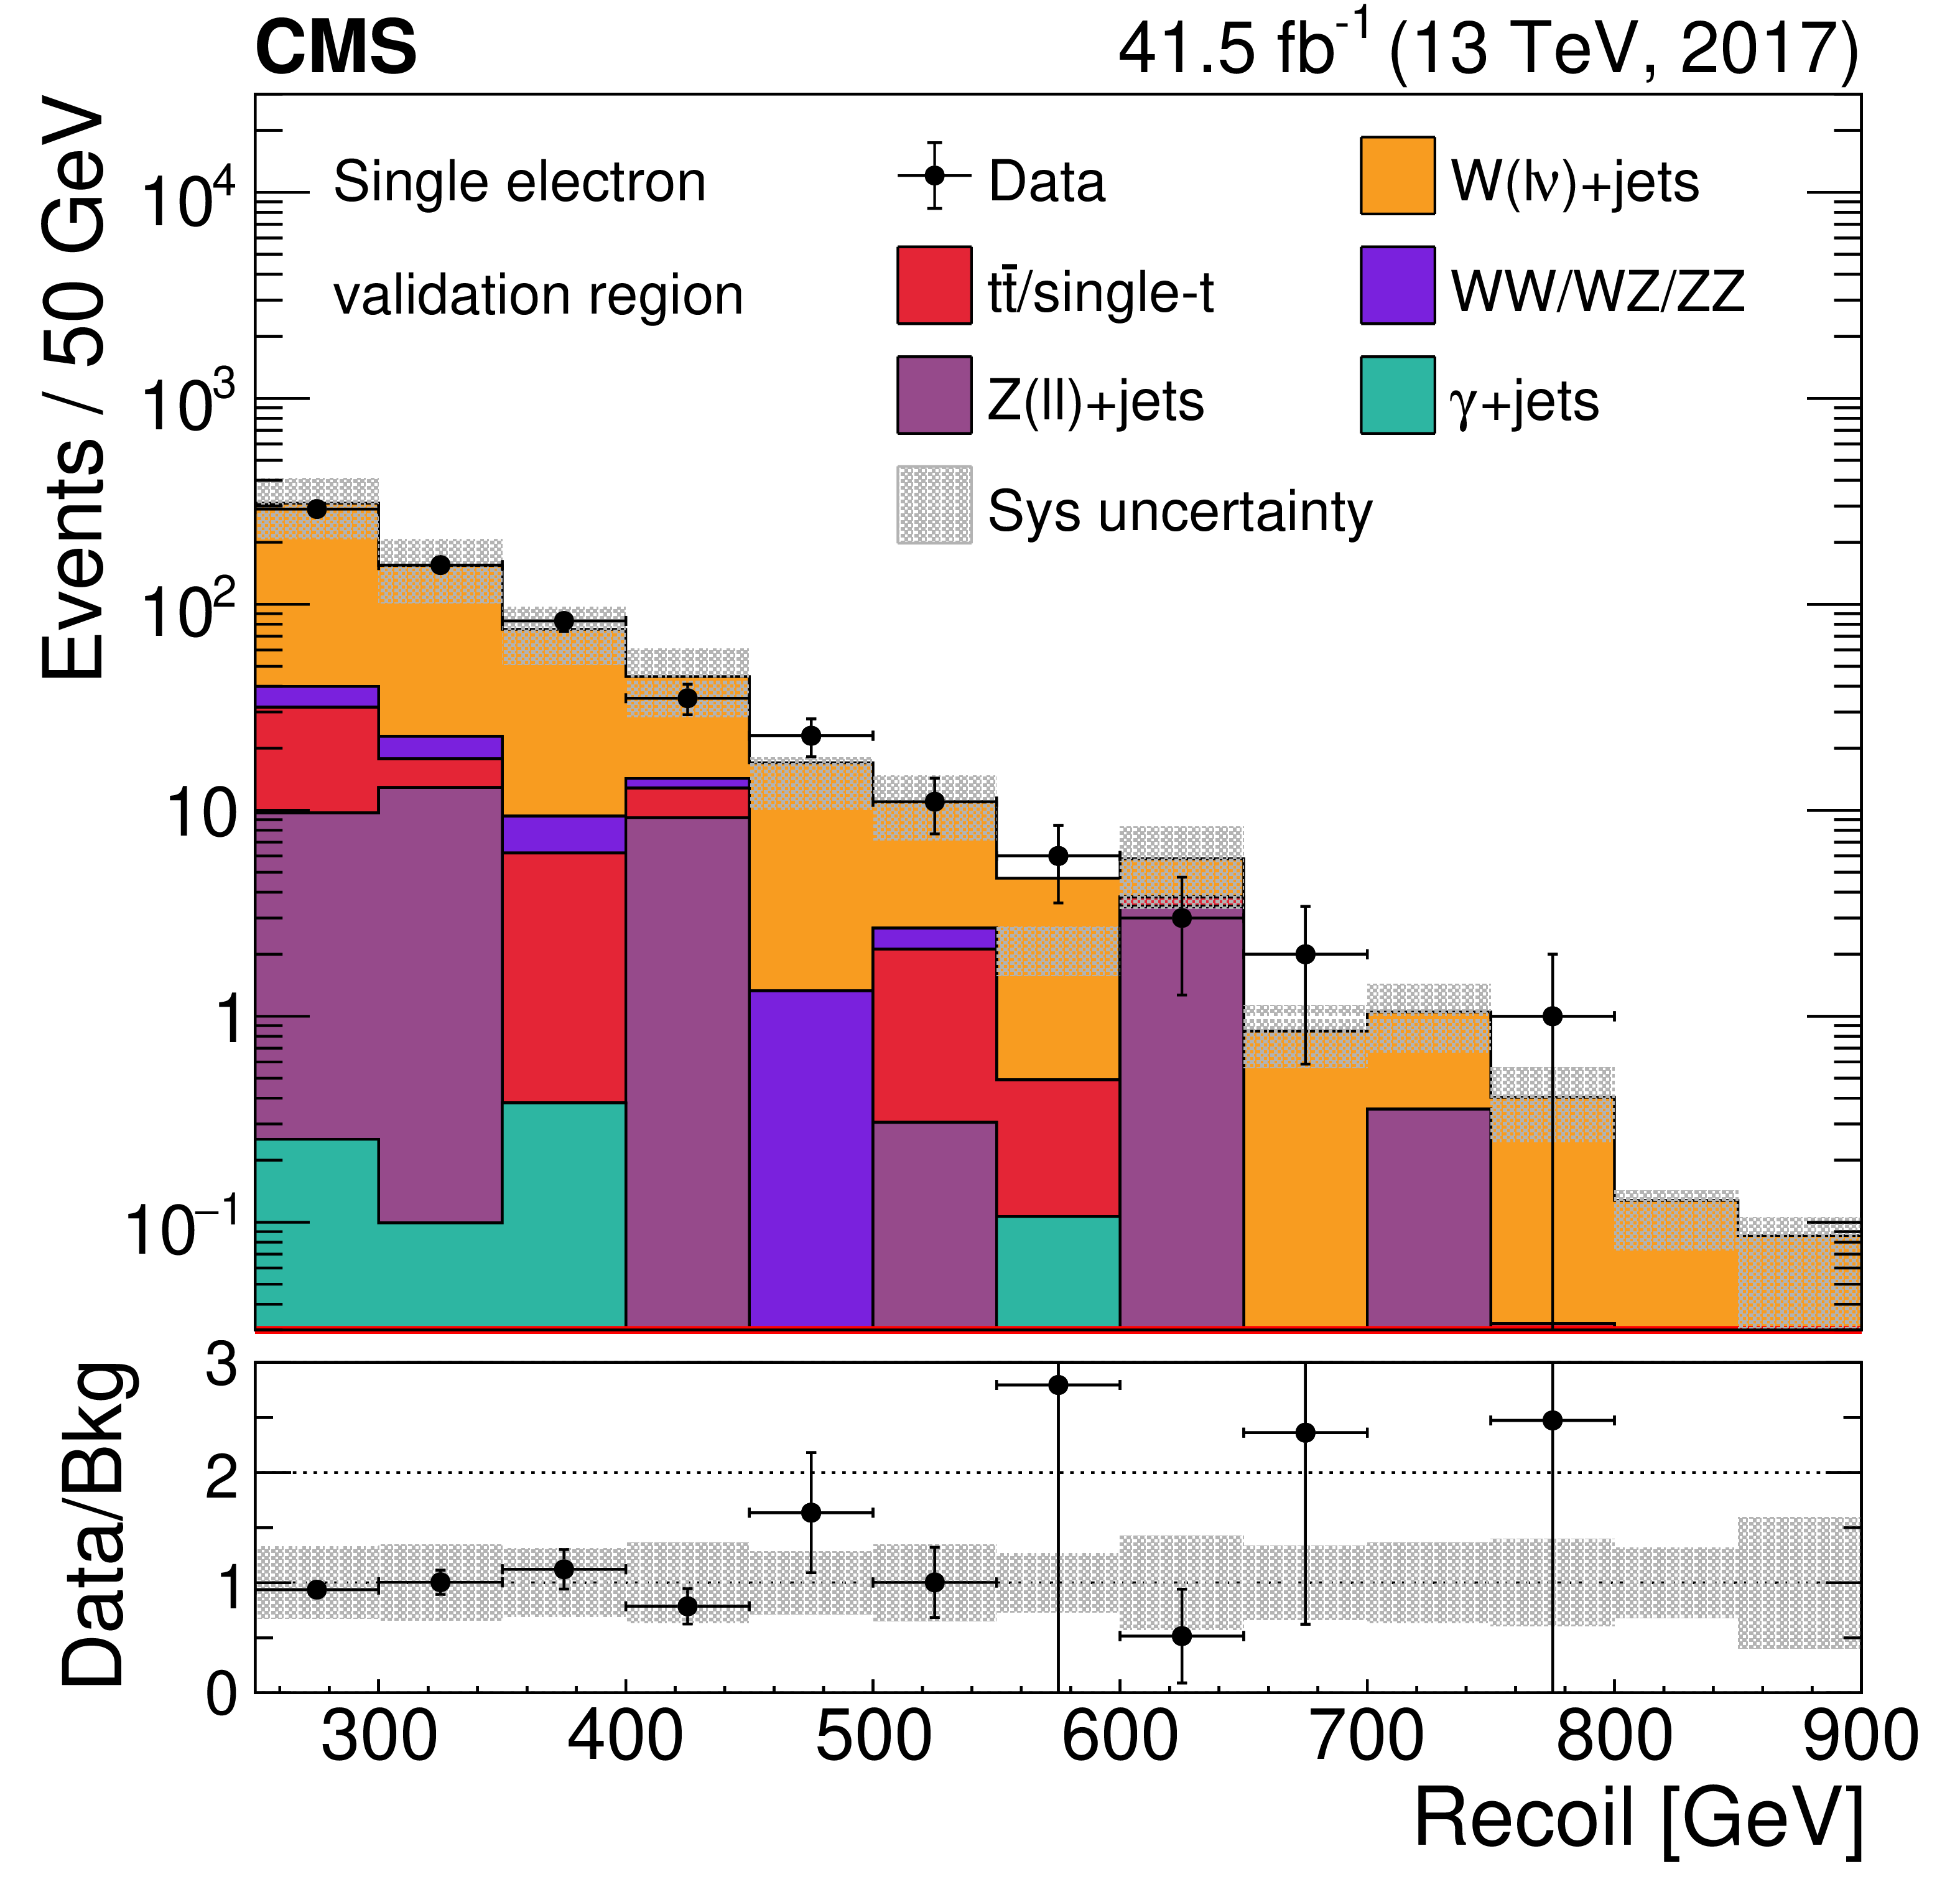
Figure 2-a:
Comparison between observed data and simulated backgrounds in the single electron validation region for the recoil (upper-left), the charged hadron energy fraction of the associated jet (upper-right), the neutral electromagnetic energy fraction of the associated jet (lower-left), and the ratio of pencil-jet $ p_{\mathrm{T}} $ to the associated jet $ p_{\mathrm{T}} $ (lower-right). This region is orthogonal to the signal region, resulting in a negligible expected signal contribution. Total systematic uncertainties are labeled as ``Sys uncertainity" in the legend box. The ratio of data to the pre-fit background prediction is shown in the bottom pads, with the grey band indicating the total systematic uncertainty. |
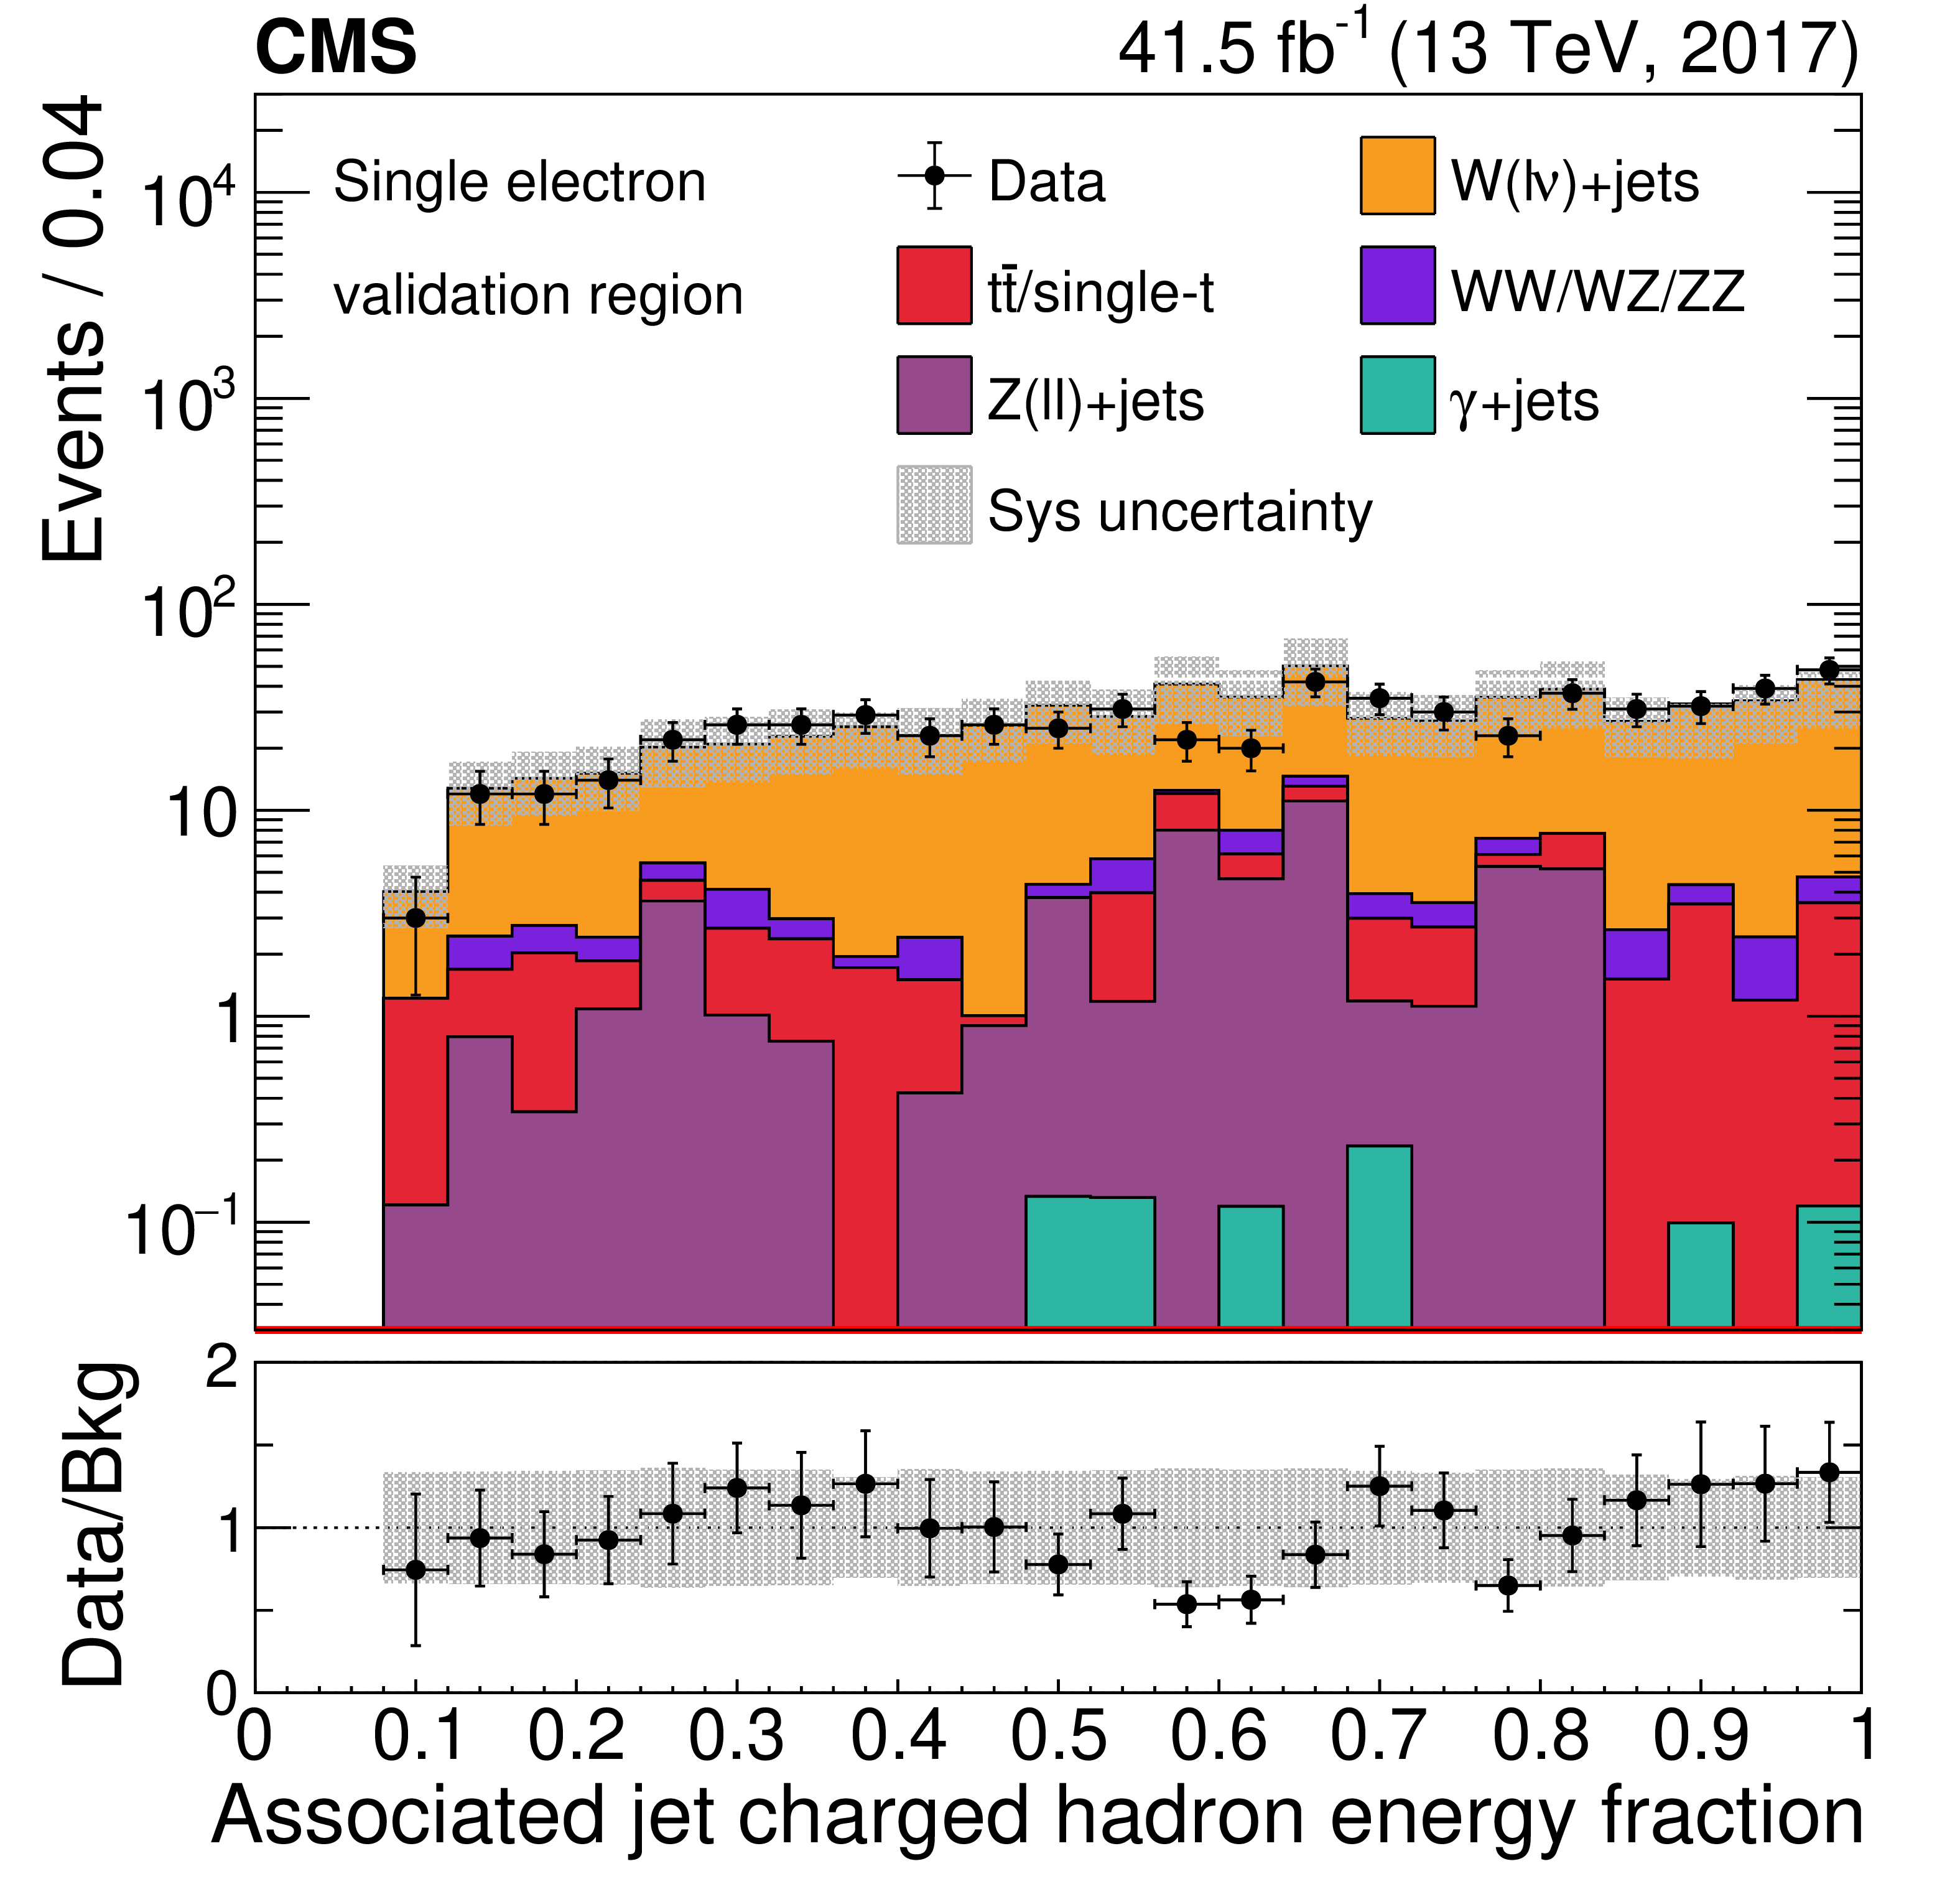
png pdf |
Figure 2-b:
Comparison between observed data and simulated backgrounds in the single electron validation region for the recoil (upper-left), the charged hadron energy fraction of the associated jet (upper-right), the neutral electromagnetic energy fraction of the associated jet (lower-left), and the ratio of pencil-jet $ p_{\mathrm{T}} $ to the associated jet $ p_{\mathrm{T}} $ (lower-right). This region is orthogonal to the signal region, resulting in a negligible expected signal contribution. Total systematic uncertainties are labeled as ``Sys uncertainity" in the legend box. The ratio of data to the pre-fit background prediction is shown in the bottom pads, with the grey band indicating the total systematic uncertainty. |
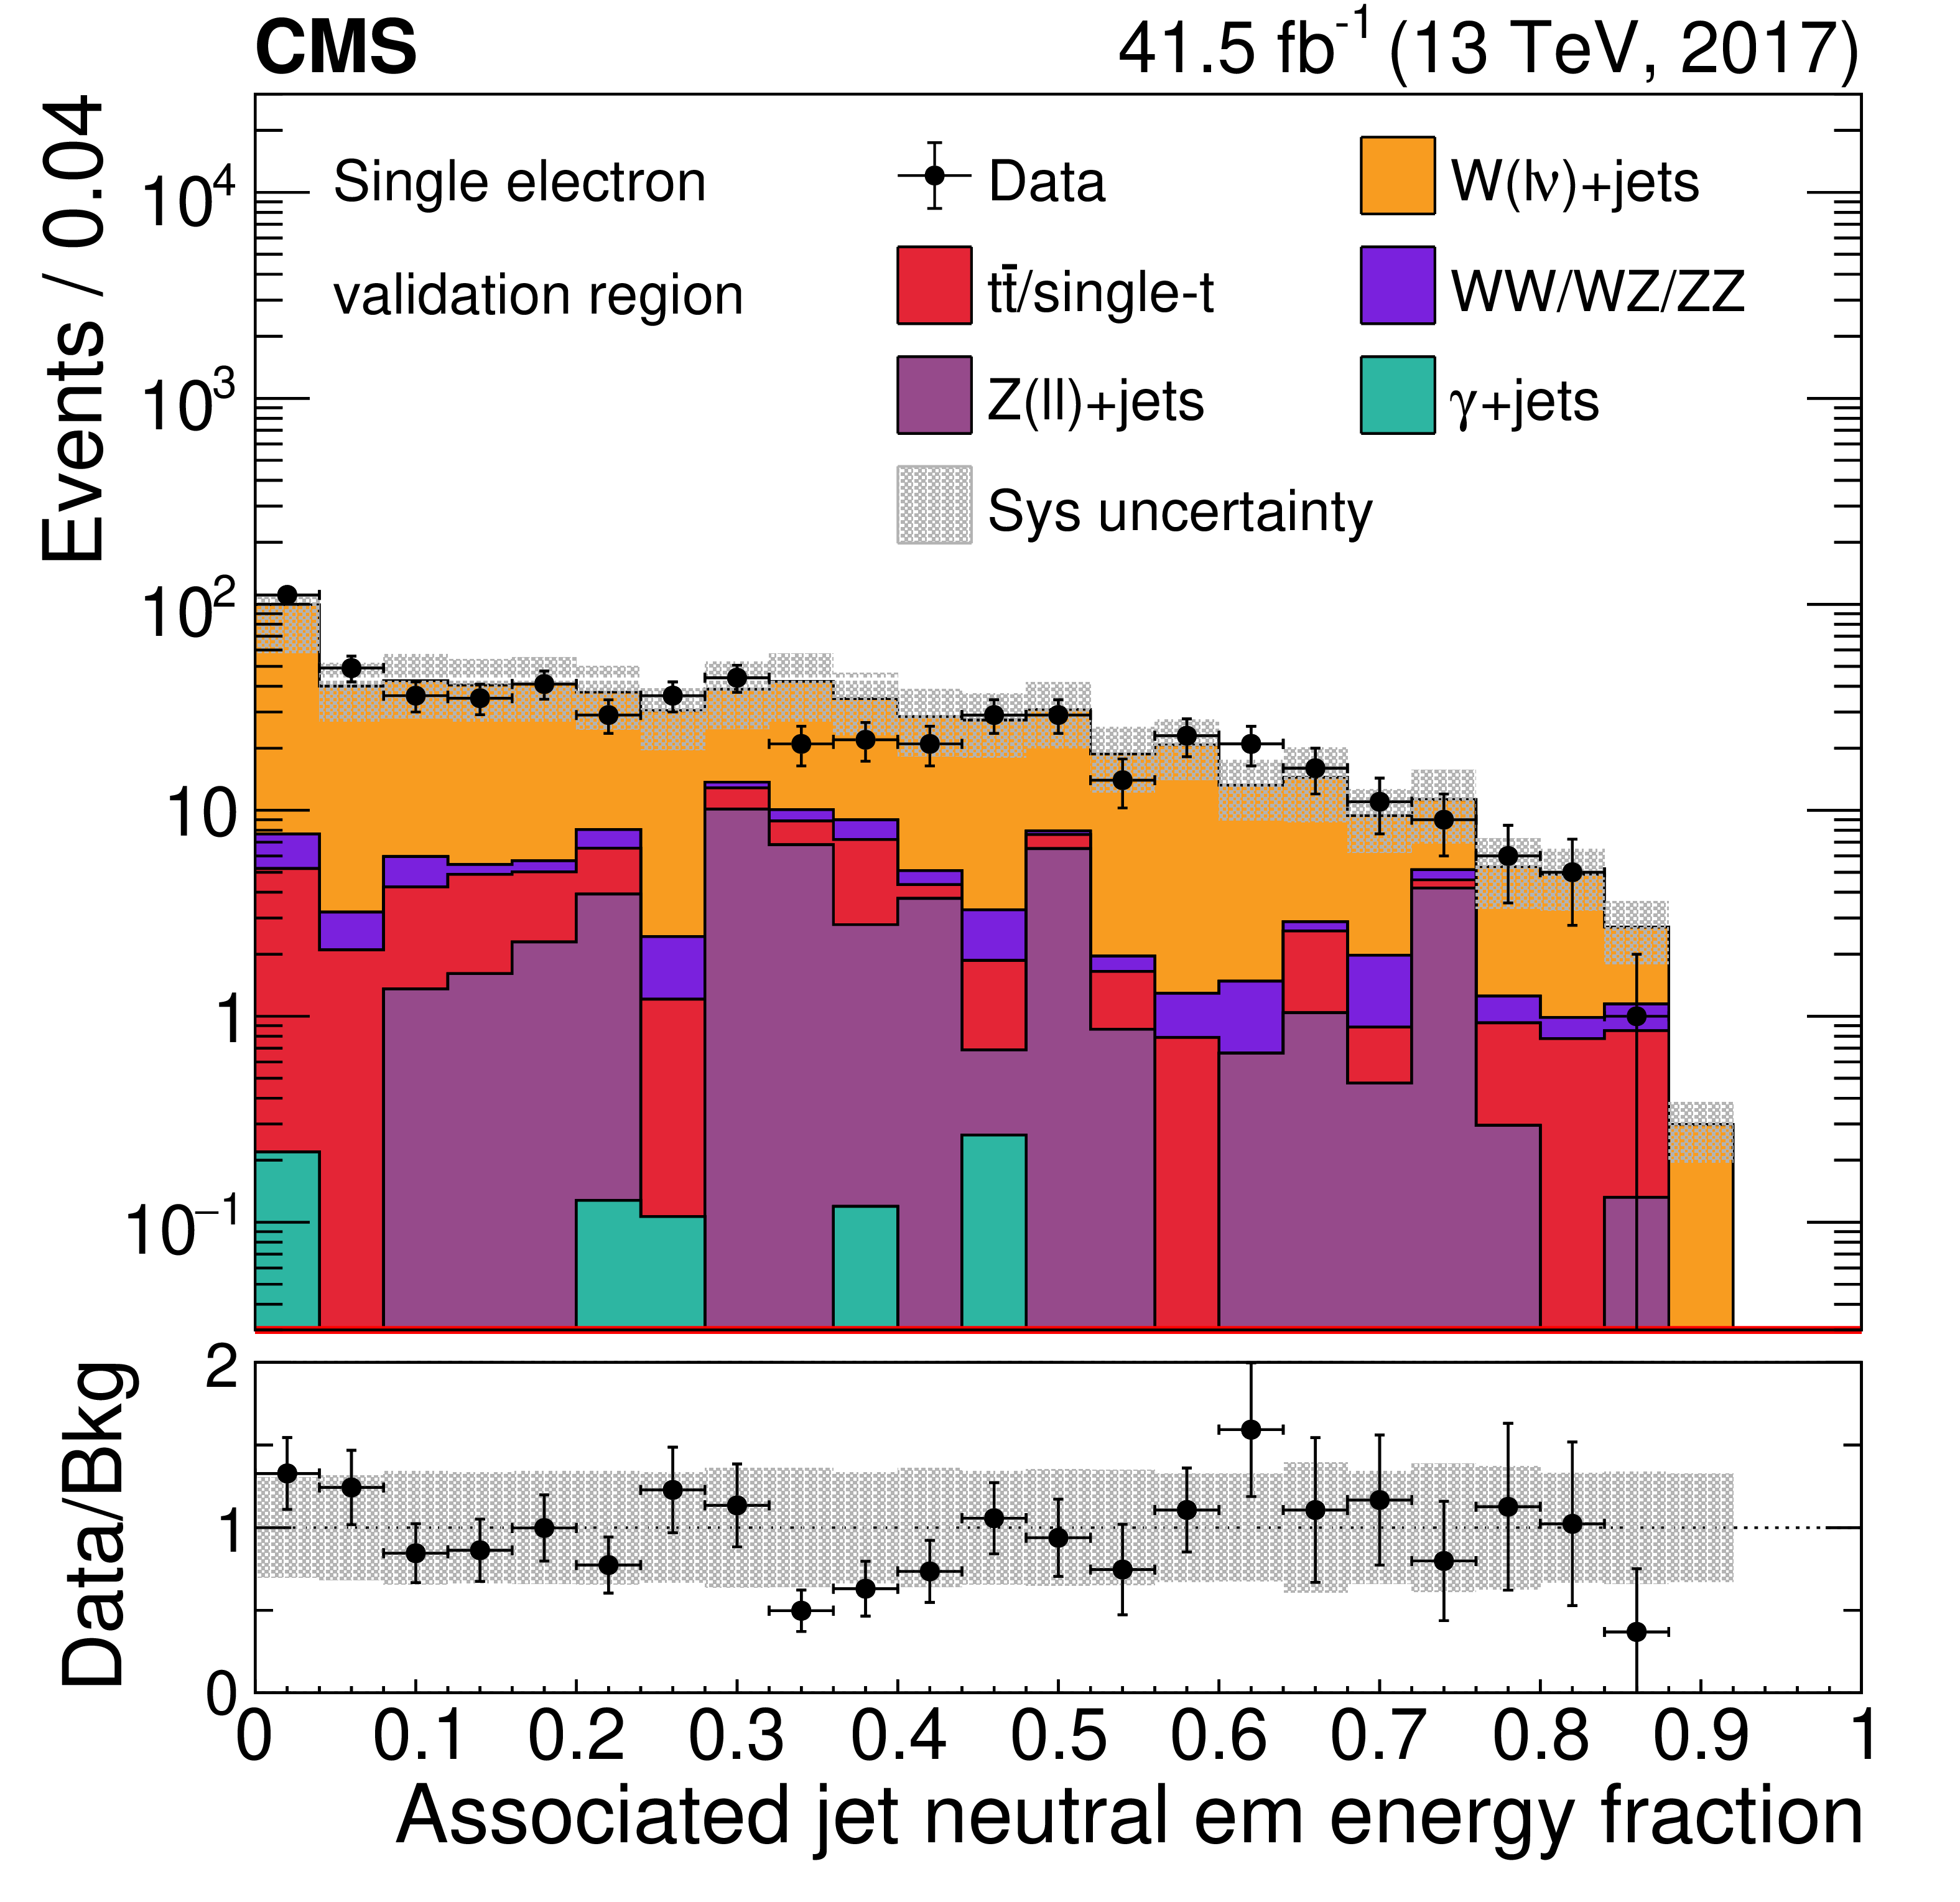
png pdf |
Figure 2-c:
Comparison between observed data and simulated backgrounds in the single electron validation region for the recoil (upper-left), the charged hadron energy fraction of the associated jet (upper-right), the neutral electromagnetic energy fraction of the associated jet (lower-left), and the ratio of pencil-jet $ p_{\mathrm{T}} $ to the associated jet $ p_{\mathrm{T}} $ (lower-right). This region is orthogonal to the signal region, resulting in a negligible expected signal contribution. Total systematic uncertainties are labeled as ``Sys uncertainity" in the legend box. The ratio of data to the pre-fit background prediction is shown in the bottom pads, with the grey band indicating the total systematic uncertainty. |
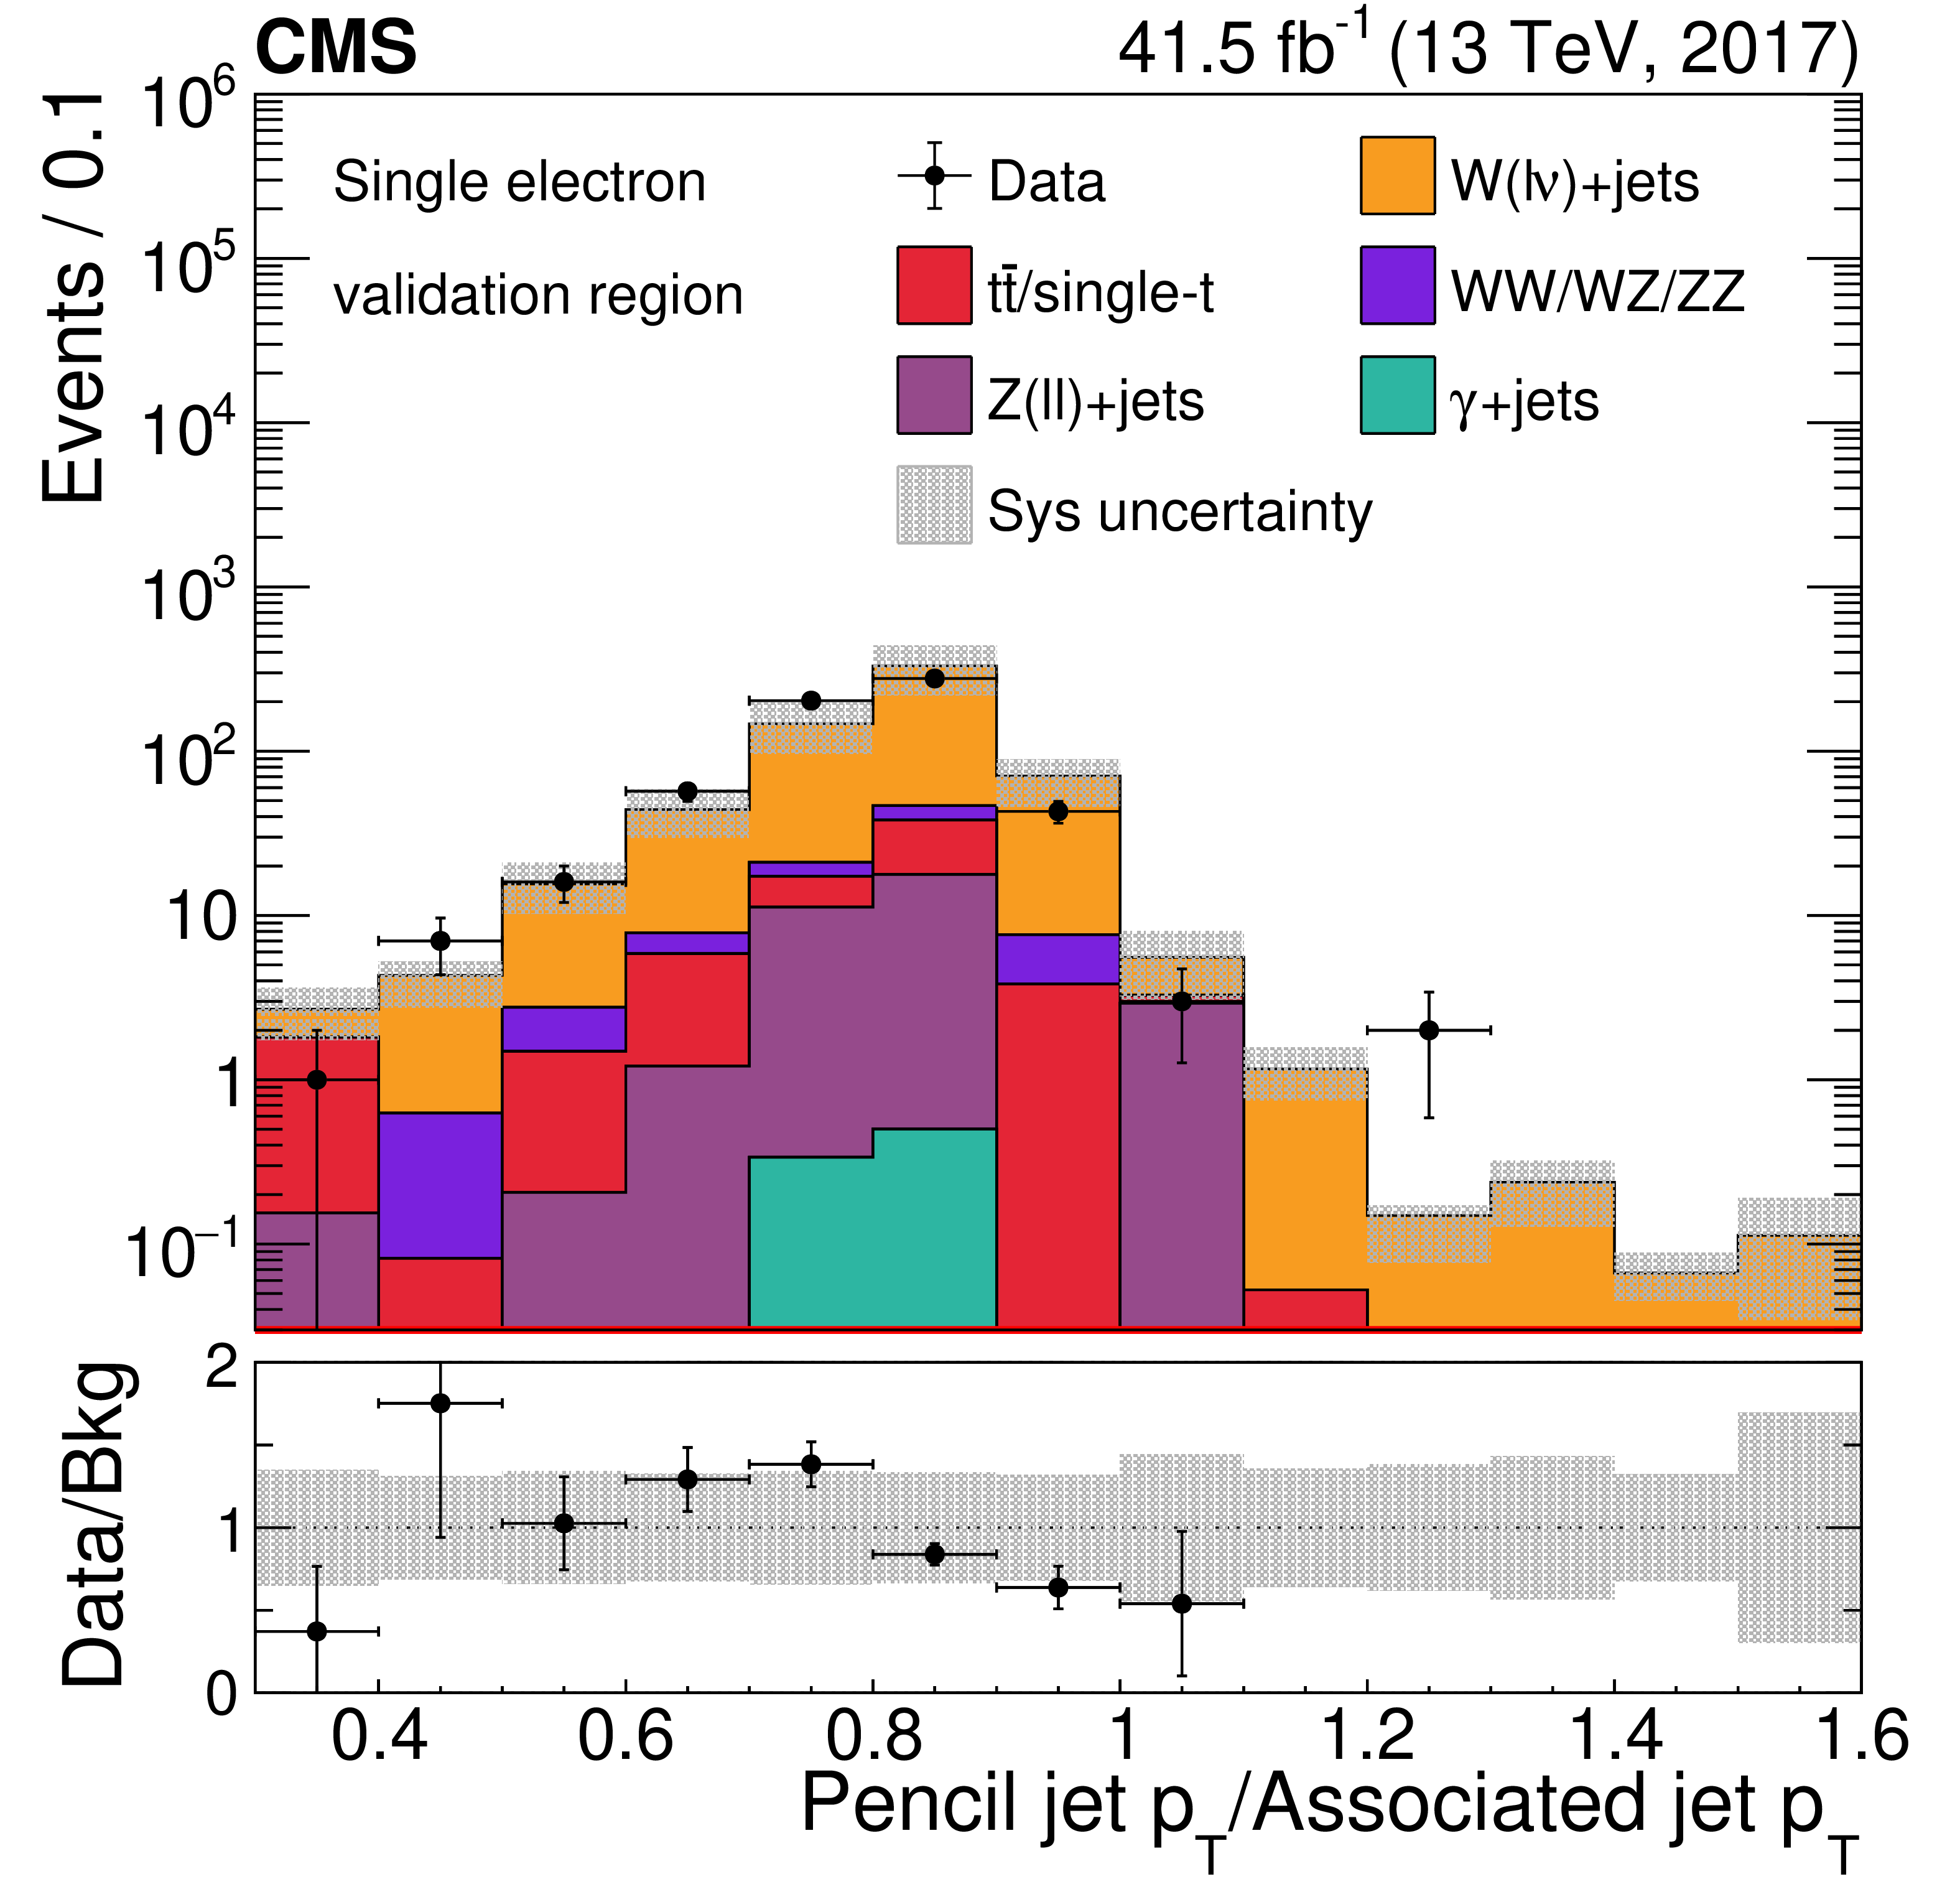
png pdf |
Figure 2-d:
Comparison between observed data and simulated backgrounds in the single electron validation region for the recoil (upper-left), the charged hadron energy fraction of the associated jet (upper-right), the neutral electromagnetic energy fraction of the associated jet (lower-left), and the ratio of pencil-jet $ p_{\mathrm{T}} $ to the associated jet $ p_{\mathrm{T}} $ (lower-right). This region is orthogonal to the signal region, resulting in a negligible expected signal contribution. Total systematic uncertainties are labeled as ``Sys uncertainity" in the legend box. The ratio of data to the pre-fit background prediction is shown in the bottom pads, with the grey band indicating the total systematic uncertainty. |
png pdf |
Figure 3:
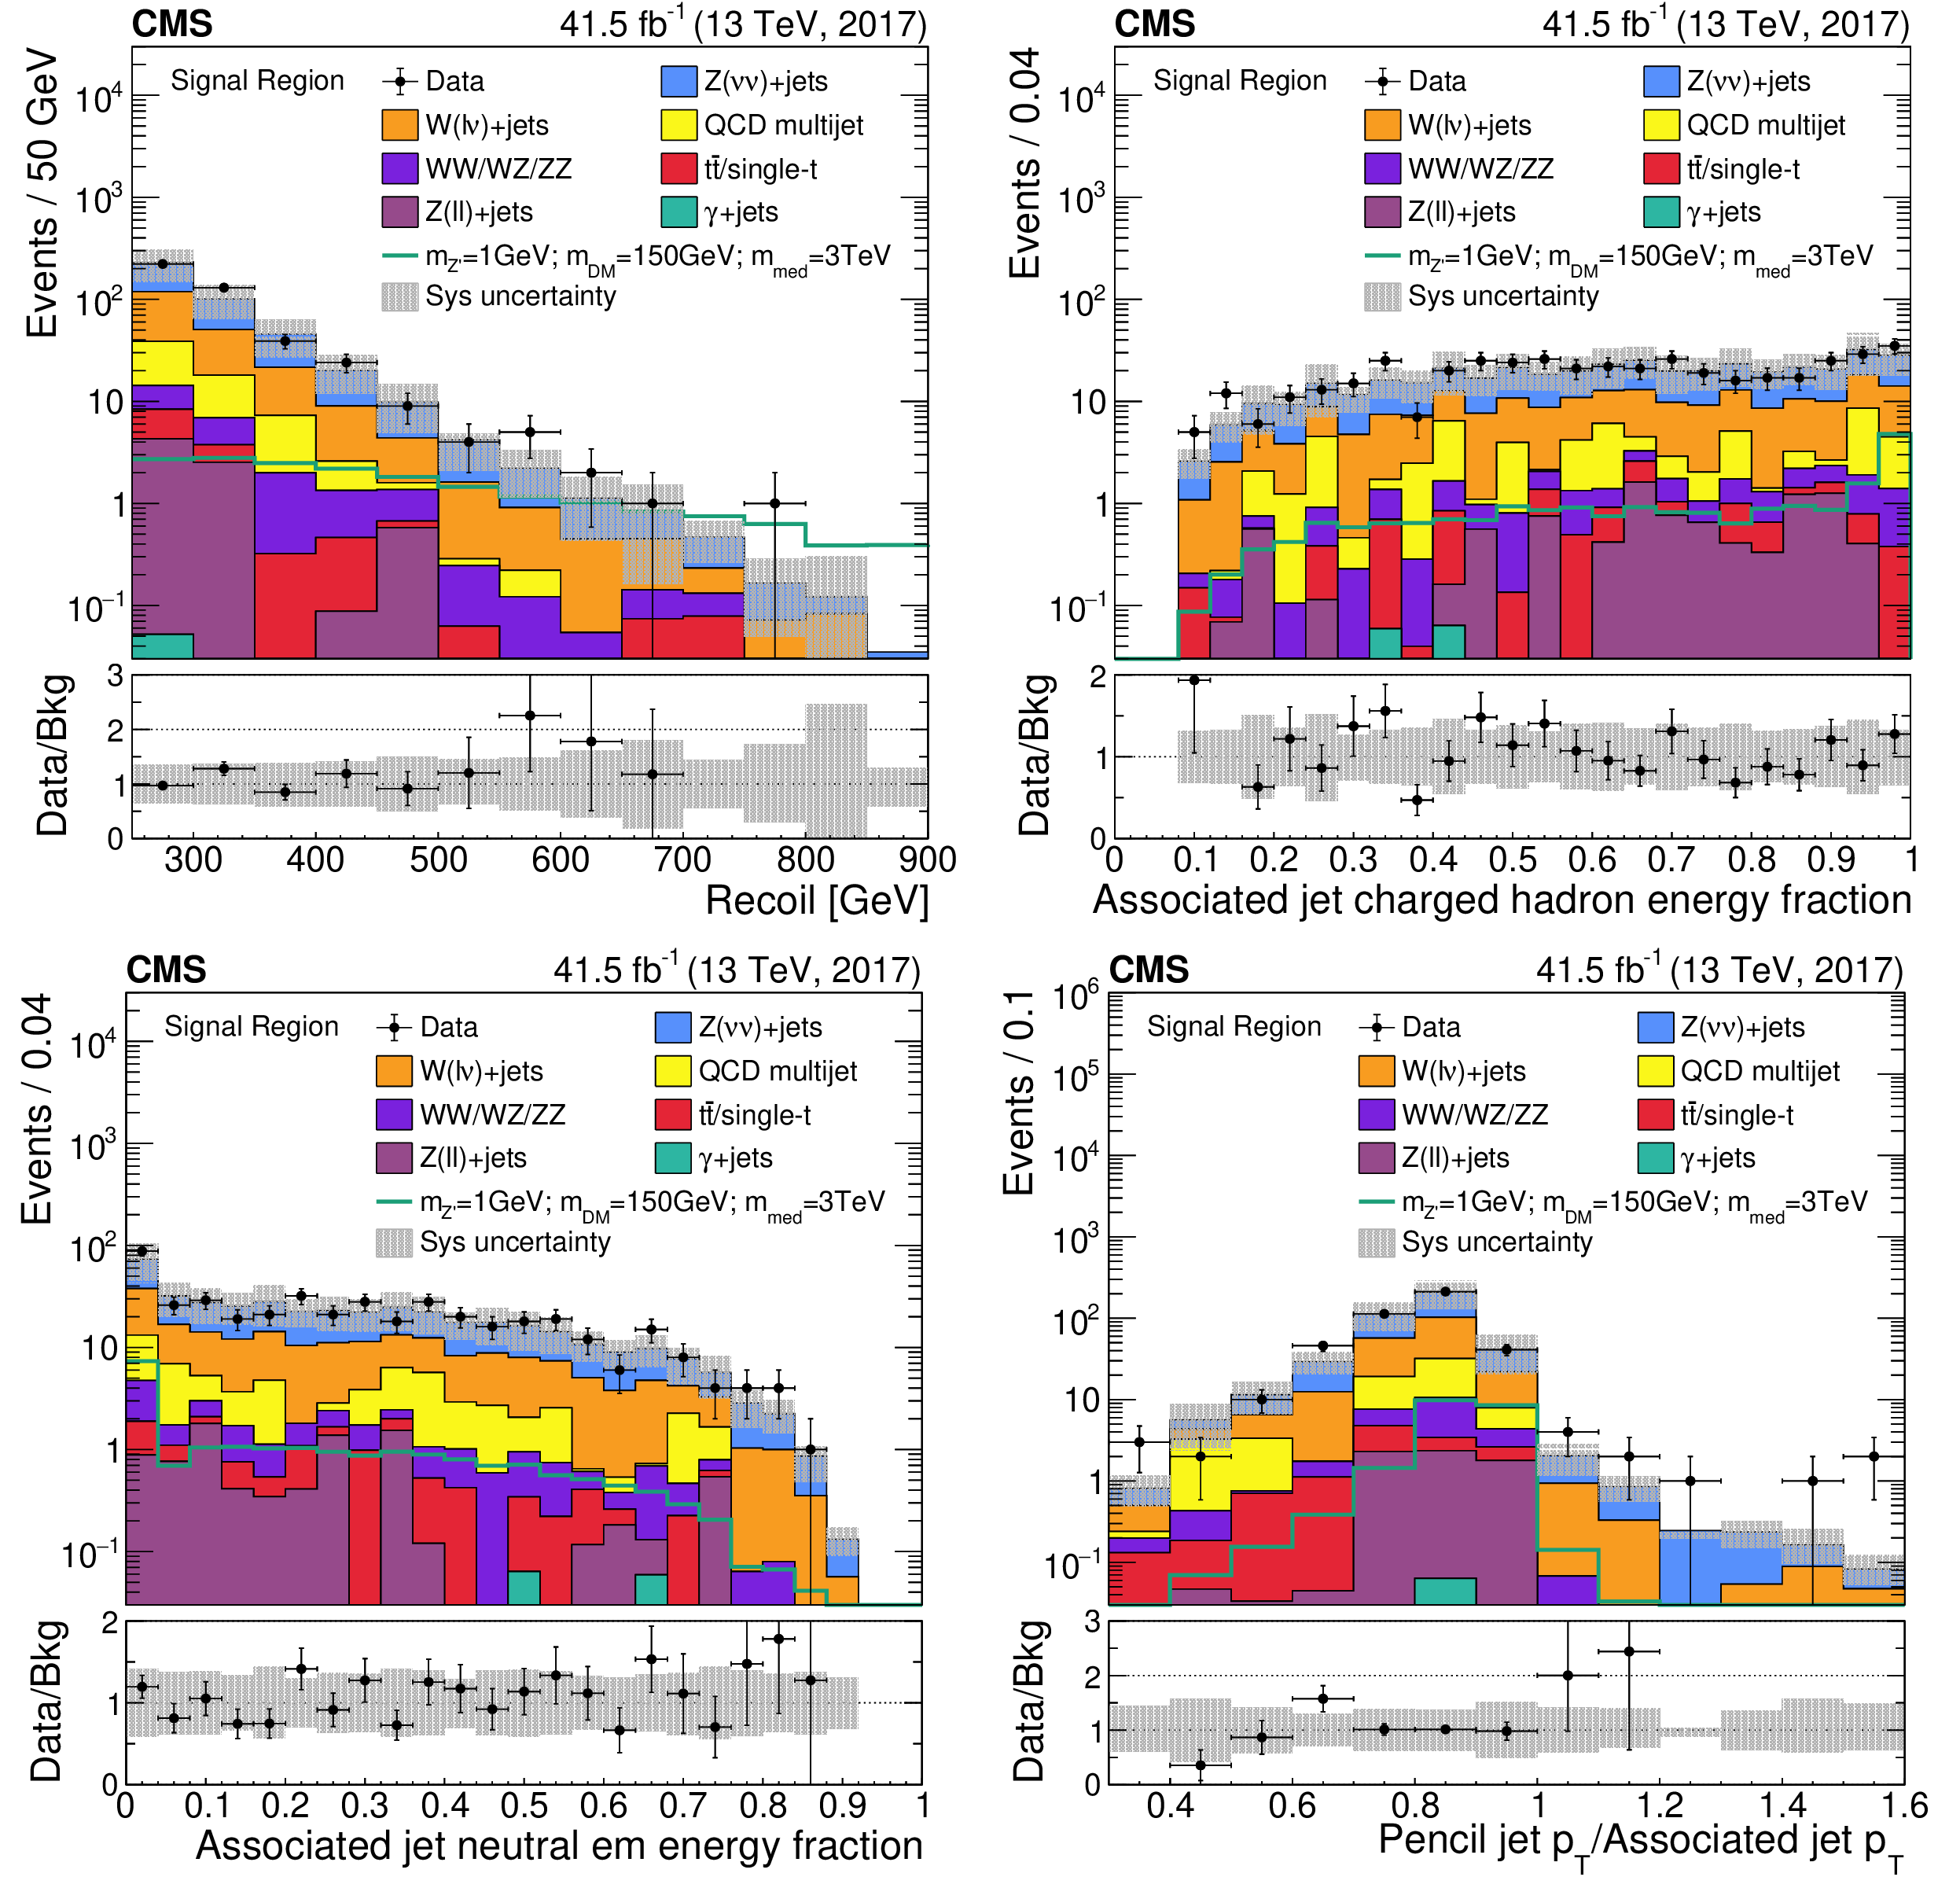
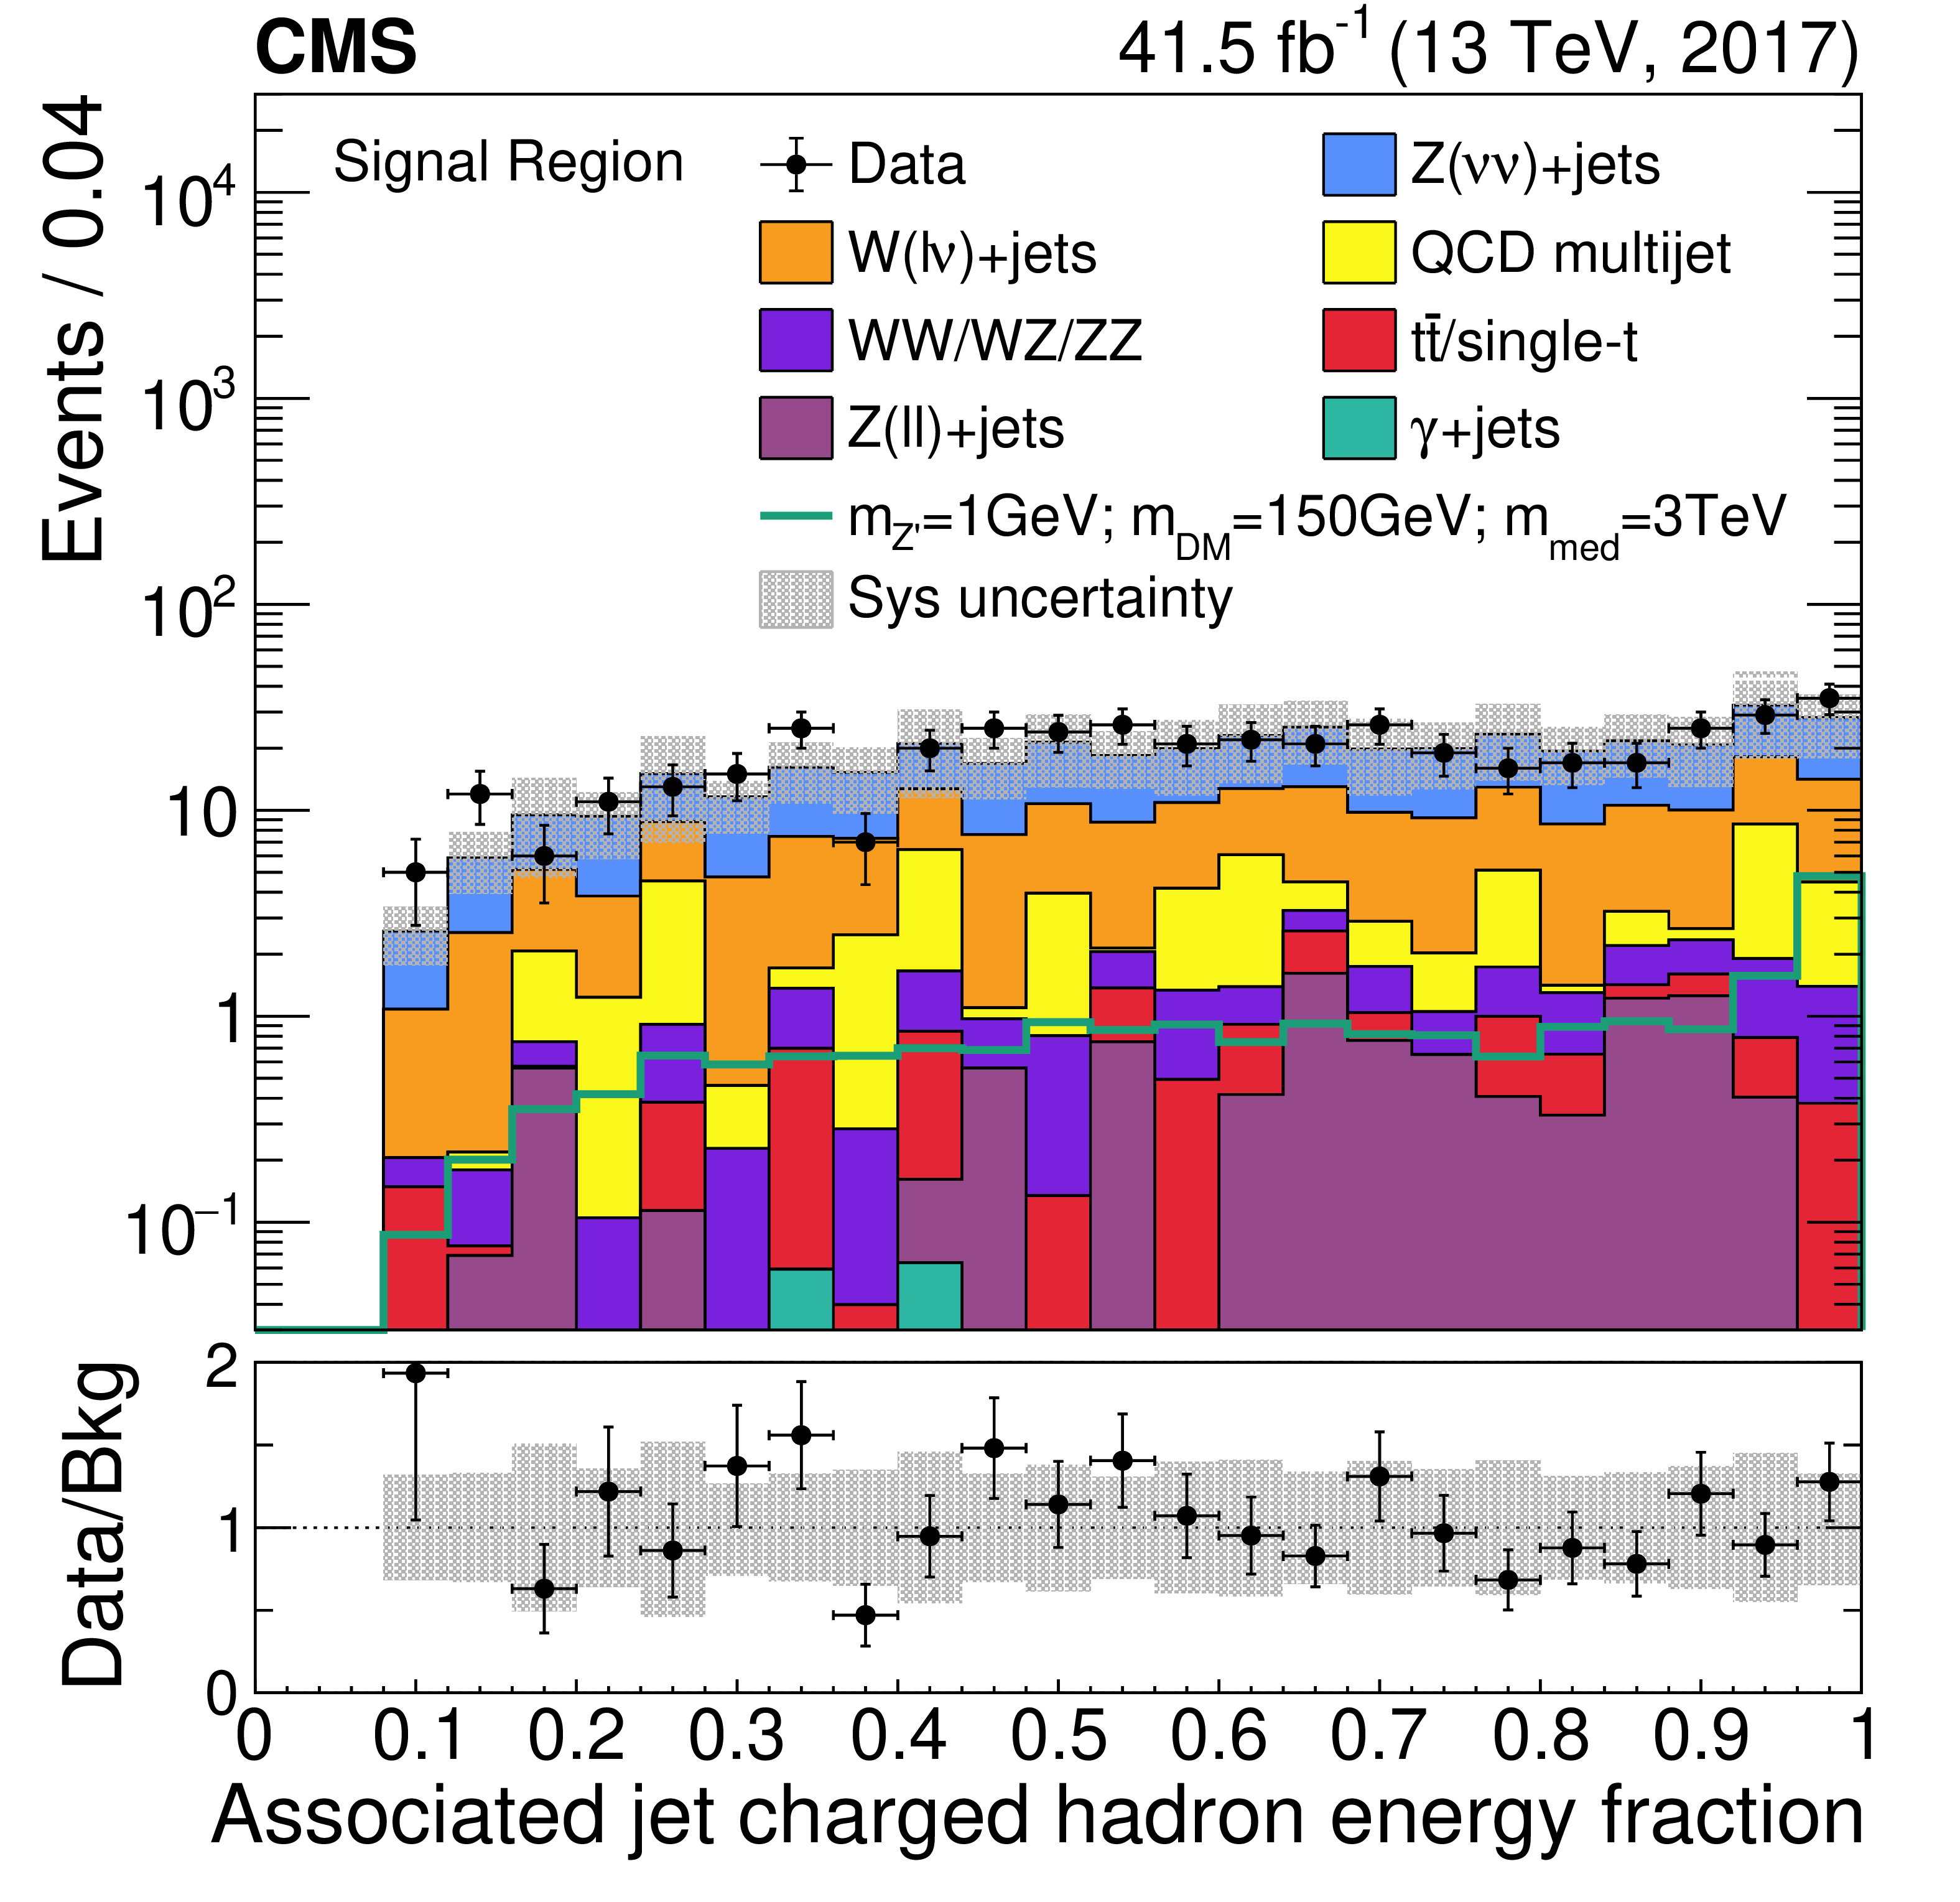
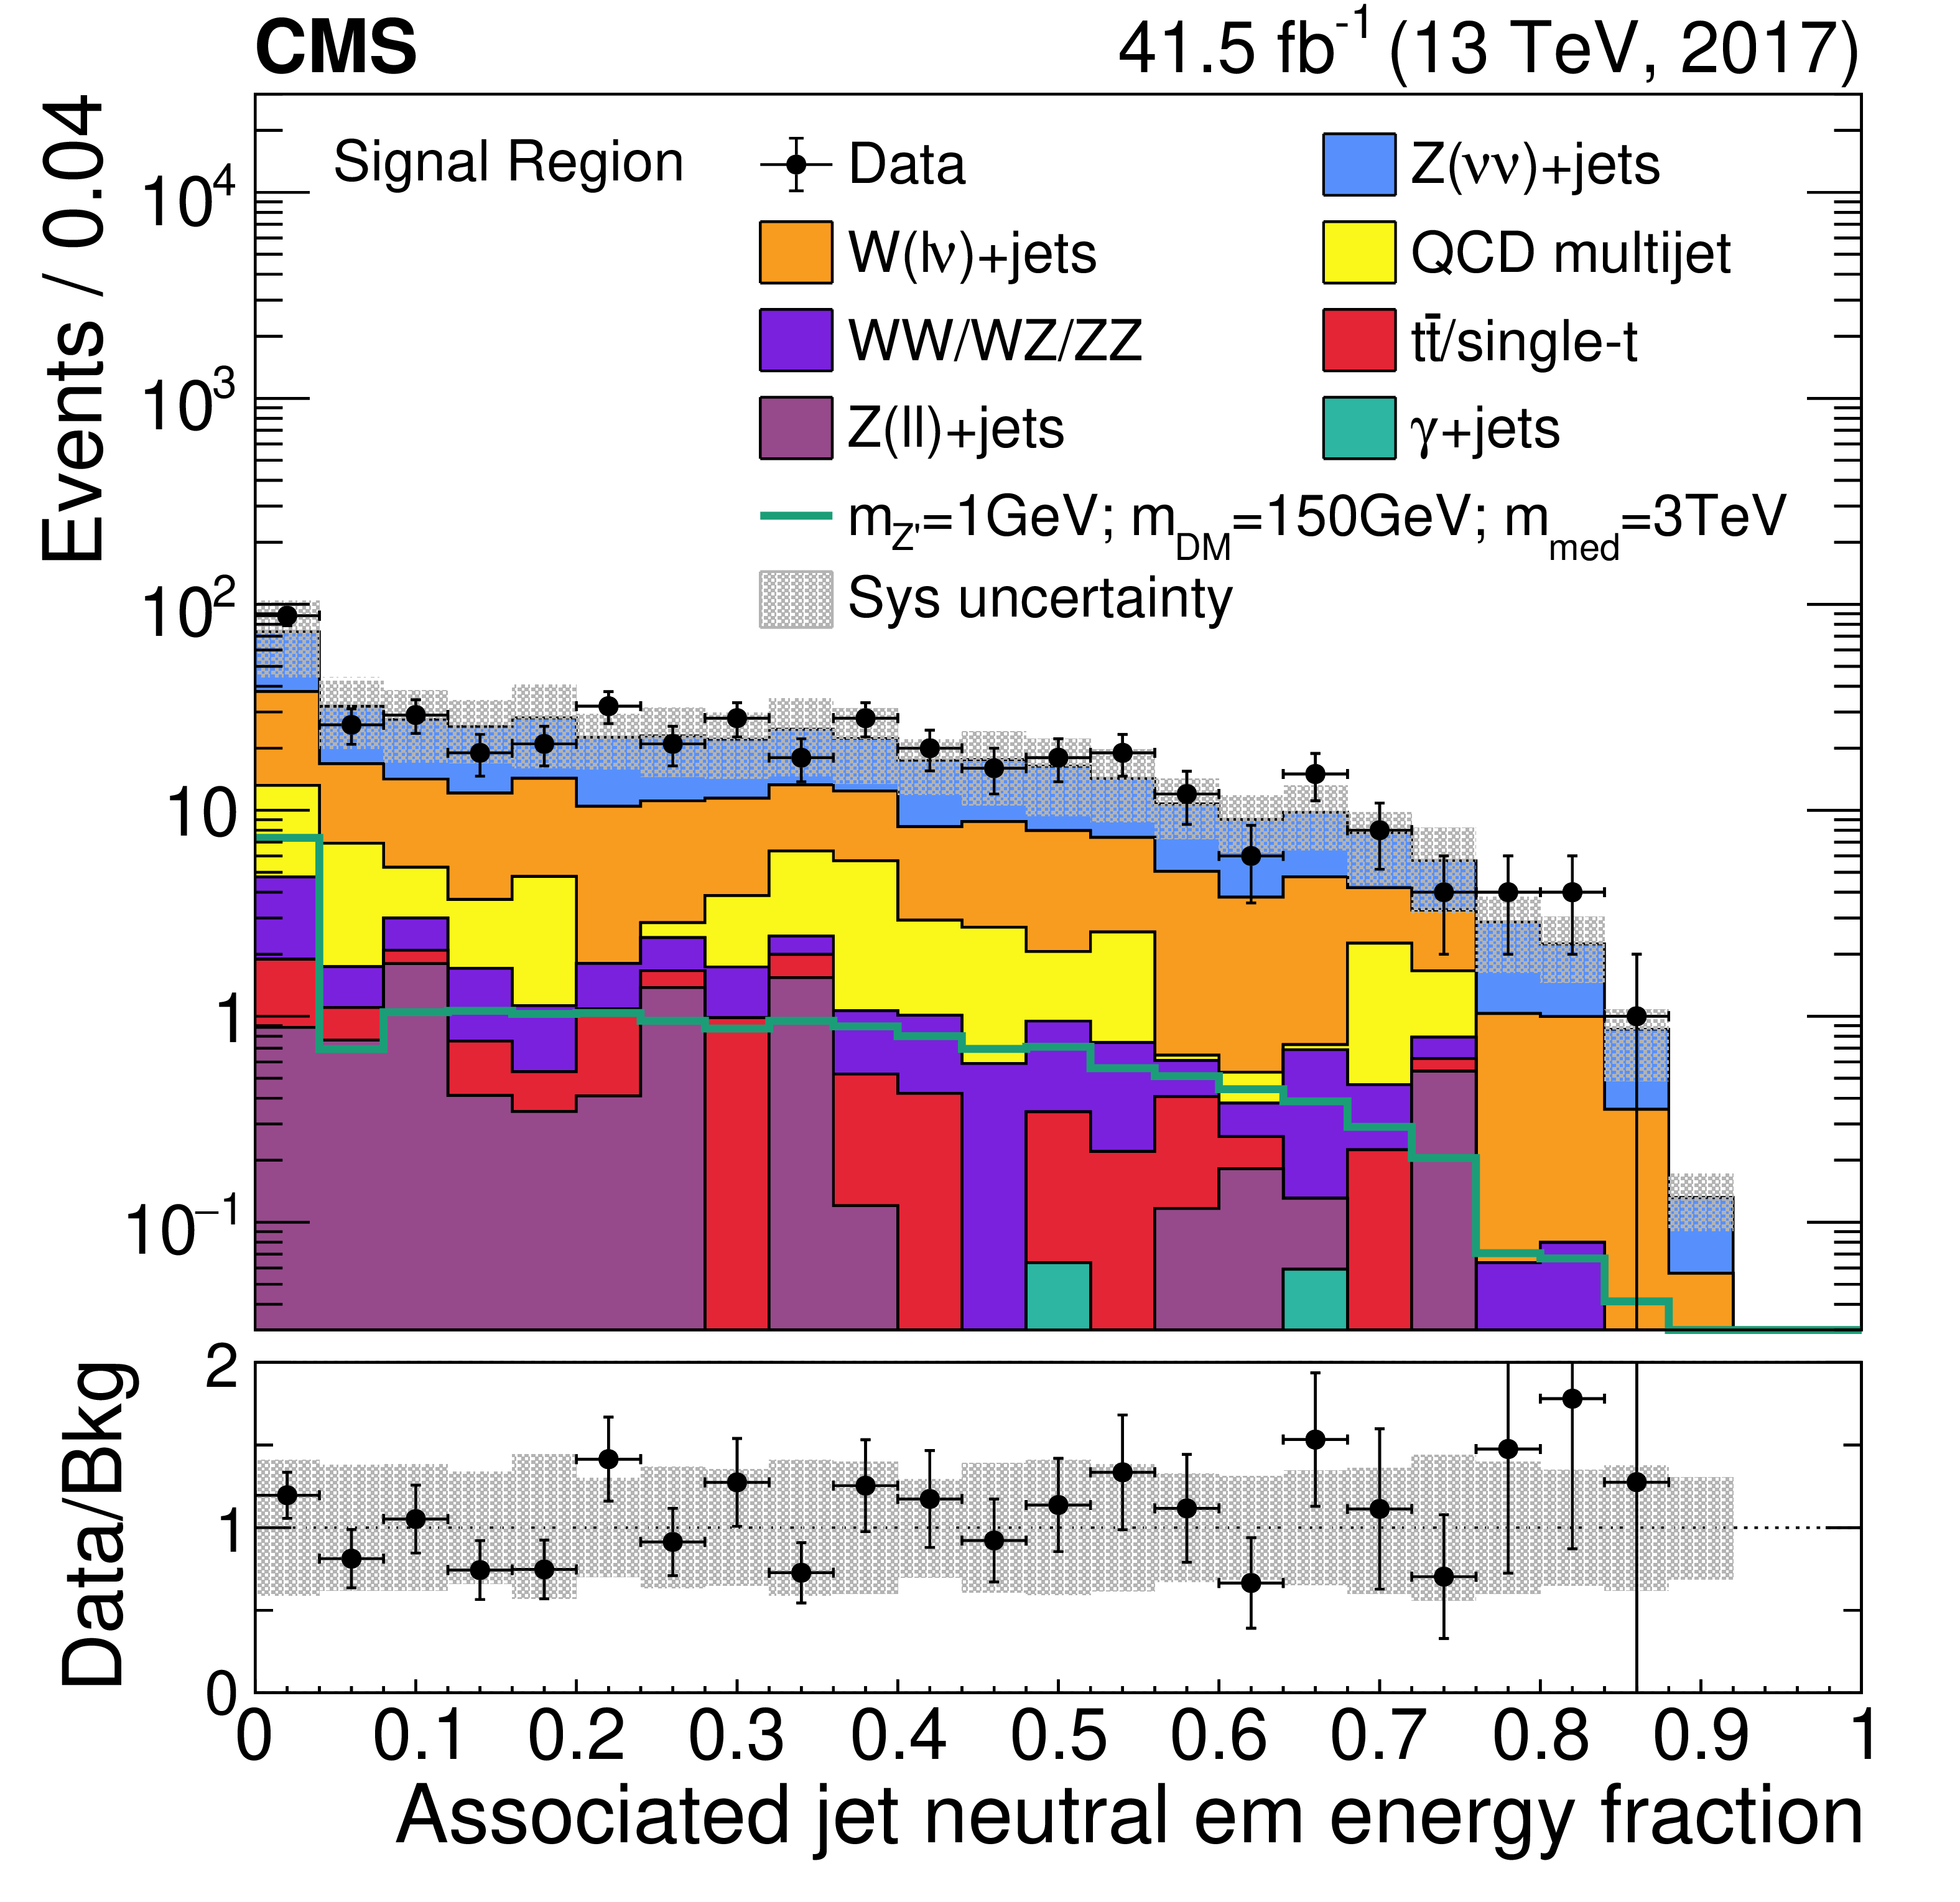
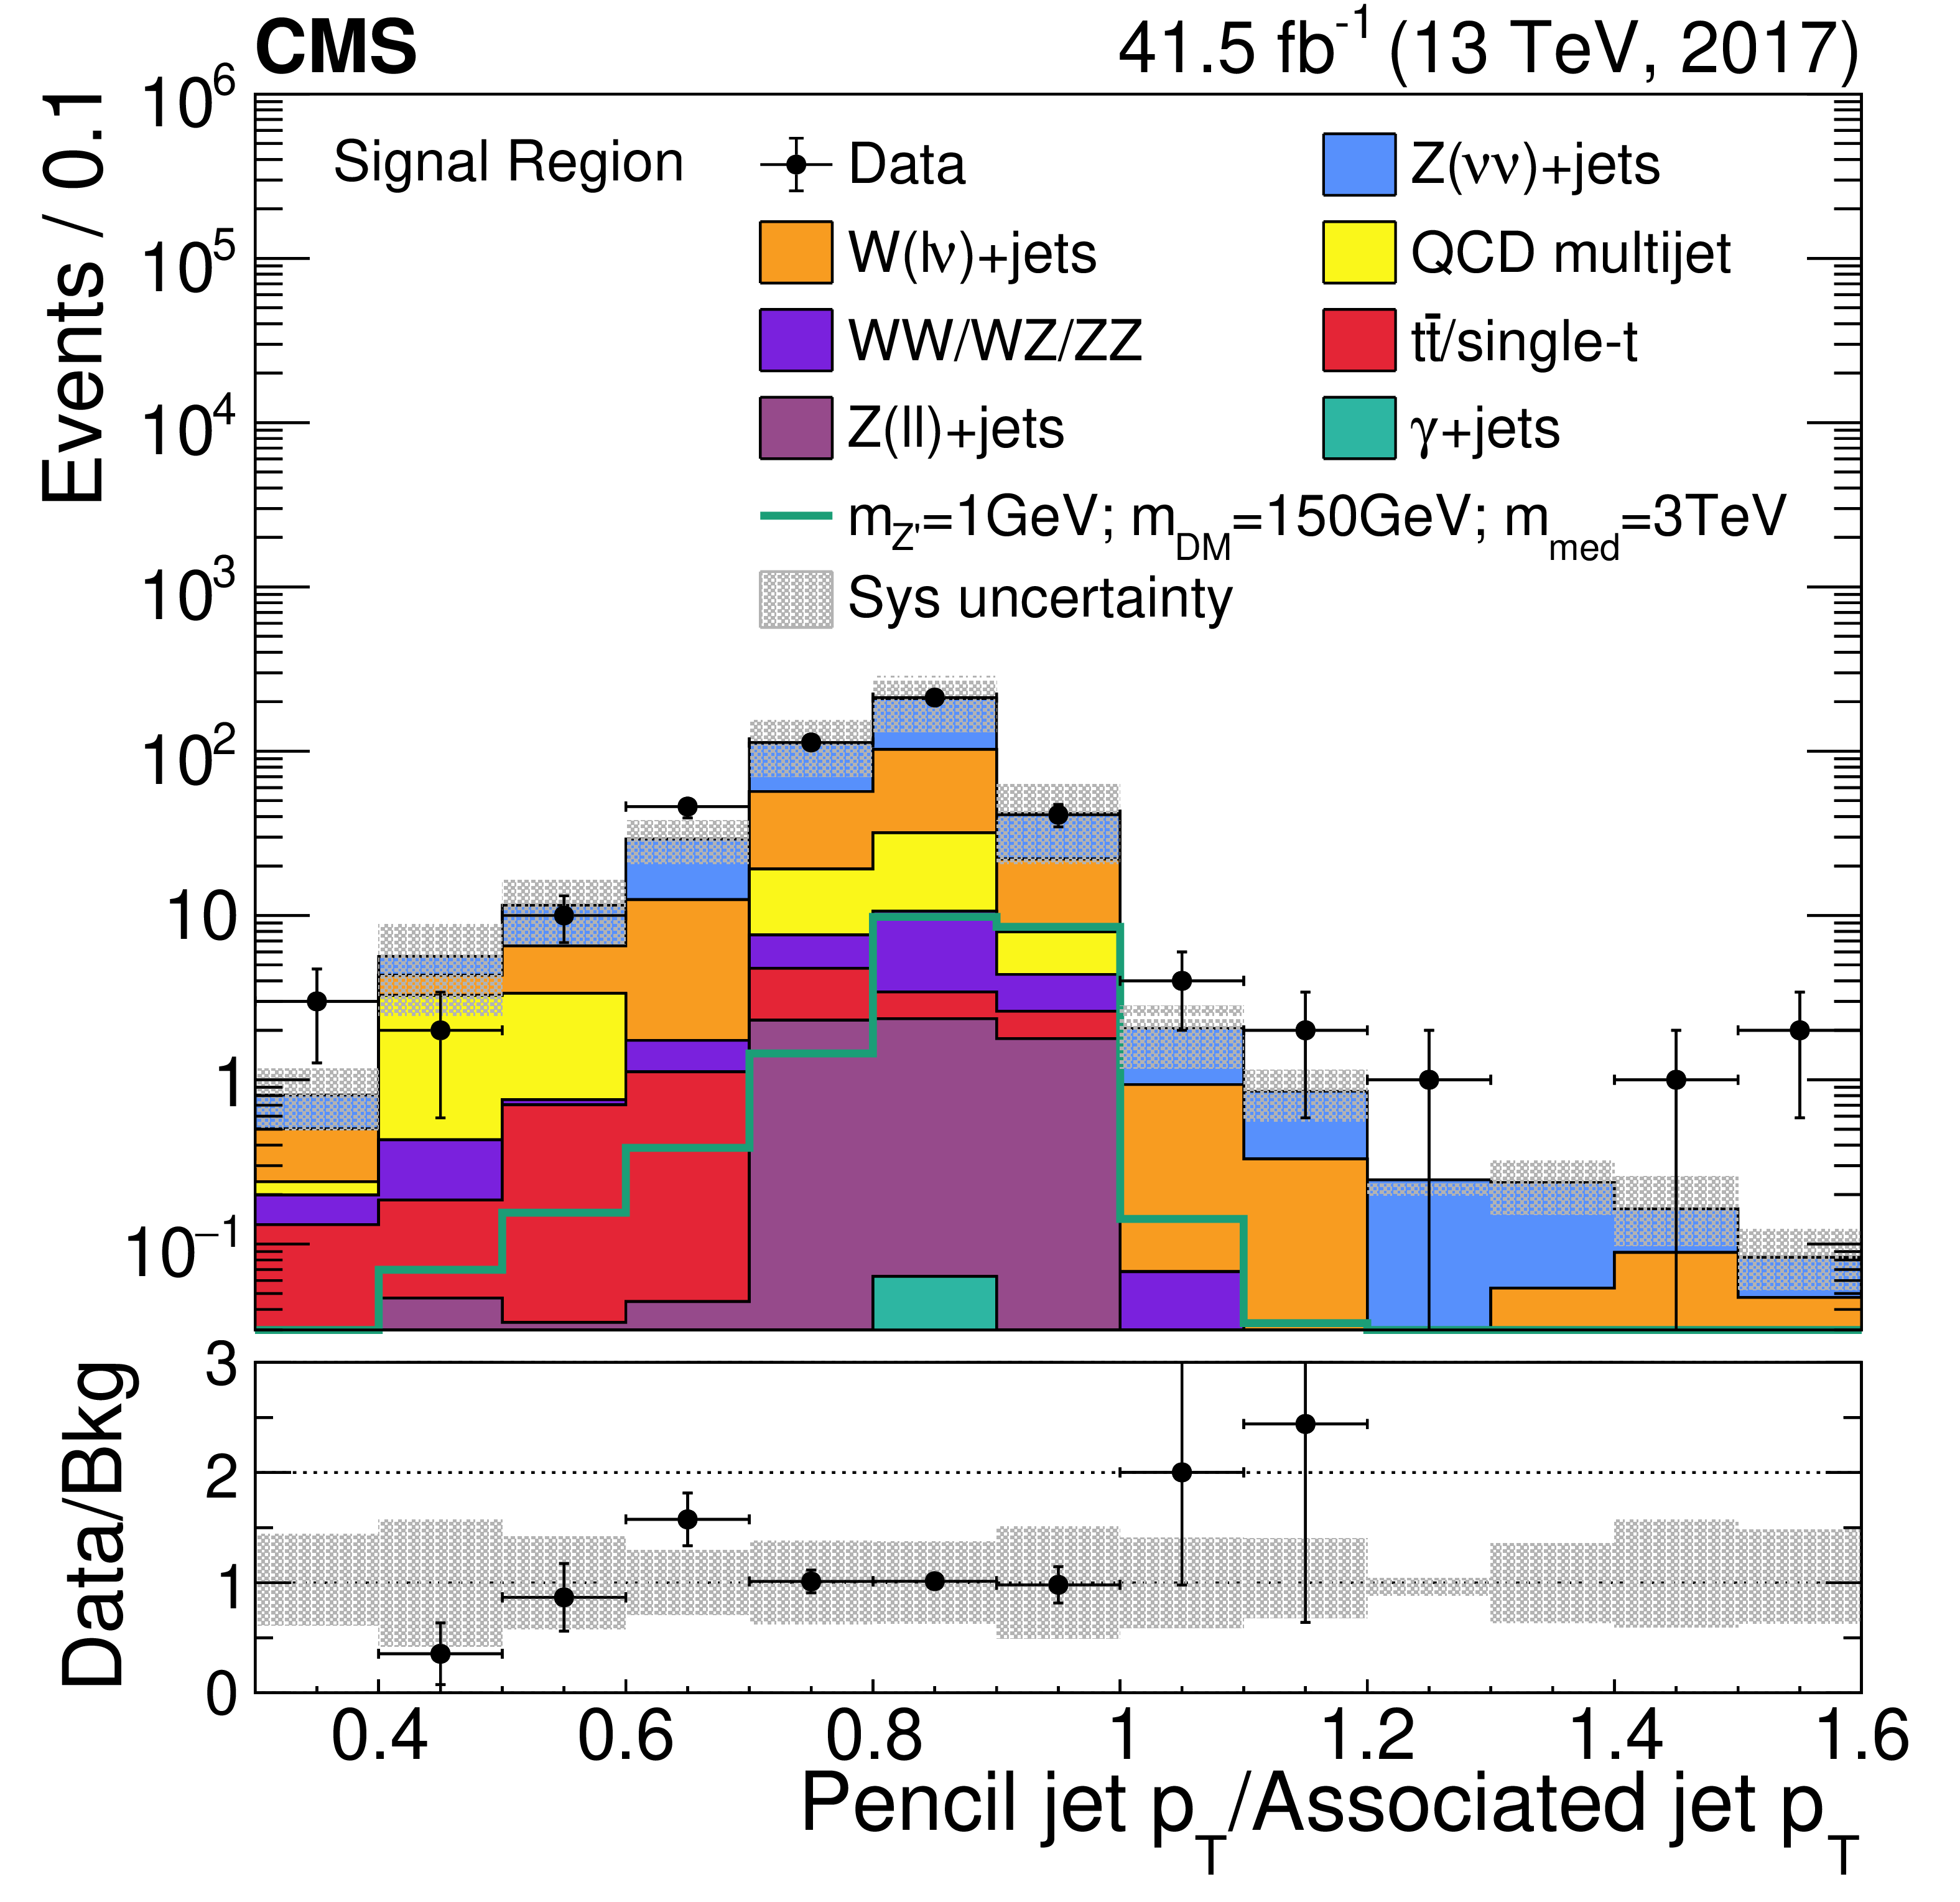
Comparison between observed data and simulated backgrounds in the signal region for the recoil (upper-left), the charged hadron energy fraction of the associated jet (upper-right), the neutral electromagnetic energy fraction of the associated jet (lower-left), and the ratio of pencil-jet $ p_{\mathrm{T}} $ to the associated jet $ p_{\mathrm{T}} $ (lower-right). Total systematic uncertainties are labeled as ``Sys uncertainity" in the legend box. The ratio of data to the pre-fit background prediction is shown in the bottom pads, with the grey band indicating the total systematic uncertainty. |
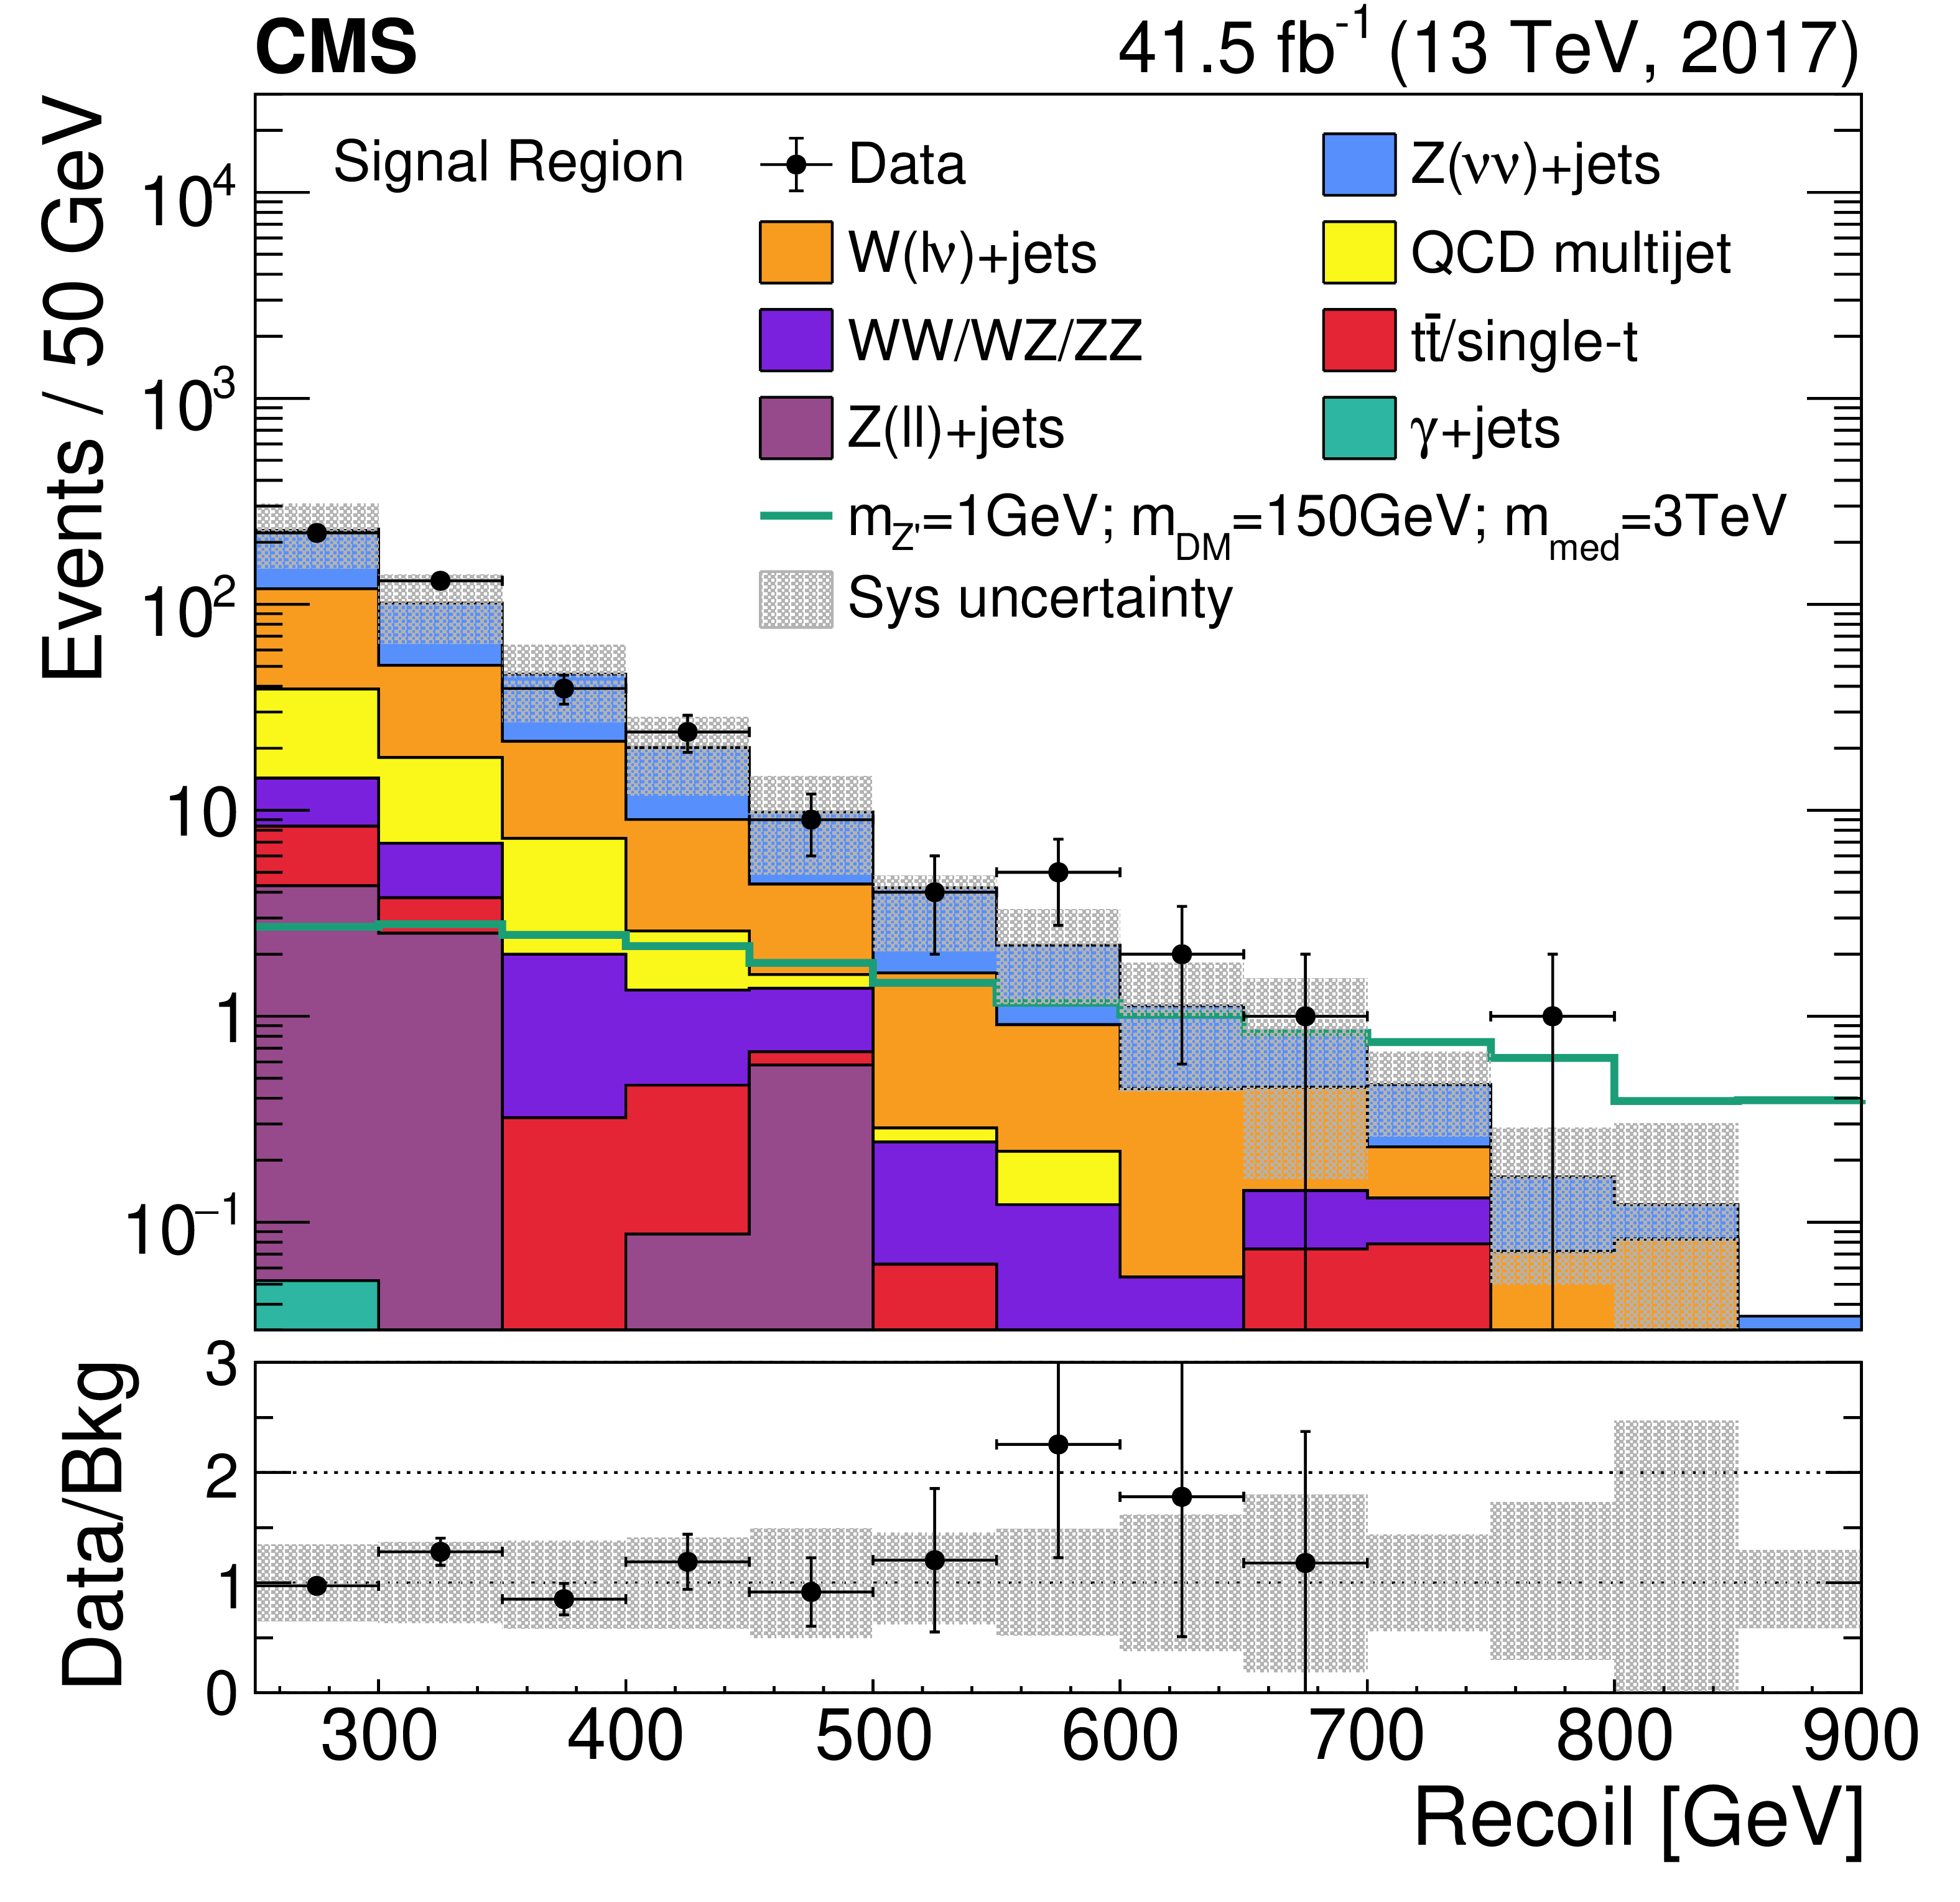
png pdf |
Figure 3-a:
Comparison between observed data and simulated backgrounds in the signal region for the recoil (upper-left), the charged hadron energy fraction of the associated jet (upper-right), the neutral electromagnetic energy fraction of the associated jet (lower-left), and the ratio of pencil-jet $ p_{\mathrm{T}} $ to the associated jet $ p_{\mathrm{T}} $ (lower-right). Total systematic uncertainties are labeled as ``Sys uncertainity" in the legend box. The ratio of data to the pre-fit background prediction is shown in the bottom pads, with the grey band indicating the total systematic uncertainty. |
png pdf |
Figure 3-b:
Comparison between observed data and simulated backgrounds in the signal region for the recoil (upper-left), the charged hadron energy fraction of the associated jet (upper-right), the neutral electromagnetic energy fraction of the associated jet (lower-left), and the ratio of pencil-jet $ p_{\mathrm{T}} $ to the associated jet $ p_{\mathrm{T}} $ (lower-right). Total systematic uncertainties are labeled as ``Sys uncertainity" in the legend box. The ratio of data to the pre-fit background prediction is shown in the bottom pads, with the grey band indicating the total systematic uncertainty. |
png pdf |
Figure 3-c:
Comparison between observed data and simulated backgrounds in the signal region for the recoil (upper-left), the charged hadron energy fraction of the associated jet (upper-right), the neutral electromagnetic energy fraction of the associated jet (lower-left), and the ratio of pencil-jet $ p_{\mathrm{T}} $ to the associated jet $ p_{\mathrm{T}} $ (lower-right). Total systematic uncertainties are labeled as ``Sys uncertainity" in the legend box. The ratio of data to the pre-fit background prediction is shown in the bottom pads, with the grey band indicating the total systematic uncertainty. |
png pdf |
Figure 3-d:
Comparison between observed data and simulated backgrounds in the signal region for the recoil (upper-left), the charged hadron energy fraction of the associated jet (upper-right), the neutral electromagnetic energy fraction of the associated jet (lower-left), and the ratio of pencil-jet $ p_{\mathrm{T}} $ to the associated jet $ p_{\mathrm{T}} $ (lower-right). Total systematic uncertainties are labeled as ``Sys uncertainity" in the legend box. The ratio of data to the pre-fit background prediction is shown in the bottom pads, with the grey band indicating the total systematic uncertainty. |
png pdf |
Figure 4:
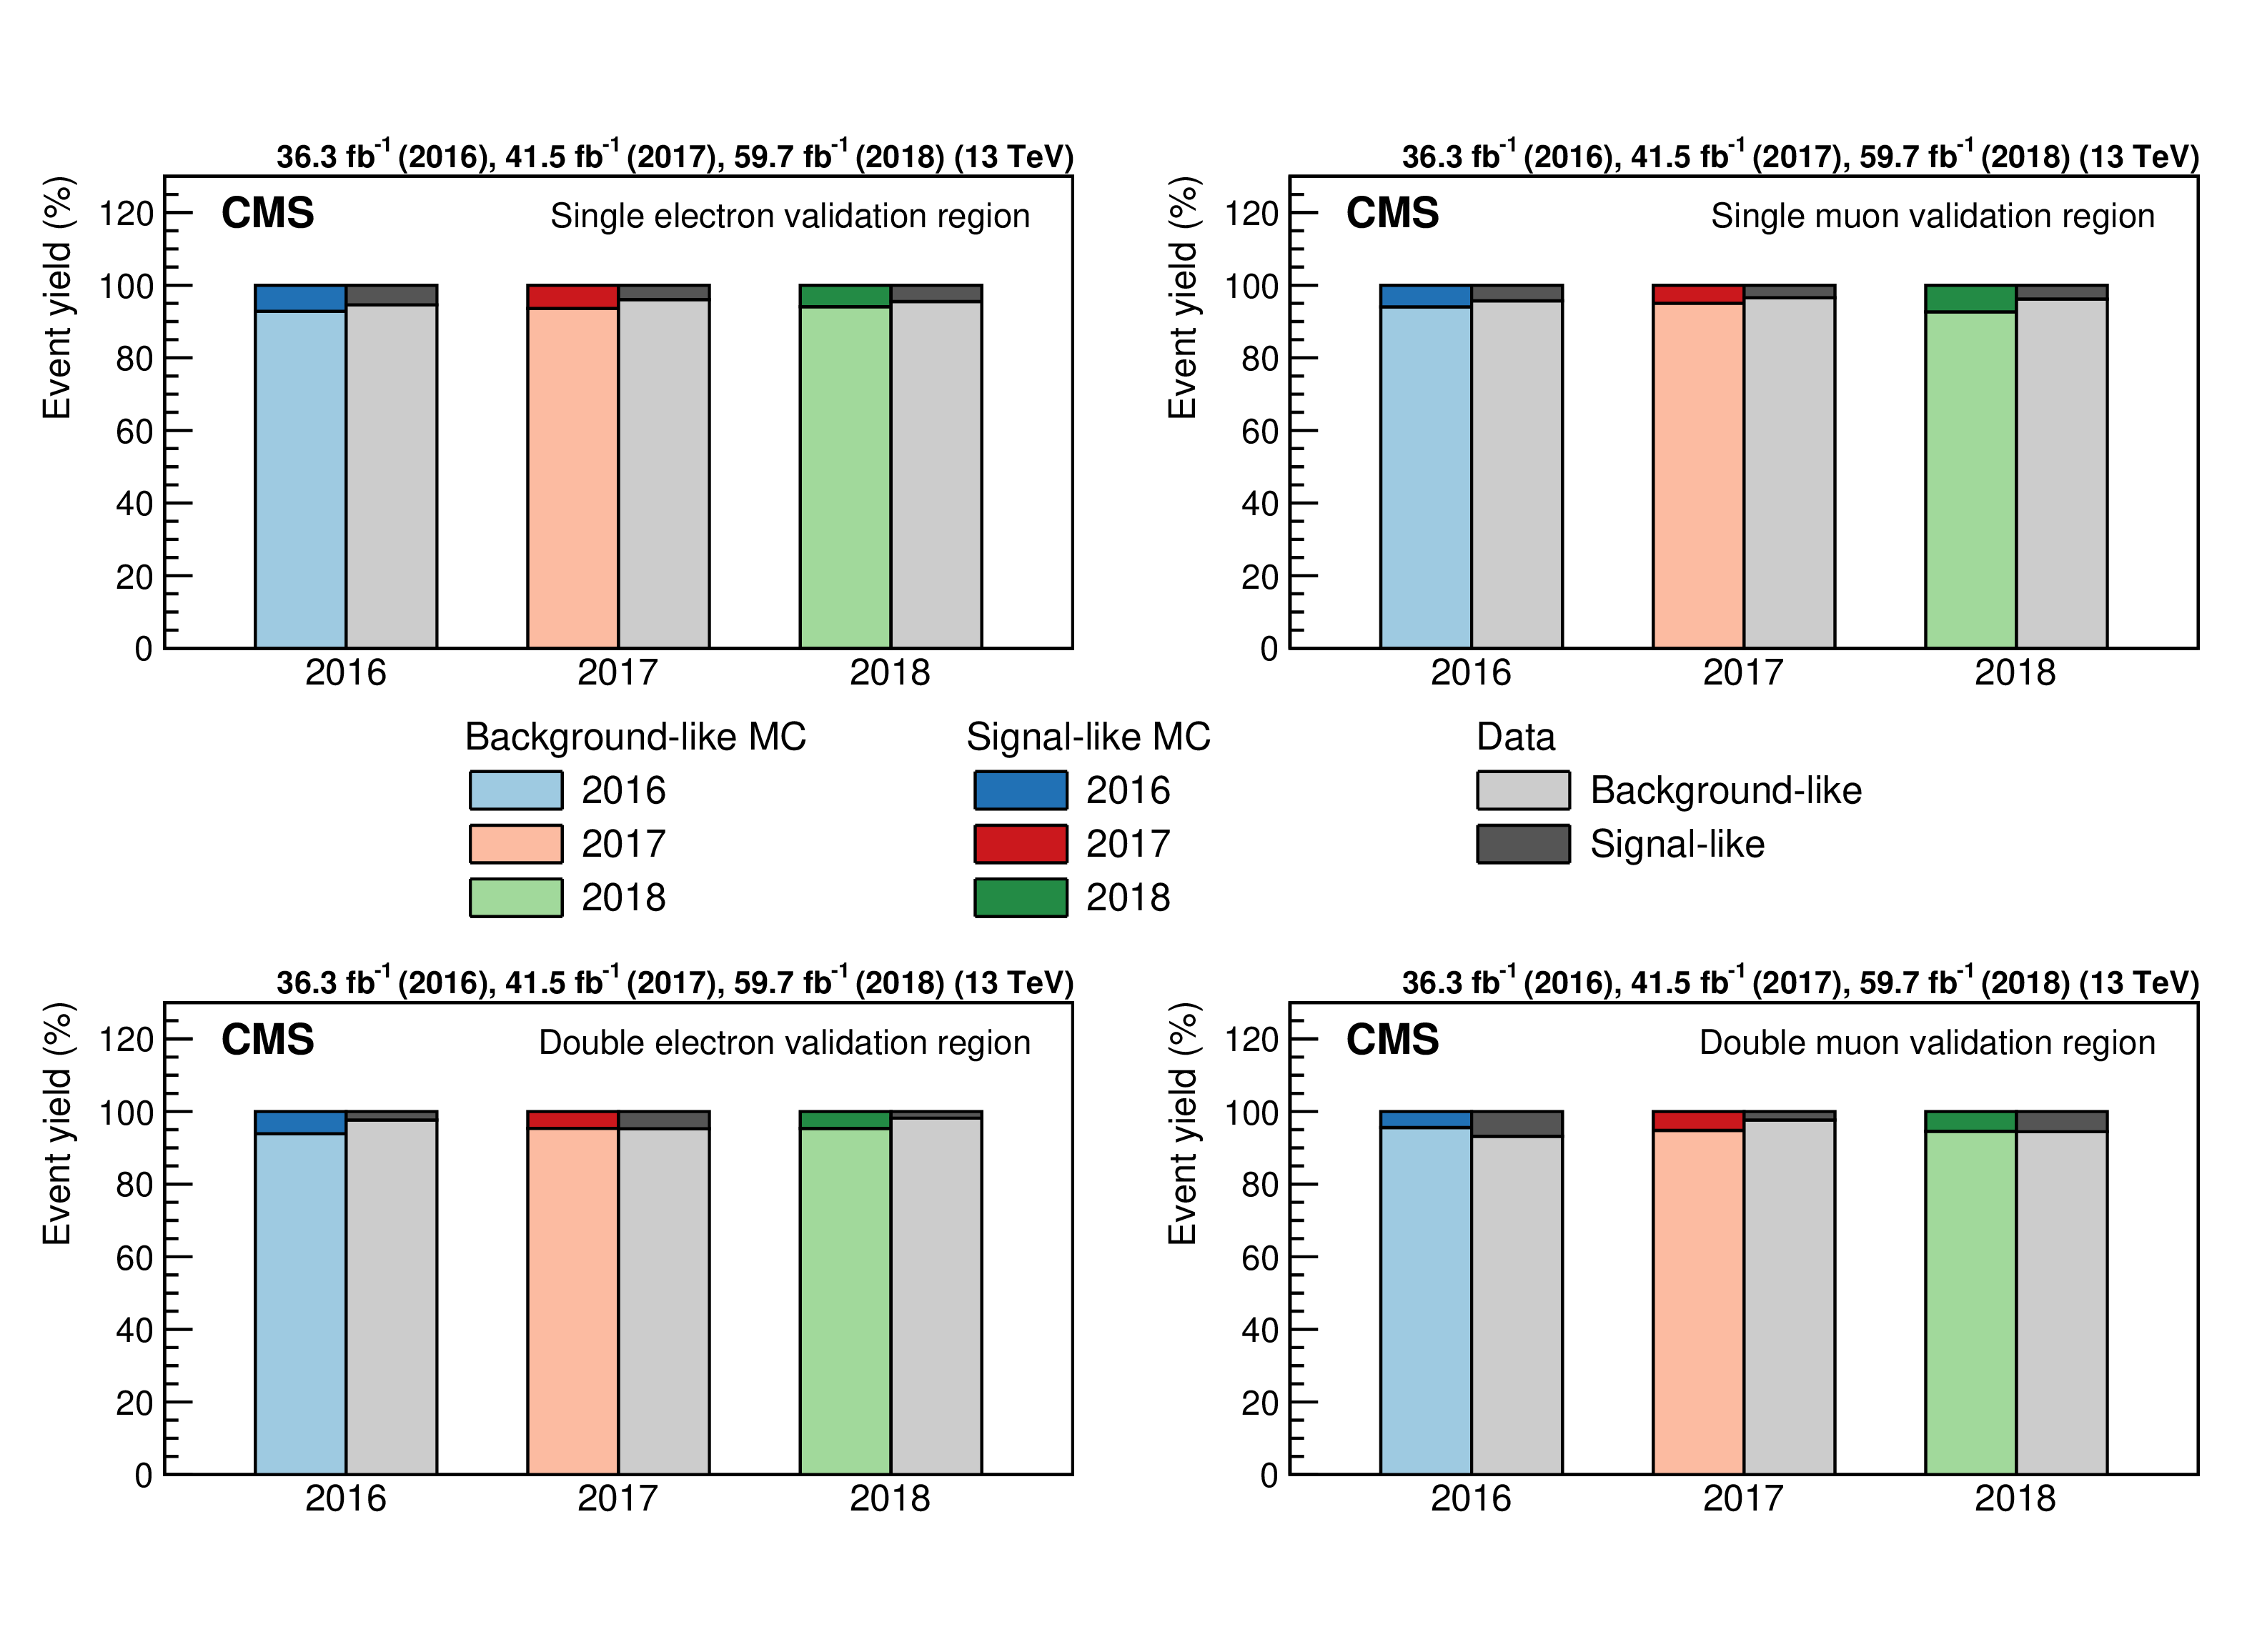
Percentage of events in the validation regions: single electron (upper-left), single muon (upper-right), double electron (lower-left), and double muon (lower-right), with low and high ML scores. The lighter shading represents the fraction of events with low scores (as expected for these background-enriched regions), while the darker shading corresponds to the fraction with high scores ($ > $ 0.71), indicative of signal-like behavior. Colored markers denote simulated samples for 2016 (blue), 2017 (red), and 2018 (green), while data are shown in grey. |
png pdf |
Figure 5:
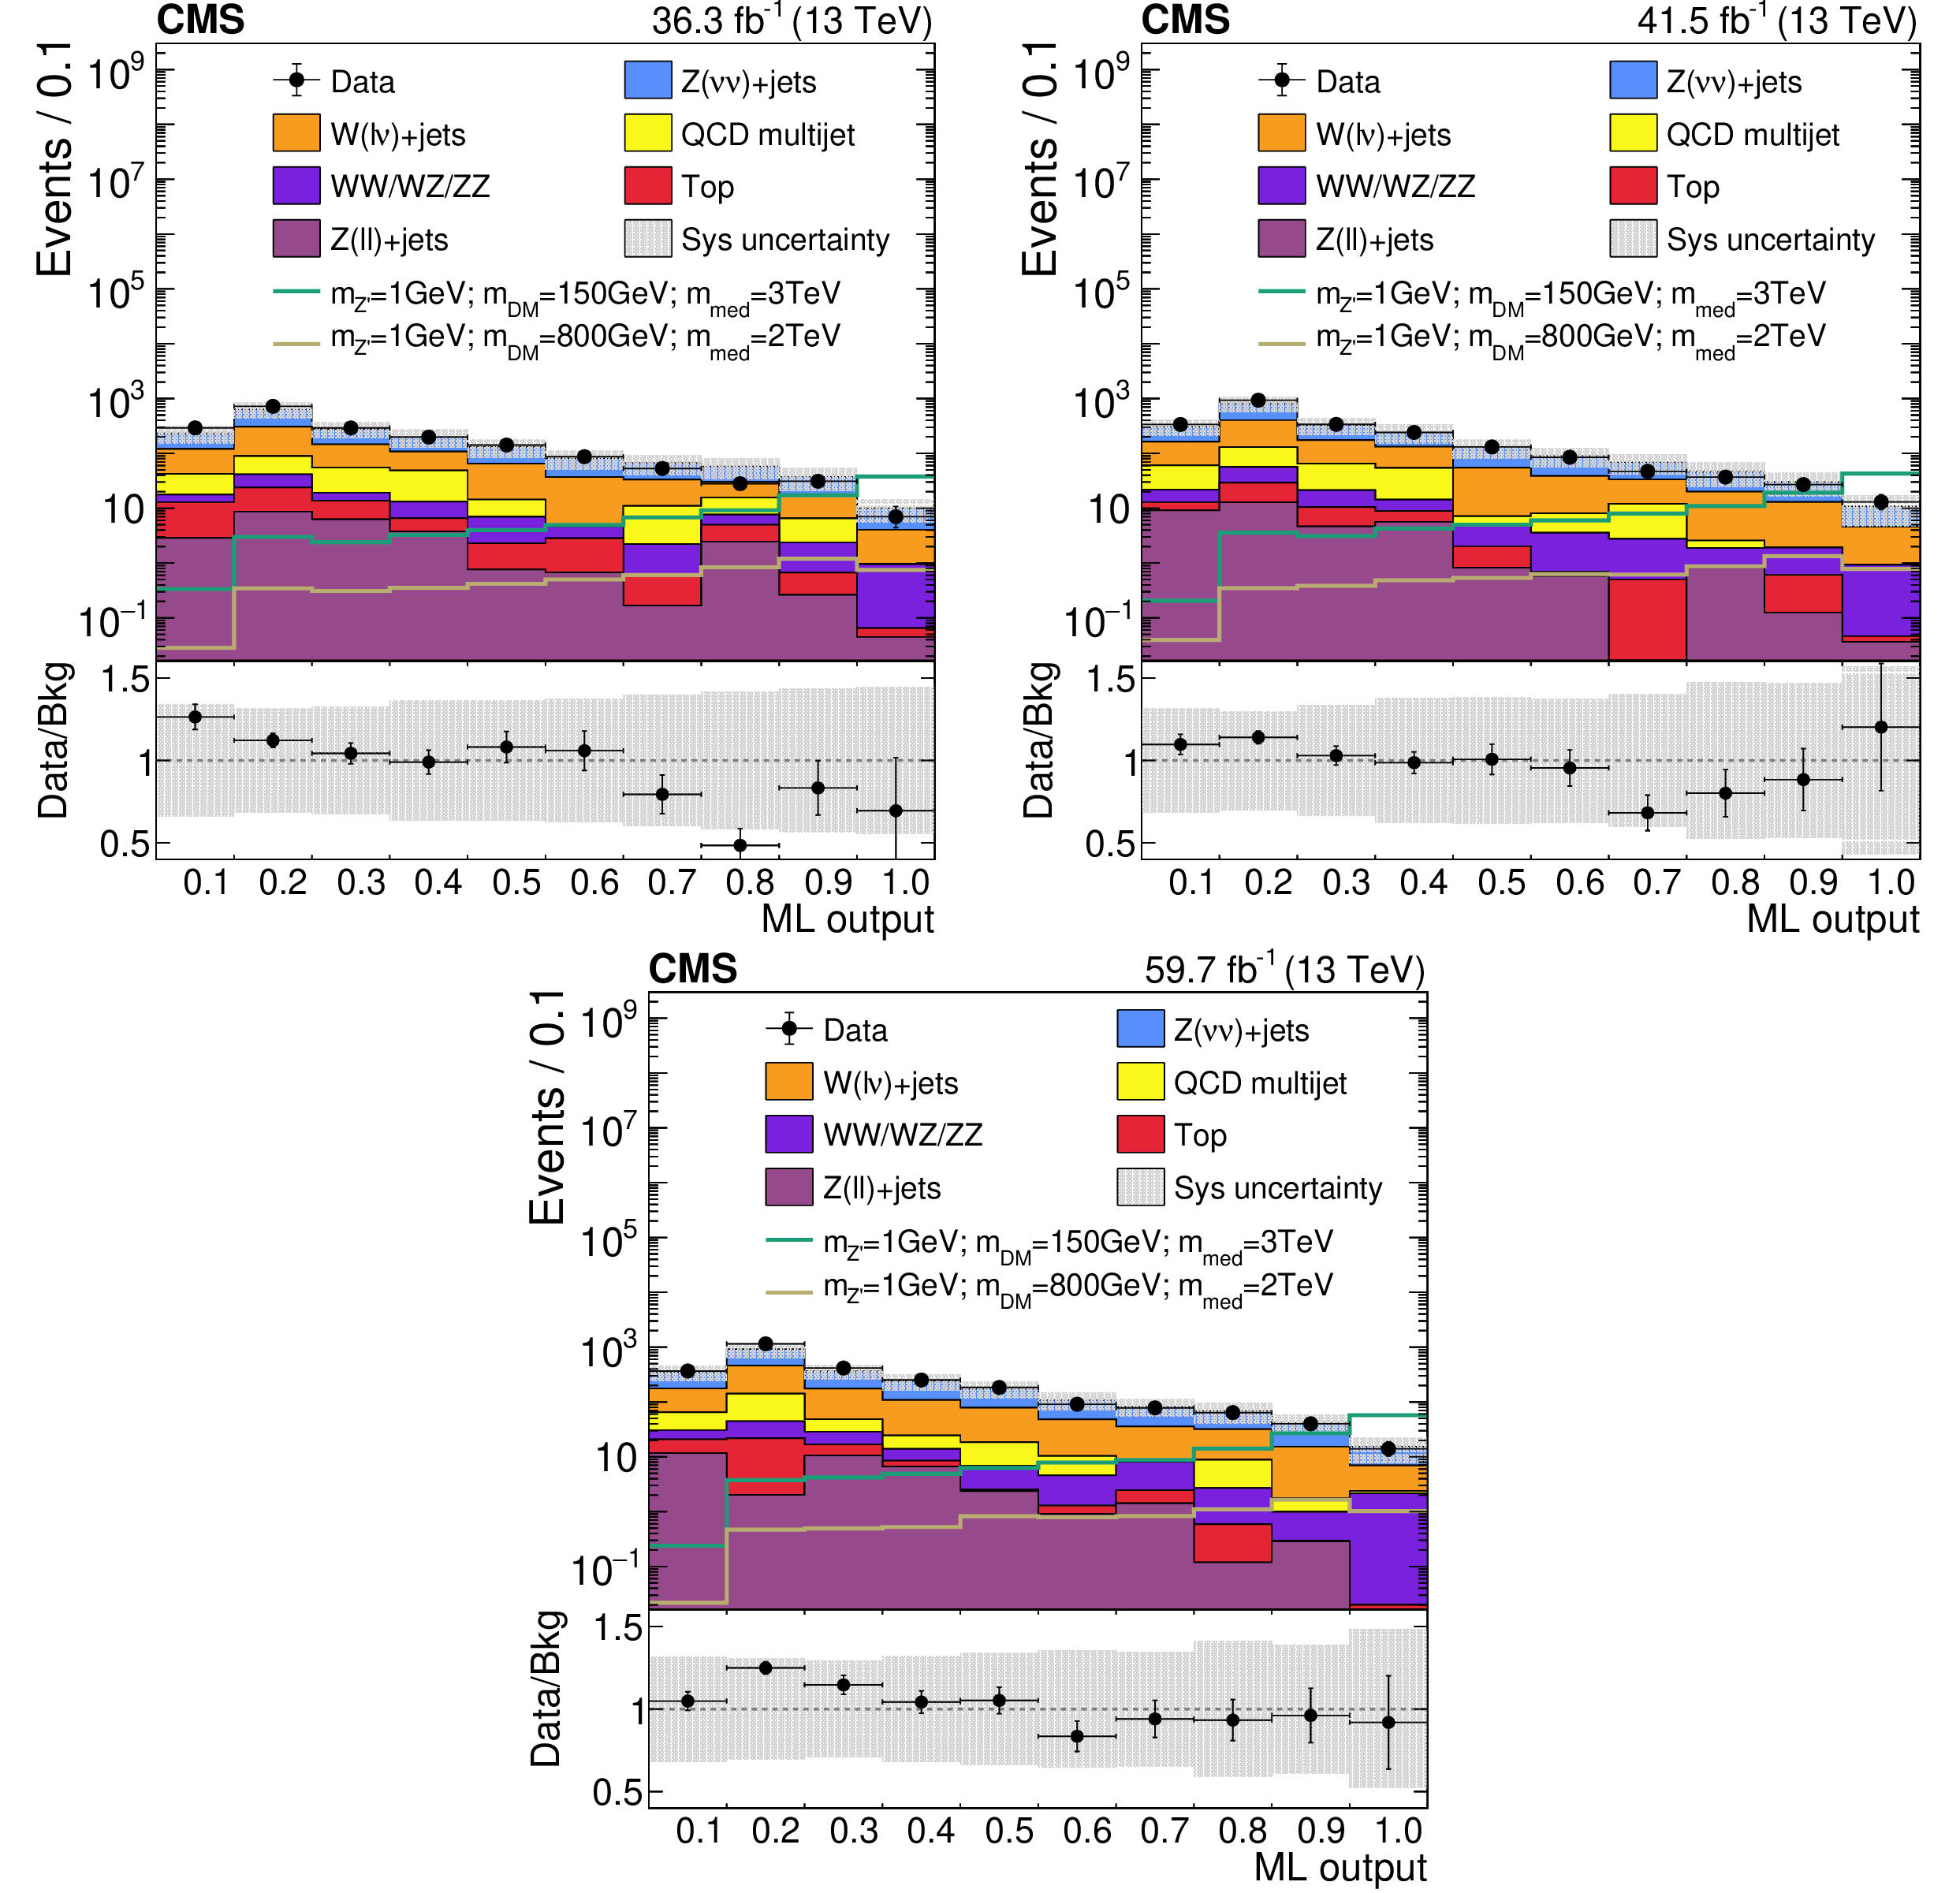
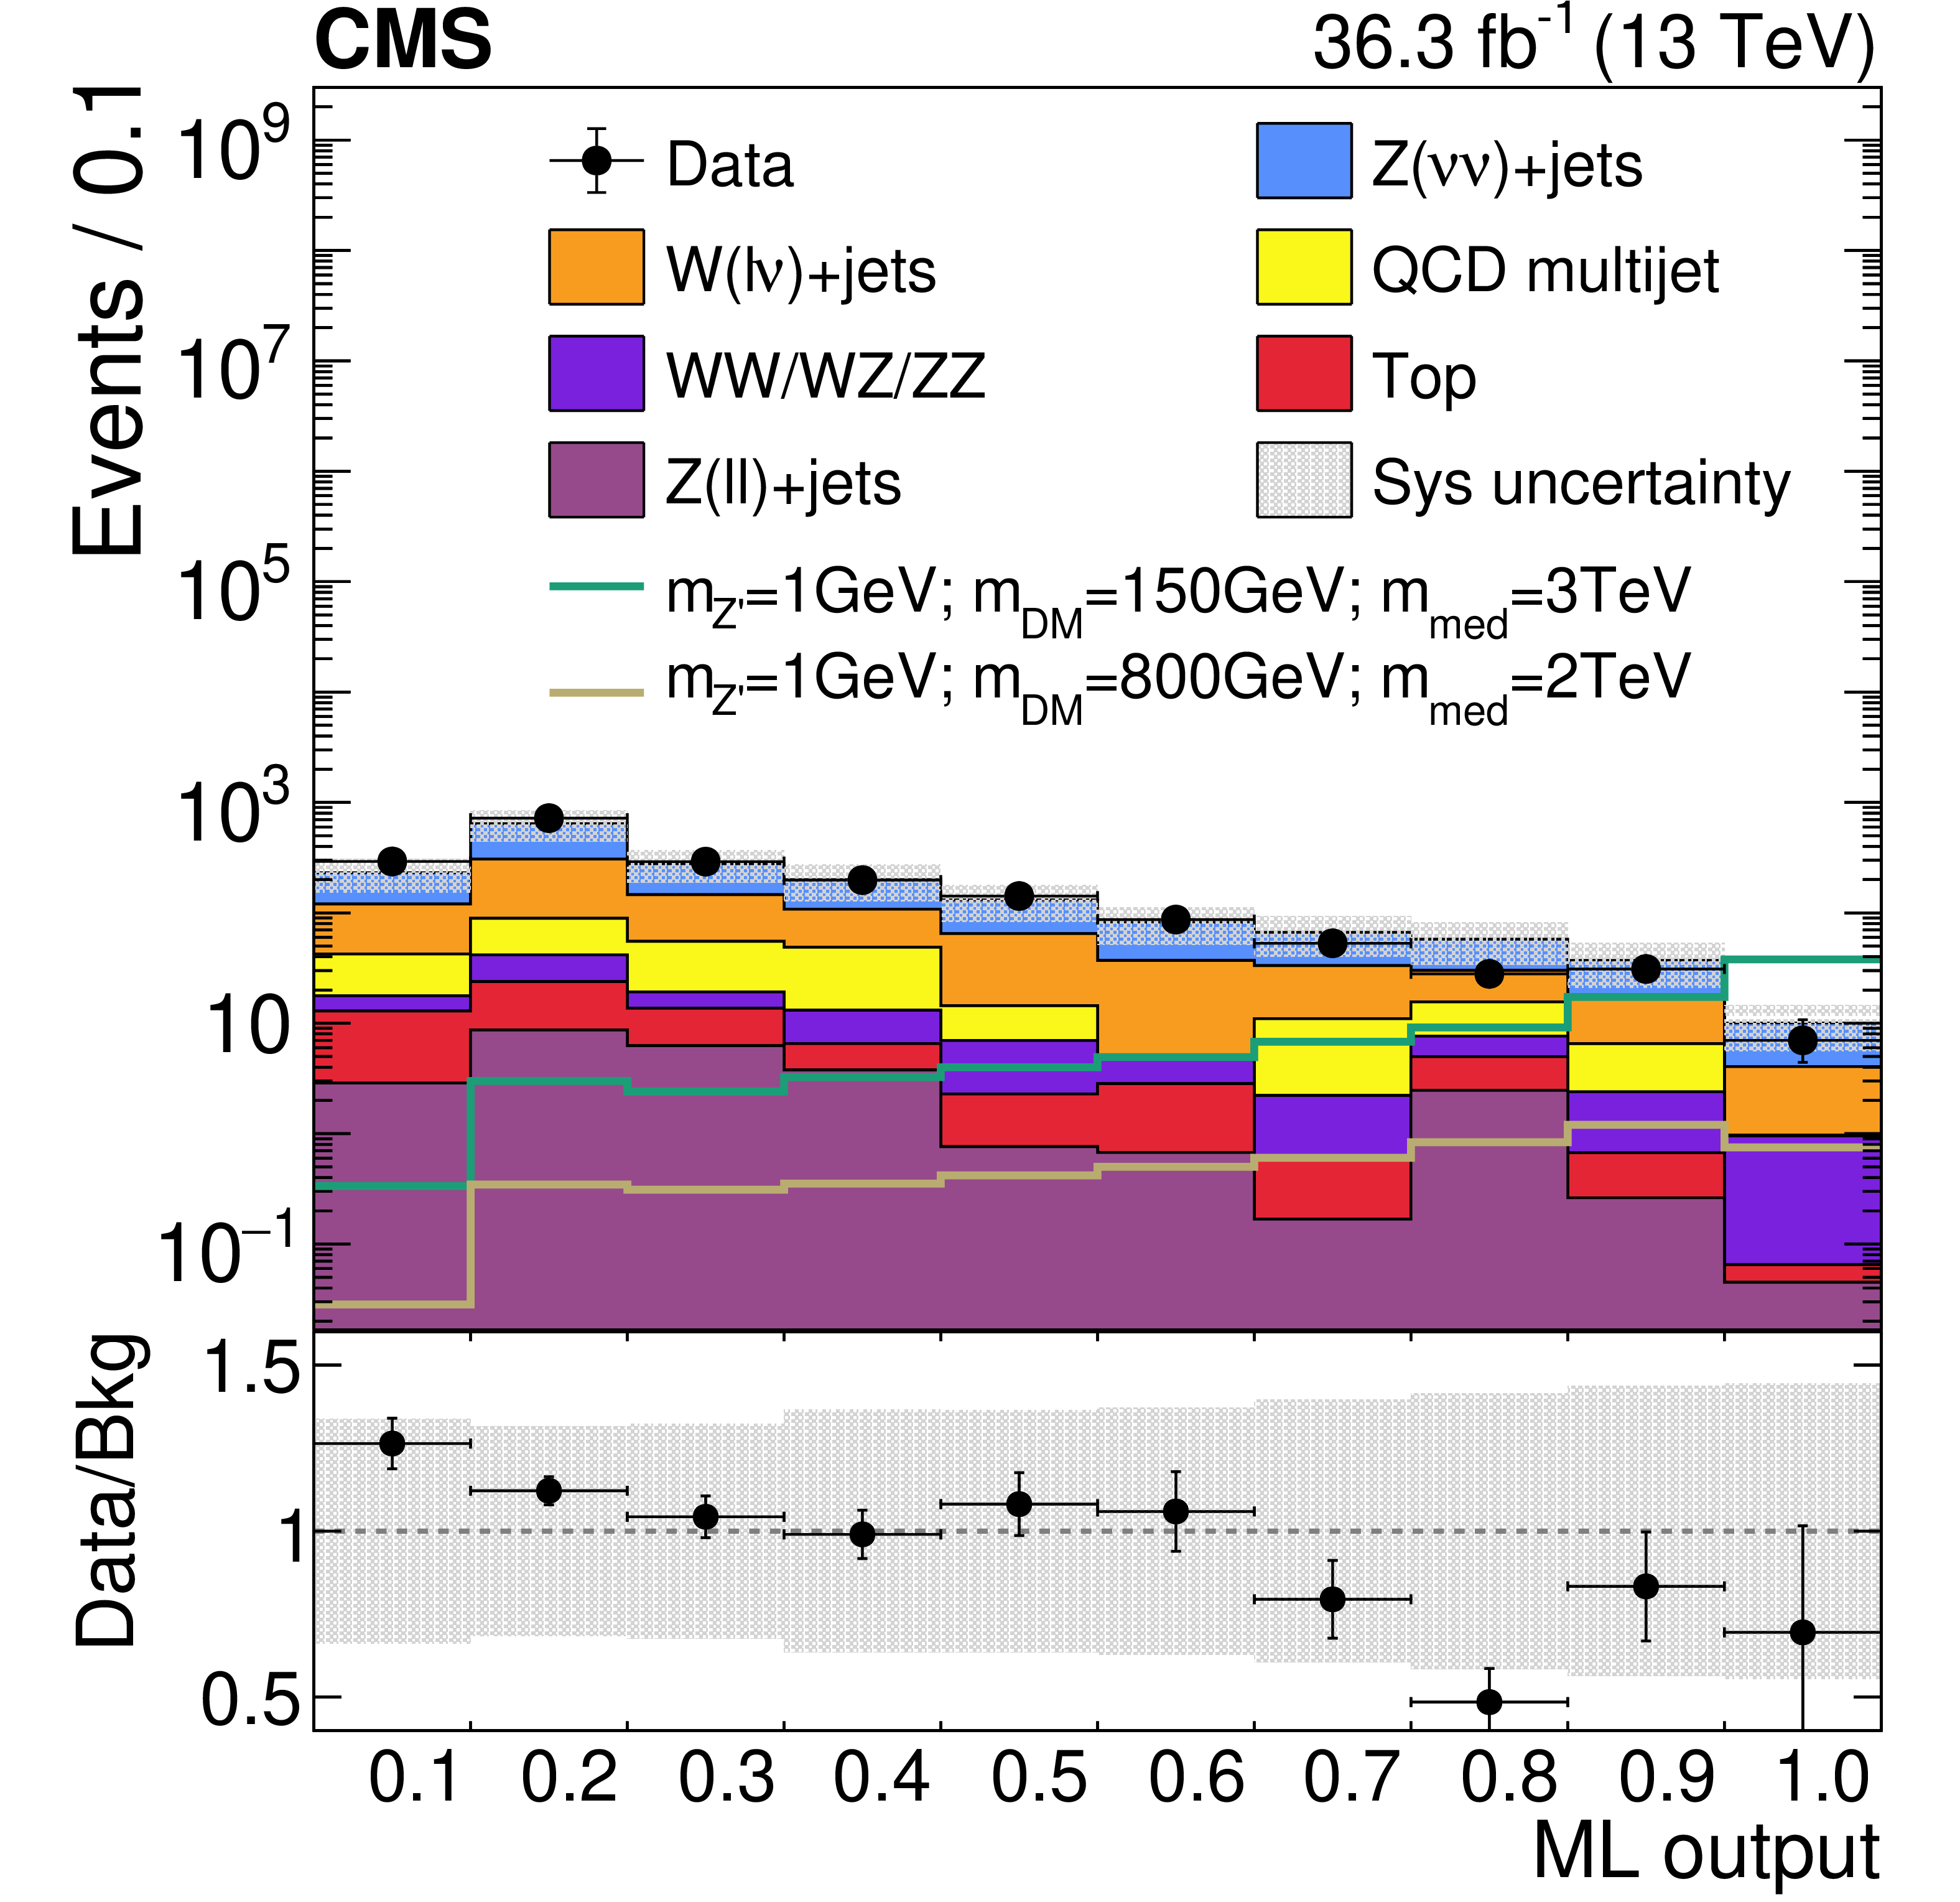
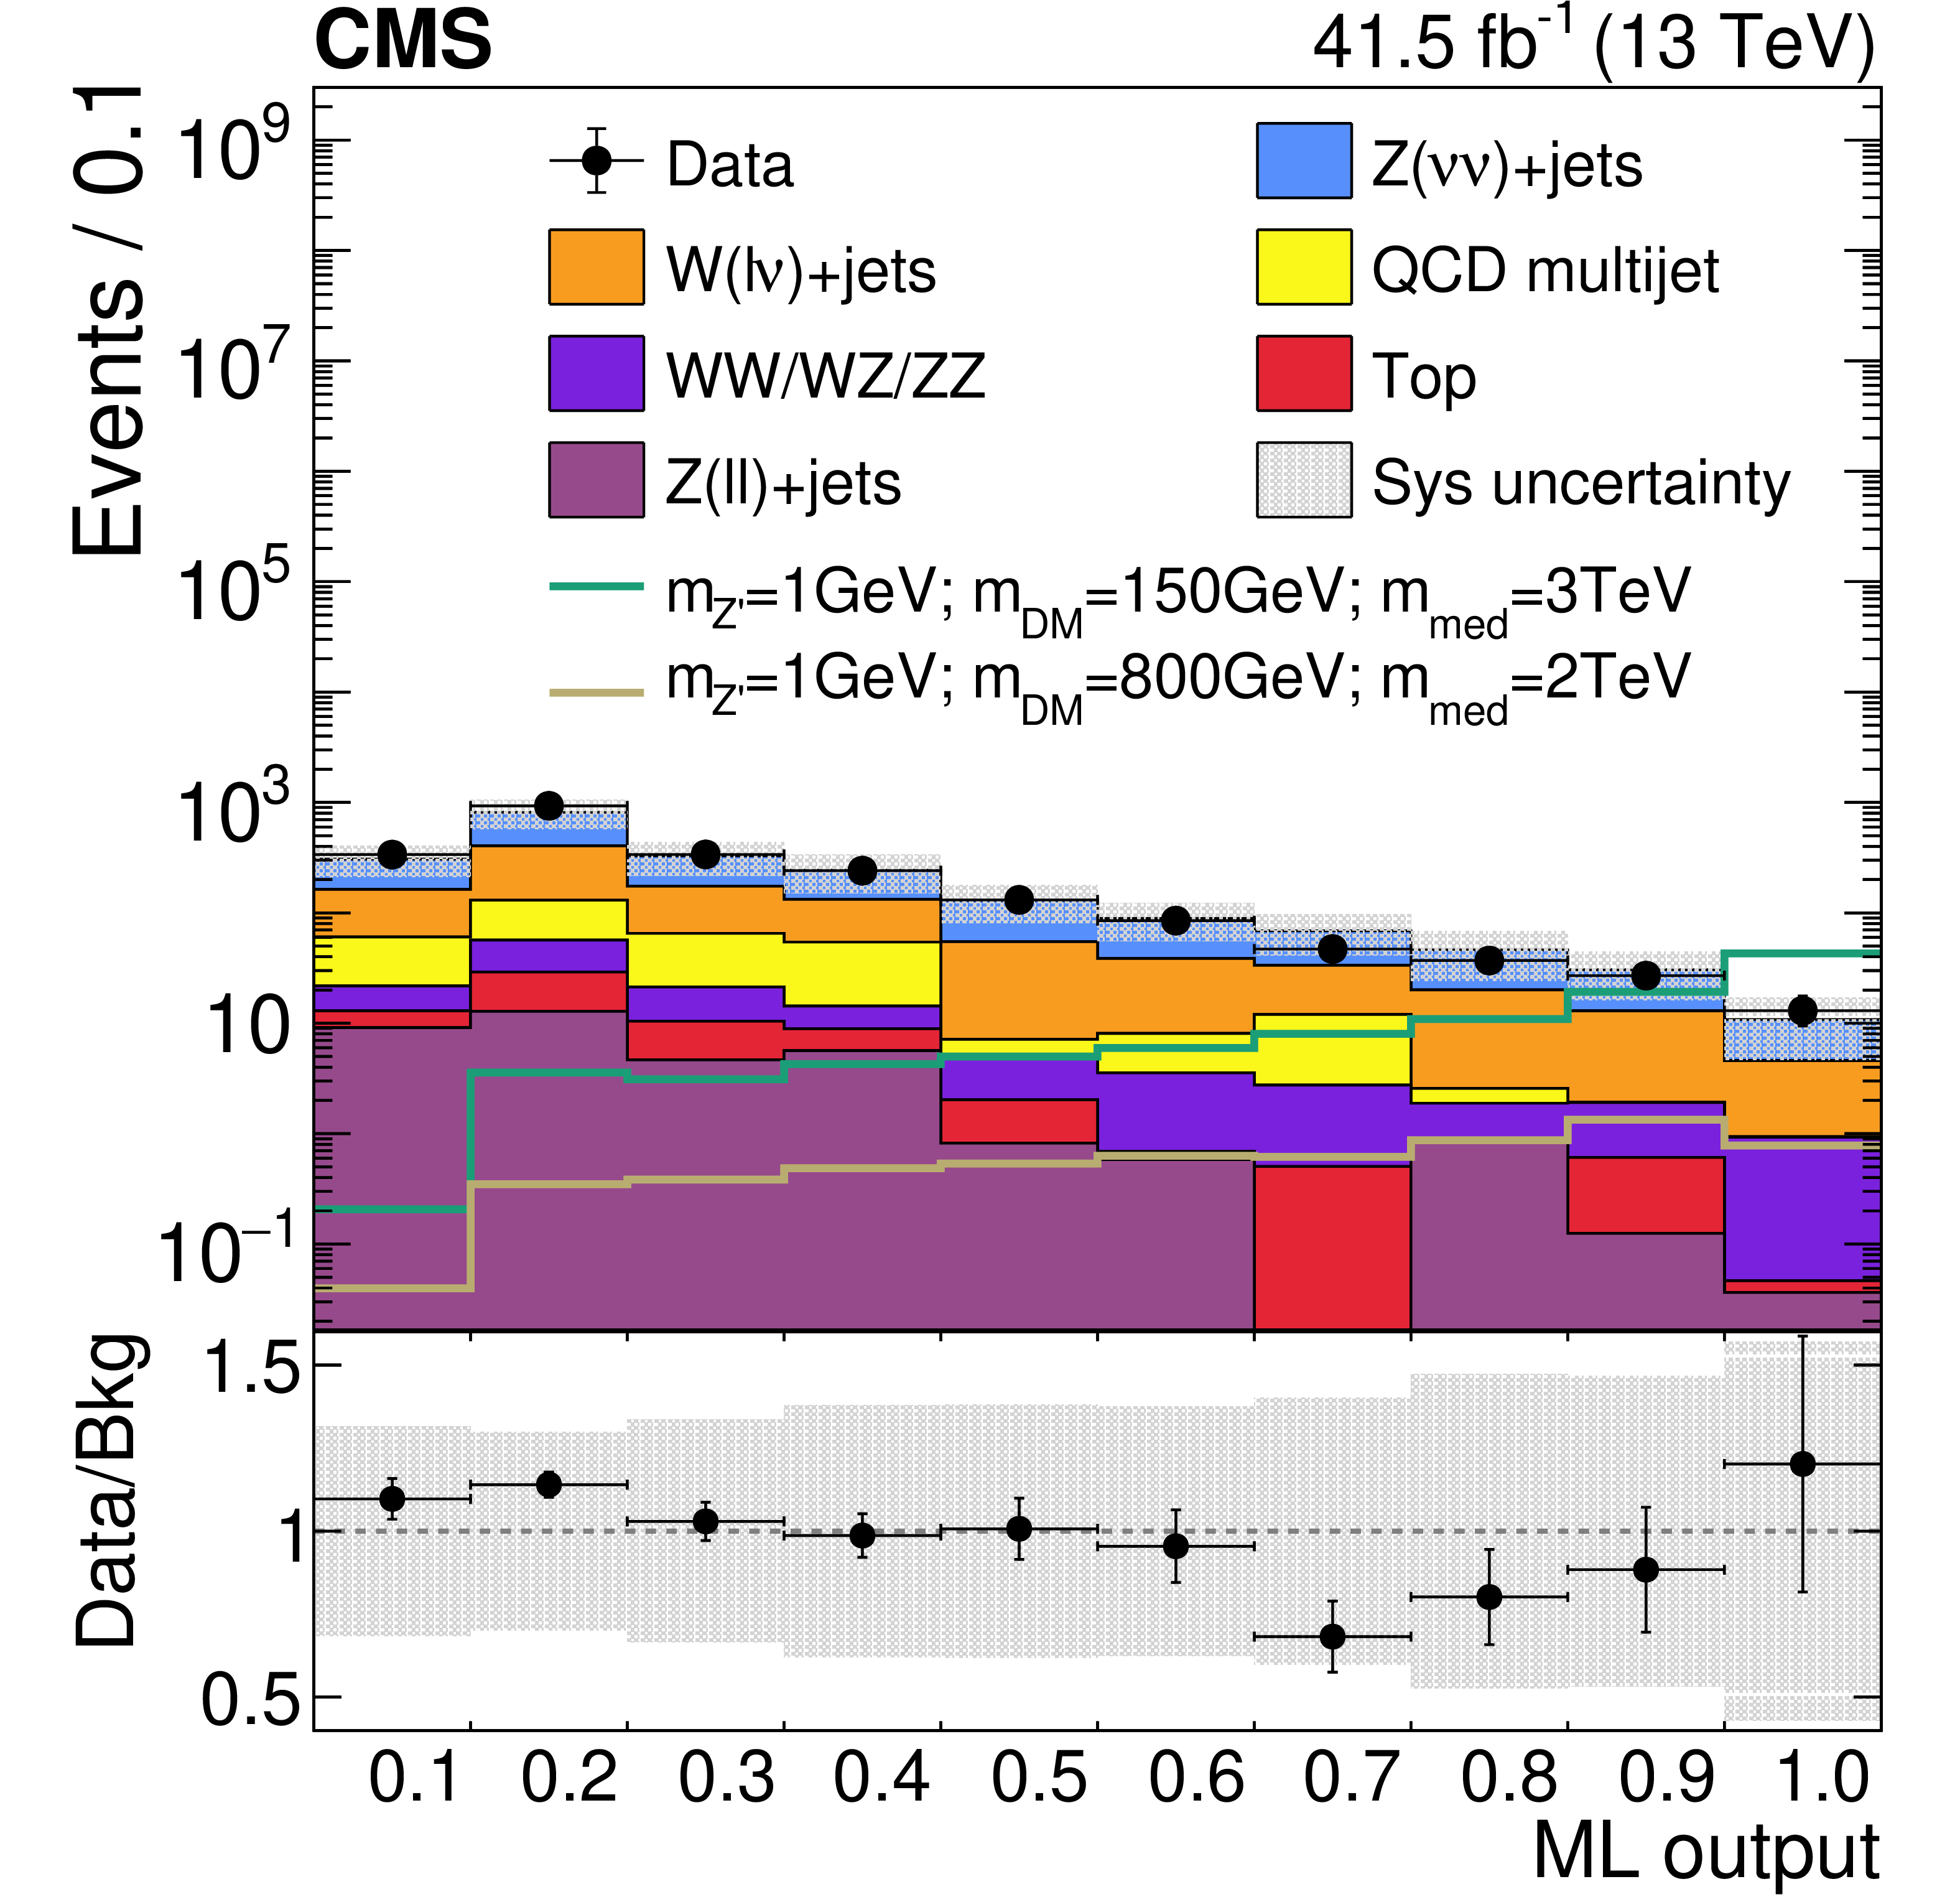
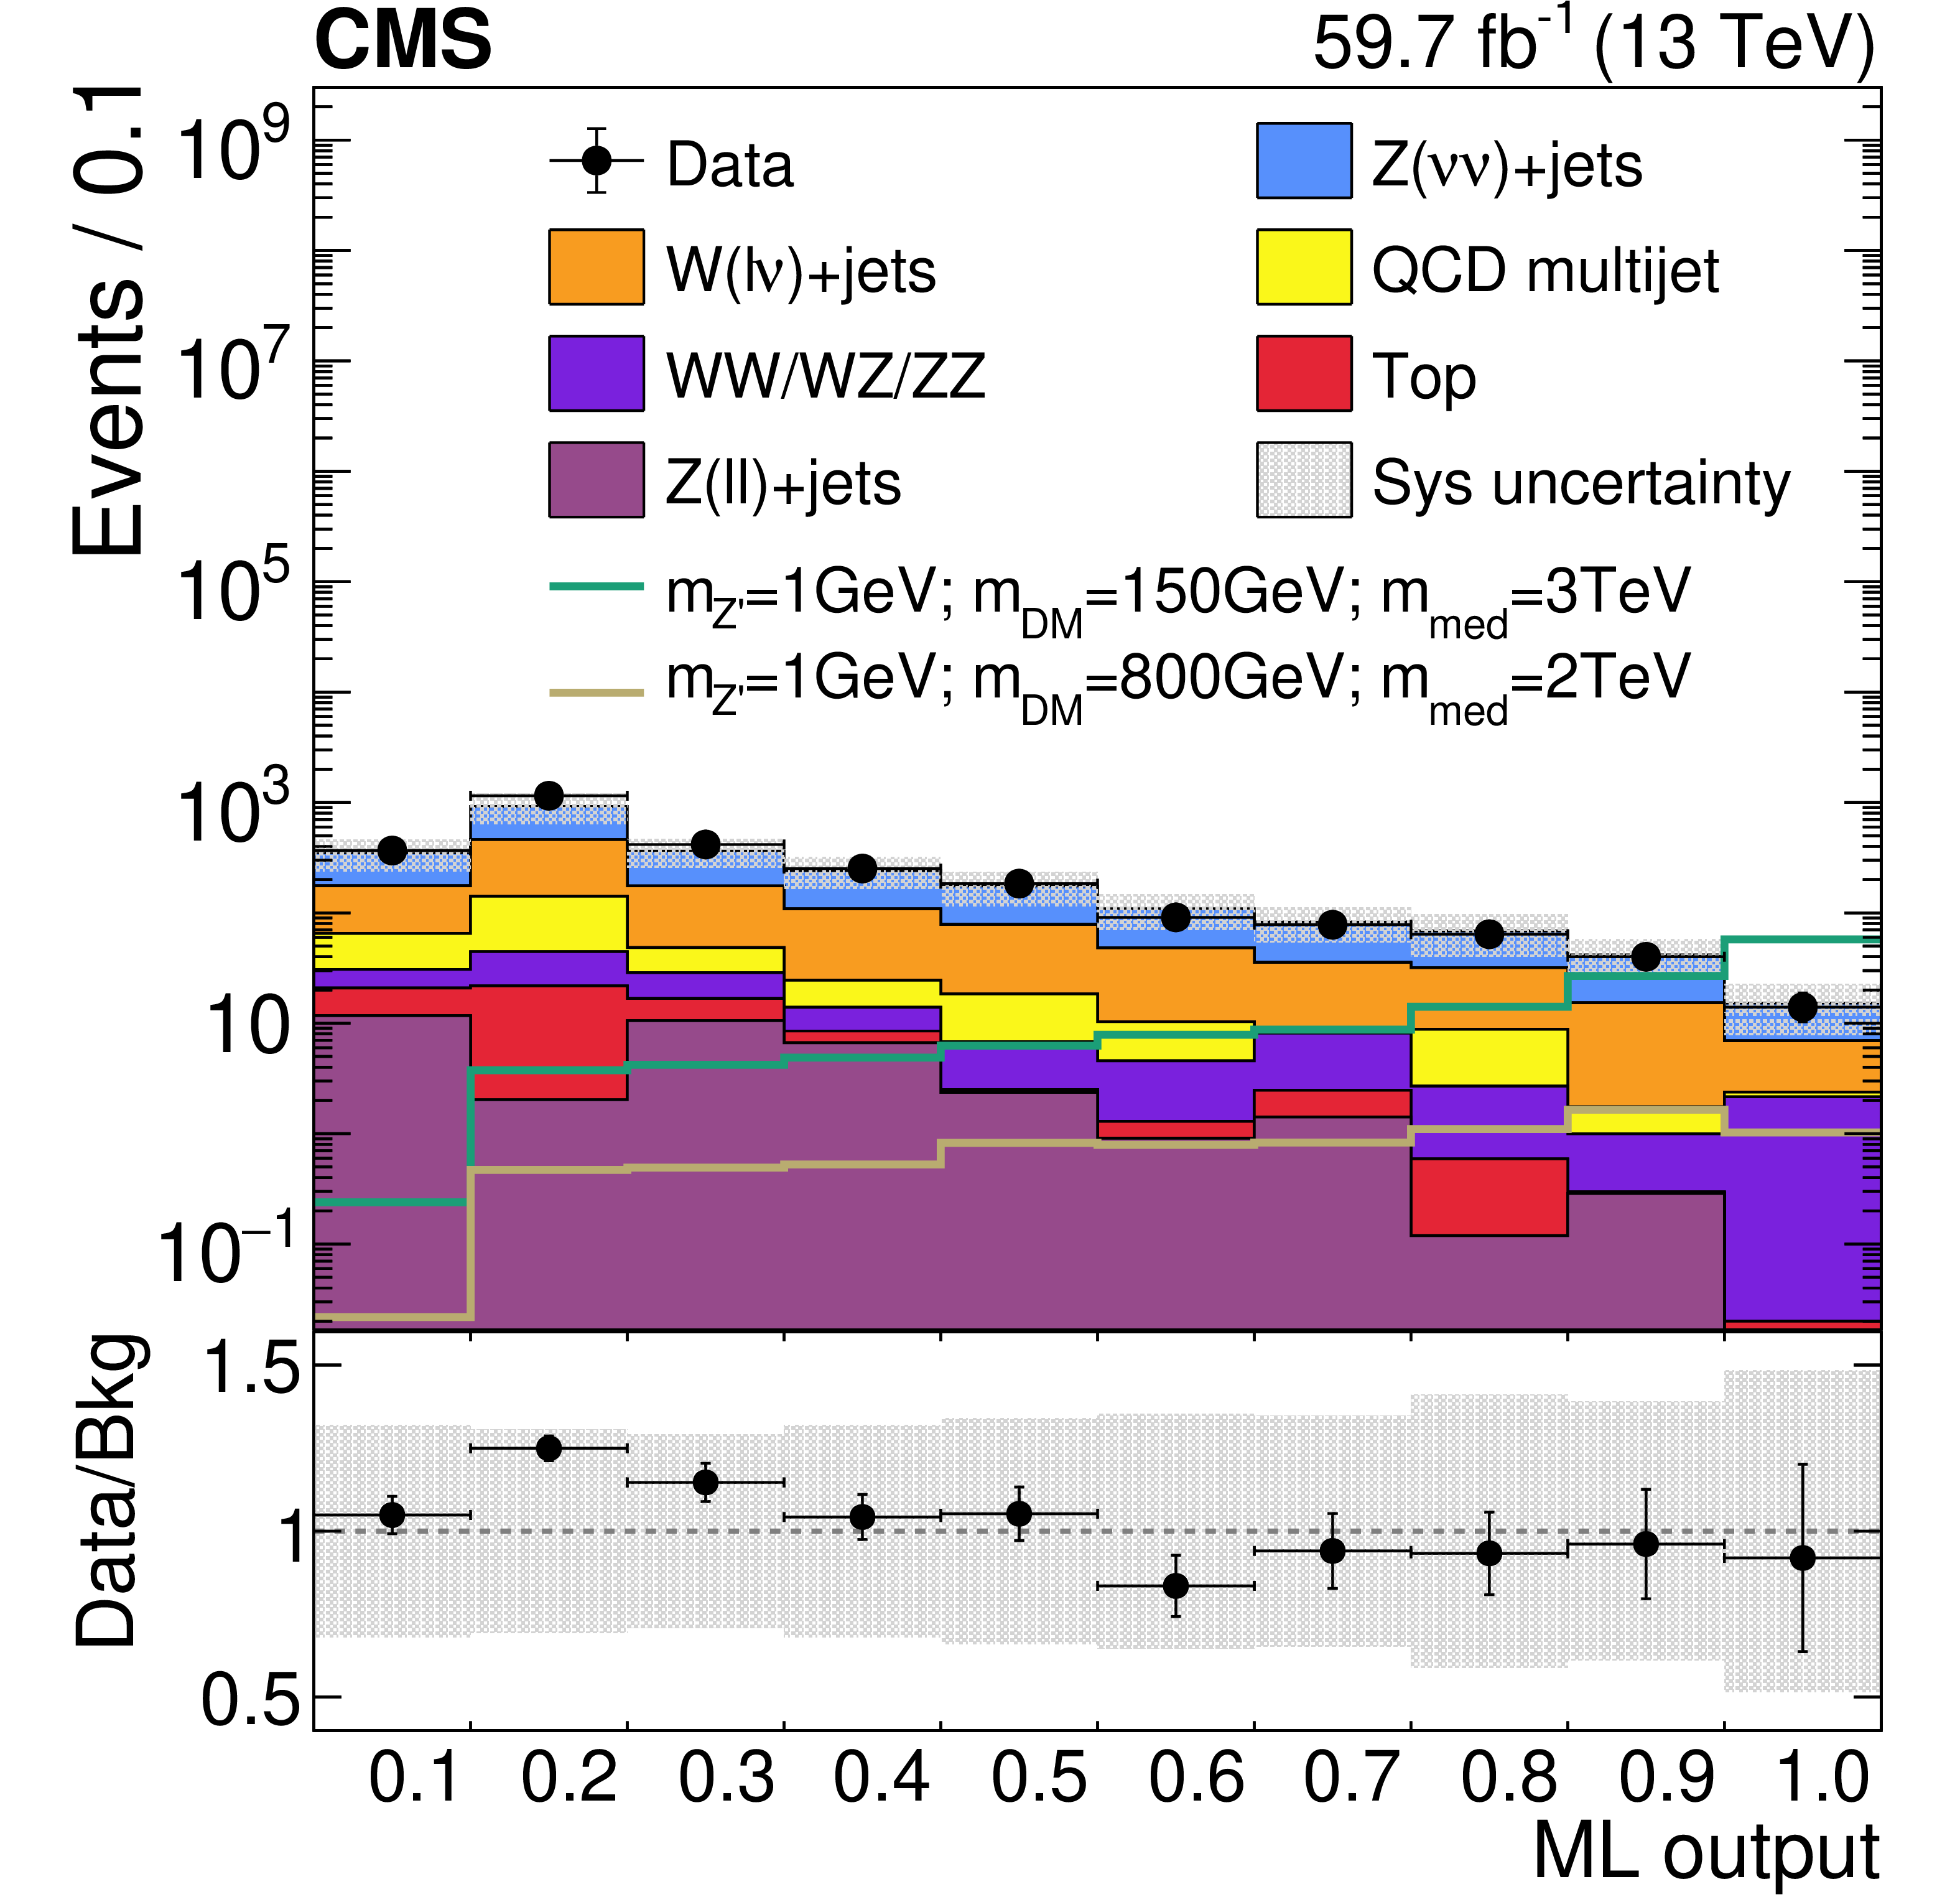
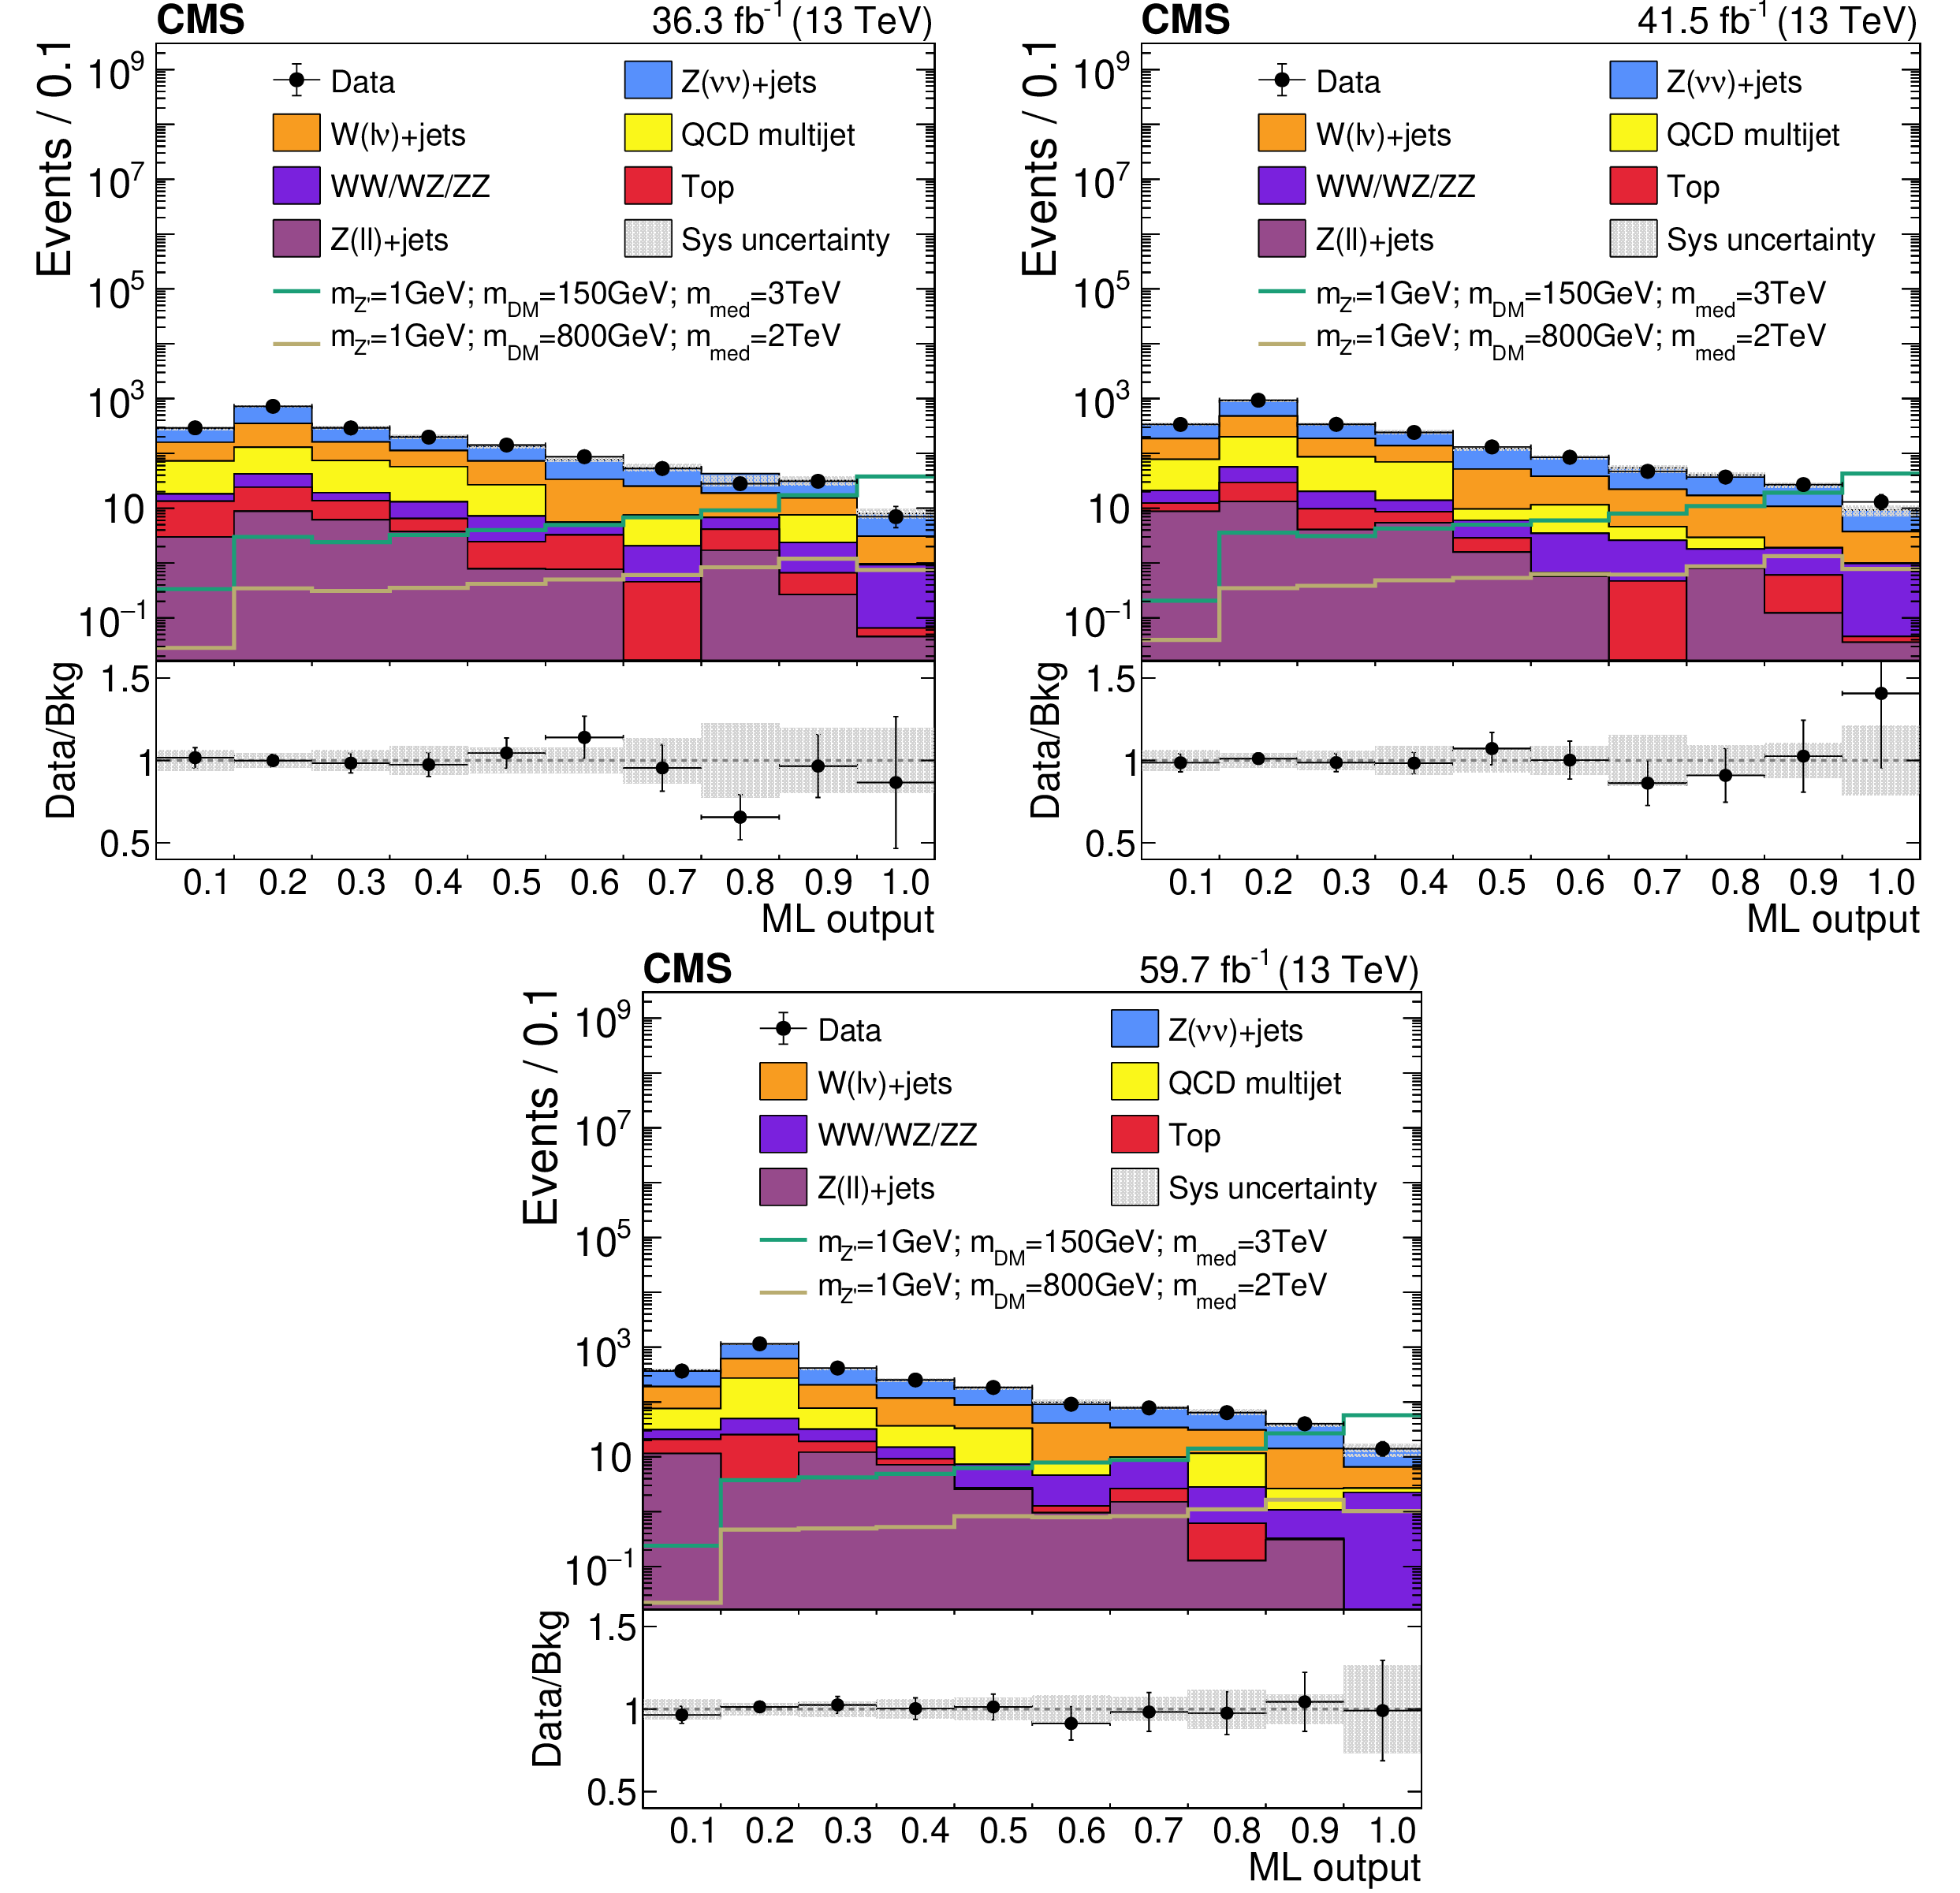
Pre-fit distributions of the ML output after full unblinding for the three data-taking periods: 2016 (upper-left), 2017 (upper-right), and 2018 (lower), comparing data with the total expected background. Distributions for two representative signal samples are overlaid, normalized to their expected theoretical cross sections. In the legend, ``Sys uncertainty" denotes total systematic uncertainties. The bottom pad in each plot shows the ratio of data to the predicted background, with the gray band indicating the pre-fit uncertainty. |
png pdf |
Figure 5-a:
Pre-fit distributions of the ML output after full unblinding for the three data-taking periods: 2016 (upper-left), 2017 (upper-right), and 2018 (lower), comparing data with the total expected background. Distributions for two representative signal samples are overlaid, normalized to their expected theoretical cross sections. In the legend, ``Sys uncertainty" denotes total systematic uncertainties. The bottom pad in each plot shows the ratio of data to the predicted background, with the gray band indicating the pre-fit uncertainty. |
png pdf |
Figure 5-b:
Pre-fit distributions of the ML output after full unblinding for the three data-taking periods: 2016 (upper-left), 2017 (upper-right), and 2018 (lower), comparing data with the total expected background. Distributions for two representative signal samples are overlaid, normalized to their expected theoretical cross sections. In the legend, ``Sys uncertainty" denotes total systematic uncertainties. The bottom pad in each plot shows the ratio of data to the predicted background, with the gray band indicating the pre-fit uncertainty. |
png pdf |
Figure 5-c:
Pre-fit distributions of the ML output after full unblinding for the three data-taking periods: 2016 (upper-left), 2017 (upper-right), and 2018 (lower), comparing data with the total expected background. Distributions for two representative signal samples are overlaid, normalized to their expected theoretical cross sections. In the legend, ``Sys uncertainty" denotes total systematic uncertainties. The bottom pad in each plot shows the ratio of data to the predicted background, with the gray band indicating the pre-fit uncertainty. |
png pdf |
Figure 6:
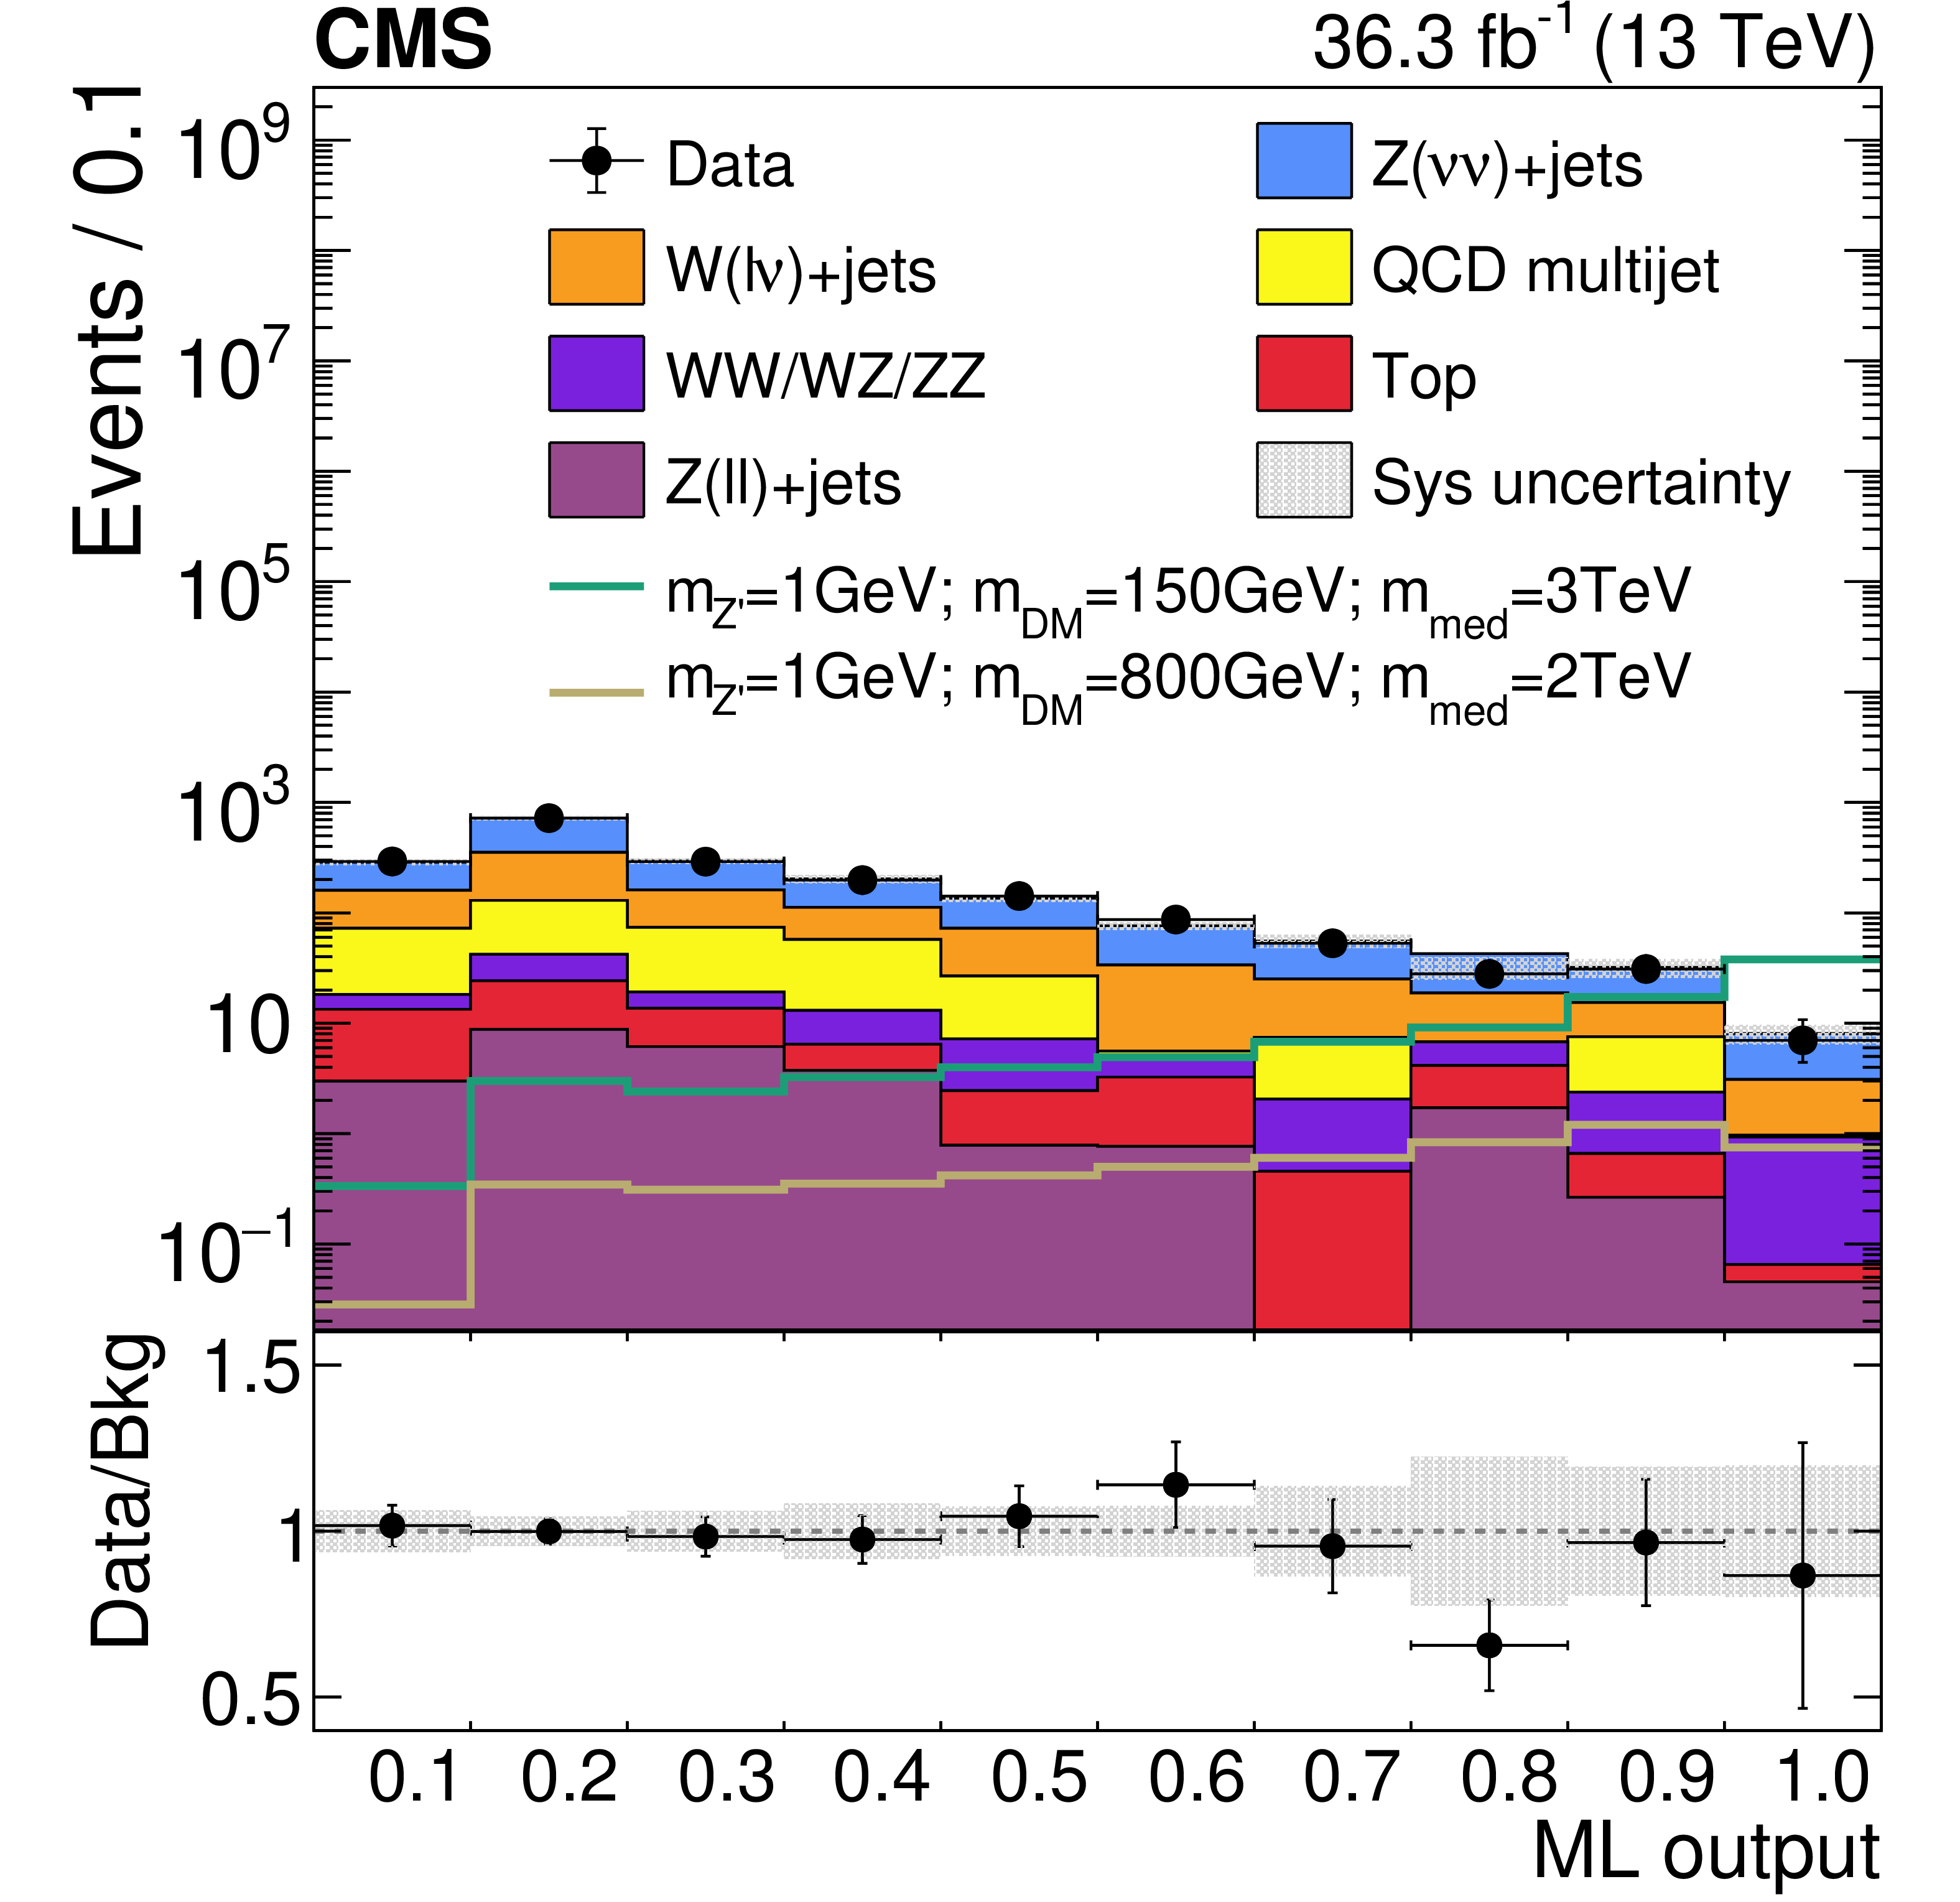
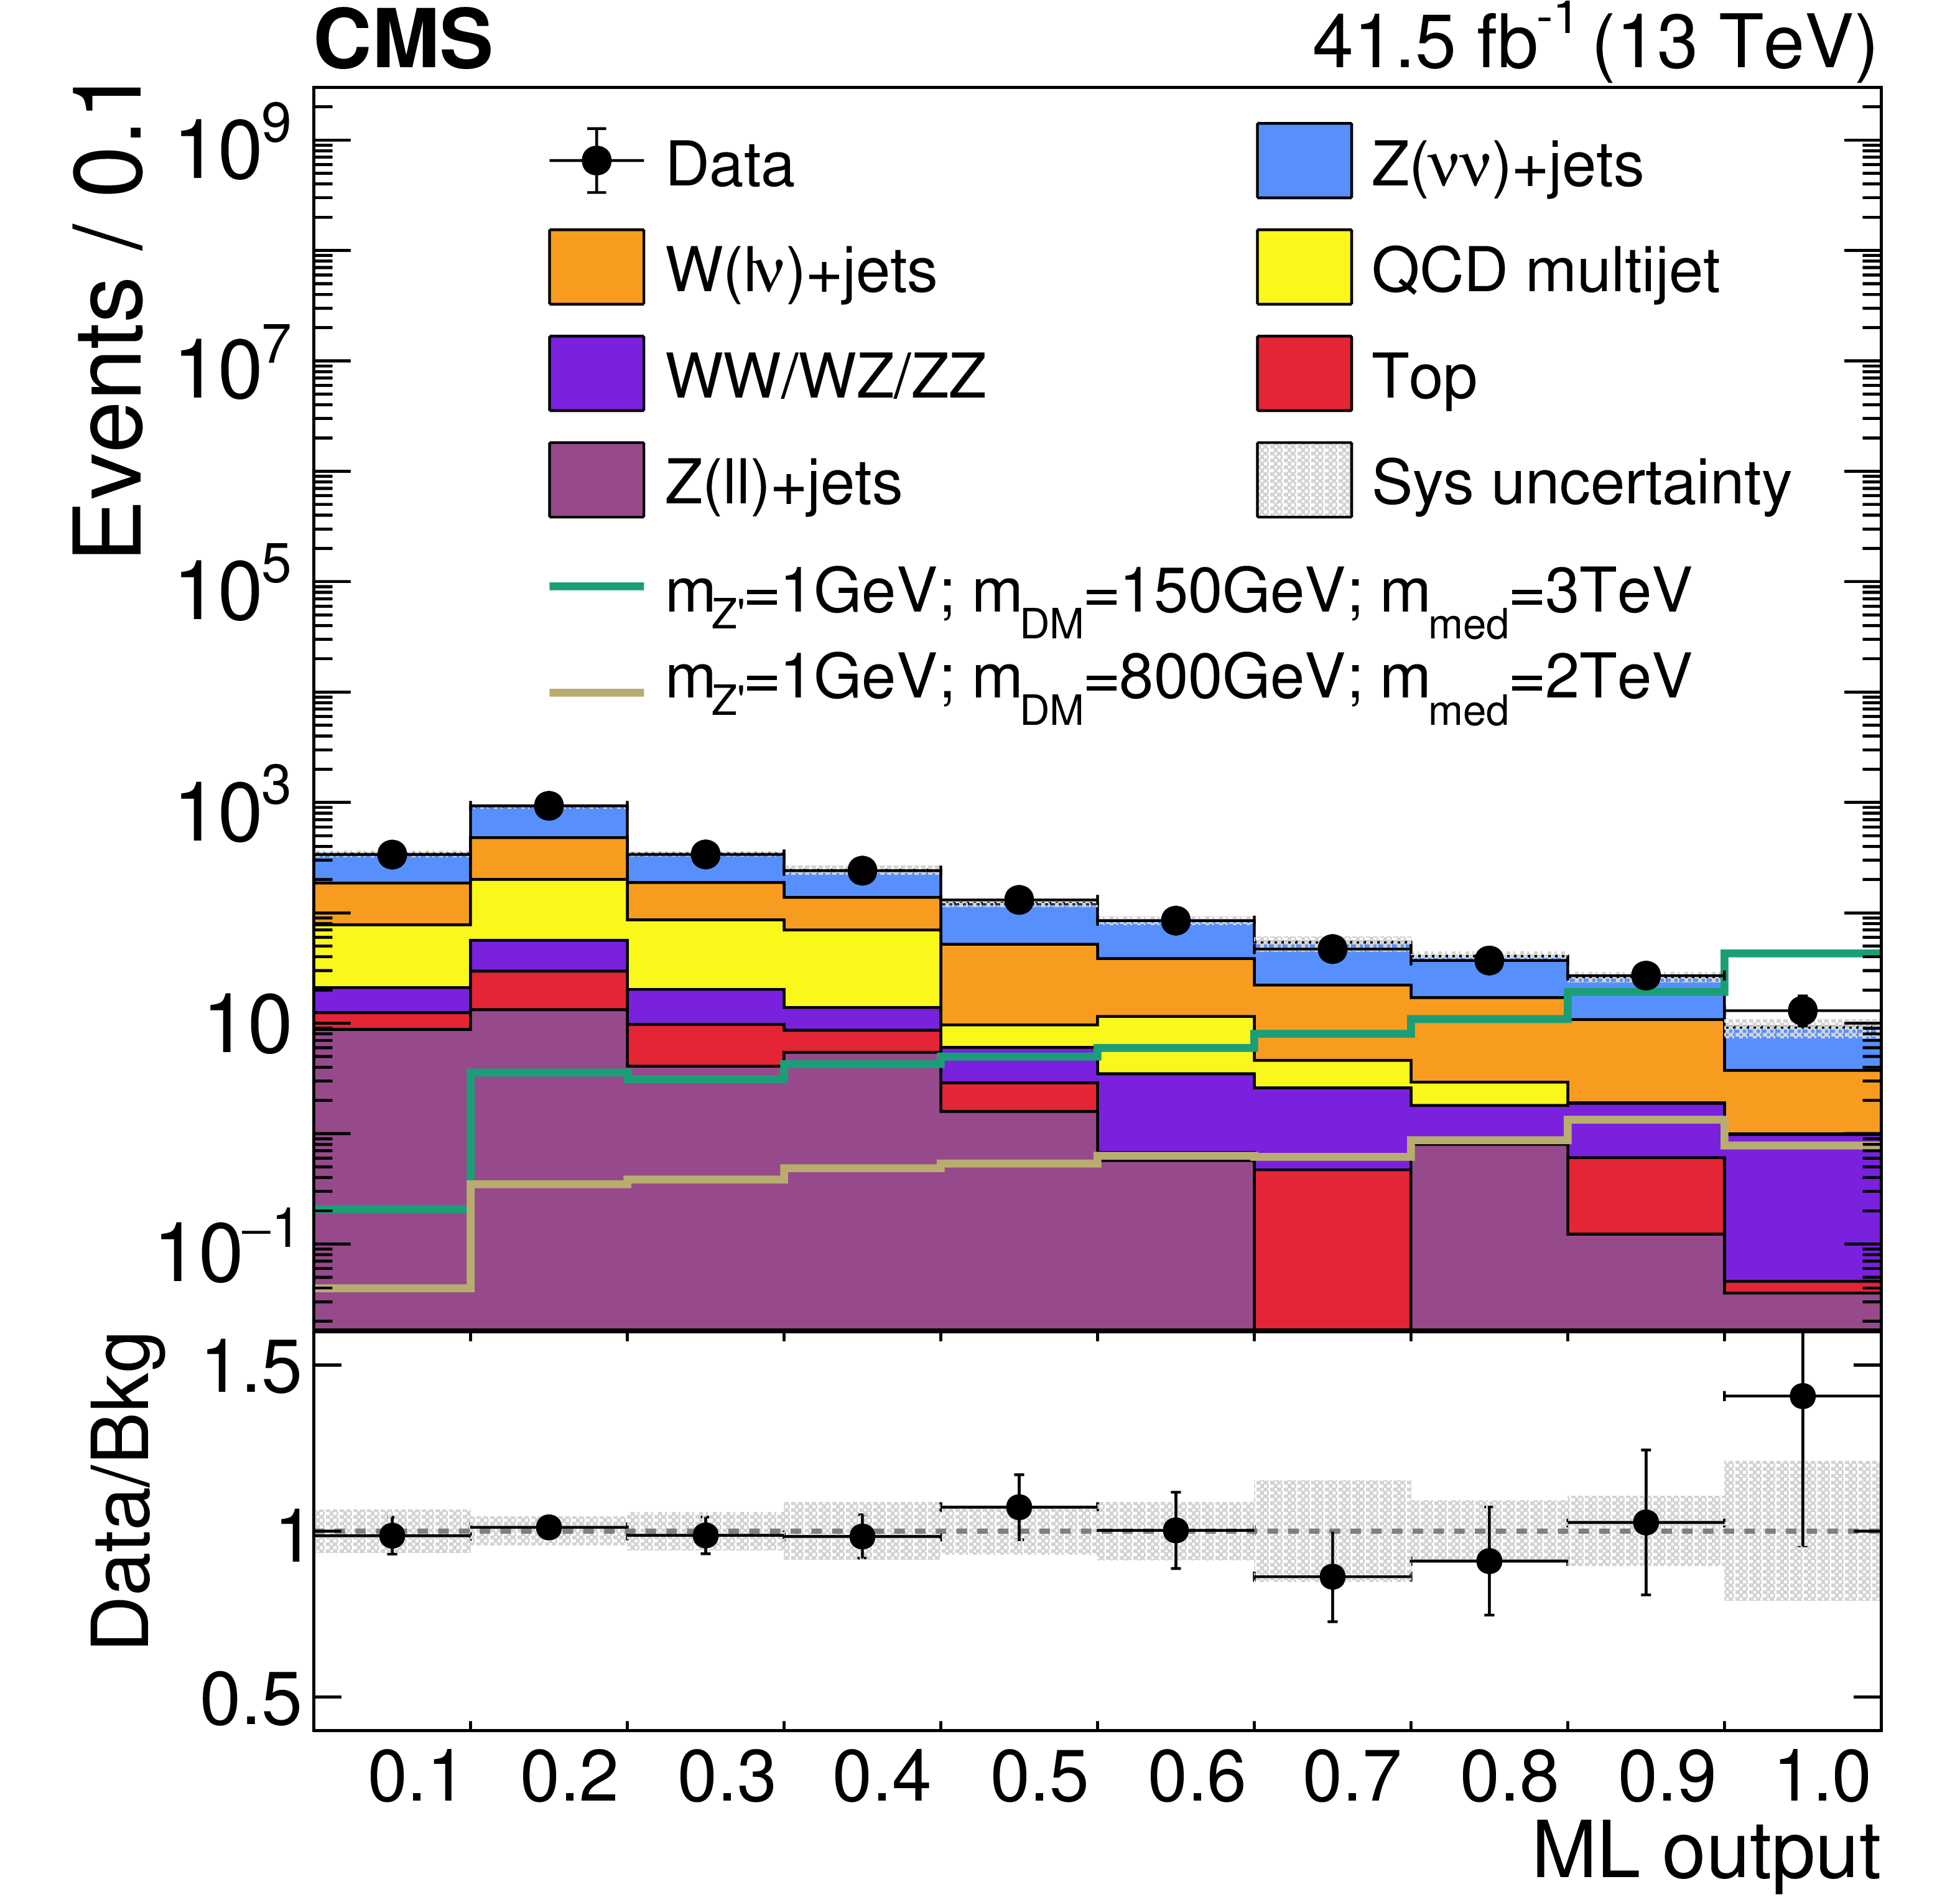
Post-fit distributions of the ML output for the three data-taking periods: 2016 (upper-left), 2017 (upper-right), and 2018 (lower), comparing data with the total expected background. Distributions for two representative signal samples are overlaid, normalized to their expected theoretical cross sections. In the legend, ``Sys uncertainty" denotes total systematic uncertainties. The bottom pad in each plot shows the ratio of data to the predicted background, with the gray band indicating the post-fit uncertainty. |
png pdf |
Figure 6-a:
Post-fit distributions of the ML output for the three data-taking periods: 2016 (upper-left), 2017 (upper-right), and 2018 (lower), comparing data with the total expected background. Distributions for two representative signal samples are overlaid, normalized to their expected theoretical cross sections. In the legend, ``Sys uncertainty" denotes total systematic uncertainties. The bottom pad in each plot shows the ratio of data to the predicted background, with the gray band indicating the post-fit uncertainty. |
png pdf |
Figure 6-b:
Post-fit distributions of the ML output for the three data-taking periods: 2016 (upper-left), 2017 (upper-right), and 2018 (lower), comparing data with the total expected background. Distributions for two representative signal samples are overlaid, normalized to their expected theoretical cross sections. In the legend, ``Sys uncertainty" denotes total systematic uncertainties. The bottom pad in each plot shows the ratio of data to the predicted background, with the gray band indicating the post-fit uncertainty. |
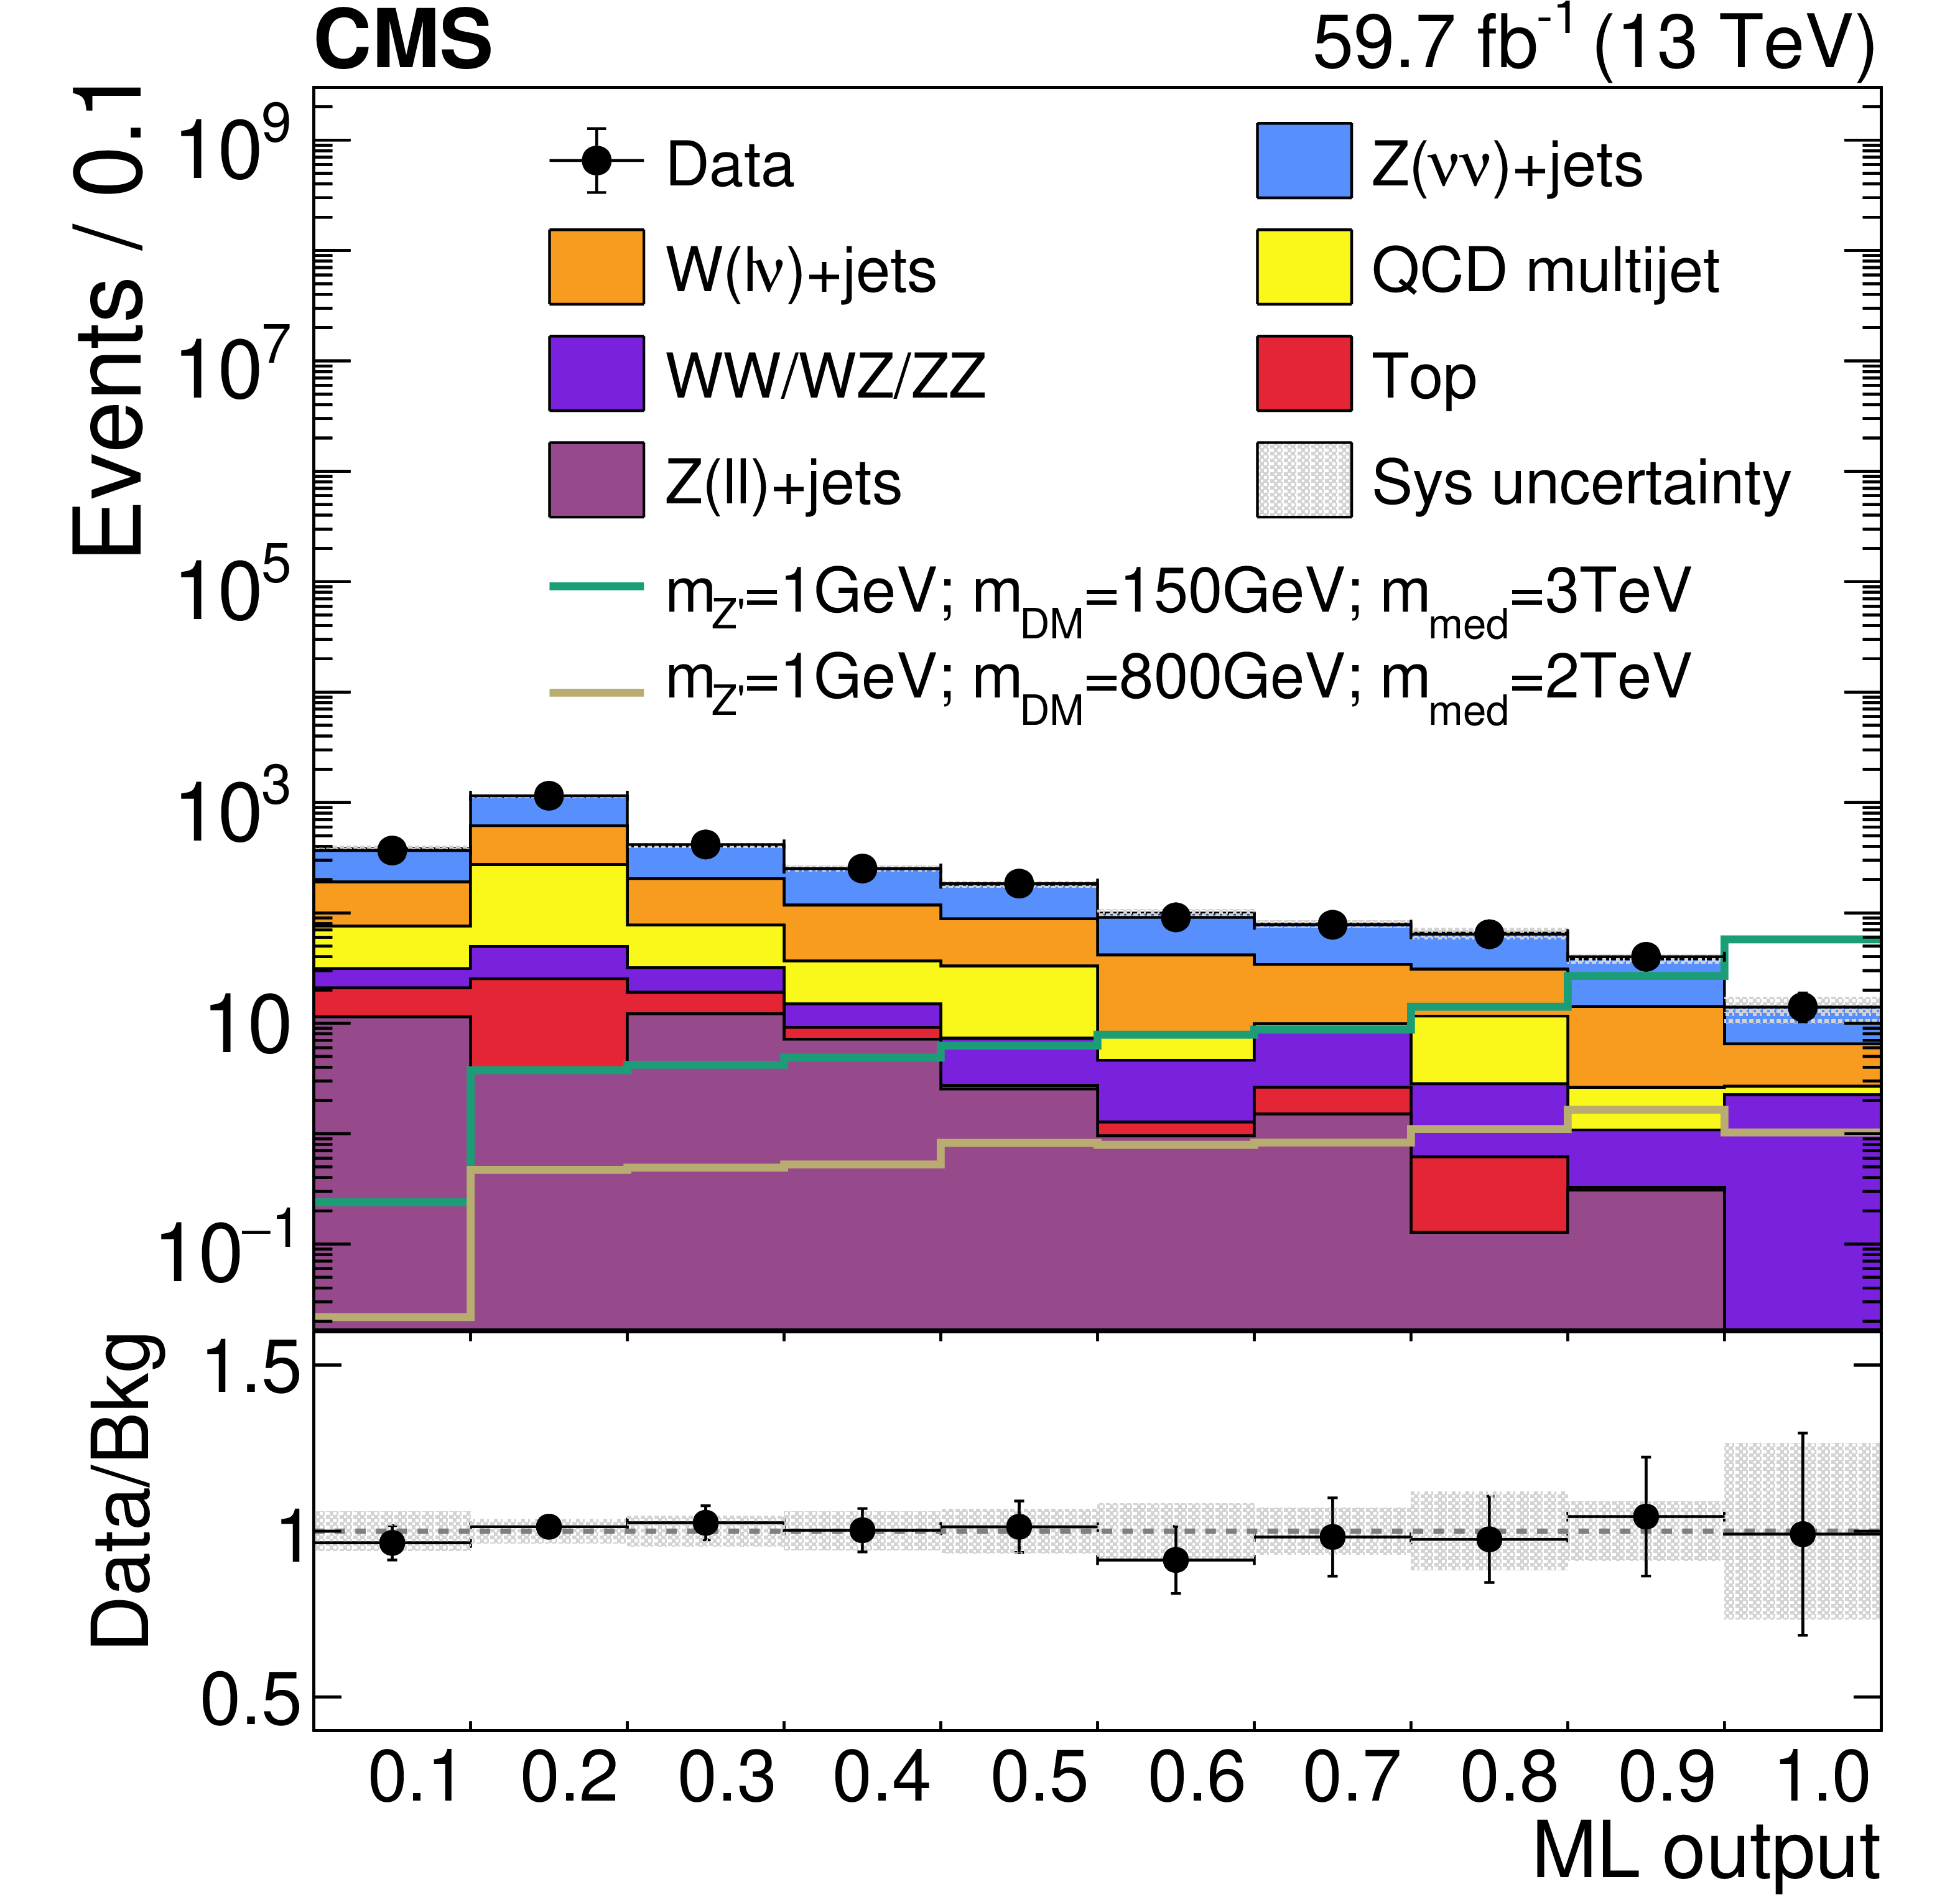
png pdf |
Figure 6-c:
Post-fit distributions of the ML output for the three data-taking periods: 2016 (upper-left), 2017 (upper-right), and 2018 (lower), comparing data with the total expected background. Distributions for two representative signal samples are overlaid, normalized to their expected theoretical cross sections. In the legend, ``Sys uncertainty" denotes total systematic uncertainties. The bottom pad in each plot shows the ratio of data to the predicted background, with the gray band indicating the post-fit uncertainty. |
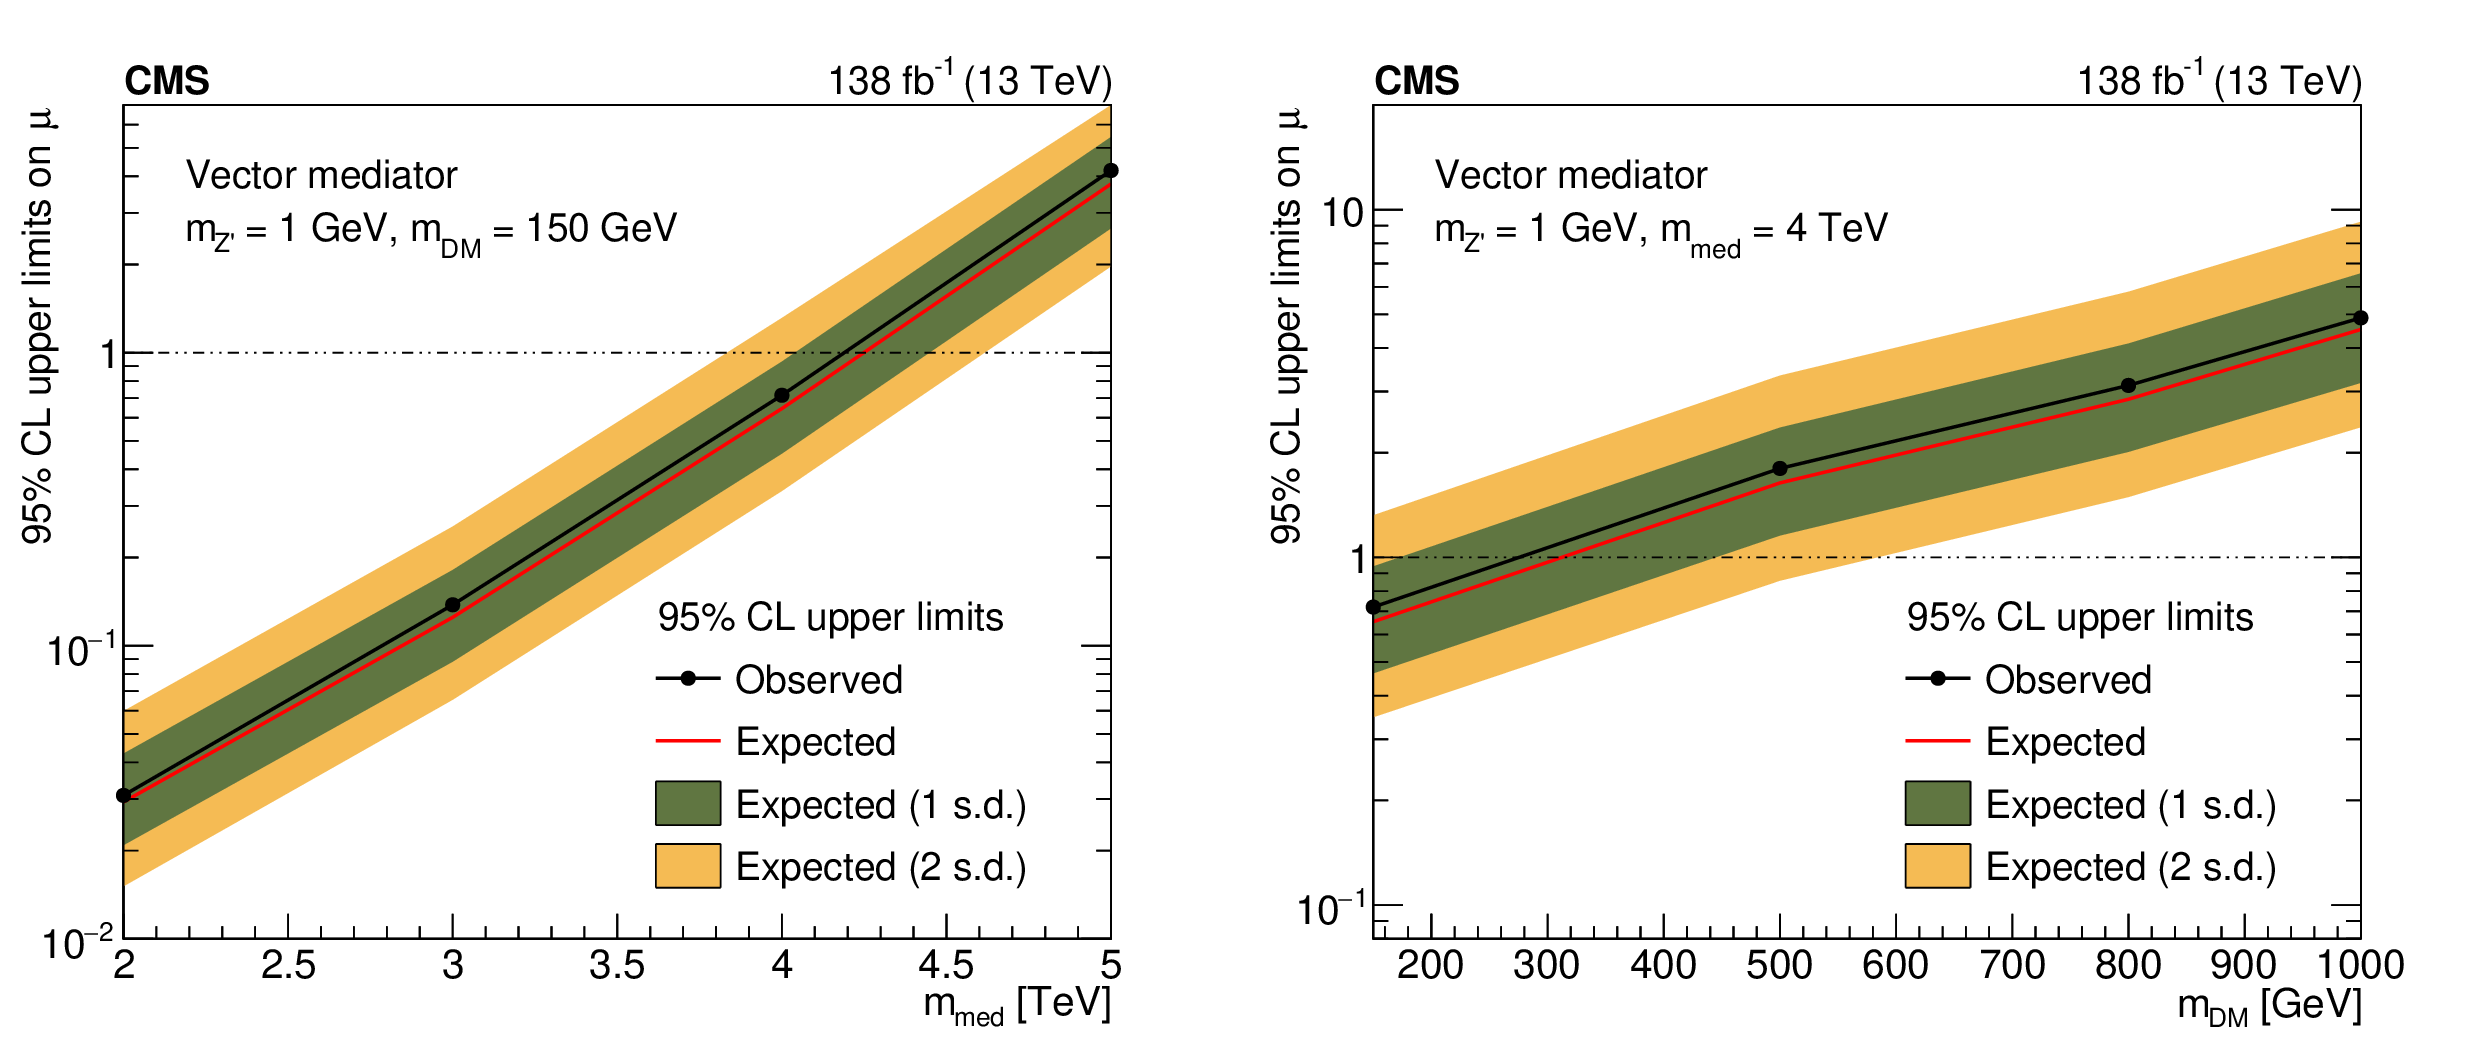
png pdf |
Figure 7:
The 95% CL upper limits on $ \mu = {\sigma}/{\sigma_{\text{theory}}} $ for the vector mediator with $ m_{\mathrm{Z}^{'}} = $ 1 GeV. The left panel shows the limits as a function of the mediator mass, $ m_{\mathrm{med}} $ for a fixed dark matter mass of $ m_{\mathrm{DM}}= $ 150 GeV, while the right panel shows the limits as a function of the dark matter mass, $ m_{\mathrm{DM}} $ for a fixed mediator mass of $ m_{\mathrm{med}} = $ 4 TeV. A linear interpolation is applied between the available mass points. The inner (green) and outer (yellow) bands correspond to the 1 and 2 standard deviations (s.d.), respectively, of the expected limits under the background-only hypothesis. |
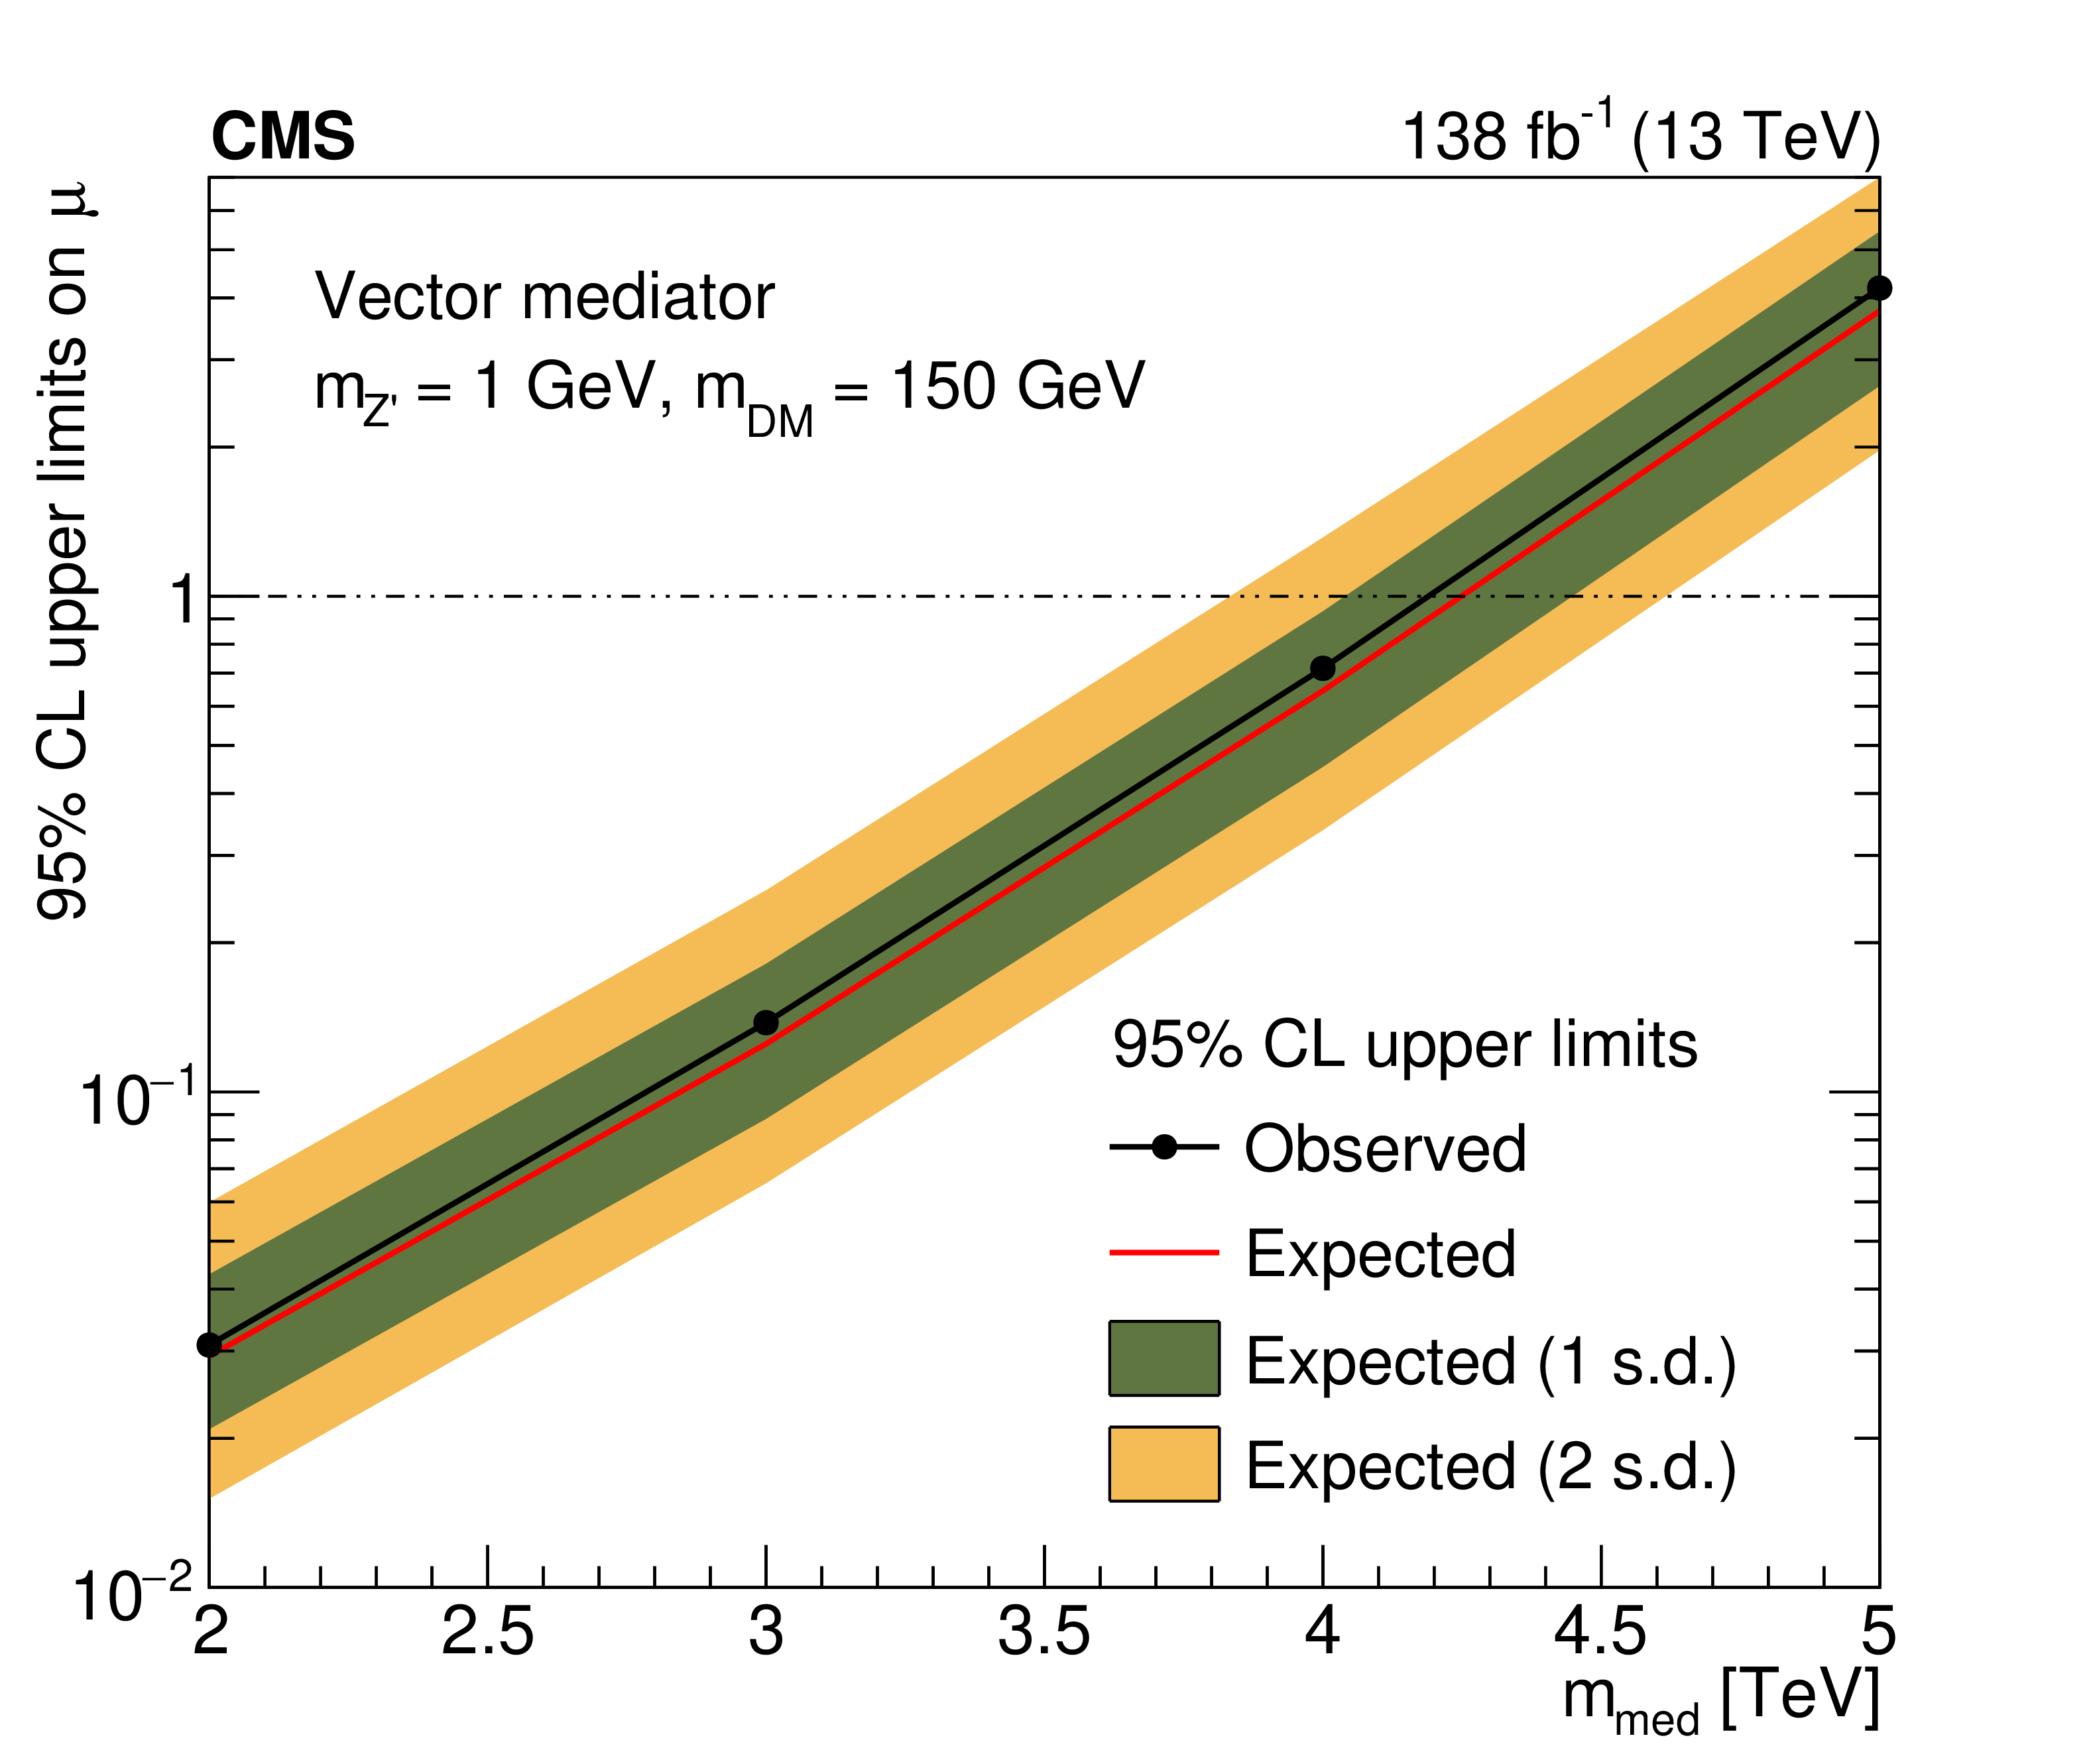
png pdf |
Figure 7-a:
The 95% CL upper limits on $ \mu = {\sigma}/{\sigma_{\text{theory}}} $ for the vector mediator with $ m_{\mathrm{Z}^{'}} = $ 1 GeV. The left panel shows the limits as a function of the mediator mass, $ m_{\mathrm{med}} $ for a fixed dark matter mass of $ m_{\mathrm{DM}}= $ 150 GeV, while the right panel shows the limits as a function of the dark matter mass, $ m_{\mathrm{DM}} $ for a fixed mediator mass of $ m_{\mathrm{med}} = $ 4 TeV. A linear interpolation is applied between the available mass points. The inner (green) and outer (yellow) bands correspond to the 1 and 2 standard deviations (s.d.), respectively, of the expected limits under the background-only hypothesis. |
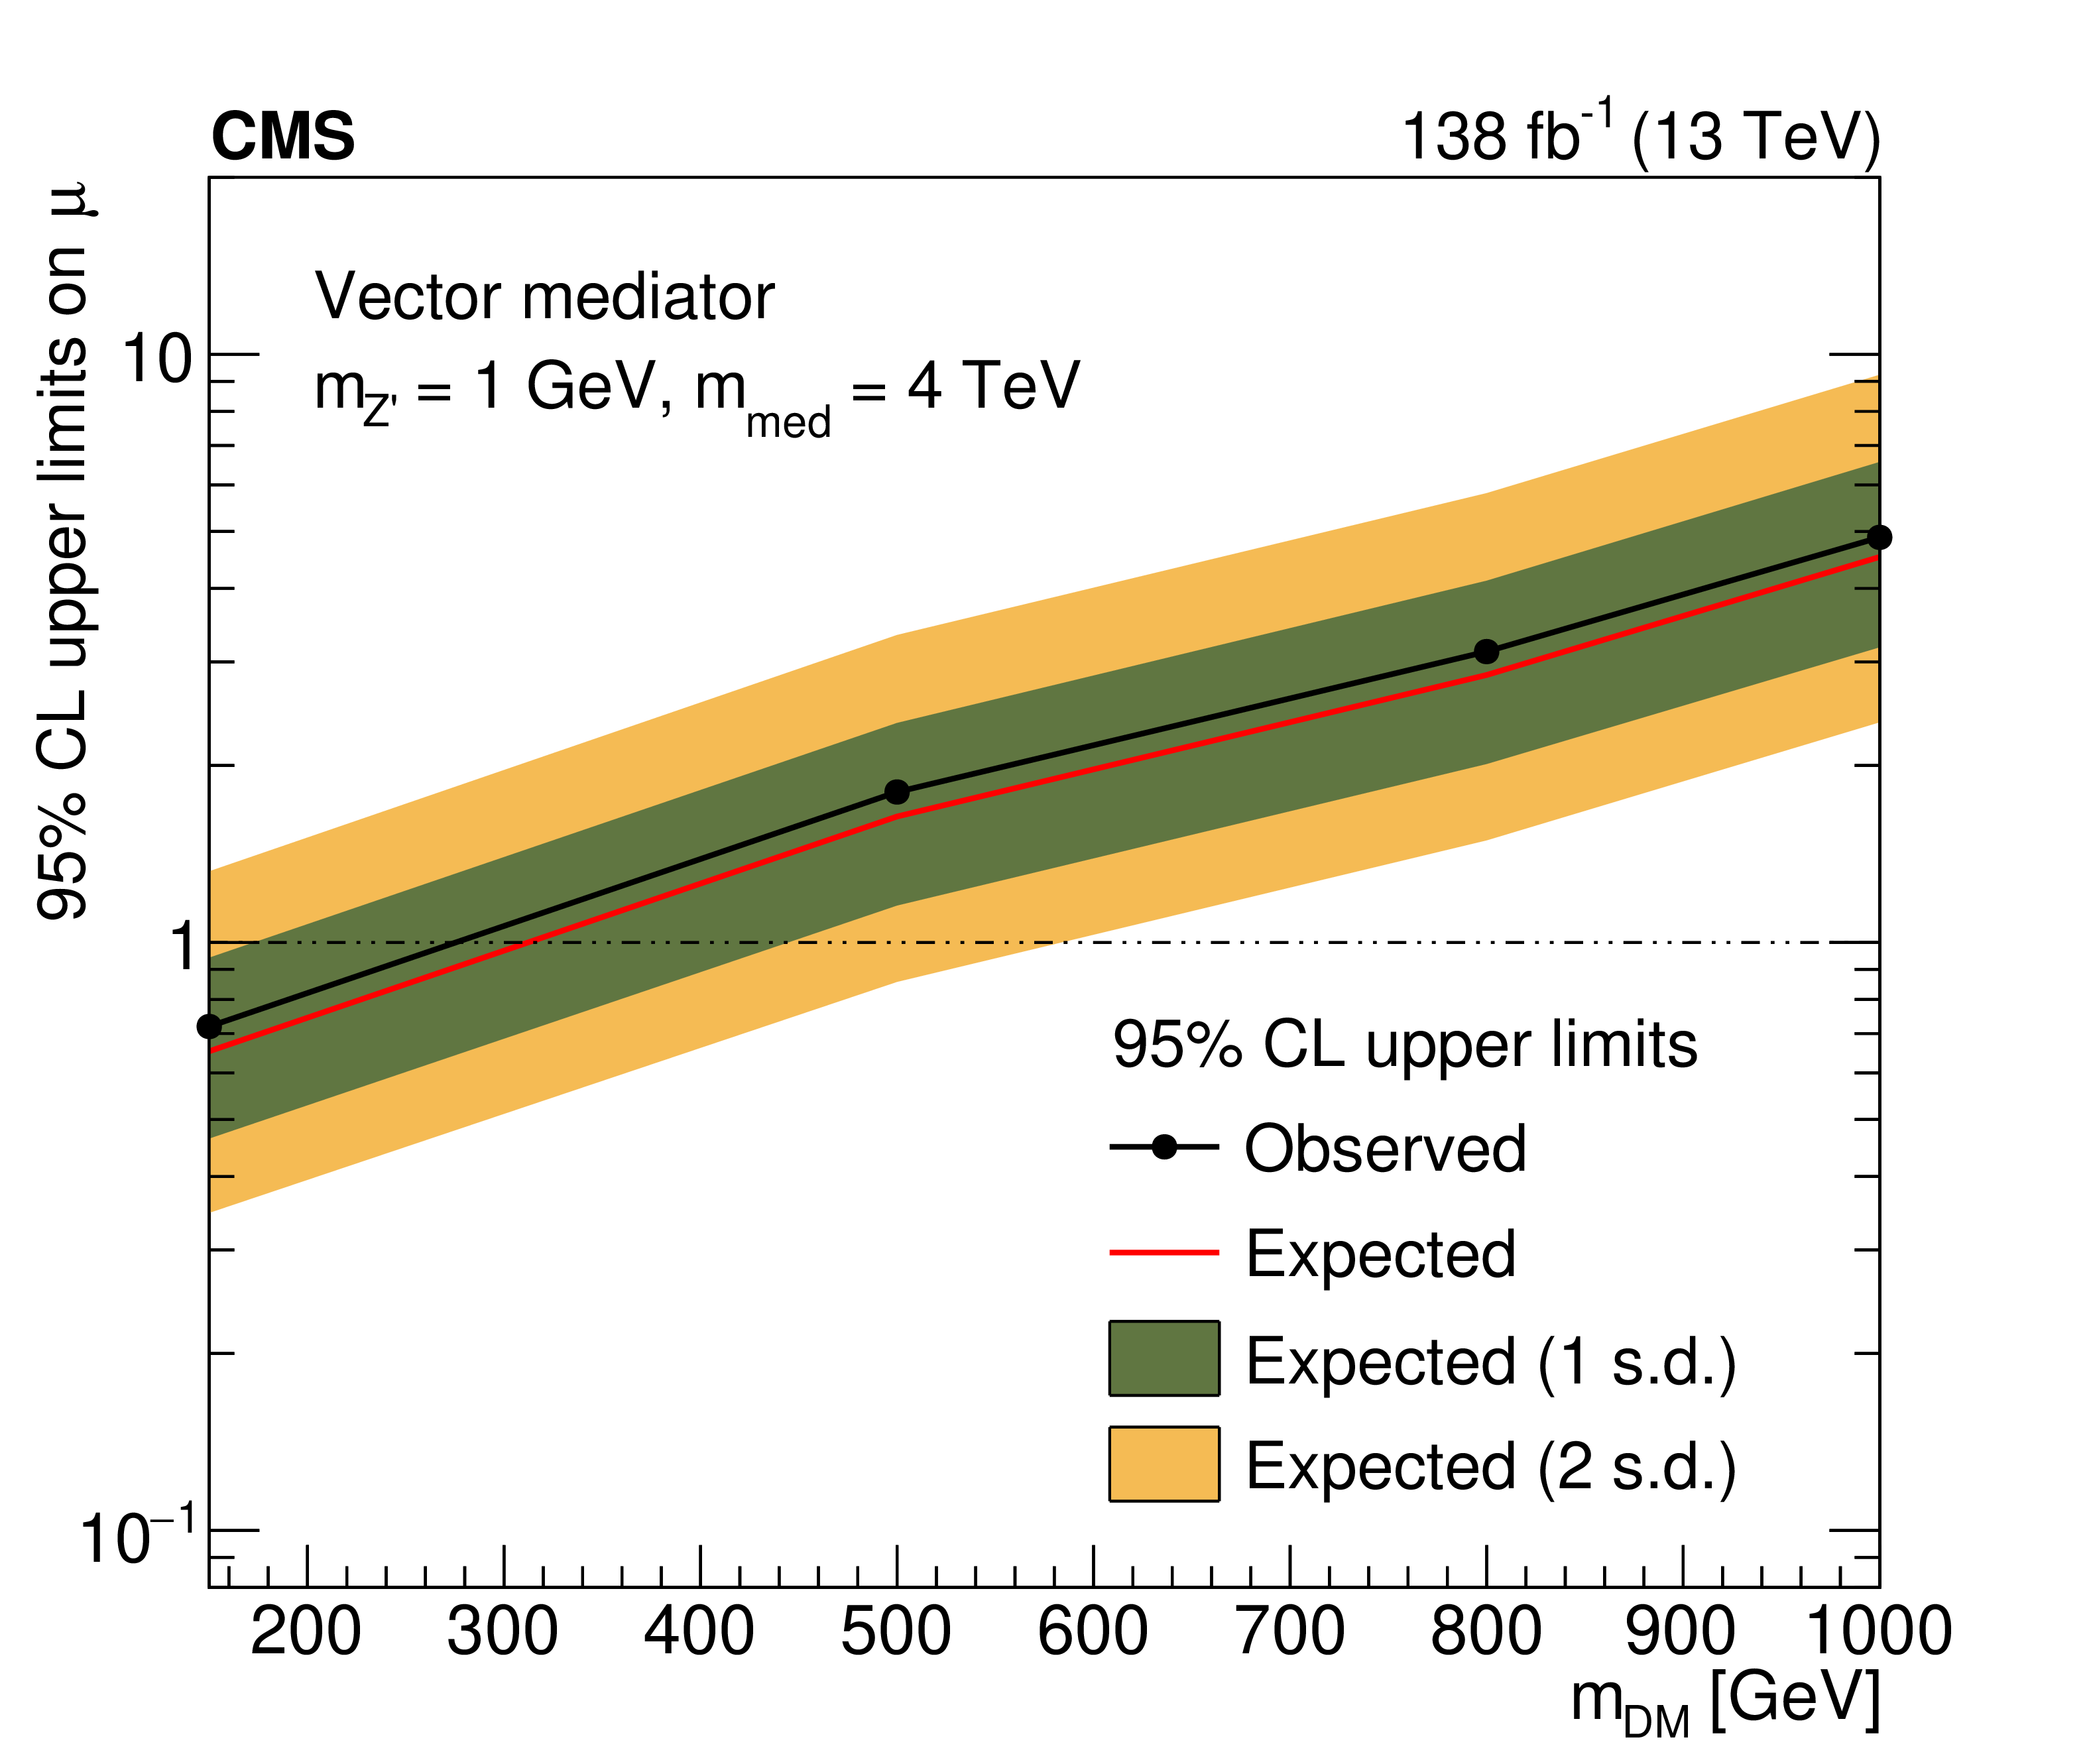
png pdf |
Figure 7-b:
The 95% CL upper limits on $ \mu = {\sigma}/{\sigma_{\text{theory}}} $ for the vector mediator with $ m_{\mathrm{Z}^{'}} = $ 1 GeV. The left panel shows the limits as a function of the mediator mass, $ m_{\mathrm{med}} $ for a fixed dark matter mass of $ m_{\mathrm{DM}}= $ 150 GeV, while the right panel shows the limits as a function of the dark matter mass, $ m_{\mathrm{DM}} $ for a fixed mediator mass of $ m_{\mathrm{med}} = $ 4 TeV. A linear interpolation is applied between the available mass points. The inner (green) and outer (yellow) bands correspond to the 1 and 2 standard deviations (s.d.), respectively, of the expected limits under the background-only hypothesis. |
png pdf |
Figure 8:
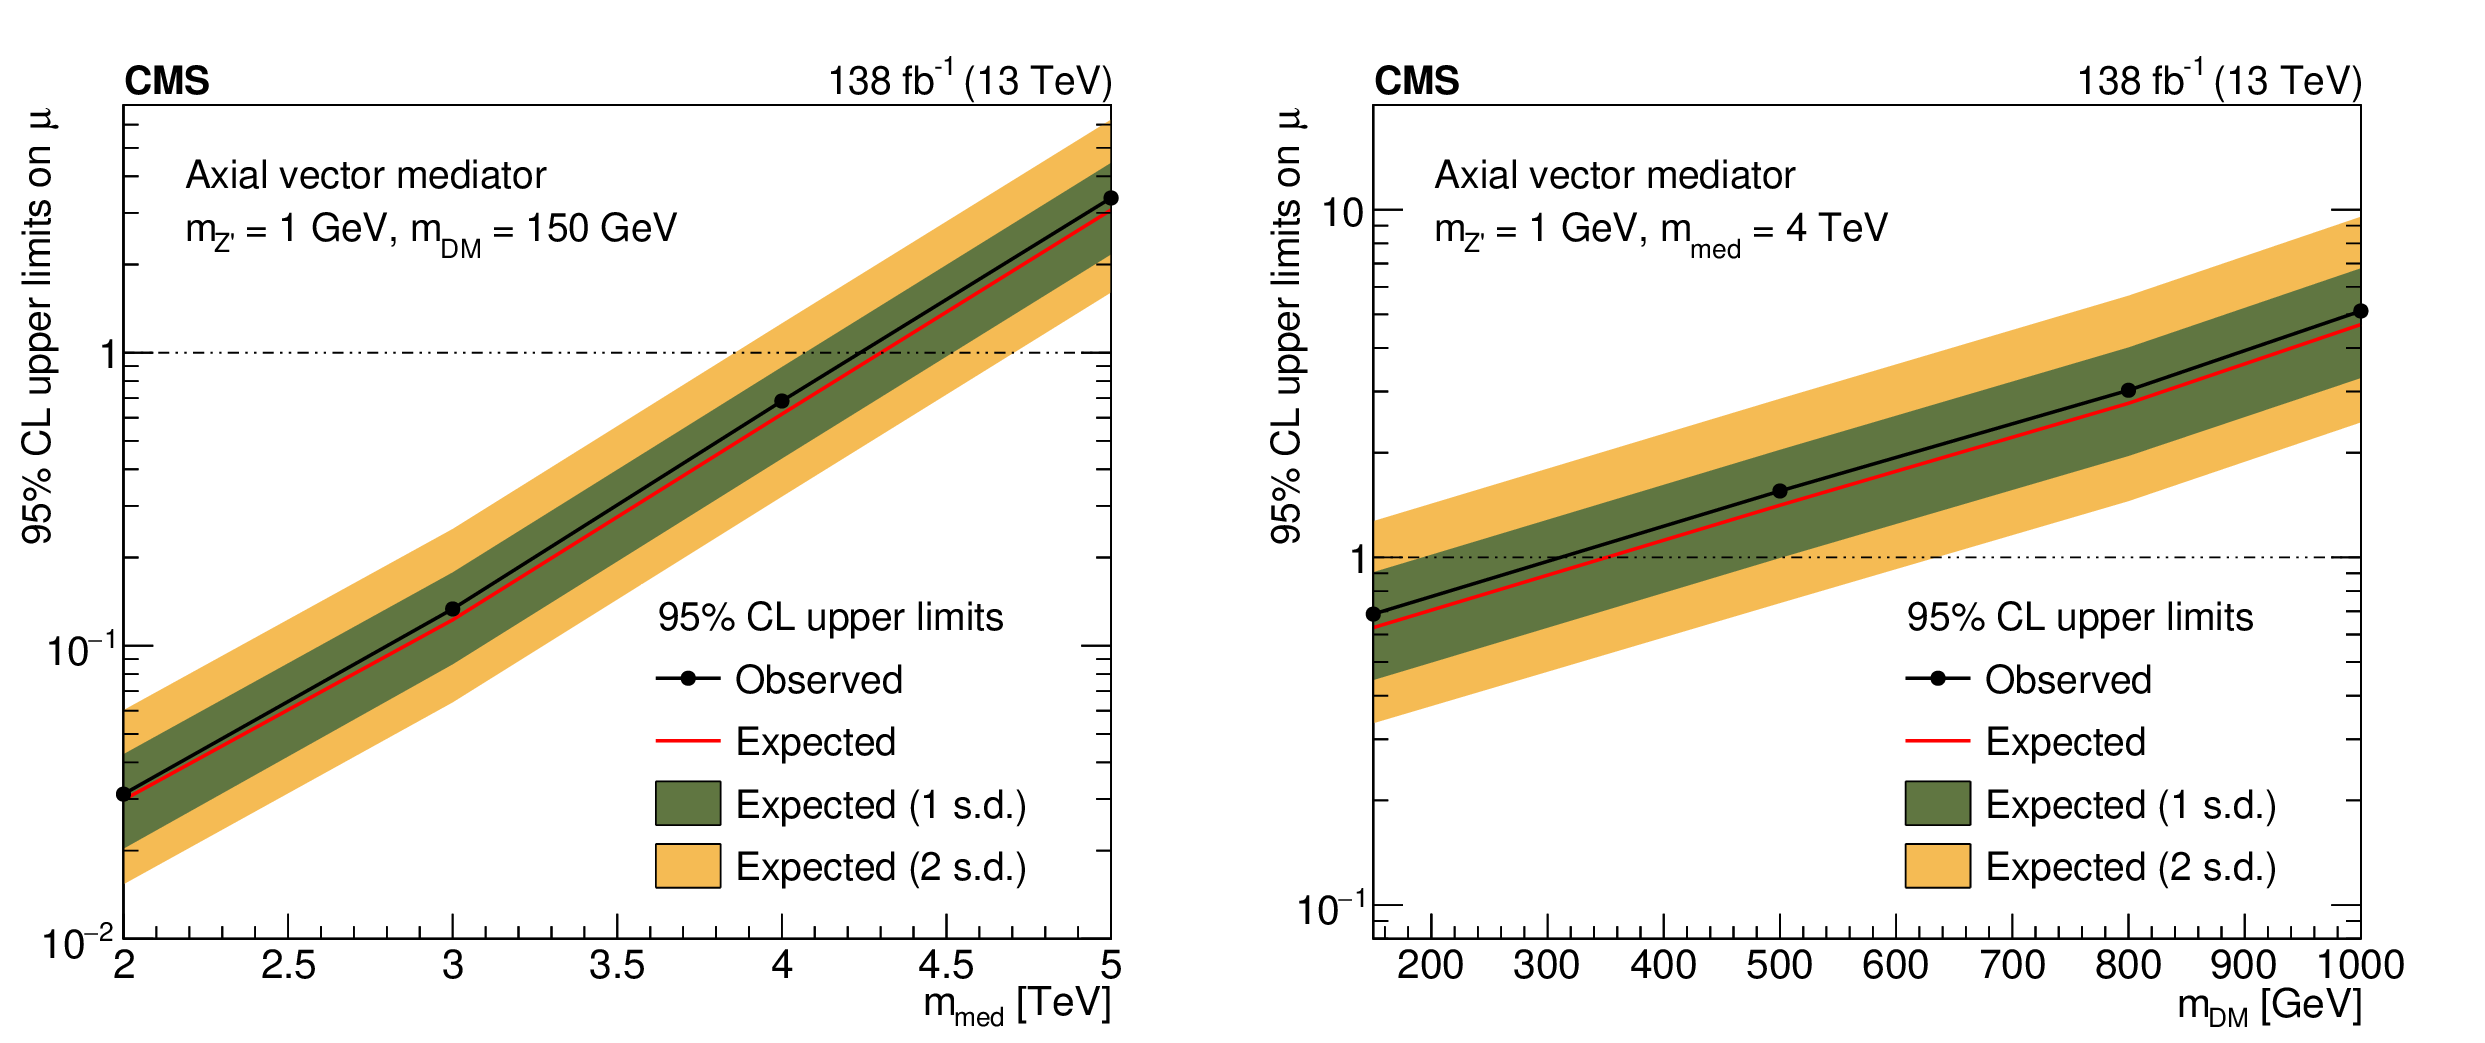
The 95% CL upper limits on $ \mu = {\sigma}/{\sigma_{\text{theory}}} $ for the axial vector mediator with $ m_{\mathrm{Z}^{'}} = $ 1 GeV. The left panel shows the limits as a function of the mediator mass, $ m_{\mathrm{med}} $ for a fixed dark matter mass of $ m_{\mathrm{DM}}= $ 150 GeV, while the right panel shows the limits as a function of the dark matter mass, $ m_{\mathrm{DM}} $ for a fixed mediator mass of $ m_{\mathrm{med}} = $ 4 TeV. A linear interpolation is applied between the available mass points. The inner (green) and outer (yellow) bands correspond to the 1 and 2 standard deviations (s.d.), respectively, of the expected limits under the background-only hypothesis. |
png pdf |
Figure 8-a:
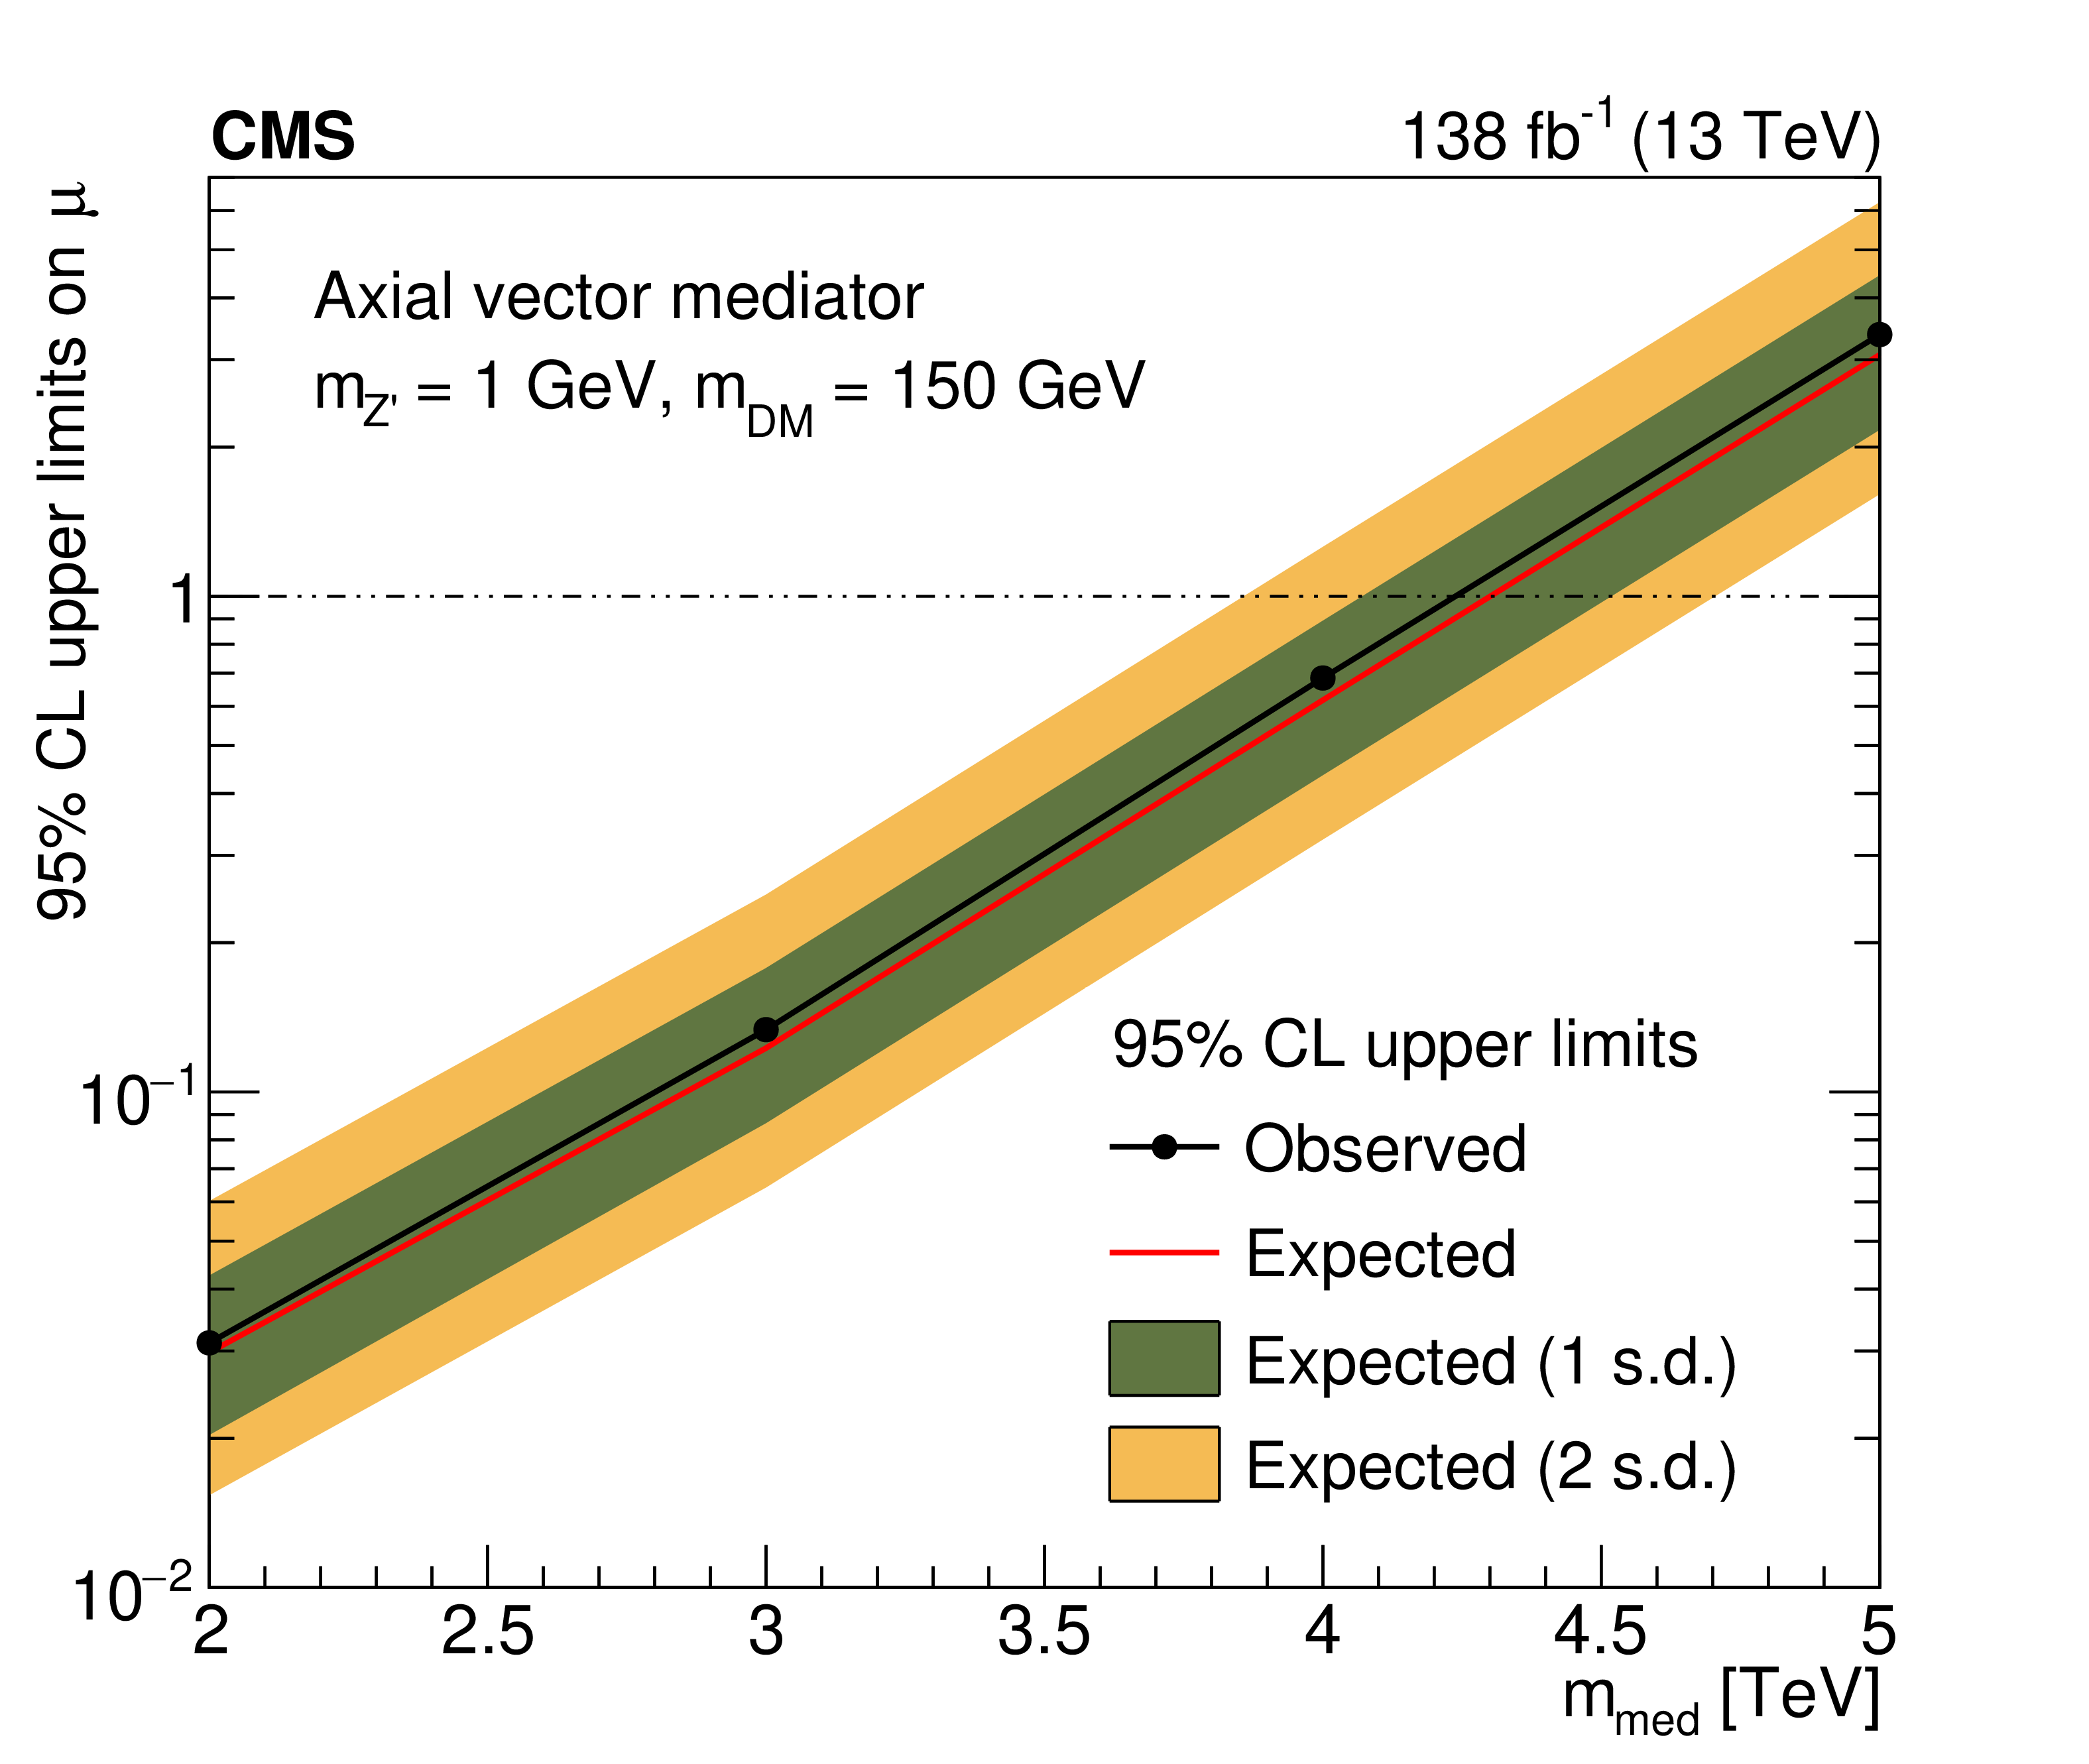
The 95% CL upper limits on $ \mu = {\sigma}/{\sigma_{\text{theory}}} $ for the axial vector mediator with $ m_{\mathrm{Z}^{'}} = $ 1 GeV. The left panel shows the limits as a function of the mediator mass, $ m_{\mathrm{med}} $ for a fixed dark matter mass of $ m_{\mathrm{DM}}= $ 150 GeV, while the right panel shows the limits as a function of the dark matter mass, $ m_{\mathrm{DM}} $ for a fixed mediator mass of $ m_{\mathrm{med}} = $ 4 TeV. A linear interpolation is applied between the available mass points. The inner (green) and outer (yellow) bands correspond to the 1 and 2 standard deviations (s.d.), respectively, of the expected limits under the background-only hypothesis. |
png pdf |
Figure 8-b:
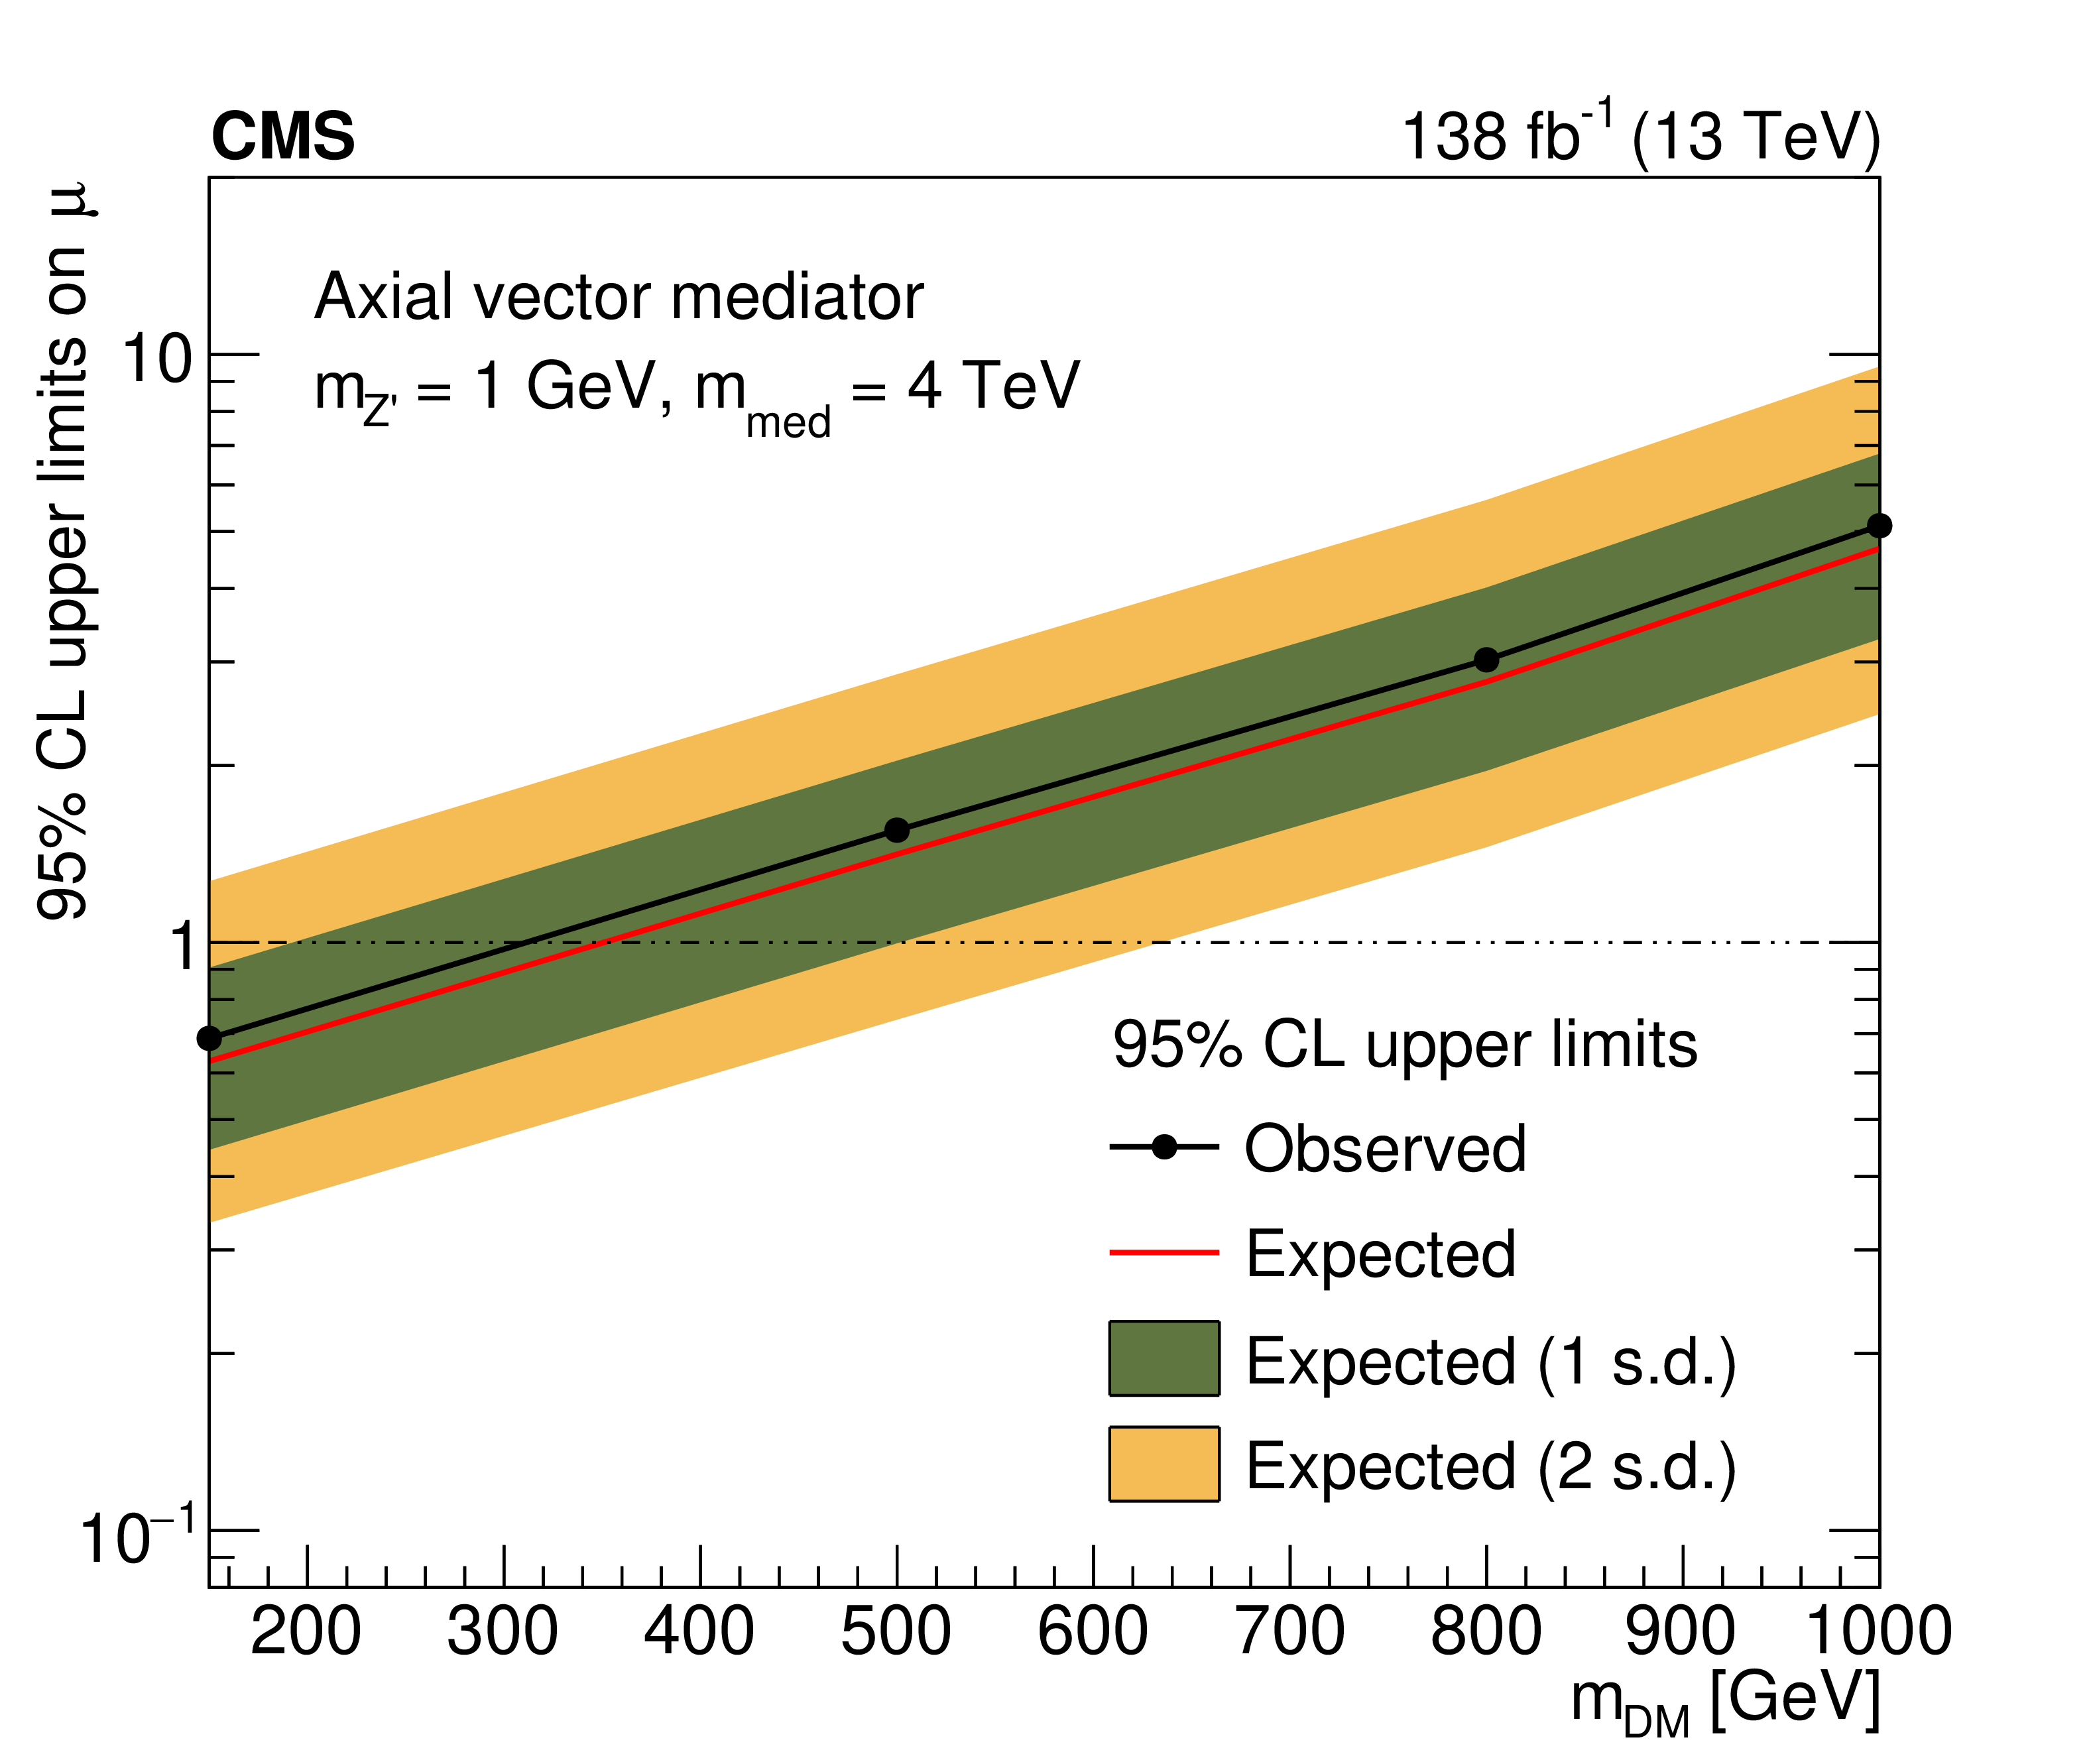
The 95% CL upper limits on $ \mu = {\sigma}/{\sigma_{\text{theory}}} $ for the axial vector mediator with $ m_{\mathrm{Z}^{'}} = $ 1 GeV. The left panel shows the limits as a function of the mediator mass, $ m_{\mathrm{med}} $ for a fixed dark matter mass of $ m_{\mathrm{DM}}= $ 150 GeV, while the right panel shows the limits as a function of the dark matter mass, $ m_{\mathrm{DM}} $ for a fixed mediator mass of $ m_{\mathrm{med}} = $ 4 TeV. A linear interpolation is applied between the available mass points. The inner (green) and outer (yellow) bands correspond to the 1 and 2 standard deviations (s.d.), respectively, of the expected limits under the background-only hypothesis. |
png pdf |
Figure 9:
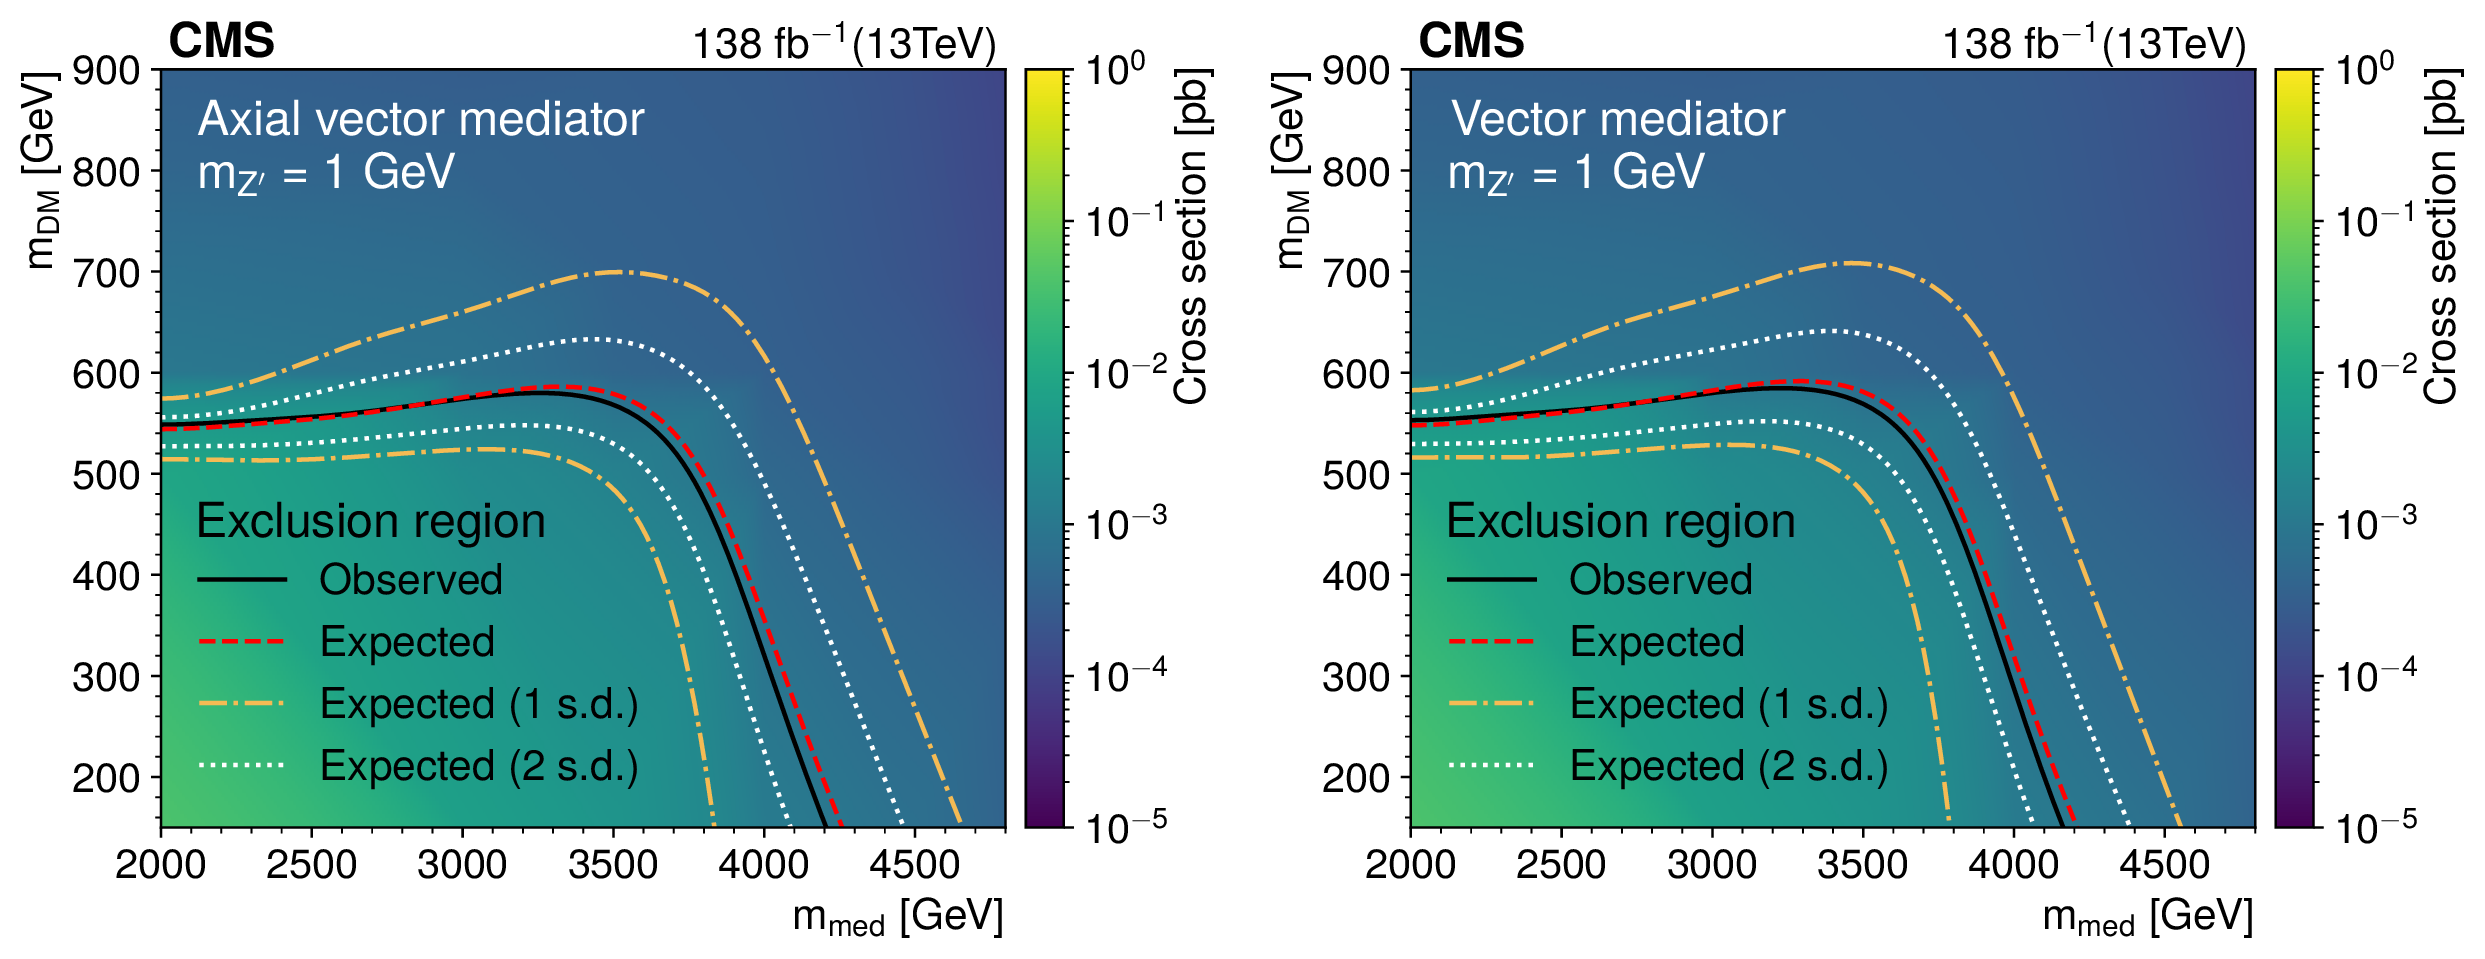
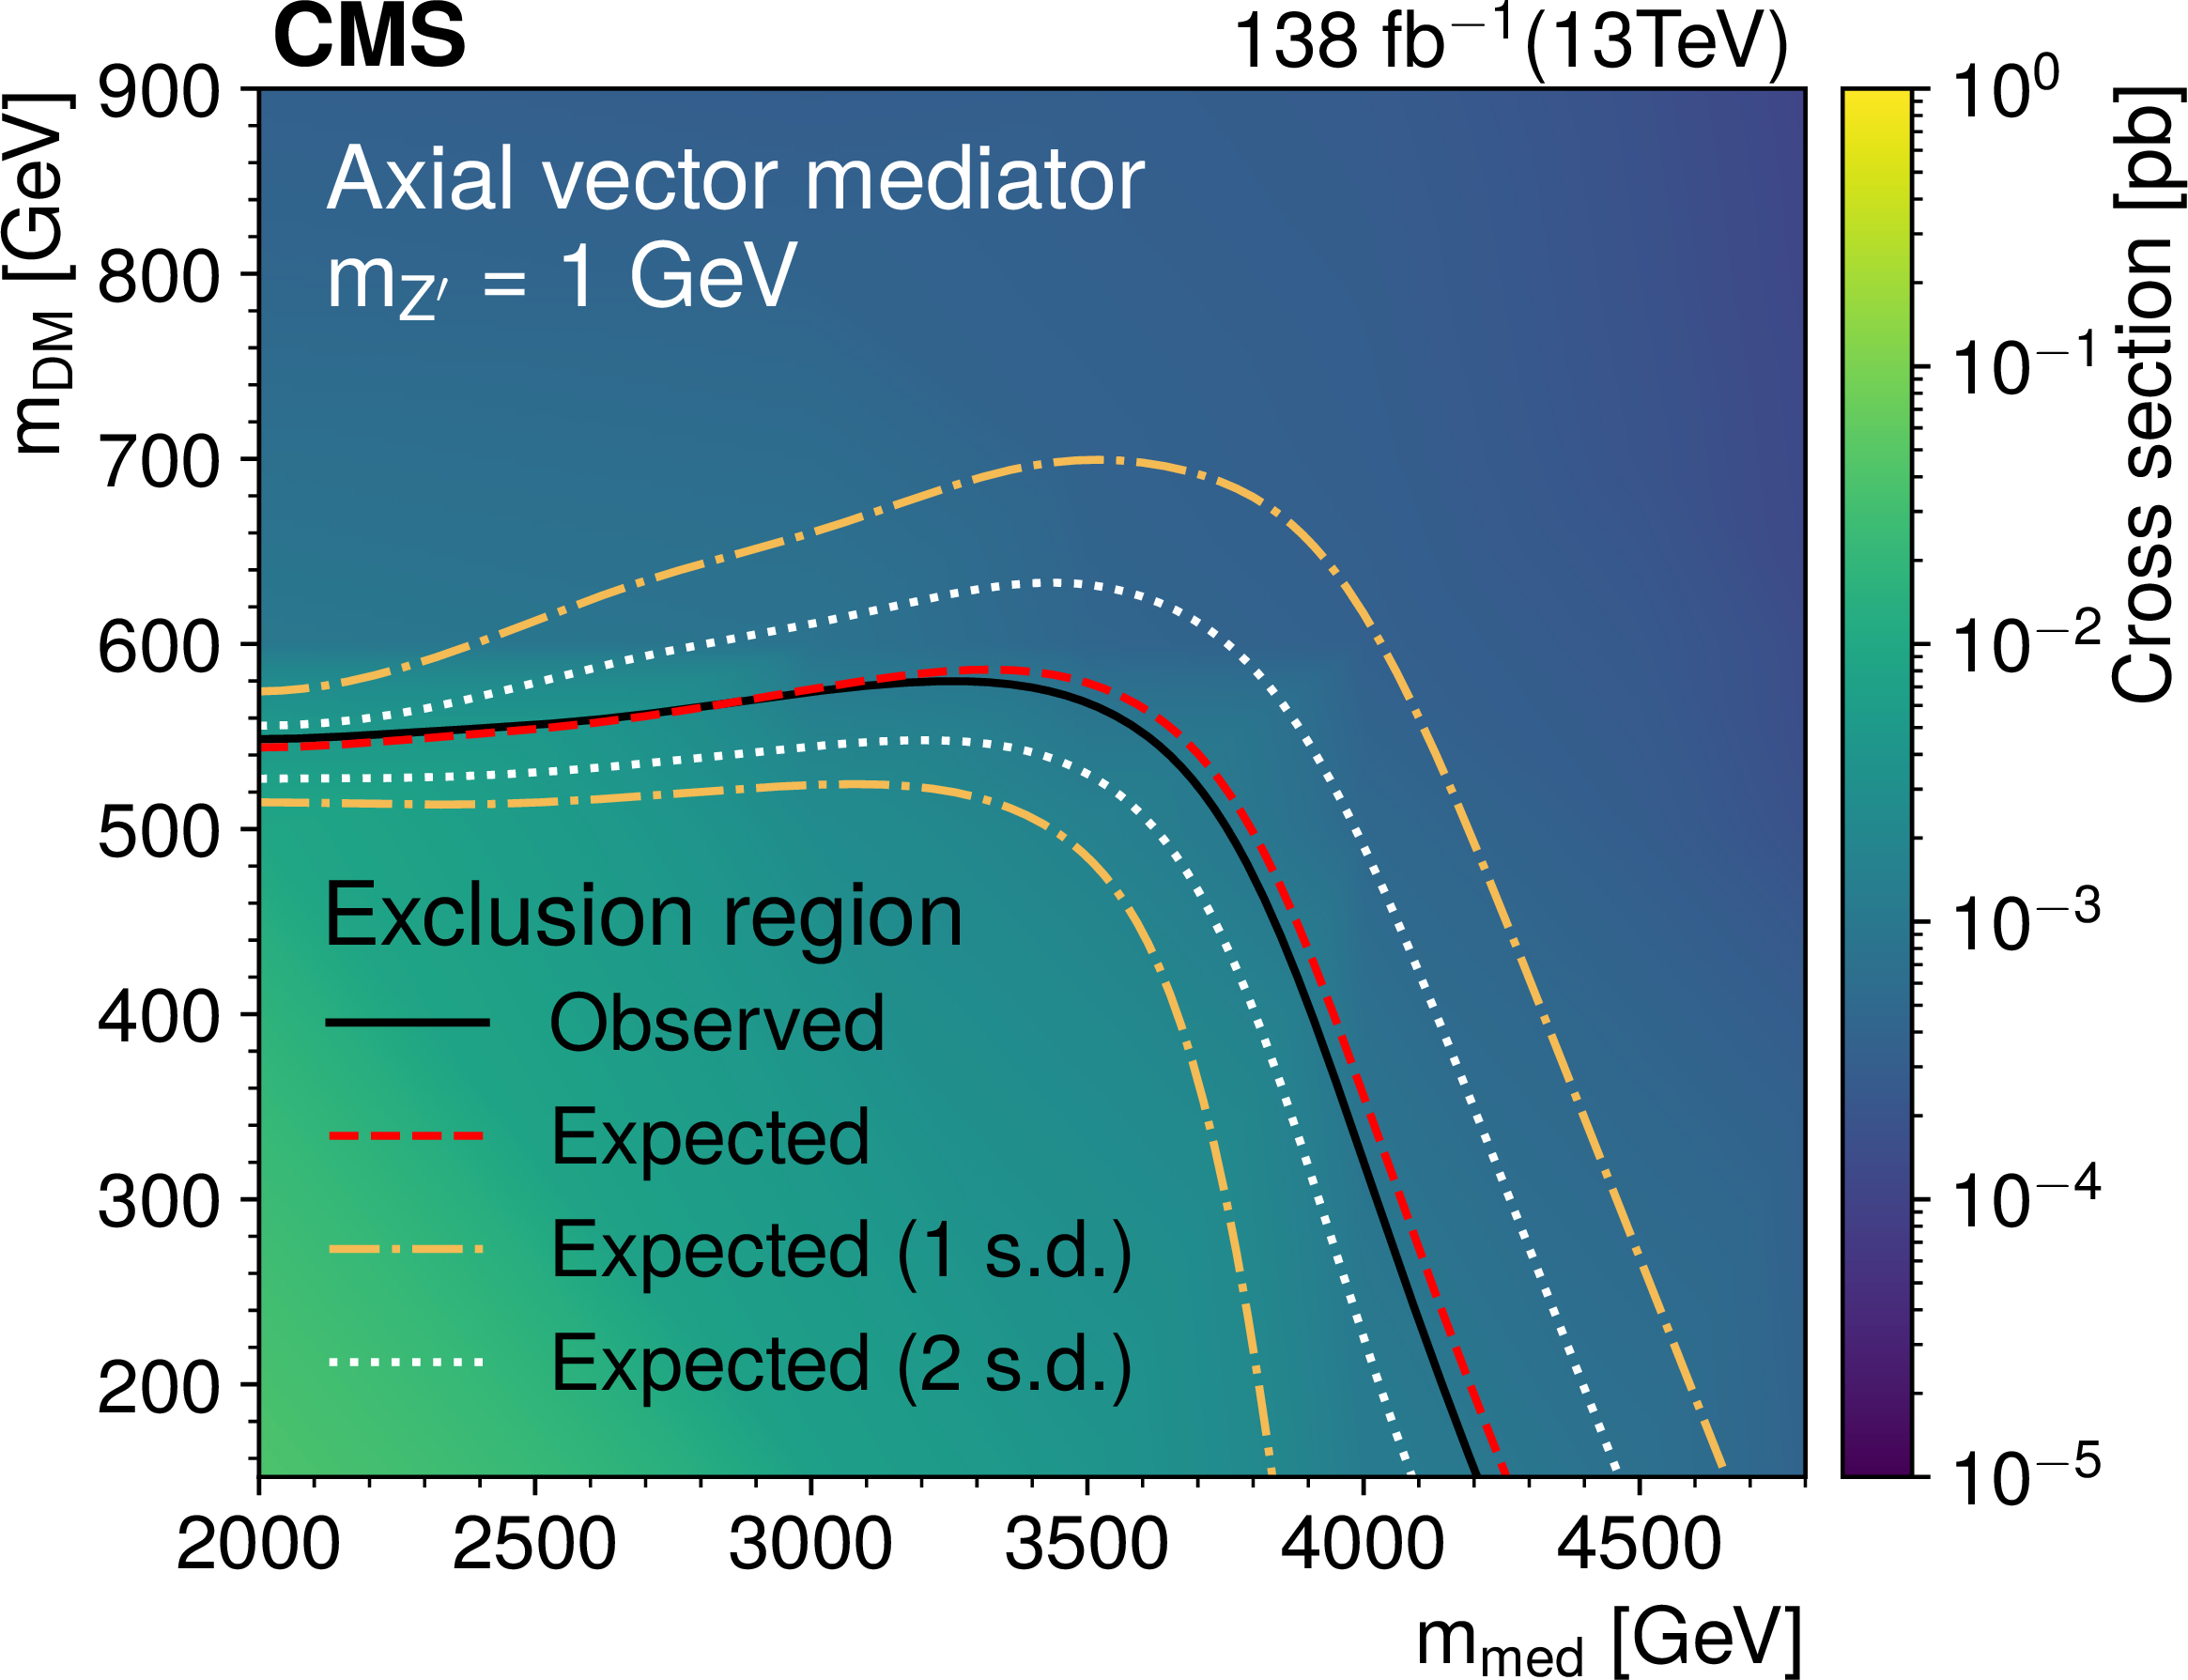
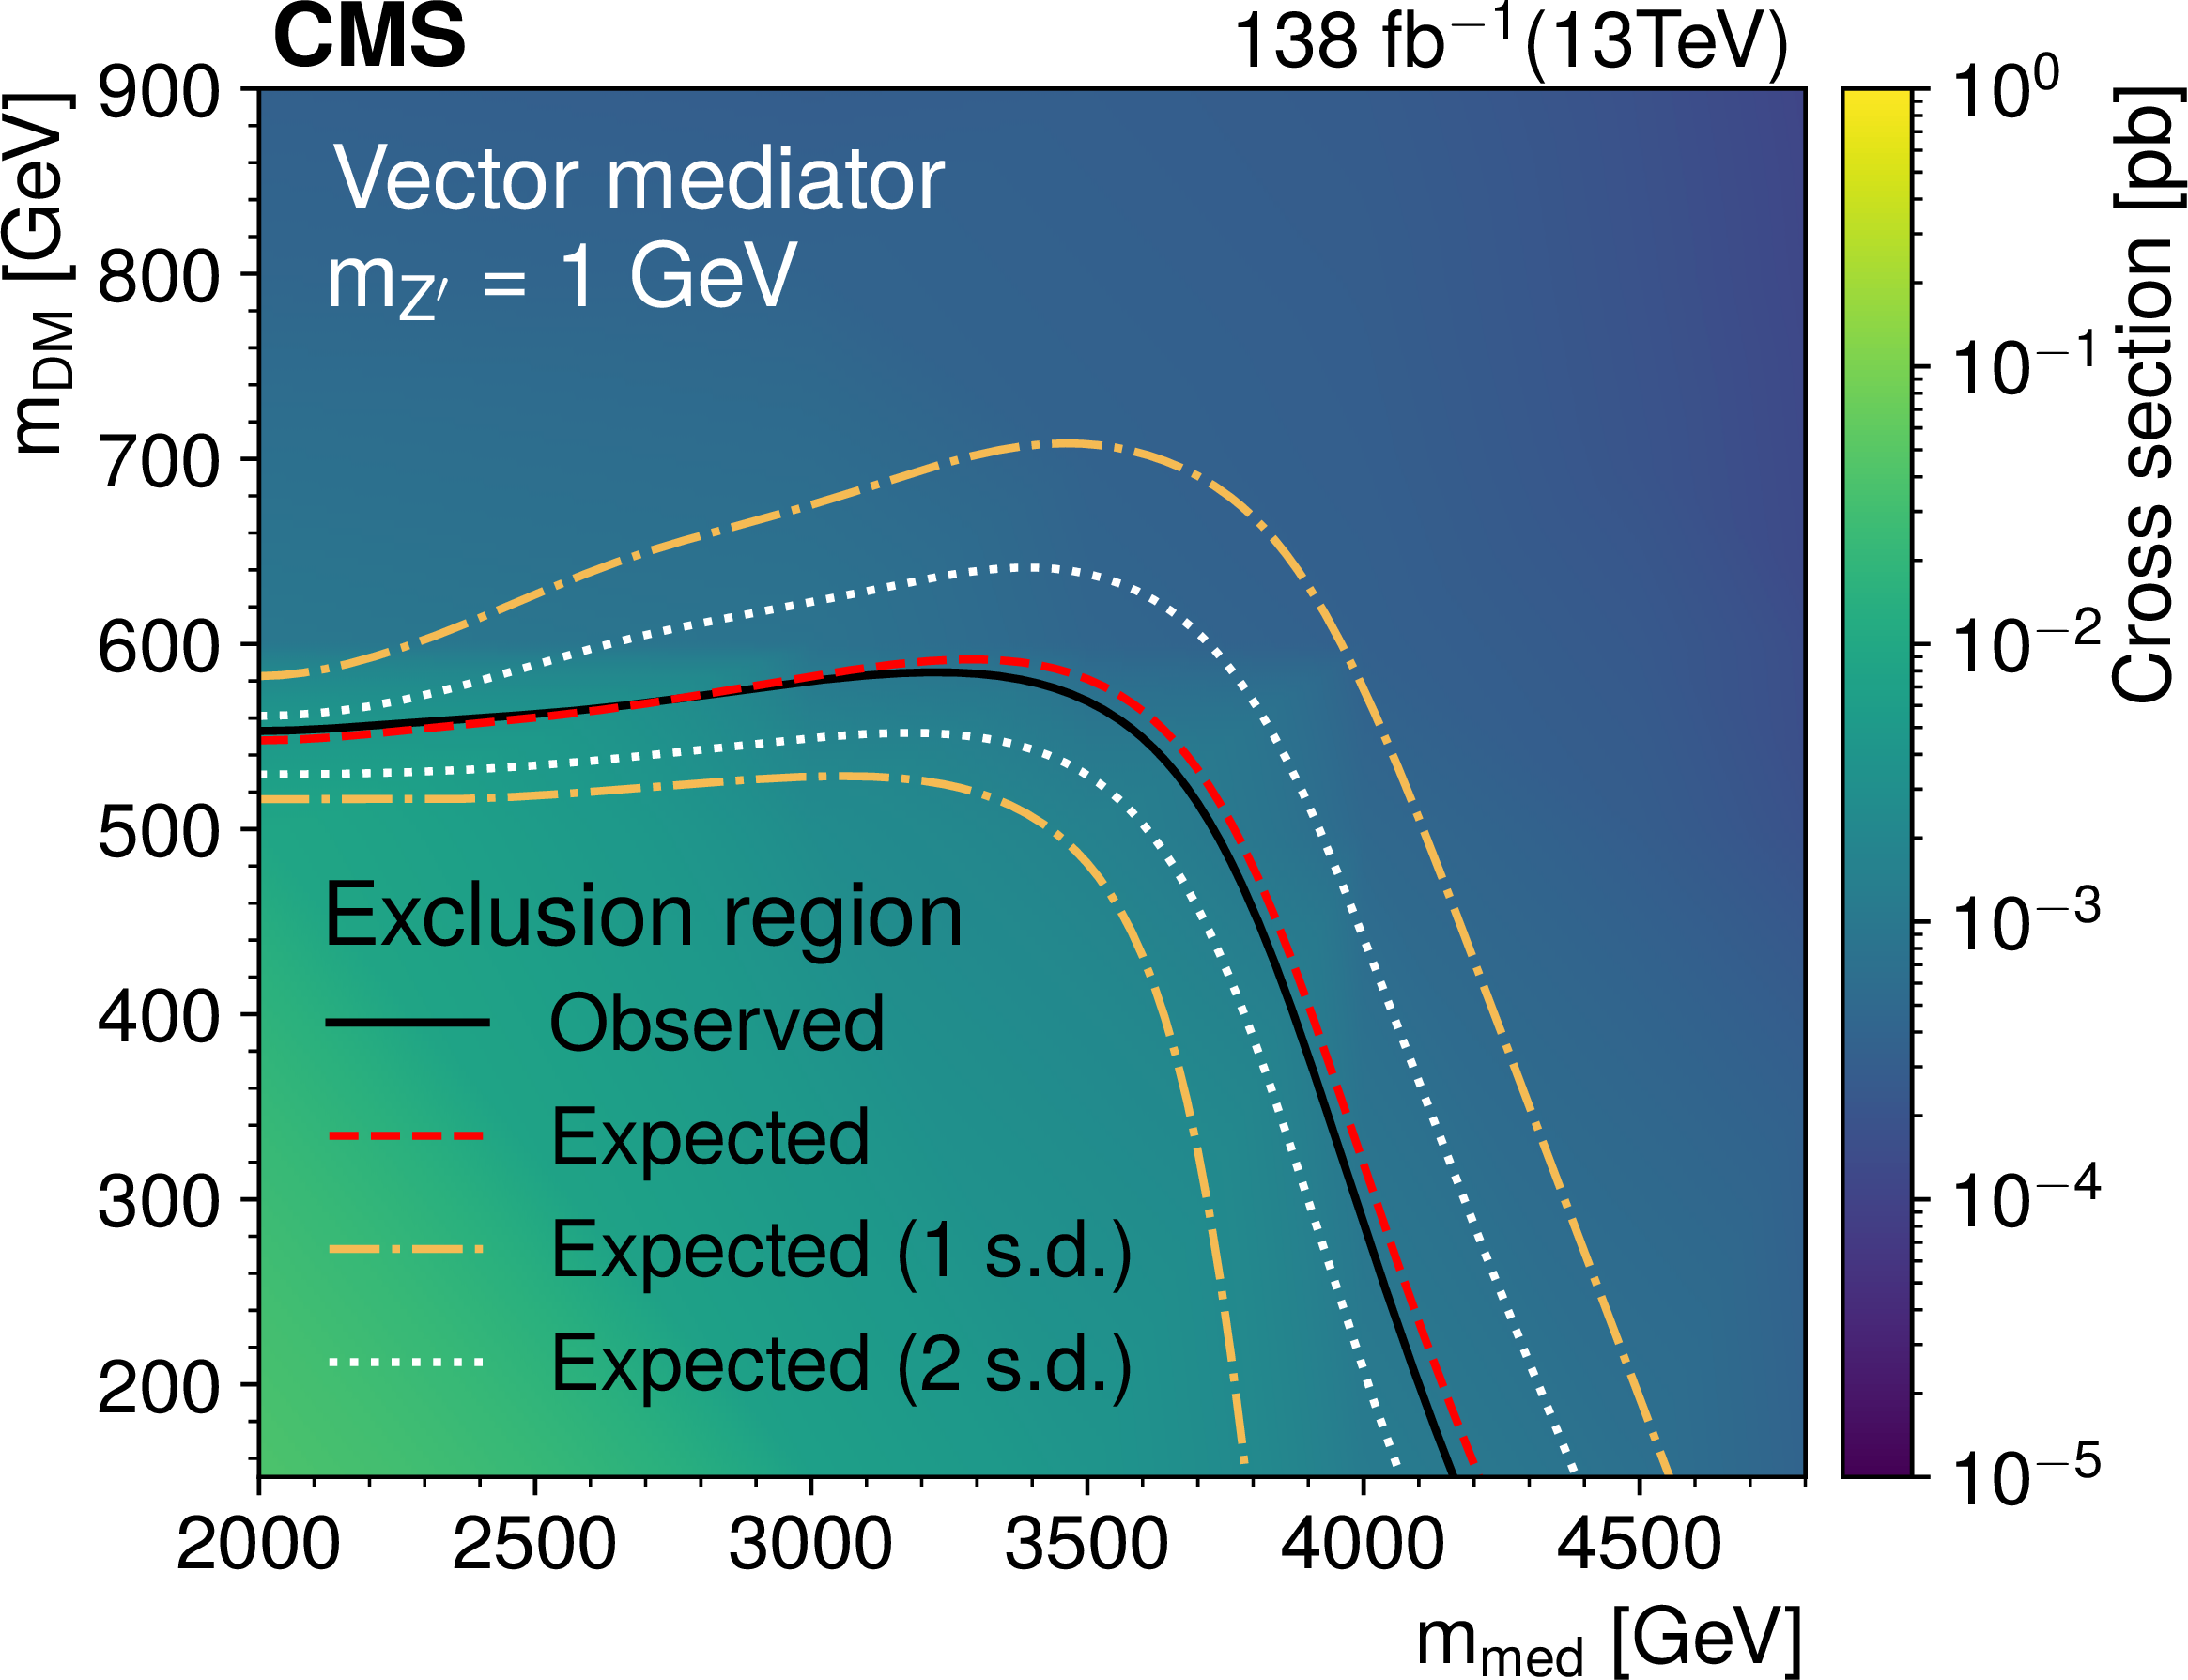
Expected and observed exclusion regions in the $ m_{\mathrm{DM}}-m_{\mathrm{med}} $ plane for the axial vector mediator (left) and vector mediator (right), assuming $ m_{\mathrm{Z}^{'}}= $ 1 GeV. The parameter space in the lower-left region of each panels is excluded at the 95% CL level. The color scale indicates the theoretical cross section of the signal process. |
png pdf |
Figure 9-a:
Expected and observed exclusion regions in the $ m_{\mathrm{DM}}-m_{\mathrm{med}} $ plane for the axial vector mediator (left) and vector mediator (right), assuming $ m_{\mathrm{Z}^{'}}= $ 1 GeV. The parameter space in the lower-left region of each panels is excluded at the 95% CL level. The color scale indicates the theoretical cross section of the signal process. |
png pdf |
Figure 9-b:
Expected and observed exclusion regions in the $ m_{\mathrm{DM}}-m_{\mathrm{med}} $ plane for the axial vector mediator (left) and vector mediator (right), assuming $ m_{\mathrm{Z}^{'}}= $ 1 GeV. The parameter space in the lower-left region of each panels is excluded at the 95% CL level. The color scale indicates the theoretical cross section of the signal process. |
| Tables | |
png pdf |
Table 1:
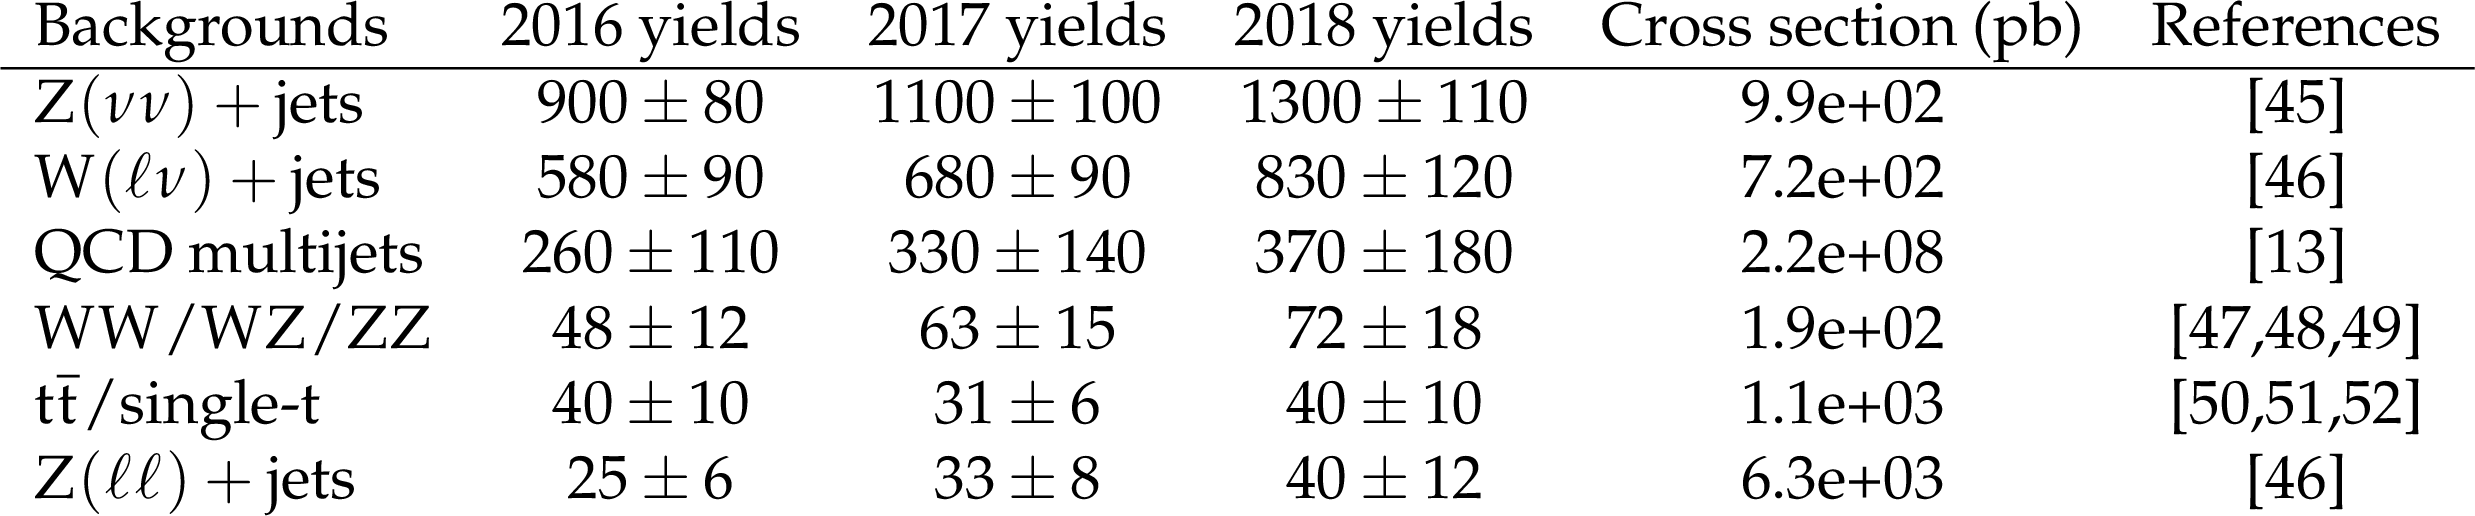
Simulated datasets used to model the background processes. The table summarizes the expected yields of each background contribution in the signal region for the corresponding data-taking years, as obtained from the background-only fit. Total systematic uncertainties are reported including both upward and downward variations. The production cross sections for each process, along with their references, are also provided. |
png pdf |
Table 2:
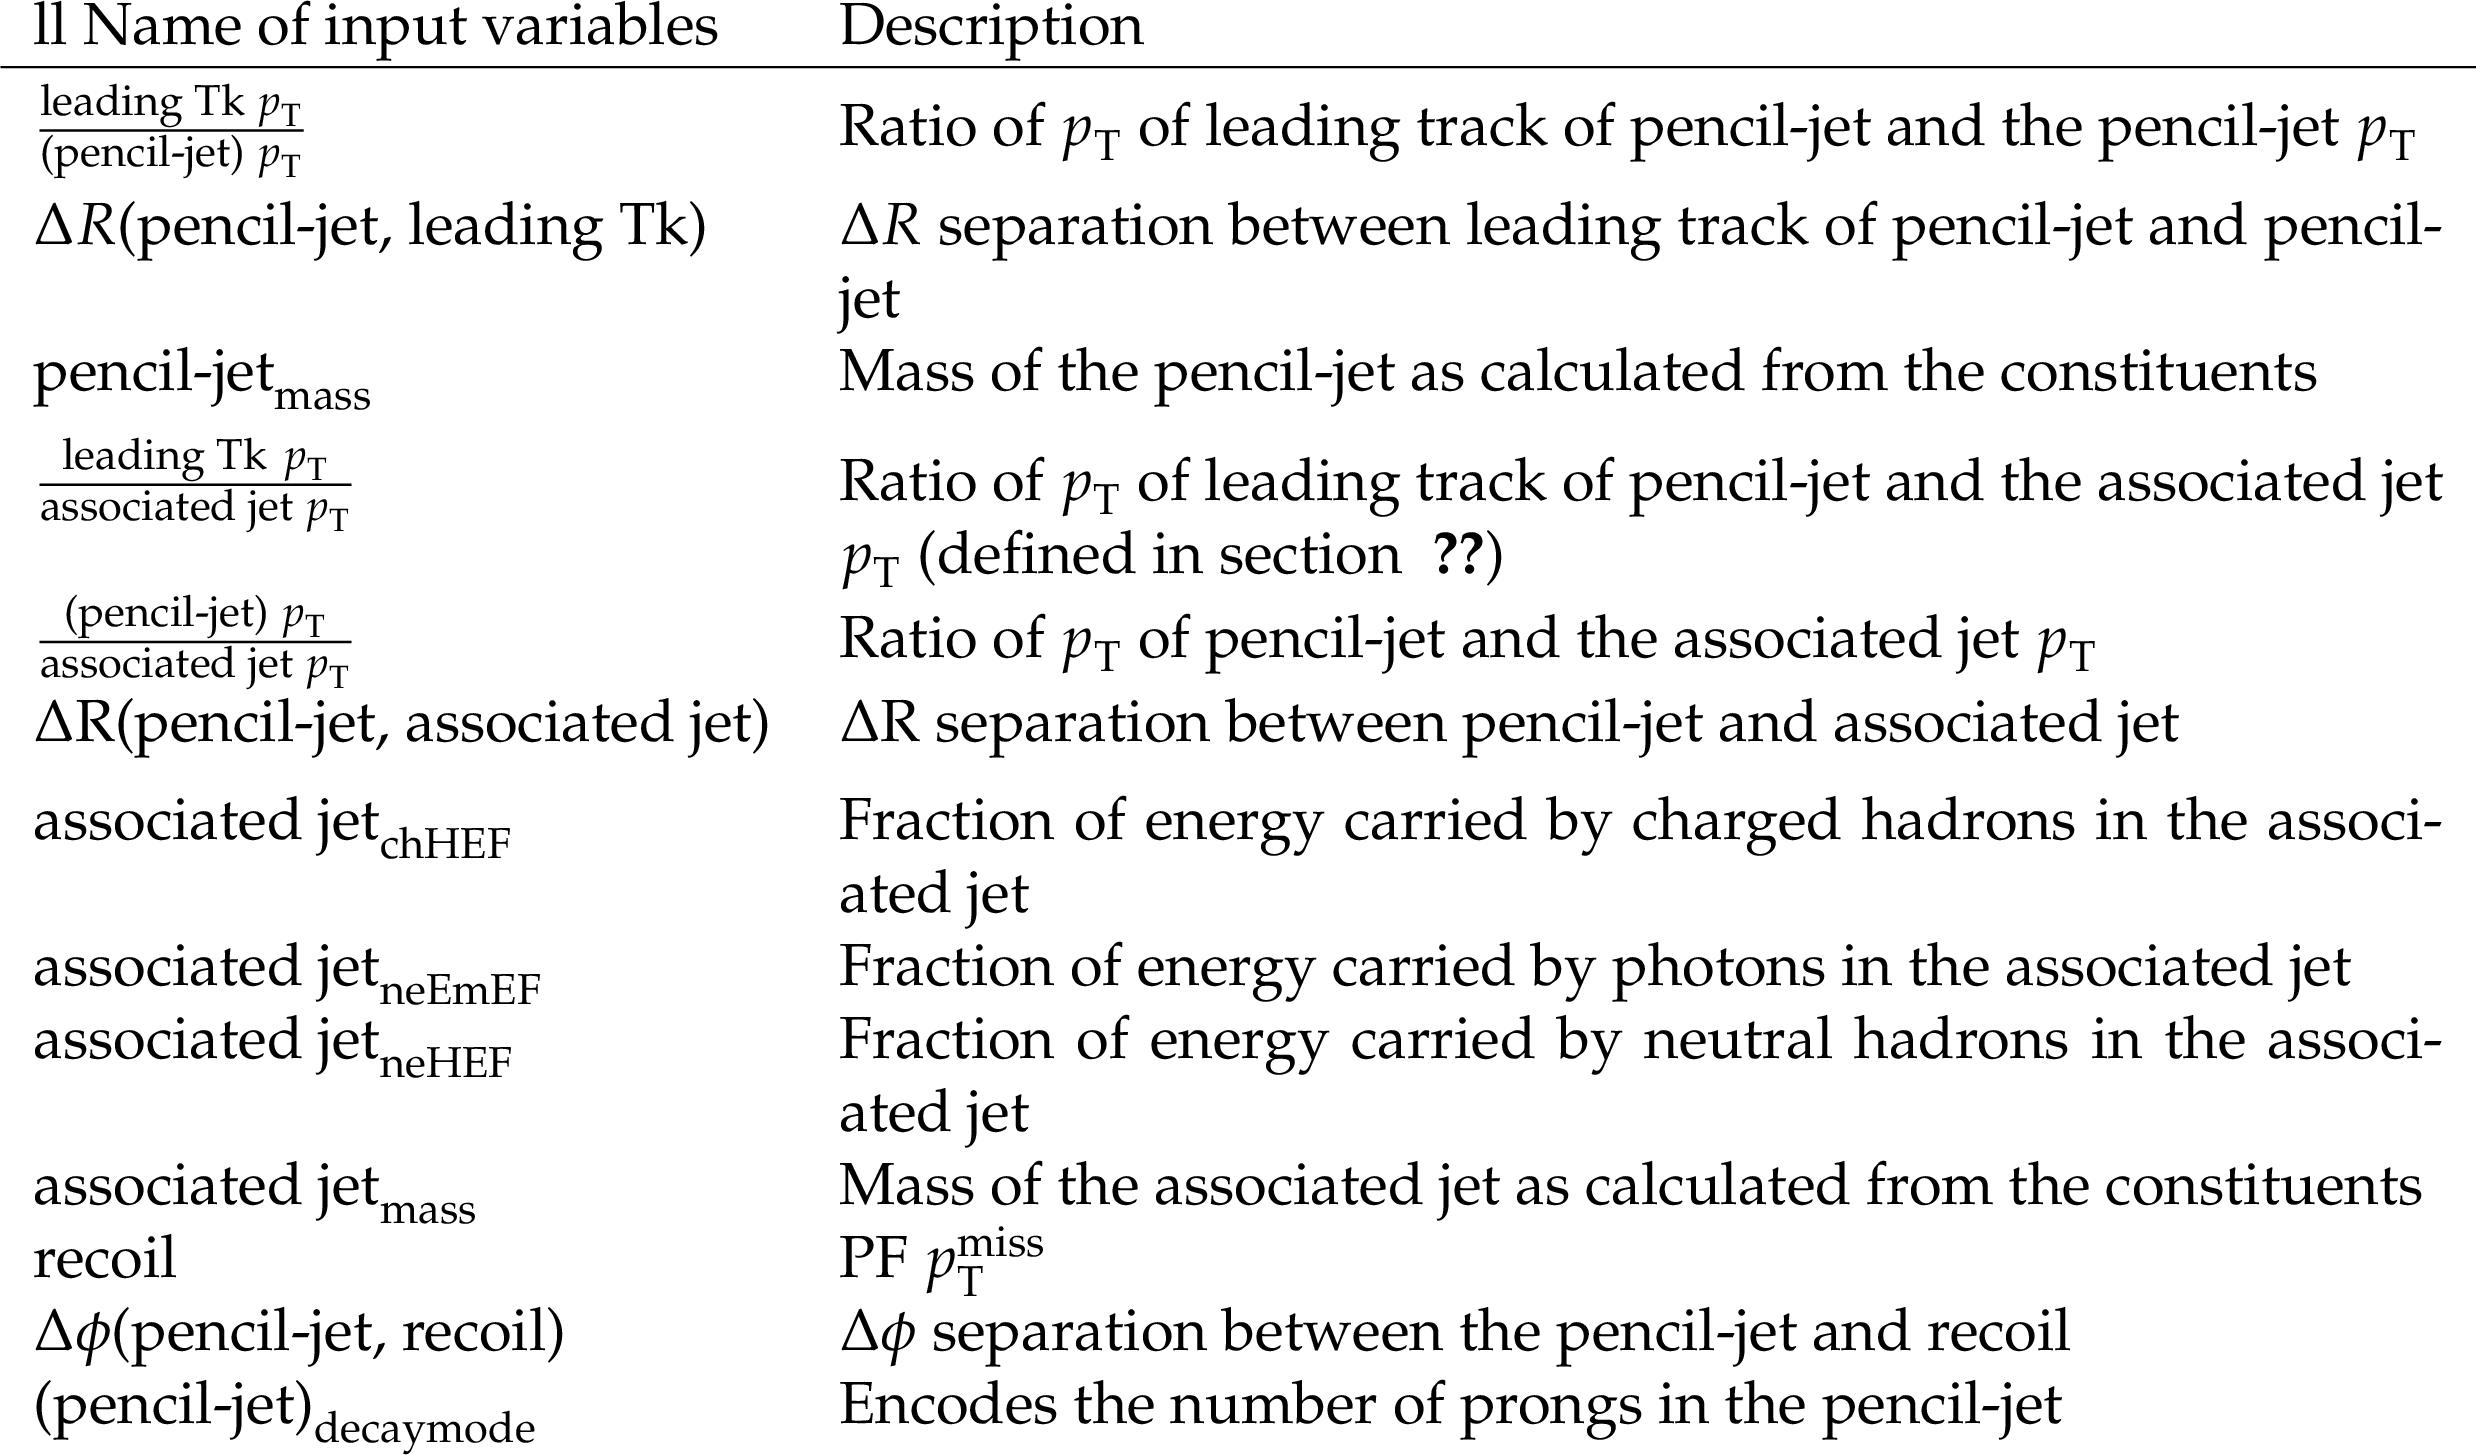
List of the input variables used in the ML model along with brief descriptions of their physical meaning. |
png pdf |
Table 3:
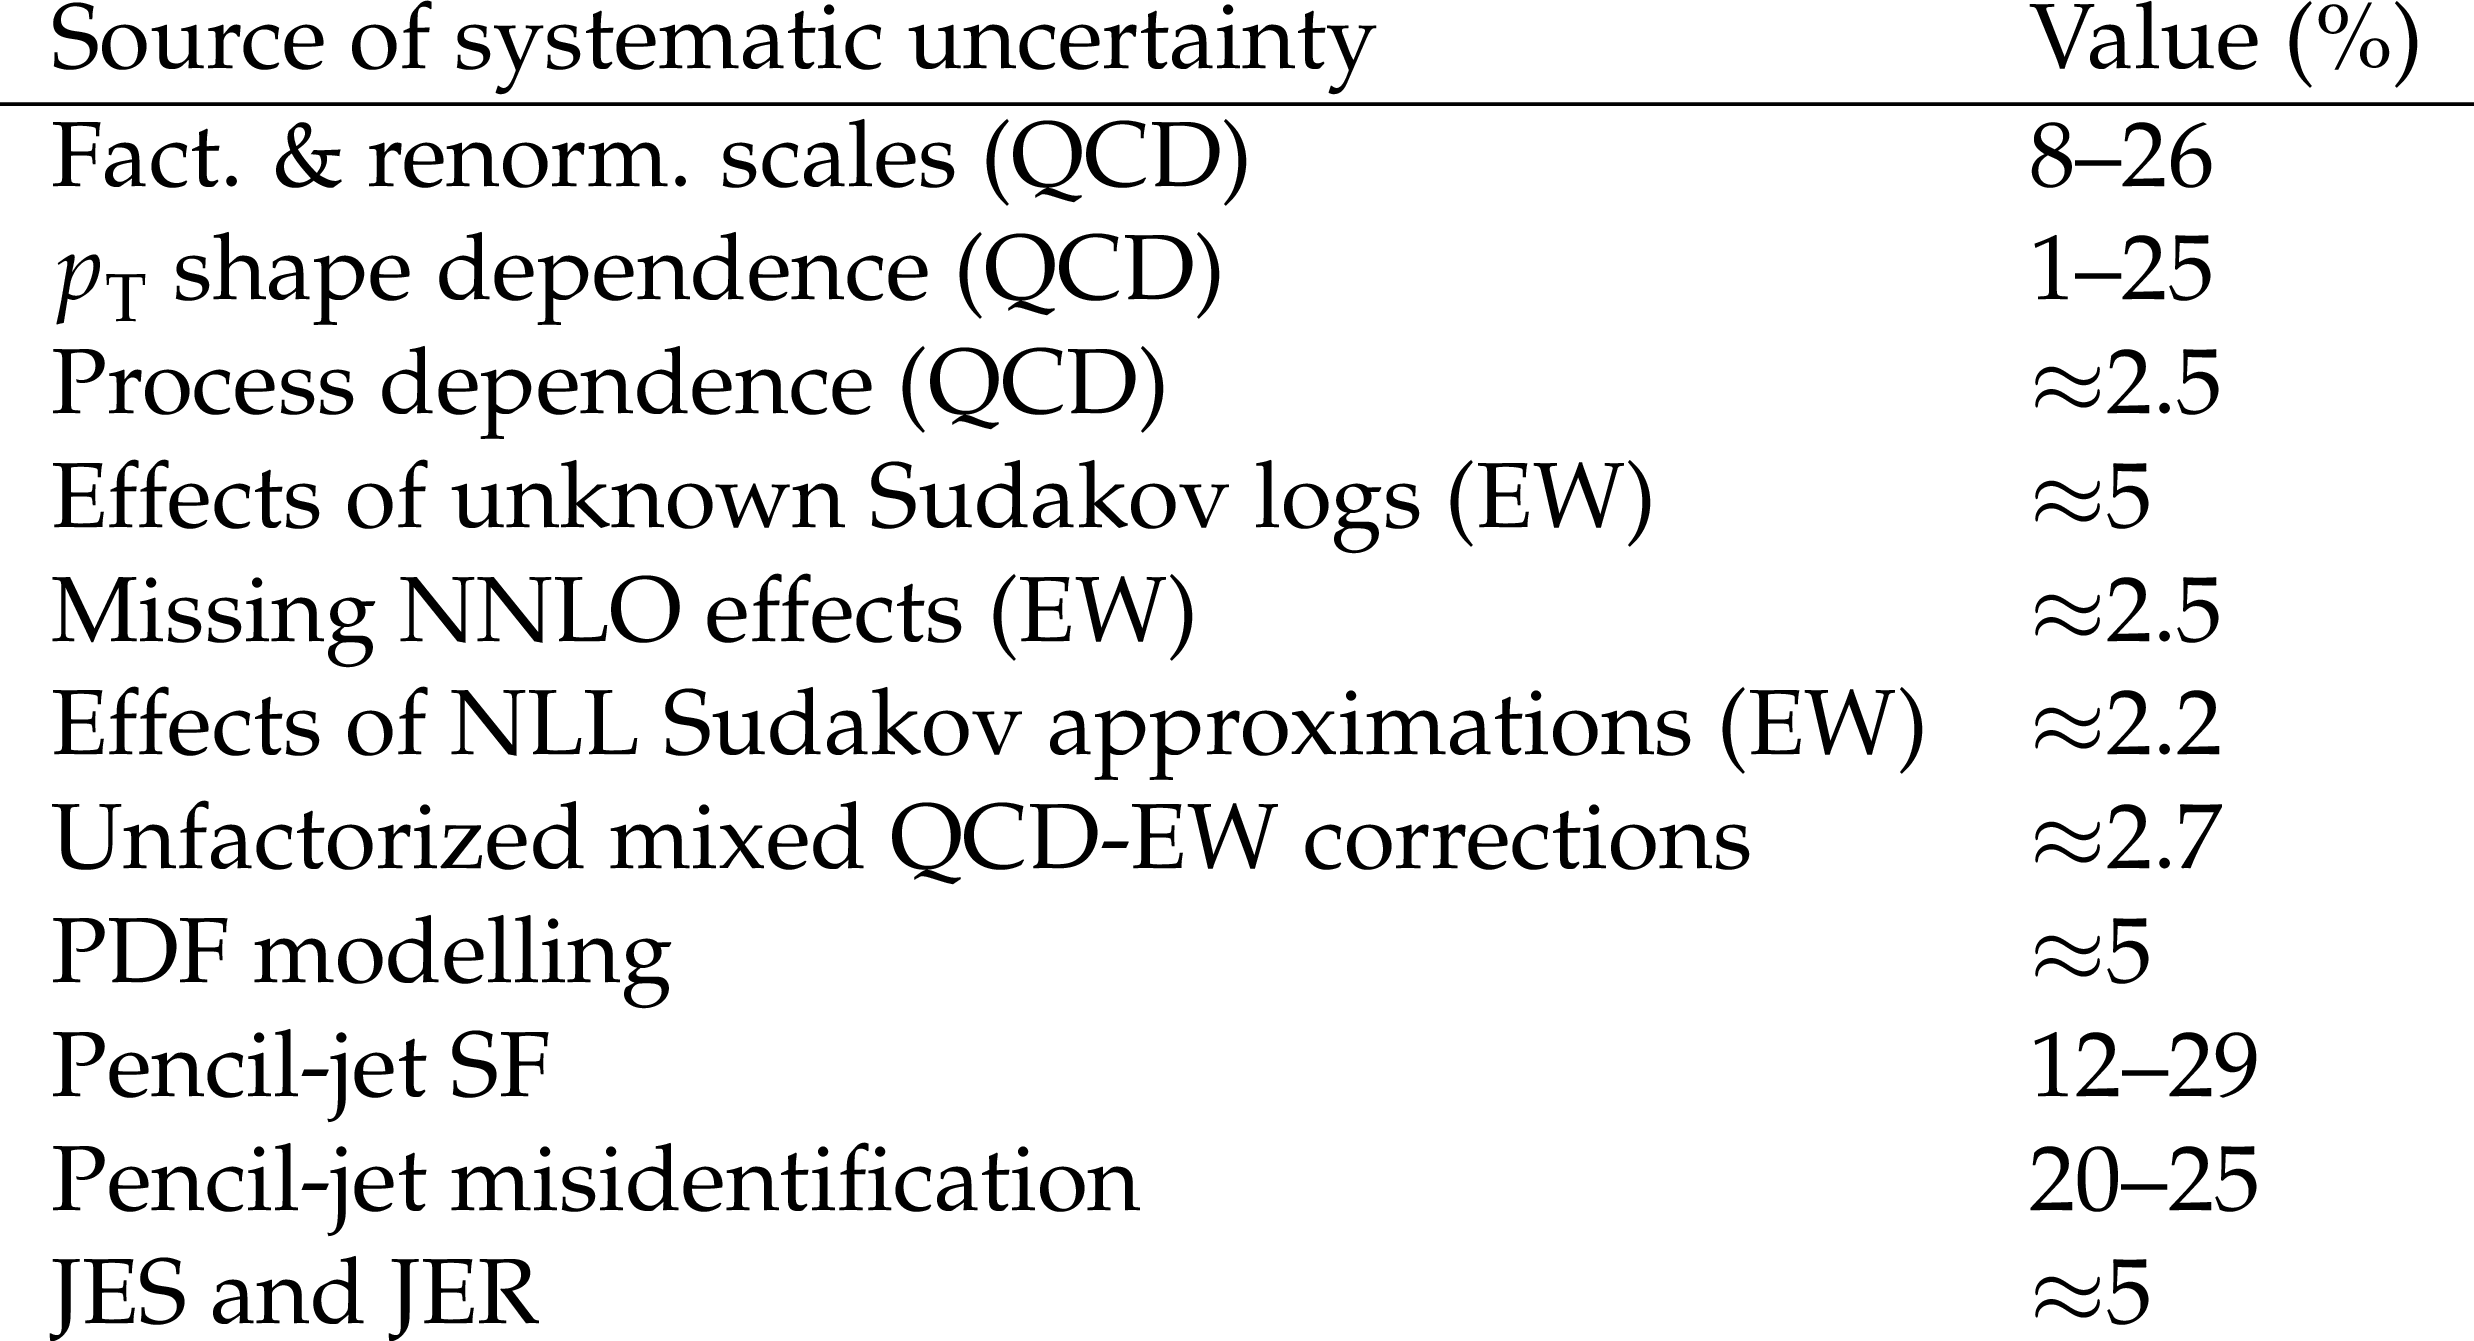
Major sources of systematic uncertainty. All listed uncertainties affect the shapes of the input variables. The ``Value" column indicates the impact of each uncertainty, expressed as a percentage of the event yield. Most uncertainties are correlated across processes and data-taking eras, except for the pencil-jet scale factors and misidentification rates, which are treated as uncorrelated across decay modes and eras. In addition, misidentification uncertainties are taken to be correlated among non-QCD processes. The labels ``QCD" and ``EW" denote uncertainties associated with higher-order QCD and electroweak effects, respectively. They affect the $ \mathrm{Z}+\text{jets} $ and $ \mathrm{W}+\text{jets} $ processes. |
| Summary |
| A novel search for dark matter (DM) particles is presented using 138 fb$ ^{-1} $ of proton-proton collision data recorded by the CMS detector at a center-of-mass energy of 13 TeV. The analysis targets a distinctive final state characterized by a large transverse momentum imbalance and an energetic low-multiplicity jet. This topology provides a distinctive and potentially more sensitive probe of dark-sector dynamics than traditional mono-jet searches. To enhance sensitivity to the signal, supervised machine learning techniques are employed. No significant deviation from the standard model predictions is observed. Upper limits at 95% confidence level are set on the DM production cross section within the framework of simplified models with vector and axial-vector mediators. Mediator masses up to approximately 4.25 TeV are excluded for a DM mass of 150 GeV, while for a DM mass of 550 GeV, mediator masses up to approximately 3.5 TeV are excluded in both scenarios. These results provide the first constraints on this novel final state and significantly extend the sensitivity of DM searches at the LHC. |
| References | ||||
| 1 | J. L. Feng | Dark Matter Candidates from Particle Physics and Methods of Detection | Ann. Rev. Astron. Astrophys. 48 (2010) 495 | 1003.0904 |
| 2 | T. A. Porter, R. P. Johnson, and P. W. Graham | Dark Matter Searches with Astroparticle Data | Ann. Rev. Astron. Astrophys. 49 (2011) 155 | 1104.2836 |
| 3 | D. Clowe, A. Gonzalez, and M. Markevitch | Weak lensing mass reconstruction of the interacting cluster 1E0657-558: Direct evidence for the existence of dark matter | Astrophys. J. 604 (2004) 596 | astro-ph/0312273 |
| 4 | Planck Collaboration | Planck 2015 results. XIII. Cosmological parameters | Astron. Astrophys. 594 (2016) A13 | 1502.01589 |
| 5 | S. Willenbrock and C. Zhang | Effective Field Theory Beyond the Standard Model | Ann. Rev. Nucl. Part. Sci. 64 (2014) 83 | 1401.0470 |
| 6 | D. Abercrombie et al. | Dark Matter benchmark models for early LHC Run-2 Searches: Report of the ATLAS/CMS Dark Matter Forum | Phys. Dark Univ. 27 (2020) 100371 | 1507.00966 |
| 7 | G. Busoni, A. De Simone, E. Morgante, and A. Riotto | On the Validity of the Effective Field Theory for Dark Matter Searches at the LHC | PLB 728 (2014) 412 | 1307.2253 |
| 8 | O. Buchmueller, M. J. Dolan, S. A. Malik, and C. McCabe | Characterising dark matter searches at colliders and direct detection experiments: Vector mediators | JHEP 01 (2015) 037 | 1407.8257 |
| 9 | B. C. Allanach | Beyond the Standard Model | CERN Yellow Rep. School Proc. 6 (2019) 113 | |
| 10 | Y. Bai, J. Bourbeau, and T. Lin | Dark matter searches with a mono-$ \mathrm{Z}^{'} $ jet | JHEP 06 (2015) 205 | 1504.01395 |
| 11 | G. Jungman, M. Kamionkowski, and K. Griest | Supersymmetric dark matter | Phys. Rept. 267 (1996) 195 | |
| 12 | L. Roszkowski, E. M. Sessolo, and S. Trojanowski | WIMP dark matter candidates and searches\textemdashcurrent status and future prospects | Rept. Prog. Phys. 81 (2018) 066201 | 1707.06277 |
| 13 | CMS Collaboration | Search for new particles in events with energetic jets and large missing transverse momentum in proton-proton collisions at $ \sqrt{s} = $ 13 TeV | JHEP 11 (2021) 153 | CMS-EXO-20-004 2107.13021 |
| 14 | CMS Collaboration | Search for new physics in final states with an energetic jet or a hadronically decaying $ W $ or $ Z $ boson and transverse momentum imbalance at $ \sqrt{s}=13\text{ }\text{ }\mathrm{TeV} $ | PRD 97 (2018) 092005 | CMS-EXO-16-048 1712.02345 |
| 15 | ATLAS Collaboration | Search for dark matter in events with a hadronically decaying vector boson and missing transverse momentum in $ pp $ collisions at $ \sqrt{s} = $ 13 TeV with the ATLAS detector | JHEP 10 (2018) 180 | 1807.11471 |
| 16 | ATLAS Collaboration | Search for new phenomena in events with an energetic jet and missing transverse momentum in $ pp $ collisions at $ \sqrt {s} = $ 13 TeV with the ATLAS detector | PRD 103 (2021) 112006 | 2102.10874 |
| 17 | CMS Collaboration | Performance of reconstruction and identification of $ \tau $ leptons decaying to hadrons and $ \nu_\tau $ in pp collisions at $ \sqrt{s}= $ 13 TeV | JINST 13 (2018) P05010 | CMS-TAU-16-003 1809.02816 |
| 18 | CMS Collaboration | HEPData record for this analysis | link | |
| 19 | CMS Collaboration | The CMS experiment at the CERN LHC | JINST 3 (2008) S08004 | |
| 20 | CMS Collaboration | Development of the CMS detector for the CERN LHC Run 3 | JINST 19 (2024) P05064 | CMS-PRF-21-001 2309.05466 |
| 21 | CMS Collaboration | Performance of the CMS Level-1 trigger in proton-proton collisions at $ \sqrt{s} = $ 13 TeV | JINST 15 (2020) P10017 | CMS-TRG-17-001 2006.10165 |
| 22 | CMS Collaboration | The CMS trigger system | JINST 12 (2017) P01020 | CMS-TRG-12-001 1609.02366 |
| 23 | CMS Collaboration | Performance of the CMS high-level trigger during LHC Run 2 | JINST 19 (2024) P11021 | CMS-TRG-19-001 2410.17038 |
| 24 | CMS Collaboration | Electron and photon reconstruction and identification with the CMS experiment at the CERN LHC | JINST 16 (2021) P05014 | CMS-EGM-17-001 2012.06888 |
| 25 | CMS Collaboration | Performance of the CMS muon detector and muon reconstruction with proton-proton collisions at $ \sqrt{s}= $ 13 TeV | JINST 13 (2018) P06015 | CMS-MUO-16-001 1804.04528 |
| 26 | CMS Collaboration | Description and performance of track and primary-vertex reconstruction with the CMS tracker | JINST 9 (2014) P10009 | CMS-TRK-11-001 1405.6569 |
| 27 | CMS Collaboration | The CMS Phase-1 Pixel Detector Upgrade | JINST 16 (2021) P02027 | 2012.14304 |
| 28 | CMS Collaboration | Track impact parameter resolution for the full pseudo rapidity coverage in the 2017 dataset with the CMS Phase-1 Pixel detector | CMS Detector Performance Note CMS-DP-2020-049, 2020 CDS |
|
| 29 | CMS Collaboration | 2017 tracking performance plots | CMS Detector Performance Note CMS-DP-2017-015, 2017 CDS |
|
| 30 | CMS Collaboration | ECAL 2016 refined calibration and Run 2 summary plots | CMS Detector Performance Note CMS-DP-2020-021, 2020 CDS |
|
| 31 | CMS Collaboration | Jet energy scale and resolution in the CMS experiment in pp collisions at 8 TeV | JINST 12 (2017) P02014 | CMS-JME-13-004 1607.03663 |
| 32 | CMS Collaboration | Technical proposal for the Phase-II upgrade of the Compact Muon Solenoid | CMS Technical Proposal CERN-LHCC-2015-010, CMS-TDR-15-02, 2015 CDS |
|
| 33 | CMS Collaboration | Particle-flow reconstruction and global event description with the CMS detector | JINST 12 (2017) P10003 | CMS-PRF-14-001 1706.04965 |
| 34 | M. Cacciari, G. P. Salam, and G. Soyez | The anti-$ k_{\mathrm{T}} $ jet clustering algorithm | JHEP 04 (2008) 063 | 0802.1189 |
| 35 | M. Cacciari, G. P. Salam, and G. Soyez | FastJet user manual | EPJC 72 (2012) 1896 | 1111.6097 |
| 36 | CMS Collaboration | Pileup mitigation at CMS in 13 TeV data | JINST 15 (2020) P09018 | CMS-JME-18-001 2003.00503 |
| 37 | CMS Collaboration | Identification of hadronic tau lepton decays using a deep neural network | JINST 17 (2022) P07023 | CMS-TAU-20-001 2201.08458 |
| 38 | CMS Collaboration | Identification of heavy-flavour jets with the CMS detector in pp collisions at 13 TeV | JINST 13 (2018) P05011 | CMS-BTV-16-002 1712.07158 |
| 39 | CMS Collaboration | Performance of missing transverse momentum reconstruction in proton-proton collisions at $ \sqrt{s} = $ 13 TeV using the CMS detector | JINST 14 (2019) P07004 | CMS-JME-17-001 1903.06078 |
| 40 | GEANT4 Collaboration | GEANT4: A simulation toolkit | NIM A 506 (2003) 250 | |
| 41 | CMS Collaboration | Precision luminosity measurement in proton-proton collisions at $ \sqrt{s} = $ 13 TeV in 2015 and 2016 at CMS | EPJC 81 (2021) 800 | CMS-LUM-17-003 2104.01927 |
| 42 | CMS Collaboration | CMS luminosity measurement for the 2017 data-taking period at $ \sqrt{s} = $ 13 TeV | CMS Physics Analysis Summary, 2018 CMS-PAS-LUM-17-004 |
CMS-PAS-LUM-17-004 |
| 43 | CMS Collaboration | CMS luminosity measurement for the 2018 data-taking period at $ \sqrt{s} = $ 13 TeV | CMS Physics Analysis Summary, 2019 CMS-PAS-LUM-18-002 |
CMS-PAS-LUM-18-002 |
| 44 | CMS Collaboration | Jet algorithms performance in 13 TeV data | CMS Physics Analysis Summary, 2017 CMS-PAS-JME-16-003 |
CMS-PAS-JME-16-003 |
| 45 | J. M. Lindert et al. | Precise predictions for V+jets dark matter backgrounds | Eur. Phys. J. 77 (2017) 829 | 1705.04664 |
| 46 | J. Alwall et al. | The automated computation of tree-level and next-to-leading order differential cross sections, and their matching to parton shower simulations | JHEP 07 (2014) 079 | 1405.0301 |
| 47 | CMS Collaboration | Measurement of the WW cross section pp collisions at $ \sqrt{s}= $ 13 TeV | CMS Physics Analysis Summary, 2016 CMS-PAS-SMP-16-006 |
CMS-PAS-SMP-16-006 |
| 48 | CMS Collaboration | Measurements of the pp $ \to $ WZ inclusive and differential production cross section and constraints on charged anomalous triple gauge couplings at $ \sqrt{s}= $ 13 TeV | JHEP 04 (2019) 122 | CMS-SMP-18-002 1901.03428 |
| 49 | CMS Collaboration | Measurements of $ \mathrm{p}\mathrm{p} \rightarrow {\mathrm{Z}} {\mathrm{Z}} $ production cross sections and constraints on anomalous triple gauge couplings at $ \sqrt{s}= $ 13 TeV | EPJC 81 (2021) 200 | CMS-SMP-19-001 2009.01186 |
| 50 | M. Czakon and A. Mitov | Top++: A Program for the Calculation of the Top-Pair Cross-Section at Hadron Colliders | Comput. Phys. Commun. 185 (2014) 2930 | 1112.5675 |
| 51 | J. Campbell, T. Neumann, and Z. Sullivan | Single-top-quark production in the $ t $-channel at NNLO | JHEP 02 (2021) 040 | 2012.01574 |
| 52 | N. Kidonakis and N. Yamanaka | Higher-order corrections for $ tW $ production at high-energy hadron colliders | JHEP 05 (2021) 278 | 2102.11300 |
| 53 | M. Abadi et al. | TensorFlow: Large-Scale Machine Learning on Heterogeneous Distributed Systems | Software available from tensorflow.org link |
1603.04467 |
| 54 | T. Chen and C. Guestrin | XGBoost: A scalable tree boosting system | link | |
| 55 | CMS Collaboration | Performance of the CMS electromagnetic calorimeter in pp collisions at $ \sqrt{s}= $ 13 TeV | JINST 19 (2024) P09004 | CMS-EGM-18-002 2403.15518 |
| 56 | PDF4LHC Working Group Collaboration | The PDF4LHC21 combination of global PDF fits for the LHC Run III | JPG 49 (2022) 080501 | 2203.05506 |
| 57 | R. J. Barlow | Event classification using weighting methods | J. Comput. Phys. 72 (1987) 202 | |
| 58 | CMS Collaboration | The CMS Statistical Analysis and Combination Tool: COMBINE | Comput. Softw. Big Sci. 8 (2024) 19 | CMS-CAT-23-001 2404.06614 |
| 59 | A. L. Read | Presentation of search results: The $ \text{CL}_\text{s} $ technique | JPG 28 (2002) 2693 | |
| 60 | T. Junk | Confidence level computation for combining searches with small statistics | NIM A 434 (1999) 435 | hep-ex/9902006 |
| 61 | G. Cowan, K. Cranmer, E. Gross, and O. Vitells | Asymptotic formulae for likelihood-based tests of new physics | EPJC 71 (2011) 1554 | 1007.1727 |
|
|
Compact Muon Solenoid LHC, CERN |

|
|
|
|
|
|