

Compact Muon Solenoid
LHC, CERN
| CMS-SUS-23-004 ; CERN-EP-2025-025 | ||
| Search for dark matter production in association with a single top quark in proton-proton collisions at $ \sqrt{s} = $ 13 TeV | ||
| CMS Collaboration | ||
| 25 March 2025 | ||
| JHEP 09 (2025) 141 | ||
| Abstract: A search for the production of a single top quark in association with invisible particles is performed using proton-proton collision data collected with the CMS detector at the LHC at $ \sqrt{s} = $ 13 TeV, corresponding to an integrated luminosity of 138 fb$^{-1}$. In this search, a flavor-changing neutral current produces a single top quark or antiquark and an invisible state nonresonantly. The invisible state consists of a hypothetical spin-1 particle acting as a new mediator and decaying to two spin-1/2 dark matter candidates. The analysis searches for events in which the top quark or antiquark decays hadronically. No significant excess of events compatible with that signature is observed. Exclusion limits at 95% confidence level are placed on the masses of the spin-1 mediator and the dark matter candidates, and are compared to constraints from the dark matter relic density measurements. In a vector (axial-vector) coupling scenario, masses of the spin-1 mediator are excluded up to 1.85 (1.85) TeV with an expectation of 2.0 (2.0) TeV, whereas masses of the dark matter candidates are excluded up to 0.75 (0.55) TeV with an expectation of 0.85 (0.65) TeV. | ||
| Links: e-print arXiv:2503.20033 [hep-ex] (PDF) ; CDS record ; inSPIRE record ; CADI line (restricted) ; | ||
| Figures | |
png pdf |
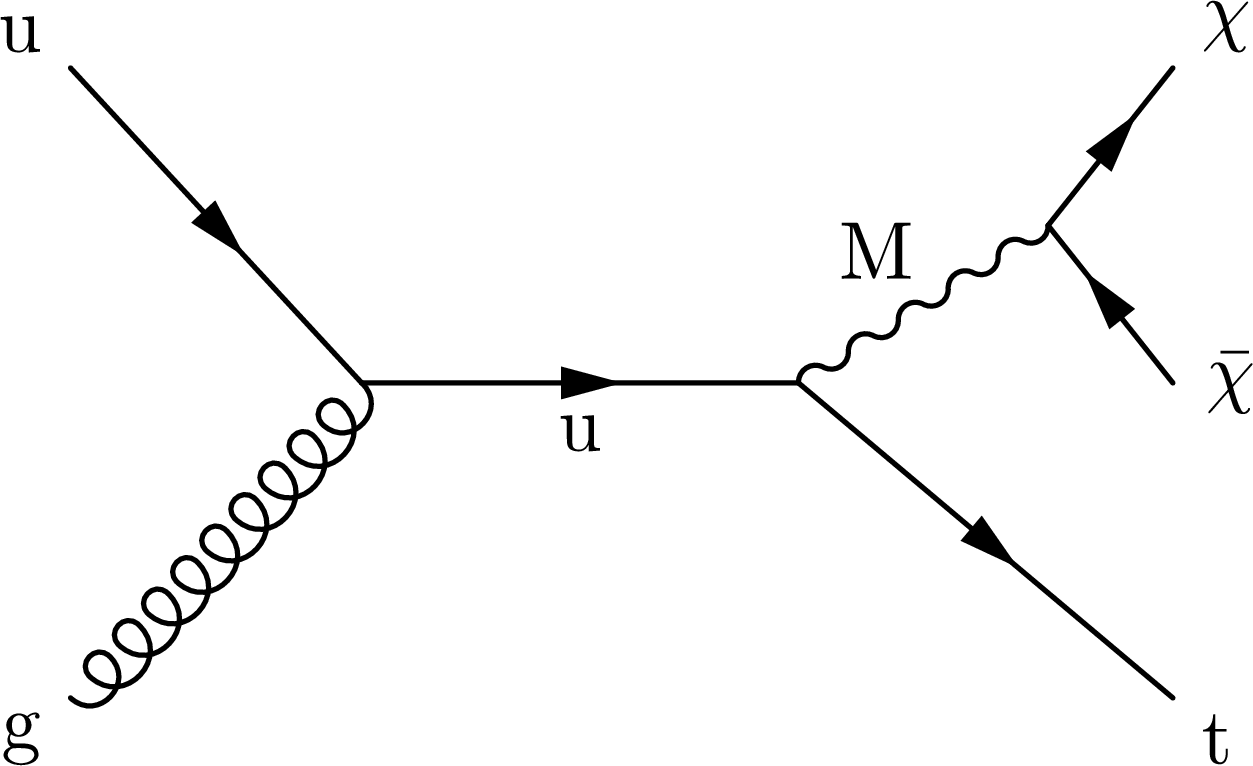
Figure 1:
Representative Feynman diagram of nonresonant mono-top production at tree level via a flavor-changing neutral current mediated by the spin-1 boson \mathrm{M}. The off-shell up quark (u) decays into an on-shell top quark (t) and an \mathrm{M} boson. The \mathrm{M} boson decays directly to a pair of DM candidates $ \chi $ and $ \overline{\chi} $. |
png pdf |
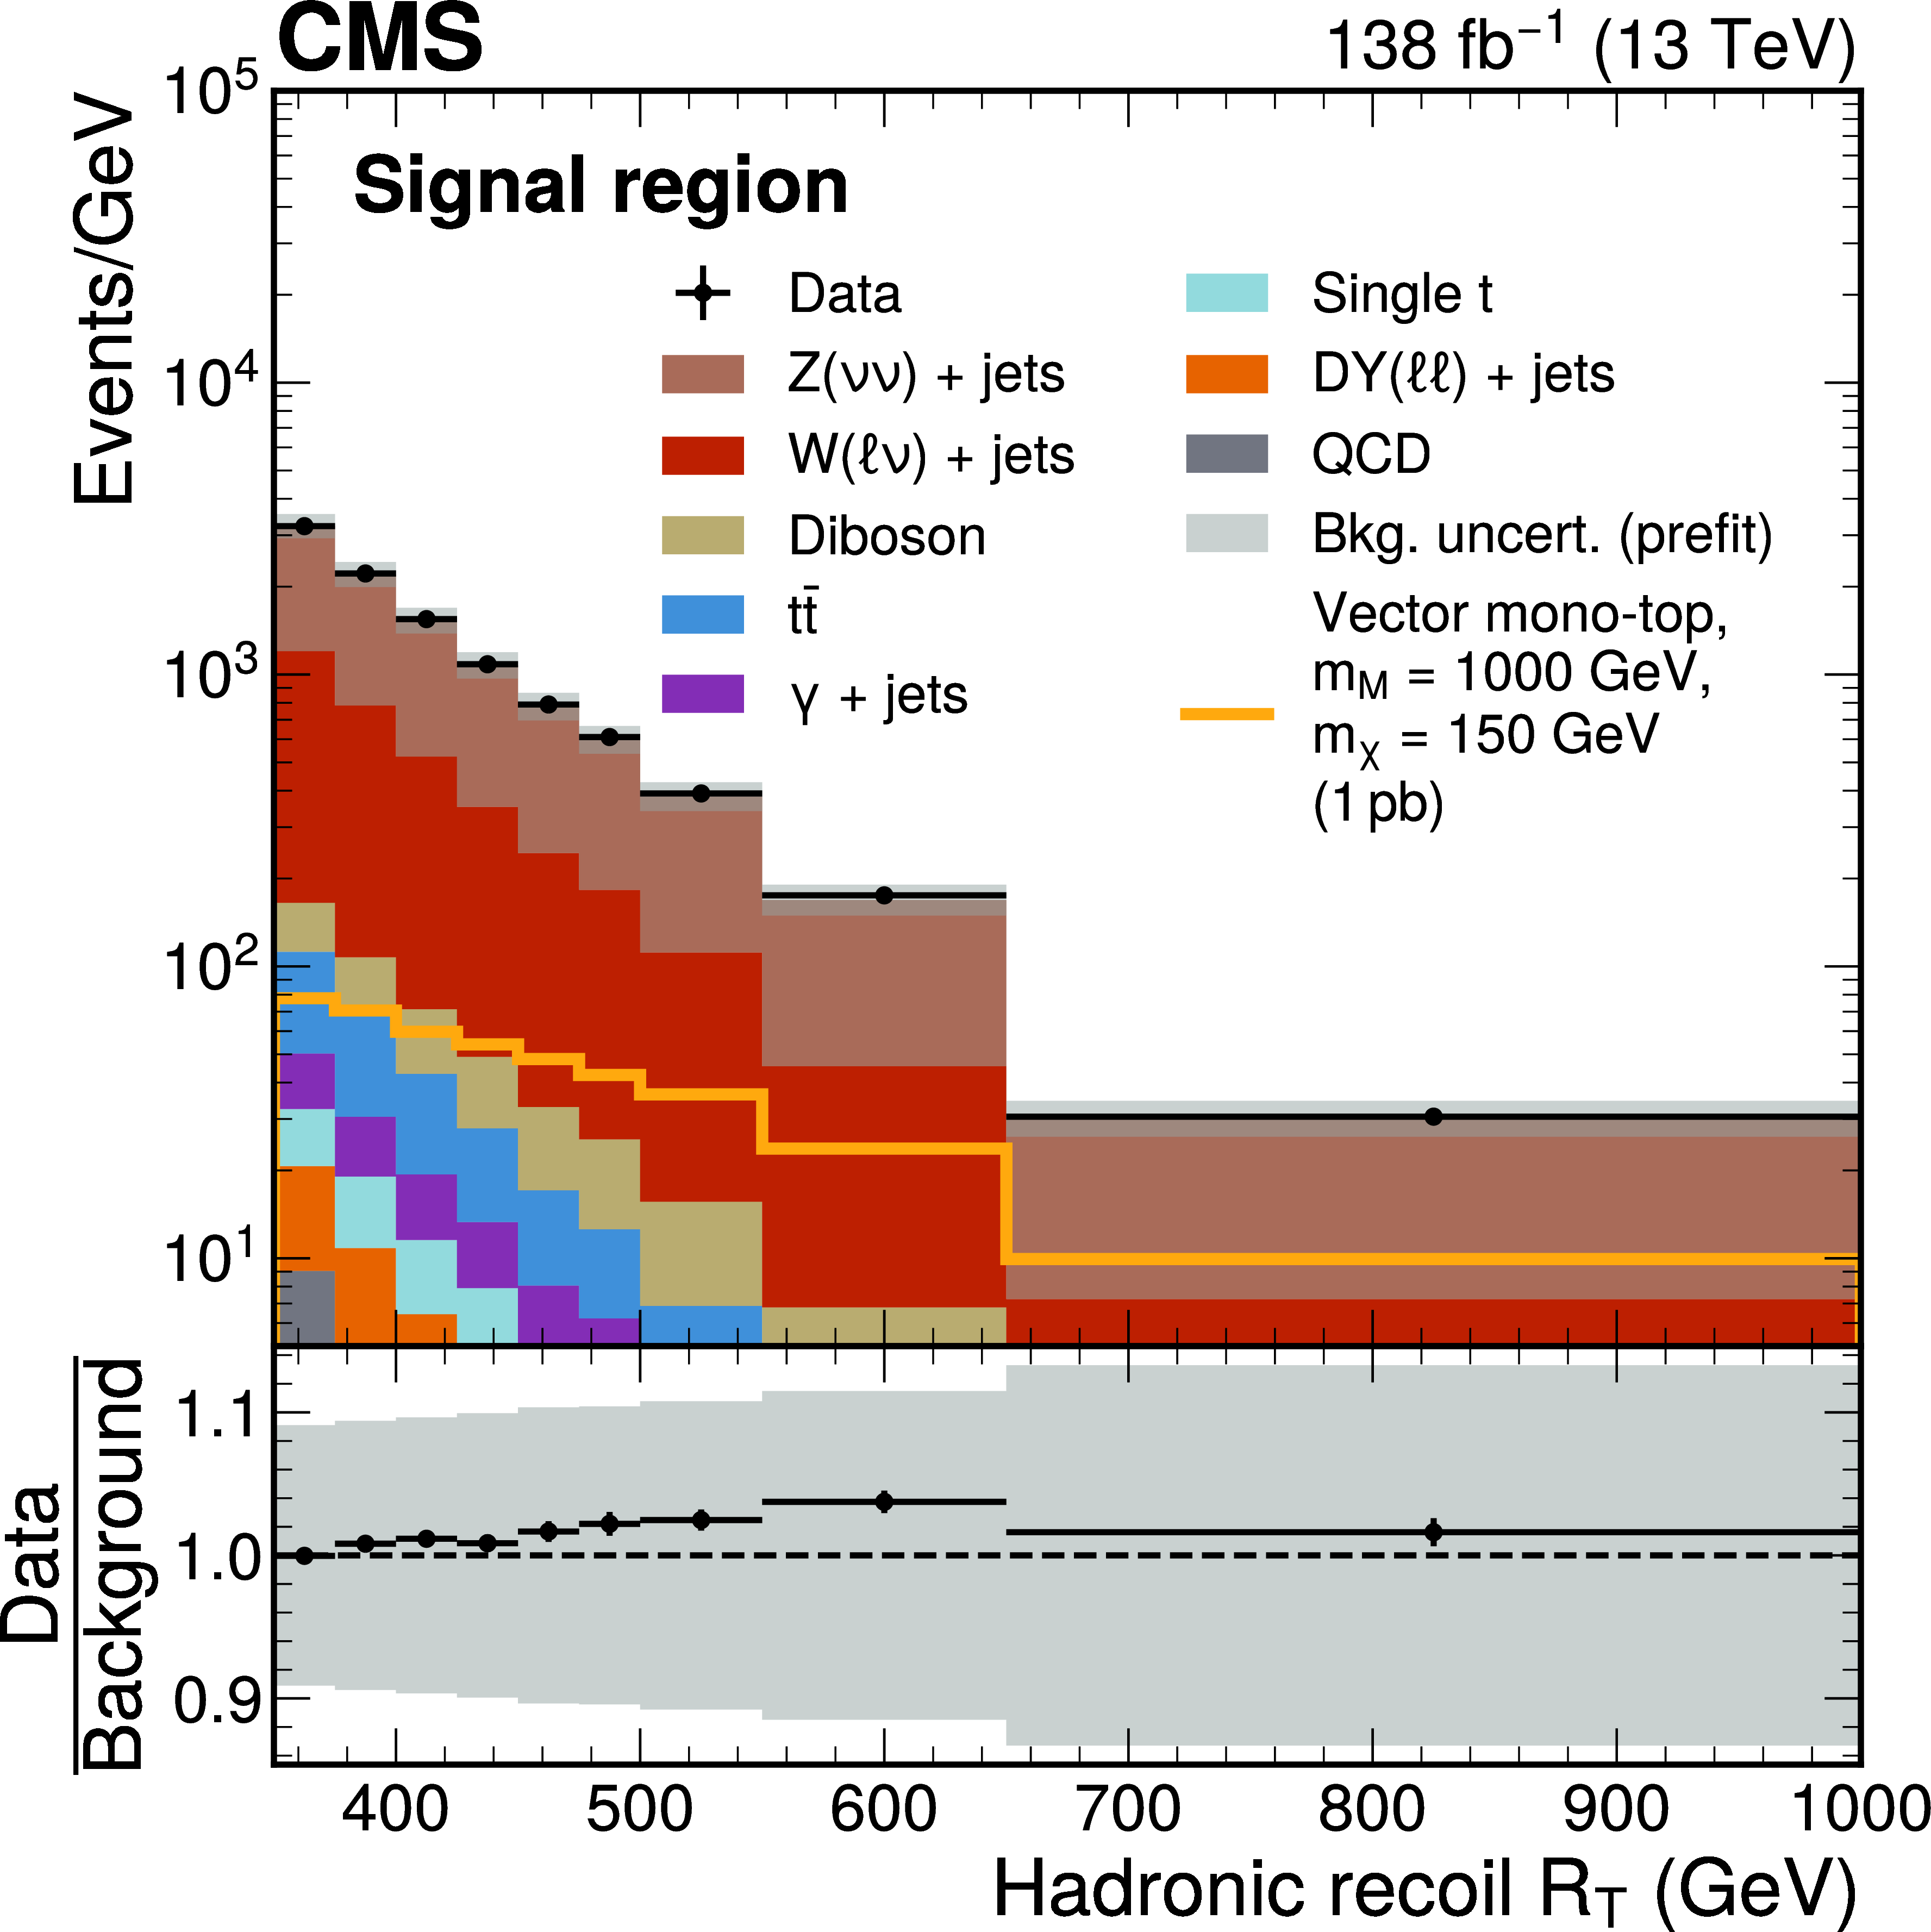
Figure 2:
Prefit distribution of the magnitude of the hadronic recoil $ R_{\mathrm{T}} $ in the SR. The last bin of the distribution also contains events with $ R_{\mathrm{T}} > $ 1000 GeV. The distributions of background processes stem from simulation and are stacked together. A representative mono-top signal (vector coupling scenario) with a mediator mass of 1 TeV, a DM candidate mass of 150 GeV, and a cross section of 1 pb is overlaid as an orange line. The gray band represents the statistical and unconstrained systematic uncertainties in the simulated event yields. |
png pdf |
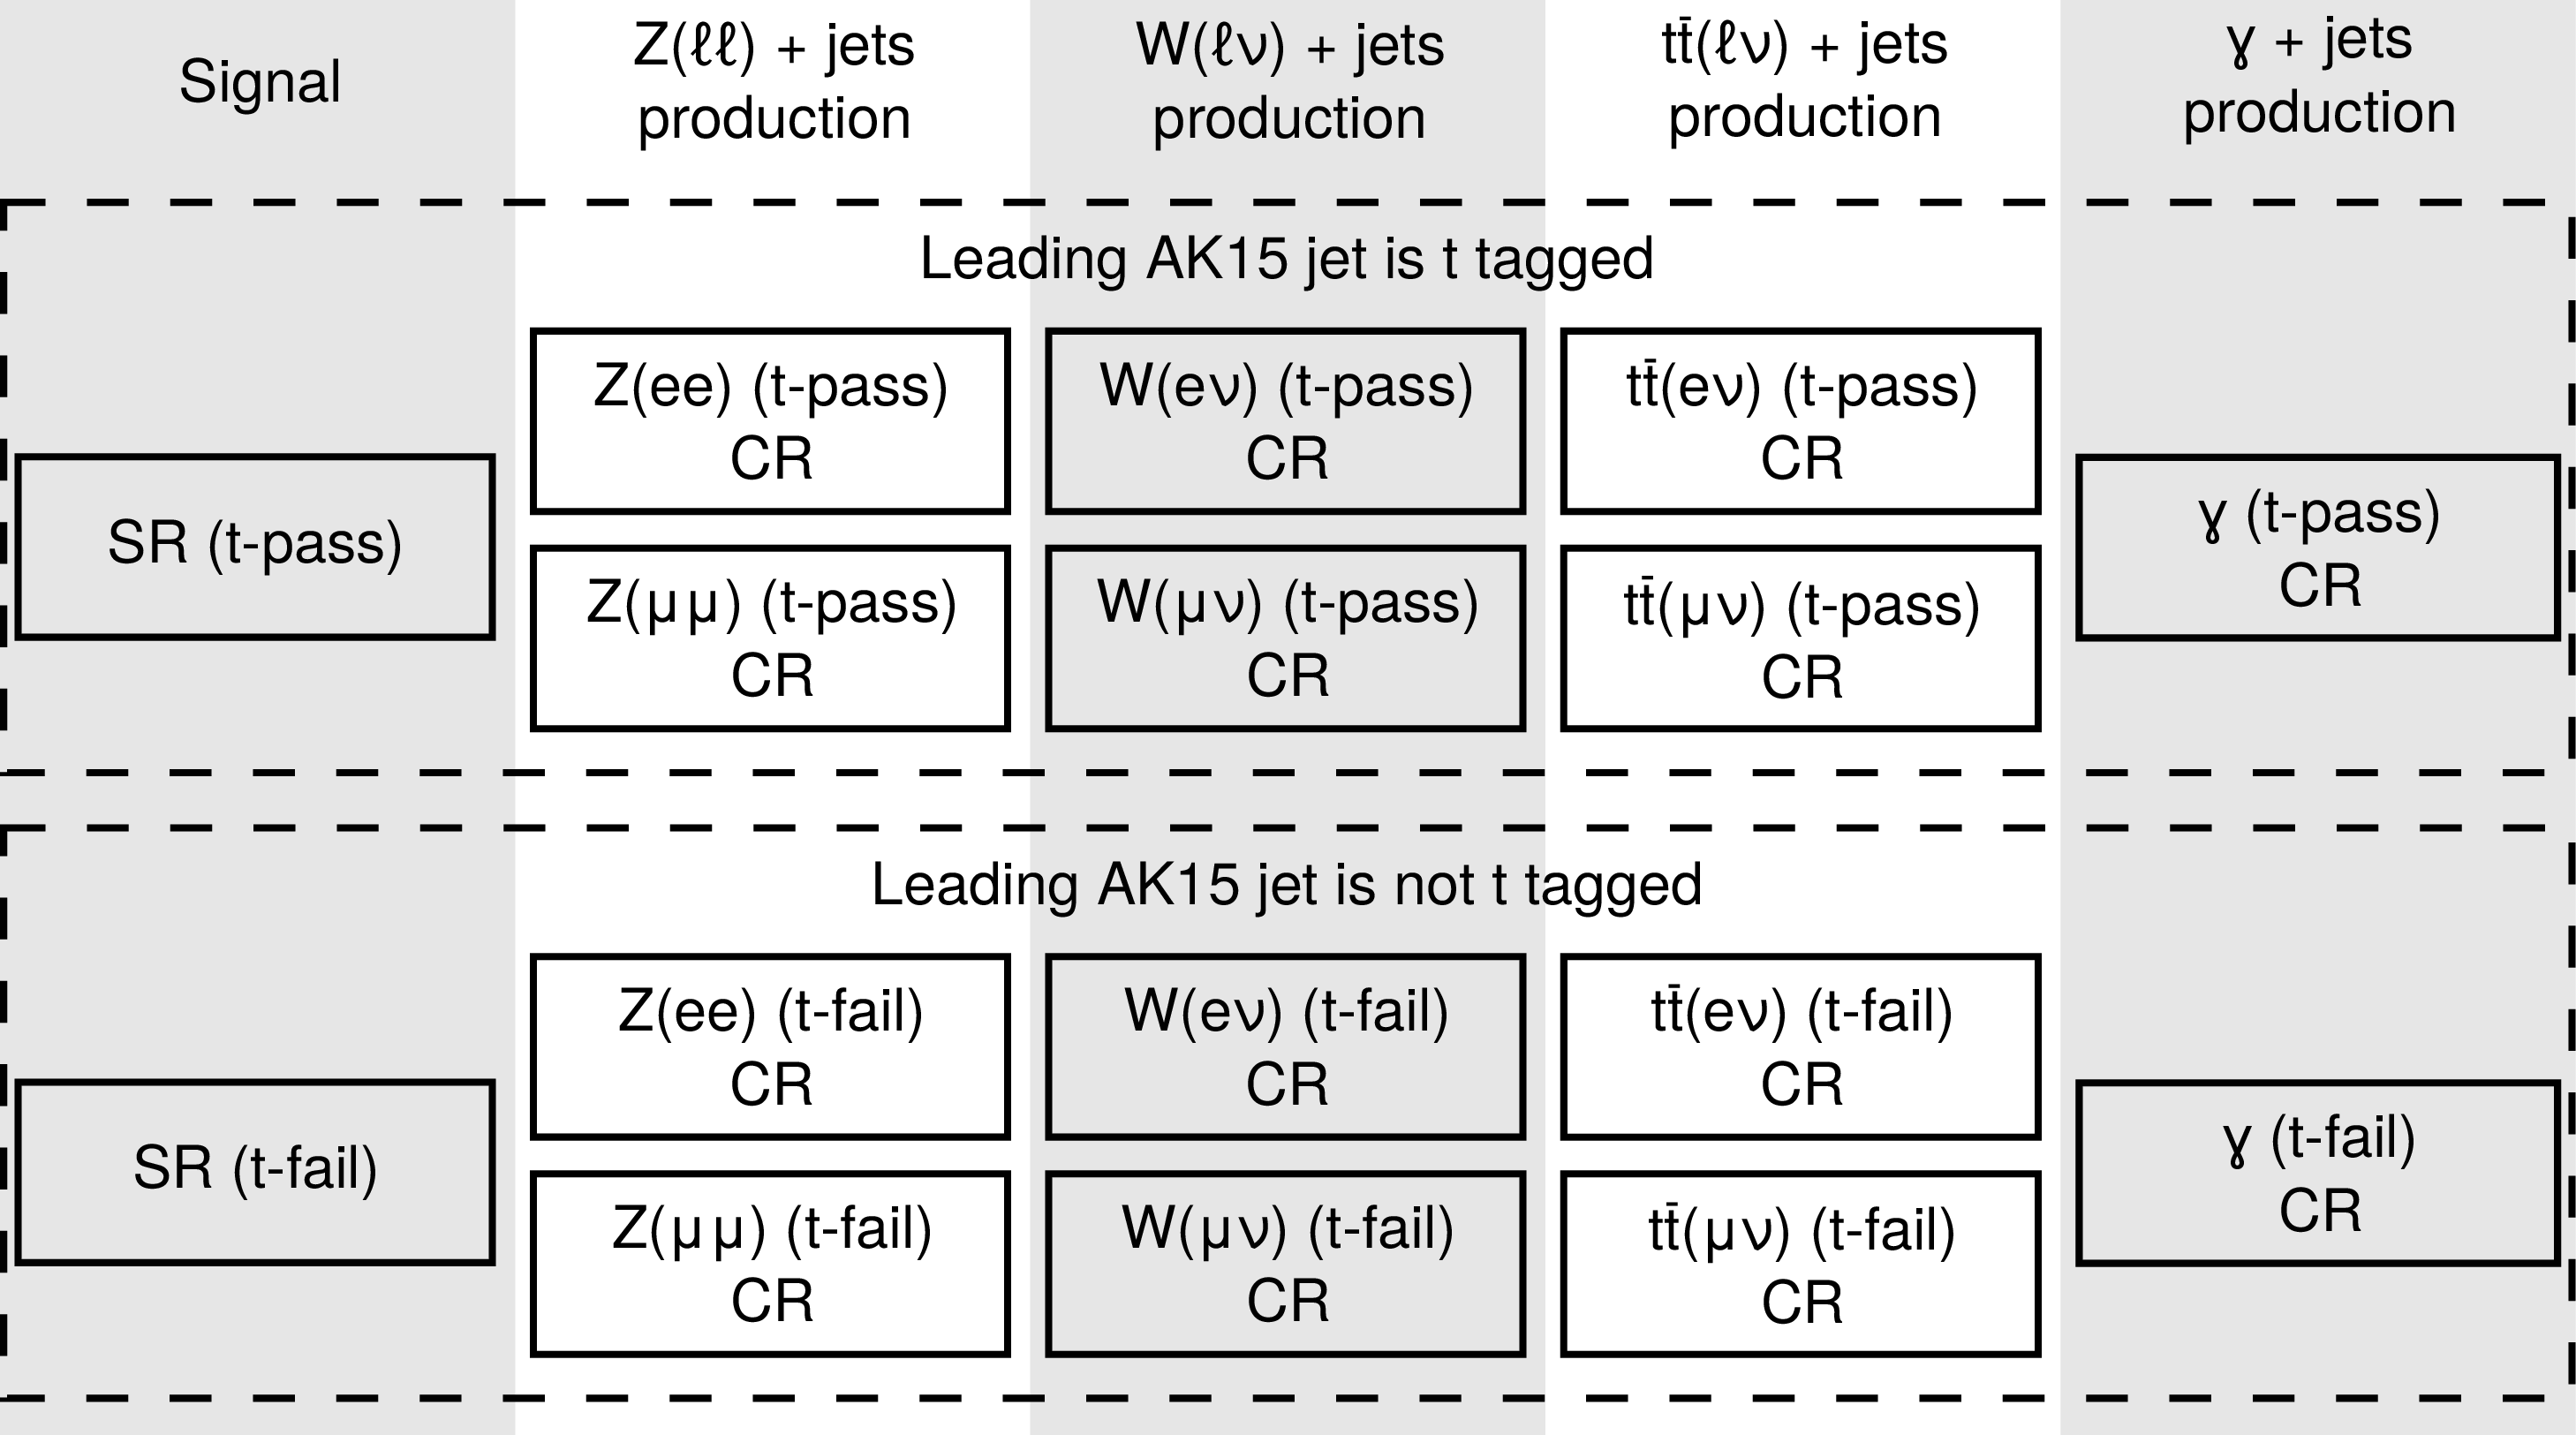
Figure 3:
Categorization of events into SRs and CRs, which are sensitive to specific processes, namely the mono-top signal, V+jets ($ \mathrm{V} = \mathrm{Z}, \mathrm{W}, \gamma $) processes, and $ \mathrm{t} \overline{\mathrm{t}} $ production. Each column contains categories that target the same process. For CRs with leptons in the final state, a version with electrons and a version with muons in the final states exist. Finally, in each category a split is performed based on whether the leading AK15 jet is t tagged or not. |
png pdf |
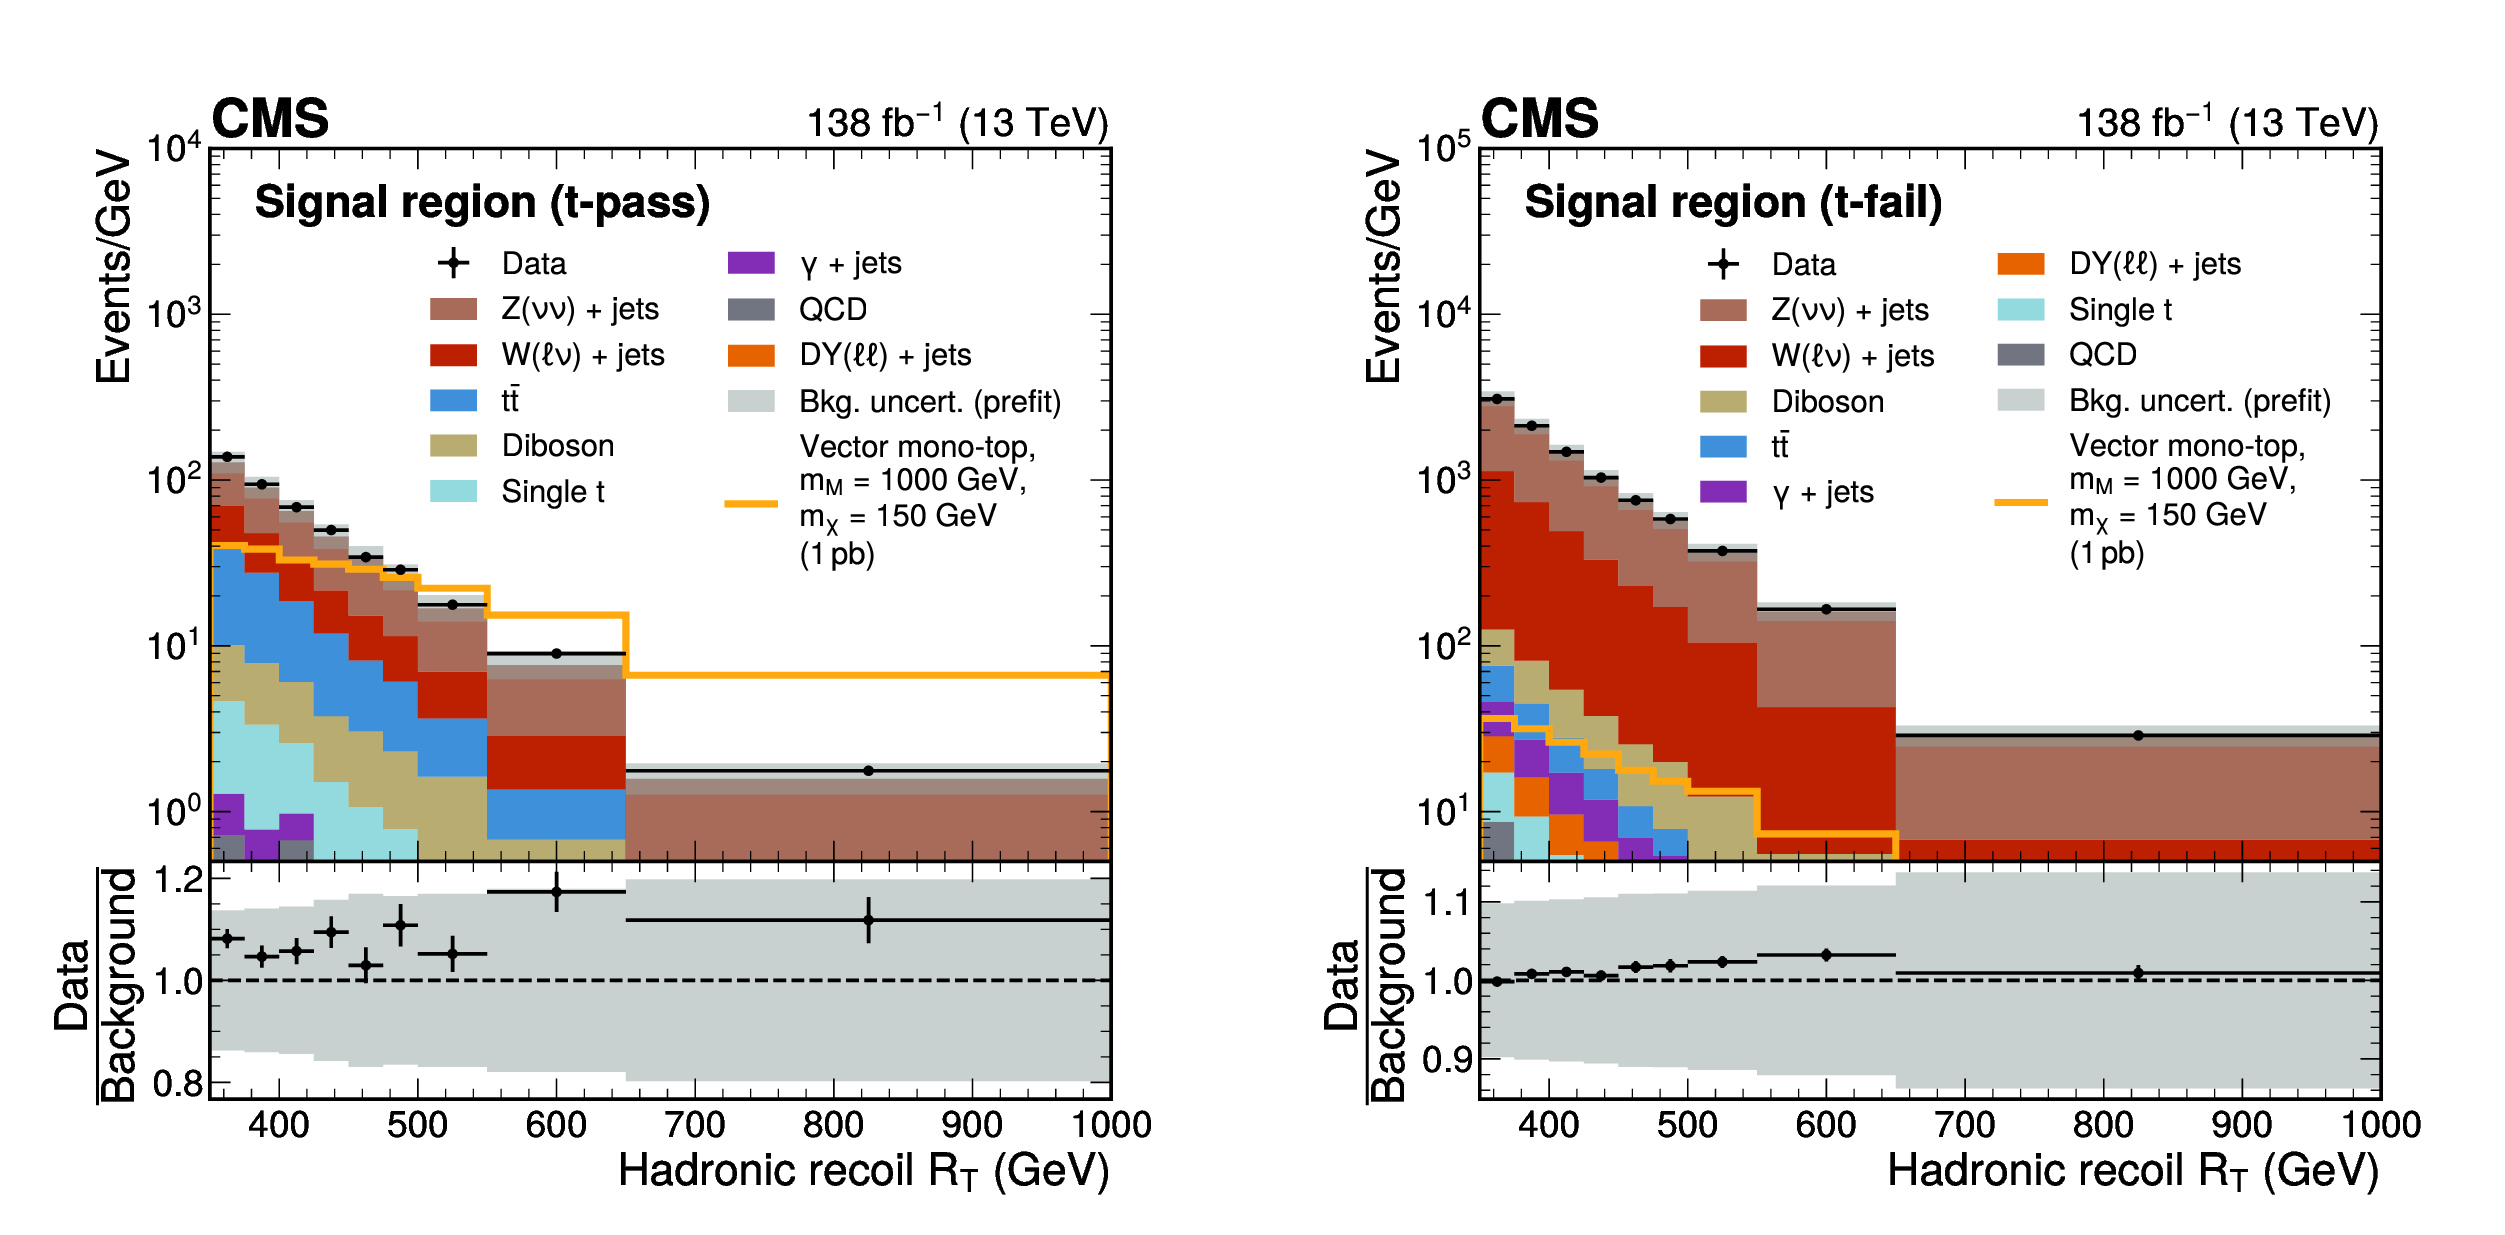
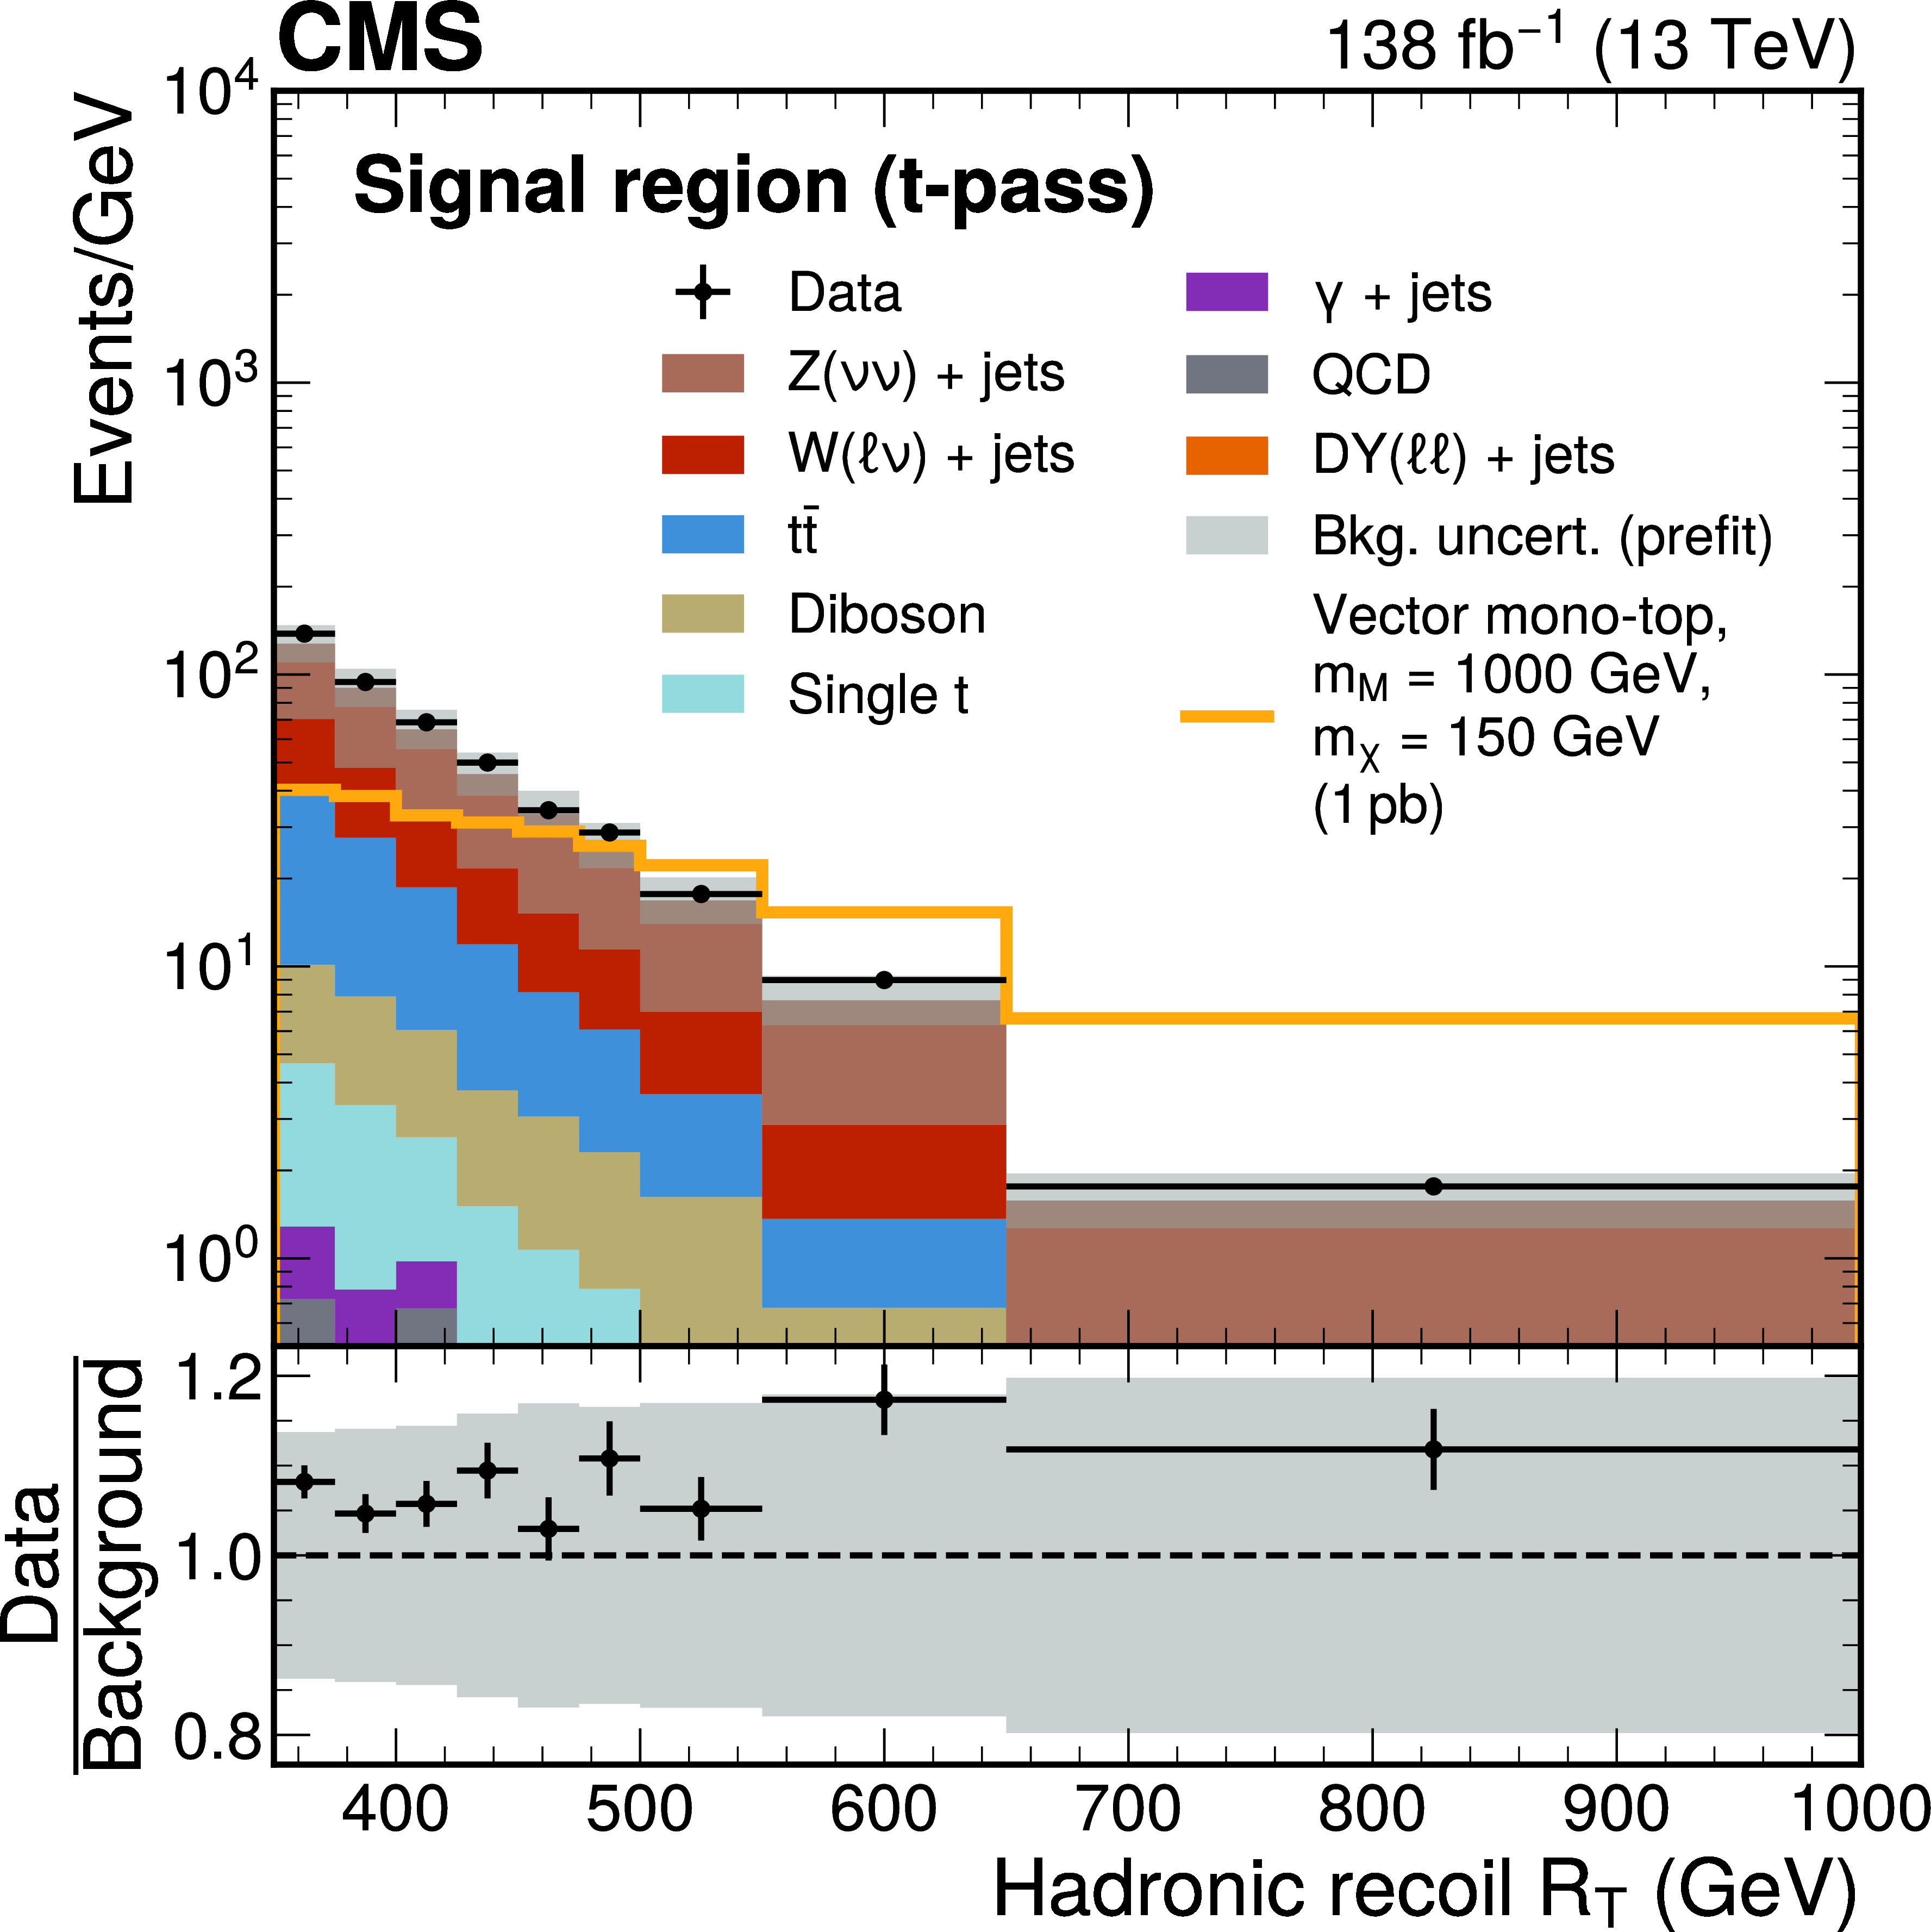
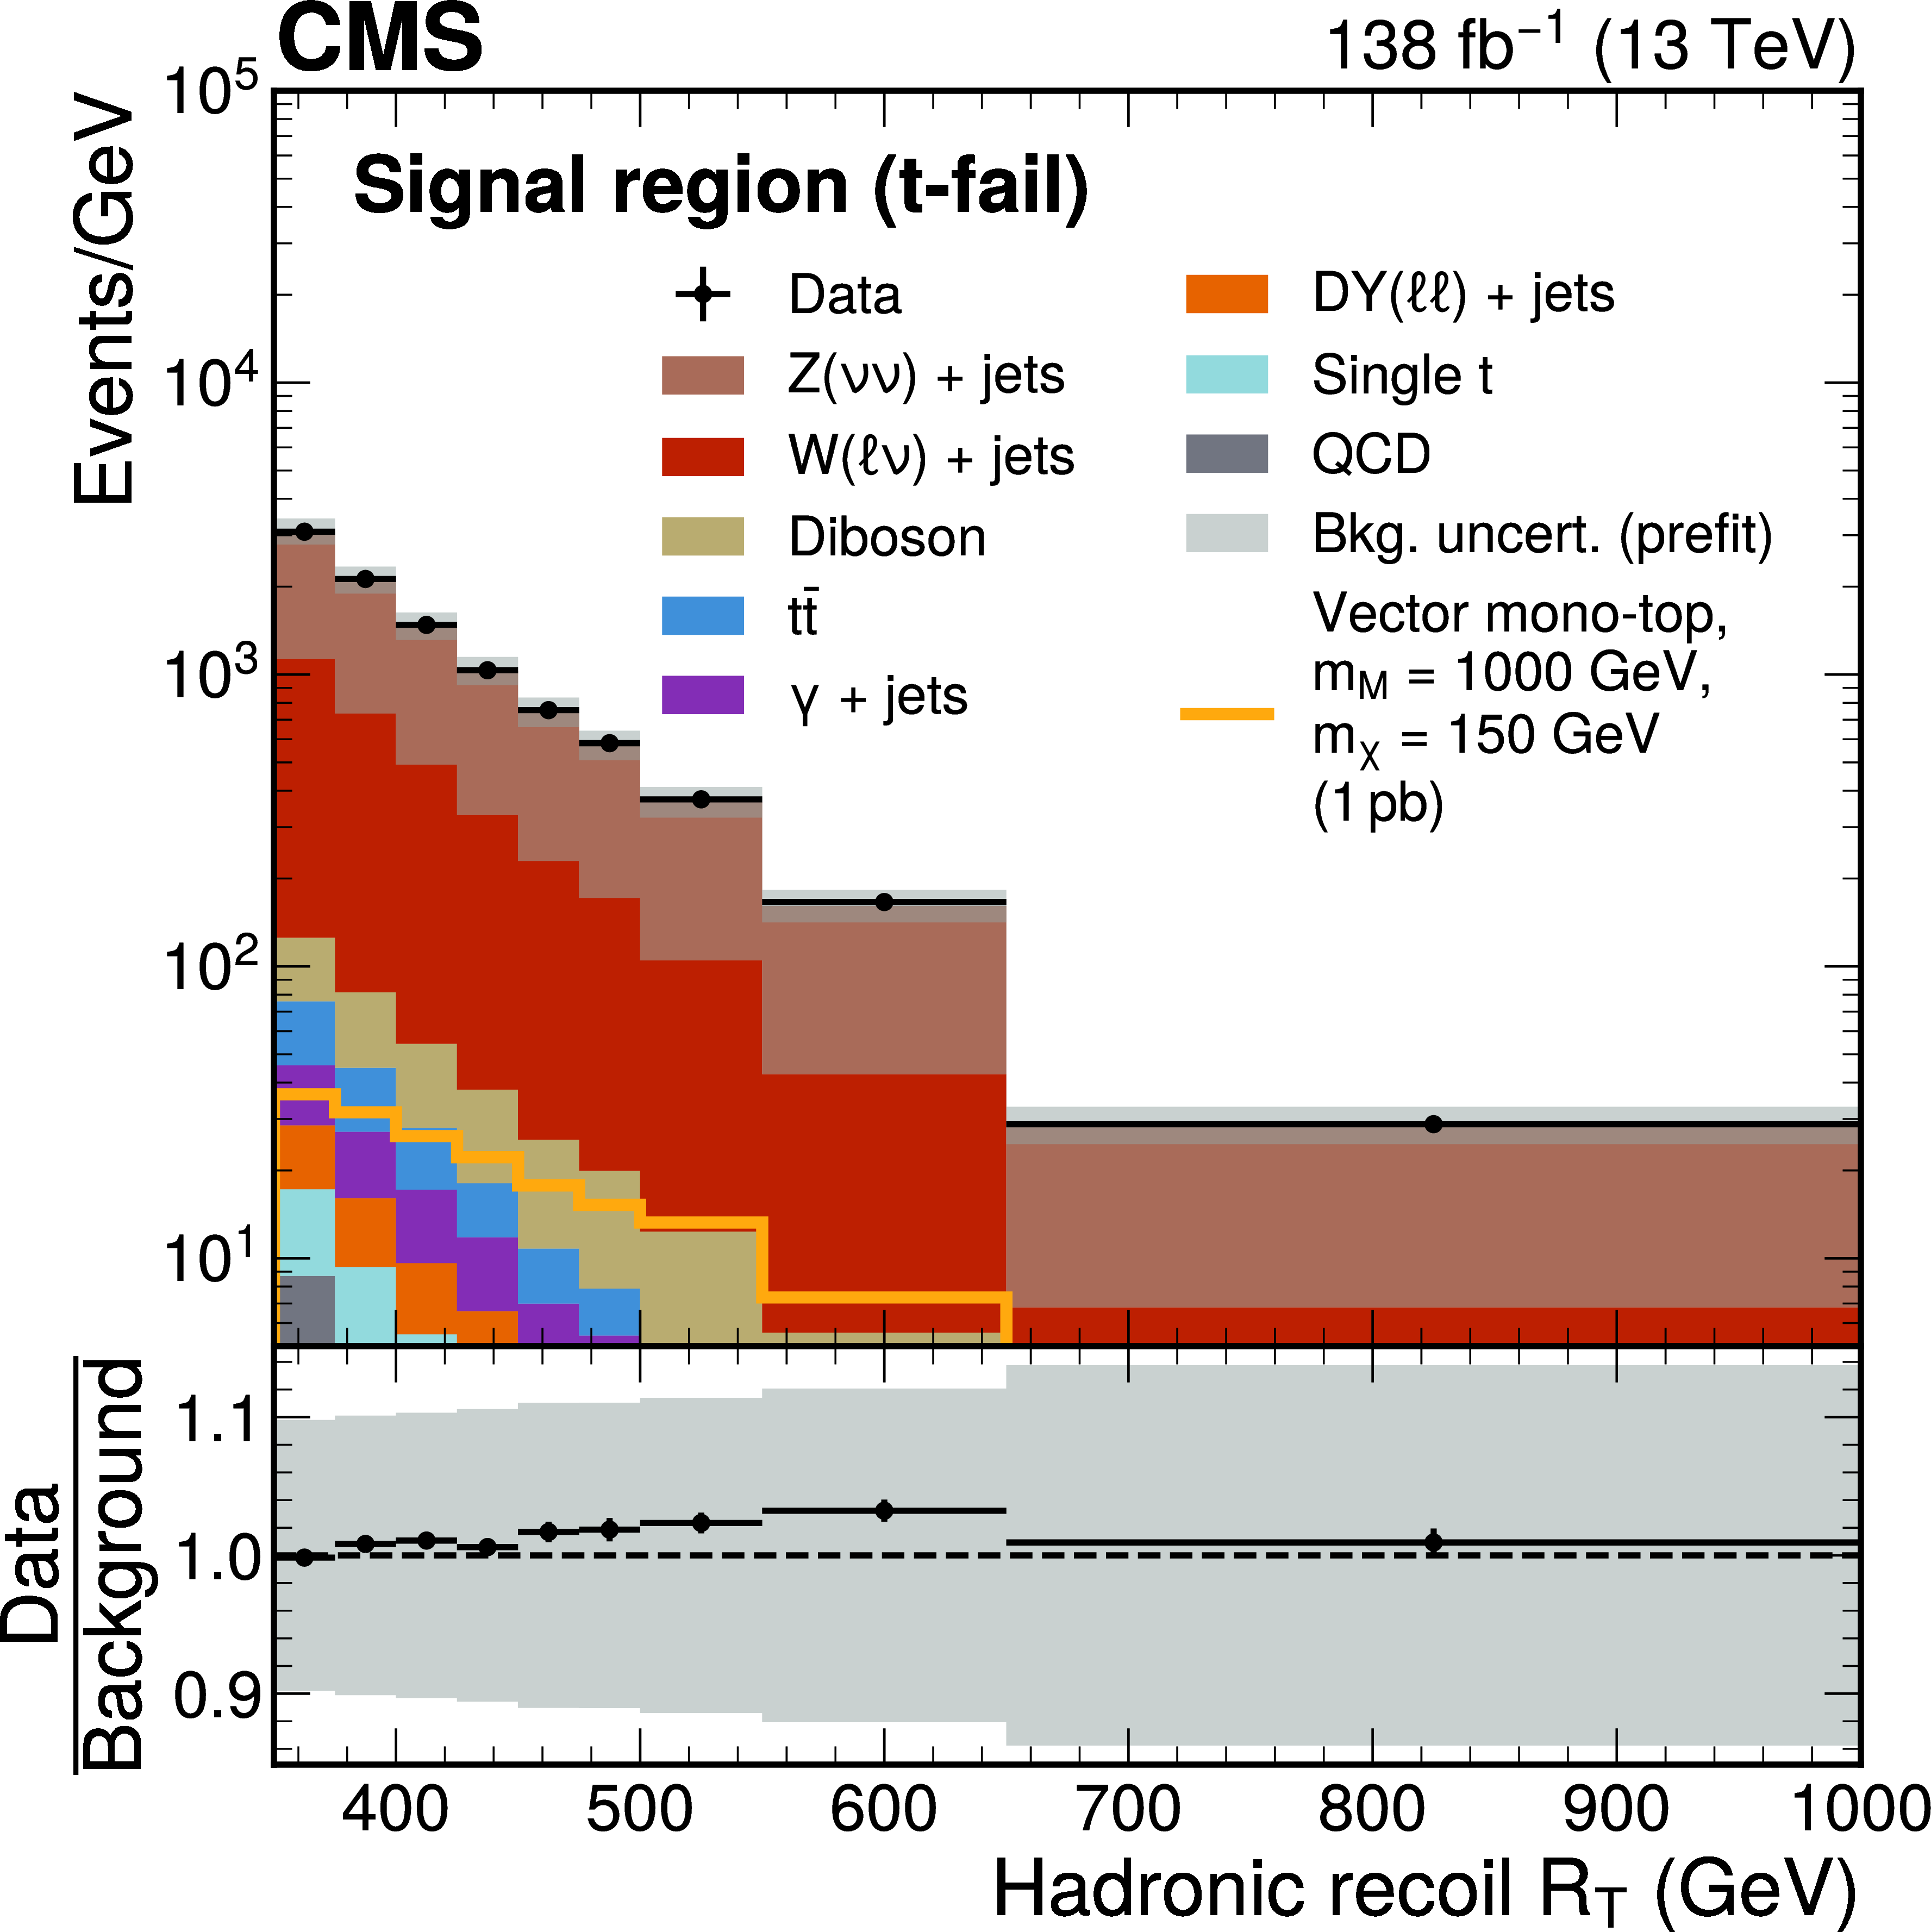
Figure 4:
Prefit distributions of the magnitude of the hadronic recoil $ R_{\mathrm{T}} $ in the SR (t-pass) and SR (t-fail). The last bin of each distribution also contains events with $ R_{\mathrm{T}} > $ 1000 GeV. The distributions of background processes stem from simulation and are stacked together. A representative mono-top signal (vector coupling scenario) with a mediator mass of 1 TeV, a DM candidate mass of 150 GeV, and a cross section of 1 pb is overlaid as an orange line. The gray band represents the statistical and unconstrained systematic uncertainties in the simulated event yields. |
png pdf |
Figure 4-a:
Prefit distributions of the magnitude of the hadronic recoil $ R_{\mathrm{T}} $ in the SR (t-pass) and SR (t-fail). The last bin of each distribution also contains events with $ R_{\mathrm{T}} > $ 1000 GeV. The distributions of background processes stem from simulation and are stacked together. A representative mono-top signal (vector coupling scenario) with a mediator mass of 1 TeV, a DM candidate mass of 150 GeV, and a cross section of 1 pb is overlaid as an orange line. The gray band represents the statistical and unconstrained systematic uncertainties in the simulated event yields. |
png pdf |
Figure 4-b:
Prefit distributions of the magnitude of the hadronic recoil $ R_{\mathrm{T}} $ in the SR (t-pass) and SR (t-fail). The last bin of each distribution also contains events with $ R_{\mathrm{T}} > $ 1000 GeV. The distributions of background processes stem from simulation and are stacked together. A representative mono-top signal (vector coupling scenario) with a mediator mass of 1 TeV, a DM candidate mass of 150 GeV, and a cross section of 1 pb is overlaid as an orange line. The gray band represents the statistical and unconstrained systematic uncertainties in the simulated event yields. |
png pdf |
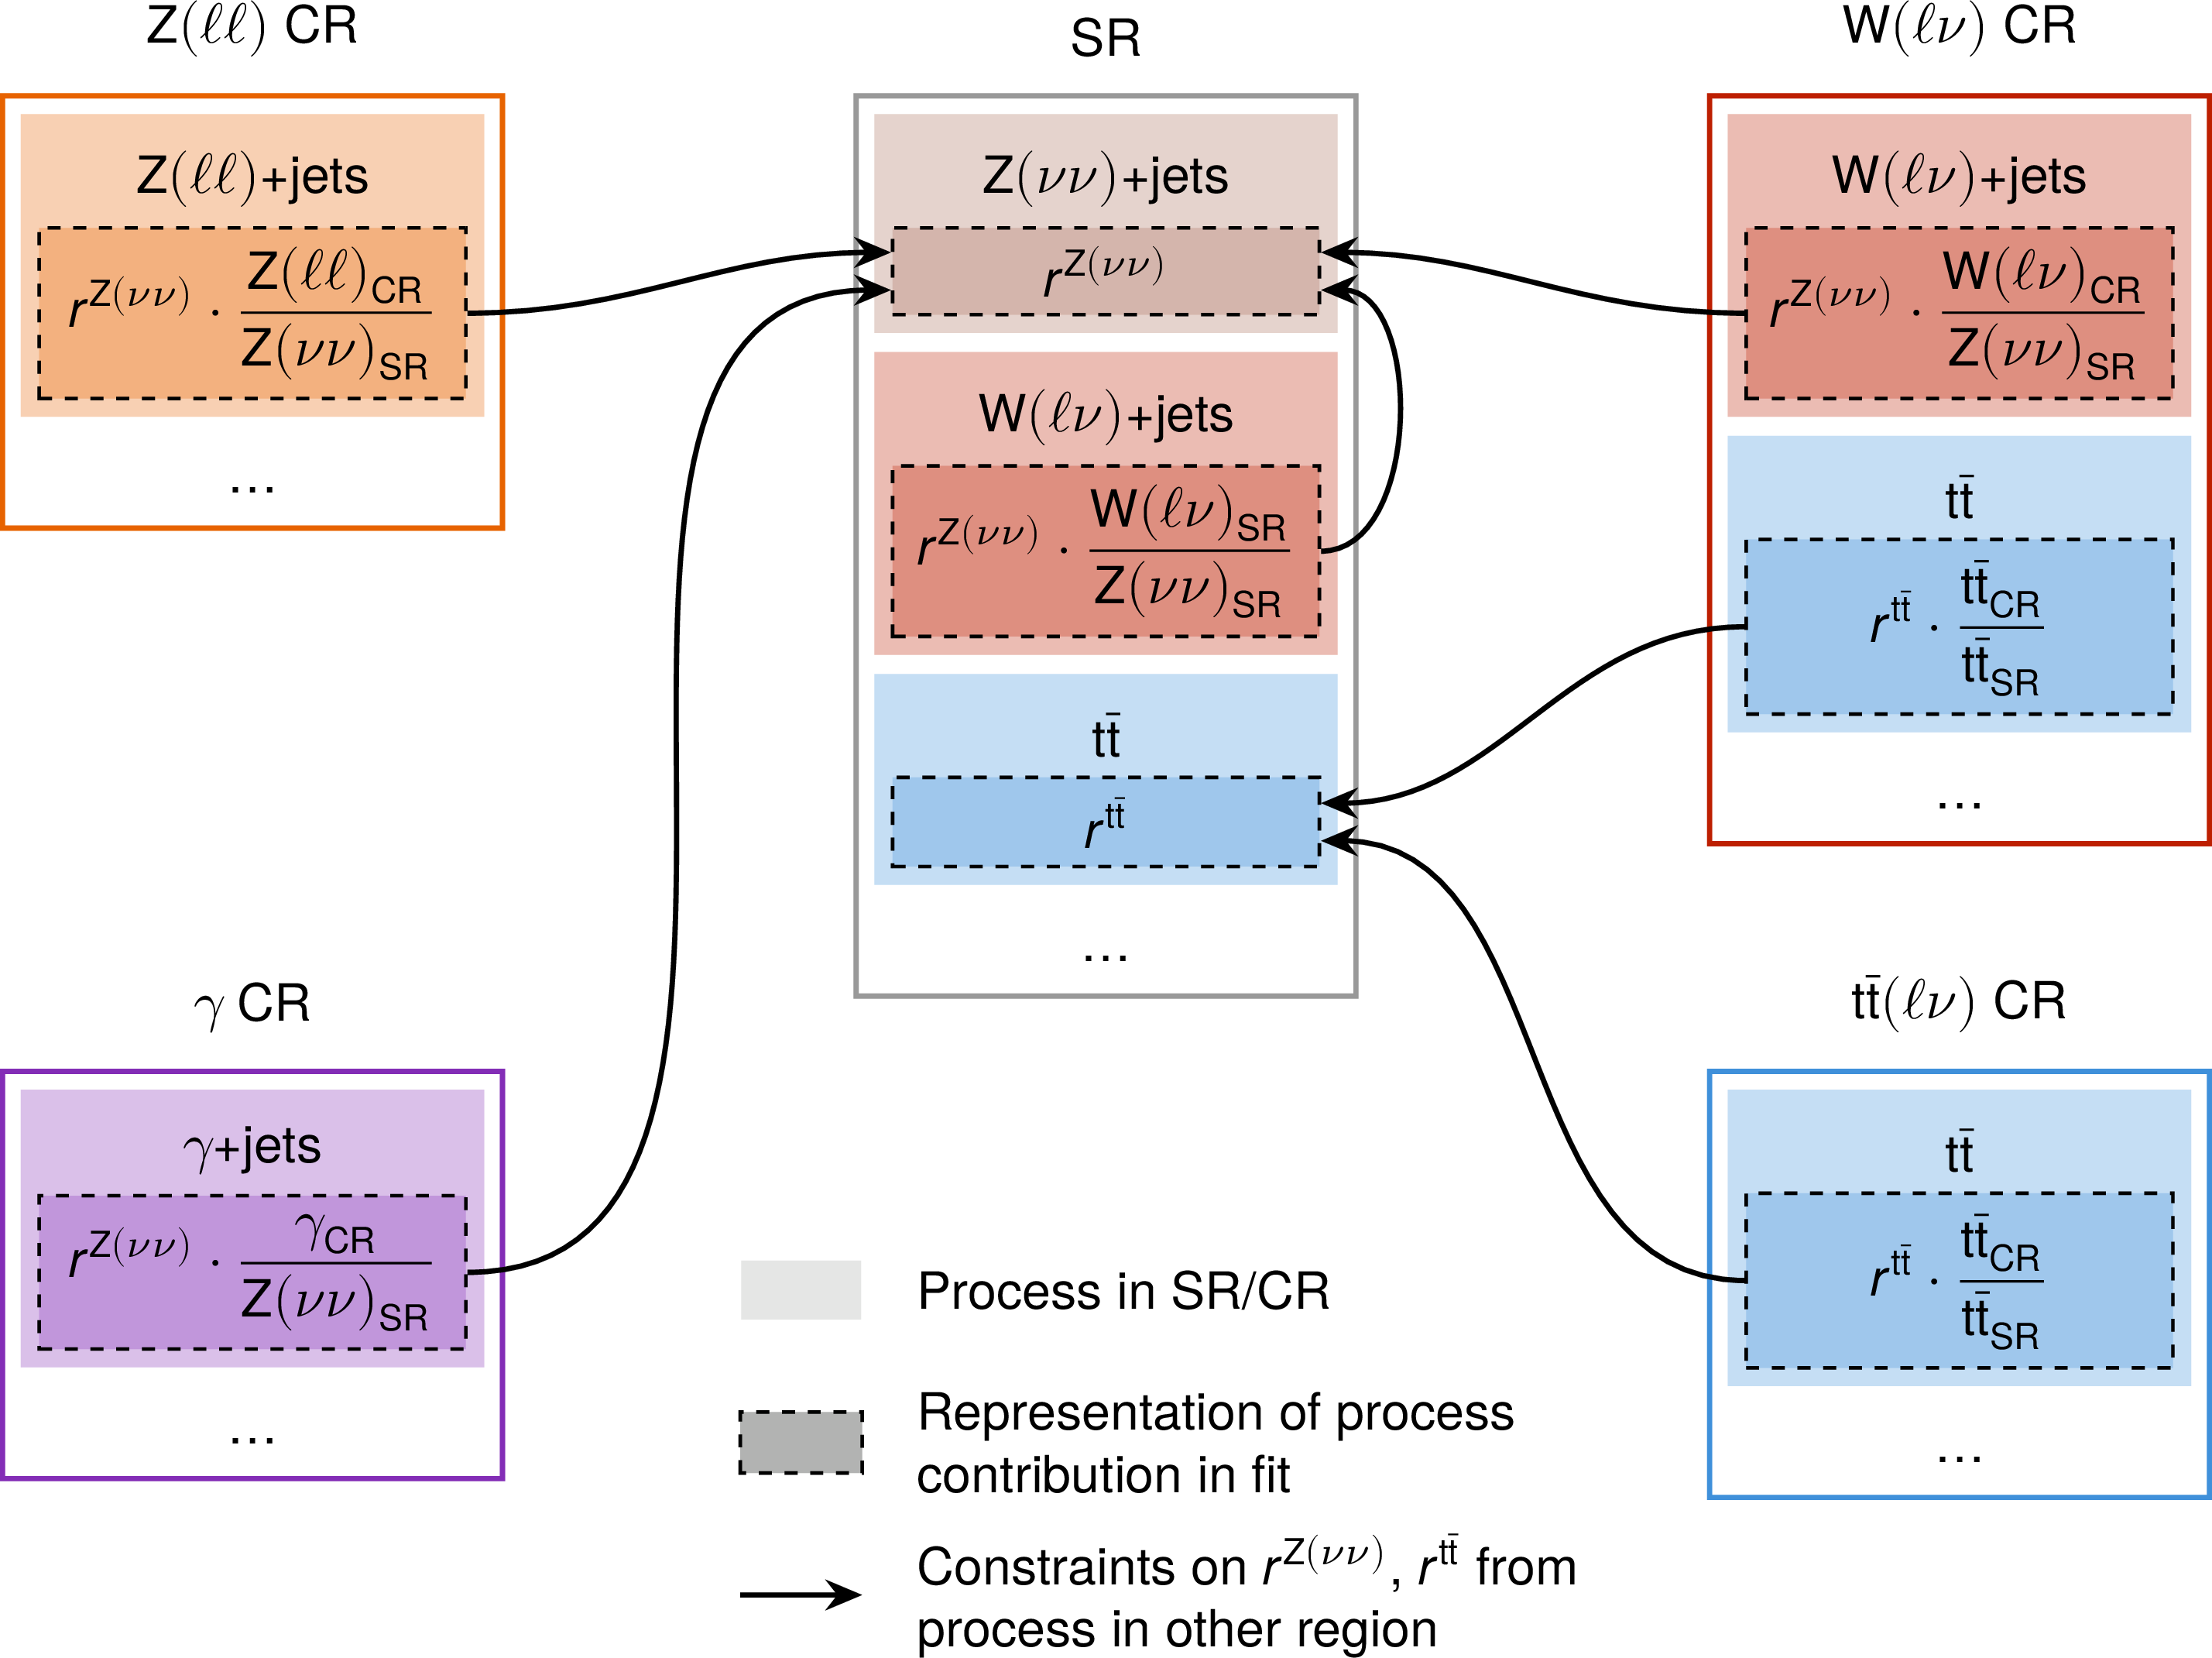
Figure 5:
Statistical model used for the estimation of the major background processes for one bin of the $ R_{\mathrm{T}} $ distribution. The contributions of $ \mathrm{Z}(\nu\nu) $+jets and $ \mathrm{t} \overline{\mathrm{t}} $ production in the SR are estimated with freely floating parameters $ r^{\mathrm{Z}(\nu\nu)} $ and $ r^{{\mathrm{t}\overline{\mathrm{t}}} } $. Constraints on $ \mathrm{Z}(\nu\nu) $+jets production are obtained by expressing similar processes in the SR and CRs as products of $ r^{\mathrm{Z}(\nu\nu)} $ and a TF, obtained from simulation. Concerning $ \mathrm{t} \overline{\mathrm{t}} $ production, the $ \mathrm{t} \overline{\mathrm{t}} $ processes in the $ {\mathrm{t}\overline{\mathrm{t}}} (\ell\nu) $ and $ \mathrm{W}(\ell\nu) $ CRs are expressed in terms of $ r^{{\mathrm{t}\overline{\mathrm{t}}} } $ and a TF. All processes not depicted in this illustration are estimated using simulated events. Regions containing charged leptons are included twice in this model, once for electrons and once for muons. The model is implemented for the t-pass and t-fail regions separately. |
png pdf |
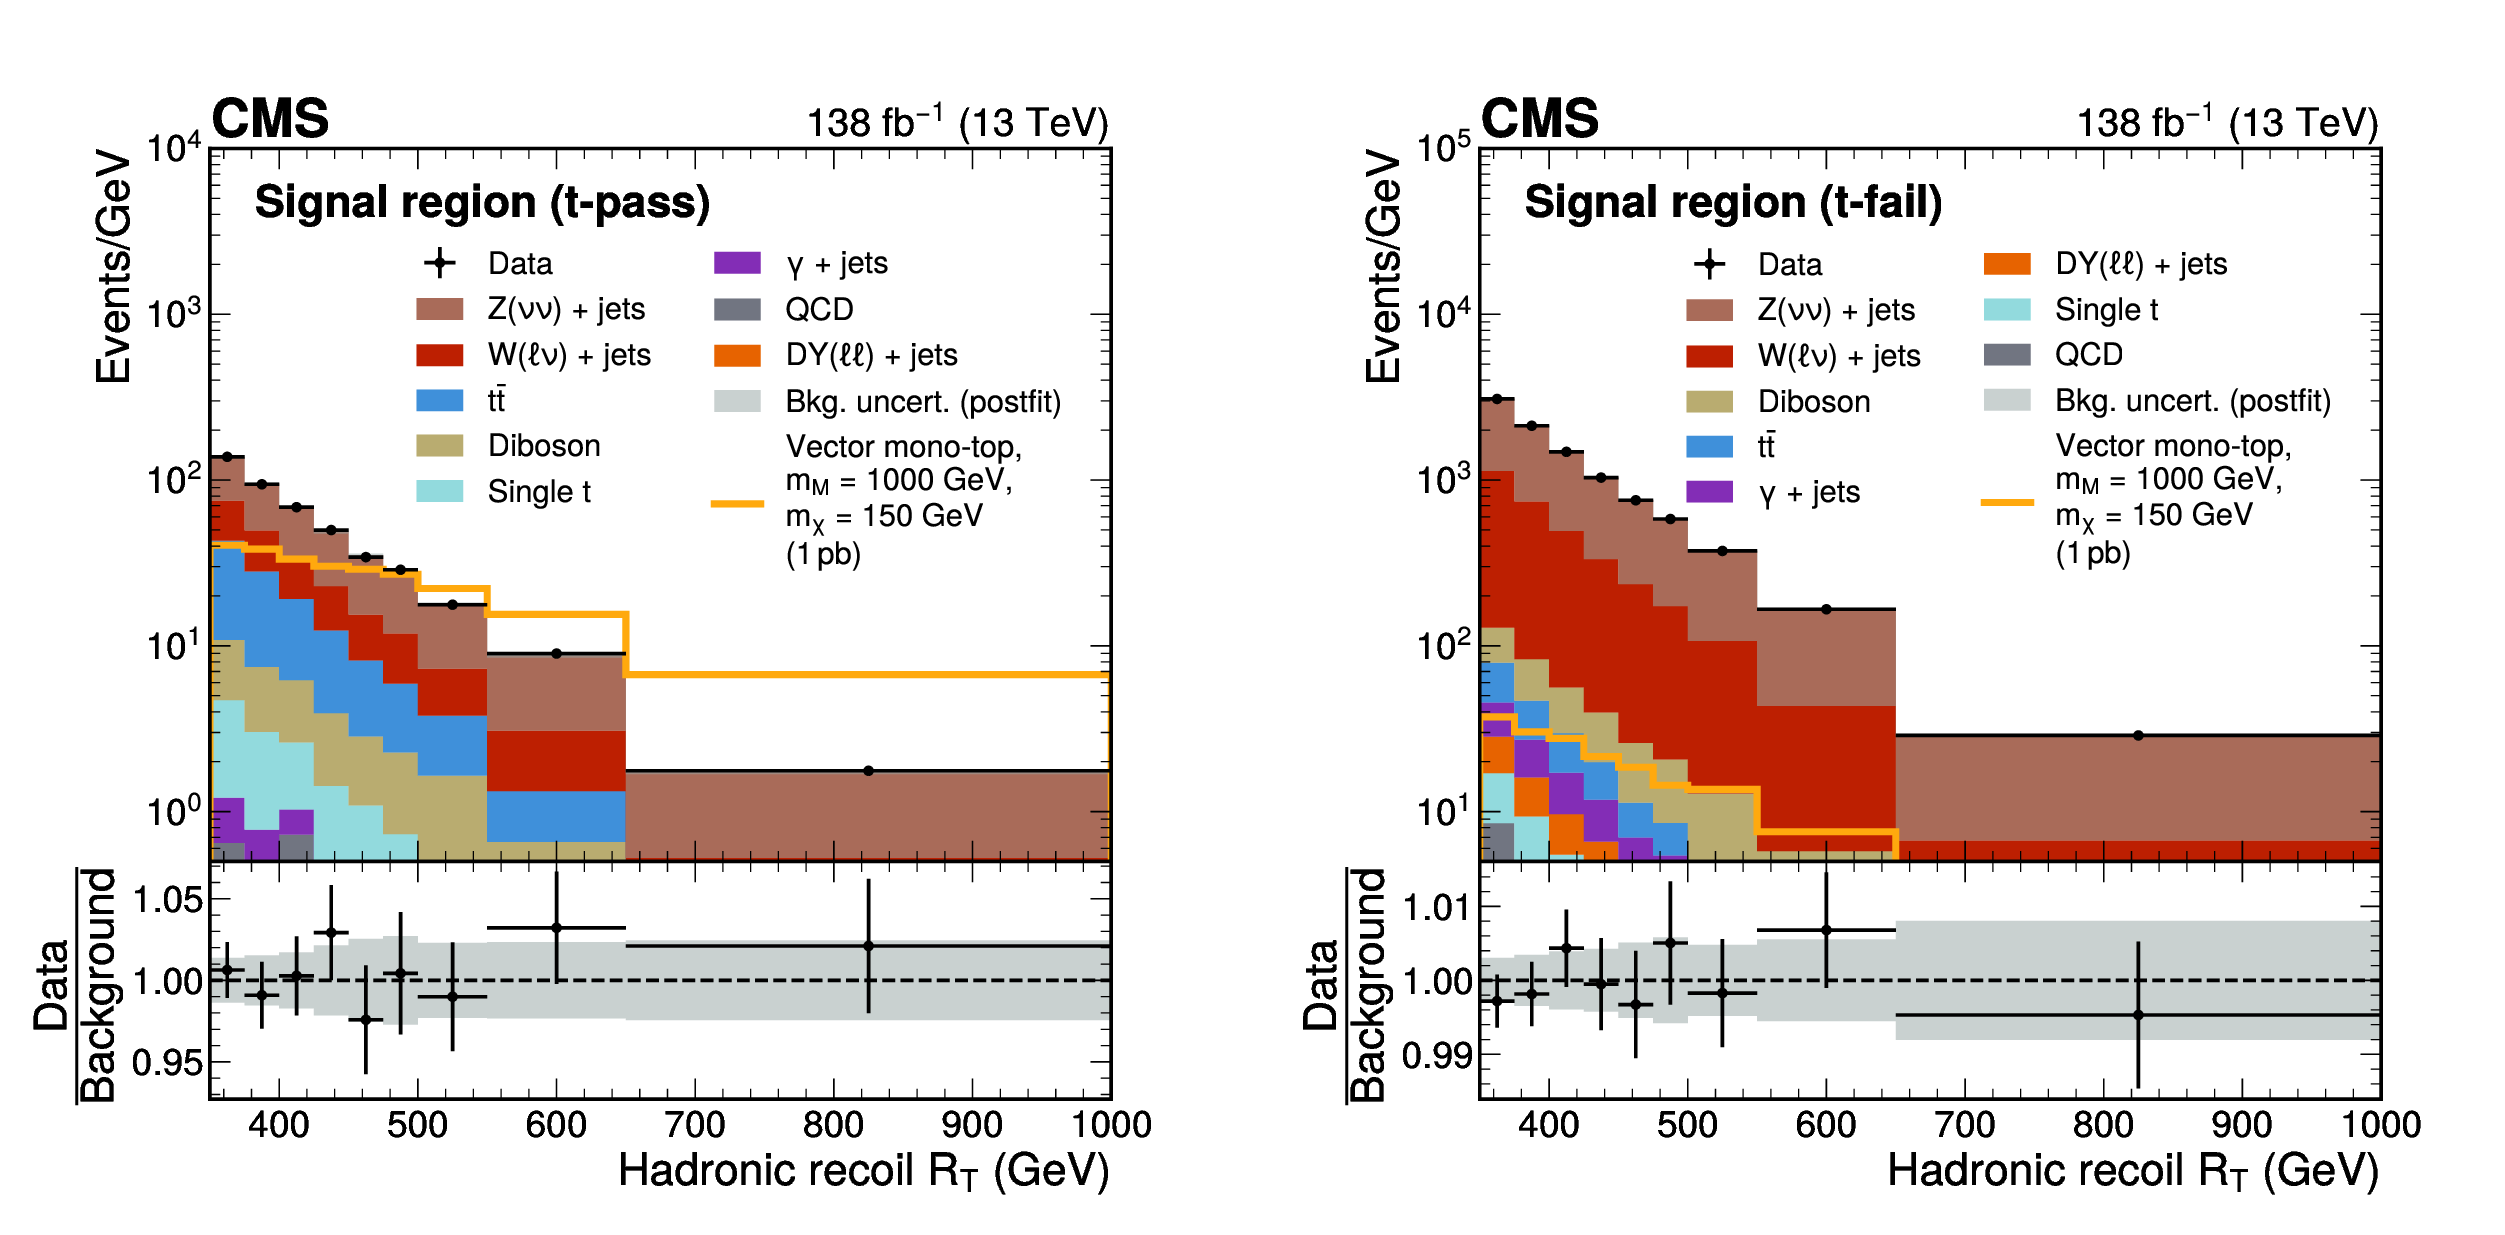
Figure 6:
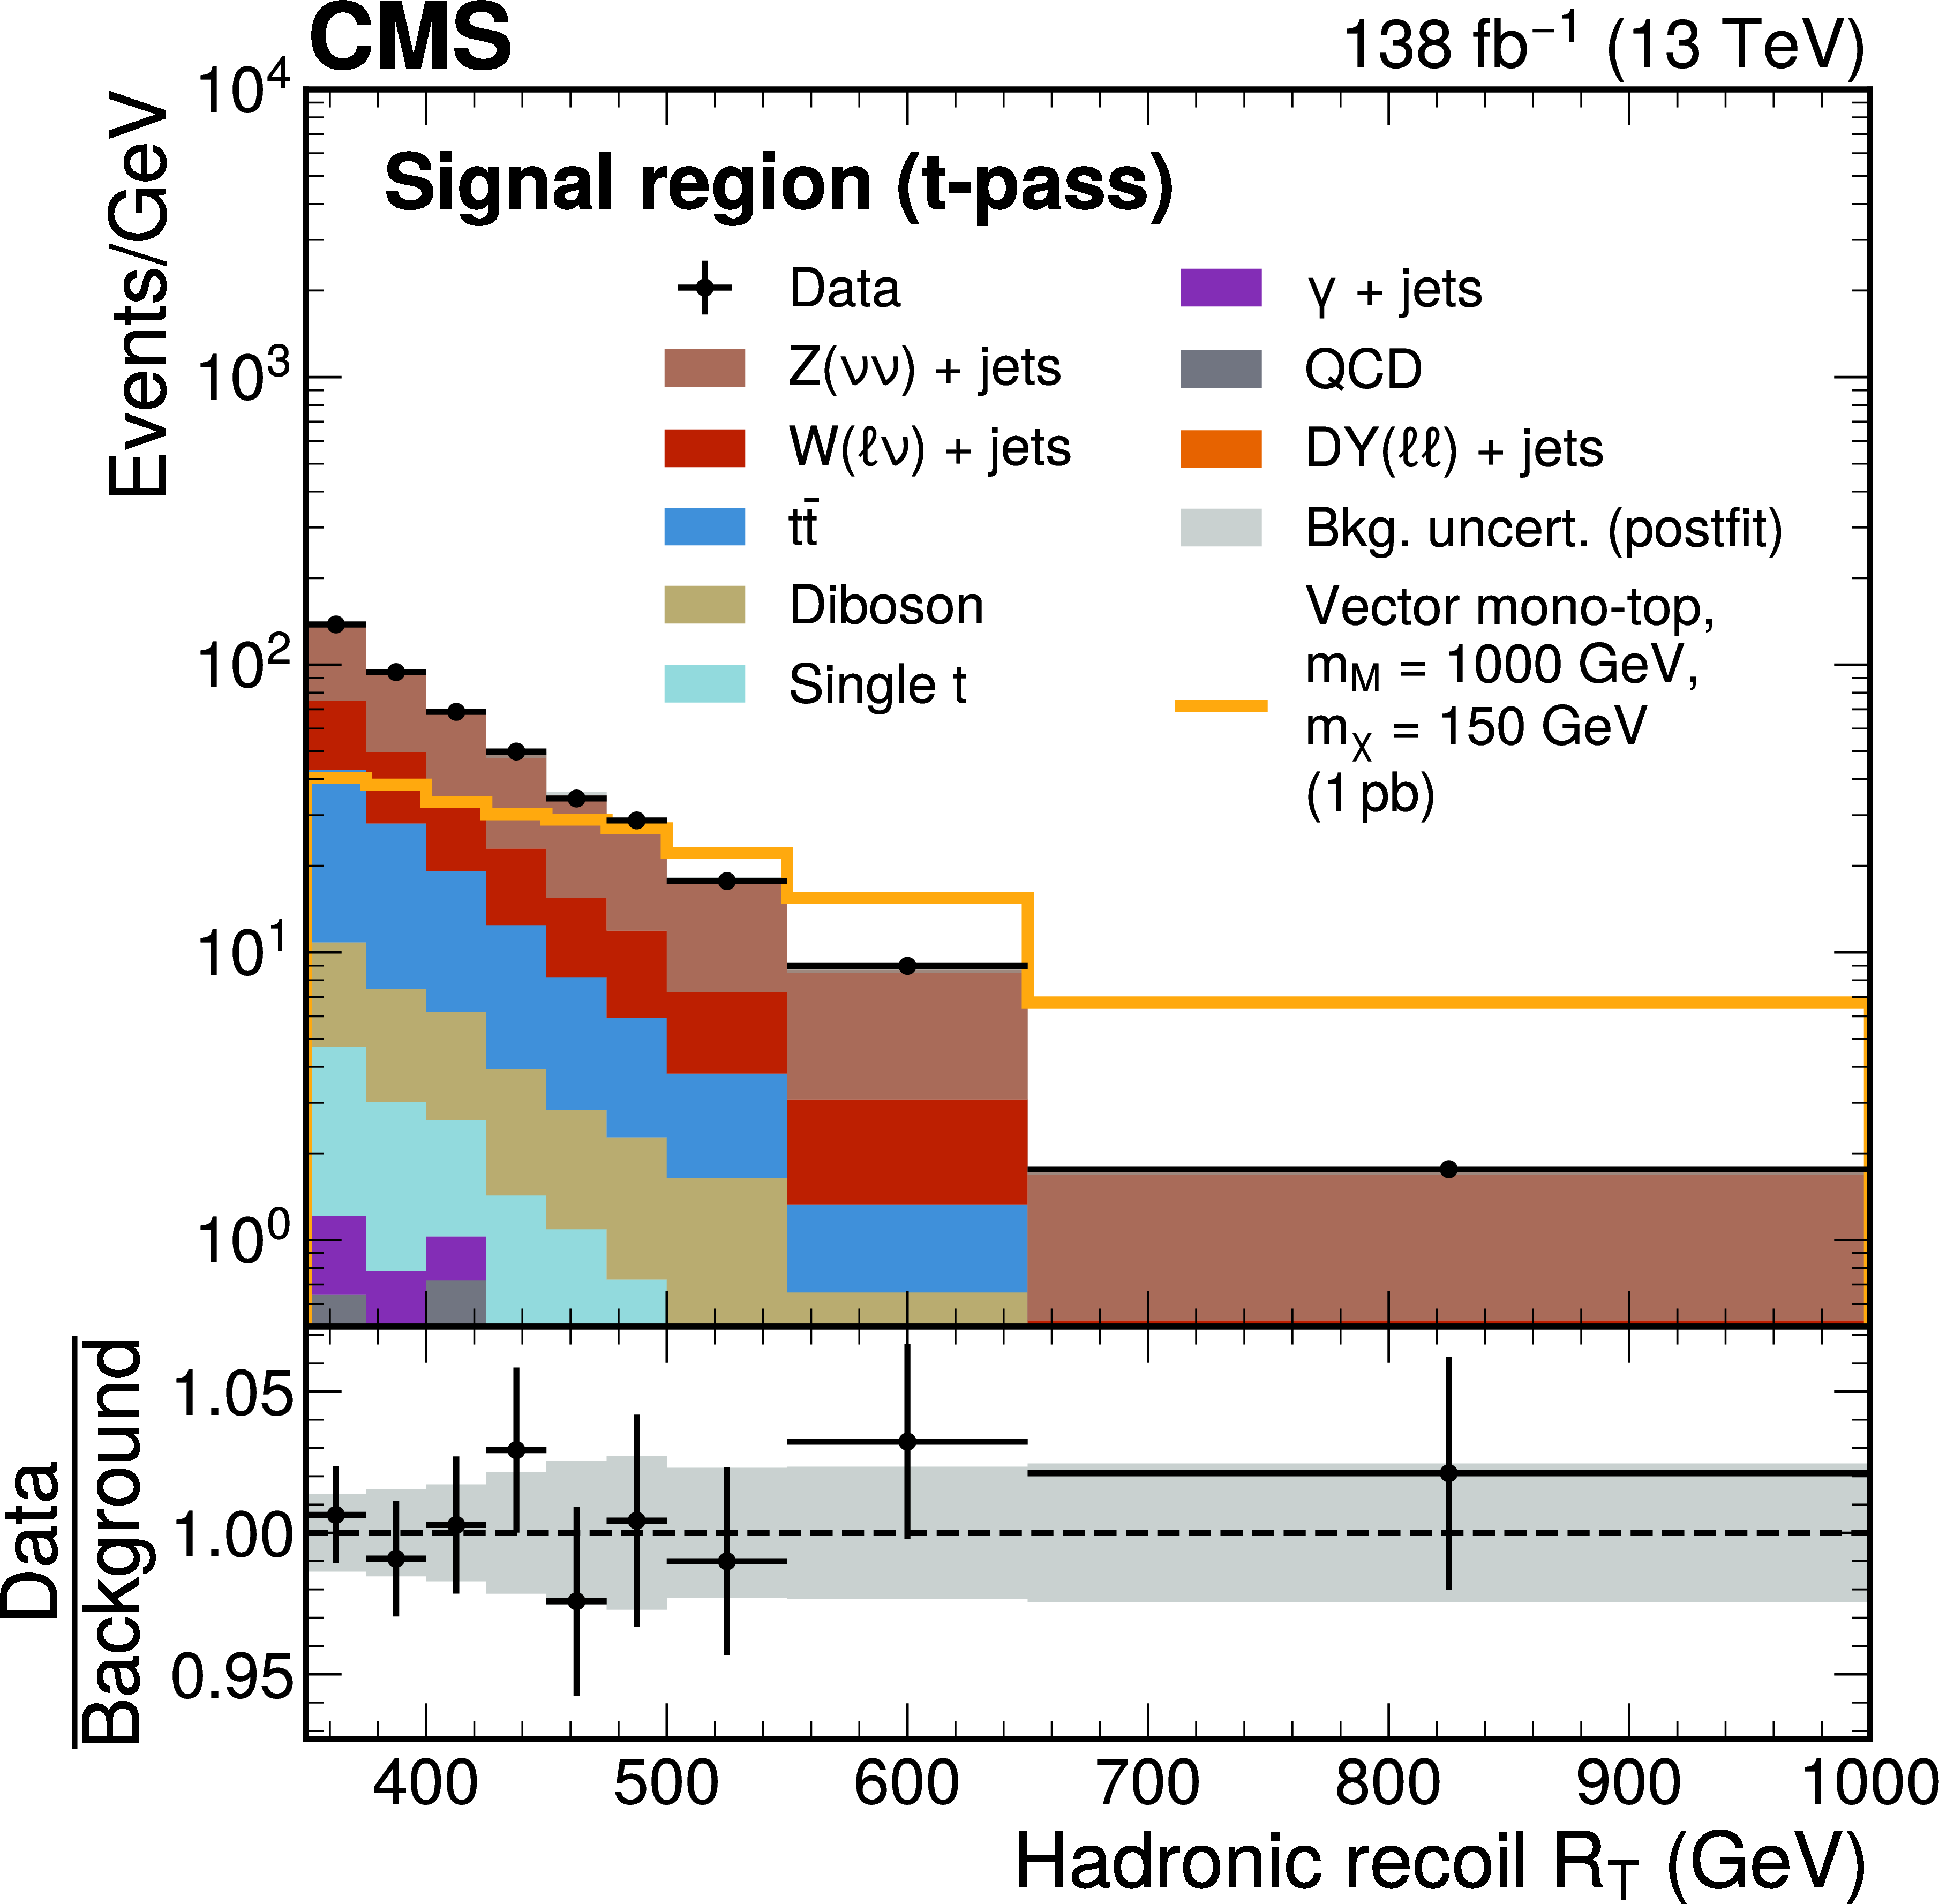
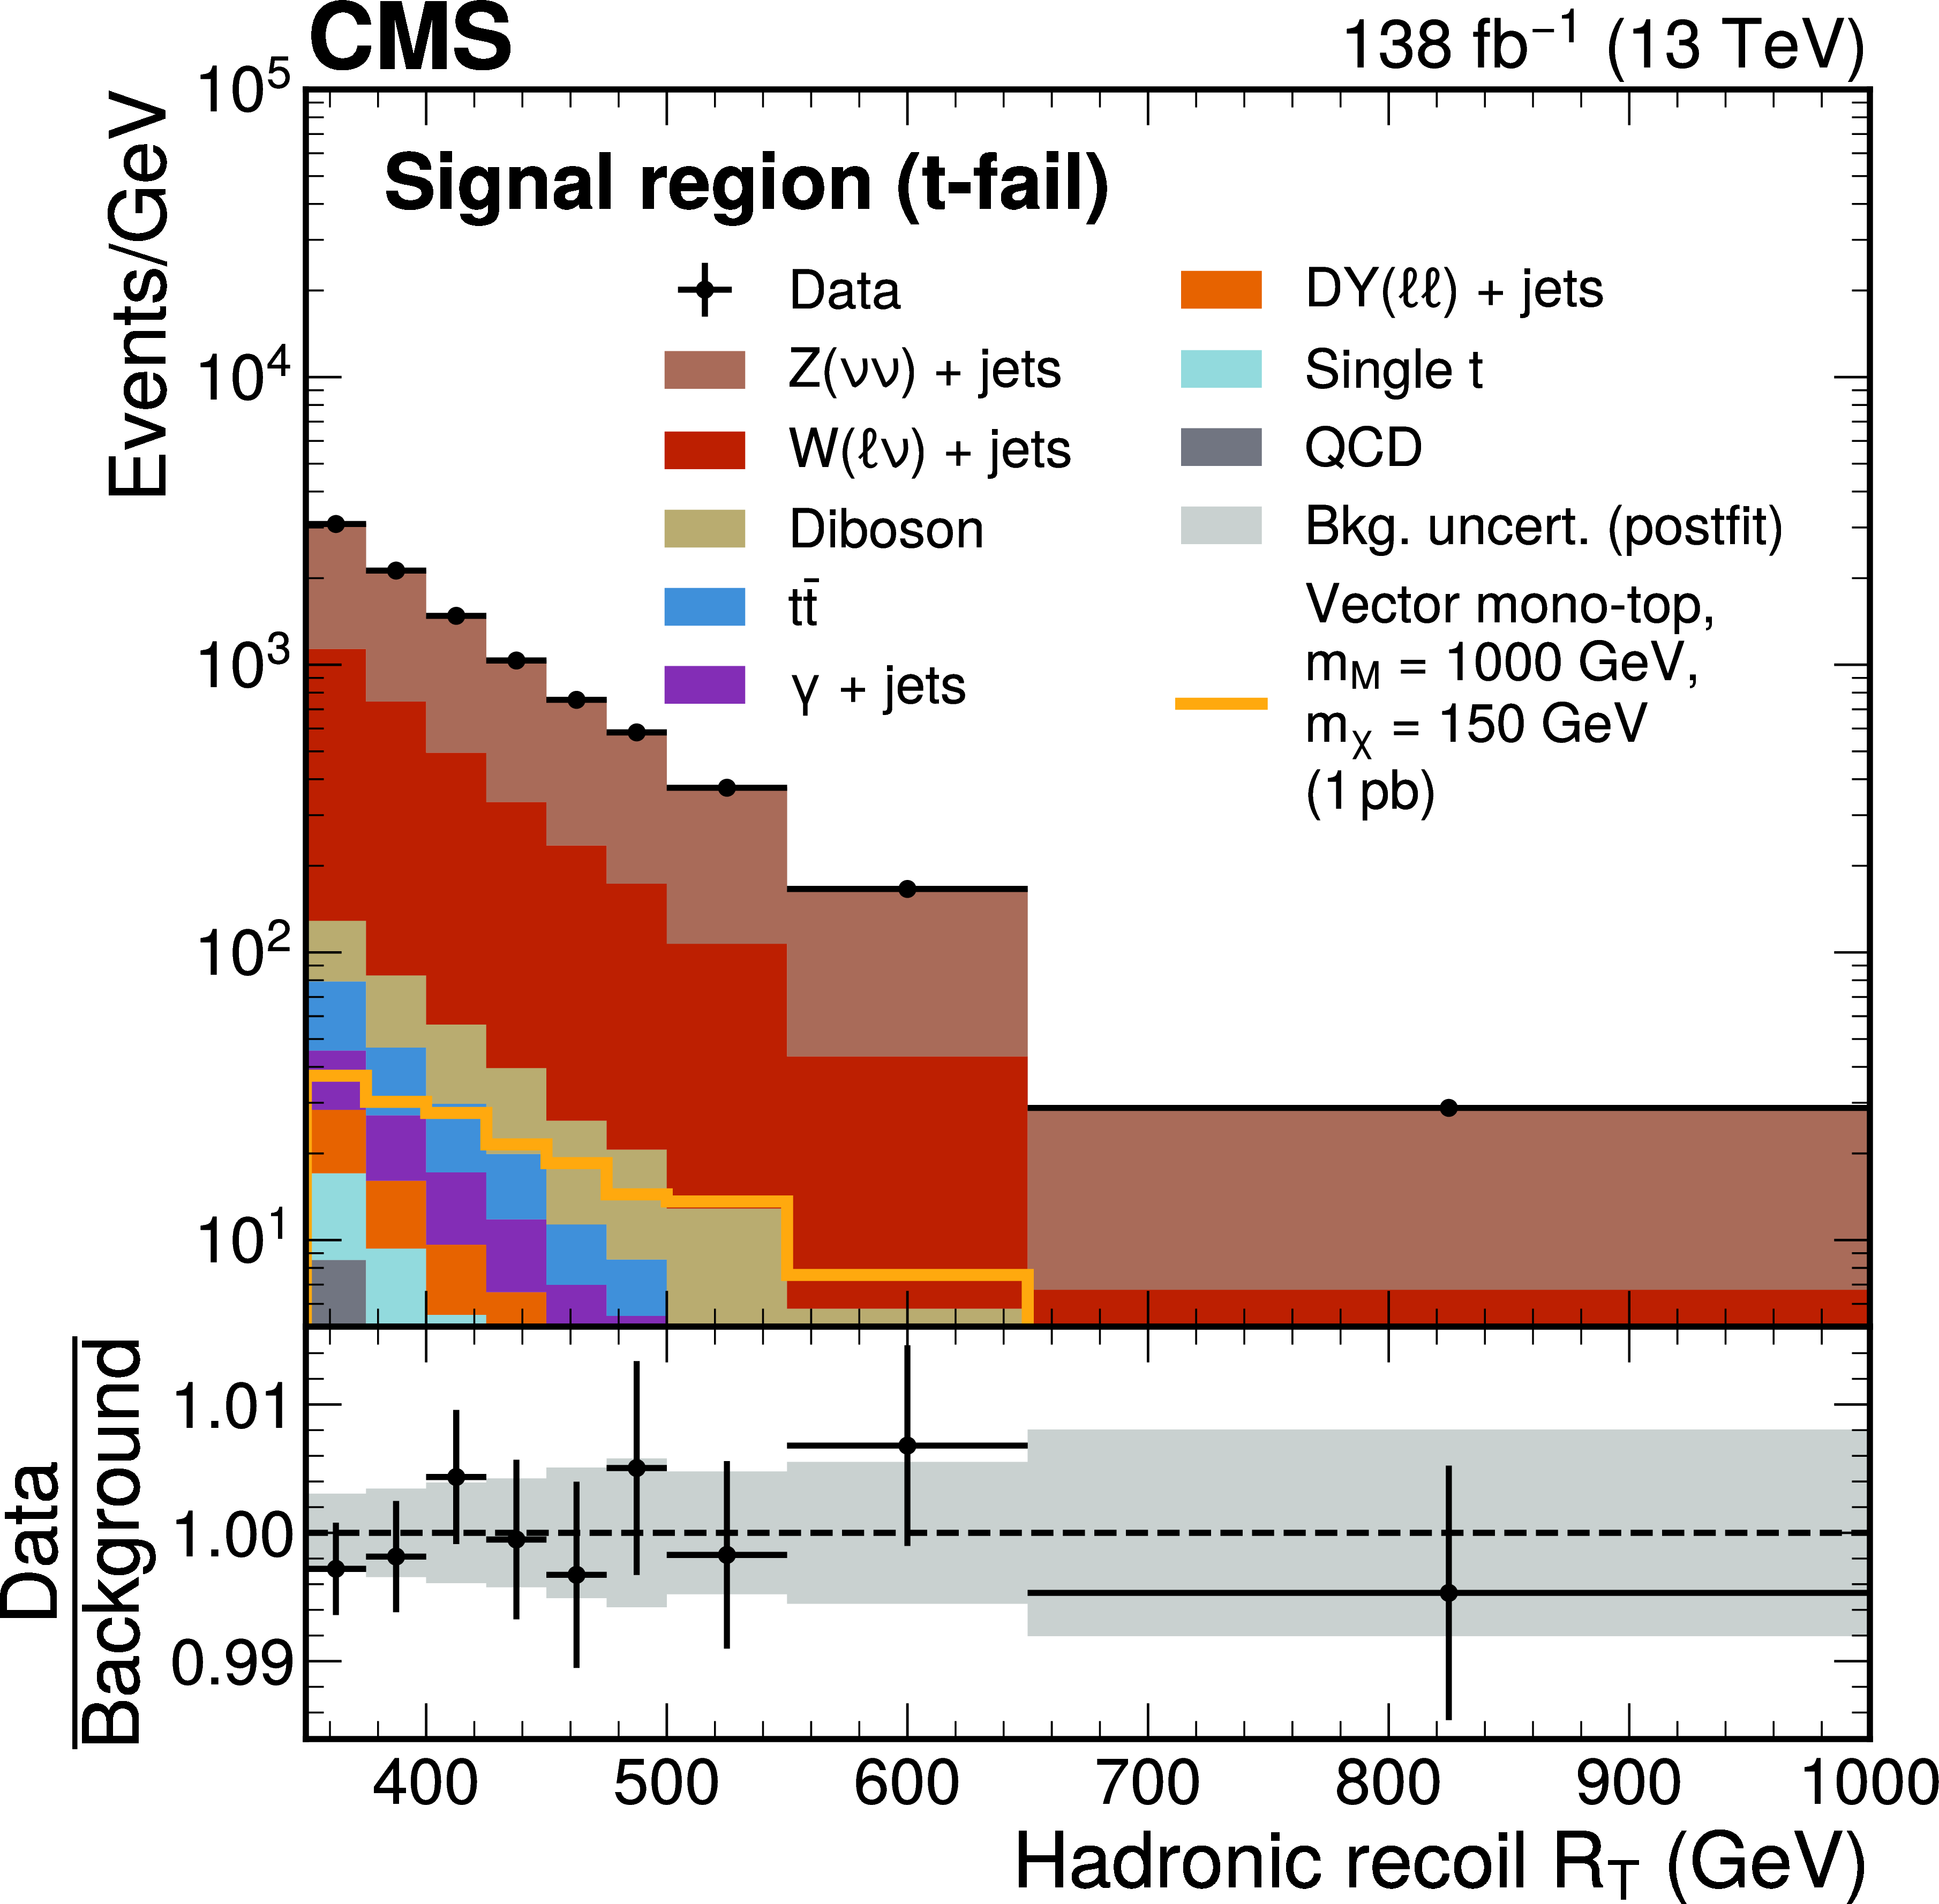
Postfit distributions of the magnitude of the hadronic recoil $ R_{\mathrm{T}} $ in the SR (t-pass) and SR (t-fail) after a fit of the background model to the data. The last bin of each distribution also contains events with $ R_{\mathrm{T}} > $ 1000 GeV. The background processes are stacked together. A representative mono-top signal (vector coupling scenario) with a mediator mass of 1 TeV, a DM candidate mass of 150 GeV, and a cross section of 1 pb is overlaid as an orange line. The gray band represents the statistical and postfit systematic uncertainties in the predicted background yields after the fit. |
png pdf |
Figure 6-a:
Postfit distributions of the magnitude of the hadronic recoil $ R_{\mathrm{T}} $ in the SR (t-pass) and SR (t-fail) after a fit of the background model to the data. The last bin of each distribution also contains events with $ R_{\mathrm{T}} > $ 1000 GeV. The background processes are stacked together. A representative mono-top signal (vector coupling scenario) with a mediator mass of 1 TeV, a DM candidate mass of 150 GeV, and a cross section of 1 pb is overlaid as an orange line. The gray band represents the statistical and postfit systematic uncertainties in the predicted background yields after the fit. |
png pdf |
Figure 6-b:
Postfit distributions of the magnitude of the hadronic recoil $ R_{\mathrm{T}} $ in the SR (t-pass) and SR (t-fail) after a fit of the background model to the data. The last bin of each distribution also contains events with $ R_{\mathrm{T}} > $ 1000 GeV. The background processes are stacked together. A representative mono-top signal (vector coupling scenario) with a mediator mass of 1 TeV, a DM candidate mass of 150 GeV, and a cross section of 1 pb is overlaid as an orange line. The gray band represents the statistical and postfit systematic uncertainties in the predicted background yields after the fit. |
png pdf |
Figure 7:
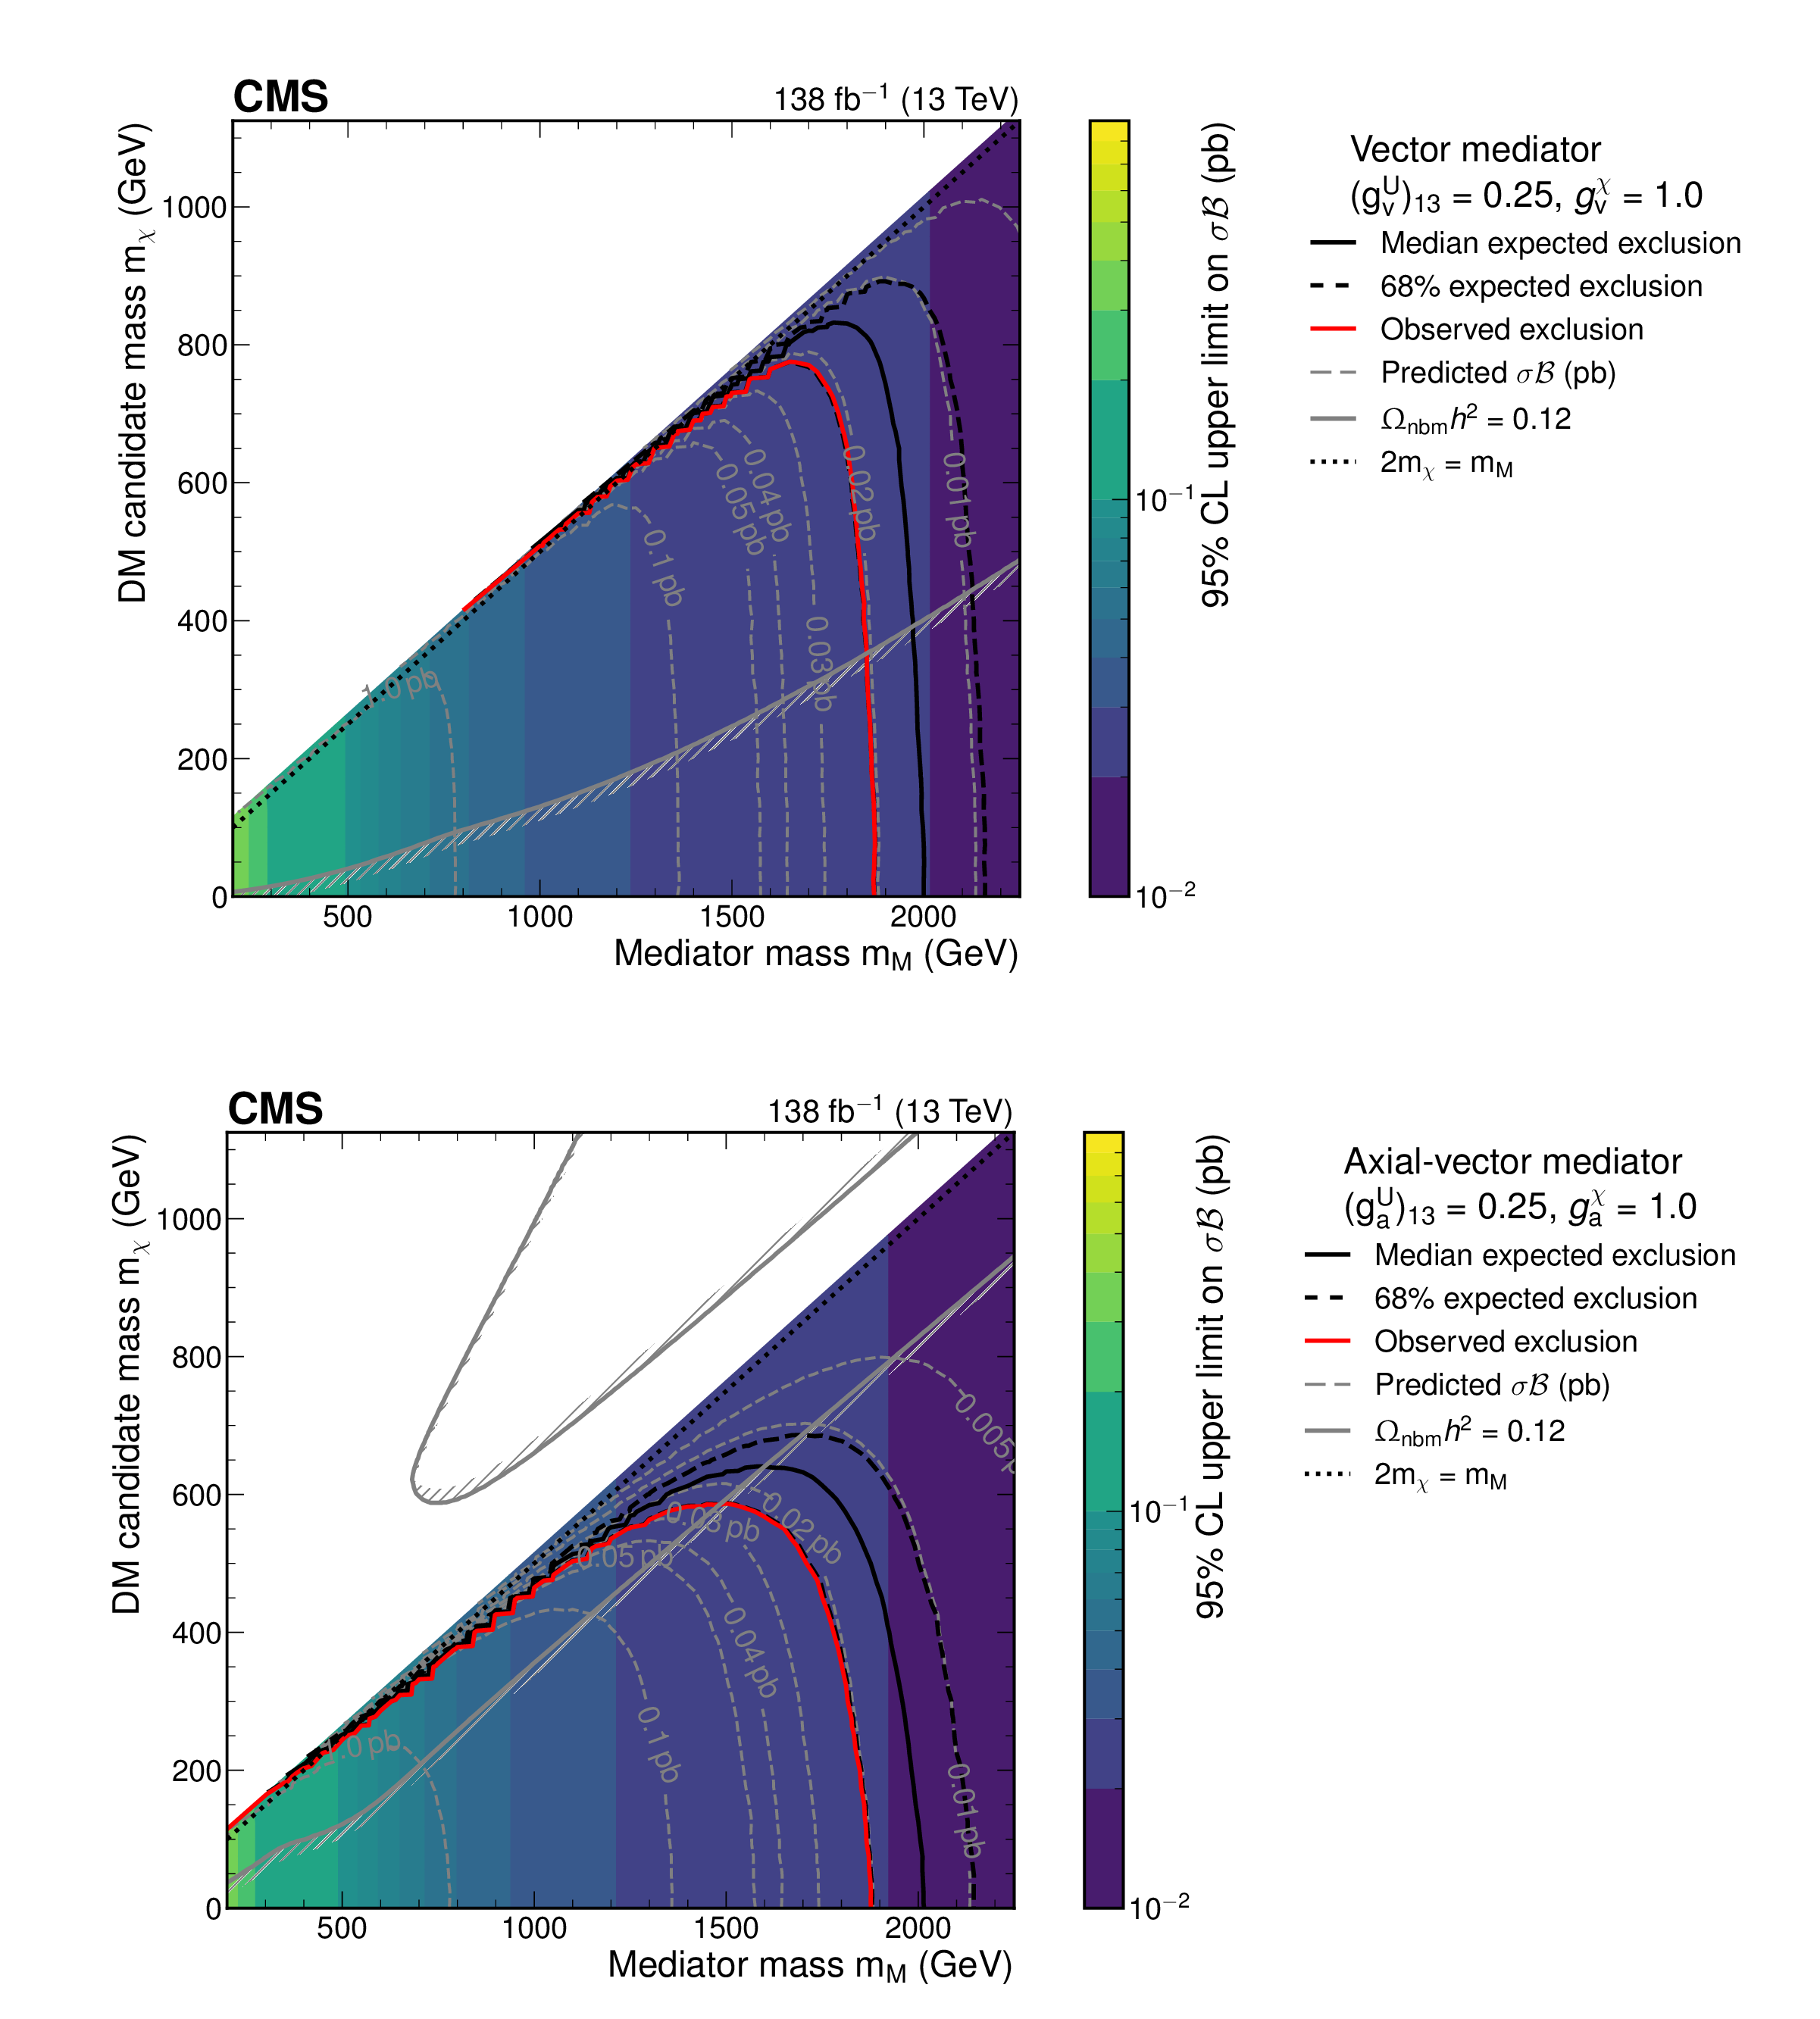
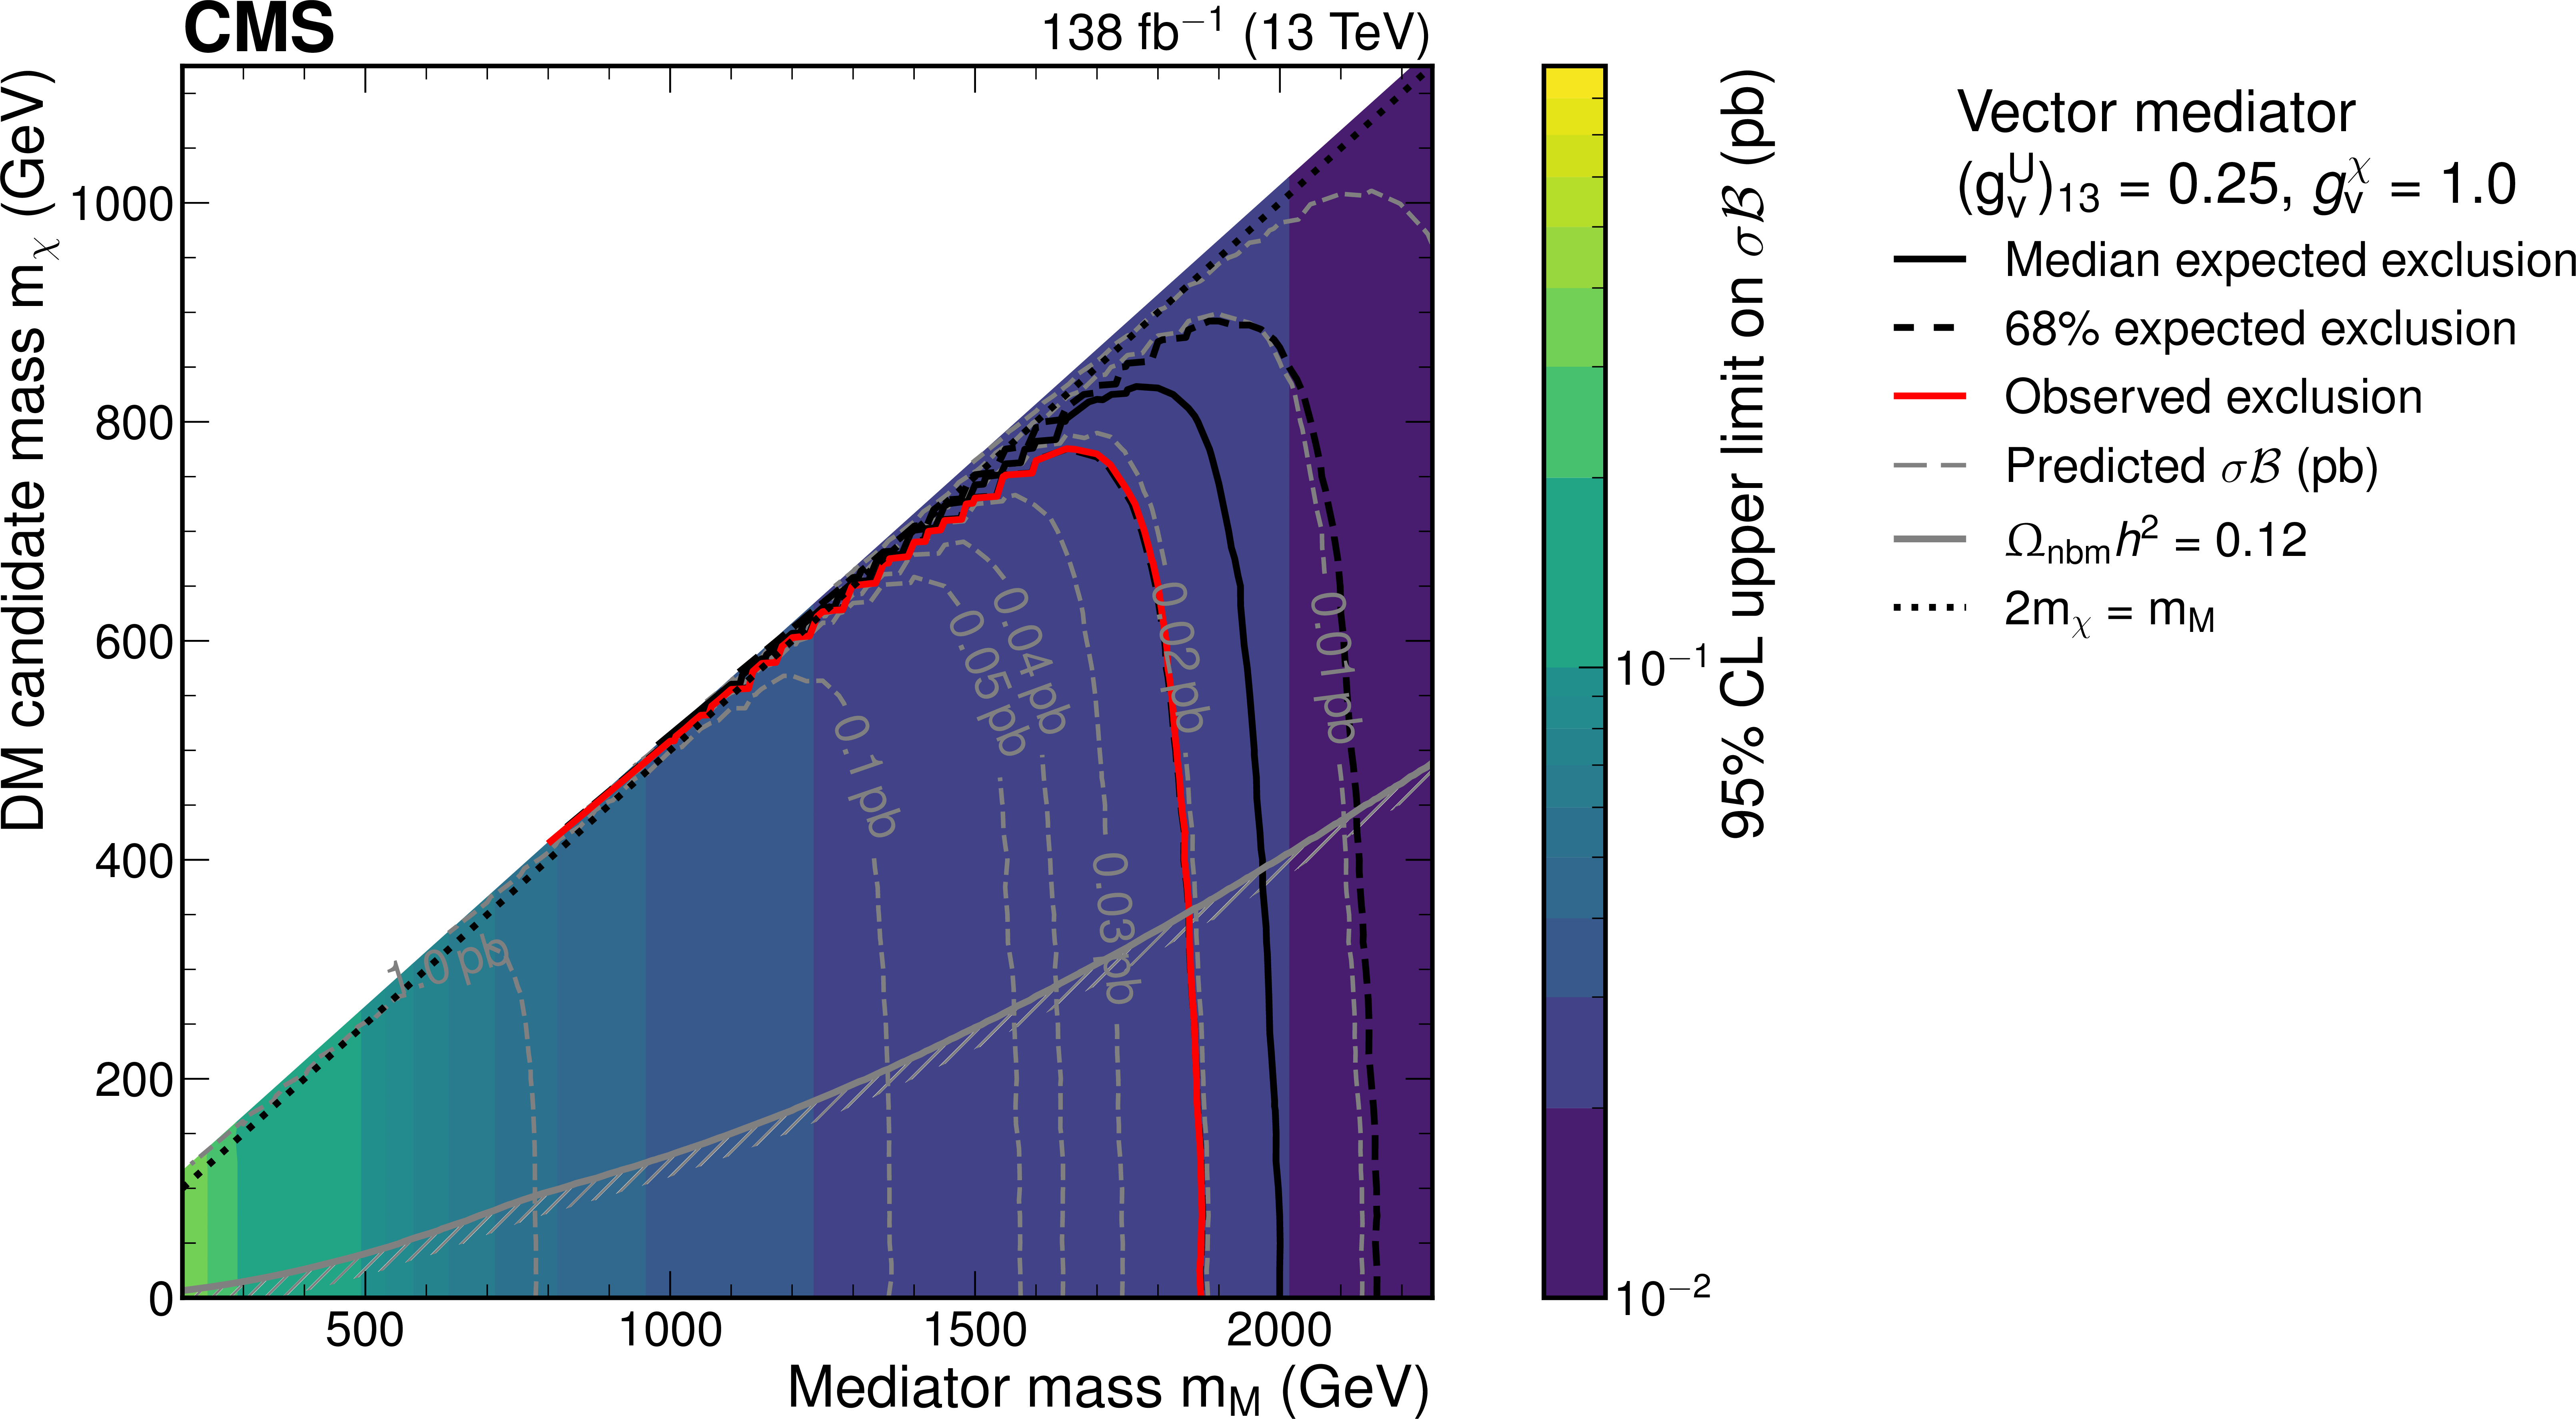
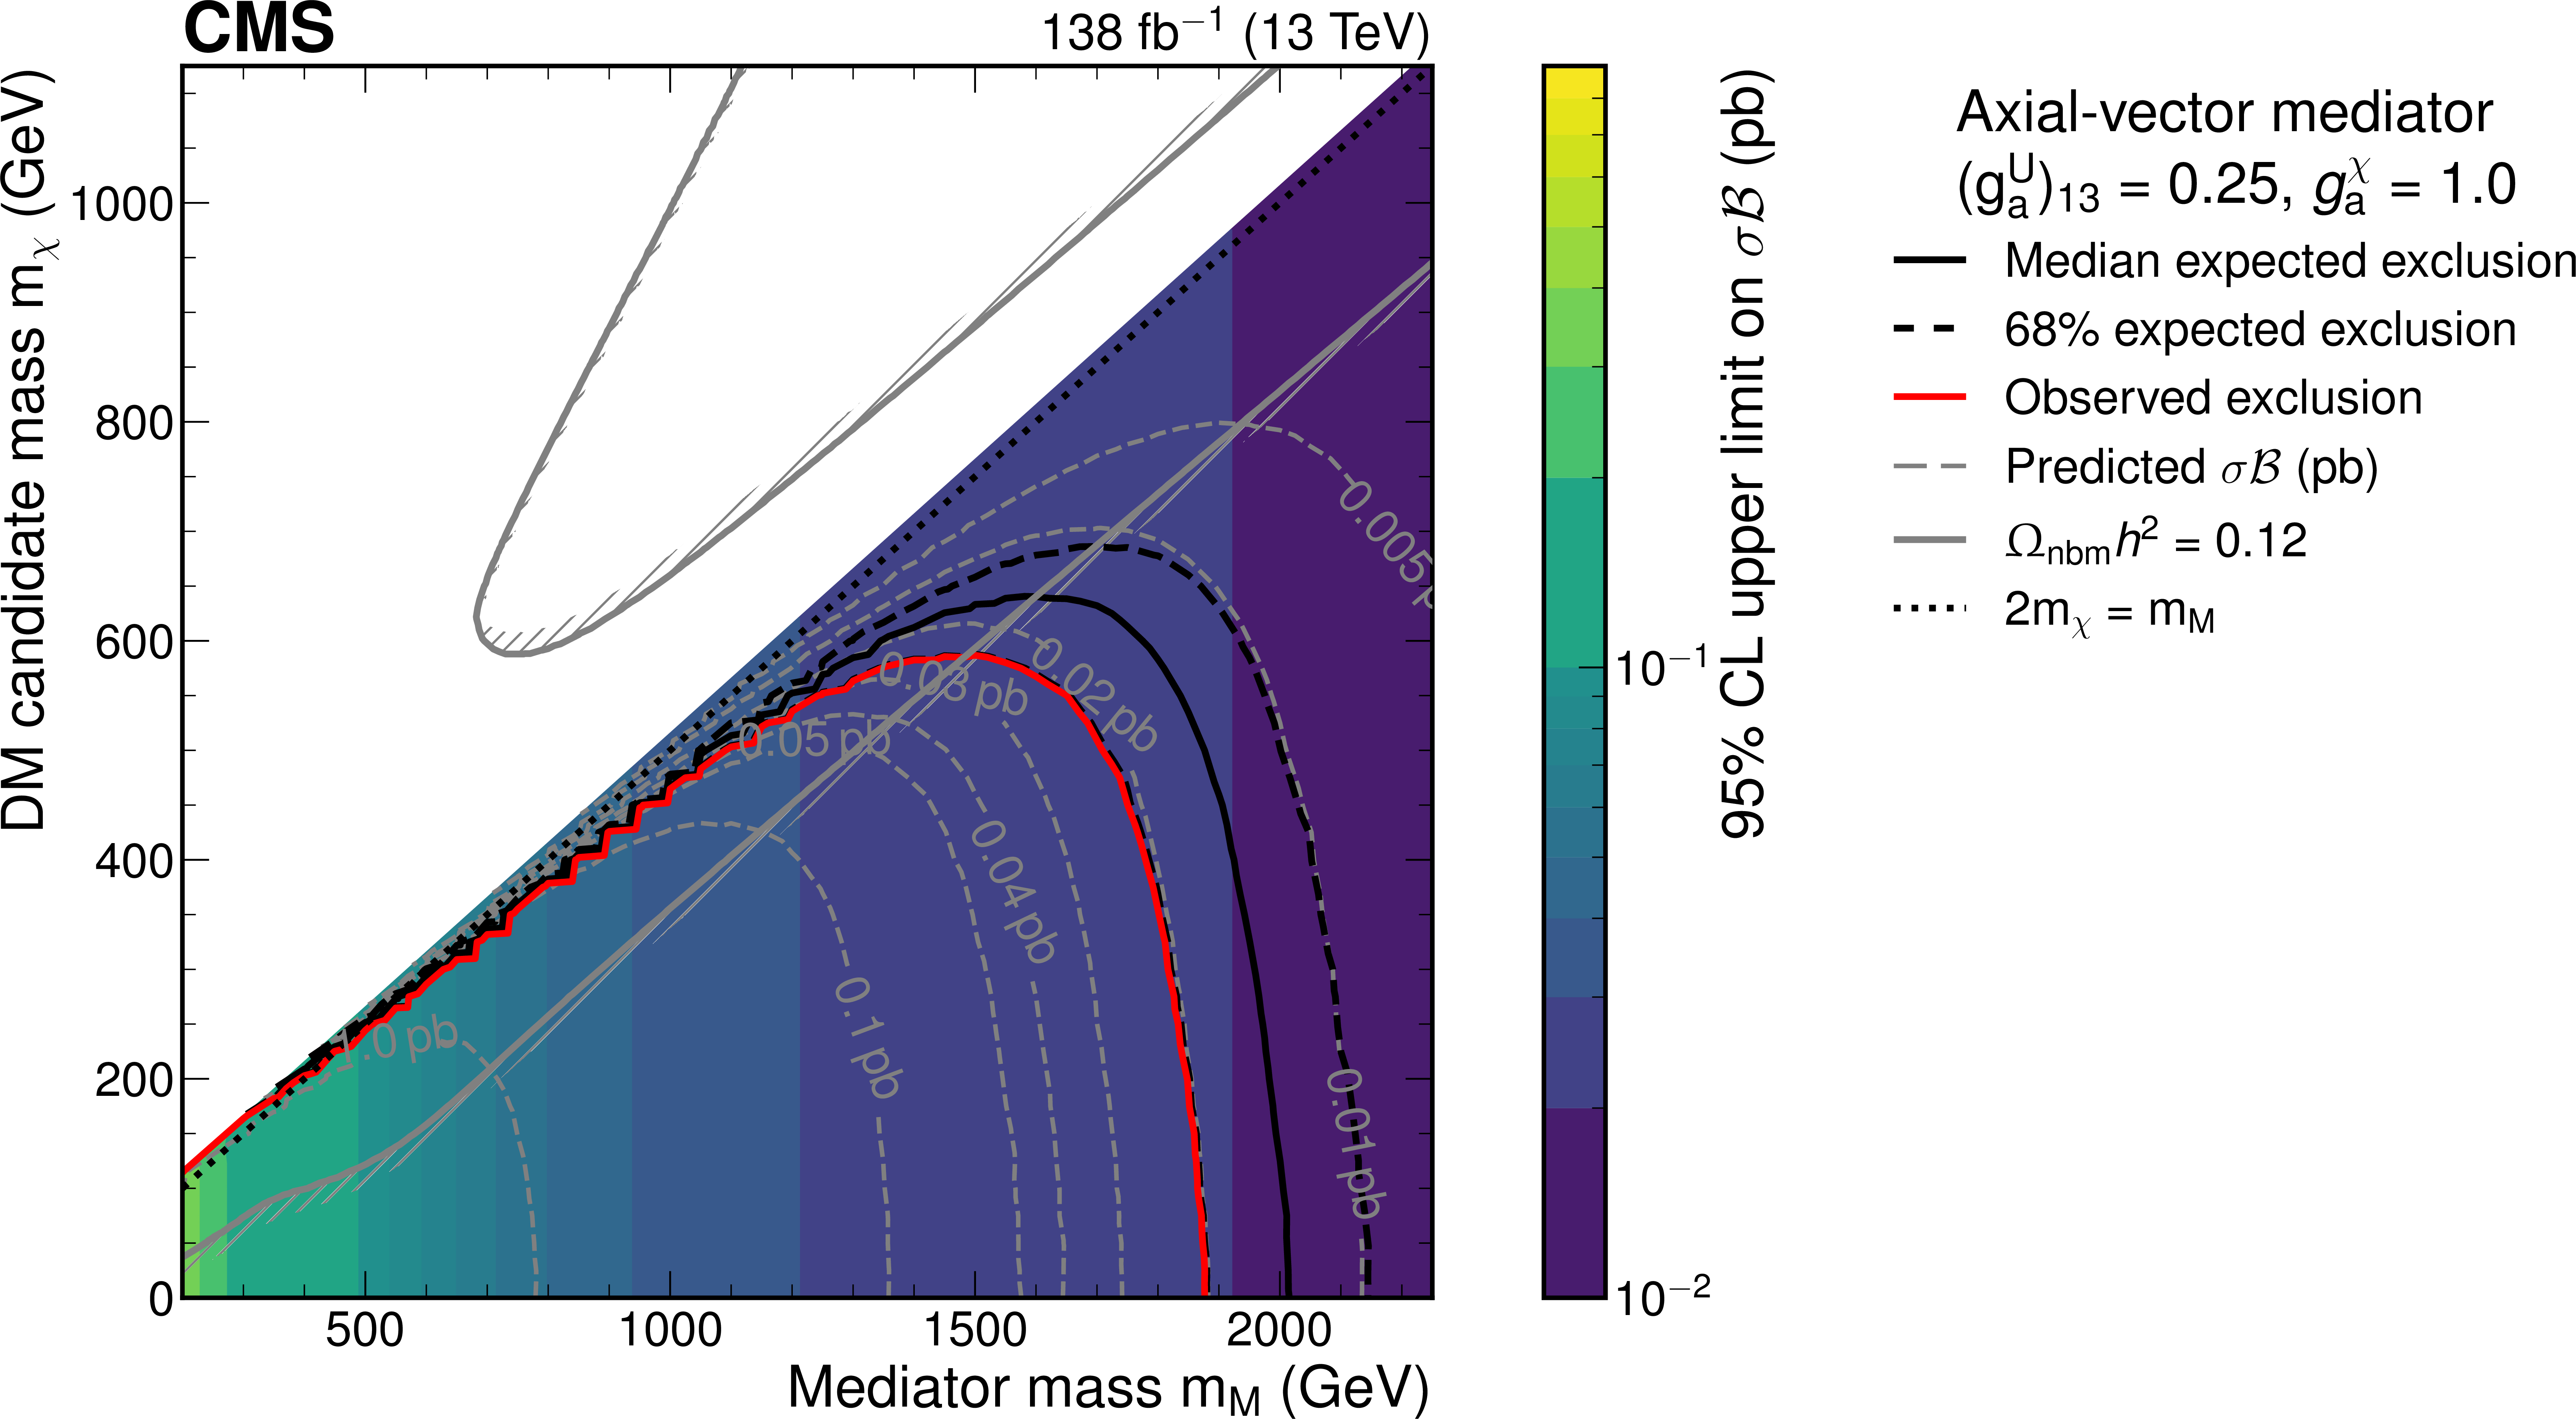
Upper limits at 95% CL on $ \sigma\mathcal{B} $ of mono-top production presented in the two-dimensional plane spanned by the mediator and DM candidate masses for a mediator mass between 200 and 2250 GeV and a DM candidate mass between 1 and 1125 GeV only considering on-shell decays of the mediator to the DM candidates. The mediator has vector couplings to quarks and DM candidates in the upper plot and axial-vector couplings in the lower plot. The median expected exclusion range is indicated by a black solid line, demonstrating the search sensitivity of the analysis. The 68% probability interval of the expected exclusion is shown in black dashed lines. Contours of theory predictions for constant values of $ \sigma\mathcal{B} $ are shown in gray dashed lines. The observed exclusion contour of mediator and DM candidate masses is represented by the red solid line. The exclusion contour obtained from measurements of the DM relic density $ \Omega_{\text{nbm}}h^{2} $ by the Planck Collaboration is shown in the gray solid line. |
png pdf |
Figure 7-a:
Upper limits at 95% CL on $ \sigma\mathcal{B} $ of mono-top production presented in the two-dimensional plane spanned by the mediator and DM candidate masses for a mediator mass between 200 and 2250 GeV and a DM candidate mass between 1 and 1125 GeV only considering on-shell decays of the mediator to the DM candidates. The mediator has vector couplings to quarks and DM candidates in the upper plot and axial-vector couplings in the lower plot. The median expected exclusion range is indicated by a black solid line, demonstrating the search sensitivity of the analysis. The 68% probability interval of the expected exclusion is shown in black dashed lines. Contours of theory predictions for constant values of $ \sigma\mathcal{B} $ are shown in gray dashed lines. The observed exclusion contour of mediator and DM candidate masses is represented by the red solid line. The exclusion contour obtained from measurements of the DM relic density $ \Omega_{\text{nbm}}h^{2} $ by the Planck Collaboration is shown in the gray solid line. |
png pdf |
Figure 7-b:
Upper limits at 95% CL on $ \sigma\mathcal{B} $ of mono-top production presented in the two-dimensional plane spanned by the mediator and DM candidate masses for a mediator mass between 200 and 2250 GeV and a DM candidate mass between 1 and 1125 GeV only considering on-shell decays of the mediator to the DM candidates. The mediator has vector couplings to quarks and DM candidates in the upper plot and axial-vector couplings in the lower plot. The median expected exclusion range is indicated by a black solid line, demonstrating the search sensitivity of the analysis. The 68% probability interval of the expected exclusion is shown in black dashed lines. Contours of theory predictions for constant values of $ \sigma\mathcal{B} $ are shown in gray dashed lines. The observed exclusion contour of mediator and DM candidate masses is represented by the red solid line. The exclusion contour obtained from measurements of the DM relic density $ \Omega_{\text{nbm}}h^{2} $ by the Planck Collaboration is shown in the gray solid line. |
png pdf |
Figure 8:
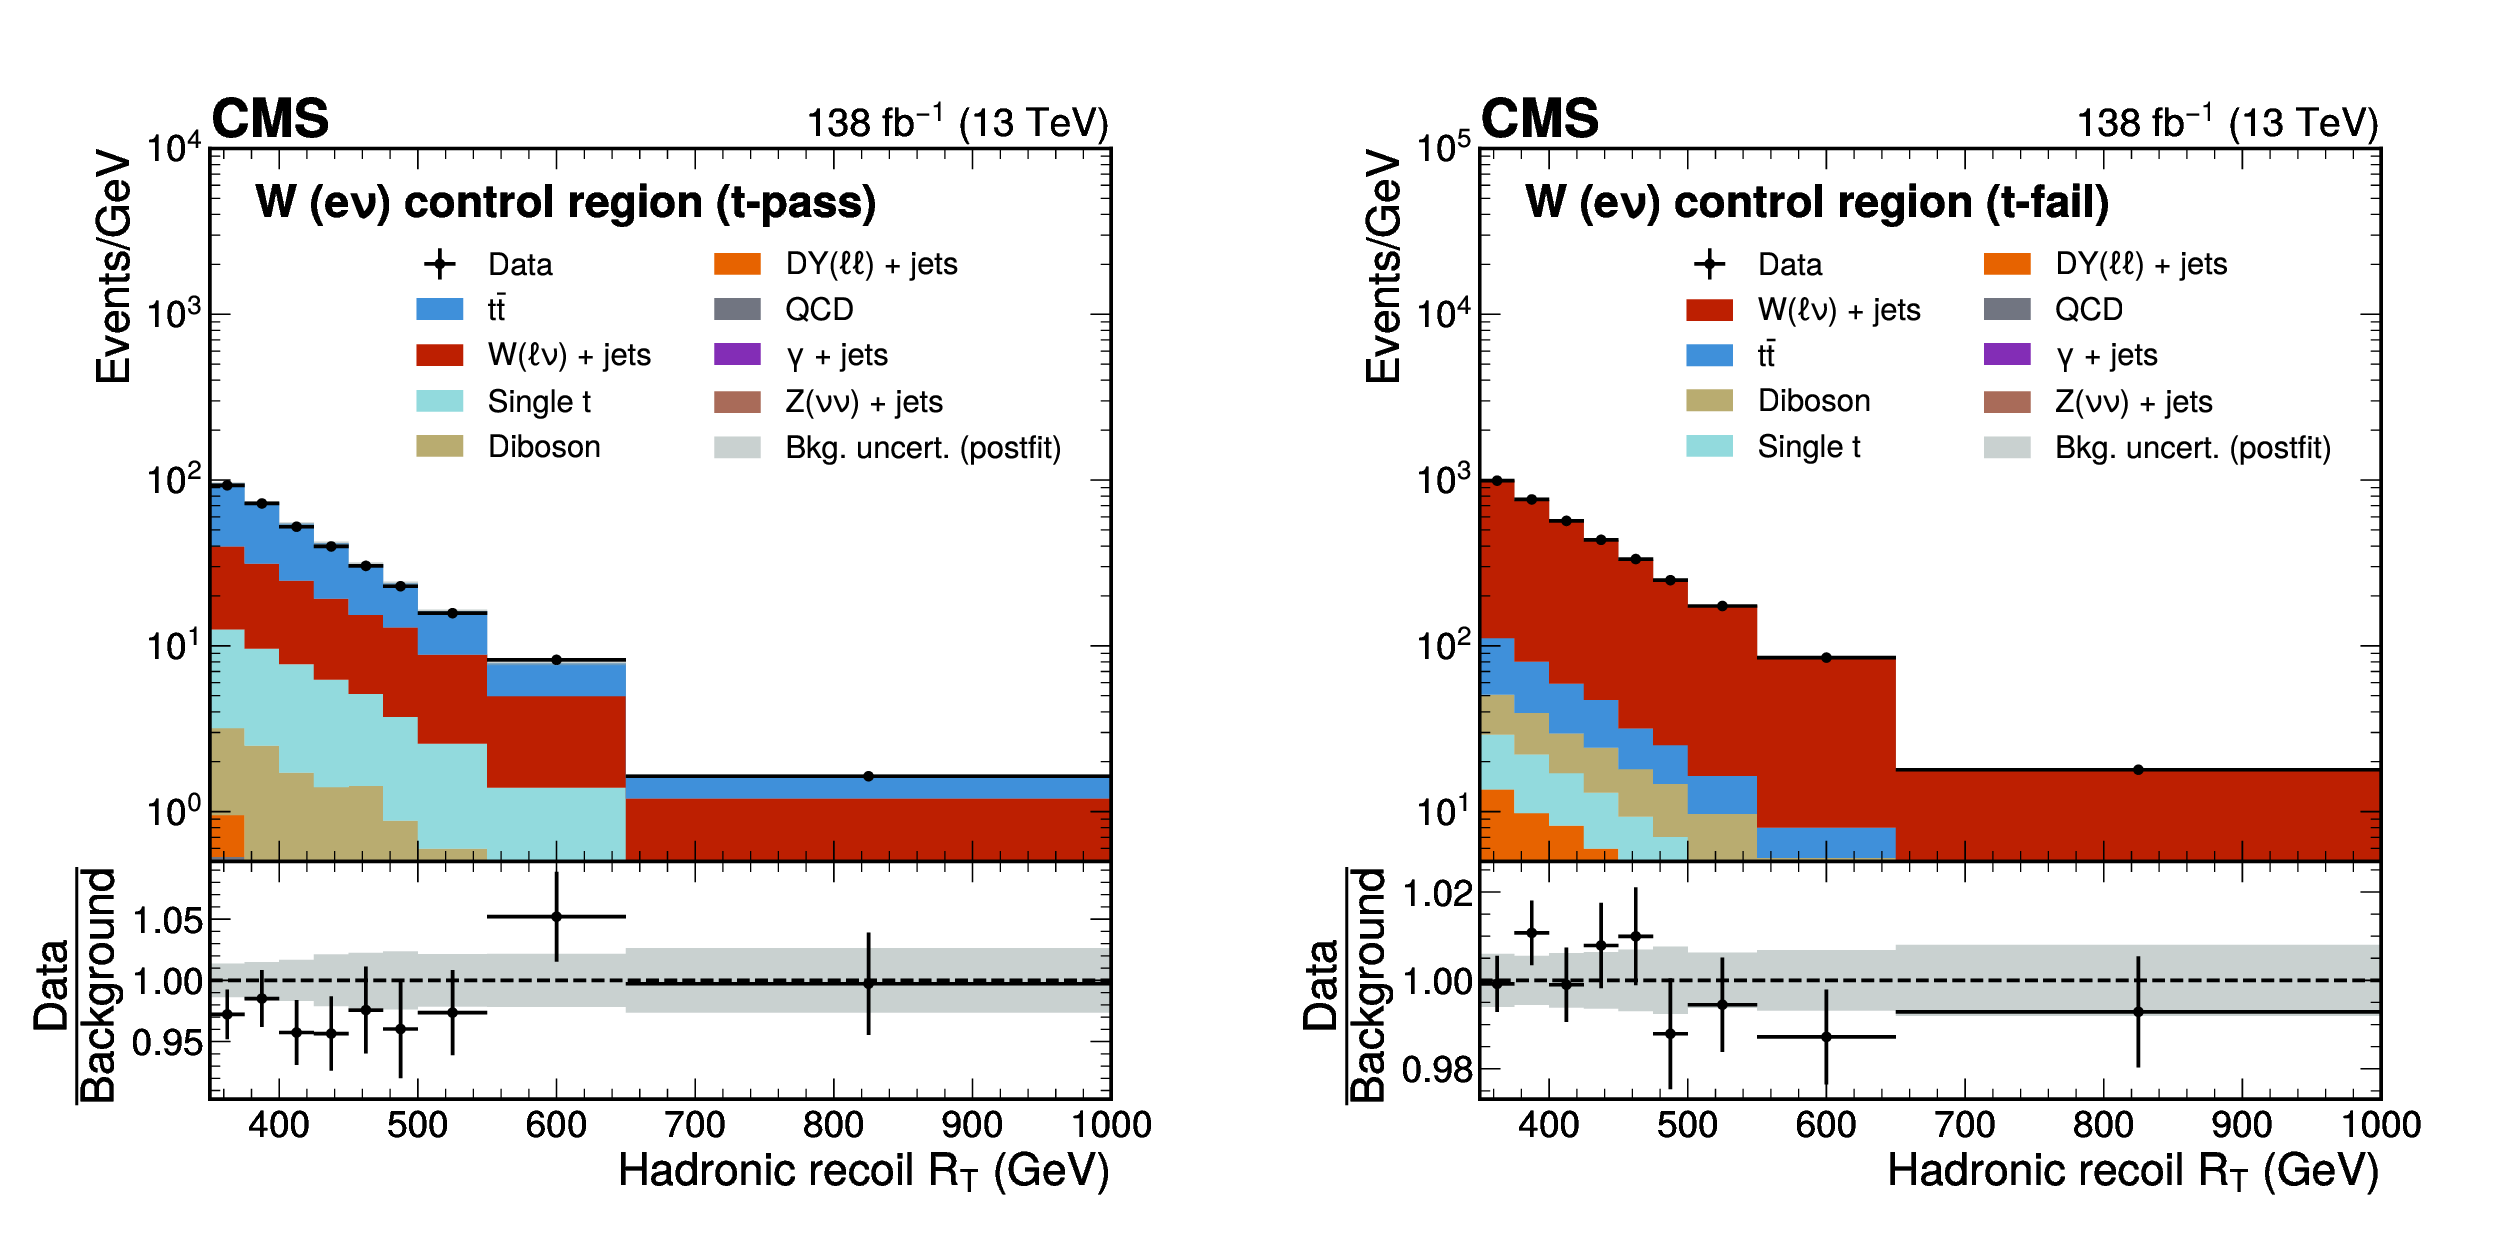
Postfit distributions of the magnitude of the hadronic recoil $ R_{\mathrm{T}} $ in the $ \mathrm{W}(\mathrm{e}\nu) $ (t-pass) and $ \mathrm{W}(\mathrm{e}\nu) $ (t-fail) CRs after a fit of the background model to the data. The last bin of each distribution also contains events with $ R_{\mathrm{T}} > $ 1000 GeV. The background processes are stacked together. The gray band represents the statistical and postfit systematic uncertainties in the predicted background yields after the fit. |
png pdf |
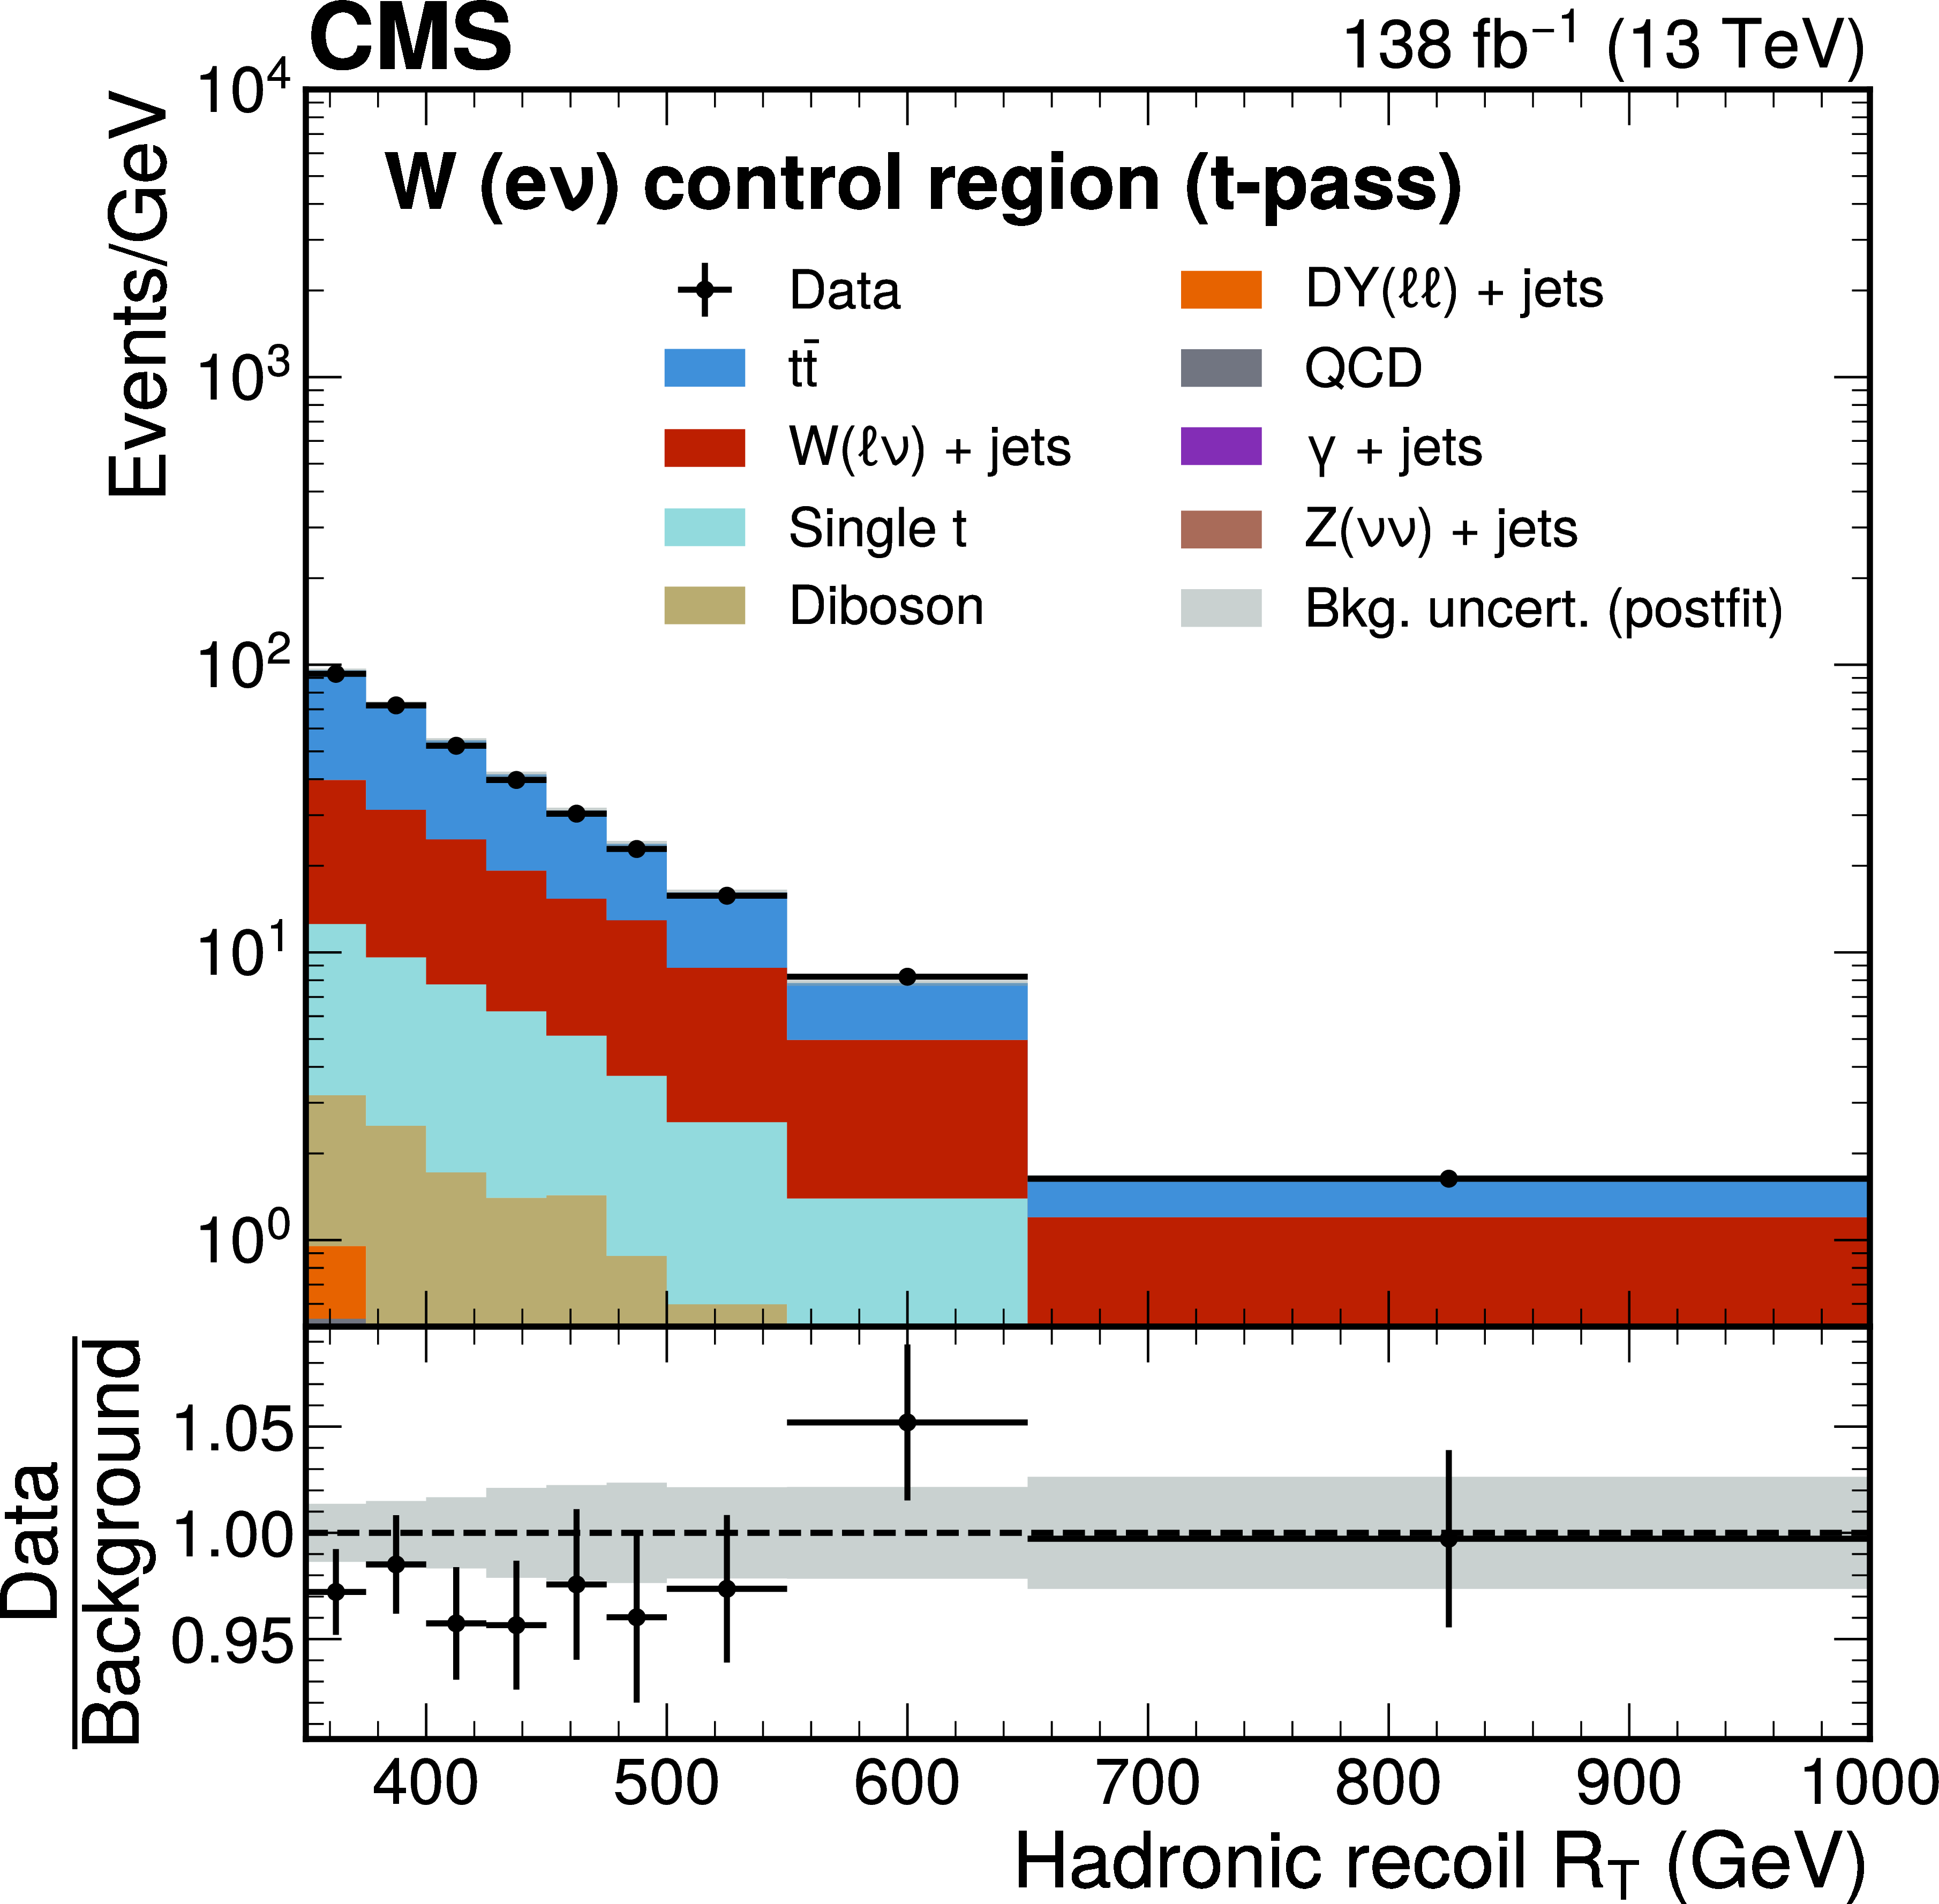
Figure 8-a:
Postfit distributions of the magnitude of the hadronic recoil $ R_{\mathrm{T}} $ in the $ \mathrm{W}(\mathrm{e}\nu) $ (t-pass) and $ \mathrm{W}(\mathrm{e}\nu) $ (t-fail) CRs after a fit of the background model to the data. The last bin of each distribution also contains events with $ R_{\mathrm{T}} > $ 1000 GeV. The background processes are stacked together. The gray band represents the statistical and postfit systematic uncertainties in the predicted background yields after the fit. |
png pdf |
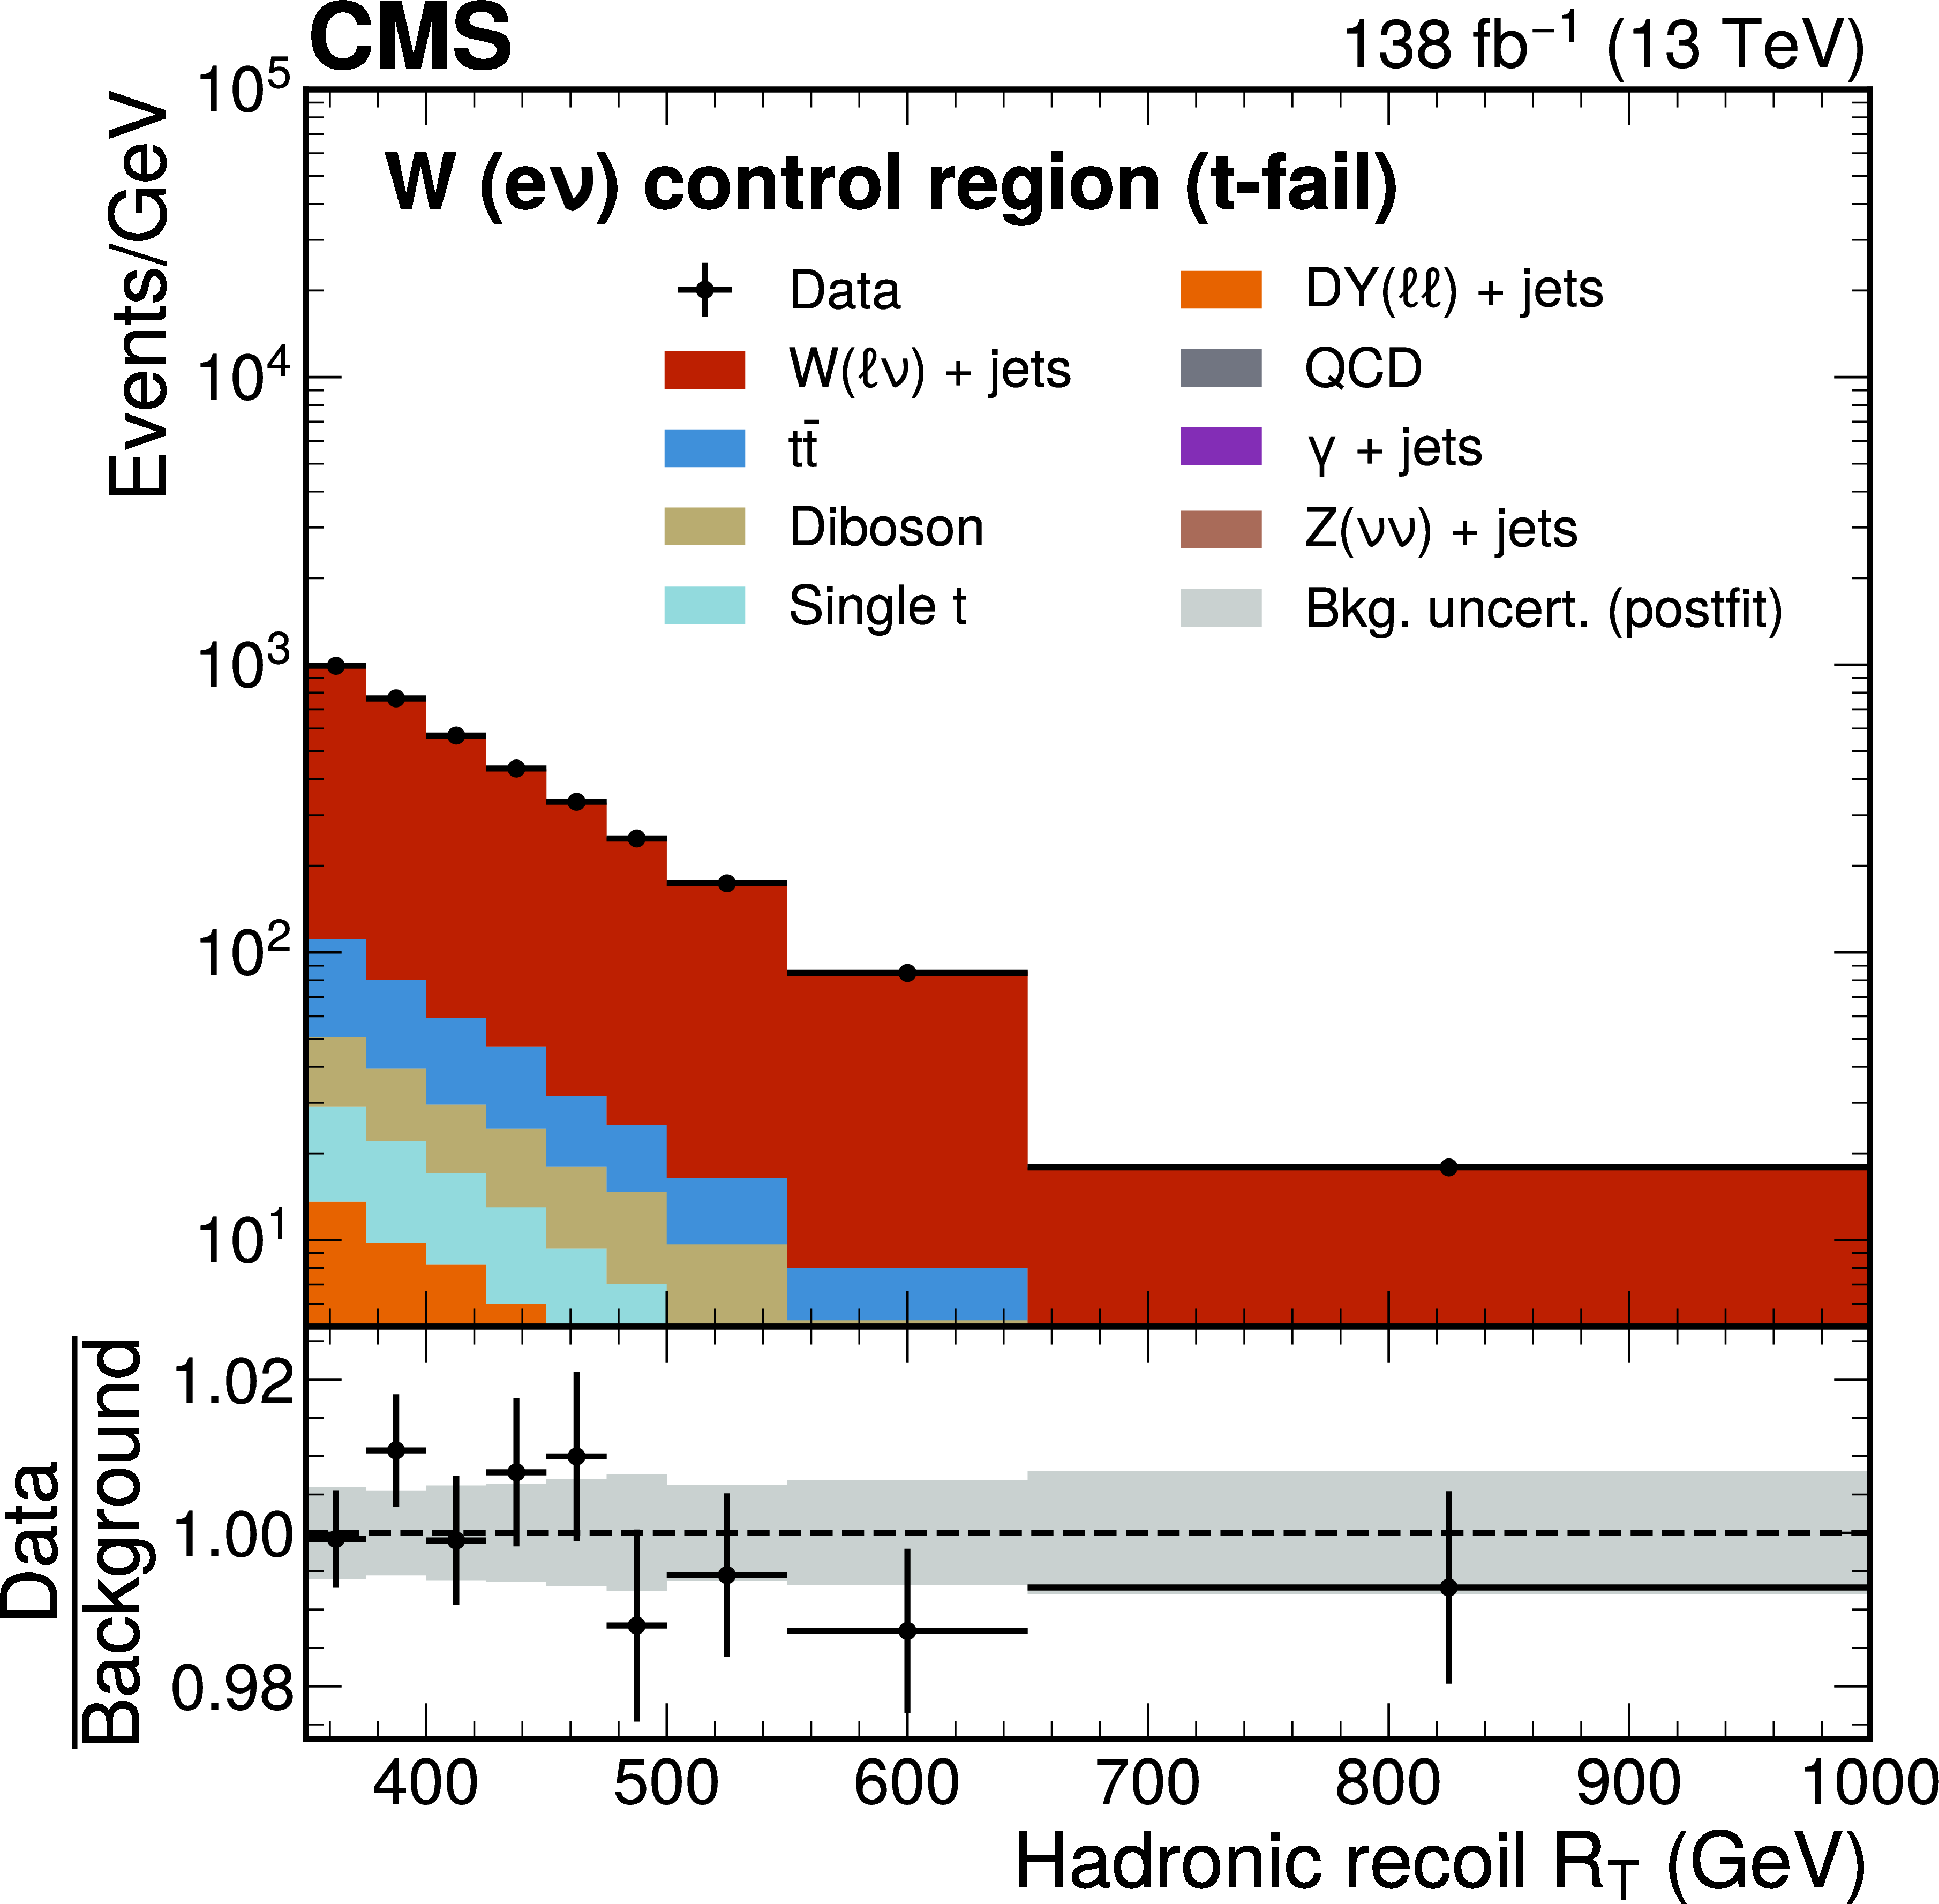
Figure 8-b:
Postfit distributions of the magnitude of the hadronic recoil $ R_{\mathrm{T}} $ in the $ \mathrm{W}(\mathrm{e}\nu) $ (t-pass) and $ \mathrm{W}(\mathrm{e}\nu) $ (t-fail) CRs after a fit of the background model to the data. The last bin of each distribution also contains events with $ R_{\mathrm{T}} > $ 1000 GeV. The background processes are stacked together. The gray band represents the statistical and postfit systematic uncertainties in the predicted background yields after the fit. |
png pdf |
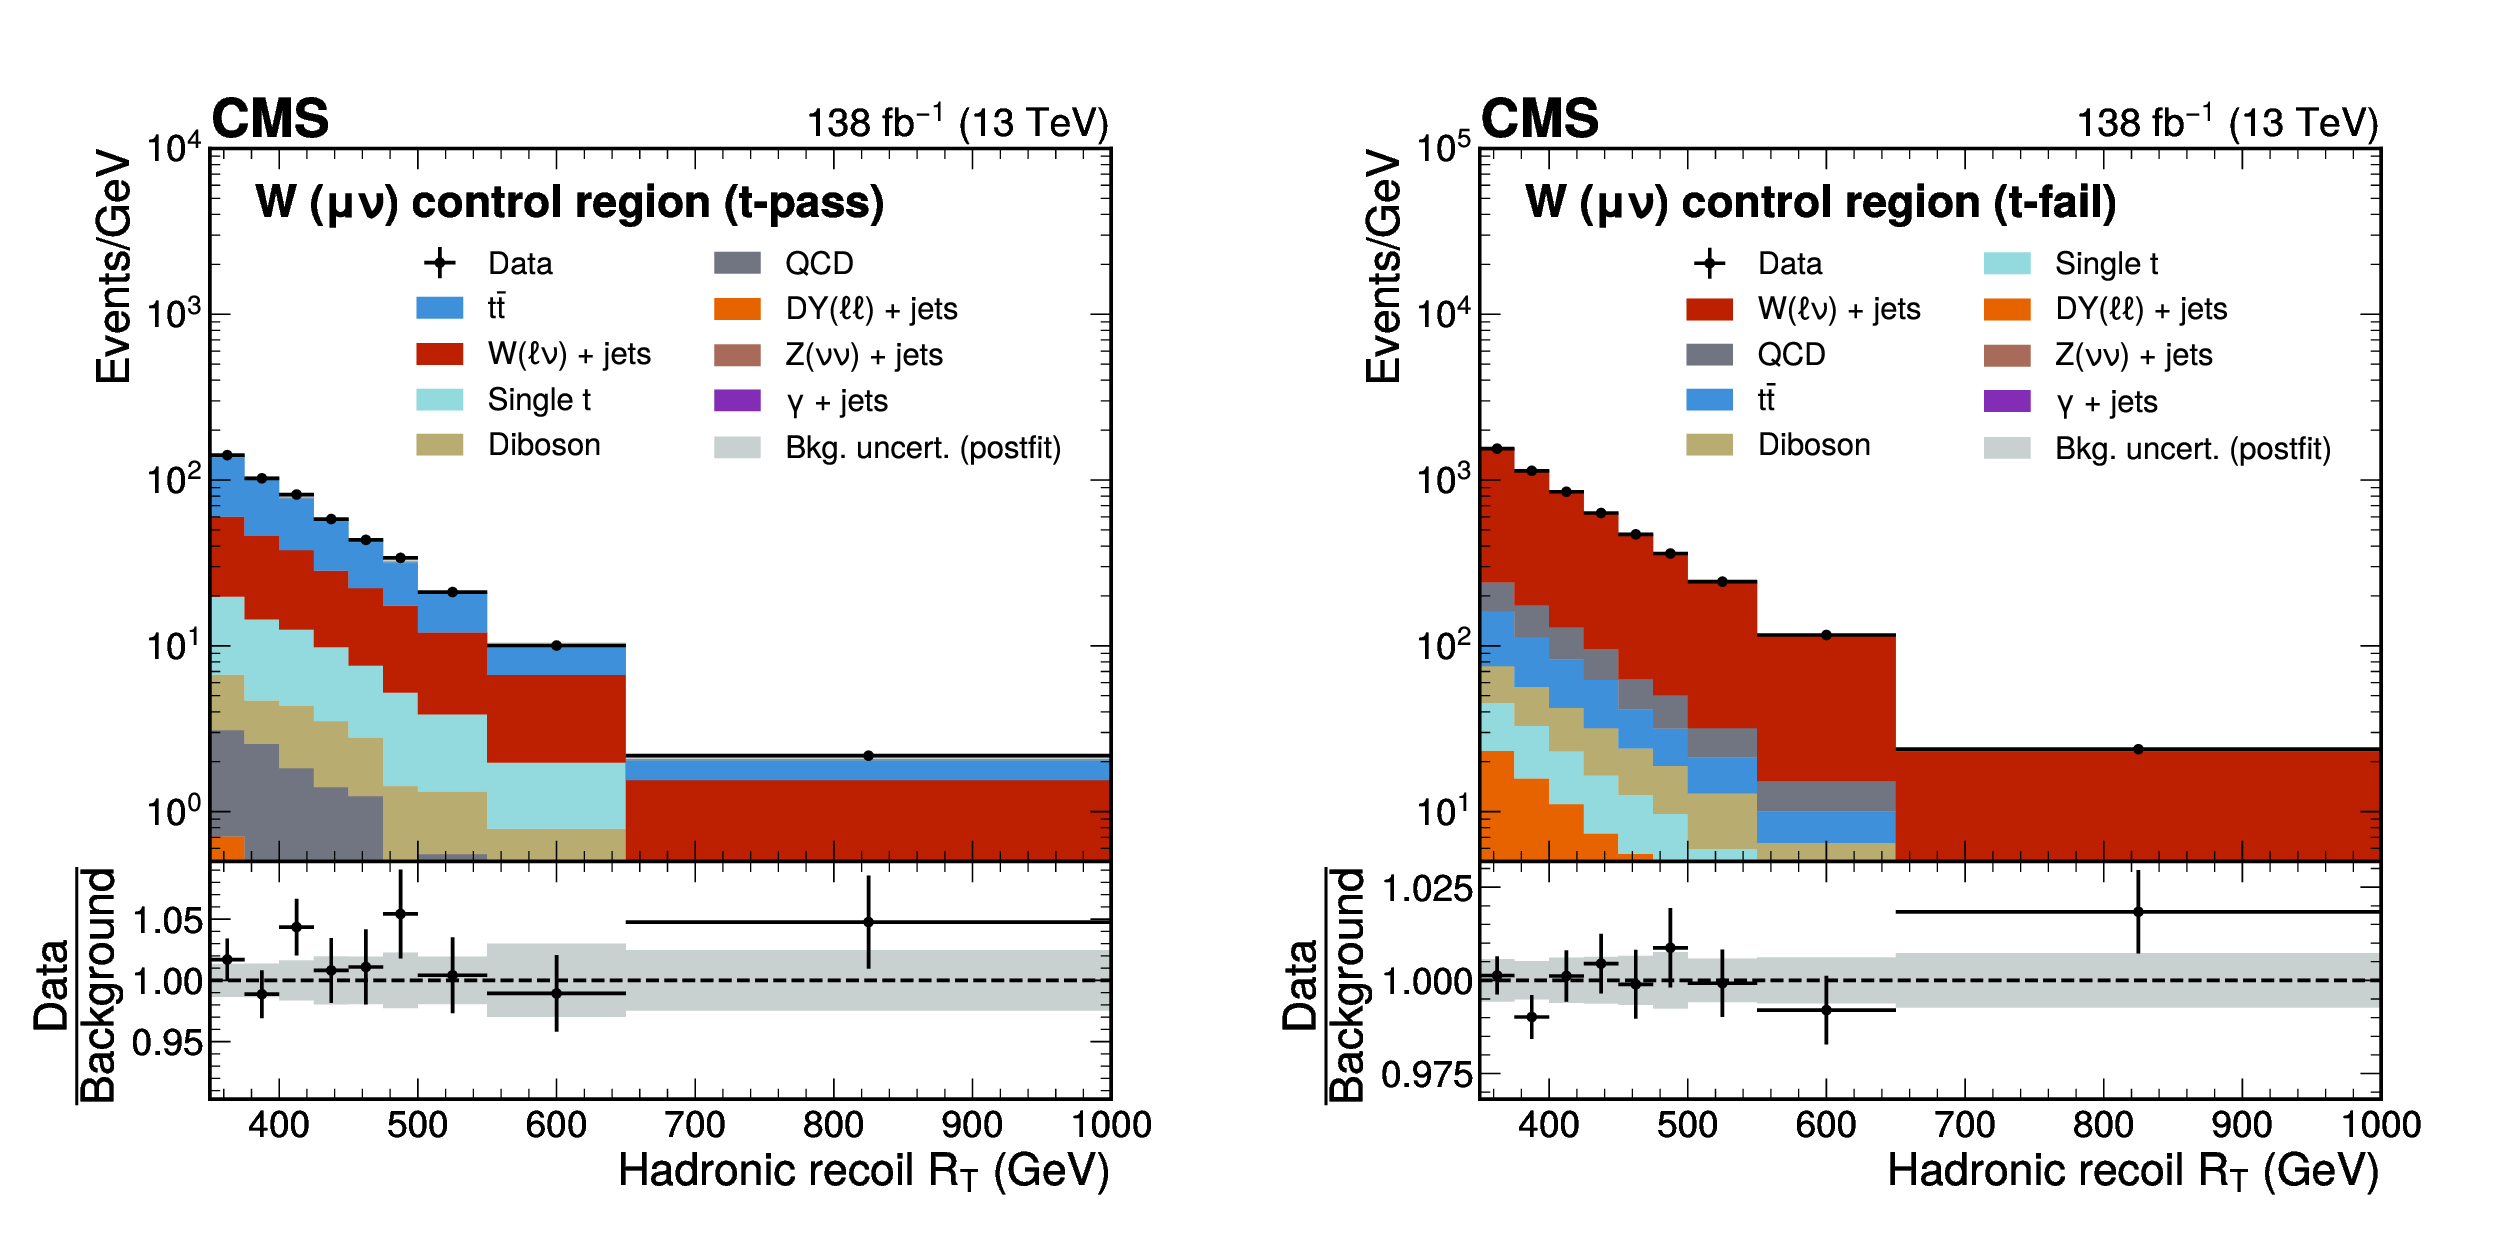
Figure 9:
Postfit distributions of the magnitude of the hadronic recoil $ R_{\mathrm{T}} $ in the $ \mathrm{W}(\mu\nu) $ (t-pass) and $ \mathrm{W}(\mu\nu) $ (t-fail) CRs after a fit of the background model to the data. The last bin of each distribution also contains events with $ R_{\mathrm{T}} > $ 1000 GeV. The background processes are stacked together. The gray band represents the statistical and postfit systematic uncertainties in the predicted background yields after the fit. |
png pdf |
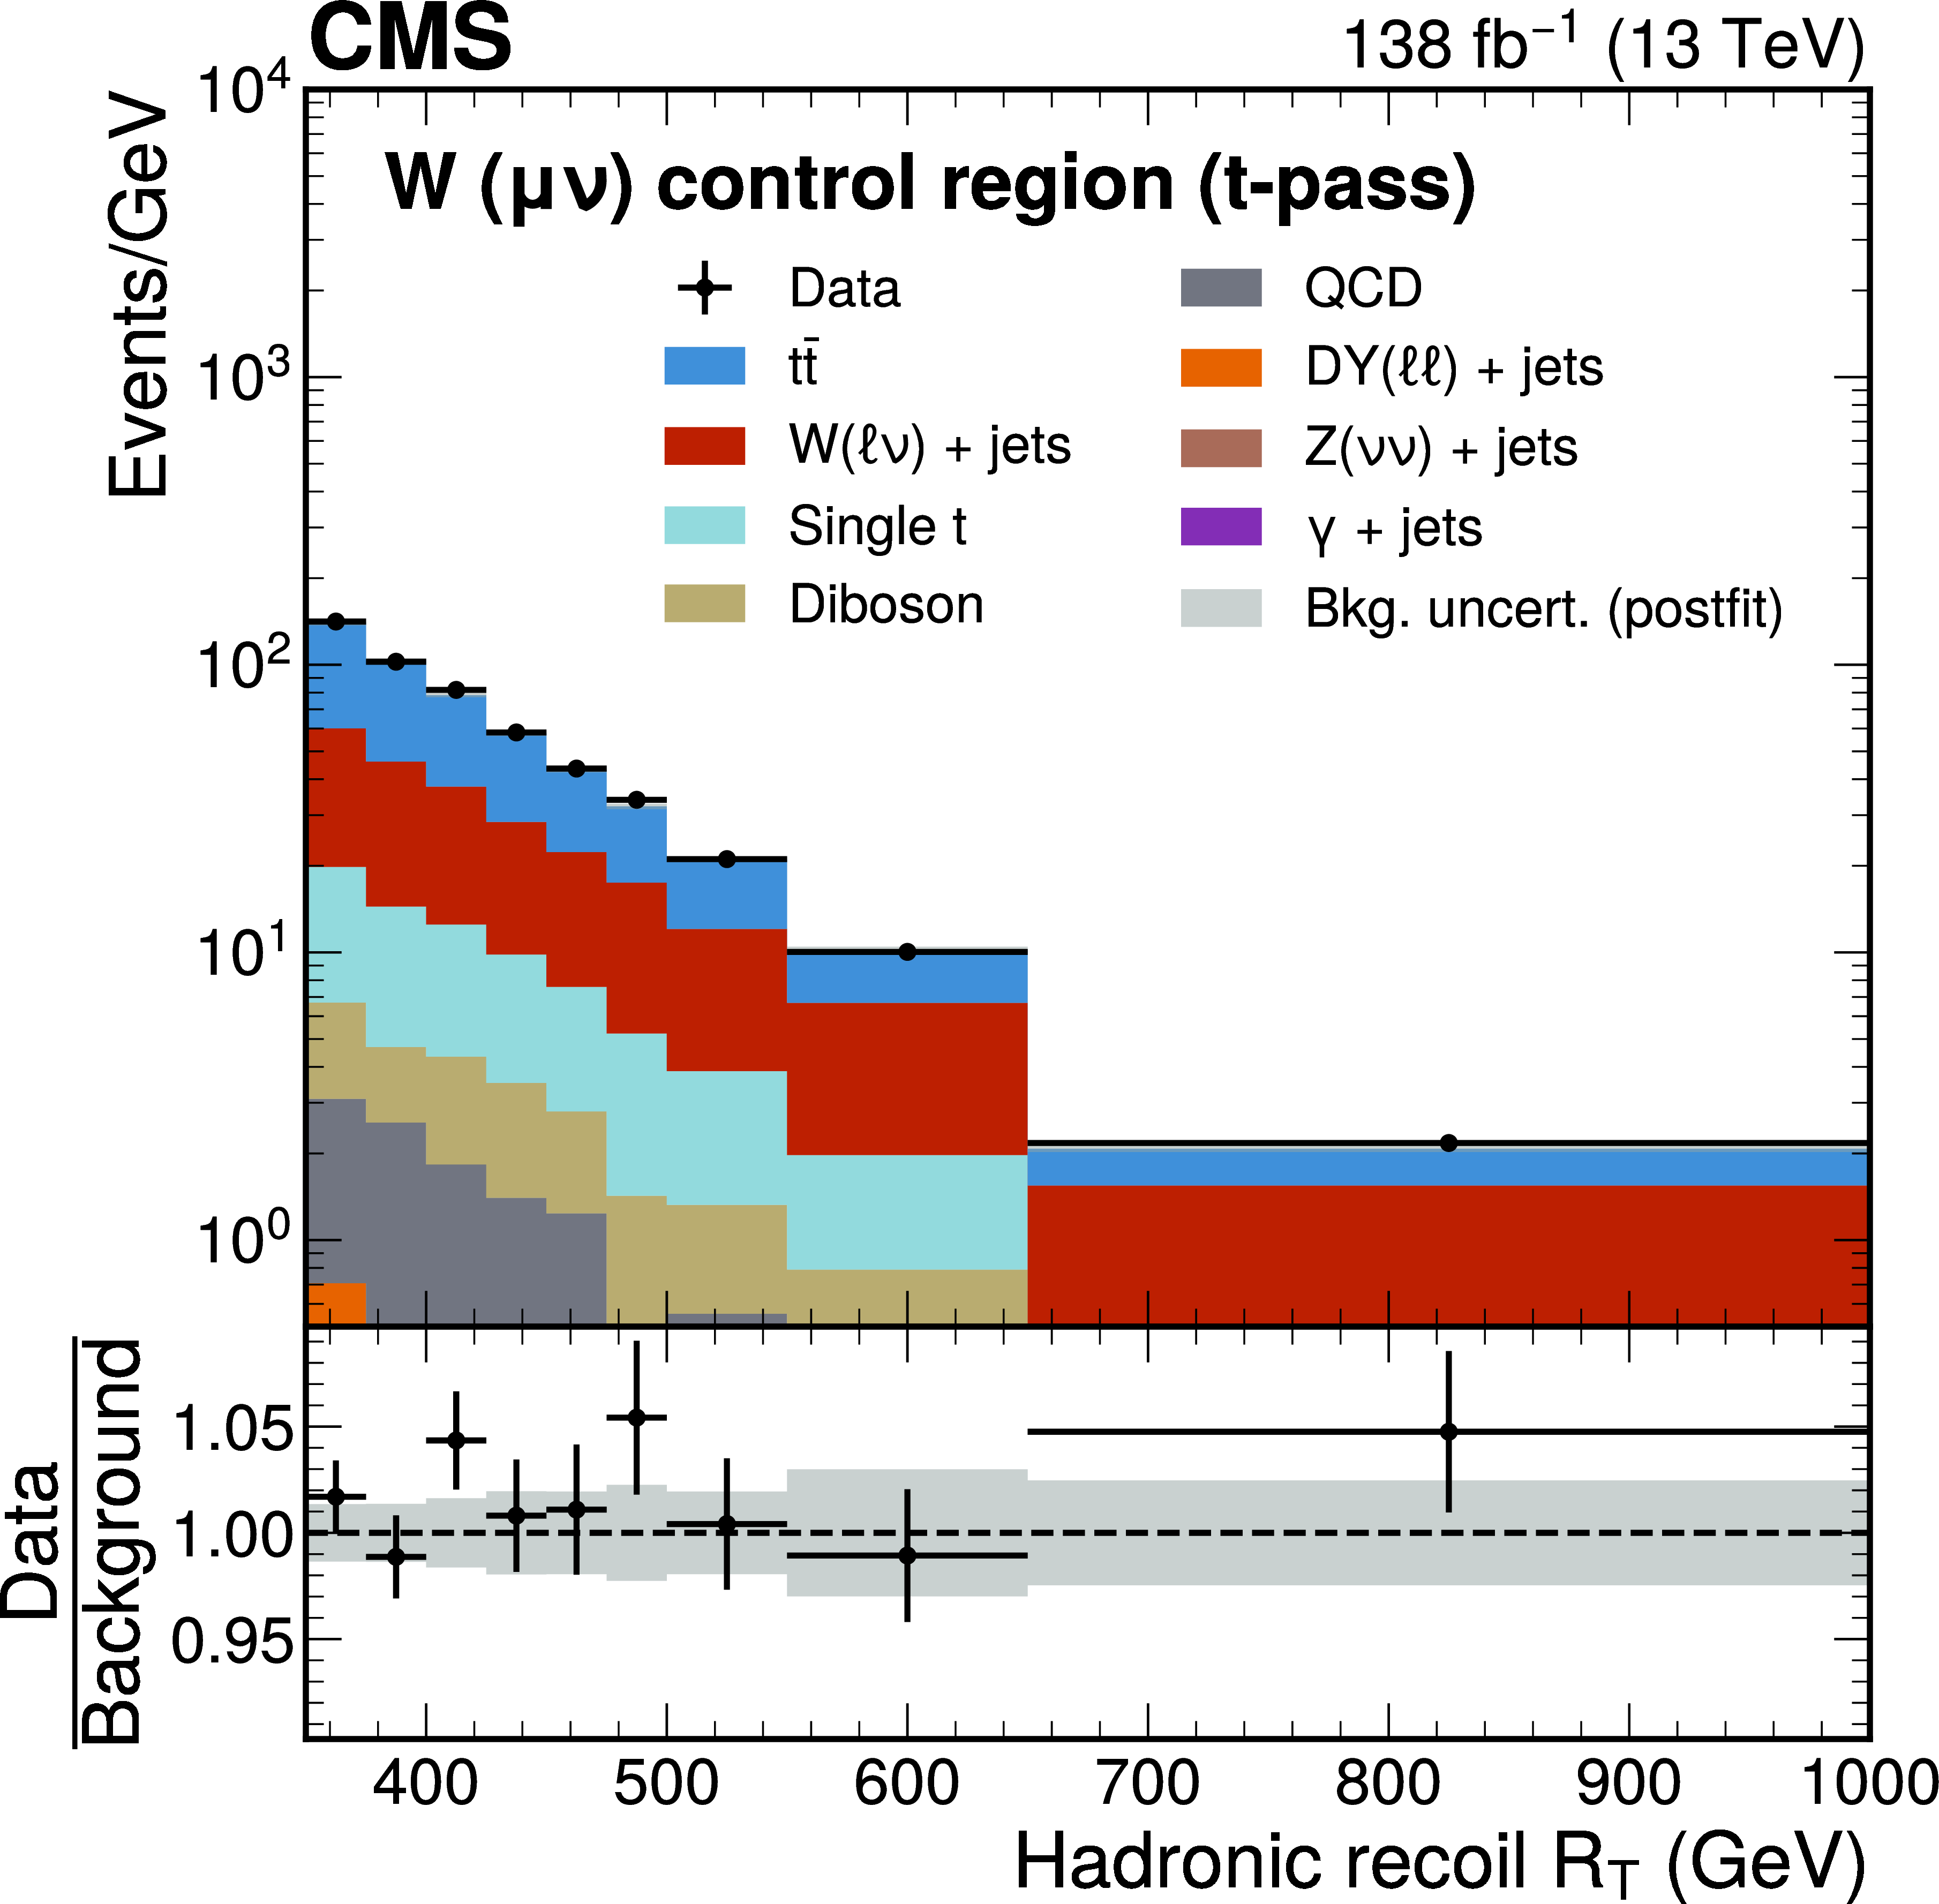
Figure 9-a:
Postfit distributions of the magnitude of the hadronic recoil $ R_{\mathrm{T}} $ in the $ \mathrm{W}(\mu\nu) $ (t-pass) and $ \mathrm{W}(\mu\nu) $ (t-fail) CRs after a fit of the background model to the data. The last bin of each distribution also contains events with $ R_{\mathrm{T}} > $ 1000 GeV. The background processes are stacked together. The gray band represents the statistical and postfit systematic uncertainties in the predicted background yields after the fit. |
png pdf |
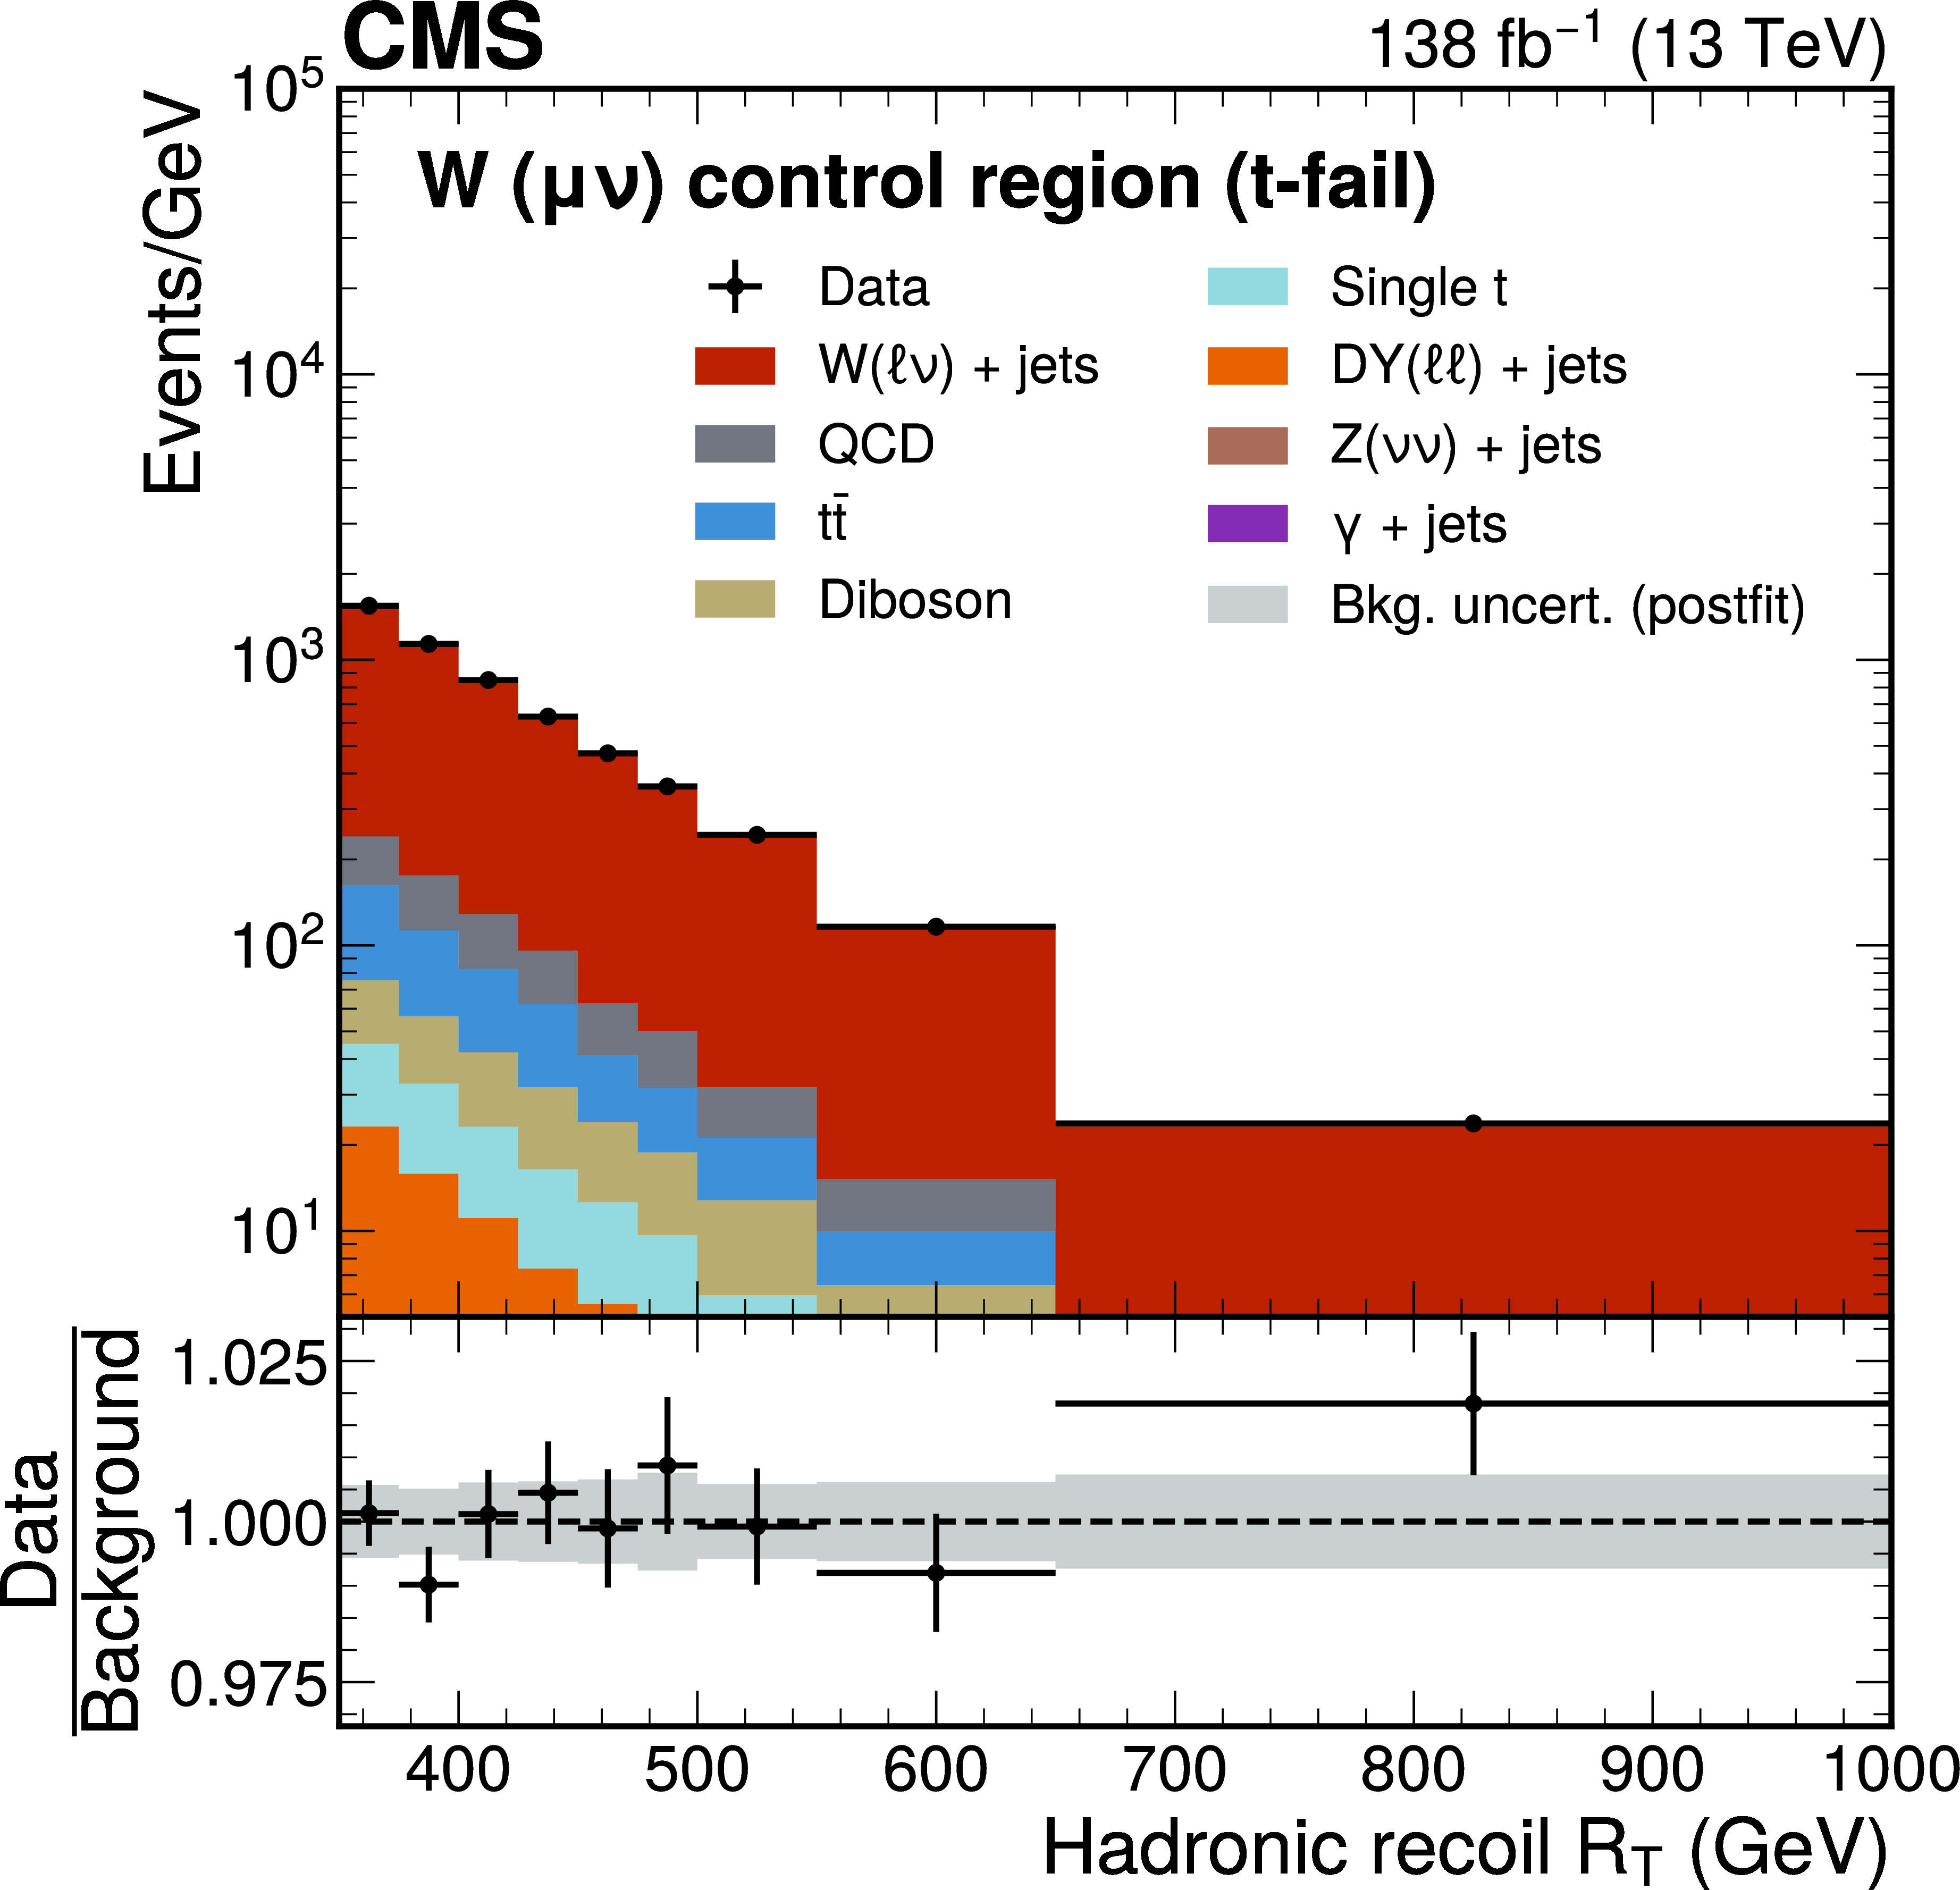
Figure 9-b:
Postfit distributions of the magnitude of the hadronic recoil $ R_{\mathrm{T}} $ in the $ \mathrm{W}(\mu\nu) $ (t-pass) and $ \mathrm{W}(\mu\nu) $ (t-fail) CRs after a fit of the background model to the data. The last bin of each distribution also contains events with $ R_{\mathrm{T}} > $ 1000 GeV. The background processes are stacked together. The gray band represents the statistical and postfit systematic uncertainties in the predicted background yields after the fit. |
png pdf |
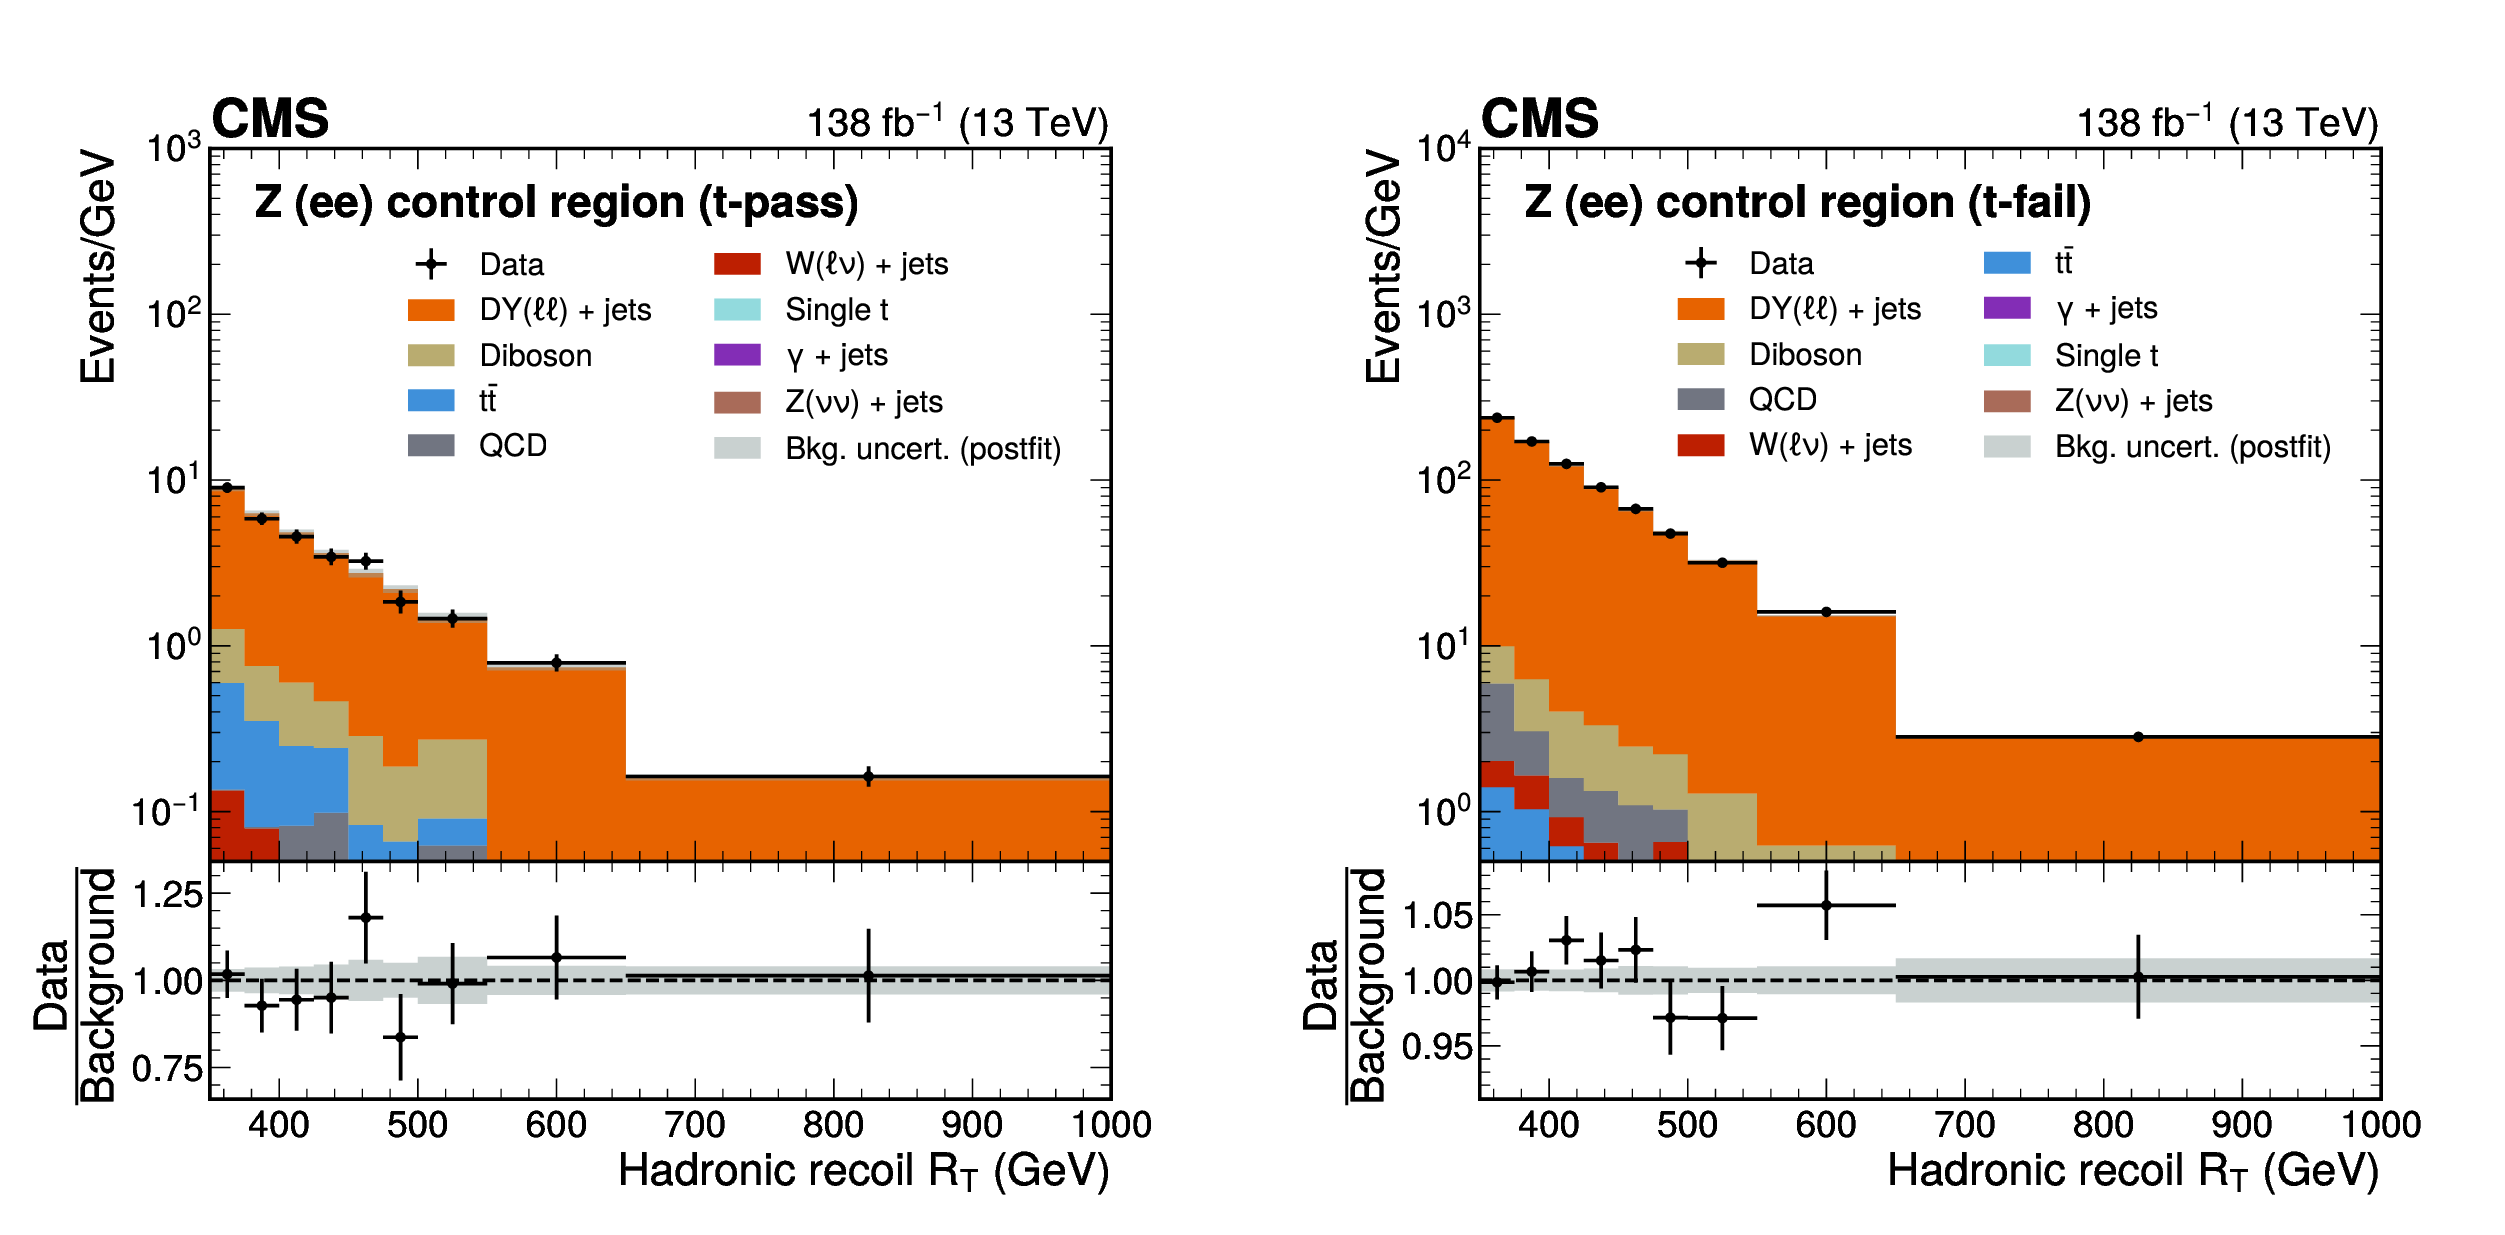
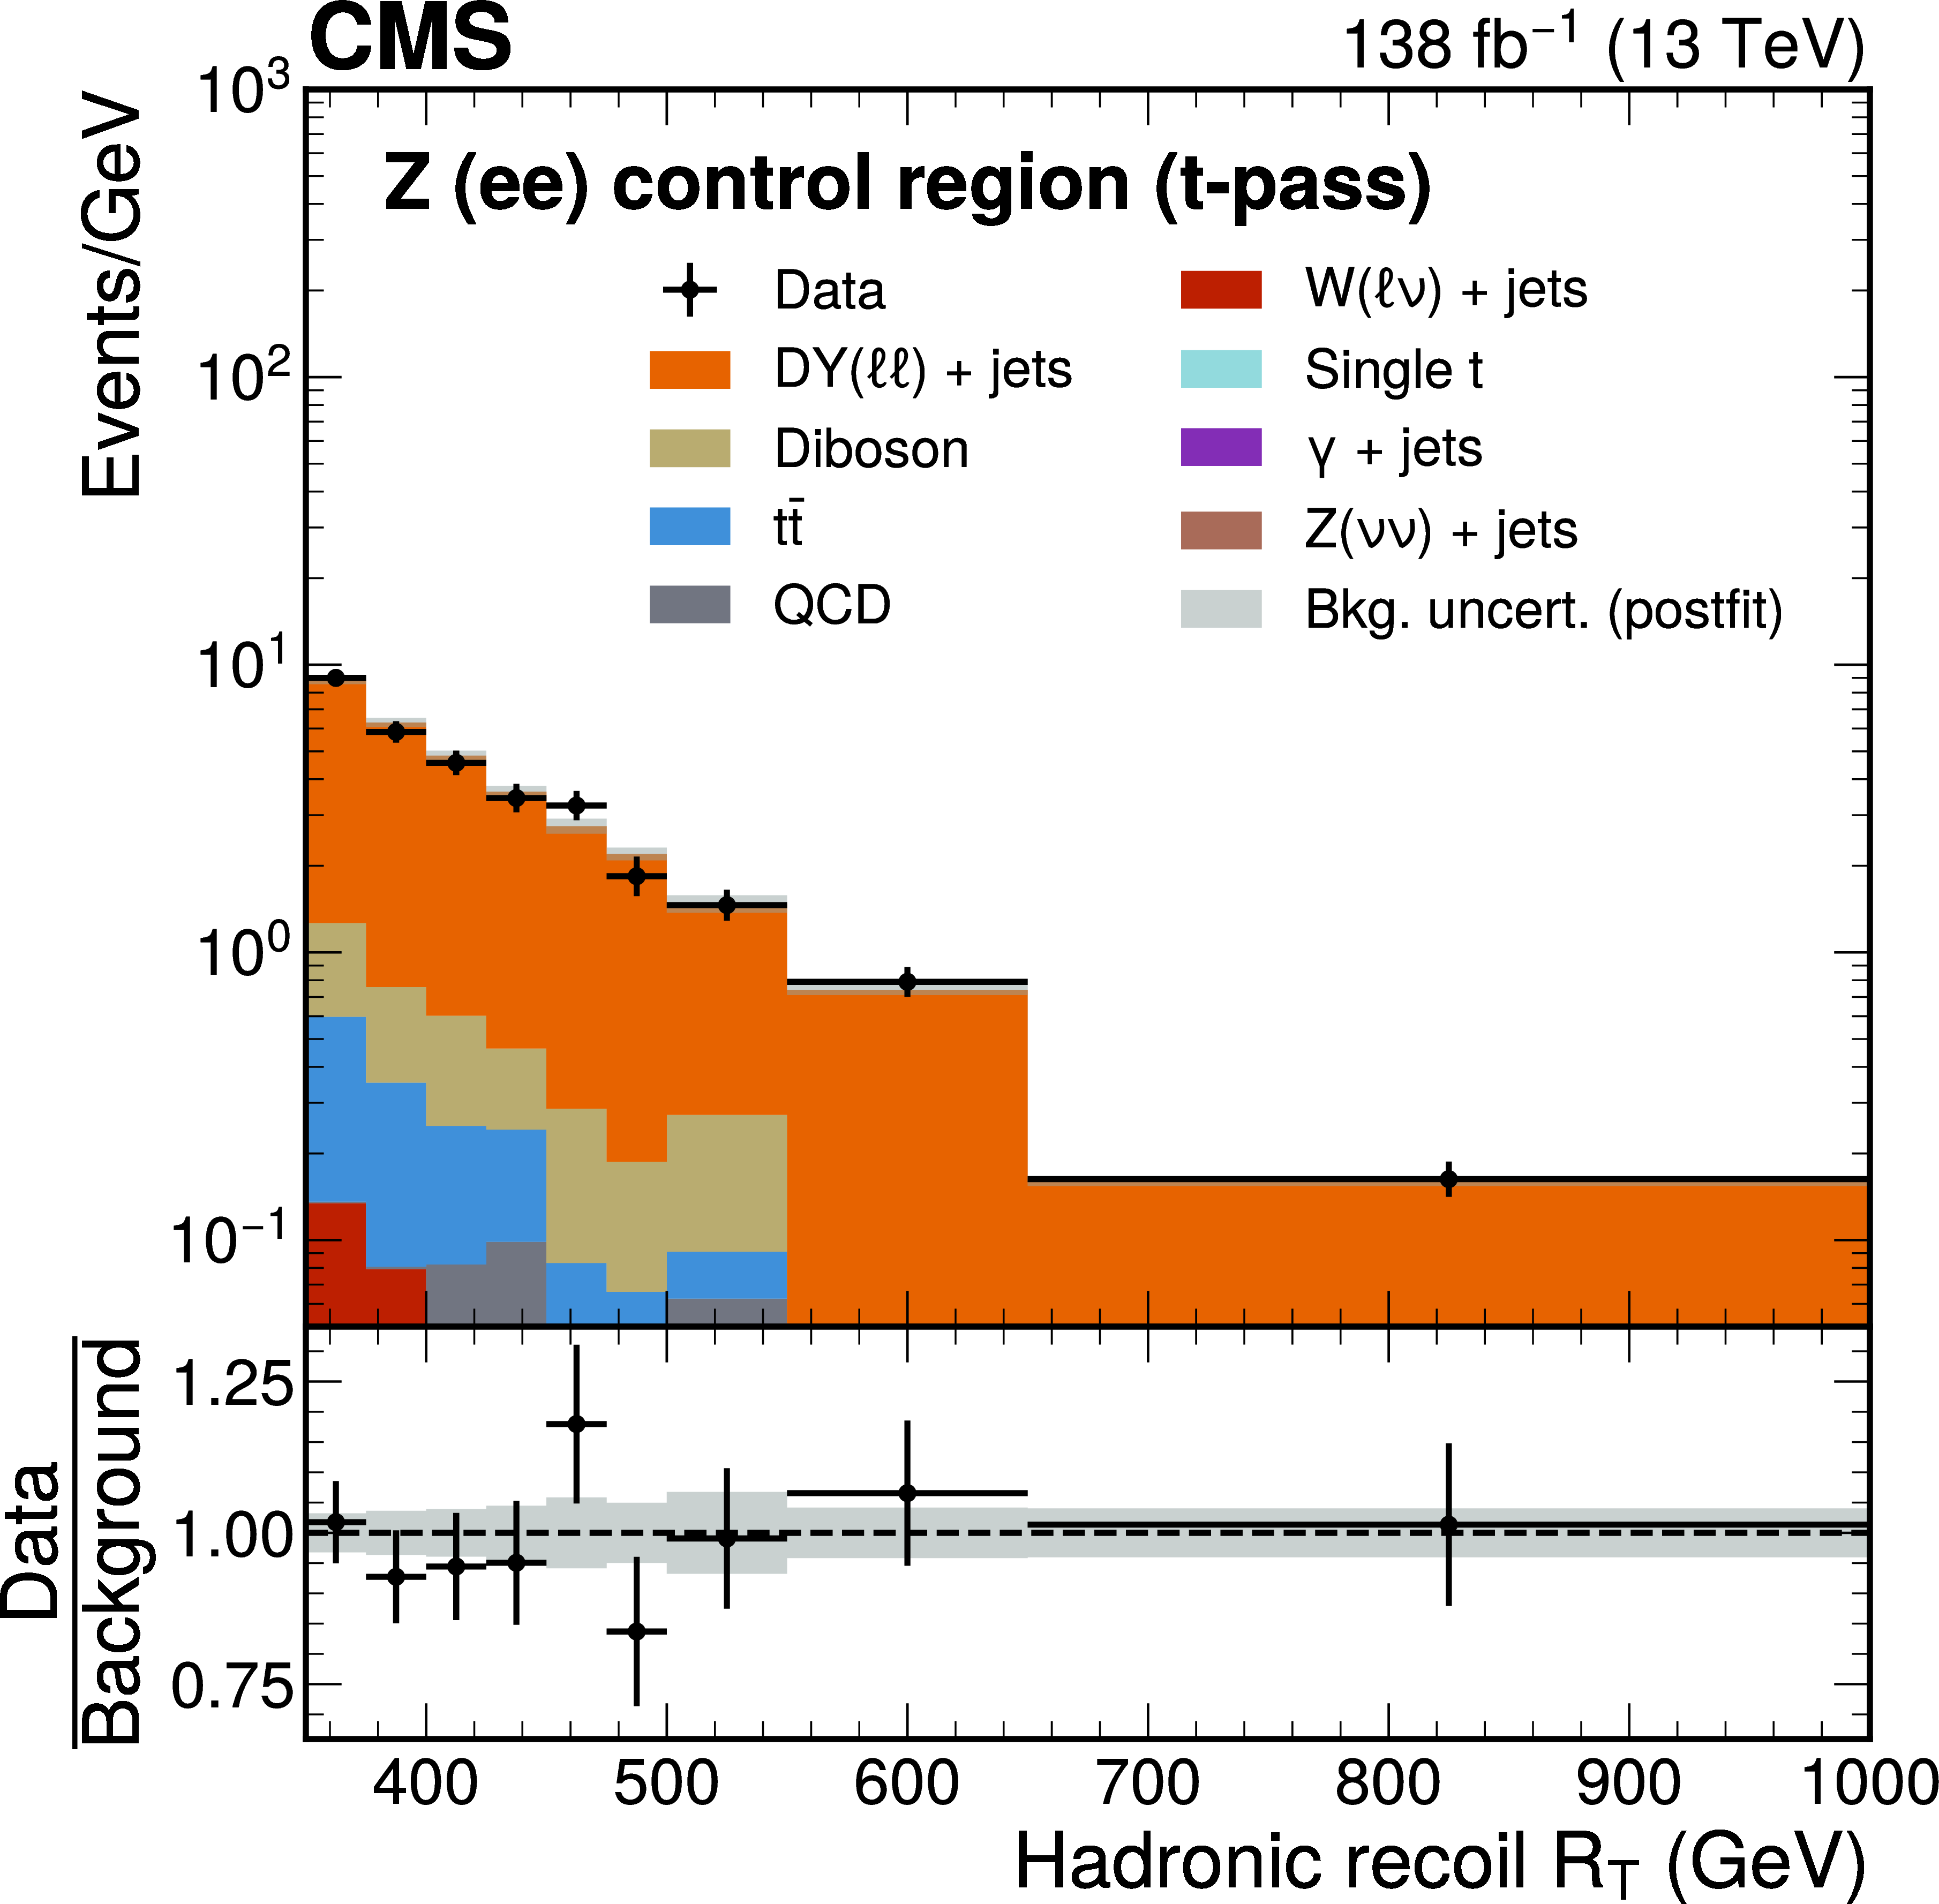
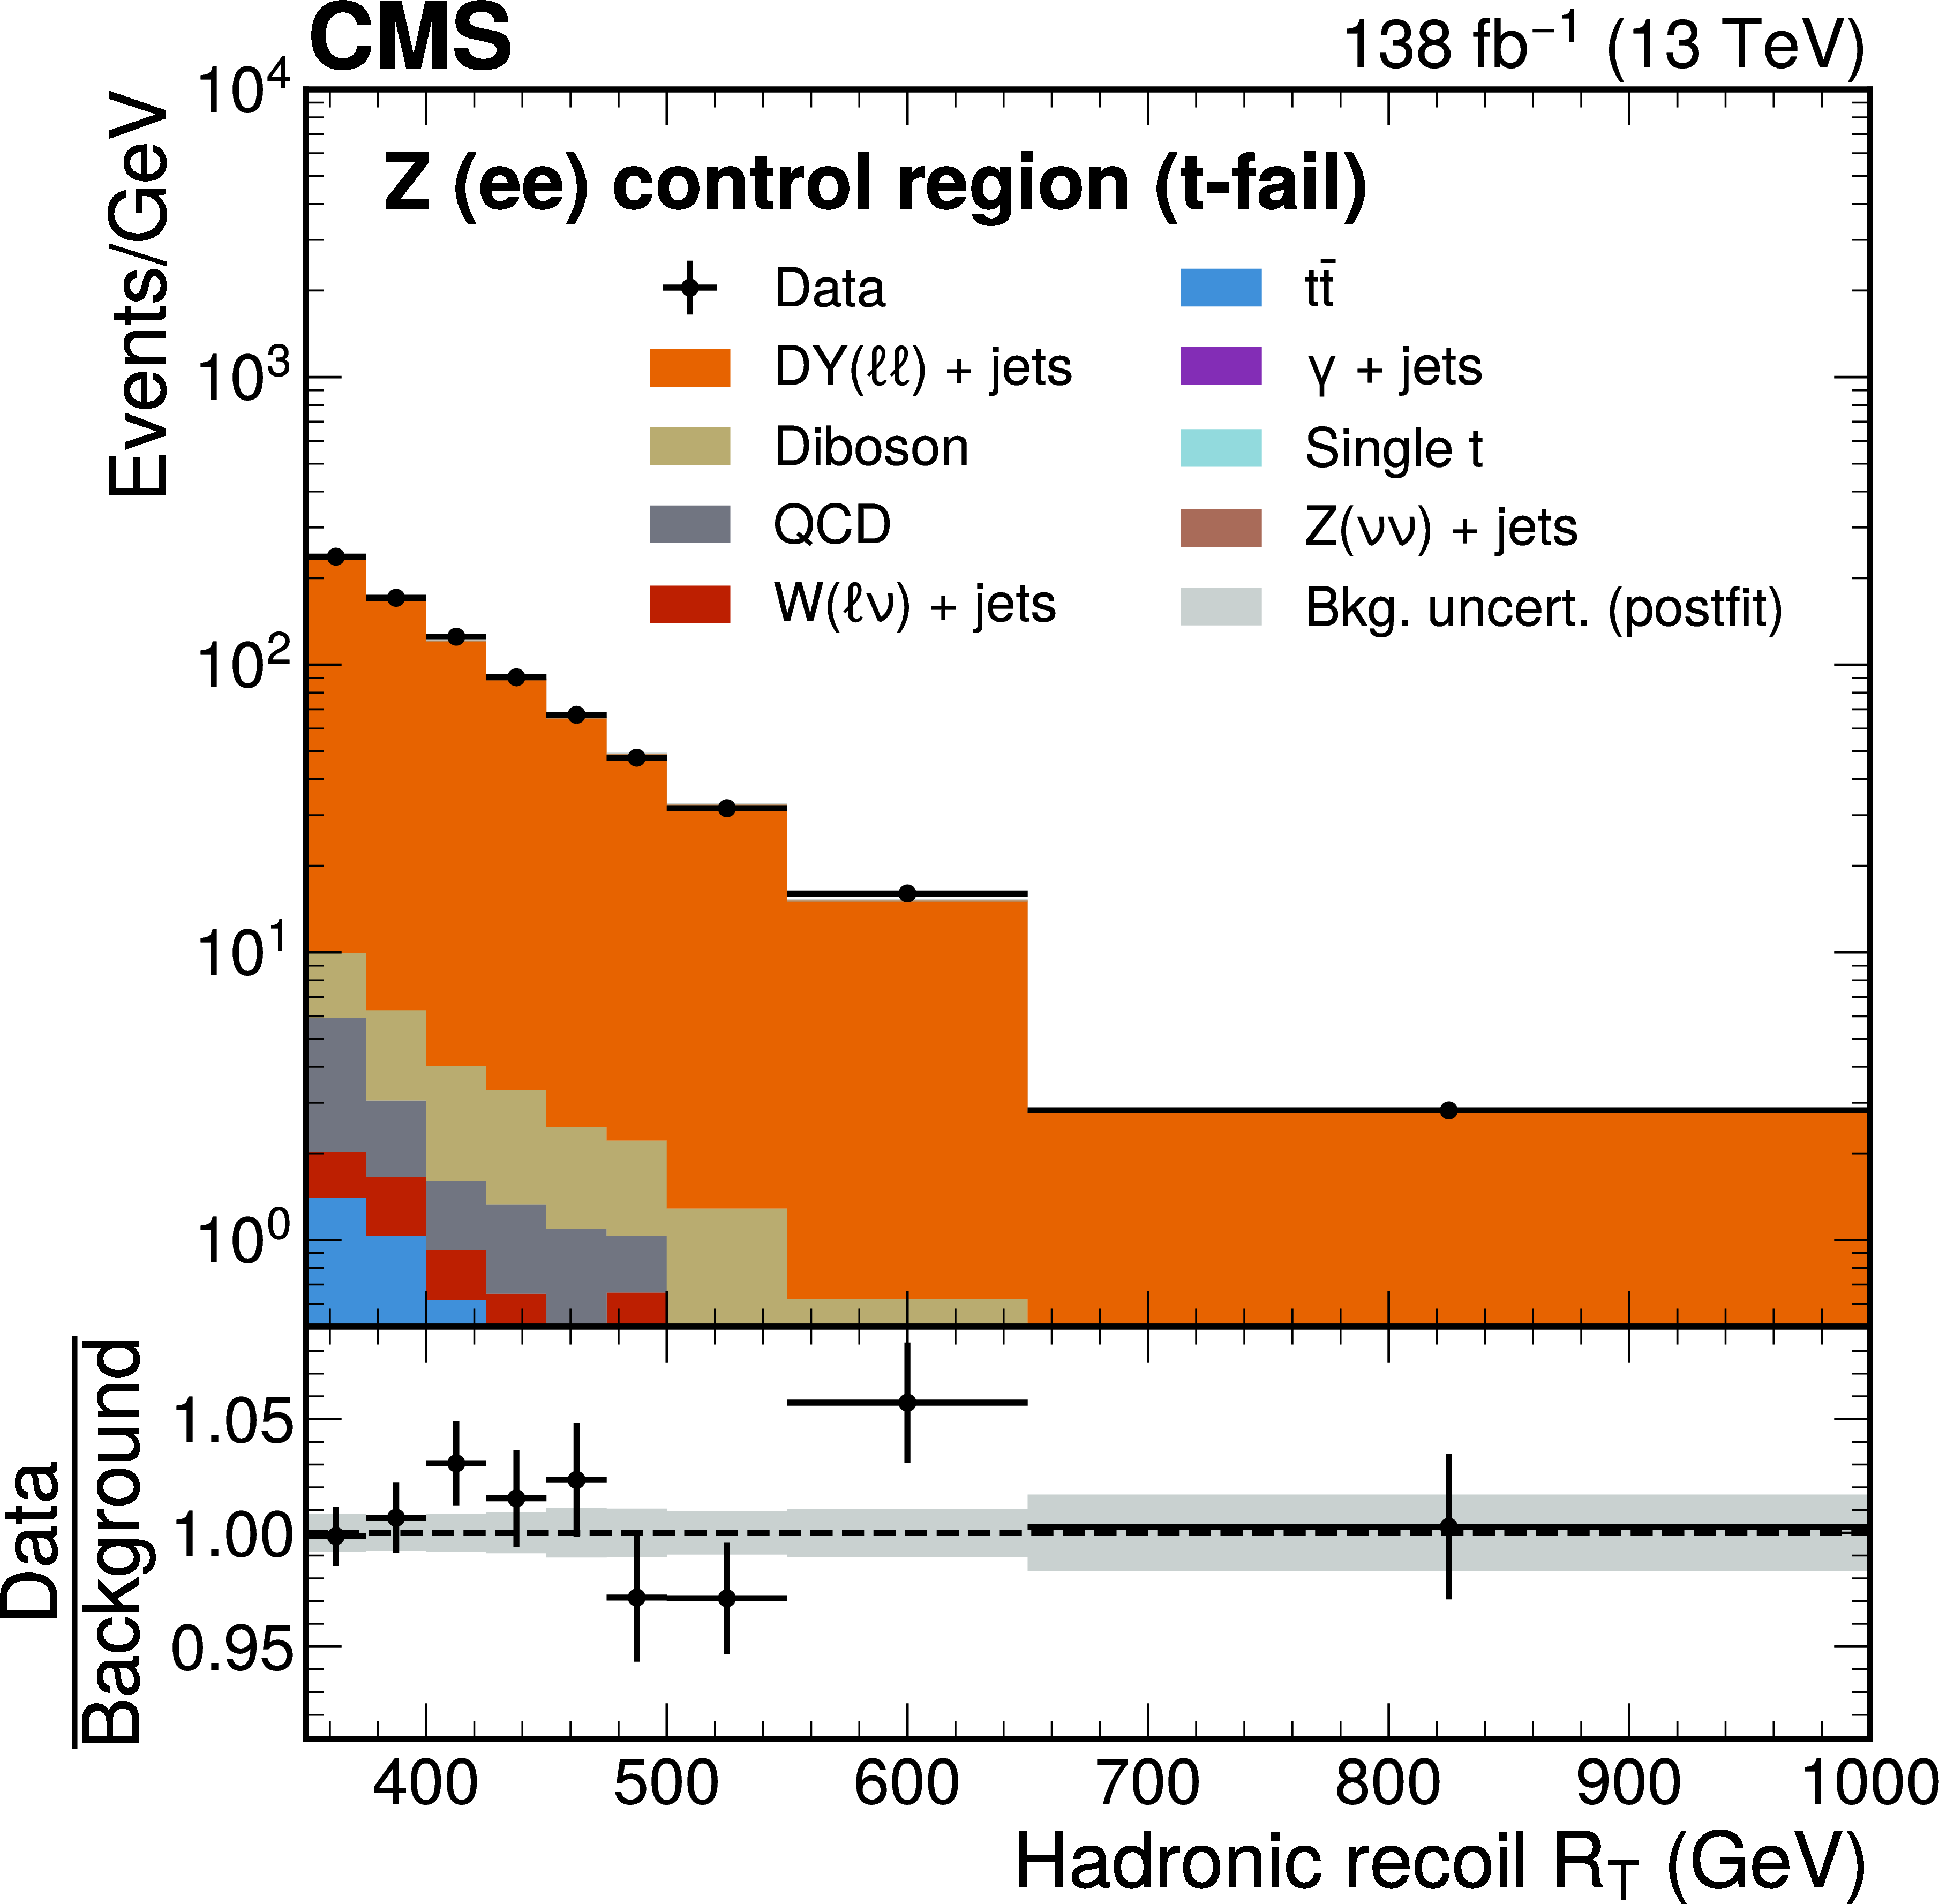
Figure 10:
Postfit distributions of the magnitude of the hadronic recoil $ R_{\mathrm{T}} $ in the $ \mathrm{Z}(\mathrm{e}\mathrm{e}) $ (t-pass) and $ \mathrm{Z}(\mathrm{e}\mathrm{e}) $ (t-fail) CRs after a fit of the background model to the data. The last bin of each distribution also contains events with $ R_{\mathrm{T}} > $ 1000 GeV. The background processes are stacked together. The gray band represents the statistical and postfit systematic uncertainties in the predicted background yields after the fit. |
png pdf |
Figure 10-a:
Postfit distributions of the magnitude of the hadronic recoil $ R_{\mathrm{T}} $ in the $ \mathrm{Z}(\mathrm{e}\mathrm{e}) $ (t-pass) and $ \mathrm{Z}(\mathrm{e}\mathrm{e}) $ (t-fail) CRs after a fit of the background model to the data. The last bin of each distribution also contains events with $ R_{\mathrm{T}} > $ 1000 GeV. The background processes are stacked together. The gray band represents the statistical and postfit systematic uncertainties in the predicted background yields after the fit. |
png pdf |
Figure 10-b:
Postfit distributions of the magnitude of the hadronic recoil $ R_{\mathrm{T}} $ in the $ \mathrm{Z}(\mathrm{e}\mathrm{e}) $ (t-pass) and $ \mathrm{Z}(\mathrm{e}\mathrm{e}) $ (t-fail) CRs after a fit of the background model to the data. The last bin of each distribution also contains events with $ R_{\mathrm{T}} > $ 1000 GeV. The background processes are stacked together. The gray band represents the statistical and postfit systematic uncertainties in the predicted background yields after the fit. |
png pdf |
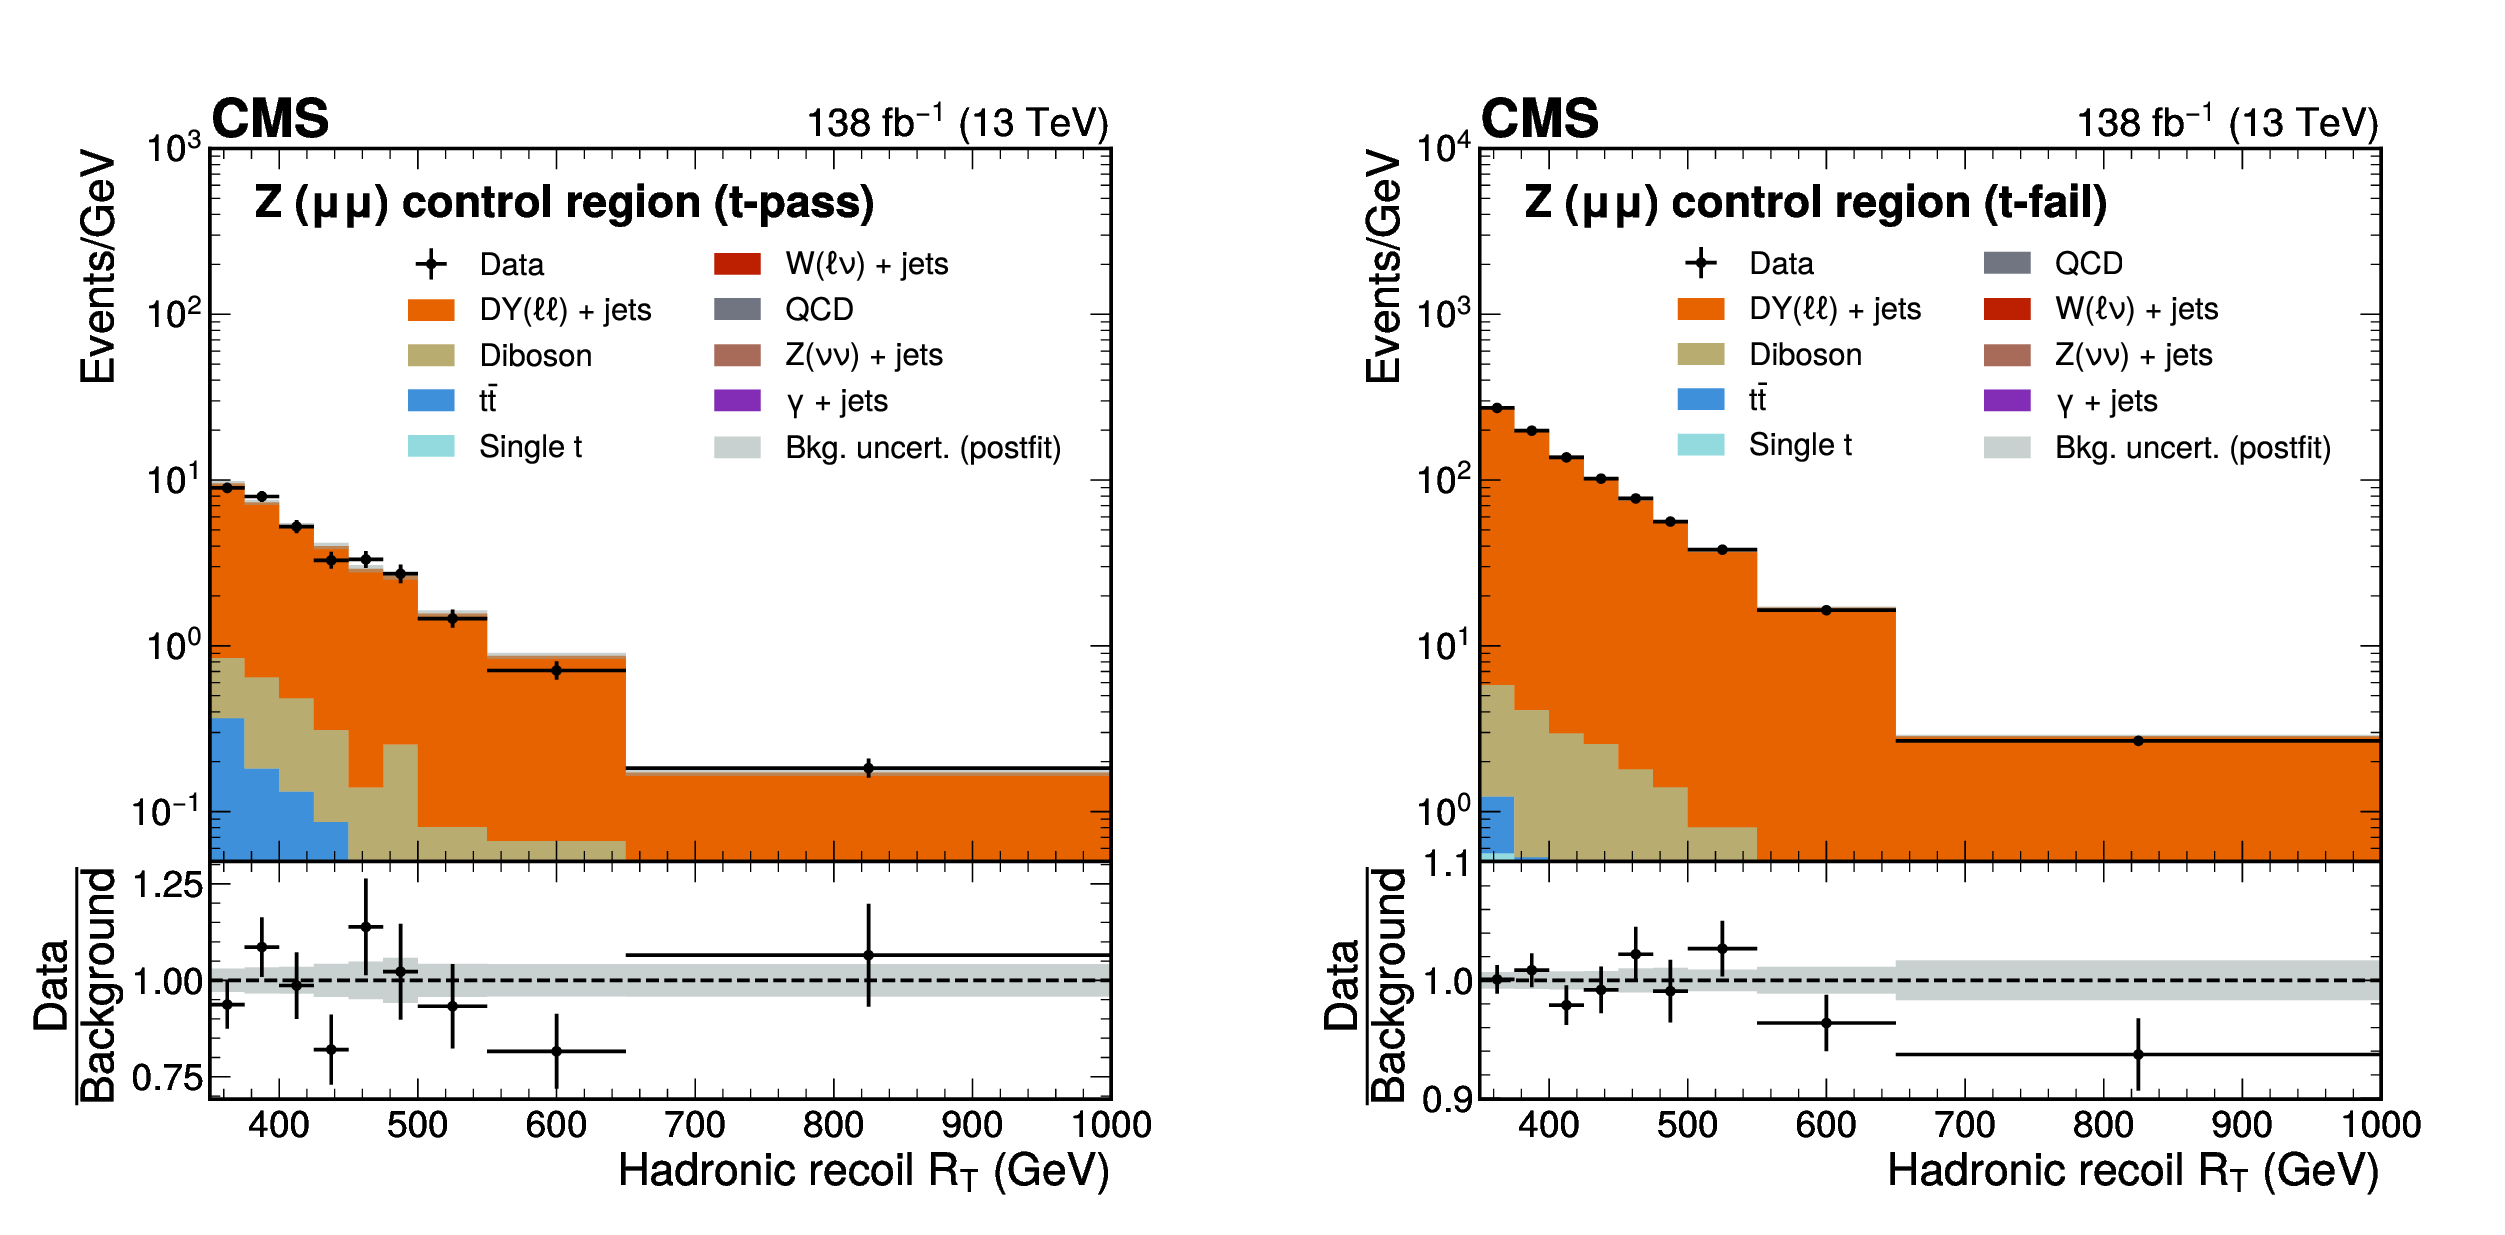
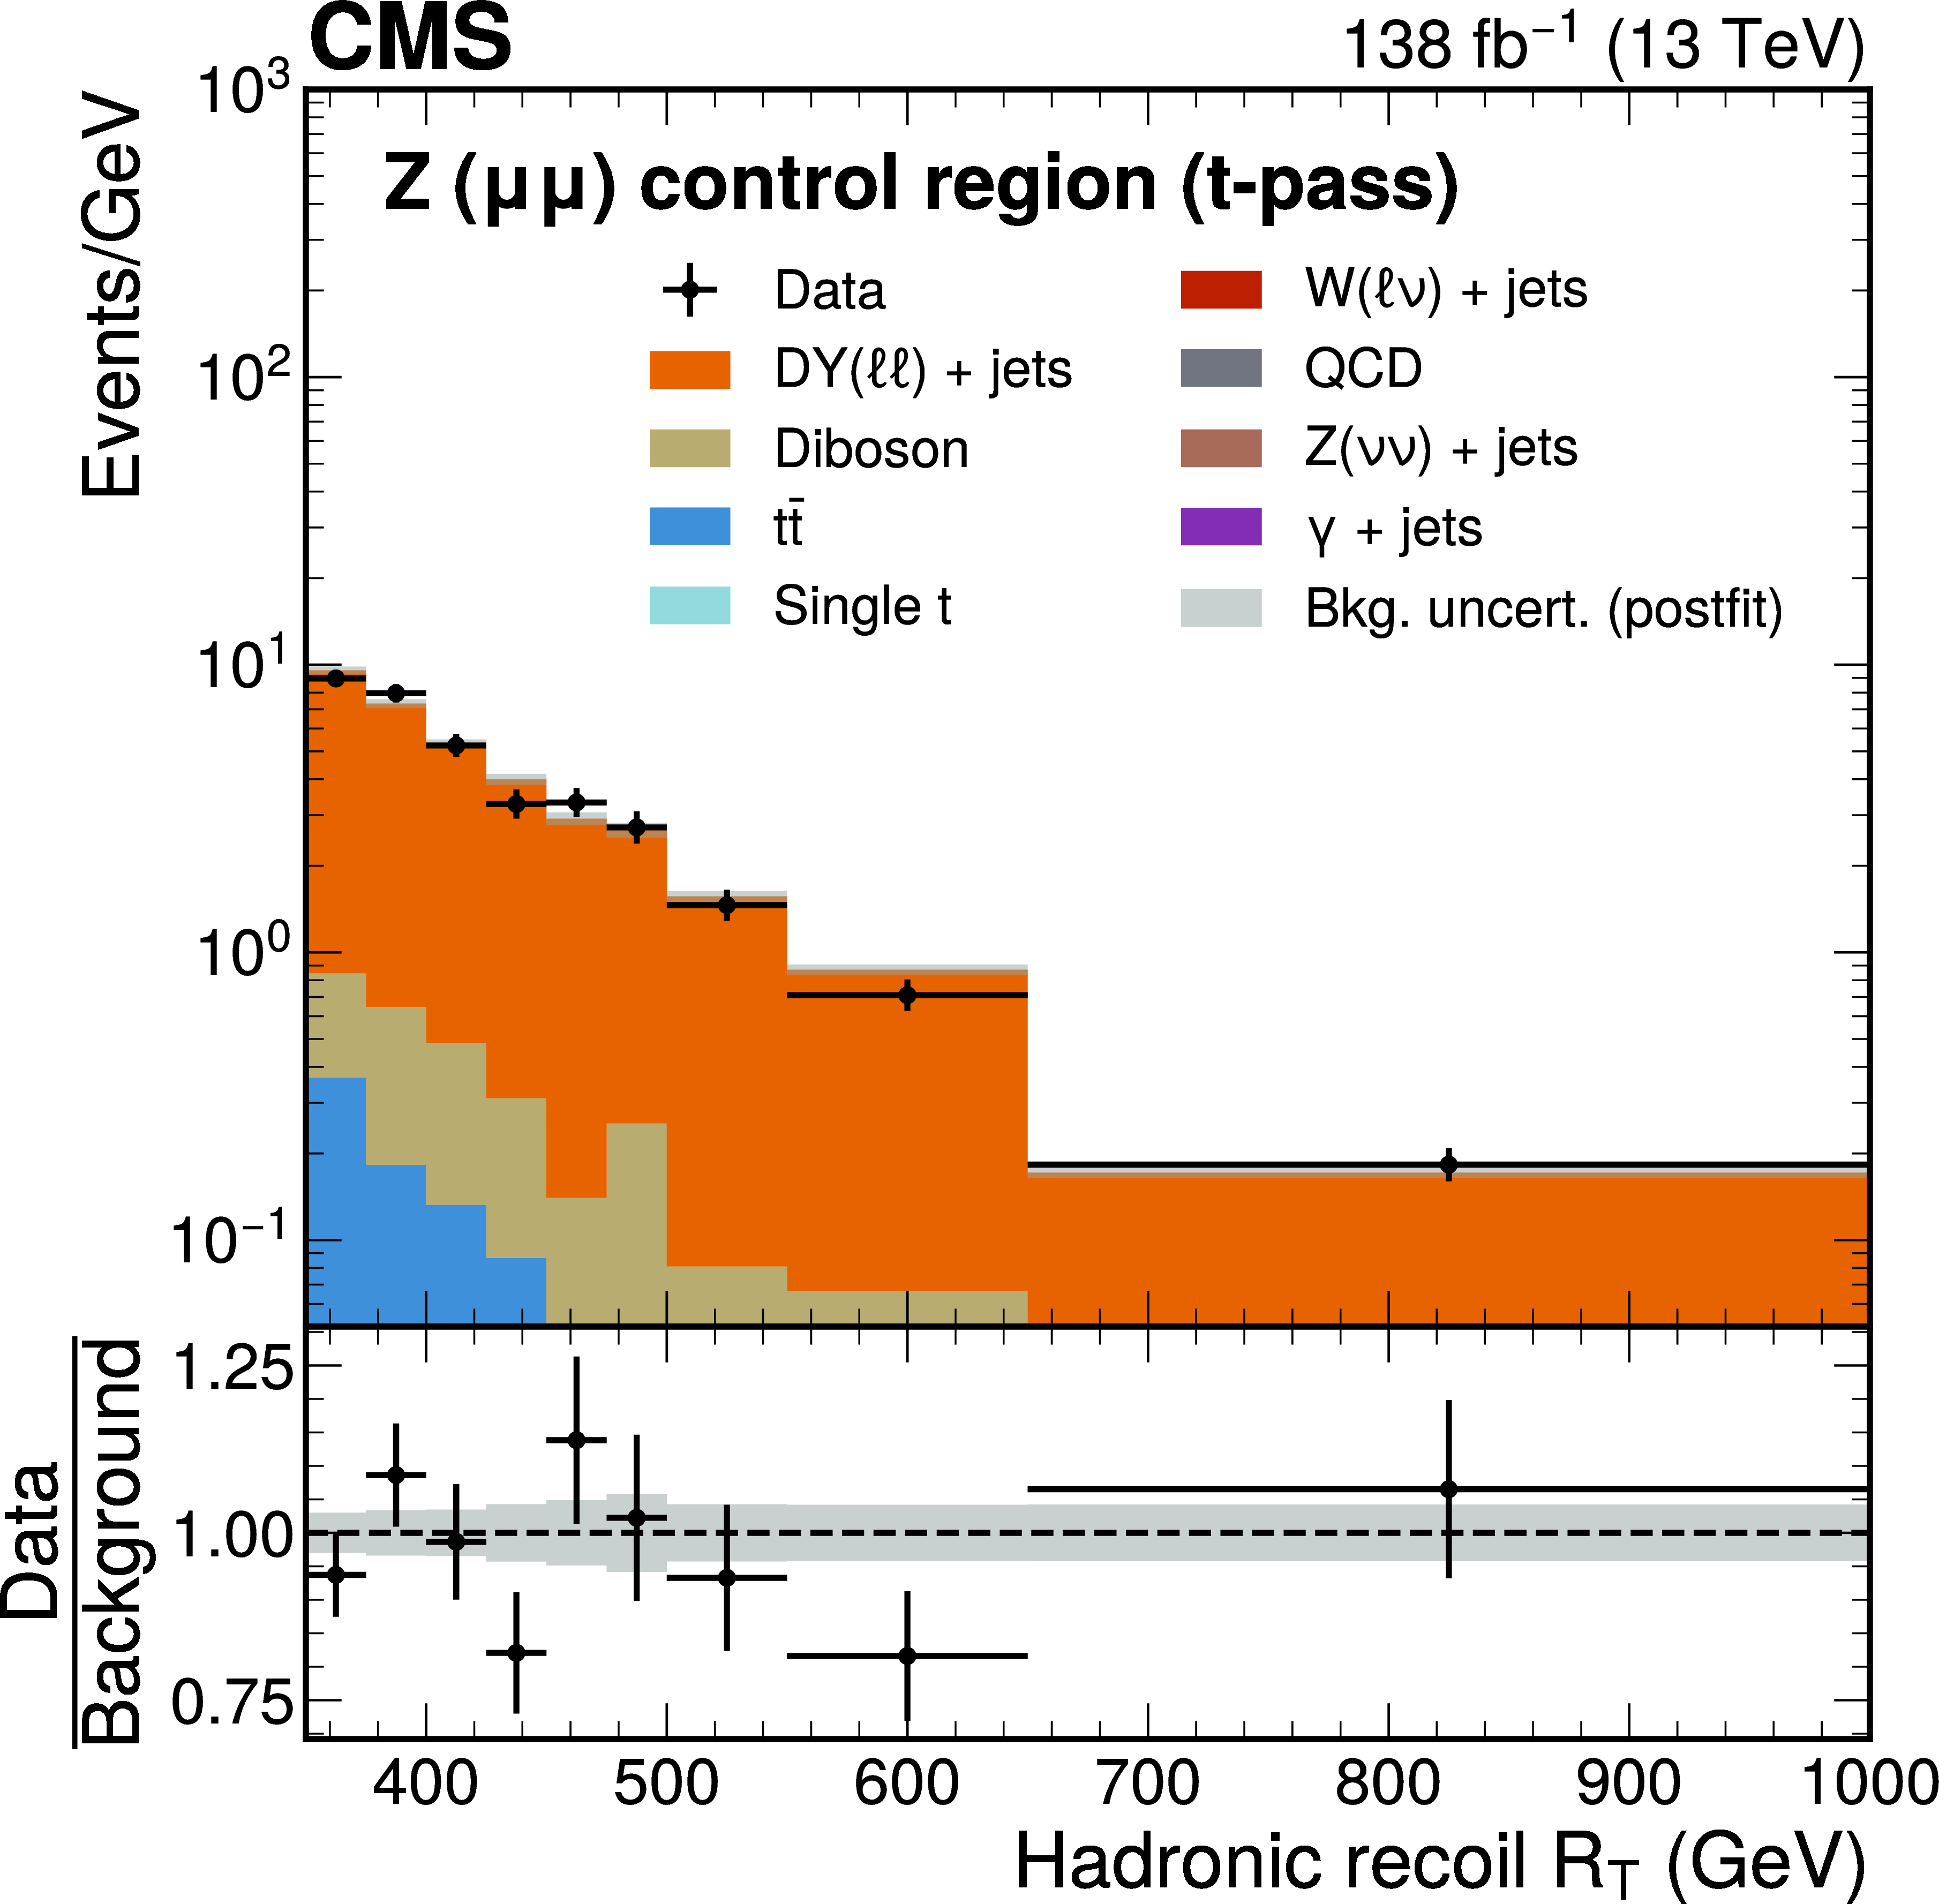
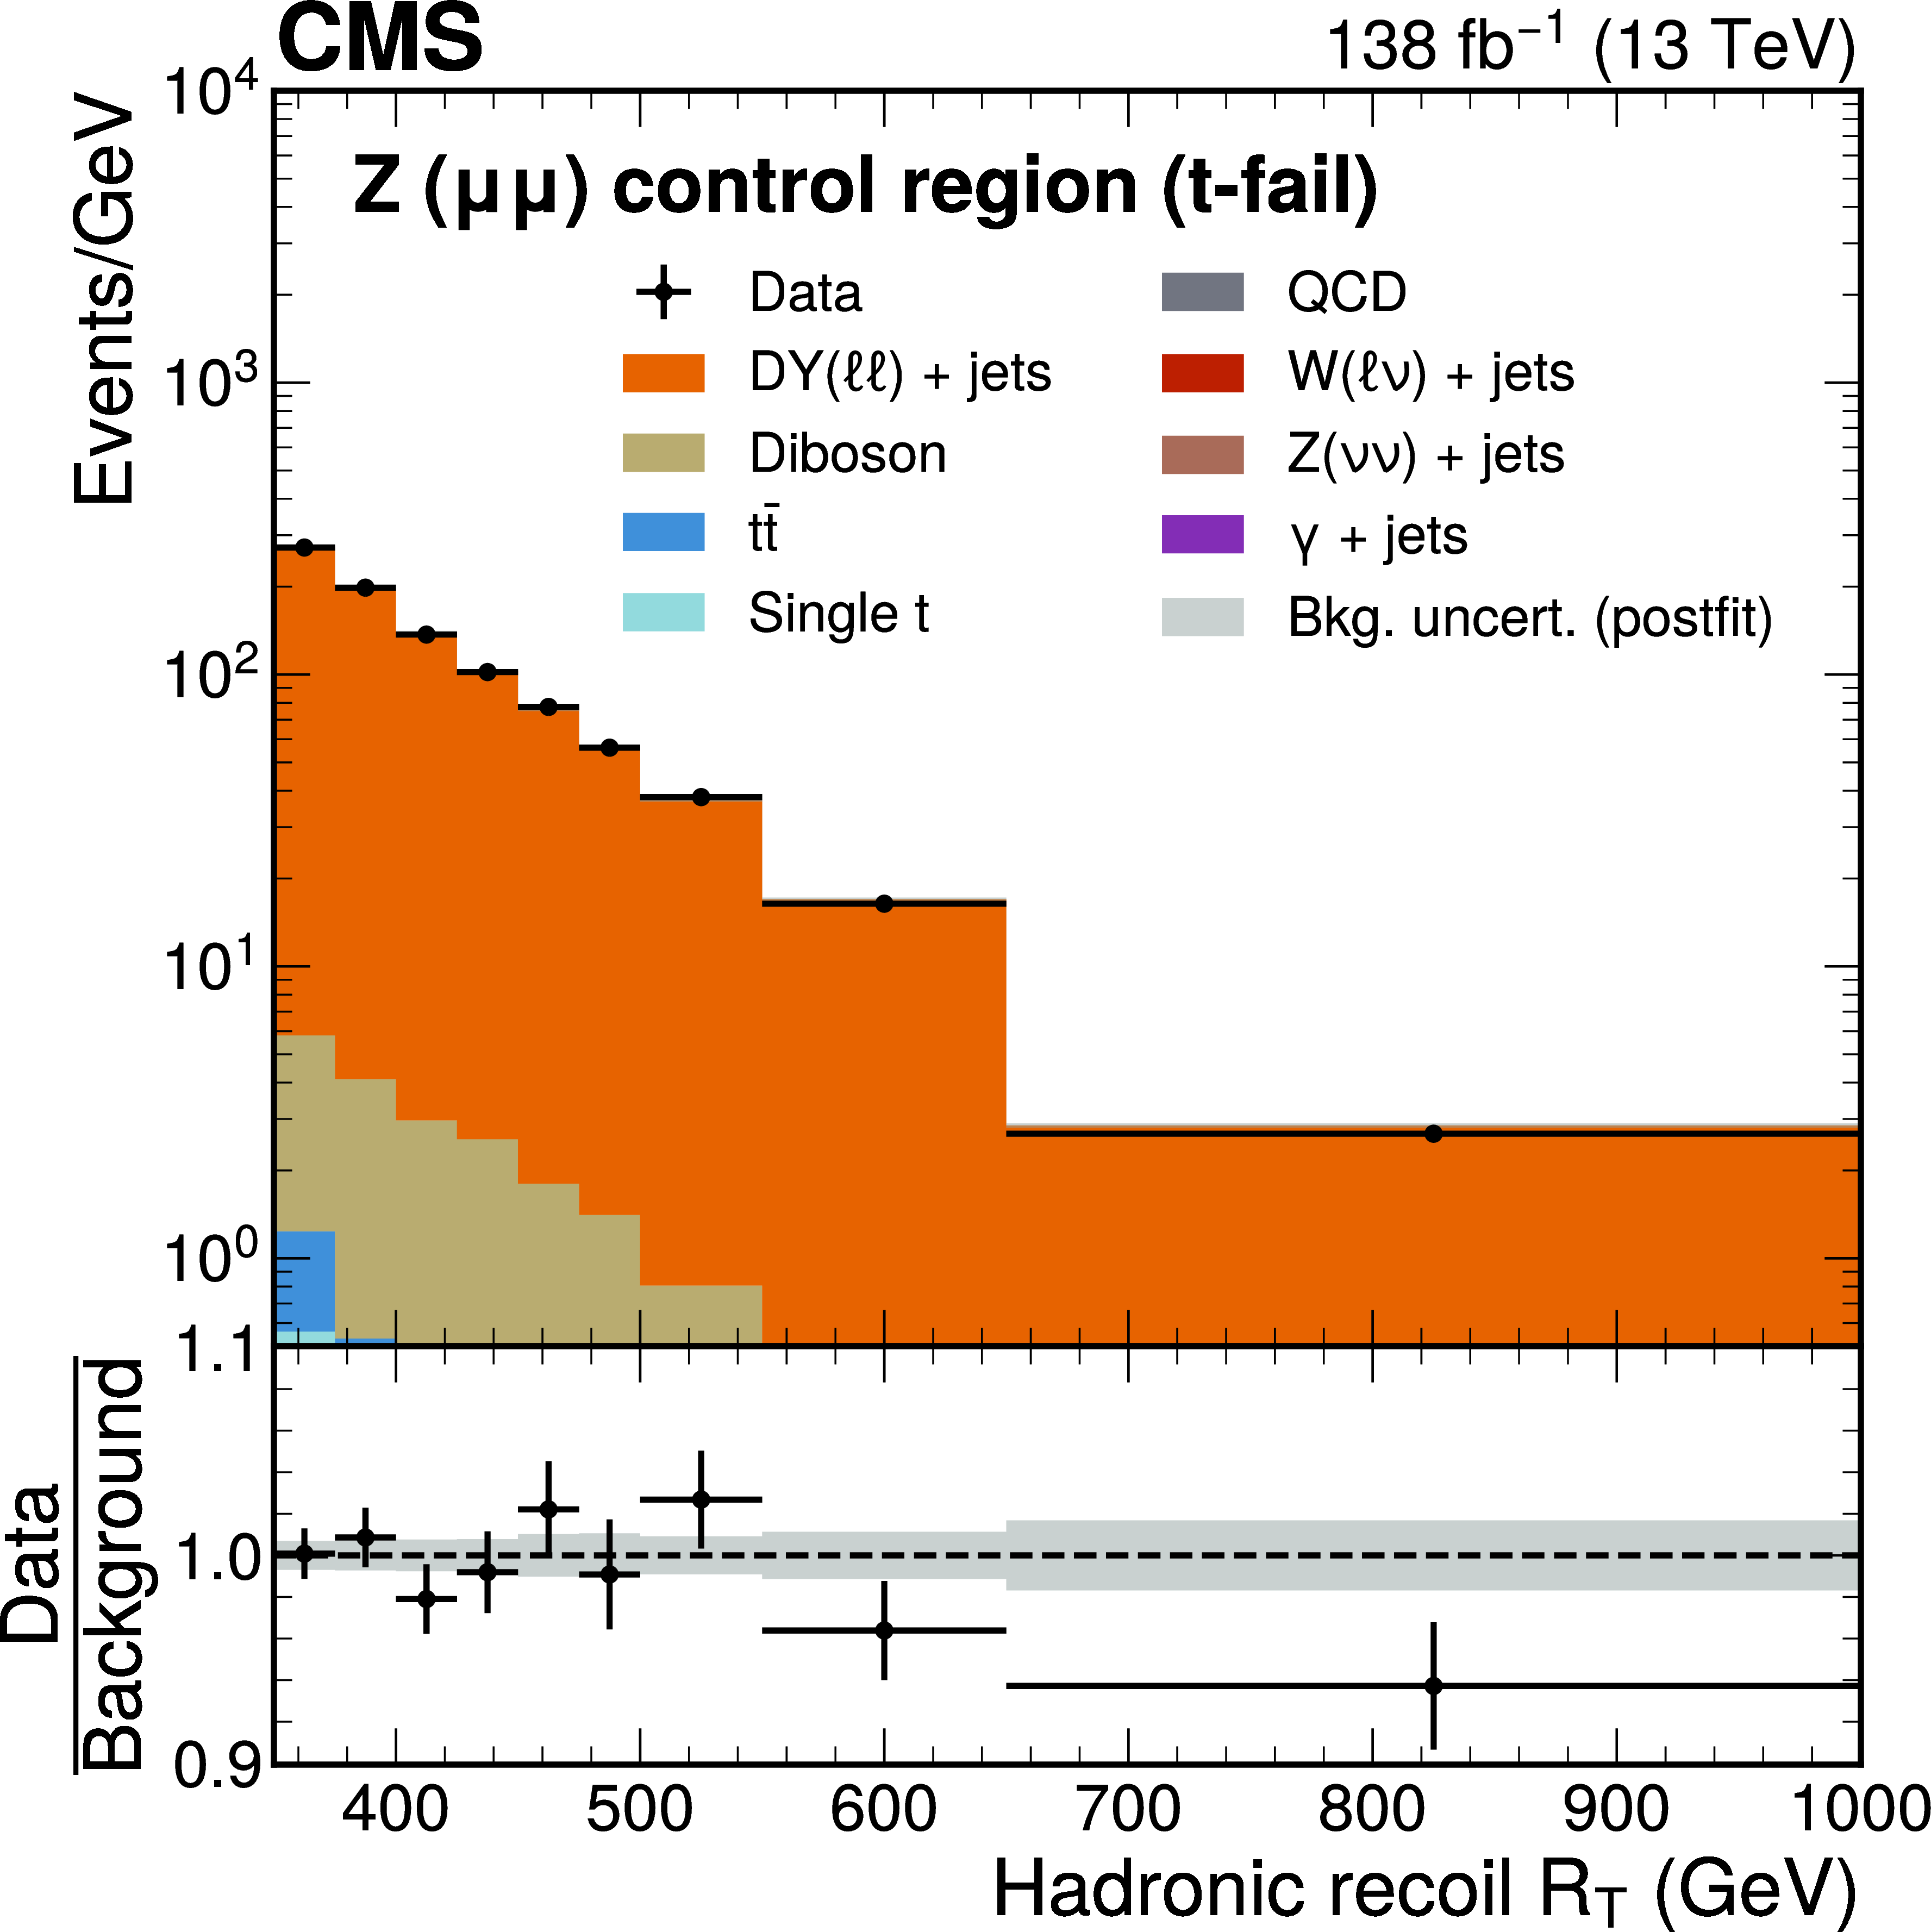
Figure 11:
Postfit distributions of the magnitude of the hadronic recoil $ R_{\mathrm{T}} $ in the $ \mathrm{Z}(\mu\mu) $ (t-pass) and $ \mathrm{Z}(\mu\mu) $ (t-fail) CRs after a fit of the background model to the data. The last bin of each distribution also contains events with $ R_{\mathrm{T}} > $ 1000 GeV. The background processes are stacked together. The gray band represents the statistical and postfit systematic uncertainties in the predicted background yields after the fit. |
png pdf |
Figure 11-a:
Postfit distributions of the magnitude of the hadronic recoil $ R_{\mathrm{T}} $ in the $ \mathrm{Z}(\mu\mu) $ (t-pass) and $ \mathrm{Z}(\mu\mu) $ (t-fail) CRs after a fit of the background model to the data. The last bin of each distribution also contains events with $ R_{\mathrm{T}} > $ 1000 GeV. The background processes are stacked together. The gray band represents the statistical and postfit systematic uncertainties in the predicted background yields after the fit. |
png pdf |
Figure 11-b:
Postfit distributions of the magnitude of the hadronic recoil $ R_{\mathrm{T}} $ in the $ \mathrm{Z}(\mu\mu) $ (t-pass) and $ \mathrm{Z}(\mu\mu) $ (t-fail) CRs after a fit of the background model to the data. The last bin of each distribution also contains events with $ R_{\mathrm{T}} > $ 1000 GeV. The background processes are stacked together. The gray band represents the statistical and postfit systematic uncertainties in the predicted background yields after the fit. |
png pdf |
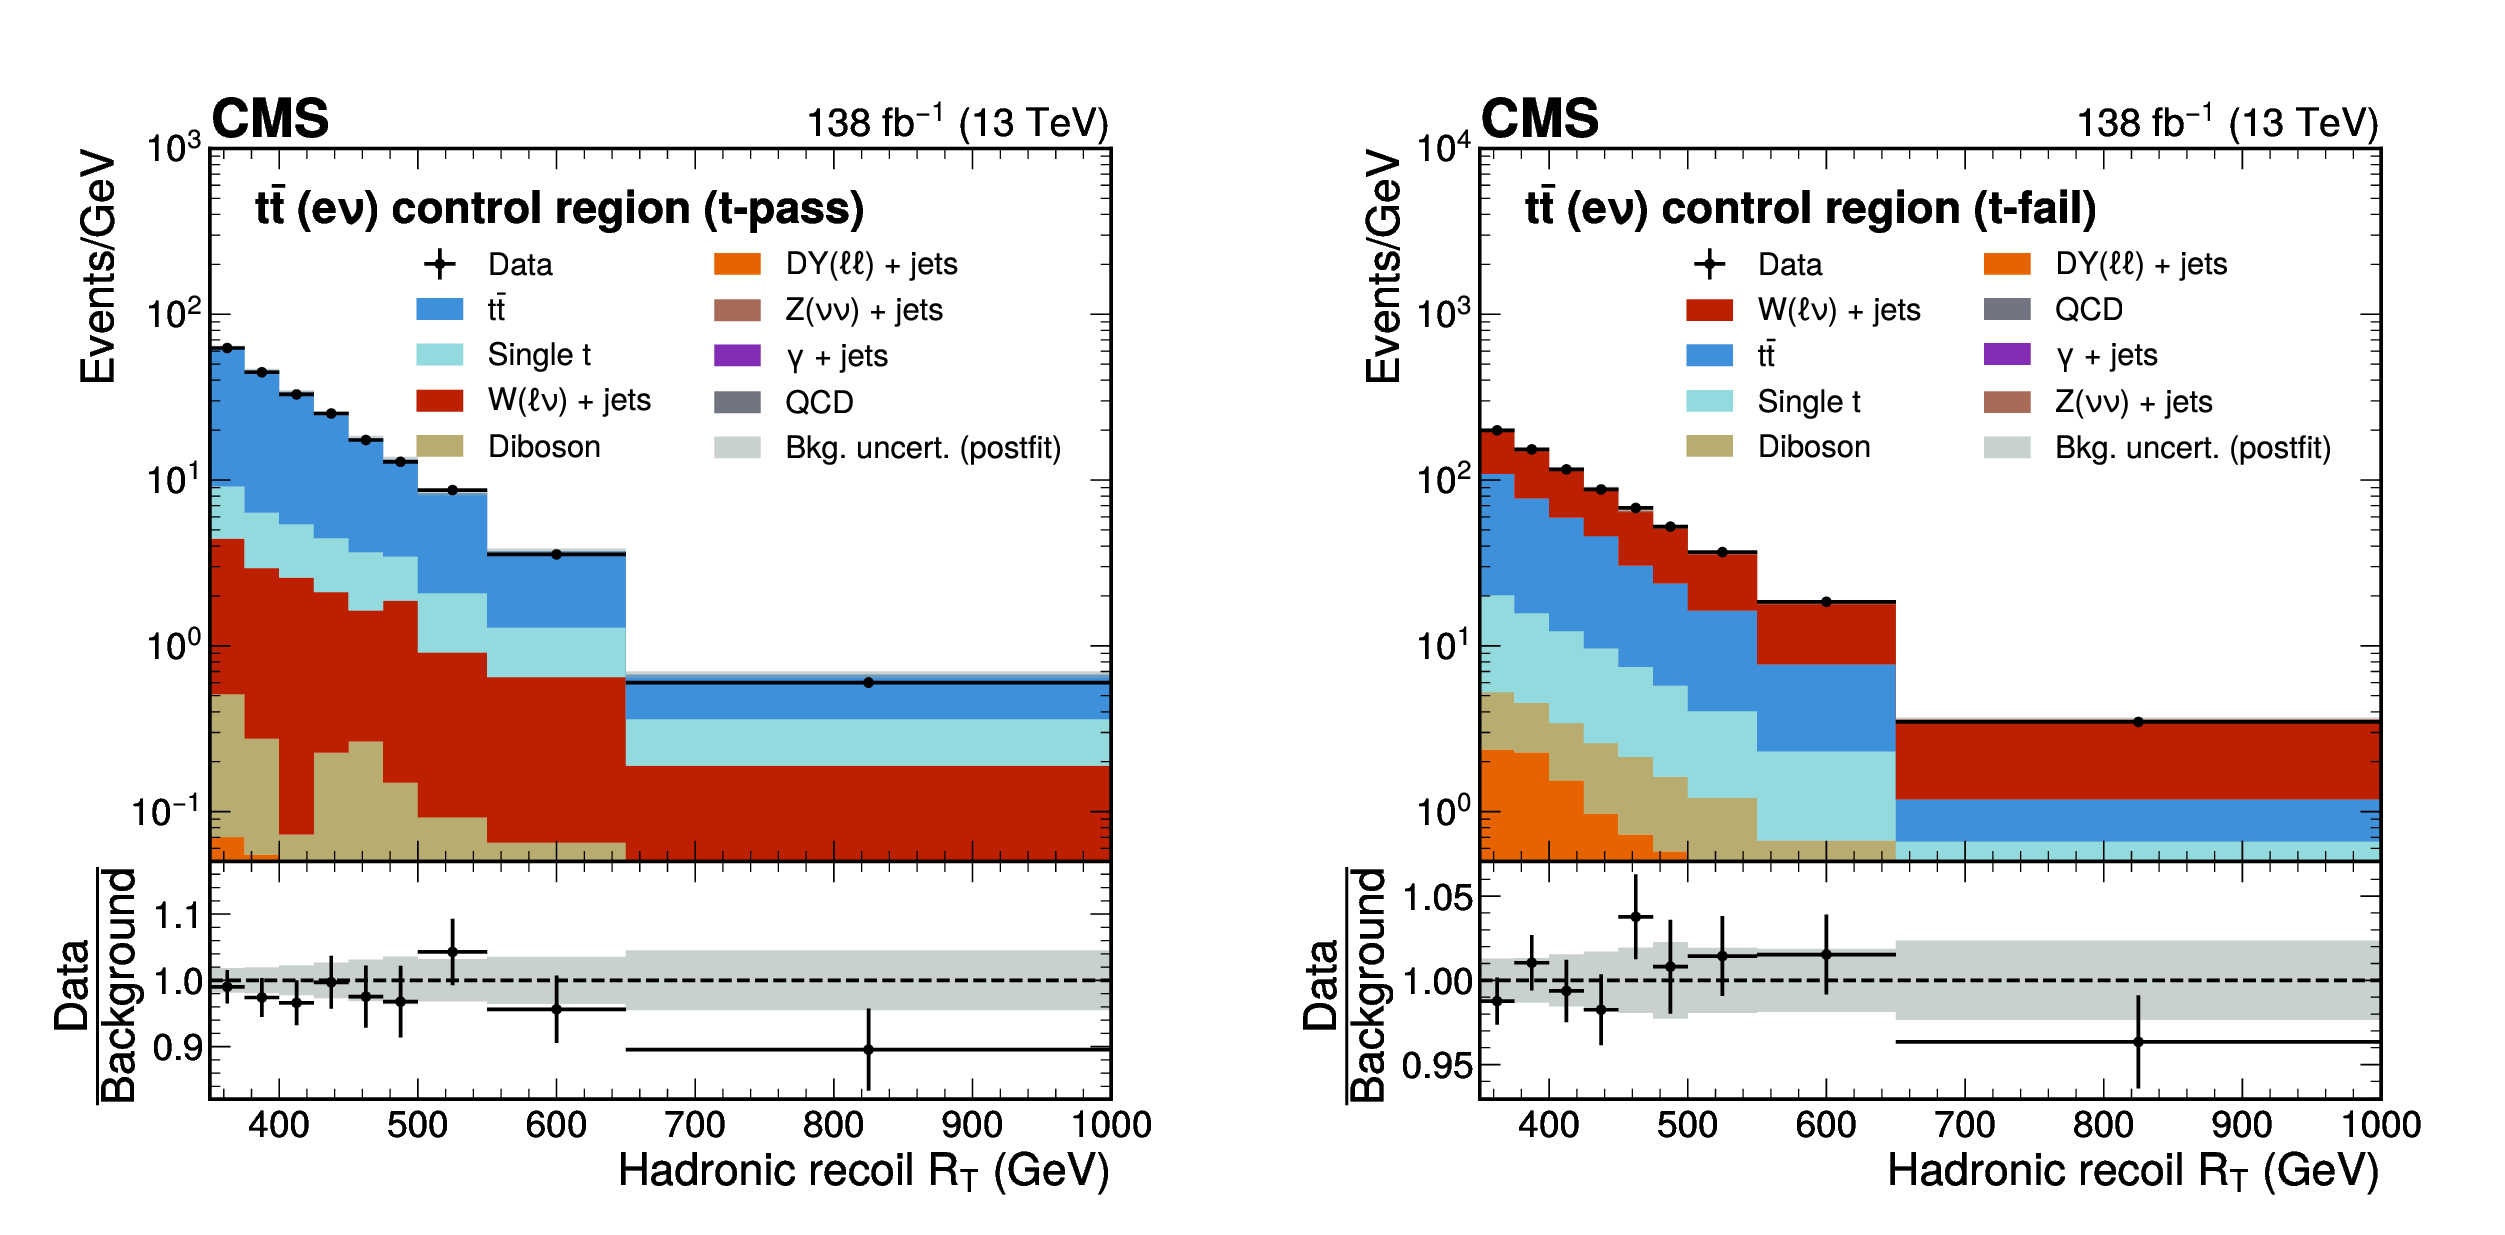
Figure 12:
Postfit distributions of the magnitude of the hadronic recoil $ R_{\mathrm{T}} $ in the $ {\mathrm{t}\overline{\mathrm{t}}} (\mathrm{e}\nu) $ (t-pass) and $ {\mathrm{t}\overline{\mathrm{t}}} (\mathrm{e}\nu) $ (t-fail) CRs after a fit of the background model to the data. The last bin of each distribution also contains events with $ R_{\mathrm{T}} > $ 1000 GeV. The background processes are stacked together. The gray band represents the statistical and postfit systematic uncertainties in the predicted background yields after the fit. |
png pdf |
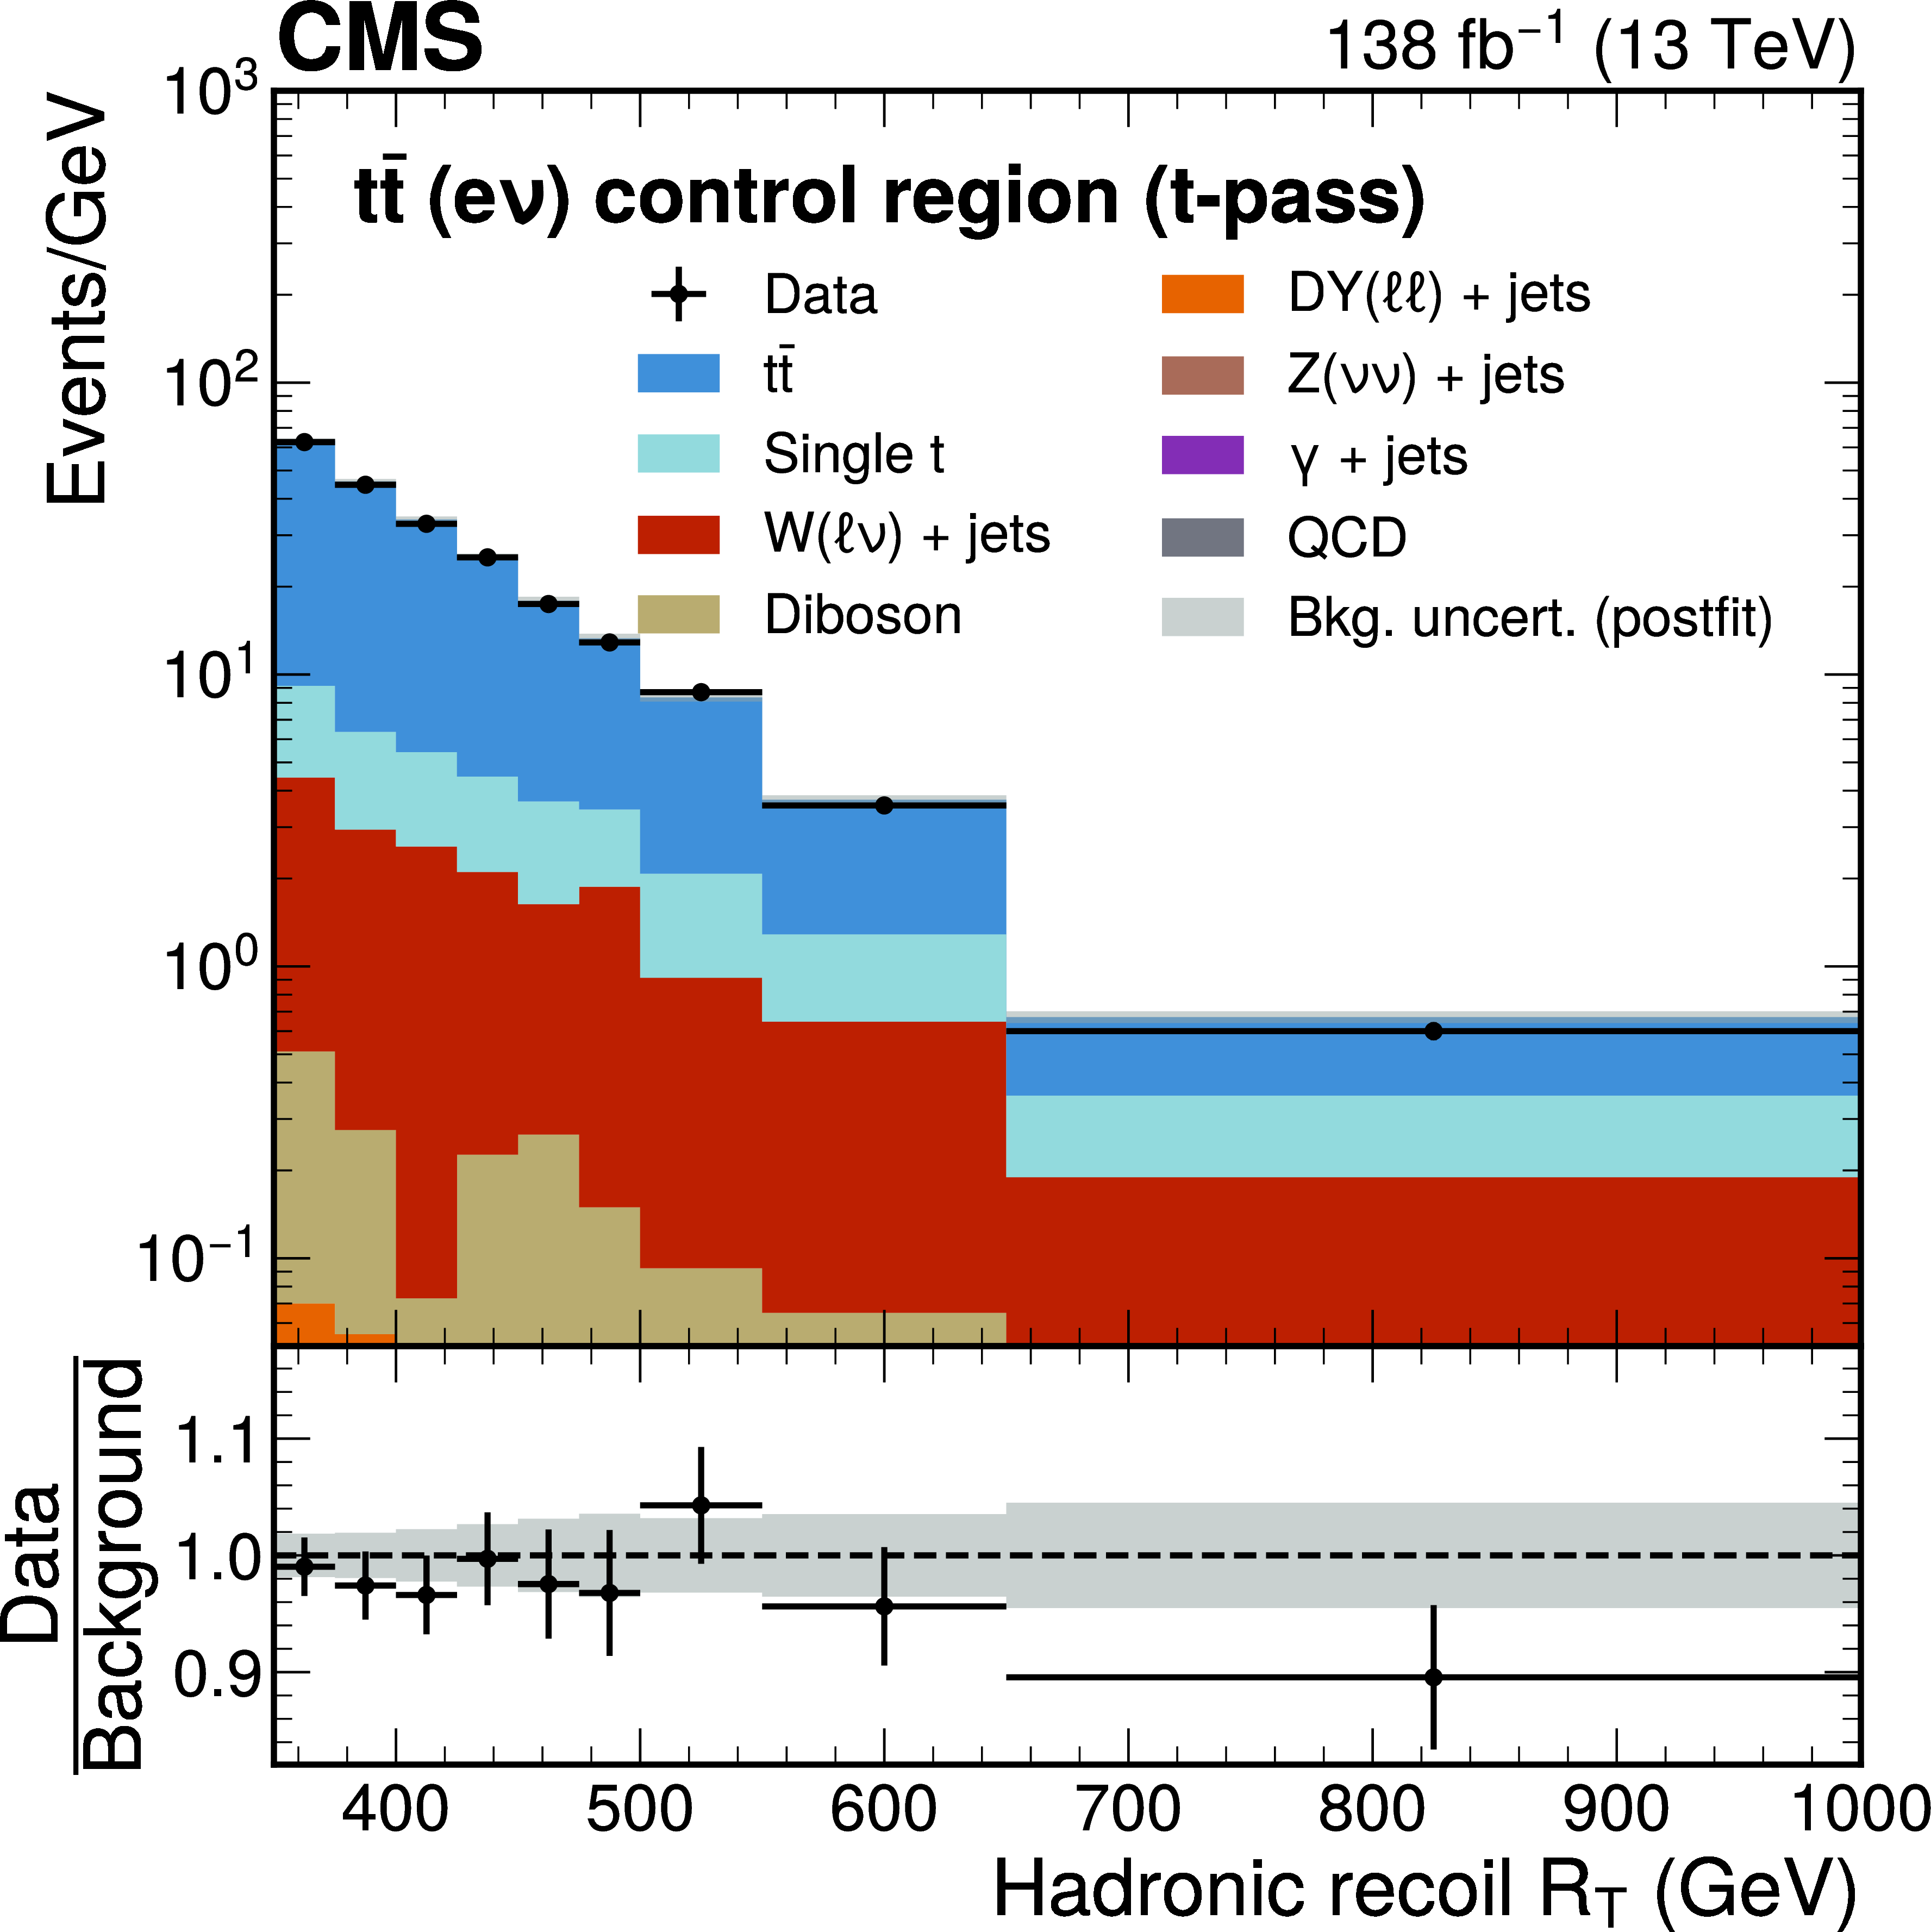
Figure 12-a:
Postfit distributions of the magnitude of the hadronic recoil $ R_{\mathrm{T}} $ in the $ {\mathrm{t}\overline{\mathrm{t}}} (\mathrm{e}\nu) $ (t-pass) and $ {\mathrm{t}\overline{\mathrm{t}}} (\mathrm{e}\nu) $ (t-fail) CRs after a fit of the background model to the data. The last bin of each distribution also contains events with $ R_{\mathrm{T}} > $ 1000 GeV. The background processes are stacked together. The gray band represents the statistical and postfit systematic uncertainties in the predicted background yields after the fit. |
png pdf |
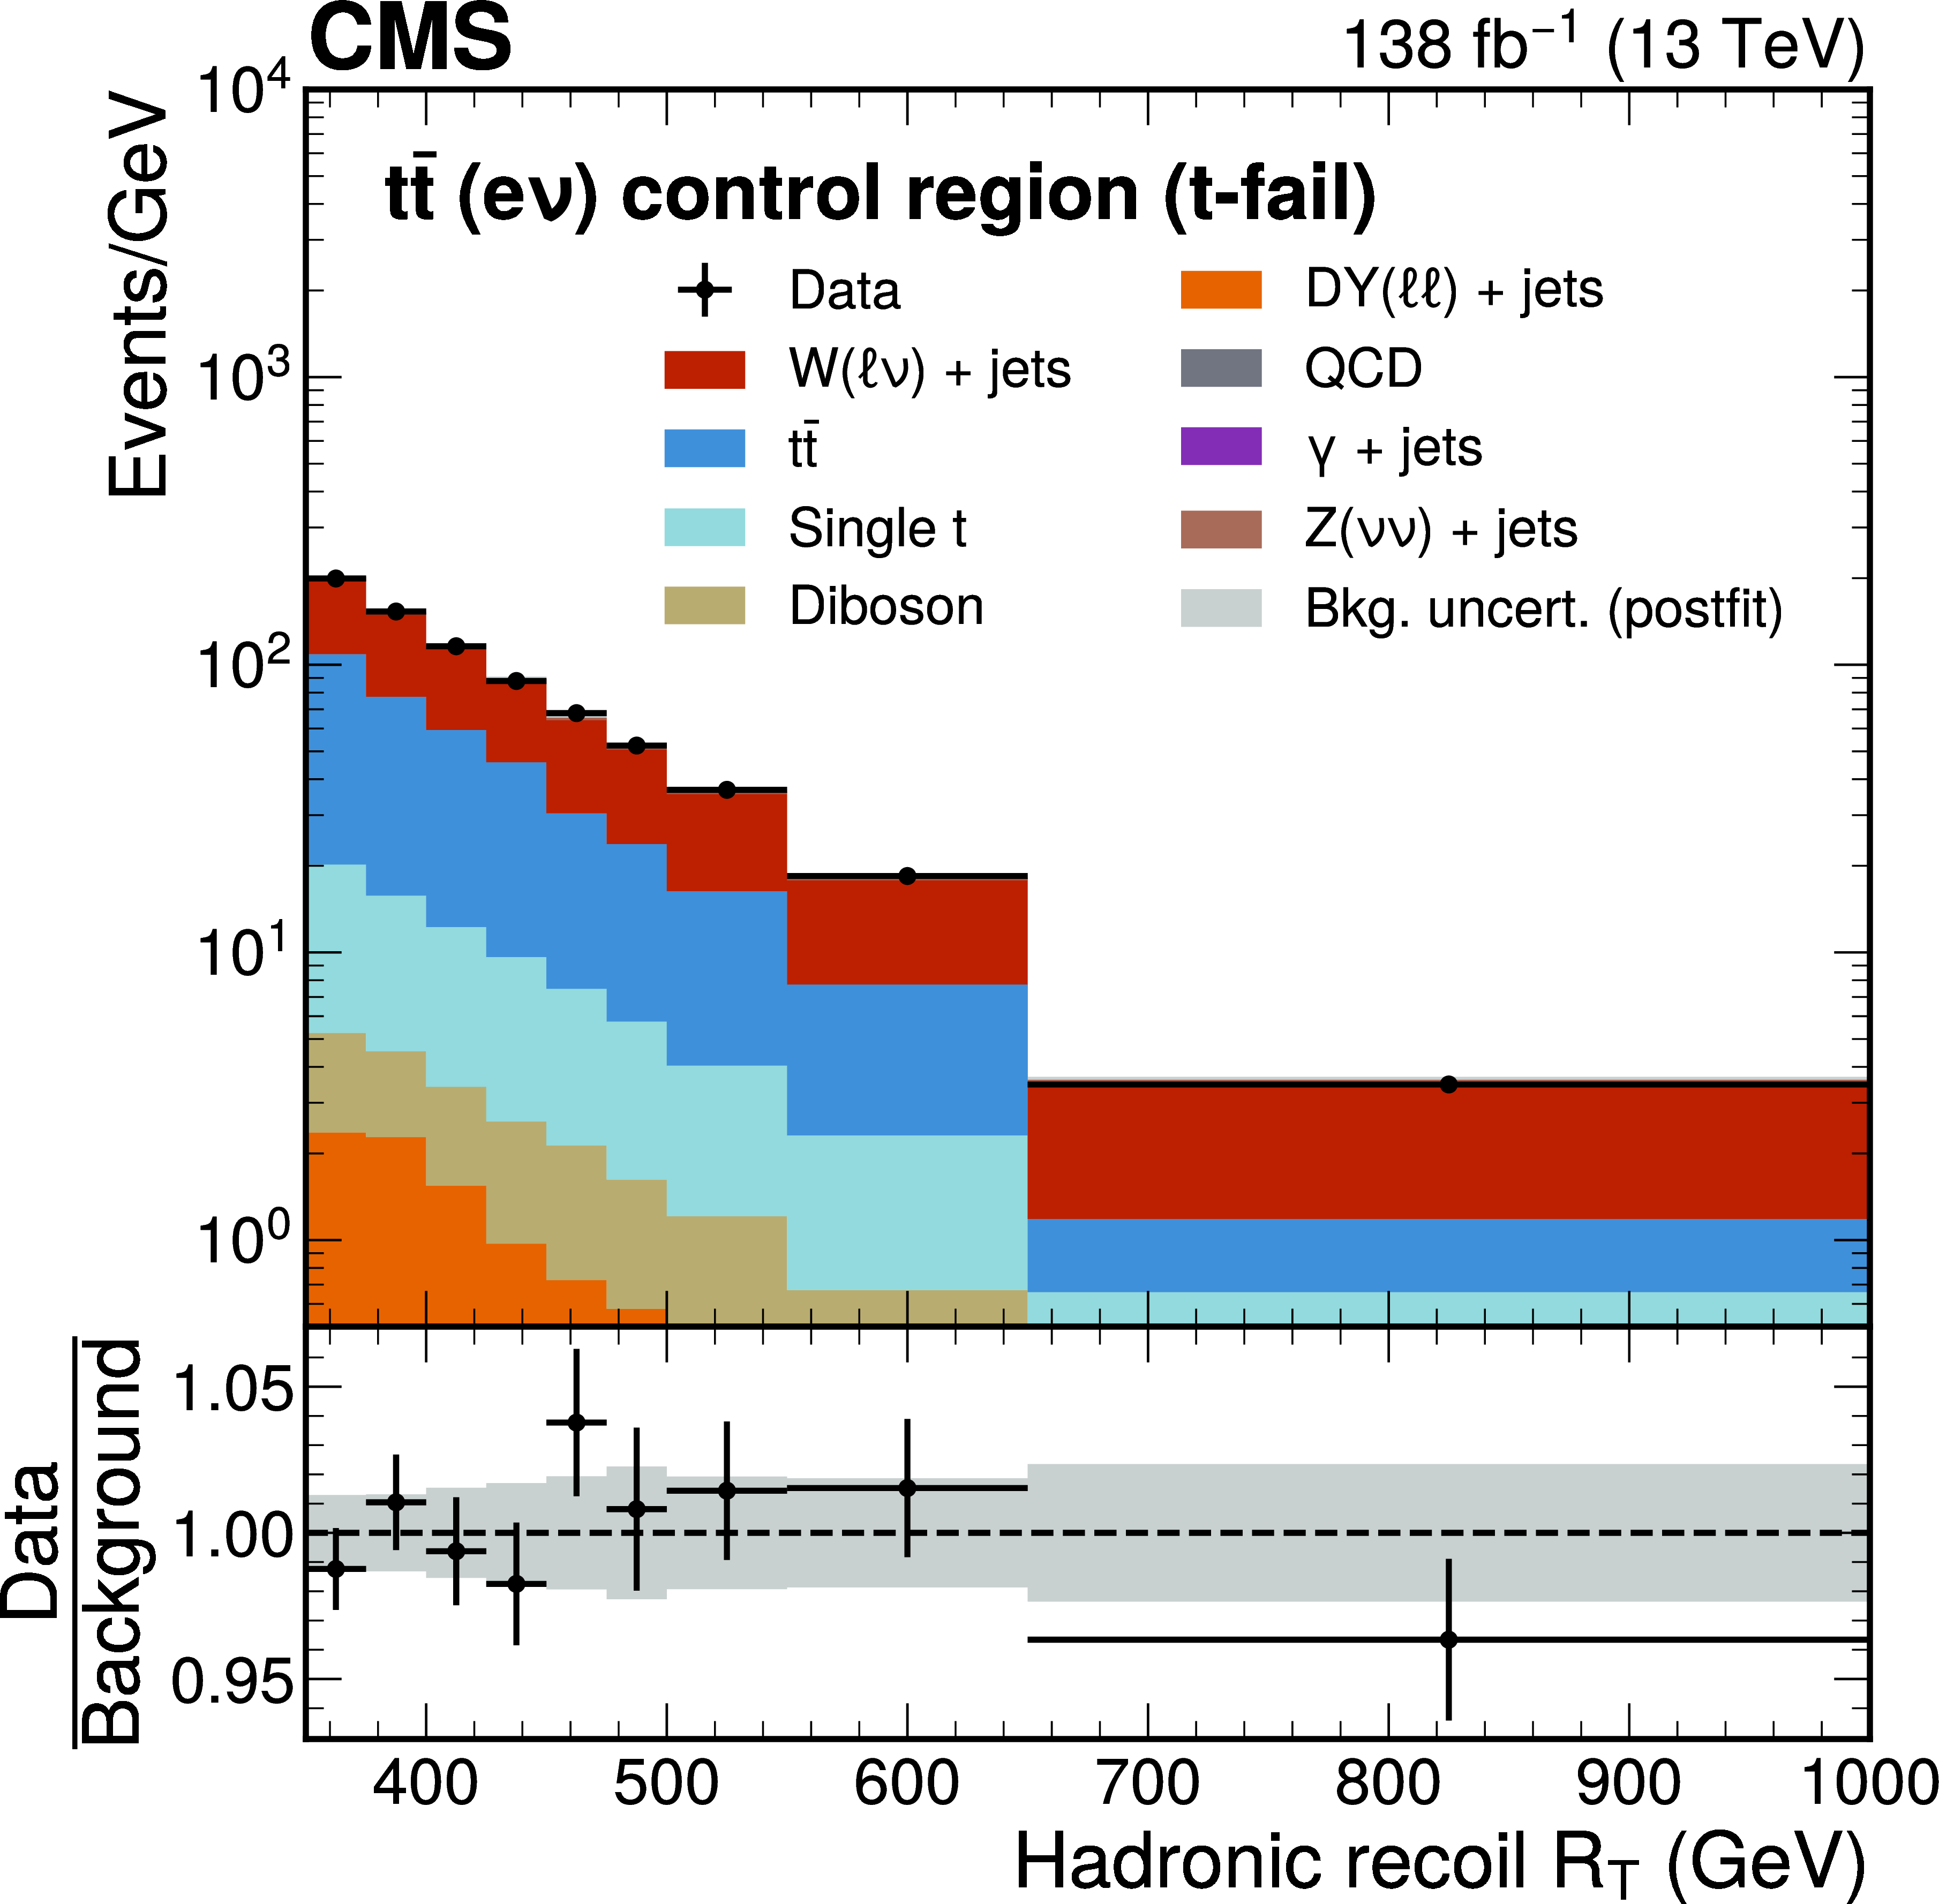
Figure 12-b:
Postfit distributions of the magnitude of the hadronic recoil $ R_{\mathrm{T}} $ in the $ {\mathrm{t}\overline{\mathrm{t}}} (\mathrm{e}\nu) $ (t-pass) and $ {\mathrm{t}\overline{\mathrm{t}}} (\mathrm{e}\nu) $ (t-fail) CRs after a fit of the background model to the data. The last bin of each distribution also contains events with $ R_{\mathrm{T}} > $ 1000 GeV. The background processes are stacked together. The gray band represents the statistical and postfit systematic uncertainties in the predicted background yields after the fit. |
png pdf |
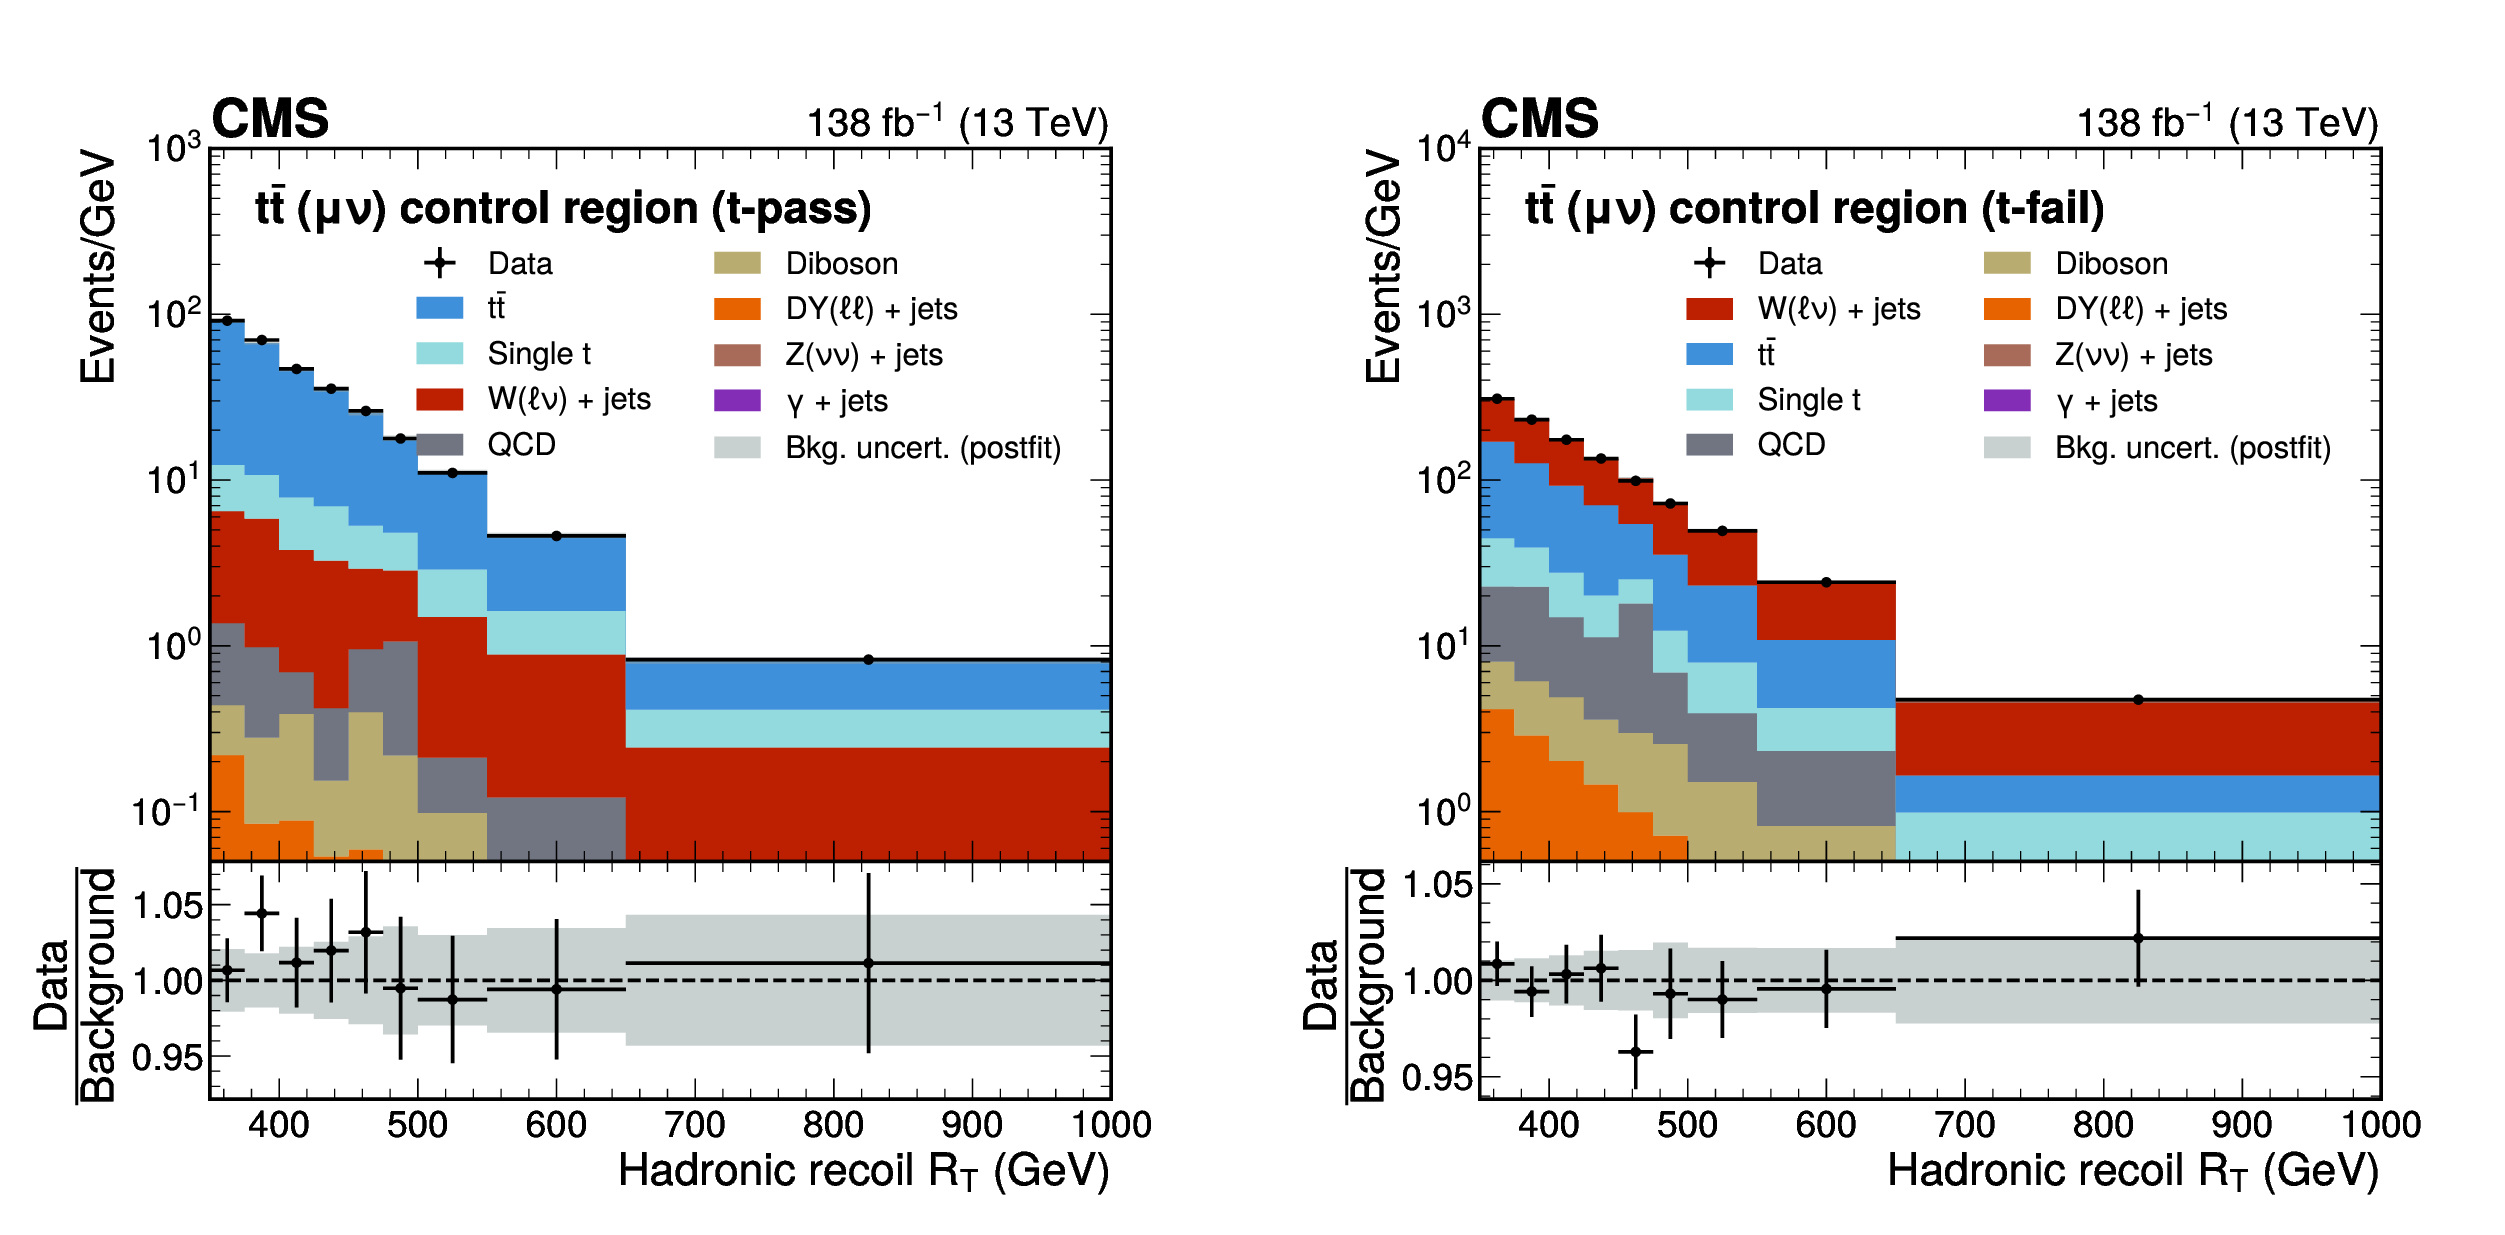
Figure 13:
Postfit distributions of the magnitude of the hadronic recoil $ R_{\mathrm{T}} $ in the $ {\mathrm{t}\overline{\mathrm{t}}} (\mu\nu) $ (t-pass) and $ {\mathrm{t}\overline{\mathrm{t}}} (\mu\nu) $ (t-fail) CRs after a fit of the background model to the data. The last bin of each distribution also contains events with $ R_{\mathrm{T}} > $ 1000 GeV. The background processes are stacked together. The gray band represents the statistical and postfit systematic uncertainties in the predicted background yields after the fit. |
png pdf |
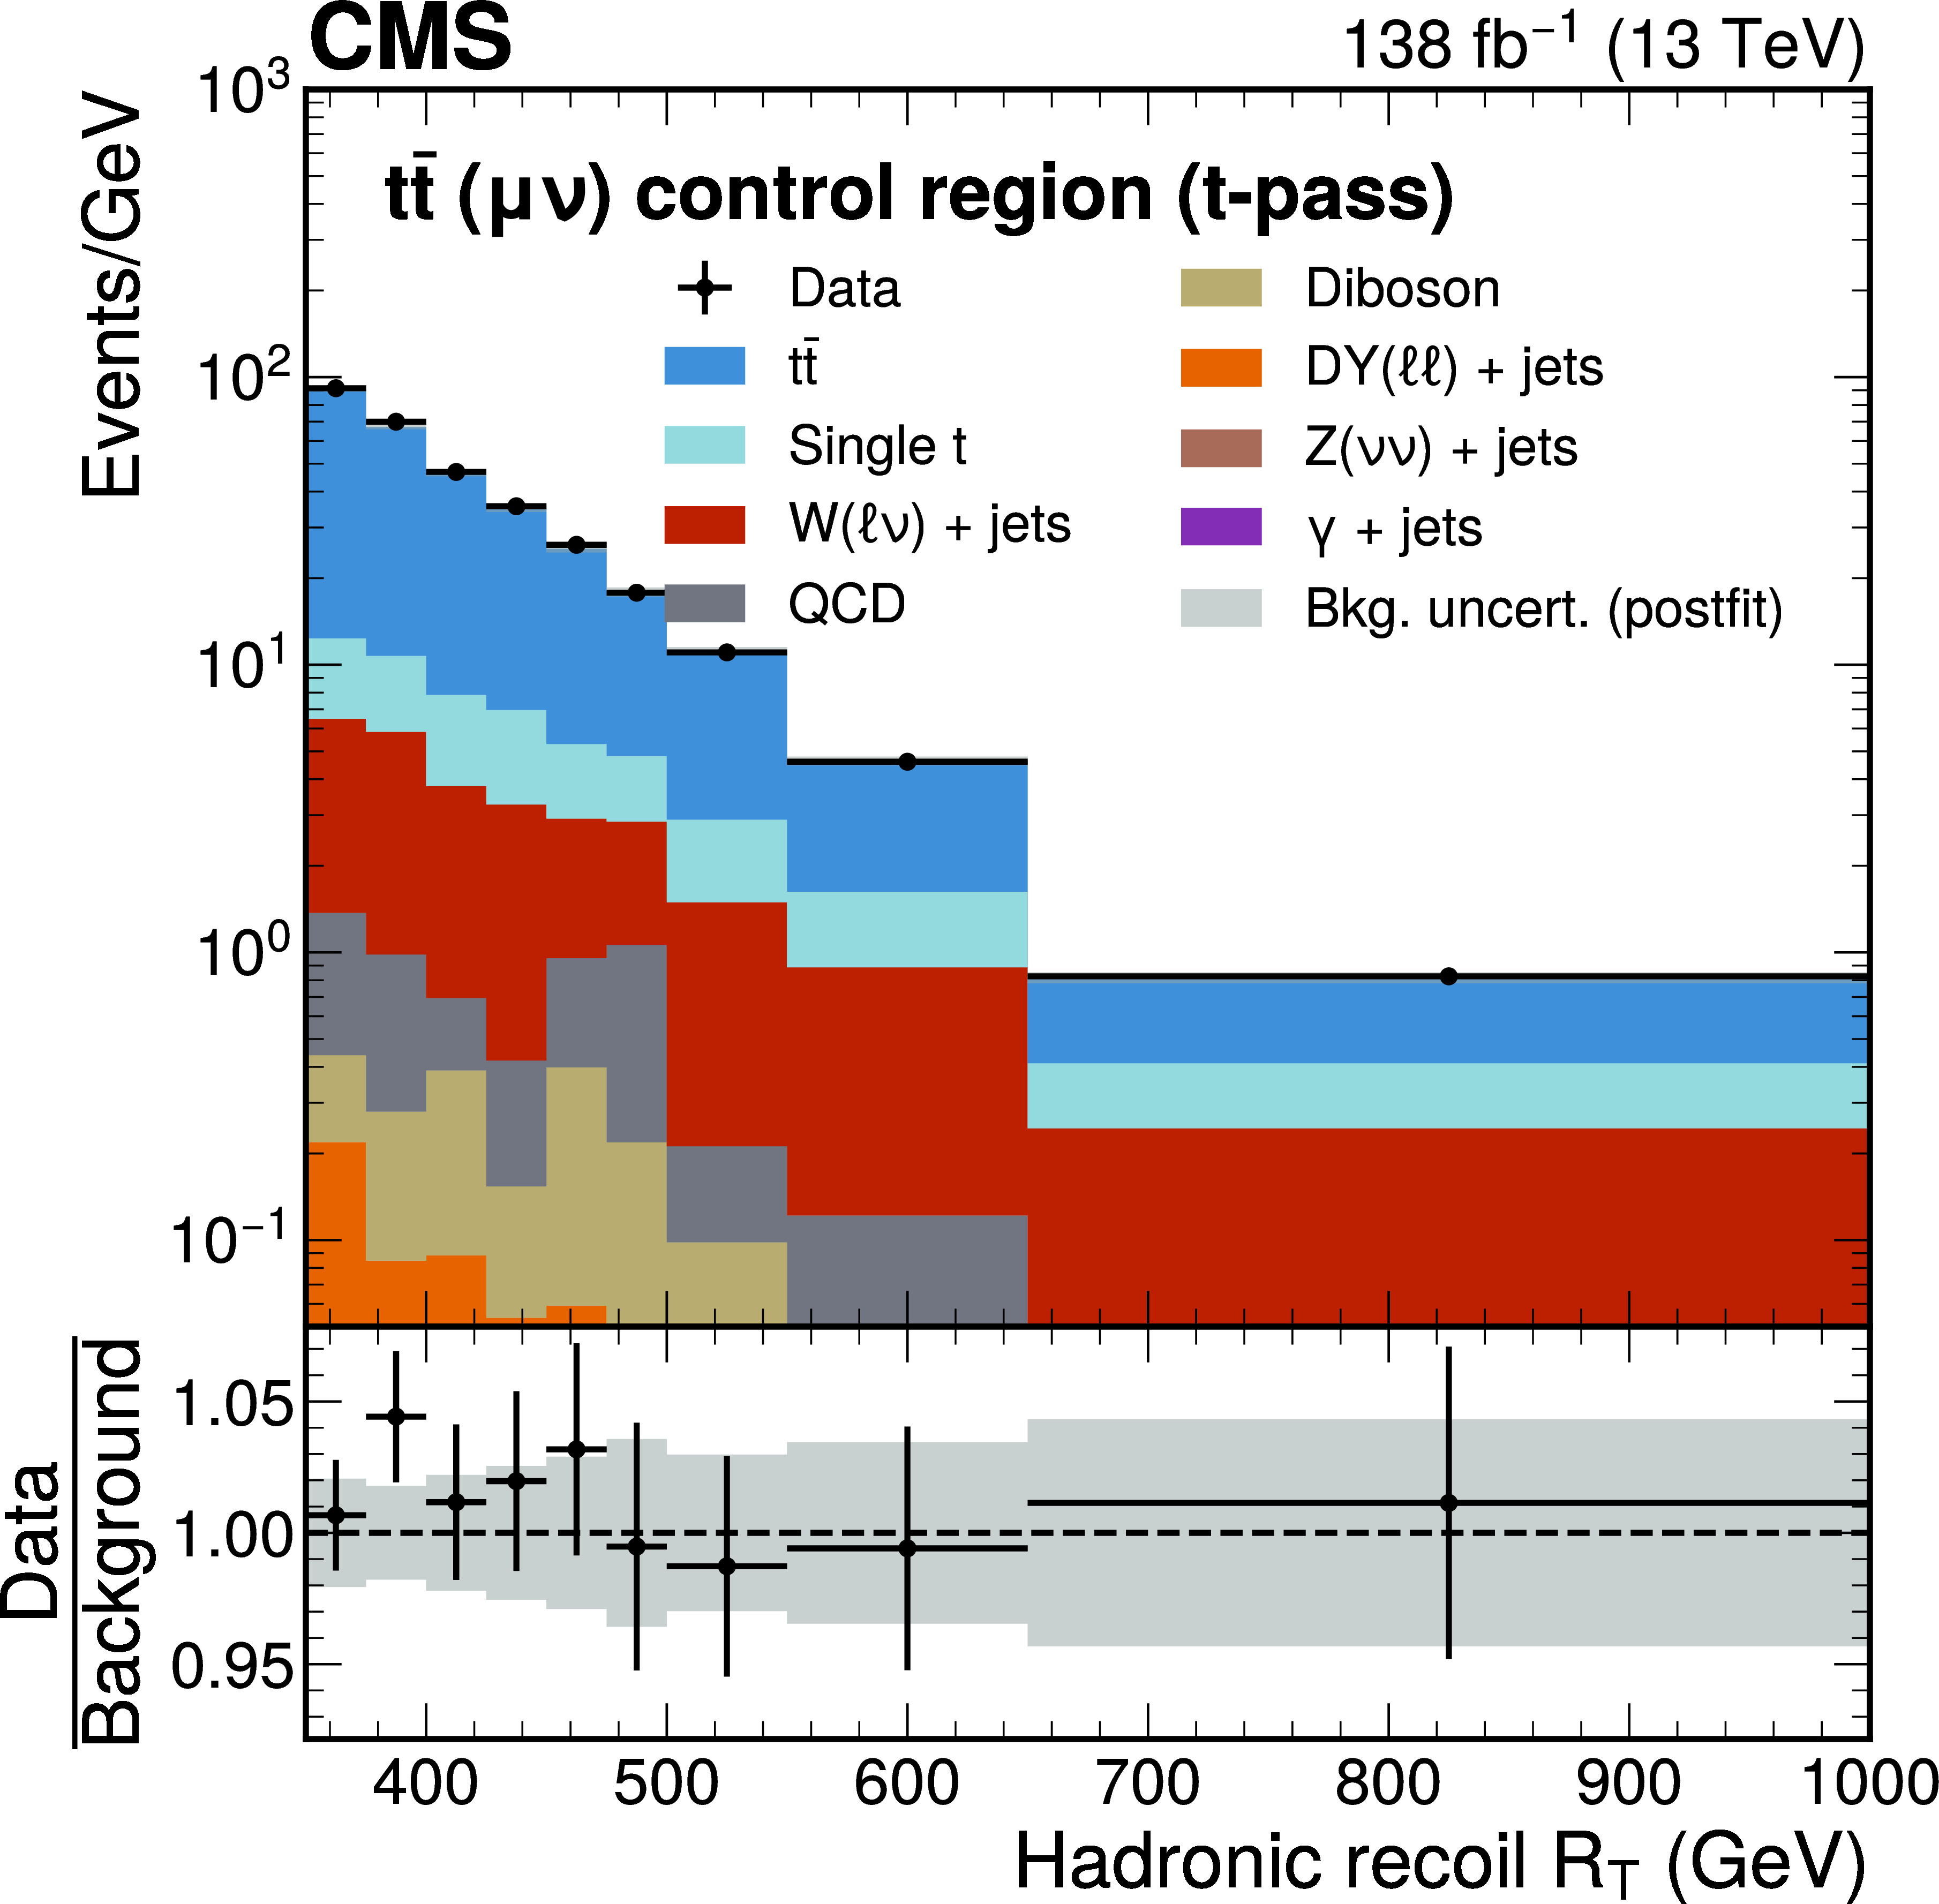
Figure 13-a:
Postfit distributions of the magnitude of the hadronic recoil $ R_{\mathrm{T}} $ in the $ {\mathrm{t}\overline{\mathrm{t}}} (\mu\nu) $ (t-pass) and $ {\mathrm{t}\overline{\mathrm{t}}} (\mu\nu) $ (t-fail) CRs after a fit of the background model to the data. The last bin of each distribution also contains events with $ R_{\mathrm{T}} > $ 1000 GeV. The background processes are stacked together. The gray band represents the statistical and postfit systematic uncertainties in the predicted background yields after the fit. |
png pdf |
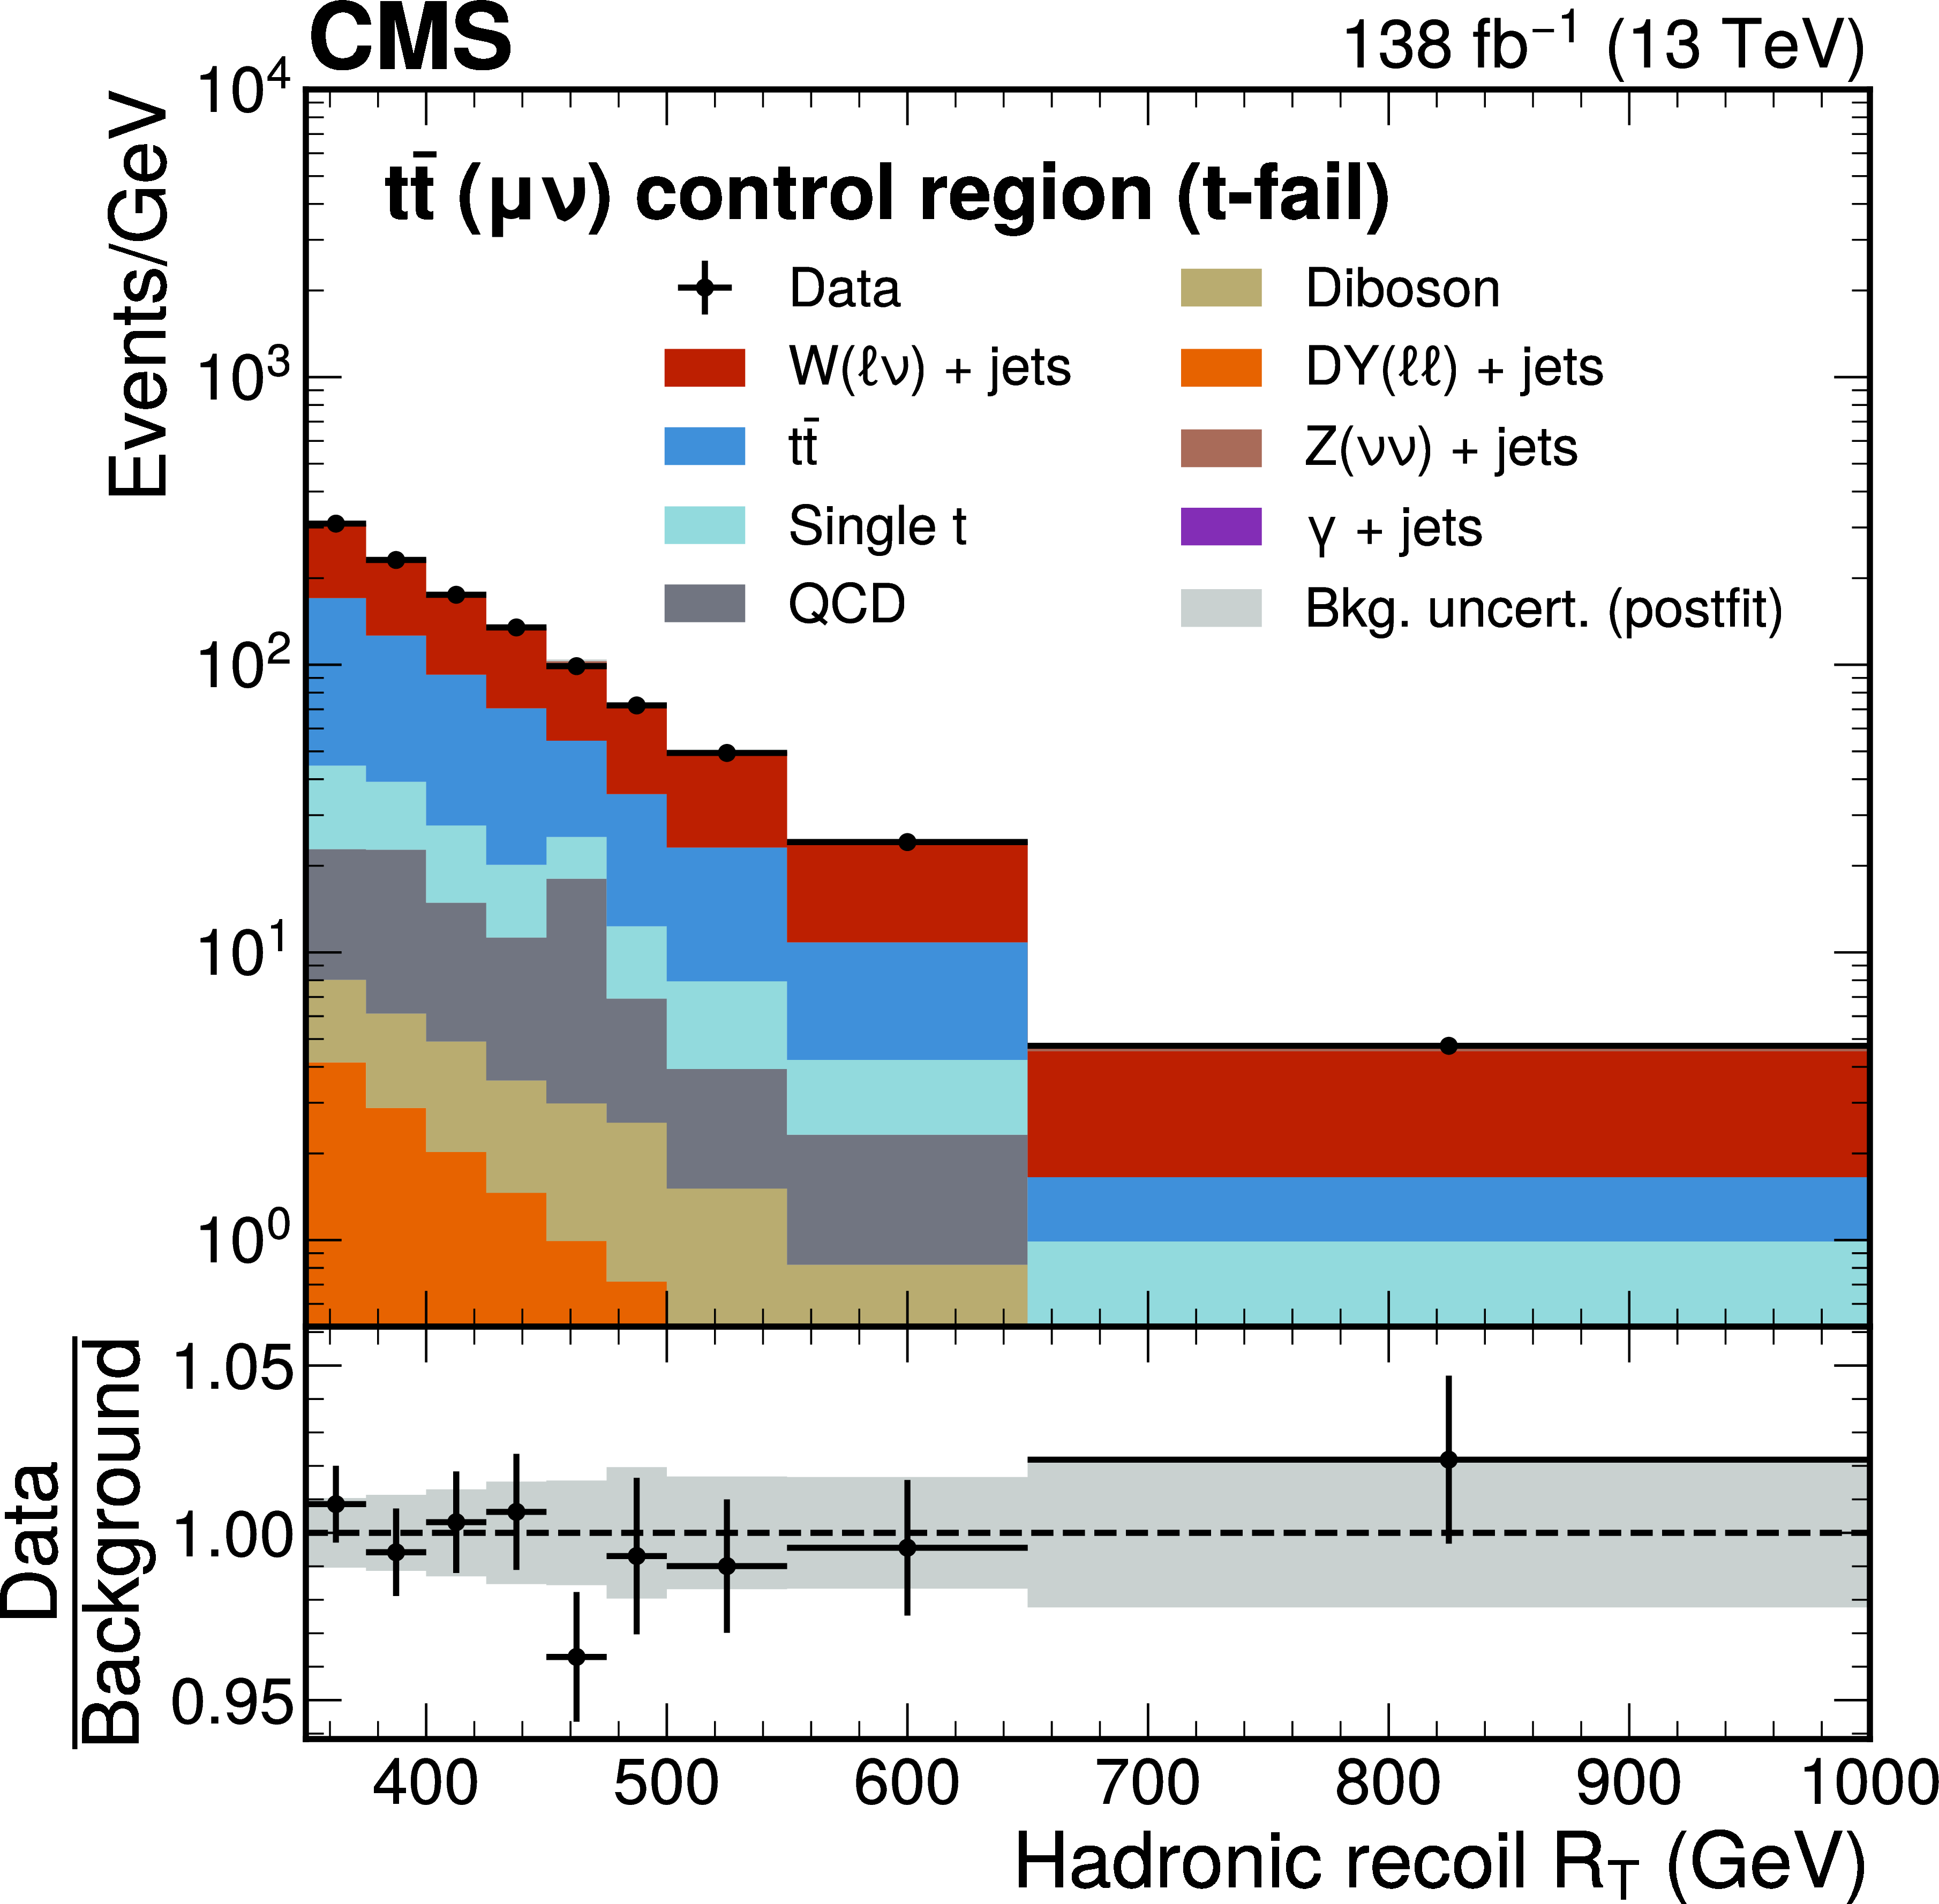
Figure 13-b:
Postfit distributions of the magnitude of the hadronic recoil $ R_{\mathrm{T}} $ in the $ {\mathrm{t}\overline{\mathrm{t}}} (\mu\nu) $ (t-pass) and $ {\mathrm{t}\overline{\mathrm{t}}} (\mu\nu) $ (t-fail) CRs after a fit of the background model to the data. The last bin of each distribution also contains events with $ R_{\mathrm{T}} > $ 1000 GeV. The background processes are stacked together. The gray band represents the statistical and postfit systematic uncertainties in the predicted background yields after the fit. |
png pdf |
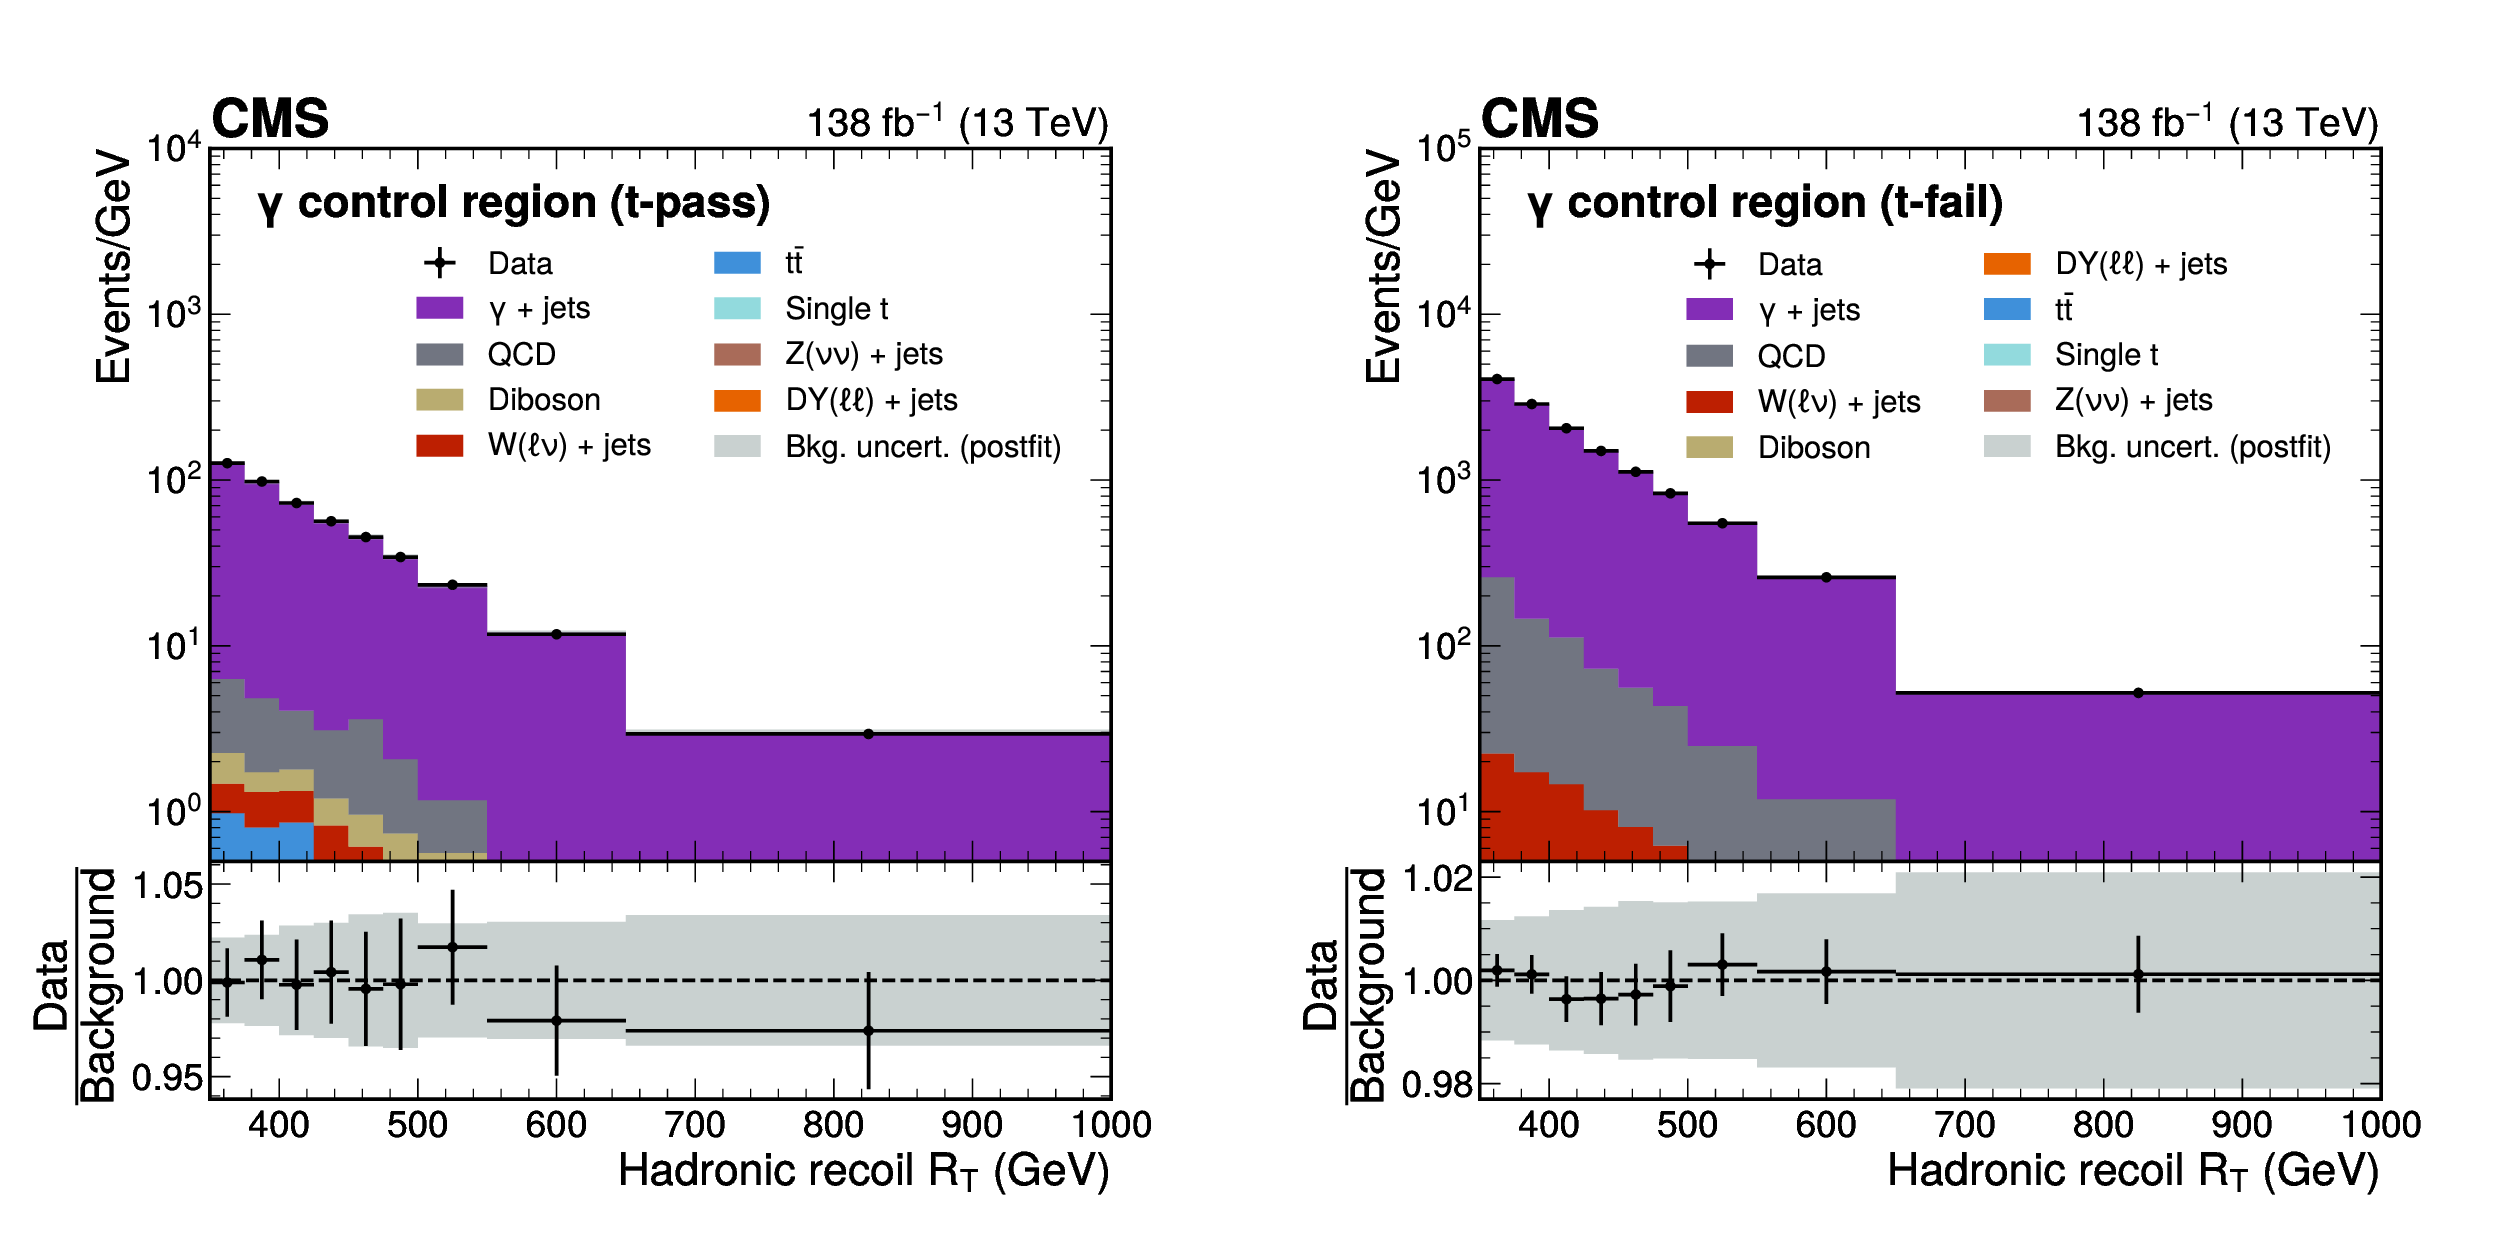
Figure 14:
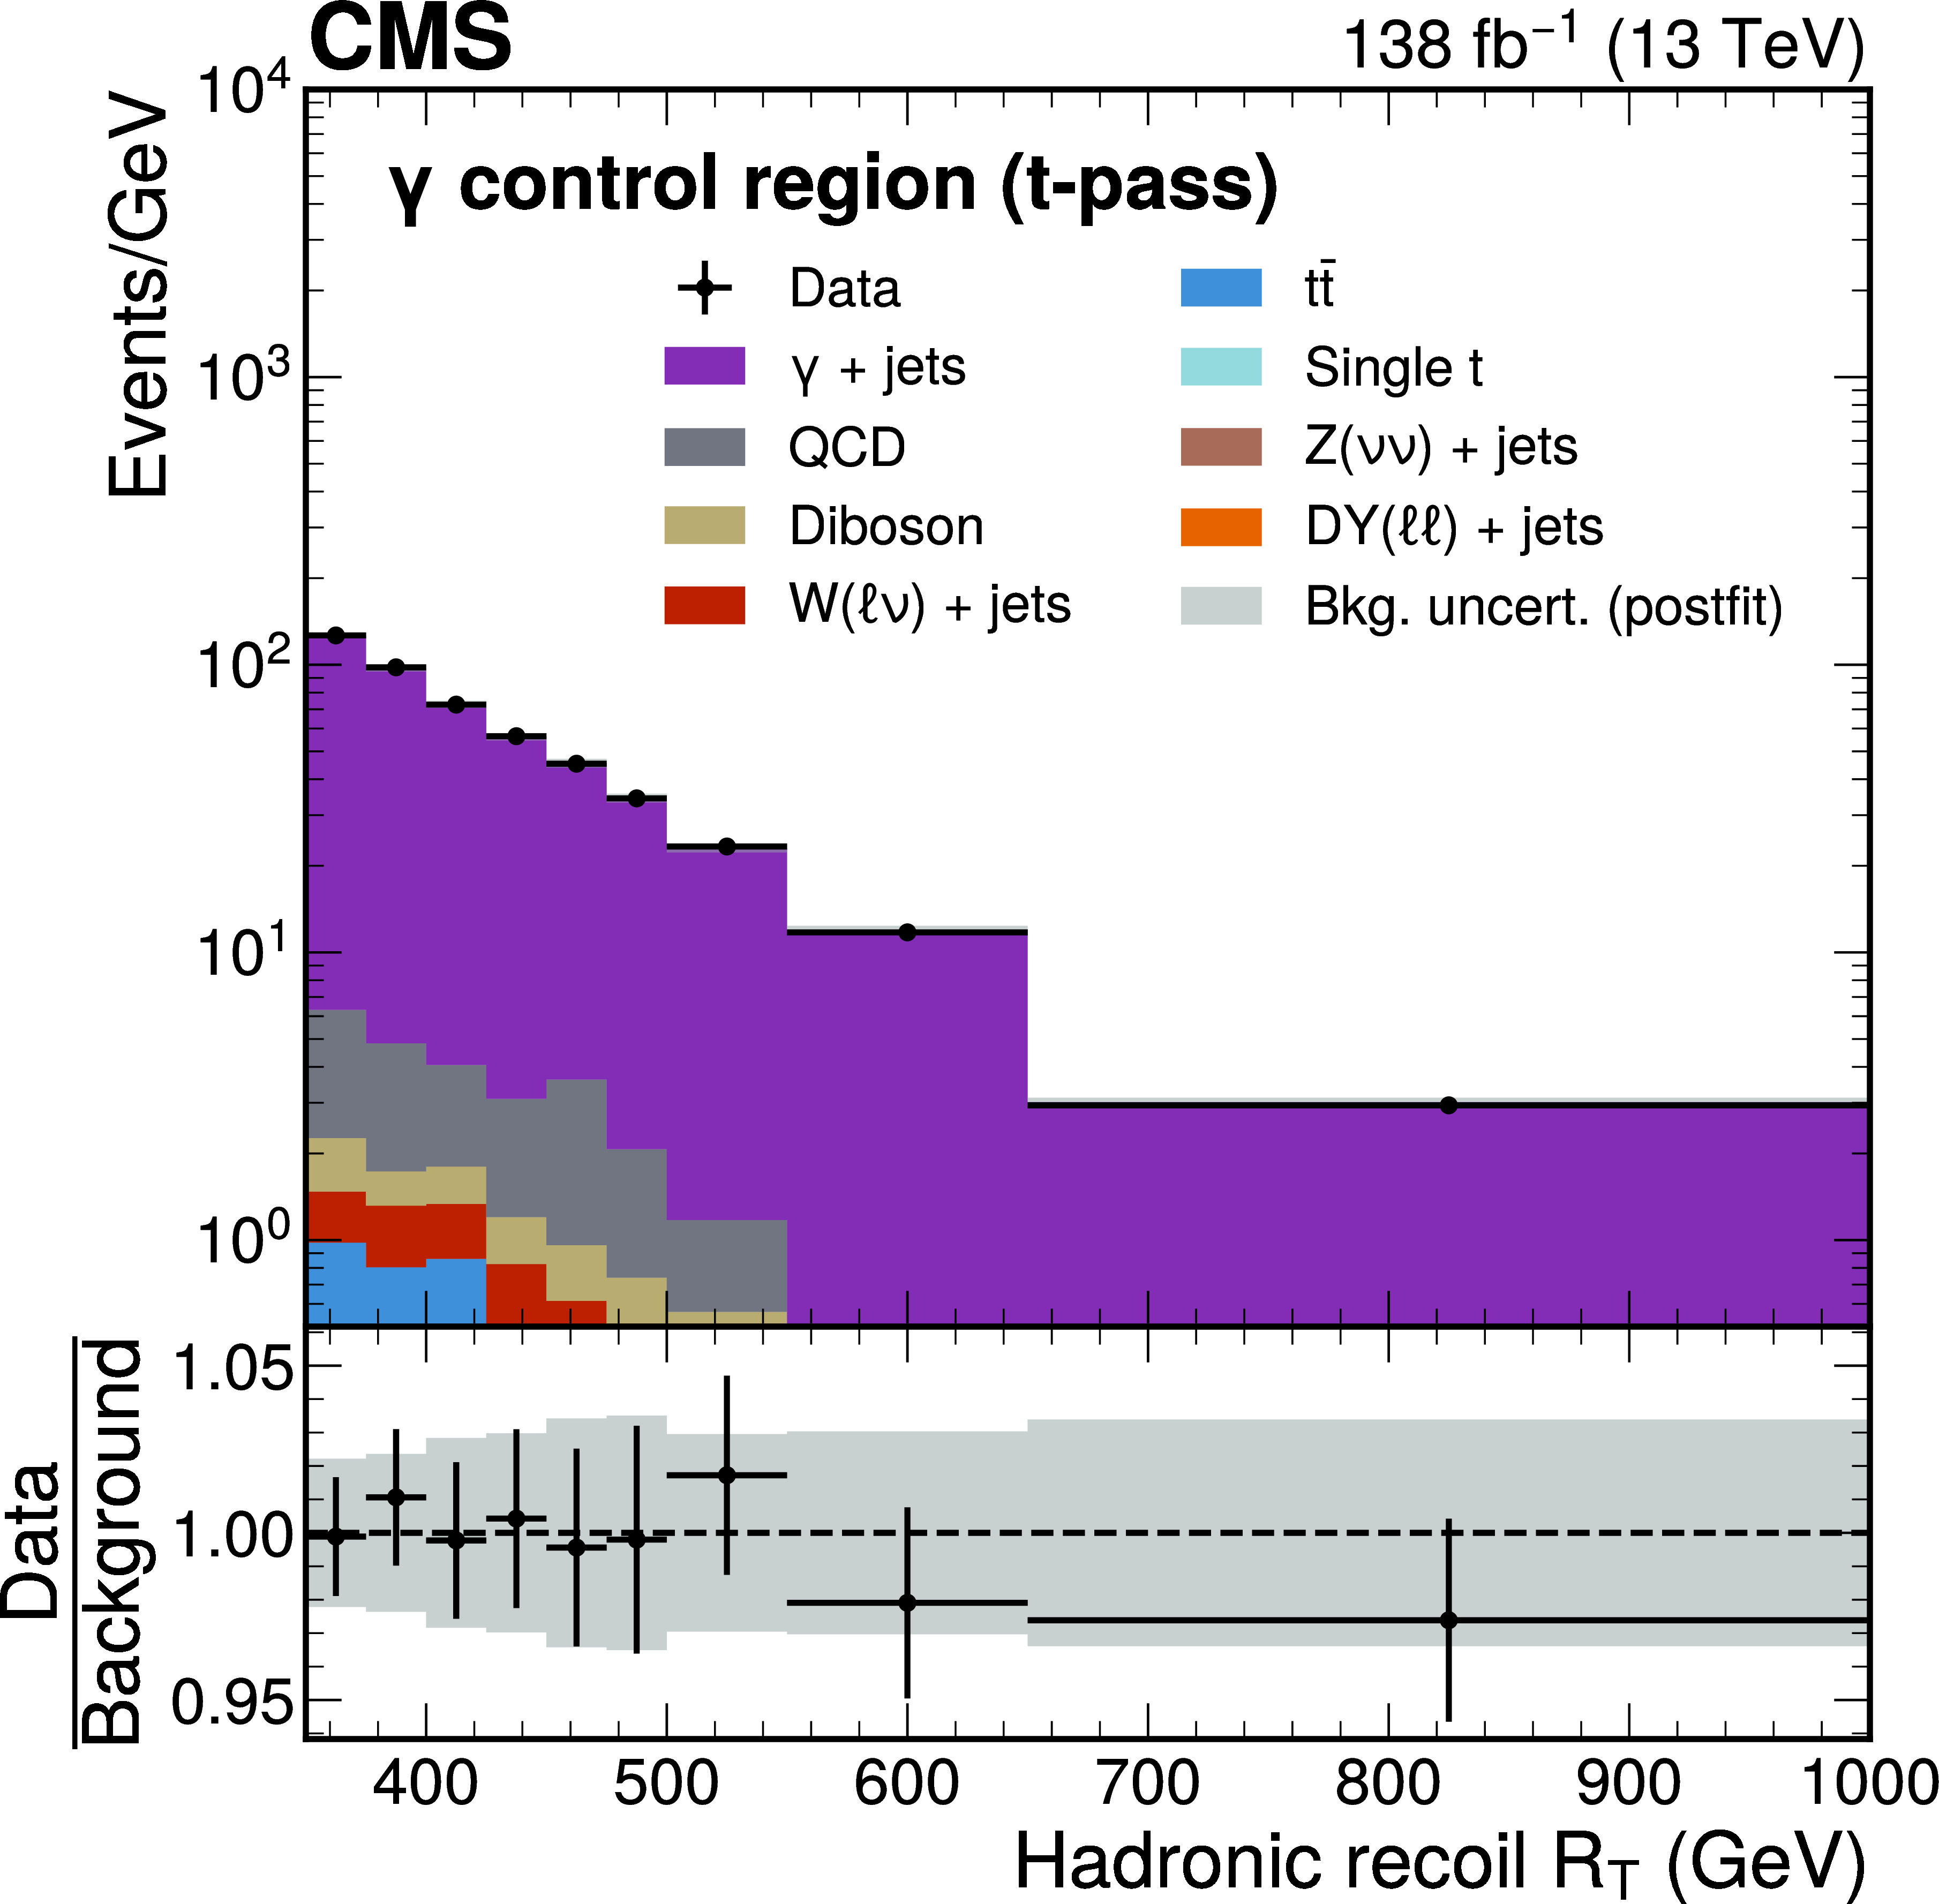
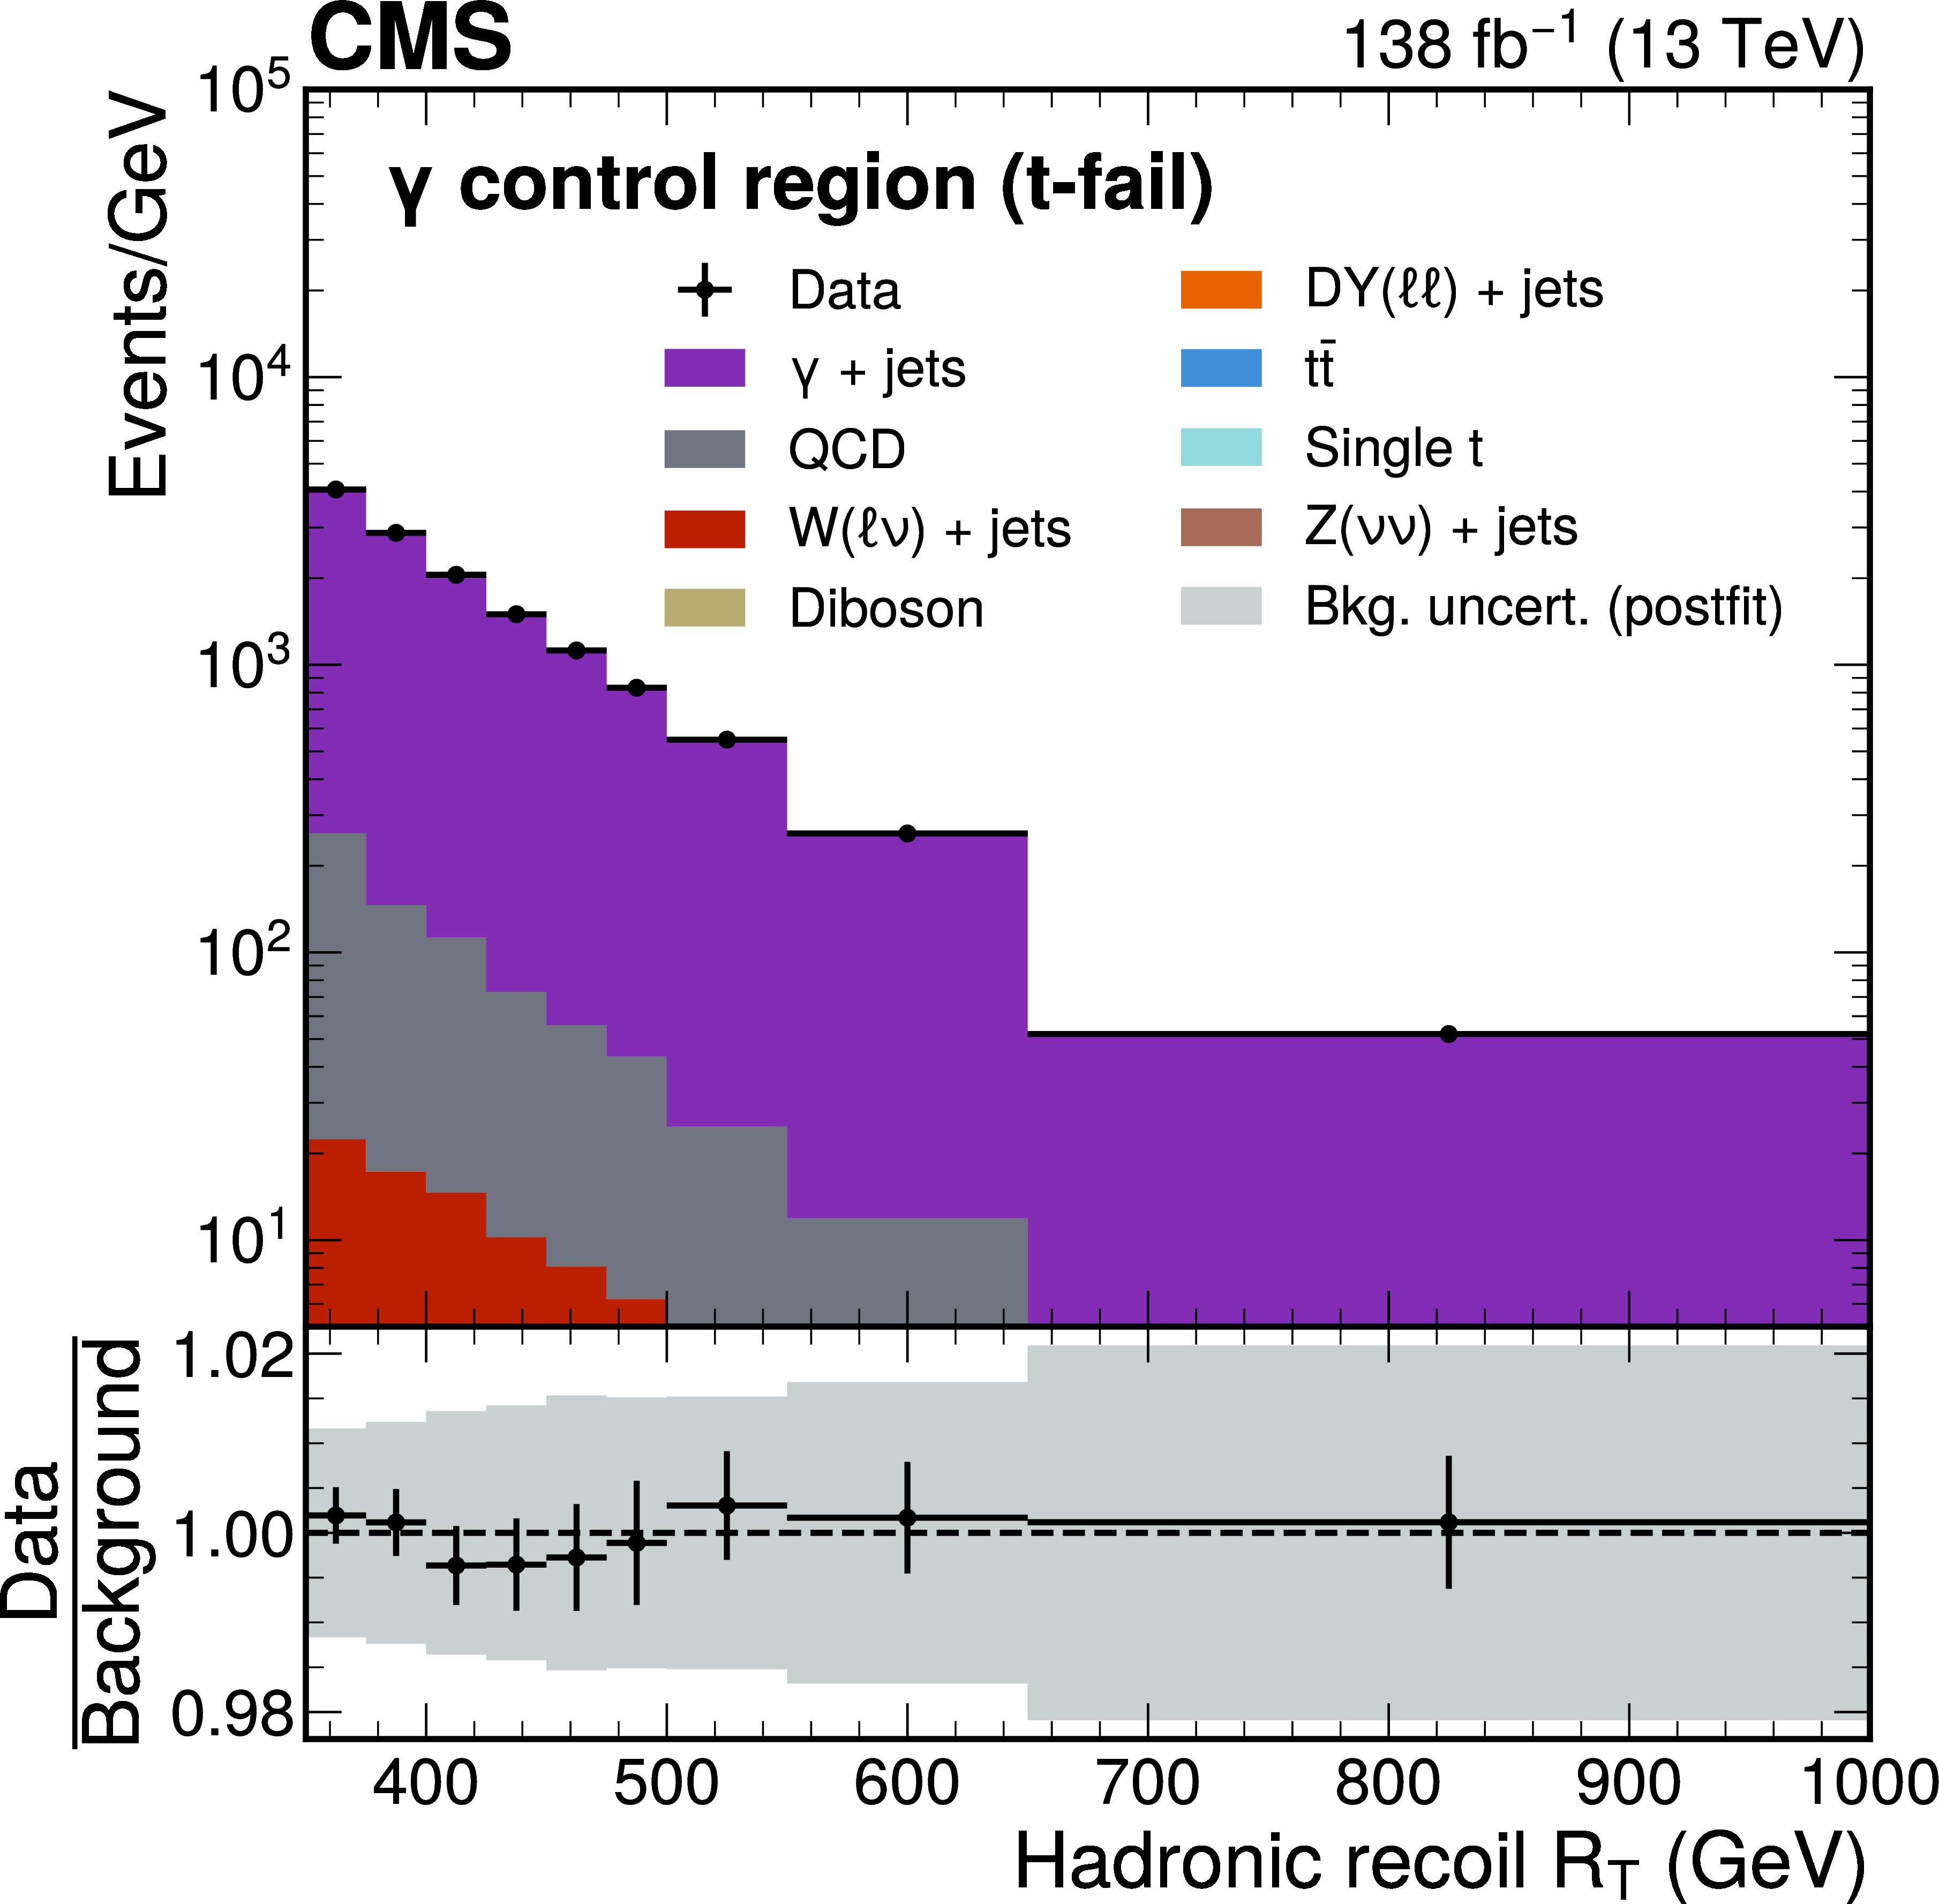
Postfit distributions of the magnitude of the hadronic recoil $ R_{\mathrm{T}} $ in the $ \gamma $ (t-pass) and $ \gamma $ (t-fail) CRs after a fit of the background model to the data. The last bin of each distribution also contains events with $ R_{\mathrm{T}} > $ 1000 GeV. The background processes are stacked together. The gray band represents the statistical and postfit systematic uncertainties in the predicted background yields after the fit. |
png pdf |
Figure 14-a:
Postfit distributions of the magnitude of the hadronic recoil $ R_{\mathrm{T}} $ in the $ \gamma $ (t-pass) and $ \gamma $ (t-fail) CRs after a fit of the background model to the data. The last bin of each distribution also contains events with $ R_{\mathrm{T}} > $ 1000 GeV. The background processes are stacked together. The gray band represents the statistical and postfit systematic uncertainties in the predicted background yields after the fit. |
png pdf |
Figure 14-b:
Postfit distributions of the magnitude of the hadronic recoil $ R_{\mathrm{T}} $ in the $ \gamma $ (t-pass) and $ \gamma $ (t-fail) CRs after a fit of the background model to the data. The last bin of each distribution also contains events with $ R_{\mathrm{T}} > $ 1000 GeV. The background processes are stacked together. The gray band represents the statistical and postfit systematic uncertainties in the predicted background yields after the fit. |
png pdf |
Figure 15:
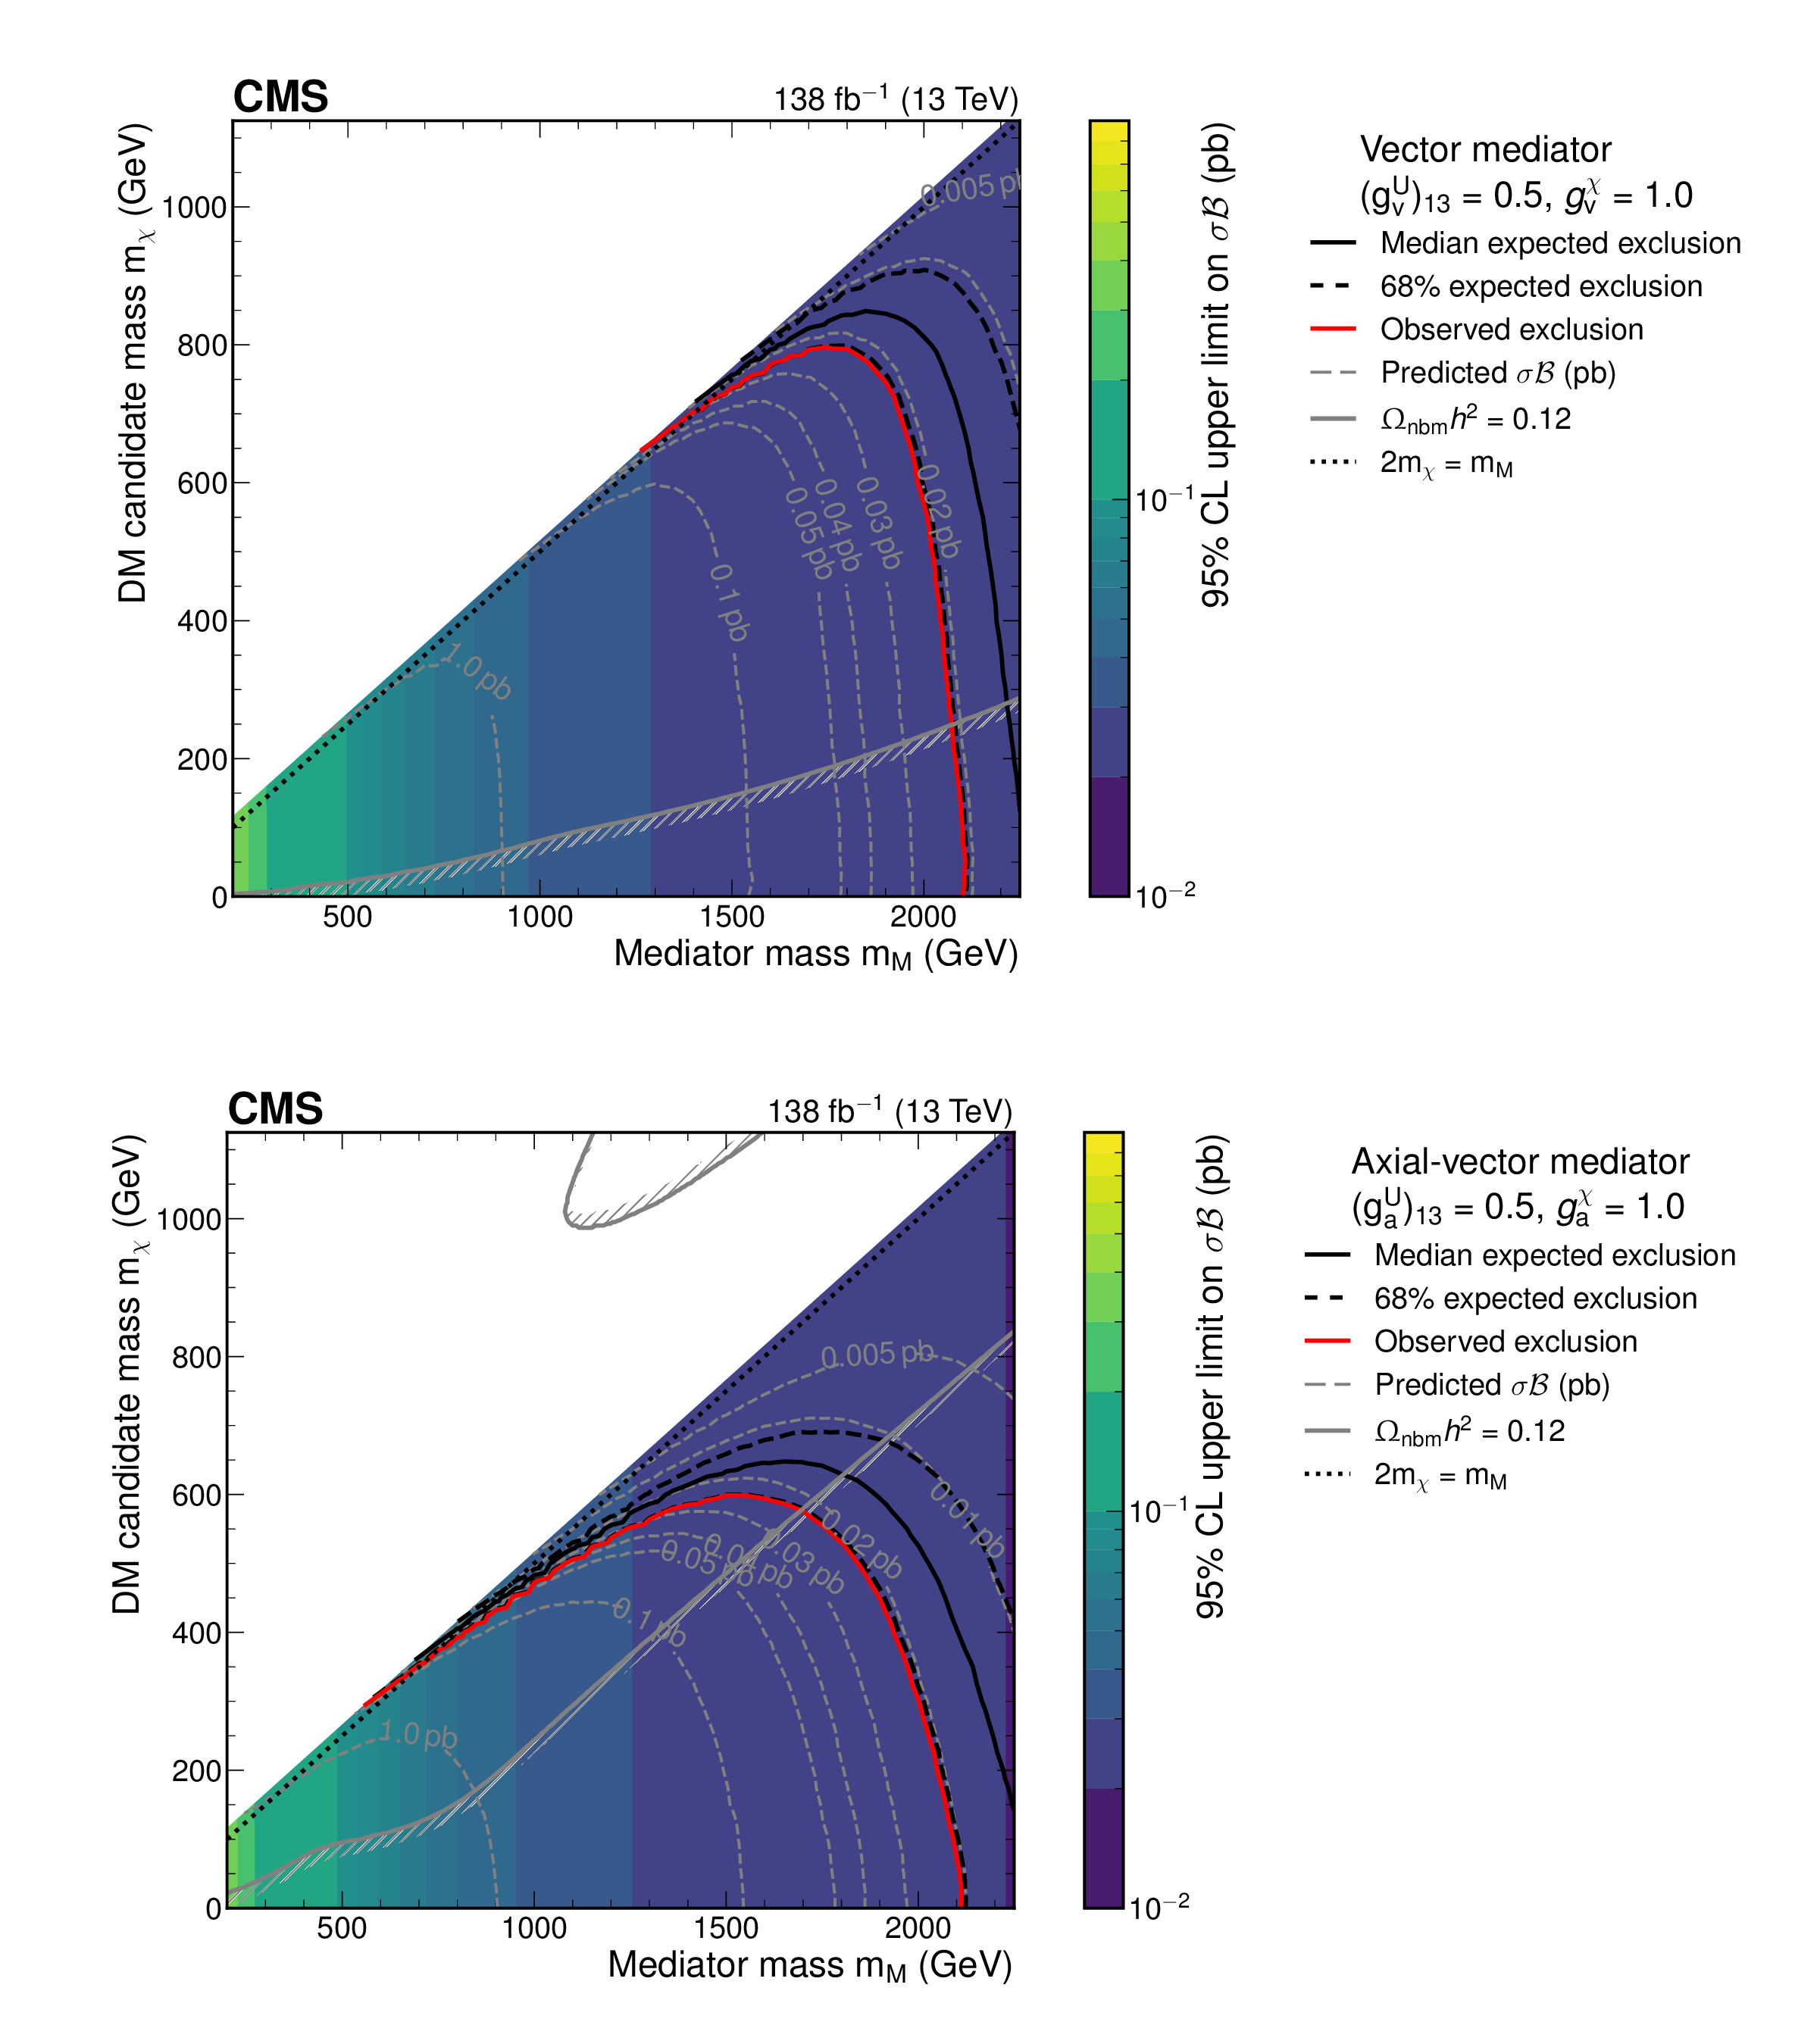
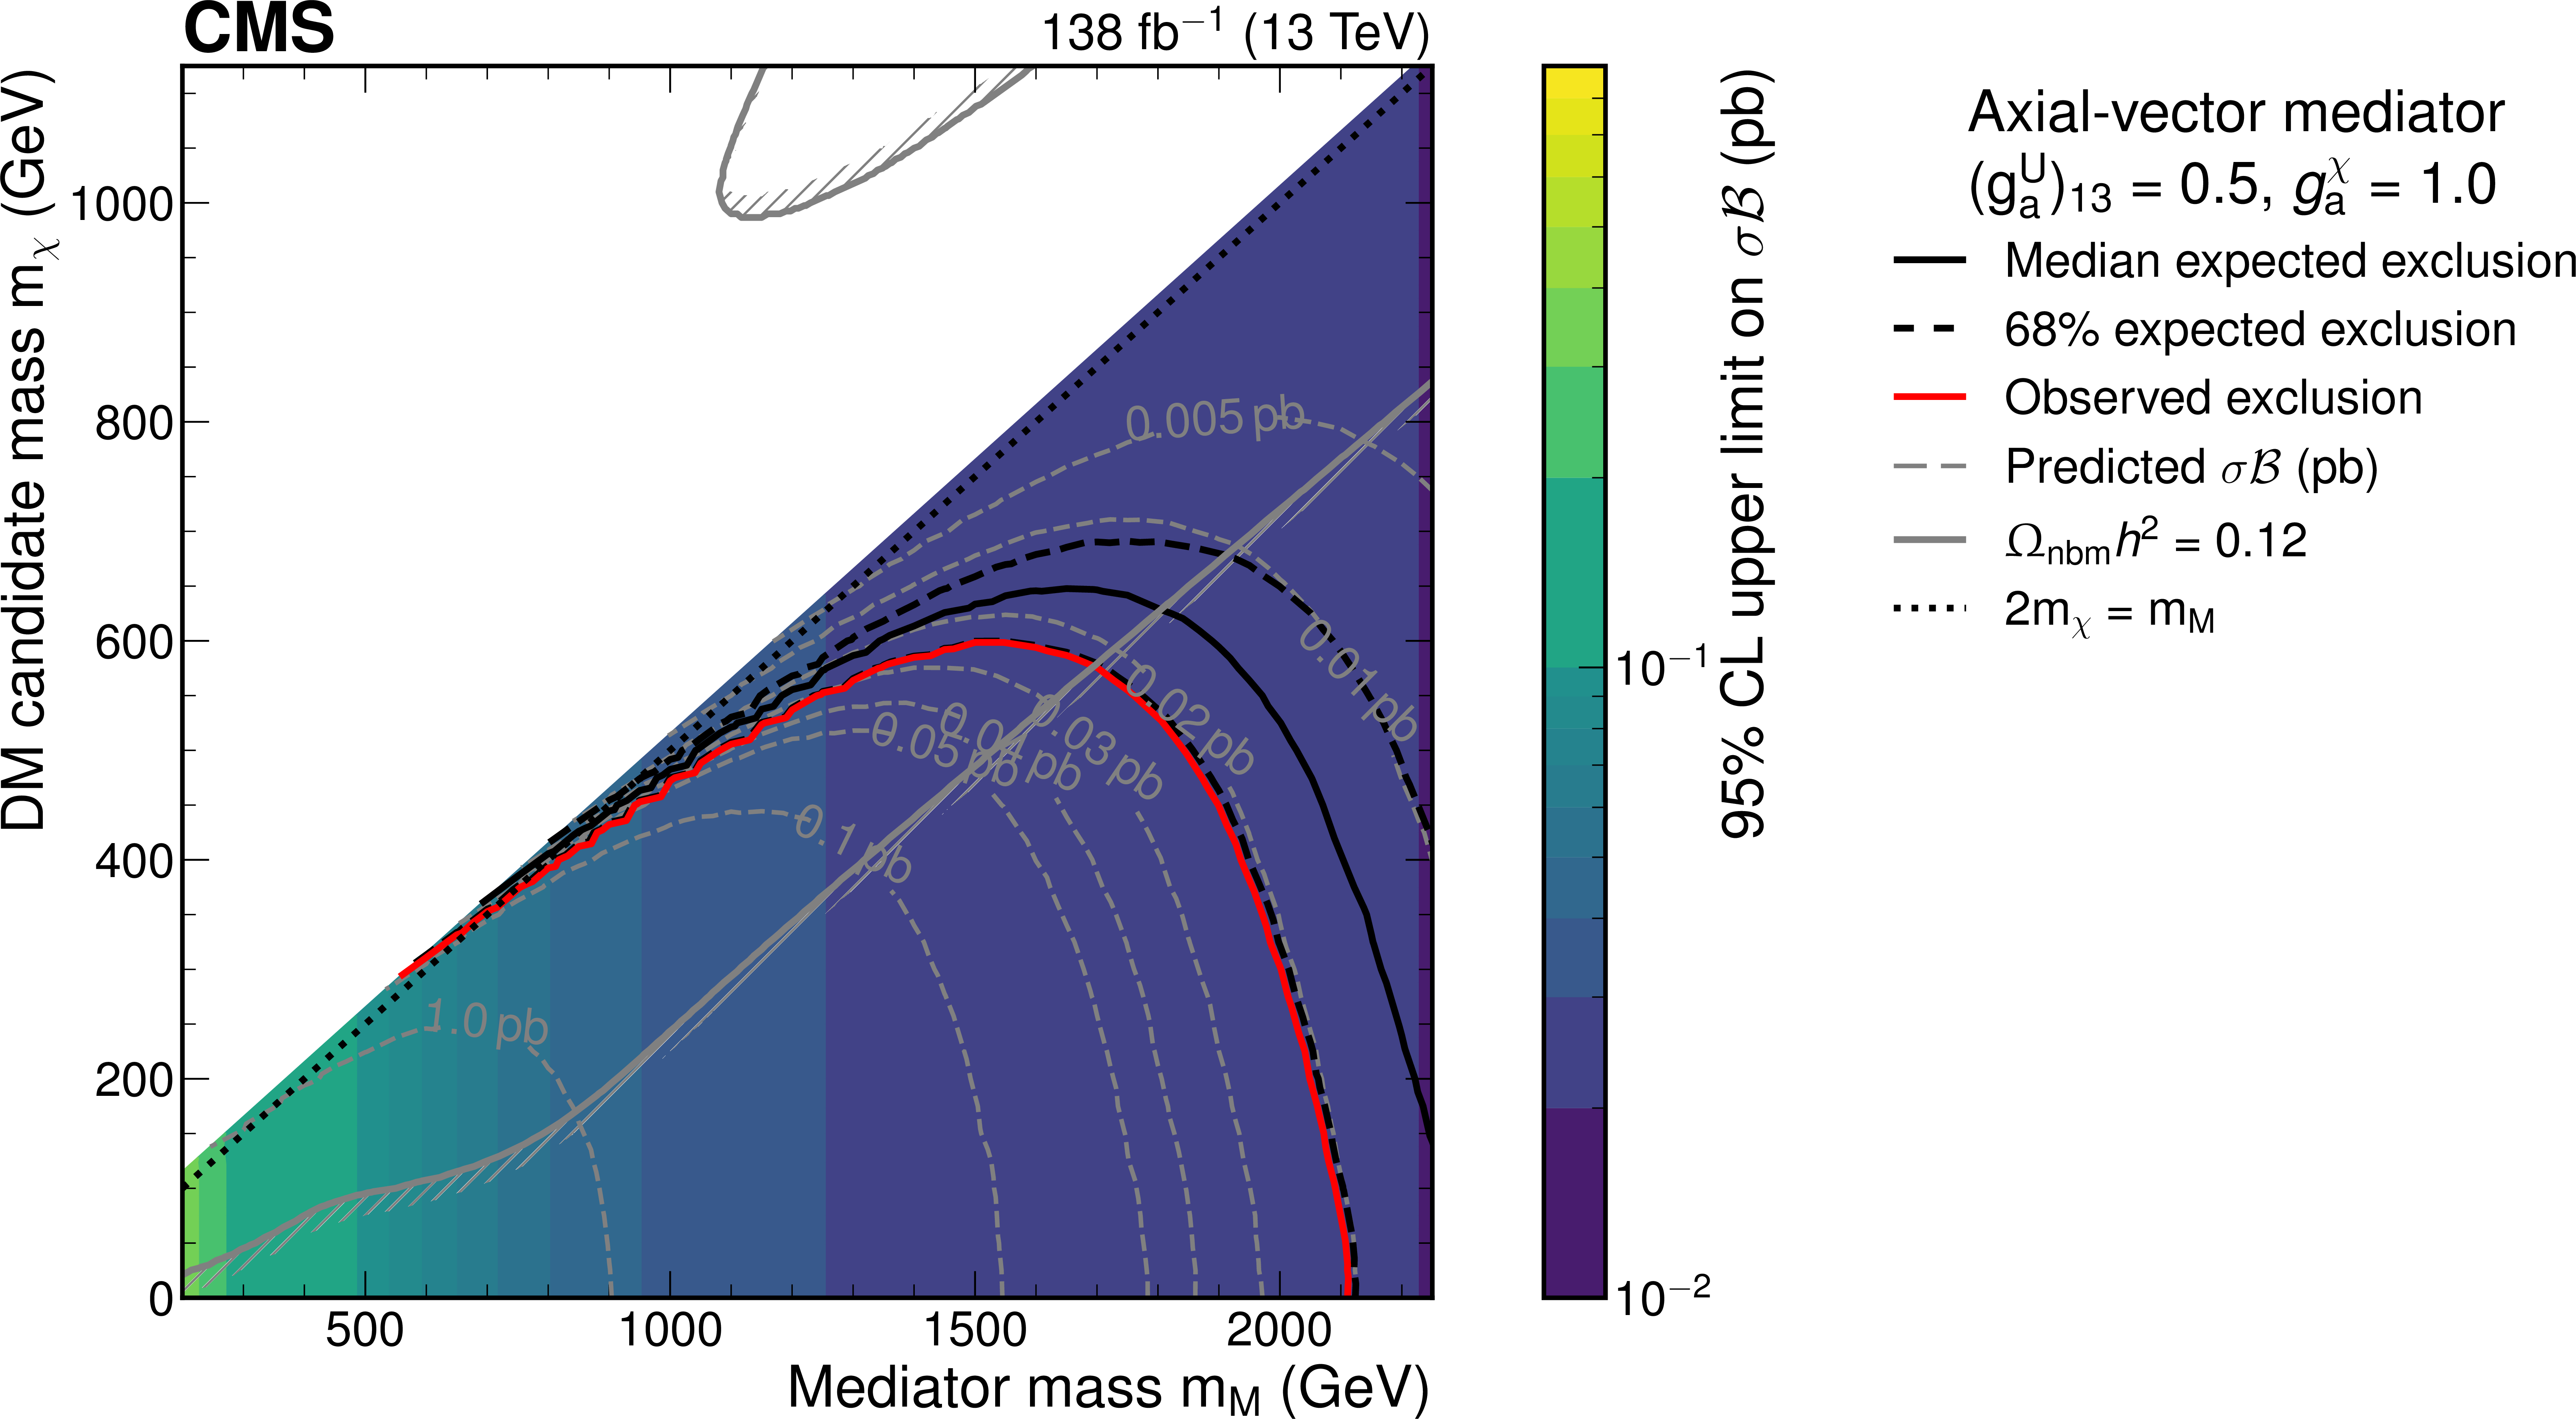
Upper limits at 95% CL on $ \sigma\mathcal{B} $ of mono-top production presented in the two-dimensional plane spanned by the mediator and DM candidate masses for a mediator mass between 200 and 2250 GeV and a DM candidate mass between 1 and 1125 GeV only considering on-shell decays of the mediator to the DM candidates. The mediator has vector couplings to quarks and DM candidates in the upper plot and axial-vector couplings in the lower plot. The median expected exclusion range is indicated by a black solid line, demonstrating the search sensitivity of the analysis. The 68% probability interval of the expected exclusion is shown in black dashed lines. Contours of theory predictions for constant values of $ \sigma\mathcal{B} $ are shown in gray dashed lines. The observed exclusion contour of mediator and DM candidate masses is represented by the red solid line. The exclusion contour obtained from measurements of the DM relic density $ \Omega_{\text{nbm}}h^{2} $ by the Planck Collaboration is shown in the gray solid line. |

png pdf |
Figure 15-a:
Upper limits at 95% CL on $ \sigma\mathcal{B} $ of mono-top production presented in the two-dimensional plane spanned by the mediator and DM candidate masses for a mediator mass between 200 and 2250 GeV and a DM candidate mass between 1 and 1125 GeV only considering on-shell decays of the mediator to the DM candidates. The mediator has vector couplings to quarks and DM candidates in the upper plot and axial-vector couplings in the lower plot. The median expected exclusion range is indicated by a black solid line, demonstrating the search sensitivity of the analysis. The 68% probability interval of the expected exclusion is shown in black dashed lines. Contours of theory predictions for constant values of $ \sigma\mathcal{B} $ are shown in gray dashed lines. The observed exclusion contour of mediator and DM candidate masses is represented by the red solid line. The exclusion contour obtained from measurements of the DM relic density $ \Omega_{\text{nbm}}h^{2} $ by the Planck Collaboration is shown in the gray solid line. |
png pdf |
Figure 15-b:
Upper limits at 95% CL on $ \sigma\mathcal{B} $ of mono-top production presented in the two-dimensional plane spanned by the mediator and DM candidate masses for a mediator mass between 200 and 2250 GeV and a DM candidate mass between 1 and 1125 GeV only considering on-shell decays of the mediator to the DM candidates. The mediator has vector couplings to quarks and DM candidates in the upper plot and axial-vector couplings in the lower plot. The median expected exclusion range is indicated by a black solid line, demonstrating the search sensitivity of the analysis. The 68% probability interval of the expected exclusion is shown in black dashed lines. Contours of theory predictions for constant values of $ \sigma\mathcal{B} $ are shown in gray dashed lines. The observed exclusion contour of mediator and DM candidate masses is represented by the red solid line. The exclusion contour obtained from measurements of the DM relic density $ \Omega_{\text{nbm}}h^{2} $ by the Planck Collaboration is shown in the gray solid line. |
| Tables | |
png pdf |
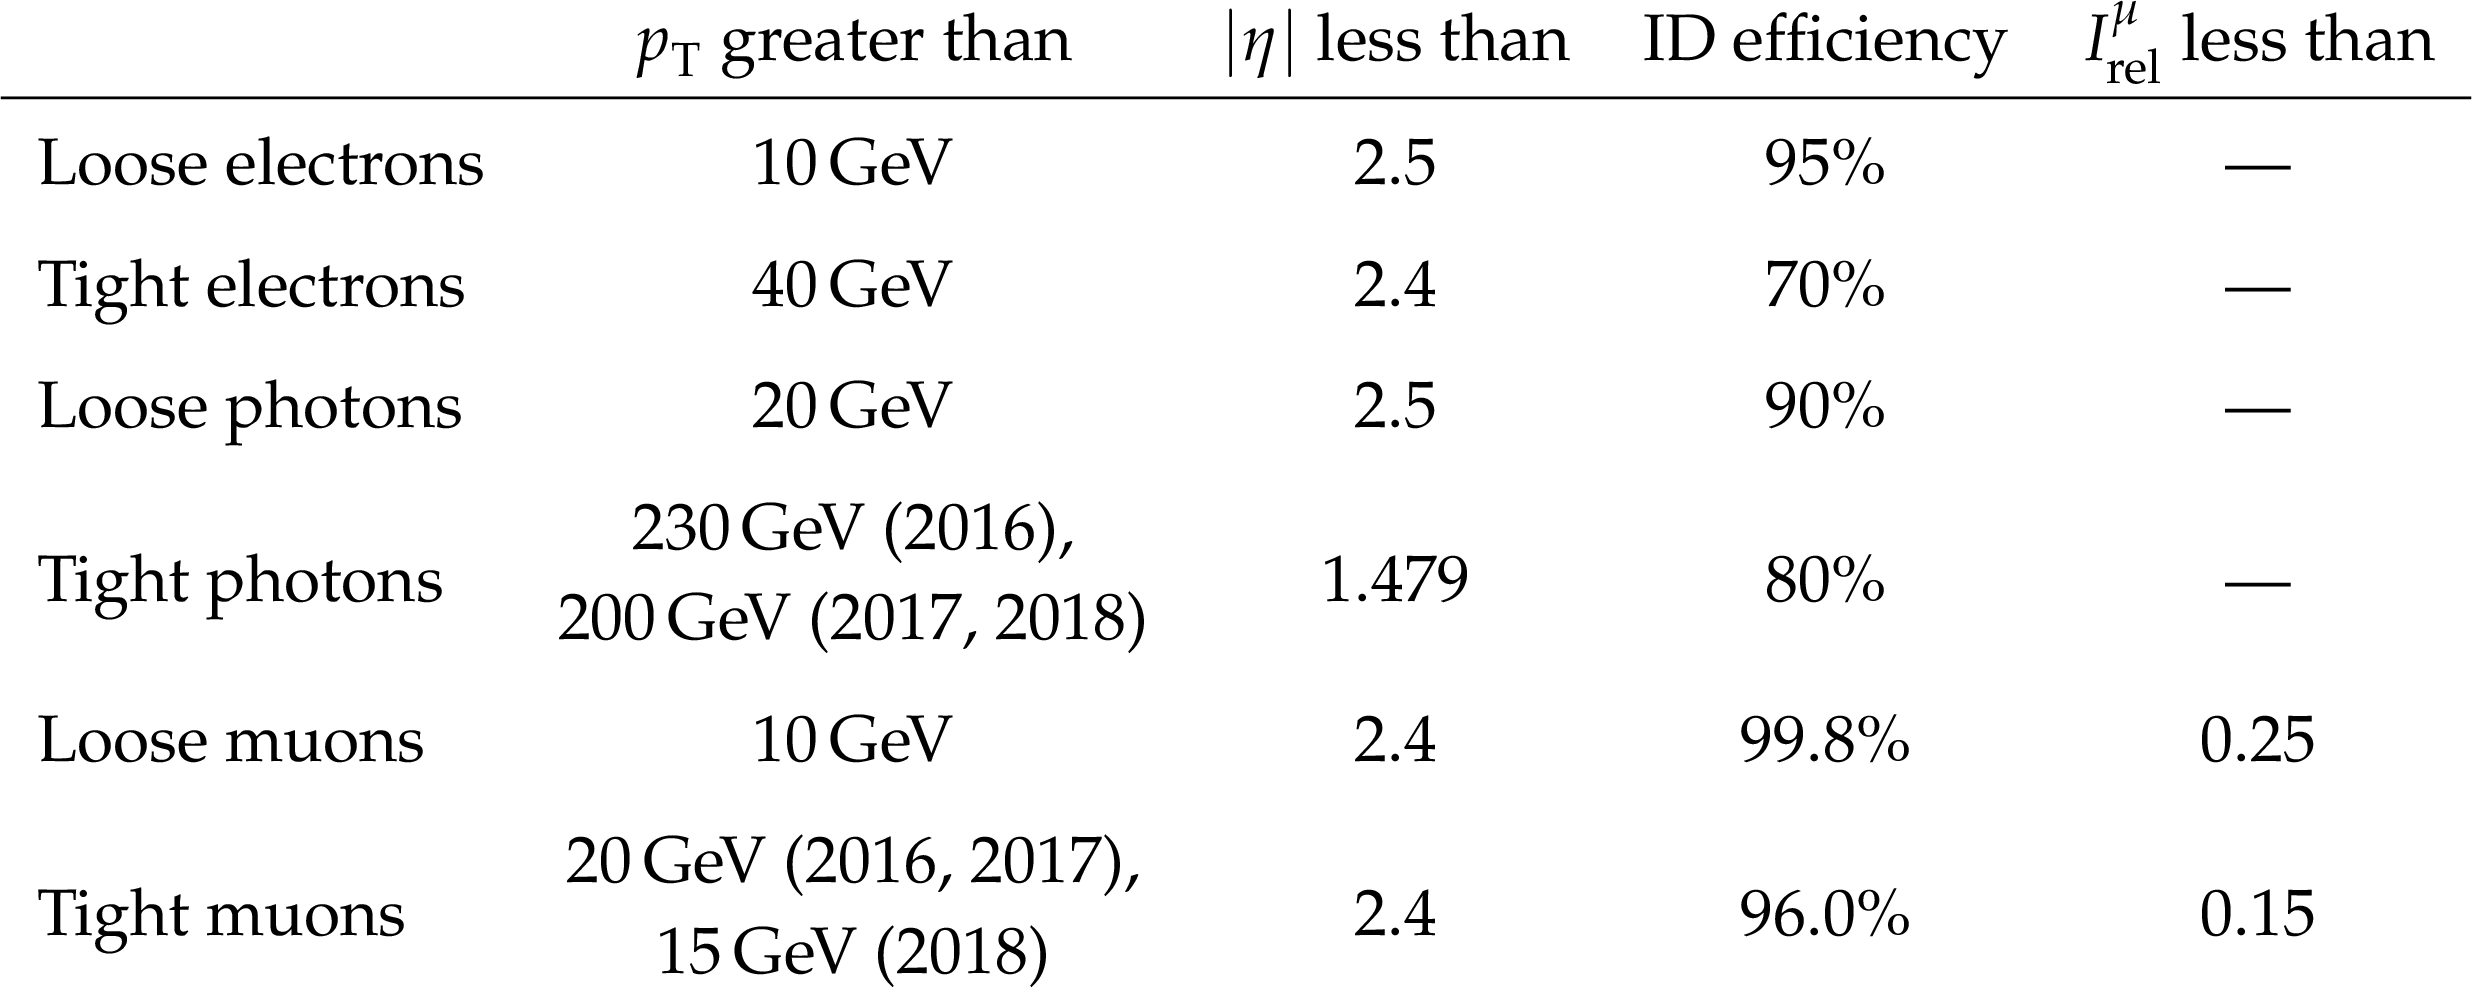
Table 1:
Requirements on electrons, photons, and muons that pass the loose or tight selection. For all objects, the minimal $ p_{\mathrm{T}} $, the maximal $ |\eta| $, and the efficiency of the object identification (ID) are provided. For muons, the requirements on the relative isolation $ I_{\text{rel}}^{\mu} $ are also listed. A more detailed discussion is given in the text. |
png pdf |
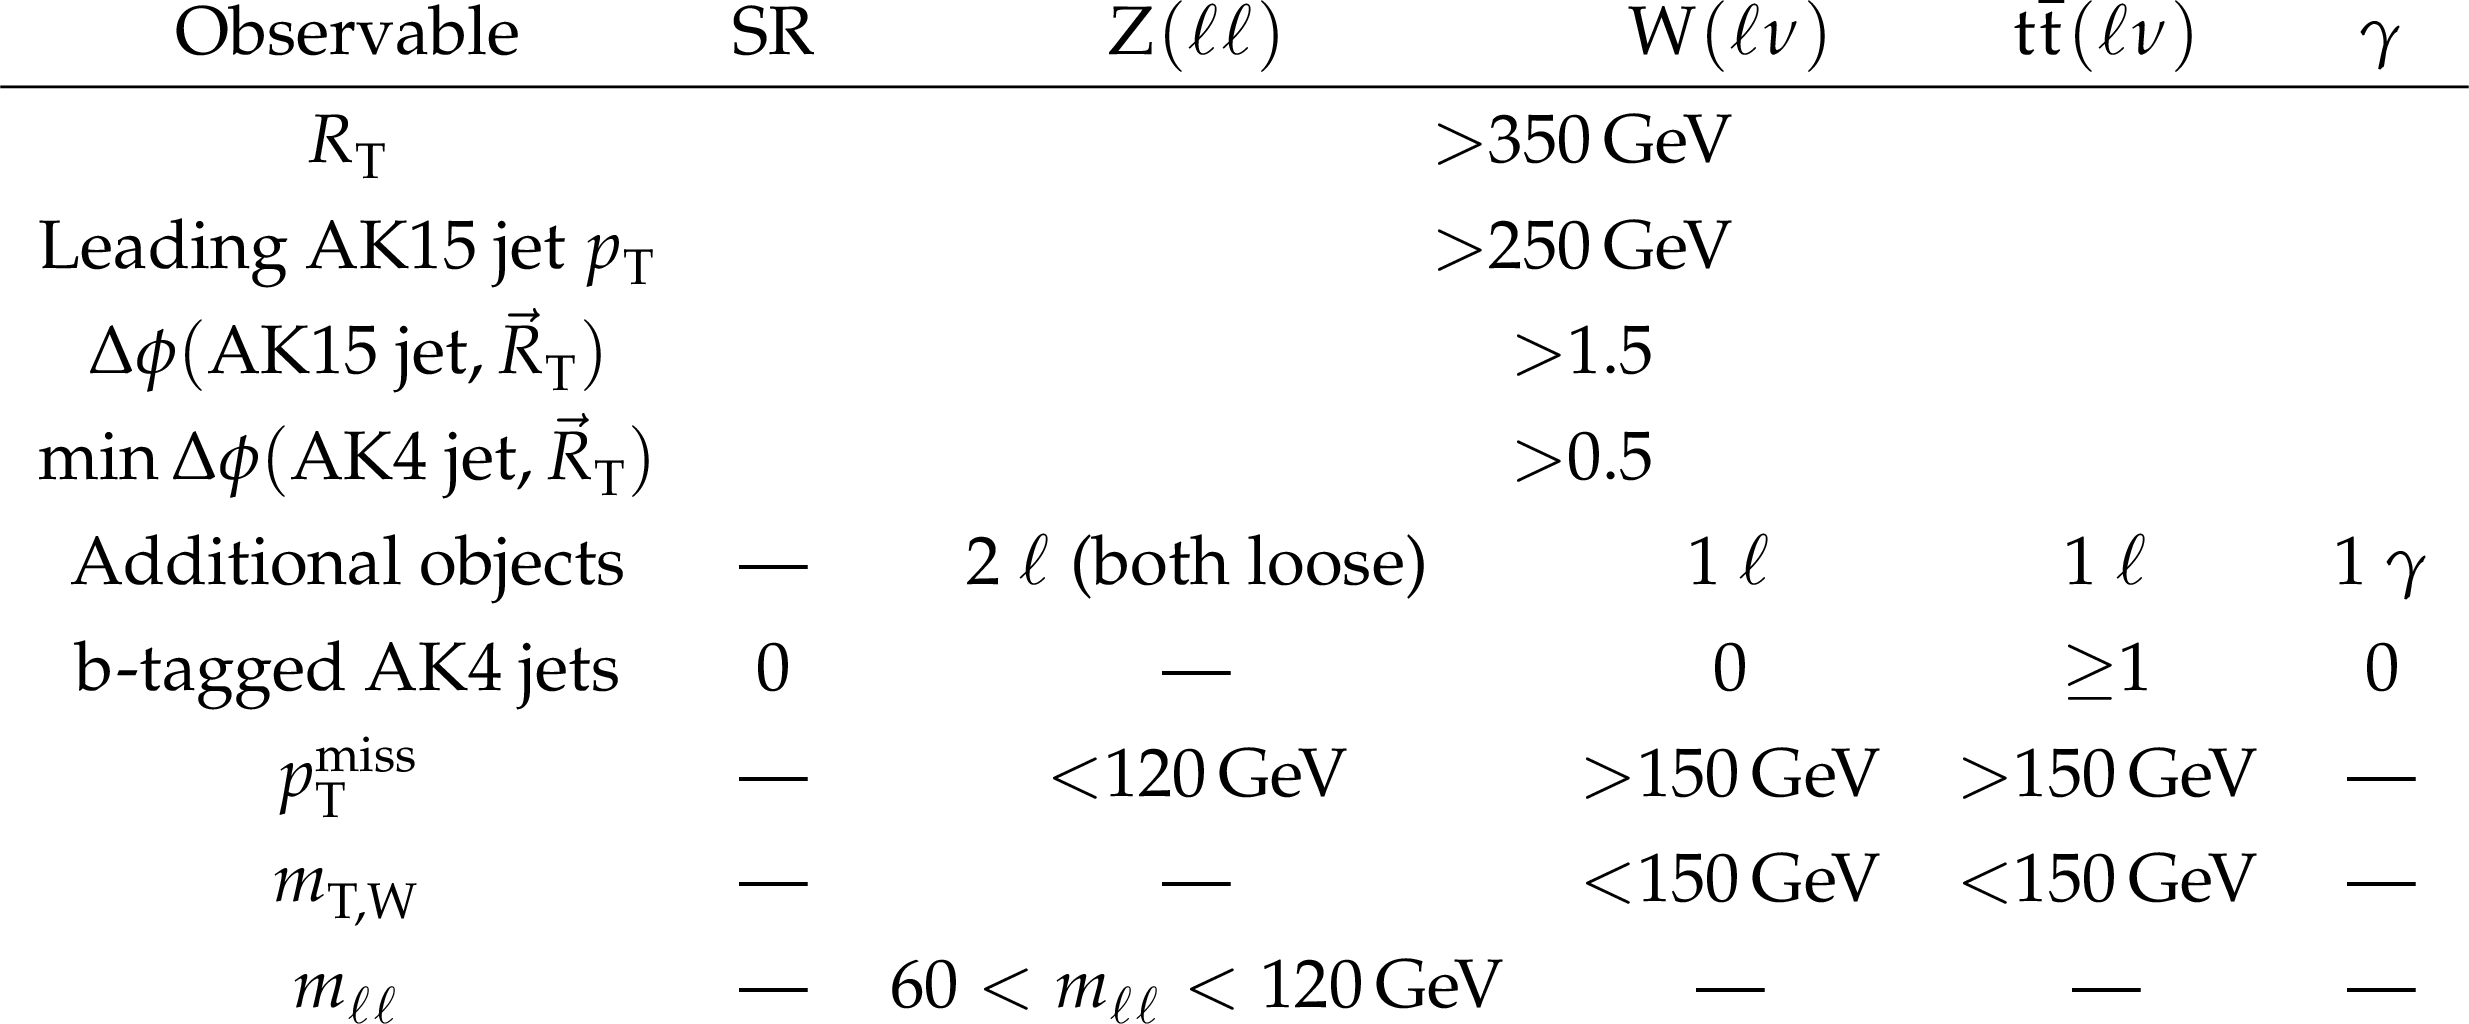
Table 2:
Overview of the selections for the SR and the CRs, including the preselection. In the $ \mathrm{Z}(\ell\ell) $ CRs, loose leptons are used for the selection of additional objects in the final state. In all other CRs, leptons and photons from the tight collections are used to determine the number of additional objects. CRs with final state leptons are defined separately for electrons and muons. |
png pdf |
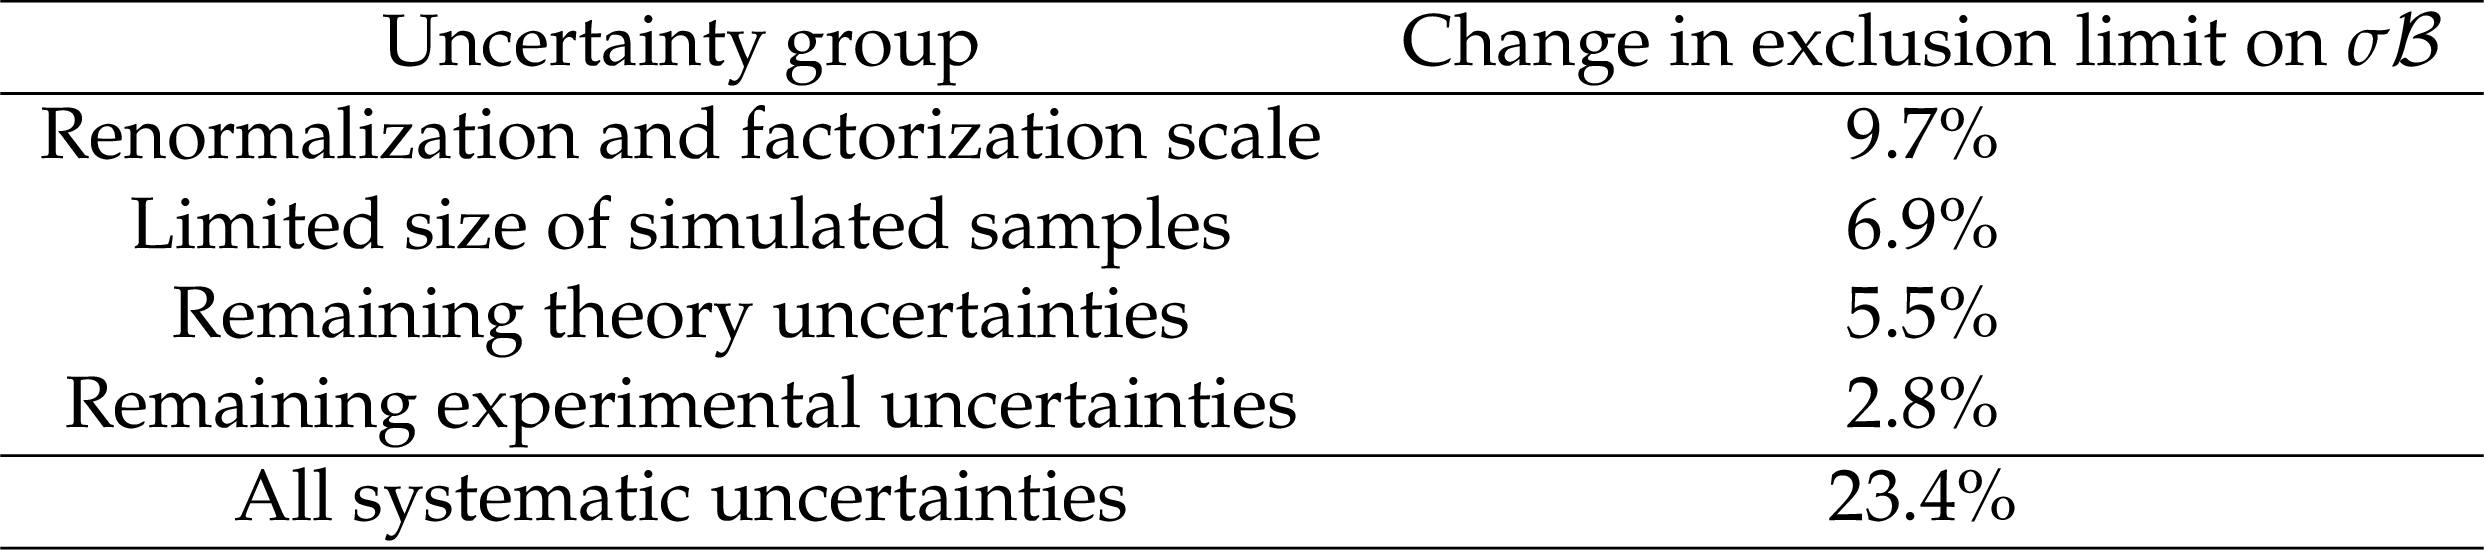
Table 3:
Impact of systematic uncertainties on the expected exclusion limit for the vector mono-top signal with $ m_{\mathrm{M} } = $ 2000 GeV and $ m_{{\chi} } = $ 150 GeV, quantified by the relative change in the expected exclusion limit when fixing the nuisance parameters related to a group of systematic uncertainties in the fit. The last row shows the impact on the exclusion limit if all nuisance parameters related to systematic uncertainties are fixed in the fit. |
| Summary |
| A search for dark matter (DM) produced in association with a single top quark via a flavor changing neutral current, referred to as nonresonant mono-top production, was presented. The analysis was performed using data collected by the CMS experiment in 2016, 2017, and 2018 at the LHC at a center-of-mass-energy of 13 TeV, and corresponding to an integrated luminosity of 138 fb$^{-1}$. The Lorentz boost of the top quark is exploited to cluster the products of the hadronic top quark decay into a large-radius jet. Furthermore, a machine-learning-based discriminator is used to distinguish large-radius jets originating from hadronic top quark decays and large-radius jets produced purely through quantum chromodynamics processes. A robust statistical model was built to determine the main backgrounds in the signal regions using data in dedicated control regions. The distribution of the hadronic recoil in the signal and control regions is used to perform the statistical fit to the data. The data are consistent with the background-only hypothesis, and no evidence for DM produced in association with a single top quark was found. Limits at 95% confidence level are calculated for the product of the signal production cross section and the branching fraction of the mediator decaying into DM candidates. Limits were obtained for both a purely vector and a purely axial-vector mediator that couples to two DM candidates and to two standard model quarks: one from the first generation and another from the third. The analysis excludes mediators with masses up to 1.85 TeV, where 2.0 TeV is expected, for both the vector and the axial-vector coupling scenarios. Dark matter candidate masses below 750 (550) GeV, where 850 (650) GeV is expected, are excluded for the vector (axial-vector) coupling scenario. In both cases, the exclusion limits are calculated for mediator masses greater than 200 GeV and DM candidate masses greater than 1 GeV. The exclusion limit on the spin-1 mediator mass obtained in this search exceeds the previous CMS result on mono-top production [27] using the 2016 data set by 100 GeV. |
| References | ||||
| 1 | V. C. Rubin and W. K. Ford, Jr. | Rotation of the Andromeda Nebula from a spectroscopic survey of emission regions | Astrophys. J. 159 (1970) 379 | |
| 2 | M. Markevitch et al. | Direct constraints on the dark matter self-interaction cross section from the merging galaxy cluster 1E 0657-56 | Astrophys. J. 606 (2004) 819 | astro-ph/0309303 |
| 3 | Planck Collaboration | Planck 2018 results. VI. cosmological parameters | Astron. Astrophys. 641 (2020) A6 | 1807.06209 |
| 4 | M. Beltran et al. | Maverick dark matter at colliders | JHEP 09 (2010) 037 | 1002.4137 |
| 5 | P. J. Fox, R. Harnik, J. Kopp, and Y. Tsai | Missing energy signatures of dark matter at the LHC | PRD 85 (2012) 056011 | 1109.4398 |
| 6 | J. Goodman et al. | Constraints on dark matter from colliders | PRD 82 (2010) 116010 | 1008.1783 |
| 7 | A. Rajaraman, W. Shepherd, T. M. P. Tait, and A. M. Wijangco | LHC bounds on interactions of dark matter | PRD 84 (2011) 095013 | 1108.1196 |
| 8 | ATLAS Collaboration | Search for new phenomena in final states with an energetic jet and large missing transverse momentum in $ {\mathrm{p}\mathrm{p}} $ collisions at $ \sqrt{s}= $ 8 TeV with the ATLAS detector | EPJC 75 (2015) 299 | 1502.01518 |
| 9 | Y. Bai and T. M. P. Tait | Searches with mono-leptons | PLB 723 (2013) 384 | 1208.4361 |
| 10 | ATLAS Collaboration | Search for dark matter in events with a hadronically decaying W or Z boson and missing transverse momentum in $ {\mathrm{p}\mathrm{p}} $ collisions at $ \sqrt{s}= $ 8 TeV with the ATLAS detector | PRL 112 (2014) 041802 | 1309.4017 |
| 11 | CMS Collaboration | Search for physics beyond the standard model in final states with a lepton and missing transverse energy in proton-proton collisions at $ \sqrt{s}= $ 8 TeV | PRD 91 (2015) 092005 | CMS-EXO-12-060 1408.2745 |
| 12 | N. F. Bell et al. | Searching for dark matter at the LHC with a mono-Z | PRD 86 (2012) 096011 | 1209.0231 |
| 13 | L. M. Carpenter et al. | Collider searches for dark matter in events with a Z boson and missing energy | PRD 87 (2013) 074005 | 1212.3352 |
| 14 | ATLAS Collaboration | Search for dark matter in events with a Z boson and missing transverse momentum in $ {\mathrm{p}\mathrm{p}} $ collisions at $ \sqrt{s}= $ 8 TeV with the ATLAS detector | PRD 90 (2014) 012004 | 1404.0051 |
| 15 | L. Carpenter et al. | Mono-Higgs-boson: A new collider probe of dark matter | PRD 89 (2014) 075017 | 1312.2592 |
| 16 | A. Berlin, T. Lin, and L.-T. Wang | Mono-Higgs detection of dark matter at the LHC | JHEP 06 (2014) 078 | 1402.7074 |
| 17 | CMS Collaboration | Search for new phenomena in monophoton final states in proton-proton collisions at $ \sqrt{s}= $ 8 TeV | PLB 755 (2016) 102 | CMS-EXO-12-047 1410.8812 |
| 18 | ATLAS Collaboration | Search for new phenomena in events with a photon and missing transverse momentum in $ {\mathrm{p}\mathrm{p}} $ collisions at $ \sqrt{s}= $ 8 TeV with the ATLAS detector | PRD 91 (2015) 012008 | 1411.1559 |
| 19 | CMS Collaboration | Search for new particles in events with energetic jets and large missing transverse momentum in proton-proton collisions at $ \sqrt{s}= $ 13 TeV | JHEP 11 (2021) 153 | CMS-EXO-20-004 2107.13021 |
| 20 | ATLAS Collaboration | Search for new phenomena in events with an energetic jet and missing transverse momentum in $ {\mathrm{p}\mathrm{p}} $ collisions at $ \sqrt{s}= $ 13 TeV with the ATLAS detector | PRD 103 (2021) 112006 | 2102.10874 |
| 21 | CMS Collaboration | Search for dark matter produced in association with a leptonically decaying Z boson in proton-proton collisions at $ \sqrt{s}= $ 13 TeV | EPJC 81 (2021) 13 | CMS-EXO-19-003 2008.04735 |
| 22 | ATLAS Collaboration | Search for associated production of a Z boson with an invisibly decaying Higgs boson or dark matter candidates at $ \sqrt{s}= $ 13 TeV with the ATLAS detector | PLB 829 (2022) 137066 | 2111.08372 |
| 23 | CMS Collaboration | Search for dark matter produced in association with a Higgs boson decaying to a pair of bottom quarks in proton-proton collisions at $ \sqrt{s}= $ 13 TeV | EPJC 79 (2019) 280 | CMS-EXO-16-050 1811.06562 |
| 24 | CMS Collaboration | Search for dark matter particles produced in association with a Higgs boson in proton-proton collisions at $ \sqrt{s}= $ 13 TeV | JHEP 03 (2020) 025 | CMS-EXO-18-011 1908.01713 |
| 25 | CMS Collaboration | Search for new physics in final states with a single photon and missing transverse momentum in proton-proton collisions at $ \sqrt{s}= $ 13 TeV | JHEP 02 (2019) 074 | CMS-EXO-16-053 1810.00196 |
| 26 | ATLAS Collaboration | Search for dark matter in association with an energetic photon in $ {\mathrm{p}\mathrm{p}} $ collisions at $ \sqrt{s}= $ 13 TeV with the ATLAS detector | JHEP 02 (2021) 226 | 2011.05259 |
| 27 | CMS Collaboration | Search for dark matter in events with energetic, hadronically decaying top quarks and missing transverse momentum at $ \sqrt{s}= $ 13 TeV | JHEP 06 (2018) 027 | CMS-EXO-16-051 1801.08427 |
| 28 | ATLAS Collaboration | Search for new particles in final states with a boosted top quark and missing transverse momentum in proton-proton collisions at $ \sqrt{s} = $ 13 TeV with the ATLAS detector | JHEP 05 (2024) 263 | 2402.16561 |
| 29 | N. Cabibbo | Unitary symmetry and leptonic decays | PRL 10 (1963) 531 | |
| 30 | M. Kobayashi and T. Maskawa | $ {CP} $-violation in the renormalizable theory of weak interaction | Prog. Theor. Phys. 49 (1973) 652 | |
| 31 | S. L. Glashow, J. Iliopoulos, and L. Maiani | Weak interactions with lepton-hadron symmetry | PRD 2 (1970) 1285 | |
| 32 | J. Andrea, B. Fuks, and F. Maltoni | Monotops at the LHC | PRD 84 (2011) 074025 | 1106.6199 |
| 33 | H. Qu and L. Gouskos | Jet tagging via particle clouds | PRD 101 (2020) 056019 | 1902.08570 |
| 34 | CMS Collaboration | HEPData record for this analysis | link | |
| 35 | CMS Collaboration | Performance of the CMS Level-1 trigger in proton-proton collisions at $ \sqrt{s}= $ 13 TeV | JINST 15 (2020) P10017 | CMS-TRG-17-001 2006.10165 |
| 36 | CMS Collaboration | The CMS trigger system | JINST 12 (2017) P01020 | CMS-TRG-12-001 1609.02366 |
| 37 | CMS Collaboration | Performance of the CMS high-level trigger during LHC Run 2 | JINST 19 (2024) P11021 | CMS-TRG-19-001 2410.17038 |
| 38 | CMS Collaboration | Technical proposal for the Phase-II upgrade of the Compact Muon Solenoid | CMS Technical Proposal CERN-LHCC-2015-010, CMS-TDR-15-02, 2015 link |
|
| 39 | CMS Collaboration | The CMS experiment at the CERN LHC | JINST 3 (2008) S08004 | |
| 40 | CMS Collaboration | Development of the CMS detector for the CERN LHC Run 3 | JINST 19 (2024) P05064 | CMS-PRF-21-001 2309.05466 |
| 41 | CMS Collaboration | Particle-flow reconstruction and global event description with the CMS detector | JINST 12 (2017) P10003 | CMS-PRF-14-001 1706.04965 |
| 42 | M. Cacciari, G. P. Salam, and G. Soyez | The anti-$ k_{\mathrm{T}} $ jet clustering algorithm | JHEP 04 (2008) 063 | 0802.1189 |
| 43 | M. Cacciari, G. P. Salam, and G. Soyez | FASTJET user manual | EPJC 72 (2012) 1896 | 1111.6097 |
| 44 | CMS Collaboration | Pileup mitigation at CMS in 13 TeV data | JINST 15 (2020) P09018 | CMS-JME-18-001 2003.00503 |
| 45 | D. Bertolini, P. Harris, M. Low, and N. Tran | Pileup per particle identification | JHEP 10 (2014) 059 | 1407.6013 |
| 46 | CMS Collaboration | Jet energy scale and resolution in the CMS experiment in $ {\mathrm{p}\mathrm{p}} $ collisions at 8 TeV | JINST 12 (2017) P02014 | CMS-JME-13-004 1607.03663 |
| 47 | CMS Collaboration | Performance of missing transverse momentum reconstruction in proton-proton collisions at $ \sqrt{s}= $ 13 TeV using the CMS detector | JINST 14 (2019) P07004 | CMS-JME-17-001 1903.06078 |
| 48 | CMS Collaboration | Electron and photon reconstruction and identification with the CMS experiment at the CERN LHC | JINST 16 (2021) P05014 | CMS-EGM-17-001 2012.06888 |
| 49 | CMS Collaboration | Muon identification using multivariate techniques in the CMS experiment in proton-proton collisions at $ \sqrt{s}= $ 13 TeV | JINST 19 (2024) P02031 | CMS-MUO-22-001 2310.03844 |
| 50 | E. Bols et al. | Jet flavour classification using DeepJet | JINST 15 (2020) P12012 | 2008.10519 |
| 51 | A. Boveia et al. | Recommendations on presenting LHC searches for missing transverse energy signals using simplified $ s $-channel models of dark matter | Phys. Dark Univ. 27 (2020) 100365 | 1603.04156 |
| 52 | A. Albert et al. | Recommendations of the LHC Dark Matter Working Group: Comparing LHC searches for dark matter mediators in visible and invisible decay channels and calculations of the thermal relic density | Phys. Dark Univ. 26 (2019) 100377 | 1703.05703 |
| 53 | T. Sjöstrand et al. | An introduction to PYTHIA8.2 | Comput. Phys. Commun. 191 (2015) 159 | 1410.3012 |
| 54 | J. Alwall et al. | The automated computation of tree-level and next-to-leading order differential cross sections, and their matching to parton shower simulations | JHEP 07 (2014) 079 | 1405.0301 |
| 55 | P. Nason | A new method for combining NLO QCD with shower Monte Carlo algorithms | JHEP 11 (2004) 040 | hep-ph/0409146 |
| 56 | S. Frixione, P. Nason, and C. Oleari | Matching NLO QCD computations with parton shower simulations: the POWHEG method | JHEP 11 (2007) 070 | 0709.2092 |
| 57 | S. Alioli, P. Nason, C. Oleari, and E. Re | A general framework for implementing NLO calculations in shower Monte Carlo programs: the POWHEG box | JHEP 06 (2010) 043 | 1002.2581 |
| 58 | NNPDF Collaboration | Parton distributions from high-precision collider data | EPJC 77 (2017) 663 | 1706.00428 |
| 59 | CMS Collaboration | Extraction and validation of a new set of CMS PYTHIA8 tunes from underlying-event measurements | EPJC 80 (2020) 4 | CMS-GEN-17-001 1903.12179 |
| 60 | GEANT4 Collaboration | GEANT 4---a simulation toolkit | NIM A 506 (2003) 250 | |
| 61 | K. Mawatari et al. | DMsimp: Simplified dark matter models | link | |
| 62 | O. Mattelaer | On the maximal use of Monte Carlo samples: re-weighting events at NLO accuracy | EPJC 76 (2016) 674 | 1607.00763 |
| 63 | S. Frixione, G. Ridolfi, and P. Nason | A positive-weight next-to-leading-order Monte Carlo for heavy flavour hadroproduction | JHEP 09 (2007) 126 | 0707.3088 |
| 64 | M. Beneke, P. Falgari, S. Klein, and C. Schwinn | Hadronic top-quark pair production with NNLL threshold resummation | NPB 855 (2012) 695 | 1109.1536 |
| 65 | M. Cacciari et al. | Top-pair production at hadron colliders with next-to-next-to-leading logarithmic soft-gluon resummation | PLB 710 (2012) 612 | 1111.5869 |
| 66 | P. Bärnreuther, M. Czakon, and A. Mitov | Percent level precision physics at the Tevatron: Next-to-next-to-leading order QCD corrections to $ \mathrm{q}\overline{\mathrm{q}}\to{\mathrm{t}\overline{\mathrm{t}}} +{\mathrm{X}} $ | PRL 109 (2012) 132001 | 1204.5201 |
| 67 | M. Czakon and A. Mitov | NNLO corrections to top-pair production at hadron colliders: the all-fermionic scattering channels | JHEP 12 (2012) 054 | 1207.0236 |
| 68 | M. Czakon and A. Mitov | NNLO corrections to top pair production at hadron colliders: the quark-gluon reaction | JHEP 01 (2013) 080 | 1210.6832 |
| 69 | M. Czakon, P. Fiedler, and A. Mitov | Total top-quark pair-production cross section at hadron colliders through $ \mathcal{O}({\alpha_\mathrm{S}}^4) $ | PRL 110 (2013) 252004 | 1303.6254 |
| 70 | M. Czakon and A. Mitov | top++: a program for the calculation of the top-pair cross-section at hadron colliders | Comput. Phys. Commun. 185 (2014) 2930 | 1112.5675 |
| 71 | S. Alioli, P. Nason, C. Oleari, and E. Re | NLO single-top production matched with shower in POWHEG: $ s $- and $ t $-channel contributions | JHEP 09 (2009) 111 | 0907.4076 |
| 72 | E. Re | Single-top $ {\mathrm{W}\mathrm{t}} $-channel production matched with parton showers using the POWHEG method | EPJC 71 (2011) 1547 | 1009.2450 |
| 73 | M. Aliev et al. | hathor: Hadronic top and heavy quarks cross section calculator | Comput. Phys. Commun. 182 (2011) 1034 | 1007.1327 |
| 74 | P. Kant et al. | hathor for single top-quark production: Updated predictions and uncertainty estimates for single top-quark production in hadronic collisions | Comput. Phys. Commun. 191 (2015) 74 | 1406.4403 |
| 75 | N. Kidonakis | Two-loop soft anomalous dimensions for single top quark associated production with a $ \mathrm{W^-} $ or $ \mathrm{H}^{-} $ | PRD 82 (2010) 054018 | 1005.4451 |
| 76 | R. Frederix and S. Frixione | Merging meets matching in MC@NLO | JHEP 12 (2012) 061 | 1209.6215 |
| 77 | J. M. Lindert et al. | Precise predictions for V+jets dark matter backgrounds | EPJC 77 (2017) 829 | 1705.04664 |
| 78 | T. Gehrmann et al. | $ {\mathrm{W^+}\mathrm{W^-}} $ production at hadron colliders in next to next to leading order QCD | PRL 113 (2014) 212001 | 1408.5243 |
| 79 | F. Cascioli et al. | $ {\mathrm{Z}\mathrm{Z}} $ production at hadron colliders in NNLO QCD | PLB 735 (2014) 311 | 1405.2219 |
| 80 | J. M. Campbell, R. K. Ellis, and C. Williams | Vector boson pair production at the LHC | JHEP 07 (2011) 018 | 1105.0020 |
| 81 | Particle Data Group , S. Navas et al. | Review of particle physics | PRD 110 (2024) 030001 | |
| 82 | M. Cacciari and G. P. Salam | Pileup subtraction using jet areas | PLB 659 (2008) 119 | 0707.1378 |
| 83 | CMS Collaboration | The CMS statistical analysis and combination tool: combine | Comput. Softw. Big Sci. 8 (2024) 19 | CMS-CAT-23-001 2404.06614 |
| 84 | W. Verkerke and D. Kirkby | The RooFit toolkit for data modeling | in Proc. 13th International Conference on Computing in High Energy and Nuclear Physics (CHEP ): La Jolla CA, United States, 2003 link |
physics/0306116 |
| 85 | L. Moneta et al. | The RooStats project | in Proc. 13th International Workshop on Advanced Computing and Analysis Techniques in Physics Research (ACAT ): Jaipur, India, 2010 link |
1009.1003 |
| 86 | A. Buckley et al. | LHAPDF6: parton density access in the LHC precision era | EPJC 75 (2015) 132 | 1412.7420 |
| 87 | J. Butterworth et al. | PDF4LHC recommendations for LHC Run 2 | JPG 43 (2016) 023001 | 1510.03865 |
| 88 | CMS Collaboration | Measurement of differential cross sections for top quark pair production using the lepton+jets final state in proton-proton collisions at 13 TeV | PRD 95 (2017) 092001 | CMS-TOP-16-008 1610.04191 |
| 89 | CMS Collaboration | Precision luminosity measurement in proton-proton collisions at $ \sqrt{s}= $ 13 TeV in 2015 and 2016 at CMS | EPJC 81 (2021) 800 | CMS-LUM-17-003 2104.01927 |
| 90 | CMS Collaboration | CMS luminosity measurement for the 2017 data-taking period at $ \sqrt{s}= $ 13 TeV | CMS Physics Analysis Summary, 2018 CMS-PAS-LUM-17-004 |
CMS-PAS-LUM-17-004 |
| 91 | CMS Collaboration | CMS luminosity measurement for the 2018 data-taking period at $ \sqrt{s}= $ 13 TeV | CMS Physics Analysis Summary, 2019 CMS-PAS-LUM-18-002 |
CMS-PAS-LUM-18-002 |
| 92 | CMS Collaboration | Measurement of the inelastic proton-proton cross section at $ \sqrt{s}= $ 13 TeV | JHEP 07 (2018) 161 | CMS-FSQ-15-005 1802.02613 |
| 93 | CMS Collaboration | Jet energy scale and resolution performance with 13 TeV data collected by CMS in 2016--2018 | CMS Detector Performance Note CMS-DP-2020-019, 2020 CDS |
|
| 94 | CMS Collaboration | Jet energy scale and resolution measurements with legacy Run 2 data collected by CMS at 13 TeV | CMS Detector Performance Note CMS-DP-2021-033, 2021 CDS |
|
| 95 | CMS Collaboration | Identification of heavy-flavour jets with the CMS detector in $ {\mathrm{p}\mathrm{p}} $ collisions at 13 TeV | JINST 13 (2018) P05011 | CMS-BTV-16-002 1712.07158 |
| 96 | R. Barlow and C. Beeston | Fitting using finite Monte Carlo samples | Comput. Phys. Commun. 77 (1993) 219 | |
| 97 | R. D. Cousins | Lectures on statistics in theory: Prelude to statistics in practice | 1807.05996 | |
| 98 | G. Cowan, K. Cranmer, E. Gross, and O. Vitells | Asymptotic formulae for likelihood-based tests of new physics | EPJC 71 (2011) 1554 | 1007.1727 |
| 99 | T. Junk | Confidence level computation for combining searches with small statistics | NIM A 434 (1999) 435 | hep-ex/9902006 |
| 100 | A. L. Read | Presentation of search results: The $ \text{CL}_\text{s} $ technique | JPG 28 (2002) 2693 | |
| 101 | M. Backovic, K. Kong, and M. McCaskey | MadDM v.1.0: Computation of dark matter relic abundance using MADGRAPH5 | Phys. Dark Univ. 5-6 (2014) 18 | 1308.4955 |
| 102 | F. Ambrogi et al. | MadDM v.3.0: A comprehensive tool for dark matter studies | Phys. Dark Univ. 24 (2019) 100249 | 1804.00044 |
|
|
Compact Muon Solenoid LHC, CERN |
|

|

|

|

|

|