

Compact Muon Solenoid
LHC, CERN
| CMS-SUS-20-002 ; CERN-EP-2021-120 | ||
| Combined searches for the production of supersymmetric top quark partners in proton-proton collisions at $\sqrt{s} = $ 13 TeV | ||
| CMS Collaboration | ||
| 22 July 2021 | ||
| Eur. Phys. J. C 81 (2021) 970 | ||
| Abstract: A combination of searches for top squark pair production using proton-proton collision data at a center-of-mass energy of 13 TeV at the CERN LHC, corresponding to an integrated luminosity of 137 fb$^{-1}$ collected by the CMS experiment, is presented. Signatures with at least 2 jets and large missing transverse momentum are categorized into events with 0, 1, or 2 leptons. New results for regions of parameter space where the kinematical properties of top squark pair production and top quark pair production are very similar are presented. Depending on the model, the combined result excludes a top squark mass up to 1325 GeV for a massless neutralino, and a neutralino mass up to 700 GeV for a top squark mass of 1150 GeV. Top squarks with masses from 145 to 295 GeV, for neutralino masses from 0 to 100 GeV, with a mass difference between the top squark and the neutralino in a window of 30 GeV around the mass of the top quark, are excluded for the first time with CMS data. The results of theses searches are also interpreted in an alternative signal model of dark matter production via a spin-0 mediator in association with a top quark pair. Upper limits are set on the cross section for mediator particle masses of up to 420 GeV. | ||
| Links: e-print arXiv:2107.10892 [hep-ex] (PDF) ; CDS record ; inSPIRE record ; HepData record ; CADI line (restricted) ; | ||
| Figures | |
png pdf |
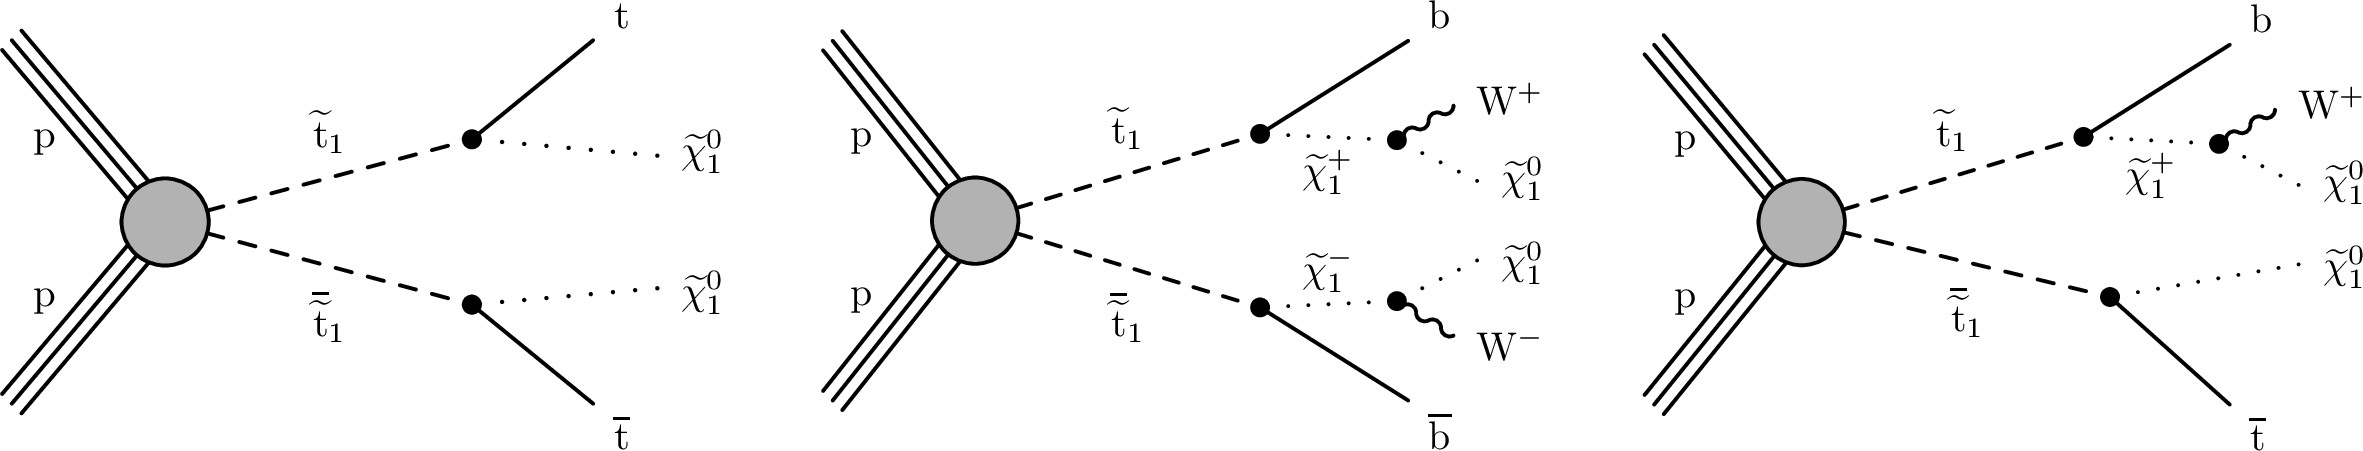
Figure 1:
Diagrams of top squark pair production with further decay of each top squark into a top quark and a neutralino (left), of each top squark into a chargino and a neutralino, with the chargino decaying then into a bottom quark and a W boson (center), and with a combination of the two top squark decay scenarios (right). |

png pdf |
Figure 1-a:
Diagram of top squark pair production with further decay of each top squark into a top quark and a neutralino. |

png pdf |
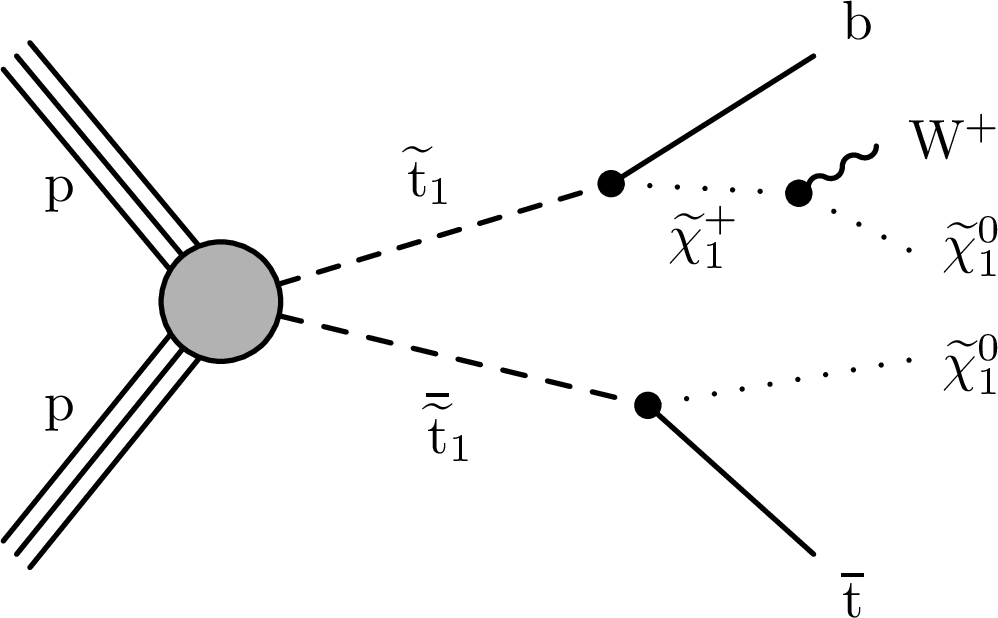
Figure 1-b:
Diagram of top squark pair production with further decay of each top squark into a chargino and a neutralino, with the chargino decaying then into a bottom quark and a W boson. |
png pdf |
Figure 1-c:
Diagram of top squark pair production with further decay with a combination of the two top squark decay scenarios. |
png pdf |
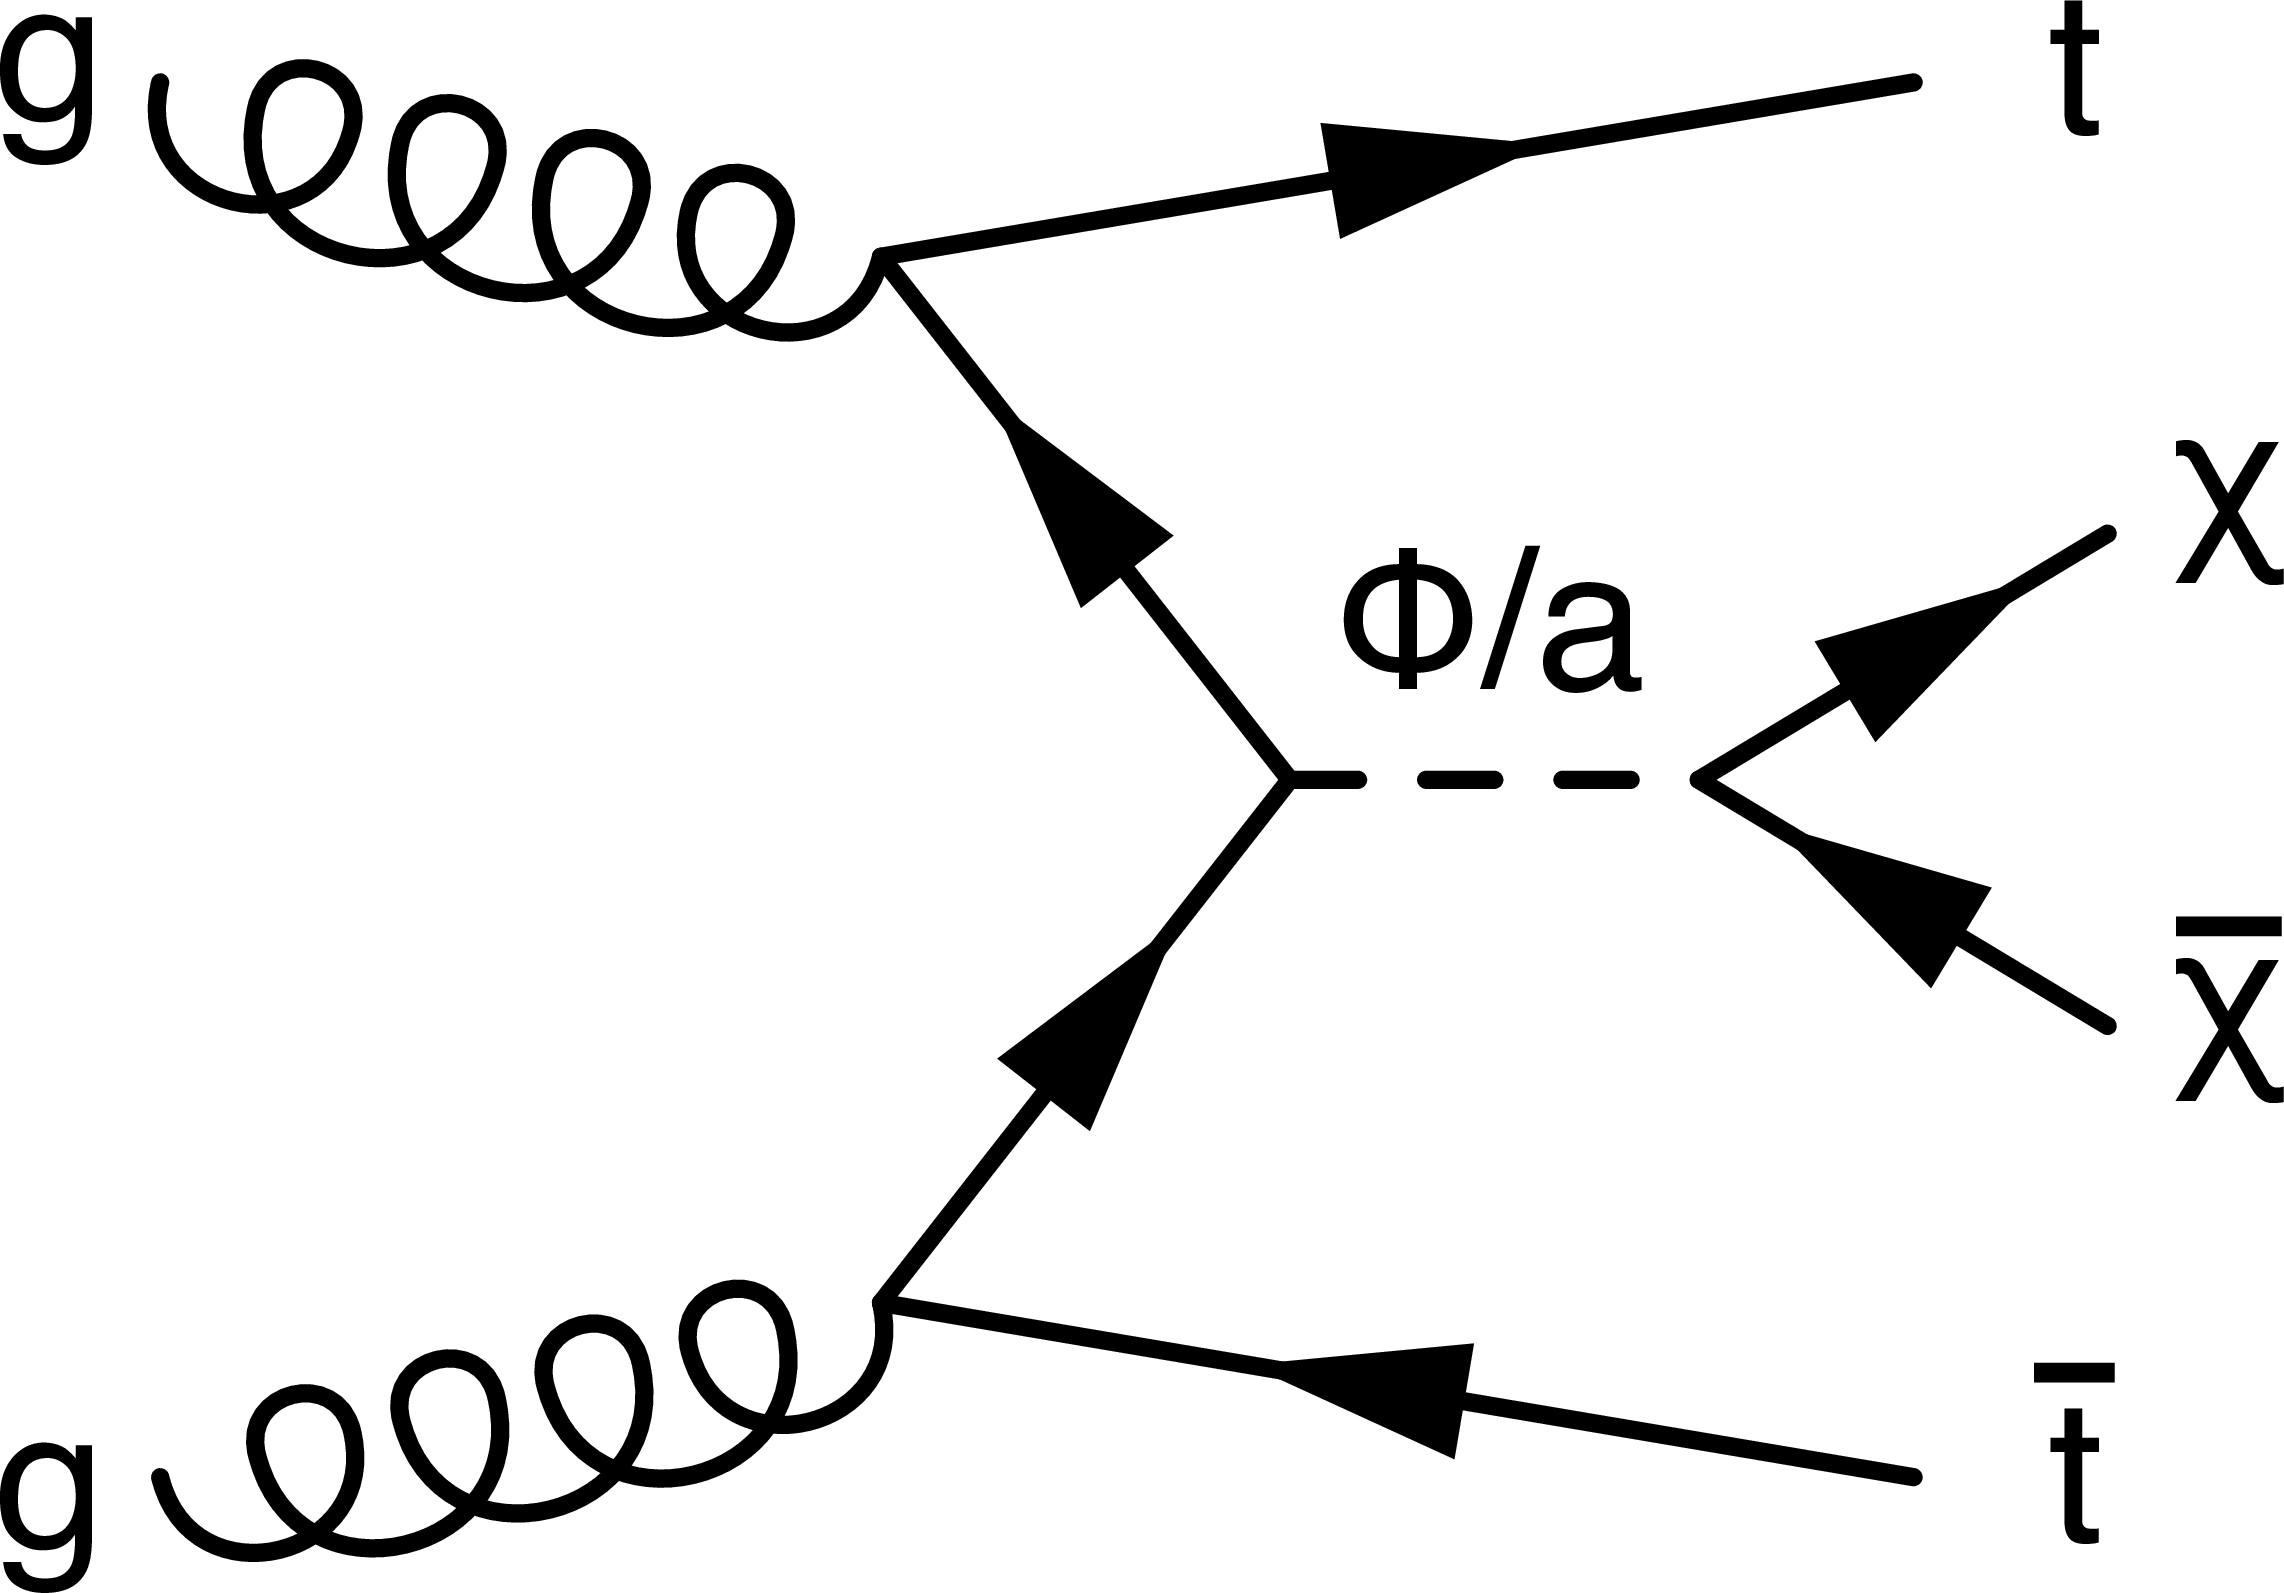
Figure 2:
Feynman diagram of direct DM production through a scalar ($\phi $) or pseudoscalar (a) mediator particle, in association with a top quark pair. |

png pdf |
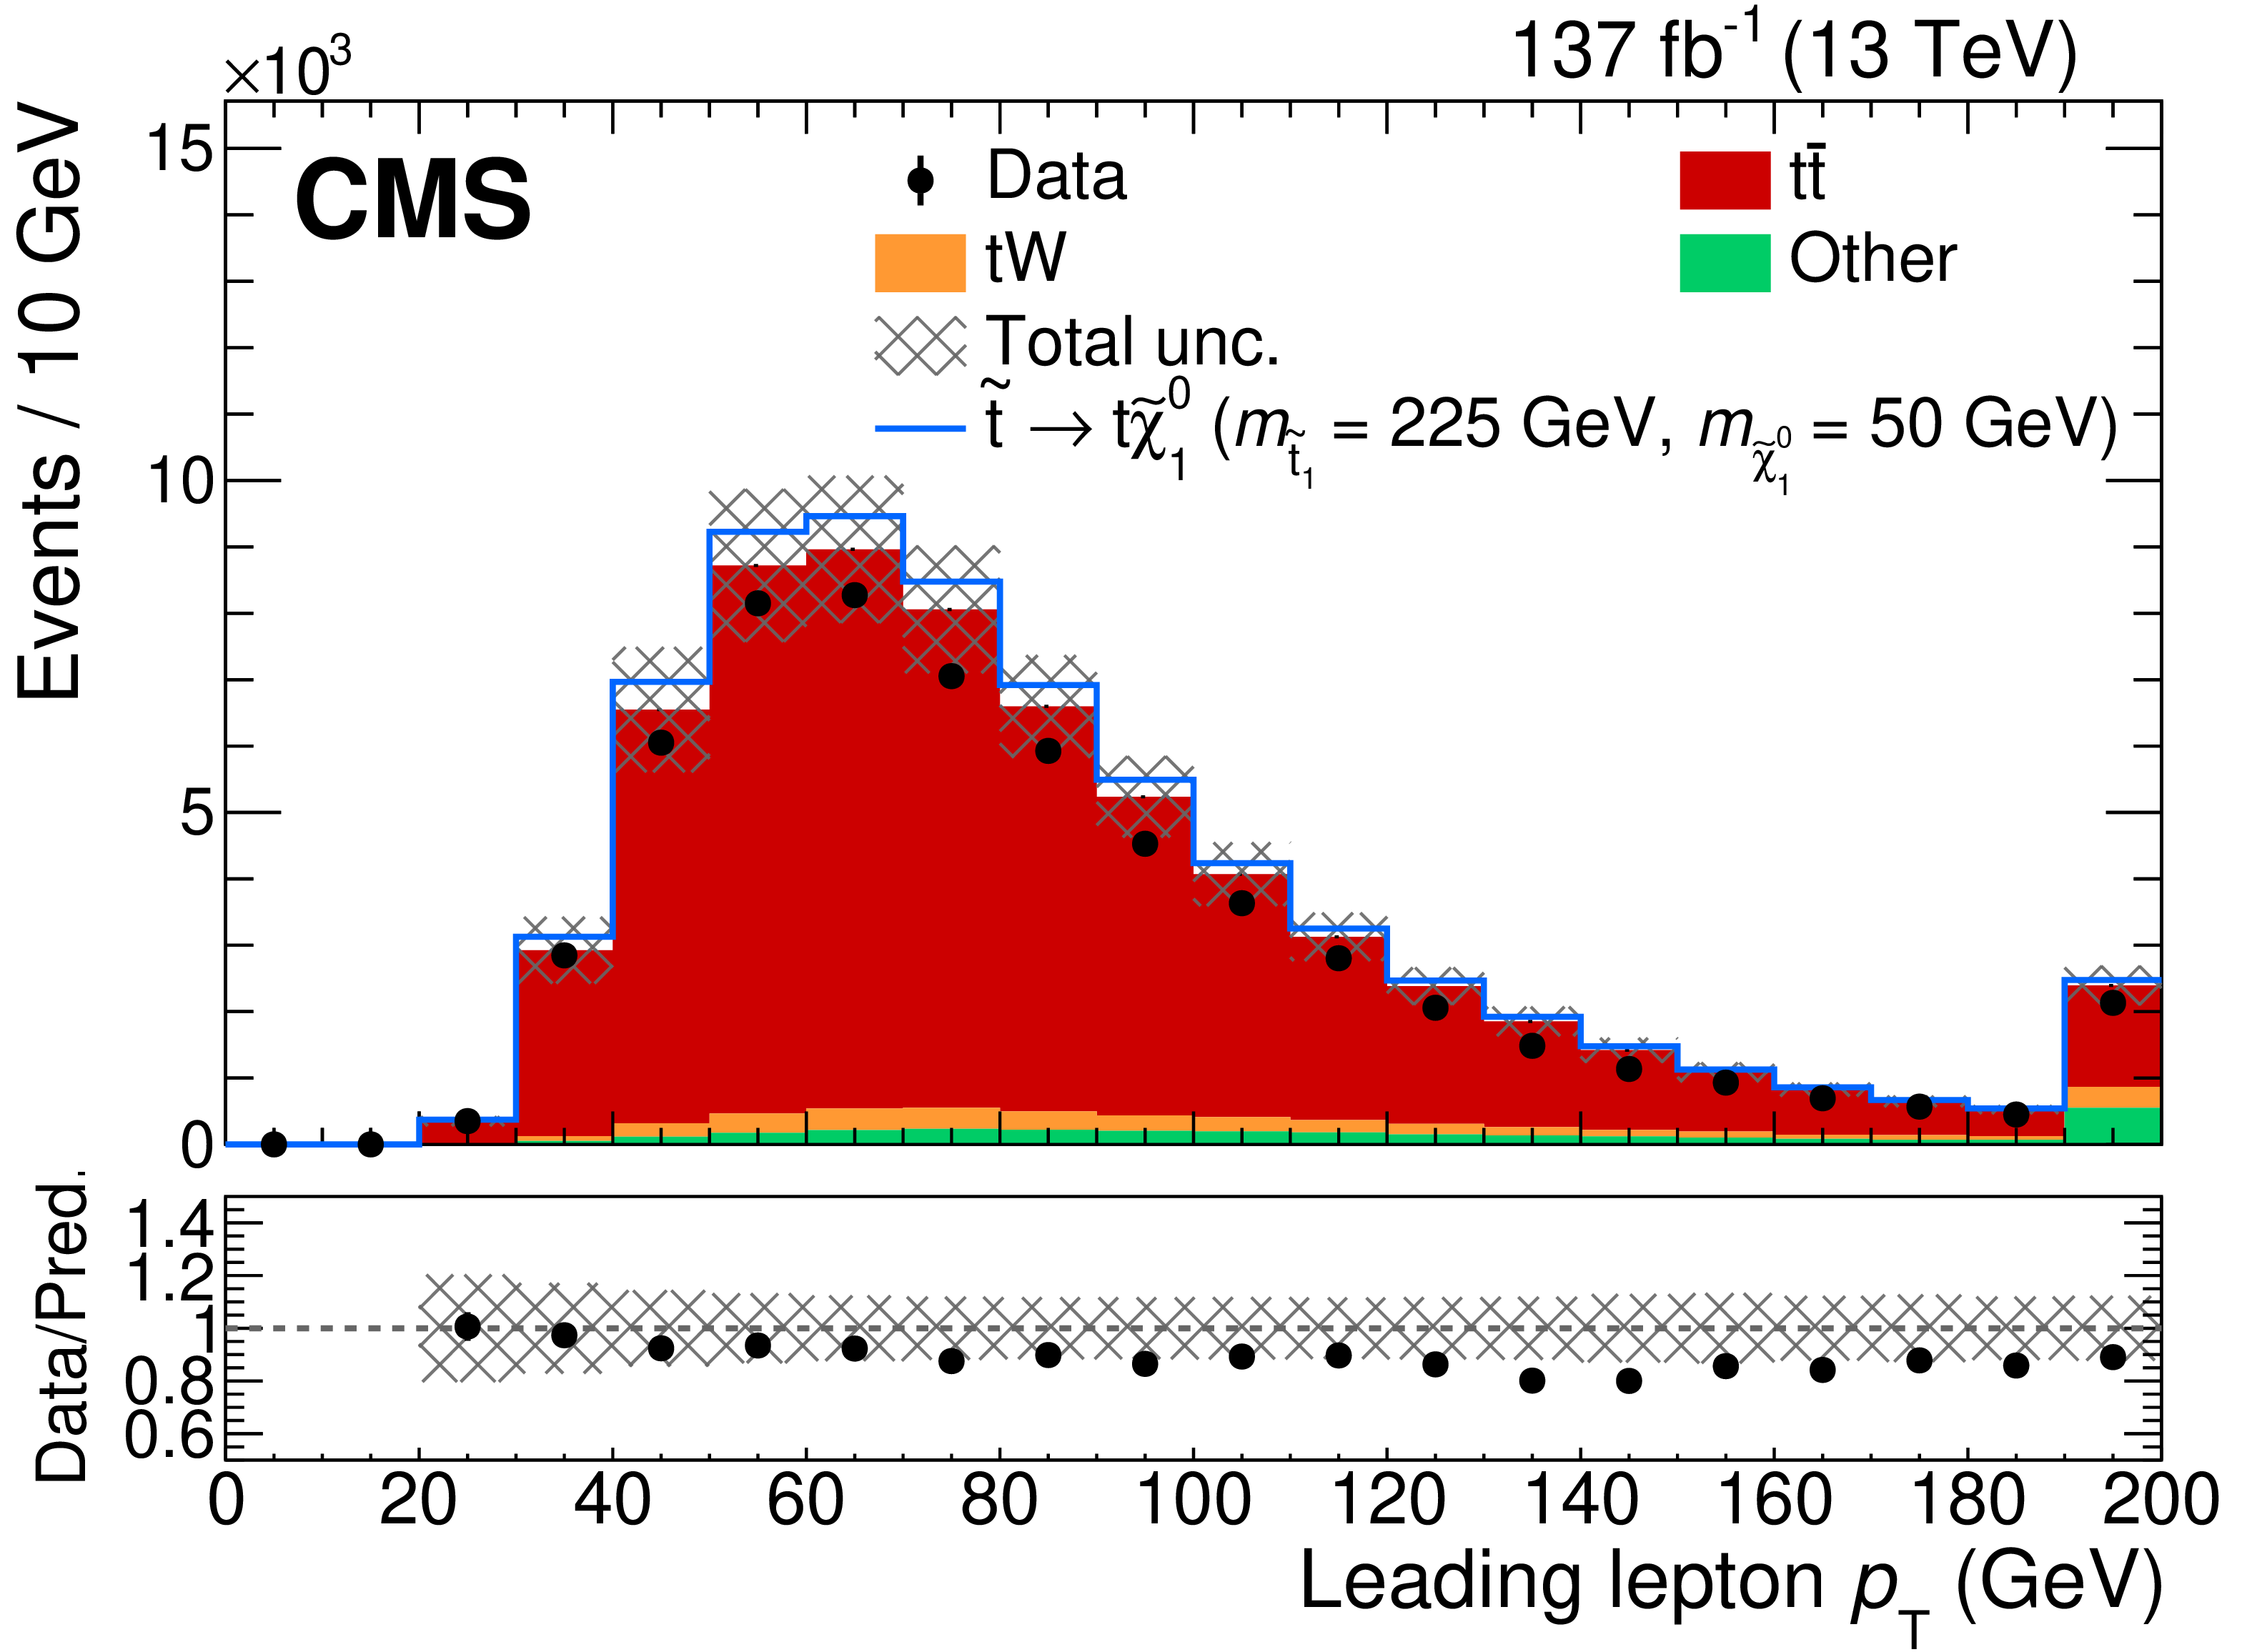
Figure 3:
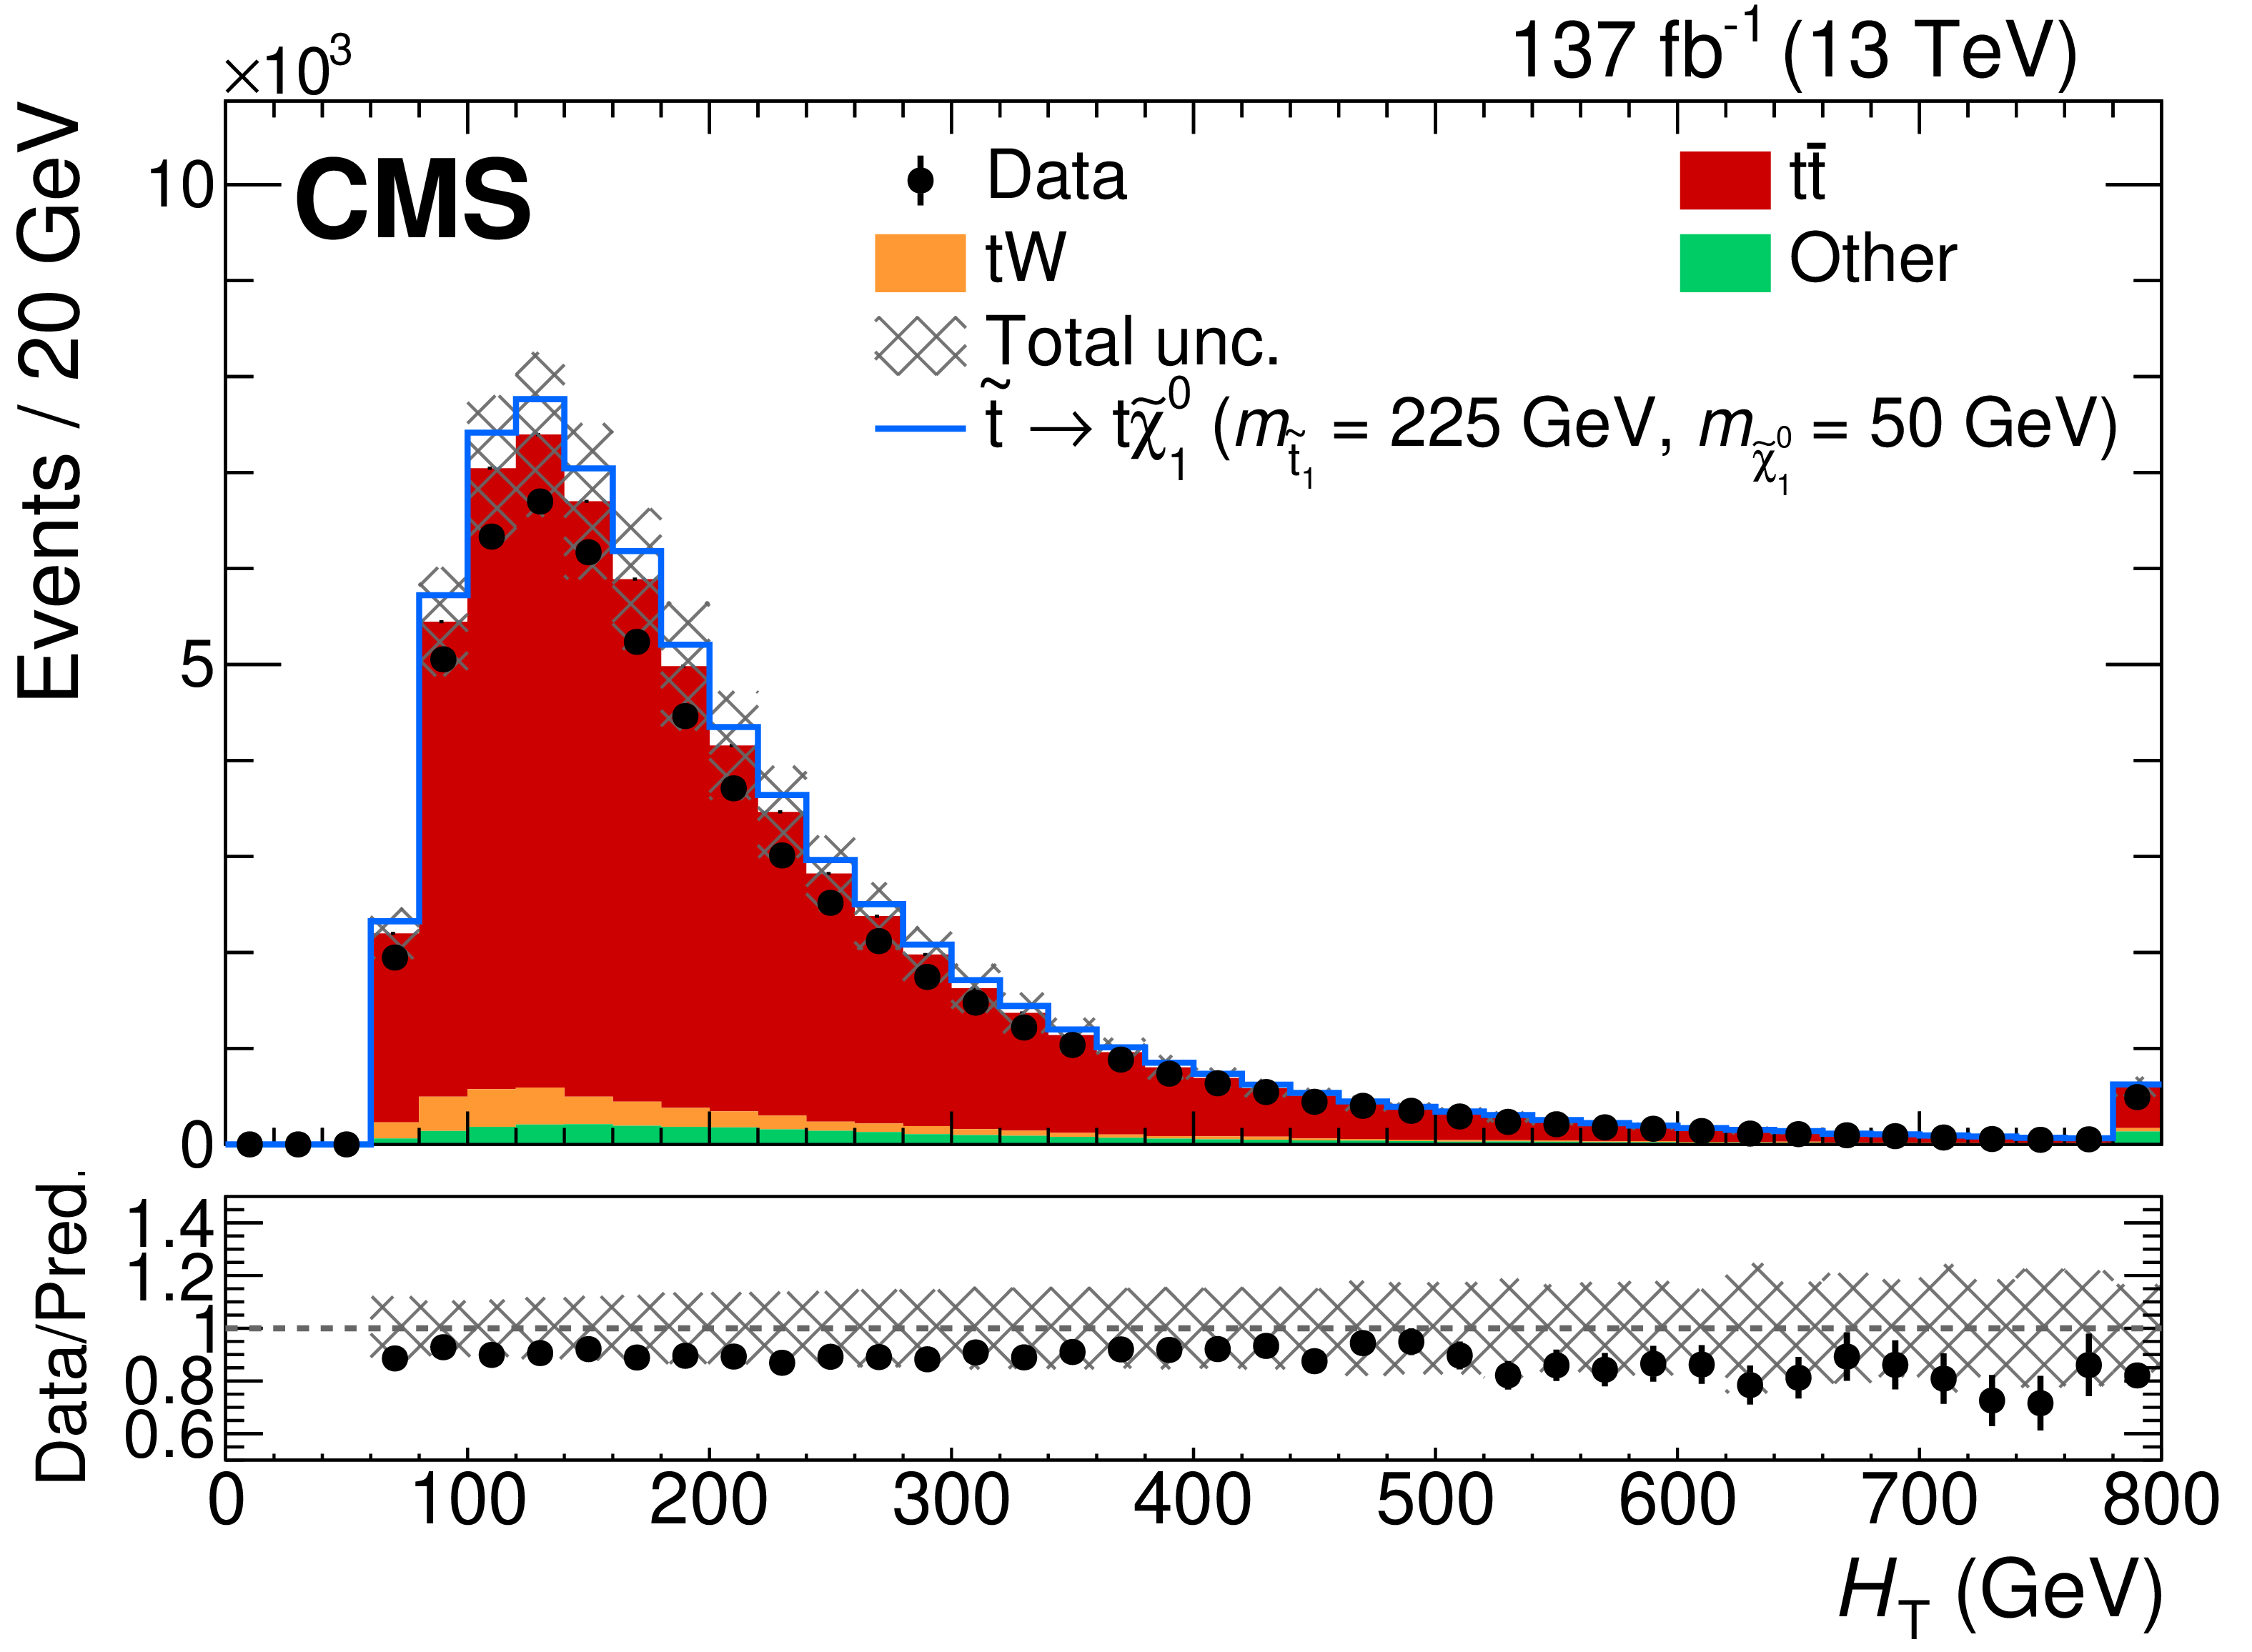
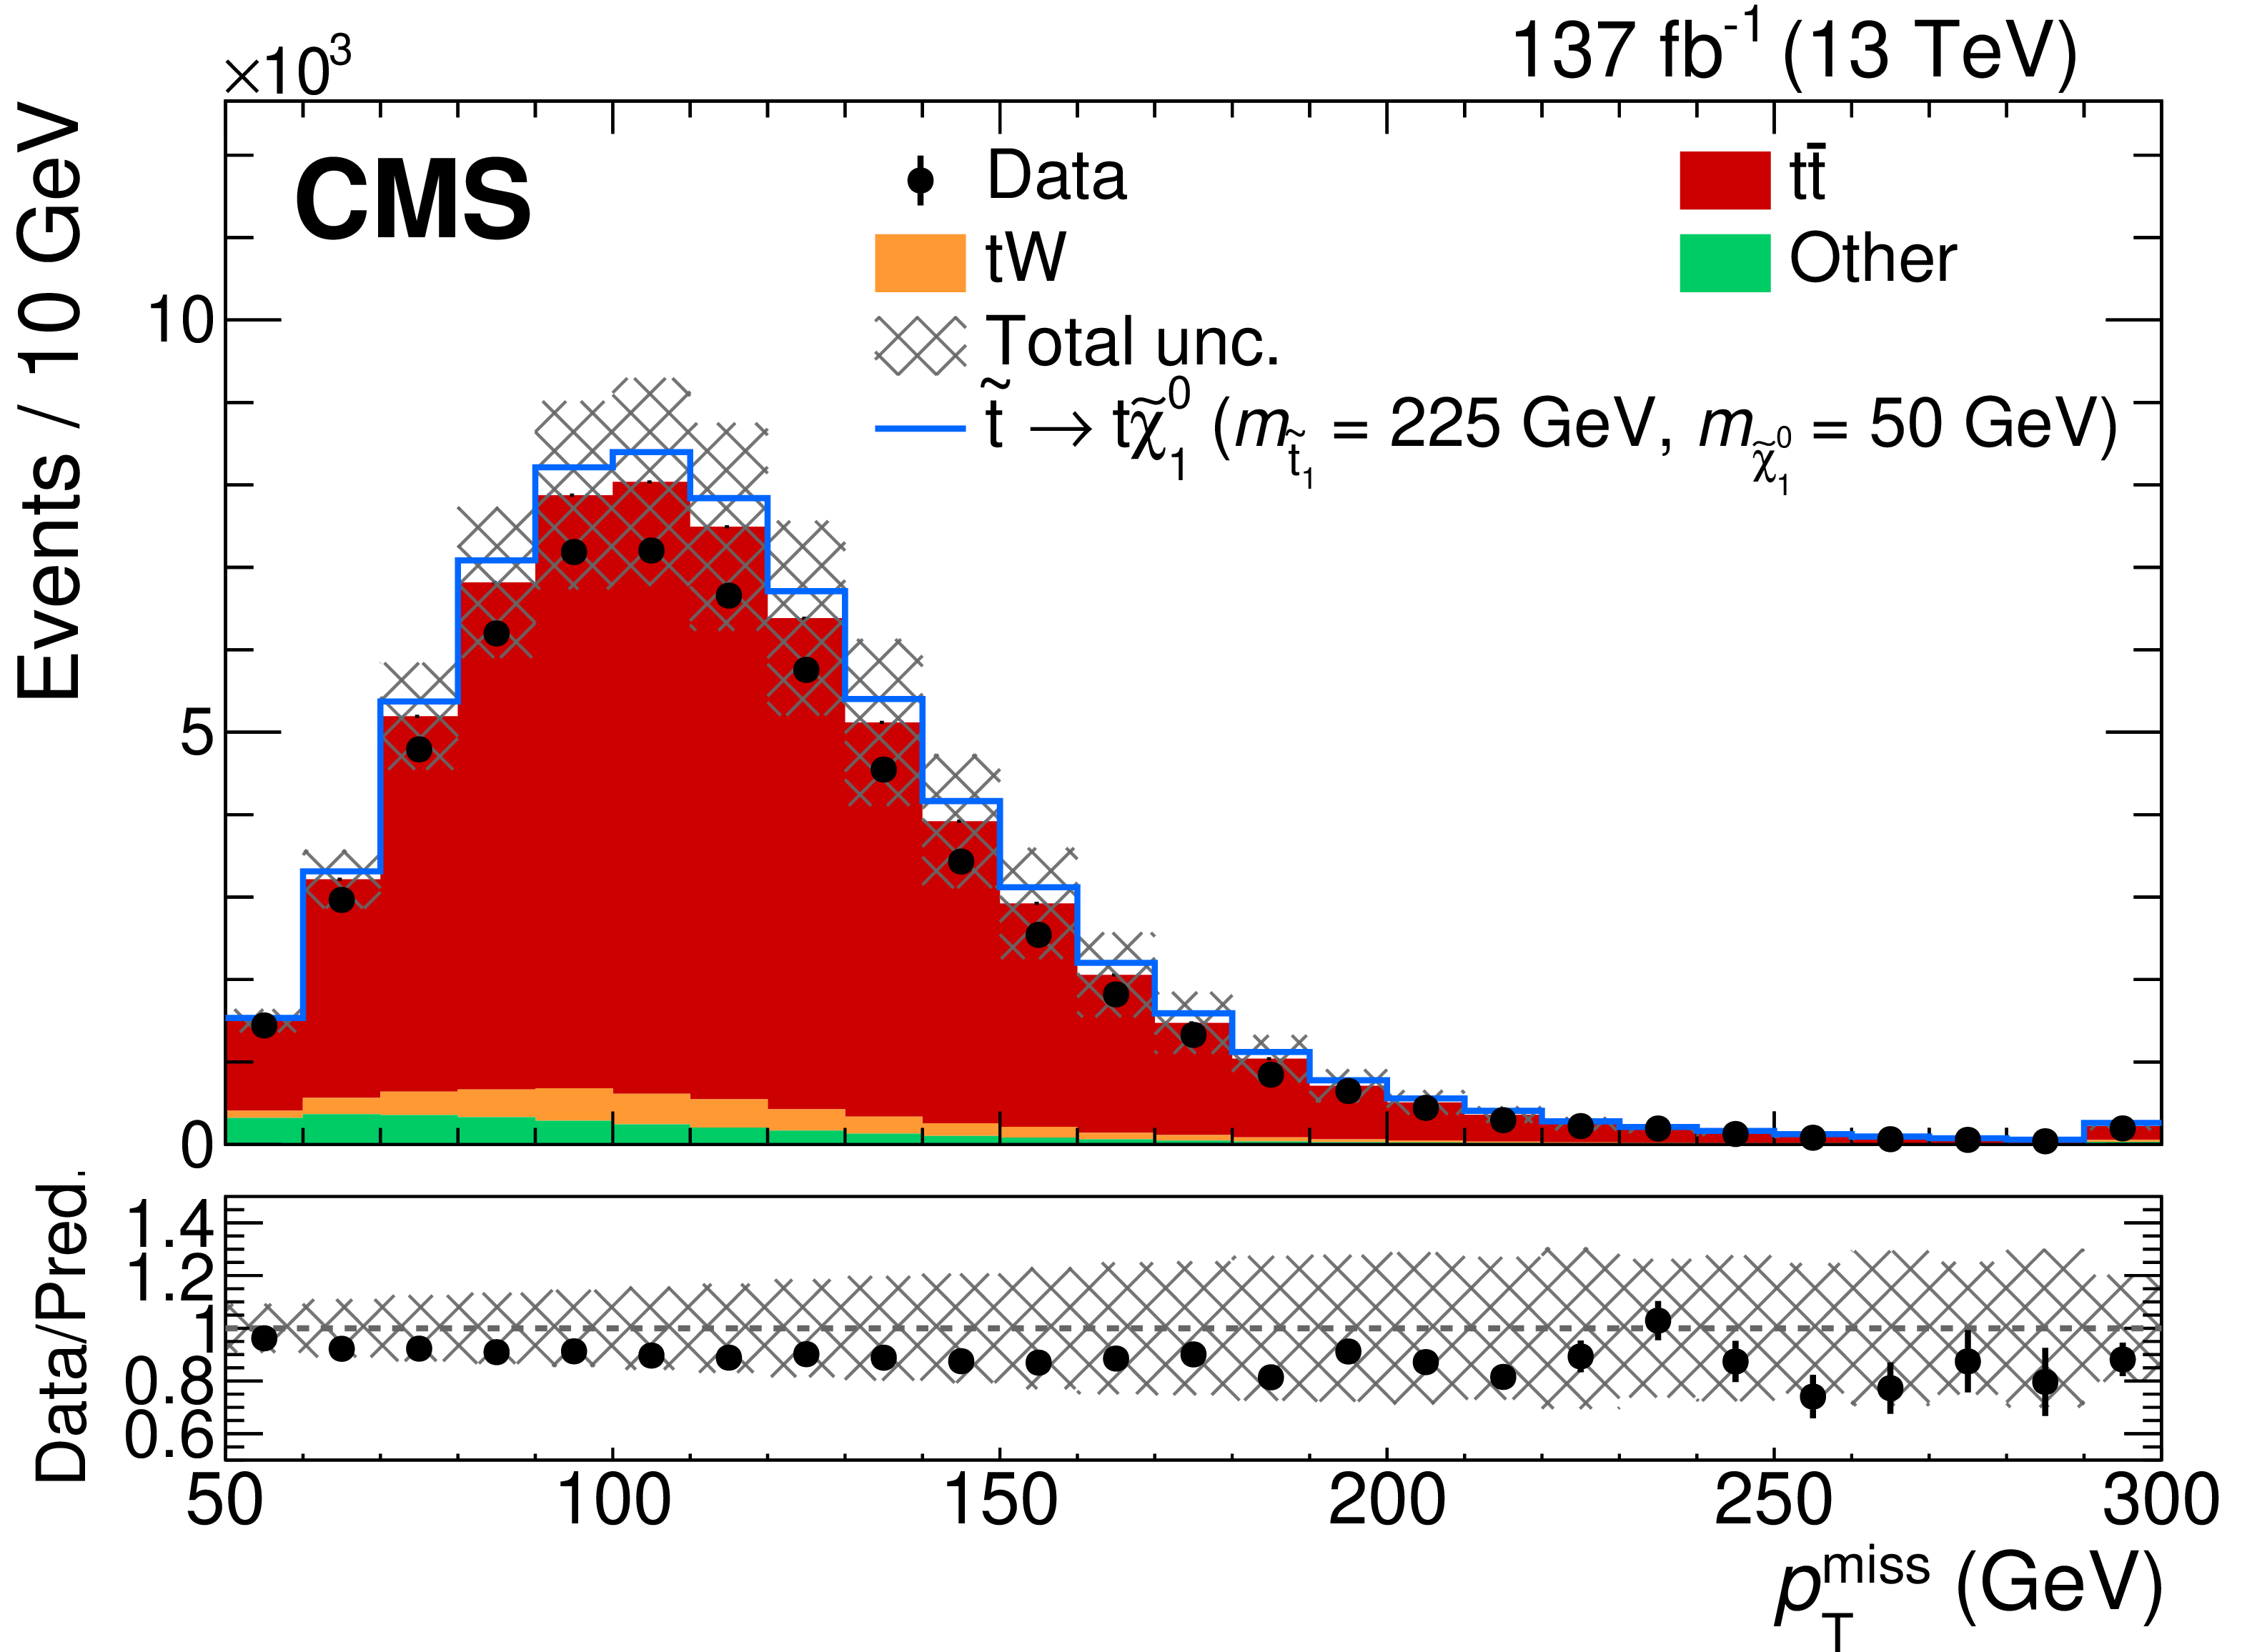
Distributions of data and MC events in the signal region with the signal stacked on above the background prediction for a mass hypothesis of $ {{m}_{\tilde{\mathrm{t}}_{1}}} = $ 225 GeV and $ {{m}_{\tilde{\chi}^0_1}} = $ 50 GeV. Events from ${\mathrm{t} {}\mathrm{\bar{t}}} \mathrm{W} $, ${\mathrm{t} {}\mathrm{\bar{t}}} \mathrm{Z} $, DY, nonprompt leptons, and diboson processes are grouped into the 'Other' category. The lower panel contains the data-to-SM prediction ratio. The uncertainty band includes statistical, background normalization and all systematic uncertainties described in Section 6.4. From upper left to lower right: leading lepton $ {p_{\mathrm {T}}} $, $ {{m_{\mathrm {T2}}} (\ell \ell)} $, ${H_{\mathrm {T}}}$, and $ {{p_{\mathrm {T}}} ^\text {miss}} $. |
png pdf |
Figure 3-a:
Distribution of the leading lepton $ {p_{\mathrm {T}}} $ for data and MC events in the signal region with the signal stacked on above the background prediction for a mass hypothesis of $ {{m}_{\tilde{\mathrm{t}}_{1}}} = $ 225 GeV and $ {{m}_{\tilde{\chi}^0_1}} = $ 50 GeV. Events from ${\mathrm{t} {}\mathrm{\bar{t}}} \mathrm{W} $, ${\mathrm{t} {}\mathrm{\bar{t}}} \mathrm{Z} $, DY, nonprompt leptons, and diboson processes are grouped into the 'Other' category. The lower panel contains the data-to-SM prediction ratio. The uncertainty band includes statistical, background normalization and all systematic uncertainties described in Section 6.4. |

png pdf |
Figure 3-b:
Distribution of $ {{m_{\mathrm {T2}}} (\ell \ell)} $ for data and MC events in the signal region with the signal stacked on above the background prediction for a mass hypothesis of $ {{m}_{\tilde{\mathrm{t}}_{1}}} = $ 225 GeV and $ {{m}_{\tilde{\chi}^0_1}} = $ 50 GeV. Events from ${\mathrm{t} {}\mathrm{\bar{t}}} \mathrm{W} $, ${\mathrm{t} {}\mathrm{\bar{t}}} \mathrm{Z} $, DY, nonprompt leptons, and diboson processes are grouped into the 'Other' category. The lower panel contains the data-to-SM prediction ratio. The uncertainty band includes statistical, background normalization and all systematic uncertainties described in Section 6.4. |
png pdf |
Figure 3-c:
Distribution of ${H_{\mathrm {T}}}$ for data and MC events in the signal region with the signal stacked on above the background prediction for a mass hypothesis of $ {{m}_{\tilde{\mathrm{t}}_{1}}} = $ 225 GeV and $ {{m}_{\tilde{\chi}^0_1}} = $ 50 GeV. Events from ${\mathrm{t} {}\mathrm{\bar{t}}} \mathrm{W} $, ${\mathrm{t} {}\mathrm{\bar{t}}} \mathrm{Z} $, DY, nonprompt leptons, and diboson processes are grouped into the 'Other' category. The lower panel contains the data-to-SM prediction ratio. The uncertainty band includes statistical, background normalization and all systematic uncertainties described in Section 6.4. |
png pdf |
Figure 3-d:
Distribution of $ {{p_{\mathrm {T}}} ^\text {miss}} $ for data and MC events in the signal region with the signal stacked on above the background prediction for a mass hypothesis of $ {{m}_{\tilde{\mathrm{t}}_{1}}} = $ 225 GeV and $ {{m}_{\tilde{\chi}^0_1}} = $ 50 GeV. Events from ${\mathrm{t} {}\mathrm{\bar{t}}} \mathrm{W} $, ${\mathrm{t} {}\mathrm{\bar{t}}} \mathrm{Z} $, DY, nonprompt leptons, and diboson processes are grouped into the 'Other' category. The lower panel contains the data-to-SM prediction ratio. The uncertainty band includes statistical, background normalization and all systematic uncertainties described in Section 6.4. |
png pdf |
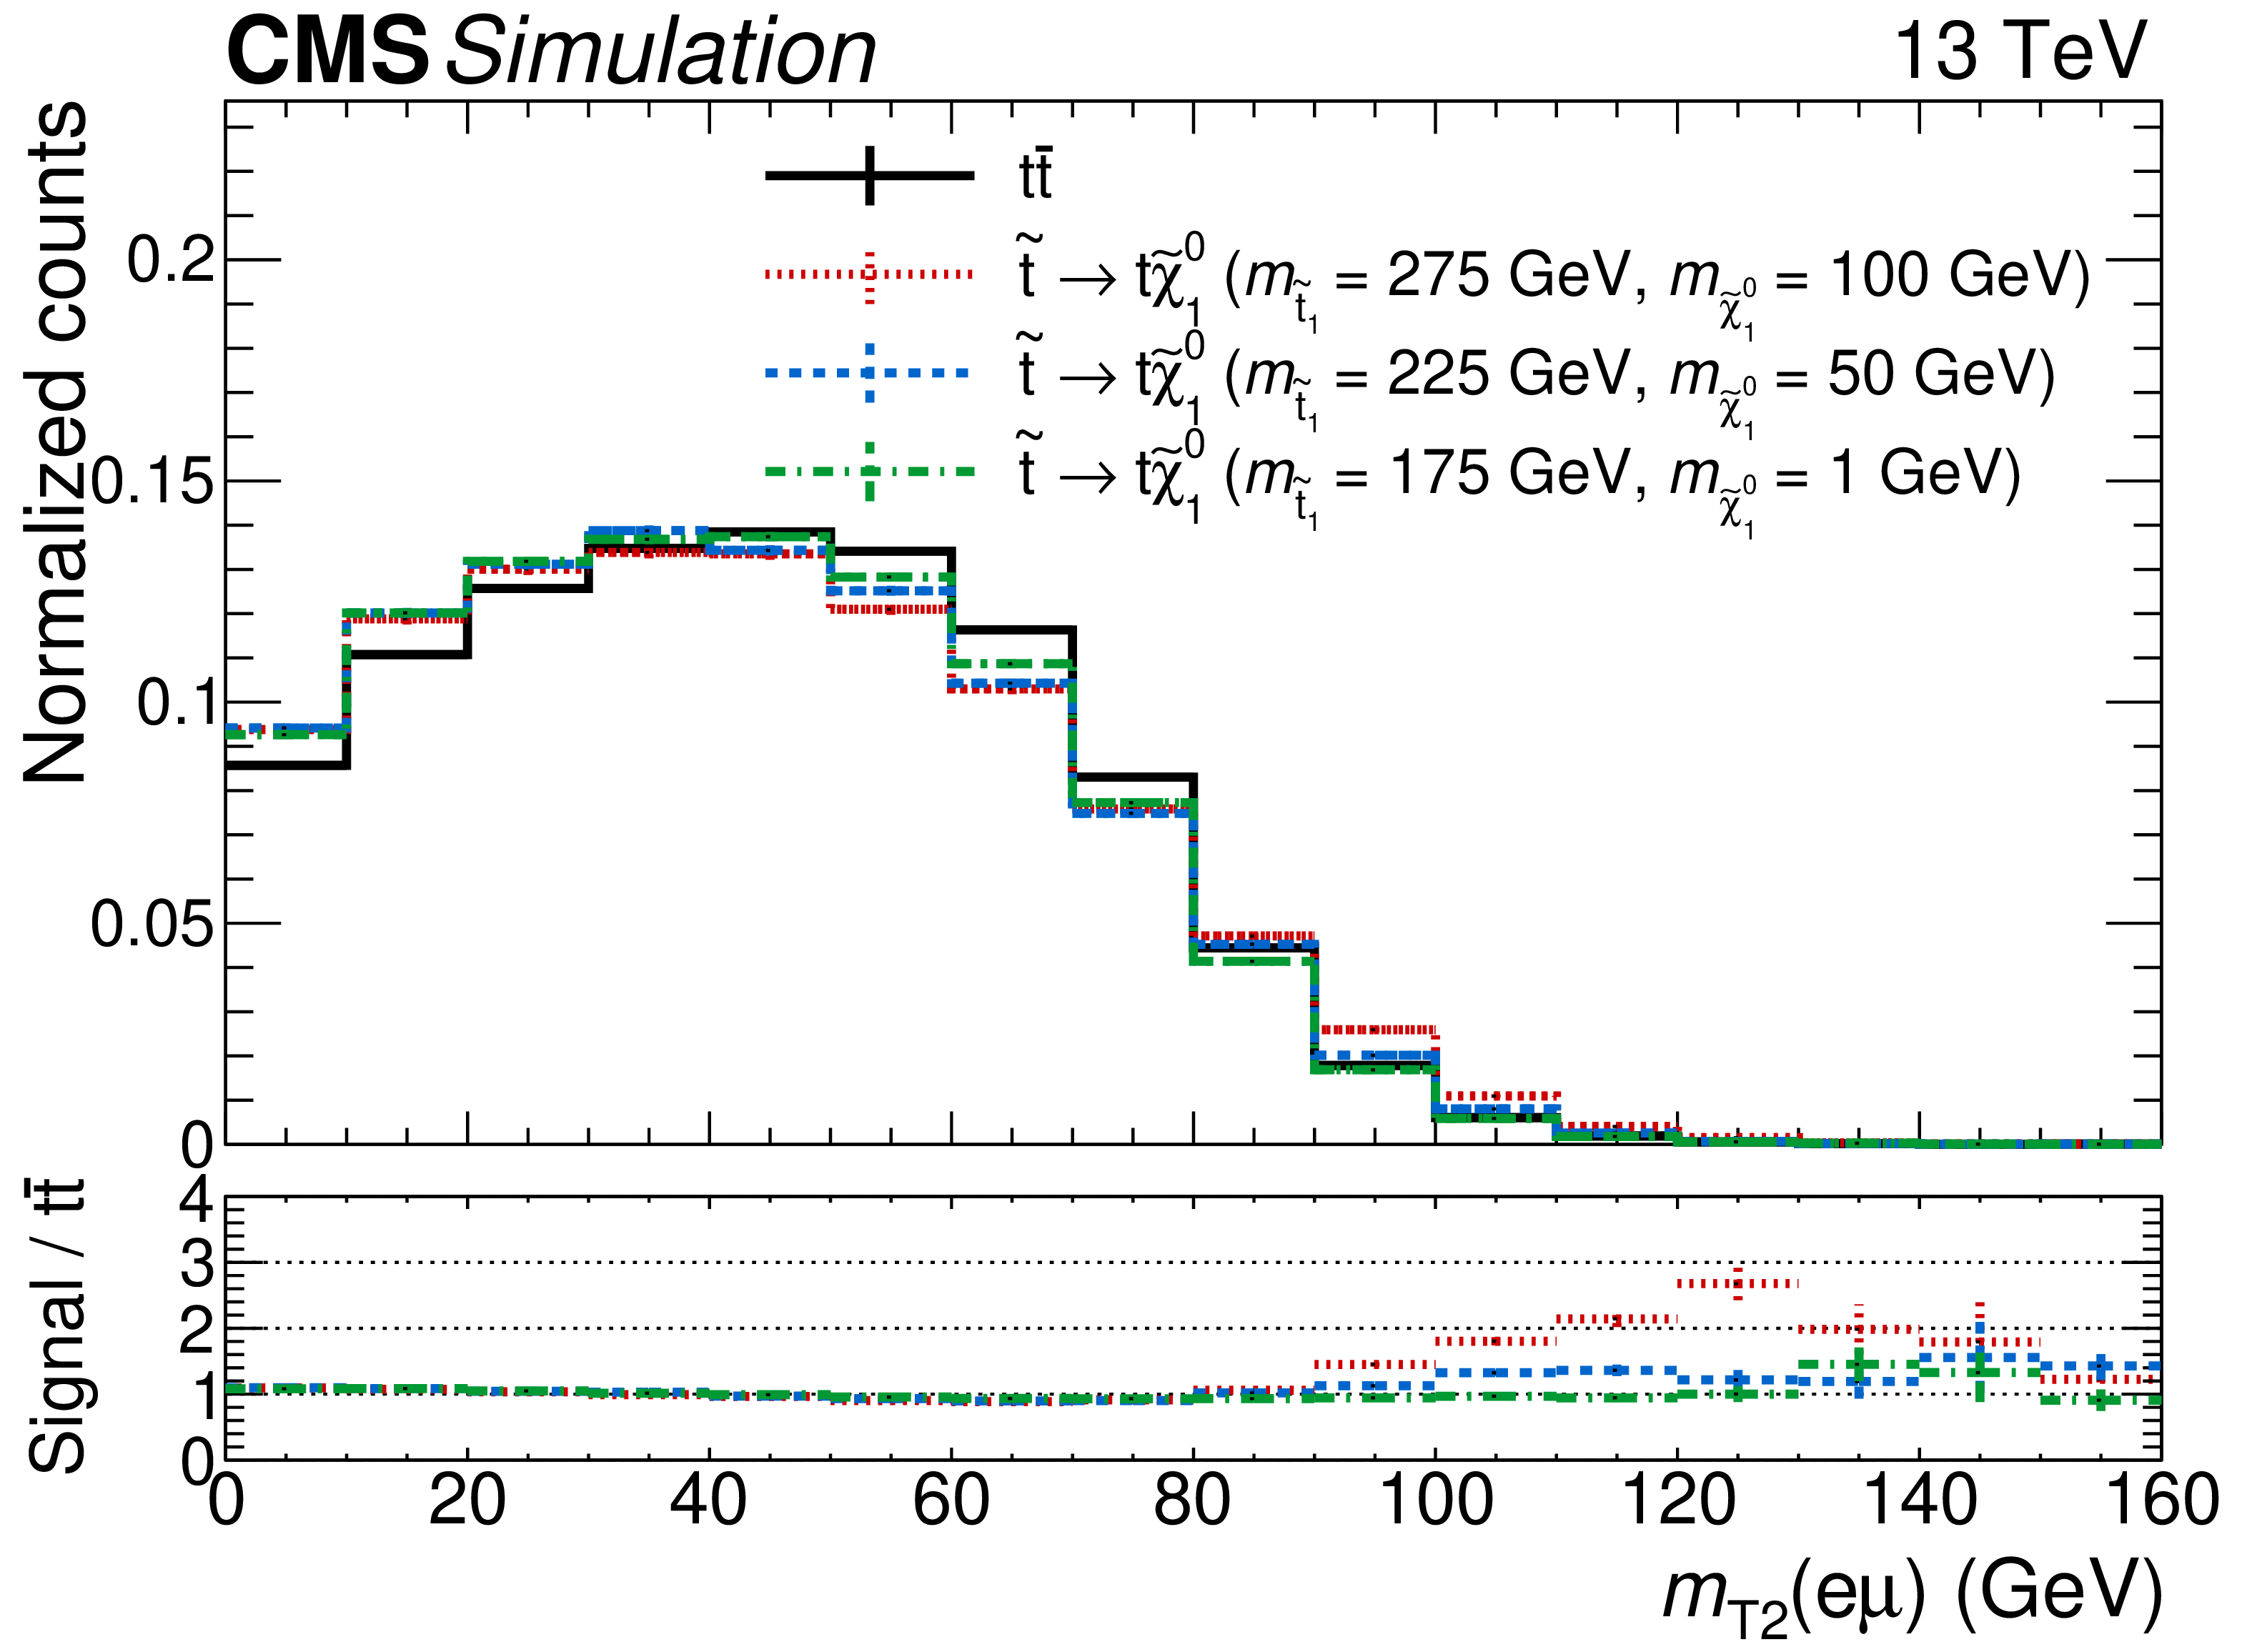
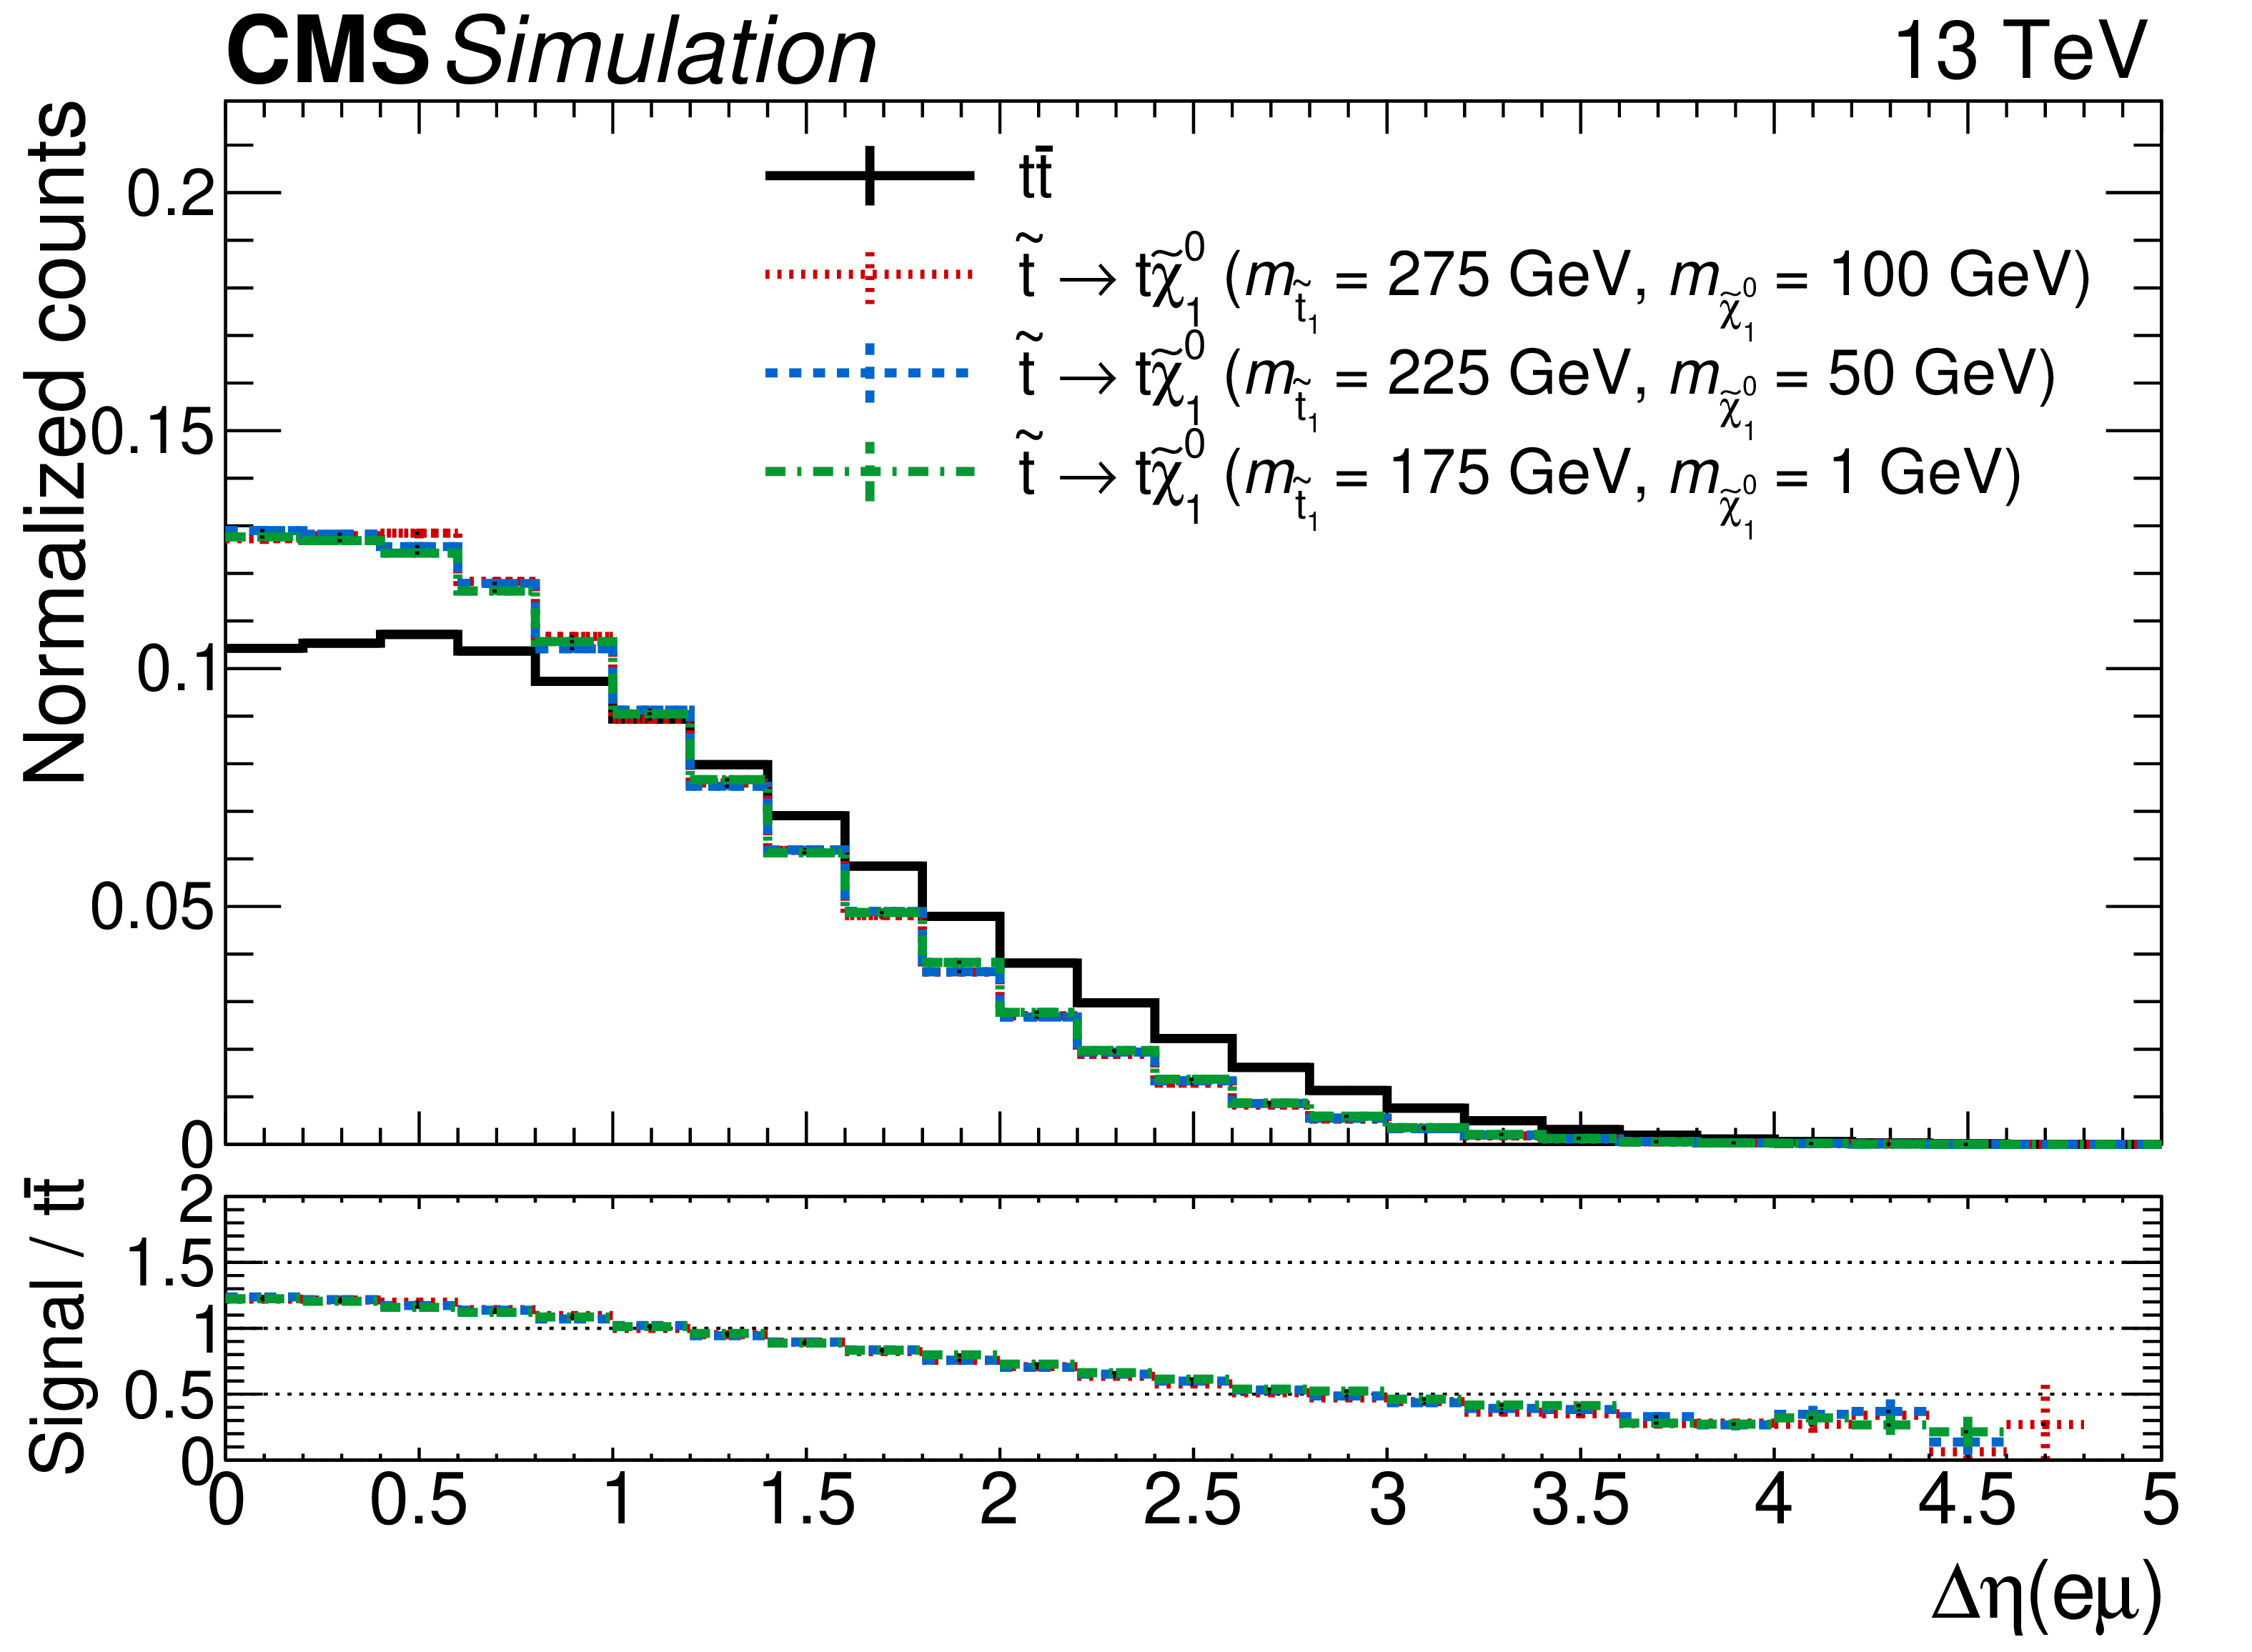
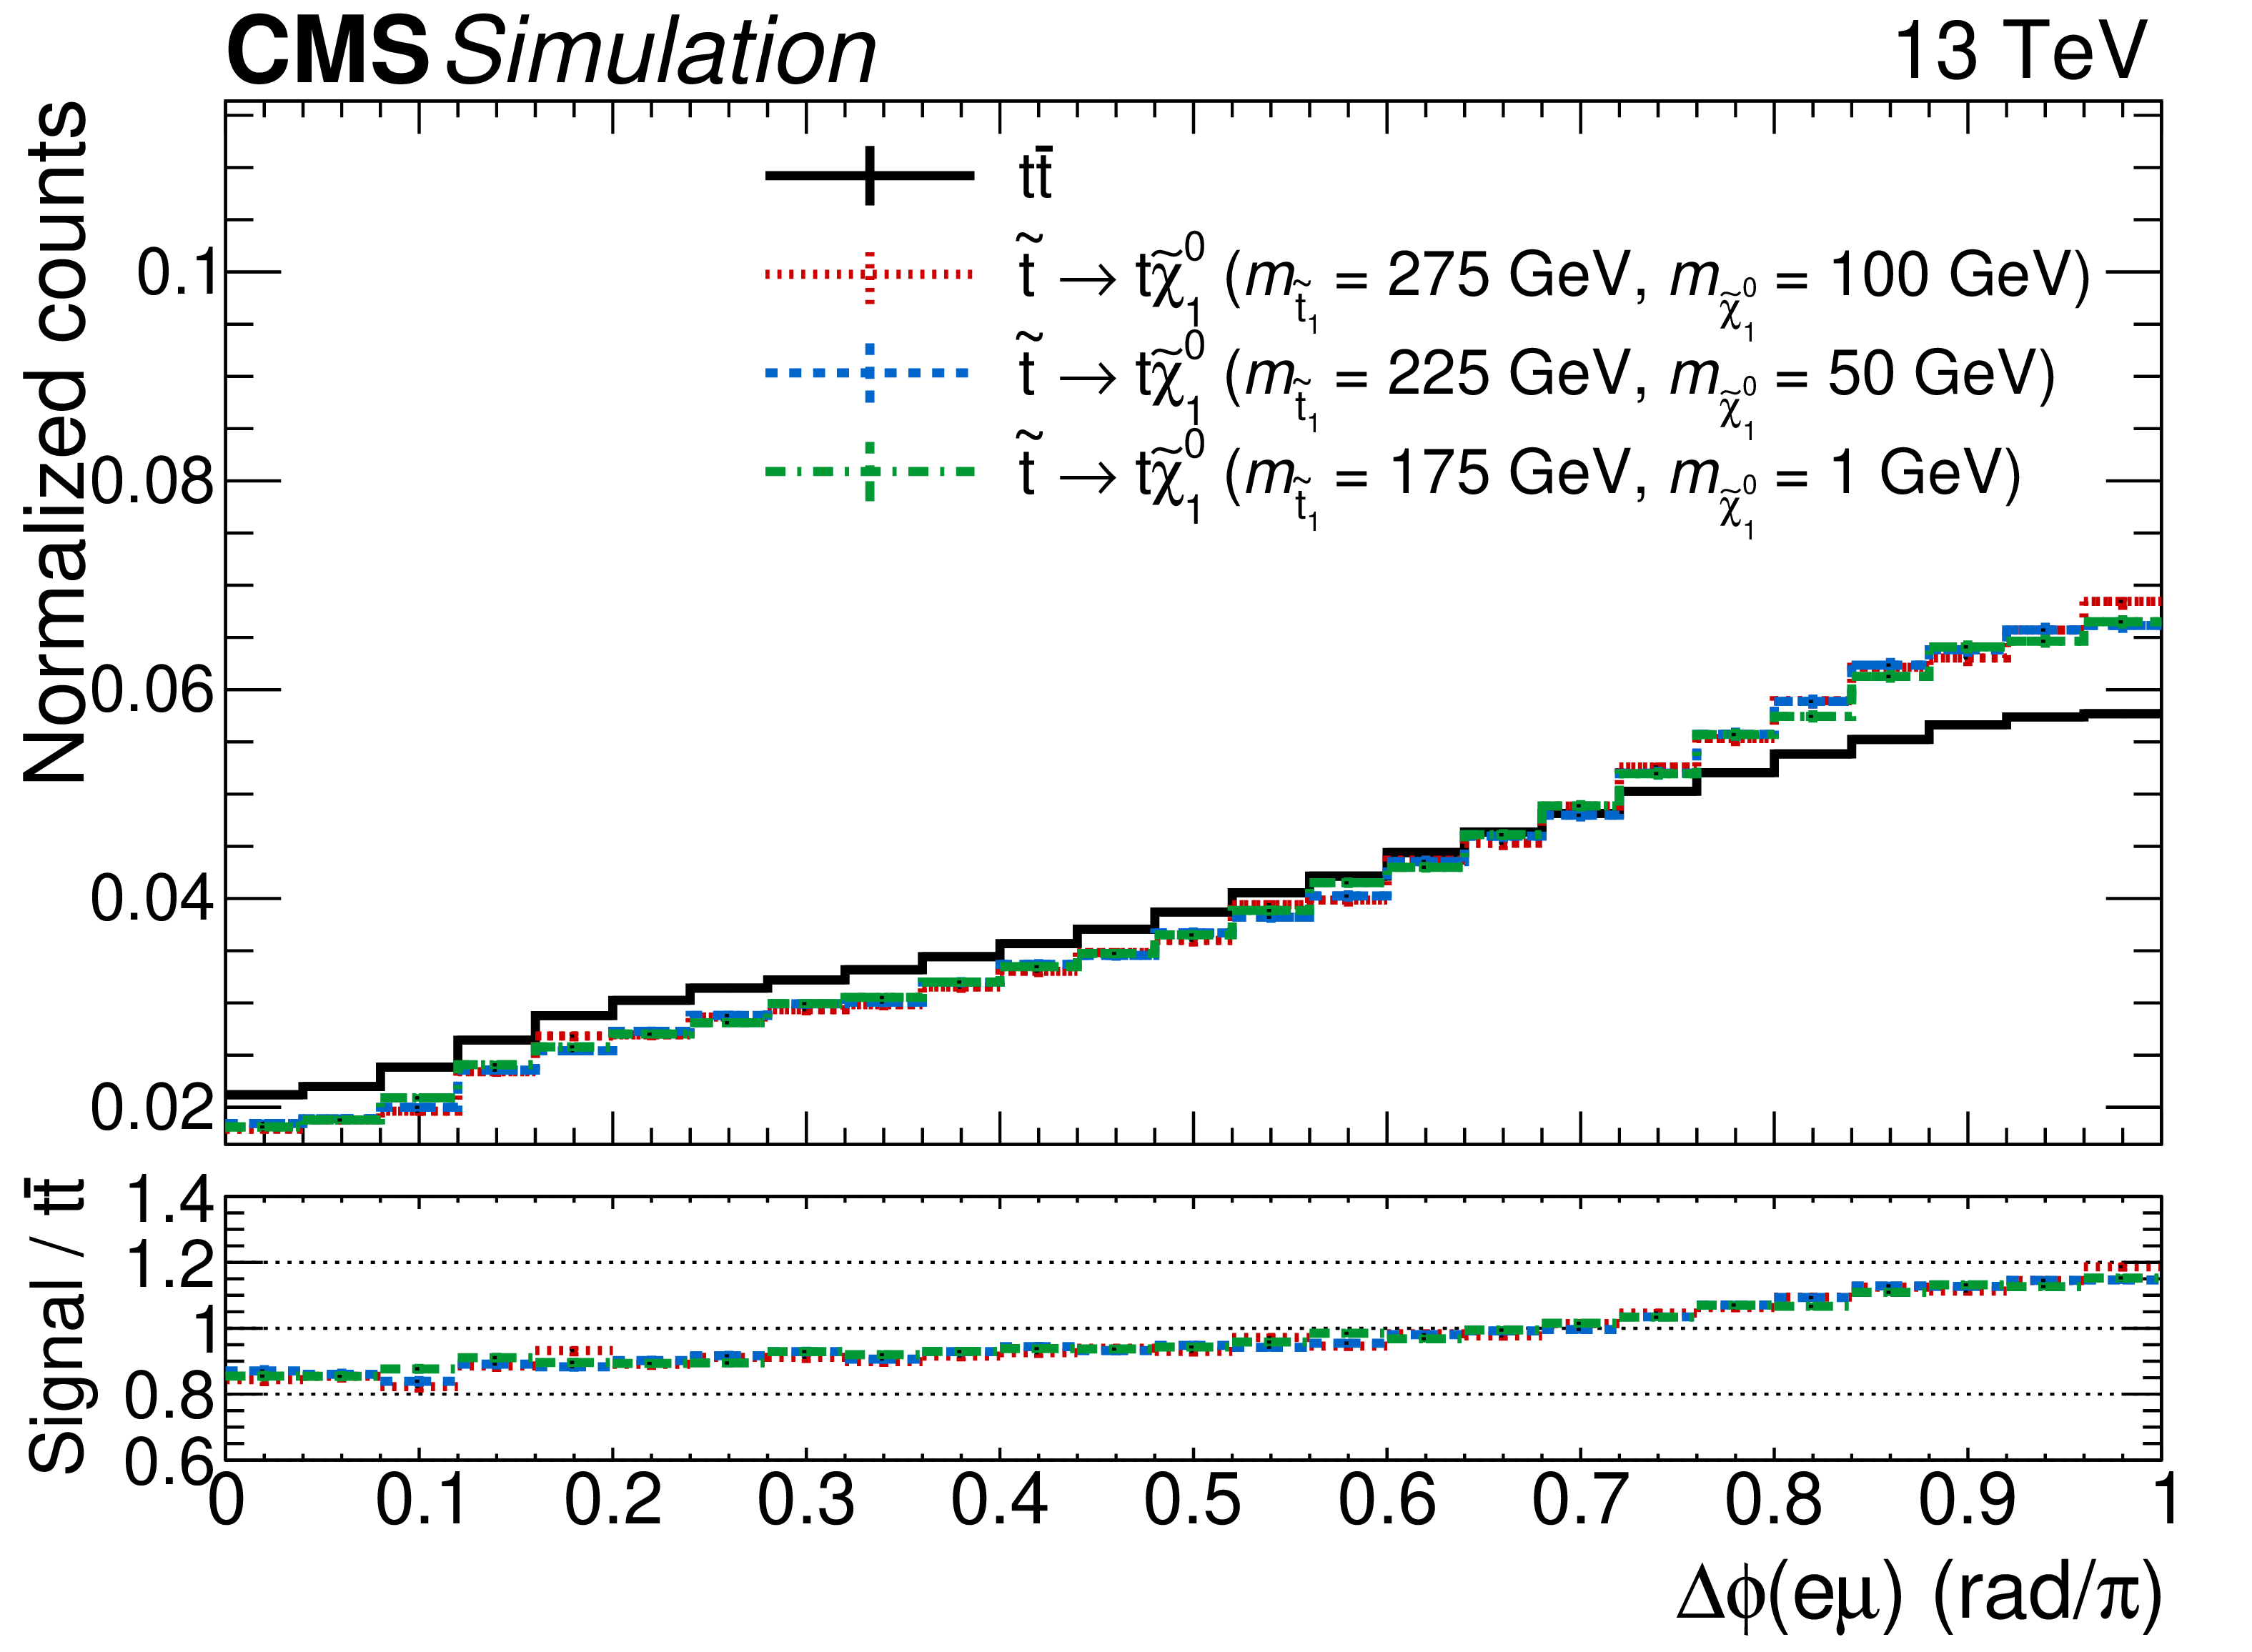
Figure 4:
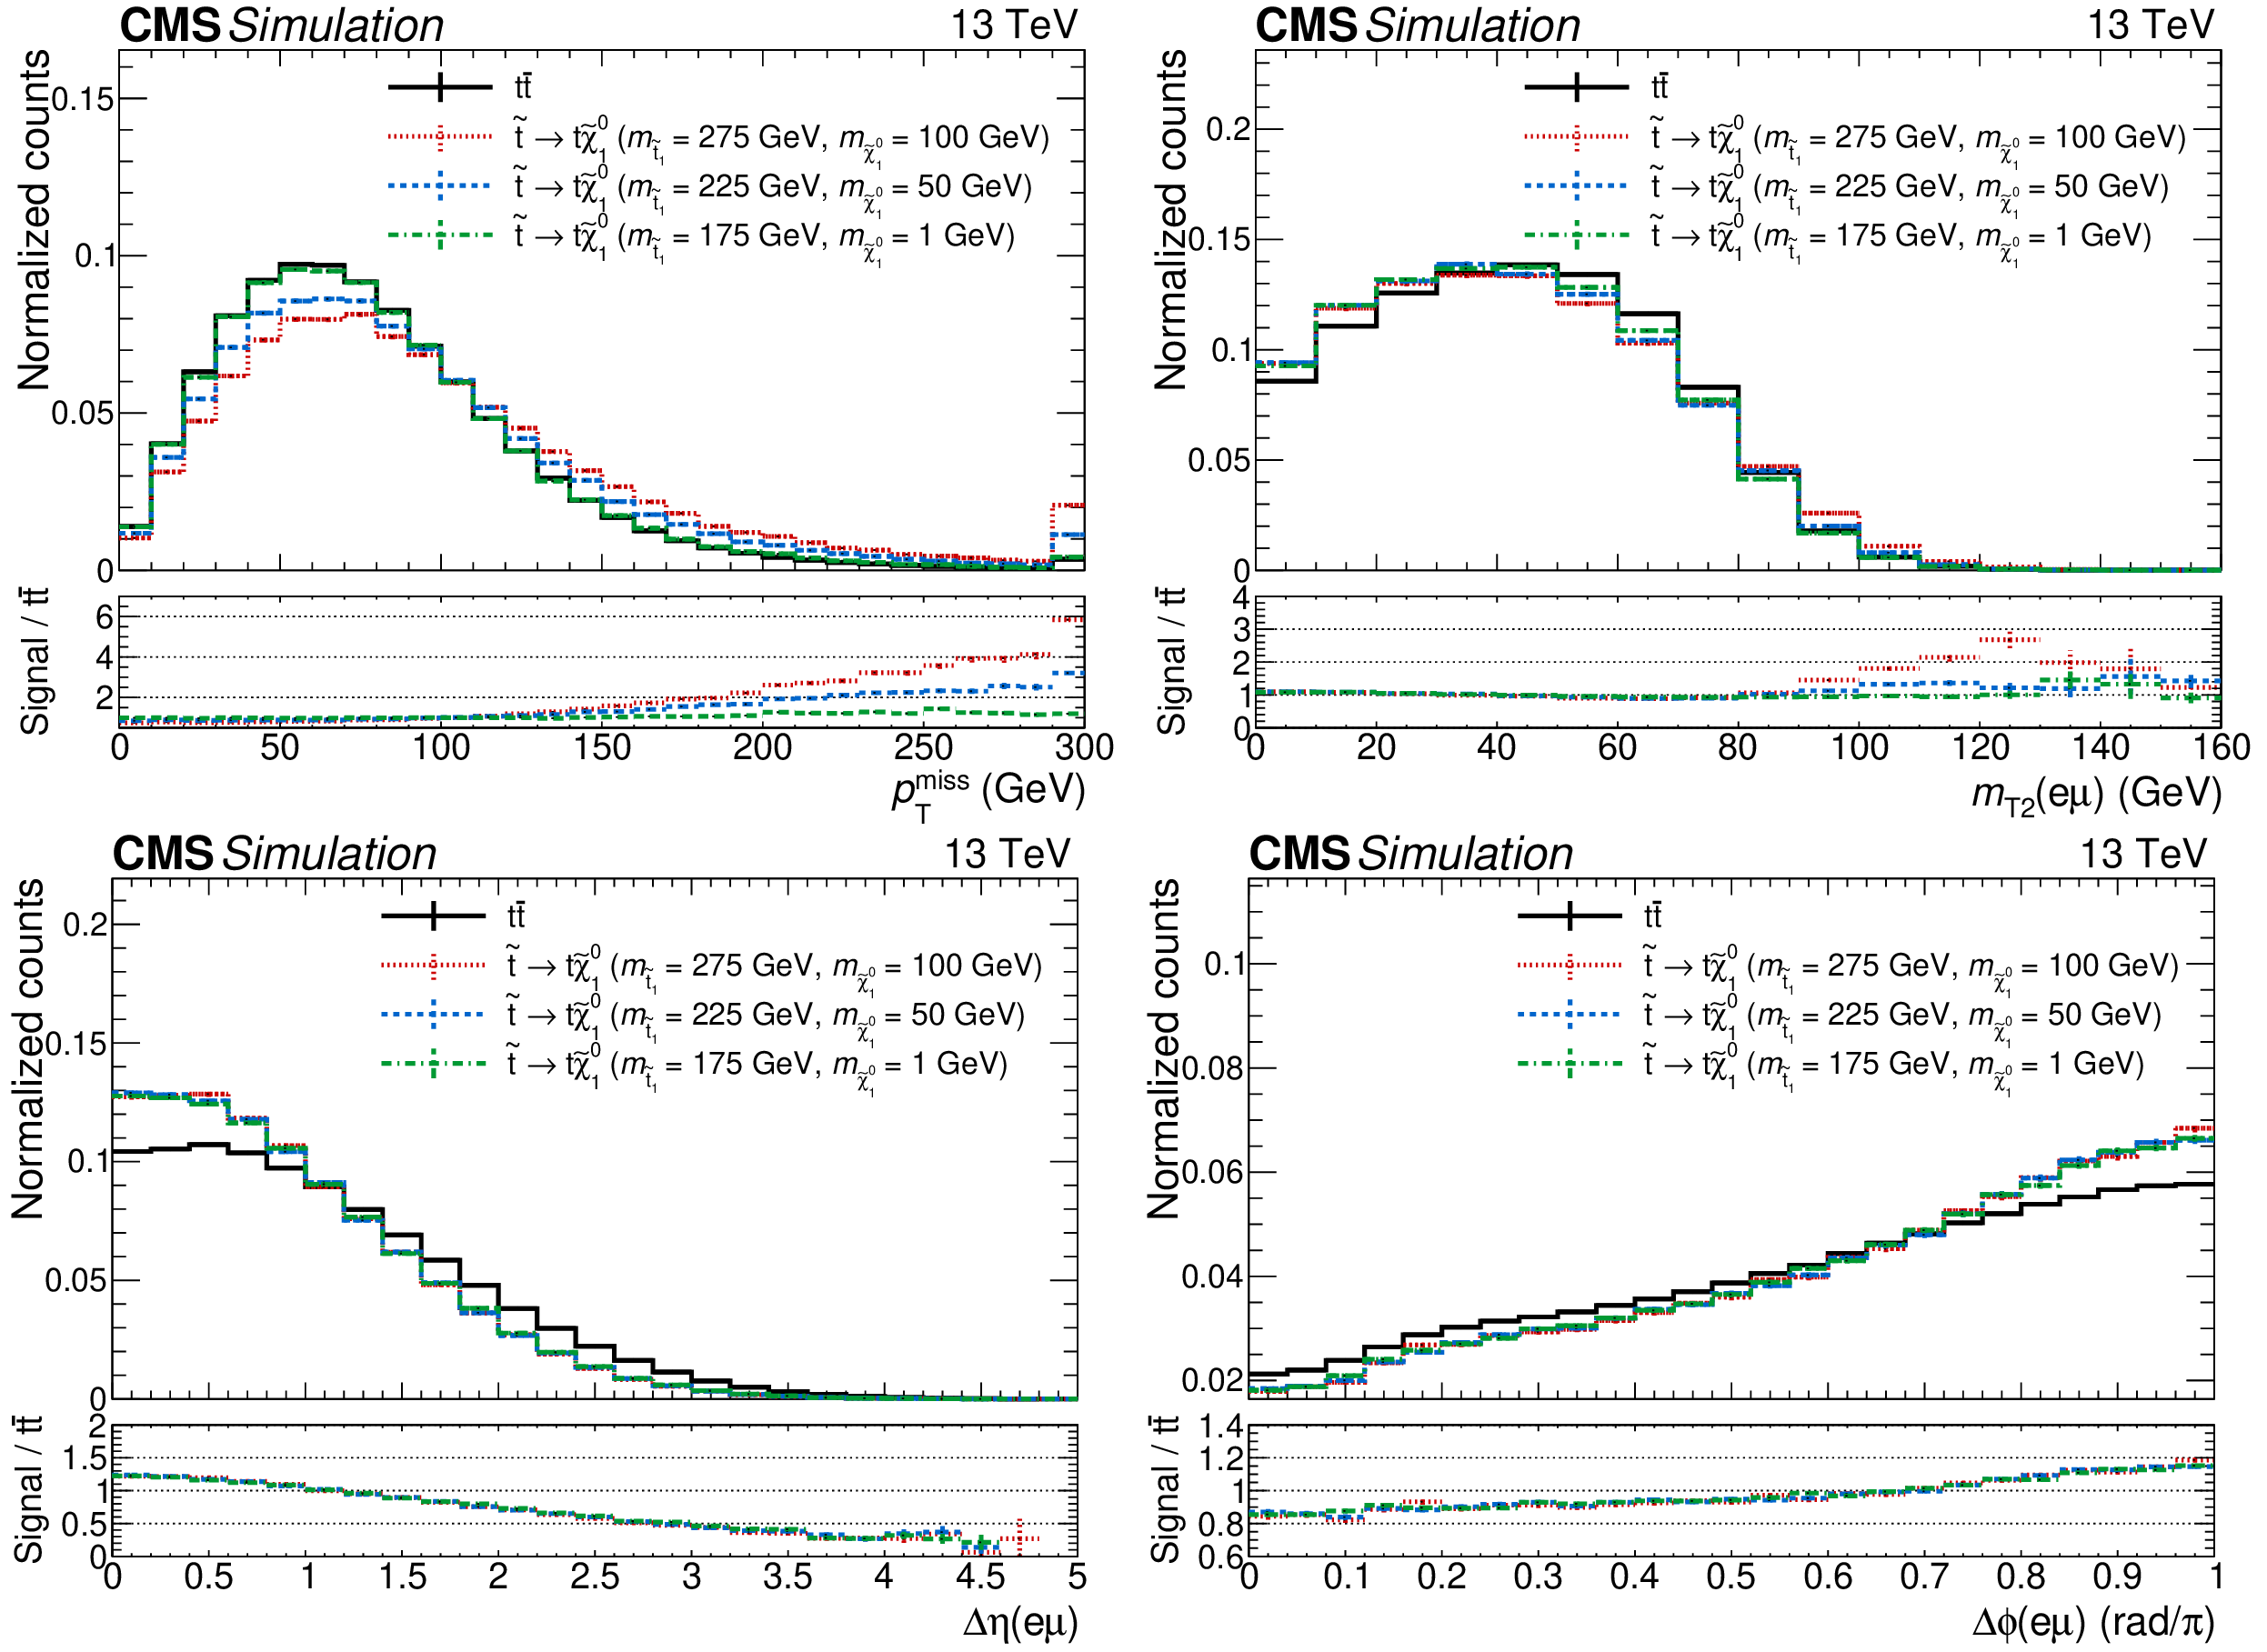
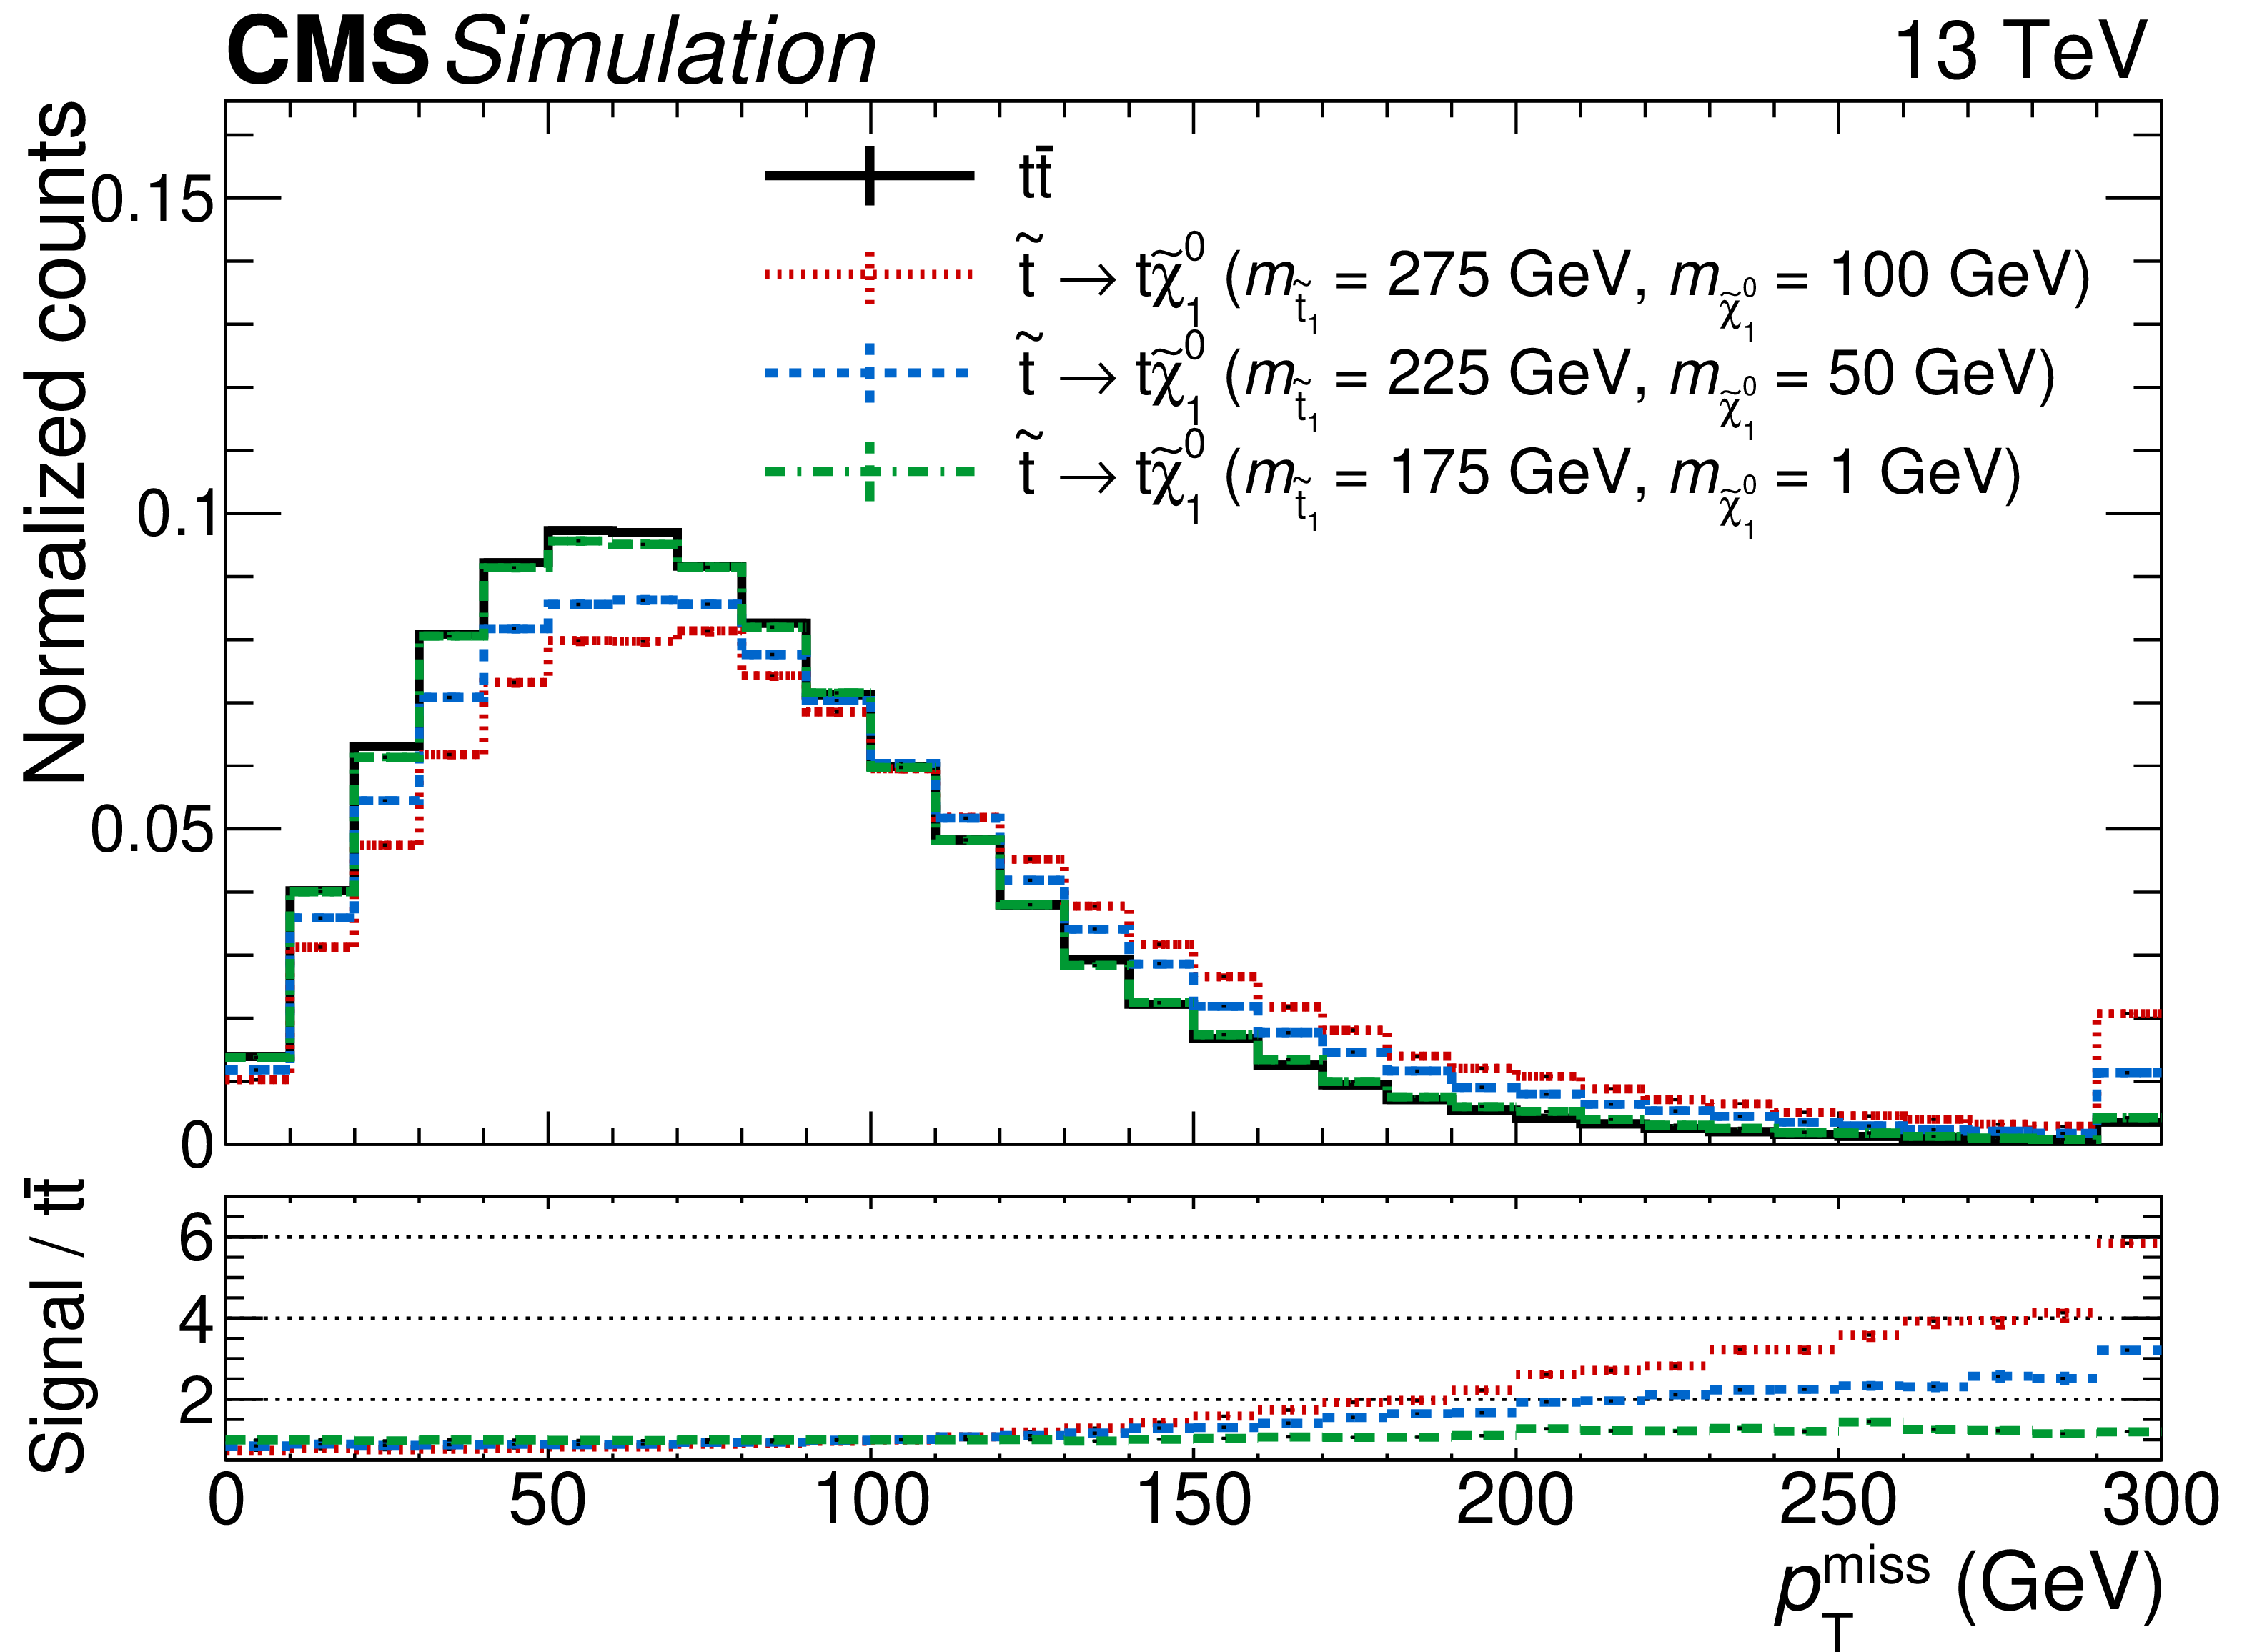
Normalized distributions for some of the training variables in the baseline selection. Distributions for signal points with different top squark and neutralino masses and SM ${\mathrm{t} {}\mathrm{\bar{t}}}$ events are compared. From upper left to lower right: ${{p_{\mathrm {T}}} ^\text {miss}}$, $ {m_{\mathrm {T2}}} ({\mathrm{e} \mu})$, $\Delta \eta ({\mathrm{e} \mu})$, and $\Delta \phi ({\mathrm{e} \mu})$. |
png pdf |
Figure 4-a:
Normalized distribution of ${{p_{\mathrm {T}}} ^\text {miss}}$. Distributions for signal points with different top squark and neutralino masses and SM ${\mathrm{t} {}\mathrm{\bar{t}}}$ events are compared. |
png pdf |
Figure 4-b:
Normalized distribution of $ {m_{\mathrm {T2}}} ({\mathrm{e} \mu})$. Distributions for signal points with different top squark and neutralino masses and SM ${\mathrm{t} {}\mathrm{\bar{t}}}$ events are compared. |
png pdf |
Figure 4-c:
Normalized distribution of $\Delta \eta ({\mathrm{e} \mu})$. Distributions for signal points with different top squark and neutralino masses and SM ${\mathrm{t} {}\mathrm{\bar{t}}}$ events are compared. |
png pdf |
Figure 4-d:
Normalized distribution of $\Delta \phi ({\mathrm{e} \mu})$. Distributions for signal points with different top squark and neutralino masses and SM ${\mathrm{t} {}\mathrm{\bar{t}}}$ events are compared. |
png pdf |
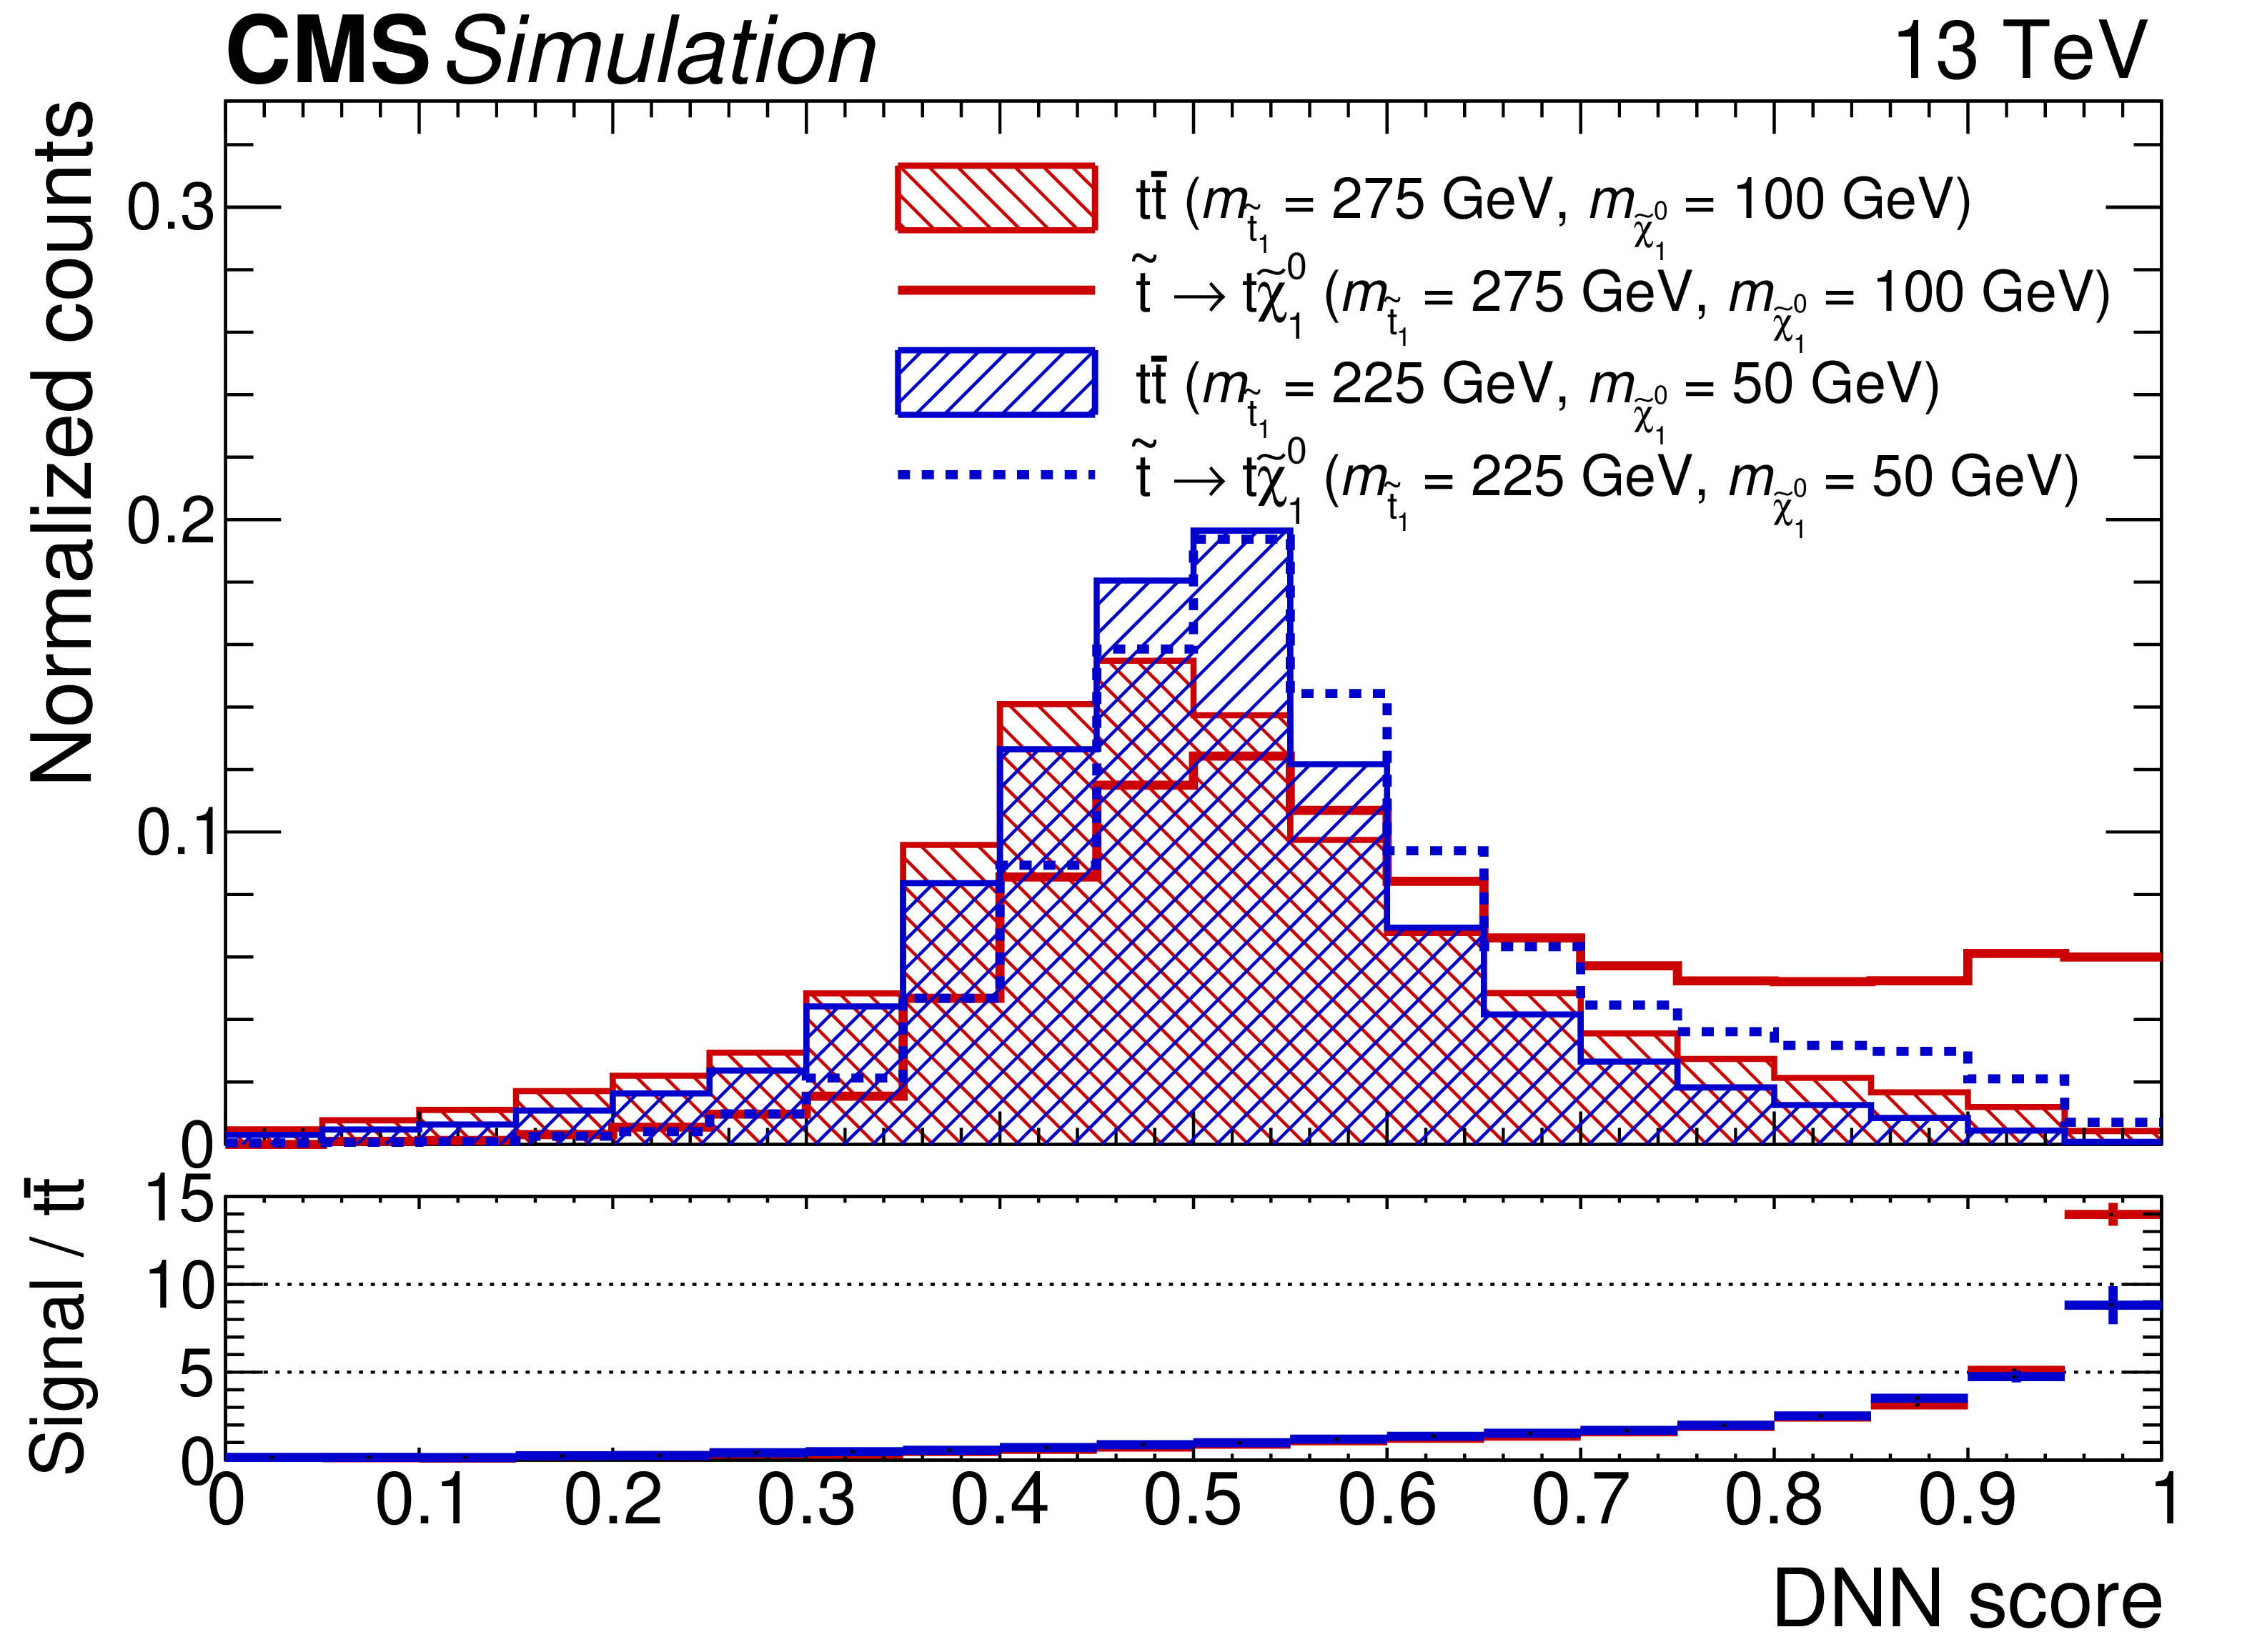
Figure 5:
Normalized DNN score distribution comparing the signal and the ${\mathrm{t} {}\mathrm{\bar{t}}}$ background in the signal region for two mass hypotheses: $ {{m}_{\tilde{\chi}^0_1}} =$ 50 (100) GeV and $ {{m}_{\tilde{\mathrm{t}}_{1}}} =$ 225 (275) GeV. |

png pdf |
Figure 6:
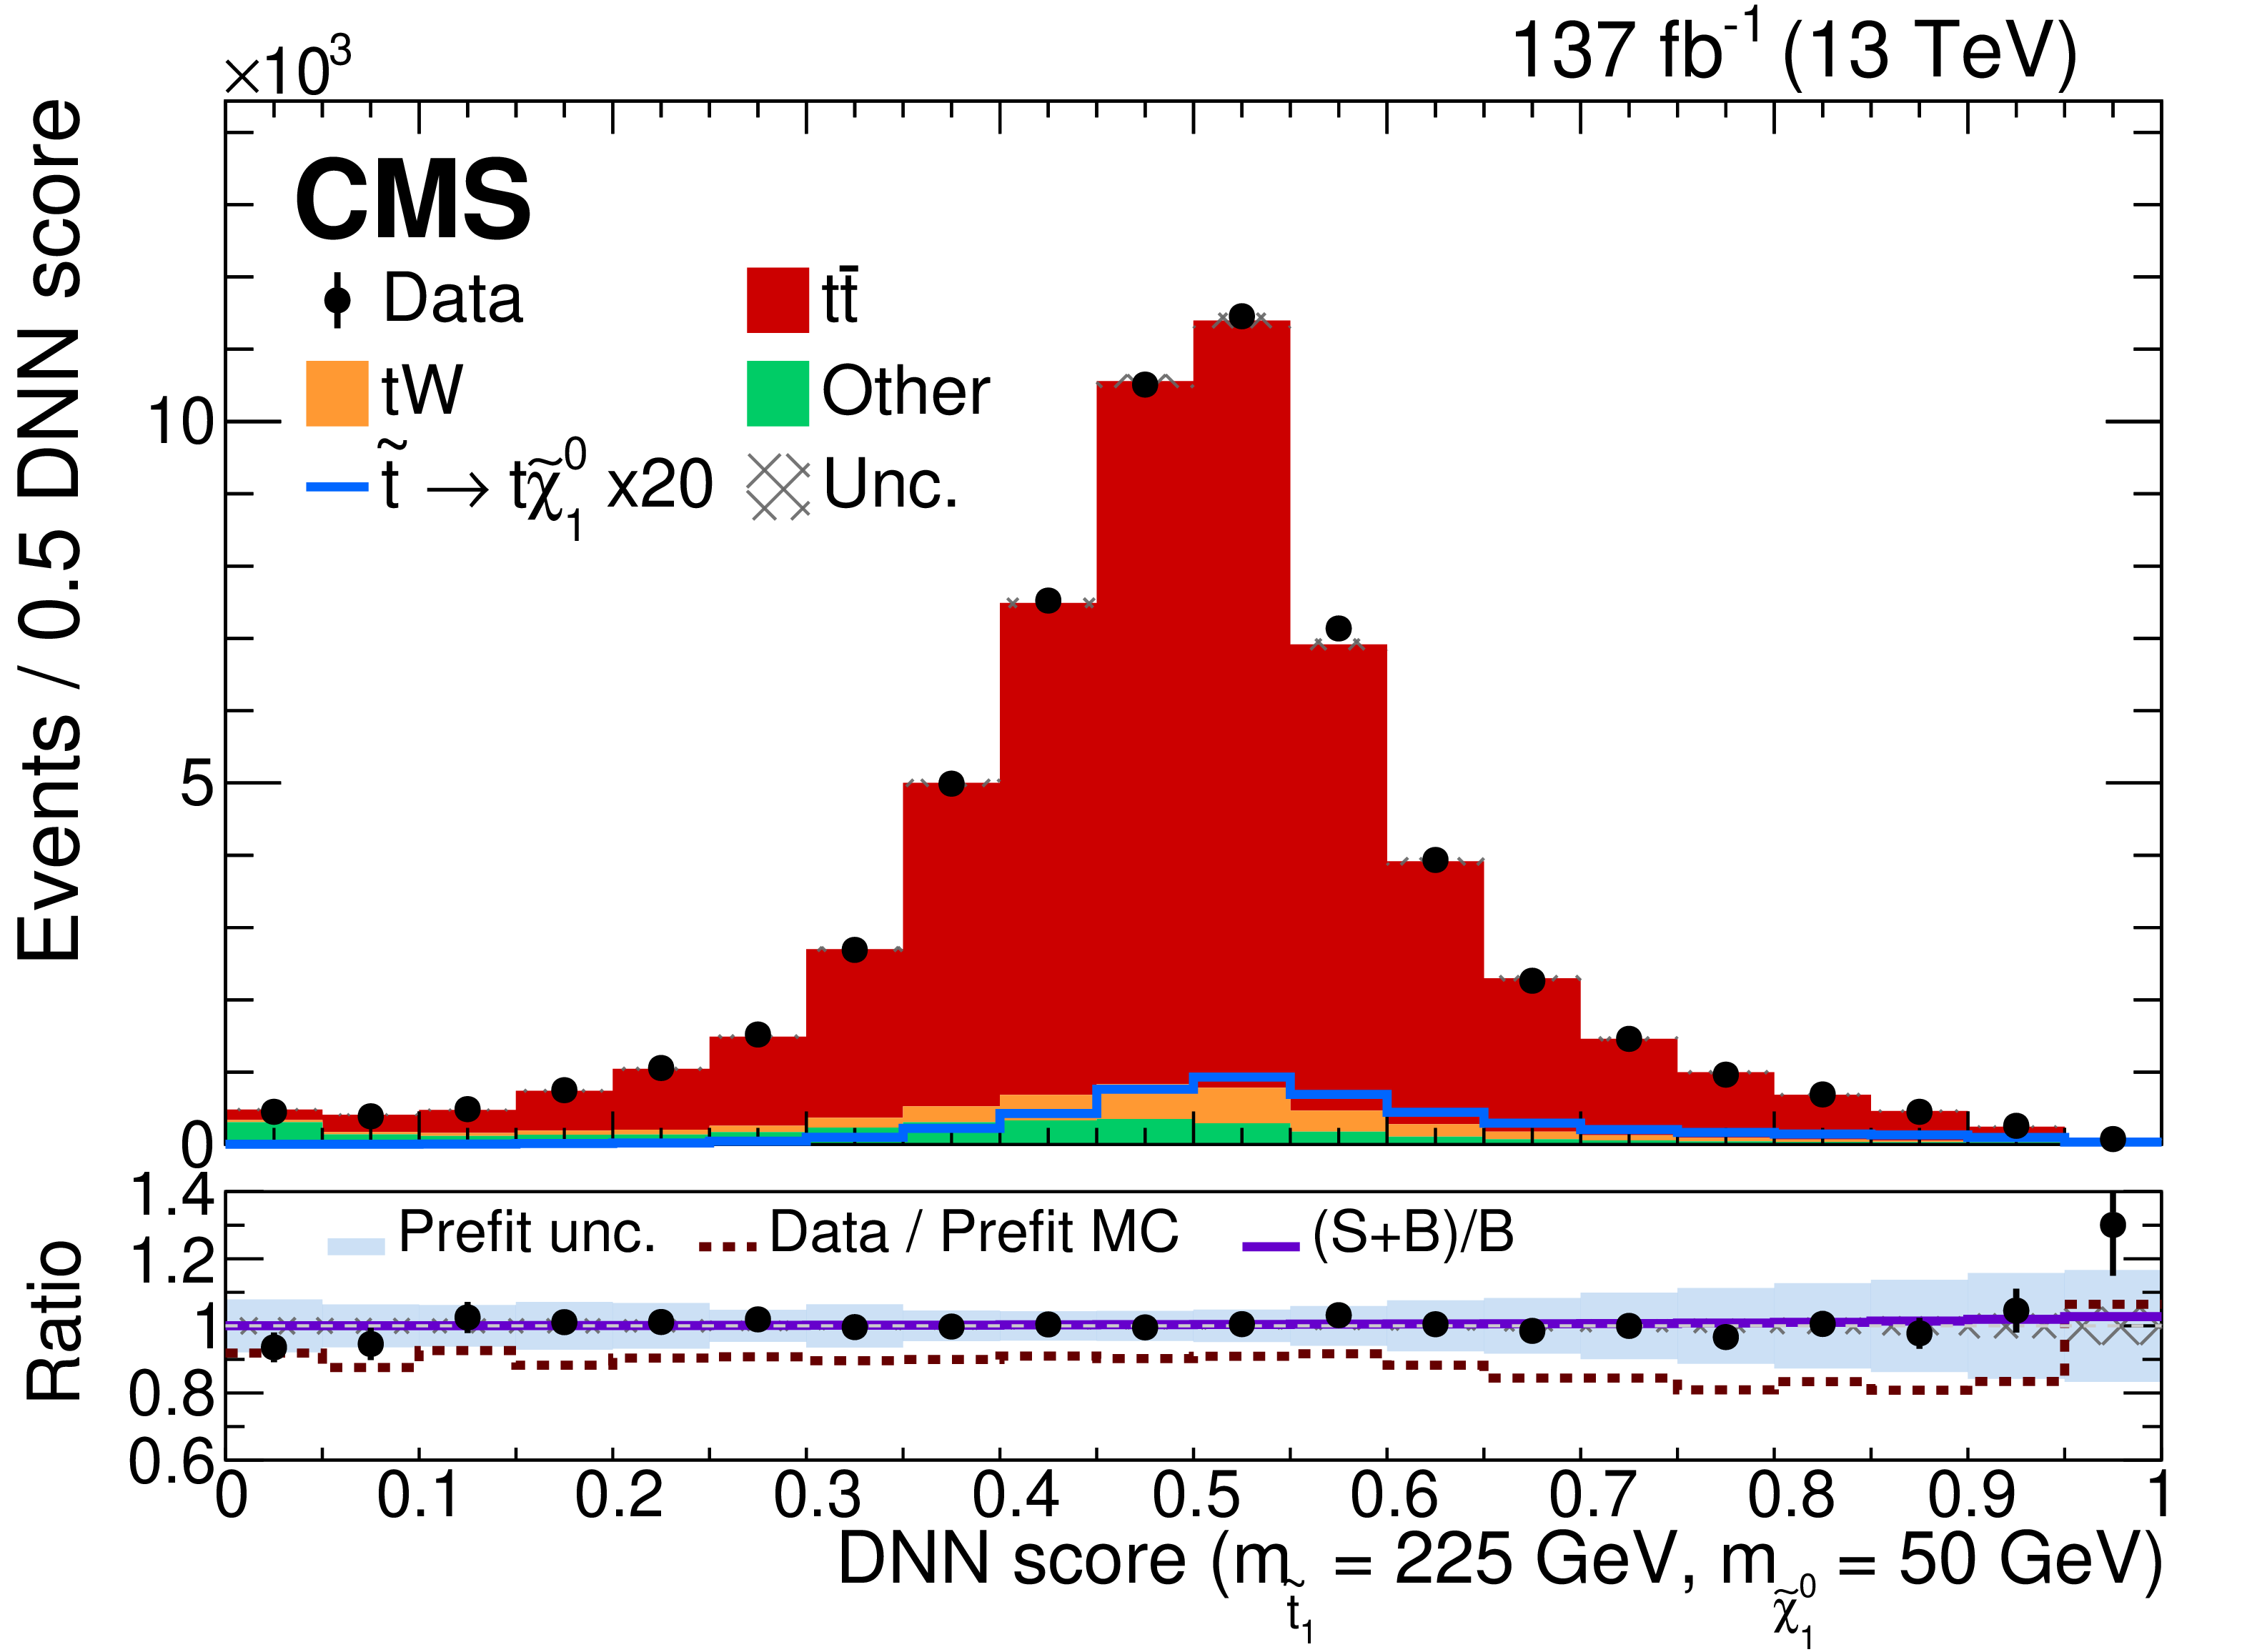
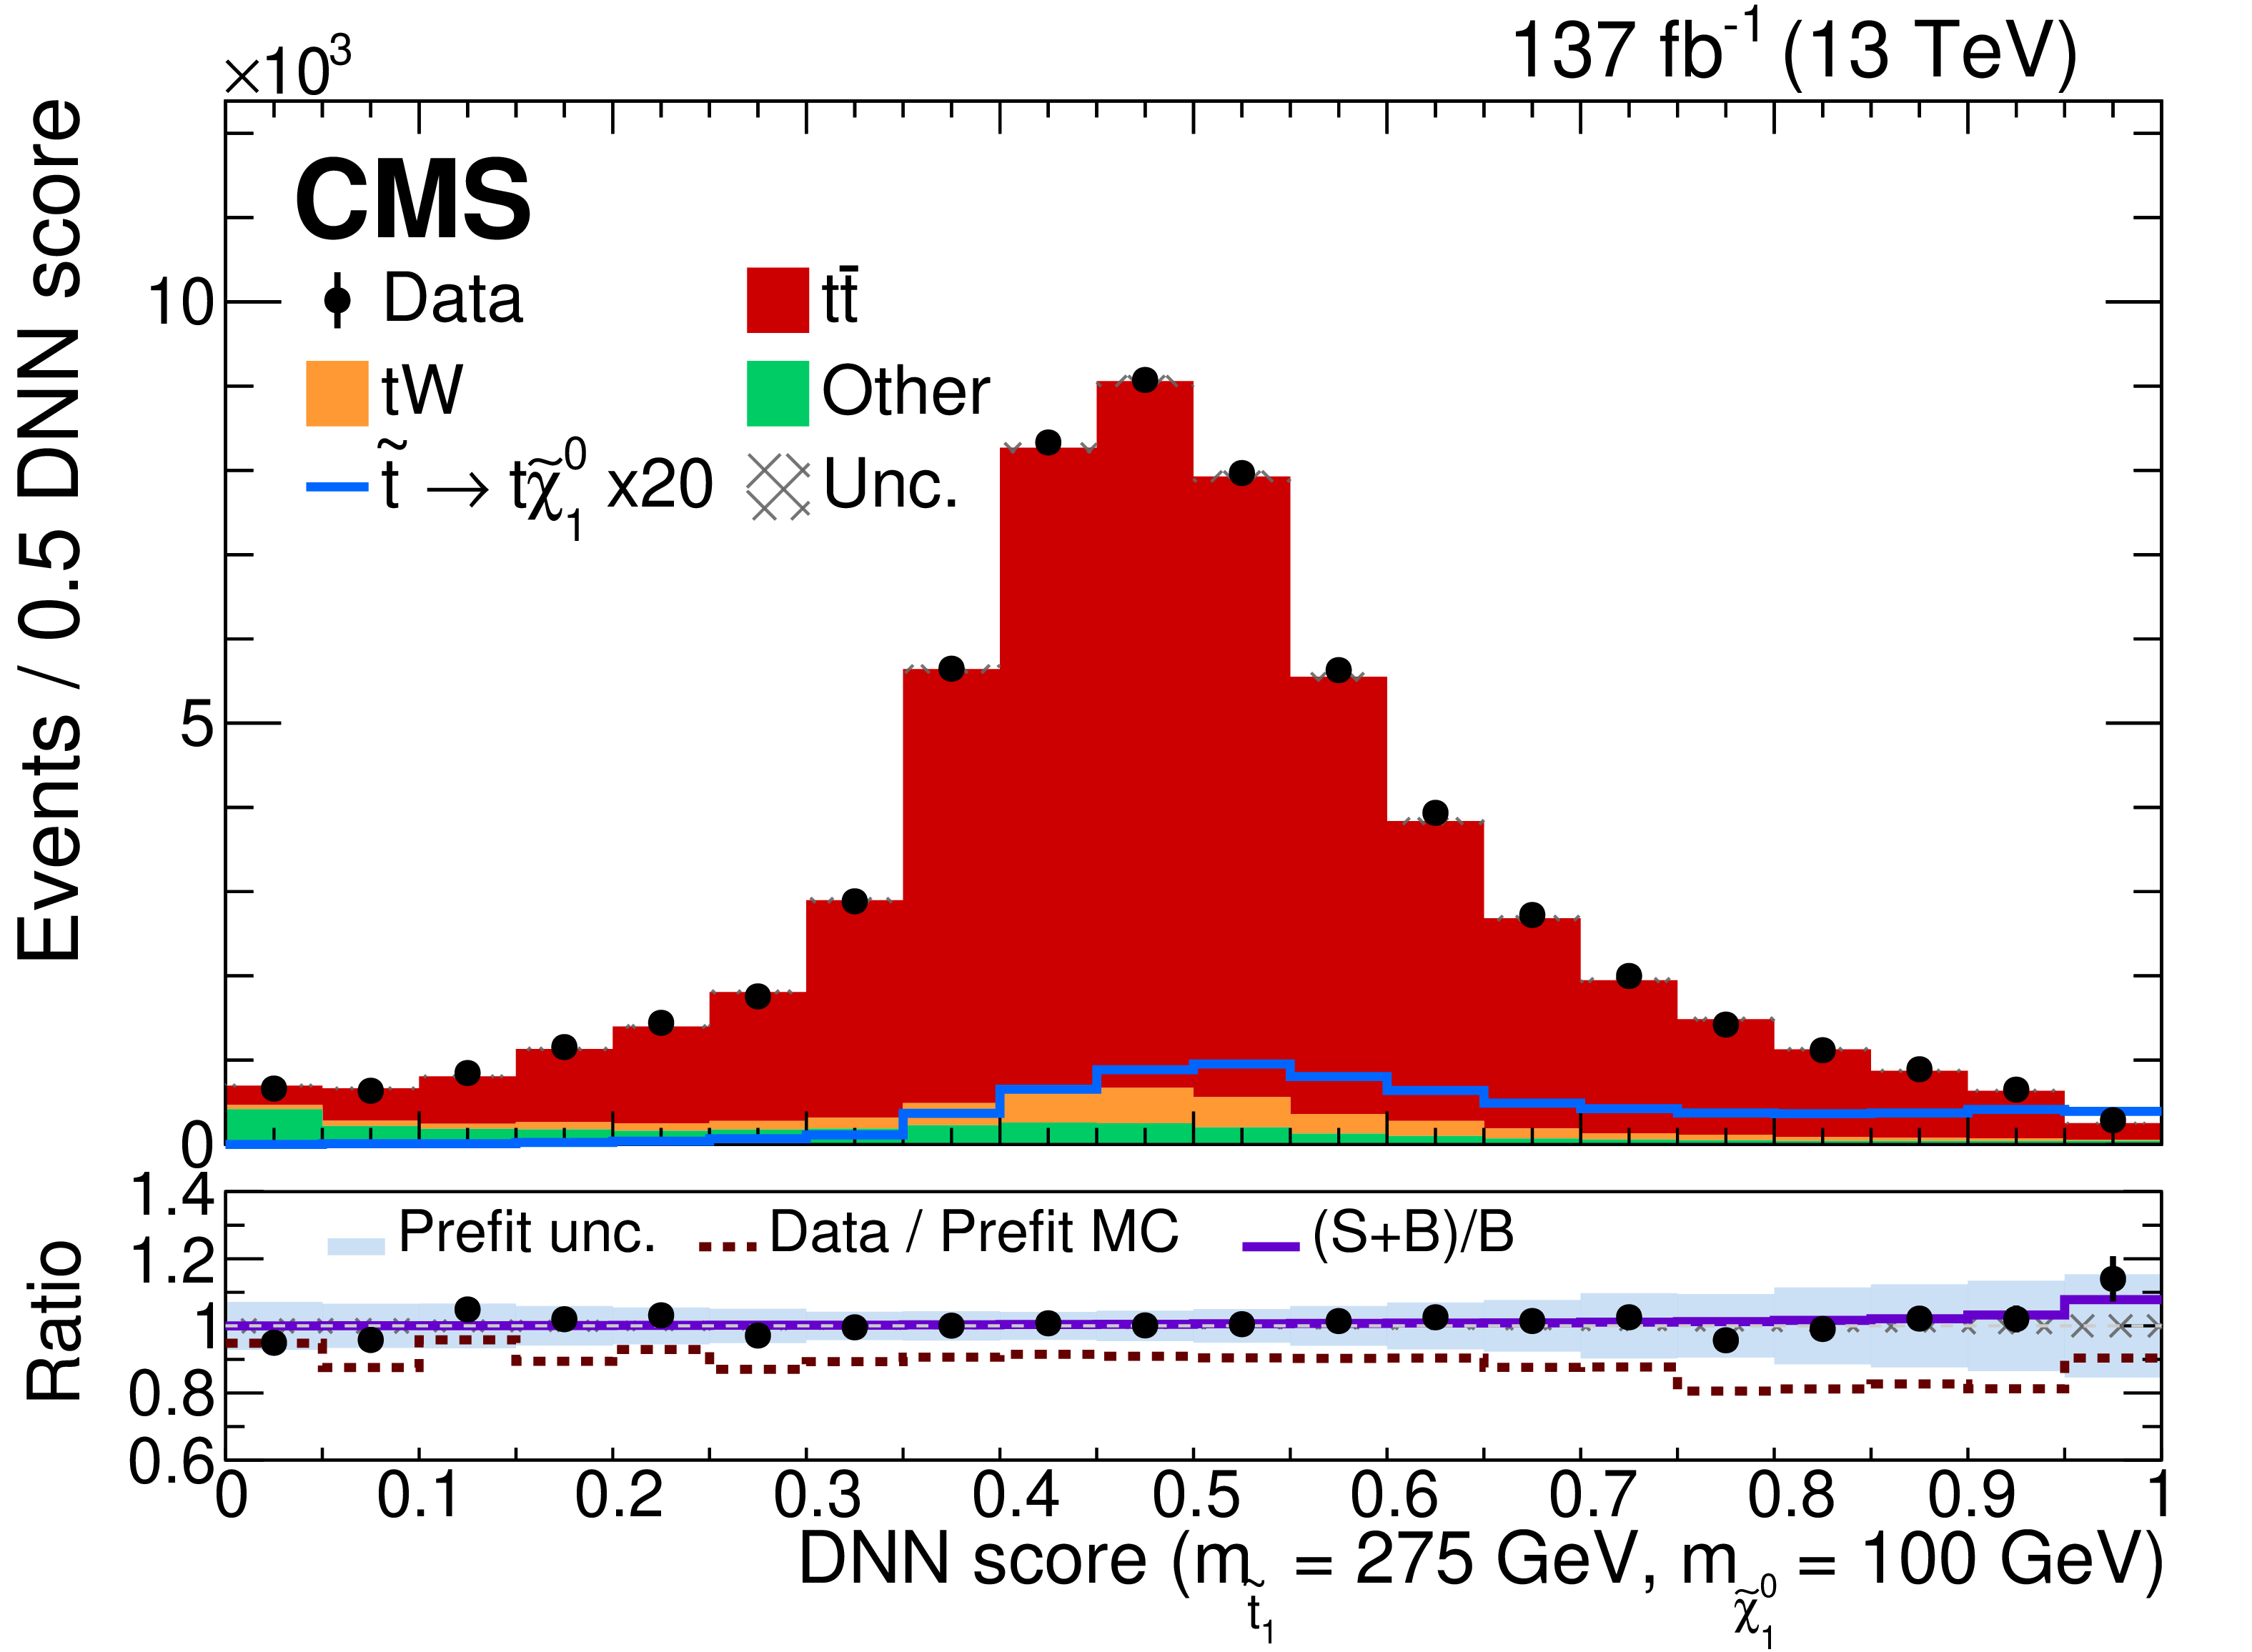
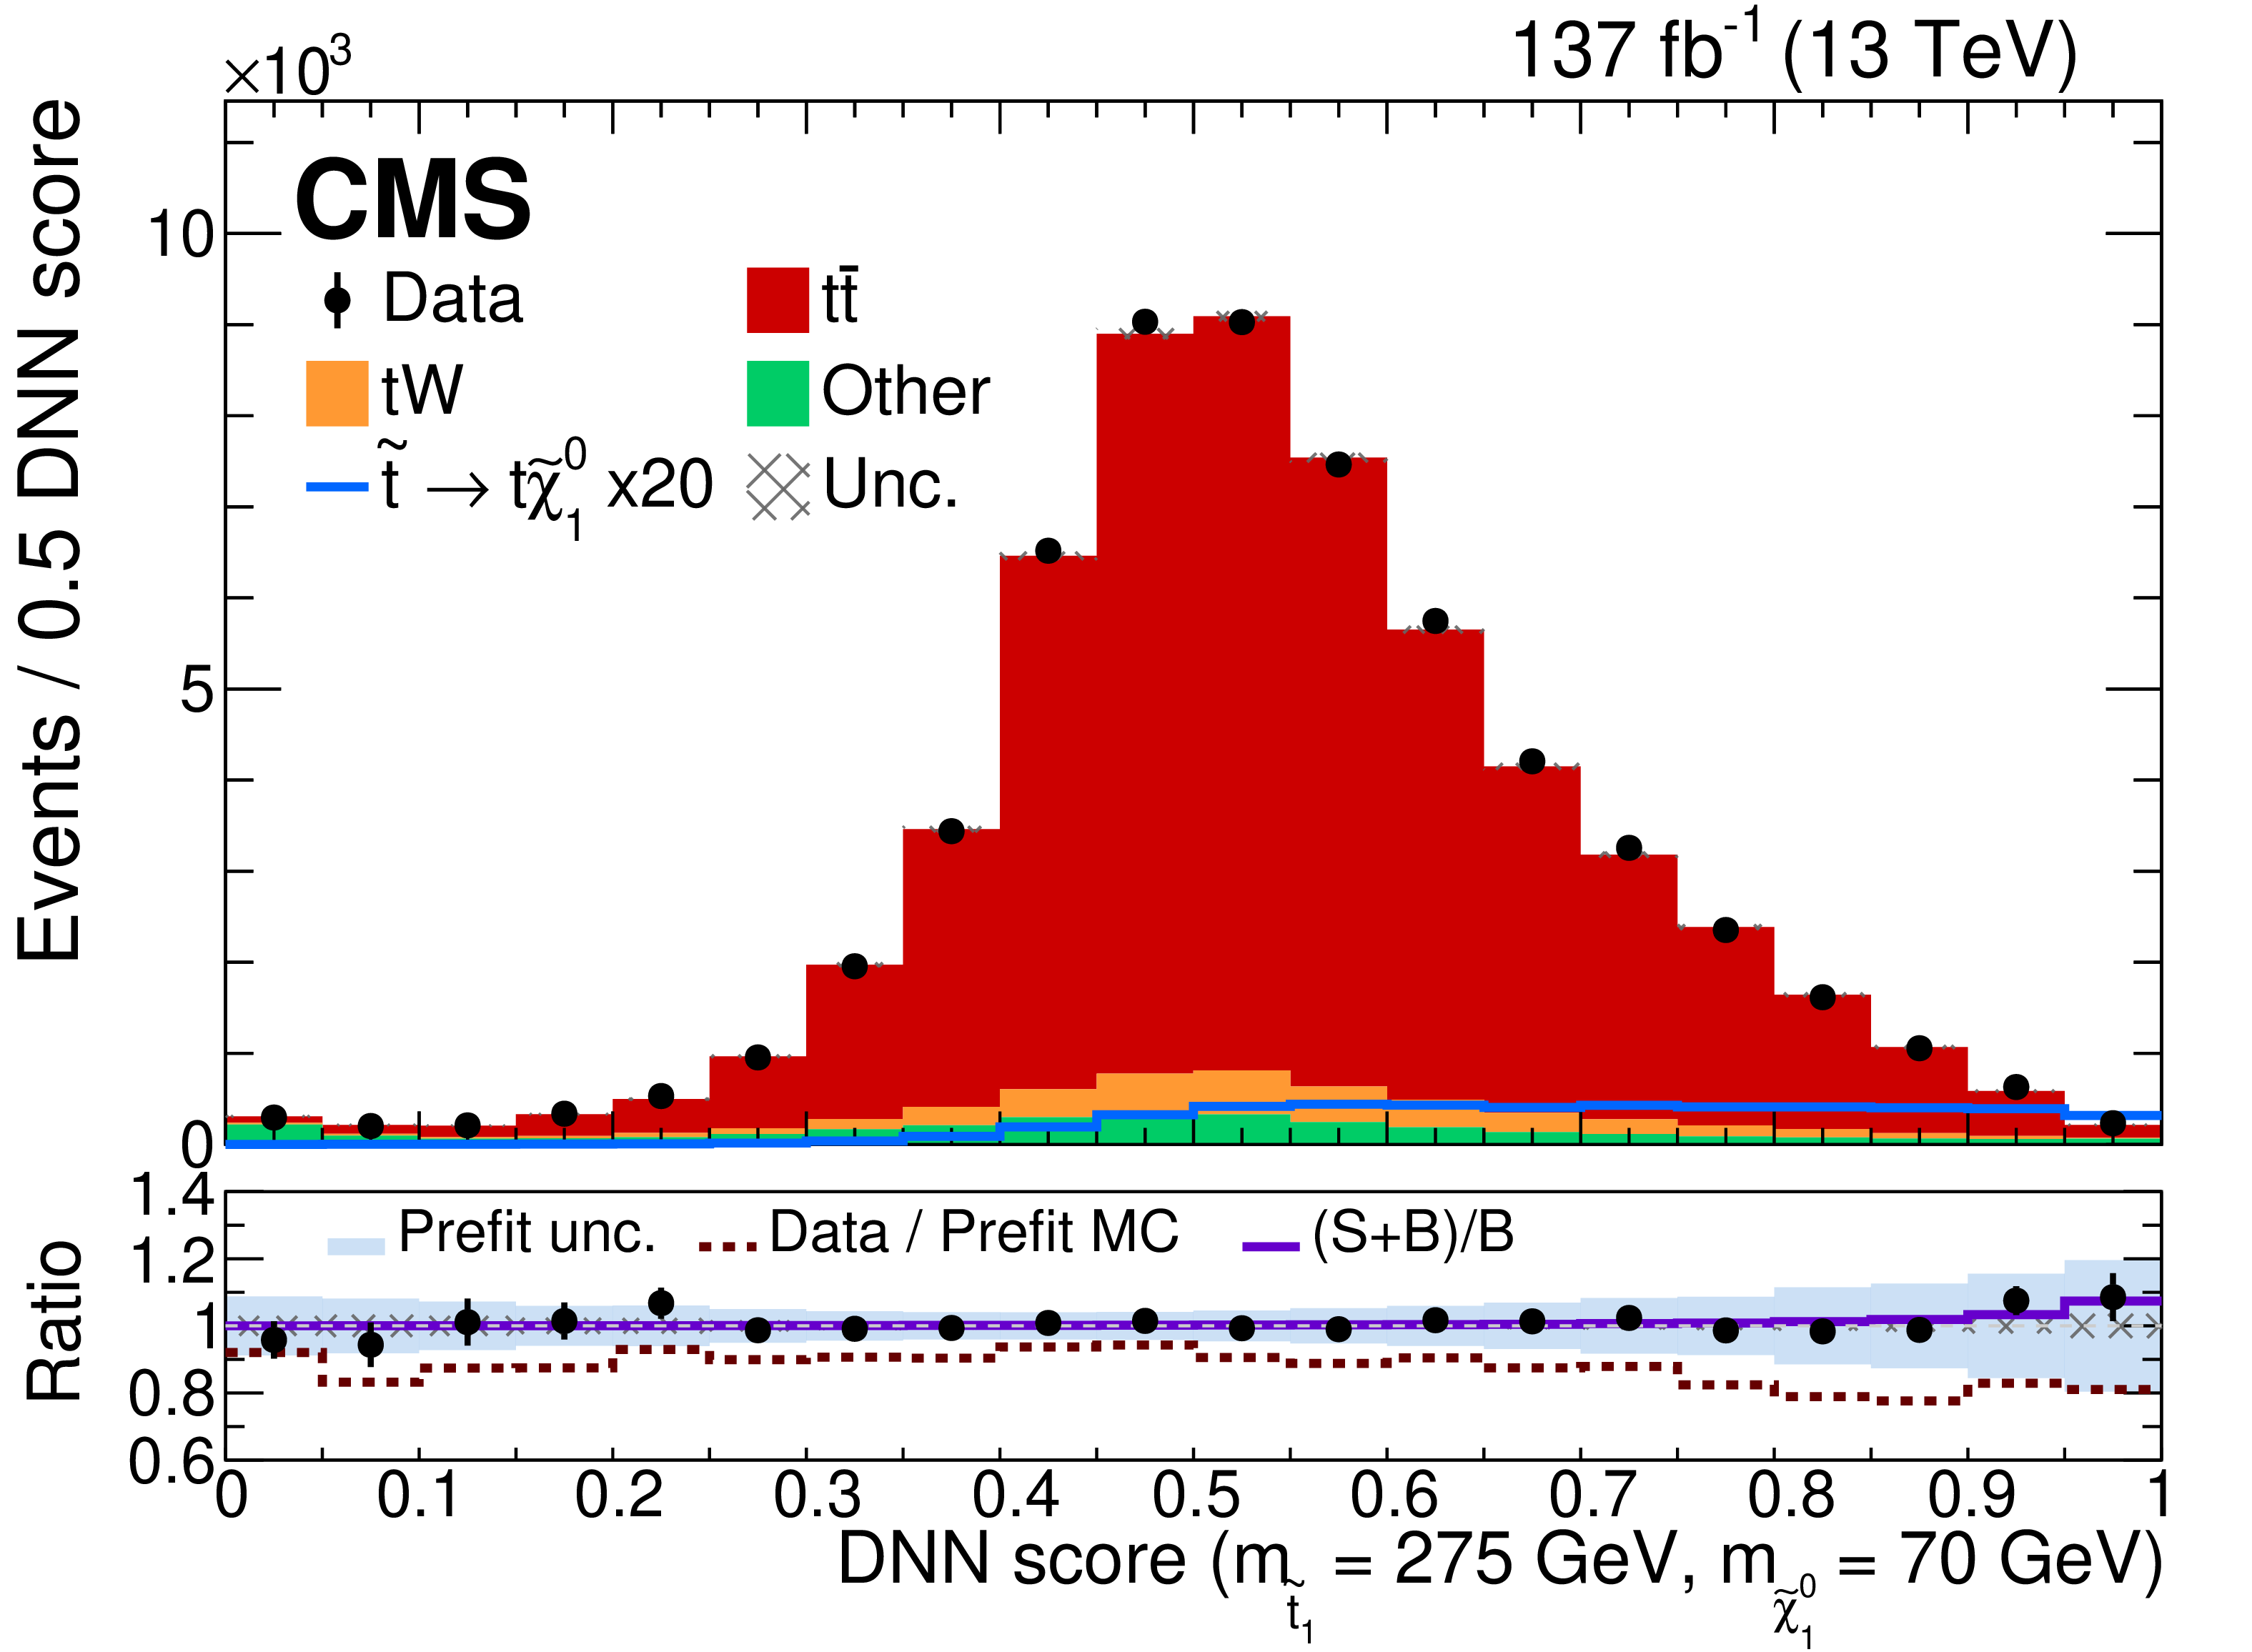
Post-fit DNN score distributions in the signal region for different mass hypotheses of, from upper left to lower right, $({{m}_{\tilde{\mathrm{t}}_{1}}}, {{m}_{\tilde{\chi}^0_1}})=$ (225, 50); (275, 100); (275, 70); and (245, 100) GeV. The superimposed signal prediction is scaled by the post-fit signal strength and, in the upper panels, it is also multiplied by a factor 20 for better visibility. The post-fit uncertainty band (crosses) includes statistical, background normalization, and all systematic uncertainties described in Section 6.4. Events from ${\mathrm{t} {}\mathrm{\bar{t}}} \mathrm{W} $, ${\mathrm{t} {}\mathrm{\bar{t}}} \mathrm{Z} $, DY, nonprompt leptons, and diboson processes are grouped into the 'Other' category. The lower panel contains the data-to-prediction ratio before the fit (dotted brown line) and after (dots), each of them with their corresponding band of uncertainties (blue band for the pre-fit and crosses band for the post-fit). The ratio between the sum of the signal and background predictions and the background prediction (purple line) is also shown. The masses of the signal model correspond to the values of the DNN mass parameters in each distribution. |
png pdf |
Figure 6-a:
Post-fit DNN score distributions in the signal region for mass hypothesis of $({{m}_{\tilde{\mathrm{t}}_{1}}}, {{m}_{\tilde{\chi}^0_1}})=$ (225, 50) GeV. The superimposed signal prediction is scaled by the post-fit signal strength and, in the upper panels, it is also multiplied by a factor 20 for better visibility. The post-fit uncertainty band (crosses) includes statistical, background normalization, and all systematic uncertainties described in Section 6.4. Events from ${\mathrm{t} {}\mathrm{\bar{t}}} \mathrm{W} $, ${\mathrm{t} {}\mathrm{\bar{t}}} \mathrm{Z} $, DY, nonprompt leptons, and diboson processes are grouped into the 'Other' category. The lower panel contains the data-to-prediction ratio before the fit (dotted brown line) and after (dots), each of them with their corresponding band of uncertainties (blue band for the pre-fit and crosses band for the post-fit). The ratio between the sum of the signal and background predictions and the background prediction (purple line) is also shown. The masses of the signal model correspond to the values of the DNN mass parameters in each distribution. |
png pdf |
Figure 6-b:
Post-fit DNN score distributions in the signal region for mass hypothesis of $({{m}_{\tilde{\mathrm{t}}_{1}}}, {{m}_{\tilde{\chi}^0_1}})=$ (275, 100) GeV. The superimposed signal prediction is scaled by the post-fit signal strength and, in the upper panels, it is also multiplied by a factor 20 for better visibility. The post-fit uncertainty band (crosses) includes statistical, background normalization, and all systematic uncertainties described in Section 6.4. Events from ${\mathrm{t} {}\mathrm{\bar{t}}} \mathrm{W} $, ${\mathrm{t} {}\mathrm{\bar{t}}} \mathrm{Z} $, DY, nonprompt leptons, and diboson processes are grouped into the 'Other' category. The lower panel contains the data-to-prediction ratio before the fit (dotted brown line) and after (dots), each of them with their corresponding band of uncertainties (blue band for the pre-fit and crosses band for the post-fit). The ratio between the sum of the signal and background predictions and the background prediction (purple line) is also shown. The masses of the signal model correspond to the values of the DNN mass parameters in each distribution. |
png pdf |
Figure 6-c:
Post-fit DNN score distributions in the signal region for mass hypothesis of $({{m}_{\tilde{\mathrm{t}}_{1}}}, {{m}_{\tilde{\chi}^0_1}})=$ (275, 70) GeV. The superimposed signal prediction is scaled by the post-fit signal strength and, in the upper panels, it is also multiplied by a factor 20 for better visibility. The post-fit uncertainty band (crosses) includes statistical, background normalization, and all systematic uncertainties described in Section 6.4. Events from ${\mathrm{t} {}\mathrm{\bar{t}}} \mathrm{W} $, ${\mathrm{t} {}\mathrm{\bar{t}}} \mathrm{Z} $, DY, nonprompt leptons, and diboson processes are grouped into the 'Other' category. The lower panel contains the data-to-prediction ratio before the fit (dotted brown line) and after (dots), each of them with their corresponding band of uncertainties (blue band for the pre-fit and crosses band for the post-fit). The ratio between the sum of the signal and background predictions and the background prediction (purple line) is also shown. The masses of the signal model correspond to the values of the DNN mass parameters in each distribution. |

png pdf |
Figure 6-d:
Post-fit DNN score distributions in the signal region for mass hypothesis of $({{m}_{\tilde{\mathrm{t}}_{1}}}, {{m}_{\tilde{\chi}^0_1}})=$ (245, 100) GeV. The superimposed signal prediction is scaled by the post-fit signal strength and, in the upper panels, it is also multiplied by a factor 20 for better visibility. The post-fit uncertainty band (crosses) includes statistical, background normalization, and all systematic uncertainties described in Section 6.4. Events from ${\mathrm{t} {}\mathrm{\bar{t}}} \mathrm{W} $, ${\mathrm{t} {}\mathrm{\bar{t}}} \mathrm{Z} $, DY, nonprompt leptons, and diboson processes are grouped into the 'Other' category. The lower panel contains the data-to-prediction ratio before the fit (dotted brown line) and after (dots), each of them with their corresponding band of uncertainties (blue band for the pre-fit and crosses band for the post-fit). The ratio between the sum of the signal and background predictions and the background prediction (purple line) is also shown. The masses of the signal model correspond to the values of the DNN mass parameters in each distribution. |
png pdf |
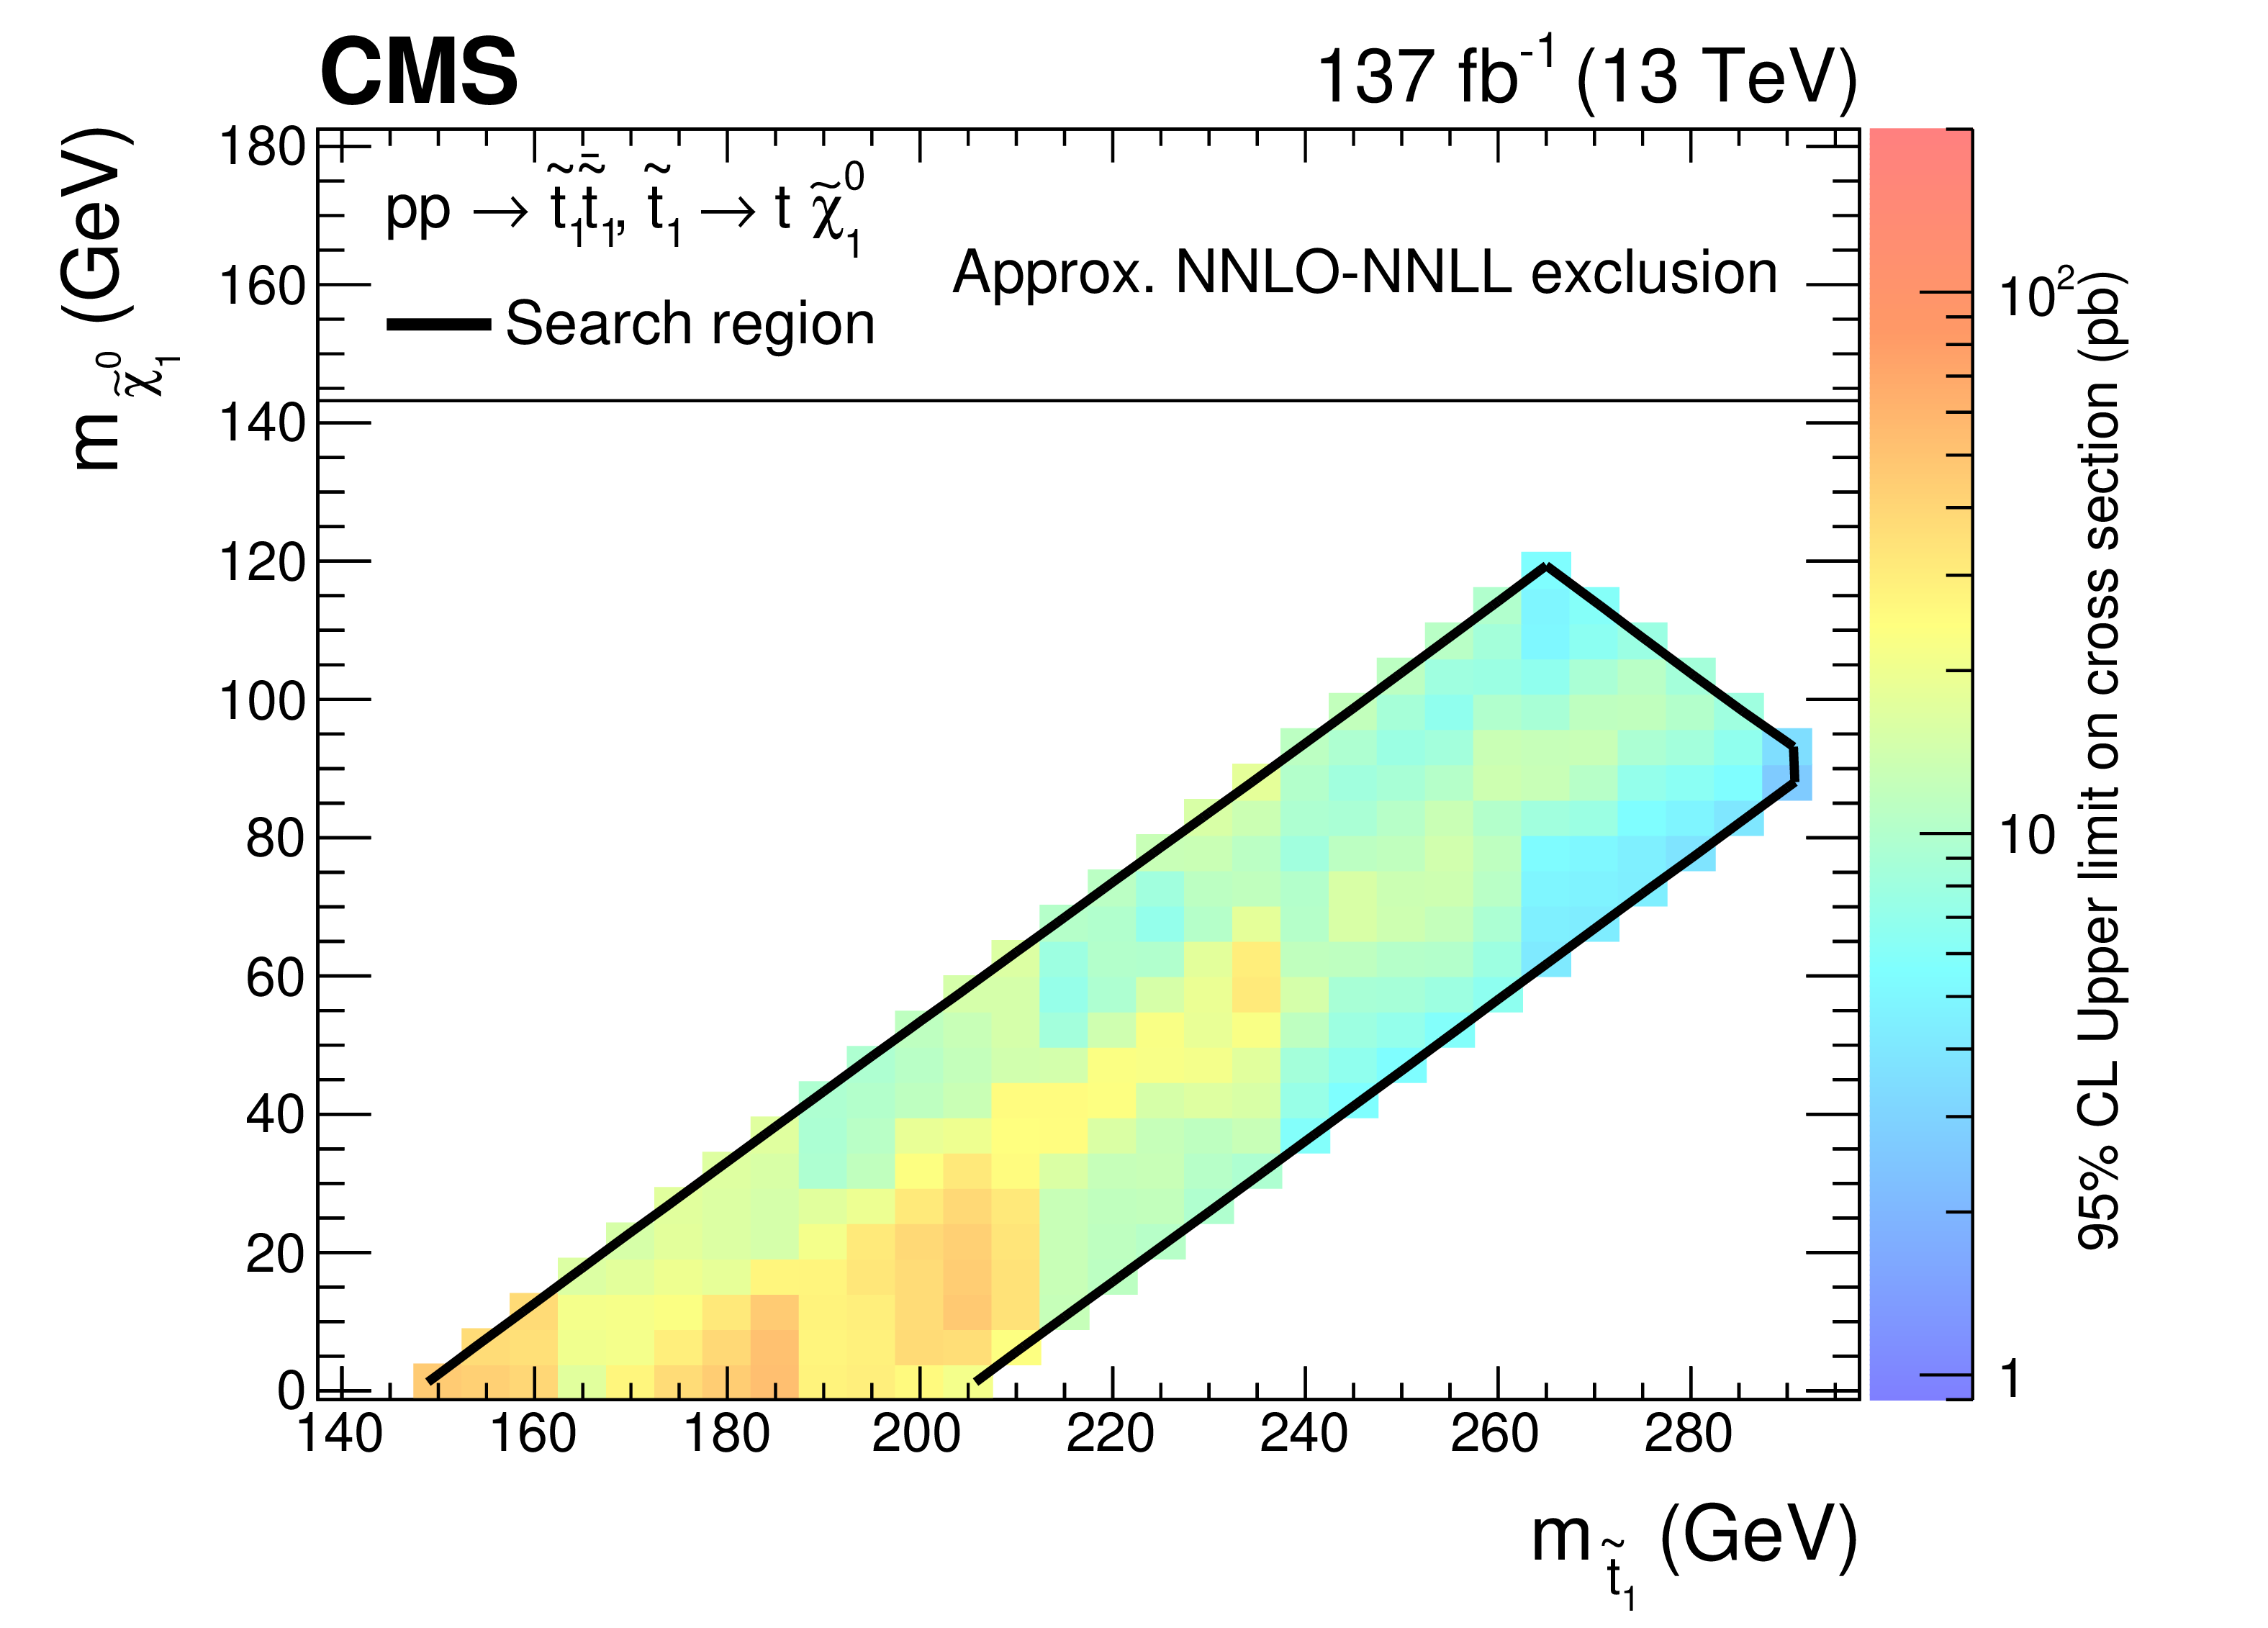
Figure 7:
Upper limit at 95% CL on the signal cross section as a function of the top squark and neutralino masses in the top quark corridor region. The model is excluded for all of the colored region inside the black boundary. |
png pdf |
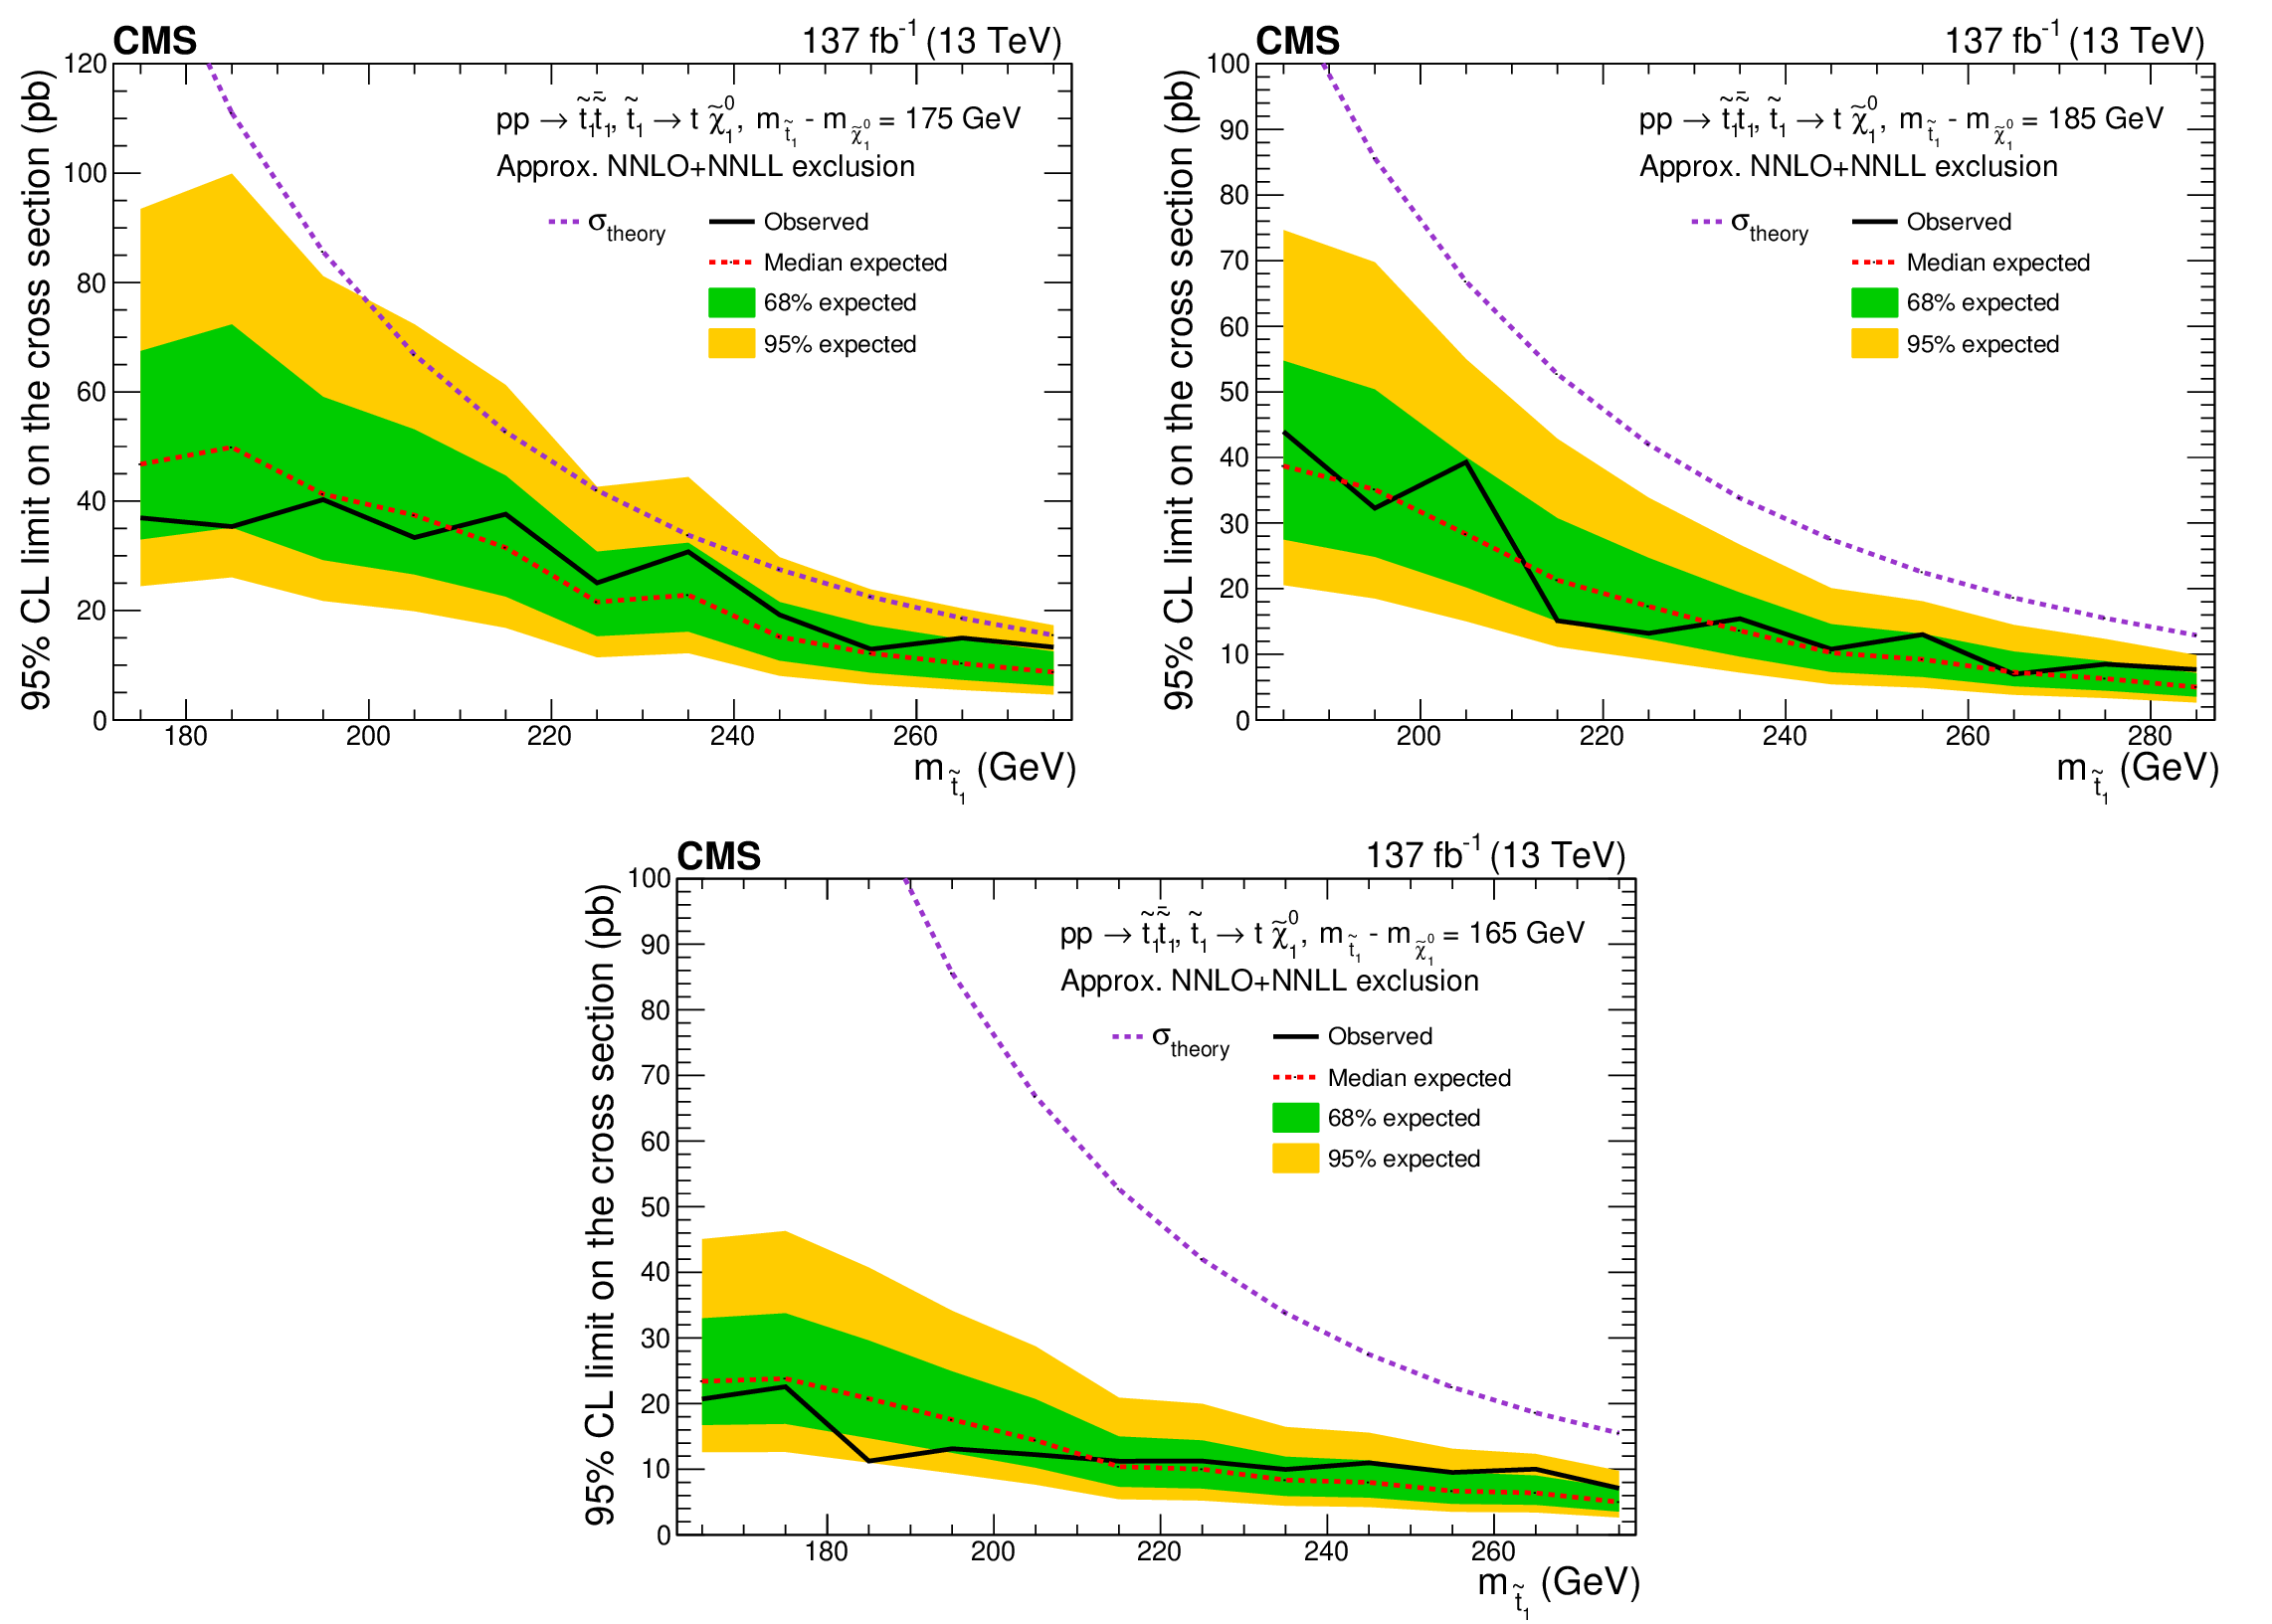
Figure 8:
Upper limit at 95% CL on the signal cross section as a function of the top squark mass for ${\Delta m\left (\tilde{\mathrm{t}}_{1},\,\tilde{\chi}^0_1 \right)}$ of 175 GeV (upper left), 185 GeV (upper right) and 165 GeV (lower). The green and yellow bands represent the regions containing 68 and 95%, respectively, of the distribution of limits expected under the background-only hypothesis. The purple dotted line indicates the approximate NNLO+NNLL production cross section. |
png pdf |
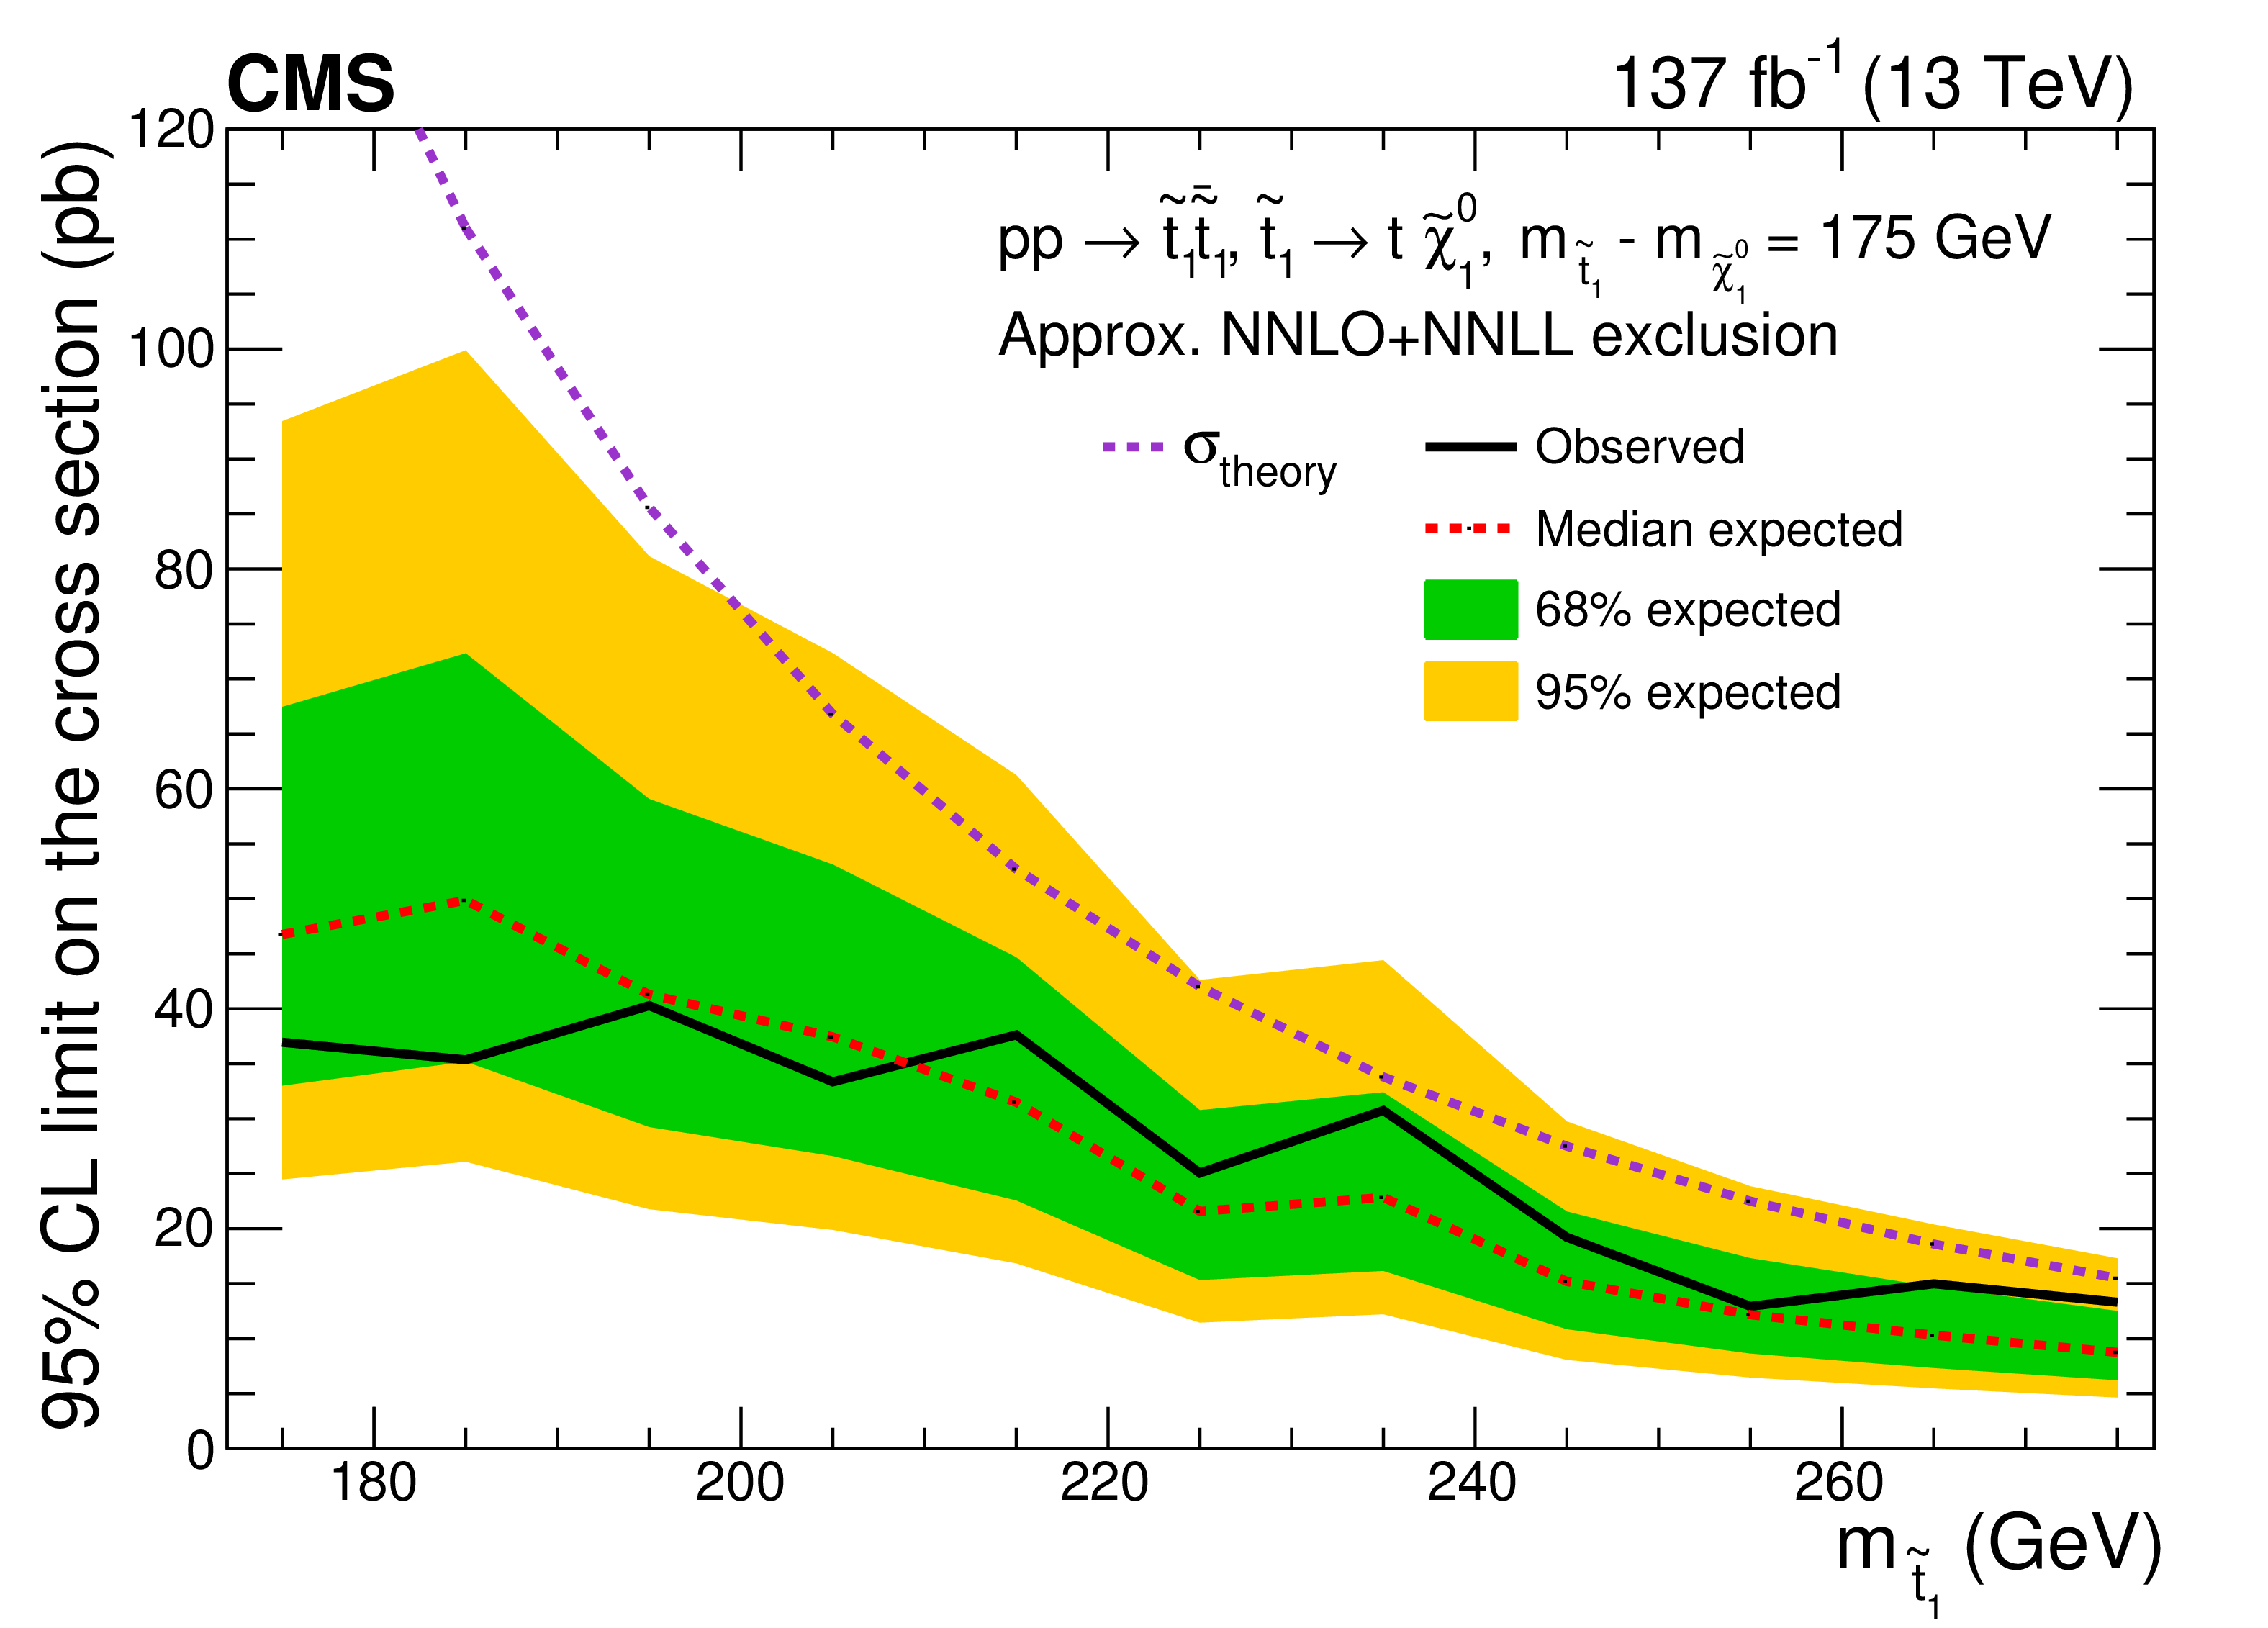
Figure 8-a:
Upper limit at 95% CL on the signal cross section as a function of the top squark mass for ${\Delta m\left (\tilde{\mathrm{t}}_{1},\,\tilde{\chi}^0_1 \right)}$ of 175 GeV.The green and yellow bands represent the regions containing 68 and 95%, respectively, of the distribution of limits expected under the background-only hypothesis. The purple dotted line indicates the approximate NNLO+NNLL production cross section. |
png pdf |
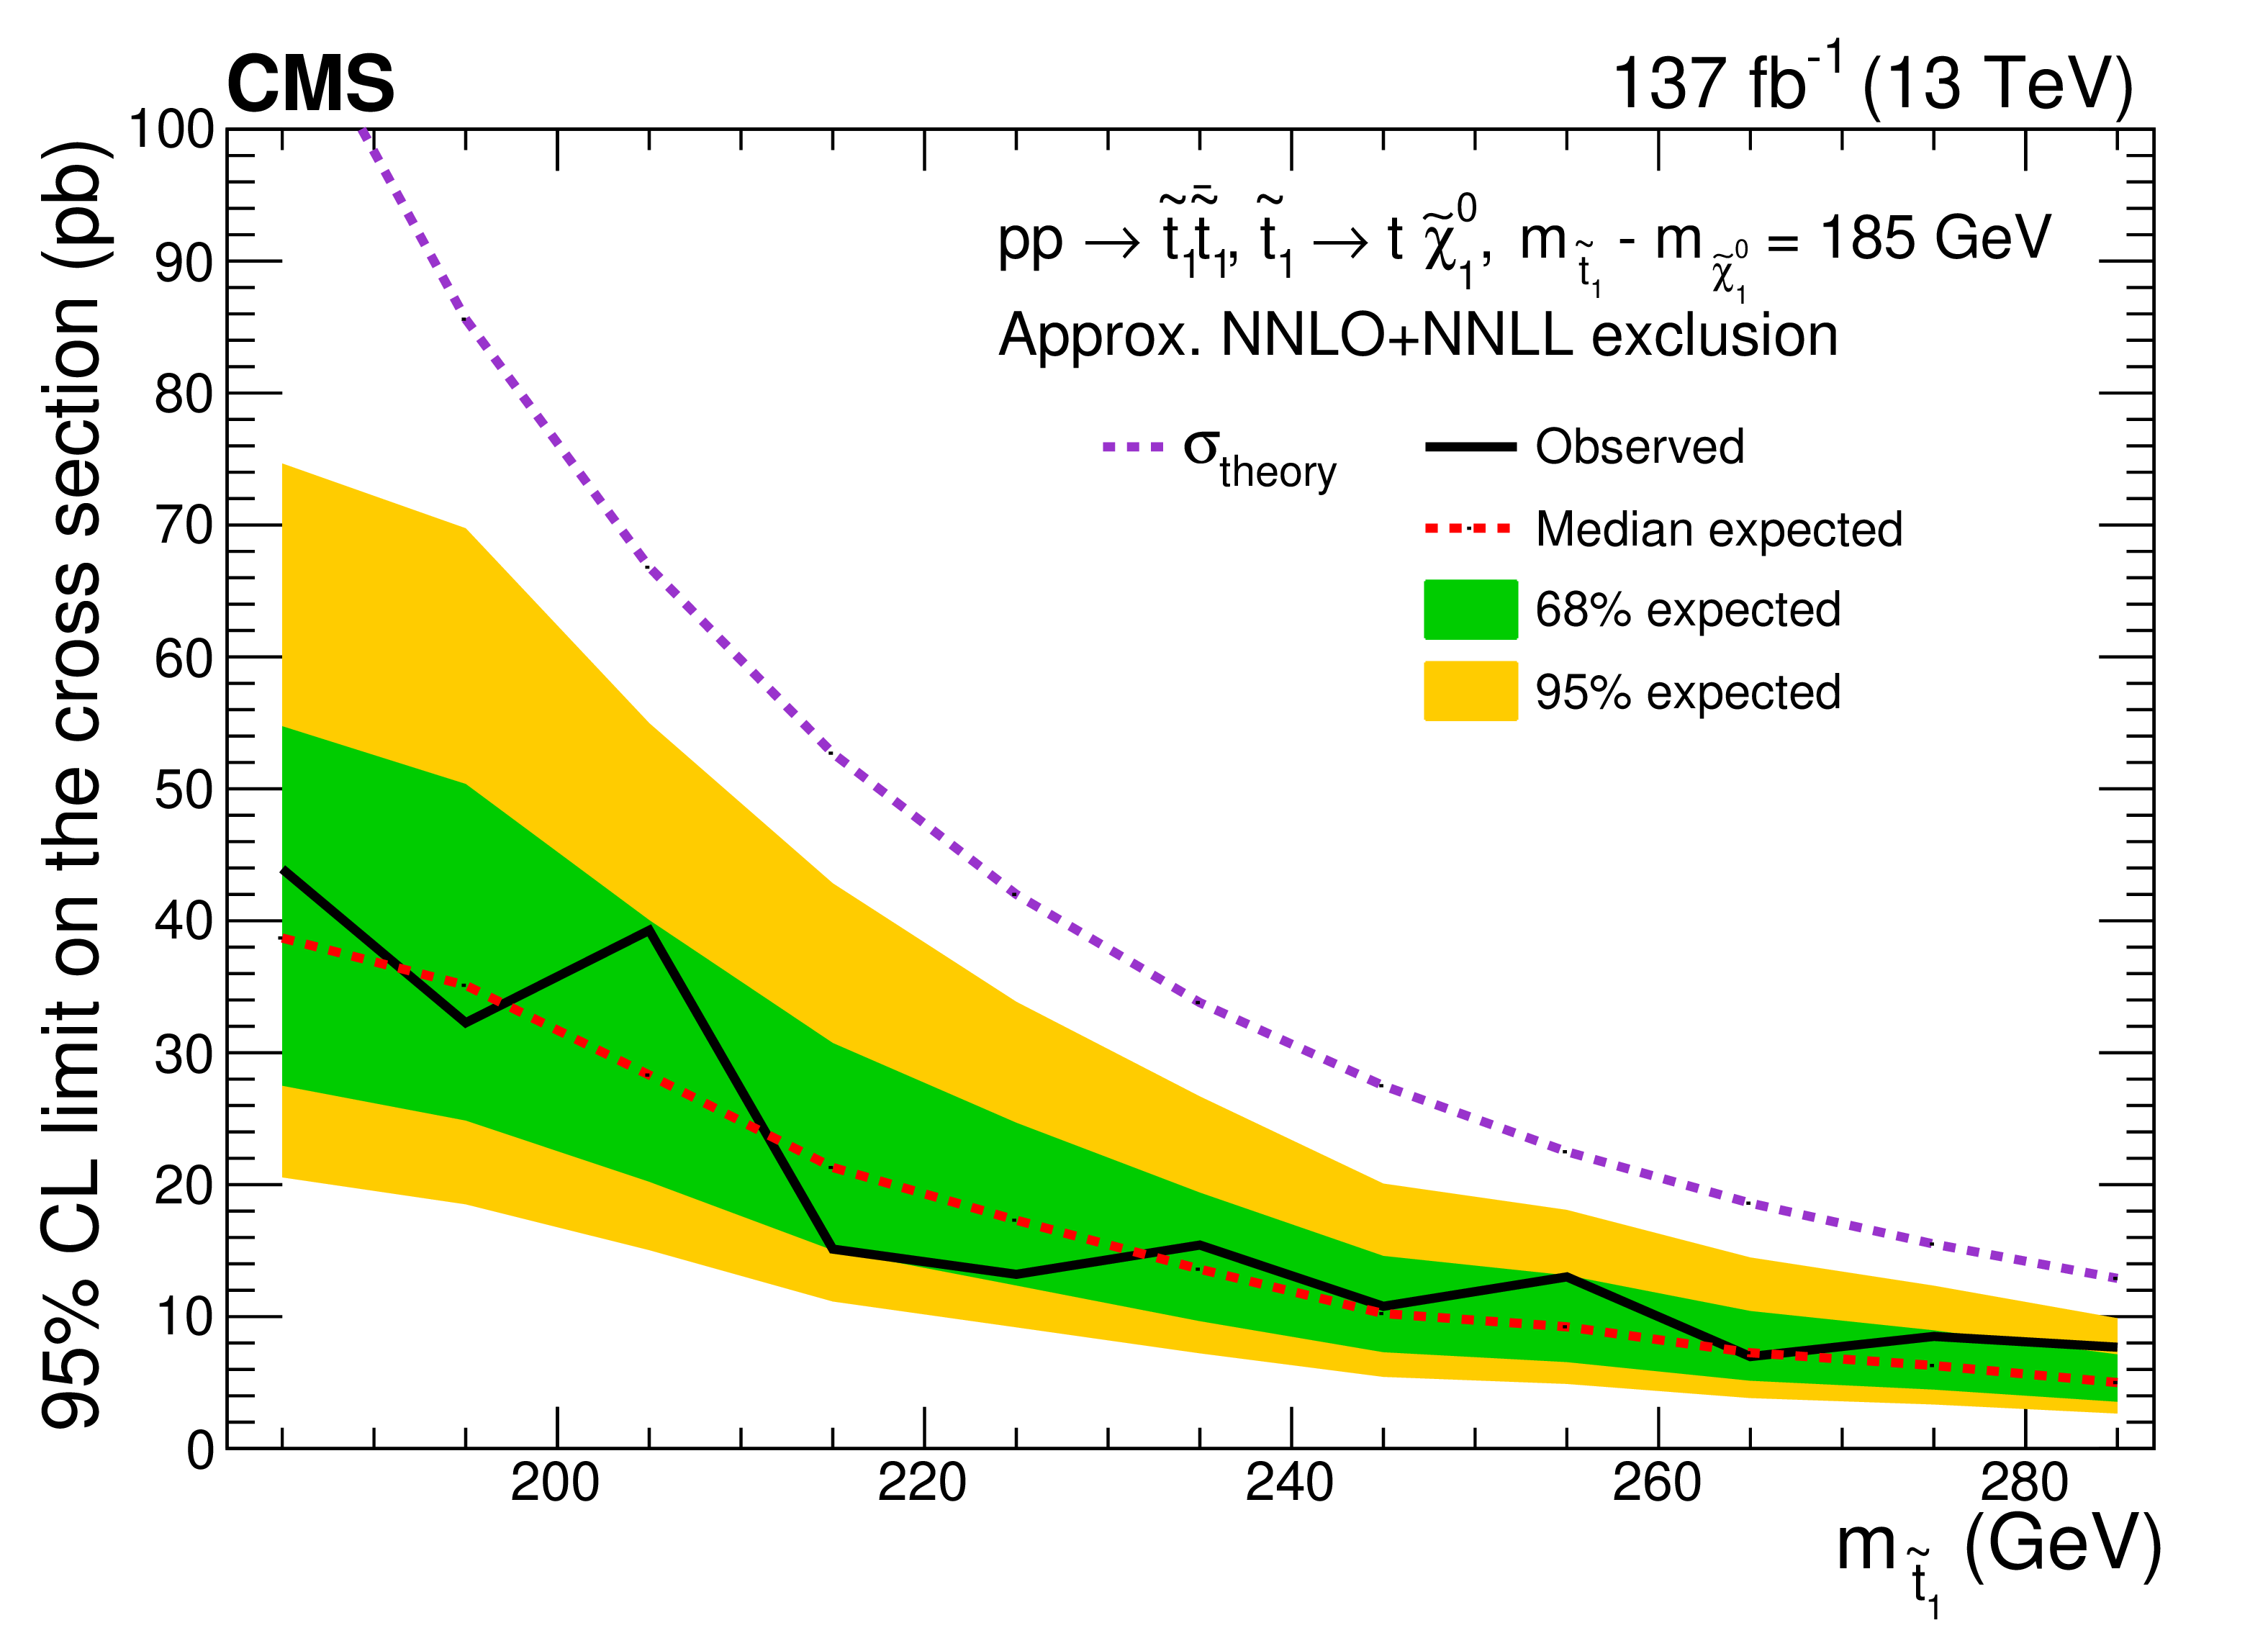
Figure 8-b:
Upper limit at 95% CL on the signal cross section as a function of the top squark mass for ${\Delta m\left (\tilde{\mathrm{t}}_{1},\,\tilde{\chi}^0_1 \right)}$ of 185 GeV.The green and yellow bands represent the regions containing 68 and 95%, respectively, of the distribution of limits expected under the background-only hypothesis. The purple dotted line indicates the approximate NNLO+NNLL production cross section. |
png pdf |
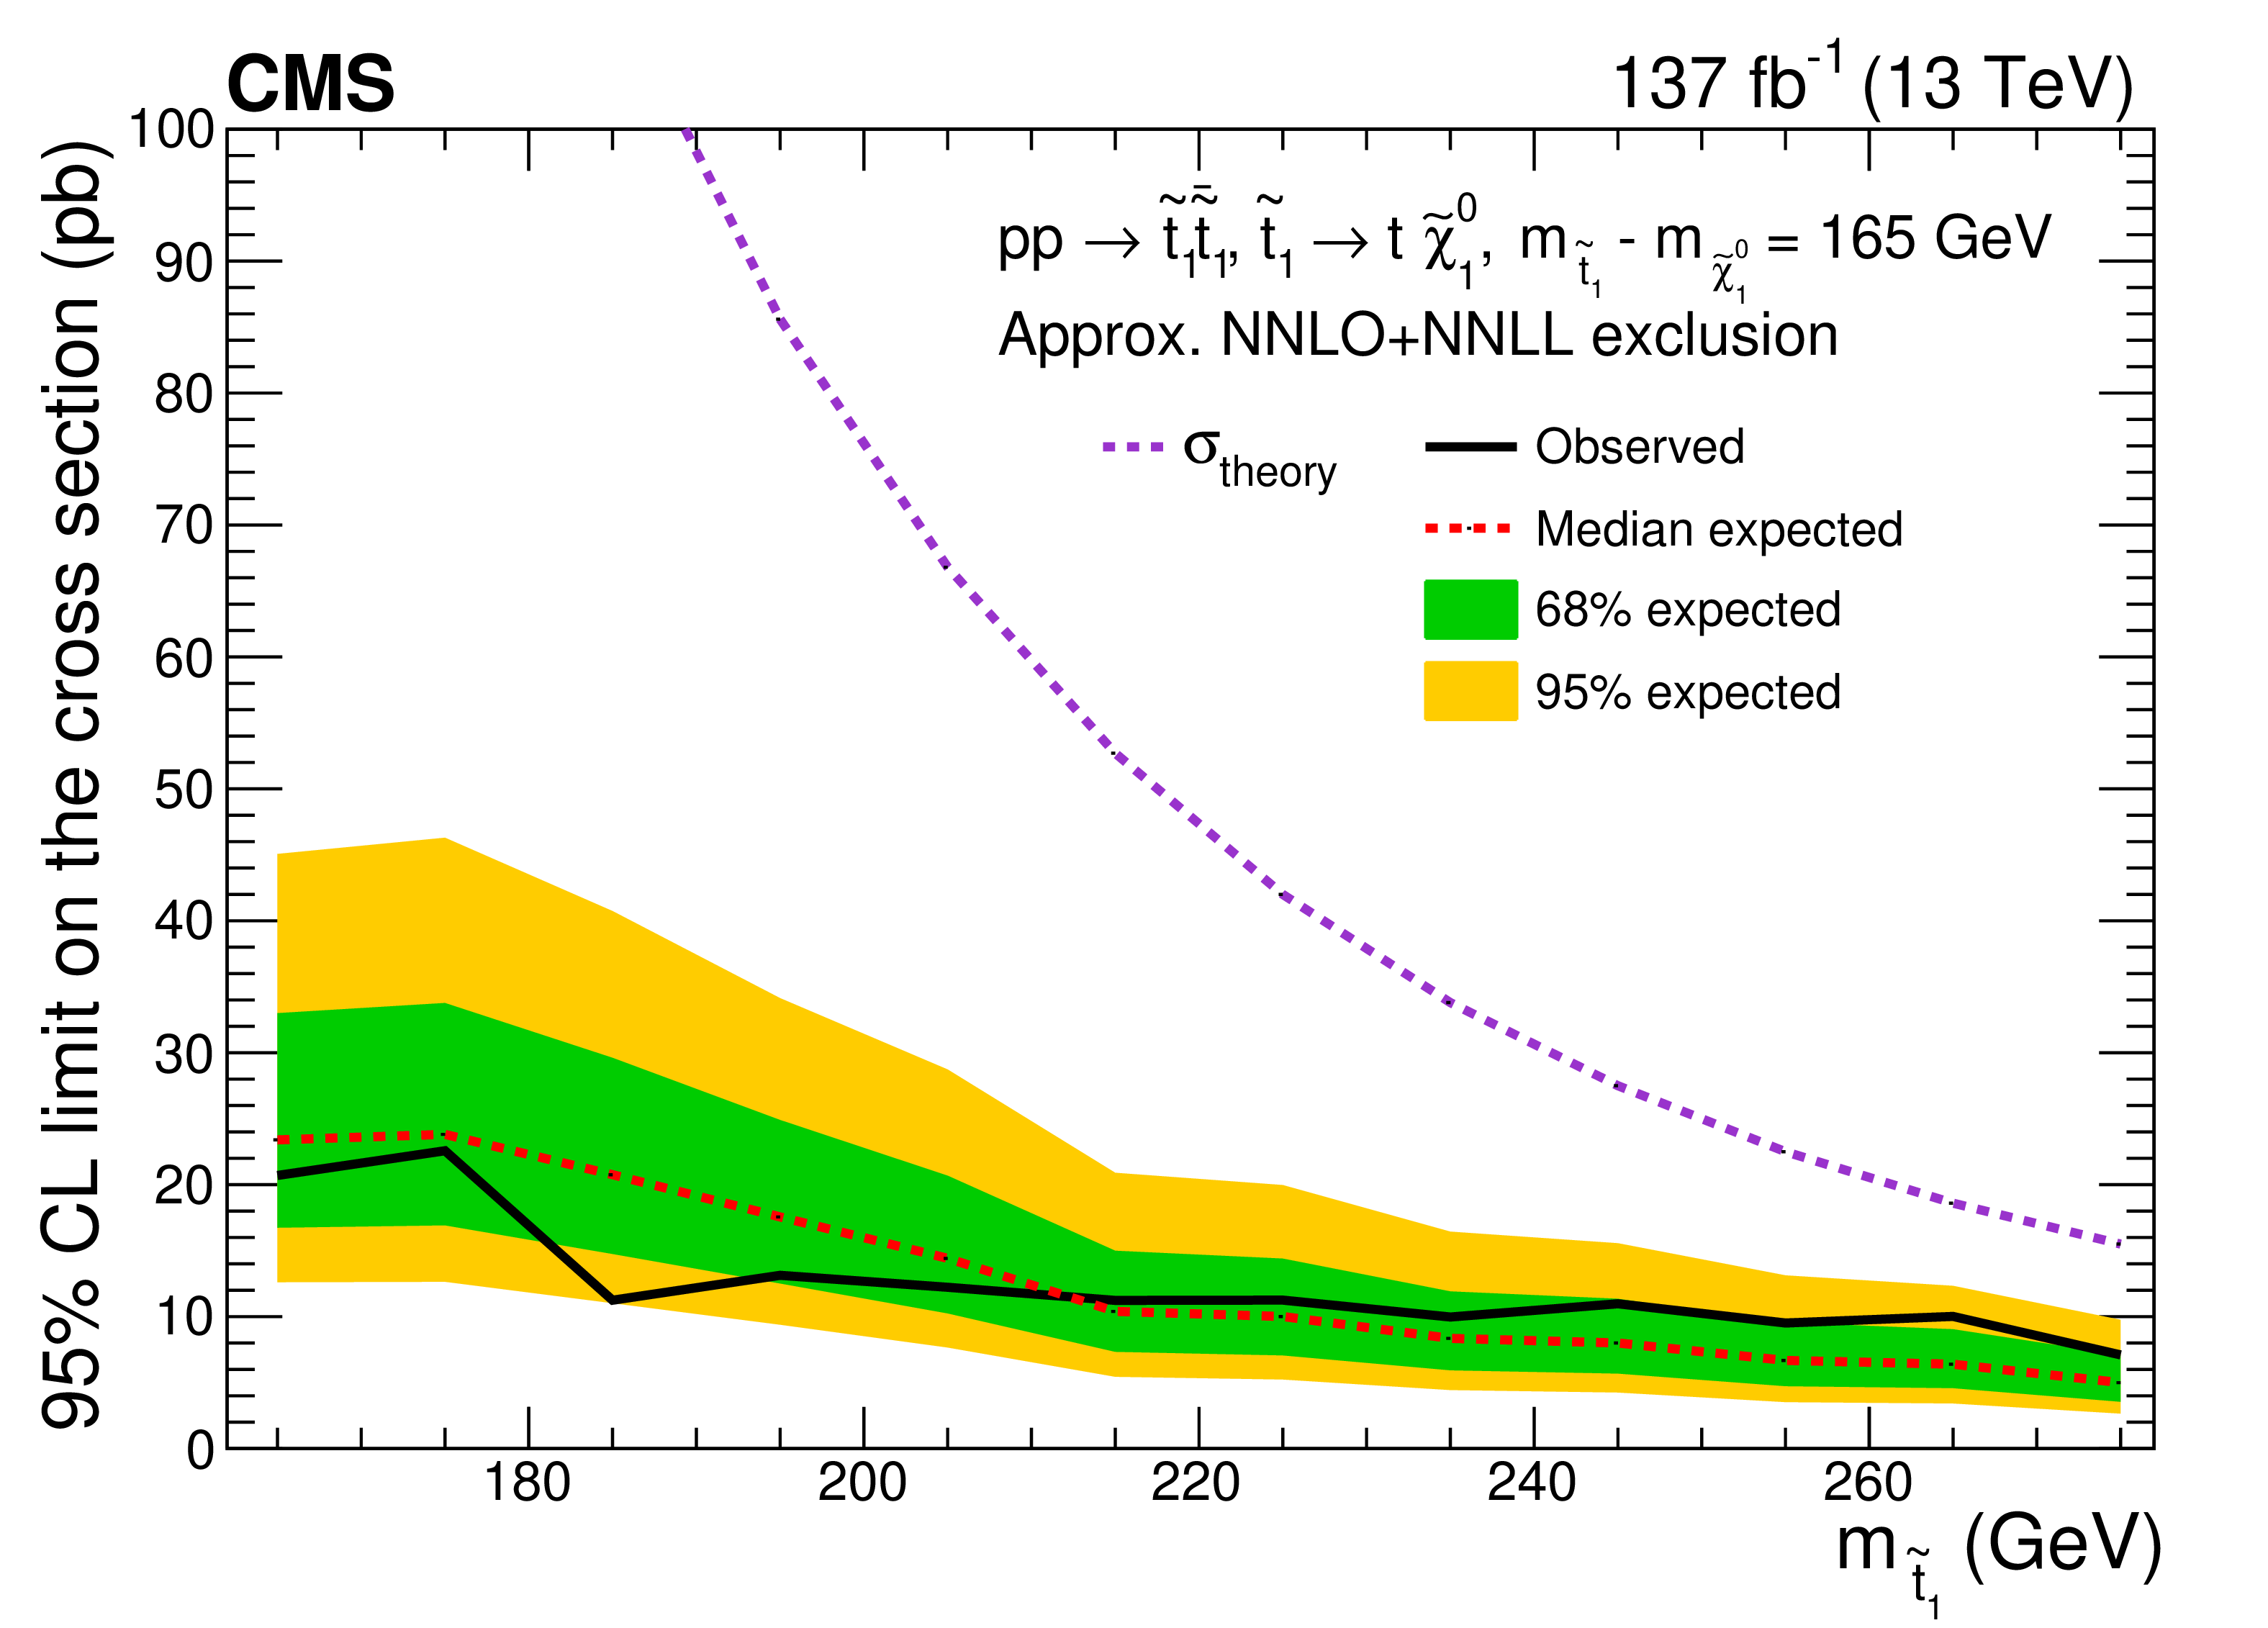
Figure 8-c:
Upper limit at 95% CL on the signal cross section as a function of the top squark mass for ${\Delta m\left (\tilde{\mathrm{t}}_{1},\,\tilde{\chi}^0_1 \right)}$ of 165 GeV.The green and yellow bands represent the regions containing 68 and 95%, respectively, of the distribution of limits expected under the background-only hypothesis. The purple dotted line indicates the approximate NNLO+NNLL production cross section. |
png pdf |
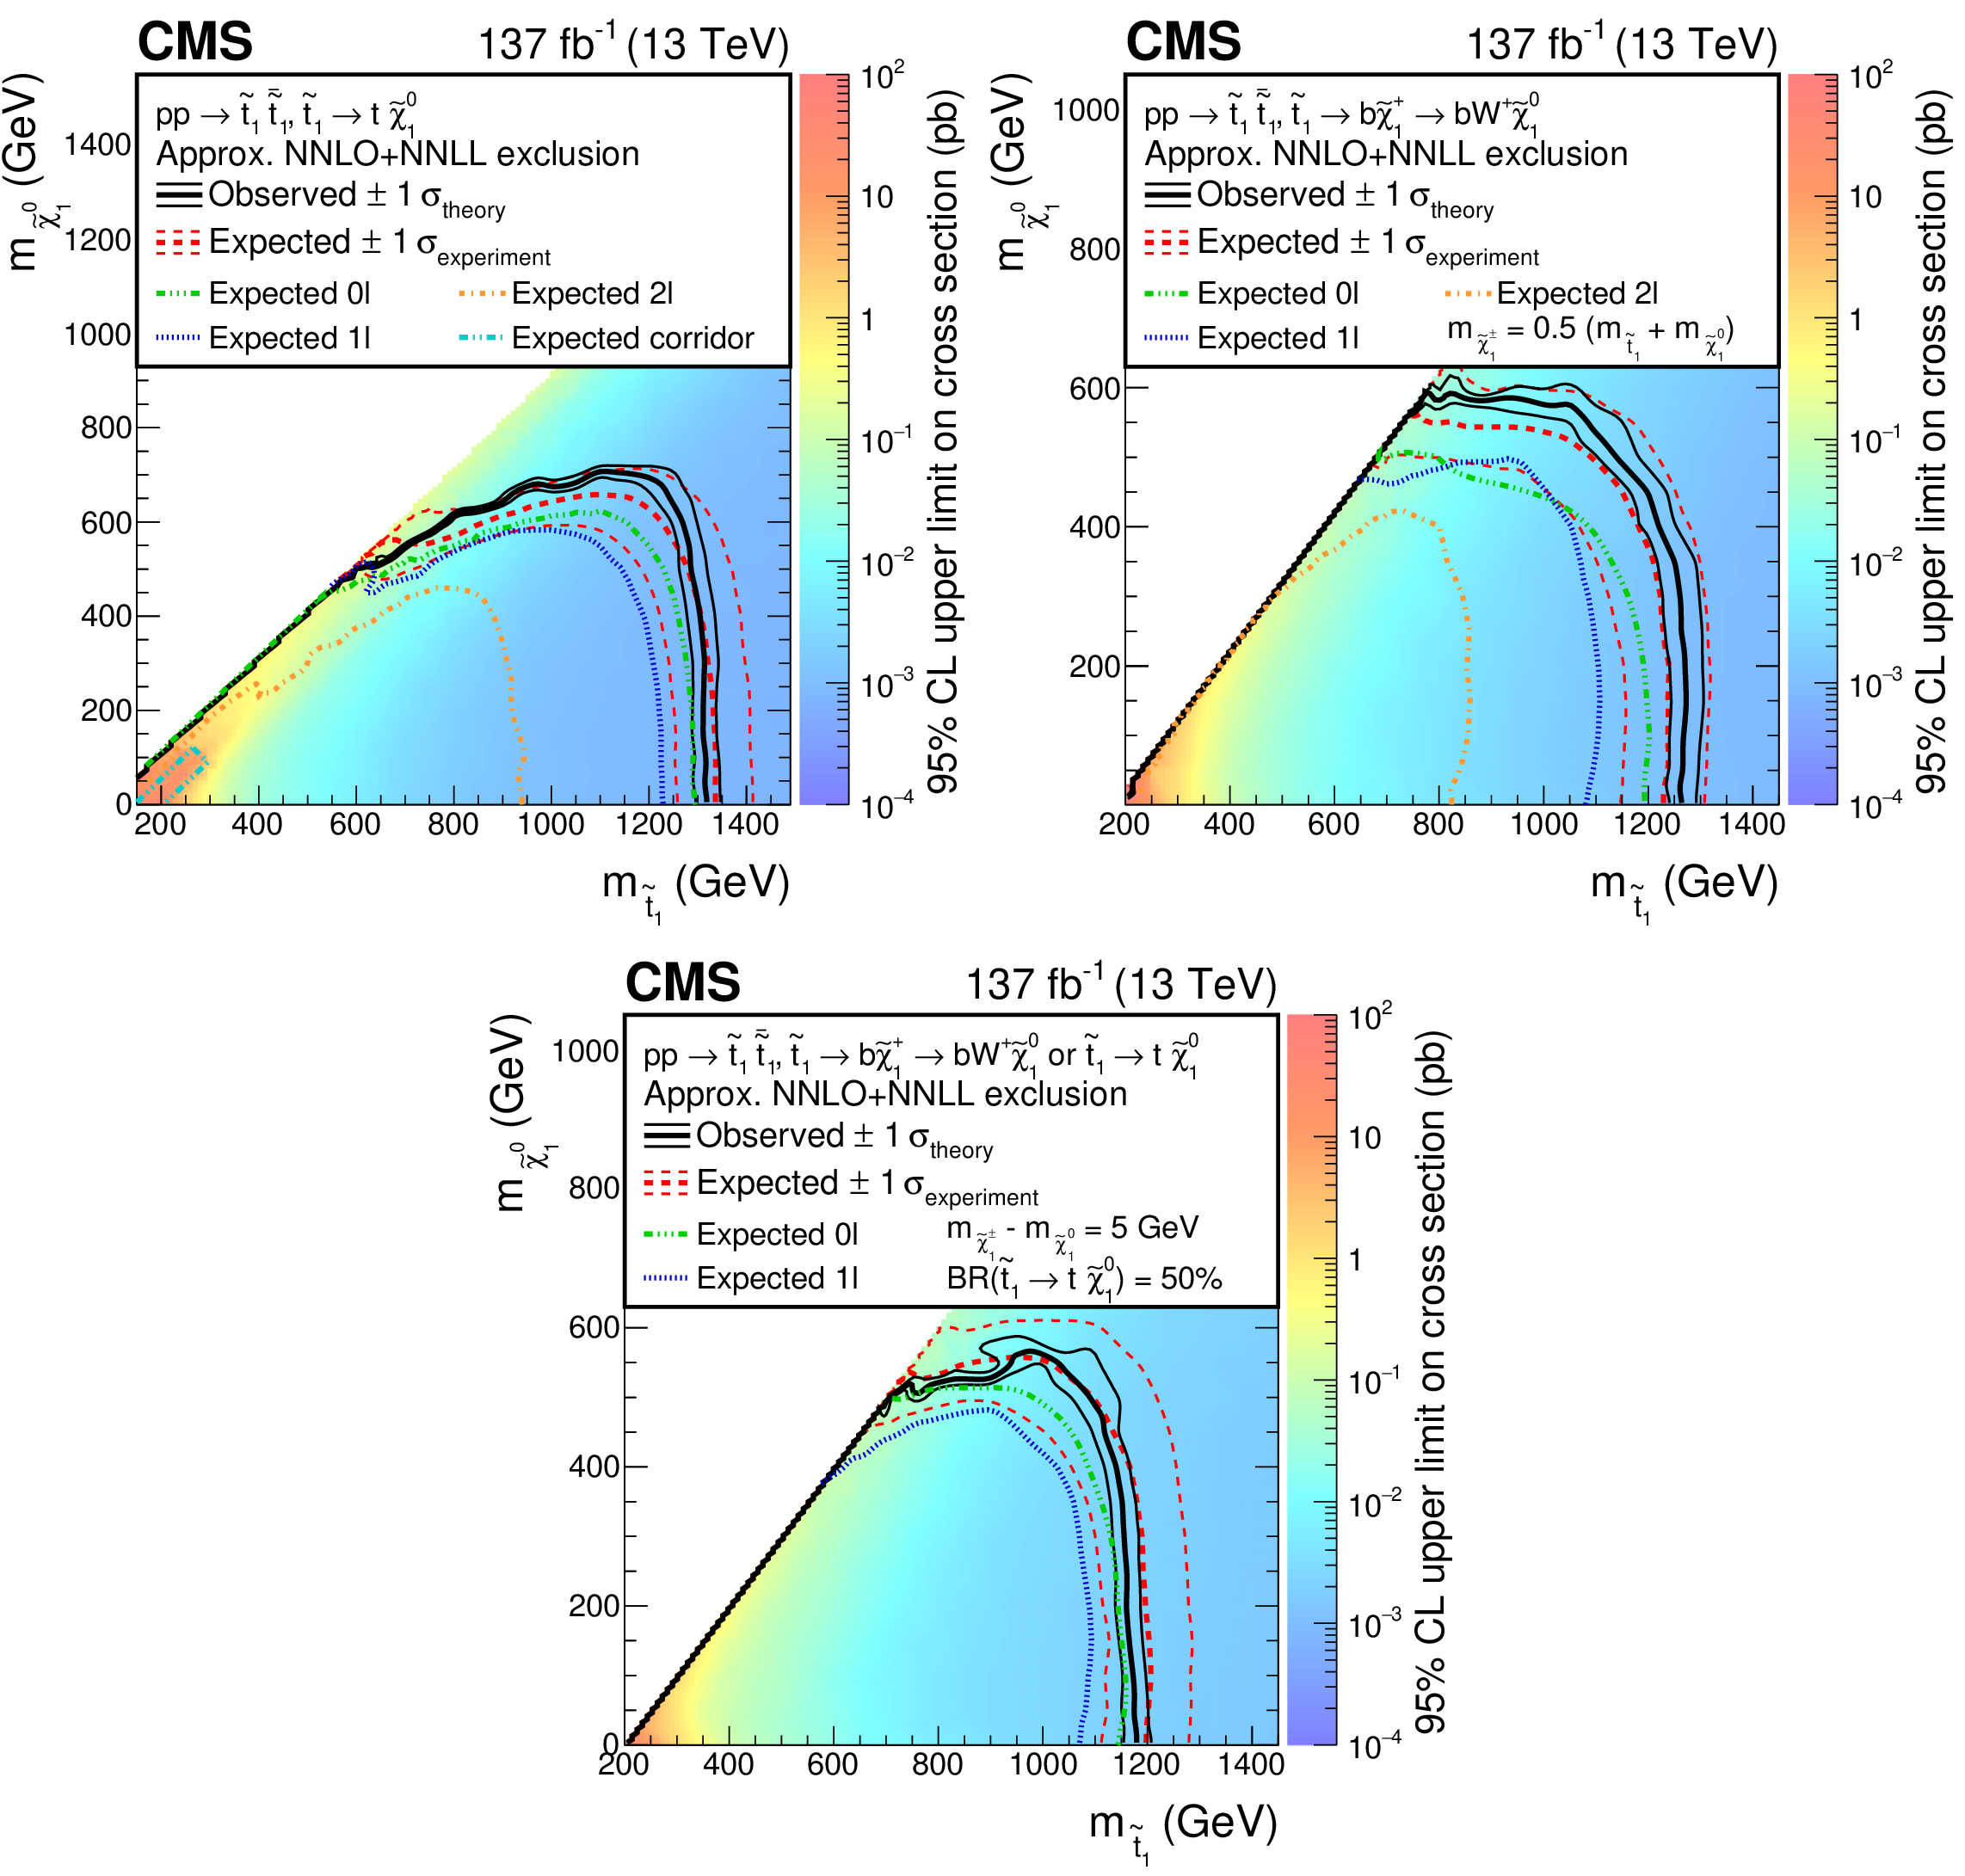
Figure 9:
Expected and observed limits in the $m_{\tilde{\mathrm{t}}_{1}}$-$m_{\tilde{\chi}^0_1}$ mass plane, for the $\tilde{\mathrm{t}}_{1} \to \mathrm{t} \tilde{\chi}^0_1 $ model (upper left), the $\tilde{\mathrm{t}}_{1} \to \mathrm{b} \chi^{+}_{1} \to \mathrm{b} \mathrm{W^{+}} \tilde{\chi}^0_1 $ model (upper right) and a model with a branching fraction of 50% for each of these top squark decay modes (lower), assuming a mass difference between the neutralino and chargino of 5 GeV. The color indicates the 95% CL upper limit on the cross section at each point in the plane. The area below the thick black curve represents the observed exclusion region at 95% CL, while the dashed red lines indicate the expected limits at 95% CL and the region containing 68% of the distribution of limits expected under the background-only hypothesis of the combined analyses. The thin black lines show the effect of the theoretical uncertainties in the signal cross section. |
png pdf |
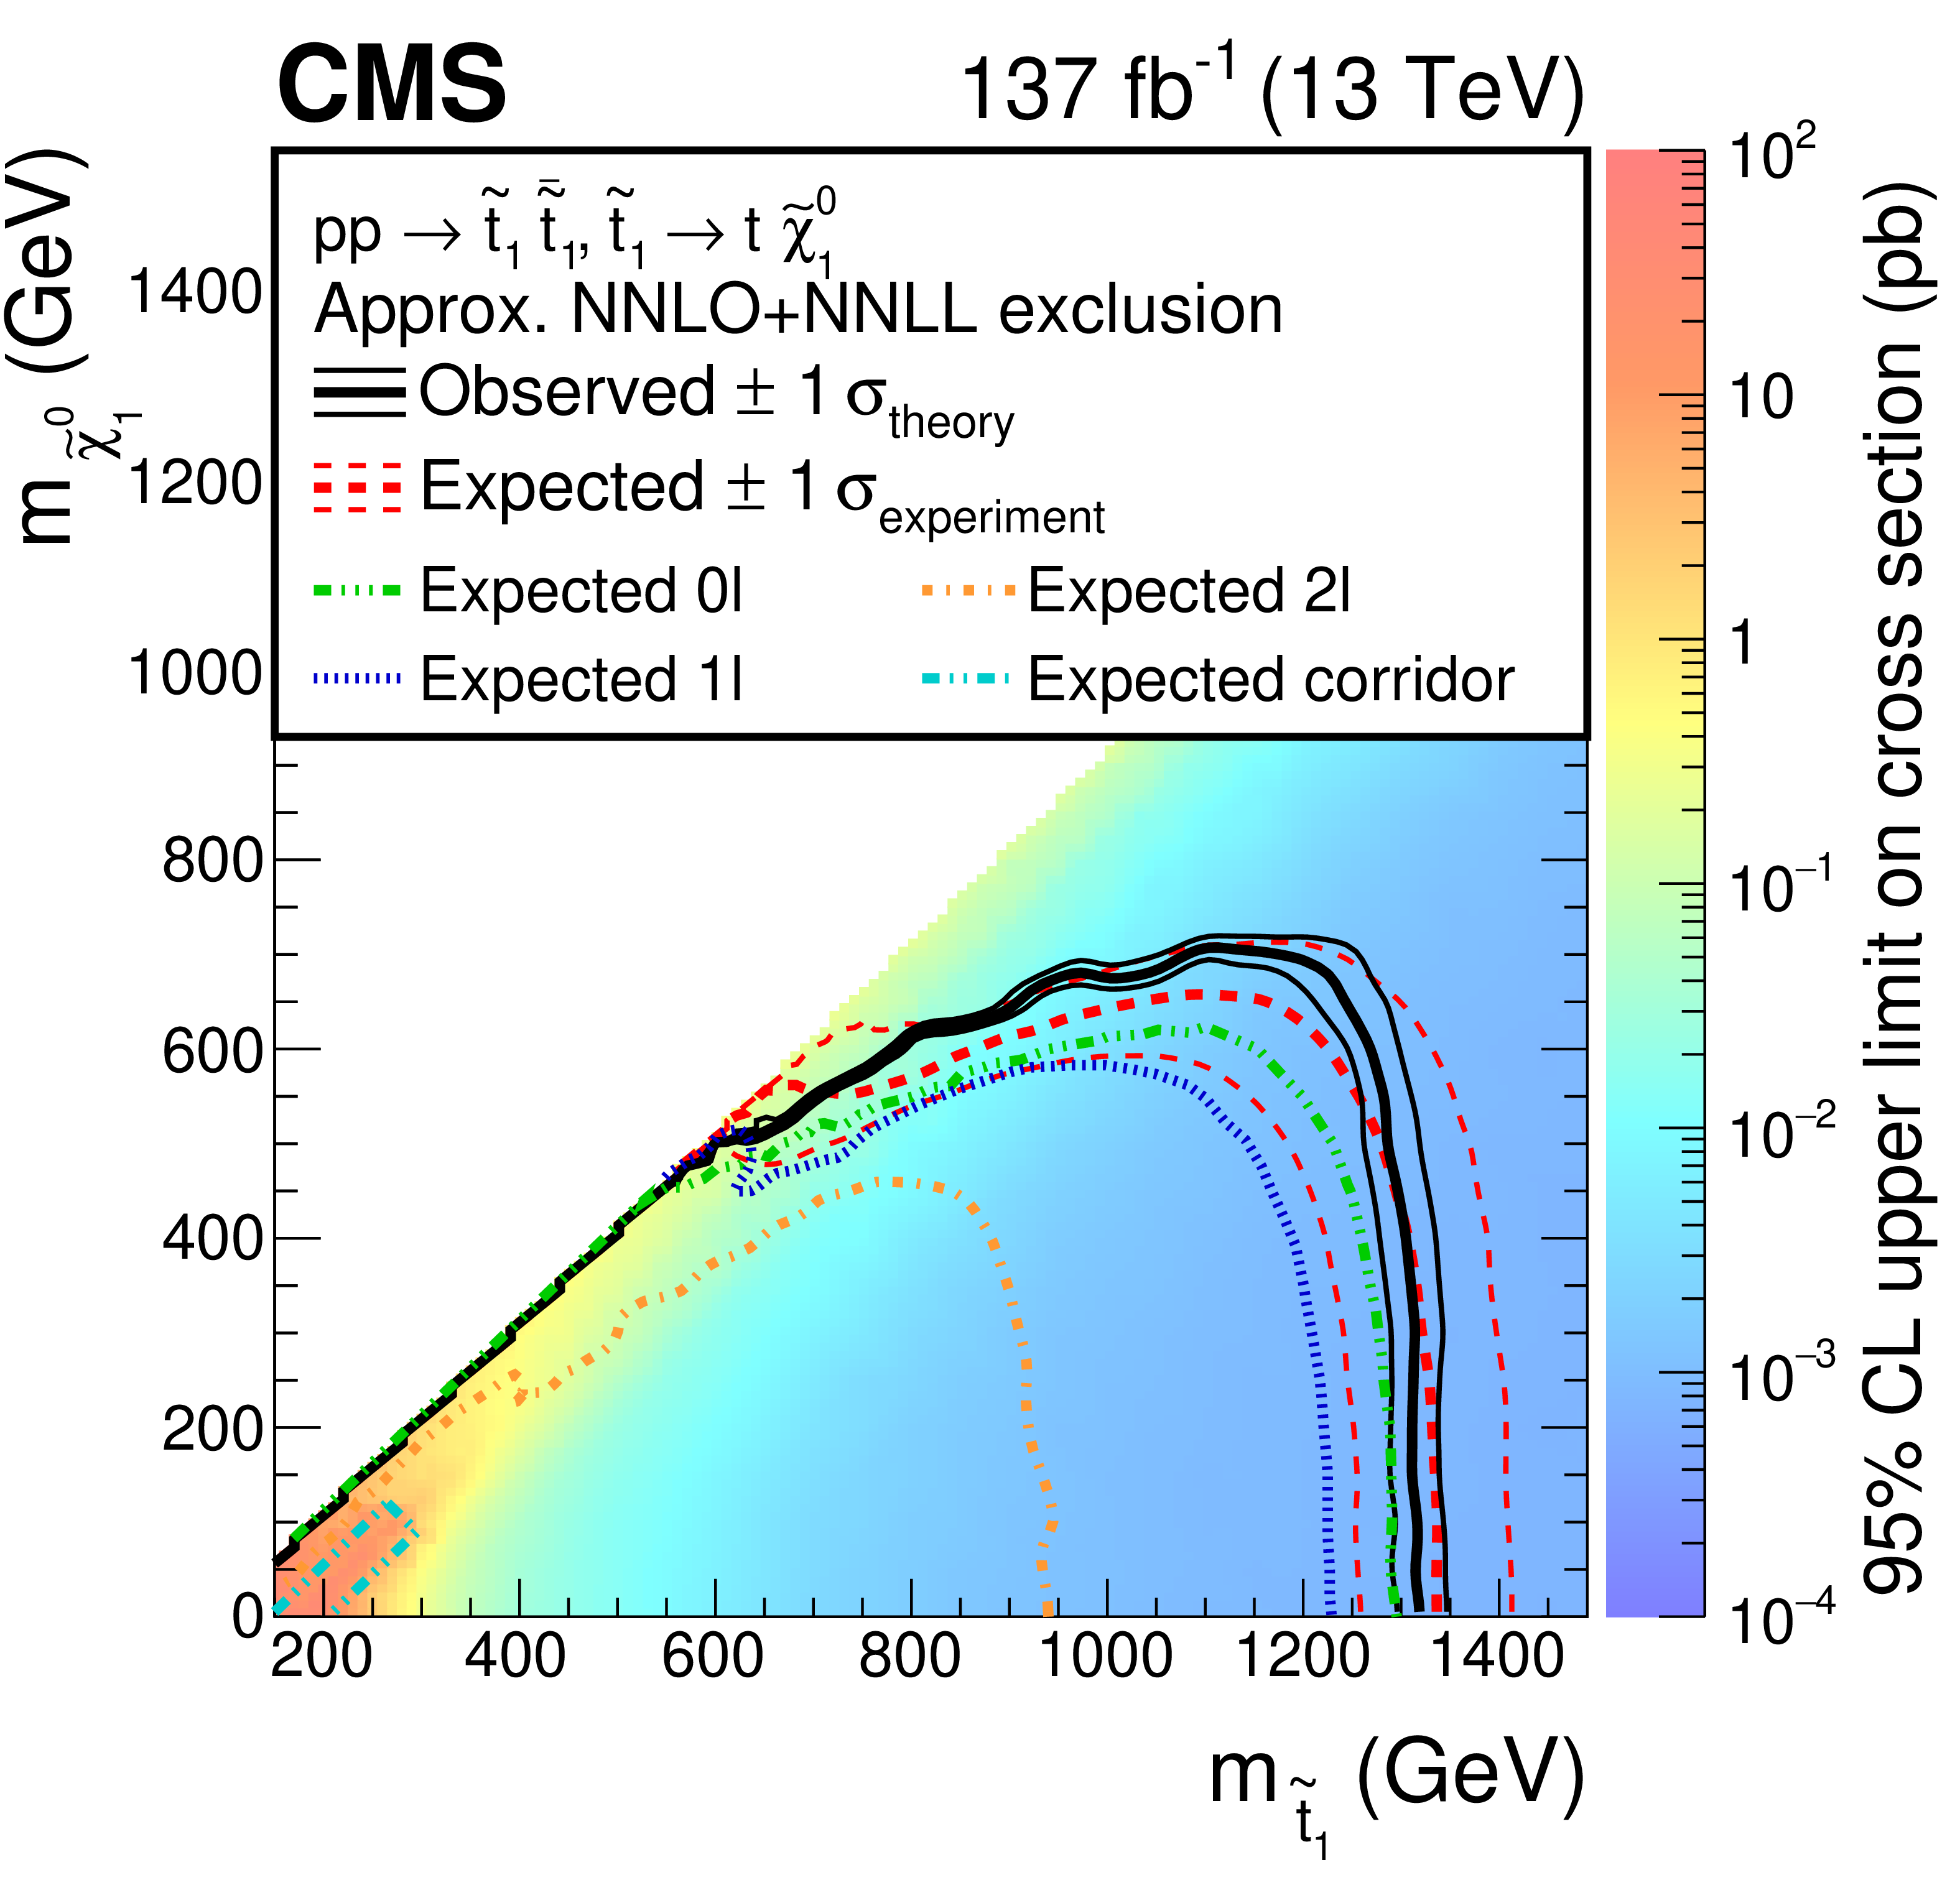
Figure 9-a:
Expected and observed limits in the $m_{\tilde{\mathrm{t}}_{1}}$-$m_{\tilde{\chi}^0_1}$ mass plane, for the $\tilde{\mathrm{t}}_{1}, assuming a mass difference between the neutralino and chargino of 5 GeV. The color indicates the 95% CL upper limit on the cross section at each point in the plane. The area below the thick black curve represents the observed exclusion region at 95% CL, while the dashed red lines indicate the expected limits at 95% CL and the region containing 68% of the distribution of limits expected under the background-only hypothesis of the combined analyses. The thin black lines show the effect of the theoretical uncertainties in the signal cross section. |
png pdf |
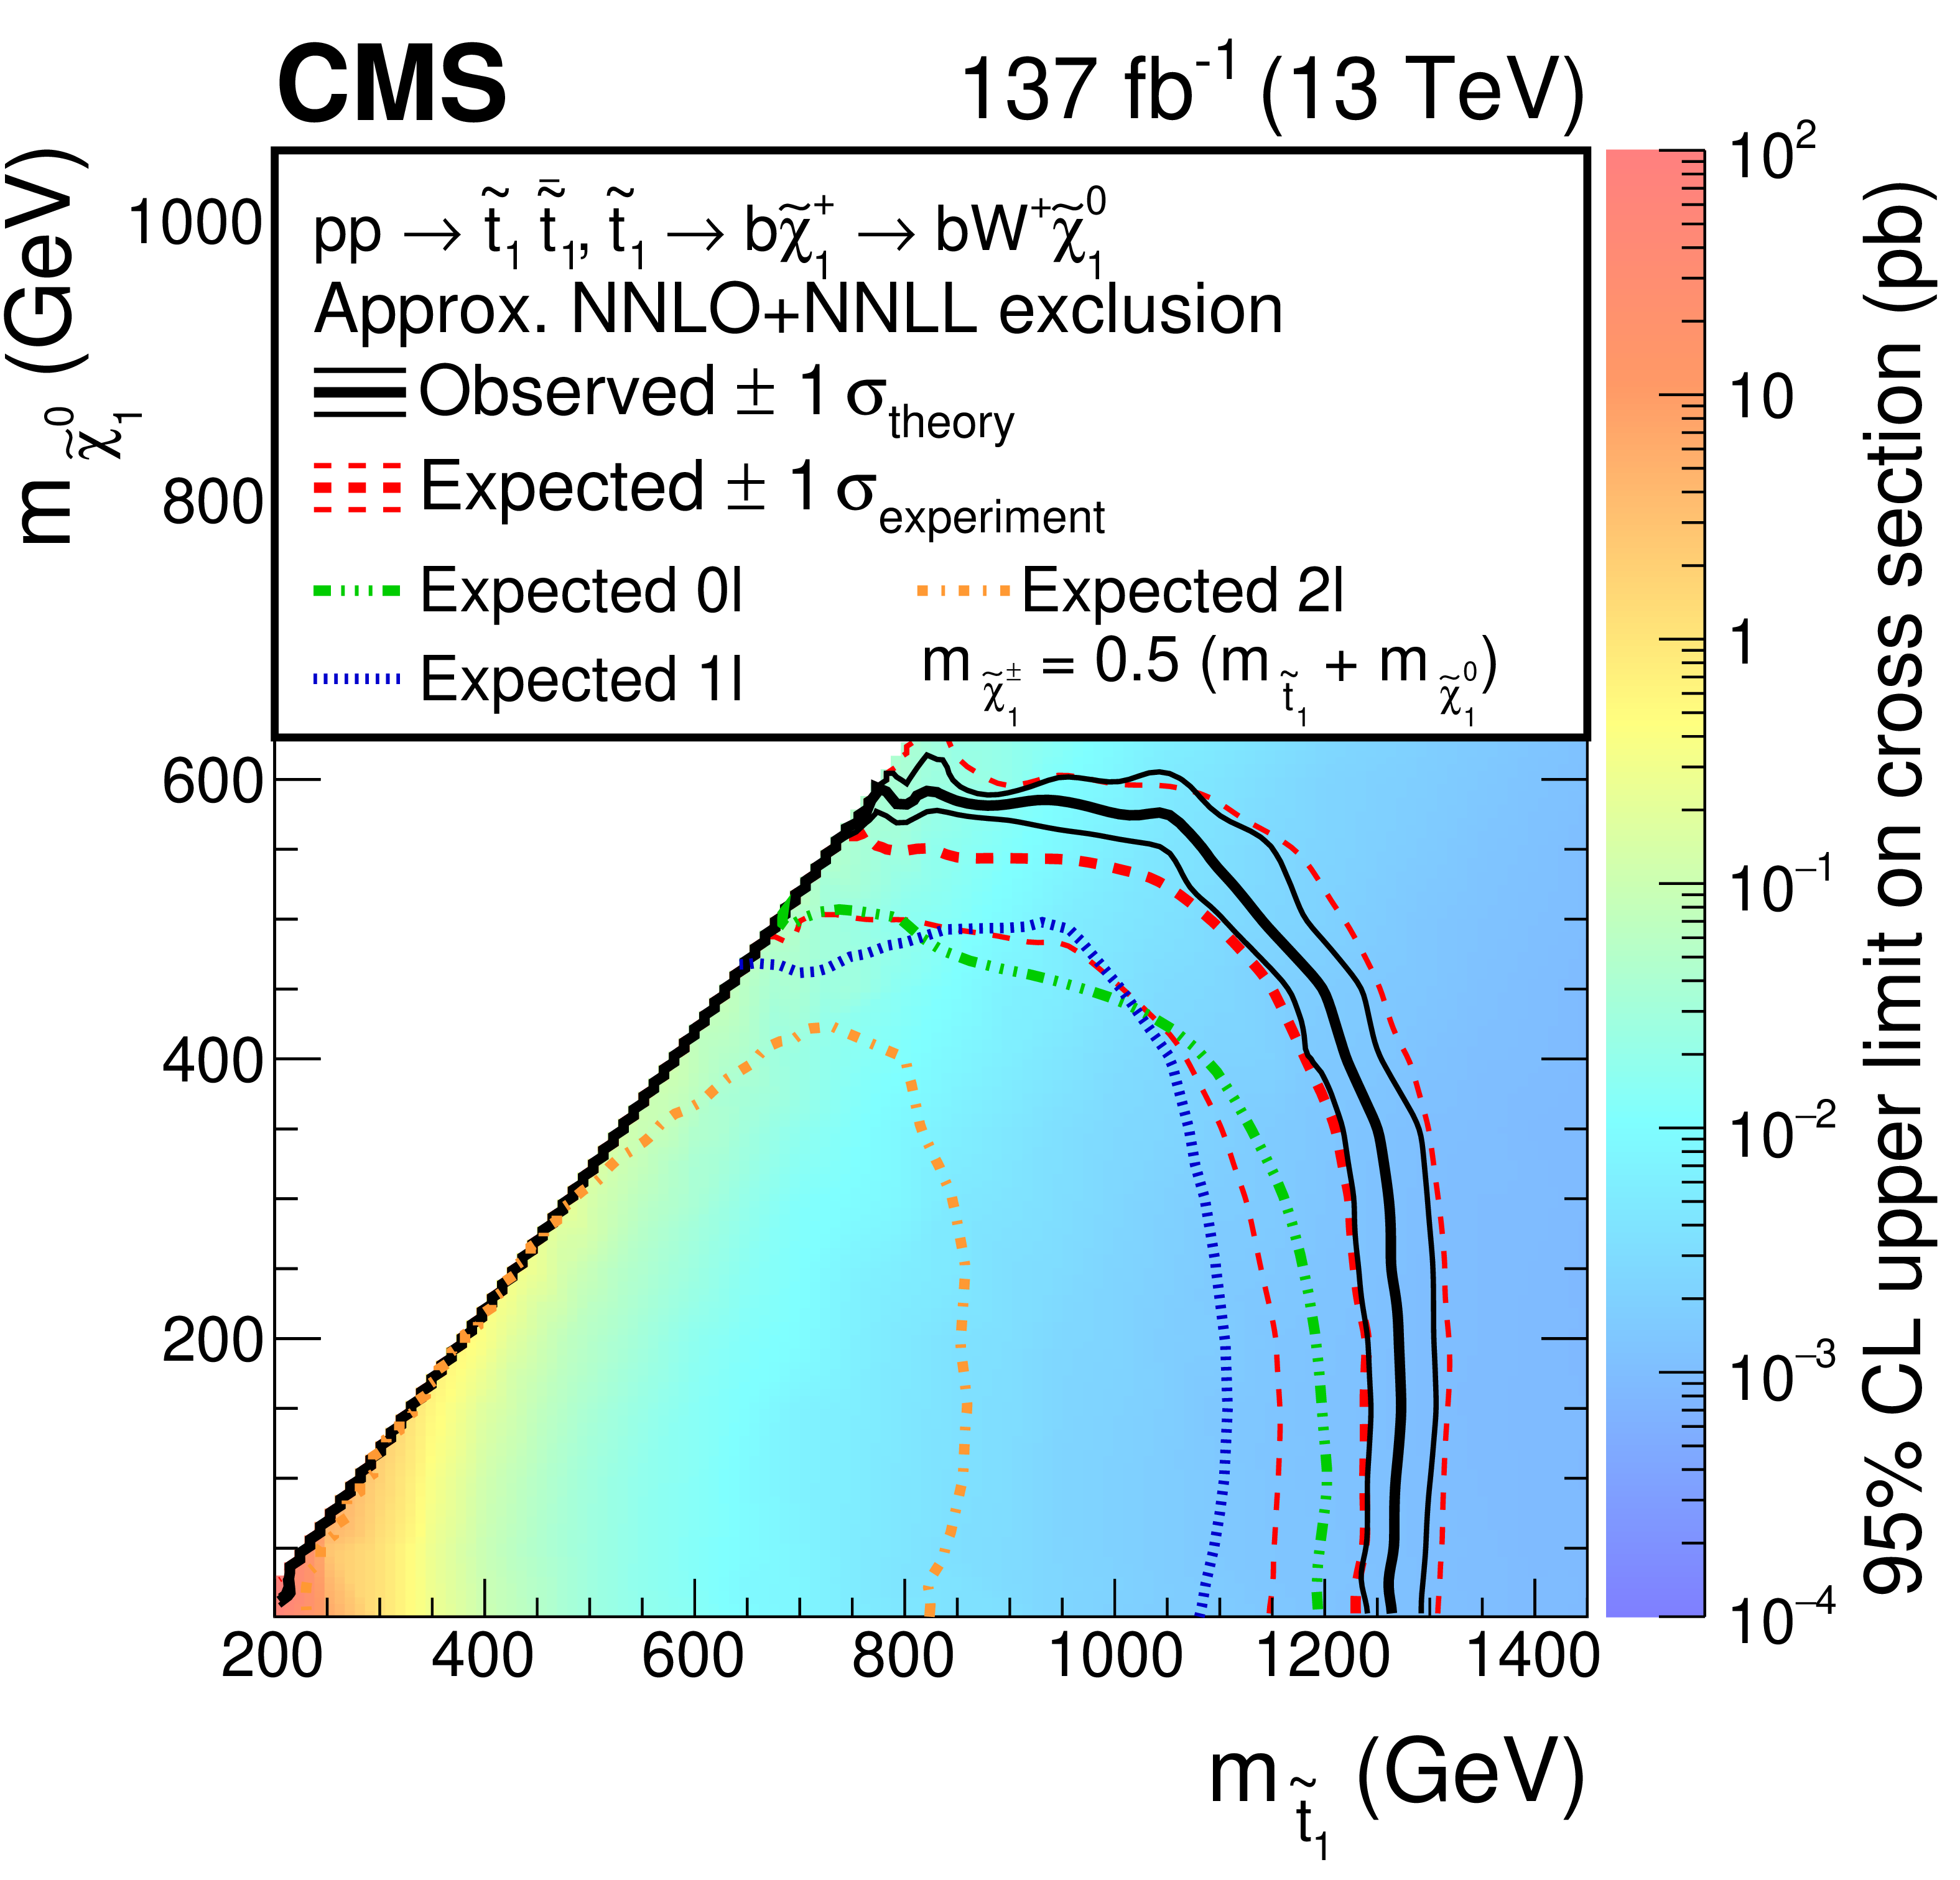
Figure 9-b:
Expected and observed limits in the $m_{\tilde{\mathrm{t}}_{1}}$-$m_{\tilde{\chi}^0_1}$ mass plane, for the $\tilde{\mathrm{t}}_{1} \to \mathrm{b} \chi^{+}_{1} \to \mathrm{b} \mathrm{W^{+}} \tilde{\chi}^0_1 $ model, assuming a mass difference between the neutralino and chargino of 5 GeV. The color indicates the 95% CL upper limit on the cross section at each point in the plane. The area below the thick black curve represents the observed exclusion region at 95% CL, while the dashed red lines indicate the expected limits at 95% CL and the region containing 68% of the distribution of limits expected under the background-only hypothesis of the combined analyses. The thin black lines show the effect of the theoretical uncertainties in the signal cross section. |
png pdf |
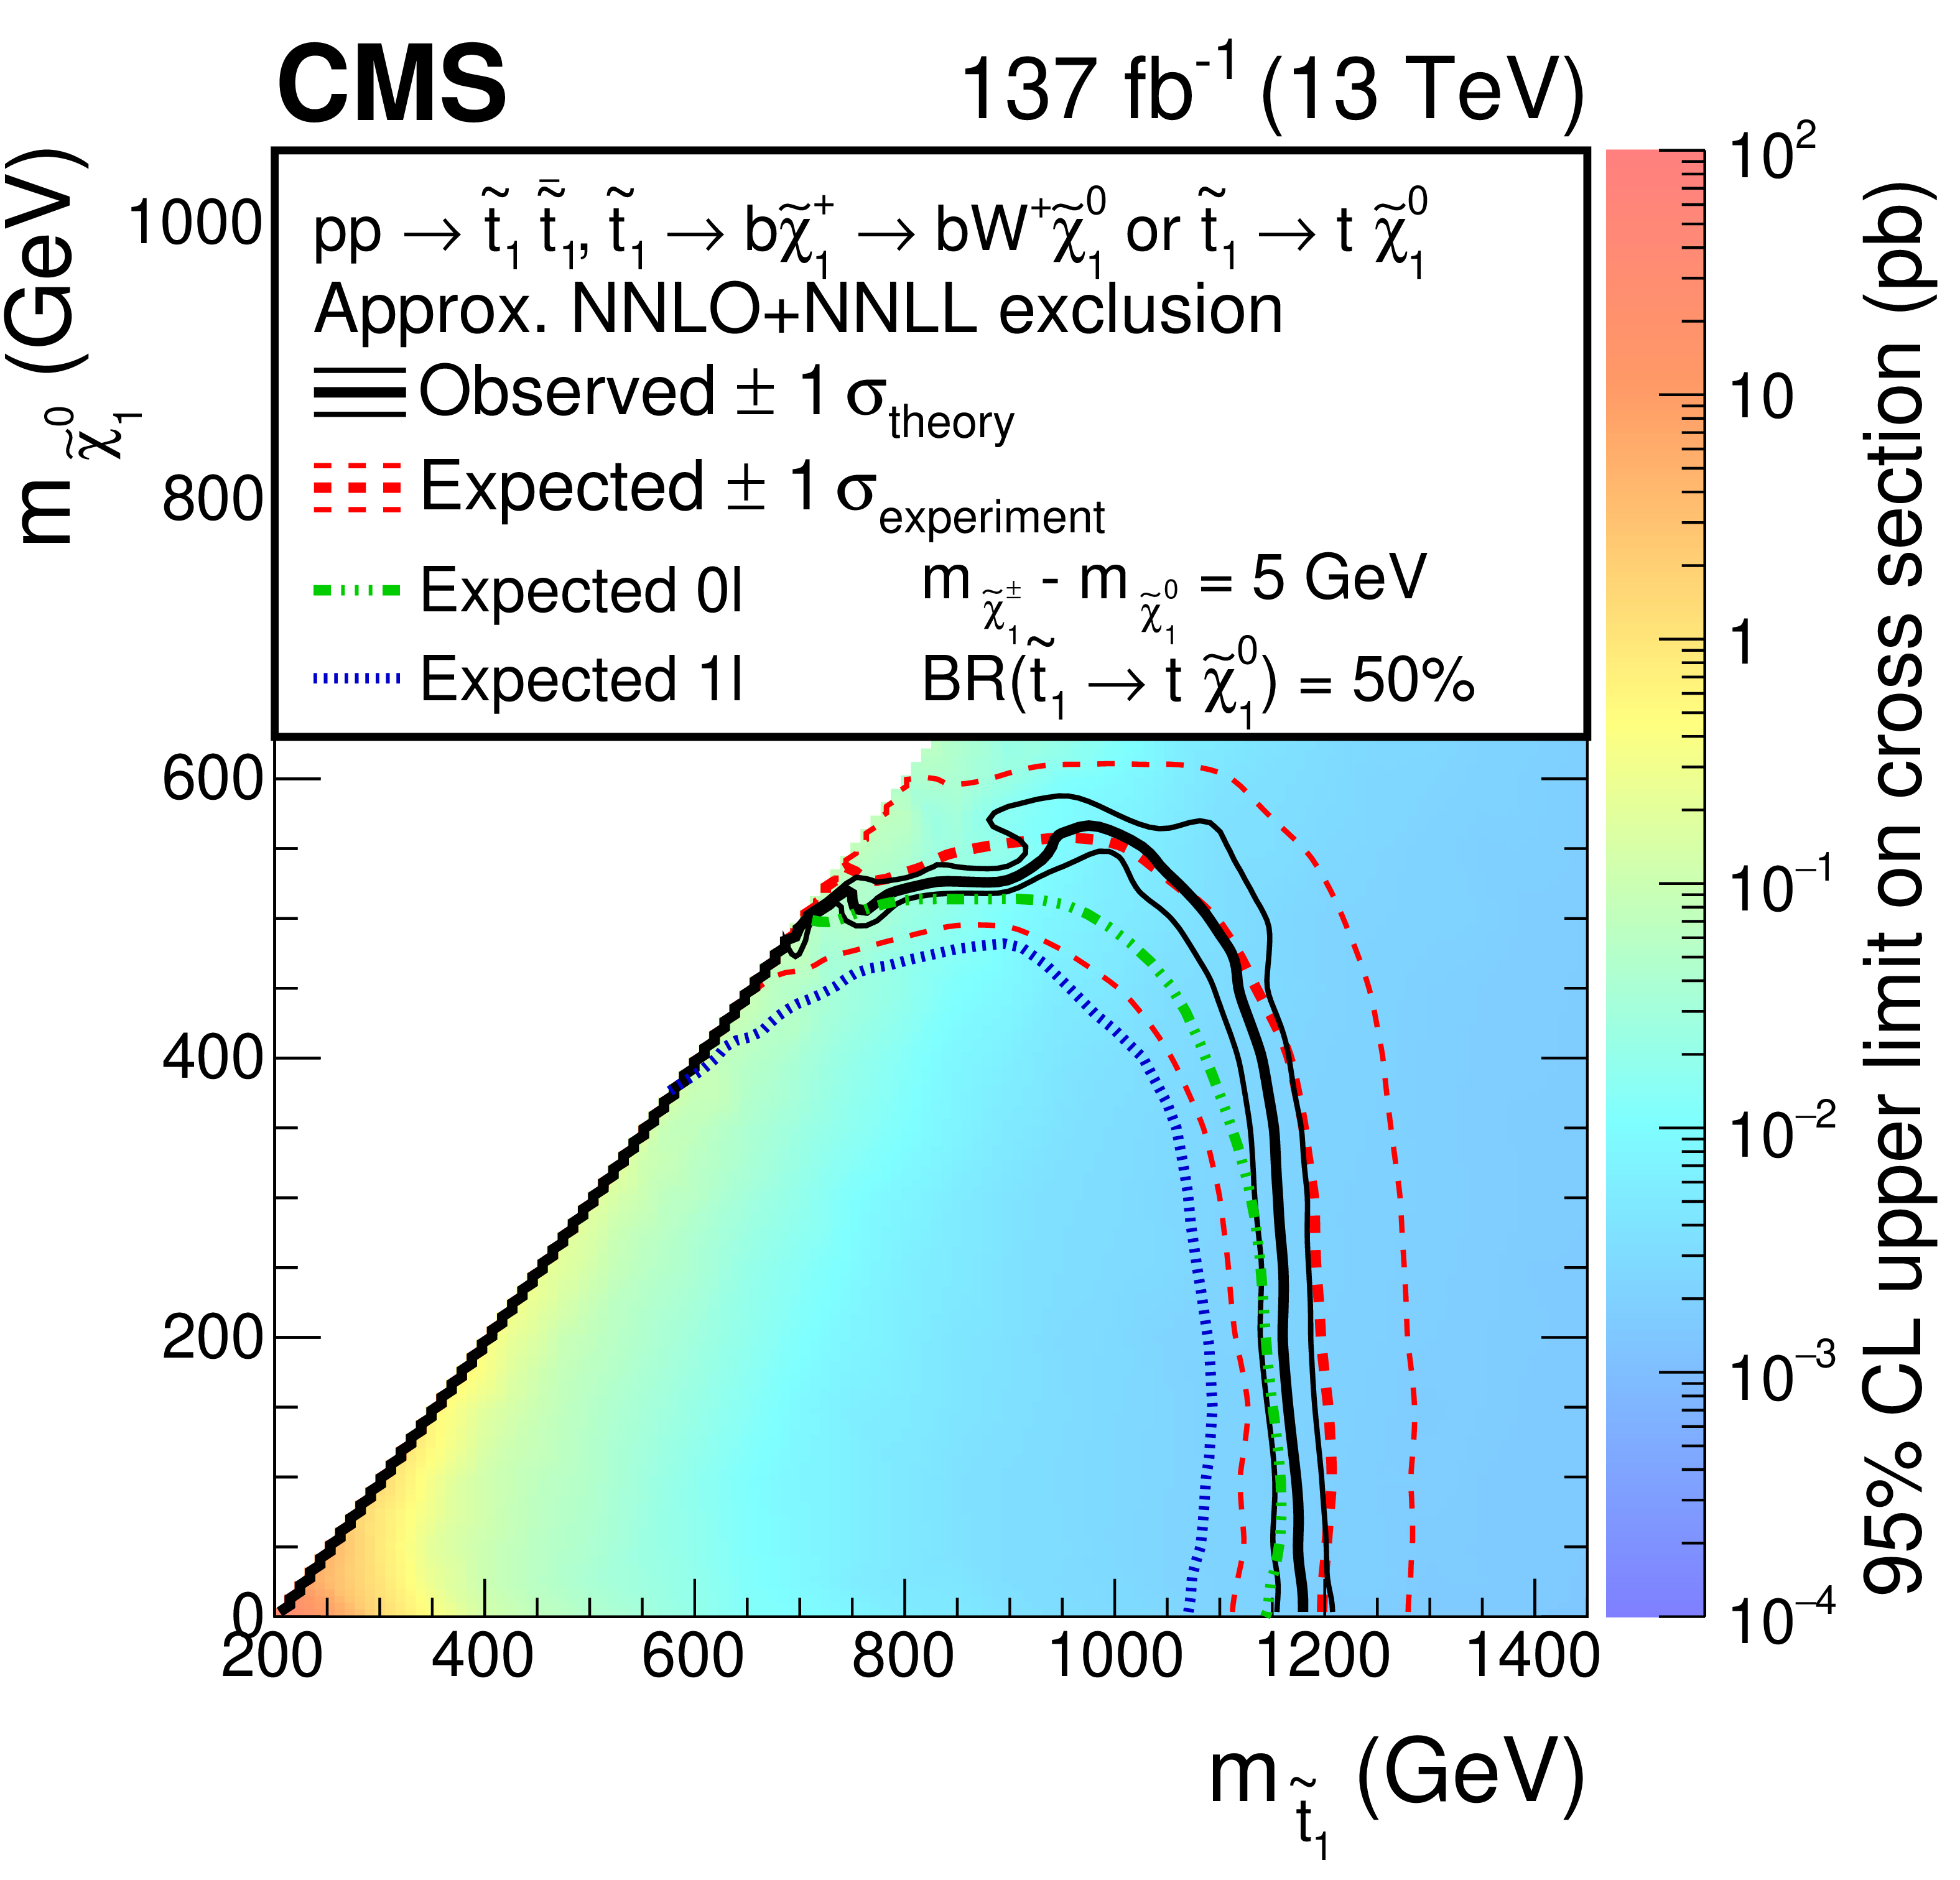
Figure 9-c:
Expected and observed limits in the $m_{\tilde{\mathrm{t}}_{1}}$-$m_{\tilde{\chi}^0_1}$ mass plane, for a model with a branching fraction of 50% for each of these top squark decay modes, assuming a mass difference between the neutralino and chargino of 5 GeV. The color indicates the 95% CL upper limit on the cross section at each point in the plane. The area below the thick black curve represents the observed exclusion region at 95% CL, while the dashed red lines indicate the expected limits at 95% CL and the region containing 68% of the distribution of limits expected under the background-only hypothesis of the combined analyses. The thin black lines show the effect of the theoretical uncertainties in the signal cross section. |
png pdf |
Figure 10:
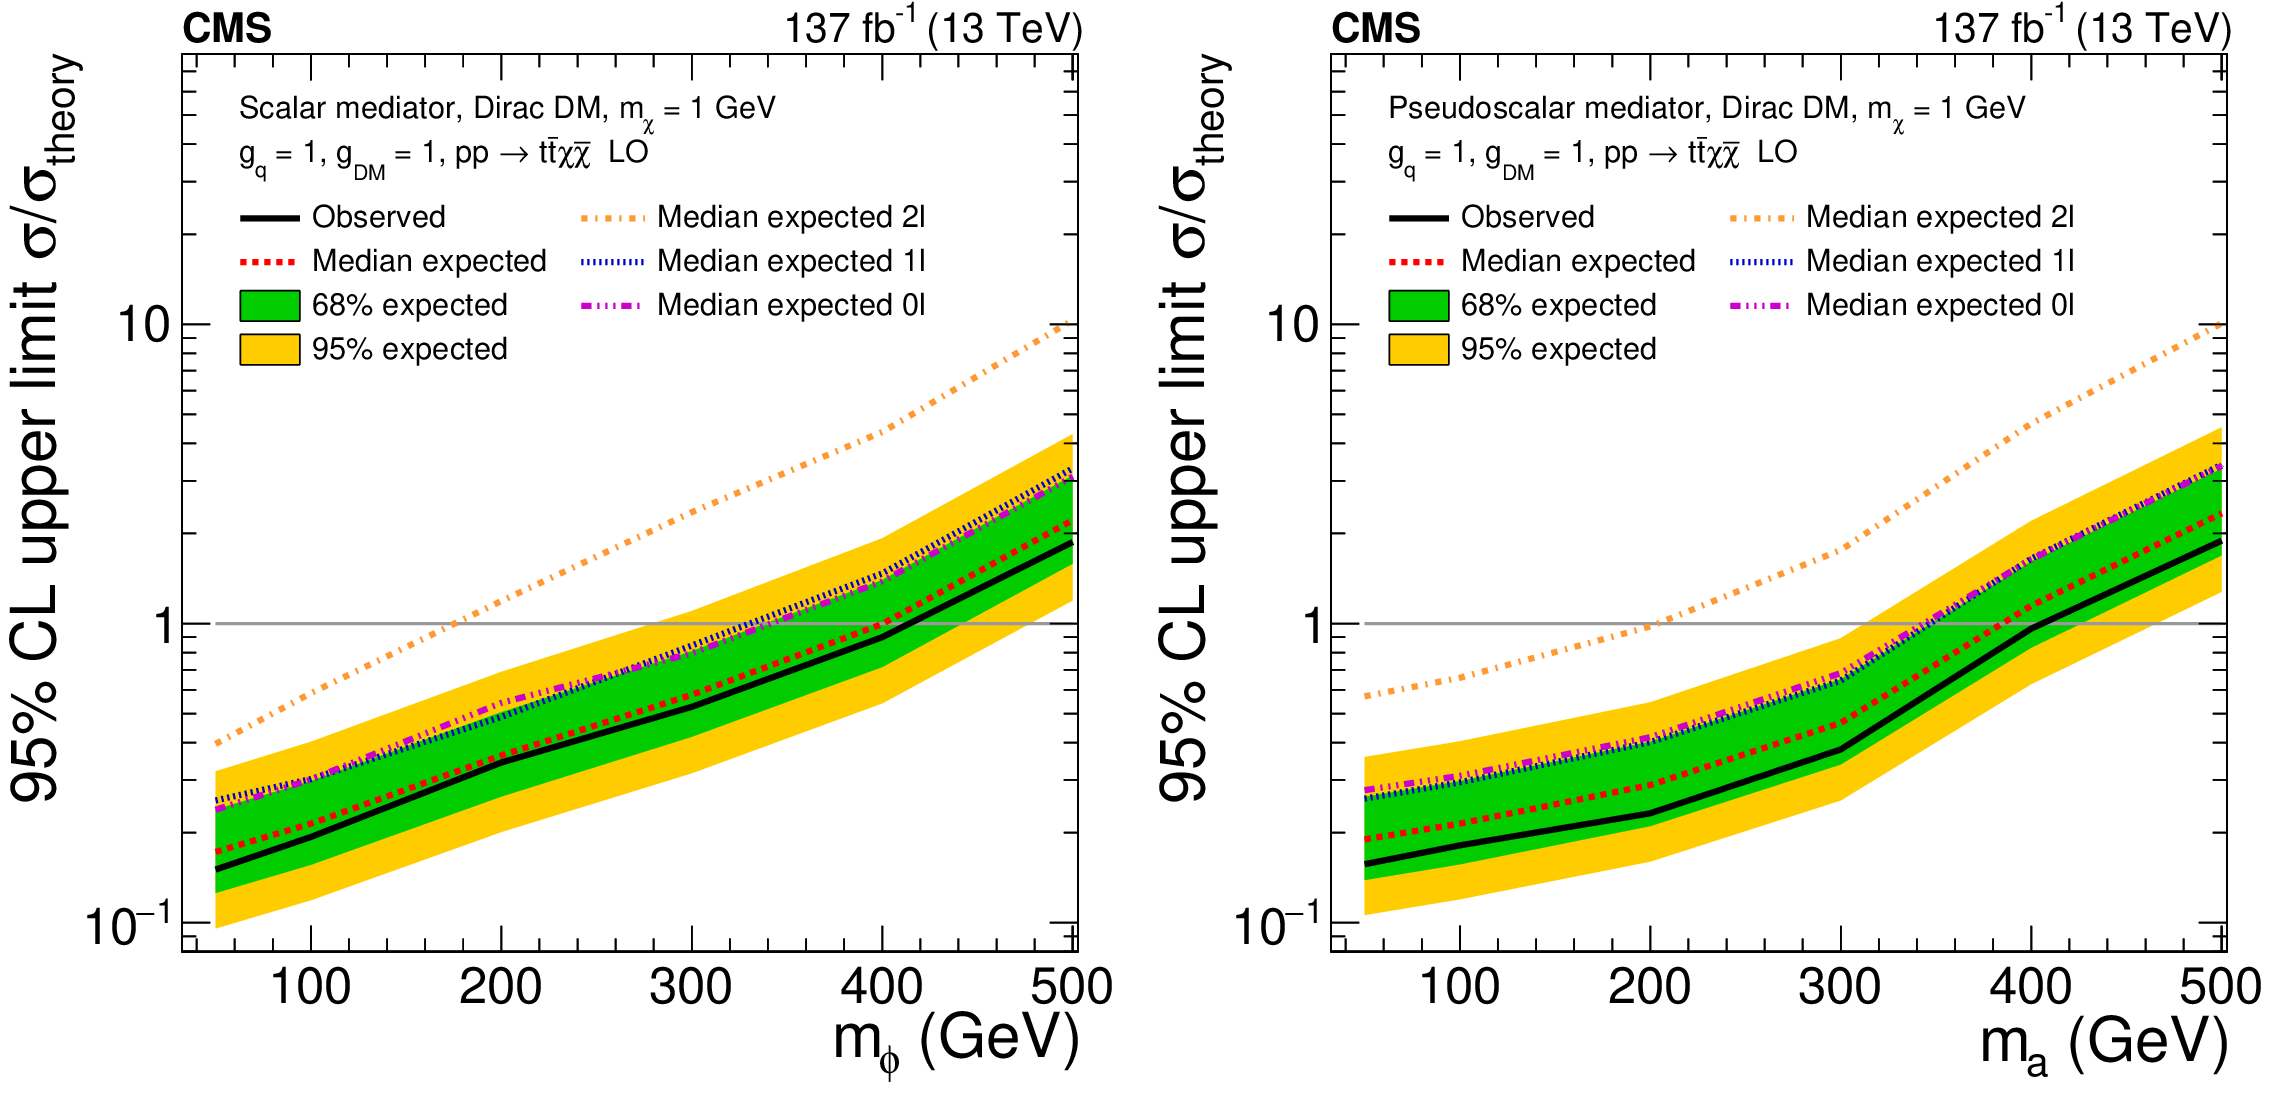
The 95% CL expected (dashed line) and observed limits (solid line) on $\sigma /\sigma _{\mathrm {theory}}$ for a fermionic DM particle with $m_{\chi} = $ 1 GeV, as a function of the mediator mass for a scalar (left) and pseudoscalar (right). The green and yellow bands represent the regions containing 68 and 95%, respectively, of the distribution of limits expected under the background-only hypothesis. The horizontal gray line indicates $\sigma /\sigma _{\mathrm {theory}}=$ 1. The mediator couplings are set to $g_\mathrm{q} =g_{\mathrm {DM}}=$ 1. |
png pdf |
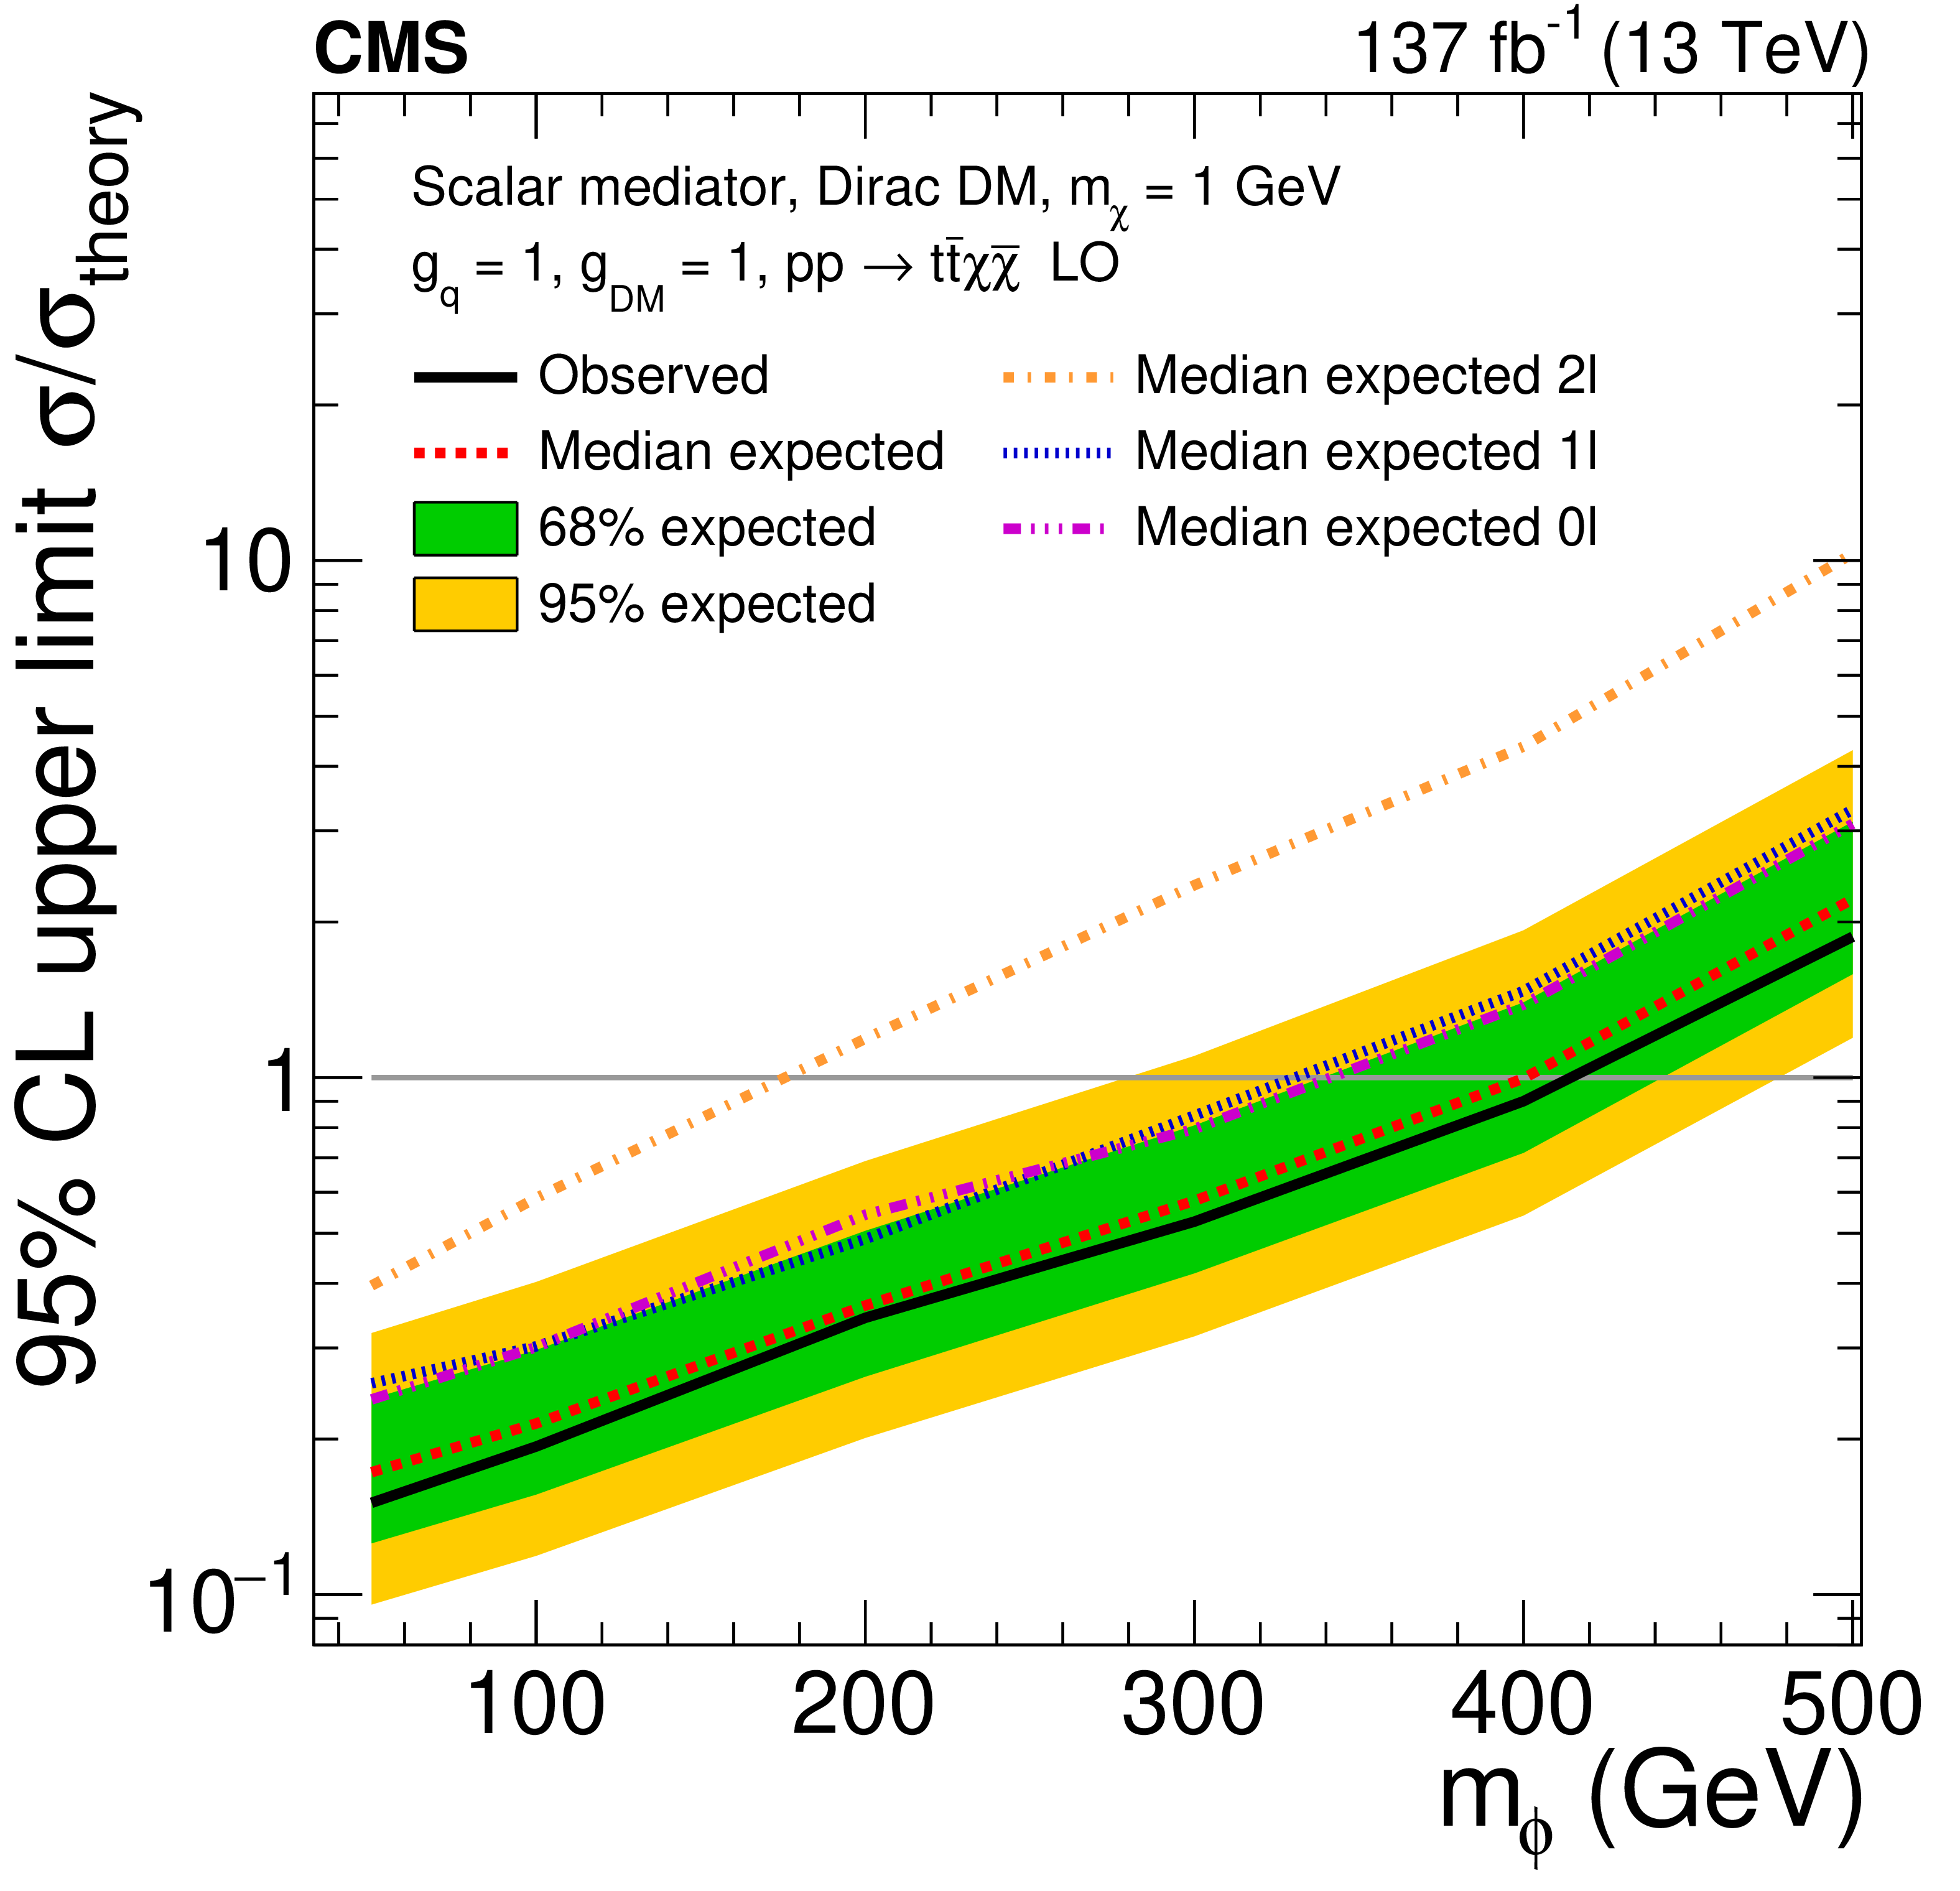
Figure 10-a:
The 95% CL expected (dashed line) and observed limits (solid line) on $\sigma /\sigma _{\mathrm {theory}}$ for a fermionic DM particle with $m_{\chi} = $ 1 GeV, as a function of the mediator mass for a scalar. The green and yellow bands represent the regions containing 68 and 95%, respectively, of the distribution of limits expected under the background-only hypothesis. The horizontal gray line indicates $\sigma /\sigma _{\mathrm {theory}}=$ 1. The mediator couplings are set to $g_\mathrm{q} =g_{\mathrm {DM}}=$ 1. |
png pdf |
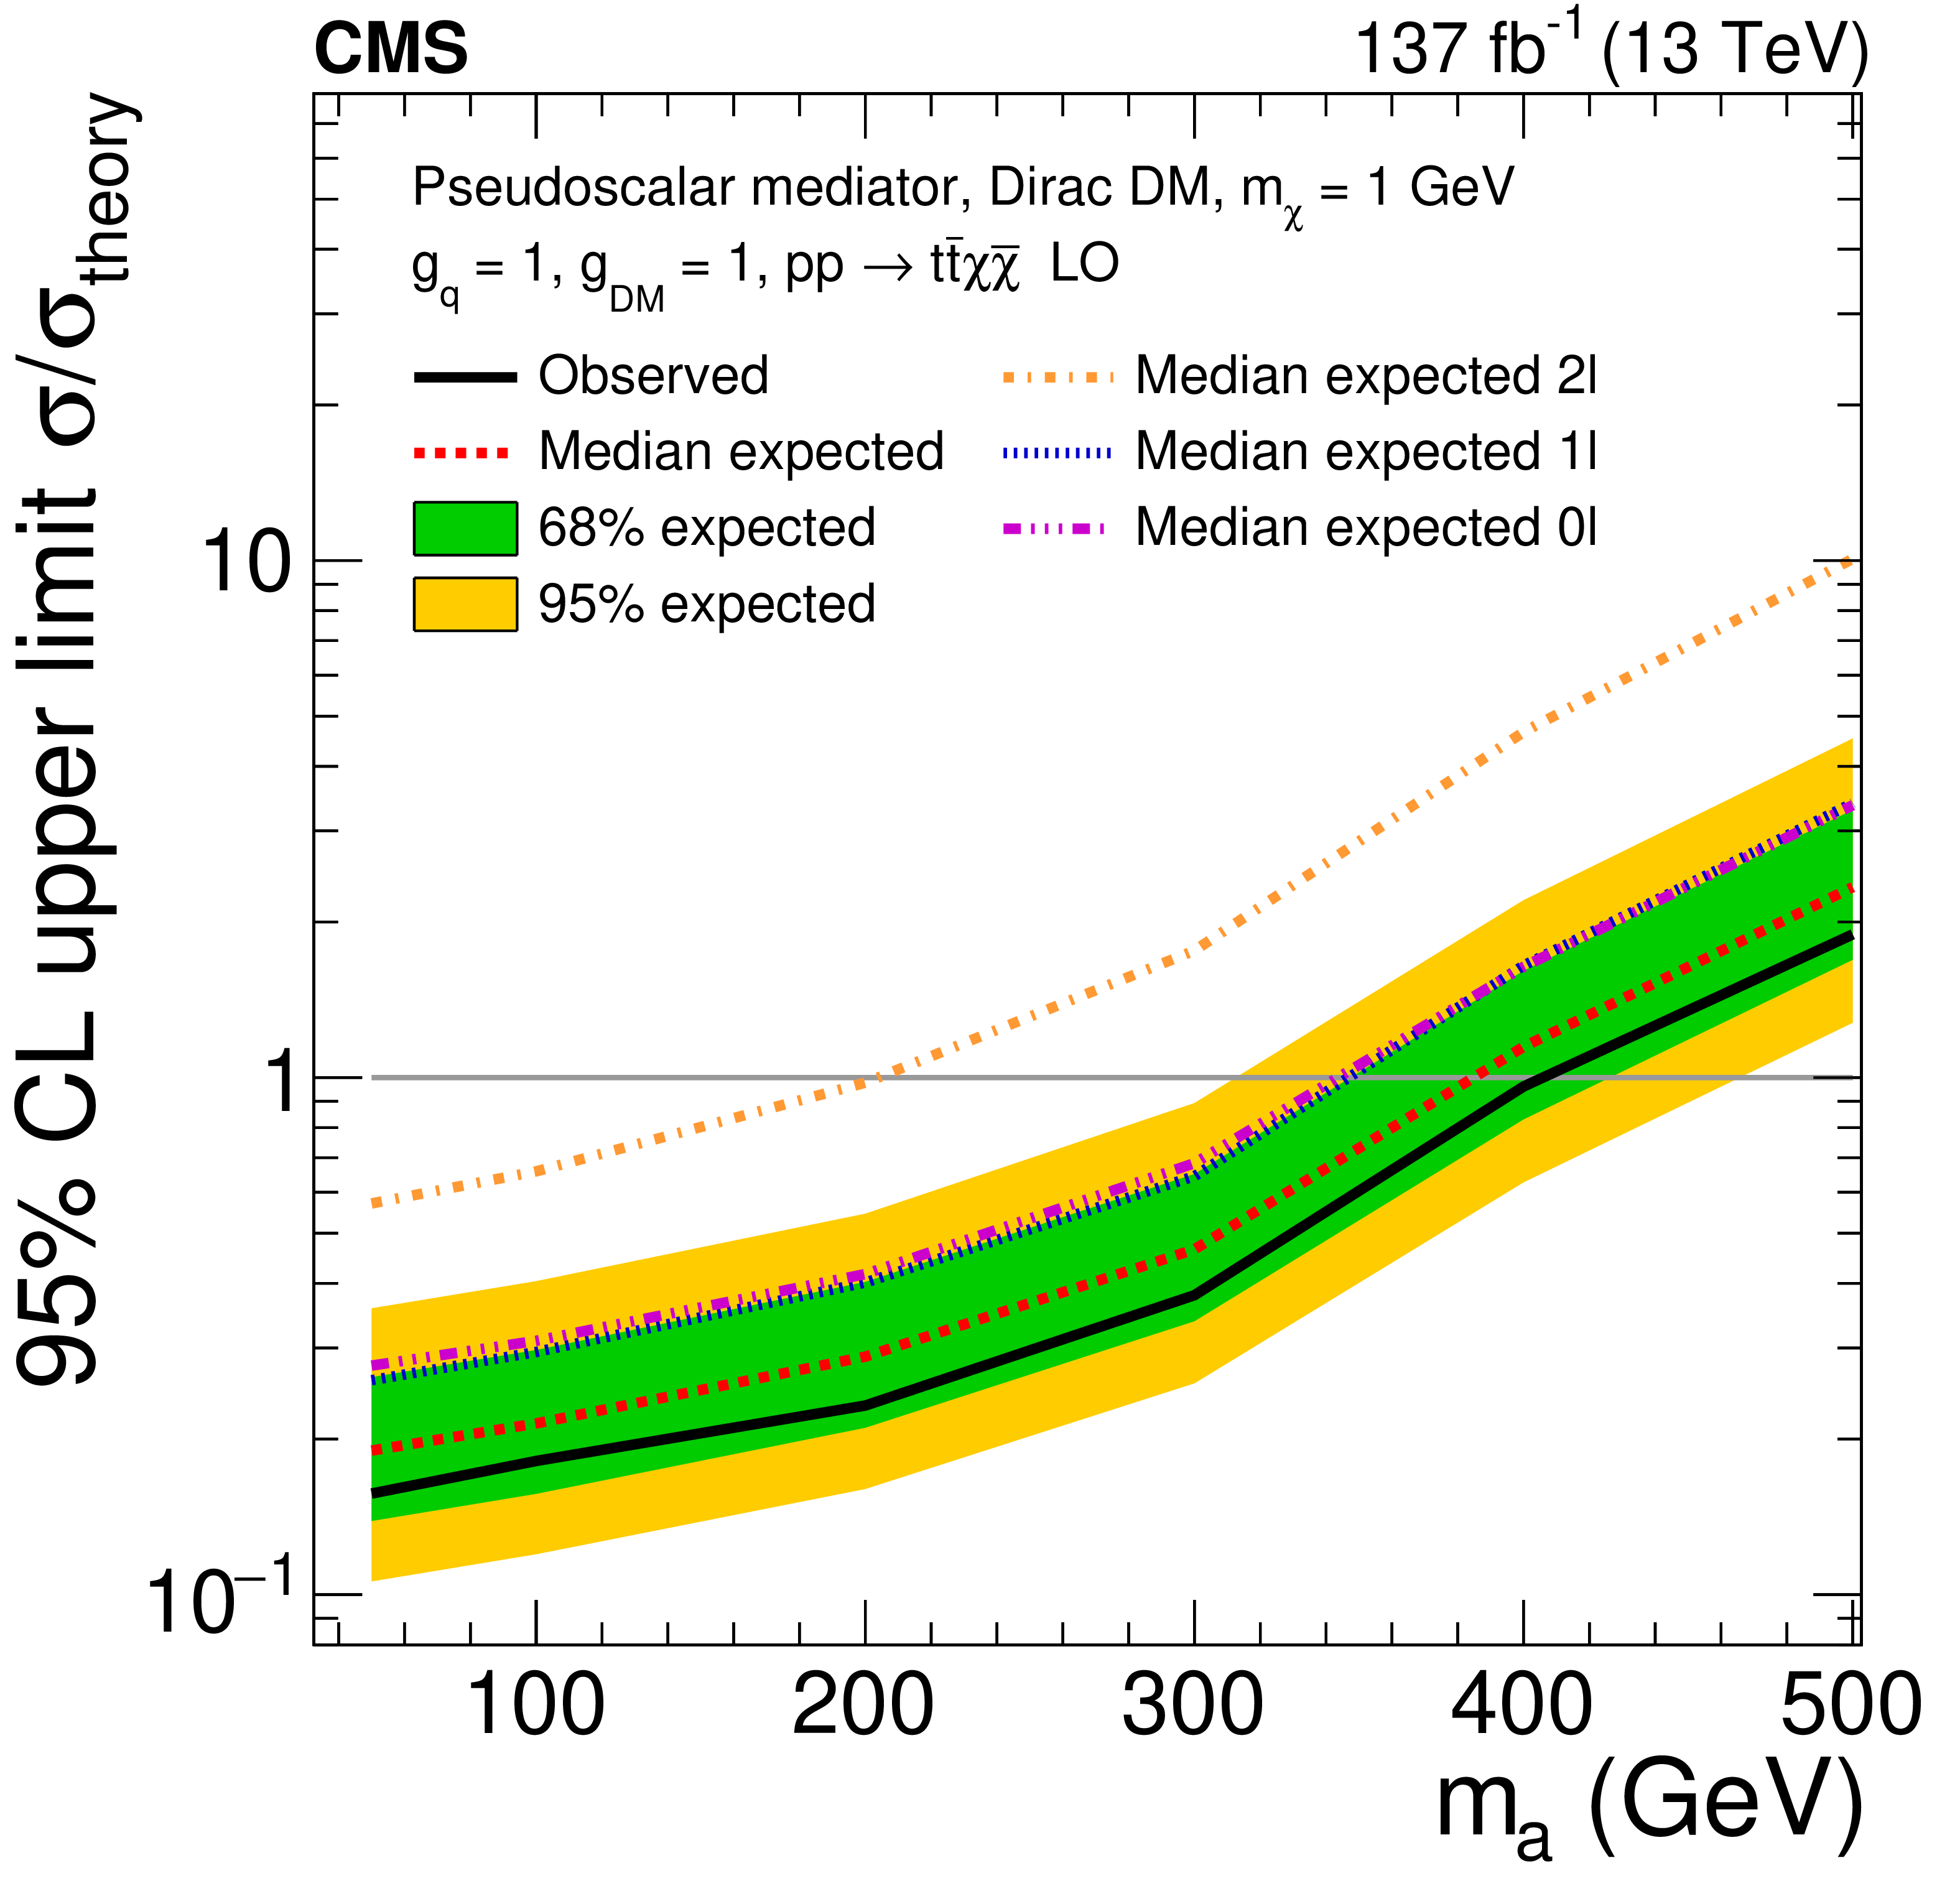
Figure 10-b:
The 95% CL expected (dashed line) and observed limits (solid line) on $\sigma /\sigma _{\mathrm {theory}}$ for a fermionic DM particle with $m_{\chi} = $ 1 GeV, as a function of the mediator mass for a pseudoscalar. The green and yellow bands represent the regions containing 68 and 95%, respectively, of the distribution of limits expected under the background-only hypothesis. The horizontal gray line indicates $\sigma /\sigma _{\mathrm {theory}}=$ 1. The mediator couplings are set to $g_\mathrm{q} =g_{\mathrm {DM}}=$ 1. |
| Tables | |
png pdf |
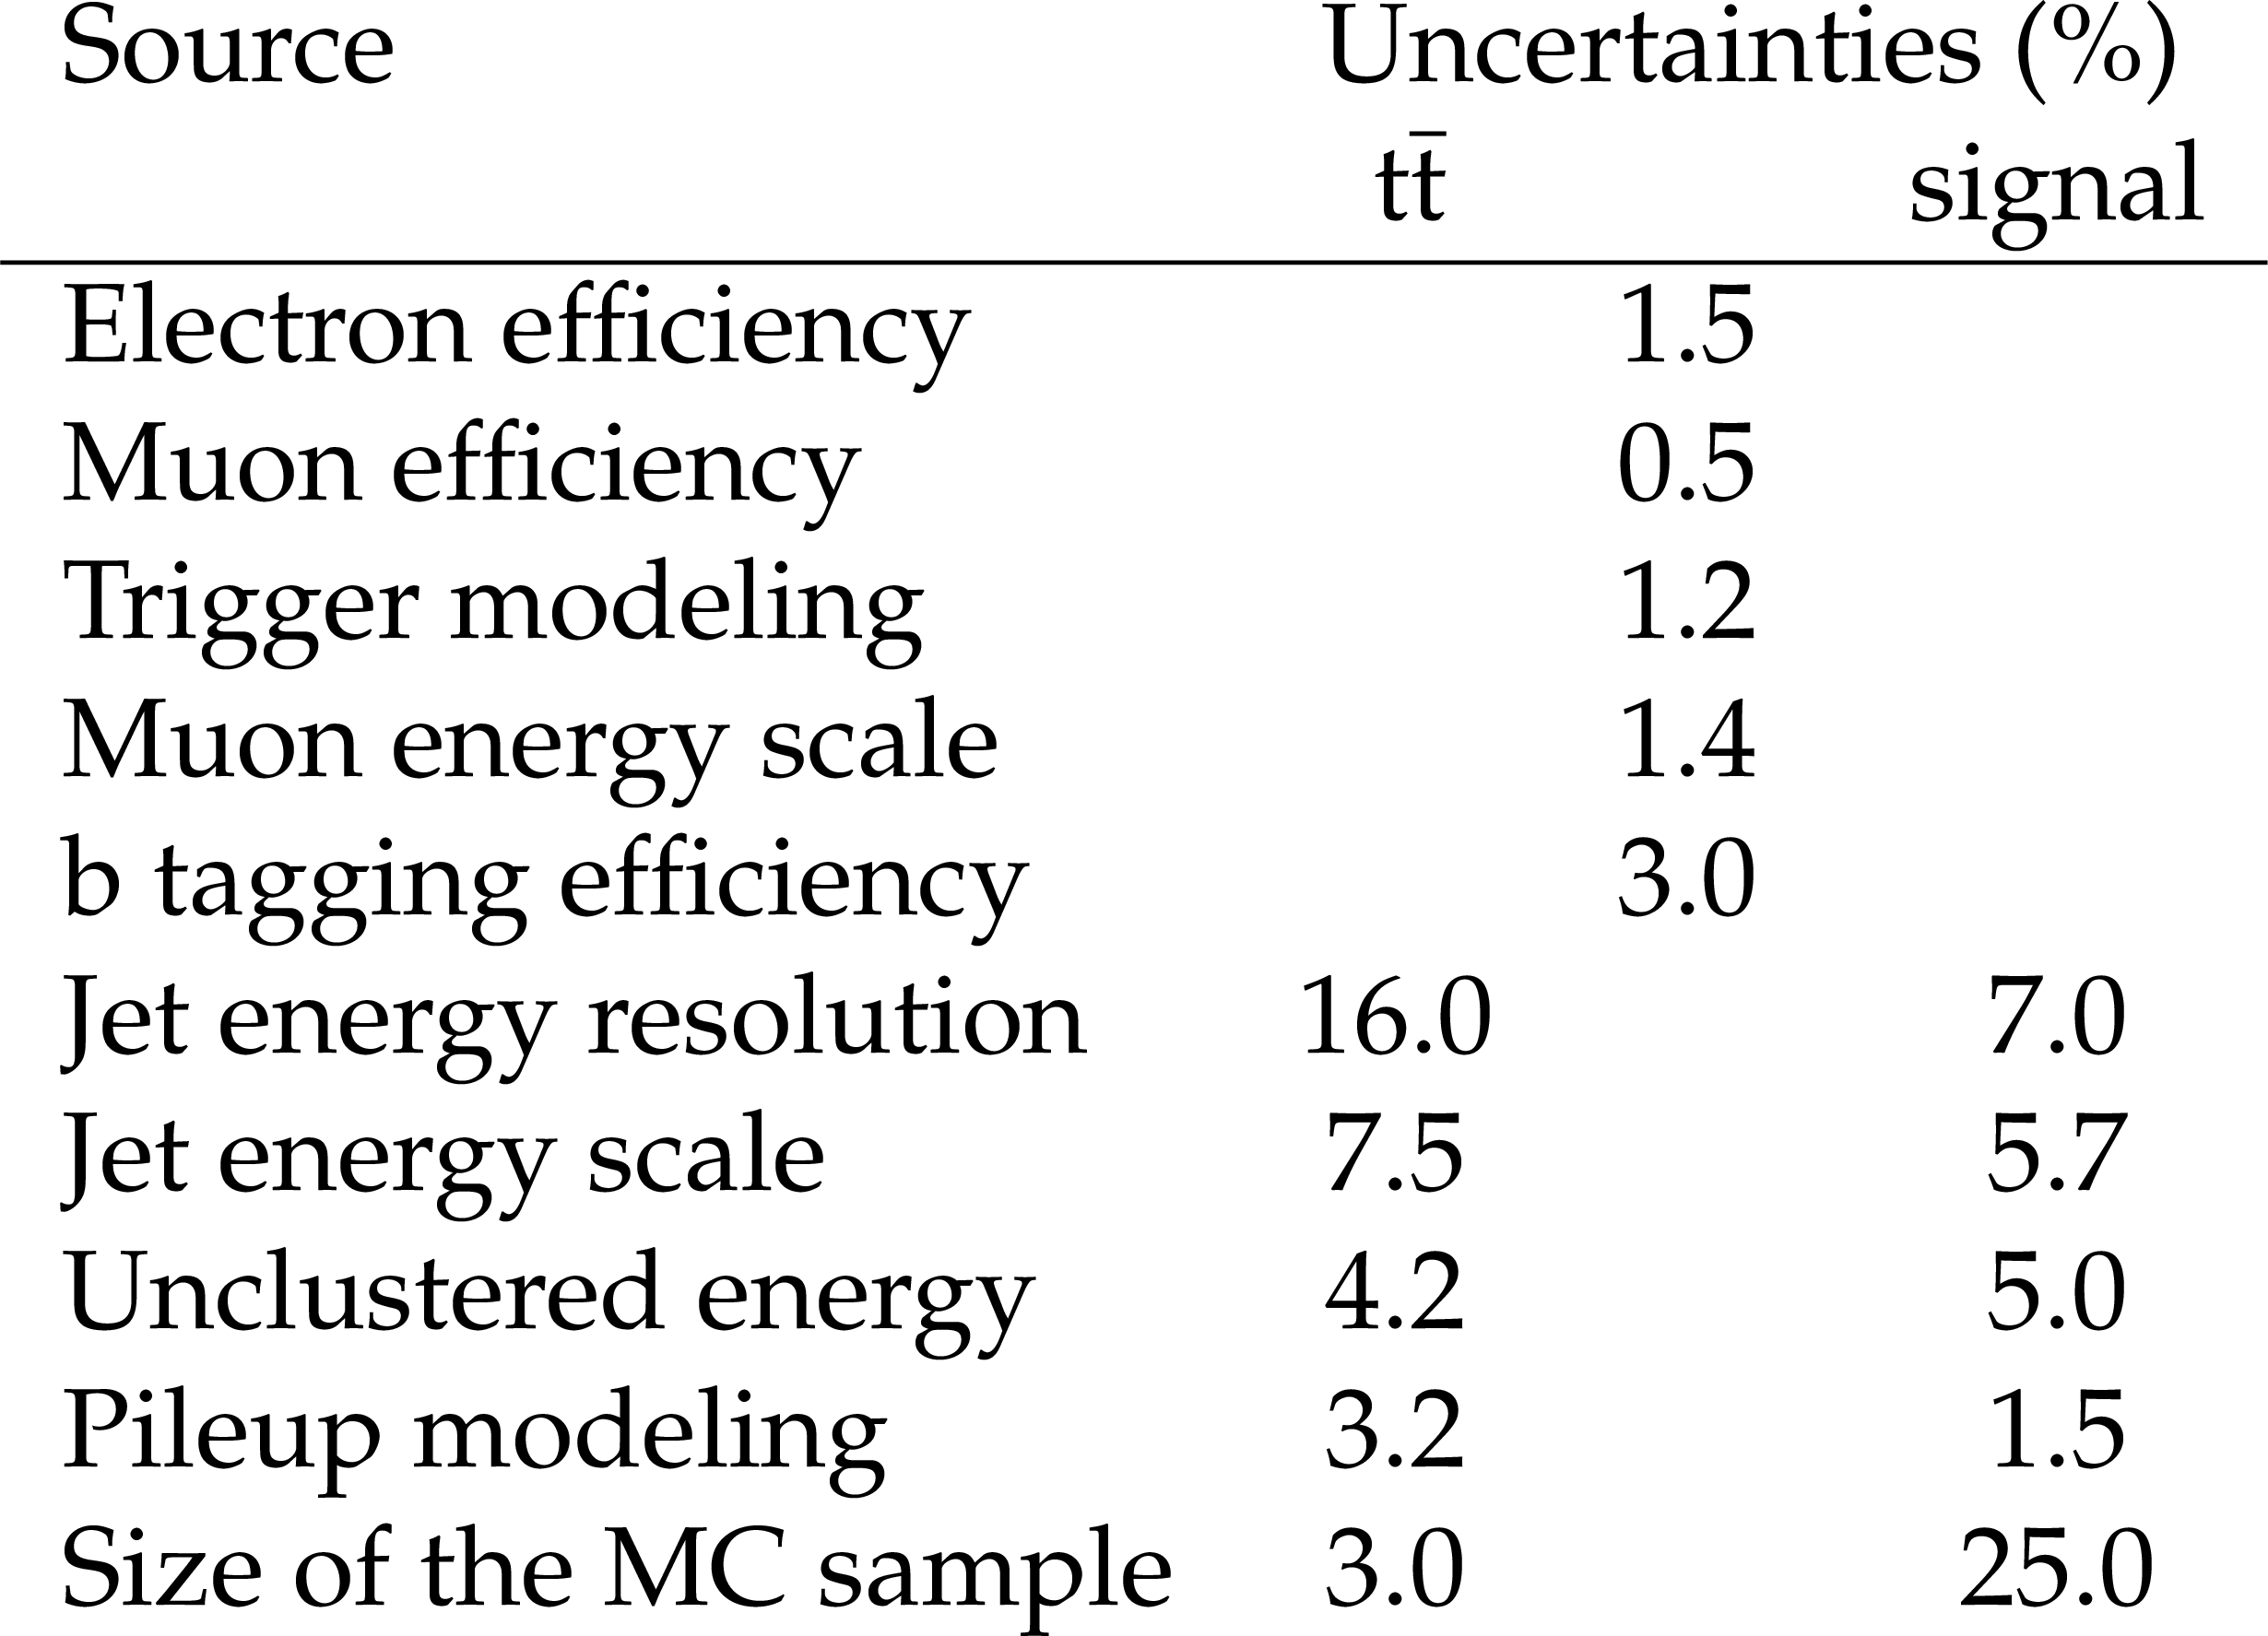
Table 1:
Summary of the contributions of the experimental uncertainties in the DNN score distribution for signal and the ${\mathrm{t} {}\mathrm{\bar{t}}}$ background. The values represent the relative variation in the number of expected events across different signal models in the signal region. |
png pdf |
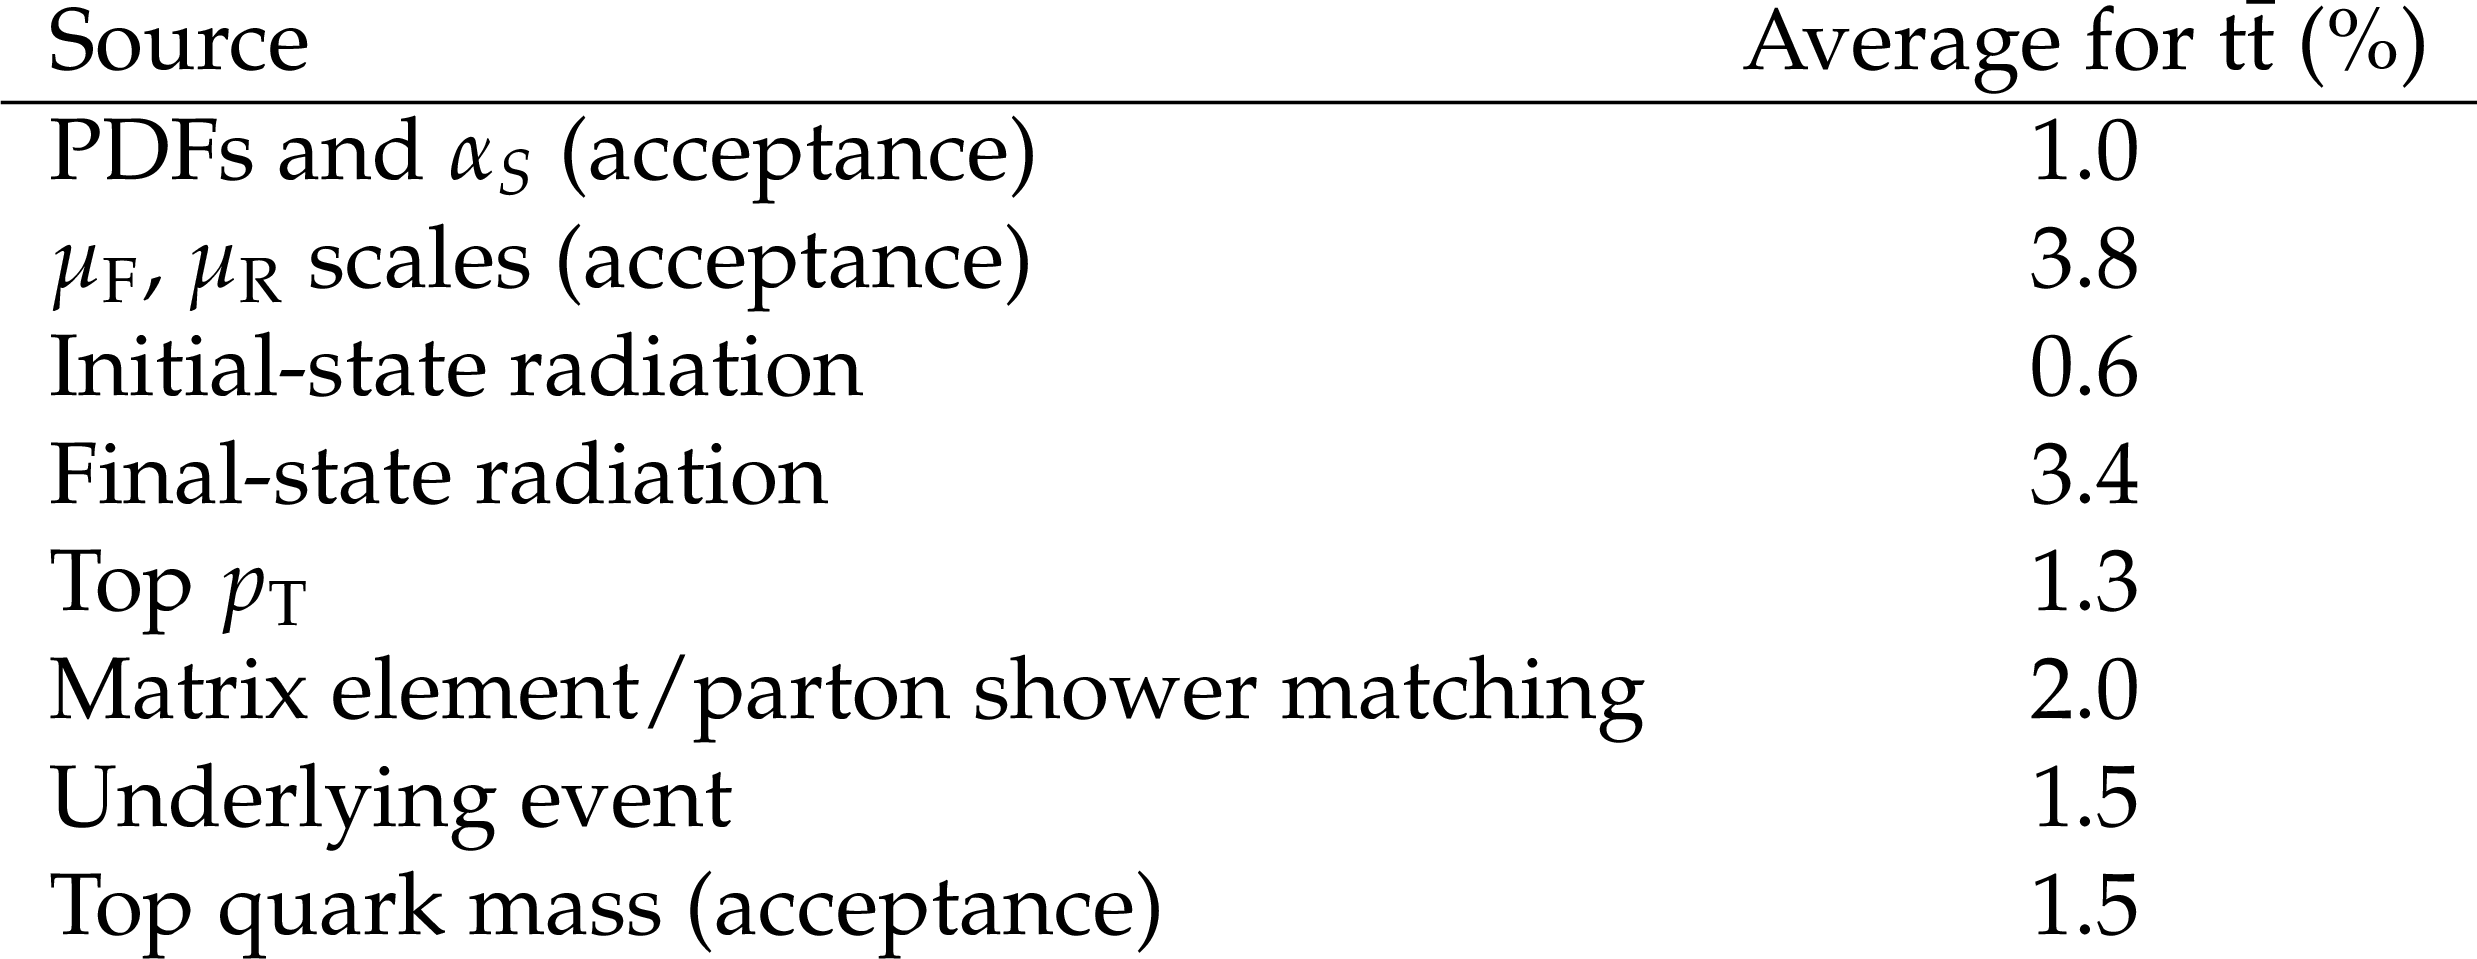
Table 2:
Summary of the contribution of each modeling uncertainty source to the DNN score distribution for the ${\mathrm{t} {}\mathrm{\bar{t}}}$ background. |
| Summary |
| Four searches for top squark pair production and their statistical combination are presented. The searches use a data set of proton-proton collisions at a center-of-mass energy of 13 TeV collected by the CMS detector and corresponding to an integrated luminosity of 137 fb$^{-1}$. A dedicated analysis is presented that is sensitive to signal models where the mass splitting between the top squark and the lightest supersymmetric particle (LSP) is close to the top quark mass. A deep neural network algorithm is used to separate the signal from the top quark background using events containing an opposite-sign dilepton pair, at least two jets, at least one b-tagged jet, ${p_{\mathrm{T}}}miss > $ 50 GeV, and stransverse mass greater than 80 GeV. No excess of data over the standard model prediction is observed, and upper limits are set at 95% confidence level on the top squark production cross section. Top squarks with mass from 145 to 275 GeV, for LSP mass from 0 to 100 GeV, with a mass difference between the top squarks and LSP of up to 30 GeV deviation around the mass of the top quark, are excluded for the first time in CMS. Previously published searches in final states with 0, 1, or 2 leptons are combined to extend the exclusion limits of top squarks with masses up to 1325 GeV for a massless LSP and an LSP mass up to 700 GeV for a top squark mass of 1150 GeV, for certain models of top squark production. In an alternative signal model of dark matter production via a spin-0 mediator in association with a top quark pair, mediator particle masses up to 400 and 420 GeV are excluded for scalar or pseudoscalar mediators, respectively, assuming a dark matter particle mass of 1 GeV. |
| References | ||||
| 1 | R. Barbieri and G. F. Giudice | Upper bounds on supersymmetric particle masses | NPB 306 (1988) 63 | |
| 2 | E. Witten | Dynamical breaking of supersymmetry | NPB 188 (1981) 513 | |
| 3 | G. Bertone, D. Hooper, and J. Silk | Particle dark matter: evidence, candidates and constraints | PR 405 (2005) 279 | 1304.0790 |
| 4 | J. L. Feng | Dark matter candidates from particle physics and methods of detection | Ann. Rev. Astron. Astrophys. 48 (2010) 495 | 1003.0904 |
| 5 | P. Ramond | Dual theory for free fermions | PRD 3 (1971) 2415 | |
| 6 | Y. A. Golfand and E. P. Likhtman | Extension of the algebra of Poincaré group generators and violation of P invariance | JEPTL 13 (1971)323 | |
| 7 | A. Neveu and J. H. Schwarz | Factorizable dual model of pions | NPB 31 (1971) 86 | |
| 8 | D. V. Volkov and V. P. Akulov | Possible universal neutrino interaction | JEPTL 16 (1972)438 | |
| 9 | J. Wess and B. Zumino | A Lagrangian model invariant under supergauge transformations | PLB 49 (1974) 52 | |
| 10 | J. Wess and B. Zumino | Supergauge transformations in four-dimensions | NPB 70 (1974) 39 | |
| 11 | P. Fayet | Supergauge invariant extension of the Higgs mechanism and a model for the electron and its neutrino | NPB 90 (1975) 104 | |
| 12 | H. P. Nilles | Supersymmetry, supergravity and particle physics | PR 110 (1984) 1 | |
| 13 | A. E. Faraggi and M. Pospelov | Selfinteracting dark matter from the hidden heterotic string sector | Astropart. Phys. 16 (2002) 451 | hep-ph/0008223 |
| 14 | R. Barbieri and D. Pappadopulo | S-particles at their naturalness limits | JHEP 10 (2009) 061 | 0906.4546 |
| 15 | M. Papucci, J. T. Ruderman, and A. Weiler | Natural SUSY endures | JHEP 09 (2012) 035 | 1110.6926 |
| 16 | CMS Collaboration | Search for top squark production in fully-hadronic final states in proton-proton collisions at $ \sqrt{s} = $ 13 TeV | Submitted to PRD | CMS-SUS-19-010 2103.01290 |
| 17 | CMS Collaboration | Search for direct top squark pair production in events with one lepton, jets, and missing transverse momentum at 13 TeV with the CMS experiment | JHEP 05 (2020) 032 | CMS-SUS-19-009 1912.08887 |
| 18 | CMS Collaboration | Search for top squark pair production using dilepton final states in $ {\text {p}}{\text {p}} $ collision data collected at $ \sqrt{s}= $ 13 TeV | EPJC 81 (2021) 3 | CMS-SUS-19-011 2008.05936 |
| 19 | J. Alwall, P. Schuster, and N. Toro | Simplified models for a first characterization of new physics at the LHC | PRD 79 (2009) 075020 | 0810.3921 |
| 20 | J. Alwall, M.-P. Le, M. Lisanti, and J. G. Wacker | Model-independent jets plus missing energy searches | PRD 79 (2009) 015005 | 0809.3264 |
| 21 | LHC New Physics Working Group | Simplified models for LHC new physics searches | JPG 39 (2012) 105005 | 1105.2838 |
| 22 | CMS Collaboration | Search for top squark pair production in pp collisions at $ \sqrt{s}= $ 13 TeV using single lepton events | JHEP 10 (2017) 019 | CMS-SUS-16-051 1706.04402 |
| 23 | CMS Collaboration | Search for top squarks and dark matter particles in opposite-charge dilepton final states at $ \sqrt{s}= $ 13 TeV | PRD 97 (2018) 032009 | CMS-SUS-17-001 1711.00752 |
| 24 | CMS Collaboration | Search for top-squark pair production in the single-lepton final state in pp collisions at $ \sqrt{s} = $ 8 TeV | EPJC 73 (2013) 2677 | CMS-SUS-13-011 1308.1586 |
| 25 | CMS Collaboration | Search for direct pair production of scalar top quarks in the single- and dilepton channels in proton-proton collisions at $ \sqrt{s} = $ 8 TeV | JHEP 07 (2016) 027 | CMS-SUS-14-015 1602.03169 |
| 26 | CMS Collaboration | Search for top squark pair production in compressed-mass-spectrum scenarios in proton-proton collisions at $ \sqrt{s} = $ 8 TeV using the $ \alpha_{\mathrm{T}} $ variable | PLB 767 (2017) 403 | CMS-SUS-14-006 1605.08993 |
| 27 | CMS Collaboration | Searches for pair production of third-generation squarks in $ \sqrt{s}= $ 13 TeV pp collisions | EPJC 77 (2017) 327 | CMS-SUS-16-008 1612.03877 |
| 28 | CMS Collaboration | Search for direct production of supersymmetric partners of the top quark in the all-jets final state in proton-proton collisions at $ \sqrt{s}= $ 13 TeV | JHEP 10 (2017) 005 | CMS-SUS-16-049 1707.03316 |
| 29 | CMS Collaboration | Search for supersymmetry in proton-proton collisions at 13 TeV using identified top quarks | PRD 97 (2018) 012007 | CMS-SUS-16-050 1710.11188 |
| 30 | ATLAS Collaboration | Search for direct top squark pair production in final states with two leptons in $ \sqrt{s} = $ 13 TeV pp collisions with the ATLAS detector | EPJC 77 (2017) 898 | 1708.03247 |
| 31 | ATLAS Collaboration | ATLAS Run 1 searches for direct pair production of third-generation squarks at the Large Hadron Collider | EPJC 75 (2015) 510 | 1506.08616 |
| 32 | ATLAS Collaboration | Search for top squark pair production in final states with one isolated lepton, jets, and missing transverse momentum in $ \sqrt s = $ 8 TeV pp collisions with the ATLAS detector | JHEP 11 (2014) 118 | 1407.0583 |
| 33 | ATLAS Collaboration | Search for direct top-squark pair production in final states with two leptons in pp collisions at $ \sqrt{s} = $ 8 TeV with the ATLAS detector | JHEP 06 (2014) 124 | 1403.4853 |
| 34 | ATLAS Collaboration | Search for top squarks in final states with one isolated lepton, jets, and missing transverse momentum in $ \sqrt{s}= $ 13 TeV pp collisions with the ATLAS detector | PRD 94 (2016) 052009 | 1606.03903 |
| 35 | CMS Collaboration | Measurement of the $ \mathrm{t\bar{t}} $ production cross section in the e$ \mu $ channel in proton-proton collisions at $ \sqrt{s} = $ 7 and 8 TeV | JHEP 08 (2016) 029 | CMS-TOP-13-004 1603.02303 |
| 36 | CMS Collaboration | Search for the pair production of light top squarks in the e$ ^{\pm}\mu^{\mp} $ final state in proton-proton collisions at $ \sqrt{s} = $ 13 TeV | JHEP 03 (2019) 101 | CMS-SUS-18-003 1901.01288 |
| 37 | ATLAS Collaboration | Measurements of top-quark pair spin correlations in the $ e\mu $ channel at $ \sqrt{s} = $ 13 TeV using $ pp $ collisions in the ATLAS detector | EPJC 80 (2020) 754 | 1903.07570 |
| 38 | P. Baldi et al. | Parameterized neural networks for high-energy physics | EPJC 76 (2016) 235 | 1601.07913 |
| 39 | C. G. Lester and D. J. Summers | Measuring masses of semi-invisibly decaying particles pair produced at hadron colliders | PLB 463 (1999) 99 | hep-ph/9906349 |
| 40 | H.-C. Cheng and Z. Han | Minimal kinematic constraints and $ m_{T2} $ | JHEP 12 (2008) 063 | 0810.5178 |
| 41 | T. Lin, E. W. Kolb, and L.-T. Wang | Probing dark matter couplings to top and bottom quarks at the LHC | PRD 88 (2013) 063510 | 1303.6638 |
| 42 | M. R. Buckley, D. Feld, and D. Goncalves | Scalar simplified models for dark matter | PRD 91 (2015) 015017 | 1410.6497 |
| 43 | U. Haisch and E. Re | Simplified dark matter top-quark interactions at the LHC | JHEP 06 (2015) 078 | 1503.00691 |
| 44 | C. Arina et al. | A comprehensive approach to dark matter studies: exploration of simplified top-philic models | JHEP 11 (2016) 111 | 1605.09242 |
| 45 | D. Abercrombie et al. | Dark matter benchmark models for early LHC Run-2 searches: report of the ATLAS/CMS dark matter forum | Phys. Dark Univ. 27 (2020) 100371 | 1507.00966 |
| 46 | G. D'Ambrosio, G. F. Giudice, G. Isidori, and A. Strumia | Minimal flavor violation: An effective field theory approach | NPB 645 (2002) 155 | hep-ph/0207036 |
| 47 | G. Isidori and D. M. Straub | Minimal flavour violation and beyond | EPJC 72 (2012) 2103 | 1202.0464 |
| 48 | ATLAS Collaboration | Search for dark matter produced in association with bottom or top quarks in $ \sqrt{s}= $ 13 TeV pp collisions with the ATLAS detector | EPJC 78 (2018) 18 | 1710.11412 |
| 49 | ATLAS Collaboration | Search for new phenomena in events with two opposite-charge leptons, jets and missing transverse momentum in pp collisions at $ \sqrt{\mathrm{s}} = $ 13 TeV with the ATLAS detector | JHEP 04 (2021) 165 | 2102.01444 |
| 50 | CMS Collaboration | Search for dark matter particles produced in association with a top quark pair at $ \sqrt{s} = $ 13 TeV | PRL 122 (2019) 011803 | CMS-EXO-16-049 1807.06522 |
| 51 | CMS Collaboration | Search for dark matter produced in association with a single top quark or a top quark pair in proton-proton collisions at $ \sqrt{s}= $ 13 TeV | JHEP 03 (2019) 141 | CMS-EXO-18-010 1901.01553 |
| 52 | CMS Collaboration | Search for production of four top quarks in final states with same-sign or multiple leptons in proton–proton collisions $ \sqrt{s} = $ 13 TeV | EPJC 80 (2020) 75 | CMS-TOP-18-003 1908.06463 |
| 53 | CMS Collaboration | Performance of the CMS Level-1 trigger in proton-proton collisions at $ \sqrt{s} = $ 13 TeV | JINST 15 (2020) P10017 | CMS-TRG-17-001 2006.10165 |
| 54 | CMS Collaboration | The CMS trigger system | JINST 12 (2017) P01020 | CMS-TRG-12-001 1609.02366 |
| 55 | CMS Collaboration | The CMS experiment at the CERN LHC | JINST 3 (2008) S08004 | CMS-00-001 |
| 56 | J. Alwall et al. | The automated computation of tree-level and next-to-leading order differential cross sections, and their matching to parton shower simulations | JHEP 07 (2014) 079 | 1405.0301 |
| 57 | J. Alwall et al. | Comparative study of various algorithms for the merging of parton showers and matrix elements in hadronic collisions | EPJC 53 (2008) 473 | 0706.2569 |
| 58 | O. Mattelaer and E. Vryonidou | Dark matter production through loop-induced processes at the LHC: the s-channel mediator case | EPJC 75 (2015) 436 | 1508.00564 |
| 59 | S. Alioli et al. | A general framework for implementing NLO calculations in shower Monte Carlo programs: the POWHEG BOX | JHEP 06 (2010) 043 | 1002.2581 |
| 60 | S. Frixione, P. Nason, and C. Oleari | Matching NLO QCD computations with Parton Shower simulations: the POWHEG method | JHEP 11 (2007) 070 | 0709.2092 |
| 61 | P. Nason | A new method for combining NLO QCD with shower Monte Carlo algorithms | JHEP 11 (2004) 040 | hep-ph/0409146 |
| 62 | CMS Collaboration | Measurements of differential cross sections of top quark pair production as a function of kinematic event variables in proton-proton collisions at $ \sqrt{s}= $ 13 TeV | JHEP 06 (2018) 002 | CMS-TOP-16-014 1803.03991 |
| 63 | CMS Collaboration | Investigations of the impact of the parton shower tuning in Pythia8 in the modelling of $ \mathrm{t\overline{t}} $ at $ \sqrt{s}= $ 8 and 13 TeV | CMS-PAS-TOP-16-021 | CMS-PAS-TOP-16-021 |
| 64 | CMS Collaboration | Extraction and validation of a new set of CMS PYTHIA8 tunes from underlying-event measurements | EPJC 80 (2020) 4 | CMS-GEN-17-001 1903.12179 |
| 65 | E. Re | Single-top Wt-channel production matched with parton showers using the POWHEG method | EPJC 71 (2011) 1547 | 1009.2450 |
| 66 | R. Frederix and S. Frixione | Merging meets matching in MC@NLO | JHEP 12 (2012) 061 | 1209.6215 |
| 67 | NNPDF Collaboration | Parton distributions for the LHC Run II | JHEP 04 (2015) 040 | 1410.8849 |
| 68 | NNPDF Collaboration | Parton distributions from high-precision collider data | EPJC 77 (2017) 663 | 1706.00428 |
| 69 | T. Sjostrand et al. | An introduction to PYTHIA 8.2 | CPC 191 (2015) 159 | 1410.3012 |
| 70 | P. Skands, S. Carrazza, and J. Rojo | Tuning PYTHIA 8.1: the Monash 2013 Tune | EPJC 74 (2014) 3024 | 1404.5630 |
| 71 | CMS Collaboration | Event generator tunes obtained from underlying event and multiparton scattering measurements | EPJC 76 (2016) 155 | CMS-GEN-14-001 1512.00815 |
| 72 | GEANT4 Collaboration | GEANT4--a simulation toolkit | NIMA 506 (2003) 250 | |
| 73 | CMS Collaboration | The fast simulation of the CMS detector at LHC | J. Phys. Conf. Ser. 331 (2011) 032049 | |
| 74 | A. Giammanco | The fast simulation of the CMS experiment | J. Phys. Conf. Ser. 513 (2014) 022012 | |
| 75 | Y. Li and F. Petriello | Combining QCD and electroweak corrections to dilepton production in the framework of the FEWZ simulation code | PRD 86 (2012) 094034 | 1208.5967 |
| 76 | N. Kidonakis | Theoretical results for electroweak-boson and single-top production | in Proceedings, 23rd International Workshop on Deep-Inelastic Scattering and Related Subjects (DIS 2015): Dallas, Texas, 2015 | 1506.04072 |
| 77 | J. M. Campbell, R. K. Ellis, and C. Williams | Vector boson pair production at the LHC | JHEP 07 (2011) 018 | 1105.0020 |
| 78 | M. V. Garzelli, A. Kardos, C. G. Papadopoulos, and Z. Trocsanyi | $ \mathrm{t\bar{t}}\mathrm{W} $~and $ \mathrm{t\bar{t}}\mathrm{Z} $~hadroproduction at NLO accuracy in QCD with parton shower and hadronization effects | JHEP 11 (2012) 056 | 1208.2665 |
| 79 | M. Czakon, P. Fiedler, and A. Mitov | Total top-quark pair-production cross section at hadron colliders through O($ {\alpha_S}^4 $) | PRL 110 (2013) 252004 | 1303.6254 |
| 80 | M. Czakon and A. Mitov | Top++: A program for the calculation of the top-pair cross-section at hadron colliders | CPC 185 (2014) 2930 | 1112.5675 |
| 81 | W. Beenakker, R. Hopker, M. Spira, and P. M. Zerwas | Squark and gluino production at hadron colliders | NPB 492 (1997) 51 | hep-ph/9610490 |
| 82 | W. Beenakker et al. | NNLL-fast: predictions for coloured supersymmetric particle production at the LHC with threshold and Coulomb resummation | JHEP 12 (2016) 133 | 1607.07741 |
| 83 | A. Kulesza and L. Motyka | Threshold resummation for squark-antisquark and gluino-pair production at the LHC | PRL 102 (2009) 111802 | 0807.2405 |
| 84 | A. Kulesza and L. Motyka | Soft gluon resummation for the production of gluino-gluino and squark-antisquark pairs at the LHC | PRD 80 (2009) 095004 | 0905.4749 |
| 85 | W. Beenakker et al. | Soft-gluon resummation for squark and gluino hadroproduction | JHEP 12 (2009) 041 | 0909.4418 |
| 86 | W. Beenakker et al. | Squark and gluino hadroproduction | Int. J. Mod. Phys. A 26 (2011) 2637 | 1105.1110 |
| 87 | C. Borschensky et al. | Squark and gluino production cross sections in pp collisions at $ \sqrt{s} = $ 13, 14, 33 and 100 TeV | EPJC 74 (2014) 12 | 1407.5066 |
| 88 | W. Beenakker et al. | NNLL resummation for squark-antisquark pair production at the LHC | JHEP 01 (2012) 076 | 1110.2446 |
| 89 | W. Beenakker et al. | Supersymmetric top and bottom squark production at hadron colliders | JHEP 08 (2010) 098 | 1006.4771 |
| 90 | W. Beenakker et al. | NNLL resummation for stop pair-production at the LHC | JHEP 05 (2016) 153 | 1601.02954 |
| 91 | M. Cacciari, G. P. Salam, and G. Soyez | The anti-$ {k_{\mathrm{T}}} $ jet clustering algorithm | JHEP 04 (2008) 063 | 0802.1189 |
| 92 | M. Cacciari, G. P. Salam, and G. Soyez | FastJet user manual | EPJC 72 (2012) 1896 | 1111.6097 |
| 93 | CMS Collaboration | Particle-flow reconstruction and global event description with the CMS detector | JINST 12 (2017) P10003 | CMS-PRF-14-001 1706.04965 |
| 94 | M. Cacciari and G. P. Salam | Pileup subtraction using jet areas | PRL 659 (2008) 119 | 0707.1378 |
| 95 | CMS Collaboration | Jet energy scale and resolution in the CMS experiment in pp collisions at 8 TeV | JINST 12 (2017) P02014 | CMS-JME-13-004 1607.03663 |
| 96 | CMS Collaboration | Jet algorithms performance in 13 TeV data | CMS-PAS-JME-16-003 | CMS-PAS-JME-16-003 |
| 97 | CMS Collaboration | Identification of heavy-flavour jets with the CMS detector in pp collisions at 13 TeV | JINST 13 (2018) P05011 | CMS-BTV-16-002 1712.07158 |
| 98 | CMS Collaboration | Performance of the DeepJet b tagging algorithm using 41.9 fb$^{-1}$ of data from proton-proton collisions at 13 TeV with Phase 1 CMS detector | CDS | |
| 99 | E. Bols et al. | Jet flavour classification using DeepJet | JINST 15 (2020) P12012 | 2008.10519 |
| 100 | CMS Collaboration | Performance of missing transverse momentum reconstruction in proton-proton collisions at $ \sqrt{s} = $ 13 TeV using the CMS detector | JINST 14 (2019) P07004 | CMS-JME-17-001 1903.06078 |
| 101 | CMS Collaboration | Reconstruction and identification of $ \tau $ lepton decays to hadrons and $ \nu _{\tau} $ at CMS | JINST 11 (2016) P01019 | CMS-TAU-14-001 1510.07488 |
| 102 | CMS Collaboration | Performance of reconstruction and identification of tau leptons in their decays to hadrons and tau neutrino in LHC Run-2 | CMS-PAS-TAU-16-002 | CMS-PAS-TAU-16-002 |
| 103 | CMS Collaboration | Identification of heavy, energetic, hadronically decaying particles using machine-learning techniques | JINST 15 (2020) P06005 | CMS-JME-18-002 2004.08262 |
| 104 | CMS Collaboration | Search for the pair production of third-generation squarks with two-body decays to a bottom or charm quark and a neutralino in proton-proton collisions at $ \sqrt{s} = $ 13 TeV | PLB 778 (2018) 263 | CMS-SUS-16-032 1707.07274 |
| 105 | CMS Collaboration | Performance of electron reconstruction and selection with the CMS detector in proton-proton collisions at $ \sqrt{s} = $ 8 TeV | JINST 10 (2015) P06005 | CMS-EGM-13-001 1502.02701 |
| 106 | M. Abadi et al. | TensorFlow: Large-scale machine learning on heterogeneous systems | Software available from | 1603.04467 |
| 107 | F. Chollet et al. | Keras | 2015 Software available from | |
| 108 | D. P. Kingma and J. Ba | Adam: A method for stochastic optimization | Software available from | 1412.6980 |
| 109 | CMS Collaboration | Performance of the CMS muon detector and muon reconstruction with proton-proton collisions at $ \sqrt{s}= $ 13 TeV | JINST 13 (2018) P06015 | CMS-MUO-16-001 1804.04528 |
| 110 | CMS Collaboration | Performance of photon reconstruction and identification with the CMS detector in proton-proton collisions at $ \sqrt{s} = $ 8 TeV | JINST 10 (2015) P08010 | CMS-EGM-14-001 1502.02702 |
| 111 | CMS Collaboration | Description and performance of track and primary-vertex reconstruction with the CMS tracker | JINST 9 (2014) P10009 | CMS-TRK-11-001 1405.6569 |
| 112 | CMS Collaboration | Measurement of the inelastic proton-proton cross section at $ \sqrt{s}= $ 13 TeV | JHEP 07 (2018) 161 | CMS-FSQ-15-005 1802.02613 |
| 113 | J. Butterworth et al. | PDF4LHC recommendations for LHC Run II | JPG 43 (2016) 023001 | 1510.03865 |
| 114 | CMS Collaboration | Measurement of the top quark mass using proton-proton data at $ \sqrt{s} = $ 7 and 8 TeV | PRD 93 (2016) 072004 | CMS-TOP-14-022 1509.04044 |
| 115 | CMS Collaboration | Precision luminosity measurement in proton-proton collisions at $ \sqrt{s} = $ 13 TeV in 2015 and 2016 at CMS | Submitted to EPJC | CMS-LUM-17-003 2104.01927 |
| 116 | CMS Collaboration | CMS luminosity measurements for the 2016 data-taking period | CMS-PAS-LUM-17-001 | CMS-PAS-LUM-17-001 |
| 117 | CMS Collaboration | CMS luminosity measurements for the 2017 data-taking period | CMS-PAS-LUM-17-004 | CMS-PAS-LUM-17-004 |
| 118 | CMS Collaboration | CMS luminosity measurements for the 2018 data-taking period at $ \sqrt{s}= $ 13 TeV | CMS-PAS-LUM-18-002 | CMS-PAS-LUM-18-002 |
| 119 | R. Barlow and C. Beeston | Fitting using finite Monte Carlo samples | CPC 77 (1993) 219 | |
| 120 | G. Cowan, K. Cranmer, E. Gross, and O. Vitells | Asymptotic formulae for likelihood-based tests of new physics | EPJC 71 (2011) 1554 | 1007.1727 |
| 121 | T. Junk | Confidence level computation for combining searches with small statistics | NIMA 434 (1999) 435 | hep-ex/9902006 |
| 122 | A. L. Read | Presentation of search results: the CL$ _\mathrm{s} $ technique | in Durham IPPP Workshop: Advanced Statistical Techniques in Particle Physics, Durham, UK, 2002 | |
| 123 | The ATLAS Collaboration, The CMS Collaboration, The LHC Higgs Combination Group | Procedure for the LHC Higgs boson search combination in Summer 2011 | CMS-NOTE-2011-005 | |
|
|
Compact Muon Solenoid LHC, CERN |
|

|

|

|

|

|