

Compact Muon Solenoid
LHC, CERN
| CMS-SUS-19-011 ; CERN-EP-2020-131 | ||
| Search for top squark pair production using dilepton final states in pp collision data collected at $\sqrt{s} = $ 13 TeV | ||
| CMS Collaboration | ||
| 13 August 2020 | ||
| Eur. Phys. J. C 81 (2021) 3 | ||
| Abstract: A search is presented for supersymmetric partners of the top quark (top squarks) in final states with two oppositely charged leptons (electrons or muons), jets identified as originating from b quarks, and missing transverse momentum. The search uses data from proton-proton collisions at $\sqrt{s} = $ 13 TeV collected with the CMS detector, corresponding to an integrated luminosity of 137 fb$^{-1}$. Hypothetical signal events are efficiently separated from the dominant top quark pair production background with requirements on the significance of the missing transverse momentum and on transverse mass variables. No significant deviation is observed from the expected background. Exclusion limits are set in the context of simplified supersymmetric models with pair-produced lightest top squarks. For top squarks decaying exclusively to a top quark and a lightest neutralino, lower limits are placed at 95% confidence level on the masses of the top squark and the neutralino up to 925 and 450 GeV, respectively. If the decay proceeds via an intermediate chargino, the corresponding lower limits on the mass of the lightest top squark are set up to 850 GeV for neutralino masses below 420 GeV. For top squarks undergoing a cascade decay through charginos and sleptons, the mass limits reach up to 1.4 TeV and 900 GeV respectively for the top squark and the lightest neutralino. | ||
| Links: e-print arXiv:2008.05936 [hep-ex] (PDF) ; CDS record ; inSPIRE record ; CADI line (restricted) ; | ||
| Figures & Tables | Summary | Additional Tables | References | CMS Publications |
|---|
| Figures | |
png pdf |
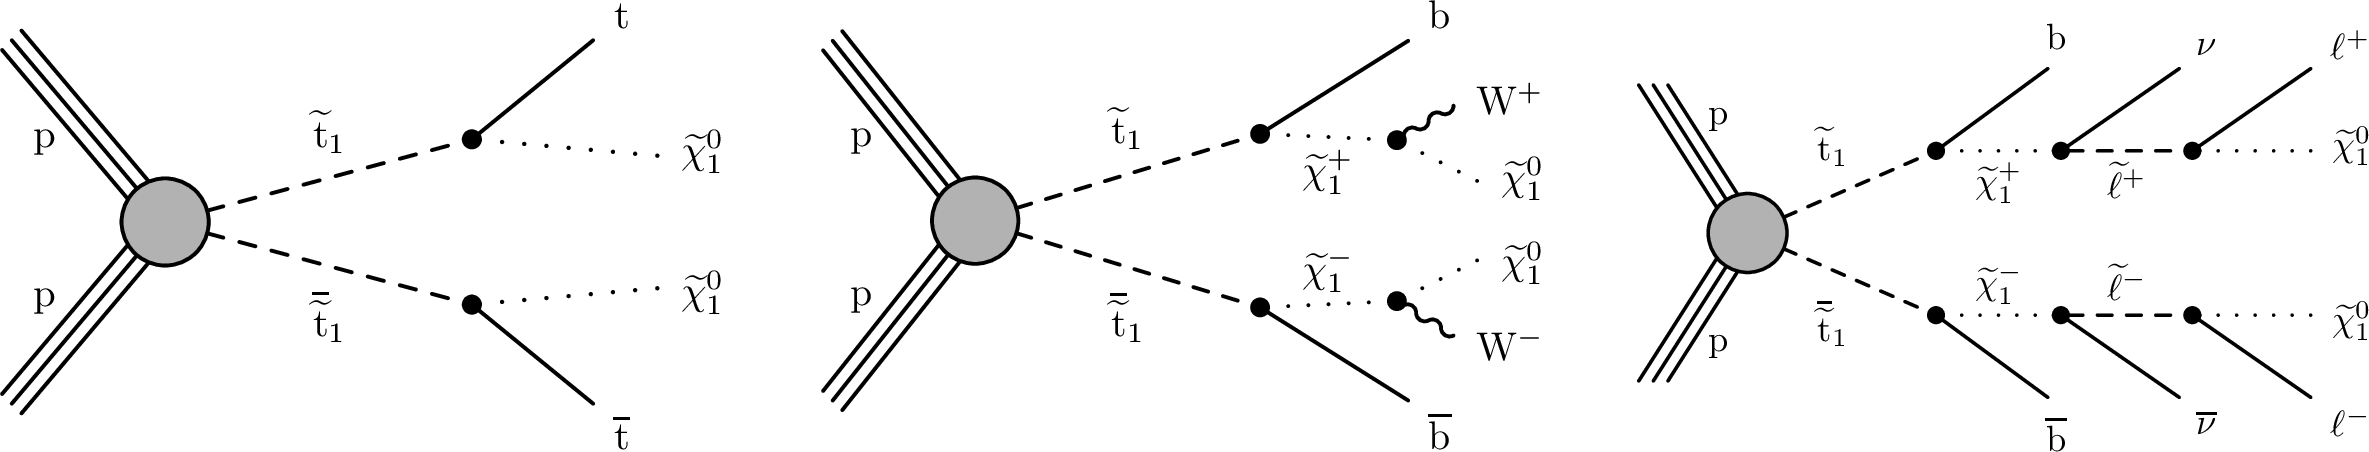
Figure 1:
Diagrams for simplified SUSY models with strong production of top squark pairs $\tilde{\mathrm{t}}_{1} \bar{\tilde{\mathrm{t}}} _{1}$. In the T2tt model (left), the top squark decays to a top quark and a $\tilde{\chi}^0_1$. In the T2bW model (center), the top squark decays into a bottom quark and an intermediate $\tilde{\chi}^{\pm}_1$ that further decays into a W boson and a $\tilde{\chi}^0_1$. The decay of the intermediate $\tilde{\chi}^{\pm}_1$, which yields a $\nu$, plus a $\tilde{\chi}^0_1$ and a $\ell ^\pm $ from the decay of a virtual slepton $\tilde{\ell}^{\pm}$, is described by the T8bb$\ell\ell\nu\nu$ model (right). |
png pdf |
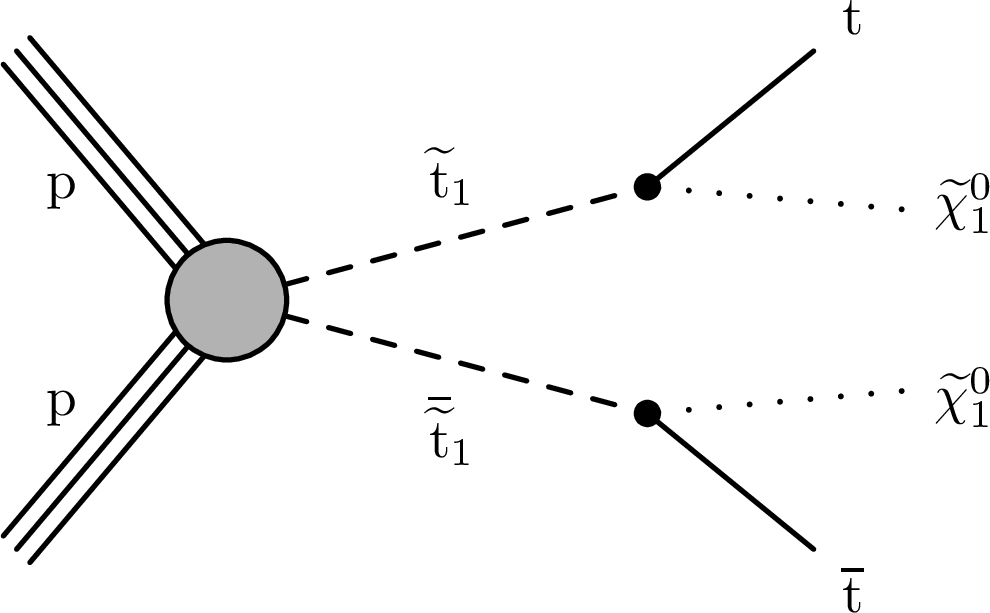
Figure 1-a:
Diagram for the T2tt simplified SUSY model with strong production of top squark pairs $\tilde{\mathrm{t}}_{1} \bar{\tilde{\mathrm{t}}} _{1}$: the top squark decays to a top quark and a $\tilde{\chi}^0_1$. |

png pdf |
Figure 1-b:
Diagram for the T2bW simplified SUSY model with strong production of top squark pairs $\tilde{\mathrm{t}}_{1} \bar{\tilde{\mathrm{t}}} _{1}$: the top squark decays into a bottom quark and an intermediate $\tilde{\chi}^{\pm}_1$ that further decays into a W boson and a $\tilde{\chi}^0_1$. |
png pdf |
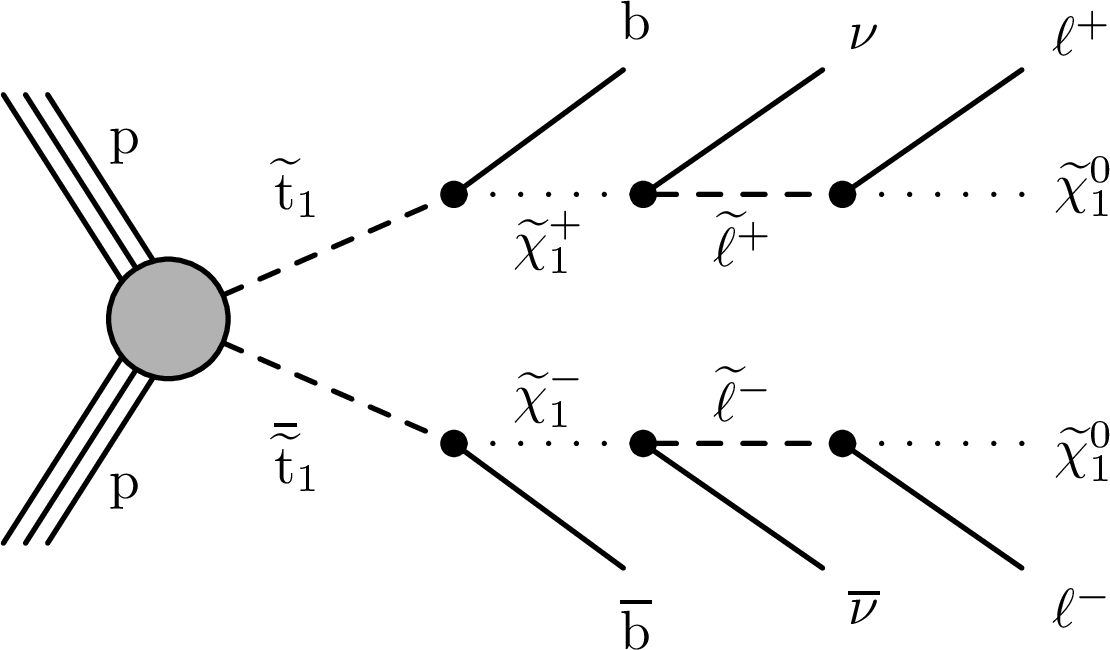
Figure 1-c:
Diagram for the T8bb$\ell\ell\nu\nu$ simplified SUSY model with strong production of top squark pairs $\tilde{\mathrm{t}}_{1} \bar{\tilde{\mathrm{t}}} _{1}$: the decay of the intermediate $\tilde{\chi}^{\pm}_1$, which yields a $\nu$, plus a $\tilde{\chi}^0_1$ and a $\ell ^\pm $ from the decay of a virtual slepton $\tilde{\ell}^{\pm}$. |
png pdf |
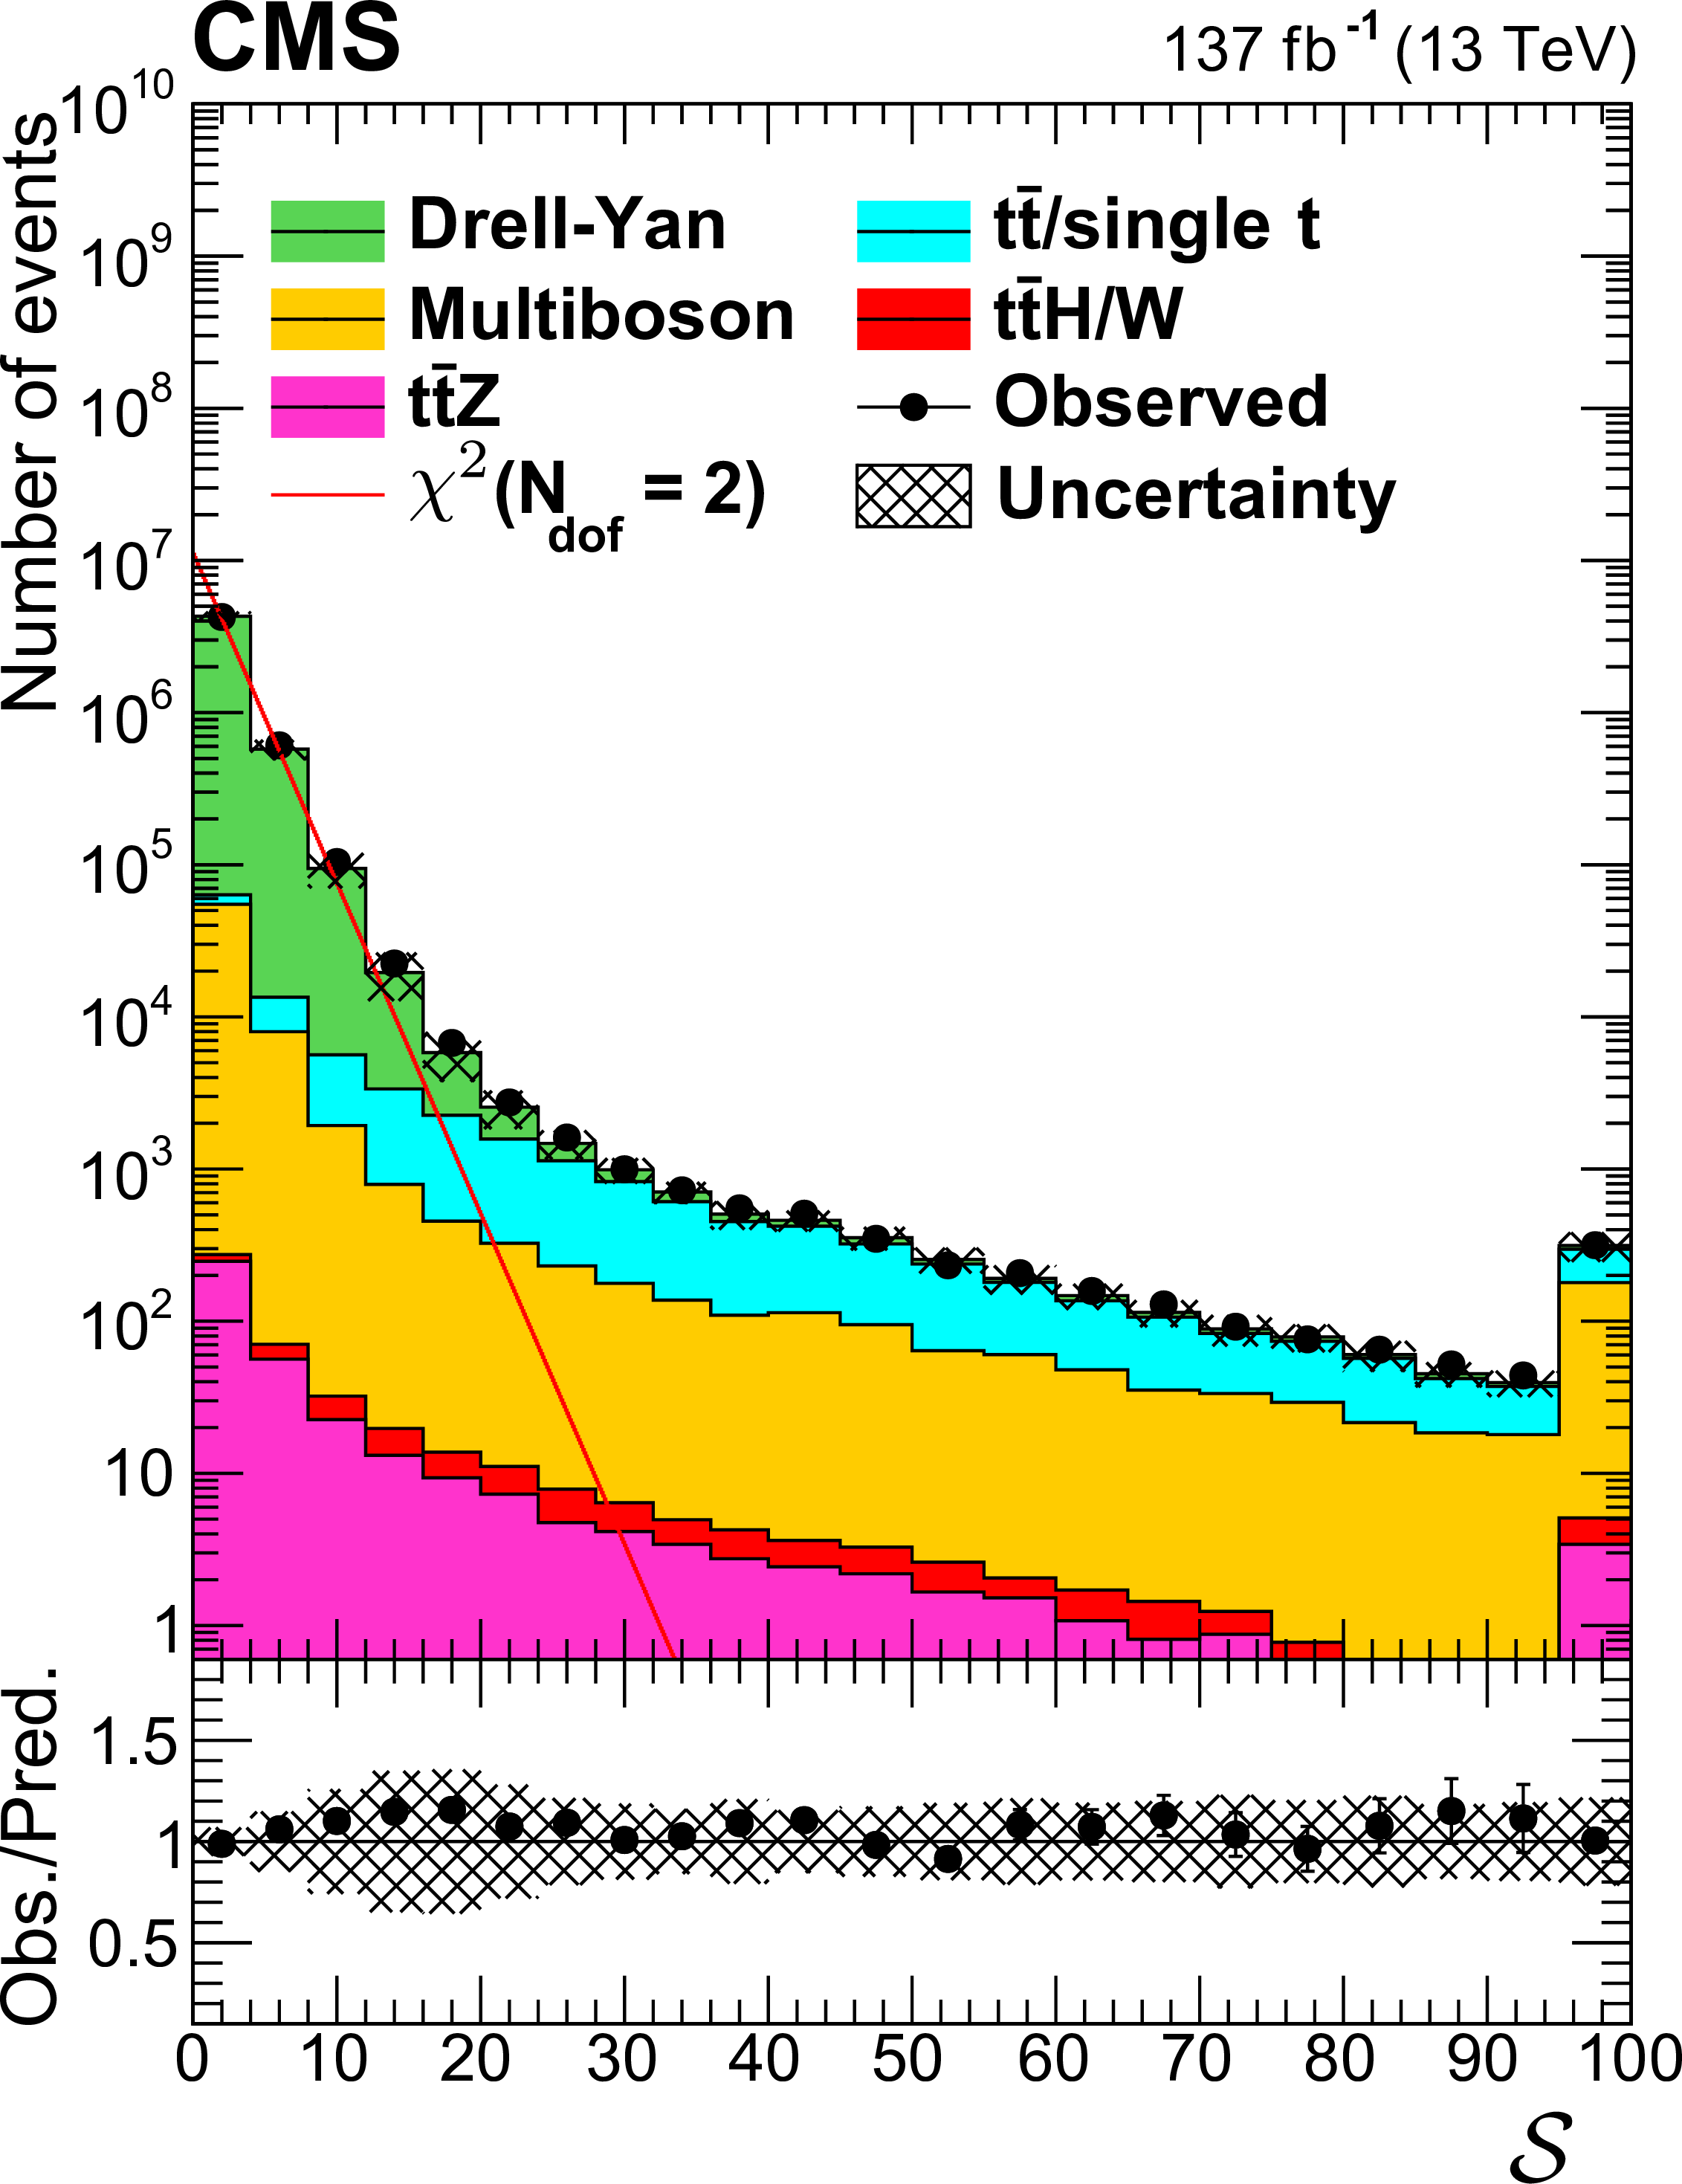
Figure 2:
Distribution of ${{p_{\mathrm {T}}} ^\text {miss}}$ significance ${\mathcal {S}}$ in a $\mathrm{Z} \to \ell \ell $ selection, requiring an SF lepton pair. Points with error bars represent the data, and the stacked histograms the SM backgrounds predicted as described in Section 6, with uncertainty in the SM prediction indicated by the hatched area. The red line represents a $\chi ^2$ distribution with two degrees of freedom. The last bin includes the overflow events. The lower panel gives the ratio between the observation and the predicted SM backgrounds. The relative uncertainty in the SM background prediction is shown as a hatched band. |
png pdf |
Figure 3:
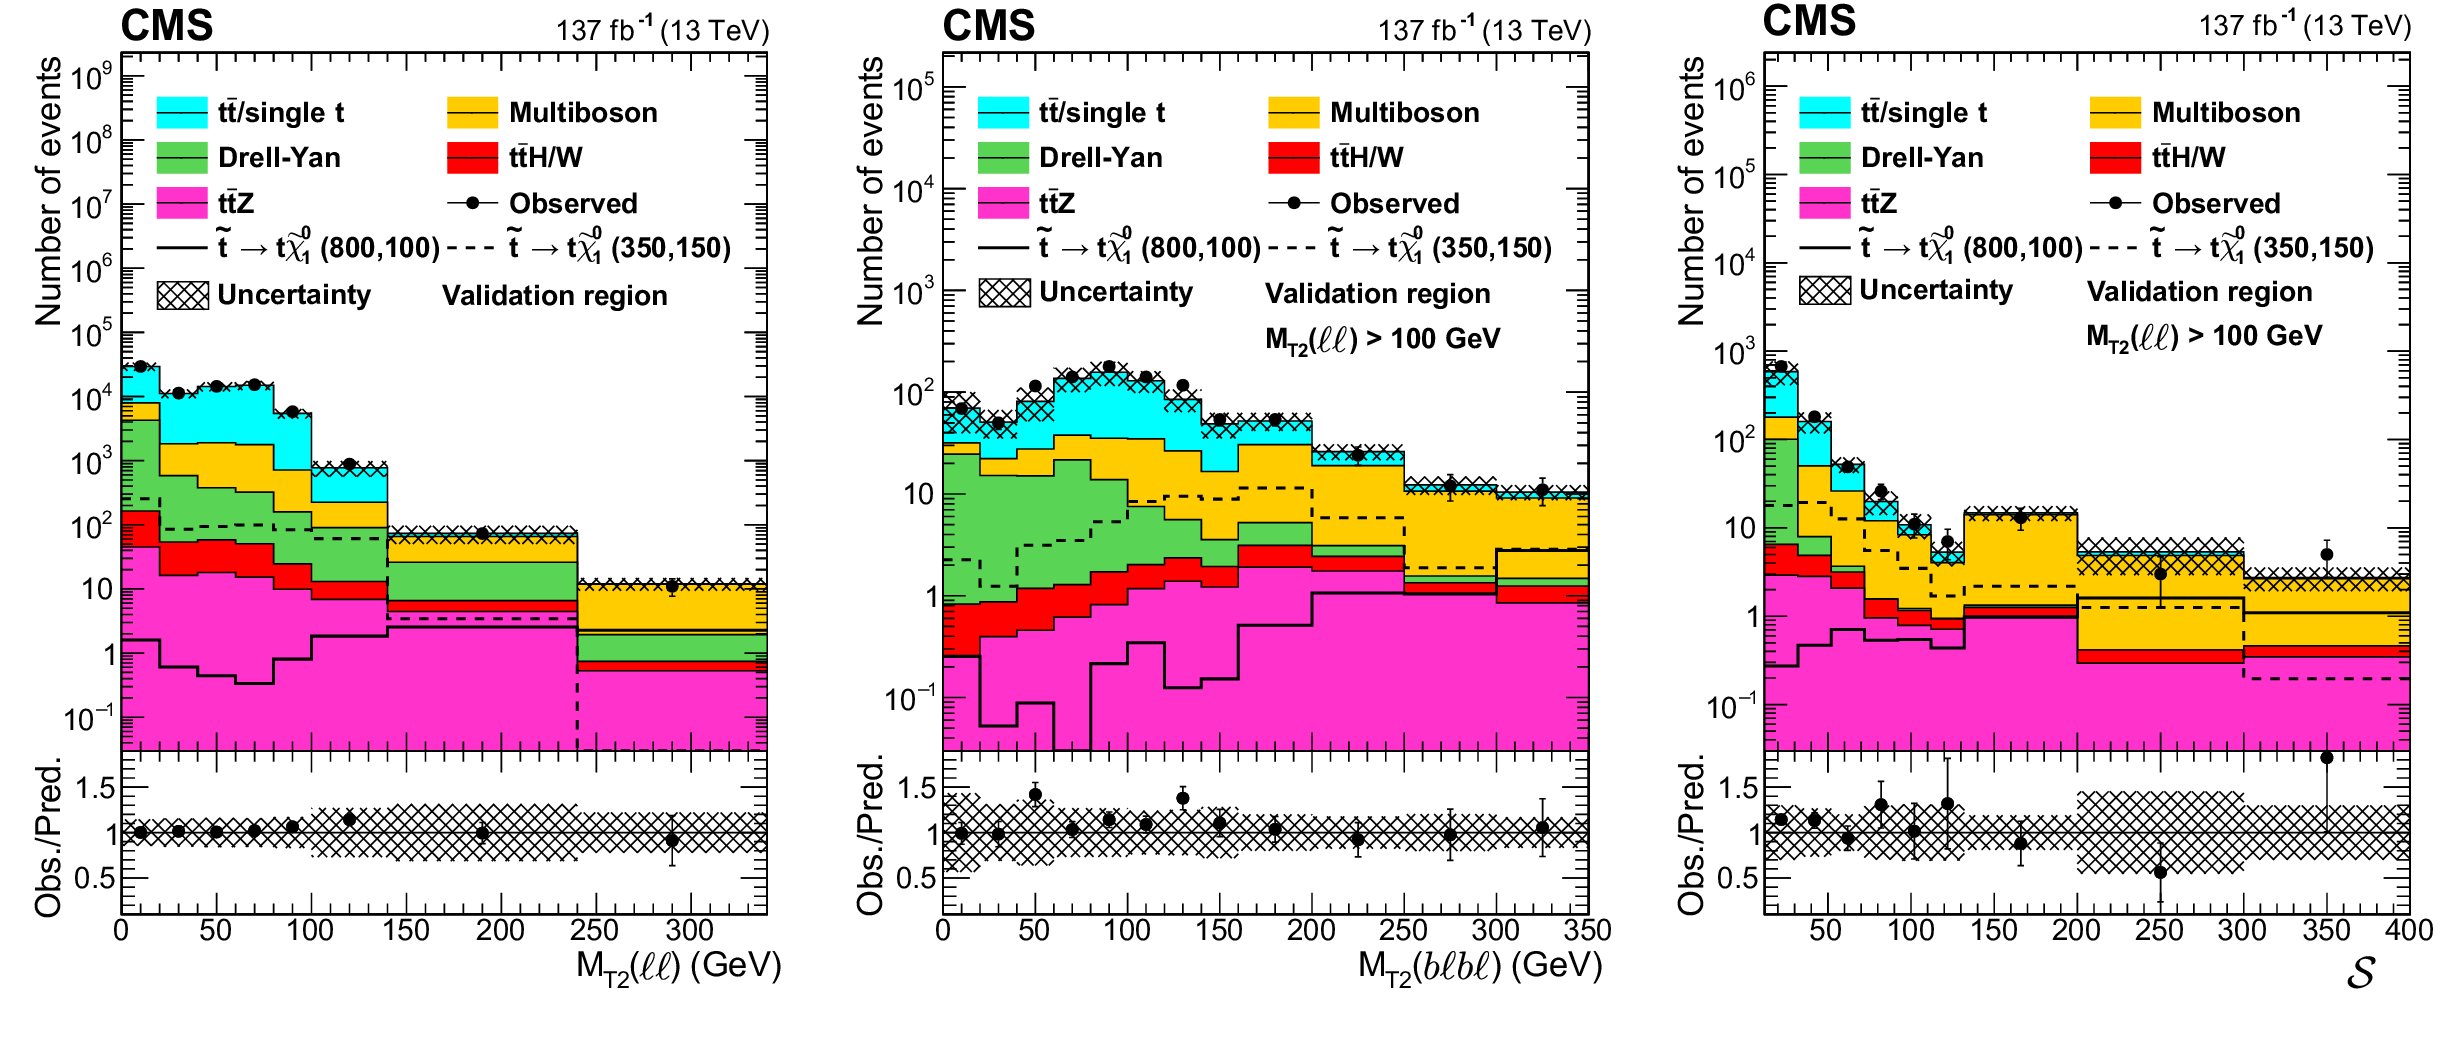
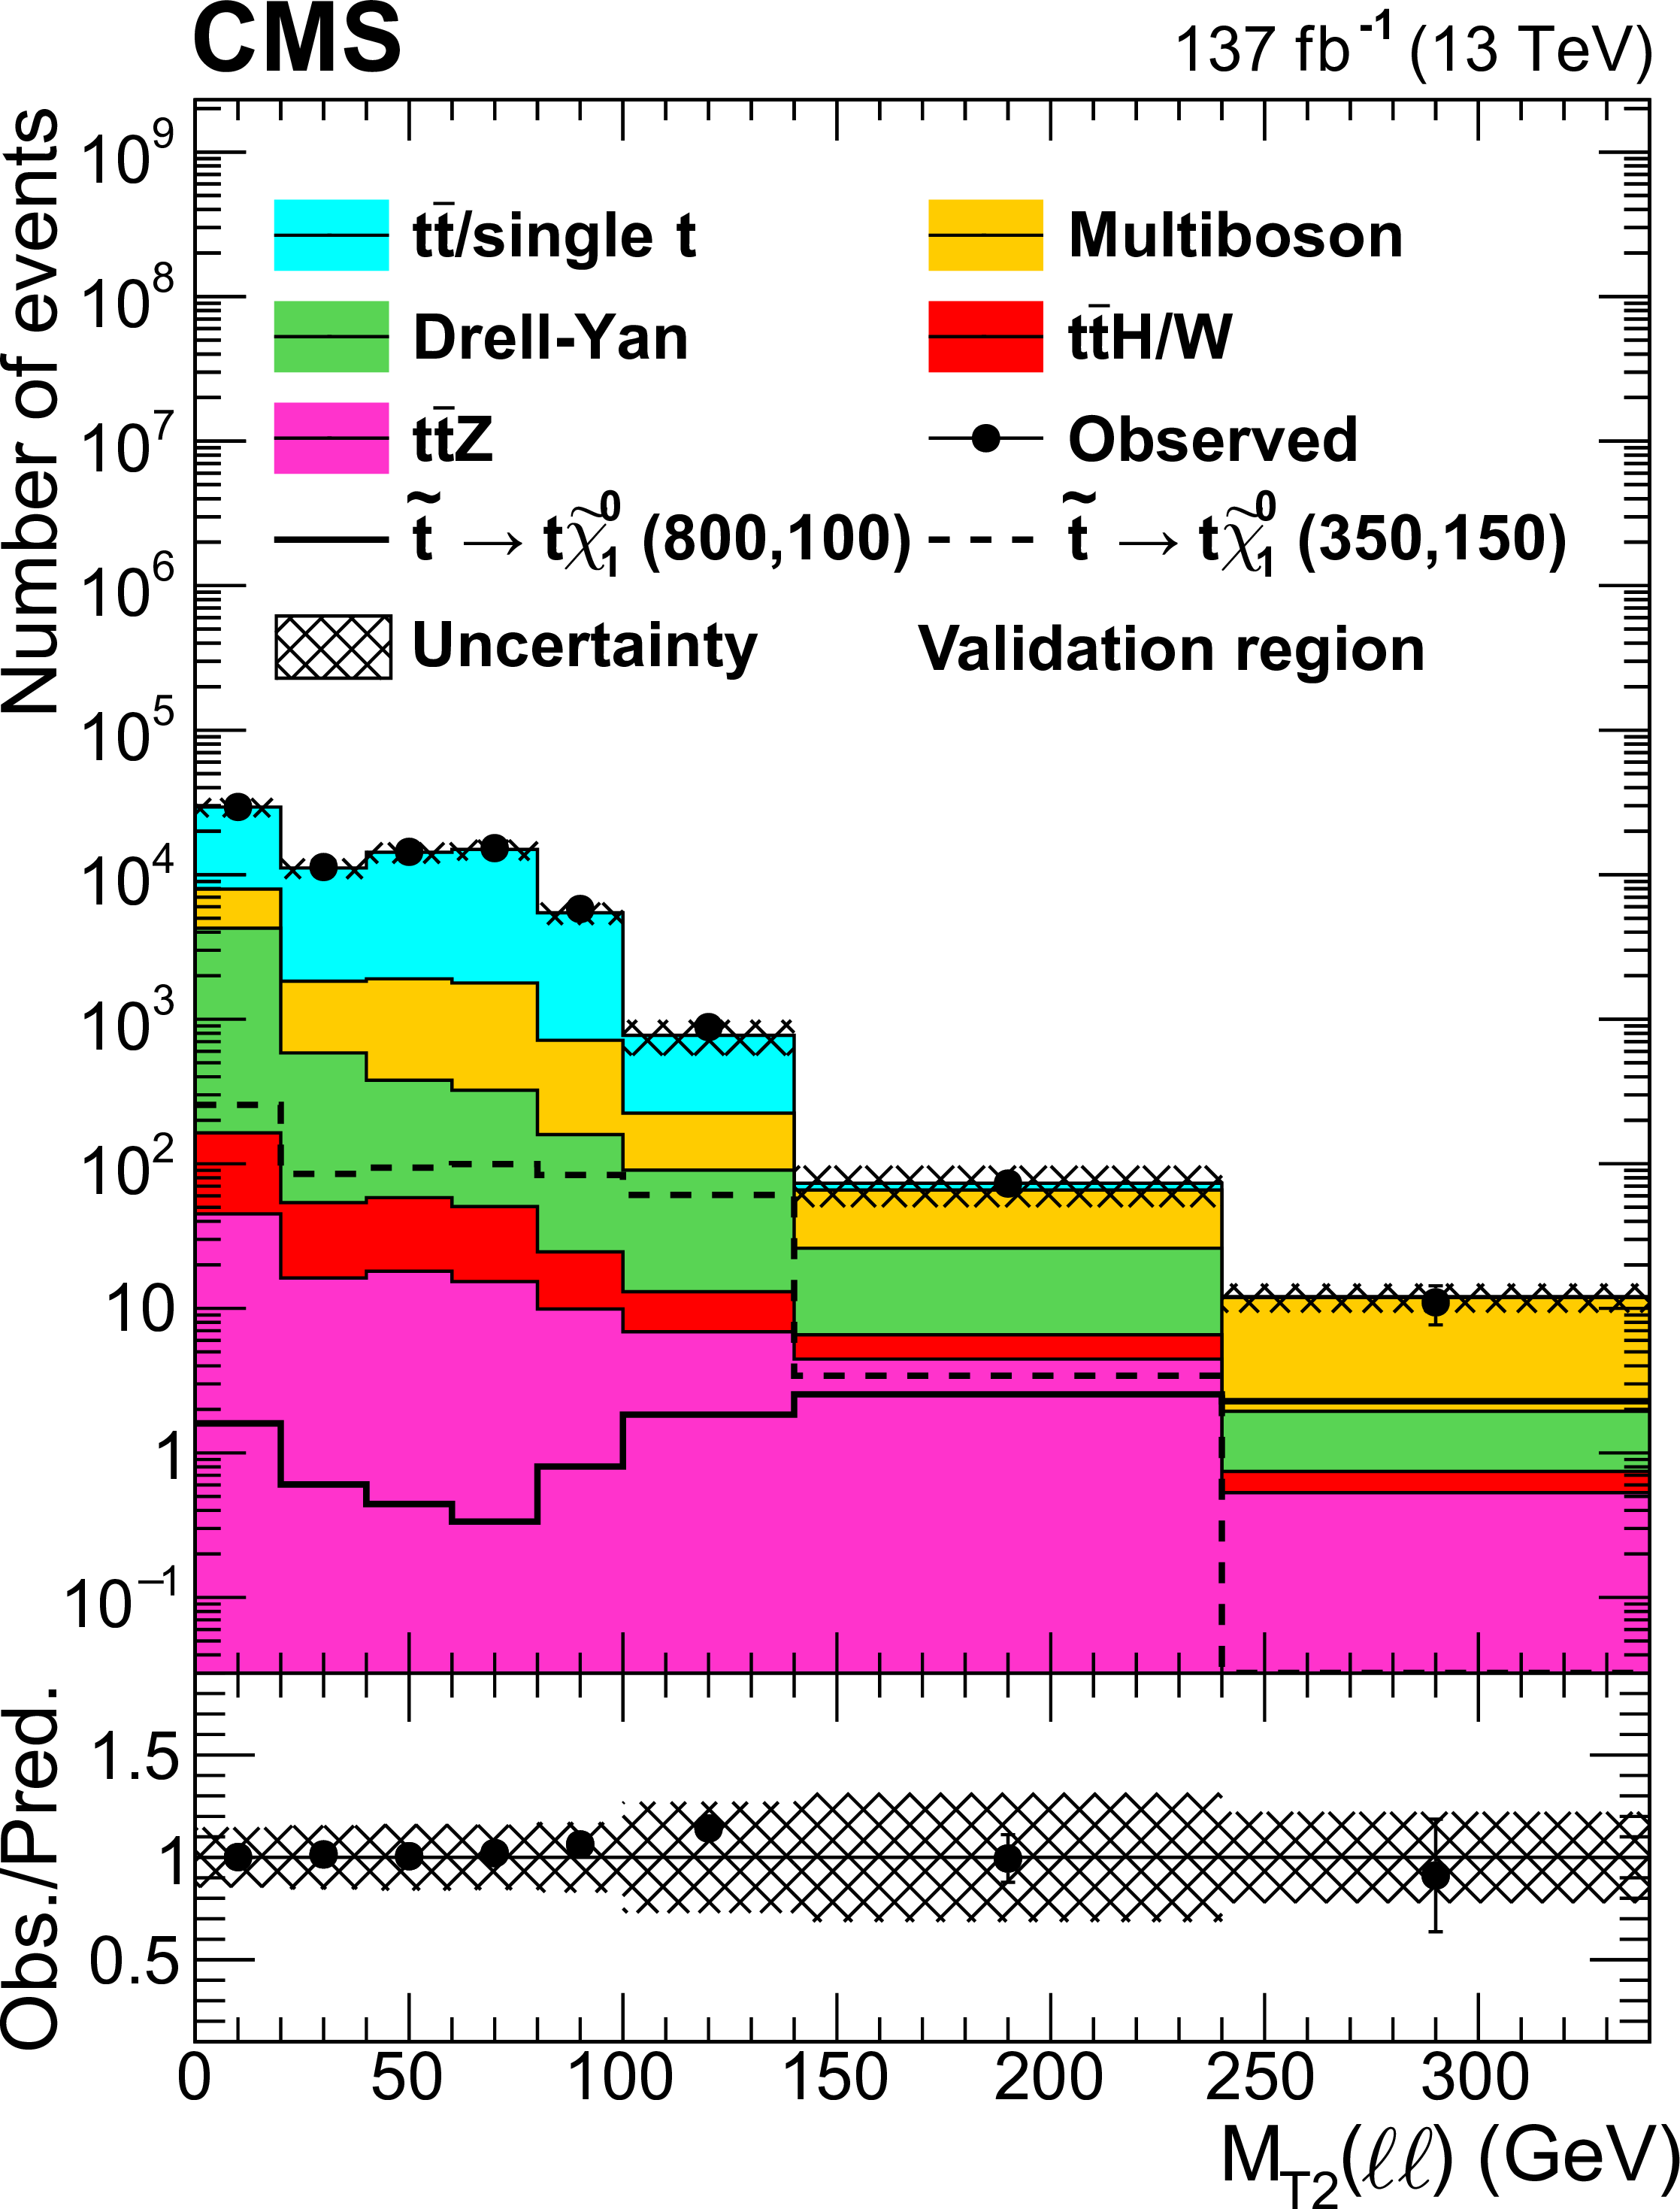
The ${M_{\text {T2}}(\ell \ell)}$, ${M_{\text {T2}}(\mathrm{b} \ell b \ell)}$, and ${\mathcal {S}}$ distributions in the validation regions requiring $ {N_\text {jets}} \geq $ 2 and $ {N_{\mathrm{b}}} =$ 0, combining the SF and DF channels. All other event selection requirements are applied. For the ${M_{\text {T2}}(\mathrm{b} \ell b \ell)}$ and ${\mathcal {S}}$ distributions, $ {M_{\text {T2}}(\ell \ell)} > $ 100 GeV is required. The individual processes are scaled using their measured respective scale factors, as described in the text. The hatched band represents the experimental systematic uncertainties and the uncertainties in the scale factors. The last bin in each distribution includes the overflow events. The lower panel gives the ratio between the observation and the predicted SM backgrounds. The relative uncertainty in the SM background prediction is shown as a hatched band. |
png pdf |
Figure 3-a:
The ${M_{\text {T2}}(\ell \ell)}$ distribution in the validation regions requiring $ {N_\text {jets}} \geq $ 2 and $ {N_{\mathrm{b}}} =$ 0, combining the SF and DF channels. All other event selection requirements are applied. The individual processes are scaled using their measured respective scale factors, as described in the text. The hatched band represents the experimental systematic uncertainties and the uncertainties in the scale factors. The last bin includes the overflow events. The lower panel gives the ratio between the observation and the predicted SM backgrounds. The relative uncertainty in the SM background prediction is shown as a hatched band. |
png pdf |
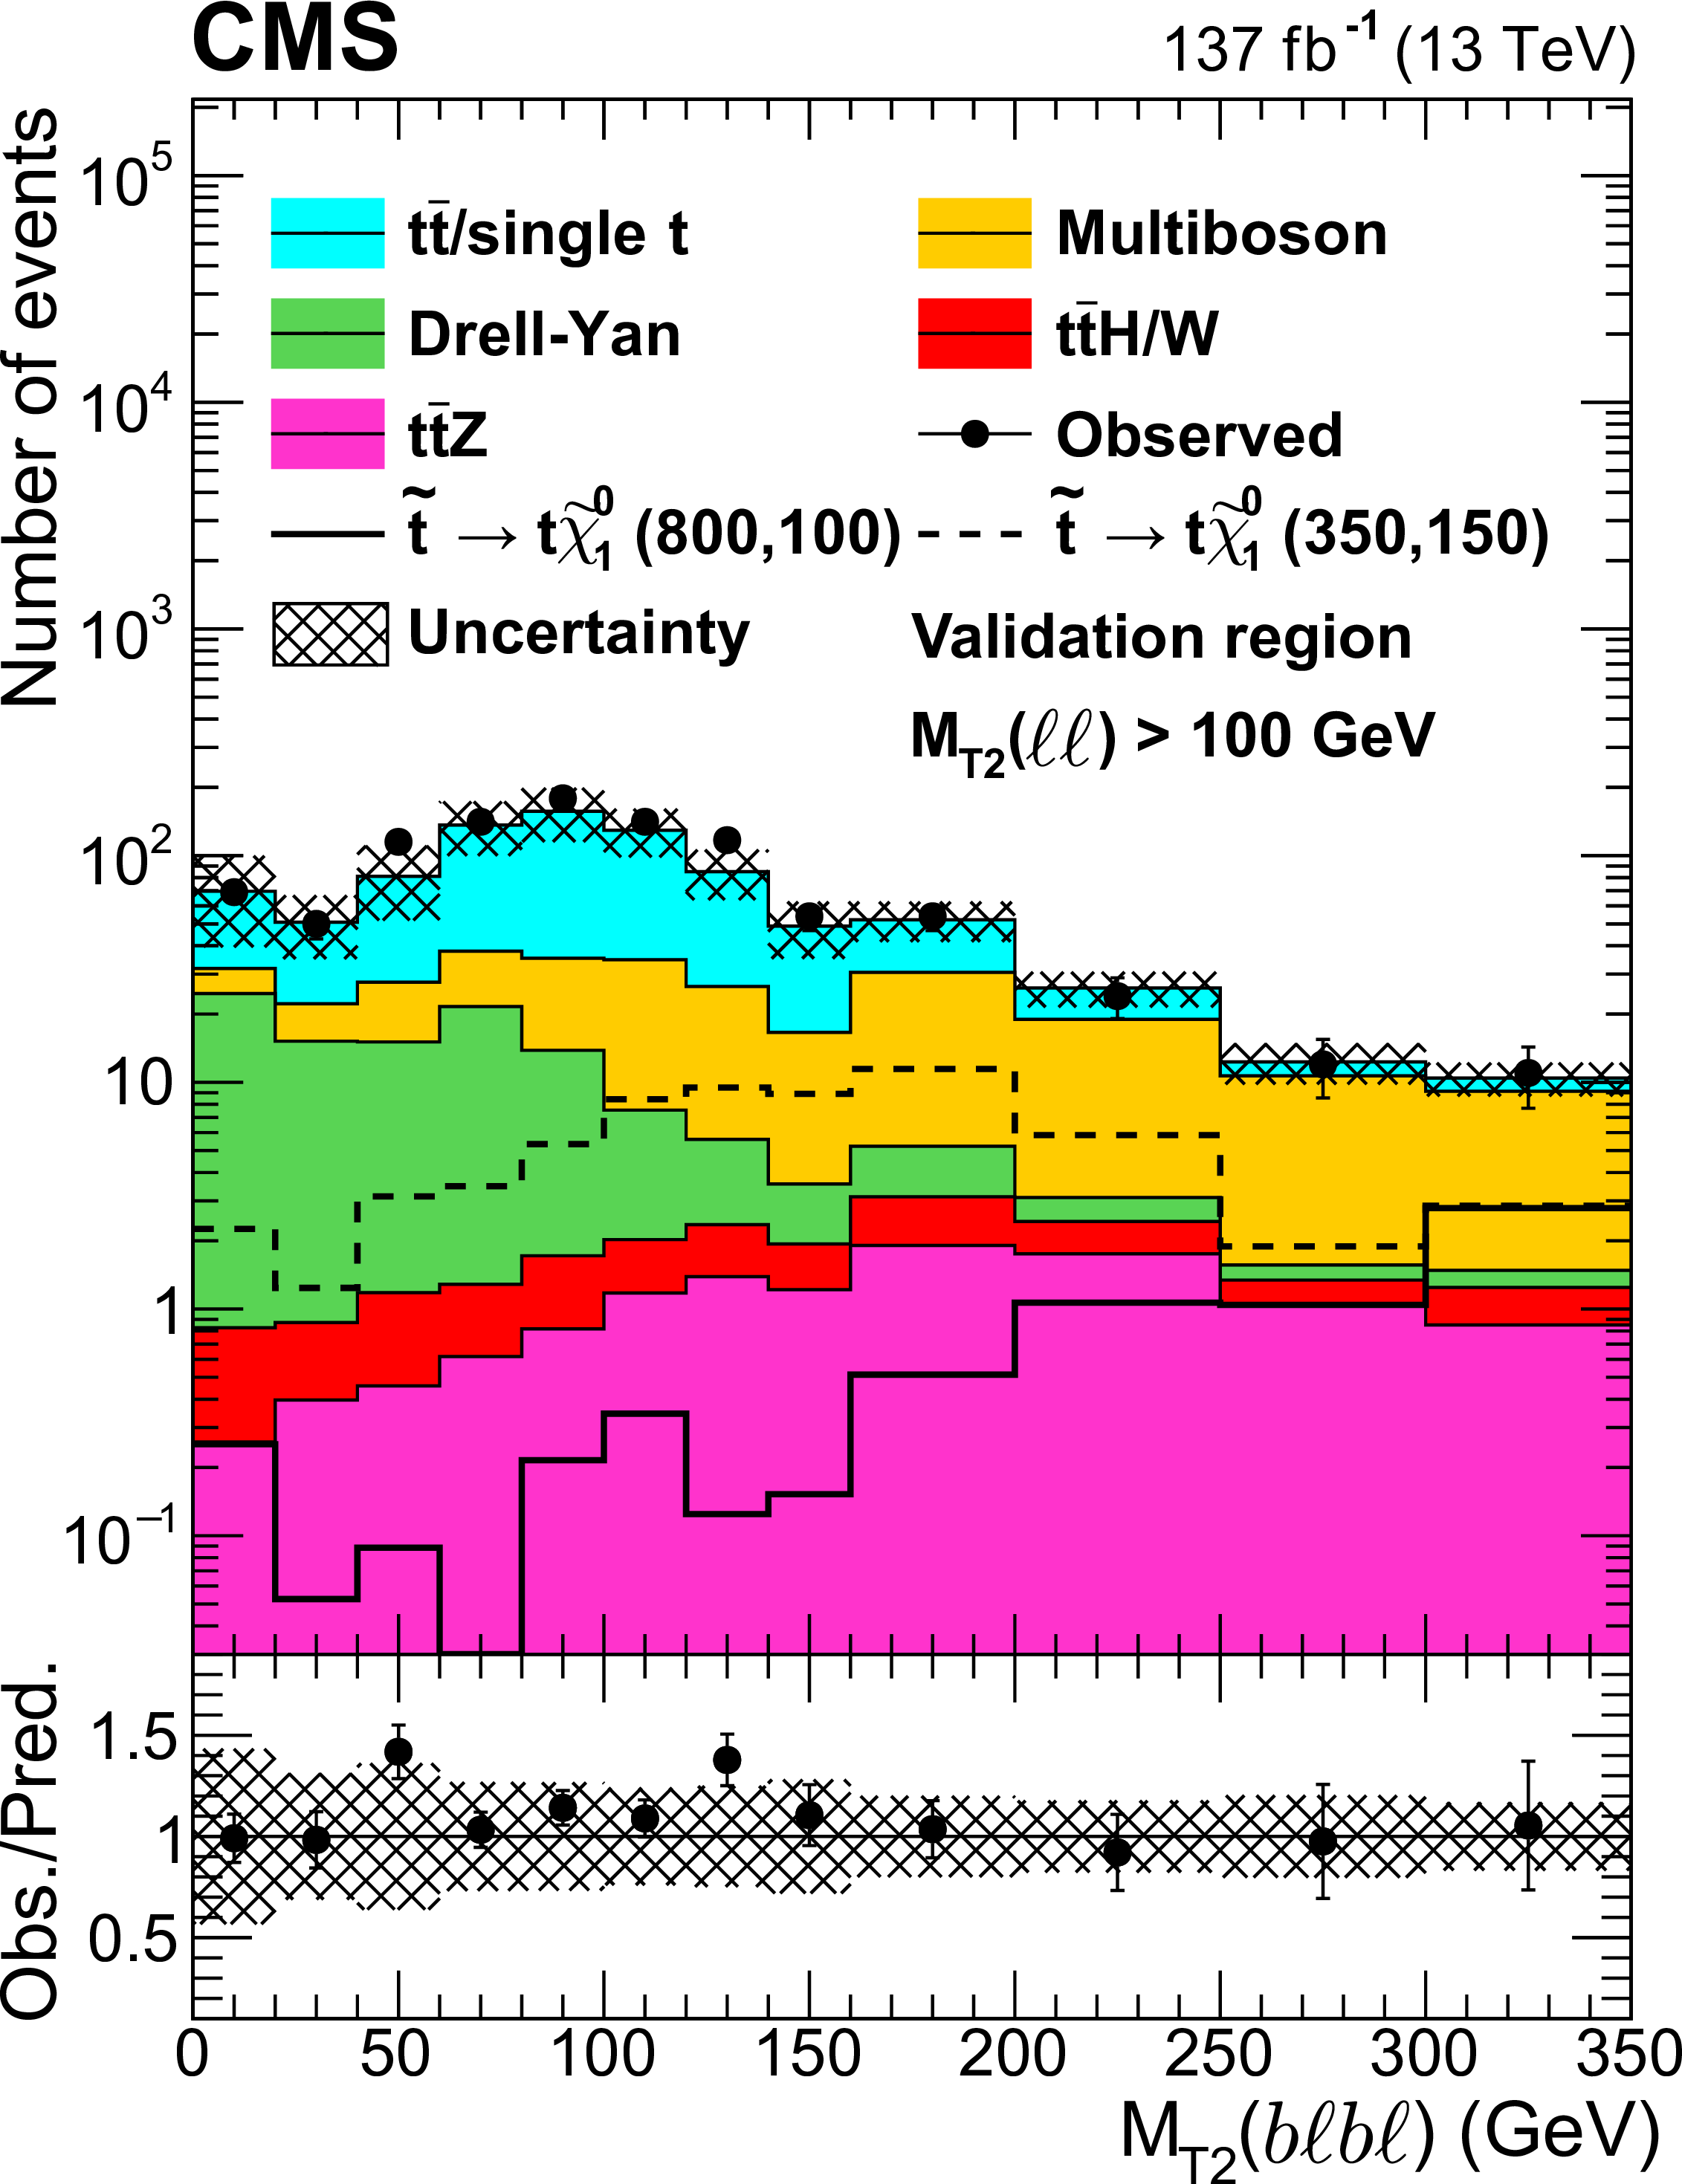
Figure 3-b:
The ${M_{\text {T2}}(\mathrm{b} \ell b \ell)}$ distribution in the validation regions requiring $ {N_\text {jets}} \geq $ 2 and $ {N_{\mathrm{b}}} =$ 0, combining the SF and DF channels. All other event selection requirements are applied. The condition $ {M_{\text {T2}}(\ell \ell)} > $ 100 GeV is required. The individual processes are scaled using their measured respective scale factors, as described in the text. The hatched band represents the experimental systematic uncertainties and the uncertainties in the scale factors. The last bin includes the overflow events. The lower panel gives the ratio between the observation and the predicted SM backgrounds. The relative uncertainty in the SM background prediction is shown as a hatched band. |
png pdf |
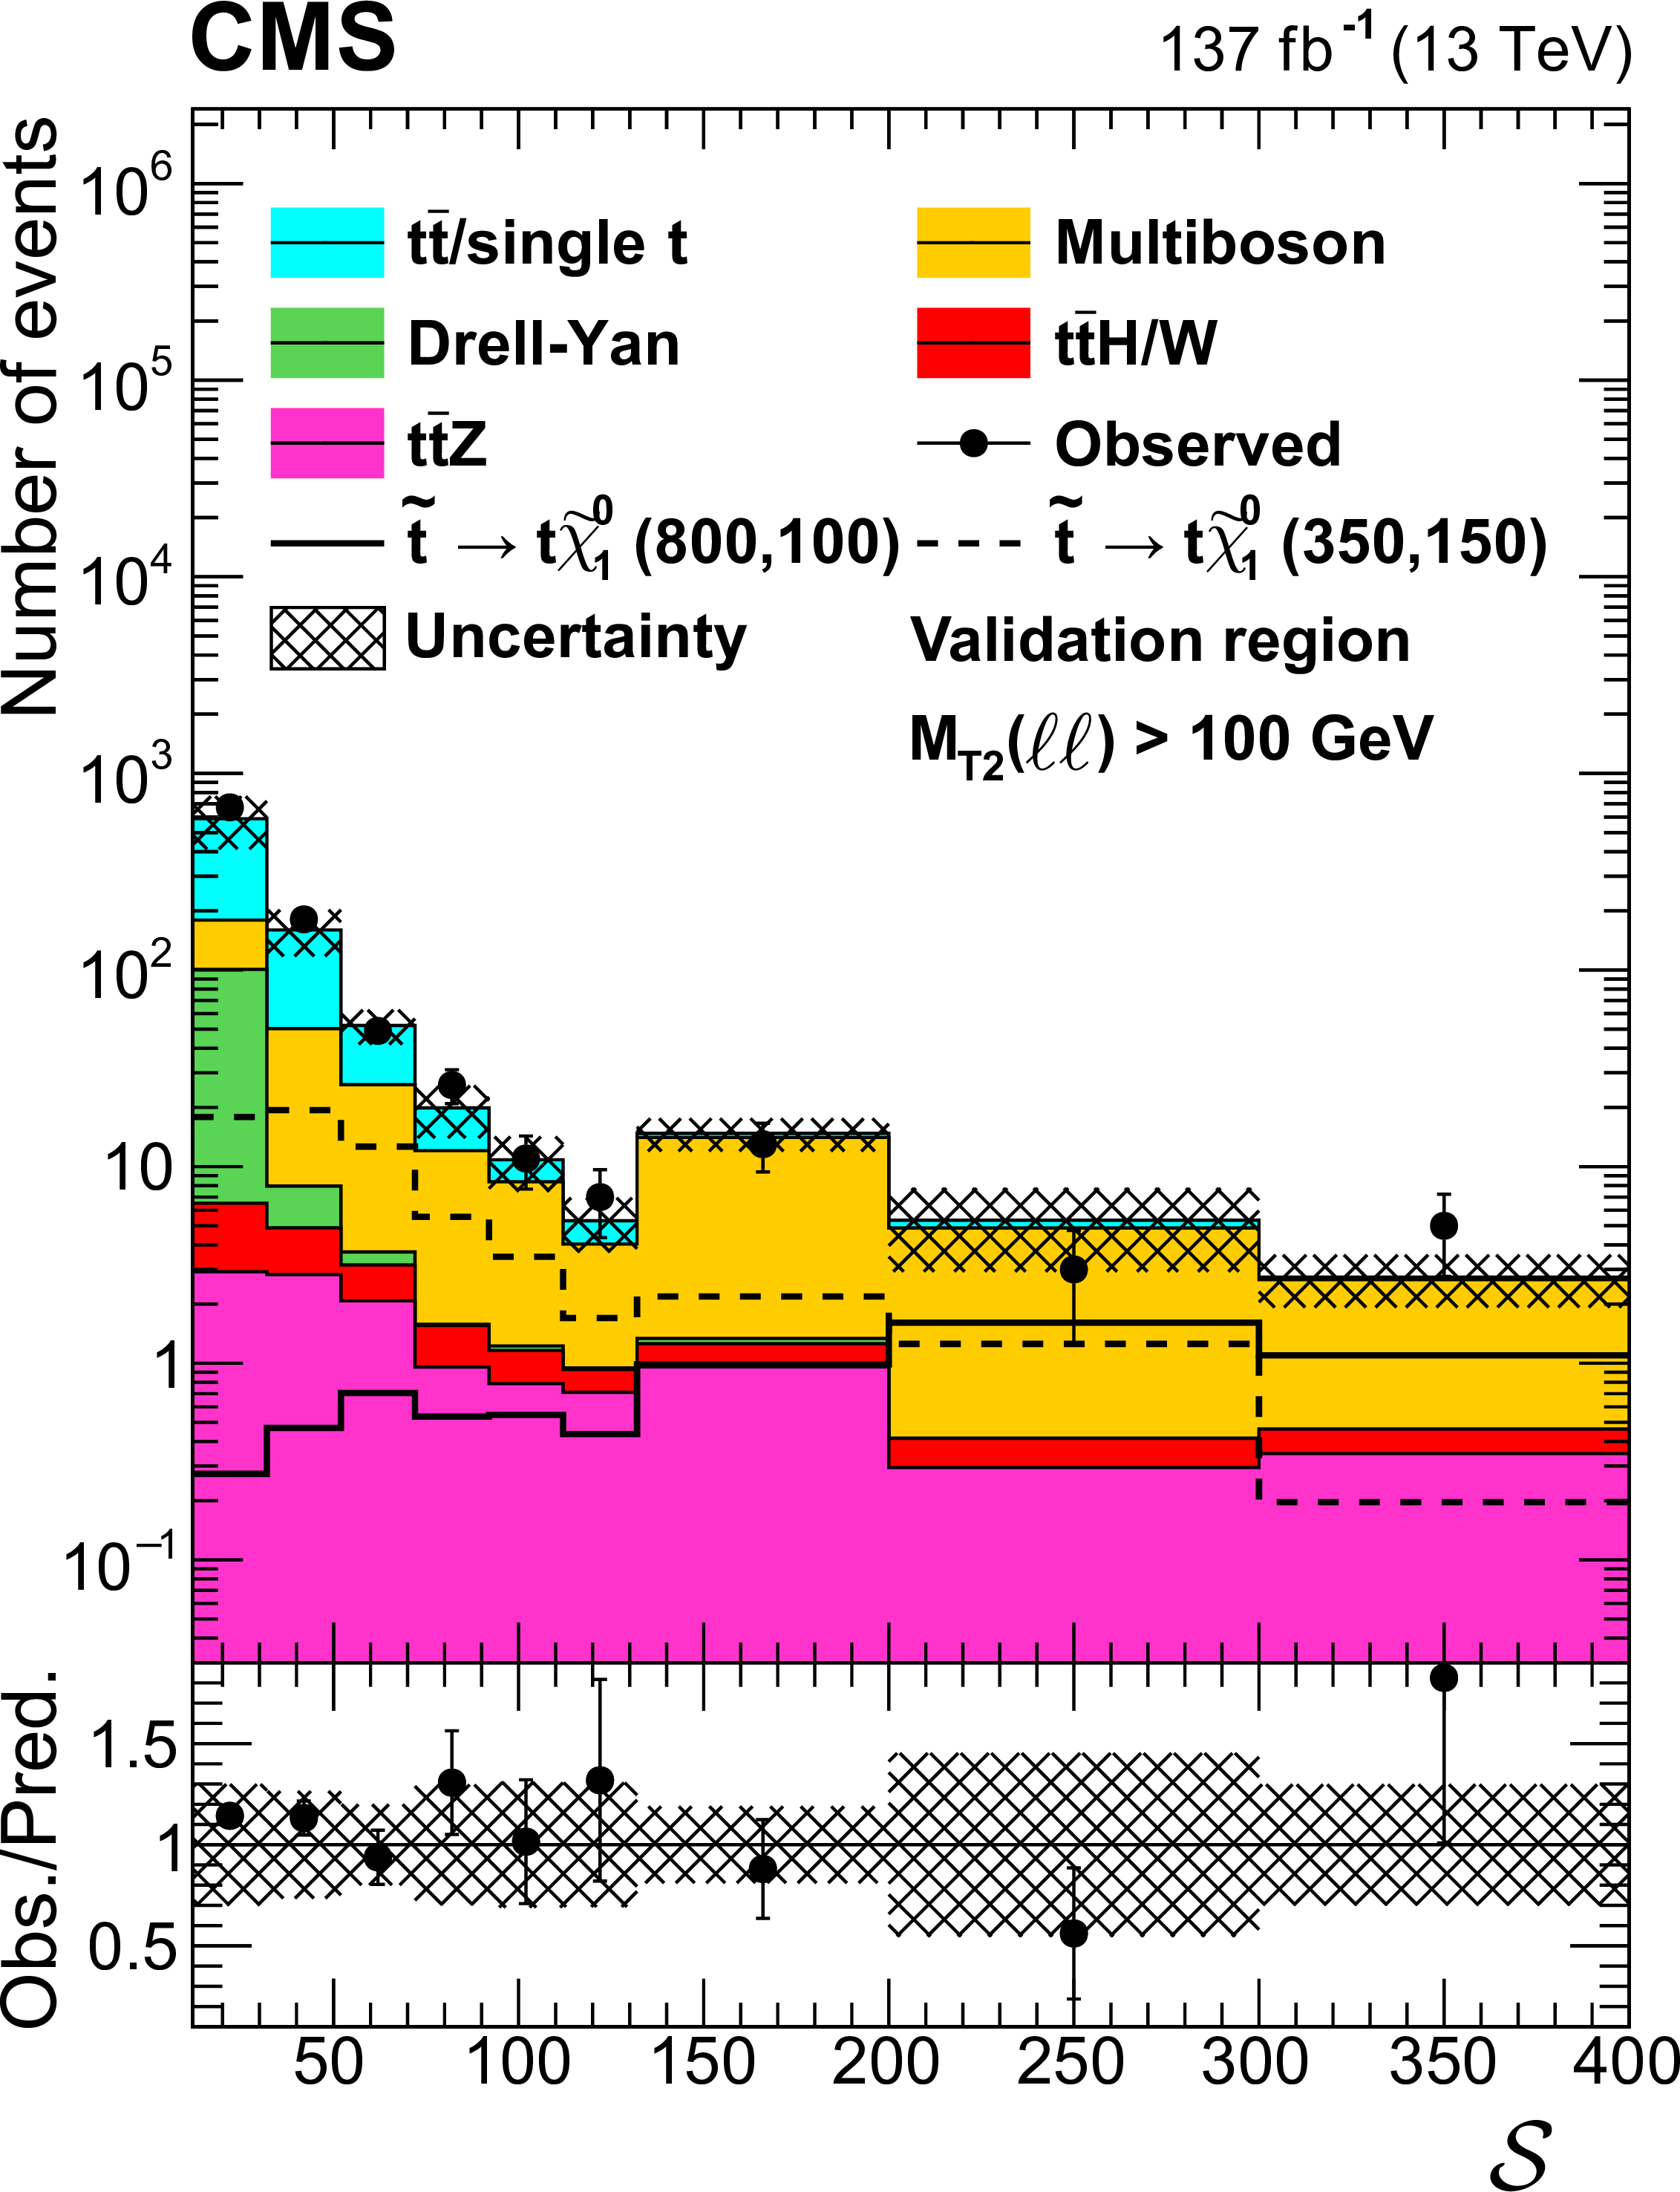
Figure 3-c:
The ${\mathcal {S}}$ distribution in the validation regions requiring $ {N_\text {jets}} \geq $ 2 and $ {N_{\mathrm{b}}} =$ 0, combining the SF and DF channels. All other event selection requirements are applied. The condition $ {M_{\text {T2}}(\ell \ell)} > $ 100 GeV is required. The individual processes are scaled using their measured respective scale factors, as described in the text. The hatched band represents the experimental systematic uncertainties and the uncertainties in the scale factors. The last bin includes the overflow events. The lower panel gives the ratio between the observation and the predicted SM backgrounds. The relative uncertainty in the SM background prediction is shown as a hatched band. |
png pdf |
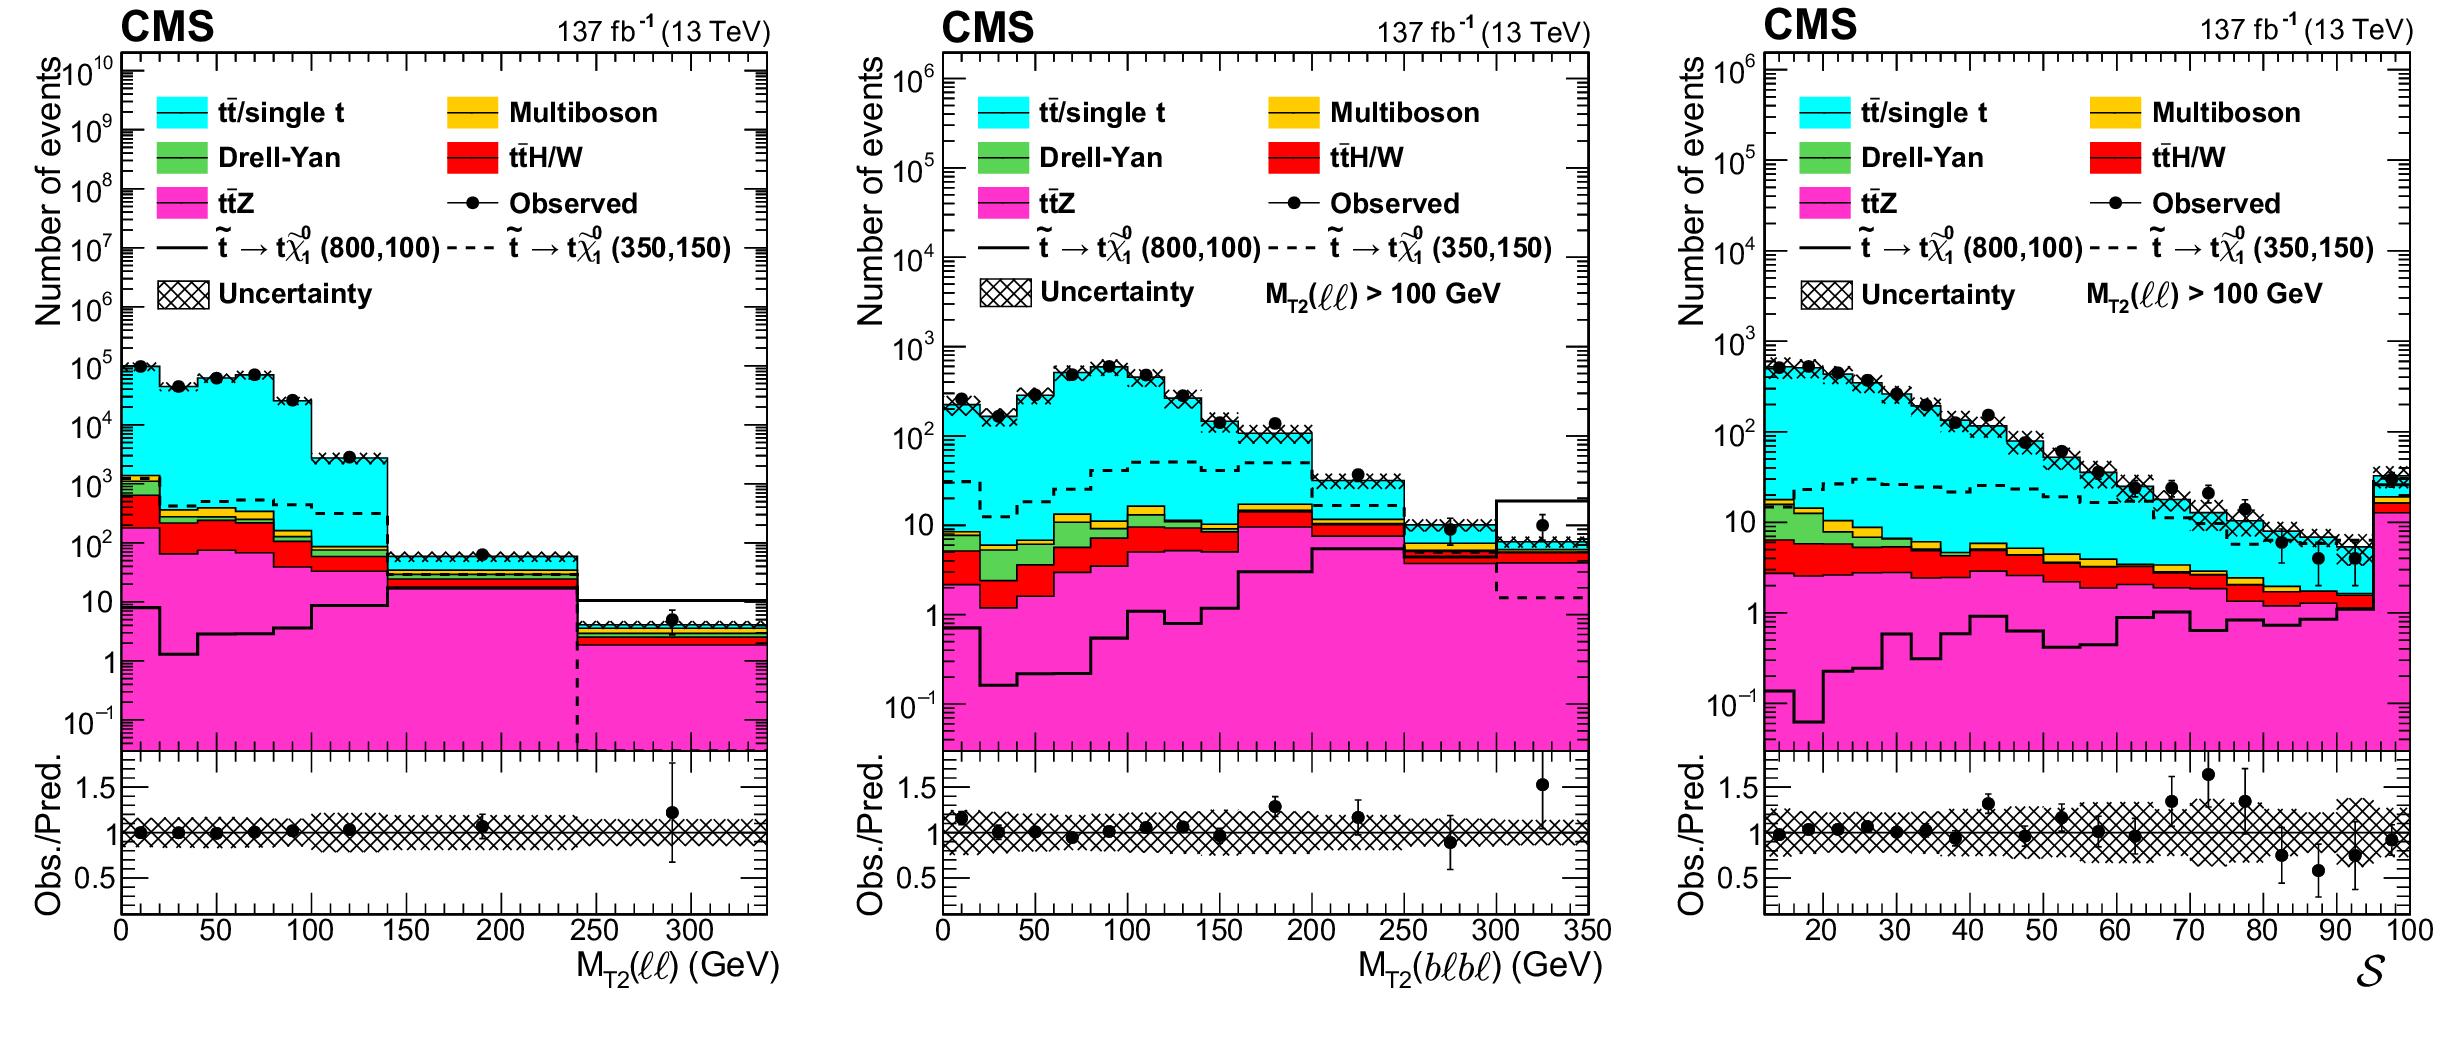
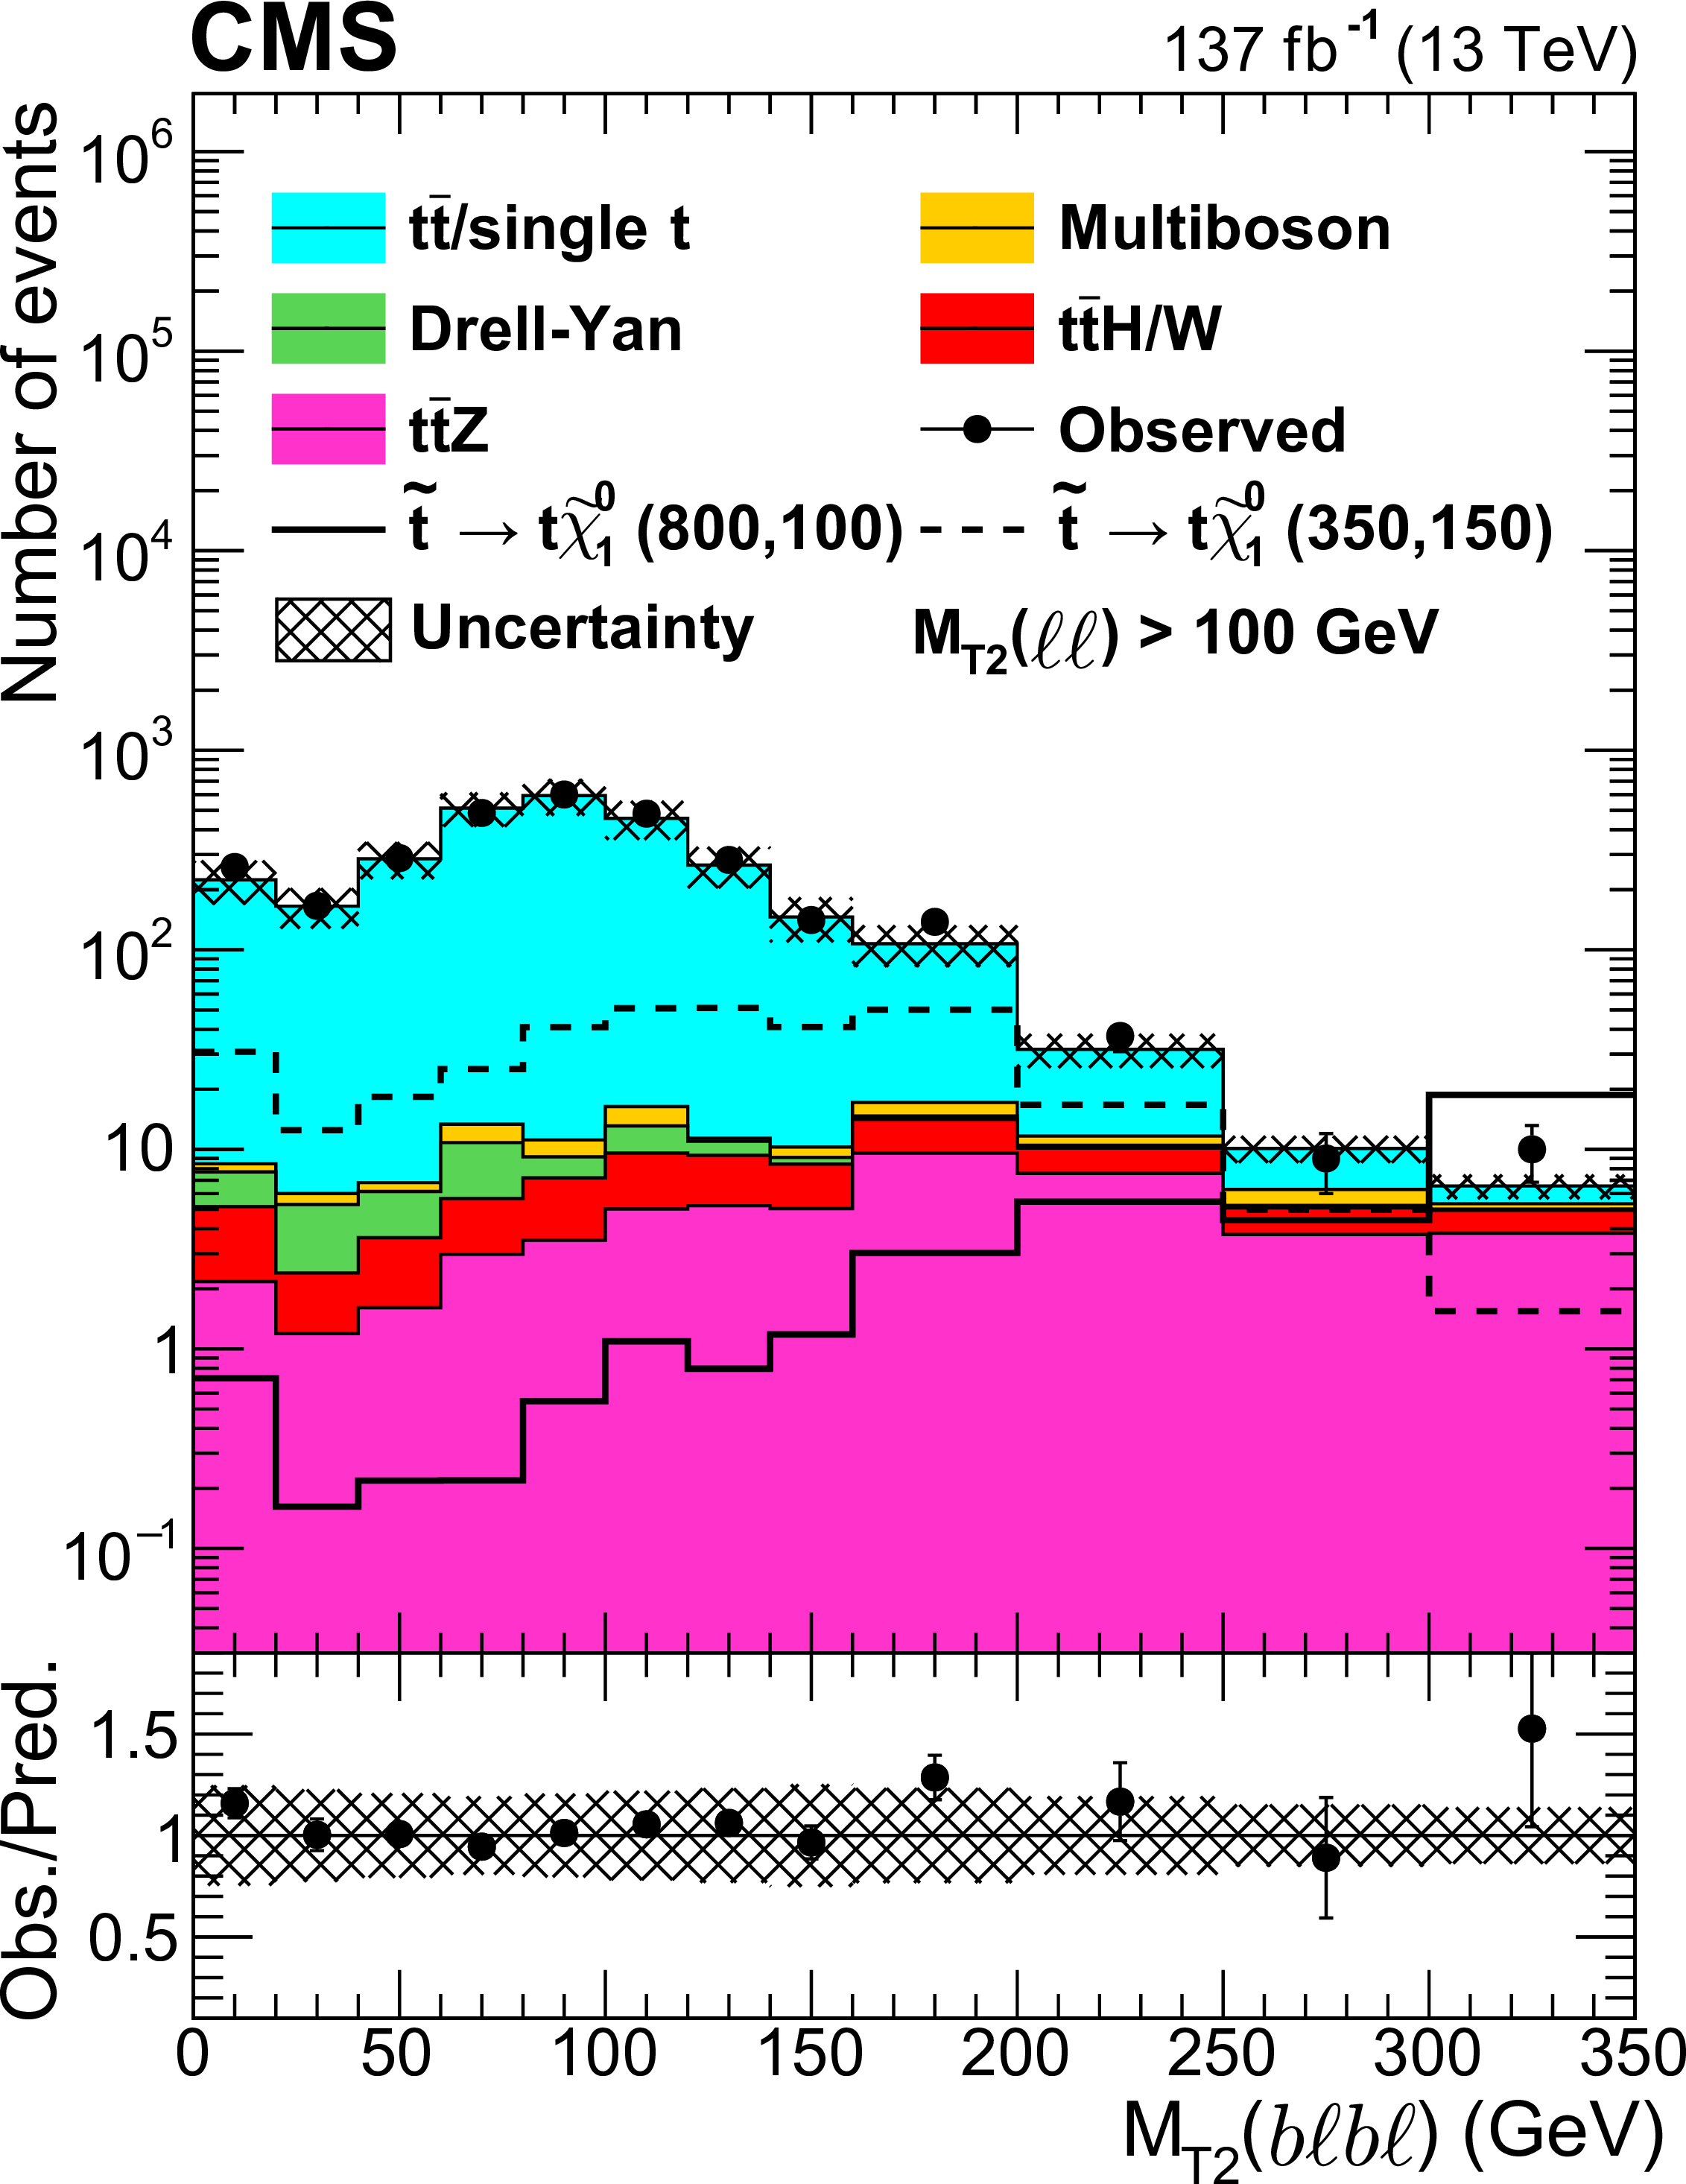
Figure 4:
Distributions of ${M_{\text {T2}}(\ell \ell)}$ (left), ${M_{\text {T2}}(\mathrm{b} \ell b \ell)}$ (middle), and ${\mathcal {S}}$ (right) for all lepton flavors for the preselection defined in Table 2. Additionally, $ {M_{\text {T2}}(\ell \ell)} > $ 100 GeV is required for the ${M_{\text {T2}}(\mathrm{b} \ell b \ell)}$ and ${\mathcal {S}}$ distributions. The last bin in each distribution includes the overflow events. The lower panel gives the ratio between the observation and the predicted SM backgrounds and the relative uncertainty in the SM background prediction is shown as a hatched band. |

png pdf |
Figure 4-a:
Distribution of ${M_{\text {T2}}(\ell \ell)}$ for all lepton flavors for the preselection defined in Table 2. The last bin includes the overflow events. The lower panel gives the ratio between the observation and the predicted SM backgrounds and the relative uncertainty in the SM background prediction is shown as a hatched band. |
png pdf |
Figure 4-b:
Distribution of ${M_{\text {T2}}(\mathrm{b} \ell b \ell)}$ for all lepton flavors for the preselection defined in Table 2. Additionally, $ {M_{\text {T2}}(\ell \ell)} > $ 100 GeV is required. The last bin includes the overflow events. The lower panel gives the ratio between the observation and the predicted SM backgrounds and the relative uncertainty in the SM background prediction is shown as a hatched band. |

png pdf |
Figure 4-c:
Distribution of ${\mathcal {S}}$ for all lepton flavors for the preselection defined in Table 2. Additionally, $ {M_{\text {T2}}(\ell \ell)} > $ 100 GeV is required. The last bin includes the overflow events. The lower panel gives the ratio between the observation and the predicted SM backgrounds and the relative uncertainty in the SM background prediction is shown as a hatched band. |

png pdf |
Figure 5:
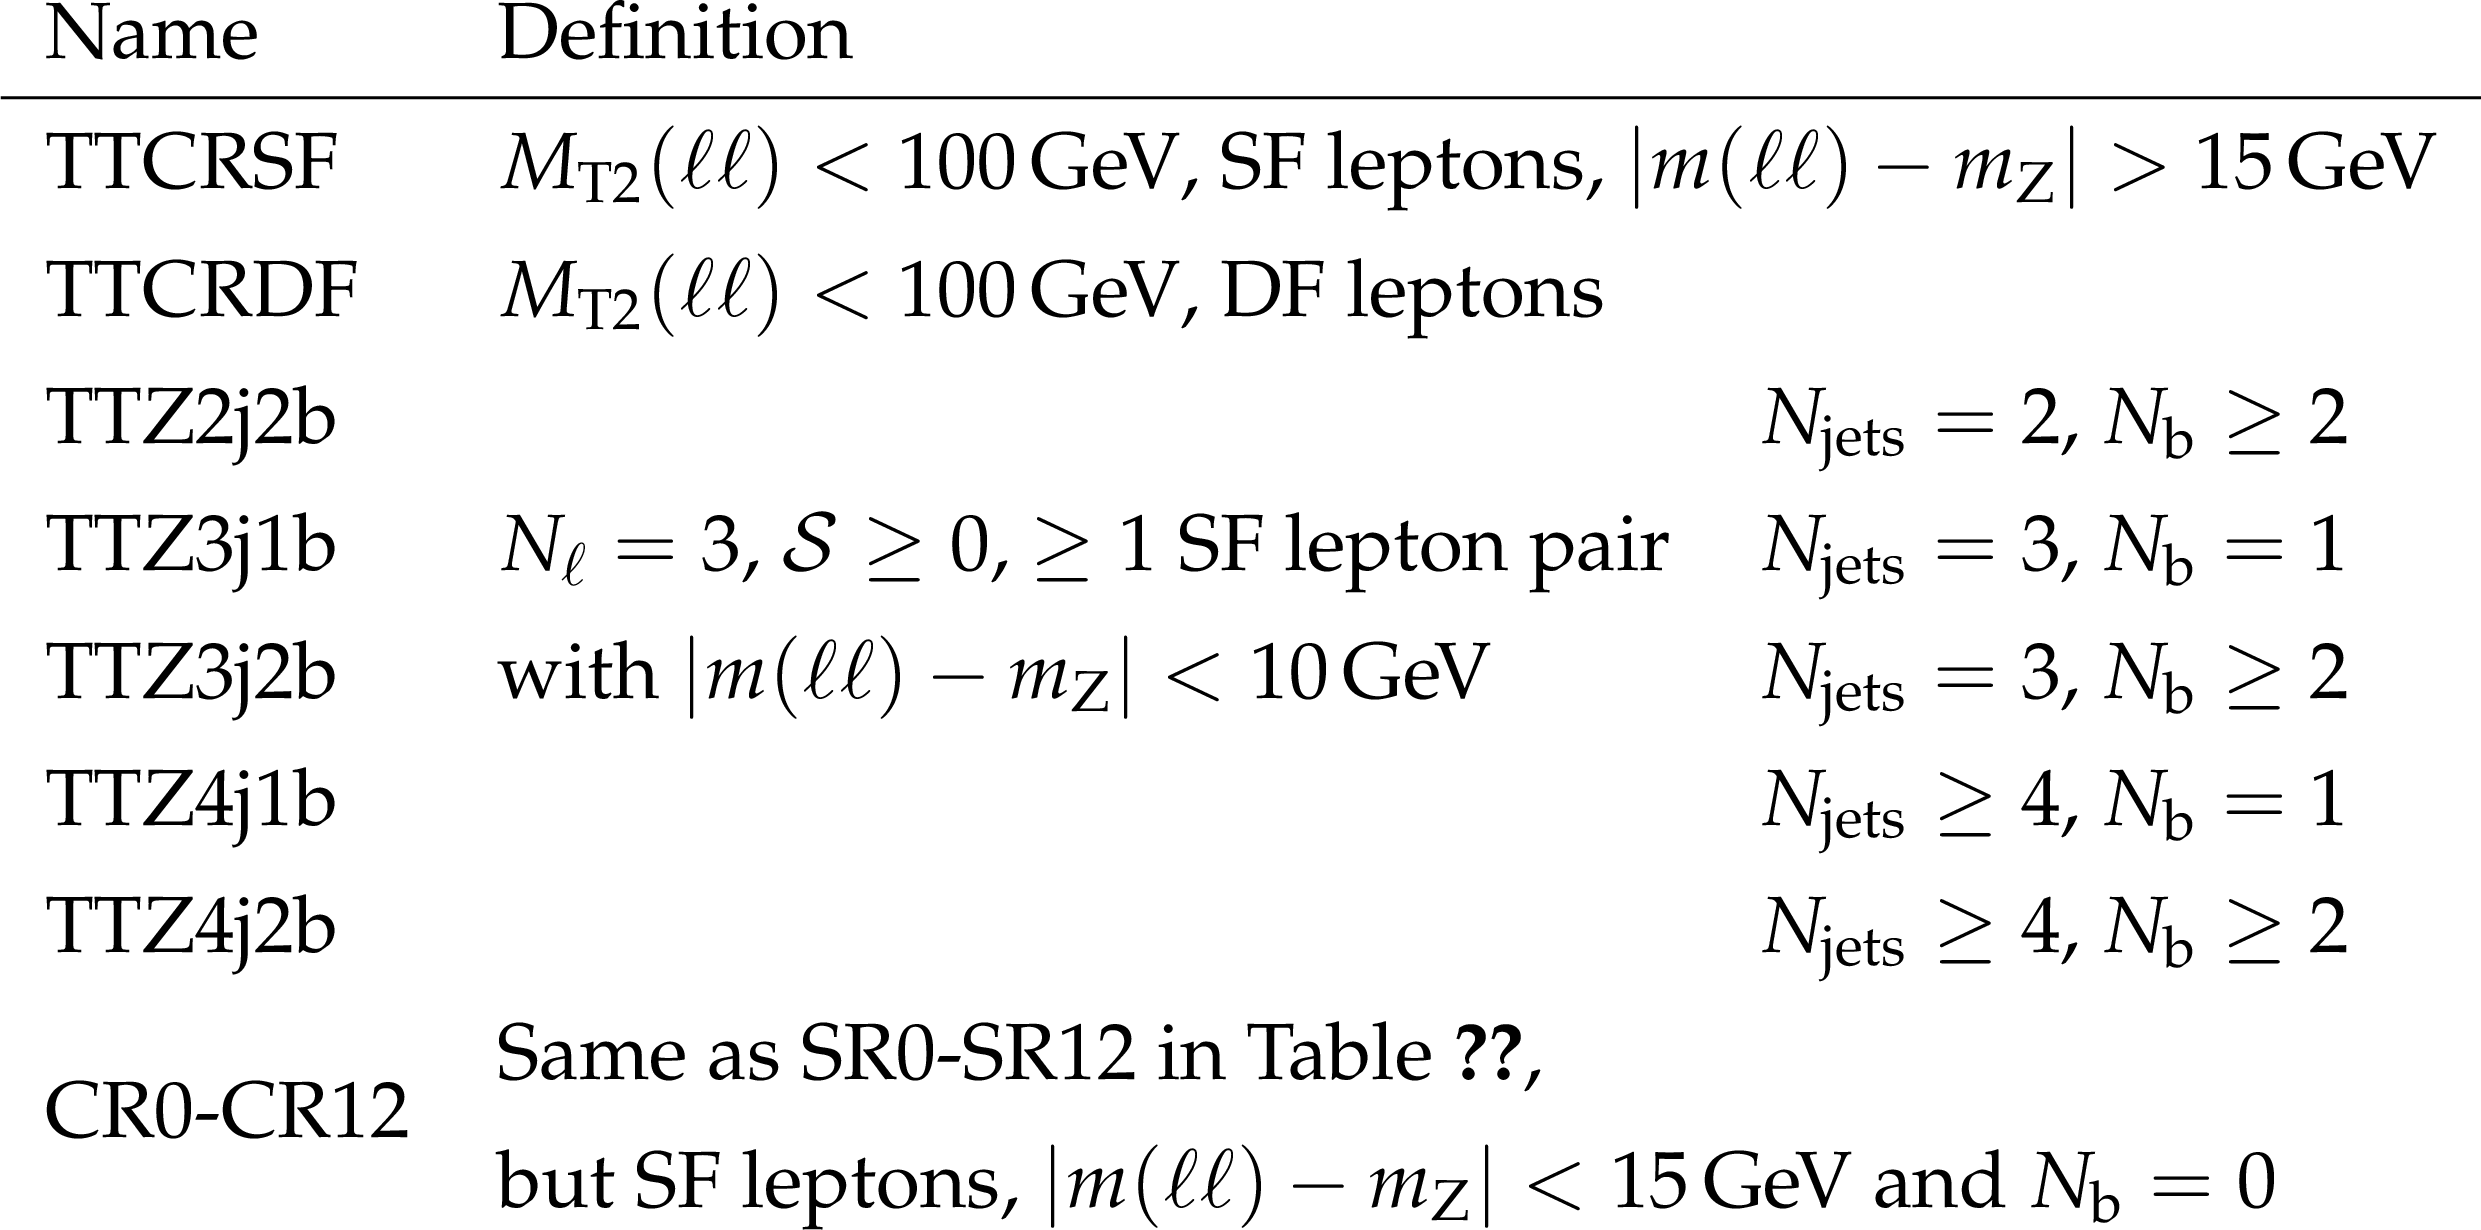
Predicted and observed yields in the signal and control regions as defined in Tables 3 and 4. The control regions TTCRSF and TTCRDF are defined by $ {M_{\text {T2}}(\ell \ell)} < $ 100 GeV and are used to constrain the ${\mathrm{t} {}\mathrm{\bar{t}}}$ normalization. The ${{\mathrm{t} {}\mathrm{\bar{t}}} \mathrm{Z}}$ control regions employ a 3 lepton requirement in different ${N_\text {jets}}$ and ${N_{\mathrm{b}}}$ bins. The dilepton invariant mass and ${N_{\mathrm{b}}}$ selections are inverted for CR0-CR12 in order to constrain the Drell-Yan and multiboson normalizations, using only the SF channel. The lower panel gives the ratio between the observation and the predicted SM backgrounds. The hatched band reflects the post-fit systematic uncertainties. |
png pdf |
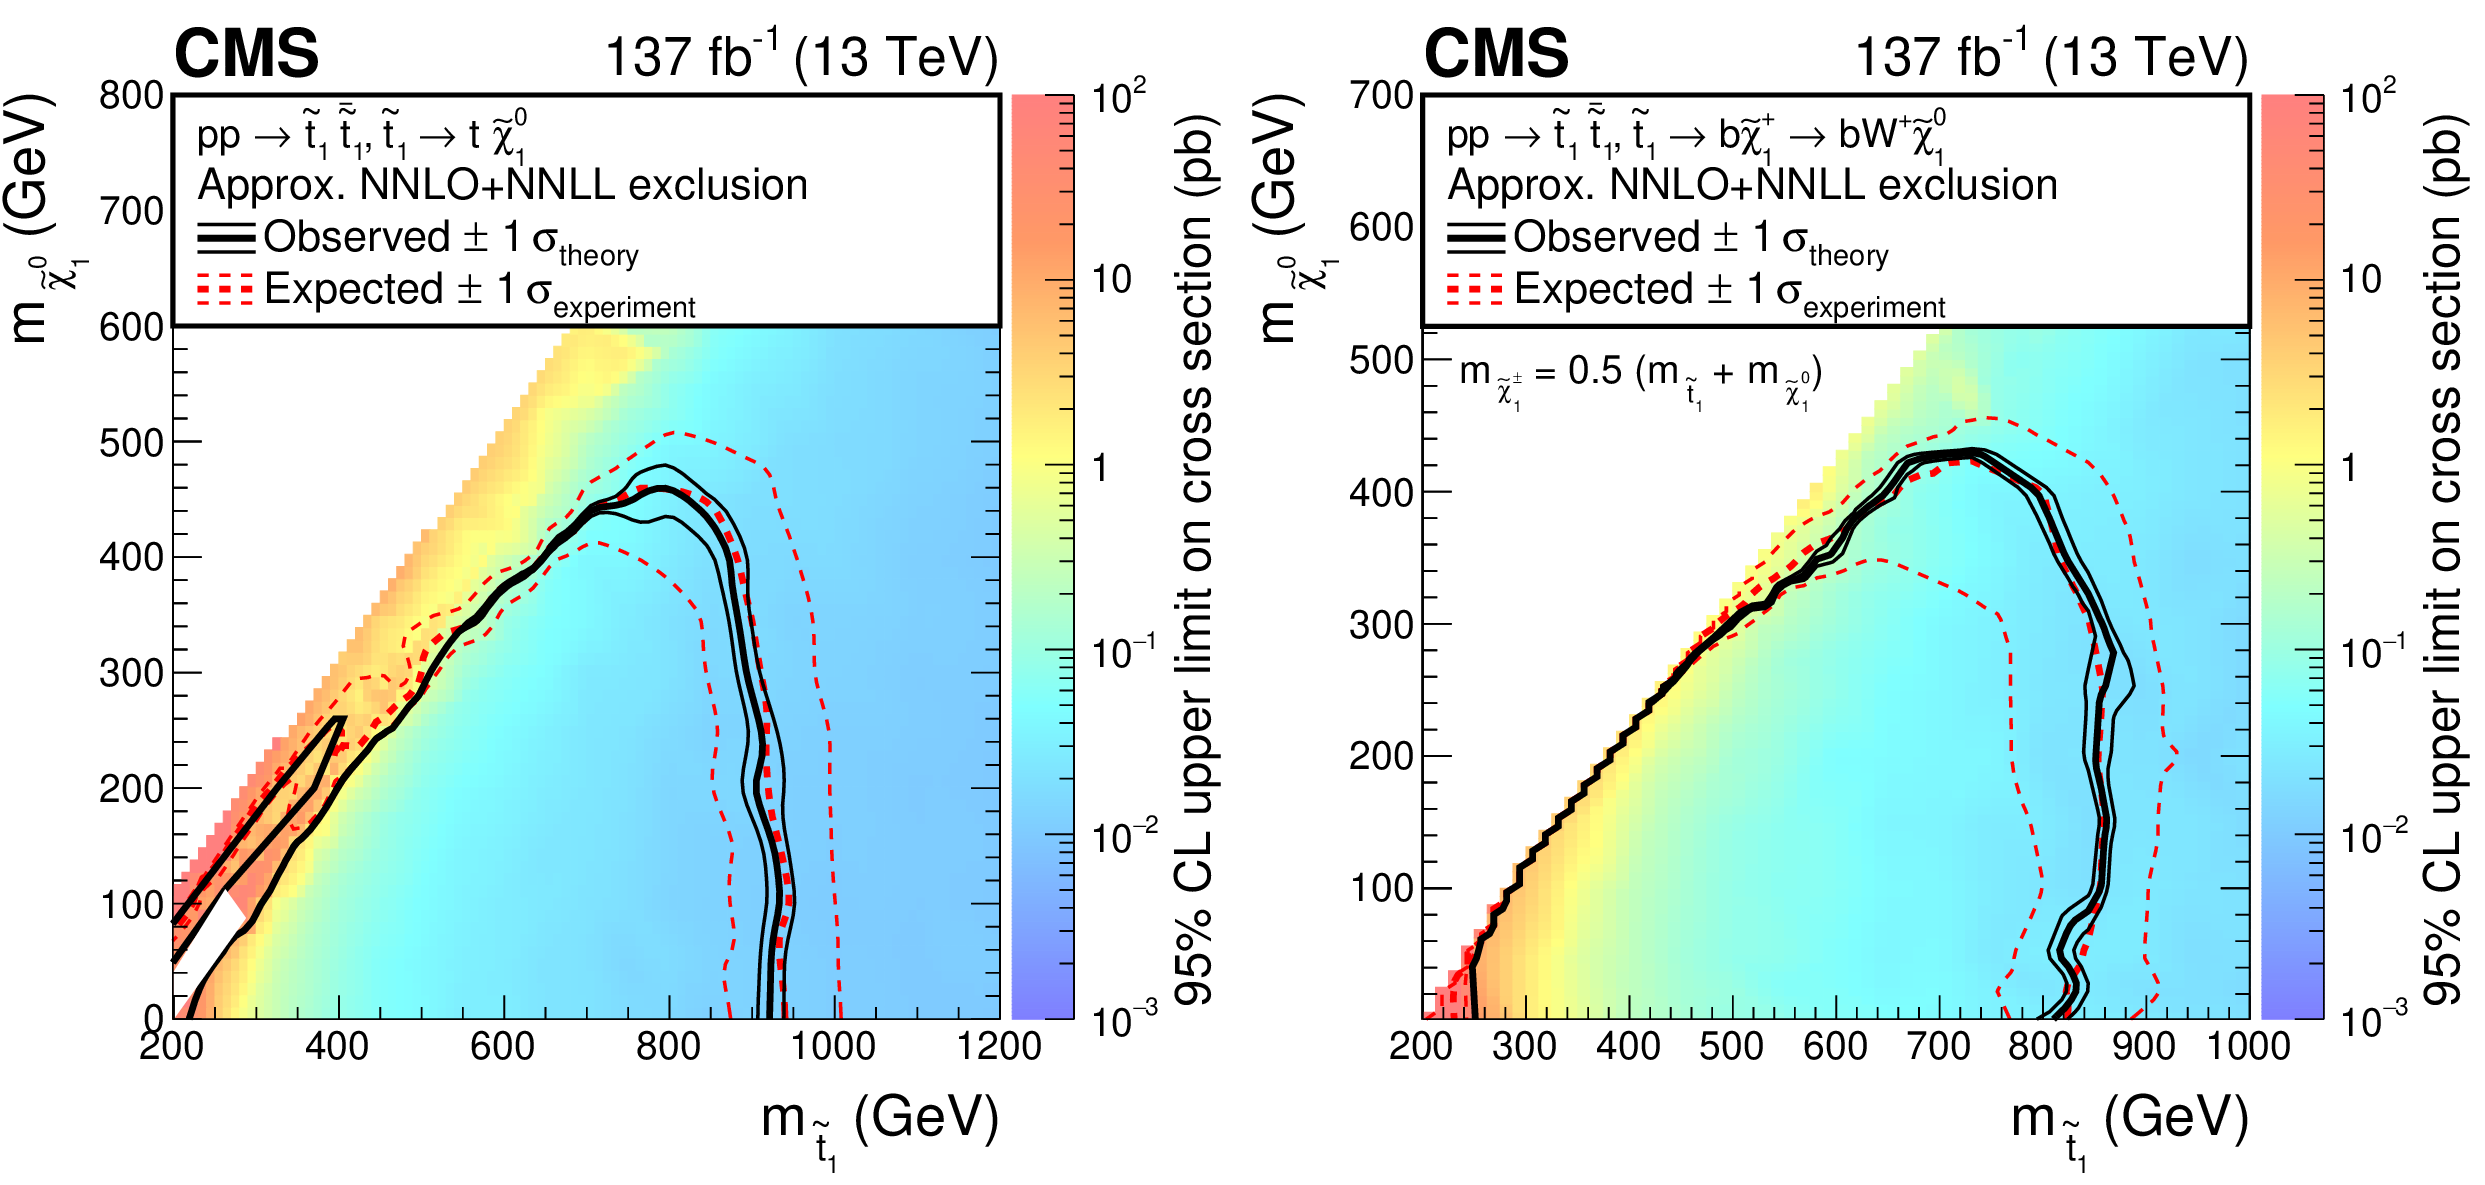
Figure 6:
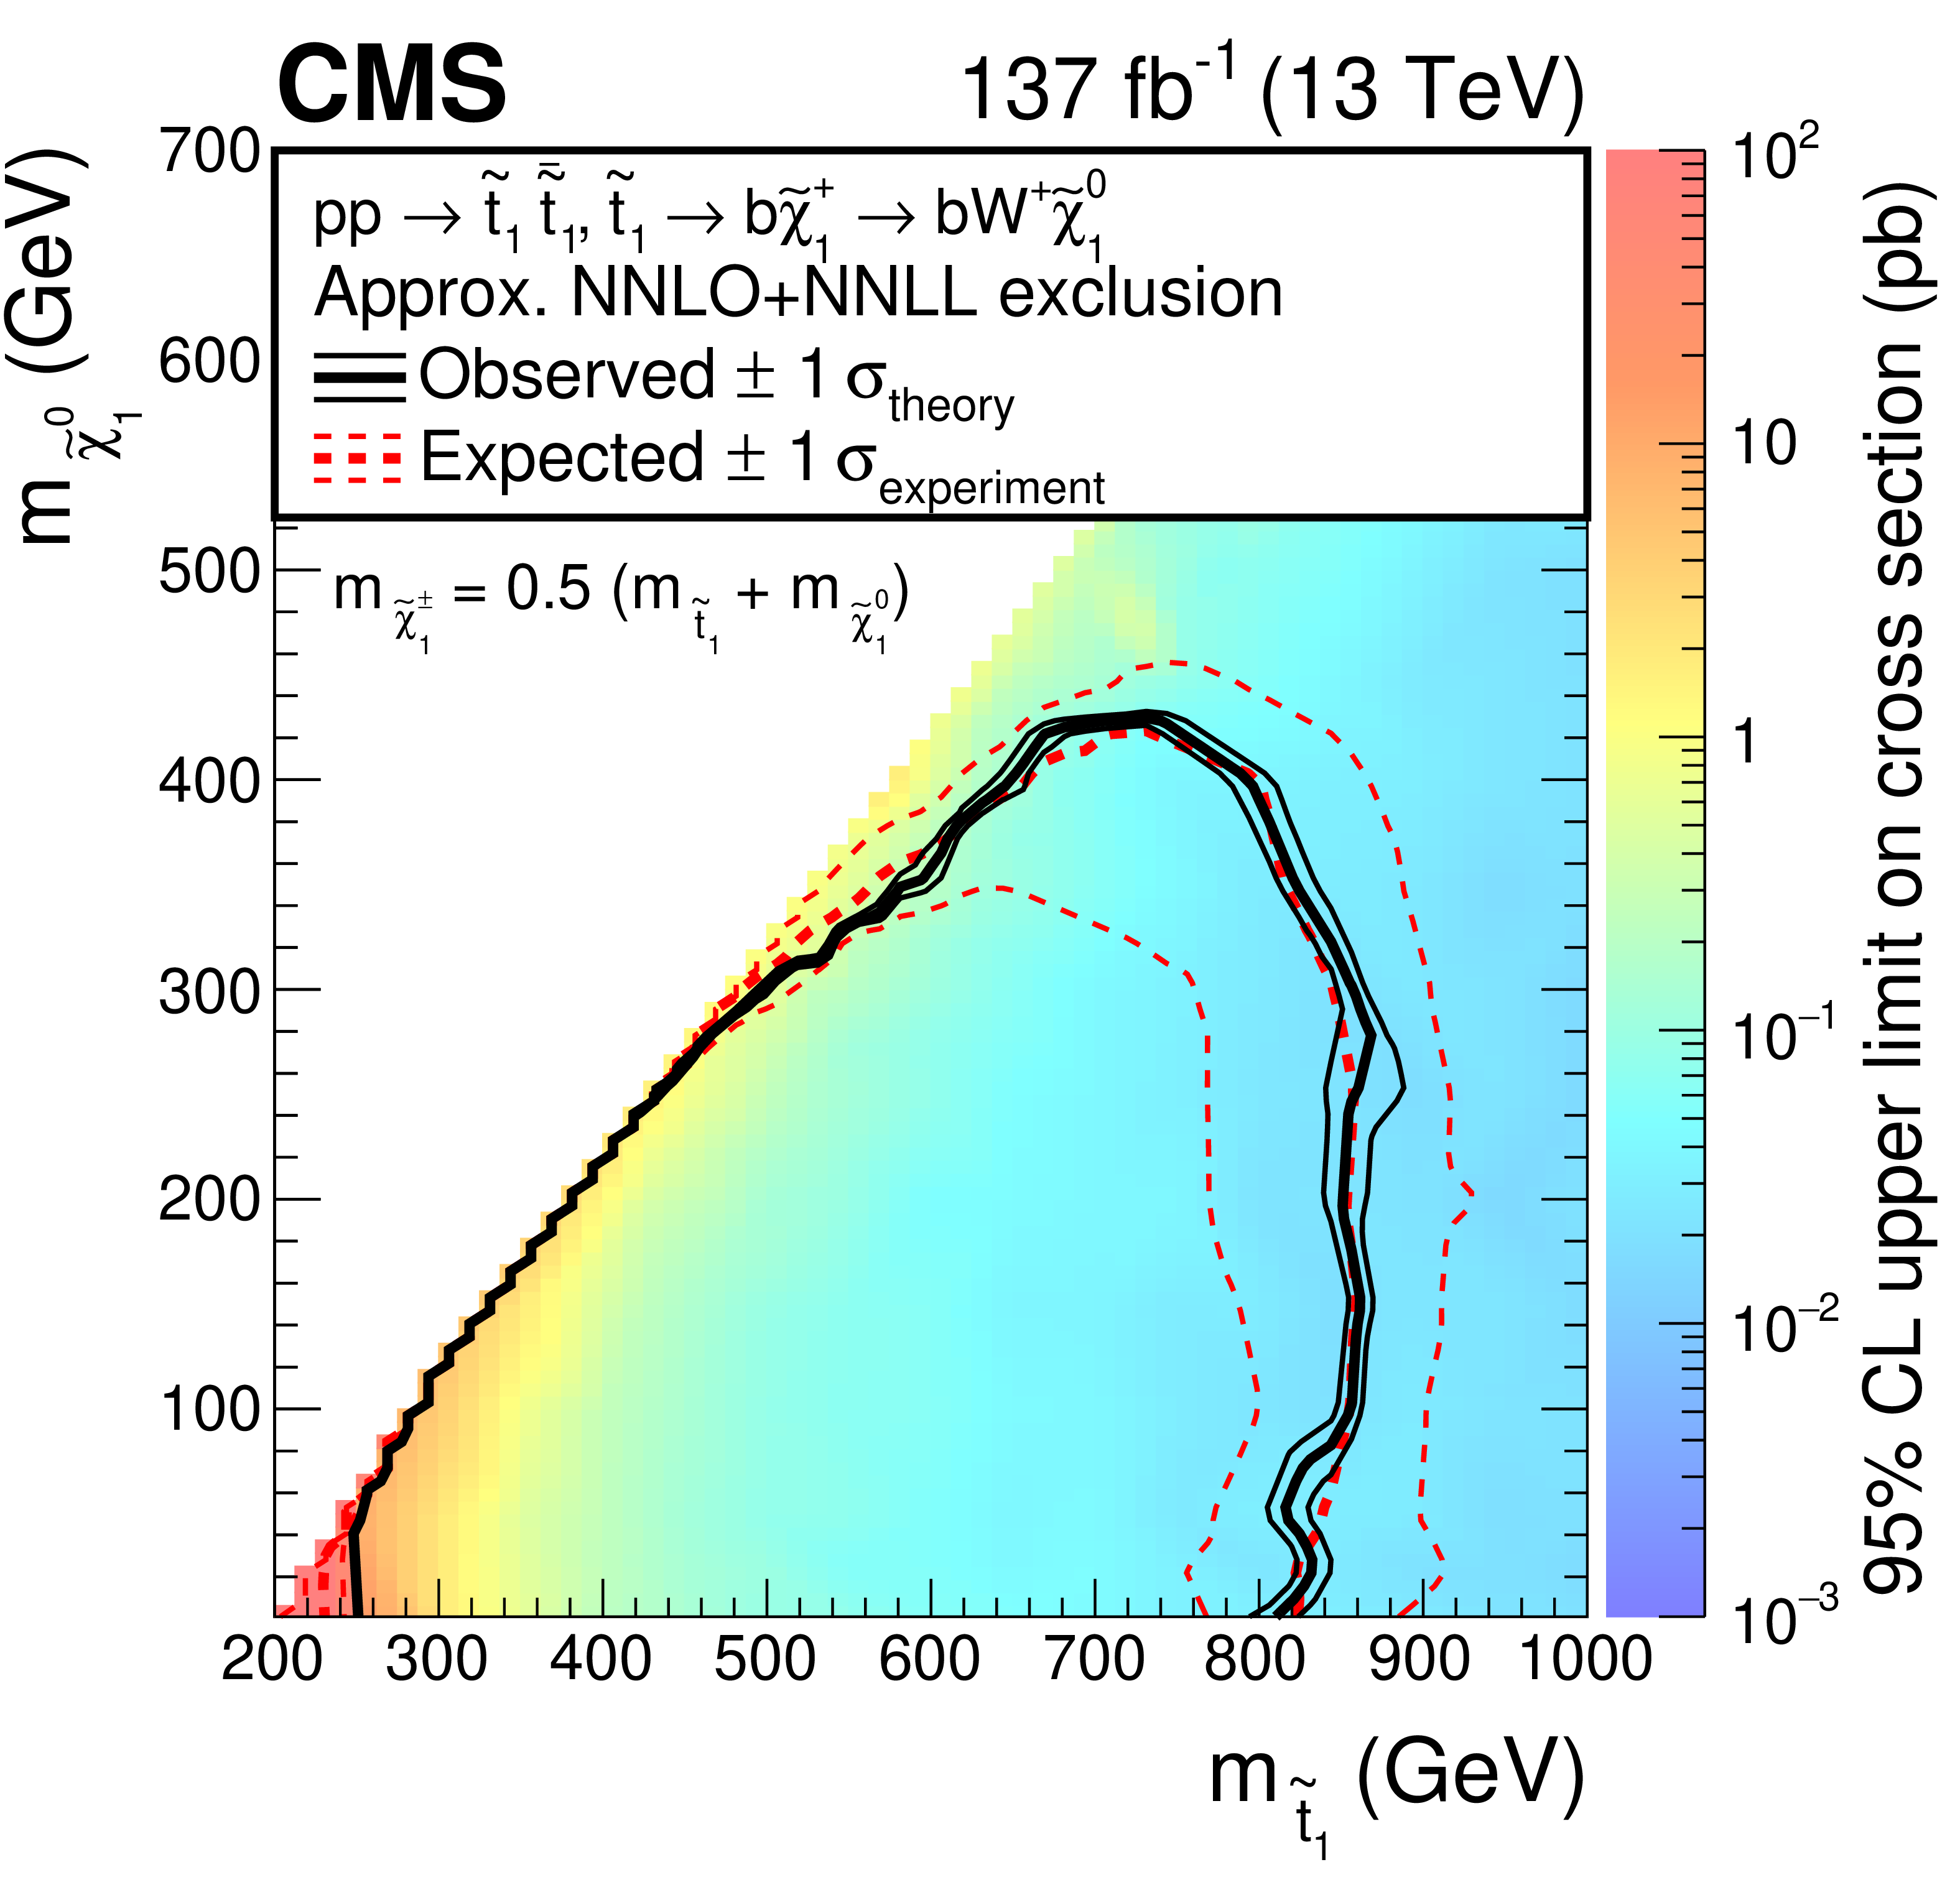
Expected and observed limits for the T2tt model with $\tilde{\mathrm{t}}_{1} \to \mathrm{t} \tilde{\chi}^0_1 $ decays (left) and for the T2bW model with $\tilde{\mathrm{t}}_{1} \to b \tilde{\chi}^{\pm}_{1} \to b \mathrm{W^{+}} \tilde{\chi}^0_1 $ decays (right) in the $m_{\tilde{\mathrm{t}}_{1}}$-$m_{\tilde{\chi}^0_1}$ mass plane. The color indicates the 95% CL upper limit on the cross section at each point in the plane. The area below the thick black curve represents the observed exclusion region at 95% CL assuming 100% branching fraction for the decays of the SUSY particles, while the dashed red lines indicate the expected limits at 95% CL and the region containing 68% of the distribution of limits expected under the background-only hypothesis. The thin black lines show the effect of the theoretical uncertainties in the signal cross section. The small white area on the diagonal in the left figure corresponds to configurations where the mass difference between $\tilde{\mathrm{t}}_{1}$ and $\tilde{\chi}^0_1$ is very close to the top quark mass. In this region the signal acceptance strongly depends on the $\tilde{\chi}^0_1$ mass and is therefore hard to model. |
png pdf root |
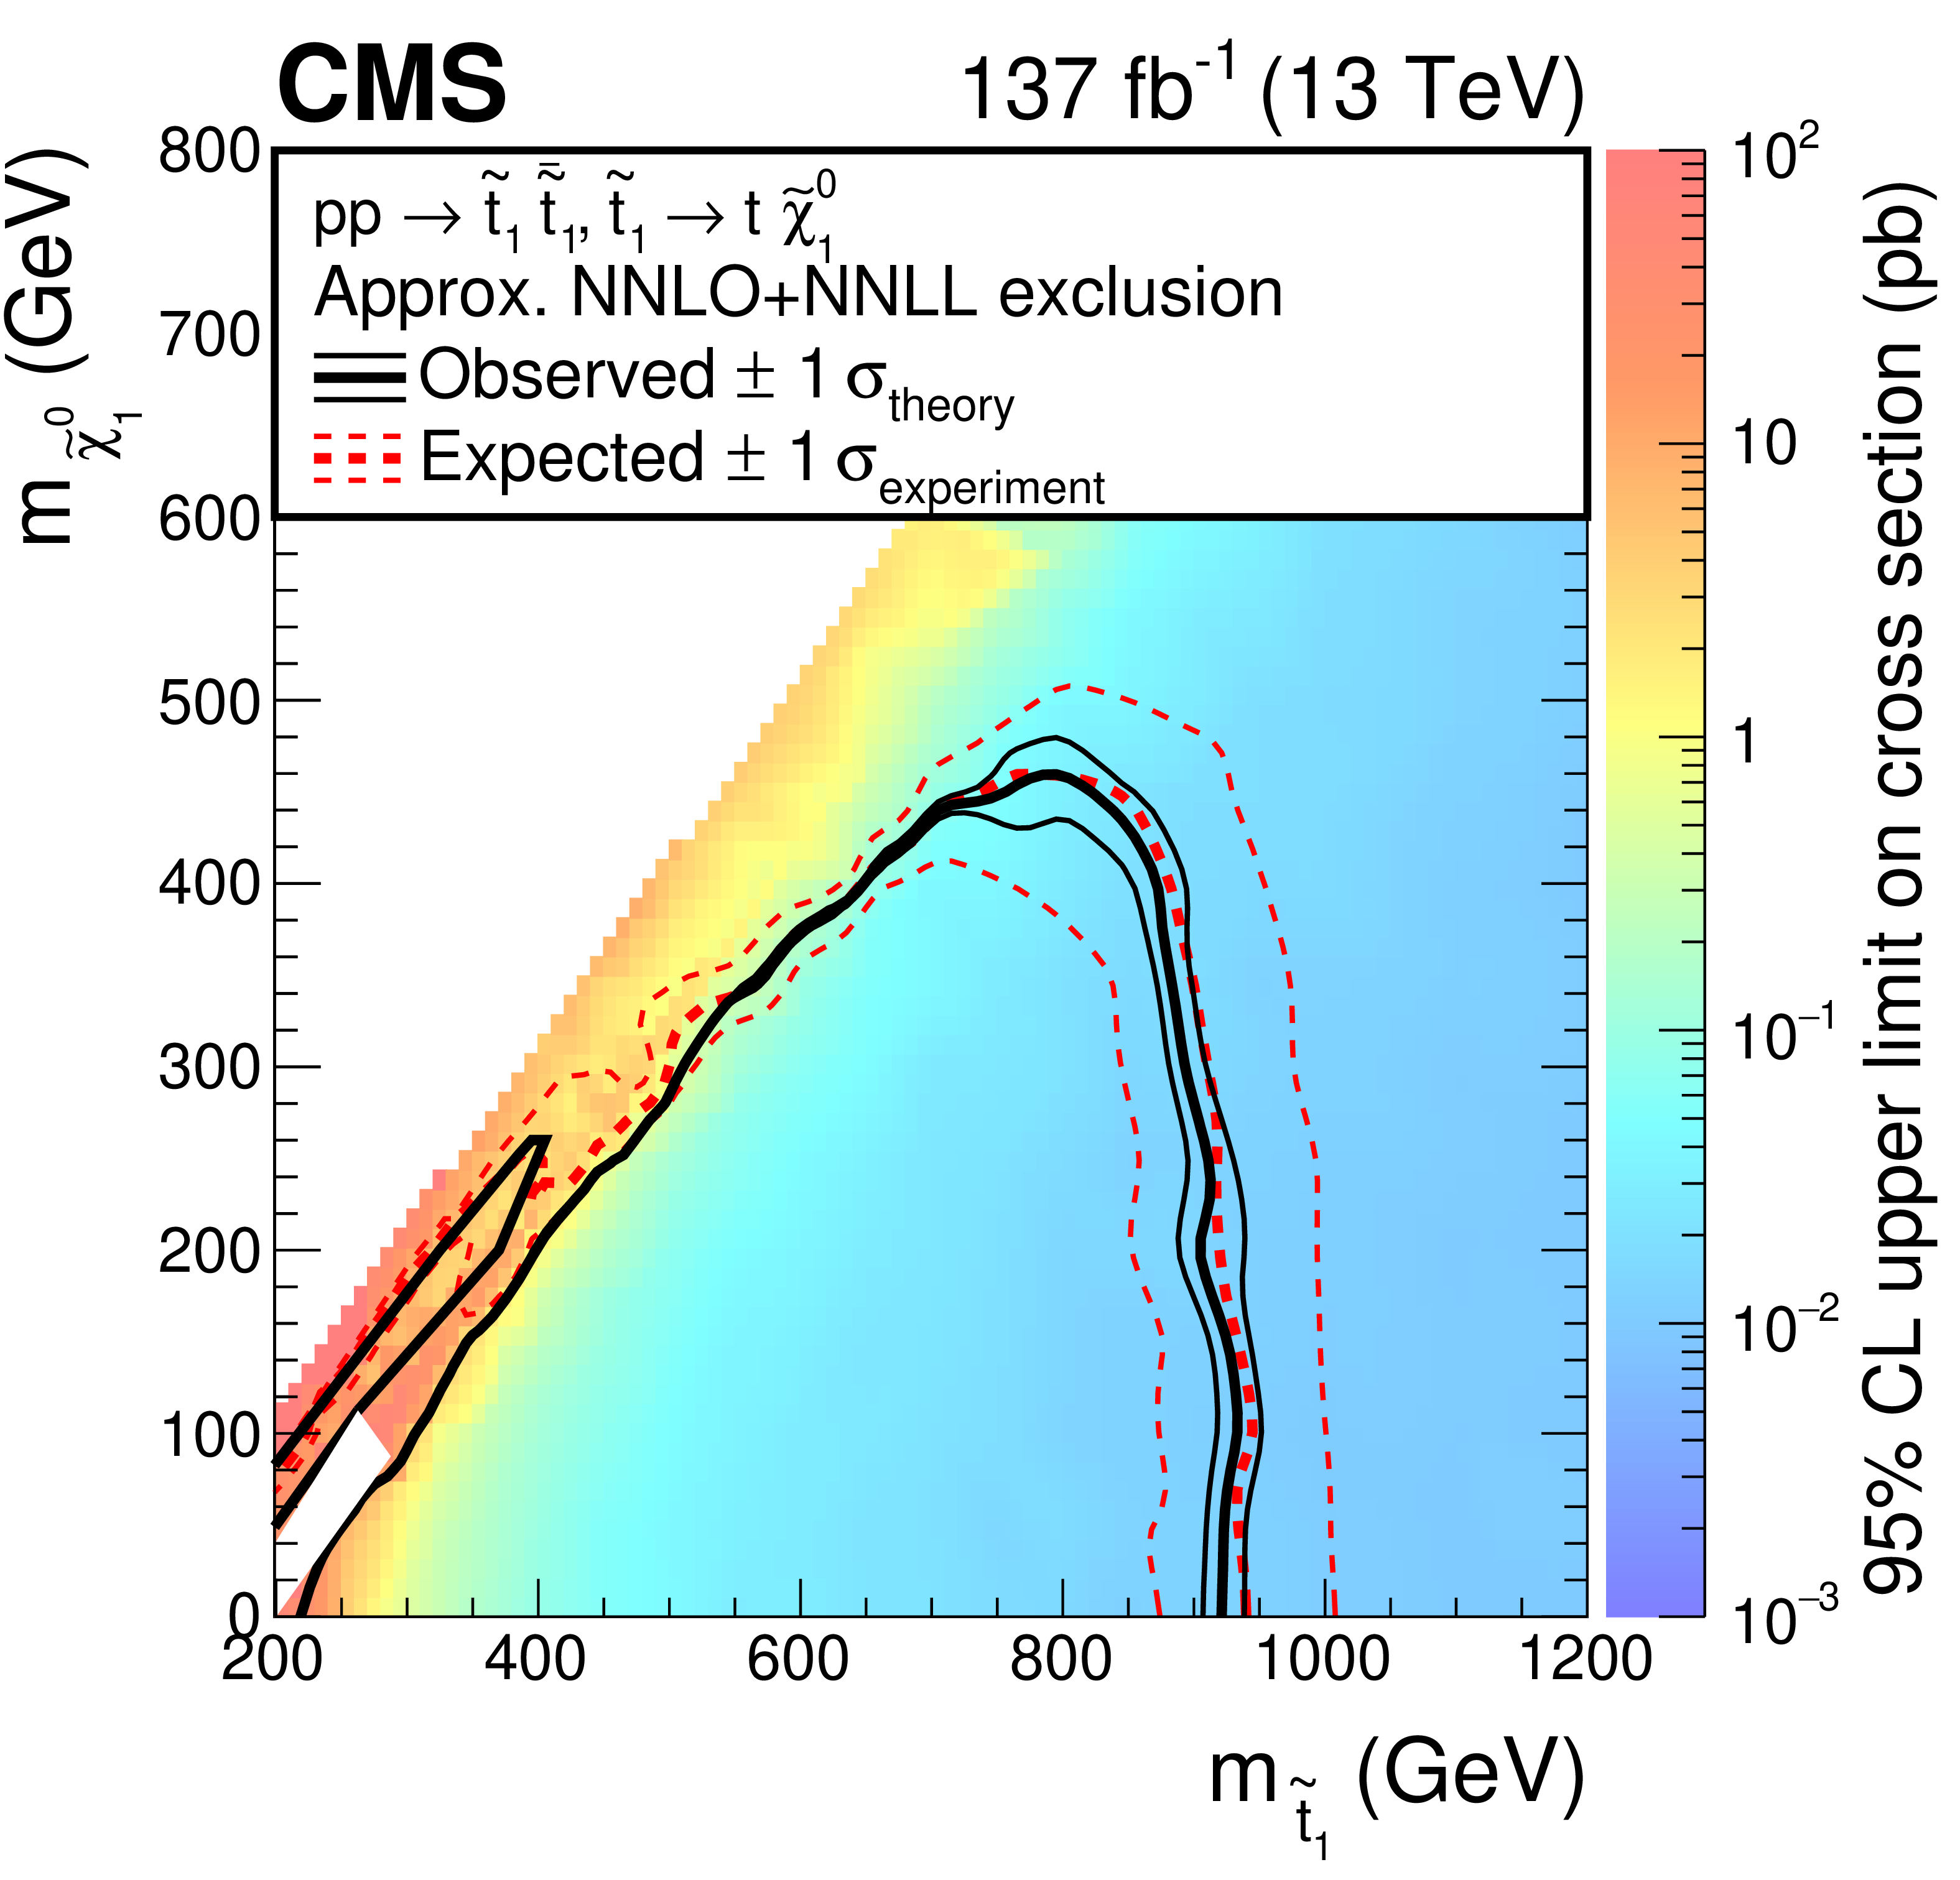
Figure 6-a:
Expected and observed limits for the T2tt model with $\tilde{\mathrm{t}}_{1} \to \mathrm{t} \tilde{\chi}^0_1 $ decays in the $m_{\tilde{\mathrm{t}}_{1}}$-$m_{\tilde{\chi}^0_1}$ mass plane. The color indicates the 95% CL upper limit on the cross section at each point in the plane. The area below the thick black curve represents the observed exclusion region at 95% CL assuming 100% branching fraction for the decays of the SUSY particles, while the dashed red lines indicate the expected limits at 95% CL and the region containing 68% of the distribution of limits expected under the background-only hypothesis. The thin black lines show the effect of the theoretical uncertainties in the signal cross section. The small white area on the diagonal corresponds to configurations where the mass difference between $\tilde{\mathrm{t}}_{1}$ and $\tilde{\chi}^0_1$ is very close to the top quark mass. In this region the signal acceptance strongly depends on the $\tilde{\chi}^0_1$ mass and is therefore hard to model. |
png pdf root |
Figure 6-b:
Expected and observed limits for the T2bW model with $\tilde{\mathrm{t}}_{1} \to b \tilde{\chi}^{\pm}_{1} \to b \mathrm{W^{+}} \tilde{\chi}^0_1 $ decays in the $m_{\tilde{\mathrm{t}}_{1}}$-$m_{\tilde{\chi}^0_1}$ mass plane. The color indicates the 95% CL upper limit on the cross section at each point in the plane. The area below the thick black curve represents the observed exclusion region at 95% CL assuming 100% branching fraction for the decays of the SUSY particles, while the dashed red lines indicate the expected limits at 95% CL and the region containing 68% of the distribution of limits expected under the background-only hypothesis. The thin black lines show the effect of the theoretical uncertainties in the signal cross section. |
png pdf |
Figure 7:
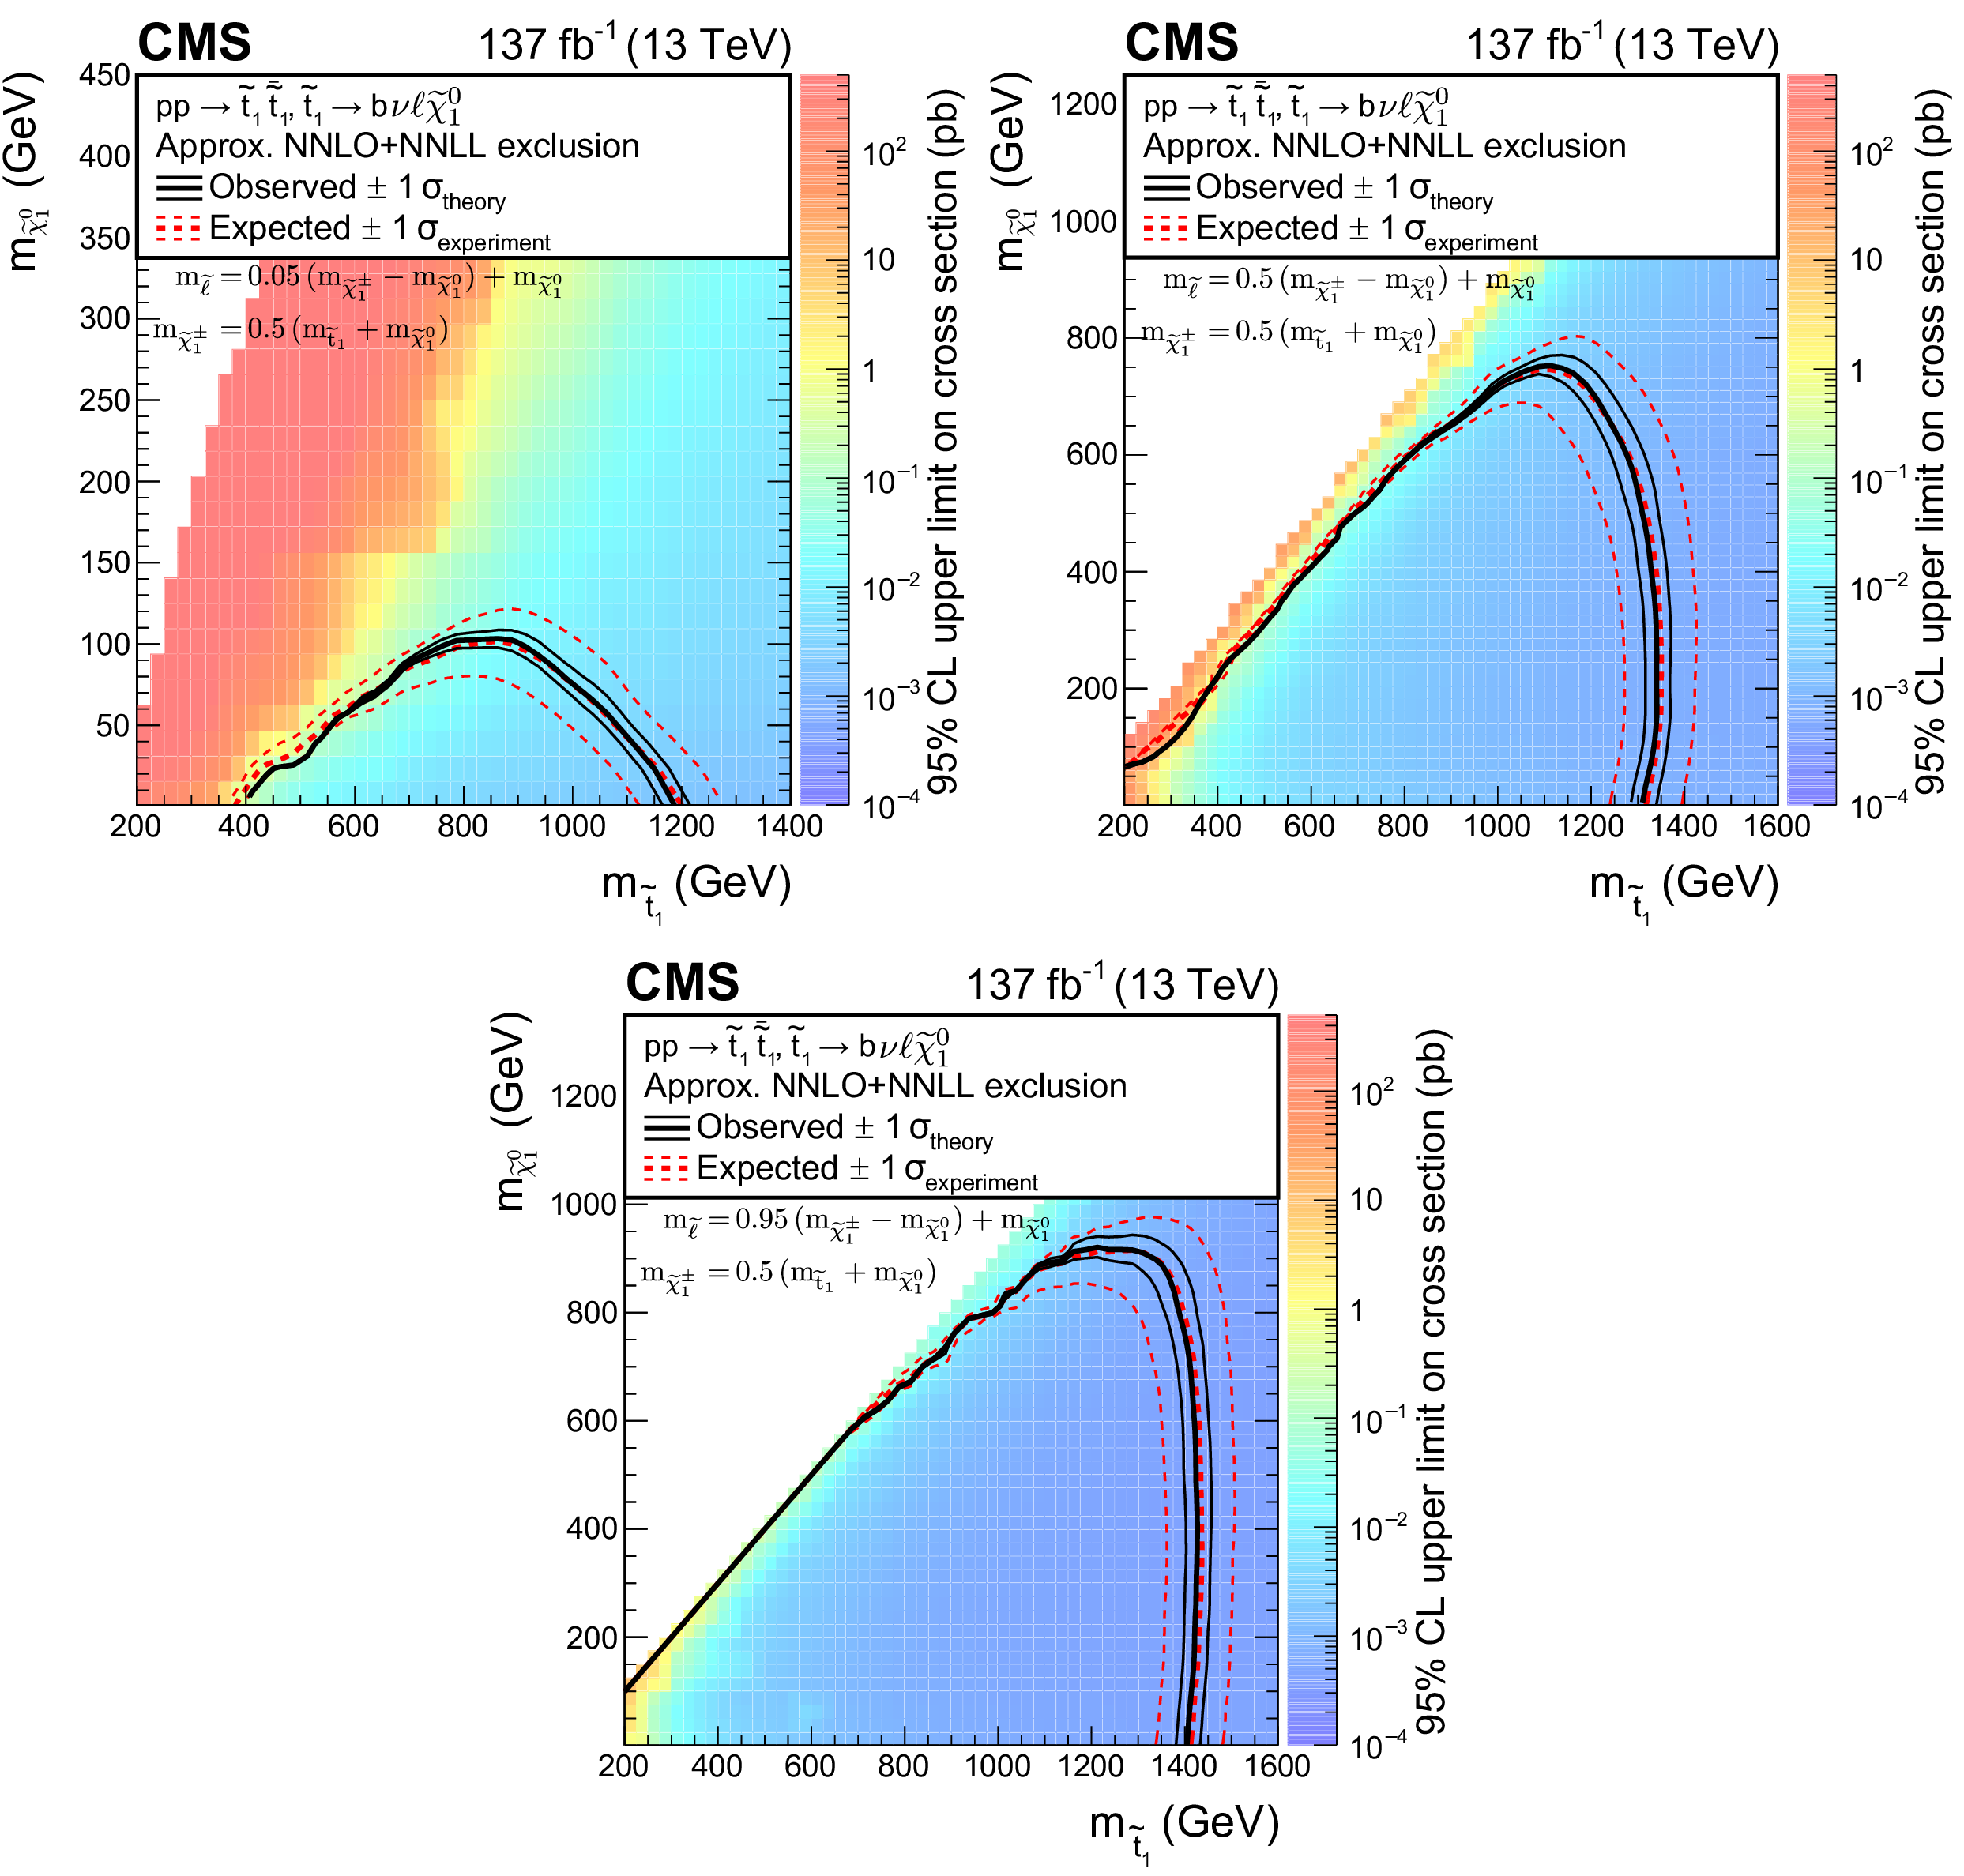
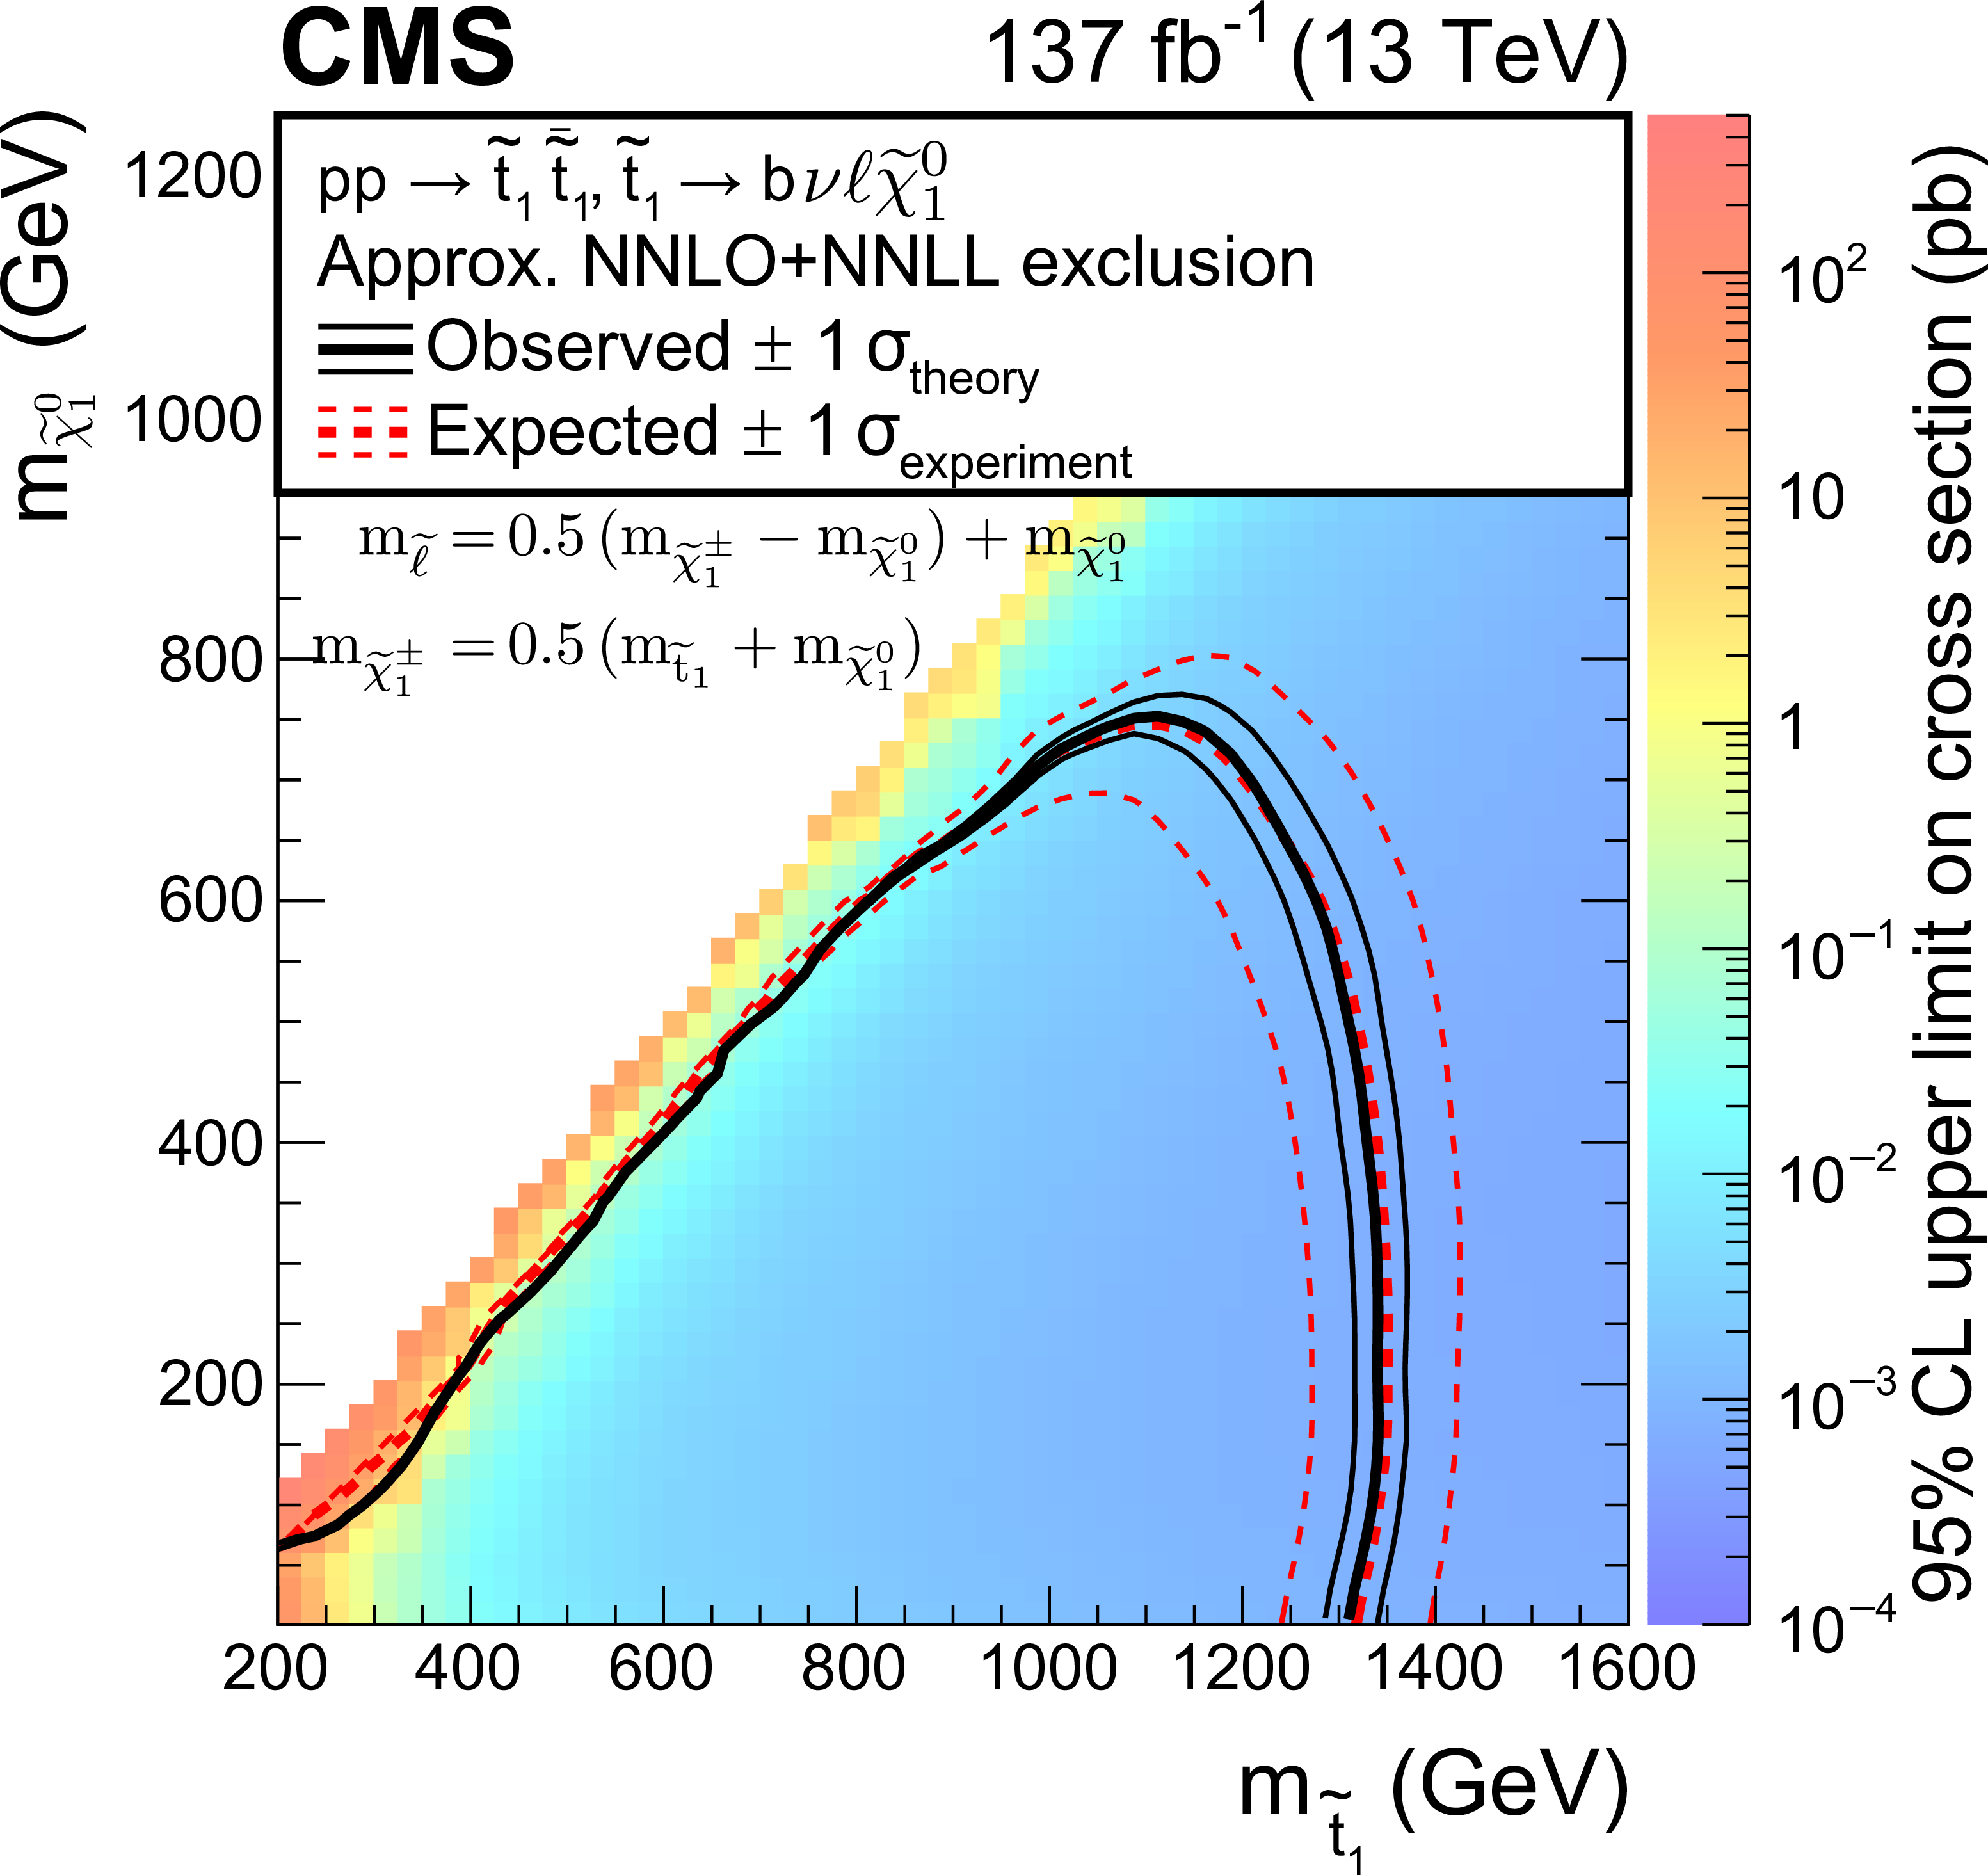
Expected and observed limits for the T8bb$\ell\ell\nu\nu$ model with $\tilde{\mathrm{t}}_{1} \to b \tilde{\chi}^{\pm}_{1} \to b \nu \tilde{\ell} \to b \nu \ell \tilde{\chi}^0_1 $ decays in the $m_{\tilde{\mathrm{t}}_{1}}$-$m_{\tilde{\chi}^0_1}$ mass plane for three different mass configurations defined by $m_{\tilde{\ell}} = x \, (m_{\tilde{\chi}^{\pm}_{1}} - m_{\tilde{\chi}^0_1}) + m_{\tilde{\chi}^0_1}$ with $x=$ 0.05 (upper left), $x=$ 0.50 (upper right), and $x=$ 0.95 (lower). The description of curves is the same as in the caption of Fig. 6. |

png pdf root |
Figure 7-a:
Expected and observed limits for the T8bb$\ell\ell\nu\nu$ model with $\tilde{\mathrm{t}}_{1} \to b \tilde{\chi}^{\pm}_{1} \to b \nu \tilde{\ell} \to b \nu \ell \tilde{\chi}^0_1 $ decays in the $m_{\tilde{\mathrm{t}}_{1}}$-$m_{\tilde{\chi}^0_1}$ mass plane for three different mass configurations defined by $m_{\tilde{\ell}} = x \, (m_{\tilde{\chi}^{\pm}_{1}} - m_{\tilde{\chi}^0_1}) + m_{\tilde{\chi}^0_1}$ with $x=$ 0.05. The description of curves is the same as in the caption of Fig. 6. |
png pdf root |
Figure 7-b:
Expected and observed limits for the T8bb$\ell\ell\nu\nu$ model with $\tilde{\mathrm{t}}_{1} \to b \tilde{\chi}^{\pm}_{1} \to b \nu \tilde{\ell} \to b \nu \ell \tilde{\chi}^0_1 $ decays in the $m_{\tilde{\mathrm{t}}_{1}}$-$m_{\tilde{\chi}^0_1}$ mass plane for three different mass configurations defined by $m_{\tilde{\ell}} = x \, (m_{\tilde{\chi}^{\pm}_{1}} - m_{\tilde{\chi}^0_1}) + m_{\tilde{\chi}^0_1}$ with $x=$ 0.50. The description of curves is the same as in the caption of Fig. 6. |

png pdf root |
Figure 7-c:
Expected and observed limits for the T8bb$\ell\ell\nu\nu$ model with $\tilde{\mathrm{t}}_{1} \to b \tilde{\chi}^{\pm}_{1} \to b \nu \tilde{\ell} \to b \nu \ell \tilde{\chi}^0_1 $ decays in the $m_{\tilde{\mathrm{t}}_{1}}$-$m_{\tilde{\chi}^0_1}$ mass plane for three different mass configurations defined by $m_{\tilde{\ell}} = x \, (m_{\tilde{\chi}^{\pm}_{1}} - m_{\tilde{\chi}^0_1}) + m_{\tilde{\chi}^0_1}$ with $x=$ 0.95. The description of curves is the same as in the caption of Fig. 6. |
| Tables | |
png pdf |
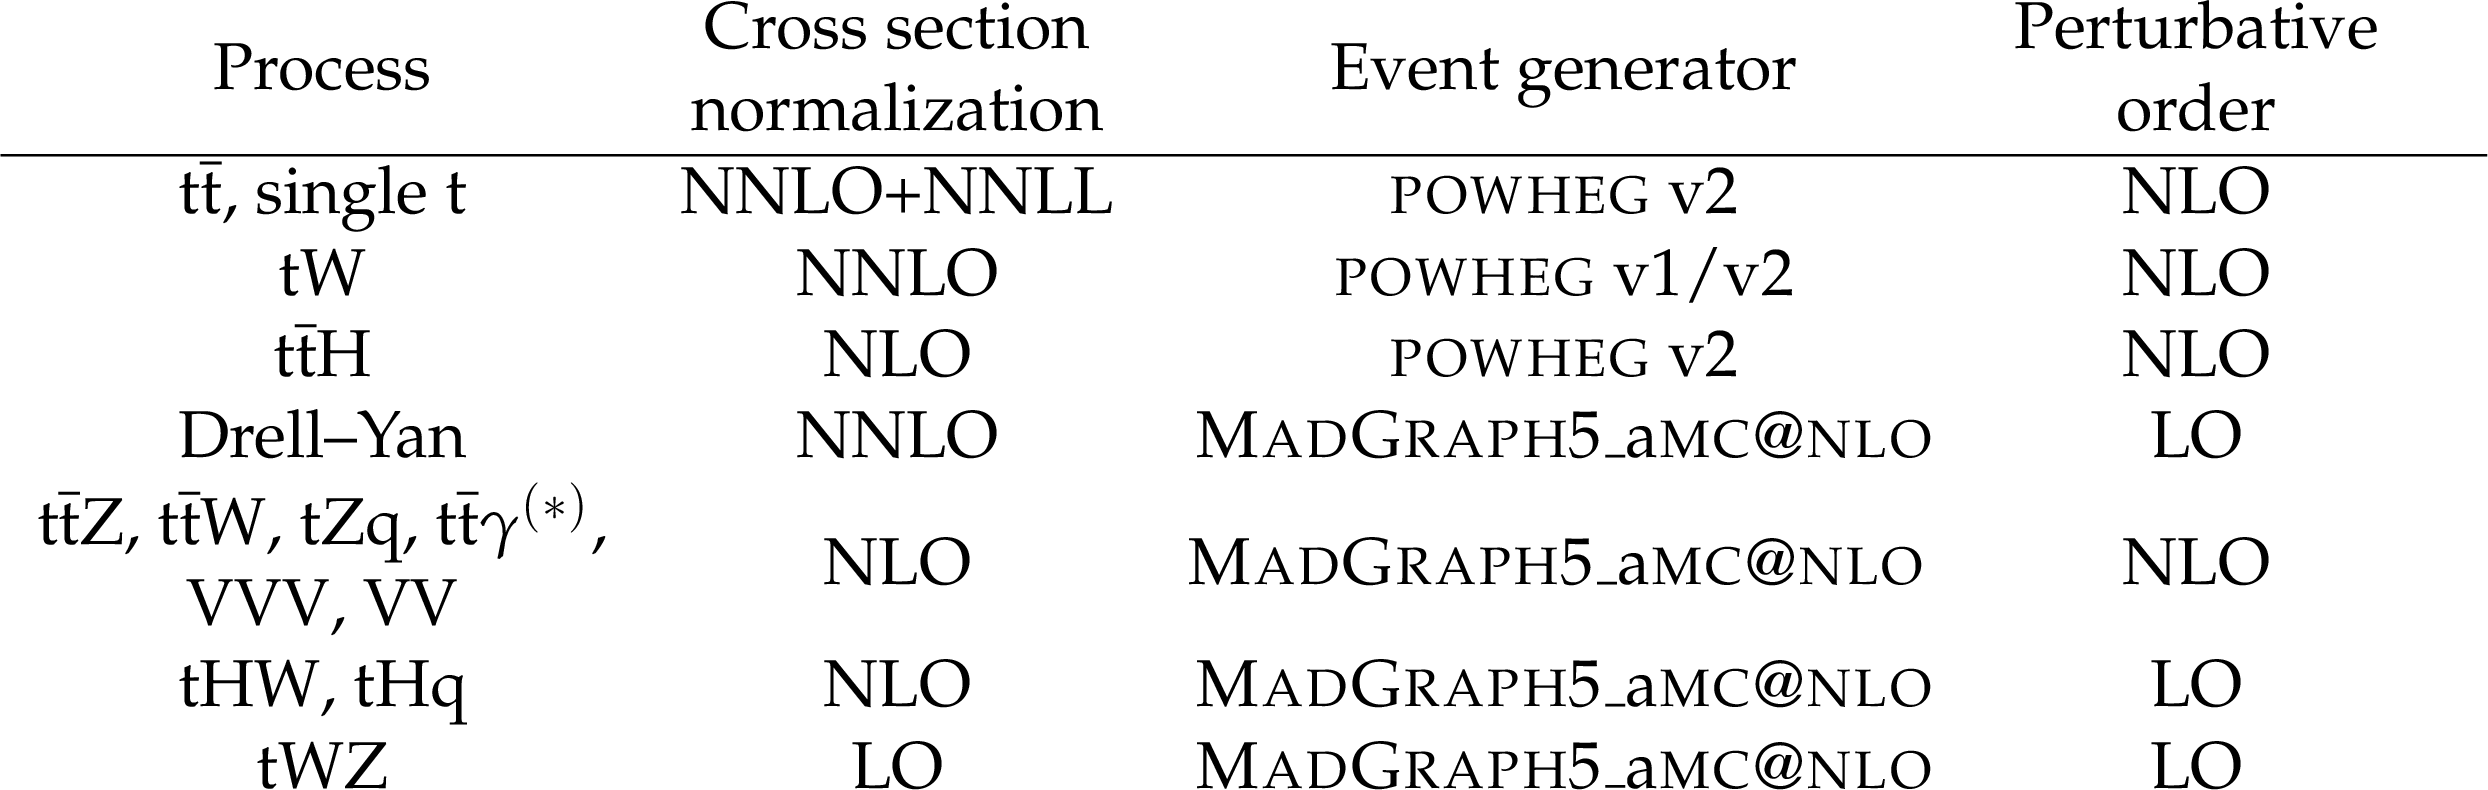
Table 1:
Event generator and orders of accuracy for each simulated background process. |

png pdf |
Table 2:
Overview of the event preselection requirements. |

png pdf |
Table 3:
Definition of the signal regions. The regions are further split into SF and DF regions. The preselection in Table 2 is applied to all regions. |
png pdf |
Table 4:
Definition of the control regions. The preselection in Table 2 is applied to all regions. |

png pdf |
Table 5:
Typical values (90% quantiles) and maximum values of the systematic uncertainties in all signal regions. |
| Summary |
|
A search for top squark pair production in final states with two opposite-charge leptons, b jets, and significant missing transverse momentum (${p_{\mathrm{T}}}^{\text{miss}})$ is presented. The data set of proton-proton collisions corresponds to an integrated luminosity of 137 fb$^{-1}$ and was collected with the CMS detector at a center-of-mass energy of 13 TeV. Transverse mass variables and the significance of ${p_{\mathrm{T}}}^{\text{miss}}$ are used to efficiently suppress backgrounds from standard model processes. No evidence for a deviation from the expected background is observed. The results are interpreted in several simplified models for supersymmetric top squark pair production and decay. In the T2tt model with $\tilde{\mathrm{t}}_{1} \to \mathrm{t}\tilde{\chi}^0_1$ decays, $\tilde{\mathrm{t}}_{1}$ masses up to 925 GeV and $\tilde{\chi}^0_1$ masses up to 450 GeV are excluded. In the TbW model with $\tilde{\mathrm{t}}_{1} \to \mathrm{b}\tilde{\chi}^{\pm}_{1} \to \mathrm{b}\mathrm{W^{+}}\tilde{\chi}^0_1$ decays, $\tilde{\mathrm{t}}_{1}$ masses up to 850 GeV and $\tilde{\chi}^0_1$ masses up to 420 GeV are excluded, assuming the chargino mass to be the mean of the $\tilde{\mathrm{t}}_{1}$ and $\tilde{\chi}^0_1$ masses. In the T8bb$\ell\ell\nu\nu$ model with decays $\tilde{\mathrm{t}}_{1} \to \mathrm{b}\tilde{\chi}^{\pm}_{1} \to \mathrm{b}\nu\tilde{\ell} \to \mathrm{b}\nu\ell\tilde{\chi}^0_1$, therefore 100% branching fraction to dilepton final states, the sensitivity depends on the intermediate particle masses. With the chargino mass again taken as the mean of the $\tilde{\mathrm{t}}_{1}$ and $\tilde{\chi}^0_1$ masses, the strongest exclusion is obtained if the slepton mass is close to the chargino mass. In this case, excluded masses reach up to 1.4 TeV for $\tilde{\mathrm{t}}_{1}$ and 900 GeV for $\tilde{\chi}^0_1$. When the slepton mass is taken as the mean of the chargino and neutralino masses, these numbers decrease to 1.3 TeV for $\tilde{\mathrm{t}}_{1}$ and 750 GeV for $\tilde{\chi}^0_1$. A further reduction to 1.2 TeV for $\tilde{\mathrm{t}}_{1}$ and to 100 GeV for $\tilde{\chi}^0_1$ is observed when the slepton mass is close to the neutralino mass. |
| Additional Tables | |
png pdf |
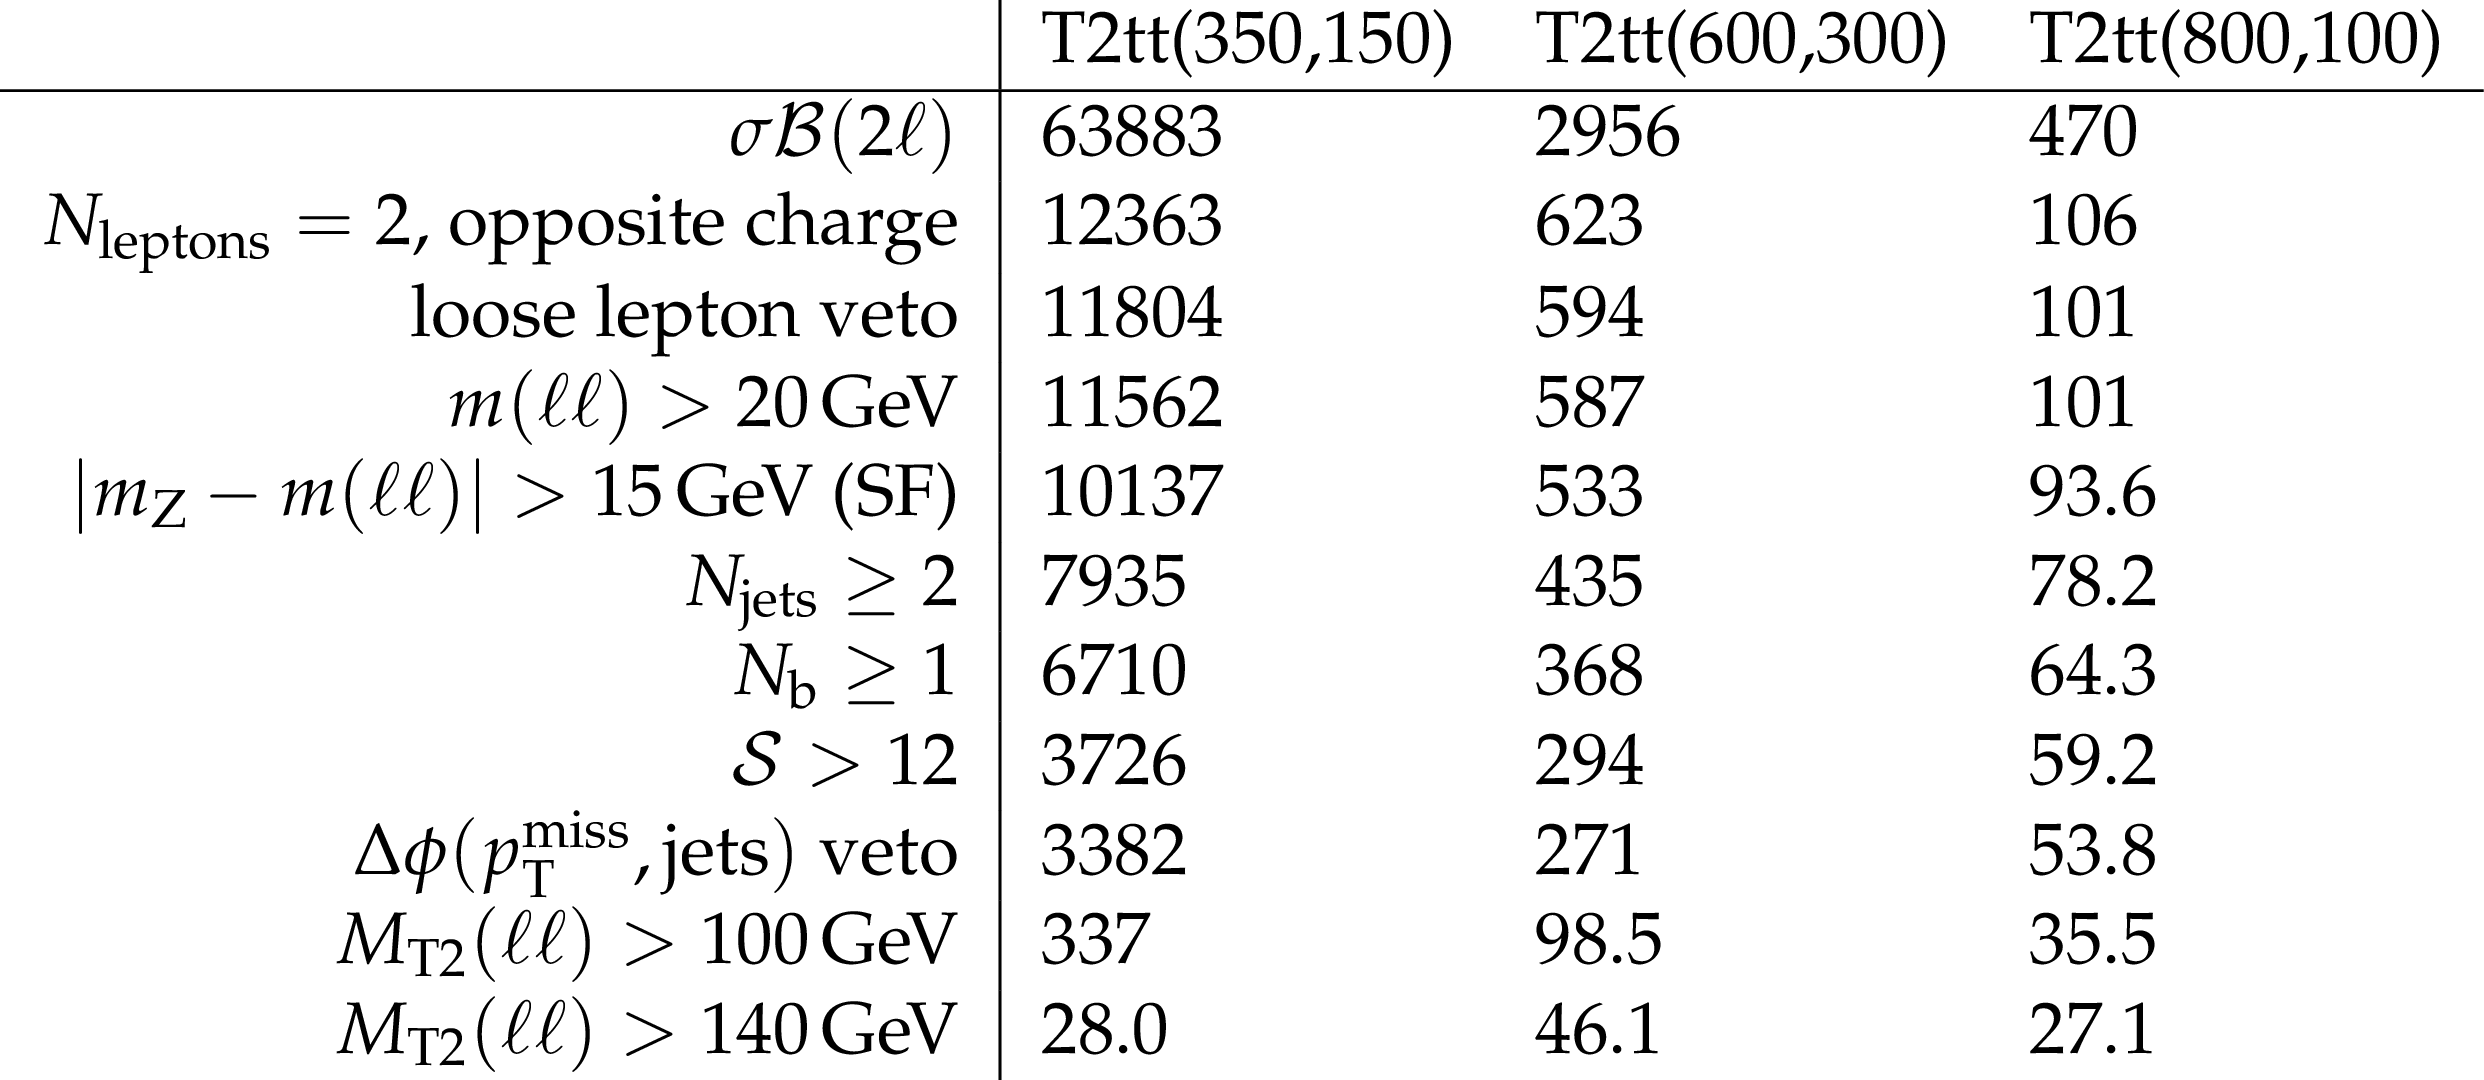
Additional Table 1:
Cutflow table for three different configurations of T2tt SUSY signal models. Numbers are normalized to an integrated luminosity of 137fb$^{-1}$ and shown for top squark and neutralino masses of 350 and 150 GeV, 600 and 300 GeV, and 800 and 100 GeV, respectively. |
| References | ||||
| 1 | E. Witten | Dynamical breaking of supersymmetry | NPB 188 (1981) 513 | |
| 2 | R. Barbieri and G. F. Giudice | Upper bounds on supersymmetric particle masses | NPB 306 (1988) 63 | |
| 3 | ATLAS Collaboration | Observation of a new particle in the search for the standard model Higgs boson with the ATLAS detector at the LHC | PLB 716 (2012) 1 | 1207.7214 |
| 4 | CMS Collaboration | Observation of a new boson at a mass of 125 GeV with the CMS experiment at the LHC | PLB 716 (2012) 30 | CMS-HIG-12-028 1207.7235 |
| 5 | G. Bertone, D. Hooper, and J. Silk | Particle dark matter: Evidence, candidates and constraints | PR 405 (2005) 279 | hep-ph/0404175 |
| 6 | J. L. Feng | Dark matter candidates from particle physics and methods of detection | Ann. Rev. Astron. Astrophys. 48 (2010) 495 | 1003.0904 |
| 7 | P. Ramond | Dual theory for free fermions | PRD 3 (1971) 2415 | |
| 8 | Y. A. Gol'fand and E. P. Likhtman | Extension of the algebra of Poincar$ \'e $ group generators and violation of P invariance | JEPTL 13 (1971)323 | |
| 9 | A. Neveu and J. H. Schwarz | Factorizable dual model of pions | NPB 31 (1971) 86 | |
| 10 | D. V. Volkov and V. P. Akulov | Possible universal neutrino interaction | JEPTL 16 (1972)438 | |
| 11 | J. Wess and B. Zumino | A Lagrangian model invariant under supergauge transformations | PLB 49 (1974) 52 | |
| 12 | J. Wess and B. Zumino | Supergauge transformations in four dimensions | NPB 70 (1974) 39 | |
| 13 | P. Fayet | Supergauge invariant extension of the Higgs mechanism and a model for the electron and its neutrino | NPB 90 (1975) 104 | |
| 14 | H. P. Nilles | Supersymmetry, supergravity and particle physics | Phys. Rep. 110 (1984) 1 | |
| 15 | S. Dimopoulos and H. Georgi | Softly broken supersymmetry and SU(5) | NPB 193 (1981) 150 | |
| 16 | R. K. Kaul and P. Majumdar | Cancellation of quadratically divergent mass corrections in globally supersymmetric spontaneously broken gauge theories | NPB 199 (1982) 36 | |
| 17 | G. R. Farrar and P. Fayet | Phenomenology of the production, decay, and detection of new hadronic states associated with supersymmetry | PLB 76 (1978) 575 | |
| 18 | M. Papucci, J. T. Ruderman, and A. Weiler | Natural SUSY endures | JHEP 09 (2012) 035 | 1110.6926 |
| 19 | J. Smith, W. L. van Neerven, and J. A. M. Vermaseren | The transverse mass and width of the $ W $ boson | PRL 50 (1983) 1738 | |
| 20 | C. G. Lester and D. J. Summers | Measuring masses of semi-invisibly decaying particles pair produced at hadron colliders | PLB 463 (1999) 99 | hep-ph/9906349 |
| 21 | J. Alwall, P. Schuster, and N. Toro | Simplified models for a first characterization of new physics at the LHC | PRD 79 (2009) 075020 | 0810.3921 |
| 22 | J. Alwall, M.-P. Le, M. Lisanti, and J. G. Wacker | Model-independent jets plus missing energy searches | PRD 79 (2009) 015005 | 0809.3264 |
| 23 | LHC New Physics Working Group | Simplified models for LHC new physics searches | JPG 39 (2012) 105005 | 1105.2838 |
| 24 | CMS Collaboration | Interpretation of searches for supersymmetry with simplified models | PRD 88 (2013) 052017 | CMS-SUS-11-016 1301.2175 |
| 25 | ATLAS Collaboration | ATLAS Run 1 searches for direct pair production of third-generation squarks at the Large Hadron Collider | EPJC 75 (2015) 510 | 1506.08616 |
| 26 | ATLAS Collaboration | Search for top squark pair production in final states with one isolated lepton, jets, and missing transverse momentum in $ \sqrt s = $ 8 TeV pp collisions with the ATLAS detector | JHEP 11 (2014) 118 | 1407.0583 |
| 27 | ATLAS Collaboration | Search for direct top-squark pair production in final states with two leptons in pp collisions at $ \sqrt{s} = $ 8 TeV with the ATLAS detector | JHEP 06 (2014) 124 | 1403.4853 |
| 28 | ATLAS Collaboration | Search for top squarks in final states with one isolated lepton, jets, and missing transverse momentum in $ \sqrt{s}= $ 13 TeV pp collisions with the ATLAS detector | PRD 94 (2016) 052009 | 1606.03903 |
| 29 | ATLAS Collaboration | Search for direct top squark pair production in final states with two leptons in $ \sqrt{s} = 13 TeV pp $ collisions with the ATLAS detector | EPJC 77 (2017) 898 | 1708.03247 |
| 30 | ATLAS Collaboration | Search for a scalar partner of the top quark in the jets plus missing transverse momentum final state at $ \sqrt{s} = $ 13 TeV with the ATLAS detector | JHEP 12 (2017) 085 | 1709.04183 |
| 31 | ATLAS Collaboration | Search for top-squark pair production in final states with one lepton, jets, and missing transverse momentum using 36 fb$ ^{-1} $ of $ \sqrt{s}= $ 13 TeV pp collision data with the ATLAS detector | JHEP 06 (2018) 108 | 1711.11520 |
| 32 | CMS Collaboration | Search for top-squark pair production in the single-lepton final state in pp collisions at $ \sqrt{s} = $ 8 TeV | EPJC 73 (2013) 2677 | CMS-SUS-13-011 1308.1586 |
| 33 | CMS Collaboration | Search for direct pair production of scalar top quarks in the single- and dilepton channels in proton-proton collisions at $ \sqrt{s} = $ 8 TeV | JHEP 07 (2016) 027 | CMS-SUS-14-015 1602.03169 |
| 34 | CMS Collaboration | Searches for pair production of third-generation squarks in $ \sqrt{s}= $ 13 TeV pp collisions | EPJC 77 (2017) 327 | CMS-SUS-16-008 1612.03877 |
| 35 | CMS Collaboration | Search for top squark pair production in pp collisions at $ \sqrt{s} = $ 13 TeV using single lepton events | JHEP 10 (2017) 019 | CMS-SUS-16-051 1706.04402 |
| 36 | CMS Collaboration | Search for direct production of supersymmetric partners of the top quark in the all-jets final state in proton-proton collisions at $ \sqrt{s}= $ 13 TeV | JHEP 10 (2017) 005 | CMS-SUS-16-049 1707.03316 |
| 37 | CMS Collaboration | Search for top squarks and dark matter particles in opposite-charge dilepton final states at $ \sqrt{s}= $ 13 TeV | PRD 97 (2018) 032009 | CMS-SUS-17-001 1711.00752 |
| 38 | CMS Collaboration | Search for the pair production of light top squarks in the e$ ^{\pm}\mu^{\mp} $ final state in proton-proton collisions at $ \sqrt{s} = $ 13 TeV | JHEP 03 (2019) 101 | CMS-SUS-18-003 1901.01288 |
| 39 | CMS Collaboration | Search for direct top squark pair production in events with one lepton, jets, and missing transverse momentum at 13 TeV with the CMS experiment | JHEP 05 (2020) 032 | CMS-SUS-19-009 1912.08887 |
| 40 | CMS Collaboration | The CMS trigger system | JINST 12 (2017) P01020 | CMS-TRG-12-001 1609.02366 |
| 41 | CMS Collaboration | The CMS experiment at the CERN LHC | JINST 3 (2008) S08004 | CMS-00-001 |
| 42 | P. Nason | A new method for combining NLO QCD with shower Monte Carlo algorithms | JHEP 11 (2004) 040 | hep-ph/0409146 |
| 43 | S. Frixione, P. Nason, and C. Oleari | Matching NLO QCD computations with Parton Shower simulations: the POWHEG method | JHEP 11 (2007) 070 | 0709.2092 |
| 44 | S. Alioli, P. Nason, C. Oleari, and E. Re | A general framework for implementing NLO calculations in shower Monte Carlo programs: the POWHEG BOX | JHEP 06 (2010) 043 | 1002.2581 |
| 45 | J. M. Campbell, R. K. Ellis, P. Nason, and E. Re | Top-pair production and decay at NLO matched with parton showers | JHEP 04 (2015) 114 | 1412.1828 |
| 46 | S. Alioli, P. Nason, C. Oleari, and E. Re | NLO single-top production matched with shower in POWHEG: $ s $- and $ t $-channel contributions | JHEP 09 (2009) 111 | 0907.4076 |
| 47 | S. Frixione, P. Nason, and G. Ridolfi | A positive-weight next-to-leading-order Monte Carlo for heavy flavour hadroproduction | JHEP 09 (2007) 126 | 0707.3088 |
| 48 | M. Aliev et al. | HATHOR: HAdronic Top and Heavy quarks crOss section calculatoR | CPC 182 (2011) 1034 | 1007.1327 |
| 49 | P. Kant et al. | HatHor for single top-quark production: Updated predictions and uncertainty estimates for single top-quark production in hadronic collisions | CPC 191 (2015) 74 | 1406.4403 |
| 50 | M. Czakon and A. Mitov | Top++: a program for the calculation of the top-pair cross-section at hadron colliders | CPC 185 (2014) 2930 | 1112.5675 |
| 51 | E. Re | Single-top Wt-channel production matched with parton showers using the POWHEG method | EPJC 71 (2011) 1547 | 1009.2450 |
| 52 | N. Kidonakis | Two-loop soft anomalous dimensions for single top quark associated production with a W- or H- | PRD 82 (2010) 054018 | 1005.4451 |
| 53 | N. Kidonakis | NNLL threshold resummation for top-pair and single-top production | Phys. Part. Nucl. 45 (2014) 714 | 1210.7813 |
| 54 | H. B. Hartanto, B. Jager, L. Reina, and D. Wackeroth | Higgs boson production in association with top quarks in the POWHEG BOX | PRD 91 (2015) 094003 | 1501.04498 |
| 55 | J. Alwall et al. | The automated computation of tree-level and next-to-leading order differential cross sections, and their matching to parton shower simulations | JHEP 07 (2014) 079 | 1405.0301 |
| 56 | R. Gavin, Y. Li, F. Petriello, and S. Quackenbush | FEWZ 2.0: A code for hadronic Z production at next-to-next-to-leading order | CPC 182 (2011) 2388 | 1011.3540 |
| 57 | M. V. Garzelli, A. Kardos, C. G. Papadopoulos, and Z. Trocsanyi | $ {\rm t\bar{t}W^{\pm}} $ and $ {\rm t\bar{t}Z} $ hadroproduction at NLO accuracy in QCD with parton shower and hadronization effects | JHEP 11 (2012) 056 | 1208.2665 |
| 58 | S. Frixione et al. | Electroweak and QCD corrections to top-pair hadroproduction in association with heavy bosons | JHEP 06 (2015) 184 | 1504.03446 |
| 59 | LHC Higgs Cross Section Working Group | Handbook of LHC Higgs cross sections: 4. deciphering the nature of the Higgs sector | CERN (2016) | 1610.07922 |
| 60 | T. Sjostrand et al. | An introduction to PYTHIA 8.2 | CPC 191 (2015) 159 | 1410.3012 |
| 61 | P. Skands, S. Carrazza, and J. Rojo | Tuning PYTHIA 8.1: the Monash 2013 tune | EPJC 74 (2014) 3024 | 1404.5630 |
| 62 | CMS Collaboration | Event generator tunes obtained from underlying event and multiparton scattering measurements | EPJC 76 (2016) 155 | CMS-GEN-14-001 1512.00815 |
| 63 | CMS Collaboration | Extraction and validation of a new set of CMS PYTHIA8 tunes from underlying-event measurements | EPJC 80 (2020) 4 | CMS-GEN-17-001 1903.12179 |
| 64 | NNPDF Collaboration | Parton distributions for the LHC Run II | JHEP 04 (2015) 040 | 1410.8849 |
| 65 | NNPDF Collaboration | Parton distributions from high-precision collider data | EPJC 77 (2017) 663 | 1706.00428 |
| 66 | J. Alwall et al. | Comparative study of various algorithms for the merging of parton showers and matrix elements in hadronic collisions | EPJC 53 (2008) 473 | 0706.2569 |
| 67 | R. Frederix and S. Frixione | Merging meets matching in MC@NLO | JHEP 12 (2012) 061 | 1209.6215 |
| 68 | GEANT4 Collaboration | GEANT4--a simulation toolkit | NIMA 506 (2003) 250 | |
| 69 | W. Beenakker, R. Hopker, M. Spira, and P. M. Zerwas | Squark and gluino production at hadron colliders | NPB 492 (1997) 51 | hep-ph/9610490 |
| 70 | A. Kulesza and L. Motyka | Threshold resummation for squark-antisquark and gluino-pair production at the LHC | PRL 102 (2009) 111802 | 0807.2405 |
| 71 | A. Kulesza and L. Motyka | Soft gluon resummation for the production of gluino-gluino and squark-antisquark pairs at the LHC | PRD 80 (2009) 095004 | 0905.4749 |
| 72 | W. Beenakker et al. | Soft-gluon resummation for squark and gluino hadroproduction | JHEP 12 (2009) 041 | 0909.4418 |
| 73 | W. Beenakker et al. | Squark and gluino hadroproduction | Int. J. Mod. Phys. A 26 (2011) 2637 | 1105.1110 |
| 74 | C. Borschensky et al. | Squark and gluino production cross sections in pp collisions at $ \sqrt{s} = $ 13, 14, 33 and 100 TeV | EPJC 74 (2014) 3174 | 1407.5066 |
| 75 | W. Beenakker et al. | NNLL resummation for squark-antisquark pair production at the LHC | JHEP 01 (2012) 076 | 1110.2446 |
| 76 | W. Beenakker et al. | Towards NNLL resummation: hard matching coefficients for squark and gluino hadroproduction | JHEP 10 (2013) 120 | 1304.6354 |
| 77 | W. Beenakker et al. | NNLL resummation for squark and gluino production at the LHC | JHEP 12 (2014) 023 | 1404.3134 |
| 78 | W. Beenakker et al. | NNLL-fast: predictions for coloured supersymmetric particle production at the LHC with threshold and Coulomb resummation | JHEP 12 (2016) 133 | 1607.07741 |
| 79 | W. Beenakker et al. | Stop production at hadron colliders | NPB 515 (1998) 3 | hep-ph/9710451 |
| 80 | W. Beenakker et al. | Supersymmetric top and bottom squark production at hadron colliders | JHEP 08 (2010) 098 | 1006.4771 |
| 81 | W. Beenakker et al. | NNLL resummation for stop pair-production at the LHC | JHEP 05 (2016) 153 | 1601.02954 |
| 82 | CMS Collaboration | The Fast Simulation of the CMS detector at LHC | J. Phys. Conf. Ser. 331 (2011) 032049 | |
| 83 | A. Giammanco | The Fast Simulation of the CMS experiment | J. Phys. Conf. Ser. 513 (2014) 022012 | |
| 84 | CMS Collaboration | Particle-flow reconstruction and global event description with the CMS detector | JINST 12 (2017) P10003 | CMS-PRF-14-001 1706.04965 |
| 85 | CMS Collaboration | Performance of electron reconstruction and selection with the CMS detector in proton-proton collisions at $ \sqrt{s}= $ 8 TeV | JINST 10 (2015) P06005 | CMS-EGM-13-001 1502.02701 |
| 86 | CMS Collaboration | Performance of the CMS muon detector and muon reconstruction with proton-proton collisions at $ \sqrt{s}= $ 13 TeV | JINST 13 (2018) P06015 | CMS-MUO-16-001 1804.04528 |
| 87 | M. Cacciari, G. P. Salam, and G. Soyez | The anti-$ {k_{\mathrm{T}}} $ jet clustering algorithm | JHEP 04 (2008) 063 | 0802.1189 |
| 88 | M. Cacciari, G. P. Salam, and G. Soyez | FastJet user manual | EPJC 72 (2012) 1896 | 1111.6097 |
| 89 | CMS Collaboration | Identification of heavy-flavour jets with the CMS detector in pp collisions at 13 TeV | JINST 13 (2018) P05011 | CMS-BTV-16-002 1712.07158 |
| 90 | CMS Collaboration | Missing transverse energy performance of the CMS detector | JINST 6 (2011) P09001 | CMS-JME-10-009 1106.5048 |
| 91 | CMS Collaboration | Performance of the CMS missing transverse momentum reconstruction in pp data at $ \sqrt{s} = $ 8 TeV | JINST 10 (2015) P02006 | CMS-JME-13-003 1411.0511 |
| 92 | CMS Collaboration | Performance of missing transverse momentum reconstruction in proton-proton collisions at $ \sqrt{s} = $ 13 TeV using the CMS detector | JINST 14 (2019) P07004 | CMS-JME-17-001 1903.06078 |
| 93 | A. Barr, C. Lester, and P. Stephens | $ m_{\textrm{T}2} $: The truth behind the glamour | JPG 29 (2003) 2343 | hep-ph/0304226 |
| 94 | M. Burns, K. Kong, K. T. Matchev, and M. Park | Using subsystem $ M_{\textrm{T}2} $ for complete mass determinations in decay chains with missing energy at hadron colliders | JHEP 03 (2009) 143 | 0810.5576 |
| 95 | C. G. Lester and B. Nachman | Bisection-based asymmetric $ M_{\textrm{T}2} $ computation: a higher precision calculator than existing symmetric methods | JHEP 03 (2015) 100 | 1411.4312 |
| 96 | CMS Collaboration | Jet energy scale and resolution in the CMS experiment in pp collisions at 8 TeV | JINST 12 (2017) P02014 | CMS-JME-13-004 1607.03663 |
| 97 | CMS Collaboration | Measurement of top quark pair production in association with a Z boson in proton-proton collisions at $ \sqrt{s}= $ 13 TeV | JHEP 03 (2020) 056 | CMS-TOP-18-009 1907.11270 |
| 98 | CMS Collaboration | CMS luminosity measurement for the 2016 data taking period | CMS-PAS-LUM-17-001 | CMS-PAS-LUM-17-001 |
| 99 | CMS Collaboration | CMS luminosity measurement for the 2017 data taking period | CMS-PAS-LUM-17-004 | CMS-PAS-LUM-17-004 |
| 100 | CMS Collaboration | CMS luminosity measurement for the 2018 data-taking period at $ \sqrt{s} = $ 13 TeV | CMS-PAS-LUM-18-002 | CMS-PAS-LUM-18-002 |
| 101 | J. Butterworth et al. | PDF4LHC recommendations for LHC Run II | JPG 43 (2016) 023001 | 1510.03865 |
| 102 | S. Catani, D. de Florian, M. Grazzini, and P. Nason | Soft gluon resummation for Higgs boson production at hadron colliders | JHEP 07 (2003) 028 | hep-ph/0306211 |
| 103 | M. Cacciari et al. | The $ \mathrm{t\bar{t}} $ cross-section at 1.8 TeV and 1.96 TeV: A study of the systematics due to parton densities and scale dependence | JHEP 04 (2004) 068 | hep-ph/0303085 |
| 104 | A. Kalogeropoulos and J. Alwall | The SysCalc code: A tool to derive theoretical systematic uncertainties | 1801.08401 | |
| 105 | G. Cowan, K. Cranmer, E. Gross, and O. Vitells | Asymptotic formulae for likelihood-based tests of new physics | EPJC 71 (2011) 1554 | 1007.1727 |
| 106 | T. Junk | Confidence level computation for combining searches with small statistics | Nucl. Instr. Meth. A 434 (1999) 435 | hep-ex/9902006 |
| 107 | A. L. Read | Presentation of search results: the CL$ _{\textrm{s}} $ technique | JPG 28 (2002) 2693 | |
|
|
Compact Muon Solenoid LHC, CERN |
|

|

|

|

|

|