

Compact Muon Solenoid
LHC, CERN
| CMS-SMP-24-012 ; CERN-EP-2026-034 | ||
| Measurement of the jet mass in hadronic decays of boosted W bosons at 13 TeV and extraction of the W boson mass | ||
| CMS Collaboration | ||
| 20 March 2026 | ||
| JHEP 07 (2026) 054 | ||
| Abstract: The jet mass of W bosons decaying to a quark-antiquark pair is measured in W+jets events from proton-proton collisions at a center-of-mass energy of 13 TeV. The data used were collected by the CMS experiment at the CERN LHC and correspond to an integrated luminosity of 138 fb$ ^{-1} $. Hadronic decays of W bosons with high momenta produce strongly collimated decay products due to the large Lorentz boost, and are reconstructed as single large-radius jets. These jets have a characteristic substructure that is exploited to distinguish them from the large background of quark- and gluon-initiated jets. The jet mass is computed using the soft-drop algorithm, which suppresses soft wide-angle radiation that leads to a broadening of the jet mass distribution. For the first time, unfolded measurements are presented of the double-differential W+jets cross section as a function of the jet transverse momentum and soft-drop mass. From these distributions, the W boson mass is obtained, with a value of 80.83 $ \pm $ 0.55 GeV, achieving the smallest uncertainty available today from an all-jets final state at a hadron collider. | ||
| Links: e-print arXiv:2603.19963 [hep-ex] (PDF) ; CDS record ; inSPIRE record ; HepData record ; Physics Briefing ; CADI line (restricted) ; | ||
| Figures & Tables | Summary | Additional Figures & Tables | References | CMS Publications |
|---|
| Figures | |
png pdf |
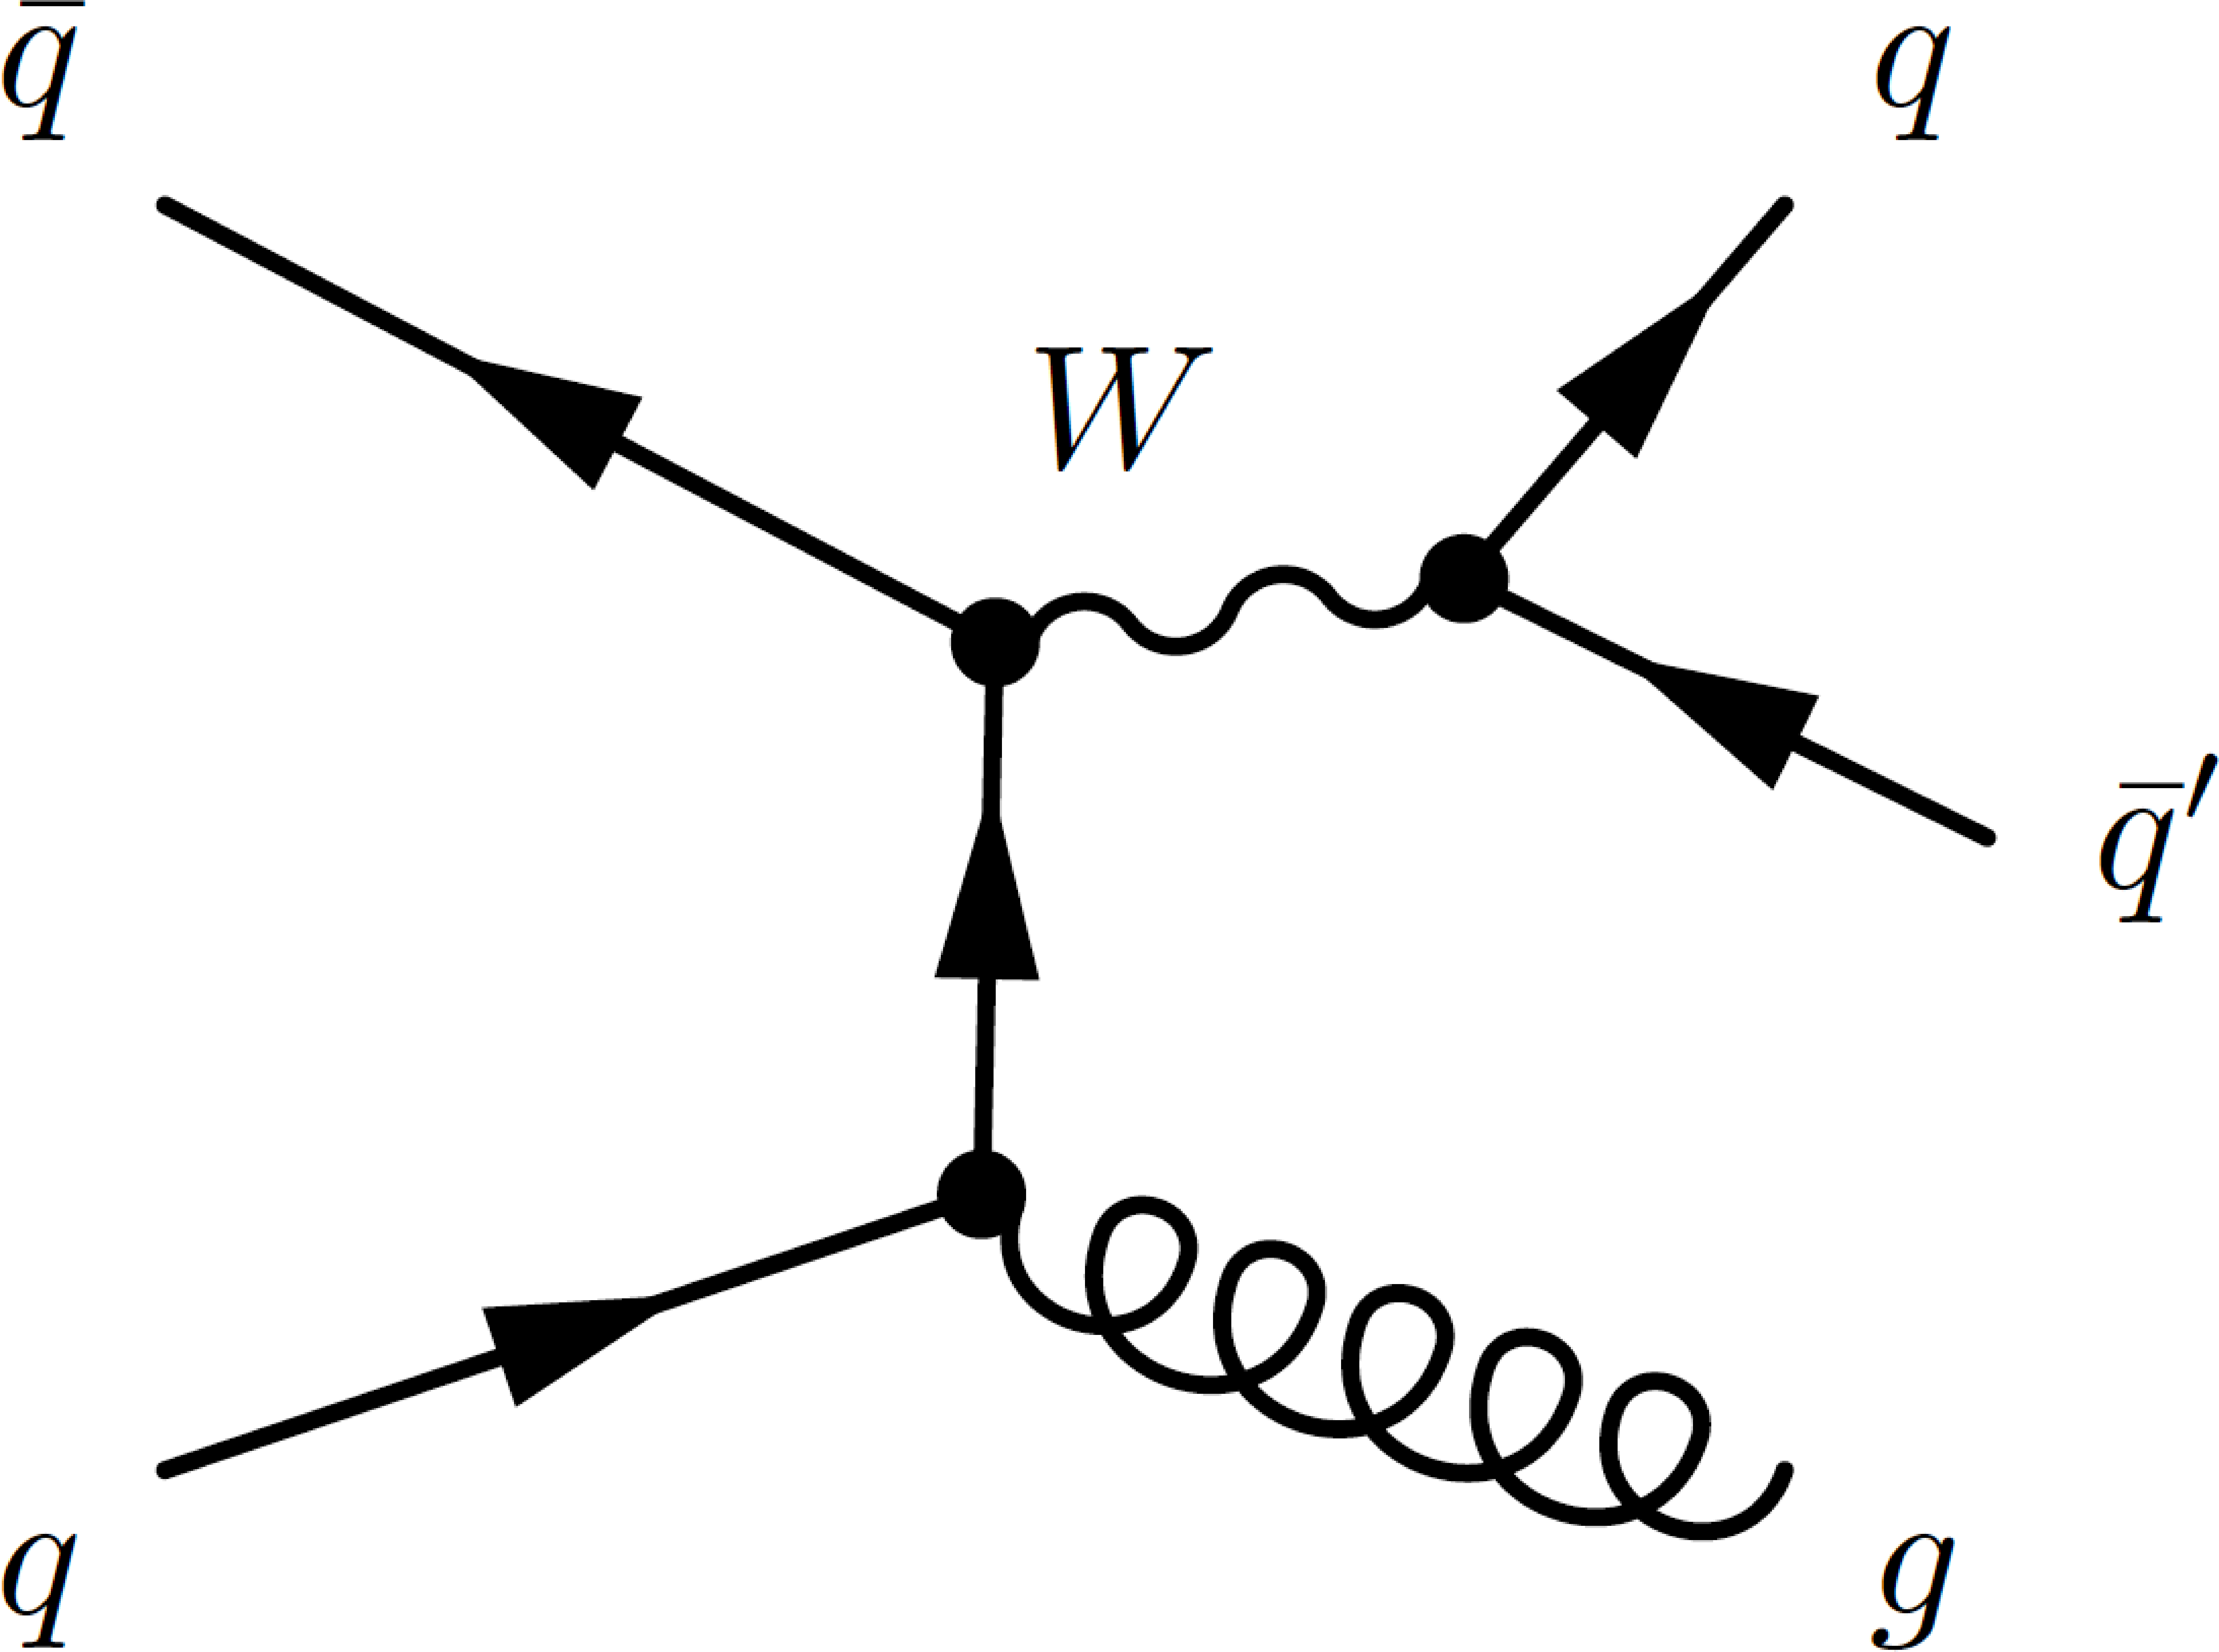
Figure 1:
Feynman diagram for tree-level $ \mathrm{W}(\mathrm{q}\overline{\mathrm{q}}') $+jets production. |
png pdf |
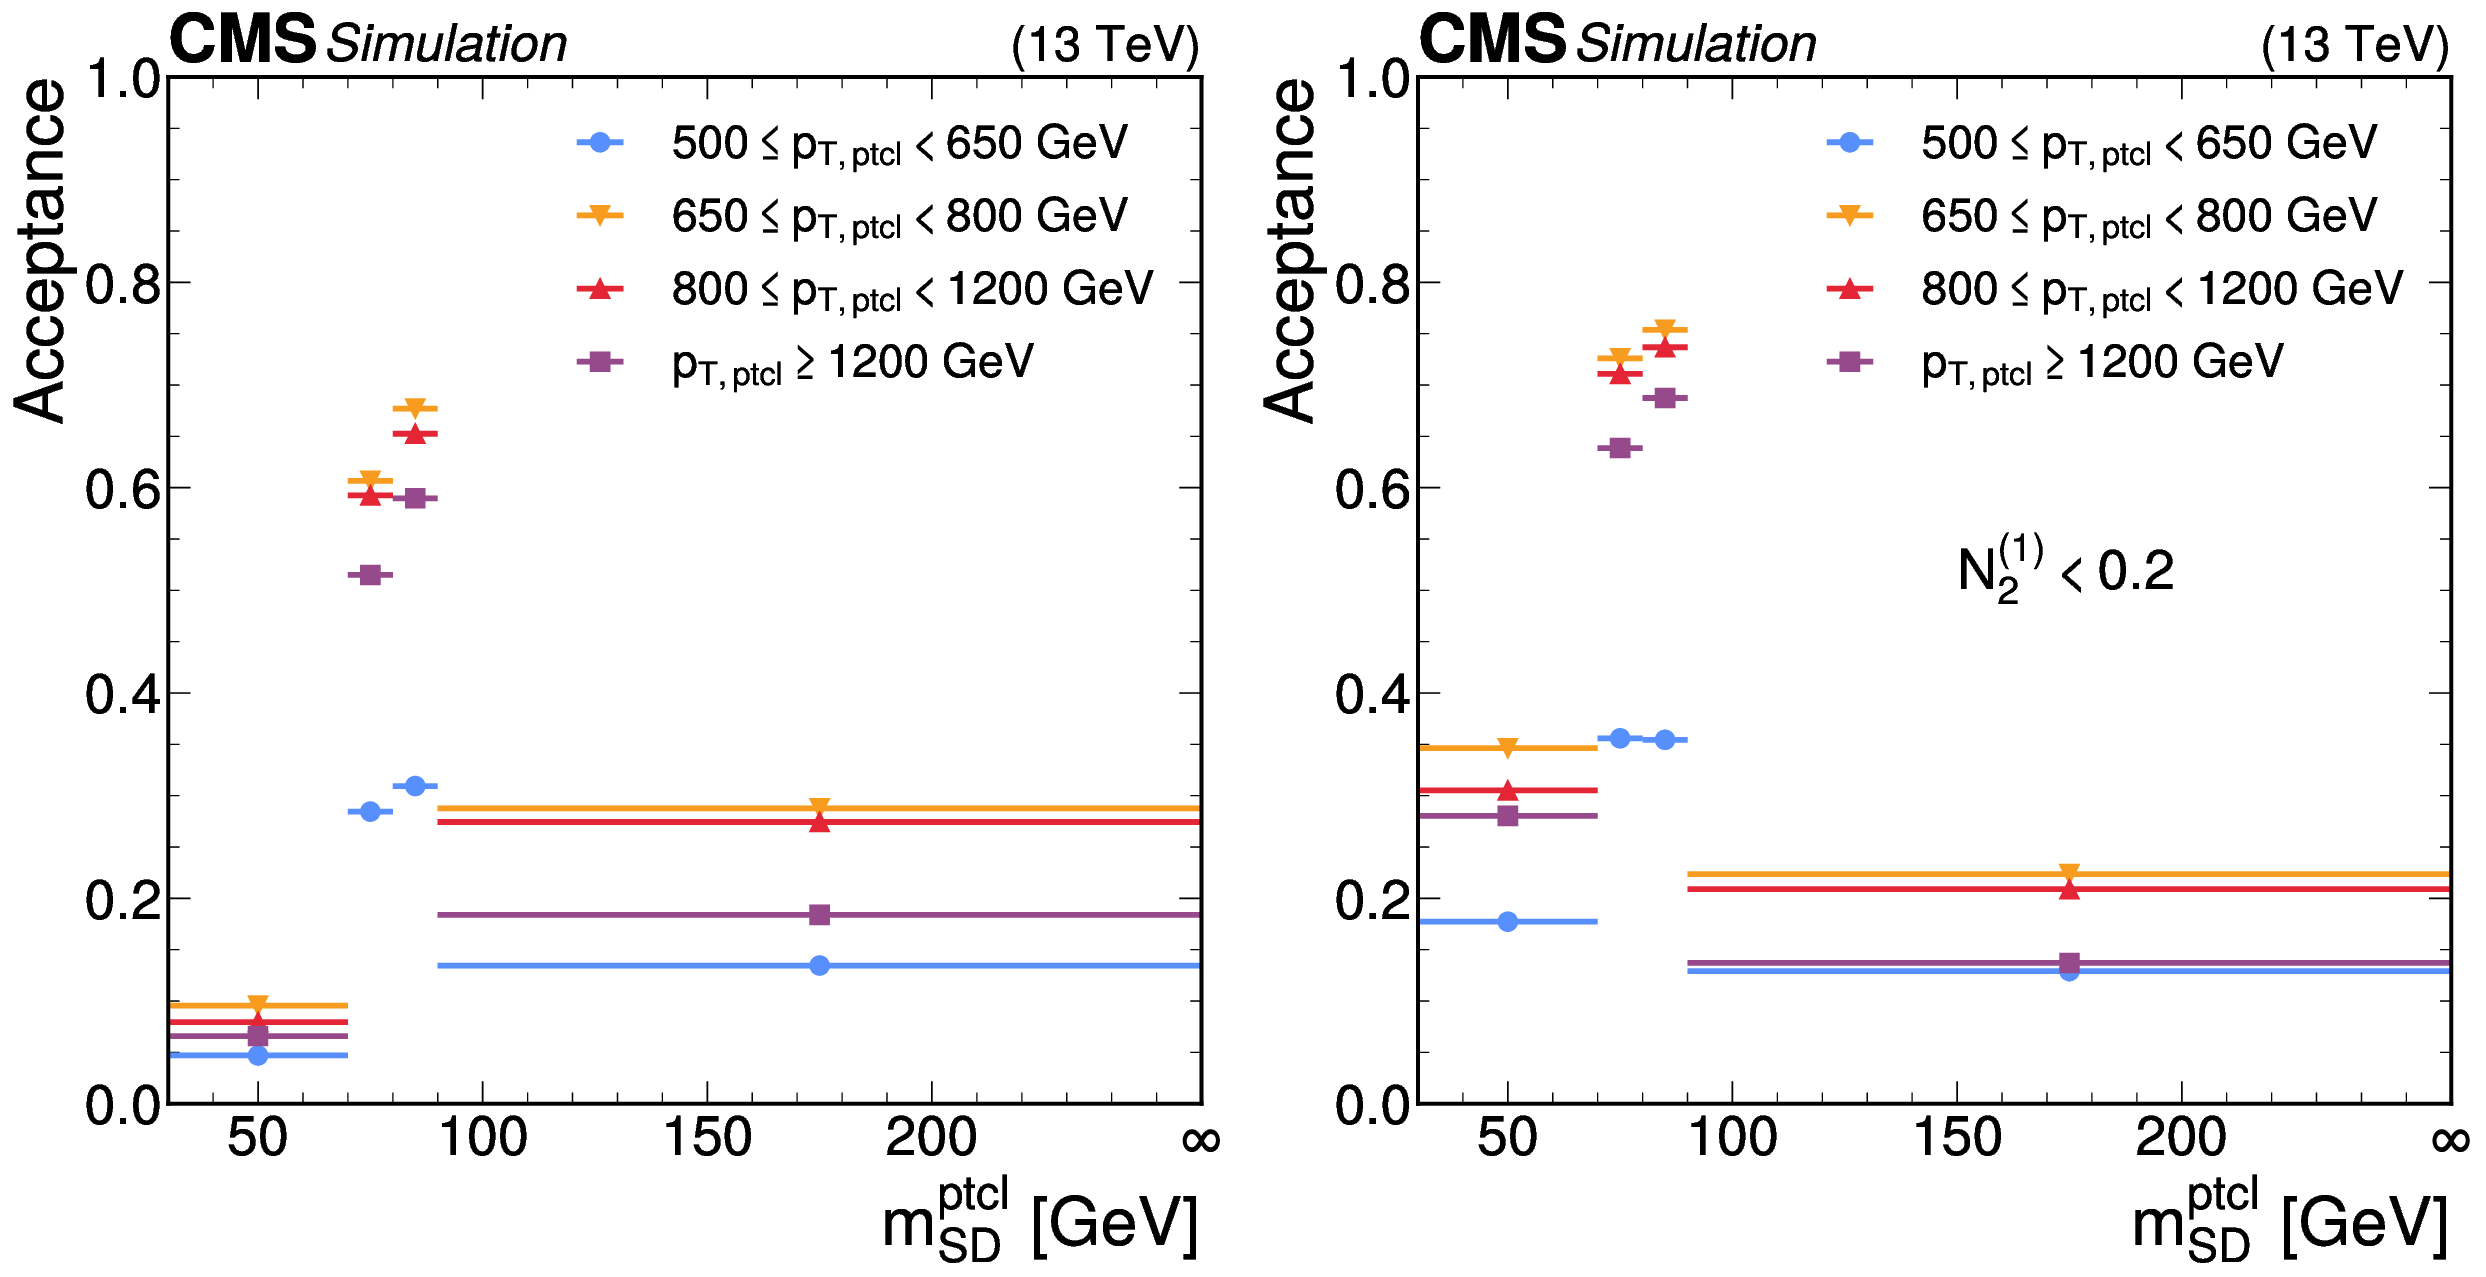
Figure 2:
Acceptance as a function of $ m_\mathrm{SD}^\mathrm{ptcl} $ without (left) and with (right) the requirement $ N_{2}^{(1)} < $ 0.2 at the particle level. The acceptance is calculated using the $ \mathrm{W}(\mathrm{q}\overline{\mathrm{q}}') $+jets signal simulation with 2018 detector conditions. |
png pdf |
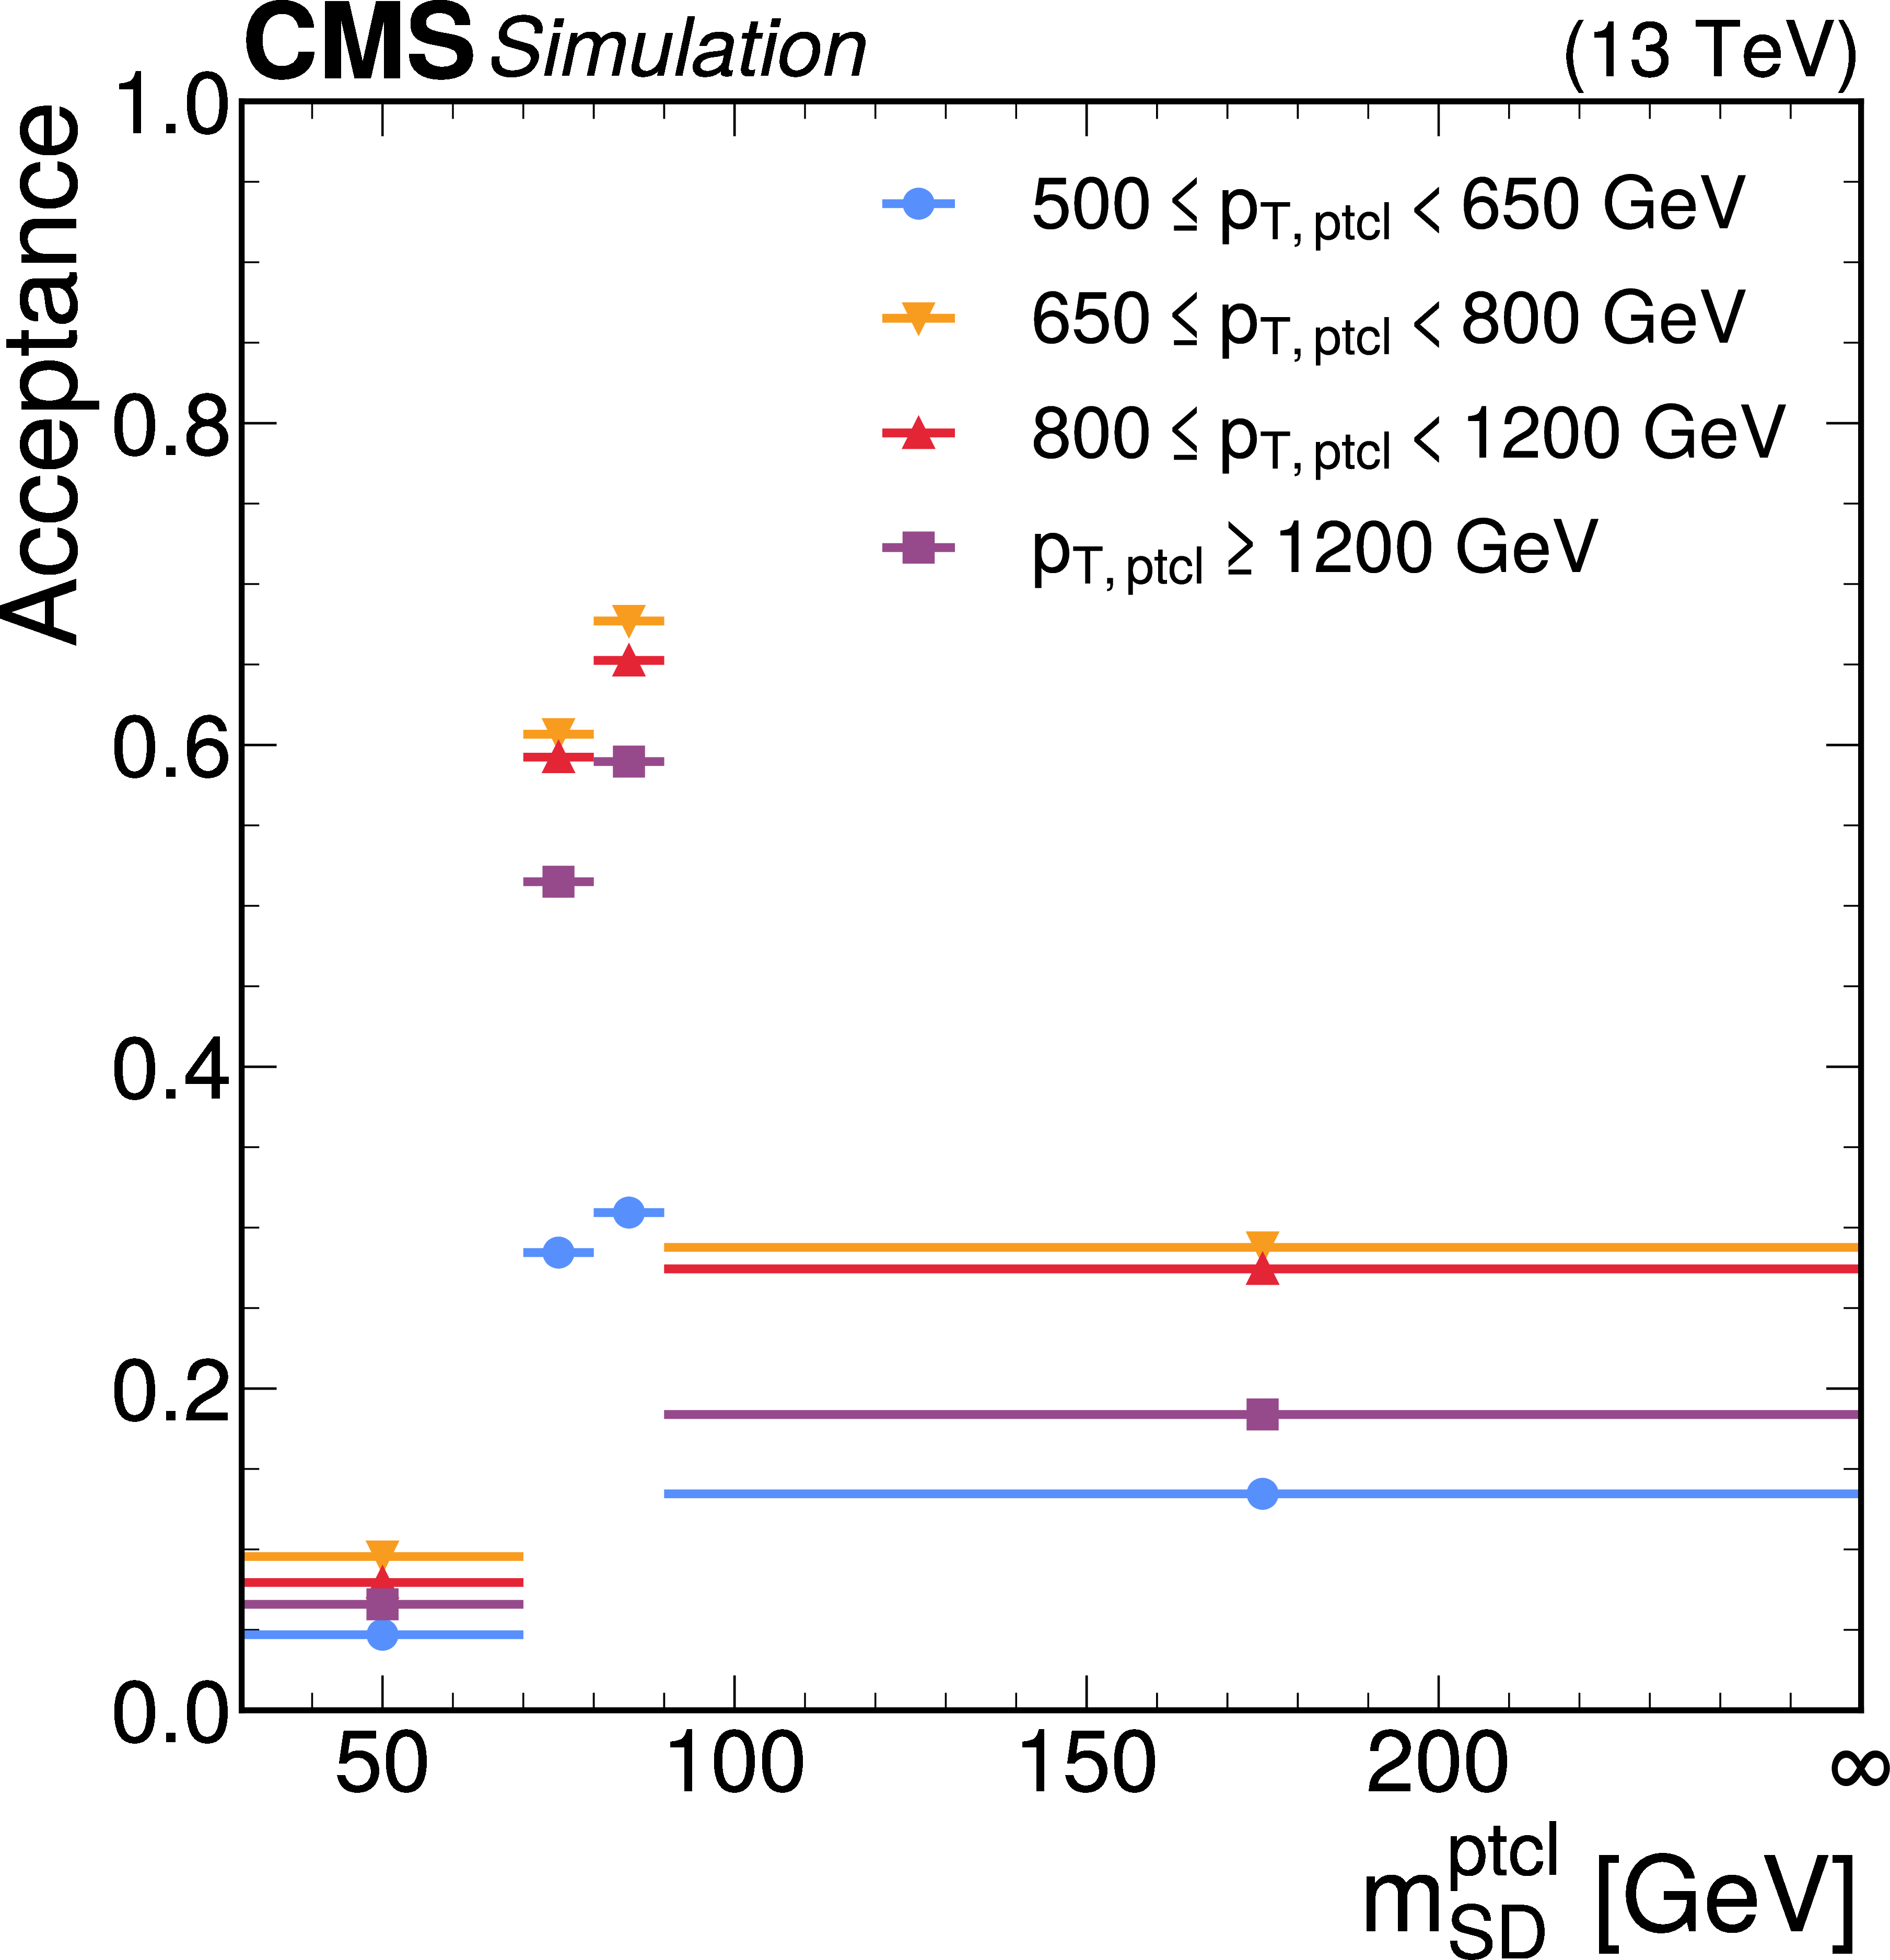
Figure 2-a:
Acceptance as a function of $ m_\mathrm{SD}^\mathrm{ptcl} $ without (left) and with (right) the requirement $ N_{2}^{(1)} < $ 0.2 at the particle level. The acceptance is calculated using the $ \mathrm{W}(\mathrm{q}\overline{\mathrm{q}}') $+jets signal simulation with 2018 detector conditions. |
png pdf |
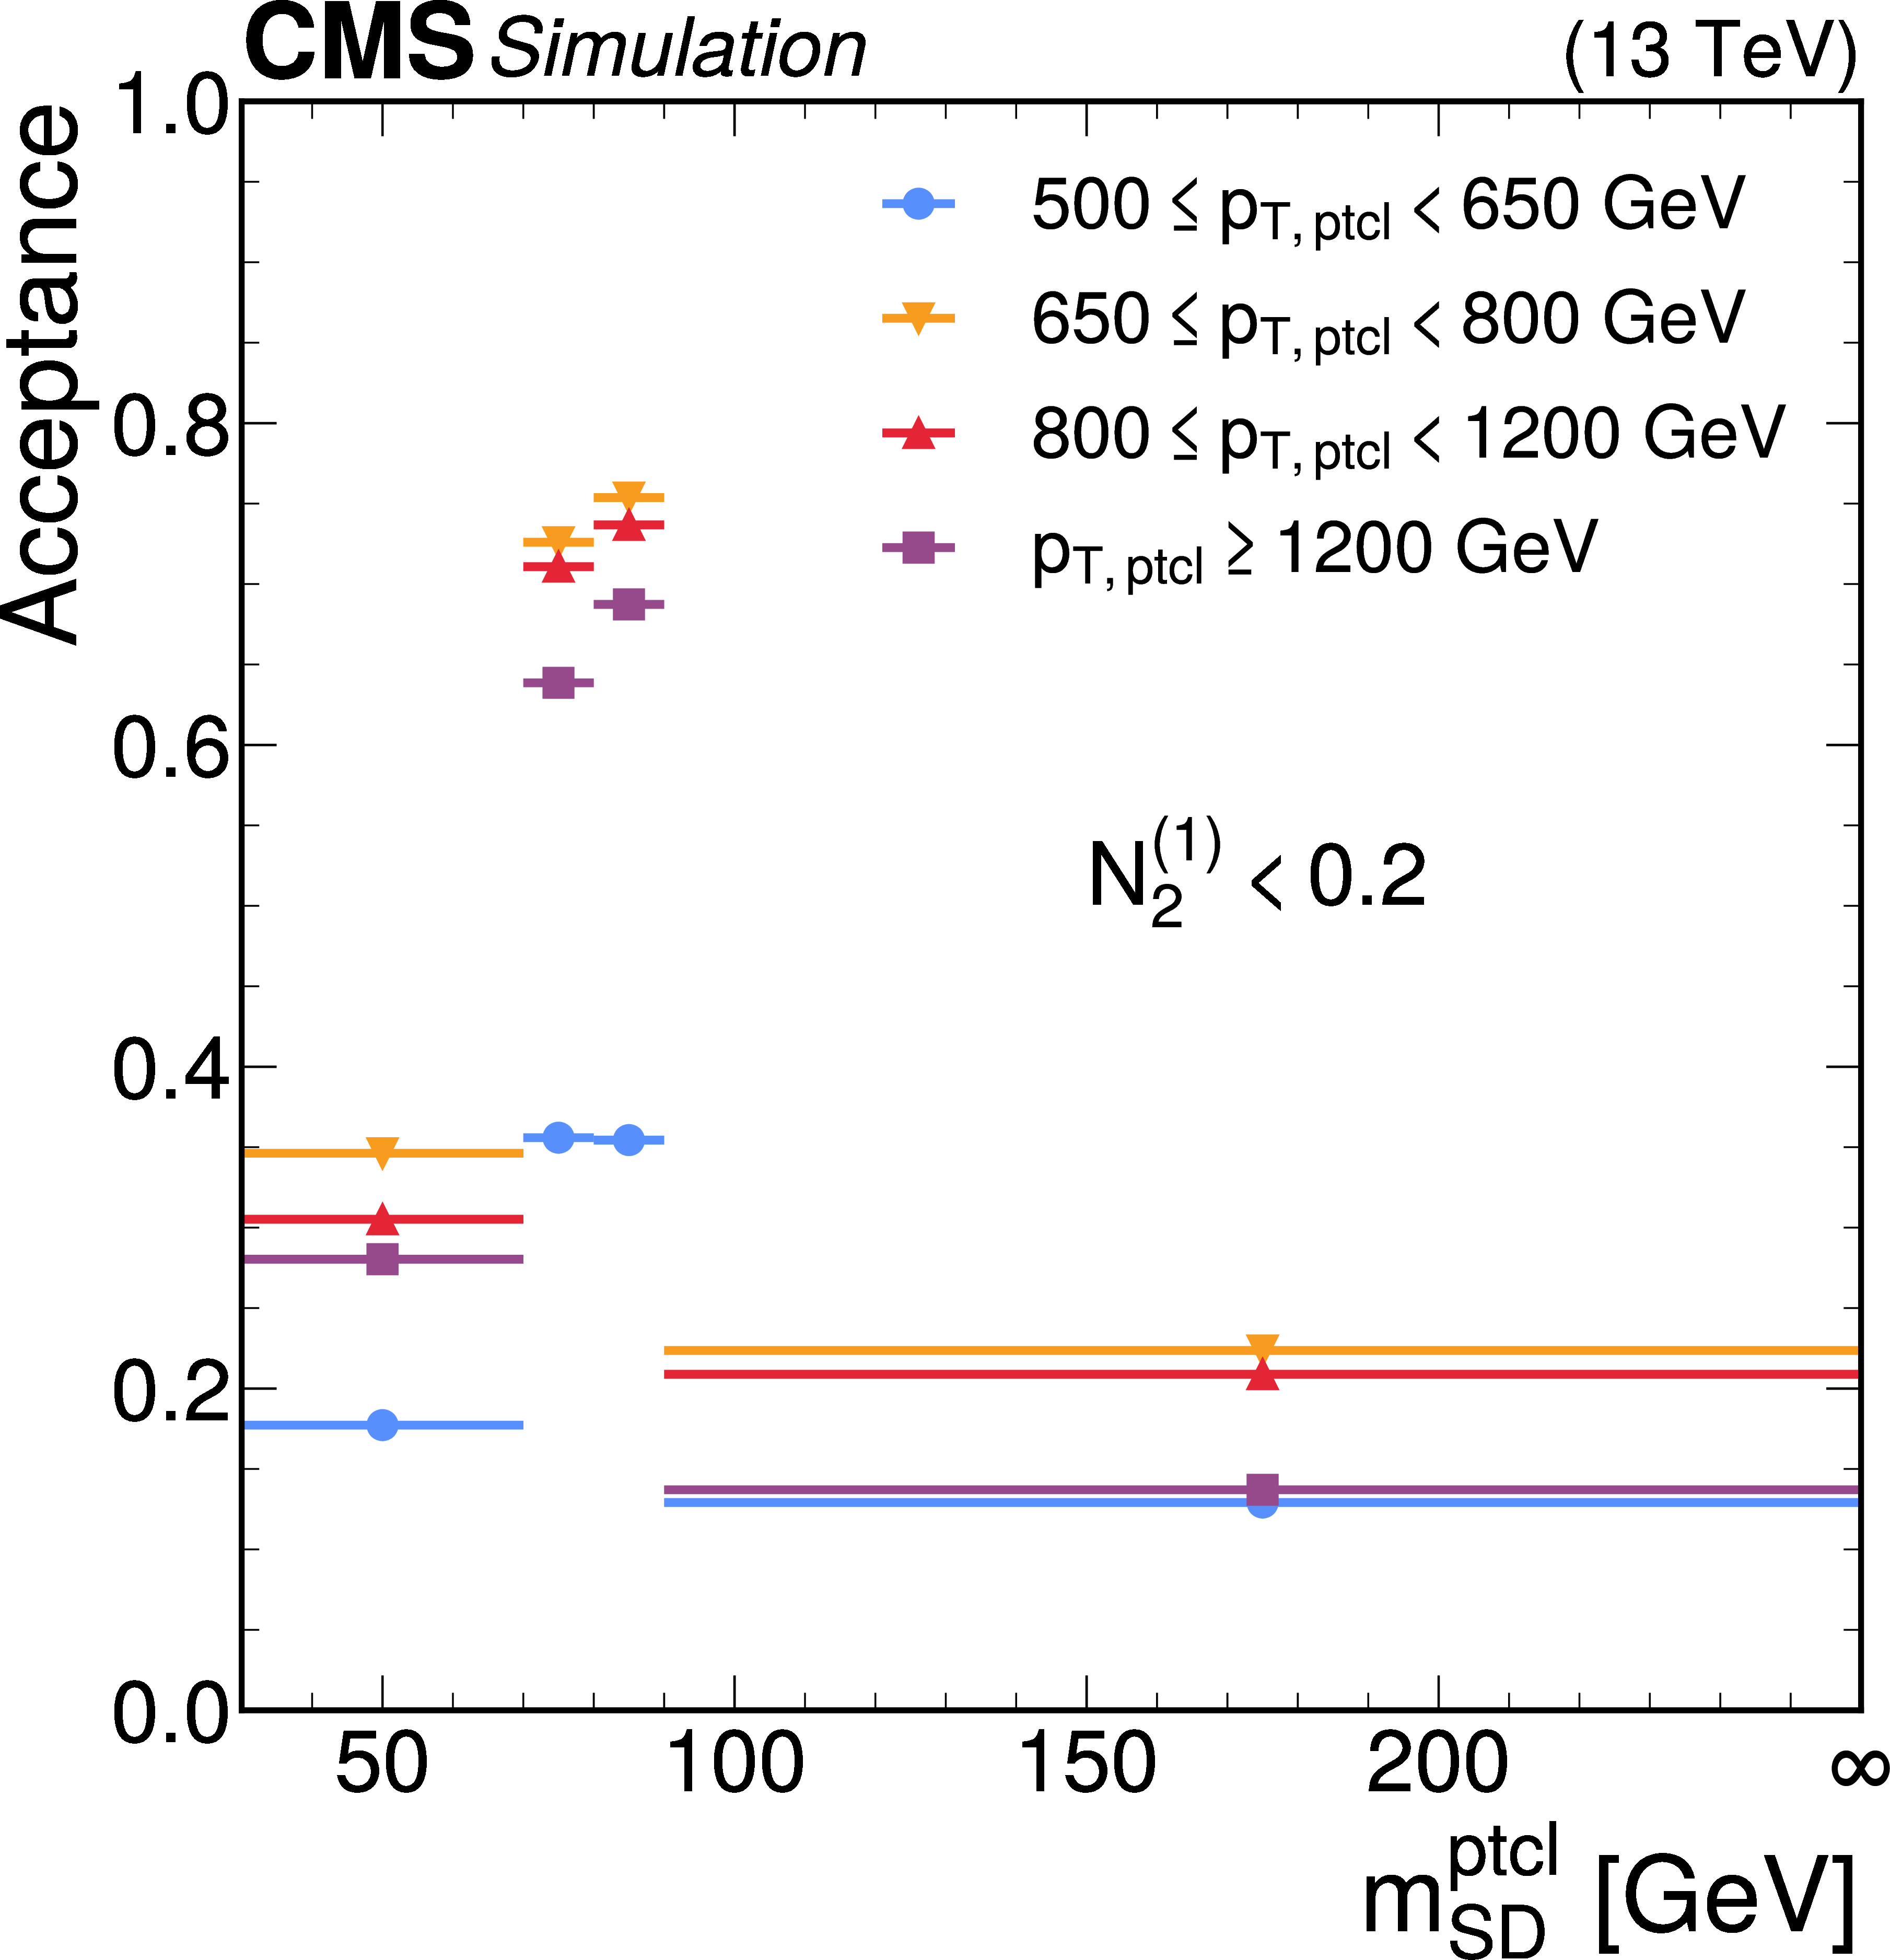
Figure 2-b:
Acceptance as a function of $ m_\mathrm{SD}^\mathrm{ptcl} $ without (left) and with (right) the requirement $ N_{2}^{(1)} < $ 0.2 at the particle level. The acceptance is calculated using the $ \mathrm{W}(\mathrm{q}\overline{\mathrm{q}}') $+jets signal simulation with 2018 detector conditions. |
png pdf |
Figure 3:
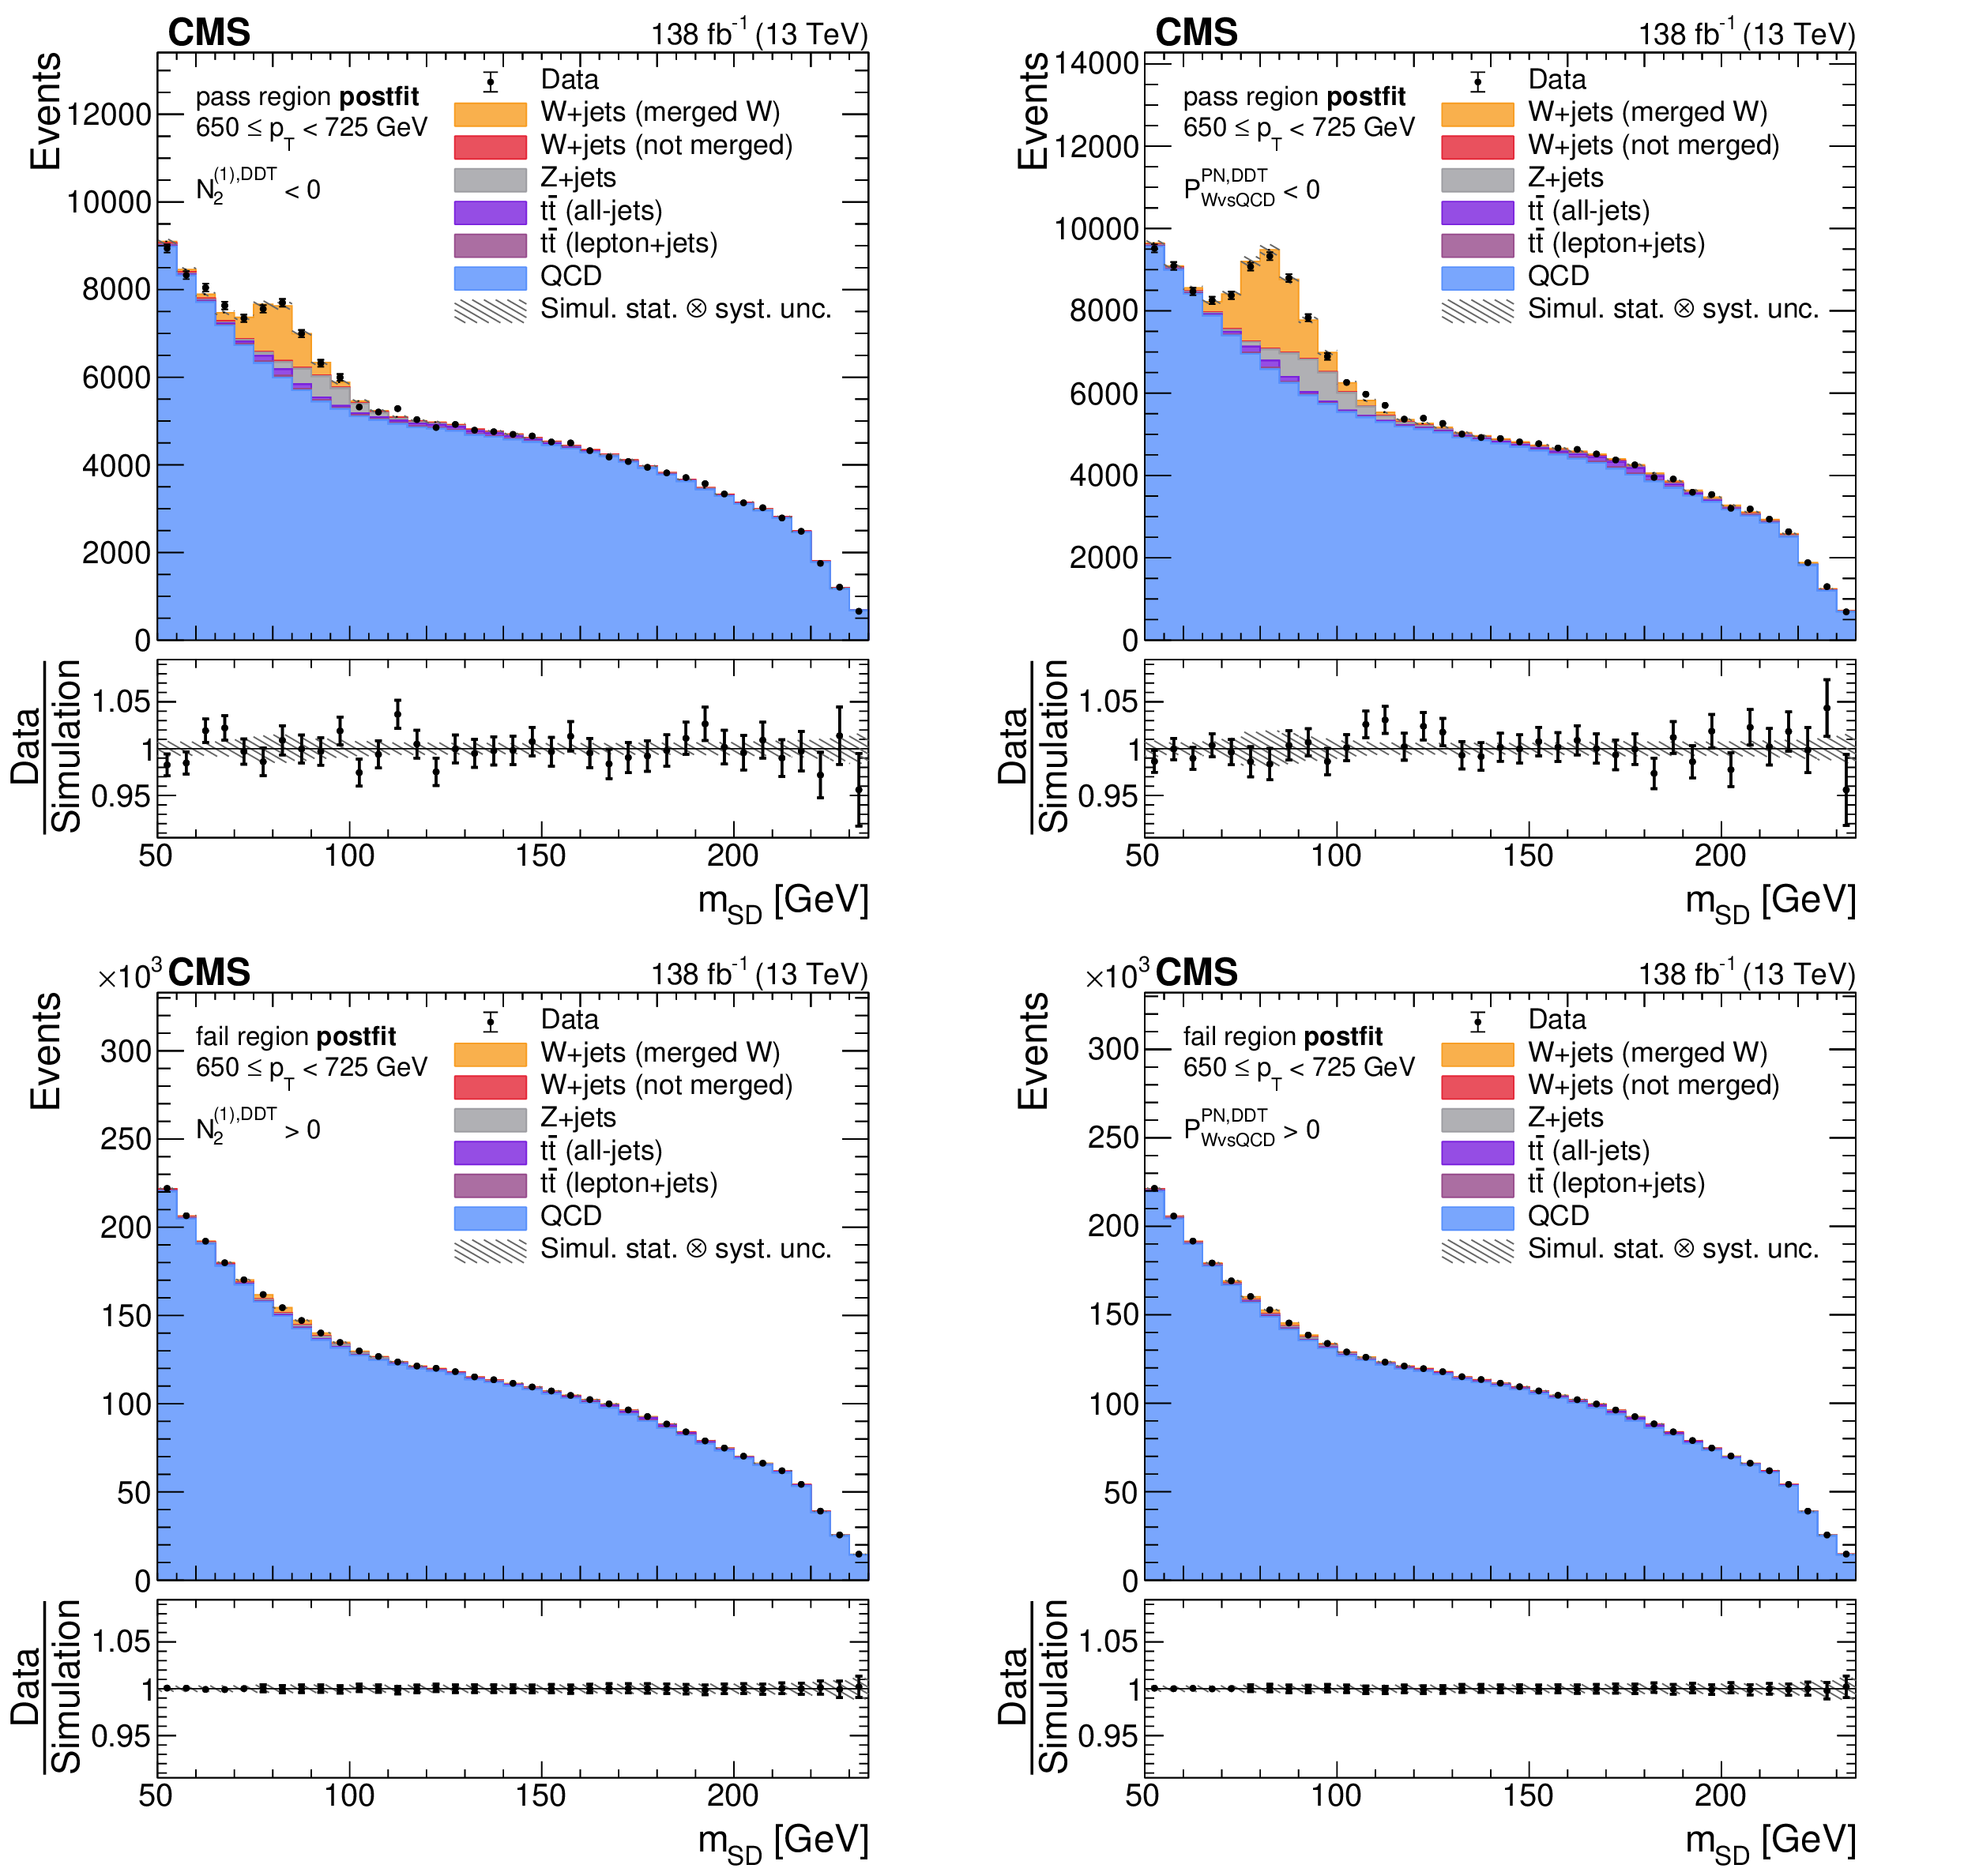
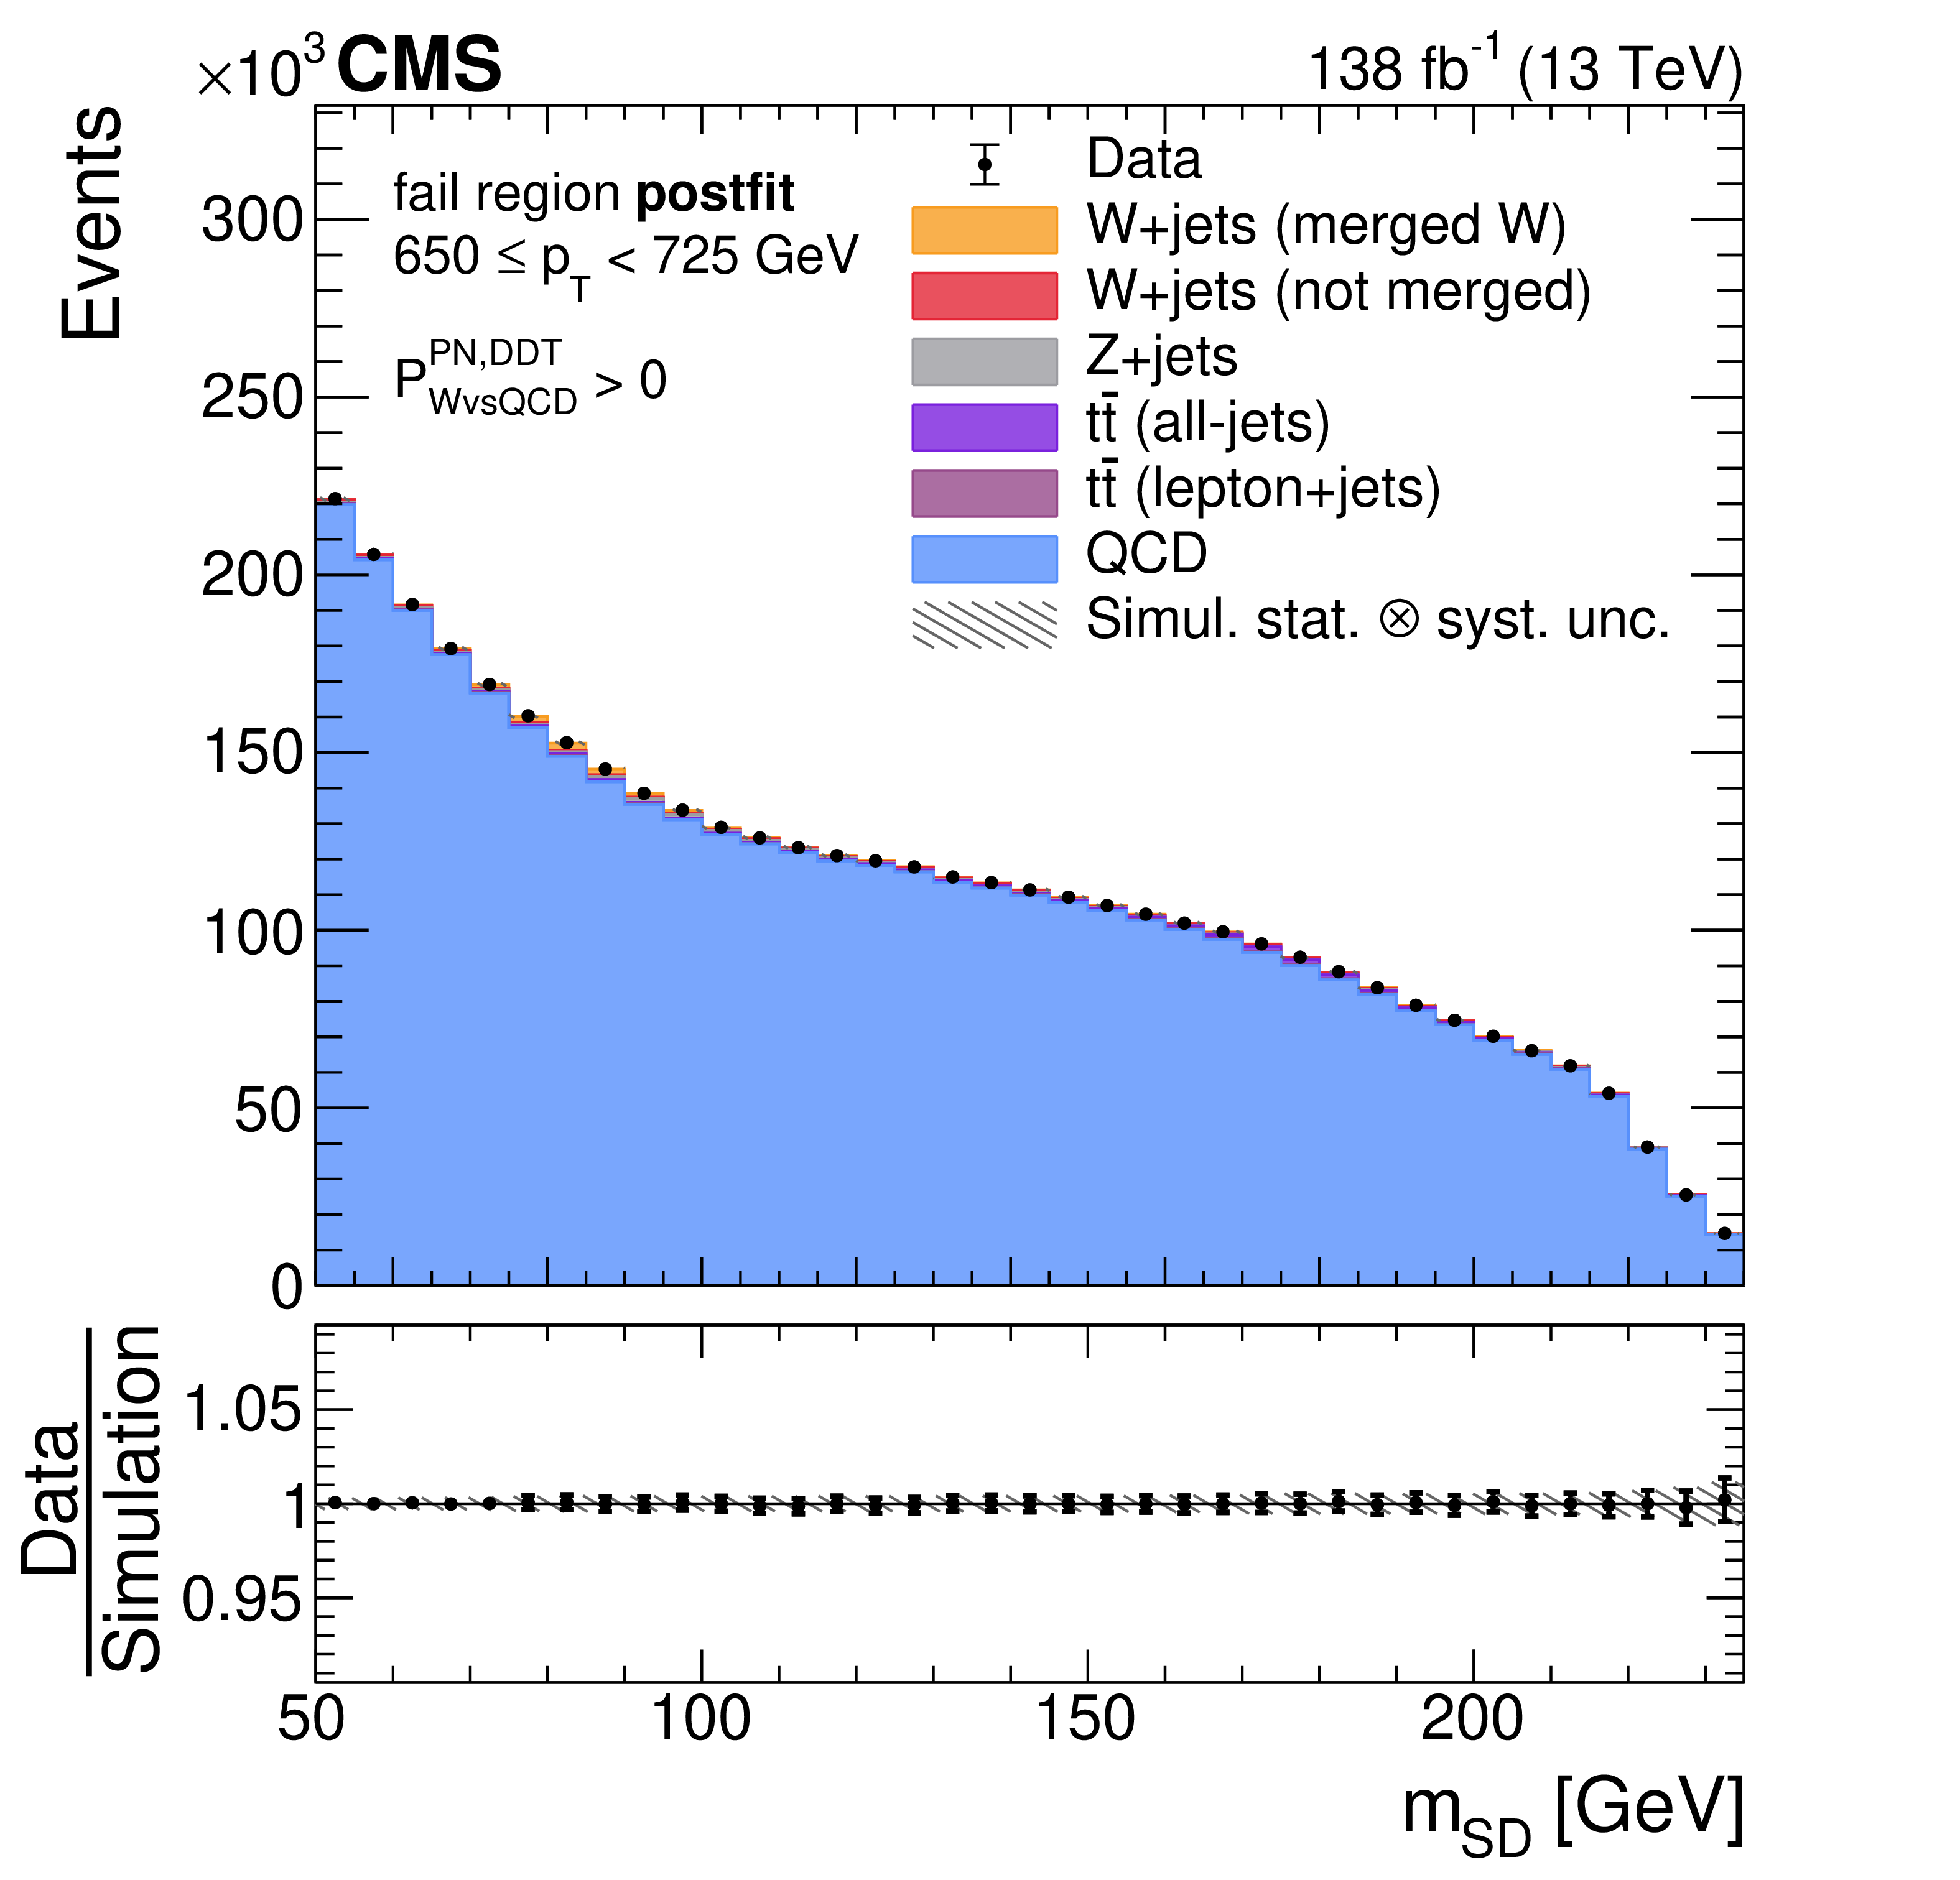
Reconstructed $ m_\mathrm{SD} $ distributions in the second $ p_{\mathrm{T}} $ bin with 650 $ < p_{\mathrm{T}} < $ 725 GeV in the signal (upper row) and control (lower row) regions defined using the $ N_{2}^{(1),\mathrm{DDT}} $ (left) and $ P^{\mathrm{PN, DDT}}_{\mathrm{W vs. QCD}} $ (right) taggers after the background estimation and a fit to the data, explained in Section 6. All four data-taking periods are combined, resulting in a total integrated luminosity of 138 fb$ ^{-1} $. The lower panels show the data-to-simulation ratio. The error bars correspond to the statistical uncertainty in the data. The dashed band is the total uncertainty on the background after a fit to the data distribution. |
png pdf |
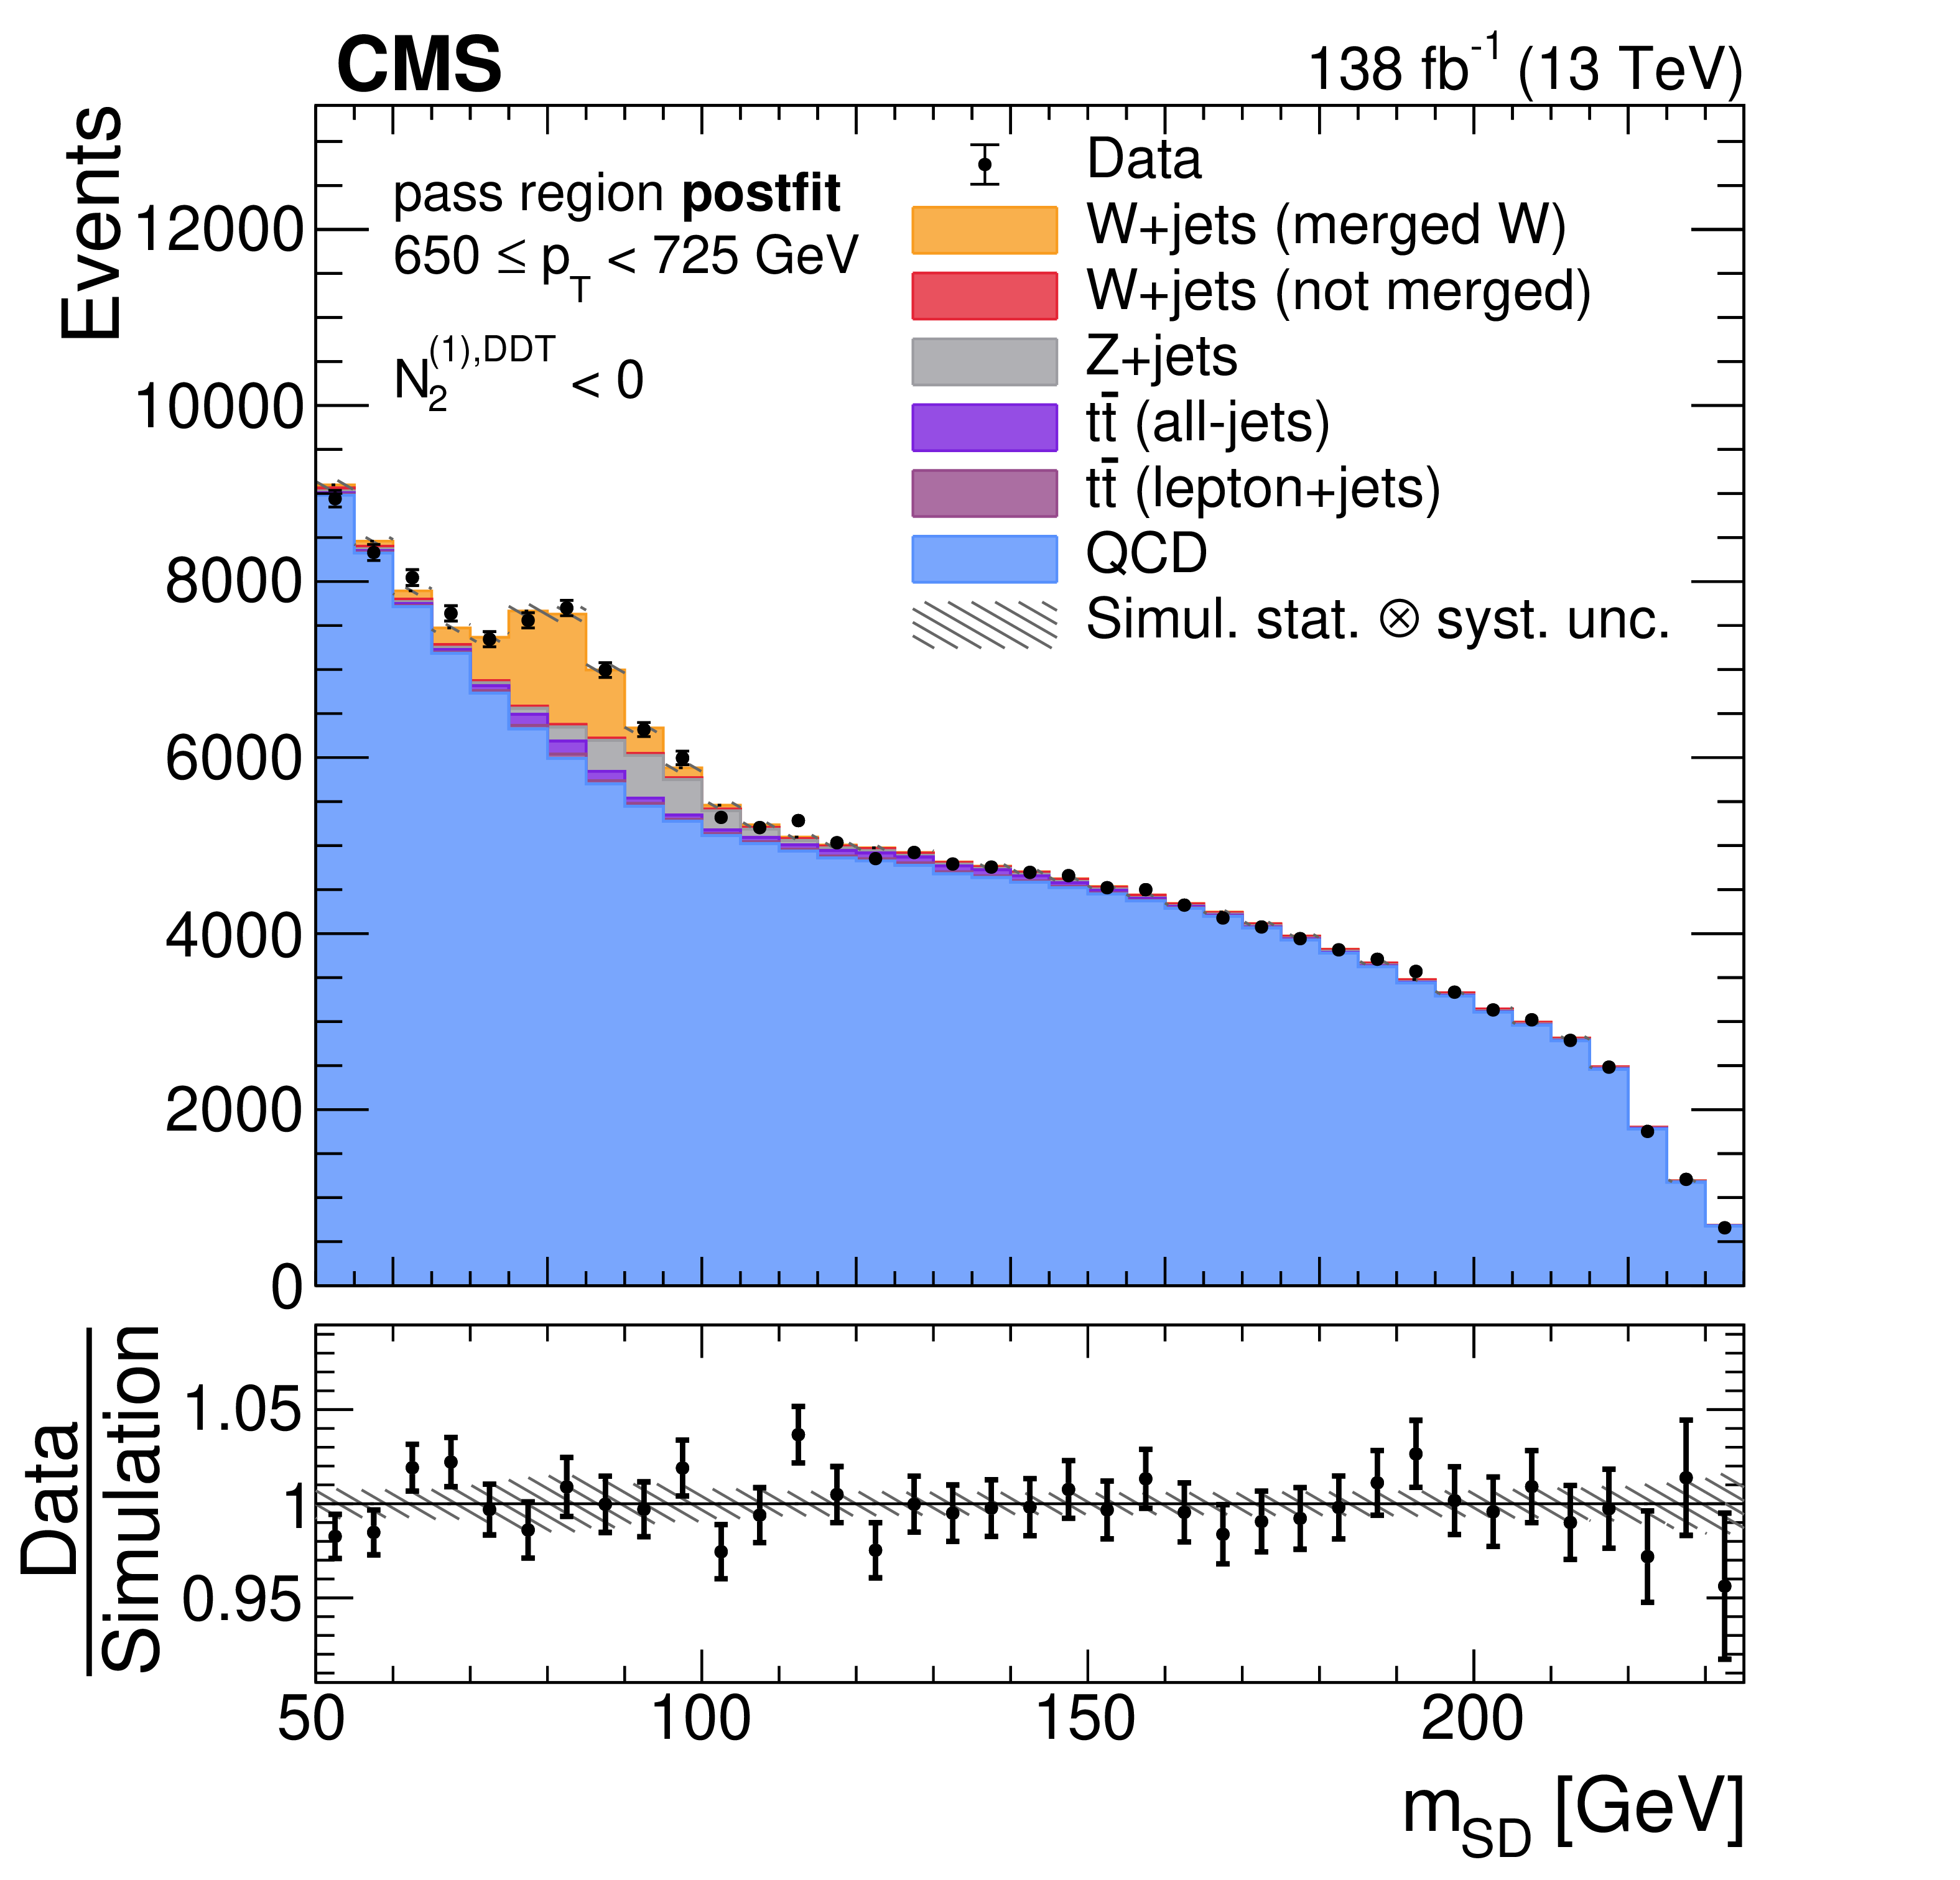
Figure 3-a:
Reconstructed $ m_\mathrm{SD} $ distributions in the second $ p_{\mathrm{T}} $ bin with 650 $ < p_{\mathrm{T}} < $ 725 GeV in the signal (upper row) and control (lower row) regions defined using the $ N_{2}^{(1),\mathrm{DDT}} $ (left) and $ P^{\mathrm{PN, DDT}}_{\mathrm{W vs. QCD}} $ (right) taggers after the background estimation and a fit to the data, explained in Section 6. All four data-taking periods are combined, resulting in a total integrated luminosity of 138 fb$ ^{-1} $. The lower panels show the data-to-simulation ratio. The error bars correspond to the statistical uncertainty in the data. The dashed band is the total uncertainty on the background after a fit to the data distribution. |
png pdf |
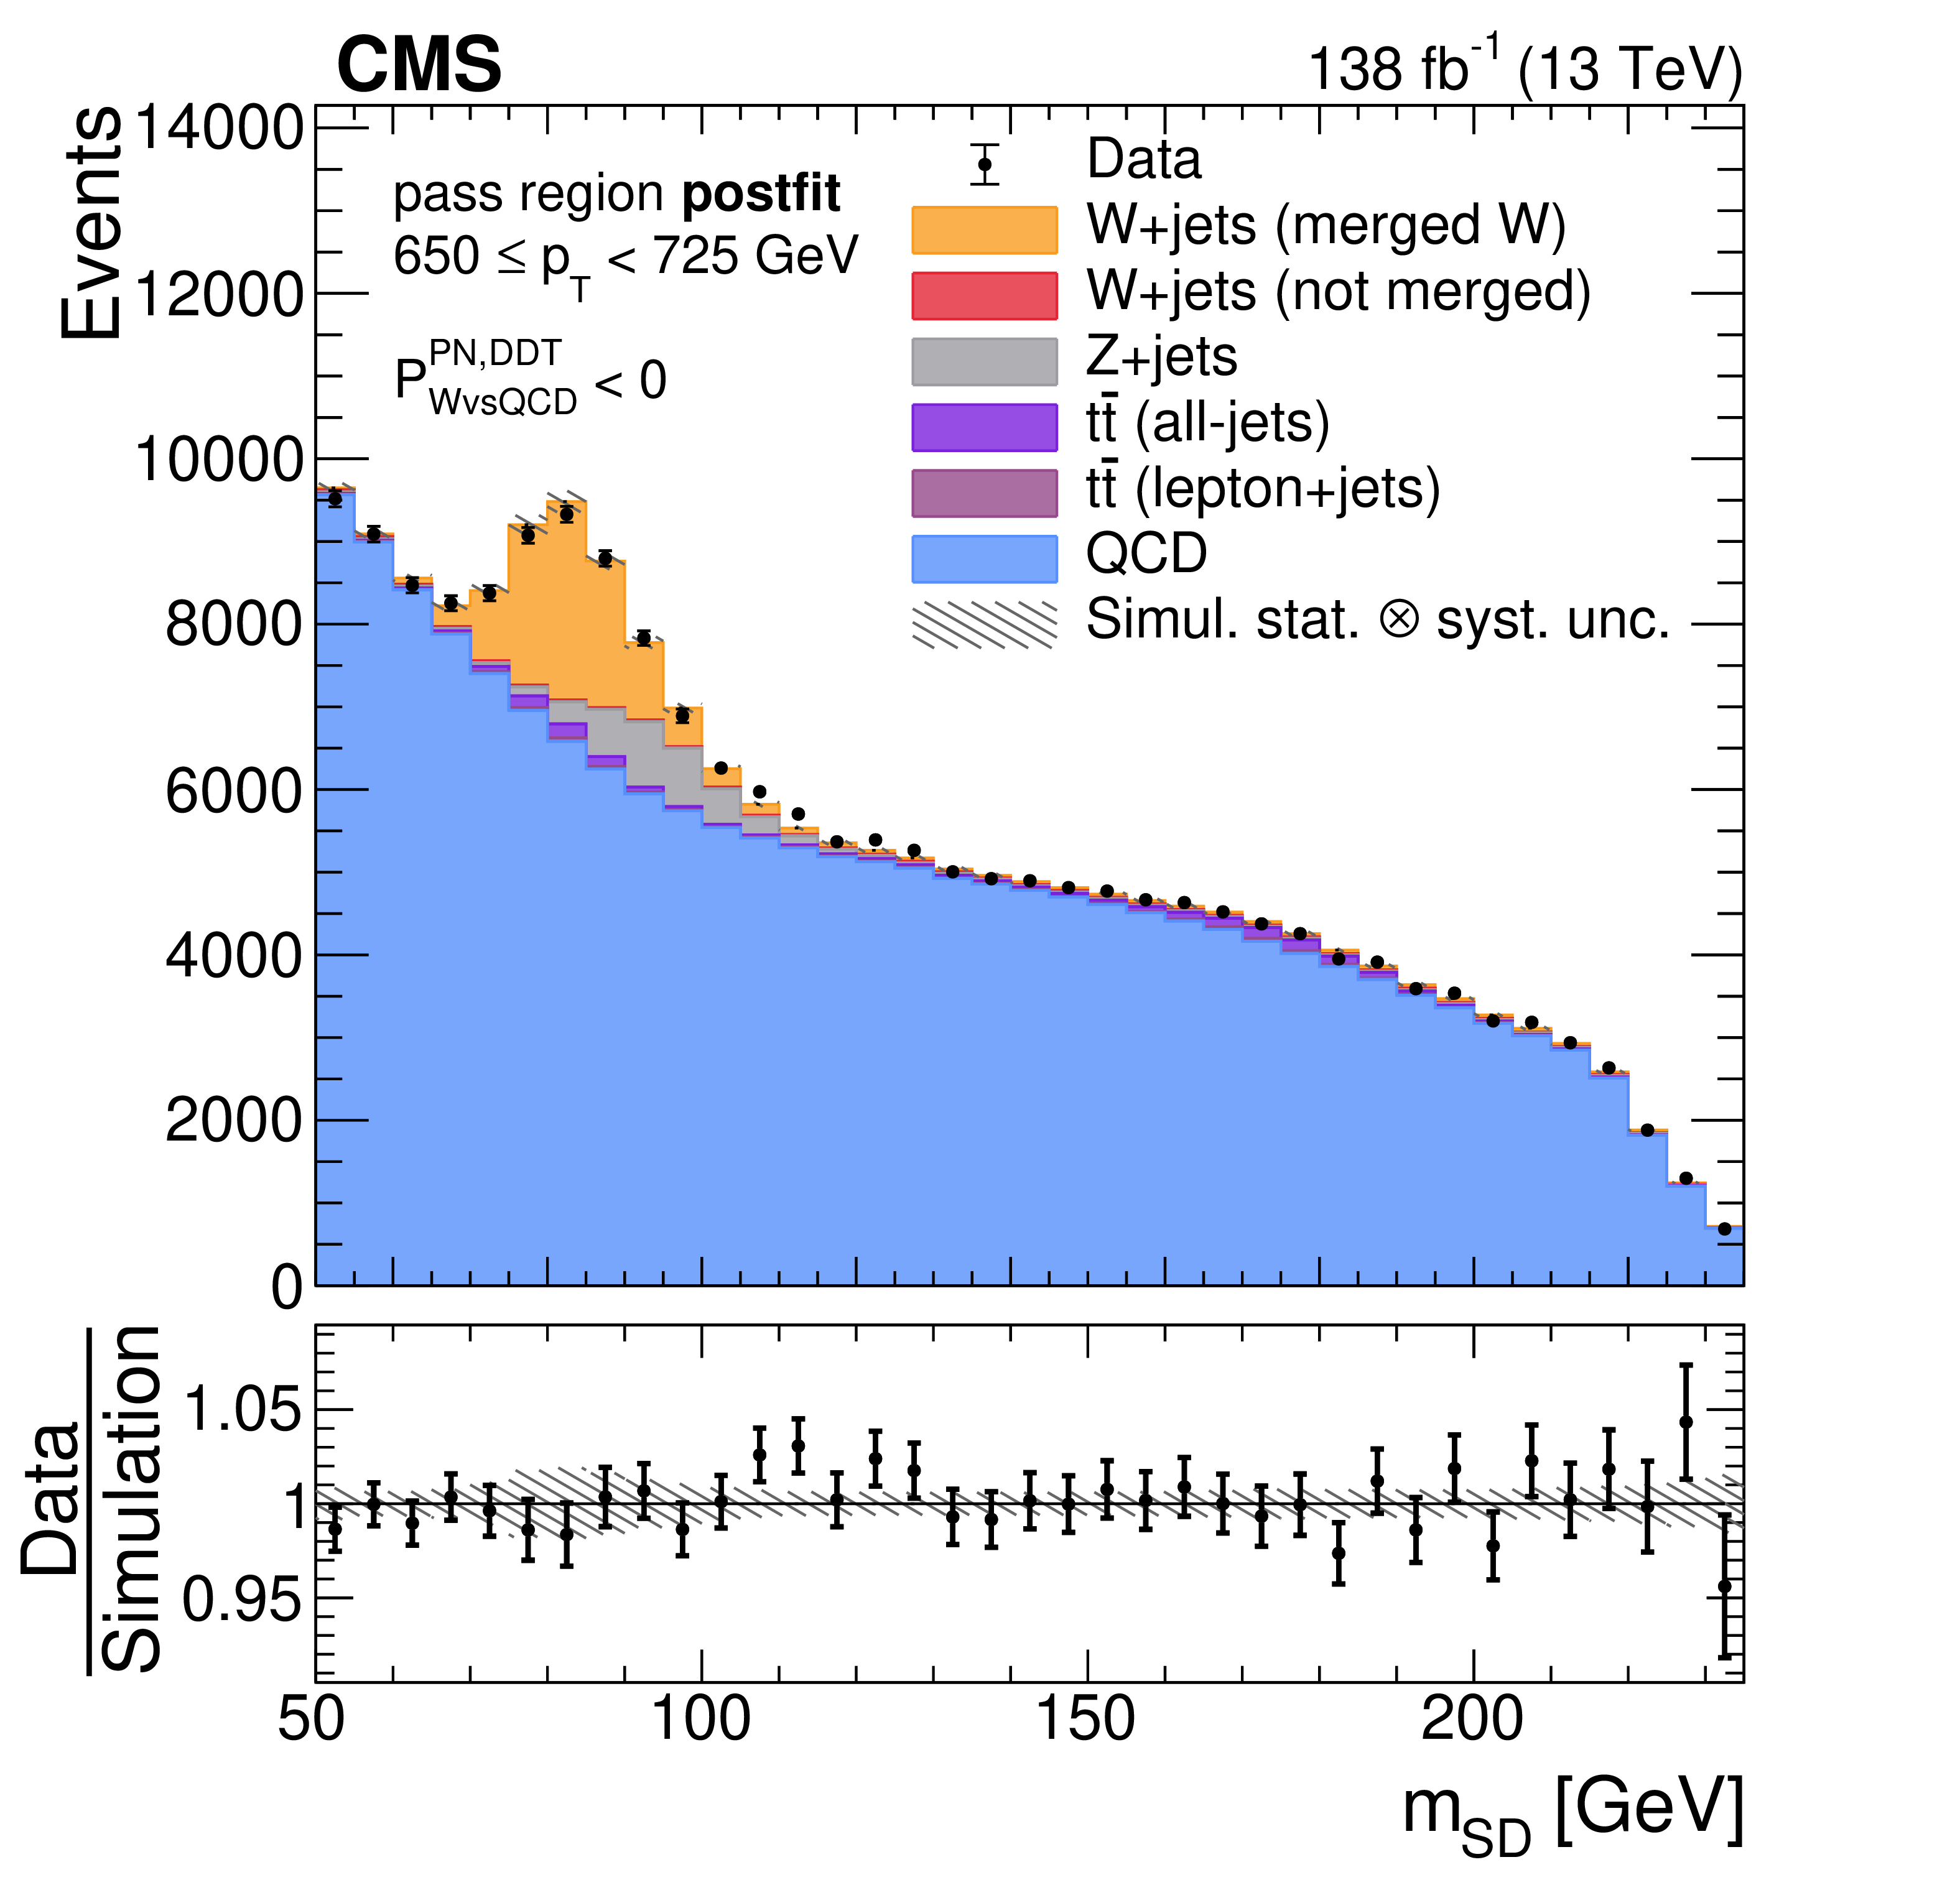
Figure 3-b:
Reconstructed $ m_\mathrm{SD} $ distributions in the second $ p_{\mathrm{T}} $ bin with 650 $ < p_{\mathrm{T}} < $ 725 GeV in the signal (upper row) and control (lower row) regions defined using the $ N_{2}^{(1),\mathrm{DDT}} $ (left) and $ P^{\mathrm{PN, DDT}}_{\mathrm{W vs. QCD}} $ (right) taggers after the background estimation and a fit to the data, explained in Section 6. All four data-taking periods are combined, resulting in a total integrated luminosity of 138 fb$ ^{-1} $. The lower panels show the data-to-simulation ratio. The error bars correspond to the statistical uncertainty in the data. The dashed band is the total uncertainty on the background after a fit to the data distribution. |
png pdf |
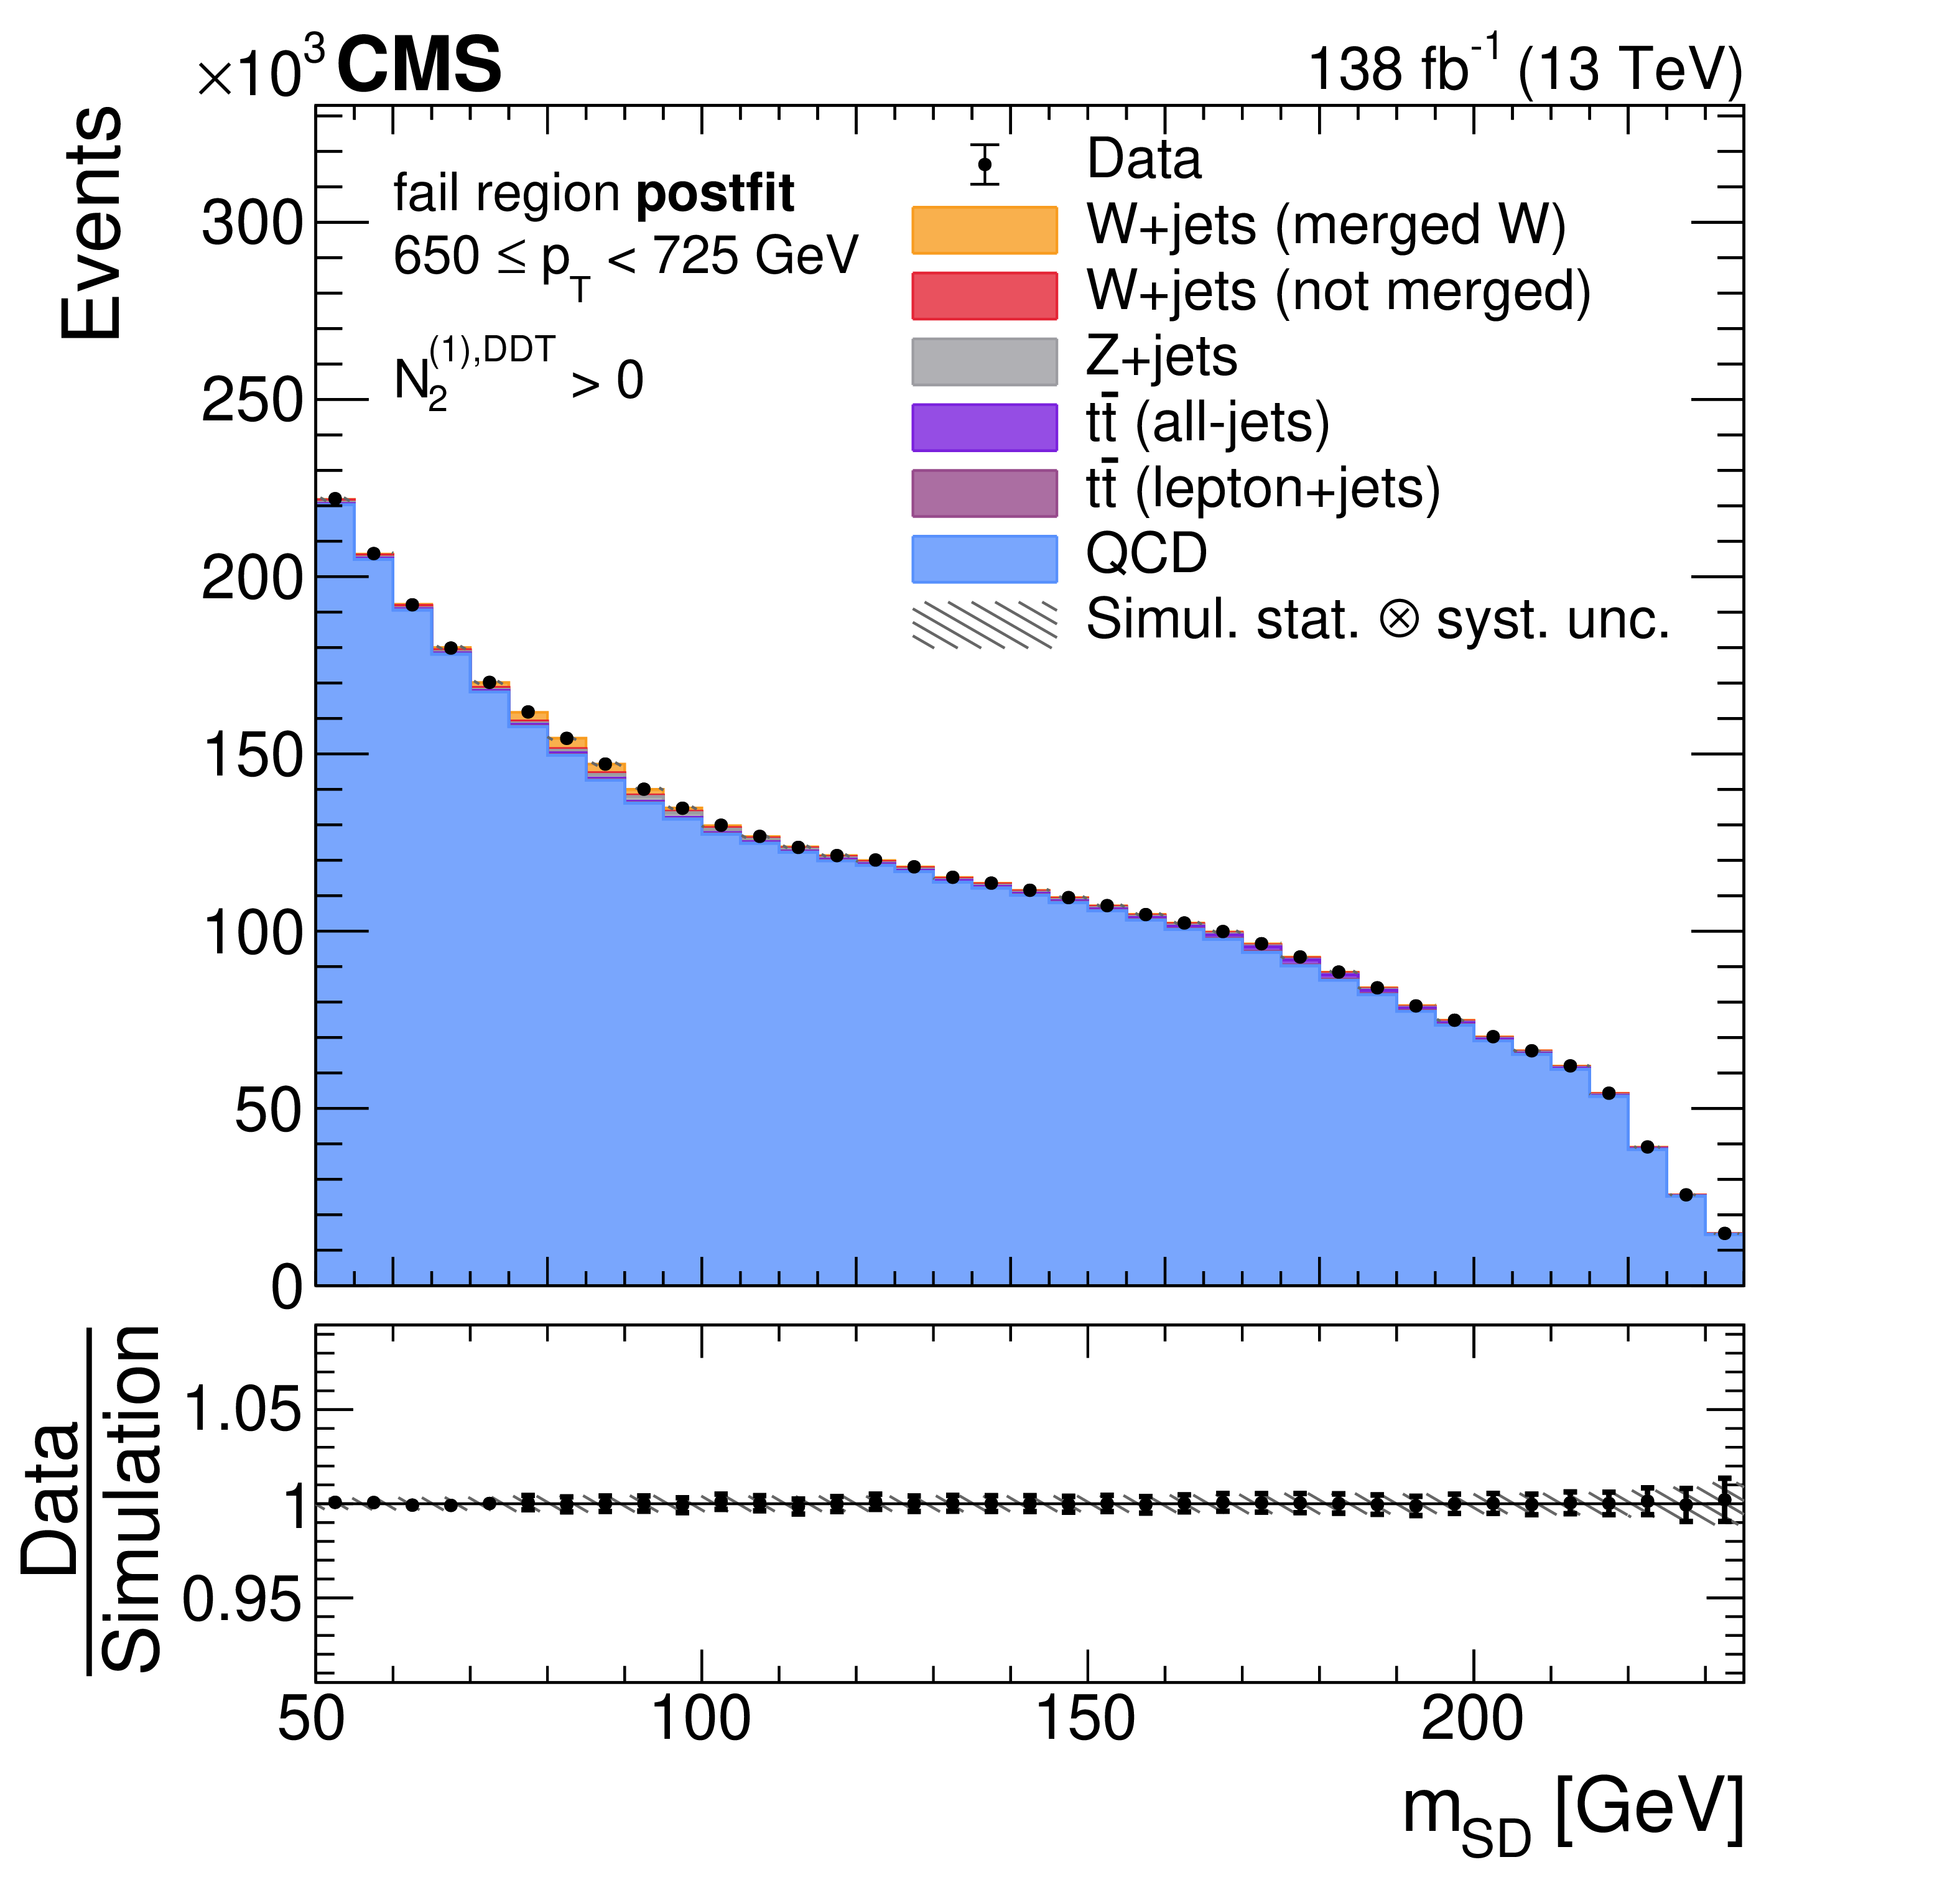
Figure 3-c:
Reconstructed $ m_\mathrm{SD} $ distributions in the second $ p_{\mathrm{T}} $ bin with 650 $ < p_{\mathrm{T}} < $ 725 GeV in the signal (upper row) and control (lower row) regions defined using the $ N_{2}^{(1),\mathrm{DDT}} $ (left) and $ P^{\mathrm{PN, DDT}}_{\mathrm{W vs. QCD}} $ (right) taggers after the background estimation and a fit to the data, explained in Section 6. All four data-taking periods are combined, resulting in a total integrated luminosity of 138 fb$ ^{-1} $. The lower panels show the data-to-simulation ratio. The error bars correspond to the statistical uncertainty in the data. The dashed band is the total uncertainty on the background after a fit to the data distribution. |
png pdf |
Figure 3-d:
Reconstructed $ m_\mathrm{SD} $ distributions in the second $ p_{\mathrm{T}} $ bin with 650 $ < p_{\mathrm{T}} < $ 725 GeV in the signal (upper row) and control (lower row) regions defined using the $ N_{2}^{(1),\mathrm{DDT}} $ (left) and $ P^{\mathrm{PN, DDT}}_{\mathrm{W vs. QCD}} $ (right) taggers after the background estimation and a fit to the data, explained in Section 6. All four data-taking periods are combined, resulting in a total integrated luminosity of 138 fb$ ^{-1} $. The lower panels show the data-to-simulation ratio. The error bars correspond to the statistical uncertainty in the data. The dashed band is the total uncertainty on the background after a fit to the data distribution. |
png pdf |
Figure 4:
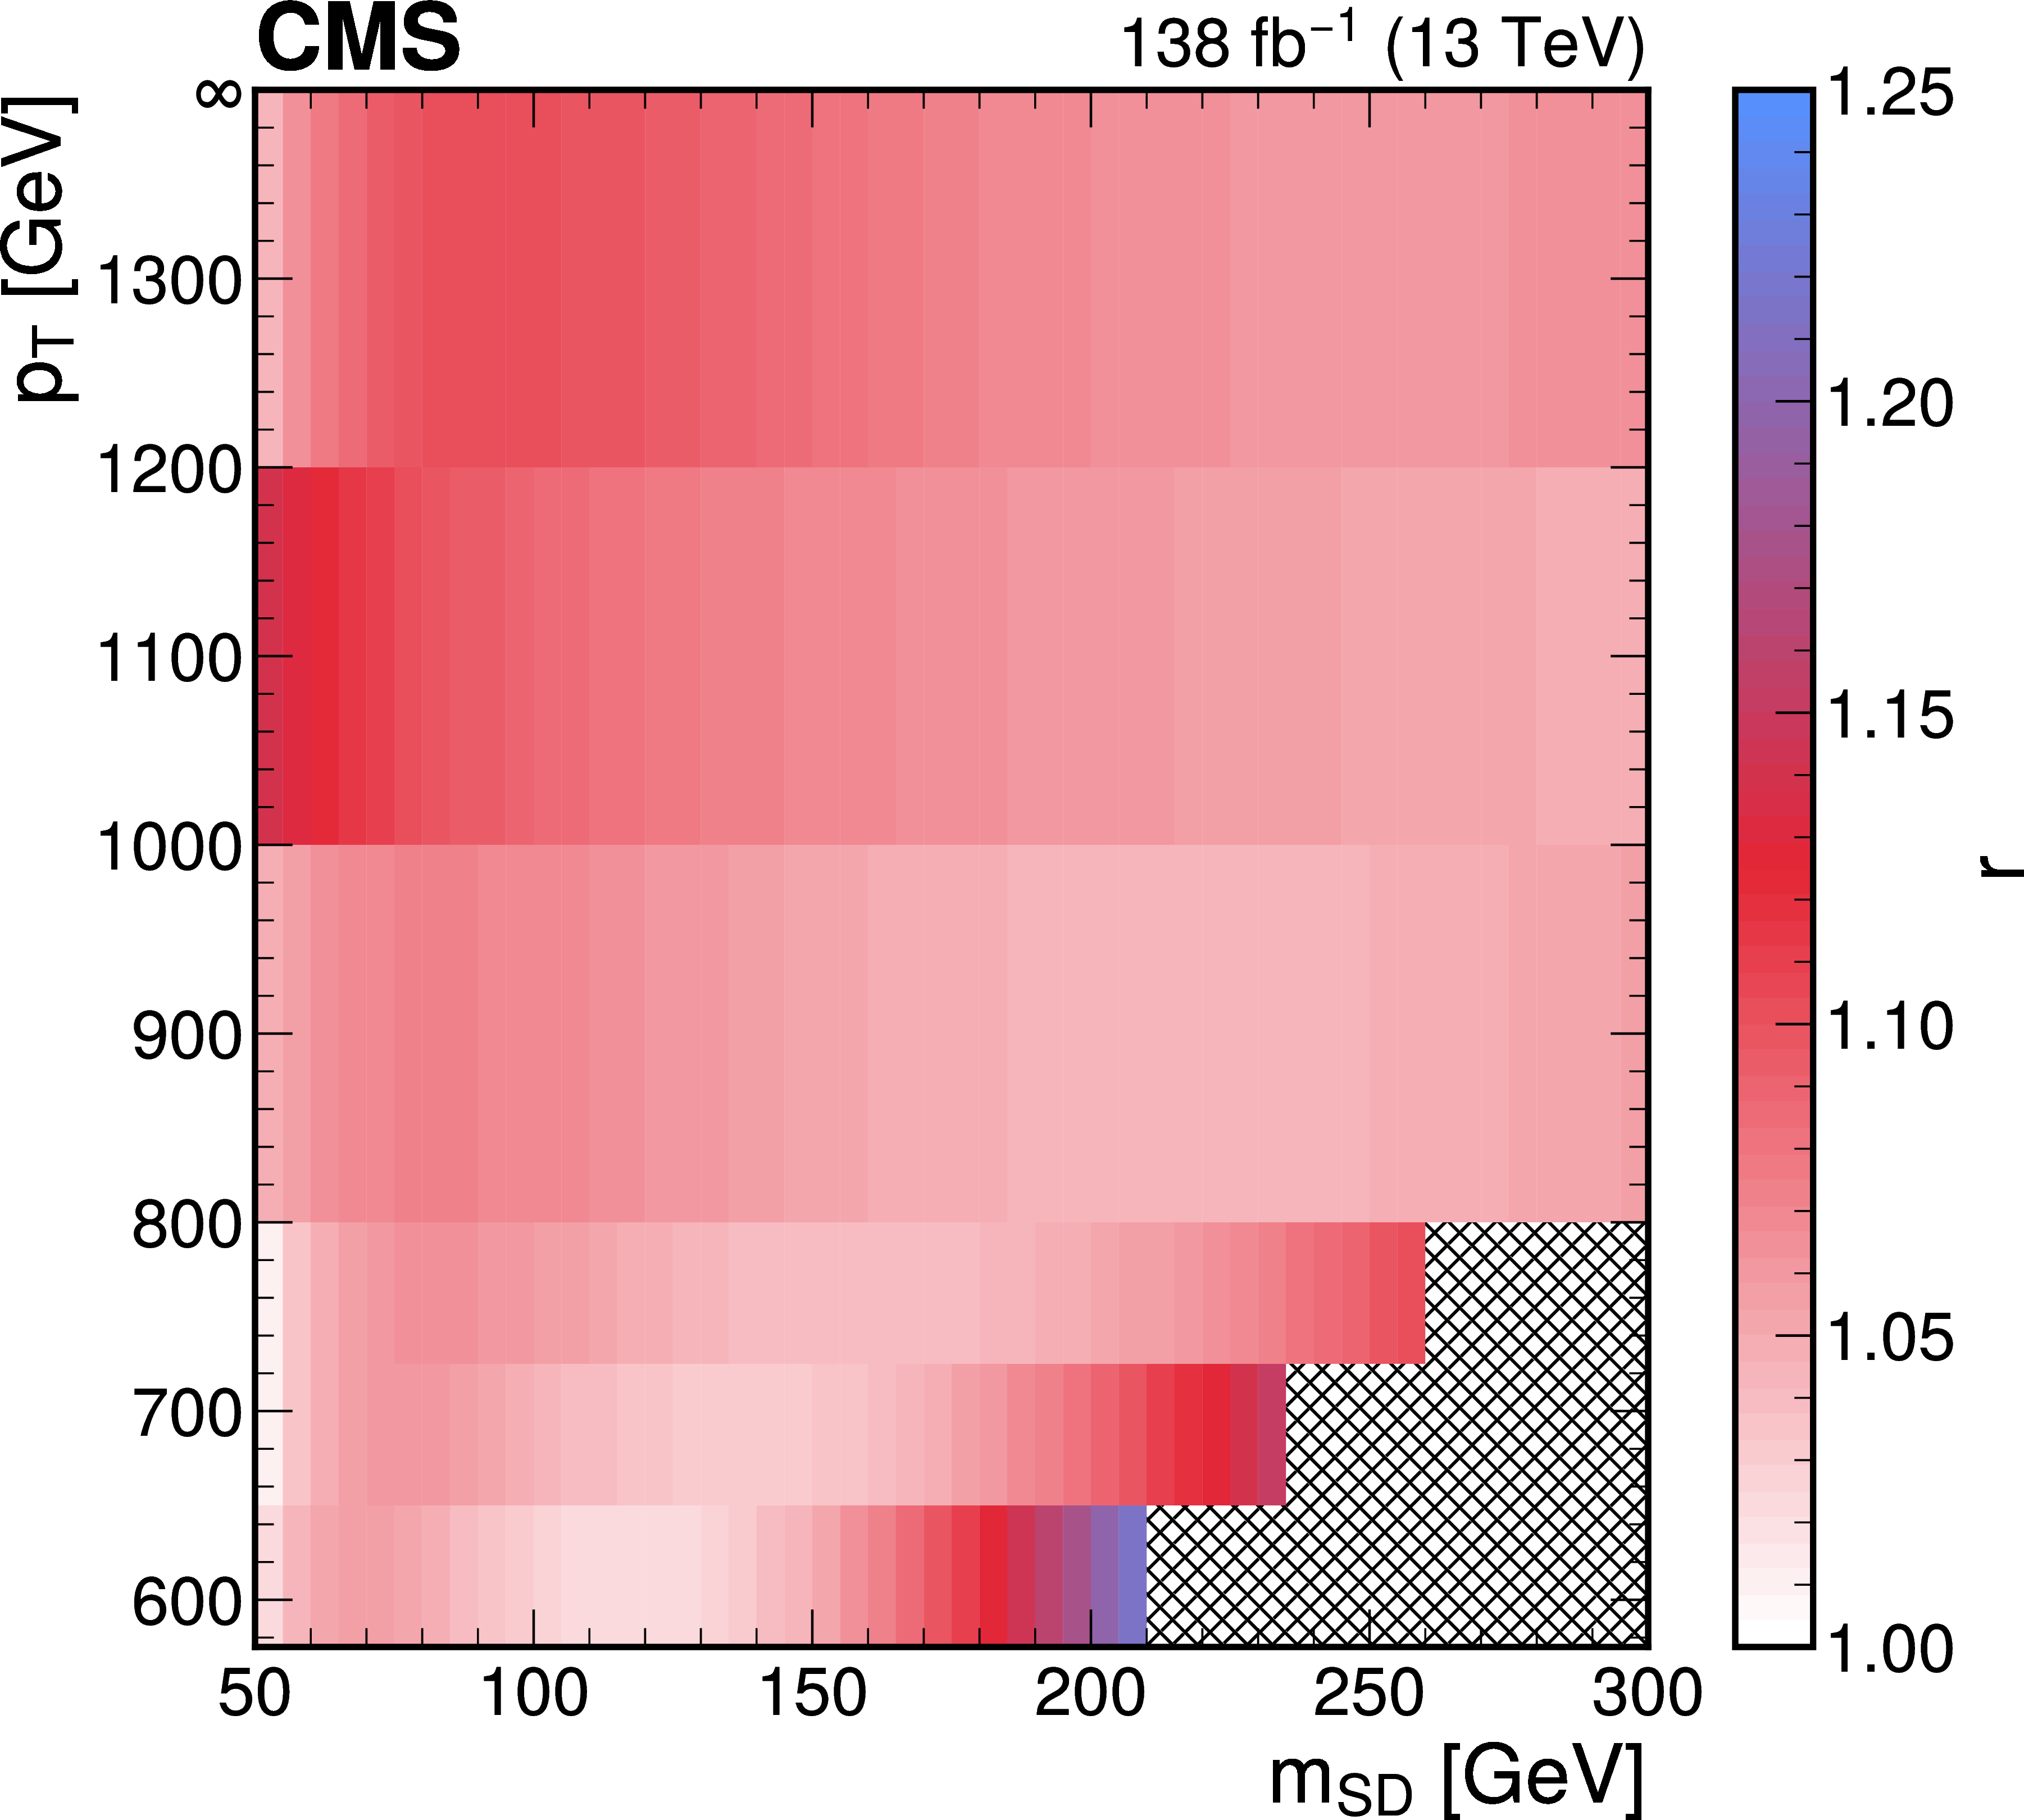
Residual function $ r(\hat{p}_{\mathrm{T}}, \hat{\rho}_\mathrm{SD}) $ obtained from a fit to data, when using the $ P^{\mathrm{PN, DDT}}_{\mathrm{W vs. QCD}} $ as jet tagger. The arguments of the function $ r $, $ \hat{p}_{\mathrm{T}} $ and $ \hat{\rho}_\mathrm{SD} $ are functions of $ m_\mathrm{SD} $ and $ p_{\mathrm{T}} $ and correspond to the normalized observables $ p_{\mathrm{T}} $ and $ \rho_{\mathrm{SD}} $, scaled to lie in the interval $ [0,1] $. The hatched area is excluded from the analyses by selecting $ \rho_{\mathrm{SD}} < - $ 2.1. |
png pdf |
Figure 5:
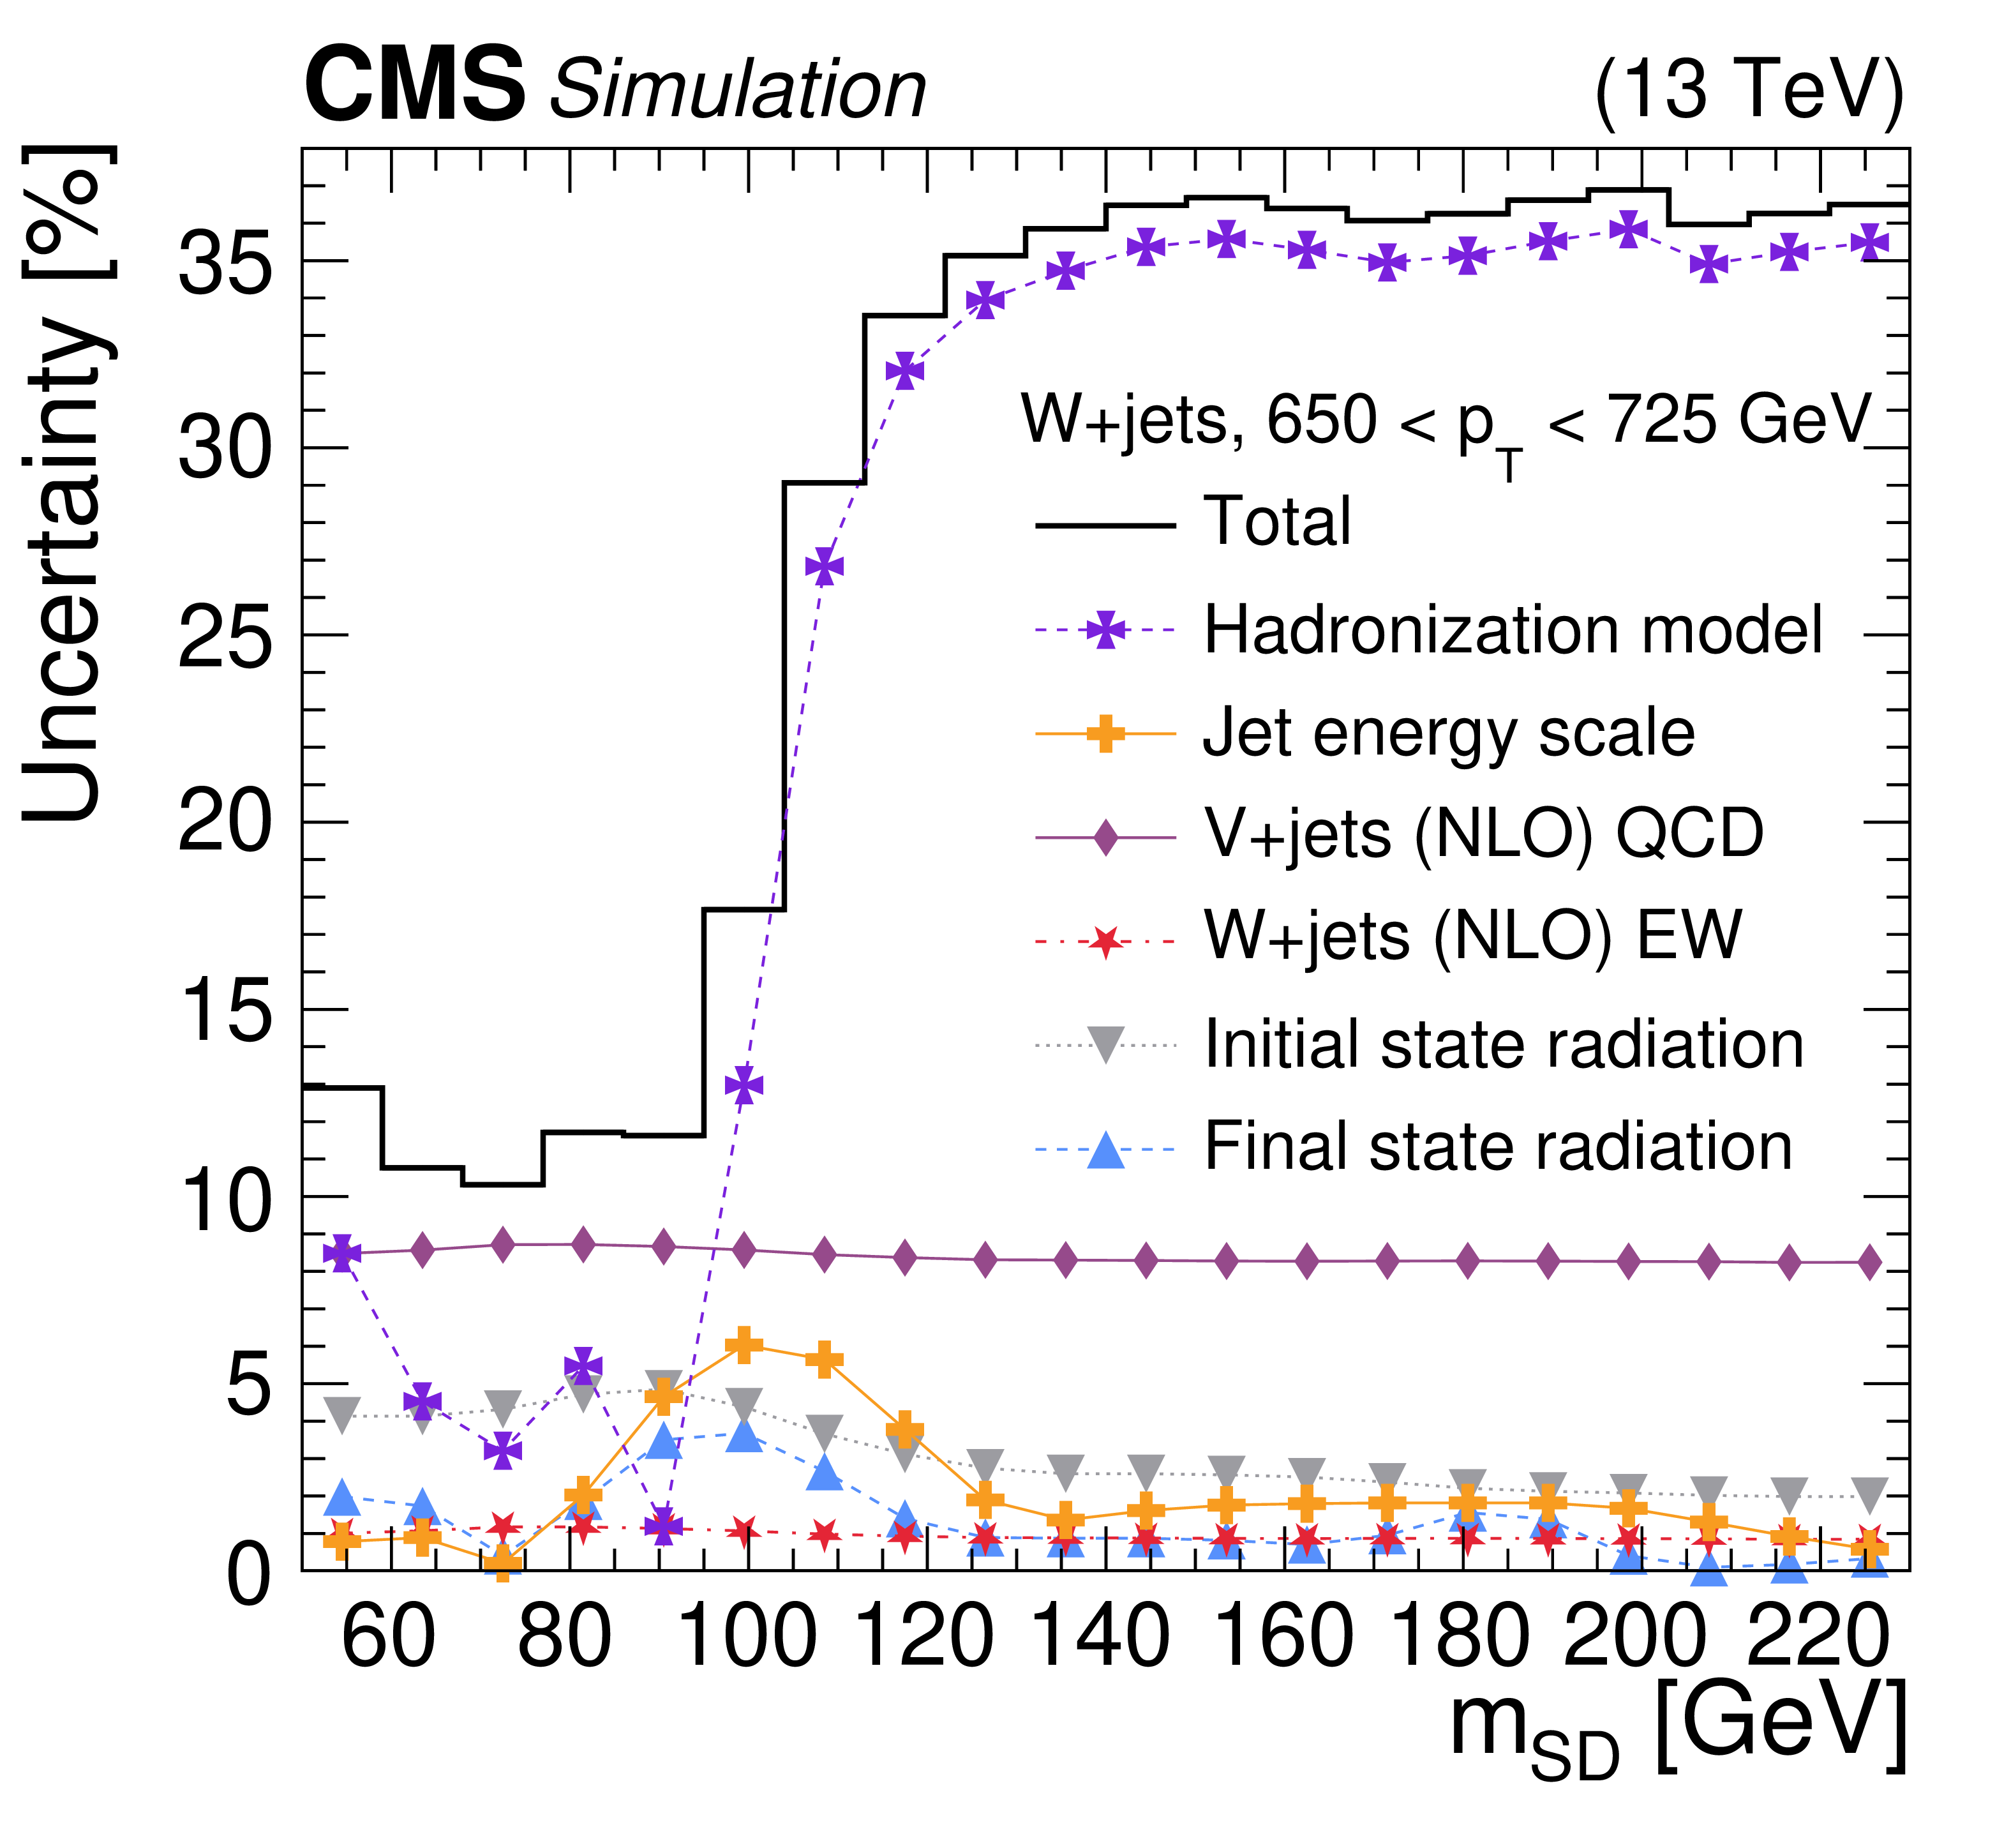
Summary of the effect of the systematic uncertainties in the reconstructed SD jet mass in the $ \mathrm{W}(\mathrm{q}\overline{\mathrm{q}}') $+jets signal sample in a representative $ p_{\mathrm{T}} $ bin. The dominant shape effects can be attributed to uncertainties in the hadronization model, jet energy scale, and final-state shower. The jet energy scale and final state shower mainly affect the region of the W boson mass peak (70 $ < m_\mathrm{SD} < $ 110 GeV). |
png pdf |
Figure 6:
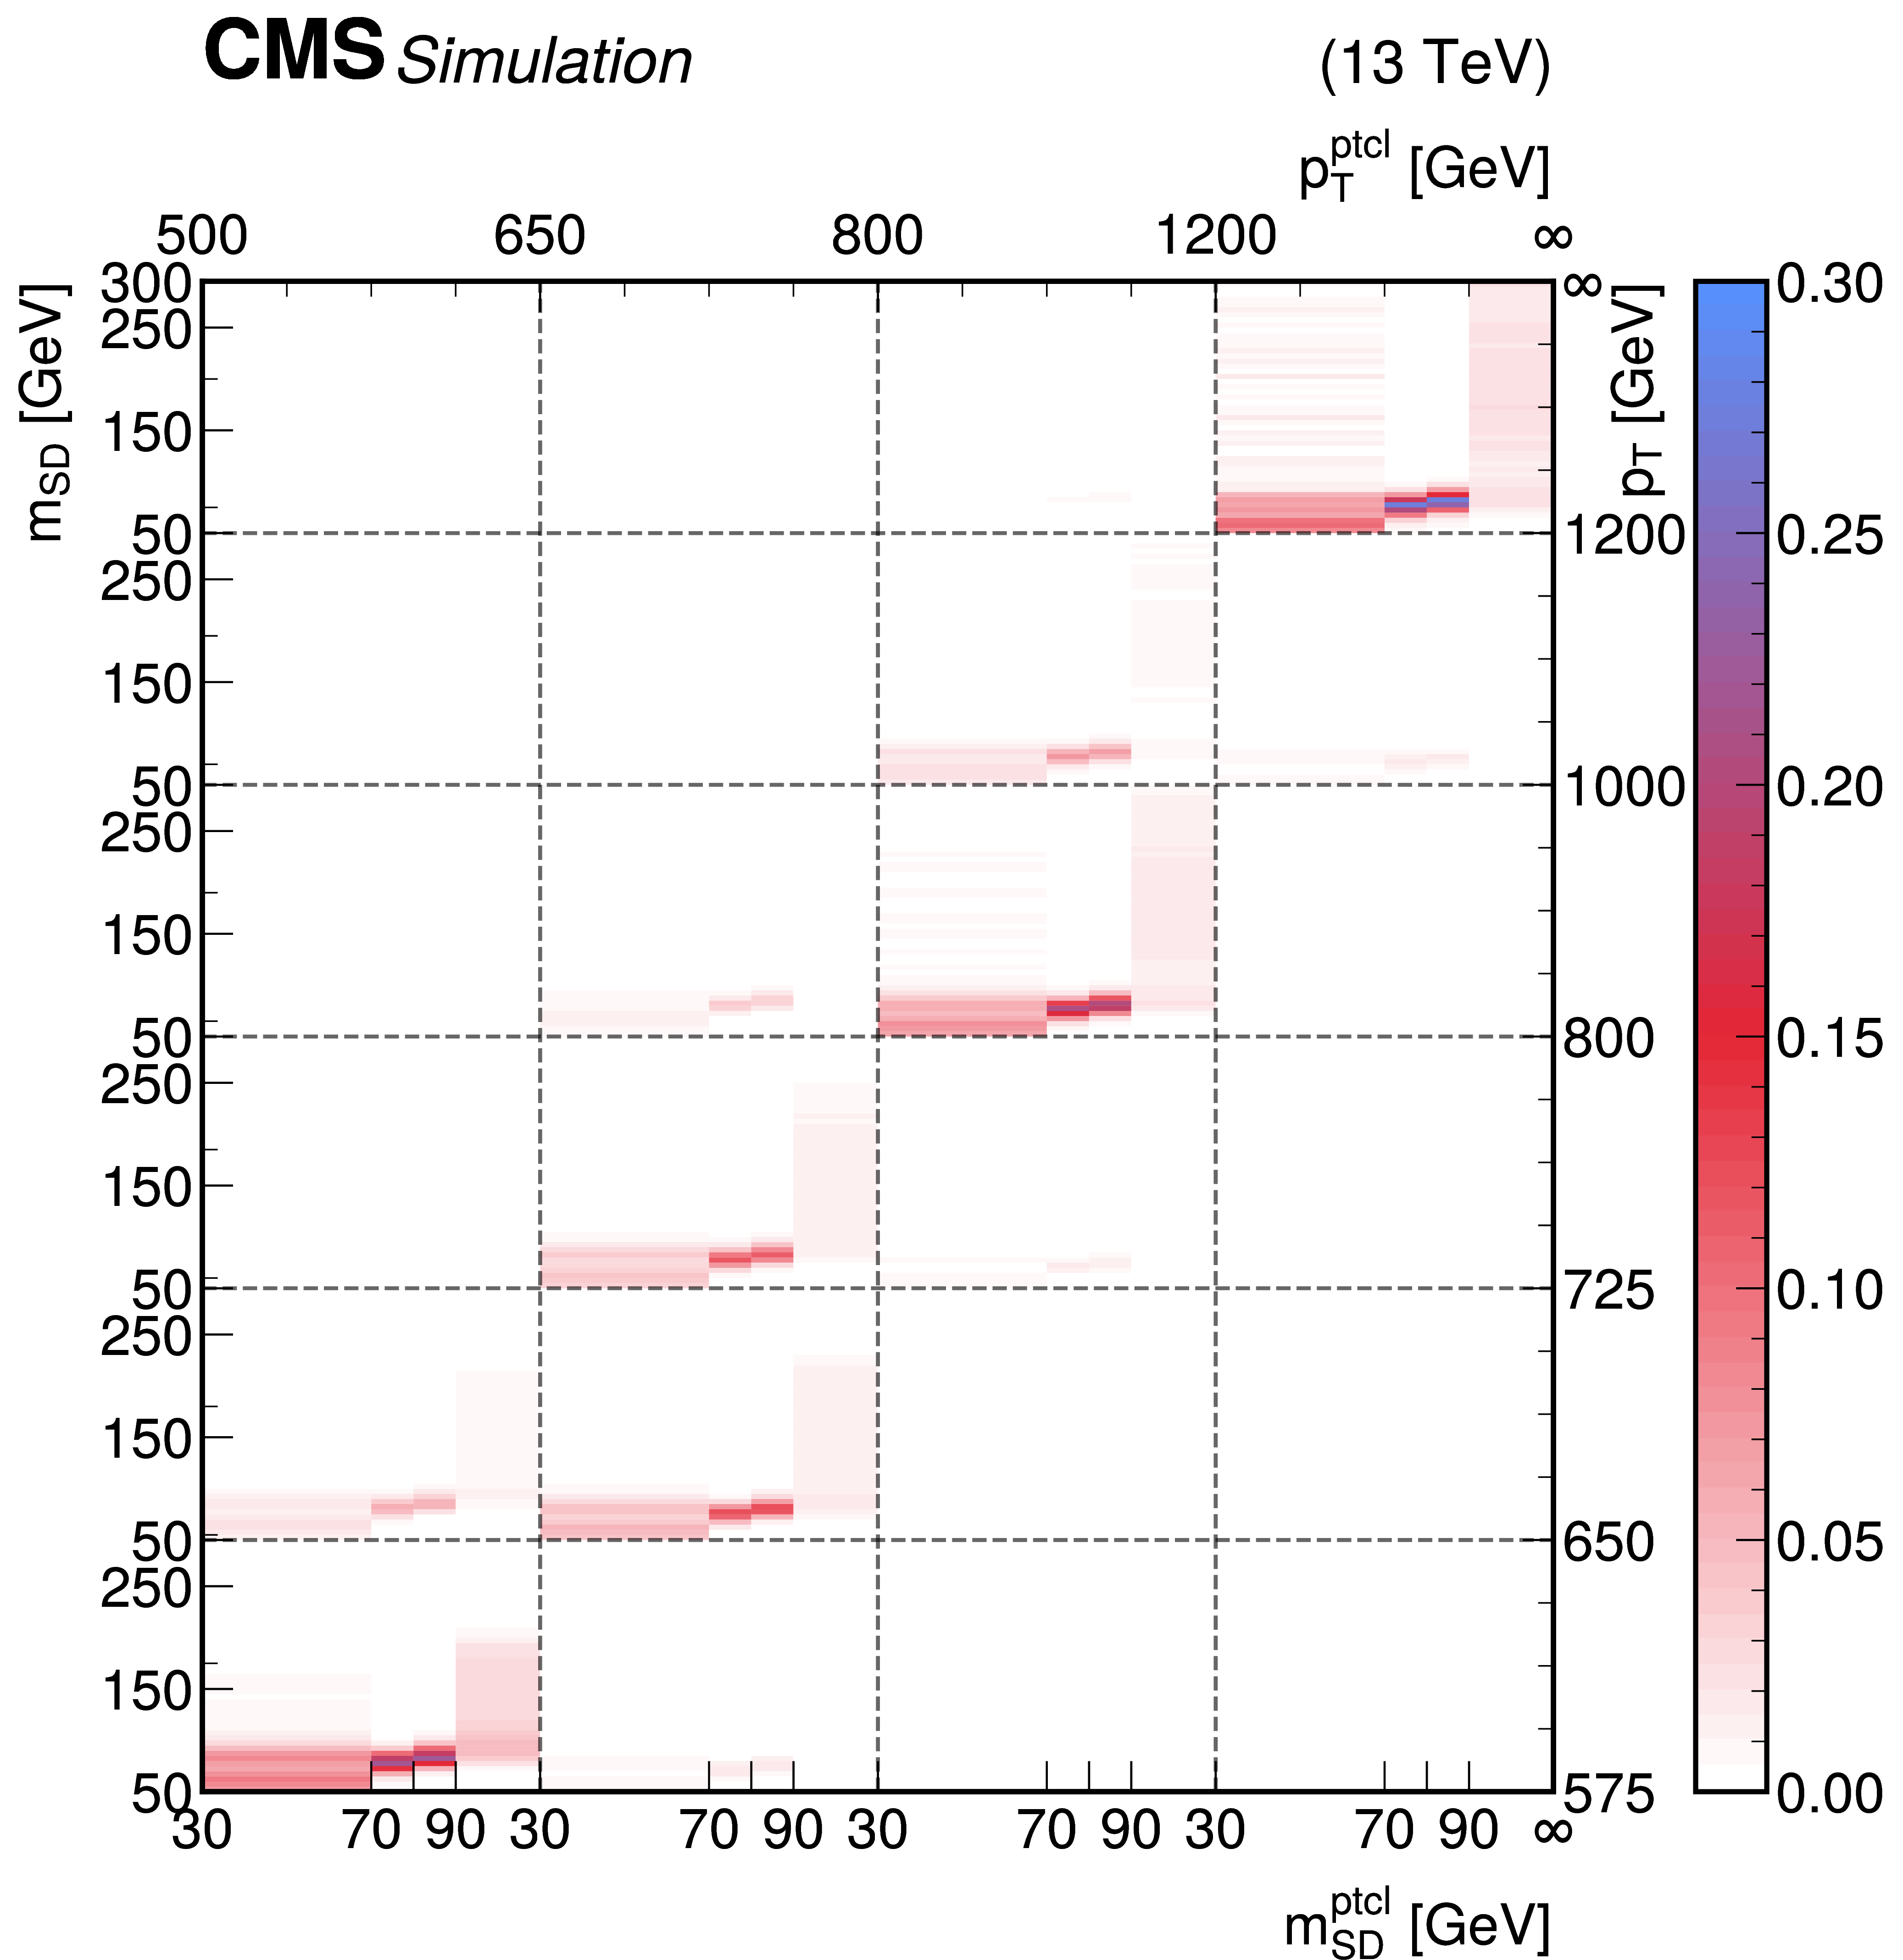
Response matrix obtained for selected events in simulation. The matrix is obtained from a sum of all data-taking eras. The grey dashed lines separate the individual $ p_{\mathrm{T}} $ bins. The binning within each $ p_{\mathrm{T}} $ bin corresponds to the $ m_\mathrm{SD} $ binning. |
png pdf |
Figure 7:
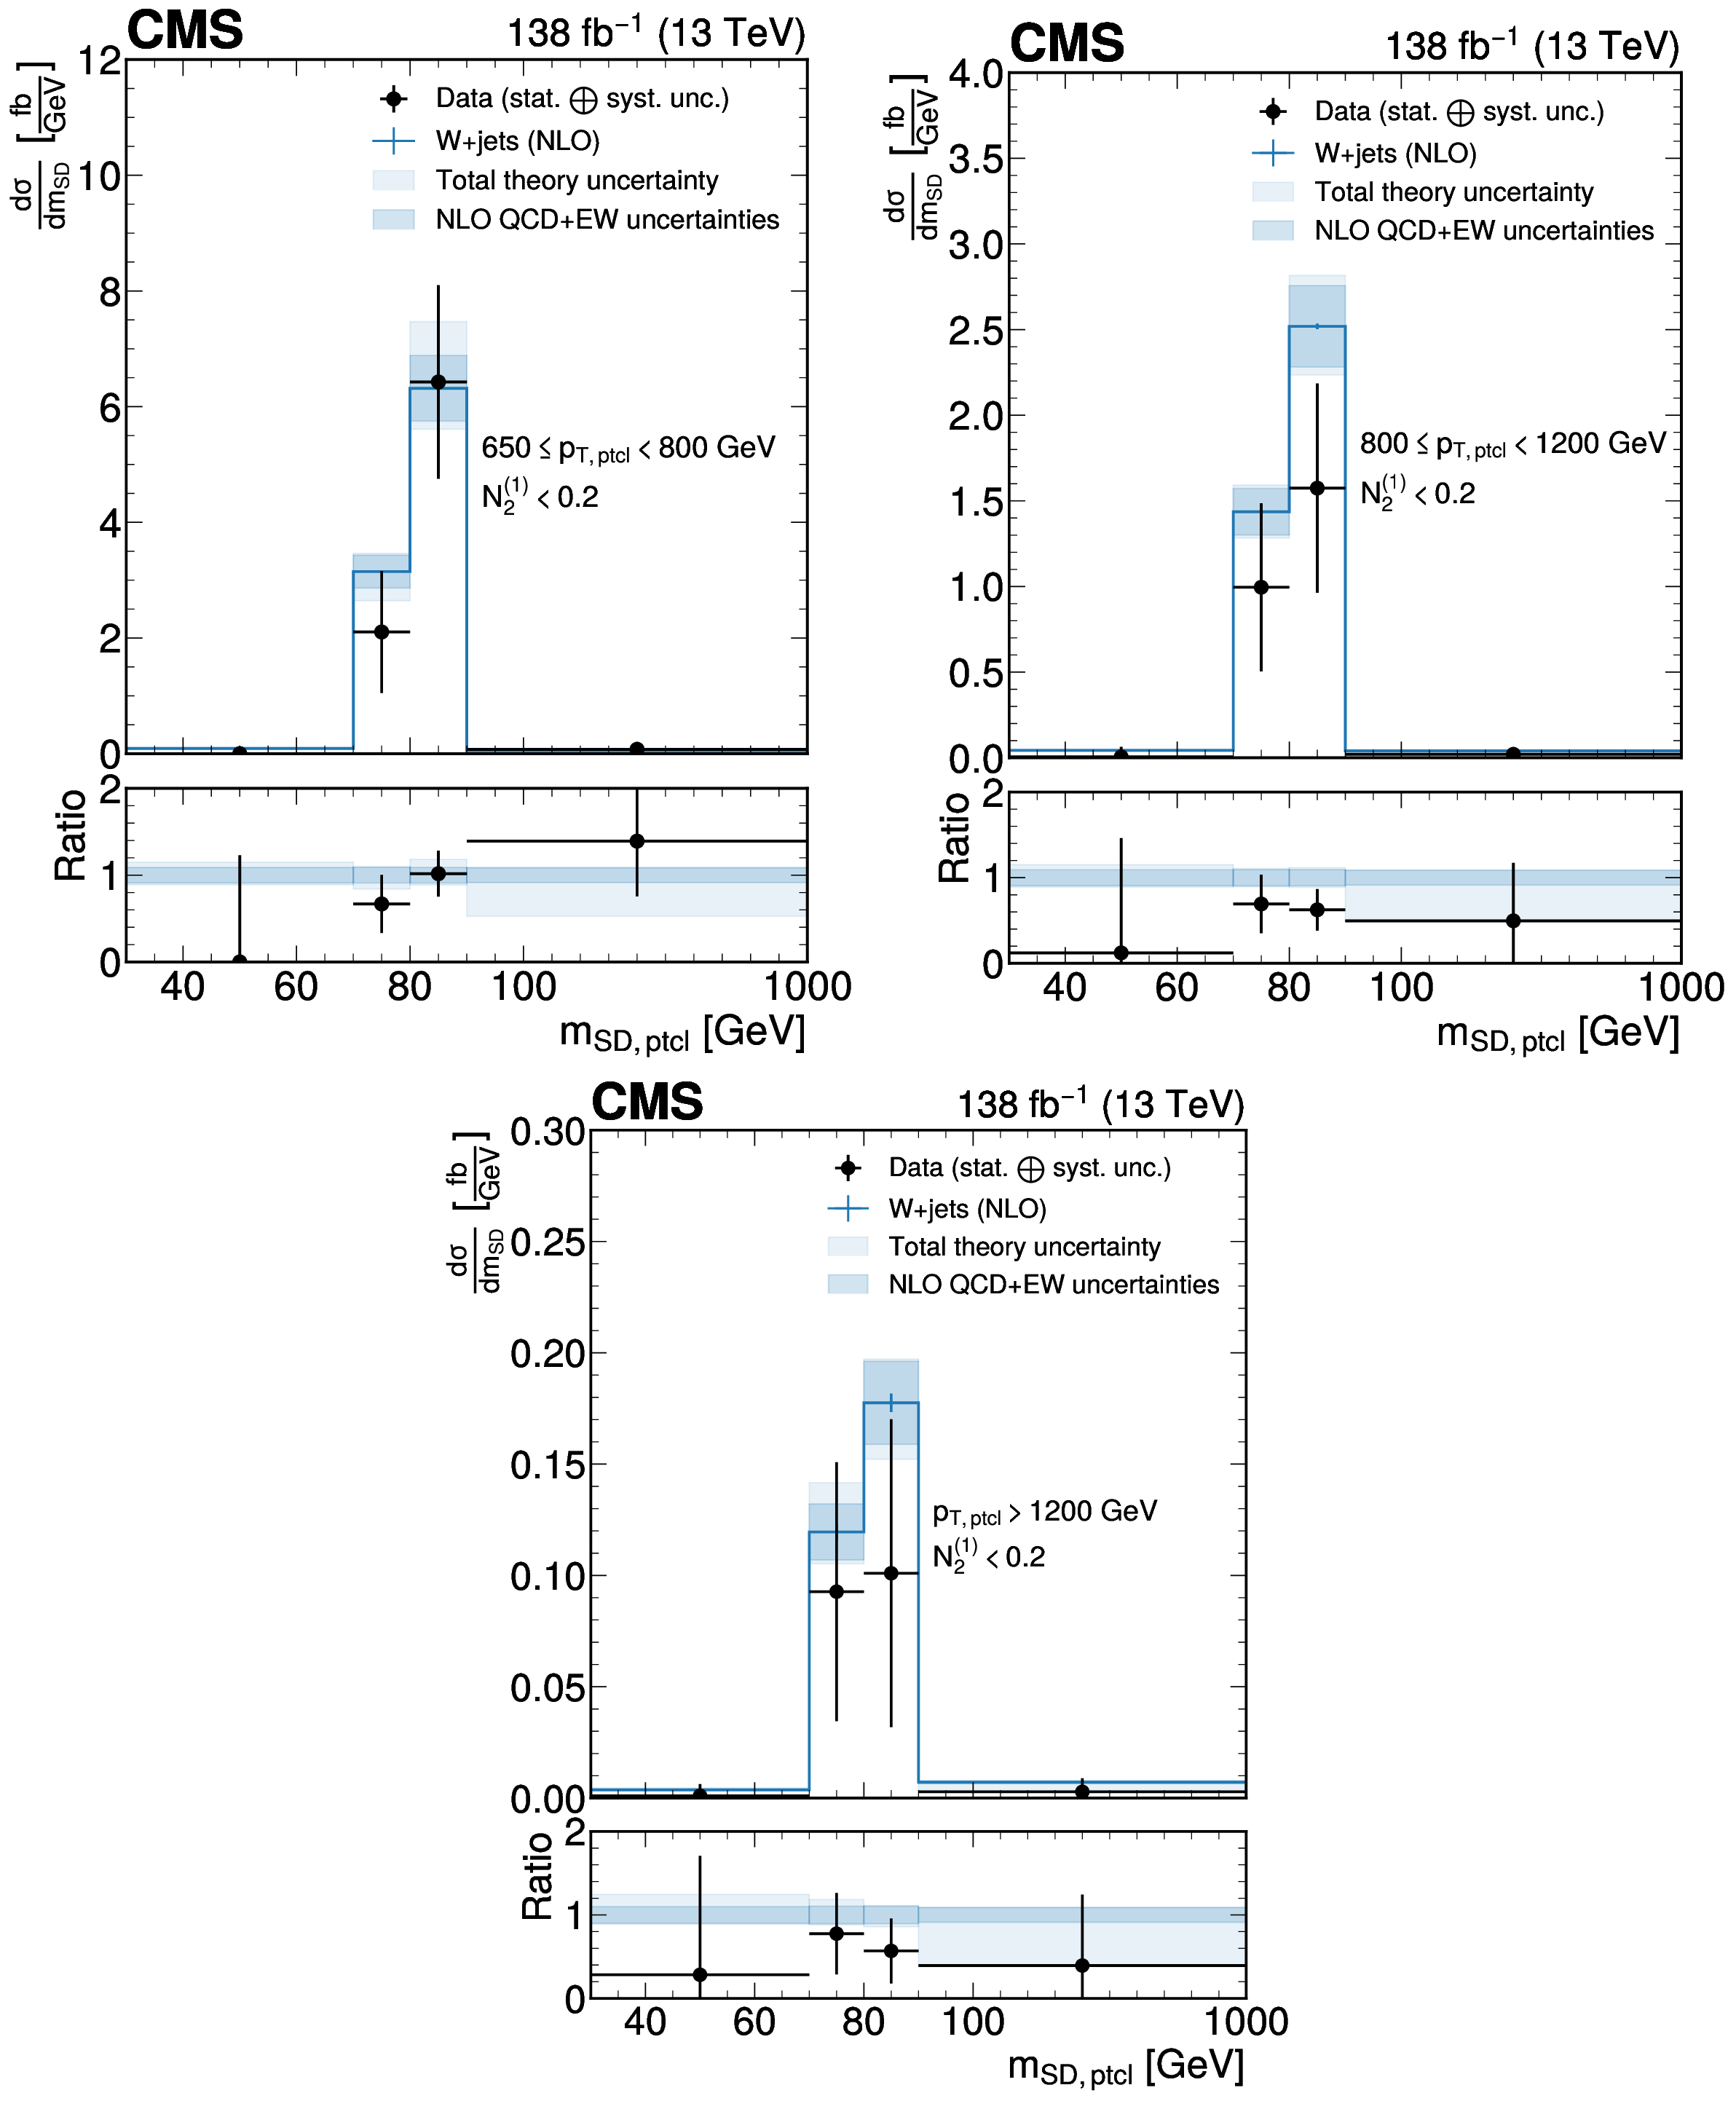
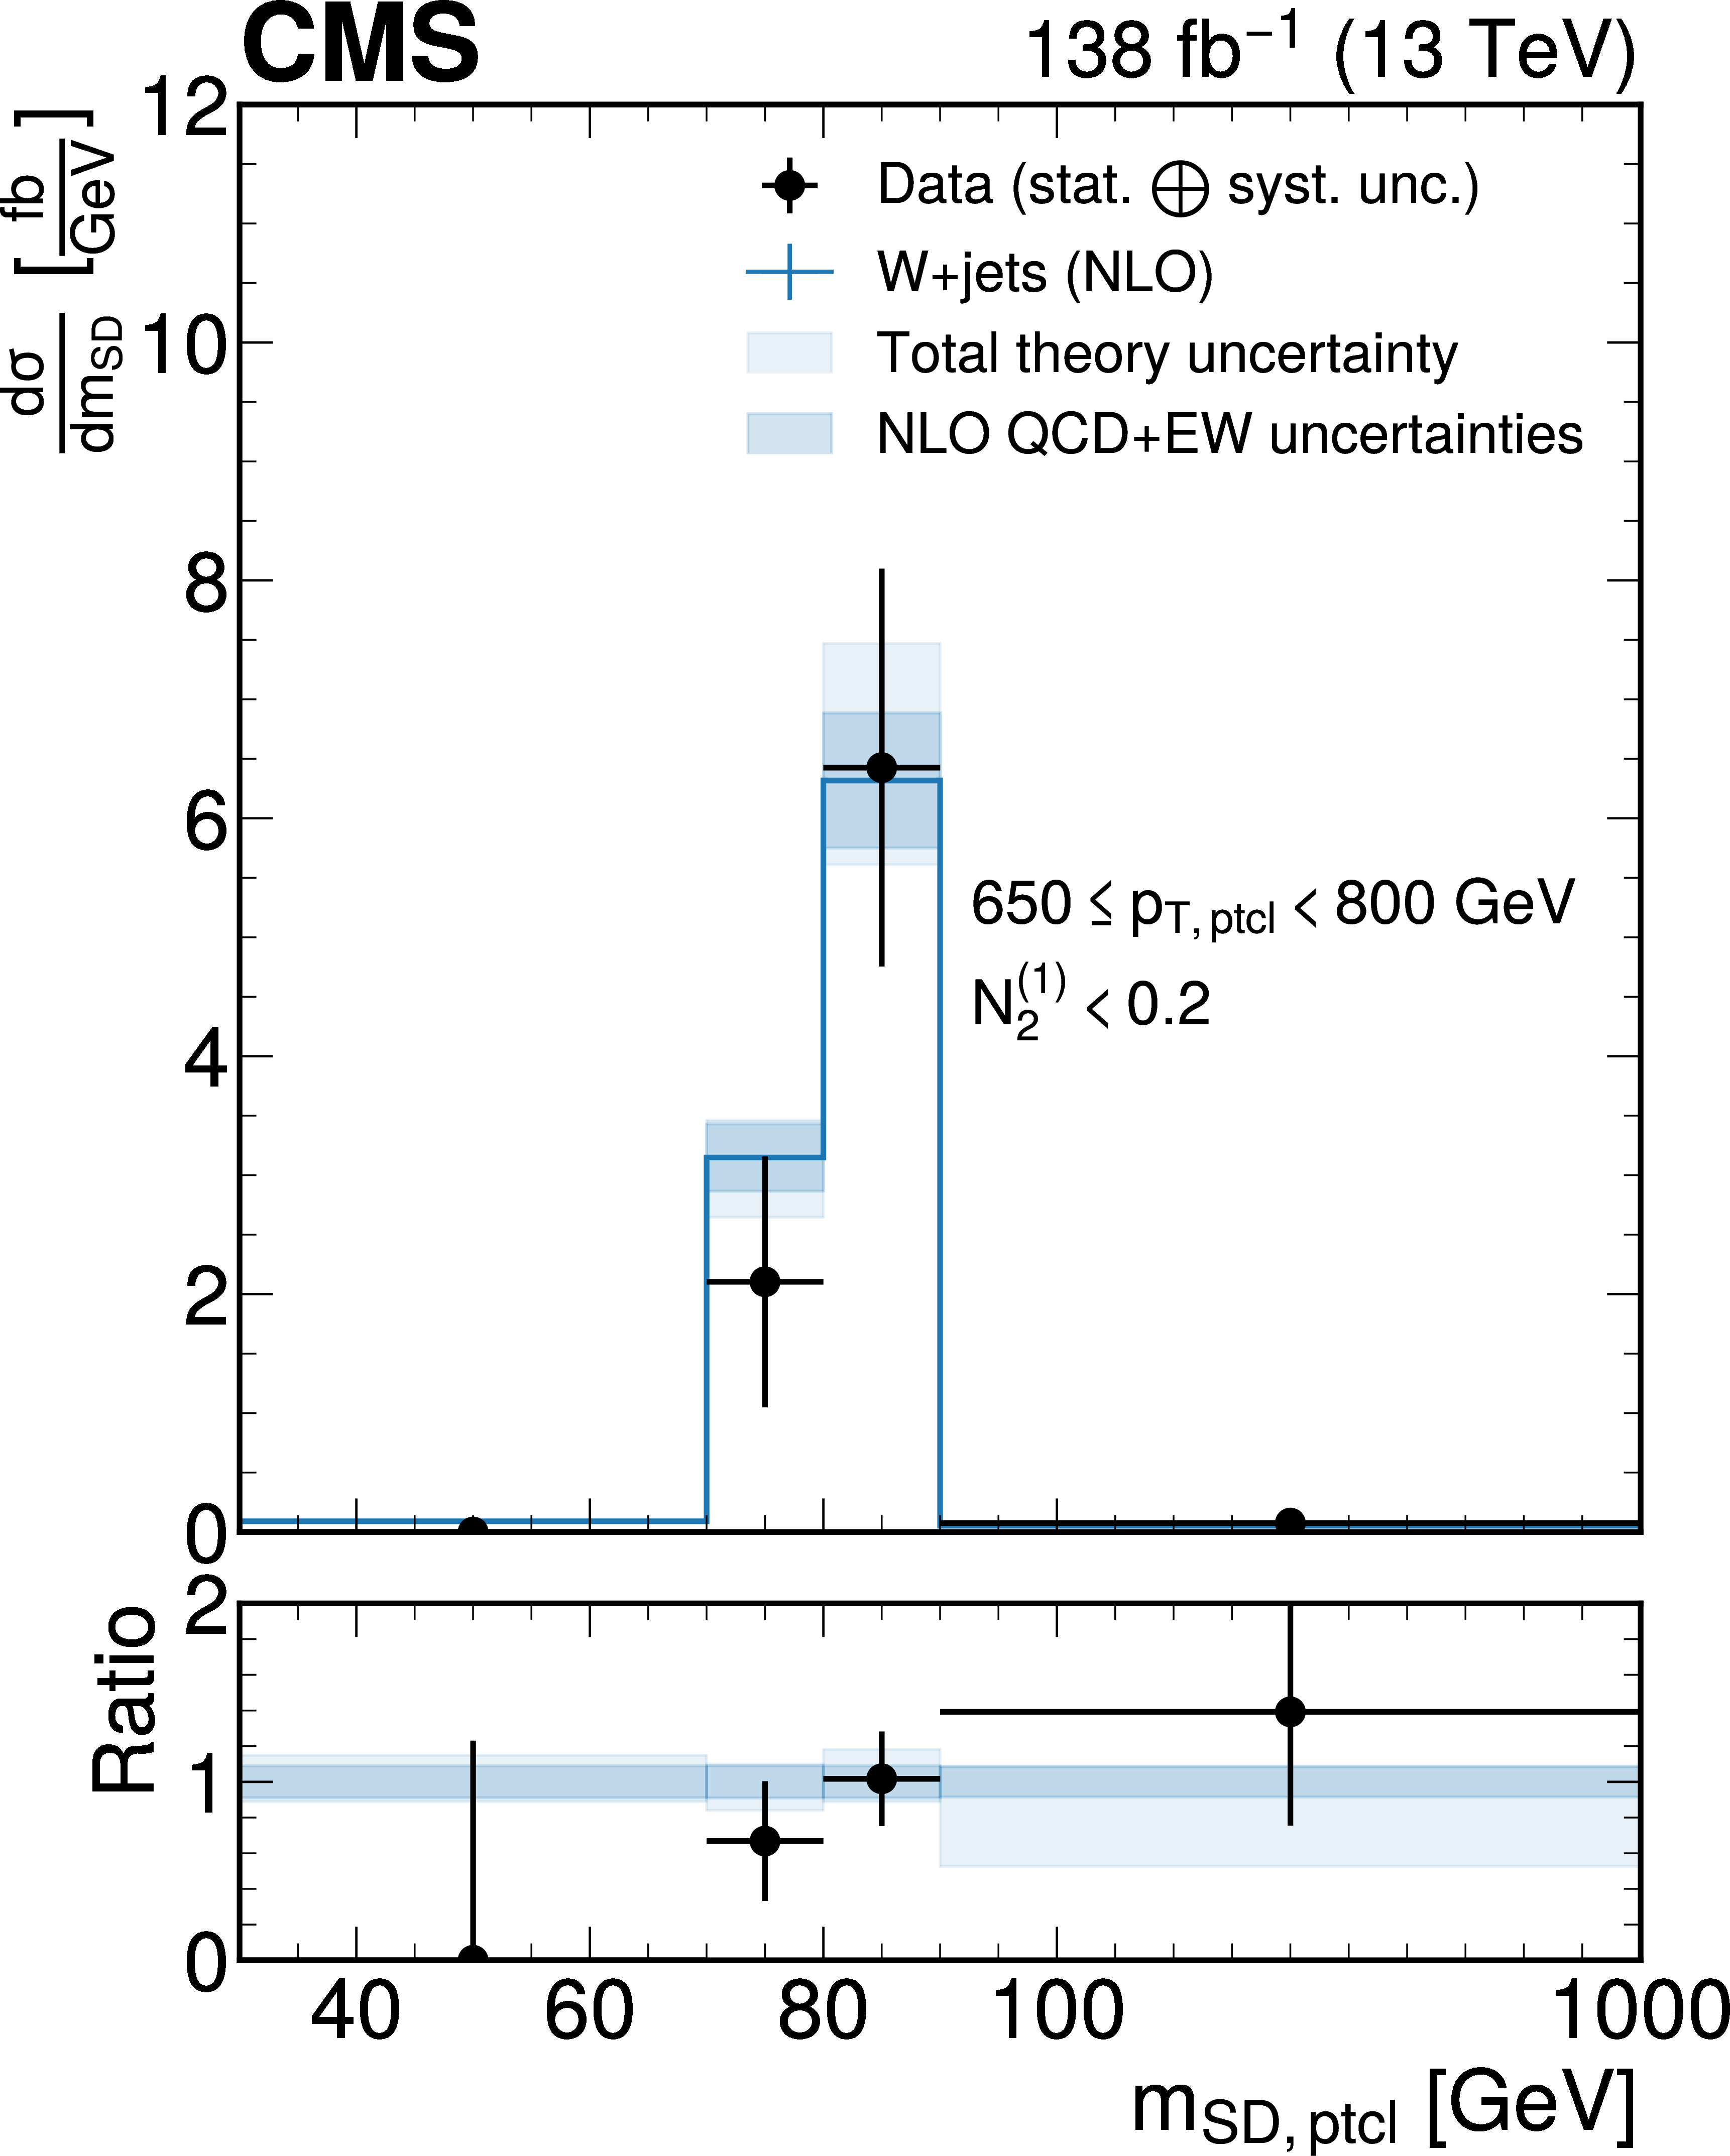
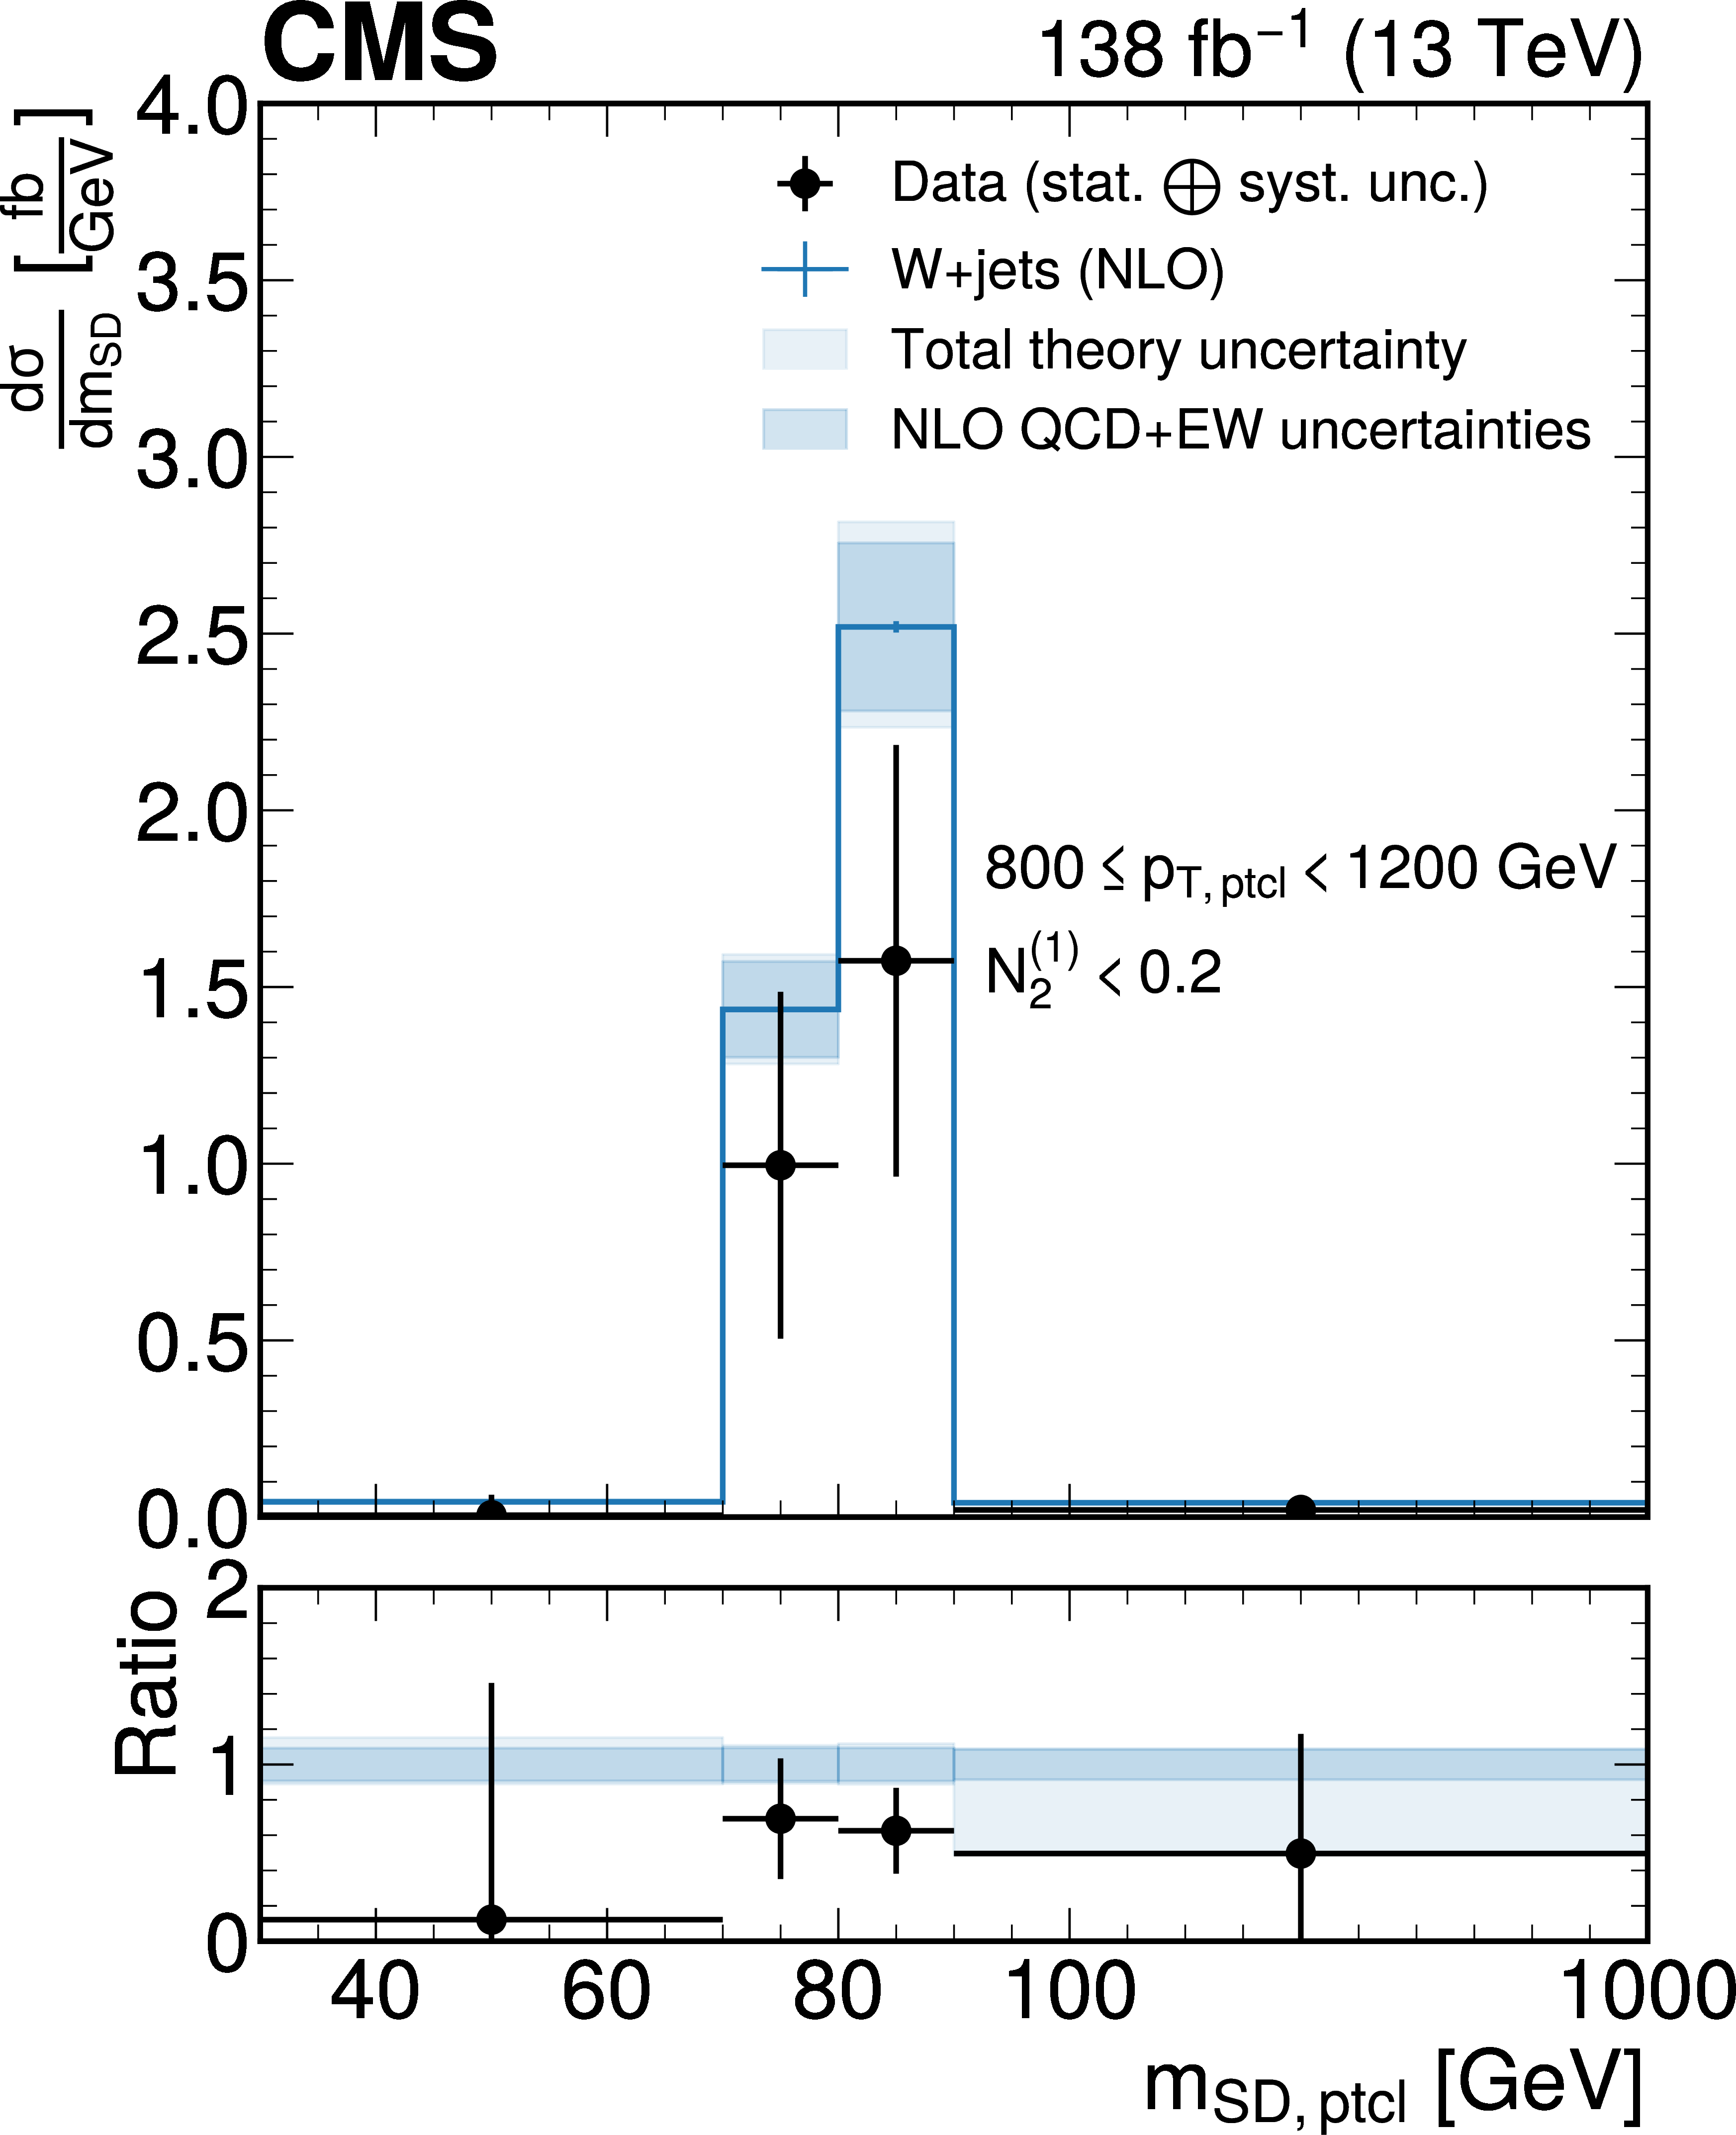
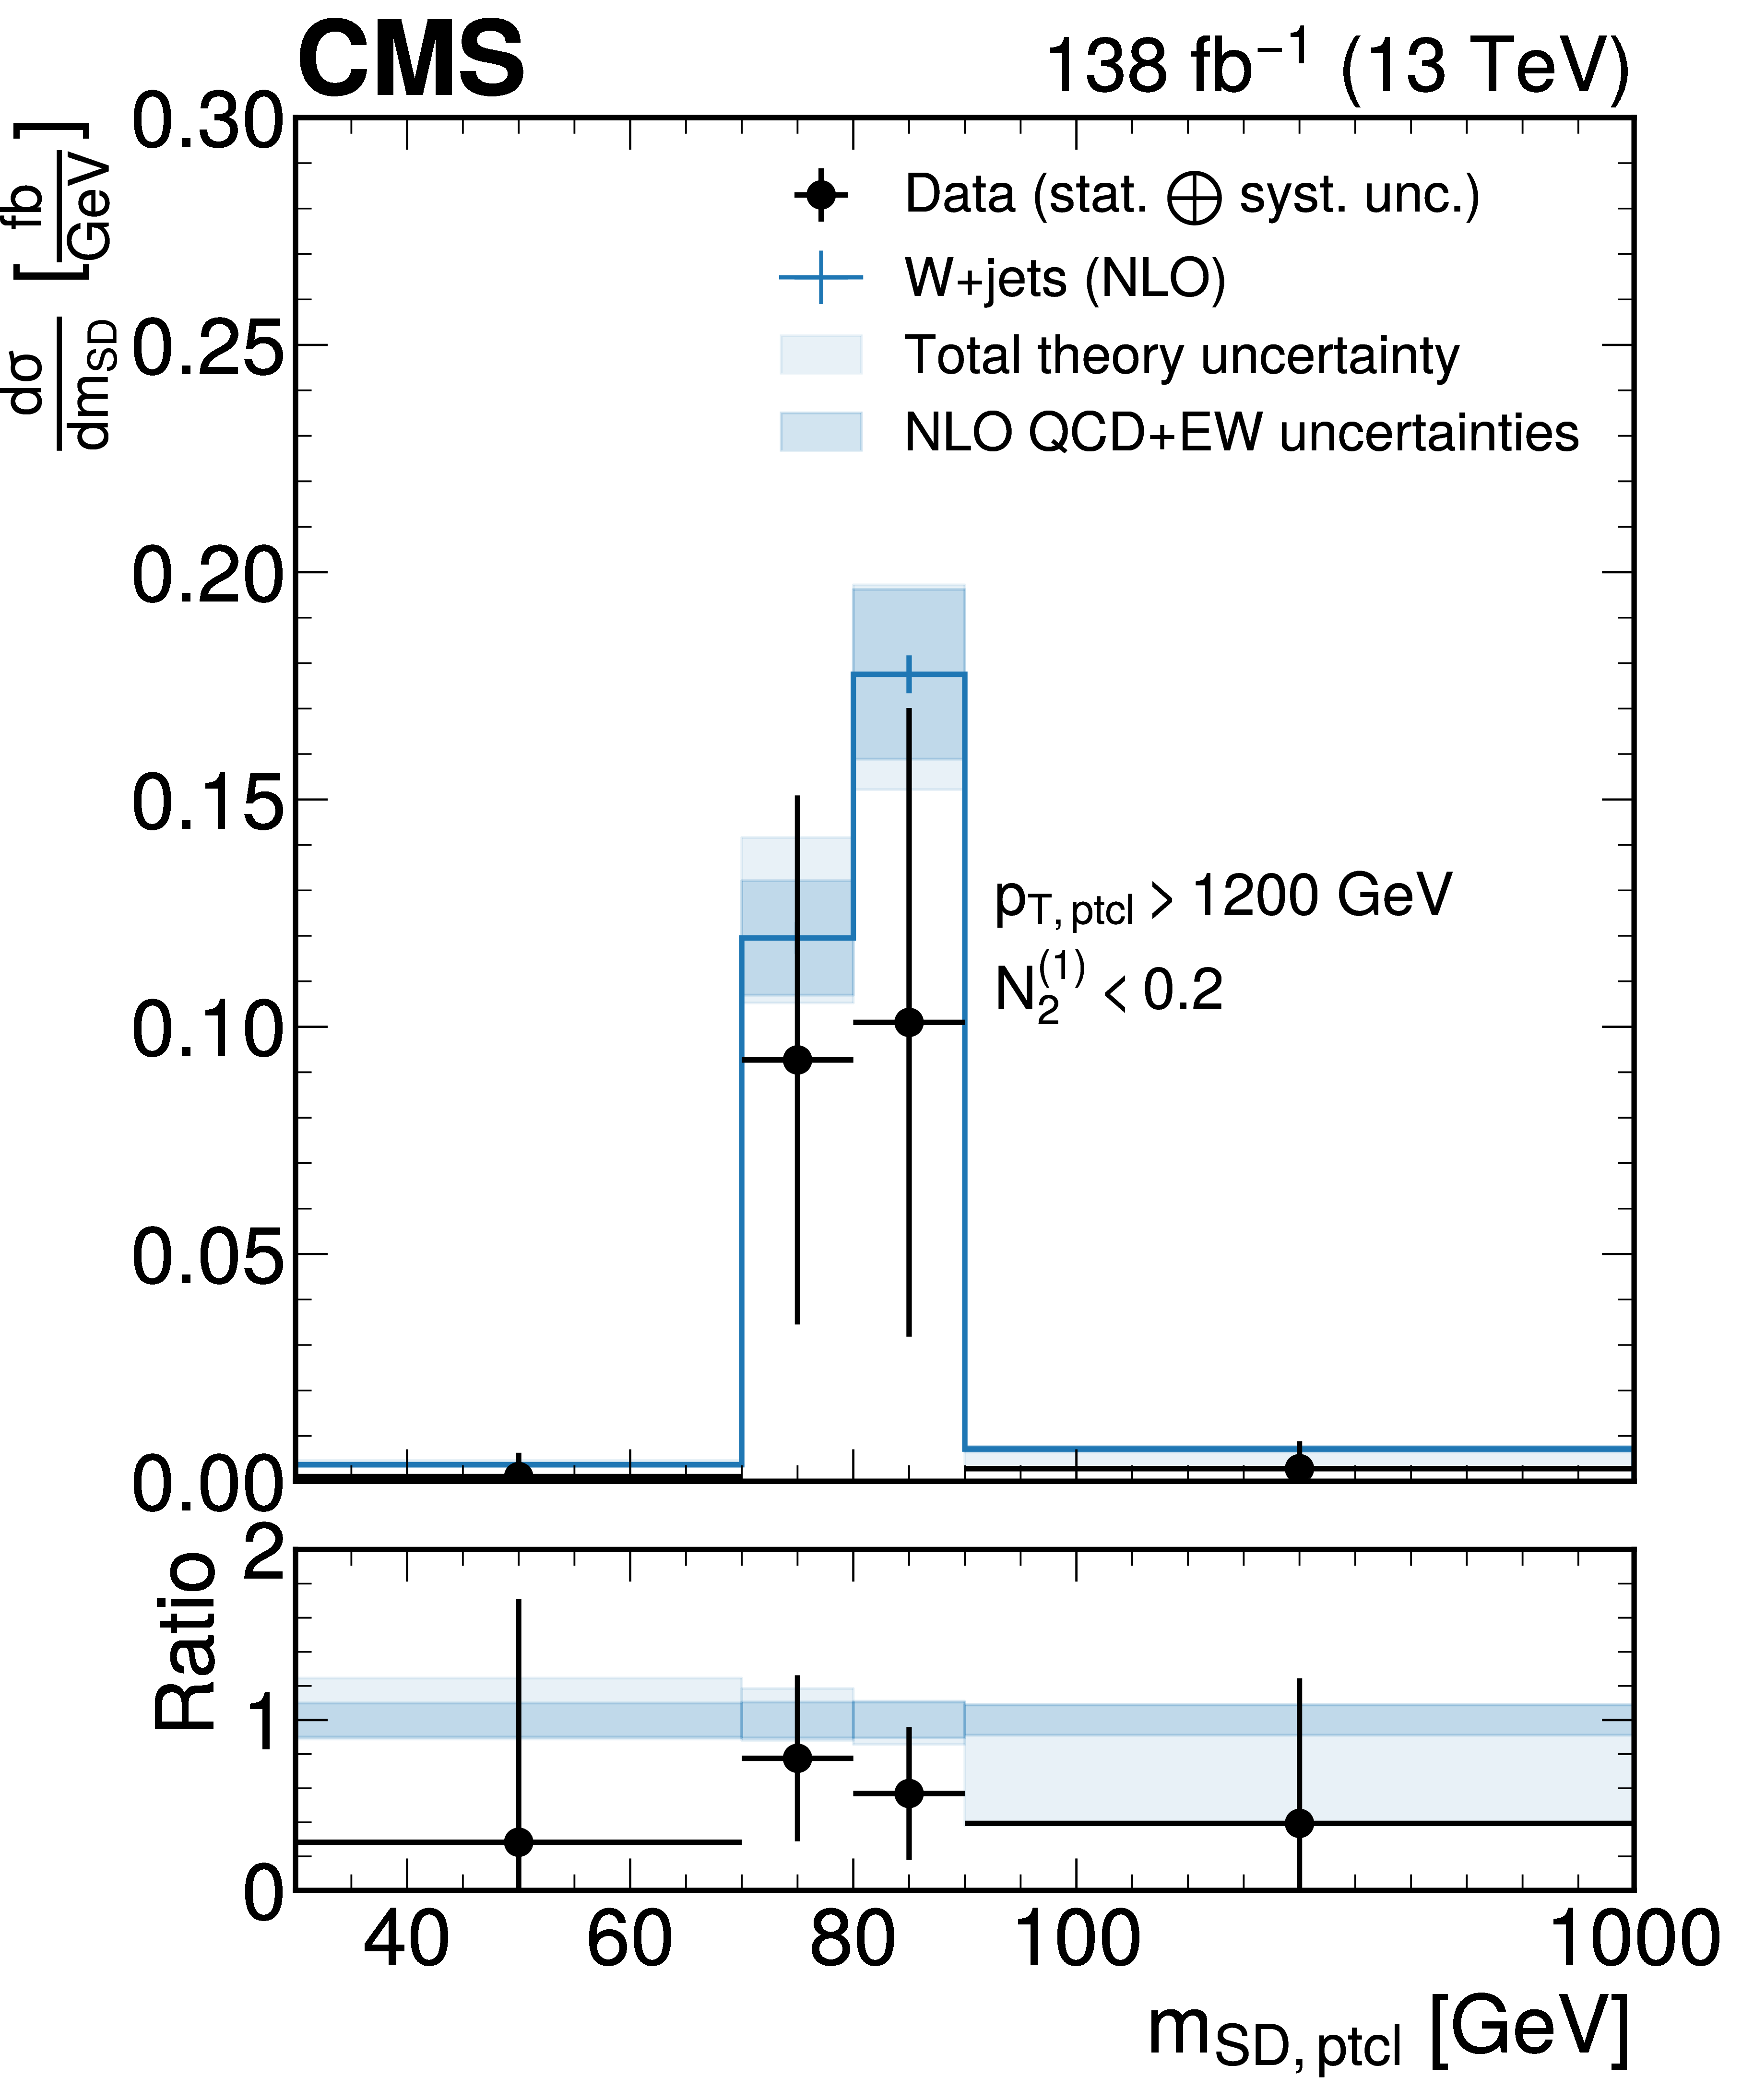
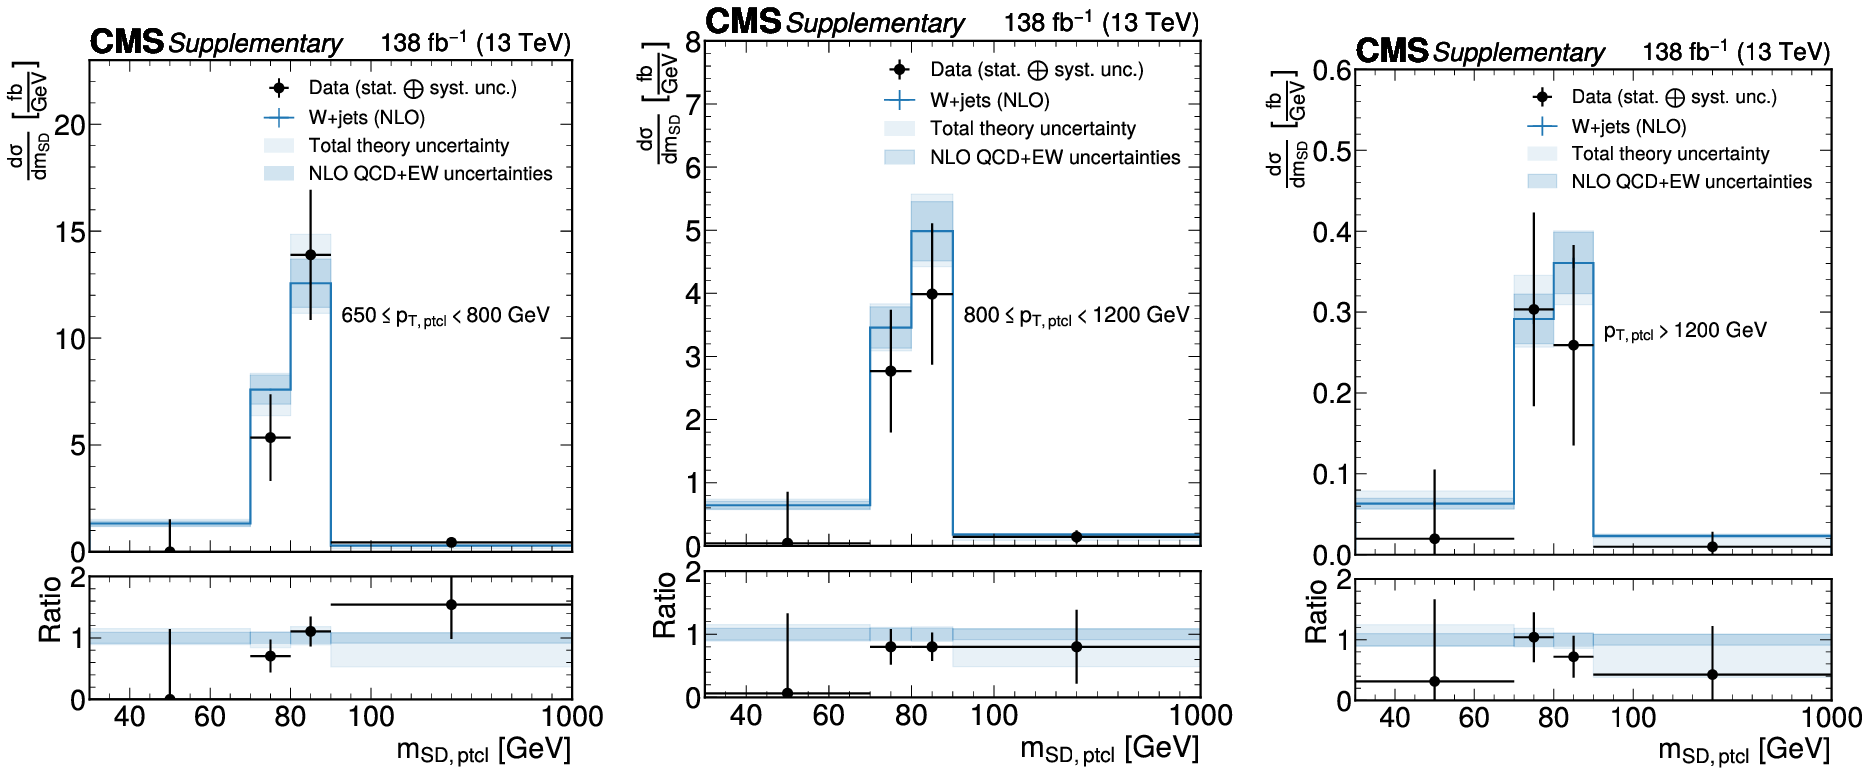
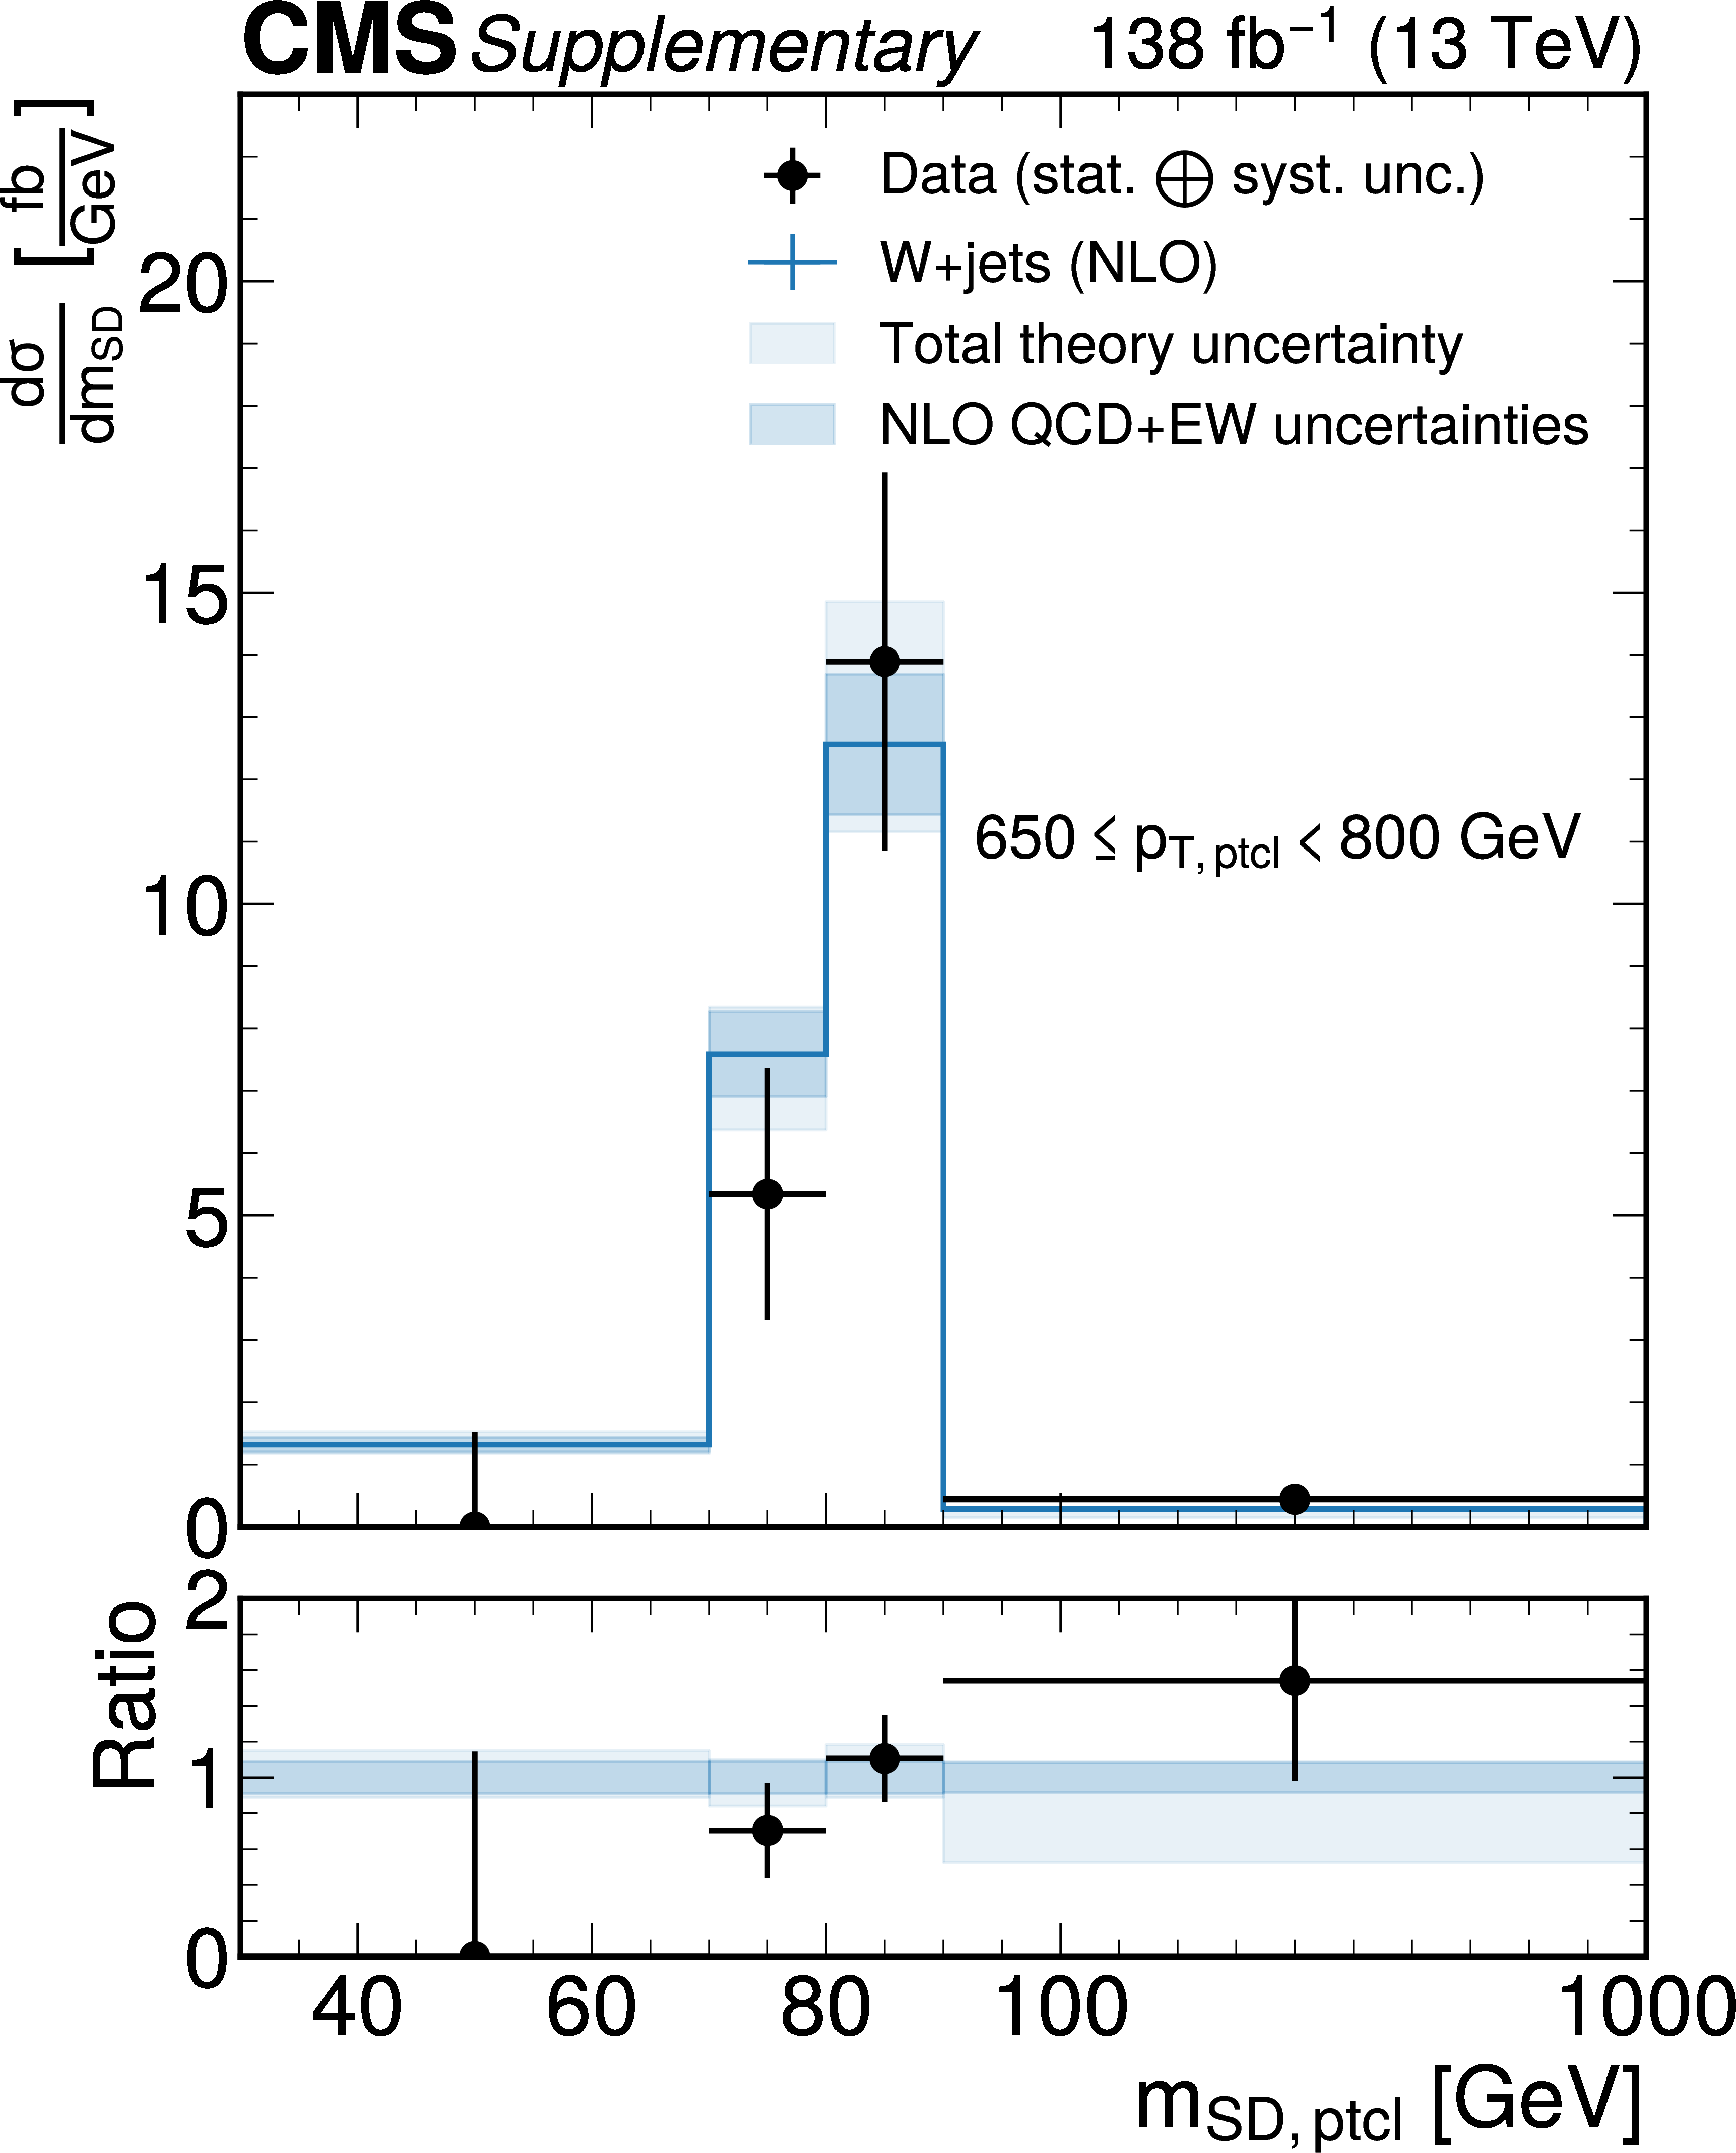
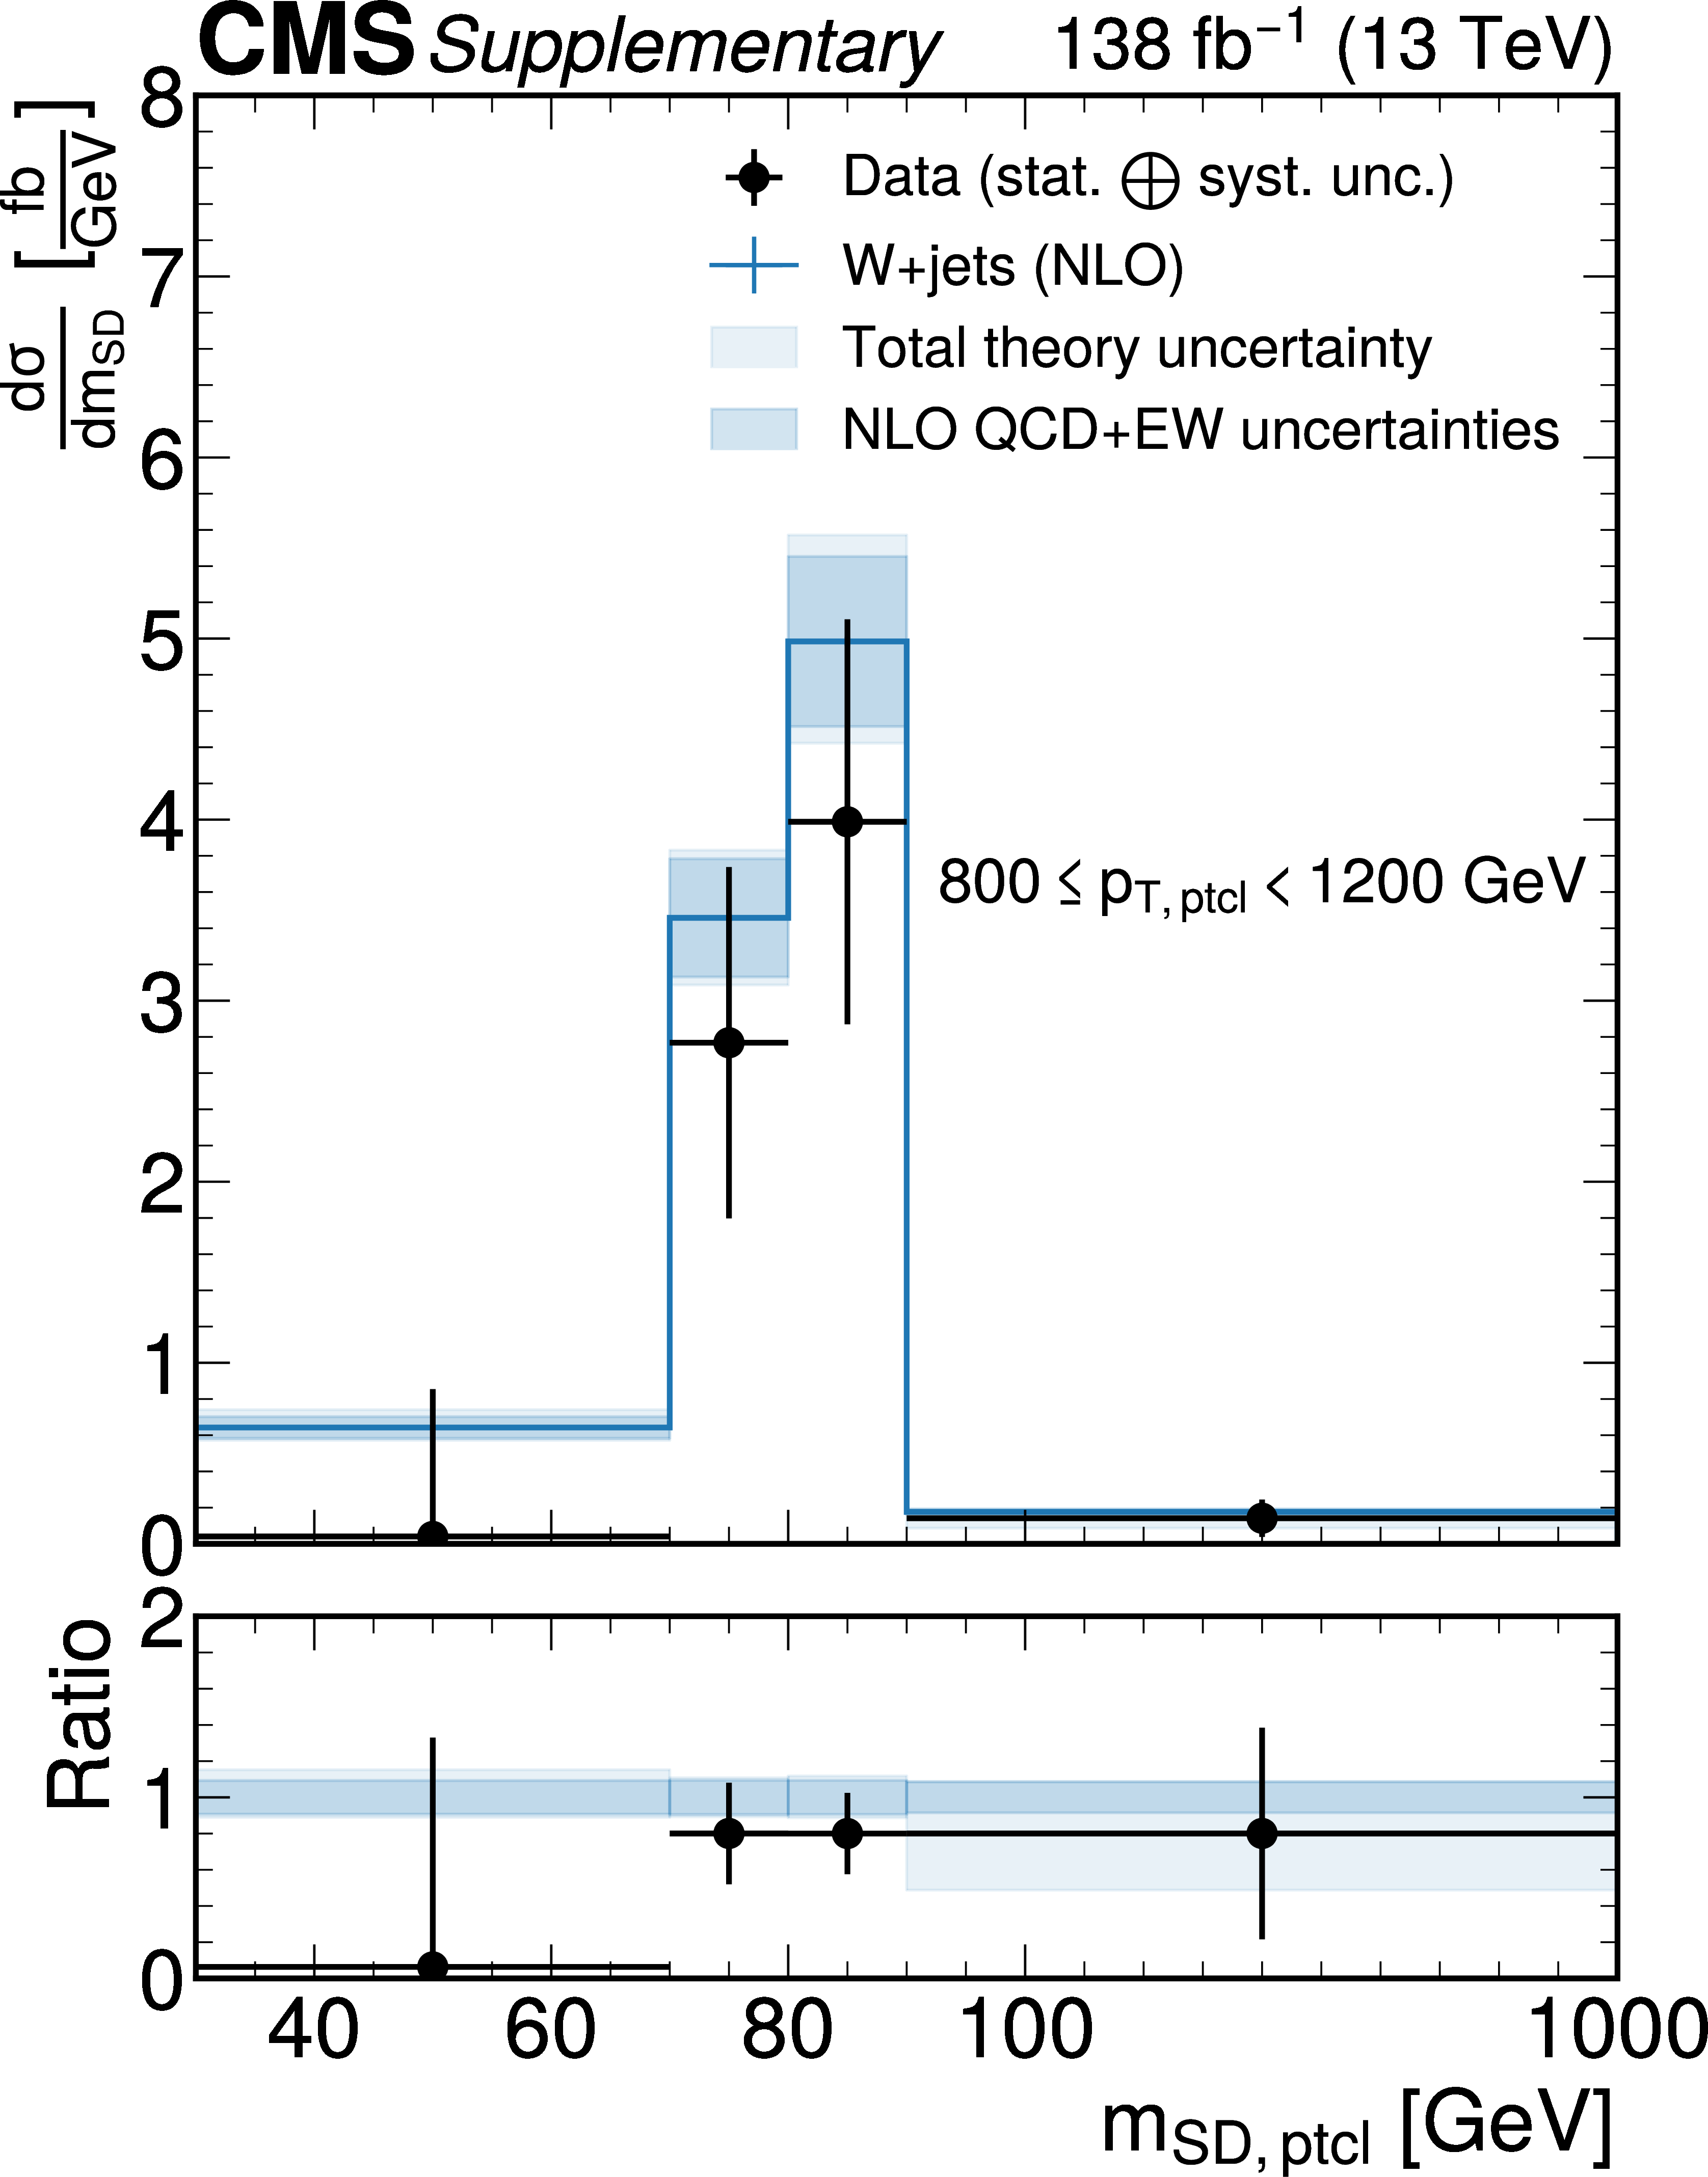
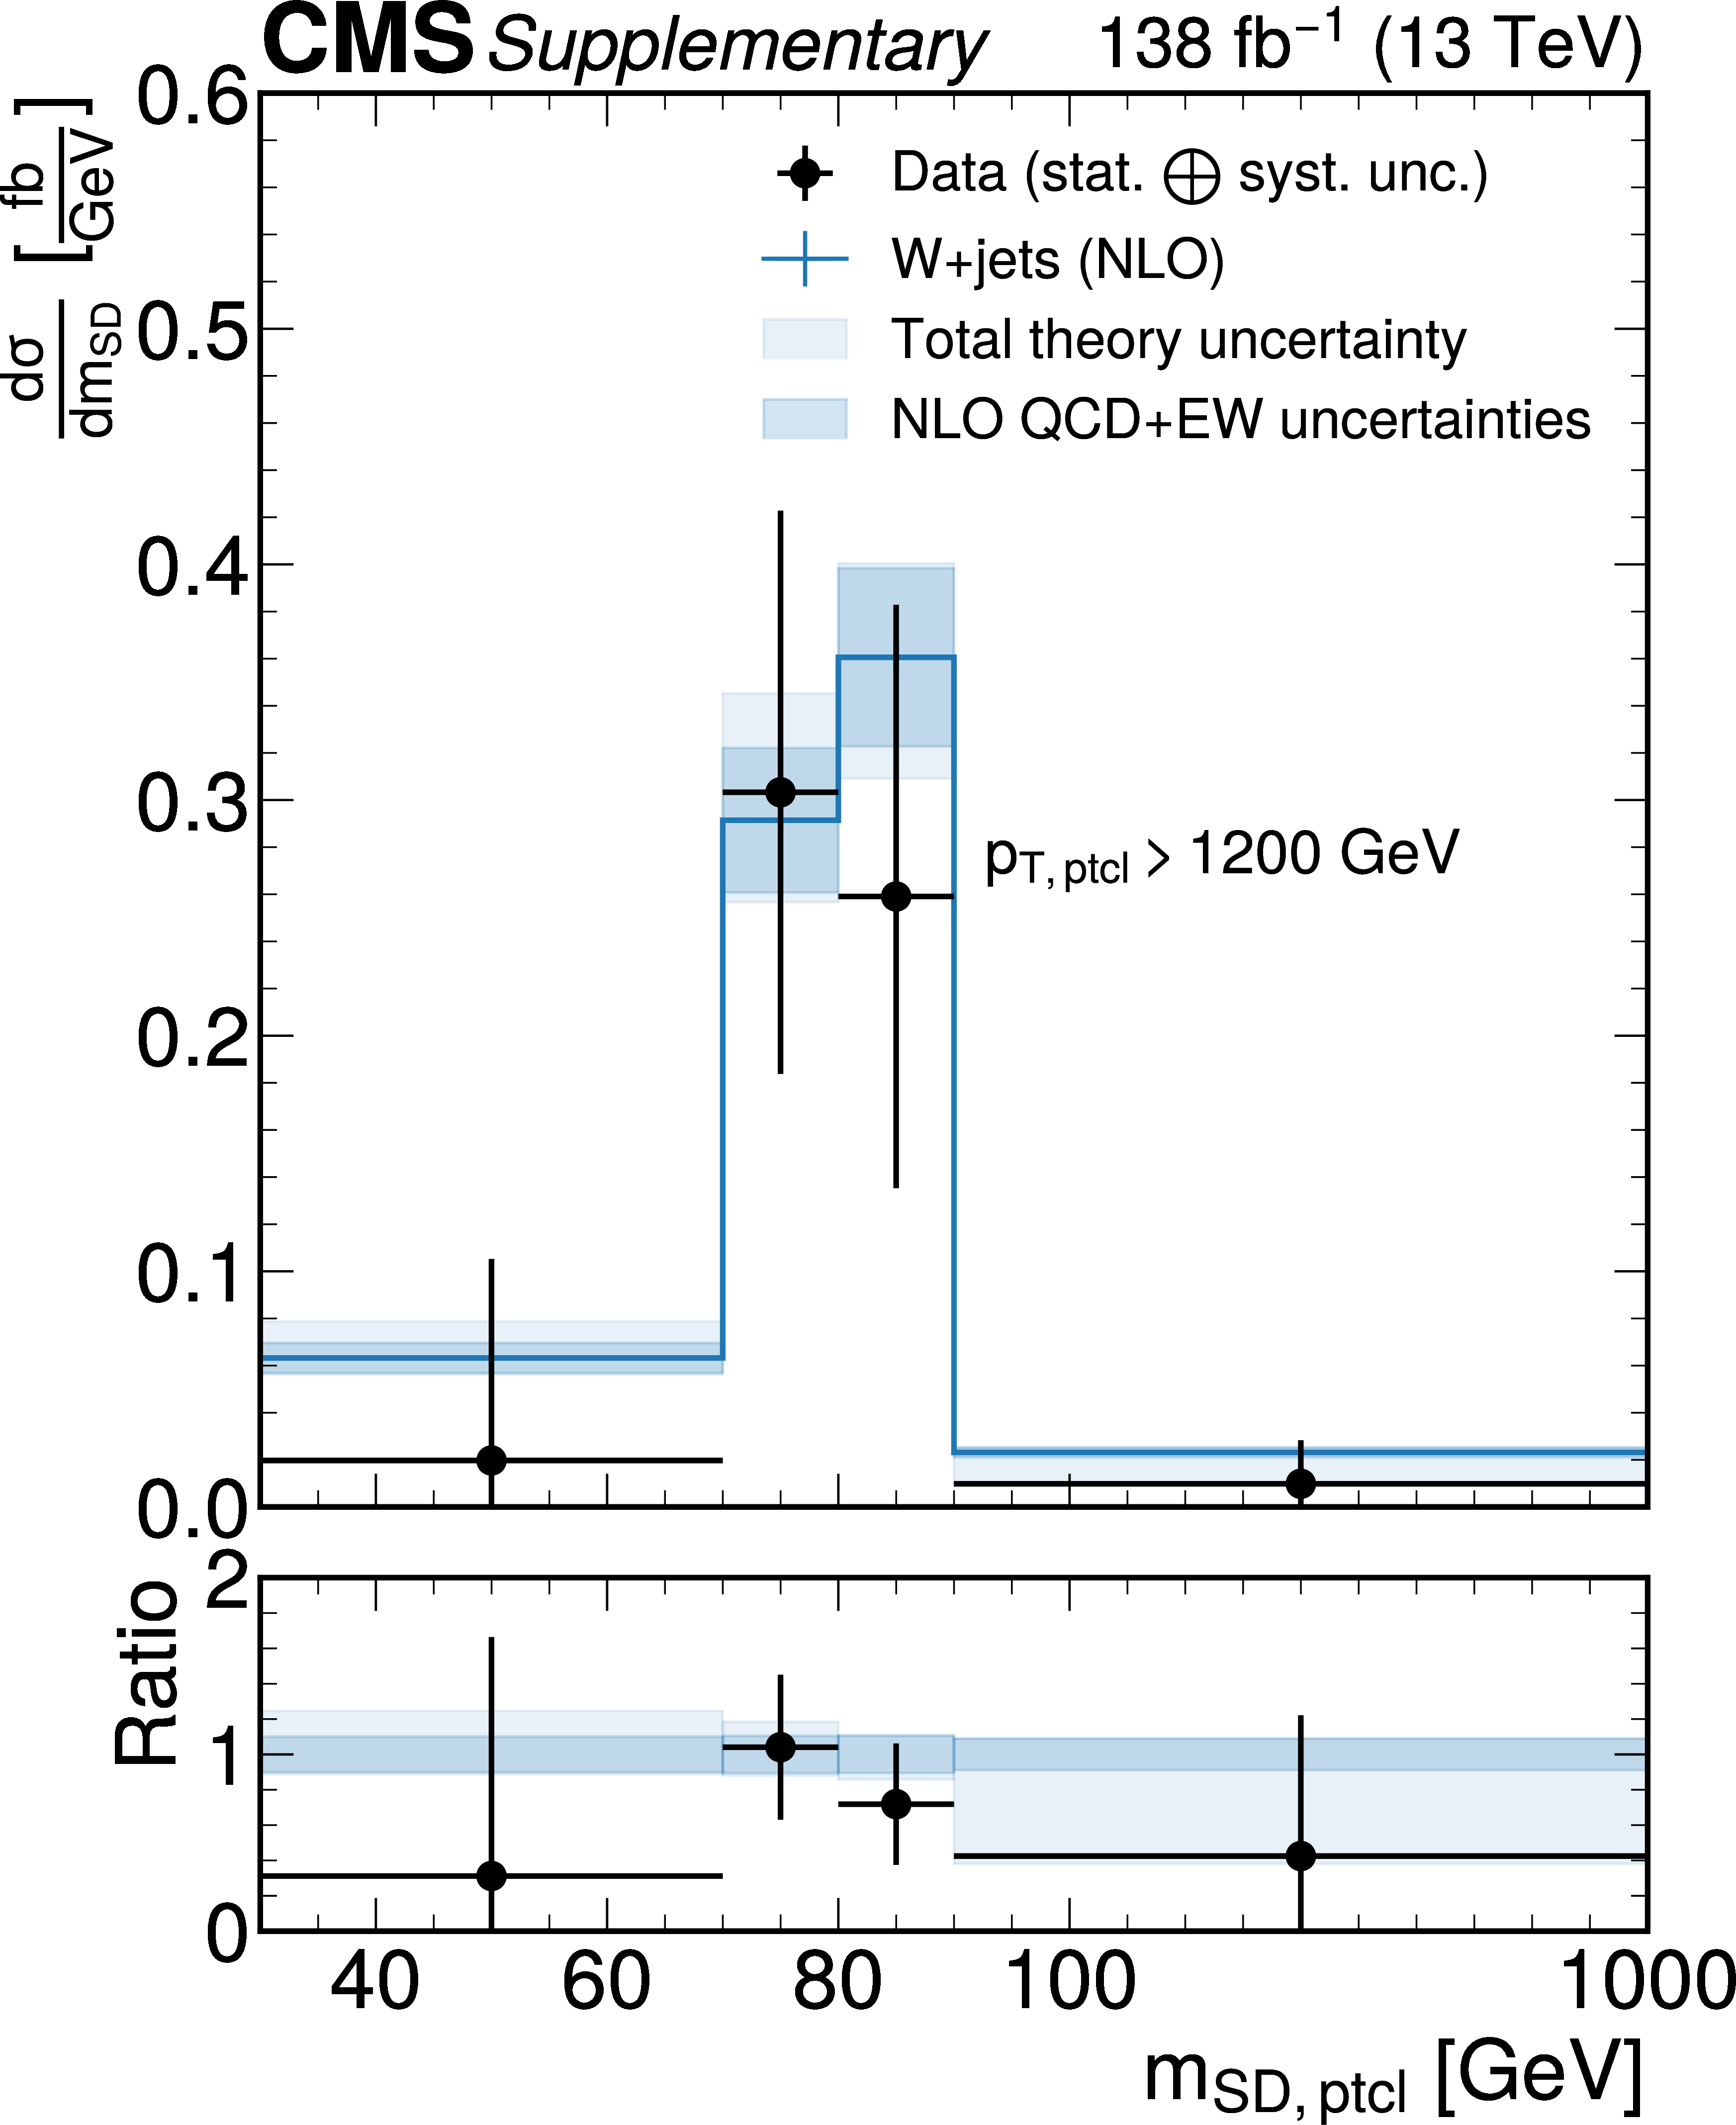
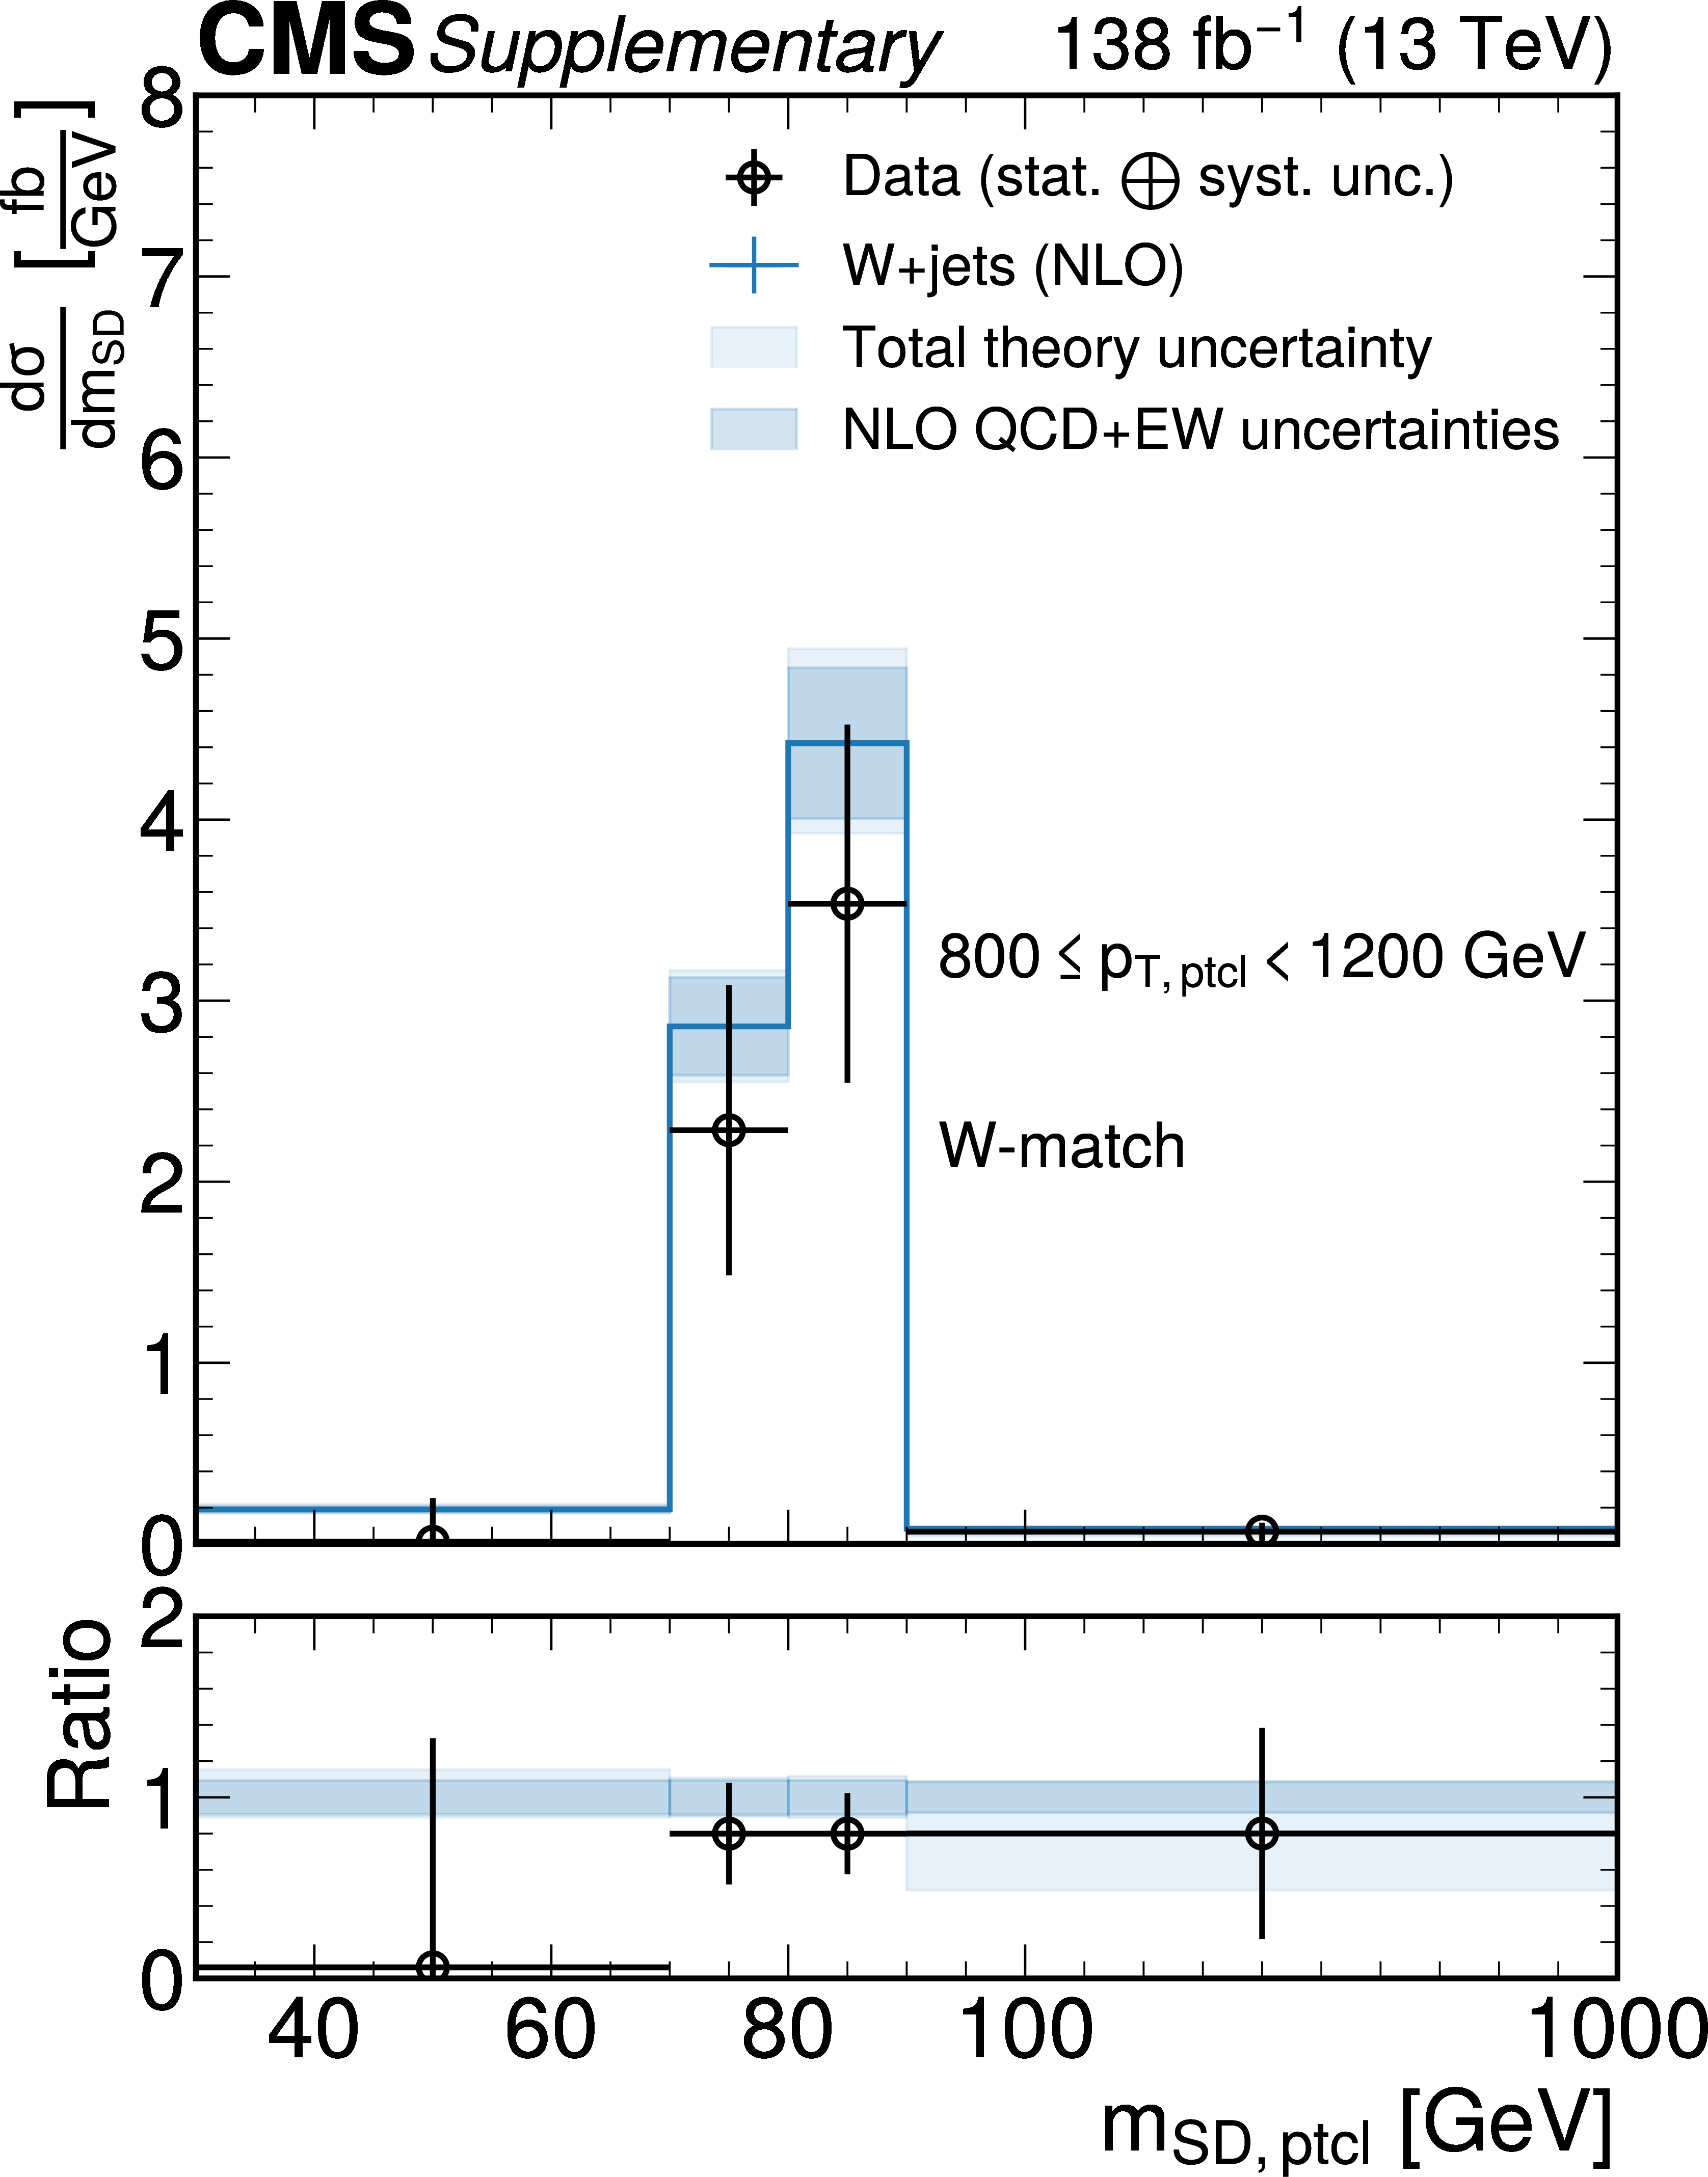
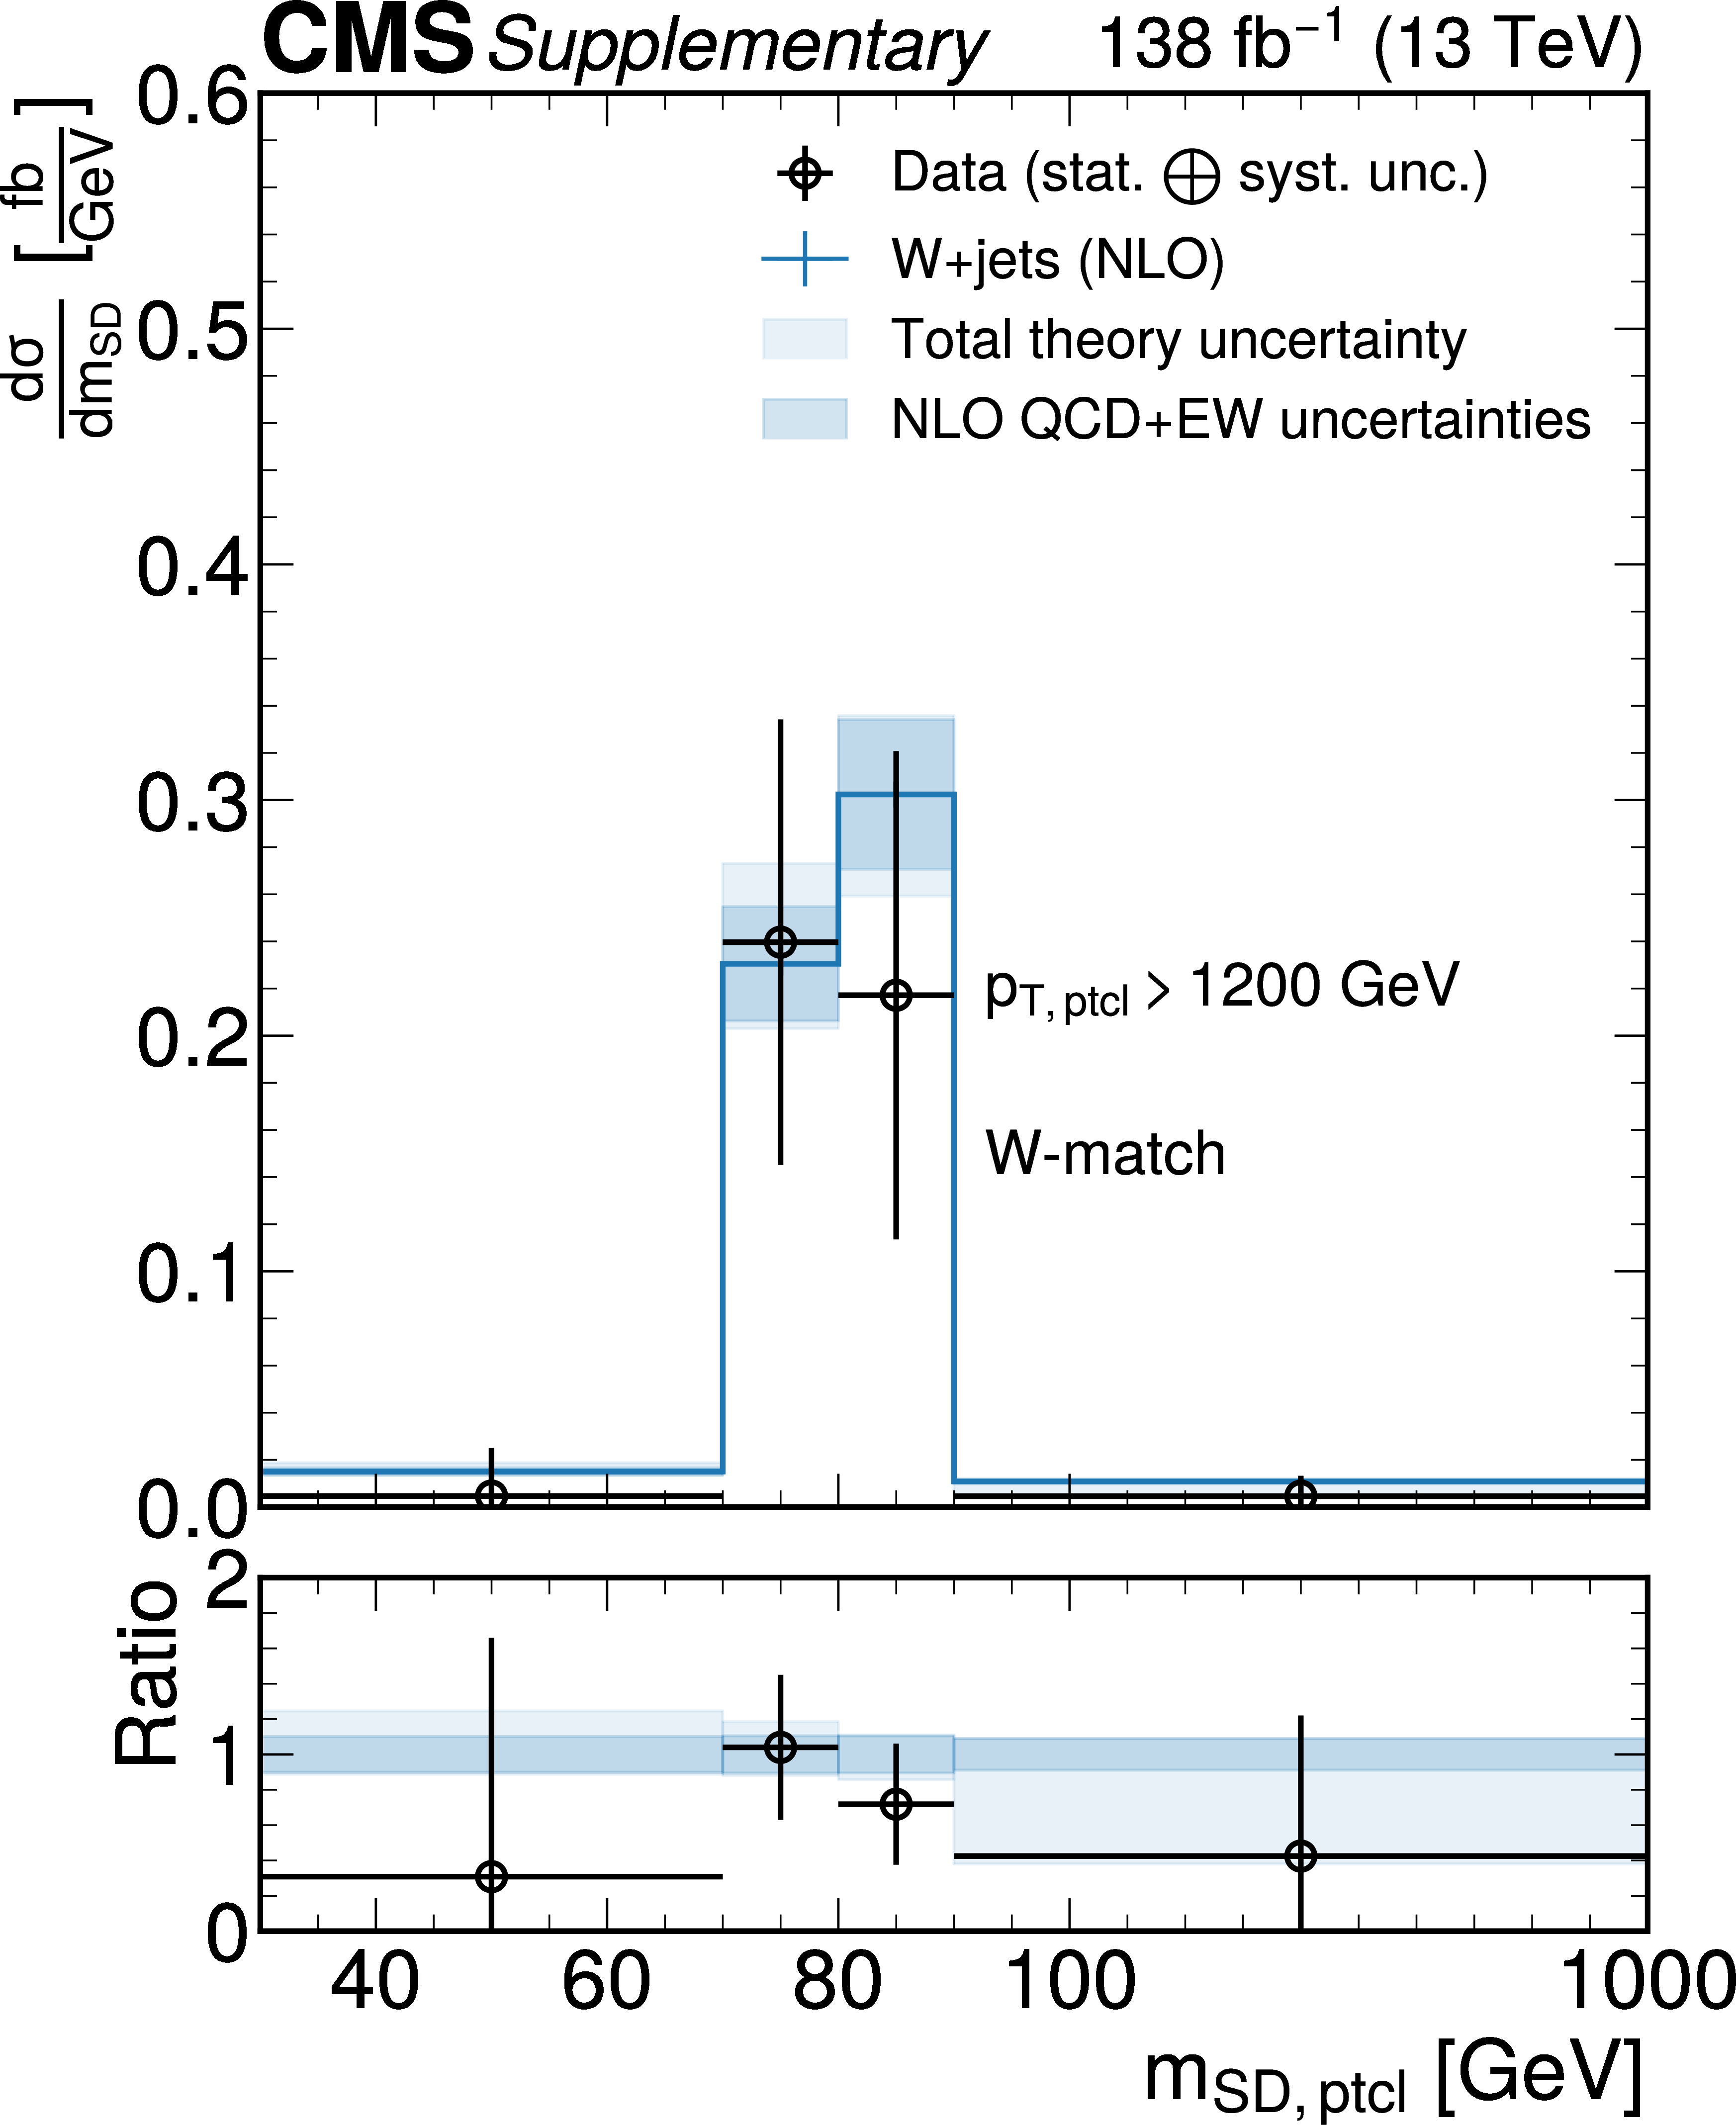
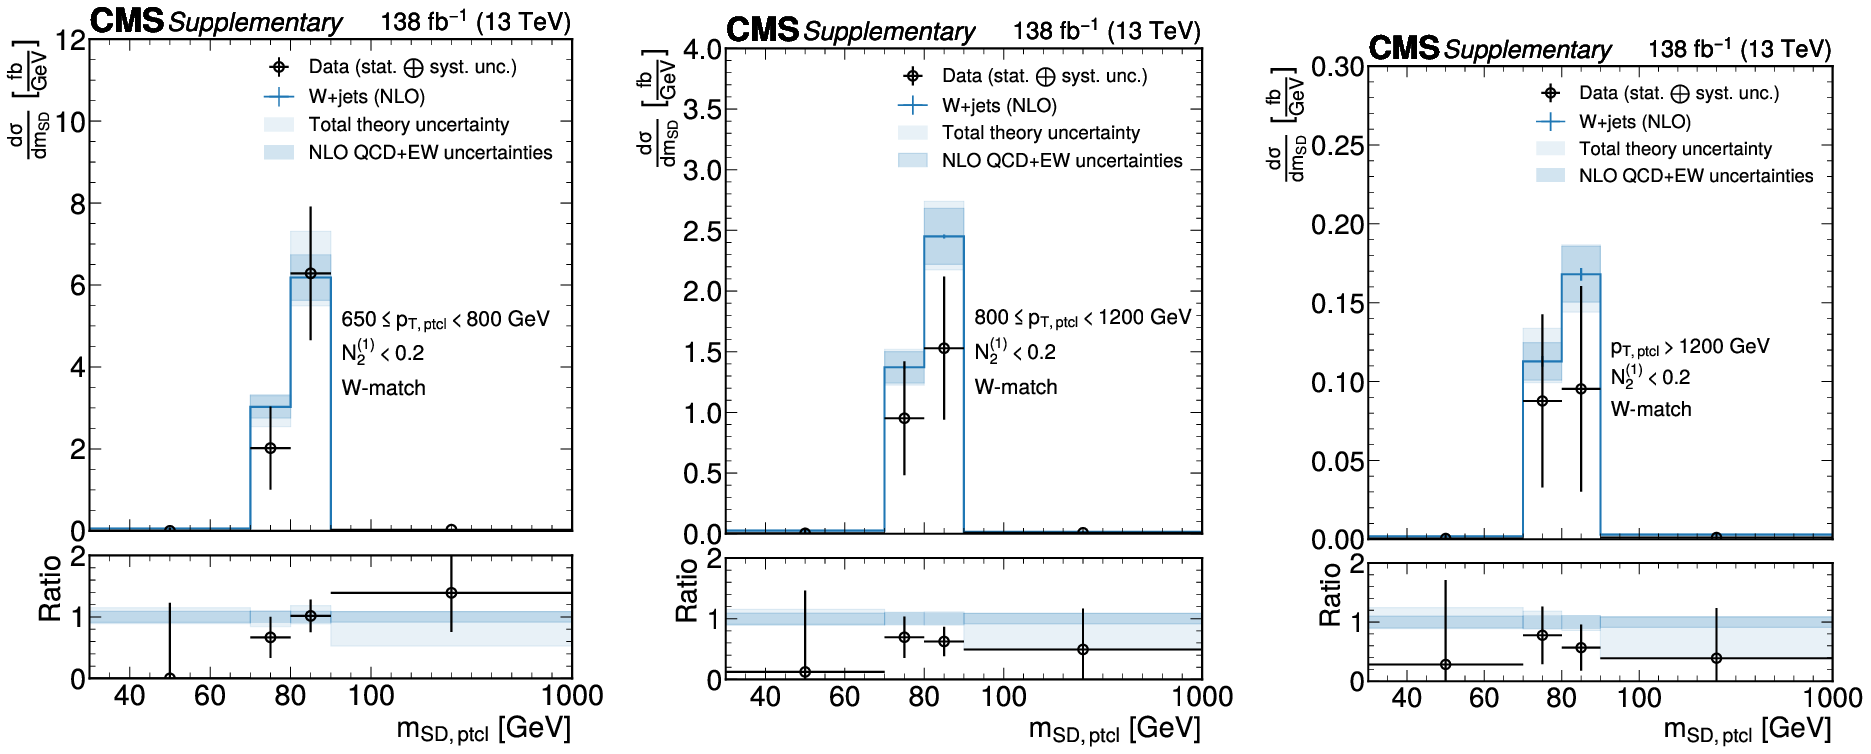
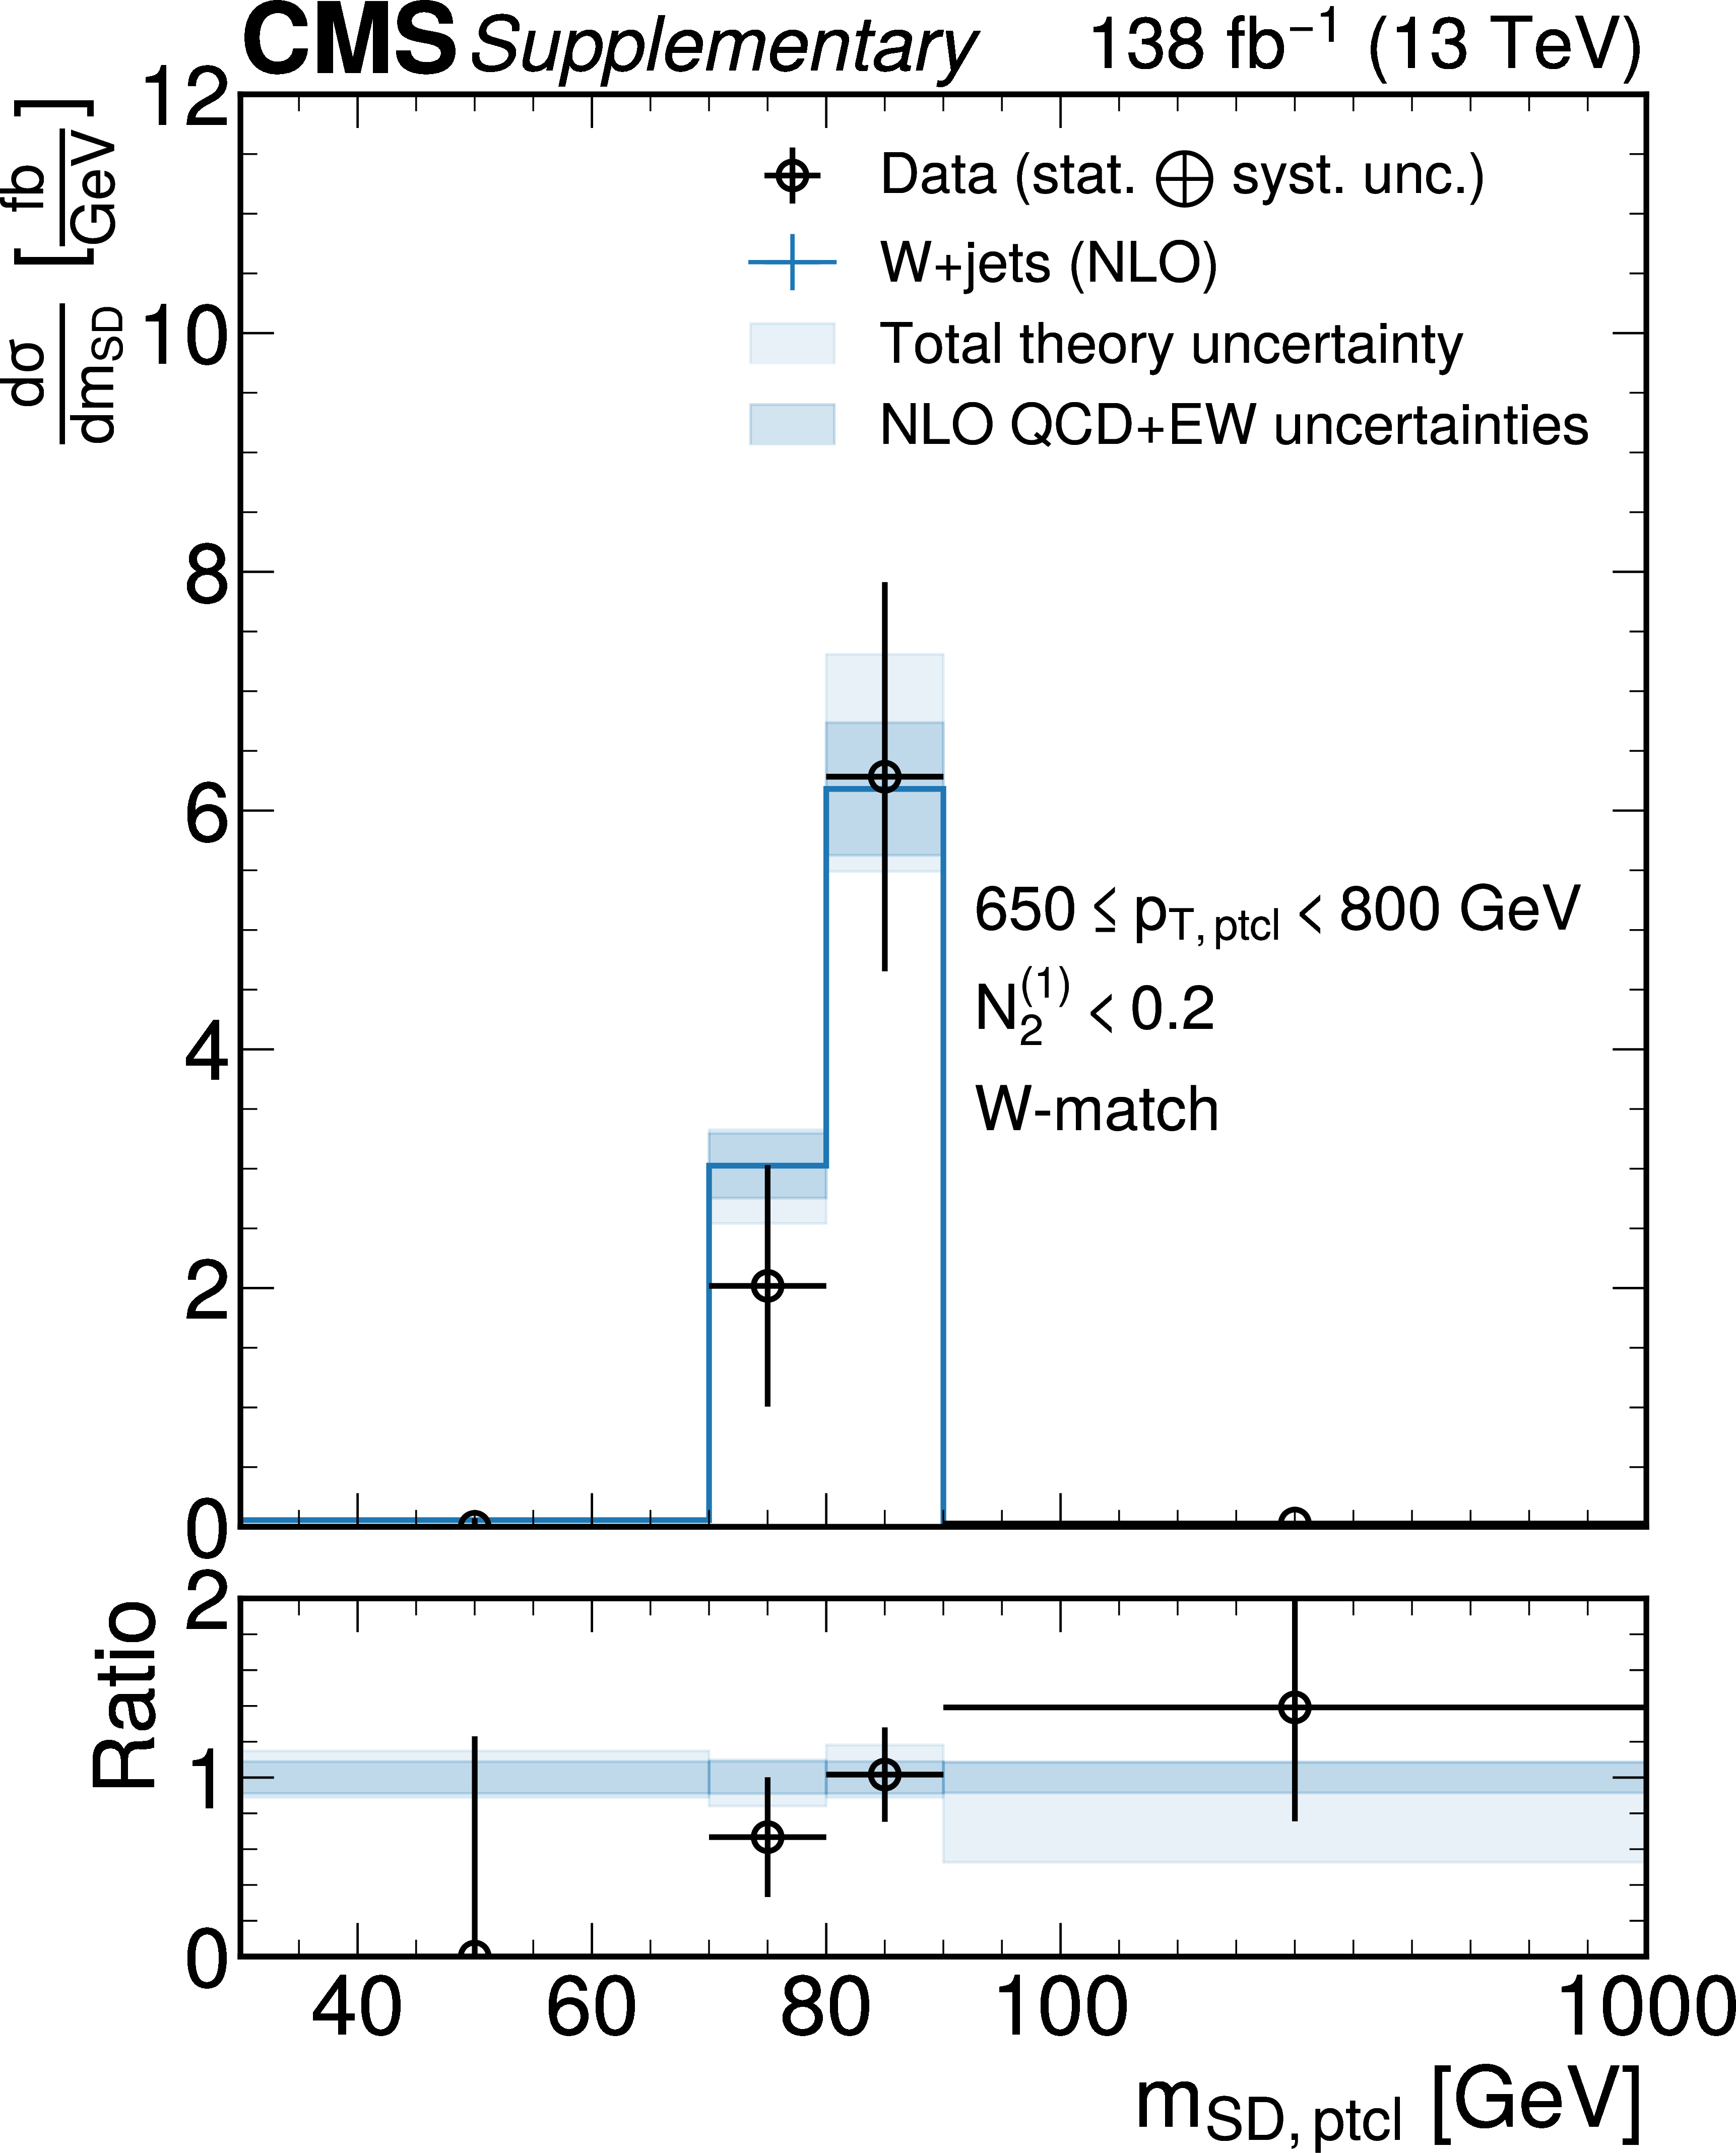
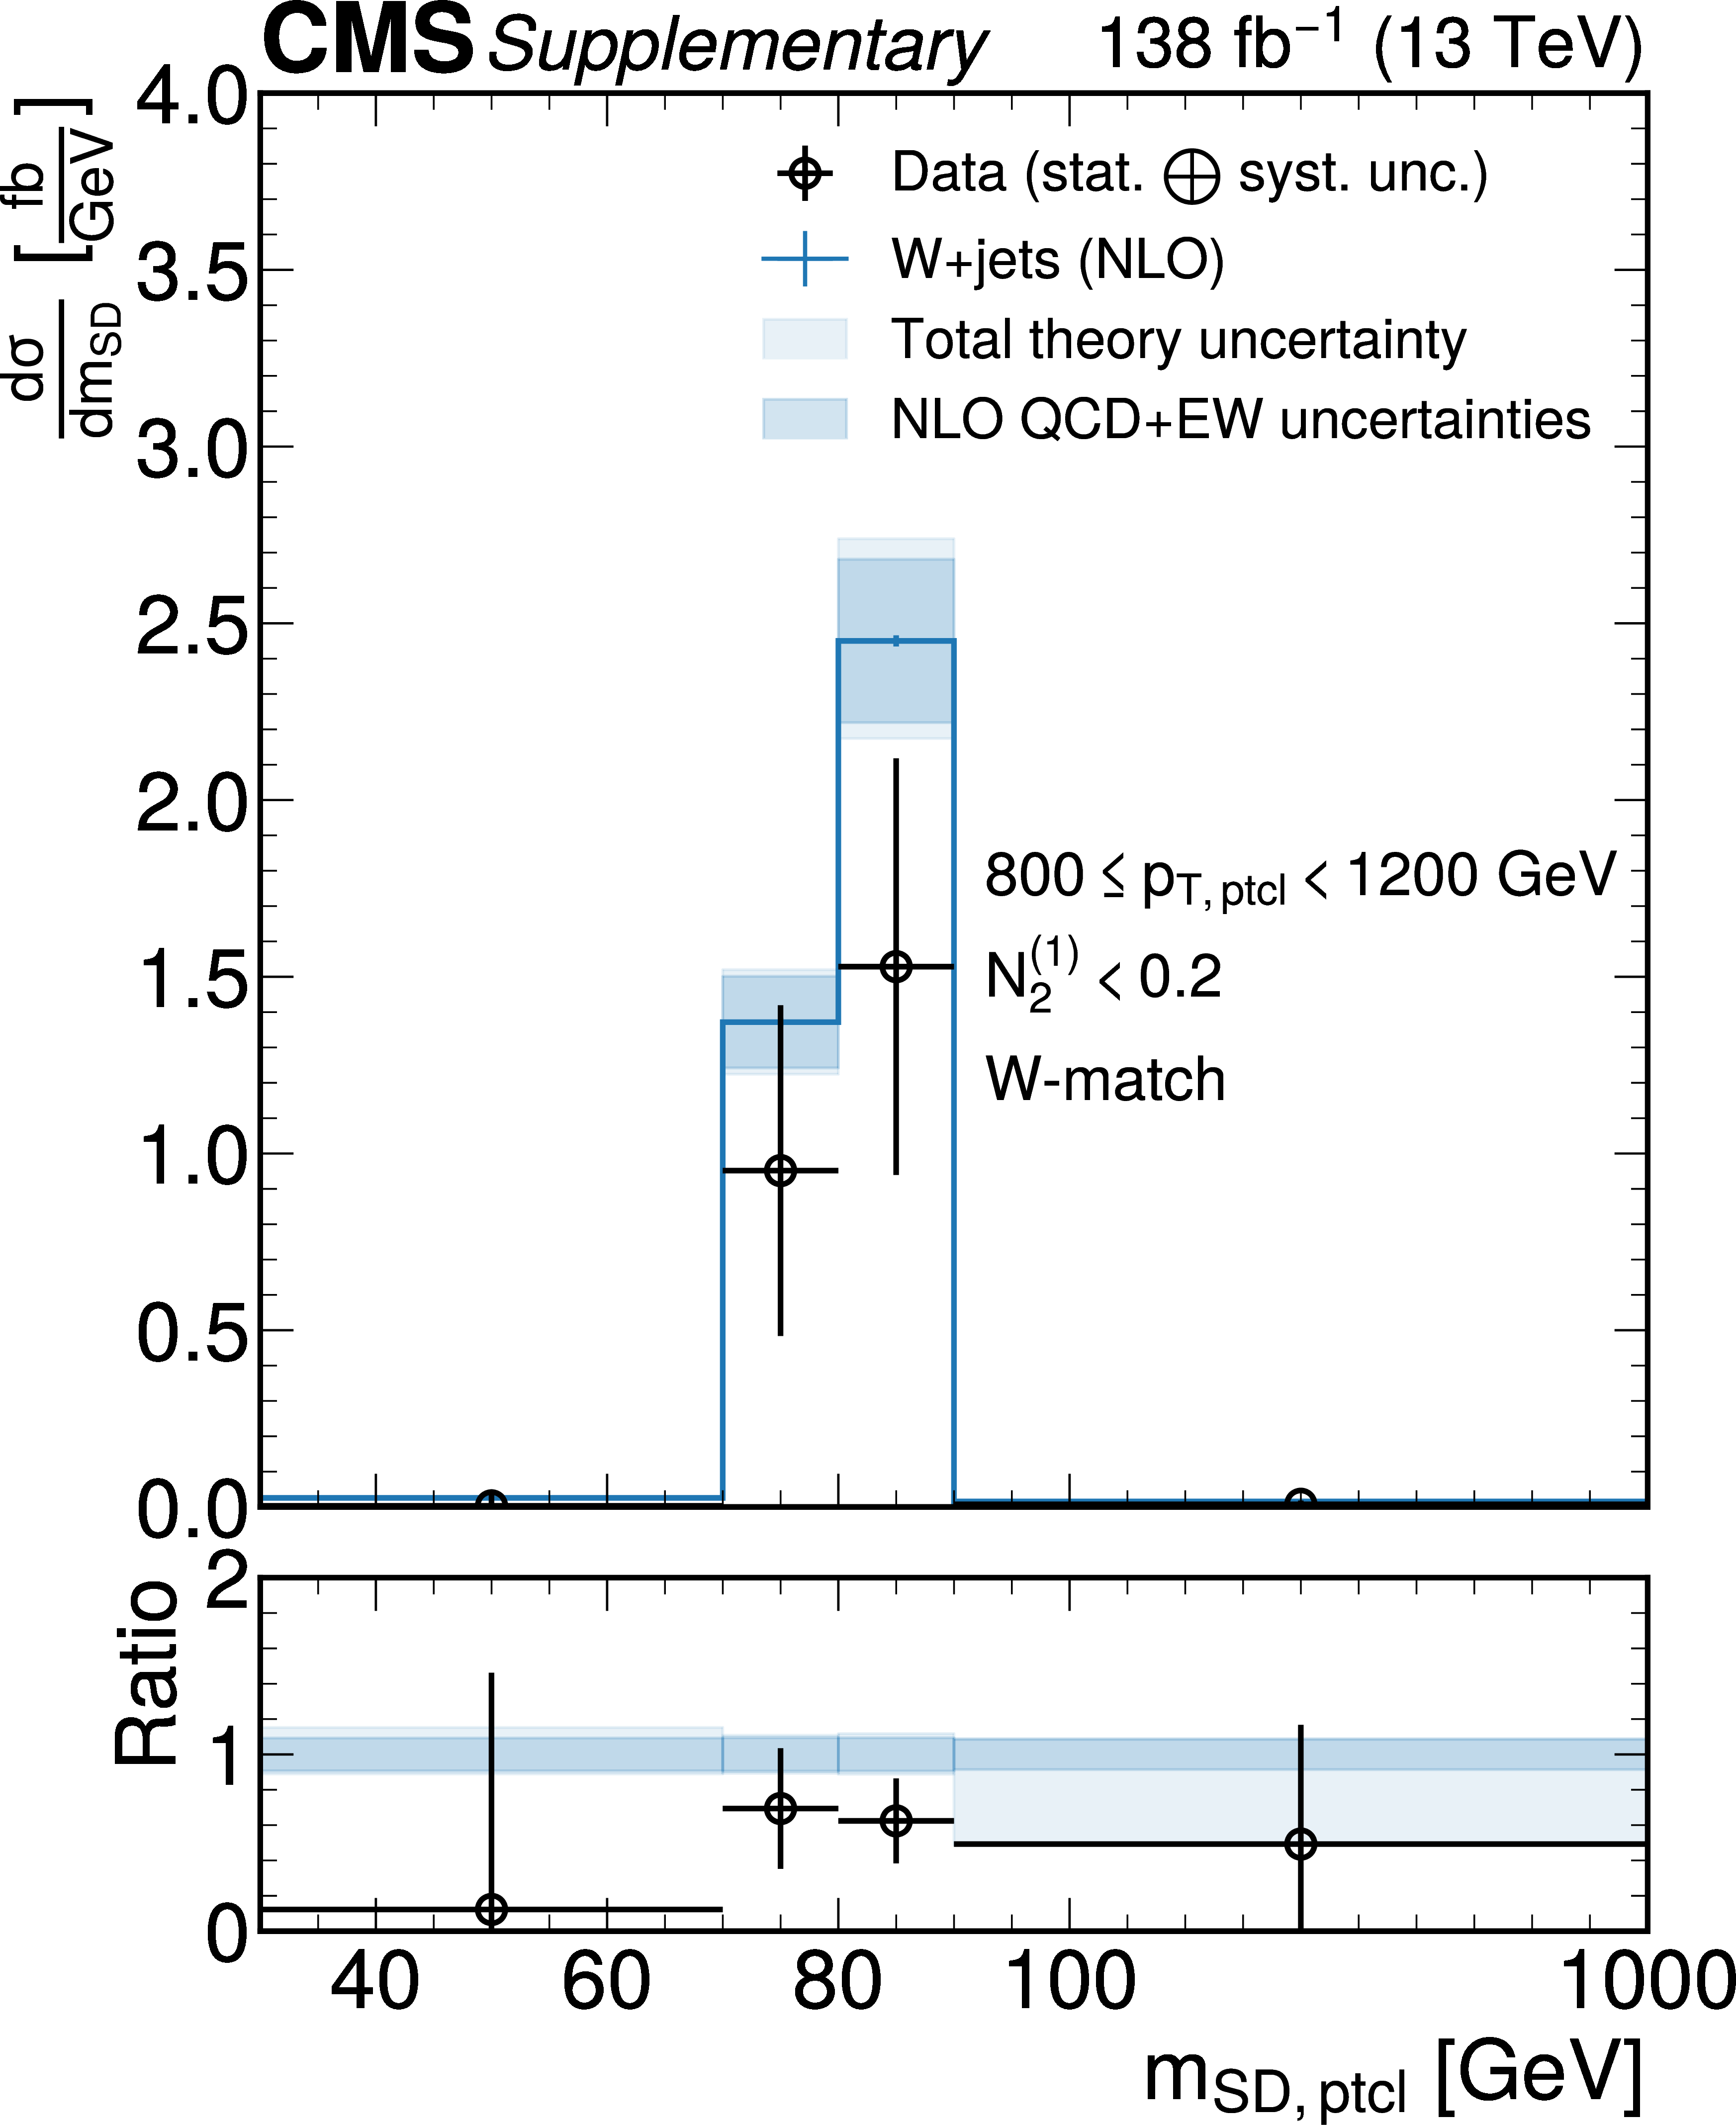
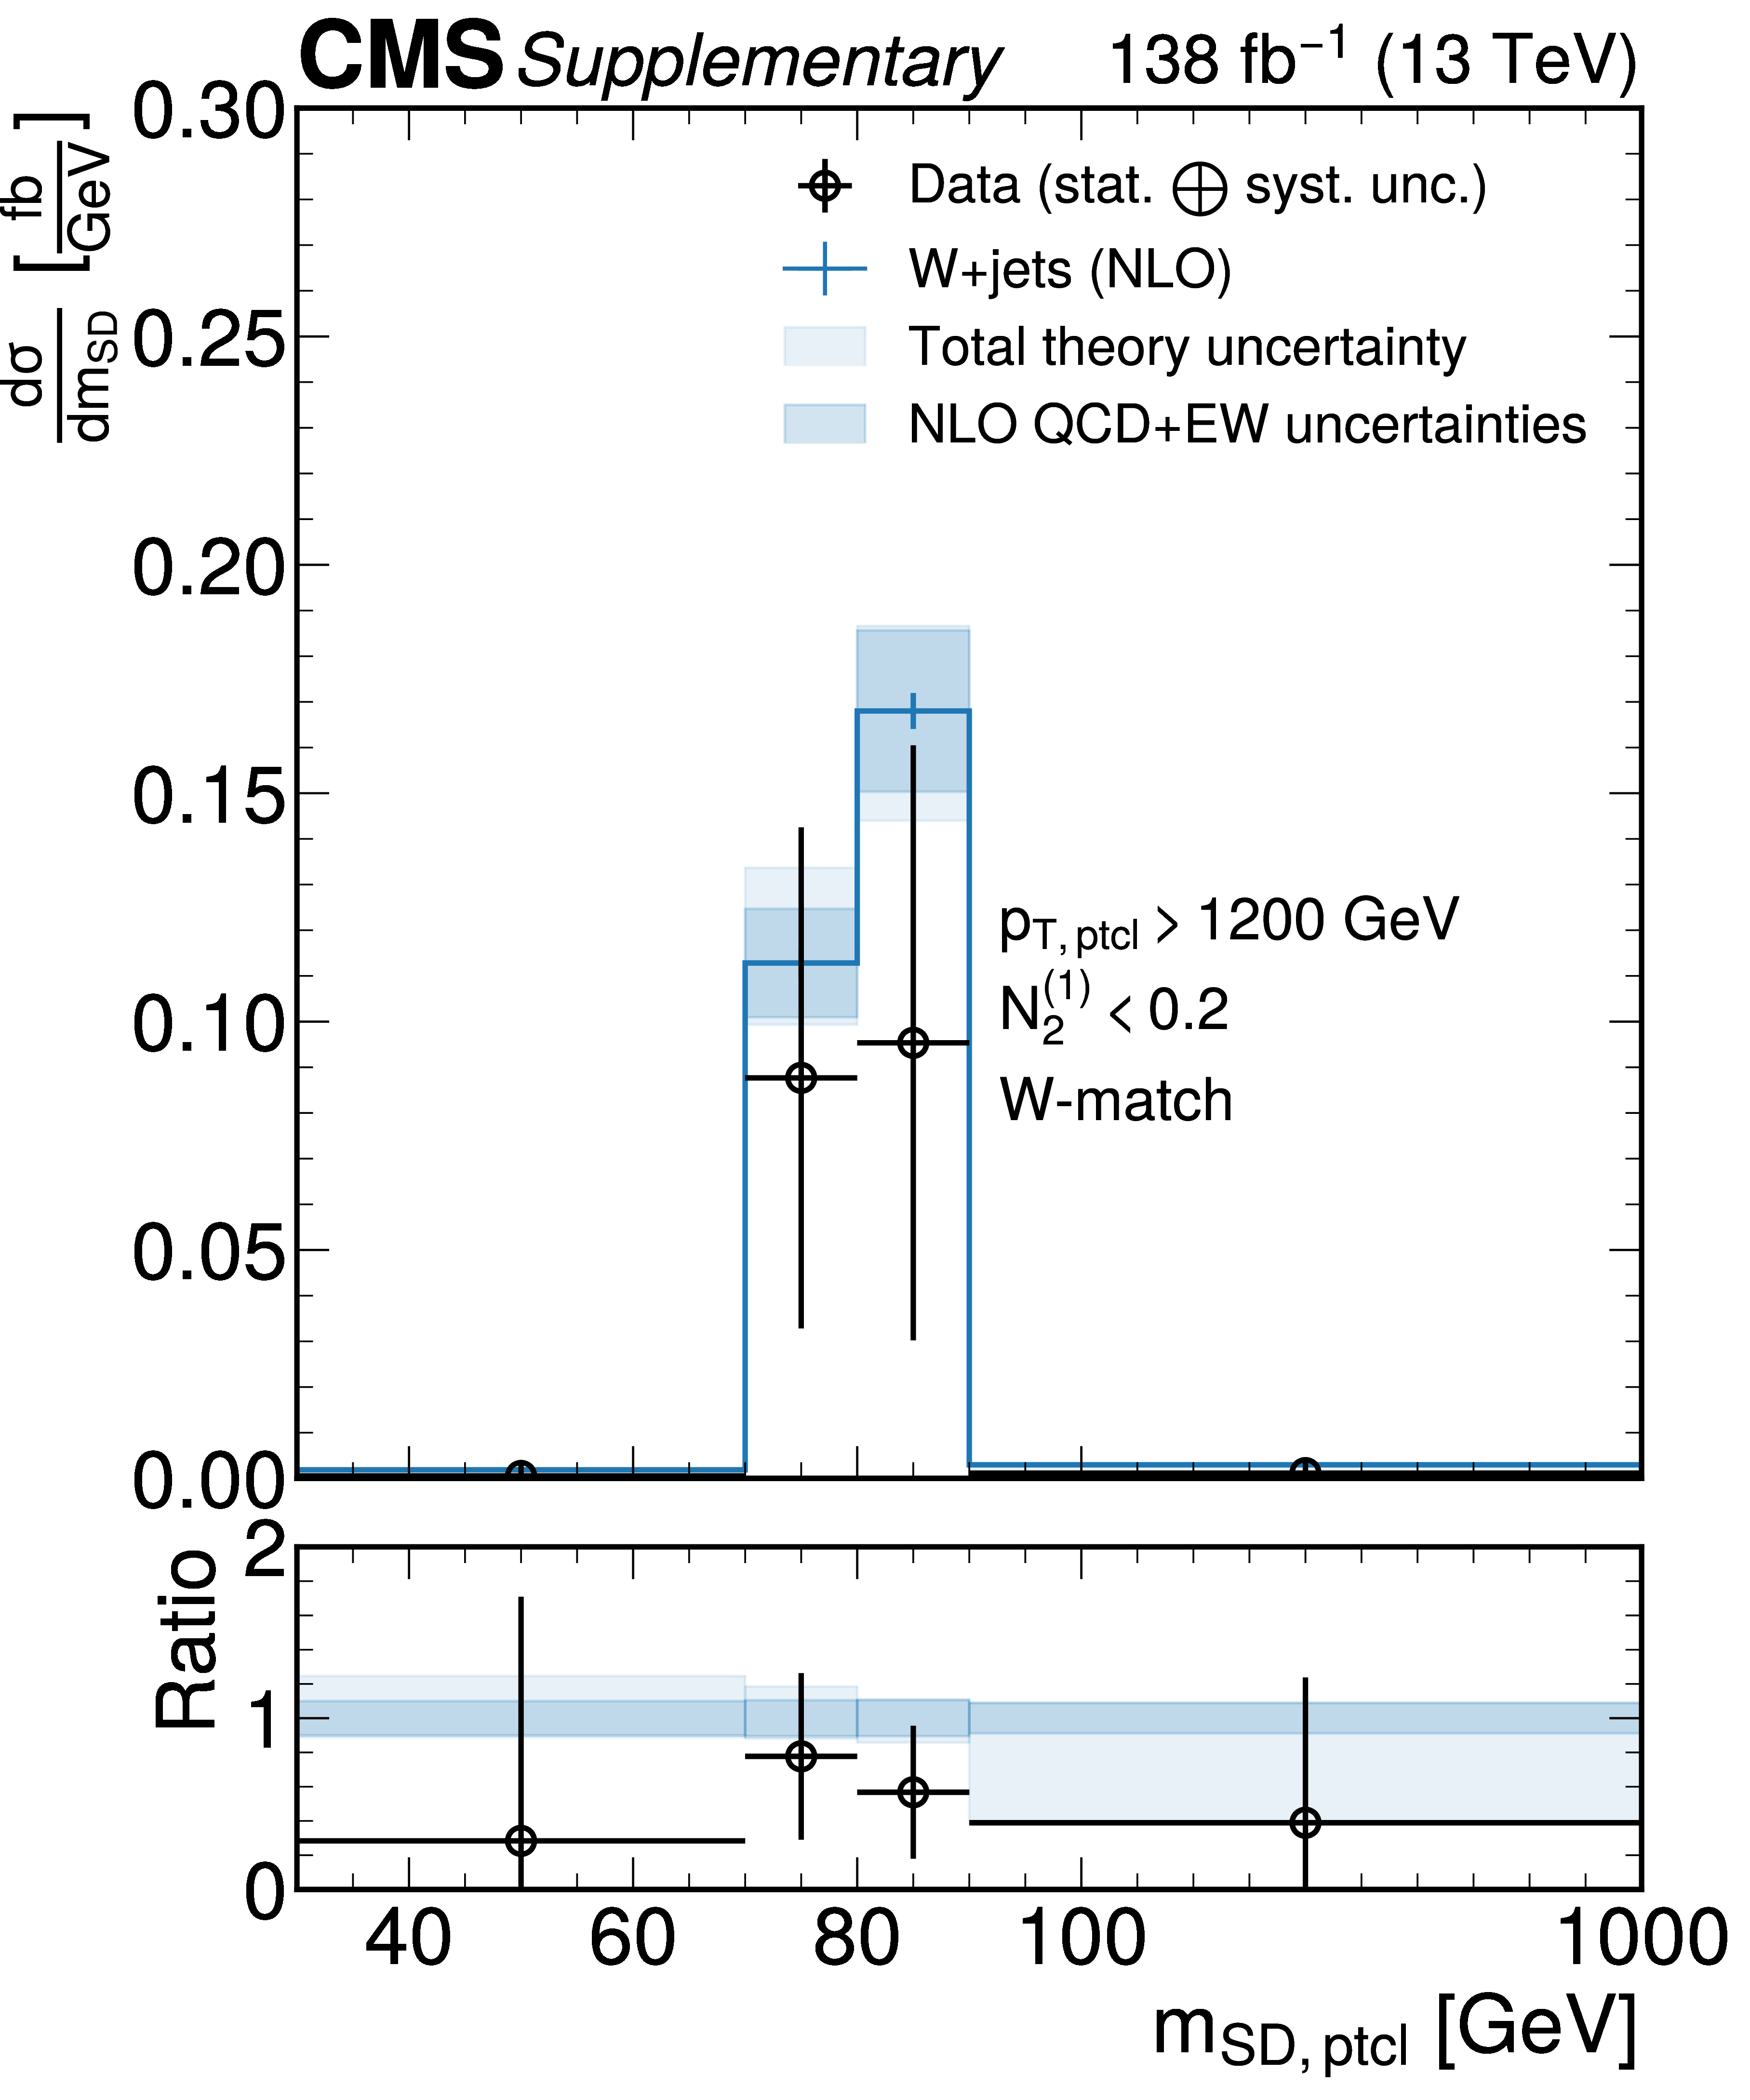
Unfolded and background subtracted jet mass distribution at the particle level for each $ p_{\mathrm{T}}^\mathrm{ptcl} $ bin obtained with $ P^{\mathrm{PN, DDT}}_{\mathrm{W vs. QCD}} $. The fiducial measurement region at the particle level includes the $ N_{2}^{(1)} < $ 0.2 selection. The unfolded data are shown as black markers with the total uncertainty indicated as error bar. The blue lines show the predictions from MadGraph-5_aMC@NLO+PYTHIA at LO with MLM matching and supplemented by NLO QCD and EW corrections with the statistical uncertainty indicated as error bar. The theory uncertainty is the sum in quadrature of parton shower variations and the hadronization model uncertainty, as well as the uncertainties in the QCD and EW corrections, and is drawn as a light shaded blue band. The purely perturbative uncertainties are overlaid as a dark, shaded blue band. |
png pdf |
Figure 7-a:
Unfolded and background subtracted jet mass distribution at the particle level for each $ p_{\mathrm{T}}^\mathrm{ptcl} $ bin obtained with $ P^{\mathrm{PN, DDT}}_{\mathrm{W vs. QCD}} $. The fiducial measurement region at the particle level includes the $ N_{2}^{(1)} < $ 0.2 selection. The unfolded data are shown as black markers with the total uncertainty indicated as error bar. The blue lines show the predictions from MadGraph-5_aMC@NLO+PYTHIA at LO with MLM matching and supplemented by NLO QCD and EW corrections with the statistical uncertainty indicated as error bar. The theory uncertainty is the sum in quadrature of parton shower variations and the hadronization model uncertainty, as well as the uncertainties in the QCD and EW corrections, and is drawn as a light shaded blue band. The purely perturbative uncertainties are overlaid as a dark, shaded blue band. |
png pdf |
Figure 7-b:
Unfolded and background subtracted jet mass distribution at the particle level for each $ p_{\mathrm{T}}^\mathrm{ptcl} $ bin obtained with $ P^{\mathrm{PN, DDT}}_{\mathrm{W vs. QCD}} $. The fiducial measurement region at the particle level includes the $ N_{2}^{(1)} < $ 0.2 selection. The unfolded data are shown as black markers with the total uncertainty indicated as error bar. The blue lines show the predictions from MadGraph-5_aMC@NLO+PYTHIA at LO with MLM matching and supplemented by NLO QCD and EW corrections with the statistical uncertainty indicated as error bar. The theory uncertainty is the sum in quadrature of parton shower variations and the hadronization model uncertainty, as well as the uncertainties in the QCD and EW corrections, and is drawn as a light shaded blue band. The purely perturbative uncertainties are overlaid as a dark, shaded blue band. |
png pdf |
Figure 7-c:
Unfolded and background subtracted jet mass distribution at the particle level for each $ p_{\mathrm{T}}^\mathrm{ptcl} $ bin obtained with $ P^{\mathrm{PN, DDT}}_{\mathrm{W vs. QCD}} $. The fiducial measurement region at the particle level includes the $ N_{2}^{(1)} < $ 0.2 selection. The unfolded data are shown as black markers with the total uncertainty indicated as error bar. The blue lines show the predictions from MadGraph-5_aMC@NLO+PYTHIA at LO with MLM matching and supplemented by NLO QCD and EW corrections with the statistical uncertainty indicated as error bar. The theory uncertainty is the sum in quadrature of parton shower variations and the hadronization model uncertainty, as well as the uncertainties in the QCD and EW corrections, and is drawn as a light shaded blue band. The purely perturbative uncertainties are overlaid as a dark, shaded blue band. |
png pdf |
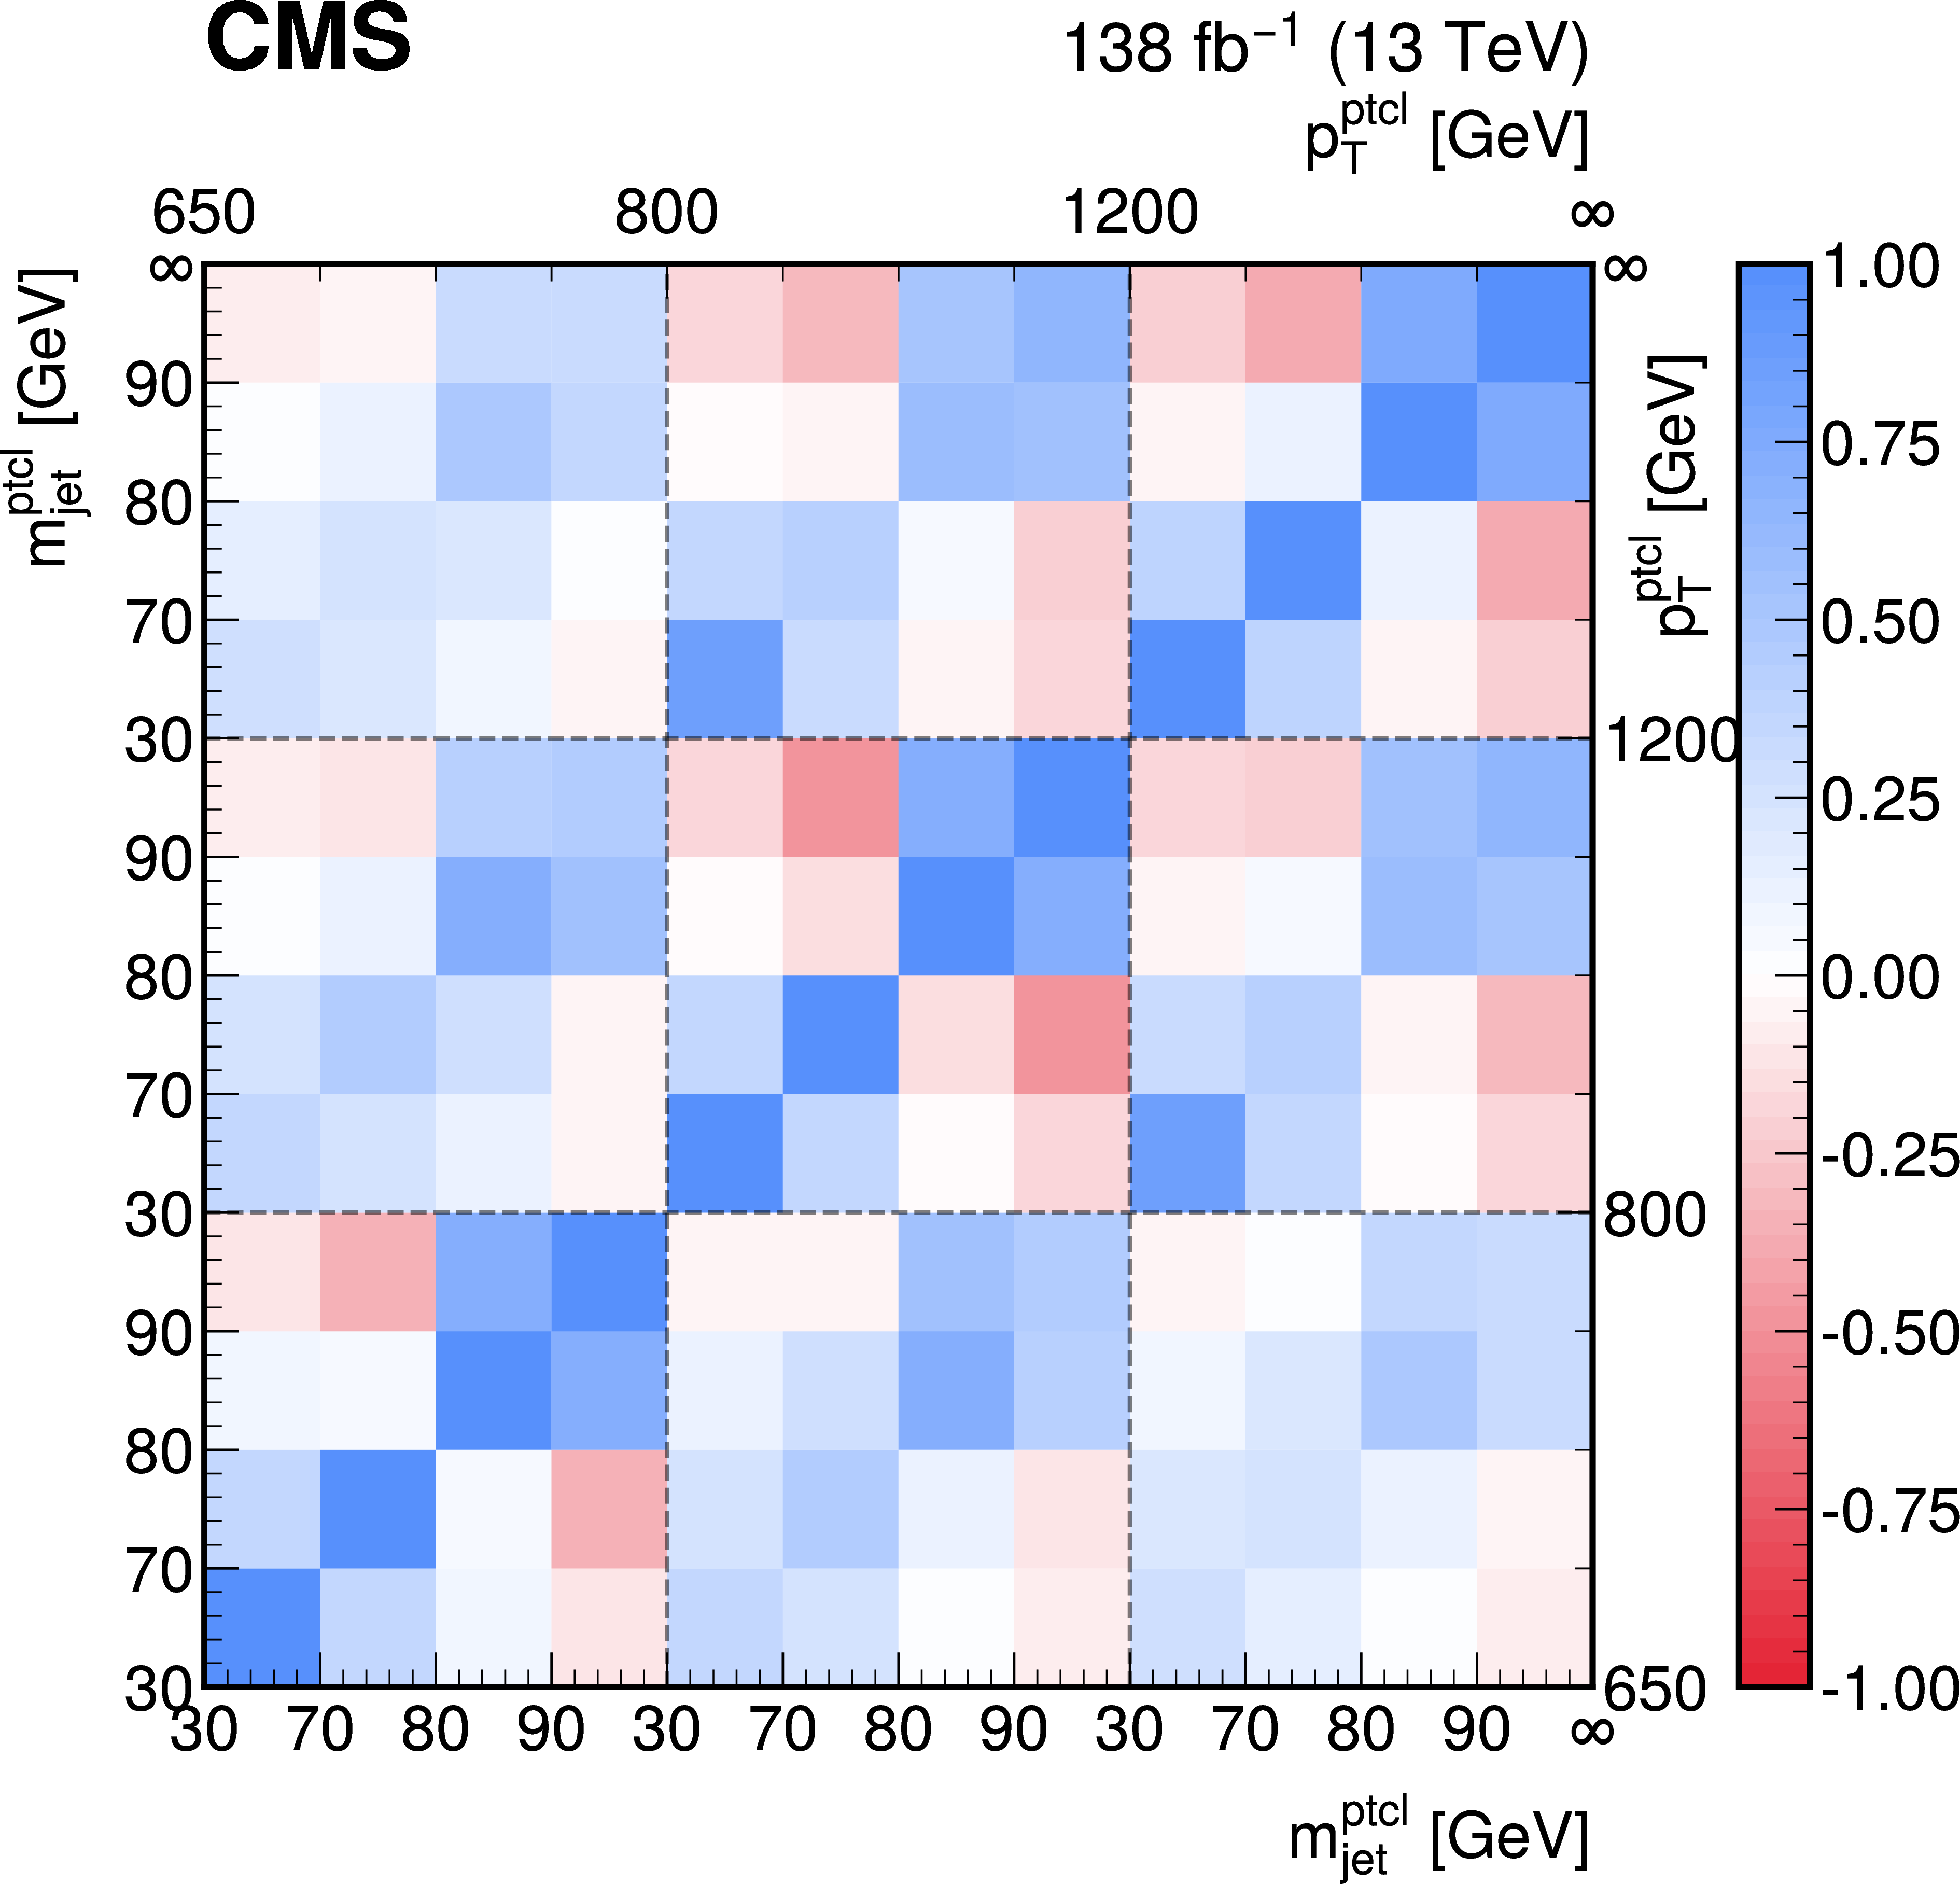
Figure 8:
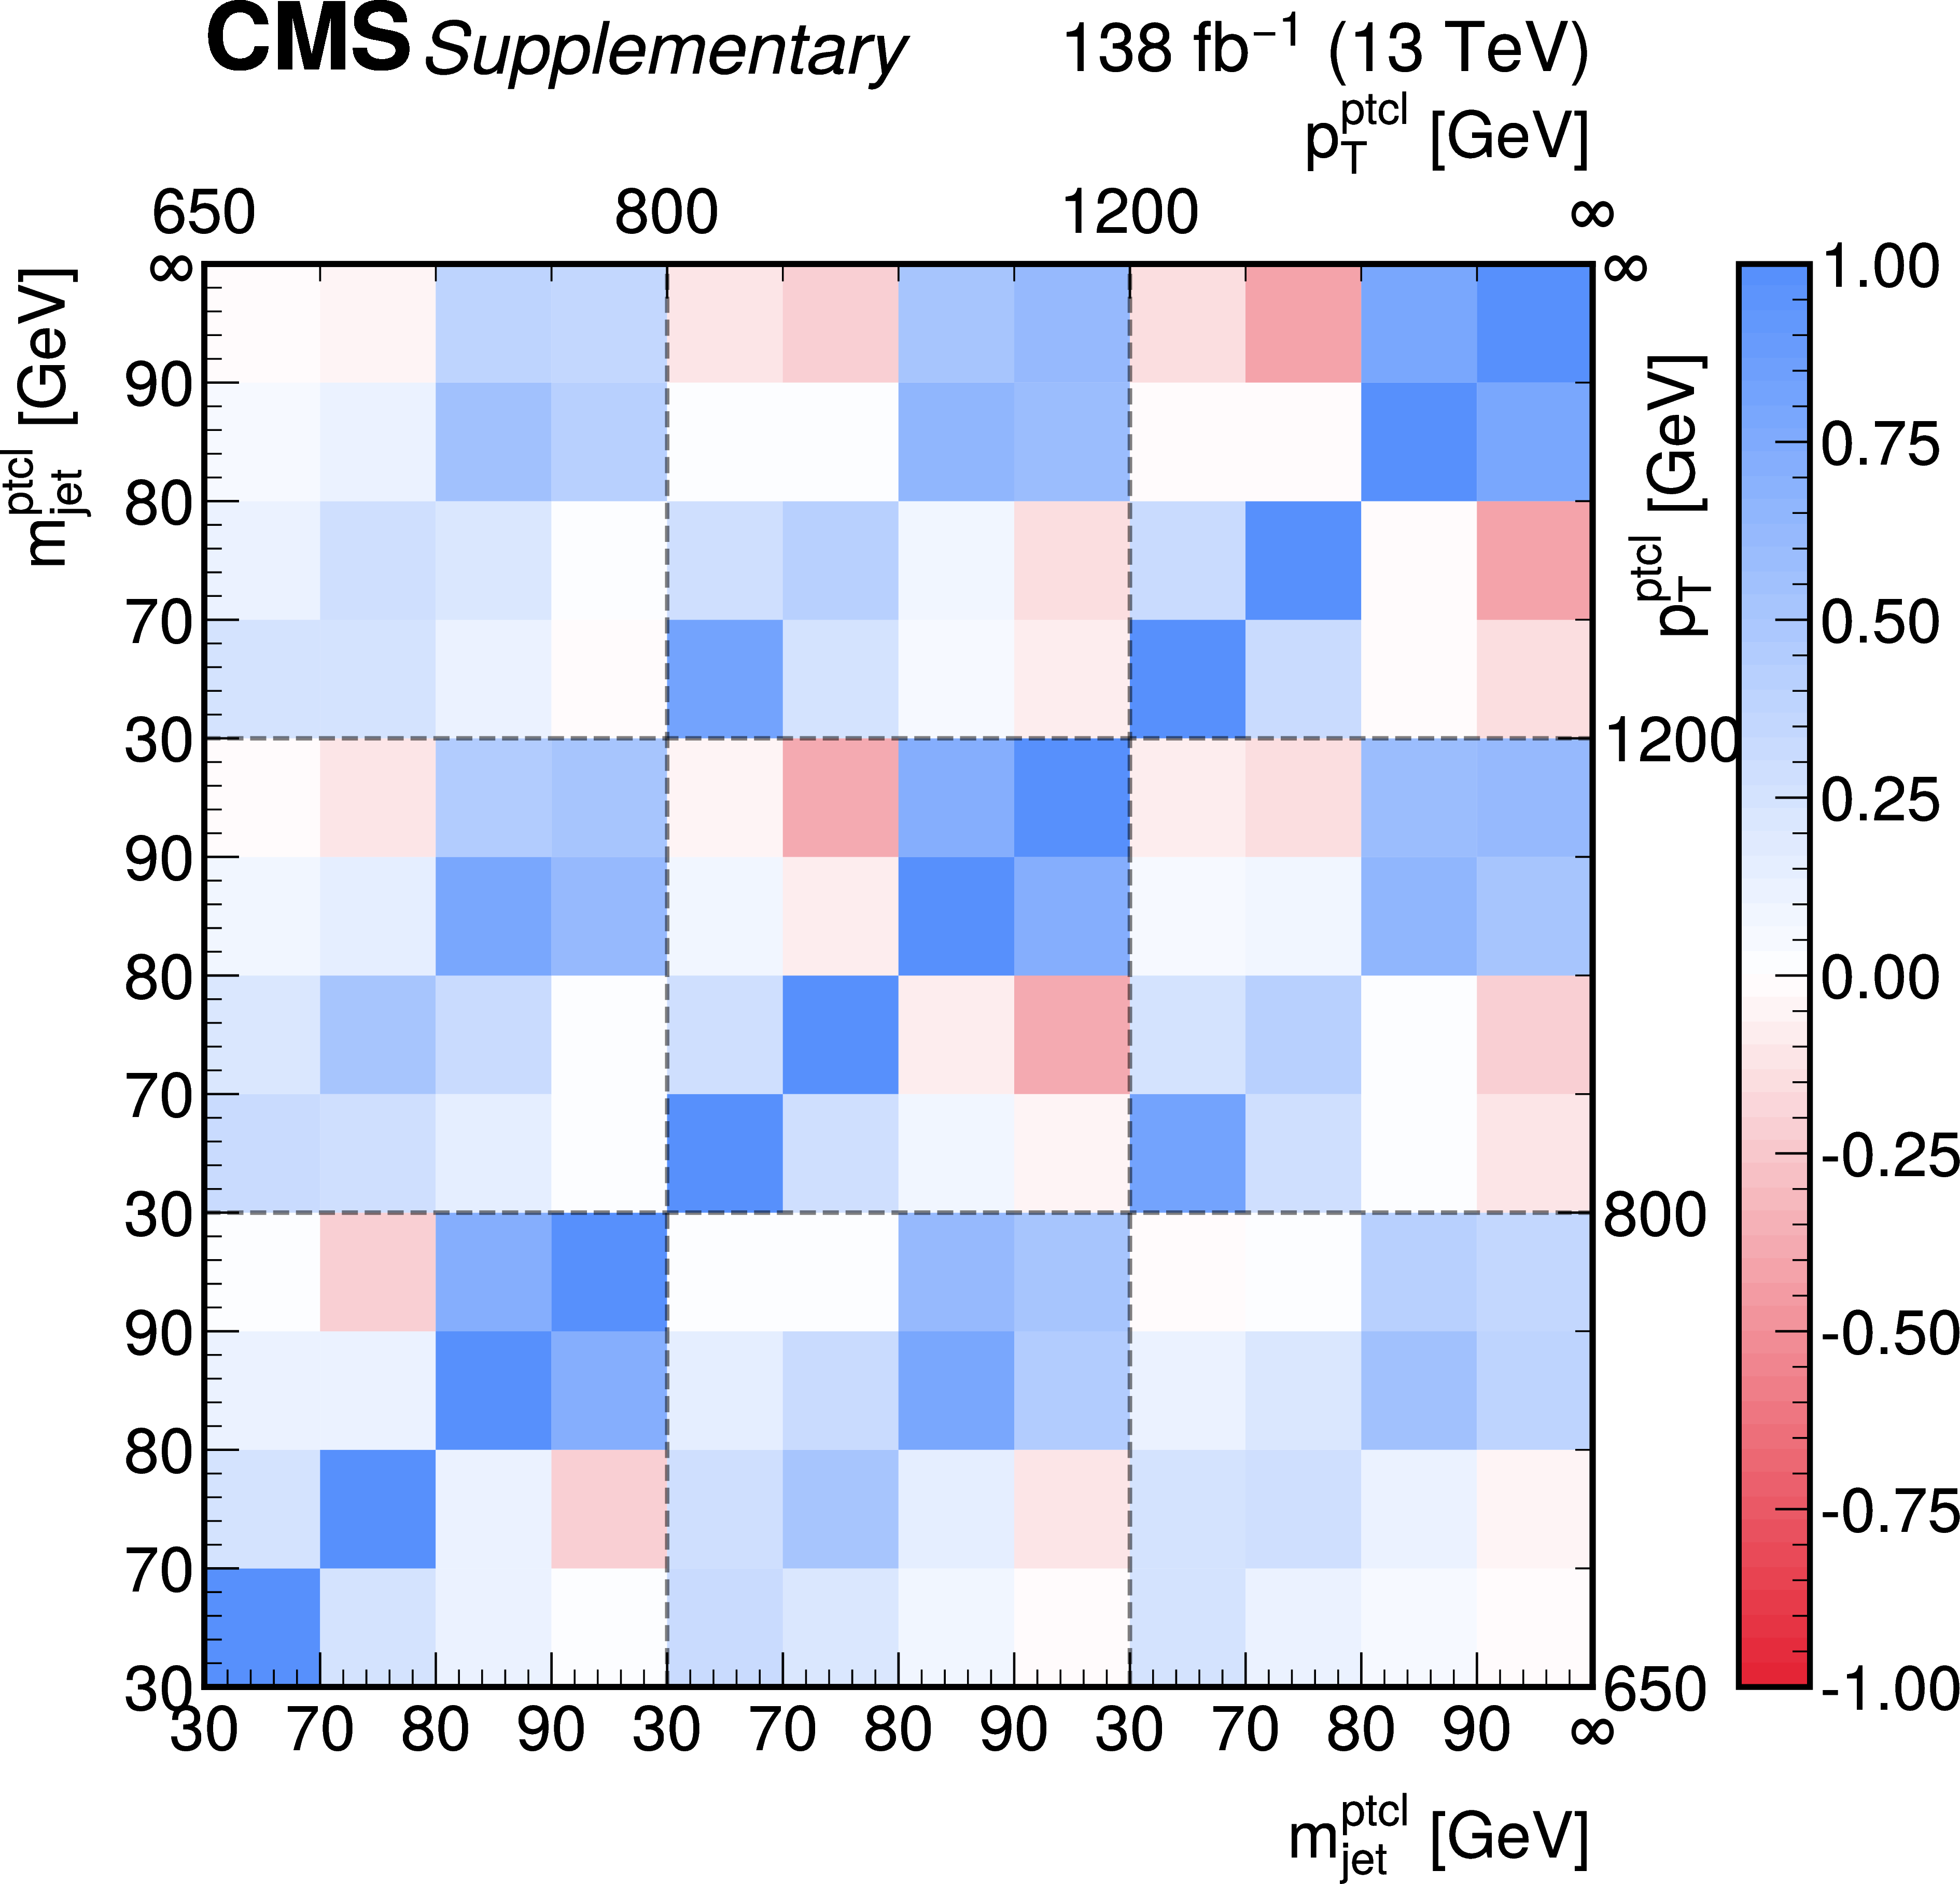
Correlation matrix of the maximum likelihood estimators of the signal strength modifiers \POI with inclusion of an $ N_{2}^{(1)} < $ 0.2 selection in the particle-level definition. The plot shows the matrix from the fit to the data using $ P^{\mathrm{PN, DDT}}_{\mathrm{W vs. QCD}} $. The grey dashed lines indicate the individual $ p_{\mathrm{T}}^\mathrm{ptcl} $ bins. The binning within each $ p_{\mathrm{T}}^\mathrm{ptcl} $ vs. $ p_{\mathrm{T}}^\mathrm{ptcl} $ bin corresponds to the $ m_\mathrm{SD}^\mathrm{ptcl} $ vs. $ m_\mathrm{SD}^\mathrm{ptcl} $ binning. |
png pdf |
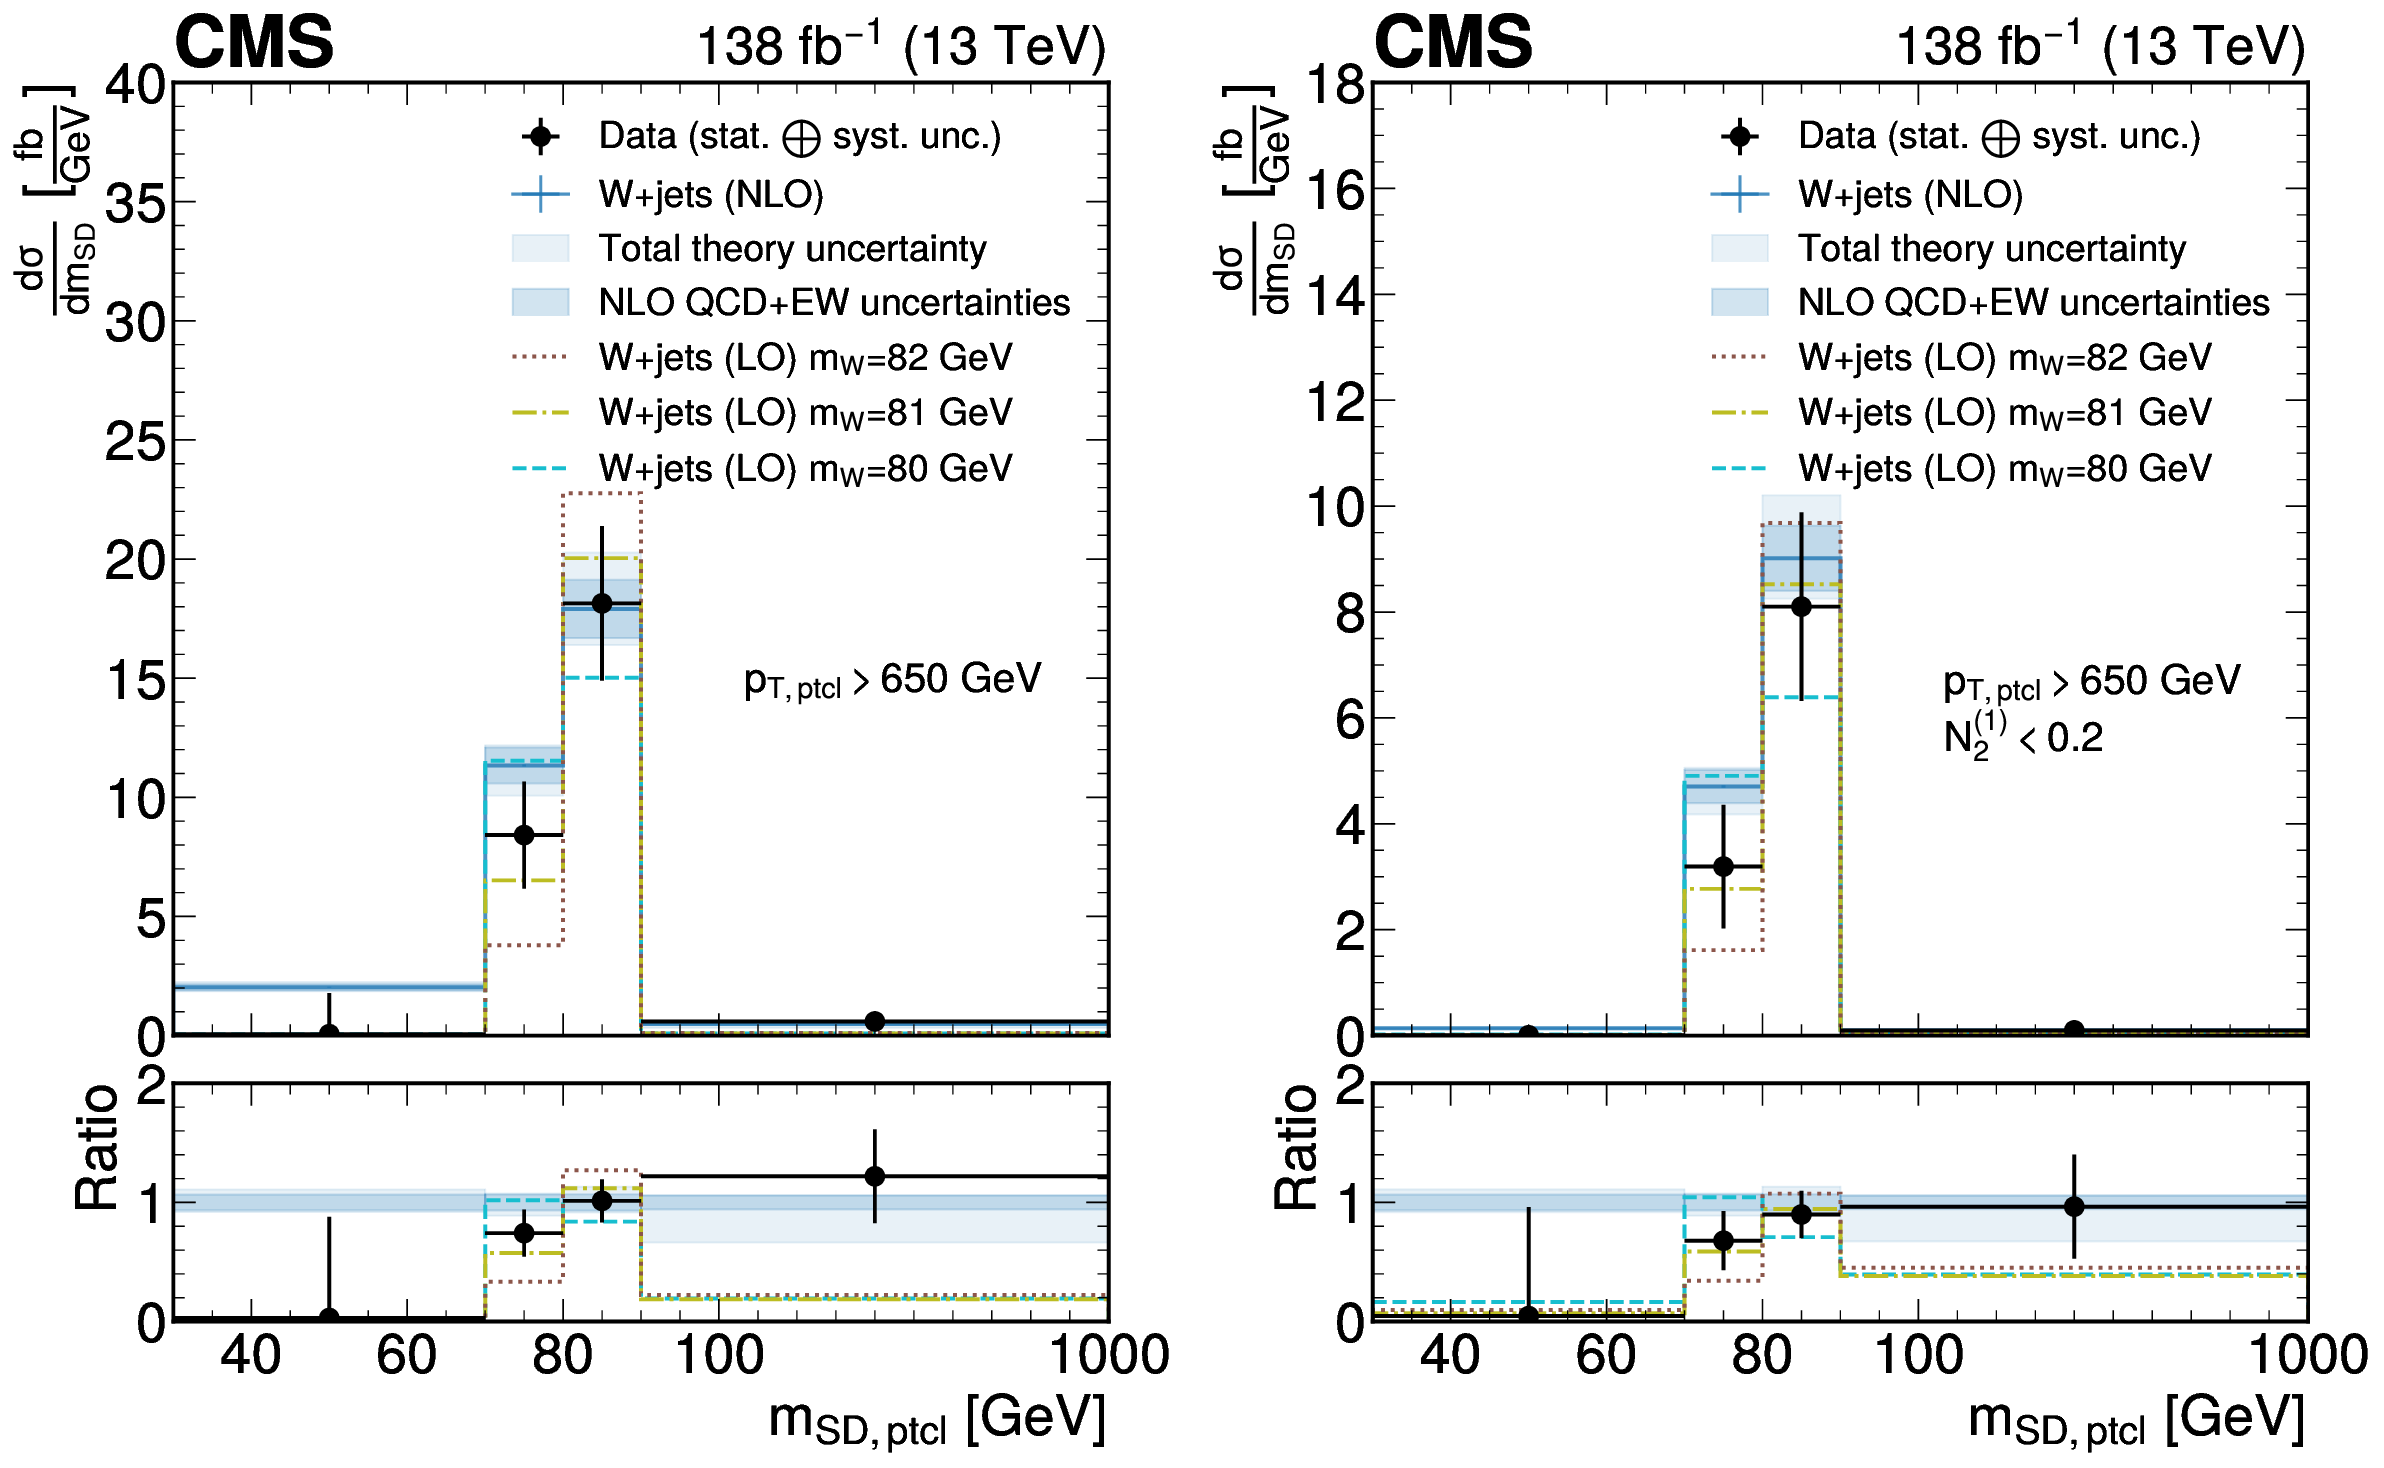
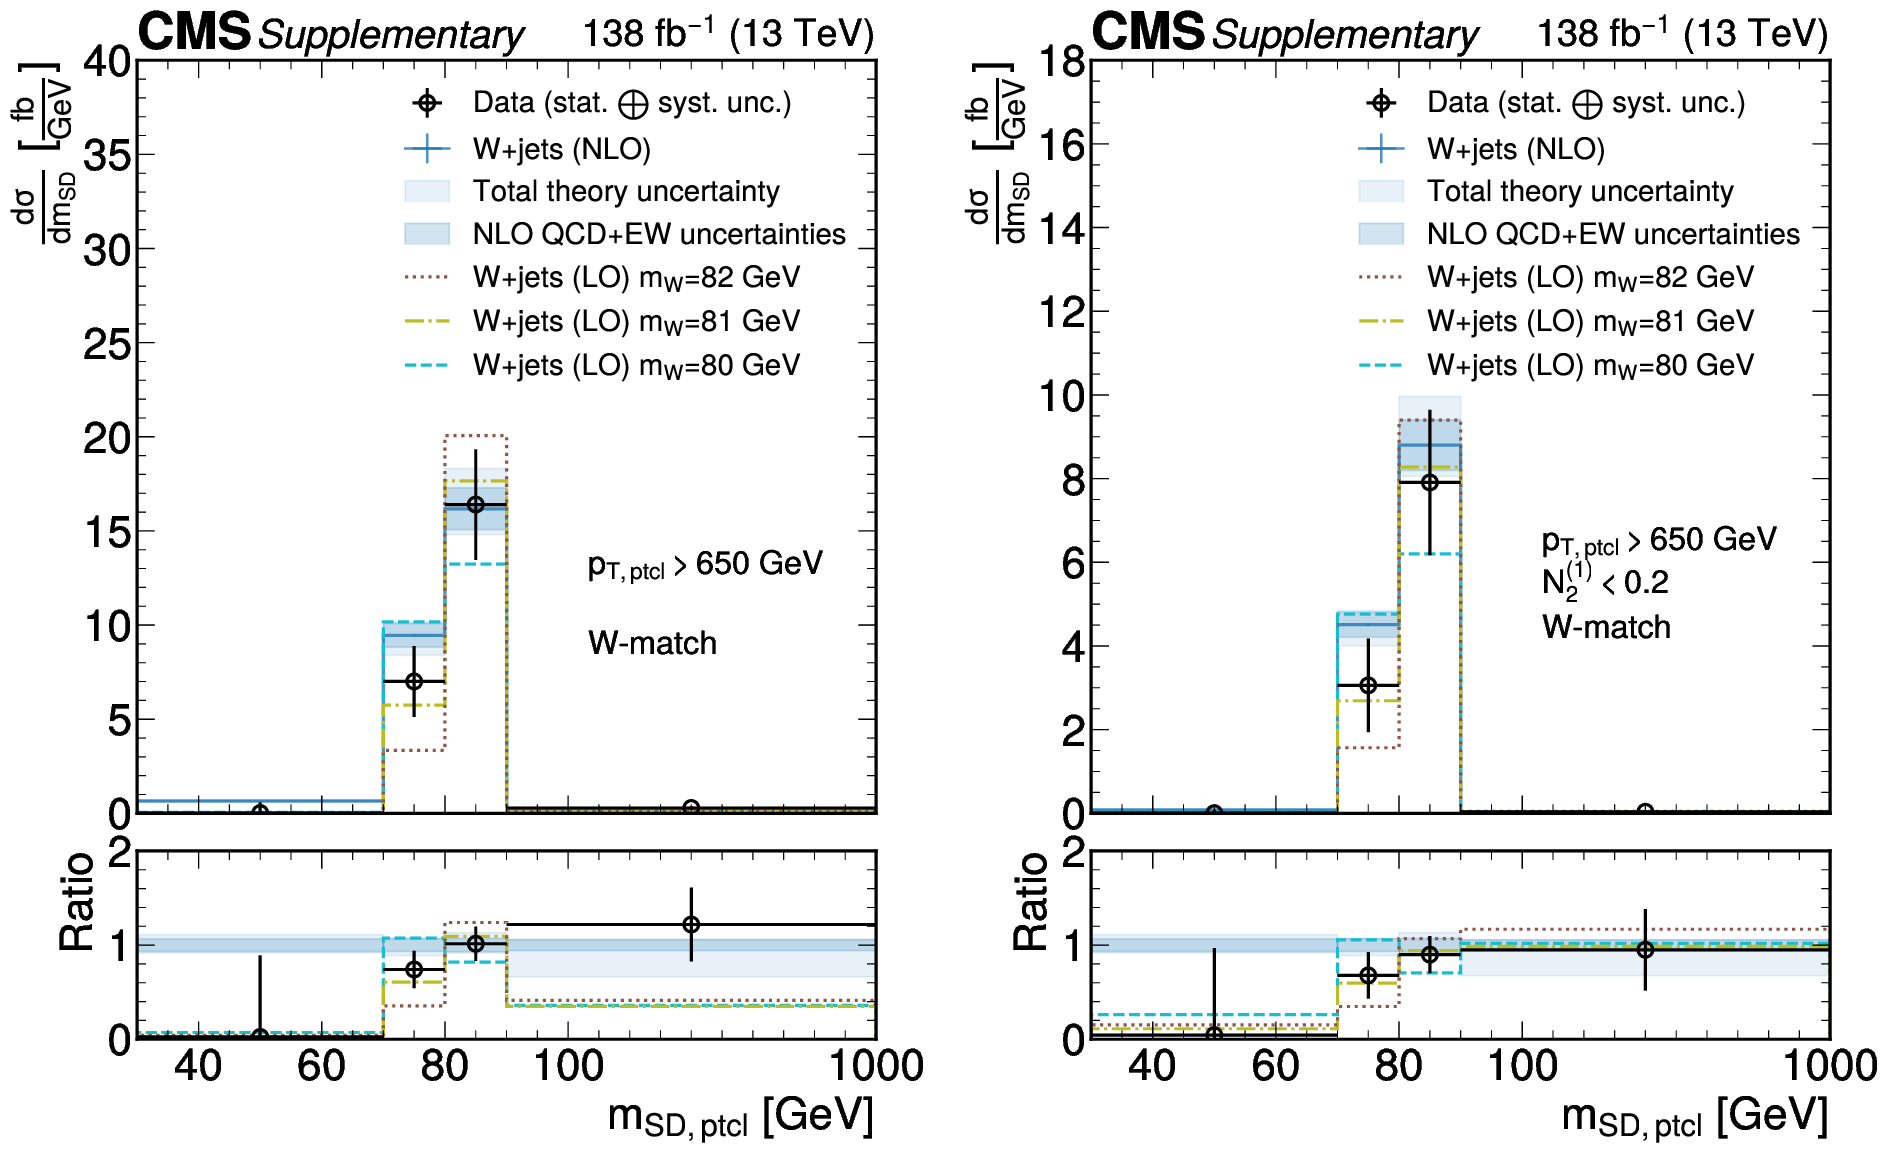
Figure 9:
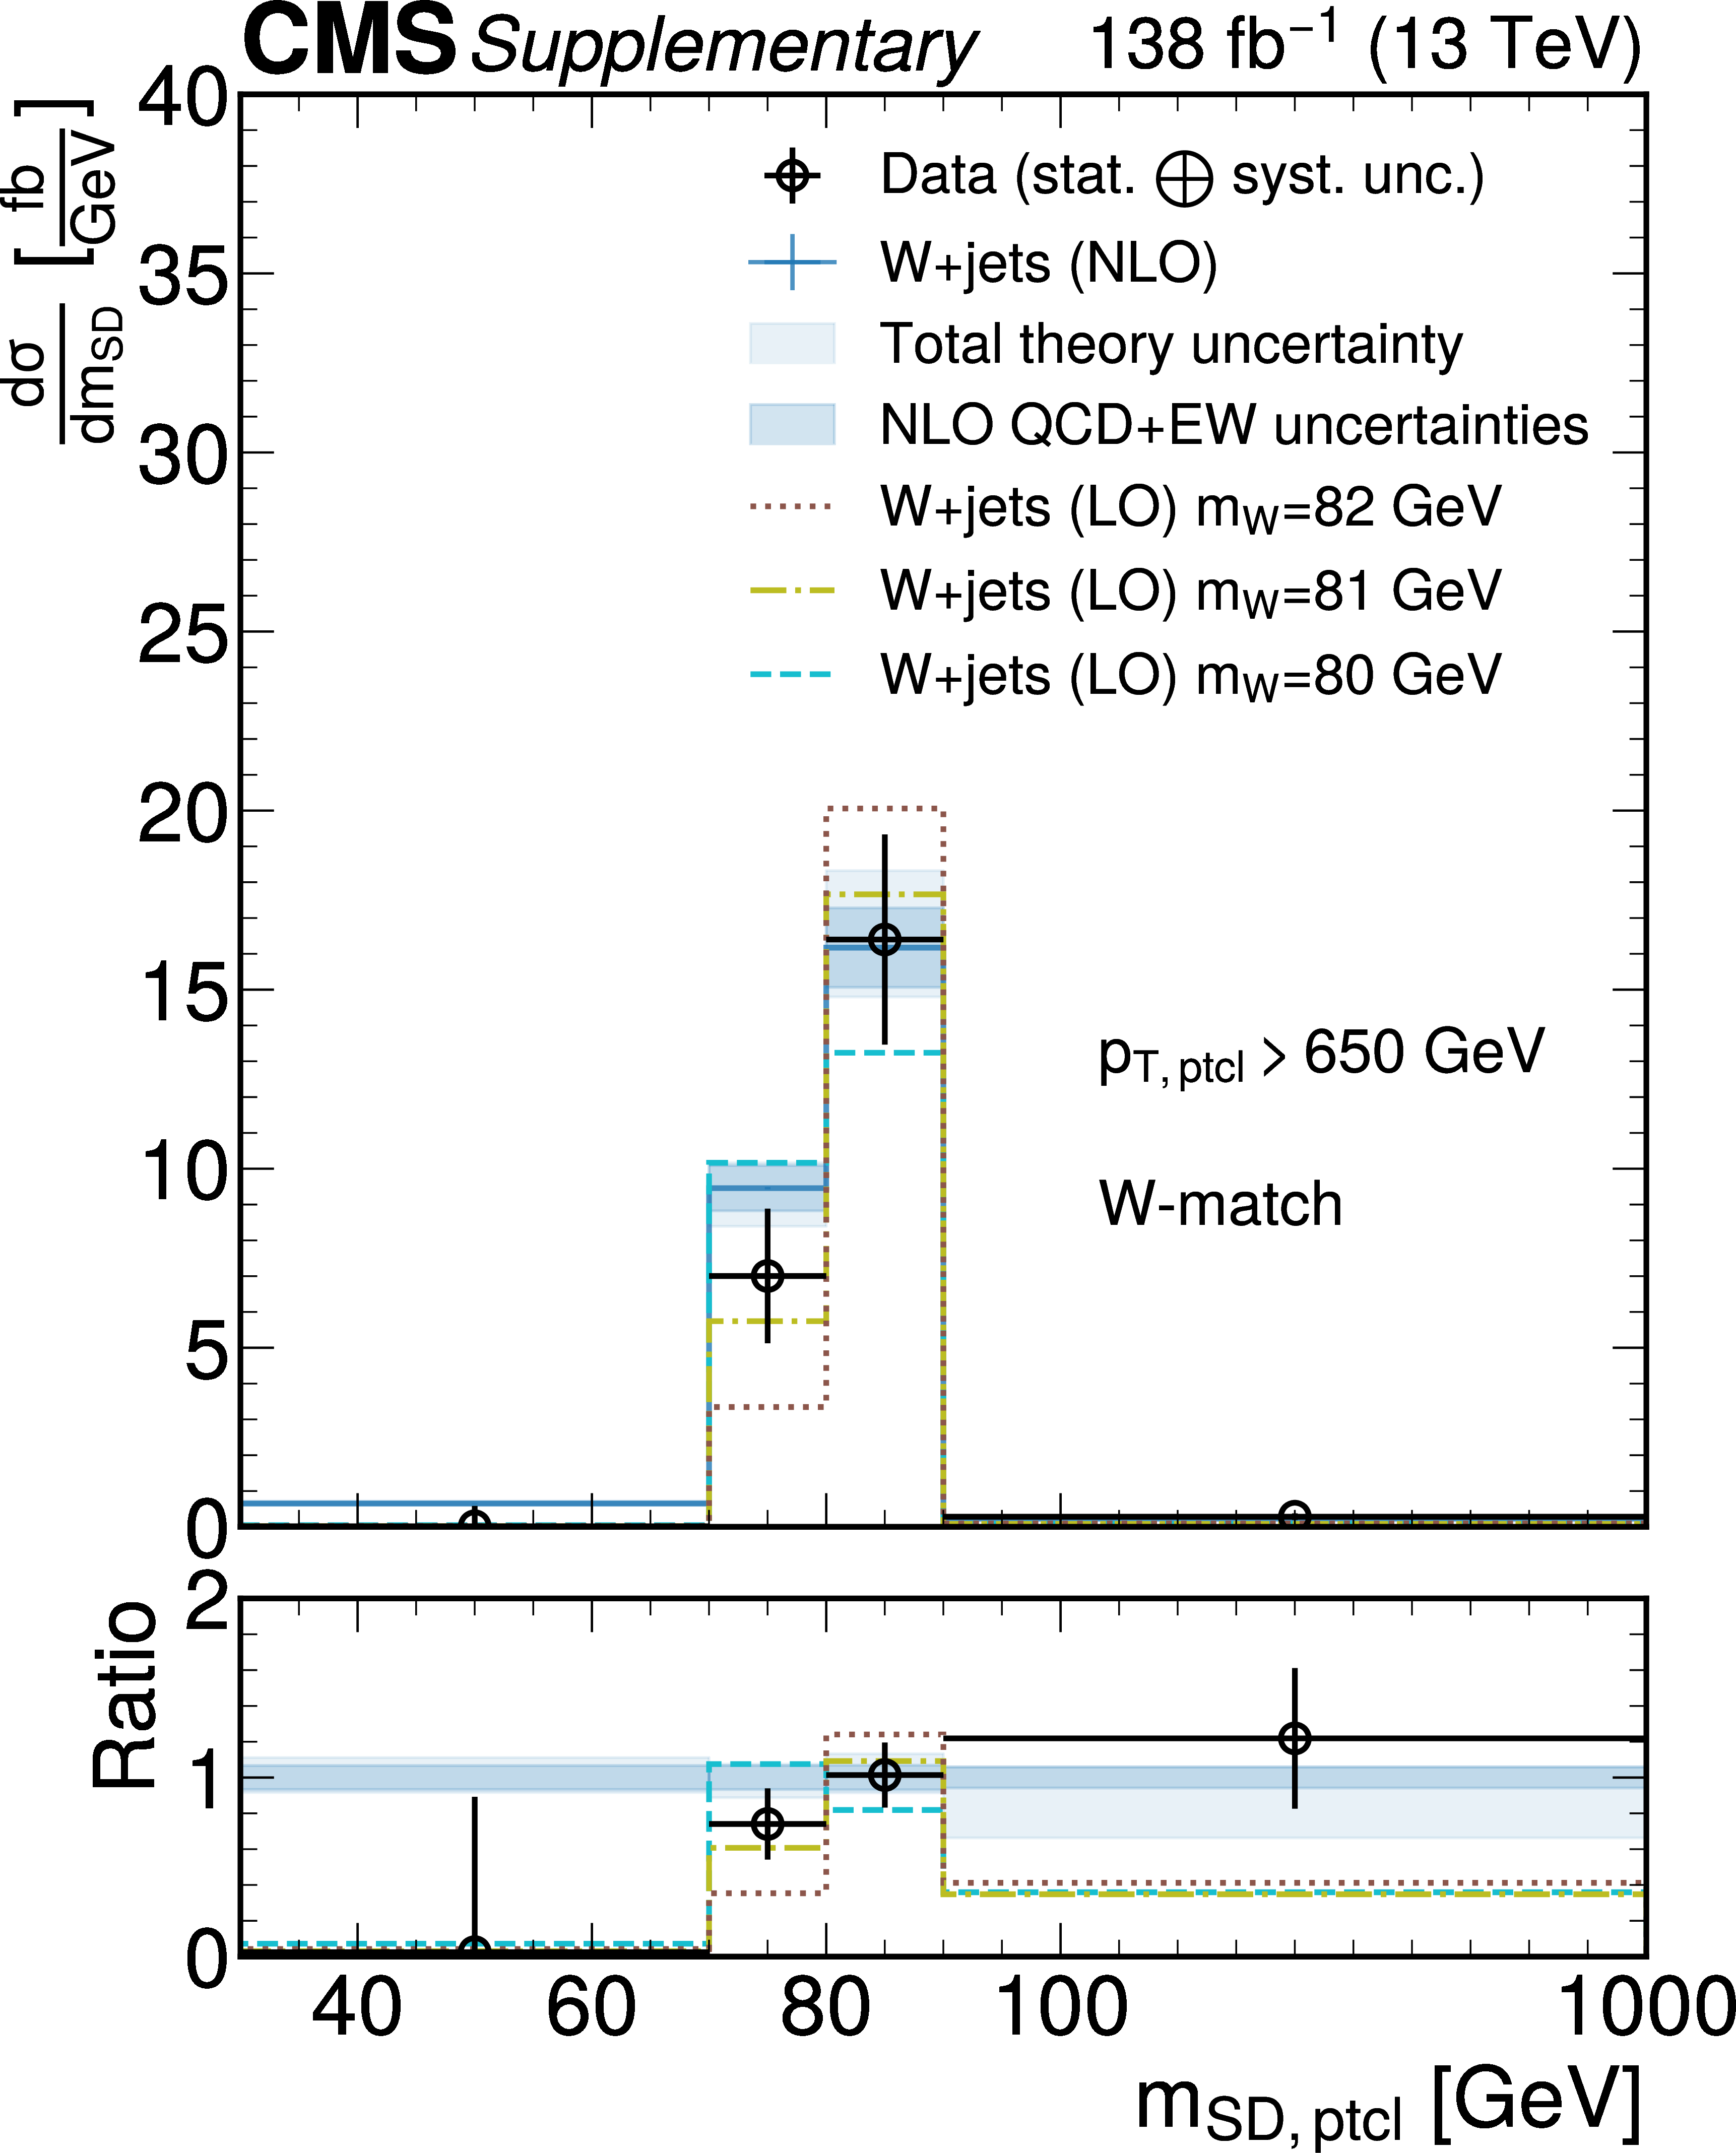
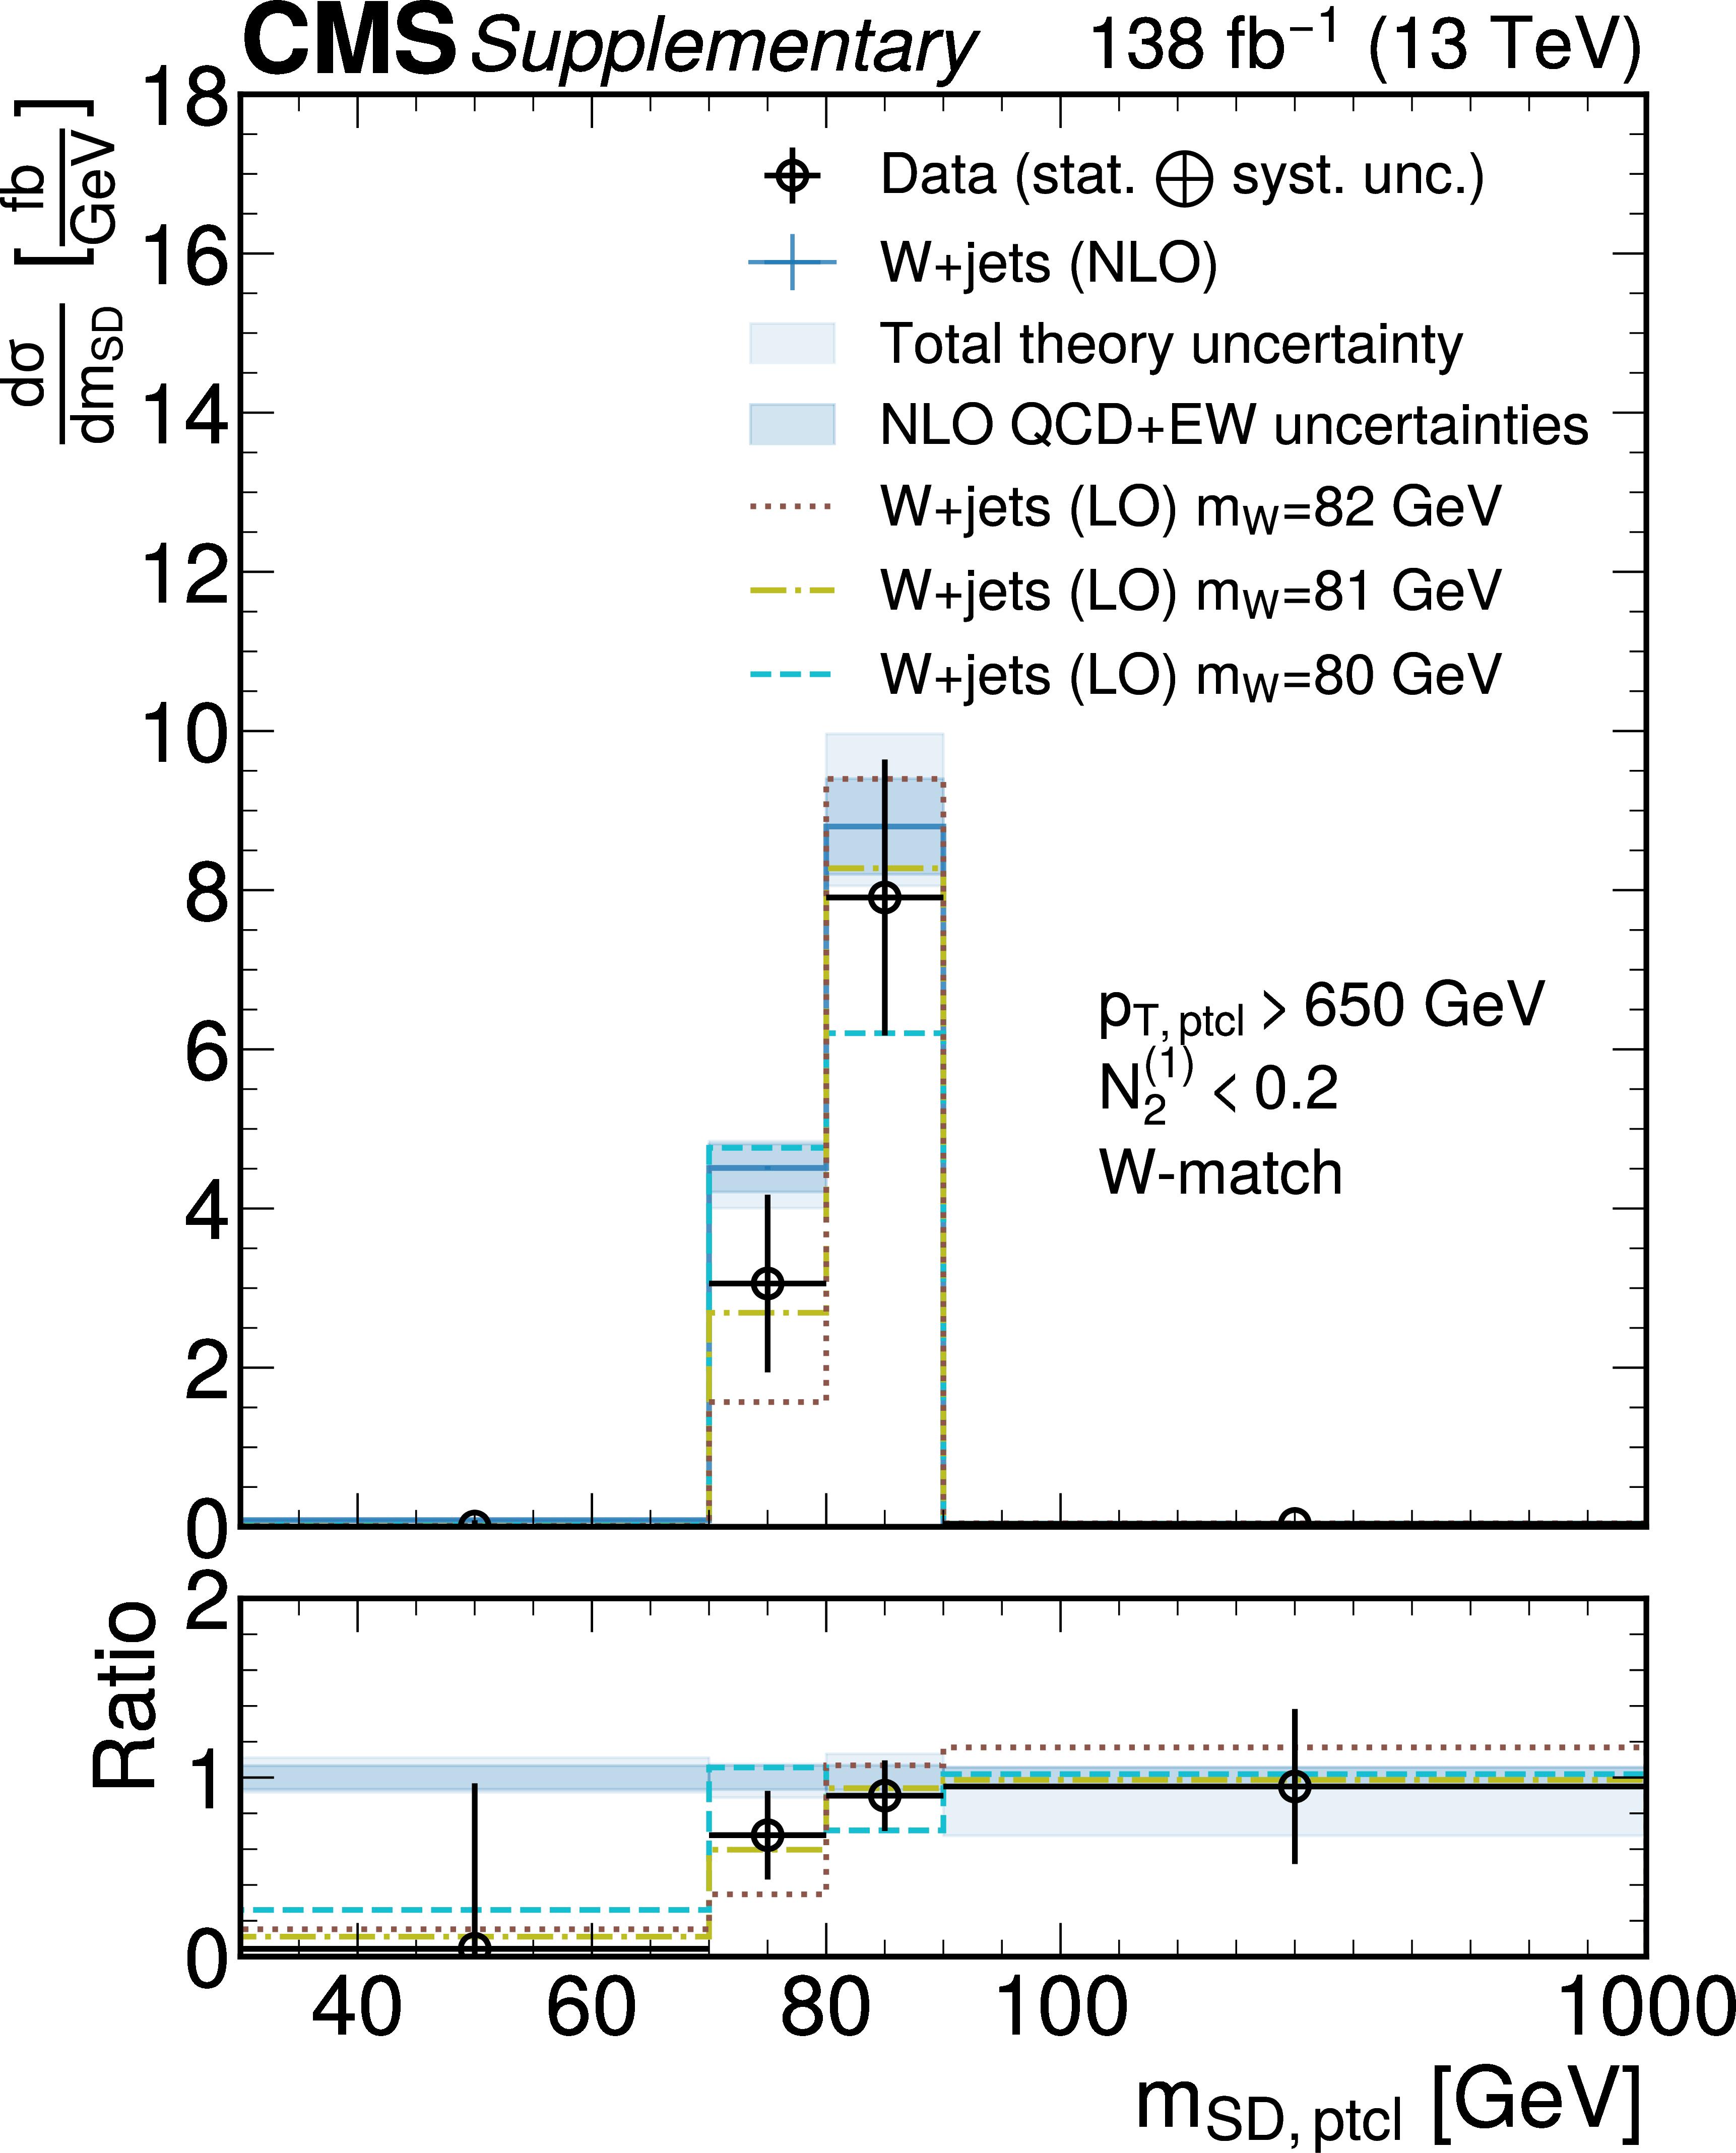
Unfolded and background subtracted jet mass distribution at the particle level for $ p_{\mathrm{T}}^\mathrm{ptcl} > $ 650 GeV, obtained by summing all $ p_{\mathrm{T}}^\mathrm{ptcl} $ bins. The results are obtained using the $ P^{\mathrm{PN, DDT}}_{\mathrm{W vs. QCD}} $ tagger without (left) and with (right) the $ N_{2}^{(1)} < $ 0.2 selection at the particle level. The unfolded data are shown as black markers. The blue lines show the predictions from MadGraph-5_aMC@NLO+PYTHIA at LO with MLM matching and supplemented by NLO QCD and EW corrections. The theory uncertainty is the sum in quadrature of parton shower variations and the hadronization model uncertainty, as well as the uncertainties in the QCD and EW corrections, and is drawn as a light shaded blue band. The purely perturbative uncertainties are overlaid as a dark, shaded blue band. Predictions with different values of the W boson mass generated with PYTHIA at LO and scaled to match the total number of events in data are overlaid. |
png pdf |
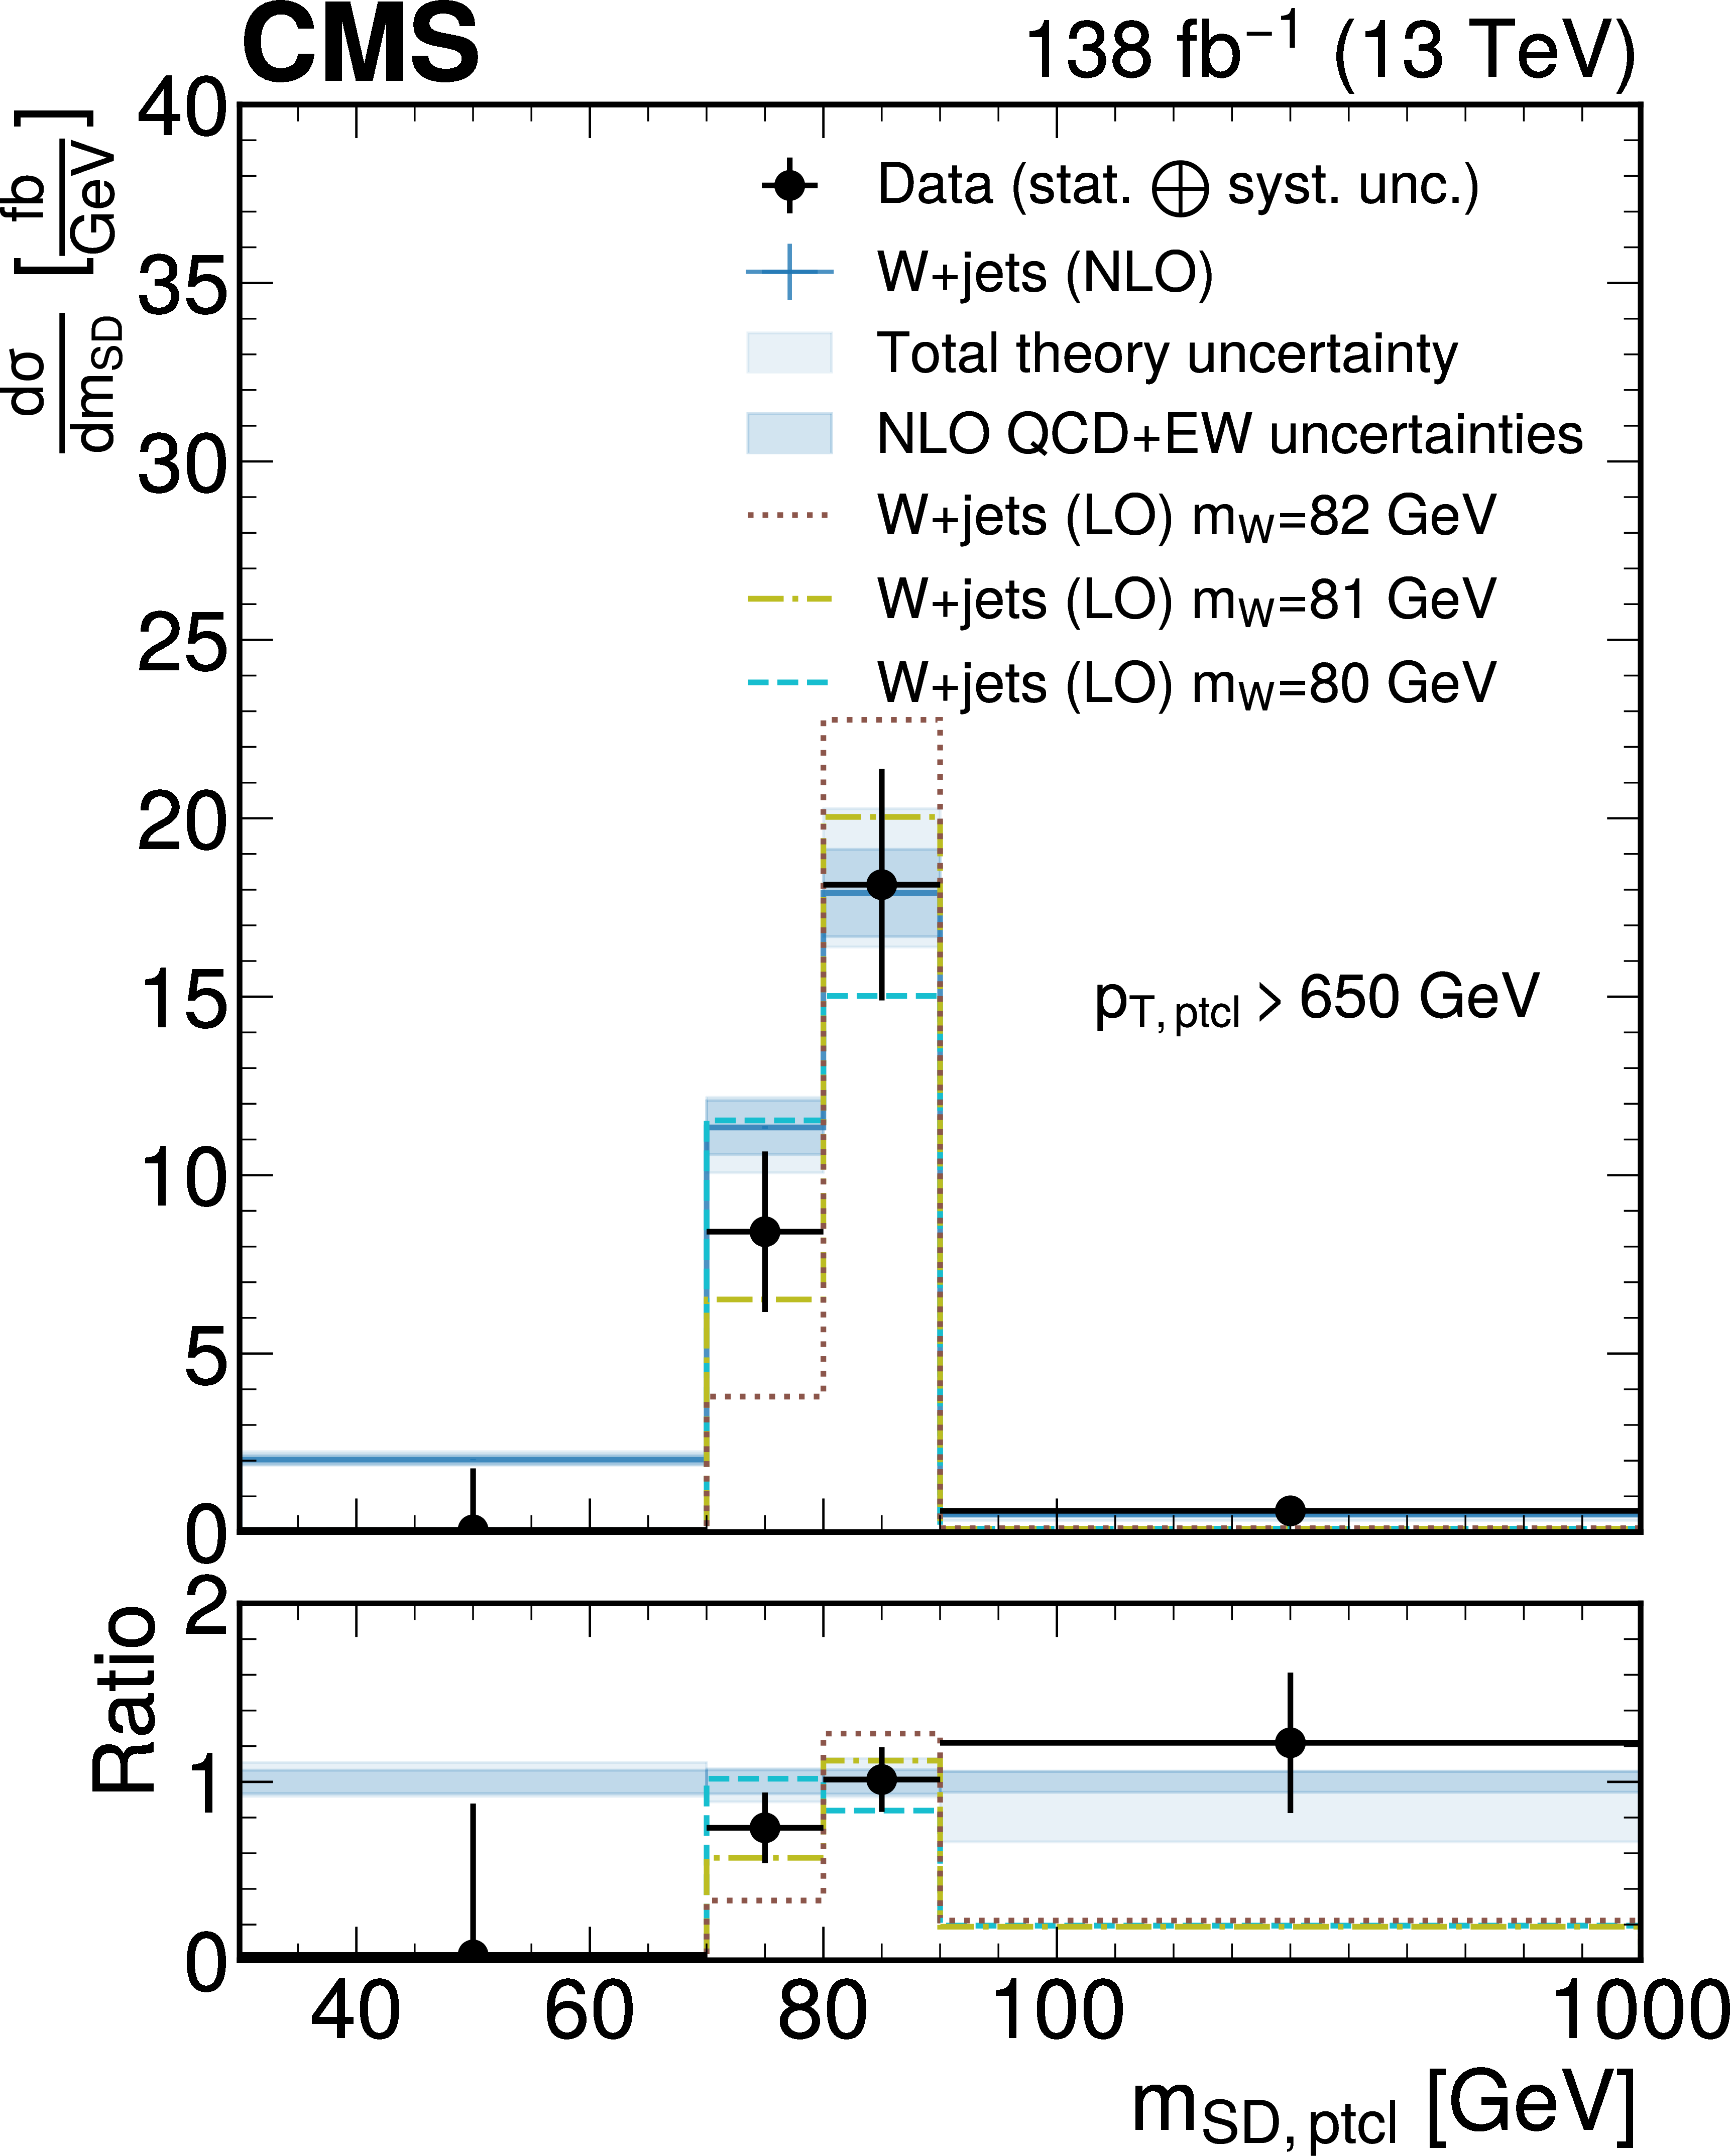
Figure 9-a:
Unfolded and background subtracted jet mass distribution at the particle level for $ p_{\mathrm{T}}^\mathrm{ptcl} > $ 650 GeV, obtained by summing all $ p_{\mathrm{T}}^\mathrm{ptcl} $ bins. The results are obtained using the $ P^{\mathrm{PN, DDT}}_{\mathrm{W vs. QCD}} $ tagger without (left) and with (right) the $ N_{2}^{(1)} < $ 0.2 selection at the particle level. The unfolded data are shown as black markers. The blue lines show the predictions from MadGraph-5_aMC@NLO+PYTHIA at LO with MLM matching and supplemented by NLO QCD and EW corrections. The theory uncertainty is the sum in quadrature of parton shower variations and the hadronization model uncertainty, as well as the uncertainties in the QCD and EW corrections, and is drawn as a light shaded blue band. The purely perturbative uncertainties are overlaid as a dark, shaded blue band. Predictions with different values of the W boson mass generated with PYTHIA at LO and scaled to match the total number of events in data are overlaid. |
png pdf |
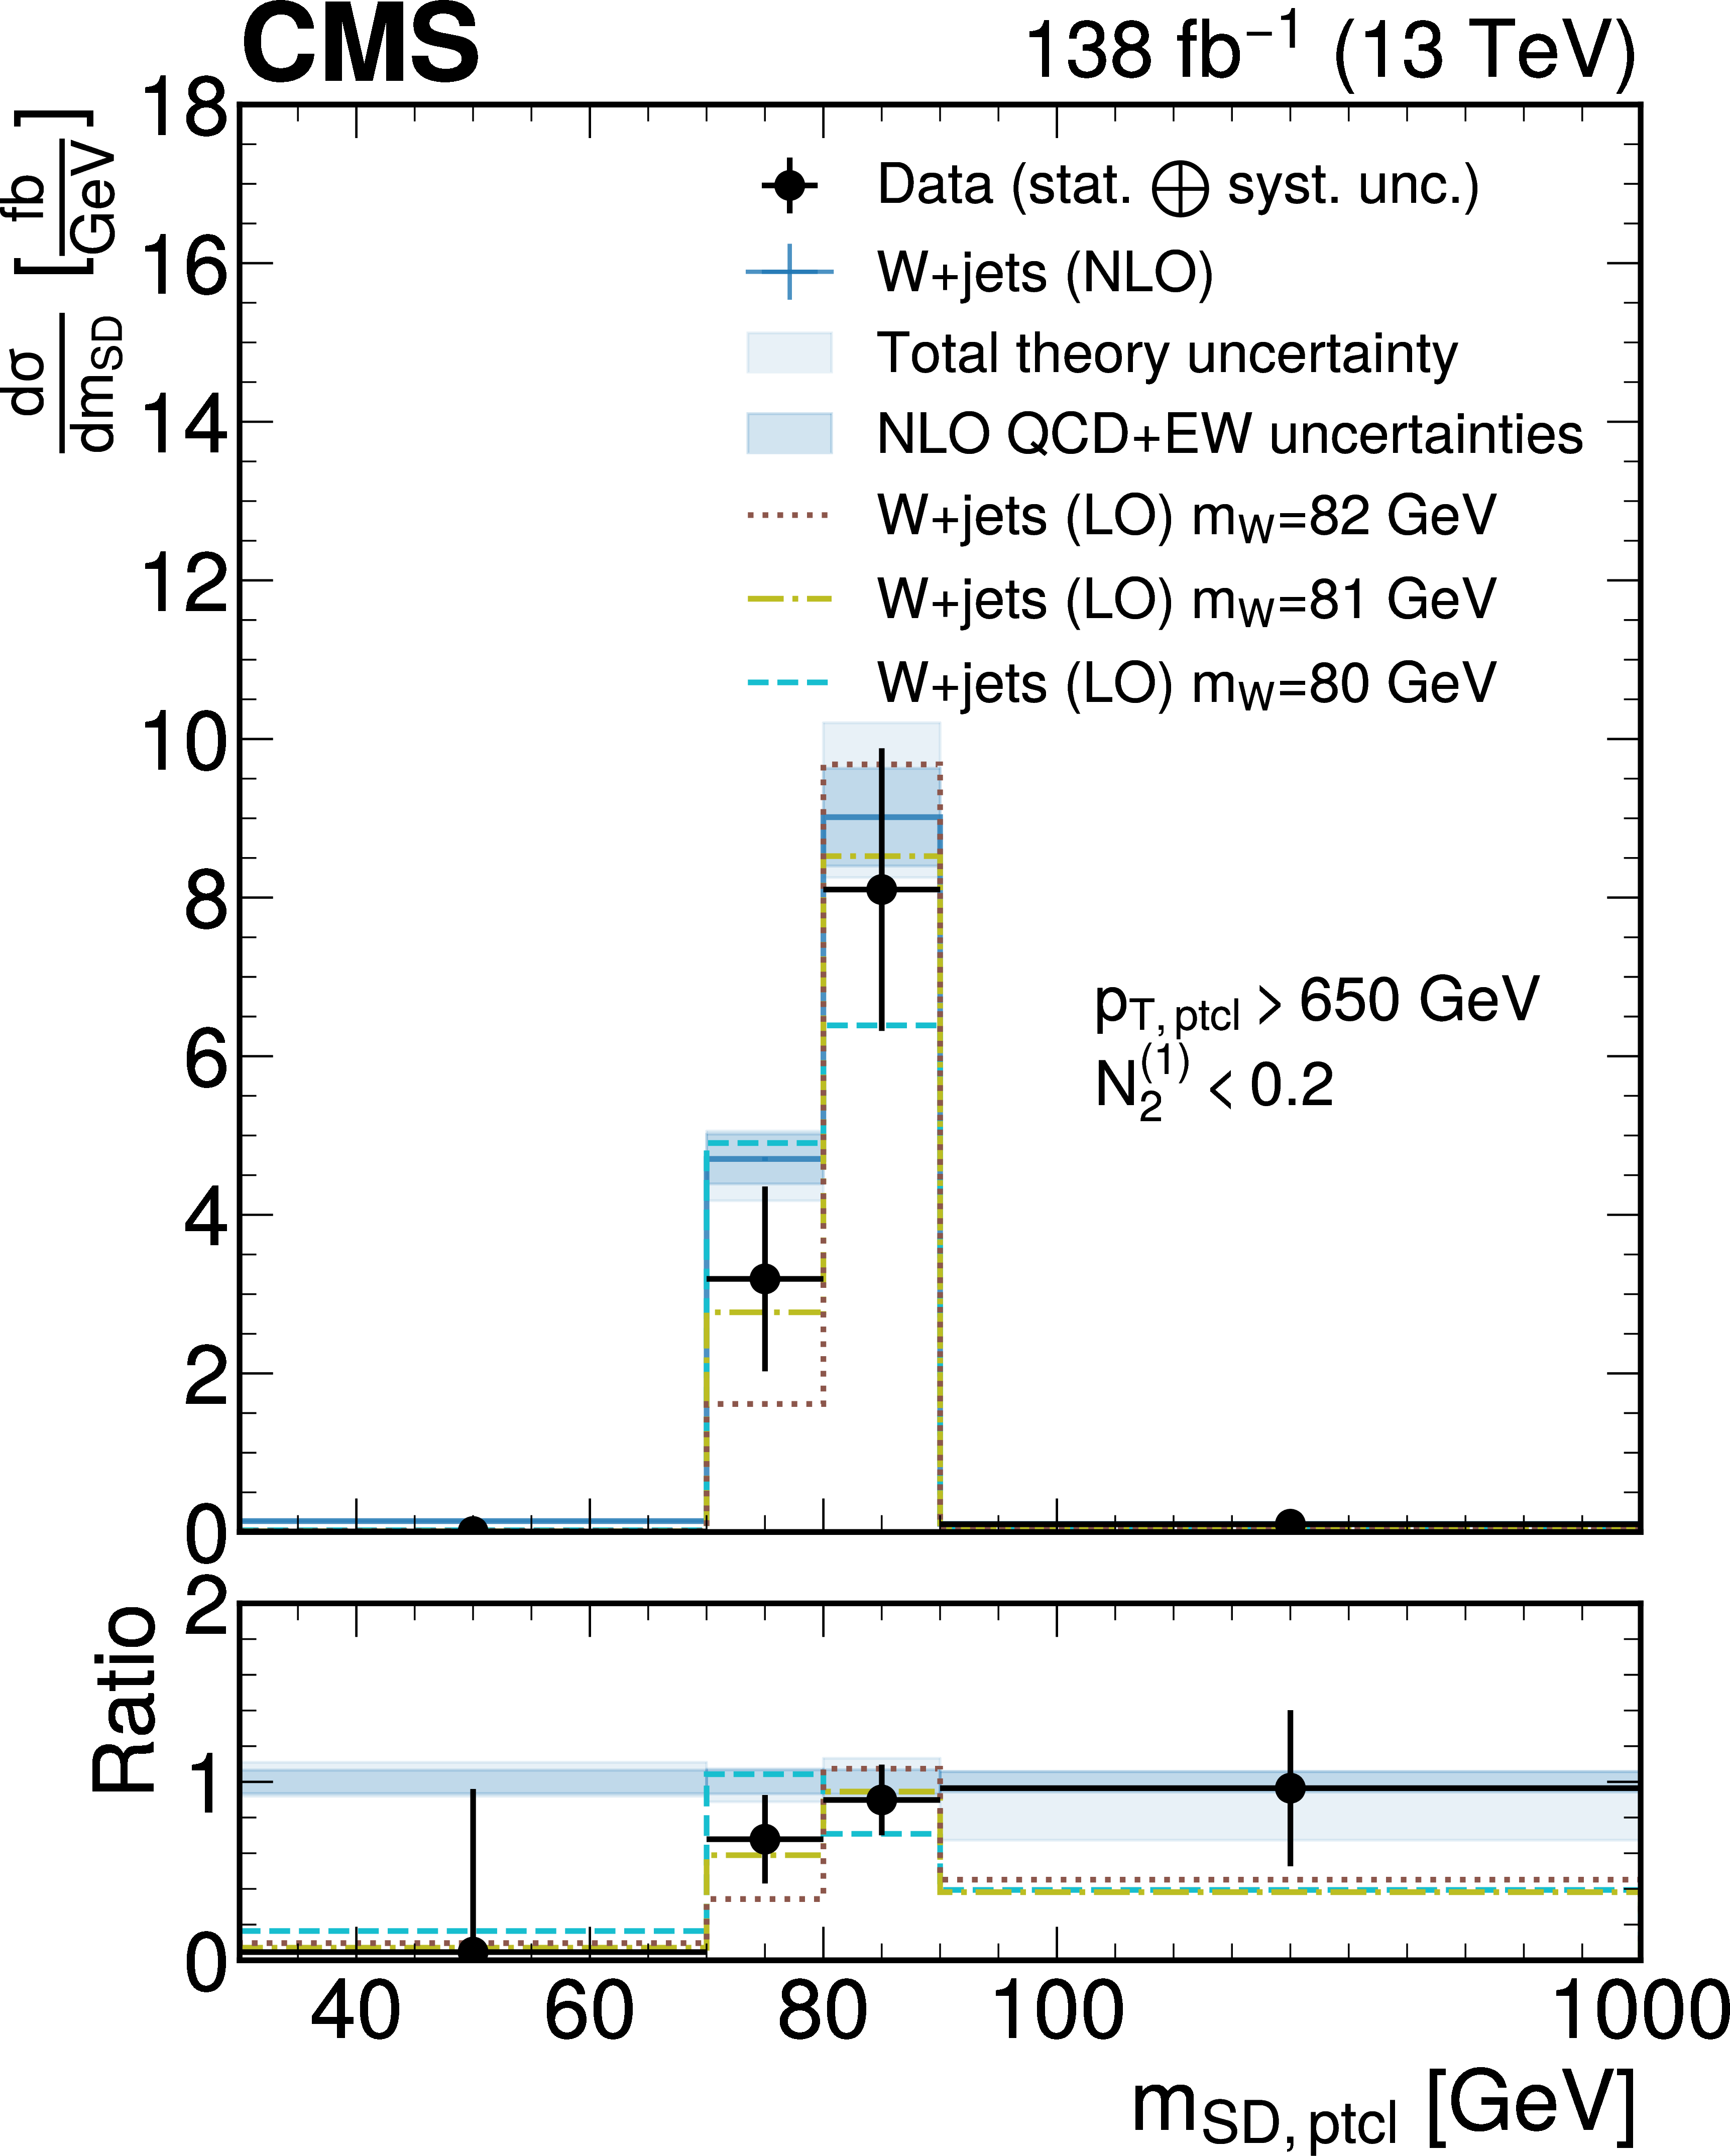
Figure 9-b:
Unfolded and background subtracted jet mass distribution at the particle level for $ p_{\mathrm{T}}^\mathrm{ptcl} > $ 650 GeV, obtained by summing all $ p_{\mathrm{T}}^\mathrm{ptcl} $ bins. The results are obtained using the $ P^{\mathrm{PN, DDT}}_{\mathrm{W vs. QCD}} $ tagger without (left) and with (right) the $ N_{2}^{(1)} < $ 0.2 selection at the particle level. The unfolded data are shown as black markers. The blue lines show the predictions from MadGraph-5_aMC@NLO+PYTHIA at LO with MLM matching and supplemented by NLO QCD and EW corrections. The theory uncertainty is the sum in quadrature of parton shower variations and the hadronization model uncertainty, as well as the uncertainties in the QCD and EW corrections, and is drawn as a light shaded blue band. The purely perturbative uncertainties are overlaid as a dark, shaded blue band. Predictions with different values of the W boson mass generated with PYTHIA at LO and scaled to match the total number of events in data are overlaid. |
| Tables | |
png pdf |
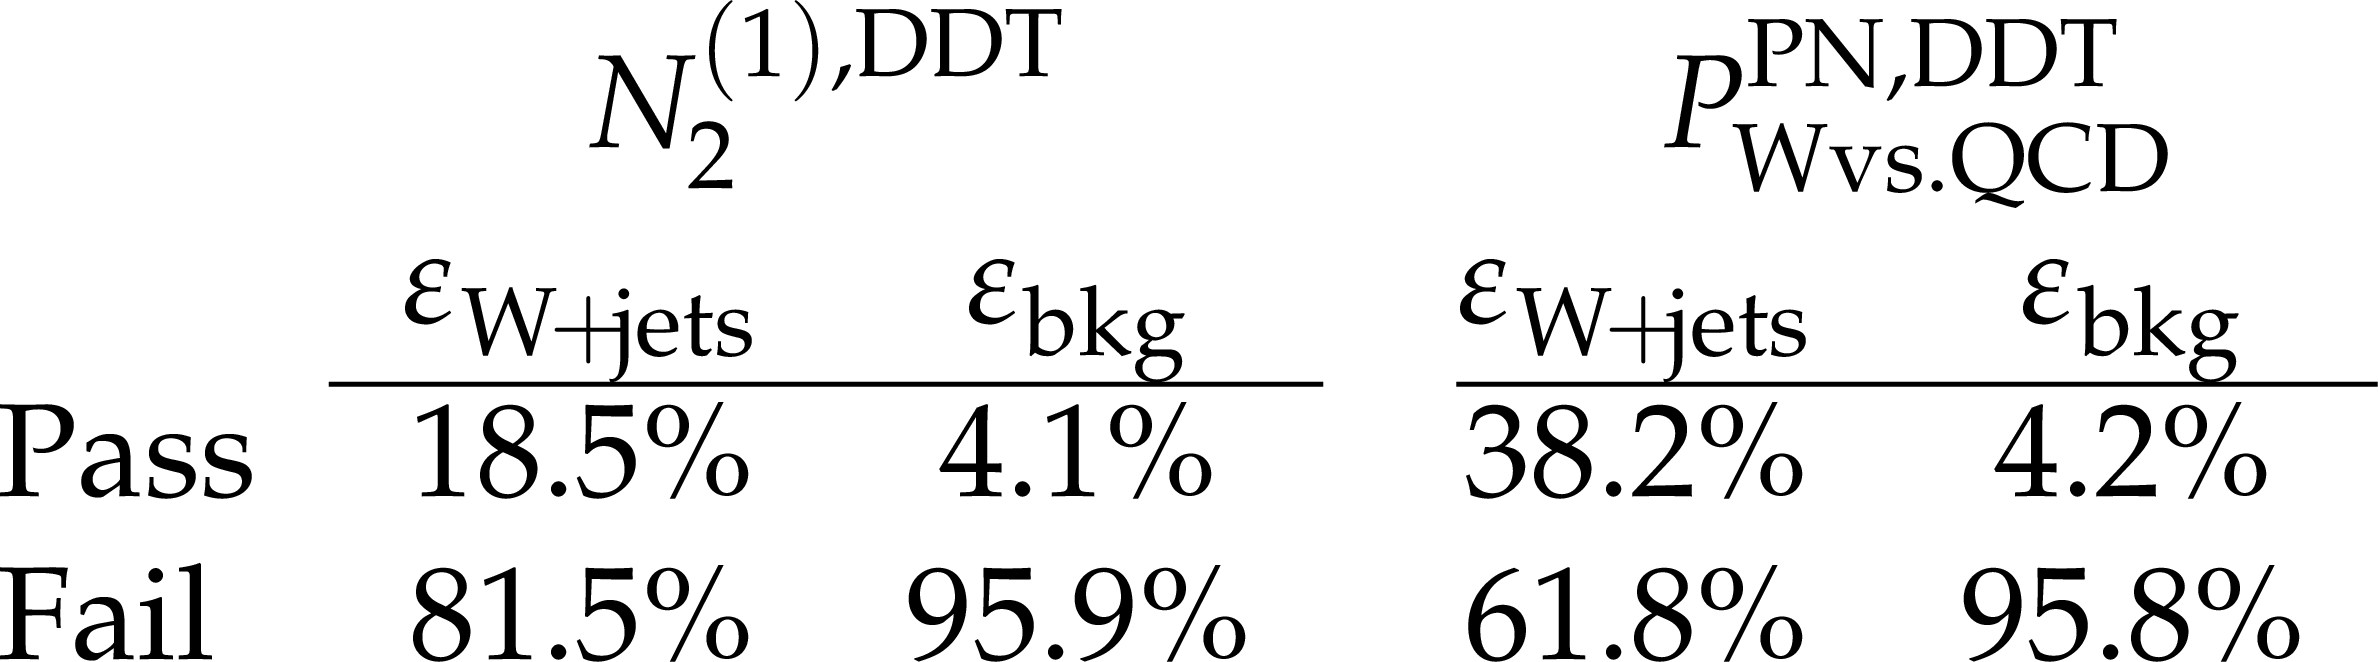
Table 1:
Summary of signal ($ \varepsilon_{\mathrm{W}\!+\!\text{jets}} $) and background ($ \varepsilon_{\text{bkg}} $) efficiencies in the different signal (pass) and control (fail) regions for the $ N_{2}^{(1),\mathrm{DDT}} $ and $ P^{\mathrm{PN, DDT}}_{\mathrm{W vs. QCD}} $ taggers in the fully-hadronic $ \mathrm{W}(\mathrm{q}\overline{\mathrm{q}}') $+jets selection. The efficiencies are estimated from simulation and averaged over the years of data-taking. |
png pdf |
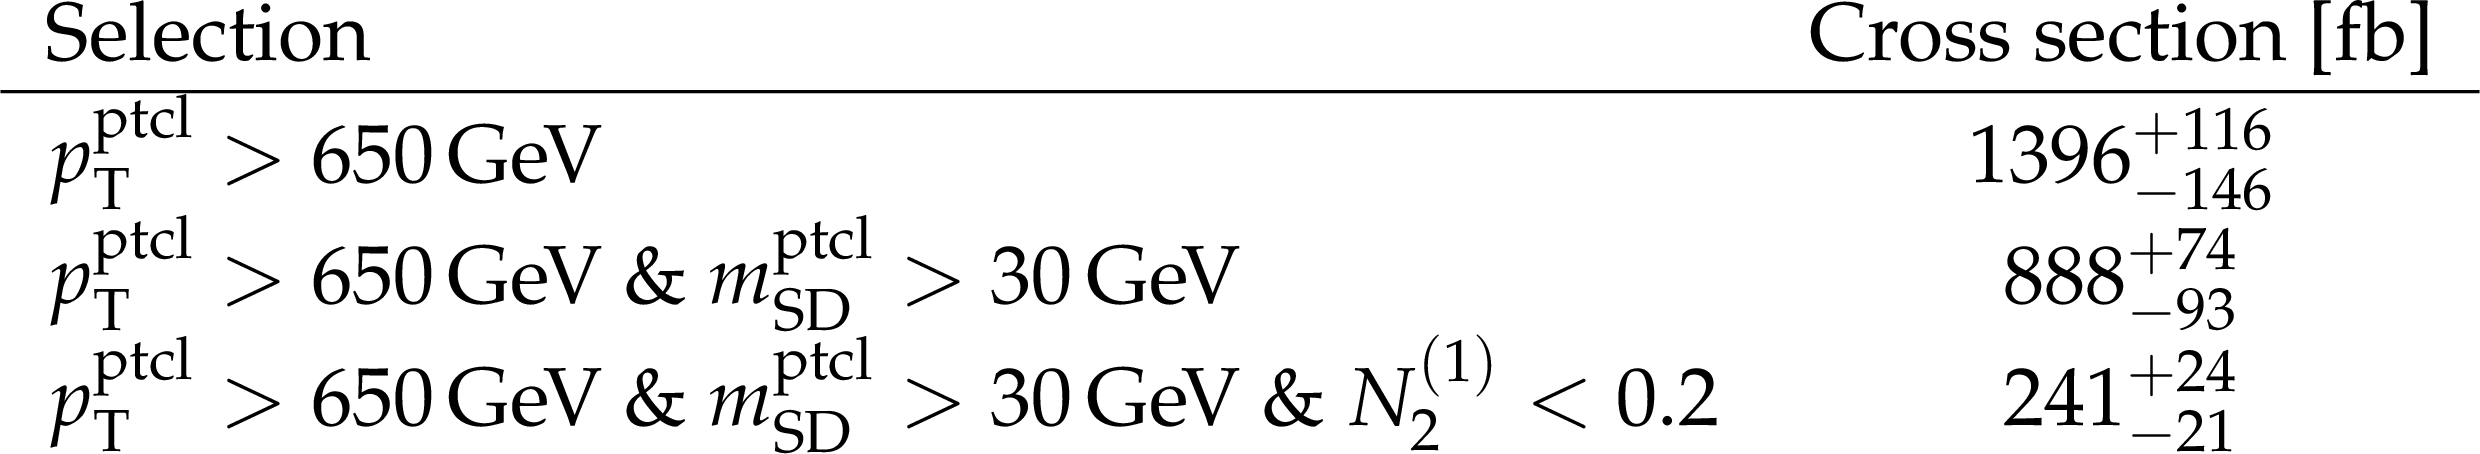
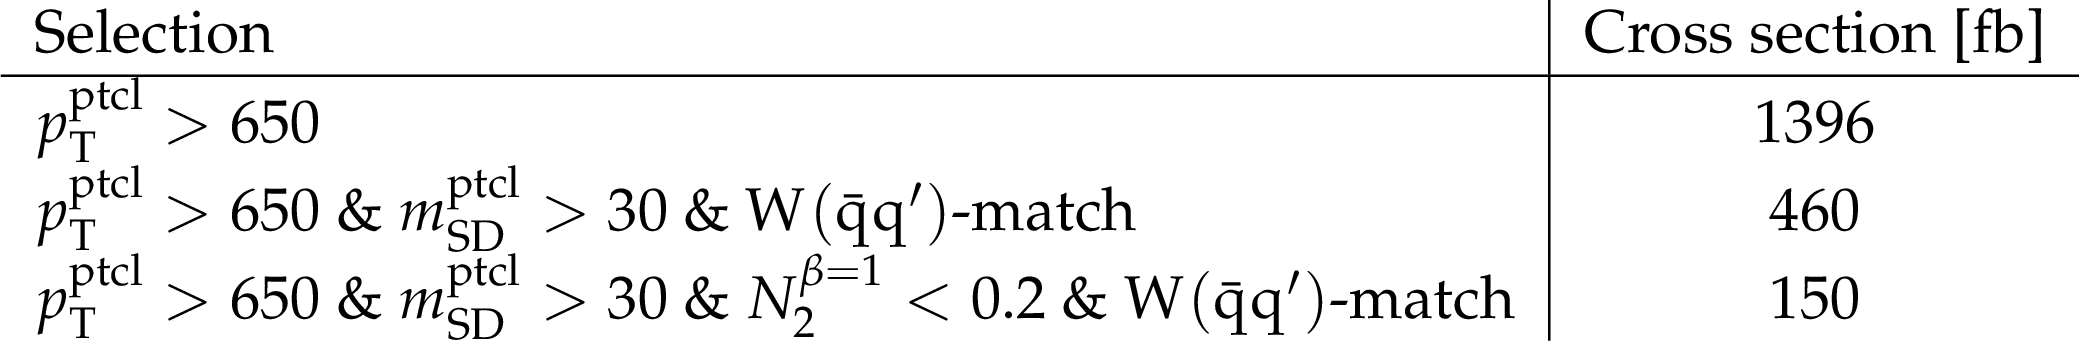
Table 2:
Fiducial $ \mathrm{W}(\mathrm{q}\overline{\mathrm{q}}') $+jets cross sections predicted by MadGraph-5_aMC@NLO+PYTHIA at NLO QCD with EW corrections after different stages of the particle-level selection. The given uncertainty is the sum in quadrature of parton shower variations and the hadronization model uncertainty, as well as the uncertainties in the QCD and EW corrections. |
png pdf |
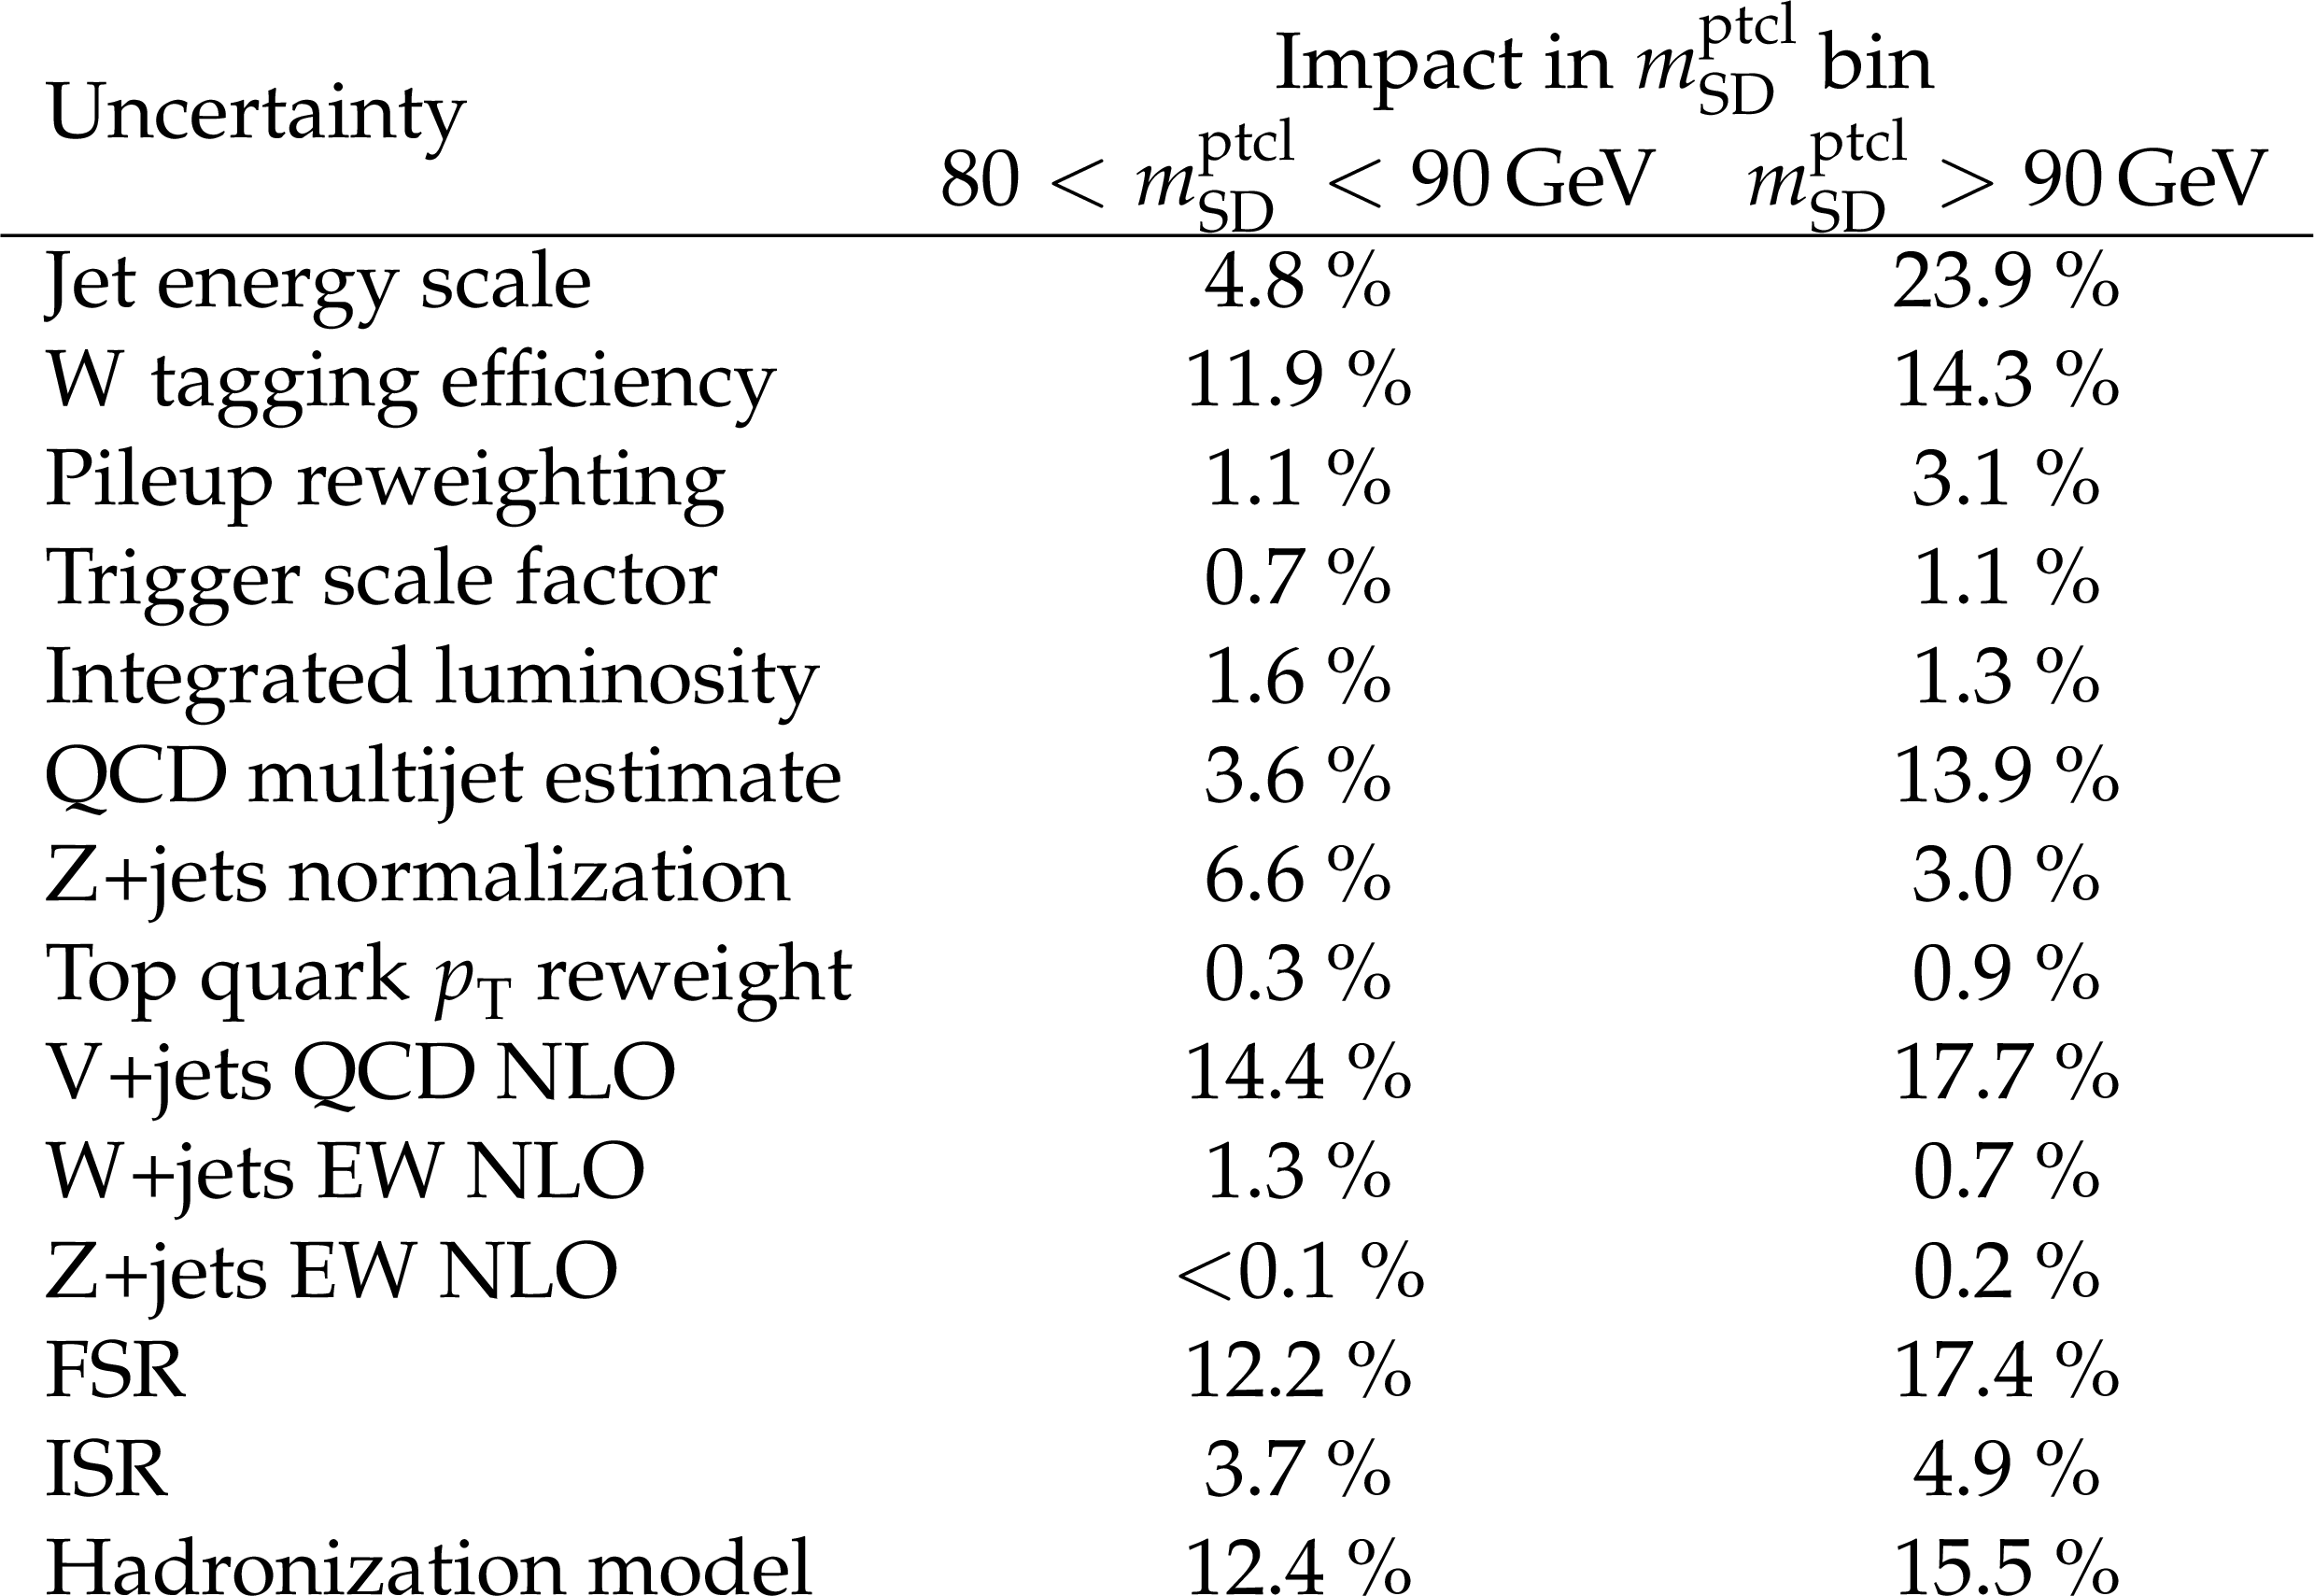
Table 3:
Summary of systematic uncertainties and their impact on the measurement in the 650 $ < p_{\mathrm{T}}^\mathrm{ptcl} < $ 800 GeV bin and two representative $ m_\mathrm{SD}^\mathrm{ptcl} $ bins, using the $ P^{\mathrm{PN, DDT}}_{\mathrm{W vs. QCD}} $ tagger. |

png pdf |
Table 4:
Summary of systematic uncertainties and their impact on the $ m_{\mathrm{W}} $ measurement. |
| Summary |
| The jet mass of W bosons decaying to a quark-antiquark pair is measured in W+jets events from proton-proton collisions at the LHC at a center-of-mass energy $ \sqrt{s} = $ 13 TeV. The data were collected by the CMS experiment in 2016--2018 and correspond to an integrated luminosity of 138 fb$ ^{-1} $. The measurement considers W bosons with large momenta, resulting in strongly collimated decay products that are reconstructed in a single large-radius jet. Jets initiated by W bosons with a characteristic two-prong substructure are distinguished from single light-flavor quark and gluon-initiated background jets using a selection based on the substructure of these jets. The jet mass is measured using the soft-drop (SD) algorithm, which suppresses soft and wide-angle radiation that can obscure the resonance peak of the W boson at its rest mass. We report the first measurement of the double-differential cross section in bins of the jet transverse momentum and SD mass. The unfolded data are found to be in agreement with predictions from simulations at leading order with additional partons added to the matrix element computation, supplemented by next-to-leading order quantum chromodynamics and electroweak corrections. A W boson mass of 80.83 $ \pm $ 0.55 GeV is obtained, achieving the smallest uncertainty available today from an all-jets final state at a hadron collider. |
| Additional Figures | |
png pdf |
Additional Figure 1:
Jet mass distribution of the sum of all $p_T^\mathrm{ptcl}$ bins resulting from the unfolding using ParticleNet$^\mathrm{DDT}$ tagger in the background estimation and without (left) and with (right) inclusion of a $N_{2}^{\beta=1} <0.2$ cut at particle-level, with matching to a W boson in the particle-level definition. The unfolded data is shown as black markers, the blue line shows the true distribution from the simulation with theory uncertainties added as the shaded blue band. The matching to a W boson further removes contributions to the cross section where the jet originates from a quark or gluon recoiling against the boson and, resulting in reduced shower and hadronization uncertainties. |
png pdf |
Additional Figure 1-a:
Jet mass distribution of the sum of all $p_T^\mathrm{ptcl}$ bins resulting from the unfolding using ParticleNet$^\mathrm{DDT}$ tagger in the background estimation and without (left) and with (right) inclusion of a $N_{2}^{\beta=1} <0.2$ cut at particle-level, with matching to a W boson in the particle-level definition. The unfolded data is shown as black markers, the blue line shows the true distribution from the simulation with theory uncertainties added as the shaded blue band. The matching to a W boson further removes contributions to the cross section where the jet originates from a quark or gluon recoiling against the boson and, resulting in reduced shower and hadronization uncertainties. |
png pdf |
Additional Figure 1-b:
Jet mass distribution of the sum of all $p_T^\mathrm{ptcl}$ bins resulting from the unfolding using ParticleNet$^\mathrm{DDT}$ tagger in the background estimation and without (left) and with (right) inclusion of a $N_{2}^{\beta=1} <0.2$ cut at particle-level, with matching to a W boson in the particle-level definition. The unfolded data is shown as black markers, the blue line shows the true distribution from the simulation with theory uncertainties added as the shaded blue band. The matching to a W boson further removes contributions to the cross section where the jet originates from a quark or gluon recoiling against the boson and, resulting in reduced shower and hadronization uncertainties. |
png pdf |
Additional Figure 2:
Jet mass distribution for each $p_T^\mathrm{ptcl}$ bin resulting from the unfolding using $P^{\mathrm{PN, DDT}}_{\mathrm{W vs. QCD}}$ in the background estimation. The unfolded data is shown as black markers, the blue line shows the true distribution from the simulation with theory uncertainties added as the shaded blue band. |
png pdf |
Additional Figure 2-a:
Jet mass distribution for each $p_T^\mathrm{ptcl}$ bin resulting from the unfolding using $P^{\mathrm{PN, DDT}}_{\mathrm{W vs. QCD}}$ in the background estimation. The unfolded data is shown as black markers, the blue line shows the true distribution from the simulation with theory uncertainties added as the shaded blue band. |
png pdf |
Additional Figure 2-b:
Jet mass distribution for each $p_T^\mathrm{ptcl}$ bin resulting from the unfolding using $P^{\mathrm{PN, DDT}}_{\mathrm{W vs. QCD}}$ in the background estimation. The unfolded data is shown as black markers, the blue line shows the true distribution from the simulation with theory uncertainties added as the shaded blue band. |
png pdf |
Additional Figure 2-c:
Jet mass distribution for each $p_T^\mathrm{ptcl}$ bin resulting from the unfolding using $P^{\mathrm{PN, DDT}}_{\mathrm{W vs. QCD}}$ in the background estimation. The unfolded data is shown as black markers, the blue line shows the true distribution from the simulation with theory uncertainties added as the shaded blue band. |
png pdf |
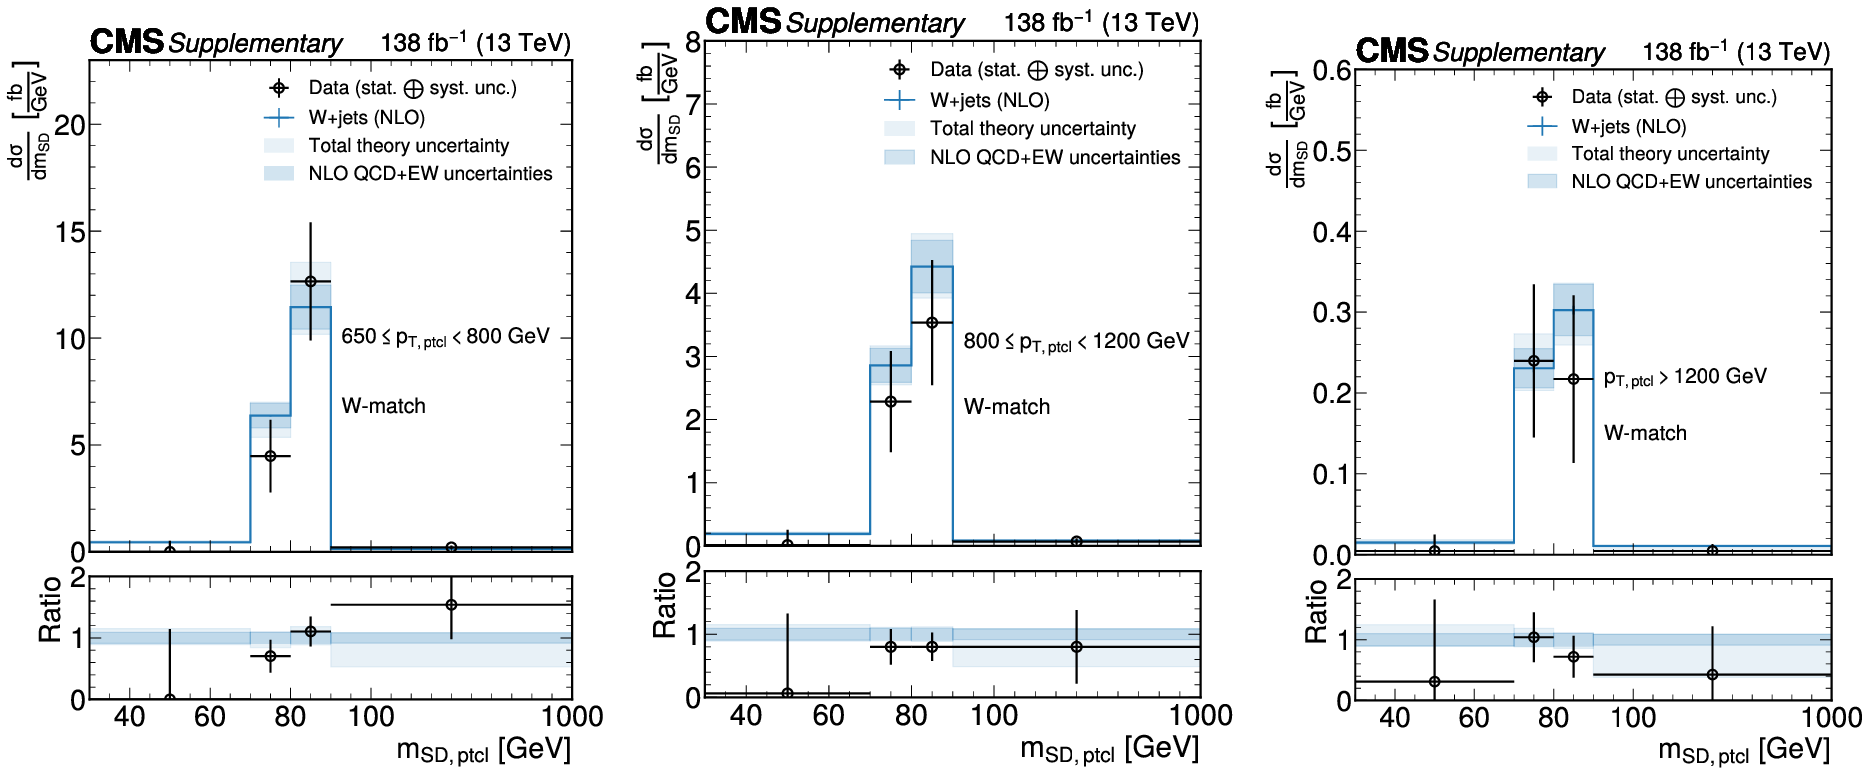
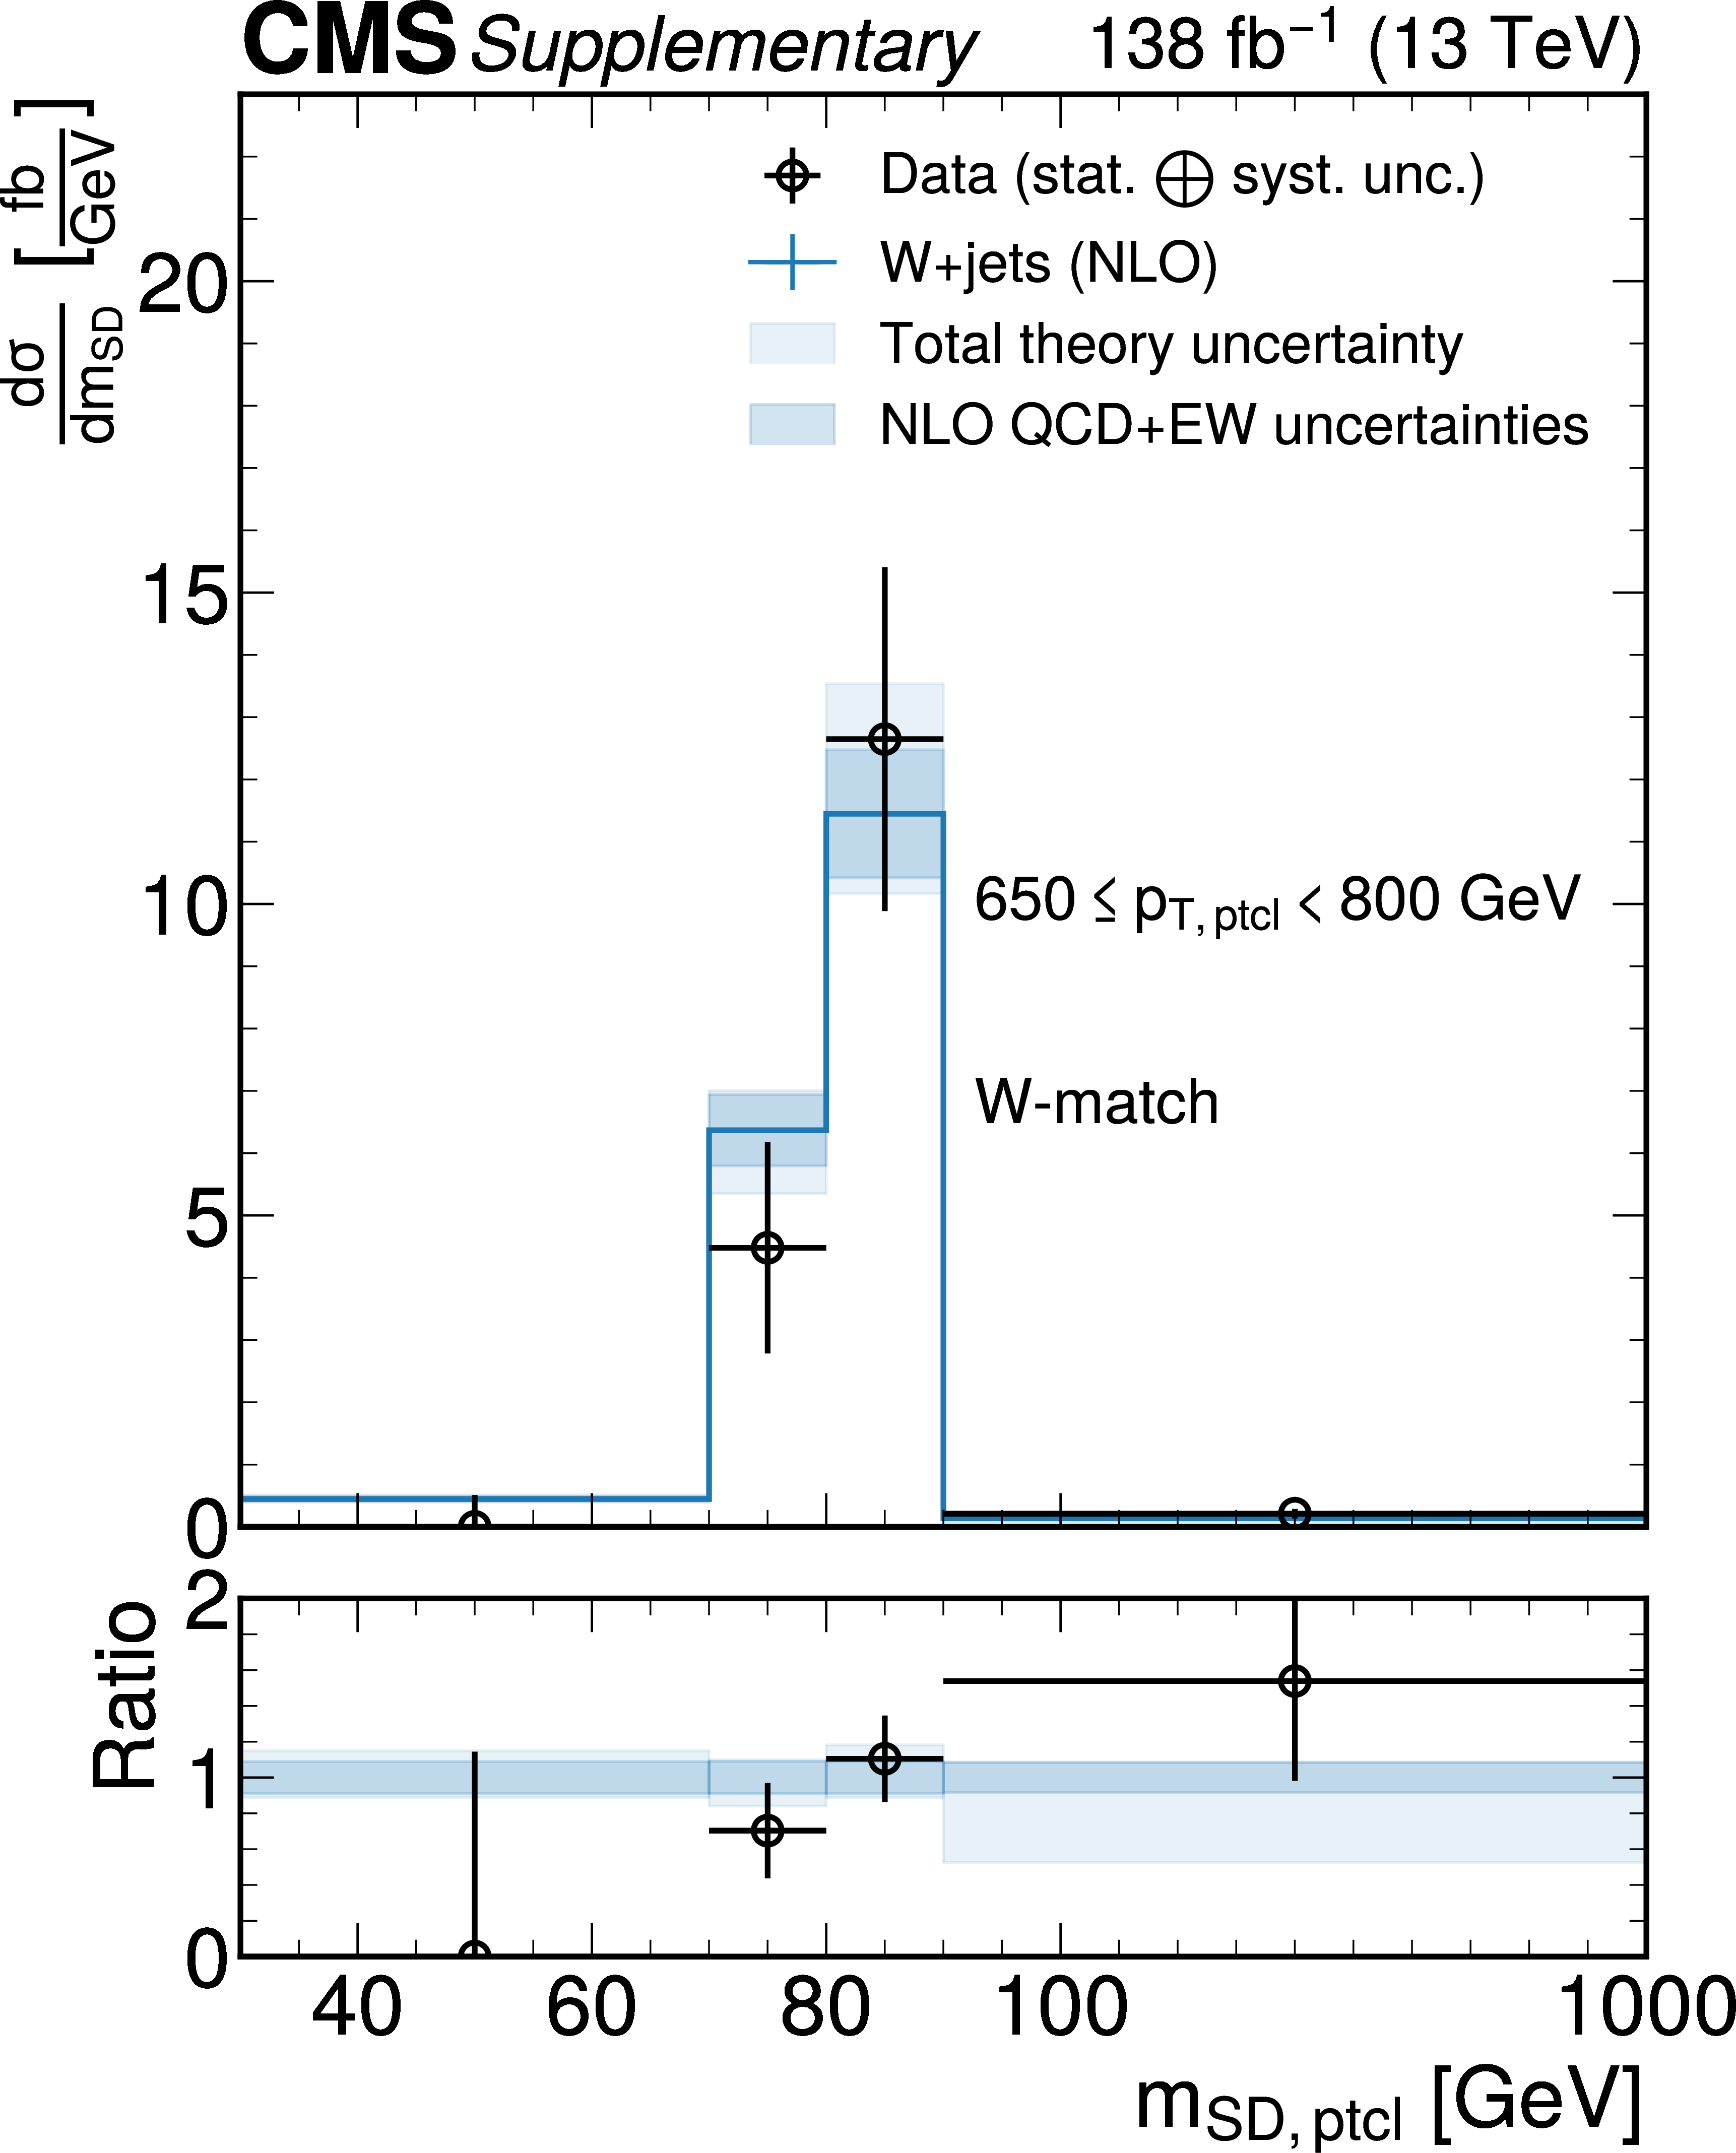
Additional Figure 3:
Jet mass distribution for each $p_T^\mathrm{ptcl}$ bin resulting from the unfolding using $P^{\mathrm{PN, DDT}}_{\mathrm{W vs. QCD}}$ in the background estimation and matching to a W boson in the particle-level definition. The unfolded data is shown as black markers, the blue line shows the true distribution from the simulation with theory uncertainties added as the shaded blue band. |
png pdf |
Additional Figure 3-a:
Jet mass distribution for each $p_T^\mathrm{ptcl}$ bin resulting from the unfolding using $P^{\mathrm{PN, DDT}}_{\mathrm{W vs. QCD}}$ in the background estimation and matching to a W boson in the particle-level definition. The unfolded data is shown as black markers, the blue line shows the true distribution from the simulation with theory uncertainties added as the shaded blue band. |
png pdf |
Additional Figure 3-b:
Jet mass distribution for each $p_T^\mathrm{ptcl}$ bin resulting from the unfolding using $P^{\mathrm{PN, DDT}}_{\mathrm{W vs. QCD}}$ in the background estimation and matching to a W boson in the particle-level definition. The unfolded data is shown as black markers, the blue line shows the true distribution from the simulation with theory uncertainties added as the shaded blue band. |
png pdf |
Additional Figure 3-c:
Jet mass distribution for each $p_T^\mathrm{ptcl}$ bin resulting from the unfolding using $P^{\mathrm{PN, DDT}}_{\mathrm{W vs. QCD}}$ in the background estimation and matching to a W boson in the particle-level definition. The unfolded data is shown as black markers, the blue line shows the true distribution from the simulation with theory uncertainties added as the shaded blue band. |
png pdf |
Additional Figure 4:
Jet mass distribution for each $p_T^\mathrm{ptcl}$ bin resulting from the unfolding using $P^{\mathrm{PN, DDT}}_{\mathrm{W vs. QCD}}$ in the background estimation and with inclusion of a $N_{2}^{\beta=1} <0.2$ cut and matching to a W boson in the particle-level definition. The unfolded data is shown as black markers, the blue line shows the true distribution from the simulation with theory uncertainties added as the shaded blue band. |
png pdf |
Additional Figure 4-a:
Jet mass distribution for each $p_T^\mathrm{ptcl}$ bin resulting from the unfolding using $P^{\mathrm{PN, DDT}}_{\mathrm{W vs. QCD}}$ in the background estimation and with inclusion of a $N_{2}^{\beta=1} <0.2$ cut and matching to a W boson in the particle-level definition. The unfolded data is shown as black markers, the blue line shows the true distribution from the simulation with theory uncertainties added as the shaded blue band. |
png pdf |
Additional Figure 4-b:
Jet mass distribution for each $p_T^\mathrm{ptcl}$ bin resulting from the unfolding using $P^{\mathrm{PN, DDT}}_{\mathrm{W vs. QCD}}$ in the background estimation and with inclusion of a $N_{2}^{\beta=1} <0.2$ cut and matching to a W boson in the particle-level definition. The unfolded data is shown as black markers, the blue line shows the true distribution from the simulation with theory uncertainties added as the shaded blue band. |
png pdf |
Additional Figure 4-c:
Jet mass distribution for each $p_T^\mathrm{ptcl}$ bin resulting from the unfolding using $P^{\mathrm{PN, DDT}}_{\mathrm{W vs. QCD}}$ in the background estimation and with inclusion of a $N_{2}^{\beta=1} <0.2$ cut and matching to a W boson in the particle-level definition. The unfolded data is shown as black markers, the blue line shows the true distribution from the simulation with theory uncertainties added as the shaded blue band. |
png pdf |
Additional Figure 5:
Correlation matrix of the maximum likelihood estimators of the signal strength modifiers $\hat{\mu}_{p_{T}^{},~m_{\mathrm{SD}}^{}}$ without $N_{2}^{\beta=1} $ cut in the particle-level definition. The plot shows the matrix from the fit to data using $P^{\mathrm{PN, DDT}}_{\mathrm{W vs. QCD}}$. The grey dashed lines indicate the individual $p_T^\mathrm{ptcl}$ bins. |
png pdf |
Additional Figure 6:
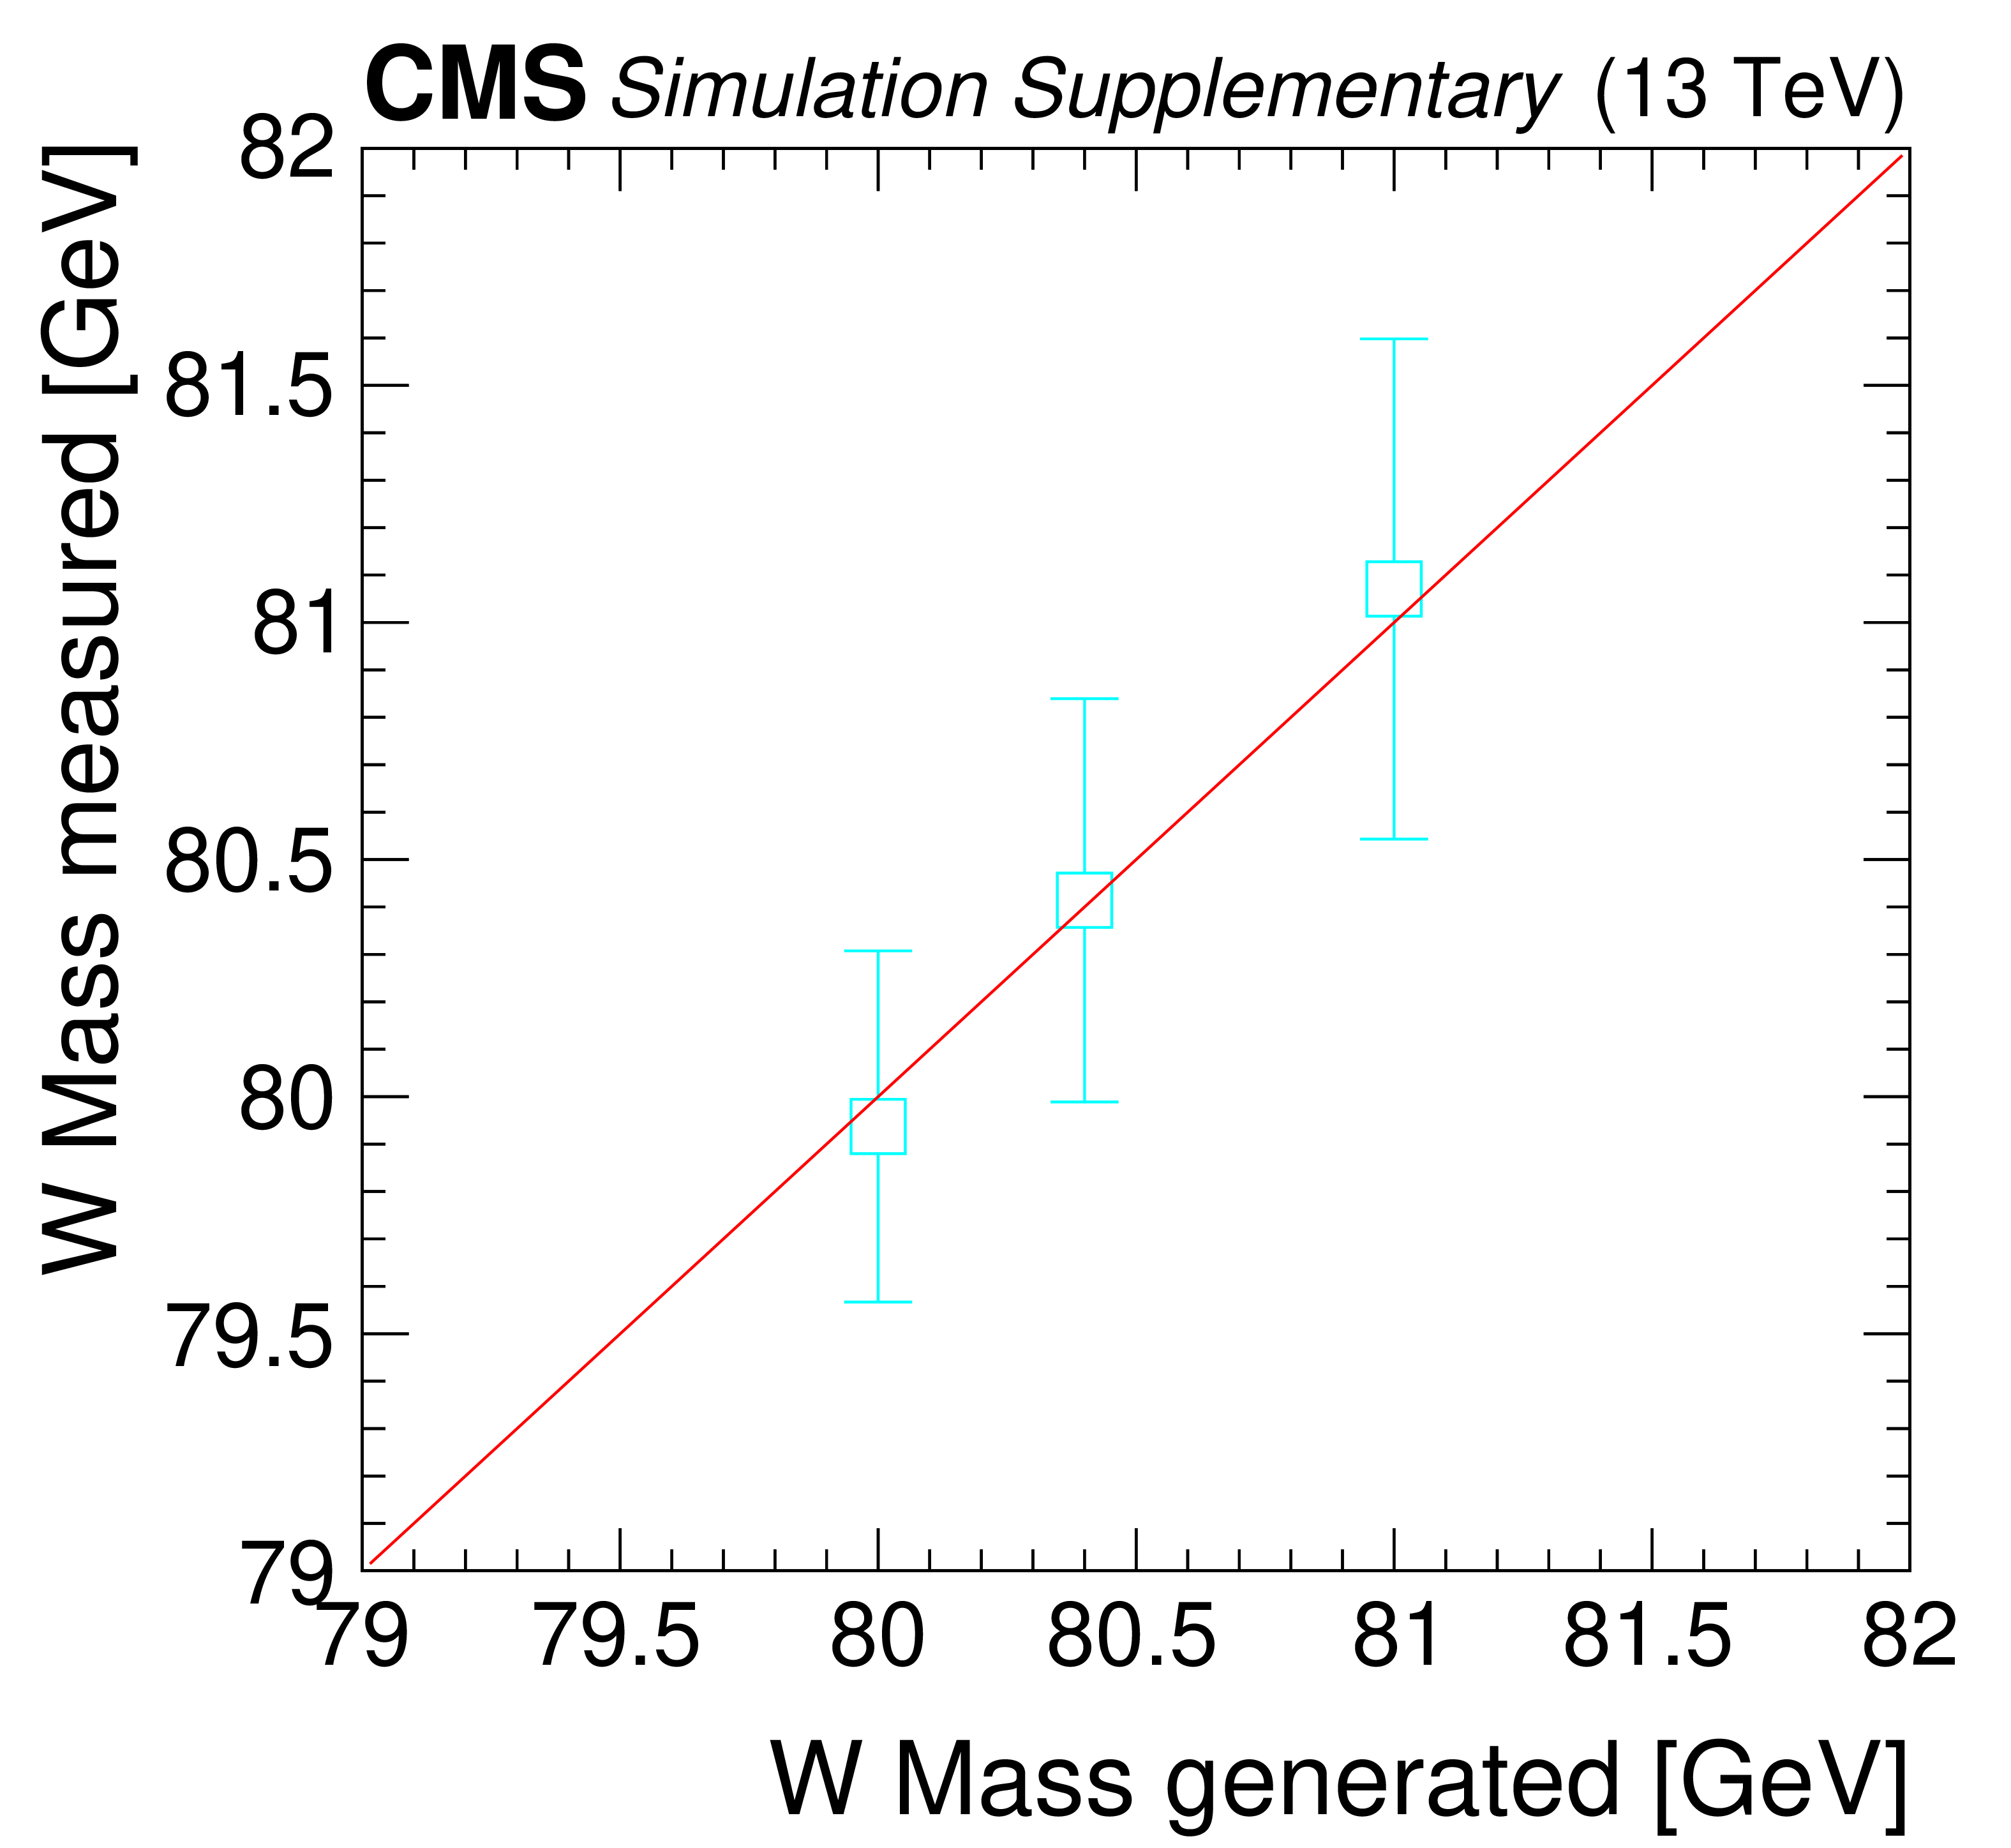
Closure test of the W mass extraction procedure. The x-axis corresponds to the W mass parameter set in PYTHIA simulation used in place of the data. The y-axis corresponds to the measured value, where the data used in place of the data is excluded from the list of templates used for carrying out the measurement. |
| Additional Tables | |
png pdf |
Additional Table 1:
Fiducial cross section predicted from MadGraph-5_aMC@NLO+PYTHIA with NLO QCD and EWK corrrections after the particle-level selection |
| References | ||||
| 1 | ALEPH, DELPHI, L3, OPAL, SLD, LEP Electroweak Working Group, SLD Electroweak Group, SLD Heavy Flavour Group | Electroweak measurements in electron-positron collisions at W-boson-pair energies at LEP | Phys. Rept. 532 (2013) 119 | 1302.3415 |
| 2 | D0 Collaboration | Measurement of the W boson mass with the D0 detector | PRL 108 (2012) 151804 | 1203.0293 |
| 3 | CDF Collaboration | High-precision measurement of the W boson mass with the CDF II detector | Science 376 (2022) 170 | |
| 4 | ATLAS Collaboration | Measurement of the W-boson mass in pp collisions at $ \sqrt{s} = $ 7 TeV with the ATLAS detector | EPJC 78 (2018) 110 | 1701.07240 |
| 5 | LHCb Collaboration | Measurement of the W boson mass | JHEP 01 (2022) 036 | 2109.01113 |
| 6 | ATLAS Collaboration | Measurement of the W-boson mass and width with the ATLAS detector using proton-proton collisions at $ \sqrt{s} = $ 7 TeV | EPJC 84 (2024) 1309 | 2403.15085 |
| 7 | CMS Collaboration | High-precision measurement of the W boson mass with the CMS experiment at the LHC | Submitted to Nature, 2024 | CMS-SMP-23-002 2412.13872 |
| 8 | Particle Data Group | Review of particle physics | PRD 110 (2024) 030001 | |
| 9 | S. Marzani, G. Soyez, and M. Spannowsky | Looking inside jets: an introduction to jet substructure and boosted-object phenomenology | ISBN 97 (2019) 8 volume 958. Springer | |
| 10 | A. J. Larkoski, I. Moult, and B. Nachman | Jet substructure at the Large Hadron Collider: A review of recent advances in theory and machine learning | Phys. Rept. 841 (2020) 1 | 1709.04464 |
| 11 | R. Kogler et al. | Jet substructure at the Large Hadron Collider | Rev. Mod. Phys. 91 (2019) 045003 | 1803.06991 |
| 12 | R. Kogler | Advances in jet substructure at the LHC: Algorithms, measurements and searches for new physical phenomena | ISBN 97 (2021) 8 Springer Cham | |
| 13 | UA2 Collaboration | Search for decays of the $ {\mathrm{W}^\pm} $ and $ {\mathrm{Z}} $ bosons into quark-anti-quark pairs | PLB 186 (1987) 452 | |
| 14 | CDF Collaboration | Observation of hadronic W decays in $ t\bar{t} $ events with the Collider Detector at Fermilab | PRL 80 (1998) 5720 | hep-ex/9711004 |
| 15 | M. Freytsis et al. | Prospects for a measurement of the W boson mass in the all-jets final state at hadron colliders | JHEP 02 (2019) 003 | 1807.07454 |
| 16 | M. Dasgupta, A. Fregoso, S. Marzani, and G. P. Salam | Towards an understanding of jet substructure | JHEP 09 (2013) 029 | 1307.0007 |
| 17 | J. M. Butterworth, A. R. Davison, M. Rubin, and G. P. Salam | Jet substructure as a new Higgs search channel at the LHC | PRL 100 (2008) 242001 | 0802.2470 |
| 18 | A. J. Larkoski, S. Marzani, G. Soyez, and J. Thaler | Soft drop | JHEP 05 (2014) 146 | 1402.2657 |
| 19 | CMS Collaboration | The CMS experiment at the CERN LHC | JINST 3 (2008) S08004 | |
| 20 | ATLAS Collaboration | Jet mass and substructure of inclusive jets in $ \sqrt{s}= $ 7 TeV pp collisions with the ATLAS experiment | JHEP 05 (2012) 128 | 1203.4606 |
| 21 | ATLAS Collaboration | Measurement of the soft-drop jet mass in pp collisions at $ \sqrt{s} = $ 13 TeV with the ATLAS detector | PRL 121 (2018) 092001 | 1711.08341 |
| 22 | CMS Collaboration | Measurements of the differential jet cross section as a function of the jet mass in dijet events from proton-proton collisions at $ \sqrt{s}= $ 13 TeV | JHEP 11 (2018) 113 | CMS-SMP-16-010 1807.05974 |
| 23 | CMS Collaboration | Measurement of the jet mass in highly boosted $ \mathrm{t} \overline{\mathrm{t}} $ events from pp collisions at $ \sqrt{s}= $ 8 TeV | EPJC 77 (2017) 467 | CMS-TOP-15-015 1703.06330 |
| 24 | CMS Collaboration | Measurement of the jet mass distribution and top quark mass in hadronic decays of boosted top quarks in pp collisions at $ \sqrt{s} = $ 13 TeV | PRL 124 (2020) 202001 | CMS-TOP-19-005 1911.03800 |
| 25 | CMS Collaboration | Measurement of the differential $ \mathrm{t} \overline{\mathrm{t}} $ production cross section as a function of the jet mass and extraction of the top quark mass in hadronic decays of boosted top quarks | EPJC 83 (2023) 560 | CMS-TOP-21-012 2211.01456 |
| 26 | ATLAS Collaboration | Measurement of the jet mass in high transverse momentum $ \mathrm{Z}(\to \mathrm{b}\overline{\mathrm{b}})\gamma $ production at $ \sqrt{s}= $ 13 TeV using the ATLAS detector | PLB 812 (2021) 135991 | 1907.07093 |
| 27 | CMS Collaboration | Development of the CMS detector for the CERN LHC Run 3 | JINST 19 (2024) P05064 | CMS-PRF-21-001 2309.05466 |
| 28 | CMS Collaboration | Description and performance of track and primary-vertex reconstruction with the CMS tracker | JINST 9 (2014) P10009 | CMS-TRK-11-001 1405.6569 |
| 29 | CMS Tracker Group | The CMS Phase-1 pixel detector upgrade | JINST 16 (2021) P02027 | 2012.14304 |
| 30 | CMS Collaboration | Track impact parameter resolution for the full pseudo rapidity coverage in the 2017 dataset with the CMS Phase-1 pixel detector | CMS Detector Performance Note CMS-DP-2020-049, 2020 CDS |
|
| 31 | CMS Collaboration | 2017 tracking performance plots | CMS Detector Performance Note CMS-DP-2017-015, 2017 CDS |
|
| 32 | CMS Collaboration | Performance of the CMS Level-1 trigger in proton-proton collisions at $ \sqrt{s}= $ 13 TeV | JINST 15 (2020) P10017 | CMS-TRG-17-001 2006.10165 |
| 33 | CMS Collaboration | The CMS trigger system | JINST 12 (2017) P01020 | CMS-TRG-12-001 1609.02366 |
| 34 | CMS Collaboration | Performance of the CMS high-level trigger during LHC Run 2 | JINST 19 (2024) P11021 | CMS-TRG-19-001 2410.17038 |
| 35 | CMS Collaboration | Particle-flow reconstruction and global event description with the CMS detector | JINST 12 (2017) P10003 | CMS-PRF-14-001 1706.04965 |
| 36 | CMS Collaboration | Technical proposal for the Phase-II upgrade of the Compact Muon Solenoid | CMS Technical Proposal CERN-LHCC-2015-010, CMS-TDR-15-02, 2015 CDS |
|
| 37 | CMS Collaboration | Electron and photon reconstruction and identification with the CMS experiment at the CERN LHC | JINST 16 (2021) P05014 | CMS-EGM-17-001 2012.06888 |
| 38 | CMS Collaboration | Pileup mitigation at CMS in 13 TeV data | JINST 15 (2020) P09018 | CMS-JME-18-001 2003.00503 |
| 39 | D. Bertolini, P. Harris, M. Low, and N. Tran | Pileup per particle identification | JHEP 10 (2014) 059 | 1407.6013 |
| 40 | M. Cacciari, G. P. Salam, and G. Soyez | The anti-$ k_{\mathrm{T}} $ jet clustering algorithm | JHEP 04 (2008) 063 | 0802.1189 |
| 41 | M. Cacciari, G. P. Salam, and G. Soyez | FASTJET user manual | EPJC 72 (2012) 1896 | 1111.6097 |
| 42 | CMS Collaboration | Jet energy scale and resolution in the CMS experiment in $ {\mathrm{p}\mathrm{p}} $ collisions at 8 TeV | JINST 12 (2017) P02014 | CMS-JME-13-004 1607.03663 |
| 43 | J. Alwall et al. | The automated computation of tree-level and next-to-leading order differential cross sections, and their matching to parton shower simulations | JHEP 07 (2014) 079 | 1405.0301 |
| 44 | C. Bierlich et al. | A comprehensive guide to the physics and usage of PYTHIA8.3 | SciPost Phys. Codeb. 2022 (2022) 8 | 2203.11601 |
| 45 | CMS Collaboration | Extraction and validation of a new set of CMS PYTHIA8 tunes from underlying-event measurements | EPJC 80 (2020) 4 | CMS-GEN-17-001 1903.12179 |
| 46 | B. Andersson, G. Gustafson, G. Ingelman, and T. Sjöstrand | Parton fragmentation and string dynamics | Phys. Rept. 97 (1983) 31 | |
| 47 | T. Sjöstrand | The merging of jets | PLB 142 (1984) 420 | |
| 48 | J. Alwall et al. | Comparative study of various algorithms for the merging of parton showers and matrix elements in hadronic collisions | EPJC 53 (2008) 473 | 0706.2569 |
| 49 | J. Bellm et al. | HERWIG 7.0/ HERWIG++ 3.0 release note | EPJC 76 (2016) 196 | 1512.01178 |
| 50 | CMS Collaboration | Development and validation of HERWIG 7 tunes from CMS underlying-event measurements | EPJC 81 (2021) 312 | CMS-GEN-19-001 2011.03422 |
| 51 | R. Frederix and S. Frixione | Merging meets matching in MC@NLO | JHEP 12 (2012) 061 | 1209.6215 |
| 52 | P. Nason | A new method for combining NLO QCD with shower Monte Carlo algorithms | JHEP 11 (2004) 040 | hep-ph/0409146 |
| 53 | S. Frixione, P. Nason, and C. Oleari | Matching NLO QCD computations with parton shower simulations: the POWHEG method | JHEP 11 (2007) 070 | 0709.2092 |
| 54 | S. Alioli, P. Nason, C. Oleari, and E. Re | A general framework for implementing NLO calculations in shower Monte Carlo programs: the POWHEG box | JHEP 06 (2010) 043 | 1002.2581 |
| 55 | S. Frixione, G. Ridolfi, and P. Nason | A positive-weight next-to-leading-order Monte Carlo for heavy flavour hadroproduction | JHEP 09 (2007) 126 | 0707.3088 |
| 56 | NNPDF Collaboration | Parton distributions from high-precision collider data | EPJC 77 (2017) 663 | 1706.00428 |
| 57 | GEANT4 Collaboration | GEANT 4---a simulation toolkit | NIM A 506 (2003) 250 | |
| 58 | CMS Collaboration | Search for boosted Higgs boson decay to a charm quark-antiquark pair in proton-proton collisions at $ \sqrt{s}= $ 13 TeV | PRL 131 (2023) 041801 | CMS-HIG-21-012 2211.14181 |
| 59 | J. M. Lindert et al. | Precise predictions for V+jets dark matter backgrounds | EPJC 77 (2017) 829 | 1705.04664 |
| 60 | CMS Collaboration | Measurement of normalized differential $ \mathrm{t} \overline{\mathrm{t}} $ cross sections in the dilepton channel from $ {\mathrm{p}\mathrm{p}} $ collisions at $ \sqrt{s}= $ 13 TeV | JHEP 04 (2018) 060 | CMS-TOP-16-007 1708.07638 |
| 61 | CMS Collaboration | Measurement of differential cross sections for top quark pair production using the lepton+jets final state in proton-proton collisions at 13 TeV | PRD 95 (2017) 092001 | CMS-TOP-16-008 1610.04191 |
| 62 | Y. L. Dokshitzer, G. D. Leder, S. Moretti, and B. R. Webber | Better jet clustering algorithms | JHEP 08 (1997) 001 | hep-ph/9707323 |
| 63 | CMS Collaboration | Identification of heavy, energetic, hadronically decaying particles using machine-learning techniques | JINST 15 (2020) P06005 | CMS-JME-18-002 2004.08262 |
| 64 | I. Moult, L. Necib, and J. Thaler | New angles on energy correlation functions | JHEP 12 (2016) 153 | 1609.07483 |
| 65 | A. J. Larkoski, G. P. Salam, and J. Thaler | Energy correlation functions for jet substructure | JHEP 06 (2013) 108 | 1305.0007 |
| 66 | H. Qu and L. Gouskos | Jet tagging via particle clouds | PRD 101 (2020) 056019 | 1902.08570 |
| 67 | Y. Wang et al. | Dynamic graph CNN for learning on point clouds | ACM Trans. Graph. 38 (2019) 12 | 1801.07829 |
| 68 | CMS Collaboration | Identification of highly Lorentz-boosted heavy particles using graph neural networks and new mass decorrelation techniques | CMS Detector Performance Note CMS-DP-2020-002, 2020 CDS |
|
| 69 | J. Dolen et al. | Thinking outside the ROCs: Designing decorrelated taggers (DDT) for jet substructure | JHEP 05 (2016) 156 | 1603.00027 |
| 70 | CMS Collaboration | Search for low mass vector resonances decaying into quark-antiquark pairs in proton-proton collisions at $ \sqrt{s}= $ 13 TeV | PRD 100 (2019) 112007 | CMS-EXO-18-012 1909.04114 |
| 71 | CMS Collaboration | Performance of the CMS muon detector and muon reconstruction with proton-proton collisions at $ \sqrt{s}= $ 13 TeV | JINST 13 (2018) P06015 | CMS-MUO-16-001 1804.04528 |
| 72 | CMS Collaboration | The CMS statistical analysis and combination tool: combine | Comput. Softw. Big Sci. 8 (2024) 19 | CMS-CAT-23-001 2404.06614 |
| 73 | CMS Collaboration | Precision luminosity measurement in proton-proton collisions at $ \sqrt{s}= $ 13 TeV in 2015 and 2016 at CMS | EPJC 81 (2021) 800 | CMS-LUM-17-003 2104.01927 |
| 74 | CMS Collaboration | CMS luminosity measurement for the 2017 data-taking period at $ \sqrt{s}= $ 13 TeV | CMS Physics Analysis Summary, 2018 link |
CMS-PAS-LUM-17-004 |
| 75 | CMS Collaboration | CMS luminosity measurement for the 2018 data-taking period at $ \sqrt{s}= $ 13 TeV | CMS Physics Analysis Summary, 2019 link |
CMS-PAS-LUM-18-002 |
| 76 | CMS Collaboration | Measurement of the inelastic proton-proton cross section at $ \sqrt{s}= $ 13 TeV | JHEP 07 (2018) 161 | CMS-FSQ-15-005 1802.02613 |
| 77 | M. Rubin, G. P. Salam, and S. Sapeta | Giant QCD K-factors beyond NLO | JHEP 09 (2010) 084 | 1006.2144 |
| 78 | S. Schmitt | TUnfold, an algorithm for correcting migration effects in high energy physics | JINST 7 (2012) T10003 | 1205.6201 |
| 79 | A. N. Tikhonov | Solution of incorrectly formulated problems and the regularization method | Soviet Math. Dokl. 4 (1963) 1035 | |
| 80 | CMS Collaboration | HEPData record for this analysis | link | |
| 81 | D. Britzger | The linear template fit | EPJC 82 (2022) 731 | 2112.01548 |
| 82 | S. Dittmaier and M. Huber | Radiative corrections to the neutral-current Drell-Yan process in the standard model and its minimal supersymmetric extension | JHEP 01 (2010) 060 | 0911.2329 |
|
|
Compact Muon Solenoid LHC, CERN |
|

|

|

|

|

|