

Compact Muon Solenoid
LHC, CERN
 Visit us: CMS Public Website, CMS Physics ;
Contact us: CMS Publications Committee
Visit us: CMS Public Website, CMS Physics ;
Contact us: CMS Publications Committee
| CMS-PAS-SMP-24-011 | ||
| Measurement of inclusive $ \mathrm{W}^+\mathrm{W}^- $ and $ \mathrm{t}\bar{\mathrm{t}} $ cross sections with one $ \tau $ lepton in the final state in proton-proton collisions at $ \sqrt{s}= $ 13.6 TeV | ||
| CMS Collaboration | ||
| 2026-07-30 | ||
| Abstract: A measurement of the W boson pair production cross section in proton-proton collisions at $ \sqrt{s}= $ 13.6 TeV is presented. The data used in this study correspond to an integrated luminosity of 62 $ \mathrm{fb}^{-1} $, recorded in 2022 and 2023 with the CMS detector. Events are selected by requiring one electron or one muon and a hadronically decaying $ \tau $ lepton ($ \tau_h $) of opposite charges, in the process WW$ \rightarrow \ell(\mathrm{e},\mu)\tau_h\nu\bar{\nu} $. This is the first measurement that includes hadronic $ \tau $ decays in this process at the LHC. The $ \mathrm{t}\bar{\mathrm{t}} $ cross section is measured simultaneously in the final state that includes a $ \tau_h $, $ \mathrm{t}\bar{\mathrm{t}}\rightarrow \ell (\mathrm{e},\mu)\tau_h \nu\bar{\nu} \mathrm{b}\bar{\mathrm{b}} $. Cross sections are extracted from the data using a binned maximum likelihood fit from the observed yields from the multivariate discriminator output and visible mass distributions in signal- and background-enriched event samples. The measured inclusive WW and $ \mathrm{t}\bar{\mathrm{t}} $ production cross sections are $ \sigma_{\mathrm{WW}}= $ 144 $ \pm $ 12 pb and $ \sigma_{\mathrm{t}\bar{\mathrm{t}}}= $ 908 $ \pm $ 33 pb, in agreement with standard model predictions. | ||
| Links: CDS record (PDF) ; CADI line (restricted) ; | ||
| Figures | |

png pdf |
Figure 1:
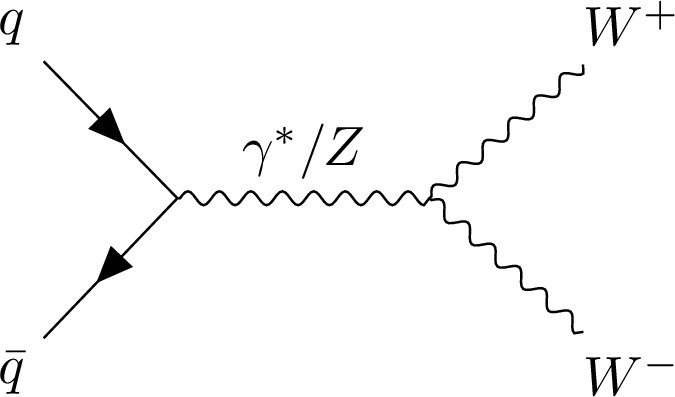
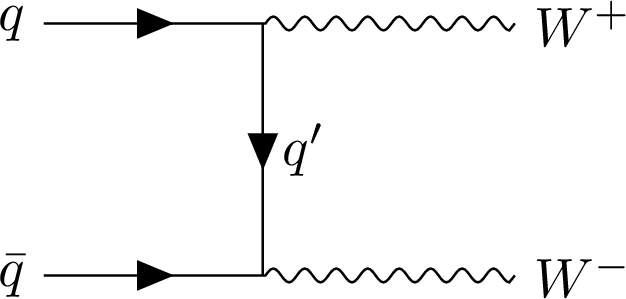
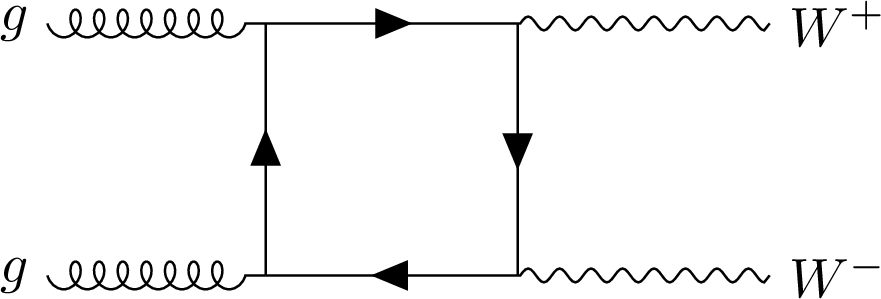
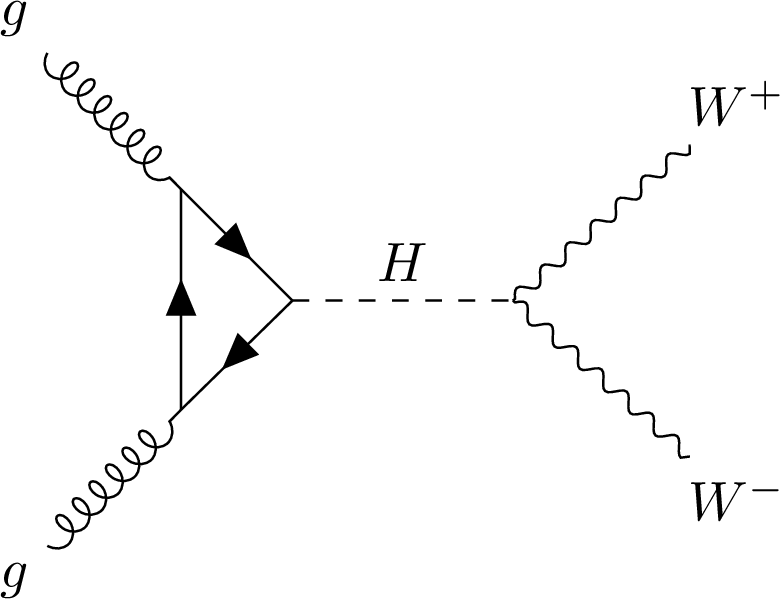
Feynman diagrams for SM $ WW $ production at leading order. From left to right: $ \mathrm{q}\overline{\mathrm{q}} $ initiated $ s $-channel production, $ \mathrm{q}\overline{\mathrm{q}} $ initiated $ t $-channel production, $ gg $ initiated non-resonant production and gg$ \to $ H$ \to \mathrm{W^+}\mathrm{W^-} $ resonant production. |
png pdf |
Figure 1-a:
Feynman diagrams for SM $ WW $ production at leading order. From left to right: $ \mathrm{q}\overline{\mathrm{q}} $ initiated $ s $-channel production, $ \mathrm{q}\overline{\mathrm{q}} $ initiated $ t $-channel production, $ gg $ initiated non-resonant production and gg$ \to $ H$ \to \mathrm{W^+}\mathrm{W^-} $ resonant production. |
png pdf |
Figure 1-b:
Feynman diagrams for SM $ WW $ production at leading order. From left to right: $ \mathrm{q}\overline{\mathrm{q}} $ initiated $ s $-channel production, $ \mathrm{q}\overline{\mathrm{q}} $ initiated $ t $-channel production, $ gg $ initiated non-resonant production and gg$ \to $ H$ \to \mathrm{W^+}\mathrm{W^-} $ resonant production. |
png pdf |
Figure 1-c:
Feynman diagrams for SM $ WW $ production at leading order. From left to right: $ \mathrm{q}\overline{\mathrm{q}} $ initiated $ s $-channel production, $ \mathrm{q}\overline{\mathrm{q}} $ initiated $ t $-channel production, $ gg $ initiated non-resonant production and gg$ \to $ H$ \to \mathrm{W^+}\mathrm{W^-} $ resonant production. |
png pdf |
Figure 1-d:
Feynman diagrams for SM $ WW $ production at leading order. From left to right: $ \mathrm{q}\overline{\mathrm{q}} $ initiated $ s $-channel production, $ \mathrm{q}\overline{\mathrm{q}} $ initiated $ t $-channel production, $ gg $ initiated non-resonant production and gg$ \to $ H$ \to \mathrm{W^+}\mathrm{W^-} $ resonant production. |
png pdf |
Figure 2:
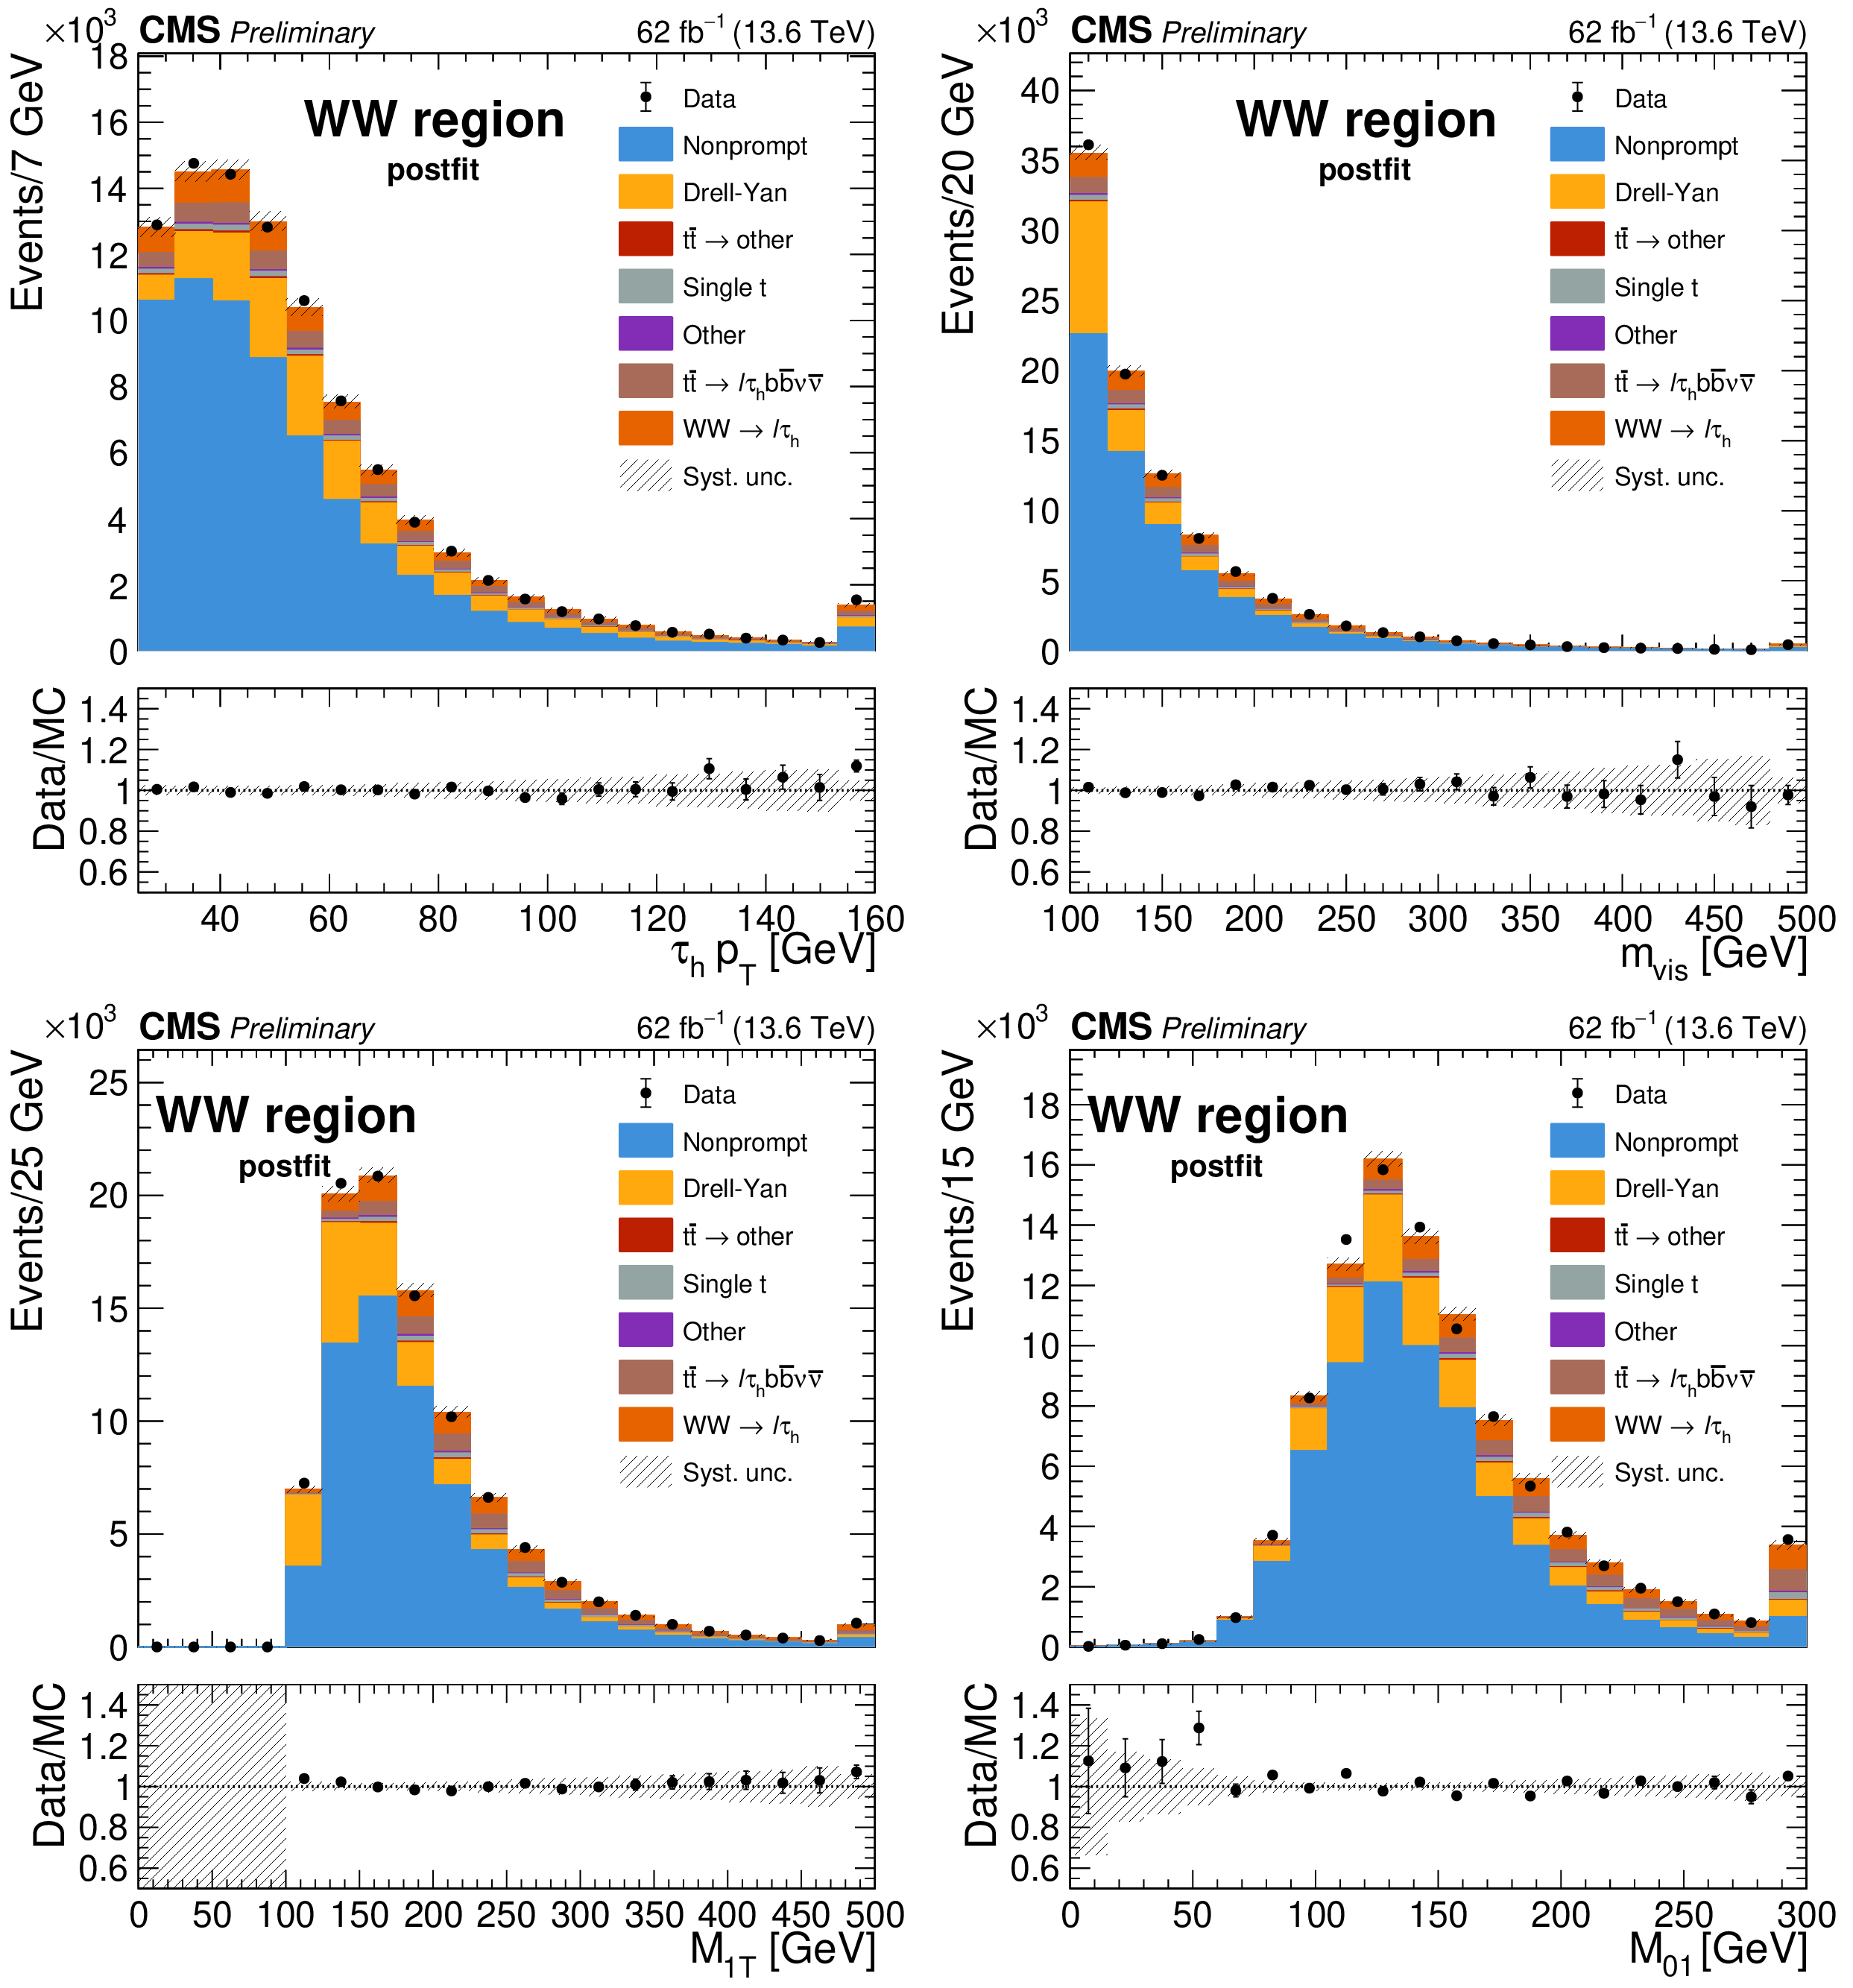
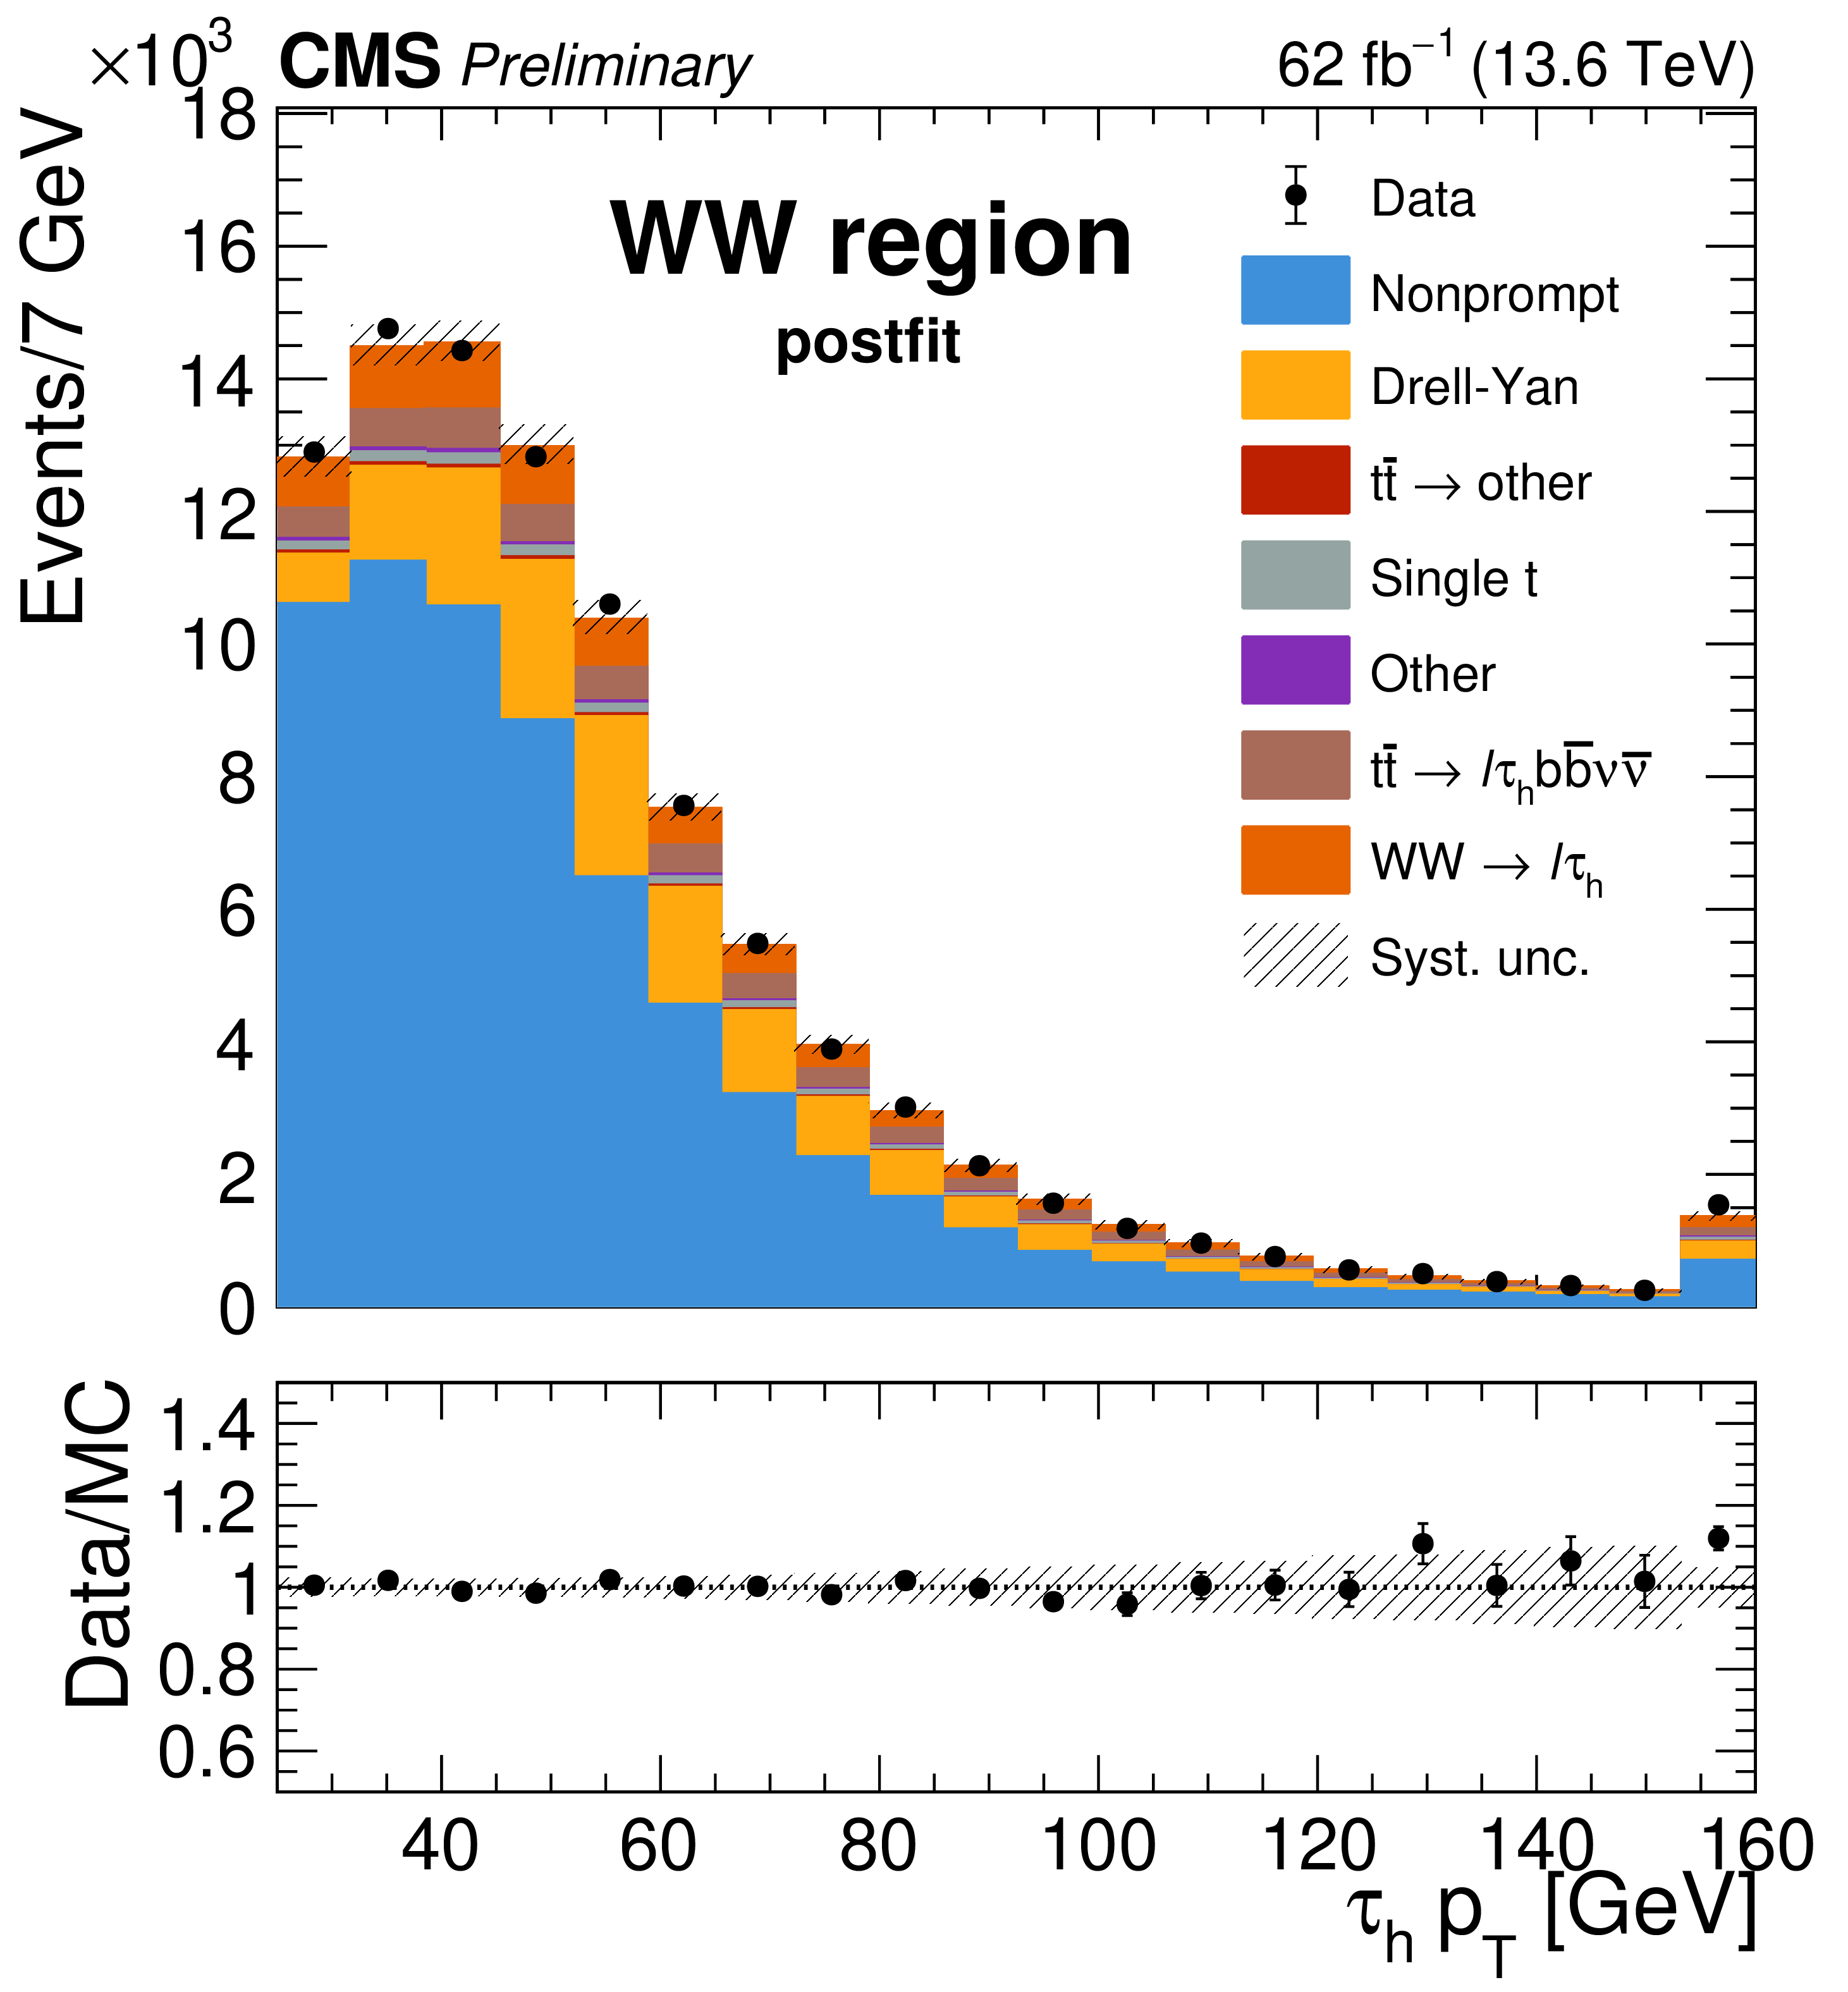
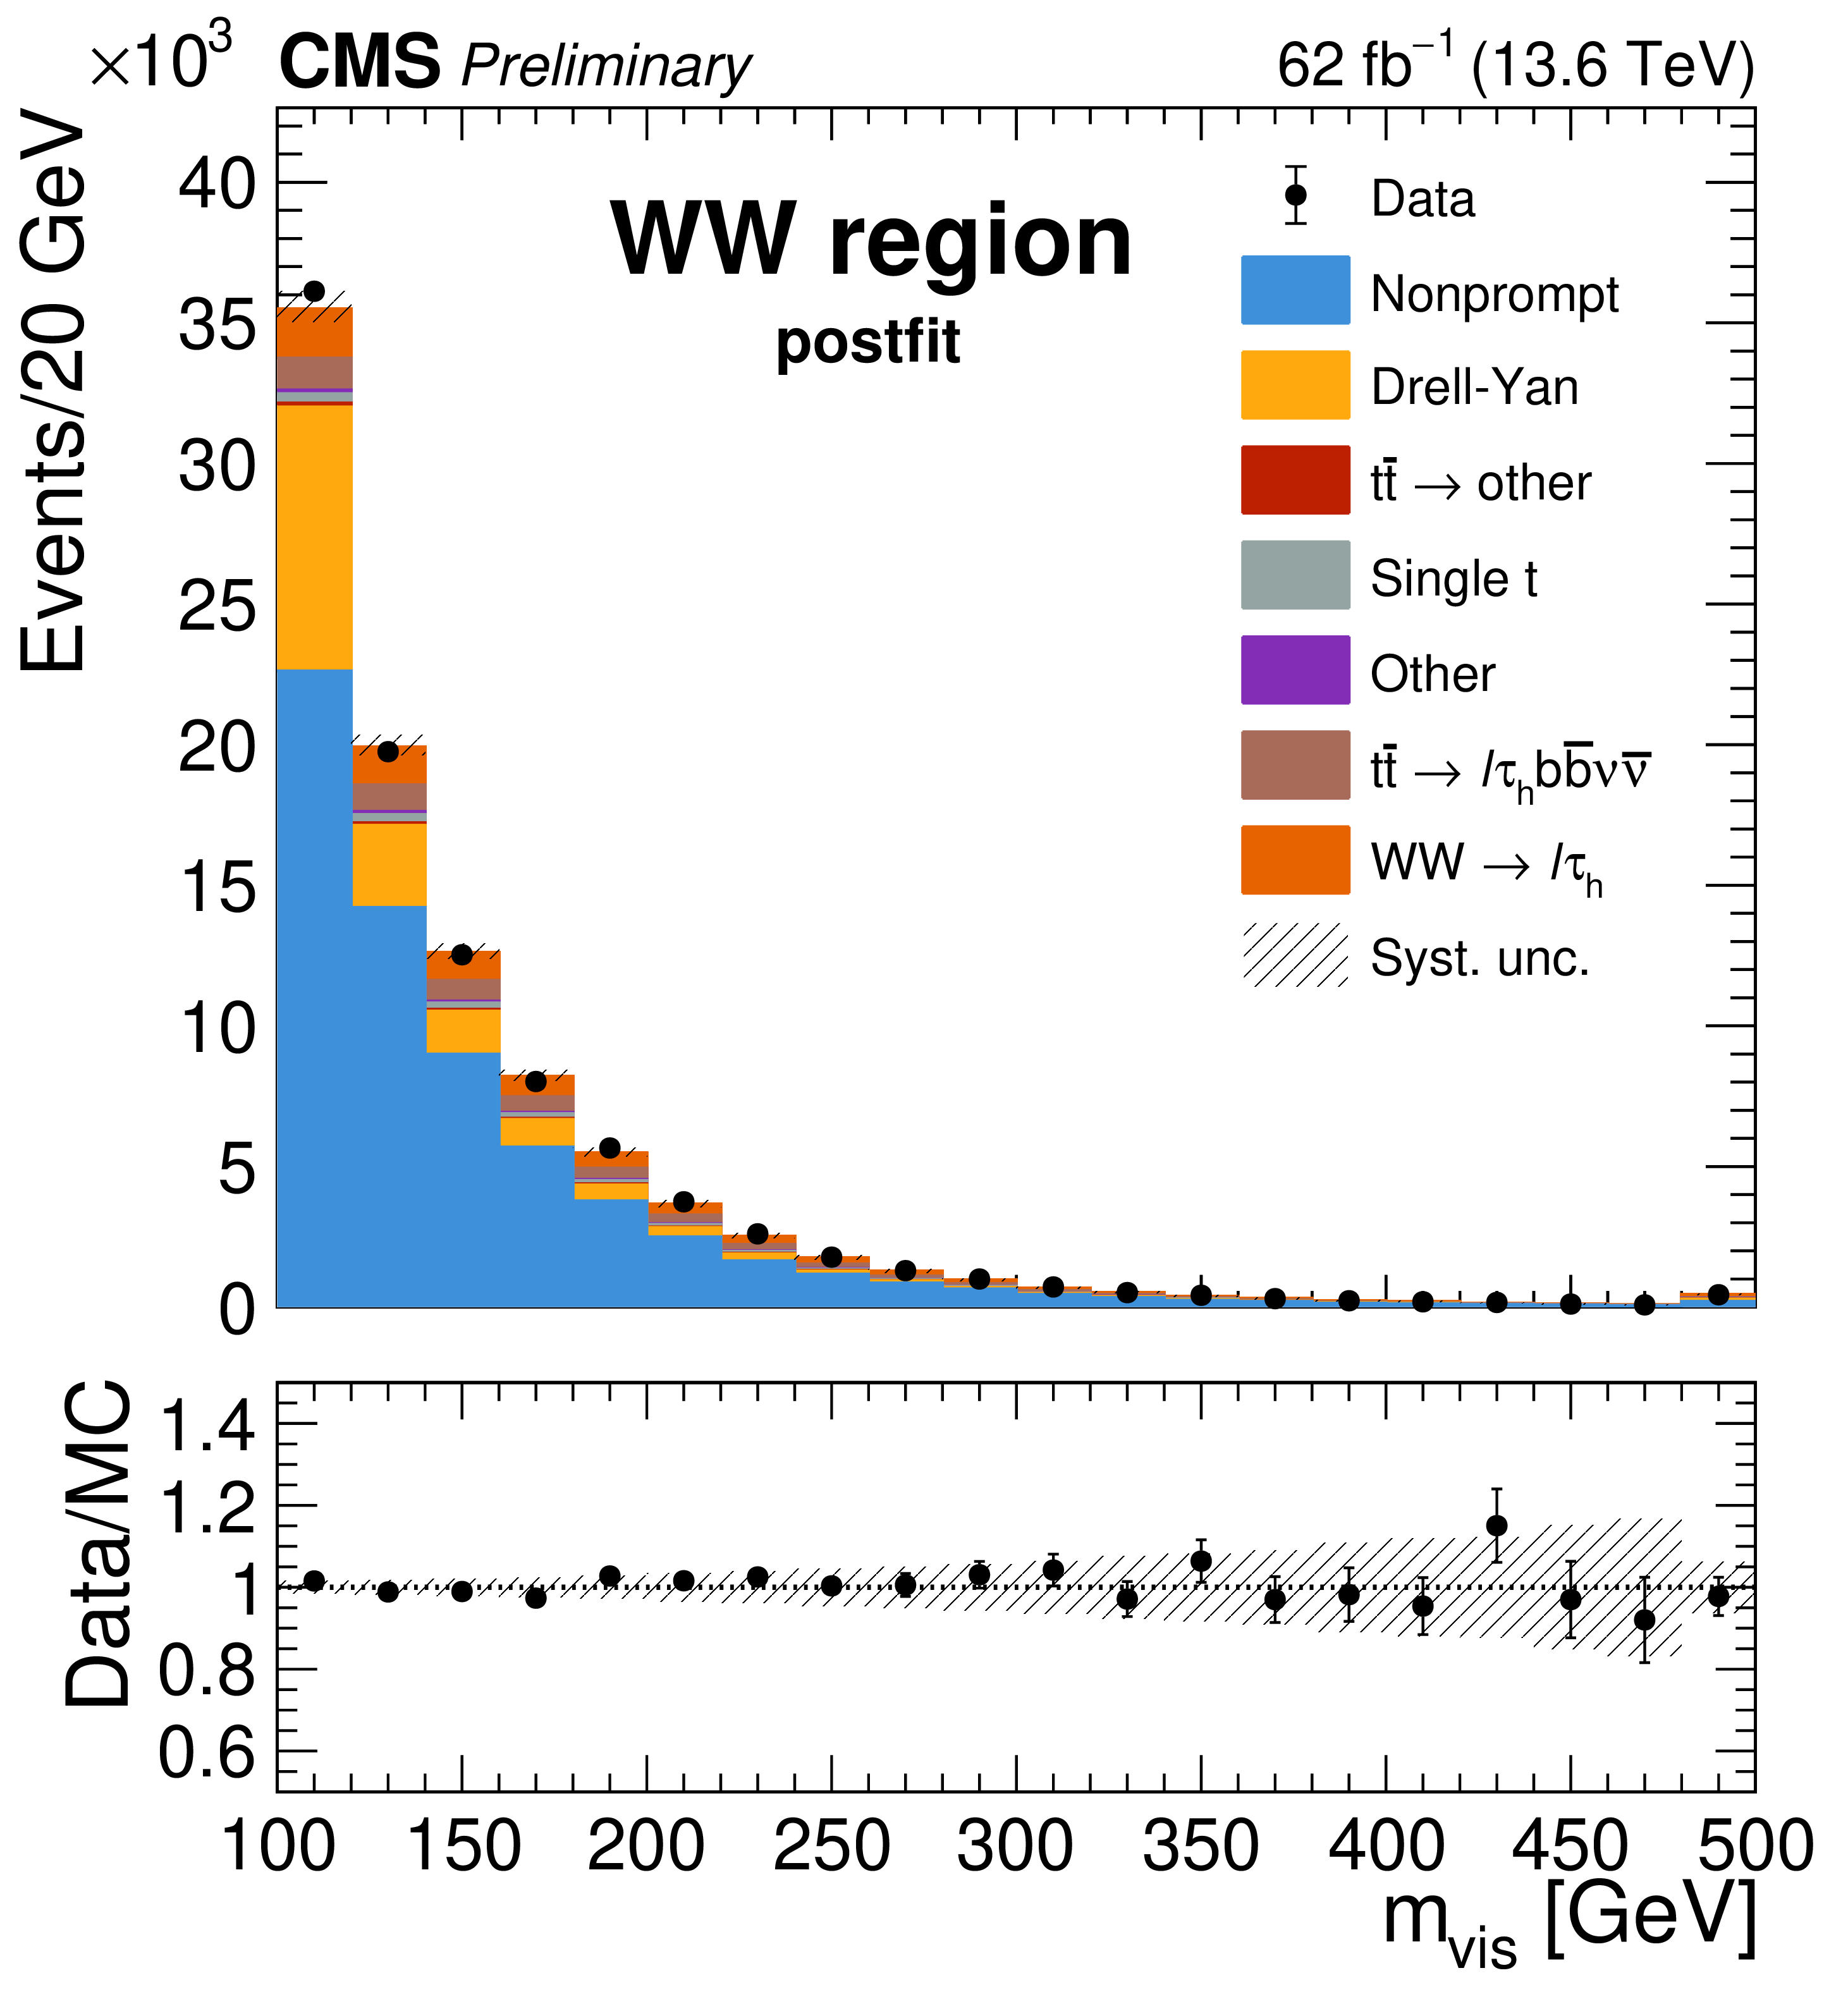
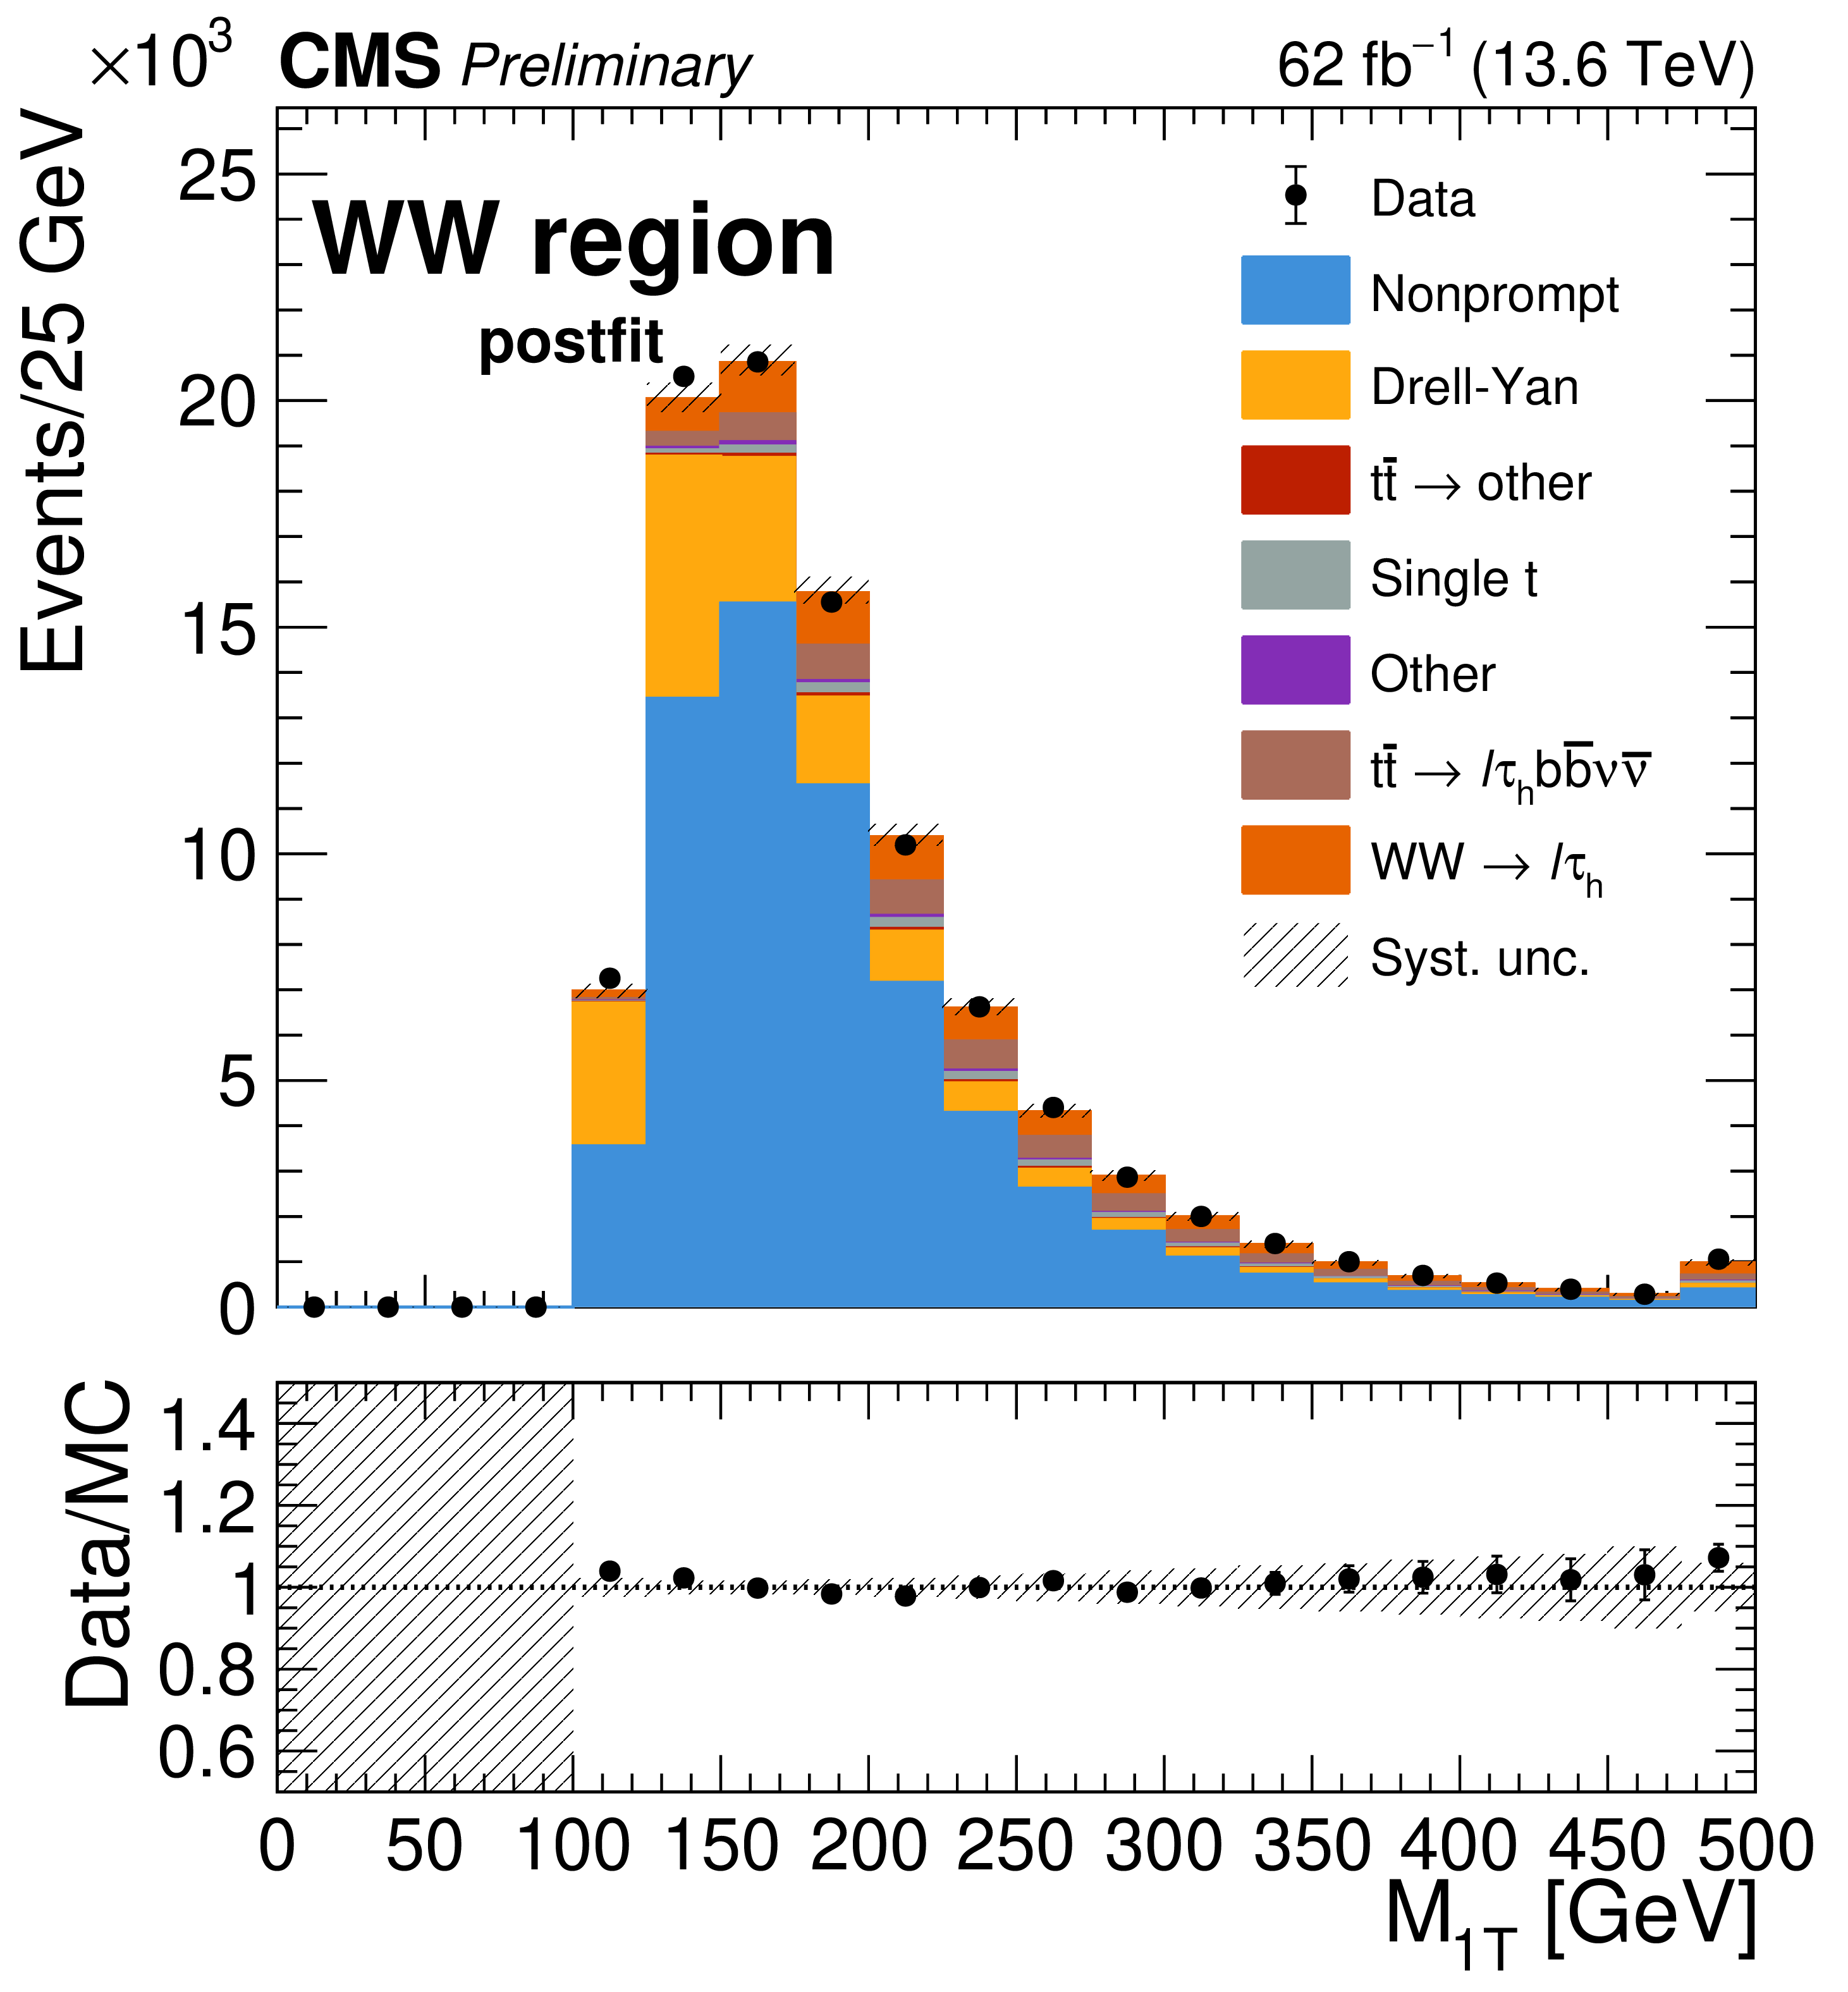
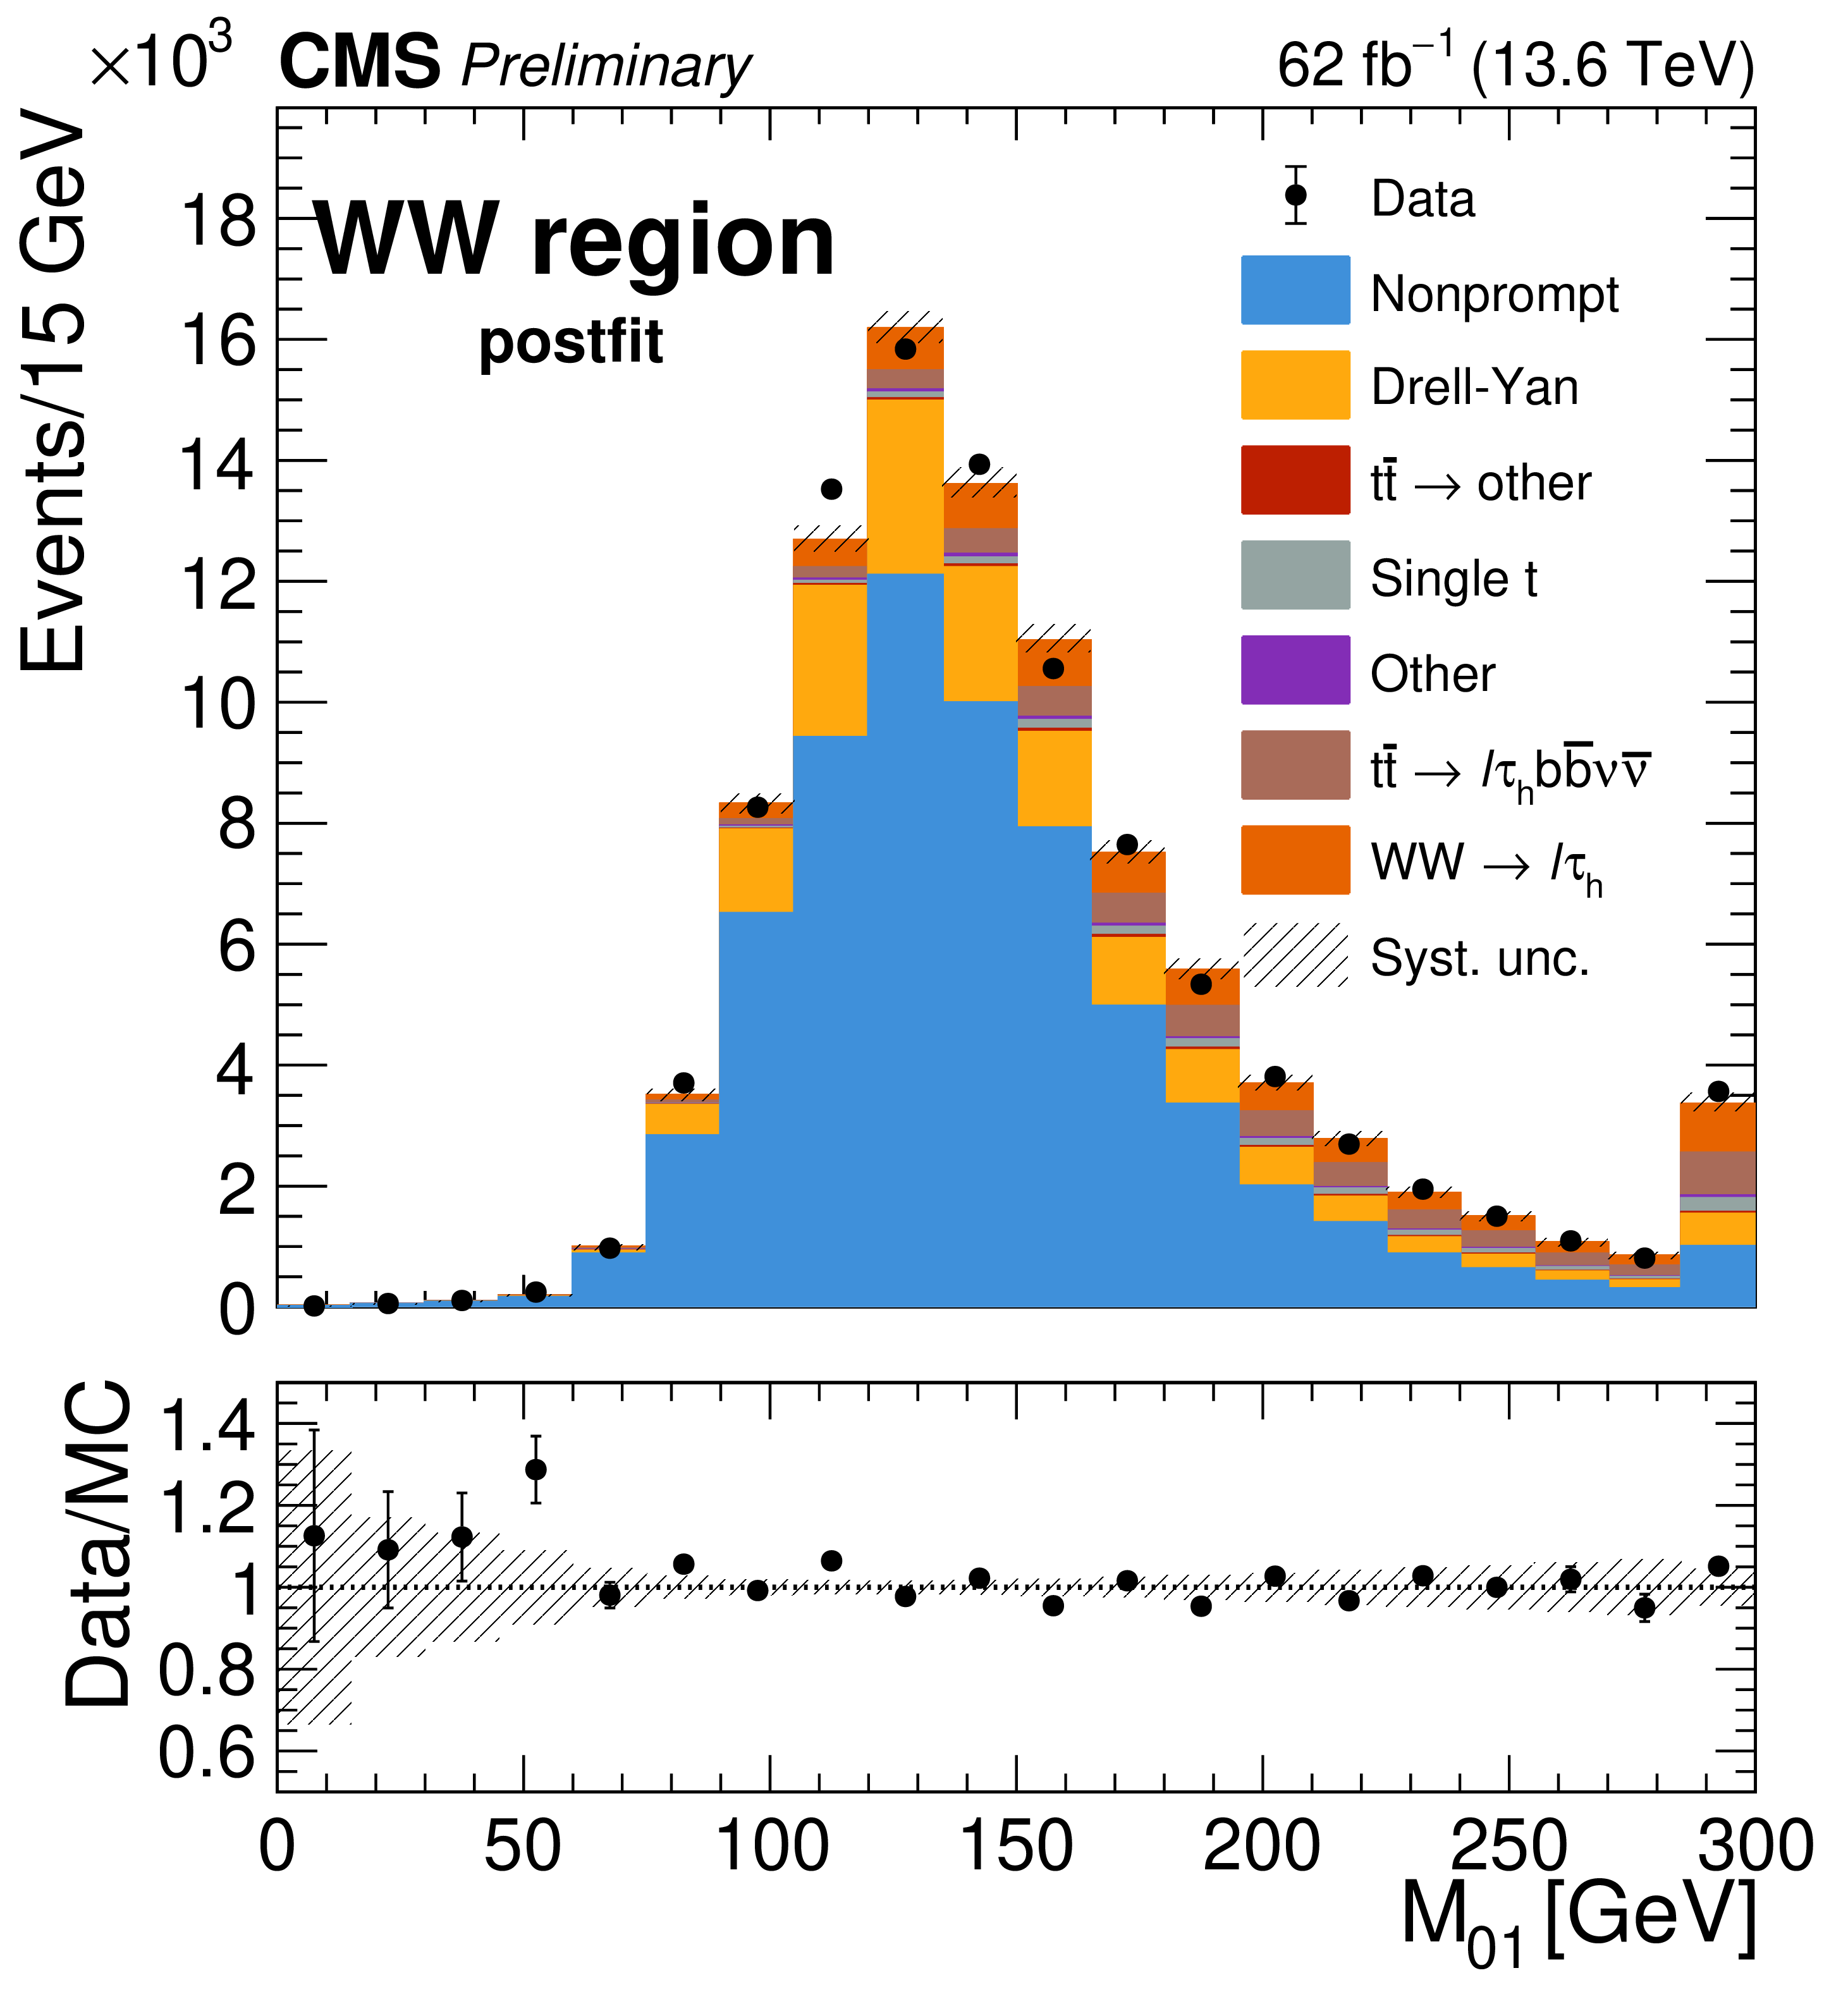
Signal and background postfit distributions for data and predictions in the WW region: $ \tau_\mathrm{h} p_{\mathrm{T}} $ (upper left), $ m_{\mathrm{vis}} $ (upper right), $ M_{1T} $ (lower left), $ M_{01} $ (lower right). The ``Other'' category includes VV, VVV, V$ \gamma $ and Higgs samples. The shaded areas represent the full systematic uncertainty. Overflow events are merged to the last bin. |
png pdf |
Figure 2-a:
Signal and background postfit distributions for data and predictions in the WW region: $ \tau_\mathrm{h} p_{\mathrm{T}} $ (upper left), $ m_{\mathrm{vis}} $ (upper right), $ M_{1T} $ (lower left), $ M_{01} $ (lower right). The ``Other'' category includes VV, VVV, V$ \gamma $ and Higgs samples. The shaded areas represent the full systematic uncertainty. Overflow events are merged to the last bin. |
png pdf |
Figure 2-b:
Signal and background postfit distributions for data and predictions in the WW region: $ \tau_\mathrm{h} p_{\mathrm{T}} $ (upper left), $ m_{\mathrm{vis}} $ (upper right), $ M_{1T} $ (lower left), $ M_{01} $ (lower right). The ``Other'' category includes VV, VVV, V$ \gamma $ and Higgs samples. The shaded areas represent the full systematic uncertainty. Overflow events are merged to the last bin. |
png pdf |
Figure 2-c:
Signal and background postfit distributions for data and predictions in the WW region: $ \tau_\mathrm{h} p_{\mathrm{T}} $ (upper left), $ m_{\mathrm{vis}} $ (upper right), $ M_{1T} $ (lower left), $ M_{01} $ (lower right). The ``Other'' category includes VV, VVV, V$ \gamma $ and Higgs samples. The shaded areas represent the full systematic uncertainty. Overflow events are merged to the last bin. |
png pdf |
Figure 2-d:
Signal and background postfit distributions for data and predictions in the WW region: $ \tau_\mathrm{h} p_{\mathrm{T}} $ (upper left), $ m_{\mathrm{vis}} $ (upper right), $ M_{1T} $ (lower left), $ M_{01} $ (lower right). The ``Other'' category includes VV, VVV, V$ \gamma $ and Higgs samples. The shaded areas represent the full systematic uncertainty. Overflow events are merged to the last bin. |
png pdf |
Figure 3:
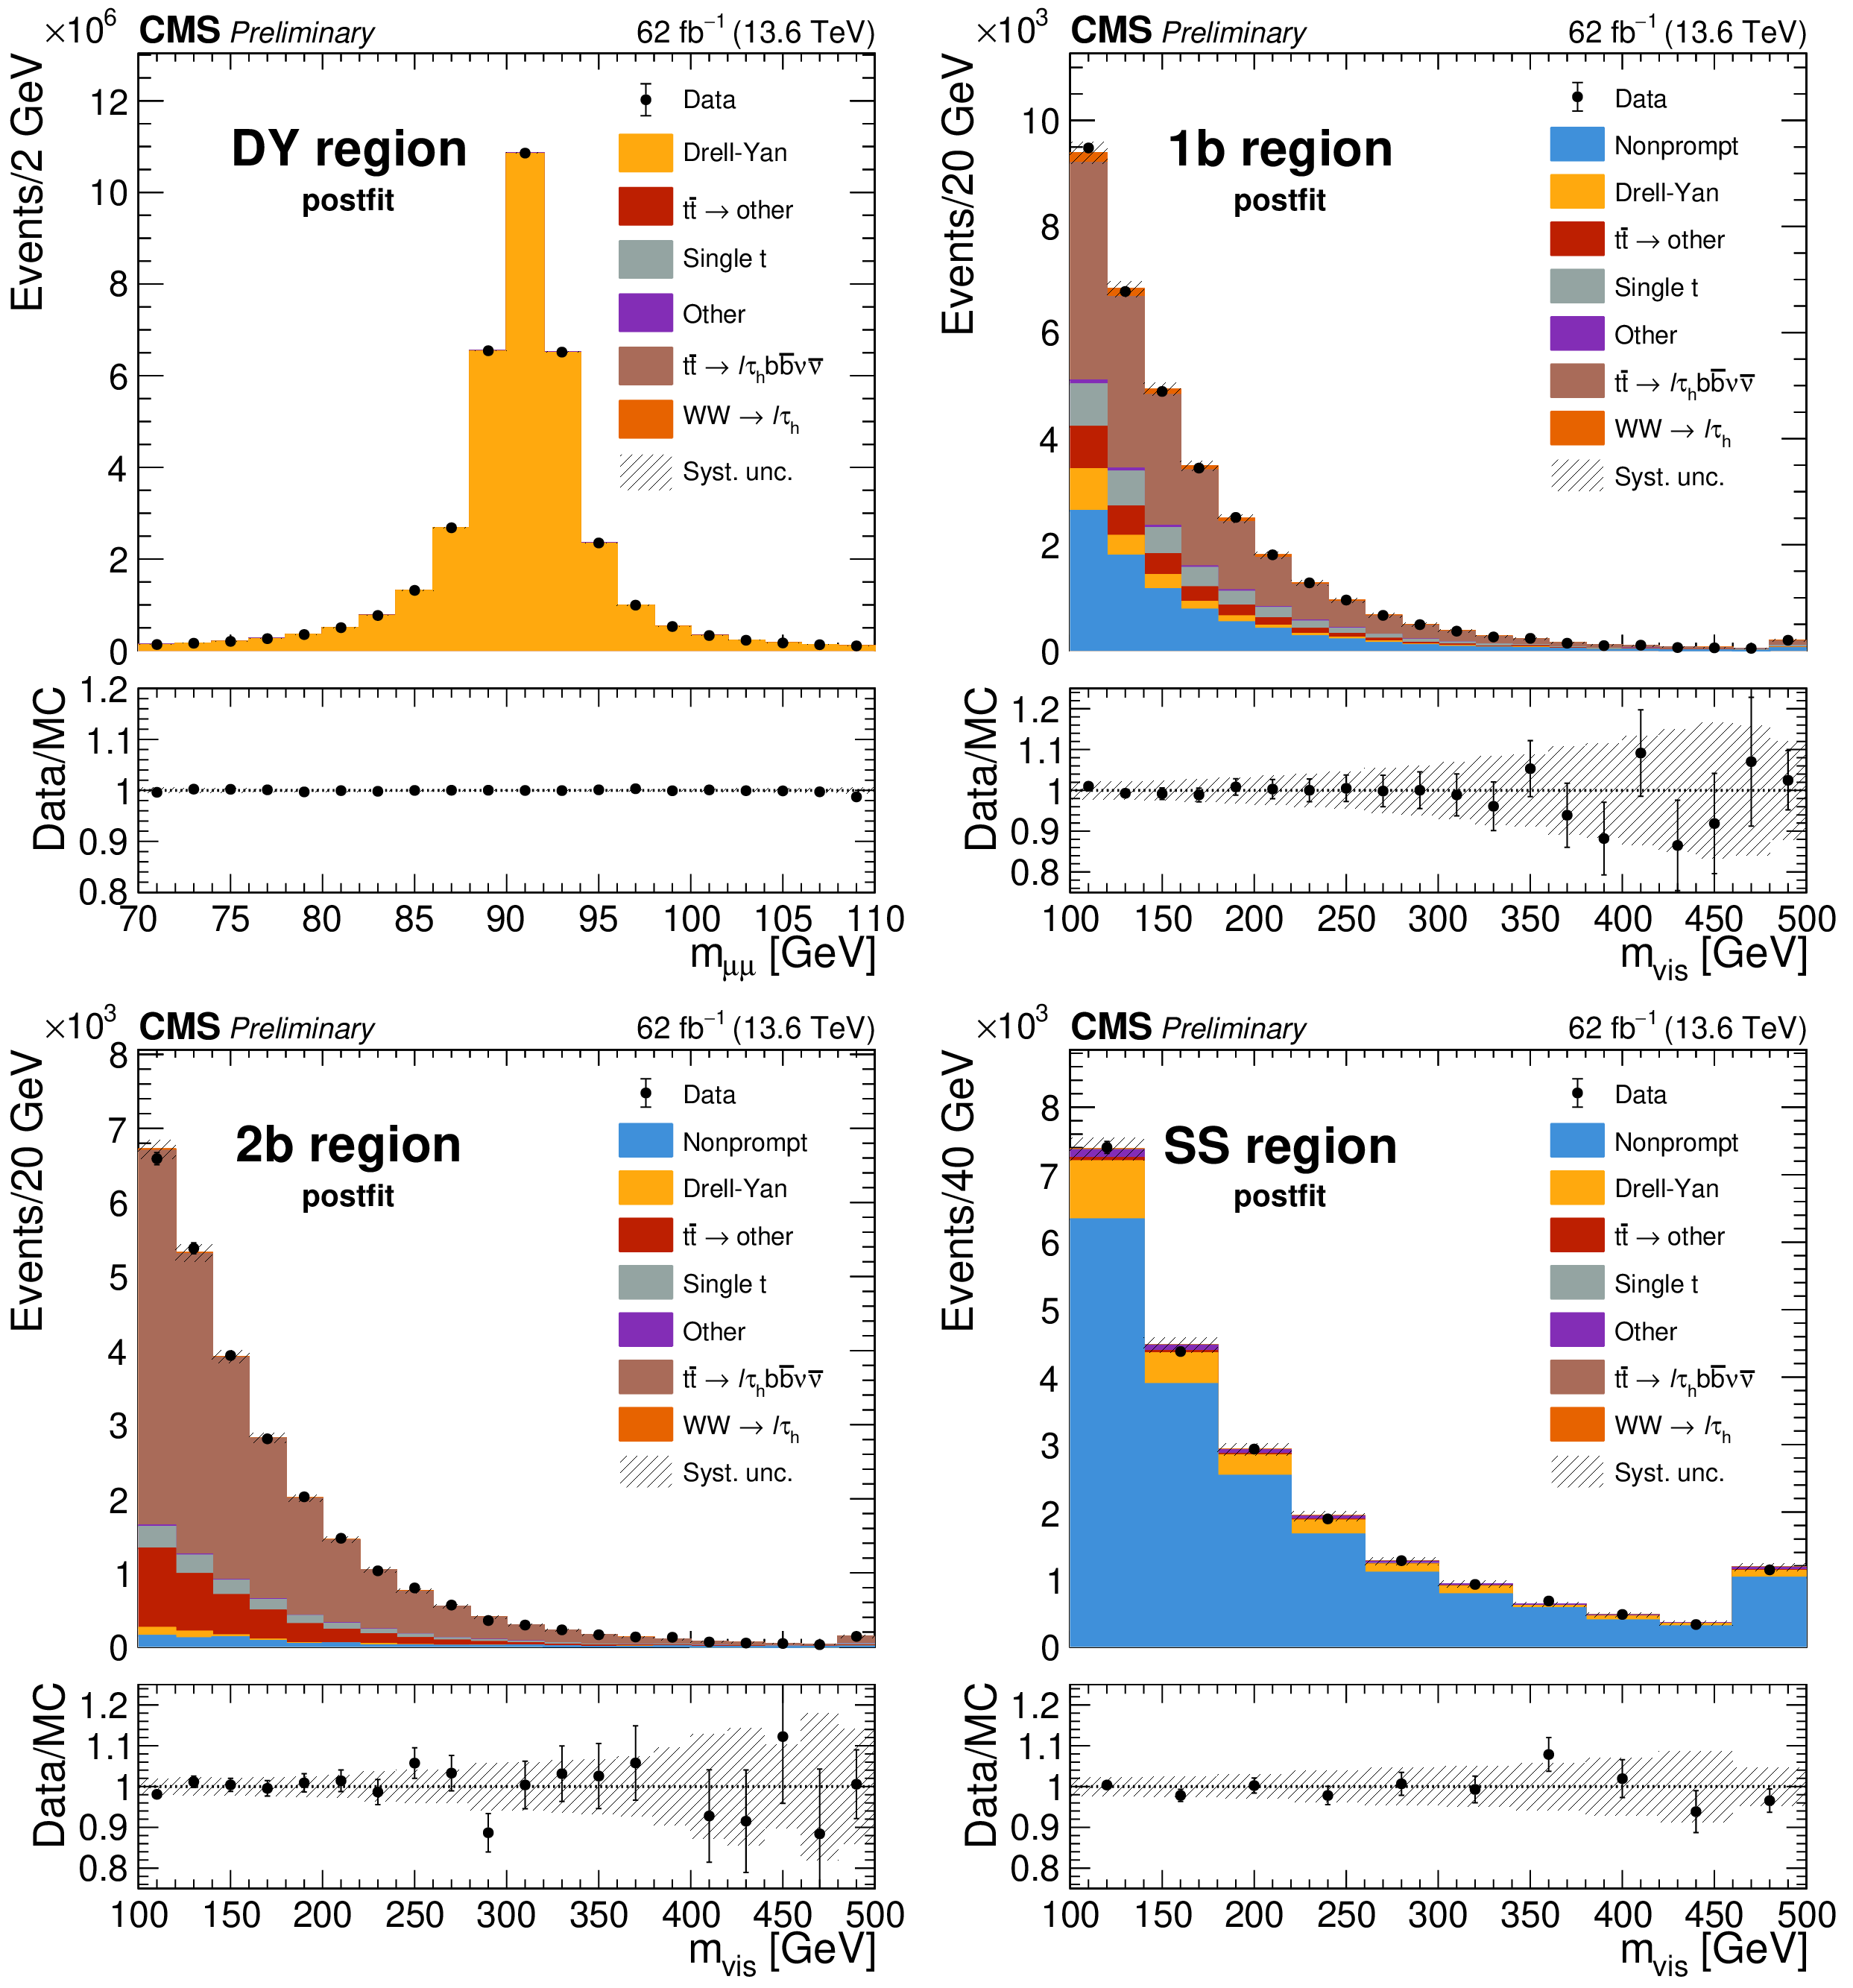
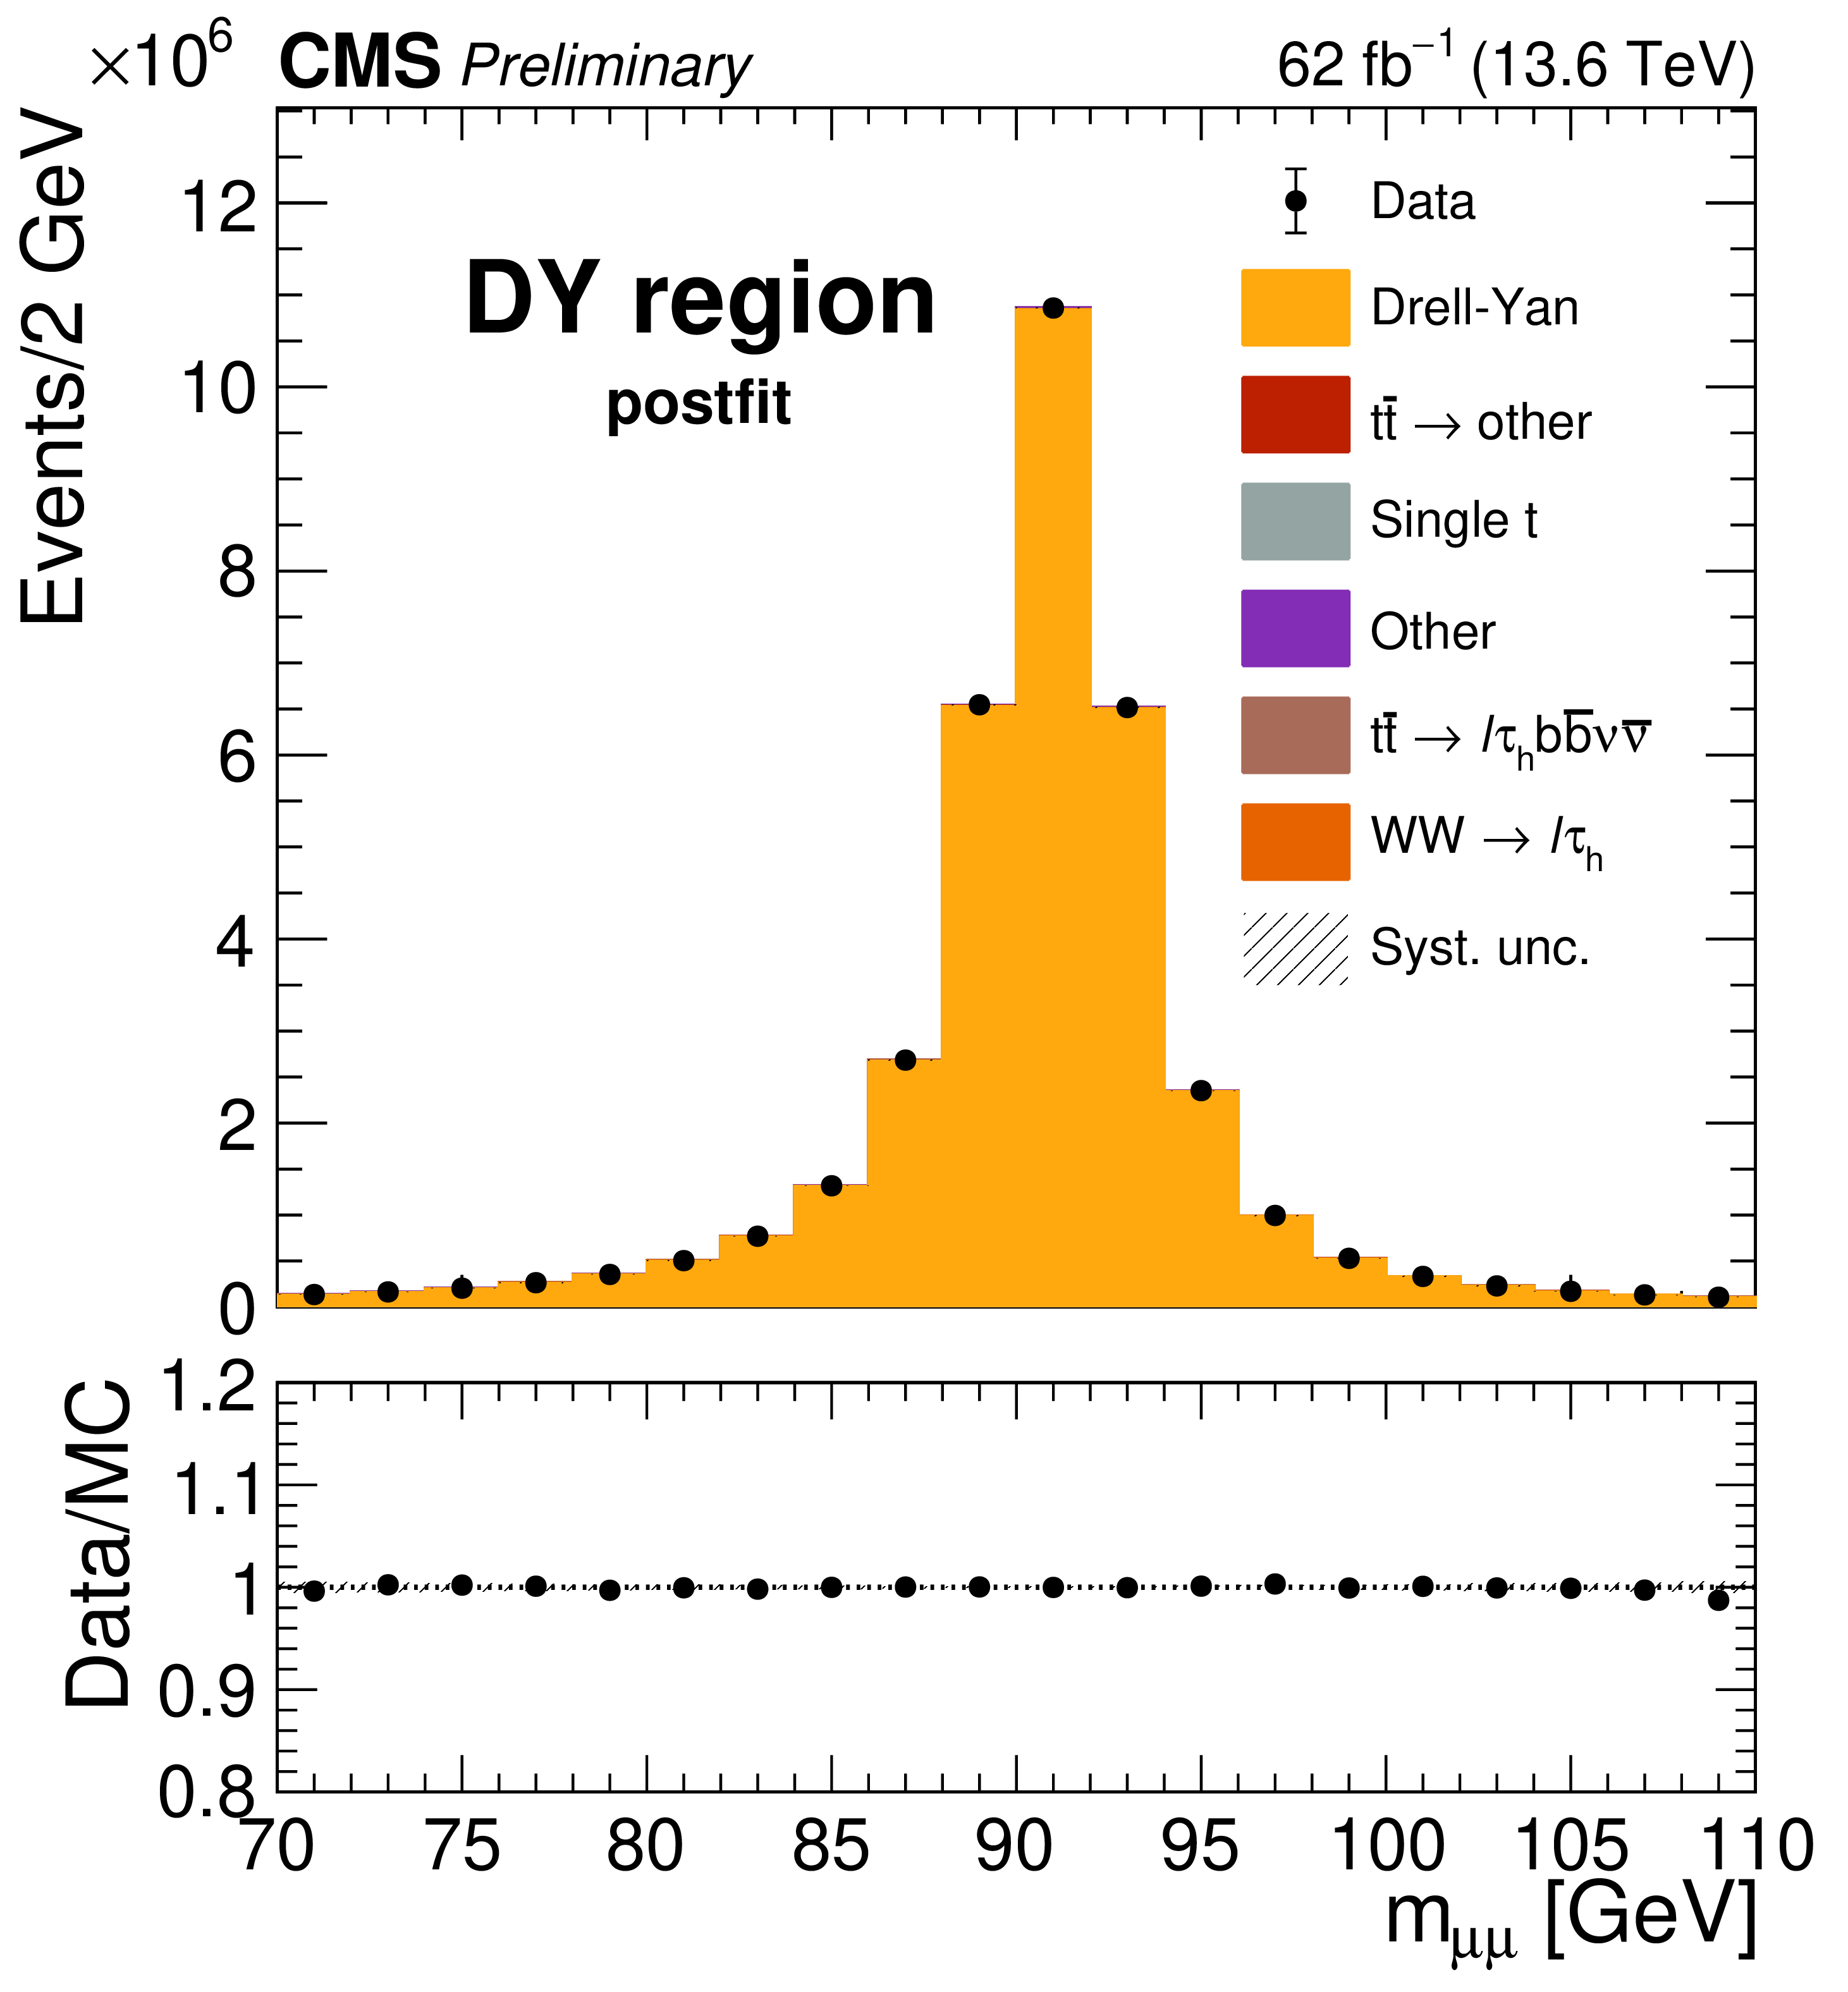
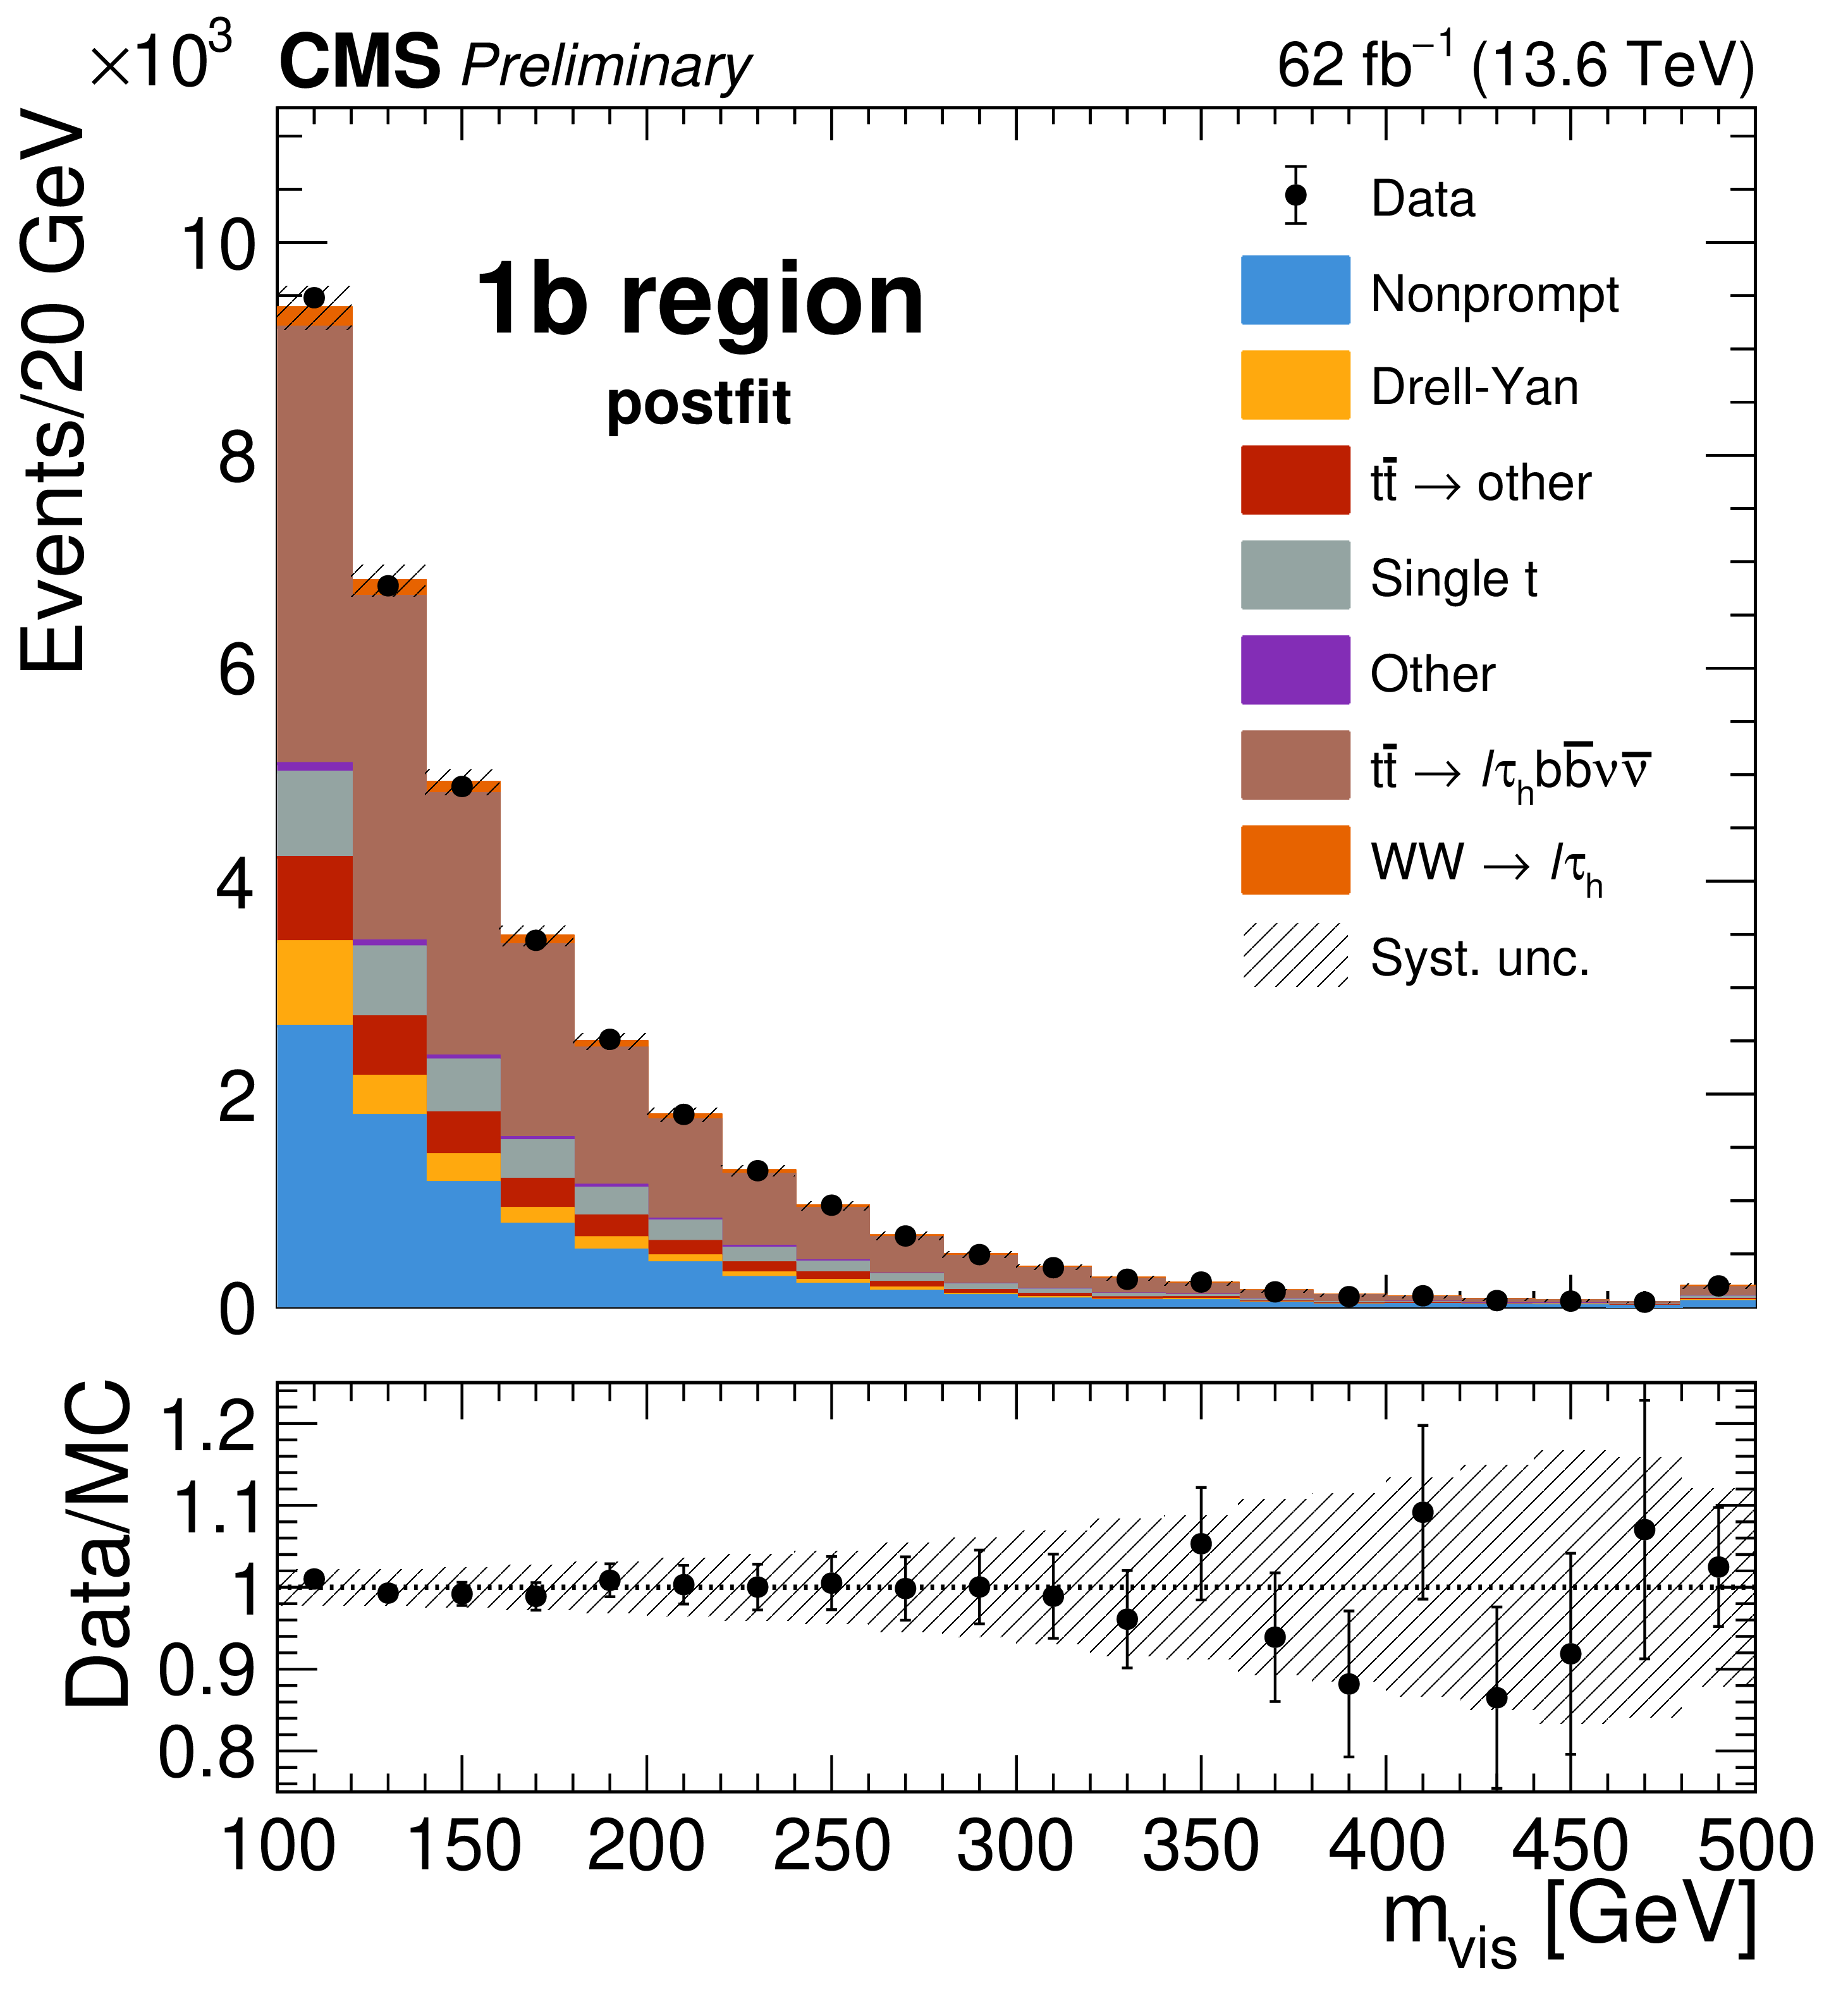
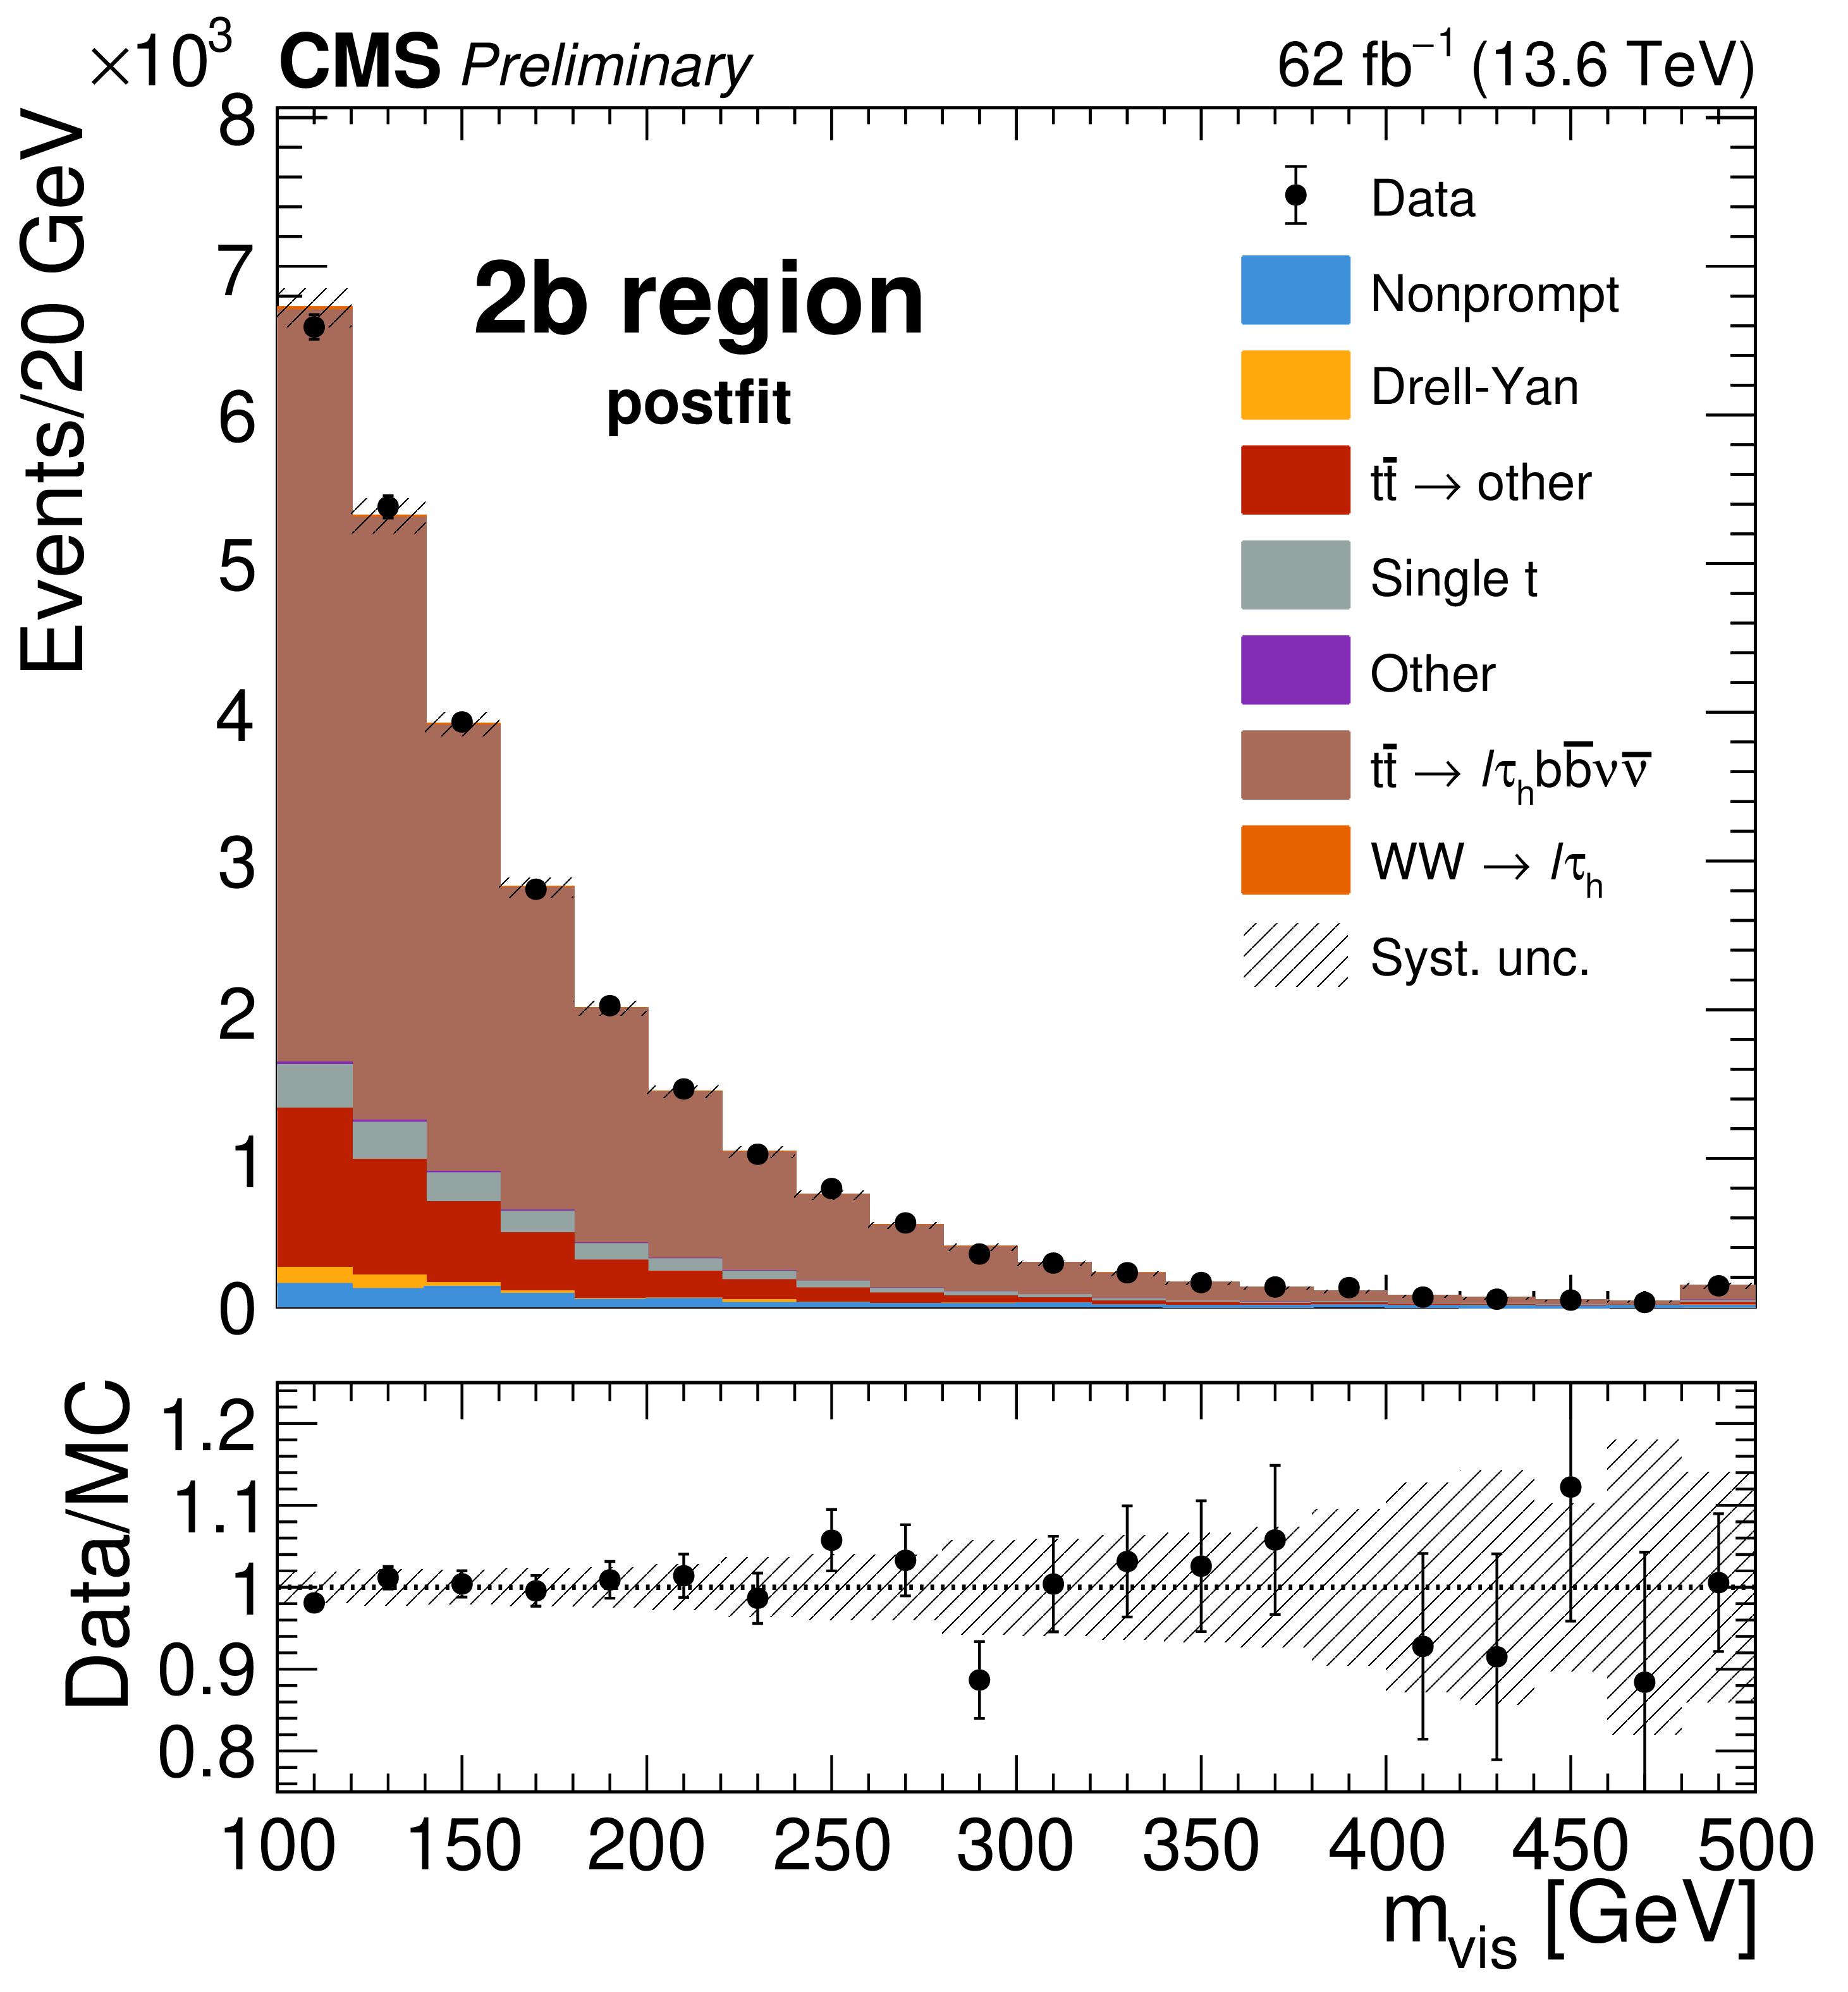
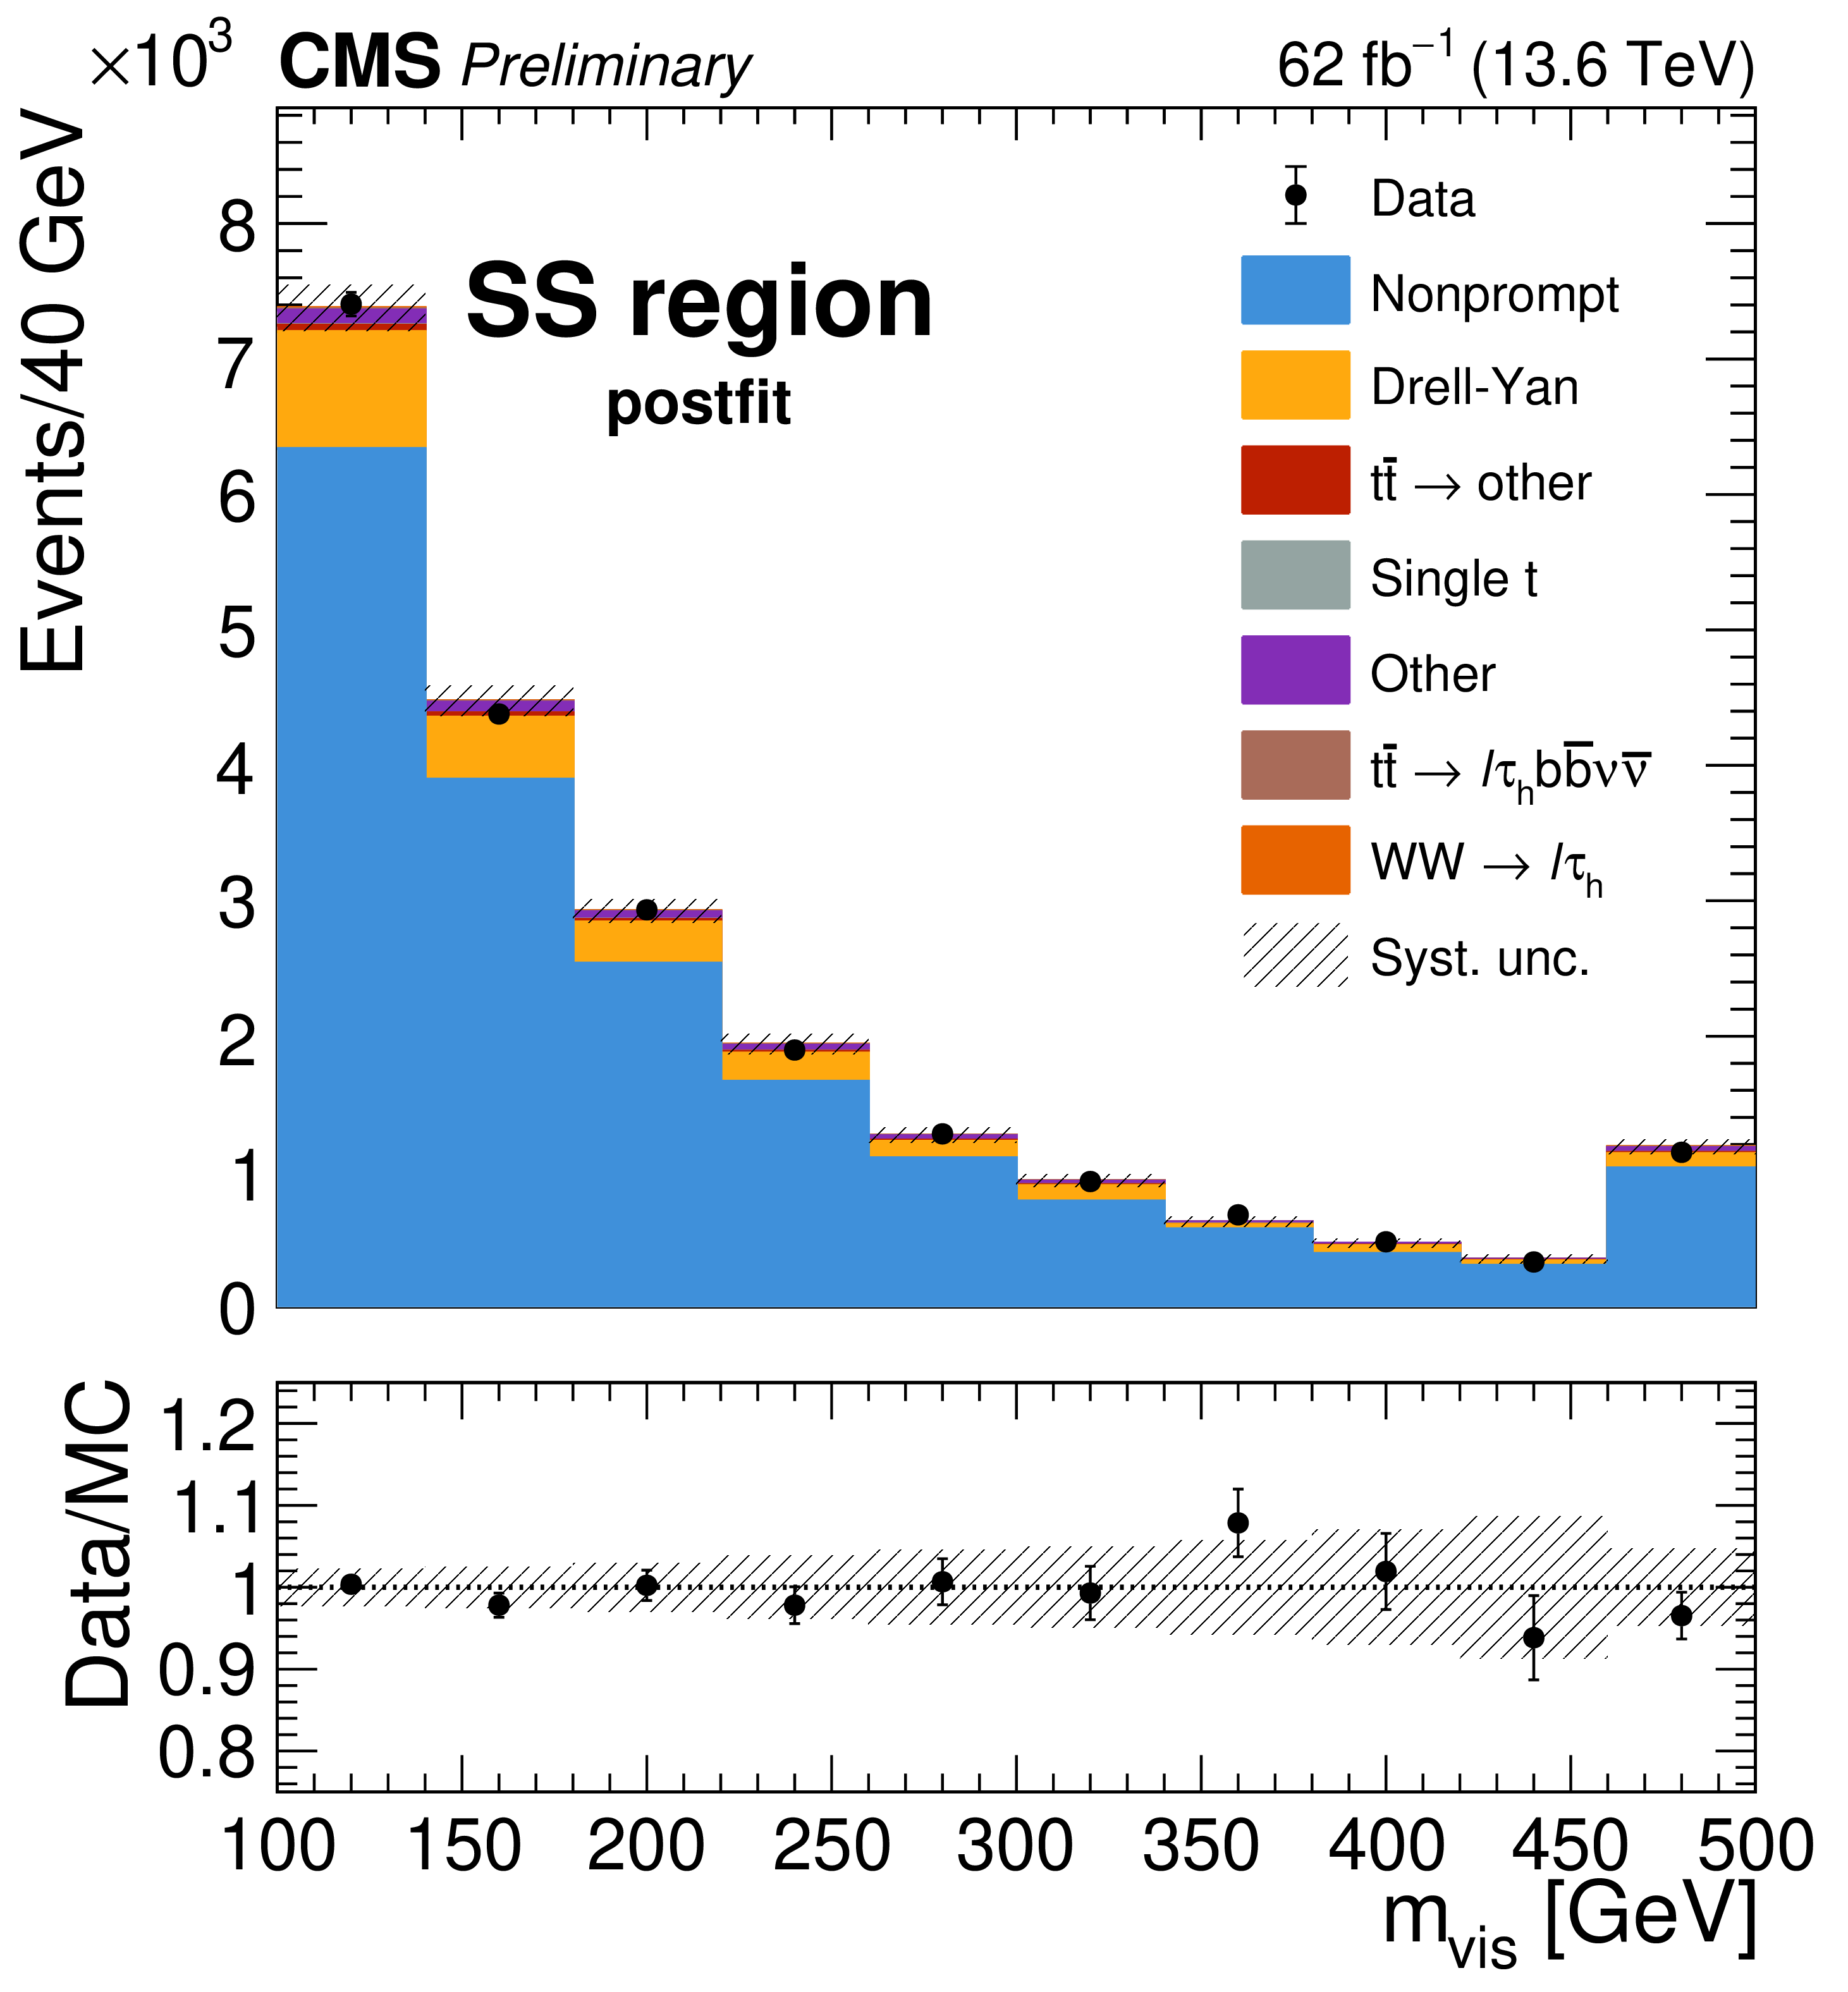
Post-fit invariant mass distributions, for data and expectations, in four of the fit regions: DY (upper left), 1b (upper right), 2b (lower left), SS (lower right). The ``Other'' category includes VV, VVV, V$ \gamma $ and Higgs samples. The shaded areas represent the full systematic uncertainty. Overflow events are merged to the last bin (except for the DY region). |
png pdf |
Figure 3-a:
Post-fit invariant mass distributions, for data and expectations, in four of the fit regions: DY (upper left), 1b (upper right), 2b (lower left), SS (lower right). The ``Other'' category includes VV, VVV, V$ \gamma $ and Higgs samples. The shaded areas represent the full systematic uncertainty. Overflow events are merged to the last bin (except for the DY region). |
png pdf |
Figure 3-b:
Post-fit invariant mass distributions, for data and expectations, in four of the fit regions: DY (upper left), 1b (upper right), 2b (lower left), SS (lower right). The ``Other'' category includes VV, VVV, V$ \gamma $ and Higgs samples. The shaded areas represent the full systematic uncertainty. Overflow events are merged to the last bin (except for the DY region). |
png pdf |
Figure 3-c:
Post-fit invariant mass distributions, for data and expectations, in four of the fit regions: DY (upper left), 1b (upper right), 2b (lower left), SS (lower right). The ``Other'' category includes VV, VVV, V$ \gamma $ and Higgs samples. The shaded areas represent the full systematic uncertainty. Overflow events are merged to the last bin (except for the DY region). |
png pdf |
Figure 3-d:
Post-fit invariant mass distributions, for data and expectations, in four of the fit regions: DY (upper left), 1b (upper right), 2b (lower left), SS (lower right). The ``Other'' category includes VV, VVV, V$ \gamma $ and Higgs samples. The shaded areas represent the full systematic uncertainty. Overflow events are merged to the last bin (except for the DY region). |
png pdf |
Figure 4:
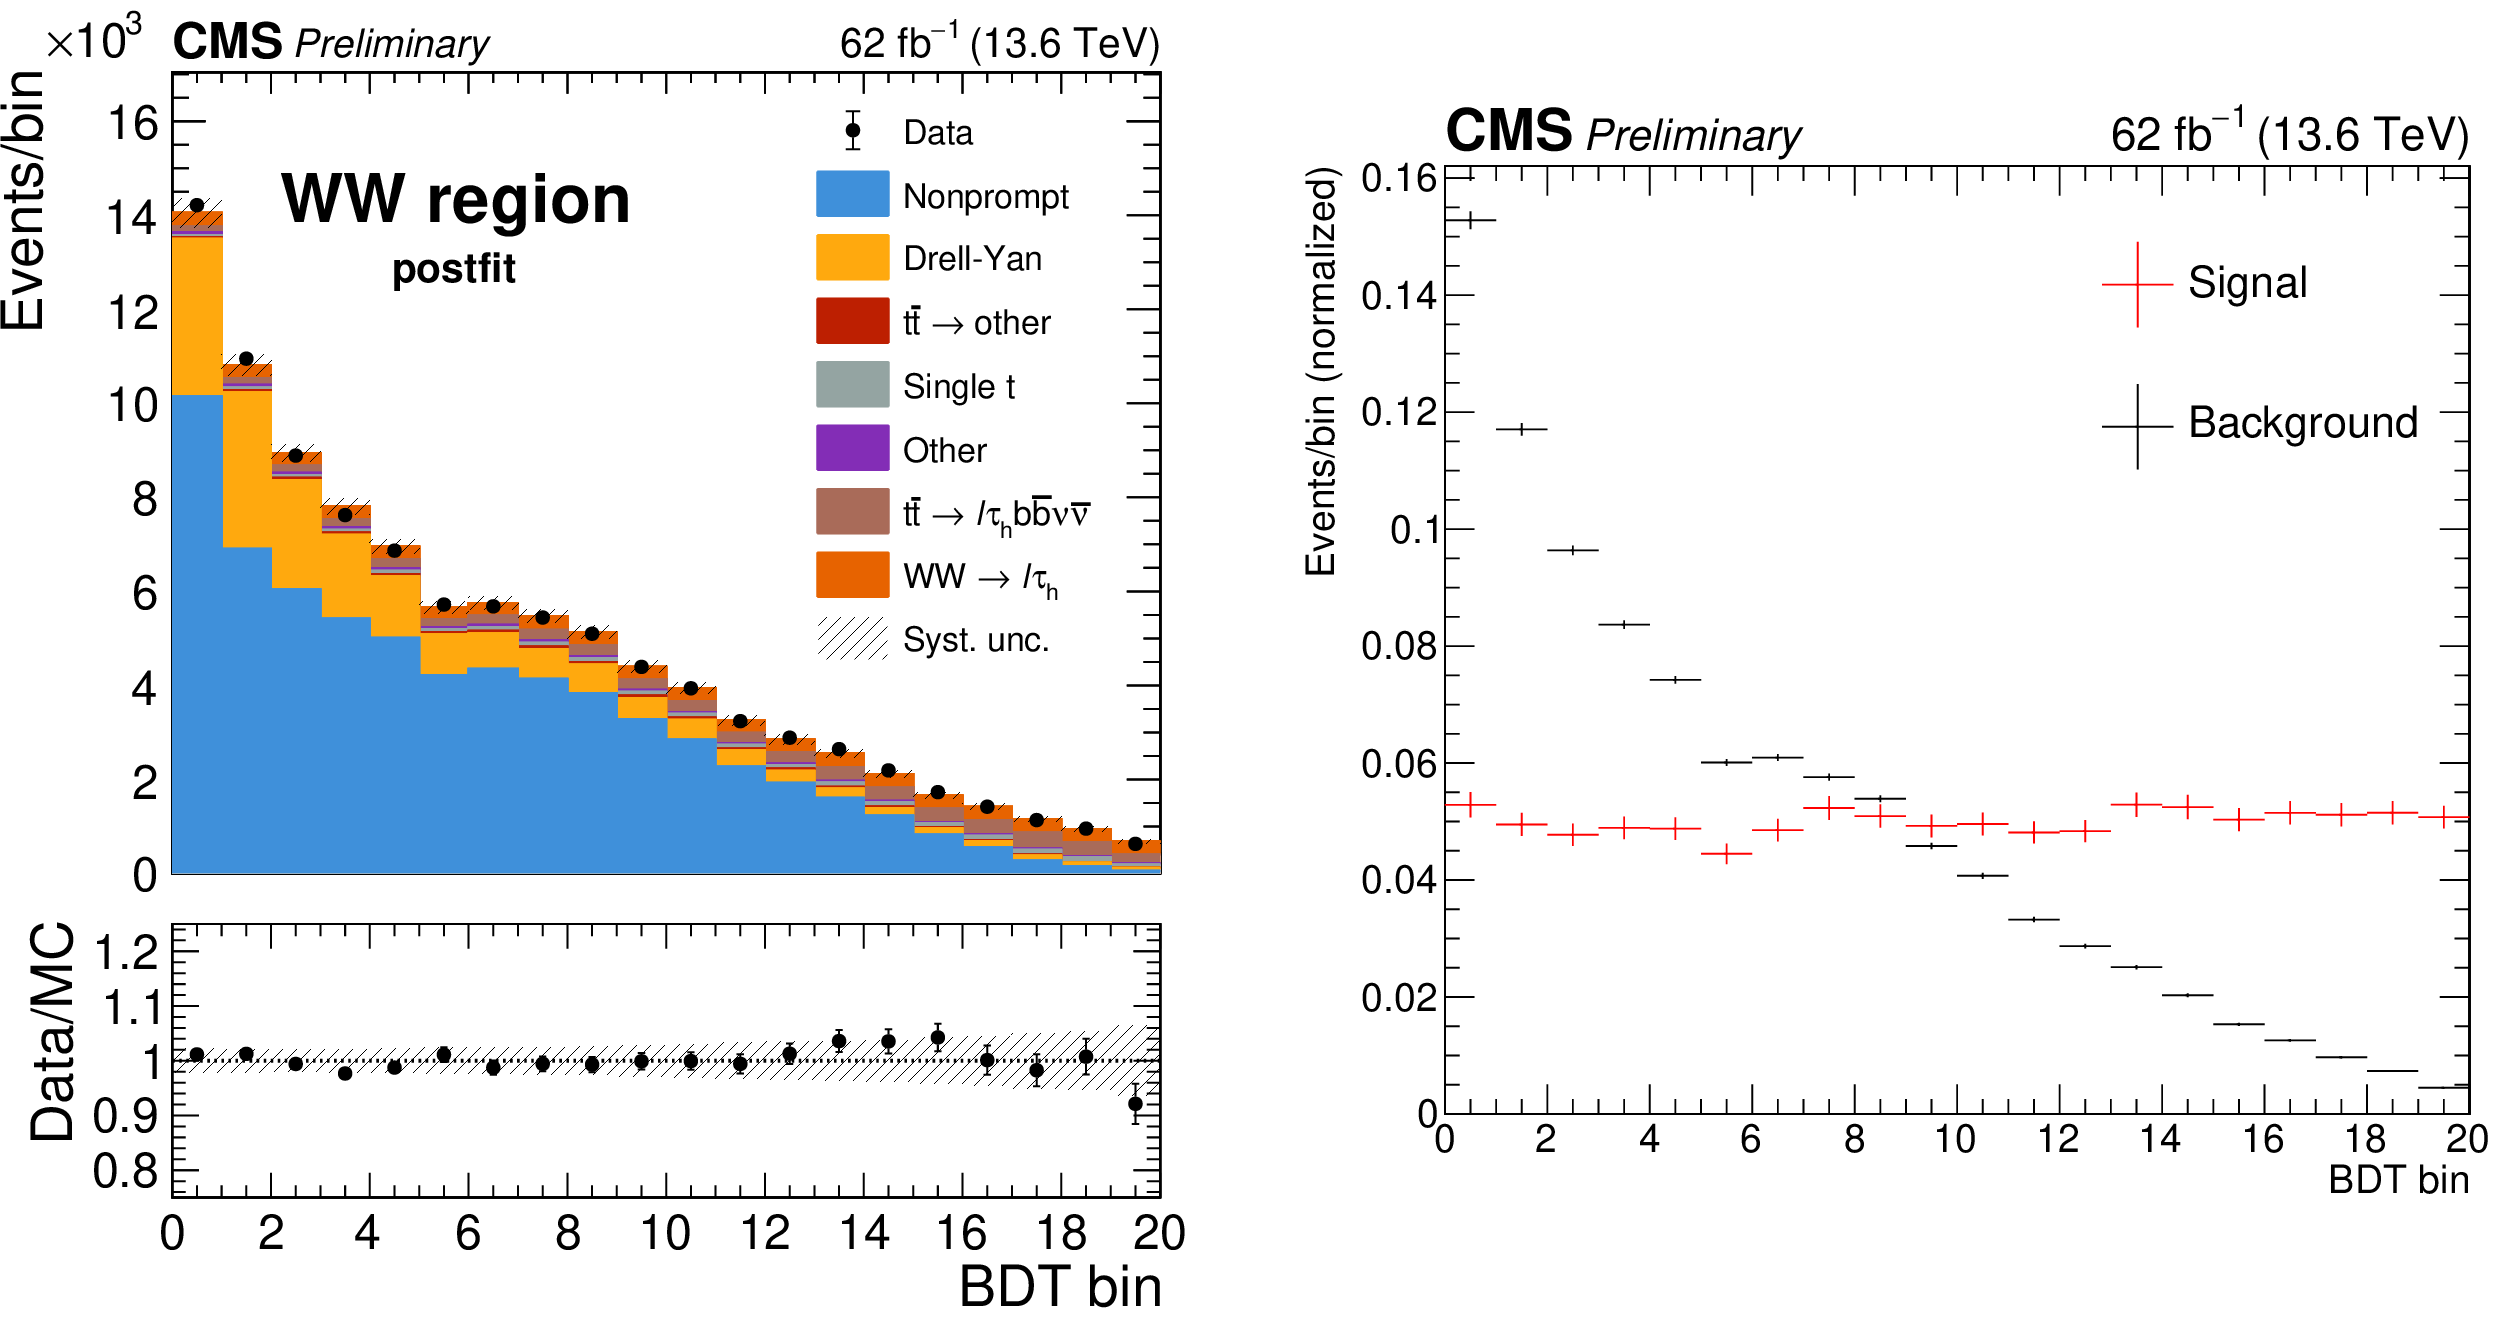
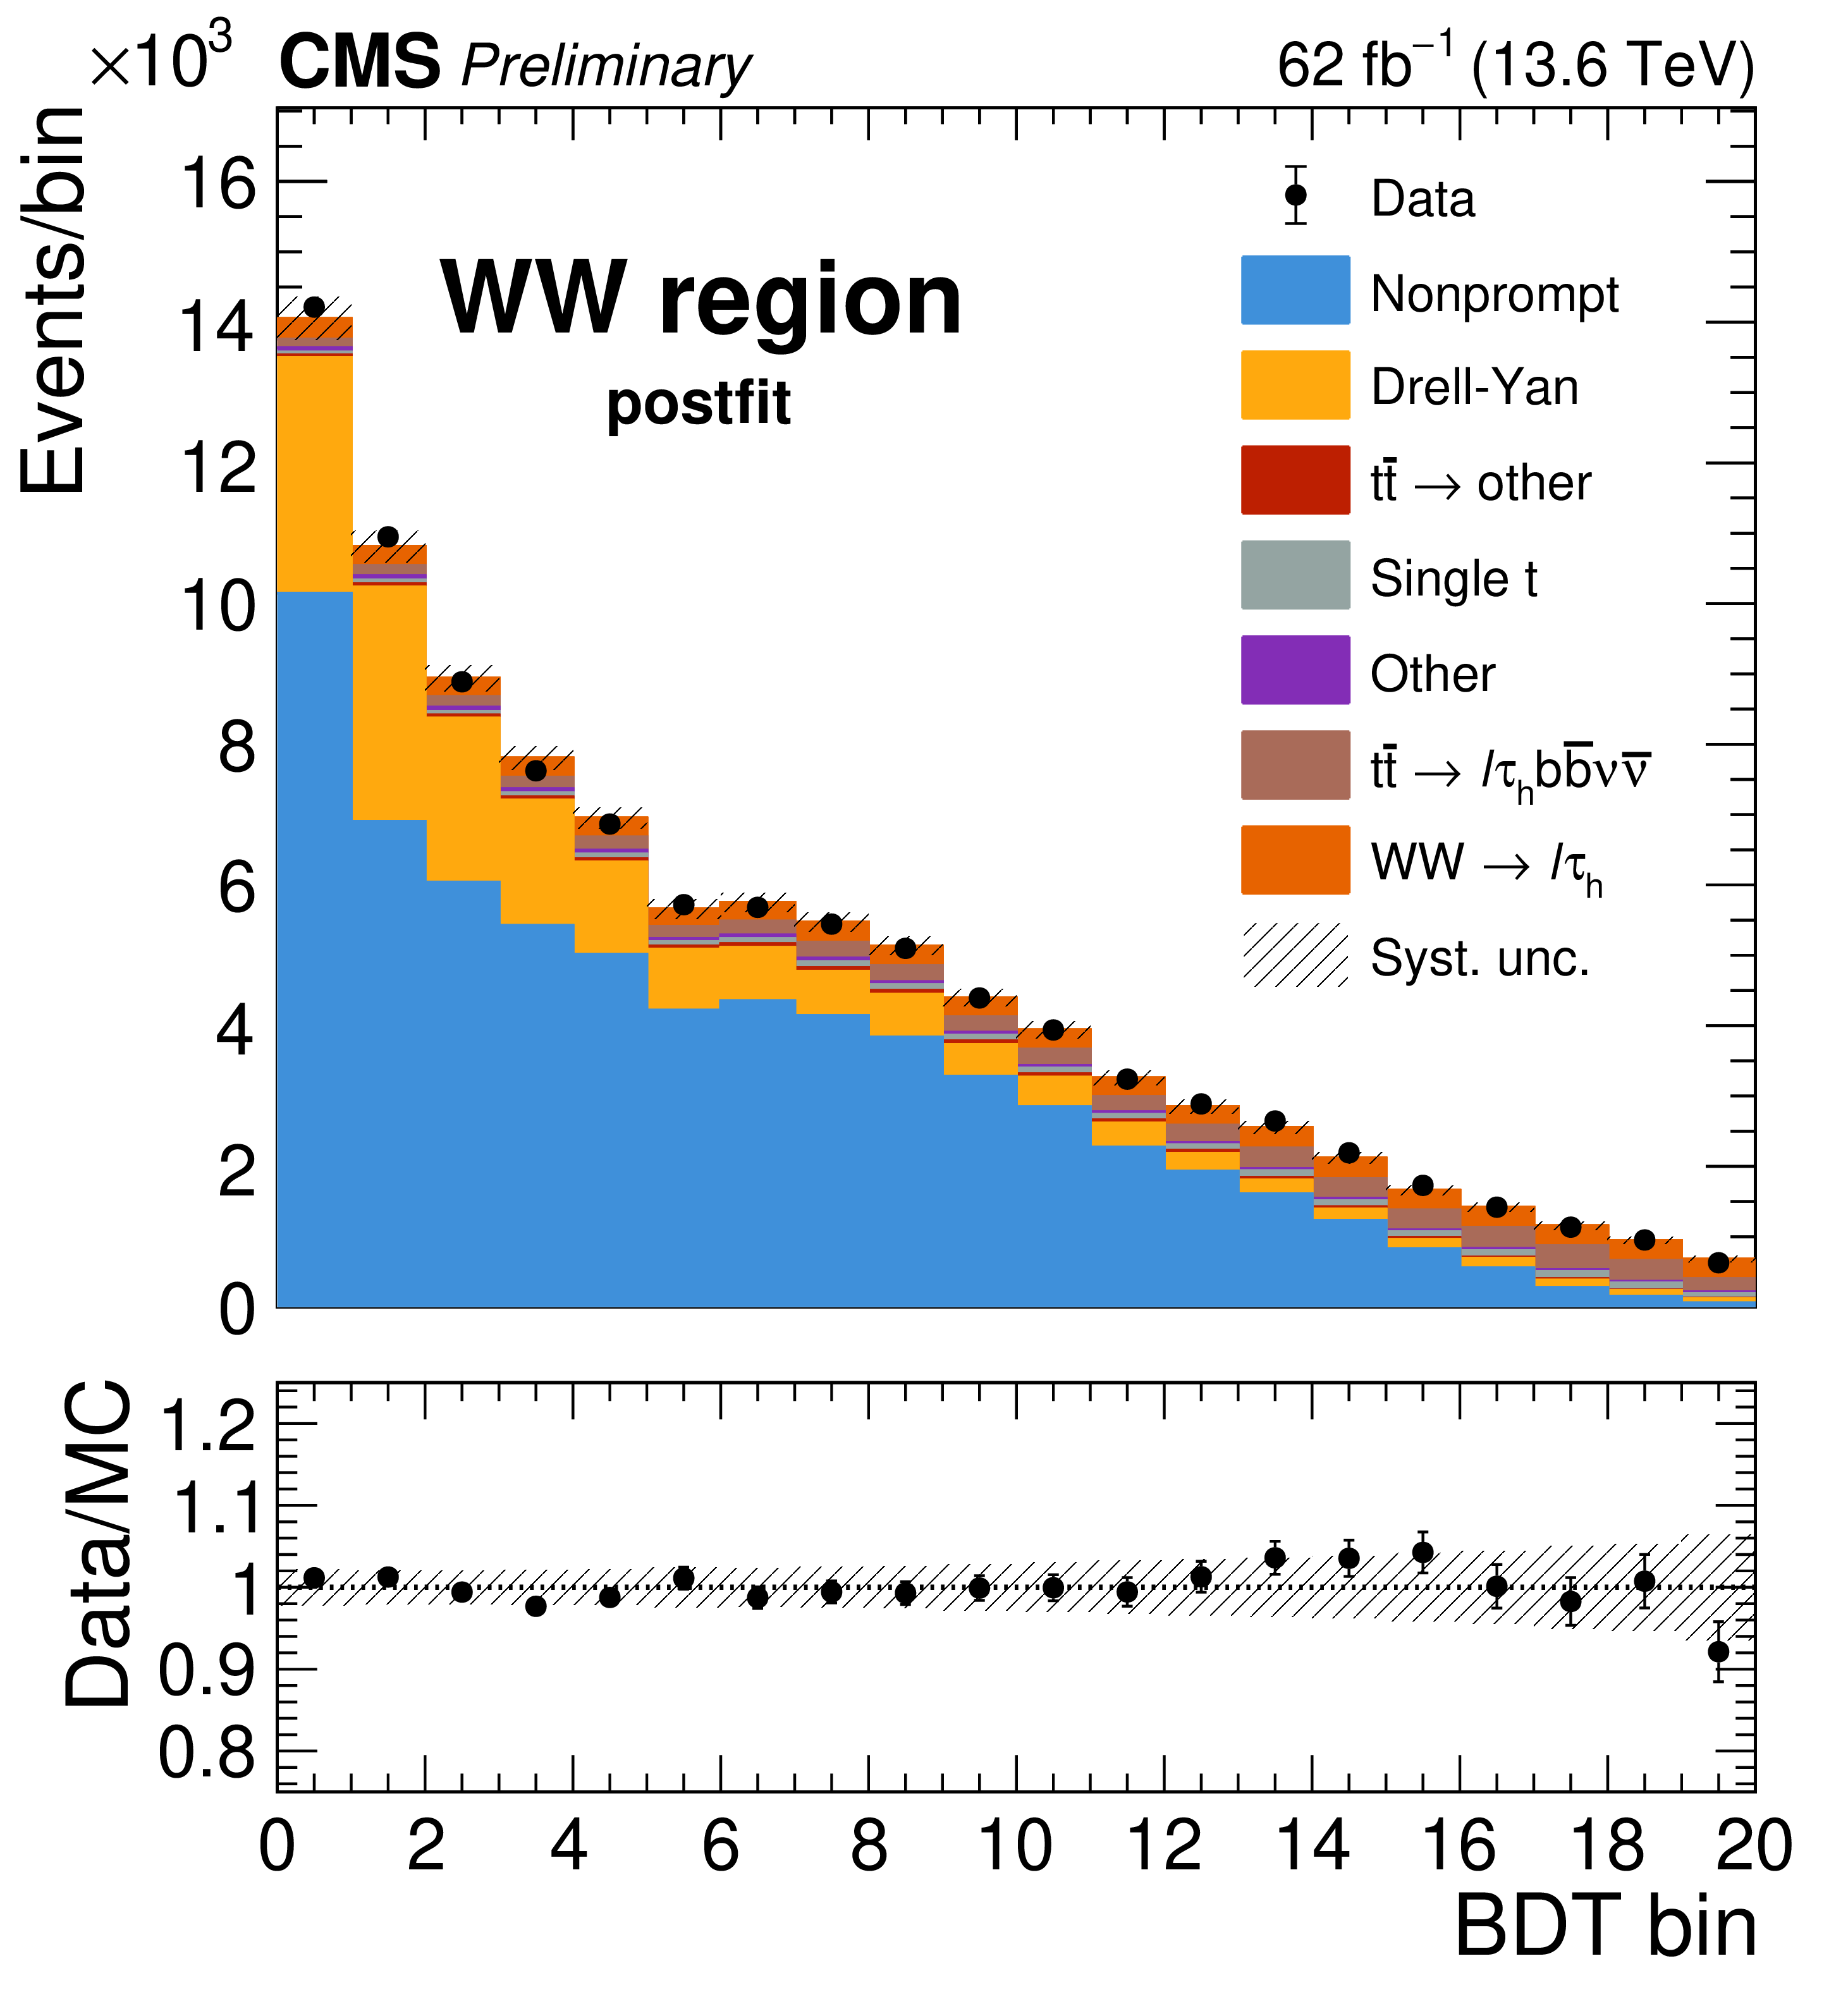
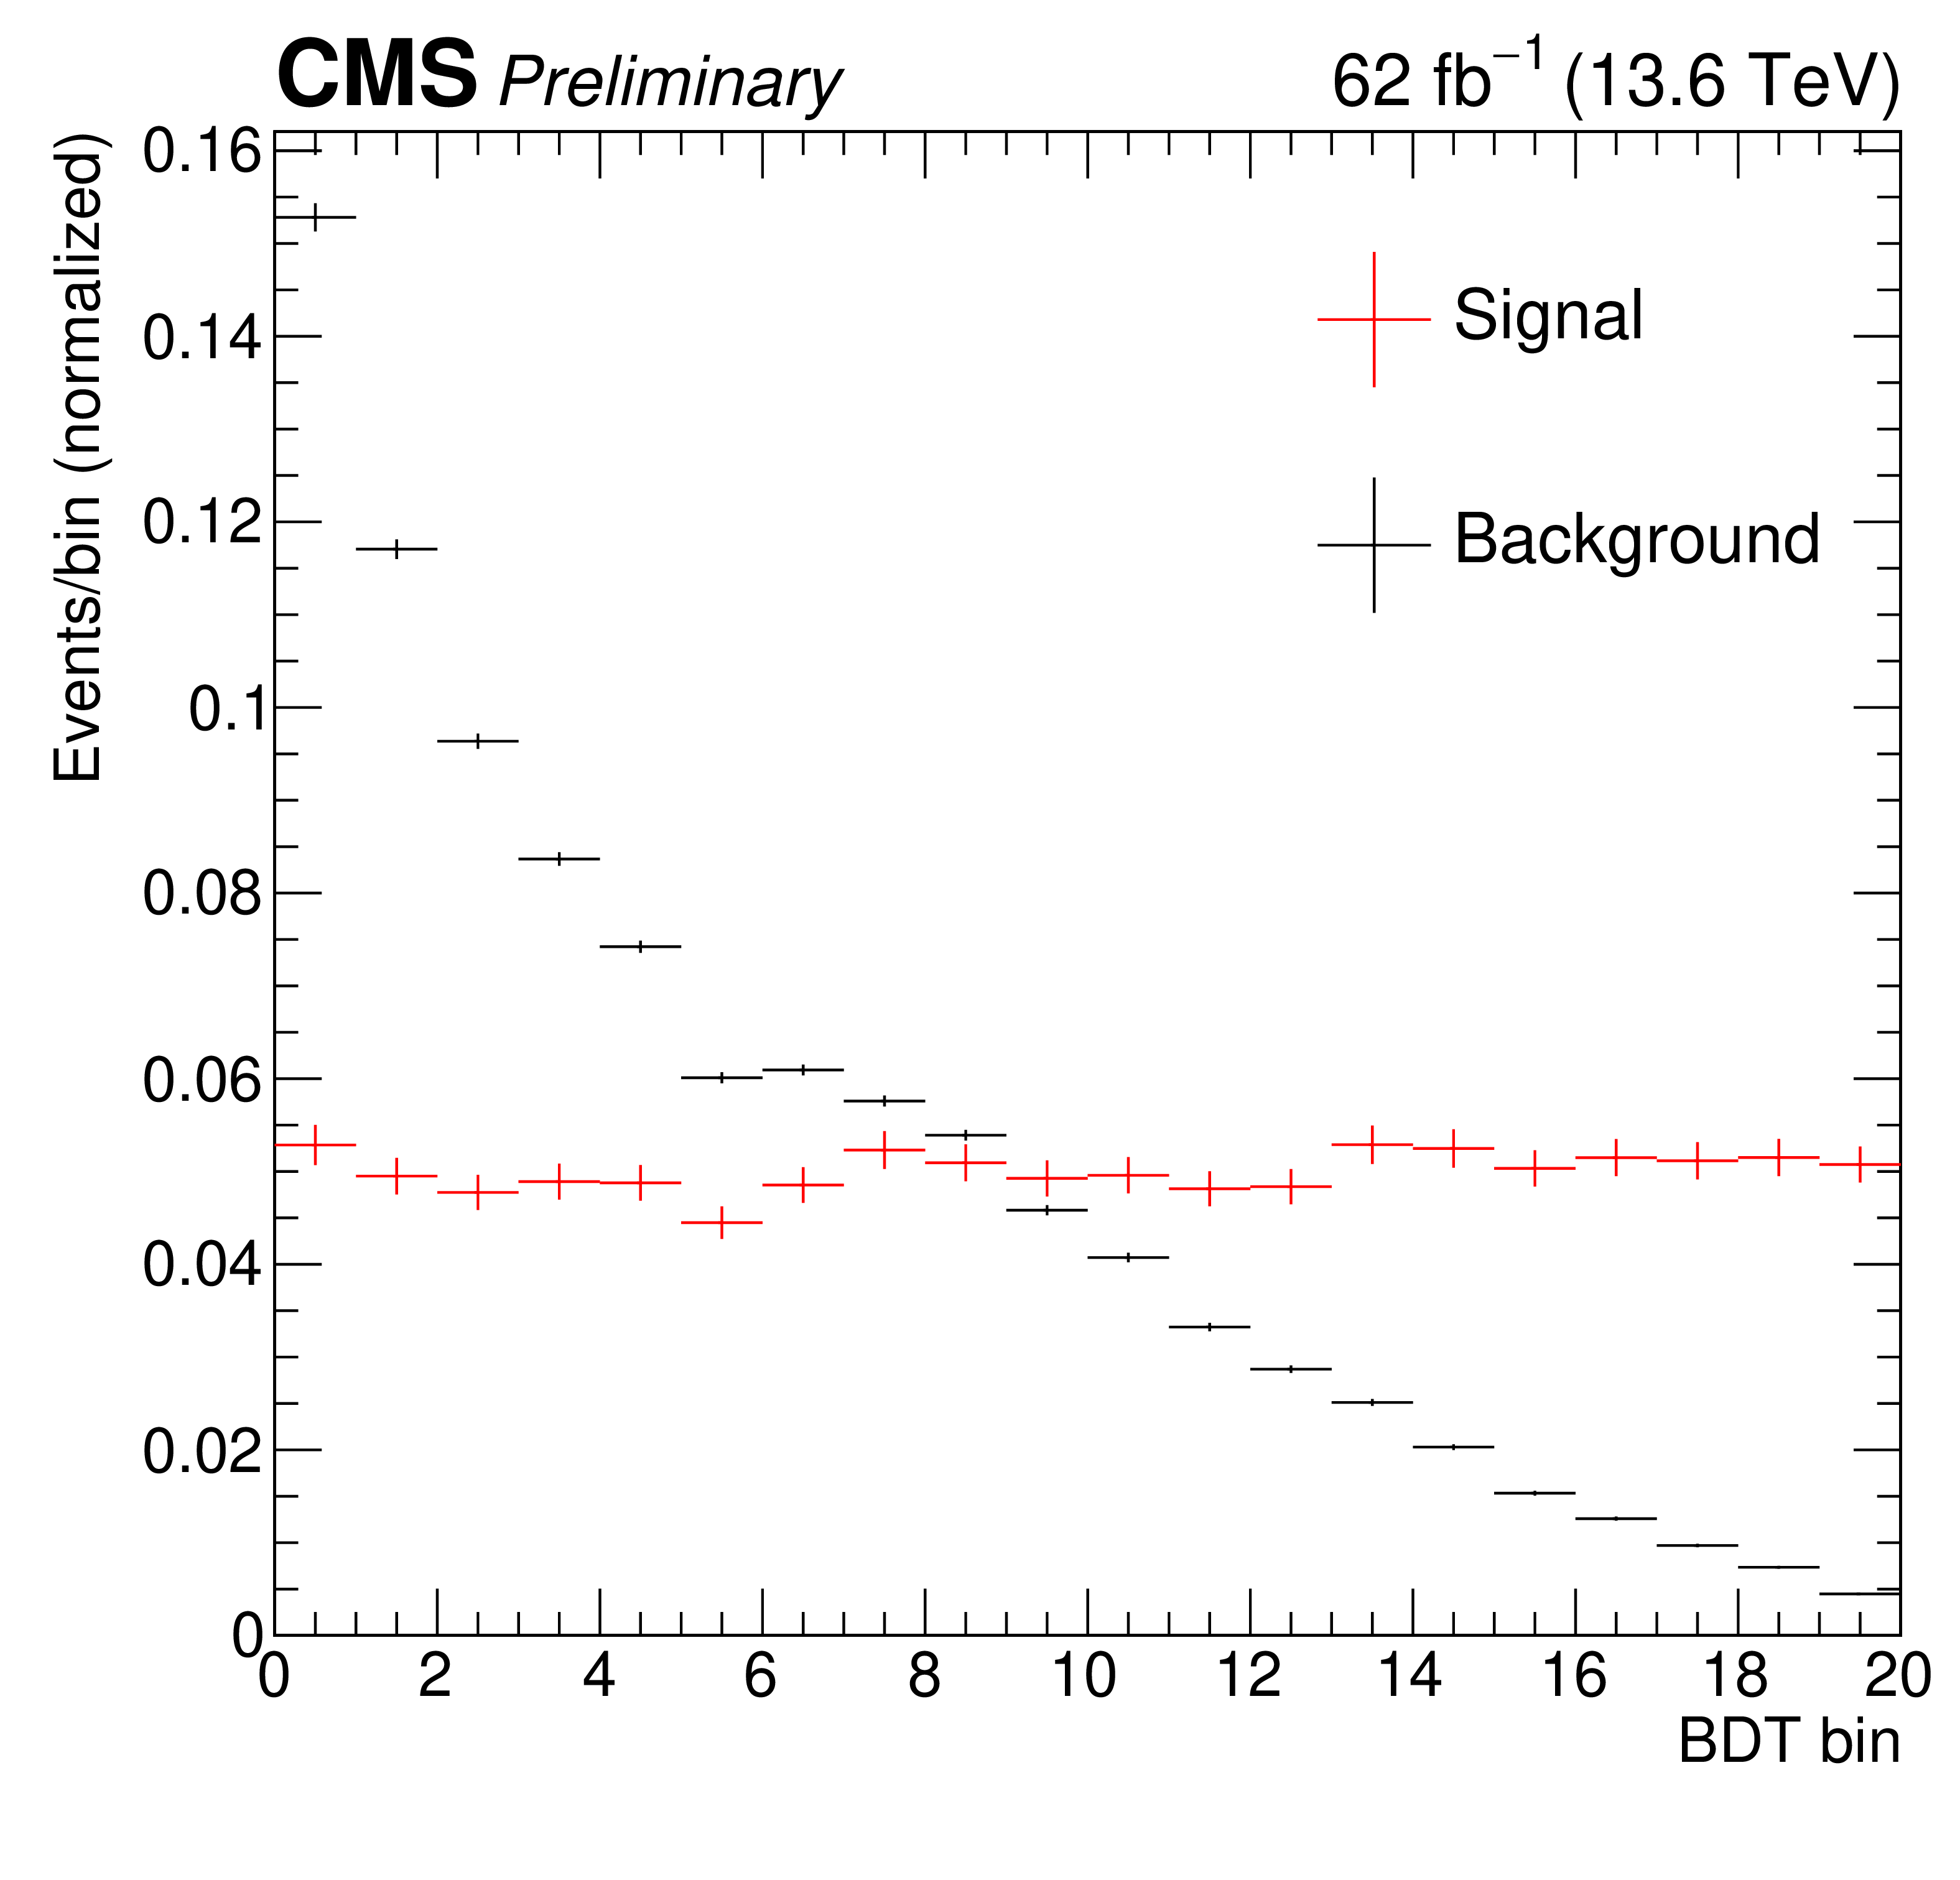
Left: post-fit BDT discriminator output distribution for the WW region, for data and expectations. The ``Other'' category includes VV, VVV, V$ \gamma $ and Higgs samples. The shaded areas represent the full systematic uncertainty. Overflow events are merged to the last bin. Right: BDT discriminator output distribution for signal and background, with both normalized to unity. |
png pdf |
Figure 4-a:
Left: post-fit BDT discriminator output distribution for the WW region, for data and expectations. The ``Other'' category includes VV, VVV, V$ \gamma $ and Higgs samples. The shaded areas represent the full systematic uncertainty. Overflow events are merged to the last bin. Right: BDT discriminator output distribution for signal and background, with both normalized to unity. |
png pdf |
Figure 4-b:
Left: post-fit BDT discriminator output distribution for the WW region, for data and expectations. The ``Other'' category includes VV, VVV, V$ \gamma $ and Higgs samples. The shaded areas represent the full systematic uncertainty. Overflow events are merged to the last bin. Right: BDT discriminator output distribution for signal and background, with both normalized to unity. |
png pdf |
Figure 5:
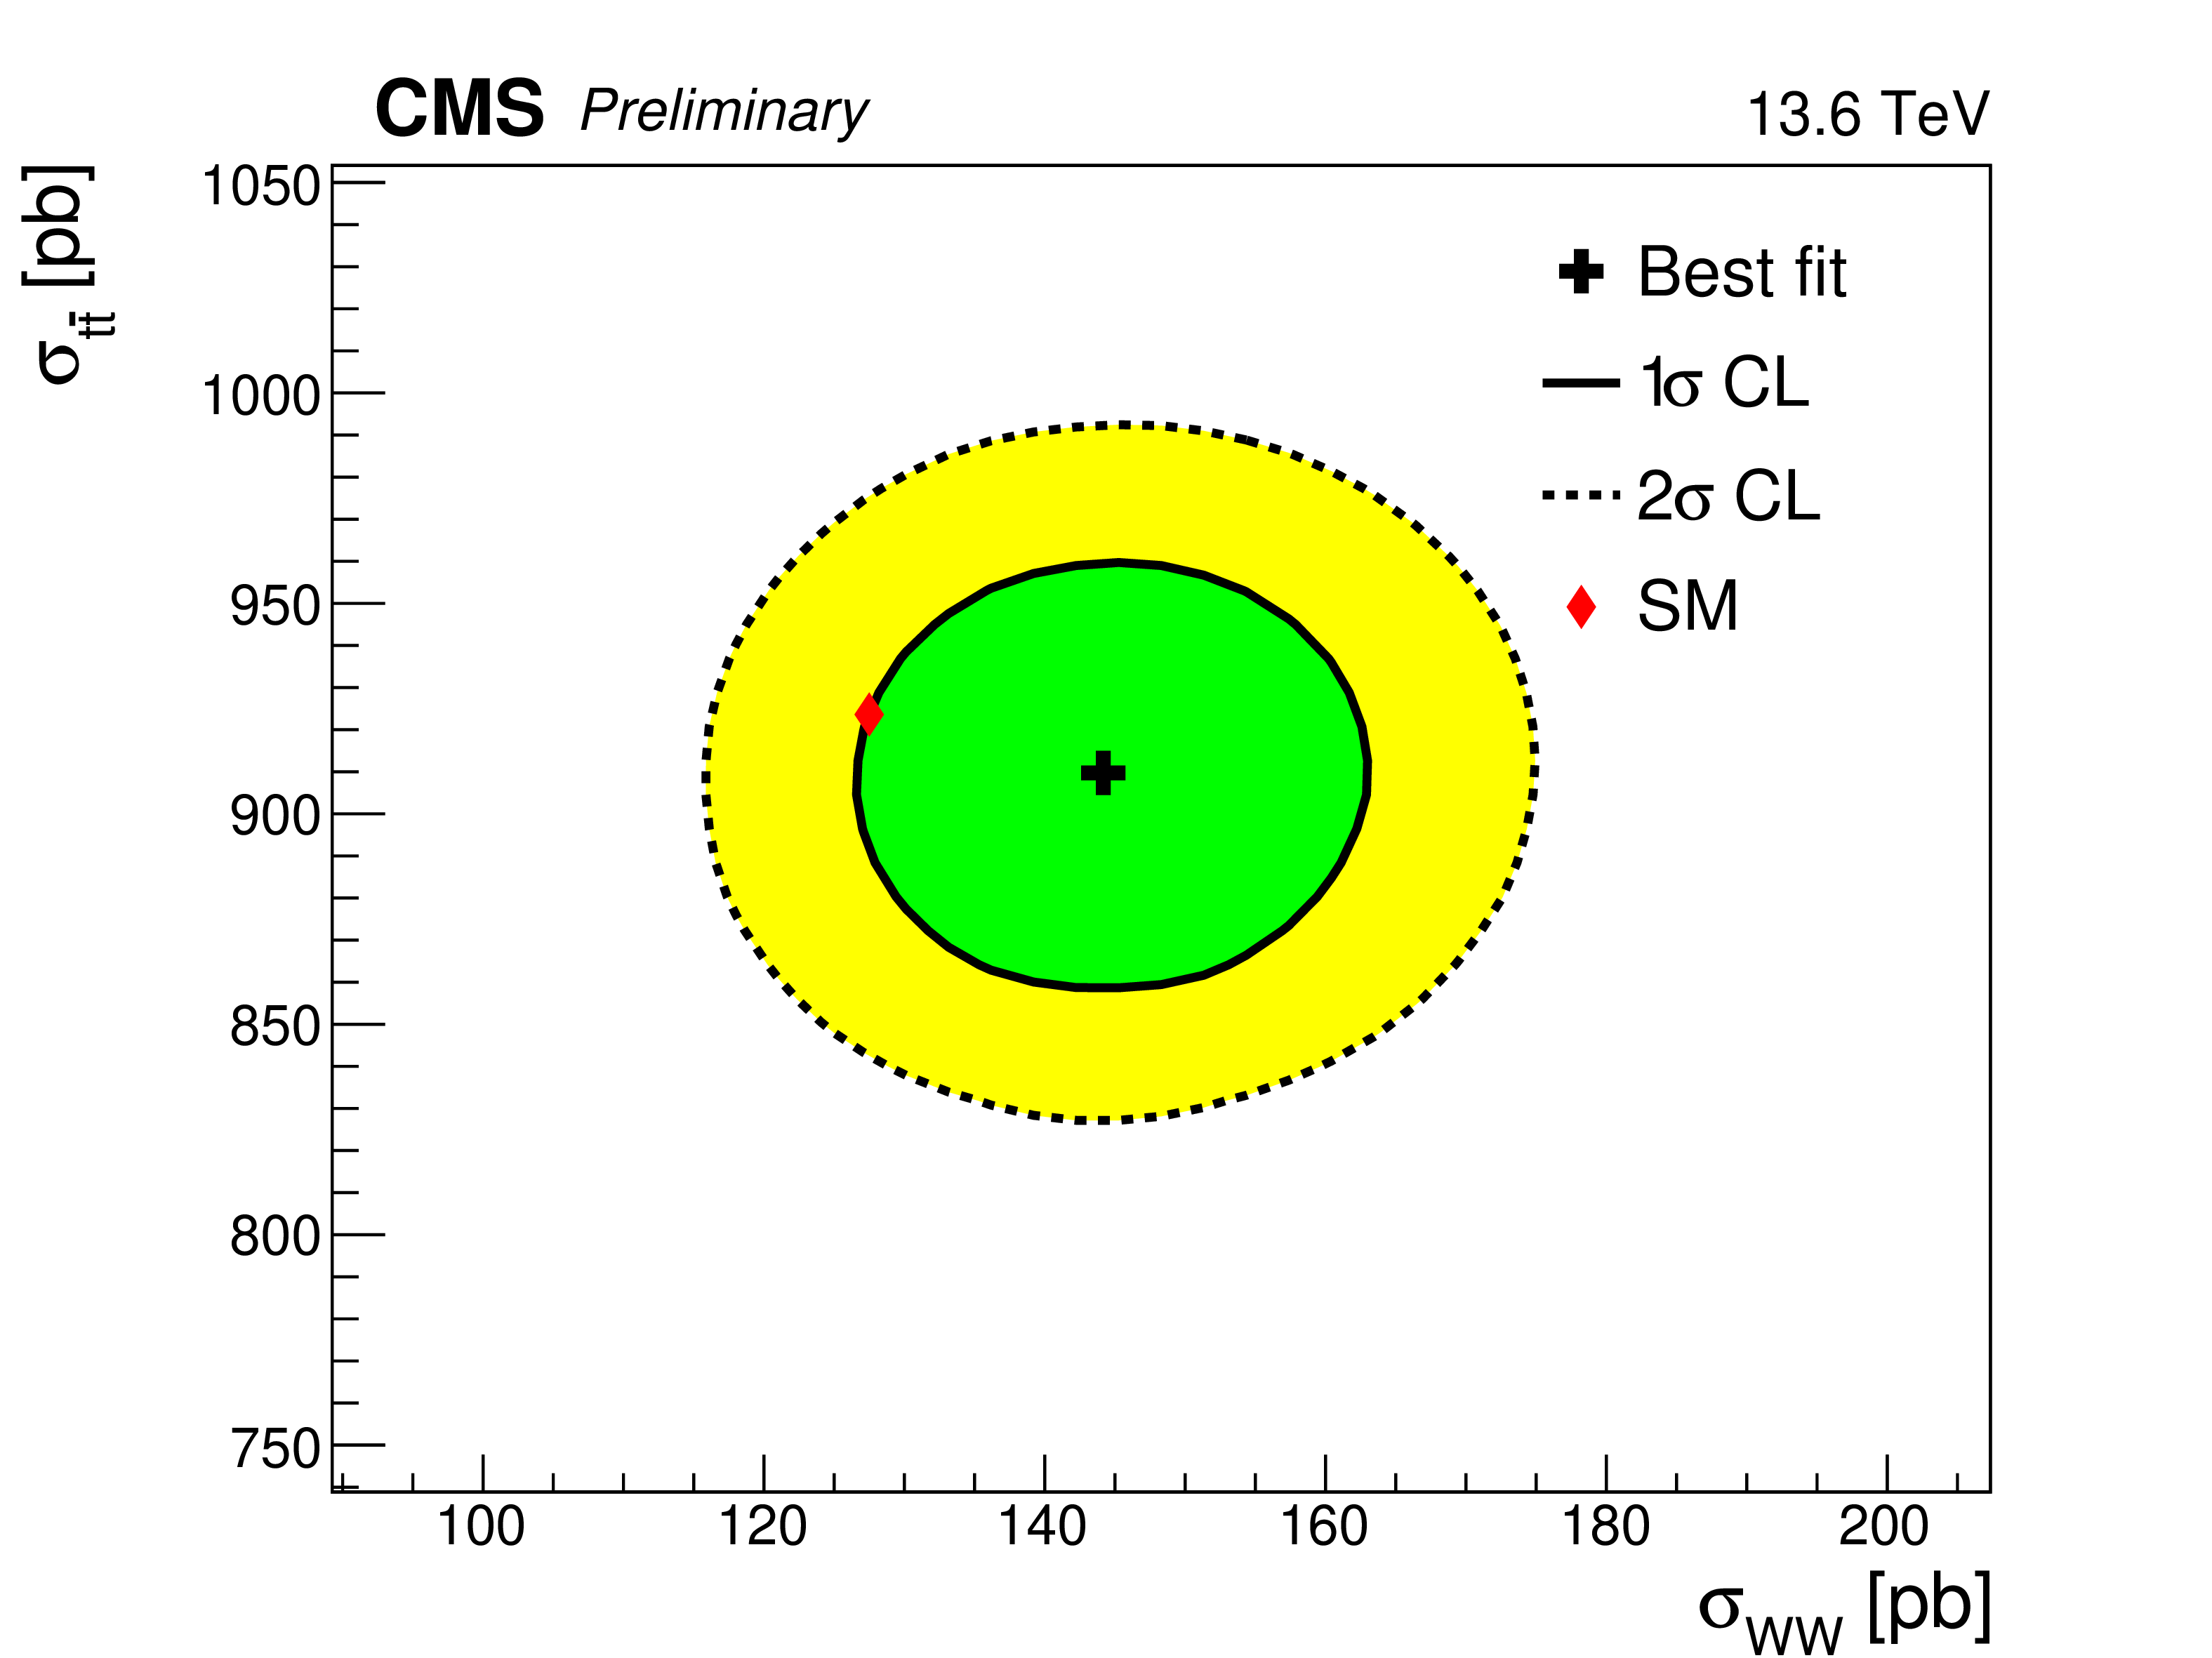
The observed 2-dimensional 68% and 95% confidence intervals of the 2D scan of $ \sigma_{\mathrm{WW}} $ and $ \sigma_{{\mathrm{t}\overline{\mathrm{t}}} } $. |
png pdf |
Figure 6:
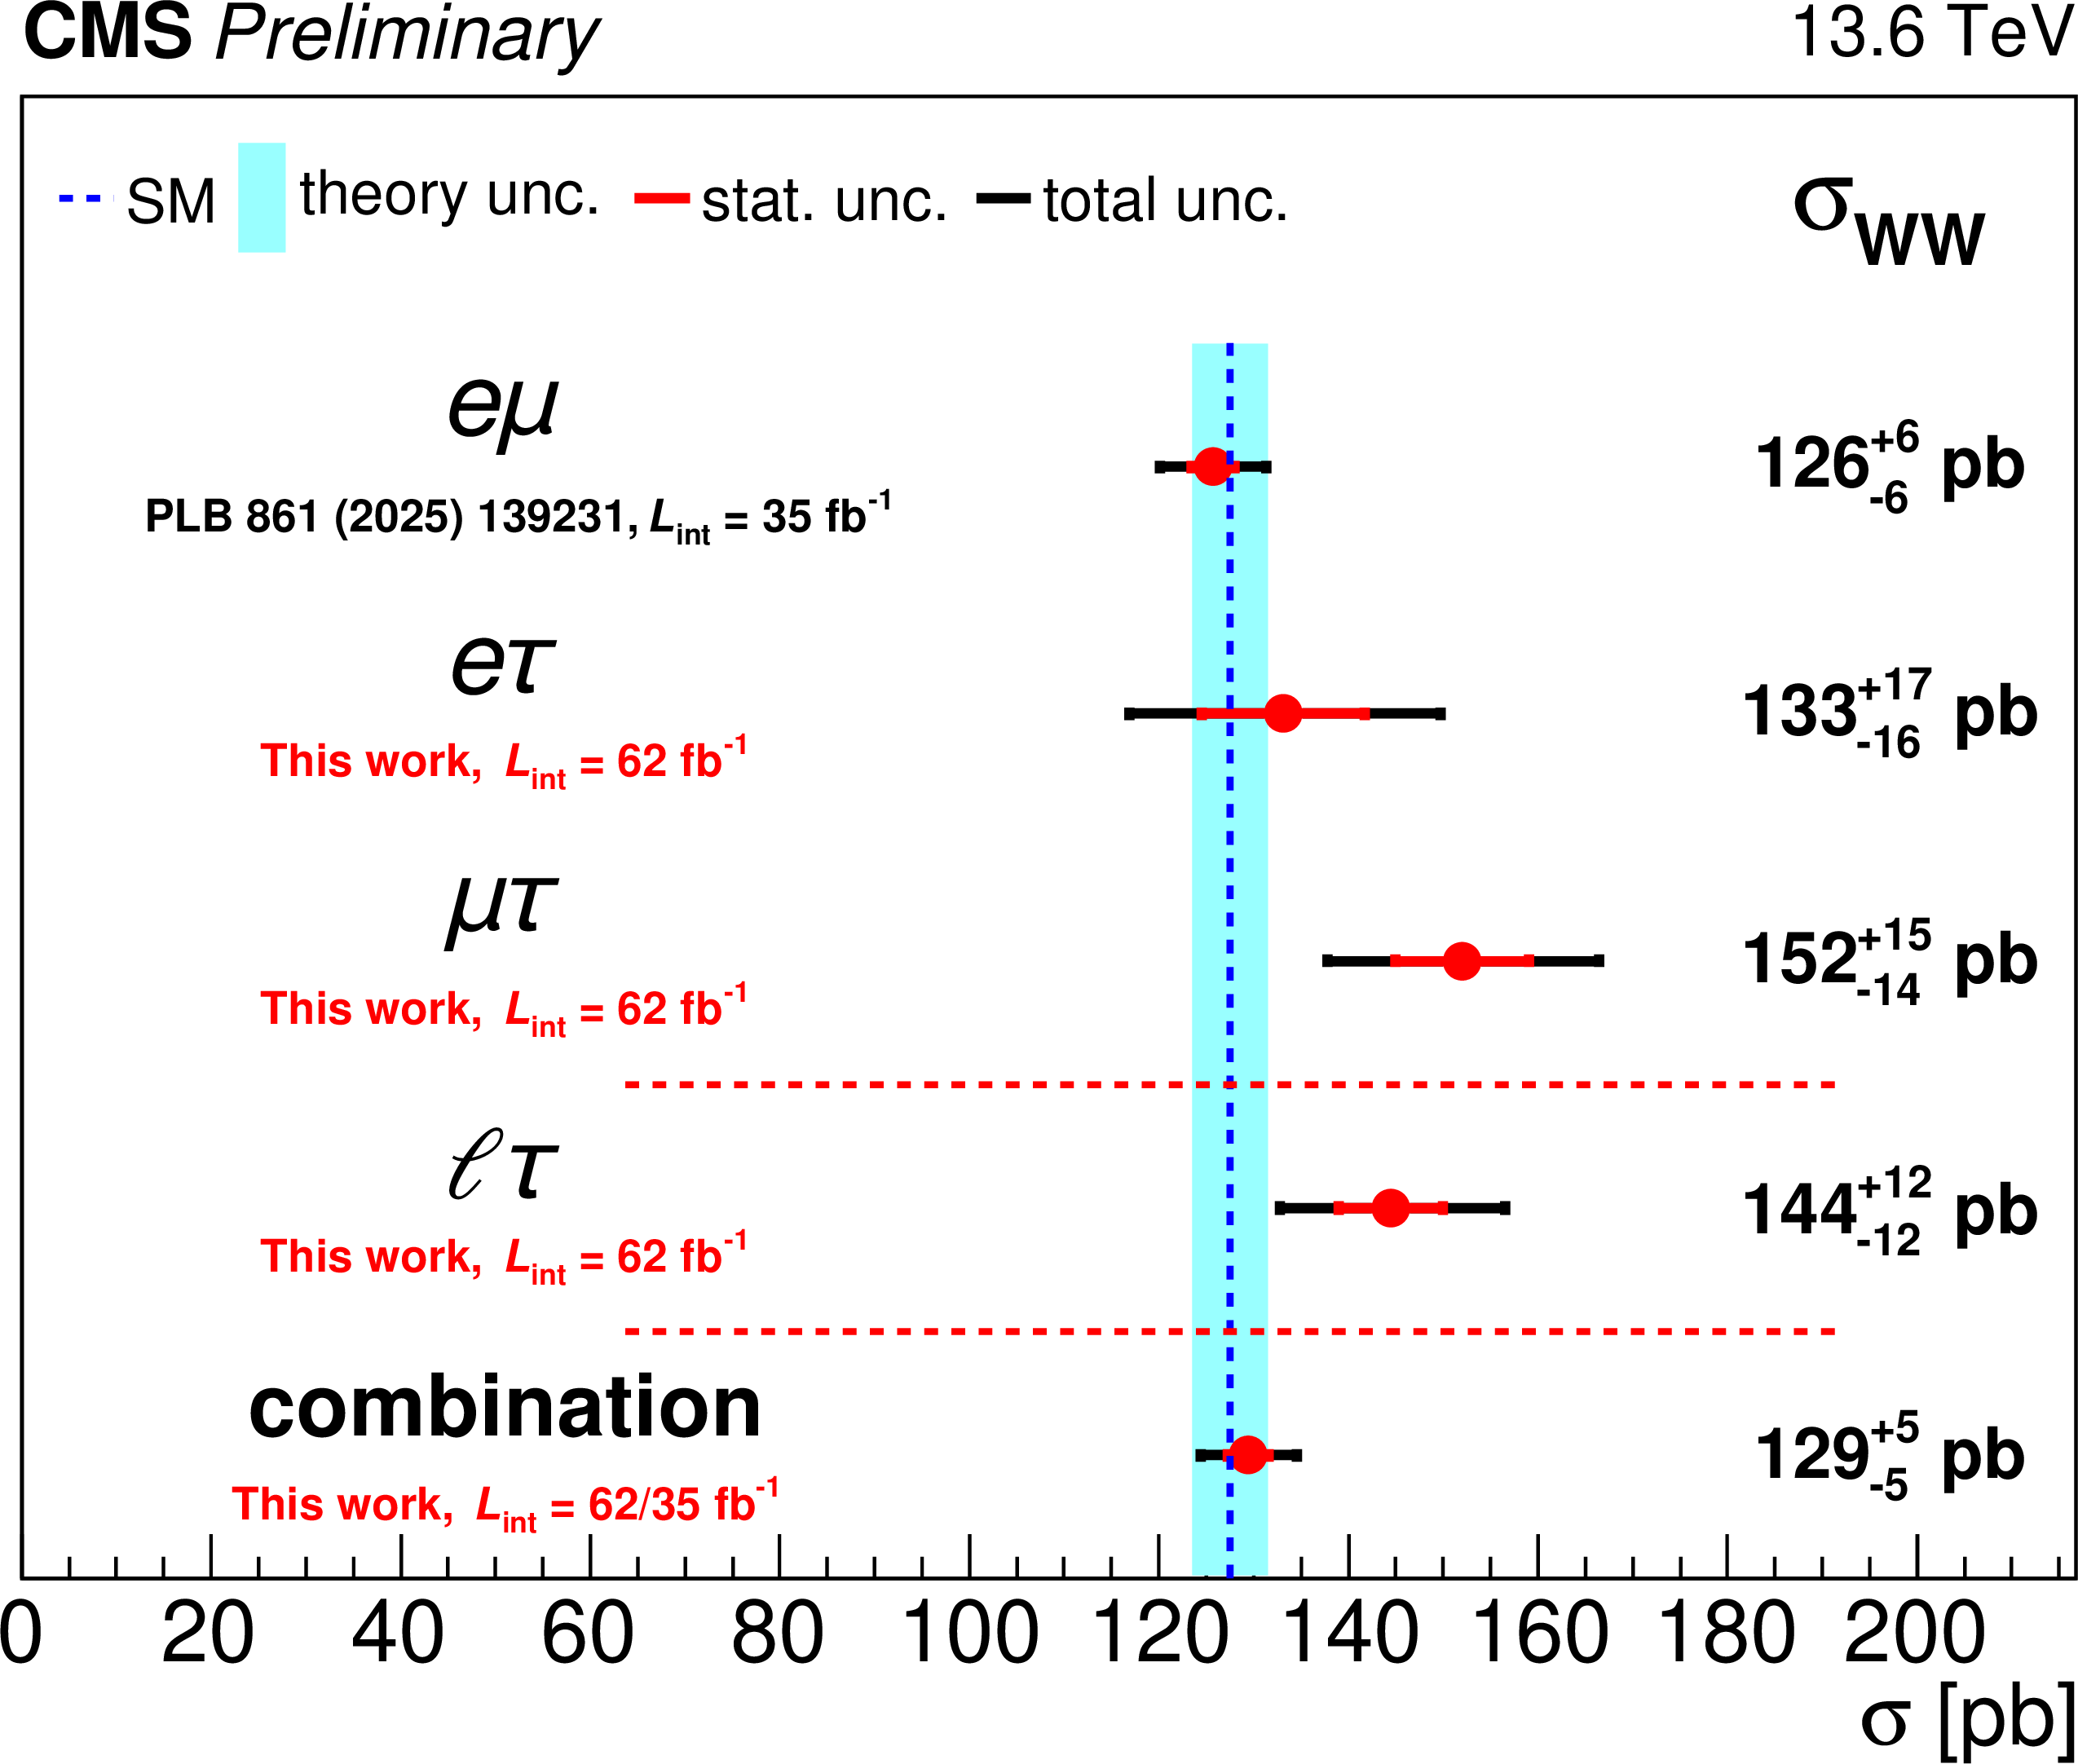
Measured WW production cross section ($ \sigma_{\mathrm{WW}} $) for each individual final state, combining $ \mu\tau_\mathrm{h} $ and $ \mathrm{e}\tau_\mathrm{h} $ final states, and for the combination of $ \mathrm{e}\mu $ [8], $ \mathrm{e}\tau_\mathrm{h} $ and $ \mu\tau_\mathrm{h} $. |
| Tables | |
png pdf |
Table 1:
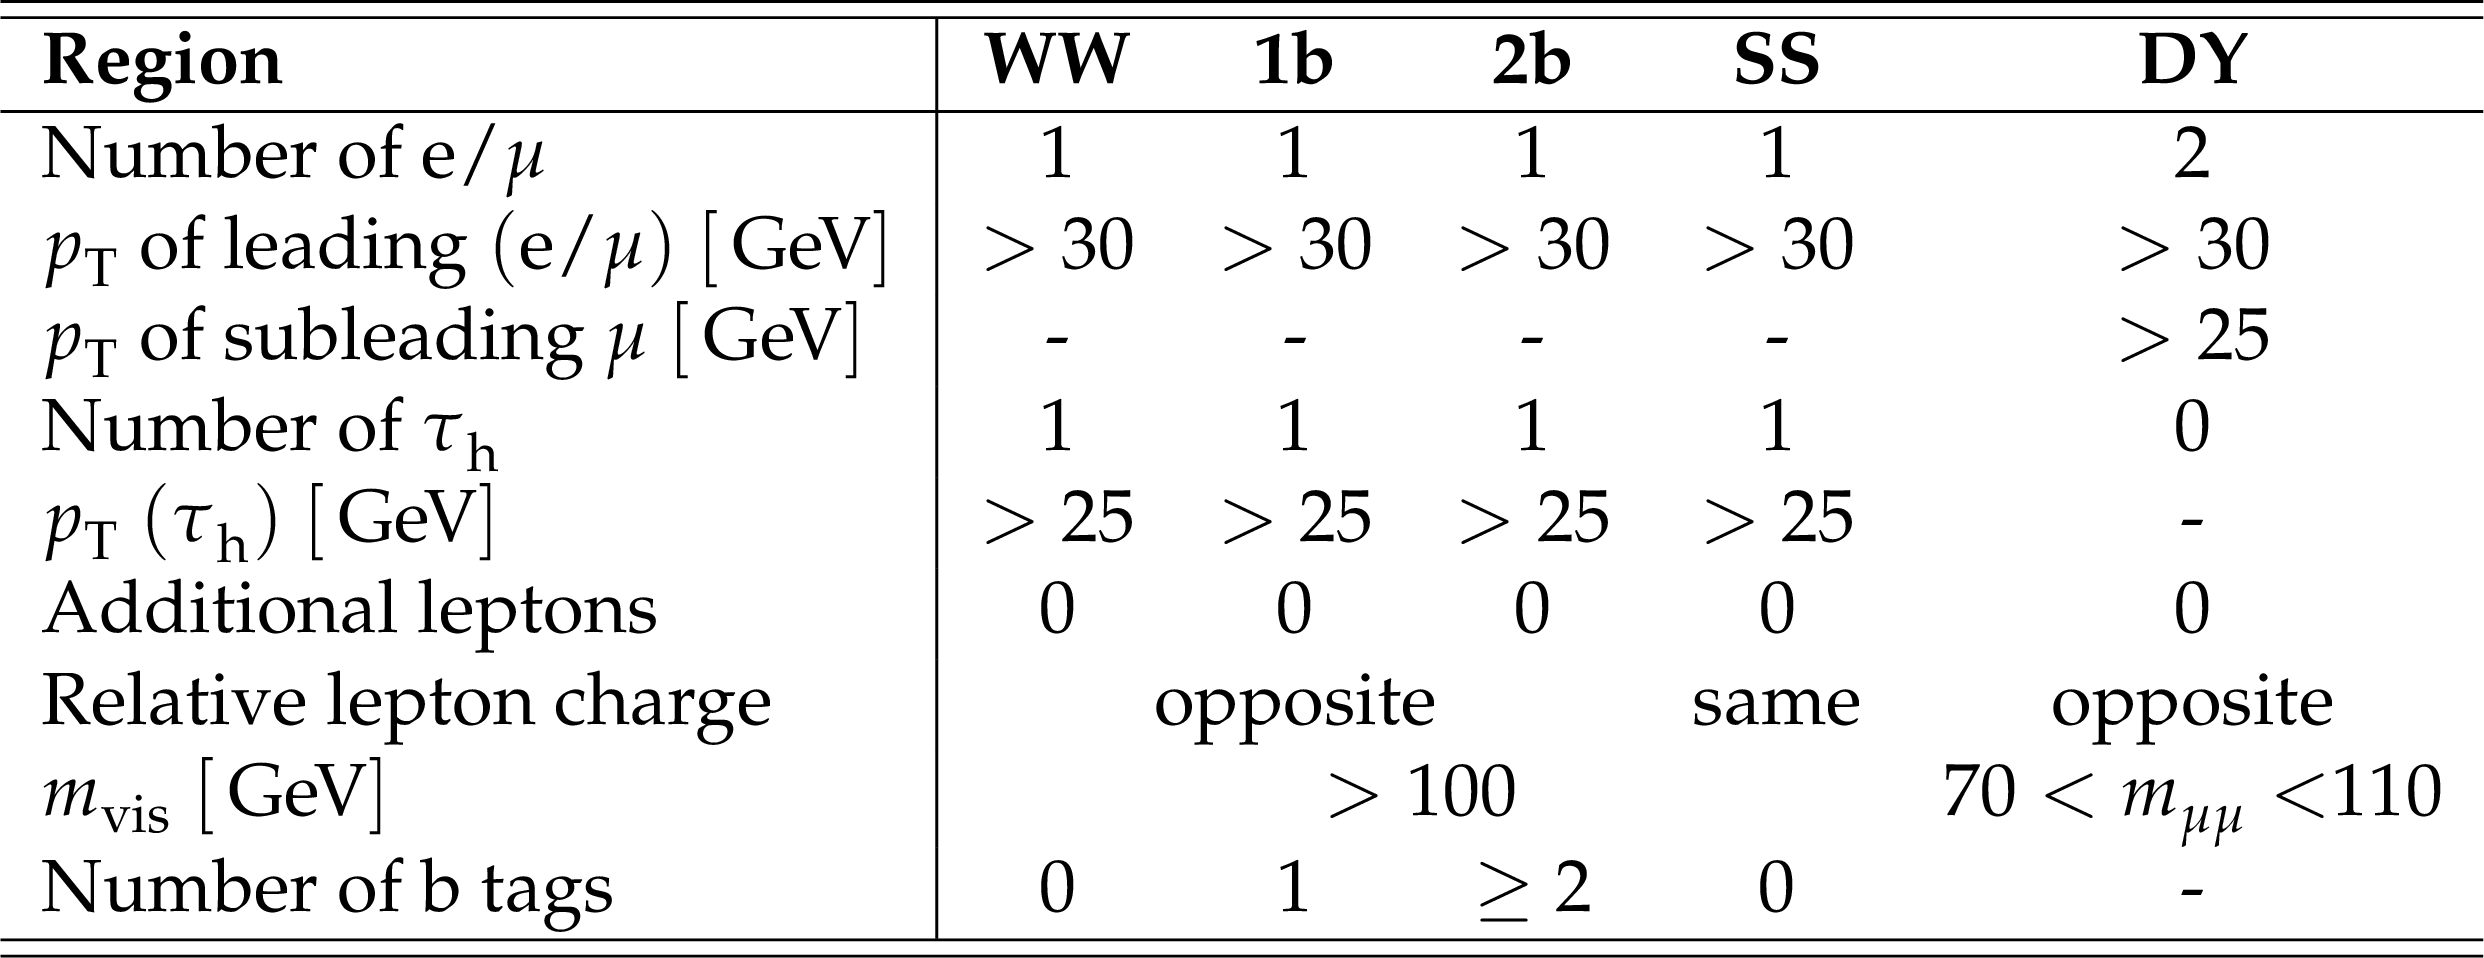
Summary of the event requirements in the five regions. |
png pdf |
Table 2:
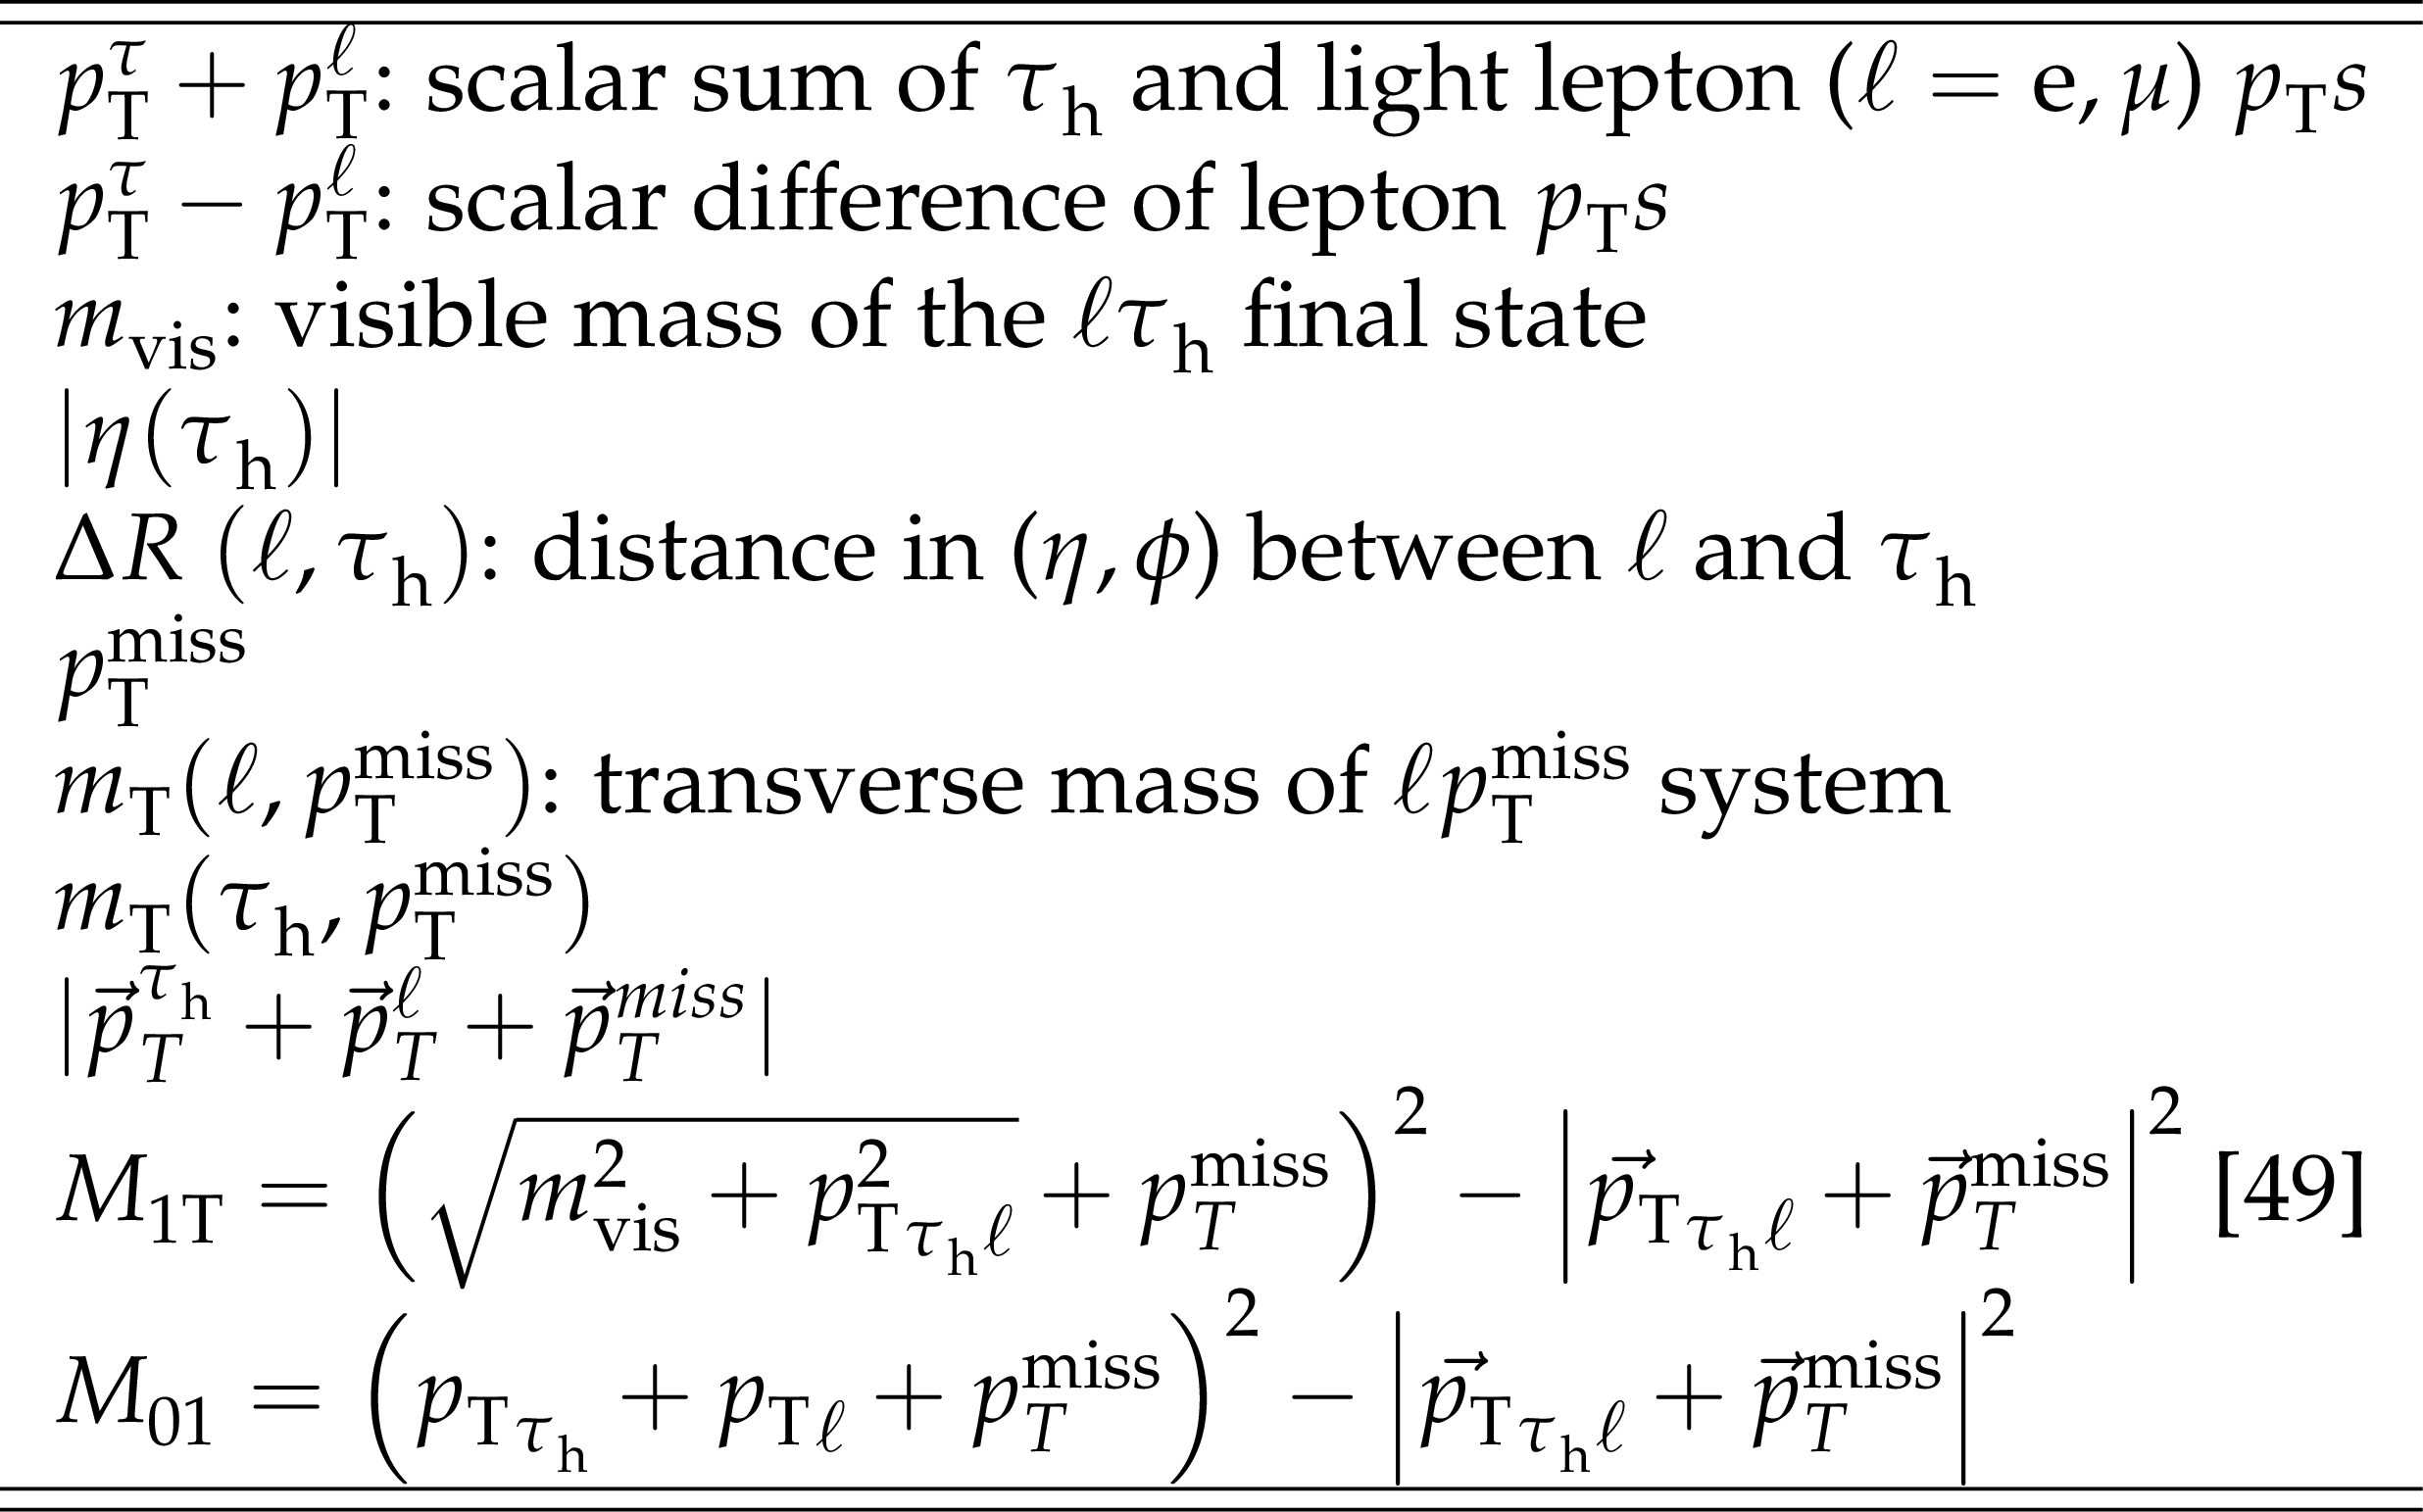
Kinematic variables used as inputs to the BDT. |
png pdf |
Table 3:
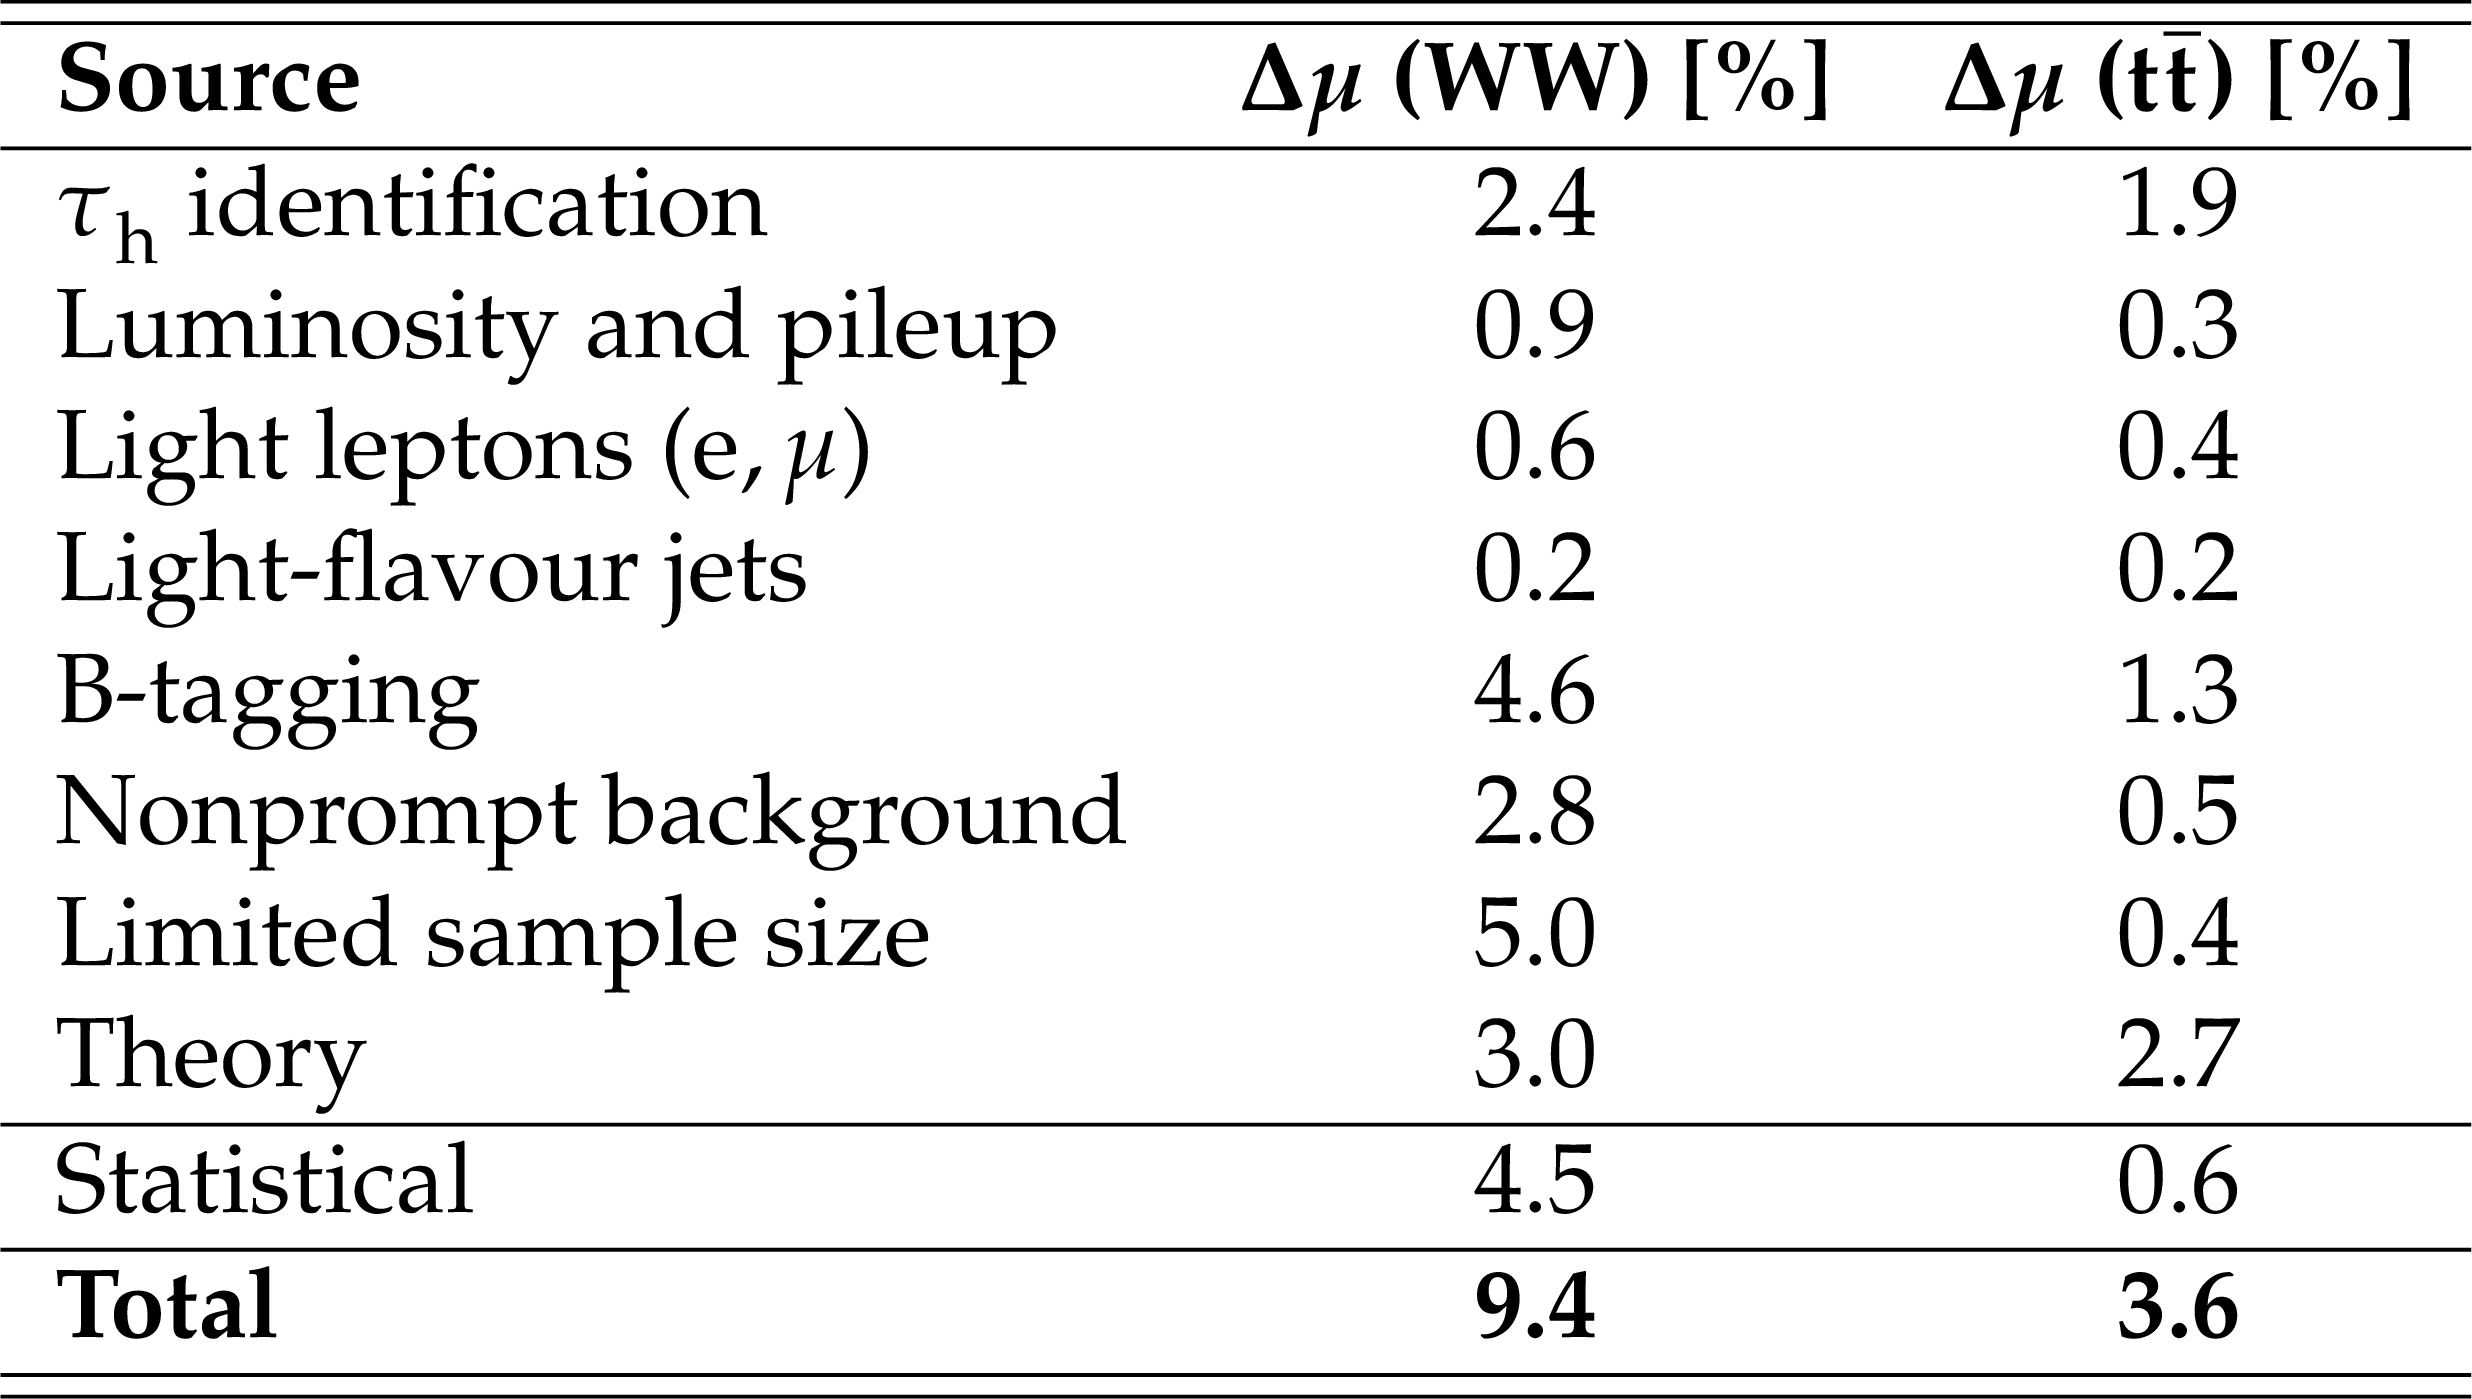
List of sources of uncertainty in the signal strengths ($ \mu $) for the WW and $ \mathrm{t} \overline{\mathrm{t}} $ processes. |
png pdf |
Table 4:
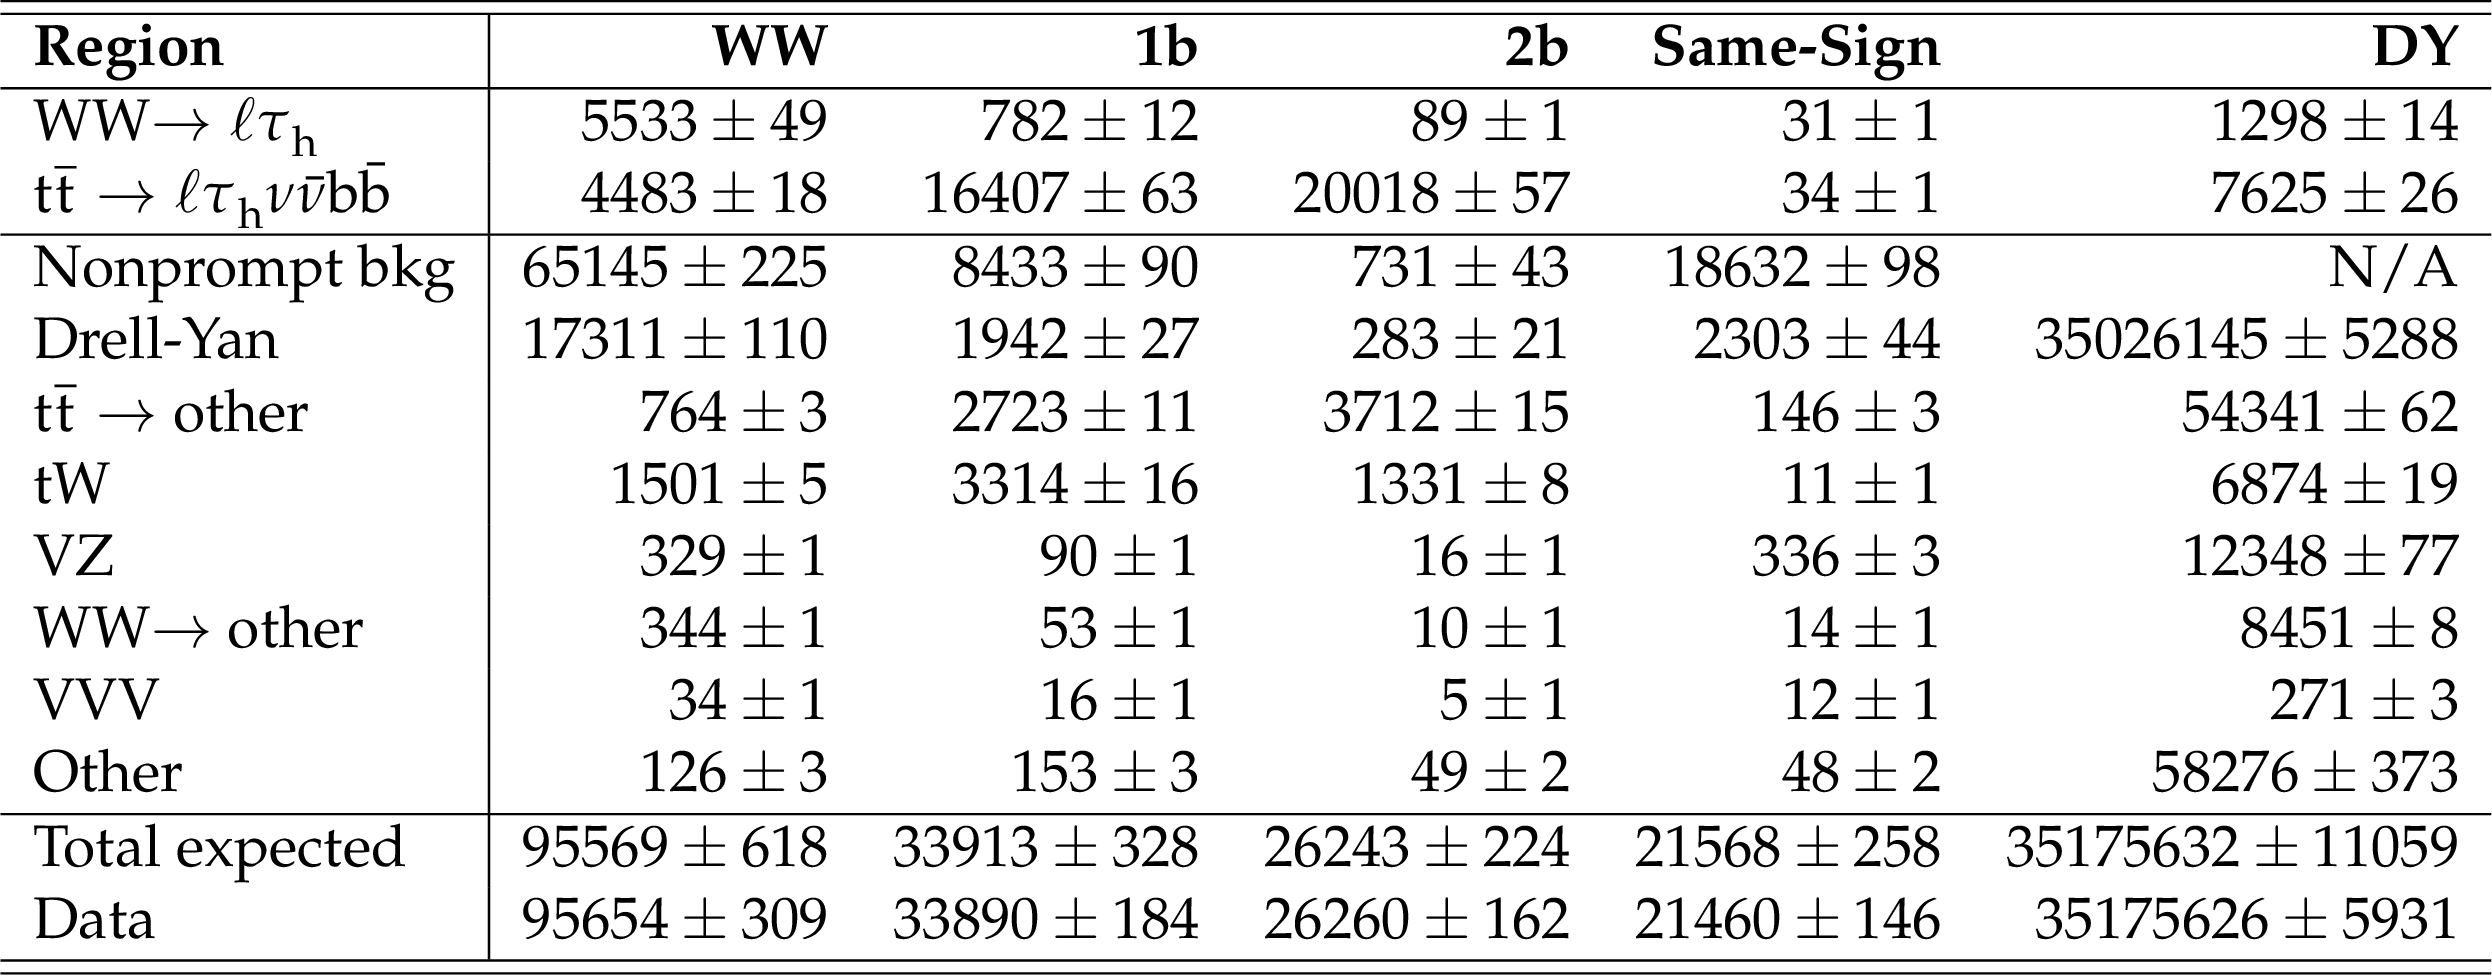
Observed yields for each process and for each region used in the fit. The ``$ {\mathrm{t}\overline{\mathrm{t}}} \to $ other'' category includes both semileptonic and fully leptonic decays that do not fit the signal definition. The ``WW$ \to $ other'' category similarly includes fully leptonic decays. Finally. the ``Other'' category includes V$ \gamma $ and Higgs samples. |
png pdf |
Table 5:
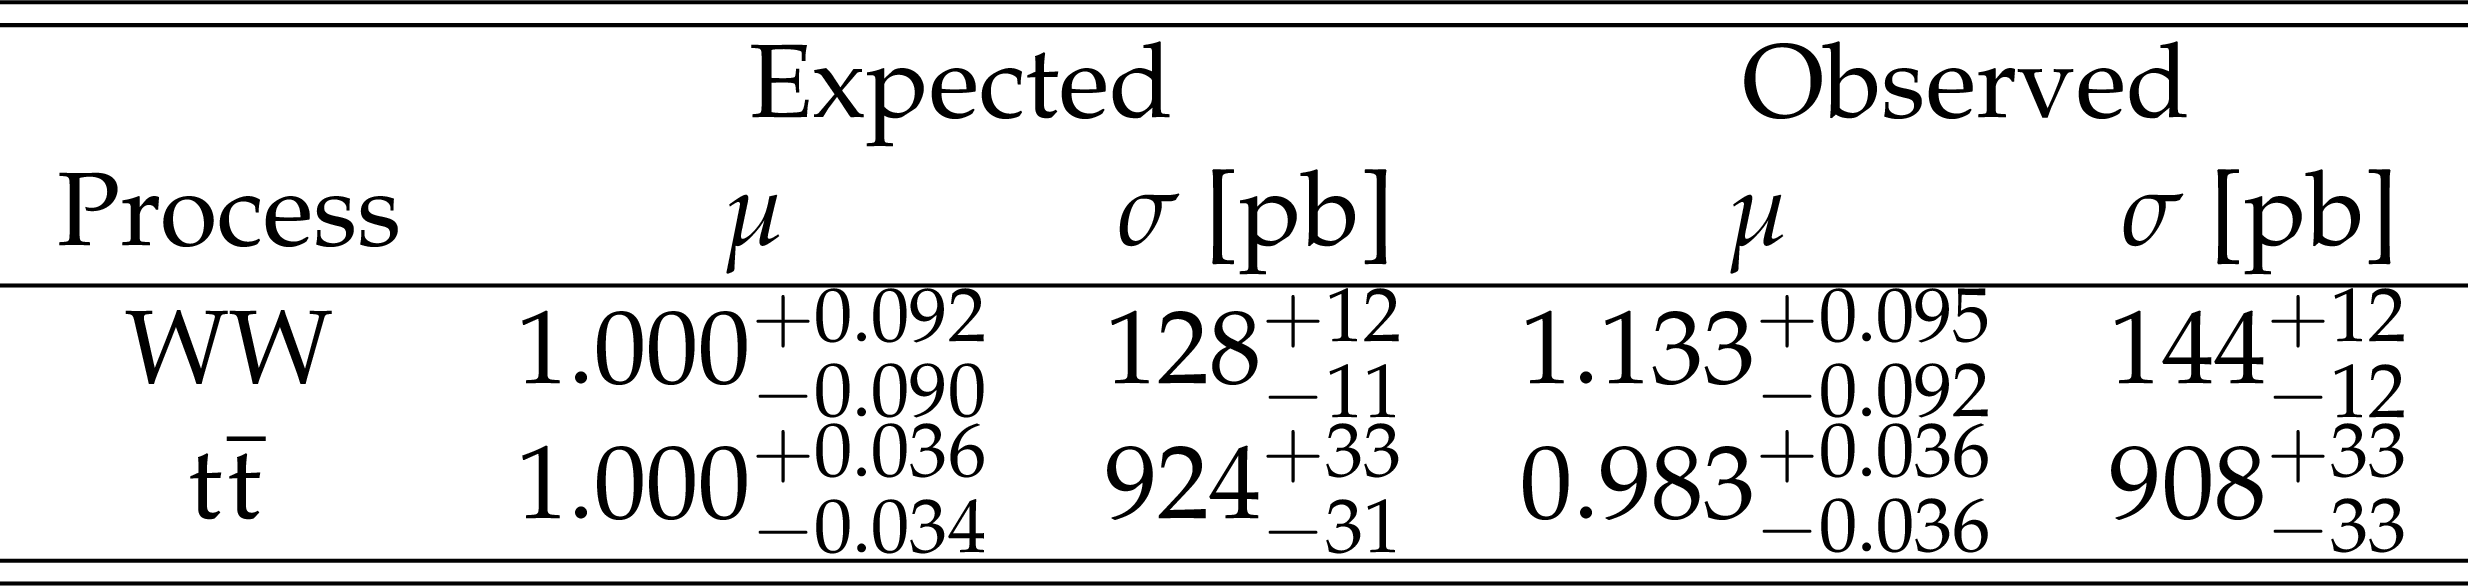
Summary of expected and observed signal strengths ($ \mu $) and cross sections ($ \sigma $) for the processes studied. The uncertainty in the expected signal strength is evaluated through a fit on the Asimov dataset [63]. |
| Summary |
| The simultaneous measurement of the WW and $ \mathrm{t} \overline{\mathrm{t}} $ cross sections is performed. The WW production cross section is measured in the final state with one $ W $ boson decaying to a light lepton (electron or muon) and the other to a $ \tau $ identified through its hadronic decay ($ \tau_\mathrm{h} $), in the process $ WW\rightarrow \ell\tau_\mathrm{h}\nu\bar{\nu} $, where $ \ell=\mathrm{e},\mu $. The $ \mathrm{t} \overline{\mathrm{t}} $ cross section is measured in the corresponding dilepton final state from the decay $ {\mathrm{t}\overline{\mathrm{t}}} \to \ell\nu_\ell\tau_\mathrm{h}\nu_\tau \mathrm{b}\bar{\mathrm{b}} $. The cross sections are measured in pp collisions at $ \sqrt{s}= $ 13.6 TeV recorded by the CMS experiment and correspond to an integrated luminosity of 62 fb$ ^{-1} $. Events are selected by requiring one electron or one muon, and one $ \tau_\mathrm{h} $ of opposite charge. The cross sections are extracted from the data using a binned maximum likelihood fit from the observed yields in the BDT discriminator output and invariant mass distributions in signal- and background-enriched event samples. The measured cross sections of the inclusive WW and $ \mathrm{t} \overline{\mathrm{t}} $ production cross sections are $ \sigma_{\mathrm{WW}}= $ 144 $ \pm $ 12 pb and $ \sigma_{{\mathrm{t}\overline{\mathrm{t}}} }= $ 908 $ \pm $ 33 pb, respectively. This analysis presents the first measurement of the inclusive WW production cross section including hadronic $ \tau $ decays, as well as the first measurement of the $ \mathrm{t} \overline{\mathrm{t}} $ production cross section including $ \tau_\mathrm{h} $ decays in pp collisions at $ \sqrt{s}= $ 13.6 TeV. |
| References | ||||
| 1 | ATLAS Collaboration | Measurement of $ \mathrm{W^+}\mathrm{W^-} $ production in pp collisions at $ \sqrt{s} = $ 7 TeV with the ATLAS detector and limits on anomalous WWZ and WW$ \gamma $ couplings | PRD 87 (2013) 112001 | 1210.2979 |
| 2 | CMS Collaboration | Measurement of the WW cross section in pp collisions at $ \sqrt{s}= $ 7 TeV and limits on anomalous $ \mathrm{W}\mathrm{W}\gamma $ and $ \mathrm{W}\mathrm{W}\mathrm{Z} $ couplings | EPJC 73 (2013) 2610 | CMS-SMP-12-005 1306.1126 |
| 3 | CMS Collaboration | Measurement of the WW cross section in pp collisions at $ \sqrt{s} = $ 8 TeV and limits on anomalous gauge couplings | EPJC 76 (2016) 401 | CMS-SMP-14-016 1507.03268 |
| 4 | ATLAS Collaboration | Measurement of total and differential $ \mathrm{W^+}\mathrm{W^-} $ production cross sections in proton-proton collisions at $ \sqrt{s}= $ 8 TeV with the ATLAS detector and limits on anomalous triple-gauge-boson couplings | JHEP 09 (2016) 029 | 1603.01702 |
| 5 | ATLAS Collaboration | Measurement of fiducial and differential $ \mathrm{W^+}\mathrm{W^-} $ production cross sections at $ \sqrt{s}= $ 13 TeV with the ATLAS detector | EPJC 79 (2019) 884 | 1905.04242 |
| 6 | CMS Collaboration | W$ ^+ $W$ ^- $ boson pair production in proton-proton collisions at $ \sqrt{s} = $ 13 TeV | PRD 102 (2020) 092001 | CMS-SMP-18-004 2009.00119 |
| 7 | ATLAS Collaboration | Measurements of $ W^+W^-+\ge 1 $jet production cross-sections in $ pp $ collisions at $ \sqrt{s}=13 $TeV with the ATLAS detector | JHEP 06 (2021) 003 | 2103.10319 |
| 8 | CMS Collaboration | Measurement of inclusive and differential cross sections for W+W- production in proton-proton collisions at 13.6 TeV | Physics Letters B 861 (2025) 139231 | CMS-SMP-24-001 2406.05101 |
| 9 | M. Grazzini, S. Kallweit, and M. Wiesemann | Fully differential NNLO computations with MATRIX | EPJC 78 (2018) 537 | 1711.06631 |
| 10 | M. Grazzini et al. | NNLO QCD + NLO EW with Matrix+OpenLoops: precise predictions for vector-boson pair production | JHEP 02 (2020) 087 | 1912.00068 |
| 11 | M. Beneke, P. Falgari, S. Klein, and C. Schwinn | Hadronic top-quark pair production with nnll threshold resummation | Nuclear Physics B 855 (2012) 695 | 1109.1536 |
| 12 | CMS Collaboration | The CMS experiment at the CERN LHC | JINST 3 (2008) 8004 | |
| 13 | CMS Collaboration | Development of the CMS detector for the CERN LHC Run 3 | JINST 19 (2024) P05064 | CMS-PRF-21-001 2309.05466 |
| 14 | CMS Collaboration | Performance of the CMS Level-1 trigger in proton-proton collisions at $ \sqrt{s} = $ 13 TeV | JINST 15 (2020) P10017 | CMS-TRG-17-001 2006.10165 |
| 15 | CMS Collaboration | The CMS trigger system | JINST 12 (2017) P01020 | CMS-TRG-12-001 1609.02366 |
| 16 | P. Nason | A new method for combining NLO QCD with shower Monte Carlo algorithms | JHEP 11 (2004) 040 | hep-ph/0409146 |
| 17 | S. Frixione, P. Nason, and C. Oleari | Matching NLO QCD computations with parton shower simulations: the POWHEG method | JHEP 11 (2007) 070 | 0709.2092 |
| 18 | S. Alioli, P. Nason, C. Oleari, and E. Re | A general framework for implementing NLO calculations in shower Monte Carlo programs: the POWHEG BOX | JHEP 06 (2010) 043 | 1002.2581 |
| 19 | P. Nason and G. Zanderighi | $ \mathrm{W^+}\mathrm{W^-} $, WZ and ZZ production in the POWHEG-BOX-V2 | EPJC 74 (2014) 2702 | 1311.1365 |
| 20 | S. Alioli, P. Nason, C. Oleari, and E. Re | NLO vector-boson production matched with shower in POWHEG | JHEP 07 (2008) 060 | 0805.4802 |
| 21 | S. Alioli, P. Nason, C. Oleari, and E. Re | NLO Higgs boson production via gluon fusion matched with shower in POWHEG | JHEP 04 (2009) 002 | 0812.0578 |
| 22 | J. Alwall et al. | The automated computation of tree-level and next-to-leading order differential cross sections, and their matching to parton shower simulations | JHEP 07 (2014) 079 | 1405.0301 |
| 23 | J. Alwall et al. | Comparative study of various algorithms for the merging of parton showers and matrix elements in hadronic collisions | EPJC 53 (2008) 473 | 0706.2569 |
| 24 | R. Frederix and S. Frixione | Merging meets matching in MC@NLO | JHEP 12 (2012) 061 | 1209.6215 |
| 25 | P. Artoisenet, R. Frederix, O. Mattelaer, and R. Rietkerk | Automatic spin-entangled decays of heavy resonances in Monte Carlo simulations | JHEP 03 (2013) 015 | 1212.3460 |
| 26 | I. Anderson et al. | Constraining anomalous HVV interactions at proton and lepton colliders | PRD 89 (2014) 035007 | 1309.4819 |
| 27 | A. V. Gritsan et al. | New features in the JHU generator framework: constraining Higgs boson properties from on-shell and off-shell production | PRD 102 (2020) 056022 | 2002.09888 |
| 28 | NNPDF Collaboration | Parton distributions from high-precision collider data | EPJC 77 (2017) 663 | 1706.00428 |
| 29 | T. Sjöstrand et al. | An introduction to PYTHIA 8.2 | Comput. Phys. Commun. 191 (2015) 159 | 1410.3012 |
| 30 | CMS Collaboration | Extraction and validation of a new set of CMS PYTHIA8 tunes from underlying-event measurements | EPJC 80 (2020) 4 | CMS-GEN-17-001 1903.12179 |
| 31 | \GEANTfour Collaboration | $ GEANT $ 4 --- a simulation toolkit | NIM A 506 (2003) 250 | |
| 32 | CMS Collaboration | Particle-flow reconstruction and global event description with the CMS detector | JINST 12 (2017) P10003 | CMS-PRF-14-001 1706.04965 |
| 33 | CMS Collaboration | Technical proposal for the Phase-II upgrade of the Compact Muon Solenoid | CMS Technical Proposal CERN-LHCC-2015-010, CMS-TDR-15-02, 2015 CDS |
|
| 34 | M. Cacciari, G. P. Salam, and G. Soyez | The anti-$ k_{\mathrm{T}} $ jet clustering algorithm | JHEP 04 (2008) 063 | 0802.1189 |
| 35 | M. Cacciari, G. P. Salam, and G. Soyez | FastJet user manual | EPJC 72 (2012) 1896 | 1111.6097 |
| 36 | CMS Collaboration | Pileup mitigation at CMS in 13 TeV data | JINST 15 (2020) P09018 | CMS-JME-18-001 2003.00503 |
| 37 | D. Bertolini, P. Harris, M. Low, and N. Tran | Pileup per particle identification | JHEP 10 (2014) 059 | 1407.6013 |
| 38 | CMS Collaboration | Jet energy scale and resolution in the CMS experiment in pp collisions at 8 TeV | JINST 12 (2017) P02014 | CMS-JME-13-004 1607.03663 |
| 39 | CMS Collaboration | Performance of missing transverse momentum reconstruction in proton-proton collisions at $ \sqrt{s} = $ 13 TeV using the CMS detector | JINST 14 (2019) P07004 | CMS-JME-17-001 1903.06078 |
| 40 | CMS Collaboration | Electron and photon reconstruction and identification with the CMS experiment at the CERN LHC | JINST 16 (2021) P05014 | CMS-EGM-17-001 2012.06888 |
| 41 | CMS Collaboration | Performance of the CMS muon detector and muon reconstruction with proton-proton collisions at $ \sqrt{s}= $ 13 TeV | JINST 13 (2018) P06015 | CMS-MUO-16-001 1804.04528 |
| 42 | CMS Collaboration | Performance of reconstruction and identification of $ \tau $ leptons decaying to hadrons and $ \nu_\tau $ in pp collisions at $ \sqrt{s}= $ 13 TeV | JINST 13 (2018) P10005 | CMS-TAU-16-003 1809.02816 |
| 43 | CMS Collaboration | Identification of hadronic tau lepton decays using a deep neural network | JINST 17 (2022) P07023 | CMS-TAU-20-001 2201.08458 |
| 44 | A. Hayrapetyan et al. | Identification of tau leptons using a convolutional neural network with domain adaptation | Journal of Instrumentation 20 (2025) P12032 | 2511.05468 |
| 45 | CMS Collaboration | Comparison of the performance of tau reconstruction and identification algorithms in Run 3 | CDS | |
| 46 | CMS Collaboration | Measurement of Higgs boson production and properties in the WW Decay channel with leptonic final states | JHEP 01 (2014) 096 | CMS-HIG-13-023 1312.1129 |
| 47 | H. Voss, A. Höcker, J. Stelzer, and F. Tegenfeldt | TMVA, the toolkit for multivariate data analysis with ROOT | in XIth International Workshop on Advanced Computing and Analysis Techniques in Physics Research (ACAT),.. [PoS(ACAT)040], 2007 link |
physics/0703039 |
| 48 | A. J. Barr et al. | Guide to transverse projections and mass-constraining variables | Physical Review D 84 (2011) | 1105.2977 |
| 49 | A. J. Barr et al. | Guide to transverse projections and mass-constraining variables | PRD 84 (2011) 095031 | 1105.2977 |
| 50 | S. S. Wilks | The Large-Sample Distribution of the Likelihood Ratio for Testing Composite Hypotheses | Annals Math. Statist. 9 (1938) 60 | |
| 51 | CMS Collaboration | The CMS Statistical Analysis and Combination Tool: Combine | Comput. Softw. Big Sci. 8 (2024) 19 | CMS-CAT-23-001 2404.06614 |
| 52 | W. Verkerke and D. P. Kirkby | The RooFit toolkit for data modeling | eConf C0303241 MOLT007, 2003 | physics/0306116 |
| 53 | L. Moneta et al. | The RooStats Project | PoS ACAT 057, 2010 link |
1009.1003 |
| 54 | CMS Collaboration | Luminosity measurement in proton-proton collisions at 13.6 TeV in 2022 at CMS | CMS Physics Analysis Summary, 2024 CMS-PAS-LUM-22-001 |
CMS-PAS-LUM-22-001 |
| 55 | J. Butterworth et al. | PDF4LHC recommendations for LHC Run II | JPG 43 (2016) 023001 | 1510.03865 |
| 56 | CMS Collaboration | Investigations of the impact of the parton shower tuning in \mboxPYTHIA8 in the modelling of $ \mathrm{t} \overline{\mathrm{t}} $ at $ \sqrt{s}= $ 8 and 13 TeV | CMS Physics Analysis Summary, 2016 CMS-PAS-TOP-16-021 |
CMS-PAS-TOP-16-021 |
| 57 | ATLAS and CMS Collaborations | Improved common $ \mathrm{t} \overline{\mathrm{t}} $ Monte Carlo settings for ATLAS and CMS | Technical Report CMS-NOTE-2023-004, ATL-PHYS-PUB-2023-016, 2023 | |
| 58 | CMS Collaboration | Measurement of differential cross sections for top quark pair production using the lepton+jets final state in proton-proton collisions at 13 TeV | PRD 95 (2017) 092001 | CMS-TOP-16-008 1610.04191 |
| 59 | CMS Collaboration | Measurement of the differential cross section for top quark pair production in $ {\mathrm{p}\mathrm{p}} $ collisions at $ \sqrt{s} = $ 8 TeV | EPJC 75 (2015) 542 | CMS-TOP-12-028 1505.04480 |
| 60 | CMS Collaboration | Measurement of the $ \mathrm{t} \overline{\mathrm{t}} $ production cross section in the all-jets final state in $ {\mathrm{p}\mathrm{p}} $ collisions at $ \sqrt{s}= $ 8 TeV | EPJC 76 (2016) 128 | CMS-TOP-14-018 1509.06076 |
| 61 | M. Czakon et al. | Top-pair production at the LHC through NNLO QCD and NLO EW | JHEP 10 (2017) 186 | 1705.04105 |
| 62 | Particle Data Group Collaboration Collaboration | Review of particle physics | PRD 110 (2024) 030001 | |
| 63 | G. Cowan, K. Cranmer, E. Gross, and O. Vitells | Asymptotic formulae for likelihood-based tests of new physics | [Erratum: Eur.Phys.J.C 73, 2501 ()], 2011 EPJC 71 (2011) 1554 |
1007.1727 |
|
|
Compact Muon Solenoid LHC, CERN |

|

|

|

|

|

|