

Compact Muon Solenoid
LHC, CERN
| CMS-SMP-24-001 ; CERN-EP-2024-129 | ||
| Measurement of inclusive and differential cross sections for W$^{+}$W$^{-}$ production in proton-proton collisions at $ \sqrt{s} = $ 13.6 TeV | ||
| CMS Collaboration | ||
| 7 June 2024 | ||
| Phys. Lett. B 861 (2025) 139231 | ||
| Abstract: Measurements at $ \sqrt{s}= $ 13.6 TeV of the opposite-sign W boson pair production cross section in proton-proton collisions are presented. The data used in this study were collected with the CMS detector at the CERN LHC in 2022, and correspond to an integrated luminosity of 34.8 fb$ ^{-1} $. Events are selected by requiring one electron and one muon of opposite charge. A maximum likelihood fit is performed on signal- and background-enriched data categories defined by the flavour and charge of the leptons, the number of jets, and number of jets originating from b quarks. An inclusive W$^{+}$W$^{-}$ production cross section of 125.7 $ \pm $ 5.6 pb is measured, in agreement with standard model predictions. Cross sections are also reported in a fiducial region close to that of the detector acceptance, both inclusively and differentially, as a function of the jet multiplicity in the event. For first time in proton-proton collisions, WW events with at least two reconstructed jets are studied and compared with recent theoretical predictions. | ||
| Links: e-print arXiv:2406.05101 [hep-ex] (PDF) ; CDS record ; inSPIRE record ; HepData record ; Physics Briefing ; CADI line (restricted) ; | ||
| Figures & Tables | Summary | Additional Figures & Tables | References | CMS Publications |
|---|
| Figures | |
png pdf |
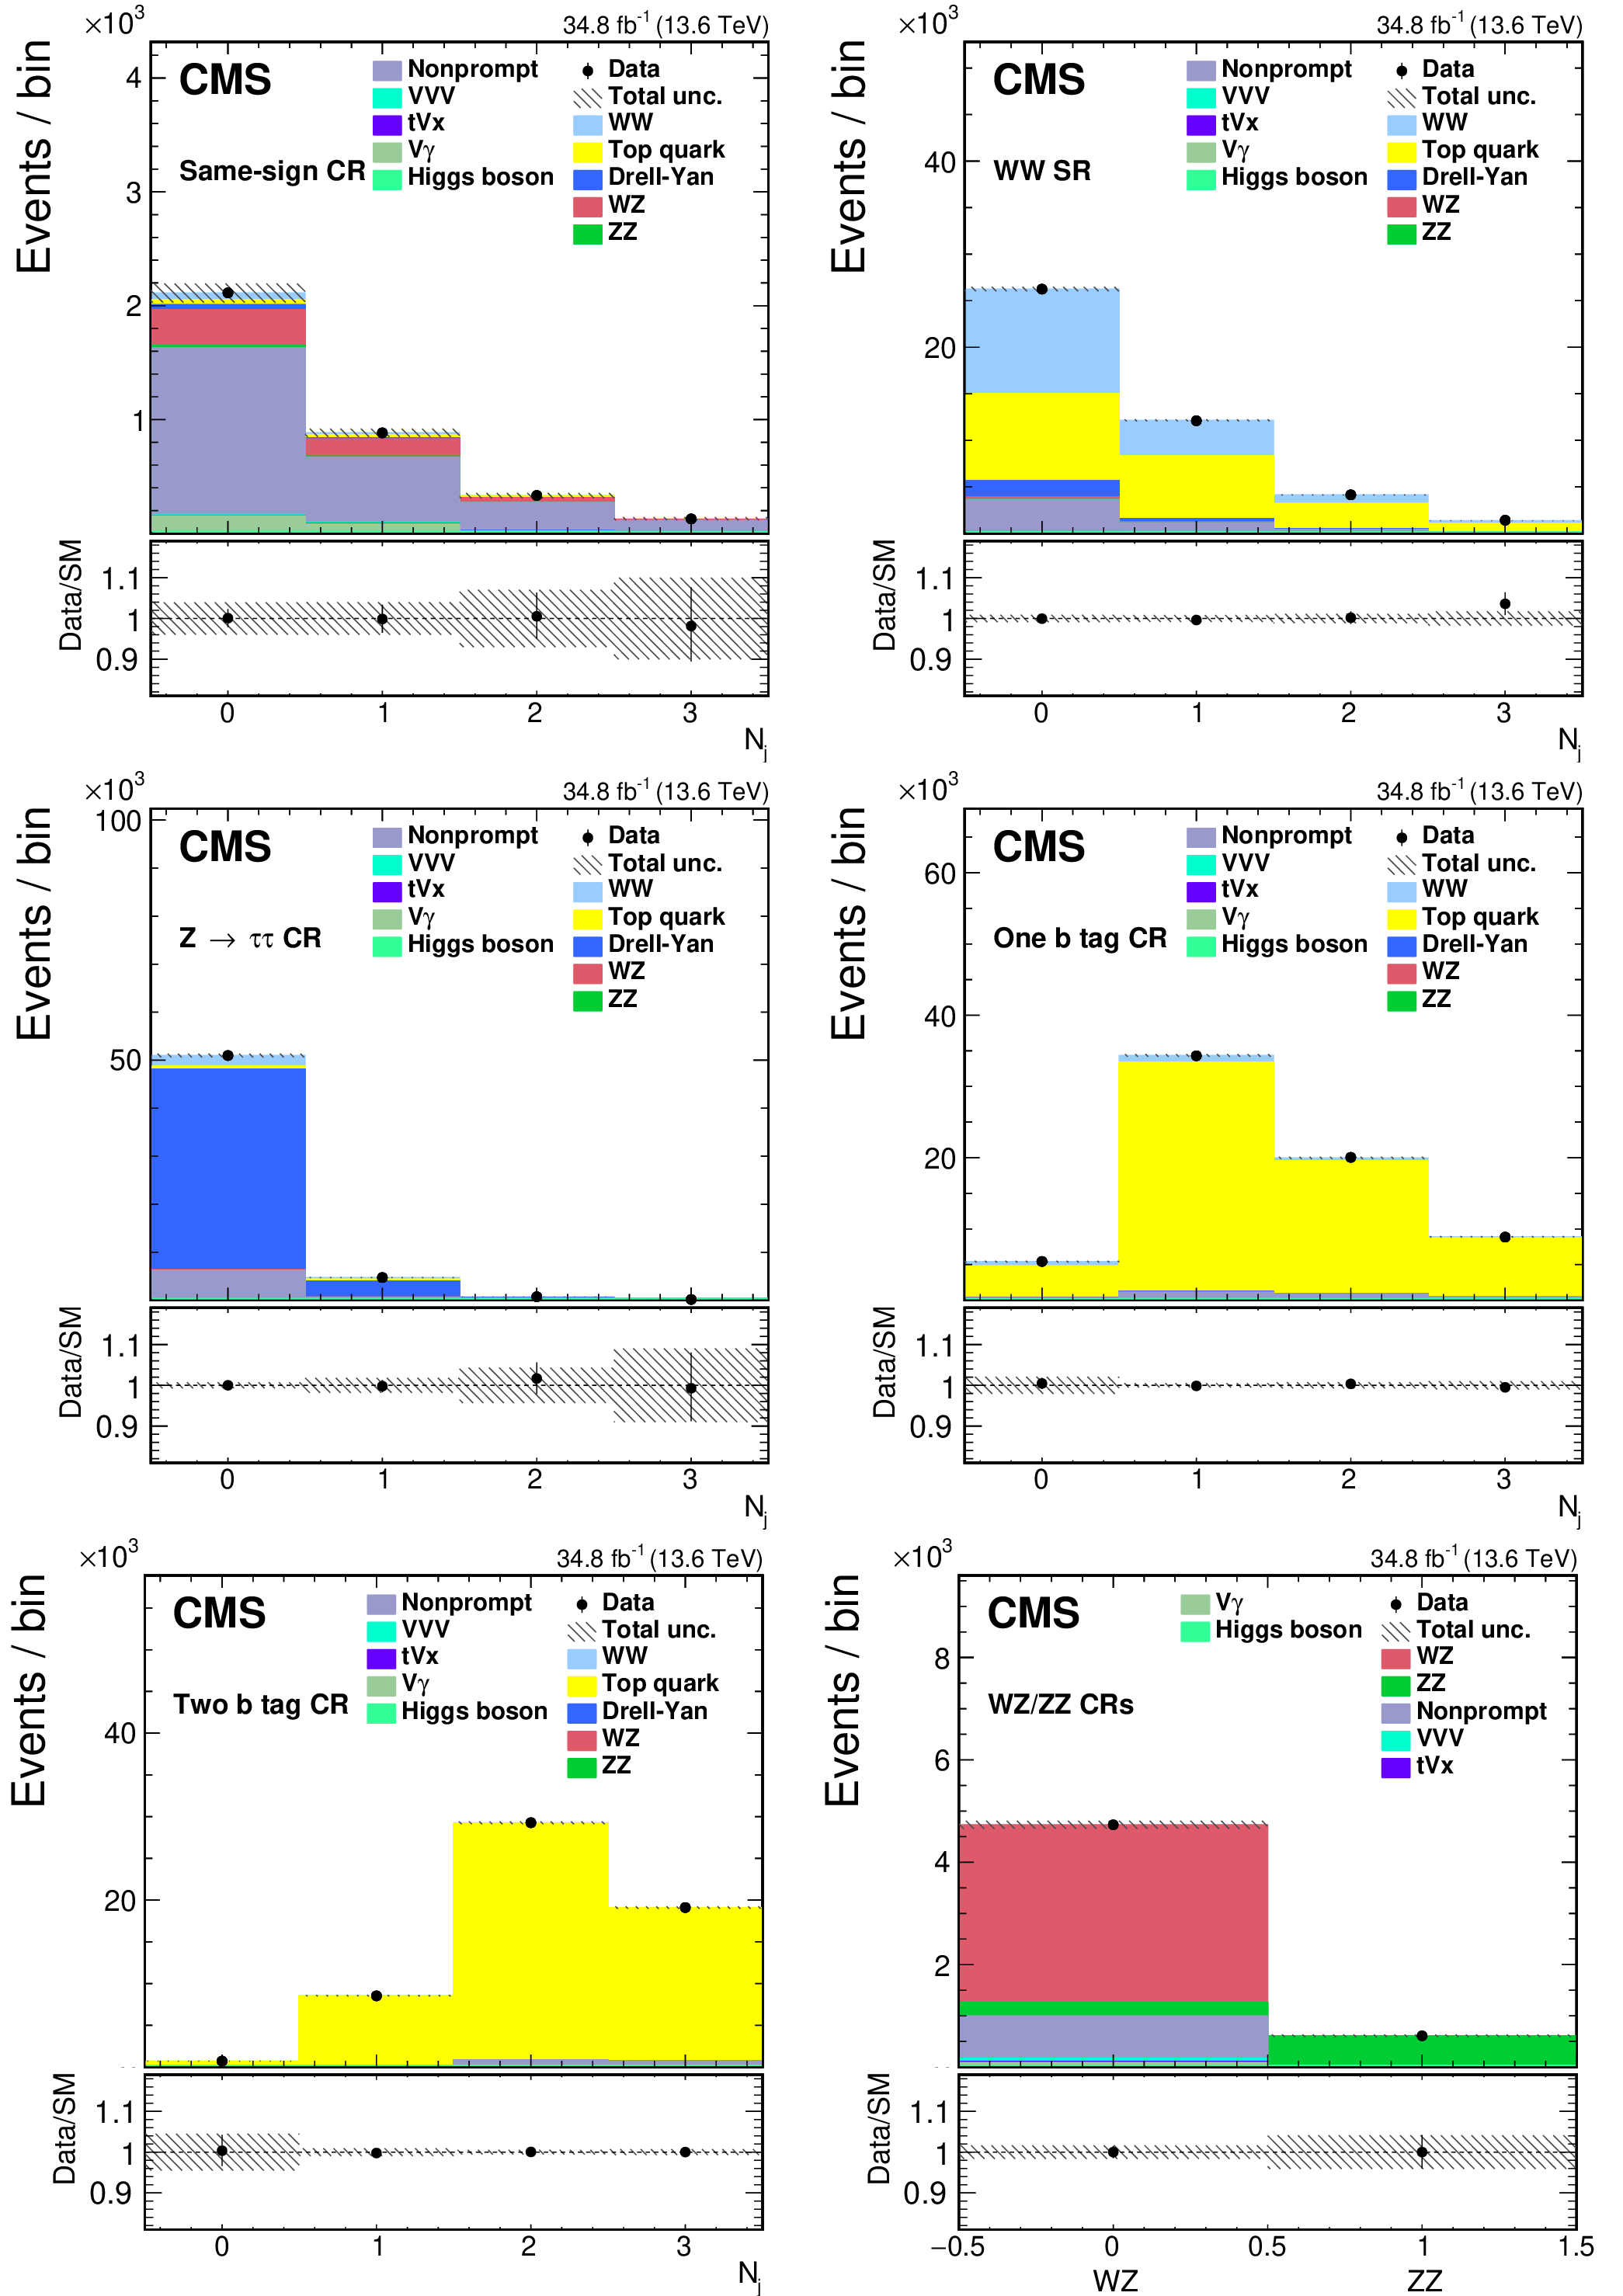
Figure 1:
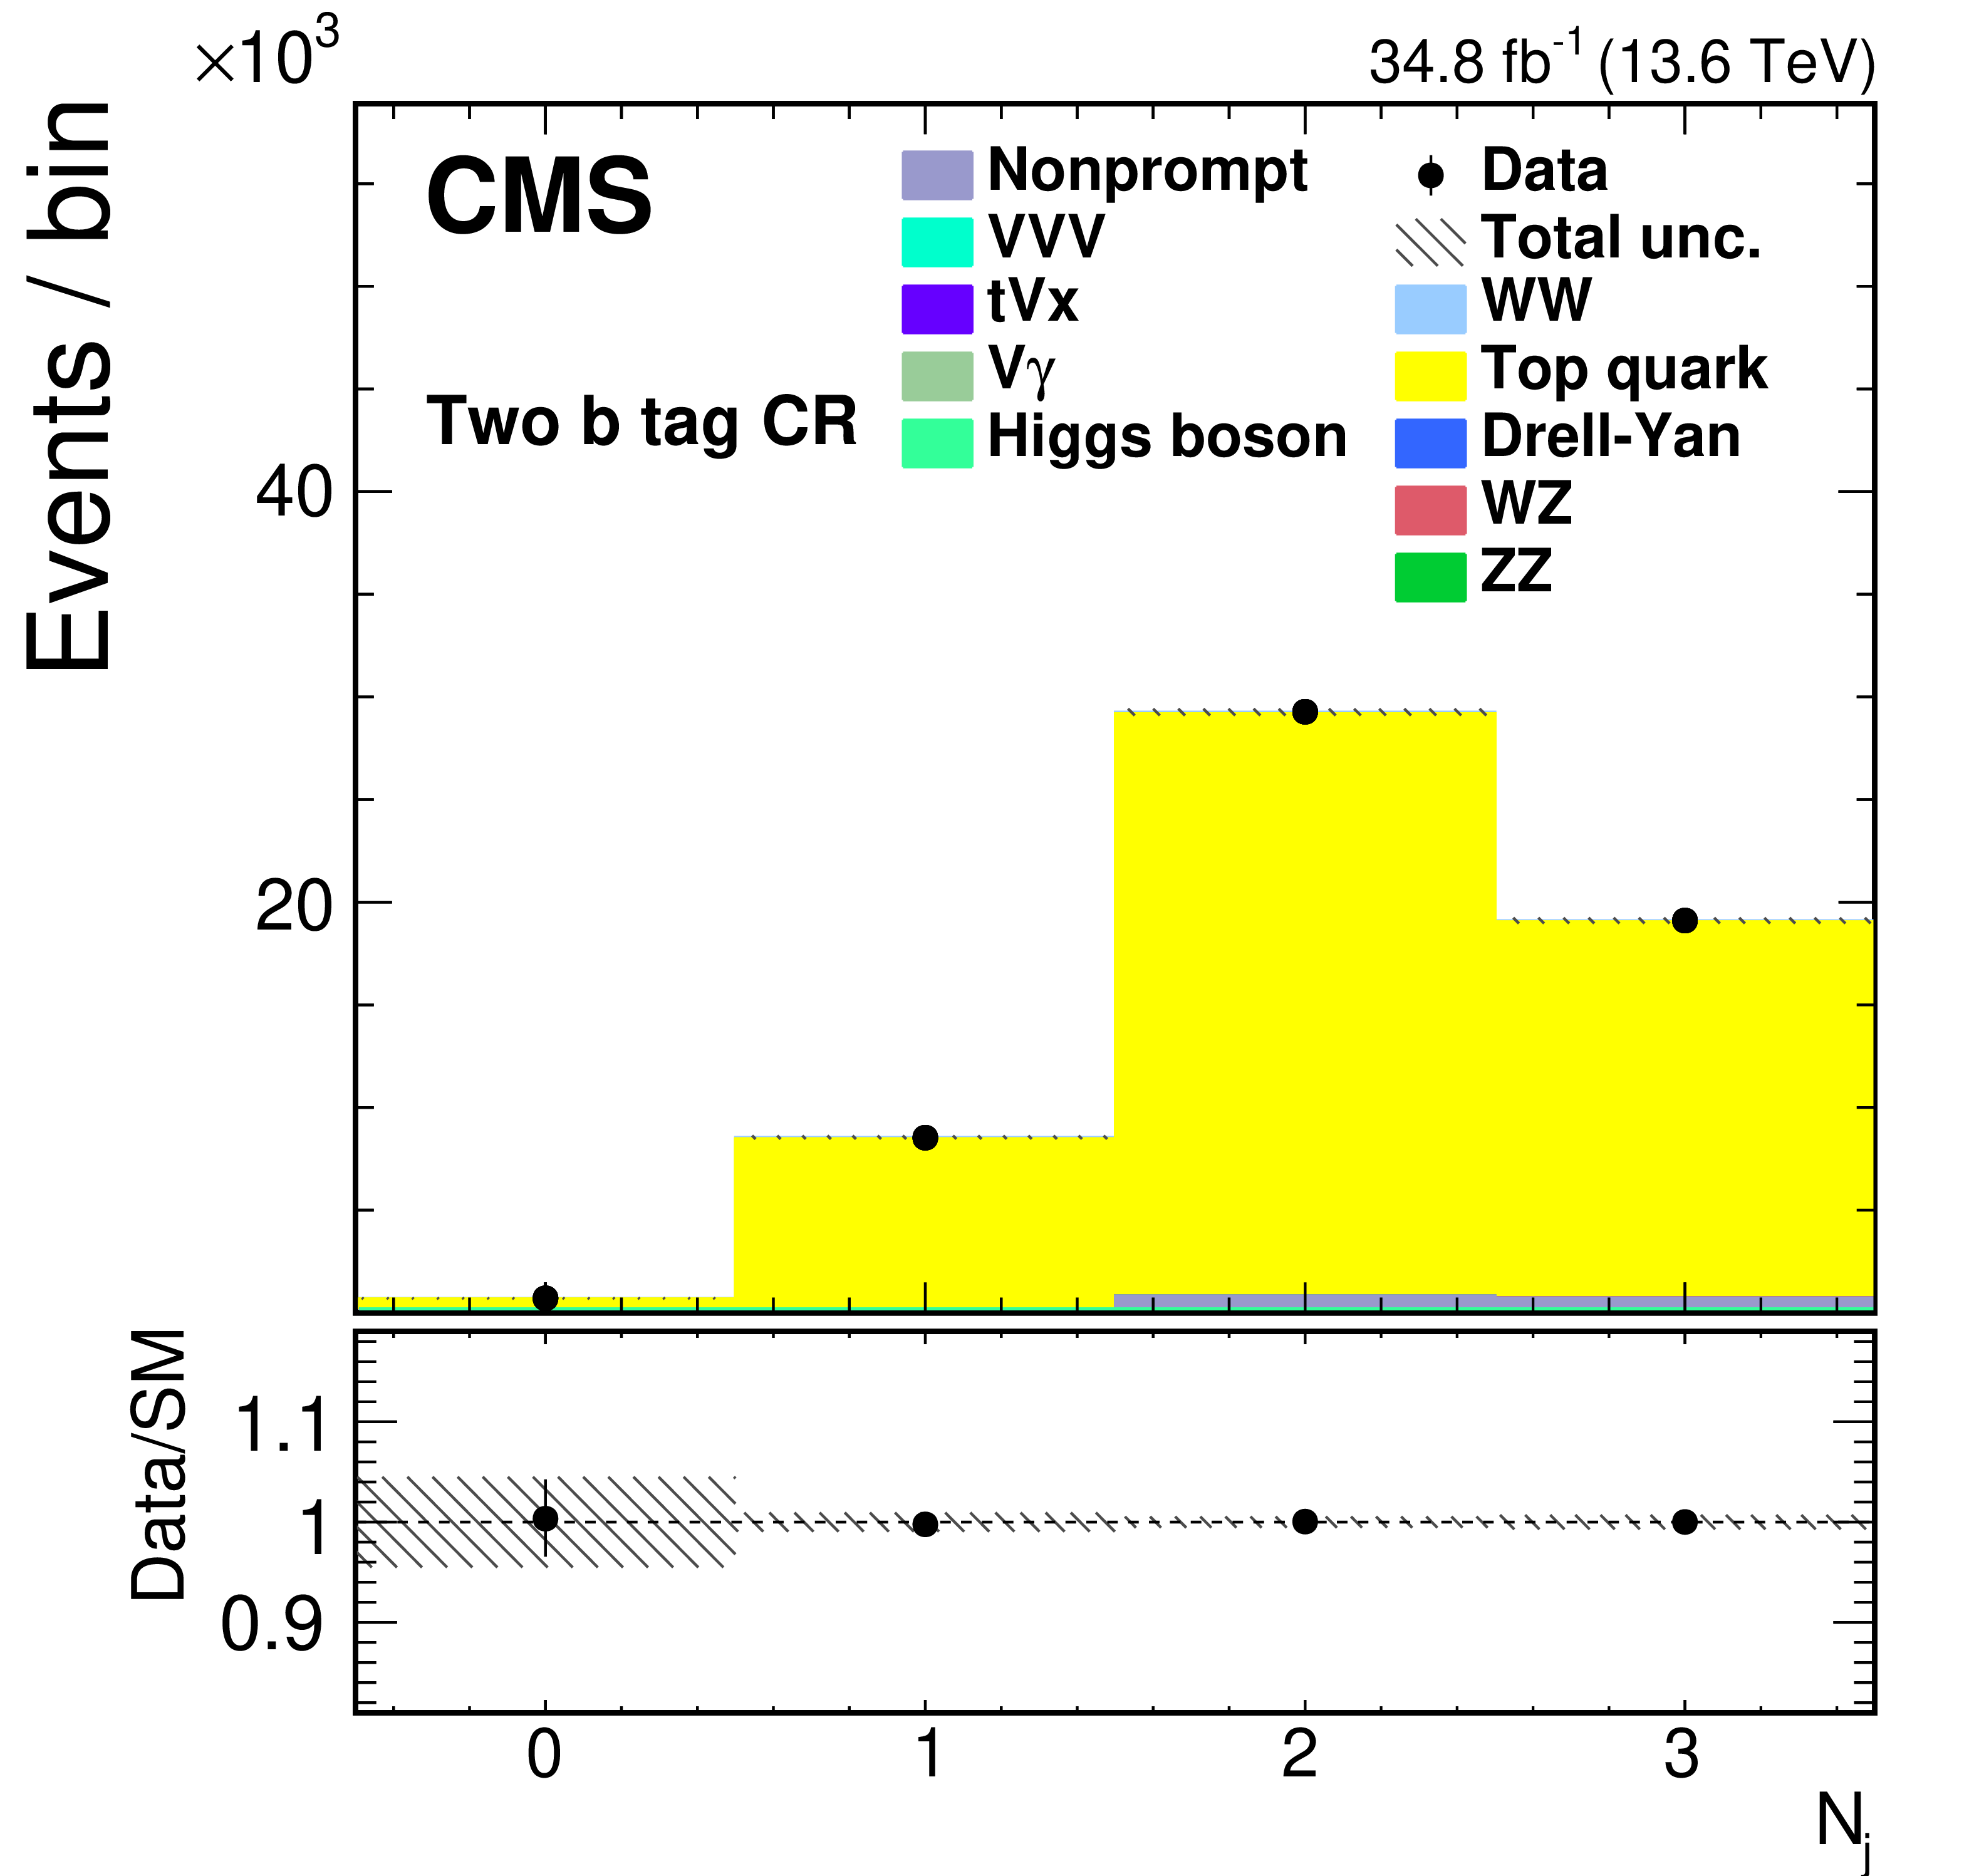
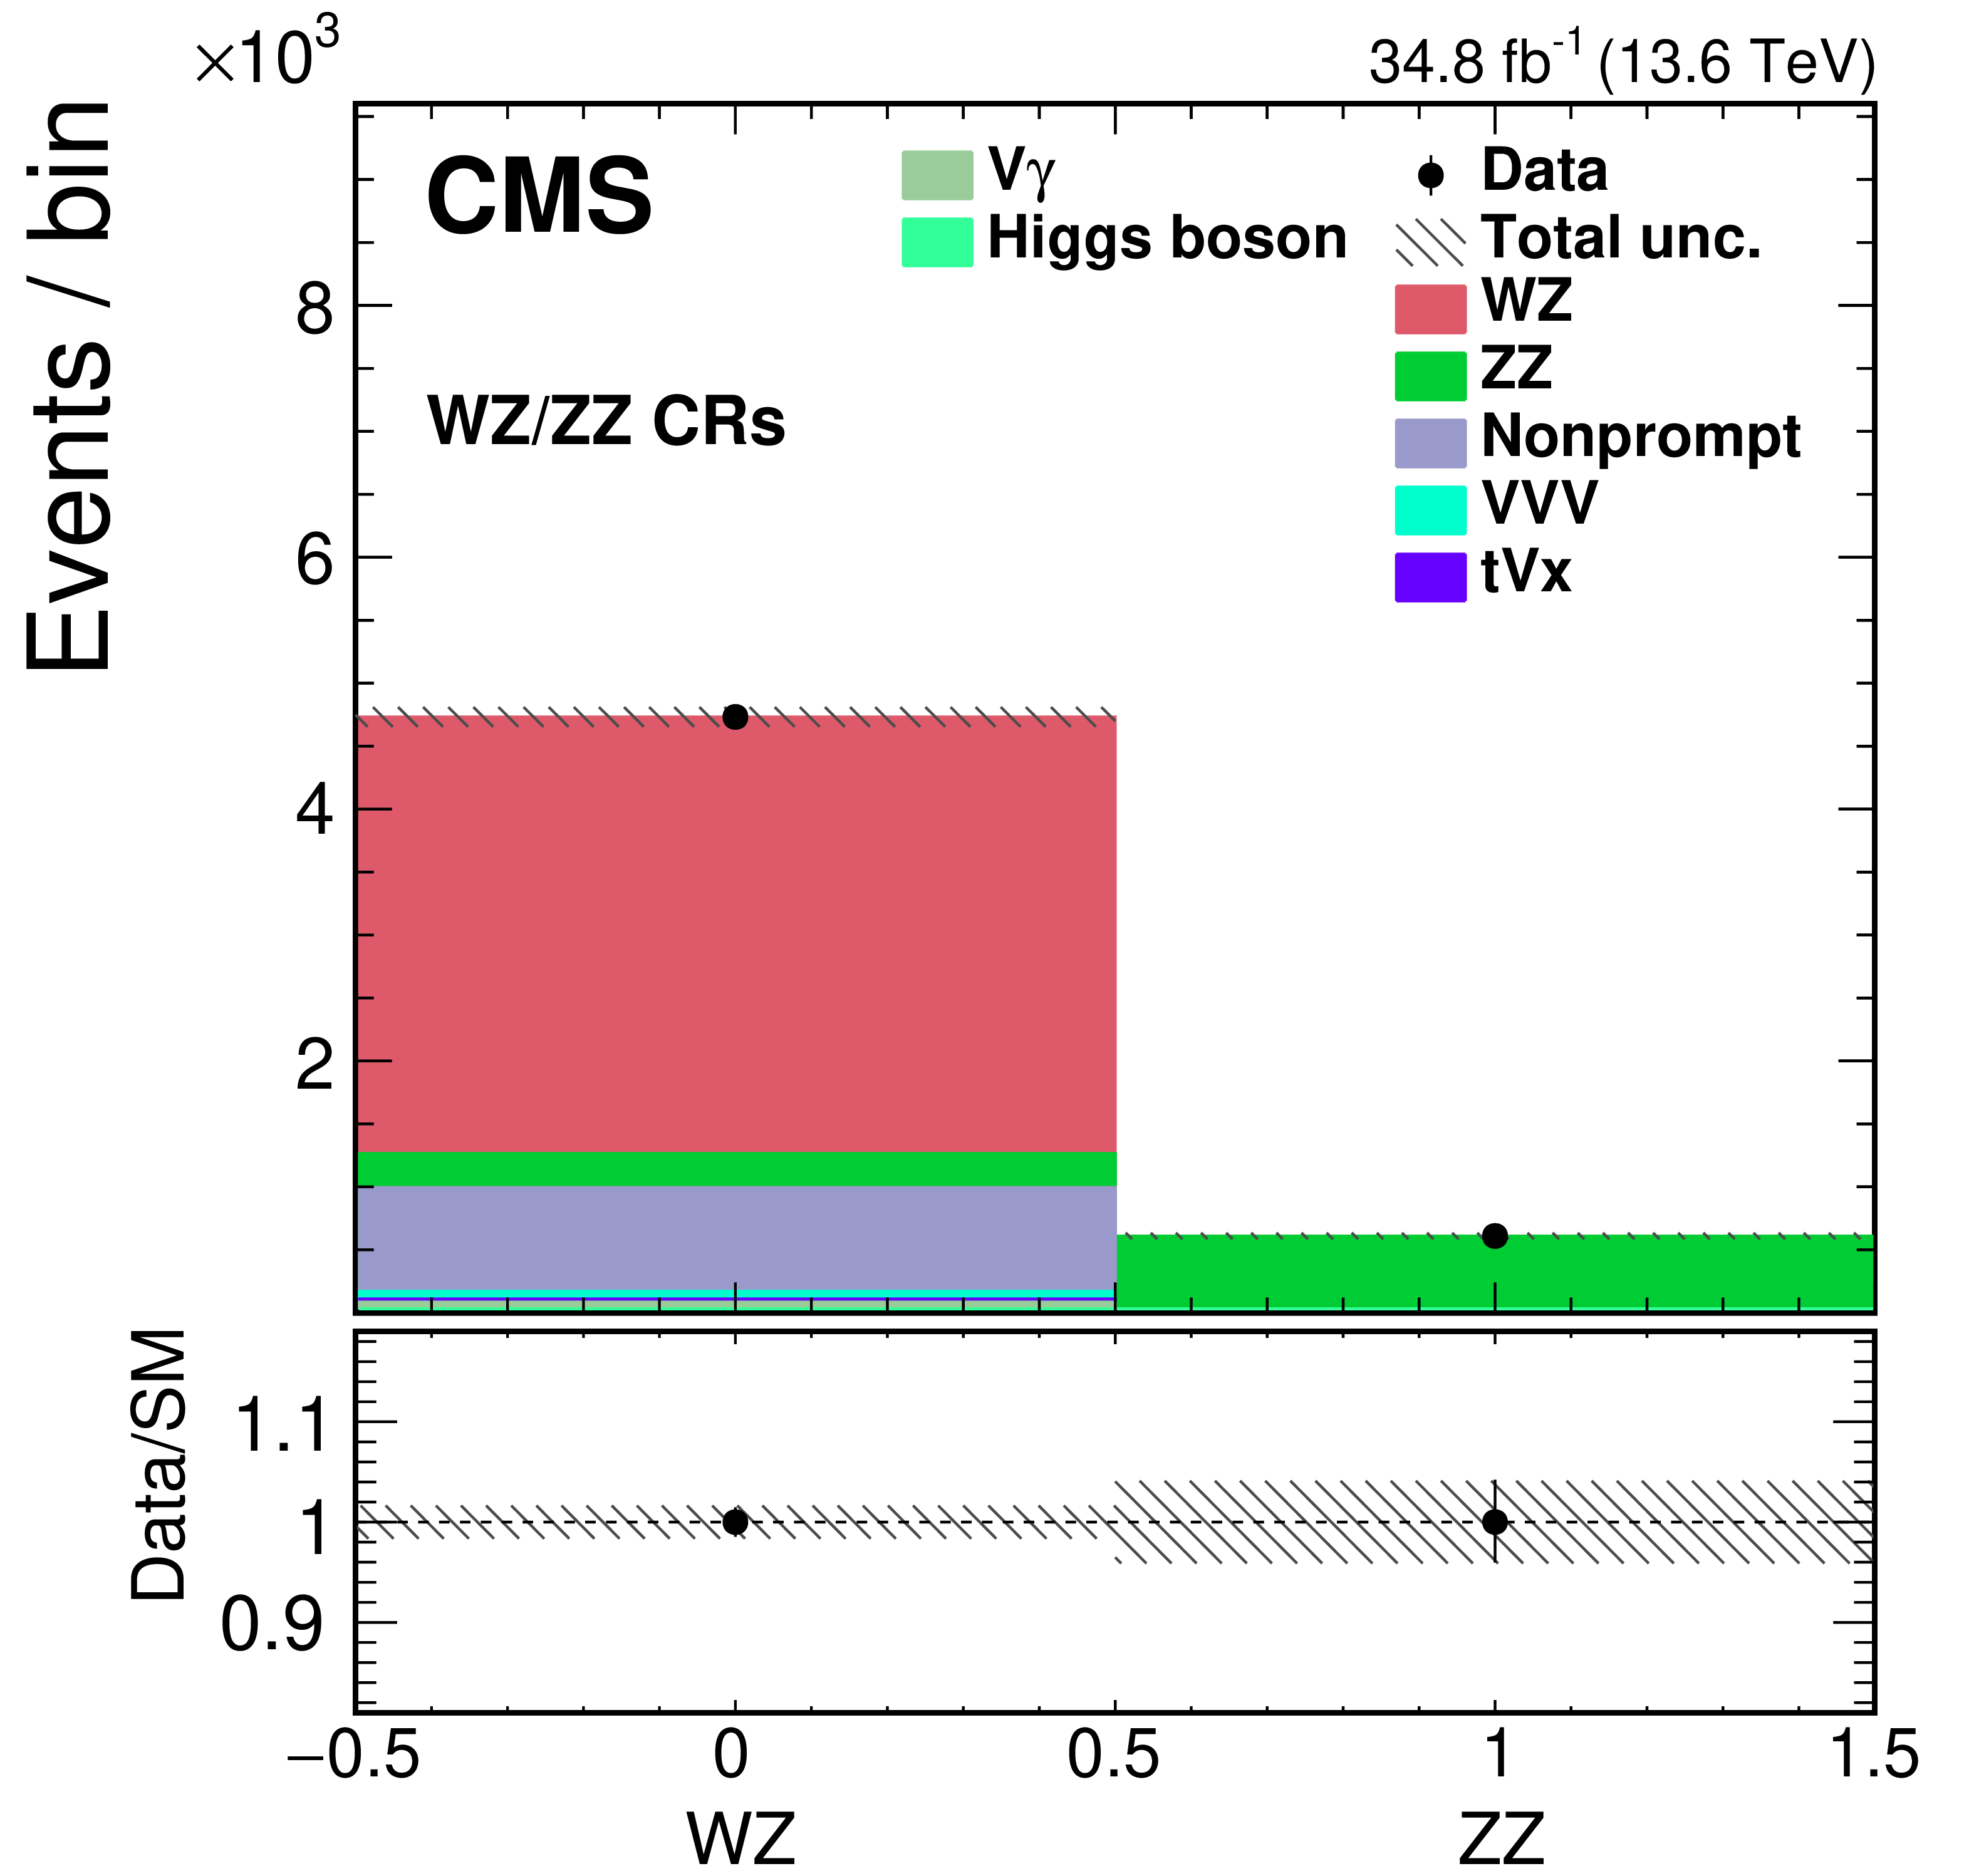
Distributions of the number of reconstructed jets after the fit to the data in the WW SR (upper left), same-sign CR (upper right), $ \mathrm{Z}\to\tau\tau $ CR (center left), one b tag CR (center right), and two b tags CR (lower left), and the number of events in the $ \mathrm{W}\mathrm{Z}\to3\ell\nu $ and $ \mathrm{Z}\mathrm{Z}\to4\ell $ CRs (lower right). The histograms for $ \mathrm{t}\mathrm{V}\mathrm{x} $ backgrounds include the contributions from $ {\mathrm{t}\overline{\mathrm{t}}} \mathrm{V}(\mathrm{V}) $ processes. The histograms for V$\gamma$ backgrounds include the contributions from W$\gamma$ and Z$\gamma$ processes. The overflow is included in the last bin. The bottom panel in each figure shows the ratio of the number of events observed in data to that of the total SM prediction. The grey bands represent the uncertainties in the predicted yields. The vertical bars represent the statistical uncertainties in the data. |
png pdf |
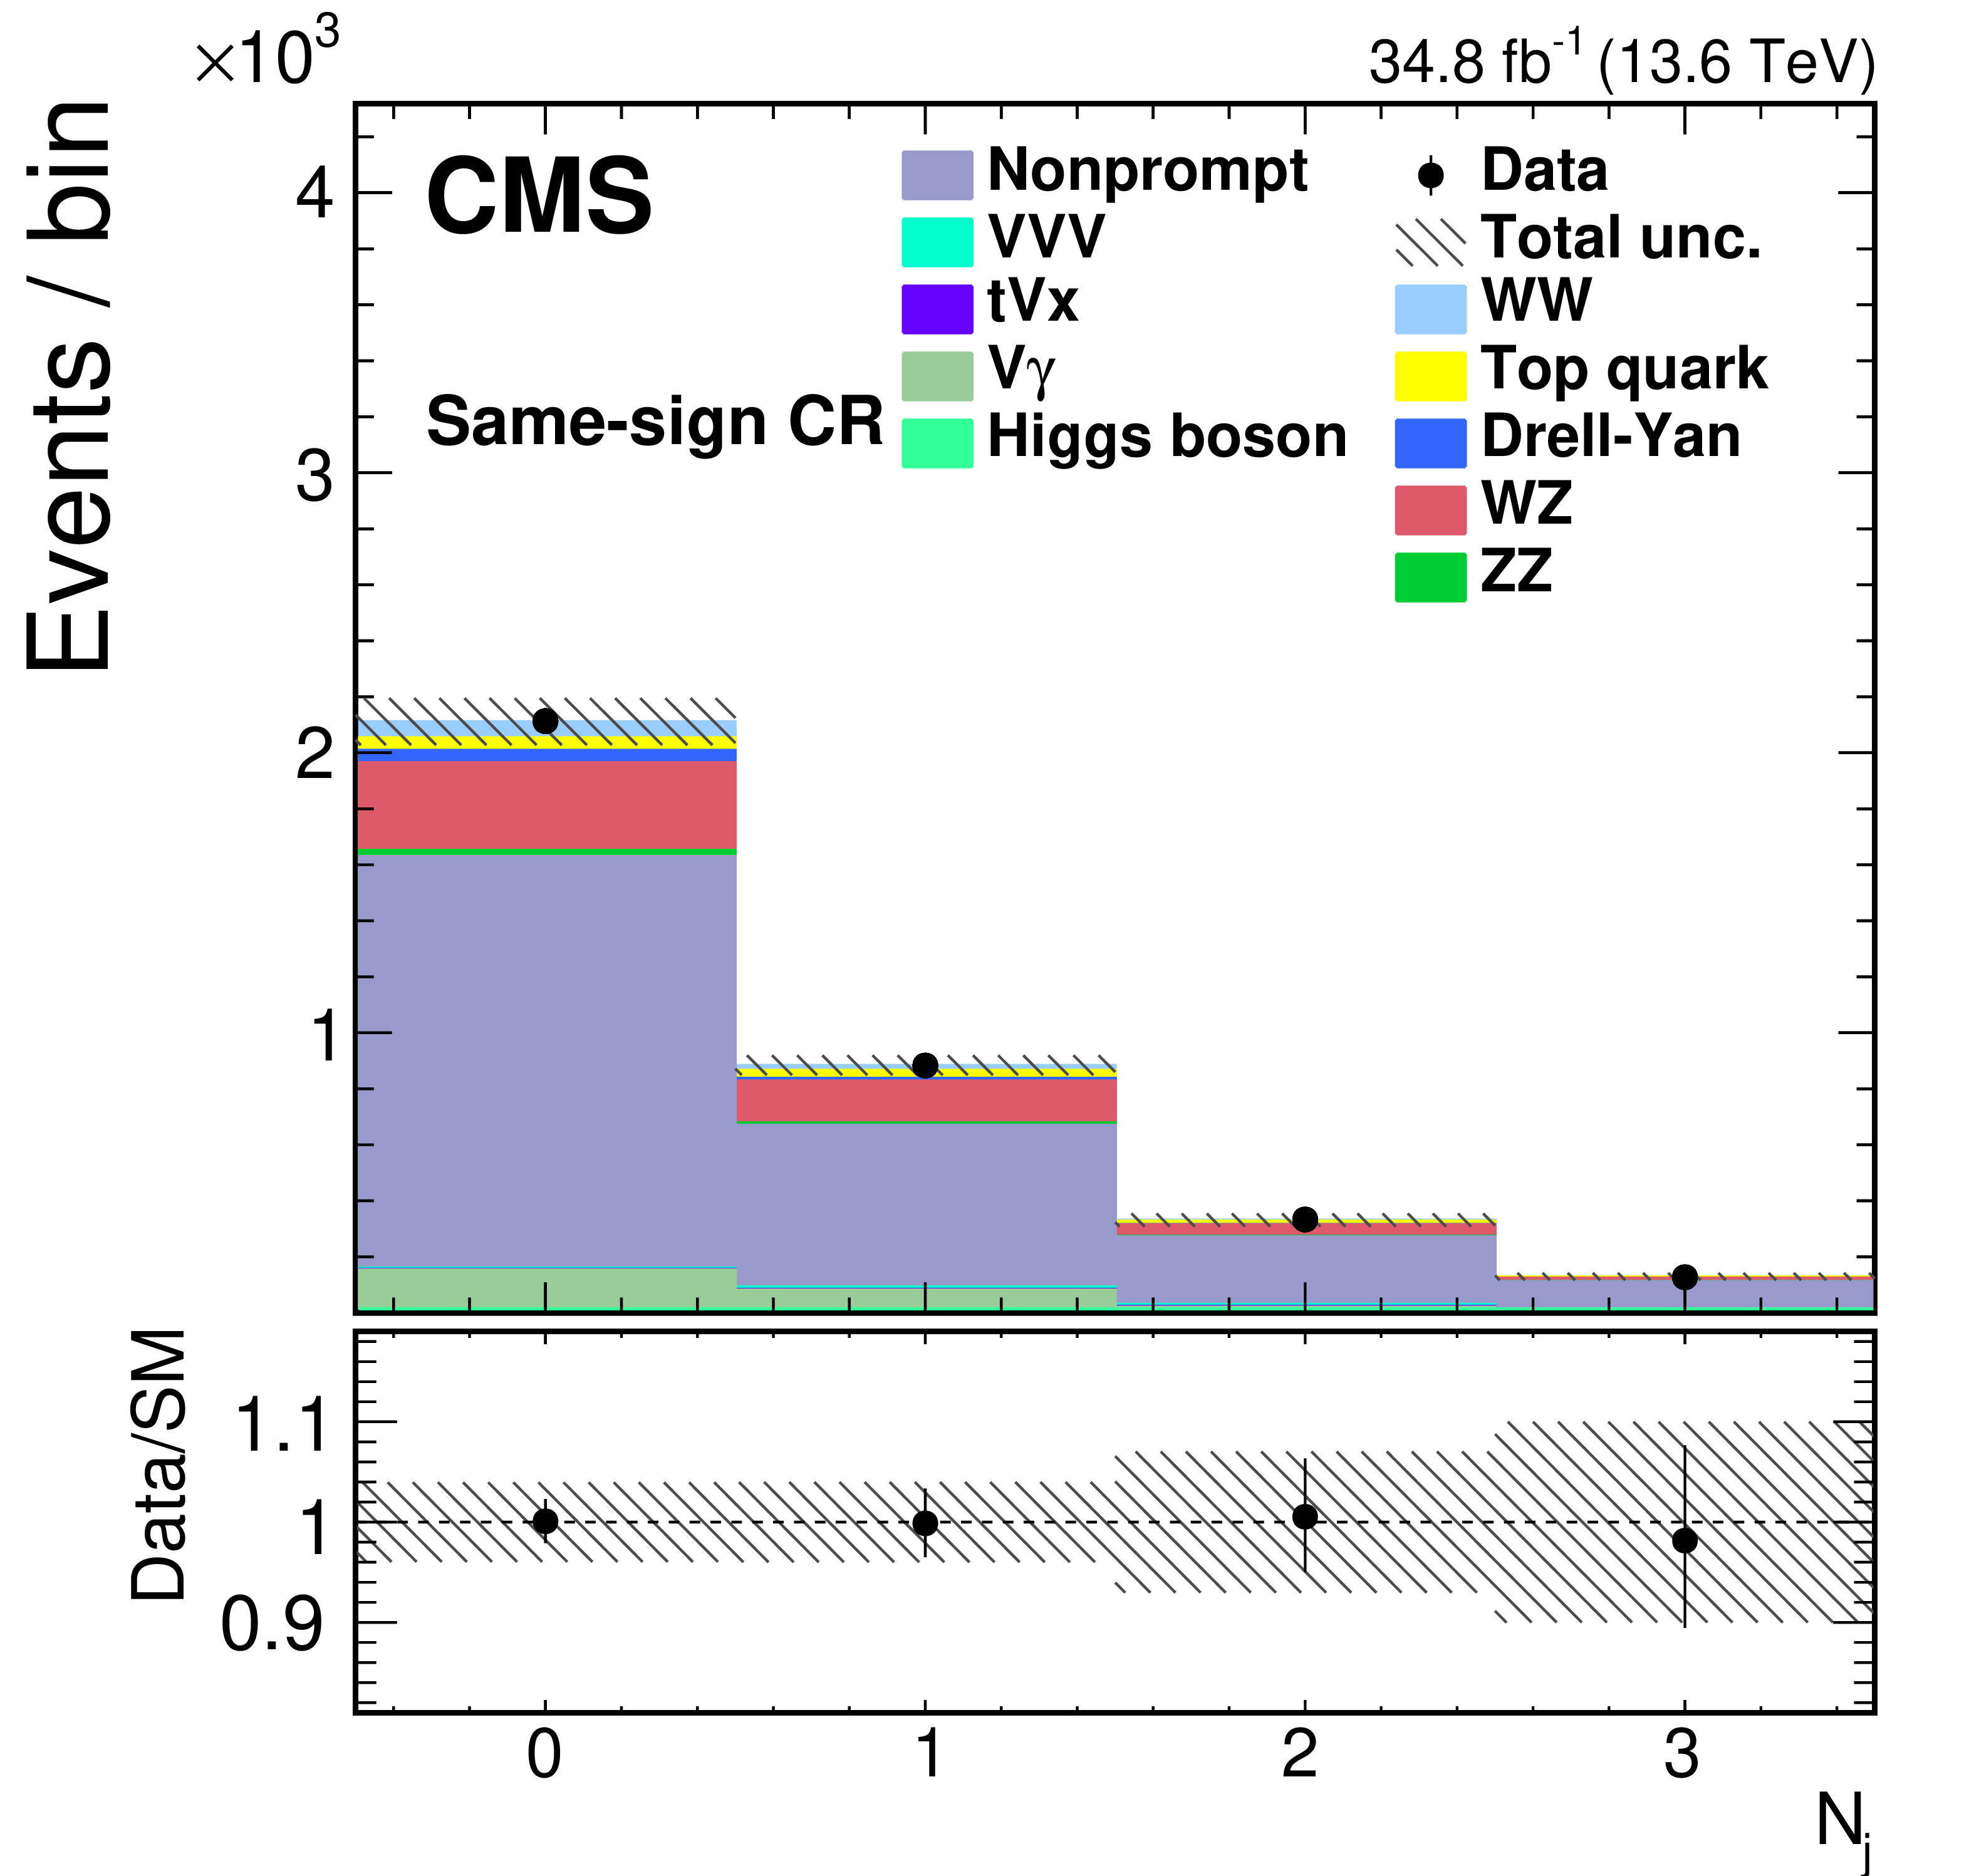
Figure 1-a:
Distributions of the number of reconstructed jets after the fit to the data in the WW SR (upper left), same-sign CR (upper right), $ \mathrm{Z}\to\tau\tau $ CR (center left), one b tag CR (center right), and two b tags CR (lower left), and the number of events in the $ \mathrm{W}\mathrm{Z}\to3\ell\nu $ and $ \mathrm{Z}\mathrm{Z}\to4\ell $ CRs (lower right). The histograms for $ \mathrm{t}\mathrm{V}\mathrm{x} $ backgrounds include the contributions from $ {\mathrm{t}\overline{\mathrm{t}}} \mathrm{V}(\mathrm{V}) $ processes. The histograms for V$\gamma$ backgrounds include the contributions from W$\gamma$ and Z$\gamma$ processes. The overflow is included in the last bin. The bottom panel in each figure shows the ratio of the number of events observed in data to that of the total SM prediction. The grey bands represent the uncertainties in the predicted yields. The vertical bars represent the statistical uncertainties in the data. |

png pdf |
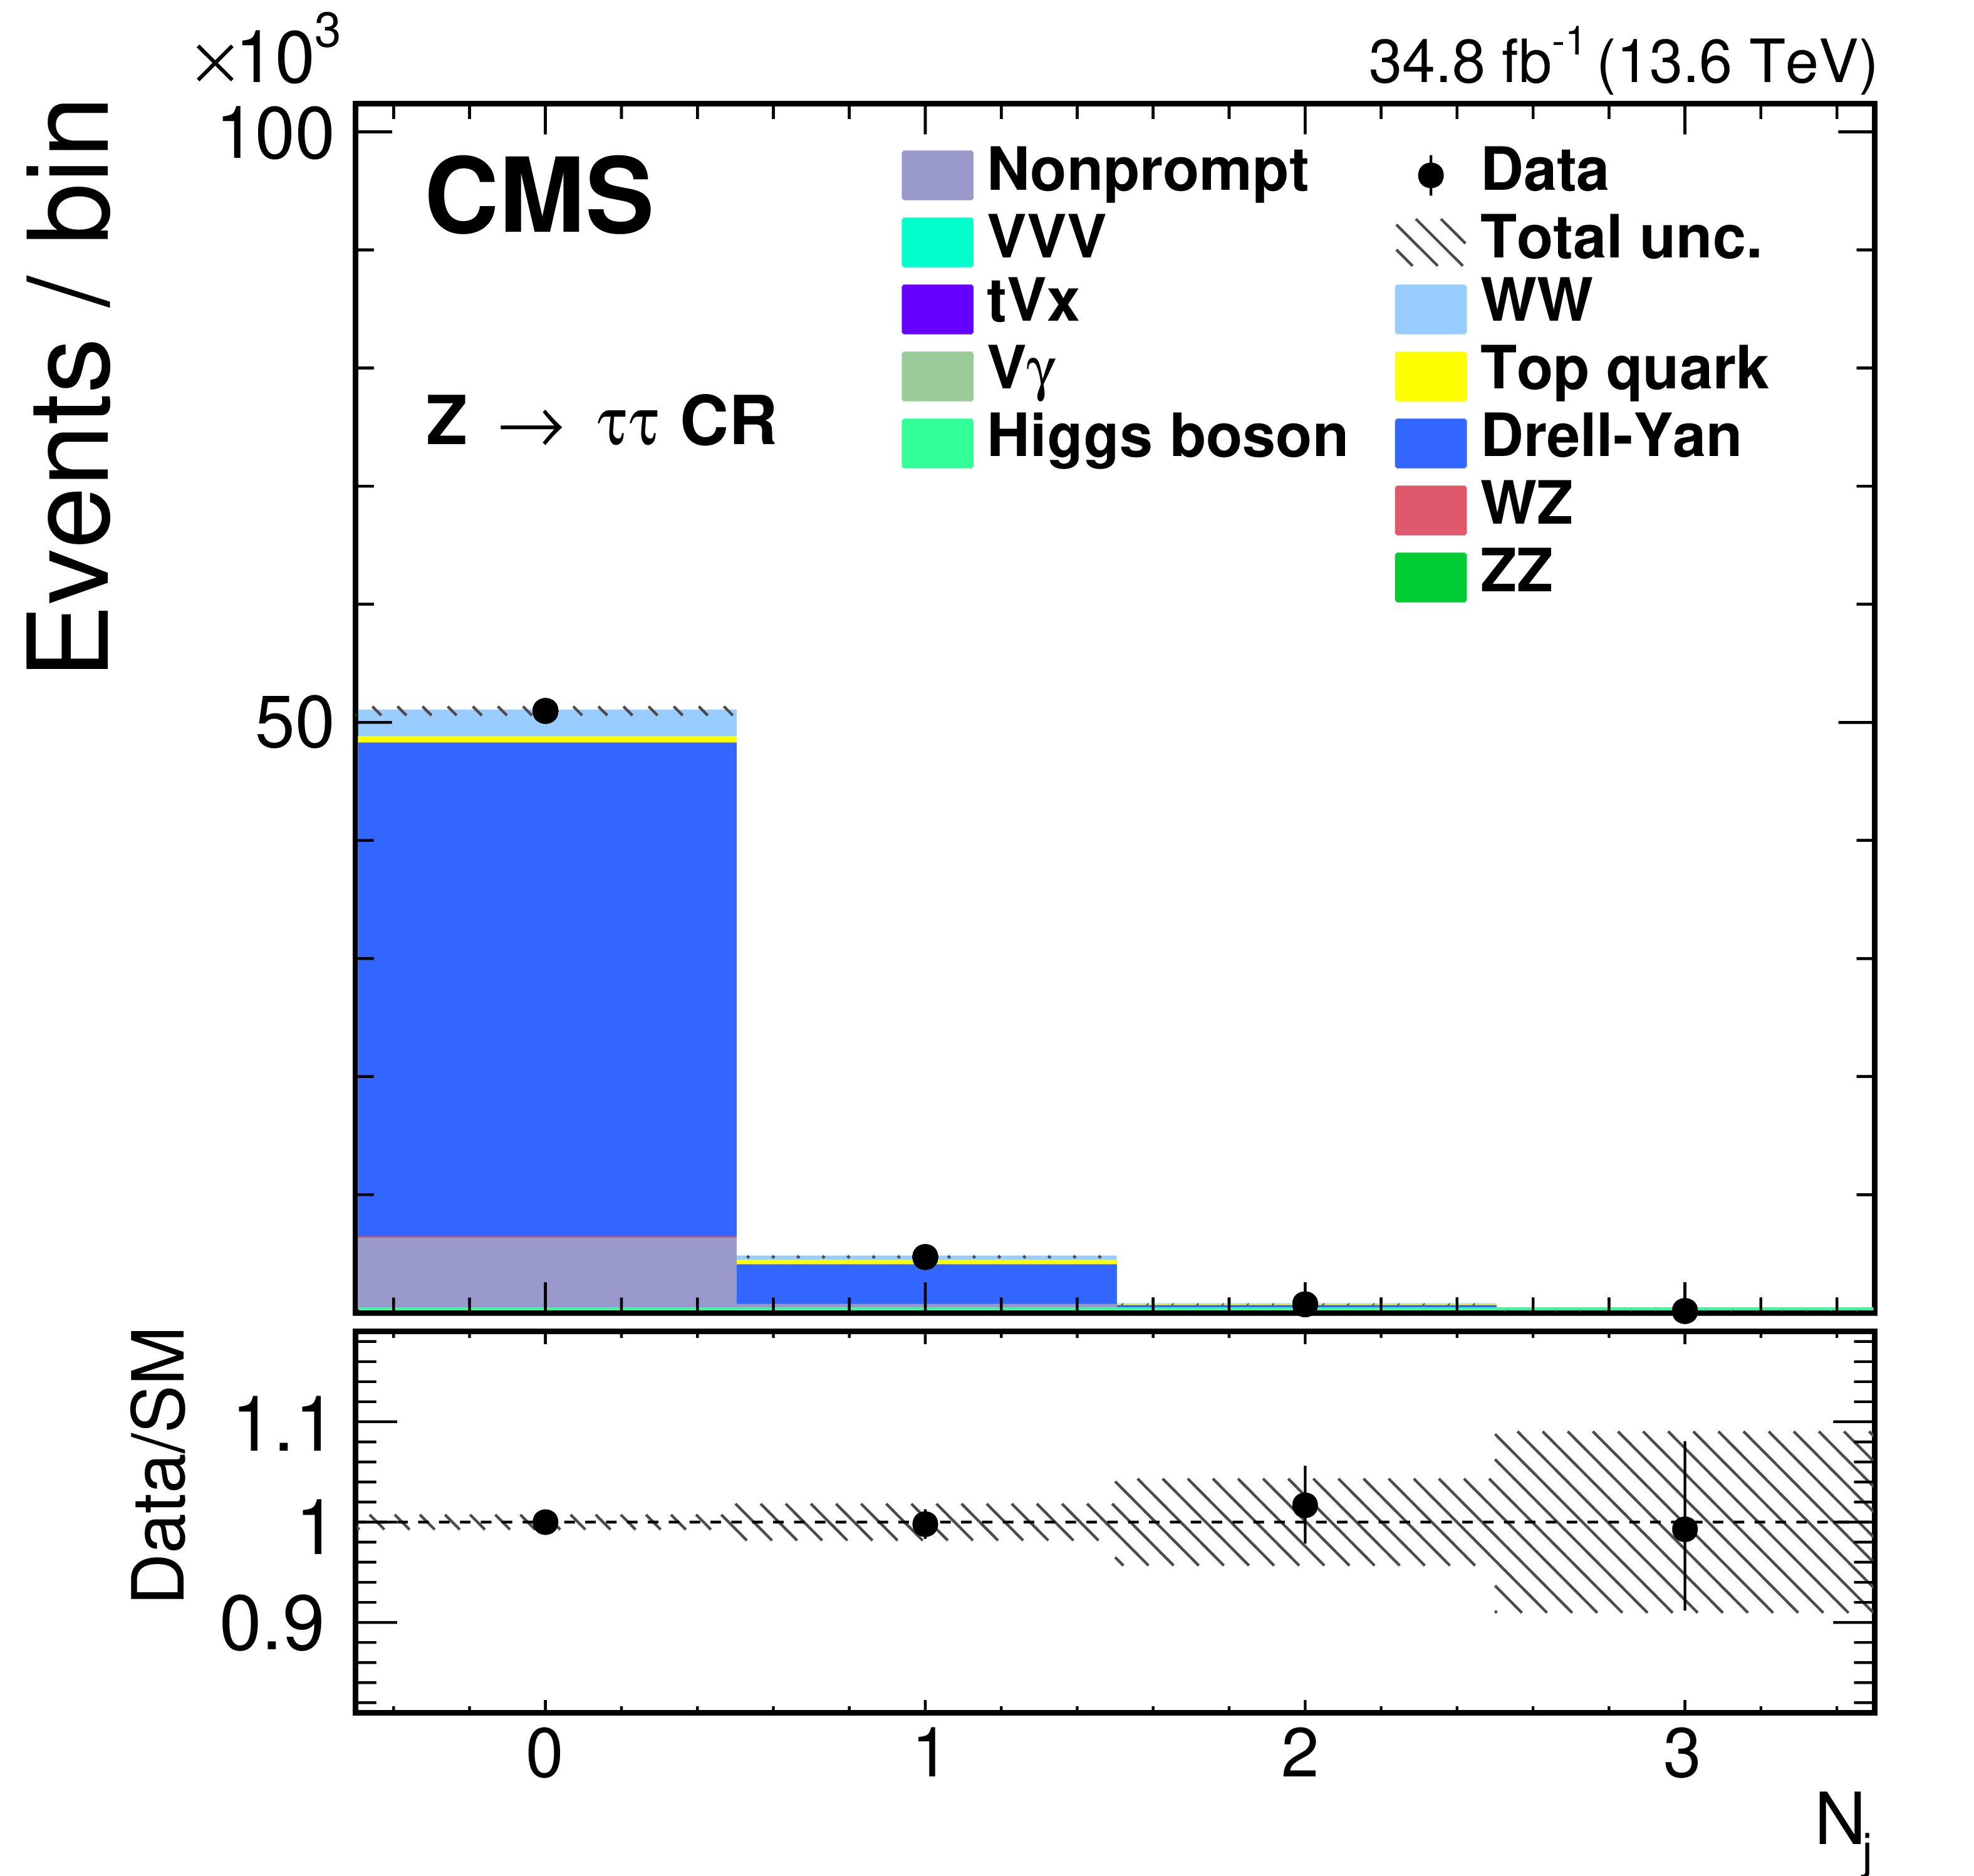
Figure 1-b:
Distributions of the number of reconstructed jets after the fit to the data in the WW SR (upper left), same-sign CR (upper right), $ \mathrm{Z}\to\tau\tau $ CR (center left), one b tag CR (center right), and two b tags CR (lower left), and the number of events in the $ \mathrm{W}\mathrm{Z}\to3\ell\nu $ and $ \mathrm{Z}\mathrm{Z}\to4\ell $ CRs (lower right). The histograms for $ \mathrm{t}\mathrm{V}\mathrm{x} $ backgrounds include the contributions from $ {\mathrm{t}\overline{\mathrm{t}}} \mathrm{V}(\mathrm{V}) $ processes. The histograms for V$\gamma$ backgrounds include the contributions from W$\gamma$ and Z$\gamma$ processes. The overflow is included in the last bin. The bottom panel in each figure shows the ratio of the number of events observed in data to that of the total SM prediction. The grey bands represent the uncertainties in the predicted yields. The vertical bars represent the statistical uncertainties in the data. |
png pdf |
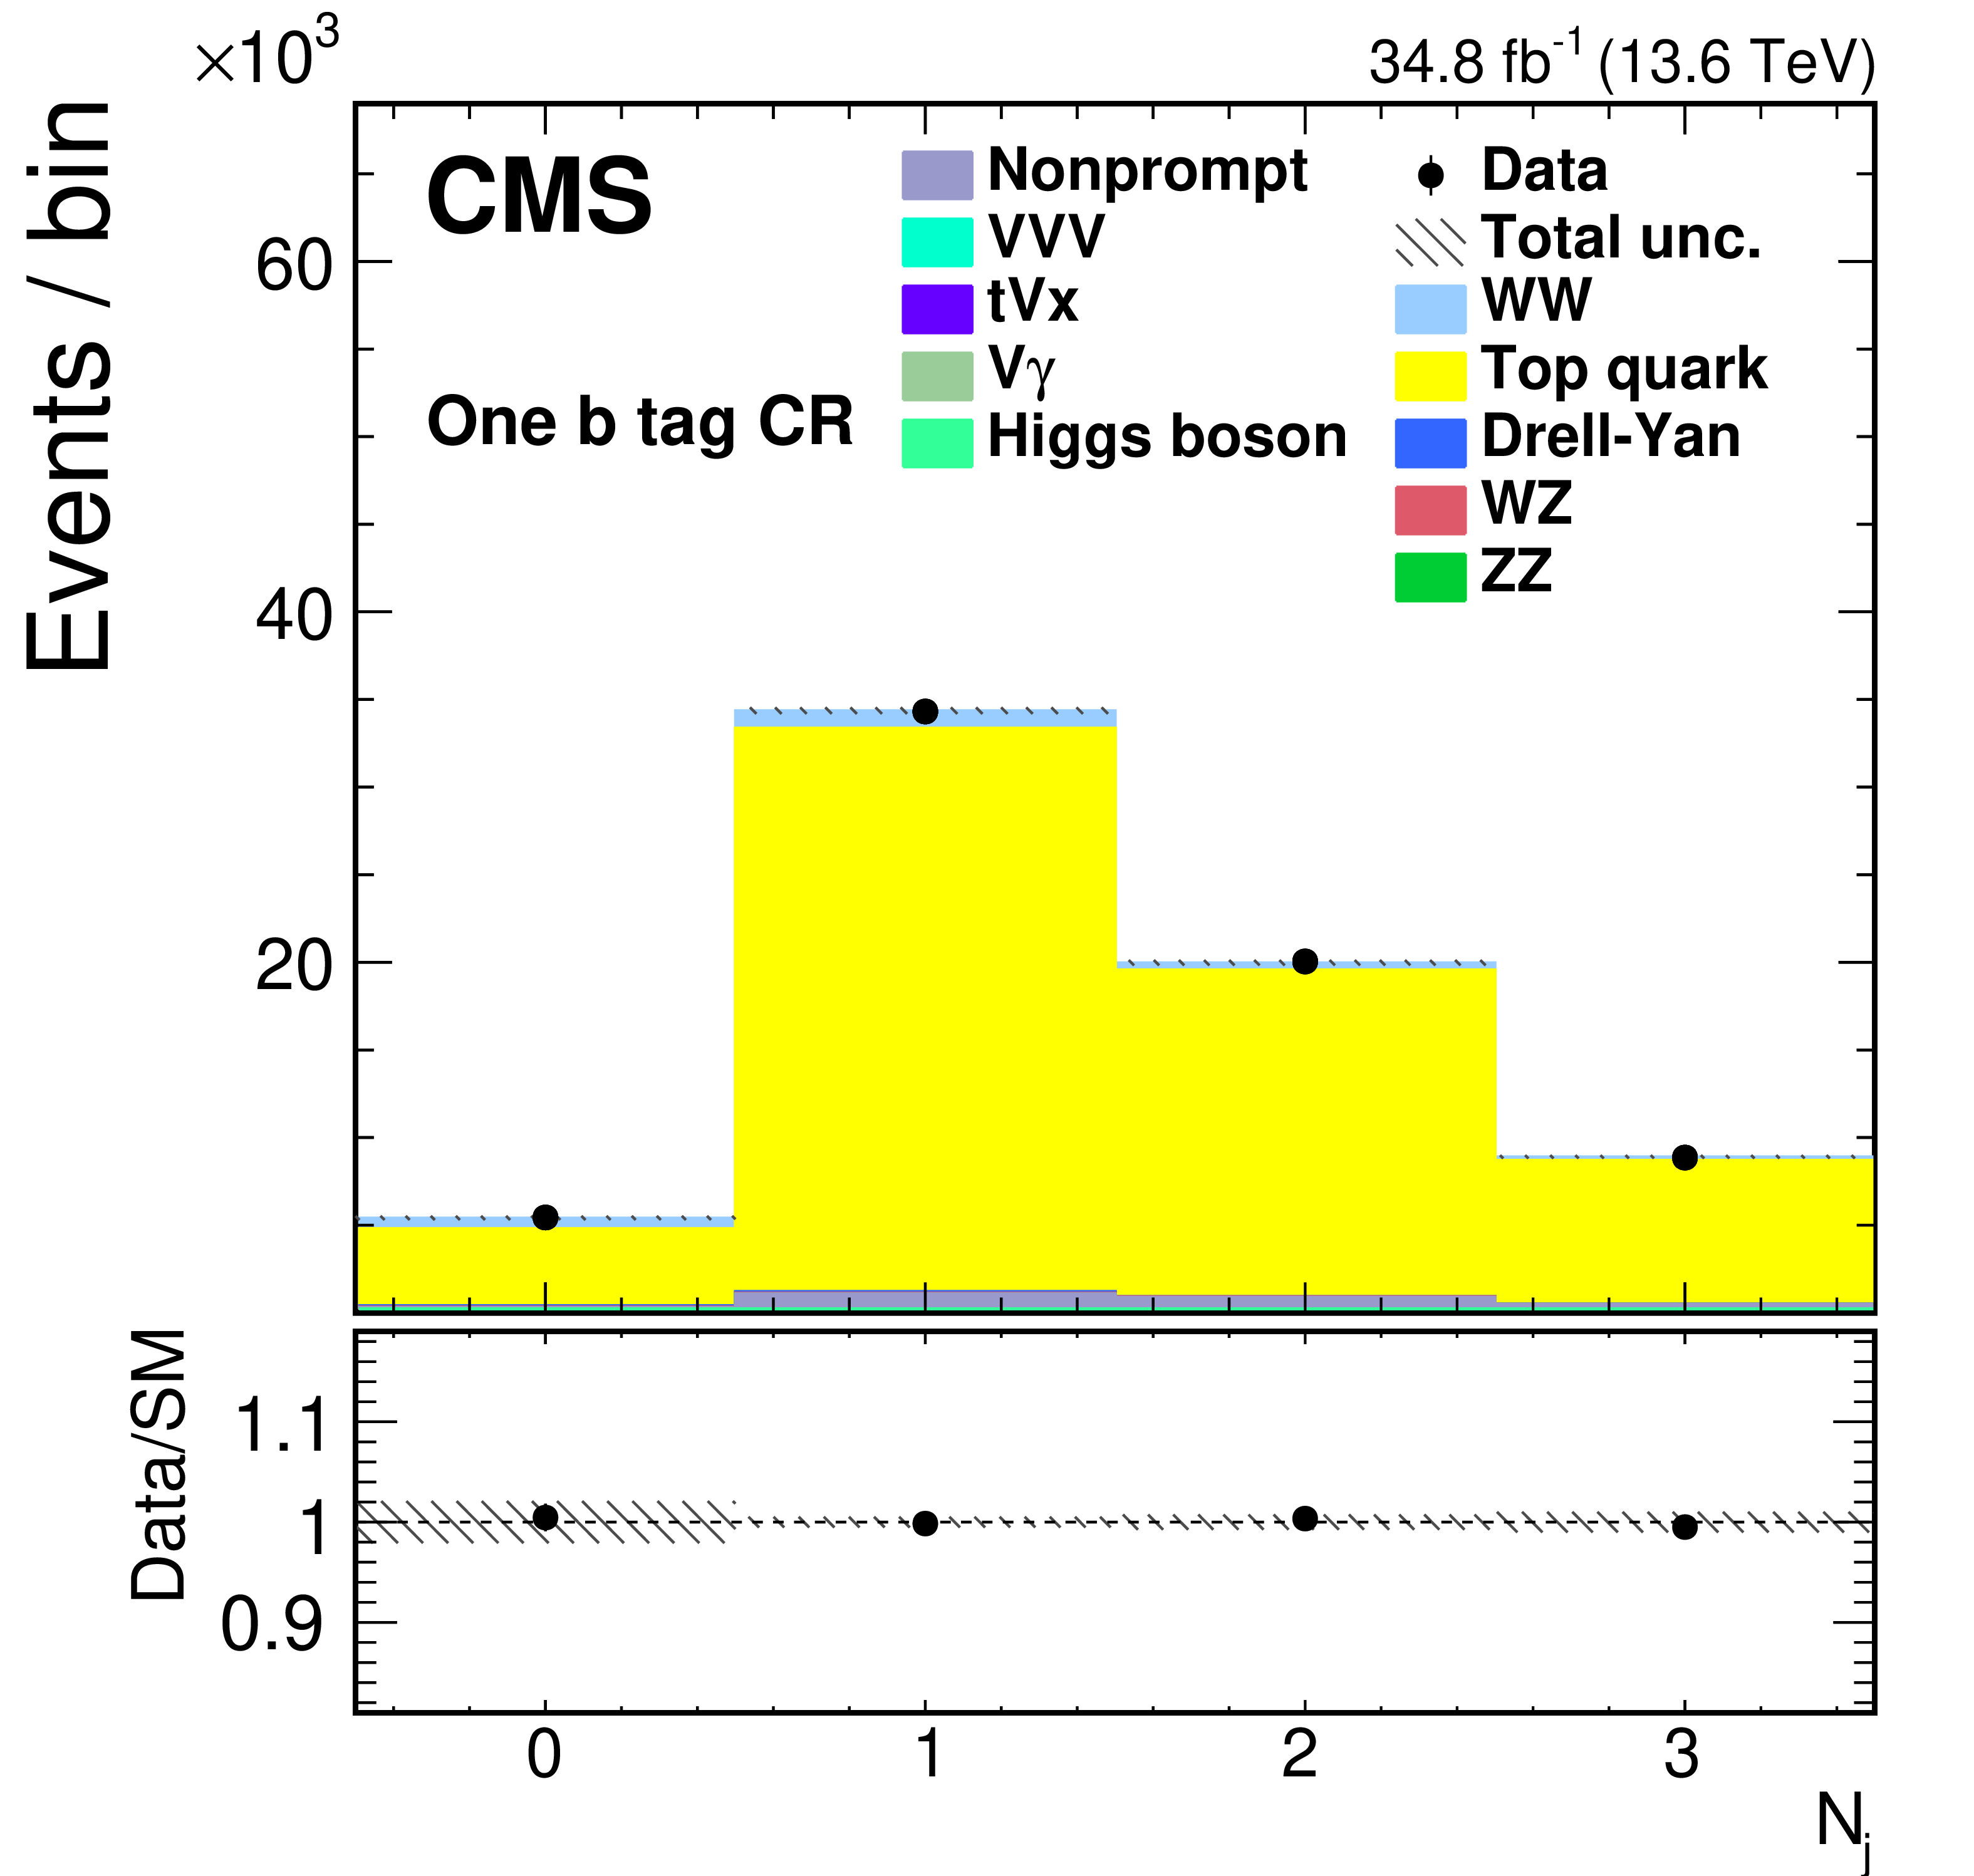
Figure 1-c:
Distributions of the number of reconstructed jets after the fit to the data in the WW SR (upper left), same-sign CR (upper right), $ \mathrm{Z}\to\tau\tau $ CR (center left), one b tag CR (center right), and two b tags CR (lower left), and the number of events in the $ \mathrm{W}\mathrm{Z}\to3\ell\nu $ and $ \mathrm{Z}\mathrm{Z}\to4\ell $ CRs (lower right). The histograms for $ \mathrm{t}\mathrm{V}\mathrm{x} $ backgrounds include the contributions from $ {\mathrm{t}\overline{\mathrm{t}}} \mathrm{V}(\mathrm{V}) $ processes. The histograms for V$\gamma$ backgrounds include the contributions from W$\gamma$ and Z$\gamma$ processes. The overflow is included in the last bin. The bottom panel in each figure shows the ratio of the number of events observed in data to that of the total SM prediction. The grey bands represent the uncertainties in the predicted yields. The vertical bars represent the statistical uncertainties in the data. |
png pdf |
Figure 1-d:
Distributions of the number of reconstructed jets after the fit to the data in the WW SR (upper left), same-sign CR (upper right), $ \mathrm{Z}\to\tau\tau $ CR (center left), one b tag CR (center right), and two b tags CR (lower left), and the number of events in the $ \mathrm{W}\mathrm{Z}\to3\ell\nu $ and $ \mathrm{Z}\mathrm{Z}\to4\ell $ CRs (lower right). The histograms for $ \mathrm{t}\mathrm{V}\mathrm{x} $ backgrounds include the contributions from $ {\mathrm{t}\overline{\mathrm{t}}} \mathrm{V}(\mathrm{V}) $ processes. The histograms for V$\gamma$ backgrounds include the contributions from W$\gamma$ and Z$\gamma$ processes. The overflow is included in the last bin. The bottom panel in each figure shows the ratio of the number of events observed in data to that of the total SM prediction. The grey bands represent the uncertainties in the predicted yields. The vertical bars represent the statistical uncertainties in the data. |
png pdf |
Figure 1-e:
Distributions of the number of reconstructed jets after the fit to the data in the WW SR (upper left), same-sign CR (upper right), $ \mathrm{Z}\to\tau\tau $ CR (center left), one b tag CR (center right), and two b tags CR (lower left), and the number of events in the $ \mathrm{W}\mathrm{Z}\to3\ell\nu $ and $ \mathrm{Z}\mathrm{Z}\to4\ell $ CRs (lower right). The histograms for $ \mathrm{t}\mathrm{V}\mathrm{x} $ backgrounds include the contributions from $ {\mathrm{t}\overline{\mathrm{t}}} \mathrm{V}(\mathrm{V}) $ processes. The histograms for V$\gamma$ backgrounds include the contributions from W$\gamma$ and Z$\gamma$ processes. The overflow is included in the last bin. The bottom panel in each figure shows the ratio of the number of events observed in data to that of the total SM prediction. The grey bands represent the uncertainties in the predicted yields. The vertical bars represent the statistical uncertainties in the data. |
png pdf |
Figure 1-f:
Distributions of the number of reconstructed jets after the fit to the data in the WW SR (upper left), same-sign CR (upper right), $ \mathrm{Z}\to\tau\tau $ CR (center left), one b tag CR (center right), and two b tags CR (lower left), and the number of events in the $ \mathrm{W}\mathrm{Z}\to3\ell\nu $ and $ \mathrm{Z}\mathrm{Z}\to4\ell $ CRs (lower right). The histograms for $ \mathrm{t}\mathrm{V}\mathrm{x} $ backgrounds include the contributions from $ {\mathrm{t}\overline{\mathrm{t}}} \mathrm{V}(\mathrm{V}) $ processes. The histograms for V$\gamma$ backgrounds include the contributions from W$\gamma$ and Z$\gamma$ processes. The overflow is included in the last bin. The bottom panel in each figure shows the ratio of the number of events observed in data to that of the total SM prediction. The grey bands represent the uncertainties in the predicted yields. The vertical bars represent the statistical uncertainties in the data. |

png pdf |
Figure 2:
Results obtained in this analysis and other WW production cross section measurements at different center-of-mass energies for the CMS [6,7,11], ATLAS [5,8,71], CDF [4], and D0 [3] Collaborations are presented, and compared with the NNLO QCD $ \times $ NLO EW and NLO predictions from MATRIX. The vertical error bars represent the uncertainty in the measured cross section. |
png pdf |
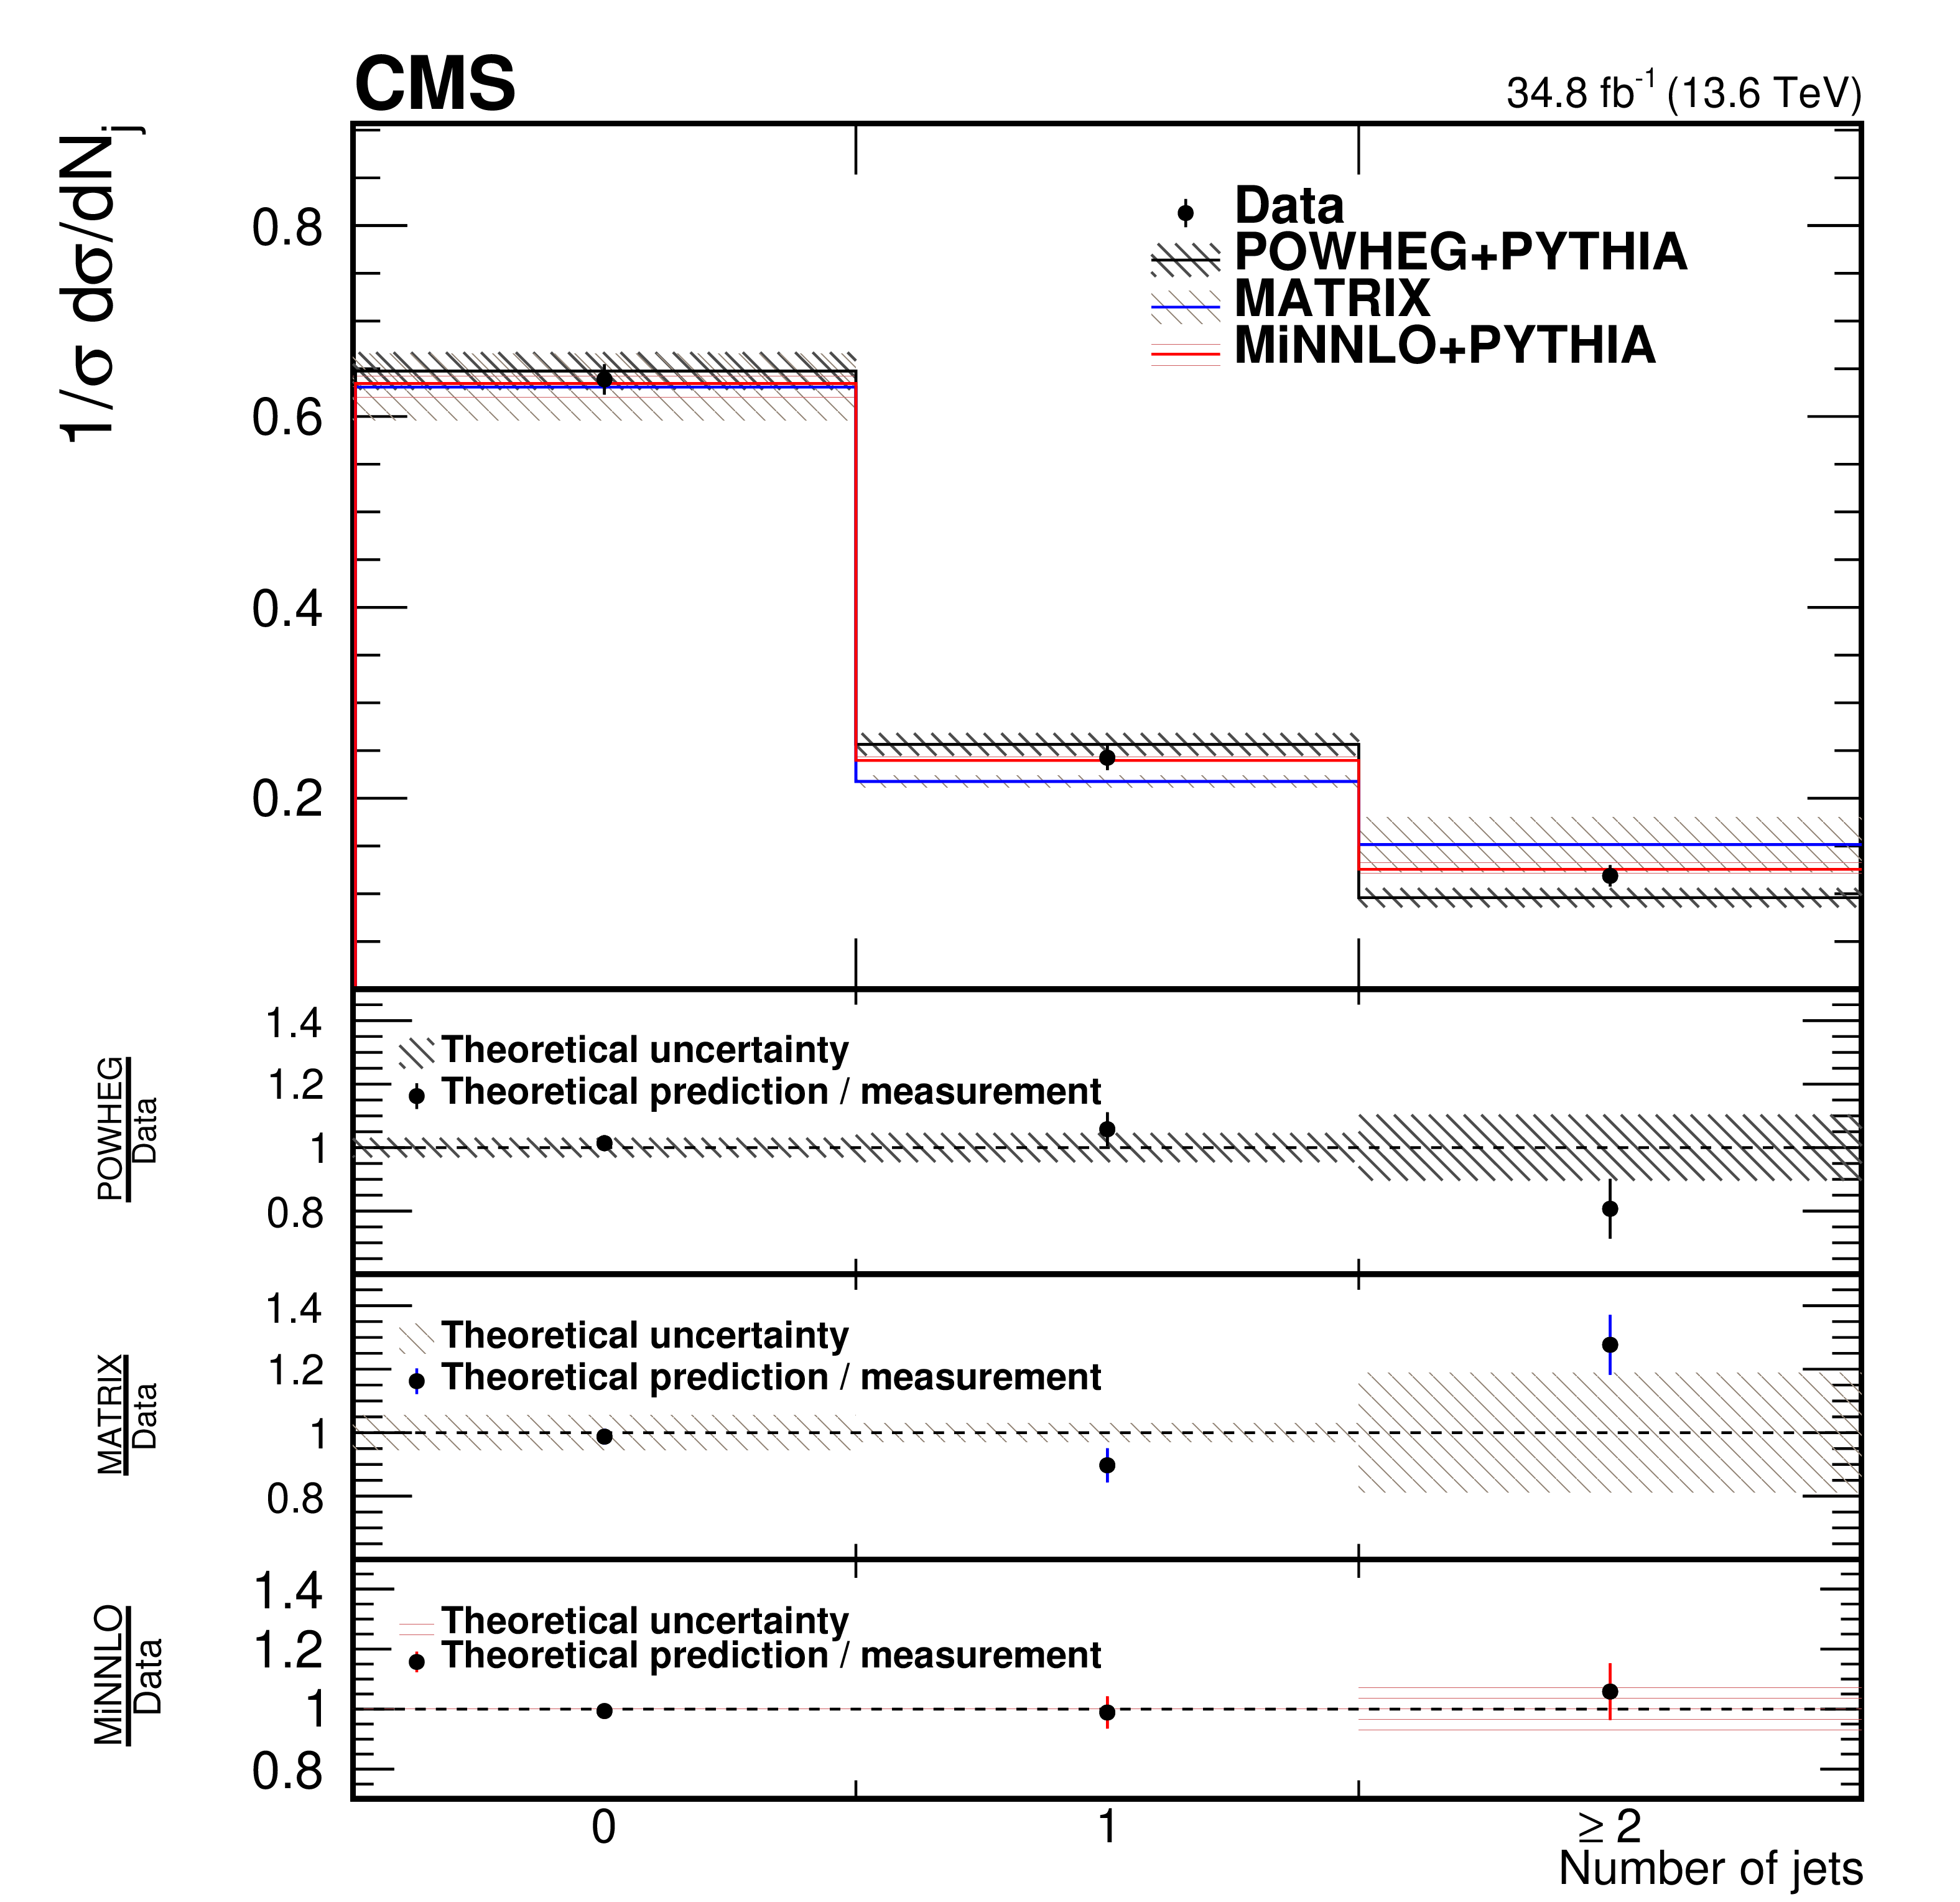
Figure 3:
The upper panel shows the normalized cross section measurement for events with $ N_{\mathrm{j}}= $ 0, 1, $ {\ge} $2 jets. The filled circles represent the unfolded data results. The black, blue, and red lines represent the predictions from POWHEG +PYTHIA, MATRIX, and POWHEG MINNLO+PYTHIA, respectively. The lower panels show the ratio of the theoretical predictions to the measurement. In all panels, the error bars on the data points represent the total uncertainty in the measurement, and the shaded band depicts the uncertainty in the prediction. |
| Tables | |
png pdf |
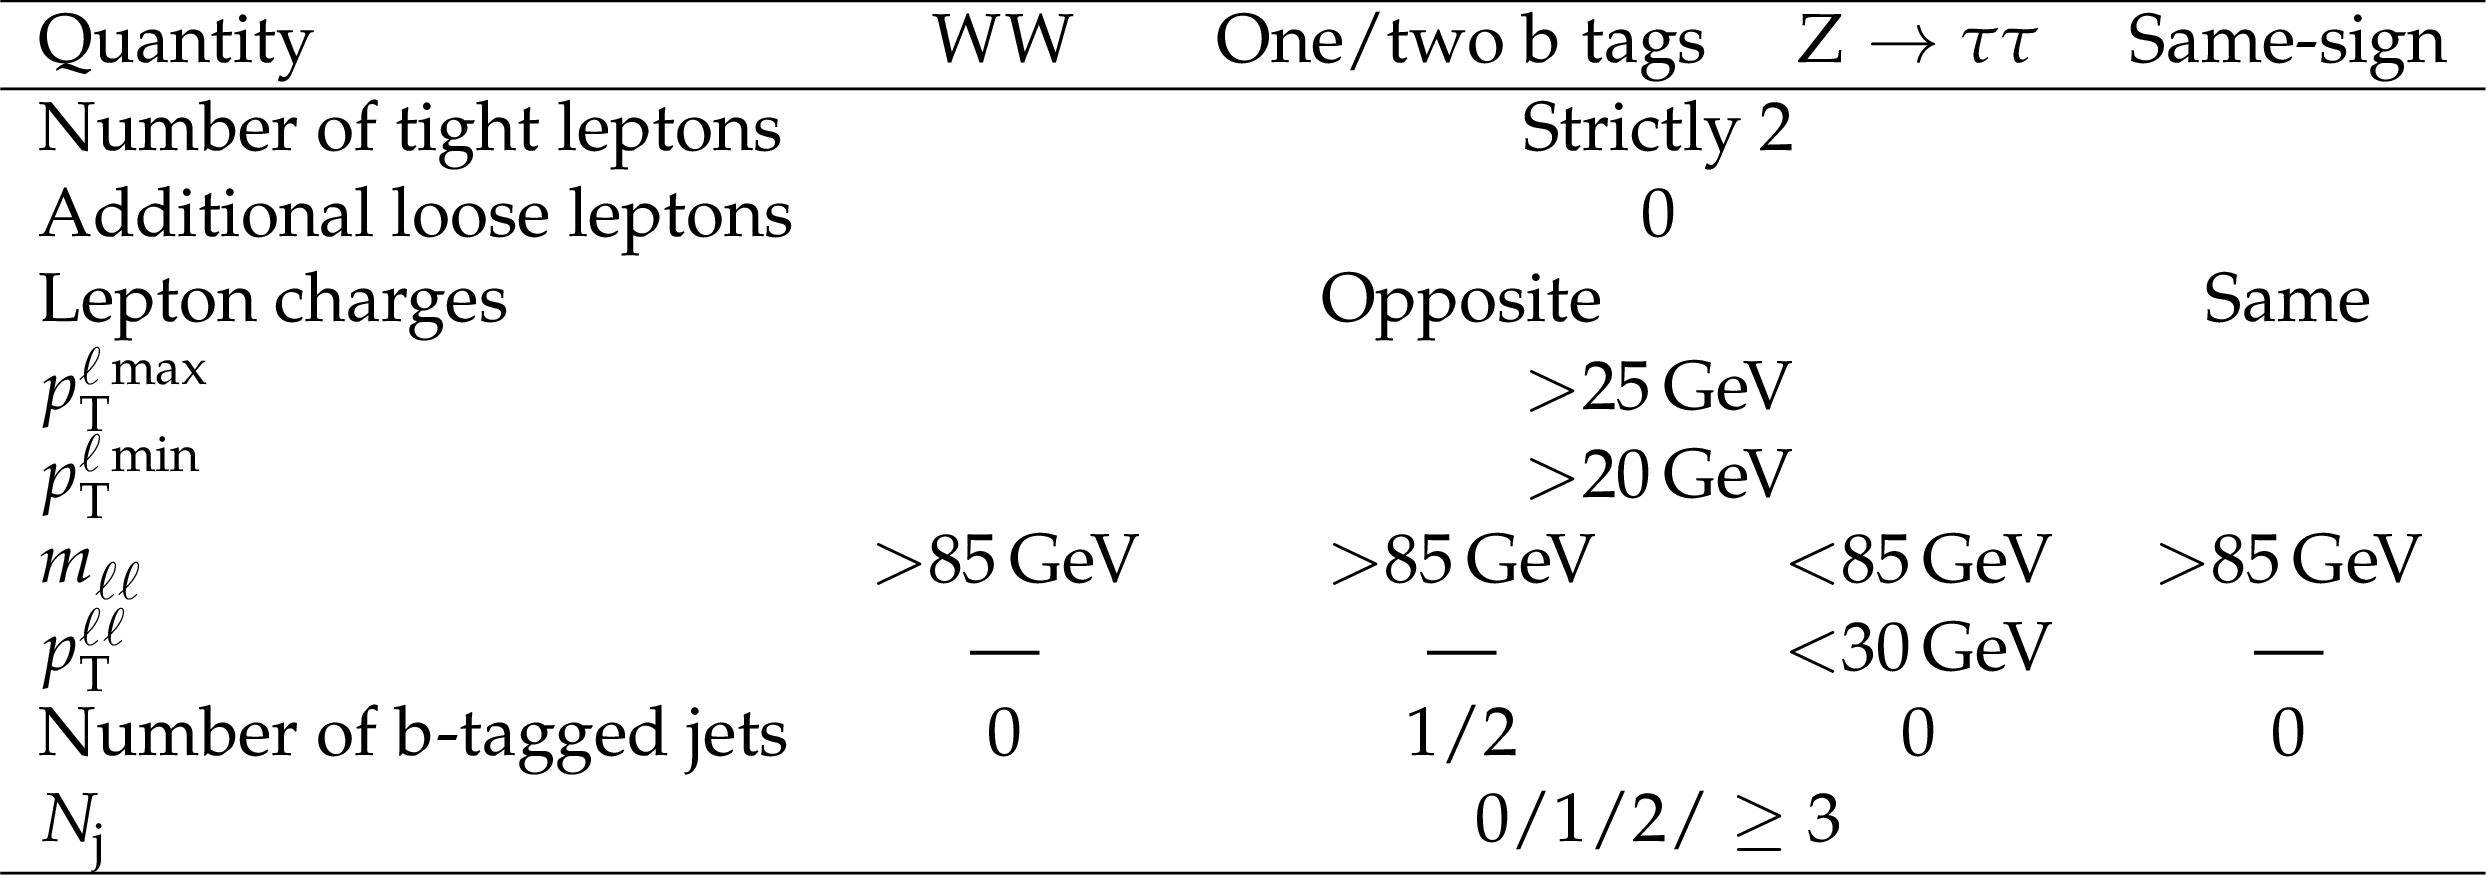
Table 1:
Summary of the requirements defining the WW SR and dilepton CRs. |
png pdf |
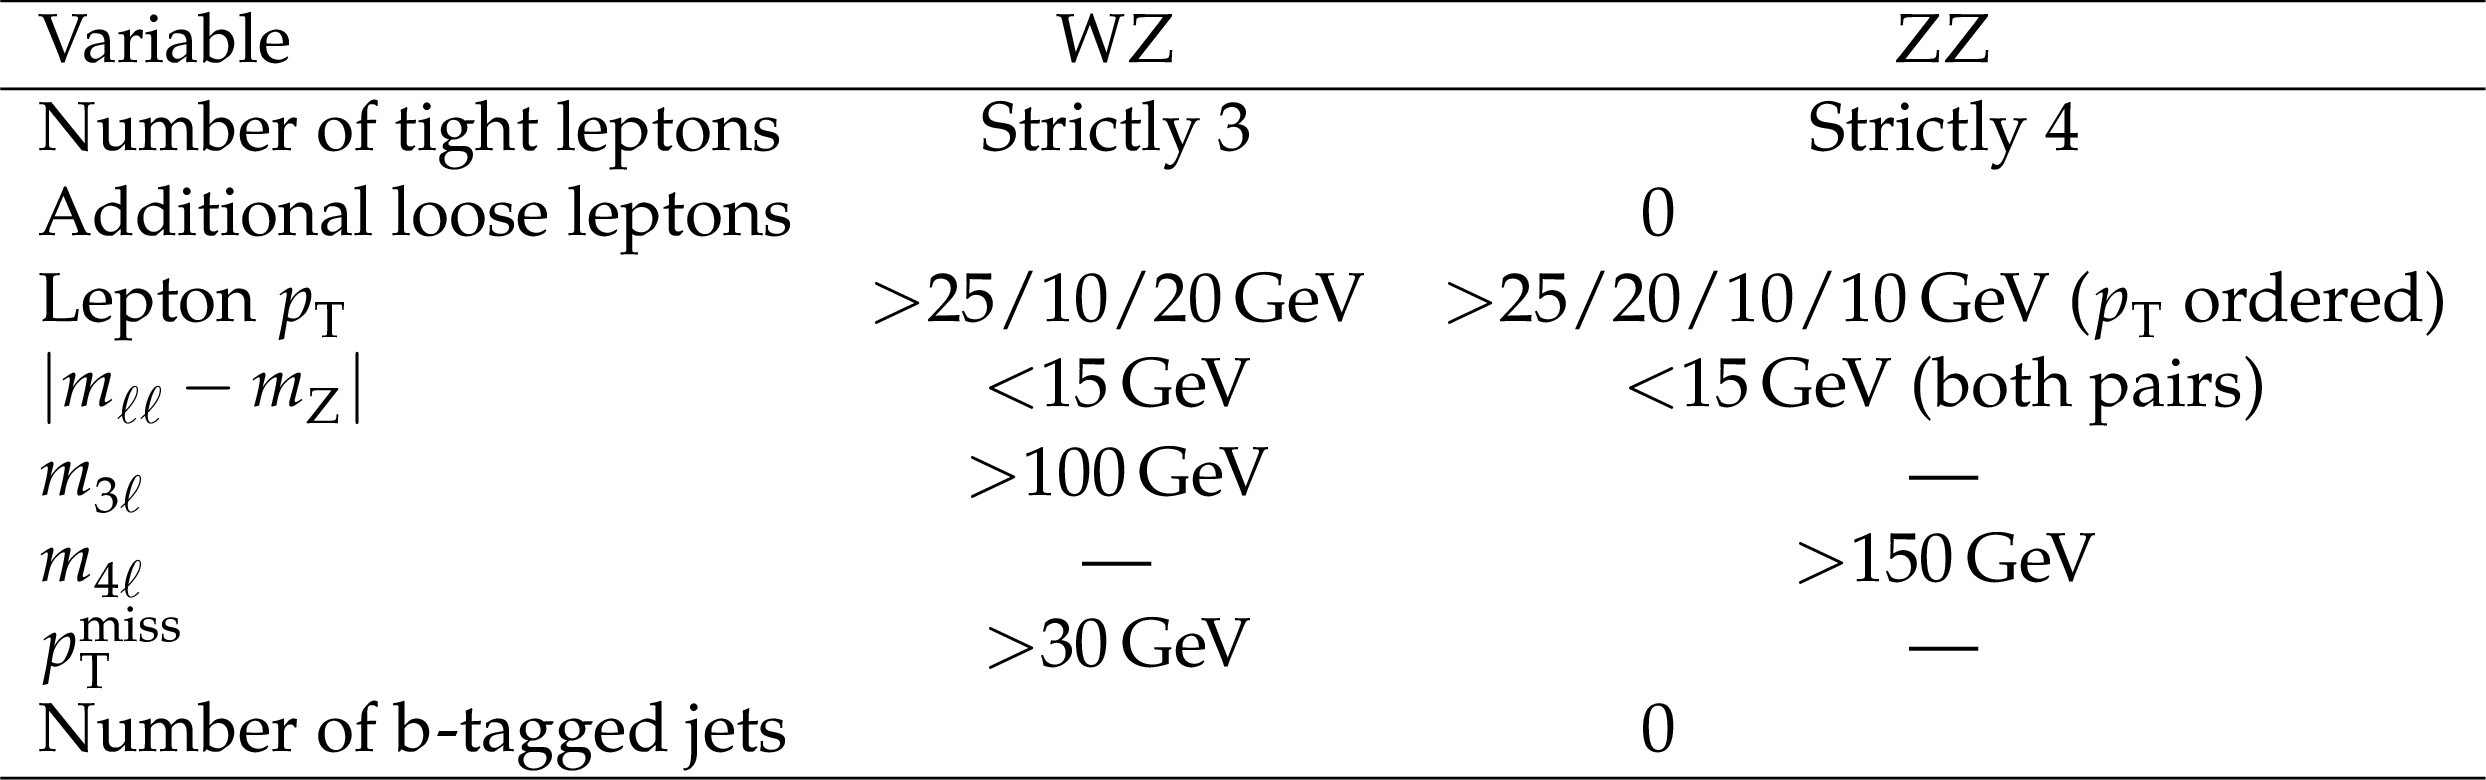
Table 2:
Summary of the requirements defining the WZ and ZZ CRs. |
png pdf |
Table 3:
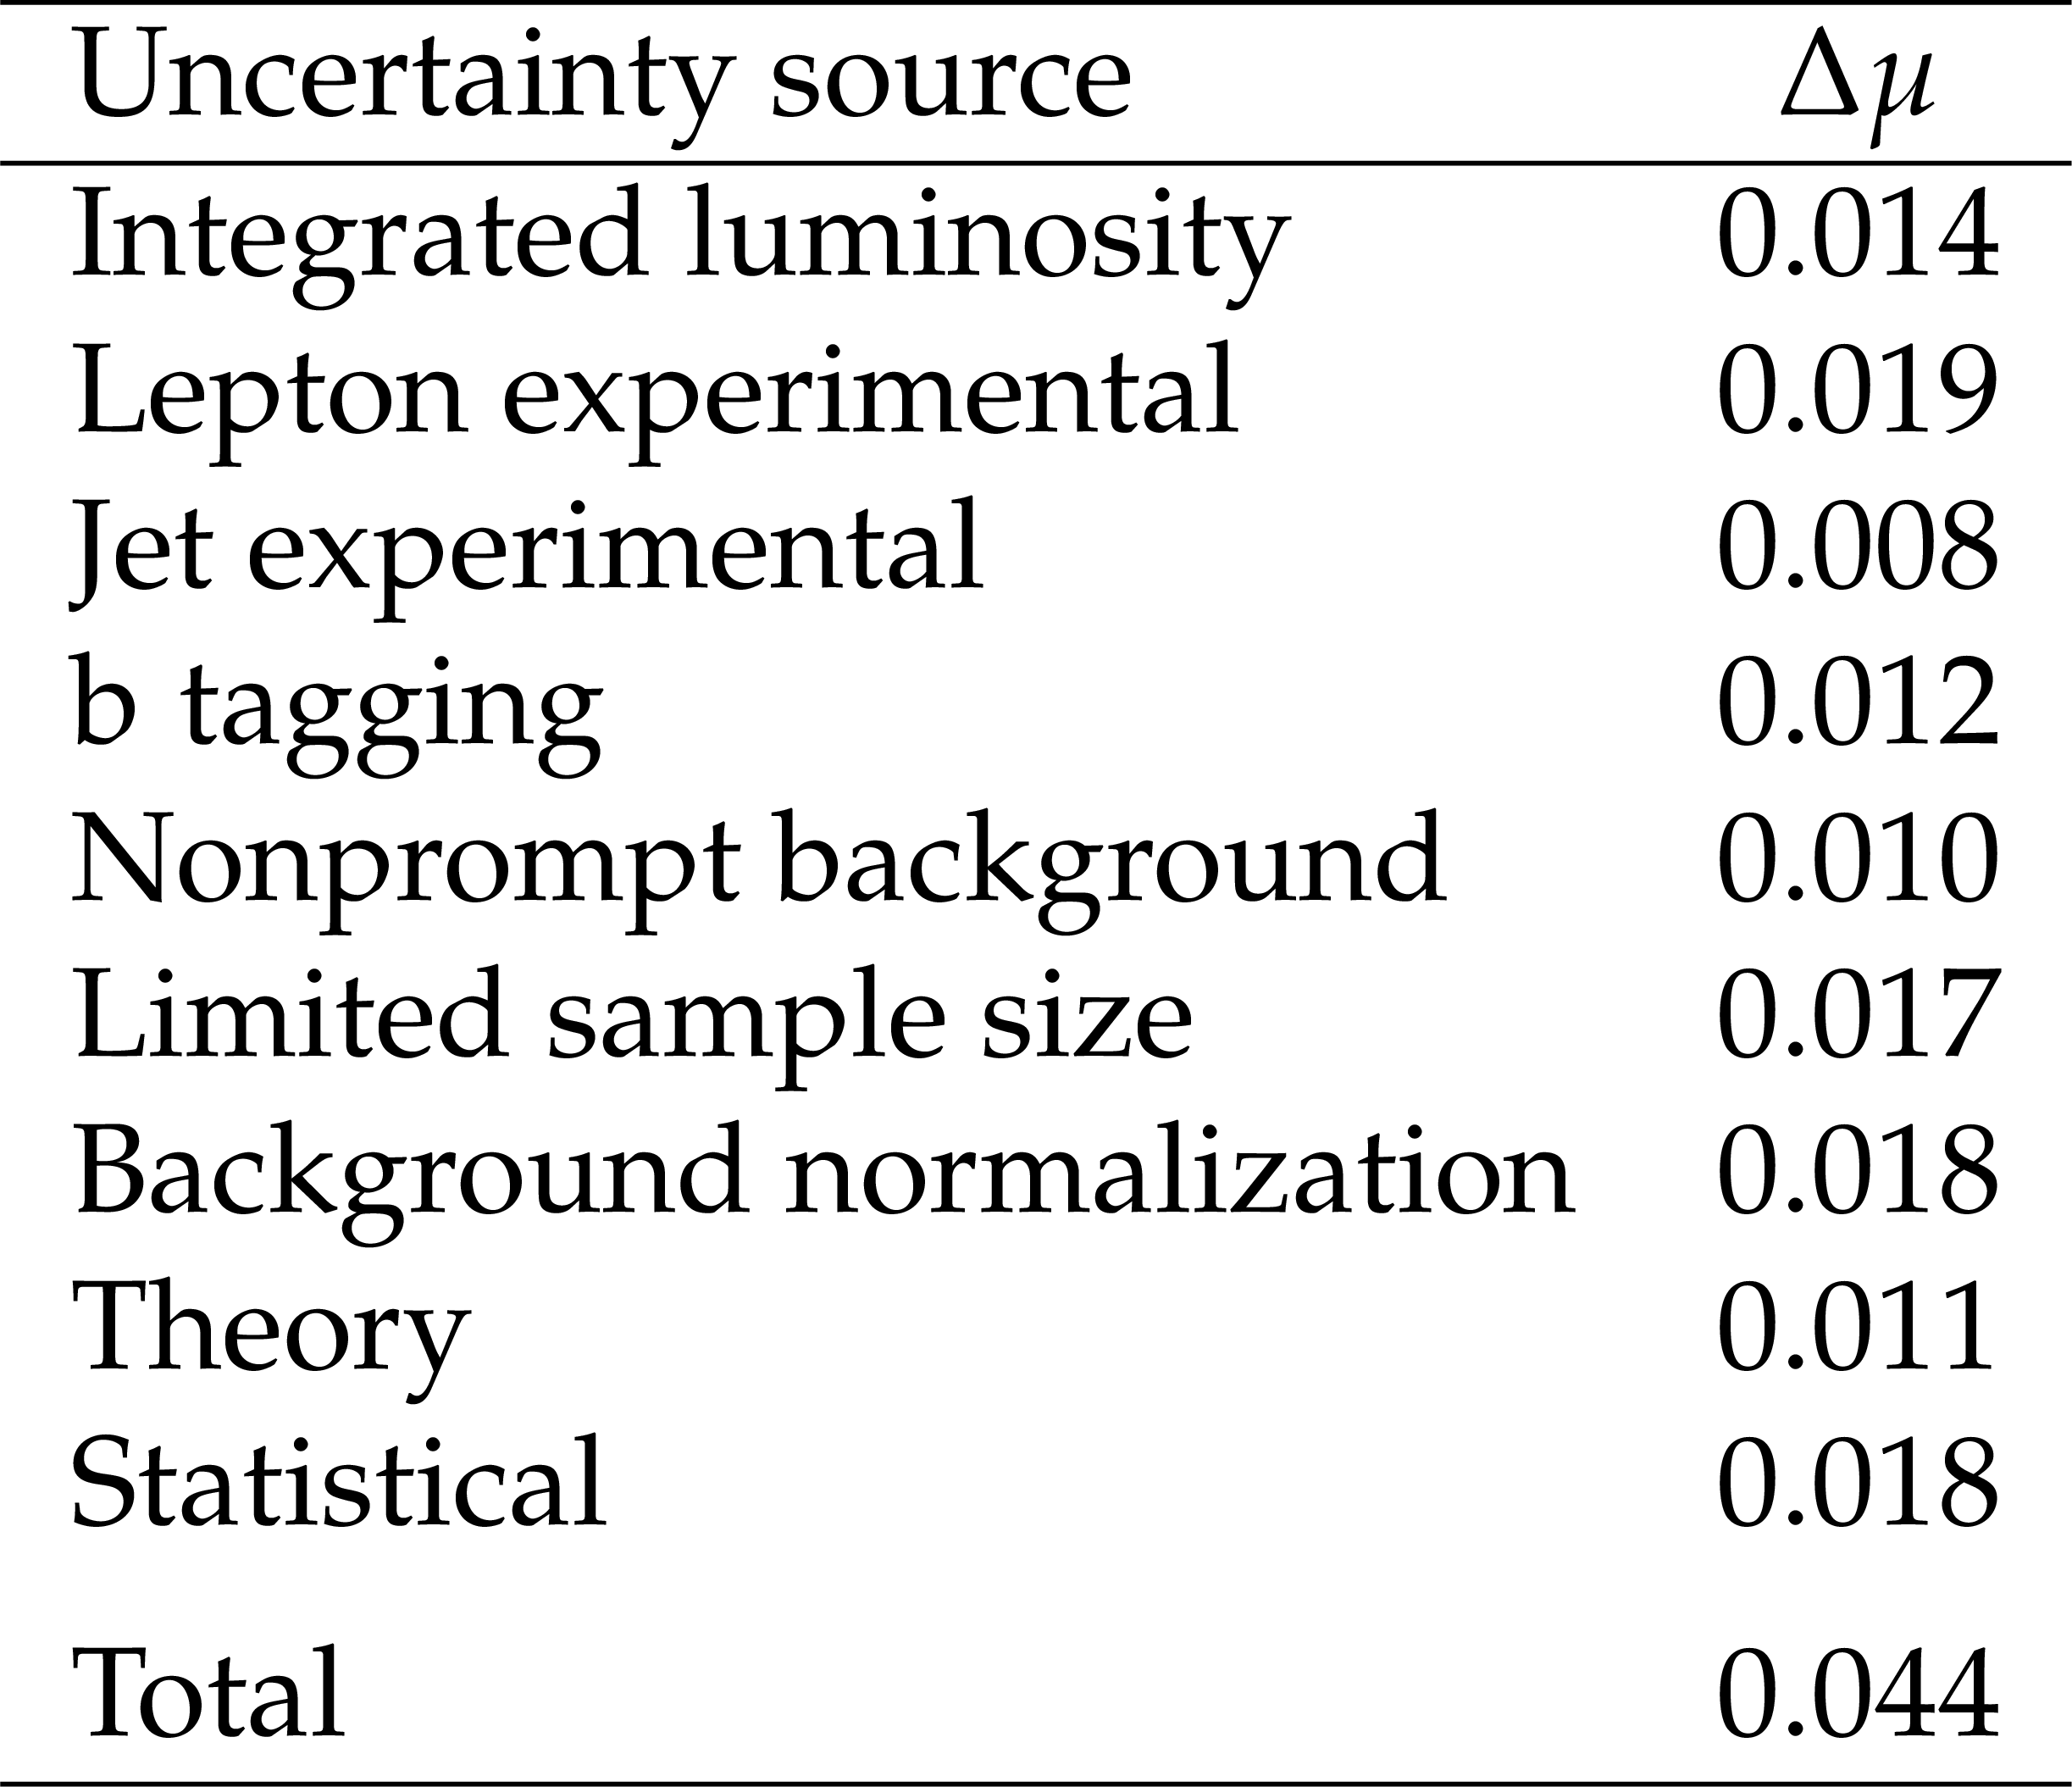
Systematic uncertainties on $ \mu $, the measured inclusive cross section divided by the predicted cross section. Lepton experimental uncertainties encompass the effects of calibration of lepton momentum scale and resolution, as well as lepton trigger, reconstruction, identification, and isolation efficiencies. Jet experimental uncertainties encompass the effects of the jet energy scale and resolution. The limited sample size category is related to the finite number of MC events and data events used for data-driven background estimates. |
png pdf |
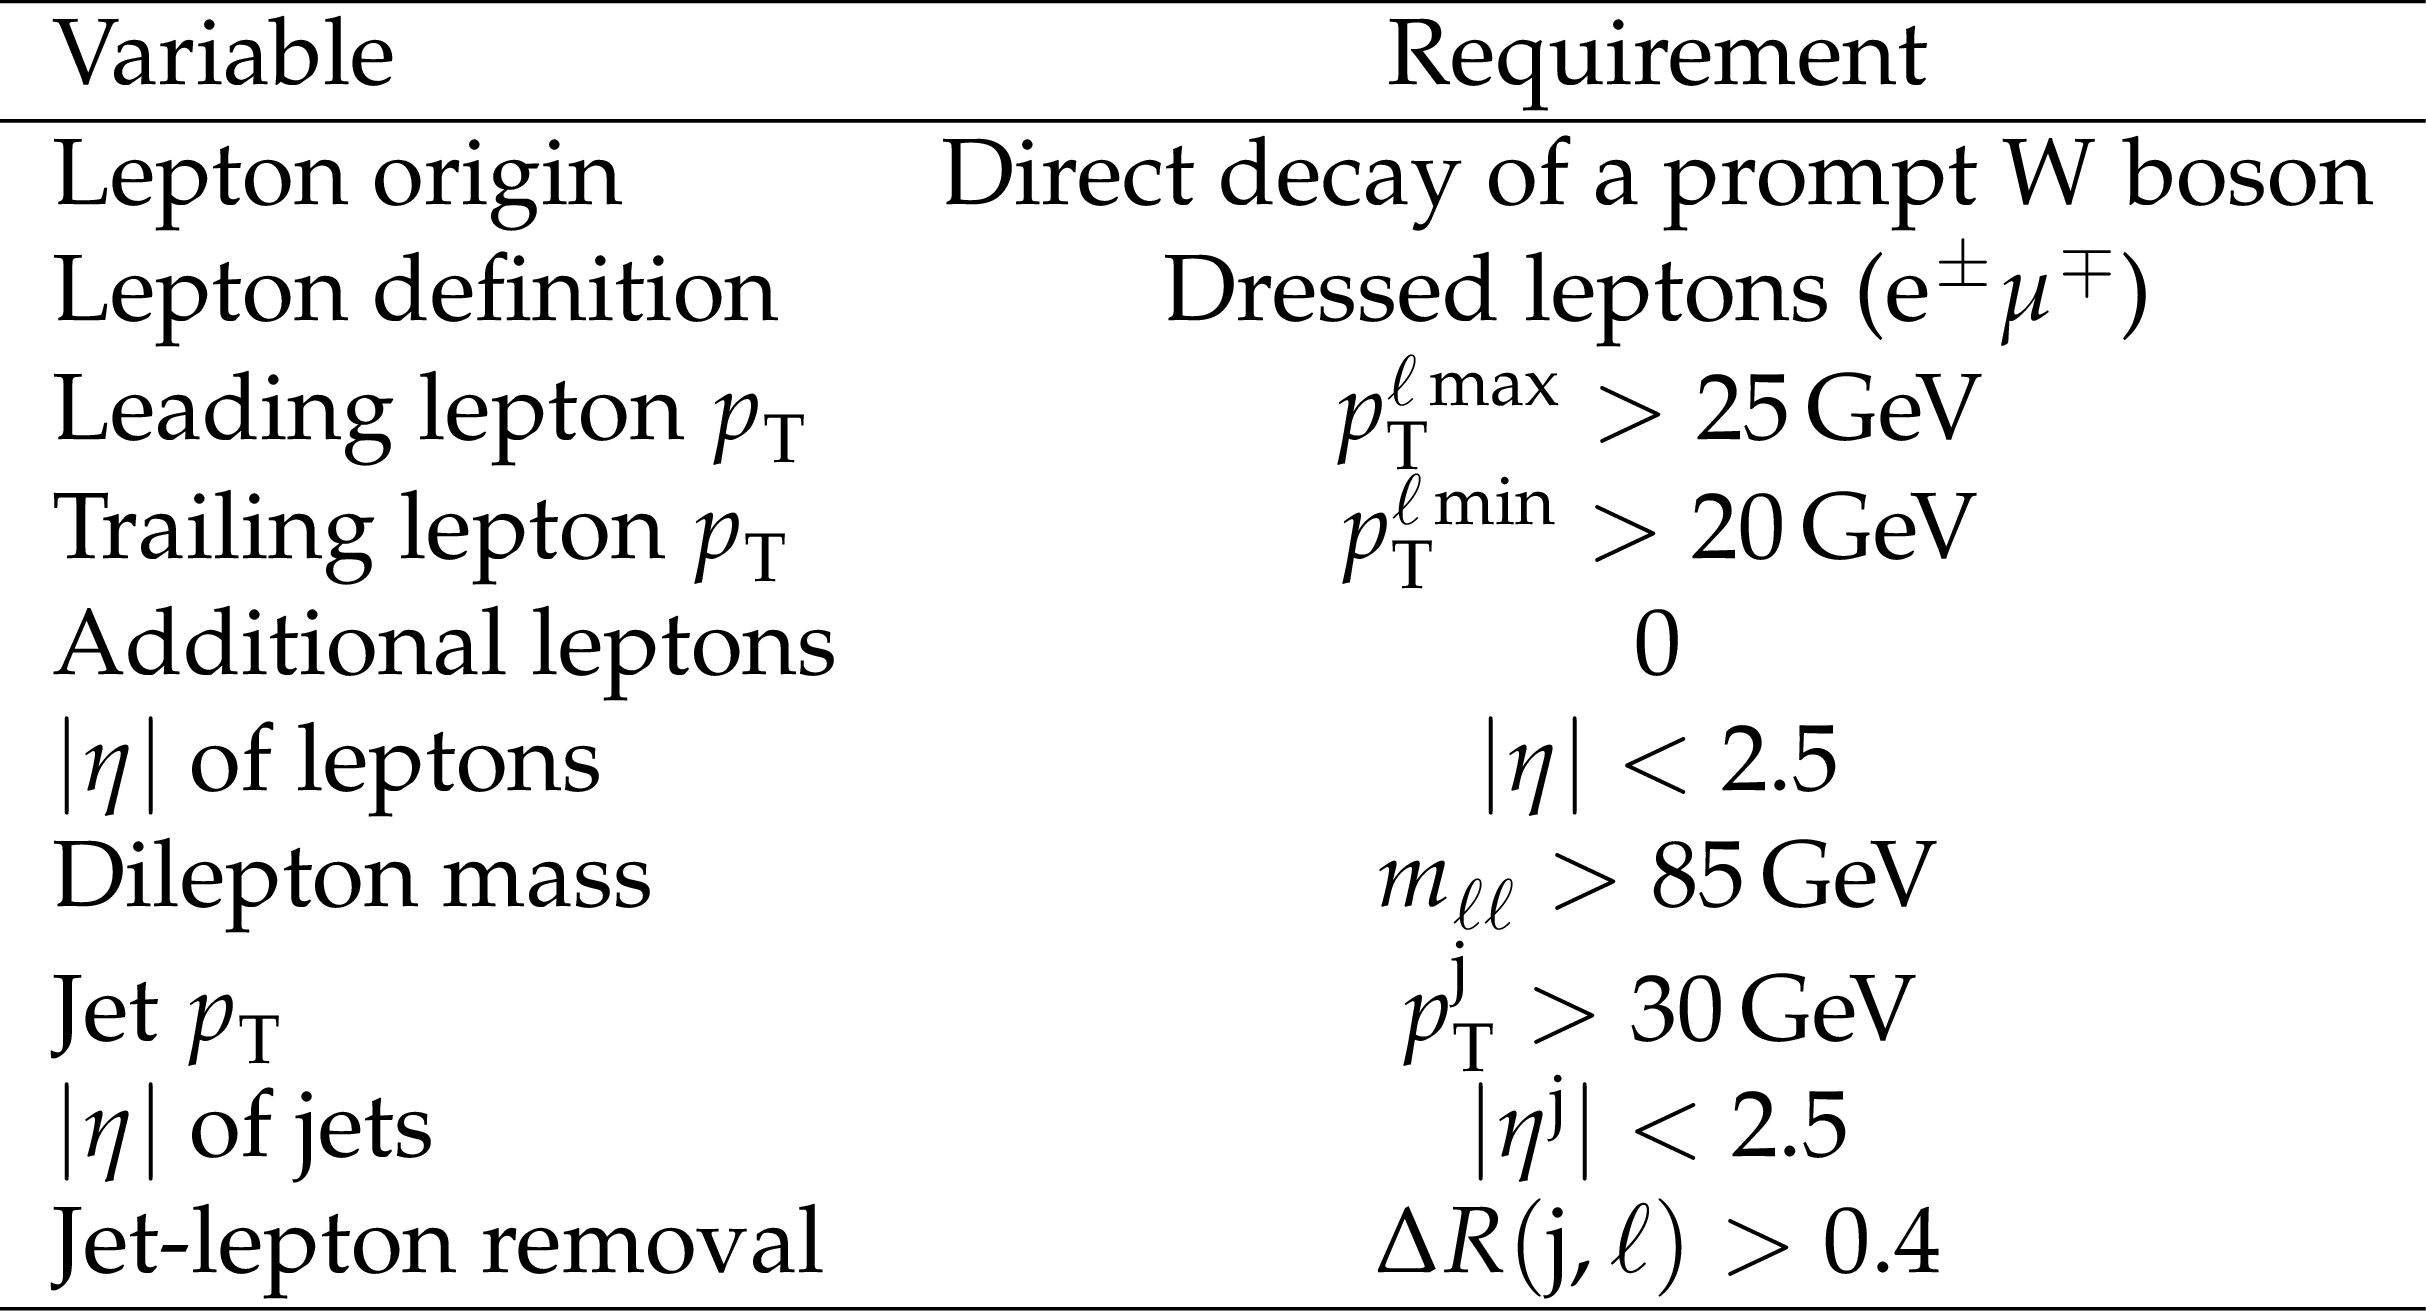
Table 4:
Definition of the fiducial region. |
png pdf |
Table 5:
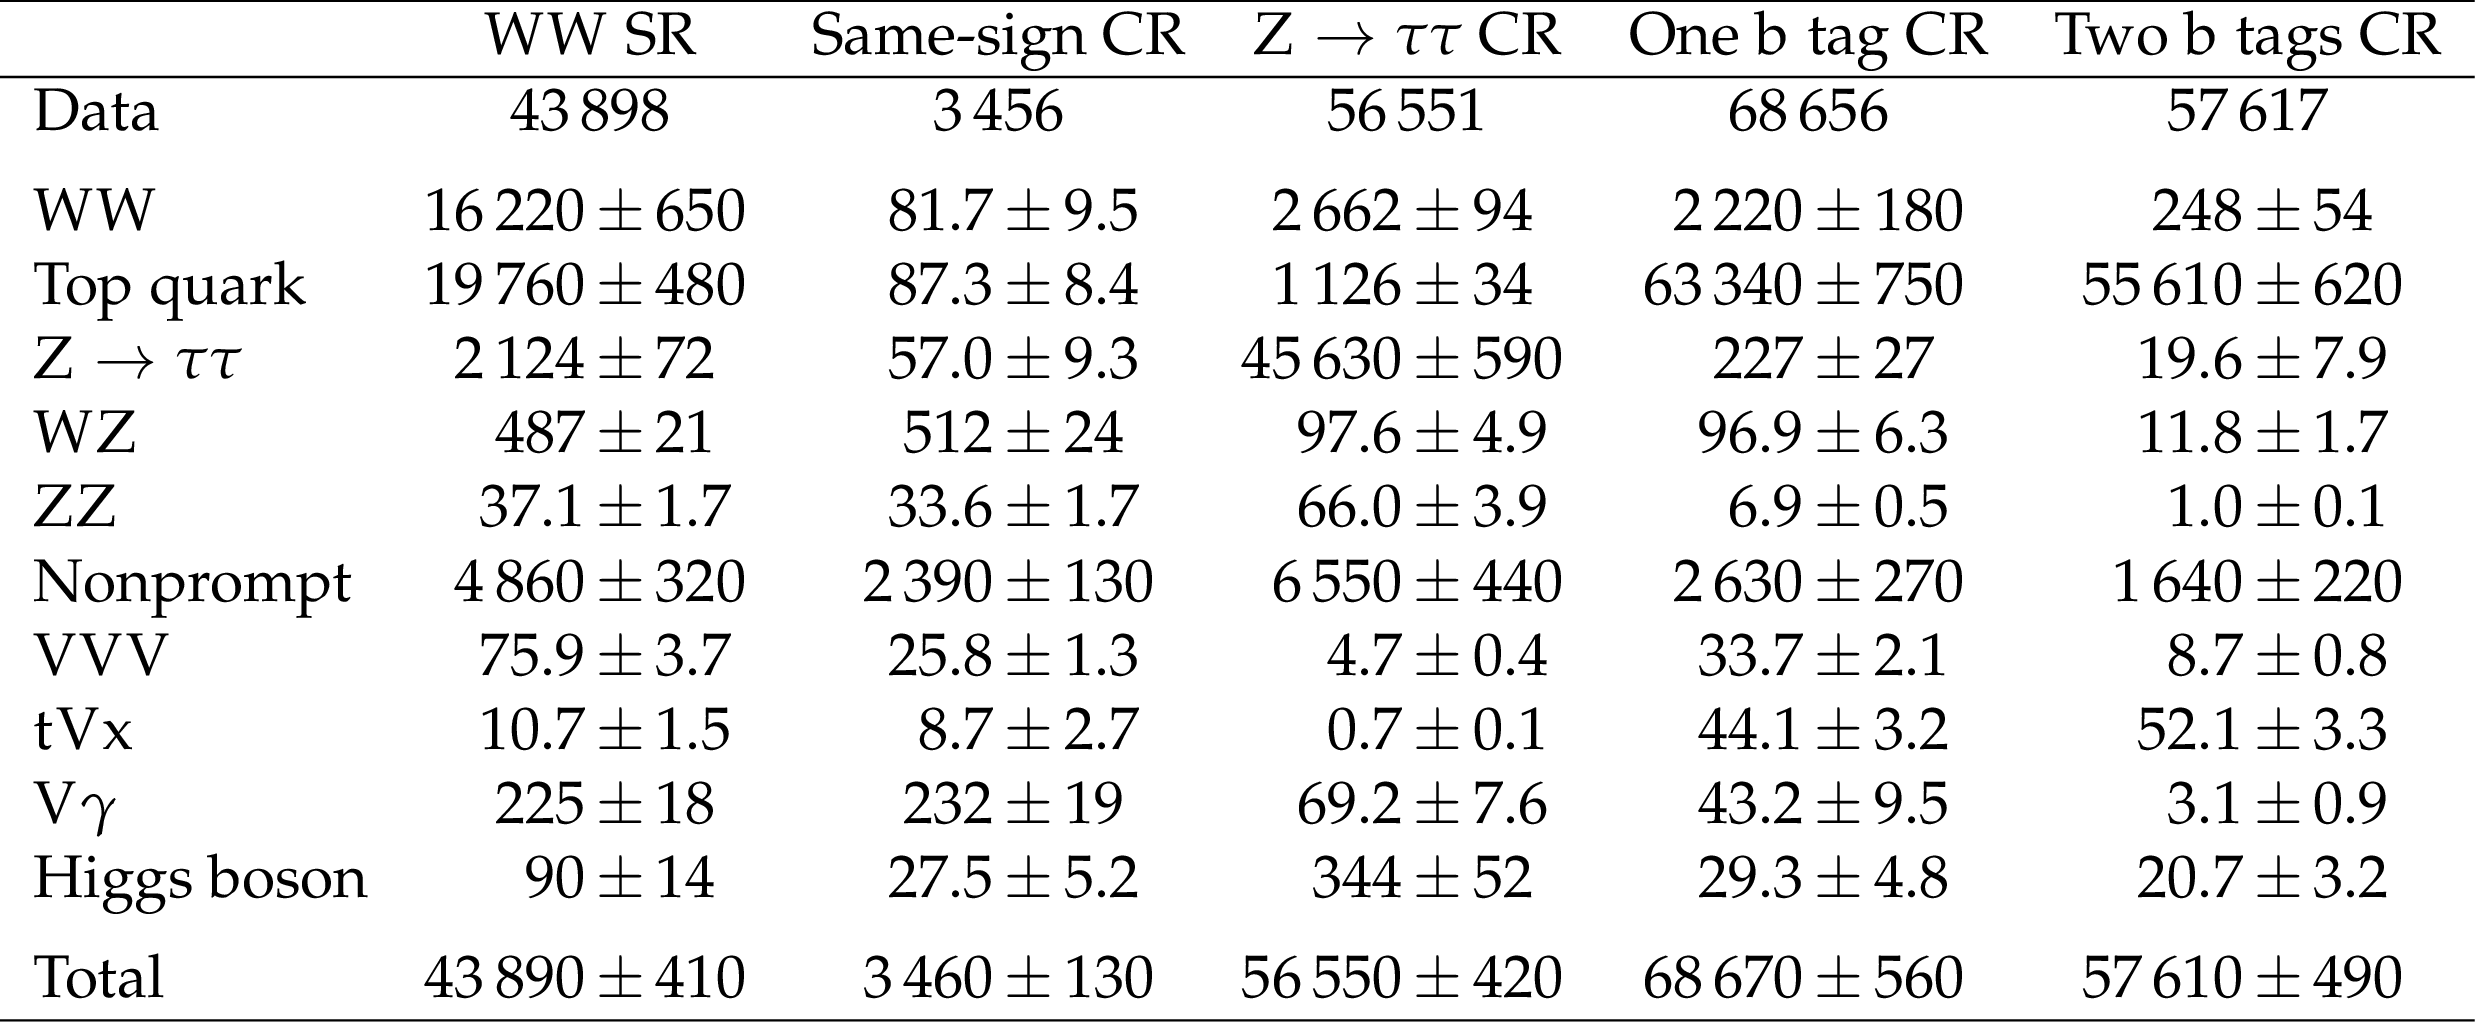
Data, signal, and background yields combining all reconstructed jet multiplicity bins. The combination of the statistical and systematic uncertainties is shown. The expected yields are shown with their best fit normalizations from the simultaneous fit to data. |

png pdf |
Table 6:
Data, signal and background yields in events in the WZ and ZZ CRs. The combination of the statistical and systematic uncertainties is shown. The expected yields are shown with their best fit normalizations from the simultaneous fit to data. |
png pdf |
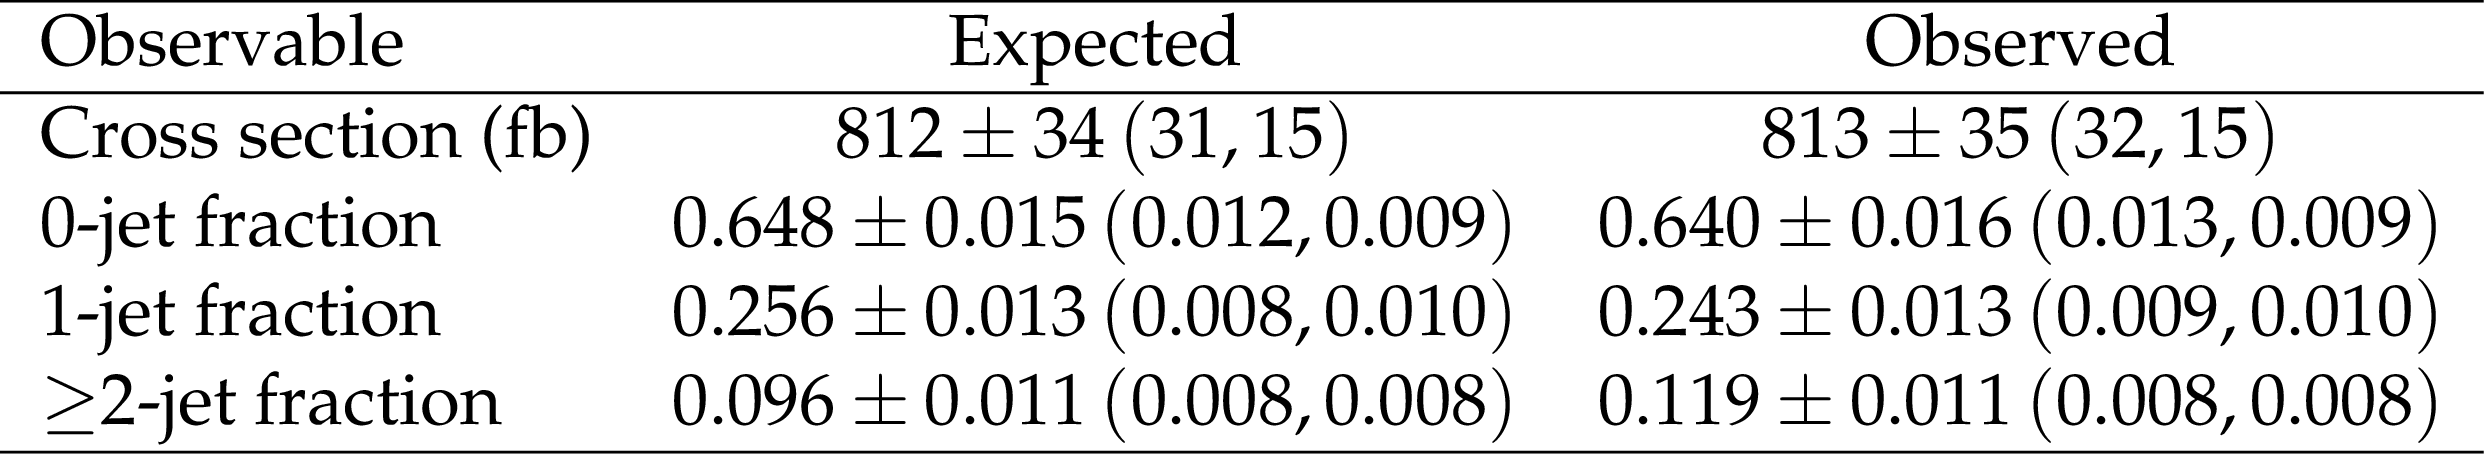
Table 7:
Inclusive fiducial cross section and normalized cross sections for events with $ N_{\mathrm{j}}= $ 0, 1, ${\ge} $2 jets. The uncertainty listed is the total uncertainty obtained from the fit to the yields. The expected predictions are obtained from POWHEG +PYTHIA. In parentheses, the split of systematic and statistical uncertainties are reported. |
| Summary |
| First measurements at $ \sqrt{s}= $ 13.6 TeV of the WW production cross section in proton-proton collisions have been presented. The data used in this study were collected with the CMS detector at the CERN LHC in 2022, and correspond to an integrated luminosity of 34.8 fb$ ^{-1} $. Events were selected by requiring one electron and one muon of opposite charge. A maximum likelihood fit has been performed in event signal- and background-enriched categories defined by the flavour and charge of the leptons, the number of jets, and number of jets identified as originating from b quarks. An inclusive WW production cross section of 125.7 $ \pm $ 2.3 (stat) $ \pm $ 4.8 (syst) $ \pm $ 1.8 (lumi) pb $ = $ 125.7 $ \pm $ 5.6 pb is measured, in agreement with the standard model prediction. The overall sensitivity is about 25% better than previous CMS measurements at $ \sqrt{s}= $ 13 TeV with a similar integrated luminosity, because of several reduced experimental uncertainties and the improved fit strategy. Cross sections have also been reported in a fiducial region close to that of the detector acceptance, both inclusively and differentially, as a function of the jet multiplicity in the event. For first time in proton-proton collisions, WW events with at least two reconstructed jets are studied and compared with the most precise theoretical predictions. |
| Additional Figures | |
png pdf |
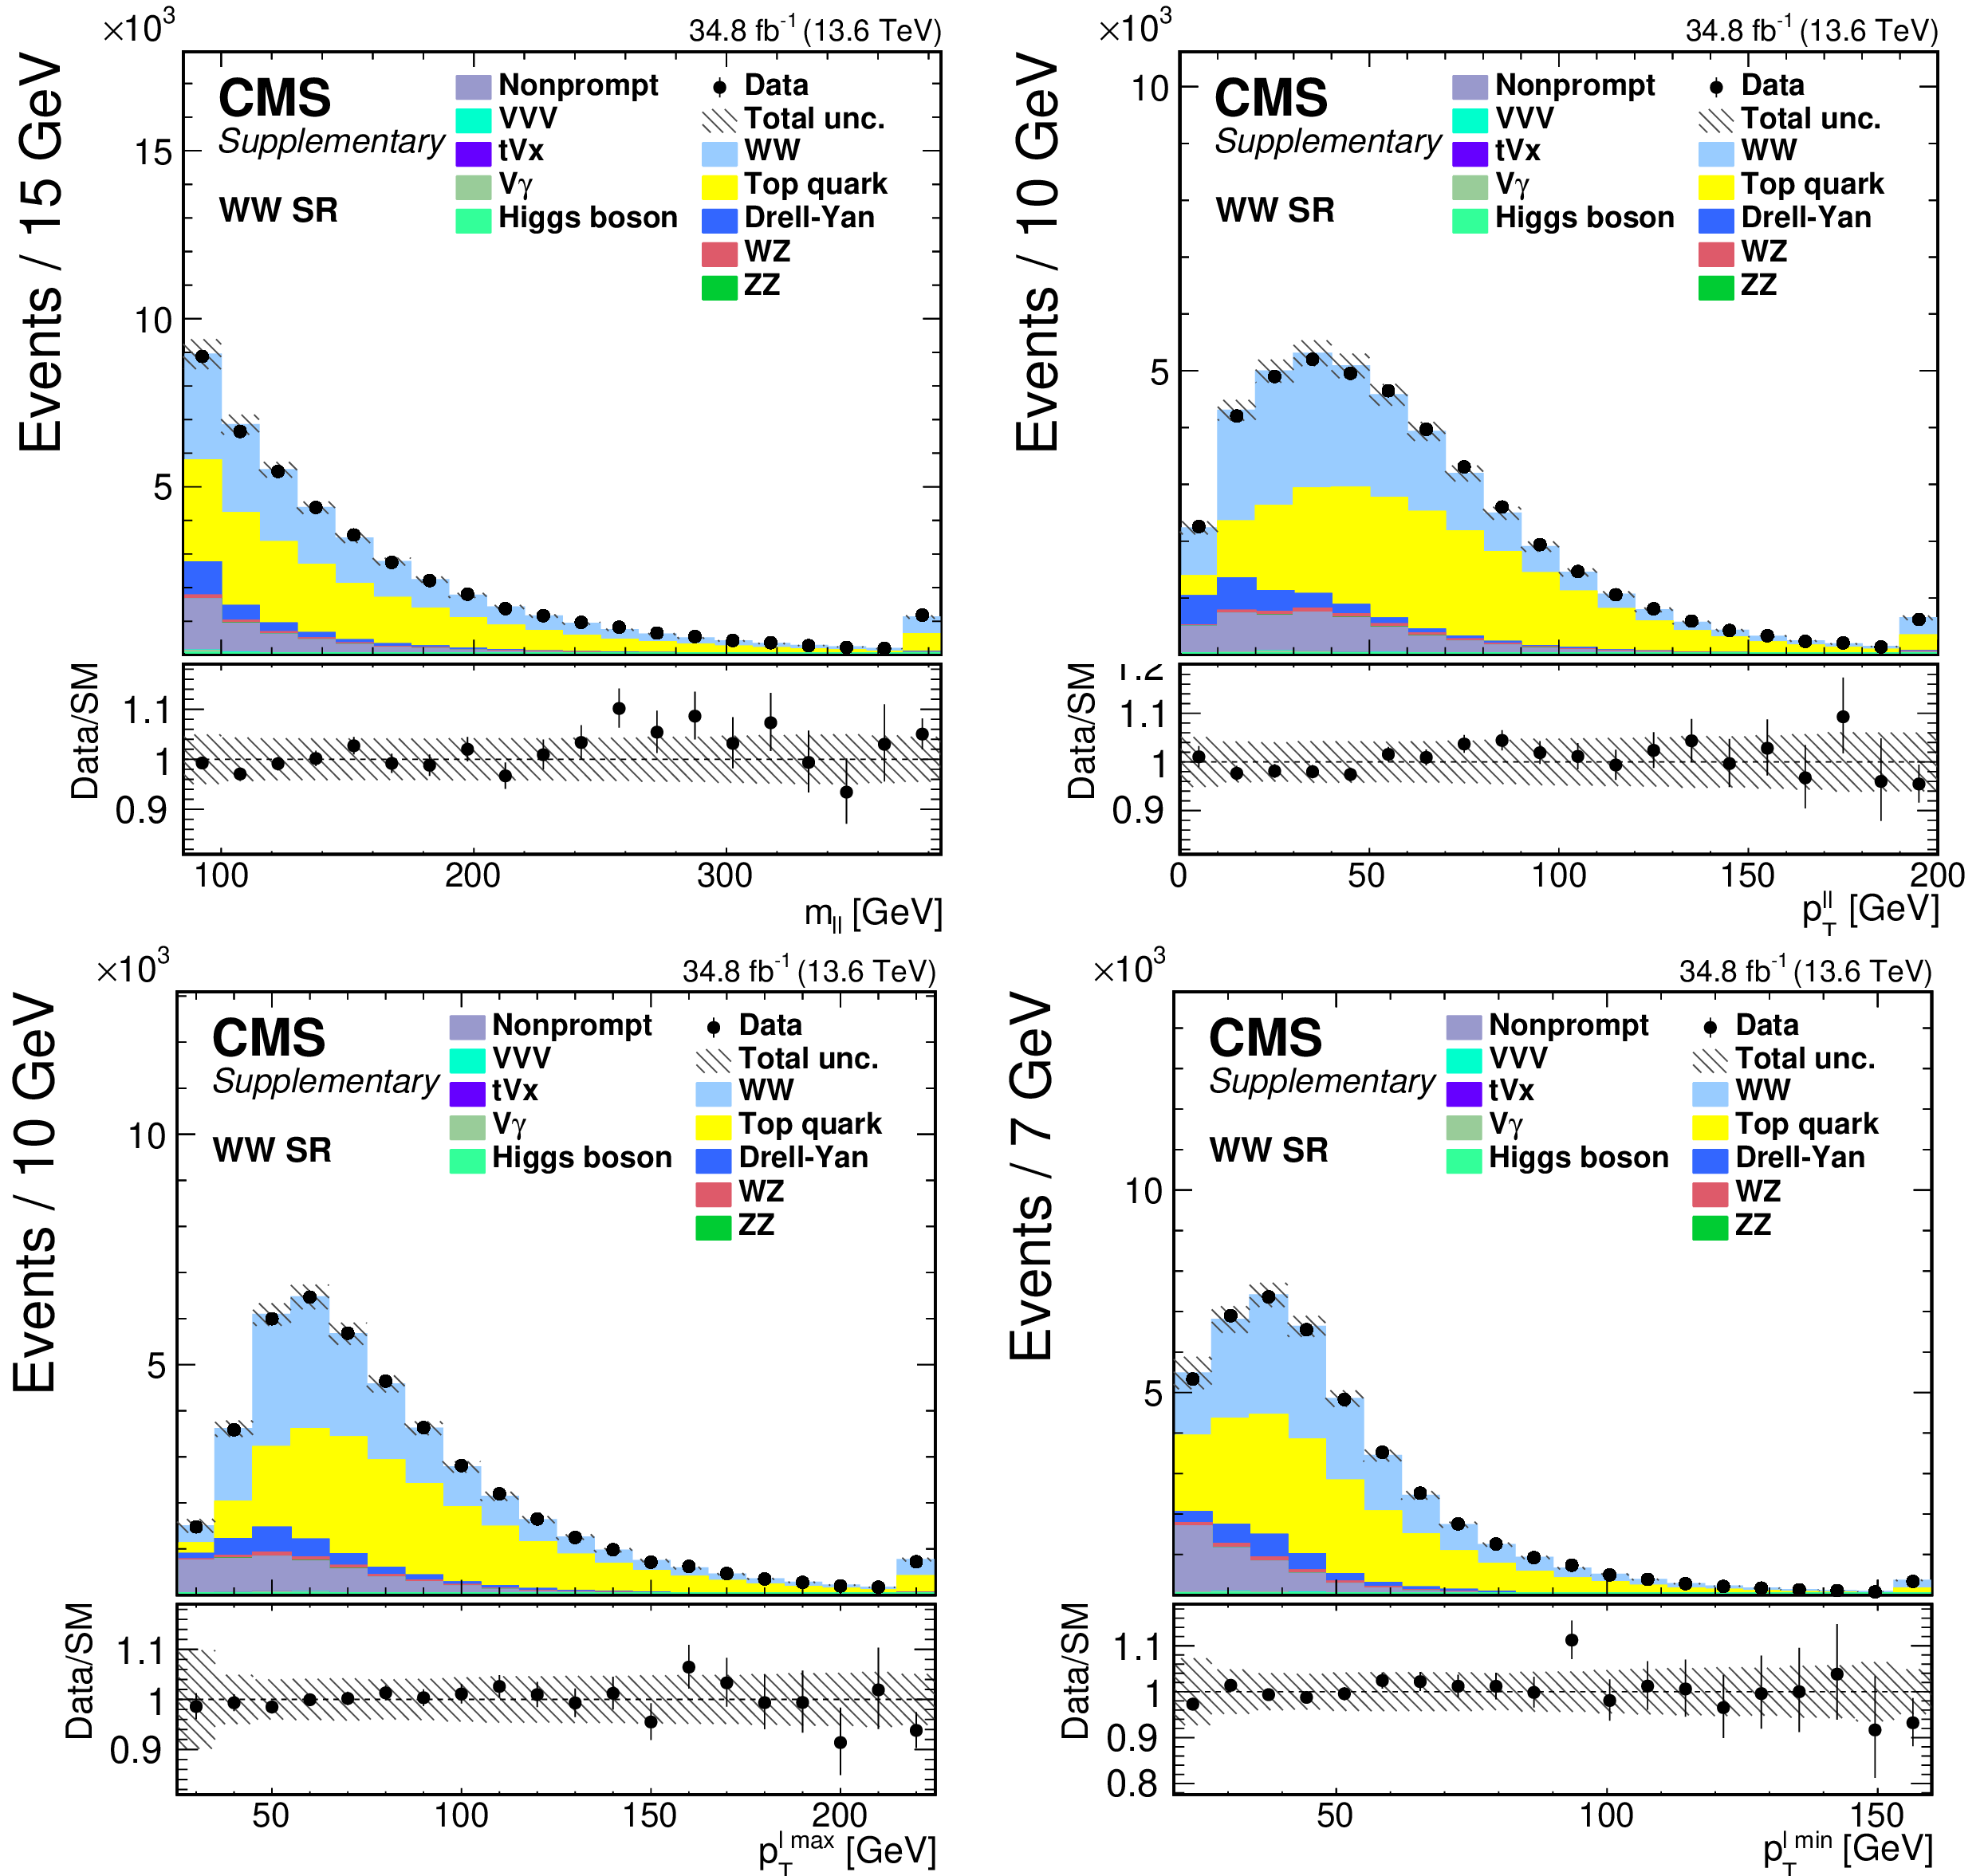
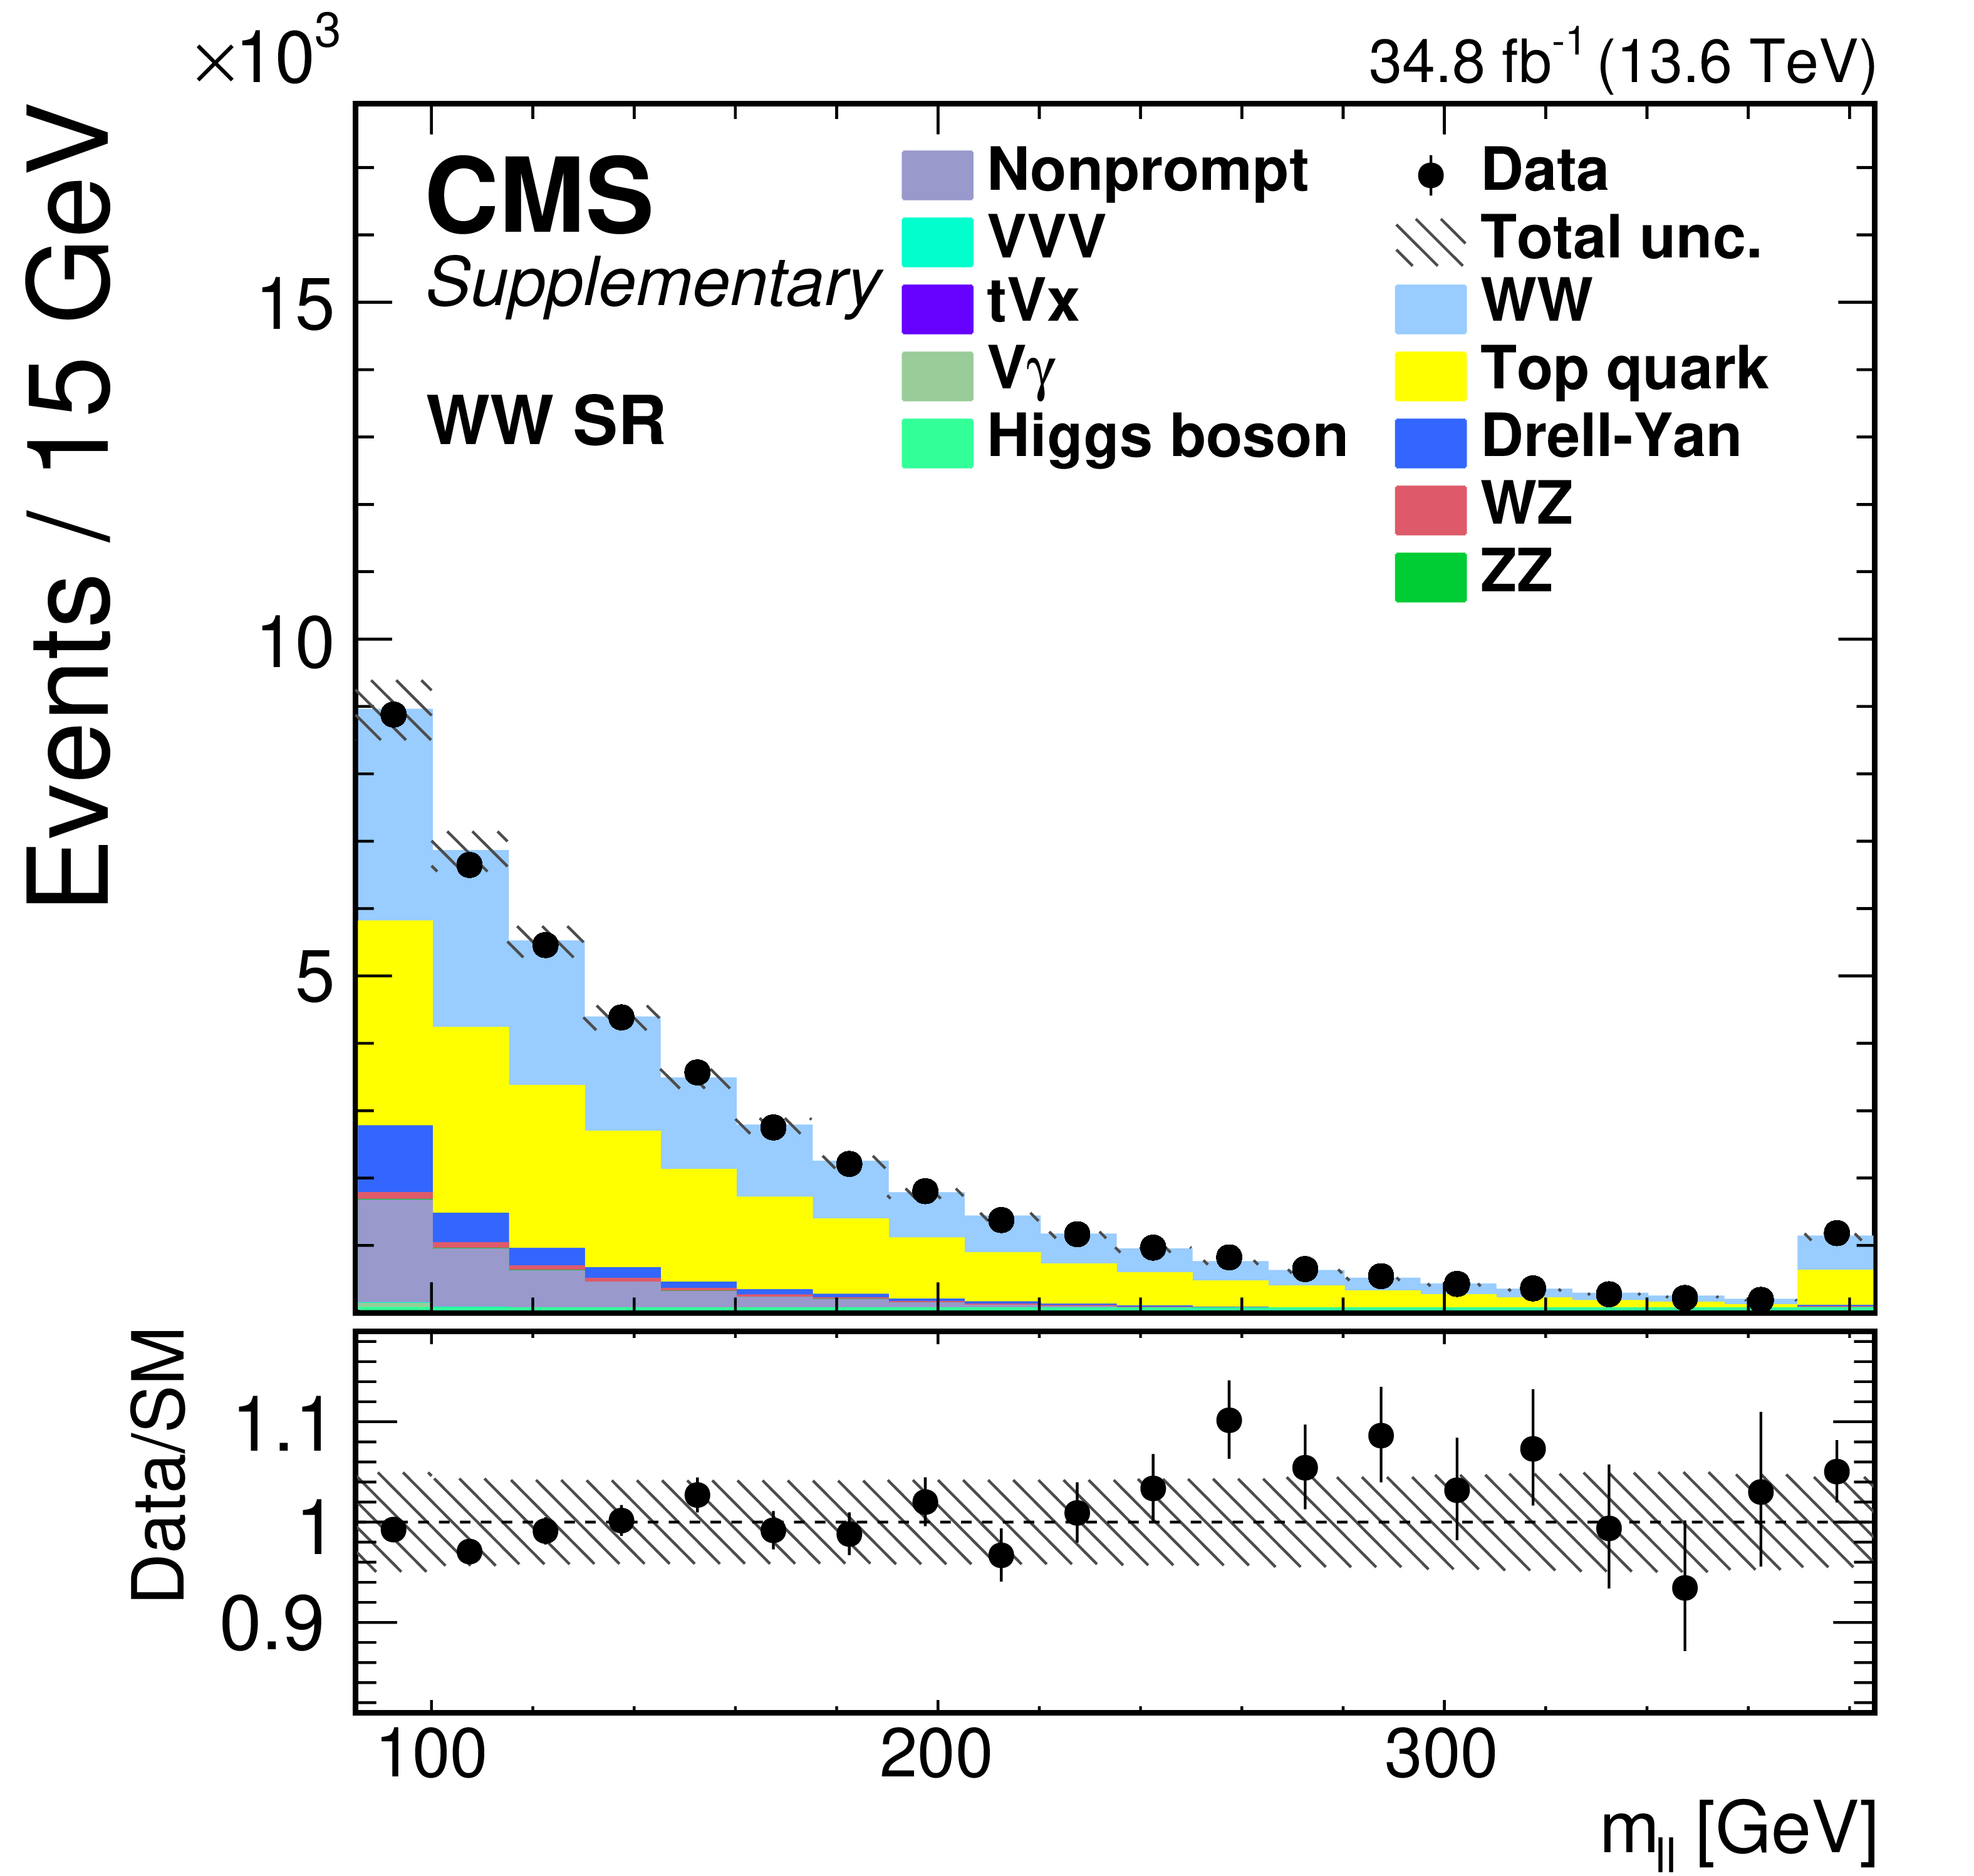
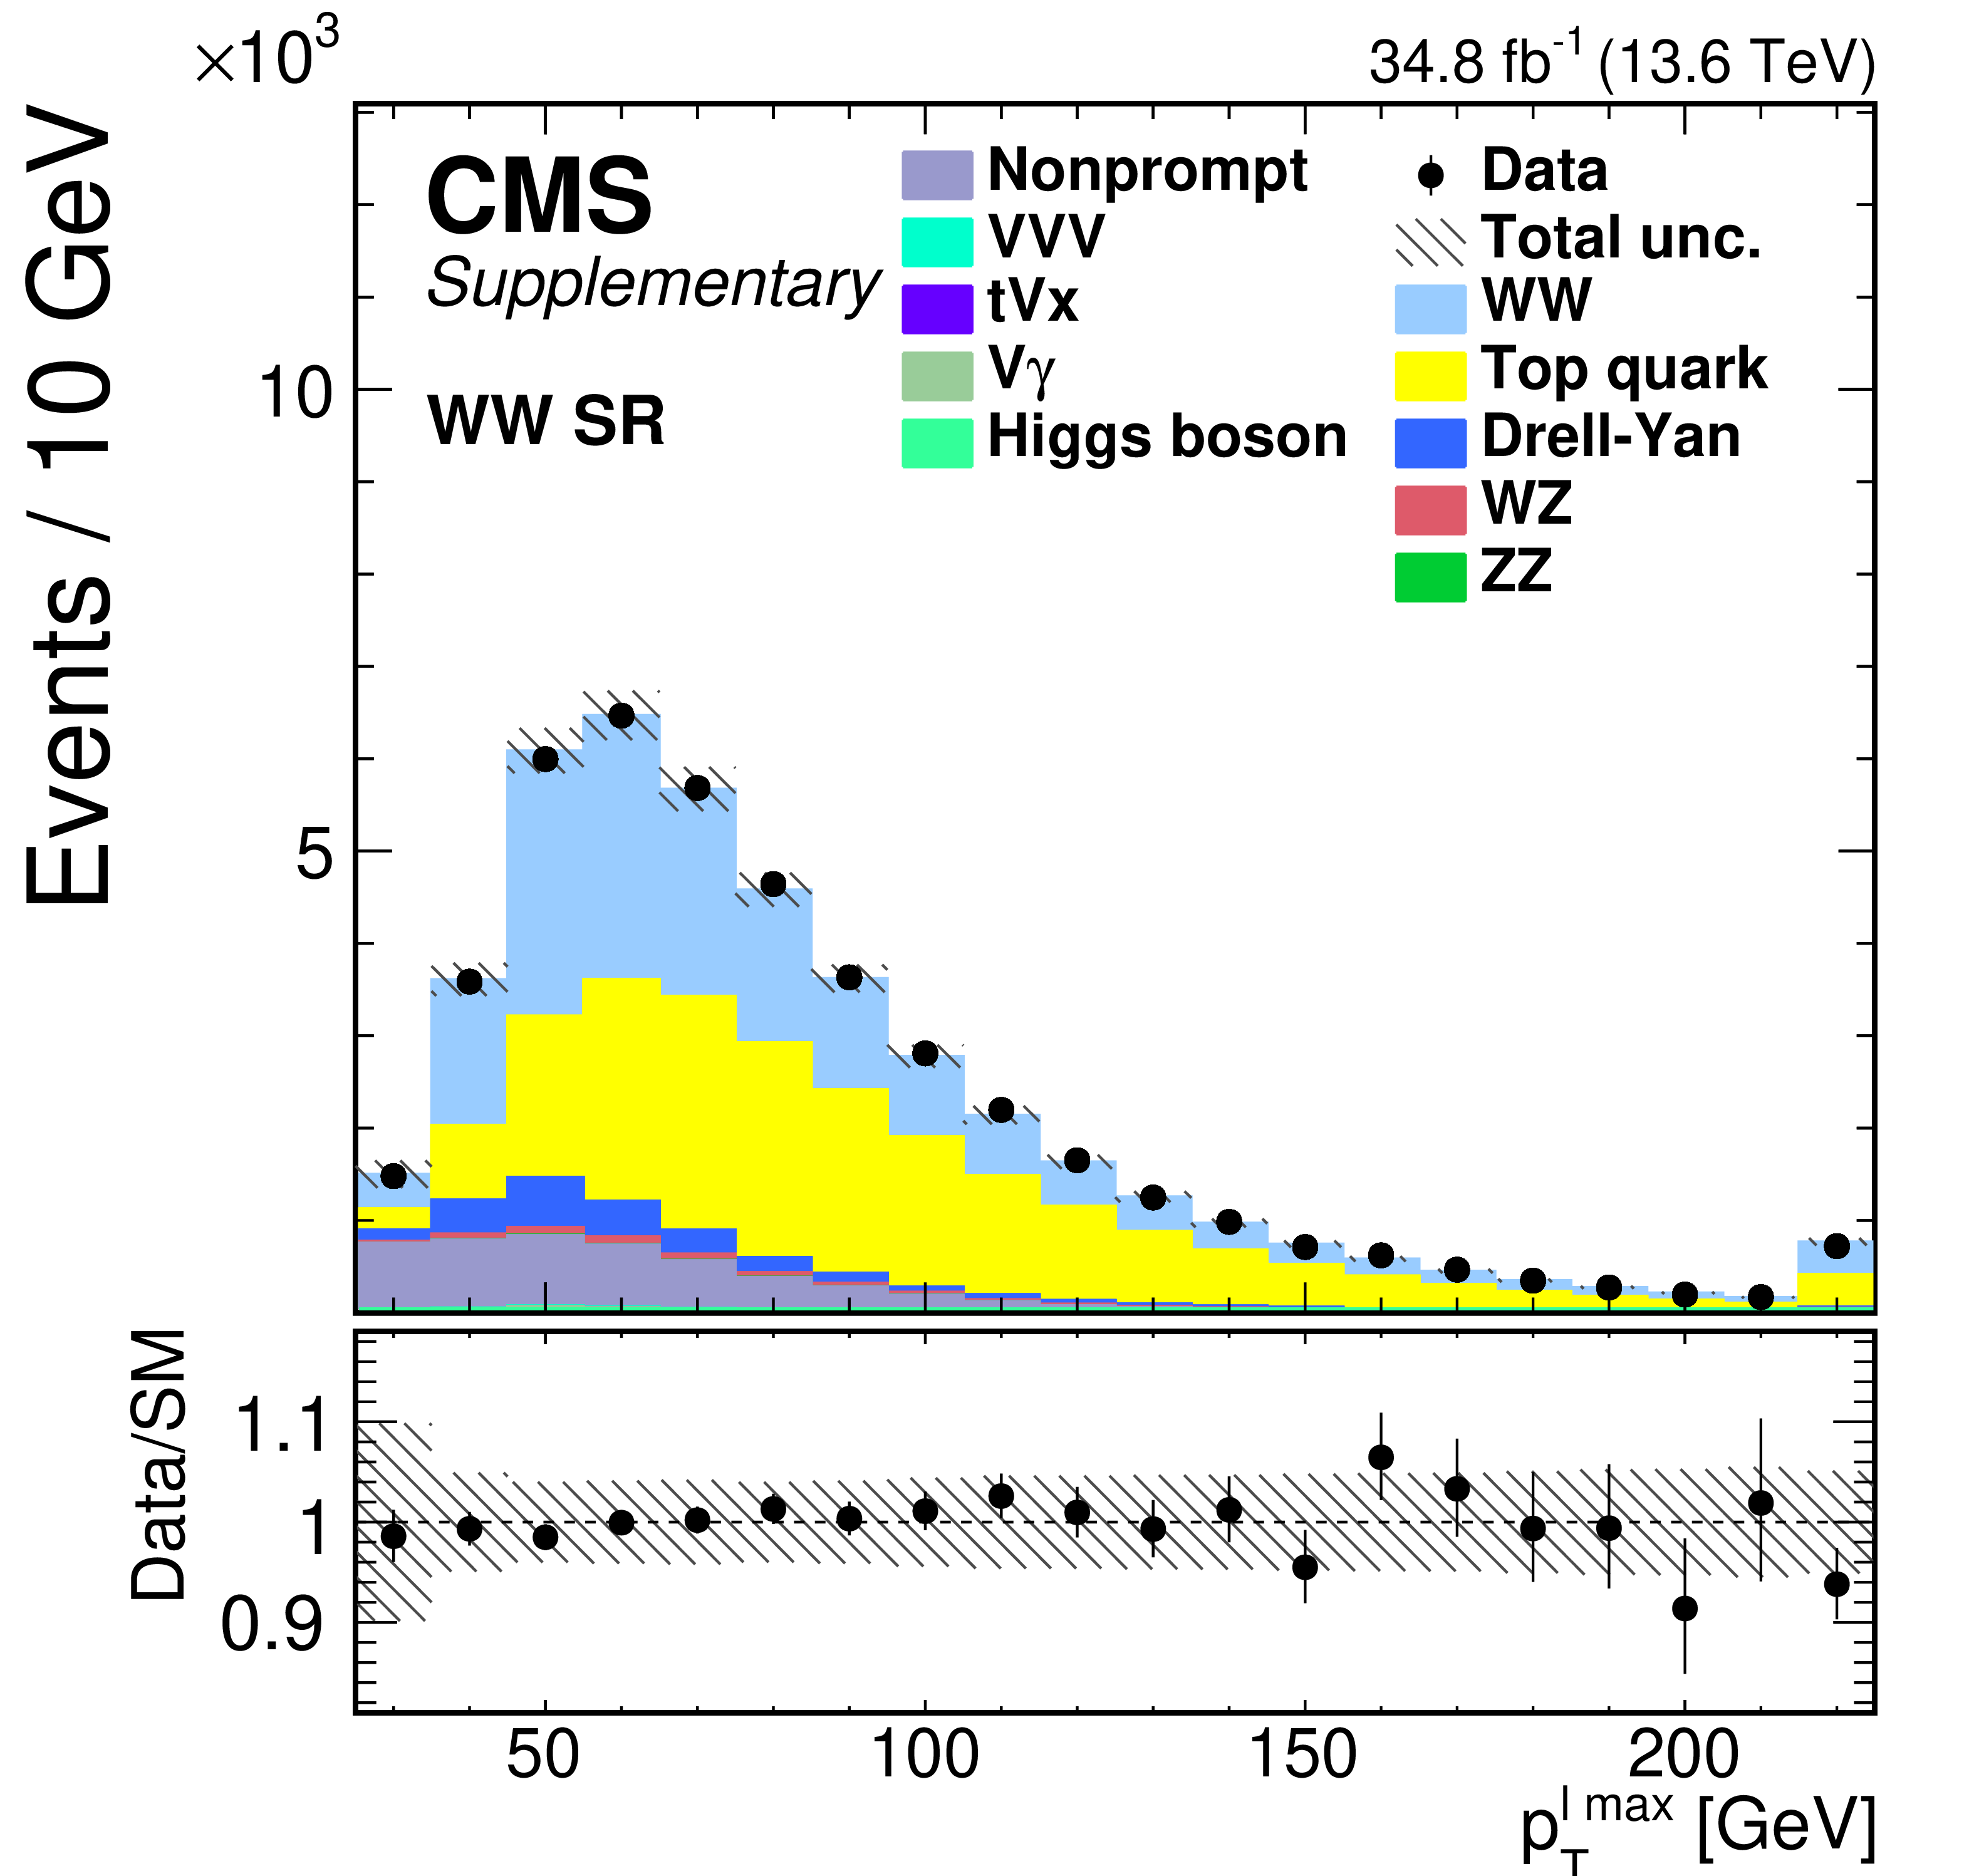
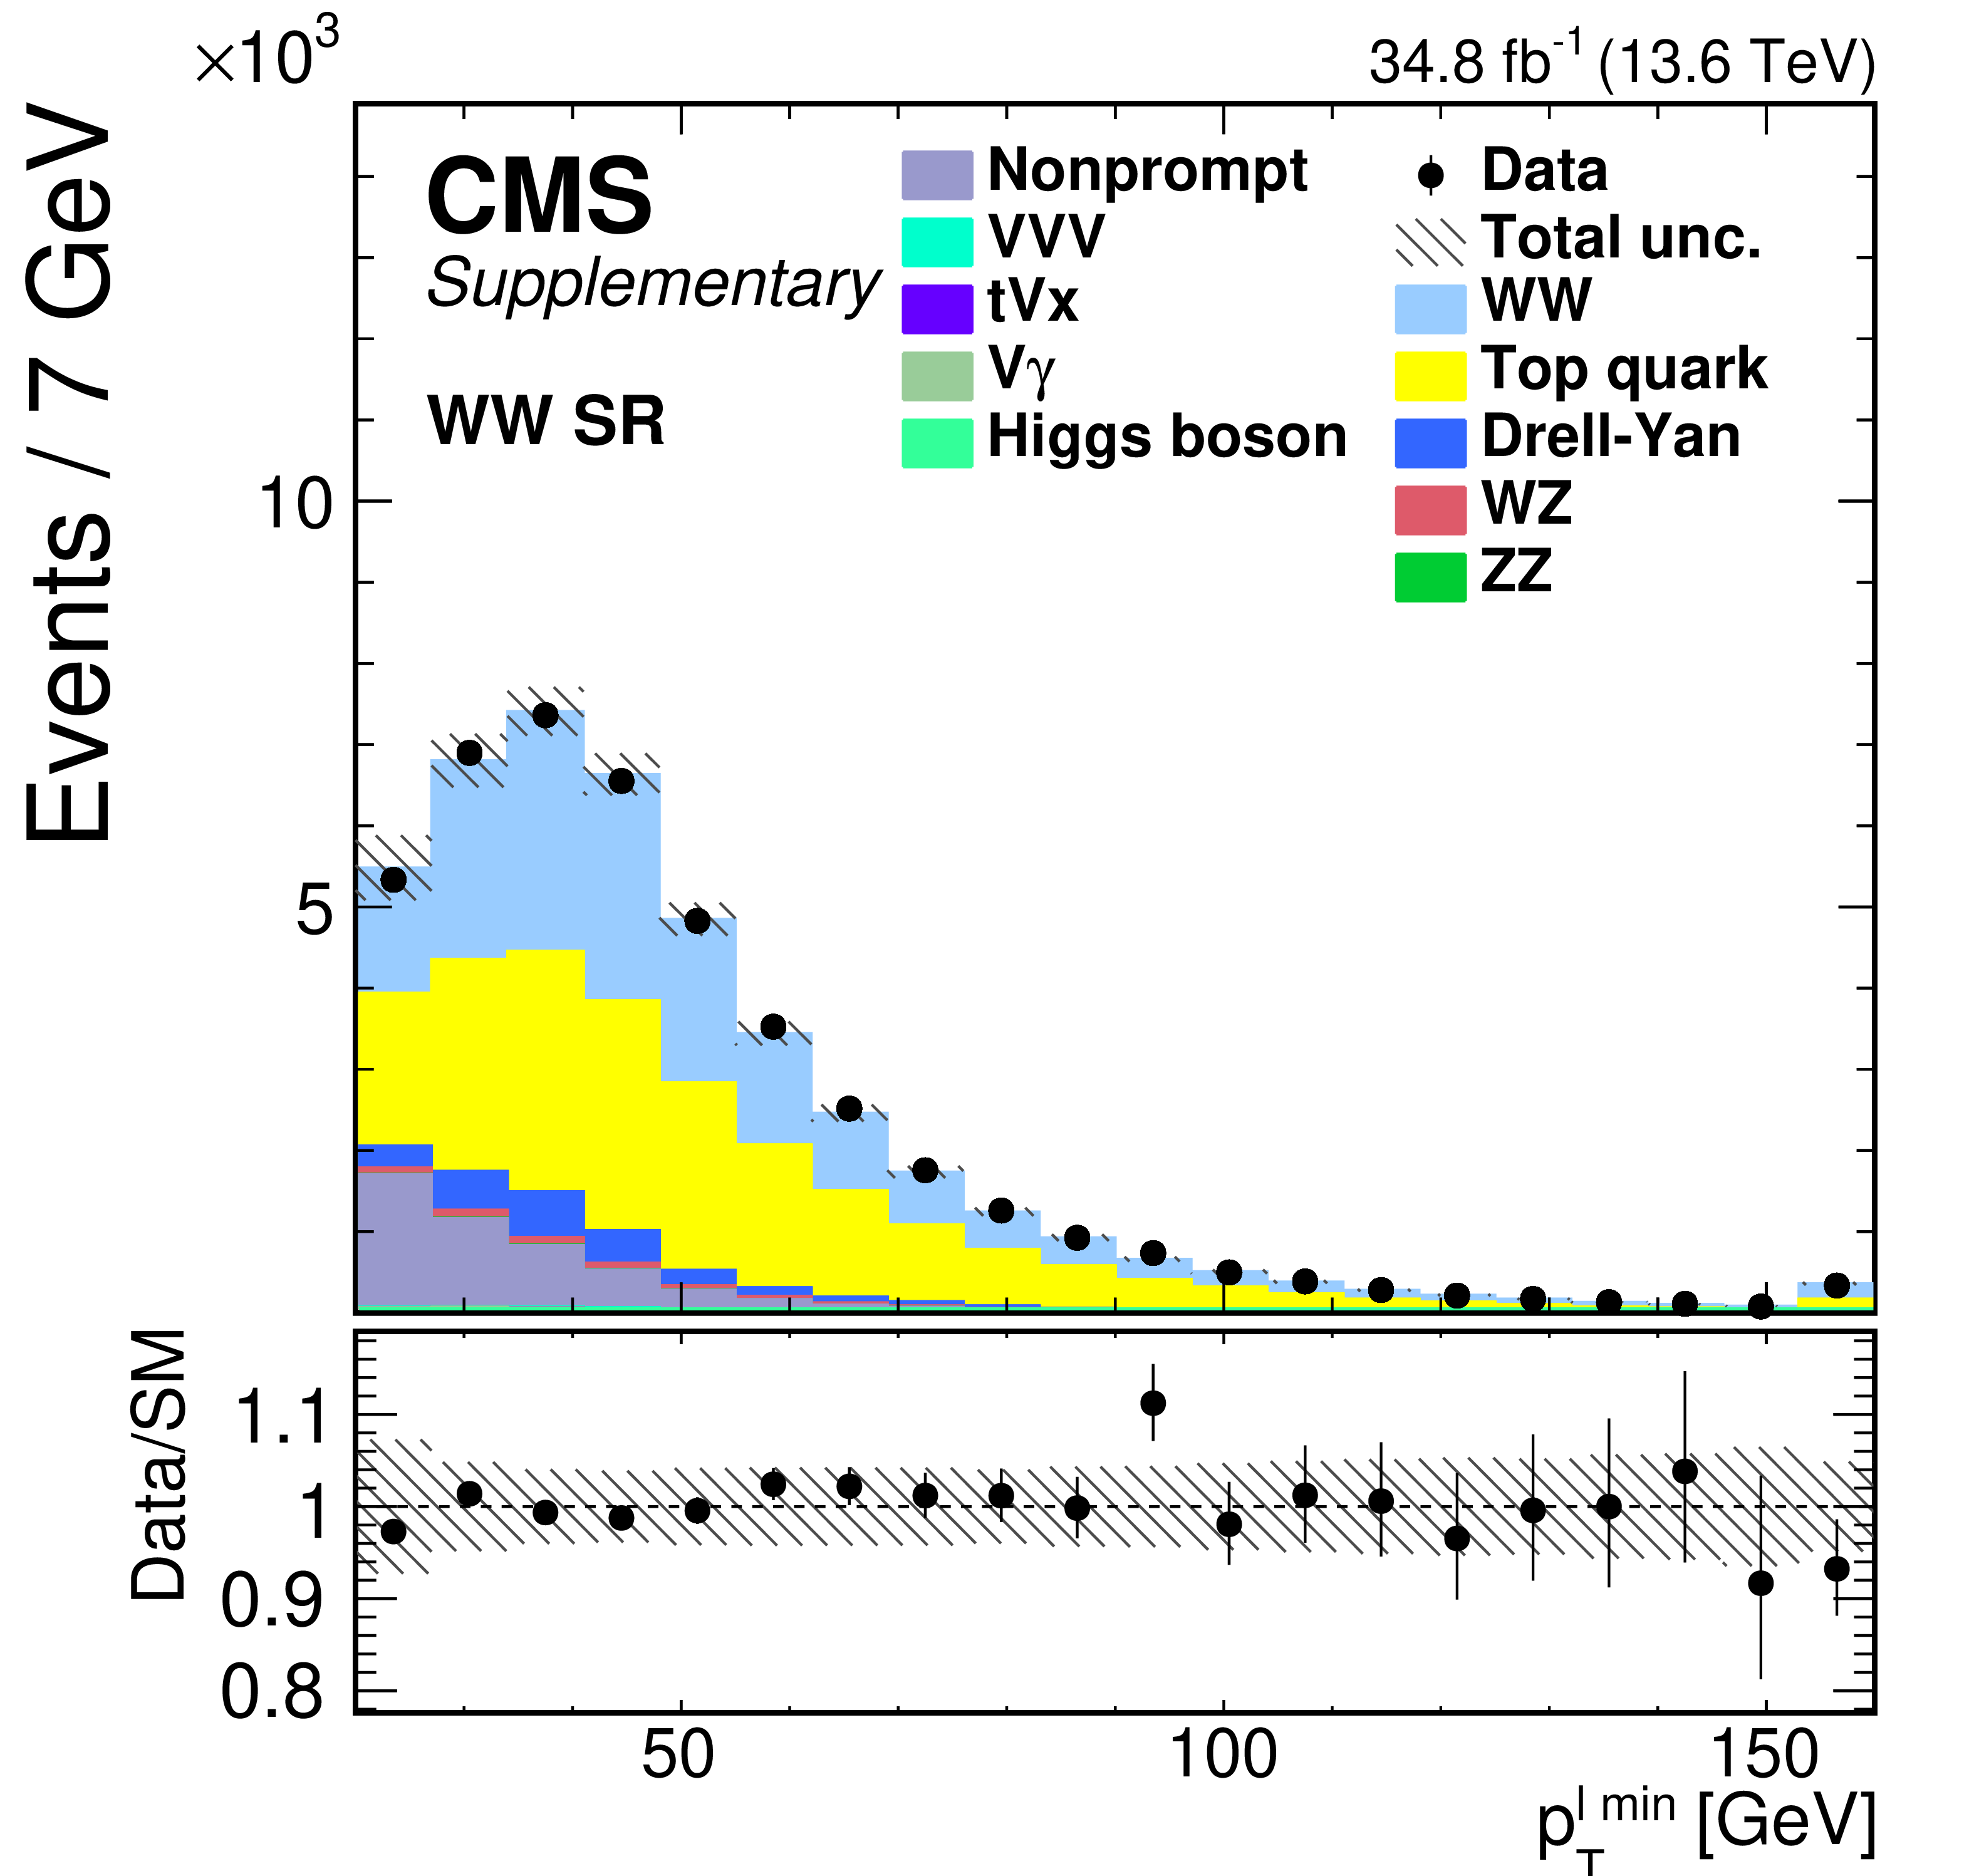
Additional Figure 1:
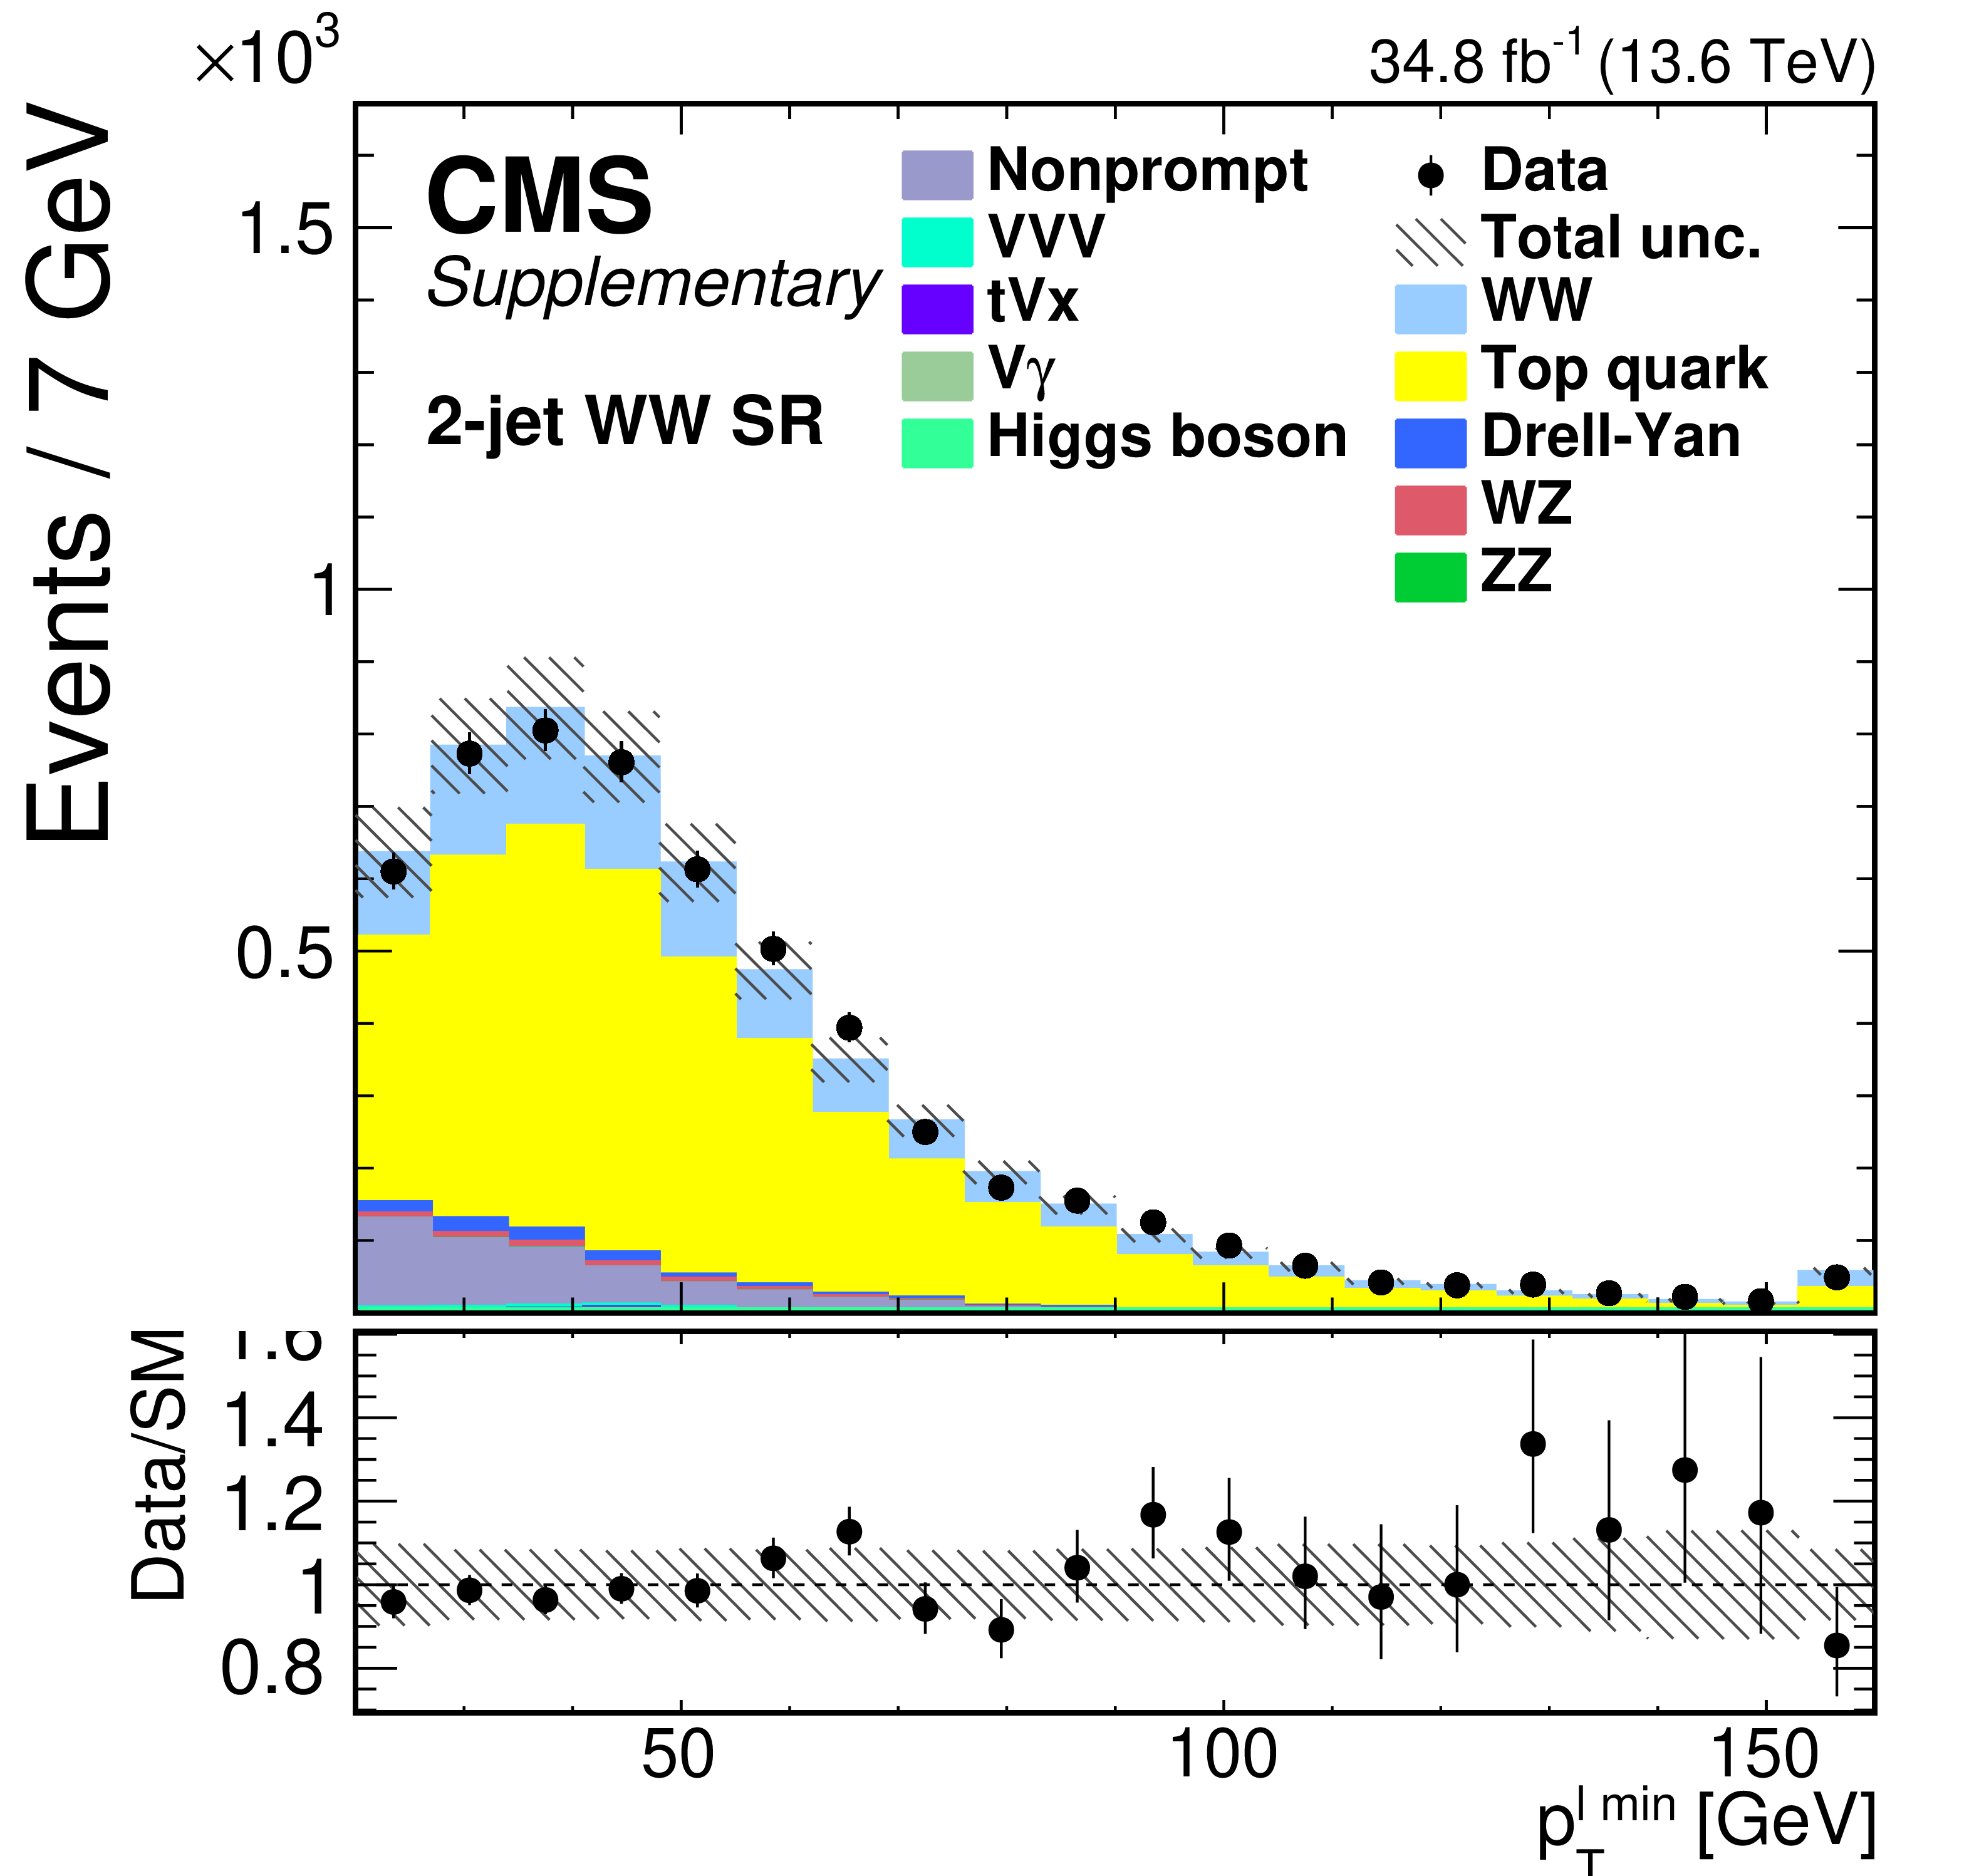
Distributions of the $ m_{\ell\ell} $ (upper left), $ p_{\mathrm{T}}^{\ell\ell} $ (upper right), $ p_{\mathrm{T}}^{\ell\text{ max}} $ (lower left), and $ p_{\mathrm{T}}^{\ell\text{ min}} $ (lower right) variables in the WW SR. The error bars represent the uncertainties associated with statistical and systematic uncertainties before the fit to data. |
png pdf |
Additional Figure 1-a:
Distributions of the $ m_{\ell\ell} $ (upper left), $ p_{\mathrm{T}}^{\ell\ell} $ (upper right), $ p_{\mathrm{T}}^{\ell\text{ max}} $ (lower left), and $ p_{\mathrm{T}}^{\ell\text{ min}} $ (lower right) variables in the WW SR. The error bars represent the uncertainties associated with statistical and systematic uncertainties before the fit to data. |

png pdf |
Additional Figure 1-b:
Distributions of the $ m_{\ell\ell} $ (upper left), $ p_{\mathrm{T}}^{\ell\ell} $ (upper right), $ p_{\mathrm{T}}^{\ell\text{ max}} $ (lower left), and $ p_{\mathrm{T}}^{\ell\text{ min}} $ (lower right) variables in the WW SR. The error bars represent the uncertainties associated with statistical and systematic uncertainties before the fit to data. |
png pdf |
Additional Figure 1-c:
Distributions of the $ m_{\ell\ell} $ (upper left), $ p_{\mathrm{T}}^{\ell\ell} $ (upper right), $ p_{\mathrm{T}}^{\ell\text{ max}} $ (lower left), and $ p_{\mathrm{T}}^{\ell\text{ min}} $ (lower right) variables in the WW SR. The error bars represent the uncertainties associated with statistical and systematic uncertainties before the fit to data. |
png pdf |
Additional Figure 1-d:
Distributions of the $ m_{\ell\ell} $ (upper left), $ p_{\mathrm{T}}^{\ell\ell} $ (upper right), $ p_{\mathrm{T}}^{\ell\text{ max}} $ (lower left), and $ p_{\mathrm{T}}^{\ell\text{ min}} $ (lower right) variables in the WW SR. The error bars represent the uncertainties associated with statistical and systematic uncertainties before the fit to data. |
png pdf |
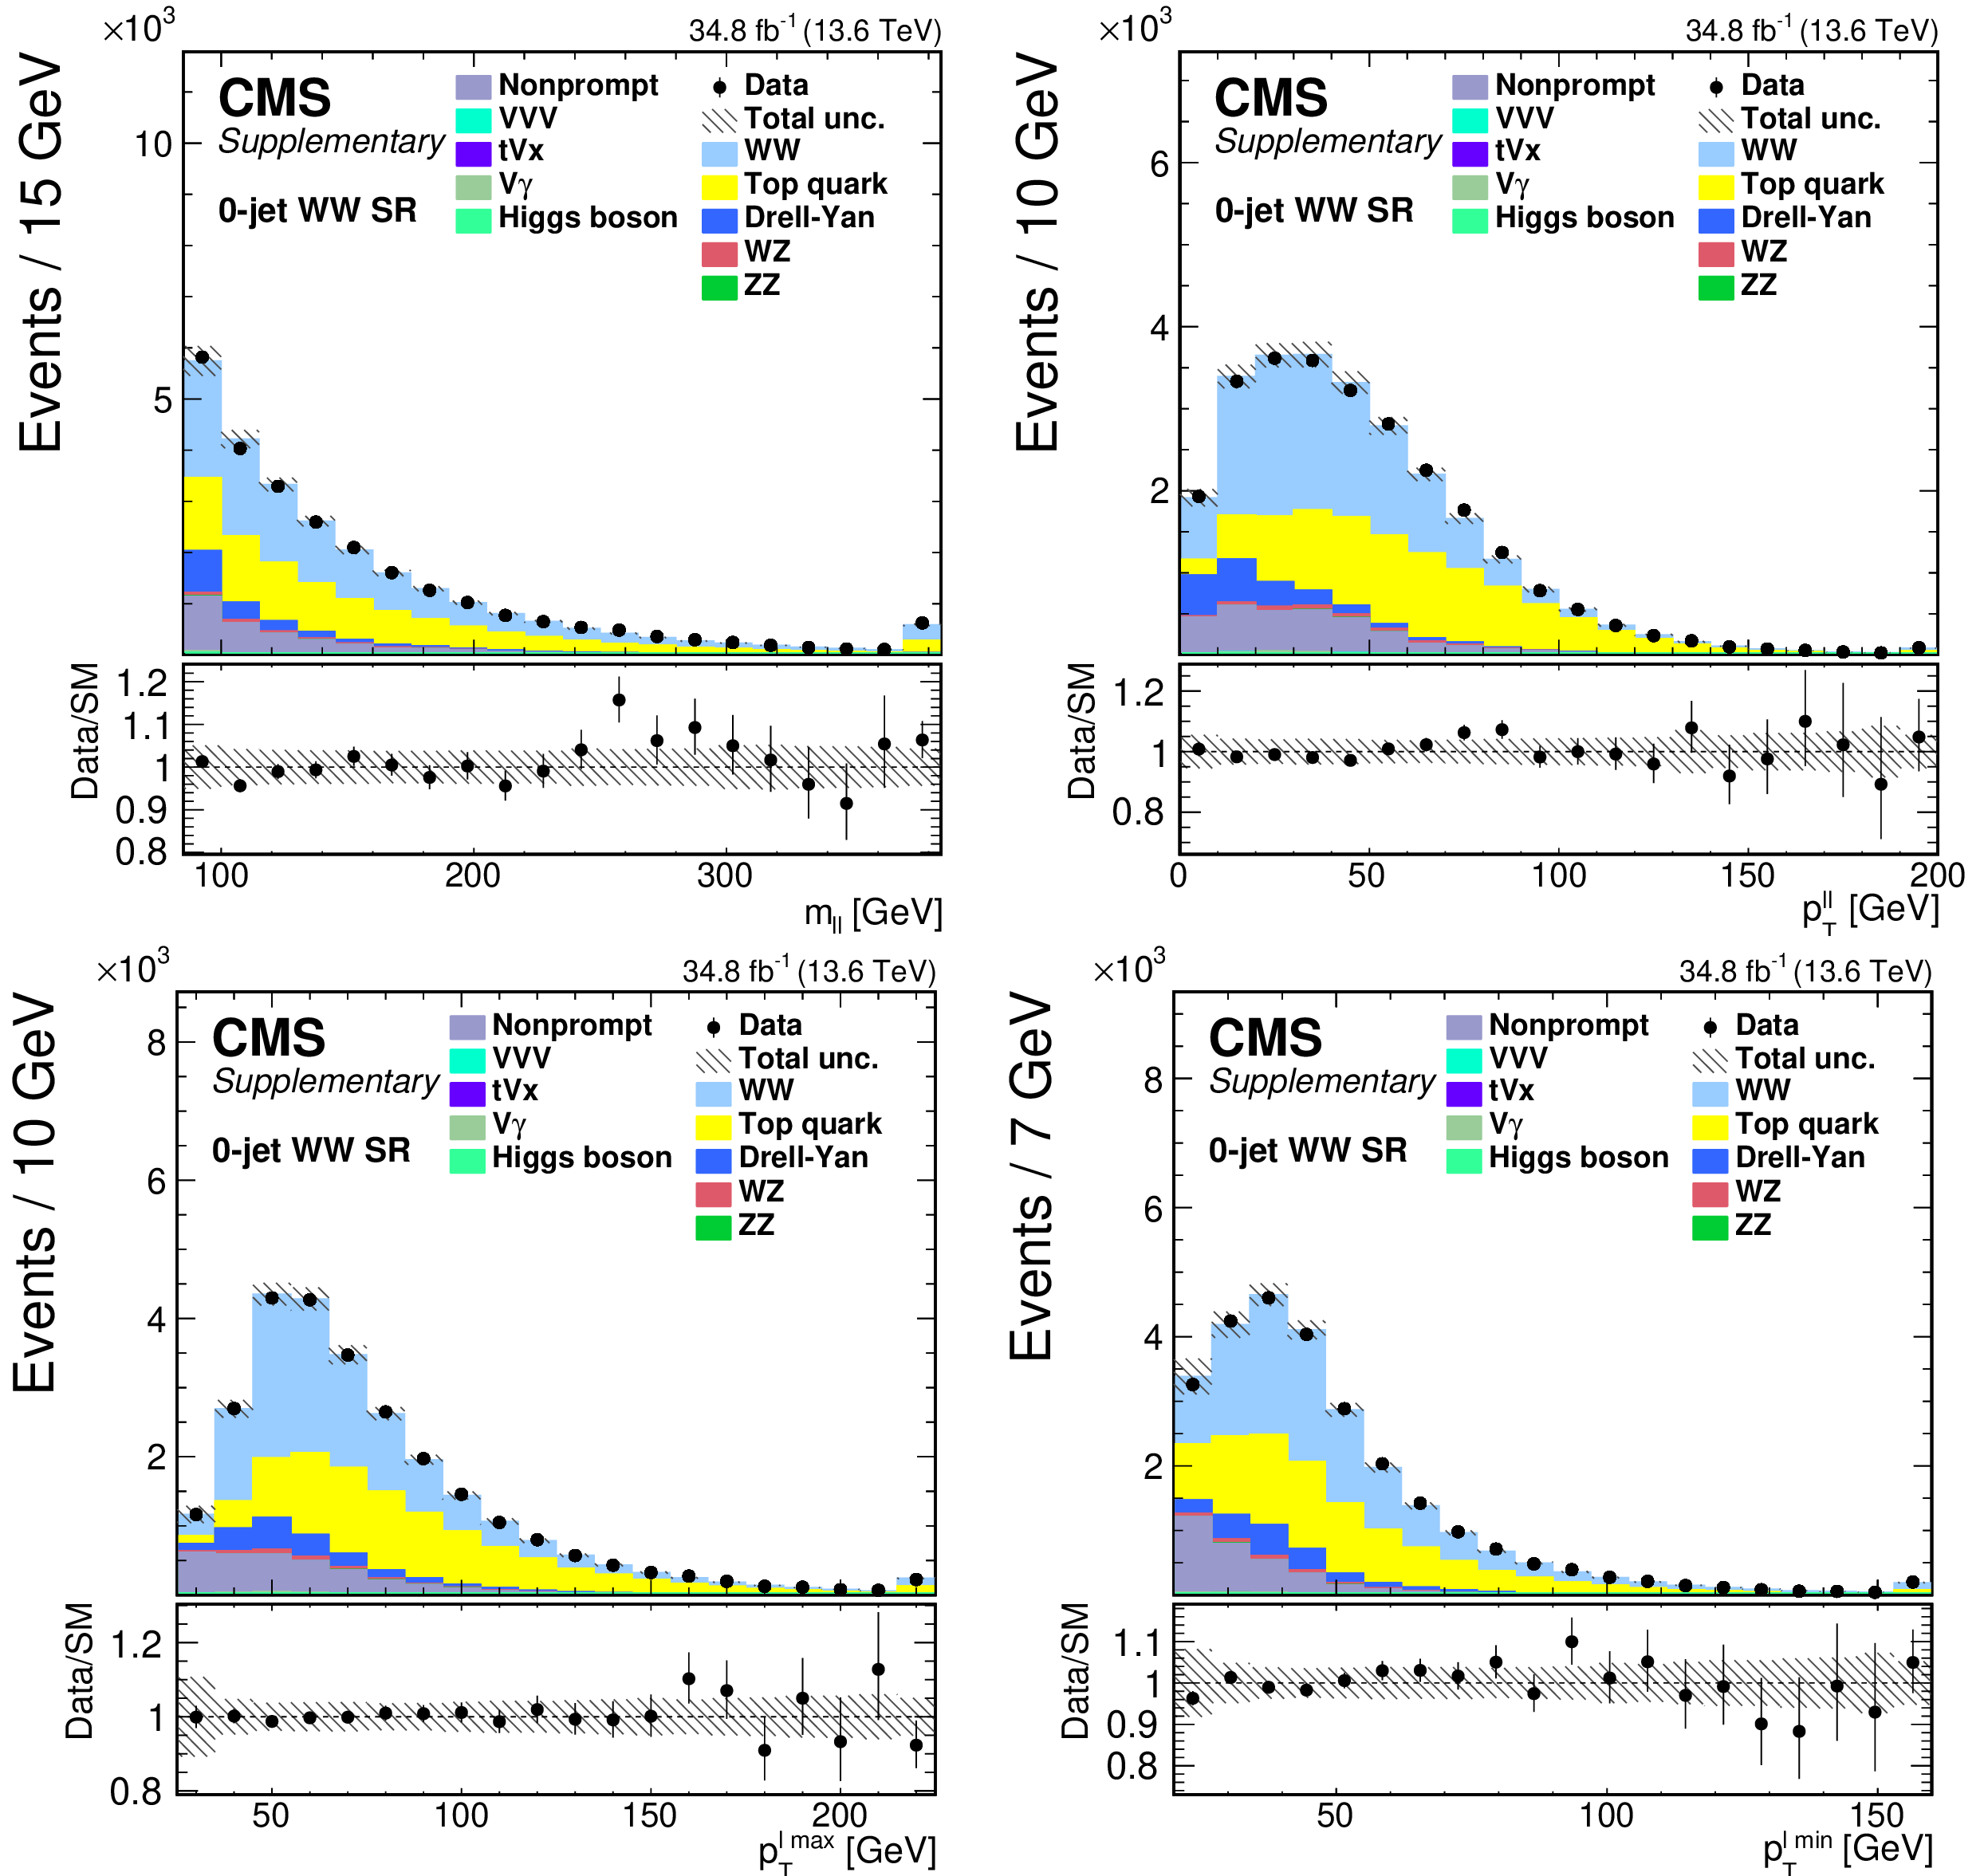
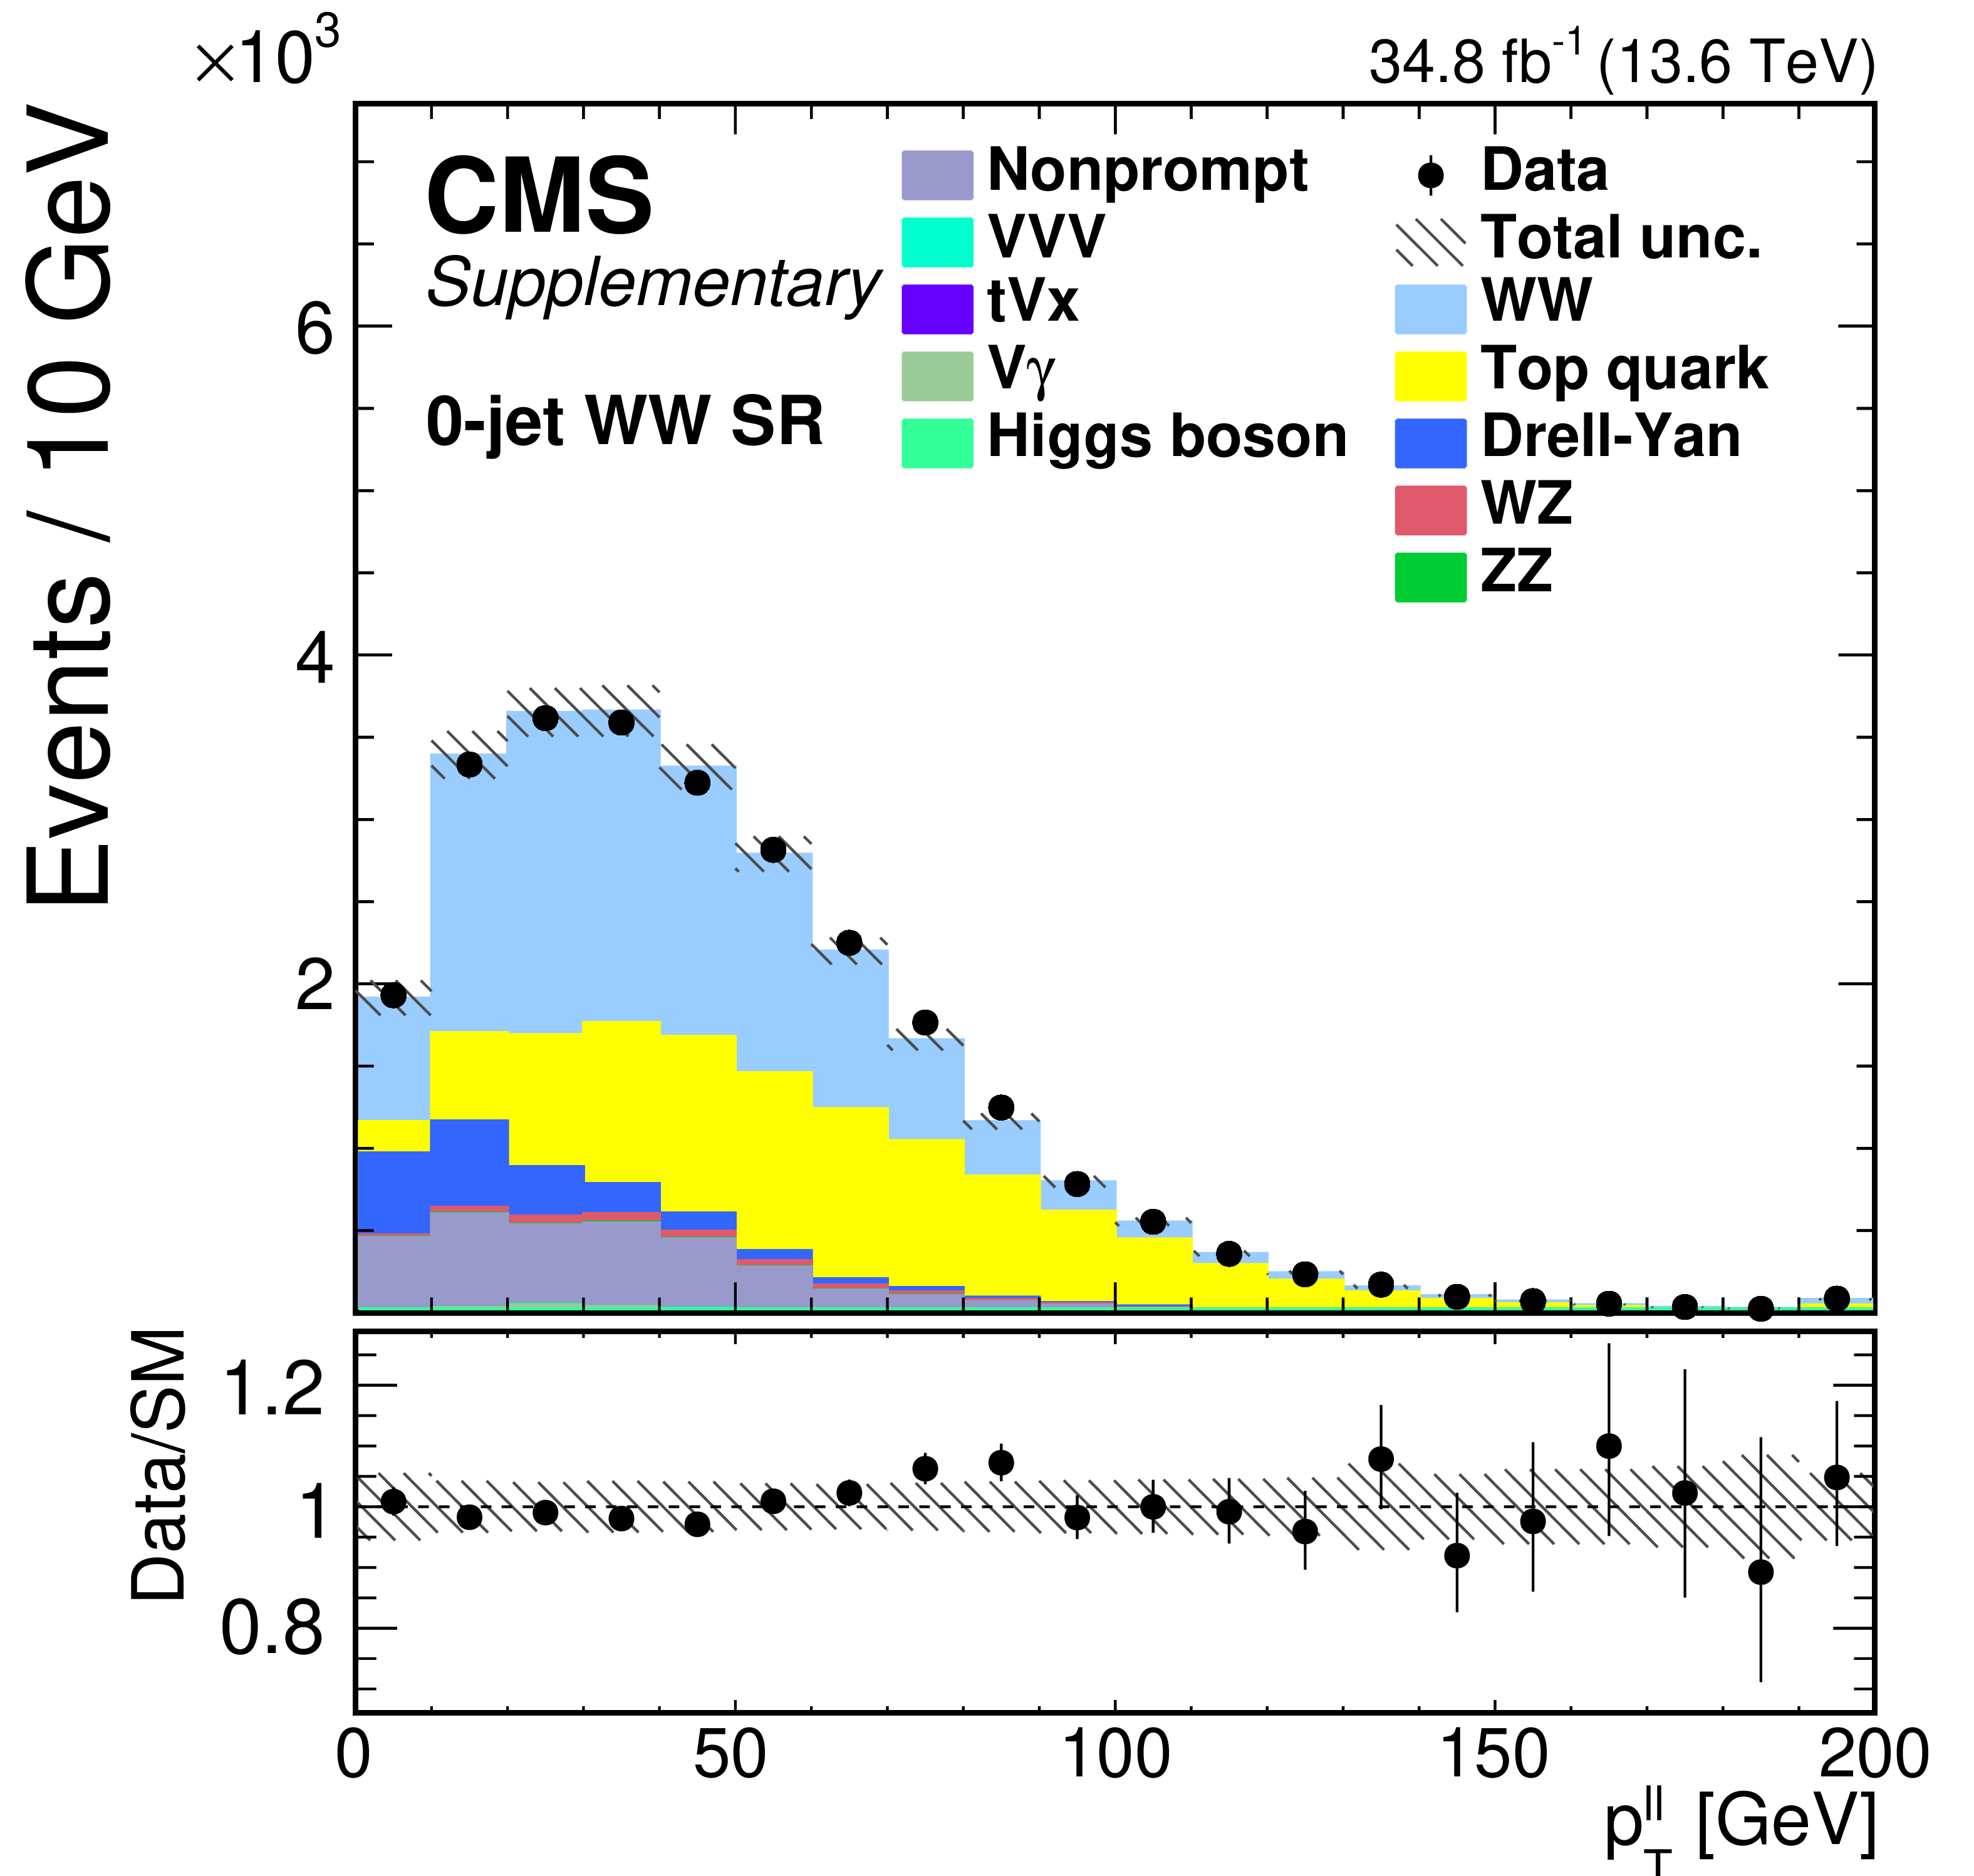
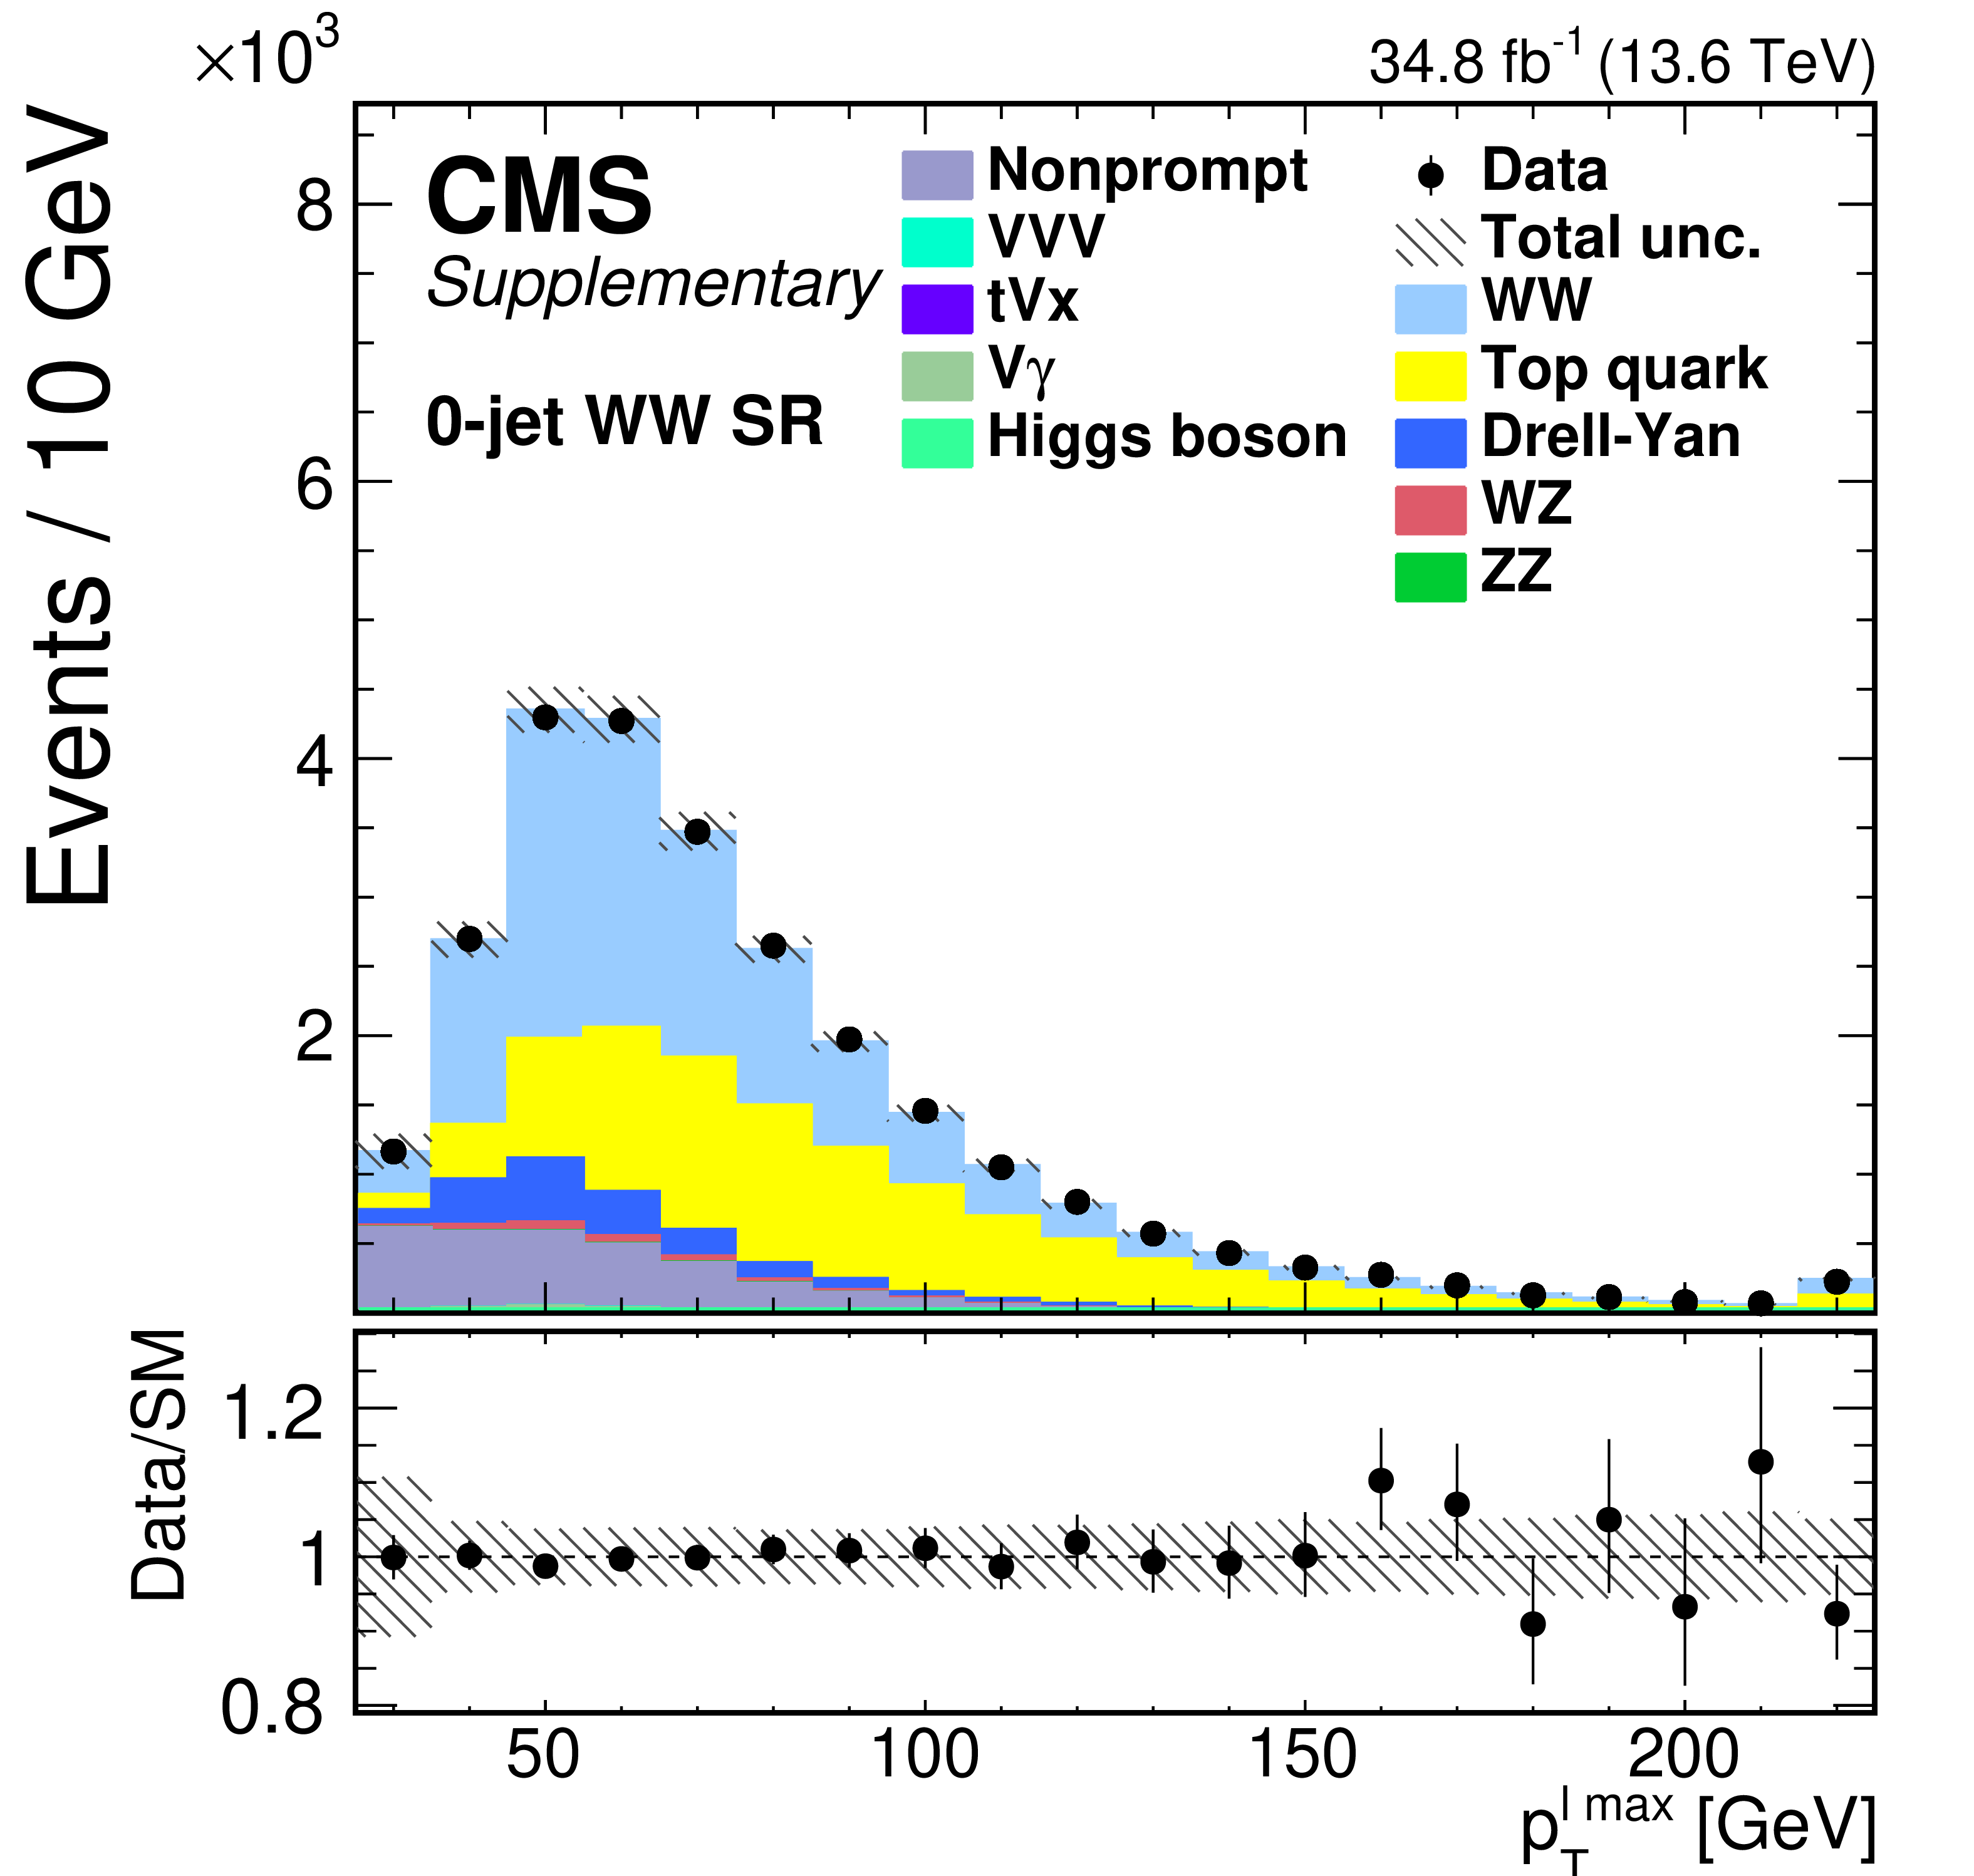
Additional Figure 2:
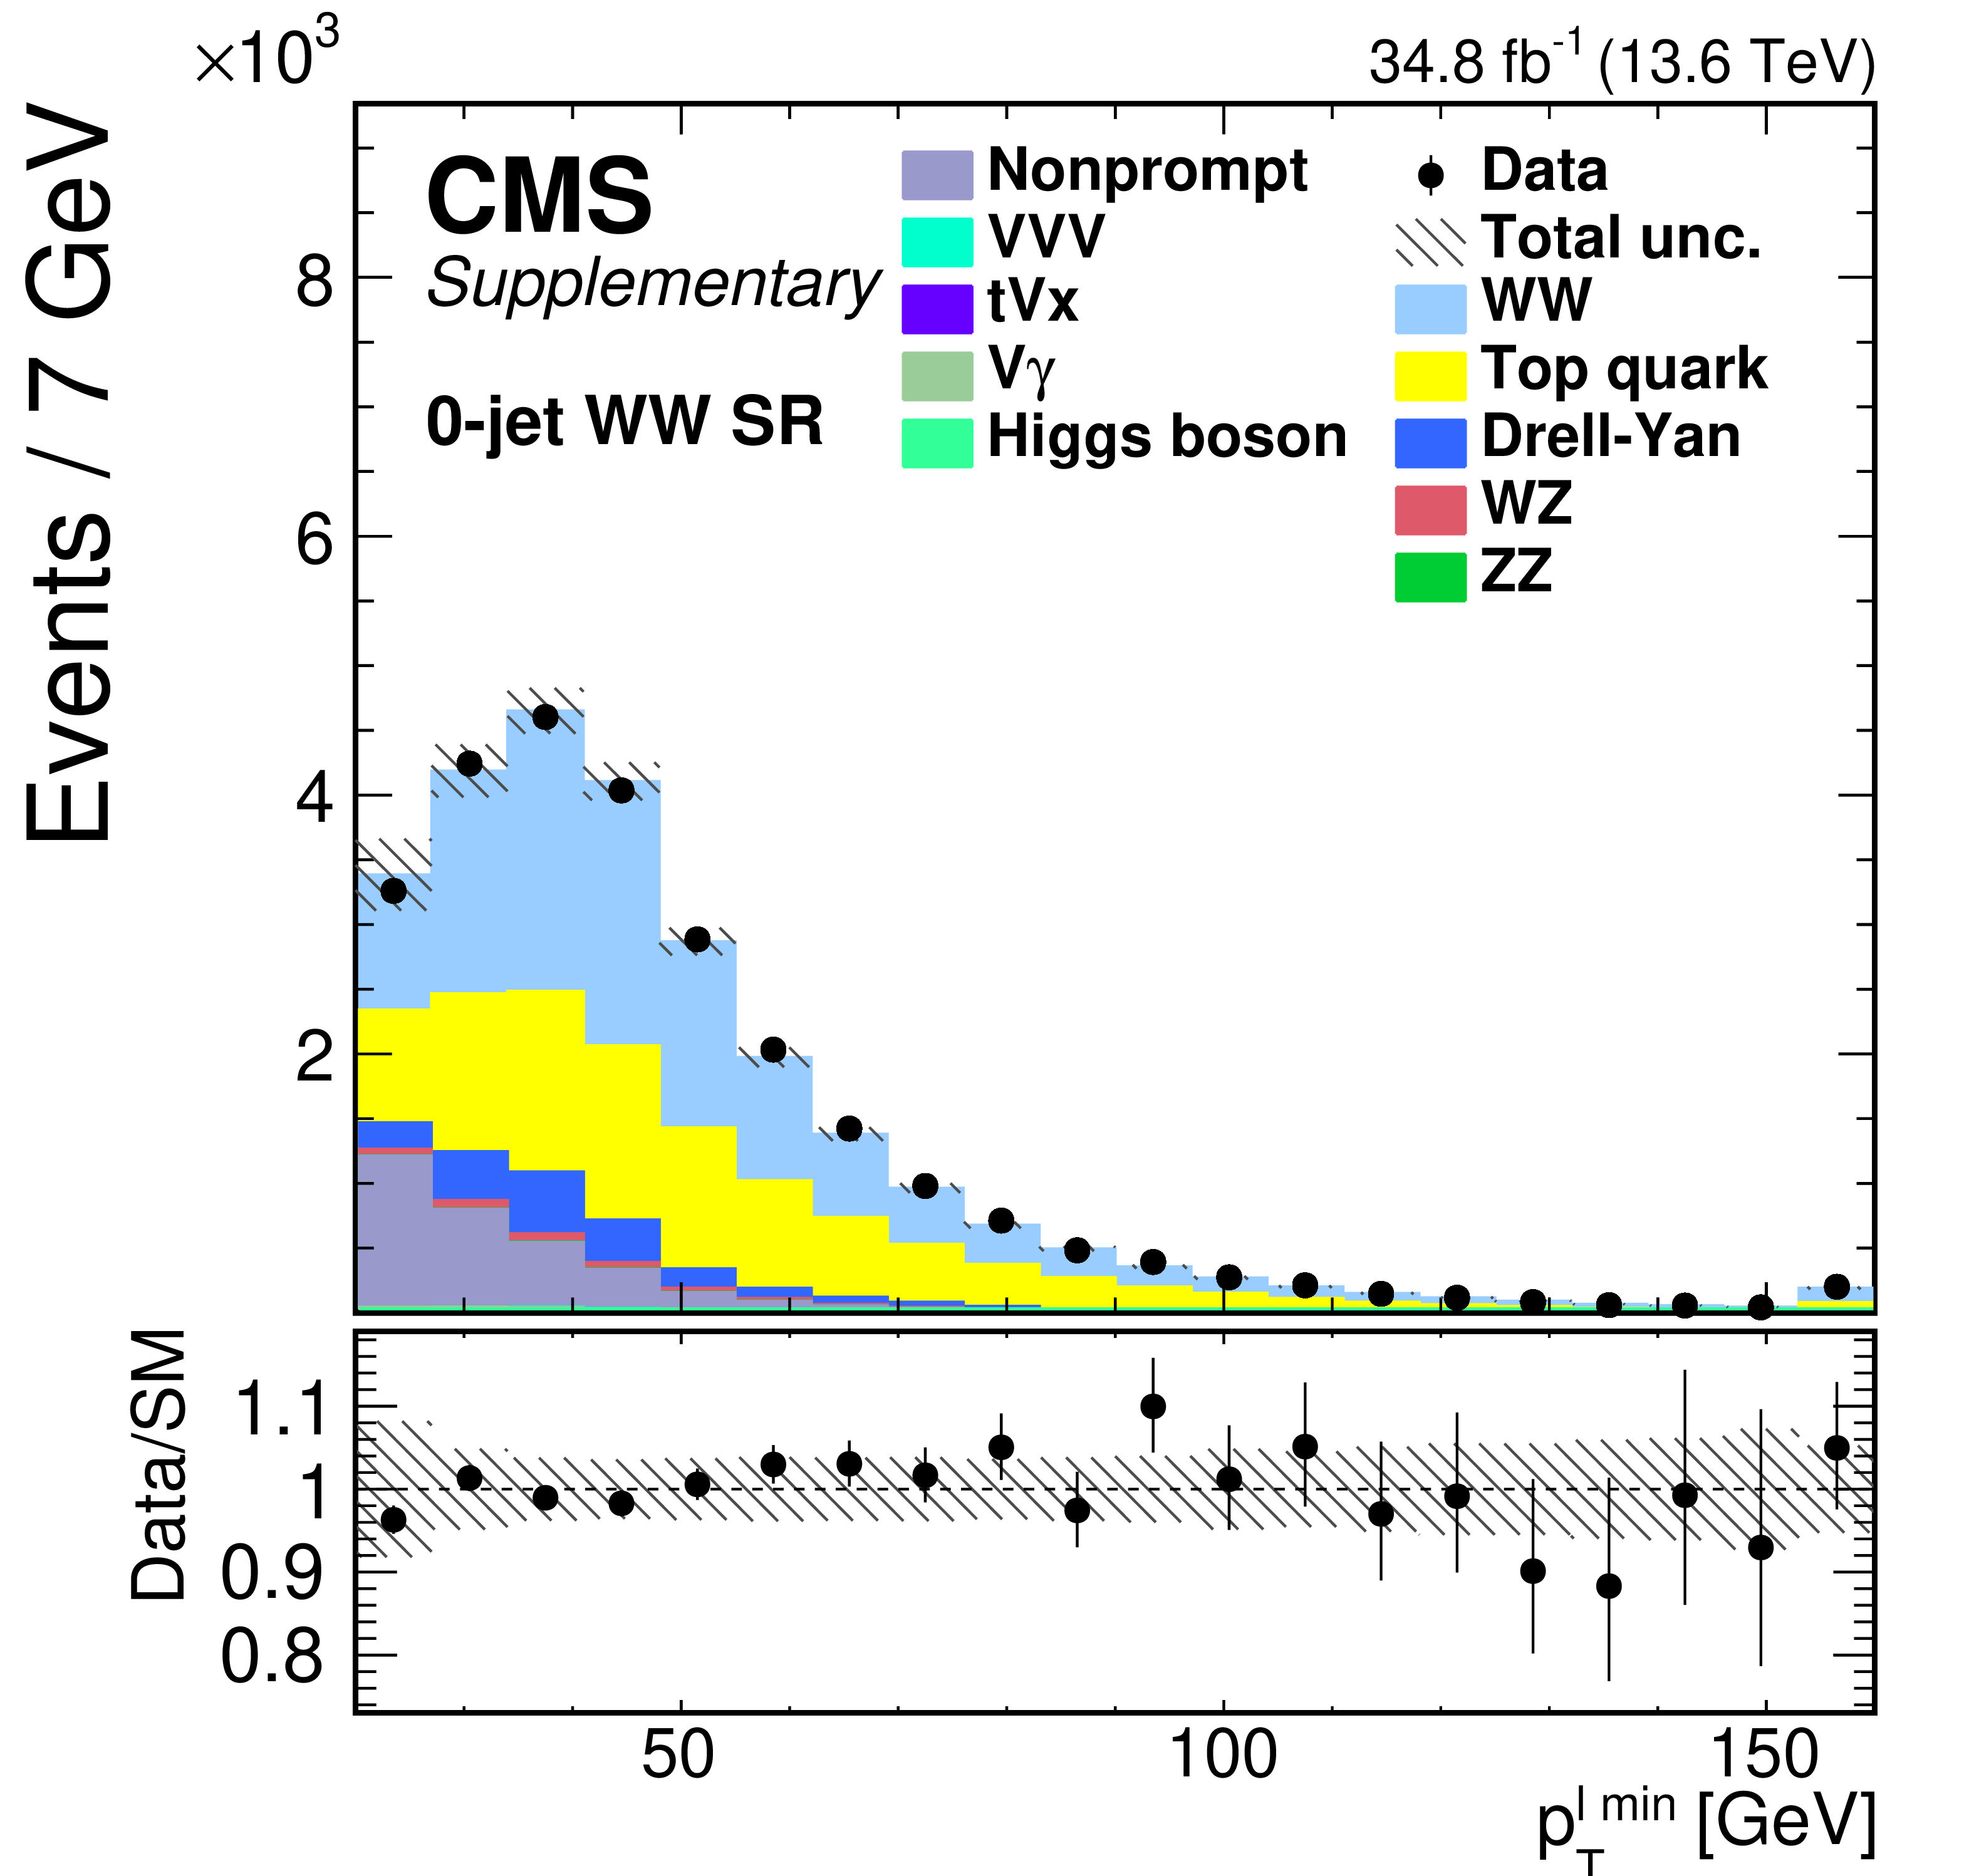
Distributions of the $ m_{\ell\ell} $ (upper left), $ p_{\mathrm{T}}^{\ell\ell} $ (upper right), $ p_{\mathrm{T}}^{\ell\text{ max}} $ (lower left), and $ p_{\mathrm{T}}^{\ell\text{ min}} $ (lower right) variables in the 0-jet WW SR. The error bars represent the uncertainties associated with statistical and systematic uncertainties before the fit to data. |

png pdf |
Additional Figure 2-a:
Distributions of the $ m_{\ell\ell} $ (upper left), $ p_{\mathrm{T}}^{\ell\ell} $ (upper right), $ p_{\mathrm{T}}^{\ell\text{ max}} $ (lower left), and $ p_{\mathrm{T}}^{\ell\text{ min}} $ (lower right) variables in the 0-jet WW SR. The error bars represent the uncertainties associated with statistical and systematic uncertainties before the fit to data. |
png pdf |
Additional Figure 2-b:
Distributions of the $ m_{\ell\ell} $ (upper left), $ p_{\mathrm{T}}^{\ell\ell} $ (upper right), $ p_{\mathrm{T}}^{\ell\text{ max}} $ (lower left), and $ p_{\mathrm{T}}^{\ell\text{ min}} $ (lower right) variables in the 0-jet WW SR. The error bars represent the uncertainties associated with statistical and systematic uncertainties before the fit to data. |
png pdf |
Additional Figure 2-c:
Distributions of the $ m_{\ell\ell} $ (upper left), $ p_{\mathrm{T}}^{\ell\ell} $ (upper right), $ p_{\mathrm{T}}^{\ell\text{ max}} $ (lower left), and $ p_{\mathrm{T}}^{\ell\text{ min}} $ (lower right) variables in the 0-jet WW SR. The error bars represent the uncertainties associated with statistical and systematic uncertainties before the fit to data. |
png pdf |
Additional Figure 2-d:
Distributions of the $ m_{\ell\ell} $ (upper left), $ p_{\mathrm{T}}^{\ell\ell} $ (upper right), $ p_{\mathrm{T}}^{\ell\text{ max}} $ (lower left), and $ p_{\mathrm{T}}^{\ell\text{ min}} $ (lower right) variables in the 0-jet WW SR. The error bars represent the uncertainties associated with statistical and systematic uncertainties before the fit to data. |
png pdf |
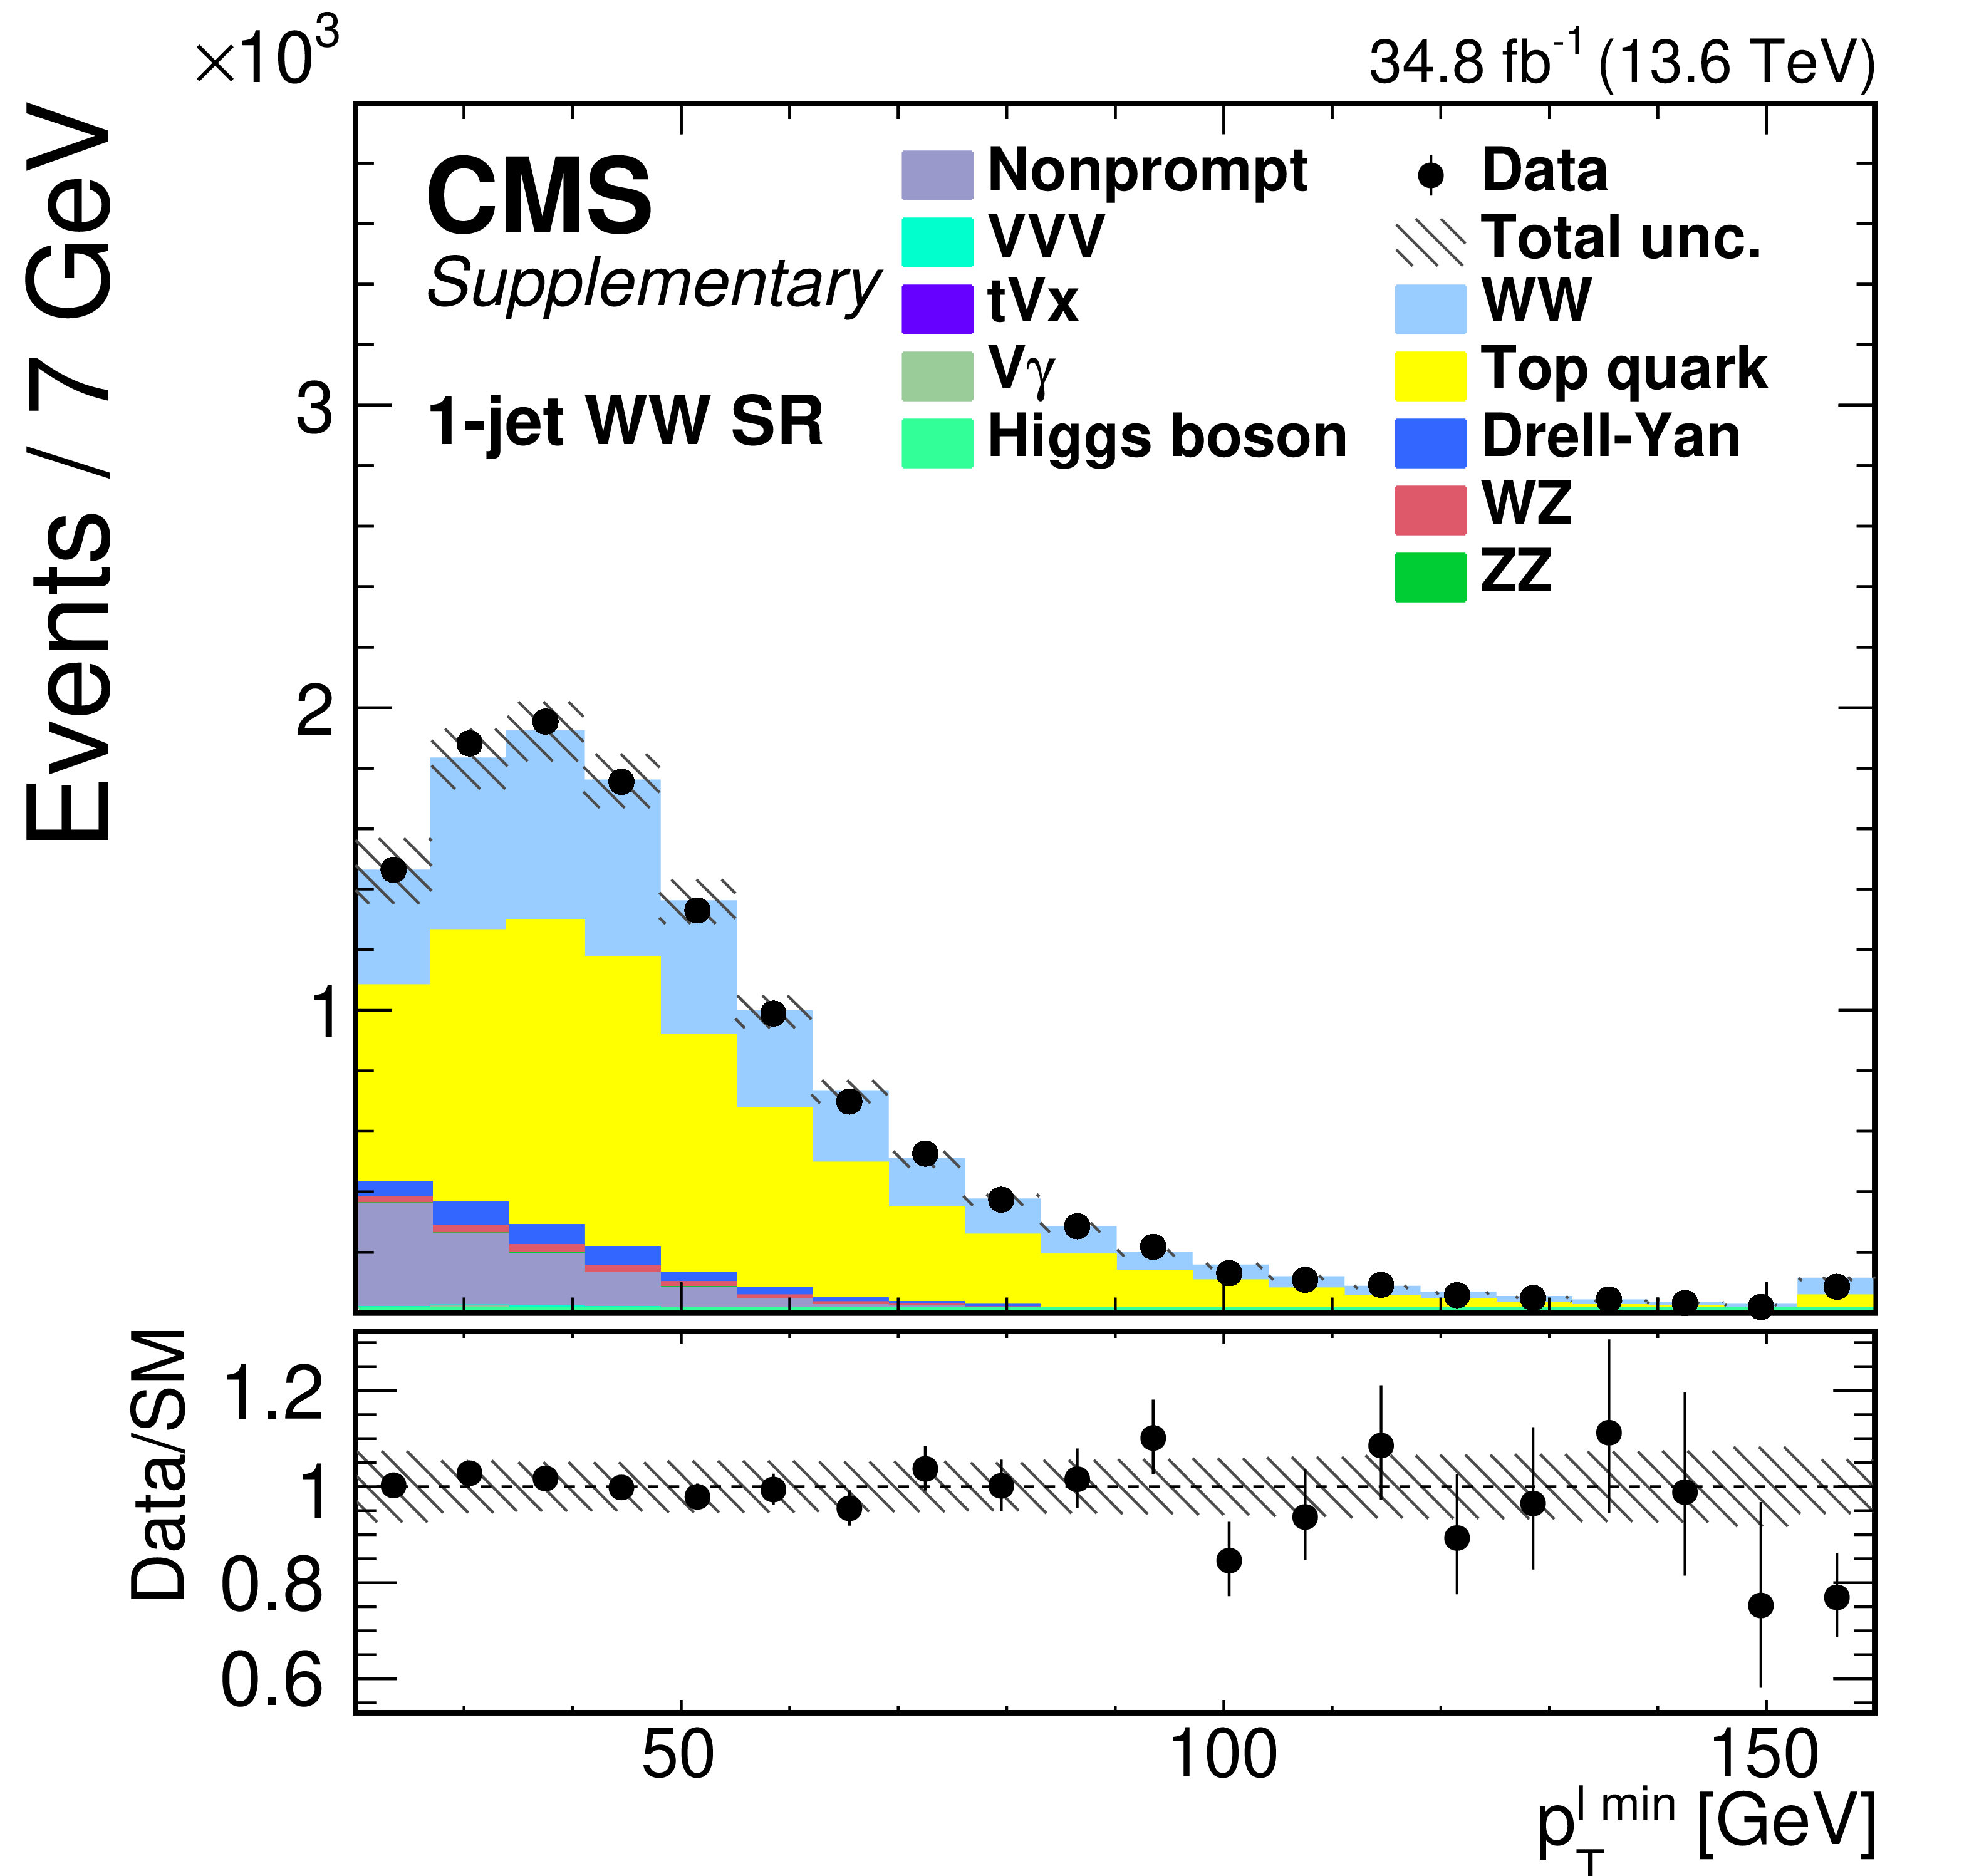
Additional Figure 3:
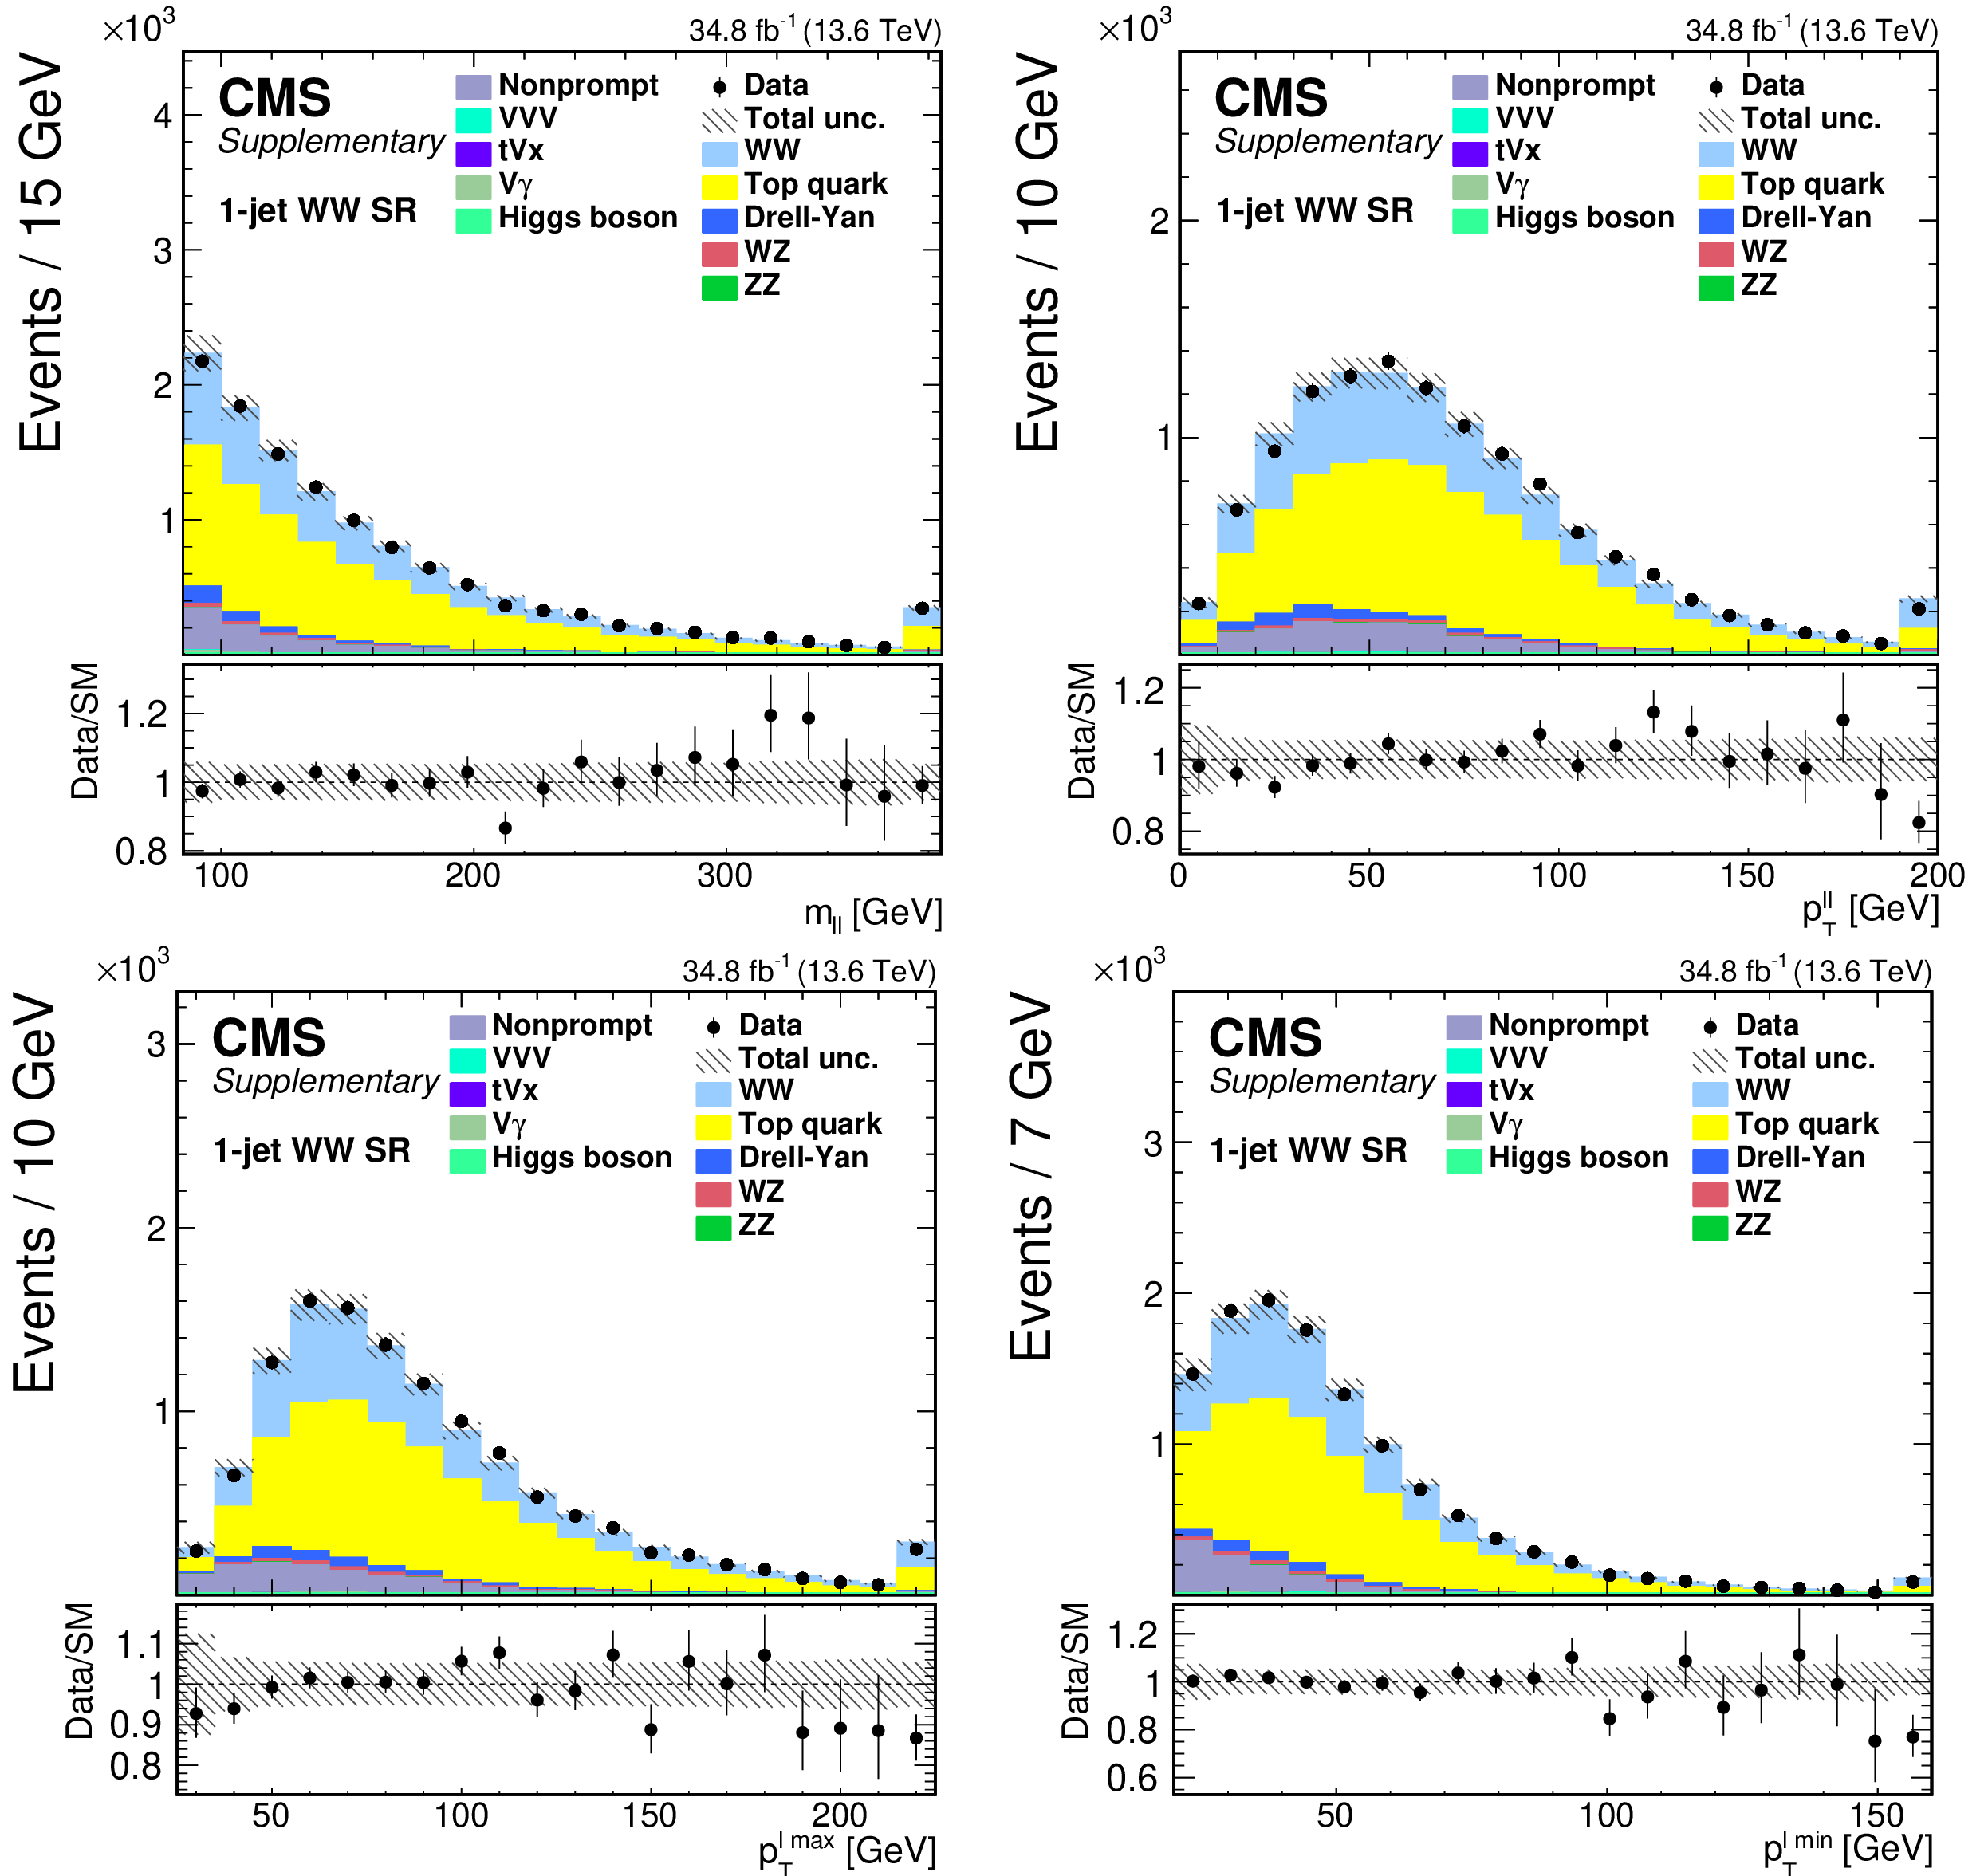
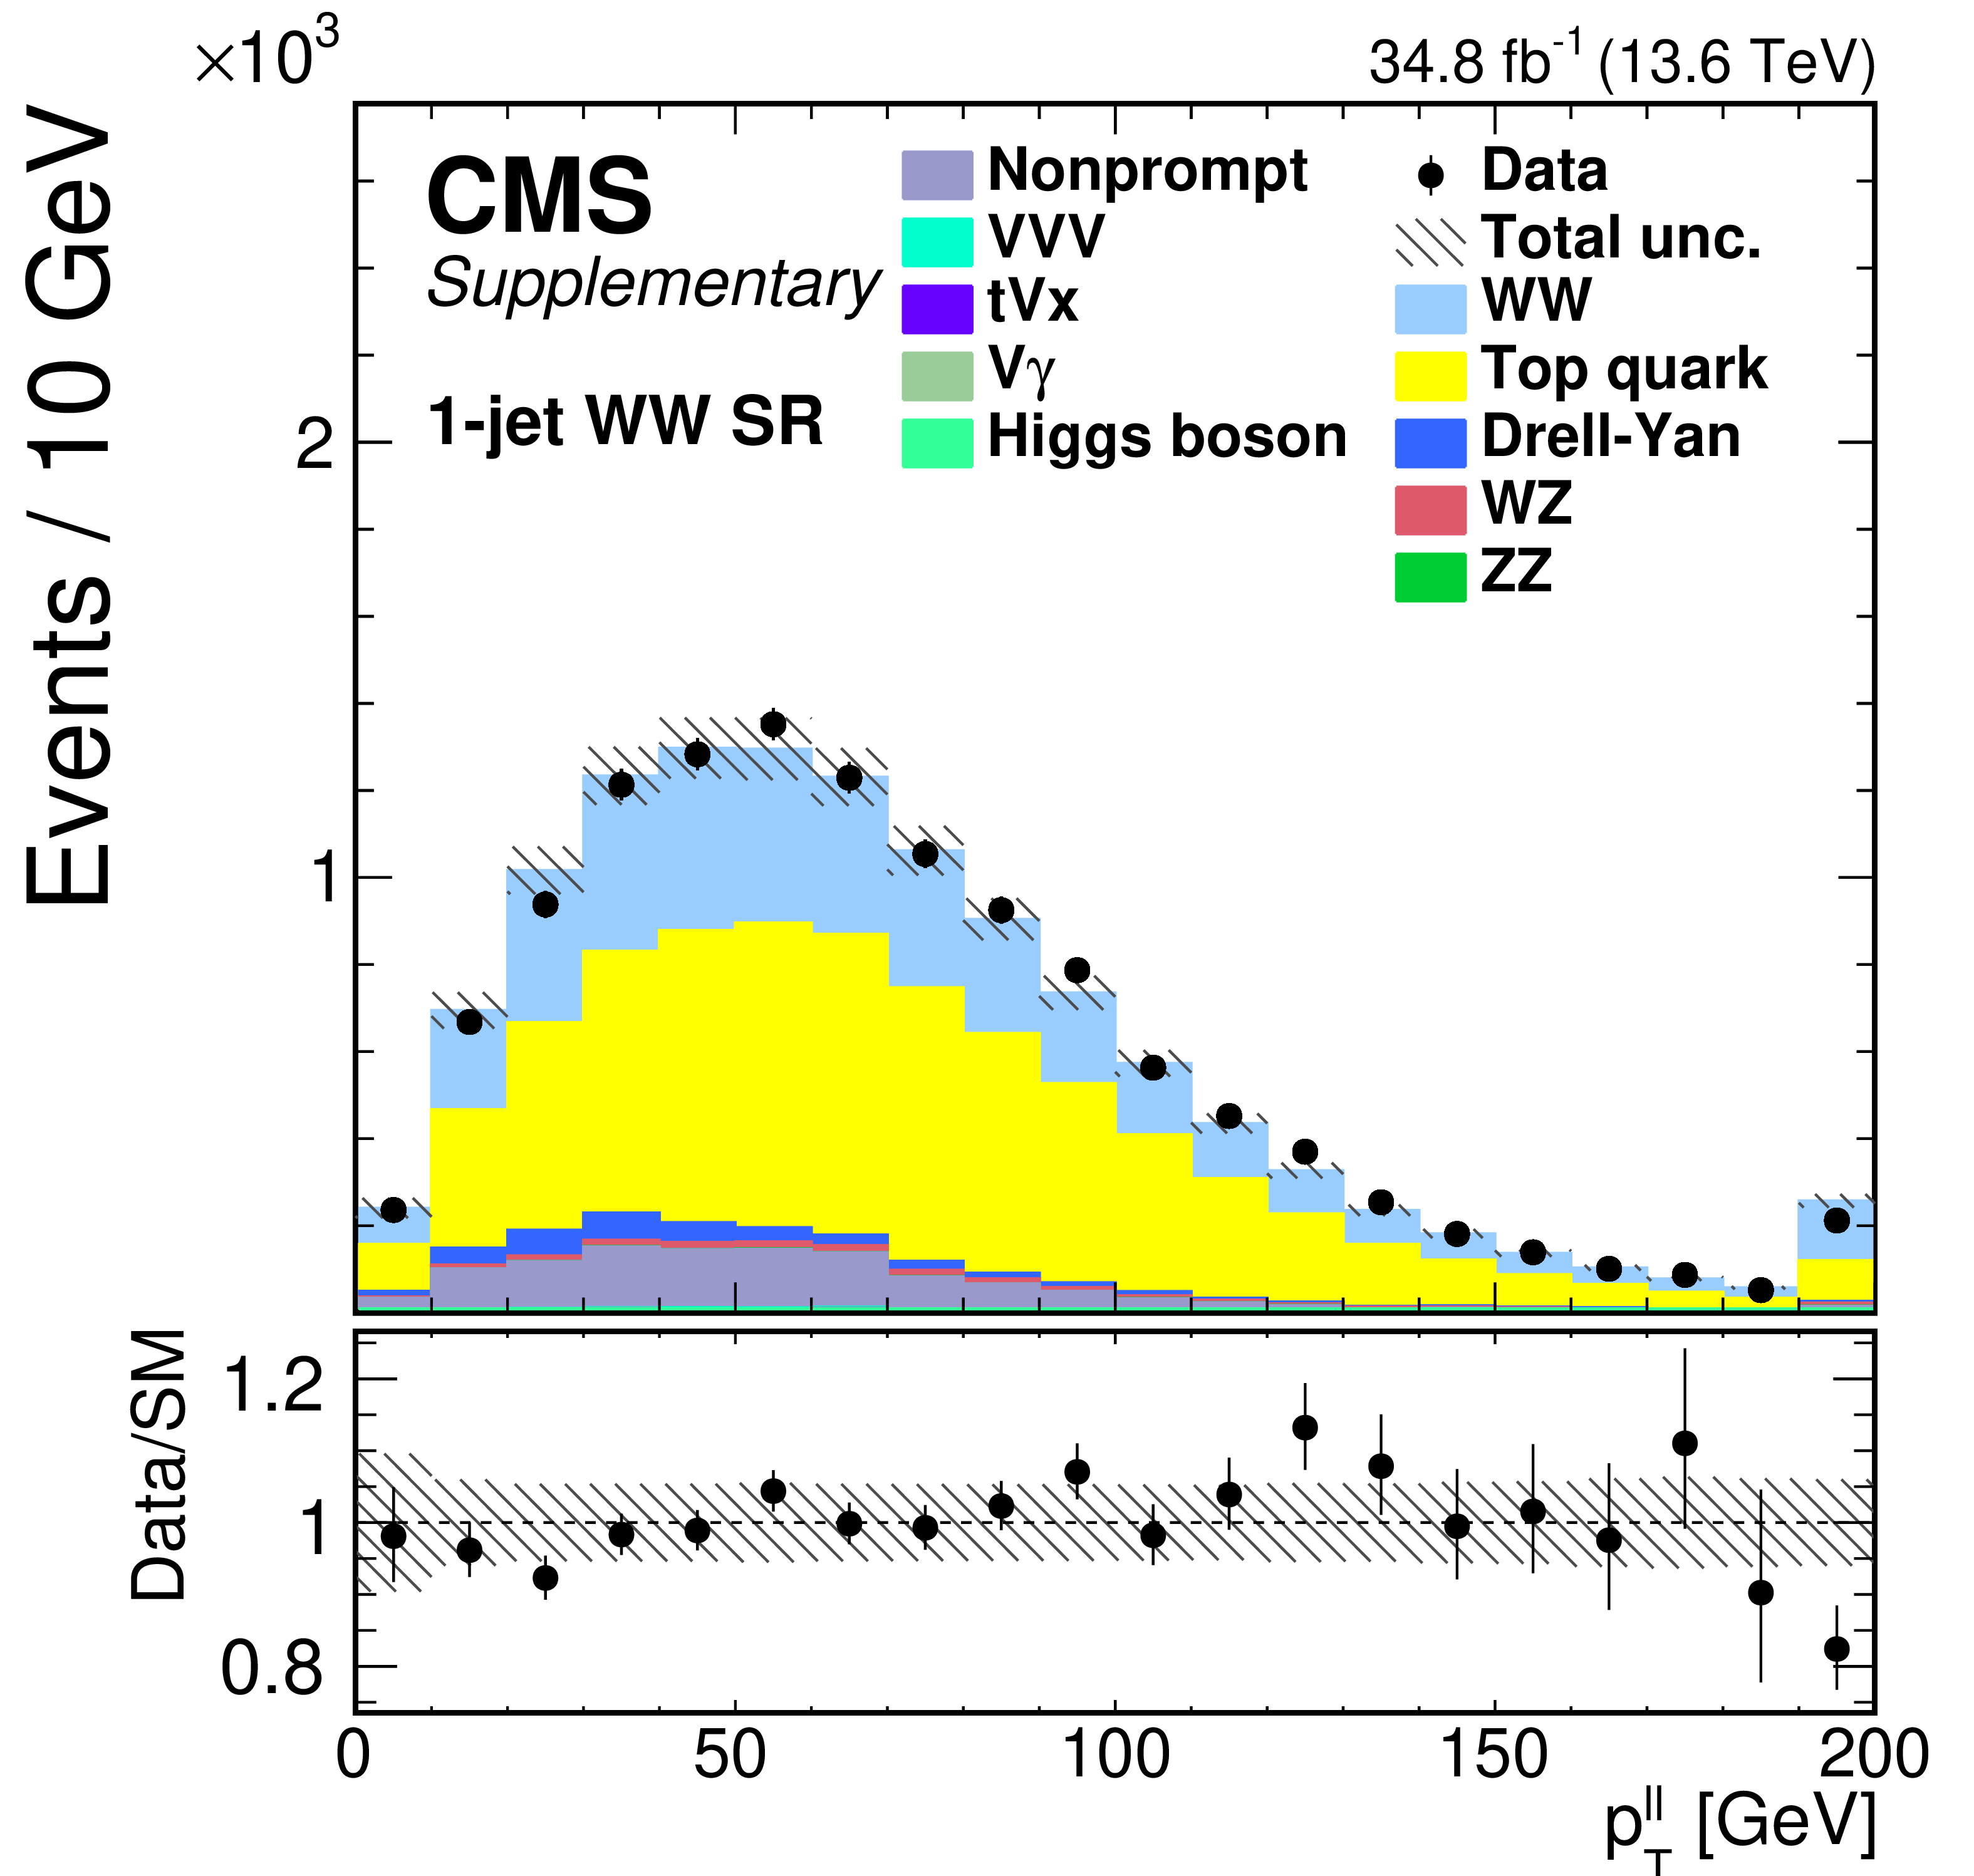
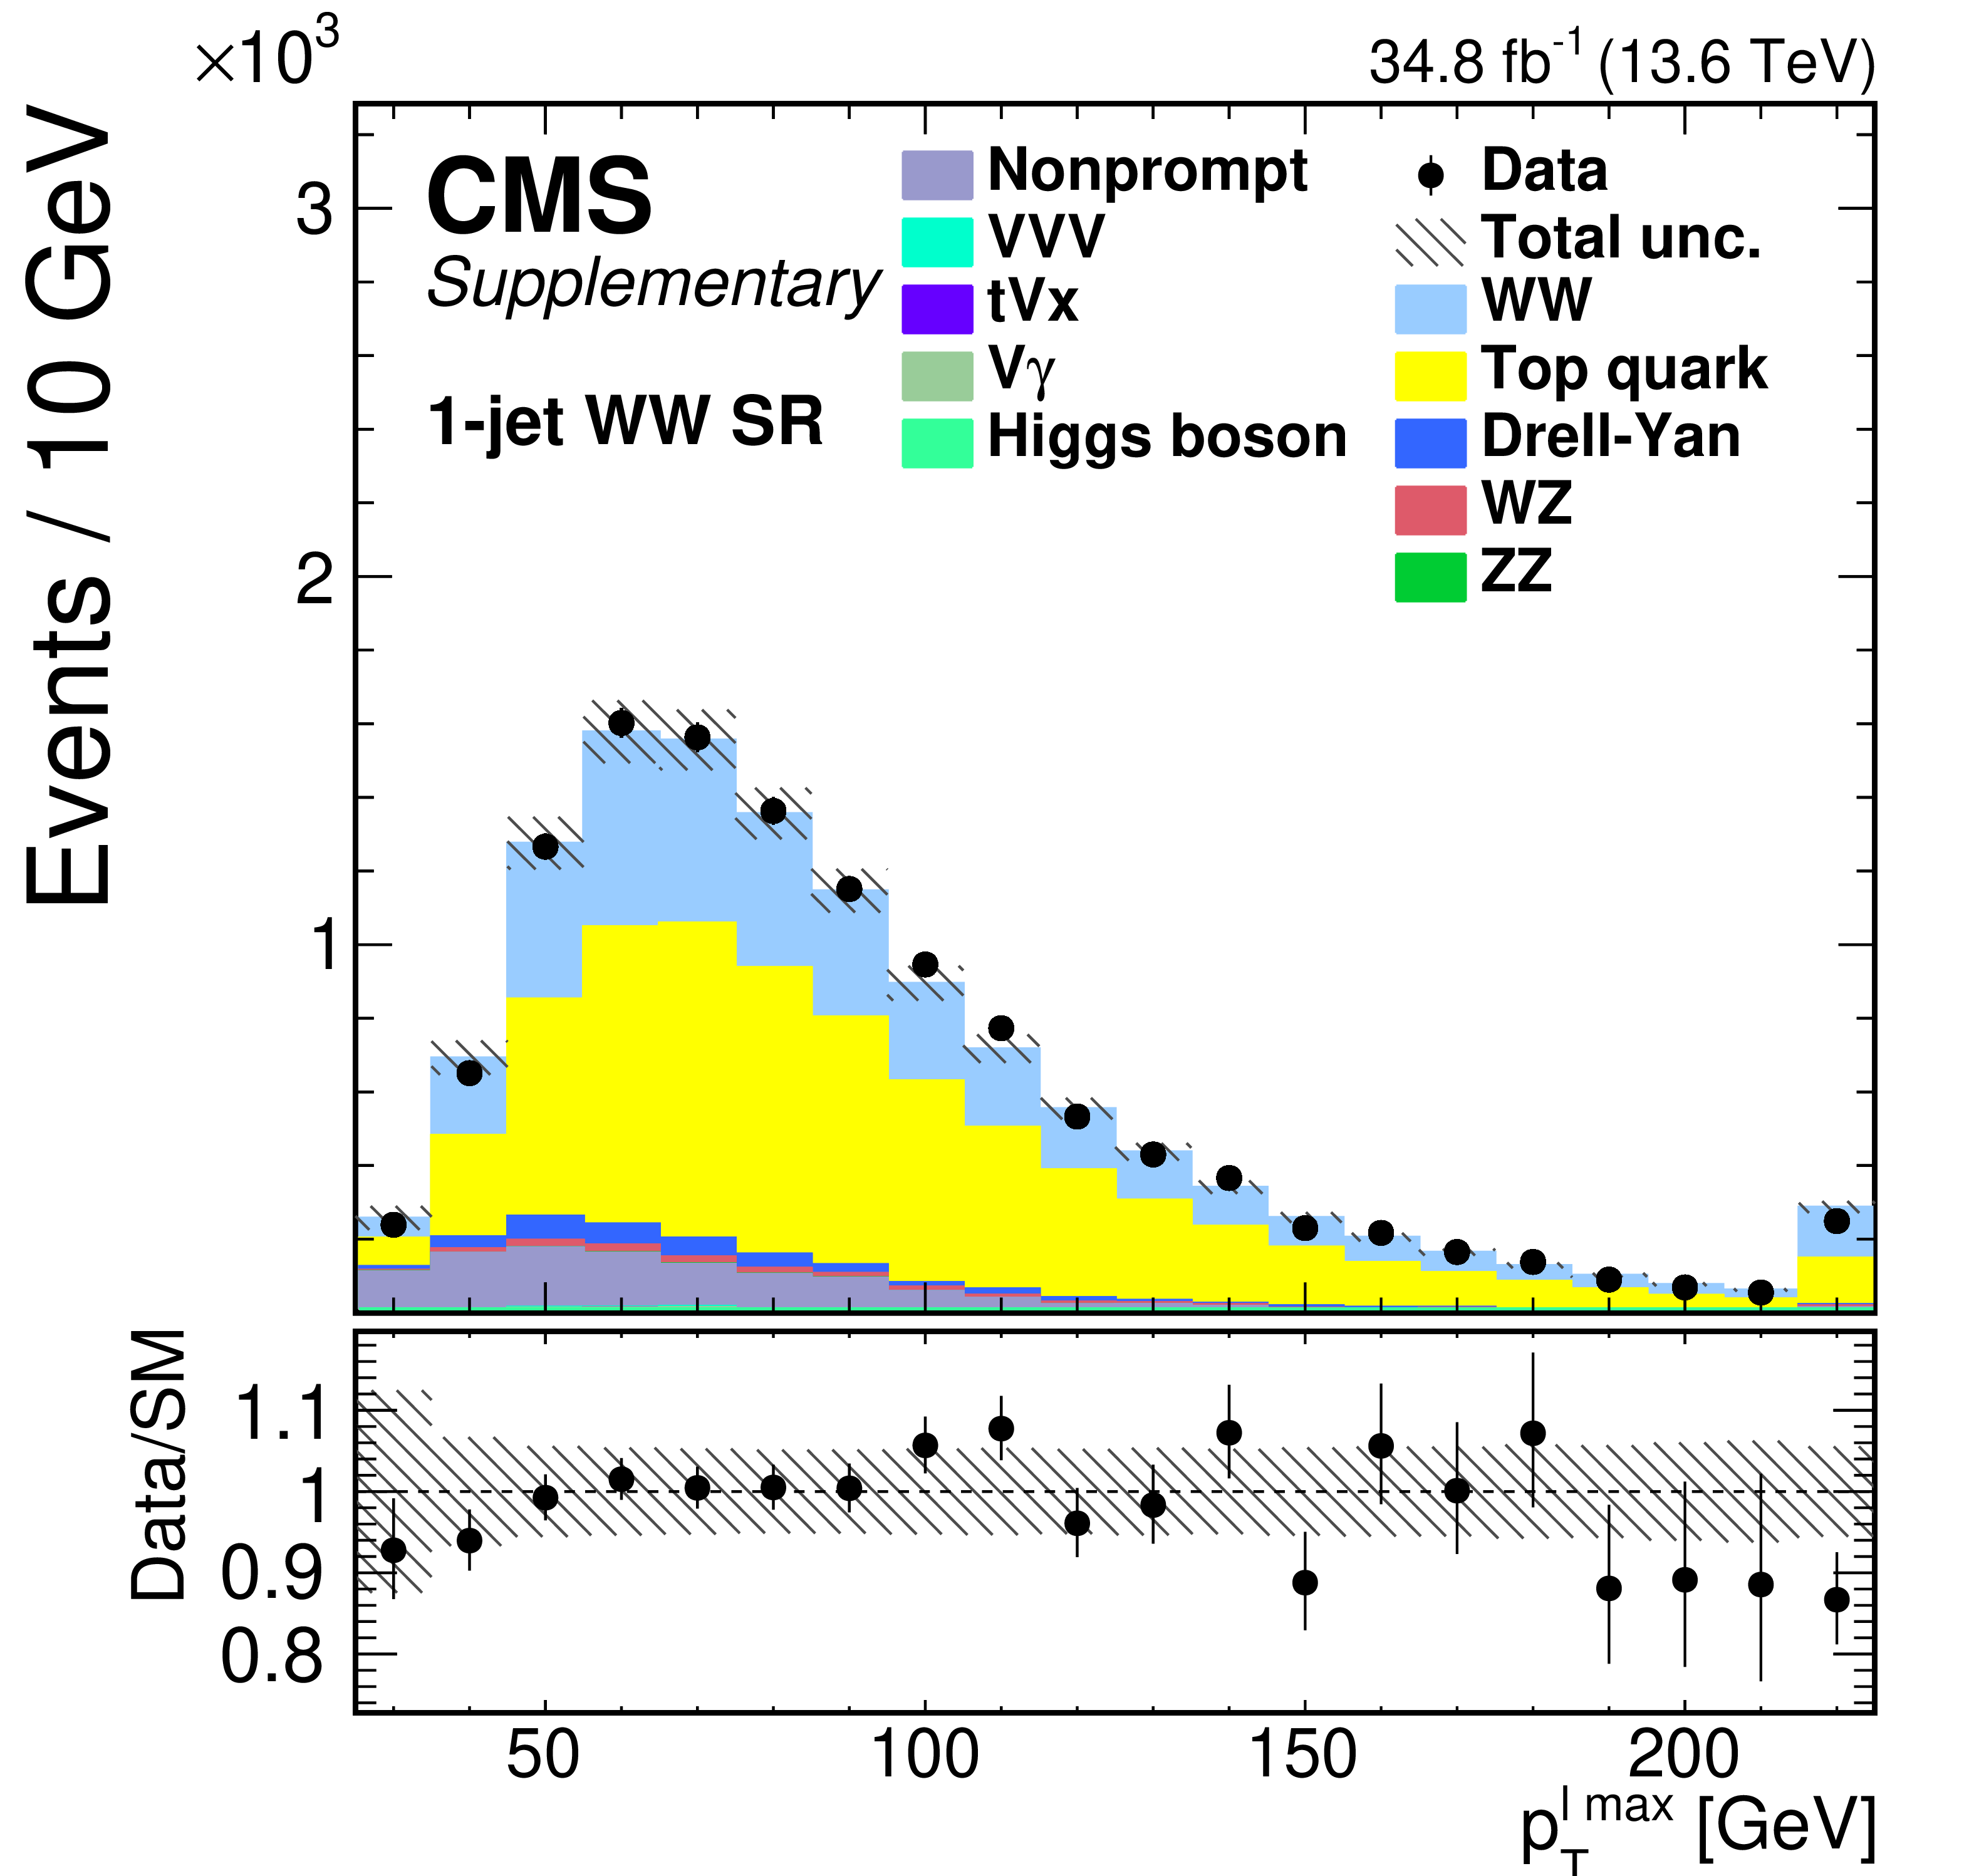
Distributions of the $ m_{\ell\ell} $ (upper left), $ p_{\mathrm{T}}^{\ell\ell} $ (upper right), $ p_{\mathrm{T}}^{\ell\text{ max}} $ (lower left), and $ p_{\mathrm{T}}^{\ell\text{ min}} $ (lower right) variables in the 1-jet WW SR. The error bars represent the uncertainties associated with statistical and systematic uncertainties before the fit to data. |

png pdf |
Additional Figure 3-a:
Distributions of the $ m_{\ell\ell} $ (upper left), $ p_{\mathrm{T}}^{\ell\ell} $ (upper right), $ p_{\mathrm{T}}^{\ell\text{ max}} $ (lower left), and $ p_{\mathrm{T}}^{\ell\text{ min}} $ (lower right) variables in the 1-jet WW SR. The error bars represent the uncertainties associated with statistical and systematic uncertainties before the fit to data. |
png pdf |
Additional Figure 3-b:
Distributions of the $ m_{\ell\ell} $ (upper left), $ p_{\mathrm{T}}^{\ell\ell} $ (upper right), $ p_{\mathrm{T}}^{\ell\text{ max}} $ (lower left), and $ p_{\mathrm{T}}^{\ell\text{ min}} $ (lower right) variables in the 1-jet WW SR. The error bars represent the uncertainties associated with statistical and systematic uncertainties before the fit to data. |
png pdf |
Additional Figure 3-c:
Distributions of the $ m_{\ell\ell} $ (upper left), $ p_{\mathrm{T}}^{\ell\ell} $ (upper right), $ p_{\mathrm{T}}^{\ell\text{ max}} $ (lower left), and $ p_{\mathrm{T}}^{\ell\text{ min}} $ (lower right) variables in the 1-jet WW SR. The error bars represent the uncertainties associated with statistical and systematic uncertainties before the fit to data. |
png pdf |
Additional Figure 3-d:
Distributions of the $ m_{\ell\ell} $ (upper left), $ p_{\mathrm{T}}^{\ell\ell} $ (upper right), $ p_{\mathrm{T}}^{\ell\text{ max}} $ (lower left), and $ p_{\mathrm{T}}^{\ell\text{ min}} $ (lower right) variables in the 1-jet WW SR. The error bars represent the uncertainties associated with statistical and systematic uncertainties before the fit to data. |

png pdf |
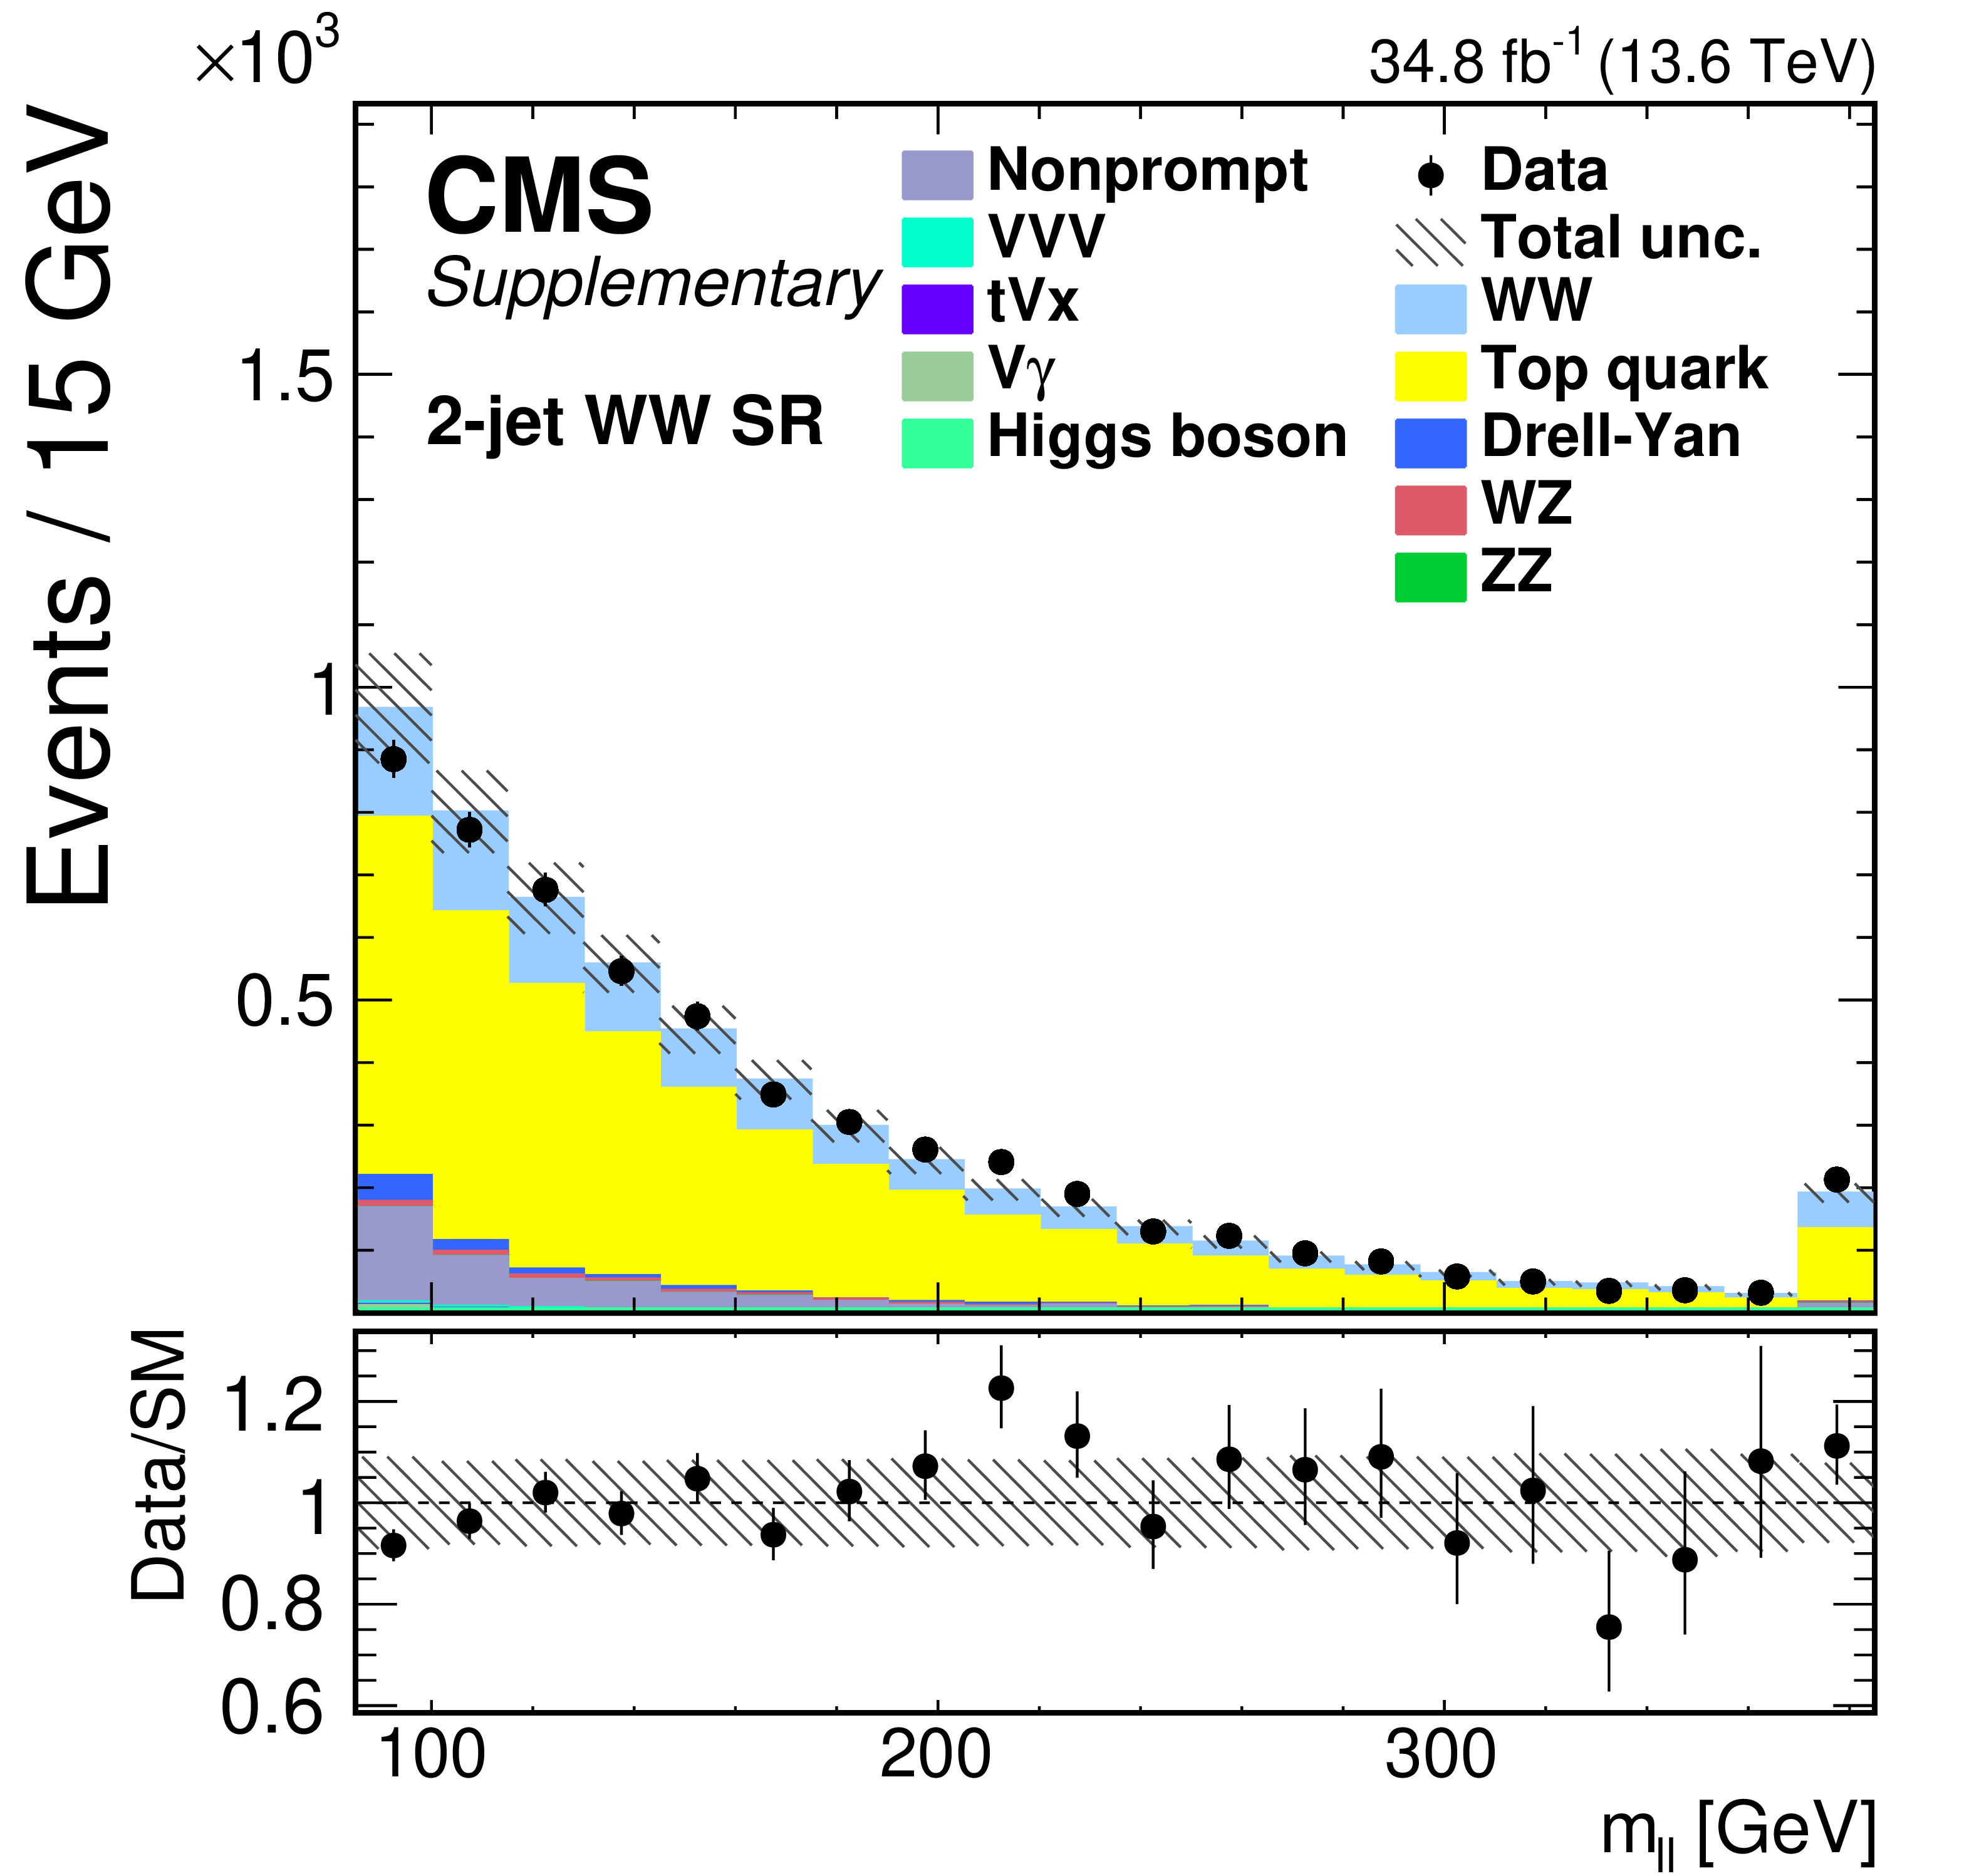
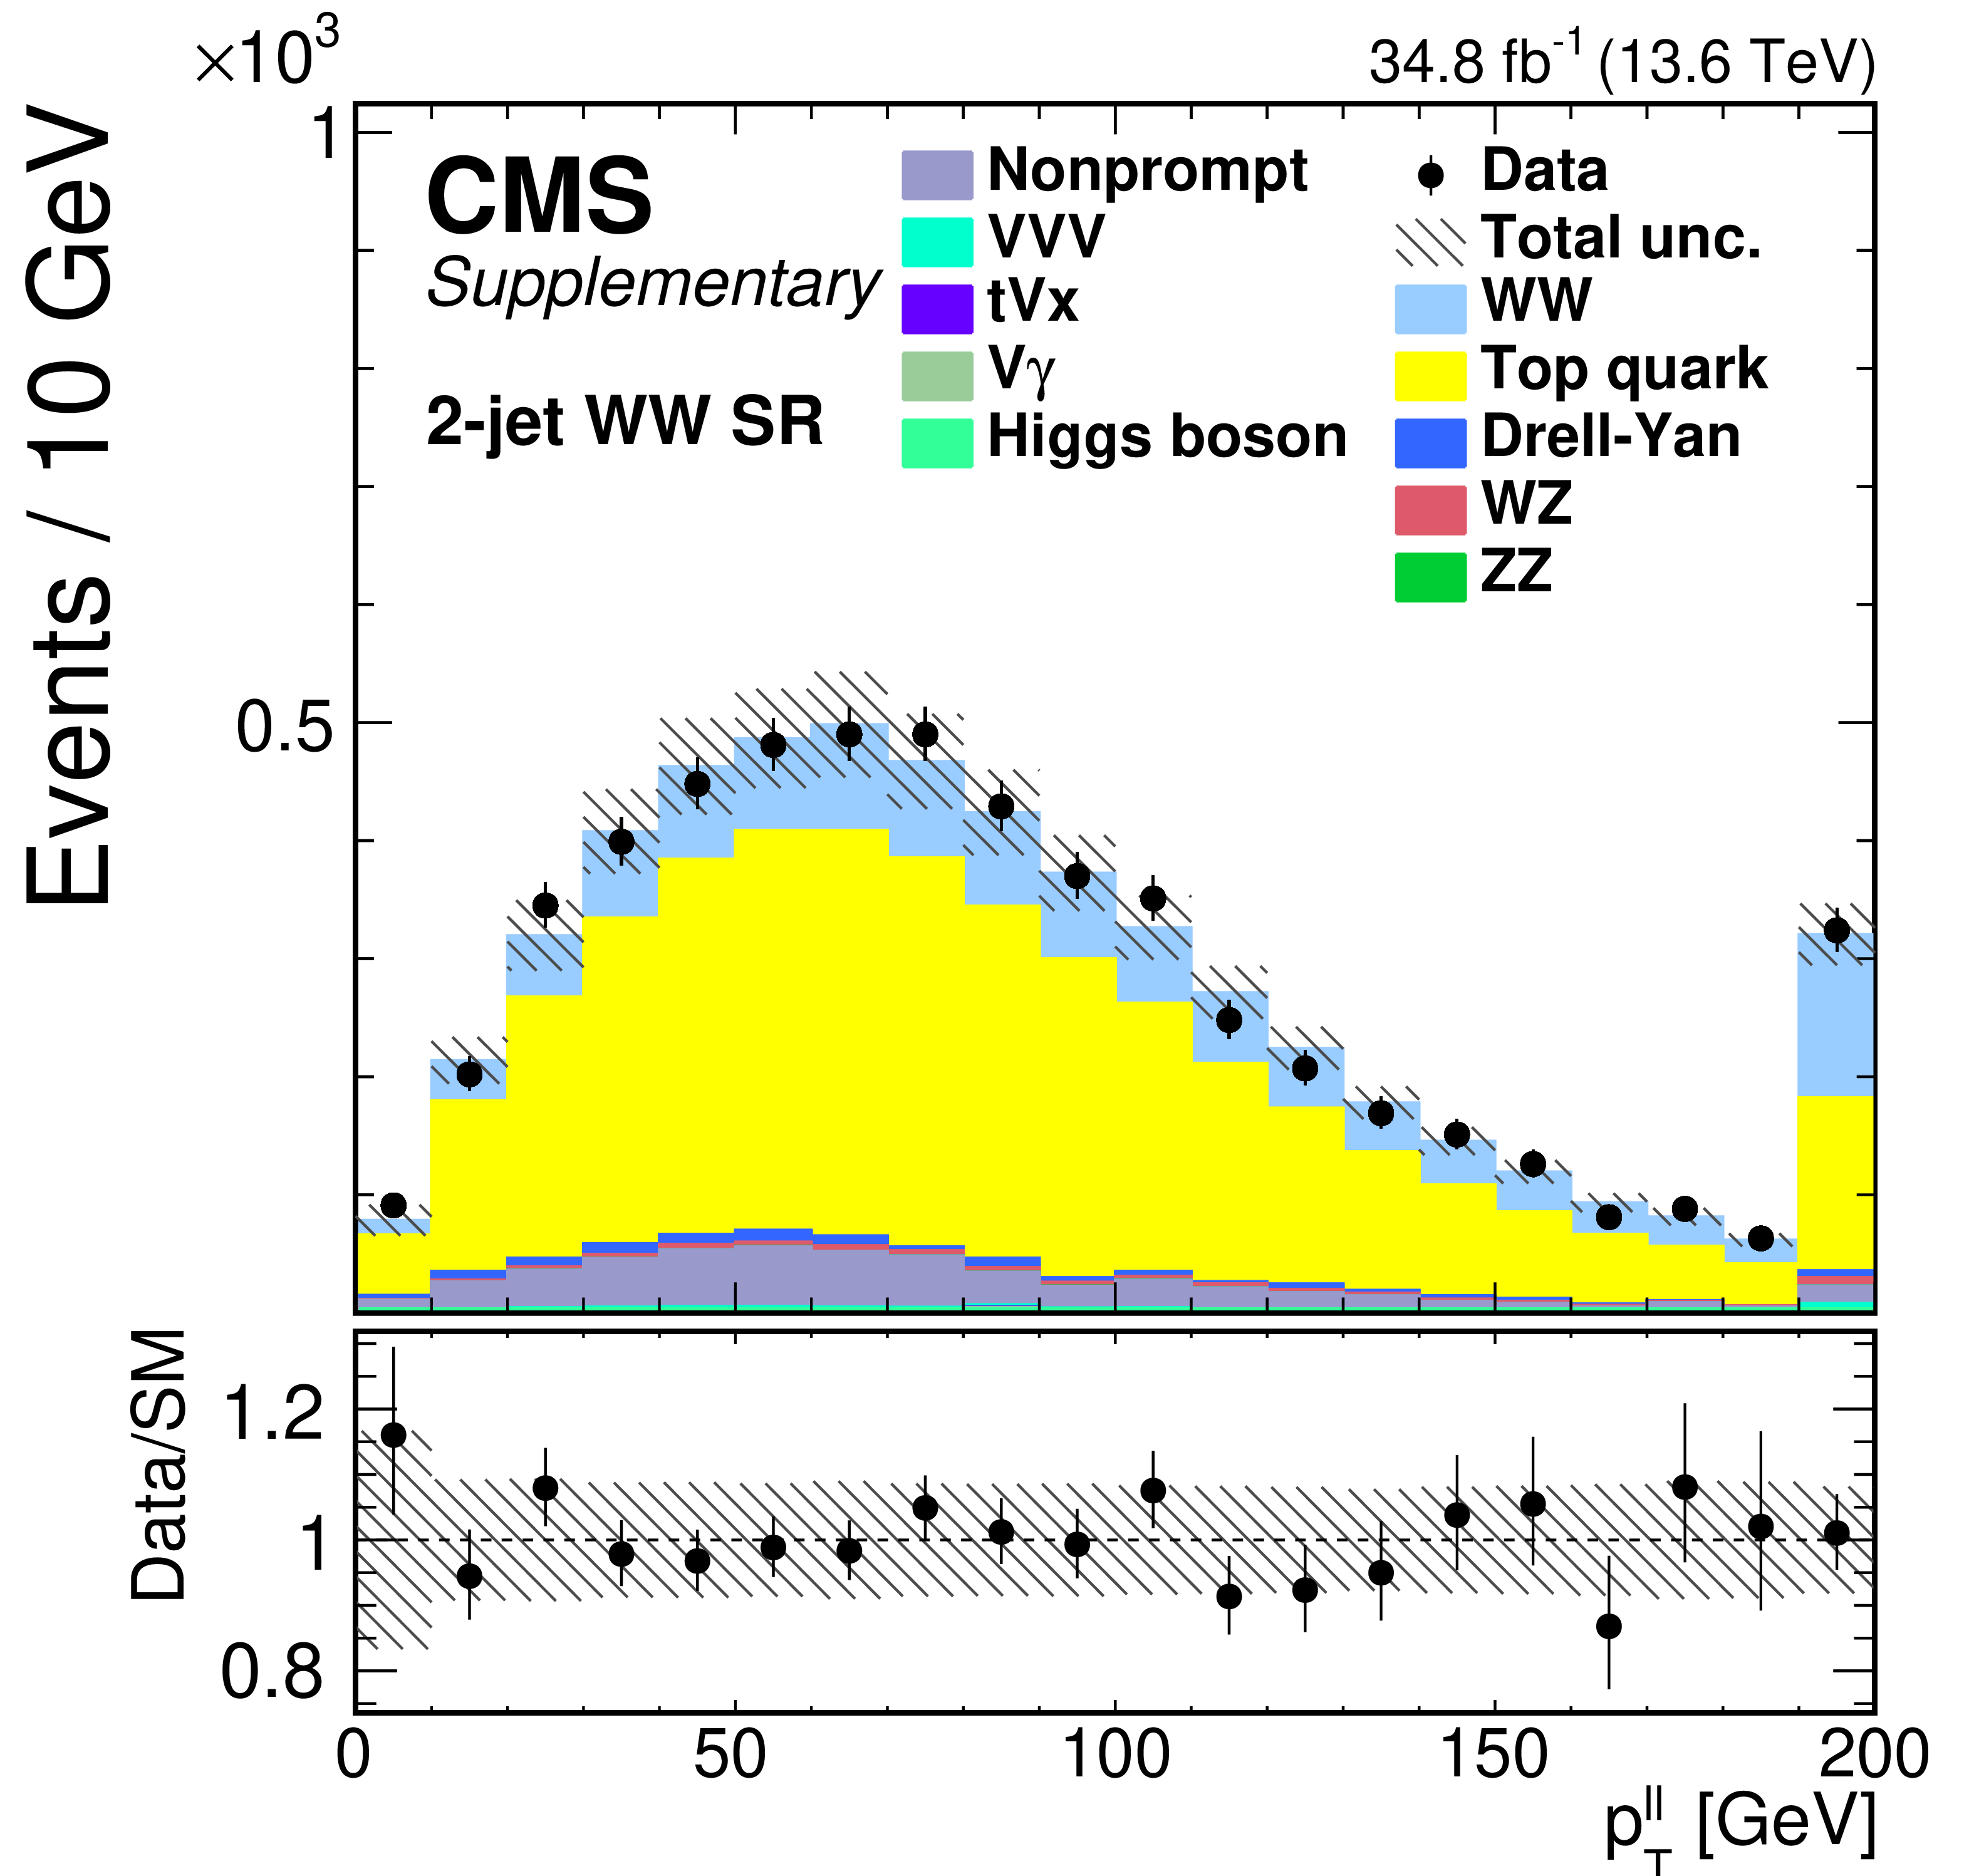
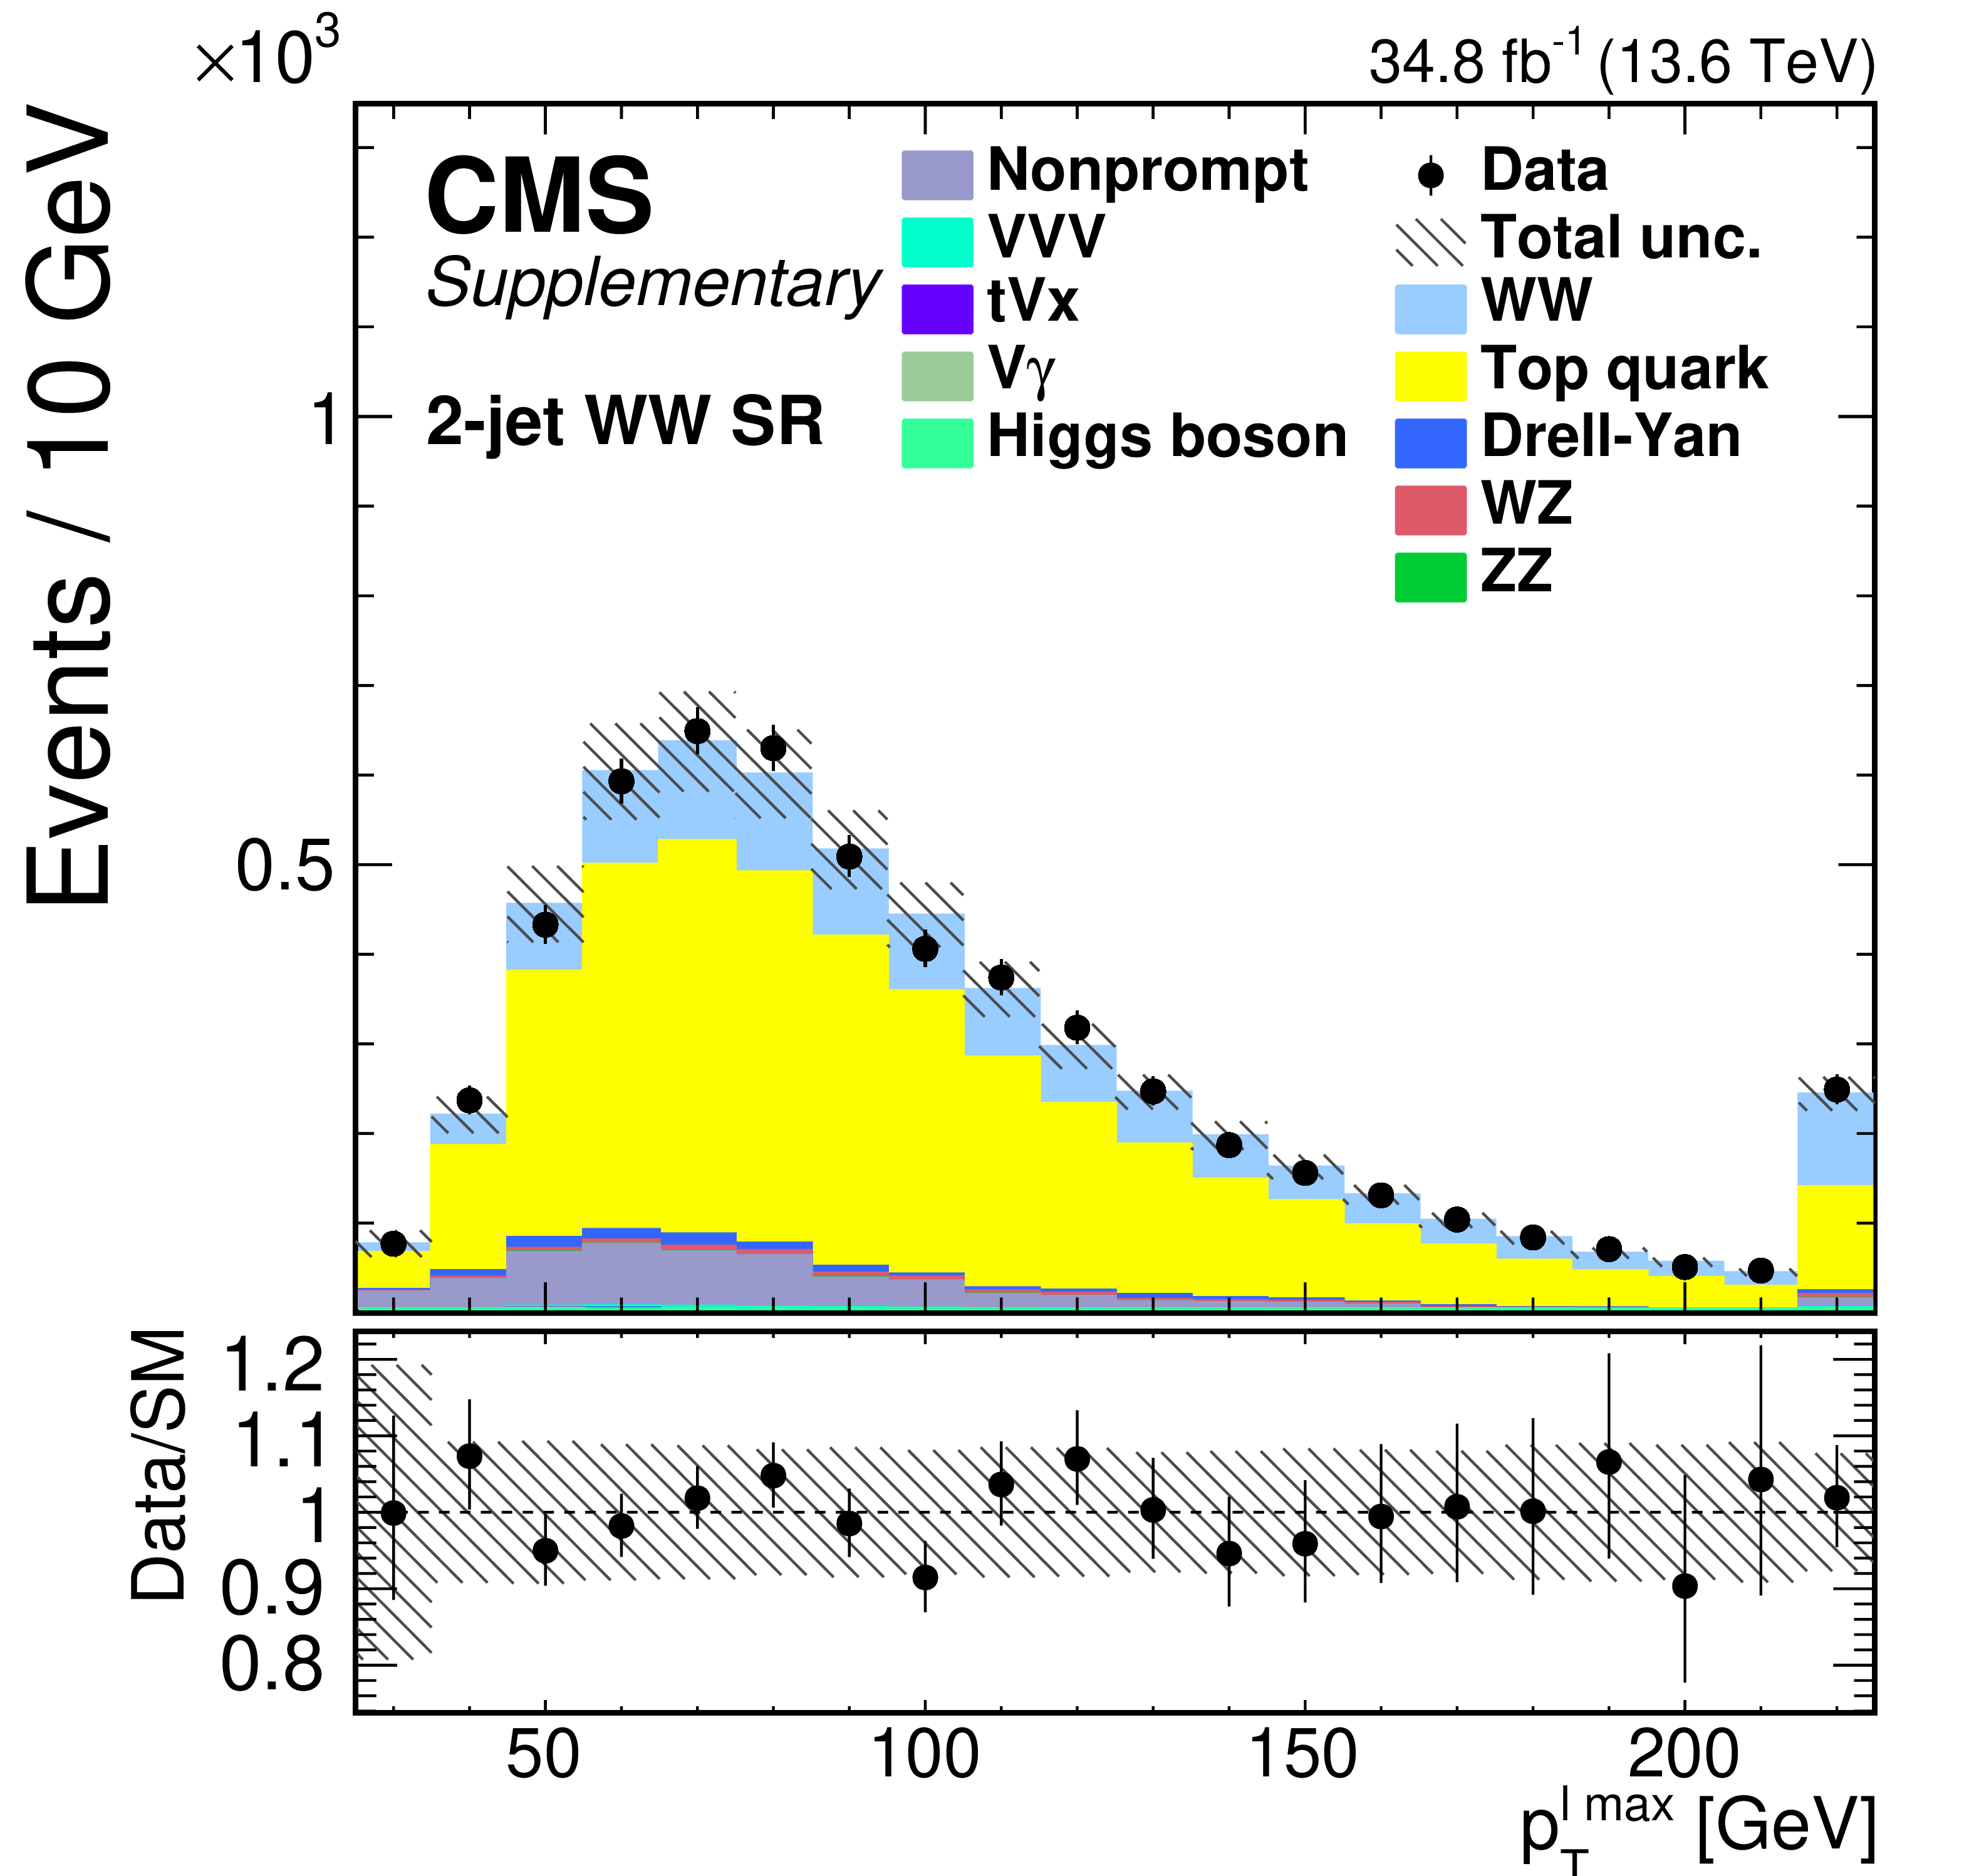
Additional Figure 4:
Distributions of the $ m_{\ell\ell} $ (upper left), $ p_{\mathrm{T}}^{\ell\ell} $ (upper right), $ p_{\mathrm{T}}^{\ell\text{ max}} $ (lower left), and $ p_{\mathrm{T}}^{\ell\text{ min}} $ (lower right) variables in the 2-jet WW SR. The error bars represent the uncertainties associated with statistical and systematic uncertainties before the fit to data. |
png pdf |
Additional Figure 4-a:
Distributions of the $ m_{\ell\ell} $ (upper left), $ p_{\mathrm{T}}^{\ell\ell} $ (upper right), $ p_{\mathrm{T}}^{\ell\text{ max}} $ (lower left), and $ p_{\mathrm{T}}^{\ell\text{ min}} $ (lower right) variables in the 2-jet WW SR. The error bars represent the uncertainties associated with statistical and systematic uncertainties before the fit to data. |
png pdf |
Additional Figure 4-b:
Distributions of the $ m_{\ell\ell} $ (upper left), $ p_{\mathrm{T}}^{\ell\ell} $ (upper right), $ p_{\mathrm{T}}^{\ell\text{ max}} $ (lower left), and $ p_{\mathrm{T}}^{\ell\text{ min}} $ (lower right) variables in the 2-jet WW SR. The error bars represent the uncertainties associated with statistical and systematic uncertainties before the fit to data. |
png pdf |
Additional Figure 4-c:
Distributions of the $ m_{\ell\ell} $ (upper left), $ p_{\mathrm{T}}^{\ell\ell} $ (upper right), $ p_{\mathrm{T}}^{\ell\text{ max}} $ (lower left), and $ p_{\mathrm{T}}^{\ell\text{ min}} $ (lower right) variables in the 2-jet WW SR. The error bars represent the uncertainties associated with statistical and systematic uncertainties before the fit to data. |
png pdf |
Additional Figure 4-d:
Distributions of the $ m_{\ell\ell} $ (upper left), $ p_{\mathrm{T}}^{\ell\ell} $ (upper right), $ p_{\mathrm{T}}^{\ell\text{ max}} $ (lower left), and $ p_{\mathrm{T}}^{\ell\text{ min}} $ (lower right) variables in the 2-jet WW SR. The error bars represent the uncertainties associated with statistical and systematic uncertainties before the fit to data. |
| Additional Tables | |

png pdf |
Additional Table 1:
Correlation matrix among the inclusive fiducial cross sections and the jet bin fractions measured in the analysis. |
png pdf |
Additional Table 2:
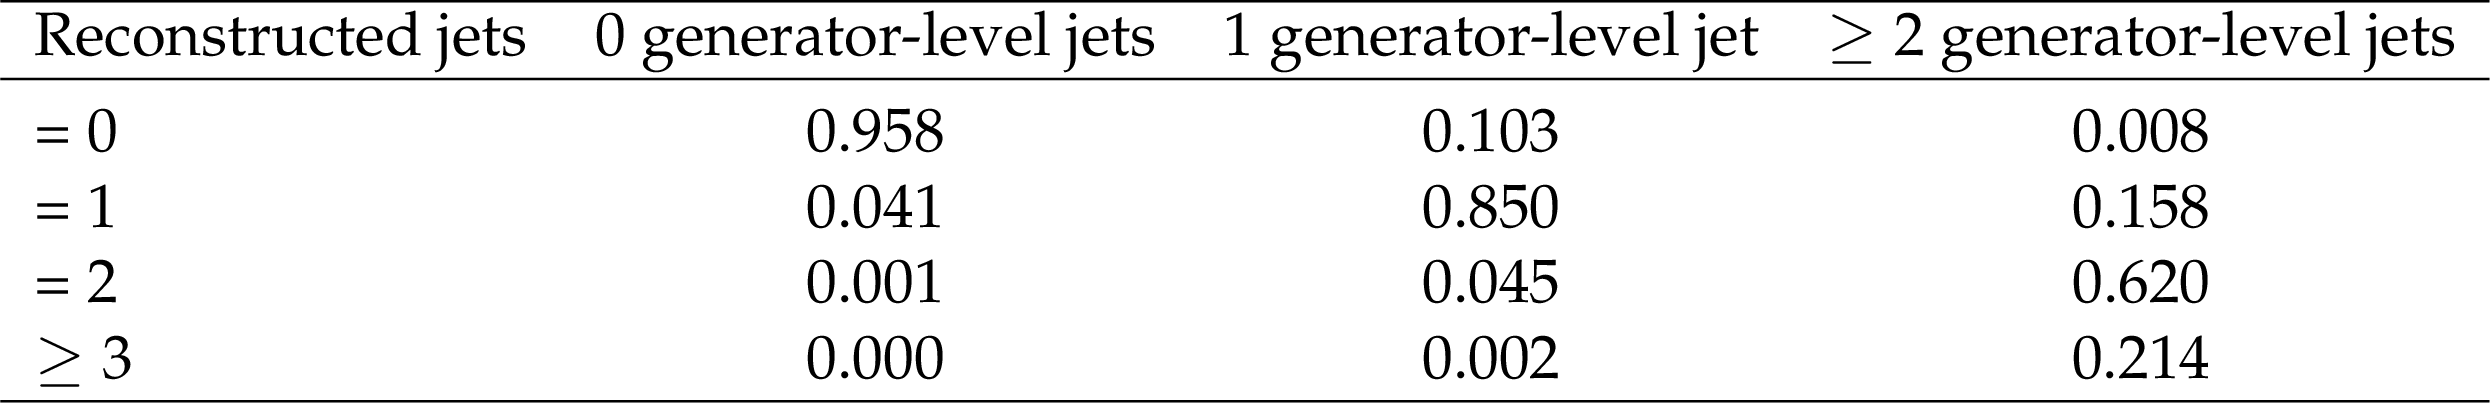
Relative fractions at the reconstruction level for each generator-level jet bin. |
png pdf |
Additional Table 3:
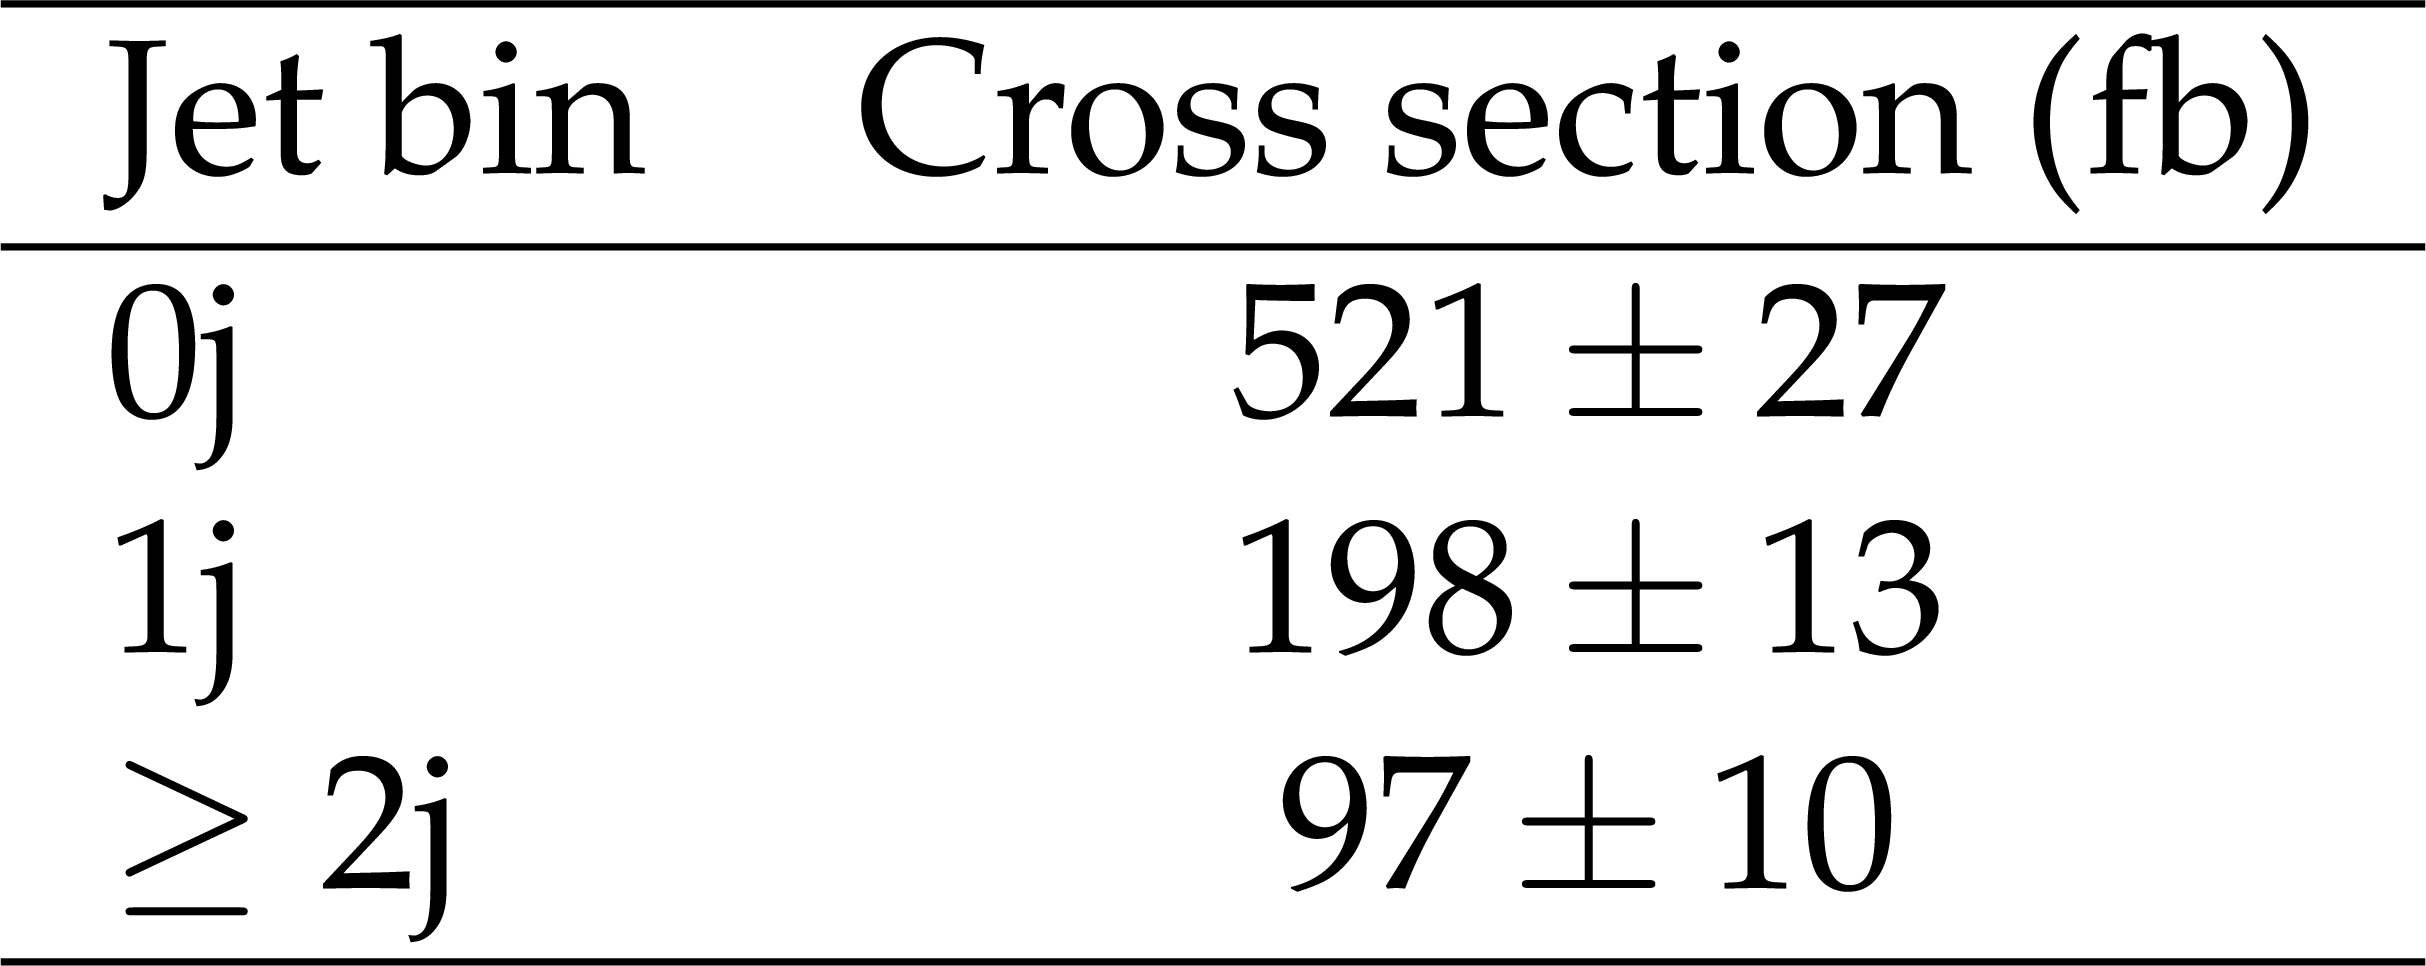
Fiducial cross sections as a function of the jet bin obtained in the analysis. The uncertainty listed is the total uncertainty obtained from the fit to the yields. |
| References | ||||
| 1 | CMS Collaboration | Search for new physics in events with two soft oppositely charged leptons and missing transverse momentum in proton-proton collisions at $ \sqrt{s}= $ 13 TeV | PLB 782 (2018) 440 | CMS-SUS-16-048 1801.01846 |
| 2 | D0 Collaboration | Measurement of the WW production cross section with dilepton final states in $ \mathrm{p\bar{p}} $ collisions at $ \sqrt{s}= $ 1.96 TeV and limits on anomalous trilinear gauge couplings | PRL 103 (2009) 191801 | 0904.0673 |
| 3 | D0 Collaboration | Search for Higgs boson production in oppositely charged dilepton and missing energy final states in 9.7 fb$ ^{-1} $ of $ \mathrm{p\bar{p}} $ collisions at $ \sqrt{s} = $ 1.96 TeV | PRD 88 (2013) 052006 | 1301.1243 |
| 4 | CDF Collaboration | Measurement of the W$ ^+ $W$ ^- $ production cross section and search for anomalous $ \mathrm{WW}\gamma $ and $ \mathrm{WWZ} $ couplings in $ \mathrm{p\bar{p}} $ collisions at $ \sqrt{s}= $ 1.96 TeV | PRL 104 (2010) 201801 | 0912.4500 |
| 5 | ATLAS Collaboration | Measurement of W$ ^+ $W$ ^- $ production in pp collisions at $ \sqrt{s} = $ 7 TeV with the ATLAS detector and limits on anomalous WWZ and WW$ \gamma $ couplings | PRD 87 (2013) 112001 | 1210.2979 |
| 6 | CMS Collaboration | Measurement of the W$ ^+ $W$ ^- $ cross section in pp collisions at $ \sqrt{s}= $ 7 TeV and limits on anomalous $ \mathrm{W}\mathrm{W}\gamma $ and $ \mathrm{W}\mathrm{W}\mathrm{Z} $ couplings | EPJC 73 (2013) 2610 | CMS-SMP-12-005 1306.1126 |
| 7 | CMS Collaboration | Measurement of the W$ ^+ $W$ ^- $ cross section in pp collisions at $ \sqrt{s} = $ 8 TeV and limits on anomalous gauge couplings | EPJC 76 (2016) 401 | CMS-SMP-14-016 1507.03268 |
| 8 | ATLAS Collaboration | Measurement of total and differential W$ ^+ $W$ ^- $ production cross sections in proton-proton collisions at $ \sqrt{s}= $ 8 TeV with the ATLAS detector and limits on anomalous triple-gauge-boson couplings | JHEP 09 (2016) 029 | 1603.01702 |
| 9 | ATLAS Collaboration | Measurement of $ W^+W^- $ production in association with one jet in proton--proton collisions at $ \sqrt{s} = $ 8 TeV with the ATLAS detector | PLB 763 (2016) 114 | 1608.03086 |
| 10 | ATLAS Collaboration | Measurement of fiducial and differential W$ ^+ $W$ ^- $ production cross sections at $ \sqrt{s}= $ 13 TeV with the ATLAS detector | EPJC 79 (2019) 884 | 1905.04242 |
| 11 | CMS Collaboration | W$ ^+ $W$ ^- $ boson pair production in proton-proton collisions at $ \sqrt{s} = $ 13 TeV | PRD 102 (2020) 092001 | CMS-SMP-18-004 2009.00119 |
| 12 | ATLAS Collaboration | Measurements of W$ ^+ $W$ ^- $ $+ \ge $ 1-jet production cross-sections in $ pp $ collisions at $ \sqrt{s}= $ 13 TeV with the ATLAS detector | JHEP 06 (2021) 003 | 2103.10319 |
| 13 | M. Grazzini, S. Kallweit, and M. Wiesemann | Fully differential NNLO computations with MATRIX | EPJC 78 (2018) 537 | 1711.06631 |
| 14 | M. Grazzini et al. | NNLO QCD + NLO EW with Matrix+OpenLoops: precise predictions for vector-boson pair production | JHEP 02 (2020) 087 | 1912.00068 |
| 15 | NNPDF Collaboration | Parton distributions from high-precision collider data | EPJC 77 (2017) 663 | 1706.00428 |
| 16 | F. Caola, K. Melnikov, R. Röntsch, and L. Tancredi | QCD corrections to W$ ^+ $W$ ^- $ production through gluon fusion | PLB 754 (2016) 275 | 1511.08617 |
| 17 | CMS Collaboration | The CMS statistical analysis and combination tool: Combine | Submitted to Comput. Softw. Big Sci, 2024 | CMS-CAT-23-001 2404.06614 |
| 18 | CMS Collaboration | The CMS experiment at the CERN LHC | JINST 3 (2008) S08004 | |
| 19 | CMS Collaboration | Development of the CMS detector for the CERN LHC Run 3 | JINST 19 (2024) P05064 | CMS-PRF-21-001 2309.05466 |
| 20 | CMS Collaboration | Performance of the CMS Level-1 trigger in proton-proton collisions at $ \sqrt{s} = $ 13 TeV | JINST 15 (2020) P10017 | CMS-TRG-17-001 2006.10165 |
| 21 | CMS Collaboration | The CMS trigger system | JINST 12 (2017) P01020 | CMS-TRG-12-001 1609.02366 |
| 22 | P. Nason | A new method for combining NLO QCD with shower Monte Carlo algorithms | JHEP 11 (2004) 040 | hep-ph/0409146 |
| 23 | S. Frixione, P. Nason, and C. Oleari | Matching NLO QCD computations with parton shower simulations: the POWHEG method | JHEP 11 (2007) 070 | 0709.2092 |
| 24 | S. Alioli, P. Nason, C. Oleari, and E. Re | A general framework for implementing NLO calculations in shower Monte Carlo programs: the POWHEG BOX | JHEP 06 (2010) 043 | 1002.2581 |
| 25 | P. Nason and G. Zanderighi | W$ ^+ $W$ ^- $, WZ and ZZ production in the POWHEG-BOX-V2 | EPJC 74 (2014) 2702 | 1311.1365 |
| 26 | S. Alioli, P. Nason, C. Oleari, and E. Re | NLO vector-boson production matched with shower in POWHEG | JHEP 07 (2008) 060 | 0805.4802 |
| 27 | S. Alioli, P. Nason, C. Oleari, and E. Re | NLO Higgs boson production via gluon fusion matched with shower in POWHEG | JHEP 04 (2009) 002 | 0812.0578 |
| 28 | J. Alwall et al. | The automated computation of tree-level and next-to-leading order differential cross sections, and their matching to parton shower simulations | JHEP 07 (2014) 079 | 1405.0301 |
| 29 | J. Alwall et al. | Comparative study of various algorithms for the merging of parton showers and matrix elements in hadronic collisions | EPJC 53 (2008) 473 | 0706.2569 |
| 30 | R. Frederix and S. Frixione | Merging meets matching in MC@NLO | JHEP 12 (2012) 061 | 1209.6215 |
| 31 | P. Artoisenet, R. Frederix, O. Mattelaer, and R. Rietkerk | Automatic spin-entangled decays of heavy resonances in Monte Carlo simulations | JHEP 03 (2013) 015 | 1212.3460 |
| 32 | I. Anderson et al. | Constraining anomalous HVV interactions at proton and lepton colliders | PRD 89 (2014) 035007 | 1309.4819 |
| 33 | A. V. Gritsan et al. | New features in the JHU generator framework: constraining Higgs boson properties from on-shell and off-shell production | PRD 102 (2020) 056022 | 2002.09888 |
| 34 | T. Sjöstrand et al. | An introduction to PYTHIA 8.2 | Comput. Phys. Commun. 191 (2015) 159 | 1410.3012 |
| 35 | CMS Collaboration | Extraction and validation of a new set of CMS PYTHIA8 tunes from underlying-event measurements | EPJC 80 (2020) 4 | CMS-GEN-17-001 1903.12179 |
| 36 | GEANT4 Collaboration | GEANT4 --- a simulation toolkit | NIM A 506 (2003) 250 | |
| 37 | CMS Collaboration | Particle-flow reconstruction and global event description with the CMS detector | JINST 12 (2017) P10003 | CMS-PRF-14-001 1706.04965 |
| 38 | CMS Collaboration | Technical proposal for the Phase-II upgrade of the Compact Muon Solenoid | CMS Technical Proposal CERN-LHCC-2015-010, CMS-TDR-15-02, 2015 CDS |
|
| 39 | M. Cacciari, G. P. Salam, and G. Soyez | The anti-$ k_{\mathrm{T}} $ jet clustering algorithm | JHEP 04 (2008) 063 | 0802.1189 |
| 40 | M. Cacciari, G. P. Salam, and G. Soyez | FastJet user manual | EPJC 72 (2012) 1896 | 1111.6097 |
| 41 | CMS Collaboration | Jet energy scale and resolution in the CMS experiment in pp collisions at 8 TeV | JINST 12 (2017) P02014 | CMS-JME-13-004 1607.03663 |
| 42 | CMS Collaboration | Performance of missing transverse momentum reconstruction in proton-proton collisions at $ \sqrt{s}= $ 13 TeV using the CMS detector | JINST 14 (2019) P07004 | CMS-JME-17-001 1903.06078 |
| 43 | CMS Collaboration | Jet algorithms performance in 13 TeV data | CMS Physics Analysis Summary, 2017 CMS-PAS-JME-16-003 |
CMS-PAS-JME-16-003 |
| 44 | CMS Collaboration | Pileup mitigation at CMS in 13 TeV data | JINST 15 (2020) P09018 | CMS-JME-18-001 2003.00503 |
| 45 | D. Bertolini, P. Harris, M. Low, and N. Tran | Pileup per particle identification | JHEP 10 (2014) 059 | 1407.6013 |
| 46 | E. Bols et al. | Jet flavour classification using DeepJet | JINST 15 (2020) P12012 | 2008.10519 |
| 47 | CMS Collaboration | Electron and photon reconstruction and identification with the CMS experiment at the CERN LHC | JINST 16 (2021) P05014 | CMS-EGM-17-001 2012.06888 |
| 48 | CMS Collaboration | Performance of the CMS muon detector and muon reconstruction with proton-proton collisions at $ \sqrt{s}= $ 13 TeV | JINST 13 (2018) P06015 | CMS-MUO-16-001 1804.04528 |
| 49 | CMS Collaboration | Measurements of properties of the Higgs boson decaying to a W boson pair in pp collisions at $ \sqrt{s}= $ 13 TeV | PLB 791 (2019) 96 | CMS-HIG-16-042 1806.05246 |
| 50 | Particle Data Group , R. L. Workman et al. | Review of Particle Physics | PTEP 2022 (2022) 083C01 | |
| 51 | CMS Collaboration | First measurement of the top quark pair production cross section in proton-proton collisions at $ \sqrt{s} = $ 13.6 TeV | JHEP 08 (2023) 204 | CMS-TOP-22-012 2303.10680 |
| 52 | CMS Collaboration | Measurement of Higgs boson production and properties in the WW decay channel with leptonic final states | JHEP 01 (2014) 096 | CMS-HIG-13-023 1312.1129 |
| 53 | G. Cowan, K. Cranmer, E. Gross, and O. Vitells | Asymptotic formulae for likelihood-based tests of new physics | EPJC 71 (2011) 1554 | 1007.1727 |
| 54 | CMS Collaboration | Luminosity measurement in proton-proton collisions at 13.6 TeV in 2022 at CMS | CMS Physics Analysis Summary, 2024 CMS-PAS-LUM-22-001 |
CMS-PAS-LUM-22-001 |
| 55 | CMS Collaboration | Measurements of differential Z boson production cross sections in proton-proton collisions at $ \sqrt{s} = $ 13 TeV | JHEP 12 (2019) 061 | CMS-SMP-17-010 1909.04133 |
| 56 | CMS Collaboration | Identification of heavy-flavour jets with the CMS detector in pp collisions at 13 TeV | JINST 13 (2018) P05011 | CMS-BTV-16-002 1712.07158 |
| 57 | J. Butterworth et al. | PDF4LHC recommendations for LHC Run II | JPG 43 (2016) 023001 | 1510.03865 |
| 58 | R. J. Barlow and C. Beeston | Fitting using finite Monte Carlo samples | Comput. Phys. Commun. 77 (1993) 219 | |
| 59 | CMS Collaboration | Object definitions for top quark analyses at the particle level | Technical Report CMS-NOTE-2017-004, 2017 CDS |
|
| 60 | CMS Collaboration | Measurements of production cross sections of WZ and same-sign WW boson pairs in association with two jets in proton-proton collisions at $ \sqrt{s} = $ 13 TeV | PLB 809 (2020) 135710 | CMS-SMP-19-012 2005.01173 |
| 61 | CMS Collaboration | Measurement of the Z boson differential production cross section using its invisible decay mode (Z$ \nu\bar{\nu} $) in proton-proton collisions at $ \sqrt{s}= $ 13 TeV | JHEP 05 (2021) 205 | CMS-SMP-18-003 2012.09254 |
| 62 | S. Schmitt | TUnfold: an algorithm for correcting migration effects in high energy physics | JINST 7 (2012) T10003 | 1205.6201 |
| 63 | CMSnoop | Statistical data analysis | \hrefG.~Cowan, , ch.~11, . Oxford University Press, 1998 | |
| 64 | R. D. Cousins | Lectures on statistics in theory: Prelude to statistics in practice | 1807.05996 | |
| 65 | ATLAS Collaboration | Measurement of the $ \mathrm{t\bar{t}} $ cross section and its ratio to the Z production cross section using pp collisions at $ \sqrt{s}= $ 13.6 TeV with the ATLAS detector | PLB 848 (2024) 138376 | 2308.09529 |
| 66 | S. Kallweit, M. Grazzini, and M. Wiesemann | Higher-order corrections on diboson production processes with MATRIX | PoS RADCOR 075, 2018 link |
|
| 67 | P. F. Monni et al. | MiNNLO$ _{\text{PS}} $: a new method to match NNLO QCD to parton showers | JHEP 05 (2020) 143 | 1908.06987 |
| 68 | P. F. Monni, E. Re, and M. Wiesemann | MiNNLO$ _{\text{PS}} $: optimizing 2 $ \to $ 1 hadronic processes | EPJC 80 (2020) 1075 | 2006.04133 |
| 69 | CMS Collaboration | HEPData record for this analysis | 2024 link |
|
| 70 | CMS Collaboration | Statistical model for this analysis | link | |
| 71 | ATLAS Collaboration | Measurement of the W$^{+}$W$^{-}$ production cross section in pp collisions at a centre-of-mass energy of $ \sqrt{s} = $ 13 TeV with the ATLAS experiment | PLB 773 (2017) 354 | 1702.04519 |
|
|
Compact Muon Solenoid LHC, CERN |
|

|

|

|

|

|