

Compact Muon Solenoid
LHC, CERN
| CMS-PAS-HIG-21-002 | ||
| Search for Higgs boson pairs decaying to WWWW, WW$\tau\tau$, and $\tau\tau\tau\tau$ in proton-proton collisions at $\sqrt{s} = $ 13 TeV | ||
| CMS Collaboration | ||
| January 2022 | ||
| Abstract: The results of a search for Higgs boson pair (HH) production in the WWWW, WW$ \tau \tau $, and $ \tau\tau\tau\tau $ decay modes are presented. The search uses proton-proton collision data recorded by the CMS experiment at a center-of-mass energy of 13 TeV, corresponding to an integrated luminosity of 138 fb$^{-1}$. The analyzed events contain two, three, or four reconstructed leptons, including electrons, muons, and hadronically decaying tau leptons. No evidence for a signal is found in the data, and upper limits are set on the cross section for nonresonant HH production, as well as resonant production in which a new heavy particle decays to a pair of Higgs bosons. For nonresonant HH production, the observed (expected) upper limit on the cross section at 95% confidence level (CL) is 21.8 (19.6) times the standard model (SM) prediction. The ratio of the trilinear Higgs boson self-coupling to its value in the SM is constrained to be between -7.0 and 11.2 at 95% CL, and limits are set on a variety of new-physics models using an effective field theory approach. The observed (expected) limits on the cross section for resonant HH production range from 0.18 to 0.90 (0.08 to 1.07) pb at 95% CL for new heavy-particle masses from 250 to 1000 GeV. | ||
|
Links:
CDS record (PDF) ;
Physics Briefing ;
CADI line (restricted) ;
These preliminary results are superseded in this paper, JHEP 07 (2023) 095. The superseded preliminary plots can be found here. |
||
| Figures | |
png pdf |
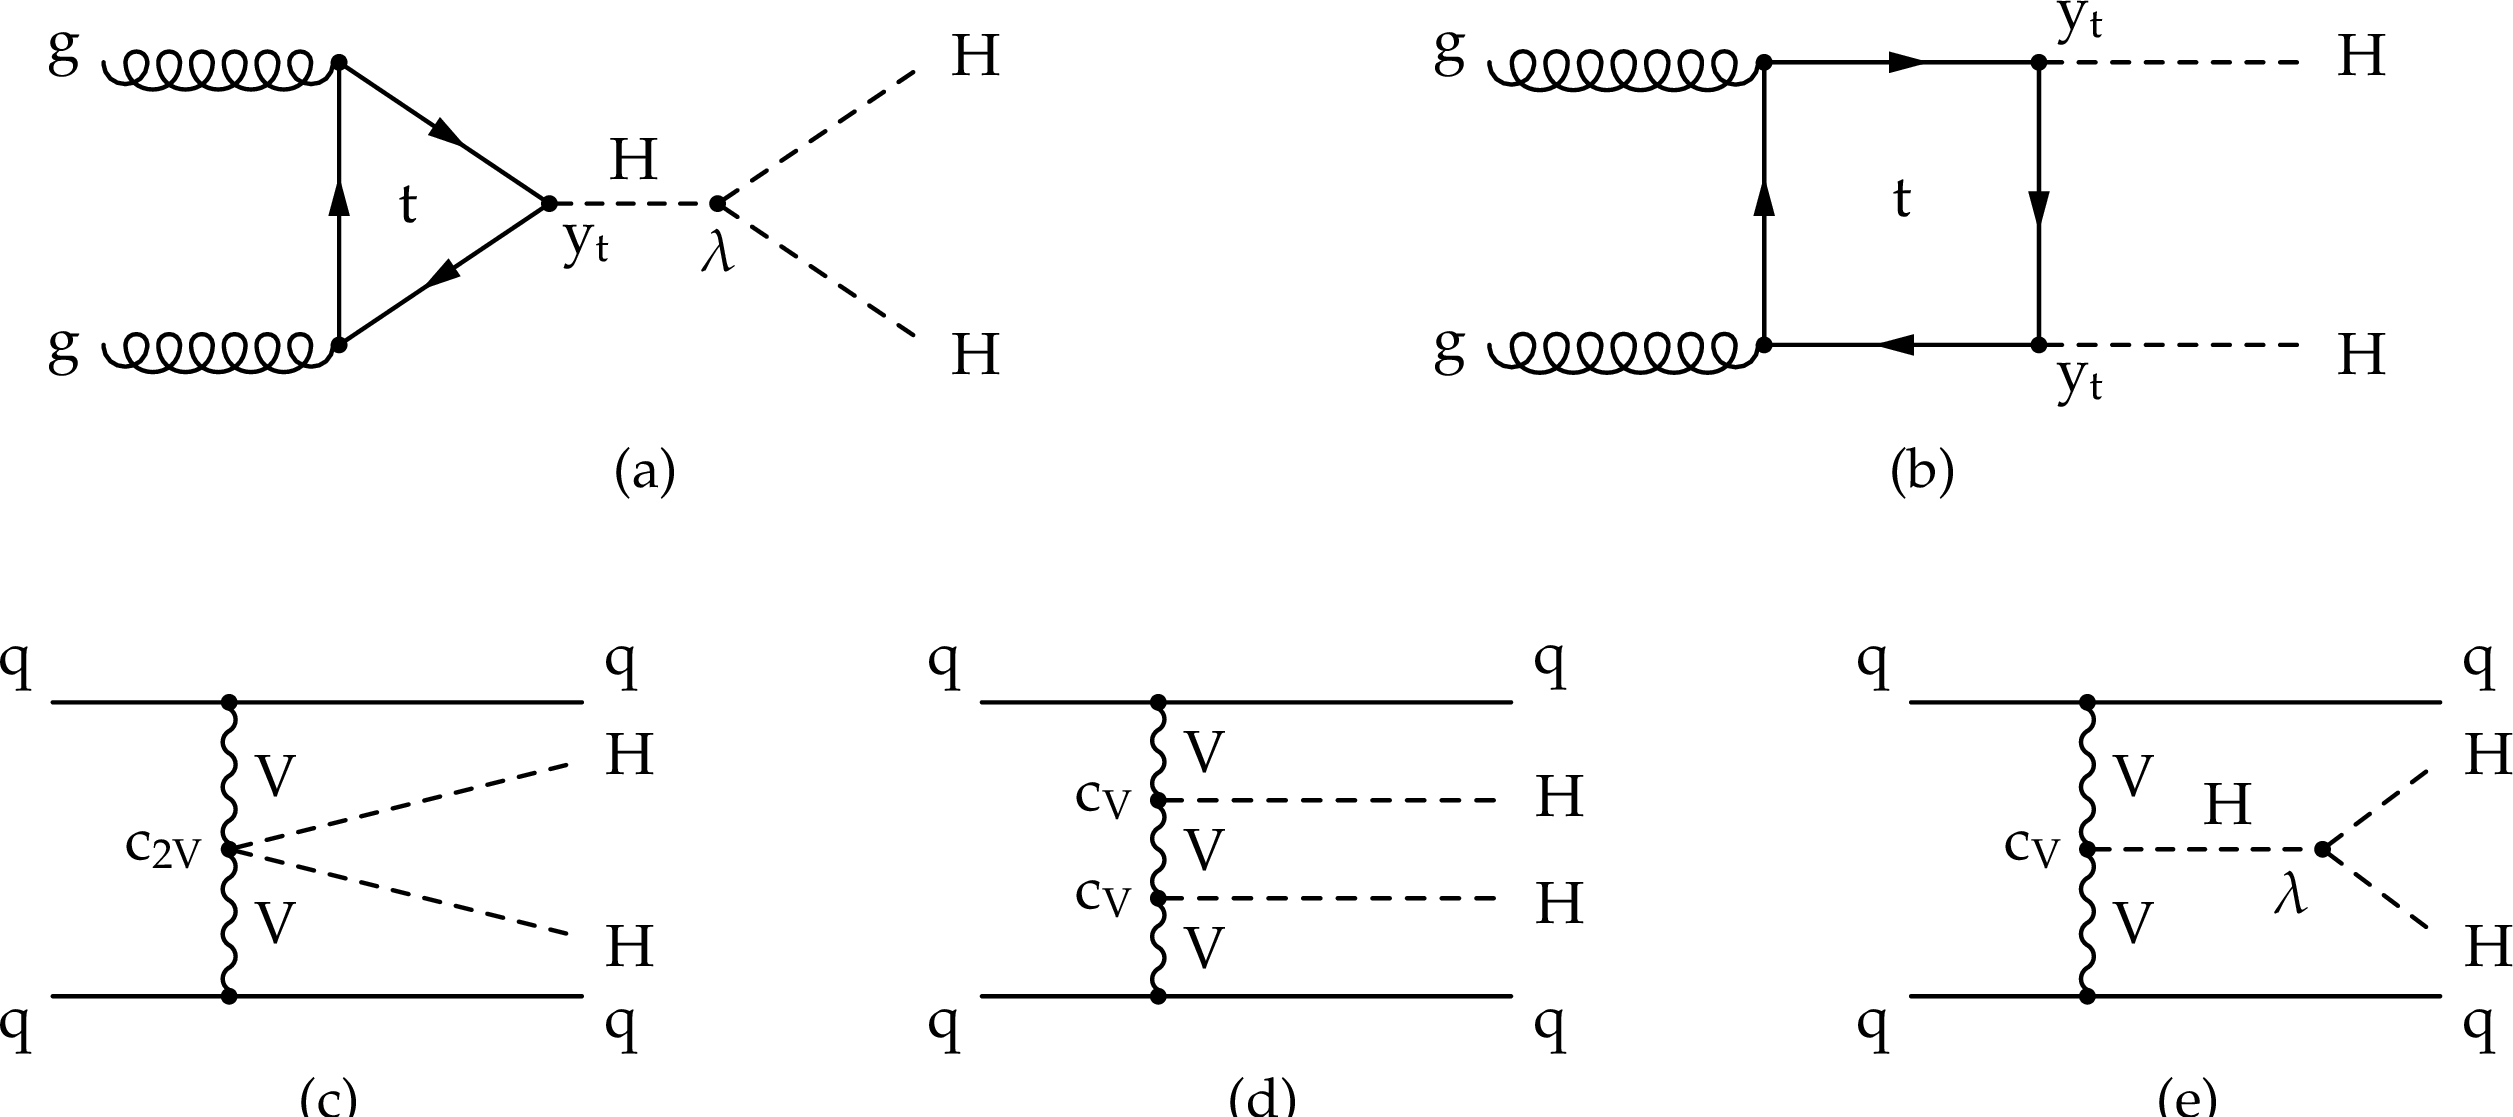
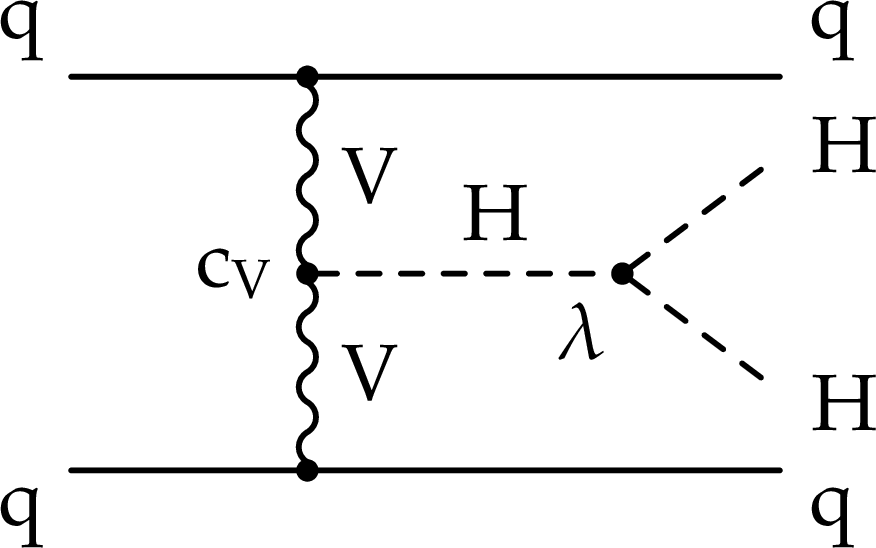
Figure 1:
LO Feynman diagrams for SM nonresonant HH production via gluon fusion (a, b) and via vector boson fusion (c, d, e). |
png pdf |
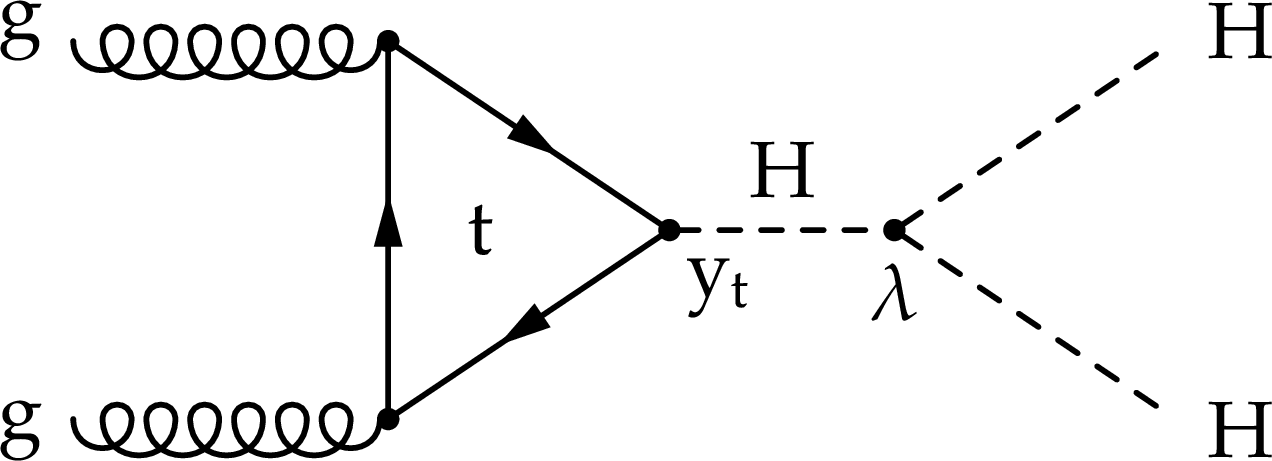
Figure 1-a:
LO Feynman diagrams for SM nonresonant HH production via gluon fusion (a, b) and via vector boson fusion (c, d, e). |
png pdf |
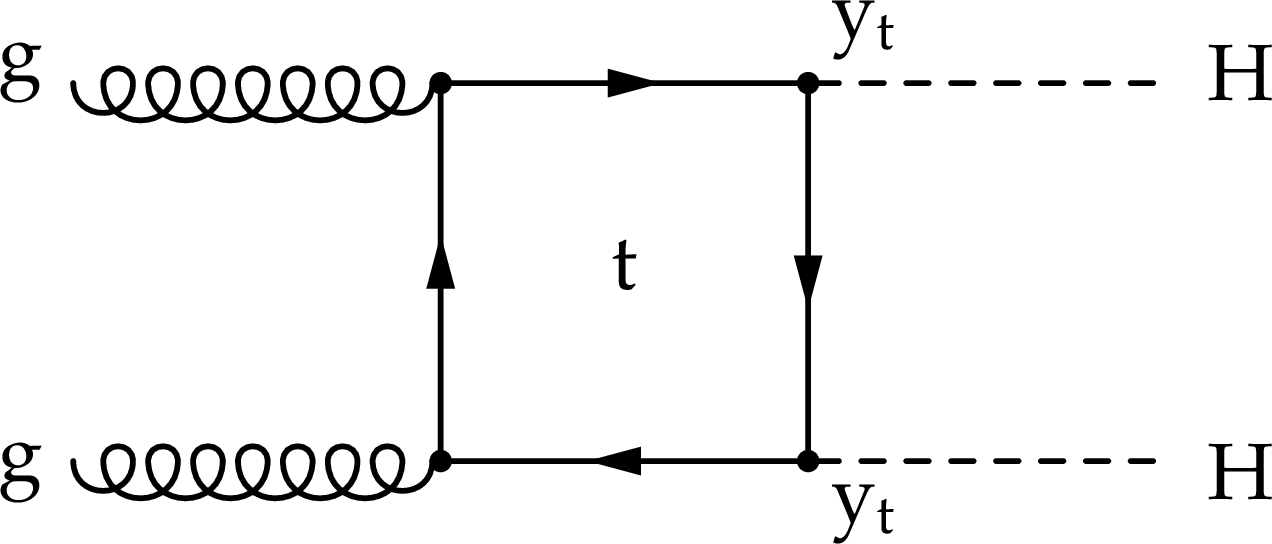
Figure 1-b:
LO Feynman diagrams for SM nonresonant HH production via gluon fusion (a, b) and via vector boson fusion (c, d, e). |
png pdf |
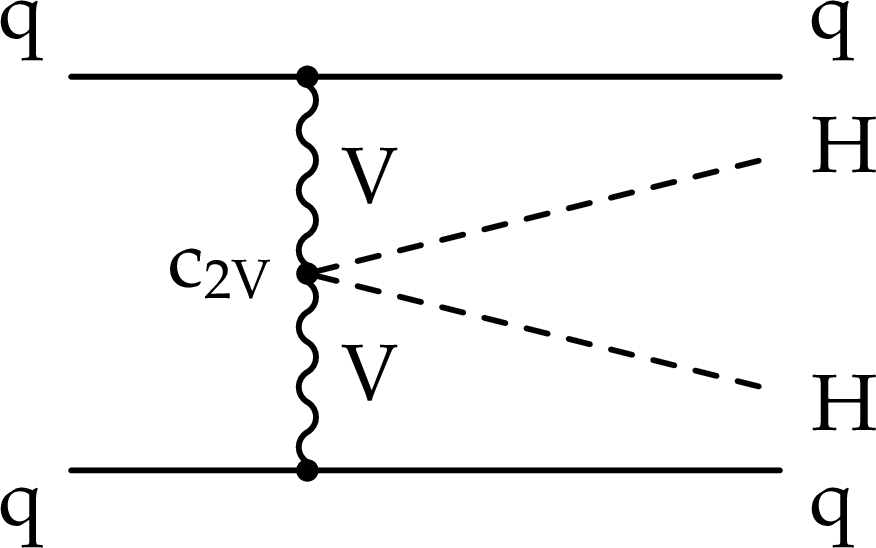
Figure 1-c:
LO Feynman diagrams for SM nonresonant HH production via gluon fusion (a, b) and via vector boson fusion (c, d, e). |

png pdf |
Figure 1-d:
LO Feynman diagrams for SM nonresonant HH production via gluon fusion (a, b) and via vector boson fusion (c, d, e). |
png pdf |
Figure 1-e:
LO Feynman diagrams for SM nonresonant HH production via gluon fusion (a, b) and via vector boson fusion (c, d, e). |
png pdf |
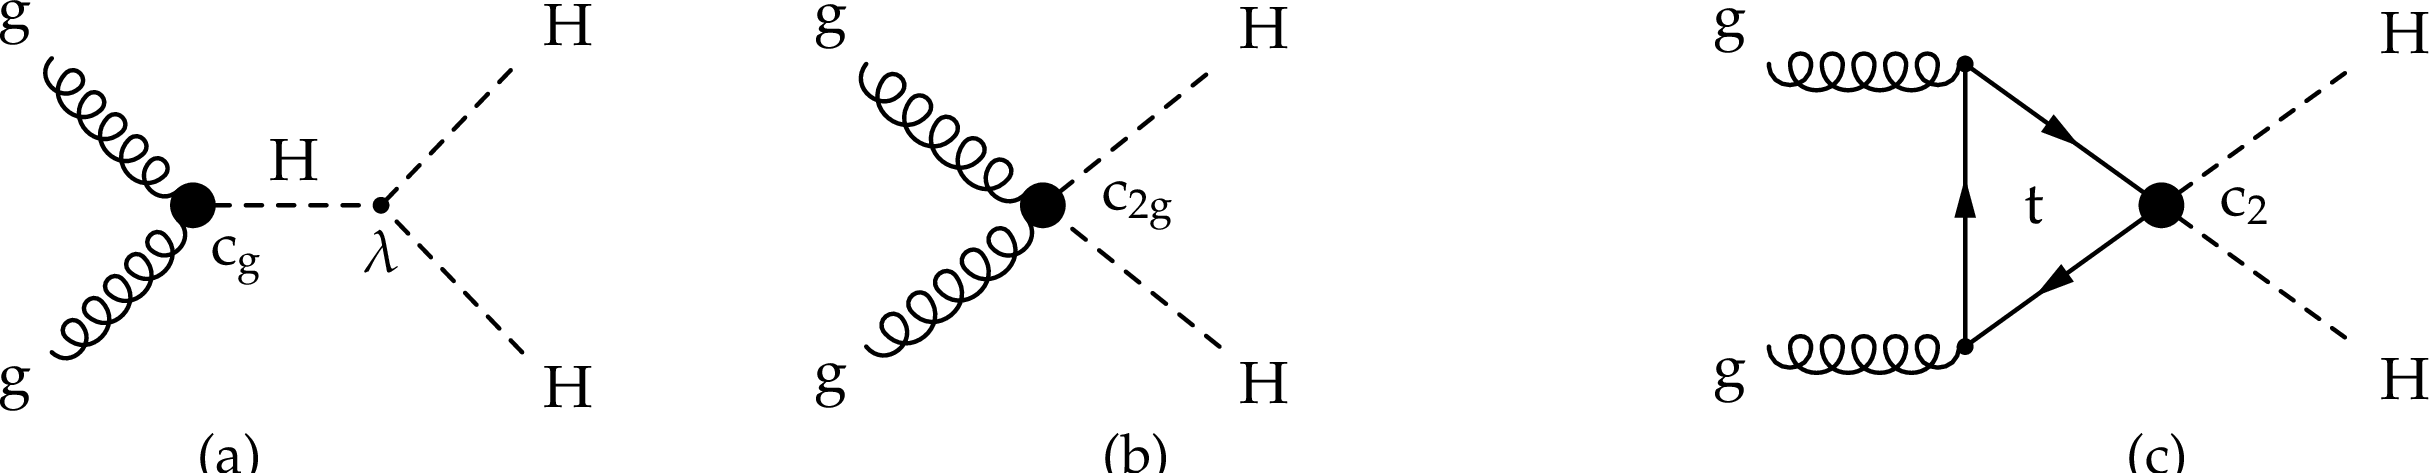
Figure 2:
LO Feynman diagrams for nonresonant HH production via gluon fusion in an effective field theory approach where loop-mediated contact interactions between (a) two gluons and one Higgs boson, (b) two gluons and two Higgs bosons, and (c) two top quarks and two Higgs bosons are parametrized by three effective couplings: $ {\text {c}_{{\mathrm{g}}}} $, $ {\text {c}_{2 {\mathrm{g}}}} $, and $ {\text {c}_{2}} $. |
png pdf |
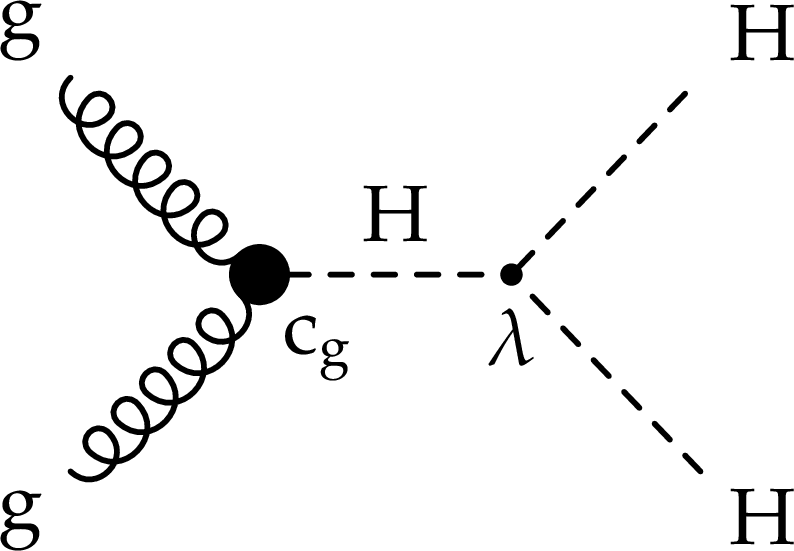
Figure 2-a:
LO Feynman diagrams for nonresonant HH production via gluon fusion in an effective field theory approach where loop-mediated contact interactions between (a) two gluons and one Higgs boson, (b) two gluons and two Higgs bosons, and (c) two top quarks and two Higgs bosons are parametrized by three effective couplings: $ {\text {c}_{{\mathrm{g}}}} $, $ {\text {c}_{2 {\mathrm{g}}}} $, and $ {\text {c}_{2}} $. |

png pdf |
Figure 2-b:
LO Feynman diagrams for nonresonant HH production via gluon fusion in an effective field theory approach where loop-mediated contact interactions between (a) two gluons and one Higgs boson, (b) two gluons and two Higgs bosons, and (c) two top quarks and two Higgs bosons are parametrized by three effective couplings: $ {\text {c}_{{\mathrm{g}}}} $, $ {\text {c}_{2 {\mathrm{g}}}} $, and $ {\text {c}_{2}} $. |
png pdf |
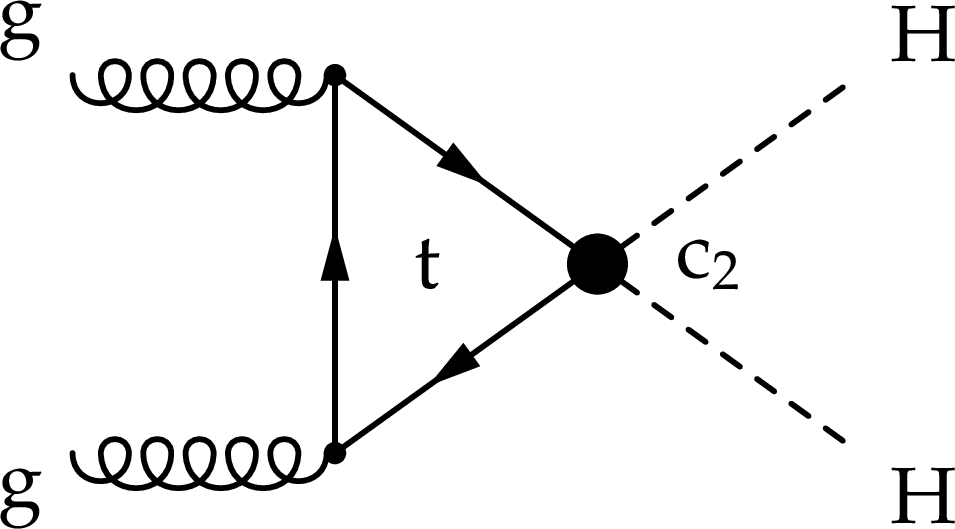
Figure 2-c:
LO Feynman diagrams for nonresonant HH production via gluon fusion in an effective field theory approach where loop-mediated contact interactions between (a) two gluons and one Higgs boson, (b) two gluons and two Higgs bosons, and (c) two top quarks and two Higgs bosons are parametrized by three effective couplings: $ {\text {c}_{{\mathrm{g}}}} $, $ {\text {c}_{2 {\mathrm{g}}}} $, and $ {\text {c}_{2}} $. |

png pdf |
Figure 3:
LO Feynman diagram for resonant HH production. |
png pdf |
Figure 4:
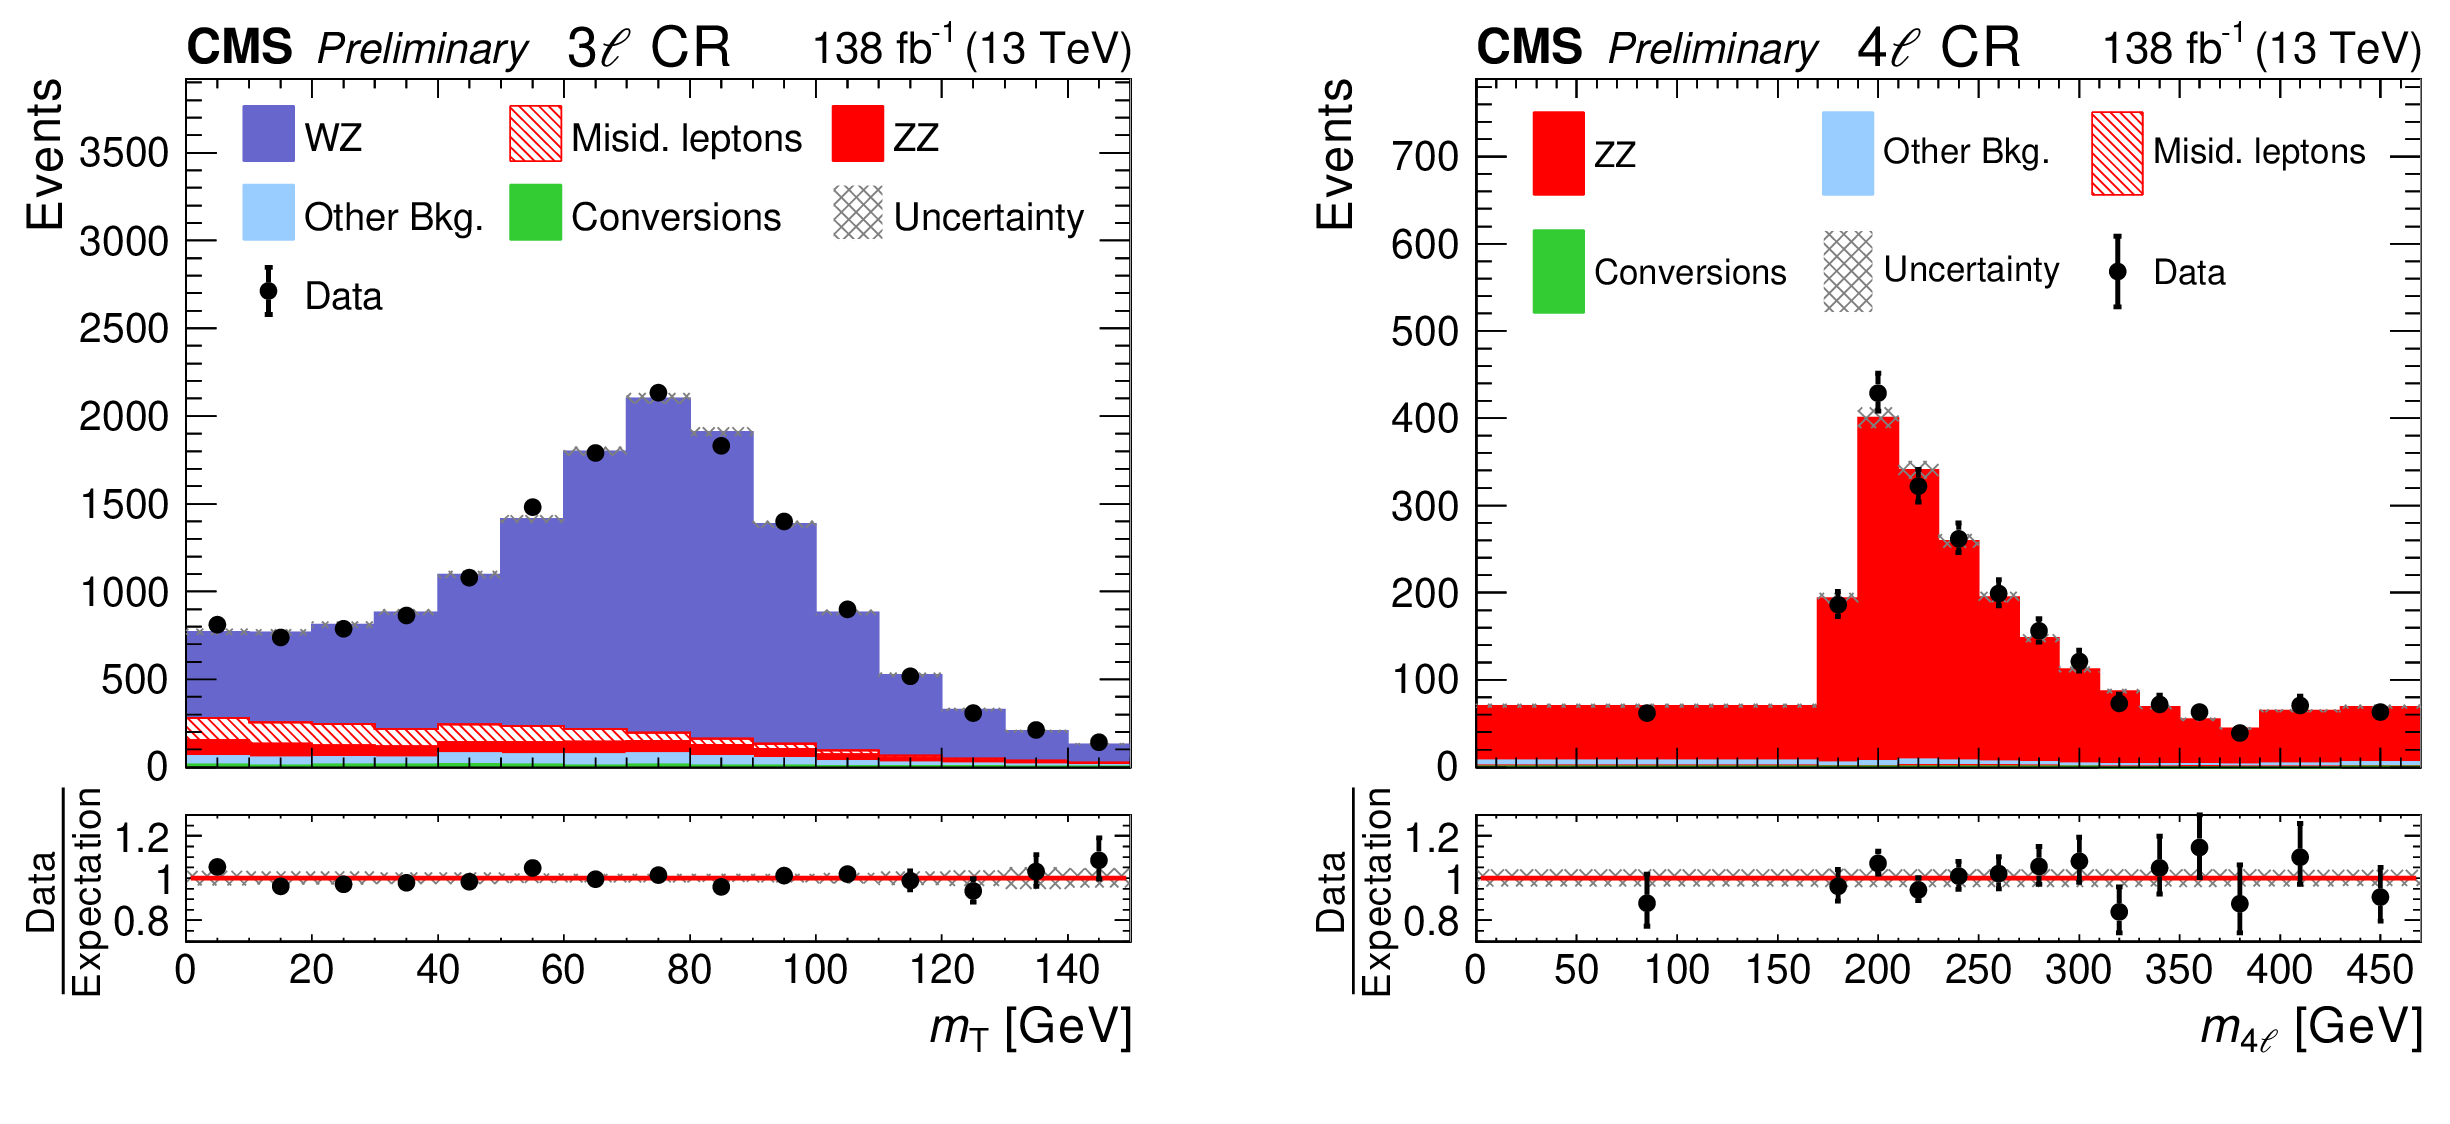
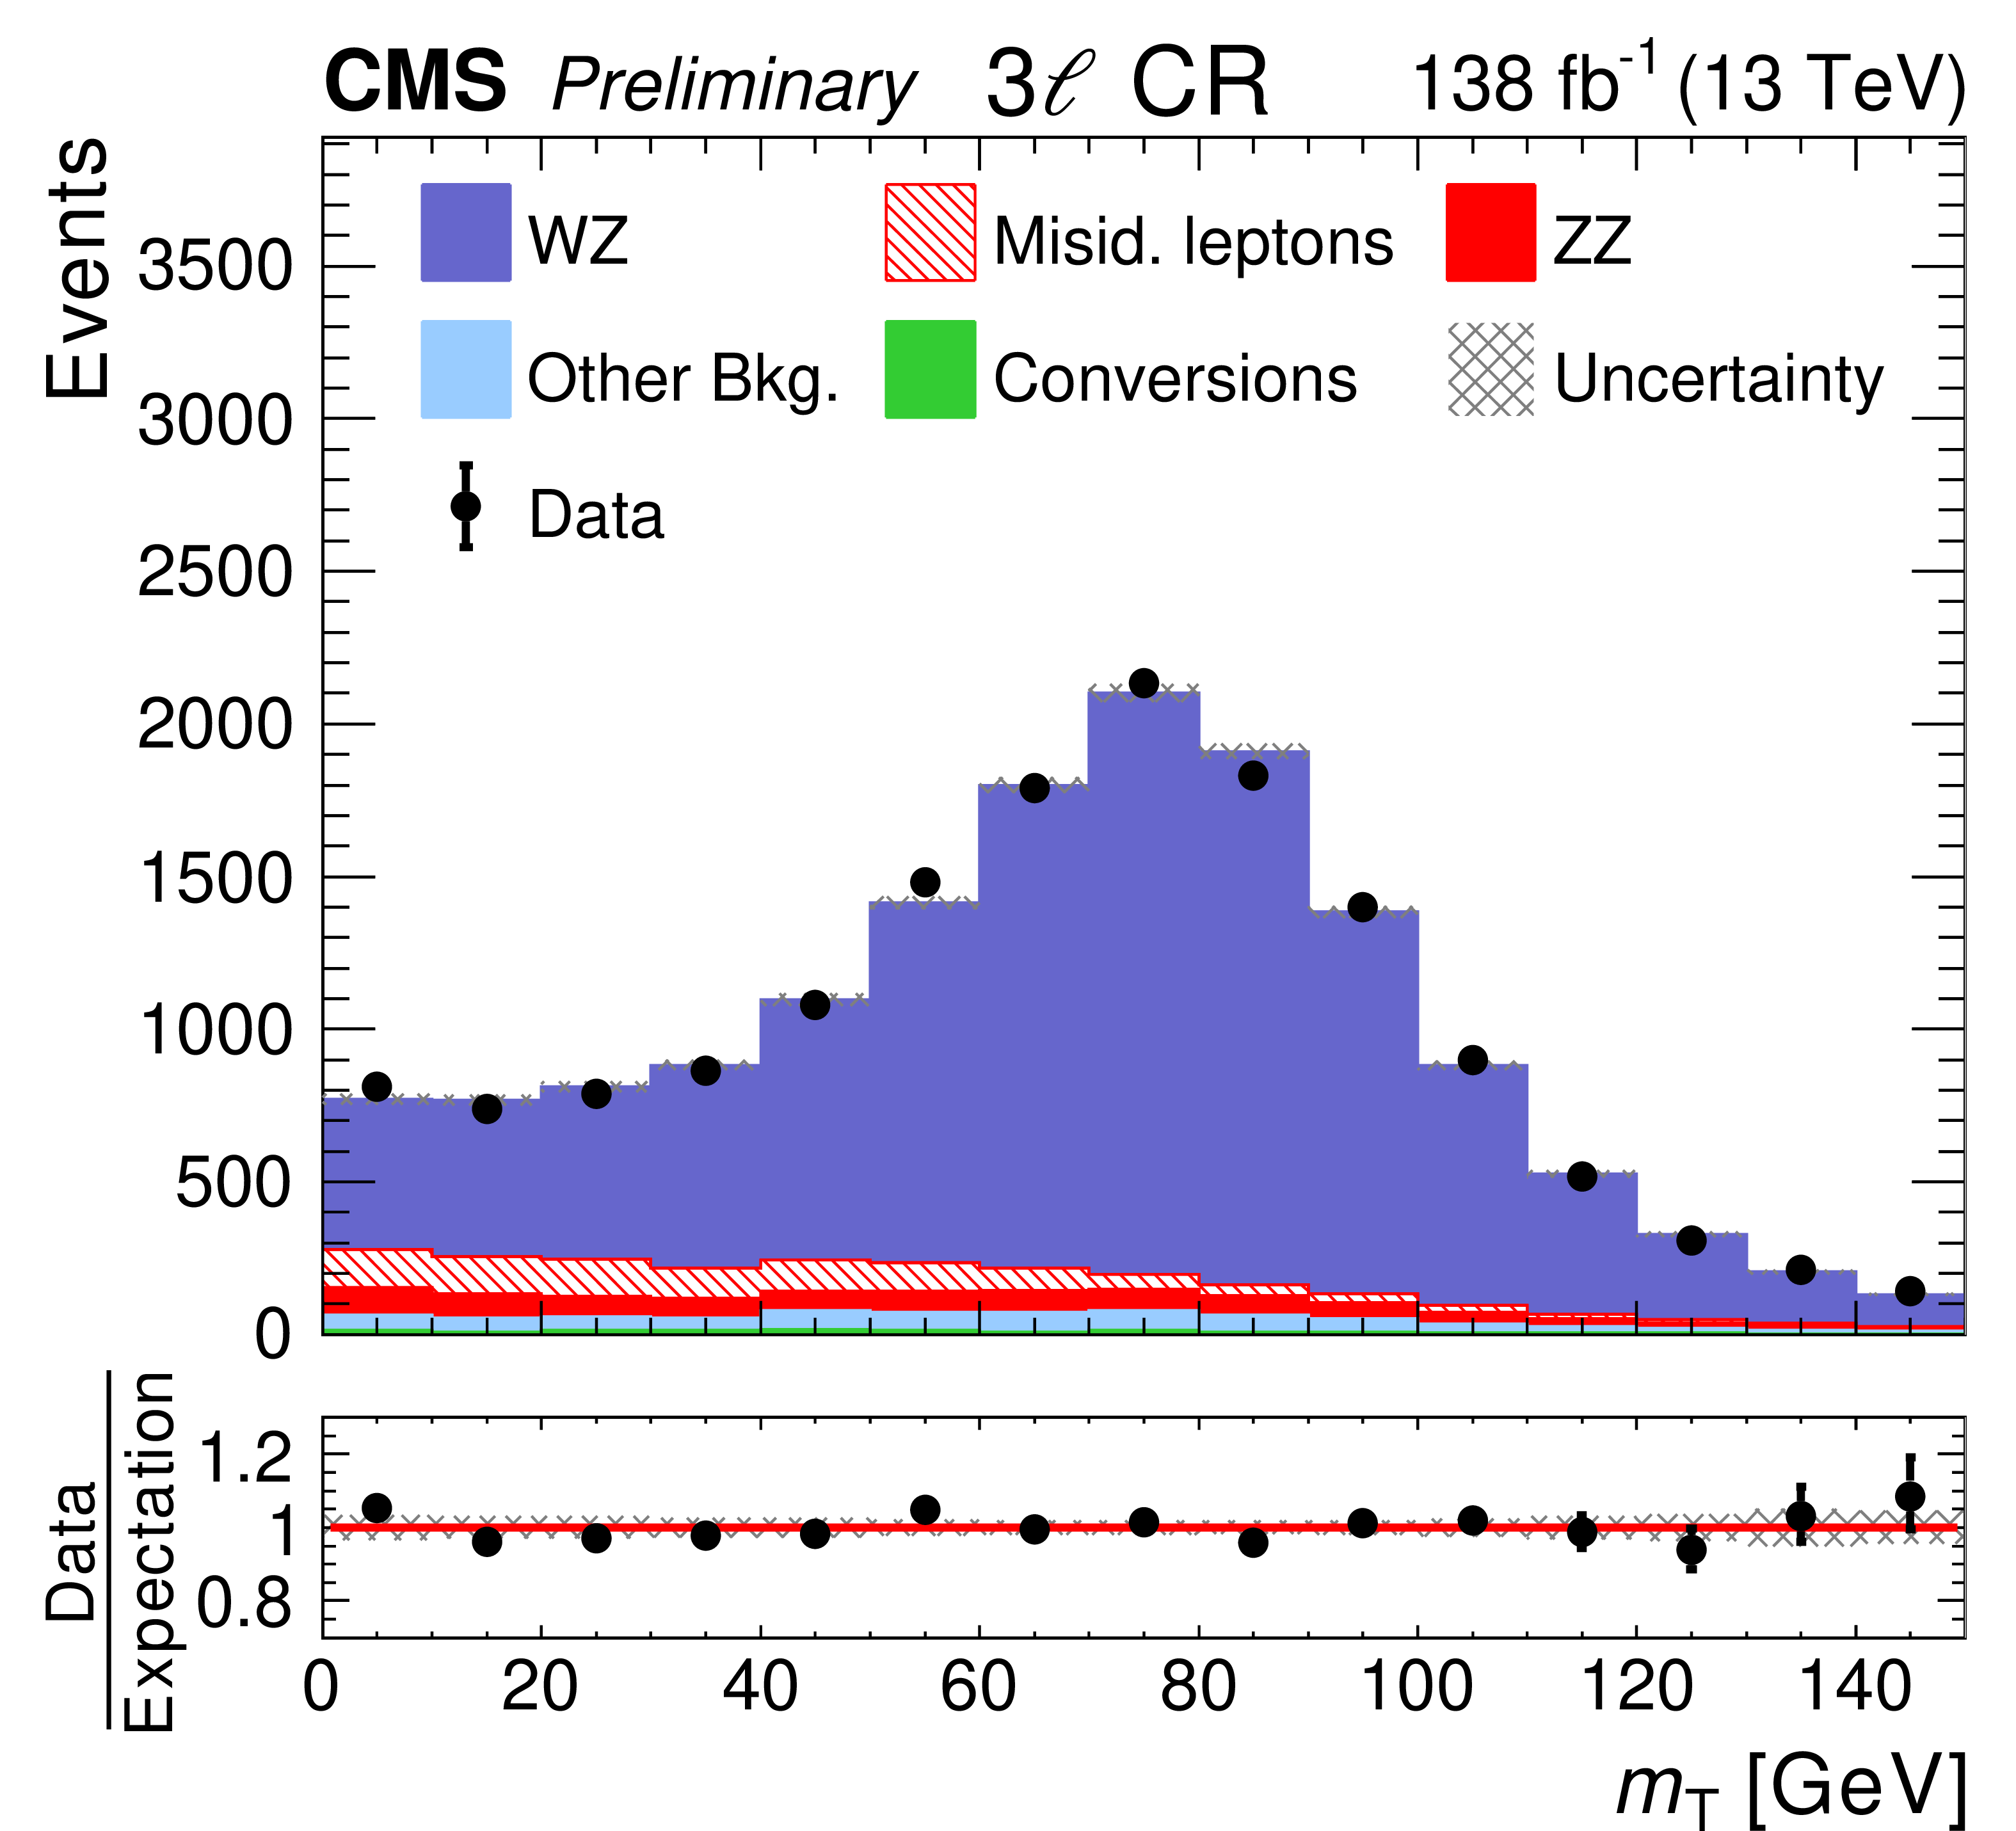
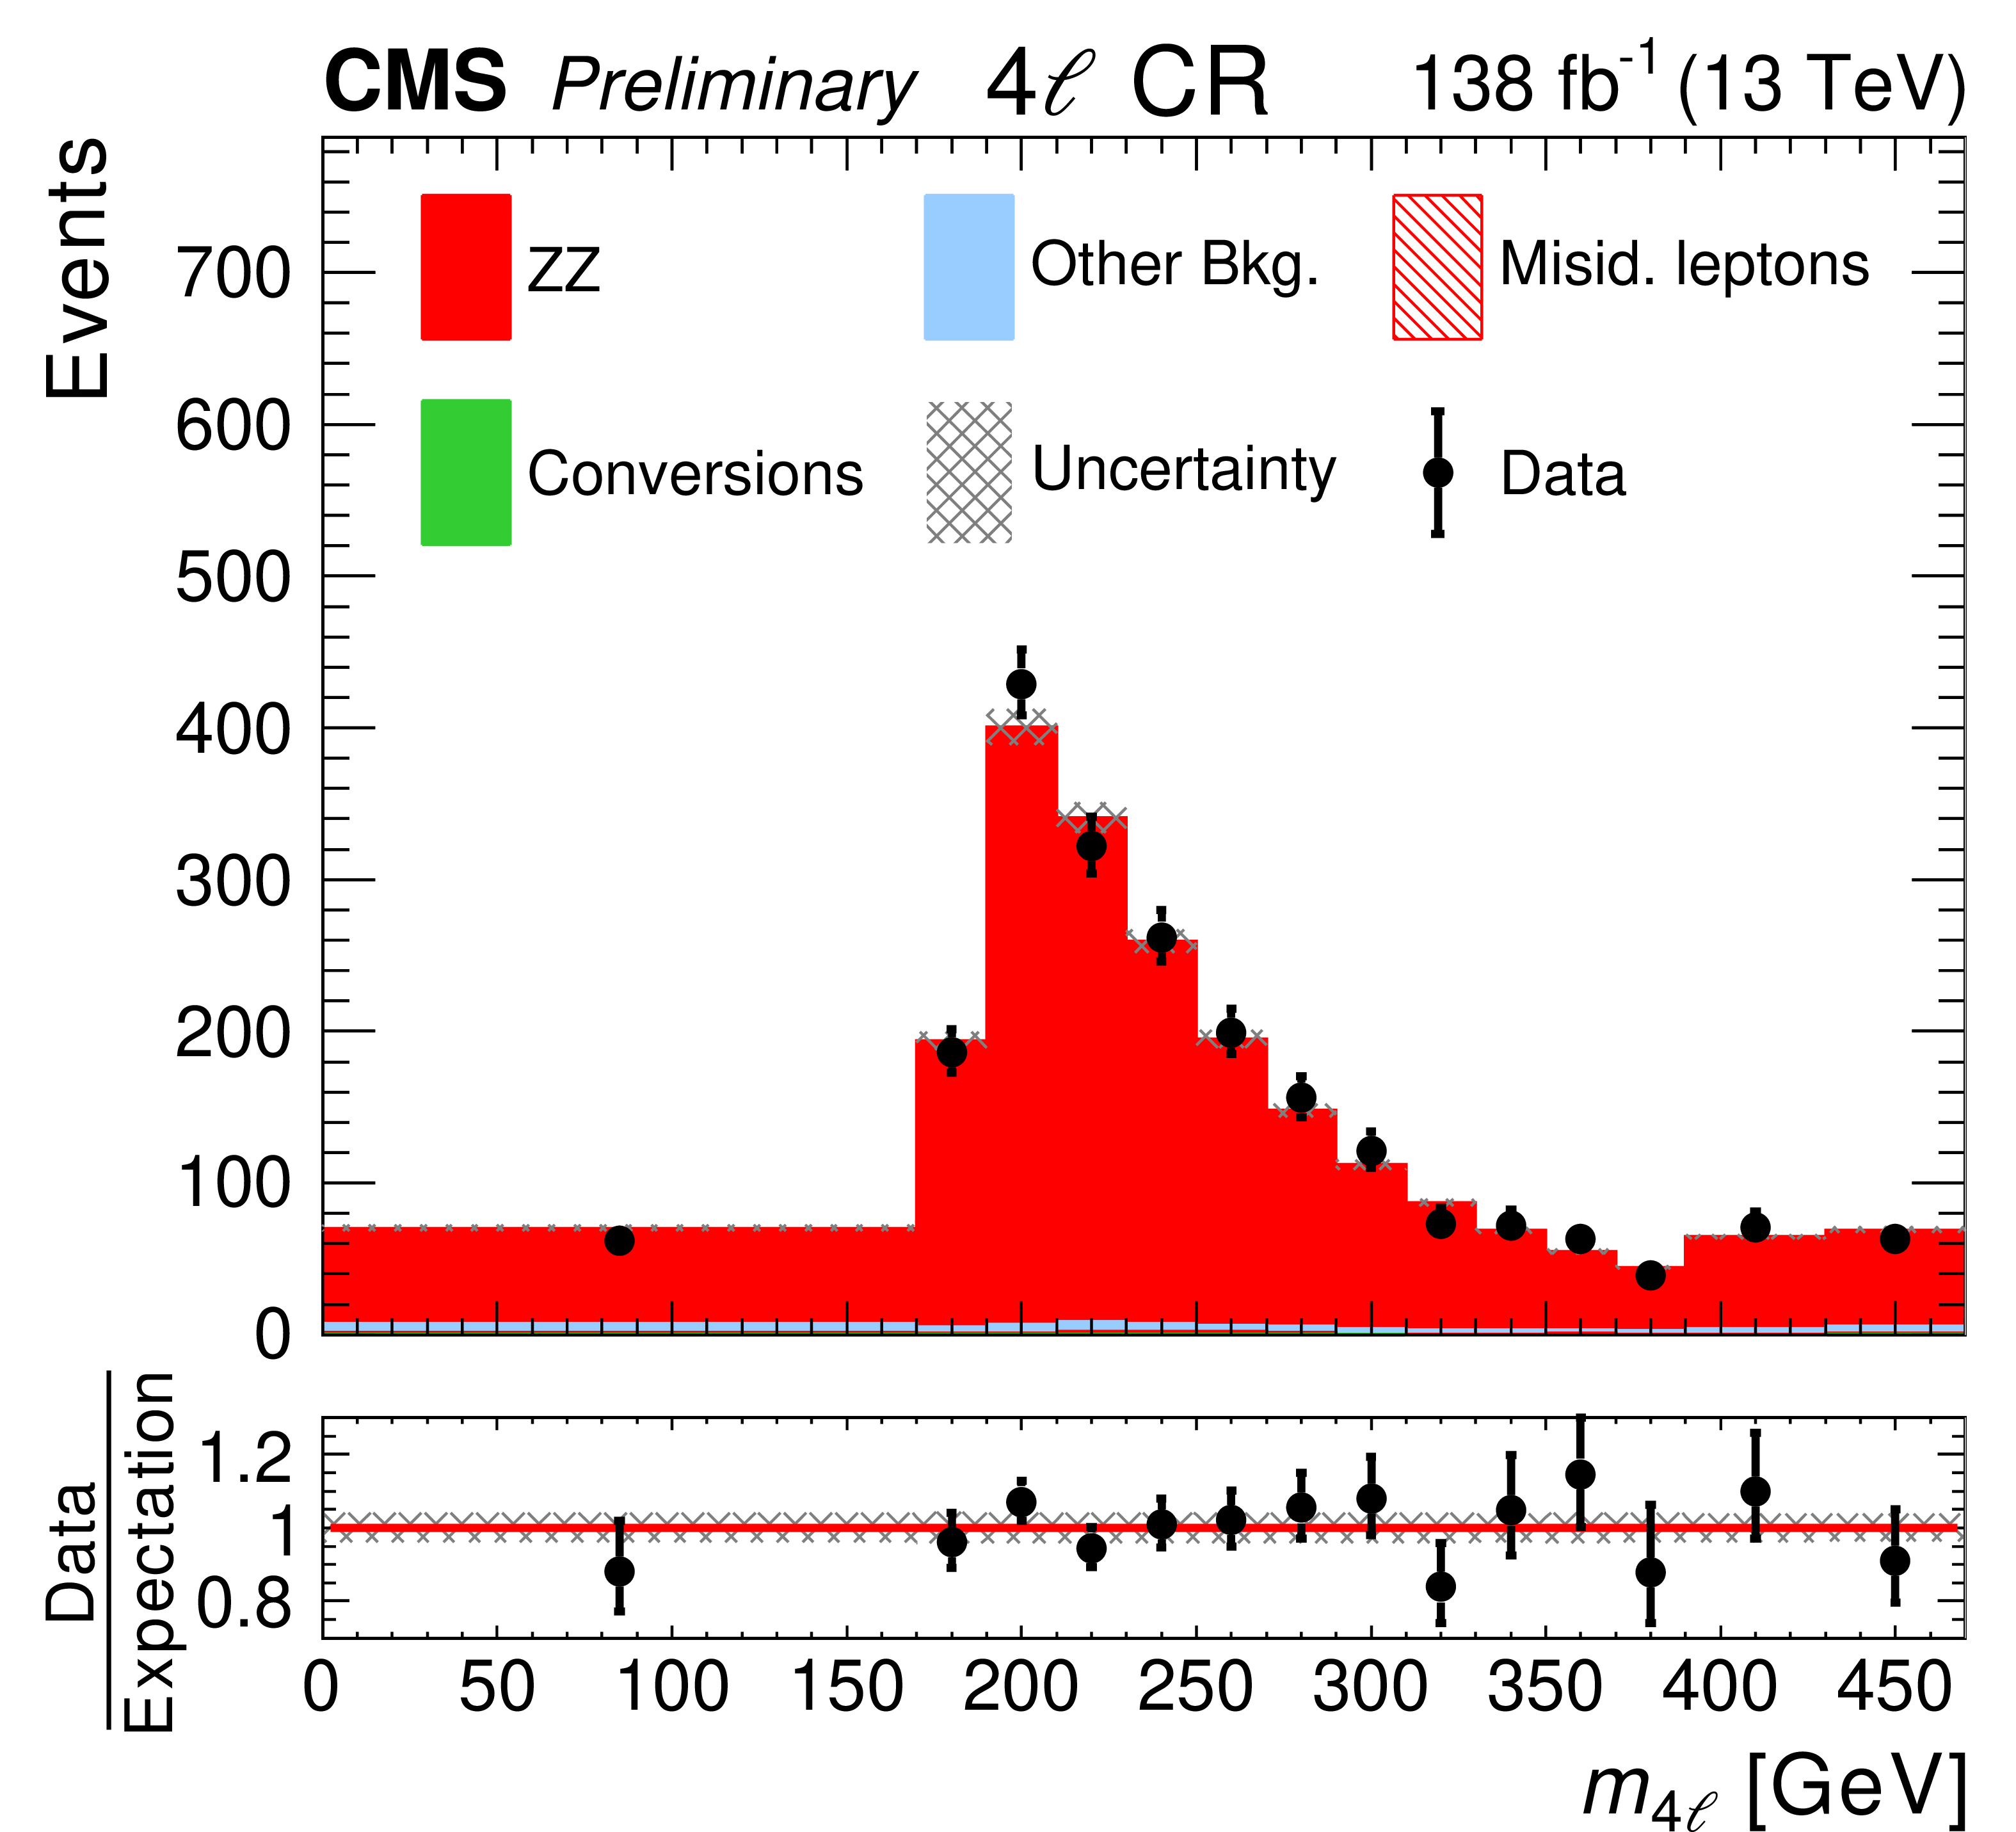
Distribution in the observable $ {m_\text {T}} $ in the 3$ {\ell} $WZ CR (left) and in the observable $m_{4 {\ell}}$ in the 4$ {\ell} $ZZ CR (right). The distributions expected for the WZ and ZZ as well as for other background processes are shown for the values of nuisance parameters obtained from the ML fit described in Section 9. |
png pdf |
Figure 4-a:
Distribution in the observable $ {m_\text {T}} $ in the 3$ {\ell} $WZ CR (left) and in the observable $m_{4 {\ell}}$ in the 4$ {\ell} $ZZ CR (right). The distributions expected for the WZ and ZZ as well as for other background processes are shown for the values of nuisance parameters obtained from the ML fit described in Section 9. |
png pdf |
Figure 4-b:
Distribution in the observable $ {m_\text {T}} $ in the 3$ {\ell} $WZ CR (left) and in the observable $m_{4 {\ell}}$ in the 4$ {\ell} $ZZ CR (right). The distributions expected for the WZ and ZZ as well as for other background processes are shown for the values of nuisance parameters obtained from the ML fit described in Section 9. |
png pdf |
Figure 5:
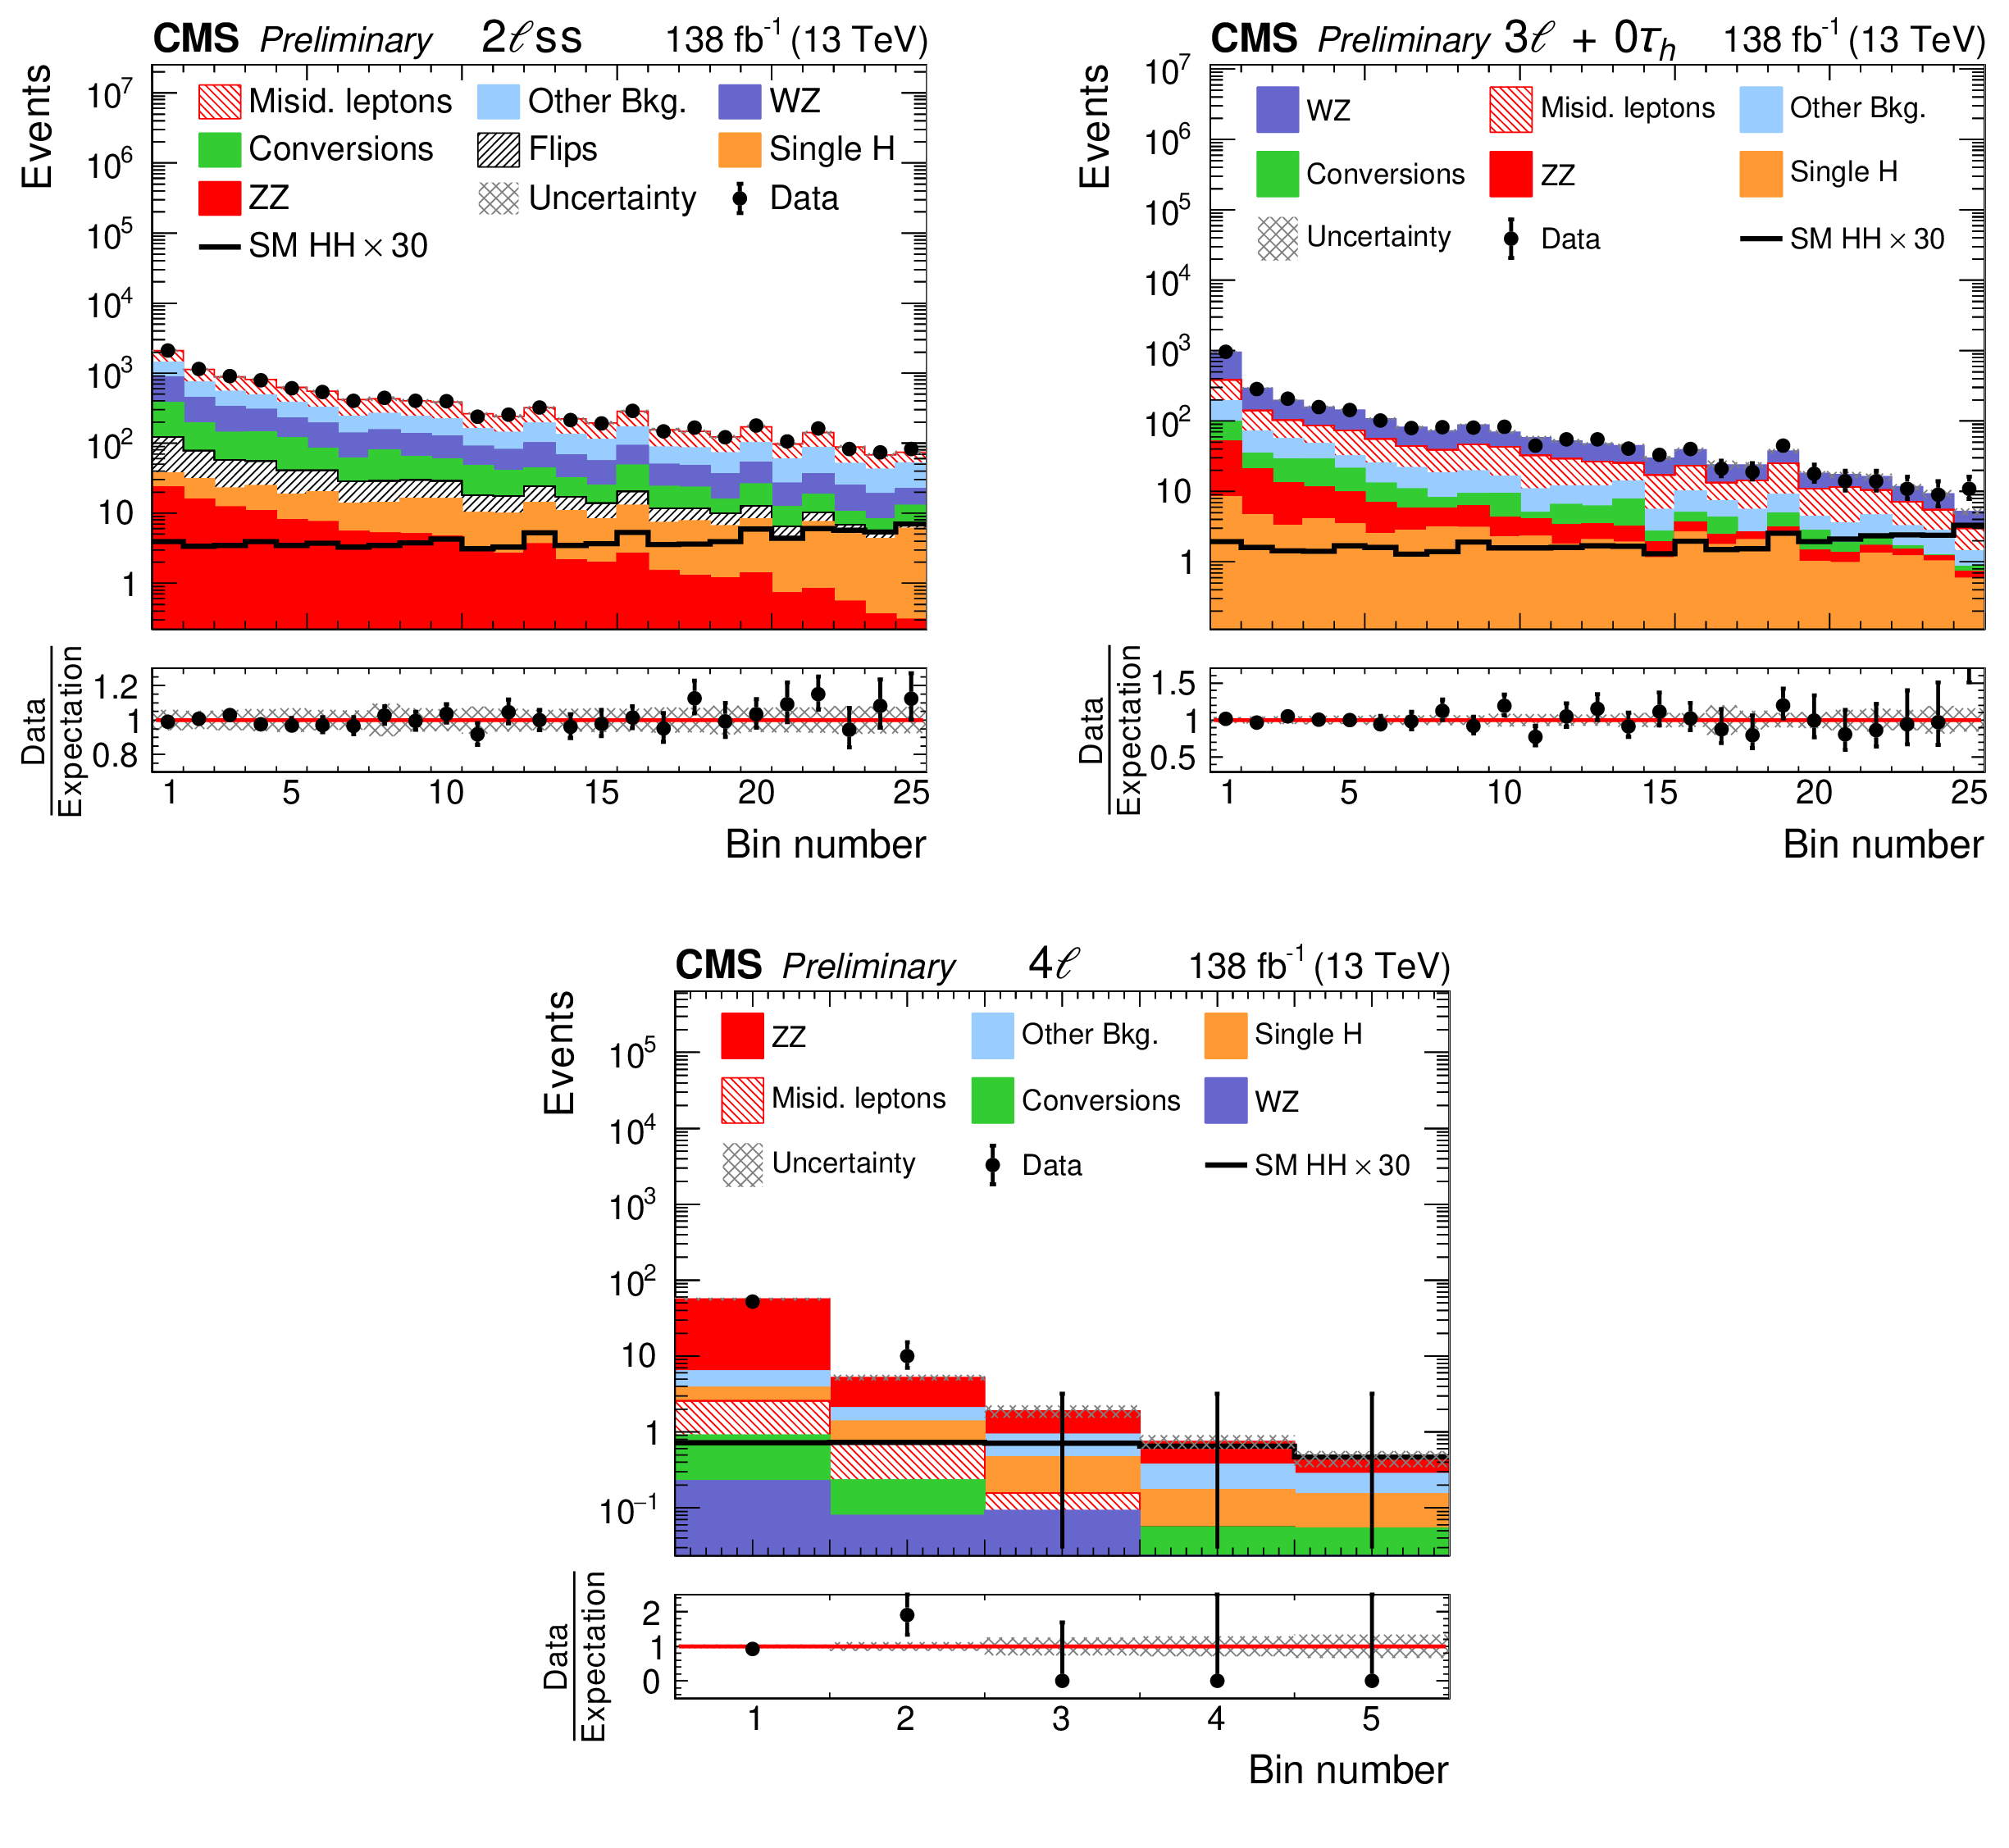
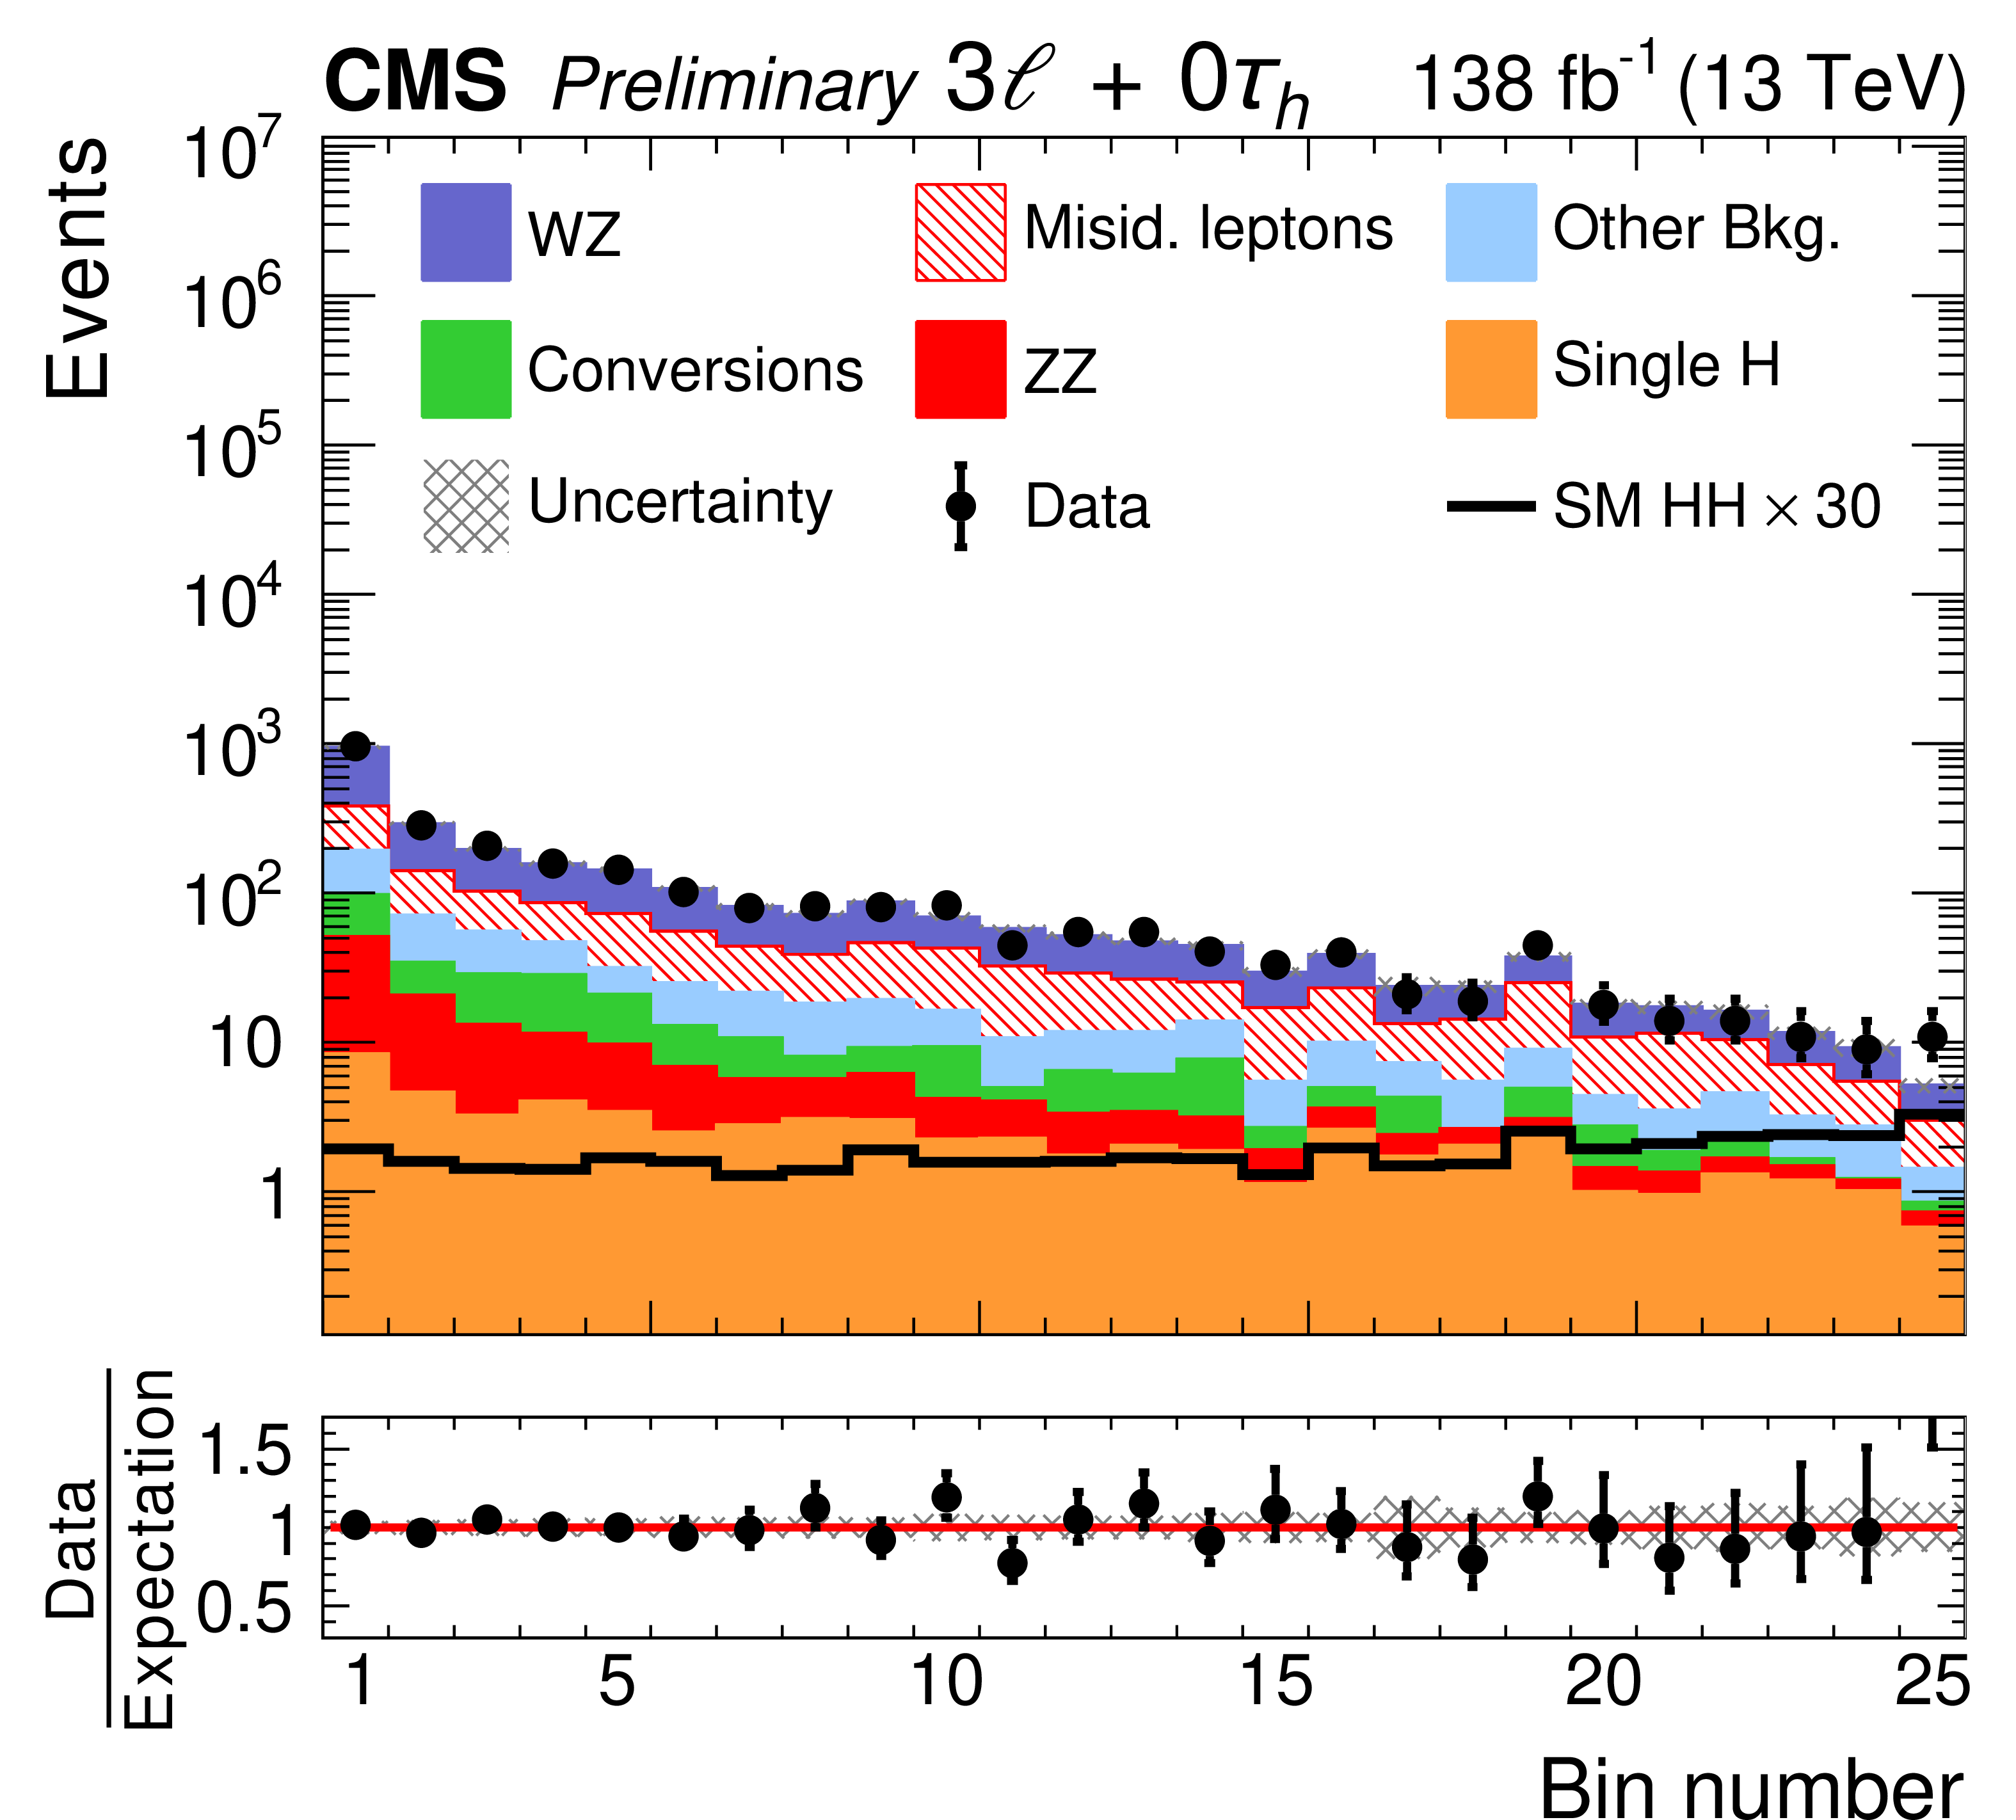
Distribution in the output of the BDT for nonresonant HH production used in the $\kappa $ scans (BM7 from Ref. [24]) for the 2$ {\ell} $ ss (top left), 3${\ell}$ (top right), and 4${\ell}$ (bottom) categories. The SM HH signal is shown for a cross section amounting to $30$ times the value predicted in the SM. The distributions expected for the background processes are shown for the values of the signal strength parameter $\mu $ and of the nuisance parameters obtained from the ML fit. The best-fit value of the HH production rate amounts to $\hat{\mu} = $ 1.96$^{+10.57}_{-9.98}$ times the rate expected in the SM. |

png pdf |
Figure 5-a:
Distribution in the output of the BDT for nonresonant HH production used in the $\kappa $ scans (BM7 from Ref. [24]) for the 2$ {\ell} $ ss (top left), 3${\ell}$ (top right), and 4${\ell}$ (bottom) categories. The SM HH signal is shown for a cross section amounting to $30$ times the value predicted in the SM. The distributions expected for the background processes are shown for the values of the signal strength parameter $\mu $ and of the nuisance parameters obtained from the ML fit. The best-fit value of the HH production rate amounts to $\hat{\mu} = $ 1.96$^{+10.57}_{-9.98}$ times the rate expected in the SM. |
png pdf |
Figure 5-b:
Distribution in the output of the BDT for nonresonant HH production used in the $\kappa $ scans (BM7 from Ref. [24]) for the 2$ {\ell} $ ss (top left), 3${\ell}$ (top right), and 4${\ell}$ (bottom) categories. The SM HH signal is shown for a cross section amounting to $30$ times the value predicted in the SM. The distributions expected for the background processes are shown for the values of the signal strength parameter $\mu $ and of the nuisance parameters obtained from the ML fit. The best-fit value of the HH production rate amounts to $\hat{\mu} = $ 1.96$^{+10.57}_{-9.98}$ times the rate expected in the SM. |

png pdf |
Figure 5-c:
Distribution in the output of the BDT for nonresonant HH production used in the $\kappa $ scans (BM7 from Ref. [24]) for the 2$ {\ell} $ ss (top left), 3${\ell}$ (top right), and 4${\ell}$ (bottom) categories. The SM HH signal is shown for a cross section amounting to $30$ times the value predicted in the SM. The distributions expected for the background processes are shown for the values of the signal strength parameter $\mu $ and of the nuisance parameters obtained from the ML fit. The best-fit value of the HH production rate amounts to $\hat{\mu} = $ 1.96$^{+10.57}_{-9.98}$ times the rate expected in the SM. |
png pdf |
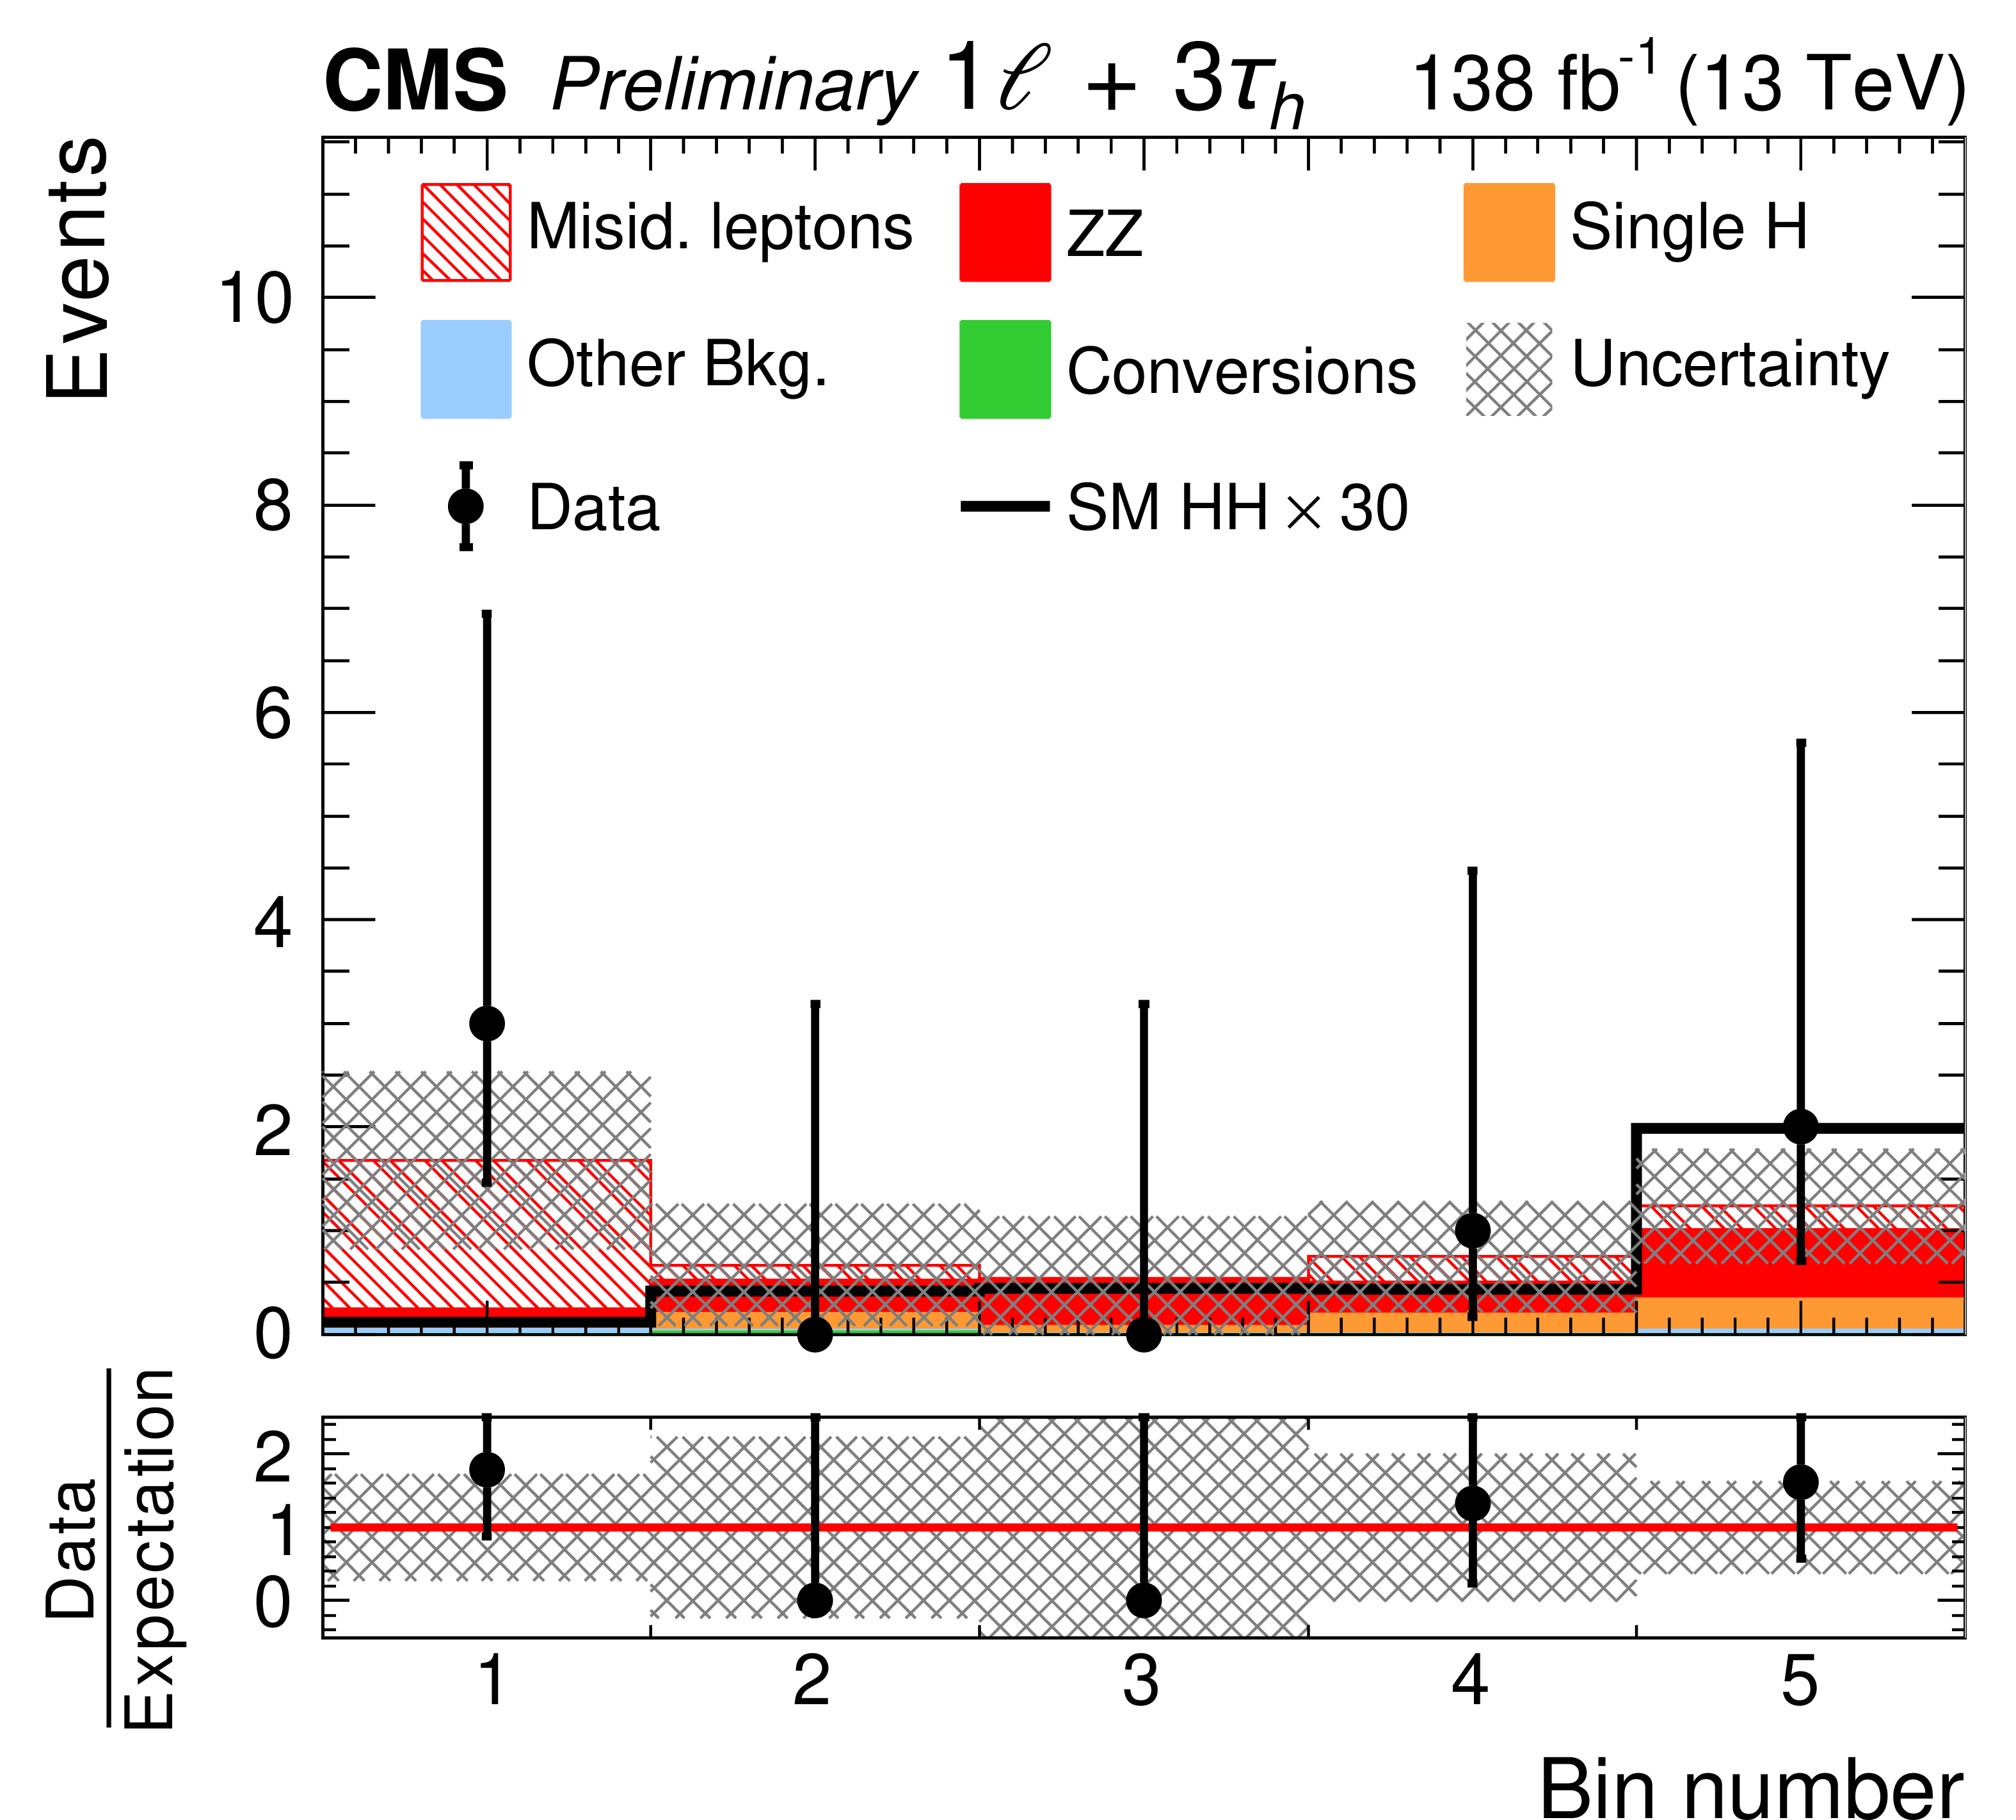
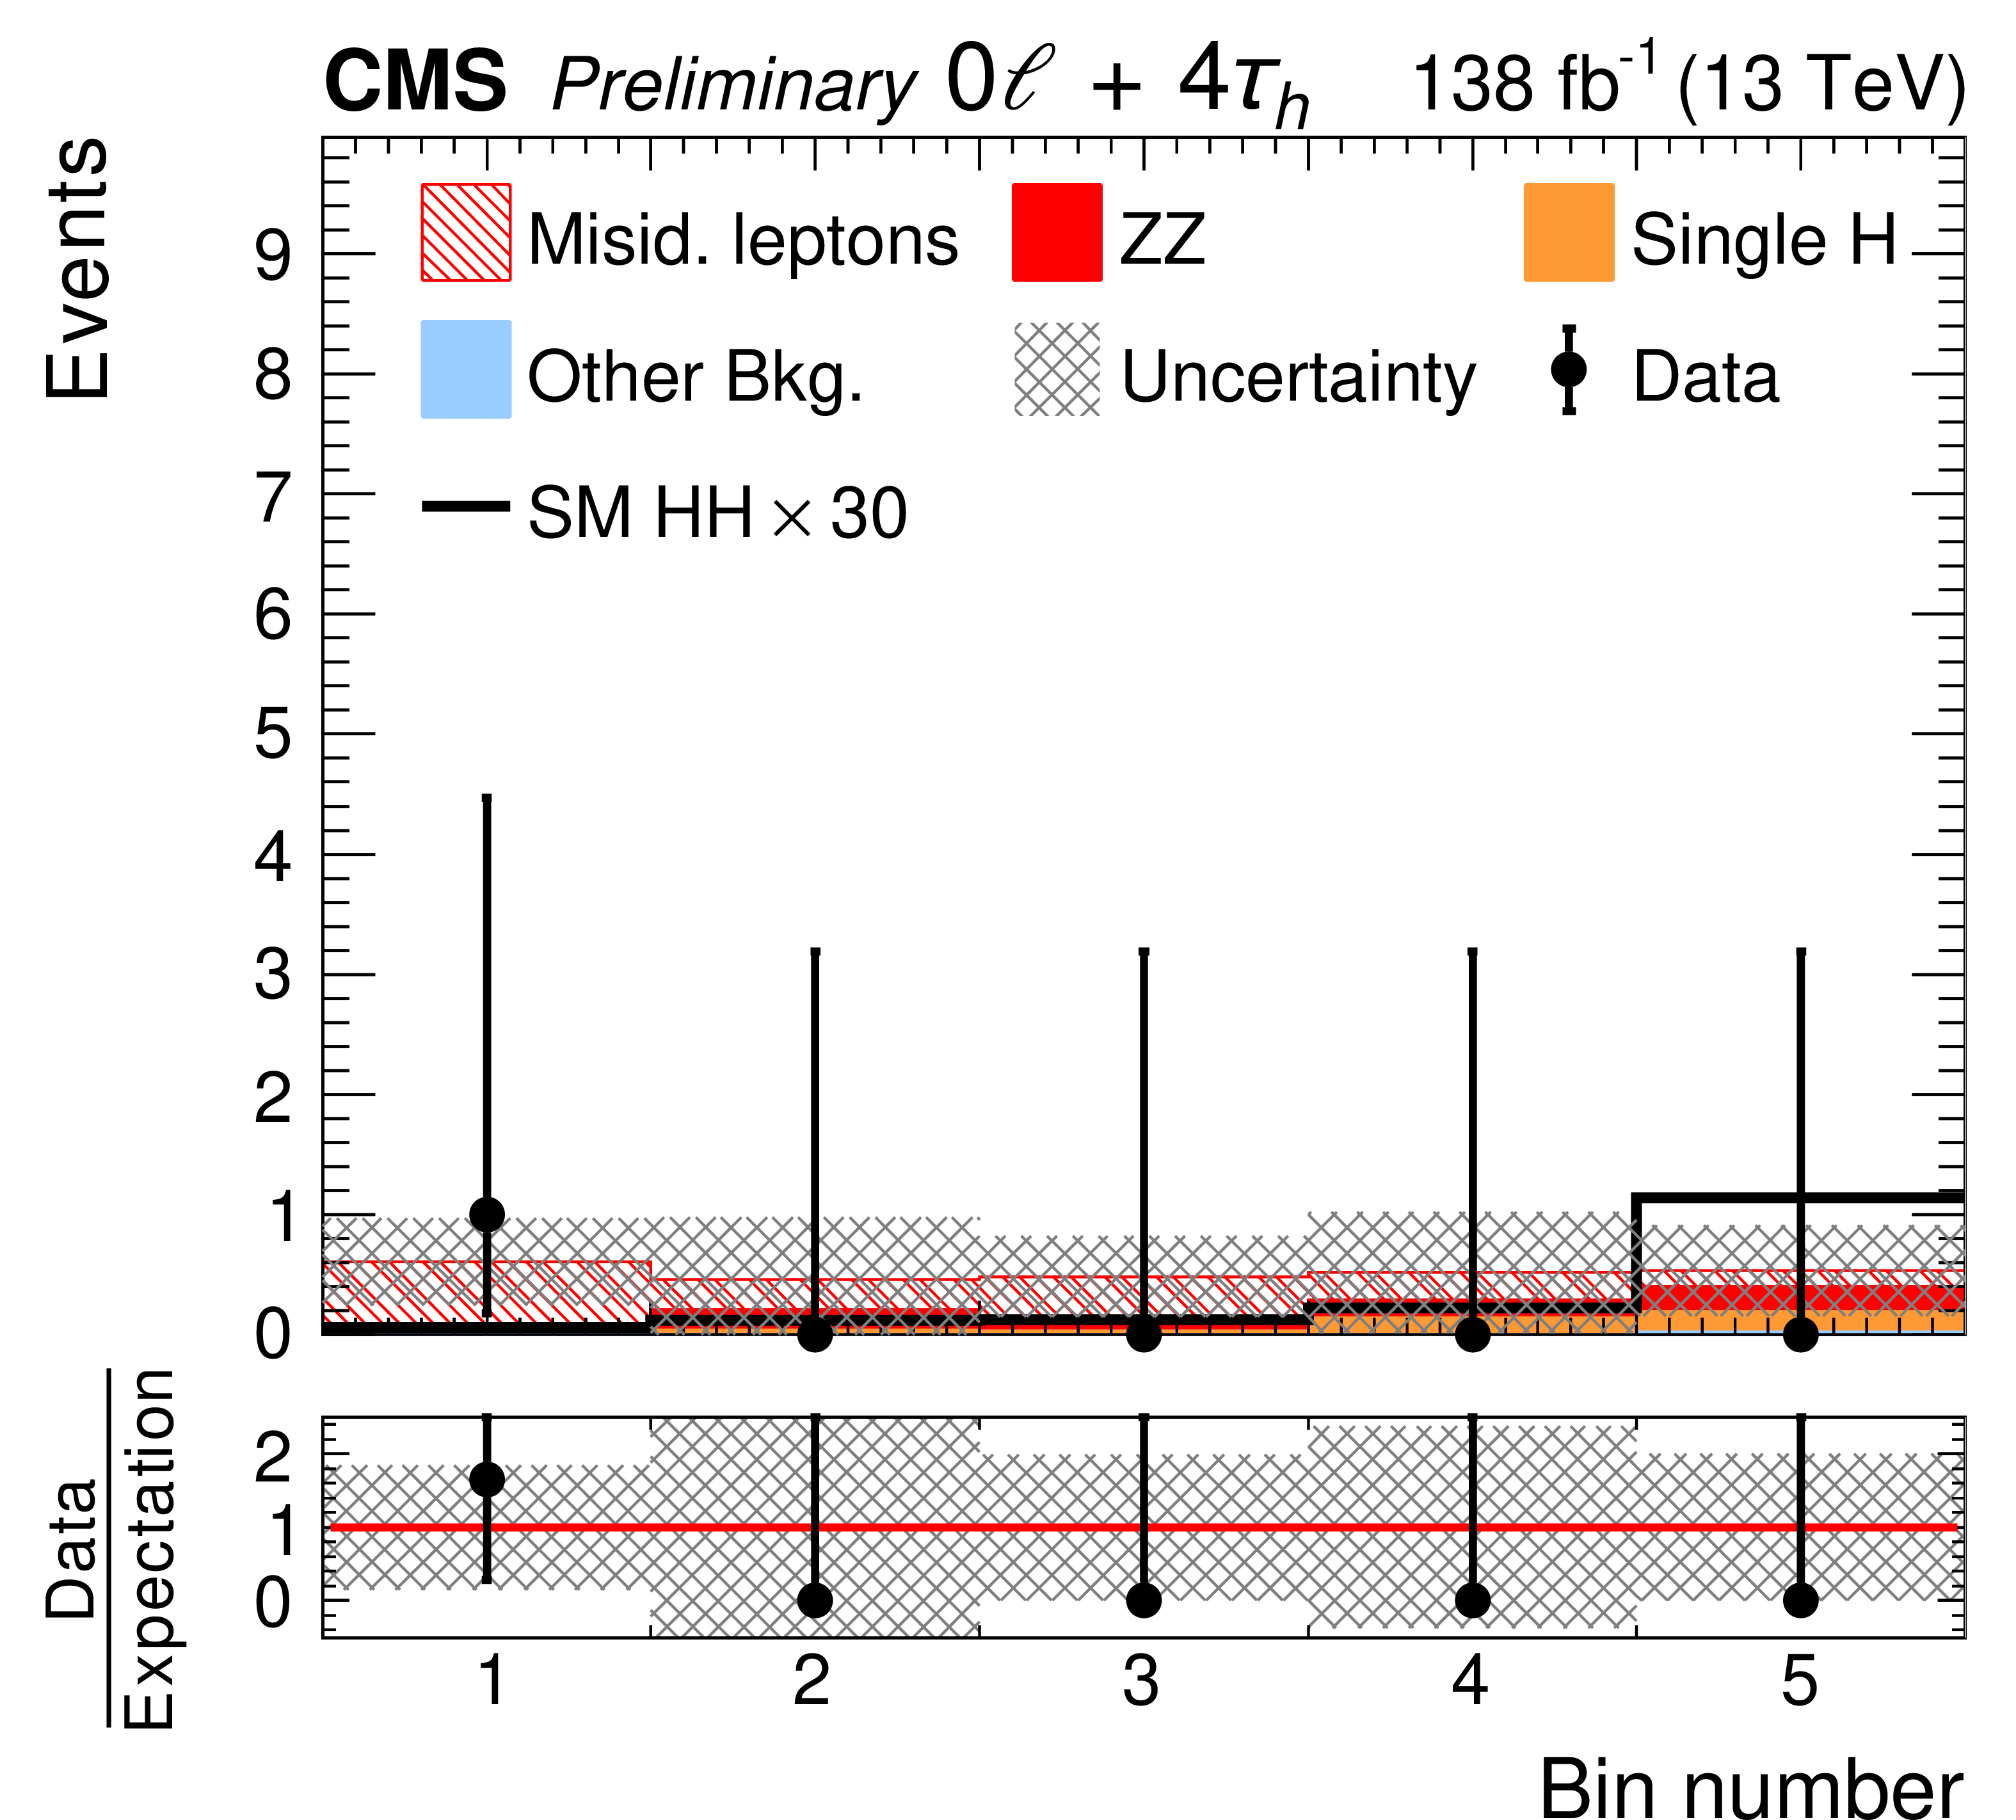
Figure 6:
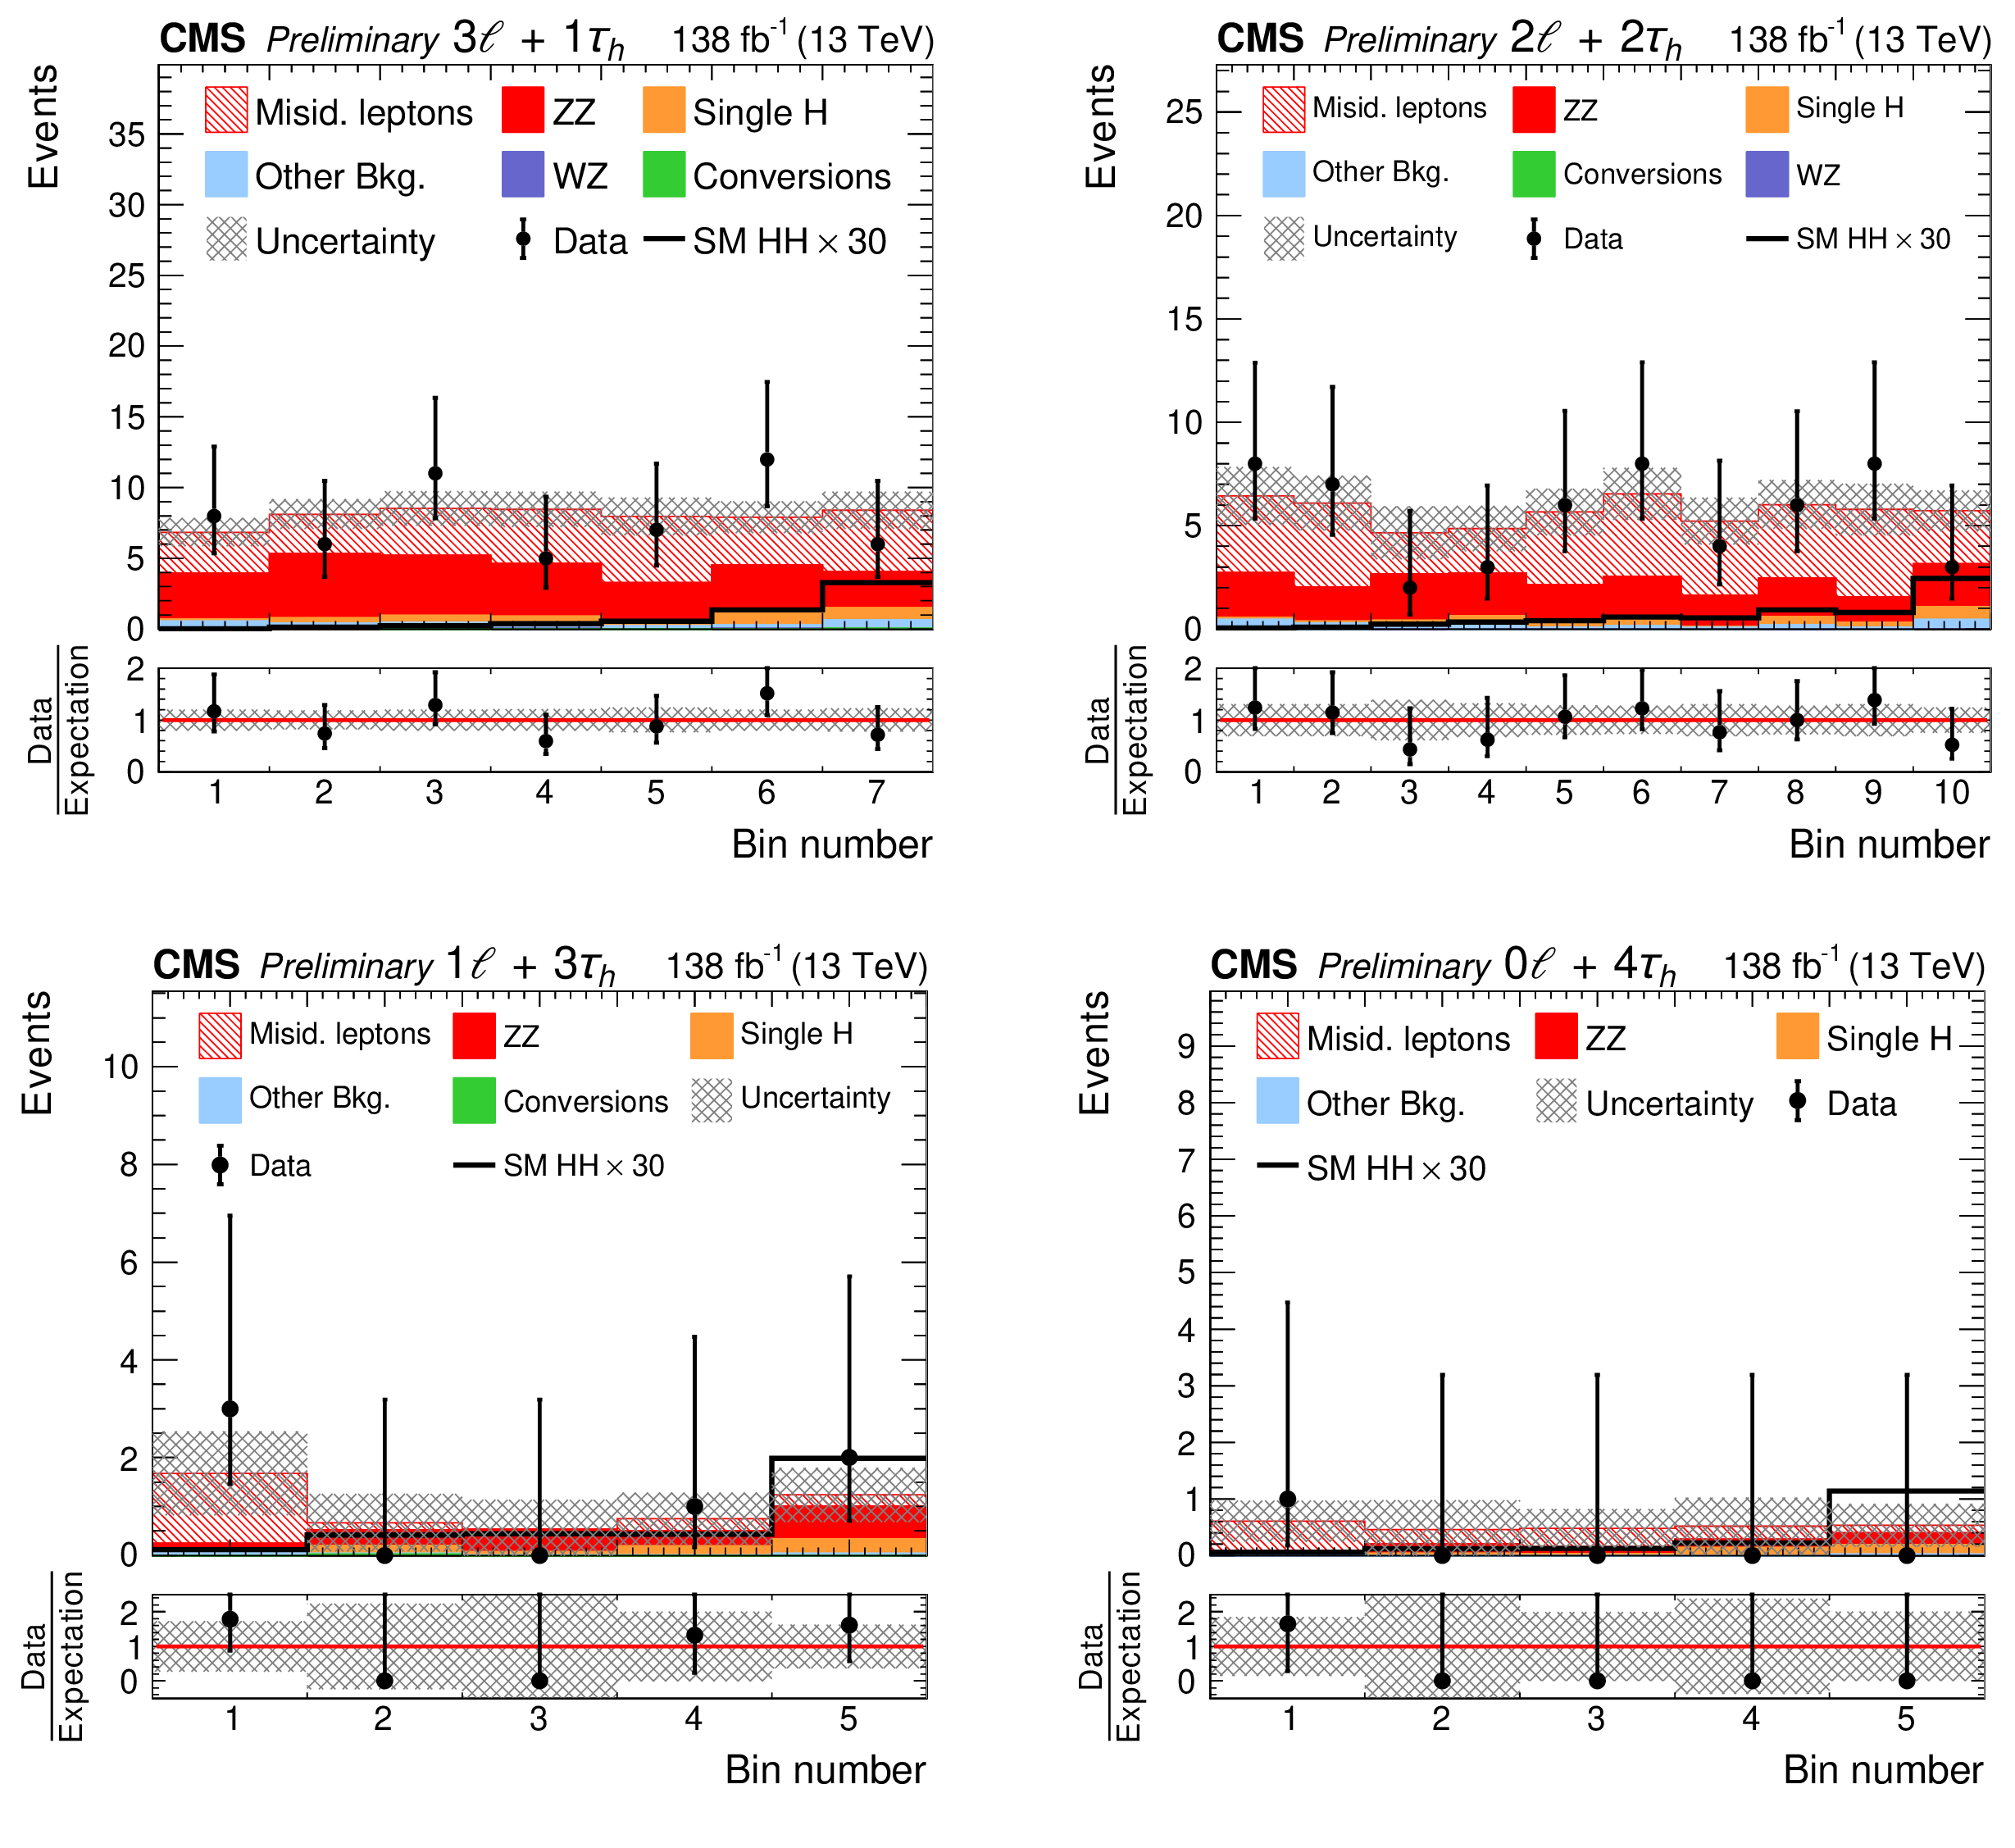
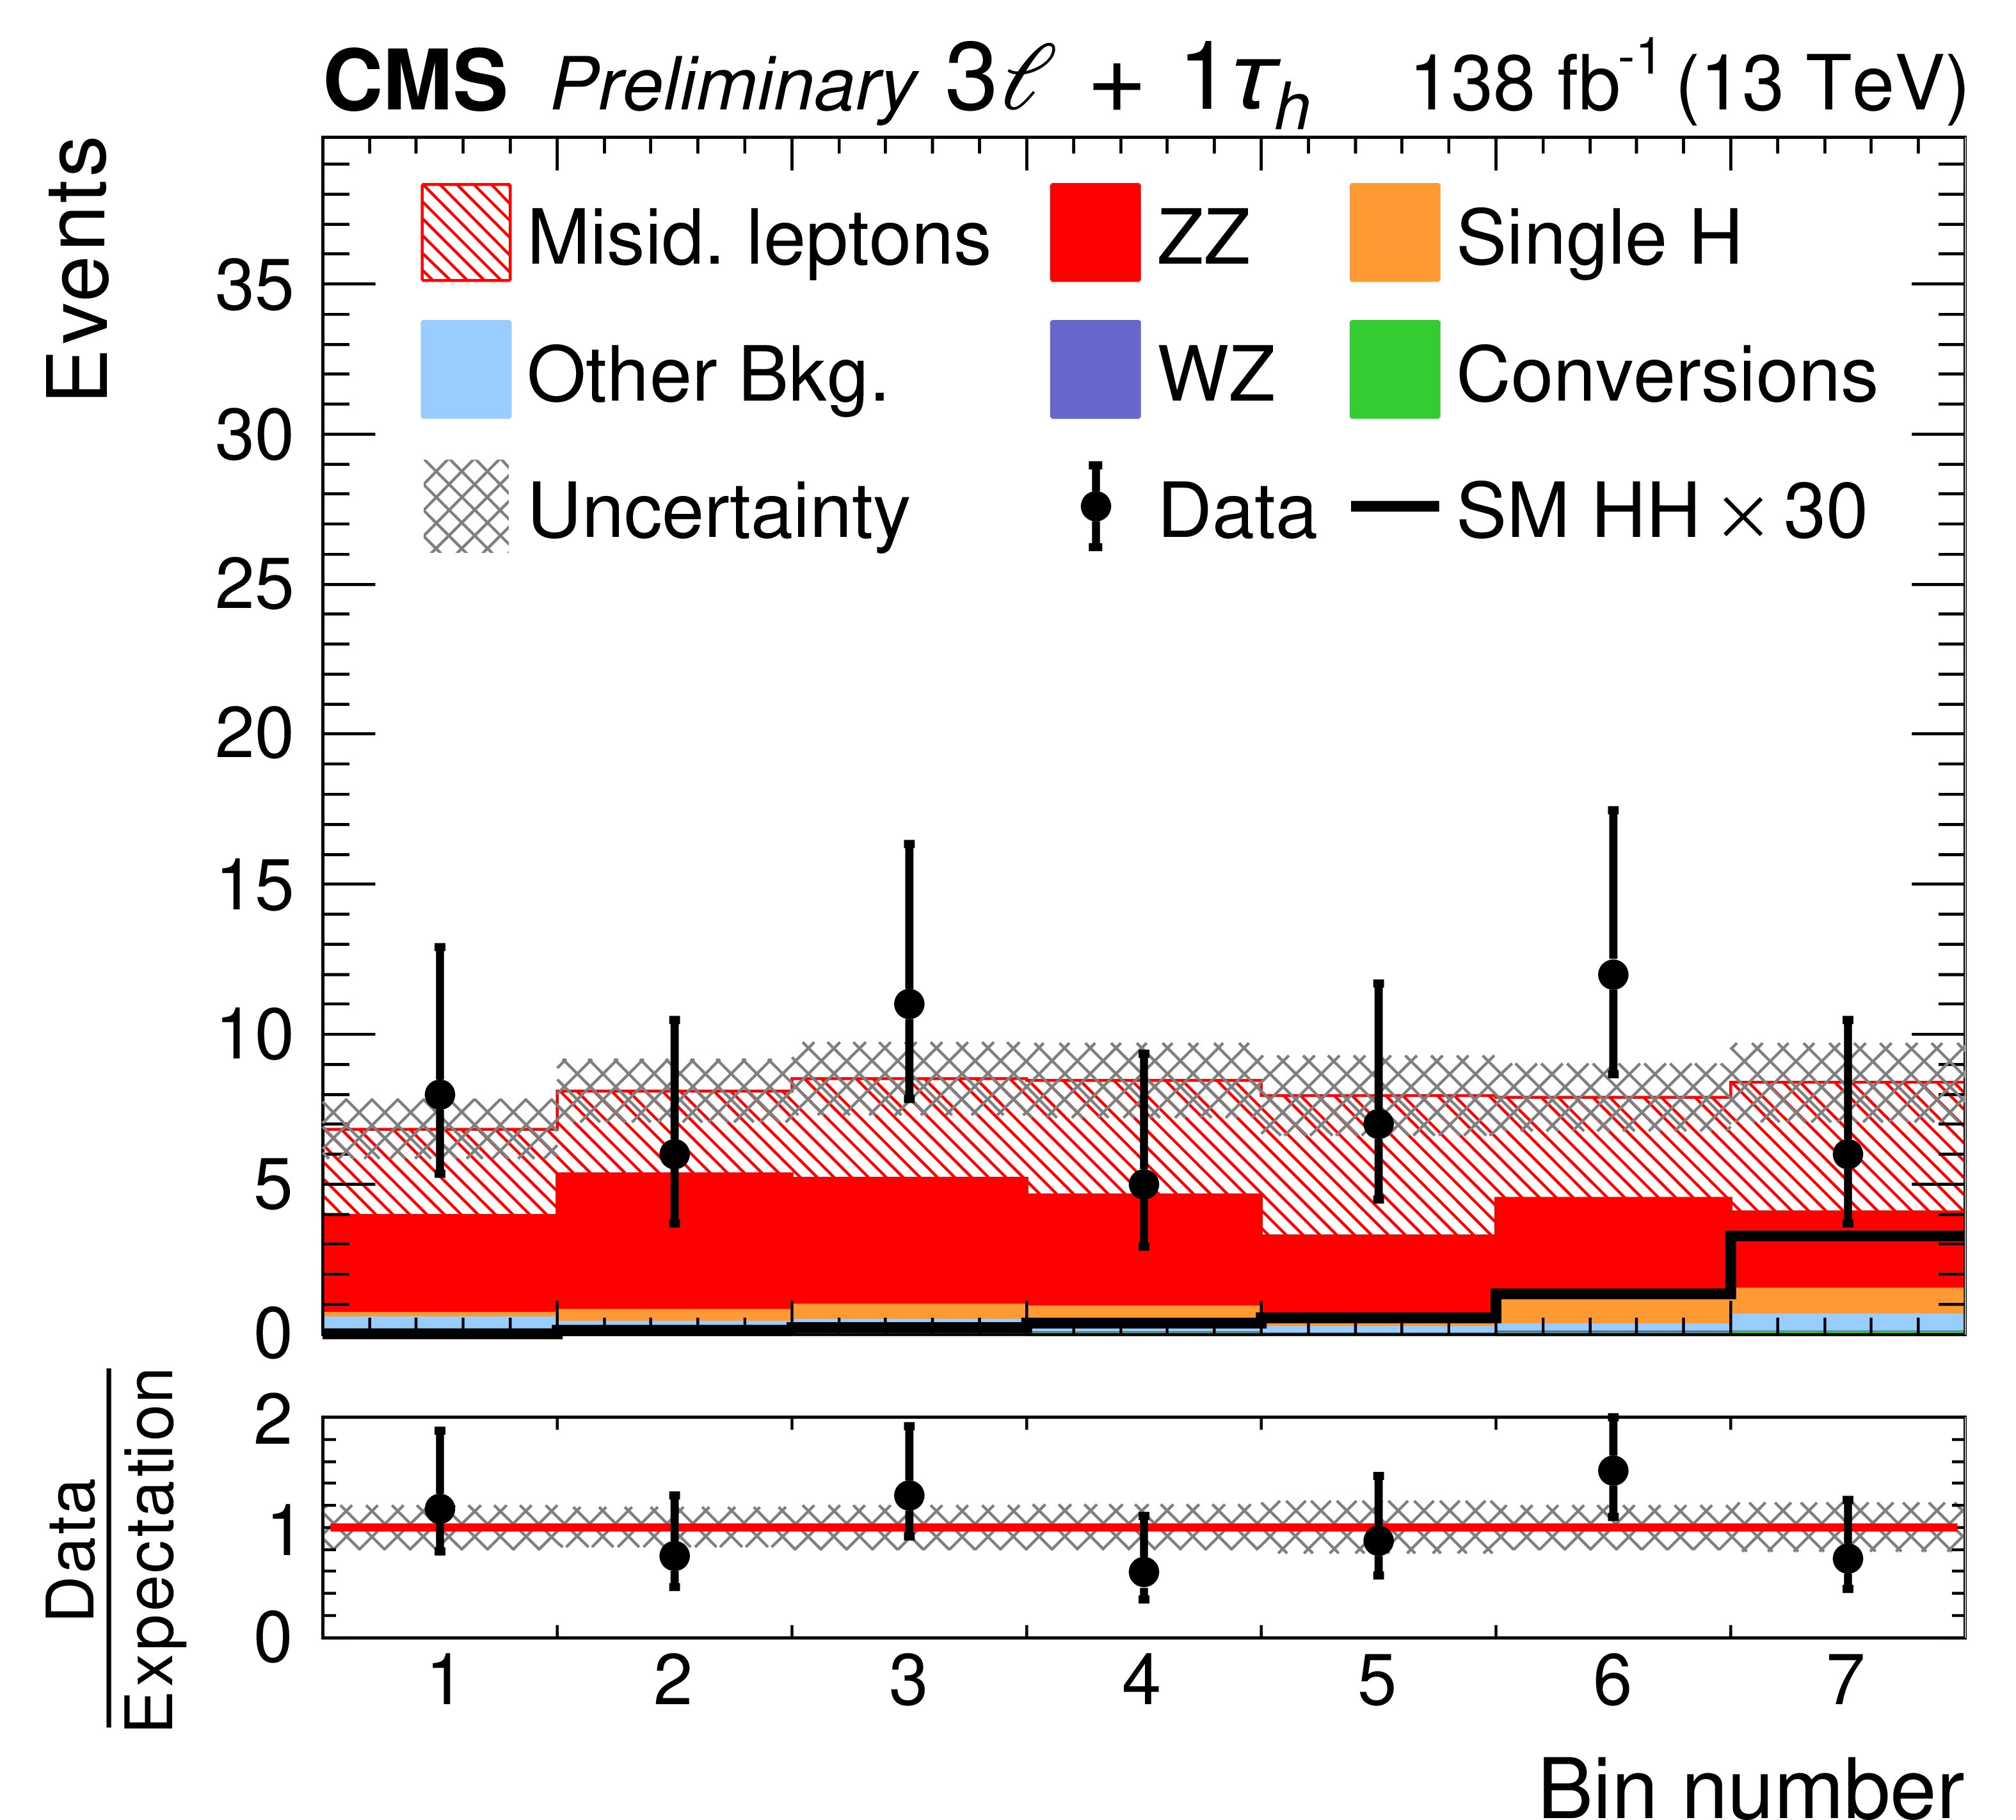
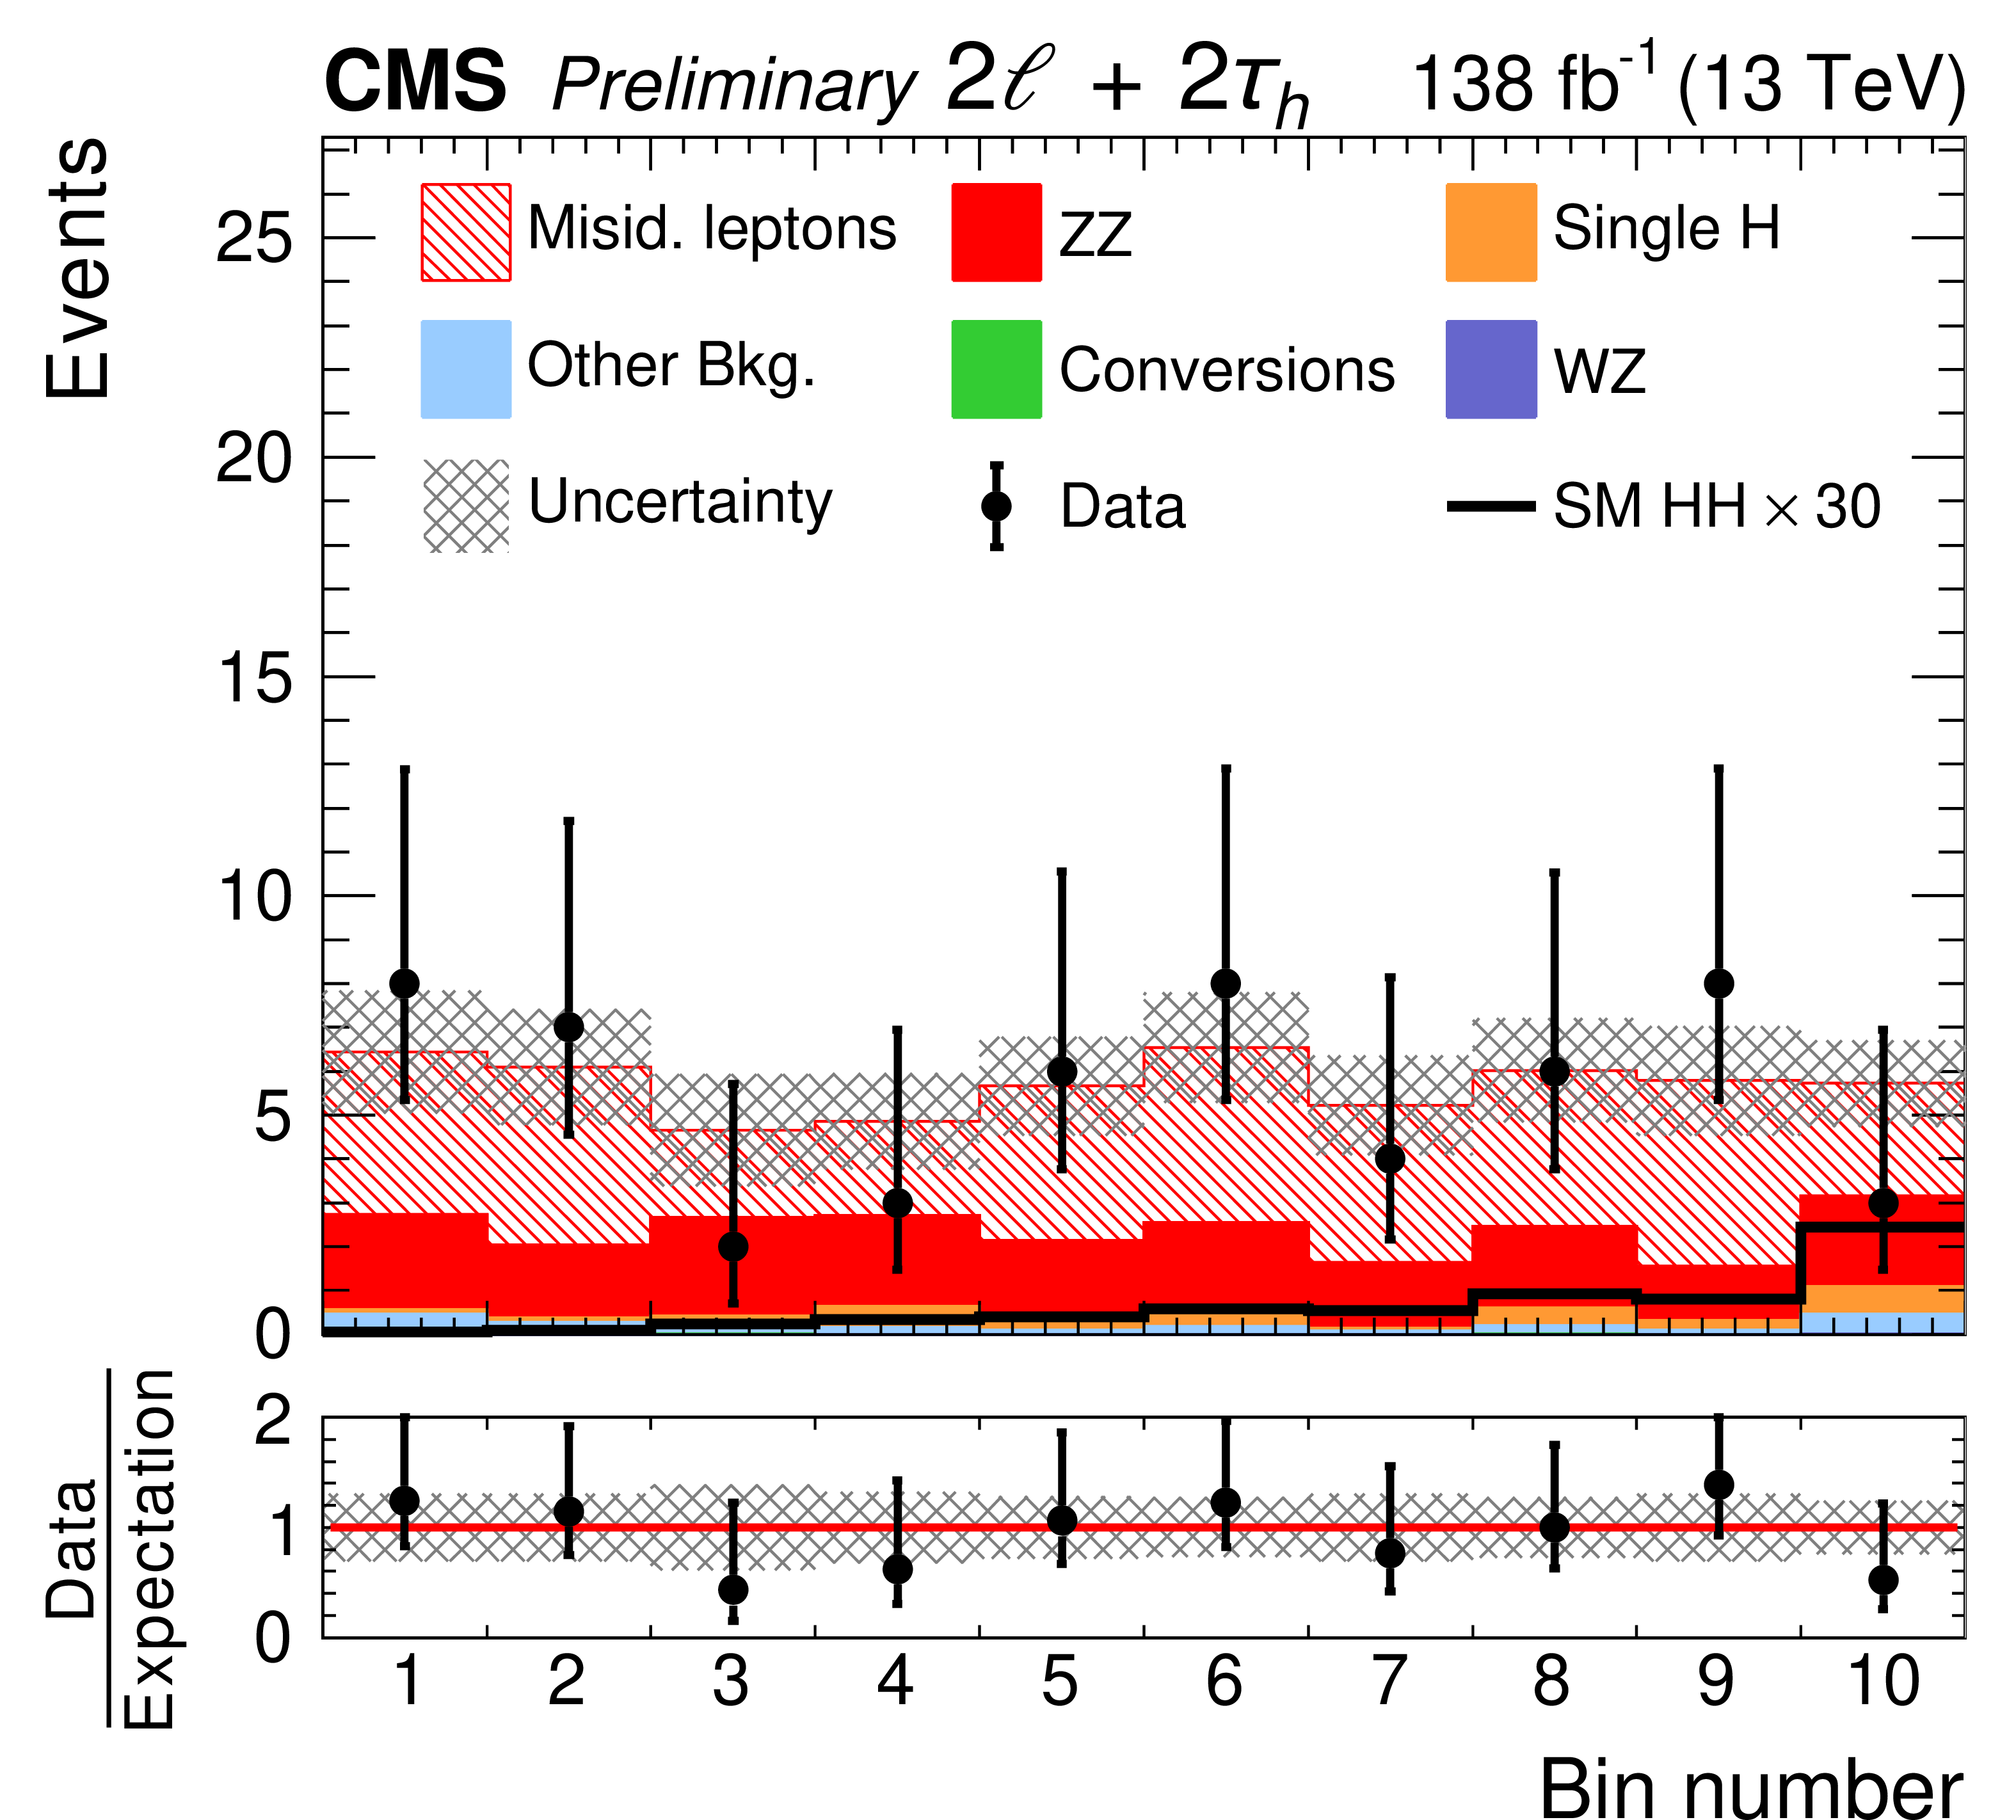
Distribution in the output of the BDT for nonresonant HH production used in the $\kappa $ scans (BM7 from Ref. [24]) for the 3$ {\ell}$ + 1${\tau _{\text {h}}}$ (top left), 2$ {\ell}$ + 2${\tau _{\text {h}}}$ (top right), 1$ {\ell}$ + 3${\tau _{\text {h}}}$ (bottom left), and 4${\tau _{\text {h}}}$ (bottom right) categories. The SM HH signal is shown for a cross section amounting to $30$ times the value predicted in the SM. The distributions expected for the background processes are shown for the values of the signal strength parameter $\mu $ and of the nuisance parameters obtained from the ML fit. The best-fit value of the HH production rate amounts to $\hat{\mu} = $ 1.96$^{+10.57}_{-9.98}$ times the rate expected in the SM. |
png pdf |
Figure 6-a:
Distribution in the output of the BDT for nonresonant HH production used in the $\kappa $ scans (BM7 from Ref. [24]) for the 3$ {\ell}$ + 1${\tau _{\text {h}}}$ (top left), 2$ {\ell}$ + 2${\tau _{\text {h}}}$ (top right), 1$ {\ell}$ + 3${\tau _{\text {h}}}$ (bottom left), and 4${\tau _{\text {h}}}$ (bottom right) categories. The SM HH signal is shown for a cross section amounting to $30$ times the value predicted in the SM. The distributions expected for the background processes are shown for the values of the signal strength parameter $\mu $ and of the nuisance parameters obtained from the ML fit. The best-fit value of the HH production rate amounts to $\hat{\mu} = $ 1.96$^{+10.57}_{-9.98}$ times the rate expected in the SM. |
png pdf |
Figure 6-b:
Distribution in the output of the BDT for nonresonant HH production used in the $\kappa $ scans (BM7 from Ref. [24]) for the 3$ {\ell}$ + 1${\tau _{\text {h}}}$ (top left), 2$ {\ell}$ + 2${\tau _{\text {h}}}$ (top right), 1$ {\ell}$ + 3${\tau _{\text {h}}}$ (bottom left), and 4${\tau _{\text {h}}}$ (bottom right) categories. The SM HH signal is shown for a cross section amounting to $30$ times the value predicted in the SM. The distributions expected for the background processes are shown for the values of the signal strength parameter $\mu $ and of the nuisance parameters obtained from the ML fit. The best-fit value of the HH production rate amounts to $\hat{\mu} = $ 1.96$^{+10.57}_{-9.98}$ times the rate expected in the SM. |
png pdf |
Figure 6-c:
Distribution in the output of the BDT for nonresonant HH production used in the $\kappa $ scans (BM7 from Ref. [24]) for the 3$ {\ell}$ + 1${\tau _{\text {h}}}$ (top left), 2$ {\ell}$ + 2${\tau _{\text {h}}}$ (top right), 1$ {\ell}$ + 3${\tau _{\text {h}}}$ (bottom left), and 4${\tau _{\text {h}}}$ (bottom right) categories. The SM HH signal is shown for a cross section amounting to $30$ times the value predicted in the SM. The distributions expected for the background processes are shown for the values of the signal strength parameter $\mu $ and of the nuisance parameters obtained from the ML fit. The best-fit value of the HH production rate amounts to $\hat{\mu} = $ 1.96$^{+10.57}_{-9.98}$ times the rate expected in the SM. |
png pdf |
Figure 6-d:
Distribution in the output of the BDT for nonresonant HH production used in the $\kappa $ scans (BM7 from Ref. [24]) for the 3$ {\ell}$ + 1${\tau _{\text {h}}}$ (top left), 2$ {\ell}$ + 2${\tau _{\text {h}}}$ (top right), 1$ {\ell}$ + 3${\tau _{\text {h}}}$ (bottom left), and 4${\tau _{\text {h}}}$ (bottom right) categories. The SM HH signal is shown for a cross section amounting to $30$ times the value predicted in the SM. The distributions expected for the background processes are shown for the values of the signal strength parameter $\mu $ and of the nuisance parameters obtained from the ML fit. The best-fit value of the HH production rate amounts to $\hat{\mu} = $ 1.96$^{+10.57}_{-9.98}$ times the rate expected in the SM. |
png pdf |
Figure 7:
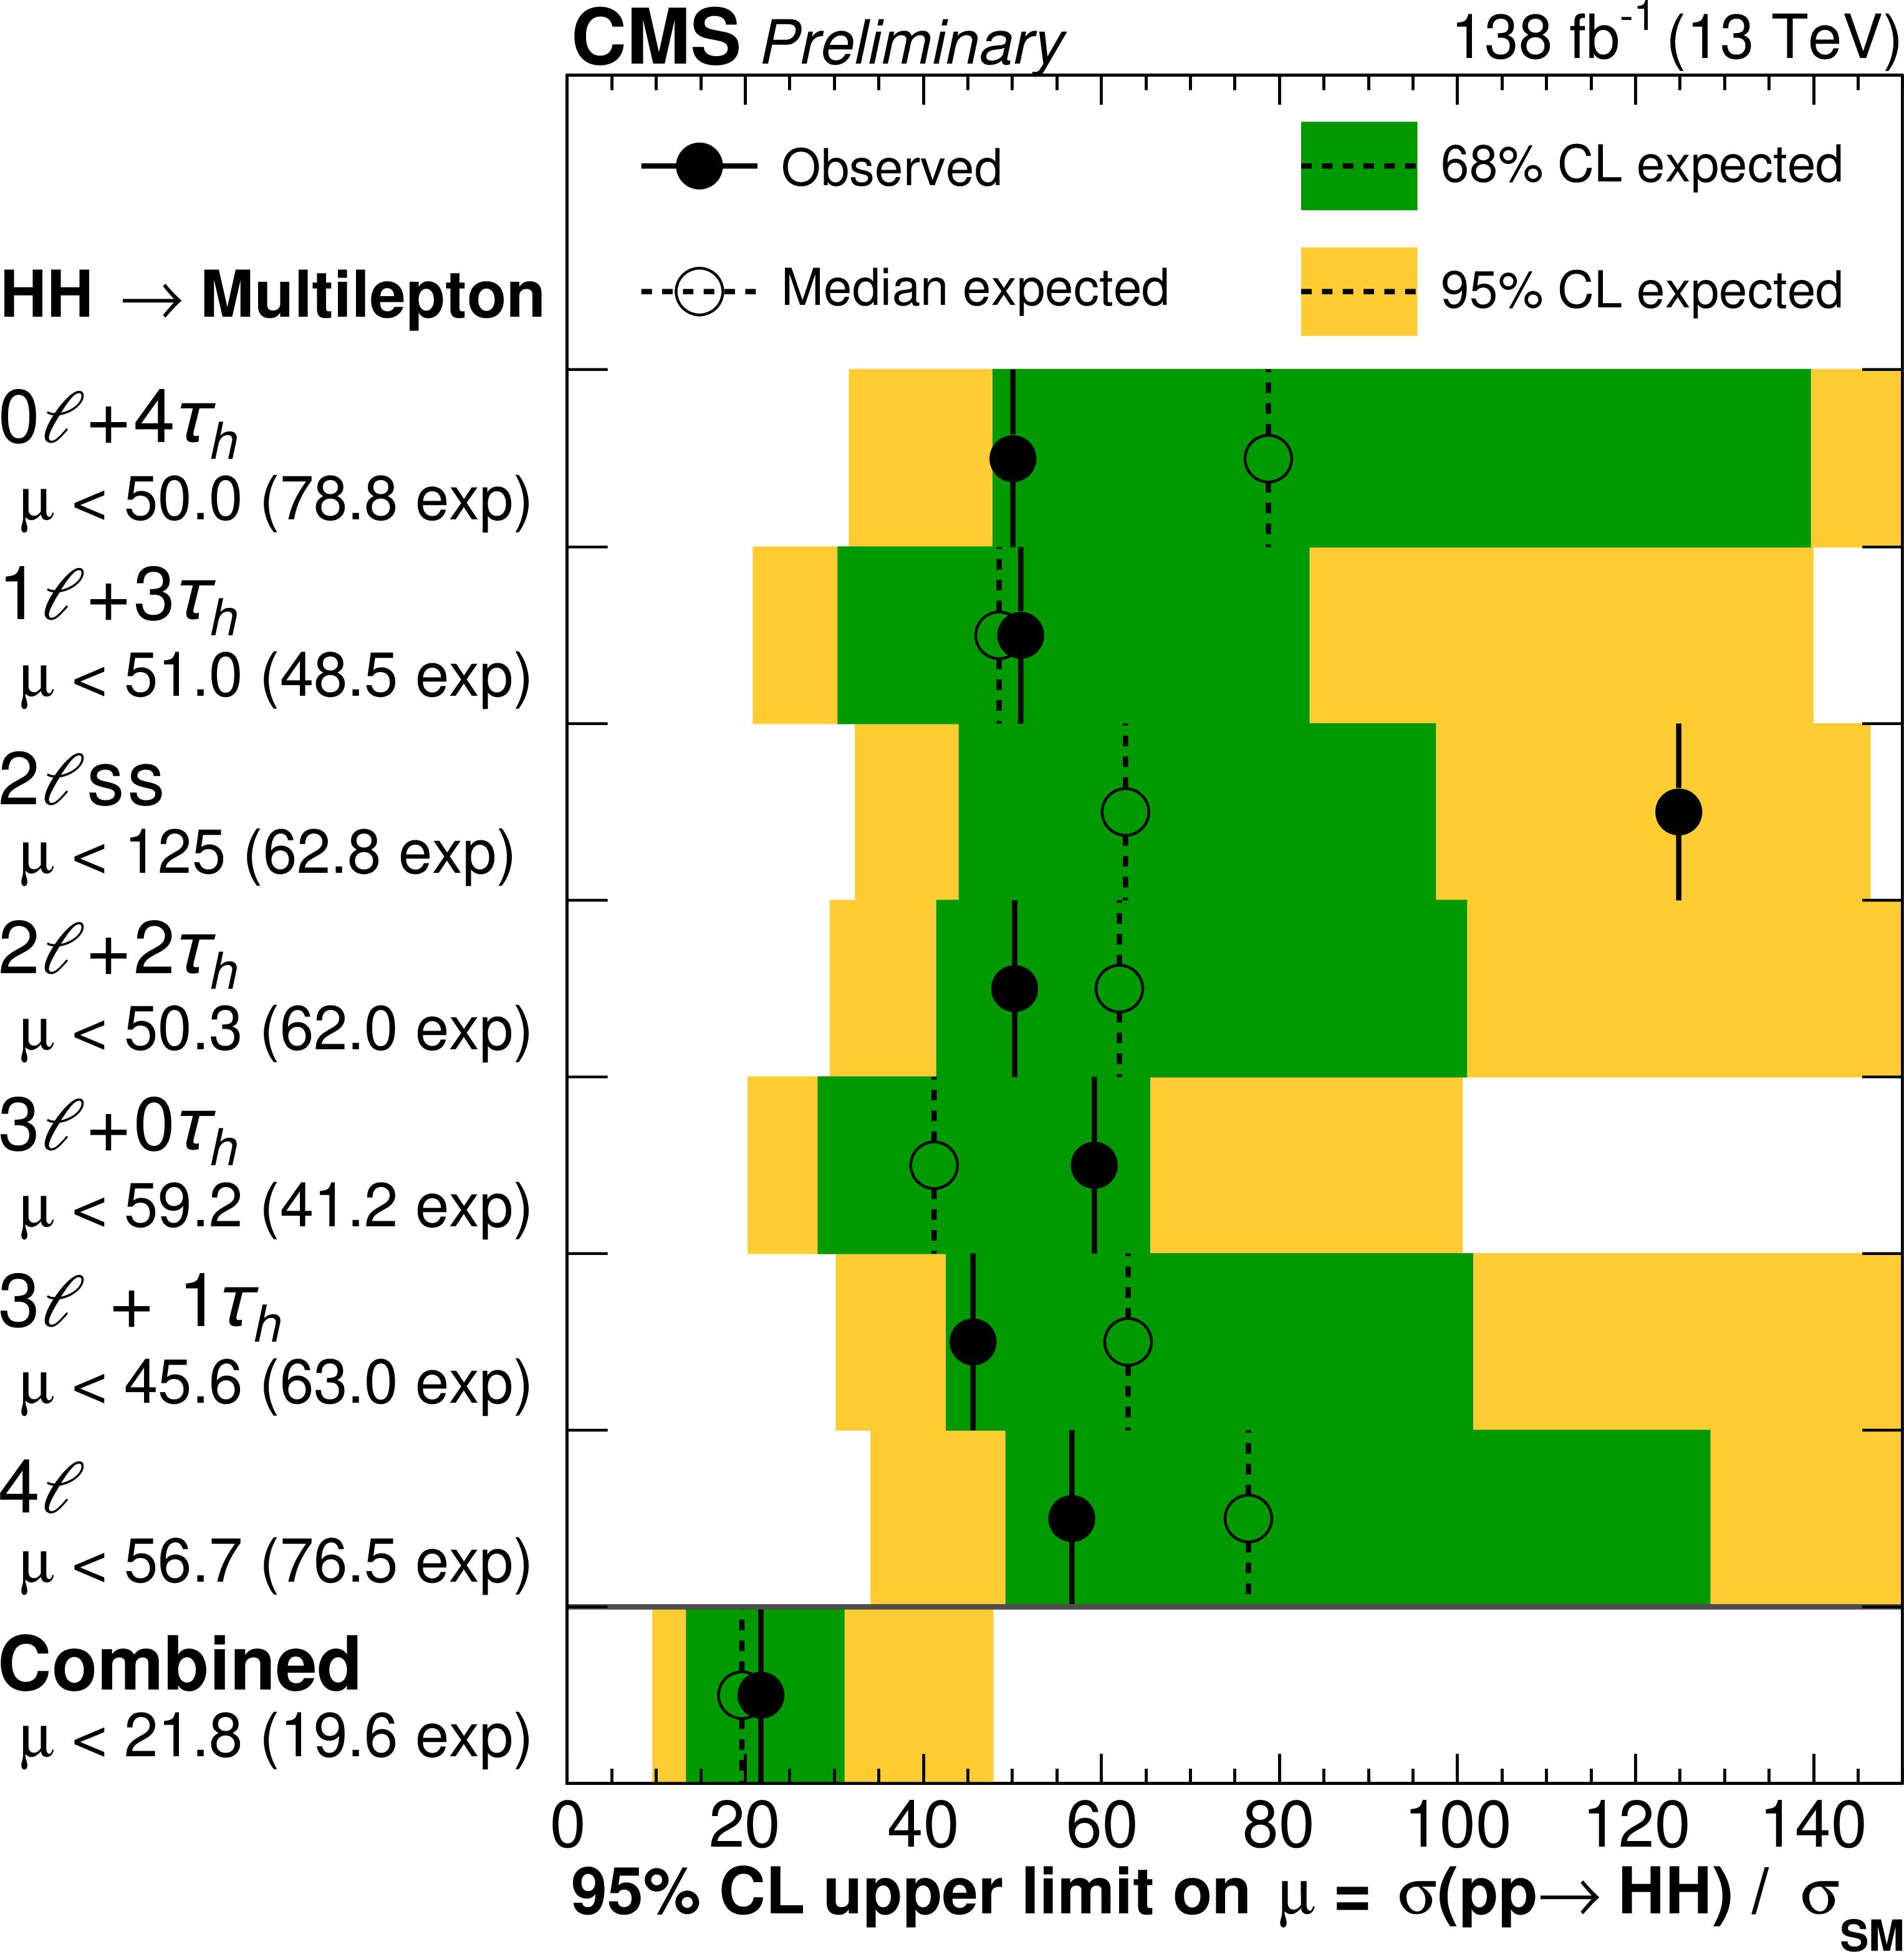
Observed and expected 95% CL upper limits on the SM HH production cross section, obtained for both individual search categories and from a simultaneous fit of all seven search categories combined. |
png pdf |
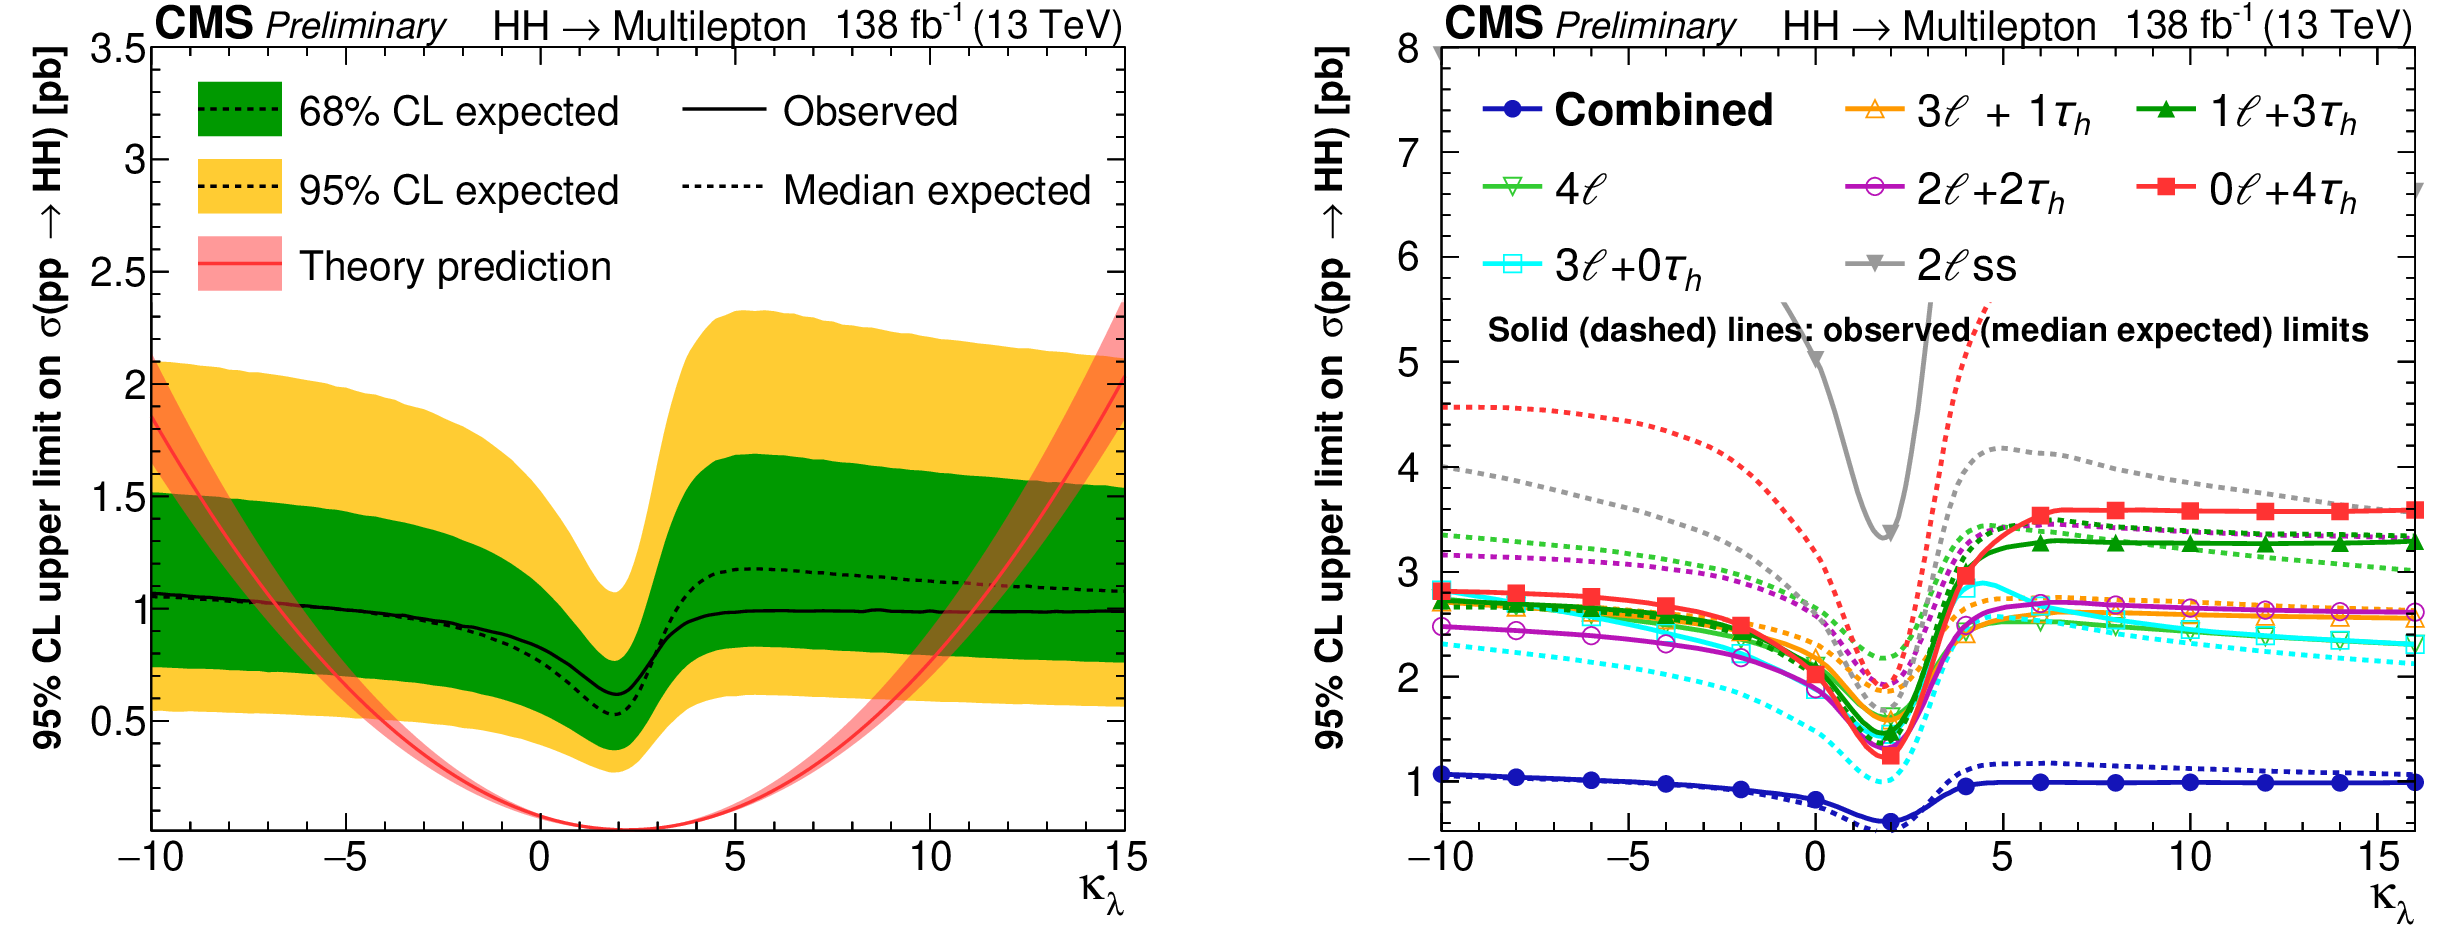
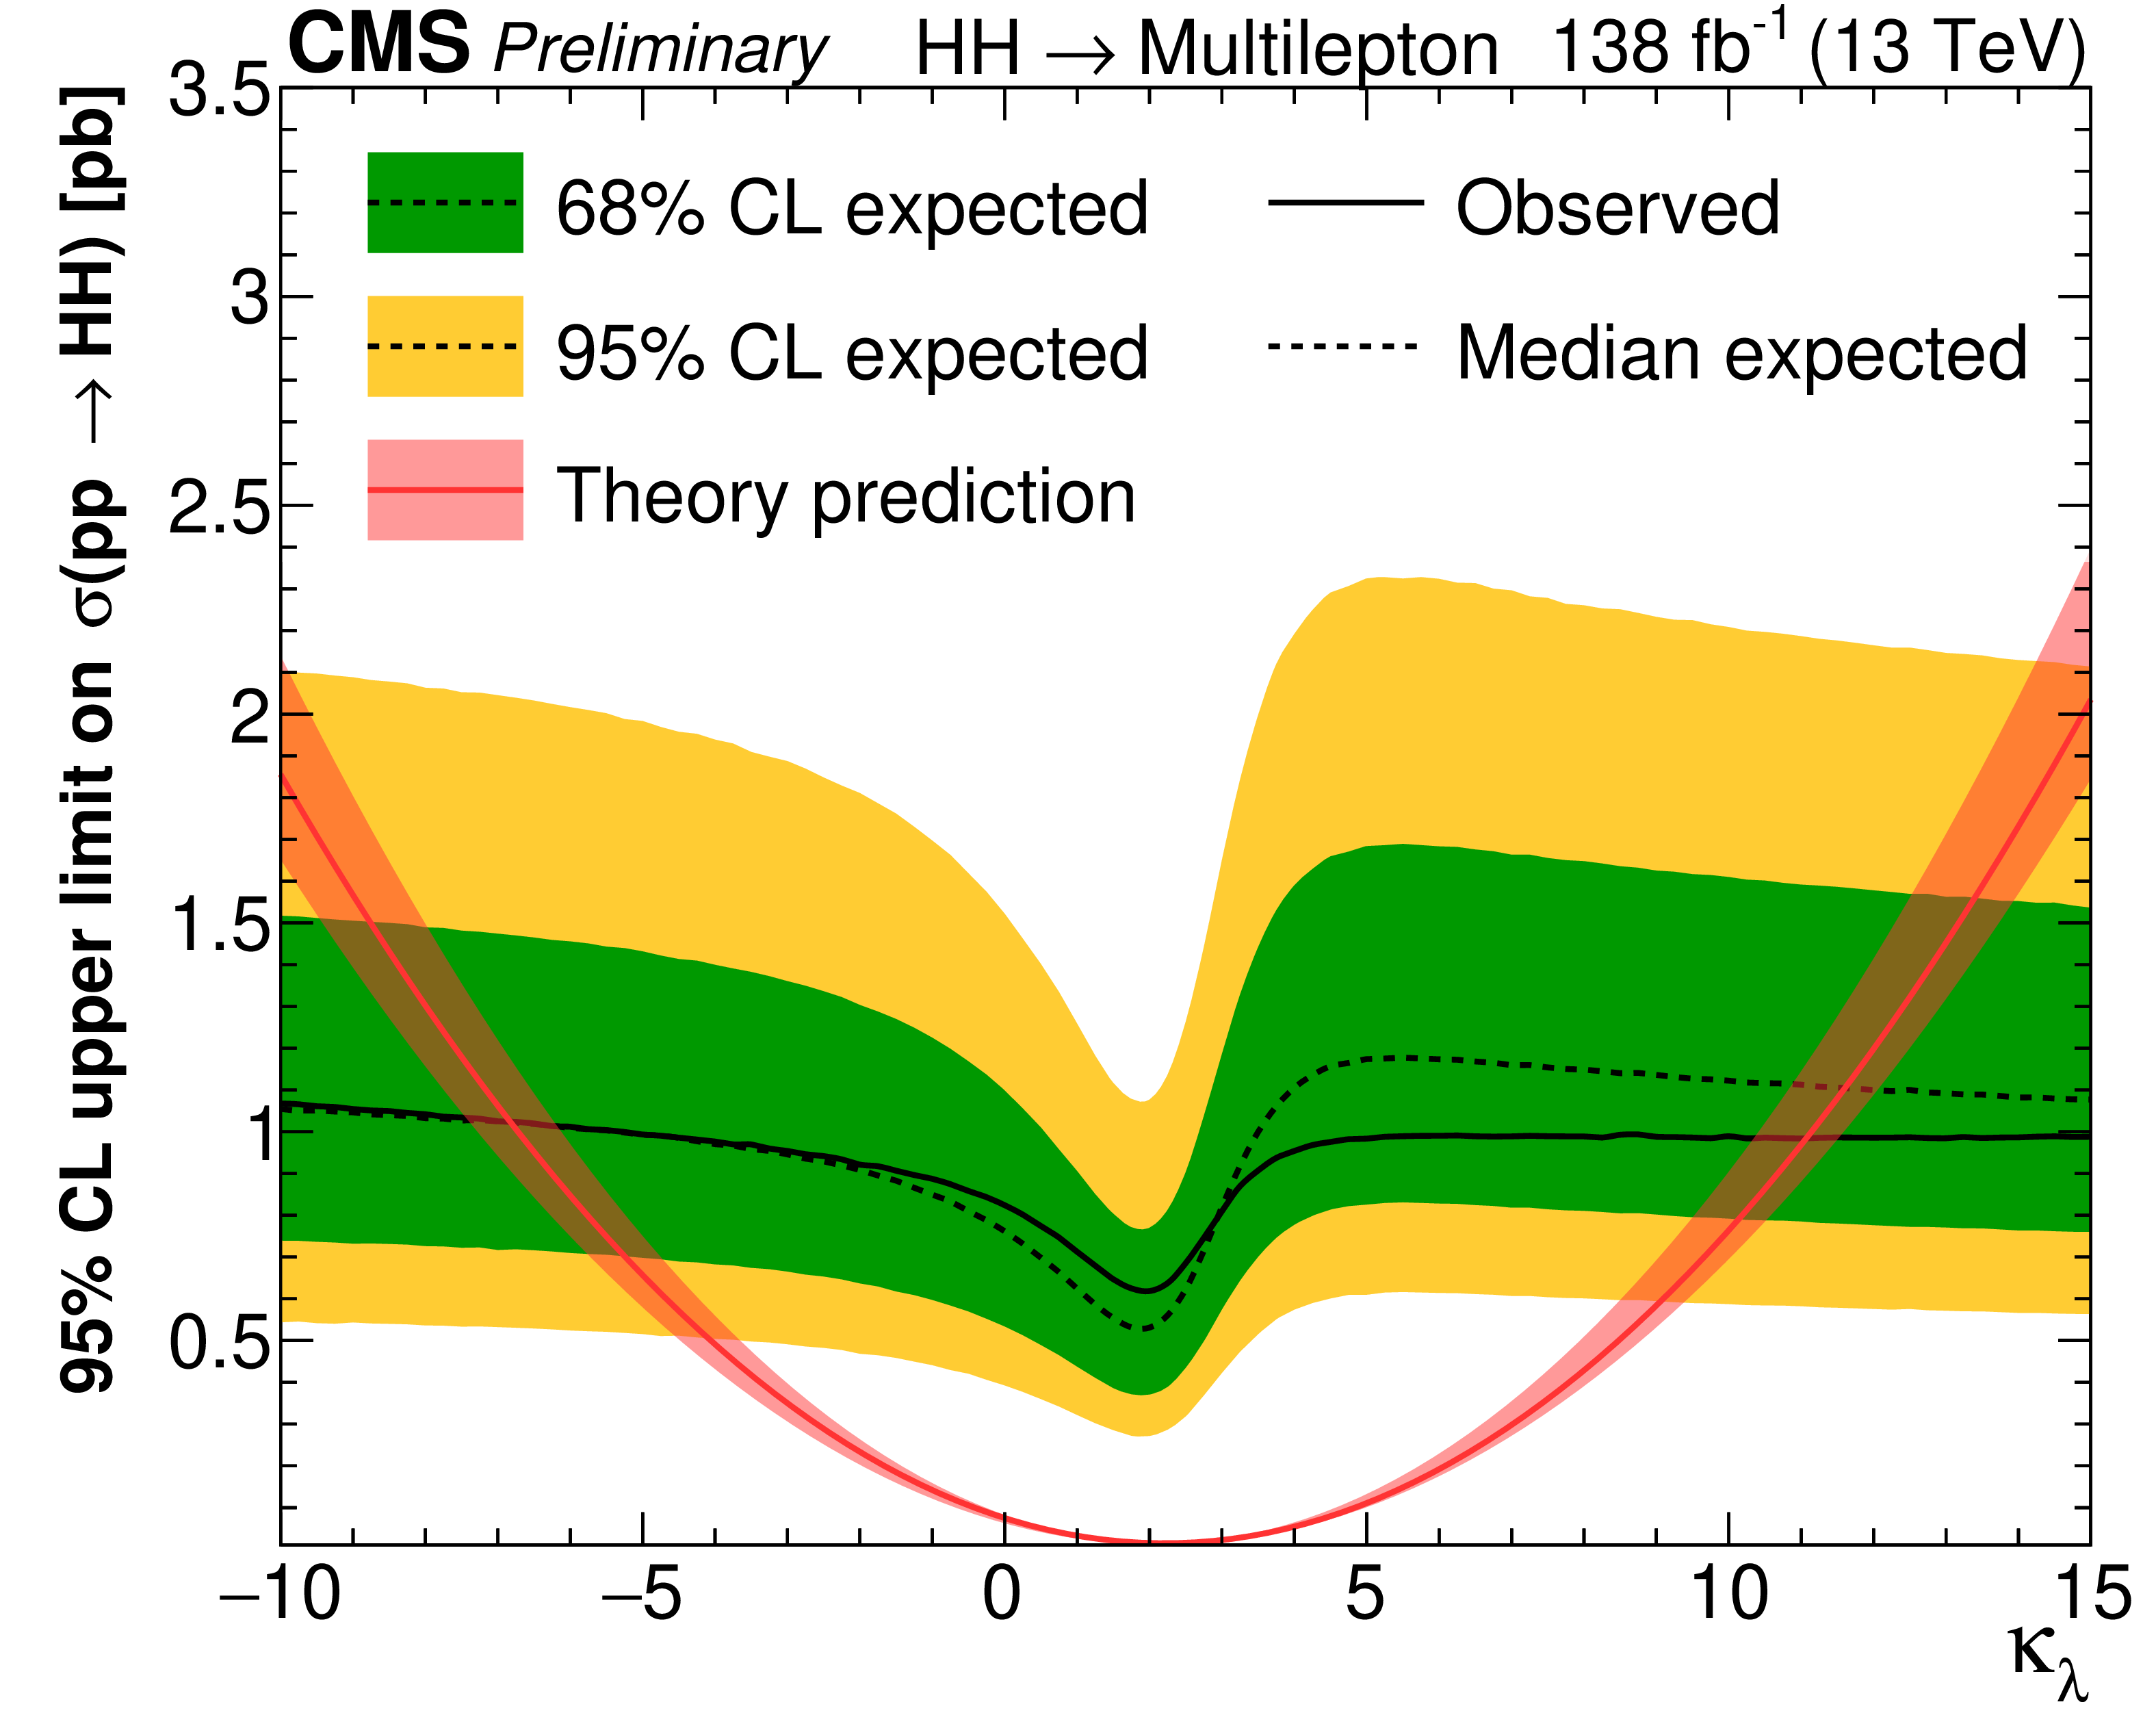
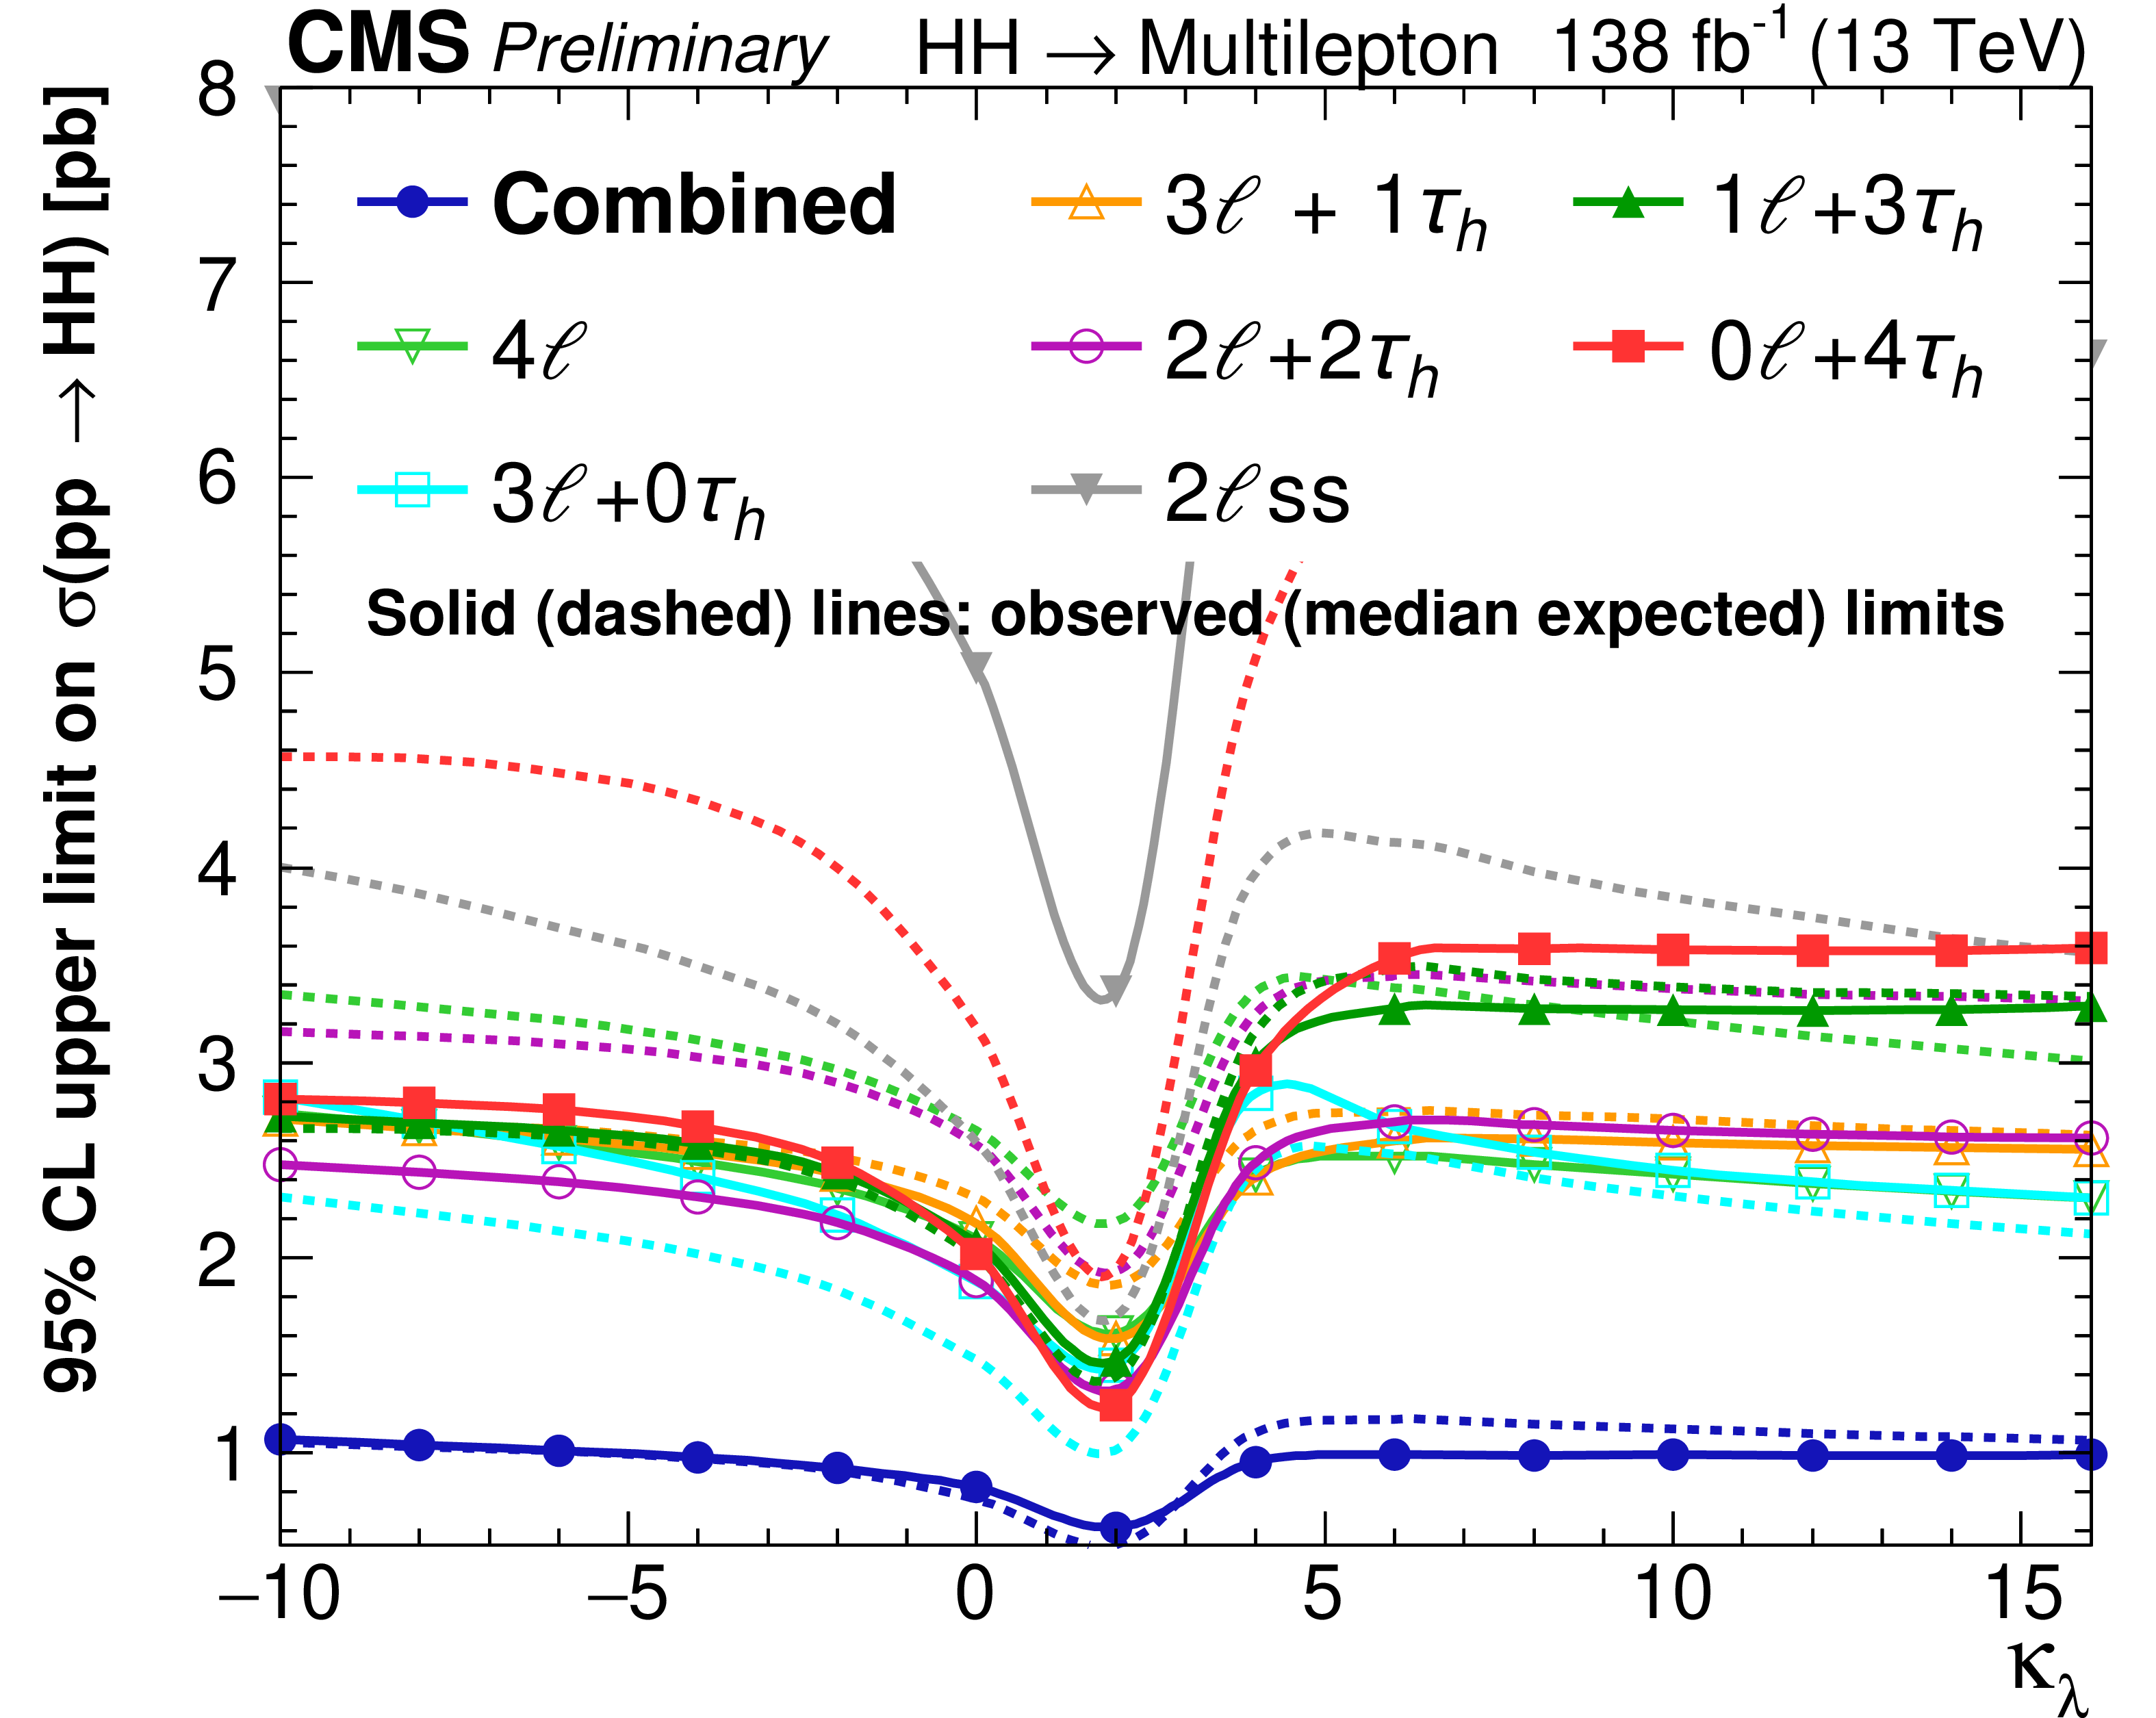
Figure 8:
Observed and expected 95% CL upper limits on the HH production cross section as a function of the Higgs boson self-coupling strength modifier $ {\kappa _{\lambda}} $. All Higgs boson couplings other than $\lambda $ are assumed to have the values predicted in the SM. The plot on the left shows the result obtained by combining all seven search categories, while the plot on the right shows the limits obtained for each search category separately. Overlaid on the left is a curve in red representing the predicted HH production cross section. |
png pdf |
Figure 8-a:
Observed and expected 95% CL upper limits on the HH production cross section as a function of the Higgs boson self-coupling strength modifier $ {\kappa _{\lambda}} $. All Higgs boson couplings other than $\lambda $ are assumed to have the values predicted in the SM. The plot on the left shows the result obtained by combining all seven search categories, while the plot on the right shows the limits obtained for each search category separately. Overlaid on the left is a curve in red representing the predicted HH production cross section. |
png pdf |
Figure 8-b:
Observed and expected 95% CL upper limits on the HH production cross section as a function of the Higgs boson self-coupling strength modifier $ {\kappa _{\lambda}} $. All Higgs boson couplings other than $\lambda $ are assumed to have the values predicted in the SM. The plot on the left shows the result obtained by combining all seven search categories, while the plot on the right shows the limits obtained for each search category separately. Overlaid on the left is a curve in red representing the predicted HH production cross section. |
png pdf |
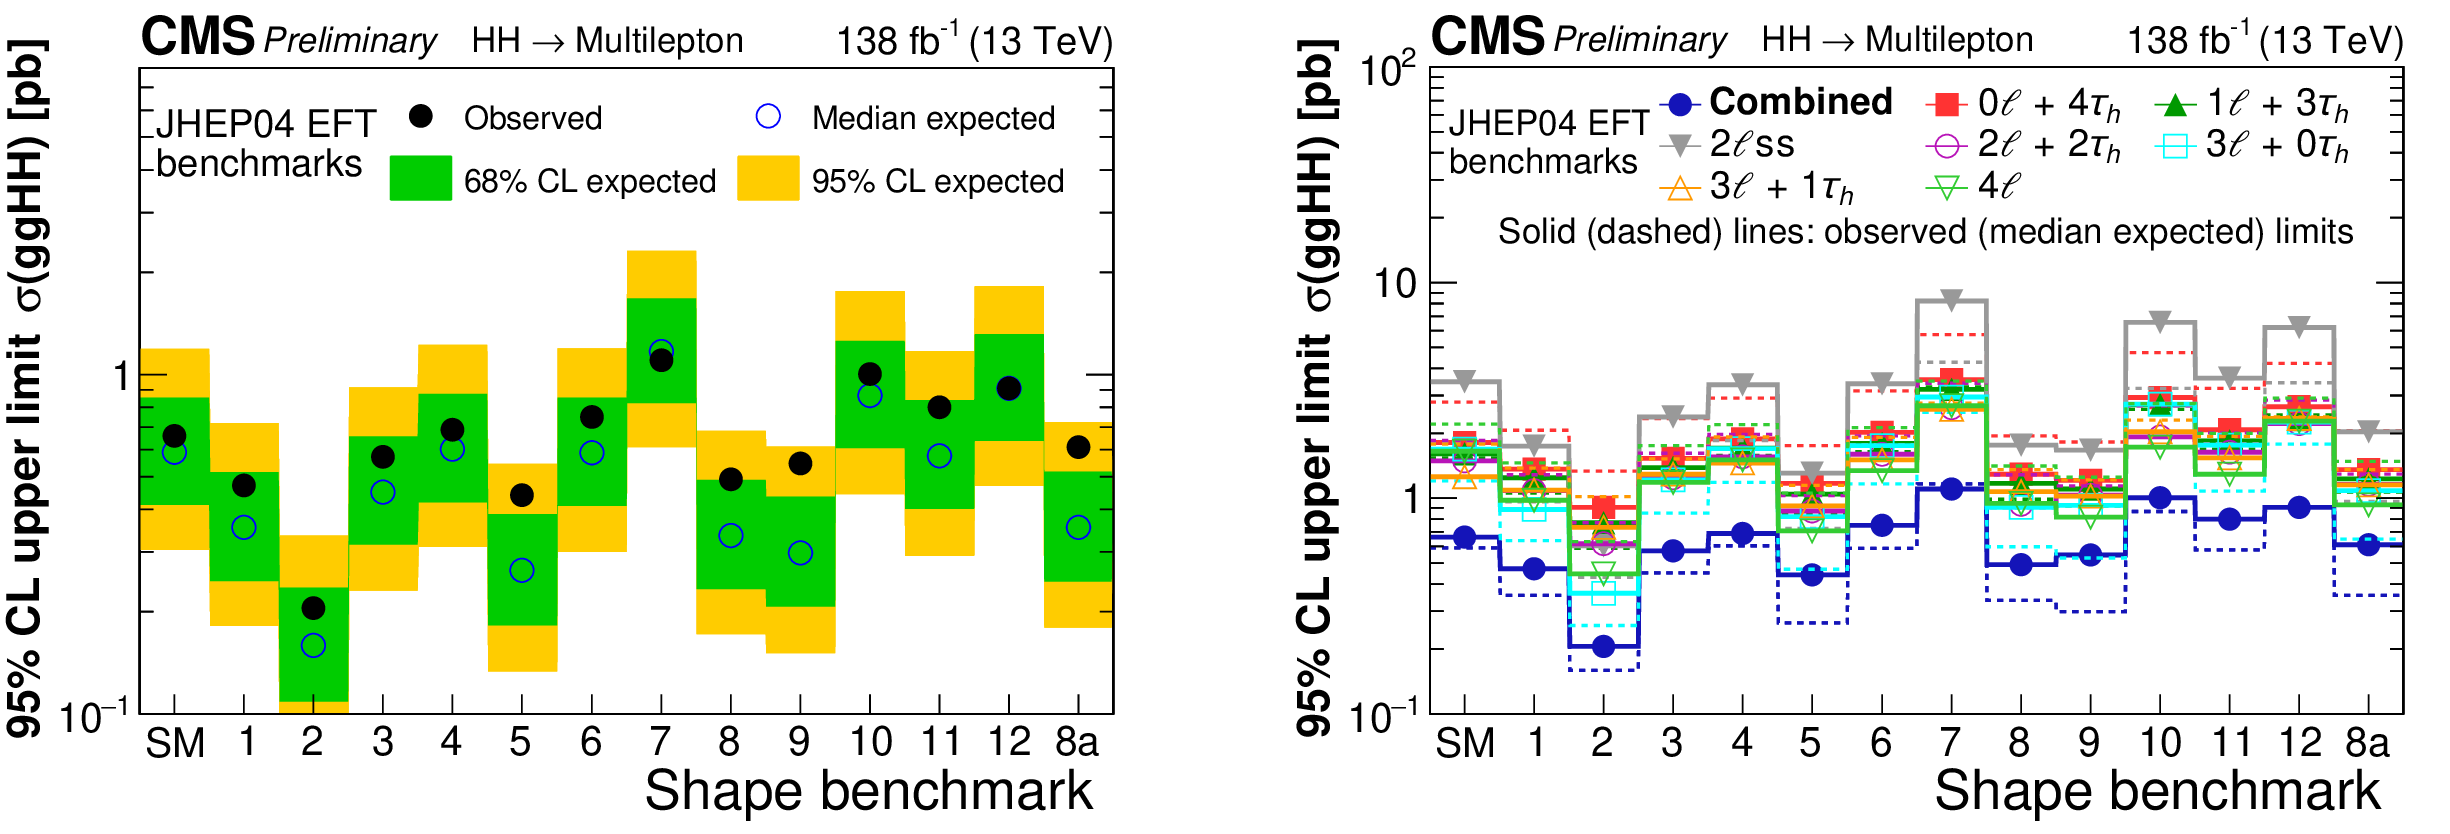
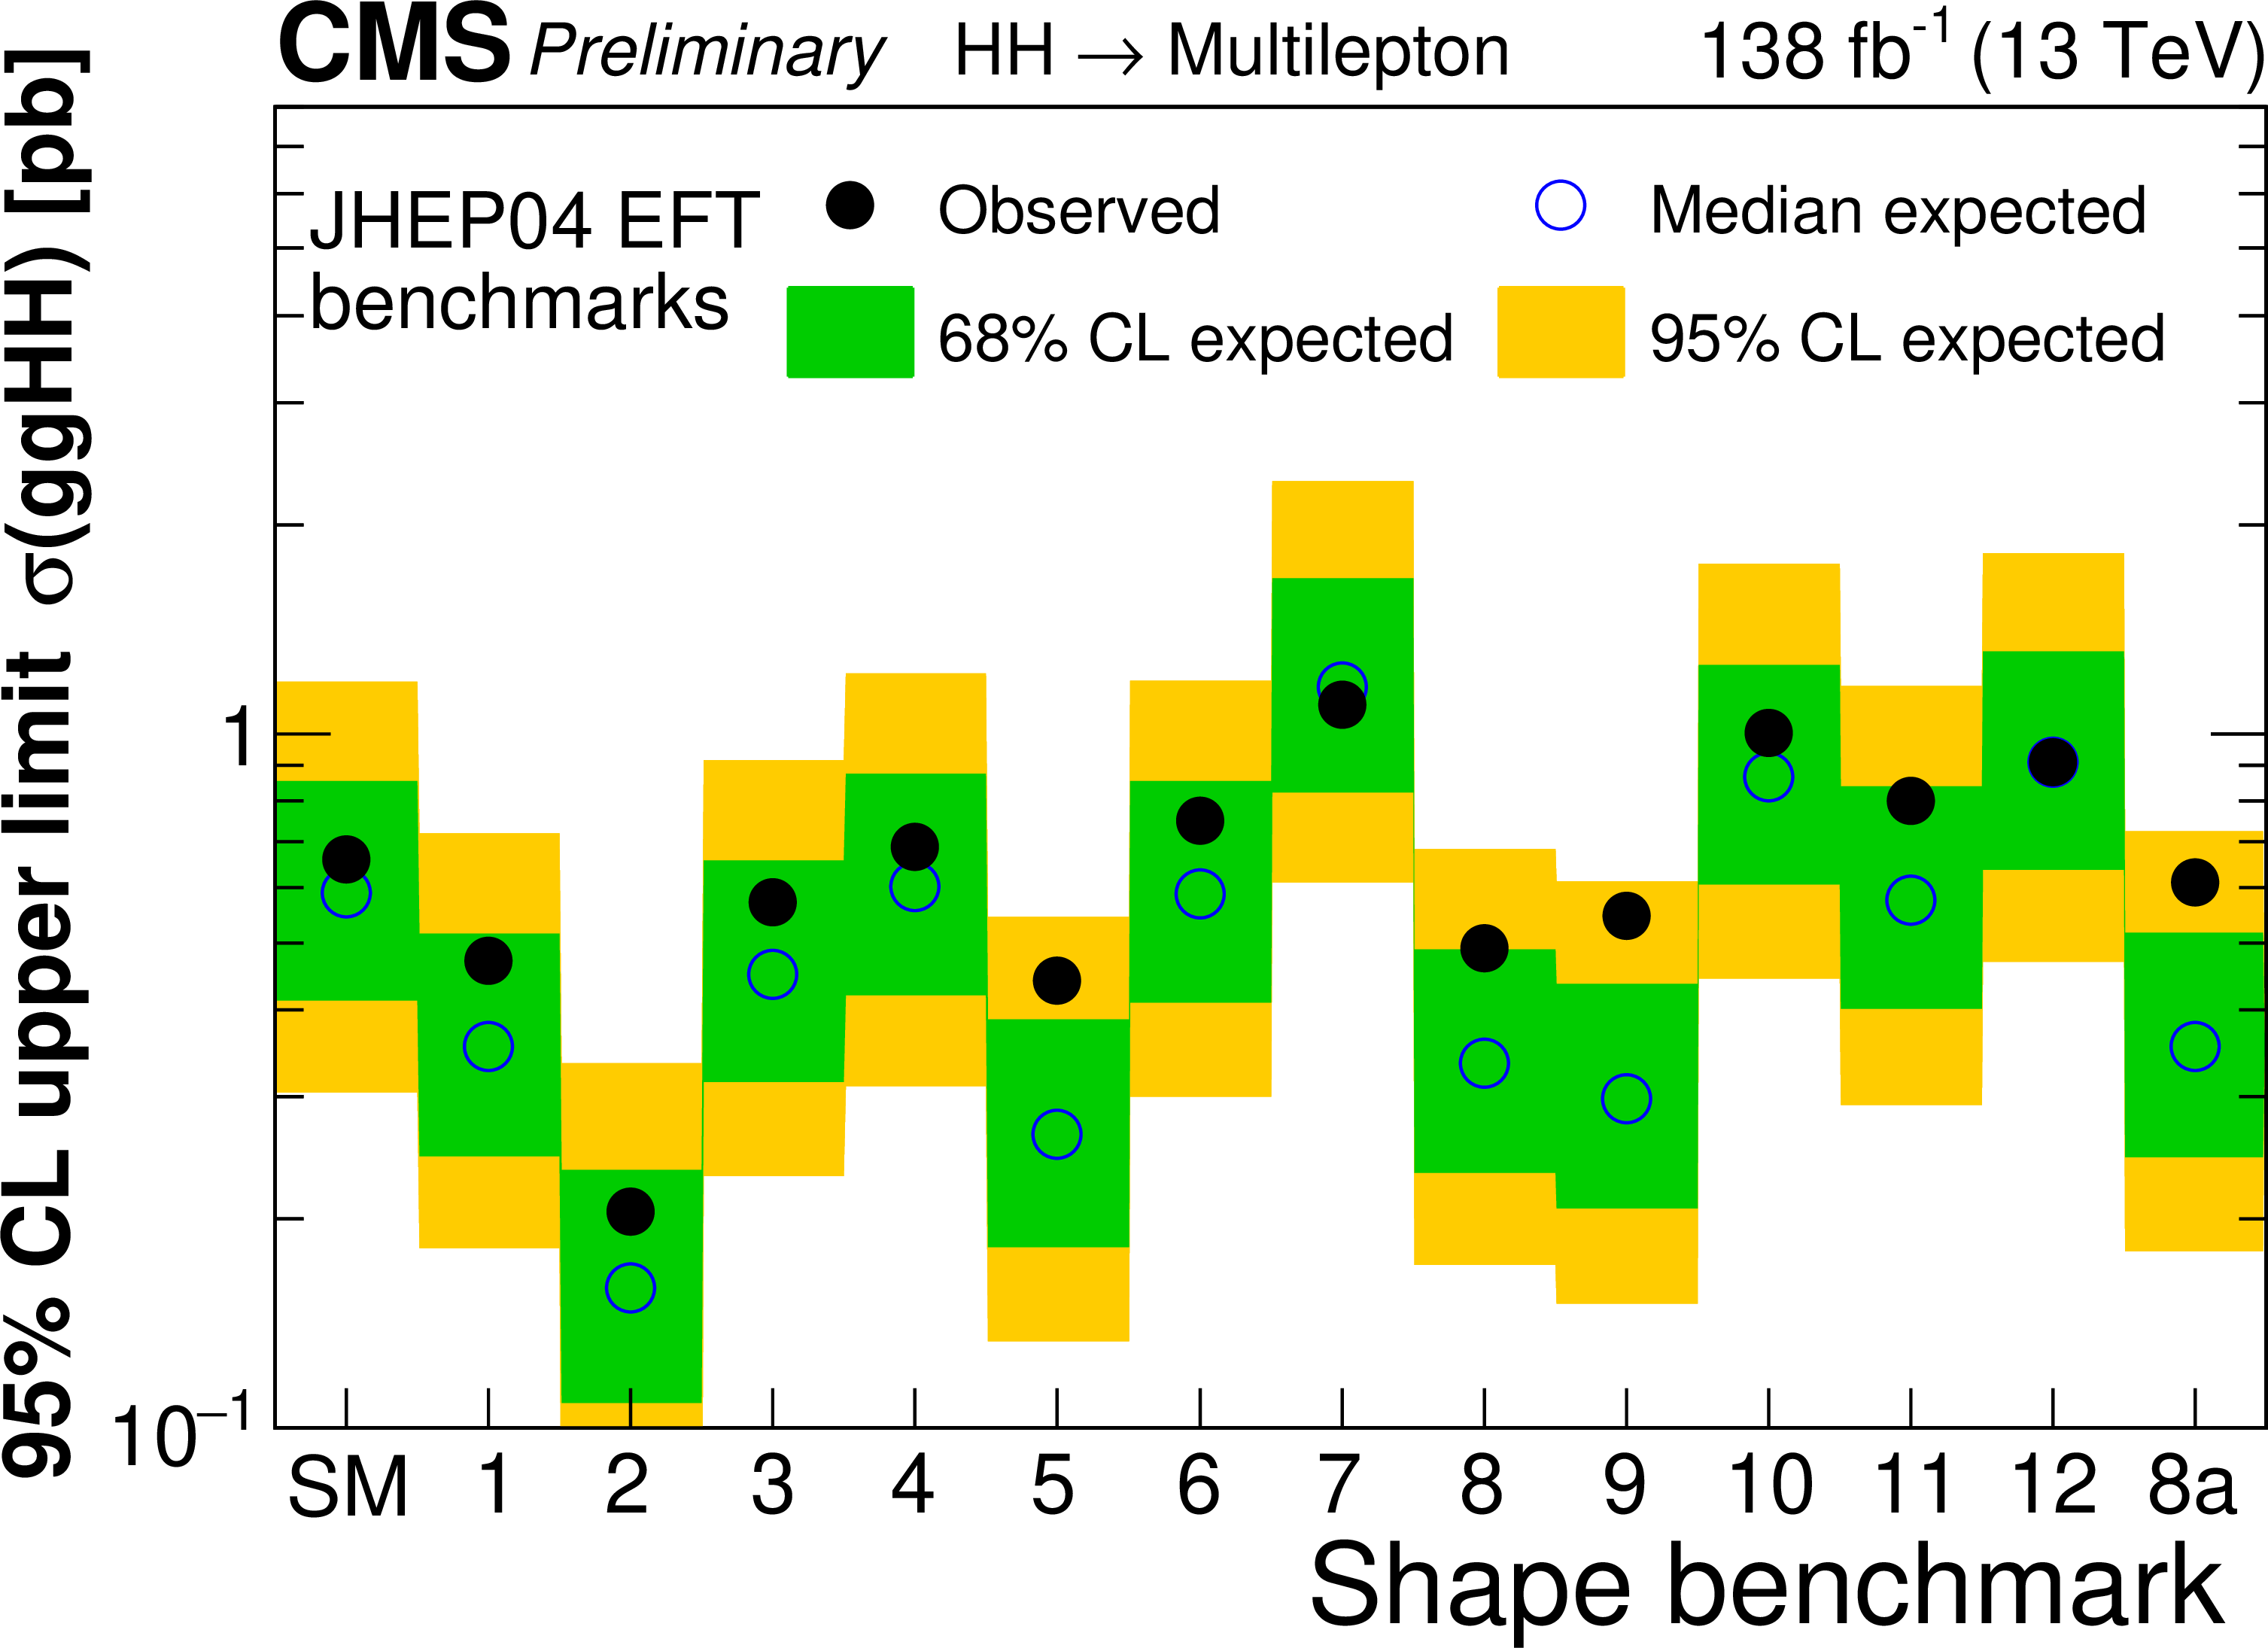
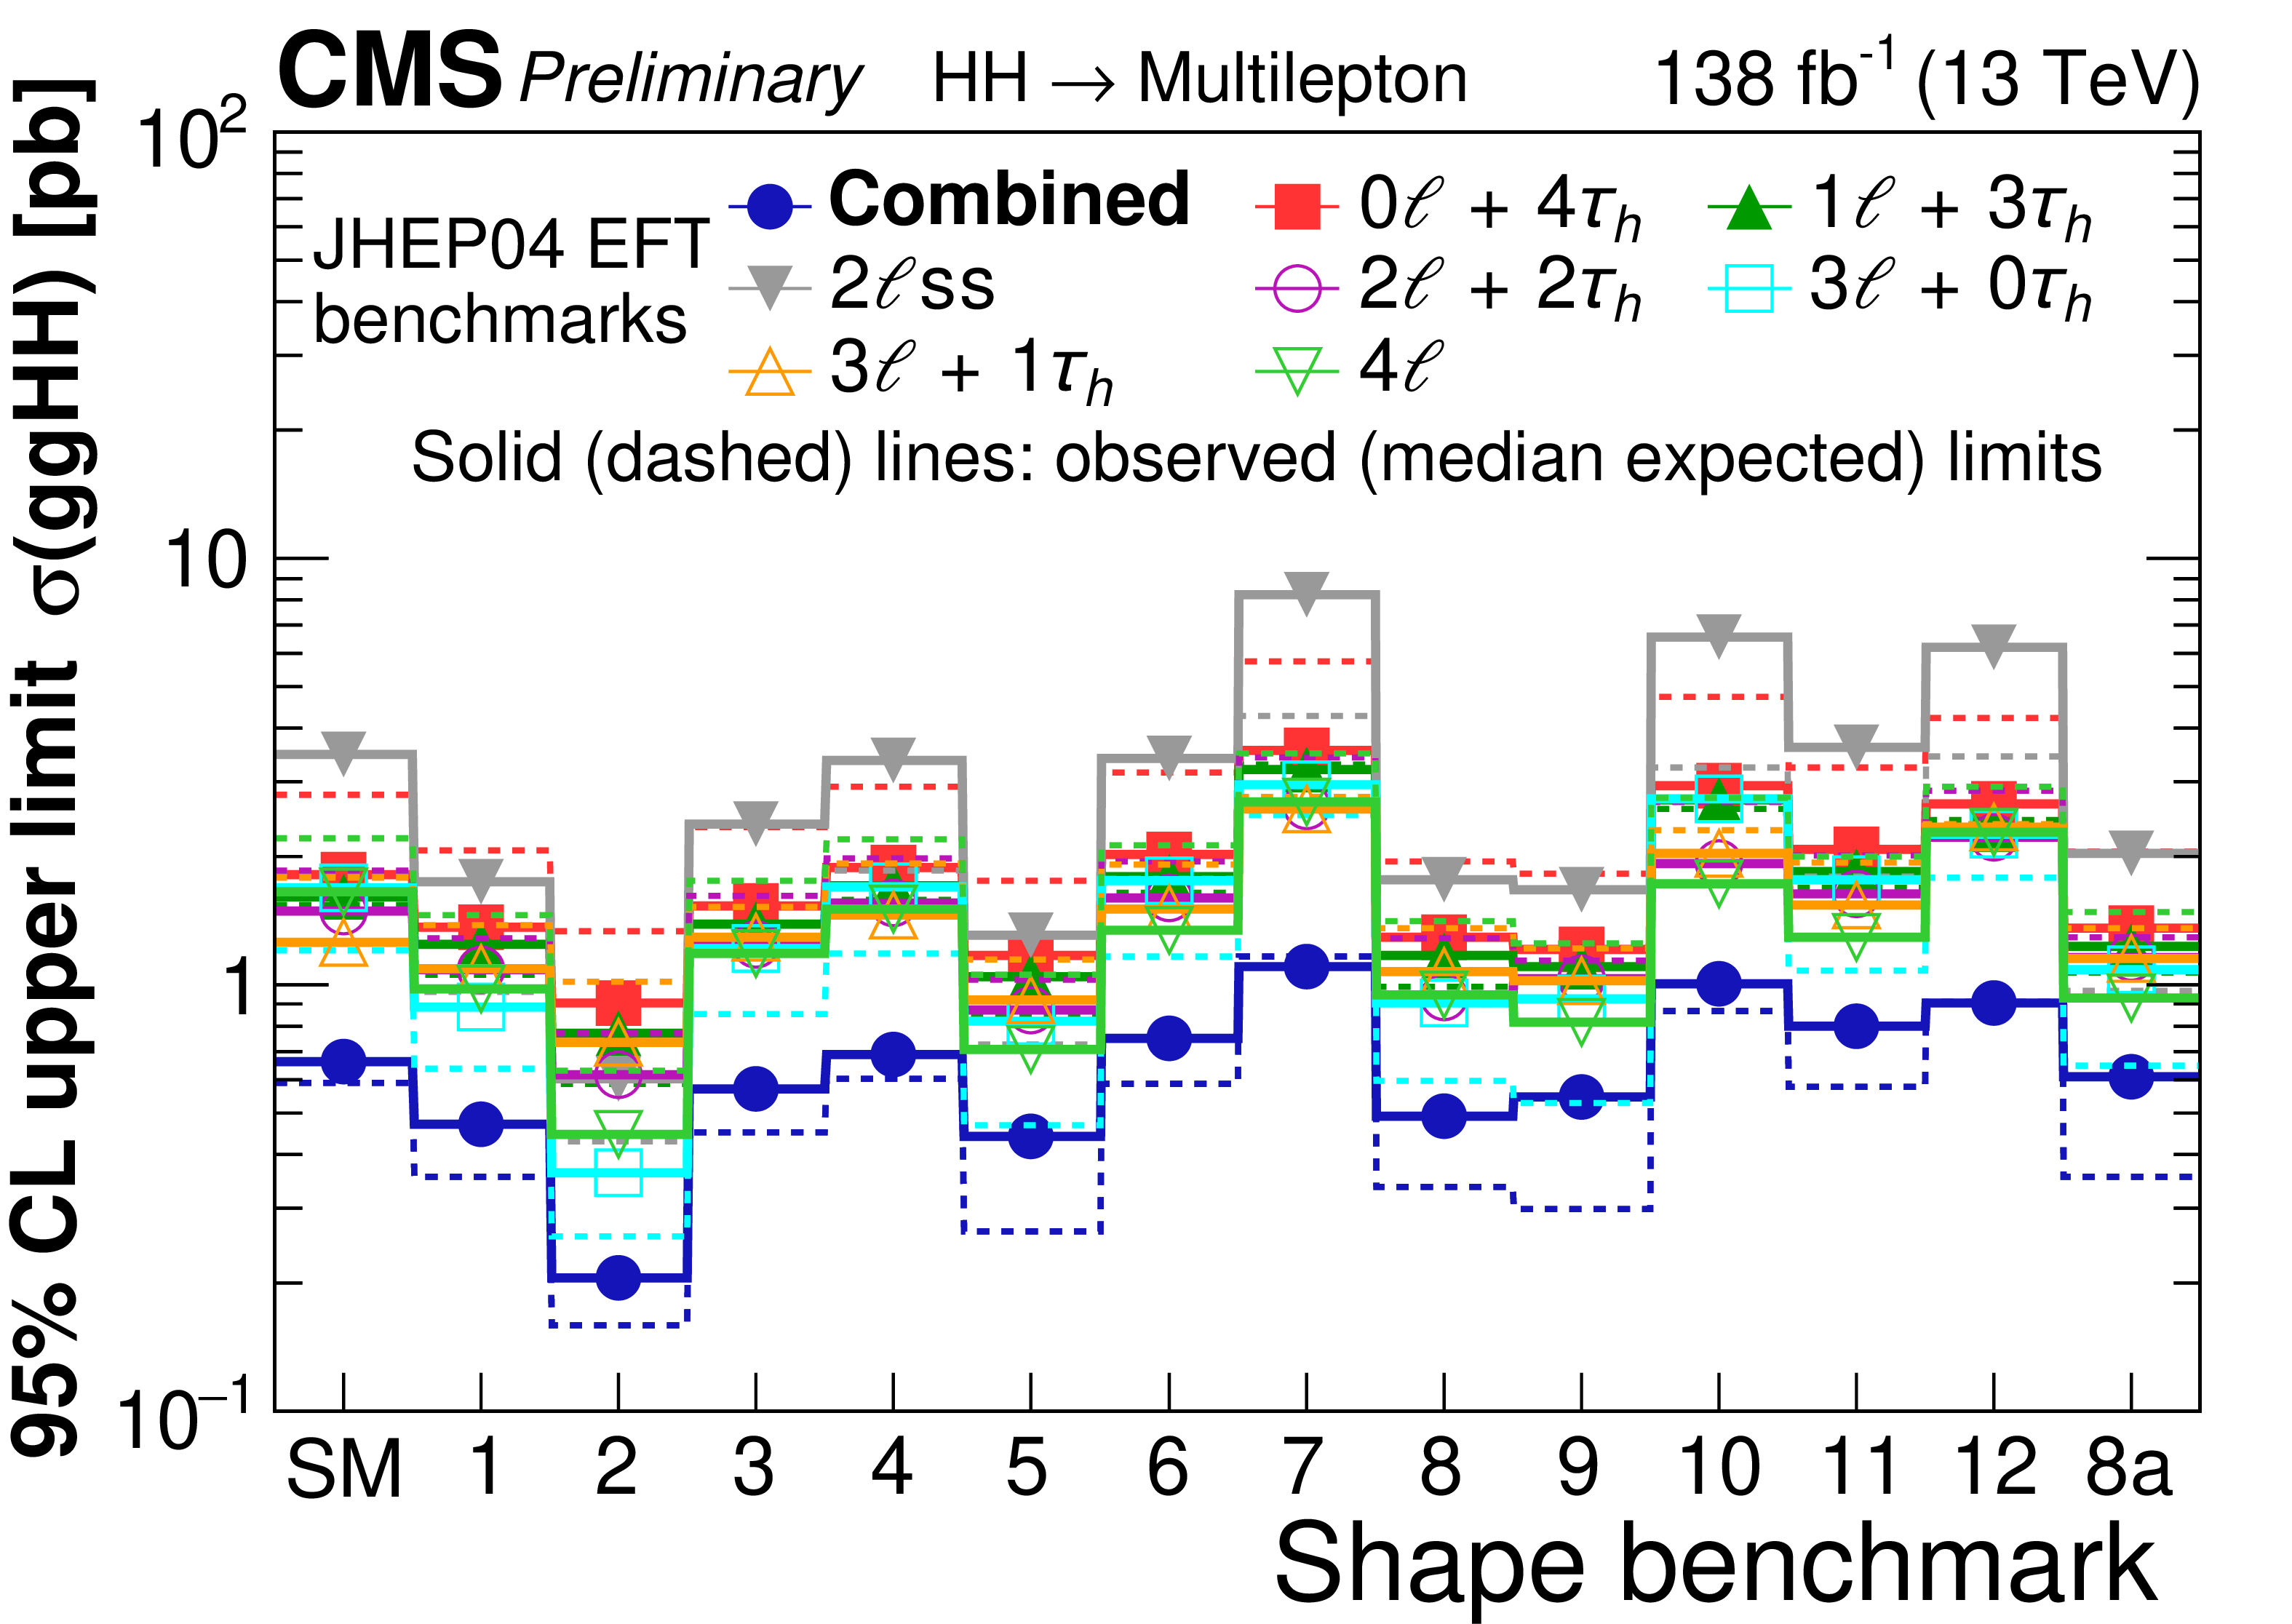
Figure 9:
Observed and expected 95% CL upper limits on the HH production cross section for twelve benchmark scenarios from Ref. [24], the additional benchmark scenario 8a from Ref. [62], and for the SM. The plot on the left shows the result obtained by combining all seven search categories, while the plot on the right shows the limits obtained for each search category separately. |
png pdf |
Figure 9-a:
Observed and expected 95% CL upper limits on the HH production cross section for twelve benchmark scenarios from Ref. [24], the additional benchmark scenario 8a from Ref. [62], and for the SM. The plot on the left shows the result obtained by combining all seven search categories, while the plot on the right shows the limits obtained for each search category separately. |
png pdf |
Figure 9-b:
Observed and expected 95% CL upper limits on the HH production cross section for twelve benchmark scenarios from Ref. [24], the additional benchmark scenario 8a from Ref. [62], and for the SM. The plot on the left shows the result obtained by combining all seven search categories, while the plot on the right shows the limits obtained for each search category separately. |
png pdf |
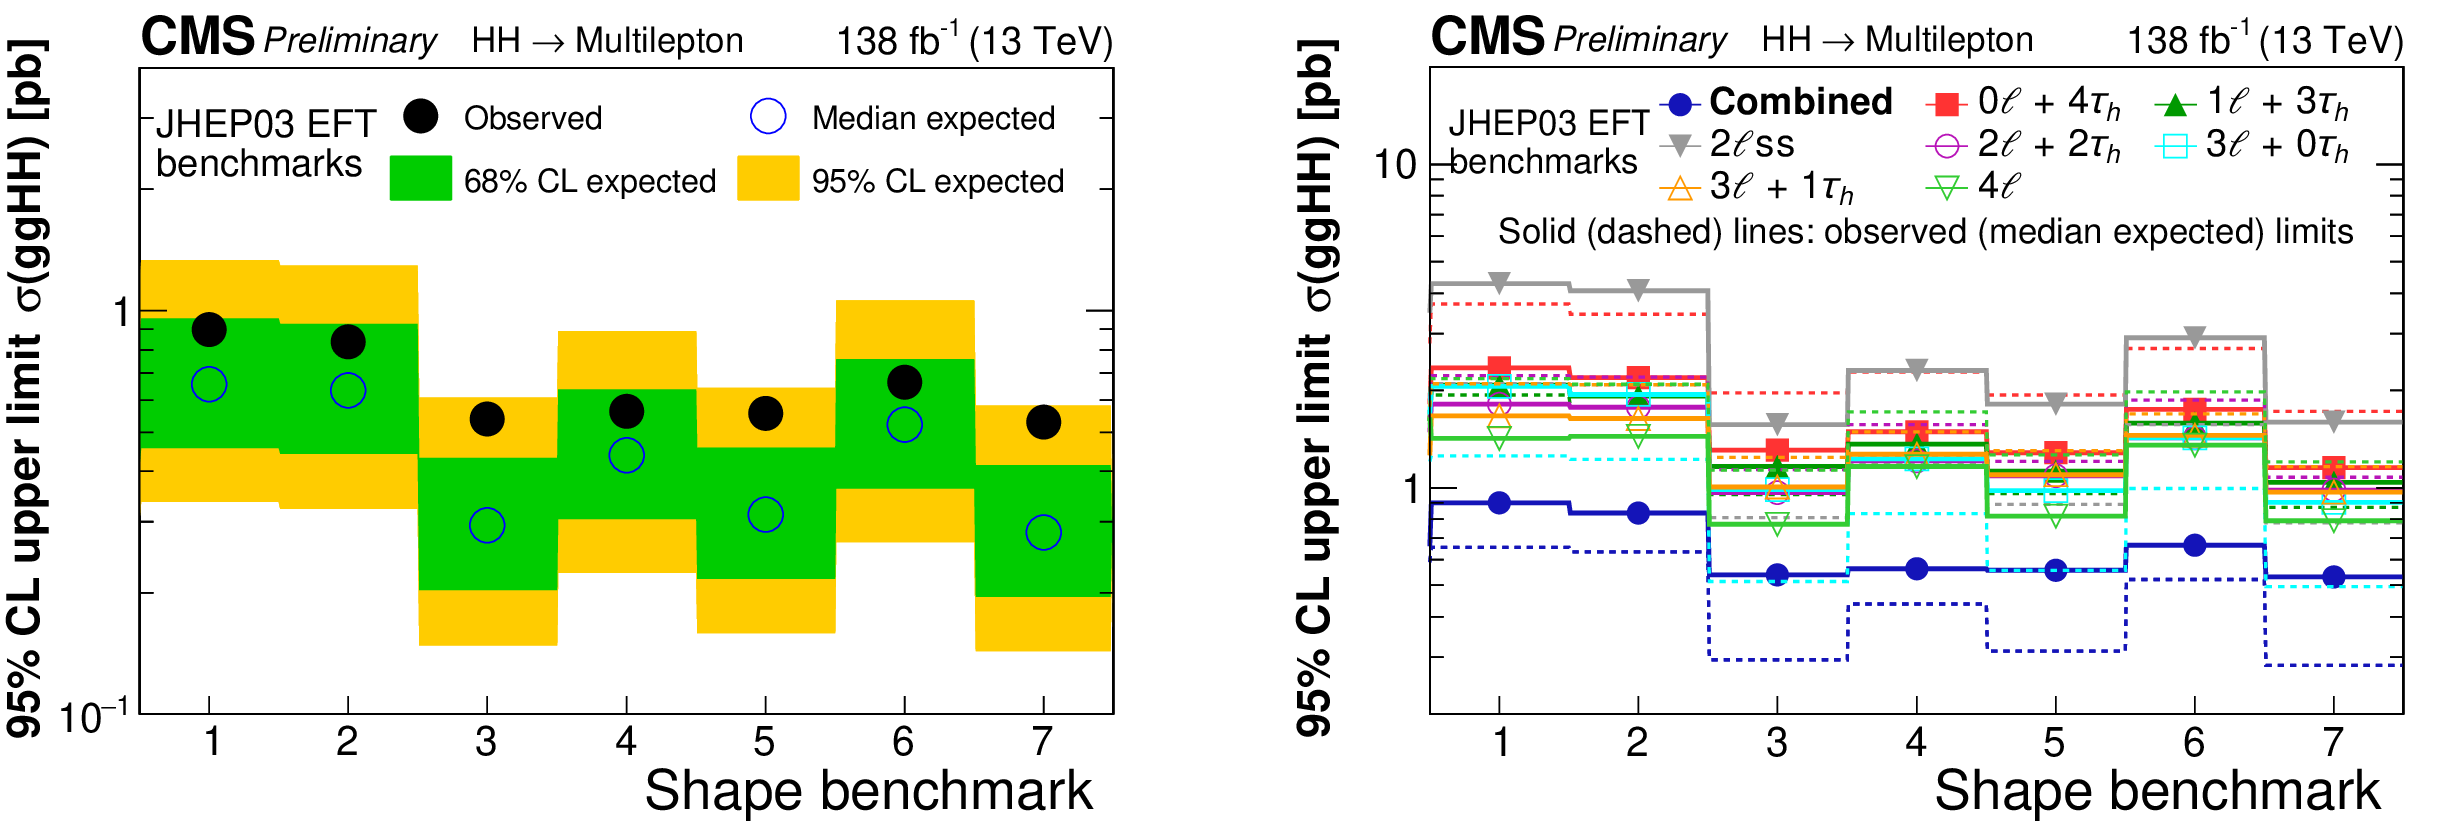
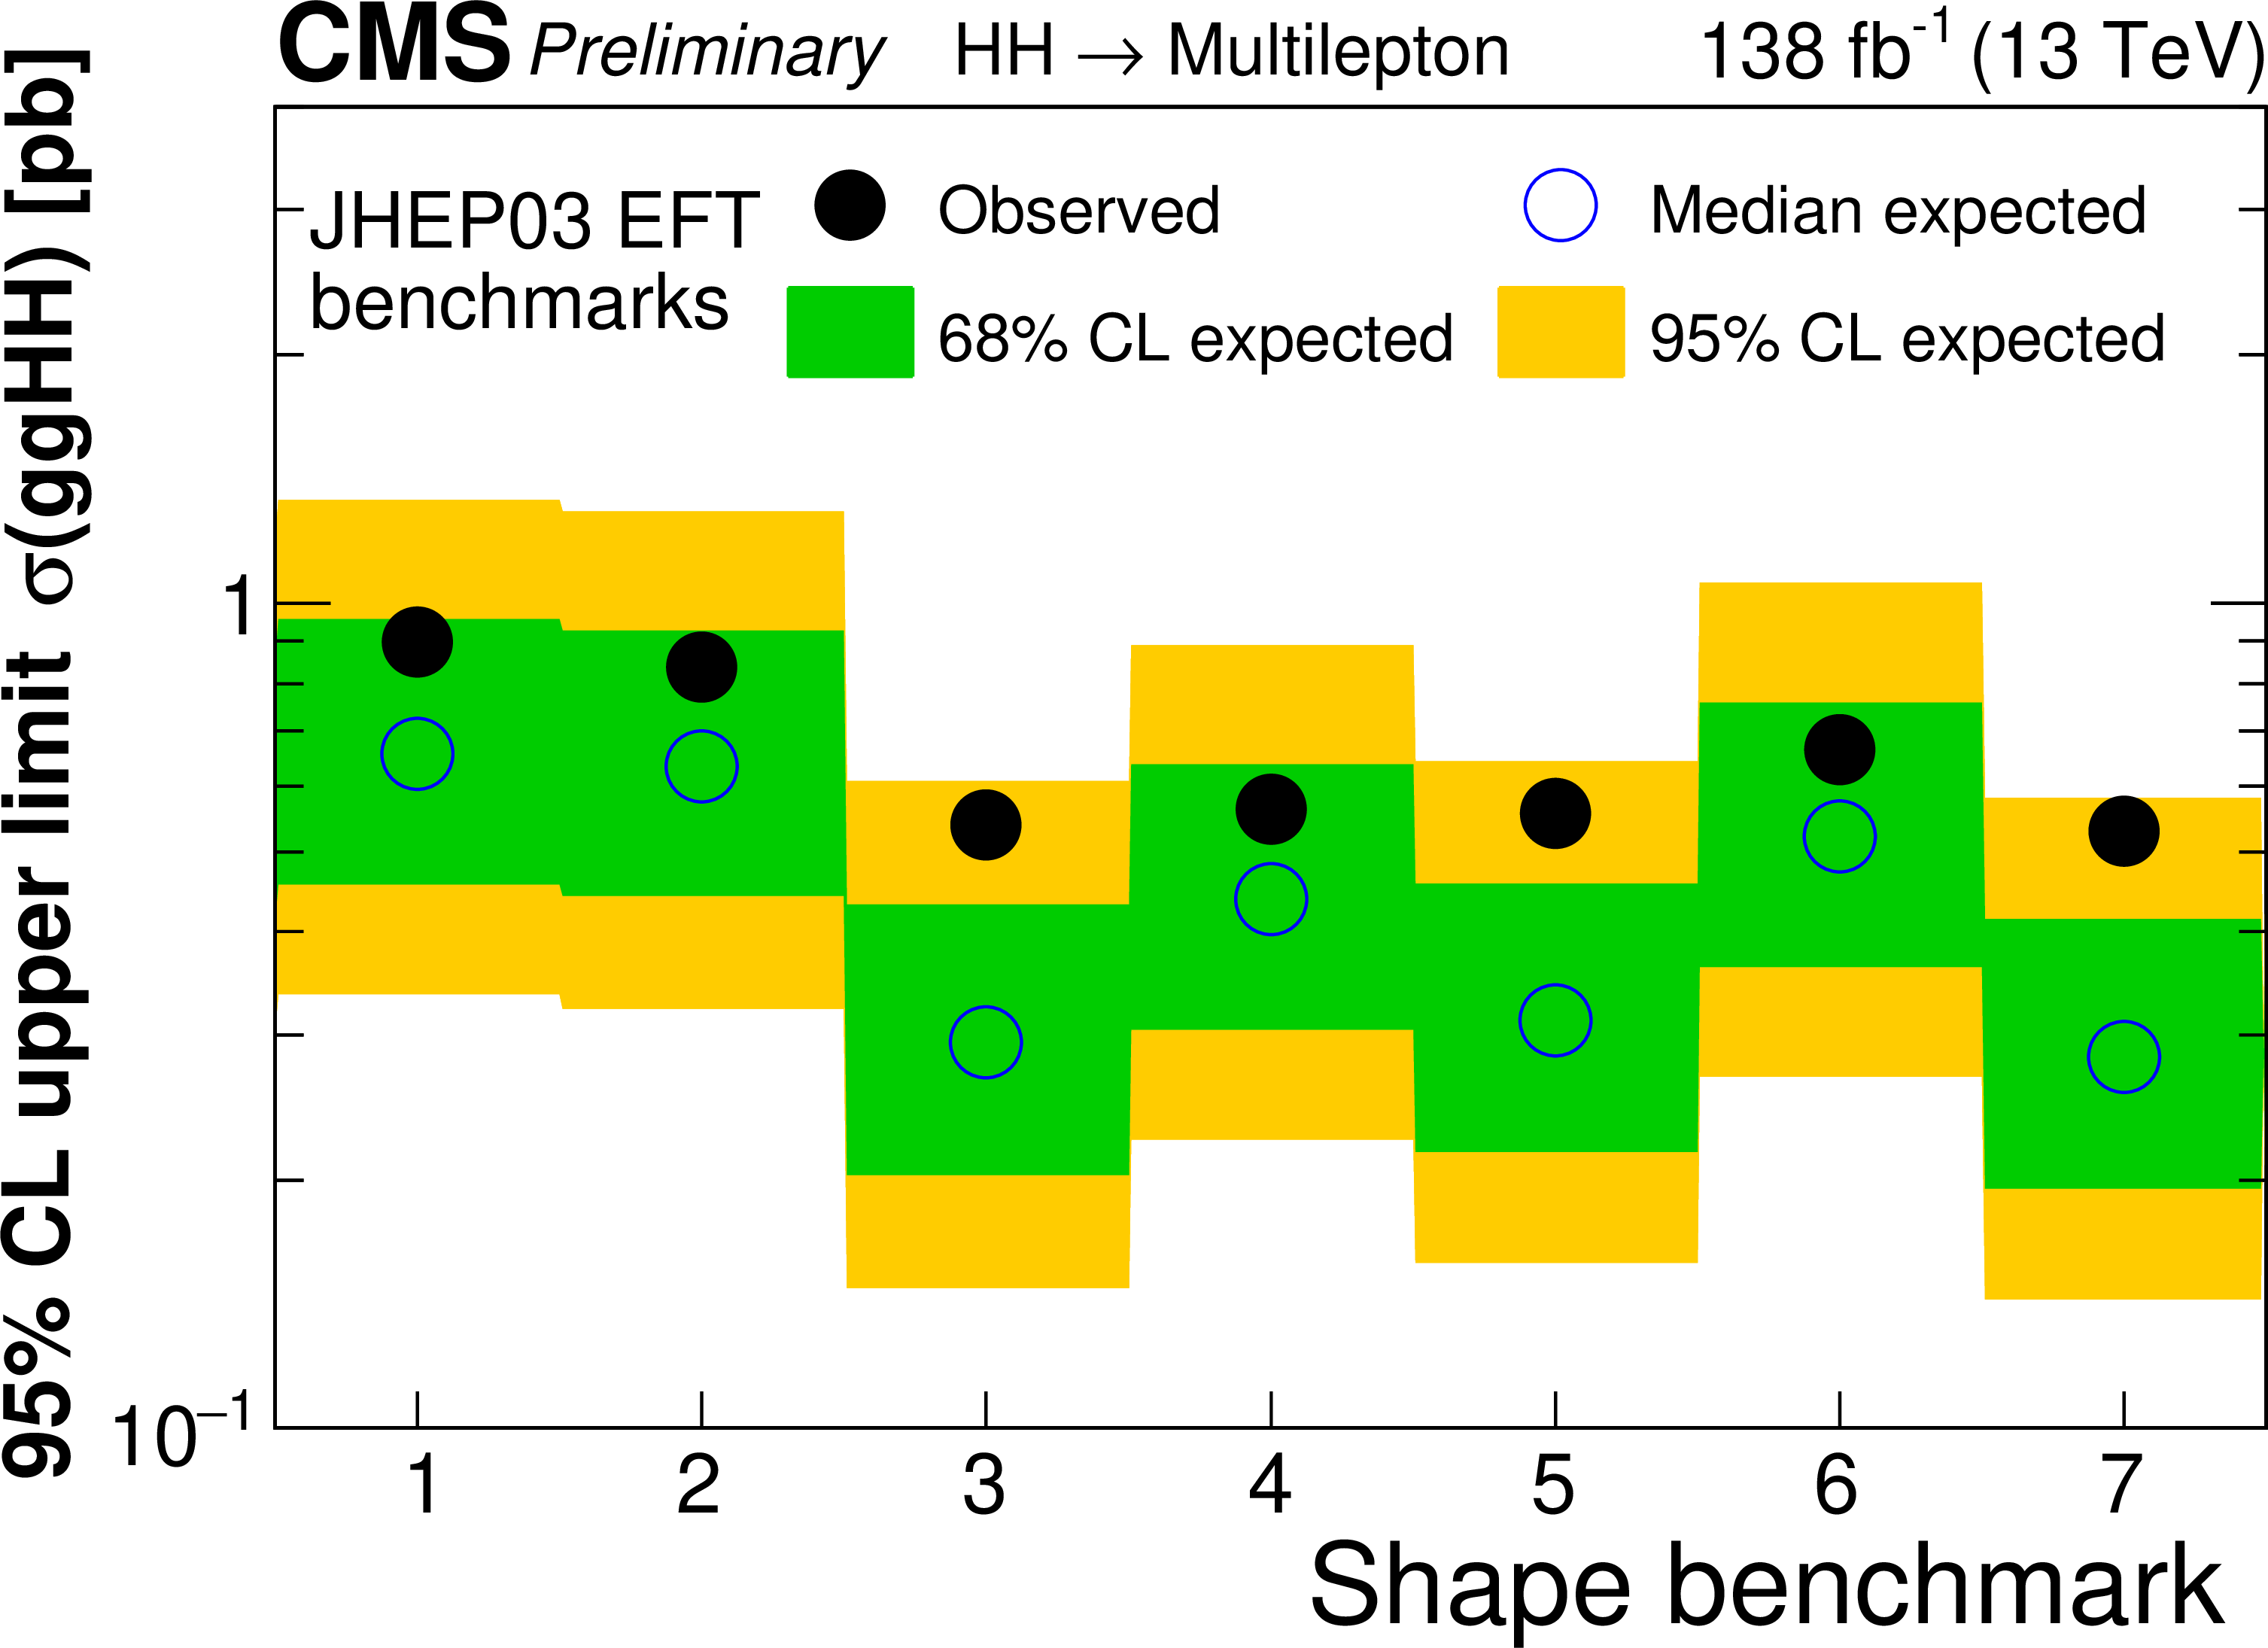
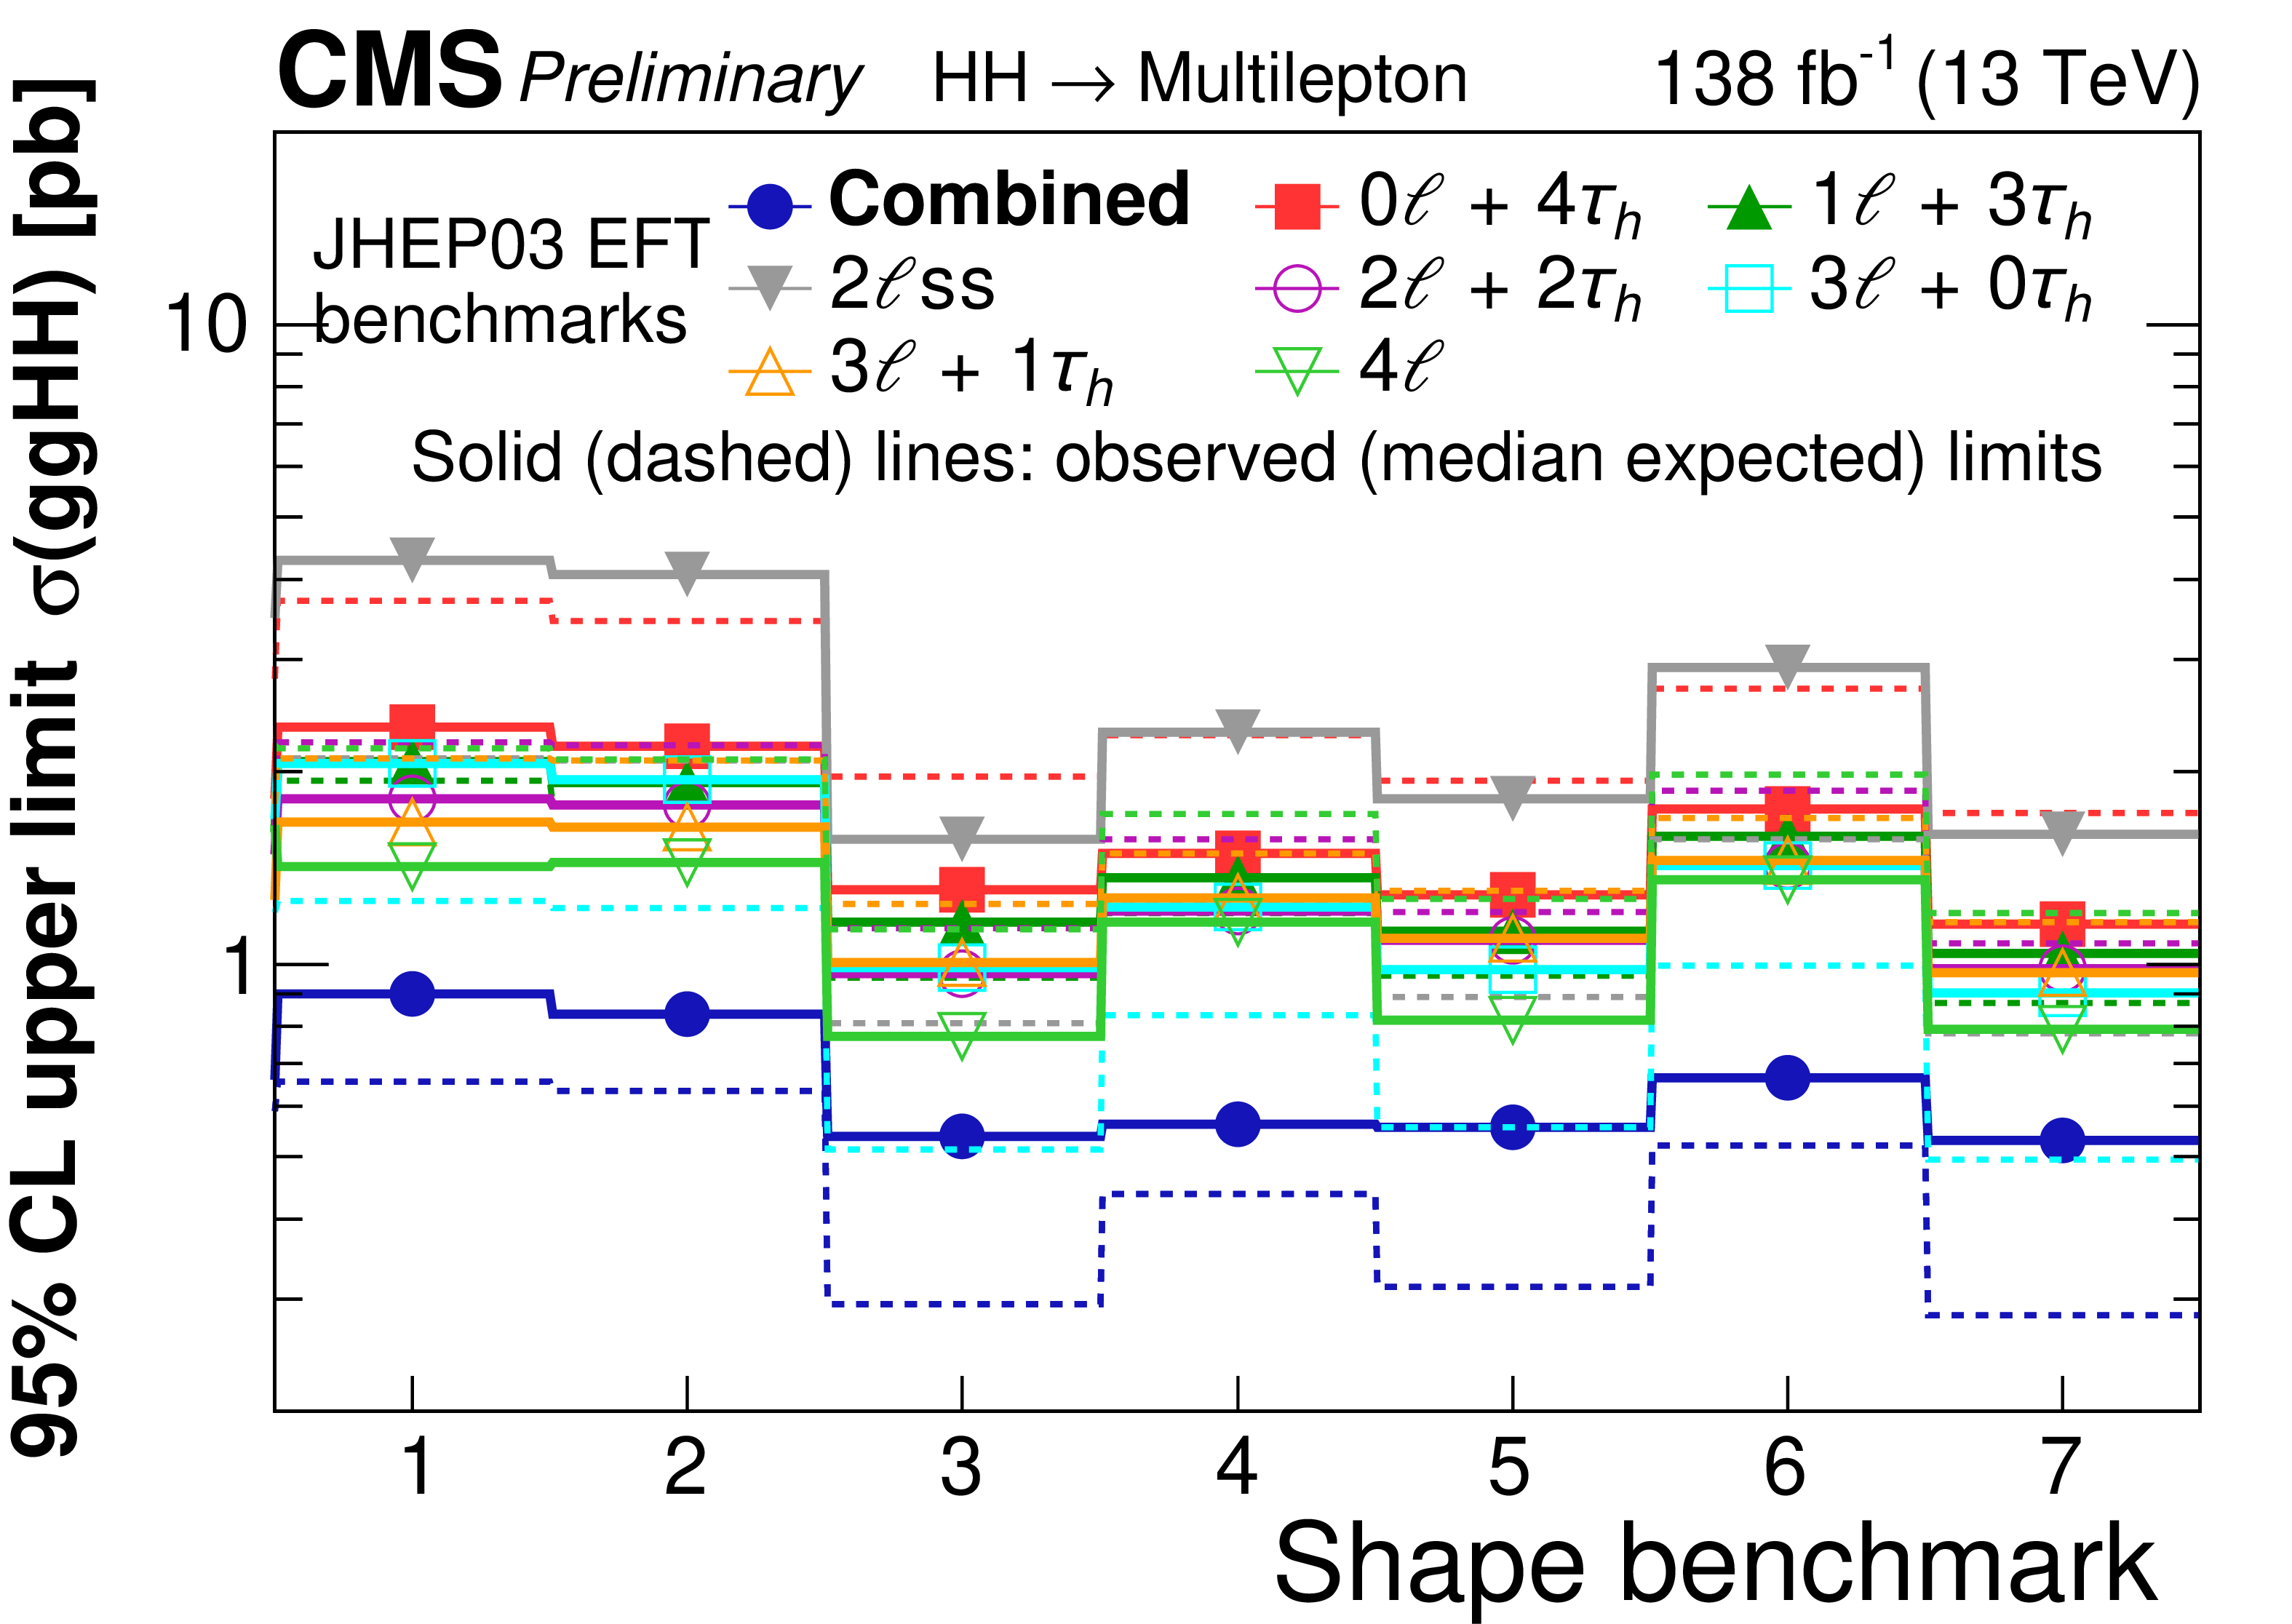
Figure 10:
Observed and expected 95% CL upper limits on the HH production cross section for seven benchmark scenarios from Ref. [61]. The plot on the left shows the result obtained by combining all seven search categories, while the plot on the right shows the limits obtained for each search category separately. |
png pdf |
Figure 10-a:
Observed and expected 95% CL upper limits on the HH production cross section for seven benchmark scenarios from Ref. [61]. The plot on the left shows the result obtained by combining all seven search categories, while the plot on the right shows the limits obtained for each search category separately. |
png pdf |
Figure 10-b:
Observed and expected 95% CL upper limits on the HH production cross section for seven benchmark scenarios from Ref. [61]. The plot on the left shows the result obtained by combining all seven search categories, while the plot on the right shows the limits obtained for each search category separately. |
png pdf |
Figure 11:
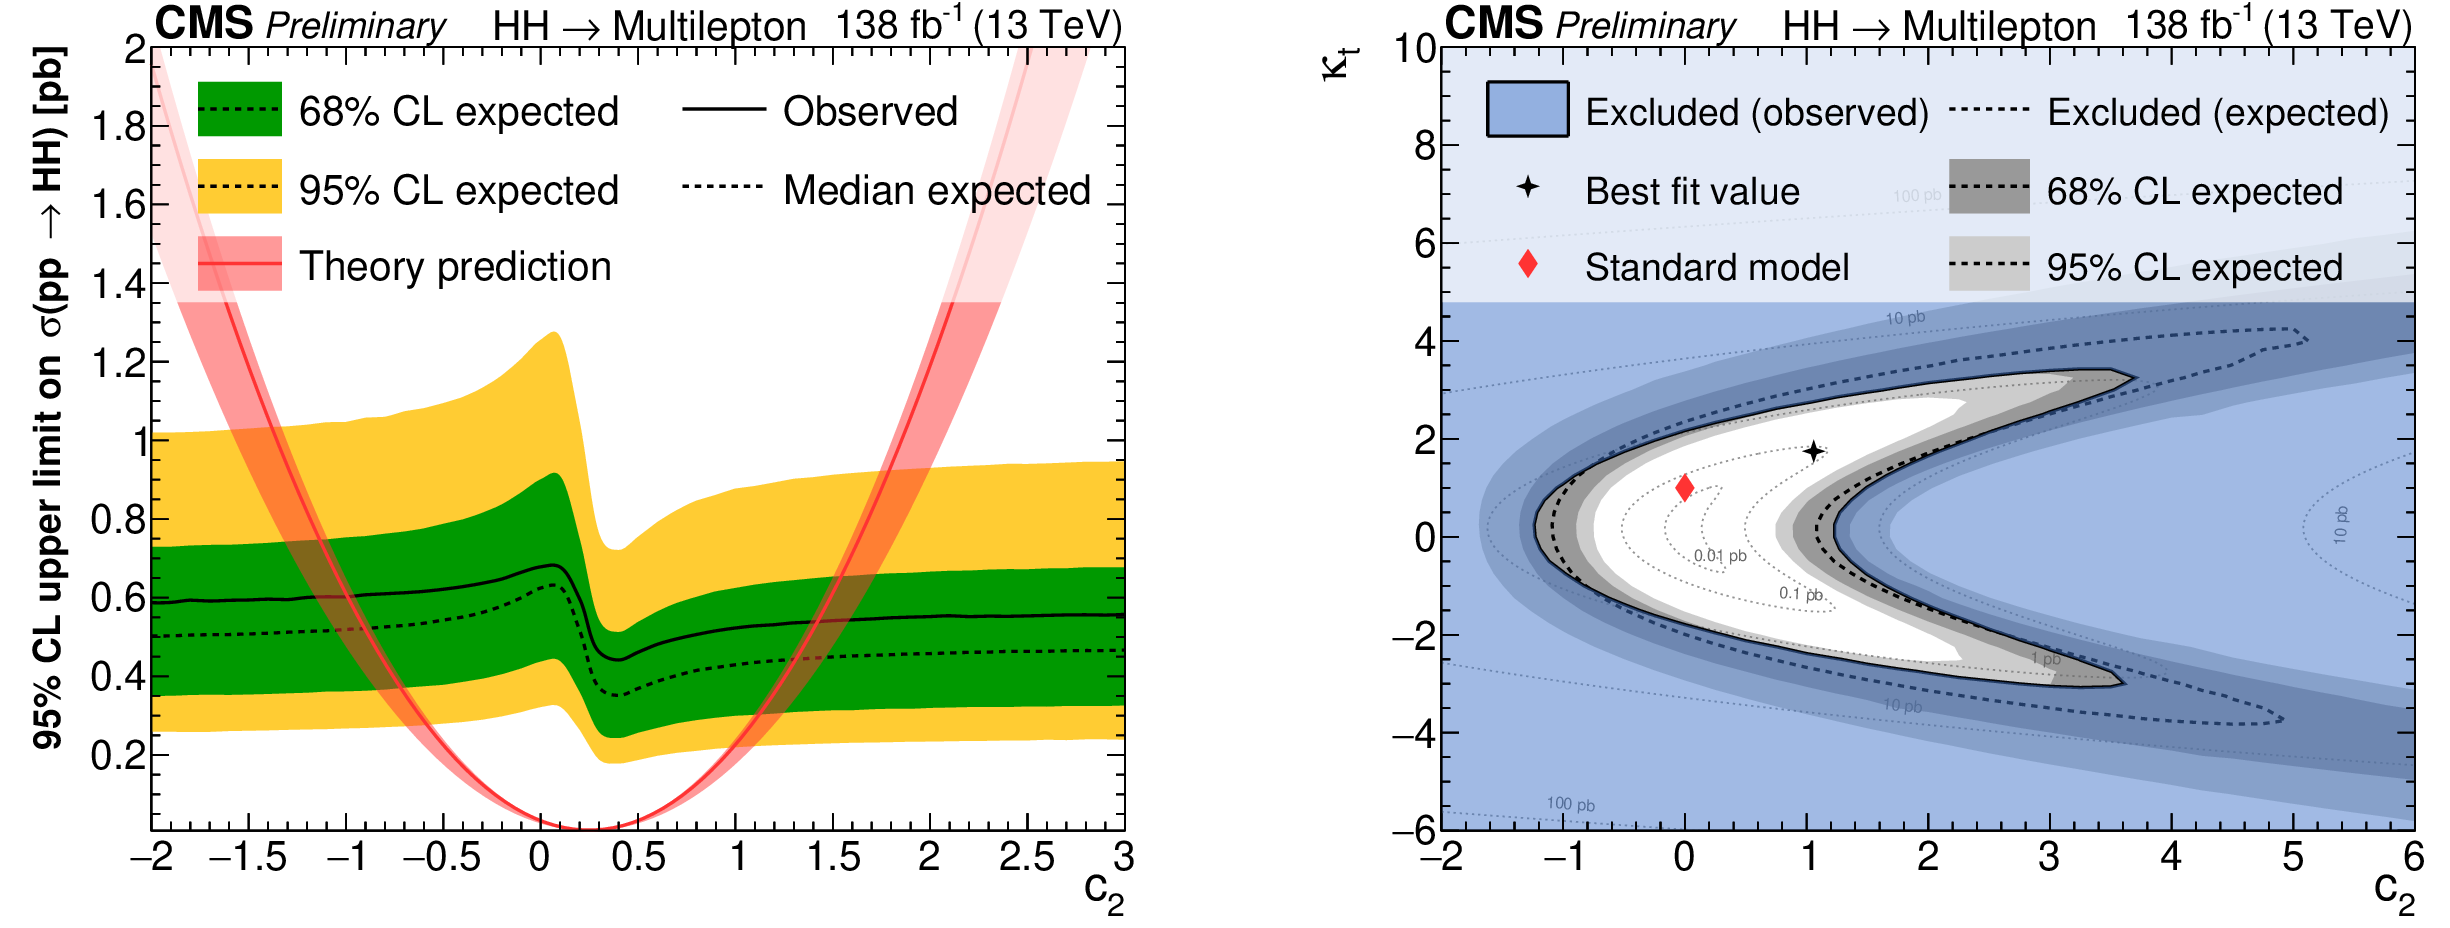
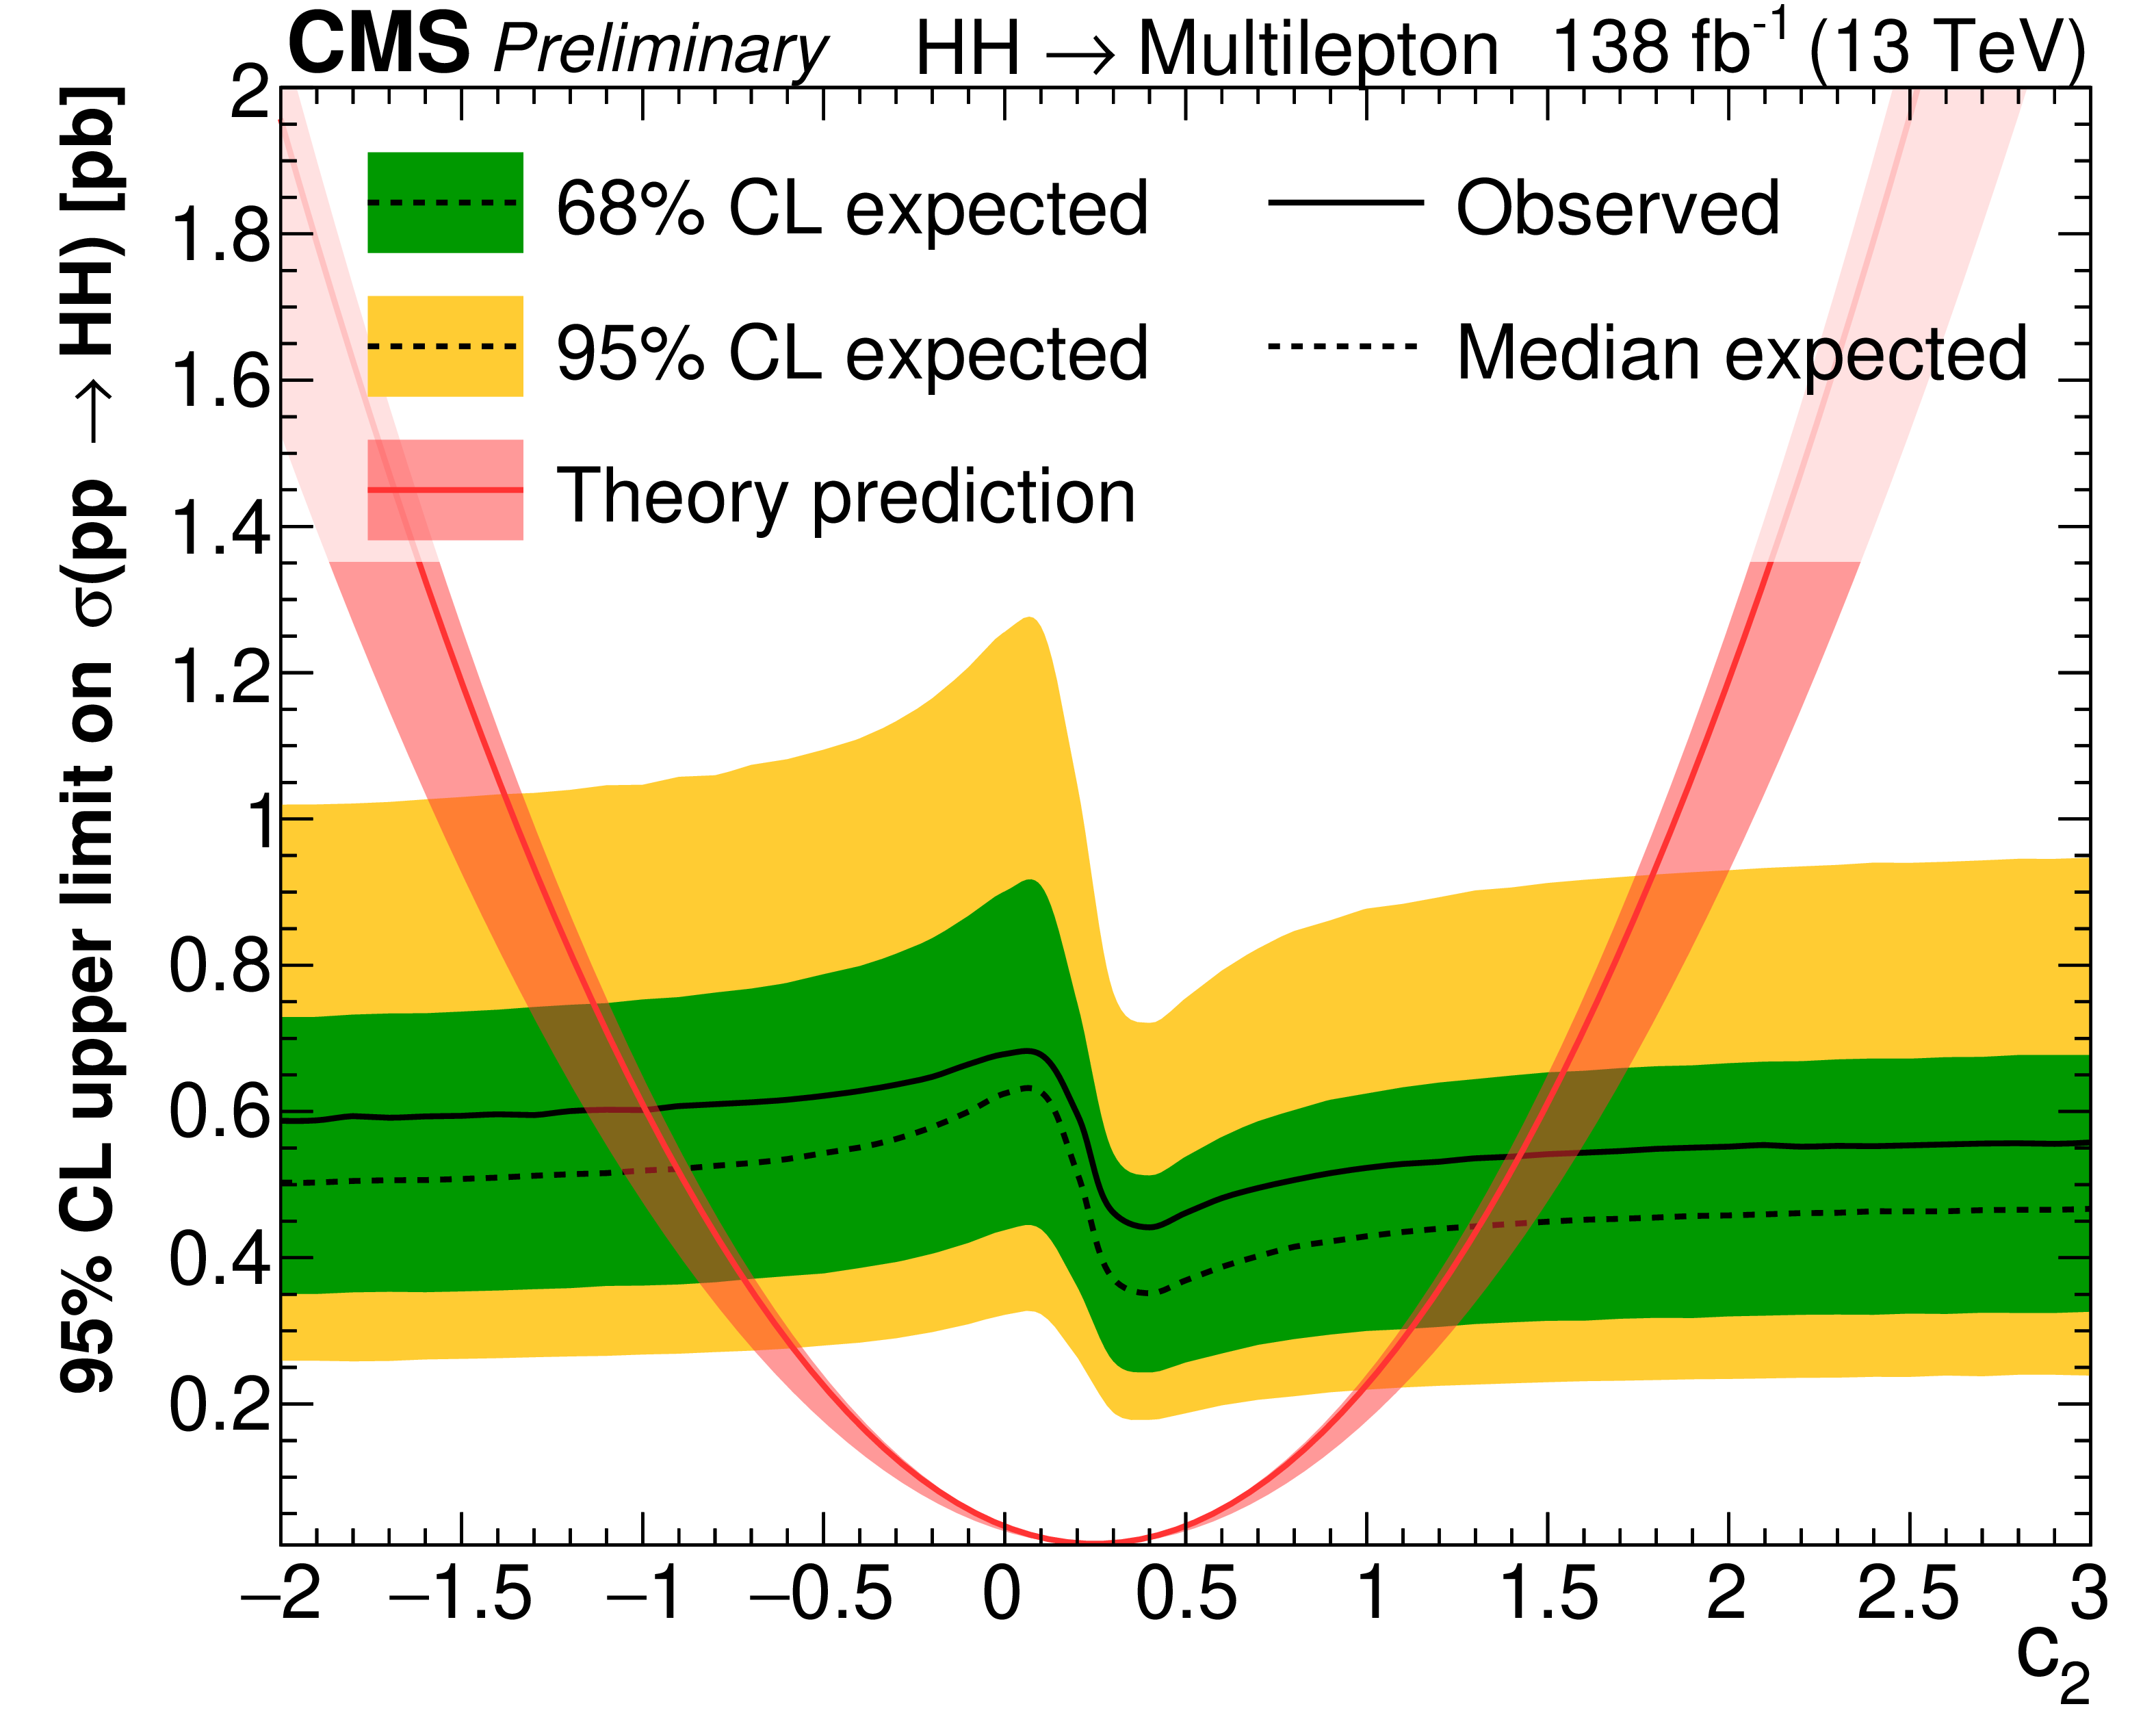
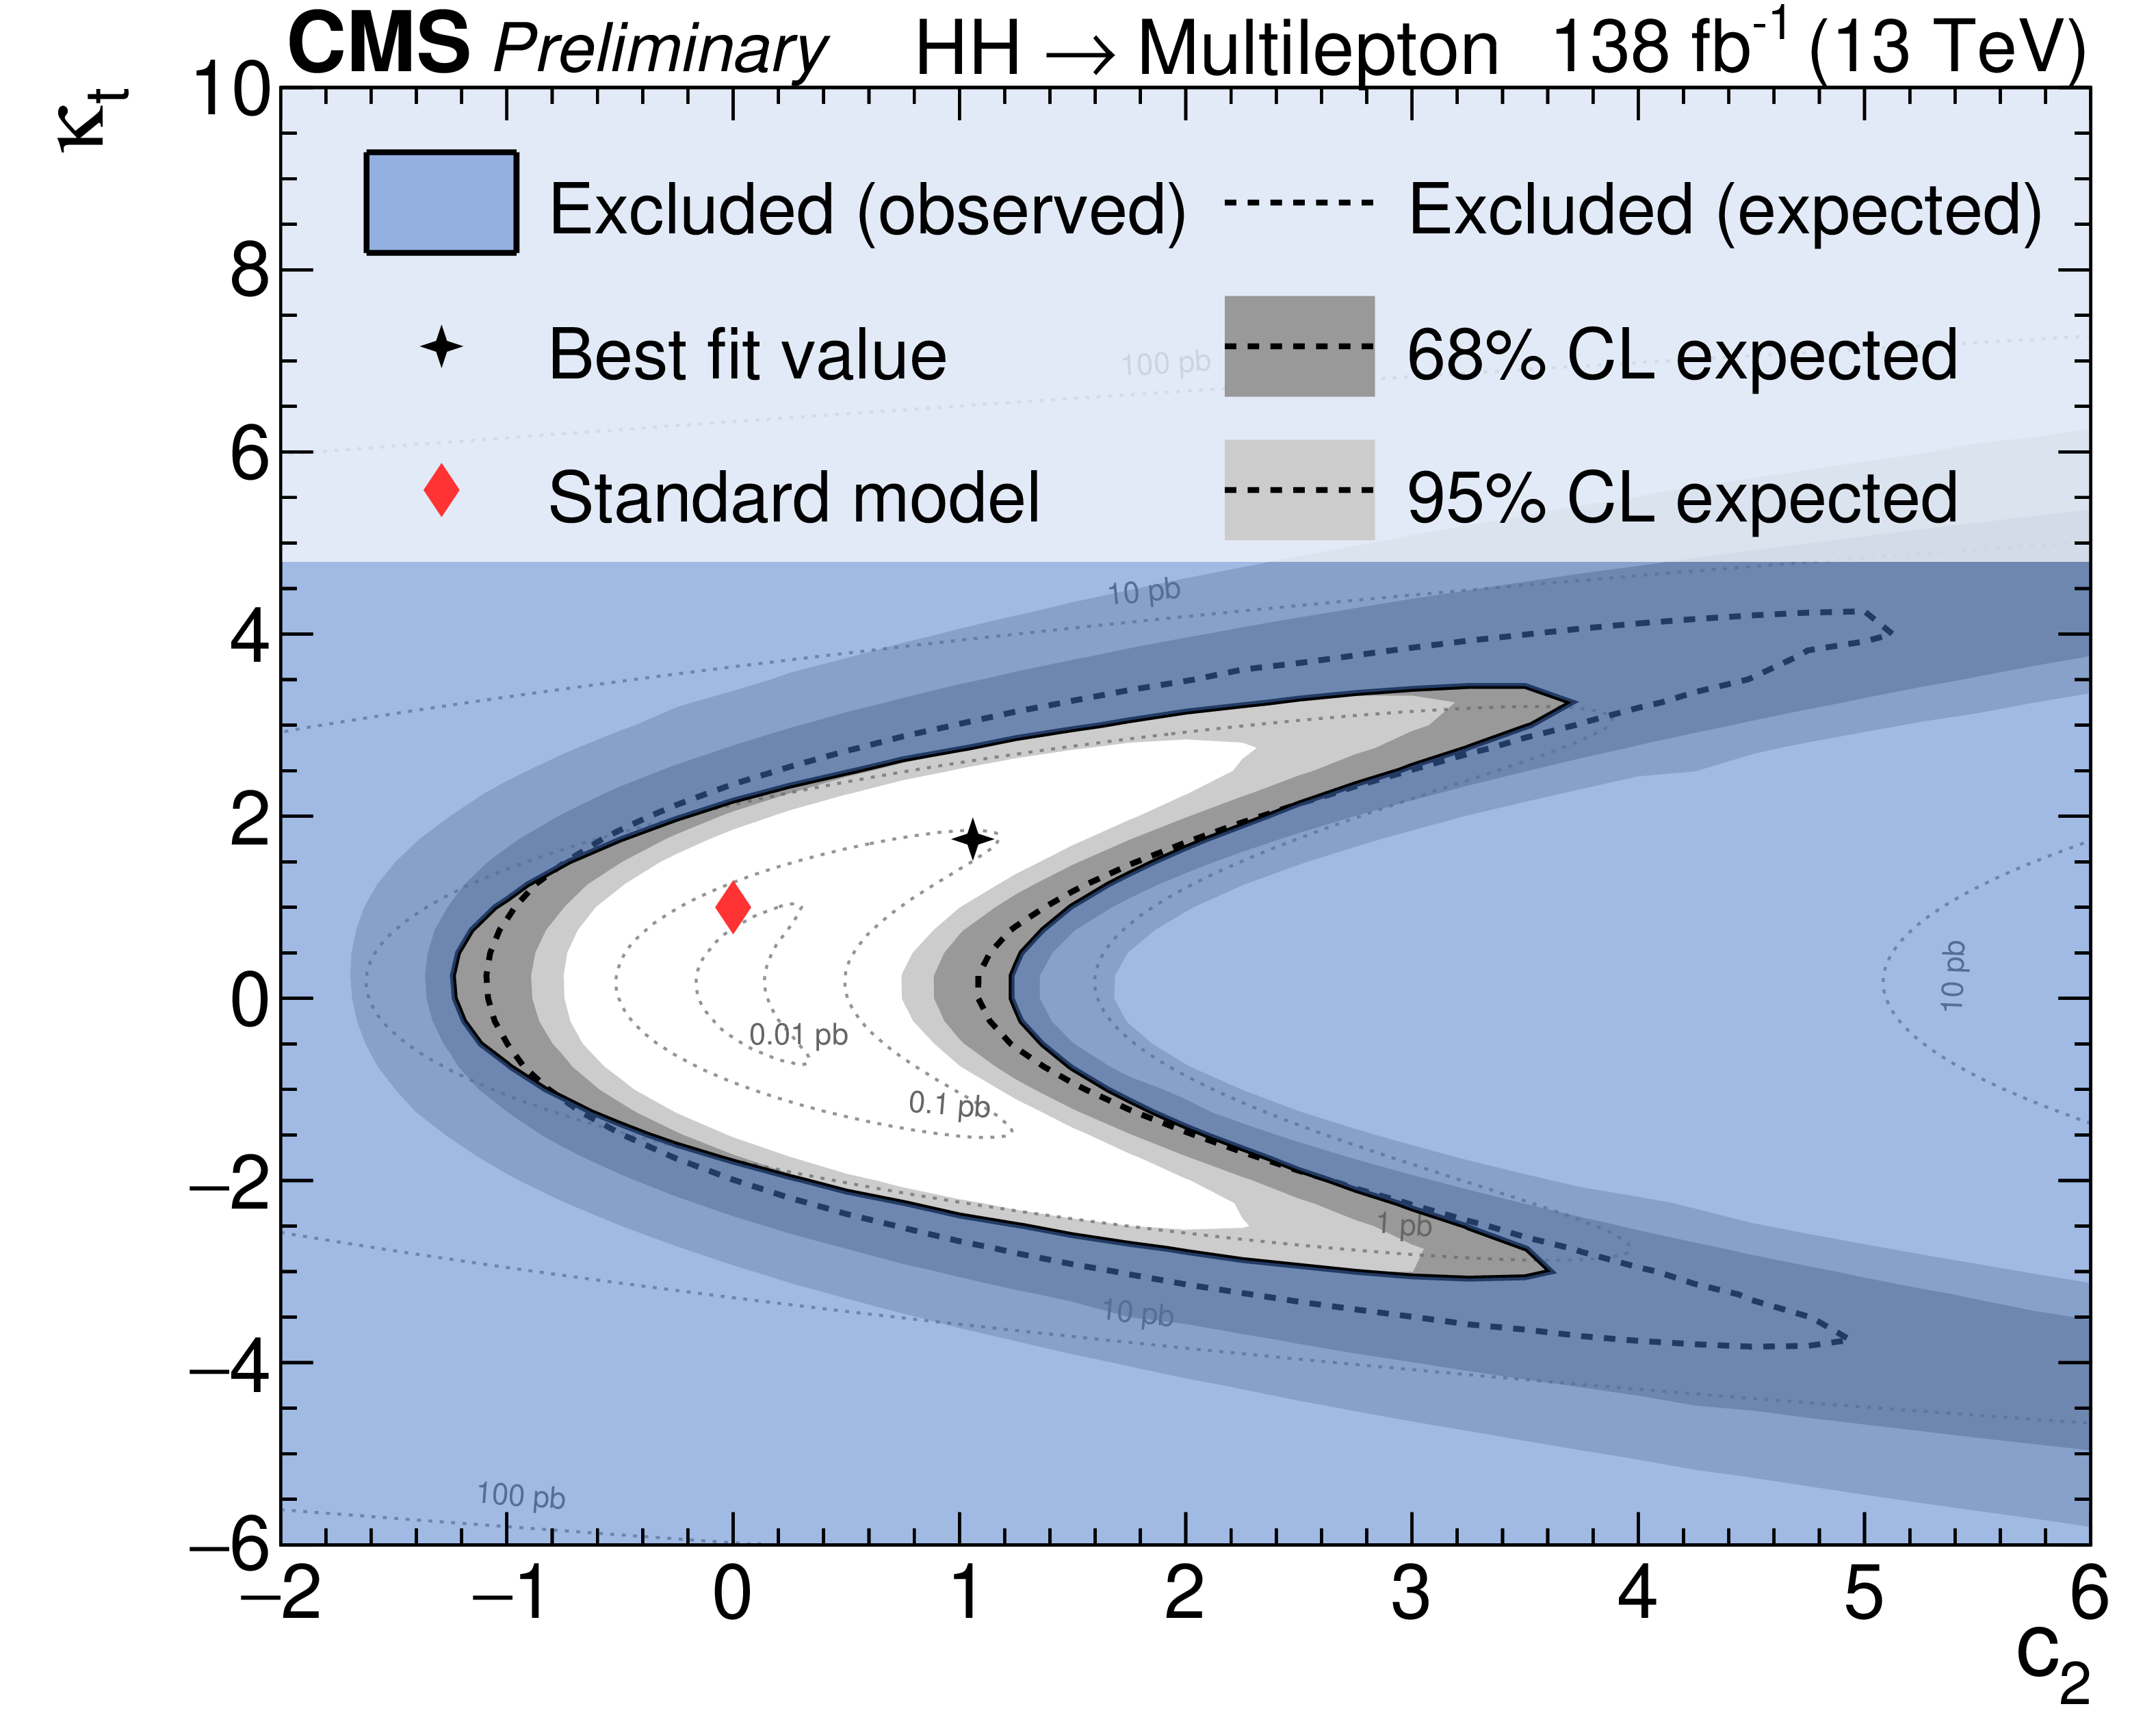
Observed and expected limits on the HH production cross section as function of the effective coupling $ {\text {c}_{2}} $ (left) and region excluded in the $ {\kappa _{{\mathrm{t}}}} $-$ {\text {c}_{2}} $ plane (right). All limits are computed at 95% CL. Higgs boson couplings other than the ones shown in the plots ($ {\text {c}_{2}} $ in the left plot and $ {\text {c}_{2}} $ and $ {\kappa _{{\mathrm{t}}}} $ in the right plot) are assumed to have the values predicted by the SM. |
png pdf |
Figure 11-a:
Observed and expected limits on the HH production cross section as function of the effective coupling $ {\text {c}_{2}} $ (left) and region excluded in the $ {\kappa _{{\mathrm{t}}}} $-$ {\text {c}_{2}} $ plane (right). All limits are computed at 95% CL. Higgs boson couplings other than the ones shown in the plots ($ {\text {c}_{2}} $ in the left plot and $ {\text {c}_{2}} $ and $ {\kappa _{{\mathrm{t}}}} $ in the right plot) are assumed to have the values predicted by the SM. |
png pdf |
Figure 11-b:
Observed and expected limits on the HH production cross section as function of the effective coupling $ {\text {c}_{2}} $ (left) and region excluded in the $ {\kappa _{{\mathrm{t}}}} $-$ {\text {c}_{2}} $ plane (right). All limits are computed at 95% CL. Higgs boson couplings other than the ones shown in the plots ($ {\text {c}_{2}} $ in the left plot and $ {\text {c}_{2}} $ and $ {\kappa _{{\mathrm{t}}}} $ in the right plot) are assumed to have the values predicted by the SM. |
png pdf |
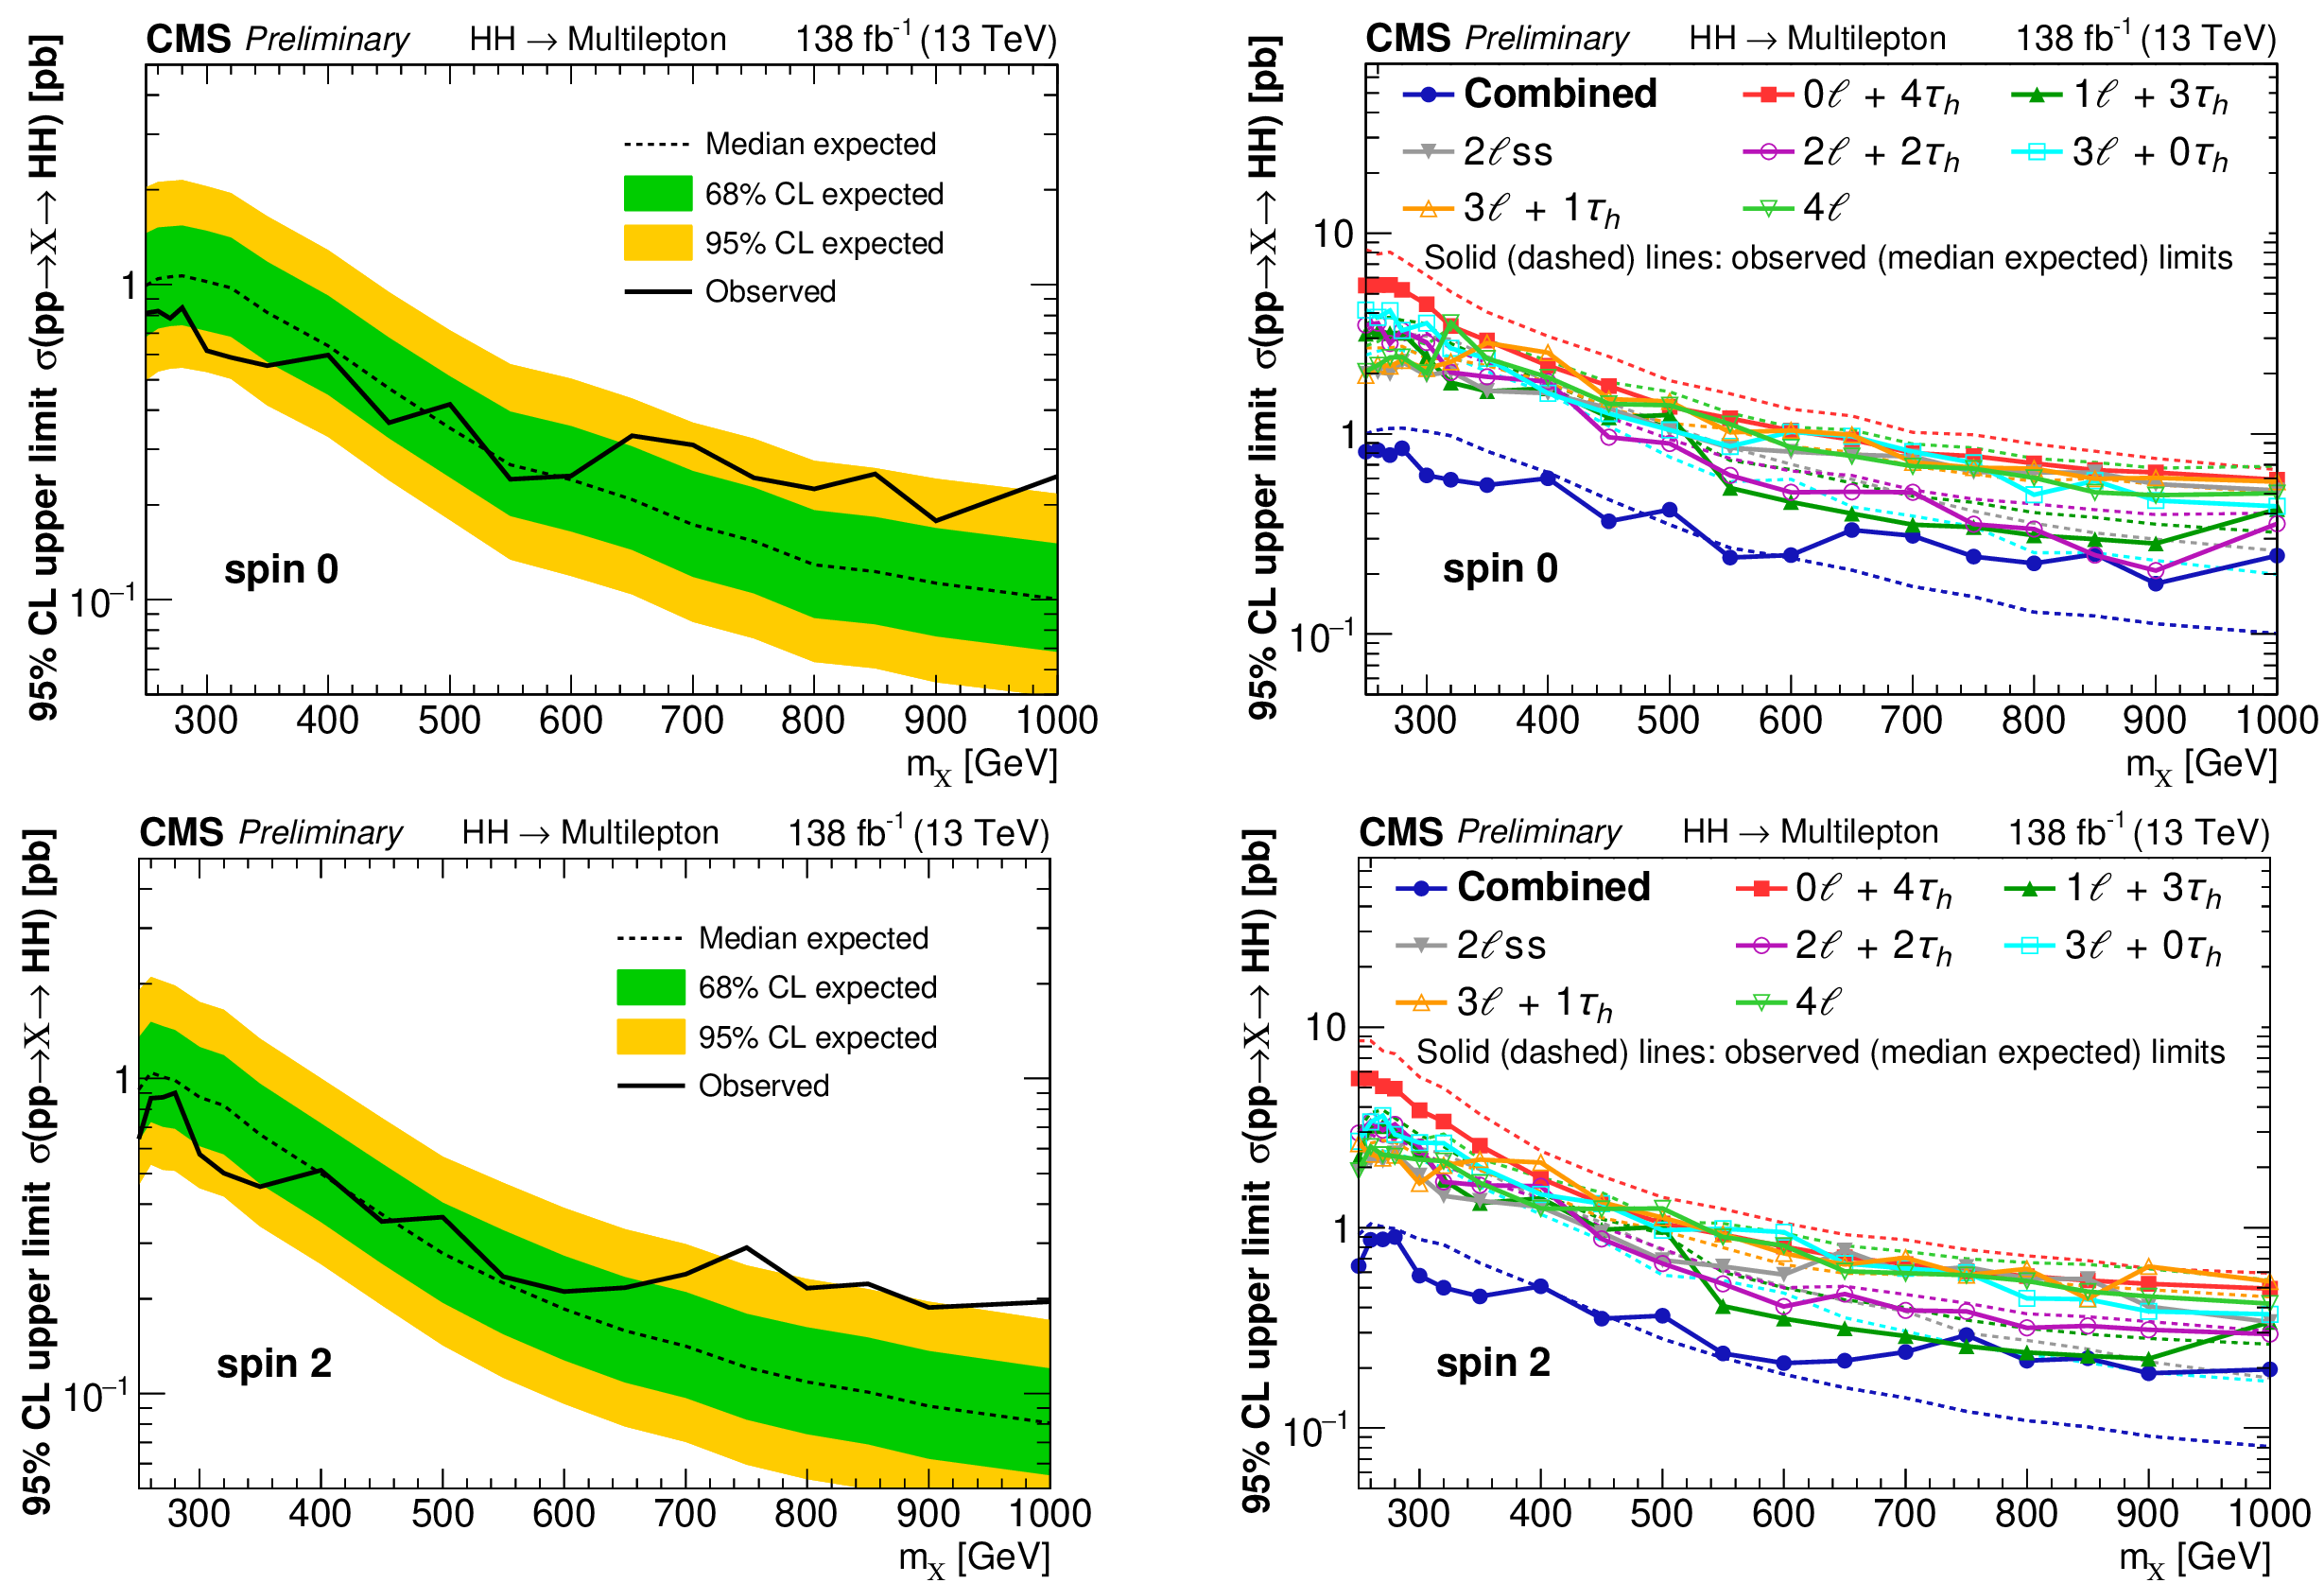
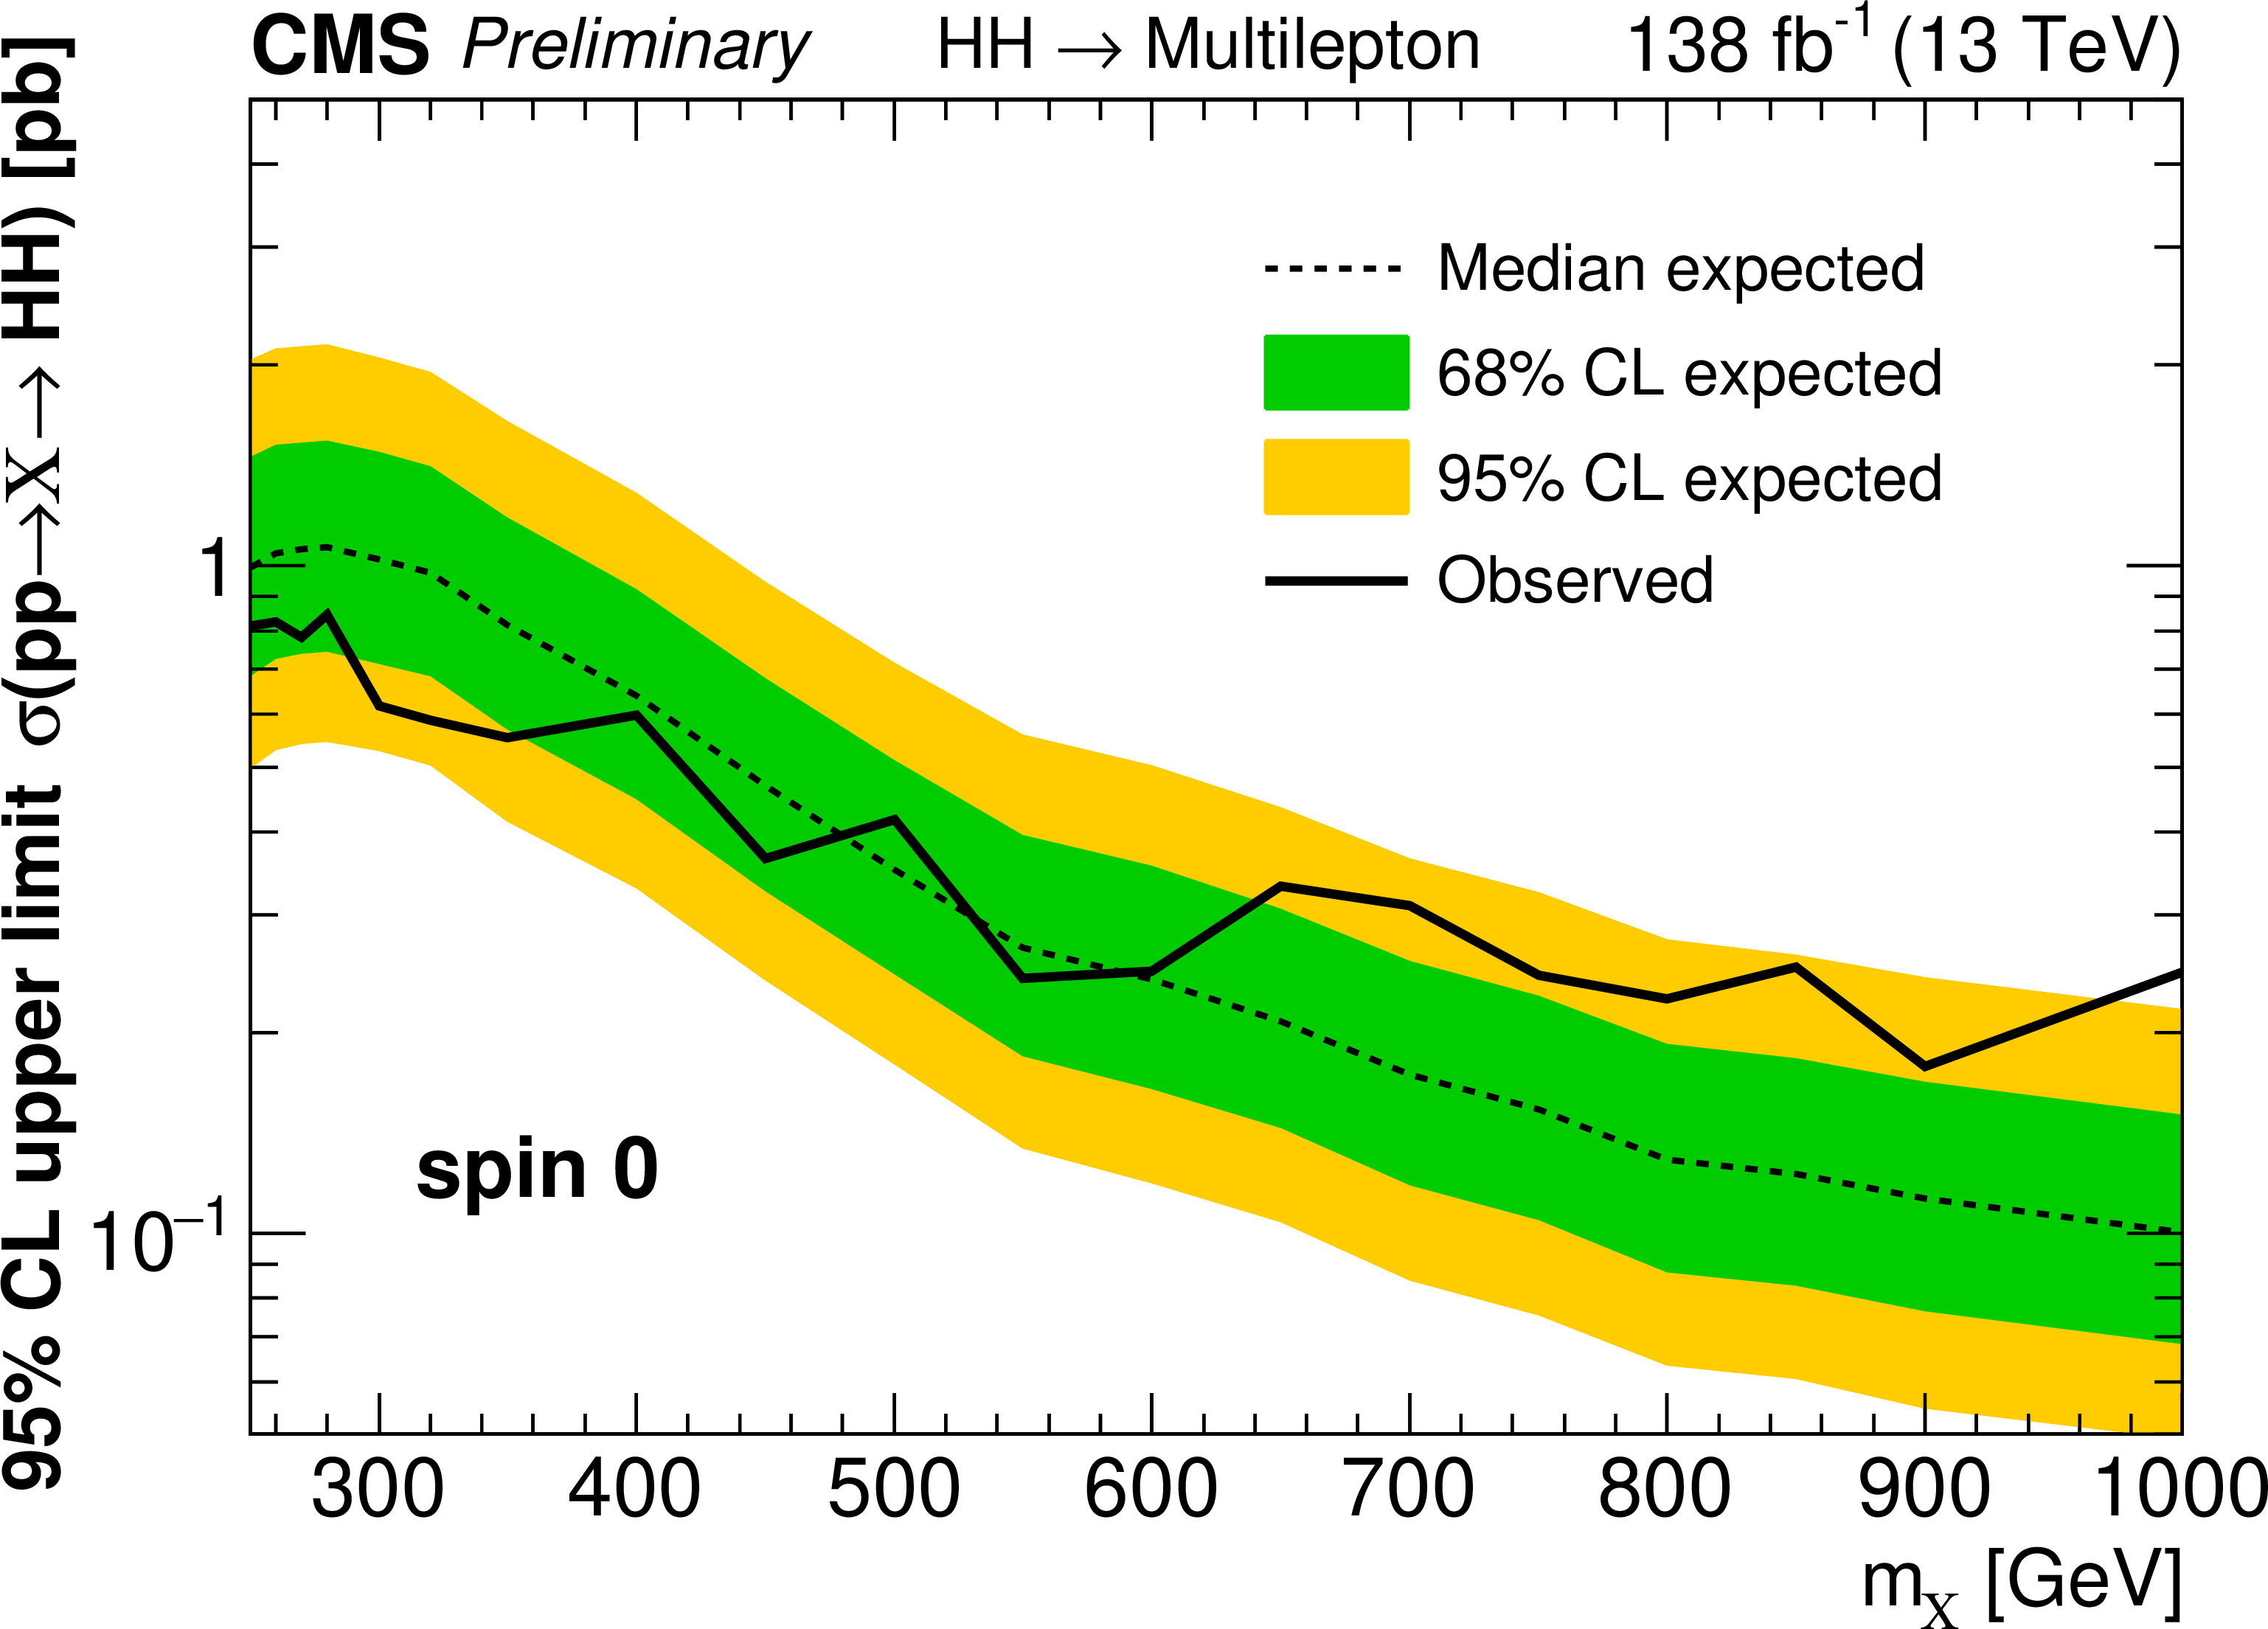
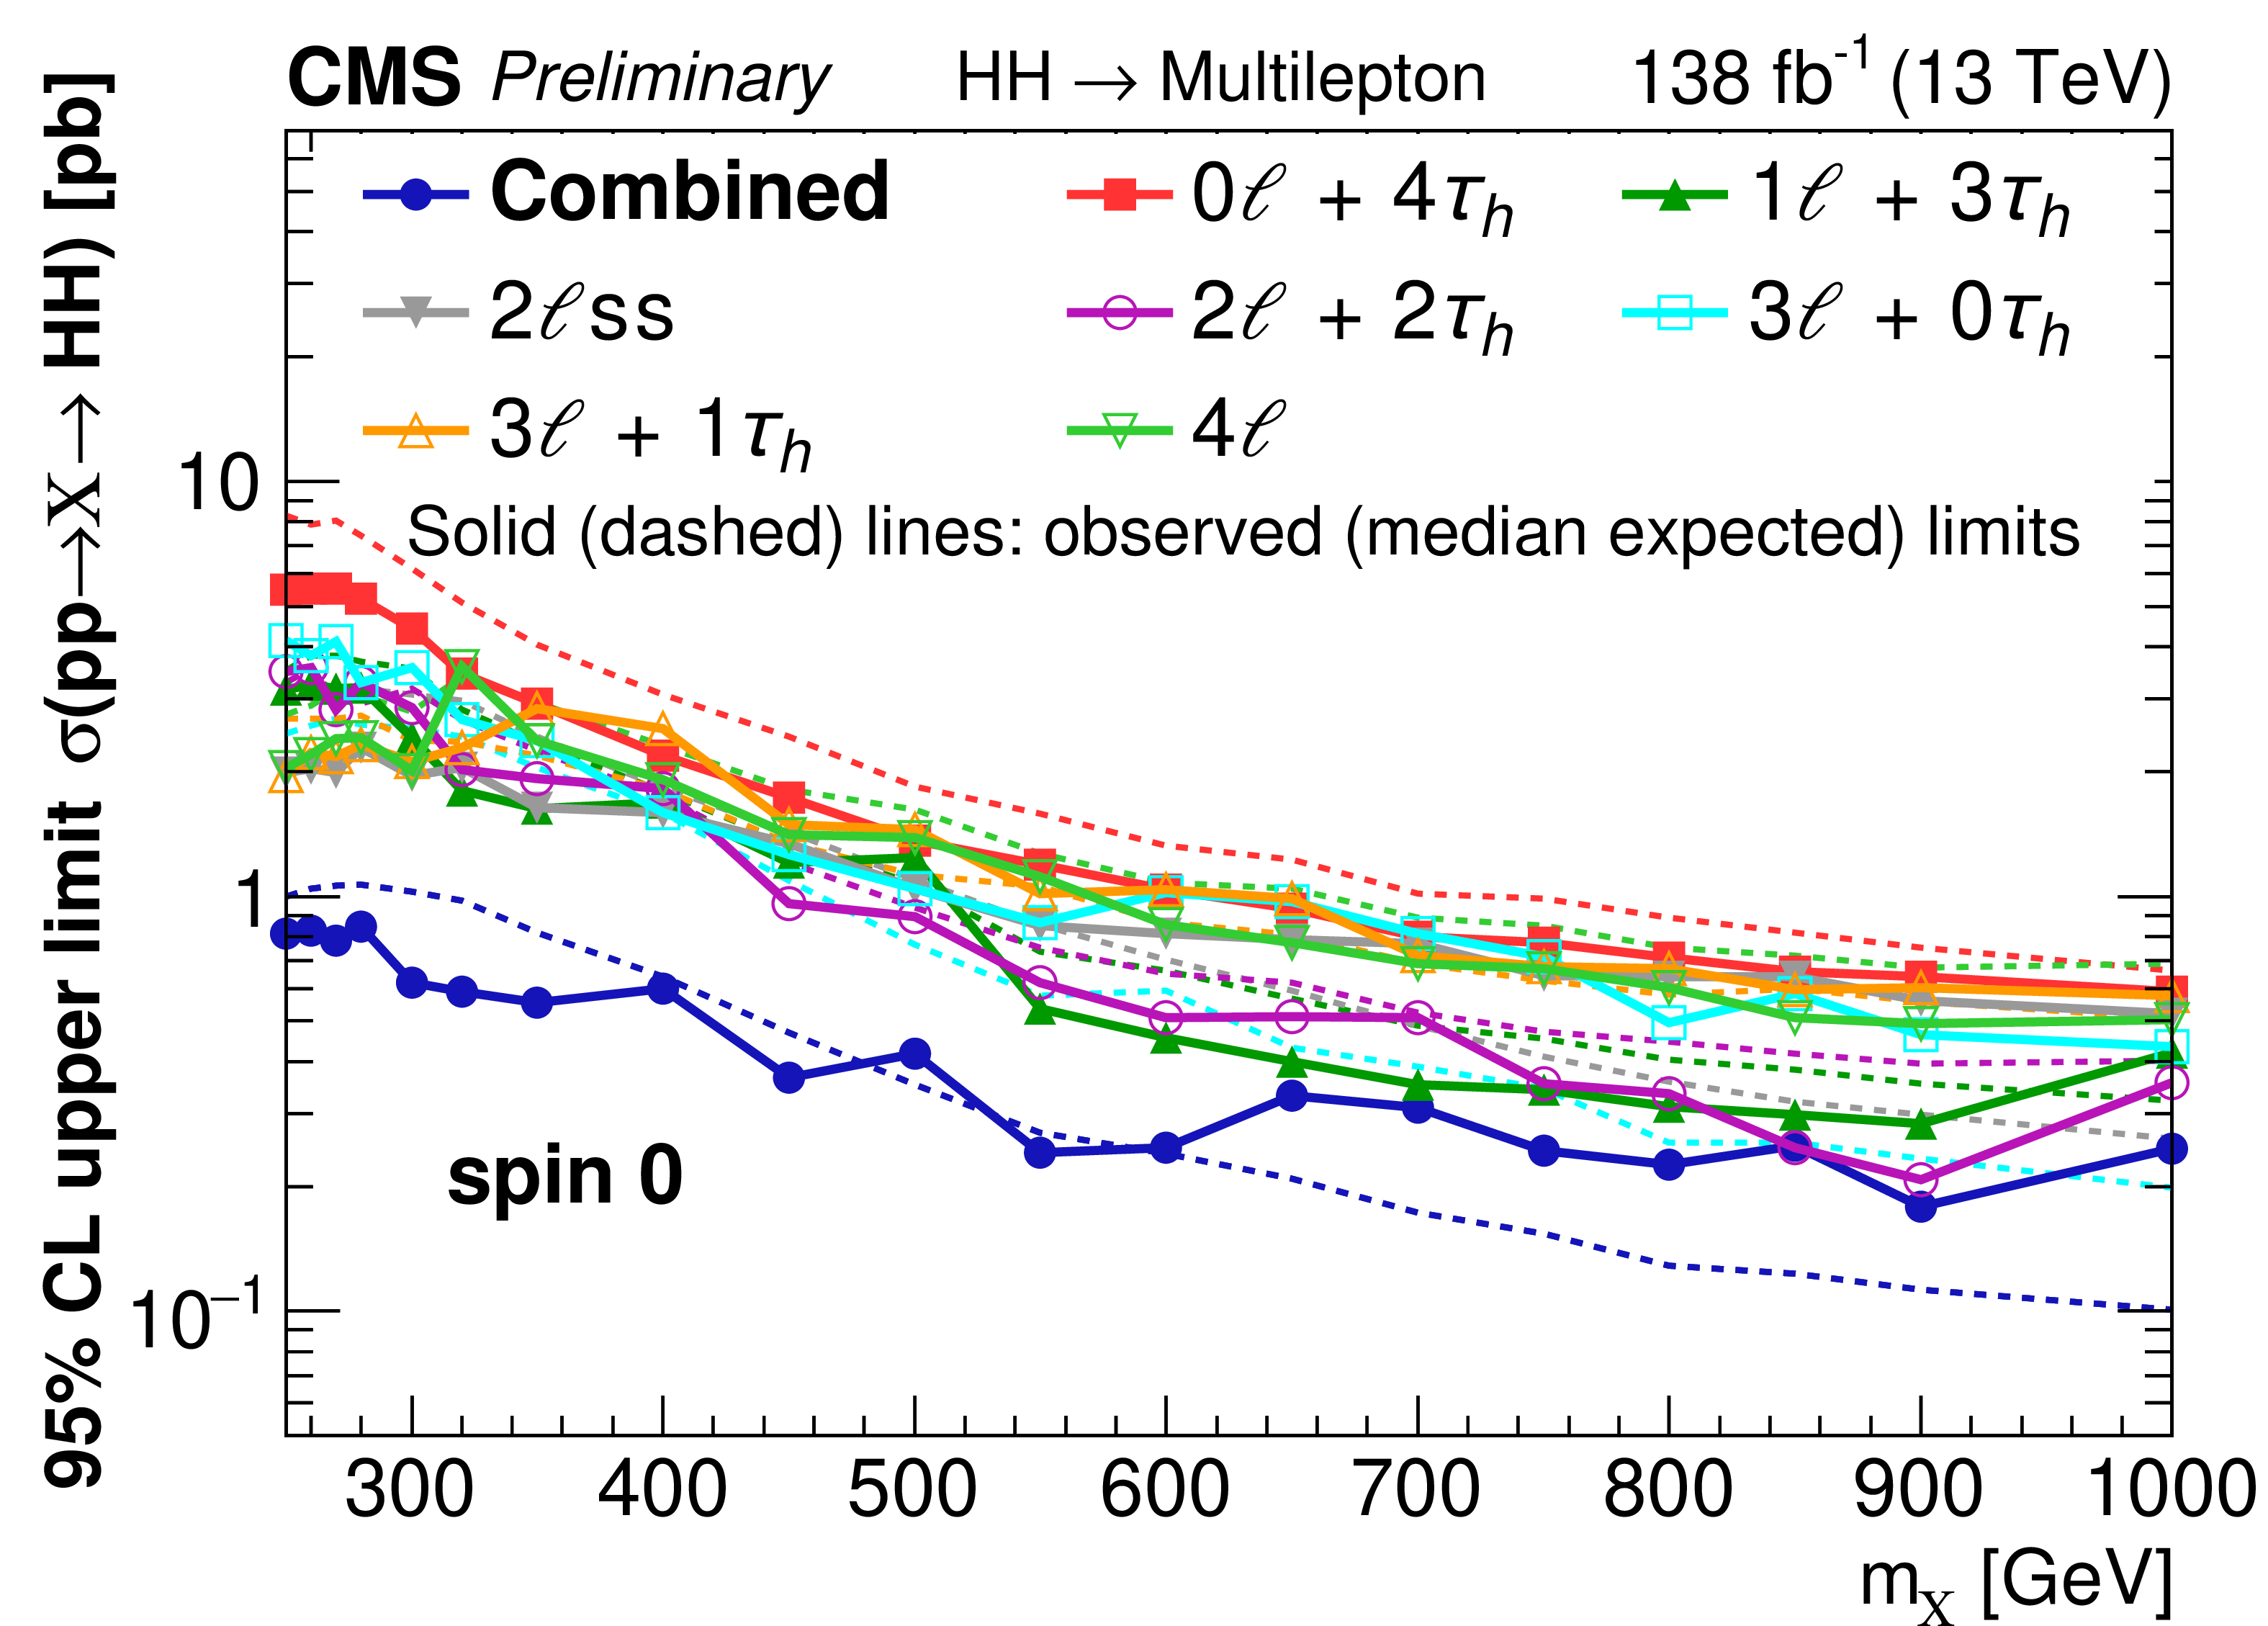
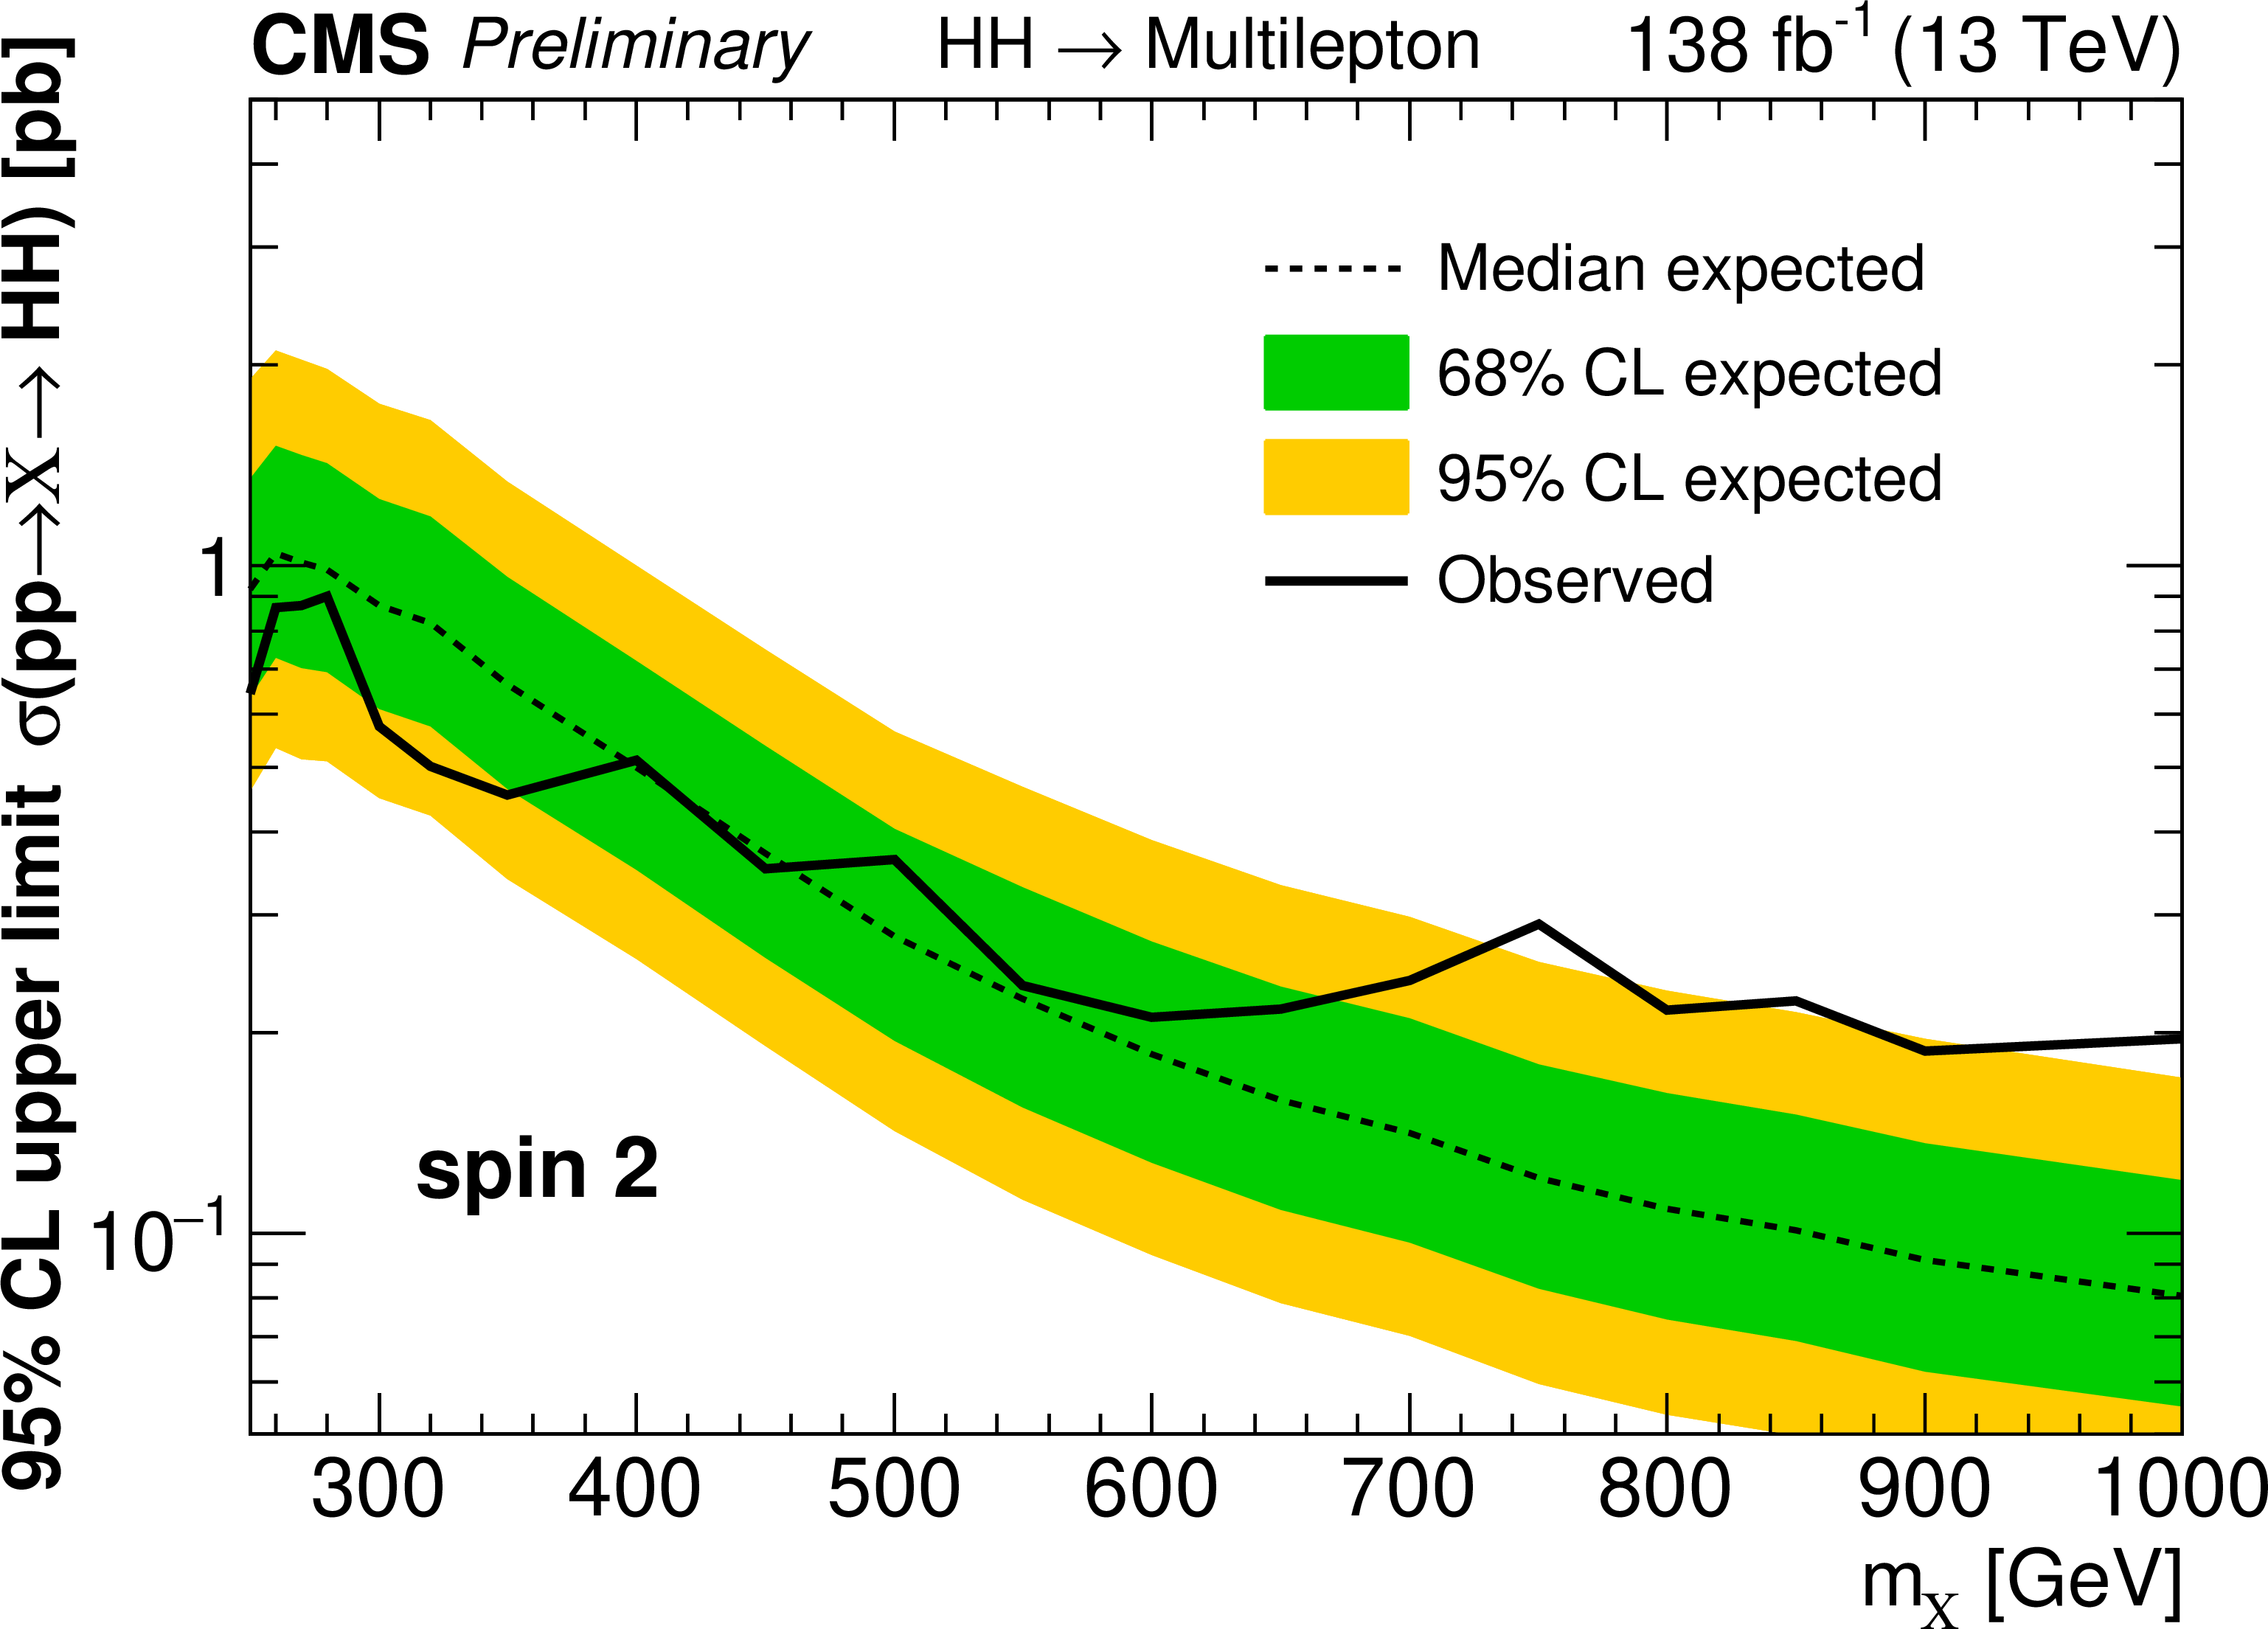
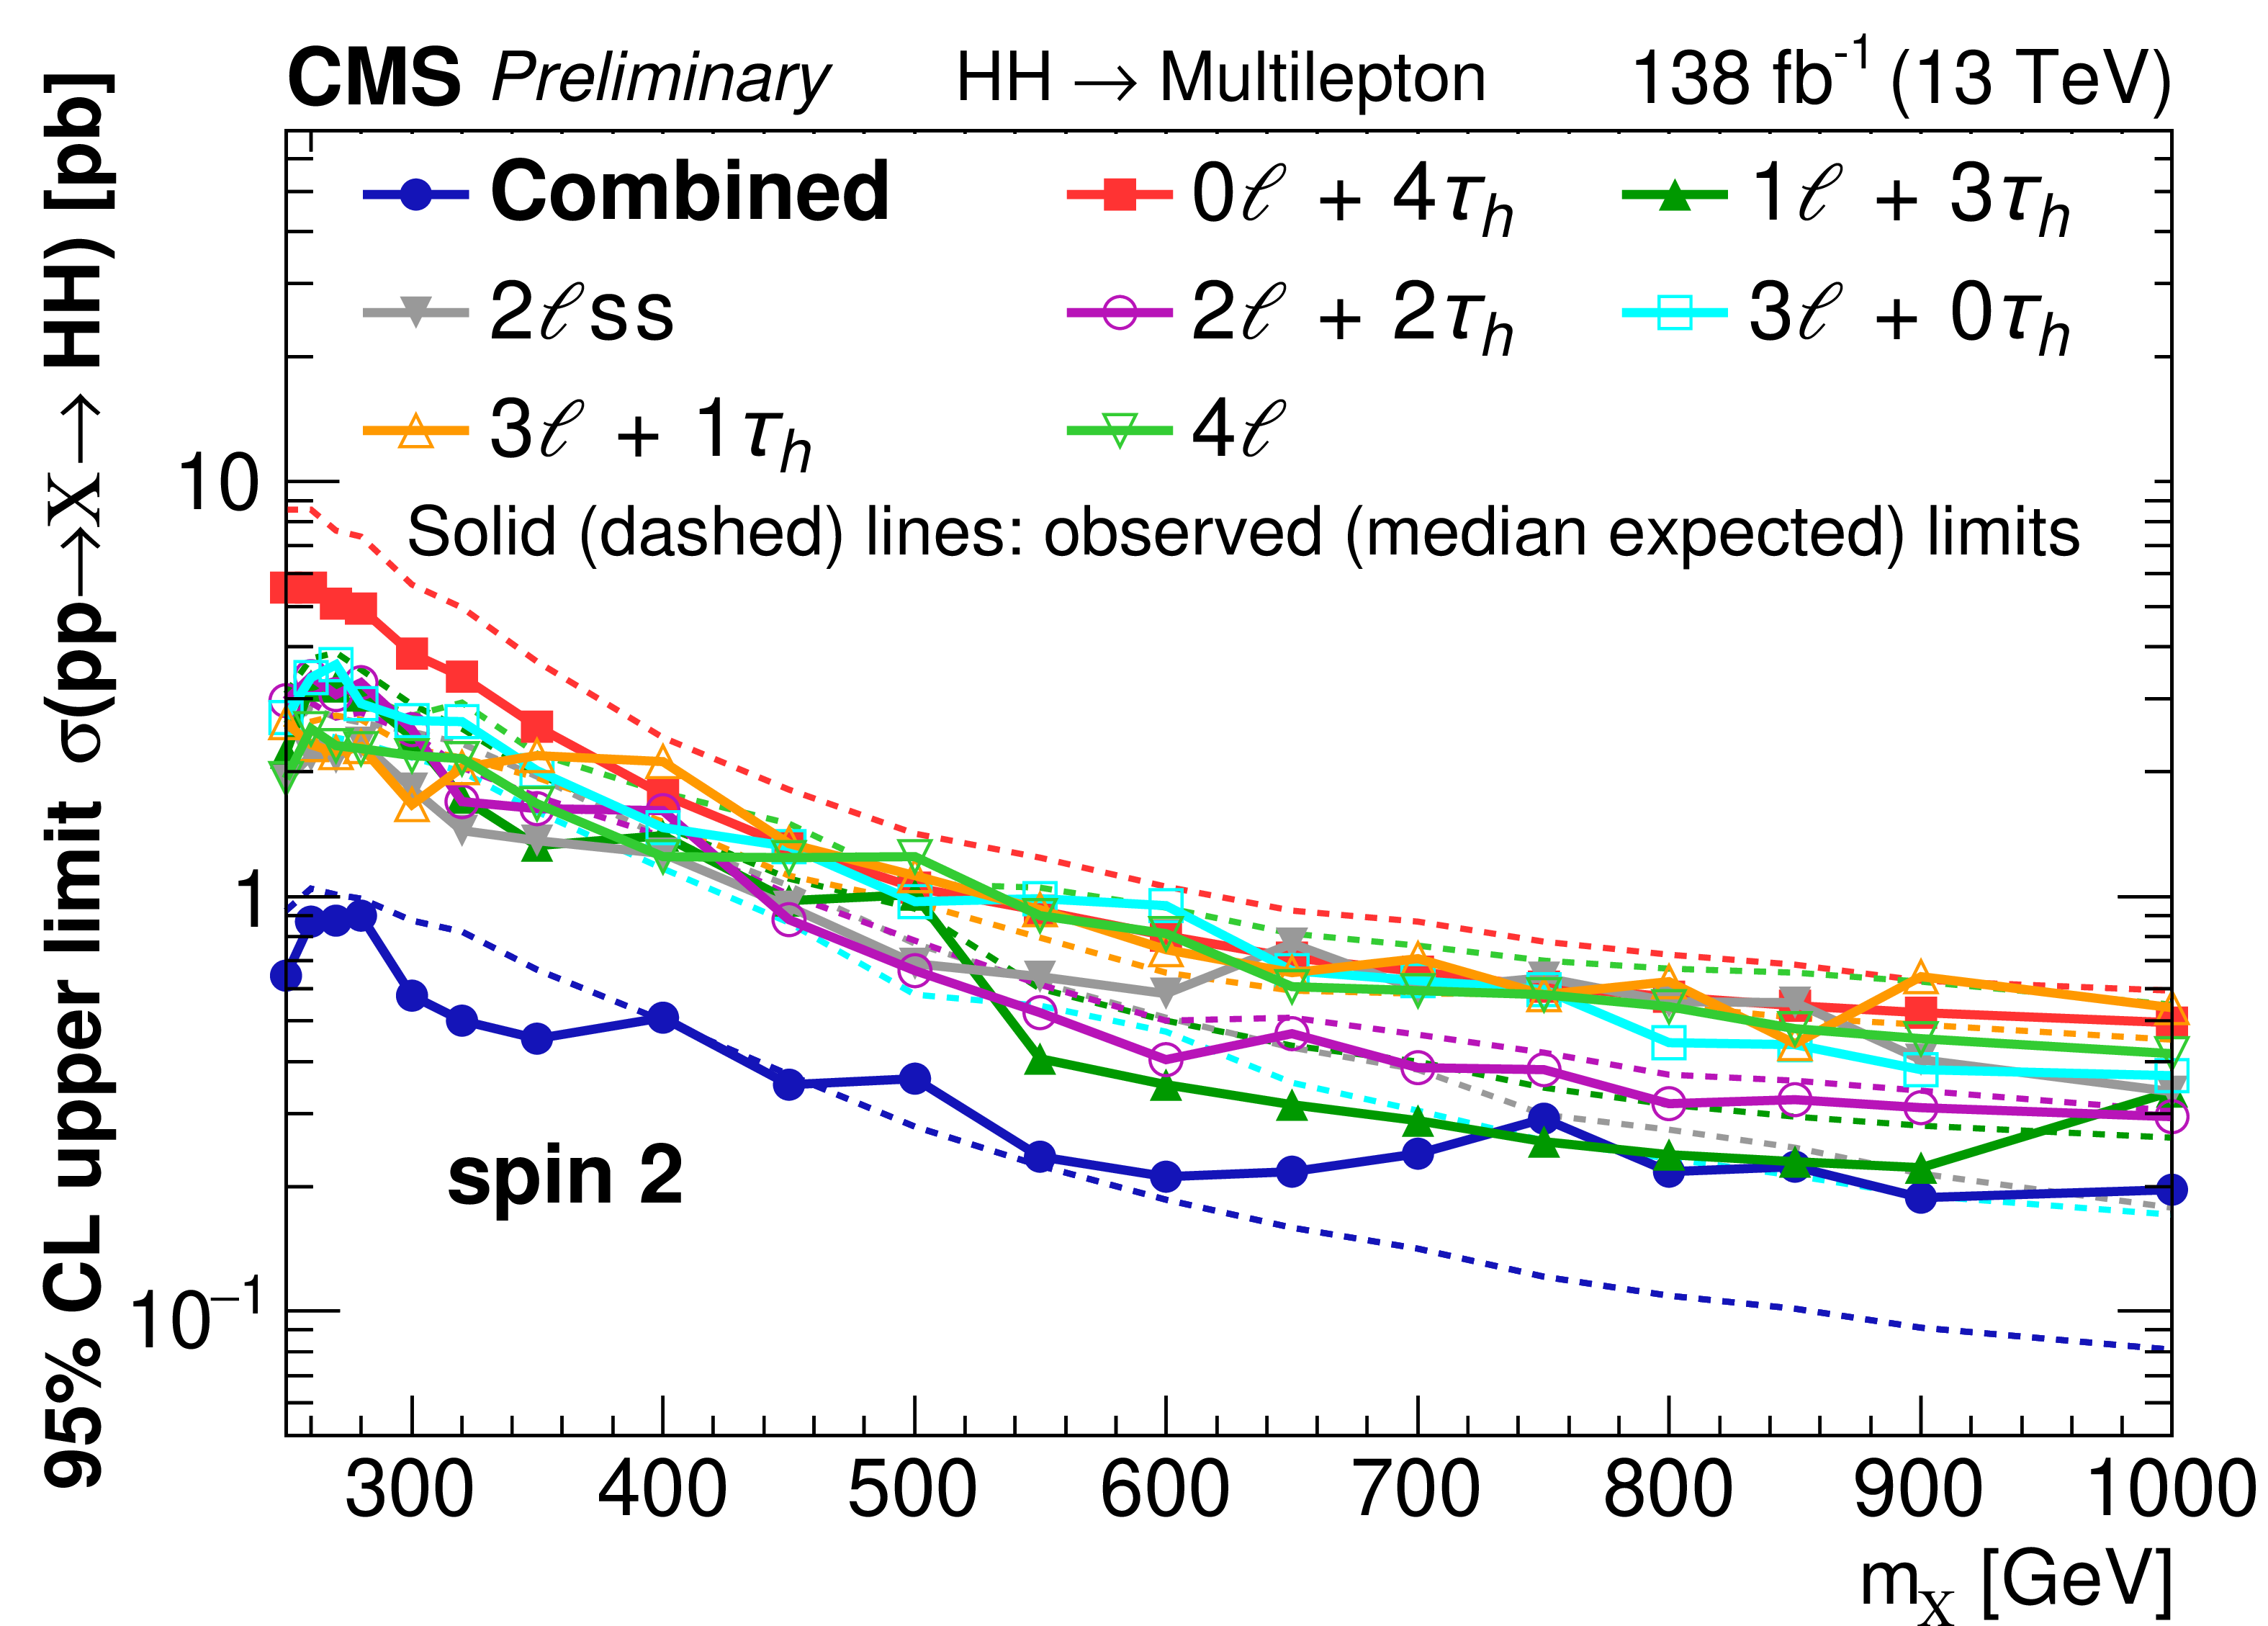
Figure 12:
Observed and expected 95% CL upper limits on the production of new particles X of spin $0$ (top) and spin $2$ (bottom) and mass $m_{{\textrm {X}}}$ in the range 250 $\leq m_{{\textrm {X}}} \leq $ 1000 GeV, which decay to Higgs boson pairs, for the combination of all seven search categories (left) and for each search category separately (right). |
png pdf |
Figure 12-a:
Observed and expected 95% CL upper limits on the production of new particles X of spin $0$ (top) and spin $2$ (bottom) and mass $m_{{\textrm {X}}}$ in the range 250 $\leq m_{{\textrm {X}}} \leq $ 1000 GeV, which decay to Higgs boson pairs, for the combination of all seven search categories (left) and for each search category separately (right). |
png pdf |
Figure 12-b:
Observed and expected 95% CL upper limits on the production of new particles X of spin $0$ (top) and spin $2$ (bottom) and mass $m_{{\textrm {X}}}$ in the range 250 $\leq m_{{\textrm {X}}} \leq $ 1000 GeV, which decay to Higgs boson pairs, for the combination of all seven search categories (left) and for each search category separately (right). |
png pdf |
Figure 12-c:
Observed and expected 95% CL upper limits on the production of new particles X of spin $0$ (top) and spin $2$ (bottom) and mass $m_{{\textrm {X}}}$ in the range 250 $\leq m_{{\textrm {X}}} \leq $ 1000 GeV, which decay to Higgs boson pairs, for the combination of all seven search categories (left) and for each search category separately (right). |
png pdf |
Figure 12-d:
Observed and expected 95% CL upper limits on the production of new particles X of spin $0$ (top) and spin $2$ (bottom) and mass $m_{{\textrm {X}}}$ in the range 250 $\leq m_{{\textrm {X}}} \leq $ 1000 GeV, which decay to Higgs boson pairs, for the combination of all seven search categories (left) and for each search category separately (right). |
png pdf |
Figure 13:
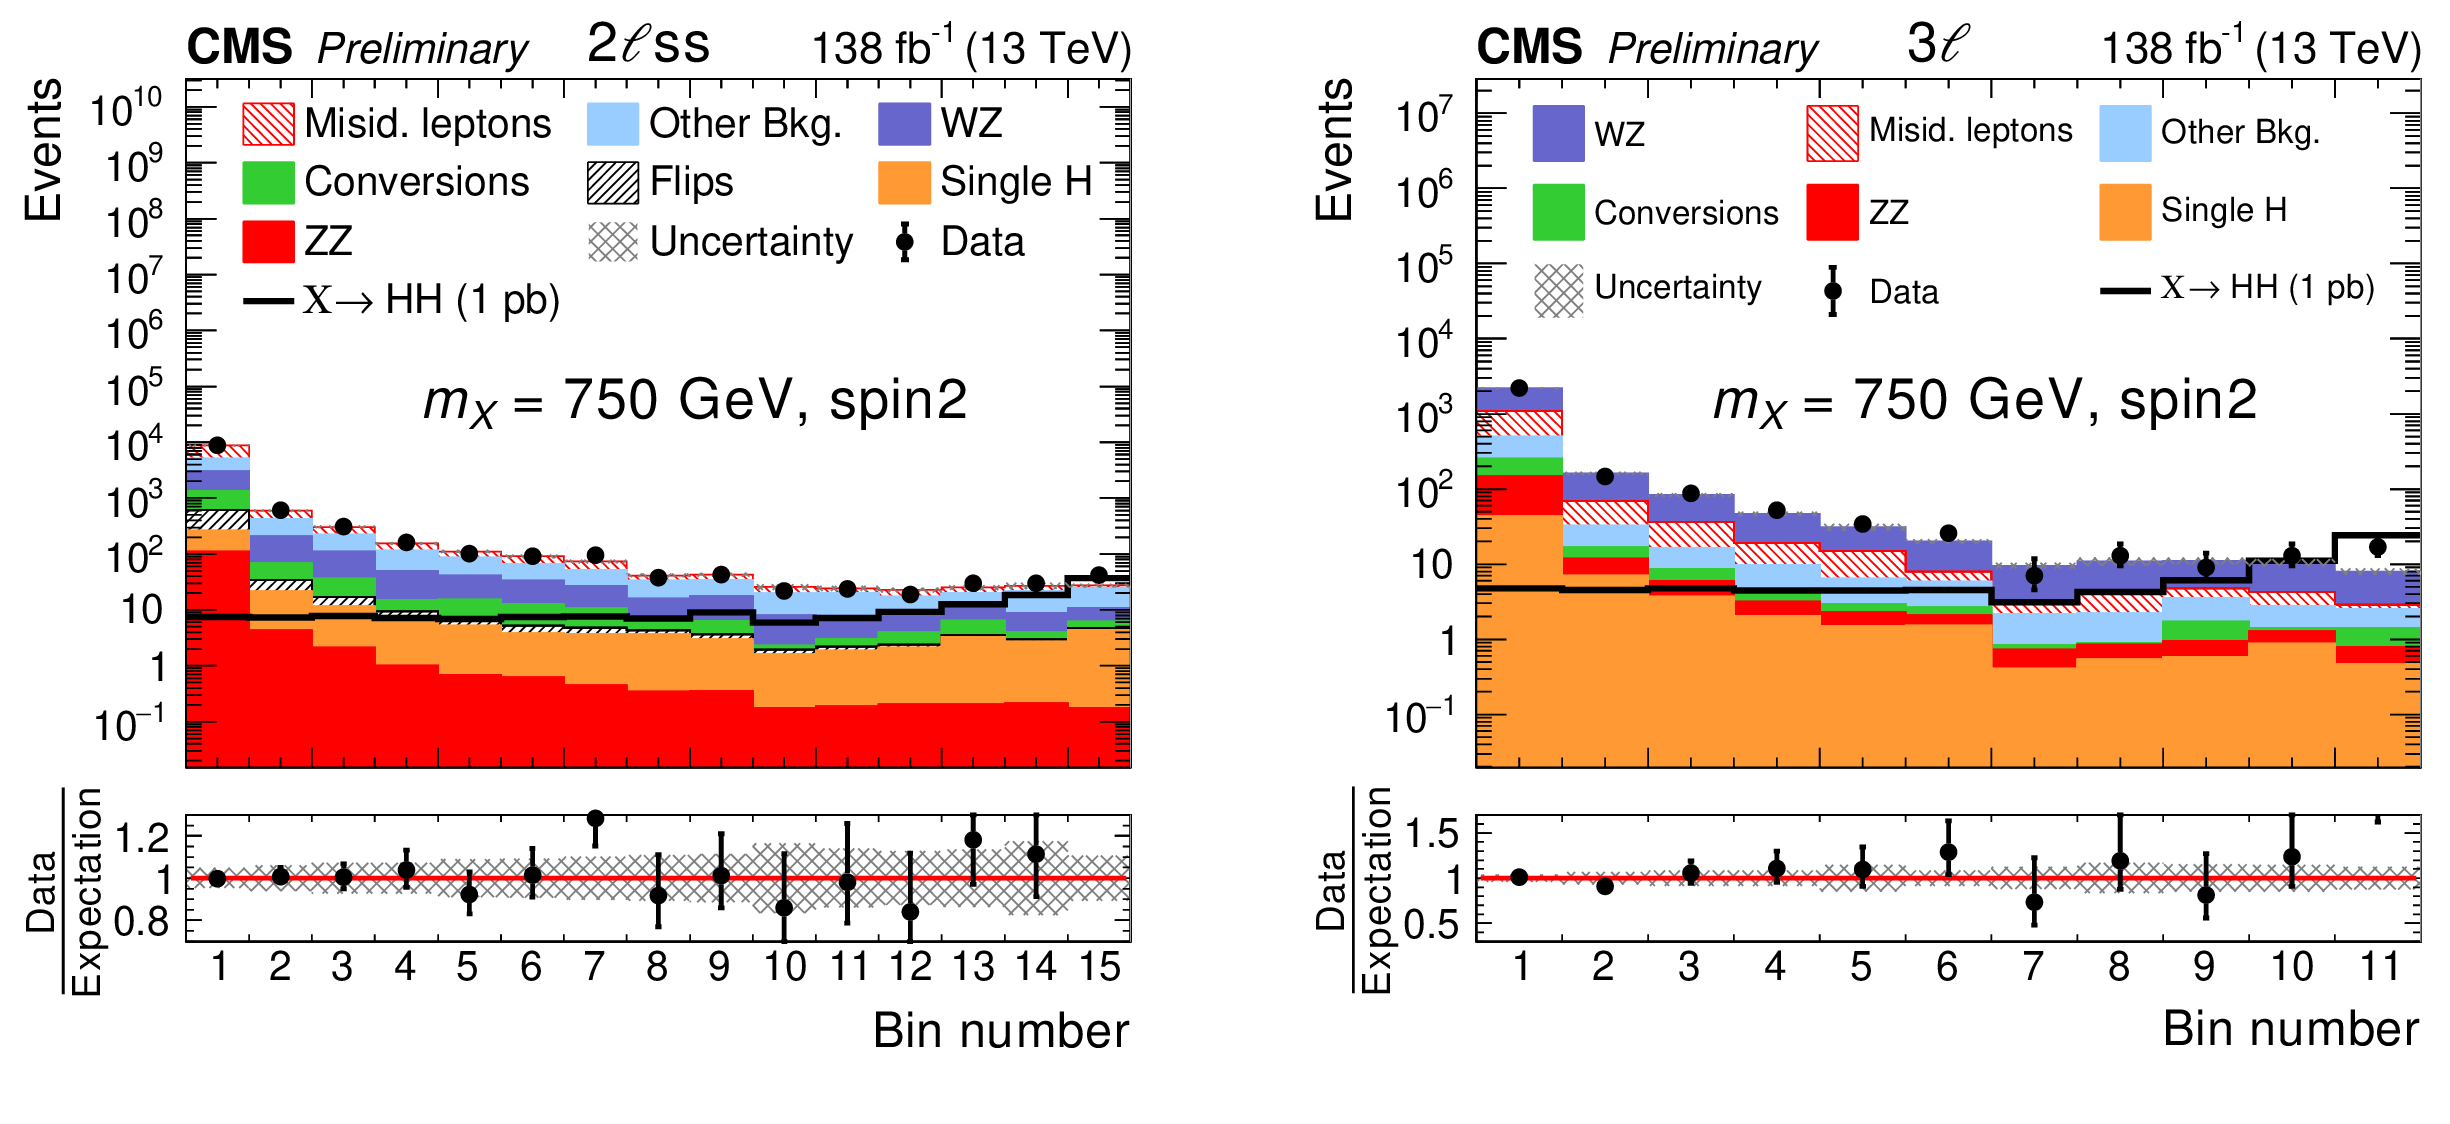
Distribution in BDT classifier output for resonances of spin 2 and mass 750 GeV in the 2$ {\ell} $ ss (left) and 3${\ell}$ (right) categories. The resonant HH signal is shown for a cross section amounting to 1 pb. The distributions expected for the background processes are shown for the values of the signal strength parameter $\mu $ and of the nuisance parameters obtained from the ML fit. The best-fit value for the HH production cross section amounts to $\hat{\sigma} = $ 0.15$^{+0.09}_{-0.07}$ pb. |
png pdf |
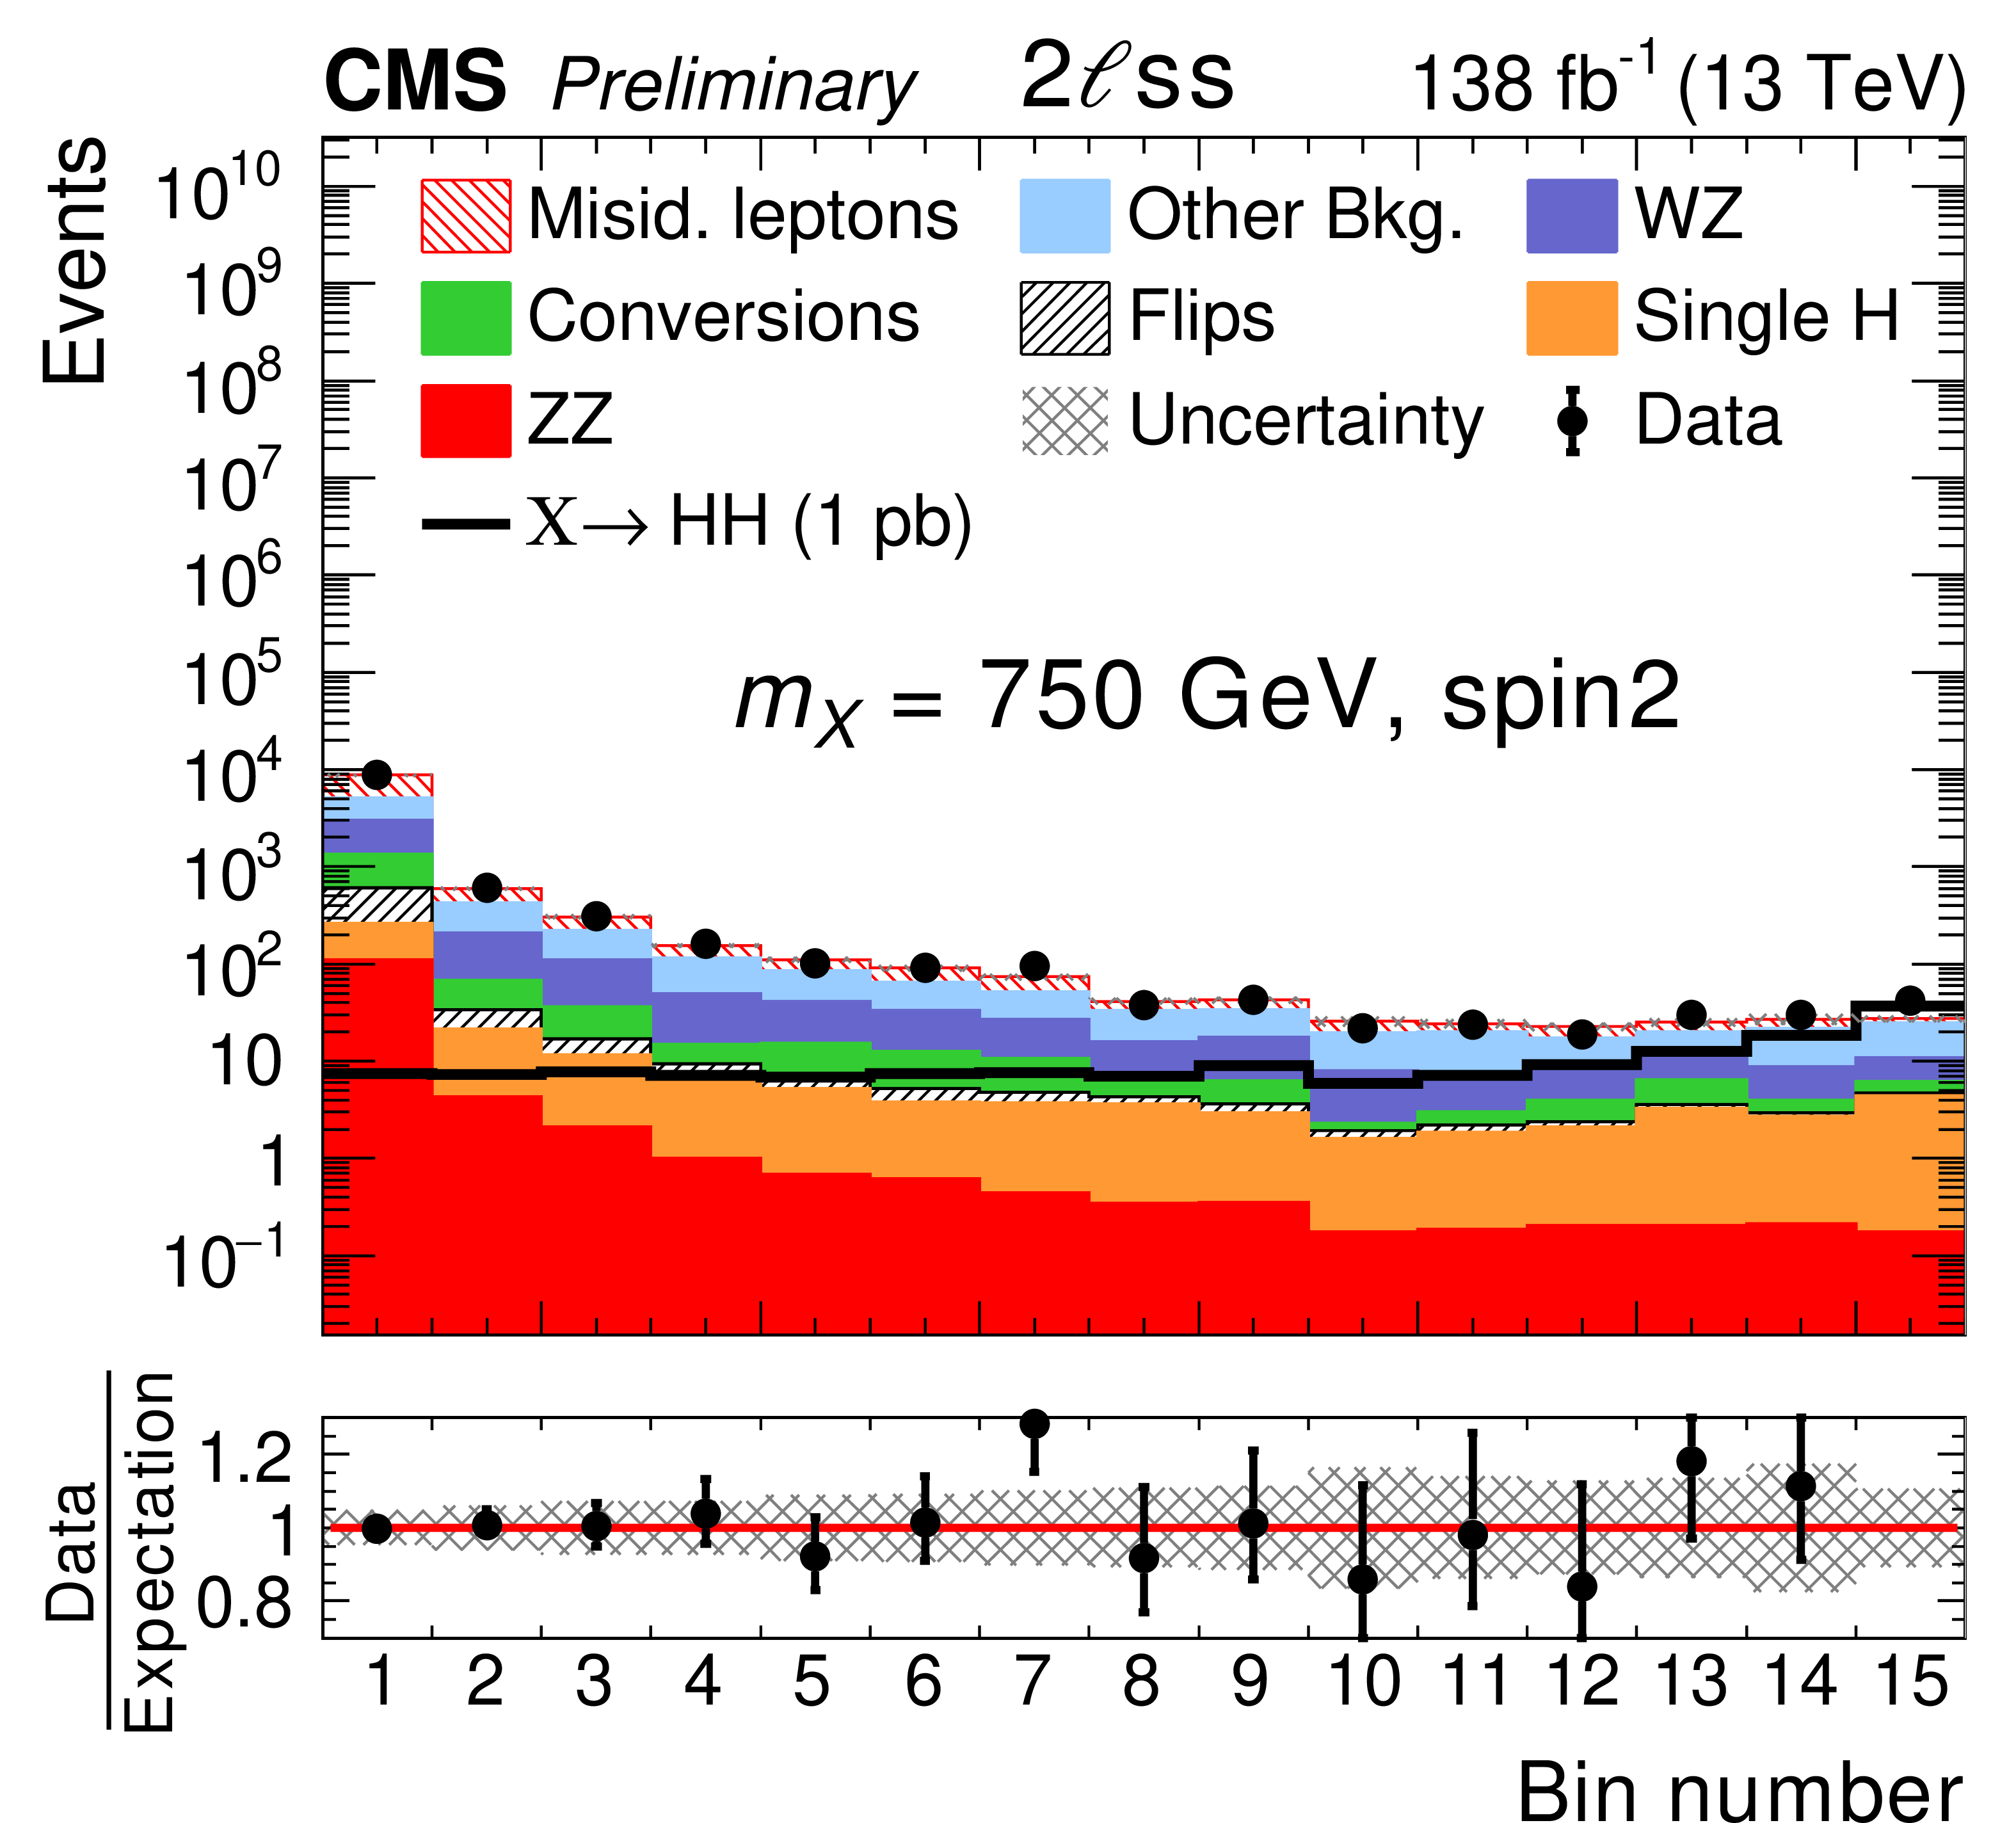
Figure 13-a:
Distribution in BDT classifier output for resonances of spin 2 and mass 750 GeV in the 2$ {\ell} $ ss (left) and 3${\ell}$ (right) categories. The resonant HH signal is shown for a cross section amounting to 1 pb. The distributions expected for the background processes are shown for the values of the signal strength parameter $\mu $ and of the nuisance parameters obtained from the ML fit. The best-fit value for the HH production cross section amounts to $\hat{\sigma} = $ 0.15$^{+0.09}_{-0.07}$ pb. |
png pdf |
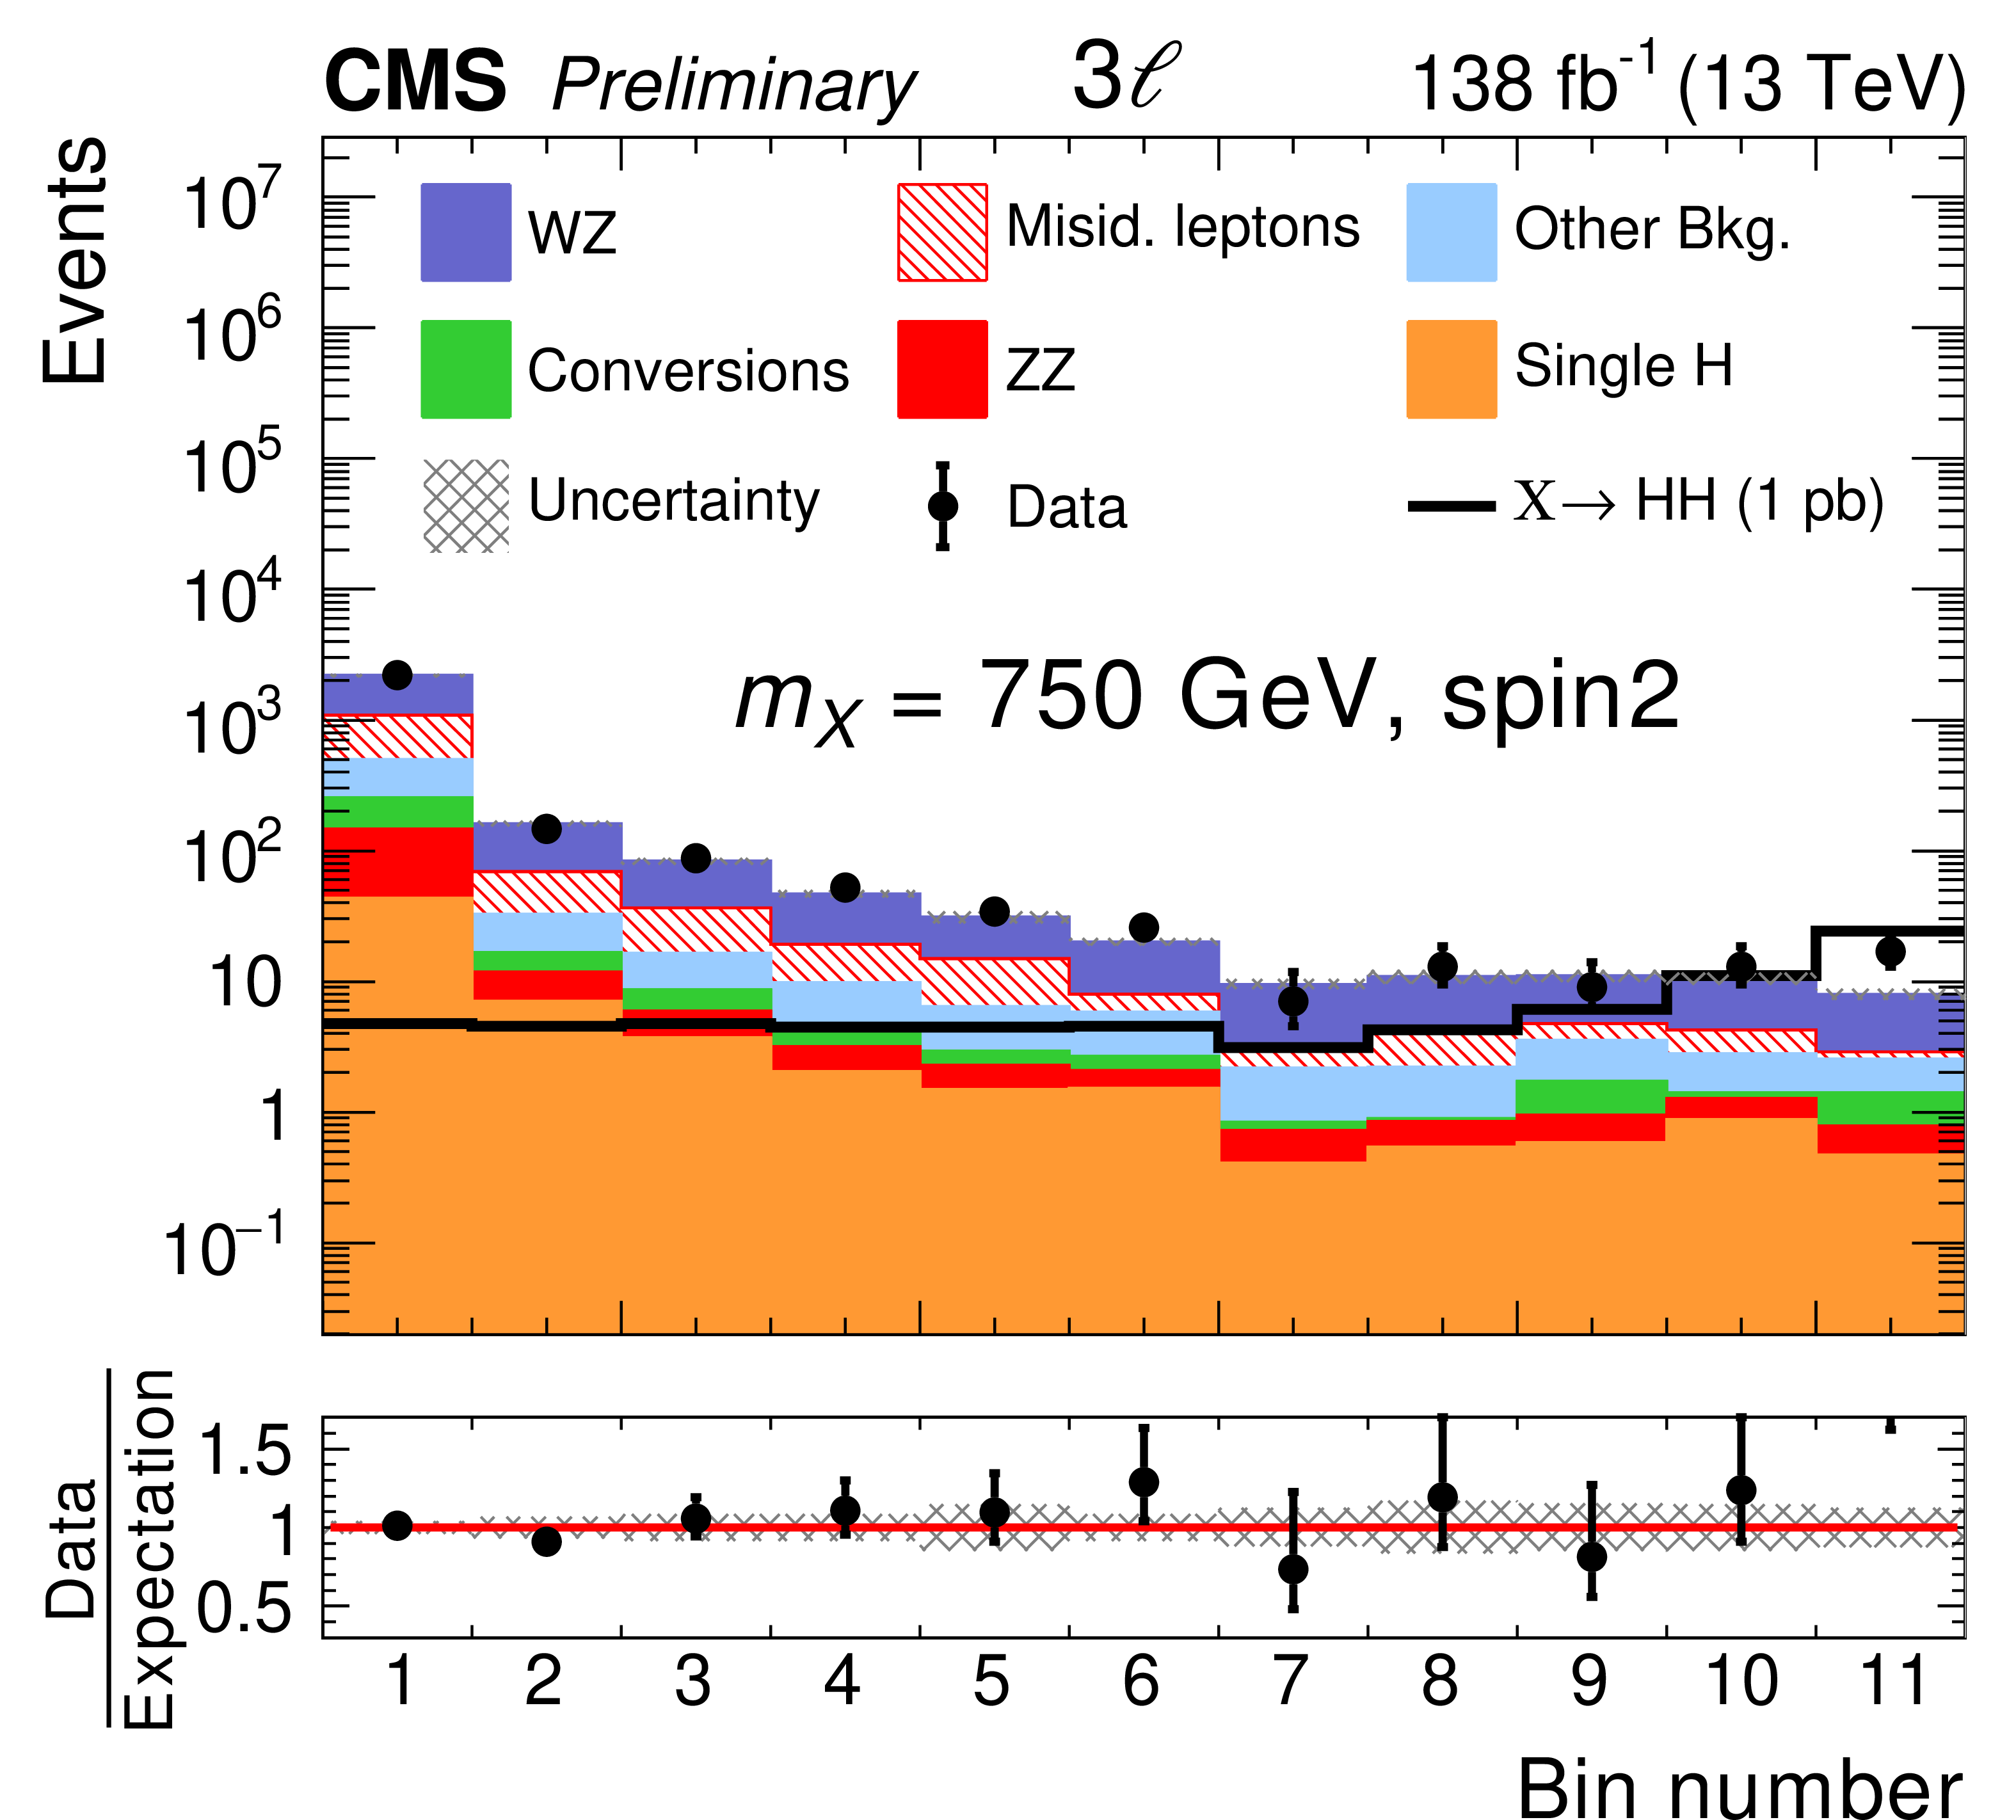
Figure 13-b:
Distribution in BDT classifier output for resonances of spin 2 and mass 750 GeV in the 2$ {\ell} $ ss (left) and 3${\ell}$ (right) categories. The resonant HH signal is shown for a cross section amounting to 1 pb. The distributions expected for the background processes are shown for the values of the signal strength parameter $\mu $ and of the nuisance parameters obtained from the ML fit. The best-fit value for the HH production cross section amounts to $\hat{\sigma} = $ 0.15$^{+0.09}_{-0.07}$ pb. |
| Tables | |

png pdf |
Table 1:
Selection requirements on ${p_{\mathrm {T}}}$ and $\eta $ of reconstructed electrons (e), muons ($\mu $), and hadronically decaying tau leptons ($ {\tau _{\text {h}}} $) applied by the triggers used in this analysis. The trigger $ {p_{\mathrm {T}}} $ thresholds for leading, subleading, and third e, $\mu $, or $ {\tau _{\text {h}}} $ are separated by commas, while a backslash indicates a threshold that depends on the year of data taking. For trigger thresholds that vary within the same year, the range of variation is indicated using an en dash. |
png pdf |
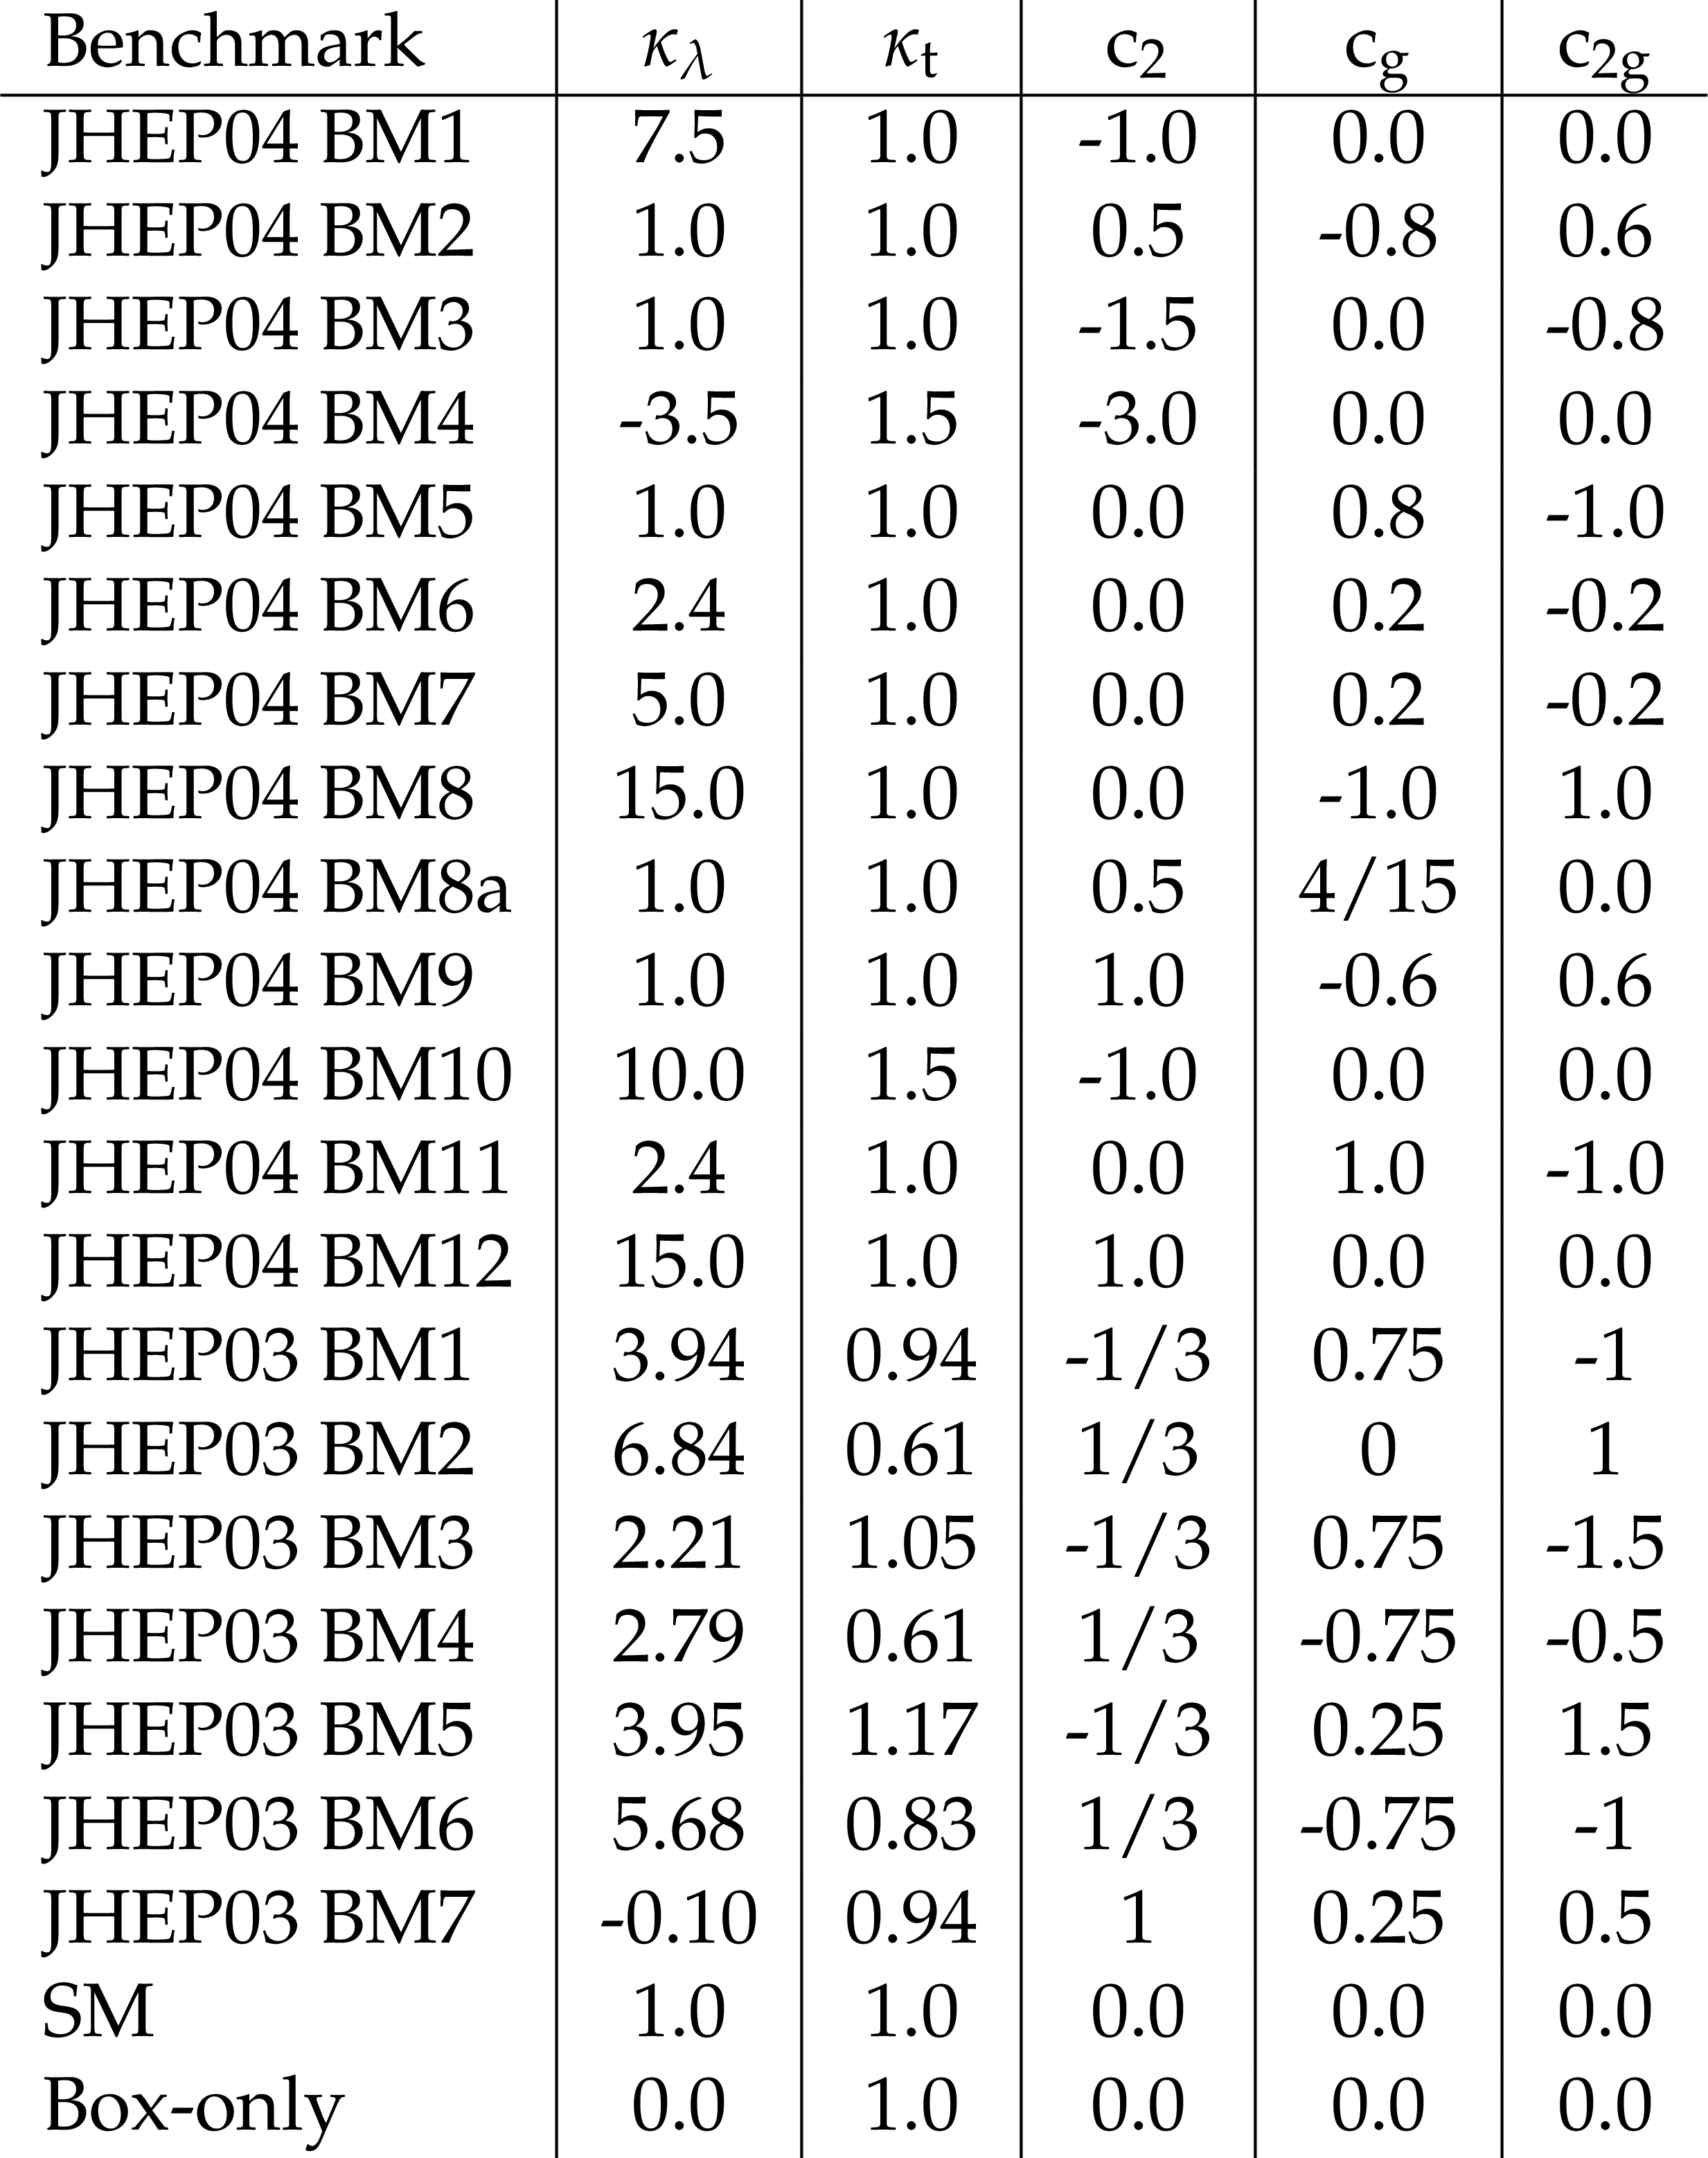
Table 2:
Parameter values for $ {\kappa _{\lambda}} $, $ {\kappa _{{\mathrm{t}}}} $, $ {\text {c}_{2}} $, $ {\text {c}_{{\mathrm{g}}}} $, and $ {\text {c}_{2 {\mathrm{g}}}} $ in MC samples modeling $20$ benchmark scenarios in the EFT approach, plus SM and "box-only'' ($\lambda = $ 0) HH production. |
png pdf |
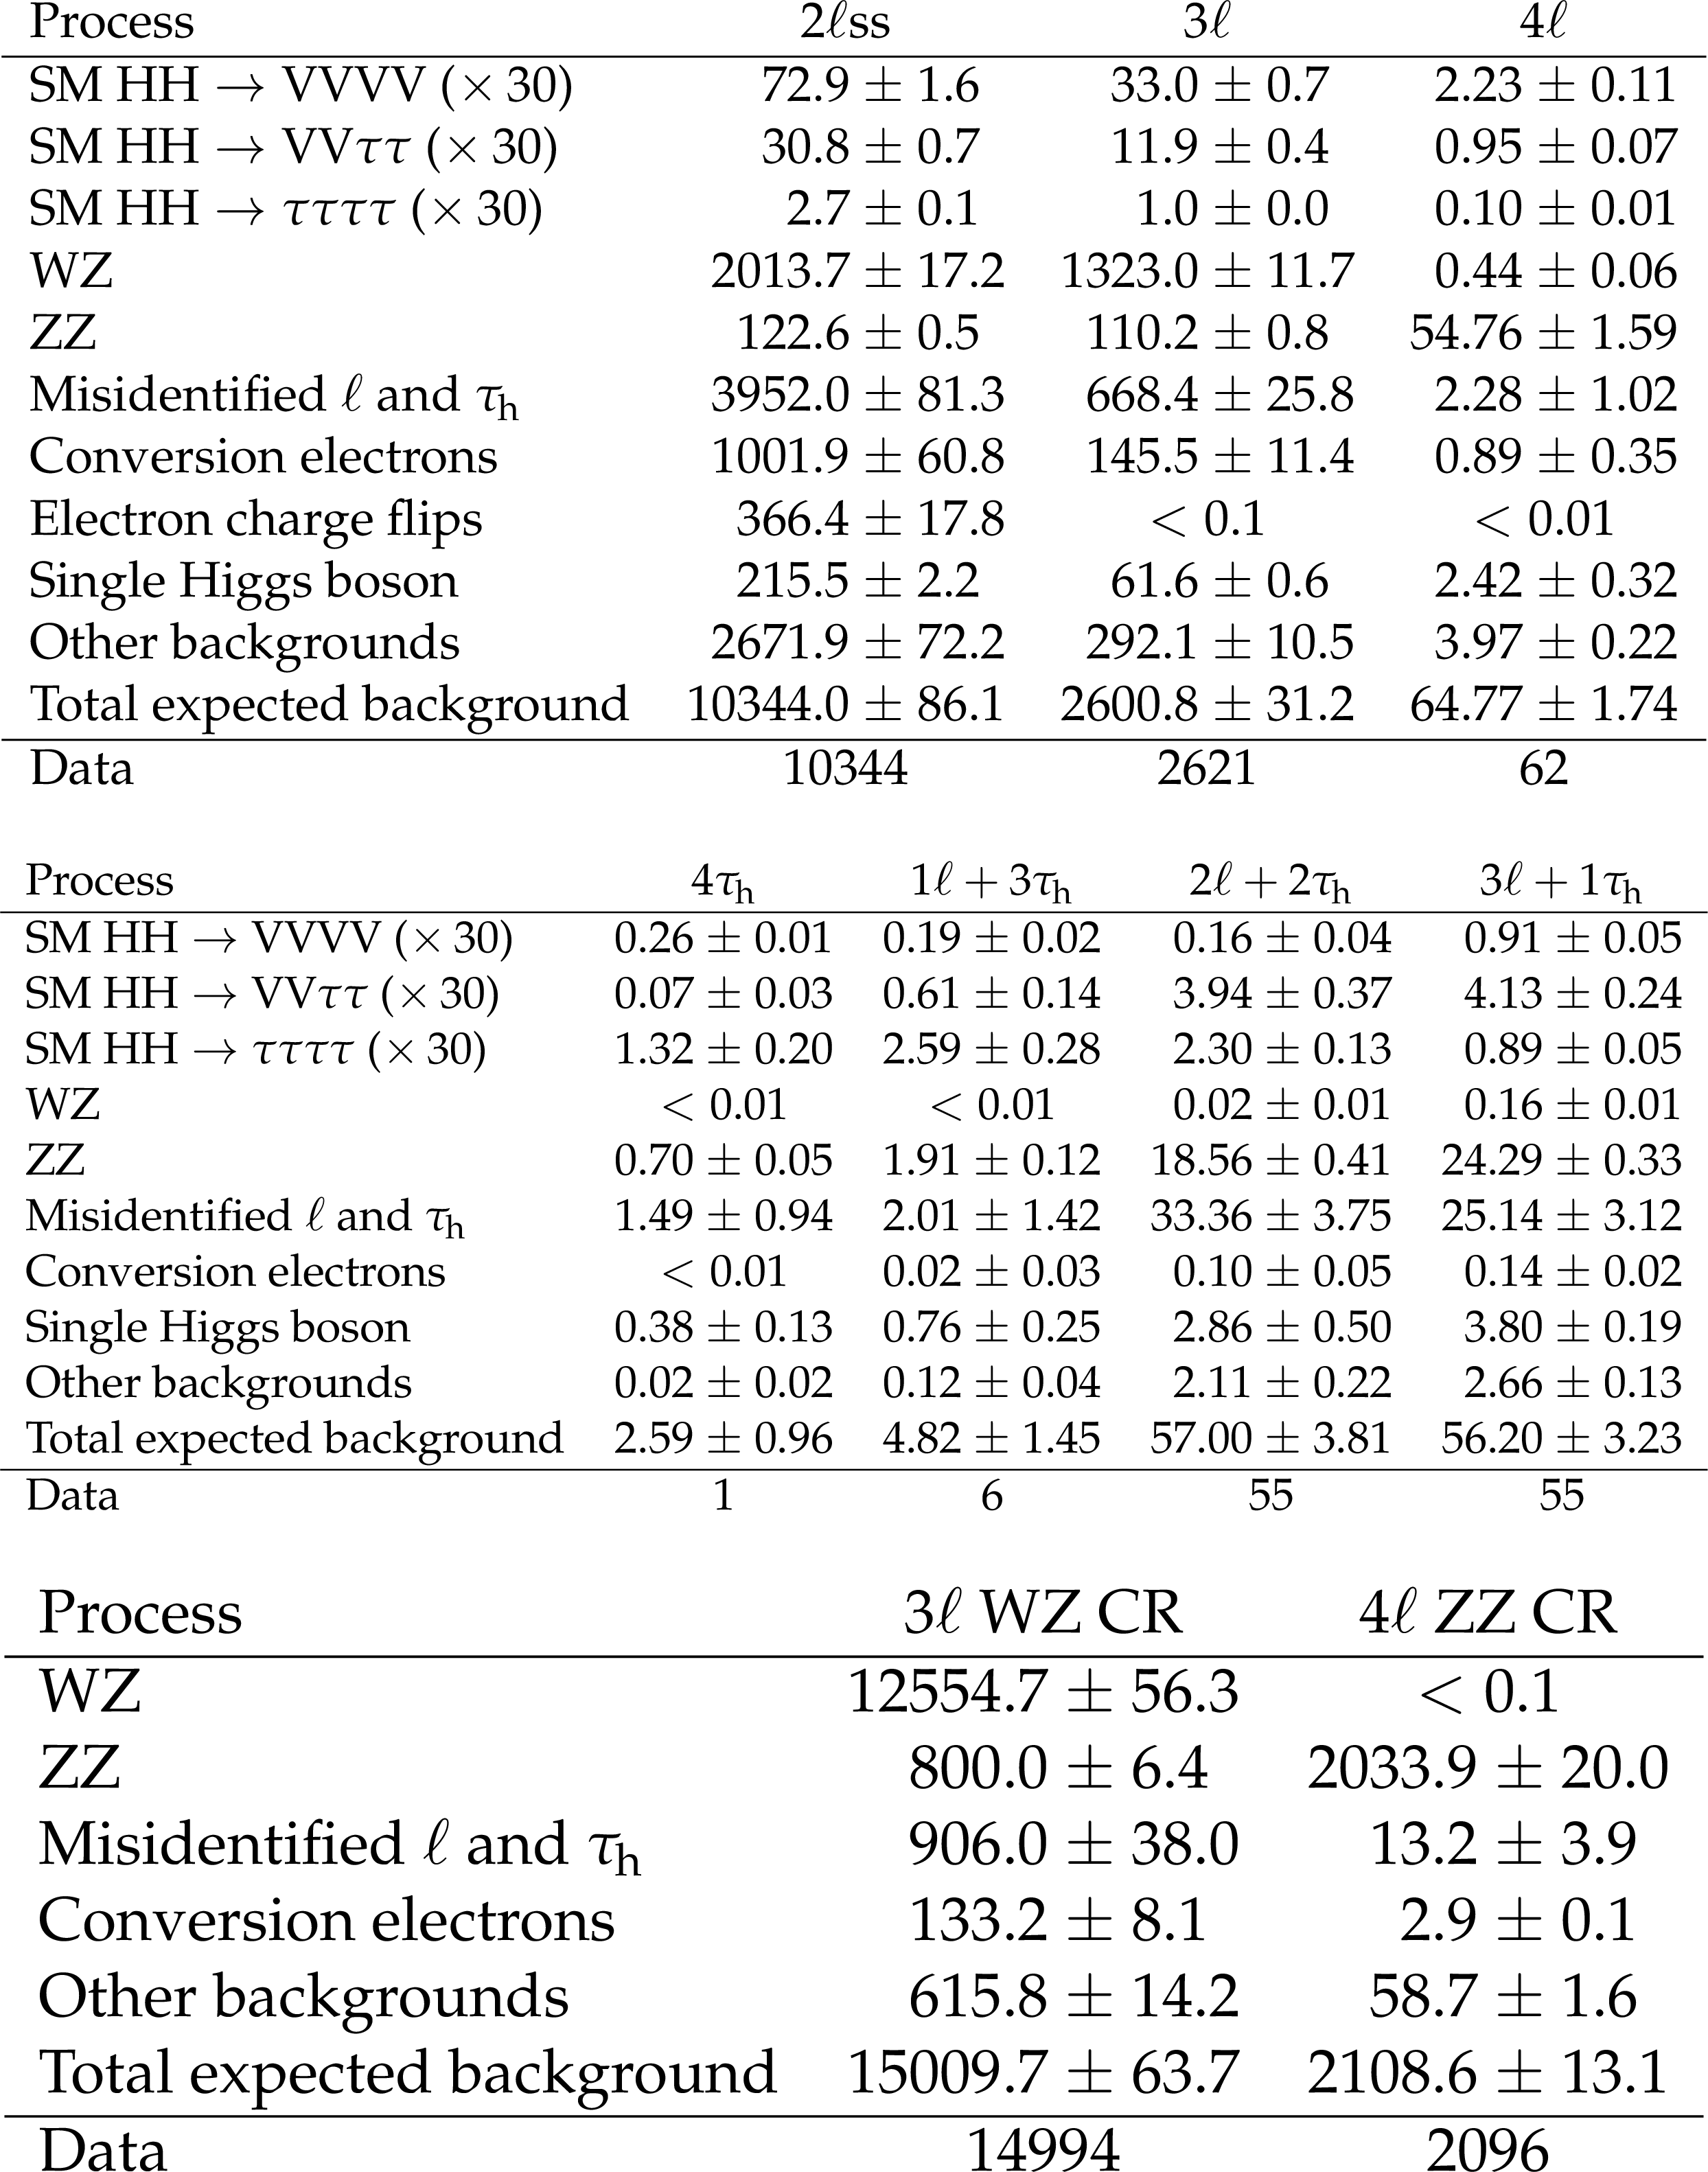
Table 3:
Number of events selected in each of the seven search categories, plus two control regions (CR) for the irreducible WZ and ZZ backgrounds, described in Section 7. The HH signal represents the sum of the ggHH and qqHH production processes and is normalized to 30 times the event yield expected in the SM, corresponding to a cross section of about 1 pb. The nomenclature HHVVVV refers to the sum of HH $ \rightarrow $ WWWW, WWZZ and ZZZZ decays and HHVV$\tau \tau $ refers to HH $ \rightarrow $ WW$\tau \tau $ and ZZ$ \tau \tau $ decays. The expected event yields are computed for the values of nuisance parameters obtained from the ML fit described in Section 9. Quoted uncertainties represent the sum of statistical and systematic components. |
png pdf |
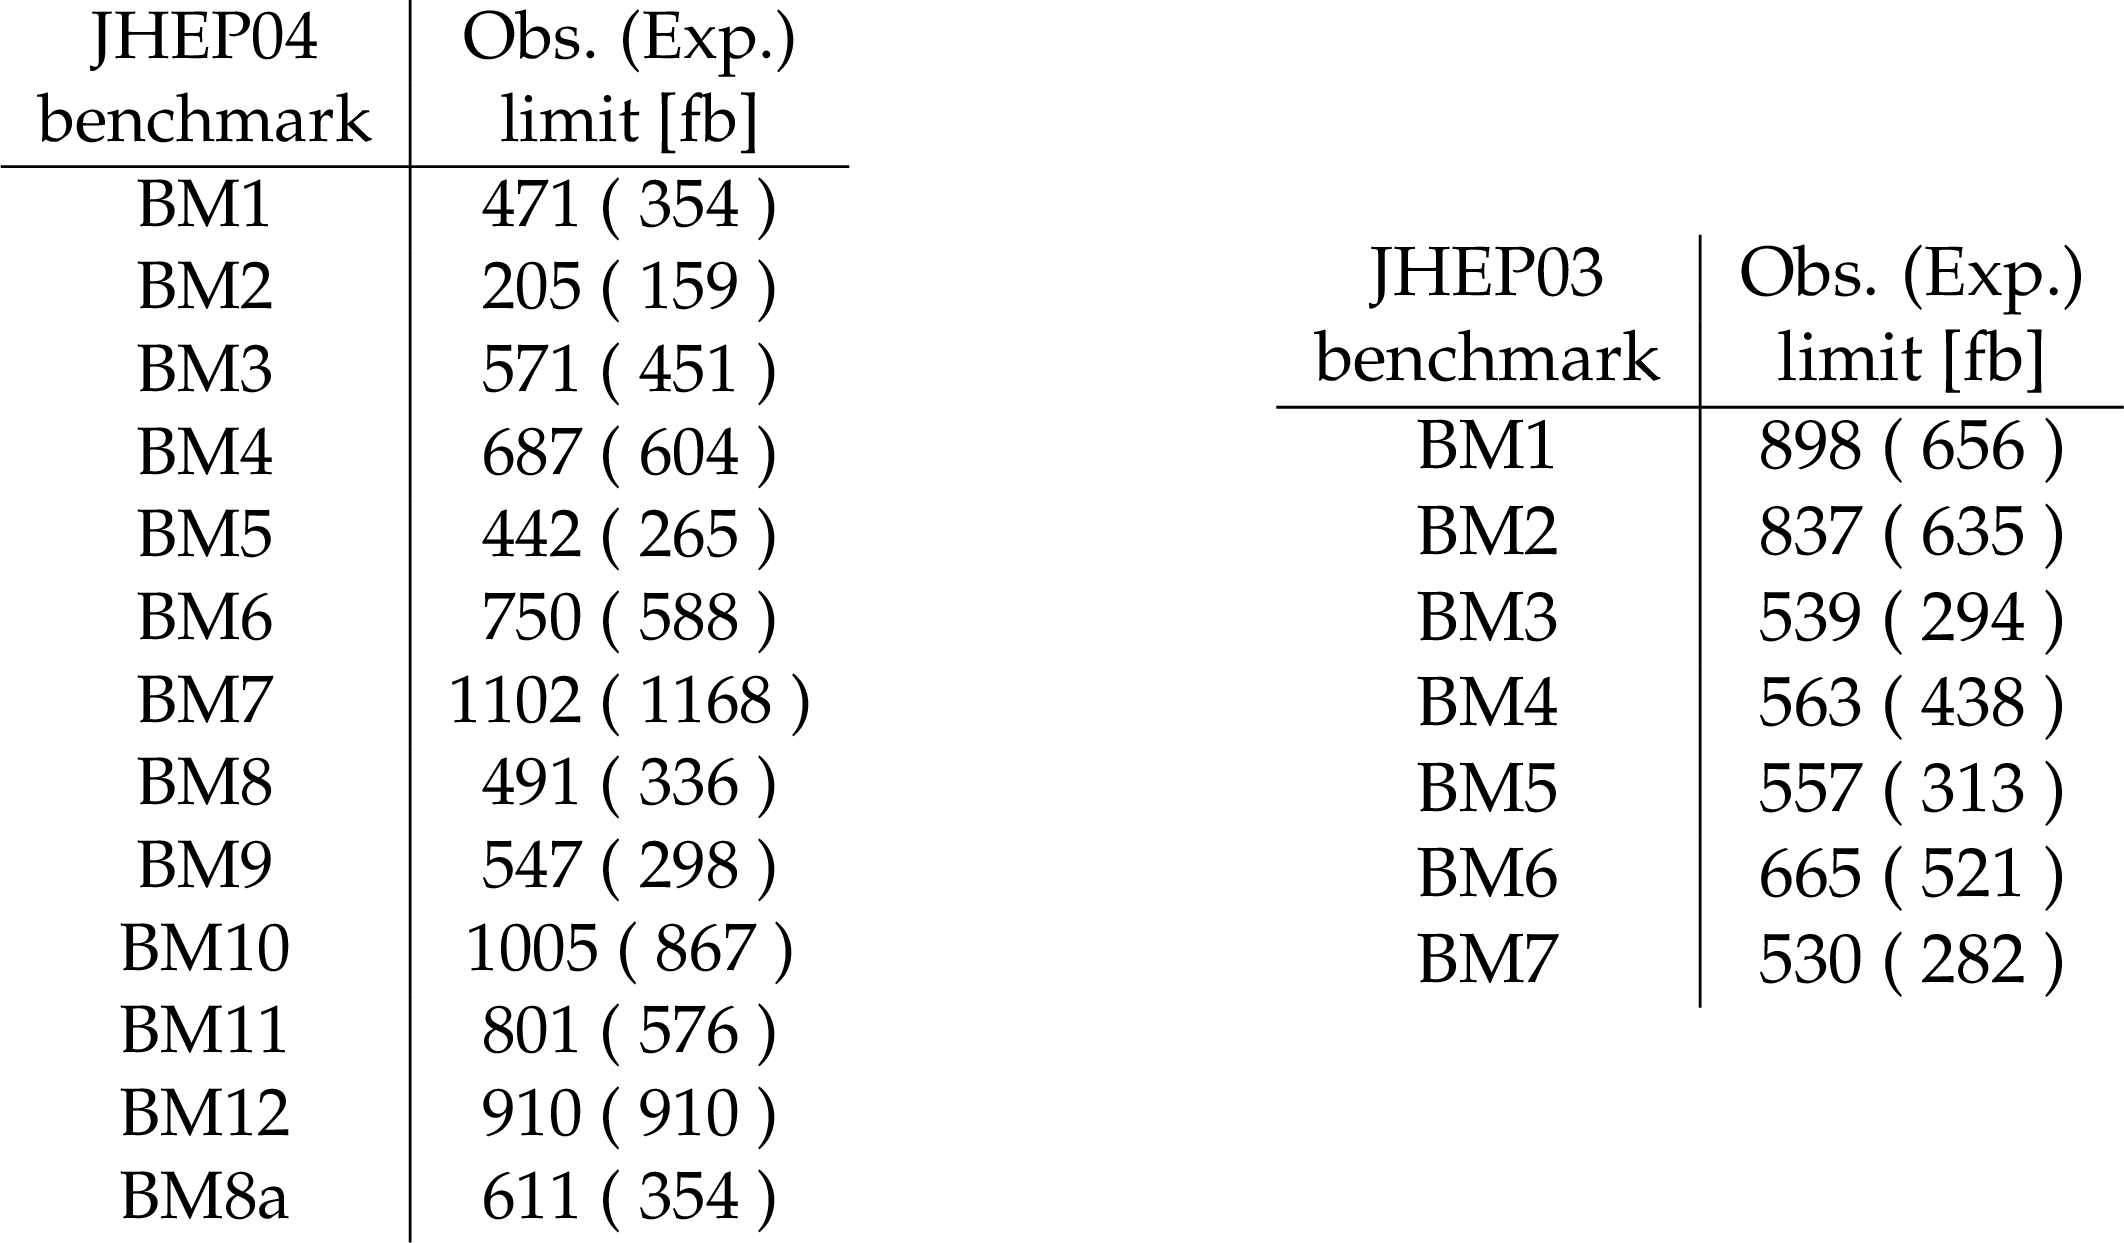
Table 4:
Observed (expected) 95% CL upper limits on the ggHH production cross section for the twelve benchmark scenarios from Ref. [24], the additional benchmark scenario 8a from Ref. [62] and the seven benchmark scenarios from Ref. [61]. The limits correspond to the combination of all seven search categories. |
| Summary |
| The results of a search for nonresonant as well as resonant Higgs boson pair (HH) production in final states with multiple reconstructed leptons including electrons and muons (${\ell} $) as well as hadronically decaying tau leptons (${\tau_\mathrm{h}}$) has been presented. The search targets the HH decay modes WWWW, WW$ \tau \tau $, and $\tau\tau\tau\tau$, using proton-proton collision data recorded by the CMS experiment at a center-of-mass energy of 13 TeV, corresponding to an integrated luminosity of 138 fb$^{-1}$, Seven search categories, distinguished by ${\ell} $ and ${\tau_\mathrm{h}}$ multiplicity, are included in the analysis: 2${{\ell}}$ ss, 3${{\ell} } $, 4${{\ell} } $, 3${\ell} $ + 1${\tau_\mathrm{h}} $, 2${\ell}$ + 2${\tau_\mathrm{h}} $, 1${\ell}$ + 3${\tau_\mathrm{h}} $, and 4${\tau_\mathrm{h}} $, where "ss" indicates two ${\ell} $ with the same charge. No evidence for a signal is found in the data and upper limits on the cross section for nonresonant as well as resonant HH production are set. The observed (expected) limits on nonresonant HH production in 20 effective field theory benchmark scenarios range from 0.21 to 1.1 (0.16 to 1.17) pb at 95% confidence level, depending on the scenario. For nonresonant HH production with event kinematics as predicted by the standard model (SM), the observed (expected) upper limit on the HH production rate is 21.8 (19.6) times the rate expected in the SM. The results of the search for nonresonant HH production are used to exclude regions in the plane of the Higgs boson coupling to the top quark, ${\text{y}_{{\mathrm{t}} }} $, and of the trilinear Higgs boson self-coupling, $\lambda$. Assuming ${\text{y}_{{\mathrm{t}} }} $ has the value expected in the SM, $\lambda$ is constrained to be between $-$7.0 and 11.2 times the value expected in the SM. For resonant HH production, the observed (expected) limits on the production cross section range from 0.18 to 0.90 (0.08 to 1.07) pb, depending on the mass and spin of the resonance. |
| References | ||||
| 1 | CMS Collaboration | Observation of a new boson at a mass of 125 GeV with the CMS experiment at the LHC | PLB 716 (2012) 30 | CMS-HIG-12-028 1207.7235 |
| 2 | CMS Collaboration | Observation of a new boson with mass near 125 GeV in pp collisions at $ \sqrt{s} = $ 7 and 8 TeV | JHEP 06 (2013) 081 | CMS-HIG-12-036 1303.4571 |
| 3 | ATLAS Collaboration | Observation of a new particle in the search for the Standard Model Higgs boson with the ATLAS detector at the LHC | PLB 716 (2012) 1 | 1207.7214 |
| 4 | ATLAS and CMS Collaborations | Combined measurement of the Higgs boson mass in pp collisions at $ \sqrt{s}= $ 7 and 8 TeV with the ATLAS and CMS experiments | PRL 114 (2015) 191803 | 1503.07589 |
| 5 | ATLAS and CMS Collaborations | Measurements of the Higgs boson production and decay rates and constraints on its couplings from a combined ATLAS and CMS analysis of the LHC pp collision data at $ \sqrt{s} = $ 7 and 8 TeV | JHEP 08 (2016) 045 | 1606.02266 |
| 6 | ATLAS Collaboration | Evidence for the spin- 0 nature of the Higgs boson using ATLAS data | PLB 726 (2013) 120 | 1307.1432 |
| 7 | CMS Collaboration | Constraints on the spin-parity and anomalous HVV couplings of the Higgs boson in proton collisions at 7 and 8 TeV | PRD 92 (2015) 012004 | CMS-HIG-14-018 1411.3441 |
| 8 | CMS Collaboration | Measurements of properties of the Higgs boson decaying into the four-lepton final state in pp collisions at $ \sqrt{s}= $ 13 TeV | JHEP 11 (2017) 047 | CMS-HIG-16-041 1706.09936 |
| 9 | F. Englert and R. Brout | Broken symmetry and the mass of gauge vector mesons | PRL 13 (1964) 321 | |
| 10 | P. W. Higgs | Broken symmetries, massless particles and gauge fields | PL12 (1964) 132 | |
| 11 | P. W. Higgs | Broken symmetries and the masses of gauge bosons | PRL 13 (1964) 508 | |
| 12 | G. S. Guralnik, C. R. Hagen, and T. W. B. Kibble | Global conservation laws and massless particles | PRL 13 (1964) 585 | |
| 13 | P. W. Higgs | Spontaneous symmetry breakdown without massless bosons | PR145 (1966) 1156 | |
| 14 | T. W. B. Kibble | Symmetry breaking in non-Abelian gauge theories | PR155 (1967) 1554 | |
| 15 | S. L. Glashow | Partial symmetries of weak interactions | NP 22 (1961) 579 | |
| 16 | S. Weinberg | A model of leptons | PRL 19 (1967) 1264 | |
| 17 | A. Salam | Weak and electromagnetic interactions | Conf. Proc. C 680519 (1968) 367 | |
| 18 | D. de Florian, I. Fabre, and J. Mazzitelli | Triple Higgs production at hadron colliders at NNLO in QCD | JHEP 03 (2020) 155 | 1912.02760 |
| 19 | G. Apollinari et al. | High-Luminosity Large Hadron Collider (HL-LHC): Technical design report V. 0.1 | CERN Yellow Report | |
| 20 | M. Grazzini et al. | Higgs boson pair production at NNLO with top quark mass effects | JHEP 05 (2018) 059 | 1803.02463 |
| 21 | F. A. Dreyer and A. Karlberg | Vector-boson fusion Higgs pair production at N$ ^3 $LO | PRD 98 (2018) 114016 | 1811.07906 |
| 22 | W. Buchmuller and D. Wyler | Effective Lagrangian analysis of new interactions and flavor conservation | NPB 268 (1986) 621 | |
| 23 | B. Grzadkowski, M. Iskrzynski, M. Misiak, and J. Rosiek | Dimension-six terms in the Standard Model Lagrangian | JHEP 10 (2010) 085 | 1008.4884 |
| 24 | A. Carvalho et al. | Higgs pair production: choosing benchmarks with cluster analysis | JHEP 04 (2016) 126 | 1507.02245 |
| 25 | N. Craig, J. Galloway, and S. Thomas | Searching for signs of the second Higgs doublet | 1305.2424 | |
| 26 | D. T. Nhung, M. Muhlleitner, J. Streicher, and K. Walz | Higher order corrections to the trilinear Higgs self-couplings in the real NMSSM | JHEP 1311 (2013) 181 | 1306.3926 |
| 27 | R. Grober and M. Muhlleitner | Composite Higgs boson pair production at the LHC | JHEP 1106 (2011) 020 | 1012.1562 |
| 28 | R. Contino et al. | Strong double Higgs production at the LHC | JHEP 1005 (2010) 089 | 1002.1011 |
| 29 | C. Englert, T. Plehn, D. Zerwas, and P. M. Zerwas | Exploring the Higgs portal | PLB 703 (2011) 298 | 1106.3097 |
| 30 | J. M. No and M. Ramsey-Musolf | Probing the Higgs portal at the LHC through resonant di-Higgs production | PRD 89 (2014) 095031 | 1310.6035 |
| 31 | L. Randall and R. Sundrum | A Large mass hierarchy from a small extra dimension | PRL 83 (1999) 3370 | hep-ph/9905221 |
| 32 | K. Cheung | Phenomenology of radion in Randall-Sundrum scenario | PRD 63 (2001) 056007 | hep-ph/0009232 |
| 33 | U. Baur, T. Plehn, and D. L. Rainwater | Measuring the Higgs boson self-coupling at the LHC and finite top mass matrix elements | PRL 89 (2002) 151801 | hep-ph/0206024 |
| 34 | U. Baur, T. Plehn, and D. L. Rainwater | Determining the Higgs boson self-coupling at hadron colliders | PRD 67 (2003) 033003 | hep-ph/0211224 |
| 35 | Q. Li, Z. Li, Q.-S. Yan, and X. Zhao | Probe Higgs boson pair production via the 3$\ell$ + 2 jets + MET mode | PRD 92 (2015) 014015 | 1503.07611 |
| 36 | A. Adhikary et al. | Revisiting the non-resonant Higgs pair production at the HL-LHC | JHEP 07 (2018) 116 | 1712.05346 |
| 37 | J. Ren et al. | LHC search of new Higgs boson via resonant di-Higgs production with decays into 4W | JHEP 06 (2018) 090 | 1706.05980 |
| 38 | ATLAS Collaboration | Search for Higgs boson pair production in the $ \mathrm{W}\mathrm{W}^{*}\mathrm{W}\mathrm{W}^{*} $ decay channel using ATLAS data recorded at $ \sqrt{s} = $ 13 TeV | JHEP 05 (2019) 124 | 1811.11028 |
| 39 | ATLAS Collaboration | Search for Higgs boson pair production in the $ \gamma\gamma\mathrm{b\bar{b}} $ final state using pp collision data at $ \sqrt{s} = $ 8 TeV from the ATLAS detector | PRL 114 (2015) 081802 | 1406.5053 |
| 40 | CMS Collaboration | Search for two Higgs bosons in final states containing two photons and two bottom quarks in proton-proton collisions at 8 TeV | PRD 94 (2016) 052012 | CMS-HIG-13-032 1603.06896 |
| 41 | CMS Collaboration | Search for Higgs boson pair production in the $ \gamma\gamma\mathrm{b\bar{b}} $ final state in pp collisions at $ \sqrt{s} = $ 13 TeV | PLB 788 (2019) 7 | CMS-HIG-17-008 1806.00408 |
| 42 | ATLAS Collaboration | Search for Higgs boson pair production in the $ \gamma\gamma\mathrm{b\bar{b}} $ final state with 13 TeV pp collision data collected by the ATLAS experiment | JHEP 11 (2018) 040 | 1807.04873 |
| 43 | CMS Collaboration | Search for resonant pair production of Higgs bosons decaying to two bottom quark-antiquark pairs in proton-proton collisions at 8 TeV | PLB 749 (2015) 560 | CMS-HIG-14-013 1503.04114 |
| 44 | ATLAS Collaboration | Search for Higgs boson pair production in the $ \mathrm{b\bar{b}}\mathrm{b\bar{b}} $ final state from pp collisions at $ \sqrt{s} = $ 8 TeV with the ATLAS detector | EPJC 75 (2015) 412 | 1506.00285 |
| 45 | ATLAS Collaboration | Search for pair production of Higgs bosons in the $ \mathrm{b\bar{b}}\mathrm{b\bar{b}} $ final state using proton-proton collisions at $ \sqrt{s} = $ 13 TeV with the ATLAS detector | JHEP 01 (2019) 030 | 1804.06174 |
| 46 | CMS Collaboration | Search for resonant pair production of Higgs bosons decaying to bottom quark-antiquark pairs in proton-proton collisions at 13 TeV | JHEP 08 (2018) 152 | CMS-HIG-17-009 1806.03548 |
| 47 | CMS Collaboration | Search for non-resonant Higgs boson pair production in the $ \mathrm{b\bar{b}}\mathrm{b\bar{b}} $ final state at $ \sqrt{s} = $ 13 TeV | JHEP 04 (2019) 112 | CMS-HIG-17-017 1810.11854 |
| 48 | ATLAS Collaboration | Searches for Higgs boson pair production in the $ \mathrm{H}\mathrm{H} \to \mathrm{b\bar{b}}\tau\tau, $\gamma\gamma\mathrm{W}\mathrm{W}^{*}$, $\gamma\gamma\mathrm{b\bar{b}}$, $\mathrm{b\bar{b}}\mathrm{b\bar{b}} $ channels with the ATLAS detector | PRD 92 (2015) 092004 | 1509.04670 |
| 49 | CMS Collaboration | Search for Higgs boson pair production in the $ \mathrm{b\bar{b}}\tau\tau $ final state in proton-proton collisions at $ \sqrt{s} = $ 8 TeV | PRD 96 (2017) 072004 | CMS-HIG-15-013 1707.00350 |
| 50 | CMS Collaboration | Search for Higgs boson pair production in events with two bottom quarks and two tau leptons in pp collisions at $ \sqrt{s} = $ 13 TeV | PLB 778 (2018) 101 | CMS-HIG-17-002 1707.02909 |
| 51 | ATLAS Collaboration | Search for resonant and non-resonant Higgs boson pair production in the $ \mathrm{b\bar{b}}\tau^{+}\tau^{-} $ decay channel in pp collisions at $ \sqrt{s} = $ 13 TeV with the ATLAS detector | PRL 121 (2018) 191801 | 1808.00336 |
| 52 | CMS Collaboration | Search for resonant and non-resonant Higgs boson pair production in the $ \mathrm{b\bar{b}}\ell\nu\ell\nu $ final state in proton-proton collisions at $ \sqrt{s} = $ 13 TeV | JHEP 01 (2018) 054 | CMS-HIG-17-006 1708.04188 |
| 53 | ATLAS Collaboration | Search for Higgs boson pair production in the $ \gamma\gamma\mathrm{W}\mathrm{W}^{*} $ channel using pp collision data recorded at $ \sqrt{s} = $ 13 TeV with the ATLAS detector | EPJC 78 (2018) 1007 | 1807.08567 |
| 54 | CMS Collaboration | Combination of searches for Higgs boson pair production in proton-proton collisions at $ \sqrt{s} = $ 13 TeV | PRL 122 (2019) 121803 | CMS-HIG-17-030 1811.09689 |
| 55 | CMS Collaboration | Performance of the CMS Level-1 trigger in proton-proton collisions at $ \sqrt{s} = $ 13 TeV | JINST 15 (2020) P10017 | CMS-TRG-17-001 2006.10165 |
| 56 | CMS Collaboration | The CMS trigger system | JINST 12 (2017) P01020 | CMS-TRG-12-001 1609.02366 |
| 57 | CMS Collaboration | The CMS experiment at the CERN LHC | JINST 3 (2008) S08004 | CMS-00-001 |
| 58 | CMS Collaboration | Precision luminosity measurement in proton-proton collisions at $ \sqrt{s} = $ 13 TeV in 2015 and 2016 at CMS | EPJC 81 (2021) 800 | CMS-LUM-17-003 2104.01927 |
| 59 | CMS Collaboration | CMS luminosity measurement for the 2017 data-taking period at $ \sqrt{s} = $ 13 TeV | CMS-PAS-LUM-17-004 | CMS-PAS-LUM-17-004 |
| 60 | CMS Collaboration | CMS luminosity measurement for the 2018 data-taking period at $ \sqrt{s} = $ 13 TeV | CMS-PAS-LUM-18-002 | CMS-PAS-LUM-18-002 |
| 61 | M. Capozi and G. Heinrich | Exploring anomalous couplings in Higgs boson pair production through shape analysis | JHEP 03 (2020) 091 | 1908.08923 |
| 62 | G. Buchalla et al. | Higgs boson pair production in non-linear effective field theory with full $ m_{\Ptop} $-dependence at NLO QCD | JHEP 09 (2018) 057 | 1806.05162 |
| 63 | A. Carvalho et al. | On the reinterpretation of non-resonant searches for Higgs boson pairs | JHEP 02 (2021) 049 | 1710.08261 |
| 64 | J. Alwall et al. | The automated computation of tree-level and next-to-leading order differential cross sections, and their matching to parton shower simulations | JHEP 07 (2014) 079 | 1405.0301 |
| 65 | A. Kalogeropoulos and J. Alwall | The SysCalc code: A tool to derive theoretical systematic uncertainties | 1801.08401 | |
| 66 | P. Nason | A new method for combining NLO QCD with shower Monte Carlo algorithms | JHEP 11 (2004) 040 | hep-ph/0409146 |
| 67 | S. Frixione, P. Nason, and C. Oleari | Matching NLO QCD computations with parton shower simulations: the POWHEG method | JHEP 11 (2007) 070 | 0709.2092 |
| 68 | S. Alioli, P. Nason, C. Oleari, and E. Re | A general framework for implementing NLO calculations in shower Monte Carlo programs: the POWHEG box | JHEP 06 (2010) 043 | 1002.2581 |
| 69 | T. Melia, P. Nason, R. Rontsch, and G. Zanderighi | $ \mathrm{W}^{+}\mathrm{W}^{-} $, $ \mathrm{W}\mathrm{Z} $ and $ \mathrm{Z}\mathrm{Z} $ production in the POWHEG BOX | JHEP 11 (2011) 078 | 1107.5051 |
| 70 | P. Nason and G. Zanderighi | $ W^+ W^- $ , $ W Z $ and $ Z Z $ production in the POWHEG-BOX-V2 | EPJC 74 (2014) 2702 | 1311.1365 |
| 71 | J. M. Campbell, R. K. Ellis, P. Nason, and E. Re | Top-pair production and decay at NLO matched with parton showers | JHEP 04 (2015) 114 | 1412.1828 |
| 72 | S. Alioli, S.-O. Moch, and P. Uwer | Hadronic top-quark pair-production with one jet and parton showering | JHEP 01 (2012) 137 | 1110.5251 |
| 73 | S. Alioli, P. Nason, C. Oleari, and E. Re | NLO single-top production matched with shower in POWHEG: s- and t-channel contributions | JHEP 09 (2009) 111 | 0907.4076 |
| 74 | E. Re | Single-top Wt-channel production matched with parton showers using the POWHEG method | EPJC 71 (2011) 1547 | 1009.2450 |
| 75 | R. Frederix, E. Re, and P. Torrielli | Single-top t-channel hadroproduction in the four-flavour scheme with POWHEG and aMC@NLO | JHEP 09 (2012) 130 | 1207.5391 |
| 76 | S. Alioli, P. Nason, C. Oleari, and E. Re | NLO Higgs boson production via gluon fusion matched with shower in POWHEG | JHEP 04 (2009) 002 | 0812.0578 |
| 77 | P. Nason and C. Oleari | NLO Higgs boson production via vector-boson fusion matched with shower in POWHEG | JHEP 02 (2010) 037 | 0911.5299 |
| 78 | K. Mimasu, V. Sanz, and C. Williams | Higher order QCD predictions for associated Higgs production with anomalous couplings to gauge bosons | JHEP 08 (2016) 039 | 1512.02572 |
| 79 | G. Heinrich et al. | NLO predictions for Higgs boson pair production with full top quark mass dependence matched to parton showers | JHEP 08 (2017) 088 | 1703.09252 |
| 80 | G. Heinrich et al. | Probing the trilinear Higgs boson coupling in di-Higgs production at NLO QCD including parton shower effects | JHEP 06 (2019) 066 | 1903.08137 |
| 81 | J. Davies et al. | Double Higgs boson production at NLO: combining the exact numerical result and high-energy expansion | JHEP 11 (2019) 024 | 1907.06408 |
| 82 | G. Heinrich, S. P. Jones, M. Kerner, and L. Scyboz | A non-linear EFT description of gg $\to $ HH at NLO interfaced to POWHEG | JHEP 10 (2020) 021 | 2006.16877 |
| 83 | B. Hespel, D. Lopez-Val, and E. Vryonidou | Higgs pair production via gluon fusion in the two-Higgs-doublet model | JHEP 09 (2014) 124 | 1407.0281 |
| 84 | A. Oliveira | Gravity particles from warped extra dimensions, predictions for LHC | 1404.0102 | |
| 85 | NNPDF Collaboration | Parton distributions for the LHC Run II | JHEP 04 (2015) 040 | 1410.8849 |
| 86 | NNPDF Collaboration | Parton distributions from high-precision collider data | EPJC 77 (2017) 663 | 1706.00428 |
| 87 | J. Butterworth et al. | PDF4LHC recommendations for LHC Run II | JPG 43 (2016) 023001 | 1510.03865 |
| 88 | J. Rojo et al. | The PDF4LHC report on PDFs and LHC data: Results from Run I and preparation for Run II | JPG 42 (2015) 103103 | 1507.00556 |
| 89 | A. Accardi et al. | A critical appraisal and evaluation of modern PDFs | EPJC 76 (2016) 471 | 1603.08906 |
| 90 | T. Sjostrand et al. | An introduction to $ PYTHIA 8.2 $ | CPC 191 (2015) 159 | 1410.3012 |
| 91 | CMS Collaboration | Event generator tunes obtained from underlying event and multiparton scattering measurements | EPJC 76 (2016) 155 | CMS-GEN-14-001 1512.00815 |
| 92 | CMS Collaboration | Extraction and validation of a new set of CMS $ PYTHIA 8 $ tunes from underlying-event measurements | EPJC. 80 (2020) 4 | CMS-GEN-17-001 1903.12179 |
| 93 | P. Skands, S. Carrazza, and J. Rojo | Tuning PYTHIA 8.1: the Monash 2013 tune | EPJC 74 (2014) 3024 | 1404.5630 |
| 94 | GEANT4 Collaboration | $ GEANT4: $ a simulation toolkit | NIMA 506 (2003) 250 | |
| 95 | CMS Collaboration | Particle-flow reconstruction and global event description with the CMS detector | JINST 12 (2017) P10003 | CMS-PRF-14-001 1706.04965 |
| 96 | M. Cacciari, G. P. Salam, and G. Soyez | The anti-$ {k_{\mathrm{T}}} $ jet clustering algorithm | JHEP 04 (2008) 063 | 0802.1189 |
| 97 | M. Cacciari, G. P. Salam, and G. Soyez | $ FastJet $ user manual | EPJC 72 (2012) 1896 | 1111.6097 |
| 98 | CMS Collaboration | Performance of electron reconstruction and selection with the CMS detector in pp collisions at $ \sqrt{s} = $ 8 TeV | JINST 10 (2015) P06005 | CMS-EGM-13-001 1502.02701 |
| 99 | CMS Collaboration | Measurement of the Higgs boson production rate in association with top quarks in final states with electrons, muons, and hadronically decaying tau leptons at $ \sqrt{s} = $ 13 TeV | EPJC 81 (2021) 378 | CMS-HIG-19-008 2011.03652 |
| 100 | CMS Collaboration | Performance of the CMS muon detector and muon reconstruction with proton-proton collisions at $ \sqrt{s} = $ 13 TeV | JINST 13 (2018) P06015 | CMS-MUO-16-001 1804.04528 |
| 101 | CMS Collaboration | Performance of reconstruction and identification of $ \tau $ leptons decaying to hadrons and $ \nu_{\tau} $ in pp collisions at $ \sqrt{s} = $ 13 TeV | JINST 13 (2018) P10005 | CMS-TAU-16-003 1809.02816 |
| 102 | CMS Collaboration | Performance of the DeepTau algorithm for the discrimination of taus against jets, electrons, and muons | CMS-DP-2019-033 | |
| 103 | Y. Lecun | Generalization and network design strategies | of the University of Toronto, CRG-TR-89-4 | |
| 104 | CMS Collaboration | Jet energy scale and resolution in the CMS experiment in pp collisions at 8 TeV | JINST 12 (2017) P02014 | CMS-JME-13-004 1607.03663 |
| 105 | CMS Collaboration | Search for resonances decaying to a pair of Higgs bosons in the $ \mathrm{b\bar{b}}\mathrmP\{q\bar{q}}'\ell\nu $ final state in proton-proton collisions at $ \sqrt{s} = $ 13 TeV | JHEP 10 (2019) 125 | 1904.04193 |
| 106 | CMS Collaboration | CMS Phase 1 heavy flavour identification performance and developments | CMS-DP-2017-013 | |
| 107 | CMS Collaboration | Performance of missing transverse momentum reconstruction in proton-proton collisions at $ \sqrt{s} = $ 13 TeV using the CMS detector | JINST 14 (2019) P07004 | CMS-JME-17-001 1903.06078 |
| 108 | CMS Collaboration | Evidence for associated production of a Higgs boson with a top quark pair in final states with electrons, muons, and hadronically decaying $ \tau $ leptons at $ \sqrt{s} = $ 13 TeV | JHEP 08 (2018) 066 | CMS-HIG-17-018 1803.05485 |
| 109 | CMS Collaboration | Search for non-resonant Higgs boson pair production in the four leptons plus two b jets final state in proton-proton collisions at $ \sqrt{s} = $ 13 TeV | CMS-PAS-HIG-20-004 | CMS-PAS-HIG-20-004 |
| 110 | L. Breiman, J. Friedman, R. A. Olshen, and C. J. Stone | Classification and regression trees | Chapman and Hall/CRC, 1984 ISBN 978-0-412-04841-8 | |
| 111 | K. Ehataht, L. Marzola, and C. Veelken | Reconstruction of the mass of Higgs boson pairs in events with Higgs boson pairs decaying into four $ \tau $ leptons | 1809.06140 | |
| 112 | T. Chen and C. Guestrin | XGBoost: A scalable tree boosting system | 1603.02754 | |
| 113 | F. Pedregosa et al. | Scikit-learn: Machine learning in Python | JMLR 12 (2011) 2825 | 1201.0490 |
| 114 | L. Tani, D. Rand, C. Veelken, and M. Kadastik | Evolutionary algorithms for hyperparameter optimization in machine learning for application in high energy physics | EPJC 81 (2021) 170 | 2011.04434 |
| 115 | J. Baglio et al. | $ gg\to HH $ : Combined uncertainties | PRD 103 (2021) 056002 | 2008.11626 |
| 116 | G. Cowan, K. Cranmer, E. Gross, and O. Vitells | Asymptotic formulae for likelihood-based tests of new physics | EPJC 71 (2011) 1554 | 1007.1727 |
| 117 | ATLAS and CMS Collaborations and LHC Higgs Combination Group | Procedure for the LHC Higgs boson search combination in summer 2011 | technical report | |
| 118 | J. S. Conway | Incorporating nuisance parameters in likelihoods for multisource spectra | in PHYSTAT 2011, p. 115 2011 | 1103.0354 |
| 119 | R. J. Barlow and C. Beeston | Fitting using finite Monte Carlo samples | CPC 77 (1993) 219 | |
| 120 | T. Junk | Confidence level computation for combining searches with small statistics | NIMA 434 (1999) 435 | hep-ex/9902006 |
| 121 | A. L. Read | Presentation of search results: The $ \textrm{CL}_{s} $ technique | JPG 28 (2002) 2693 | |
| 122 | CMS Collaboration | Search for nonresonant Higgs boson pair production in final states with two bottom quarks and two photons in proton-proton collisions at $ \sqrt{s} = $ 13 TeV | JHEP 03 (2021) 257 | CMS-HIG-19-018 2011.12373 |
| 123 | ATLAS Collaboration | Combination of searches for Higgs boson pairs in pp collisions at s=13TeV with the ATLAS detector | PLB 800 (2020) 135103 | 1906.02025 |
| 124 | F. Maltoni, D. Pagani, A. Shivaji, and X. Zhao | Trilinear Higgs coupling determination via single-Higgs differential measurements at the LHC | EPJC 77 (2017) 887 | 1709.08649 |
| 125 | G. Degrassi, P. P. Giardino, F. Maltoni, and D. Pagani | Probing the Higgs self coupling via single Higgs production at the LHC | JHEP 12 (2016) 080 | 1607.04251 |
|
|
Compact Muon Solenoid LHC, CERN |
|

|

|

|

|

|