

Compact Muon Solenoid
LHC, CERN
| CMS-PAS-GEN-19-001 | ||
| Extraction and validation of a set of HERWIG 7 tunes from CMS underlying-event measurements | ||
| CMS Collaboration | ||
| May 2020 | ||
| Abstract: This note presents a new set of parameters ("tunes") for the underlying-event model of the HERWIG 7 event generator. The parameters control the description of multiple-parton interactions (MPI) and colour reconnection in HERWIG 7, and are obtained from a fit to underlying-event and minimum-bias data collected by the CMS experiment at $\sqrt{s}=$ 0.9, 7, and 13 TeV. The tunes are based on the NNPDF3.13.1 next-to-next-to-leading-order PDF set for the parton shower, and either a leading-order or next-to-next-to-leading-order PDF set for the simulation of MPI and the beam remnants. Predictions utilizing the tunes are produced for event-shape observables, and minimum-bias, dijet, top quark pair, and weak boson events, and are compared to data. Each of the new tunes describe the data to a reasonable level, and the tunes using a leading-order PDF for the simulation of MPI are found to provide the best description of the data. | ||
|
Links:
CDS record (PDF) ;
CADI line (restricted) ;
These preliminary results are superseded in this paper, EPJC 81 (2021) 312. The superseded preliminary plots can be found here. |
||
| Figures | |
png pdf |
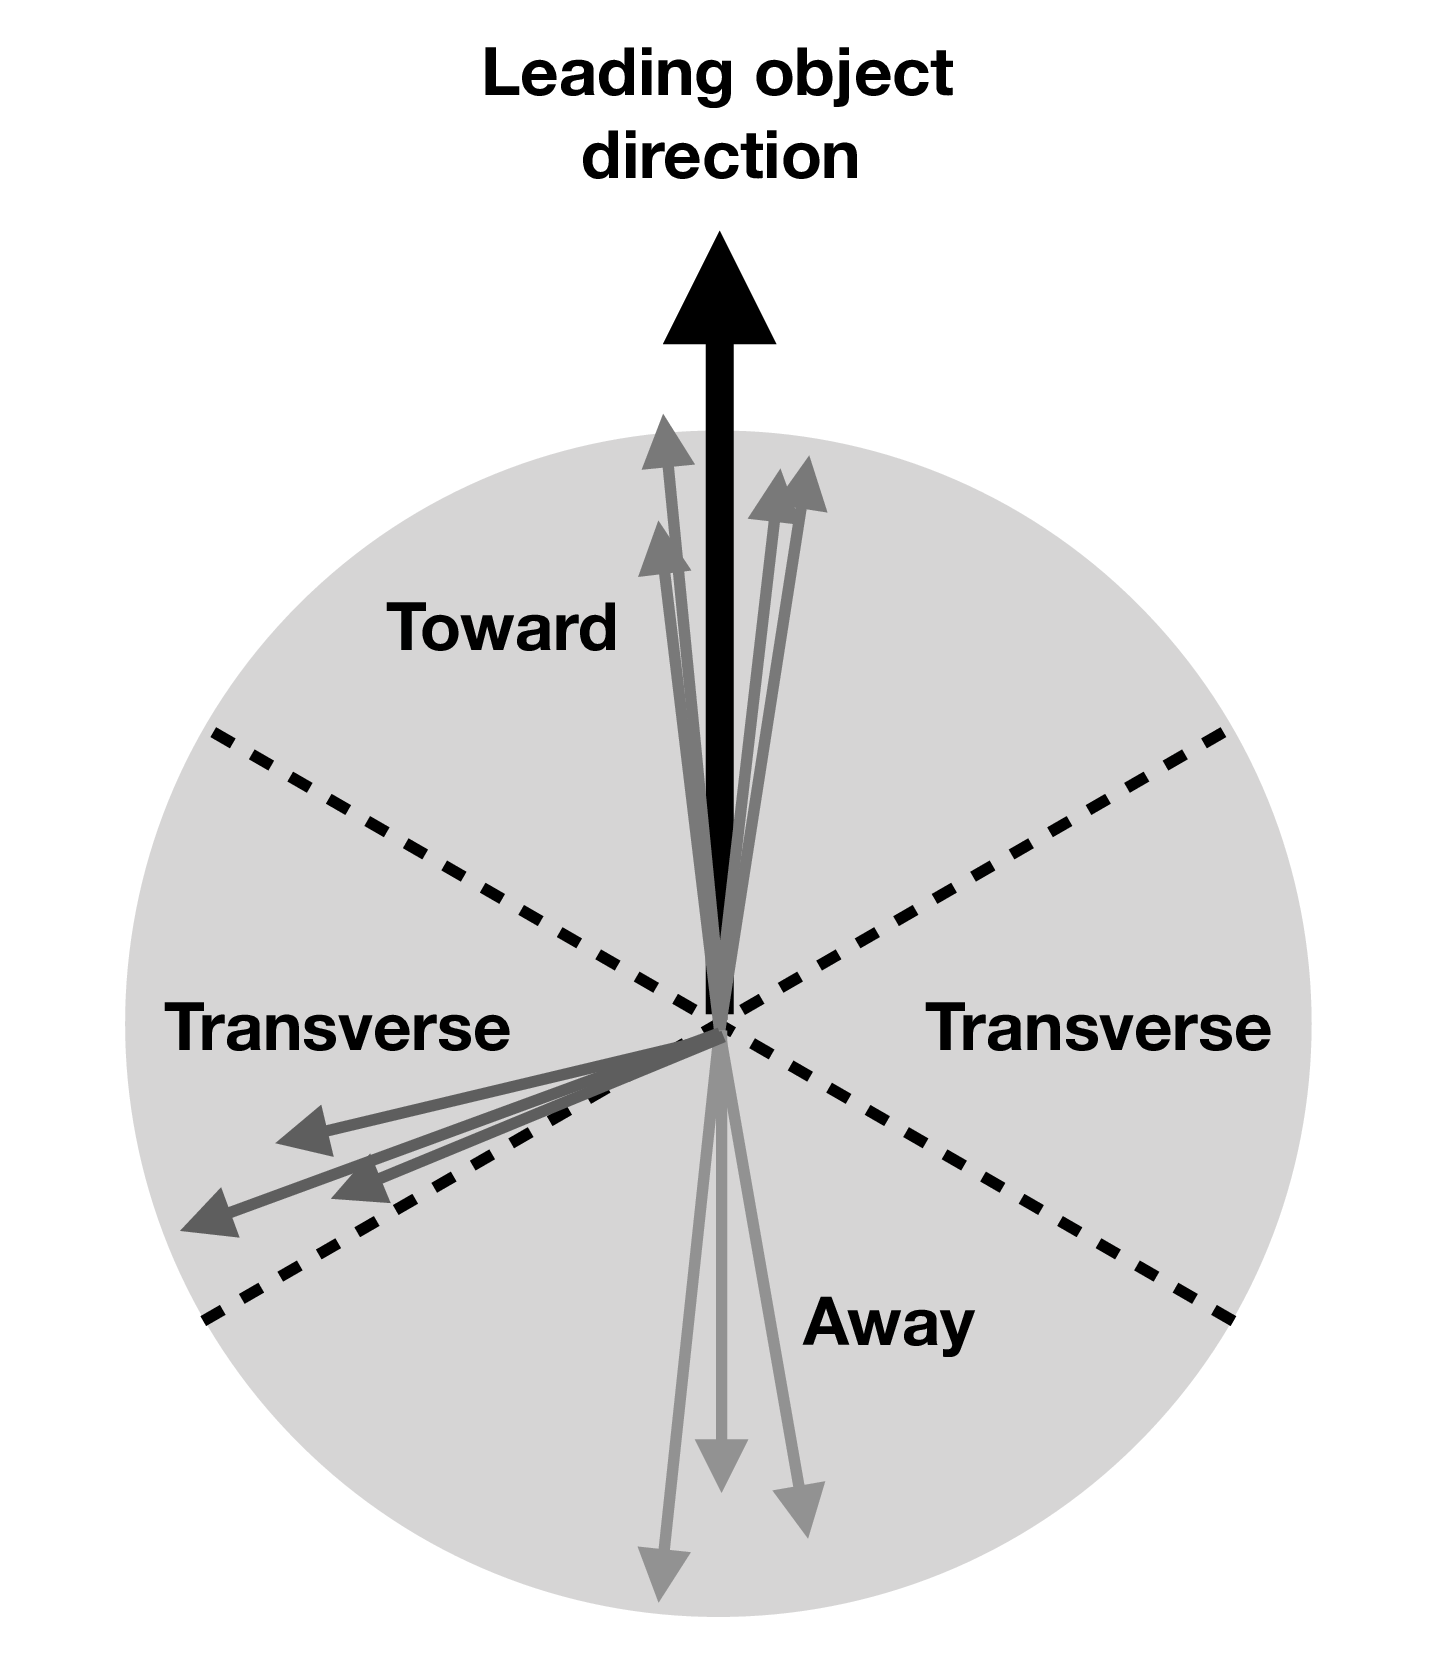
Figure 1:
Illustration of the different $\phi $ regions, with respect to the leading object in an event, used to probe the properties of the UE in experimental measurements. |
png pdf |
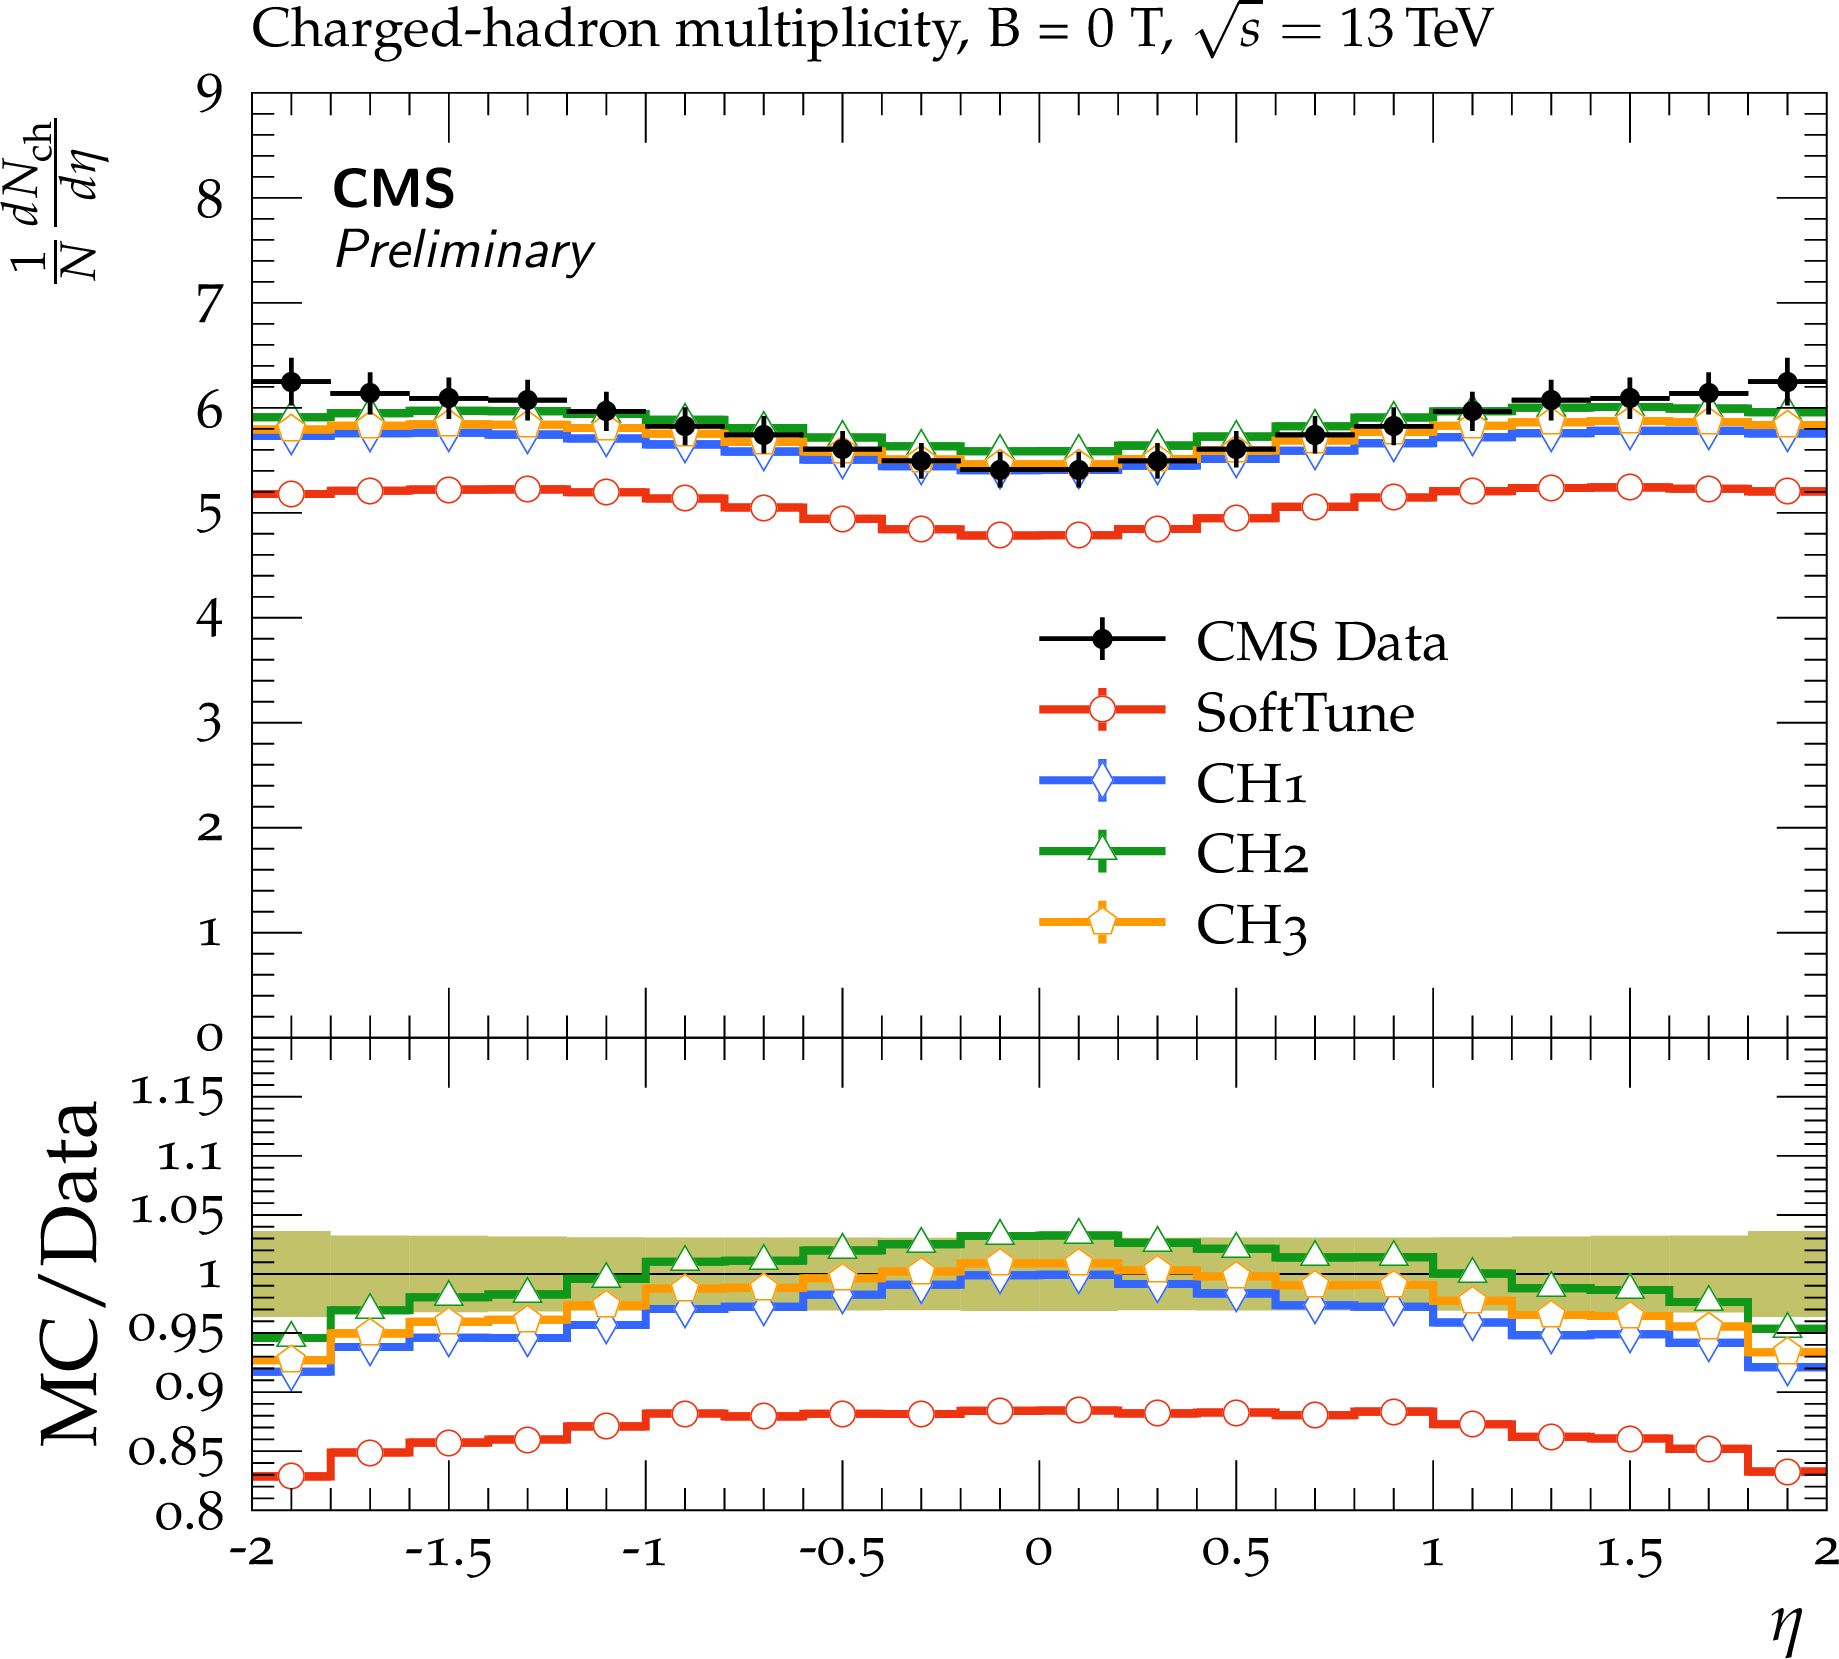
Figure 2:
CMS data at $ {\sqrt {s}} = $ 13 TeV on the ${\frac {dN_{\mathrm {ch}}}{d\eta}}$, the pseudorapidity of charged hadrons [26]. The data are compared to predictions from HERWIG 7, with the SoftTune and CH tunes. The coloured band in the ratios of the different predictions from simulation to the data represents the total experimental uncertainty in the data. |
png pdf |
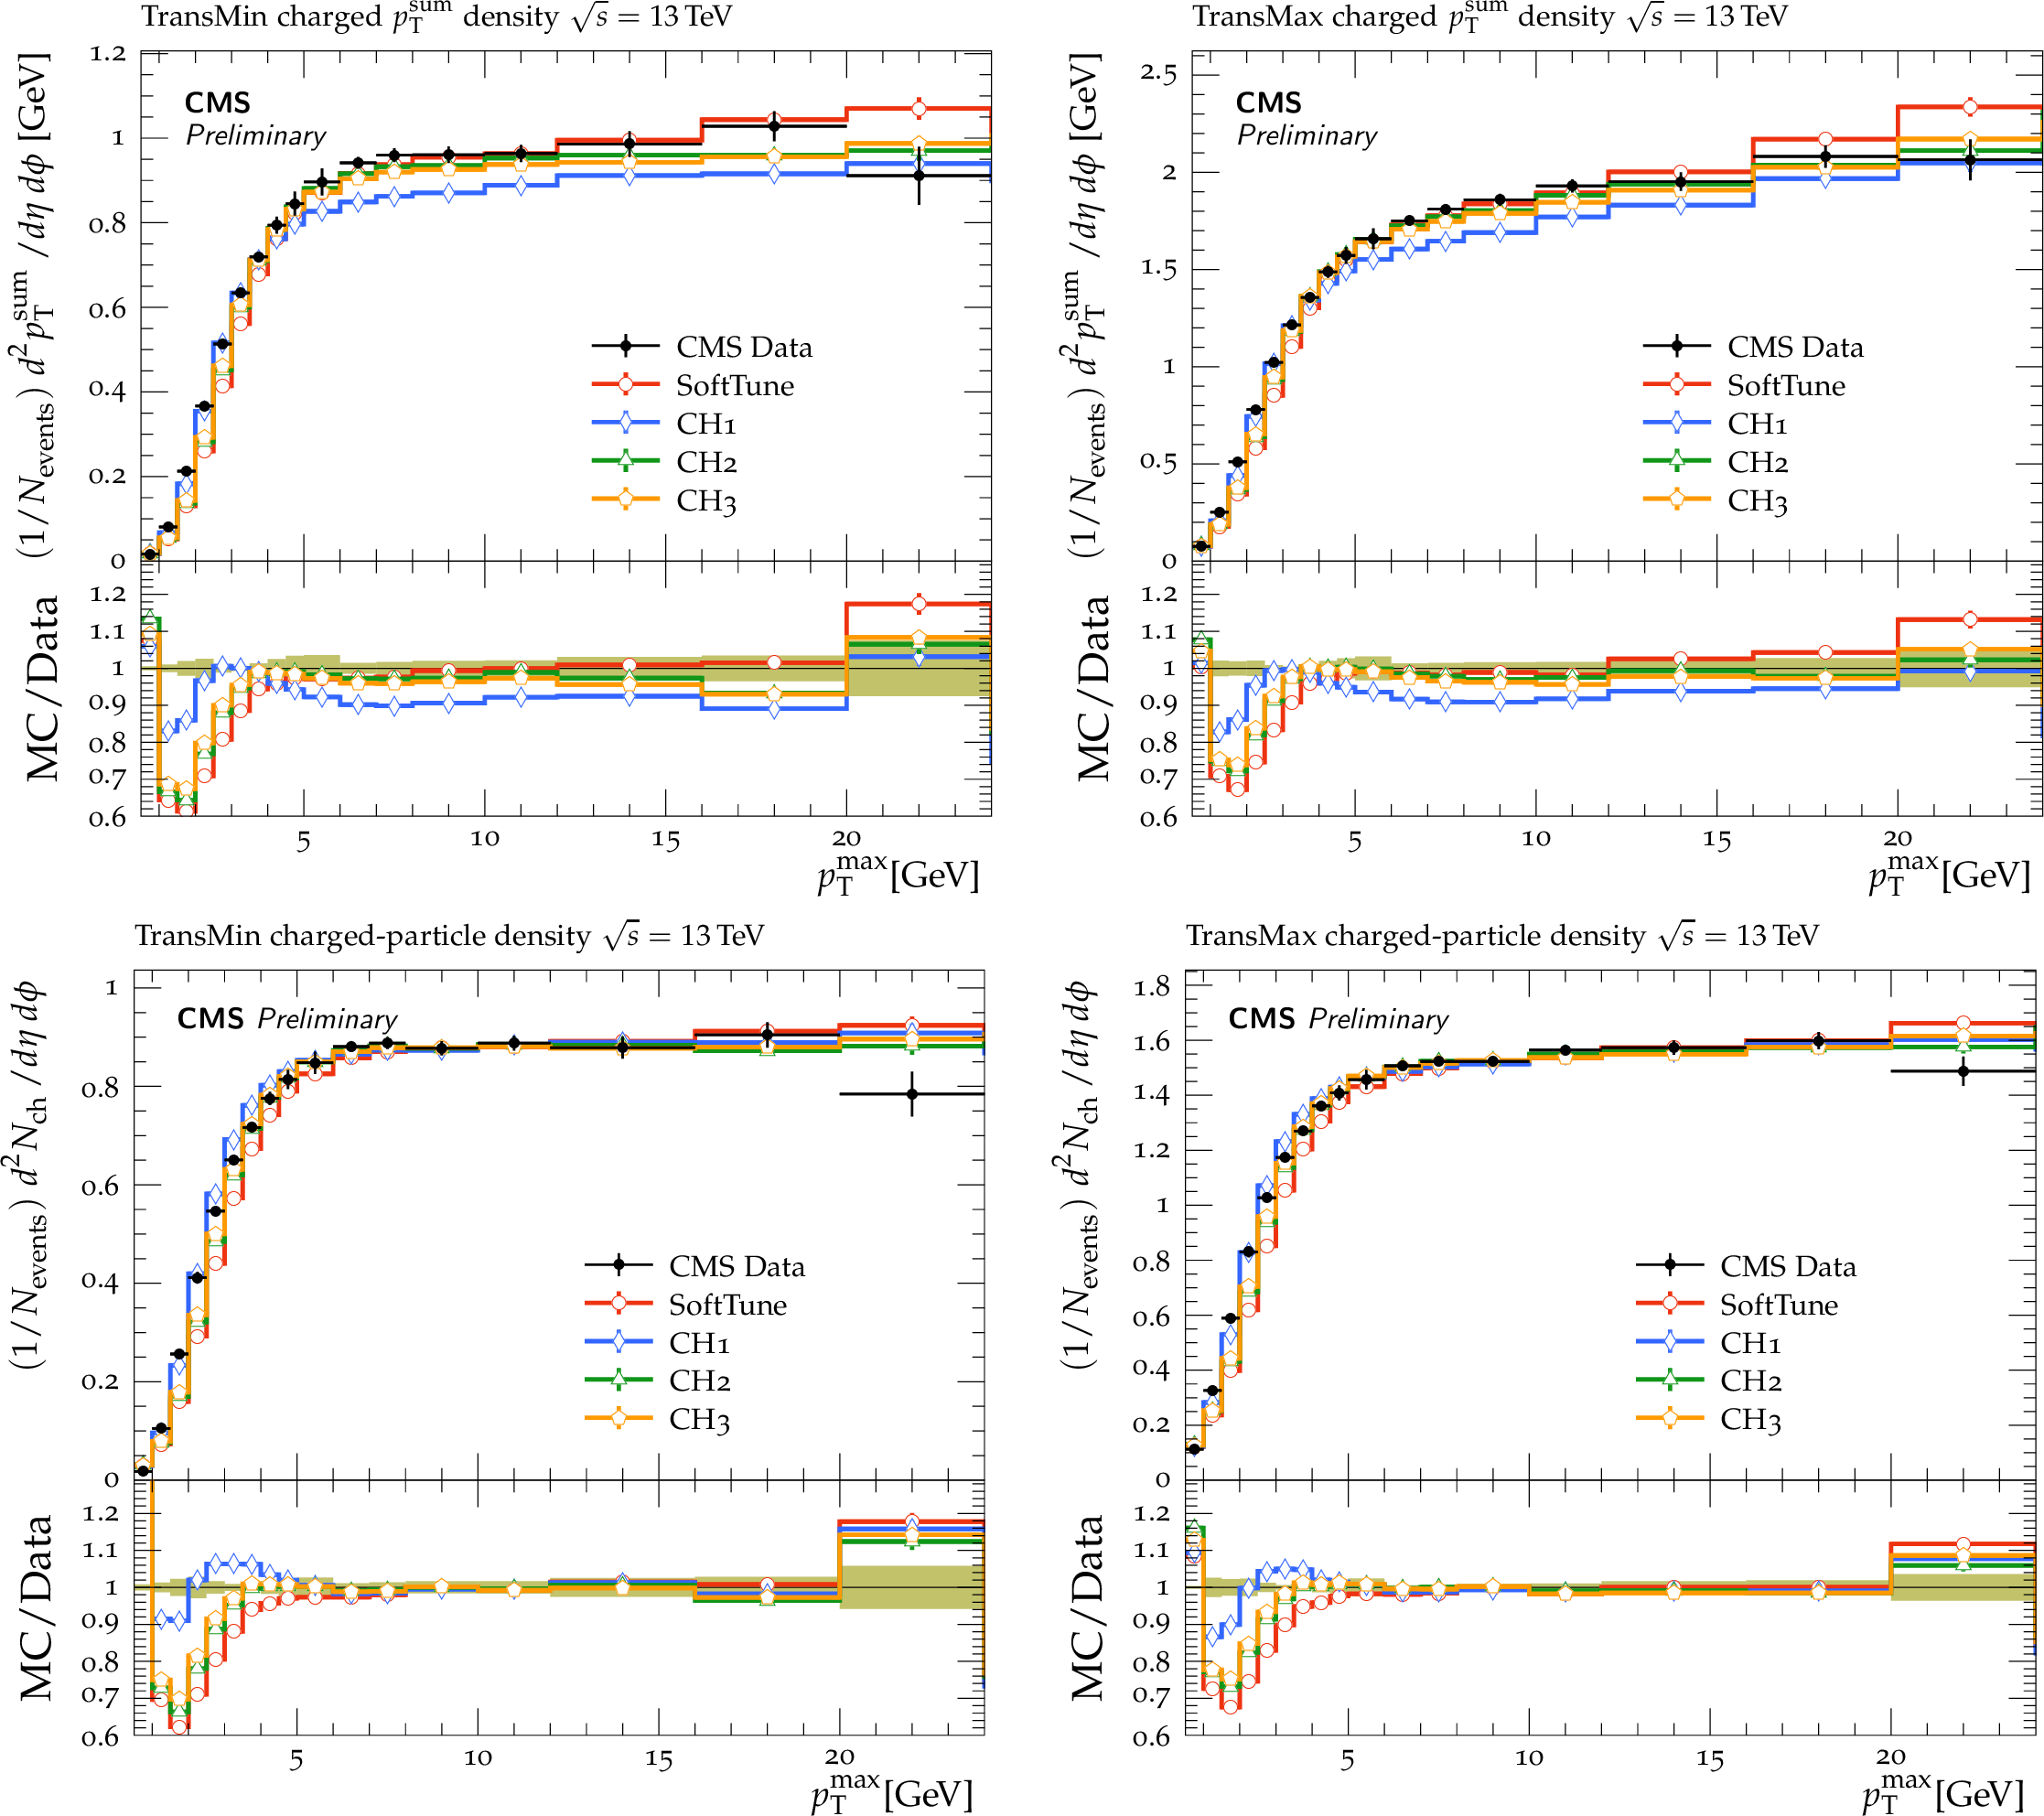
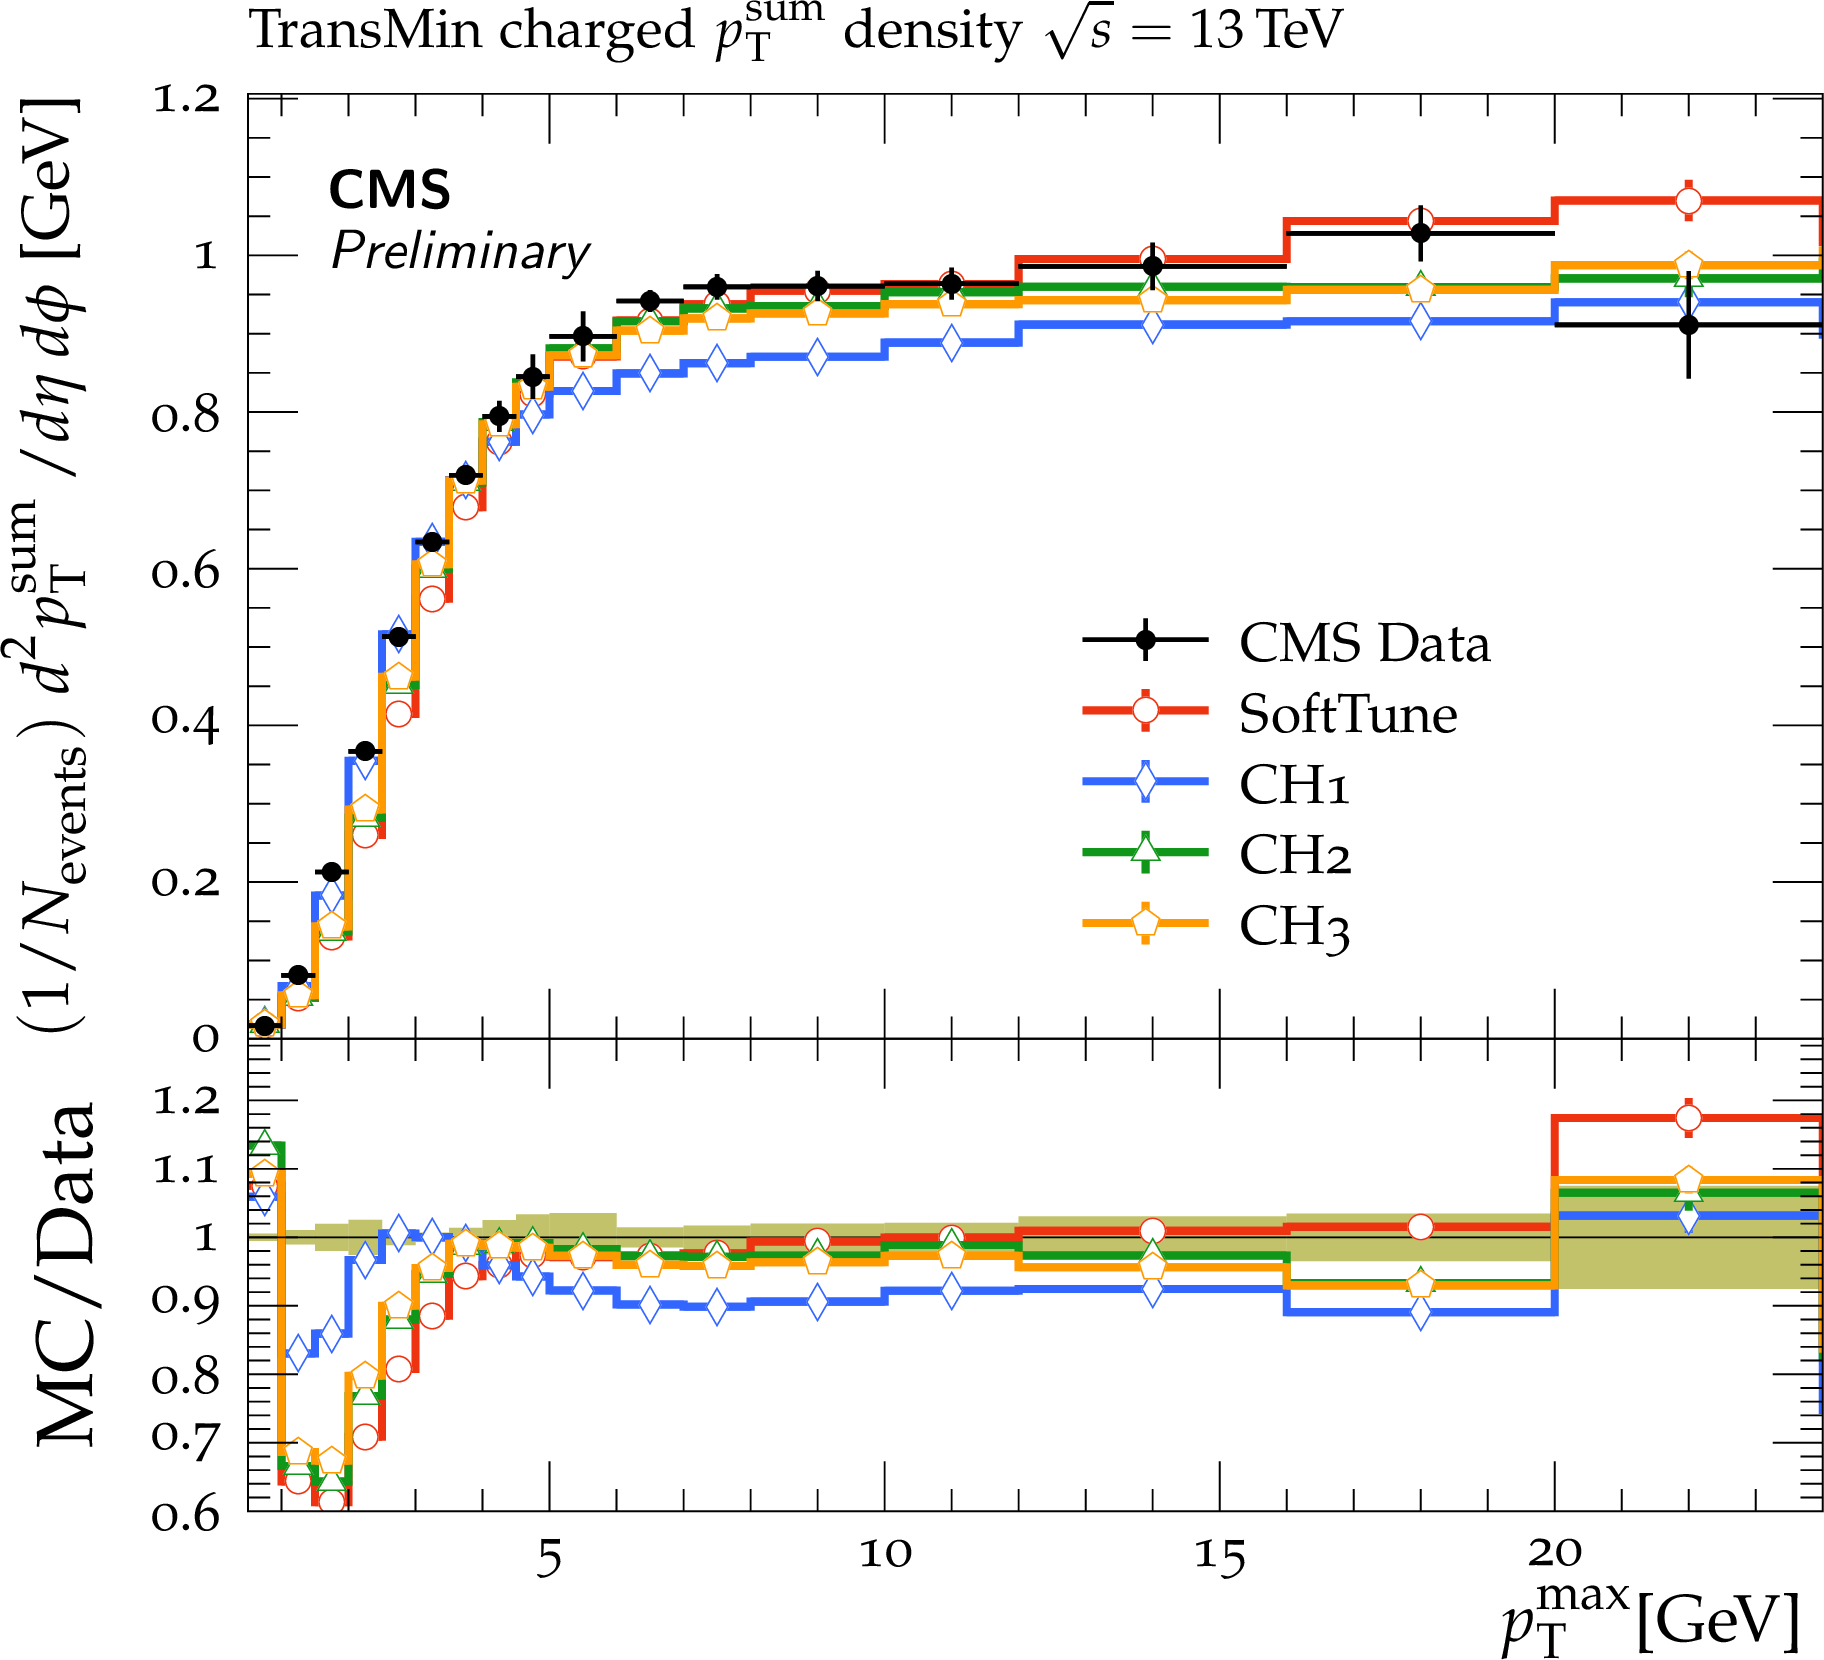
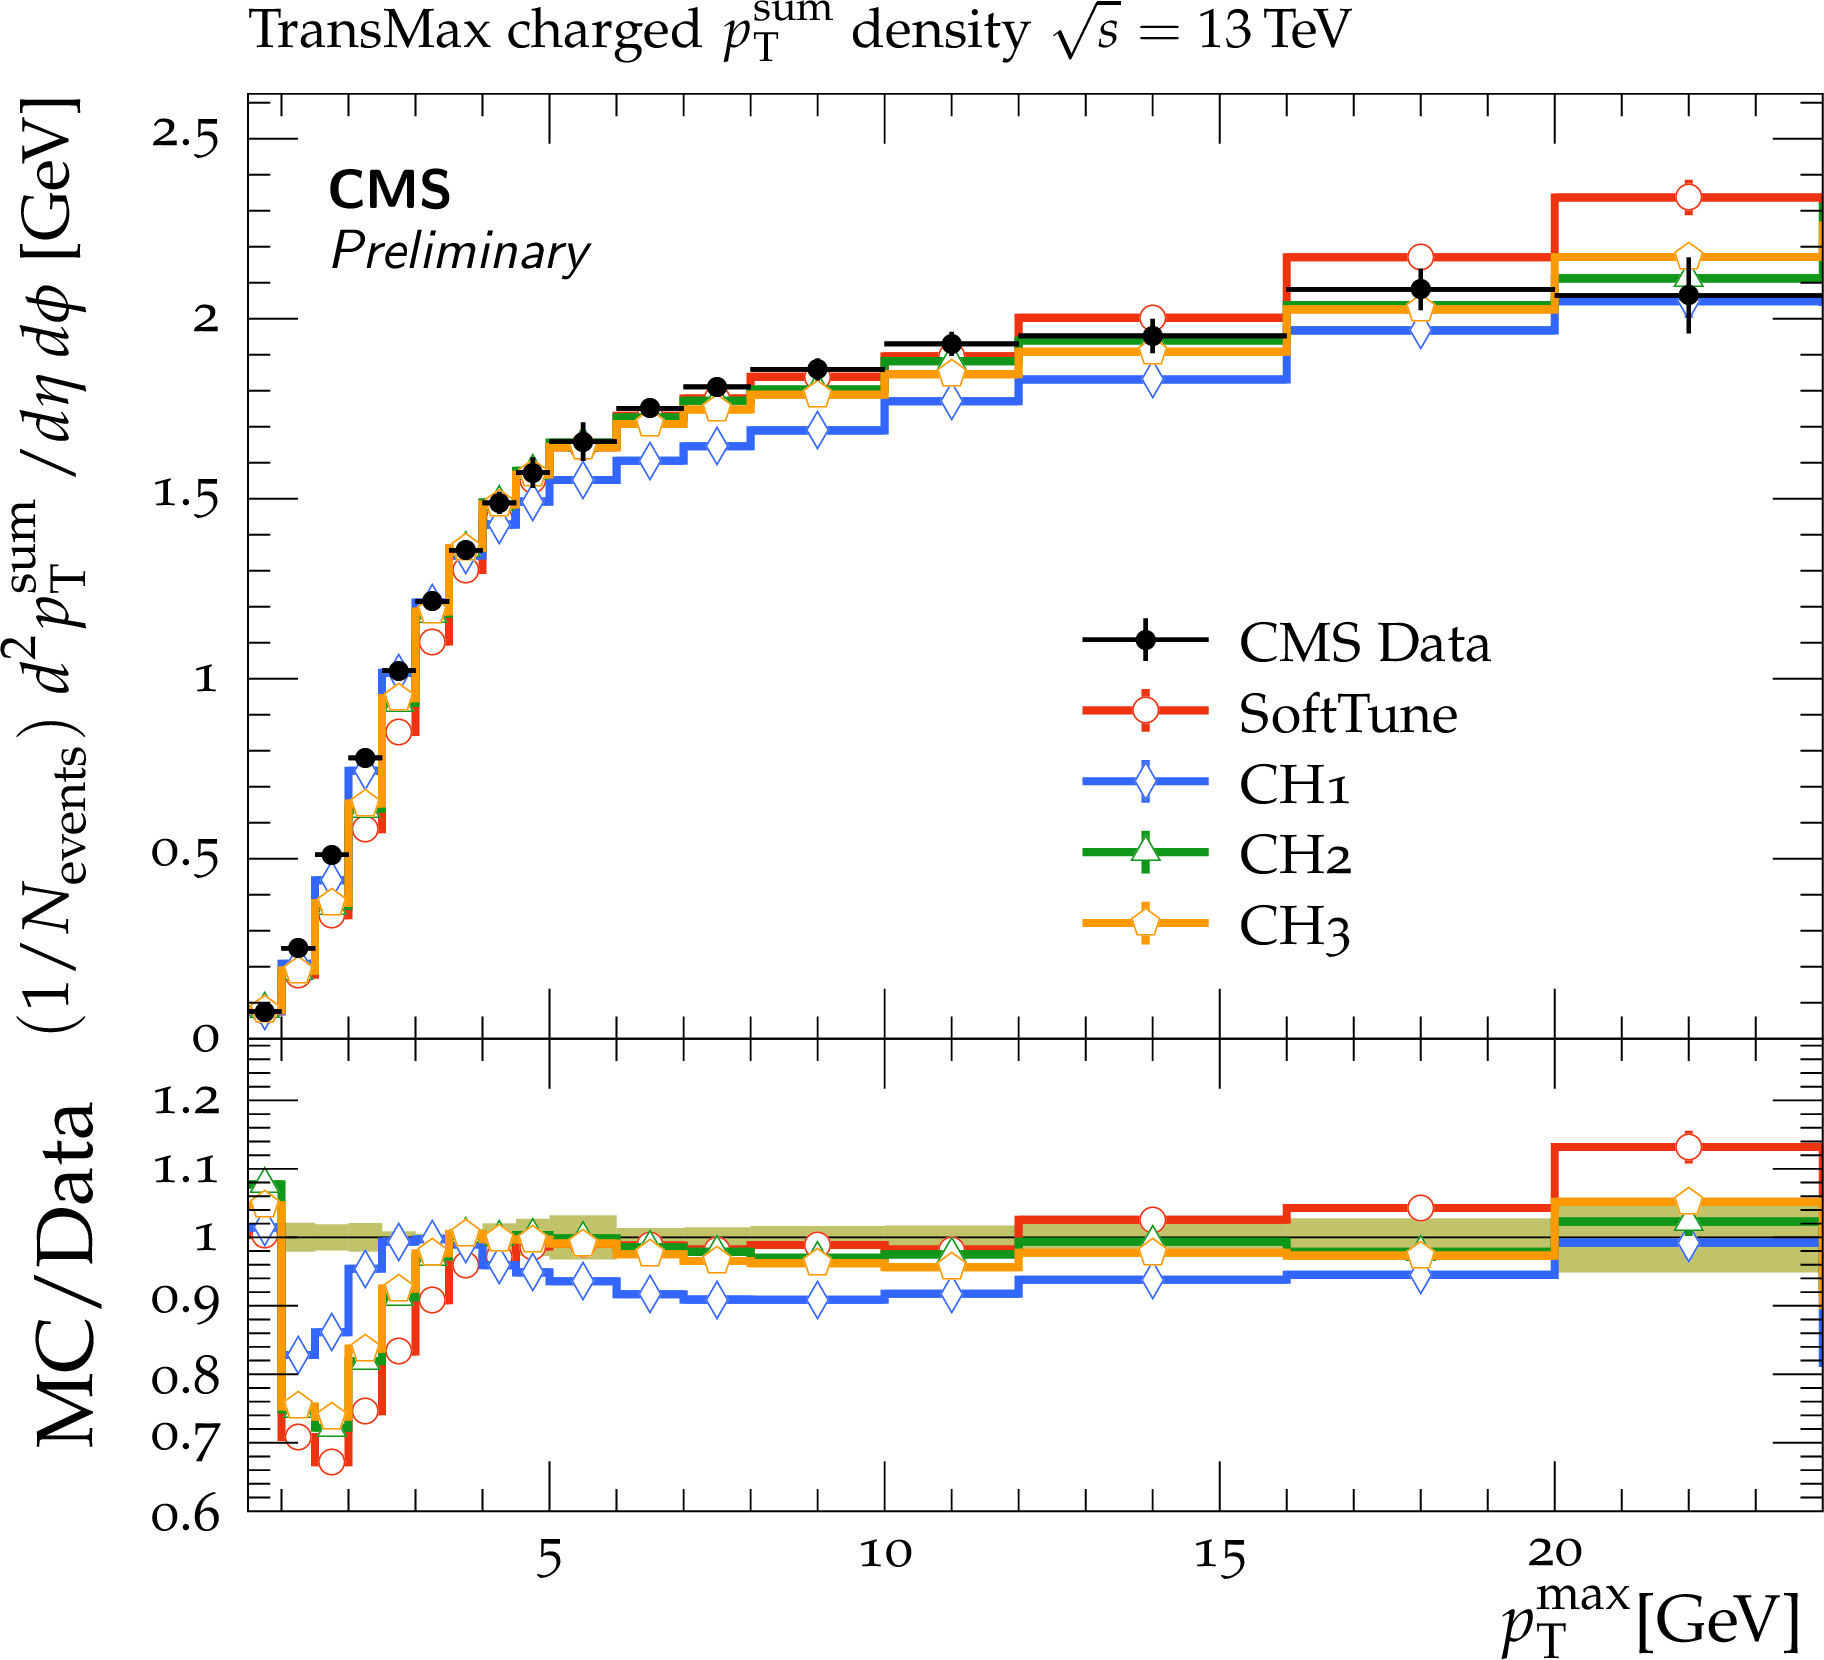
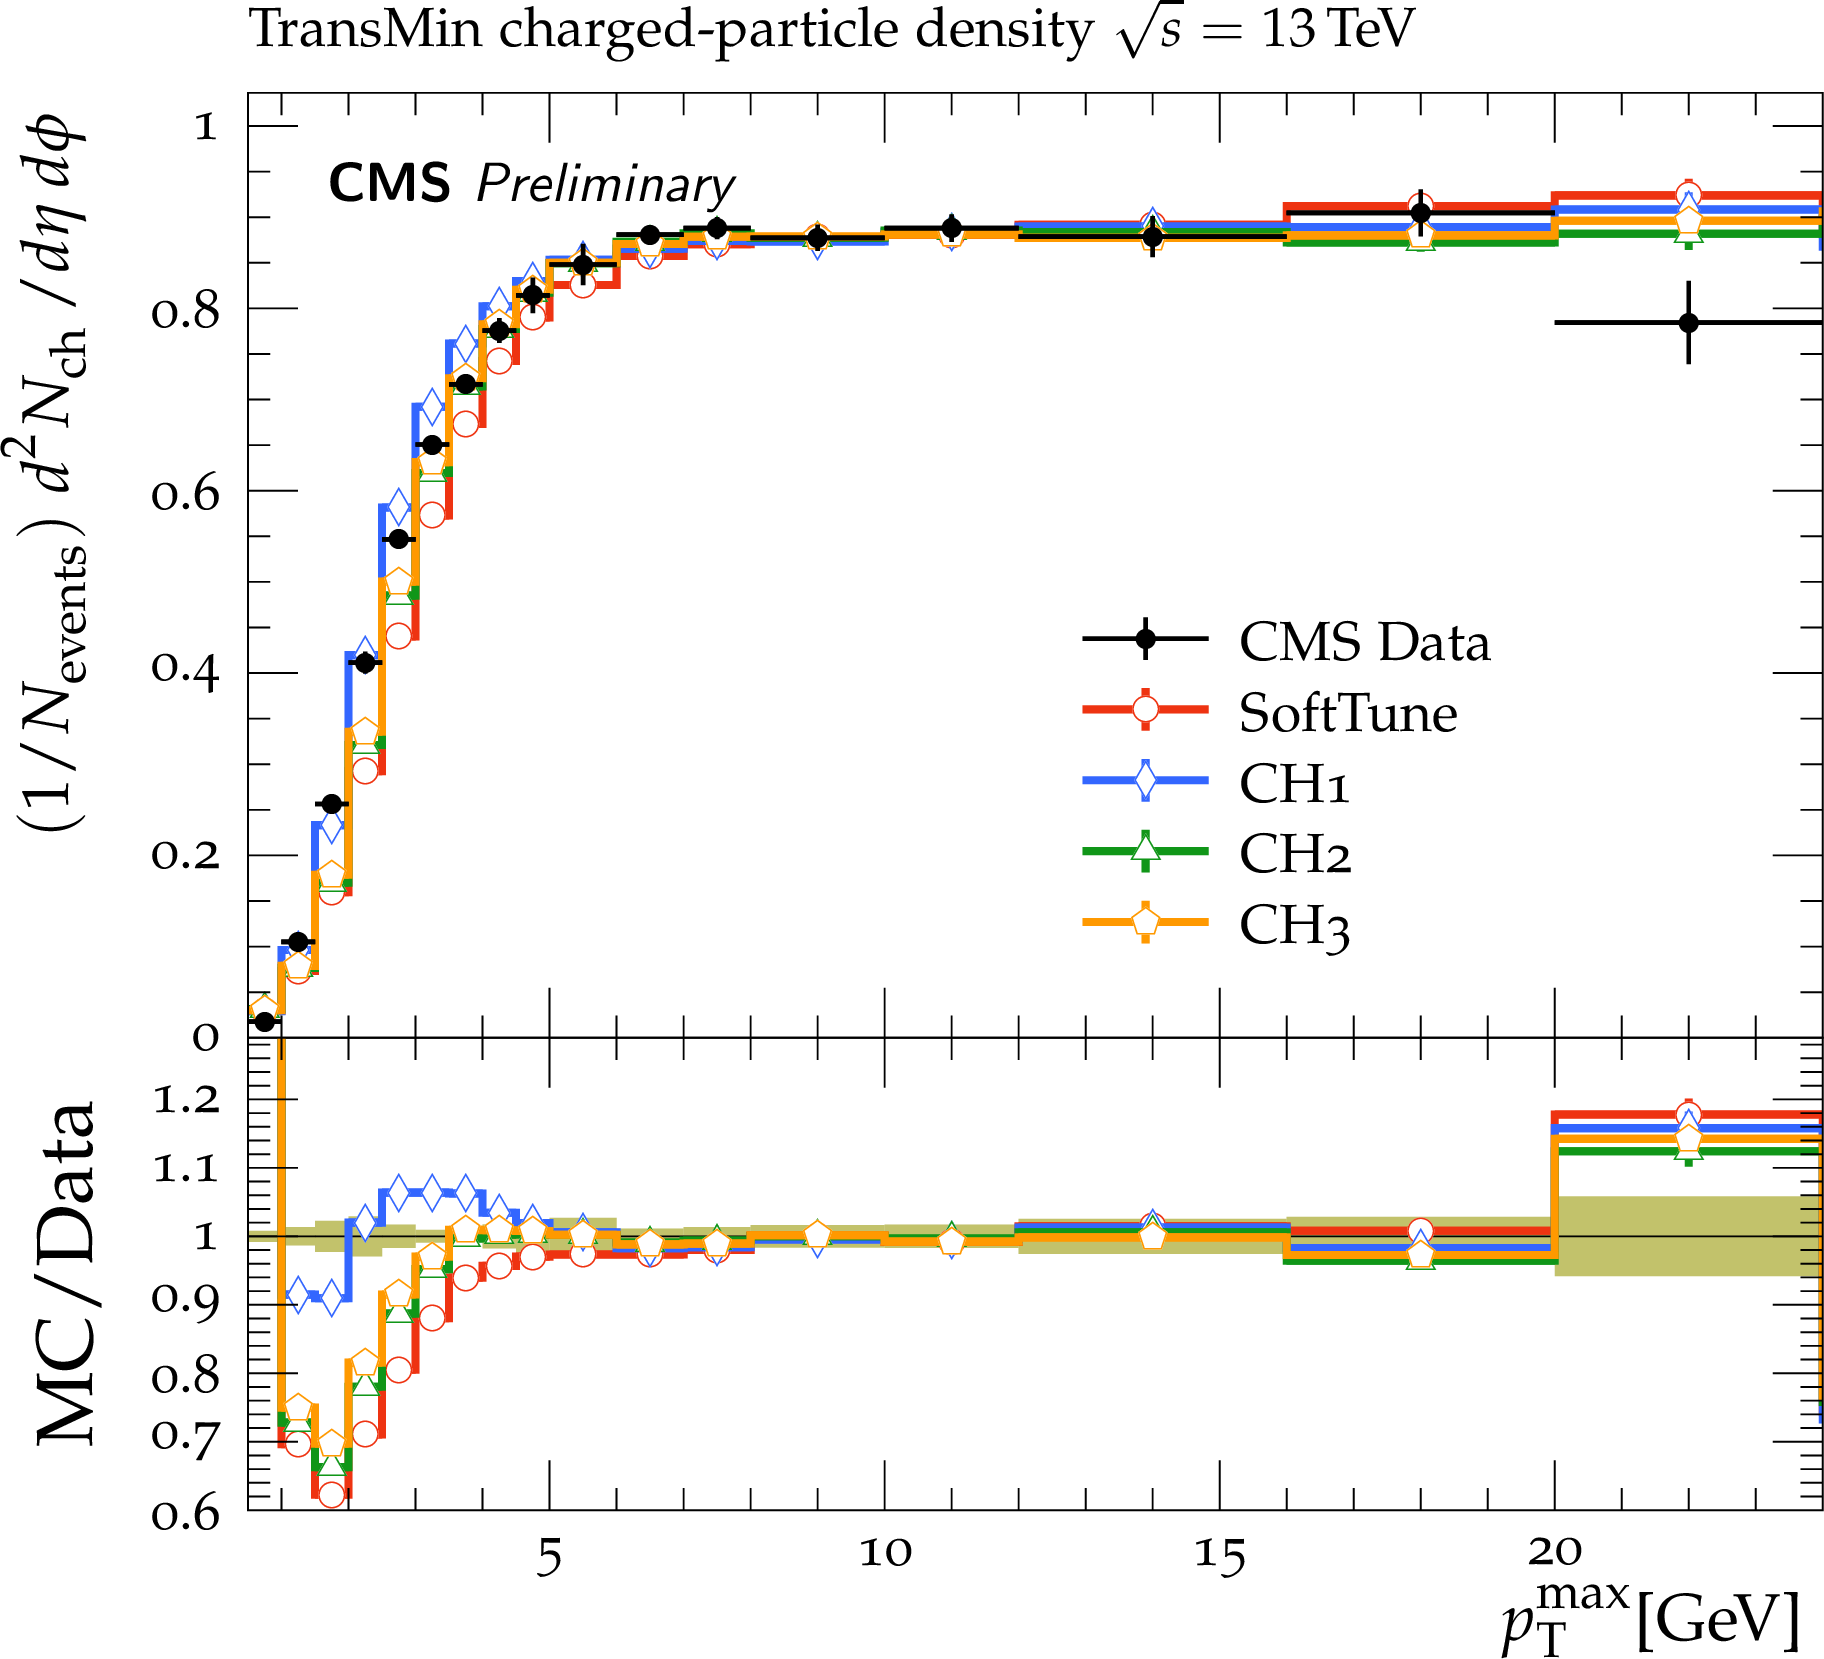
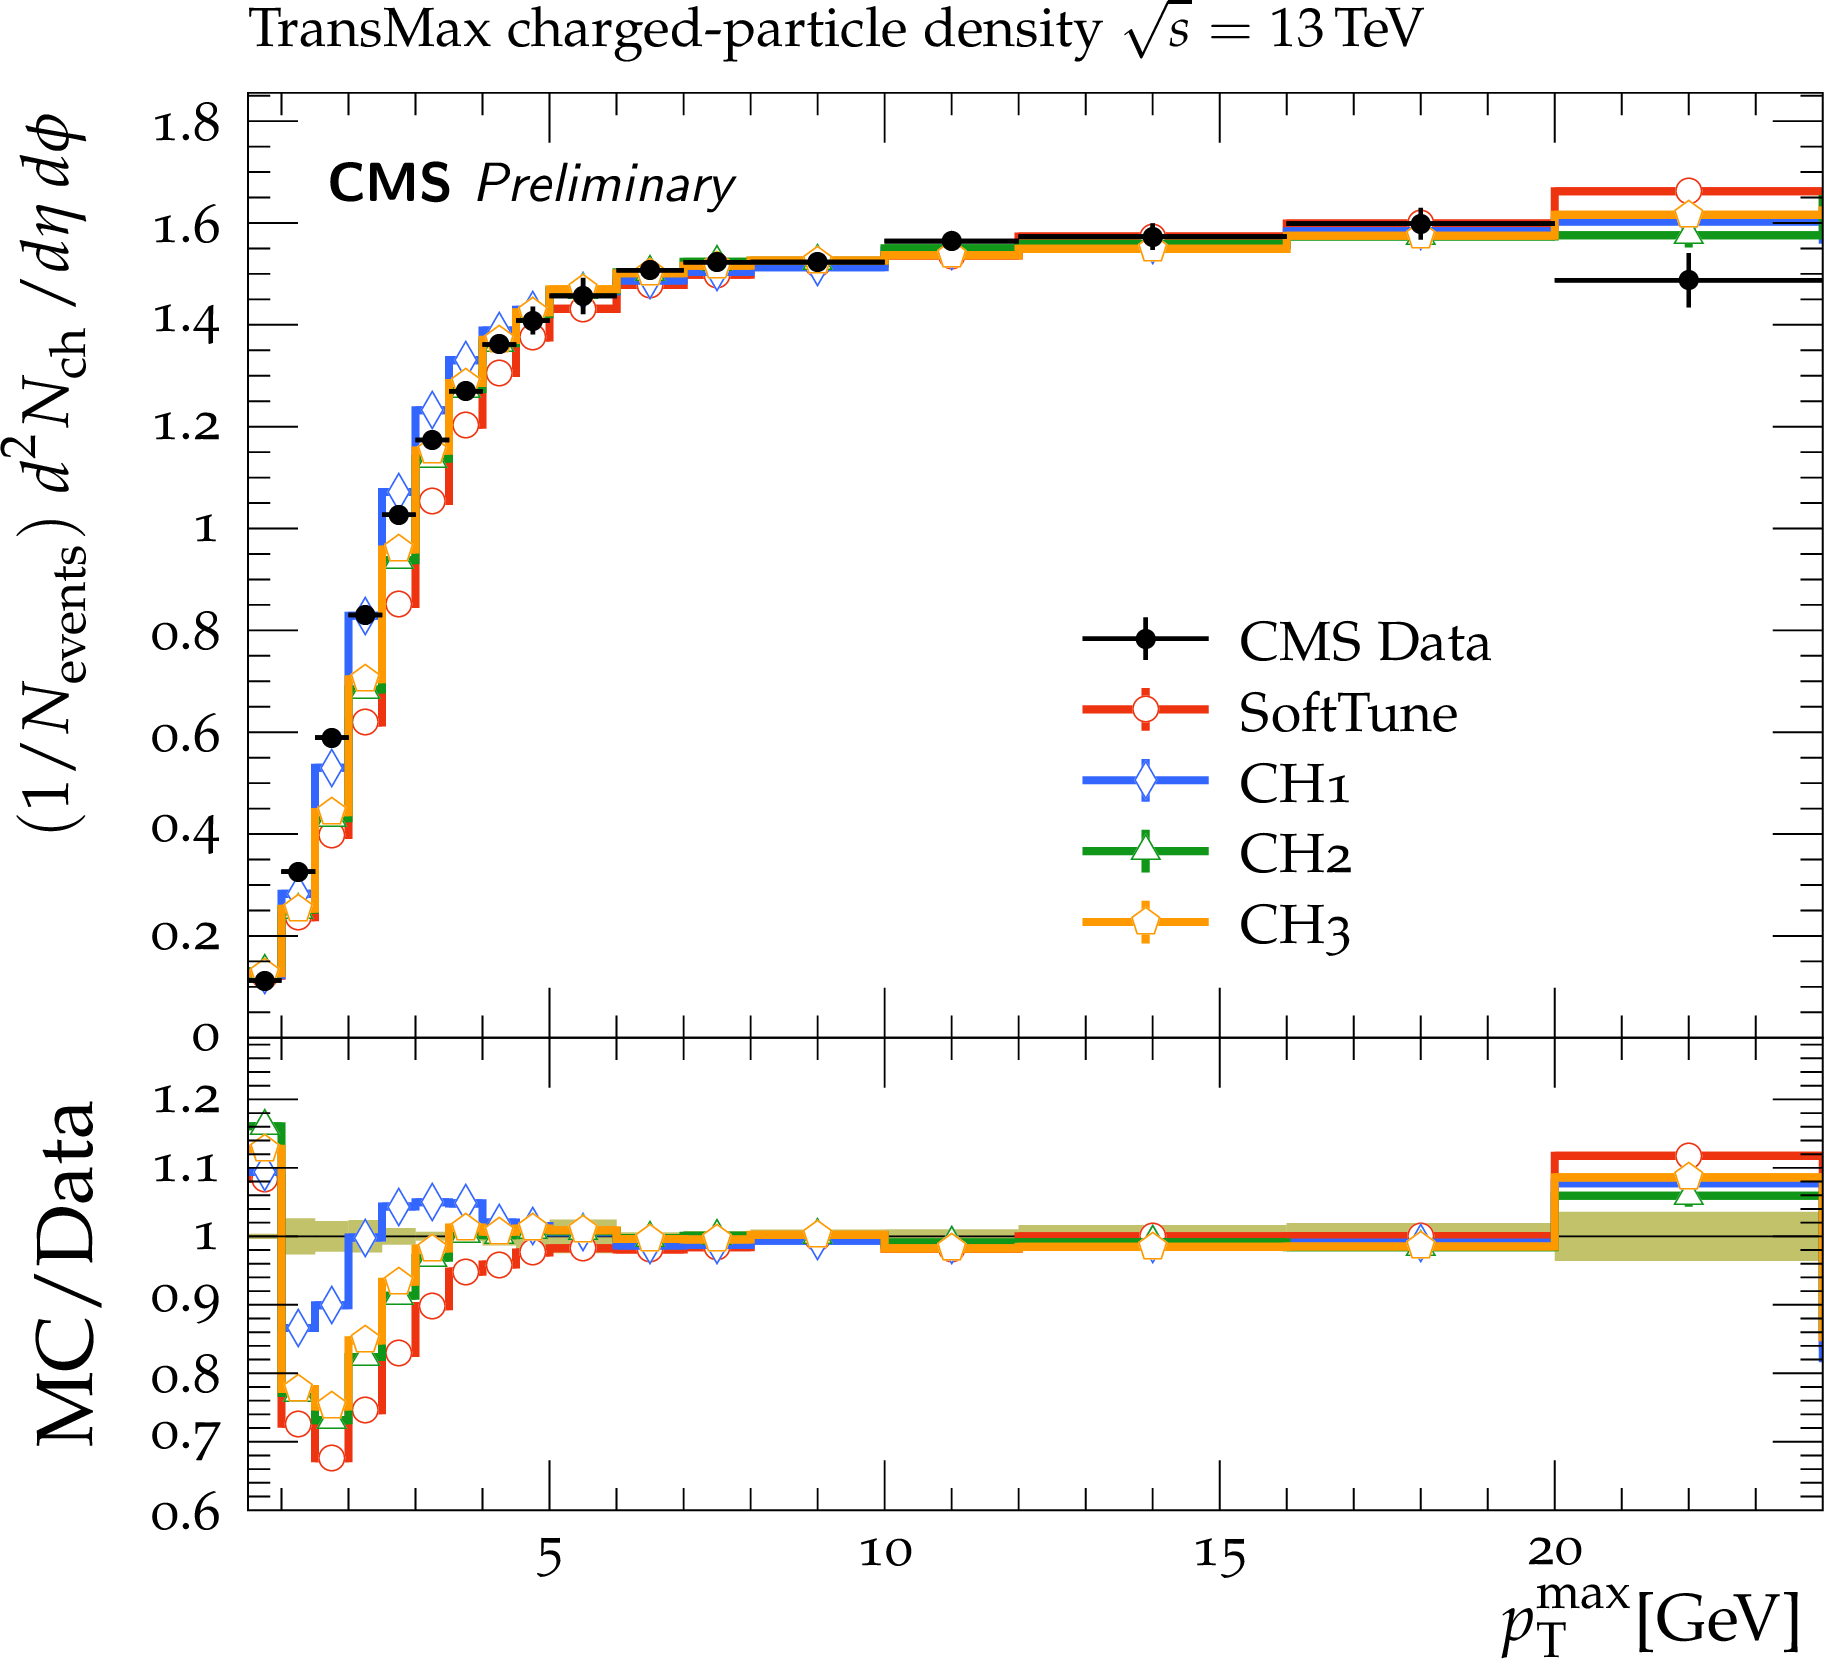
Figure 3:
CMS data at $ {\sqrt {s}} = $ 13 TeV on the ${p_{\mathrm {T}}^{\mathrm {sum}}}$ density (upper) and ${N_{\mathrm {ch}}}$ (lower) distributions in the transMin (left) and transMax (right) regions, as a function of the ${p_{\mathrm {T}}}$ of the leading track, ${p_{\mathrm {T}}^{\mathrm {max}}}$ [23]. The data are compared to predictions from HERWIG 7, with the SoftTune and CH tunes. The coloured band in the ratios of the different predictions from simulation to the data represents the total experimental uncertainty in the data. |
png pdf |
Figure 3-a:
CMS data at $ {\sqrt {s}} = $ 13 TeV on the ${p_{\mathrm {T}}^{\mathrm {sum}}}$ density (upper) and ${N_{\mathrm {ch}}}$ (lower) distributions in the transMin (left) and transMax (right) regions, as a function of the ${p_{\mathrm {T}}}$ of the leading track, ${p_{\mathrm {T}}^{\mathrm {max}}}$ [23]. The data are compared to predictions from HERWIG 7, with the SoftTune and CH tunes. The coloured band in the ratios of the different predictions from simulation to the data represents the total experimental uncertainty in the data. |
png pdf |
Figure 3-b:
CMS data at $ {\sqrt {s}} = $ 13 TeV on the ${p_{\mathrm {T}}^{\mathrm {sum}}}$ density (upper) and ${N_{\mathrm {ch}}}$ (lower) distributions in the transMin (left) and transMax (right) regions, as a function of the ${p_{\mathrm {T}}}$ of the leading track, ${p_{\mathrm {T}}^{\mathrm {max}}}$ [23]. The data are compared to predictions from HERWIG 7, with the SoftTune and CH tunes. The coloured band in the ratios of the different predictions from simulation to the data represents the total experimental uncertainty in the data. |
png pdf |
Figure 3-c:
CMS data at $ {\sqrt {s}} = $ 13 TeV on the ${p_{\mathrm {T}}^{\mathrm {sum}}}$ density (upper) and ${N_{\mathrm {ch}}}$ (lower) distributions in the transMin (left) and transMax (right) regions, as a function of the ${p_{\mathrm {T}}}$ of the leading track, ${p_{\mathrm {T}}^{\mathrm {max}}}$ [23]. The data are compared to predictions from HERWIG 7, with the SoftTune and CH tunes. The coloured band in the ratios of the different predictions from simulation to the data represents the total experimental uncertainty in the data. |
png pdf |
Figure 3-d:
CMS data at $ {\sqrt {s}} = $ 13 TeV on the ${p_{\mathrm {T}}^{\mathrm {sum}}}$ density (upper) and ${N_{\mathrm {ch}}}$ (lower) distributions in the transMin (left) and transMax (right) regions, as a function of the ${p_{\mathrm {T}}}$ of the leading track, ${p_{\mathrm {T}}^{\mathrm {max}}}$ [23]. The data are compared to predictions from HERWIG 7, with the SoftTune and CH tunes. The coloured band in the ratios of the different predictions from simulation to the data represents the total experimental uncertainty in the data. |
png pdf |
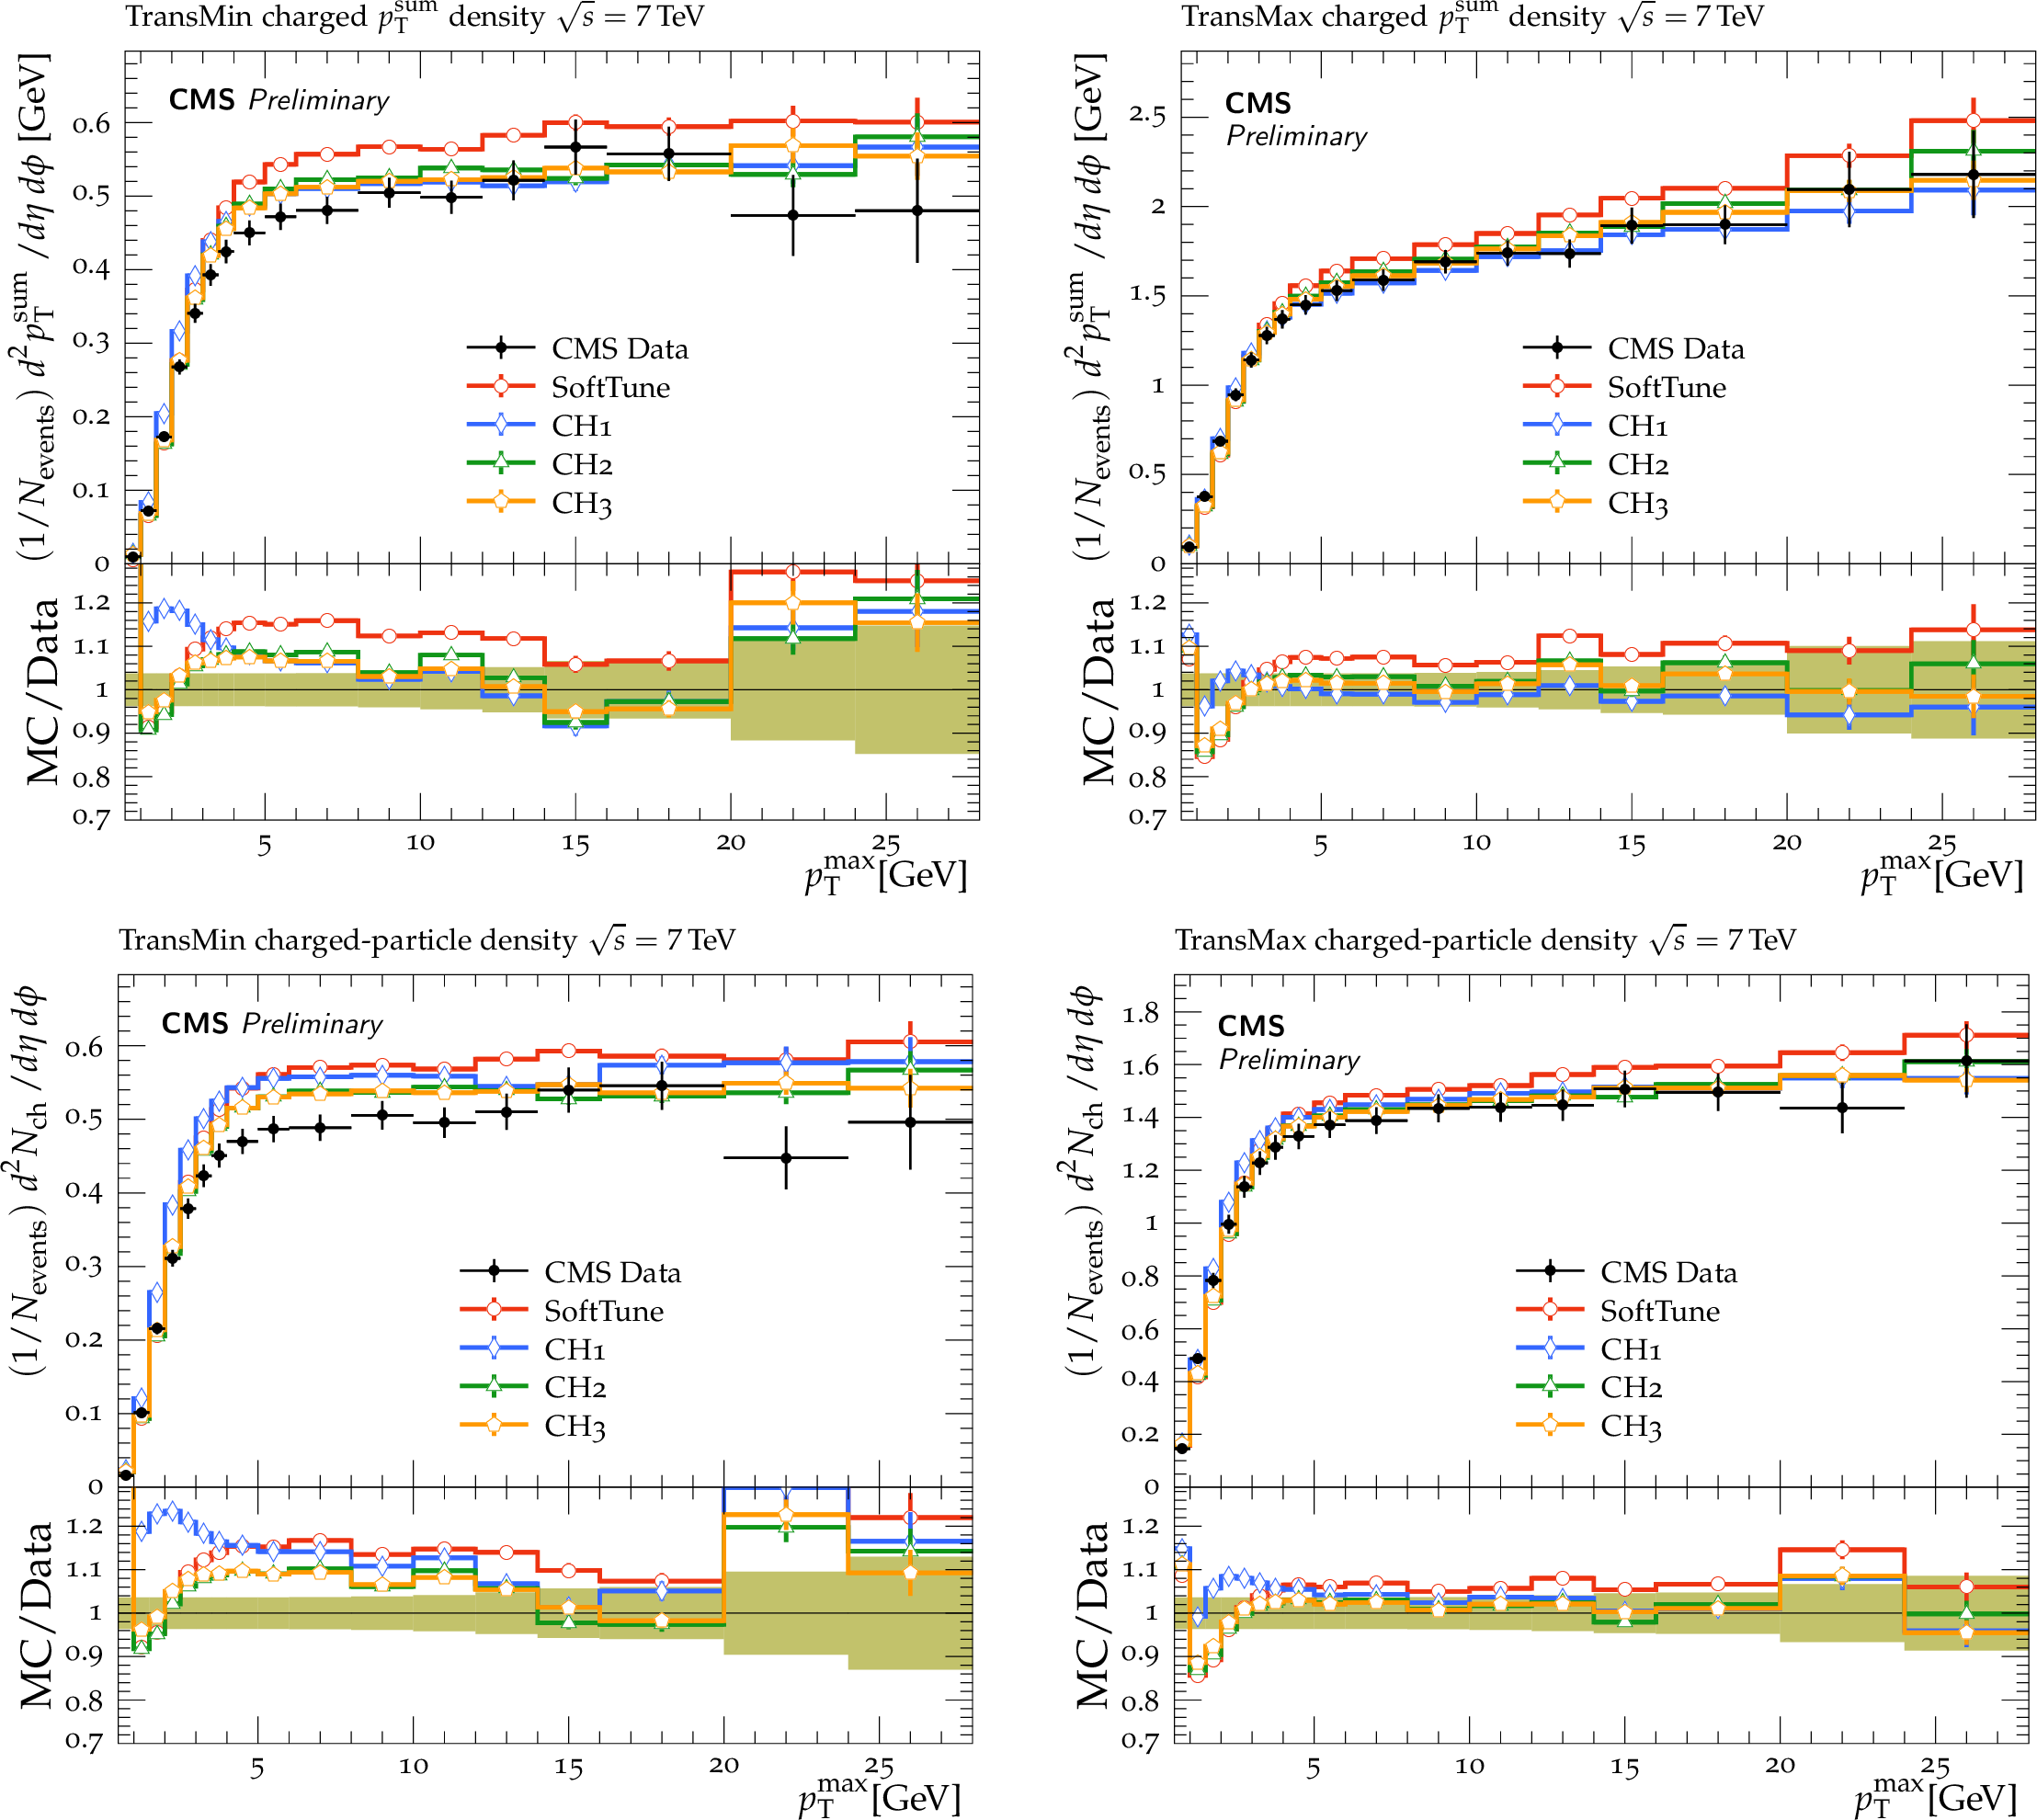
Figure 4:
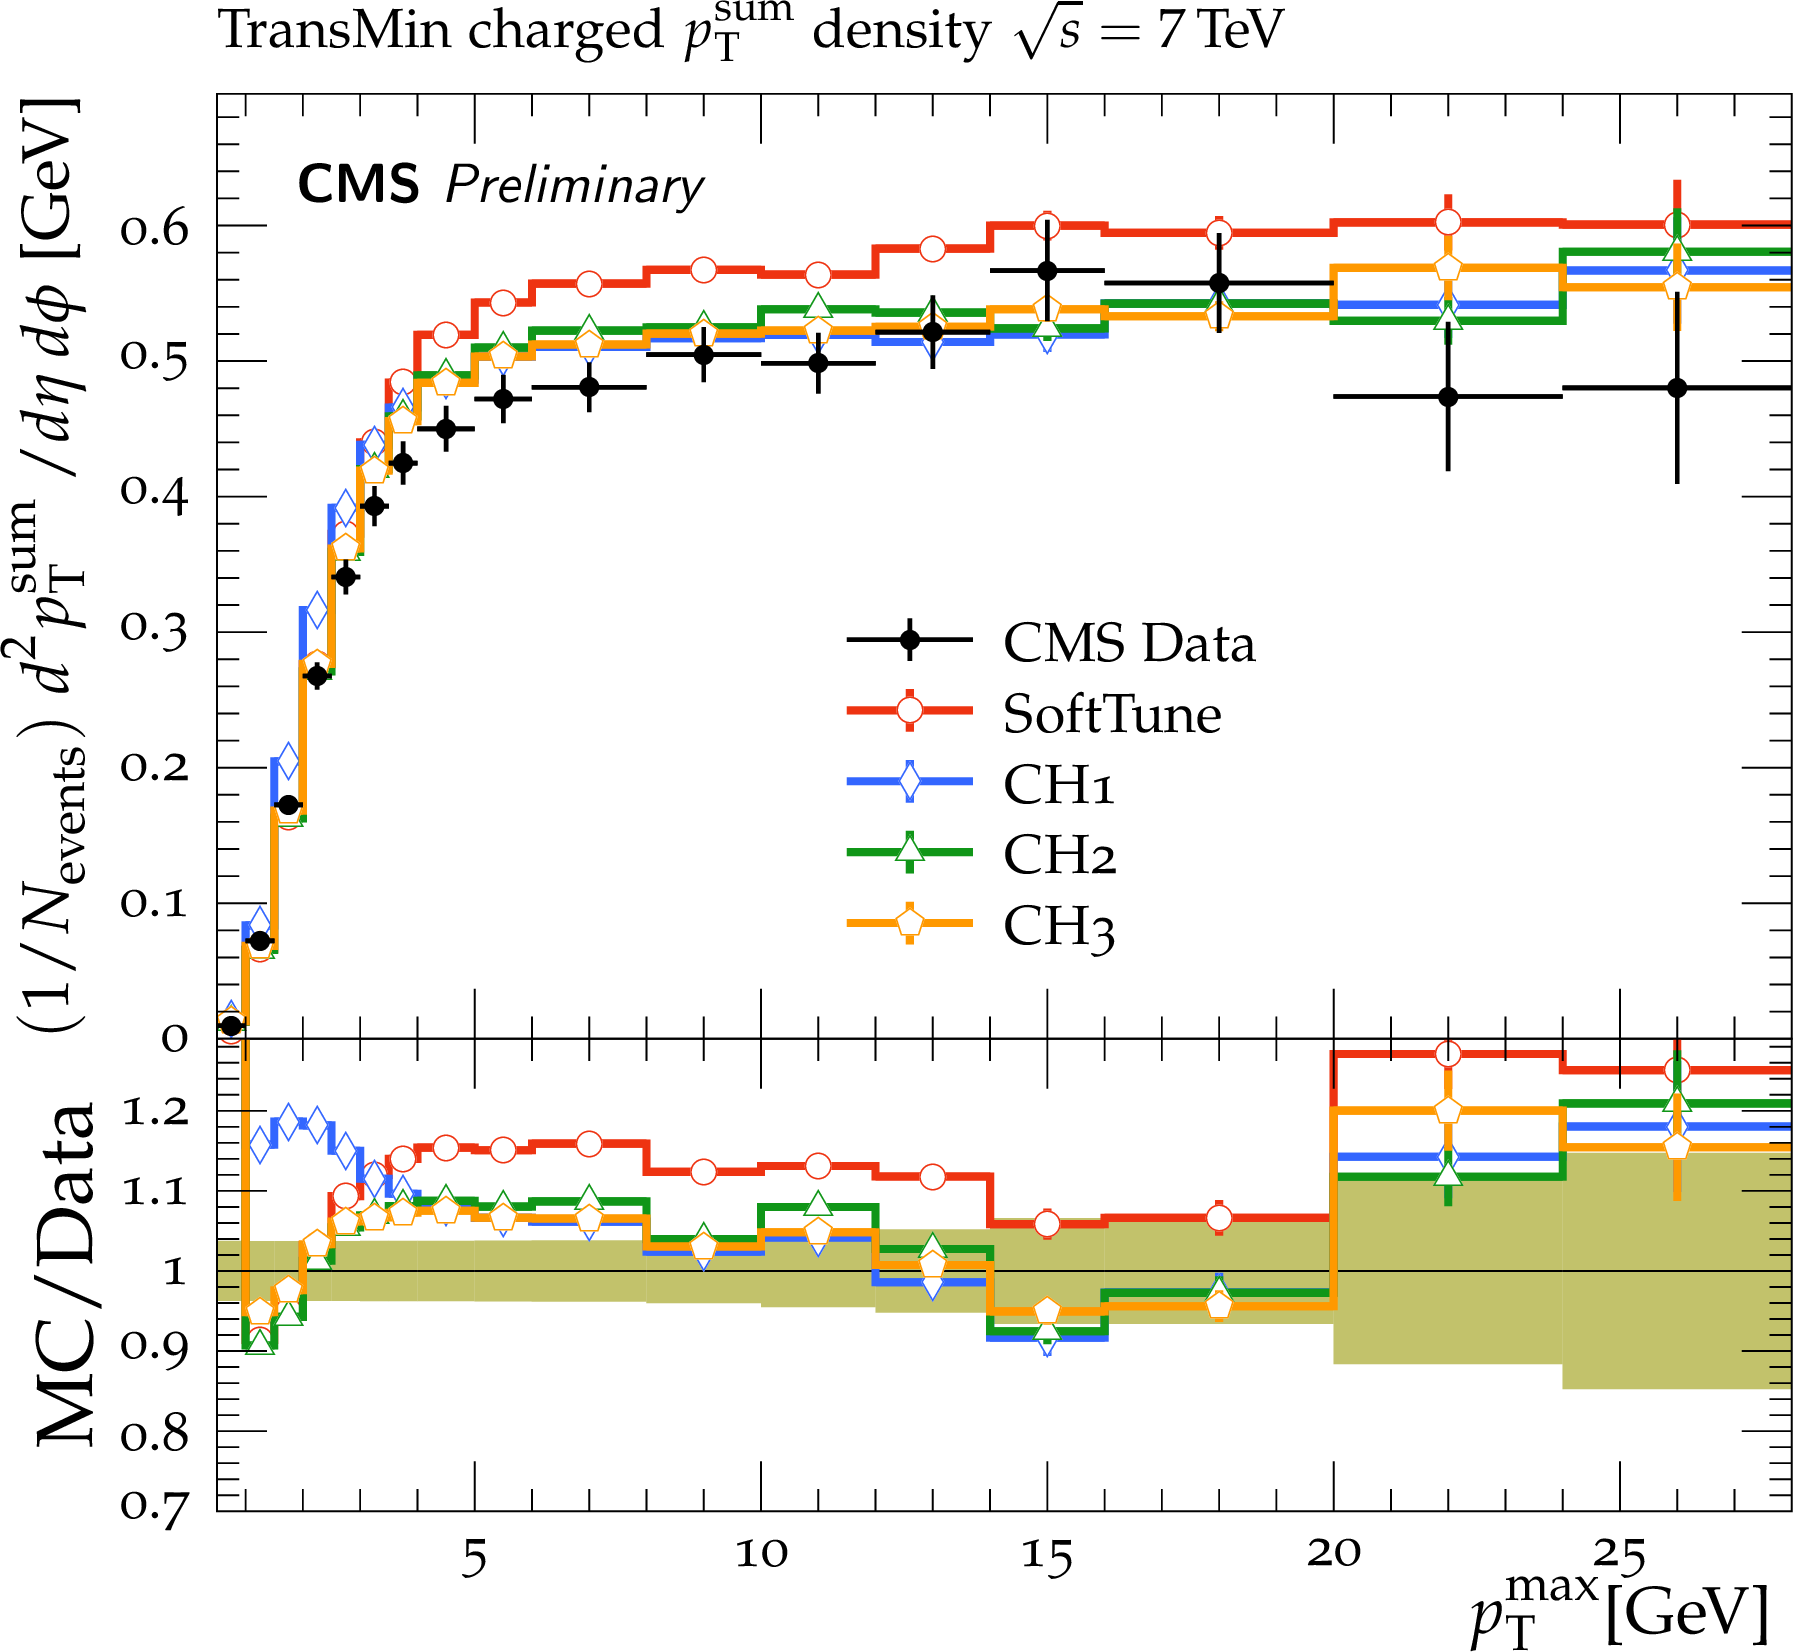
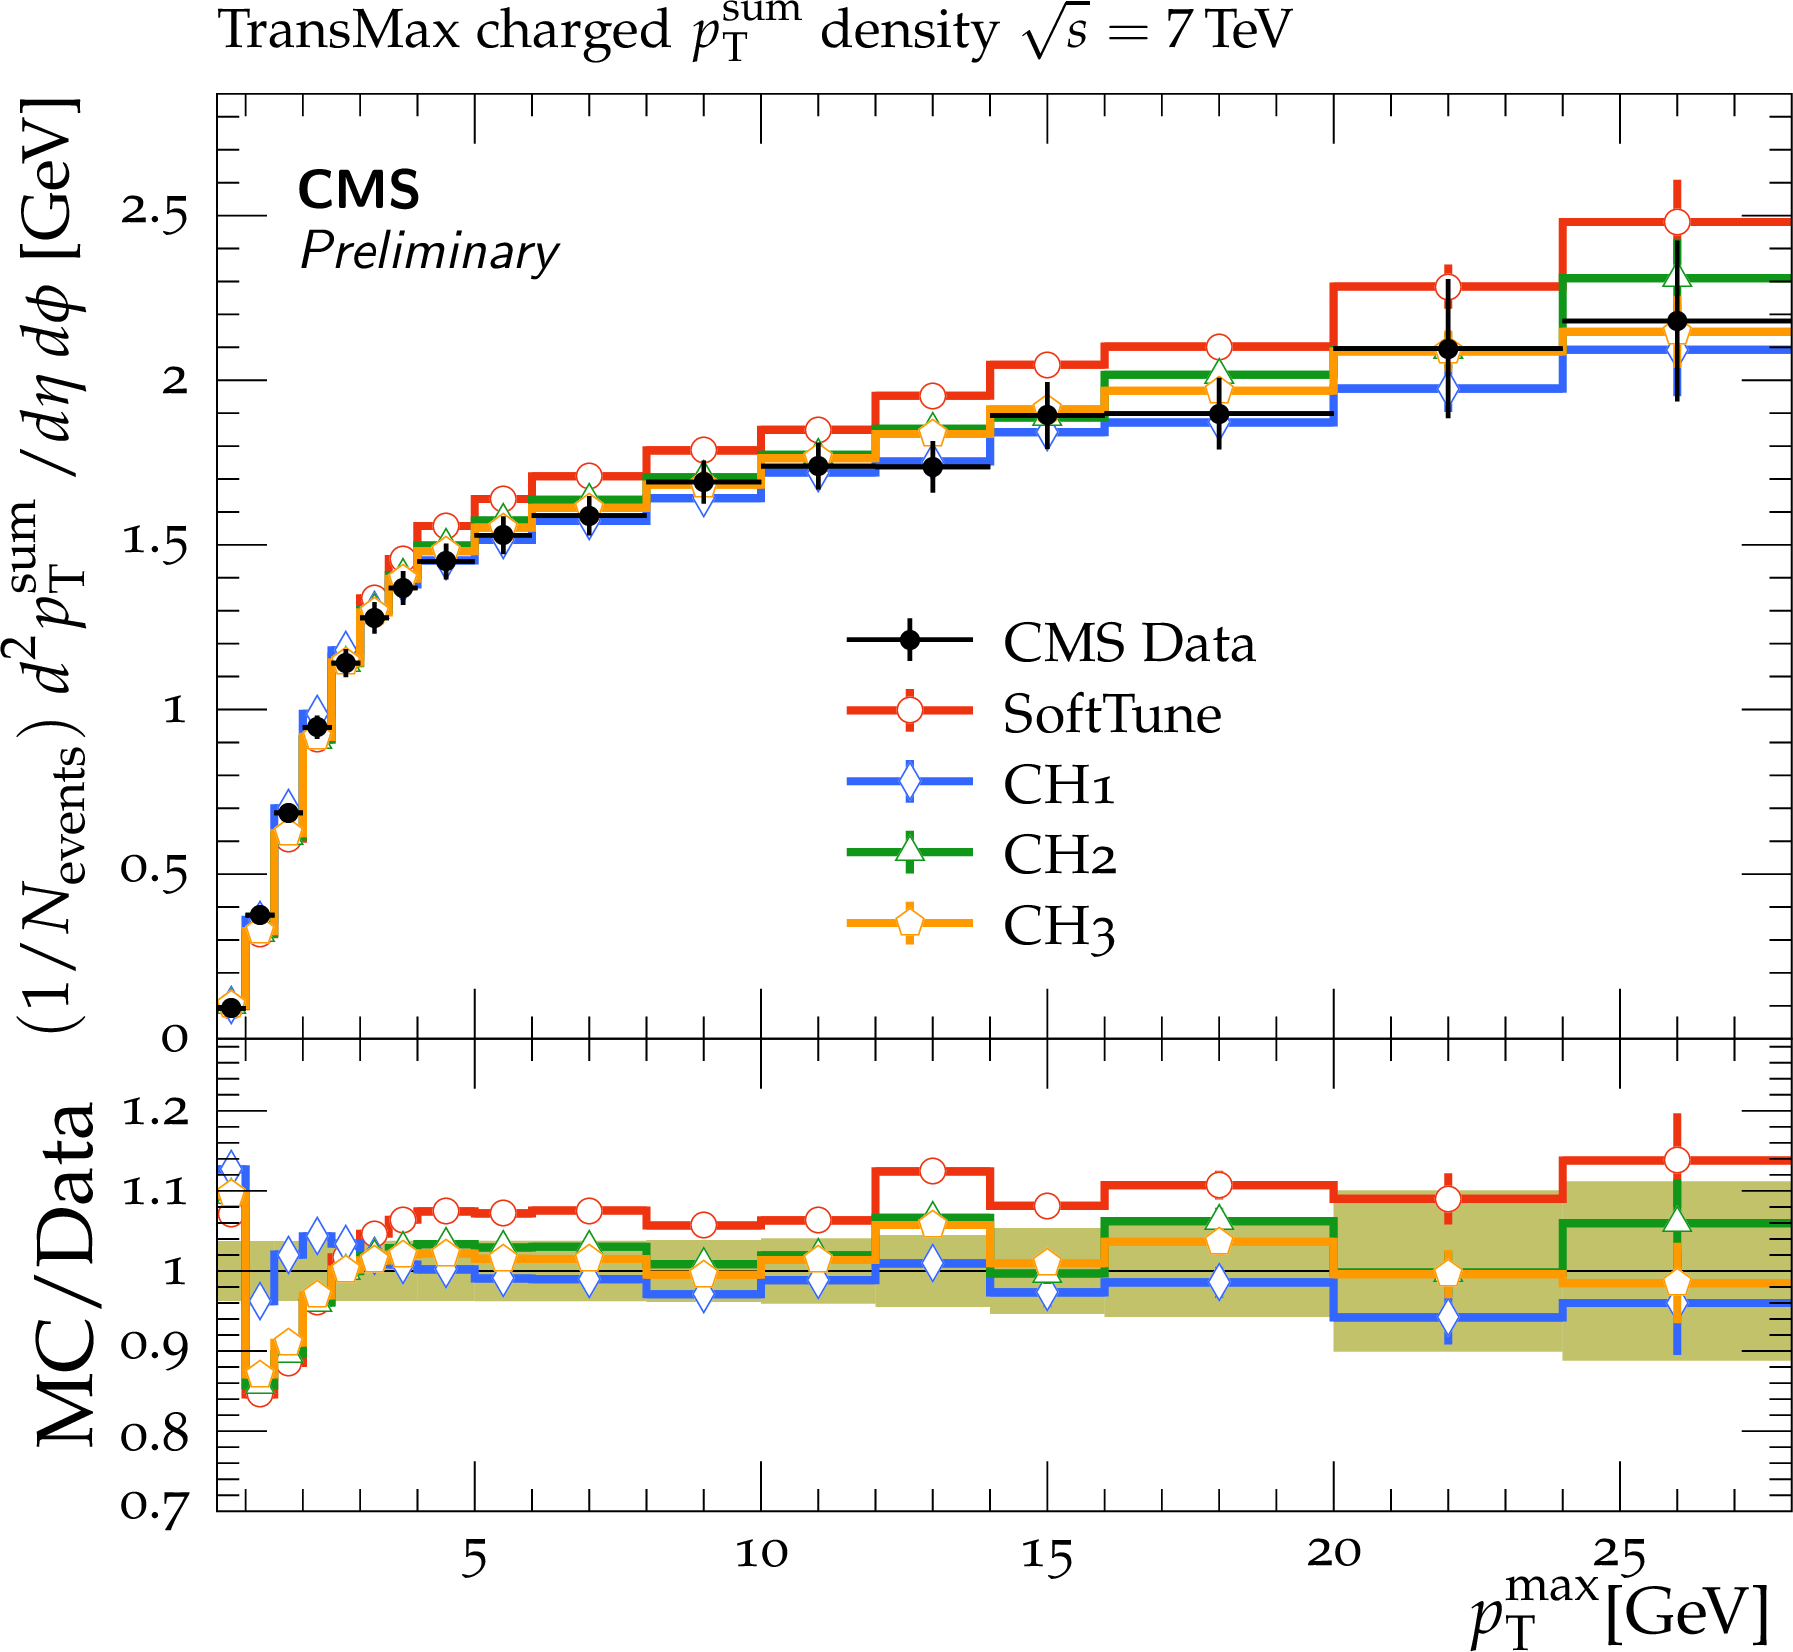
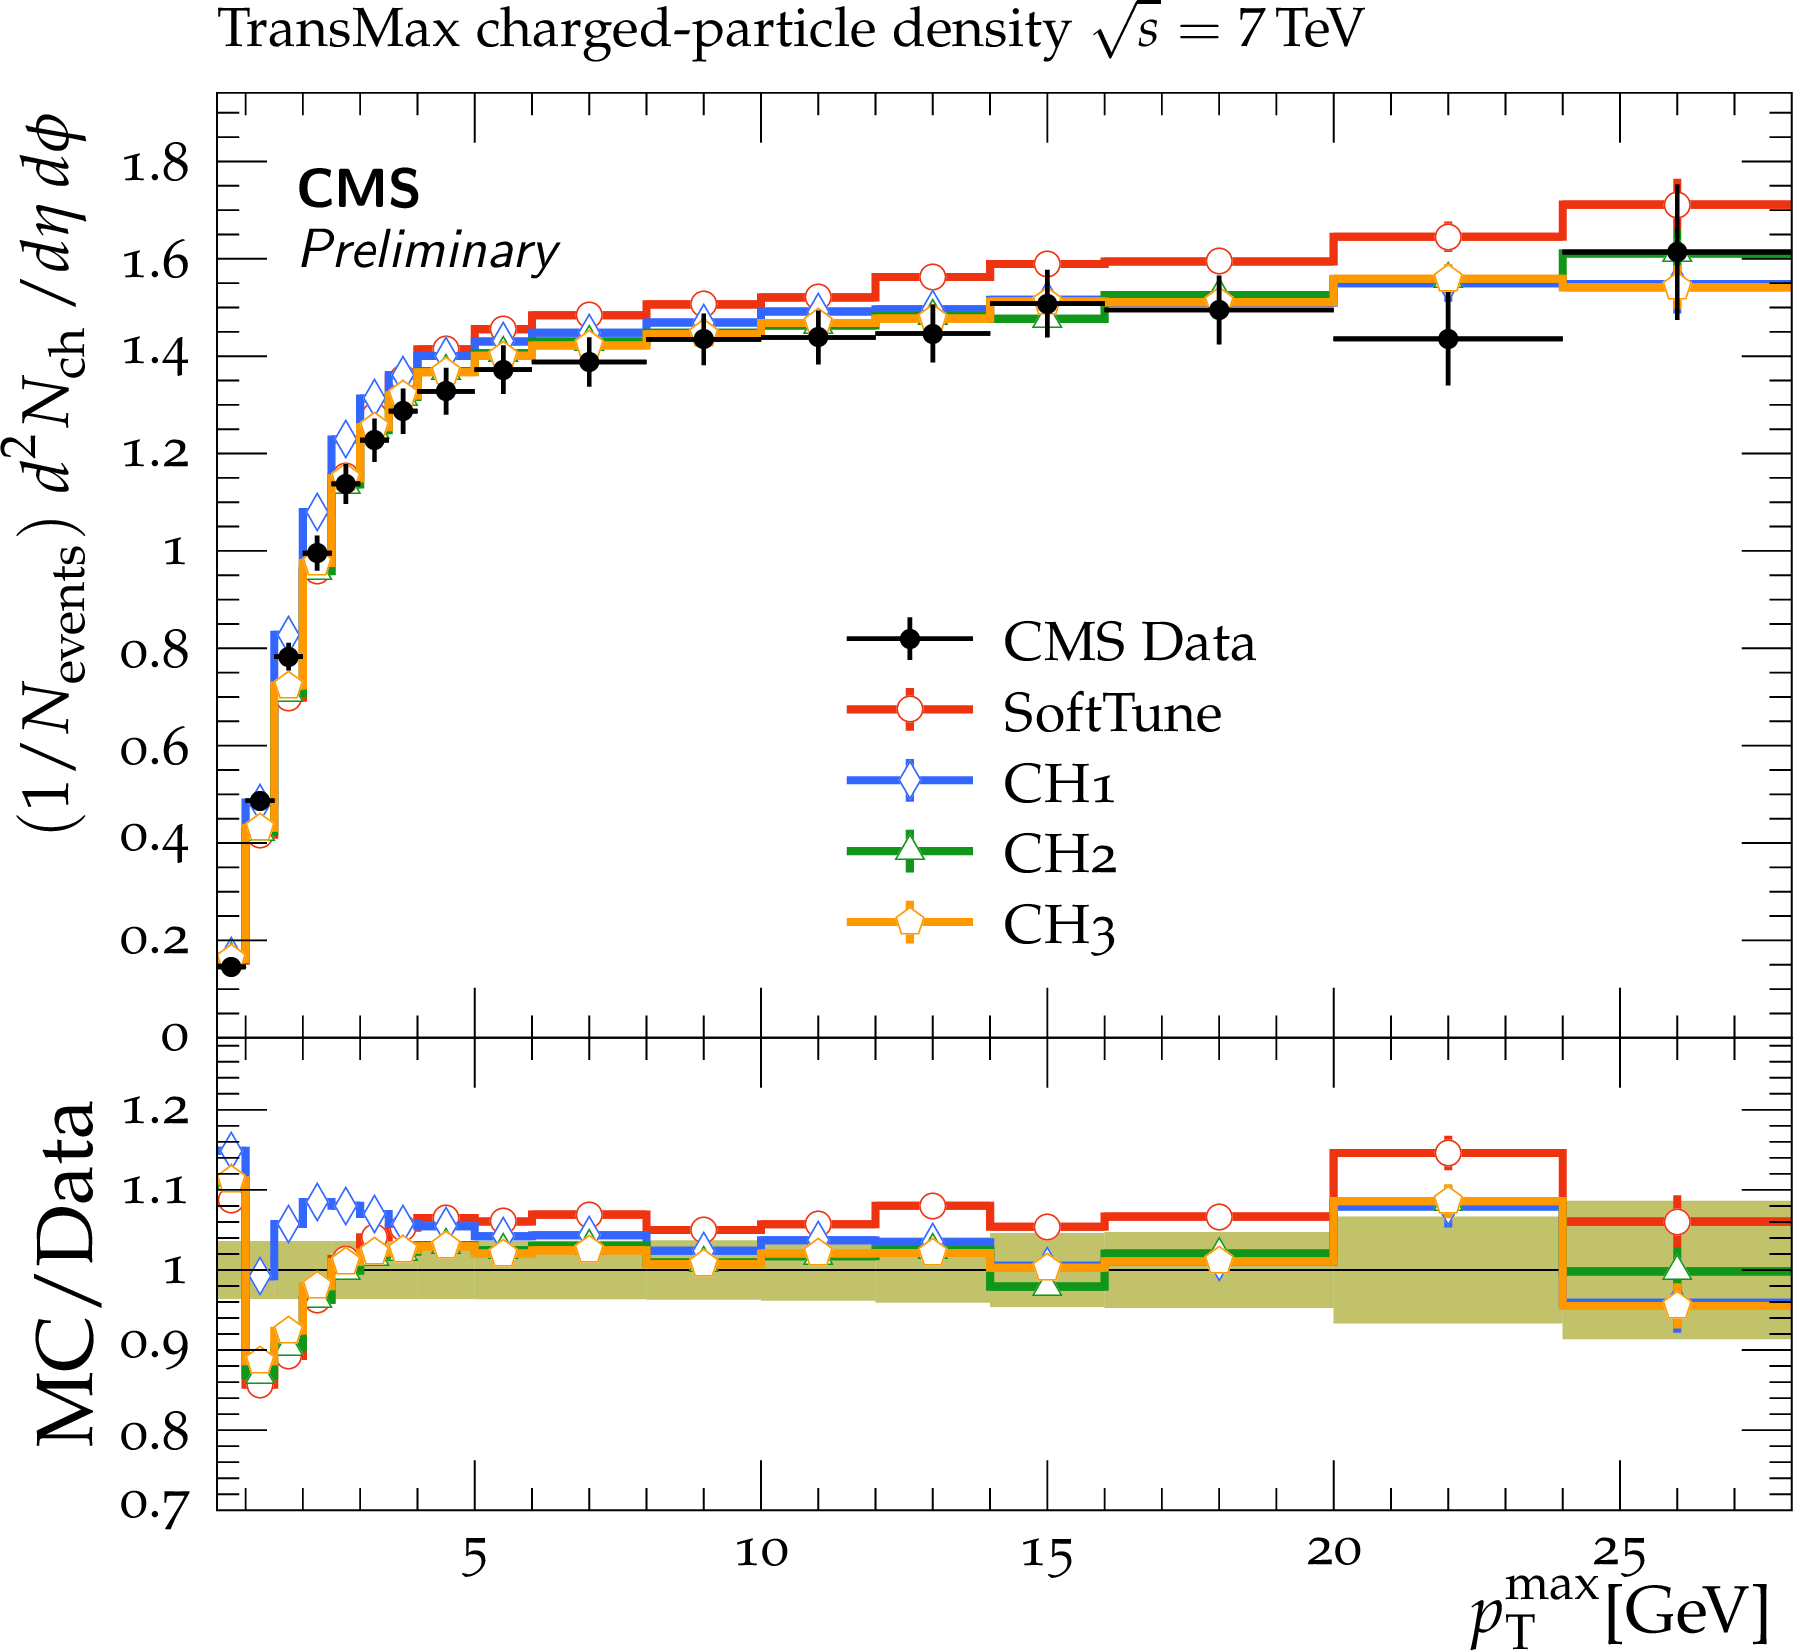
CMS data at $ {\sqrt {s}} = $ 7 TeV on the ${p_{\mathrm {T}}^{\mathrm {sum}}}$ density (upper) and ${N_{\mathrm {ch}}}$ (lower) distributions in the transMin (left) and transMax (right) regions, as a function of the ${p_{\mathrm {T}}}$ of the leading track, ${p_{\mathrm {T}}^{\mathrm {max}}}$ [22]. The data are compared to predictions from HERWIG 7, with the SoftTune and CH tunes. The coloured band in the ratios of the different predictions from simulation to the data represents the total experimental uncertainty in the data. |
png pdf |
Figure 4-a:
CMS data at $ {\sqrt {s}} = $ 7 TeV on the ${p_{\mathrm {T}}^{\mathrm {sum}}}$ density (upper) and ${N_{\mathrm {ch}}}$ (lower) distributions in the transMin (left) and transMax (right) regions, as a function of the ${p_{\mathrm {T}}}$ of the leading track, ${p_{\mathrm {T}}^{\mathrm {max}}}$ [22]. The data are compared to predictions from HERWIG 7, with the SoftTune and CH tunes. The coloured band in the ratios of the different predictions from simulation to the data represents the total experimental uncertainty in the data. |
png pdf |
Figure 4-b:
CMS data at $ {\sqrt {s}} = $ 7 TeV on the ${p_{\mathrm {T}}^{\mathrm {sum}}}$ density (upper) and ${N_{\mathrm {ch}}}$ (lower) distributions in the transMin (left) and transMax (right) regions, as a function of the ${p_{\mathrm {T}}}$ of the leading track, ${p_{\mathrm {T}}^{\mathrm {max}}}$ [22]. The data are compared to predictions from HERWIG 7, with the SoftTune and CH tunes. The coloured band in the ratios of the different predictions from simulation to the data represents the total experimental uncertainty in the data. |

png pdf |
Figure 4-c:
CMS data at $ {\sqrt {s}} = $ 7 TeV on the ${p_{\mathrm {T}}^{\mathrm {sum}}}$ density (upper) and ${N_{\mathrm {ch}}}$ (lower) distributions in the transMin (left) and transMax (right) regions, as a function of the ${p_{\mathrm {T}}}$ of the leading track, ${p_{\mathrm {T}}^{\mathrm {max}}}$ [22]. The data are compared to predictions from HERWIG 7, with the SoftTune and CH tunes. The coloured band in the ratios of the different predictions from simulation to the data represents the total experimental uncertainty in the data. |
png pdf |
Figure 4-d:
CMS data at $ {\sqrt {s}} = $ 7 TeV on the ${p_{\mathrm {T}}^{\mathrm {sum}}}$ density (upper) and ${N_{\mathrm {ch}}}$ (lower) distributions in the transMin (left) and transMax (right) regions, as a function of the ${p_{\mathrm {T}}}$ of the leading track, ${p_{\mathrm {T}}^{\mathrm {max}}}$ [22]. The data are compared to predictions from HERWIG 7, with the SoftTune and CH tunes. The coloured band in the ratios of the different predictions from simulation to the data represents the total experimental uncertainty in the data. |
png pdf |
Figure 5:
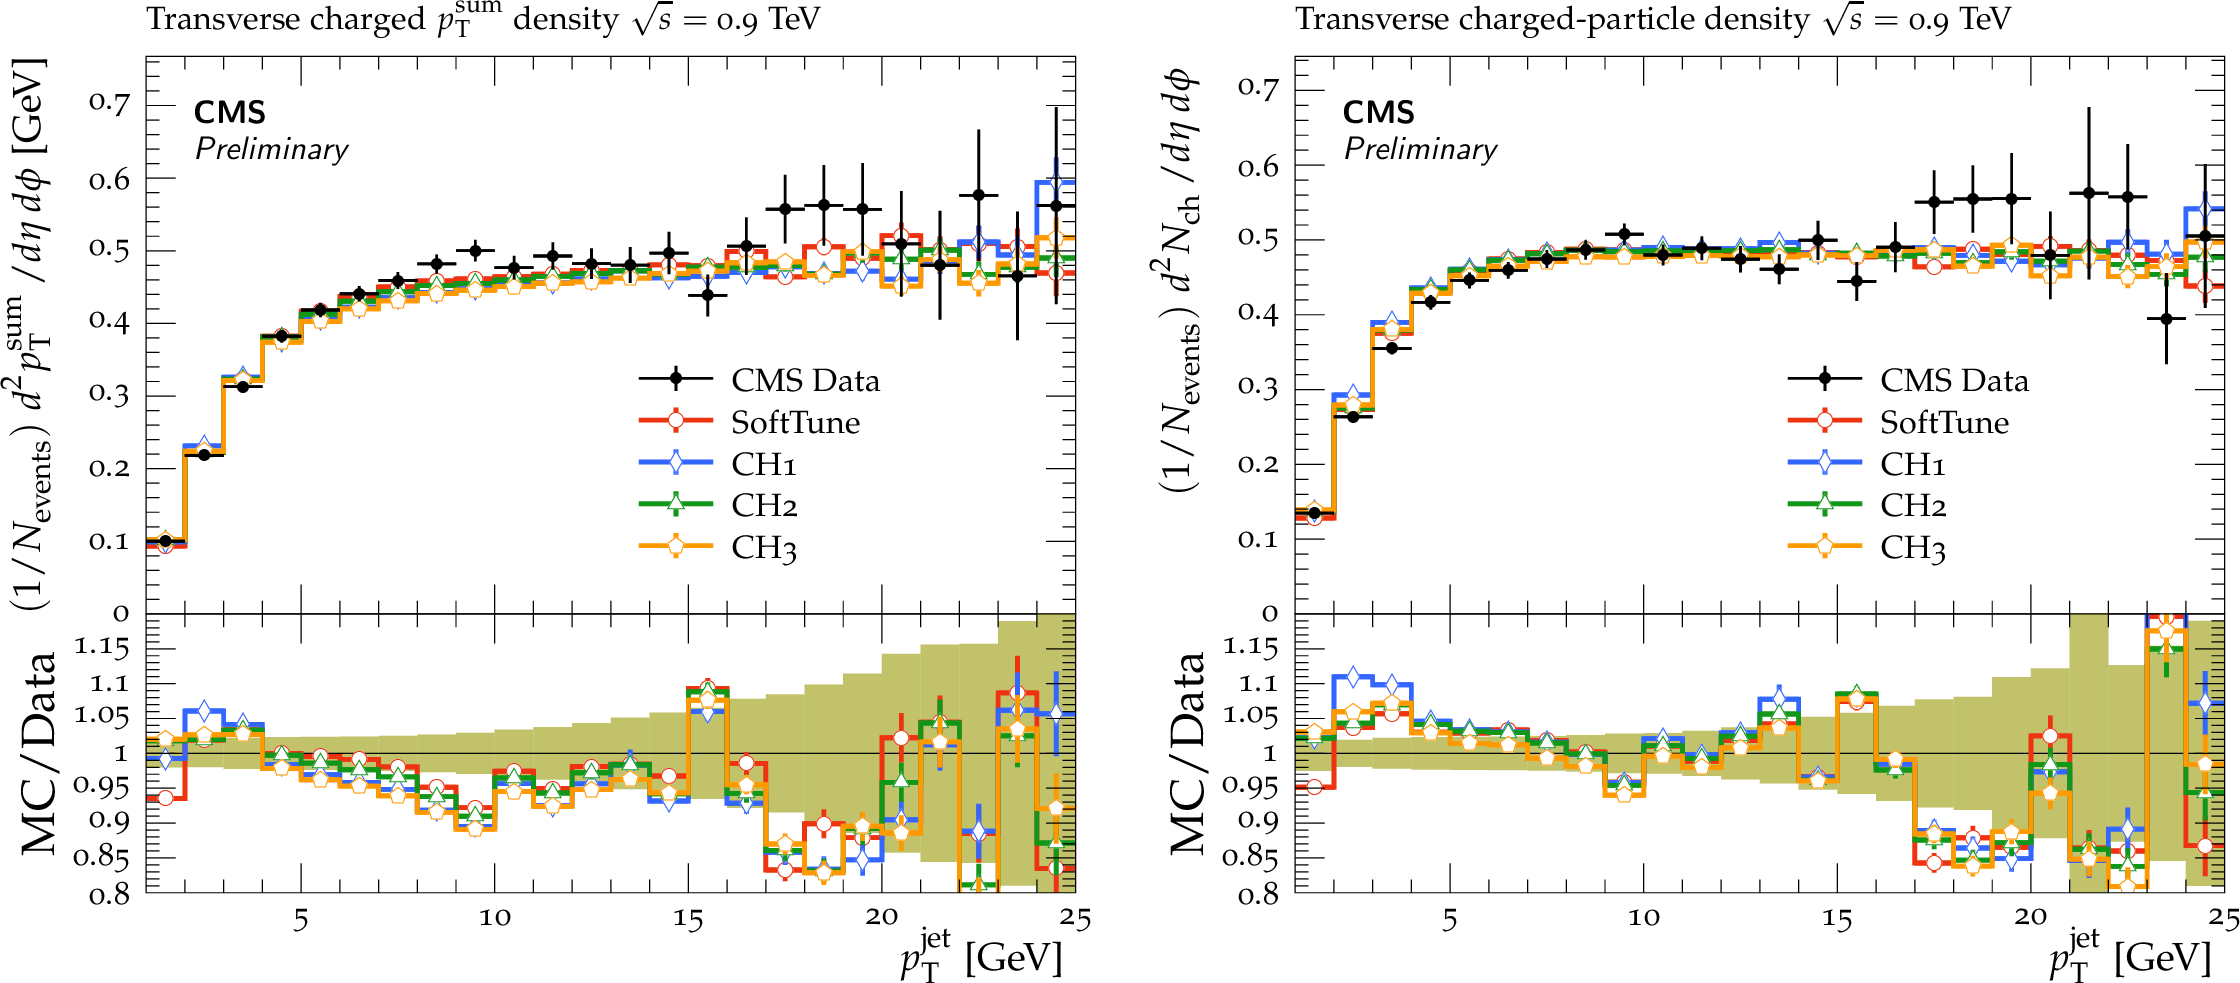
CMS data at $ {\sqrt {s}} = $ 0.9 TeV on the ${p_{\mathrm {T}}^{\mathrm {sum}}}$ density (left) and ${N_{\mathrm {ch}}}$ (right) distributions in the transverse regions, as a function of the ${p_{\mathrm {T}}}$ of the leading track jet, ${p_{\mathrm {T}}^{\mathrm {jet}}}$ [24]. The data are compared to predictions from HERWIG 7, with the SoftTune and CH tunes. The coloured band in the ratios of the different predictions from simulation to the data represents the total experimental uncertainty in the data. |

png pdf |
Figure 5-a:
CMS data at $ {\sqrt {s}} = $ 0.9 TeV on the ${p_{\mathrm {T}}^{\mathrm {sum}}}$ density (left) and ${N_{\mathrm {ch}}}$ (right) distributions in the transverse regions, as a function of the ${p_{\mathrm {T}}}$ of the leading track jet, ${p_{\mathrm {T}}^{\mathrm {jet}}}$ [24]. The data are compared to predictions from HERWIG 7, with the SoftTune and CH tunes. The coloured band in the ratios of the different predictions from simulation to the data represents the total experimental uncertainty in the data. |

png pdf |
Figure 5-b:
CMS data at $ {\sqrt {s}} = $ 0.9 TeV on the ${p_{\mathrm {T}}^{\mathrm {sum}}}$ density (left) and ${N_{\mathrm {ch}}}$ (right) distributions in the transverse regions, as a function of the ${p_{\mathrm {T}}}$ of the leading track jet, ${p_{\mathrm {T}}^{\mathrm {jet}}}$ [24]. The data are compared to predictions from HERWIG 7, with the SoftTune and CH tunes. The coloured band in the ratios of the different predictions from simulation to the data represents the total experimental uncertainty in the data. |
png pdf |
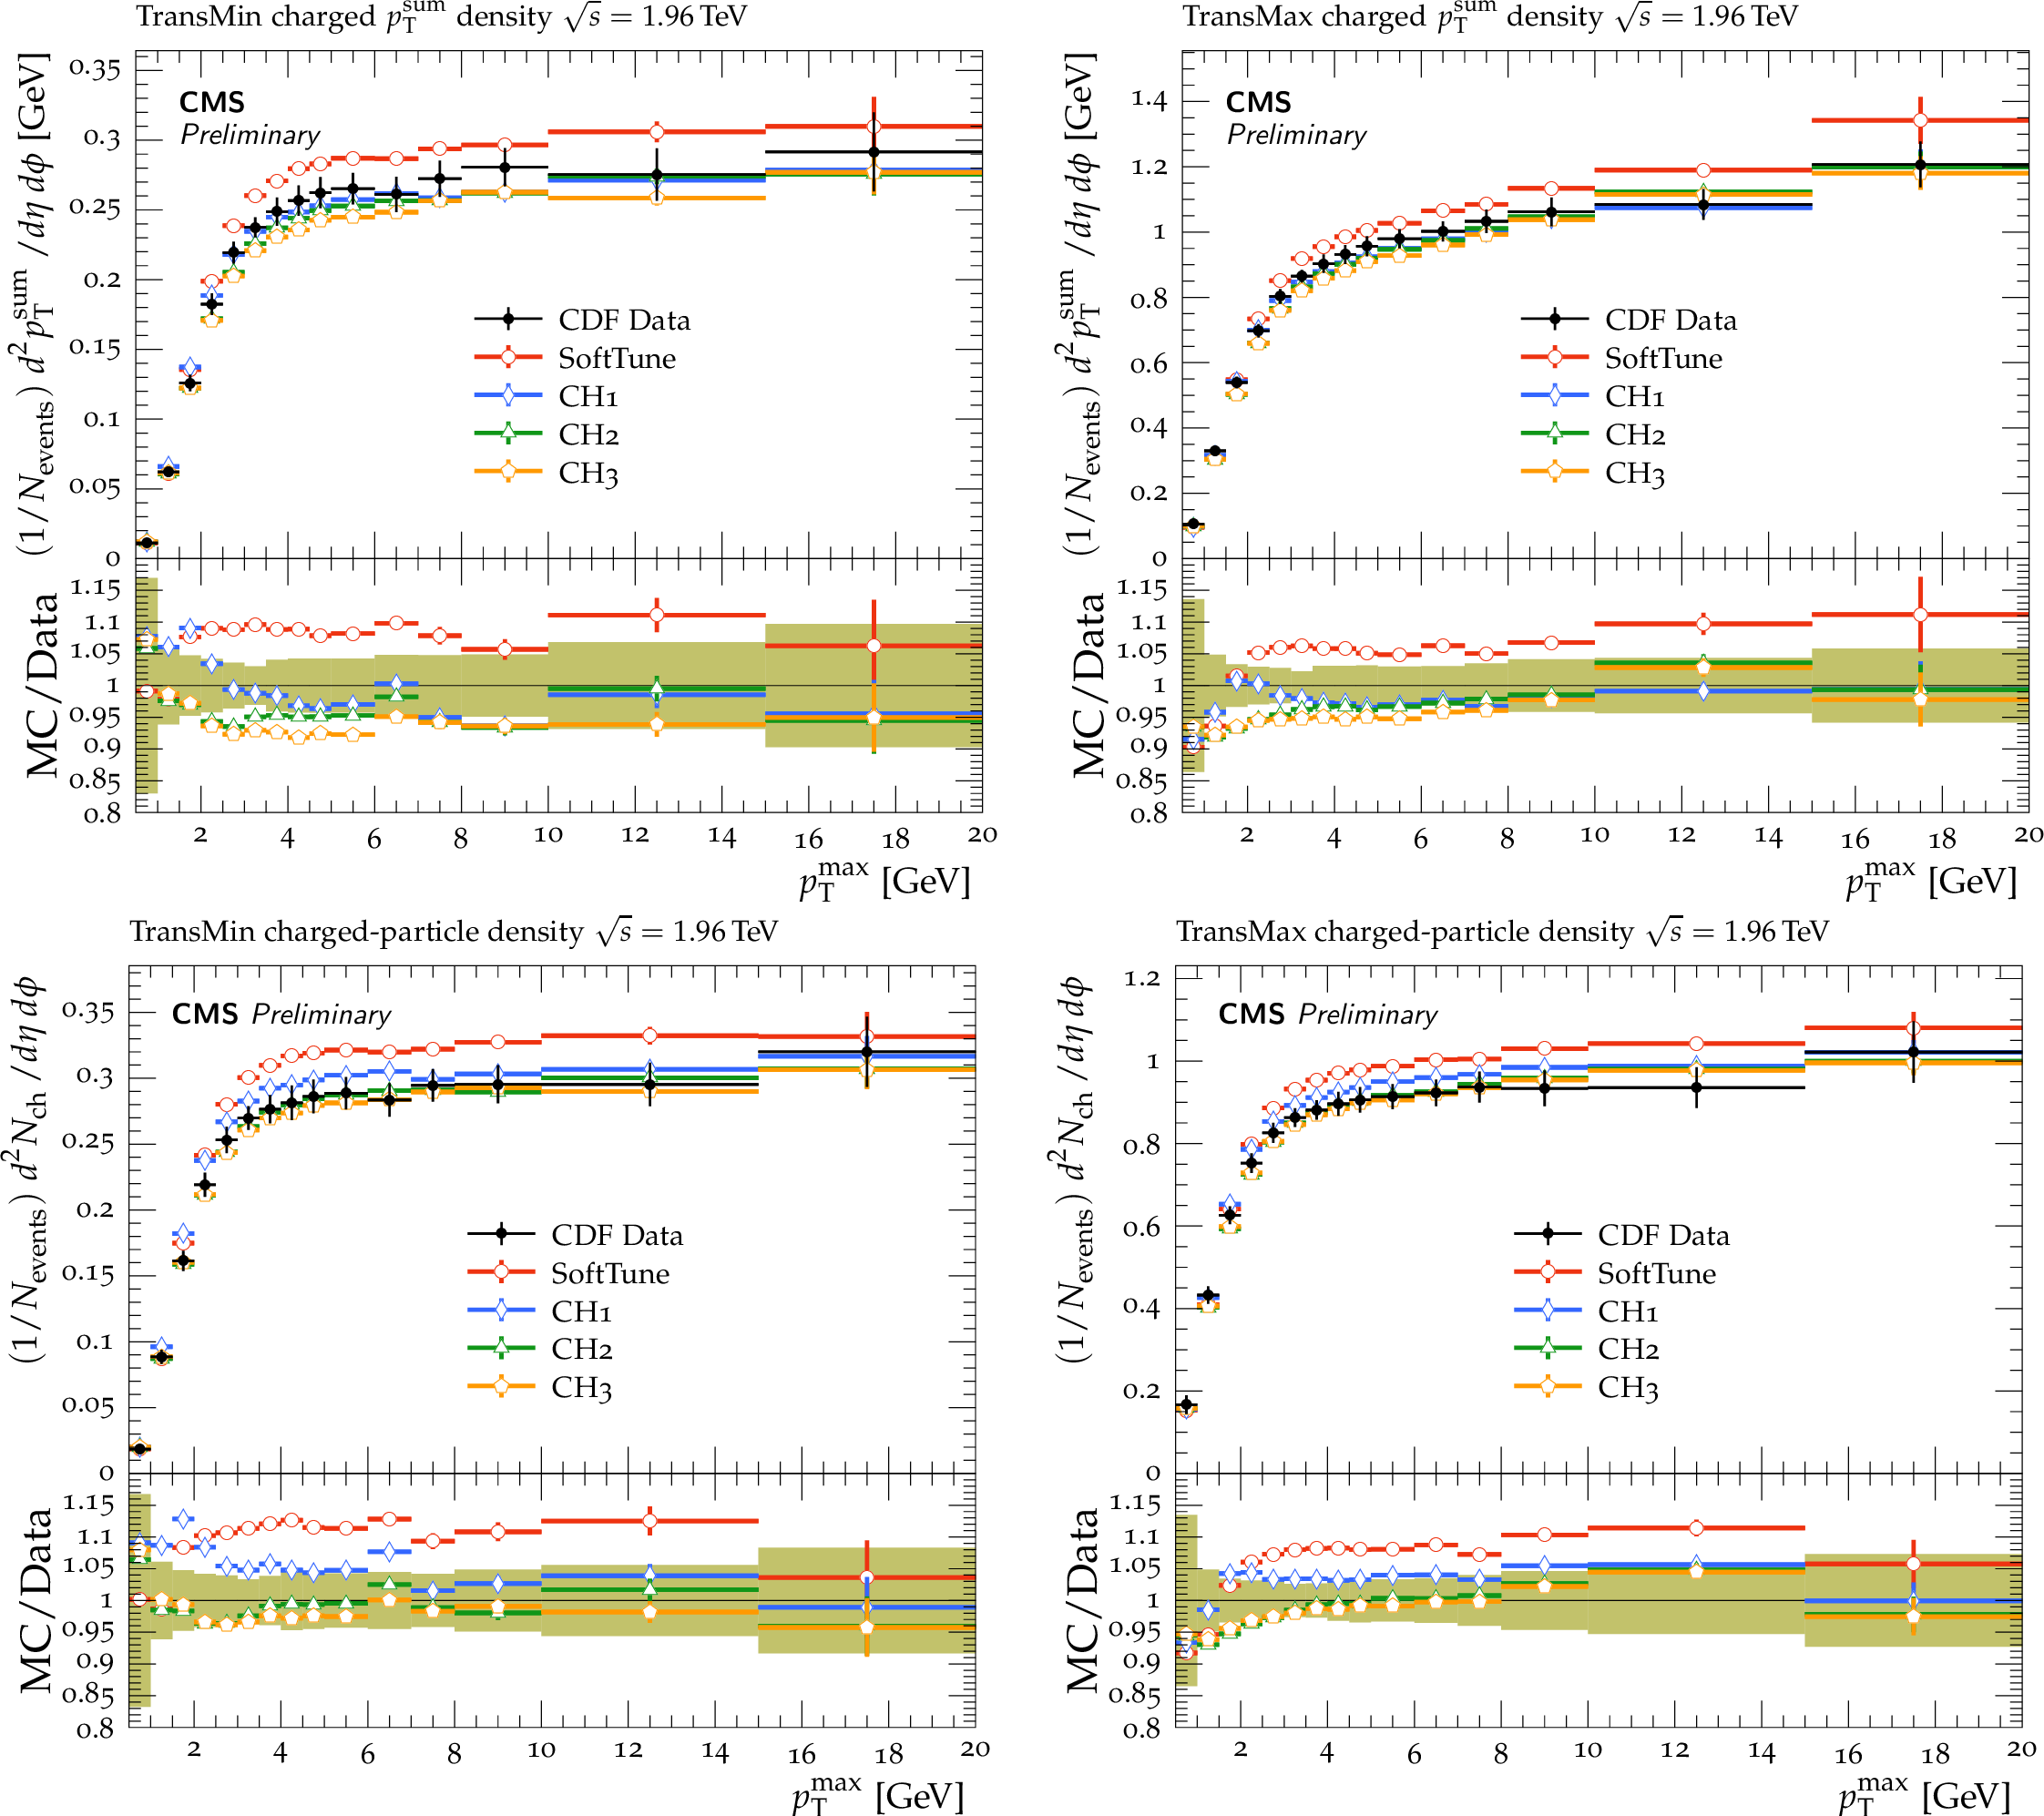
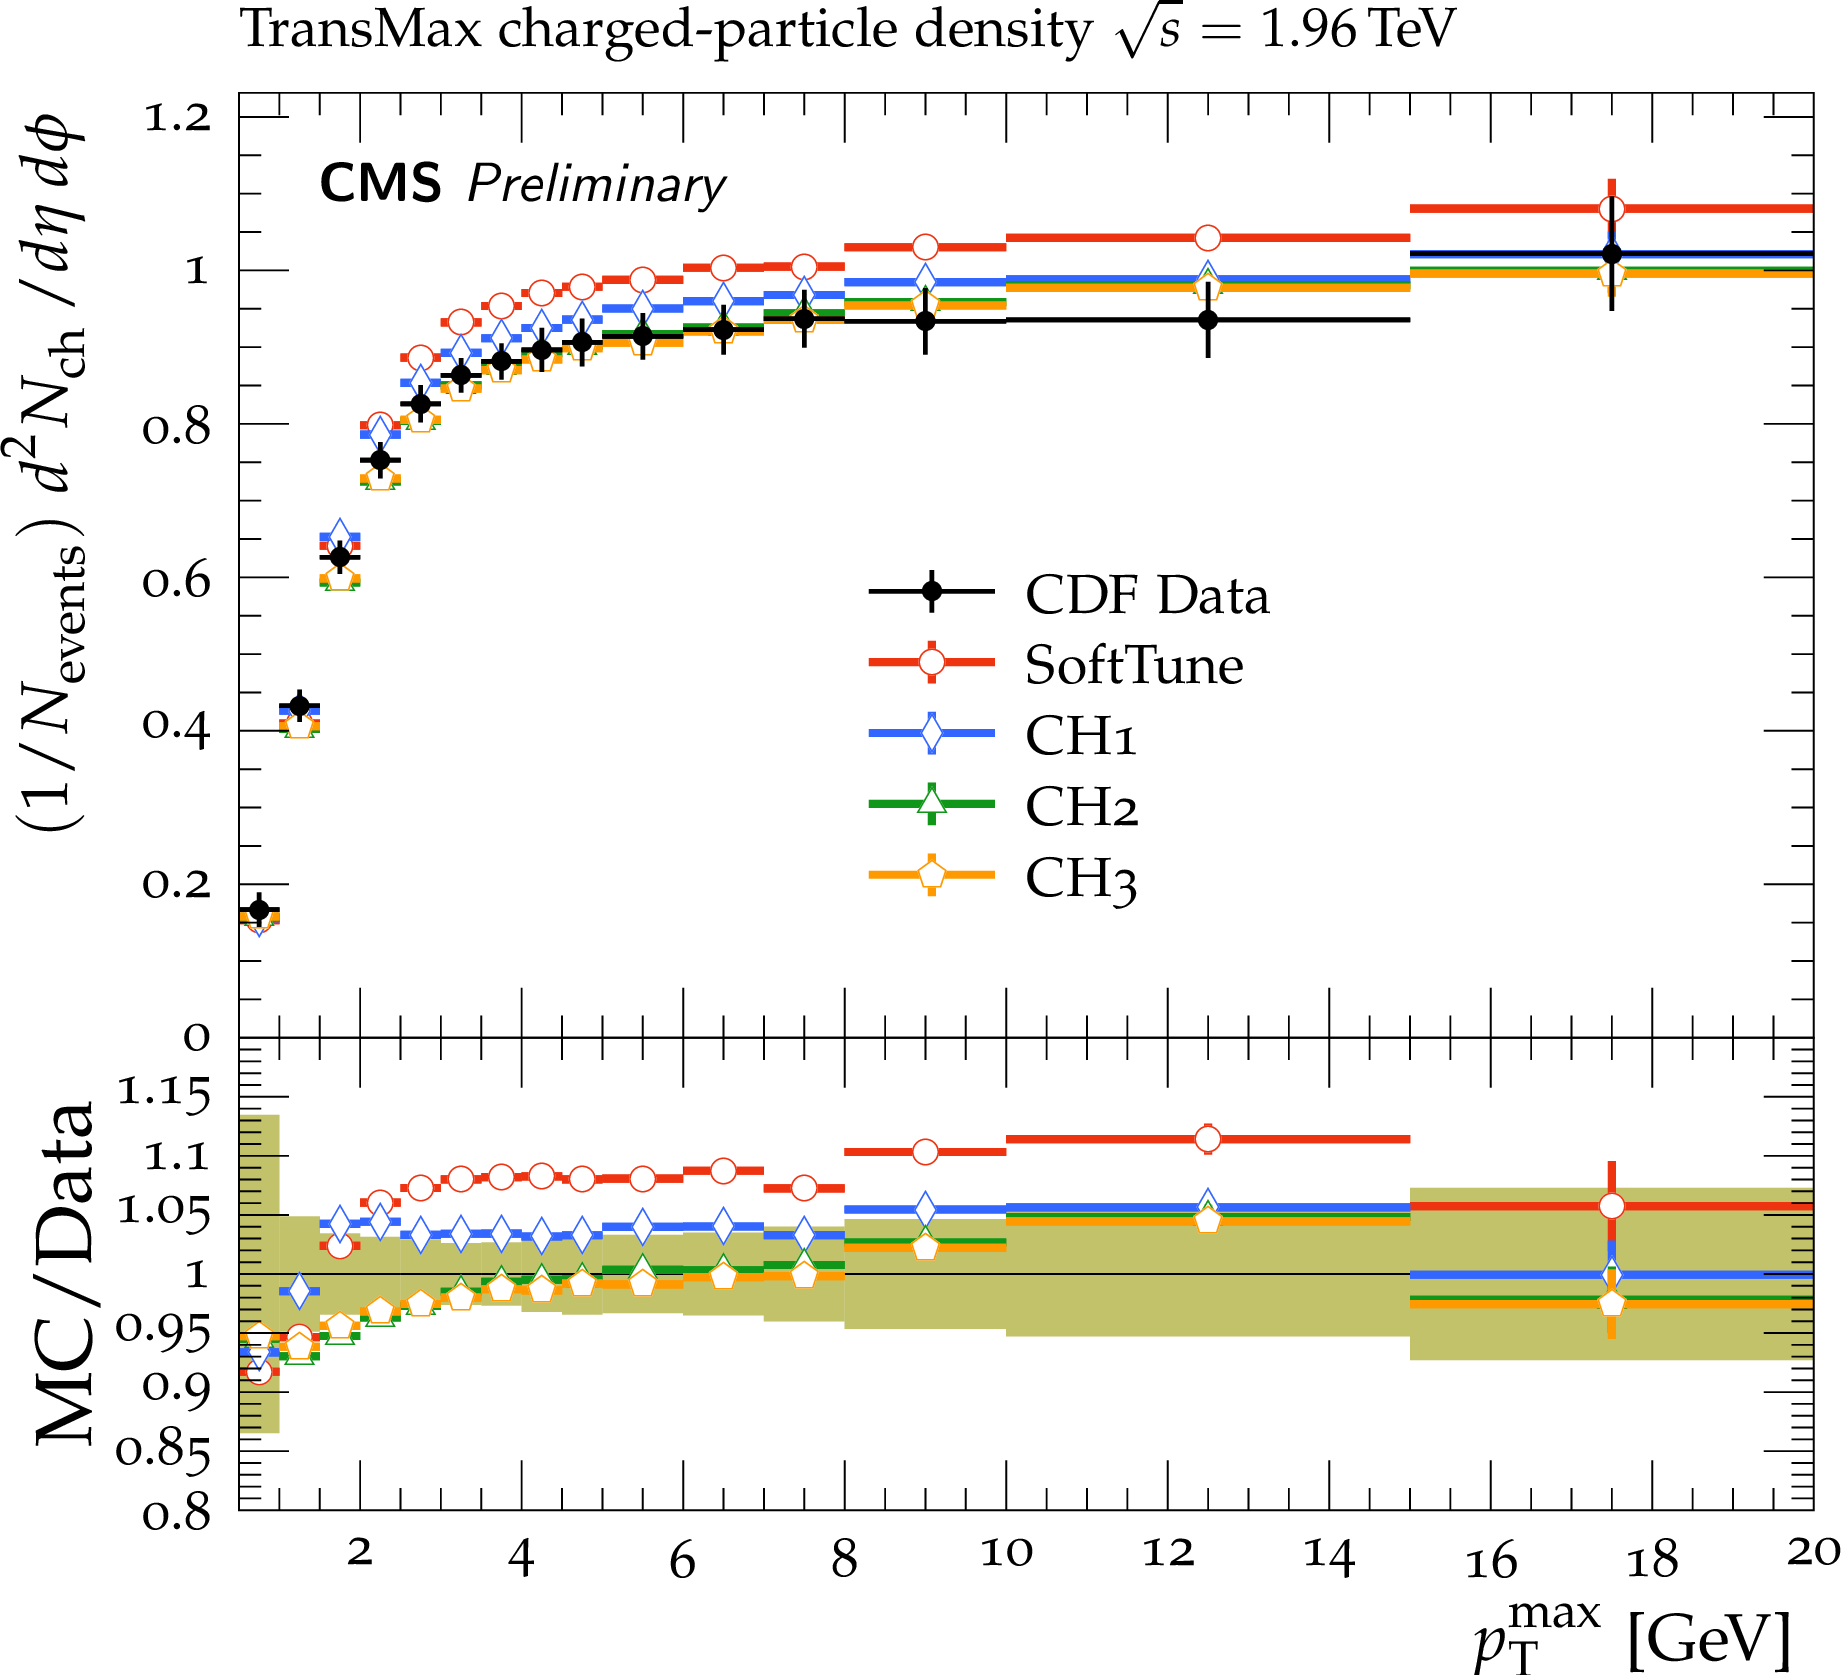
Figure 6:
CDF data at $ {\sqrt {s}} = $ 1.96 TeV on the ${p_{\mathrm {T}}^{\mathrm {sum}}}$ density (upper) and ${N_{\mathrm {ch}}}$ (lower) distributions in the transMin (left) and transMax (right) regions, as a function of the ${p_{\mathrm {T}}}$ of the leading track, ${p_{\mathrm {T}}^{\mathrm {max}}}$ [28]. The data are compared to predictions from HERWIG 7, with the SoftTune and CH tunes. The coloured band in the ratios of the different predictions from simulation to the data represents the total experimental uncertainty in the data. |
png pdf |
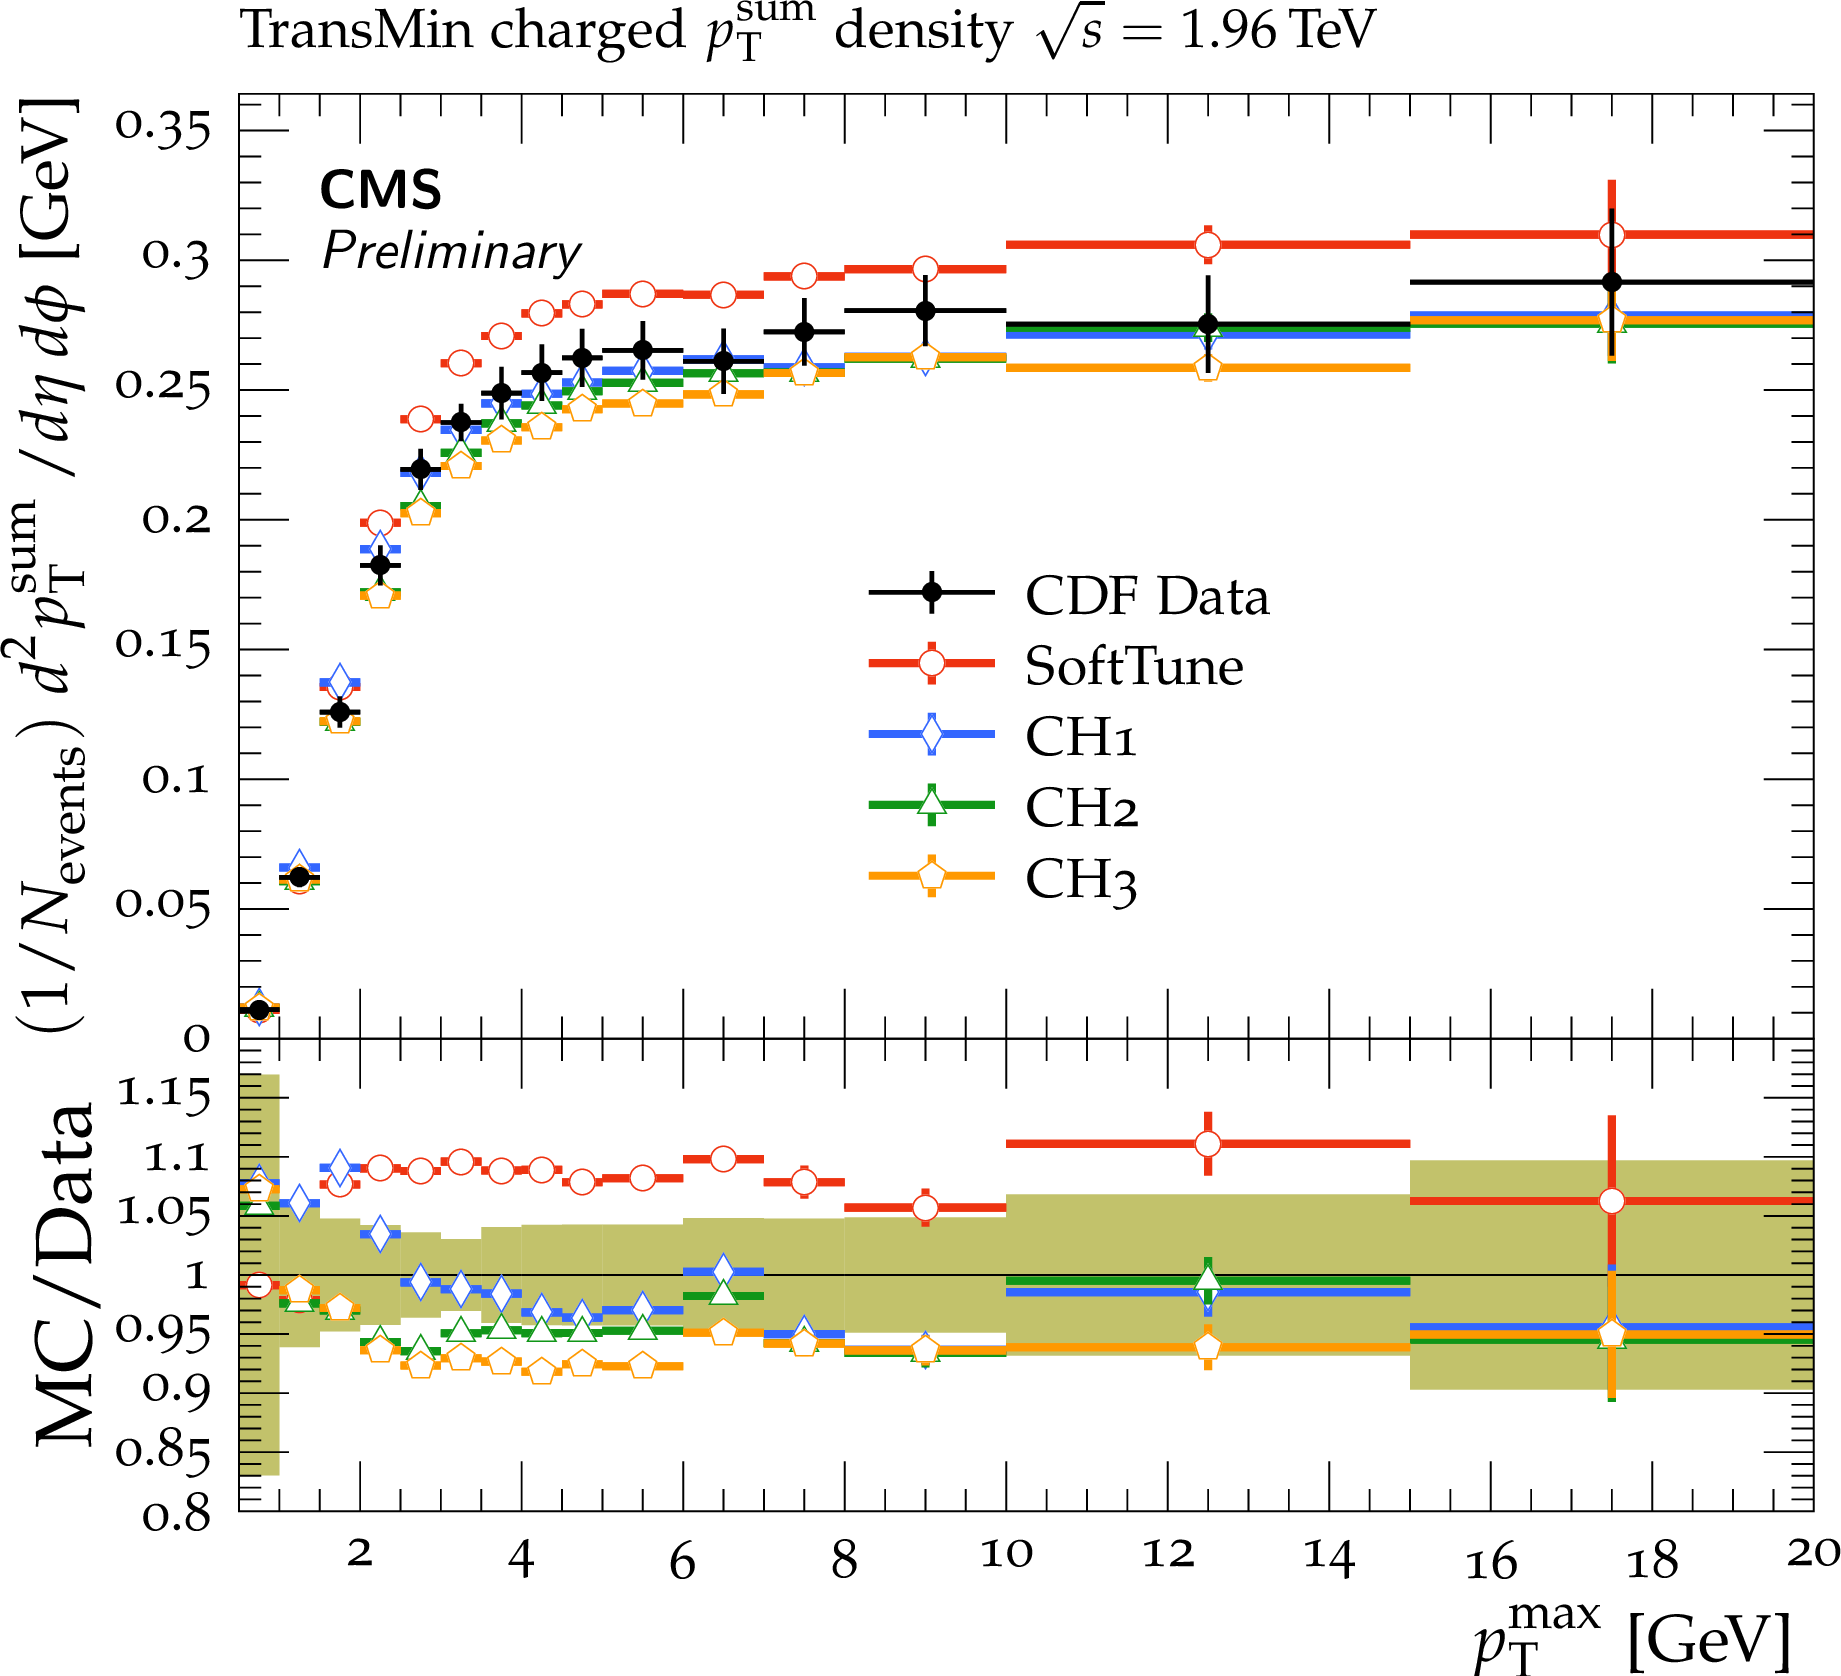
Figure 6-a:
CDF data at $ {\sqrt {s}} = $ 1.96 TeV on the ${p_{\mathrm {T}}^{\mathrm {sum}}}$ density (upper) and ${N_{\mathrm {ch}}}$ (lower) distributions in the transMin (left) and transMax (right) regions, as a function of the ${p_{\mathrm {T}}}$ of the leading track, ${p_{\mathrm {T}}^{\mathrm {max}}}$ [28]. The data are compared to predictions from HERWIG 7, with the SoftTune and CH tunes. The coloured band in the ratios of the different predictions from simulation to the data represents the total experimental uncertainty in the data. |
png pdf |
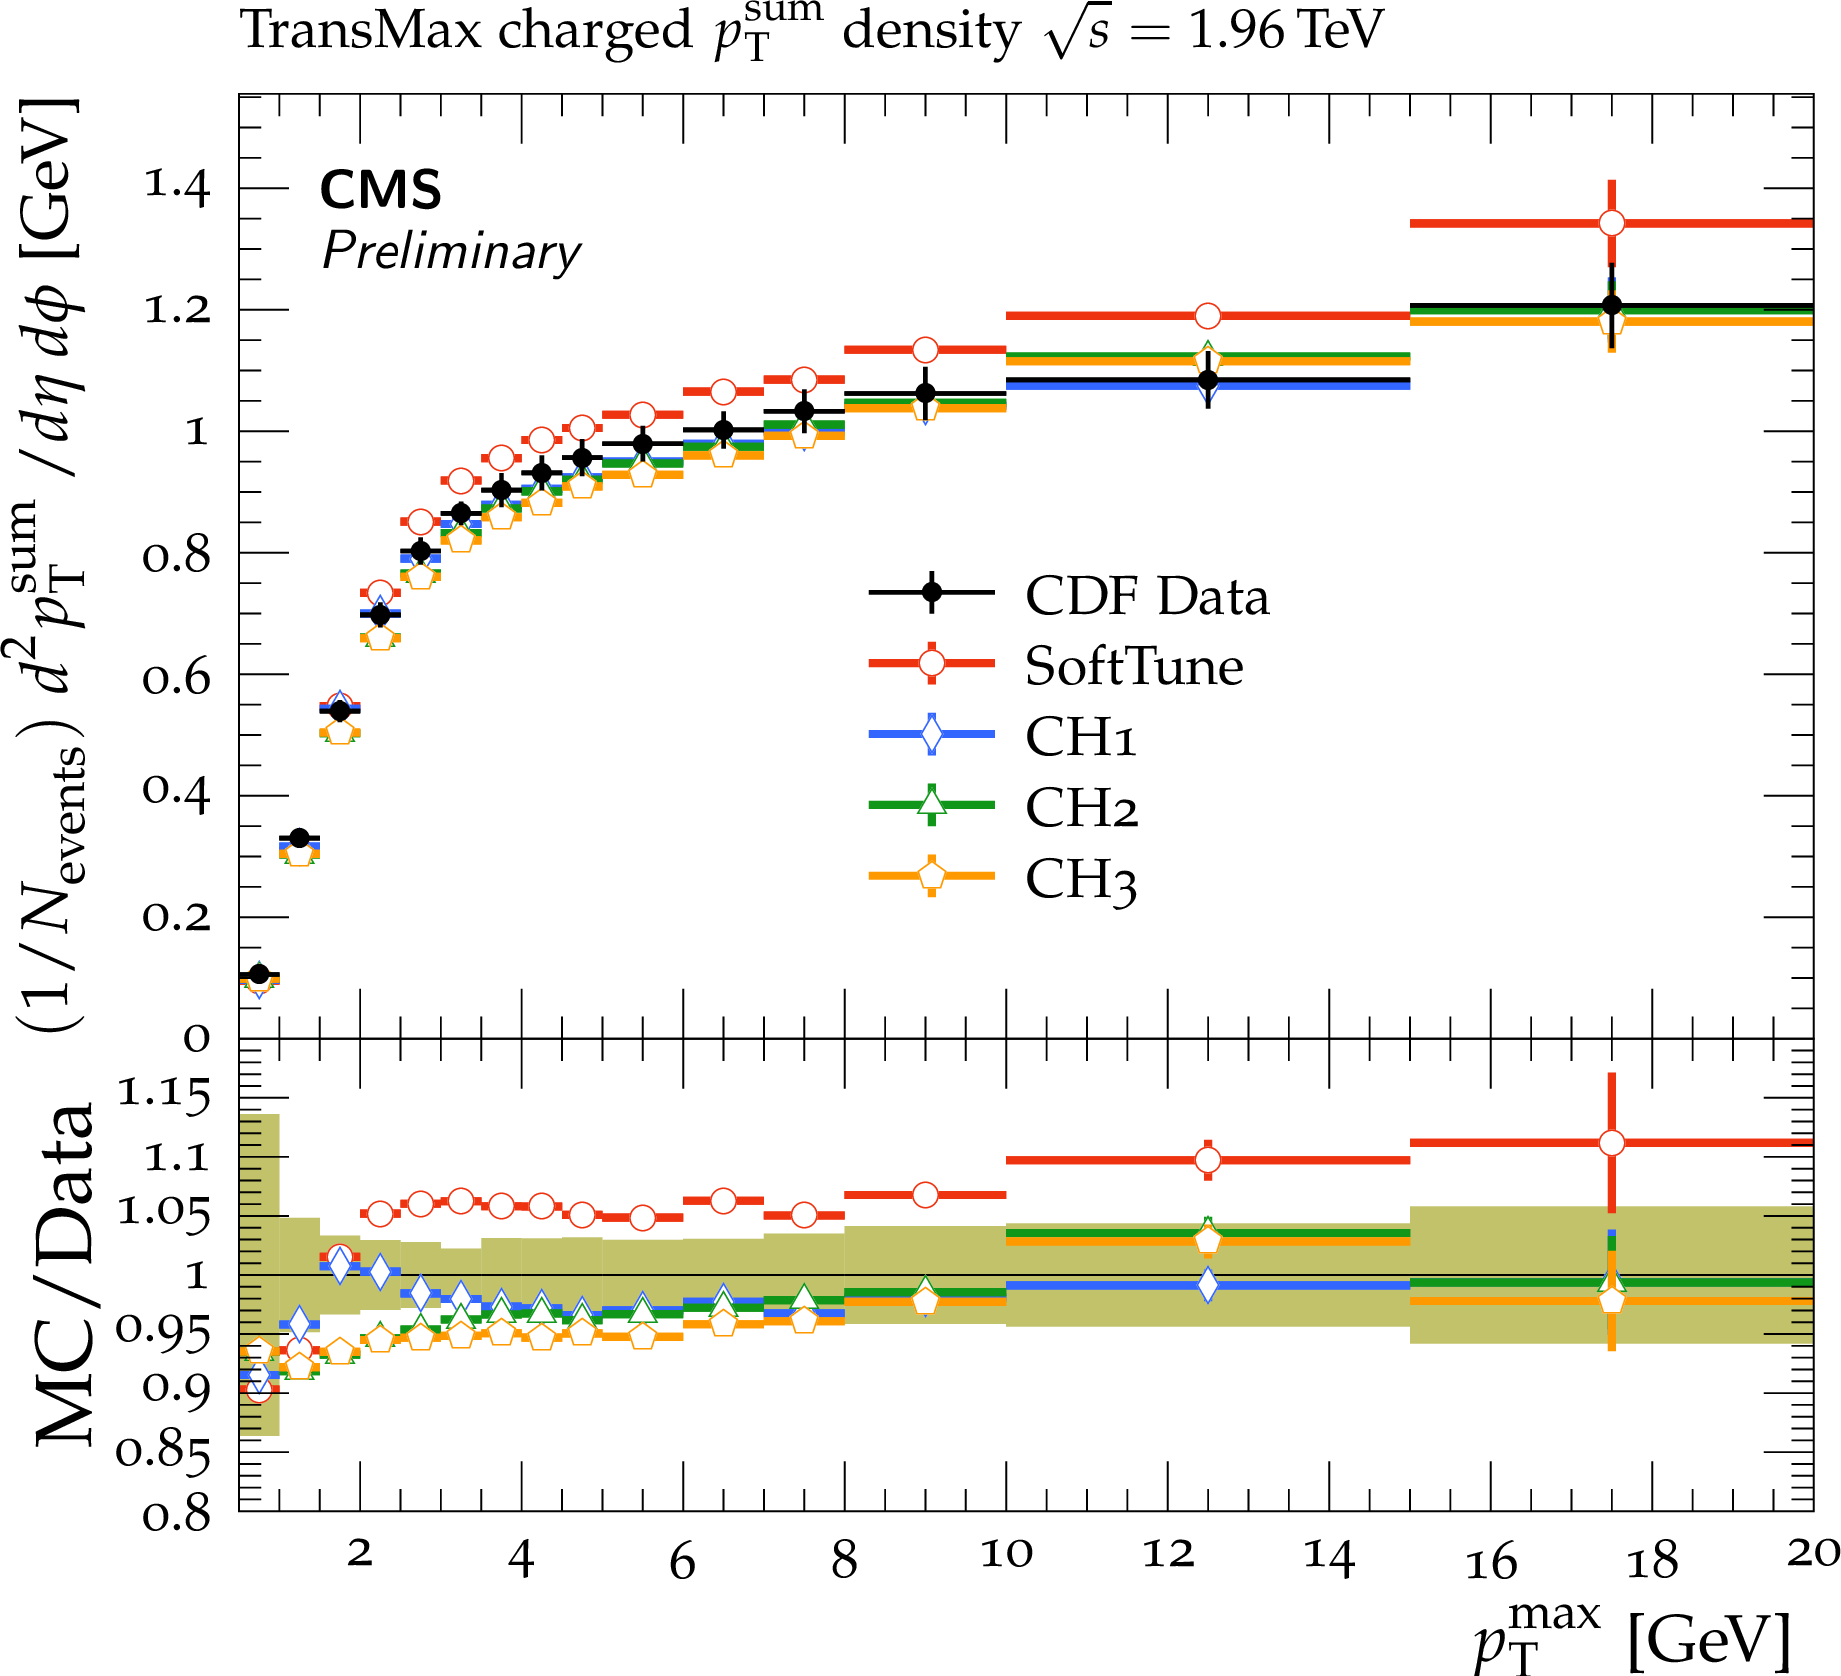
Figure 6-b:
CDF data at $ {\sqrt {s}} = $ 1.96 TeV on the ${p_{\mathrm {T}}^{\mathrm {sum}}}$ density (upper) and ${N_{\mathrm {ch}}}$ (lower) distributions in the transMin (left) and transMax (right) regions, as a function of the ${p_{\mathrm {T}}}$ of the leading track, ${p_{\mathrm {T}}^{\mathrm {max}}}$ [28]. The data are compared to predictions from HERWIG 7, with the SoftTune and CH tunes. The coloured band in the ratios of the different predictions from simulation to the data represents the total experimental uncertainty in the data. |
png pdf |
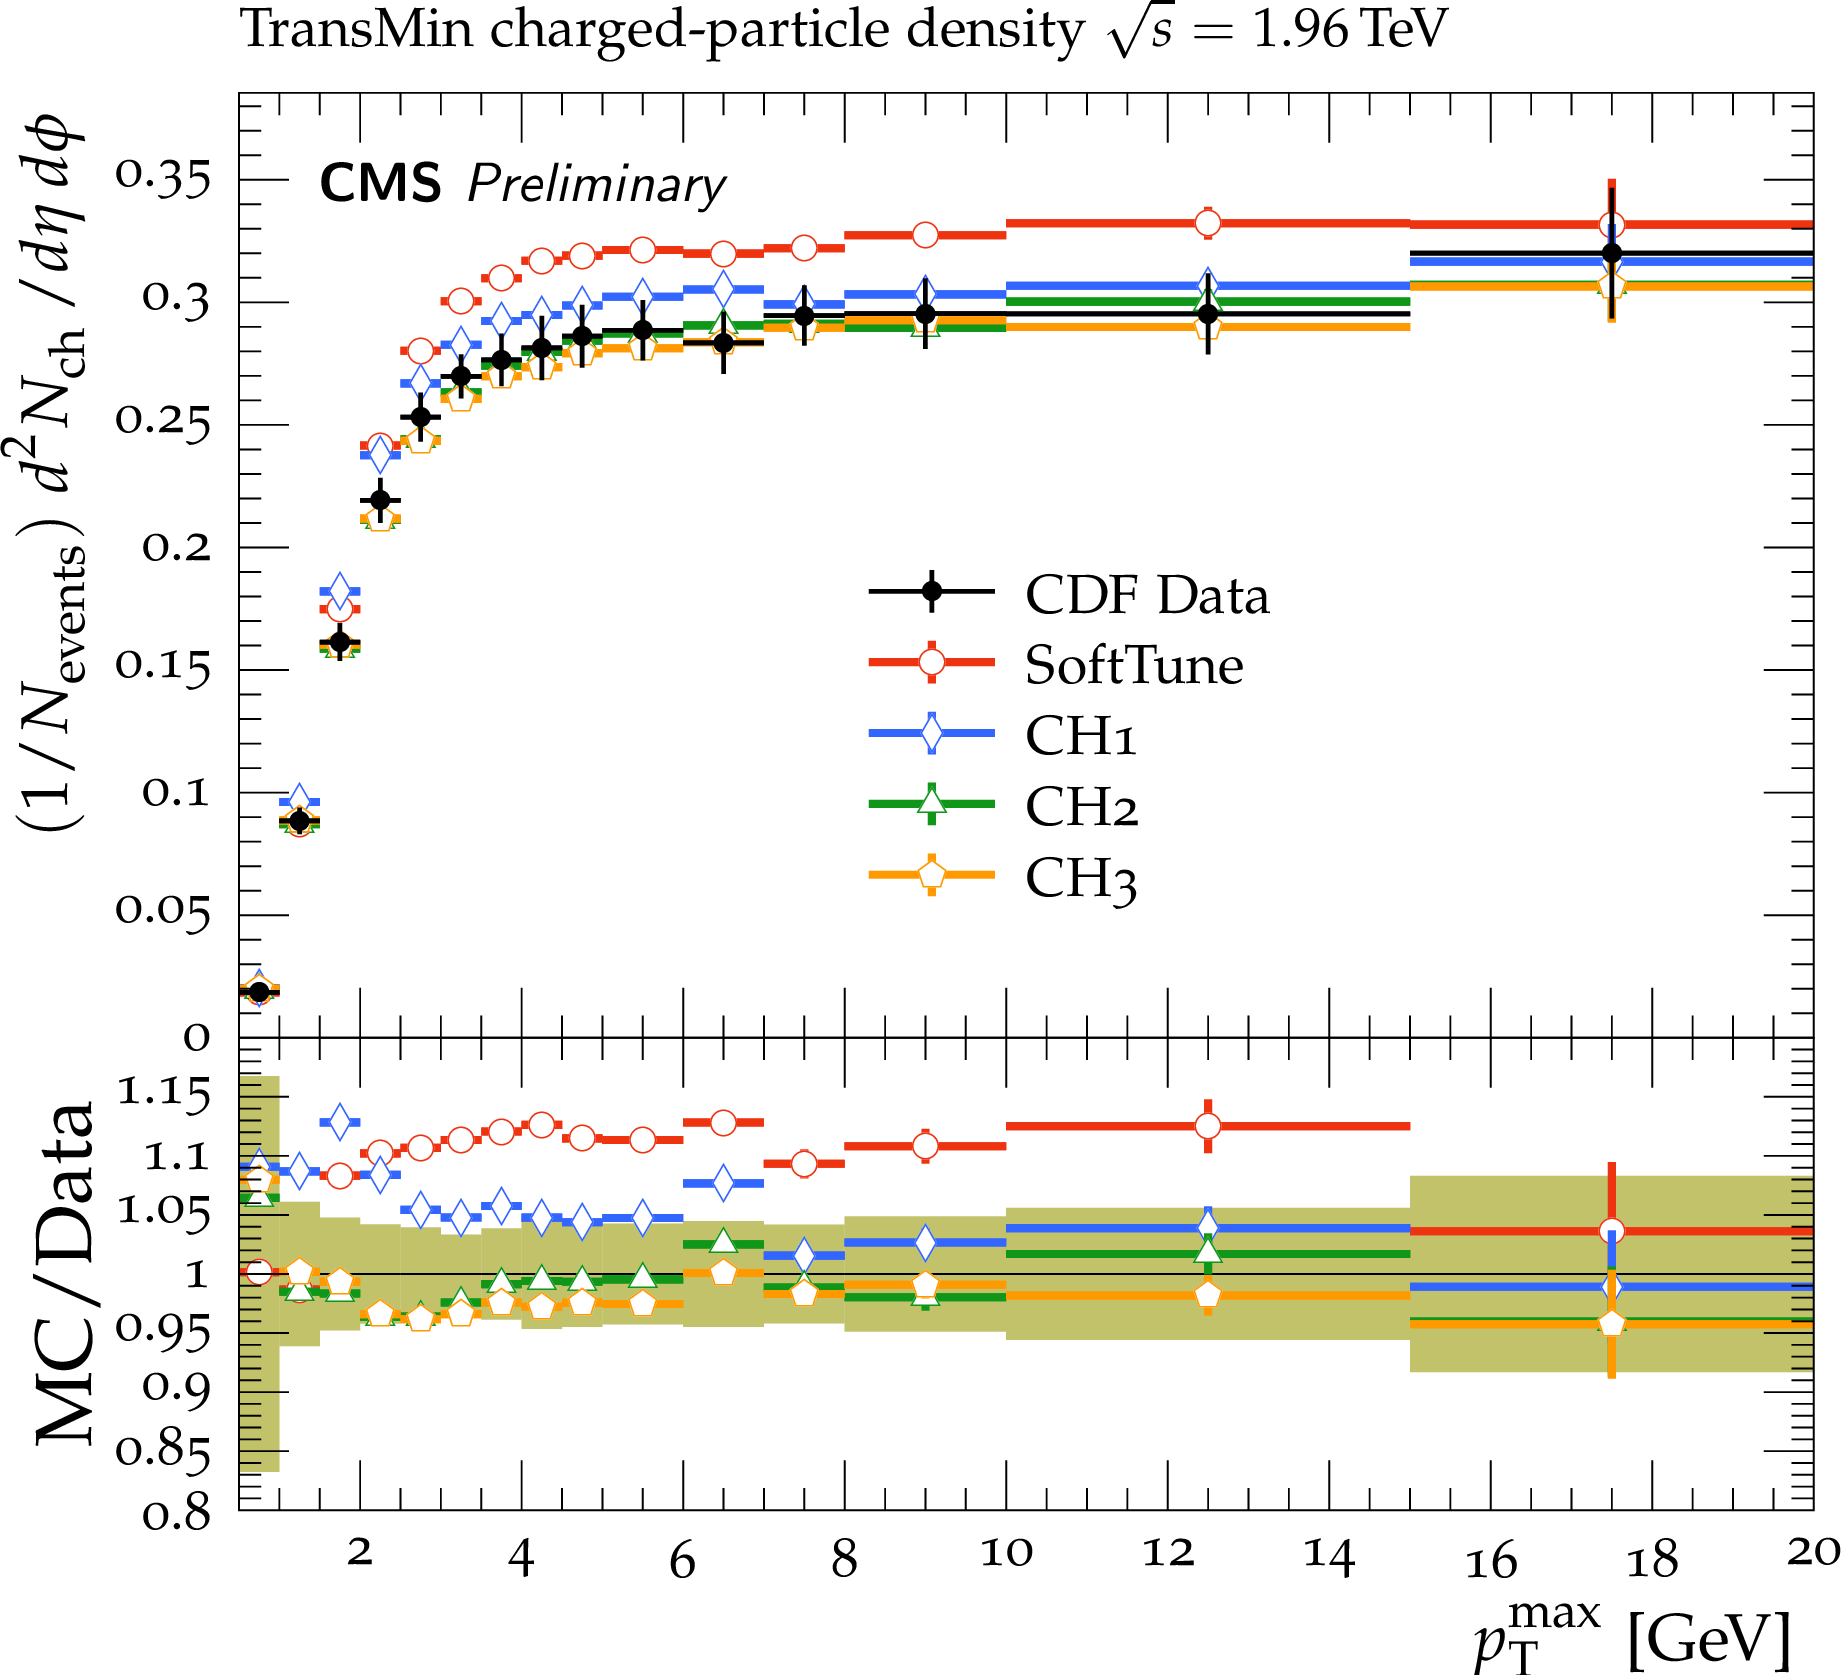
Figure 6-c:
CDF data at $ {\sqrt {s}} = $ 1.96 TeV on the ${p_{\mathrm {T}}^{\mathrm {sum}}}$ density (upper) and ${N_{\mathrm {ch}}}$ (lower) distributions in the transMin (left) and transMax (right) regions, as a function of the ${p_{\mathrm {T}}}$ of the leading track, ${p_{\mathrm {T}}^{\mathrm {max}}}$ [28]. The data are compared to predictions from HERWIG 7, with the SoftTune and CH tunes. The coloured band in the ratios of the different predictions from simulation to the data represents the total experimental uncertainty in the data. |
png pdf |
Figure 6-d:
CDF data at $ {\sqrt {s}} = $ 1.96 TeV on the ${p_{\mathrm {T}}^{\mathrm {sum}}}$ density (upper) and ${N_{\mathrm {ch}}}$ (lower) distributions in the transMin (left) and transMax (right) regions, as a function of the ${p_{\mathrm {T}}}$ of the leading track, ${p_{\mathrm {T}}^{\mathrm {max}}}$ [28]. The data are compared to predictions from HERWIG 7, with the SoftTune and CH tunes. The coloured band in the ratios of the different predictions from simulation to the data represents the total experimental uncertainty in the data. |
png pdf |
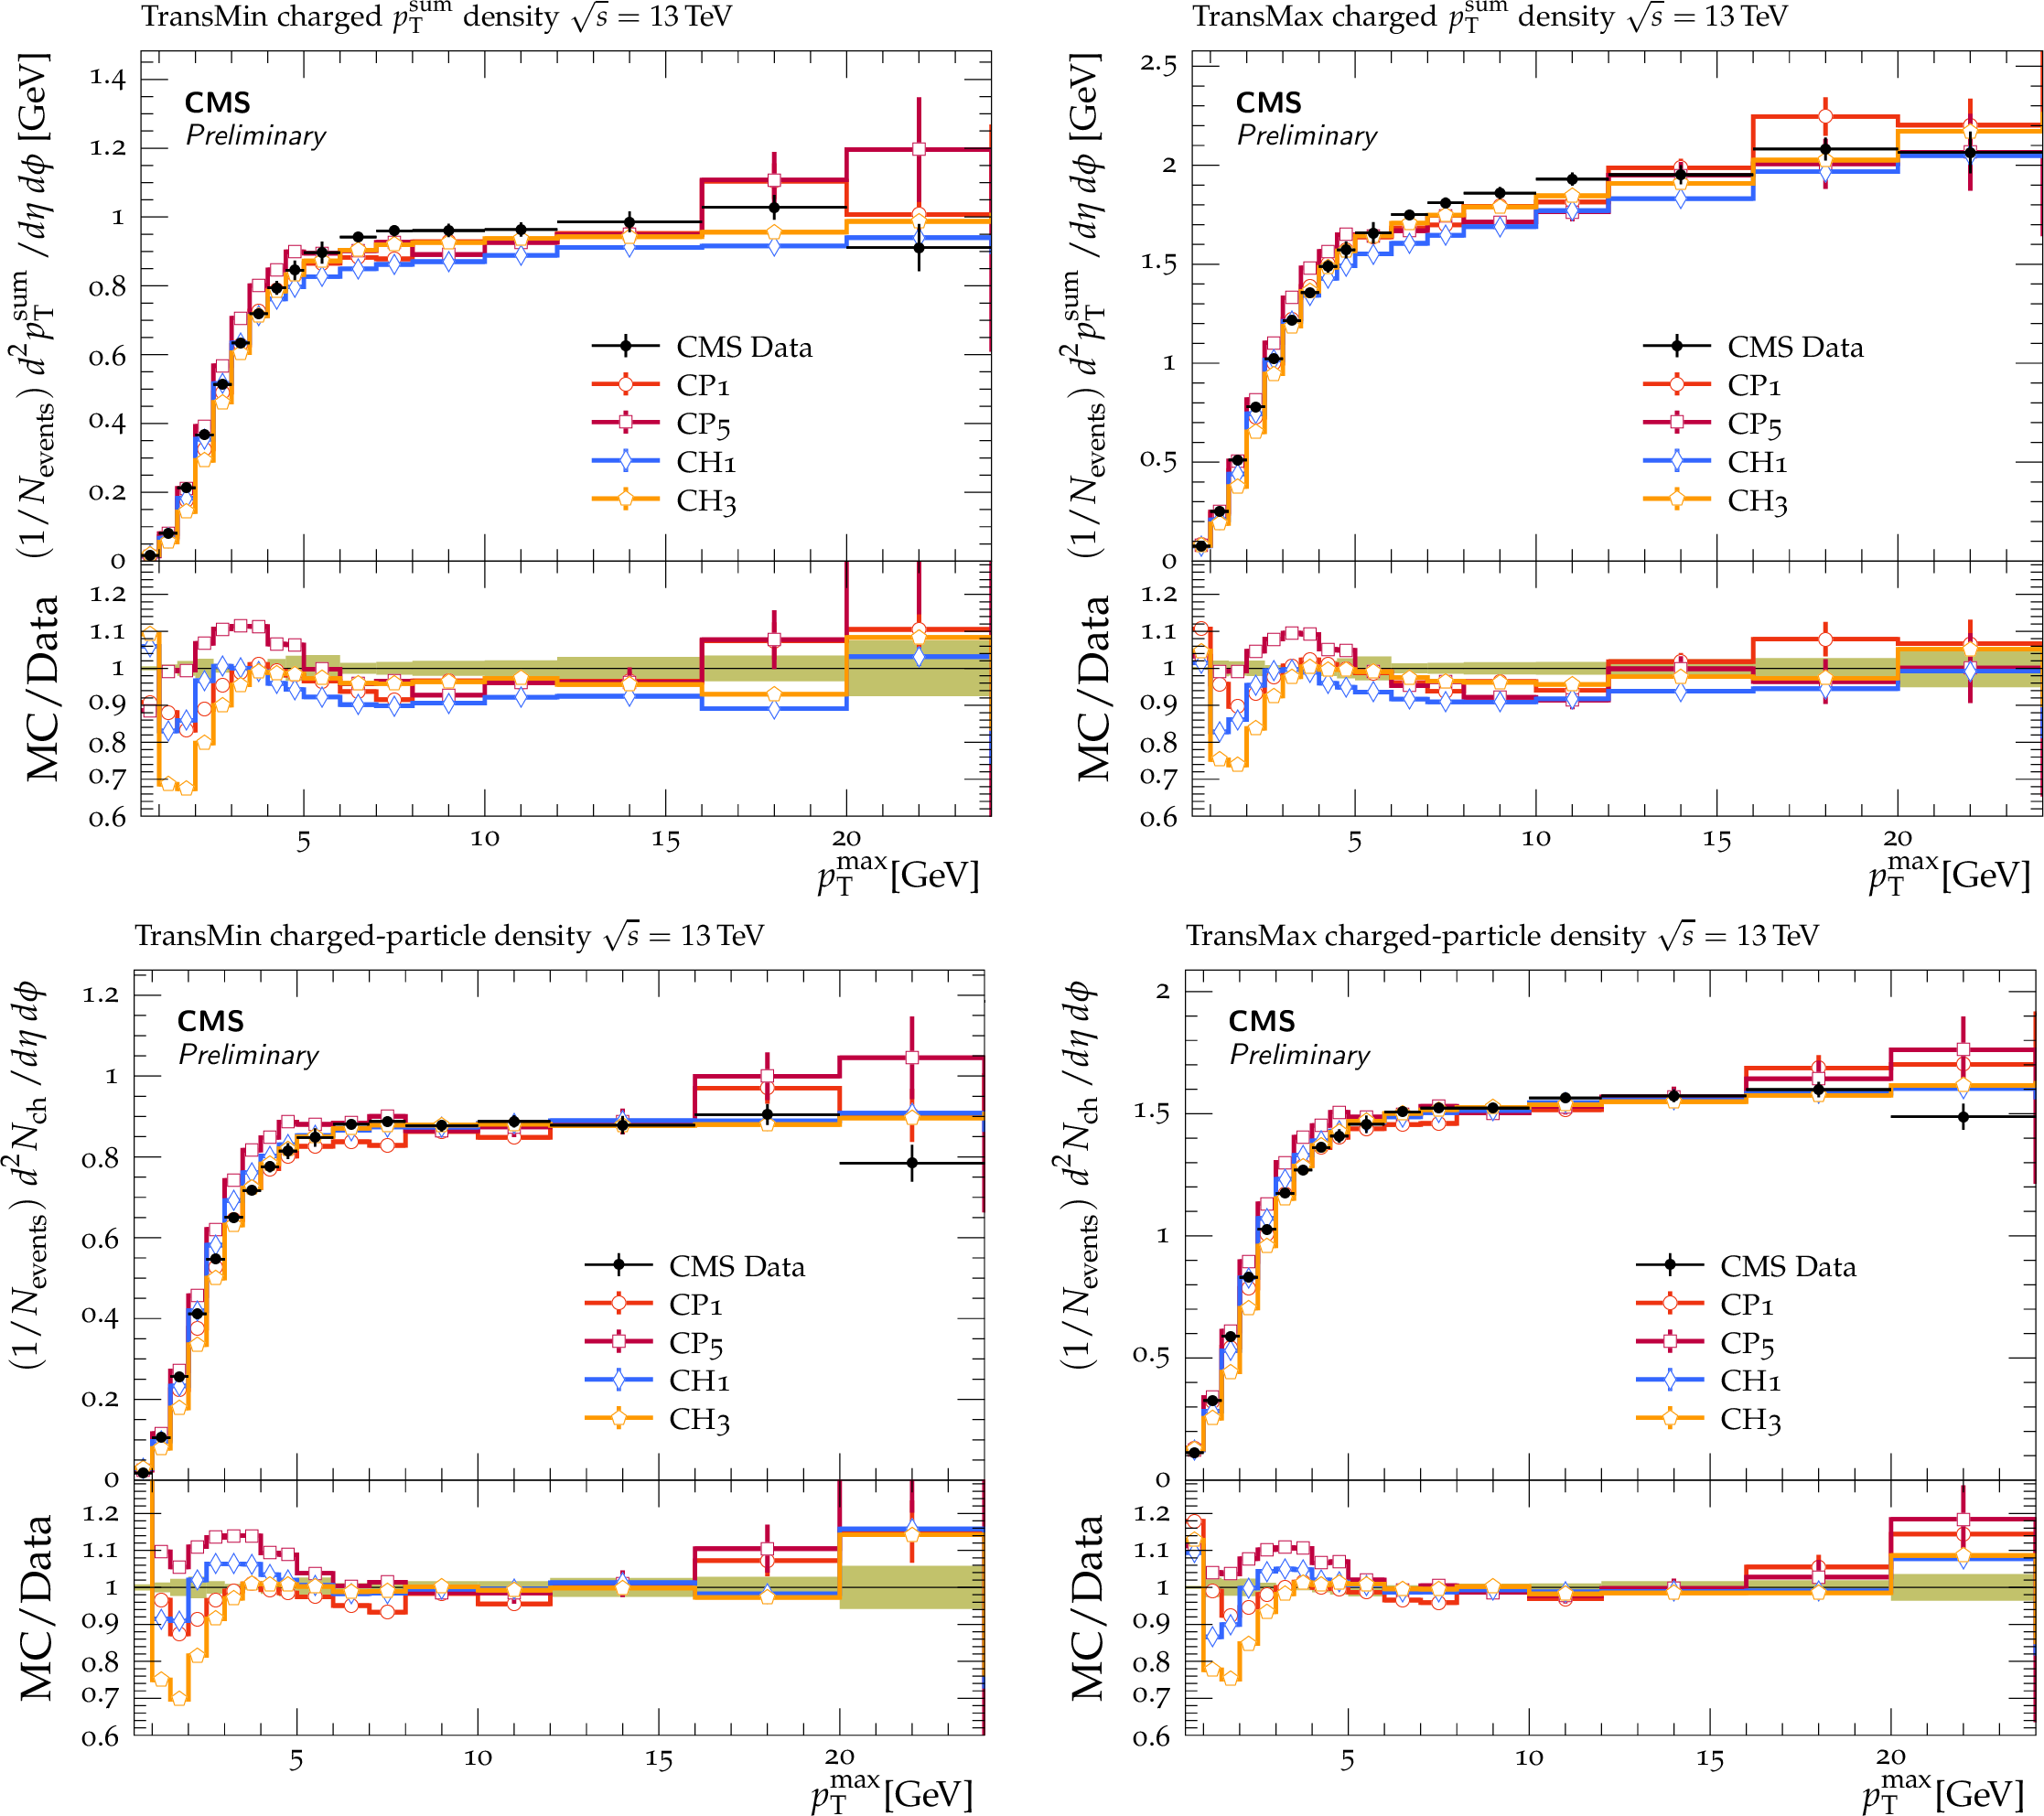
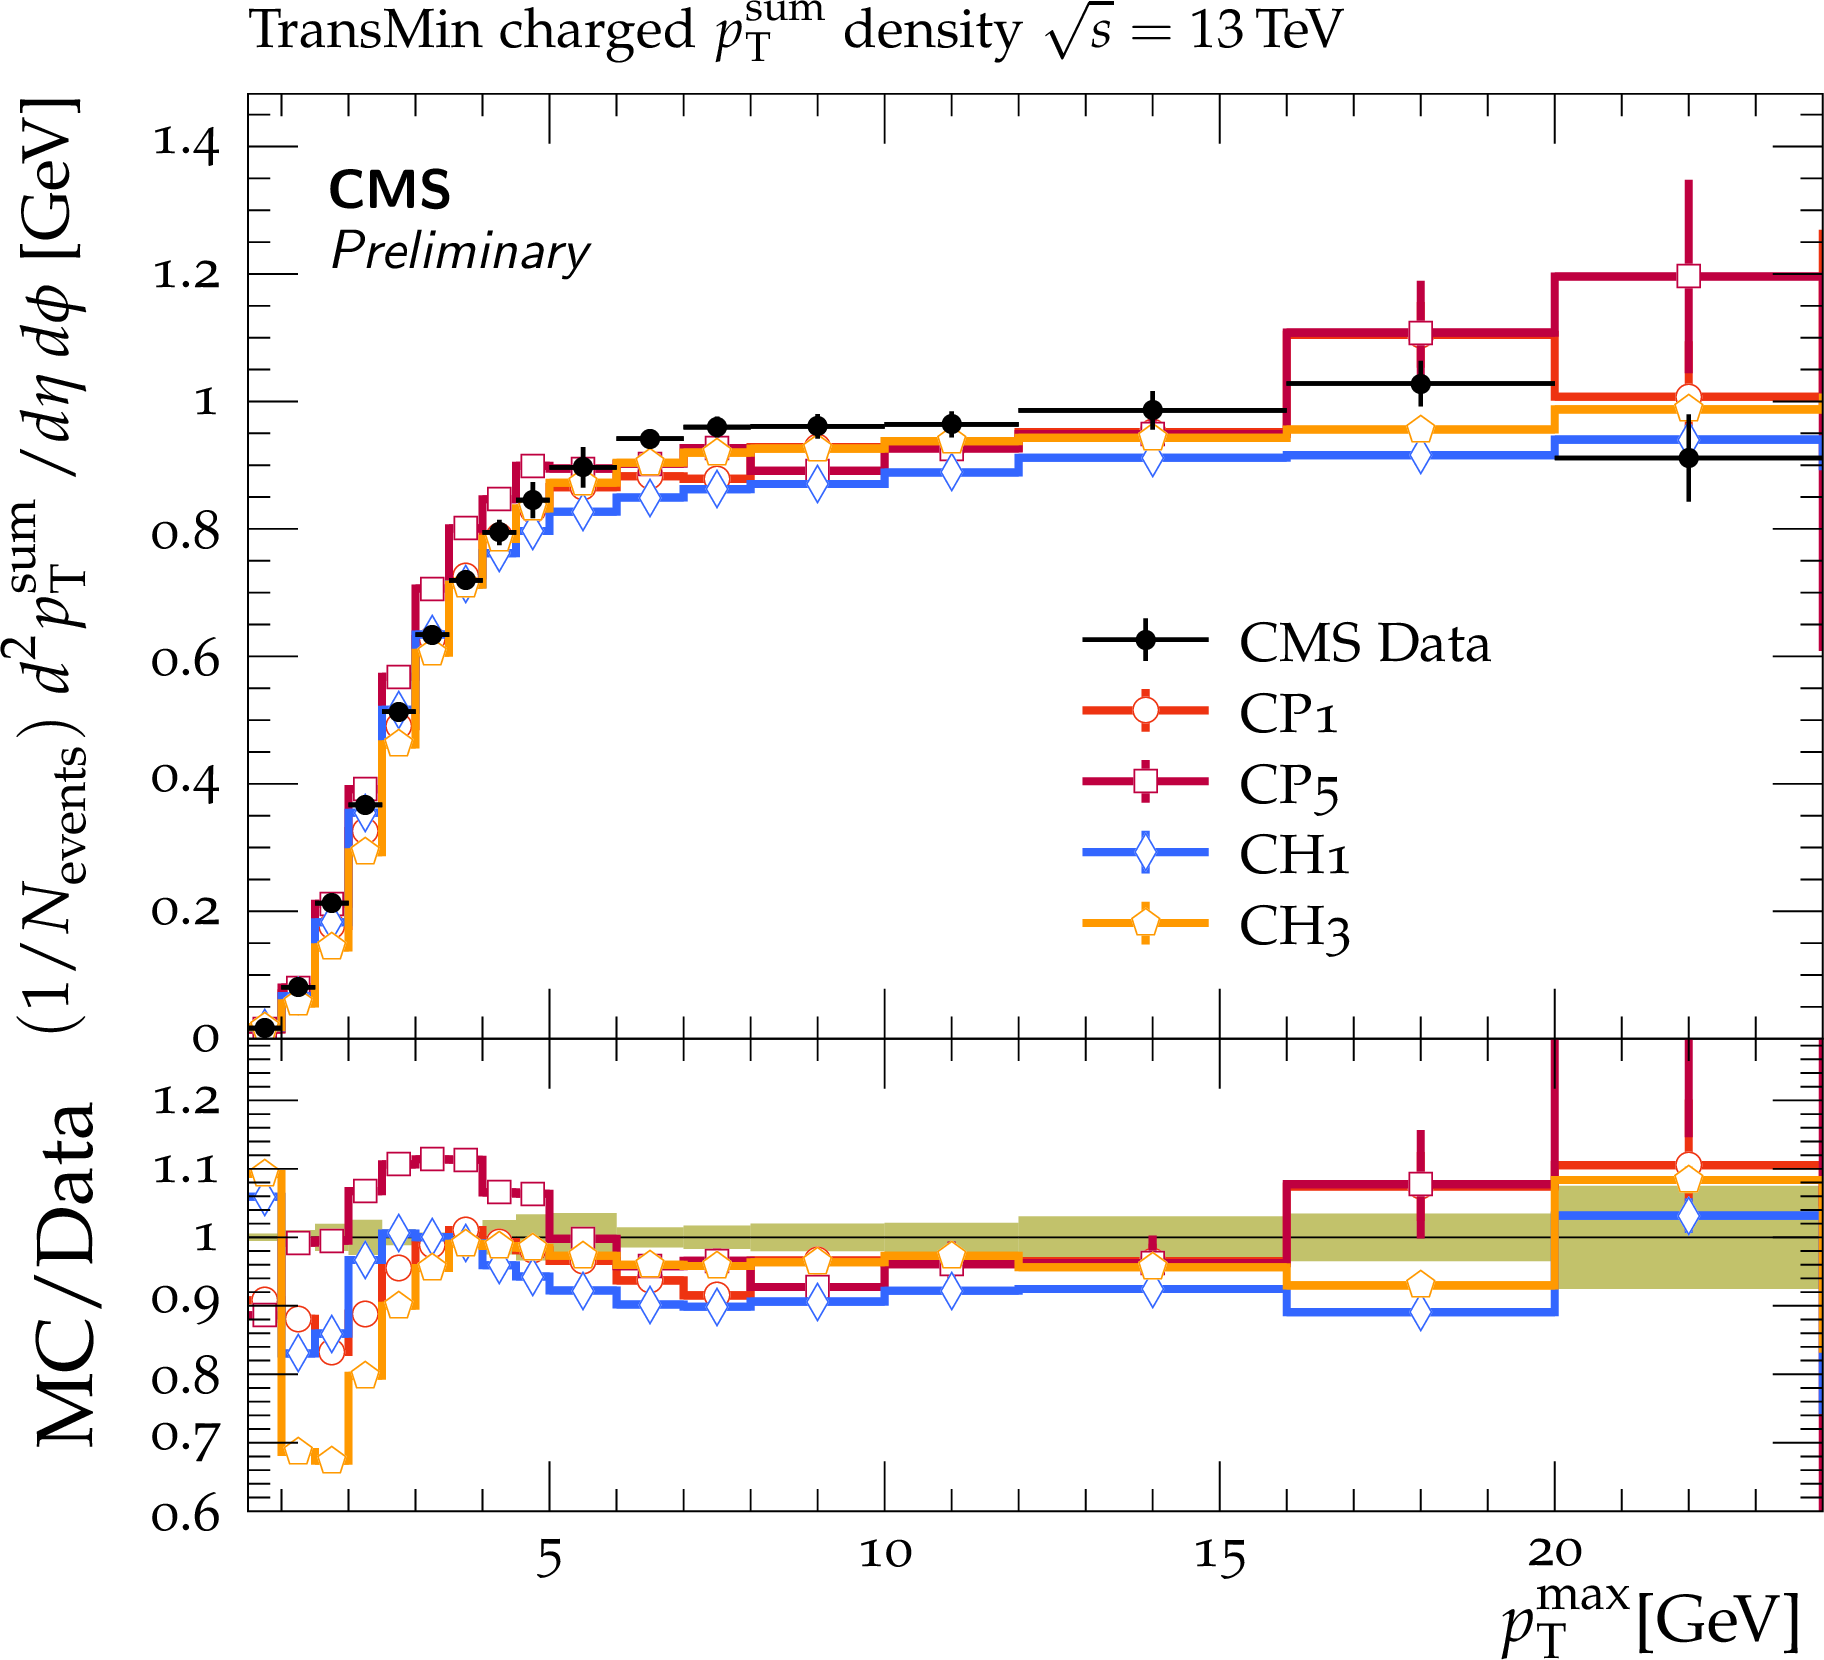
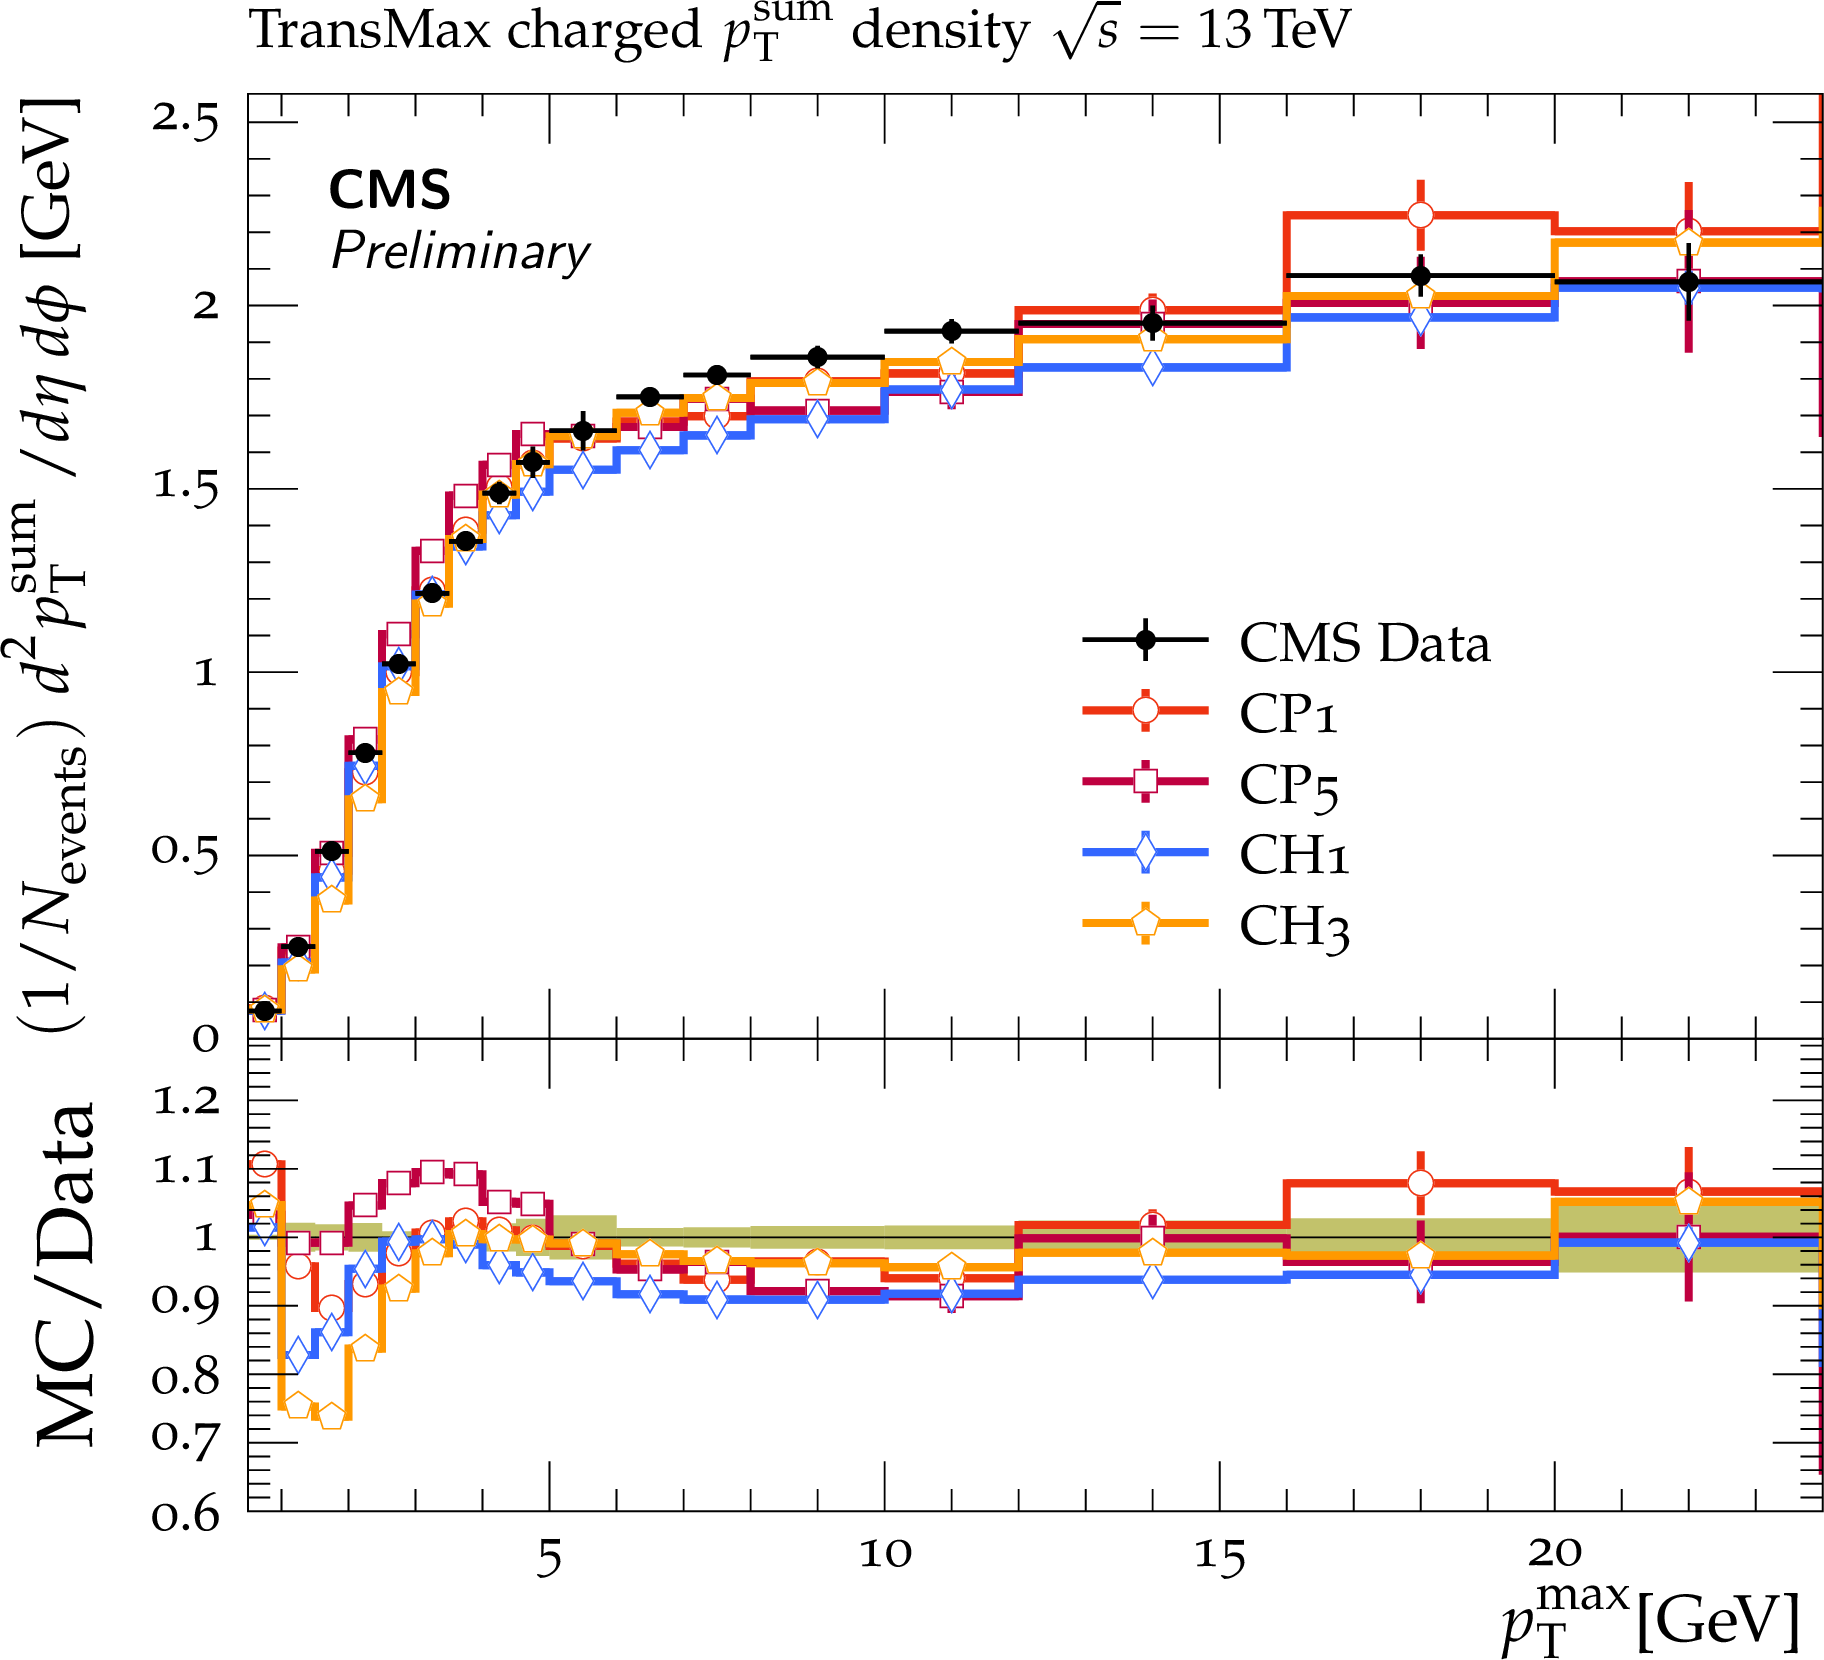
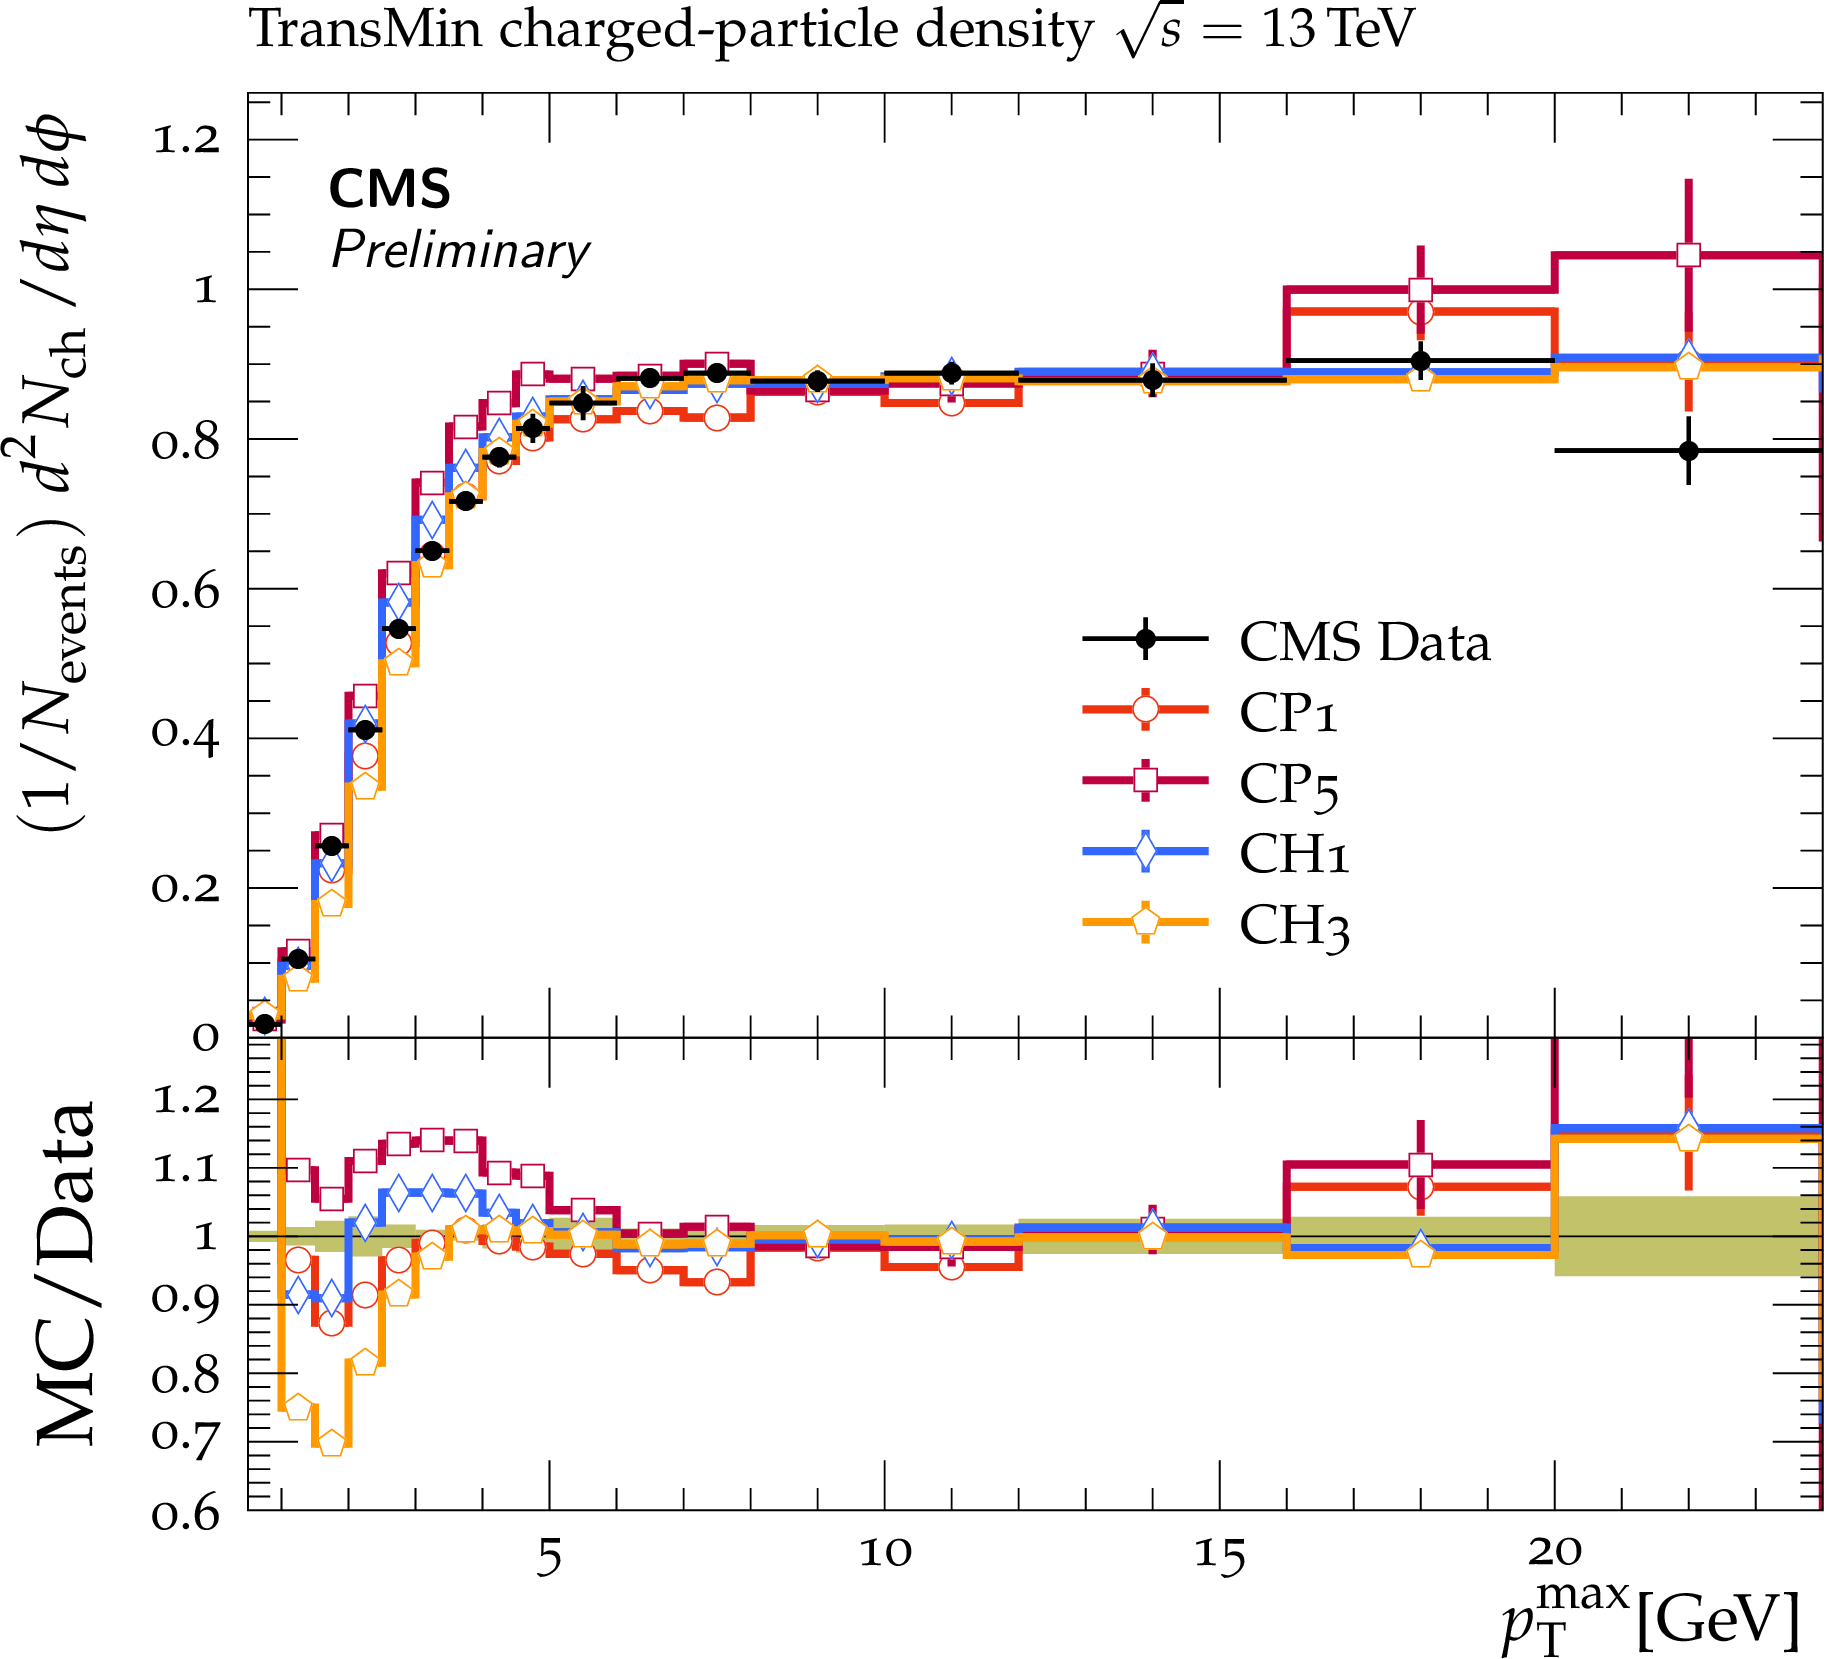
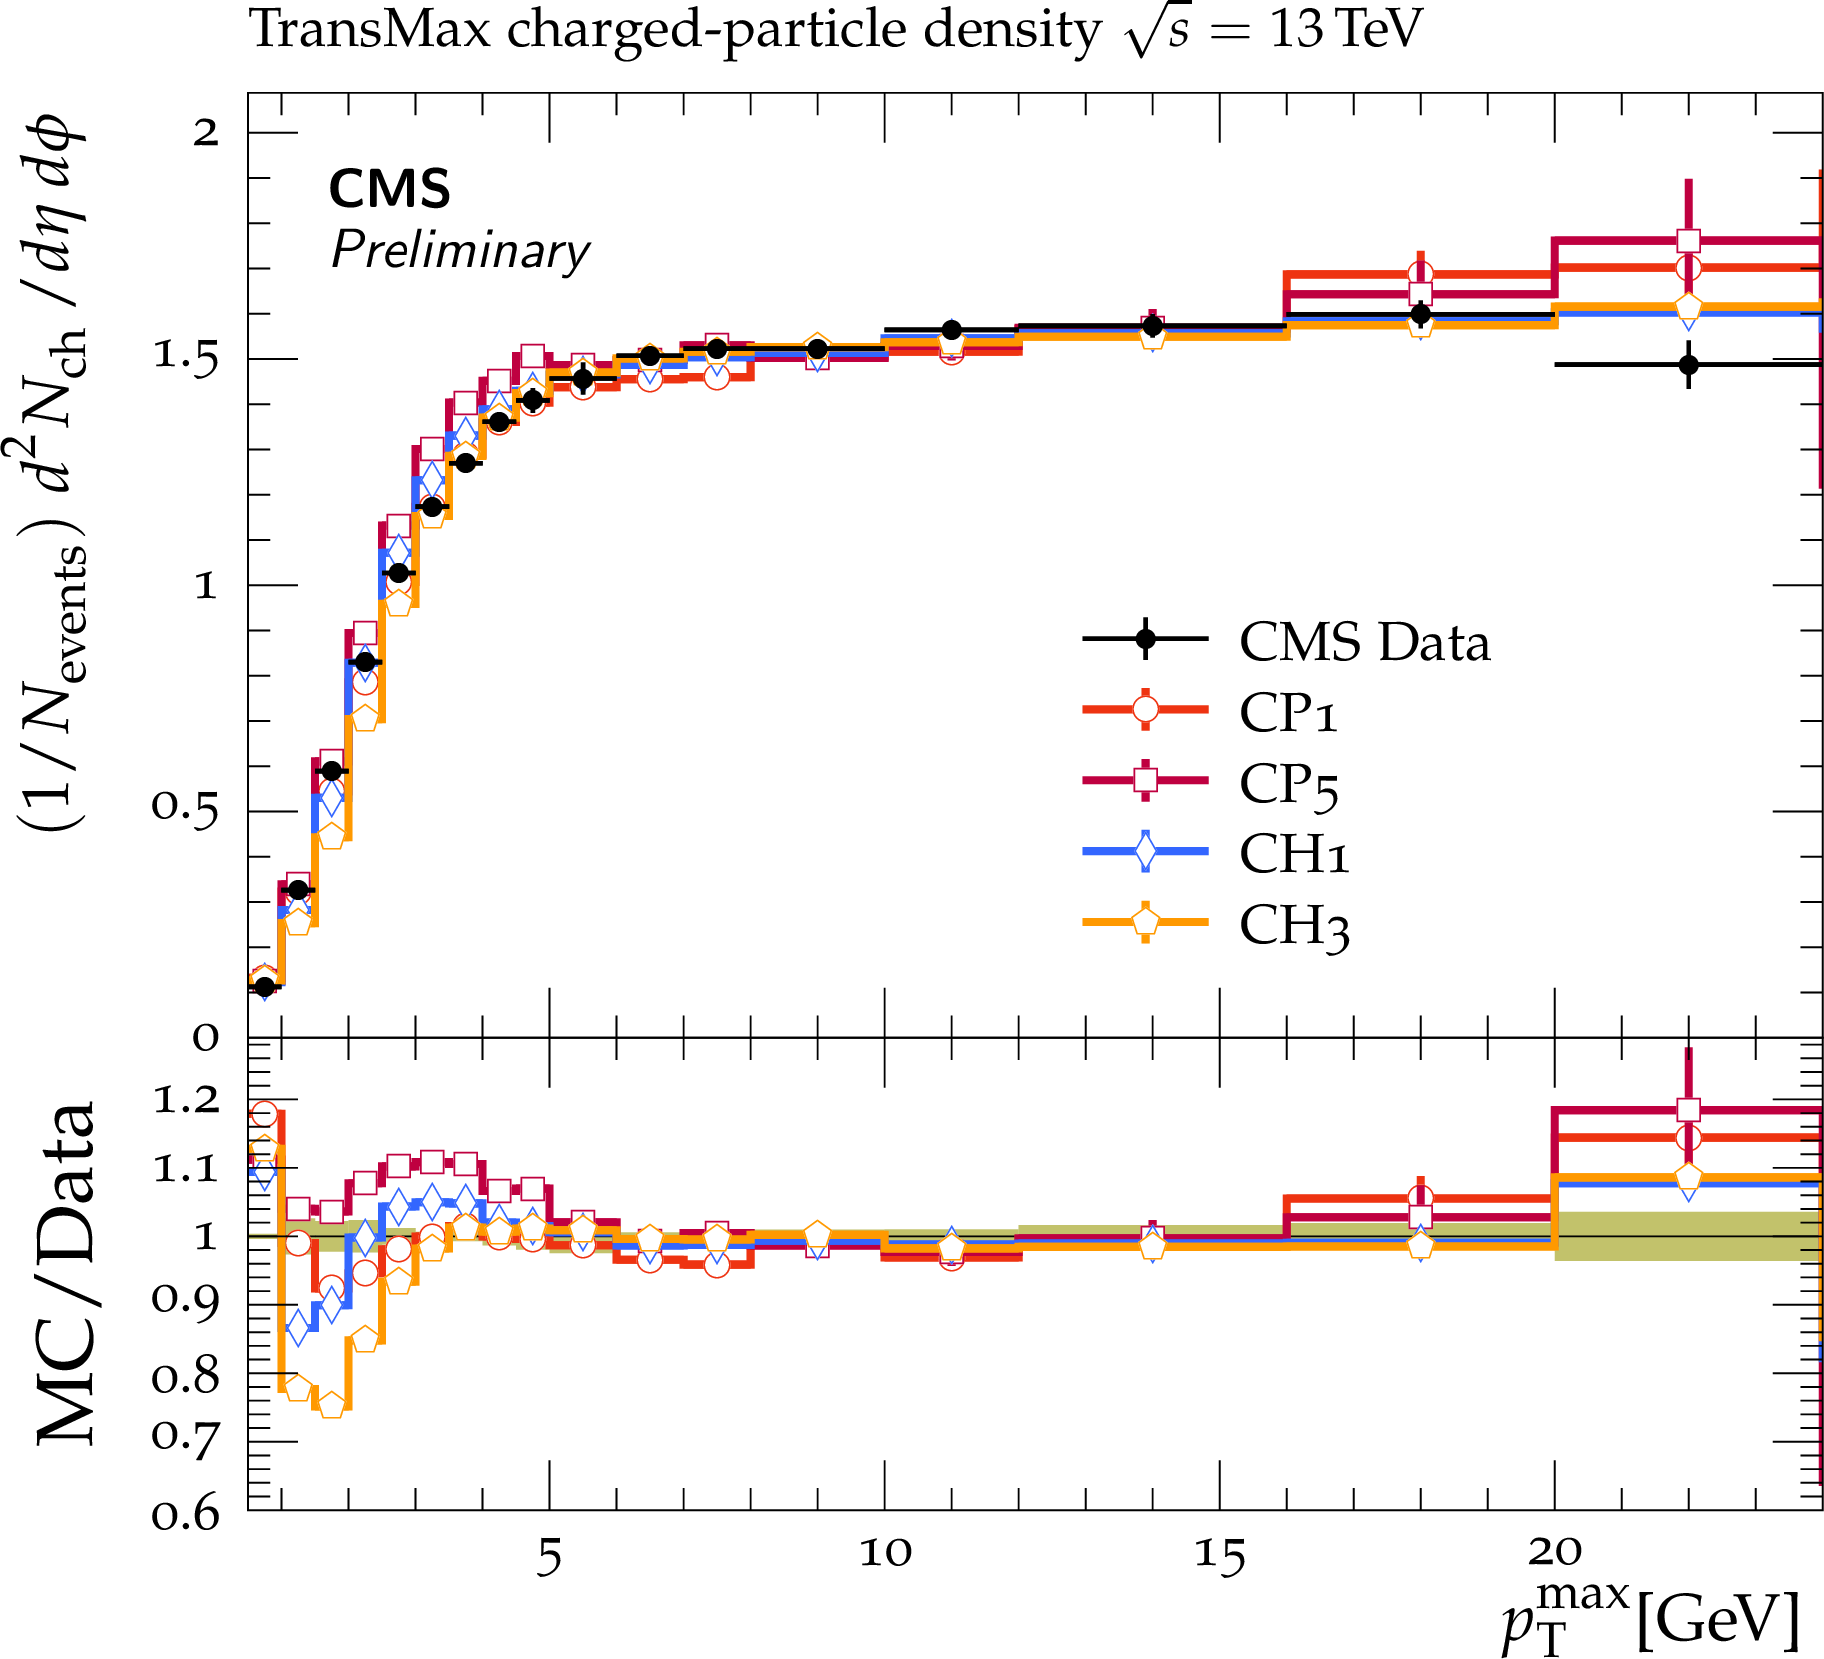
Figure 7:
CMS data at $ {\sqrt {s}} = $ 13 TeV on the ${p_{\mathrm {T}}^{\mathrm {sum}}}$ density (upper) and ${N_{\mathrm {ch}}}$ (lower) distributions in the transMin (left) and transMax (right) regions, as a function of the ${p_{\mathrm {T}}}$ of the leading track, ${p_{\mathrm {T}}^{\mathrm {max}}}$ [23]. The data are compared to predictions from HERWIG 7, with the CH1 and CH3 tunes, and from PYTHIA 8, with the CP1 and CP5 tunes. The coloured band in the ratios of the different predictions from simulation to the data represents the total experimental uncertainty in the data. |
png pdf |
Figure 7-a:
CMS data at $ {\sqrt {s}} = $ 13 TeV on the ${p_{\mathrm {T}}^{\mathrm {sum}}}$ density (upper) and ${N_{\mathrm {ch}}}$ (lower) distributions in the transMin (left) and transMax (right) regions, as a function of the ${p_{\mathrm {T}}}$ of the leading track, ${p_{\mathrm {T}}^{\mathrm {max}}}$ [23]. The data are compared to predictions from HERWIG 7, with the CH1 and CH3 tunes, and from PYTHIA 8, with the CP1 and CP5 tunes. The coloured band in the ratios of the different predictions from simulation to the data represents the total experimental uncertainty in the data. |
png pdf |
Figure 7-b:
CMS data at $ {\sqrt {s}} = $ 13 TeV on the ${p_{\mathrm {T}}^{\mathrm {sum}}}$ density (upper) and ${N_{\mathrm {ch}}}$ (lower) distributions in the transMin (left) and transMax (right) regions, as a function of the ${p_{\mathrm {T}}}$ of the leading track, ${p_{\mathrm {T}}^{\mathrm {max}}}$ [23]. The data are compared to predictions from HERWIG 7, with the CH1 and CH3 tunes, and from PYTHIA 8, with the CP1 and CP5 tunes. The coloured band in the ratios of the different predictions from simulation to the data represents the total experimental uncertainty in the data. |
png pdf |
Figure 7-c:
CMS data at $ {\sqrt {s}} = $ 13 TeV on the ${p_{\mathrm {T}}^{\mathrm {sum}}}$ density (upper) and ${N_{\mathrm {ch}}}$ (lower) distributions in the transMin (left) and transMax (right) regions, as a function of the ${p_{\mathrm {T}}}$ of the leading track, ${p_{\mathrm {T}}^{\mathrm {max}}}$ [23]. The data are compared to predictions from HERWIG 7, with the CH1 and CH3 tunes, and from PYTHIA 8, with the CP1 and CP5 tunes. The coloured band in the ratios of the different predictions from simulation to the data represents the total experimental uncertainty in the data. |
png pdf |
Figure 7-d:
CMS data at $ {\sqrt {s}} = $ 13 TeV on the ${p_{\mathrm {T}}^{\mathrm {sum}}}$ density (upper) and ${N_{\mathrm {ch}}}$ (lower) distributions in the transMin (left) and transMax (right) regions, as a function of the ${p_{\mathrm {T}}}$ of the leading track, ${p_{\mathrm {T}}^{\mathrm {max}}}$ [23]. The data are compared to predictions from HERWIG 7, with the CH1 and CH3 tunes, and from PYTHIA 8, with the CP1 and CP5 tunes. The coloured band in the ratios of the different predictions from simulation to the data represents the total experimental uncertainty in the data. |
png pdf |
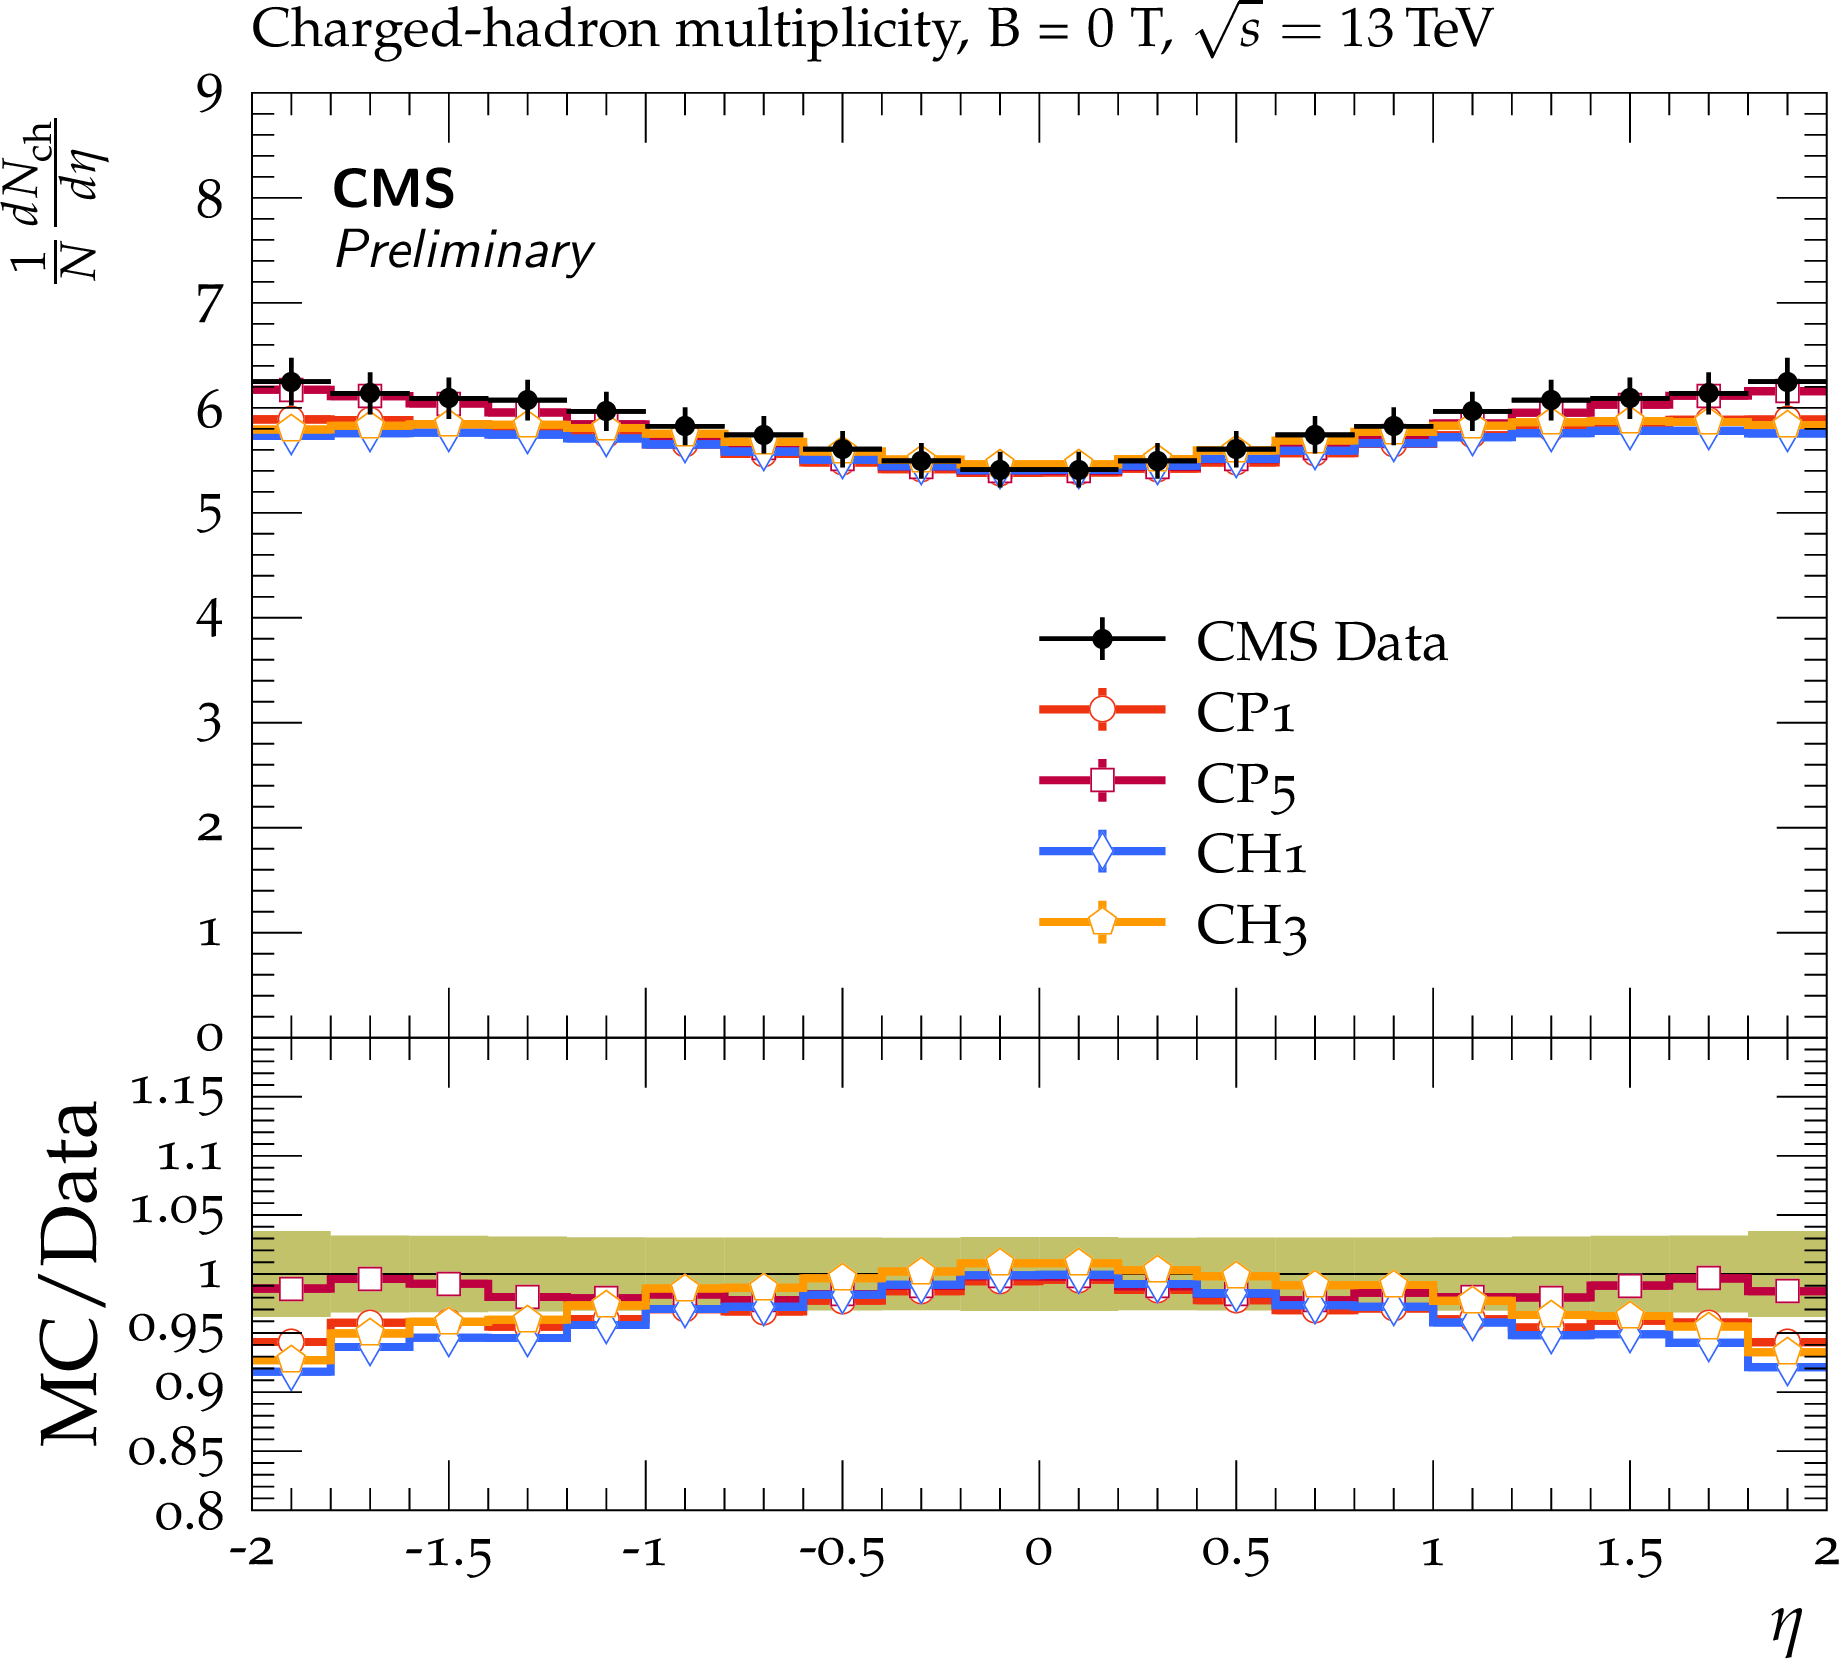
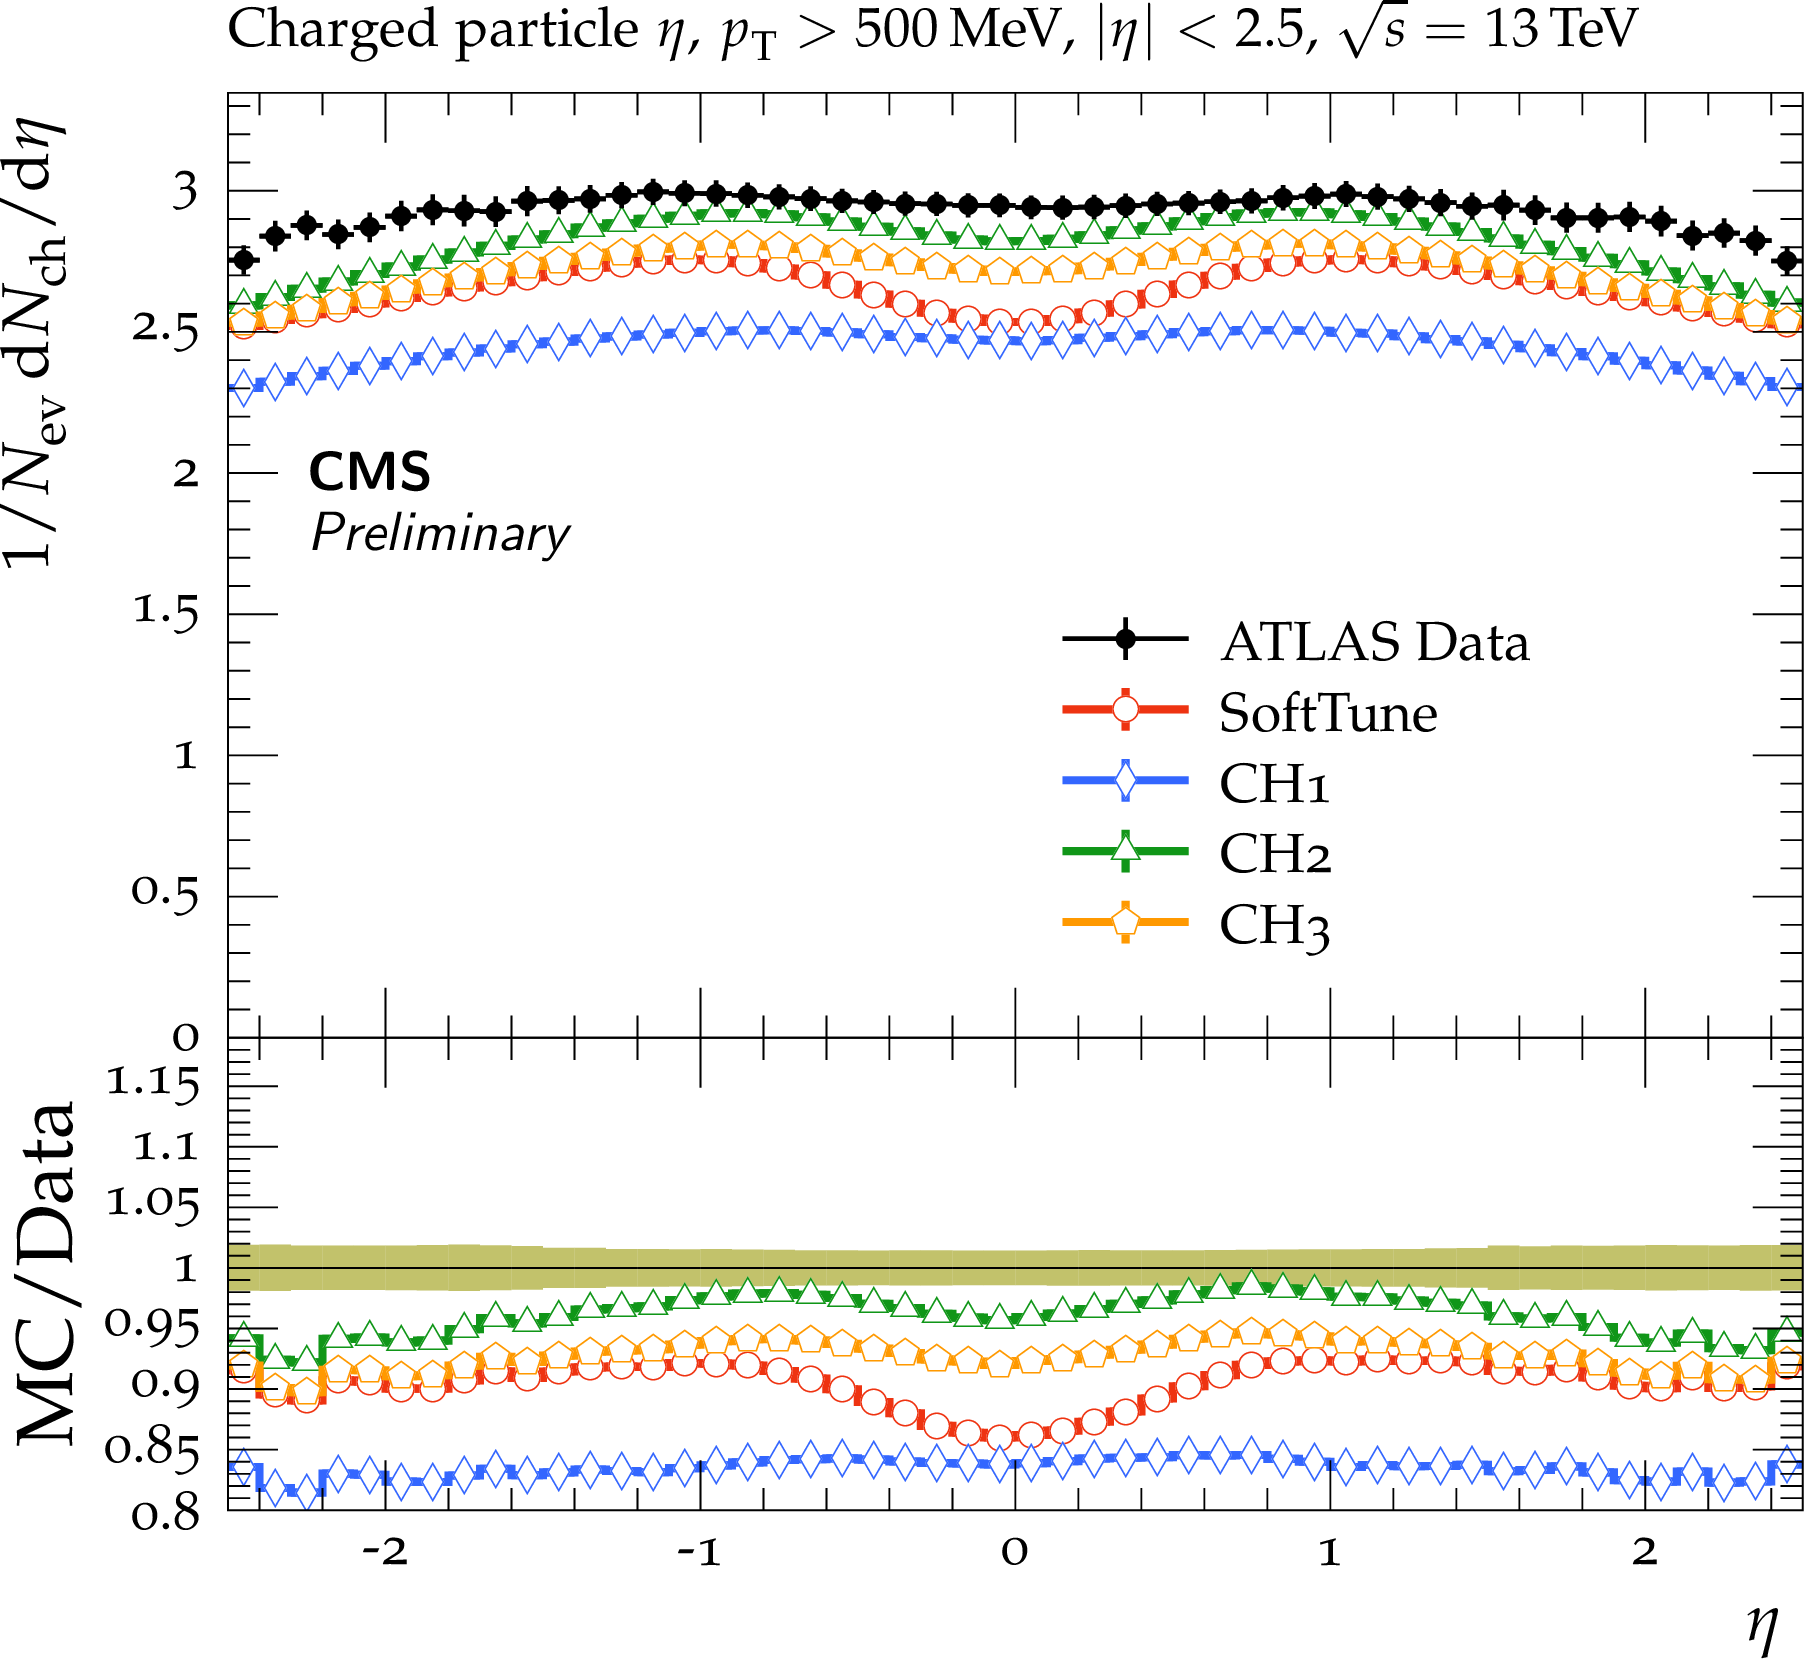
Figure 8:
CMS data at $ {\sqrt {s}} = $ 13 TeV on the ${\frac {dN_{\mathrm {ch}}}{d\eta}}$, the pseudorapidity of charged hadrons [26]. The data are compared to predictions from HERWIG 7, with the CH1 and CH3 tunes, and from PYTHIA 8, with the CP1 and CP5 tunes. The coloured band in the ratios of the different predictions from simulation to the data represents the total experimental uncertainty in the data. |

png pdf |
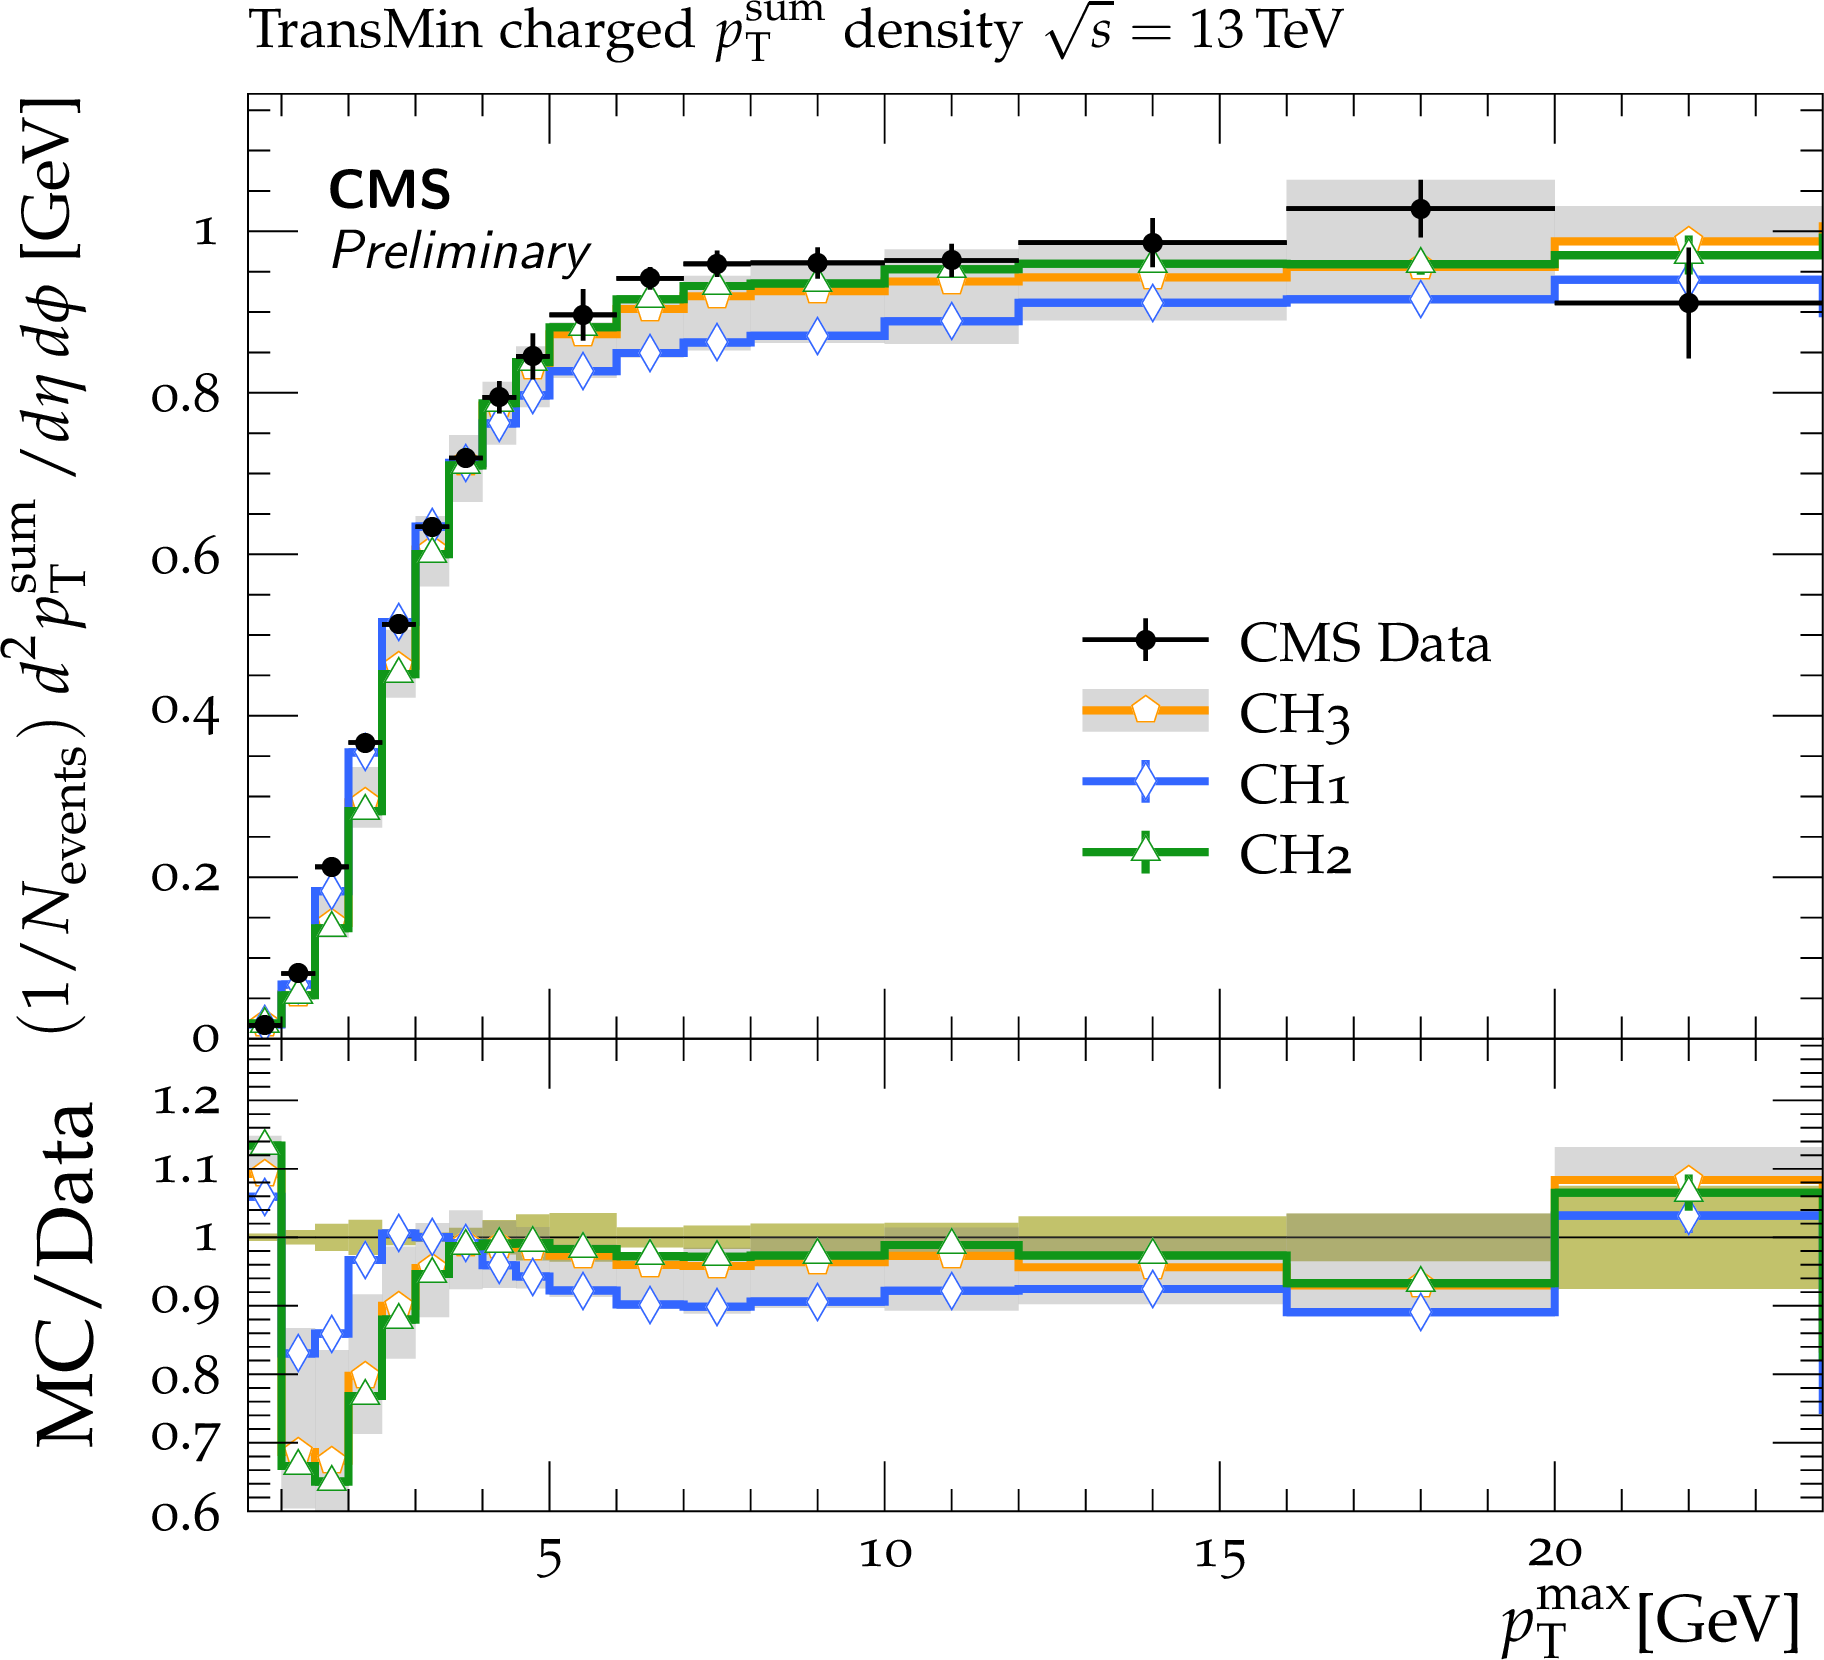
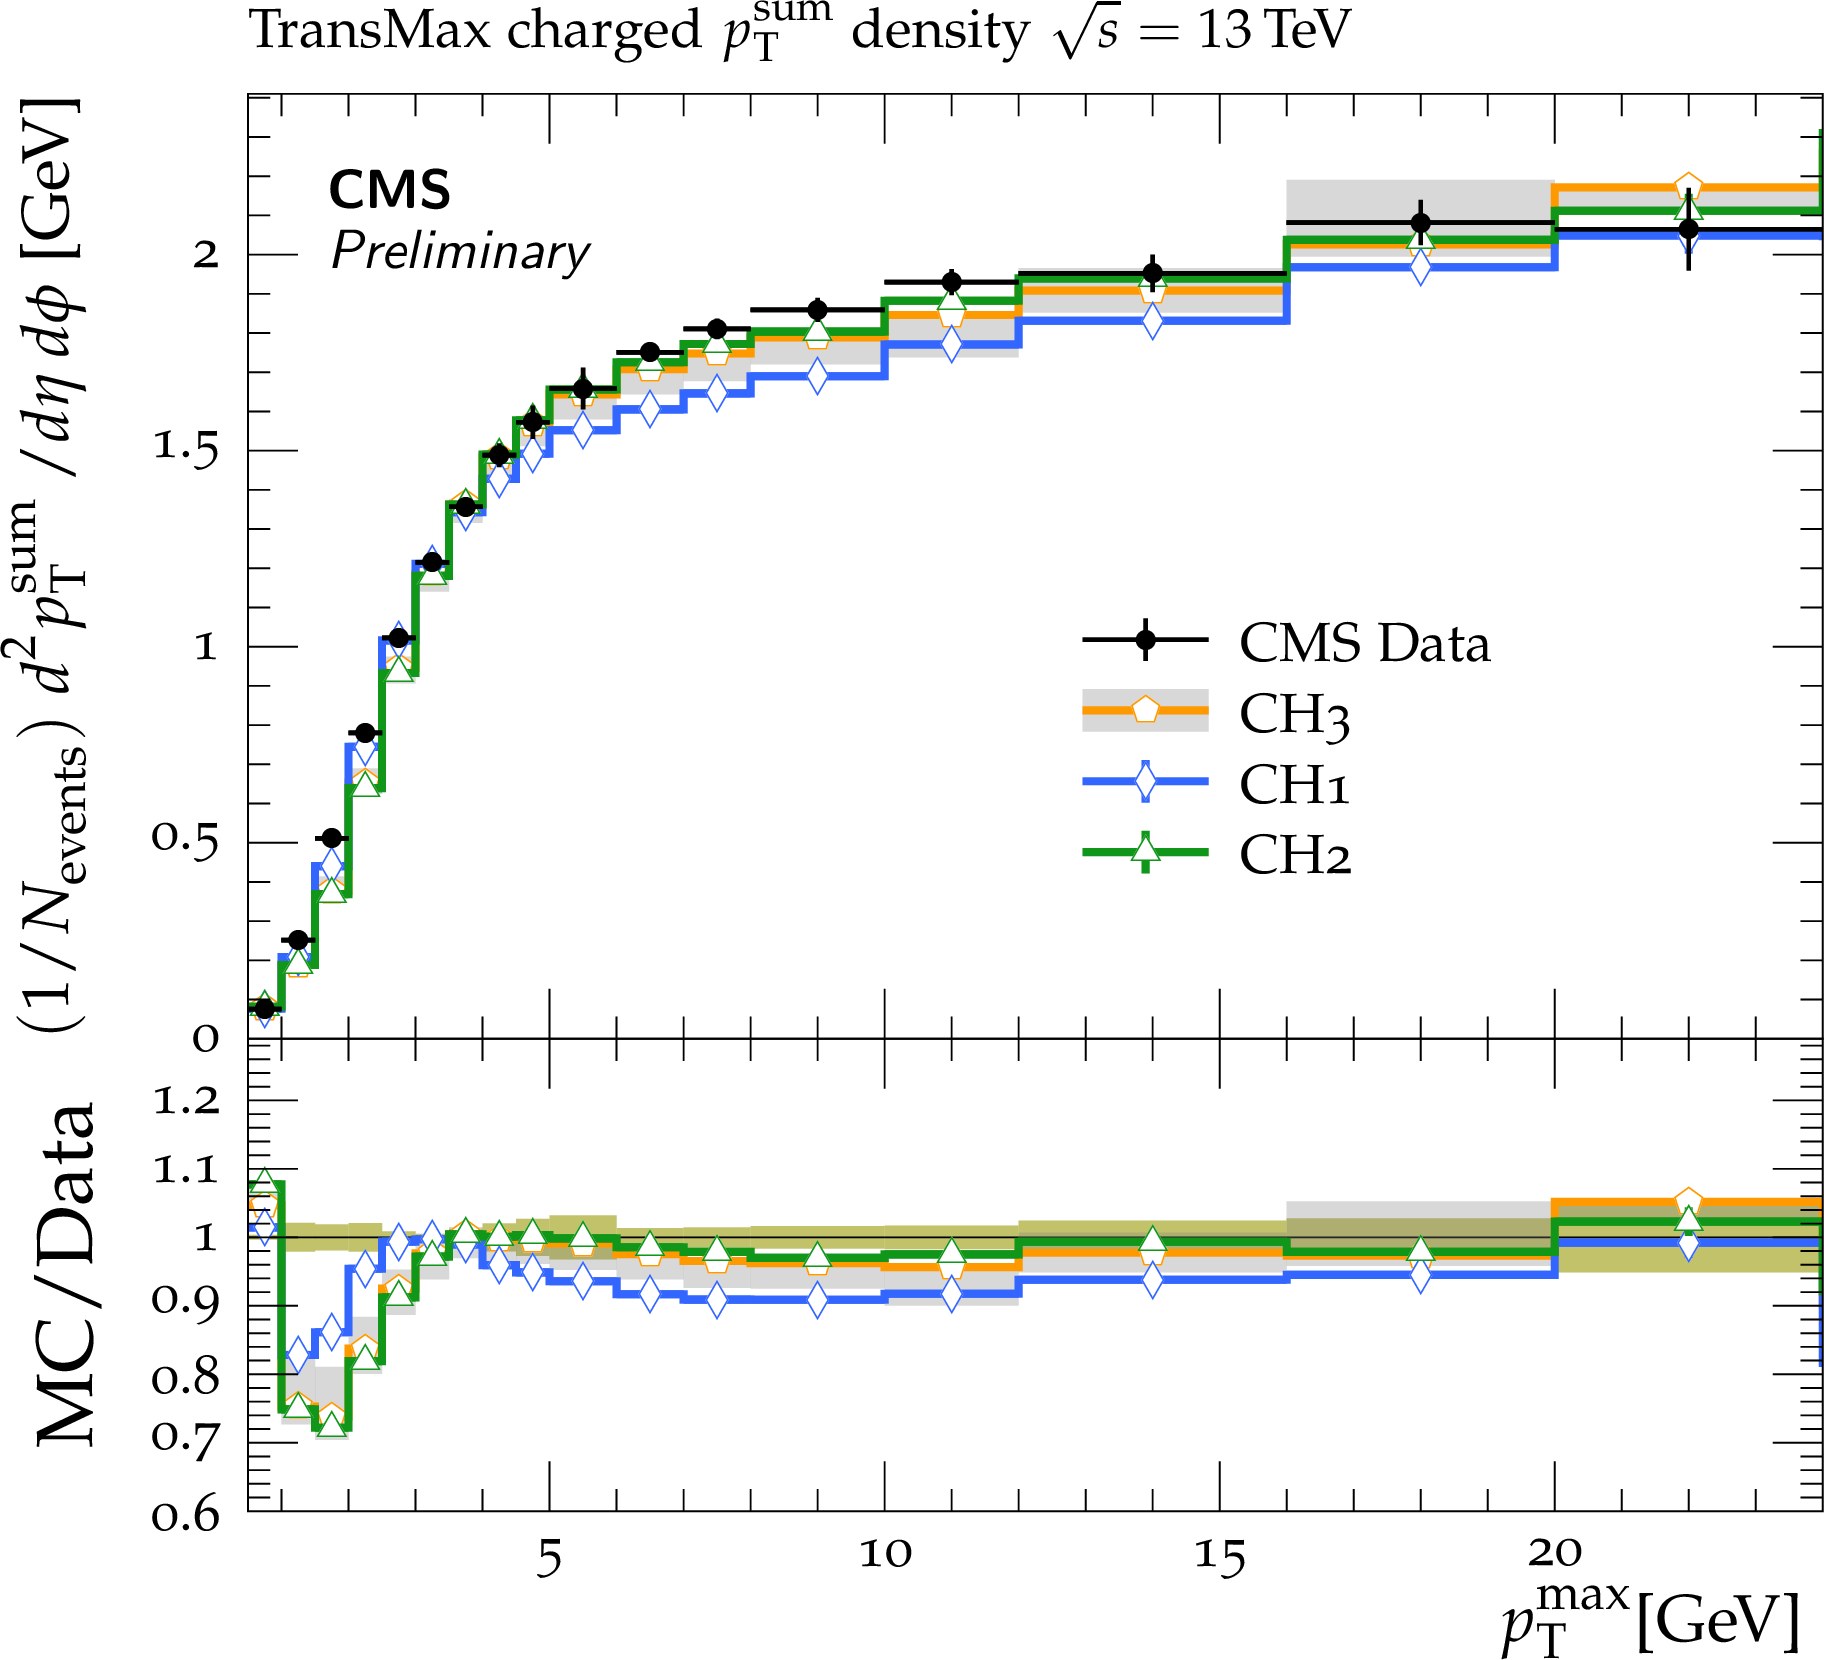
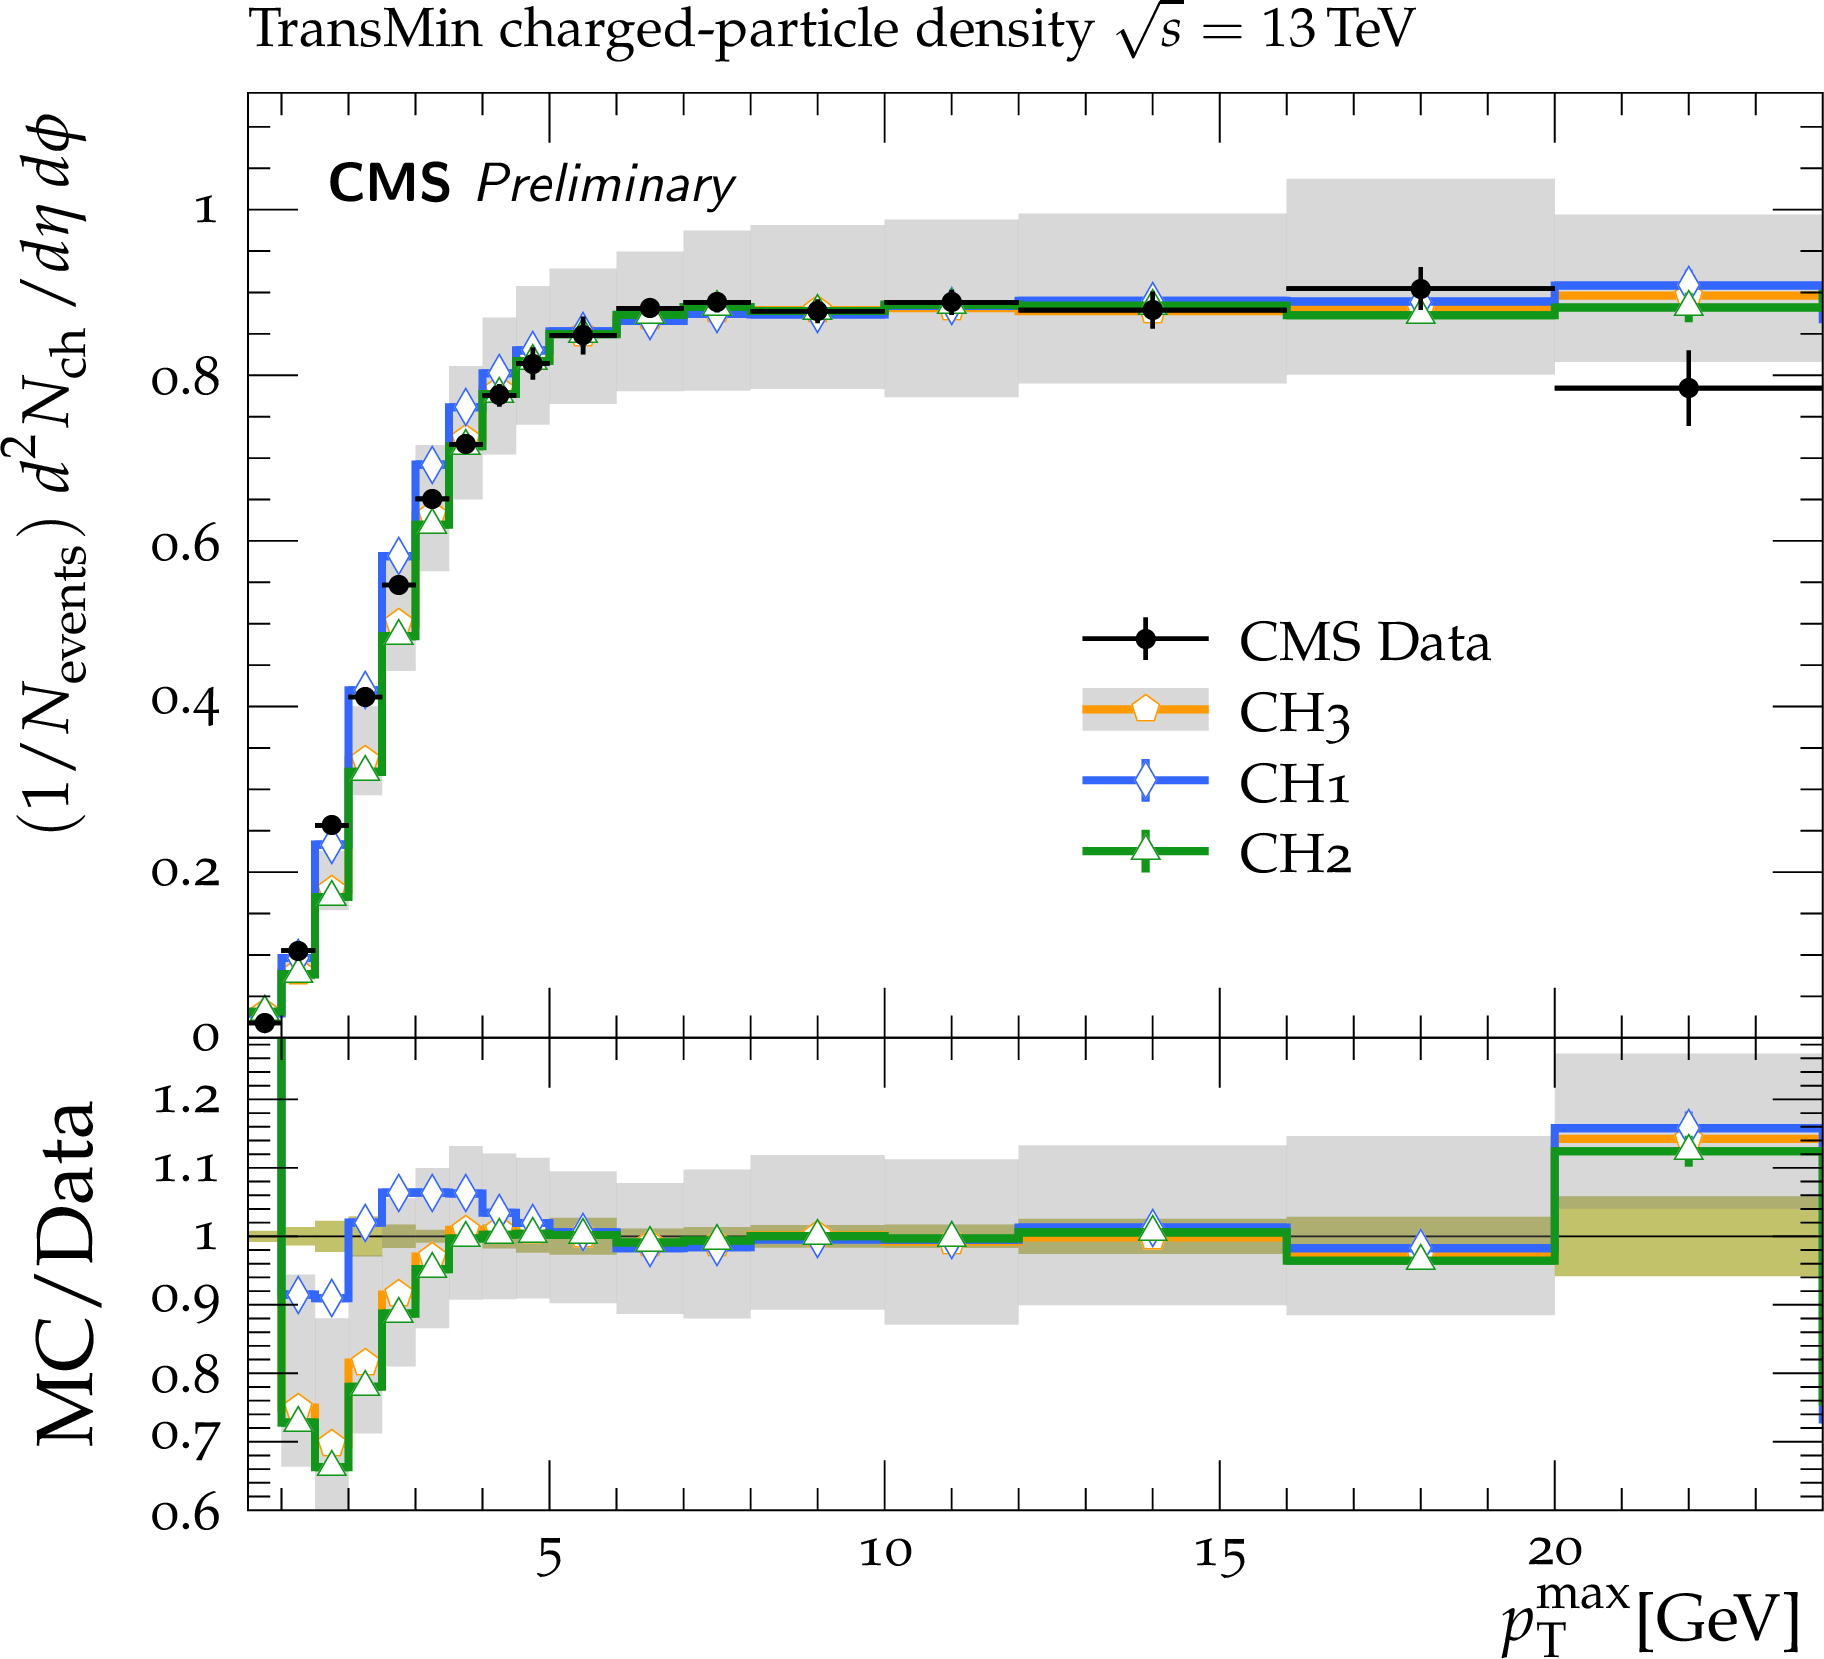
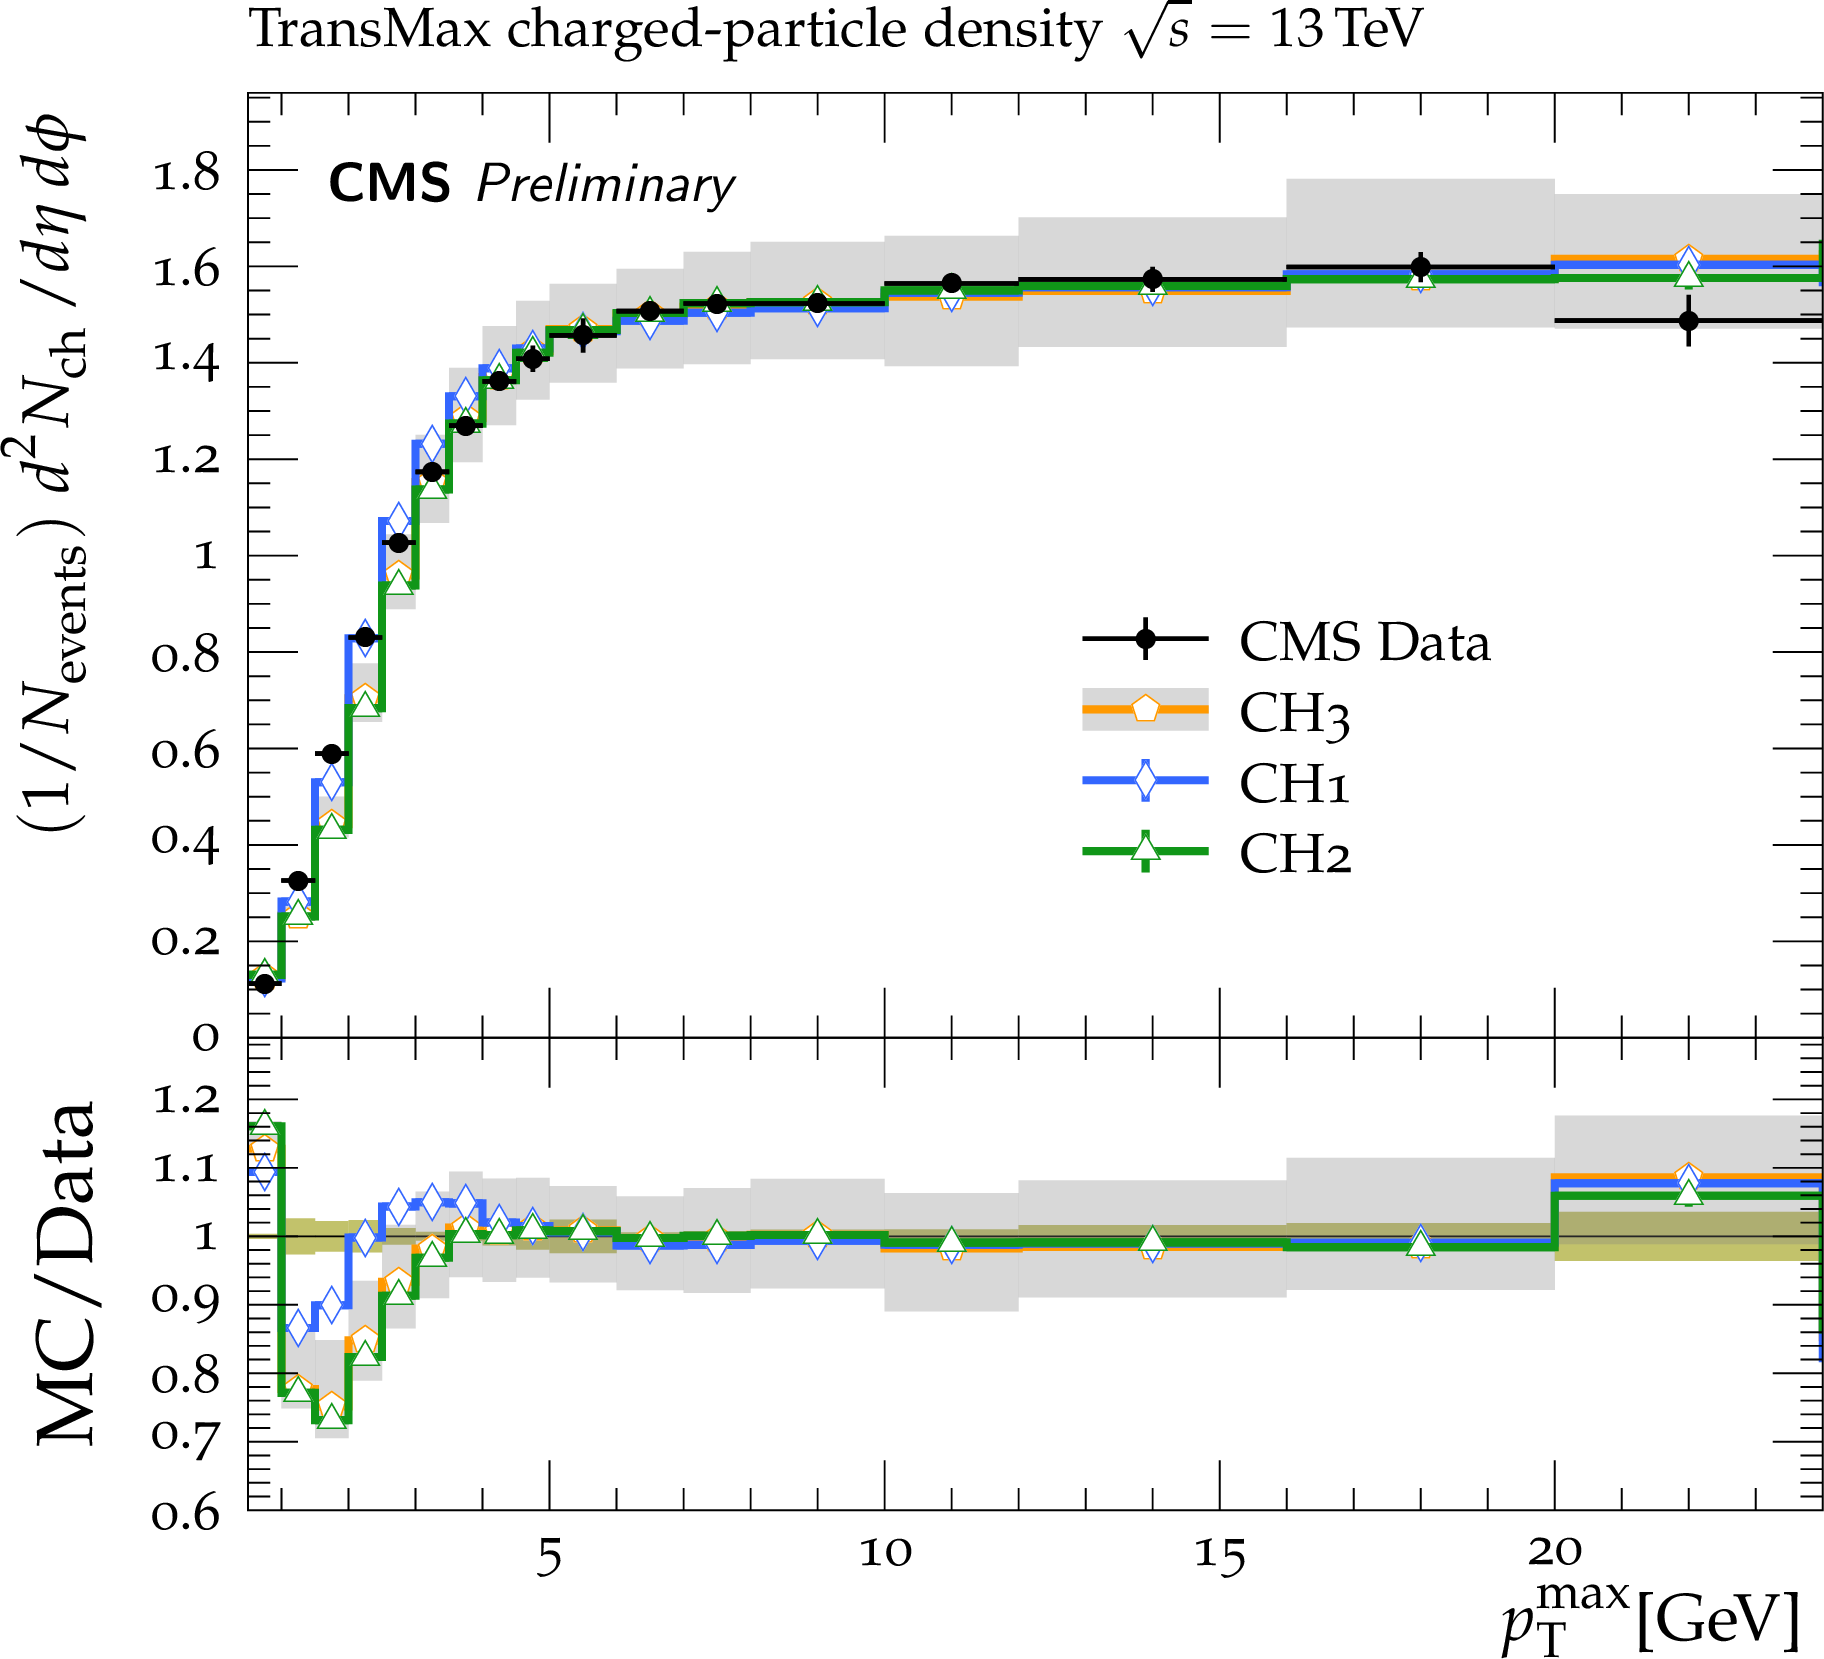
Figure 9:
CMS data at $ {\sqrt {s}} = $ 13 TeV on the ${p_{\mathrm {T}}^{\mathrm {sum}}}$ density (upper) and ${N_{\mathrm {ch}}}$ (lower) distributions in the transMin (left) and transMax (right) regions, as a function of the ${p_{\mathrm {T}}}$ of the leading track, ${p_{\mathrm {T}}^{\mathrm {max}}}$ [23]. The data are compared to predictions from HERWIG 7, with the CH tunes. The coloured band in the ratios of the different predictions from simulation to the data represents the total experimental uncertainty in the data. The grey shaded band corresponds to the envelope of the "up" and "down" variations of the CH3 tune. |
png pdf |
Figure 9-a:
CMS data at $ {\sqrt {s}} = $ 13 TeV on the ${p_{\mathrm {T}}^{\mathrm {sum}}}$ density (upper) and ${N_{\mathrm {ch}}}$ (lower) distributions in the transMin (left) and transMax (right) regions, as a function of the ${p_{\mathrm {T}}}$ of the leading track, ${p_{\mathrm {T}}^{\mathrm {max}}}$ [23]. The data are compared to predictions from HERWIG 7, with the CH tunes. The coloured band in the ratios of the different predictions from simulation to the data represents the total experimental uncertainty in the data. The grey shaded band corresponds to the envelope of the "up" and "down" variations of the CH3 tune. |
png pdf |
Figure 9-b:
CMS data at $ {\sqrt {s}} = $ 13 TeV on the ${p_{\mathrm {T}}^{\mathrm {sum}}}$ density (upper) and ${N_{\mathrm {ch}}}$ (lower) distributions in the transMin (left) and transMax (right) regions, as a function of the ${p_{\mathrm {T}}}$ of the leading track, ${p_{\mathrm {T}}^{\mathrm {max}}}$ [23]. The data are compared to predictions from HERWIG 7, with the CH tunes. The coloured band in the ratios of the different predictions from simulation to the data represents the total experimental uncertainty in the data. The grey shaded band corresponds to the envelope of the "up" and "down" variations of the CH3 tune. |
png pdf |
Figure 9-c:
CMS data at $ {\sqrt {s}} = $ 13 TeV on the ${p_{\mathrm {T}}^{\mathrm {sum}}}$ density (upper) and ${N_{\mathrm {ch}}}$ (lower) distributions in the transMin (left) and transMax (right) regions, as a function of the ${p_{\mathrm {T}}}$ of the leading track, ${p_{\mathrm {T}}^{\mathrm {max}}}$ [23]. The data are compared to predictions from HERWIG 7, with the CH tunes. The coloured band in the ratios of the different predictions from simulation to the data represents the total experimental uncertainty in the data. The grey shaded band corresponds to the envelope of the "up" and "down" variations of the CH3 tune. |
png pdf |
Figure 9-d:
CMS data at $ {\sqrt {s}} = $ 13 TeV on the ${p_{\mathrm {T}}^{\mathrm {sum}}}$ density (upper) and ${N_{\mathrm {ch}}}$ (lower) distributions in the transMin (left) and transMax (right) regions, as a function of the ${p_{\mathrm {T}}}$ of the leading track, ${p_{\mathrm {T}}^{\mathrm {max}}}$ [23]. The data are compared to predictions from HERWIG 7, with the CH tunes. The coloured band in the ratios of the different predictions from simulation to the data represents the total experimental uncertainty in the data. The grey shaded band corresponds to the envelope of the "up" and "down" variations of the CH3 tune. |
png pdf |
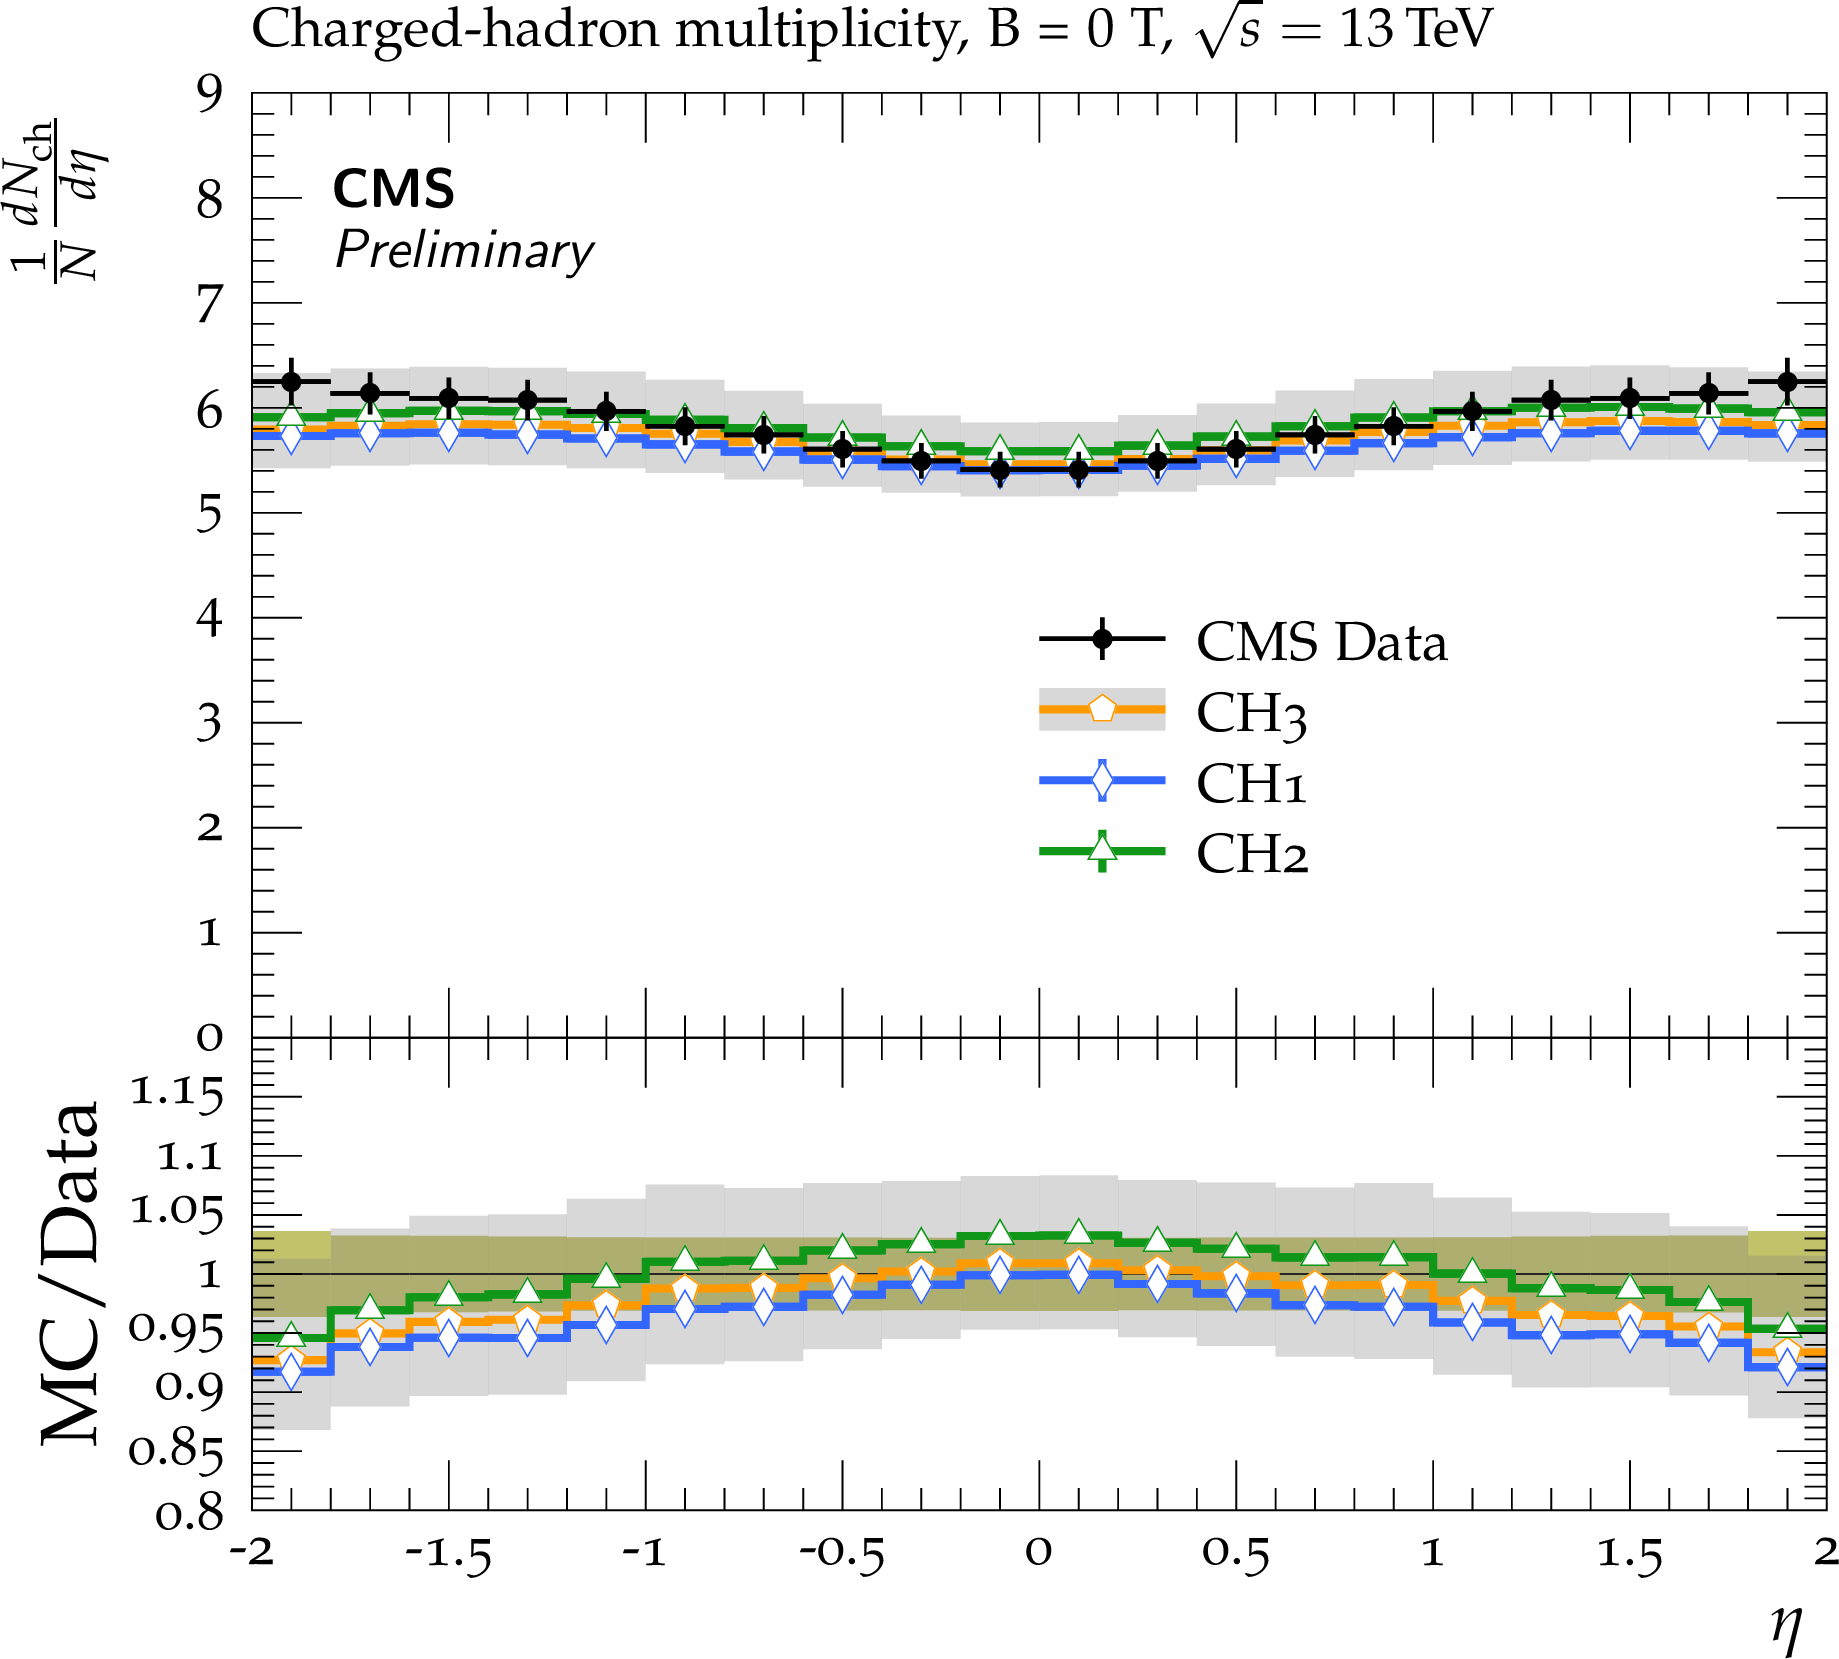
Figure 10:
CMS data at $ {\sqrt {s}} = $ 13 TeV on the ${\frac {dN_{\mathrm {ch}}}{d\eta}}$, the pseudorapidity of charged hadrons [26]. The data are compared to predictions from HERWIG 7, with the CH tunes. The coloured band in the ratios of the different predictions from simulation to the data represents the total experimental uncertainty in the data. The grey shaded band corresponds to the envelope of the "up" and "down" variations of the CH3 tune. |
png pdf |
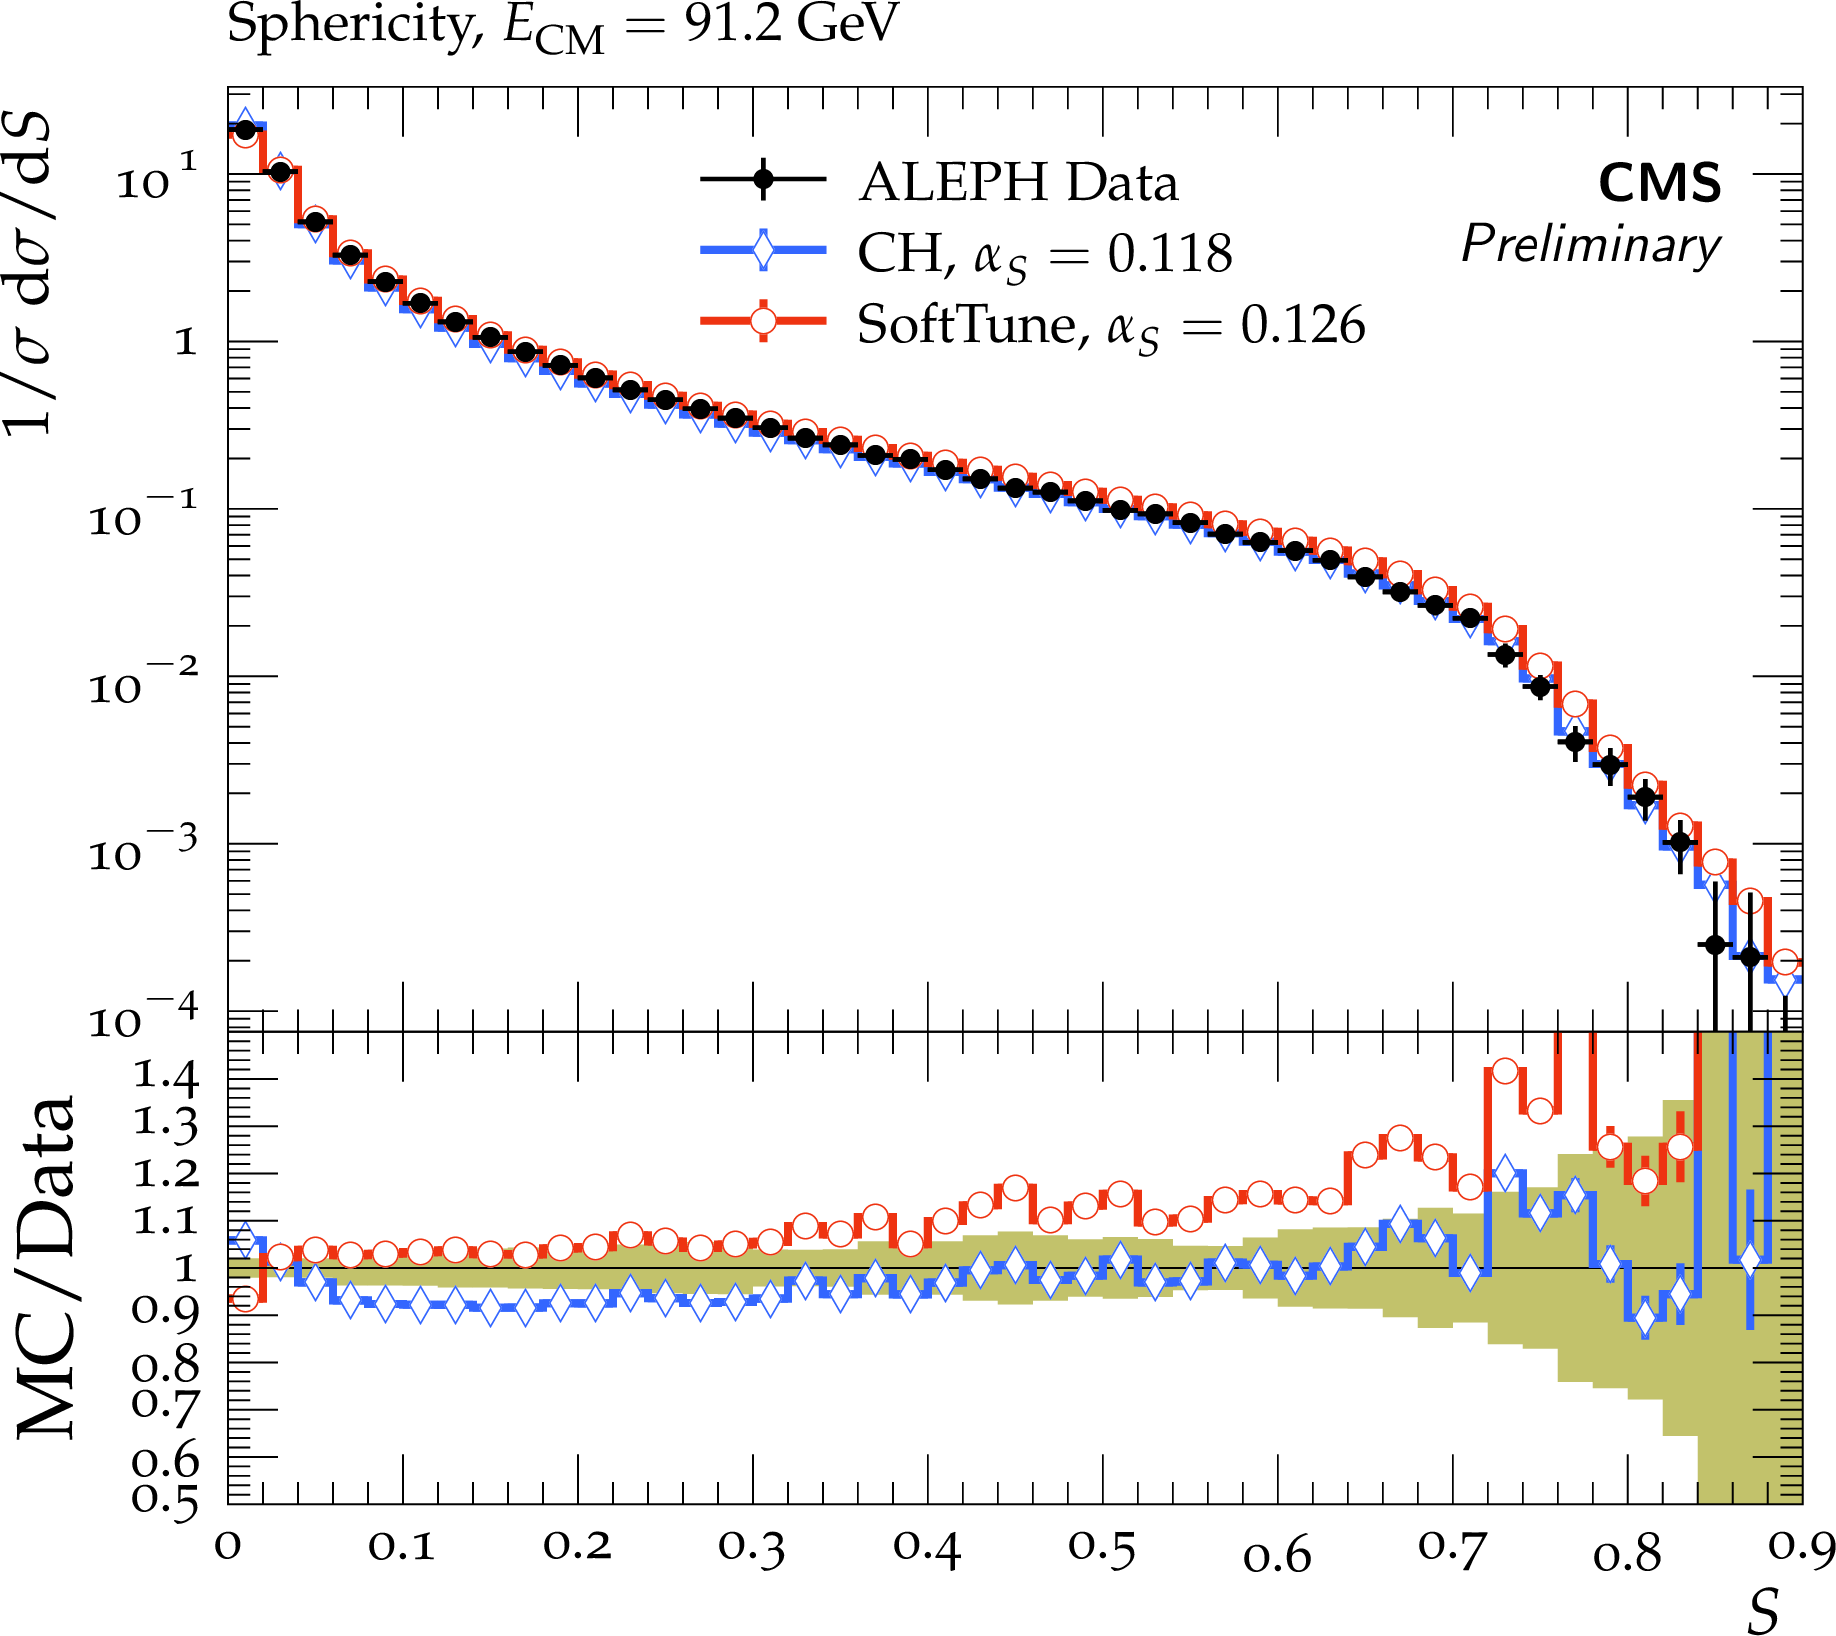
Figure 11:
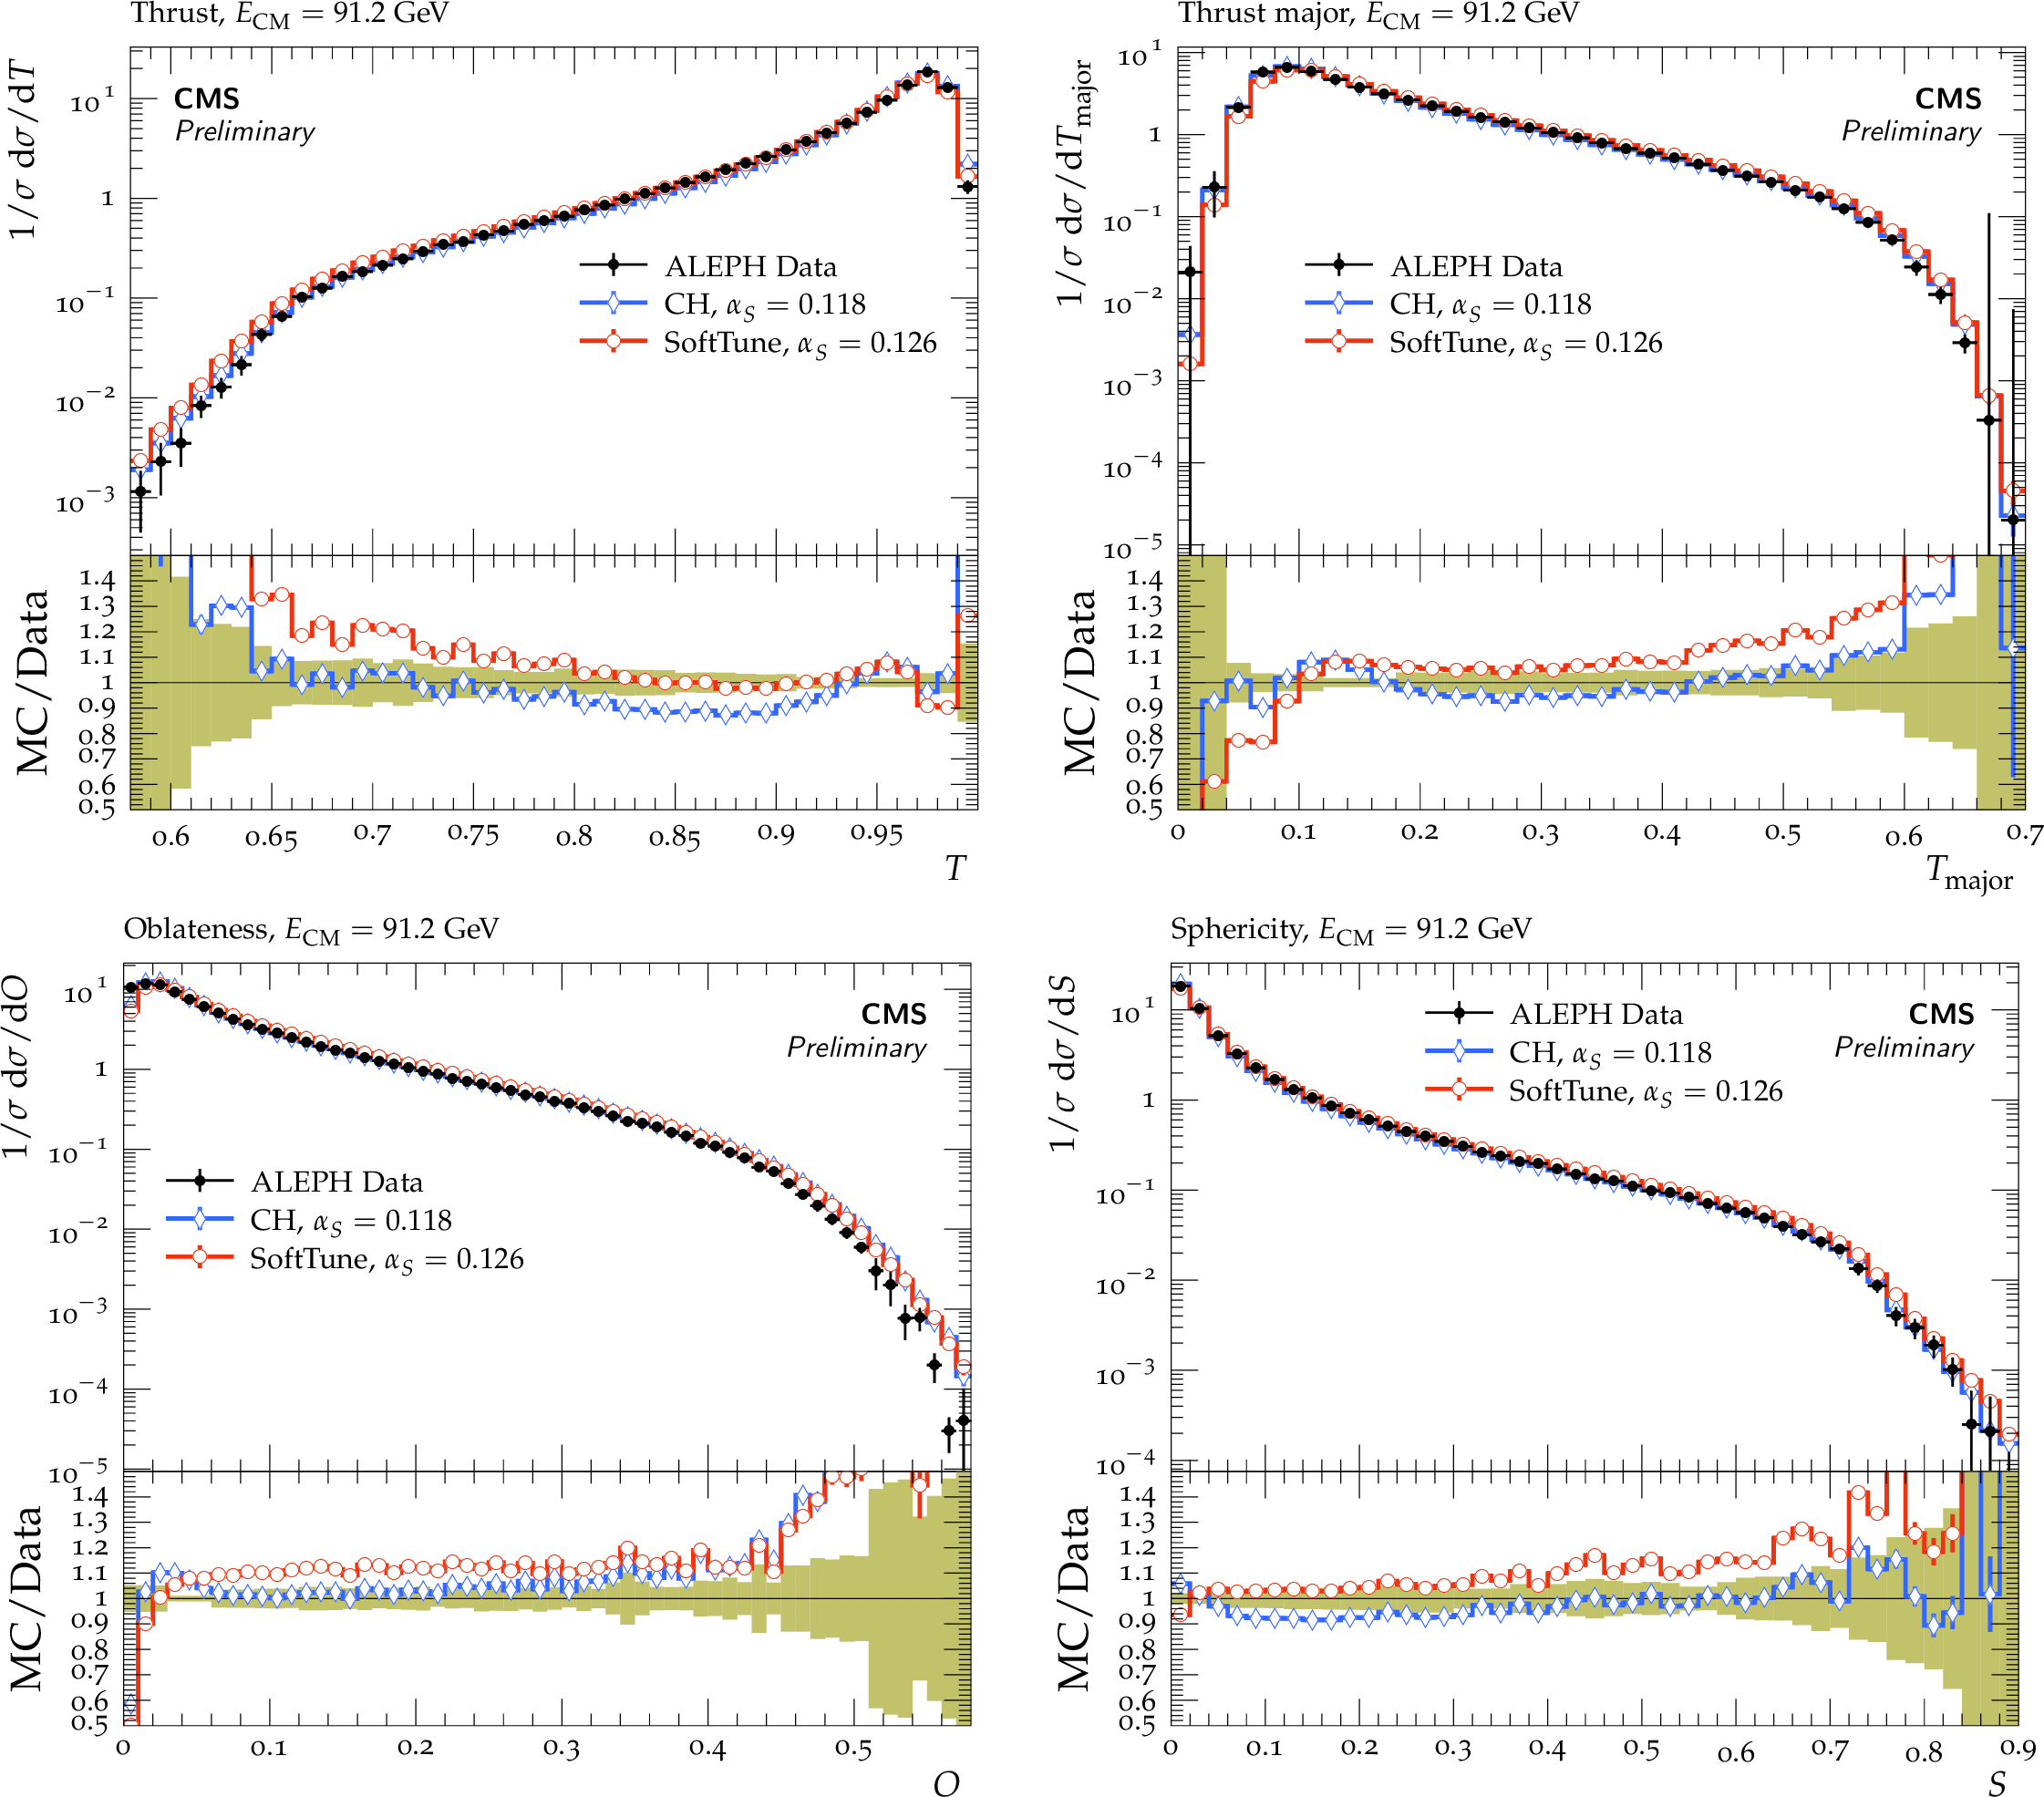
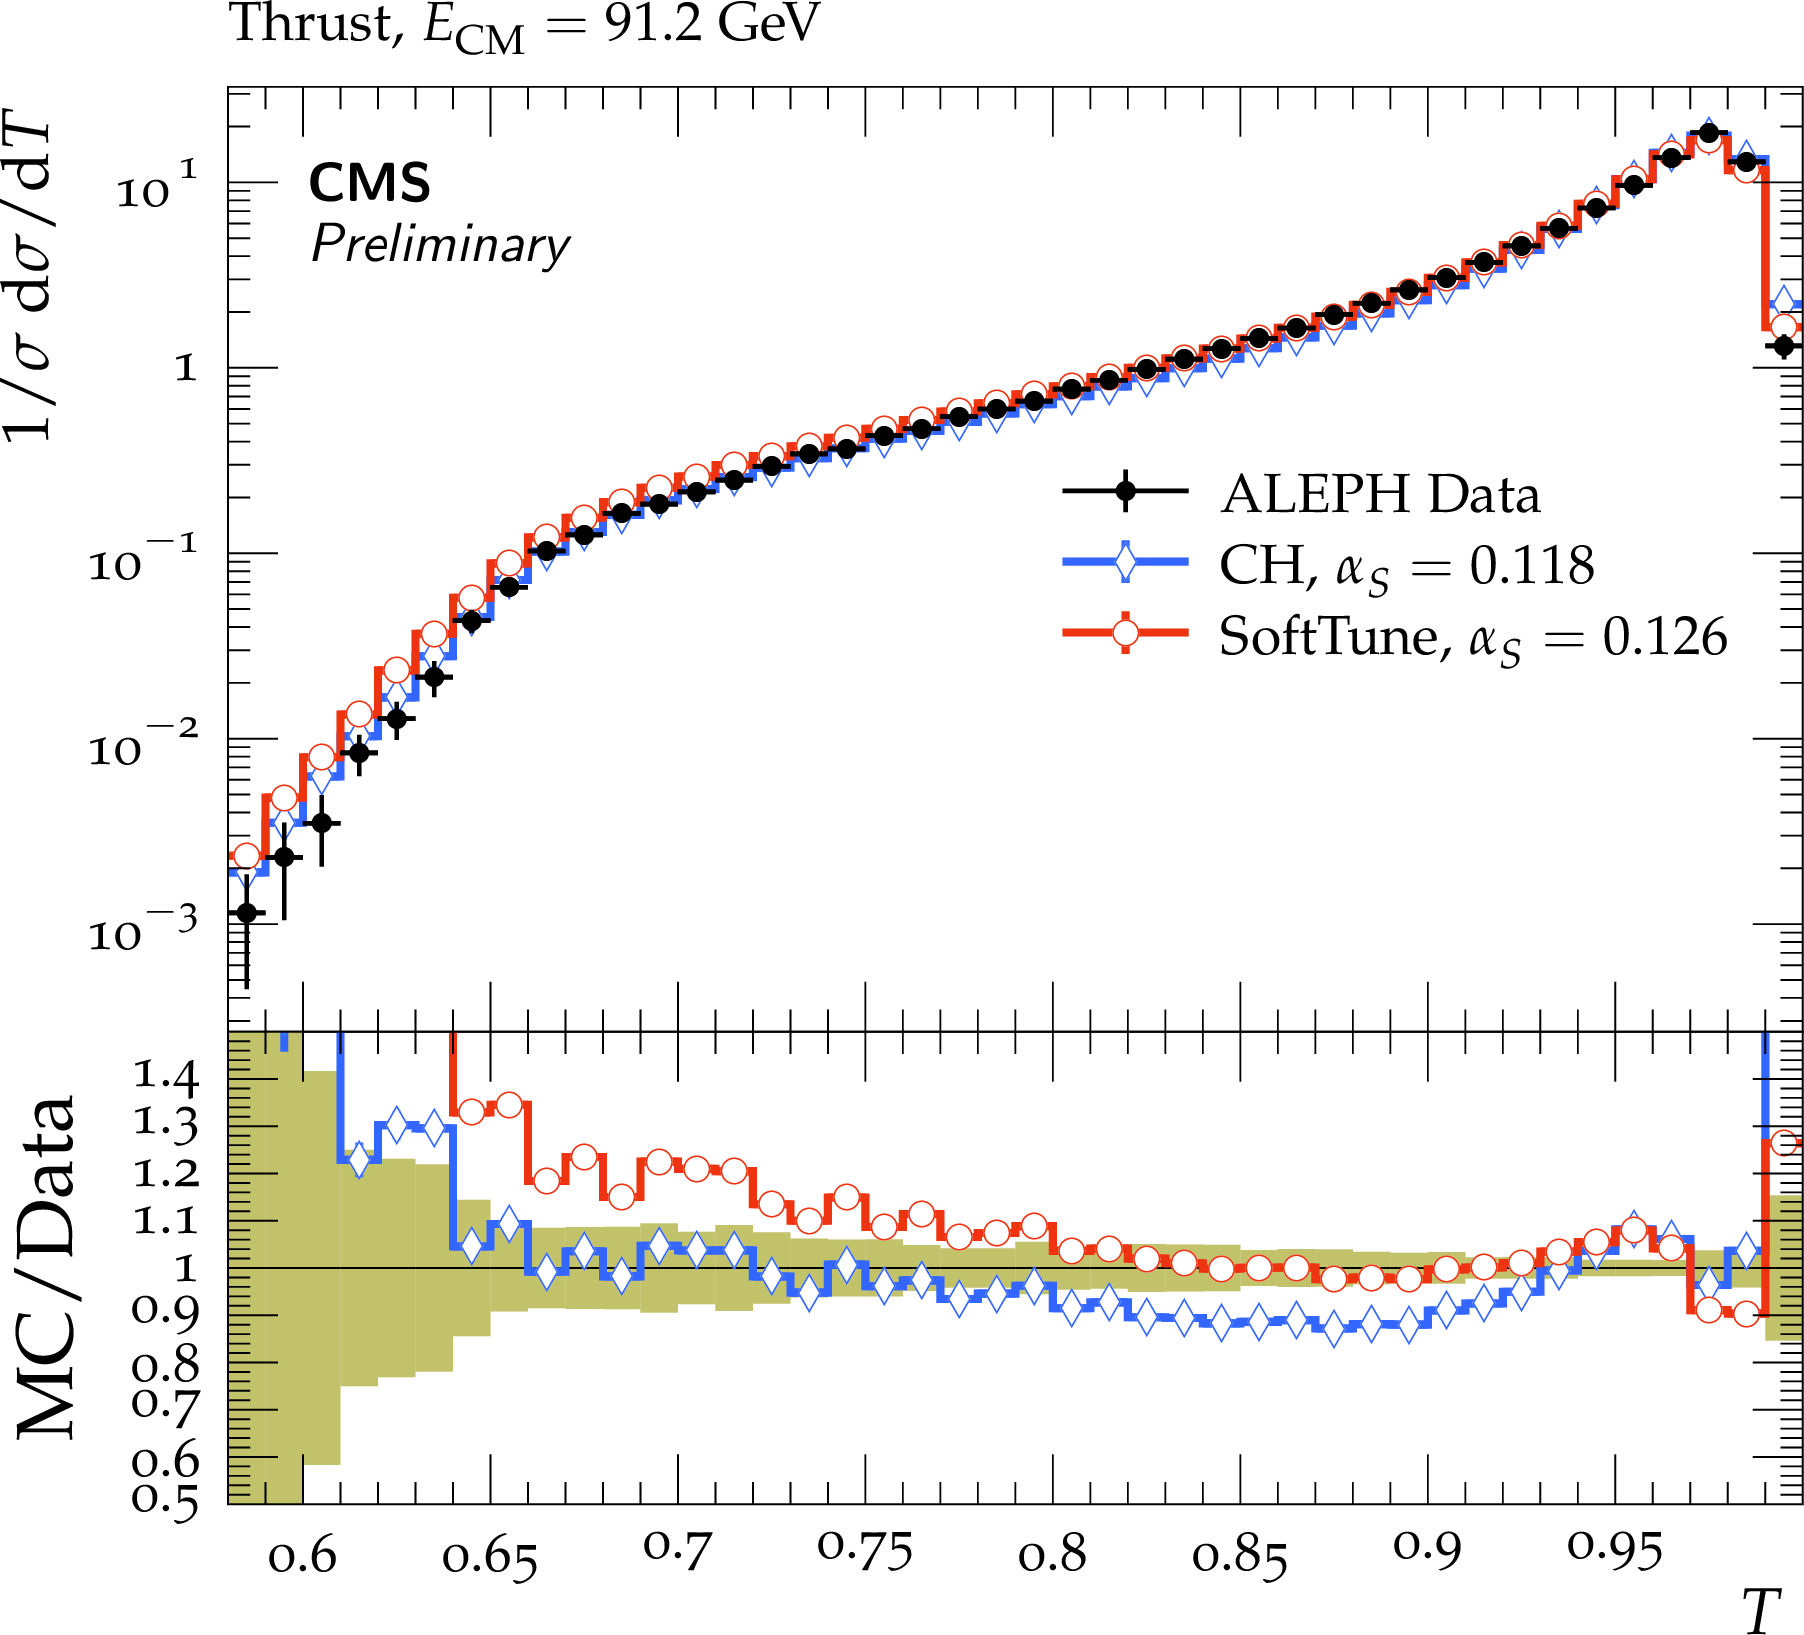
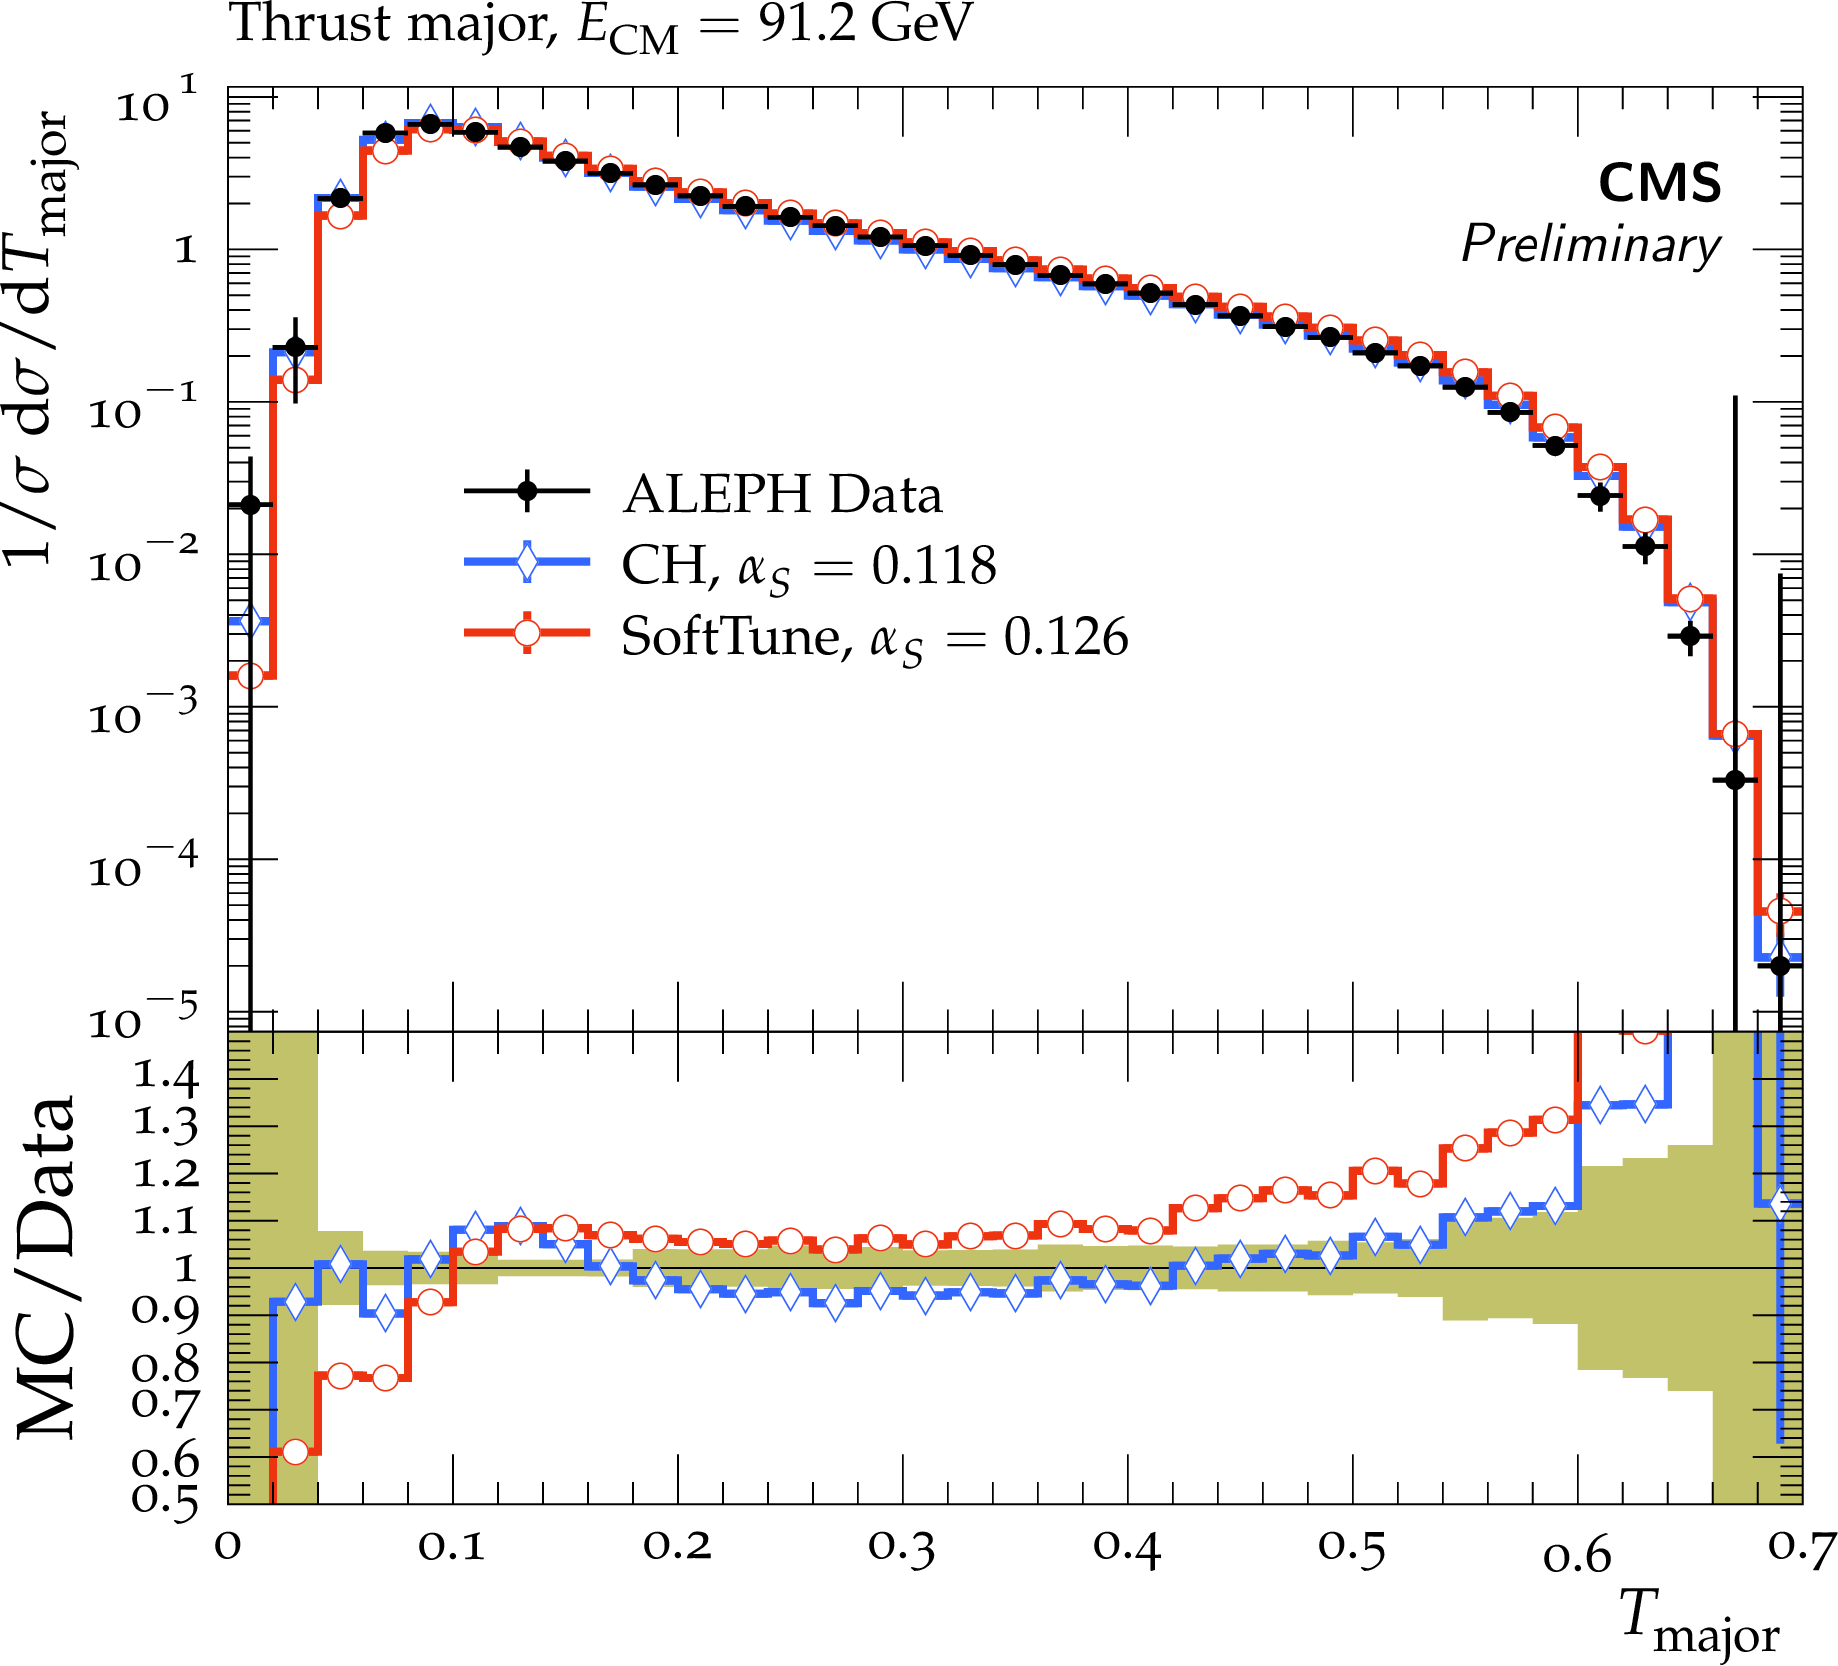
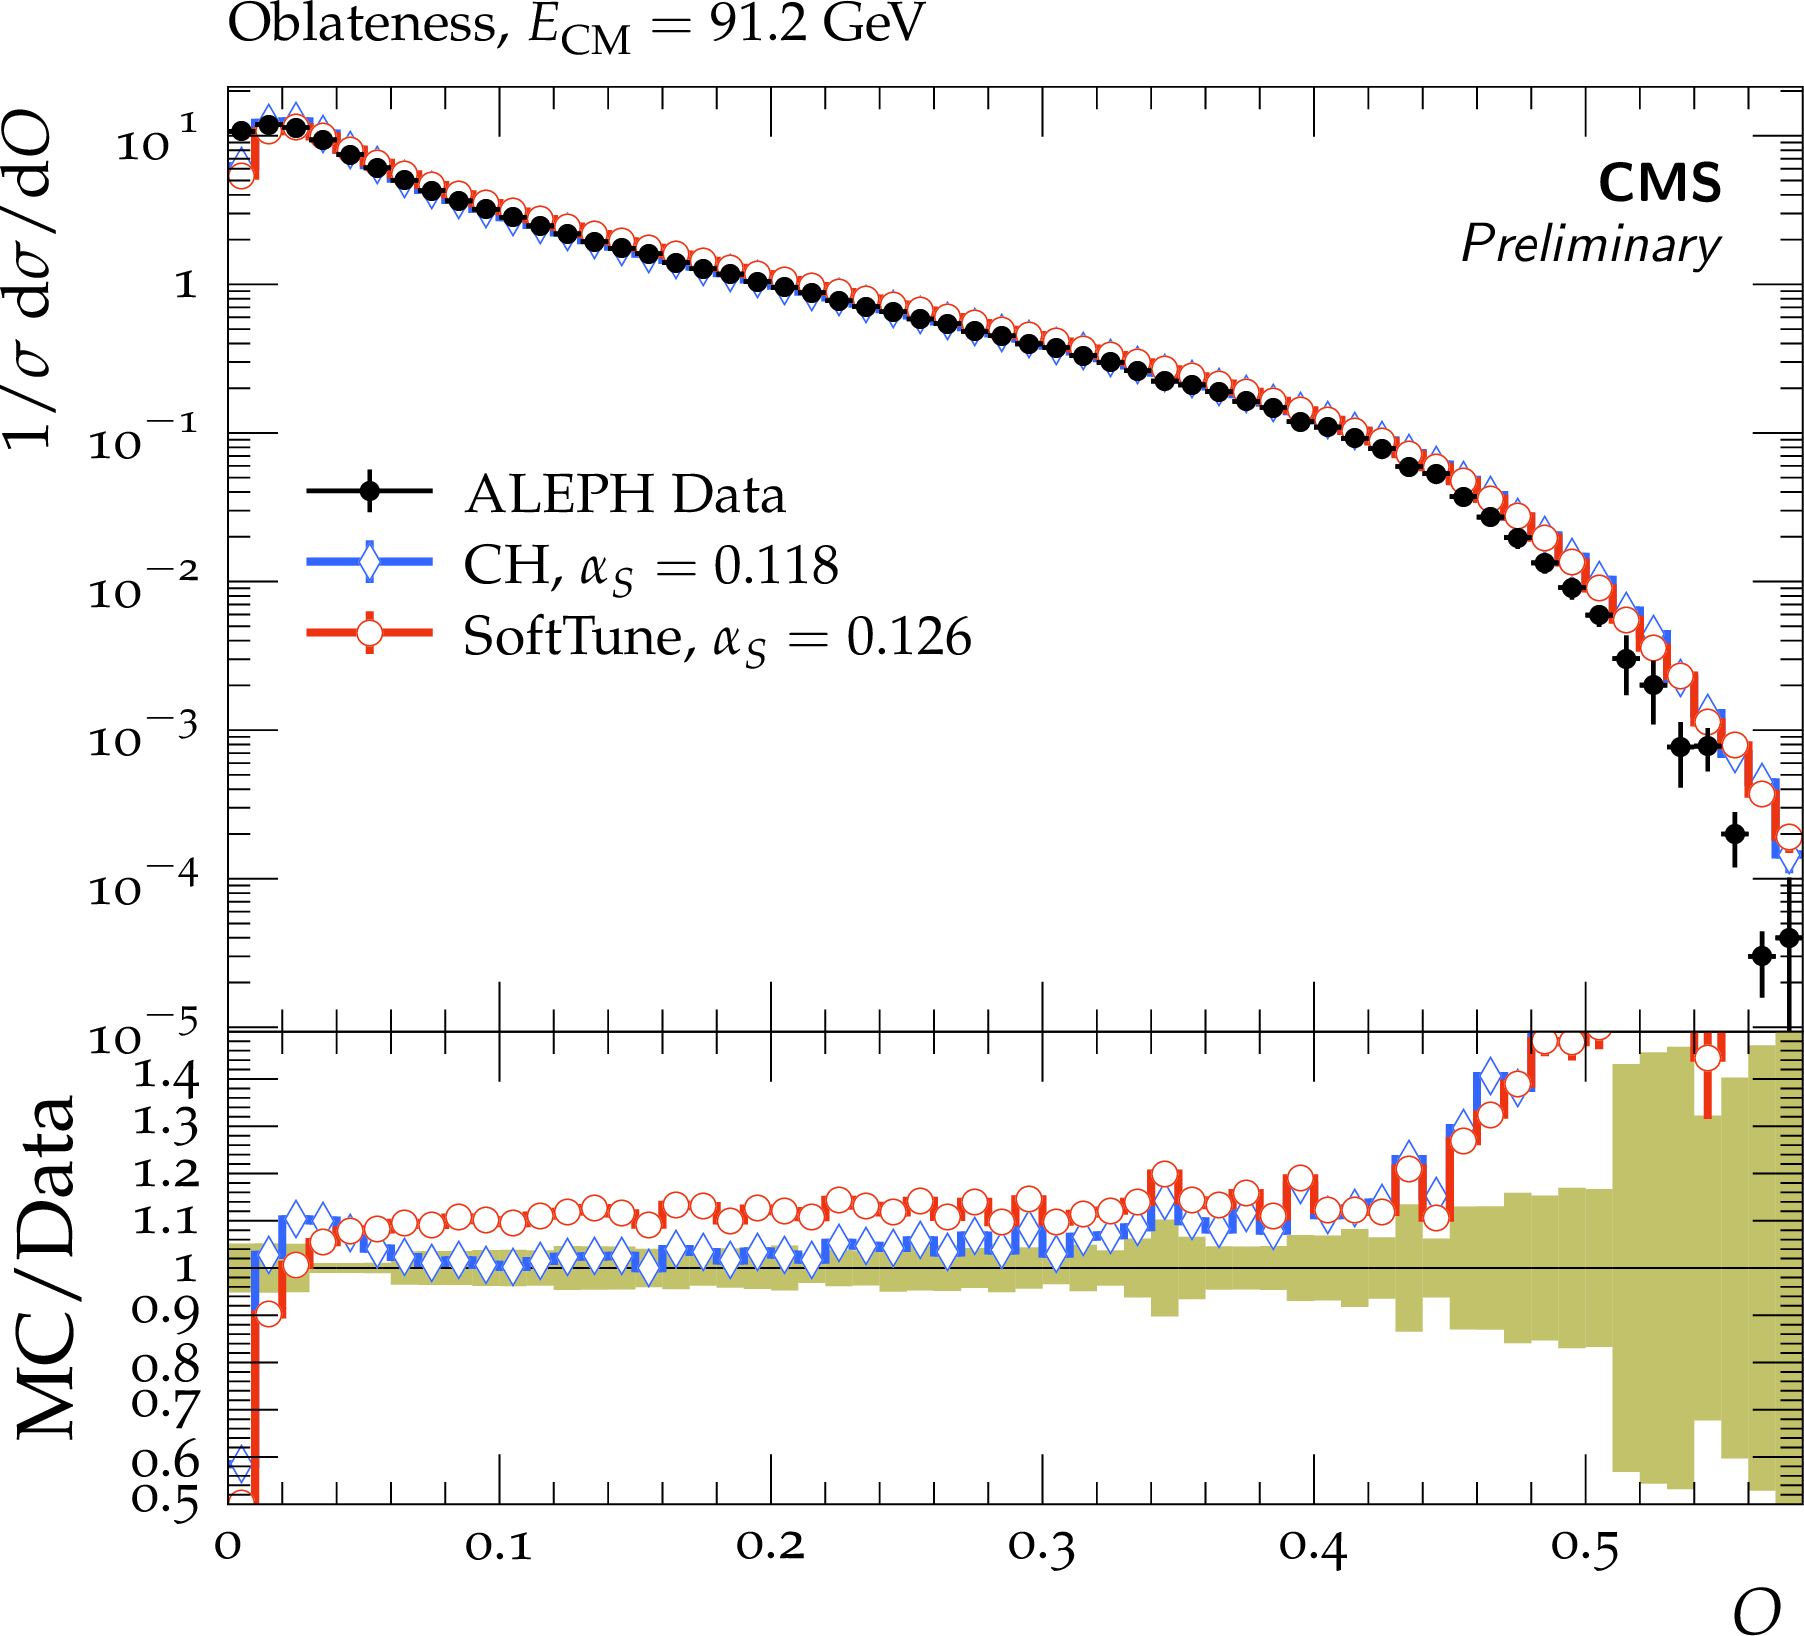
ALEPH data at $ {\sqrt {s}} = $ 91.2 GeV showing the T (upper left), T$_{\mathrm {major}}$ (upper right), {O} (lower left), and {S} (lower right) event-shape observables [29]. The data are compared to predictions from HERWIG 7, with the SoftTune and CH tune. The coloured band in the ratios of the different predictions from simulation to the data represents the total experimental uncertainty in the data. |
png pdf |
Figure 11-a:
ALEPH data at $ {\sqrt {s}} = $ 91.2 GeV showing the T (upper left), T$_{\mathrm {major}}$ (upper right), {O} (lower left), and {S} (lower right) event-shape observables [29]. The data are compared to predictions from HERWIG 7, with the SoftTune and CH tune. The coloured band in the ratios of the different predictions from simulation to the data represents the total experimental uncertainty in the data. |
png pdf |
Figure 11-b:
ALEPH data at $ {\sqrt {s}} = $ 91.2 GeV showing the T (upper left), T$_{\mathrm {major}}$ (upper right), {O} (lower left), and {S} (lower right) event-shape observables [29]. The data are compared to predictions from HERWIG 7, with the SoftTune and CH tune. The coloured band in the ratios of the different predictions from simulation to the data represents the total experimental uncertainty in the data. |
png pdf |
Figure 11-c:
ALEPH data at $ {\sqrt {s}} = $ 91.2 GeV showing the T (upper left), T$_{\mathrm {major}}$ (upper right), {O} (lower left), and {S} (lower right) event-shape observables [29]. The data are compared to predictions from HERWIG 7, with the SoftTune and CH tune. The coloured band in the ratios of the different predictions from simulation to the data represents the total experimental uncertainty in the data. |
png pdf |
Figure 11-d:
ALEPH data at $ {\sqrt {s}} = $ 91.2 GeV showing the T (upper left), T$_{\mathrm {major}}$ (upper right), {O} (lower left), and {S} (lower right) event-shape observables [29]. The data are compared to predictions from HERWIG 7, with the SoftTune and CH tune. The coloured band in the ratios of the different predictions from simulation to the data represents the total experimental uncertainty in the data. |
png pdf |
Figure 12:
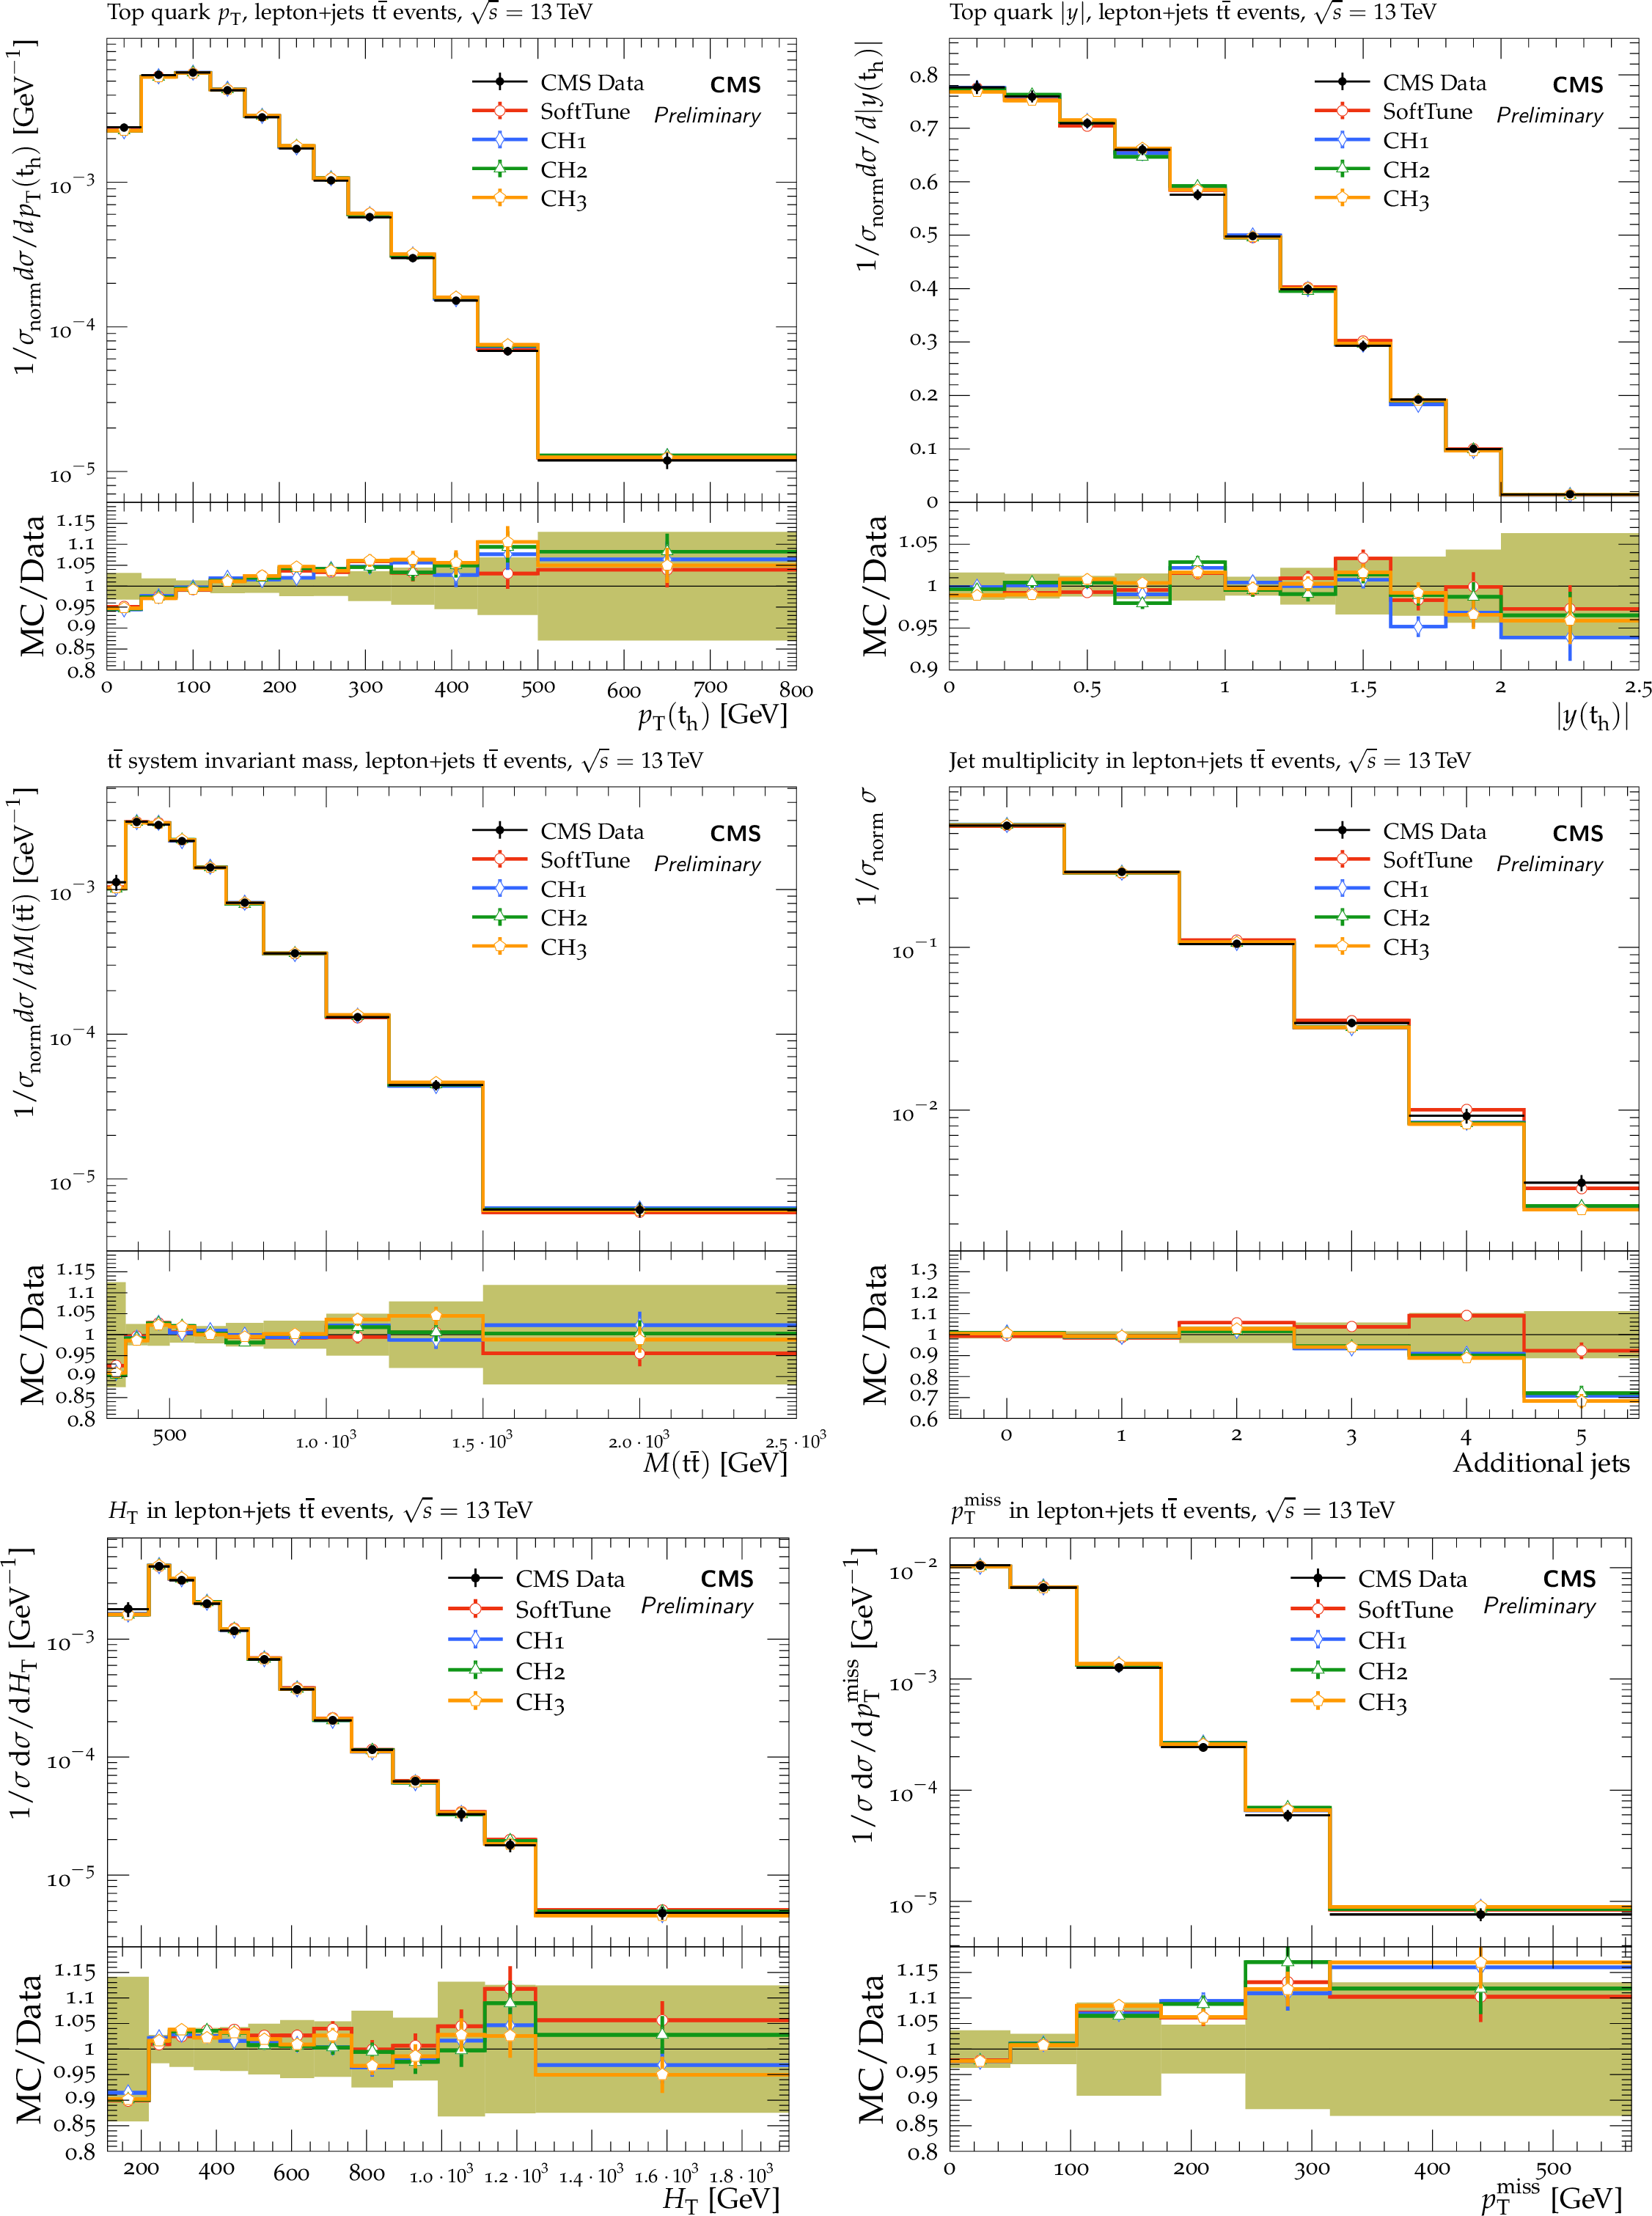
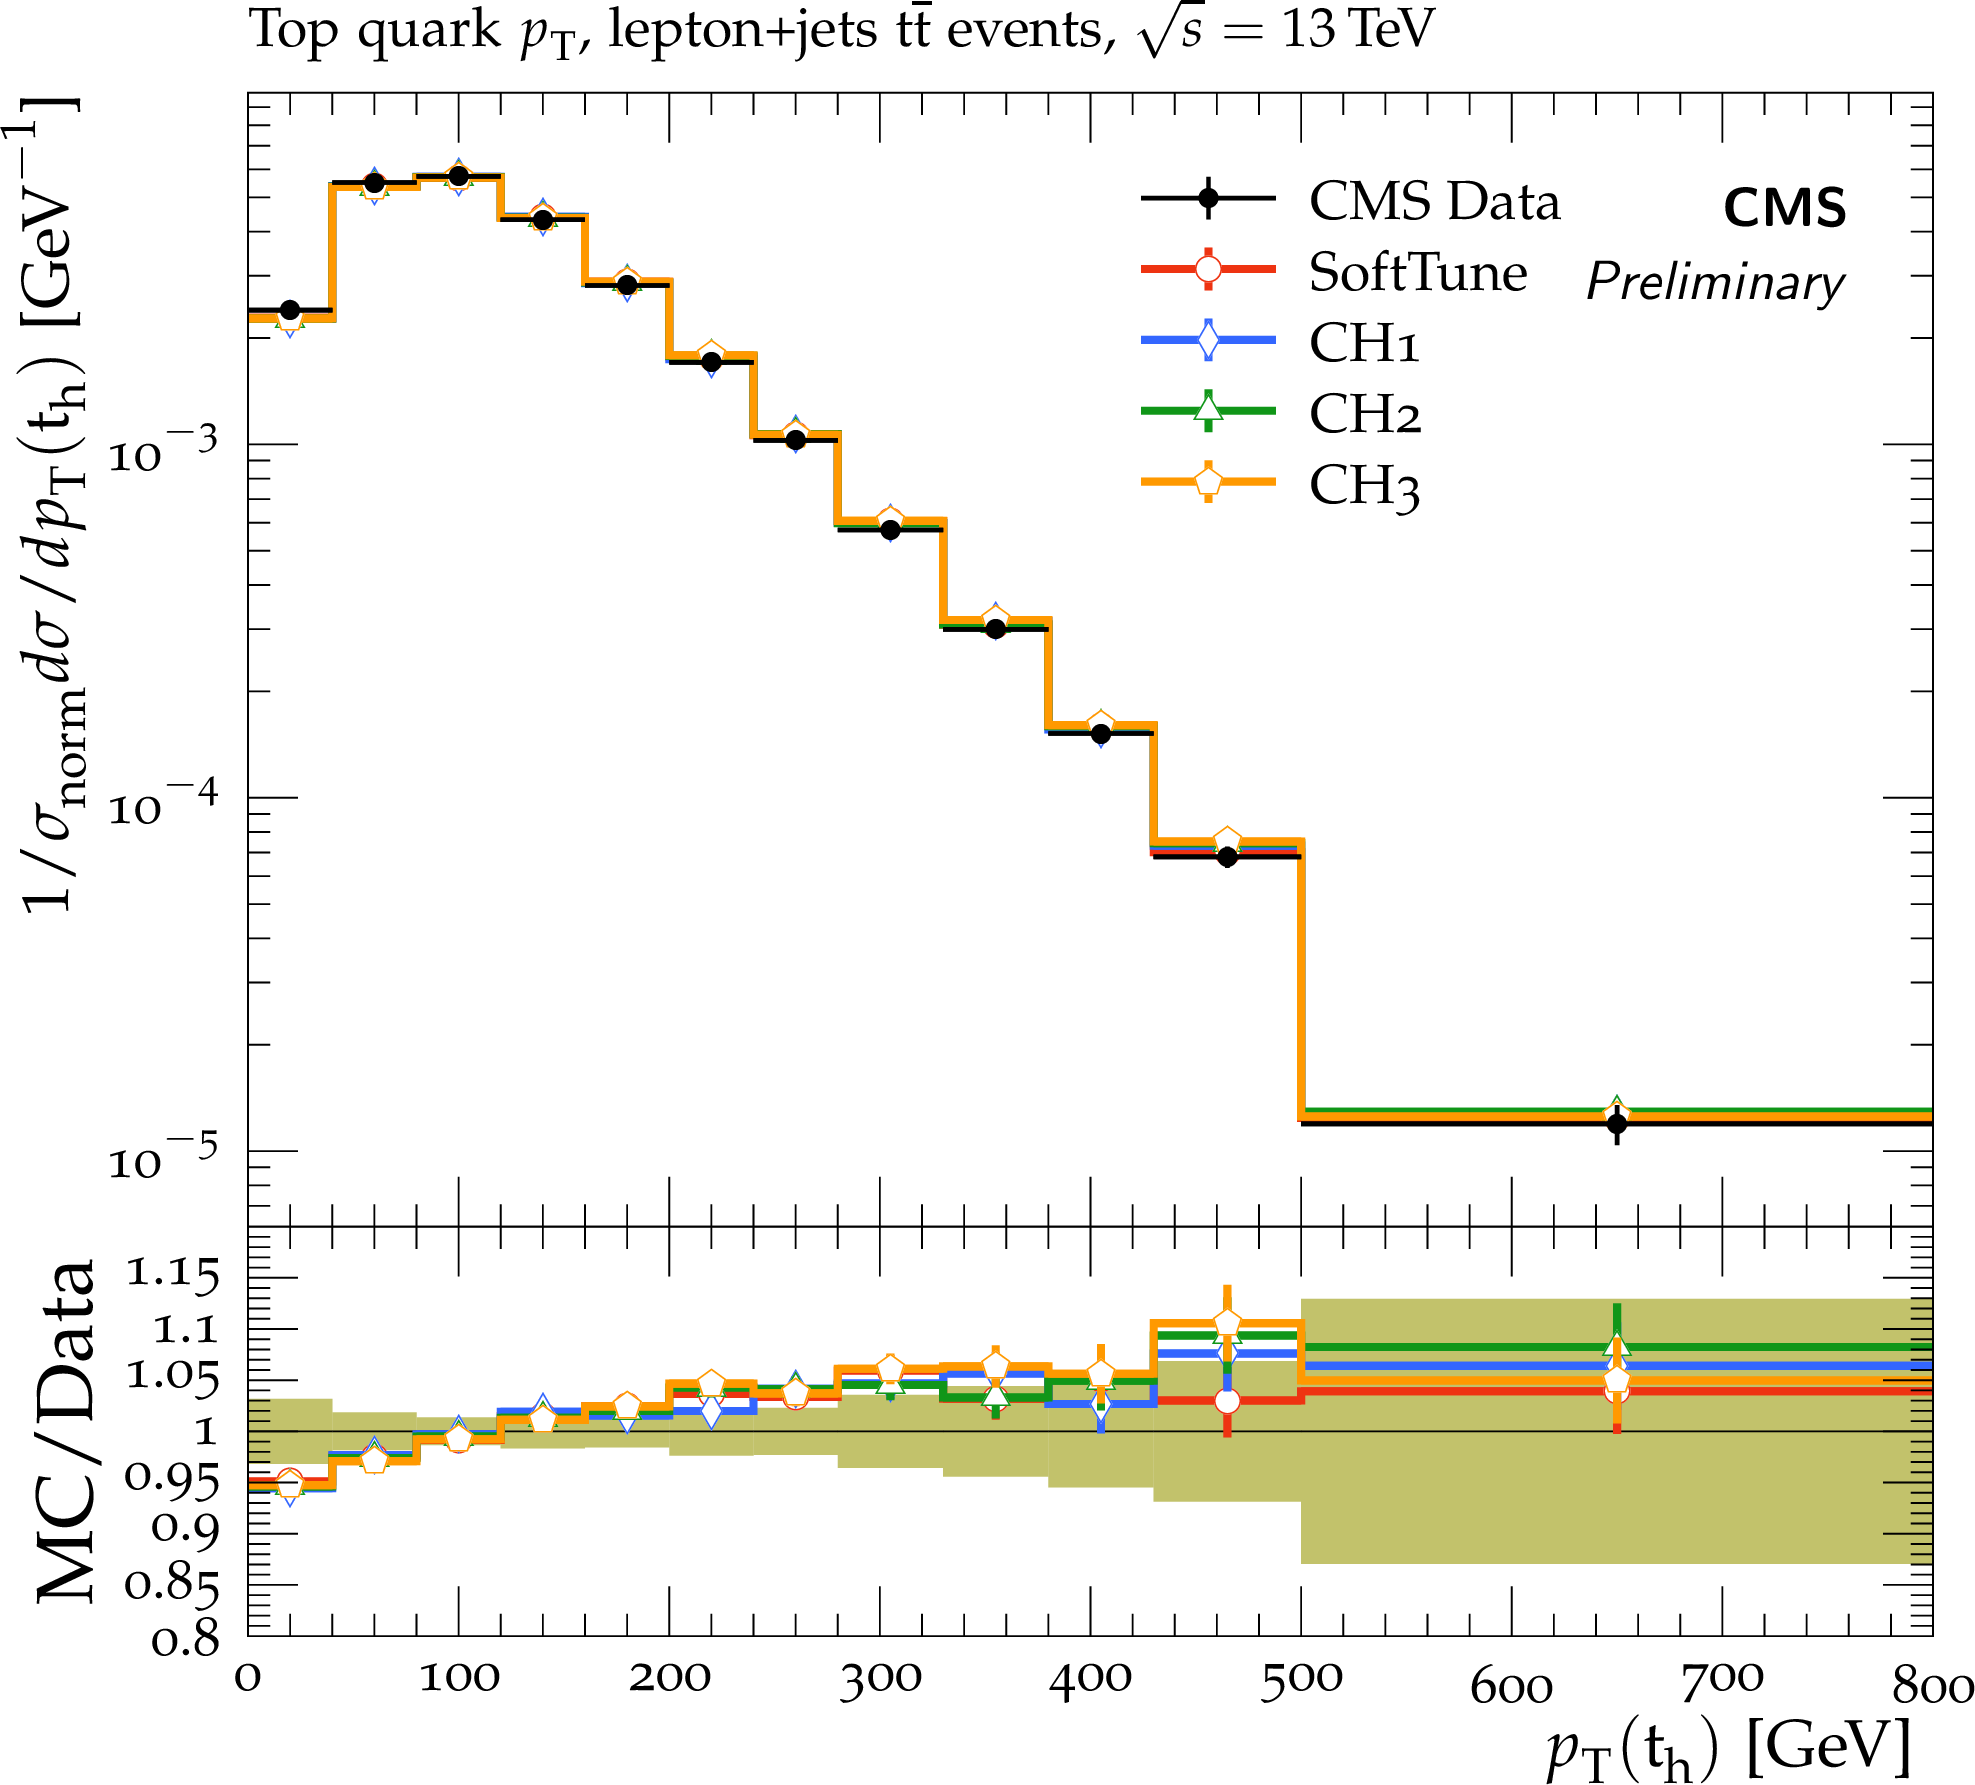
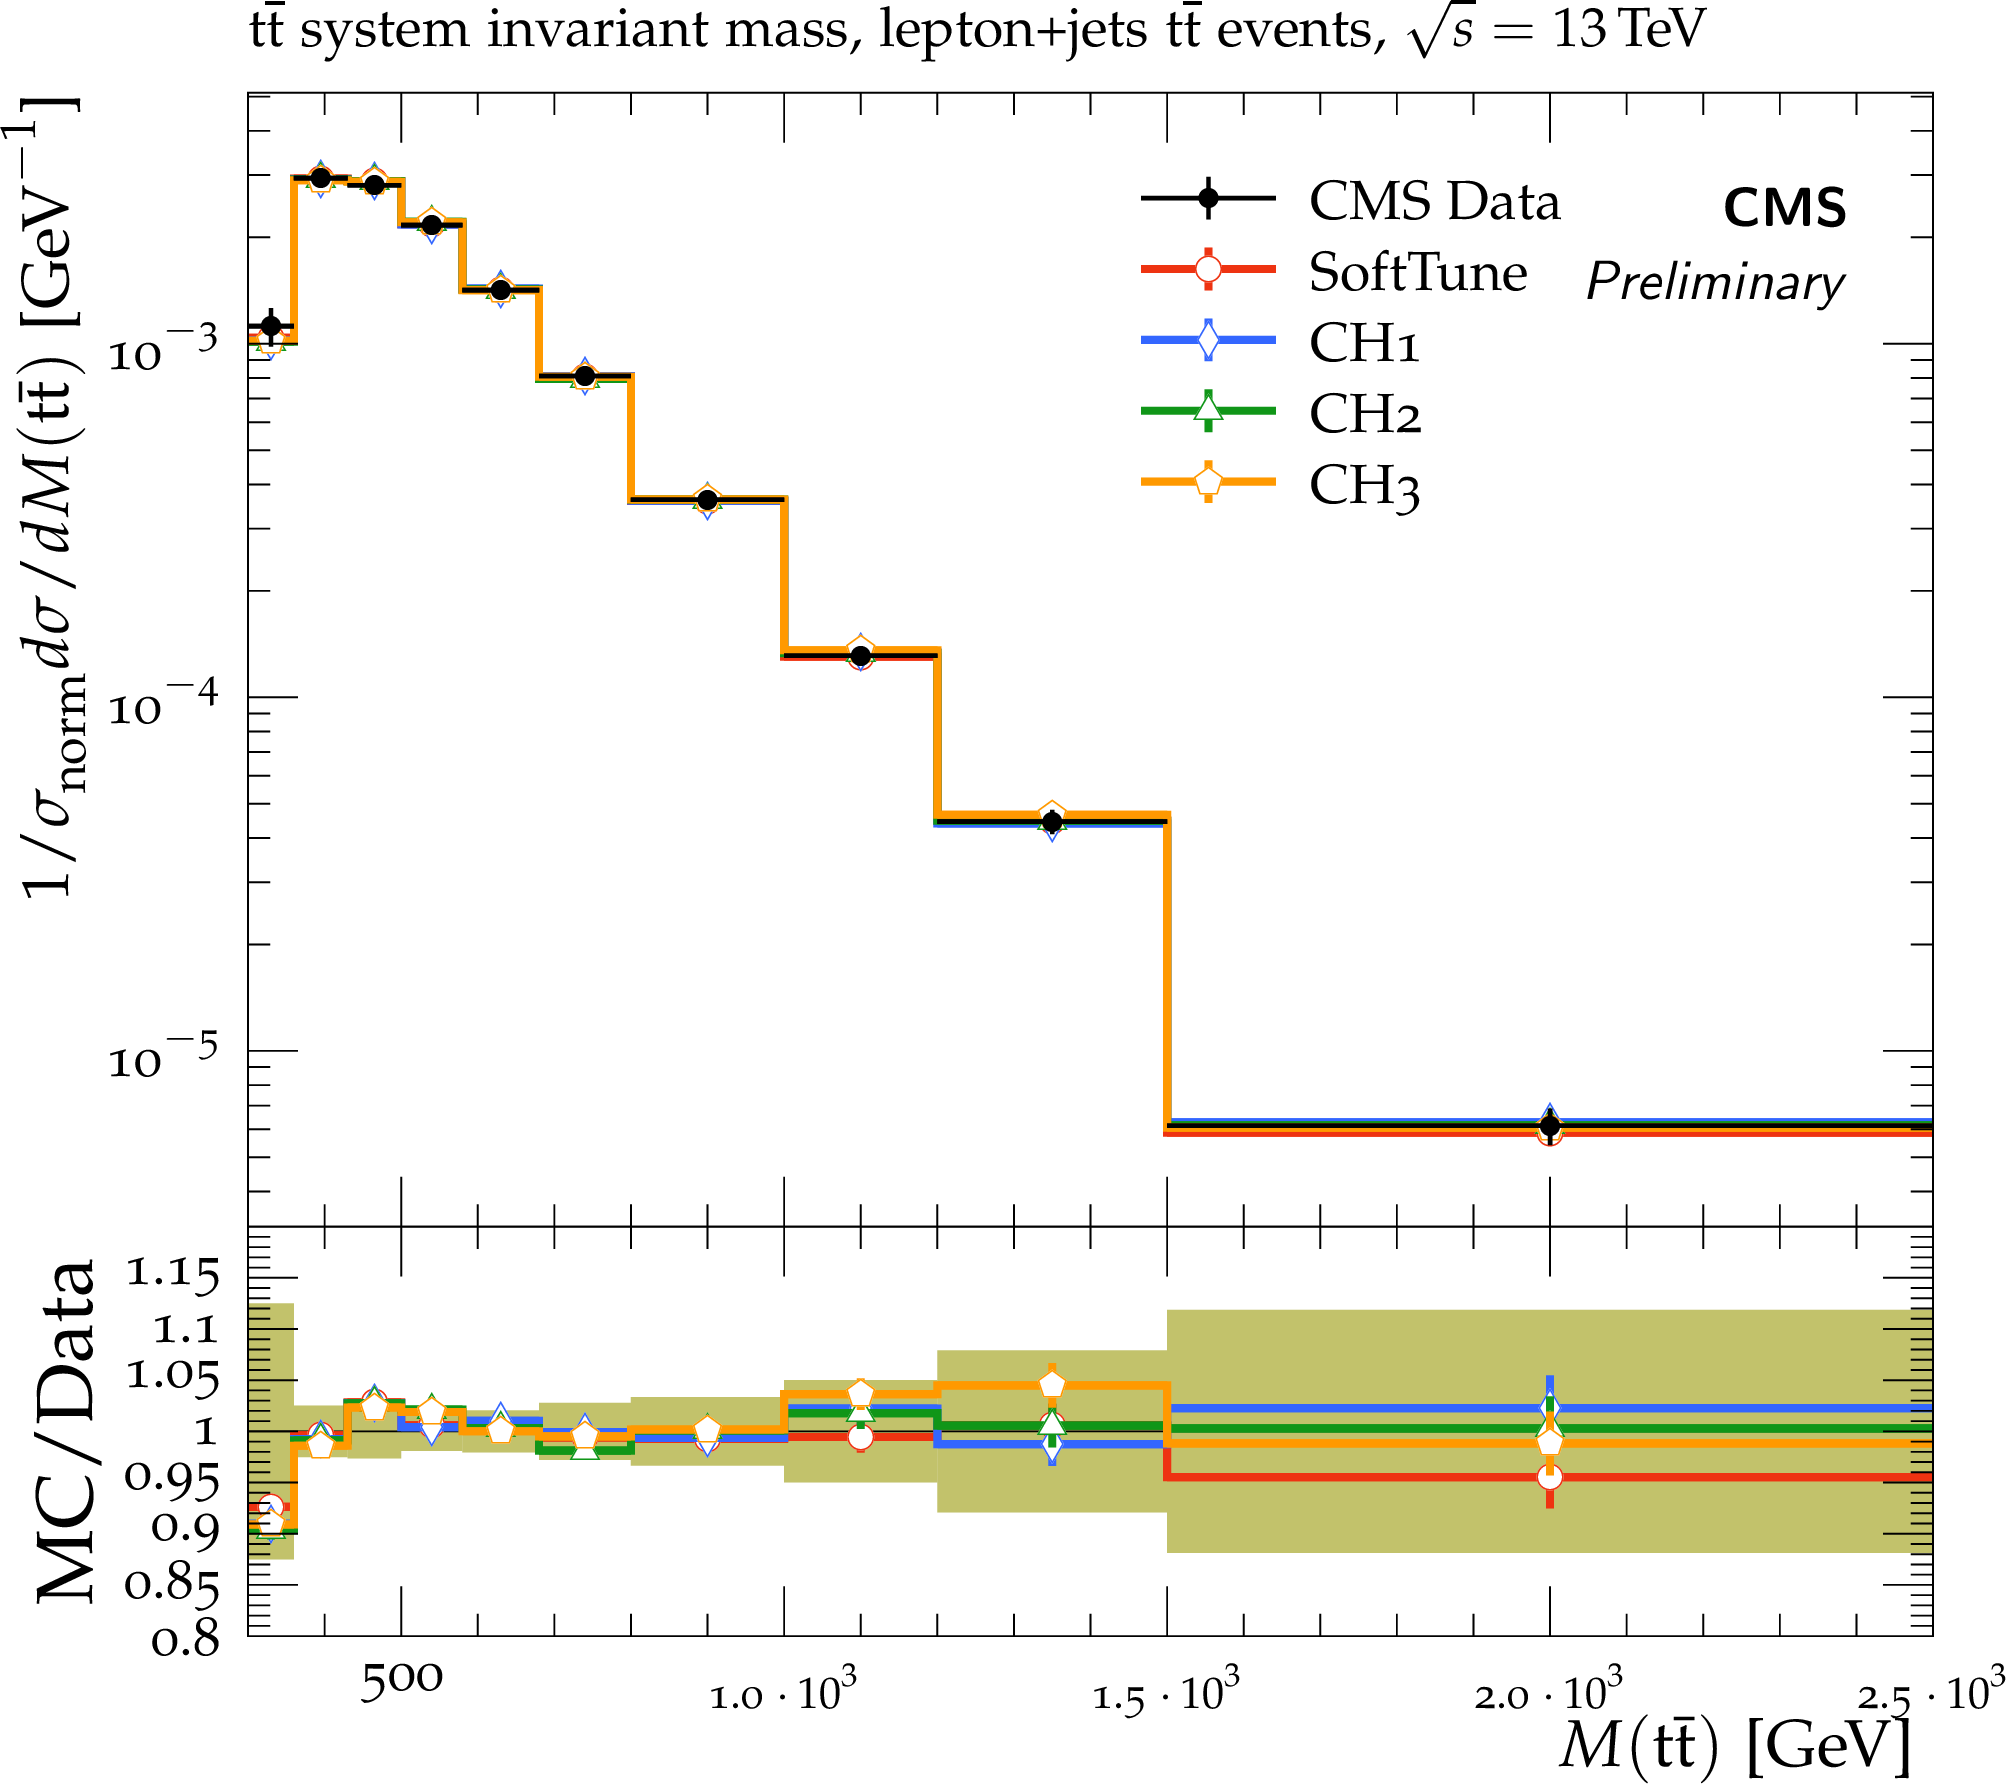
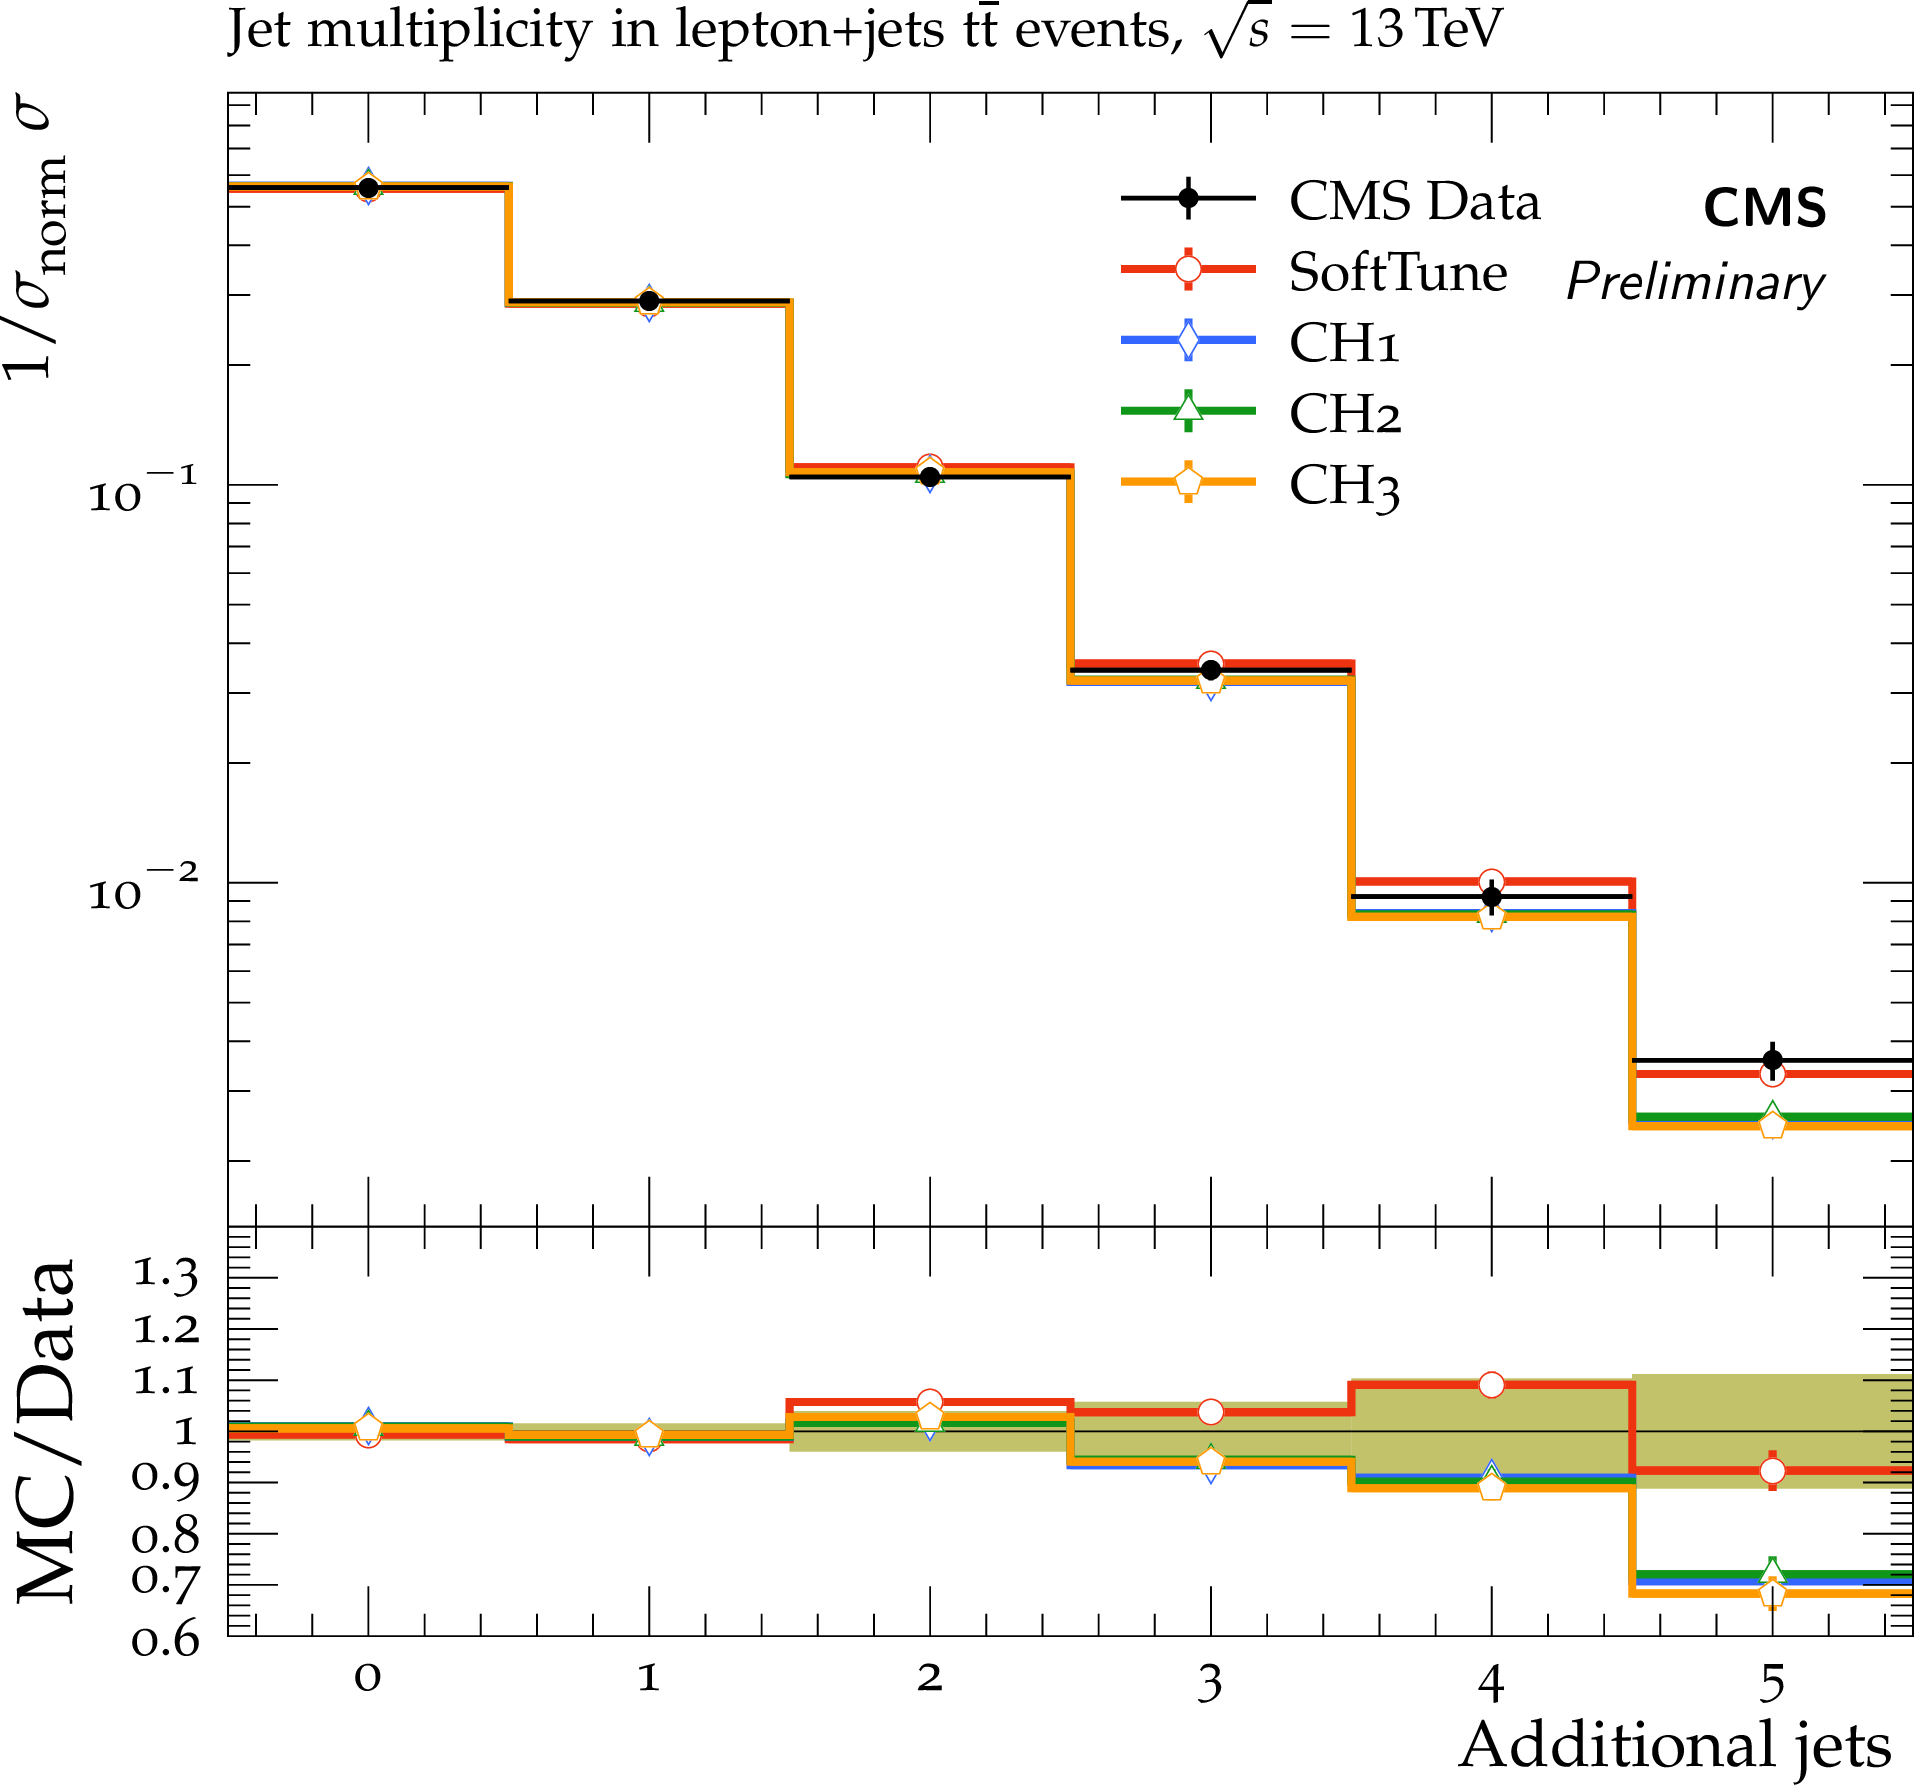
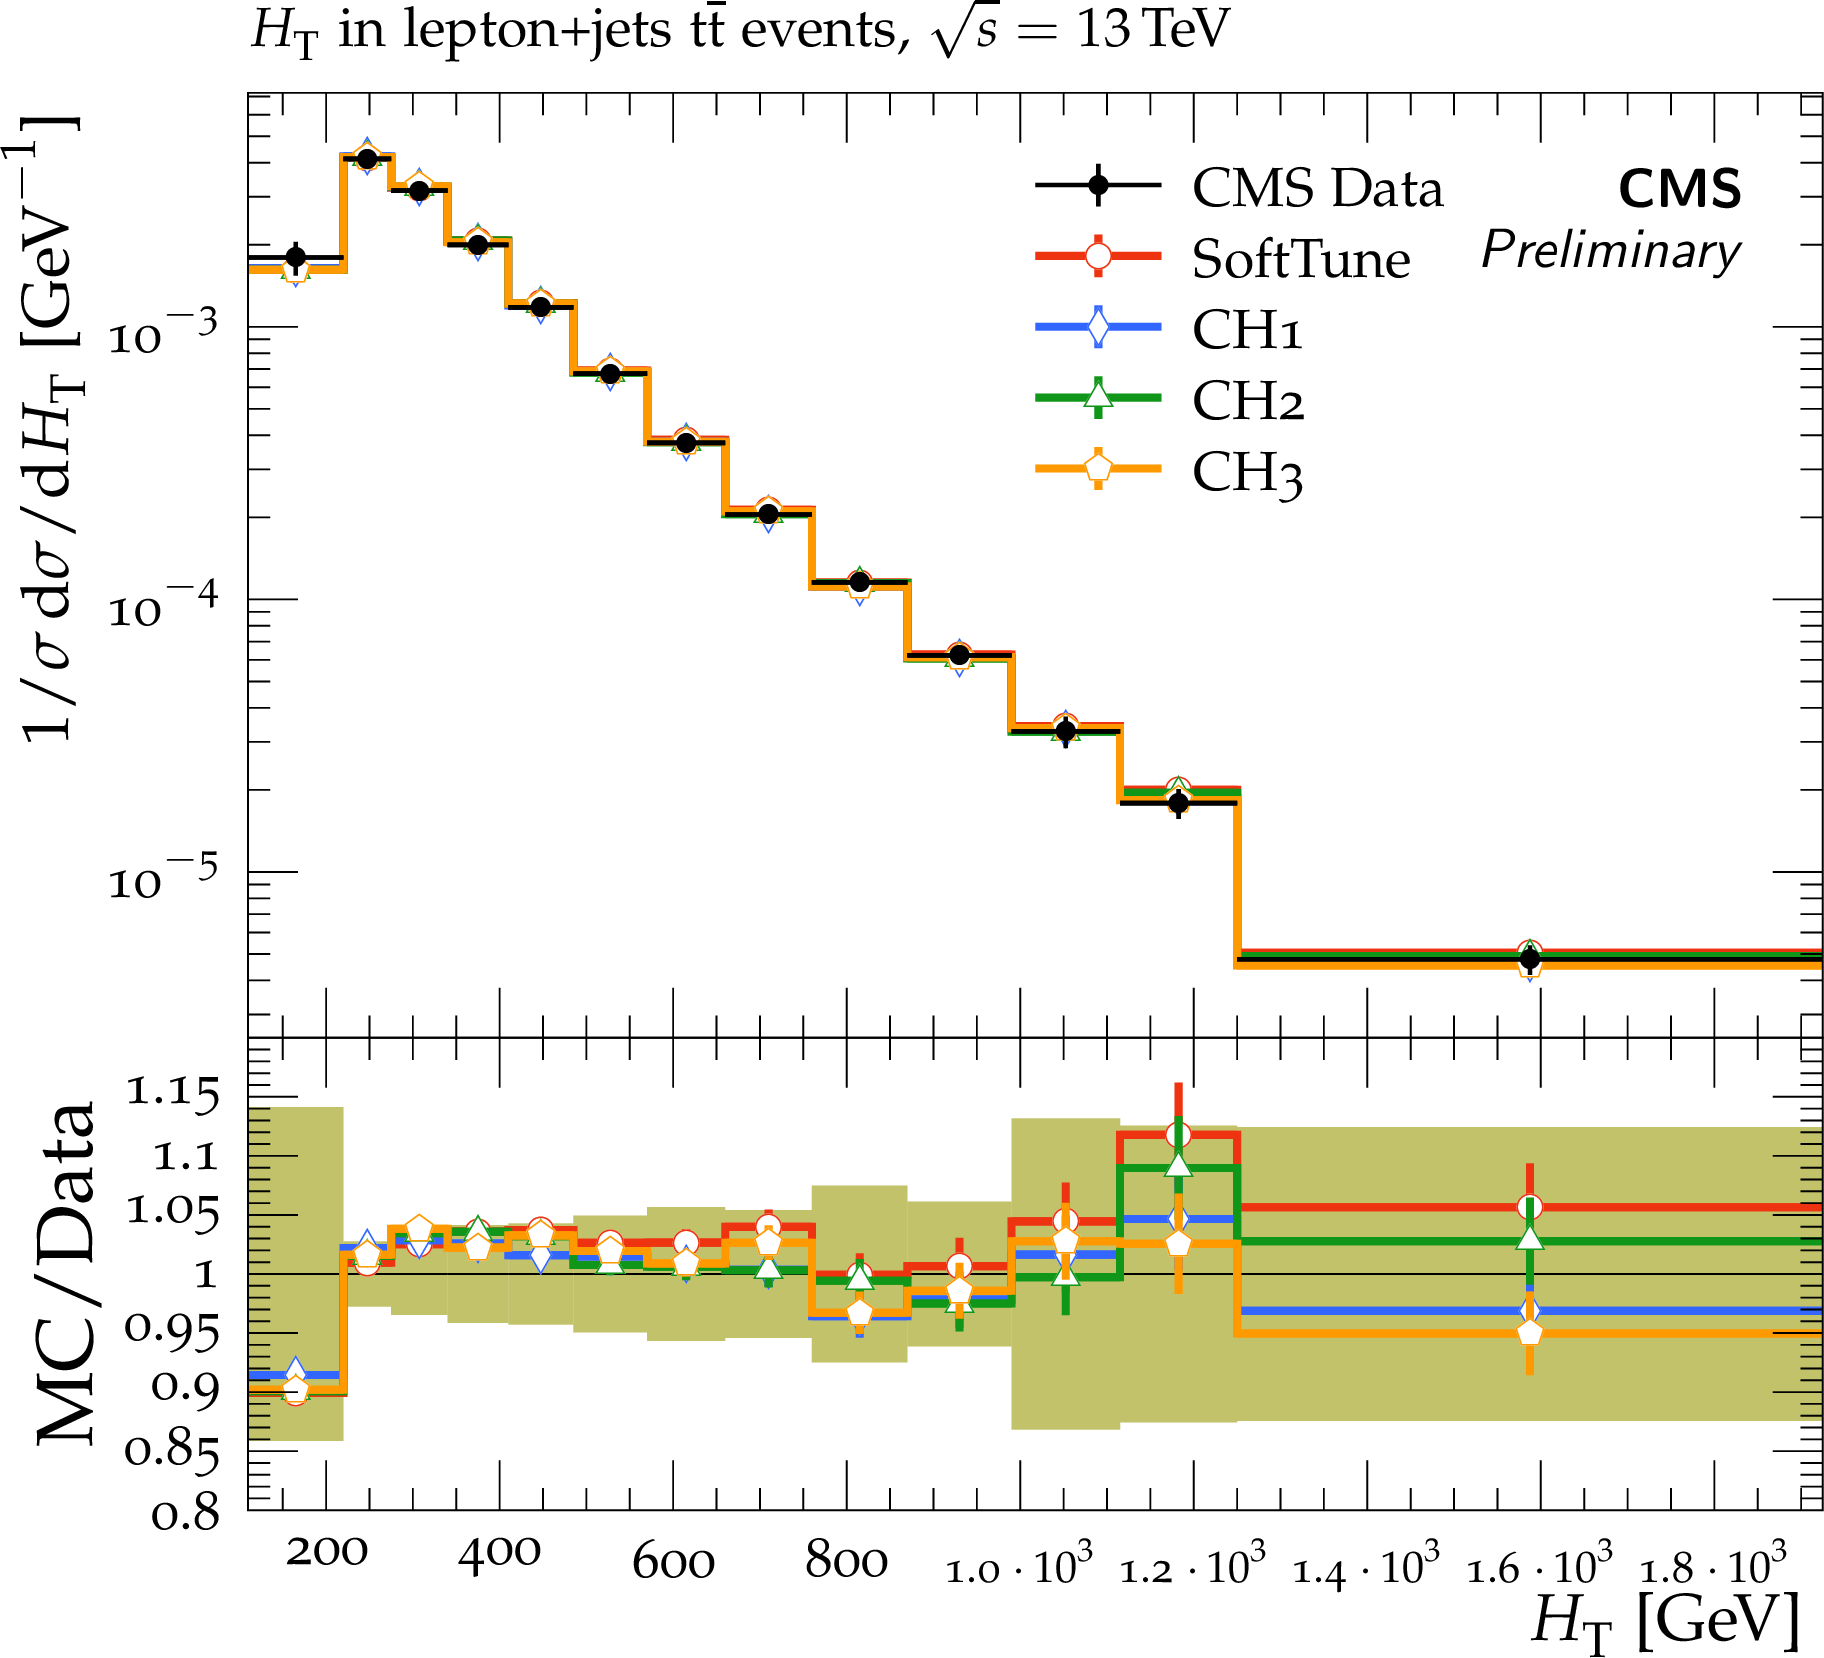
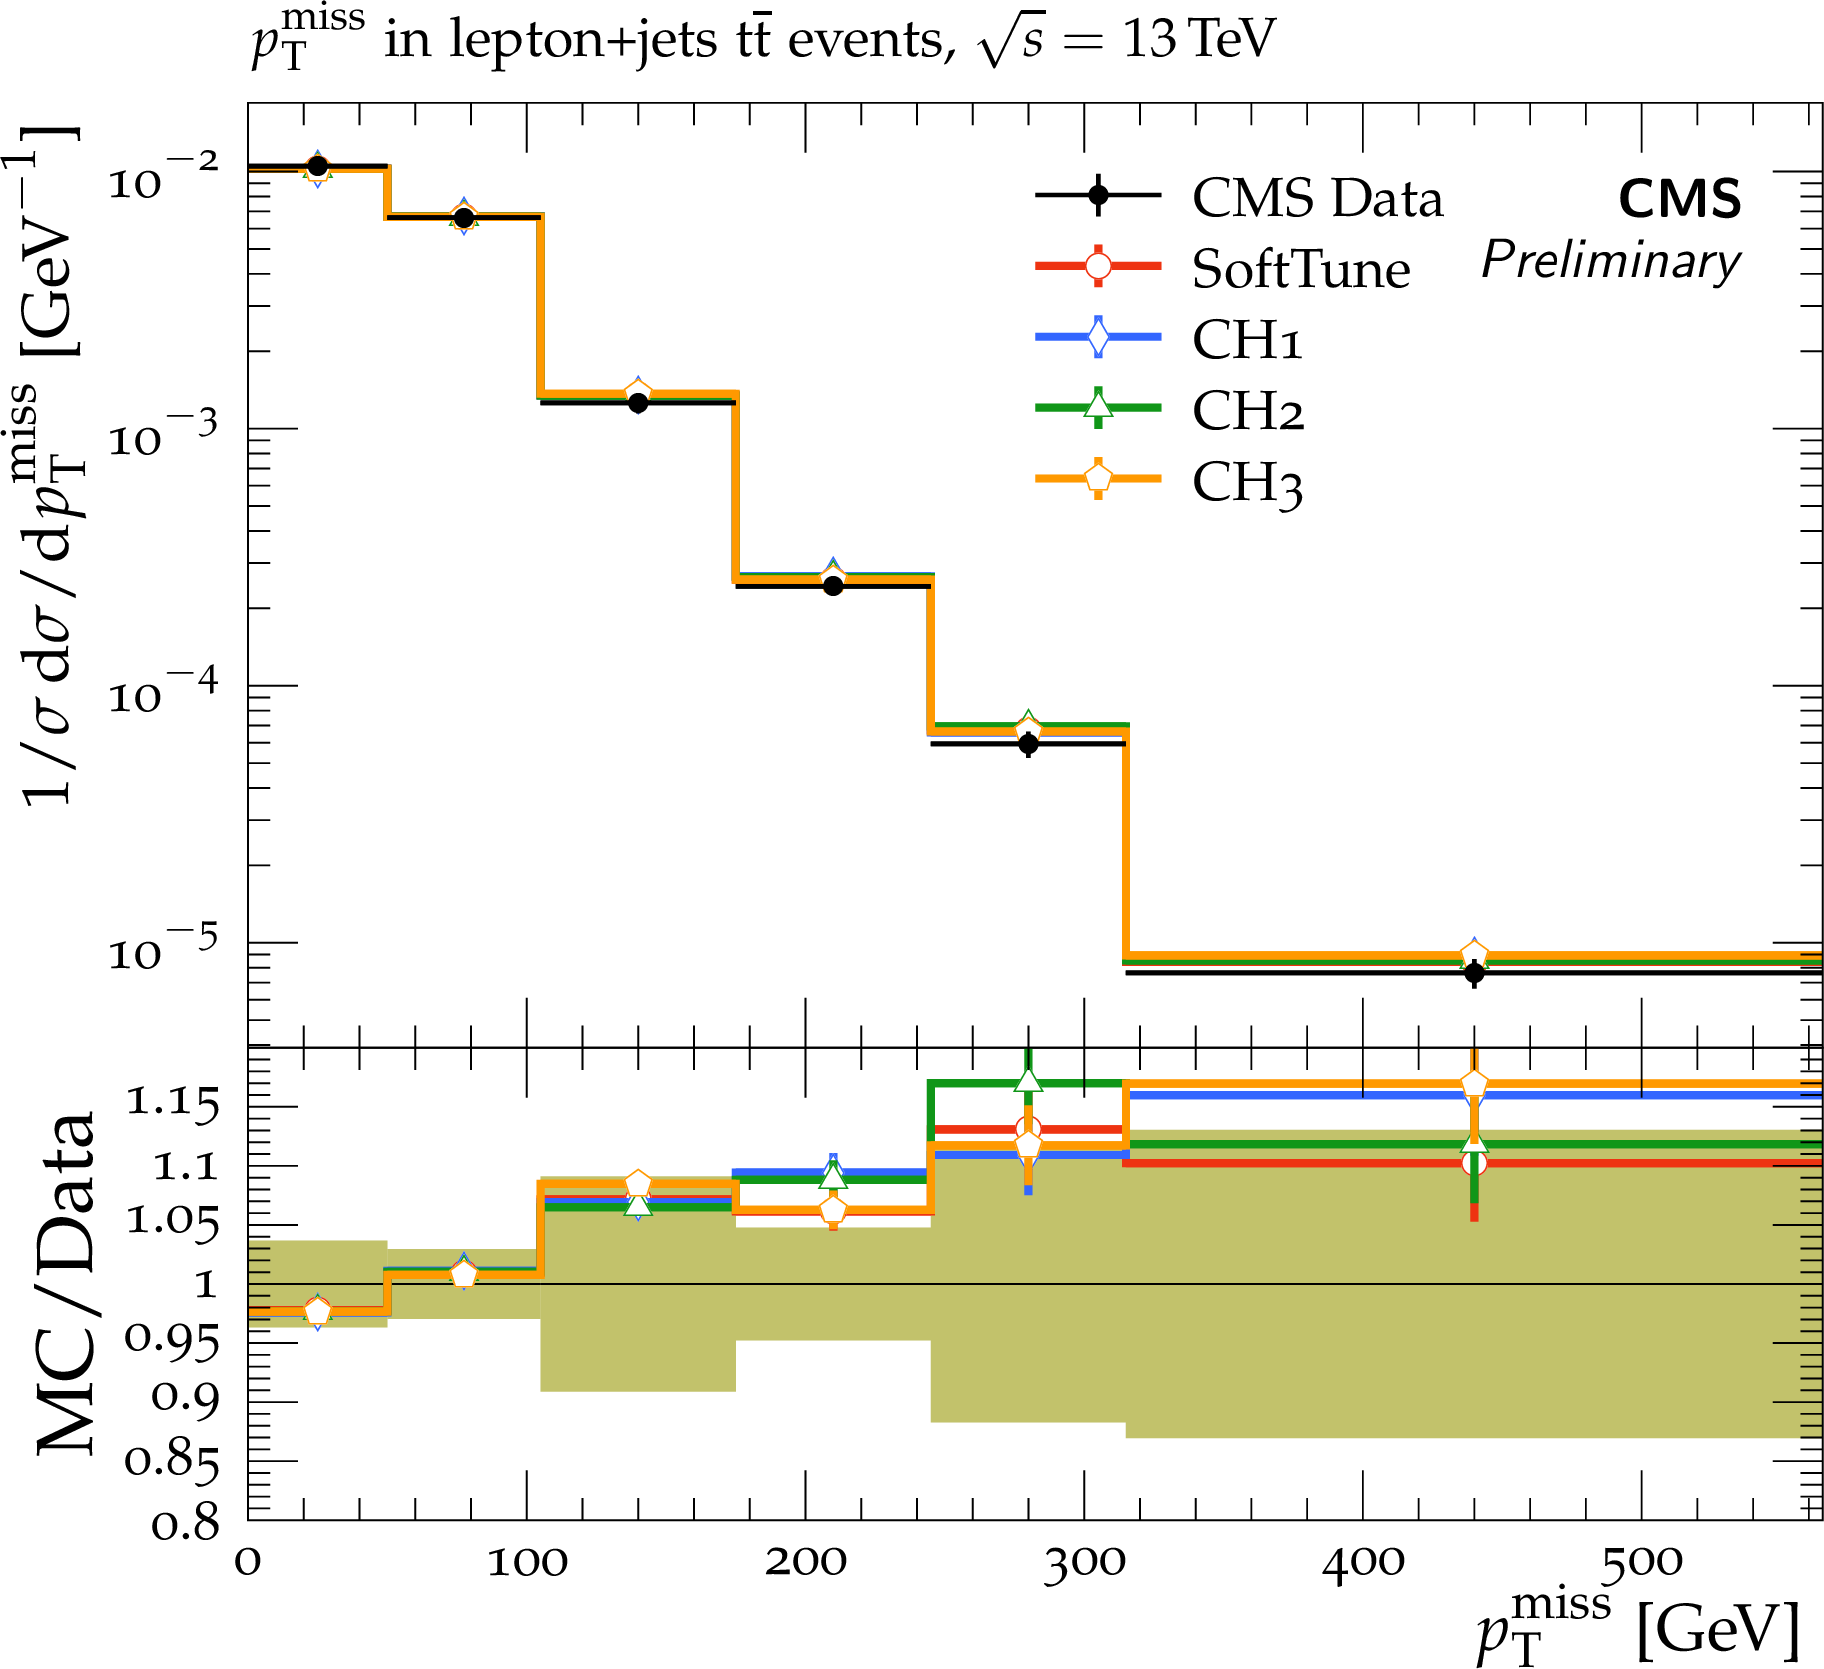
CMS data at $ {\sqrt {s}} = $ 13 TeV [35,38] of the ${p_{\mathrm {T}}}$ (upper left) and rapidity $y$ (upper right) of the hadronically decaying top quark, the invariant mass of the ${\mathrm{t} {}\mathrm{\bar{t}}}$ system (middle left), and the additional jet multiplicity (middle right). The ${H_{\mathrm {T}}}$ (lower left) and ${{p_{\mathrm {T}}} ^\text {miss}}$ (lower right) in single-leptonic ${\mathrm{t} {}\mathrm{\bar{t}}}$ events are also shown. The data are compared to predictions from {powheg} + HERWIG 7, with the SoftTune, CH1, CH2, and CH3 tunes. The coloured band in the ratios of the different predictions from simulation to the data represents the total experimental uncertainty in the data. |
png pdf |
Figure 12-a:
CMS data at $ {\sqrt {s}} = $ 13 TeV [35,38] of the ${p_{\mathrm {T}}}$ (upper left) and rapidity $y$ (upper right) of the hadronically decaying top quark, the invariant mass of the ${\mathrm{t} {}\mathrm{\bar{t}}}$ system (middle left), and the additional jet multiplicity (middle right). The ${H_{\mathrm {T}}}$ (lower left) and ${{p_{\mathrm {T}}} ^\text {miss}}$ (lower right) in single-leptonic ${\mathrm{t} {}\mathrm{\bar{t}}}$ events are also shown. The data are compared to predictions from {powheg} + HERWIG 7, with the SoftTune, CH1, CH2, and CH3 tunes. The coloured band in the ratios of the different predictions from simulation to the data represents the total experimental uncertainty in the data. |
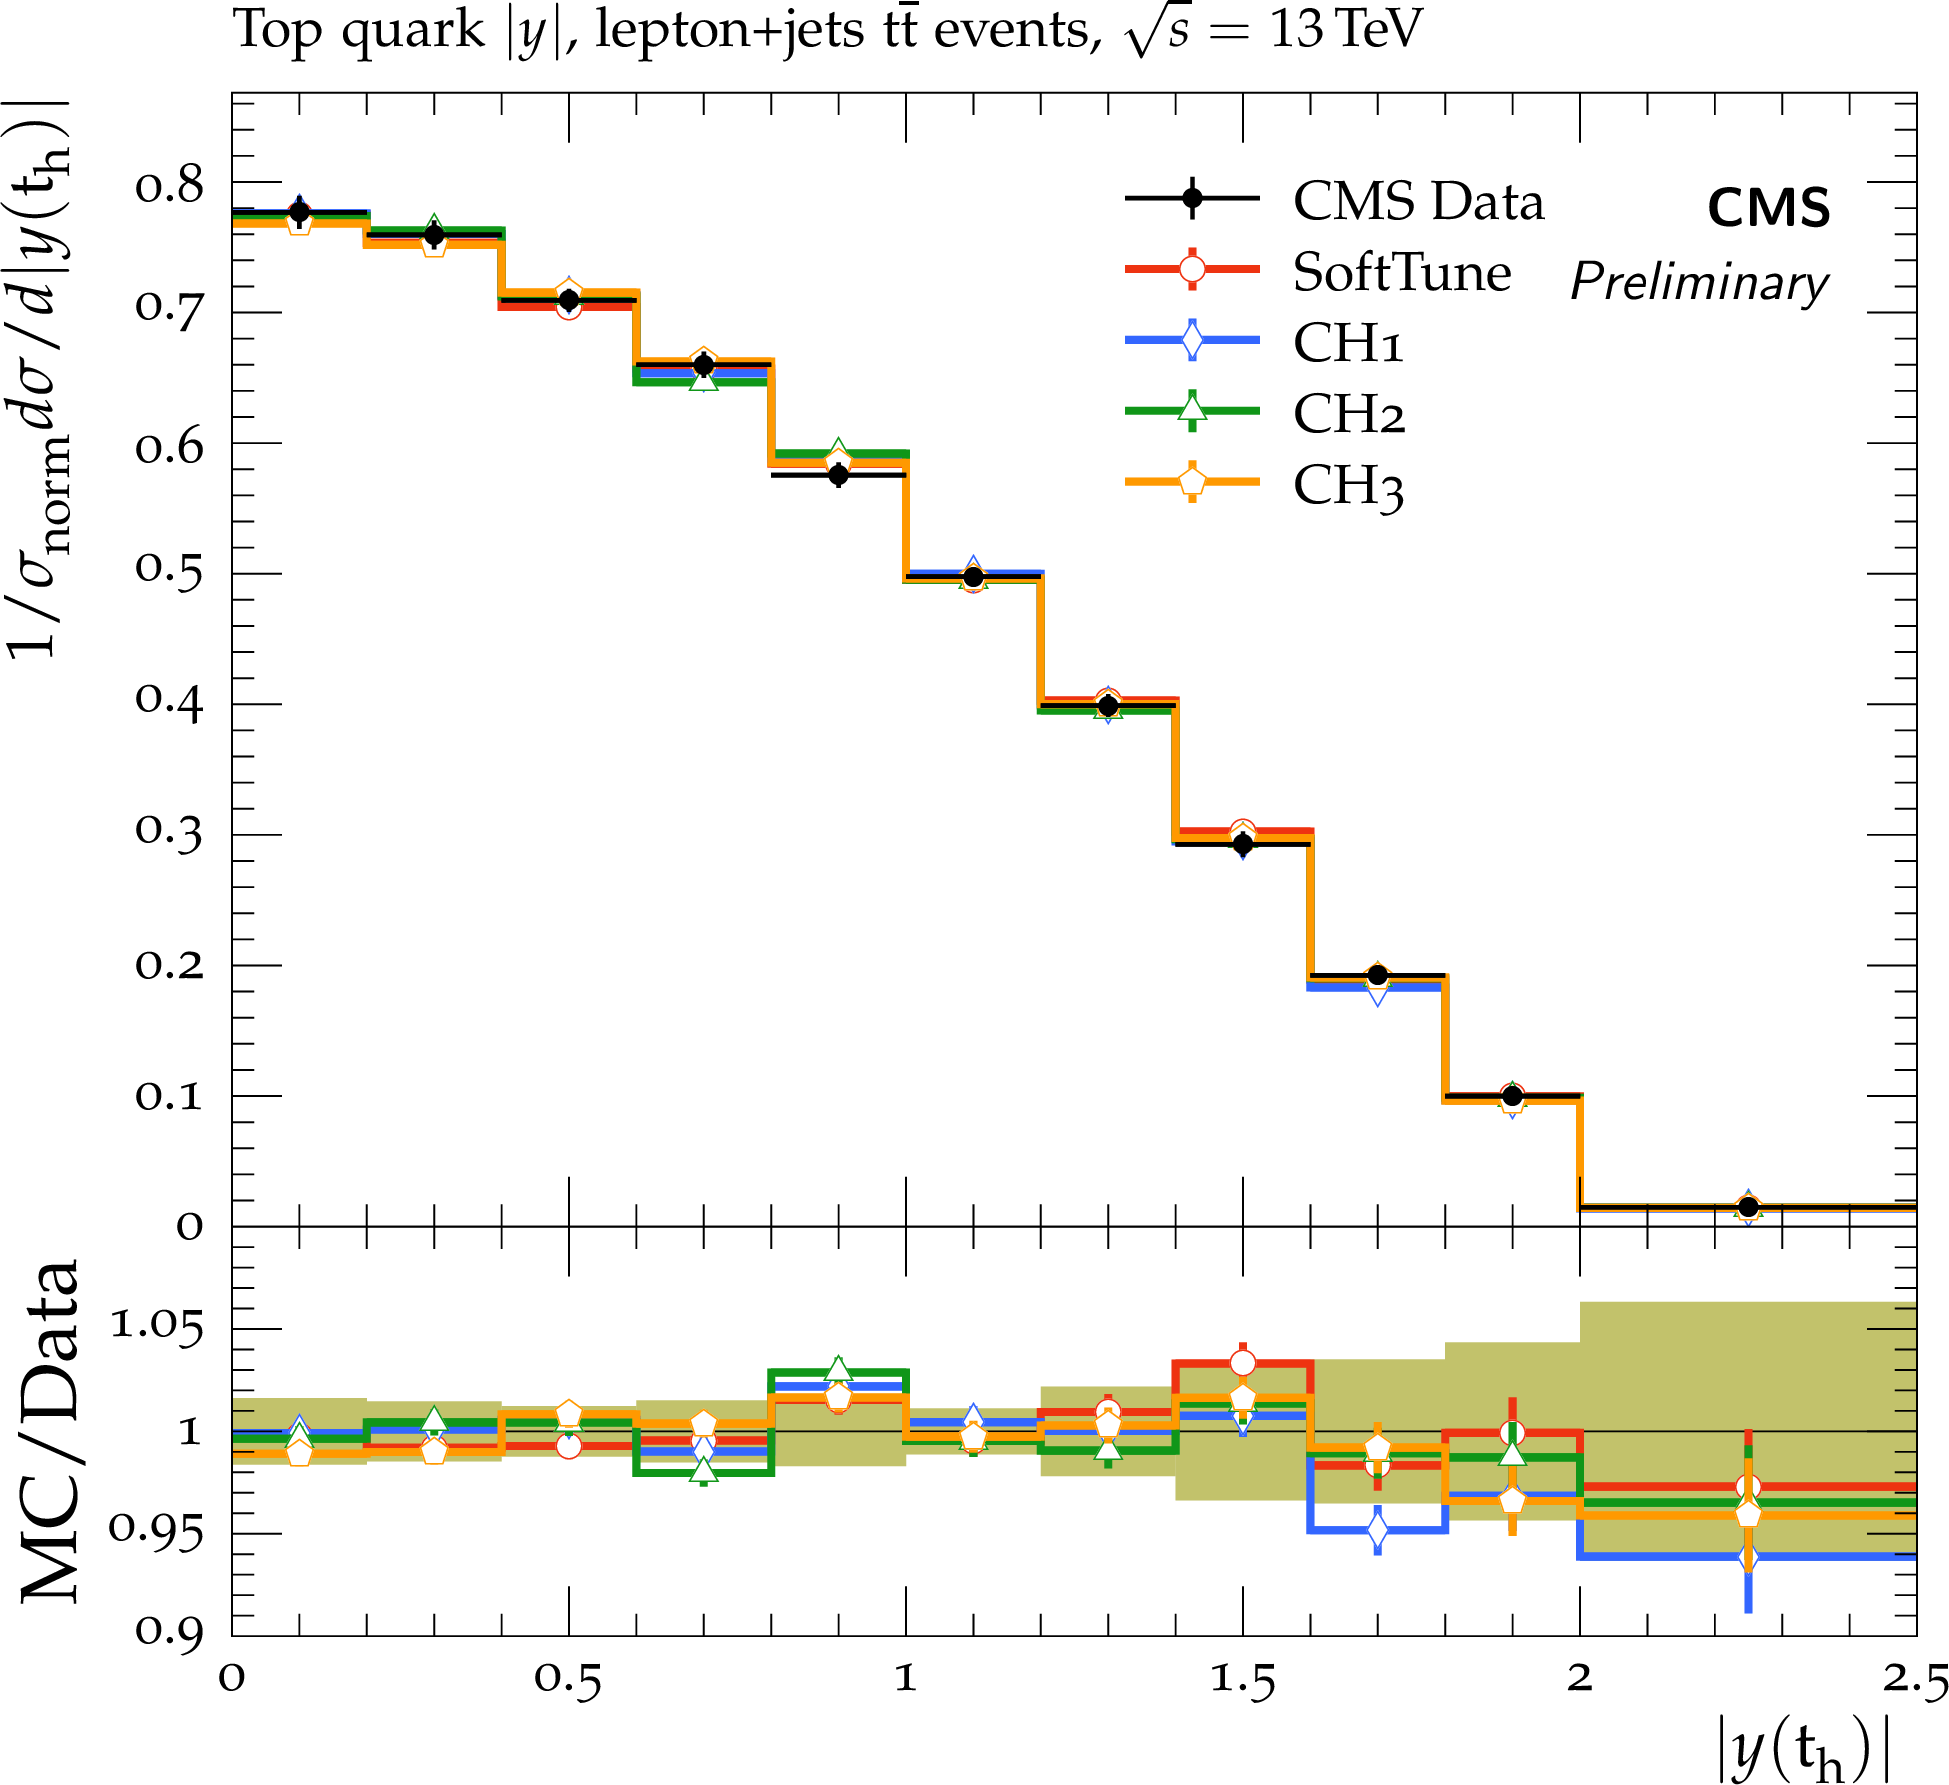
png pdf |
Figure 12-b:
CMS data at $ {\sqrt {s}} = $ 13 TeV [35,38] of the ${p_{\mathrm {T}}}$ (upper left) and rapidity $y$ (upper right) of the hadronically decaying top quark, the invariant mass of the ${\mathrm{t} {}\mathrm{\bar{t}}}$ system (middle left), and the additional jet multiplicity (middle right). The ${H_{\mathrm {T}}}$ (lower left) and ${{p_{\mathrm {T}}} ^\text {miss}}$ (lower right) in single-leptonic ${\mathrm{t} {}\mathrm{\bar{t}}}$ events are also shown. The data are compared to predictions from {powheg} + HERWIG 7, with the SoftTune, CH1, CH2, and CH3 tunes. The coloured band in the ratios of the different predictions from simulation to the data represents the total experimental uncertainty in the data. |
png pdf |
Figure 12-c:
CMS data at $ {\sqrt {s}} = $ 13 TeV [35,38] of the ${p_{\mathrm {T}}}$ (upper left) and rapidity $y$ (upper right) of the hadronically decaying top quark, the invariant mass of the ${\mathrm{t} {}\mathrm{\bar{t}}}$ system (middle left), and the additional jet multiplicity (middle right). The ${H_{\mathrm {T}}}$ (lower left) and ${{p_{\mathrm {T}}} ^\text {miss}}$ (lower right) in single-leptonic ${\mathrm{t} {}\mathrm{\bar{t}}}$ events are also shown. The data are compared to predictions from {powheg} + HERWIG 7, with the SoftTune, CH1, CH2, and CH3 tunes. The coloured band in the ratios of the different predictions from simulation to the data represents the total experimental uncertainty in the data. |
png pdf |
Figure 12-d:
CMS data at $ {\sqrt {s}} = $ 13 TeV [35,38] of the ${p_{\mathrm {T}}}$ (upper left) and rapidity $y$ (upper right) of the hadronically decaying top quark, the invariant mass of the ${\mathrm{t} {}\mathrm{\bar{t}}}$ system (middle left), and the additional jet multiplicity (middle right). The ${H_{\mathrm {T}}}$ (lower left) and ${{p_{\mathrm {T}}} ^\text {miss}}$ (lower right) in single-leptonic ${\mathrm{t} {}\mathrm{\bar{t}}}$ events are also shown. The data are compared to predictions from {powheg} + HERWIG 7, with the SoftTune, CH1, CH2, and CH3 tunes. The coloured band in the ratios of the different predictions from simulation to the data represents the total experimental uncertainty in the data. |
png pdf |
Figure 12-e:
CMS data at $ {\sqrt {s}} = $ 13 TeV [35,38] of the ${p_{\mathrm {T}}}$ (upper left) and rapidity $y$ (upper right) of the hadronically decaying top quark, the invariant mass of the ${\mathrm{t} {}\mathrm{\bar{t}}}$ system (middle left), and the additional jet multiplicity (middle right). The ${H_{\mathrm {T}}}$ (lower left) and ${{p_{\mathrm {T}}} ^\text {miss}}$ (lower right) in single-leptonic ${\mathrm{t} {}\mathrm{\bar{t}}}$ events are also shown. The data are compared to predictions from {powheg} + HERWIG 7, with the SoftTune, CH1, CH2, and CH3 tunes. The coloured band in the ratios of the different predictions from simulation to the data represents the total experimental uncertainty in the data. |
png pdf |
Figure 12-f:
CMS data at $ {\sqrt {s}} = $ 13 TeV [35,38] of the ${p_{\mathrm {T}}}$ (upper left) and rapidity $y$ (upper right) of the hadronically decaying top quark, the invariant mass of the ${\mathrm{t} {}\mathrm{\bar{t}}}$ system (middle left), and the additional jet multiplicity (middle right). The ${H_{\mathrm {T}}}$ (lower left) and ${{p_{\mathrm {T}}} ^\text {miss}}$ (lower right) in single-leptonic ${\mathrm{t} {}\mathrm{\bar{t}}}$ events are also shown. The data are compared to predictions from {powheg} + HERWIG 7, with the SoftTune, CH1, CH2, and CH3 tunes. The coloured band in the ratios of the different predictions from simulation to the data represents the total experimental uncertainty in the data. |
png pdf |
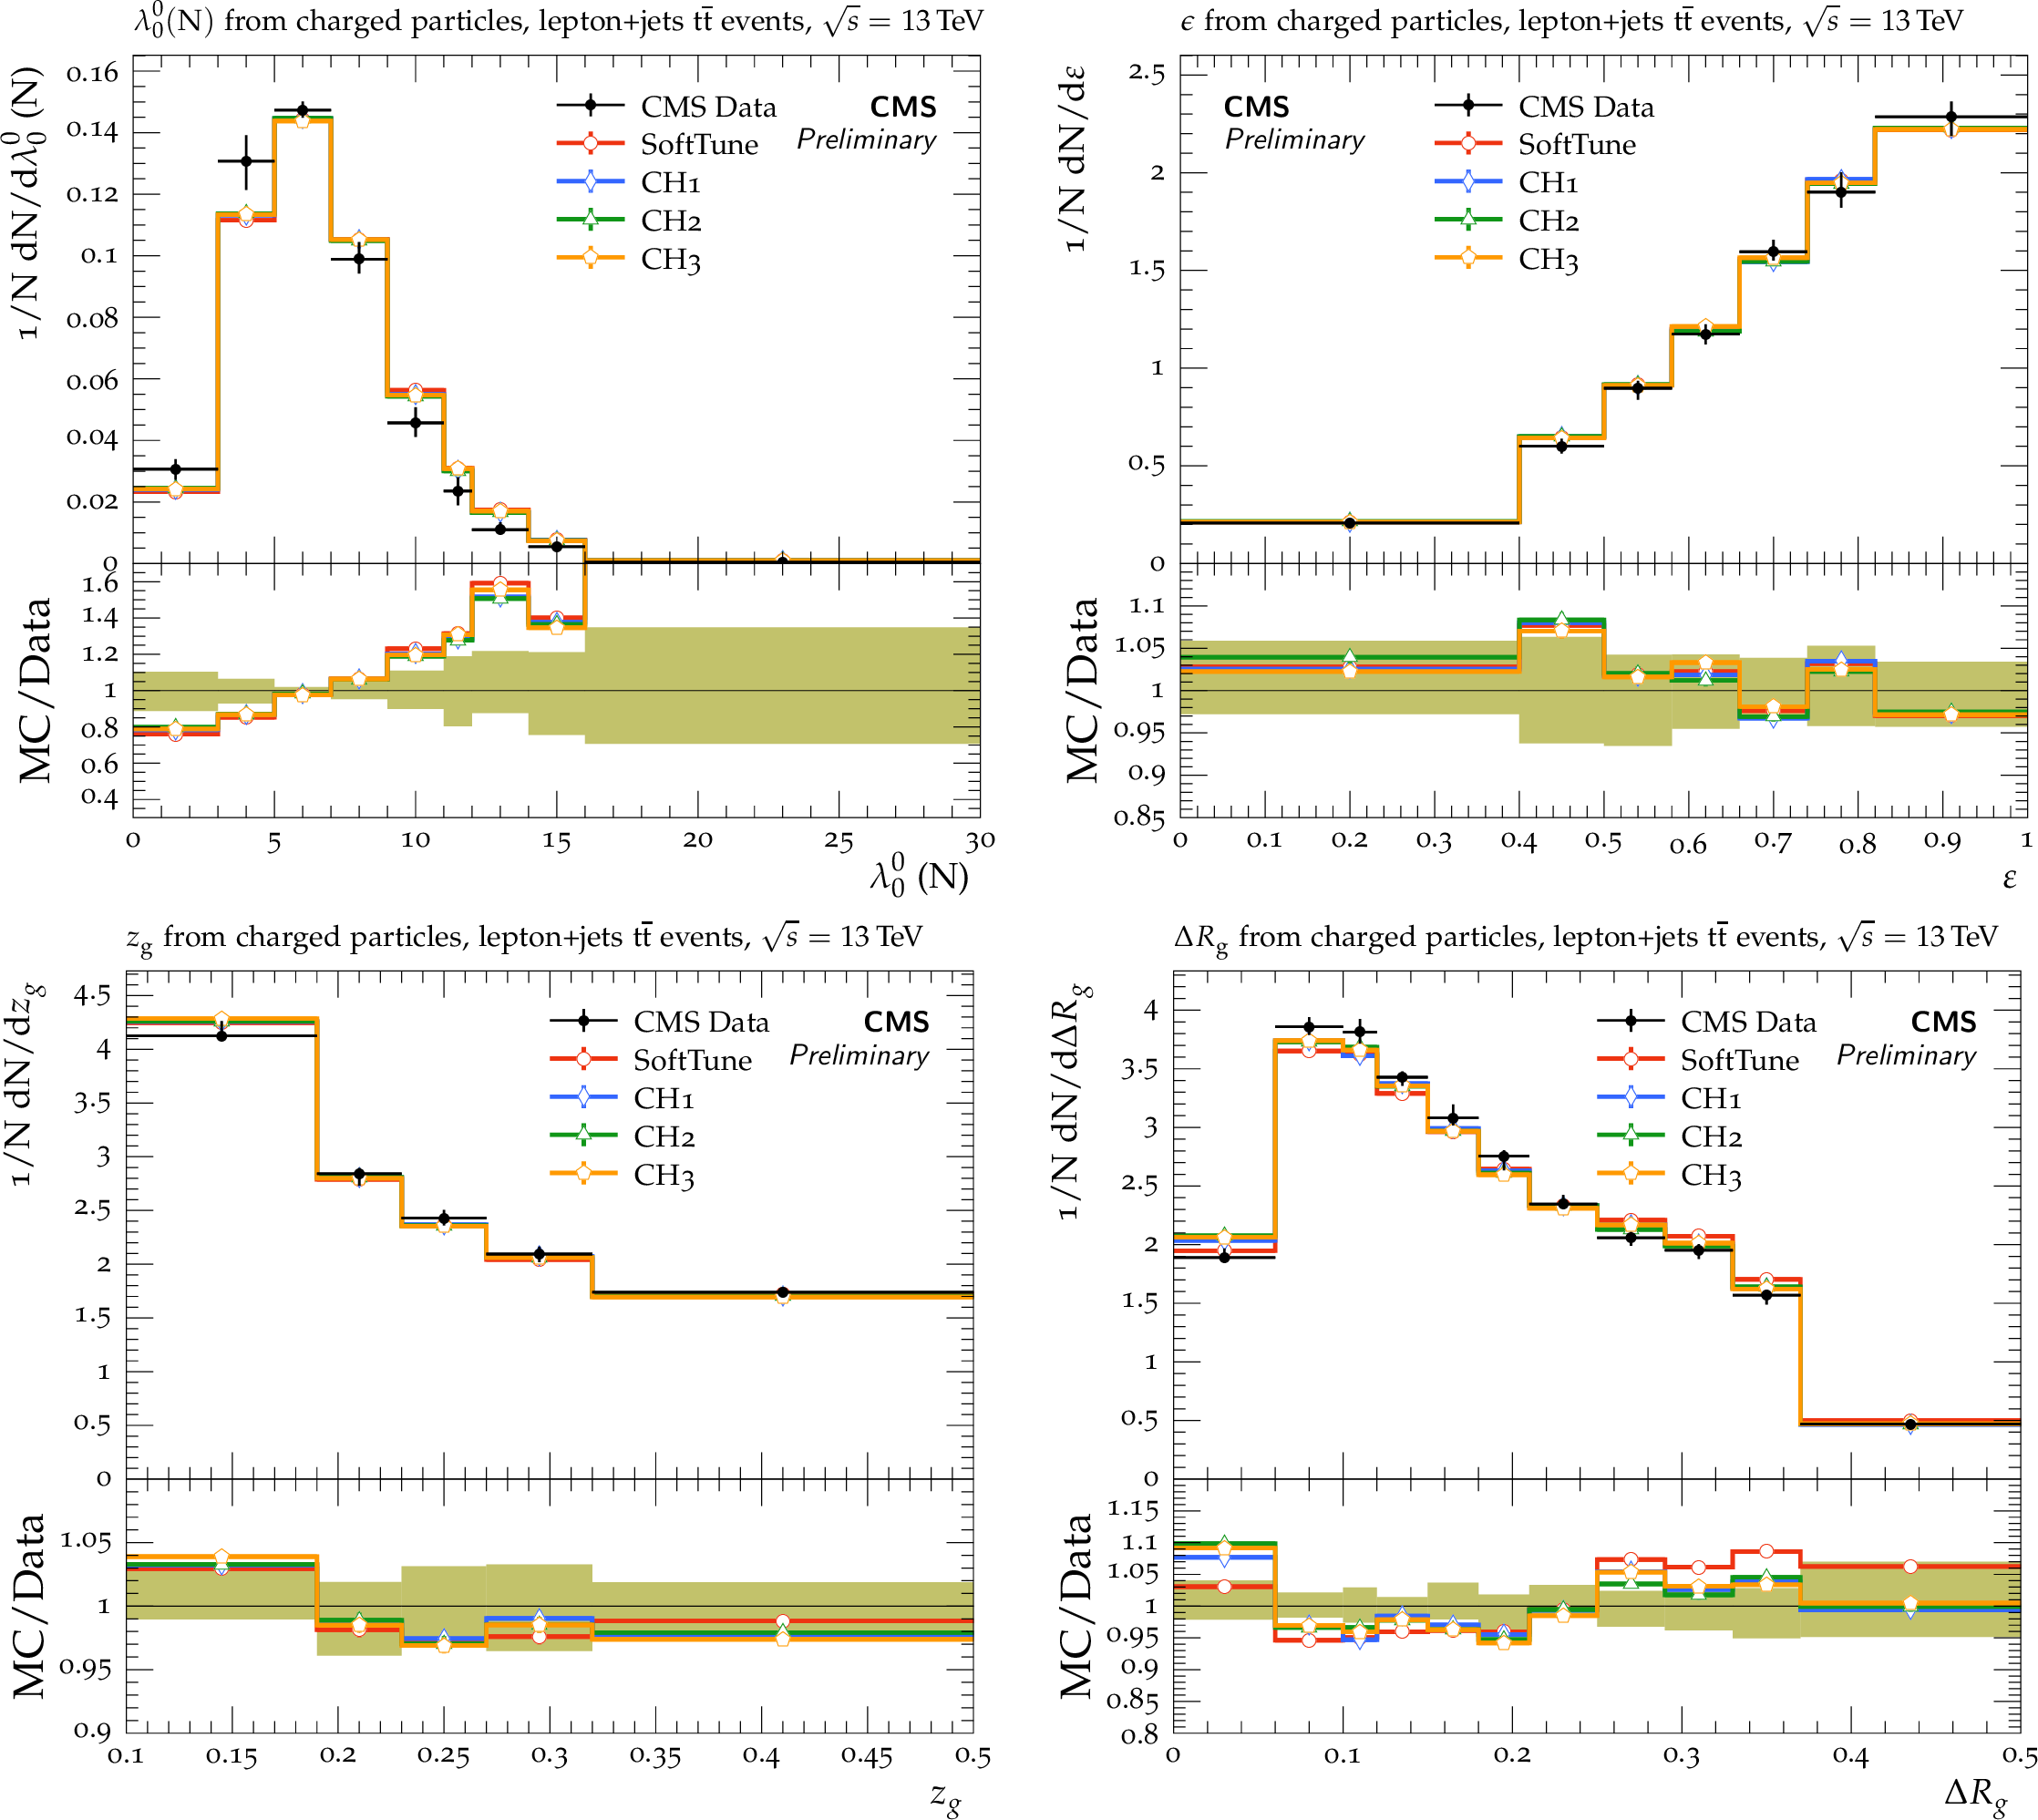
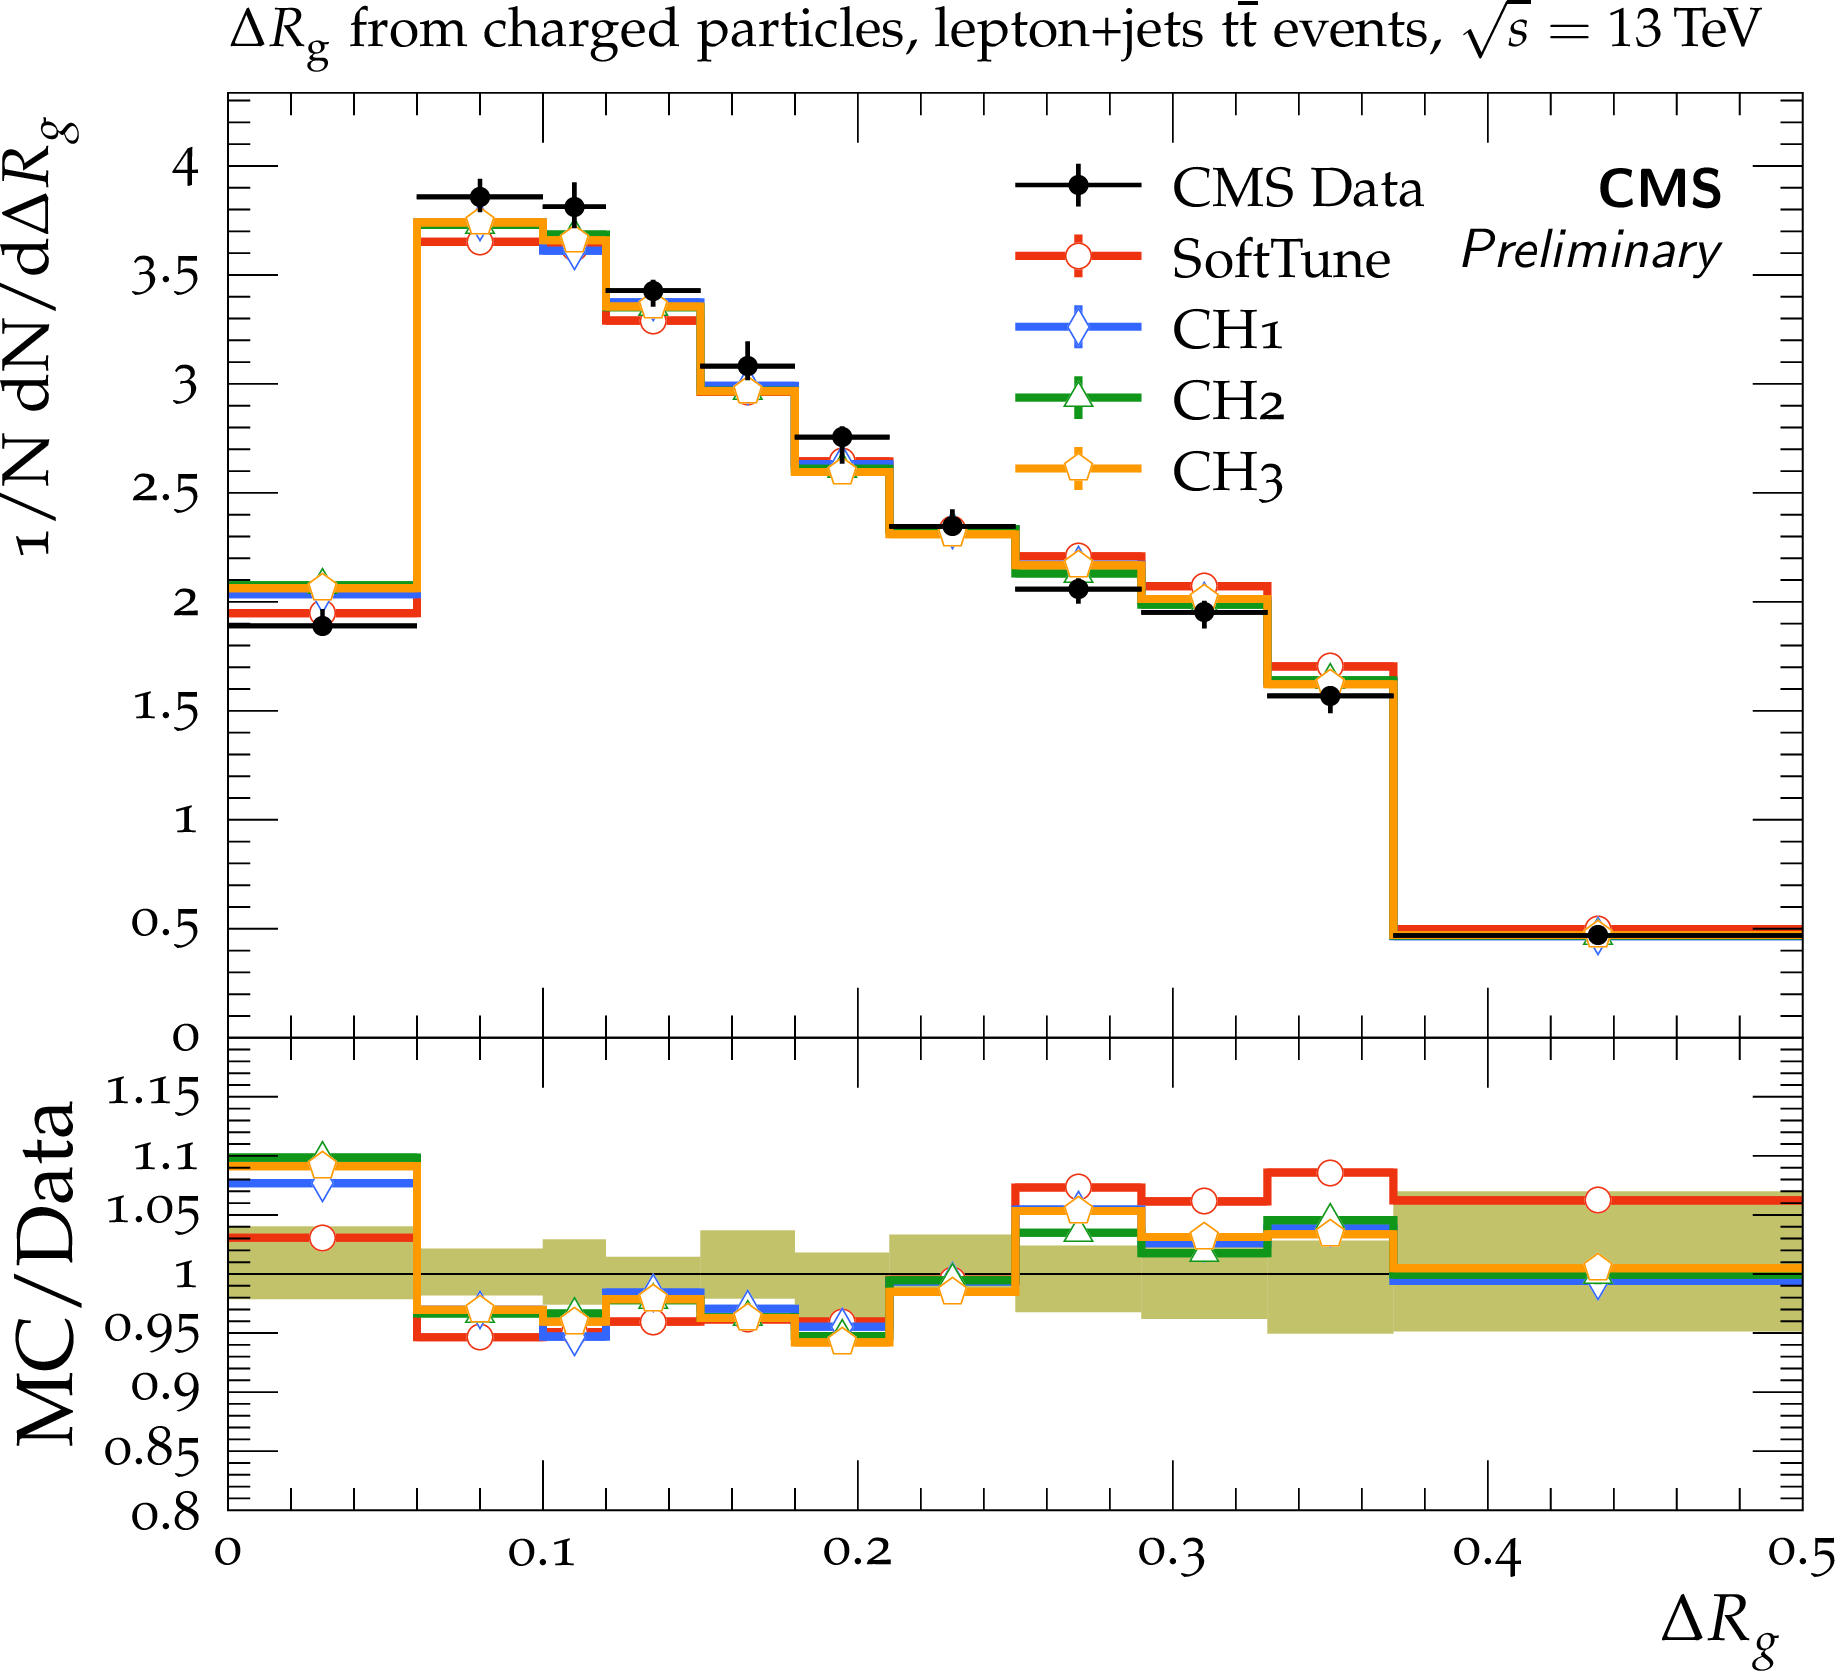
Figure 13:
CMS data at $ {\sqrt {s}} = $ 13 TeV [39] of several jet substructure observables: the charged-particle multiplicity (upper left), the eccentricity (upper right), the groomed momentum fraction (lower left), and angle between the groomed subjets (lower right). The data are compared to predictions from {powheg} + HERWIG 7, with the SoftTune, CH1, CH2, and CH3 tunes. The coloured band in the ratios of the different predictions from simulation to the data represents the total experimental uncertainty in the data. |
png pdf |
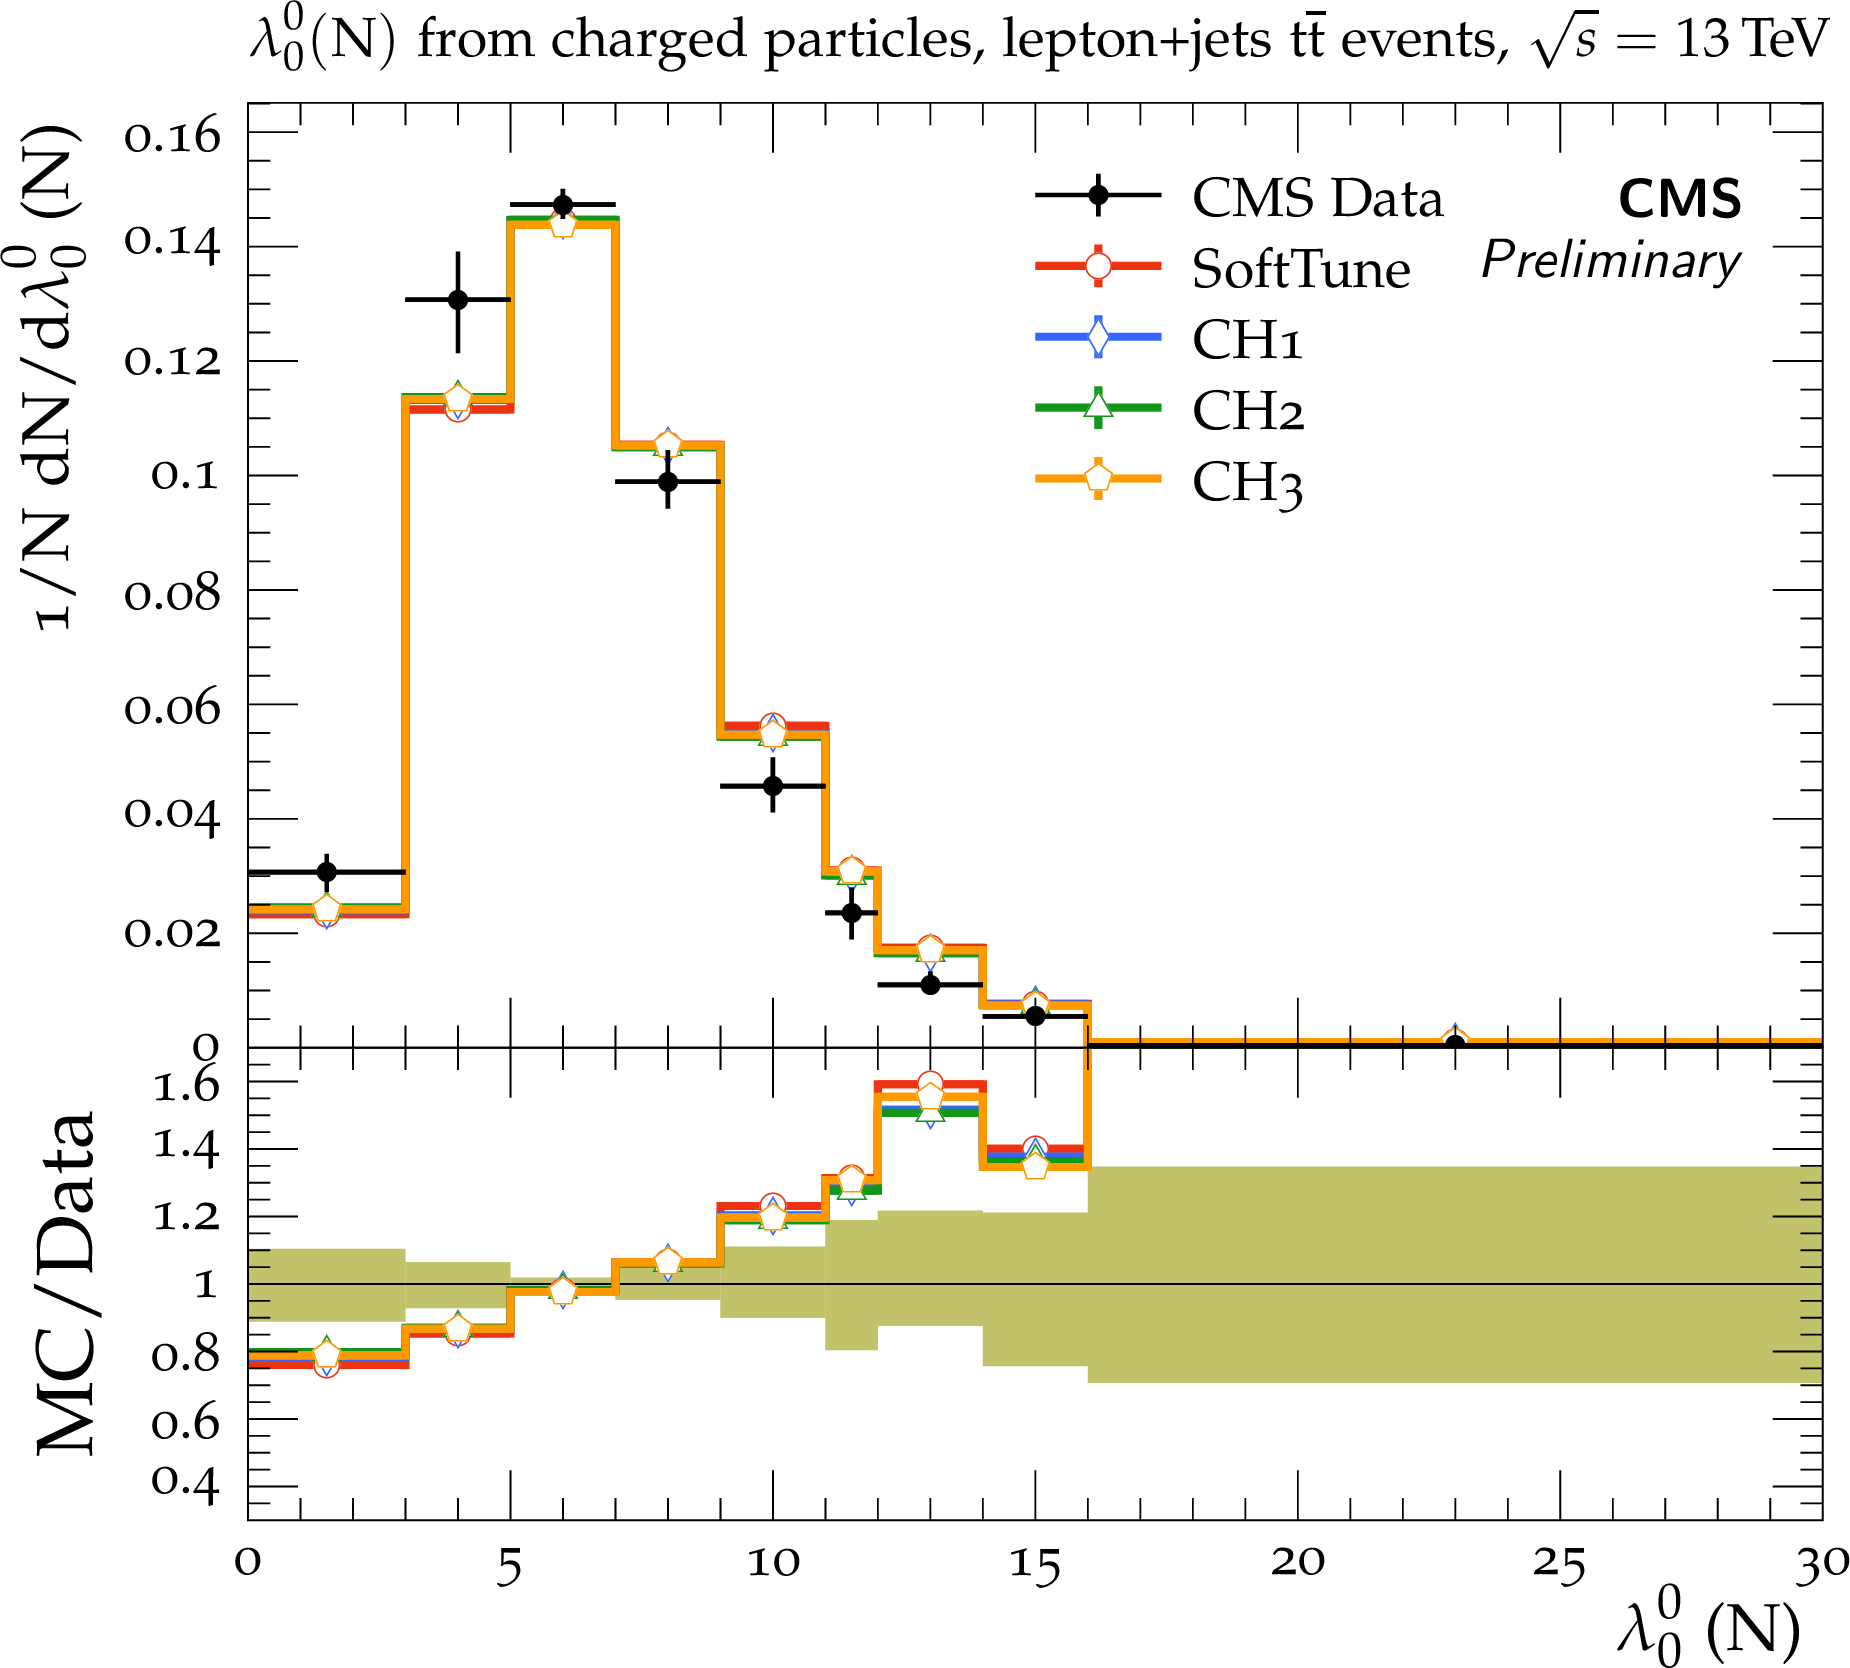
Figure 13-a:
CMS data at $ {\sqrt {s}} = $ 13 TeV [39] of several jet substructure observables: the charged-particle multiplicity (upper left), the eccentricity (upper right), the groomed momentum fraction (lower left), and angle between the groomed subjets (lower right). The data are compared to predictions from {powheg} + HERWIG 7, with the SoftTune, CH1, CH2, and CH3 tunes. The coloured band in the ratios of the different predictions from simulation to the data represents the total experimental uncertainty in the data. |
png pdf |
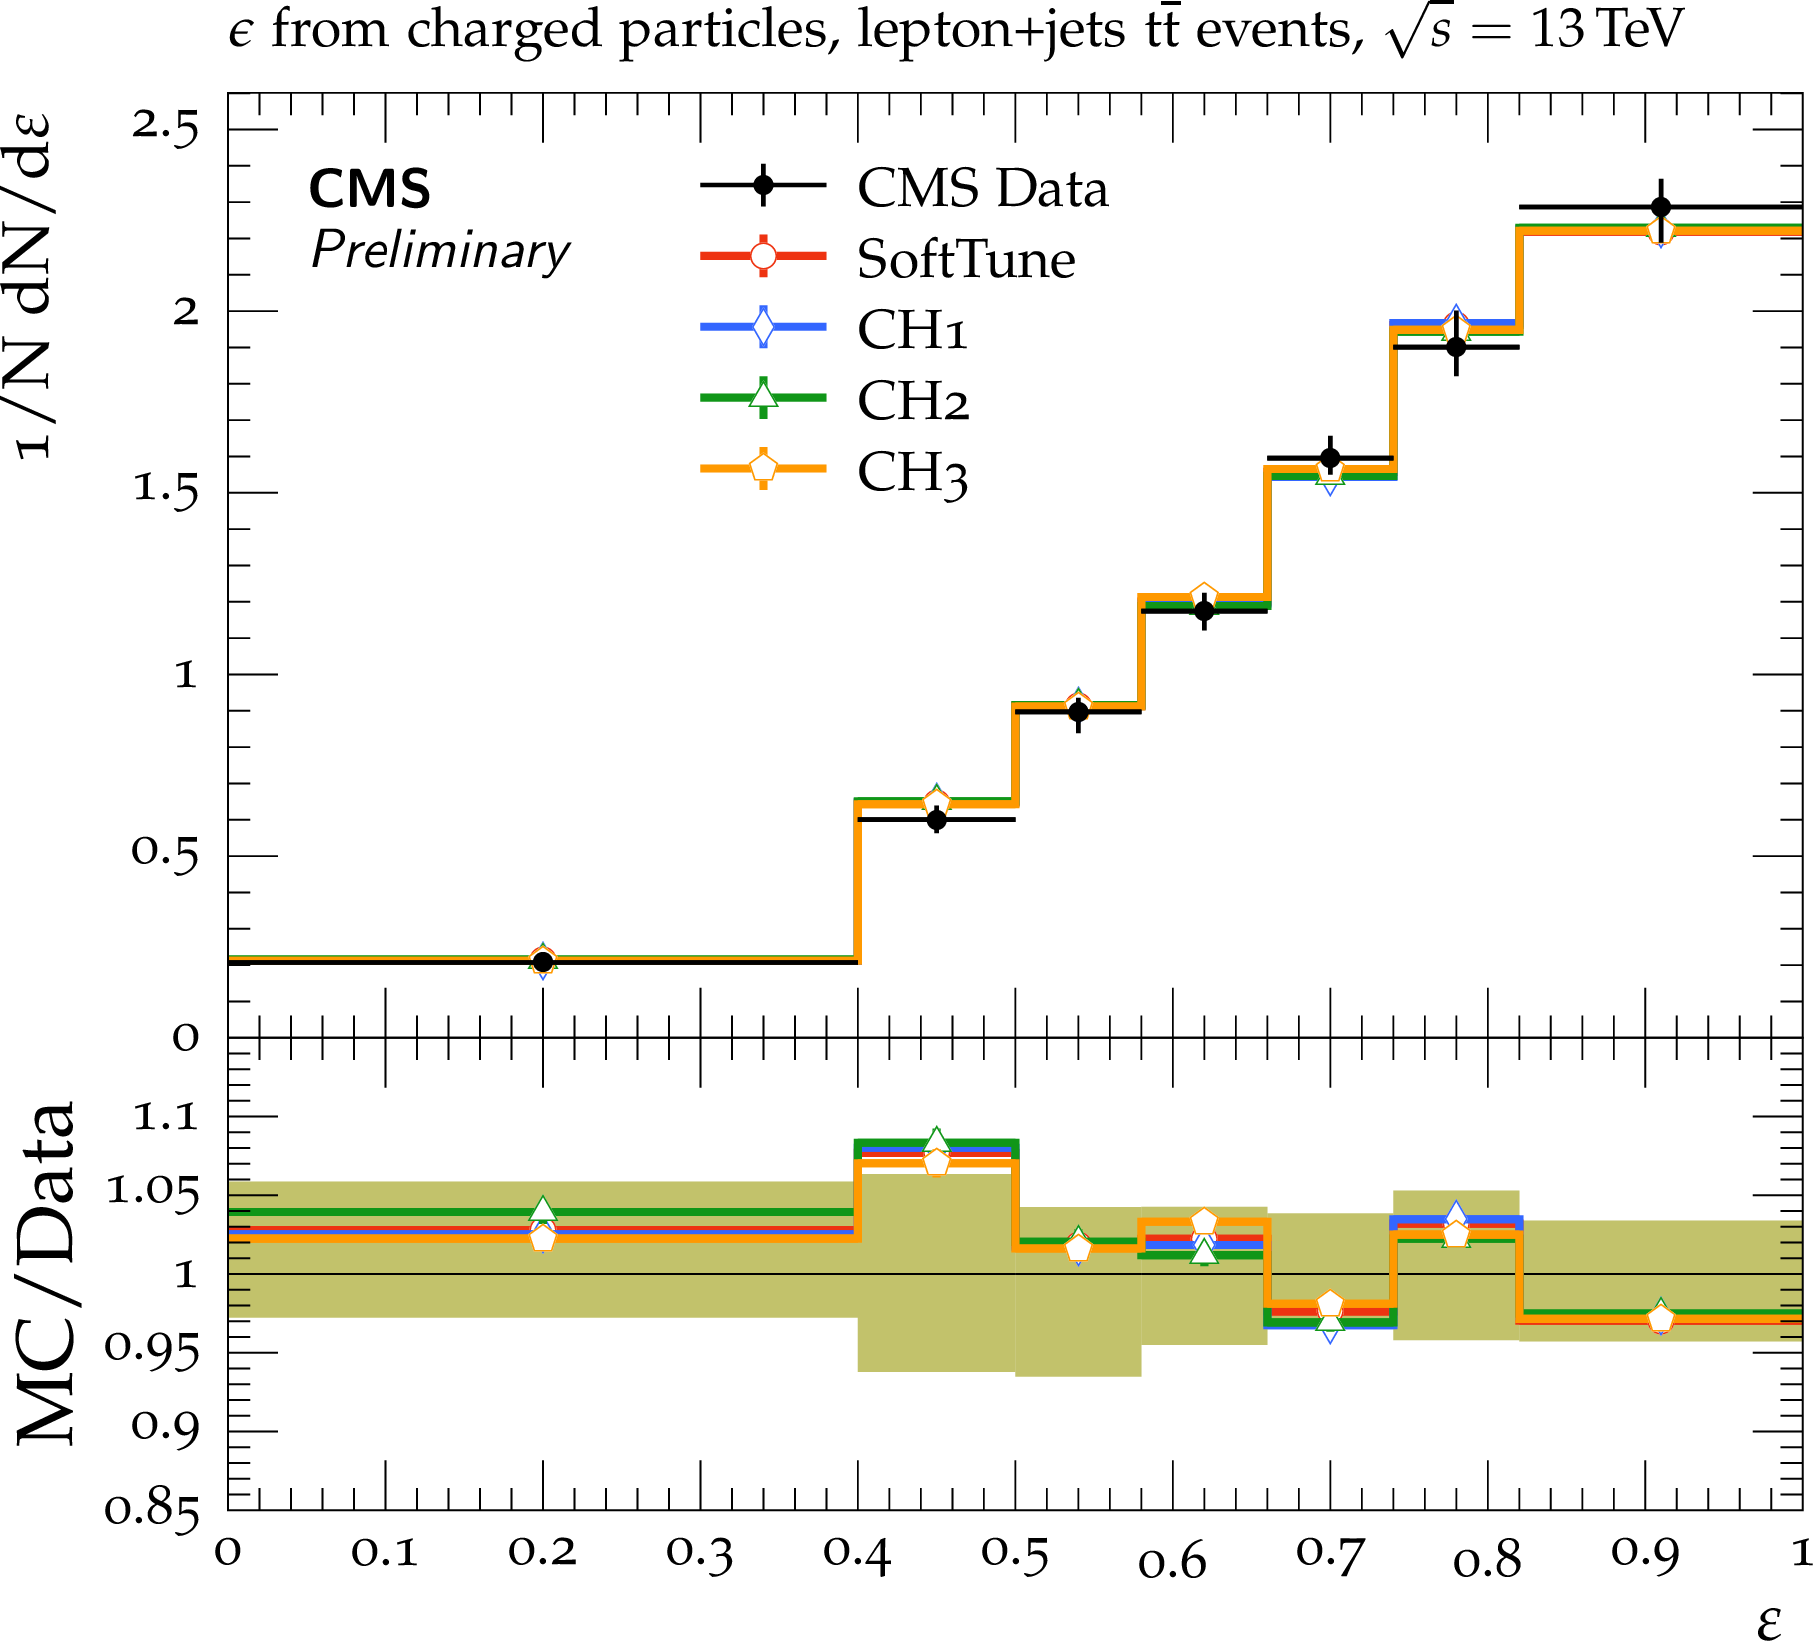
Figure 13-b:
CMS data at $ {\sqrt {s}} = $ 13 TeV [39] of several jet substructure observables: the charged-particle multiplicity (upper left), the eccentricity (upper right), the groomed momentum fraction (lower left), and angle between the groomed subjets (lower right). The data are compared to predictions from {powheg} + HERWIG 7, with the SoftTune, CH1, CH2, and CH3 tunes. The coloured band in the ratios of the different predictions from simulation to the data represents the total experimental uncertainty in the data. |
png pdf |
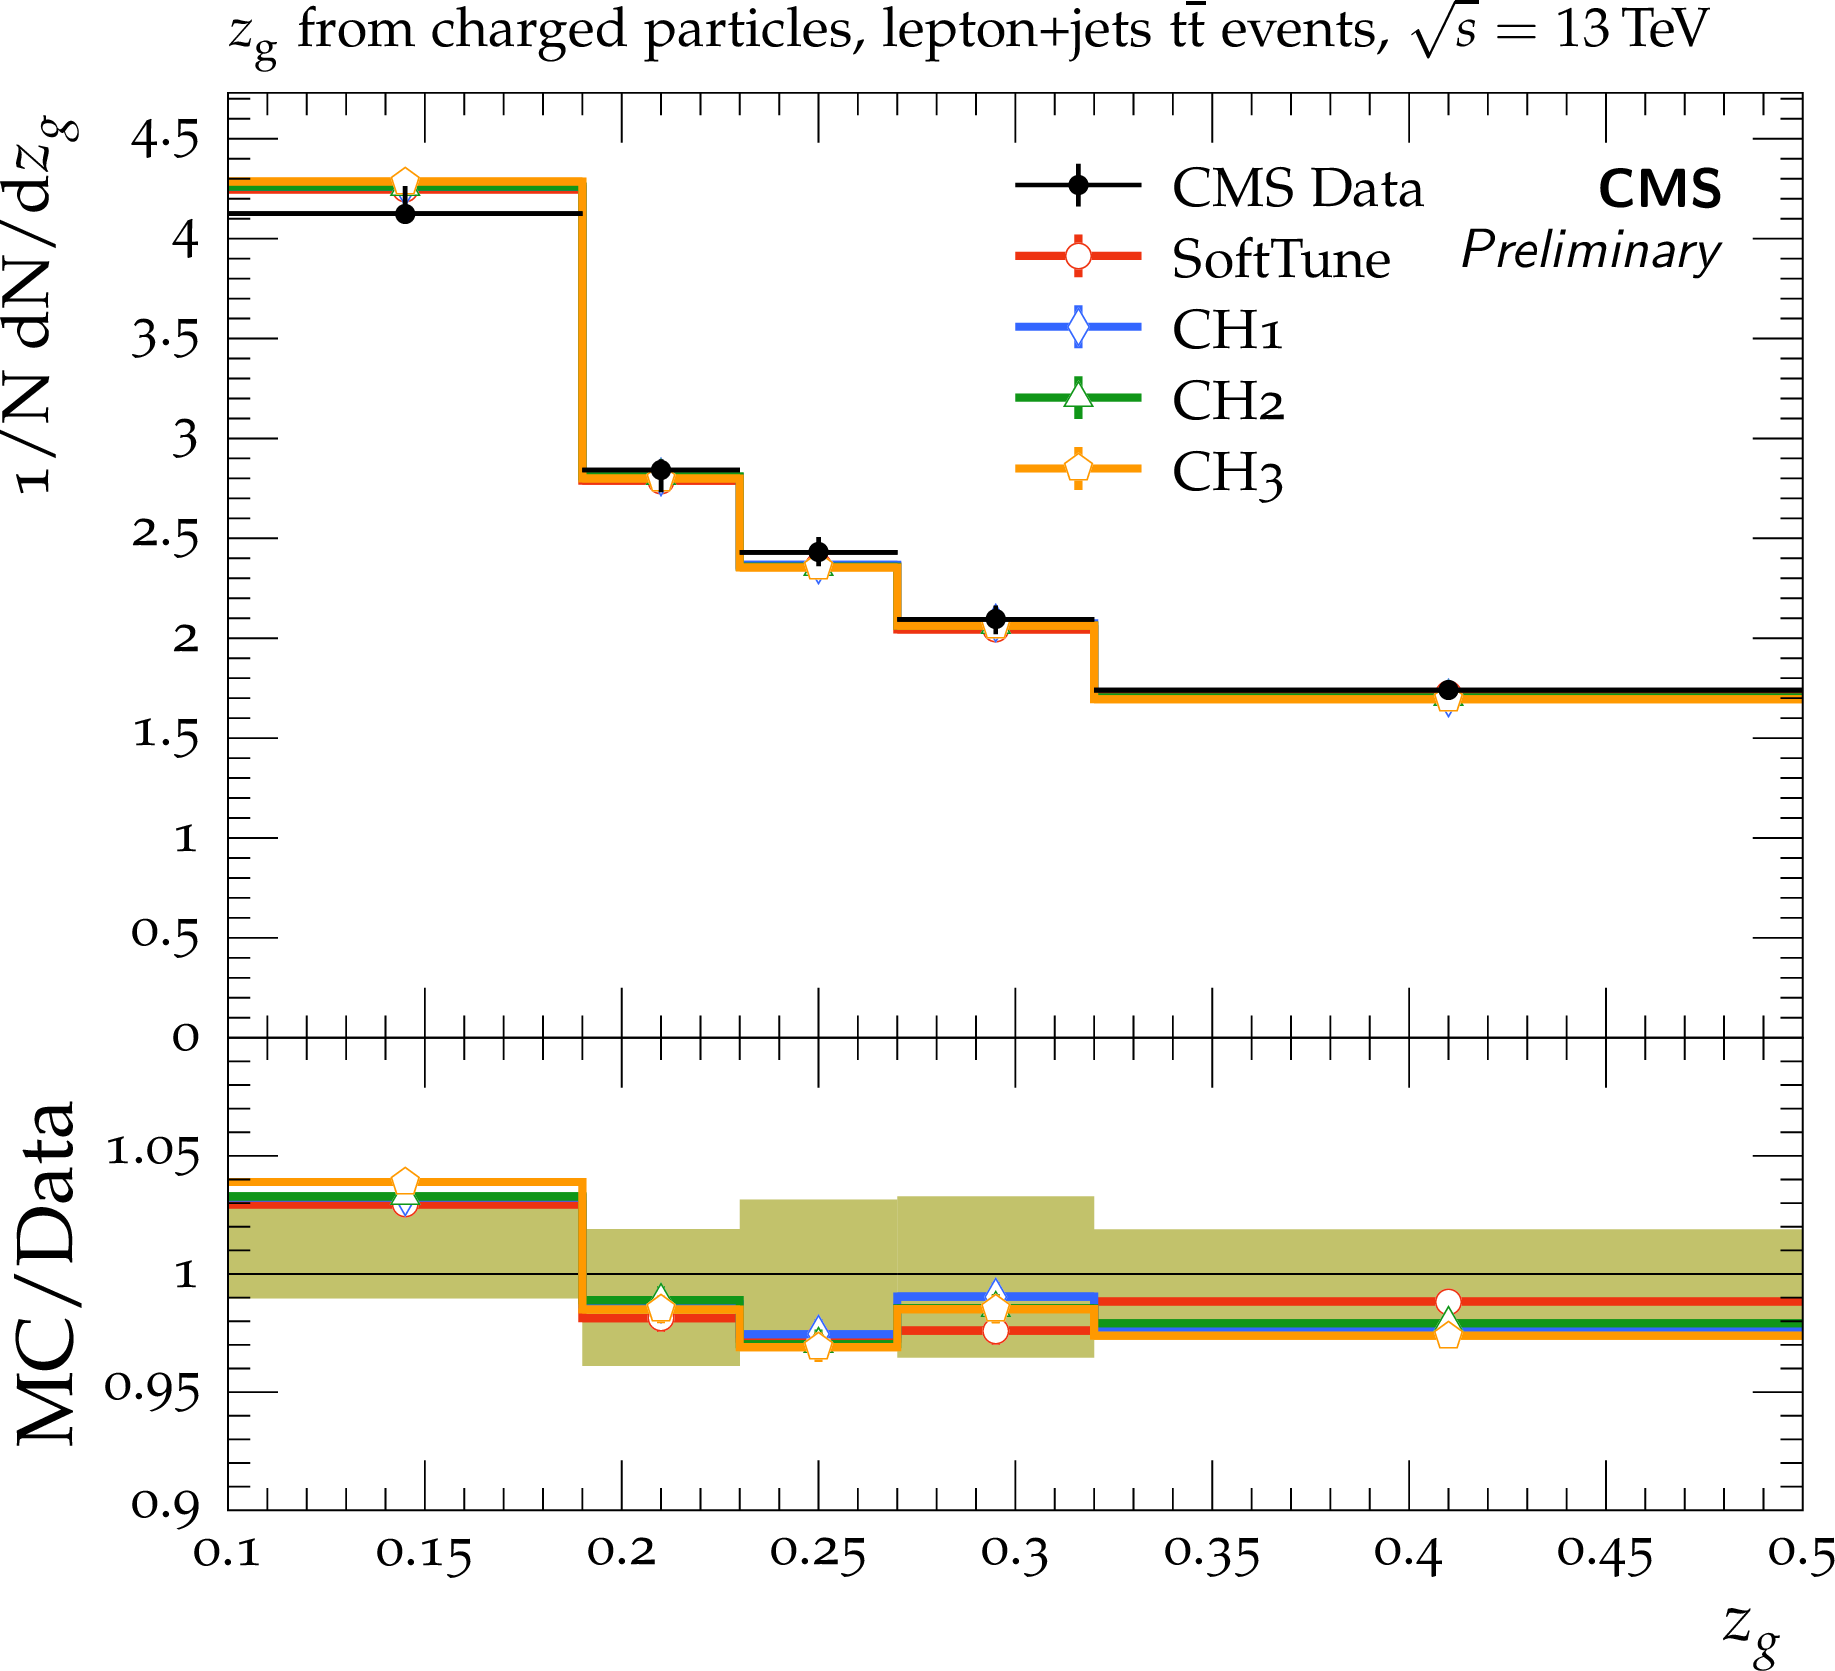
Figure 13-c:
CMS data at $ {\sqrt {s}} = $ 13 TeV [39] of several jet substructure observables: the charged-particle multiplicity (upper left), the eccentricity (upper right), the groomed momentum fraction (lower left), and angle between the groomed subjets (lower right). The data are compared to predictions from {powheg} + HERWIG 7, with the SoftTune, CH1, CH2, and CH3 tunes. The coloured band in the ratios of the different predictions from simulation to the data represents the total experimental uncertainty in the data. |
png pdf |
Figure 13-d:
CMS data at $ {\sqrt {s}} = $ 13 TeV [39] of several jet substructure observables: the charged-particle multiplicity (upper left), the eccentricity (upper right), the groomed momentum fraction (lower left), and angle between the groomed subjets (lower right). The data are compared to predictions from {powheg} + HERWIG 7, with the SoftTune, CH1, CH2, and CH3 tunes. The coloured band in the ratios of the different predictions from simulation to the data represents the total experimental uncertainty in the data. |

png pdf |
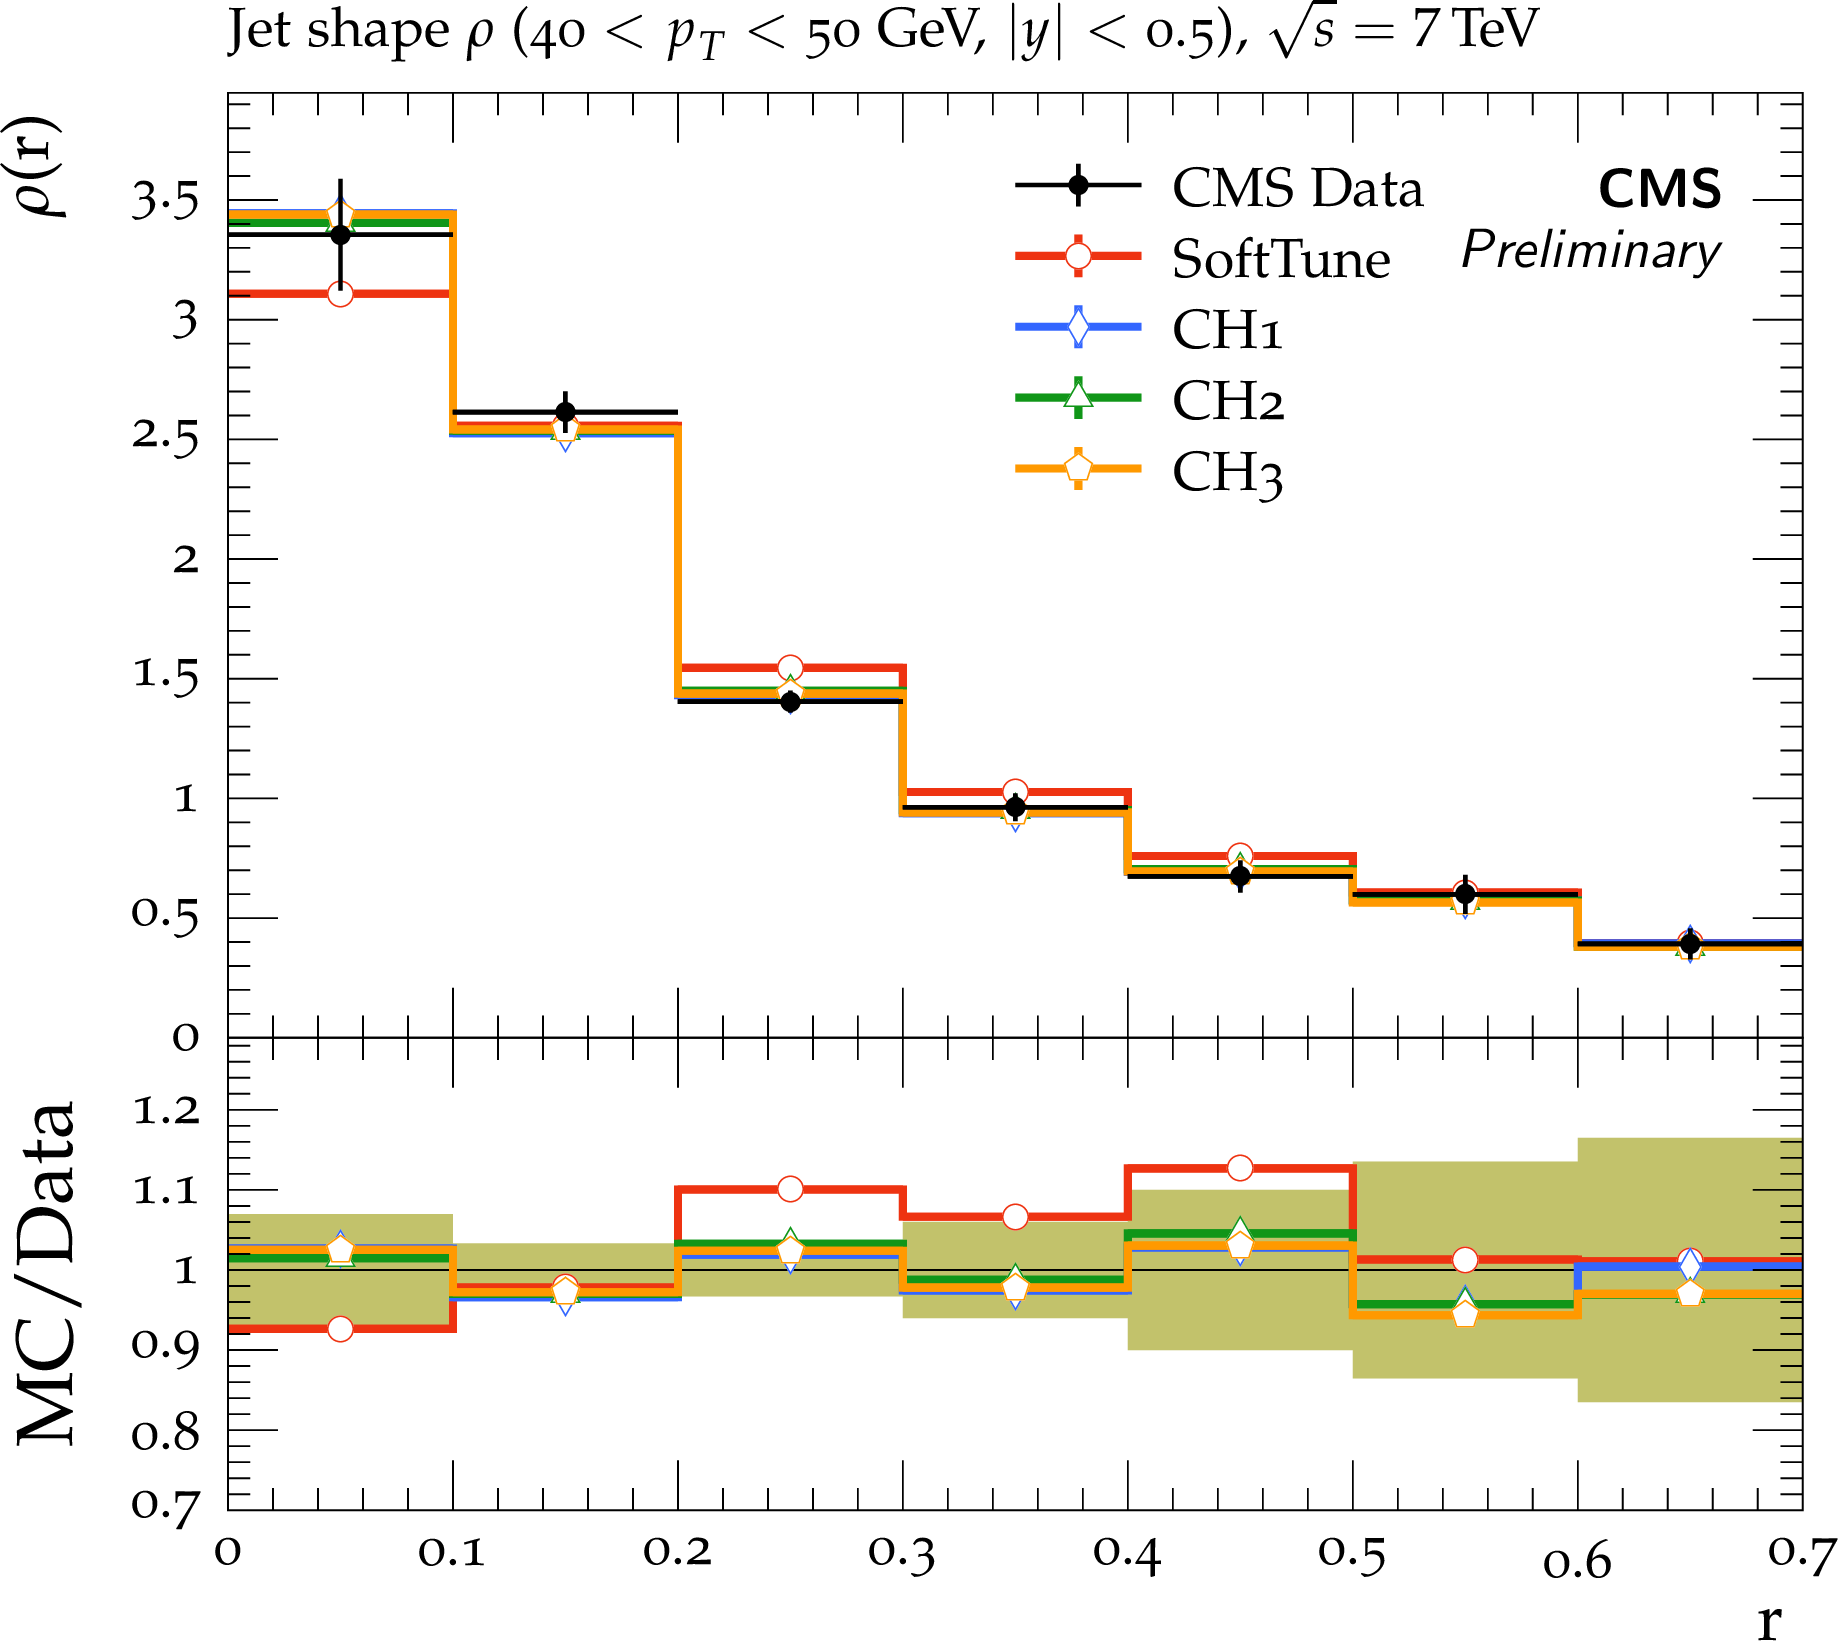
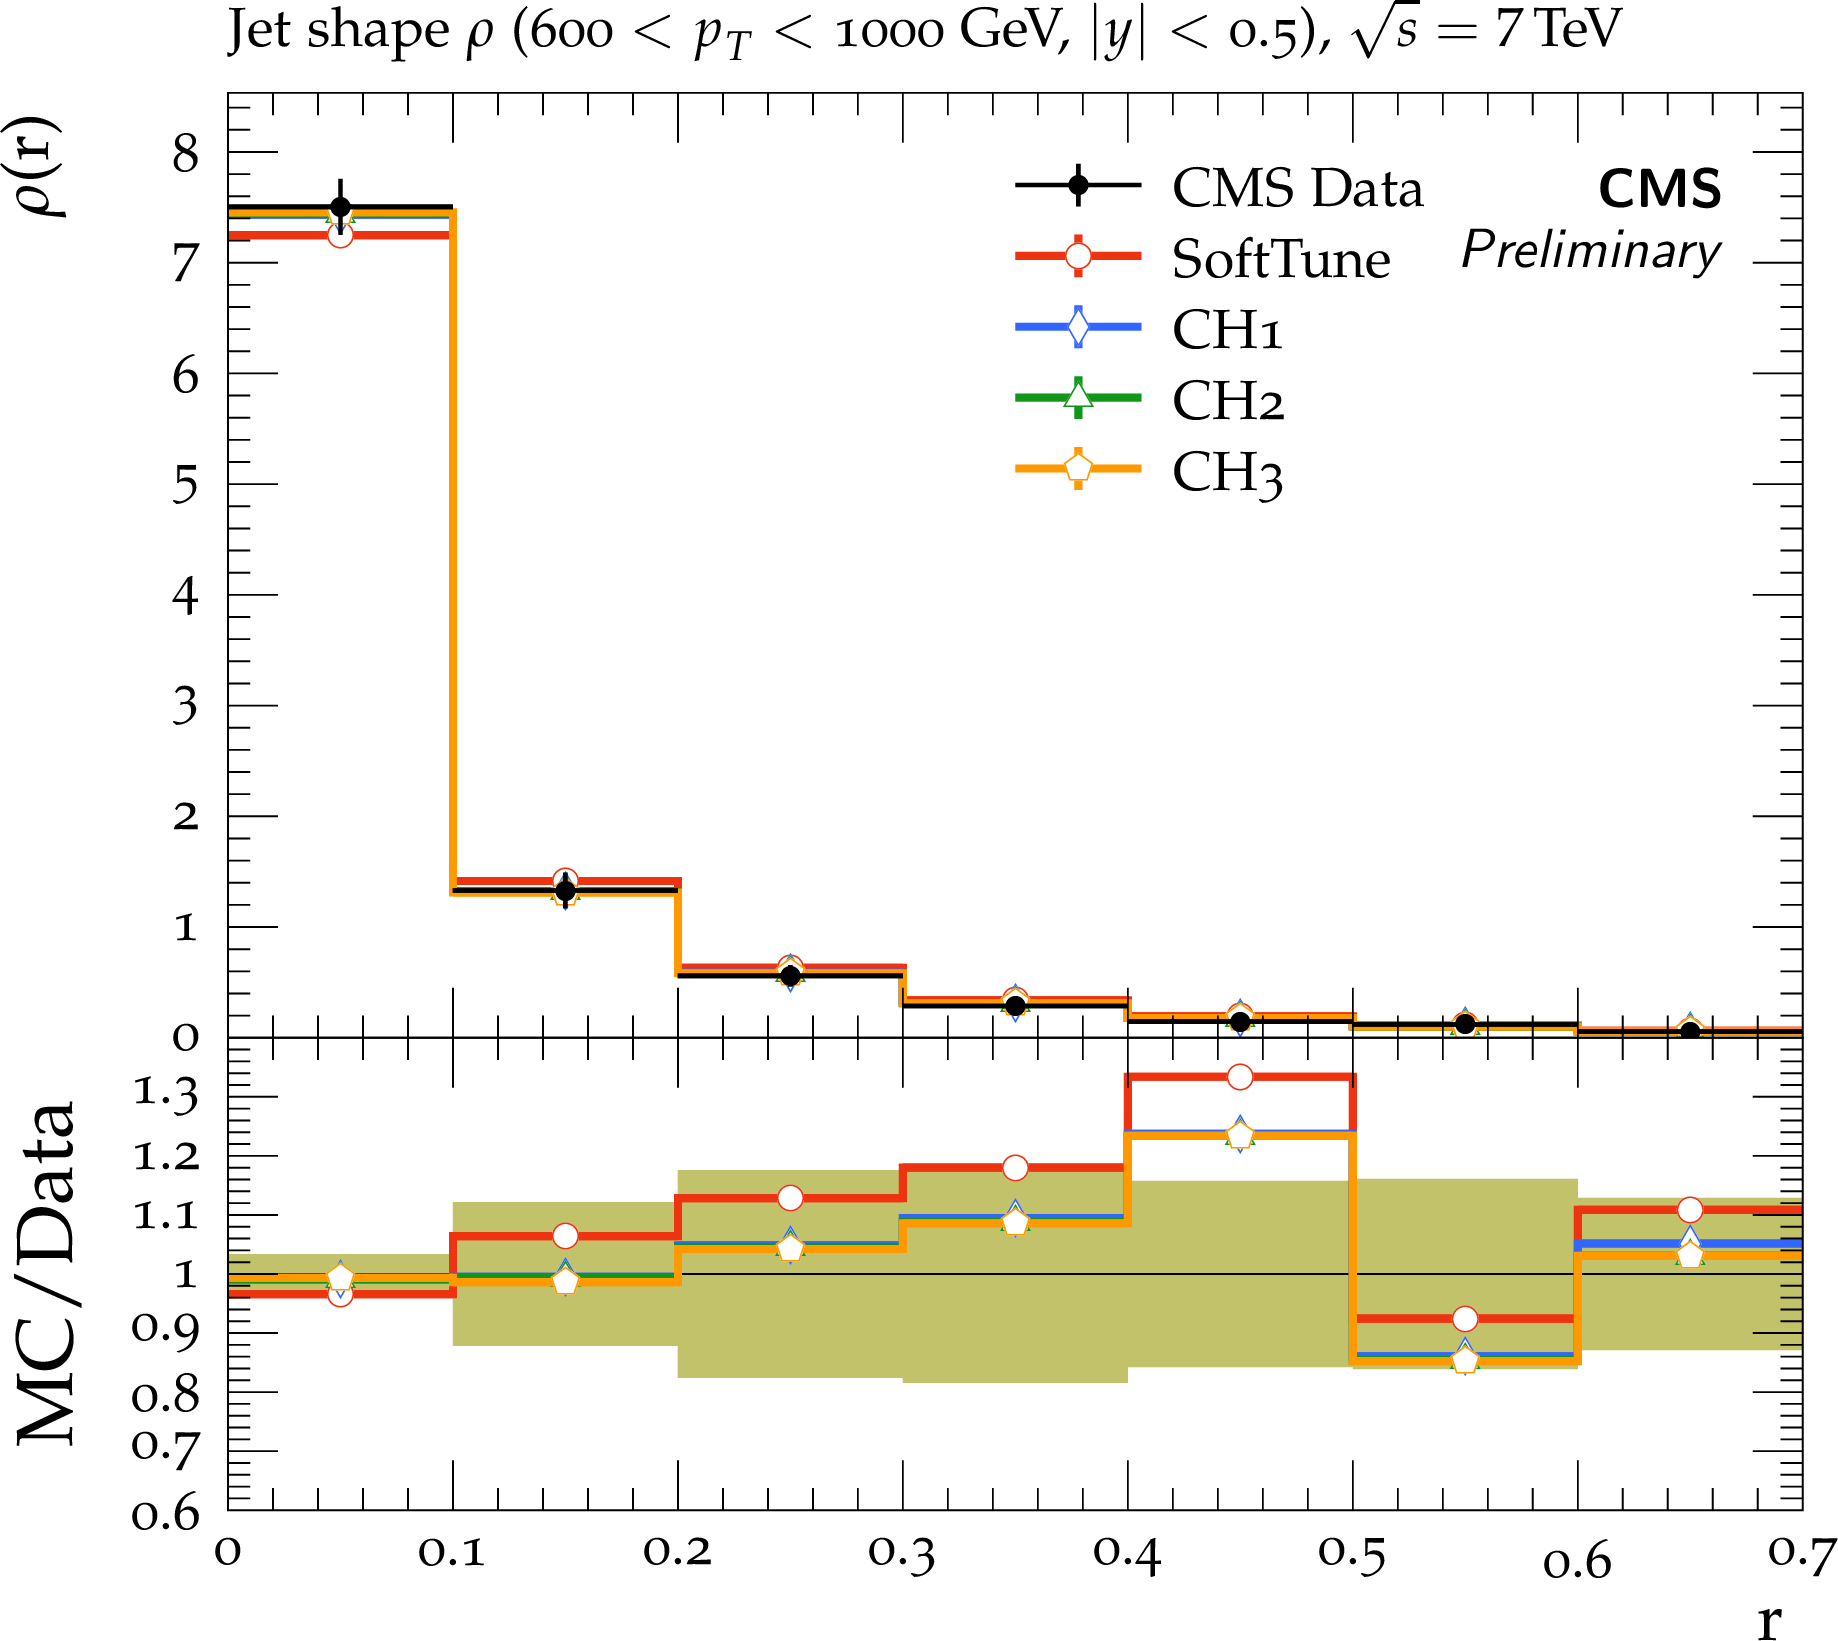
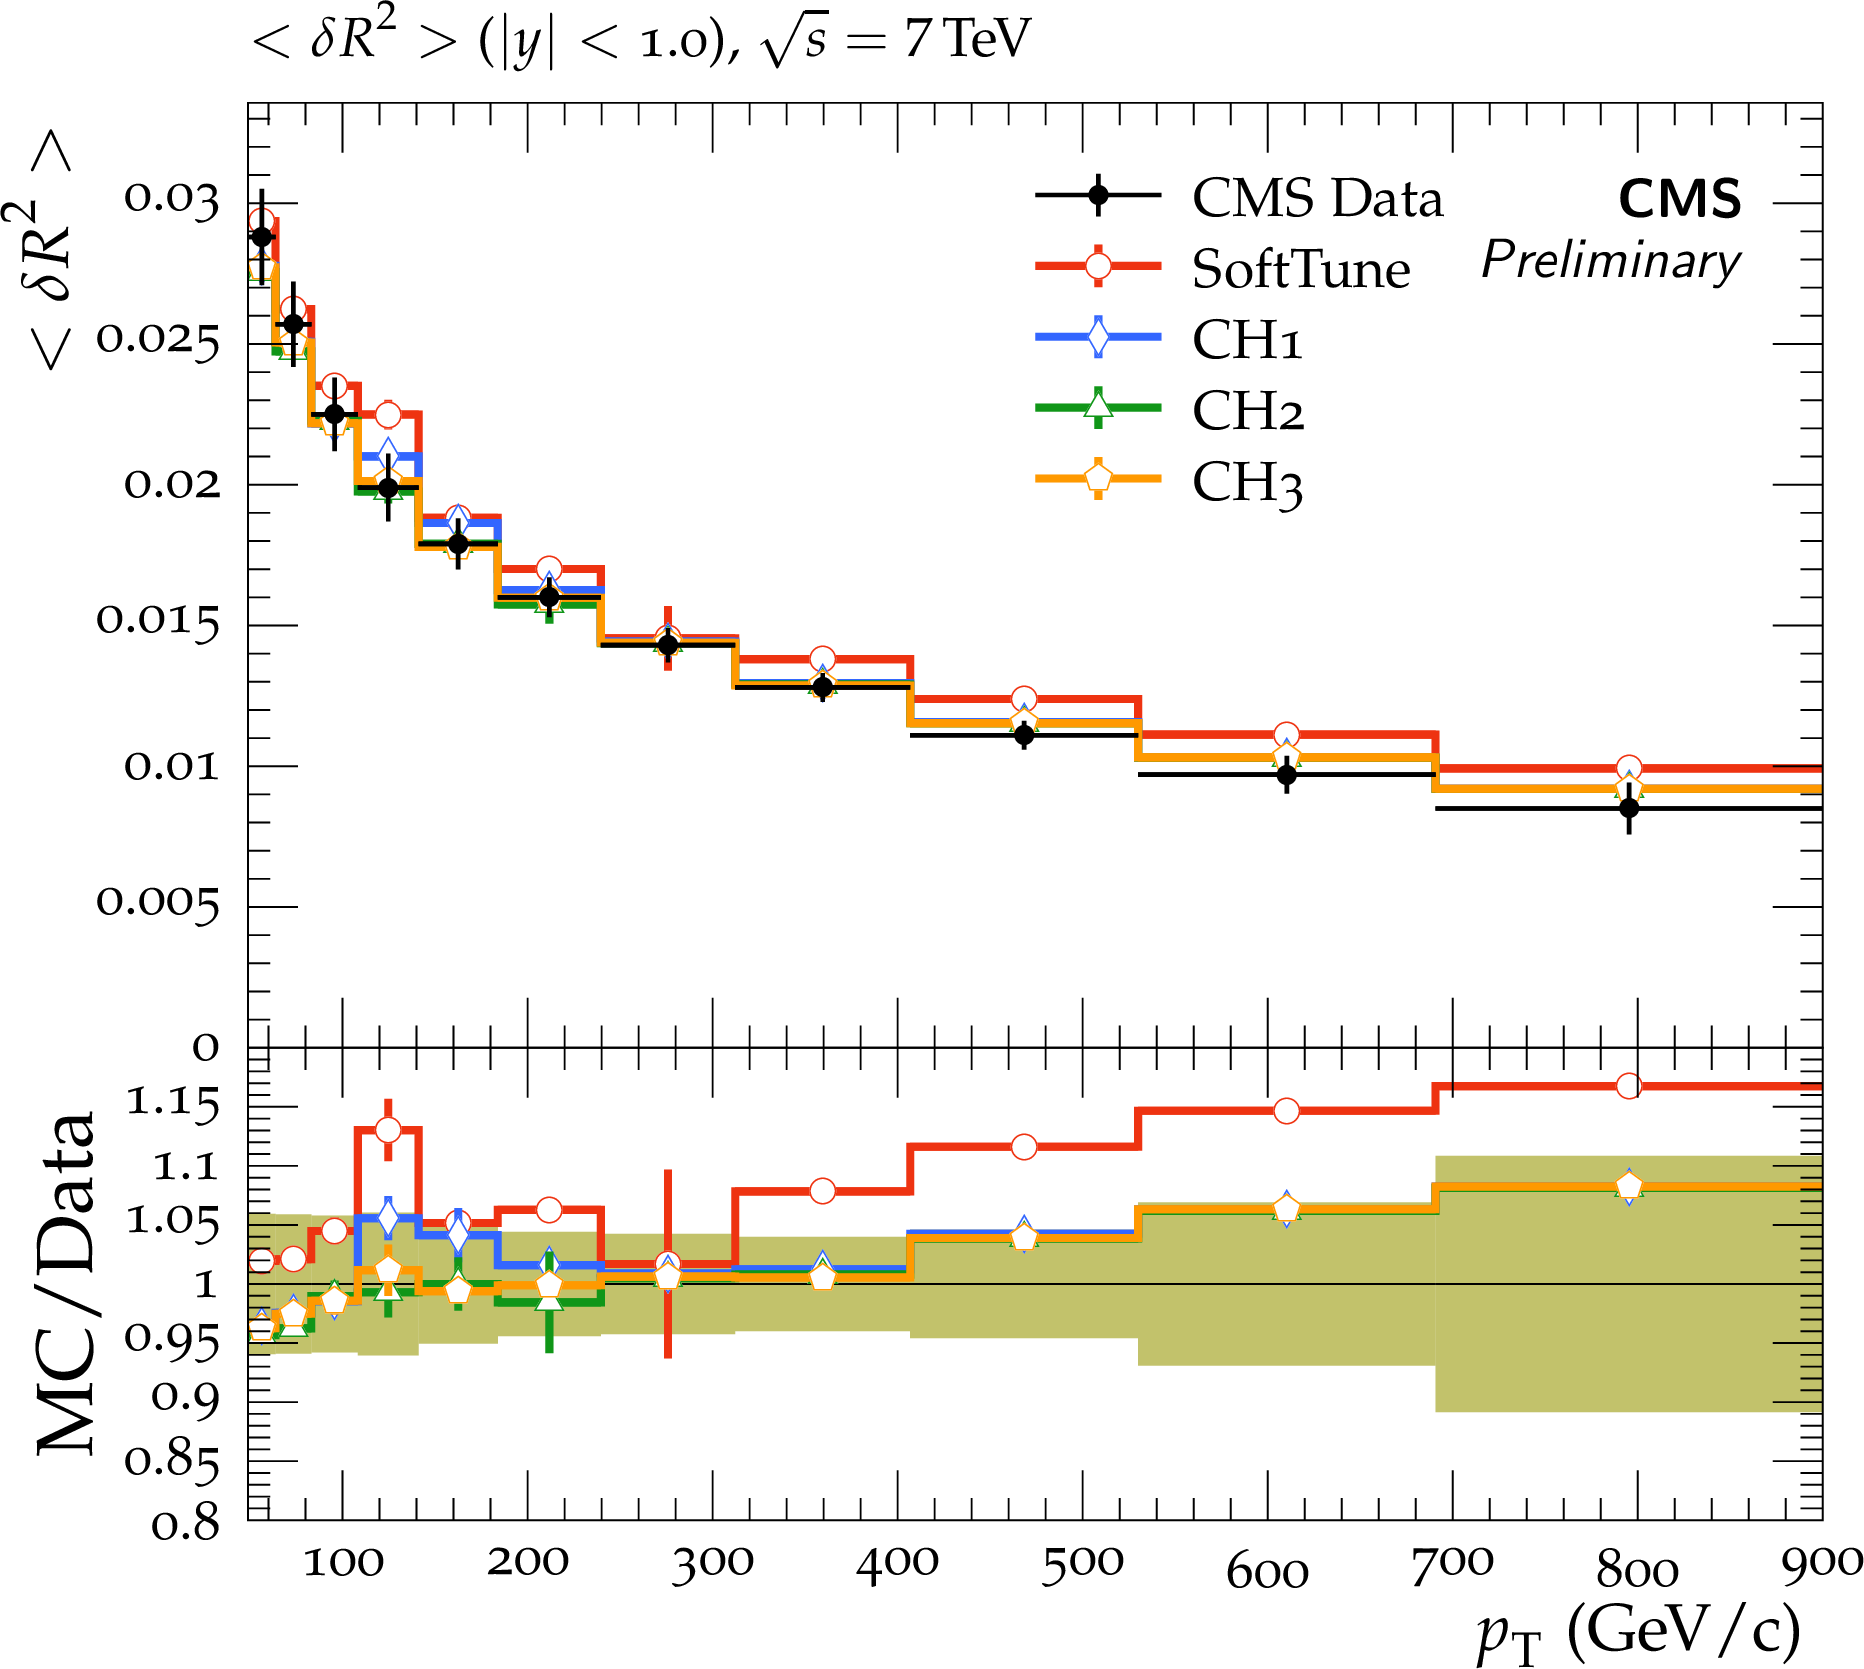
Figure 14:
CMS dijet data at $ {\sqrt {s}} = $ 7 TeV on ${\rho (\mathrm {r})}$ and ${< \delta R^2 >} [40]$. The data are compared to predictions from HERWIG 7, with the SoftTune and CH tunes. The coloured band in the ratios of the different predictions from simulation to the data represents the total experimental uncertainty in the data. |
png pdf |
Figure 14-a:
CMS dijet data at $ {\sqrt {s}} = $ 7 TeV on ${\rho (\mathrm {r})}$ and ${< \delta R^2 >} [40]$. The data are compared to predictions from HERWIG 7, with the SoftTune and CH tunes. The coloured band in the ratios of the different predictions from simulation to the data represents the total experimental uncertainty in the data. |
png pdf |
Figure 14-b:
CMS dijet data at $ {\sqrt {s}} = $ 7 TeV on ${\rho (\mathrm {r})}$ and ${< \delta R^2 >} [40]$. The data are compared to predictions from HERWIG 7, with the SoftTune and CH tunes. The coloured band in the ratios of the different predictions from simulation to the data represents the total experimental uncertainty in the data. |
png pdf |
Figure 14-c:
CMS dijet data at $ {\sqrt {s}} = $ 7 TeV on ${\rho (\mathrm {r})}$ and ${< \delta R^2 >} [40]$. The data are compared to predictions from HERWIG 7, with the SoftTune and CH tunes. The coloured band in the ratios of the different predictions from simulation to the data represents the total experimental uncertainty in the data. |
png pdf |
Figure 15:
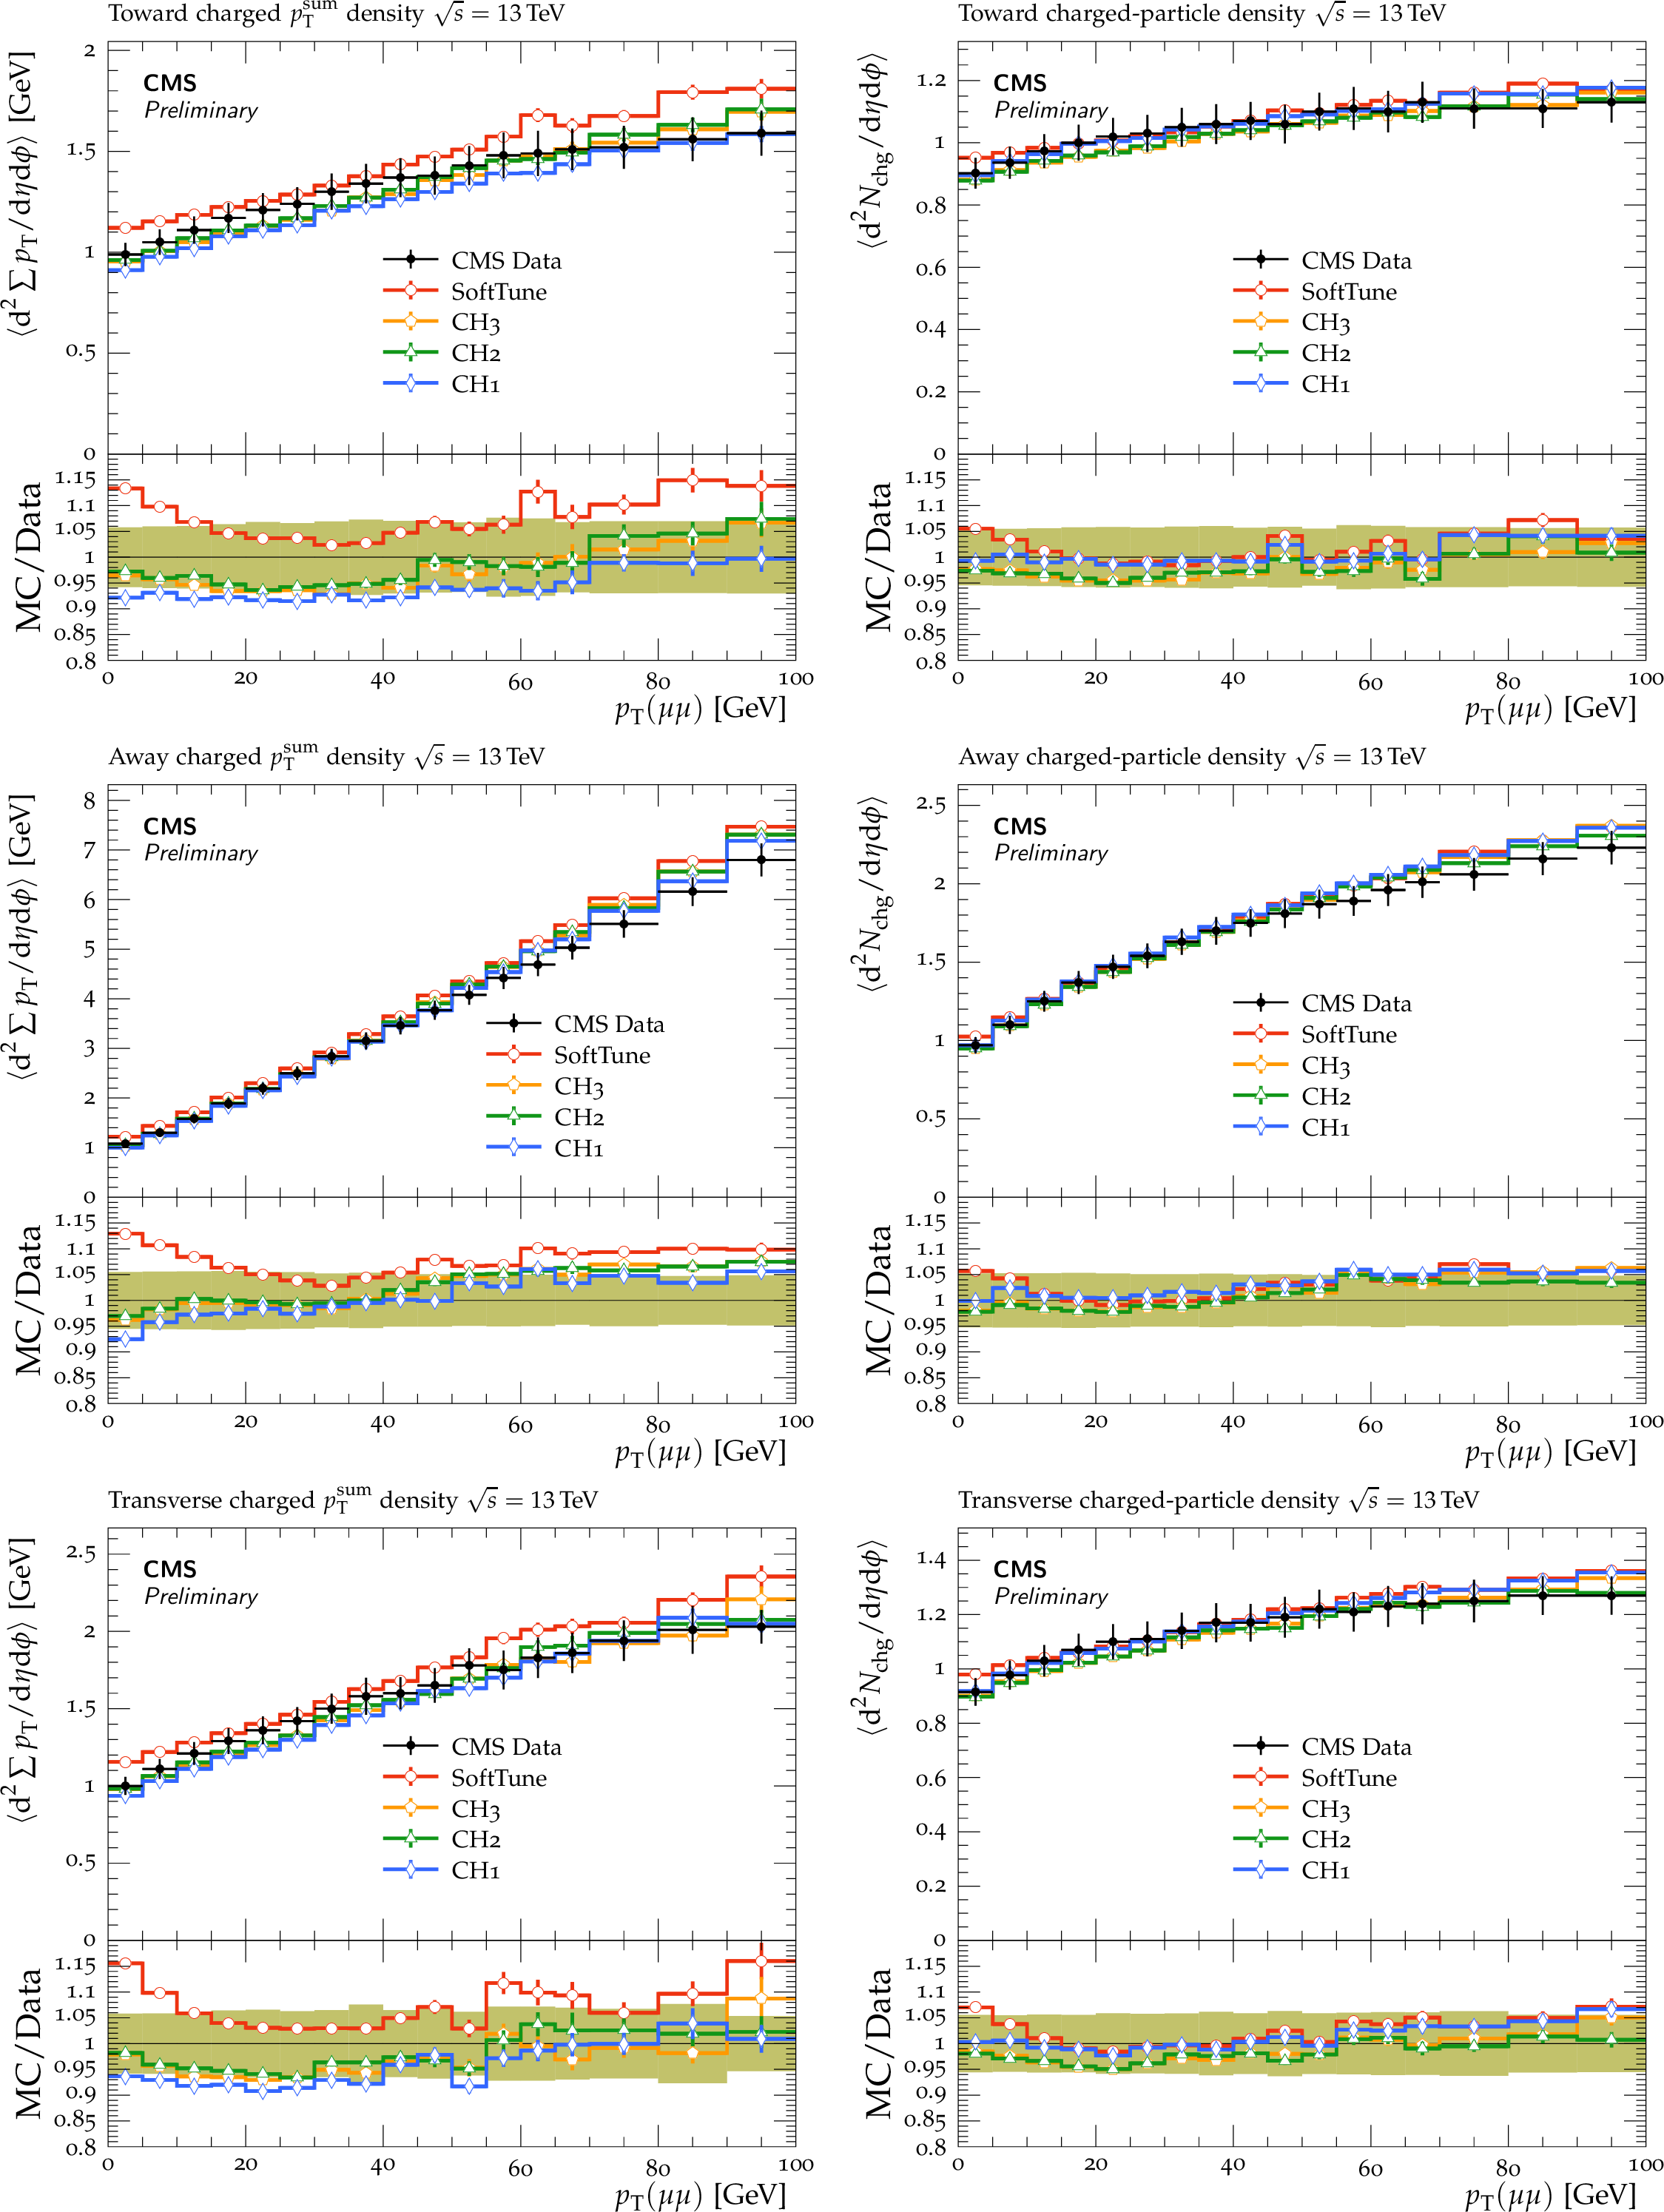
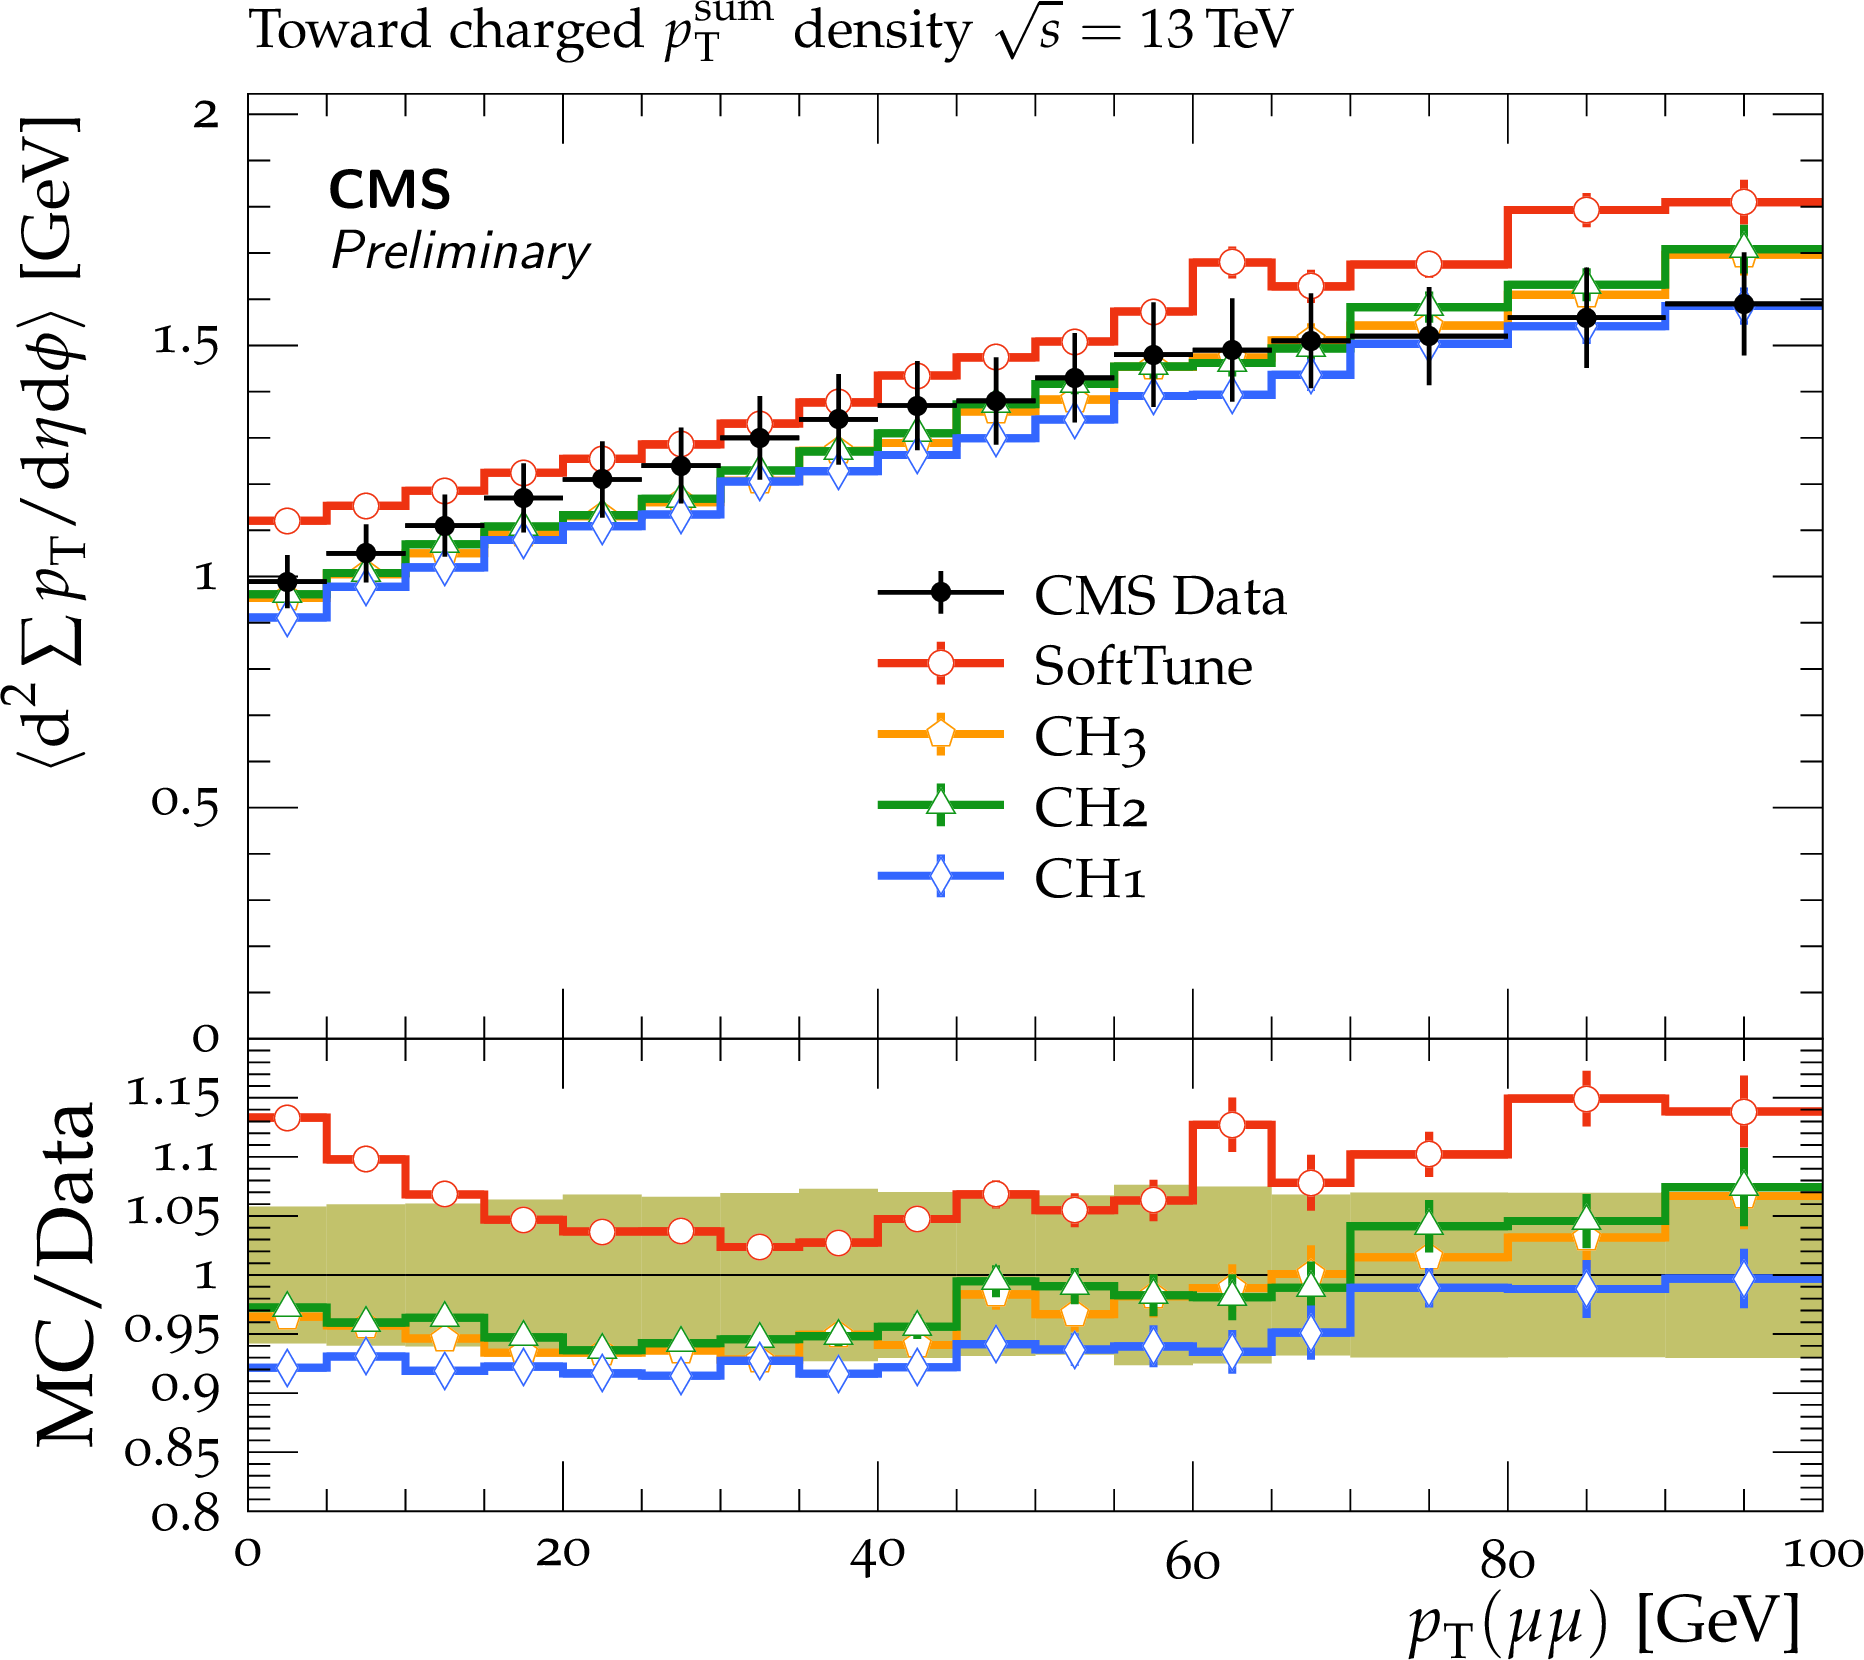
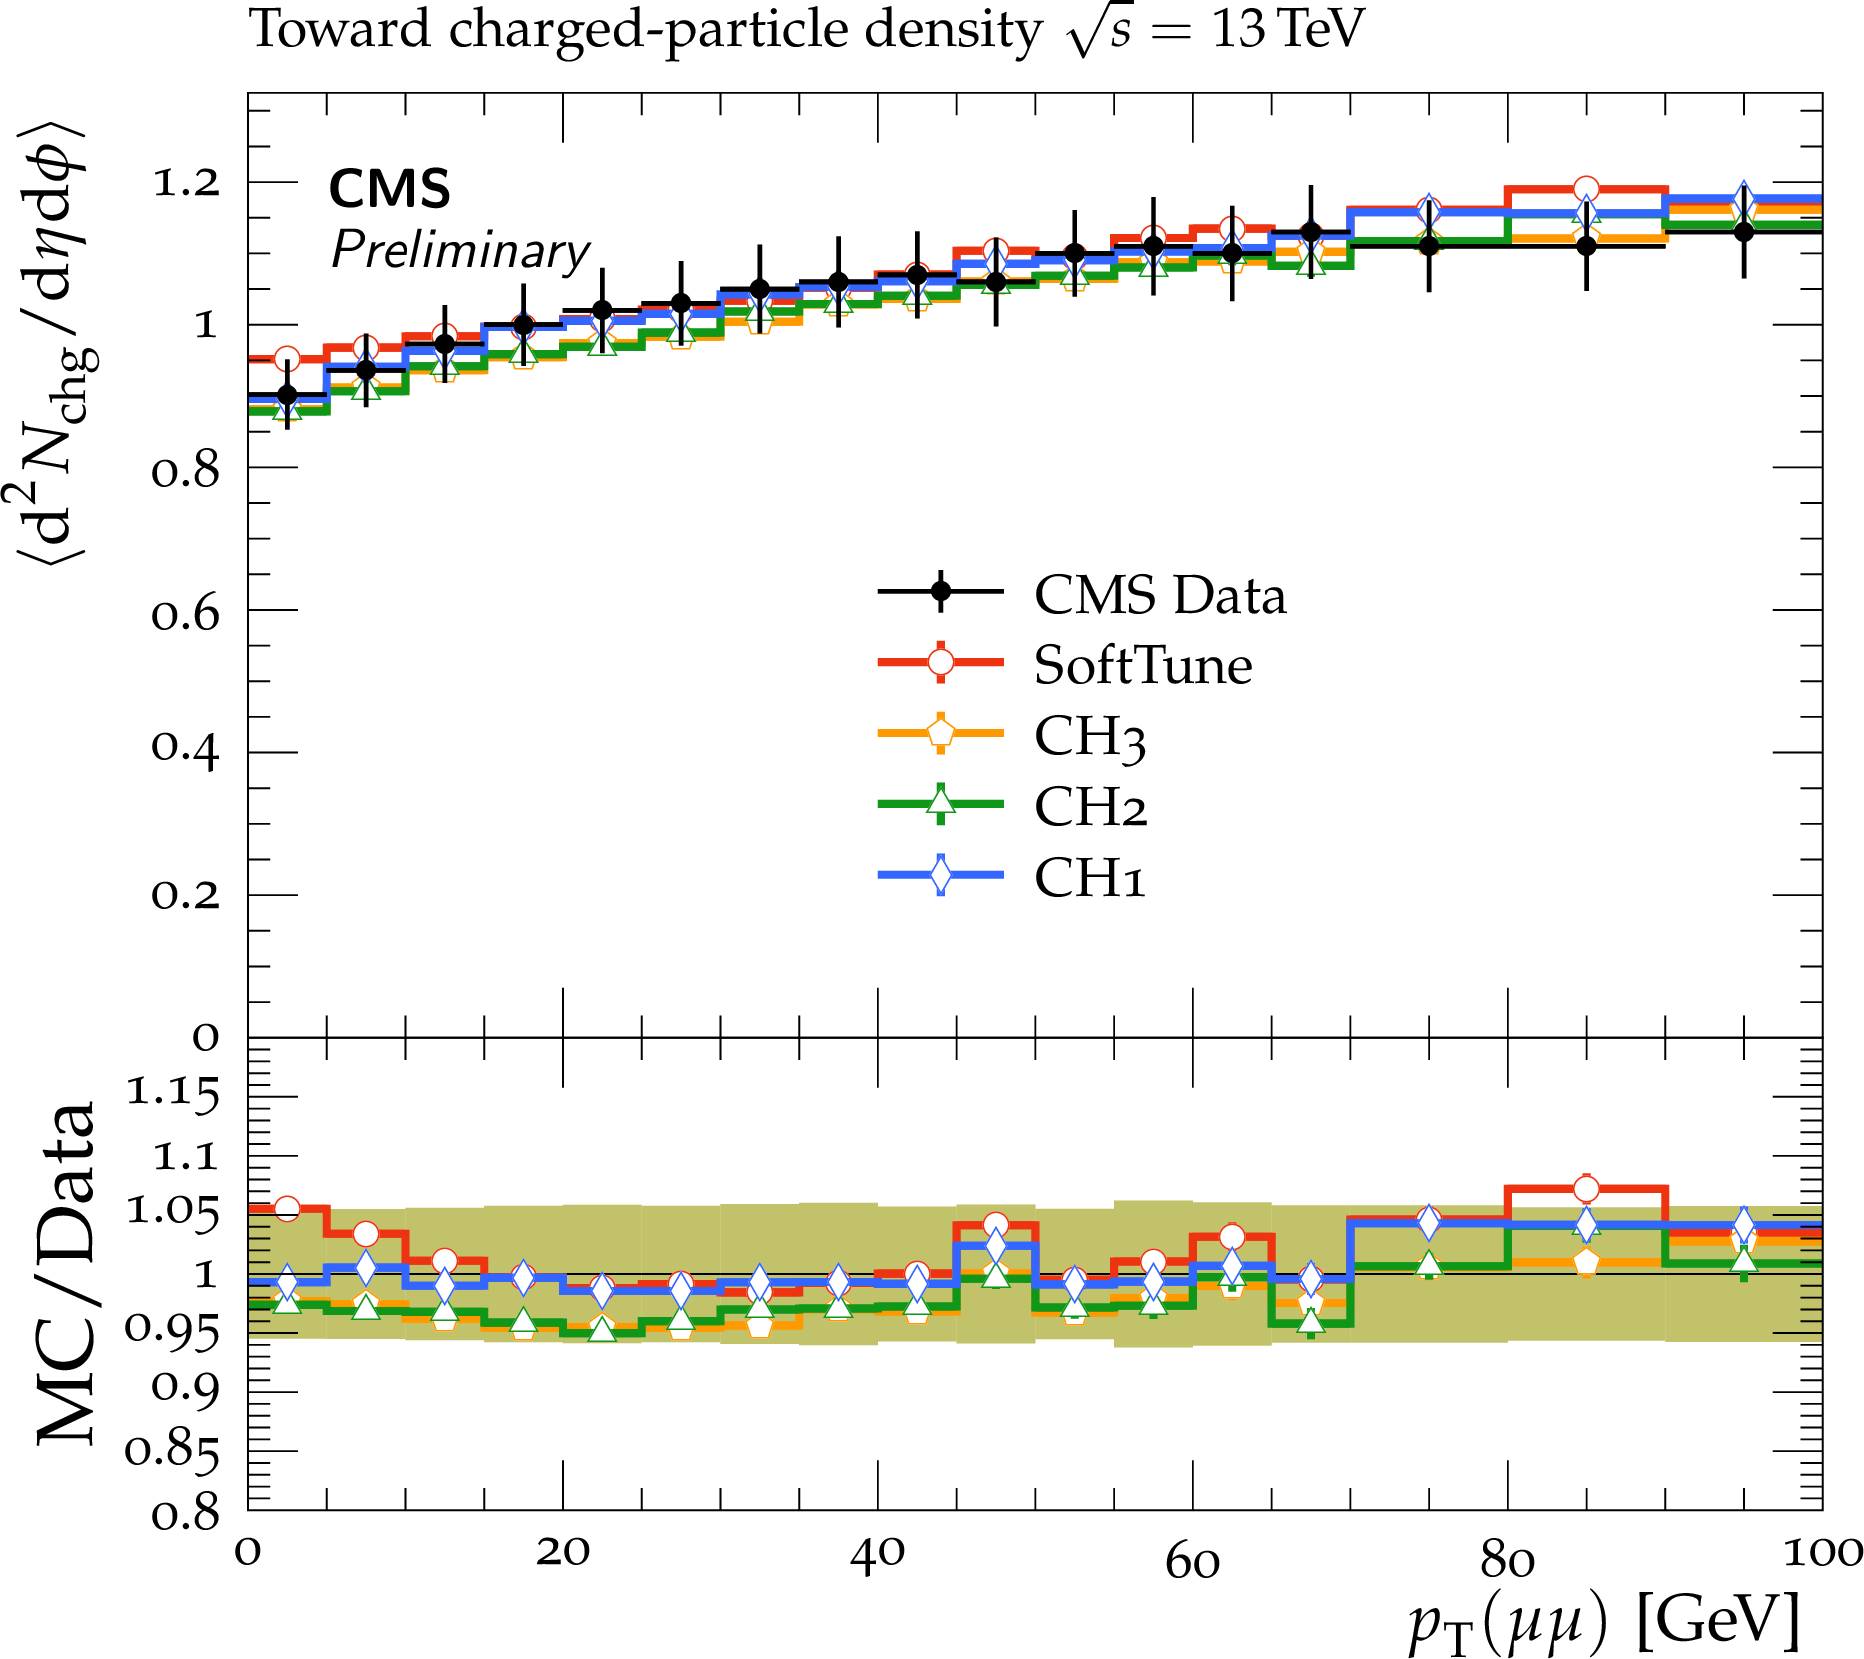
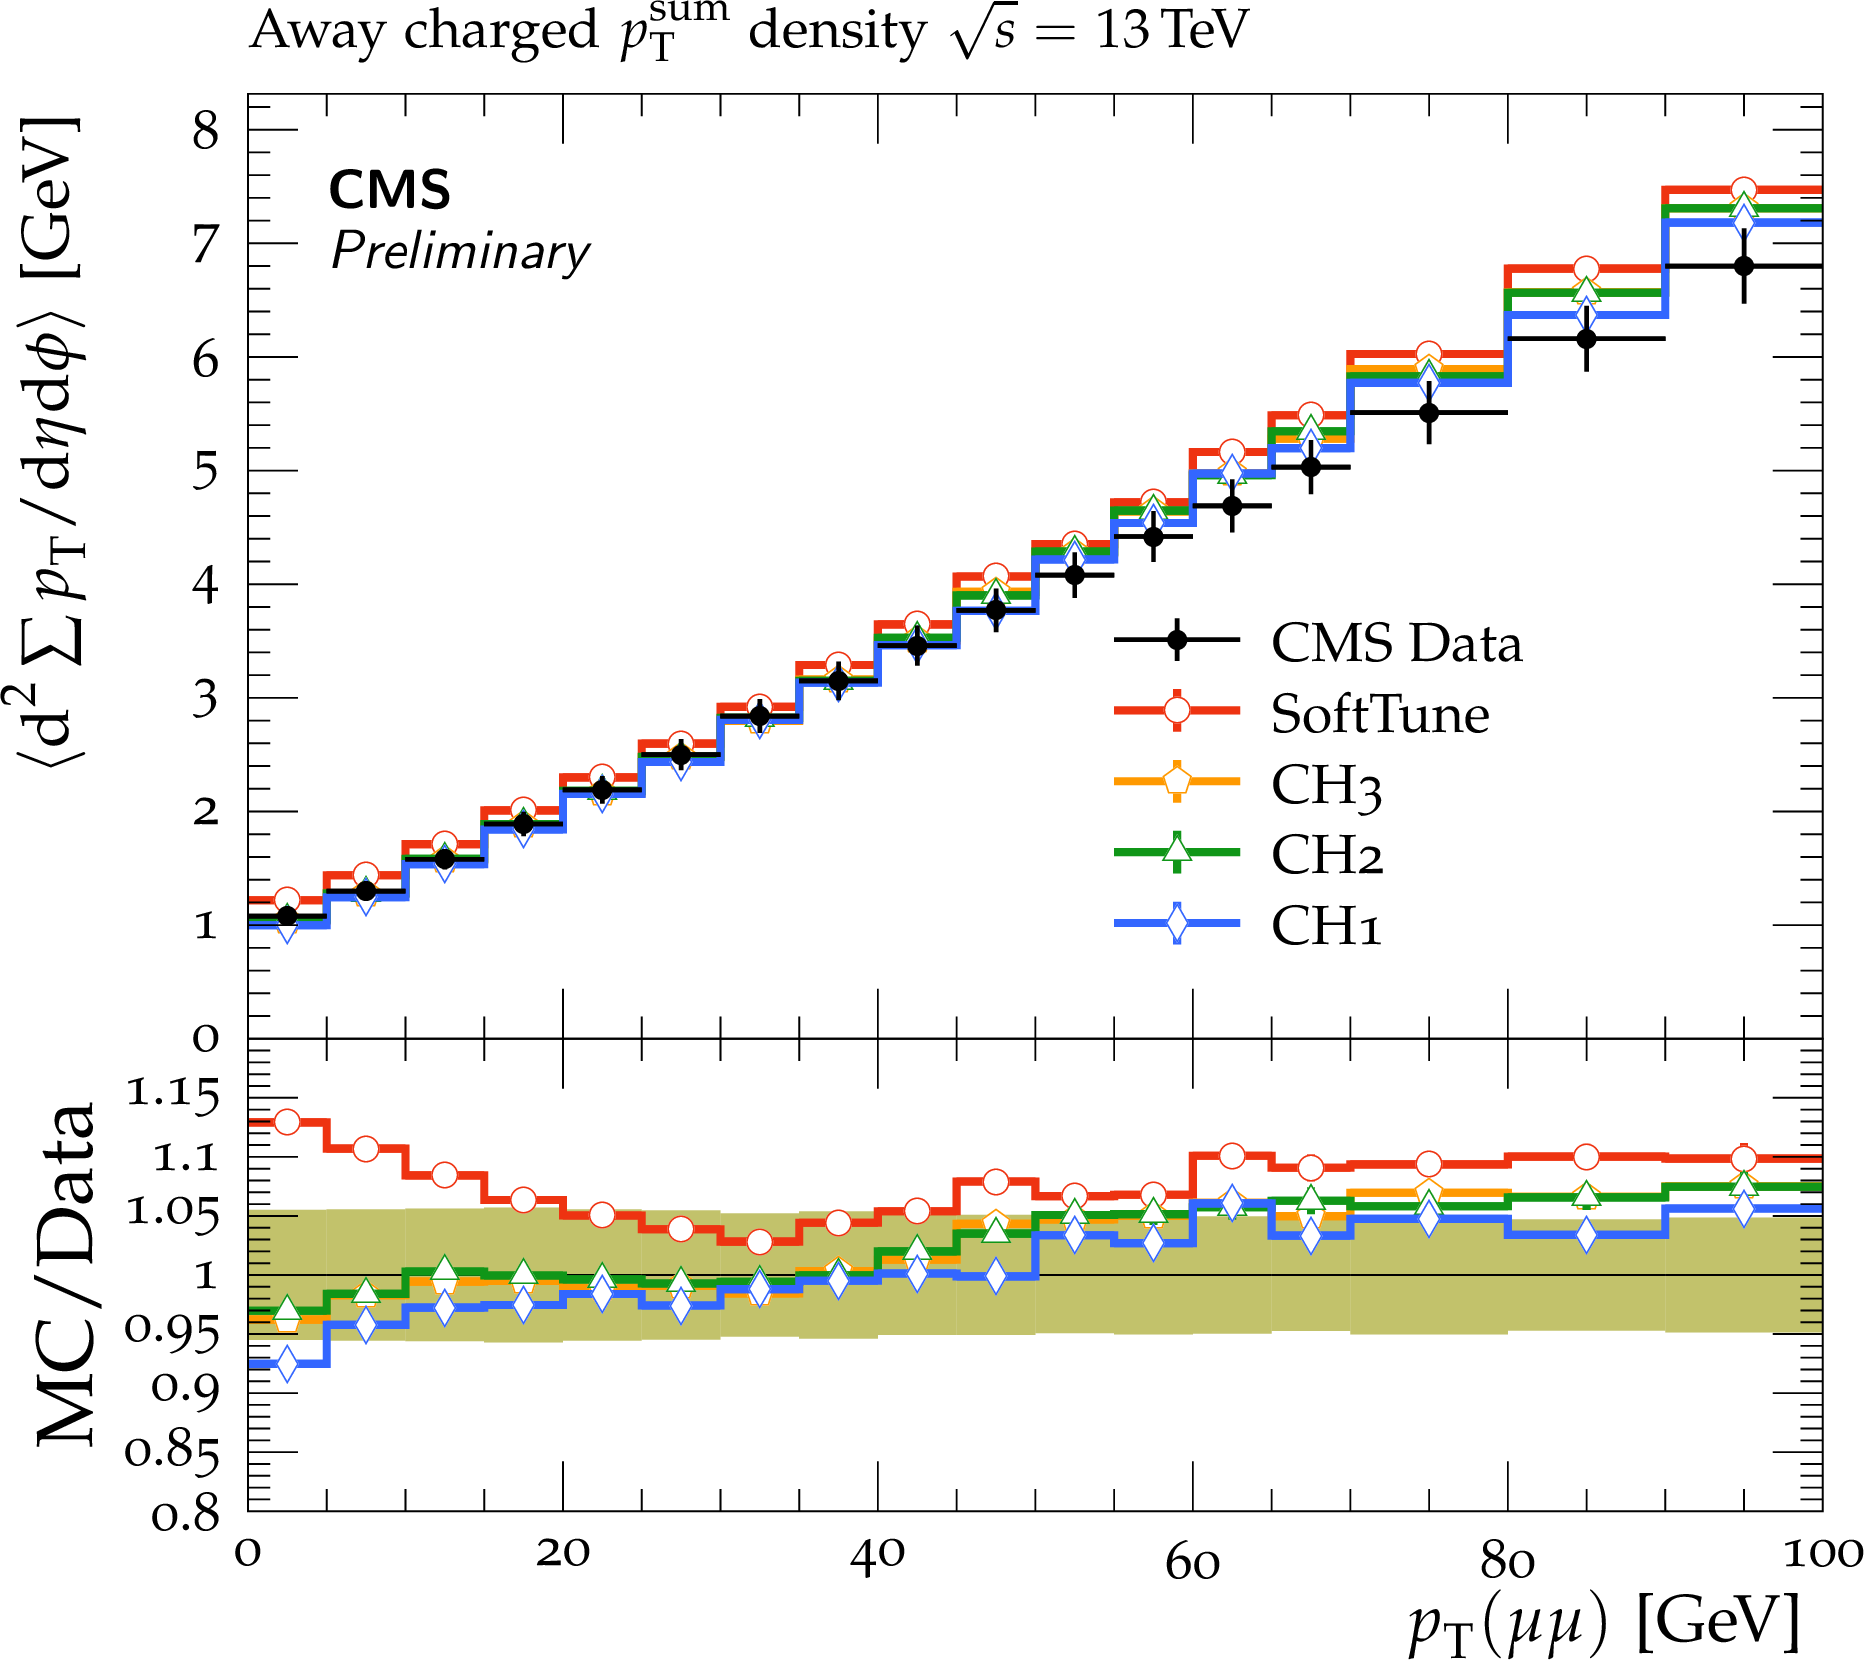
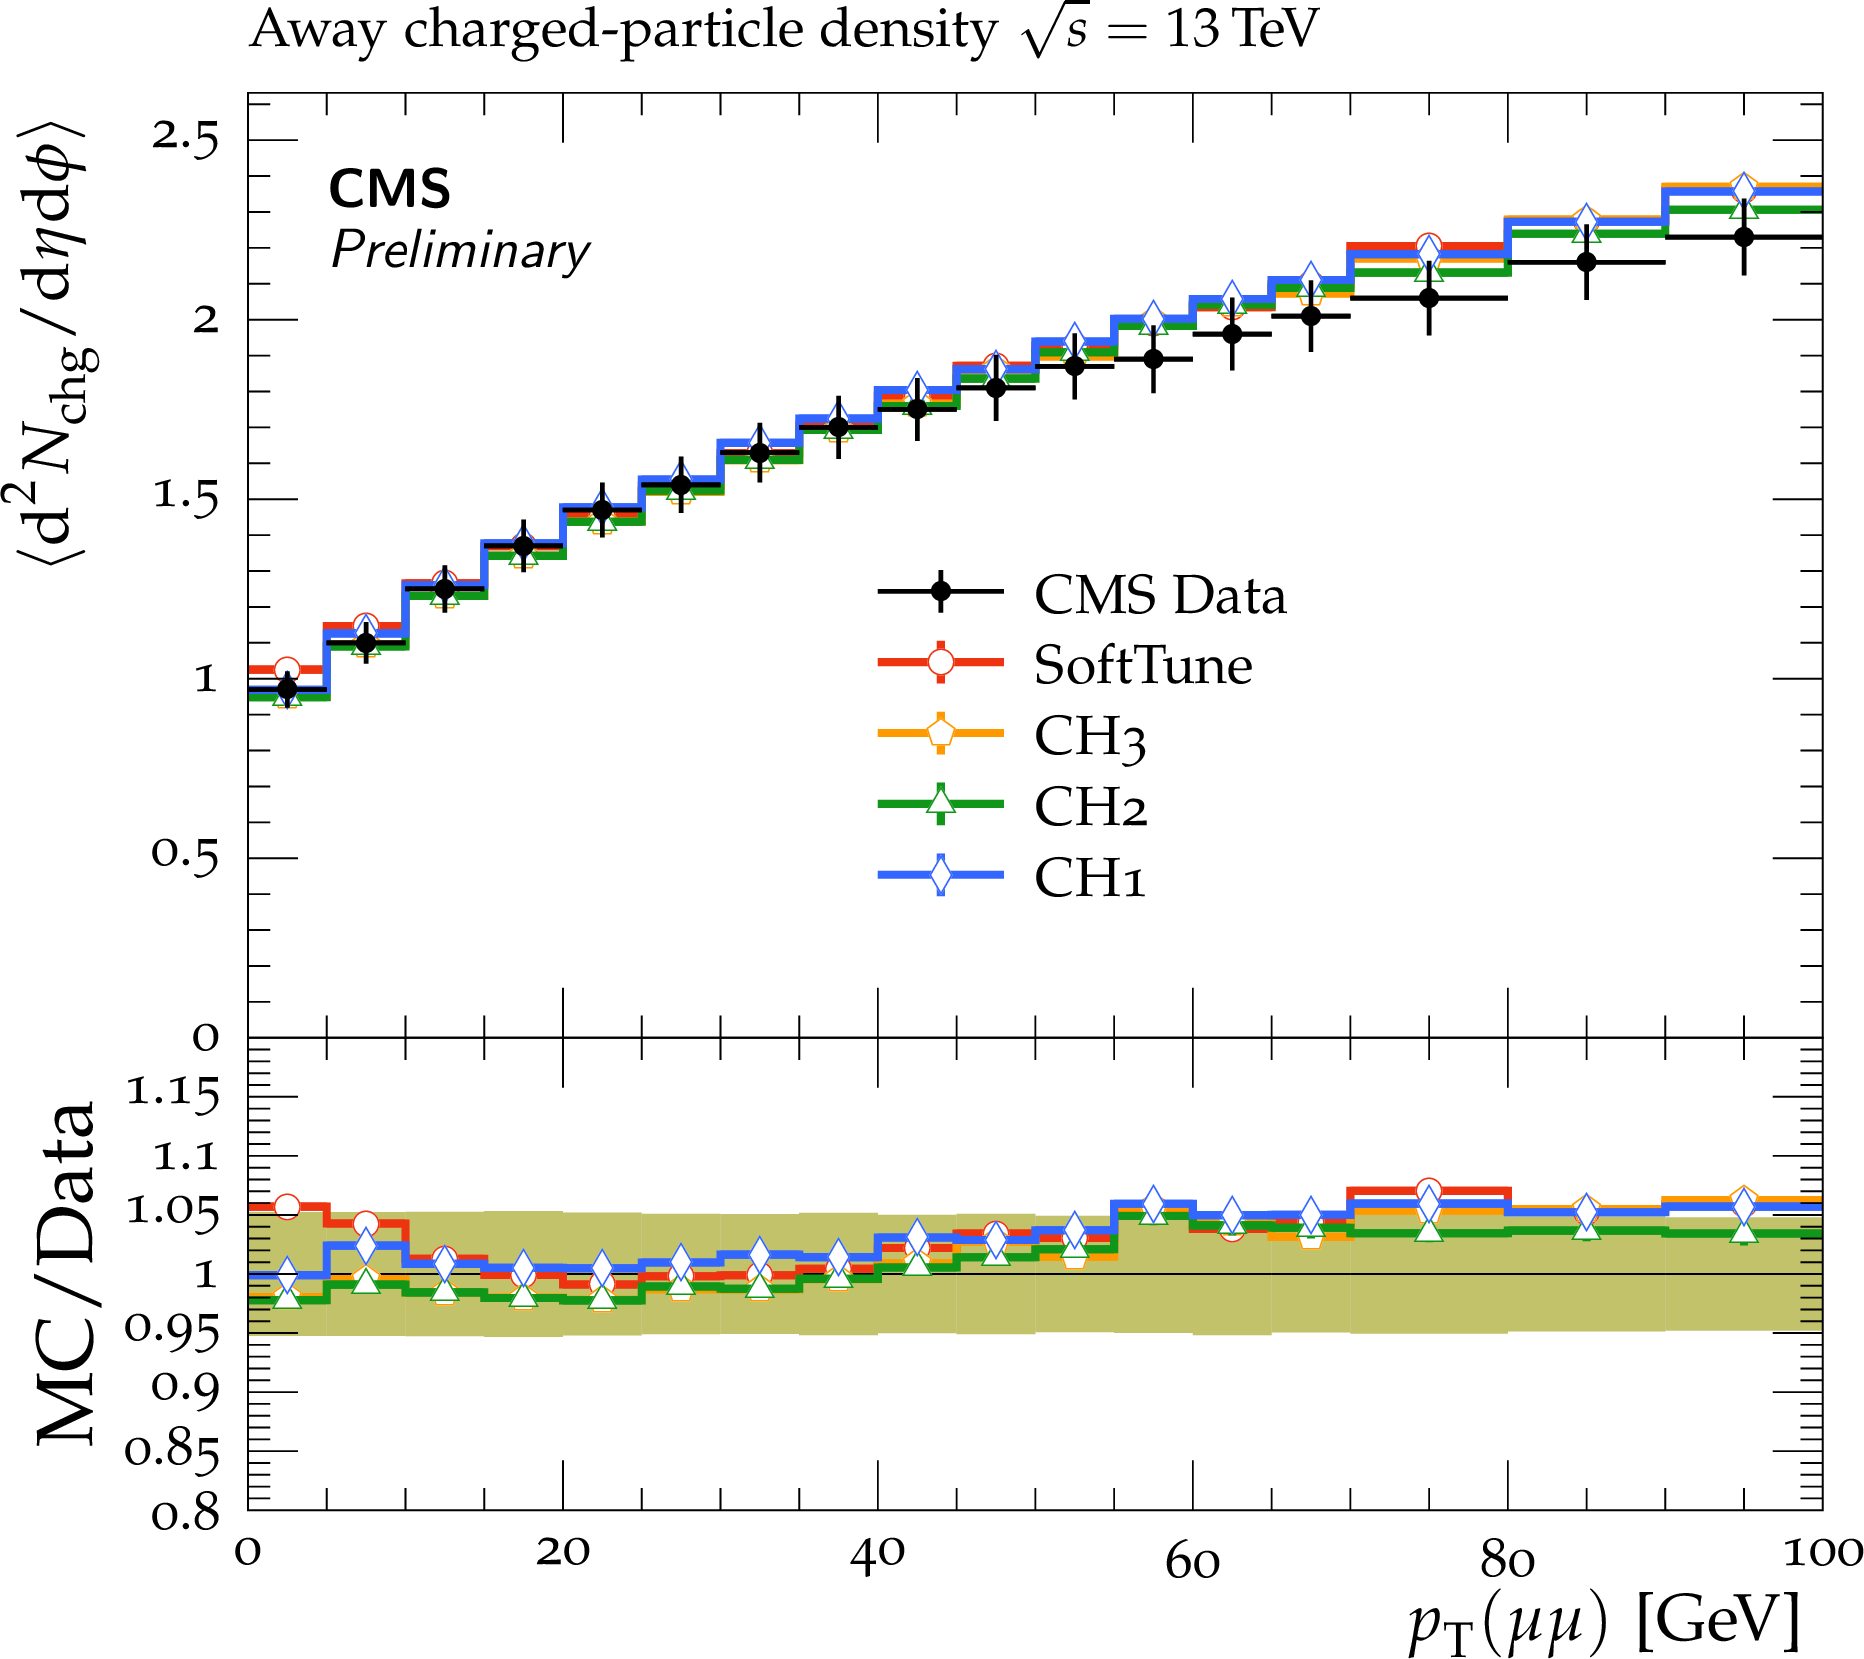
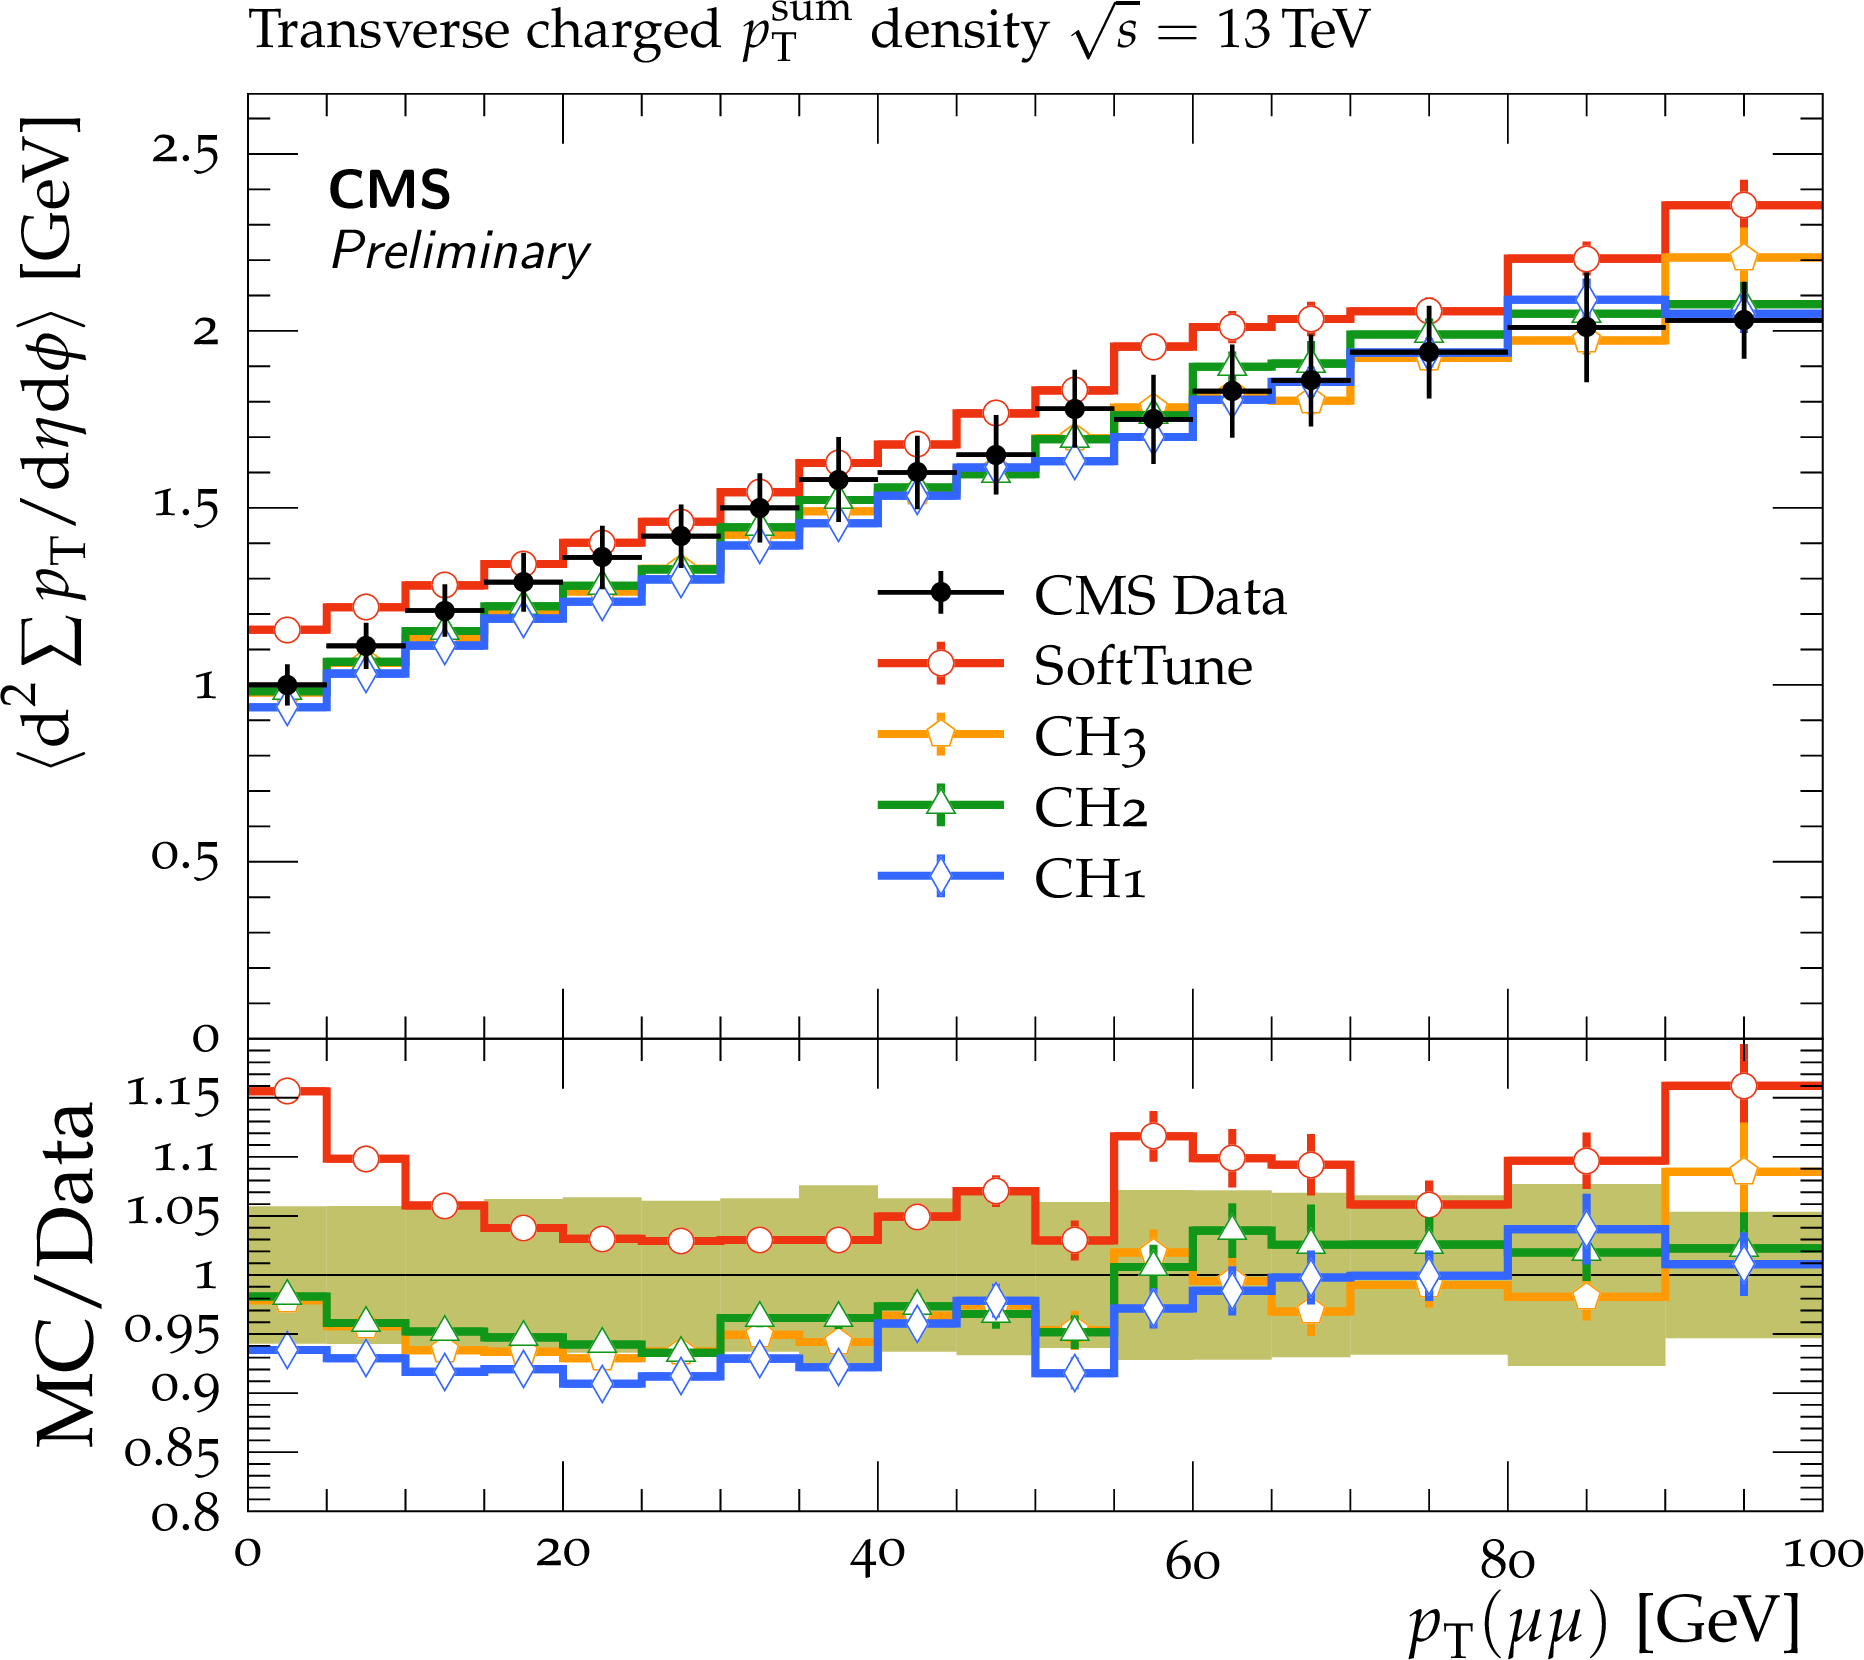
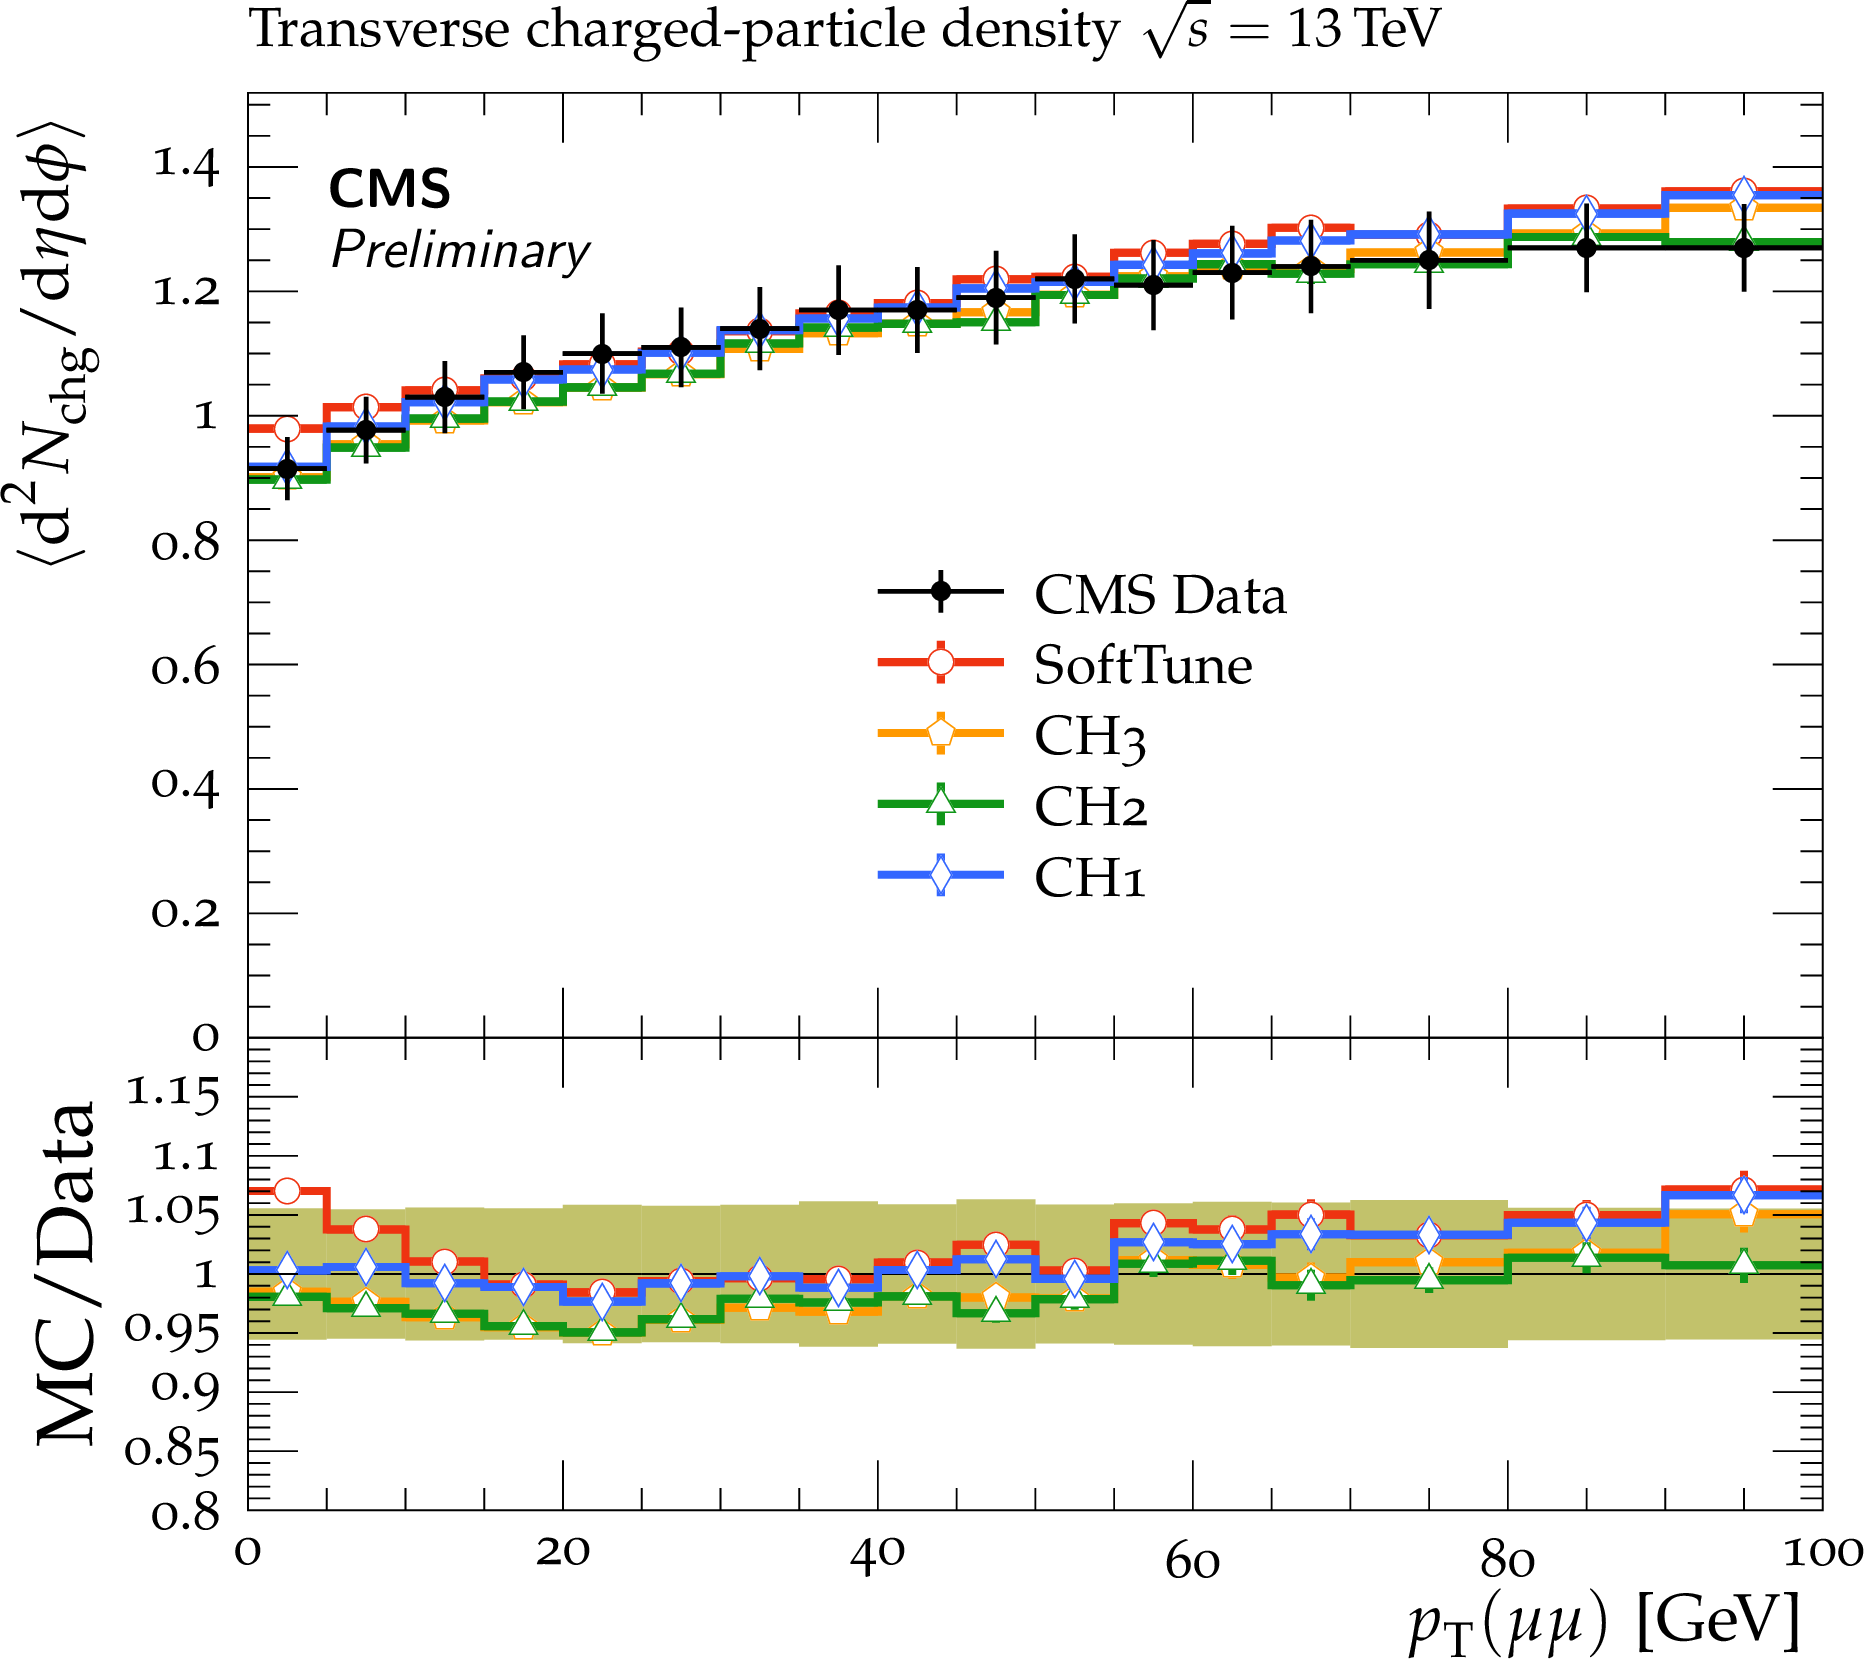
CMS data on Z boson production at $ {\sqrt {s}} = $ 13 TeV on the ${p_{\mathrm {T}}^{\mathrm {sum}}}$ density (left) and ${N_{\mathrm {ch}}}$ (right) distributions in the towards (upper), away (middle), and transverse (lower) regions, as a function of the ${p_{\mathrm {T}}}$ of the two muons, ${{p_{\mathrm {T}}} (\mu \mu)}$ [42]. The data are compared to predictions from MG5_aMC@NLO + HERWIG 7, with the SoftTune and CH tunes. The coloured band in the ratios of the different predictions from simulation to the data represents the total experimental uncertainty in the data. |
png pdf |
Figure 15-a:
CMS data on Z boson production at $ {\sqrt {s}} = $ 13 TeV on the ${p_{\mathrm {T}}^{\mathrm {sum}}}$ density (left) and ${N_{\mathrm {ch}}}$ (right) distributions in the towards (upper), away (middle), and transverse (lower) regions, as a function of the ${p_{\mathrm {T}}}$ of the two muons, ${{p_{\mathrm {T}}} (\mu \mu)}$ [42]. The data are compared to predictions from MG5_aMC@NLO + HERWIG 7, with the SoftTune and CH tunes. The coloured band in the ratios of the different predictions from simulation to the data represents the total experimental uncertainty in the data. |
png pdf |
Figure 15-b:
CMS data on Z boson production at $ {\sqrt {s}} = $ 13 TeV on the ${p_{\mathrm {T}}^{\mathrm {sum}}}$ density (left) and ${N_{\mathrm {ch}}}$ (right) distributions in the towards (upper), away (middle), and transverse (lower) regions, as a function of the ${p_{\mathrm {T}}}$ of the two muons, ${{p_{\mathrm {T}}} (\mu \mu)}$ [42]. The data are compared to predictions from MG5_aMC@NLO + HERWIG 7, with the SoftTune and CH tunes. The coloured band in the ratios of the different predictions from simulation to the data represents the total experimental uncertainty in the data. |
png pdf |
Figure 15-c:
CMS data on Z boson production at $ {\sqrt {s}} = $ 13 TeV on the ${p_{\mathrm {T}}^{\mathrm {sum}}}$ density (left) and ${N_{\mathrm {ch}}}$ (right) distributions in the towards (upper), away (middle), and transverse (lower) regions, as a function of the ${p_{\mathrm {T}}}$ of the two muons, ${{p_{\mathrm {T}}} (\mu \mu)}$ [42]. The data are compared to predictions from MG5_aMC@NLO + HERWIG 7, with the SoftTune and CH tunes. The coloured band in the ratios of the different predictions from simulation to the data represents the total experimental uncertainty in the data. |
png pdf |
Figure 15-d:
CMS data on Z boson production at $ {\sqrt {s}} = $ 13 TeV on the ${p_{\mathrm {T}}^{\mathrm {sum}}}$ density (left) and ${N_{\mathrm {ch}}}$ (right) distributions in the towards (upper), away (middle), and transverse (lower) regions, as a function of the ${p_{\mathrm {T}}}$ of the two muons, ${{p_{\mathrm {T}}} (\mu \mu)}$ [42]. The data are compared to predictions from MG5_aMC@NLO + HERWIG 7, with the SoftTune and CH tunes. The coloured band in the ratios of the different predictions from simulation to the data represents the total experimental uncertainty in the data. |
png pdf |
Figure 15-e:
CMS data on Z boson production at $ {\sqrt {s}} = $ 13 TeV on the ${p_{\mathrm {T}}^{\mathrm {sum}}}$ density (left) and ${N_{\mathrm {ch}}}$ (right) distributions in the towards (upper), away (middle), and transverse (lower) regions, as a function of the ${p_{\mathrm {T}}}$ of the two muons, ${{p_{\mathrm {T}}} (\mu \mu)}$ [42]. The data are compared to predictions from MG5_aMC@NLO + HERWIG 7, with the SoftTune and CH tunes. The coloured band in the ratios of the different predictions from simulation to the data represents the total experimental uncertainty in the data. |
png pdf |
Figure 15-f:
CMS data on Z boson production at $ {\sqrt {s}} = $ 13 TeV on the ${p_{\mathrm {T}}^{\mathrm {sum}}}$ density (left) and ${N_{\mathrm {ch}}}$ (right) distributions in the towards (upper), away (middle), and transverse (lower) regions, as a function of the ${p_{\mathrm {T}}}$ of the two muons, ${{p_{\mathrm {T}}} (\mu \mu)}$ [42]. The data are compared to predictions from MG5_aMC@NLO + HERWIG 7, with the SoftTune and CH tunes. The coloured band in the ratios of the different predictions from simulation to the data represents the total experimental uncertainty in the data. |
png pdf |
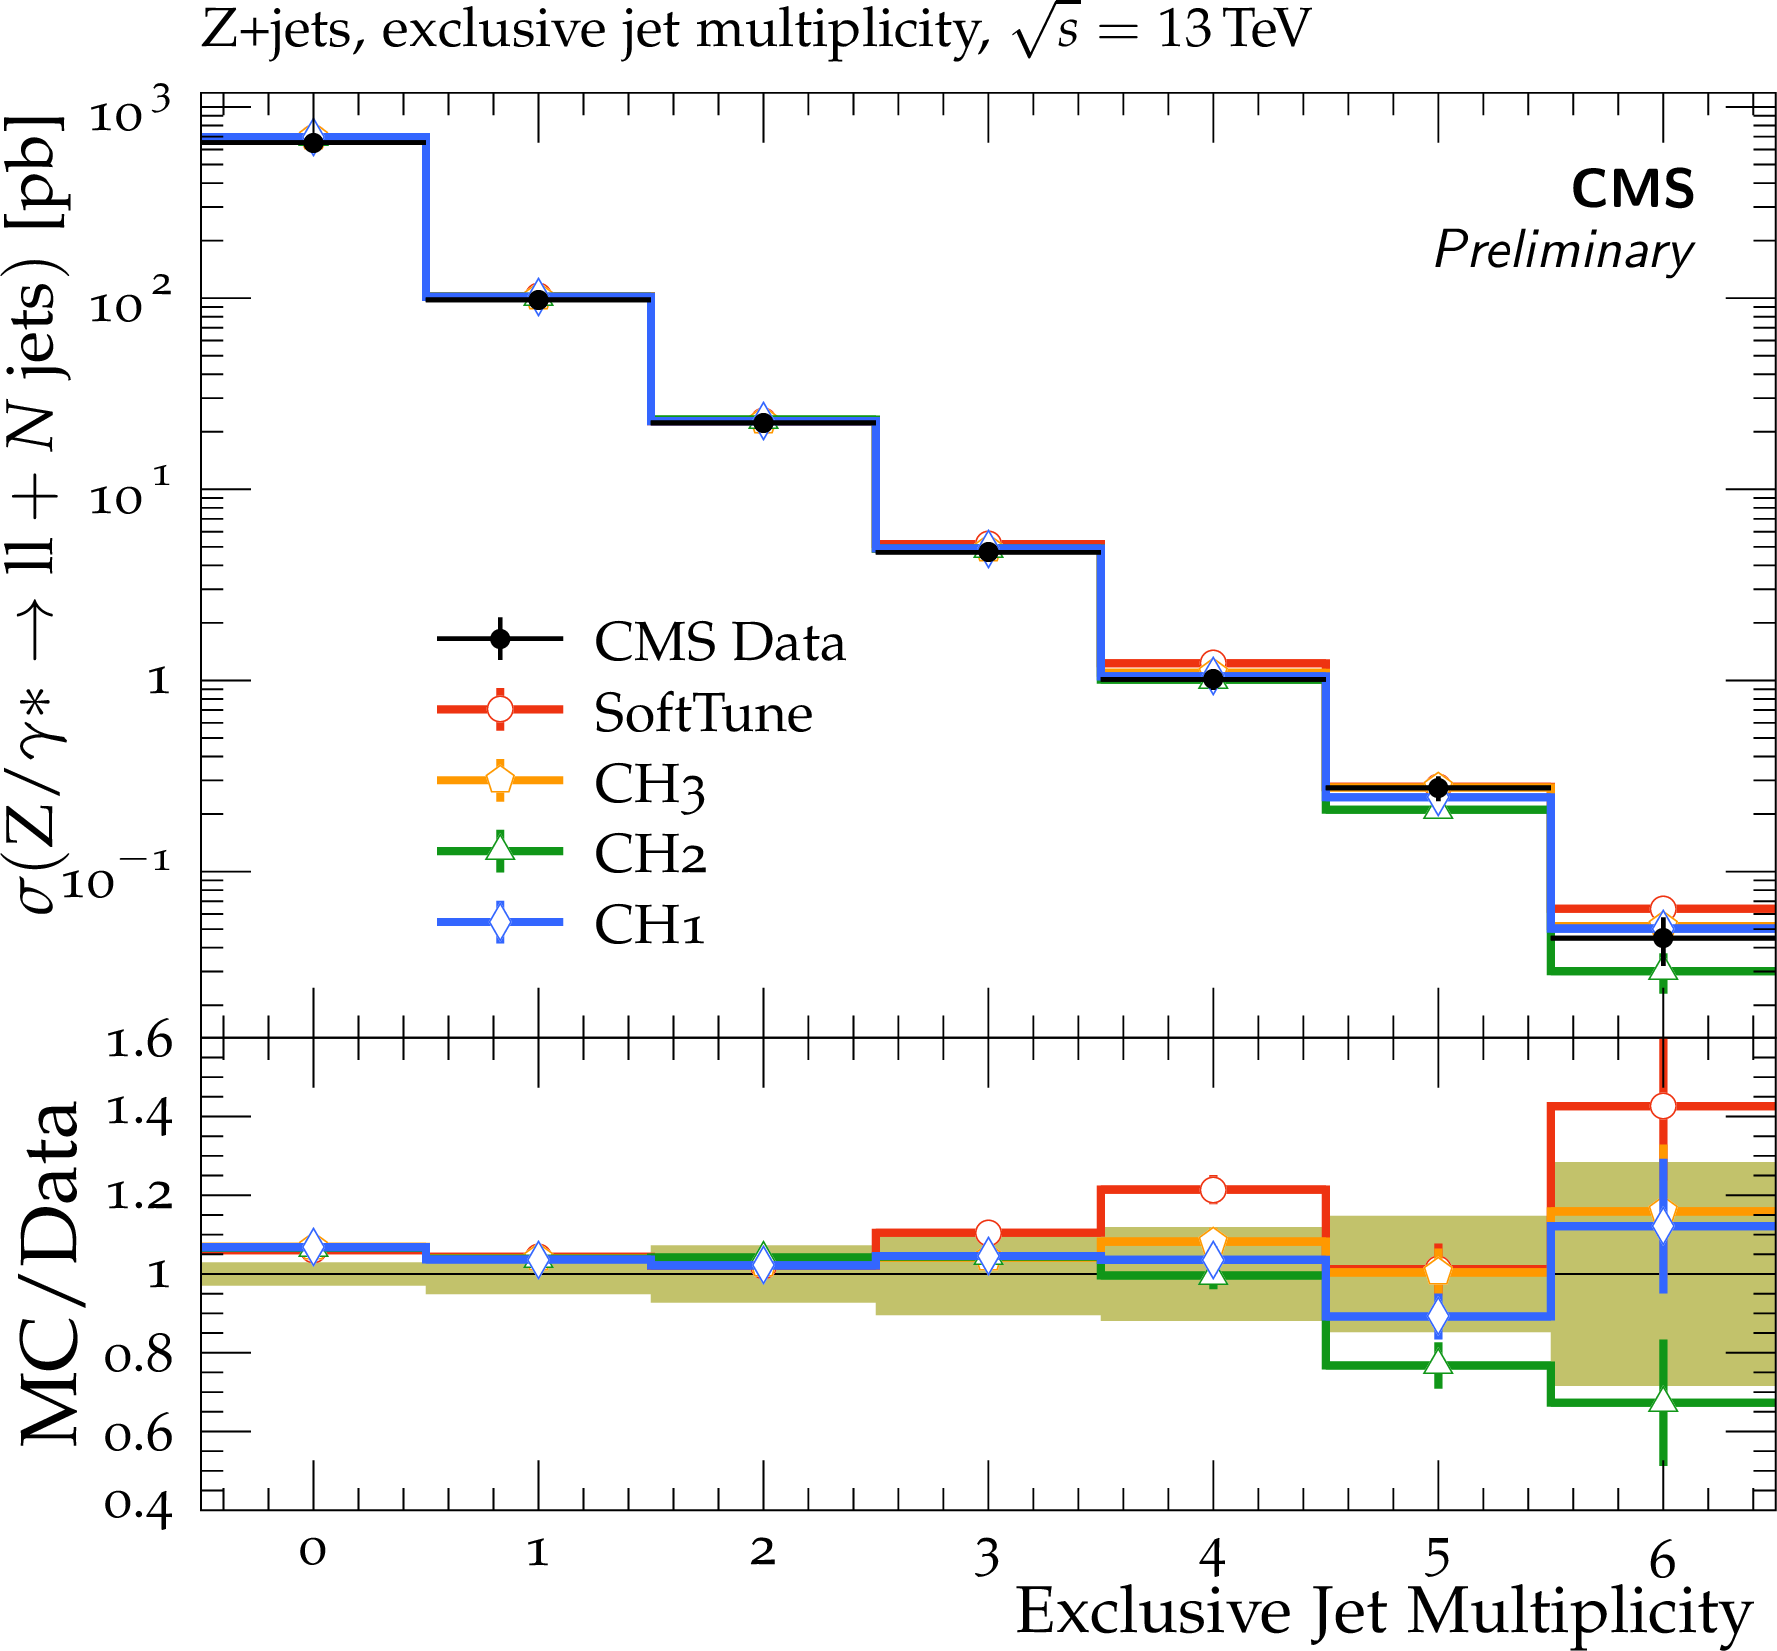
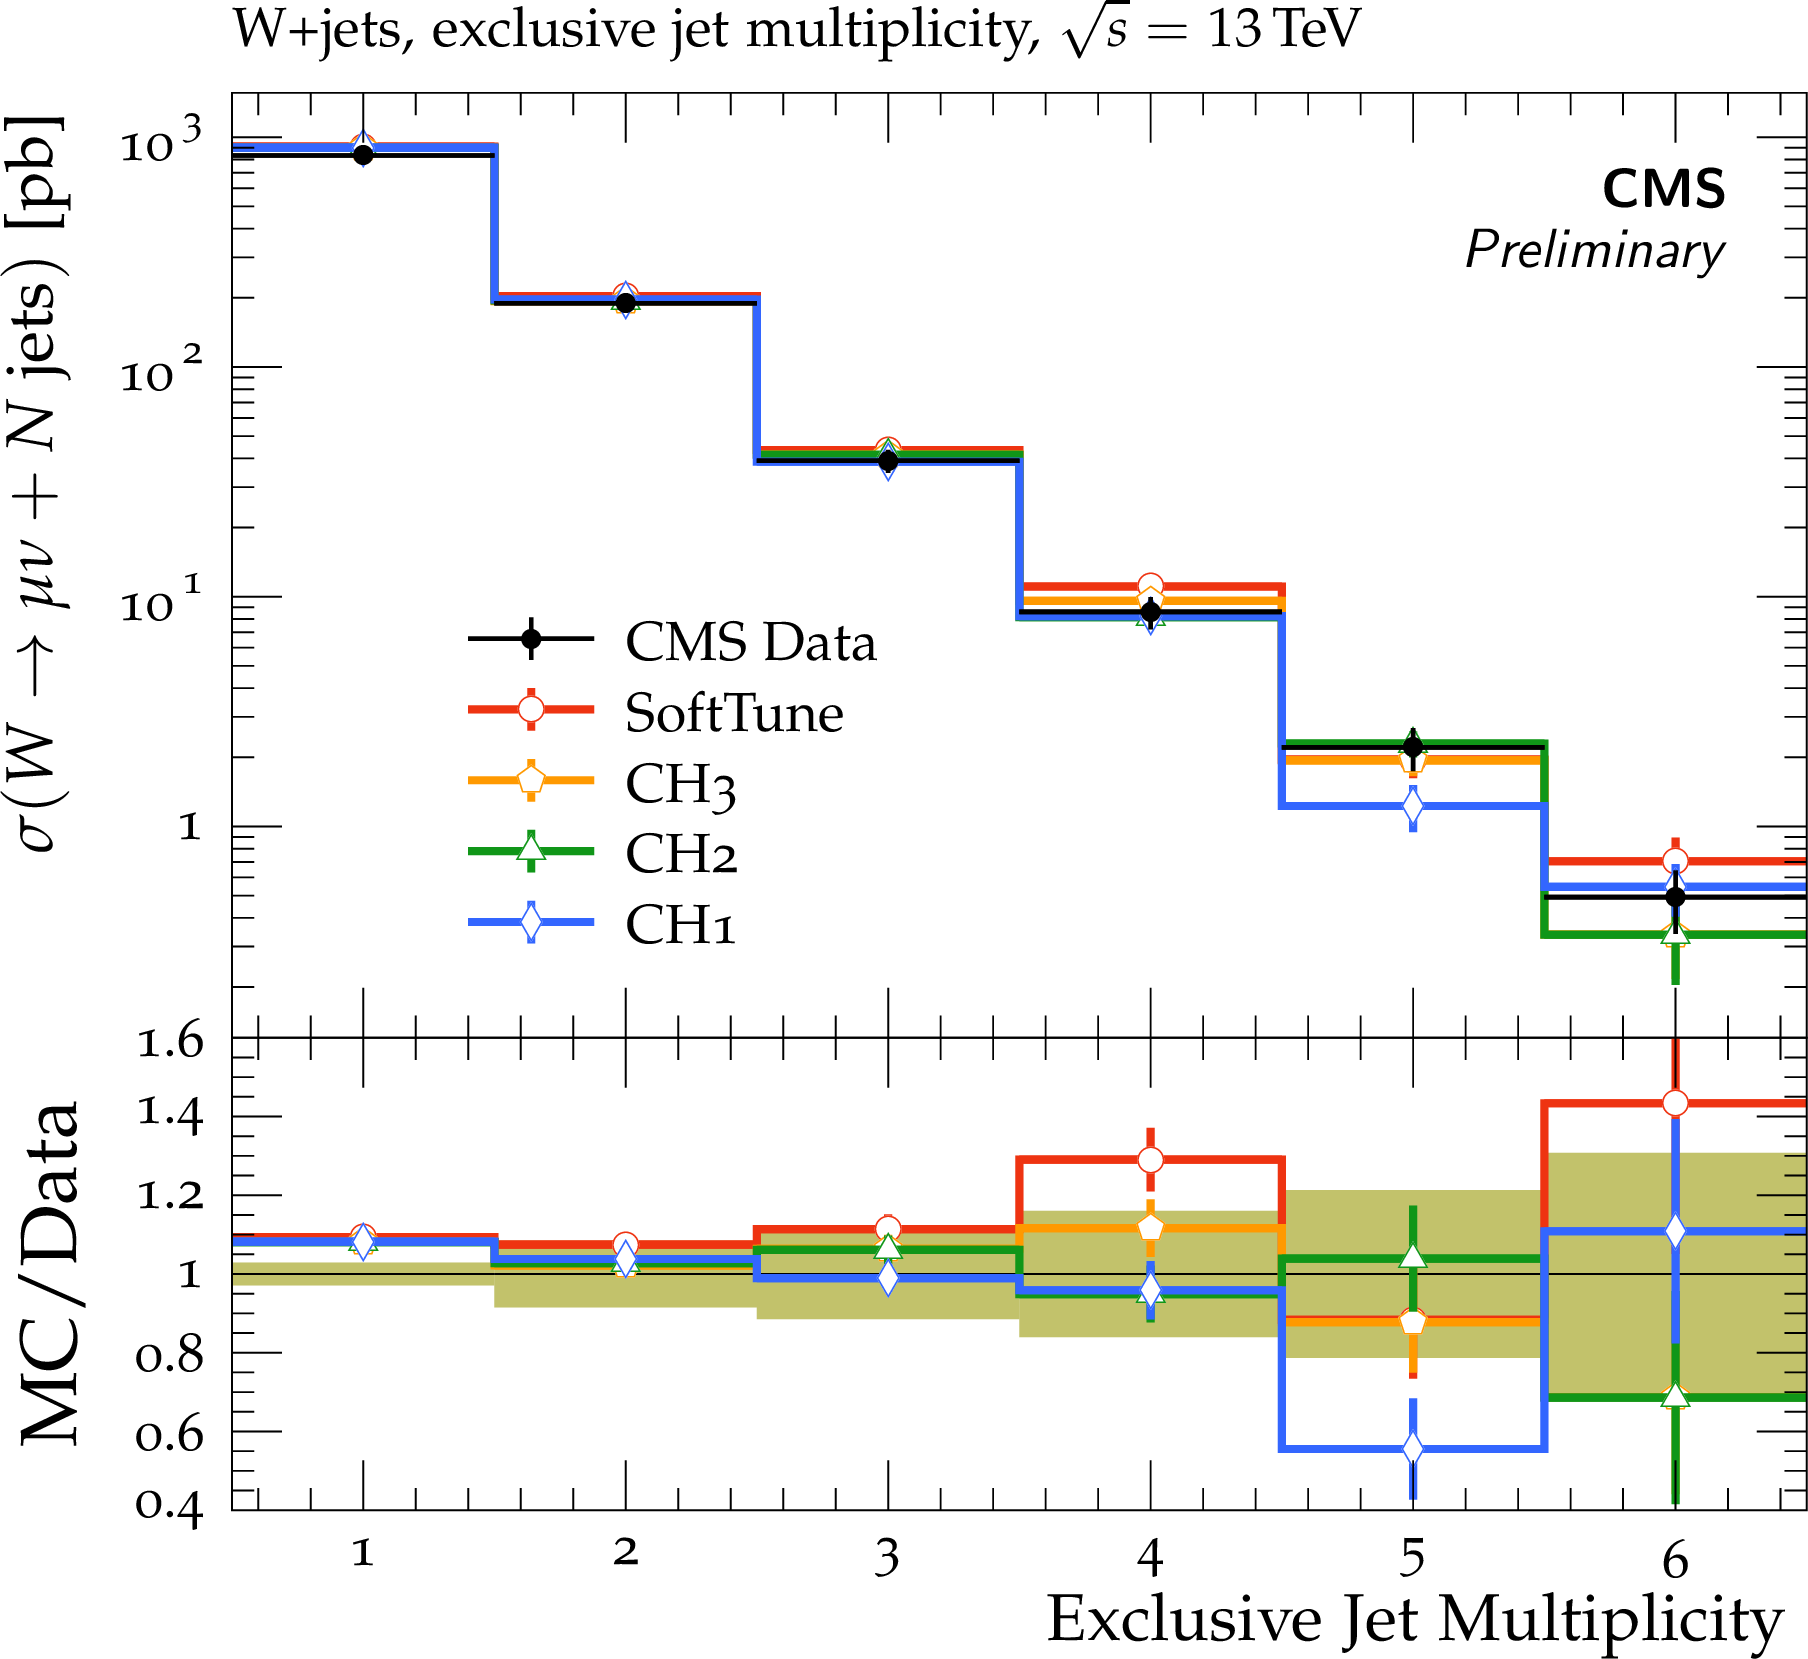
Figure 16:
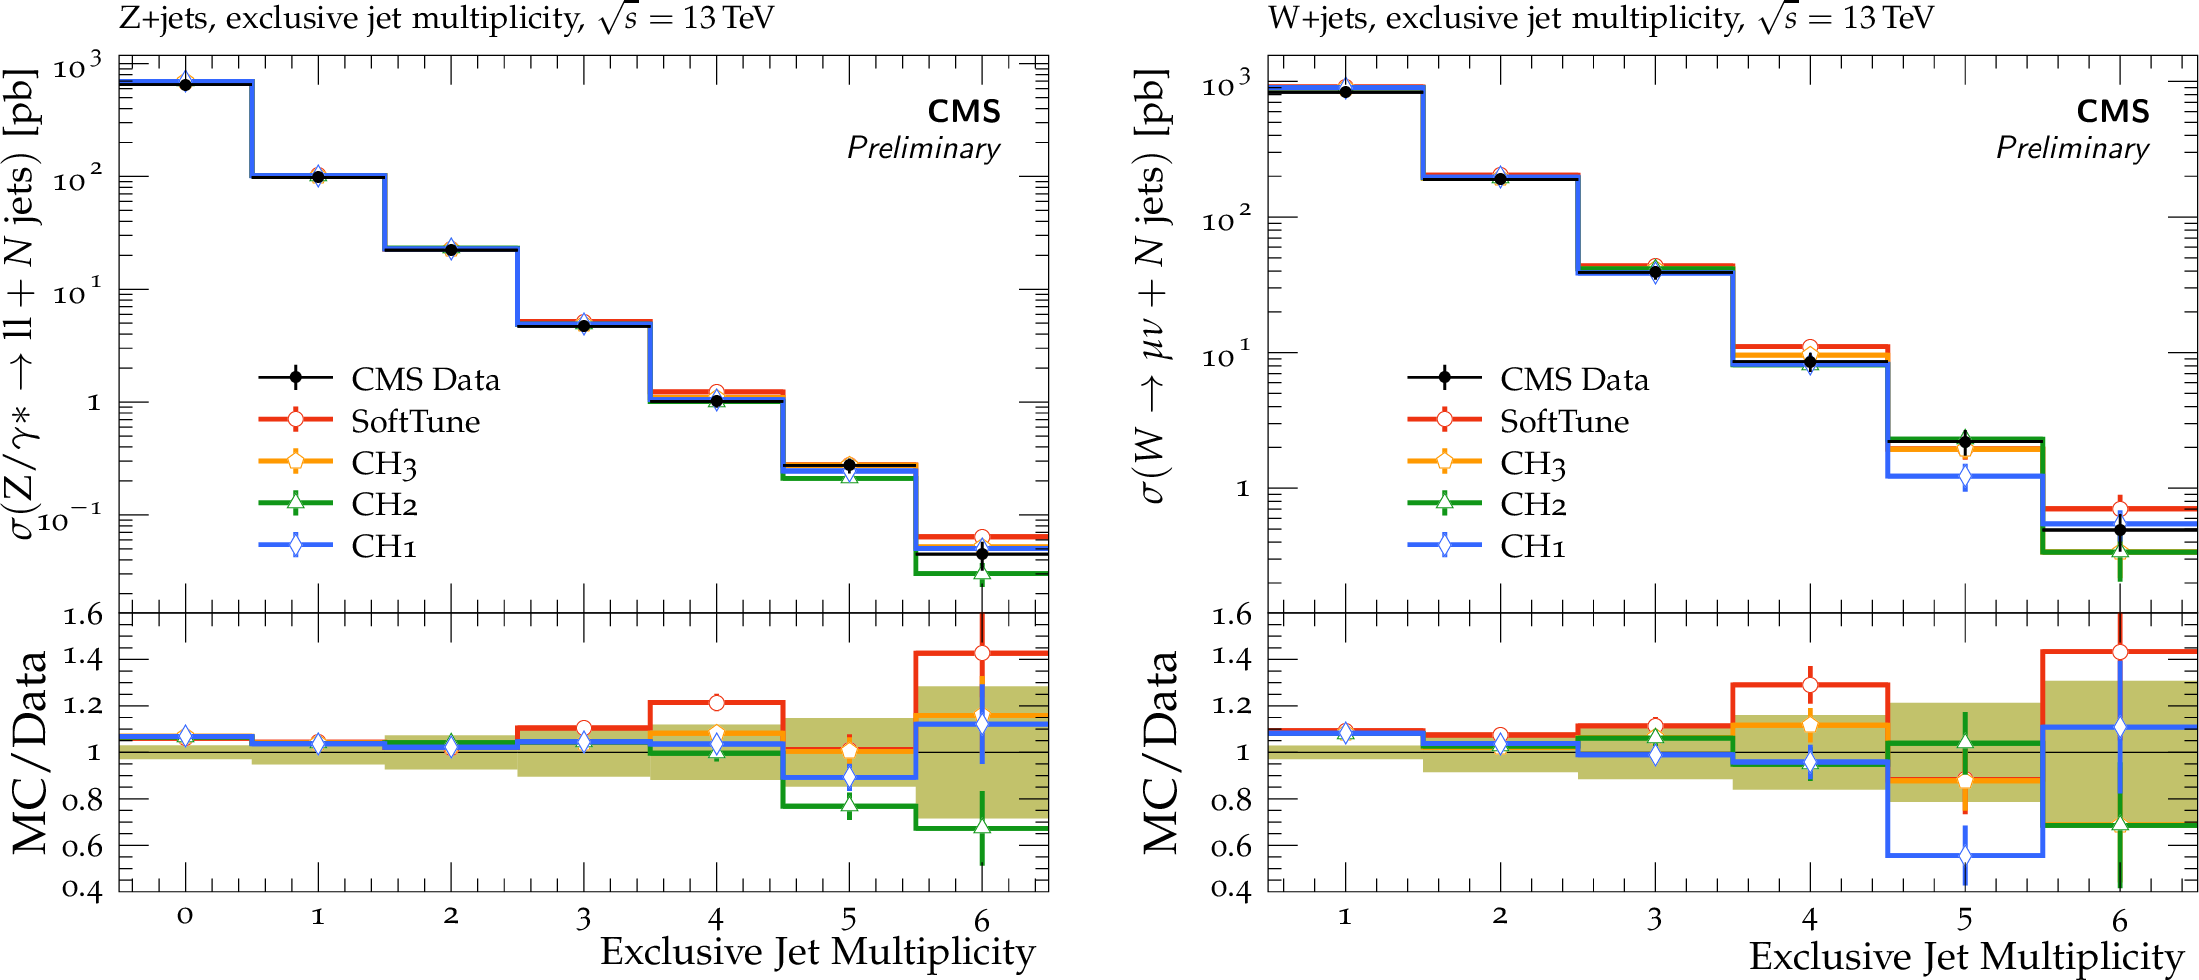
The exclusive jet multiplicity in Z (left) and W (right) boson events, measured by CMS at $ {\sqrt {s}} = $ 13 TeV [43,44]. The data are compared to predictions from MG5_aMC@NLO + HERWIG 7, with the SoftTune and CH tunes. The coloured band in the ratios of the different predictions from simulation to the data represents the total experimental uncertainty in the data. |
png pdf |
Figure 16-a:
The exclusive jet multiplicity in Z (left) and W (right) boson events, measured by CMS at $ {\sqrt {s}} = $ 13 TeV [43,44]. The data are compared to predictions from MG5_aMC@NLO + HERWIG 7, with the SoftTune and CH tunes. The coloured band in the ratios of the different predictions from simulation to the data represents the total experimental uncertainty in the data. |
png pdf |
Figure 16-b:
The exclusive jet multiplicity in Z (left) and W (right) boson events, measured by CMS at $ {\sqrt {s}} = $ 13 TeV [43,44]. The data are compared to predictions from MG5_aMC@NLO + HERWIG 7, with the SoftTune and CH tunes. The coloured band in the ratios of the different predictions from simulation to the data represents the total experimental uncertainty in the data. |
png pdf |
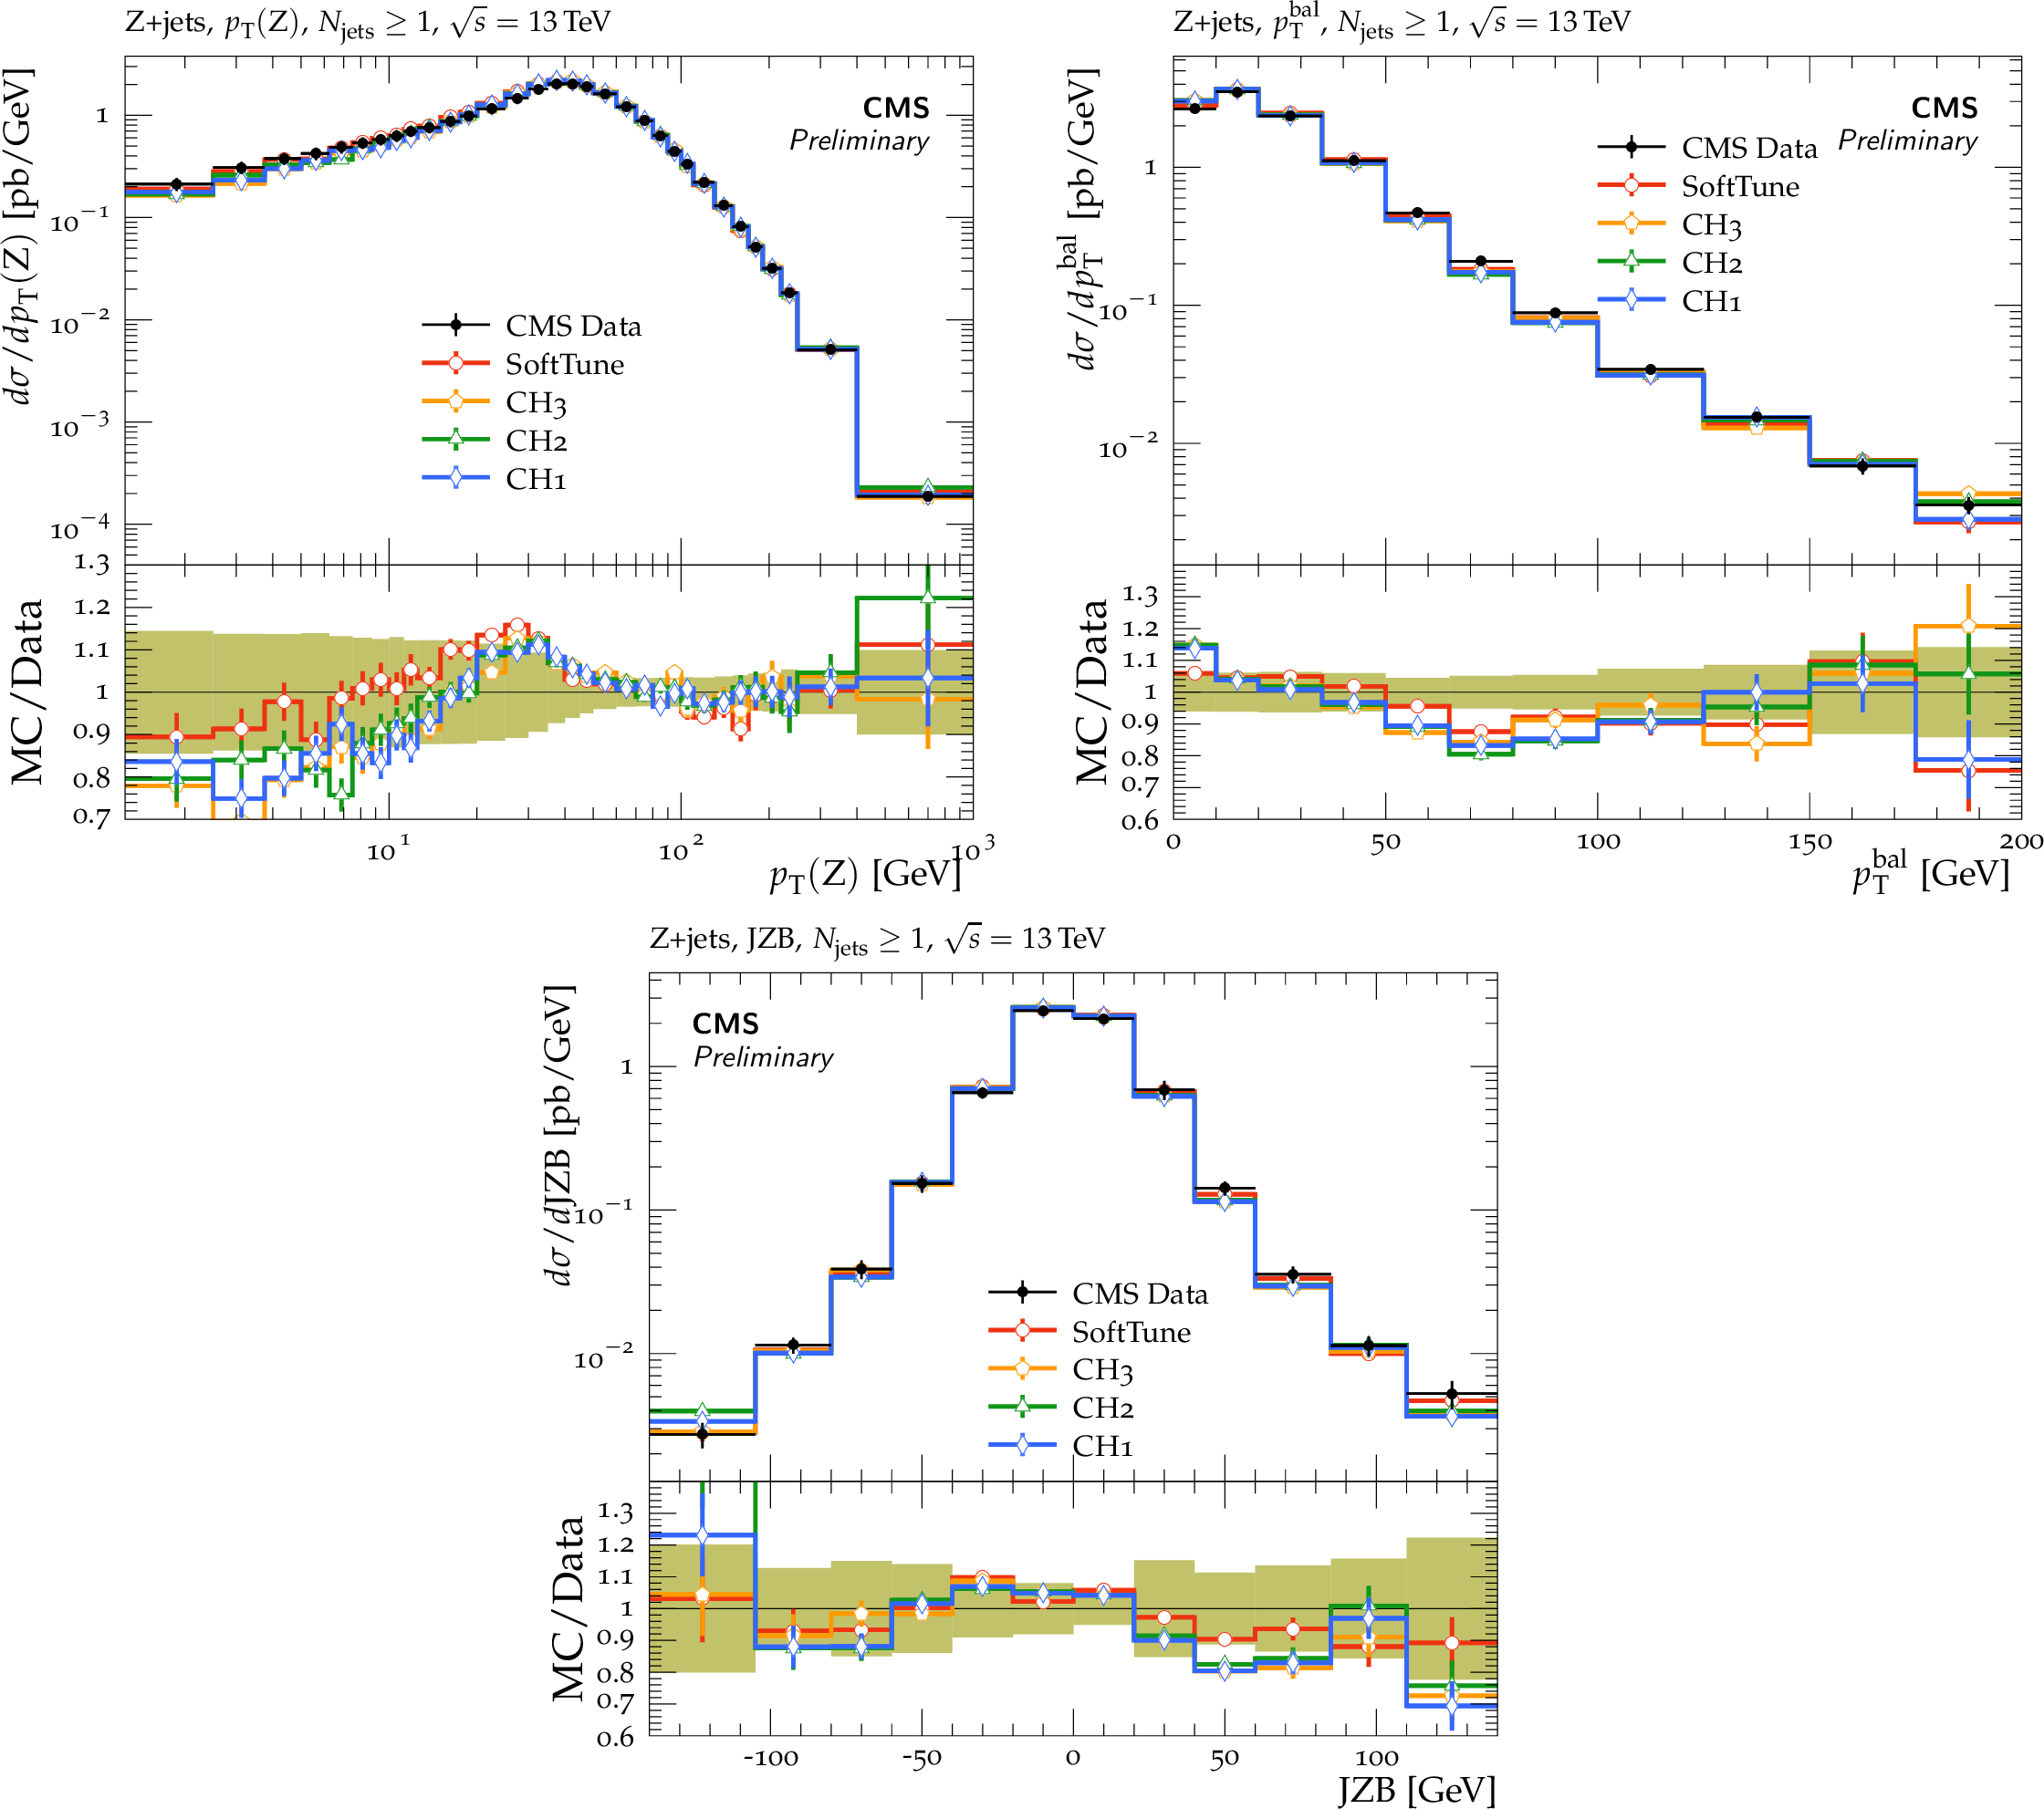
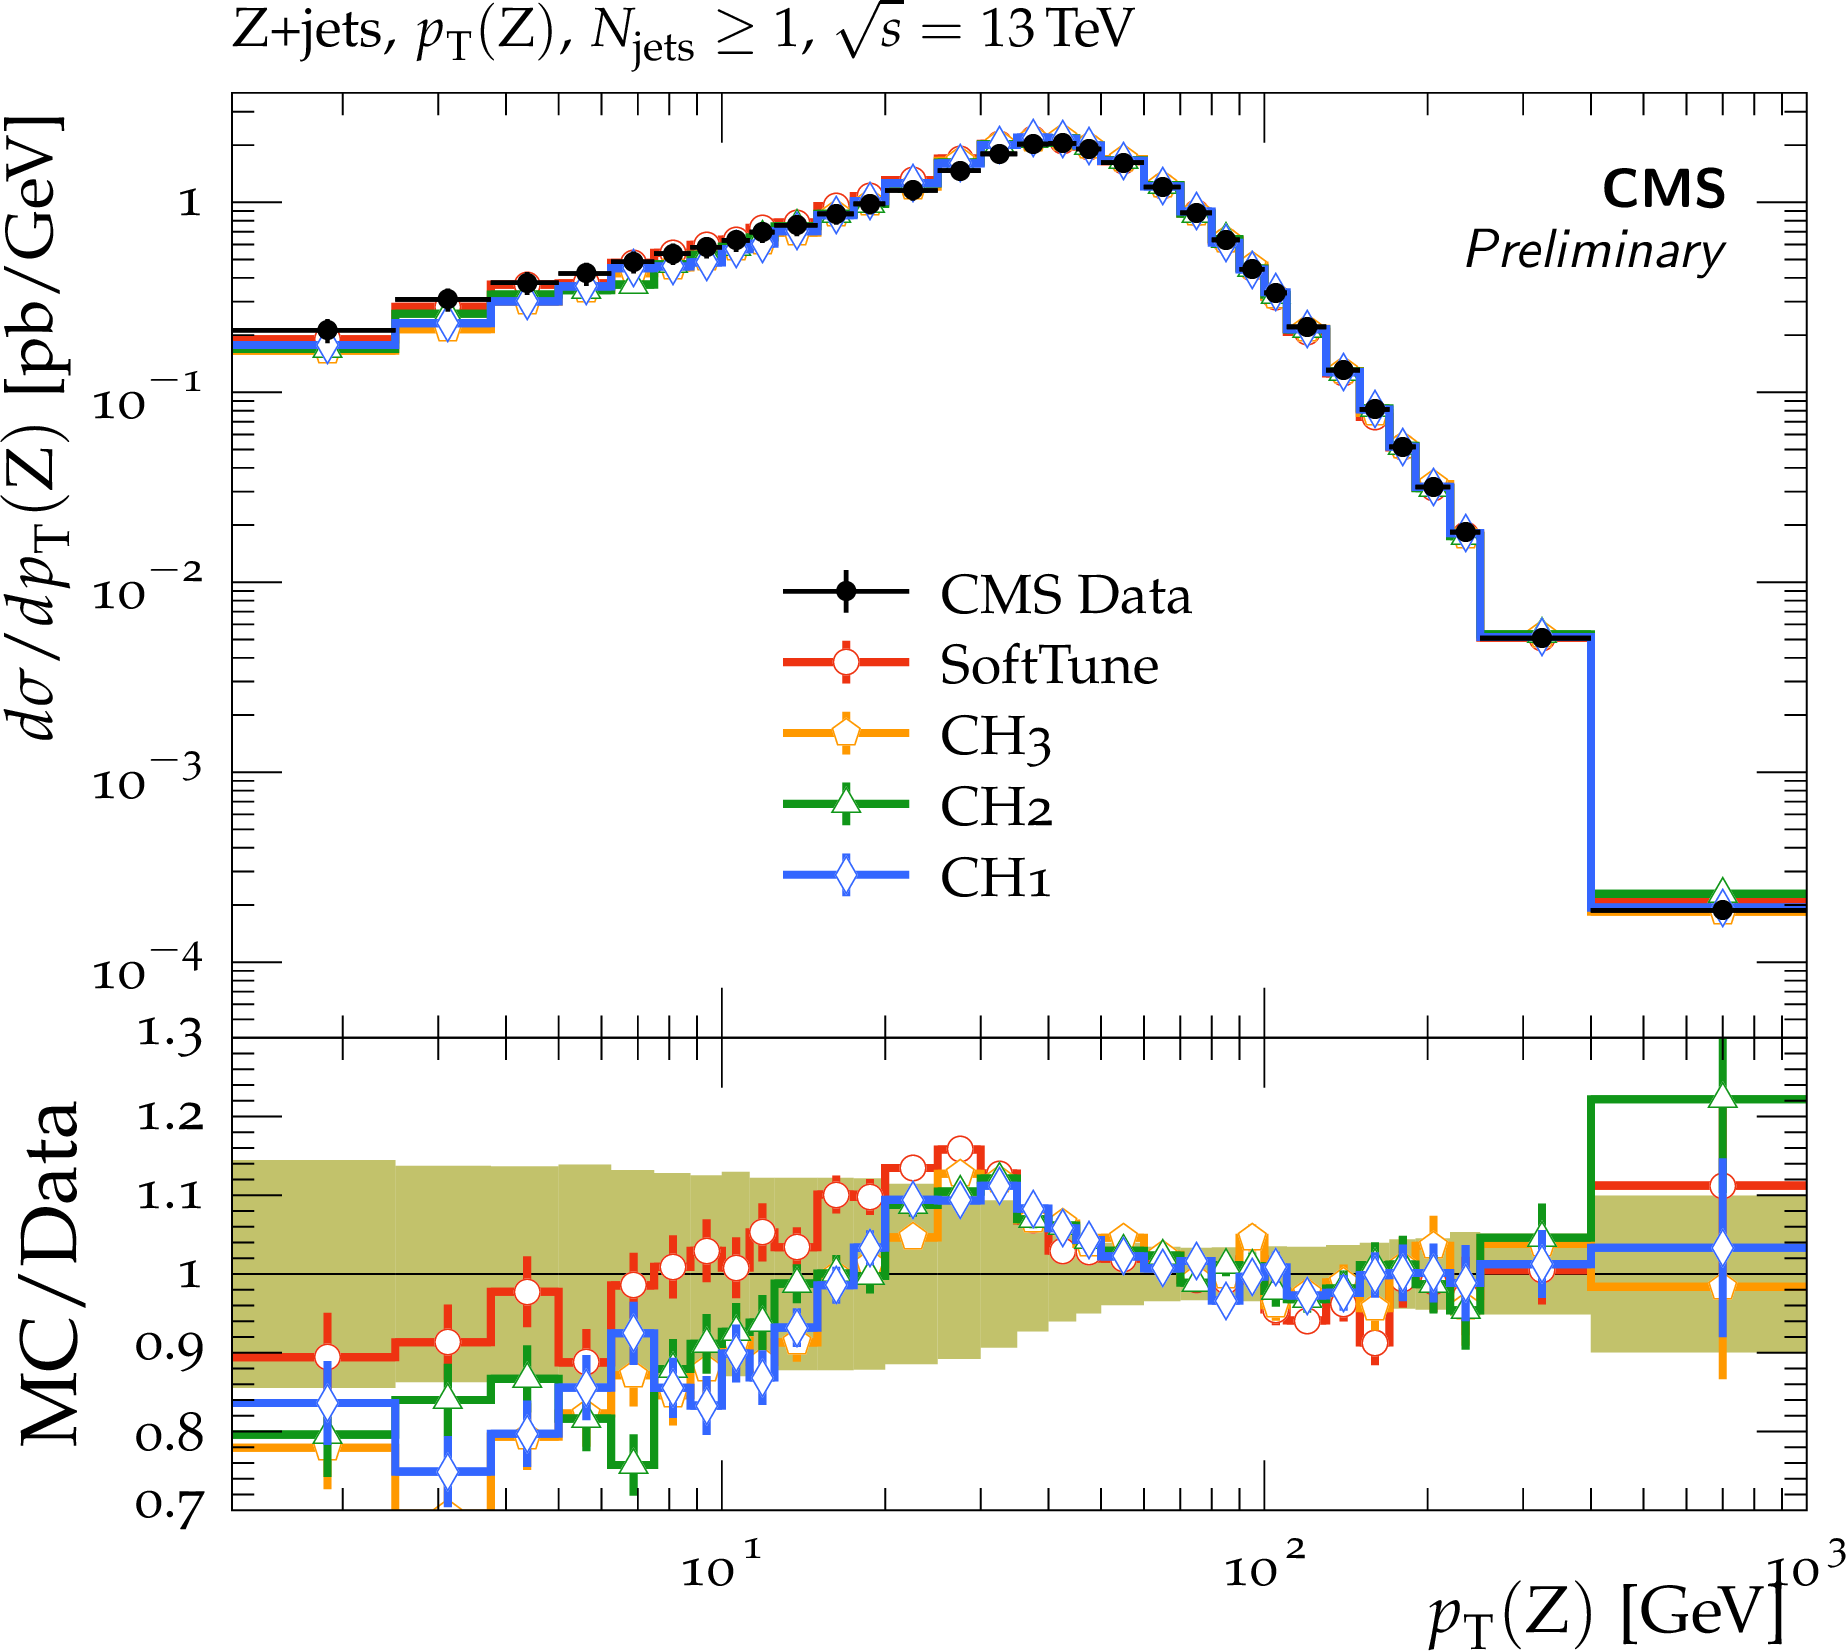
Figure 17:
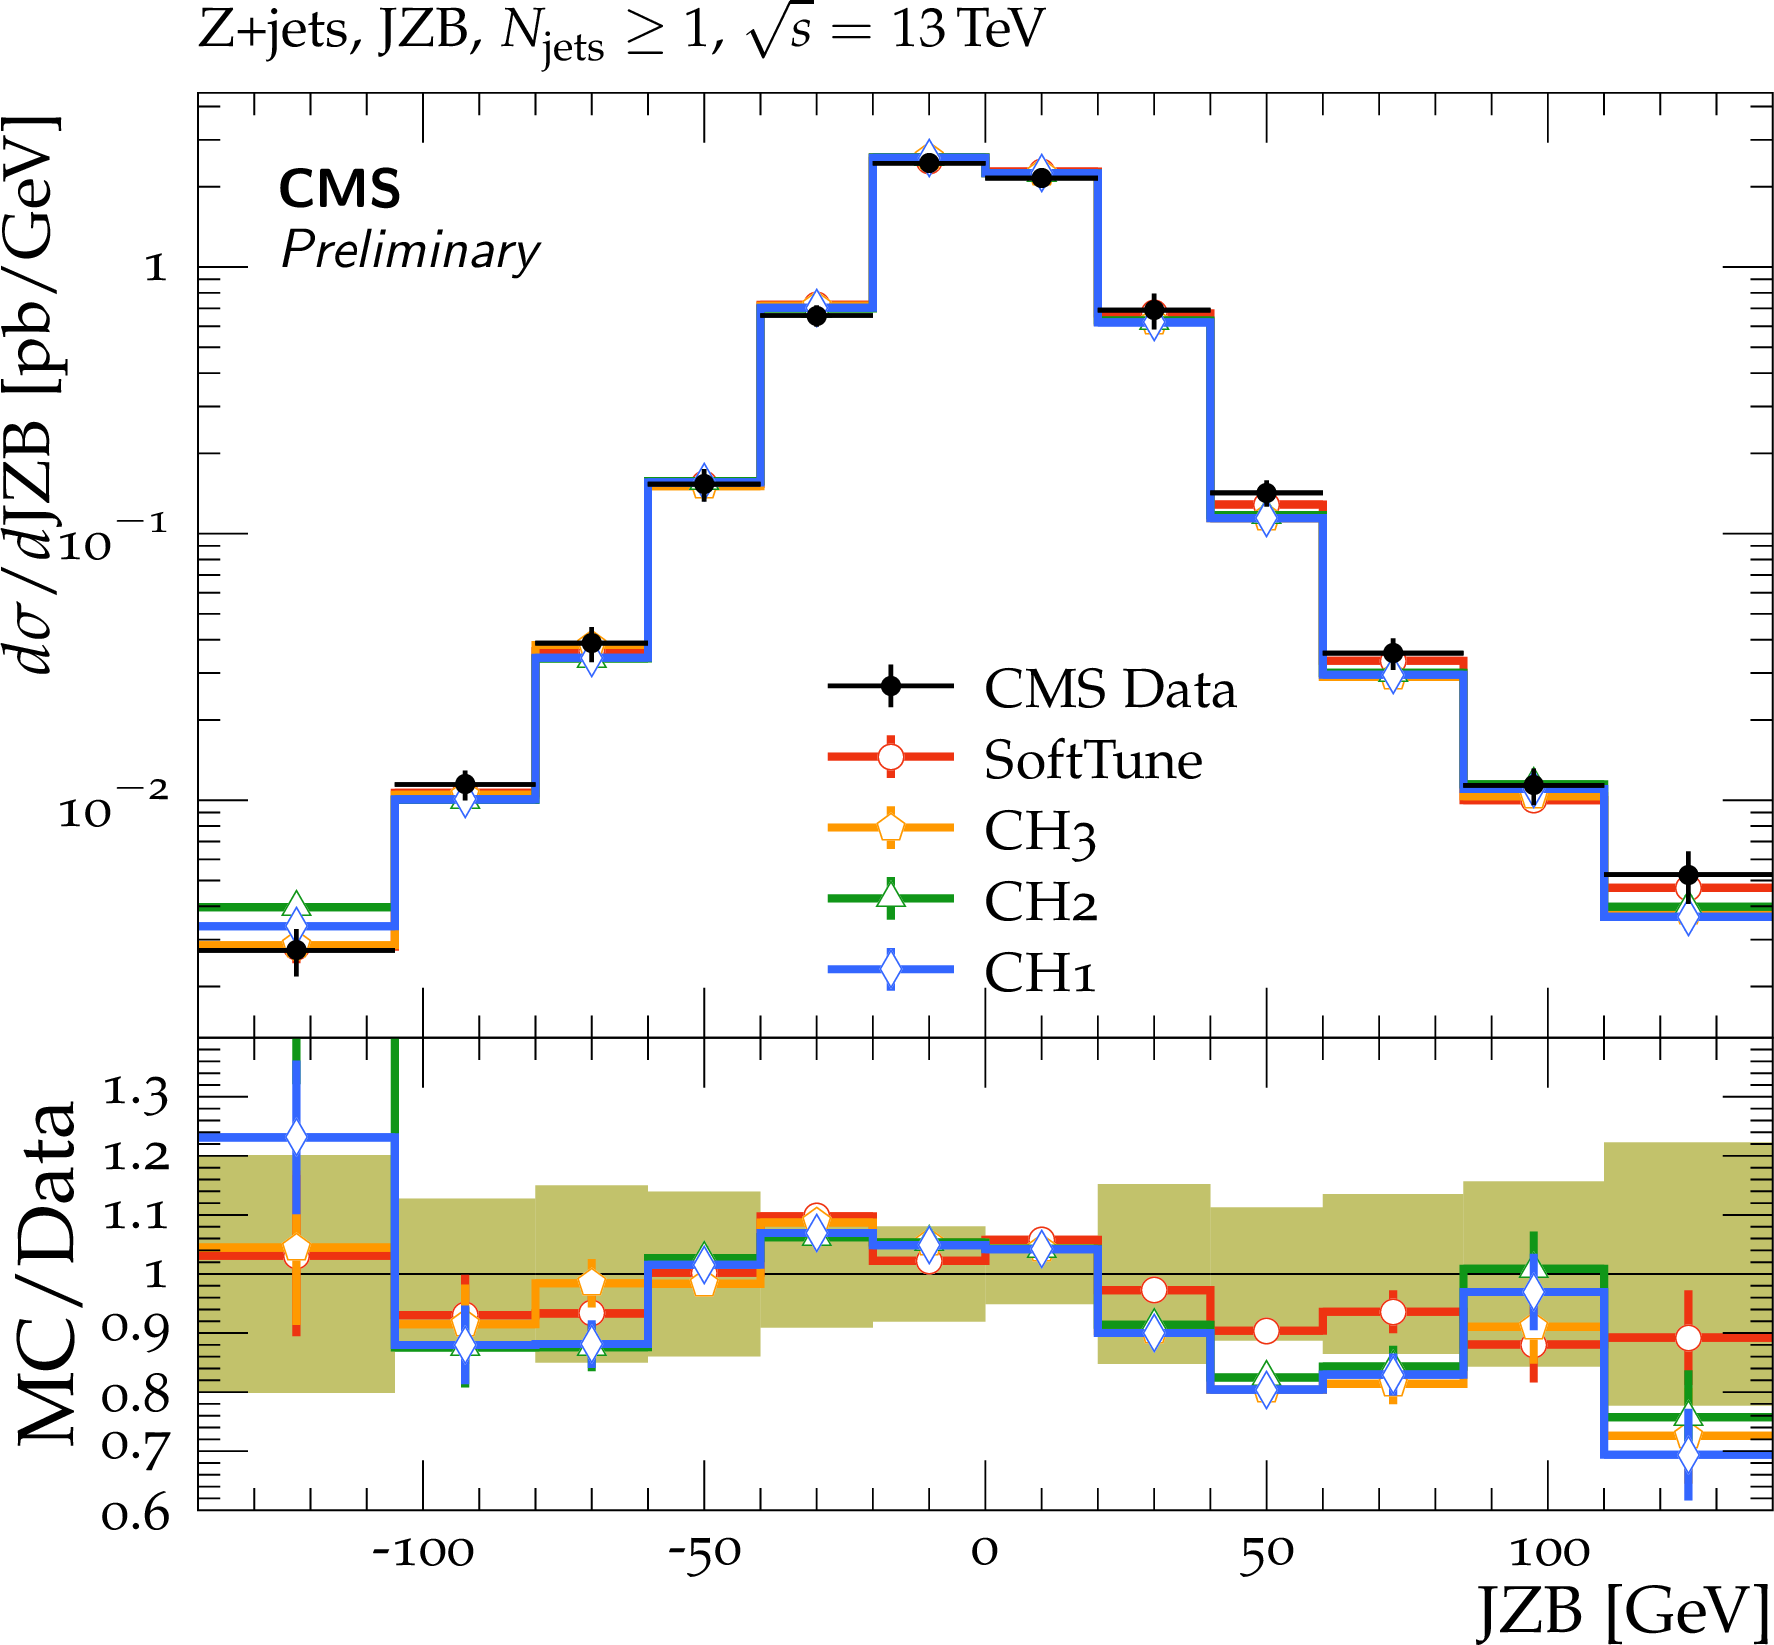
CMS data on Z boson production at $ {\sqrt {s}} = $ 13 TeV showing the measured distributions of ${{p_{\mathrm {T}}} ({\mathrm{Z}})}$ (upper left), ${{p_{\mathrm {T}}} ^{\mathrm {bal}}}$ (upper right), and JZB (lower) [43]. The data are compared to predictions from MG5_aMC@NLO + HERWIG 7, with the SoftTune and CH tunes. The coloured band in the ratios of the different predictions from simulation to the data represents the total experimental uncertainty in the data. |
png pdf |
Figure 17-a:
CMS data on Z boson production at $ {\sqrt {s}} = $ 13 TeV showing the measured distributions of ${{p_{\mathrm {T}}} ({\mathrm{Z}})}$ (upper left), ${{p_{\mathrm {T}}} ^{\mathrm {bal}}}$ (upper right), and JZB (lower) [43]. The data are compared to predictions from MG5_aMC@NLO + HERWIG 7, with the SoftTune and CH tunes. The coloured band in the ratios of the different predictions from simulation to the data represents the total experimental uncertainty in the data. |
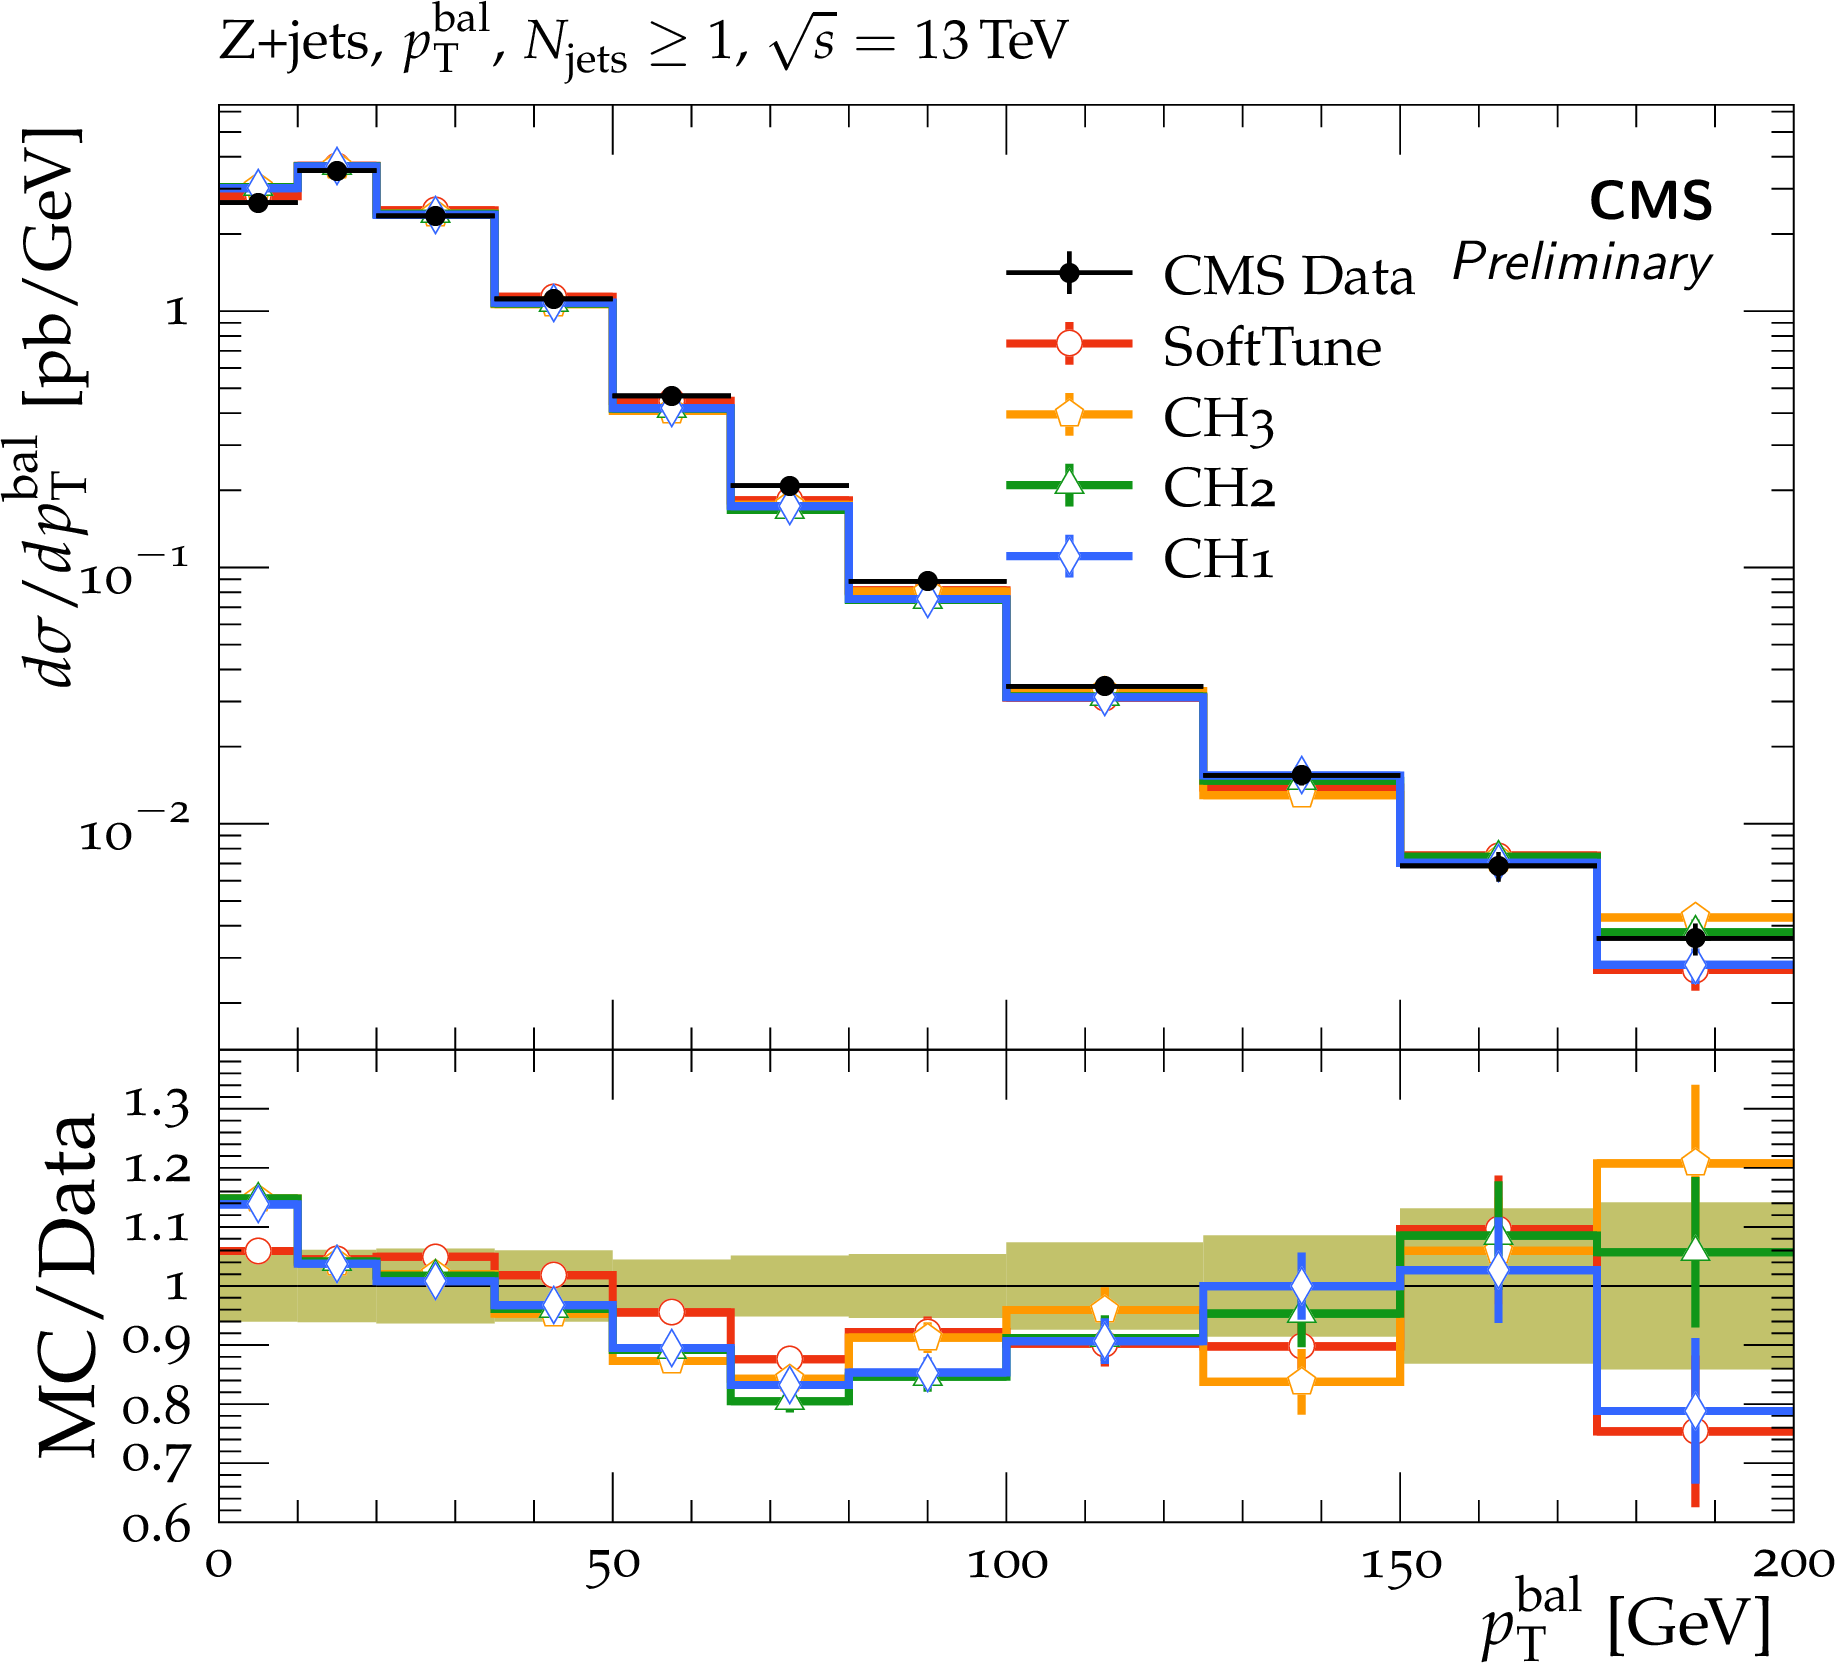
png pdf |
Figure 17-b:
CMS data on Z boson production at $ {\sqrt {s}} = $ 13 TeV showing the measured distributions of ${{p_{\mathrm {T}}} ({\mathrm{Z}})}$ (upper left), ${{p_{\mathrm {T}}} ^{\mathrm {bal}}}$ (upper right), and JZB (lower) [43]. The data are compared to predictions from MG5_aMC@NLO + HERWIG 7, with the SoftTune and CH tunes. The coloured band in the ratios of the different predictions from simulation to the data represents the total experimental uncertainty in the data. |
png pdf |
Figure 17-c:
CMS data on Z boson production at $ {\sqrt {s}} = $ 13 TeV showing the measured distributions of ${{p_{\mathrm {T}}} ({\mathrm{Z}})}$ (upper left), ${{p_{\mathrm {T}}} ^{\mathrm {bal}}}$ (upper right), and JZB (lower) [43]. The data are compared to predictions from MG5_aMC@NLO + HERWIG 7, with the SoftTune and CH tunes. The coloured band in the ratios of the different predictions from simulation to the data represents the total experimental uncertainty in the data. |
png pdf |
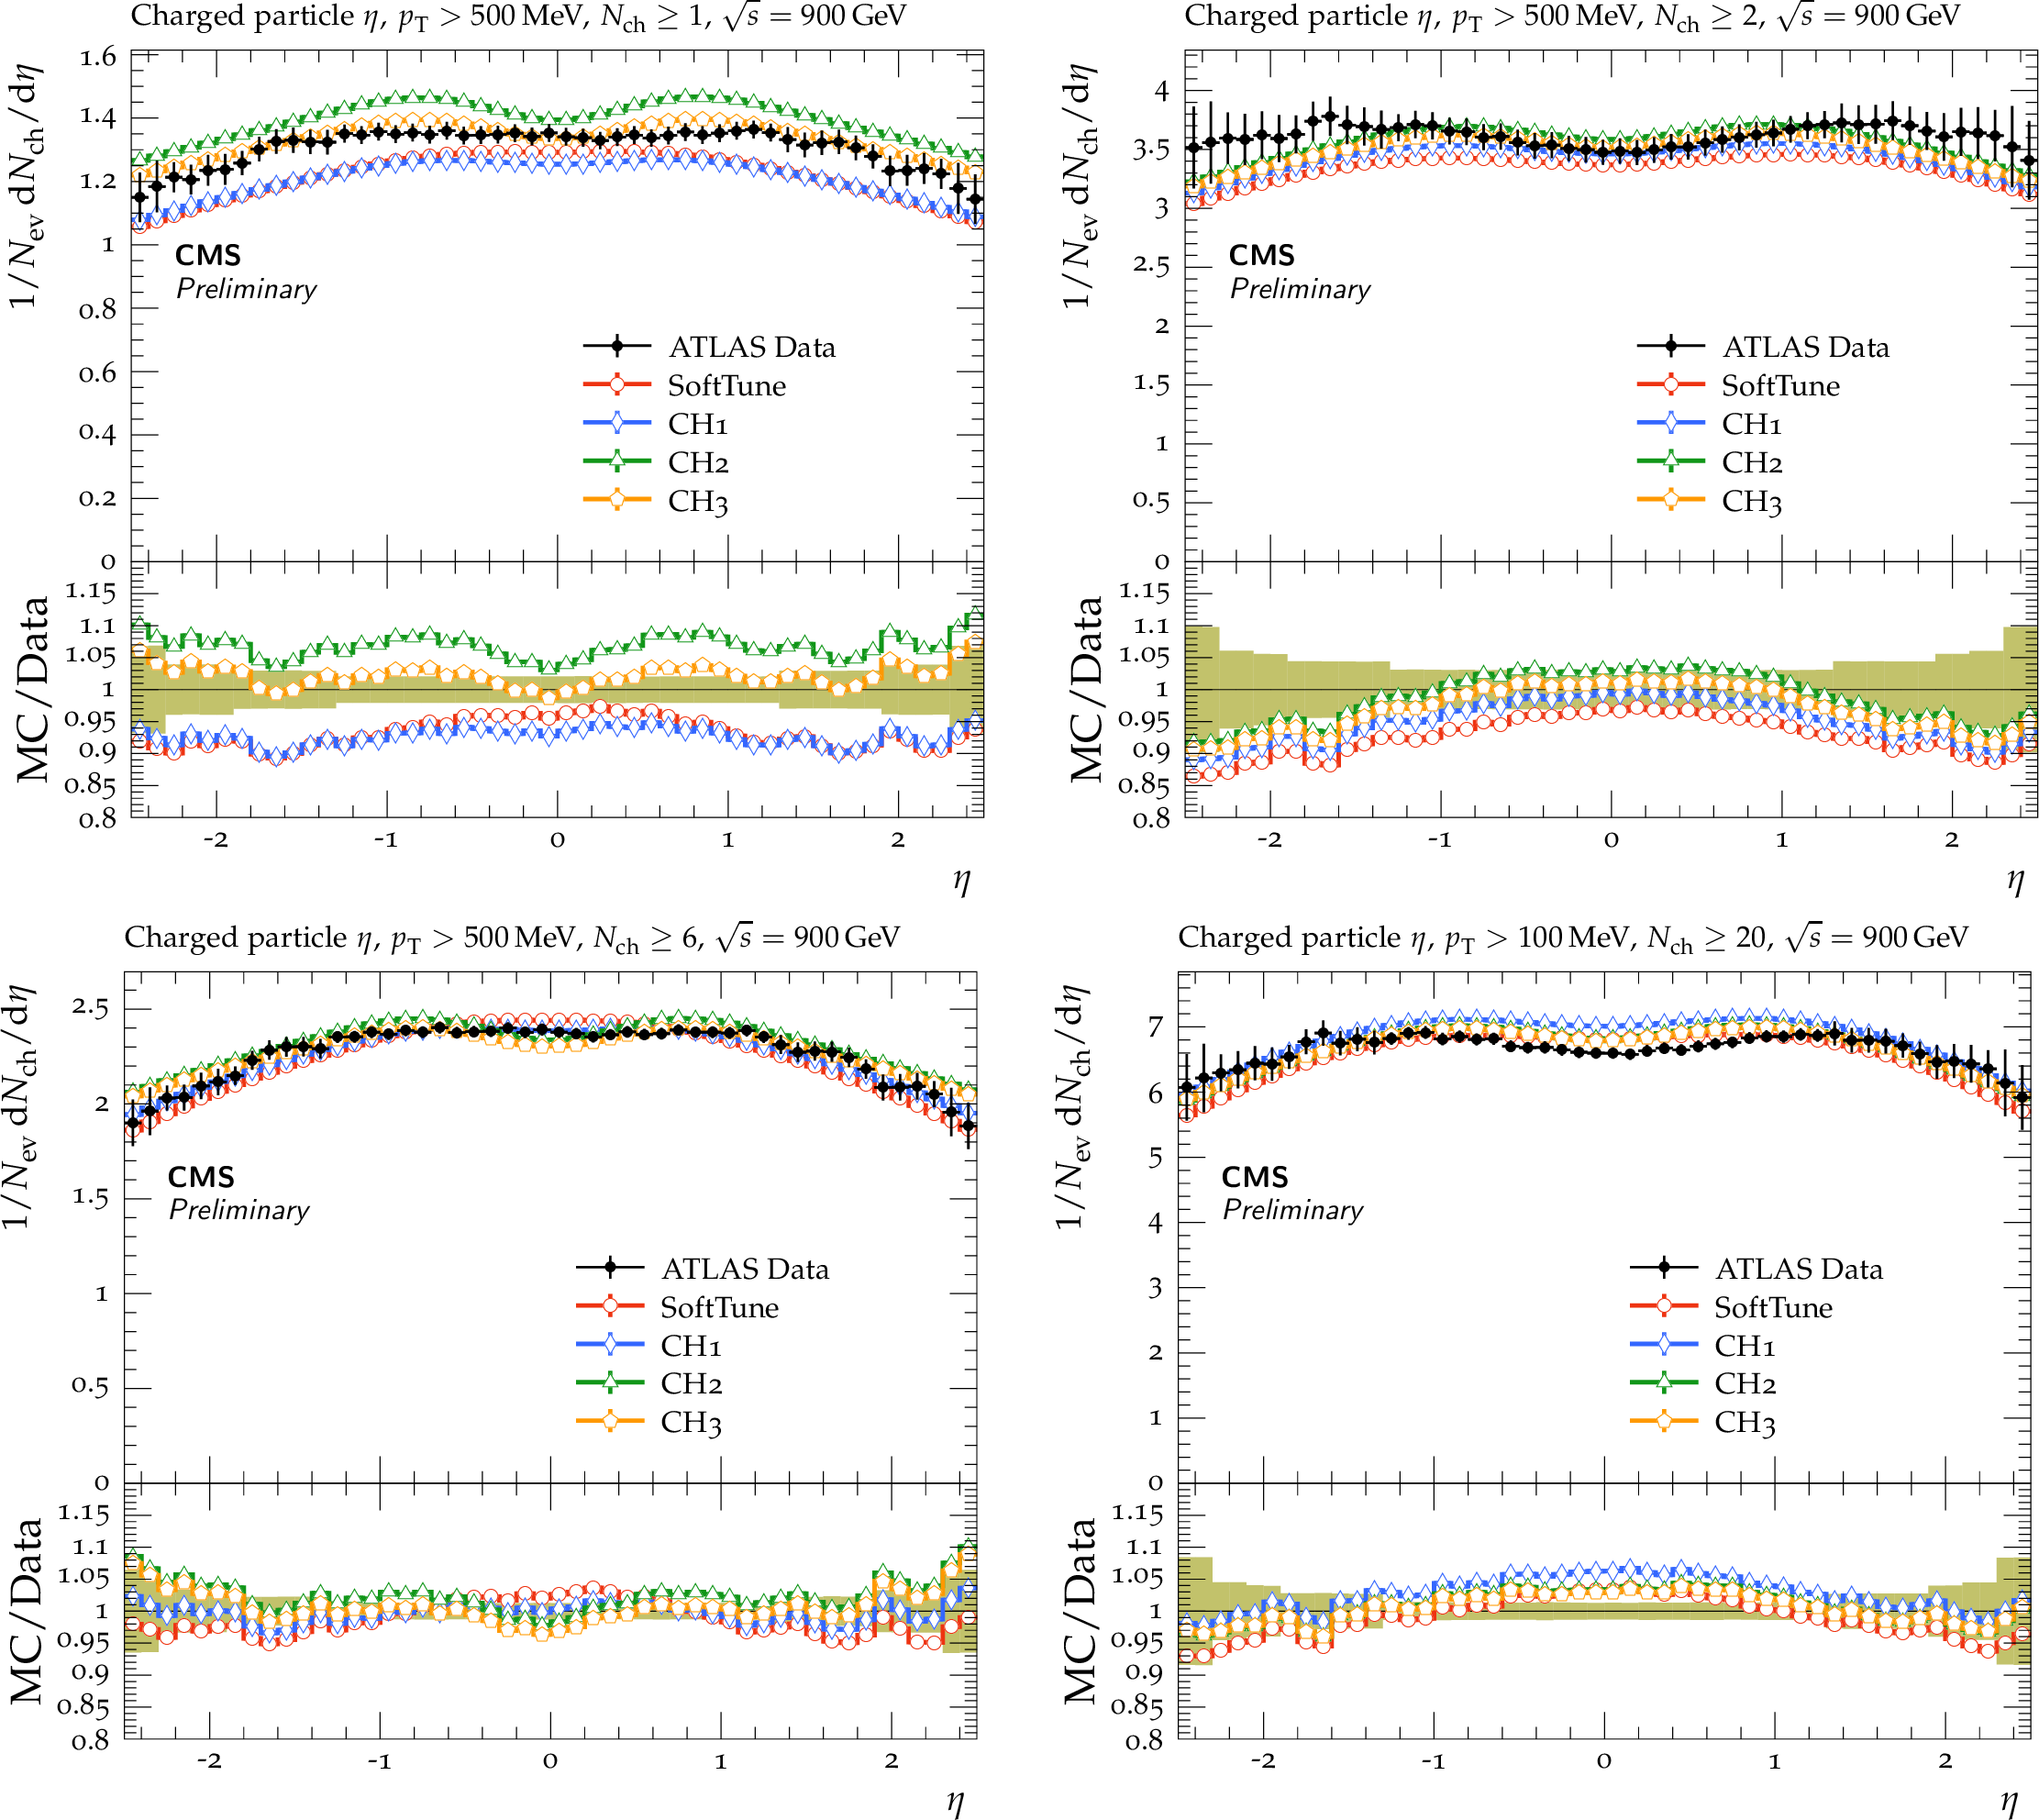
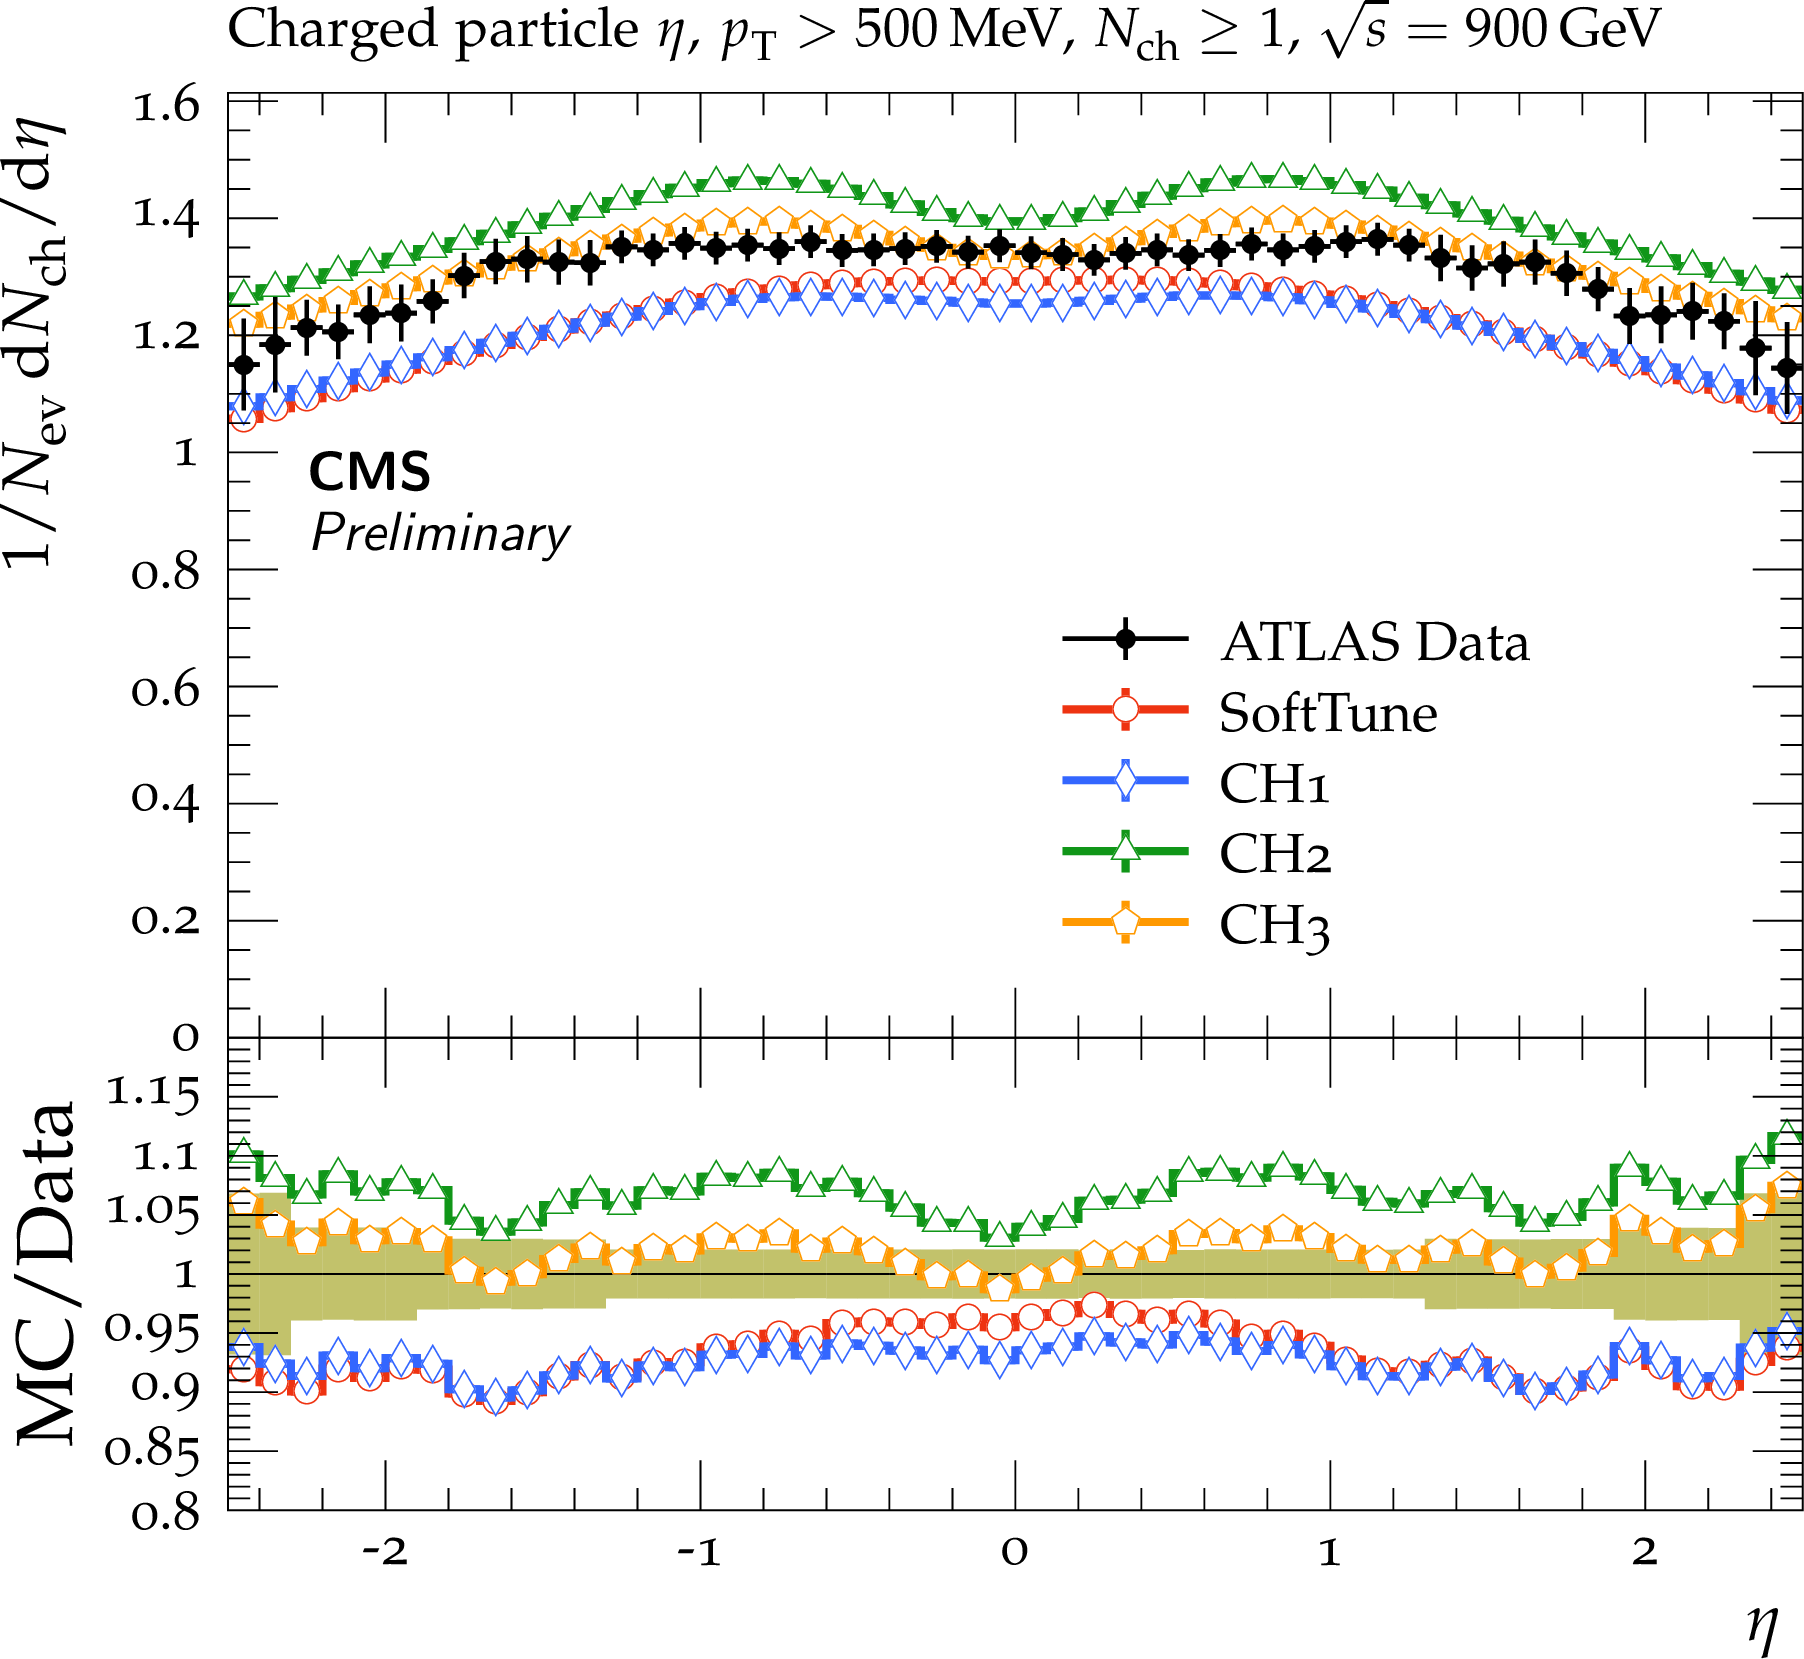
Figure 18:
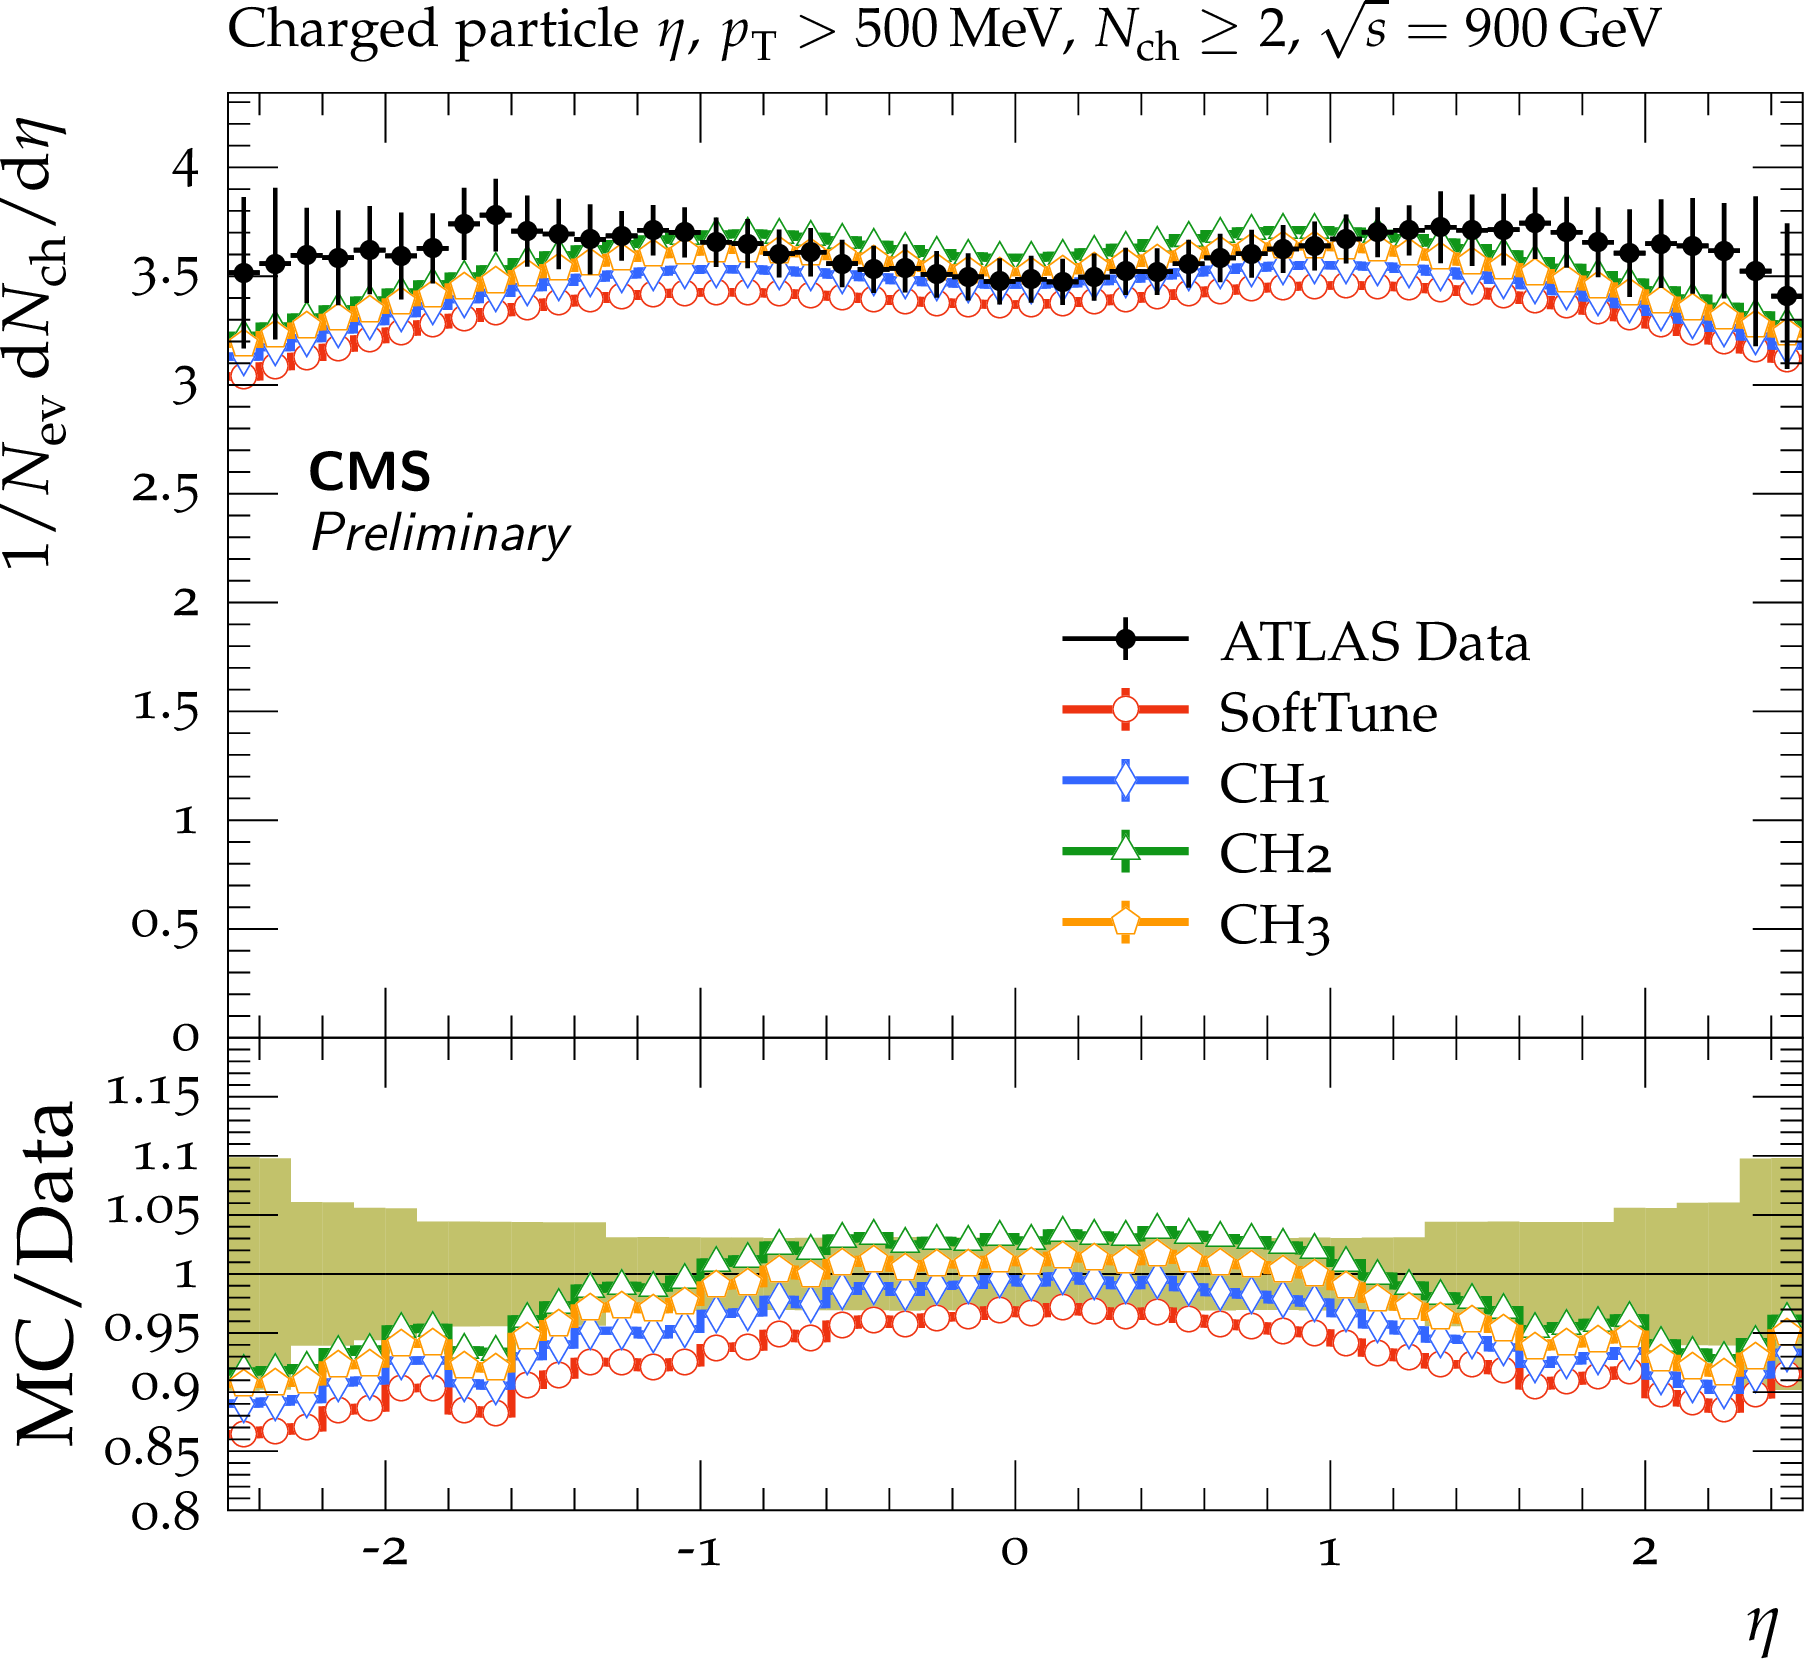
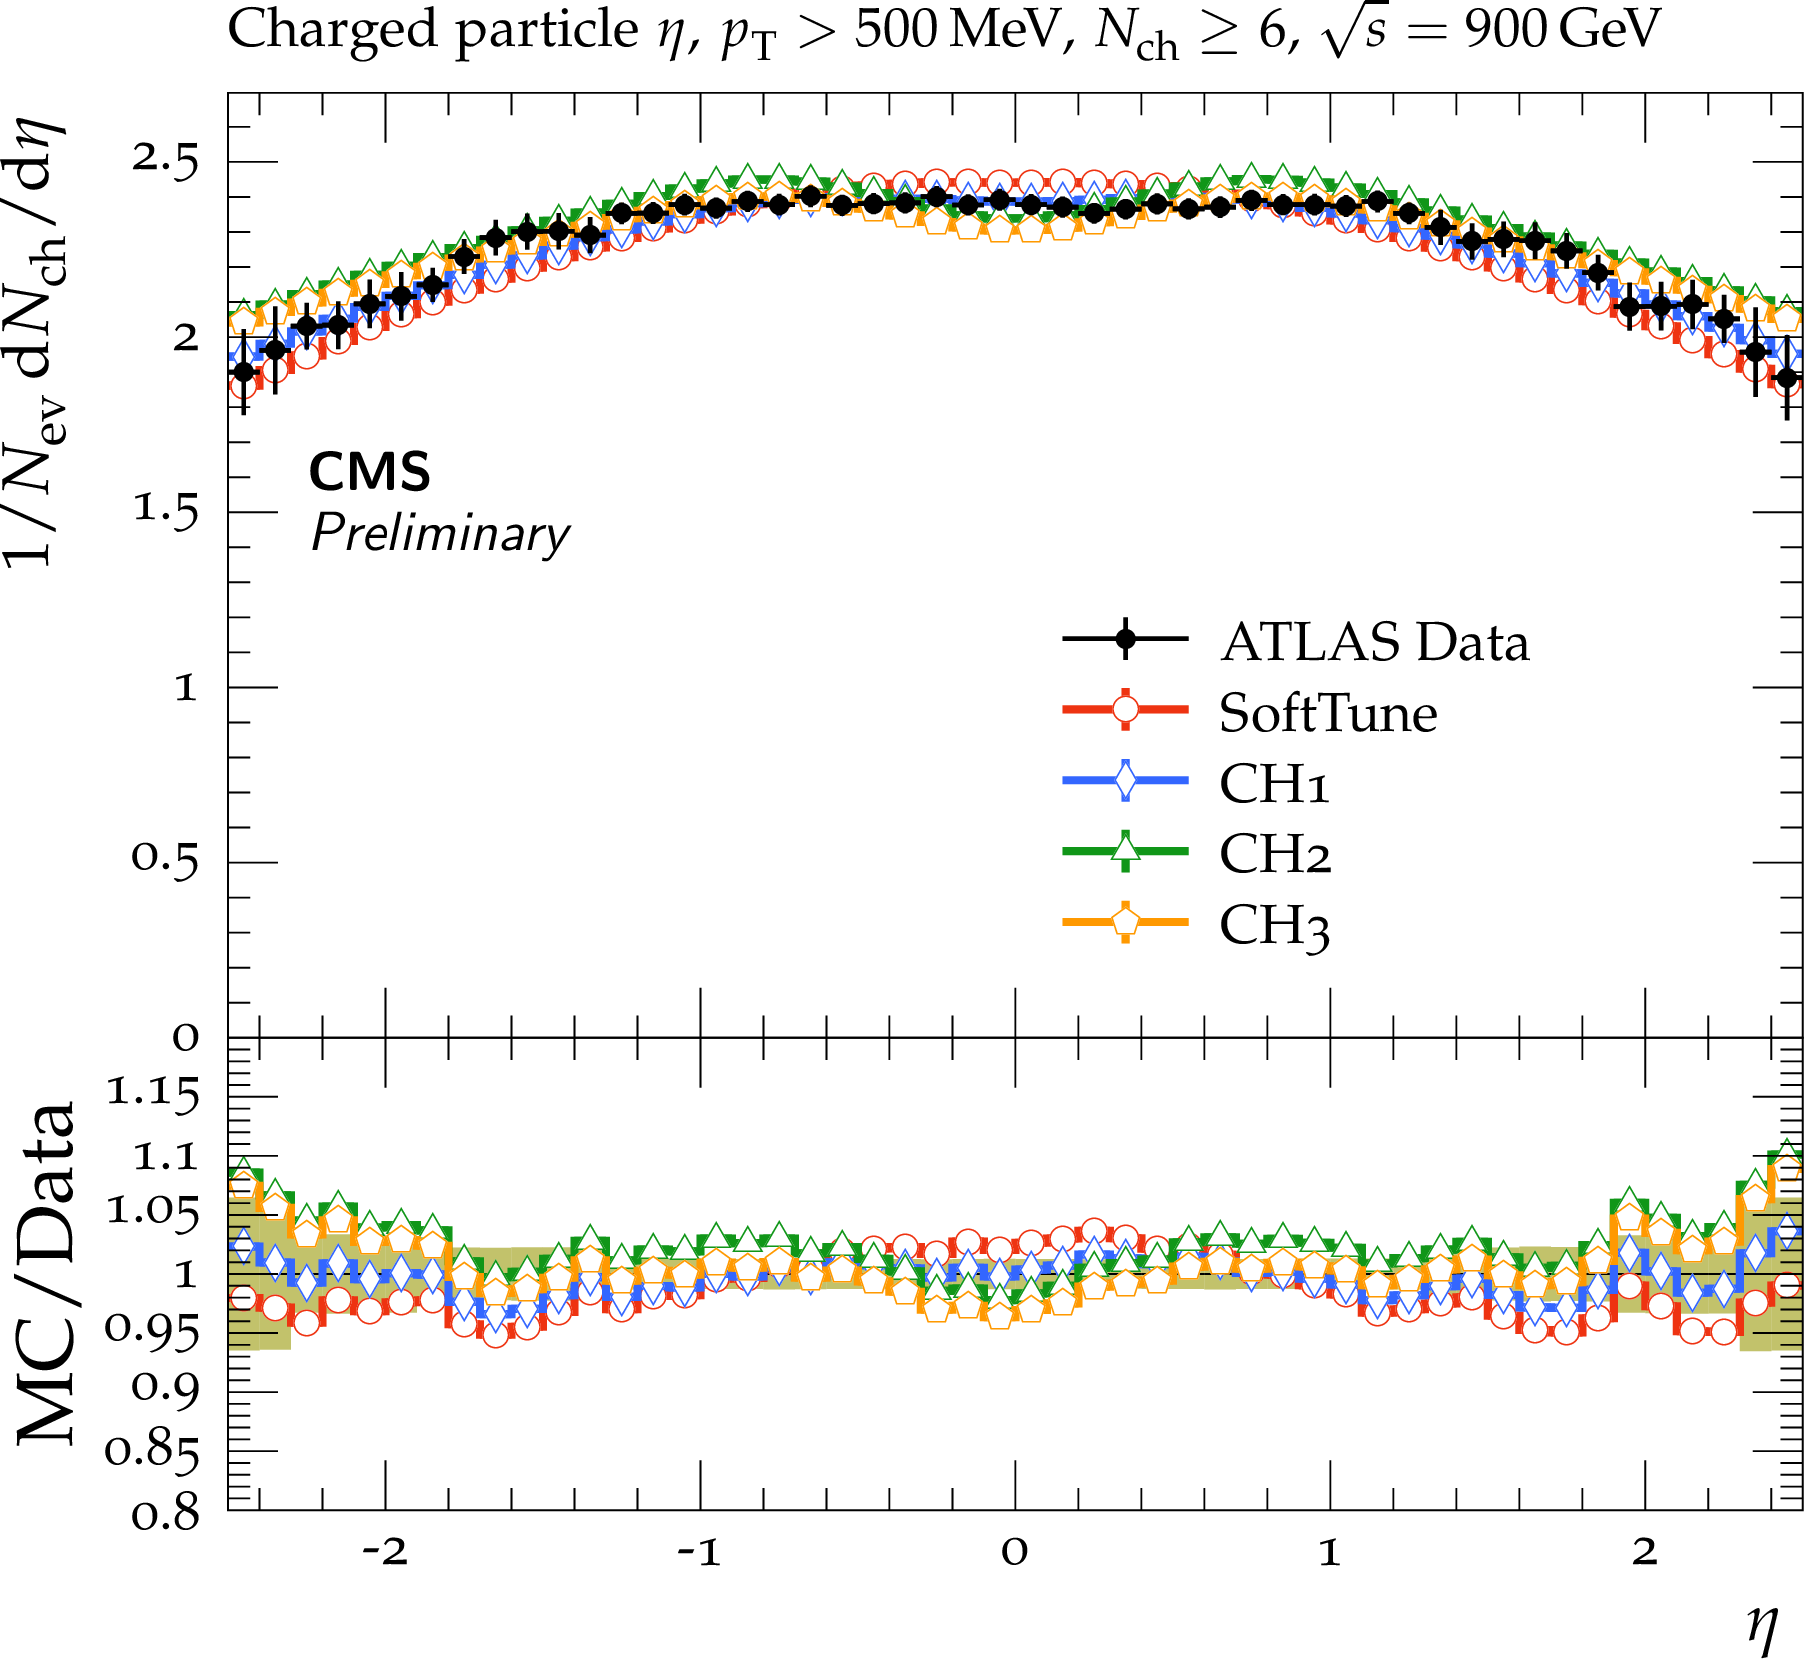
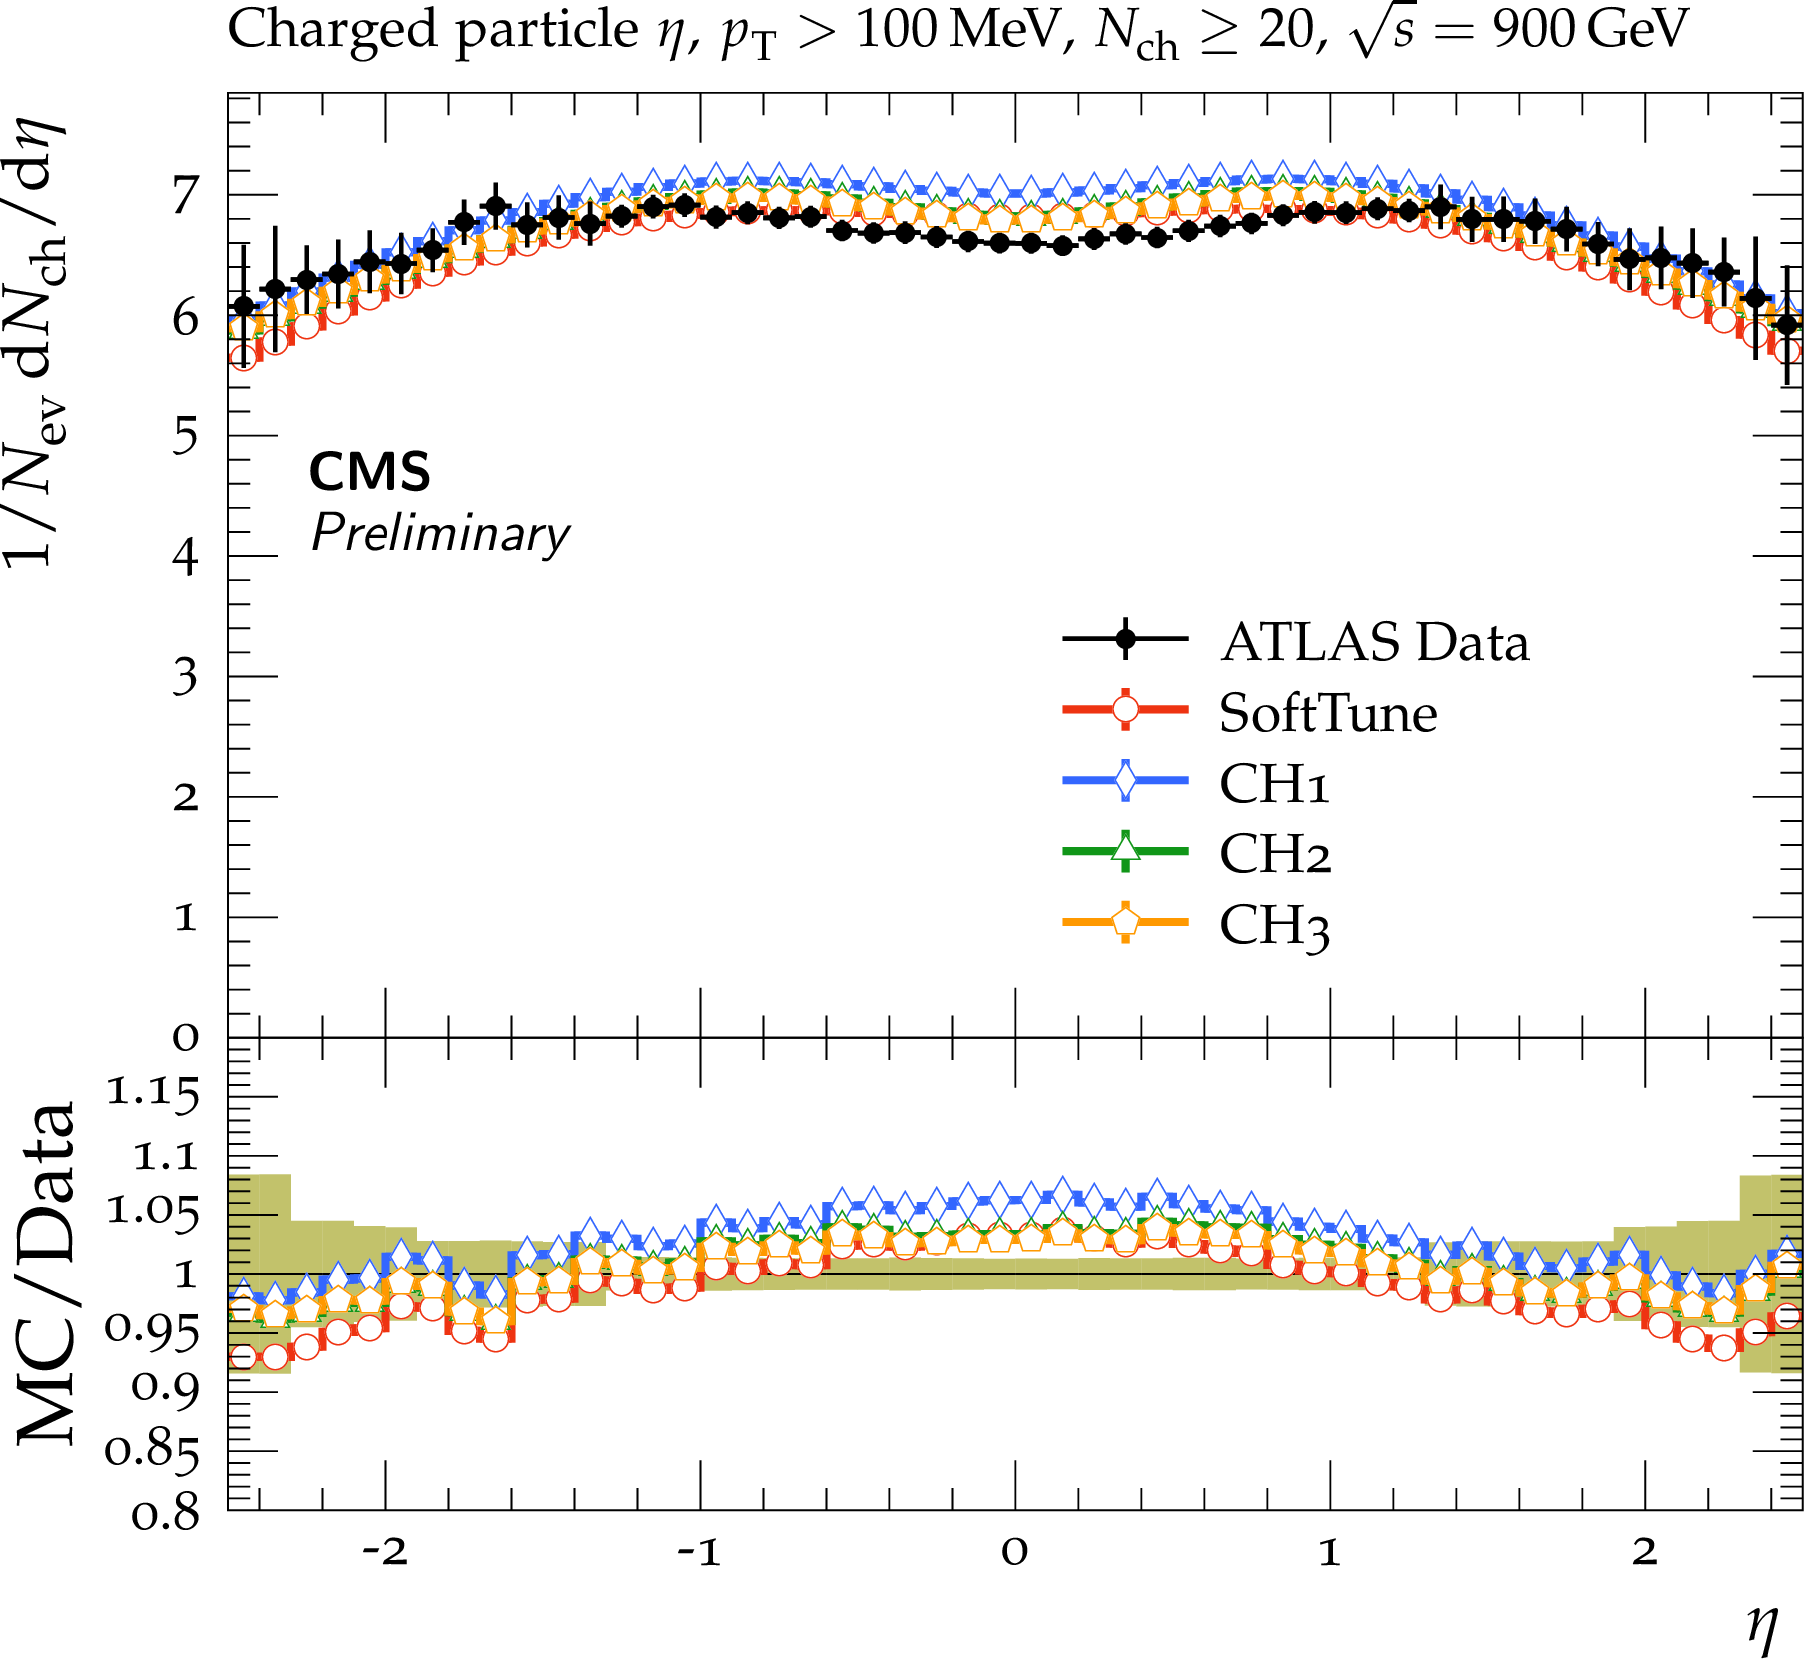
ATLAS data at $ {\sqrt {s}} = $ 900 GeV [45] on the pseudorapidity of charged particles for $ {N_{\mathrm {ch}}} \ge $ 1 (upper left), $ {N_{\mathrm {ch}}} \ge $ 2 (upper right), $ {N_{\mathrm {ch}}} \ge $ 6 (lower left), $ {N_{\mathrm {ch}}} \ge $ 20 (lower right). The data are compared to predictions from HERWIG 7, with the SoftTune and CH tunes. The coloured band in the ratios of the different predictions from simulation to the data represents the total experimental uncertainty in the data. |
png pdf |
Figure 18-a:
ATLAS data at $ {\sqrt {s}} = $ 900 GeV [45] on the pseudorapidity of charged particles for $ {N_{\mathrm {ch}}} \ge $ 1 (upper left), $ {N_{\mathrm {ch}}} \ge $ 2 (upper right), $ {N_{\mathrm {ch}}} \ge $ 6 (lower left), $ {N_{\mathrm {ch}}} \ge $ 20 (lower right). The data are compared to predictions from HERWIG 7, with the SoftTune and CH tunes. The coloured band in the ratios of the different predictions from simulation to the data represents the total experimental uncertainty in the data. |
png pdf |
Figure 18-b:
ATLAS data at $ {\sqrt {s}} = $ 900 GeV [45] on the pseudorapidity of charged particles for $ {N_{\mathrm {ch}}} \ge $ 1 (upper left), $ {N_{\mathrm {ch}}} \ge $ 2 (upper right), $ {N_{\mathrm {ch}}} \ge $ 6 (lower left), $ {N_{\mathrm {ch}}} \ge $ 20 (lower right). The data are compared to predictions from HERWIG 7, with the SoftTune and CH tunes. The coloured band in the ratios of the different predictions from simulation to the data represents the total experimental uncertainty in the data. |
png pdf |
Figure 18-c:
ATLAS data at $ {\sqrt {s}} = $ 900 GeV [45] on the pseudorapidity of charged particles for $ {N_{\mathrm {ch}}} \ge $ 1 (upper left), $ {N_{\mathrm {ch}}} \ge $ 2 (upper right), $ {N_{\mathrm {ch}}} \ge $ 6 (lower left), $ {N_{\mathrm {ch}}} \ge $ 20 (lower right). The data are compared to predictions from HERWIG 7, with the SoftTune and CH tunes. The coloured band in the ratios of the different predictions from simulation to the data represents the total experimental uncertainty in the data. |
png pdf |
Figure 18-d:
ATLAS data at $ {\sqrt {s}} = $ 900 GeV [45] on the pseudorapidity of charged particles for $ {N_{\mathrm {ch}}} \ge $ 1 (upper left), $ {N_{\mathrm {ch}}} \ge $ 2 (upper right), $ {N_{\mathrm {ch}}} \ge $ 6 (lower left), $ {N_{\mathrm {ch}}} \ge $ 20 (lower right). The data are compared to predictions from HERWIG 7, with the SoftTune and CH tunes. The coloured band in the ratios of the different predictions from simulation to the data represents the total experimental uncertainty in the data. |
png pdf |
Figure 19:
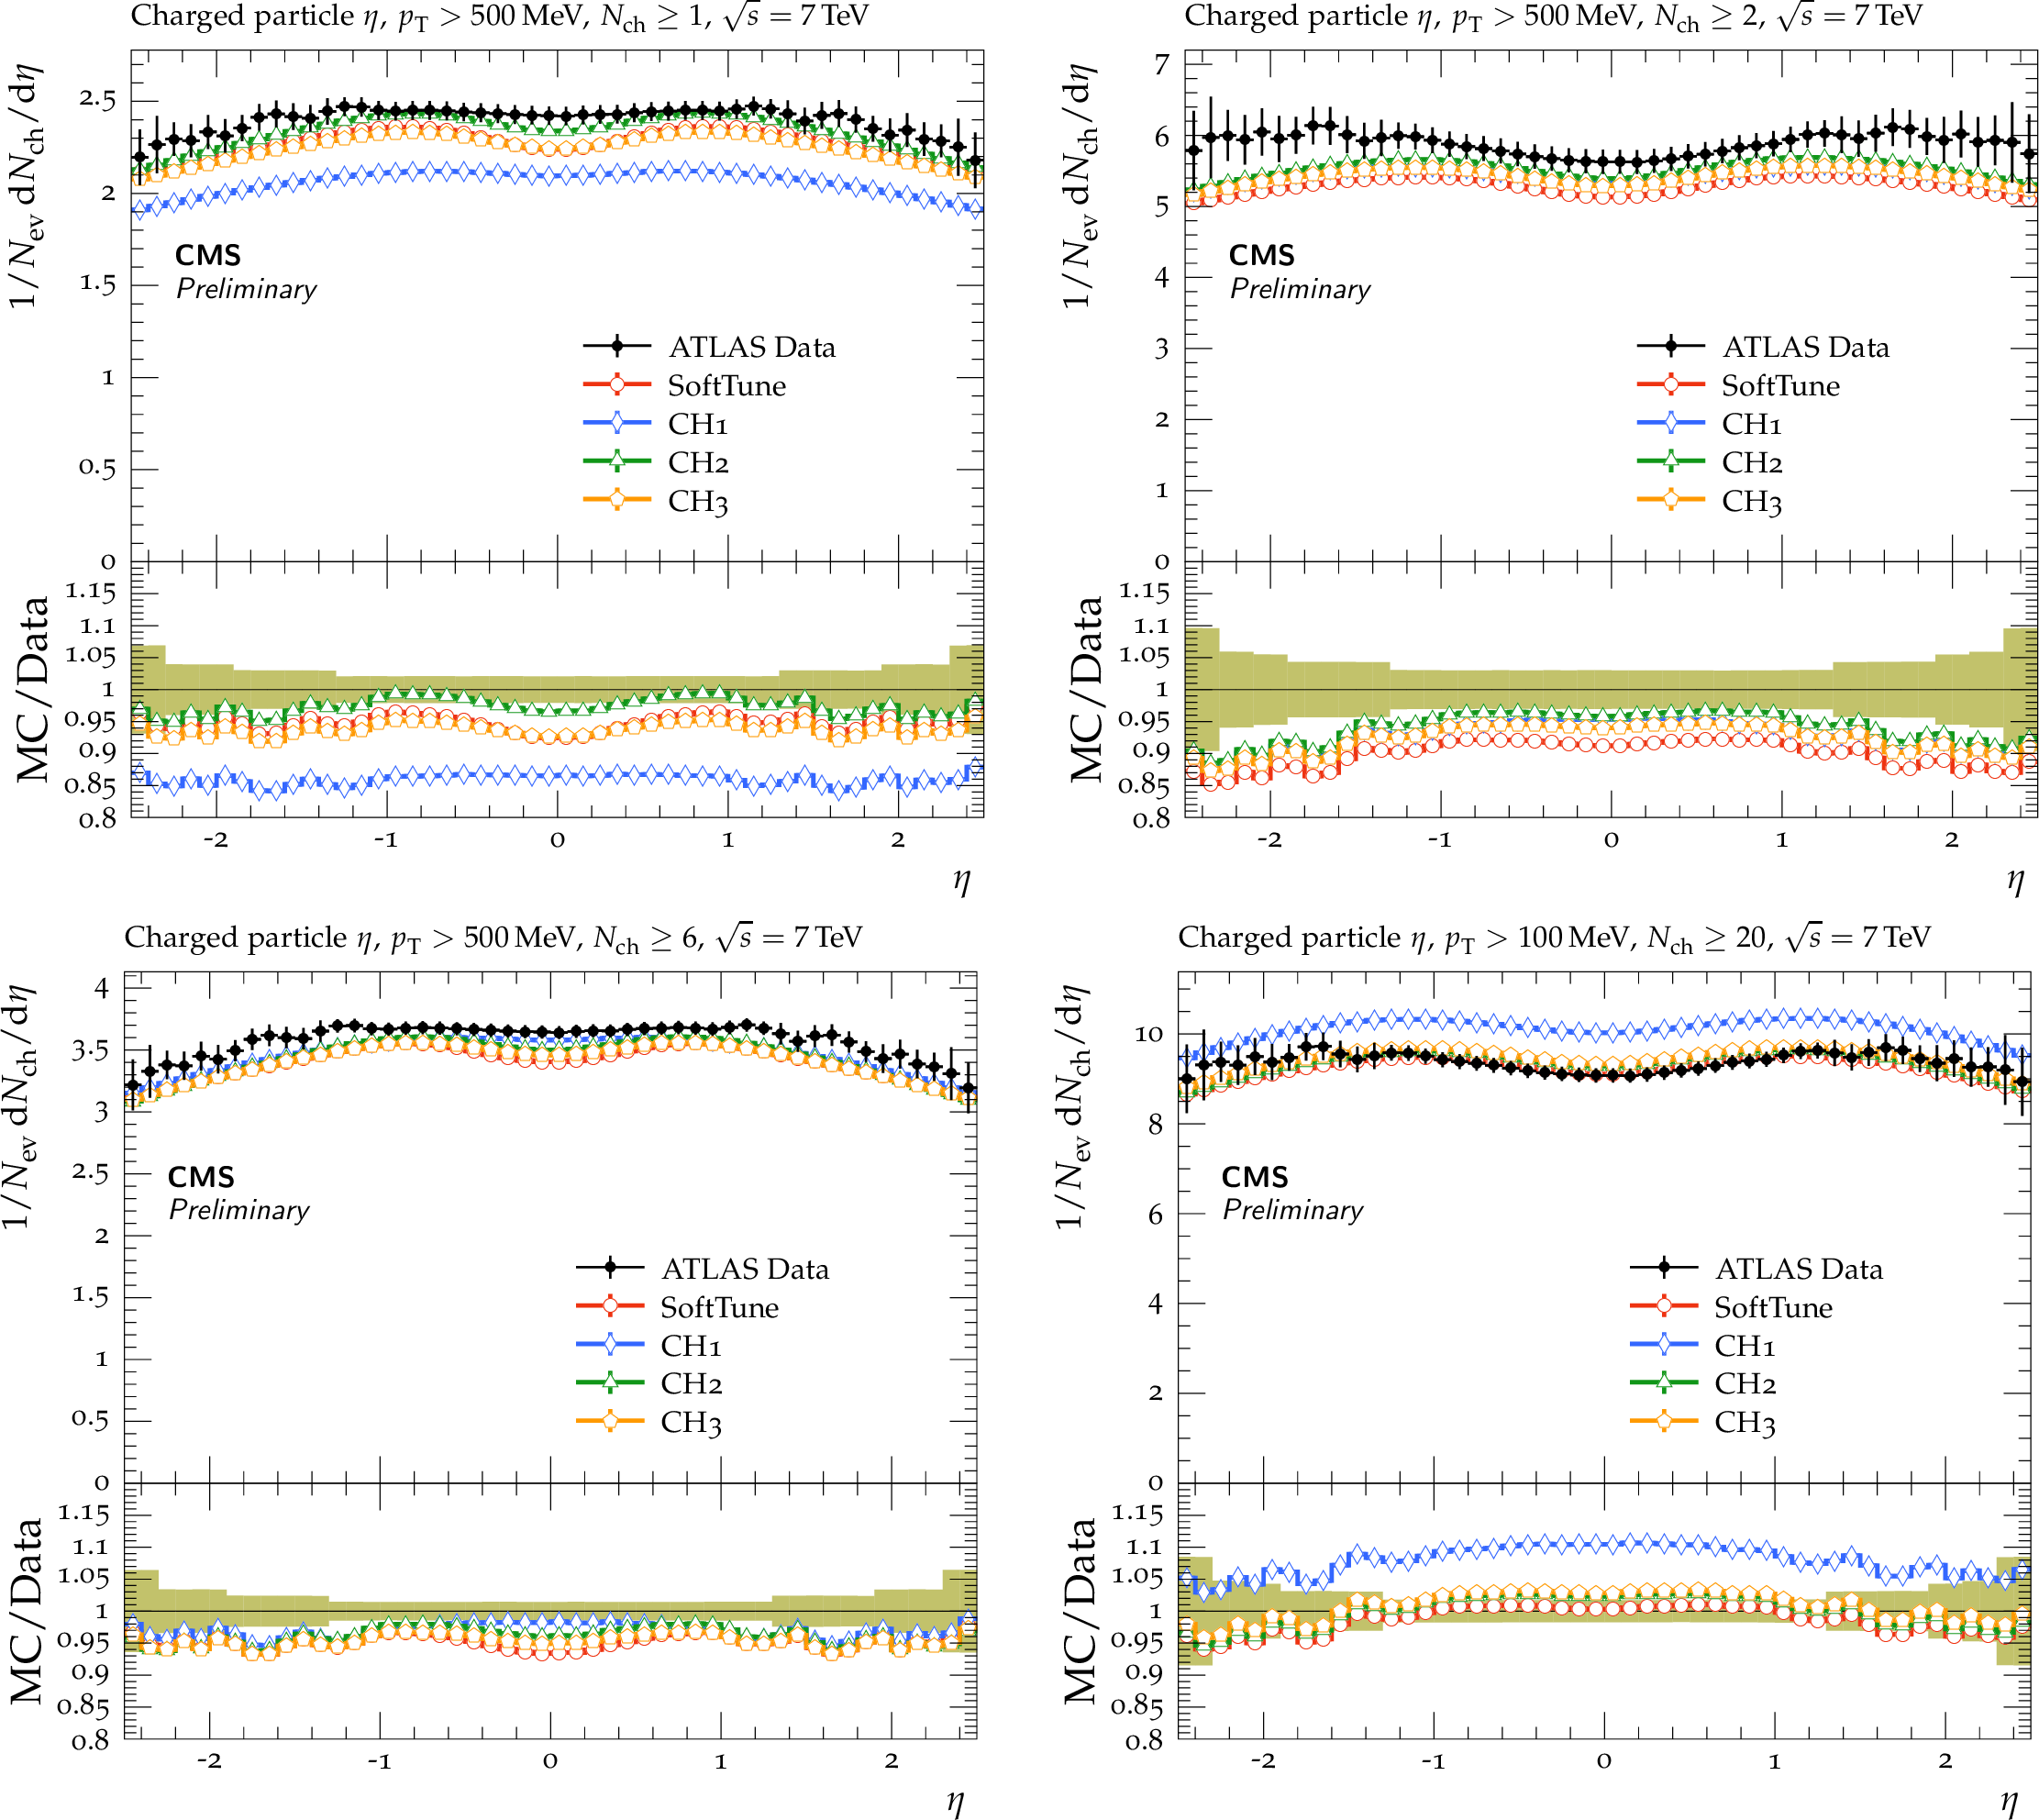
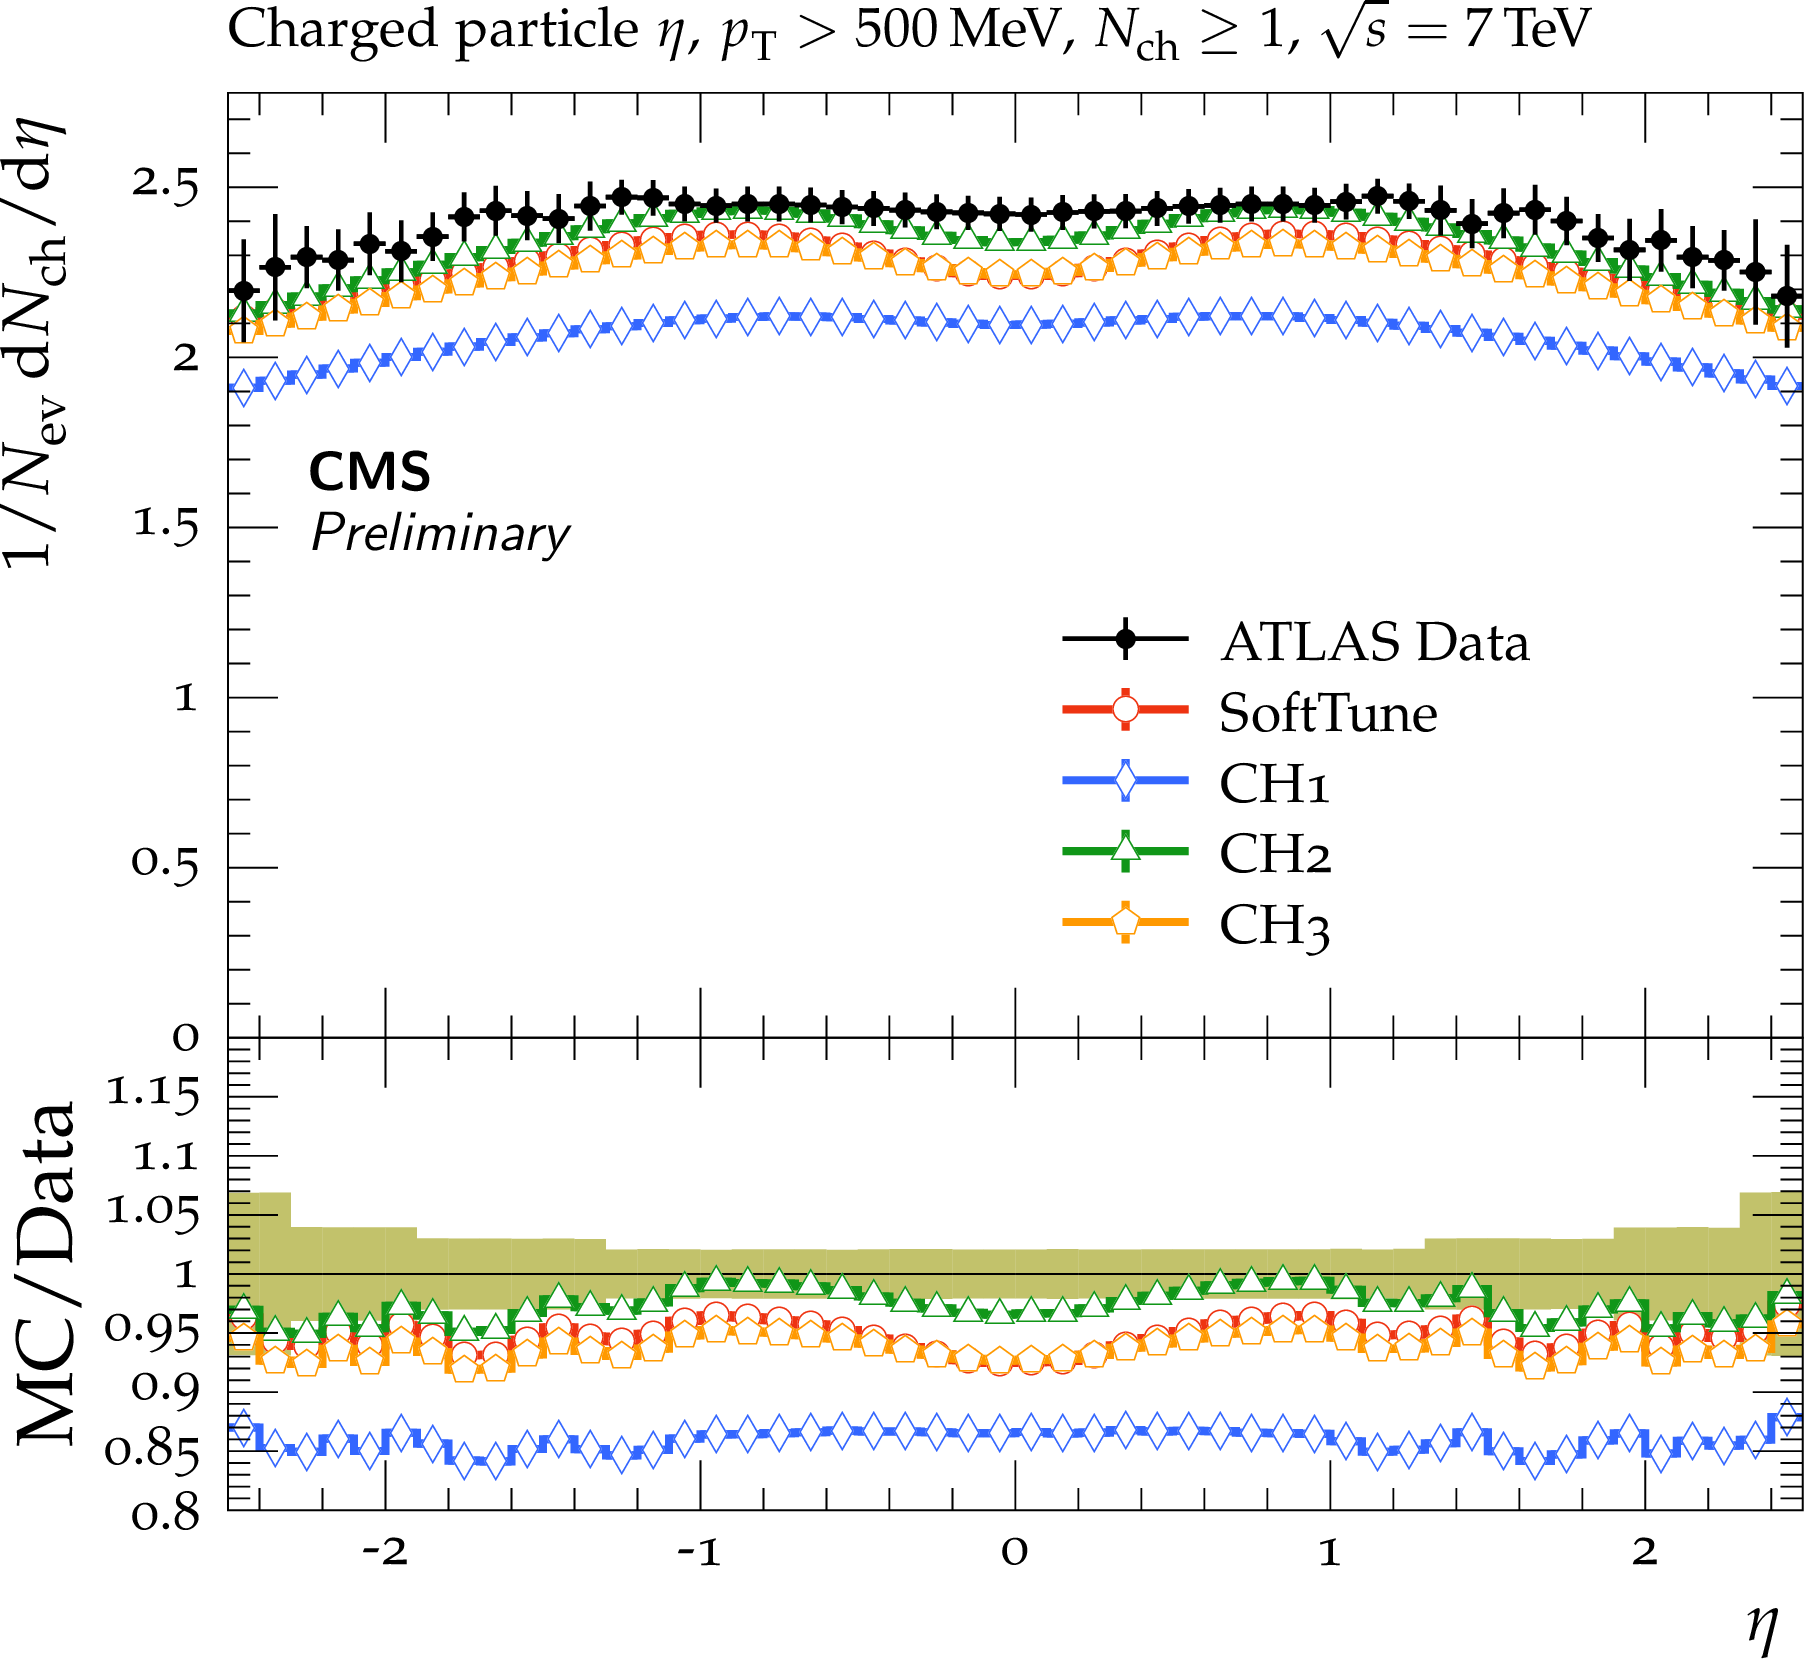
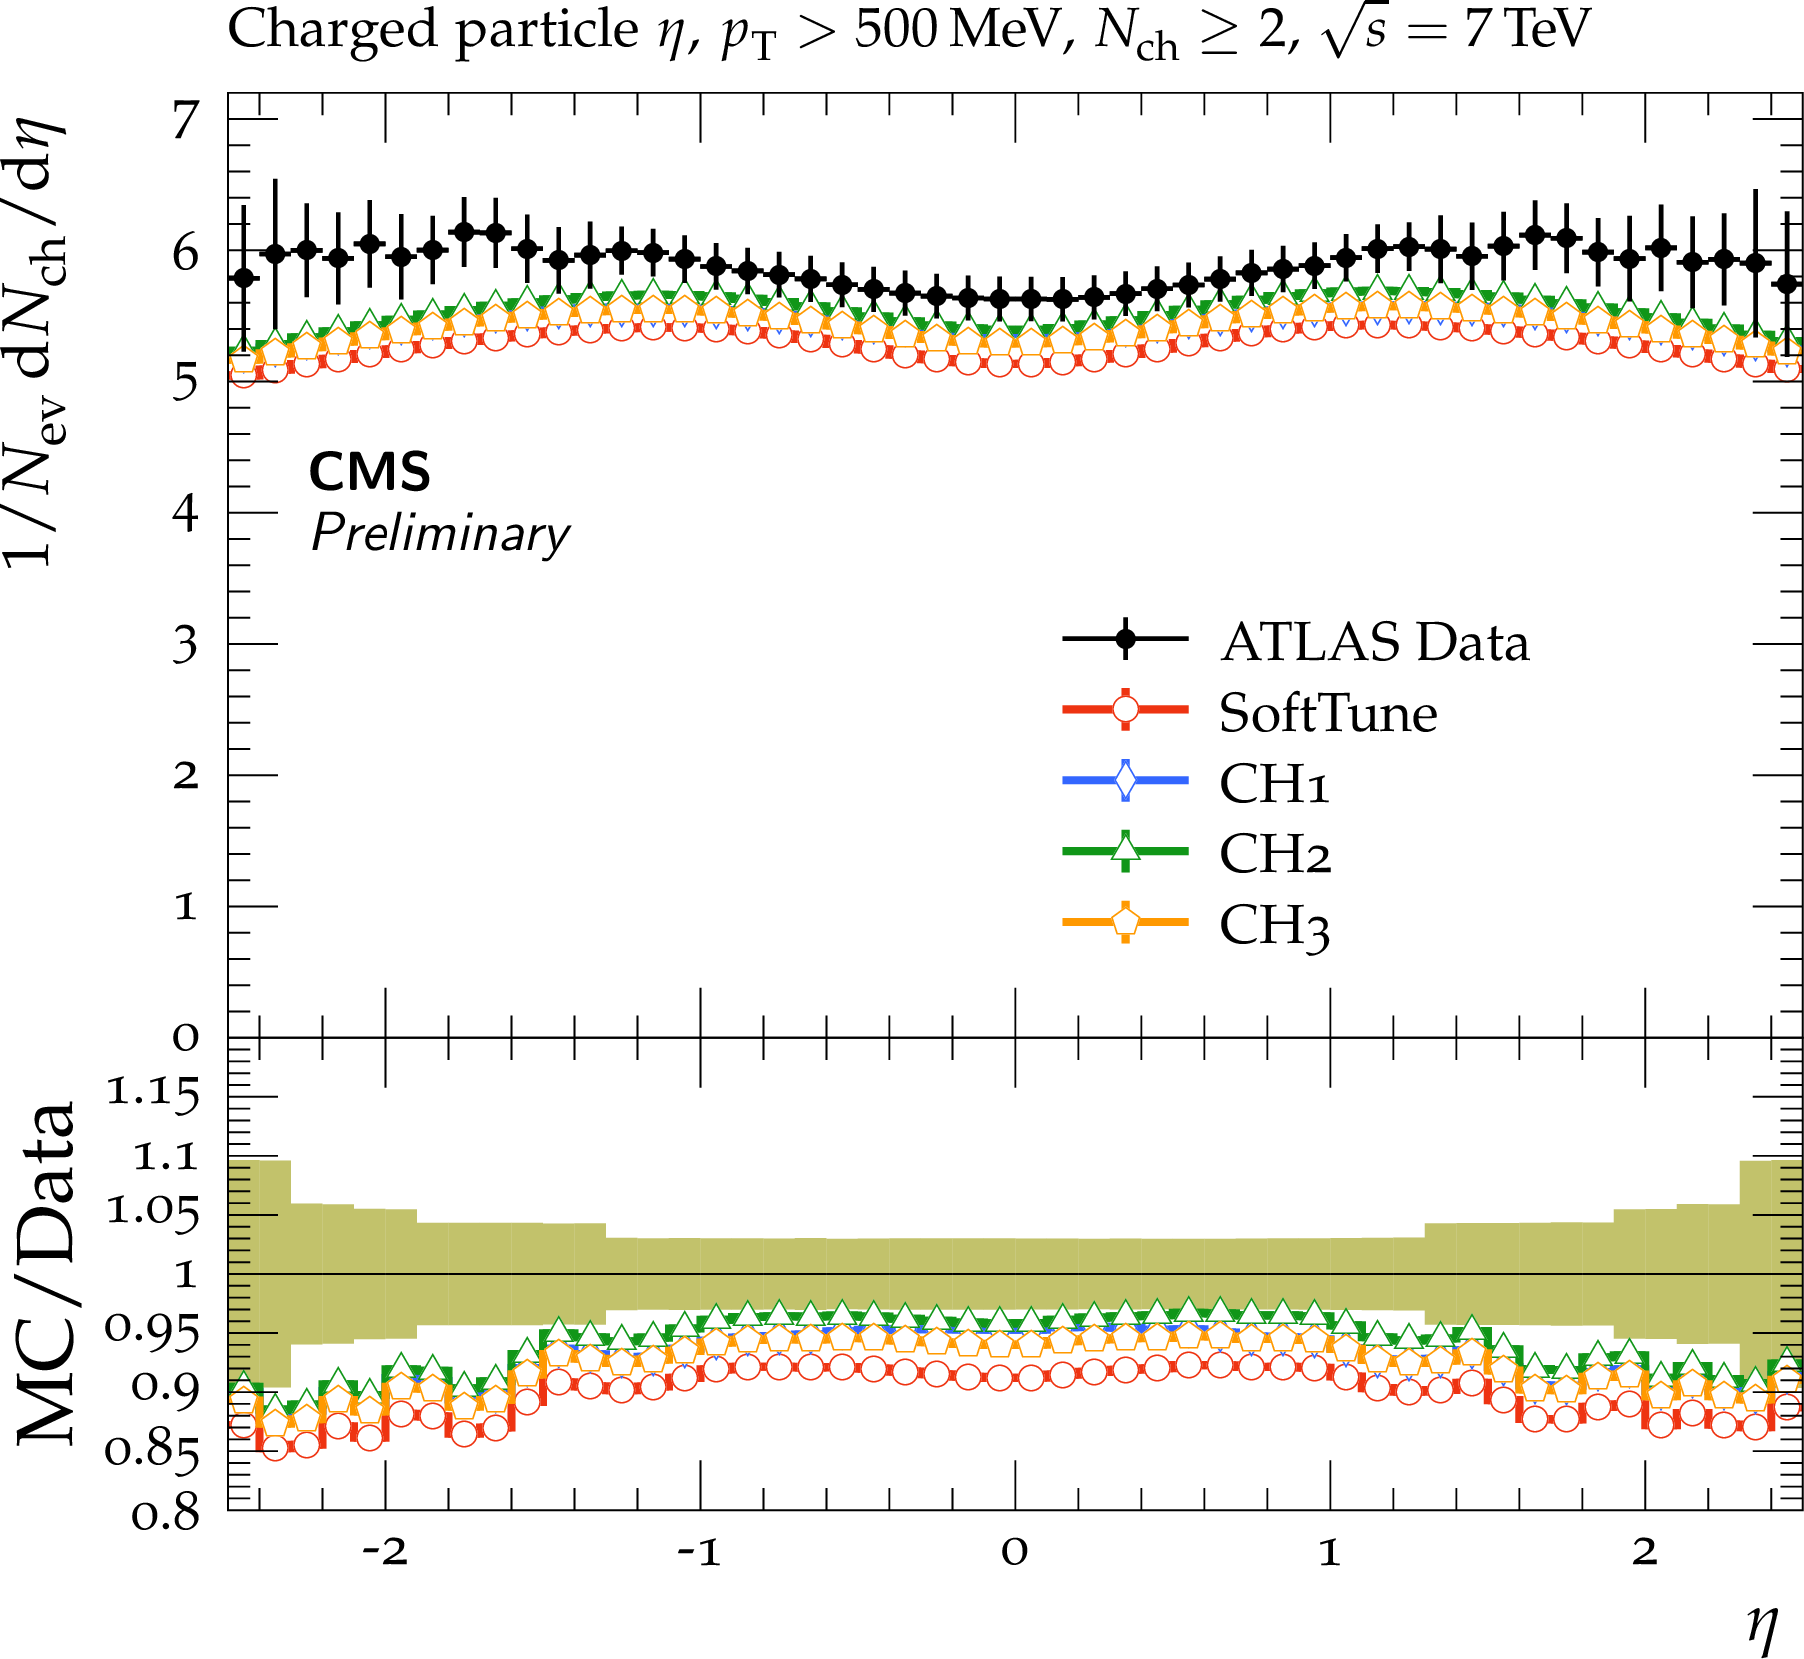
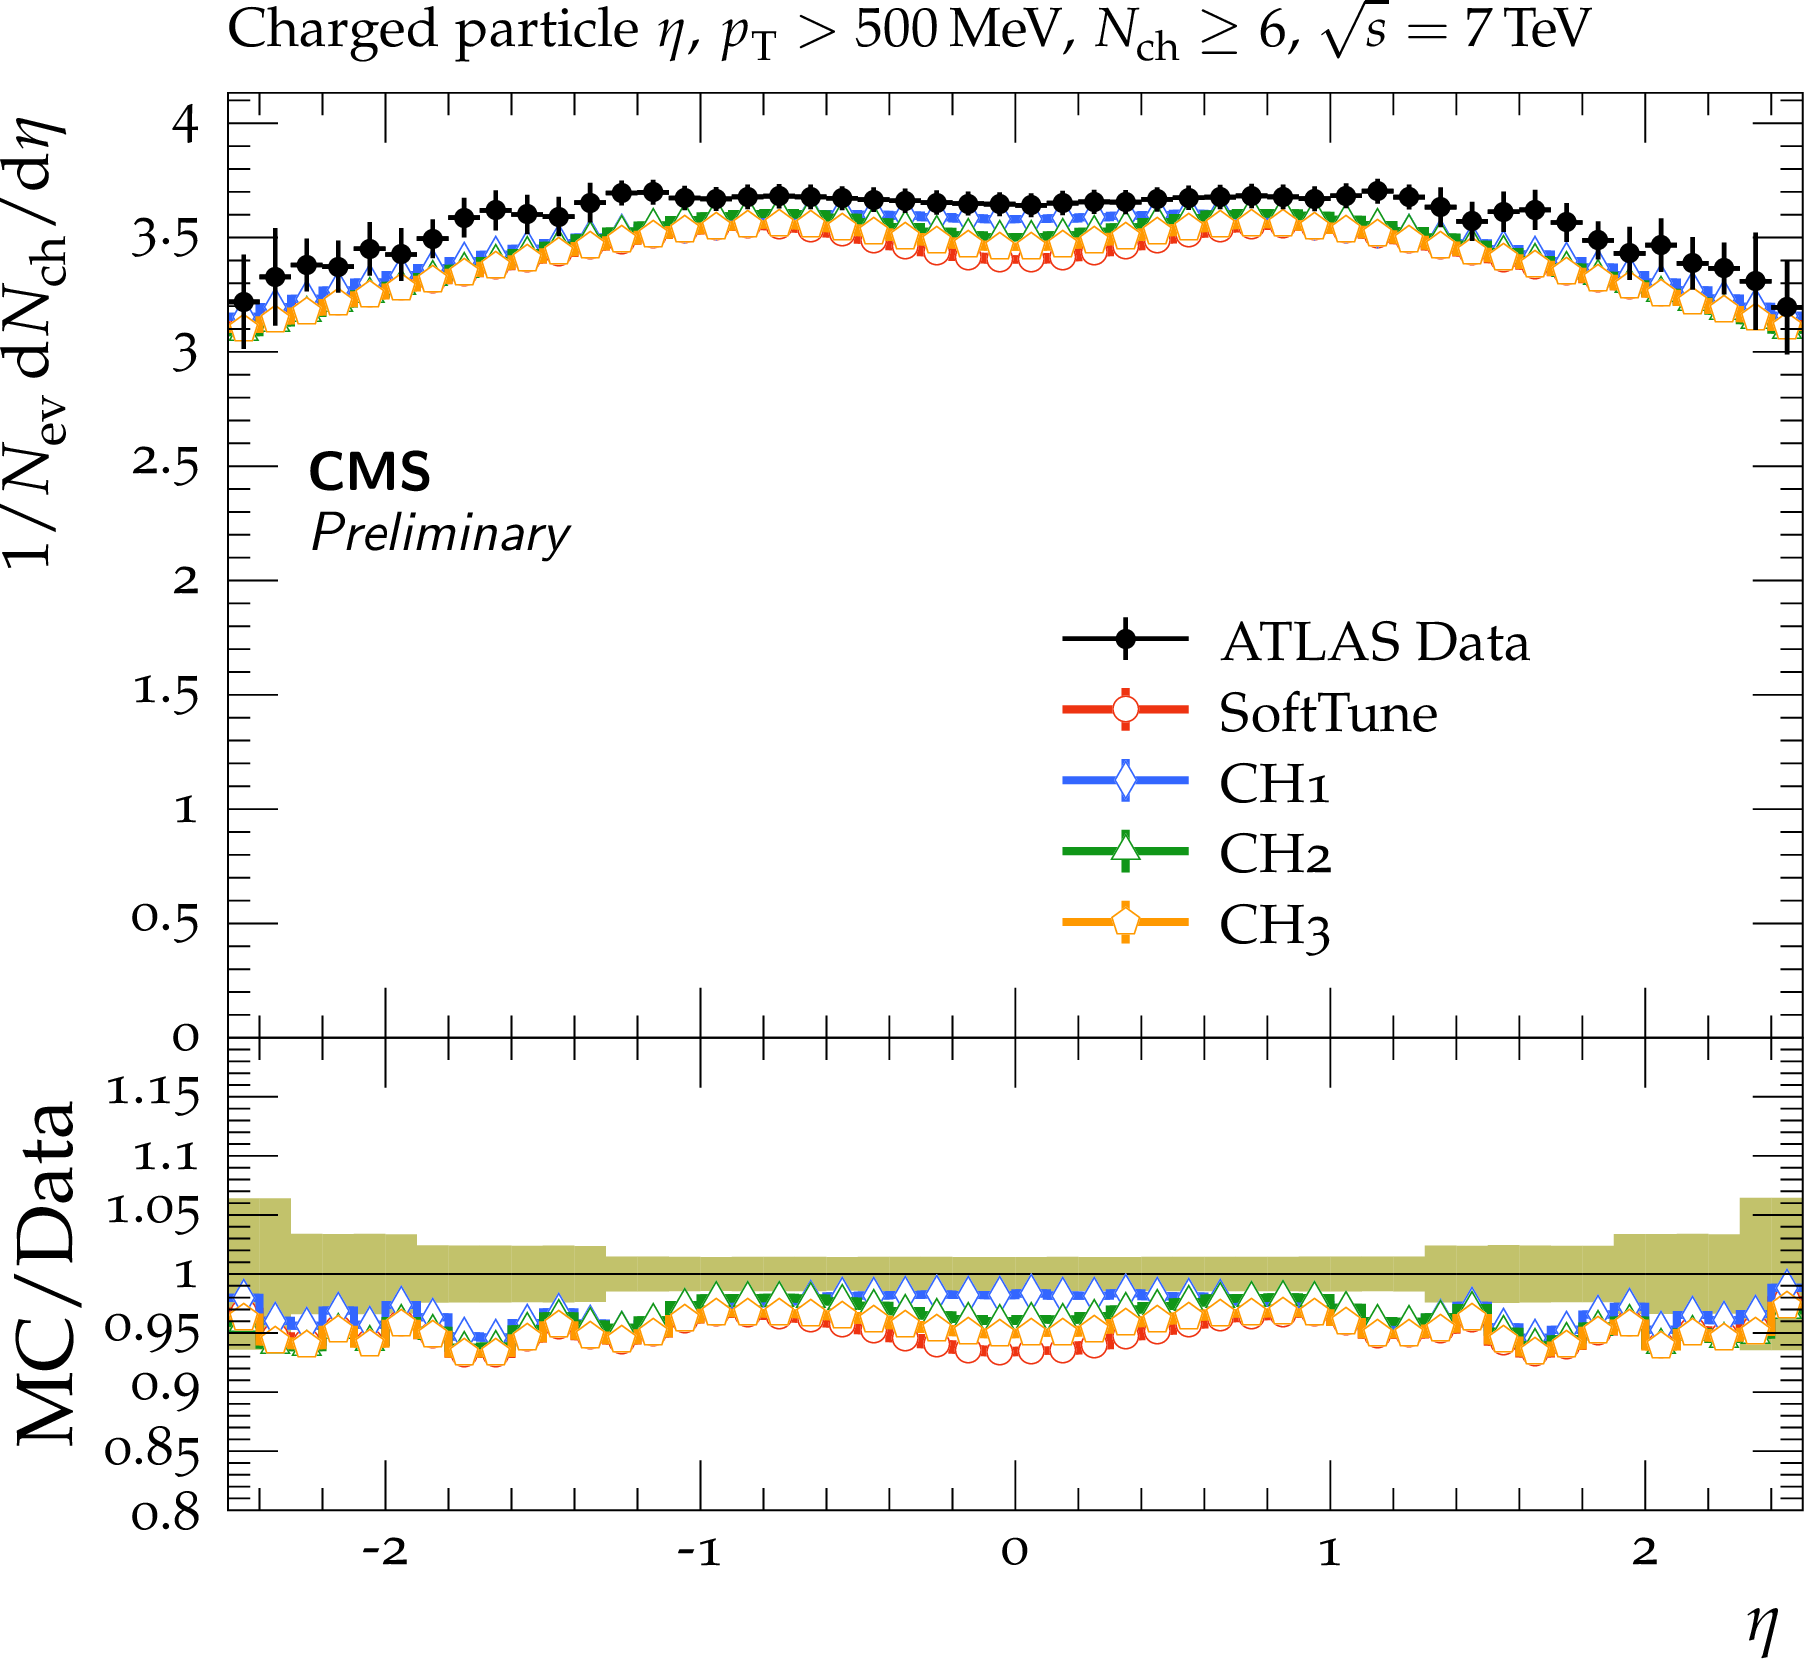
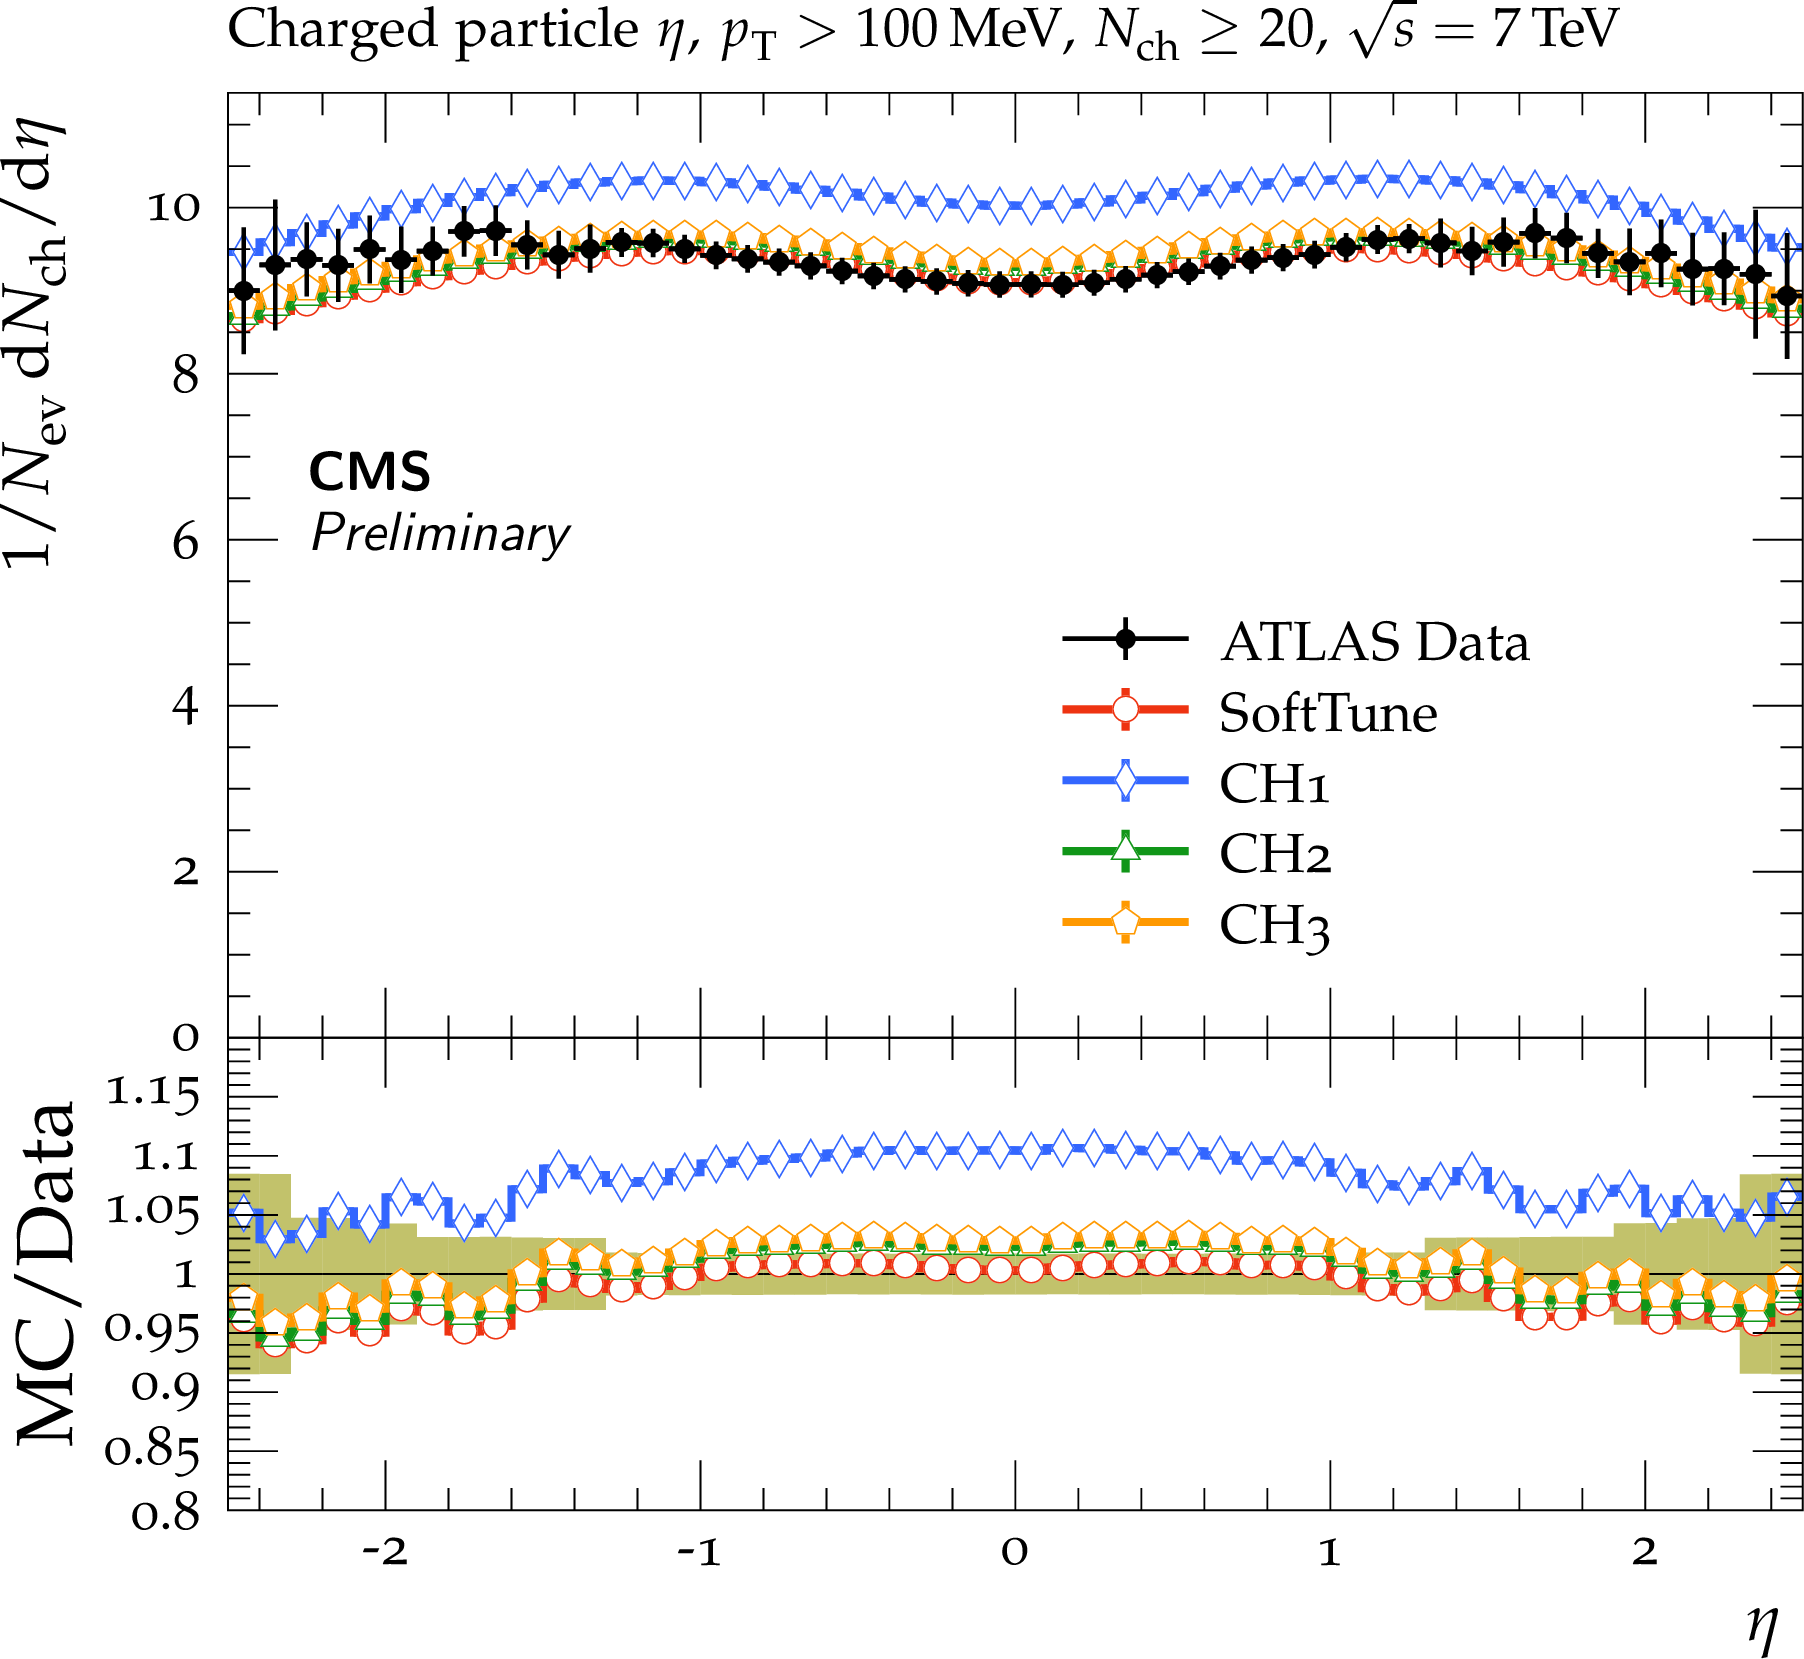
ATLAS data at $ {\sqrt {s}} = $ 7 TeV [45] on the pseudorapidity of charged particles for $ {N_{\mathrm {ch}}} \ge $ 1 (upper left), $ {N_{\mathrm {ch}}} \ge $ 2 (upper right), $ {N_{\mathrm {ch}}} \ge $ 6 (lower left), $ {N_{\mathrm {ch}}} \ge $ 20 (lower right). The data are compared to predictions from HERWIG 7, with the SoftTune and CH tunes. The coloured band in the ratios of the different predictions from simulation to the data represents the total experimental uncertainty in the data. |
png pdf |
Figure 19-a:
ATLAS data at $ {\sqrt {s}} = $ 7 TeV [45] on the pseudorapidity of charged particles for $ {N_{\mathrm {ch}}} \ge $ 1 (upper left), $ {N_{\mathrm {ch}}} \ge $ 2 (upper right), $ {N_{\mathrm {ch}}} \ge $ 6 (lower left), $ {N_{\mathrm {ch}}} \ge $ 20 (lower right). The data are compared to predictions from HERWIG 7, with the SoftTune and CH tunes. The coloured band in the ratios of the different predictions from simulation to the data represents the total experimental uncertainty in the data. |
png pdf |
Figure 19-b:
ATLAS data at $ {\sqrt {s}} = $ 7 TeV [45] on the pseudorapidity of charged particles for $ {N_{\mathrm {ch}}} \ge $ 1 (upper left), $ {N_{\mathrm {ch}}} \ge $ 2 (upper right), $ {N_{\mathrm {ch}}} \ge $ 6 (lower left), $ {N_{\mathrm {ch}}} \ge $ 20 (lower right). The data are compared to predictions from HERWIG 7, with the SoftTune and CH tunes. The coloured band in the ratios of the different predictions from simulation to the data represents the total experimental uncertainty in the data. |
png pdf |
Figure 19-c:
ATLAS data at $ {\sqrt {s}} = $ 7 TeV [45] on the pseudorapidity of charged particles for $ {N_{\mathrm {ch}}} \ge $ 1 (upper left), $ {N_{\mathrm {ch}}} \ge $ 2 (upper right), $ {N_{\mathrm {ch}}} \ge $ 6 (lower left), $ {N_{\mathrm {ch}}} \ge $ 20 (lower right). The data are compared to predictions from HERWIG 7, with the SoftTune and CH tunes. The coloured band in the ratios of the different predictions from simulation to the data represents the total experimental uncertainty in the data. |
png pdf |
Figure 19-d:
ATLAS data at $ {\sqrt {s}} = $ 7 TeV [45] on the pseudorapidity of charged particles for $ {N_{\mathrm {ch}}} \ge $ 1 (upper left), $ {N_{\mathrm {ch}}} \ge $ 2 (upper right), $ {N_{\mathrm {ch}}} \ge $ 6 (lower left), $ {N_{\mathrm {ch}}} \ge $ 20 (lower right). The data are compared to predictions from HERWIG 7, with the SoftTune and CH tunes. The coloured band in the ratios of the different predictions from simulation to the data represents the total experimental uncertainty in the data. |
png pdf |
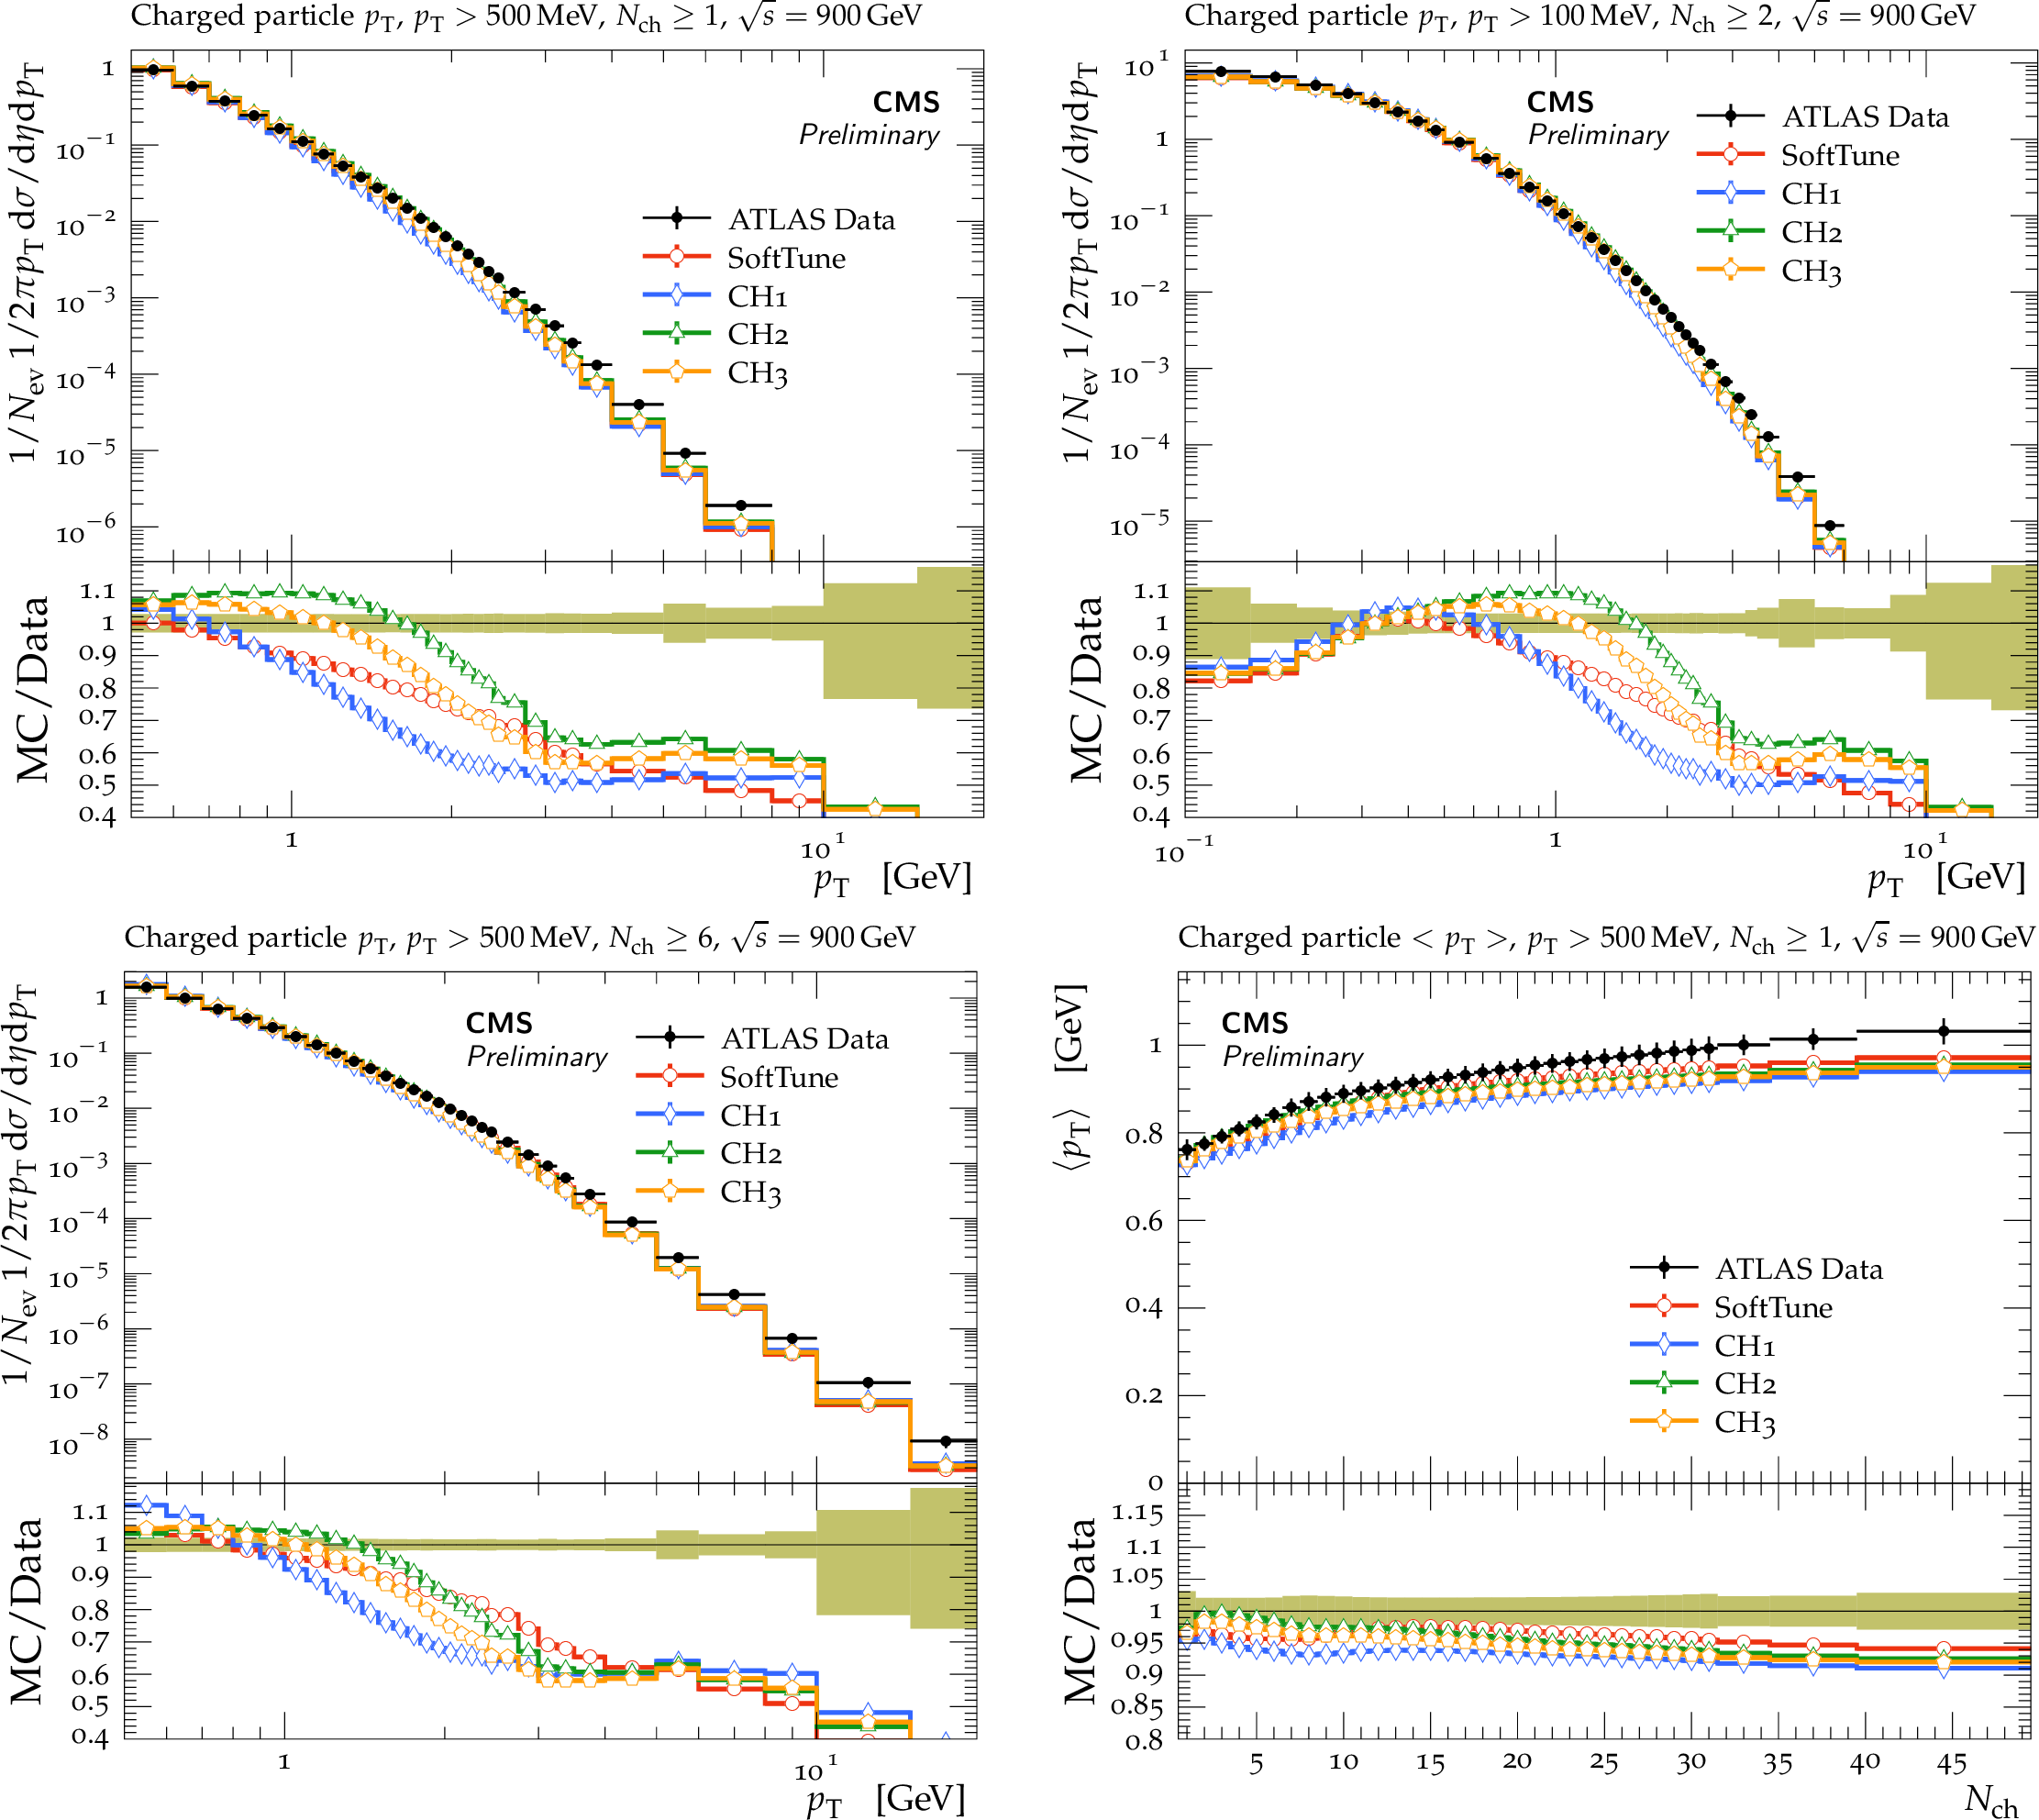
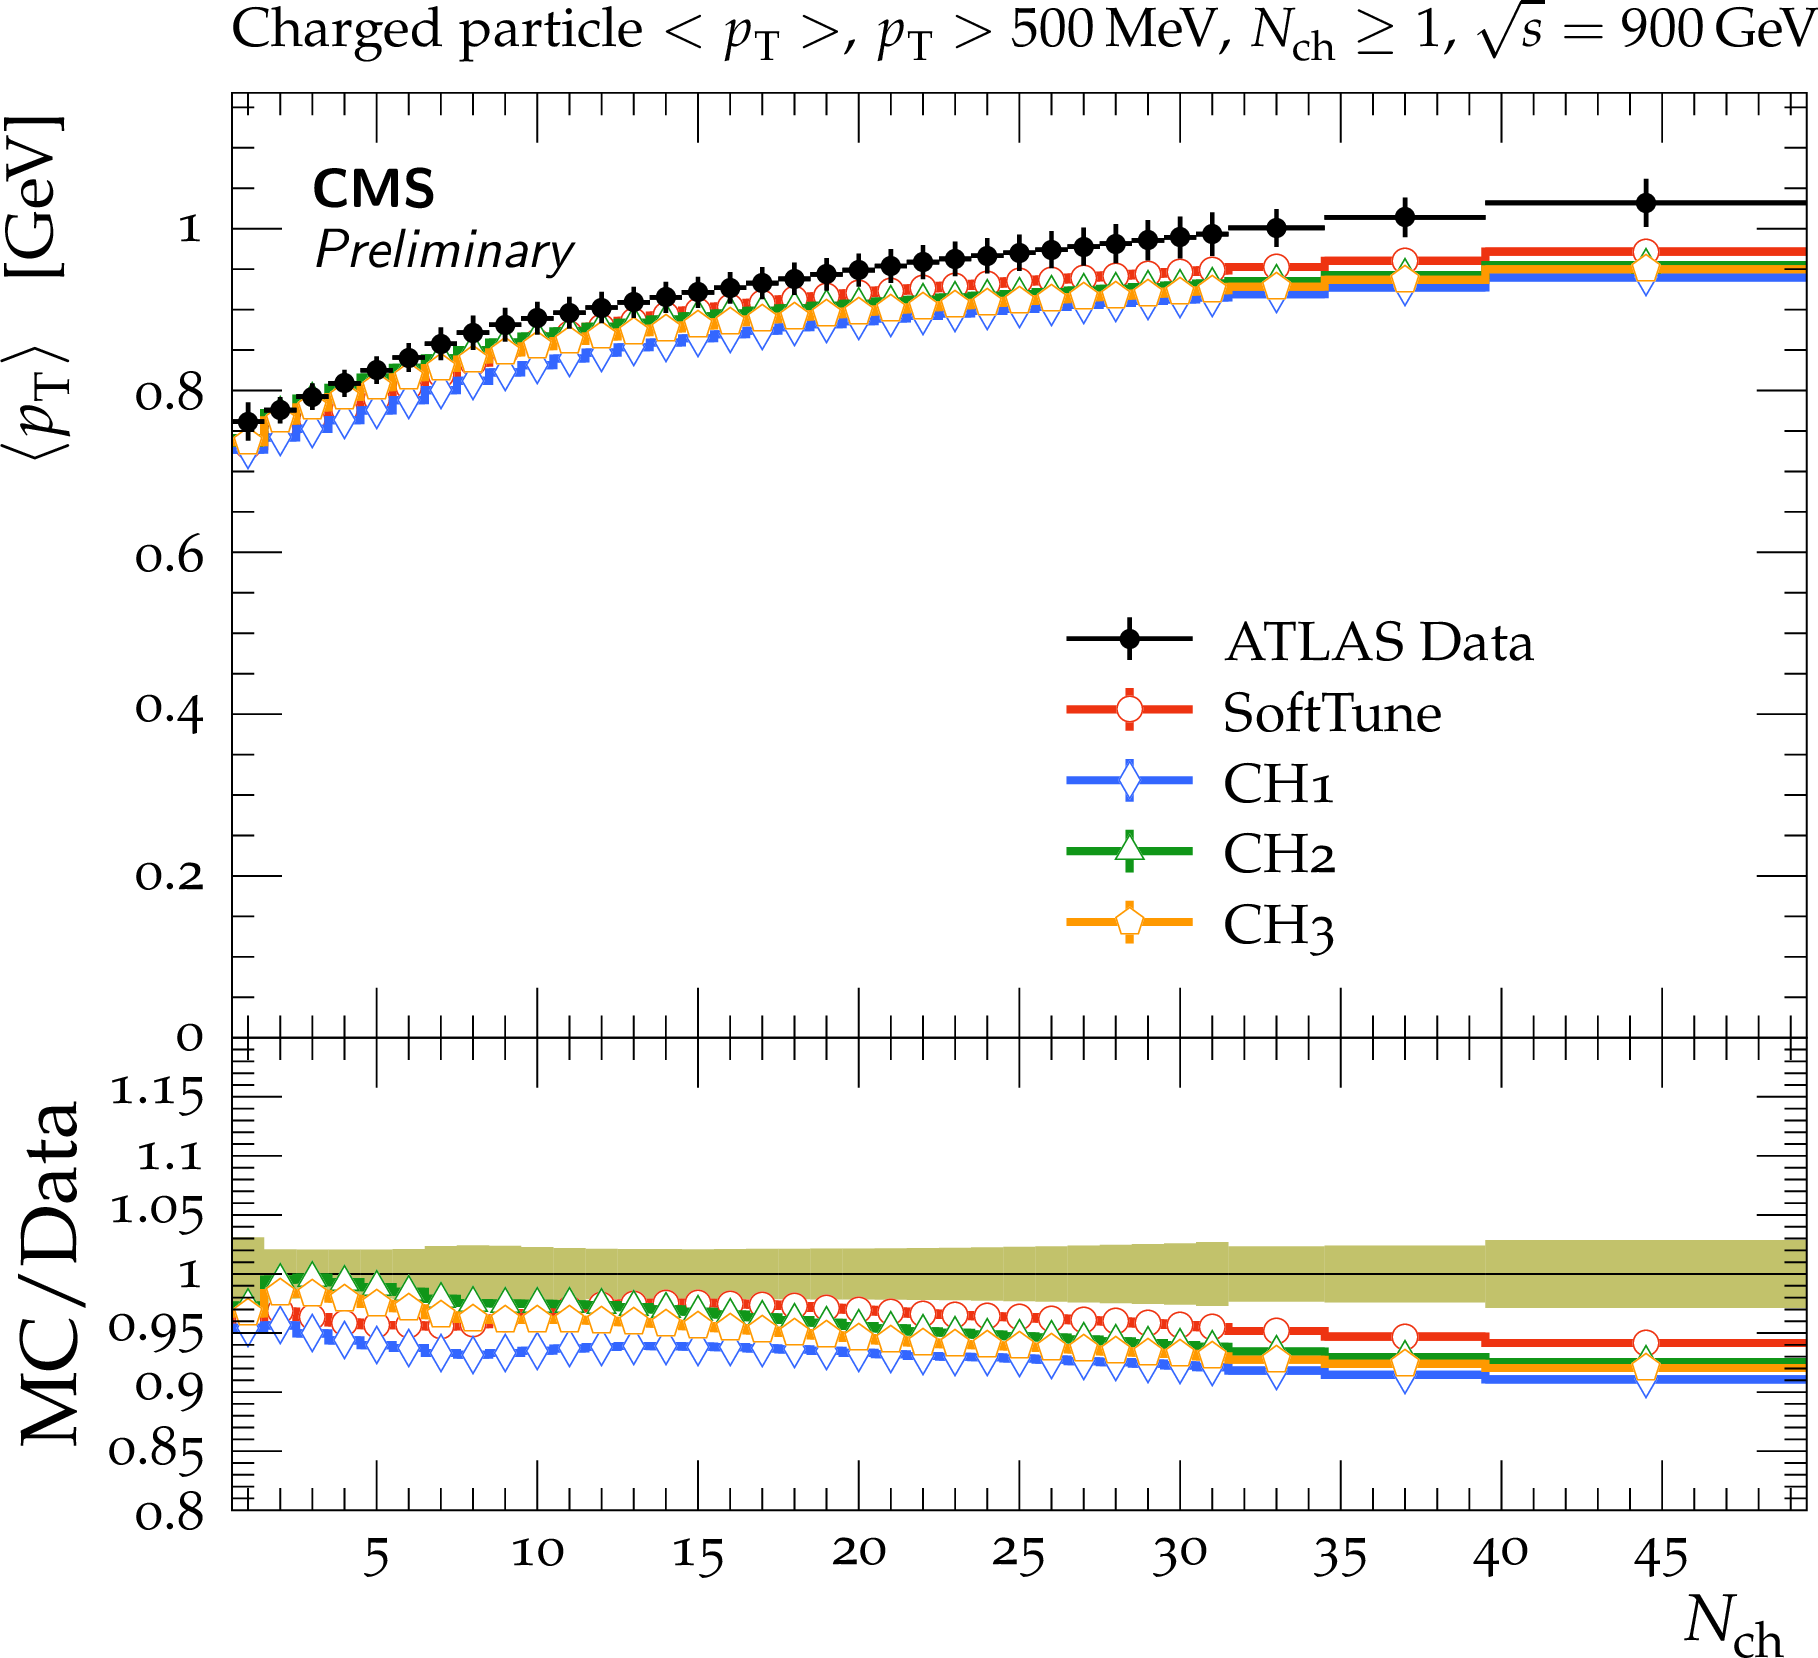
Figure 20:
ATLAS data at $ {\sqrt {s}} = $ 900 GeV [45] on the charged-particle ${p_{\mathrm {T}}}$ for $ {N_{\mathrm {ch}}} \ge $ 1 (upper left), $ {N_{\mathrm {ch}}} \ge $ 2 (upper right), $ {N_{\mathrm {ch}}} \ge $ 6 (lower left). The mean charged-particle ${p_{\mathrm {T}}}$ as a function of the charged-particle multiplicity is also shown (lower right). The data are compared to predictions from HERWIG 7, with the SoftTune and CH tunes. The coloured band in the ratios of the different predictions from simulation to the data represents the total experimental uncertainty in the data. |
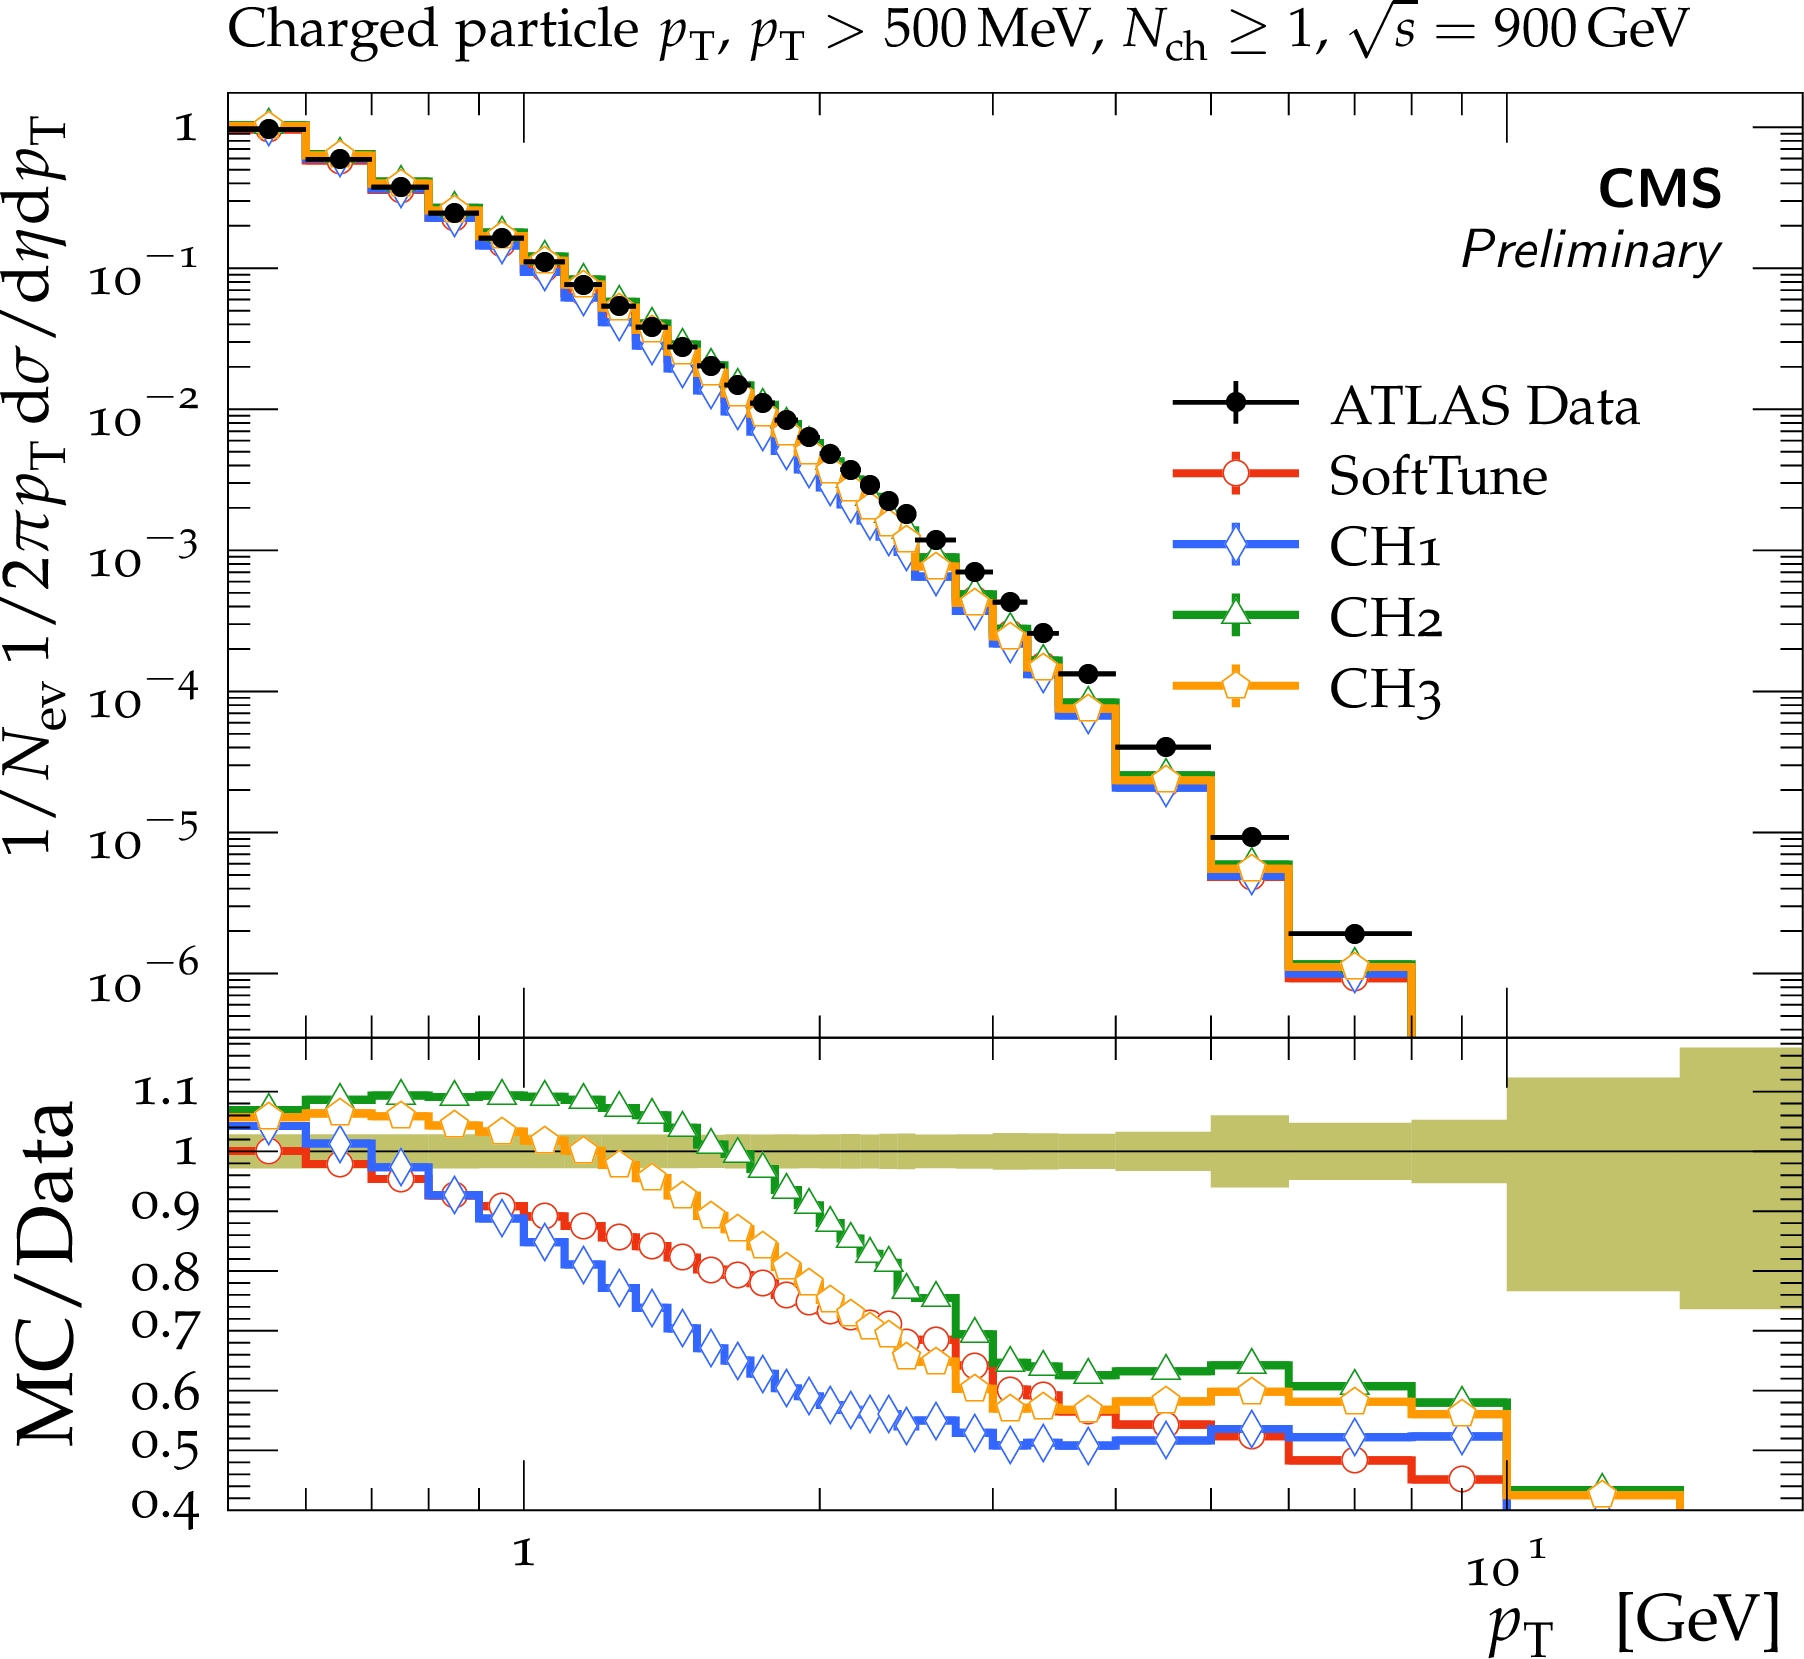
png pdf |
Figure 20-a:
ATLAS data at $ {\sqrt {s}} = $ 900 GeV [45] on the charged-particle ${p_{\mathrm {T}}}$ for $ {N_{\mathrm {ch}}} \ge $ 1 (upper left), $ {N_{\mathrm {ch}}} \ge $ 2 (upper right), $ {N_{\mathrm {ch}}} \ge $ 6 (lower left). The mean charged-particle ${p_{\mathrm {T}}}$ as a function of the charged-particle multiplicity is also shown (lower right). The data are compared to predictions from HERWIG 7, with the SoftTune and CH tunes. The coloured band in the ratios of the different predictions from simulation to the data represents the total experimental uncertainty in the data. |
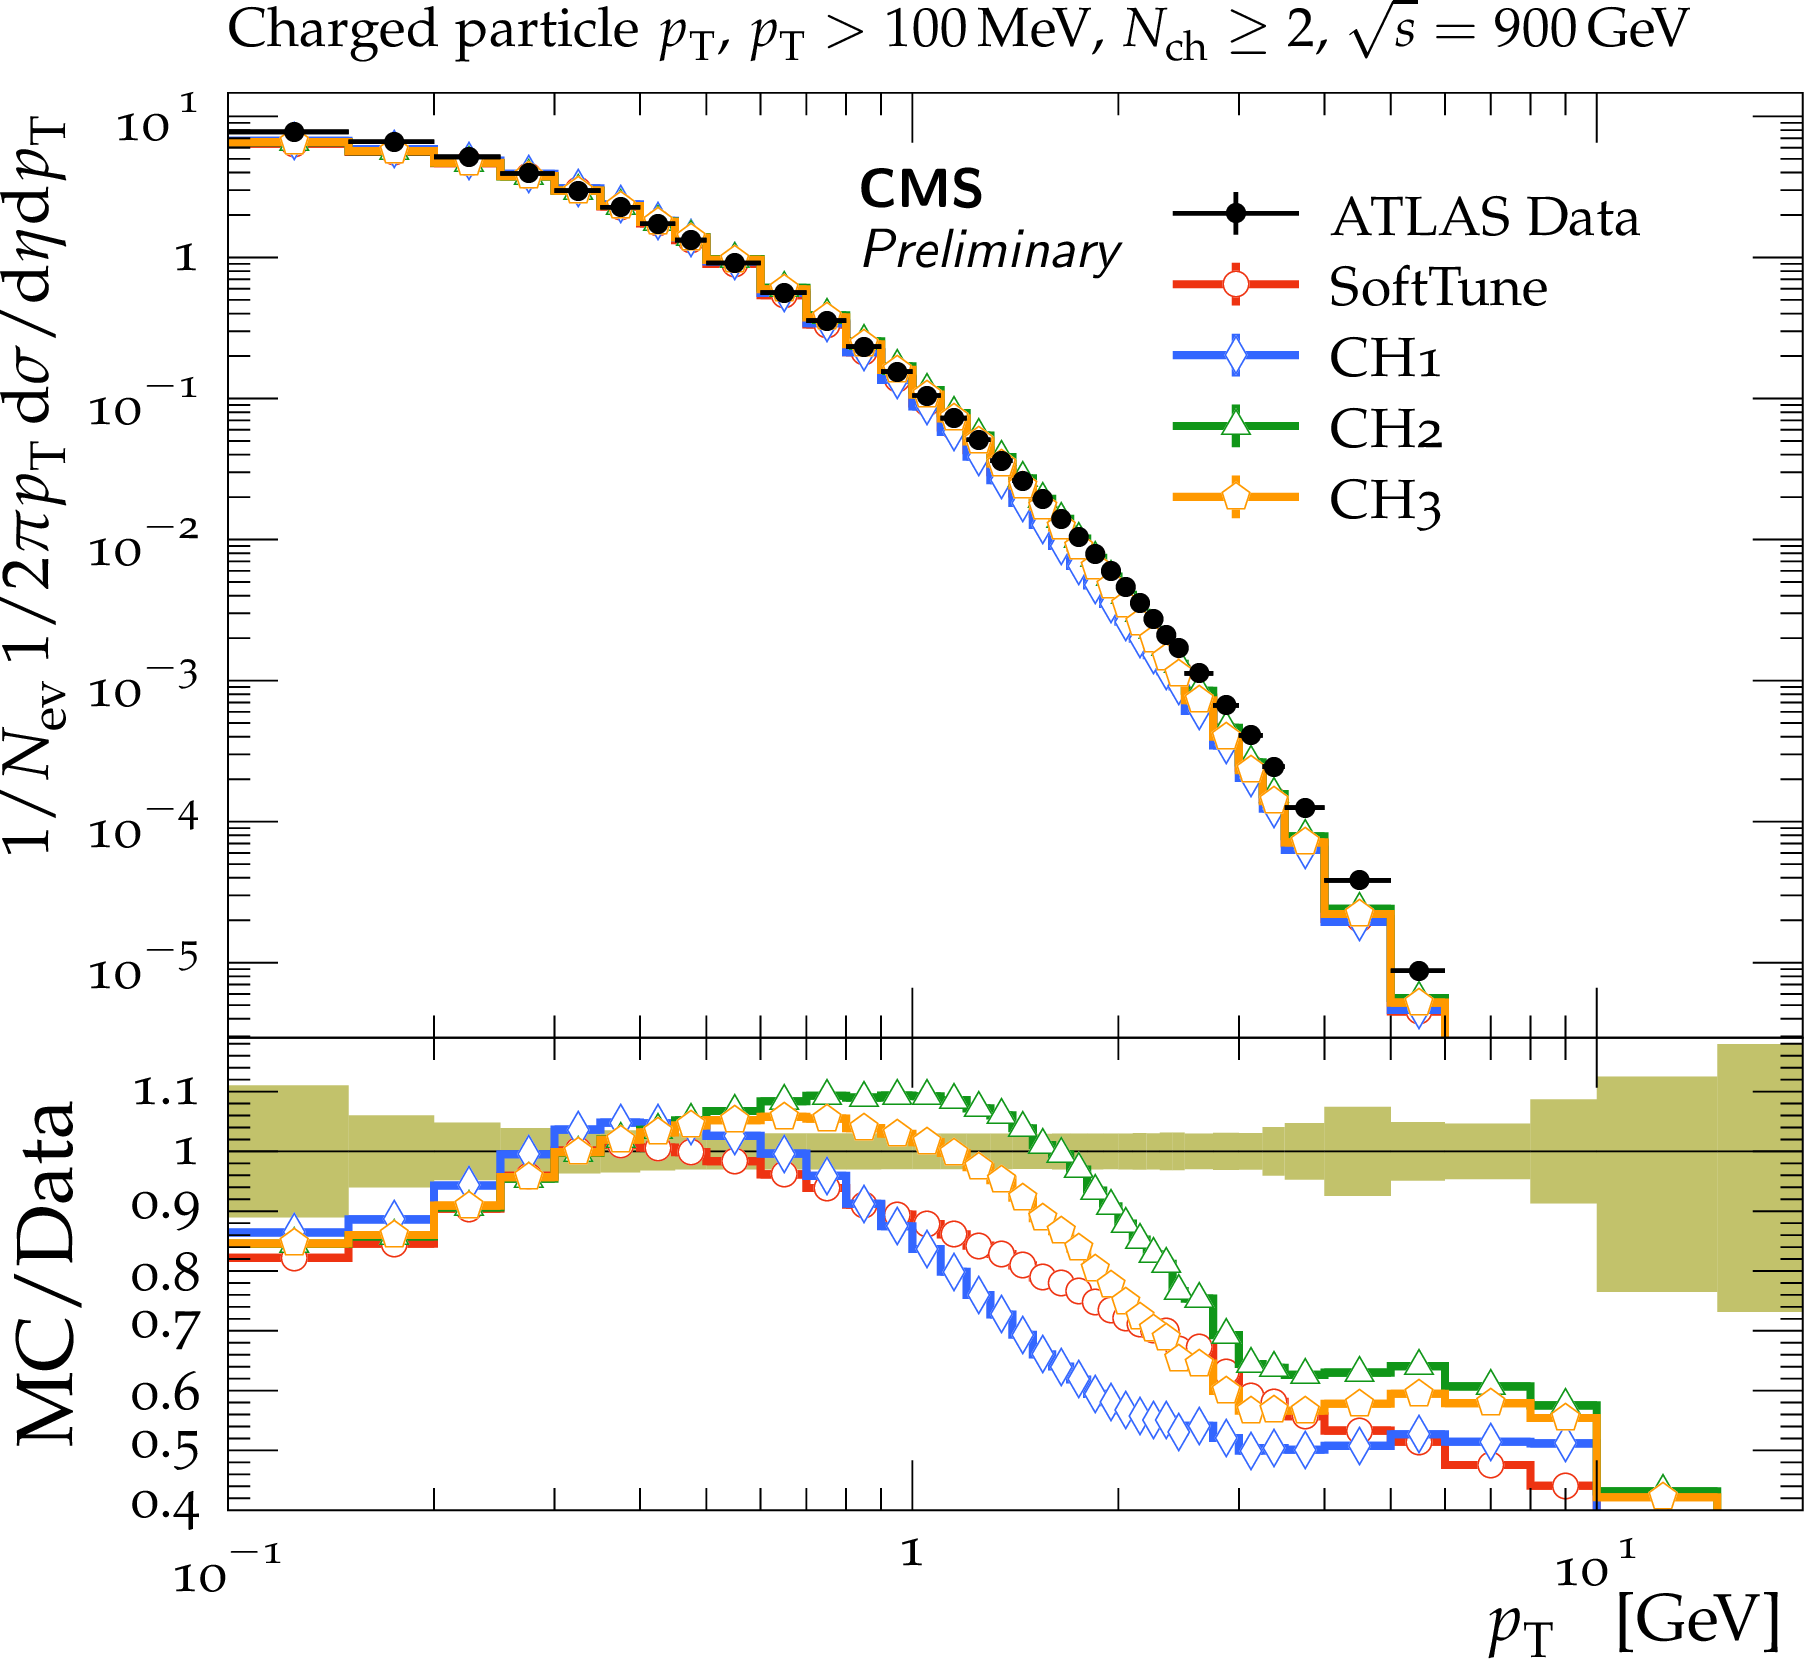
png pdf |
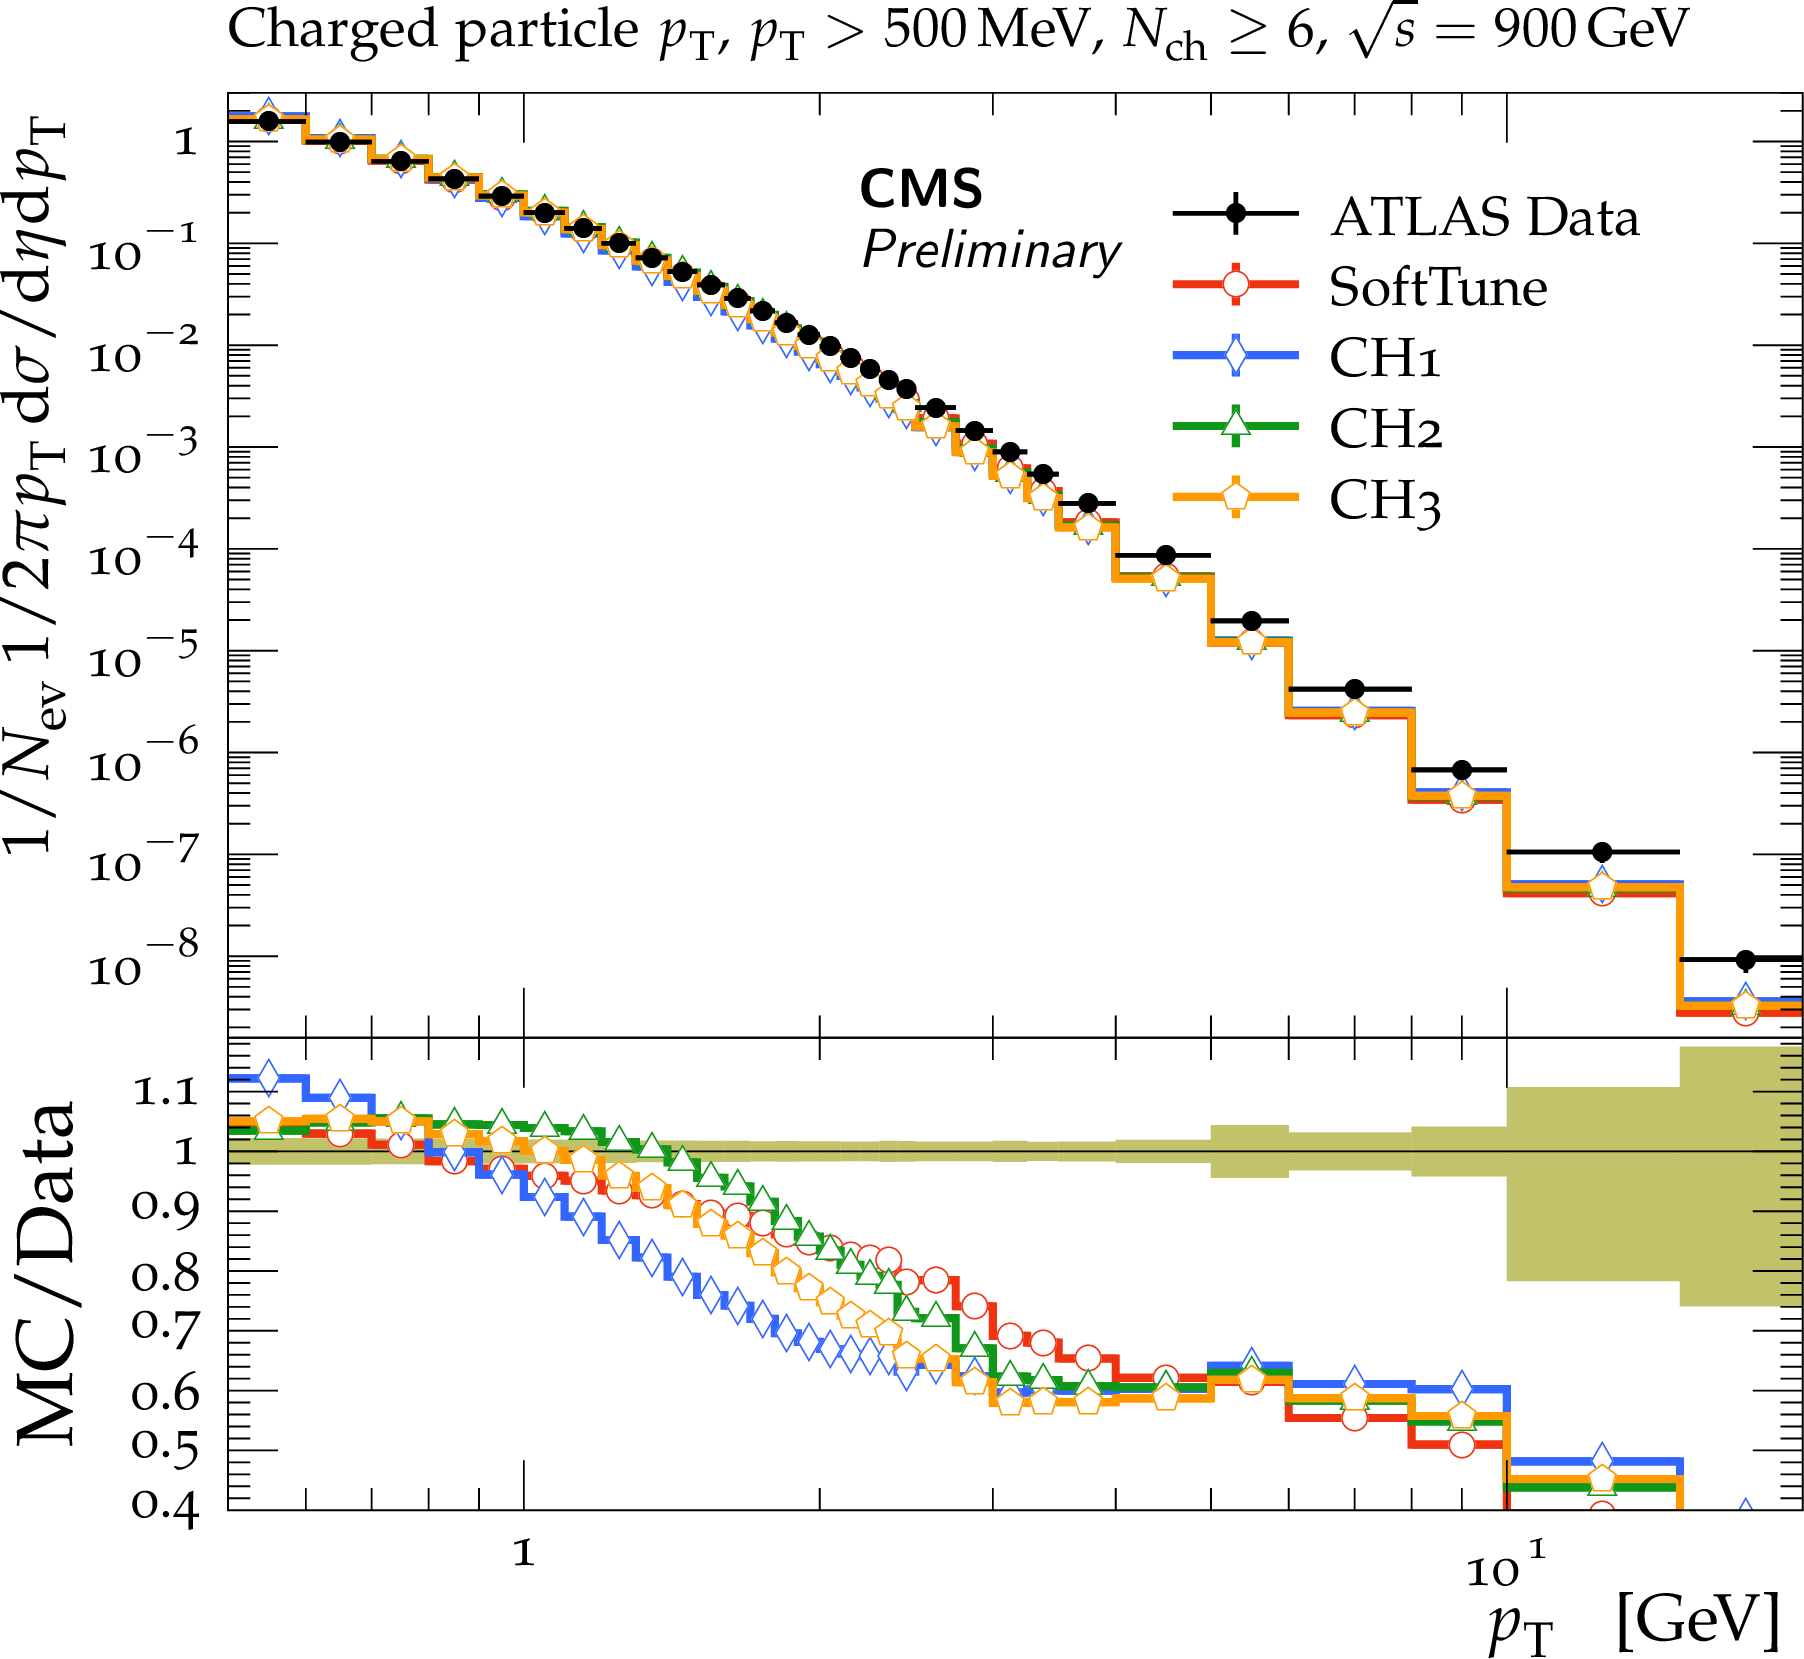
Figure 20-b:
ATLAS data at $ {\sqrt {s}} = $ 900 GeV [45] on the charged-particle ${p_{\mathrm {T}}}$ for $ {N_{\mathrm {ch}}} \ge $ 1 (upper left), $ {N_{\mathrm {ch}}} \ge $ 2 (upper right), $ {N_{\mathrm {ch}}} \ge $ 6 (lower left). The mean charged-particle ${p_{\mathrm {T}}}$ as a function of the charged-particle multiplicity is also shown (lower right). The data are compared to predictions from HERWIG 7, with the SoftTune and CH tunes. The coloured band in the ratios of the different predictions from simulation to the data represents the total experimental uncertainty in the data. |
png pdf |
Figure 20-c:
ATLAS data at $ {\sqrt {s}} = $ 900 GeV [45] on the charged-particle ${p_{\mathrm {T}}}$ for $ {N_{\mathrm {ch}}} \ge $ 1 (upper left), $ {N_{\mathrm {ch}}} \ge $ 2 (upper right), $ {N_{\mathrm {ch}}} \ge $ 6 (lower left). The mean charged-particle ${p_{\mathrm {T}}}$ as a function of the charged-particle multiplicity is also shown (lower right). The data are compared to predictions from HERWIG 7, with the SoftTune and CH tunes. The coloured band in the ratios of the different predictions from simulation to the data represents the total experimental uncertainty in the data. |
png pdf |
Figure 20-d:
ATLAS data at $ {\sqrt {s}} = $ 900 GeV [45] on the charged-particle ${p_{\mathrm {T}}}$ for $ {N_{\mathrm {ch}}} \ge $ 1 (upper left), $ {N_{\mathrm {ch}}} \ge $ 2 (upper right), $ {N_{\mathrm {ch}}} \ge $ 6 (lower left). The mean charged-particle ${p_{\mathrm {T}}}$ as a function of the charged-particle multiplicity is also shown (lower right). The data are compared to predictions from HERWIG 7, with the SoftTune and CH tunes. The coloured band in the ratios of the different predictions from simulation to the data represents the total experimental uncertainty in the data. |
png pdf |
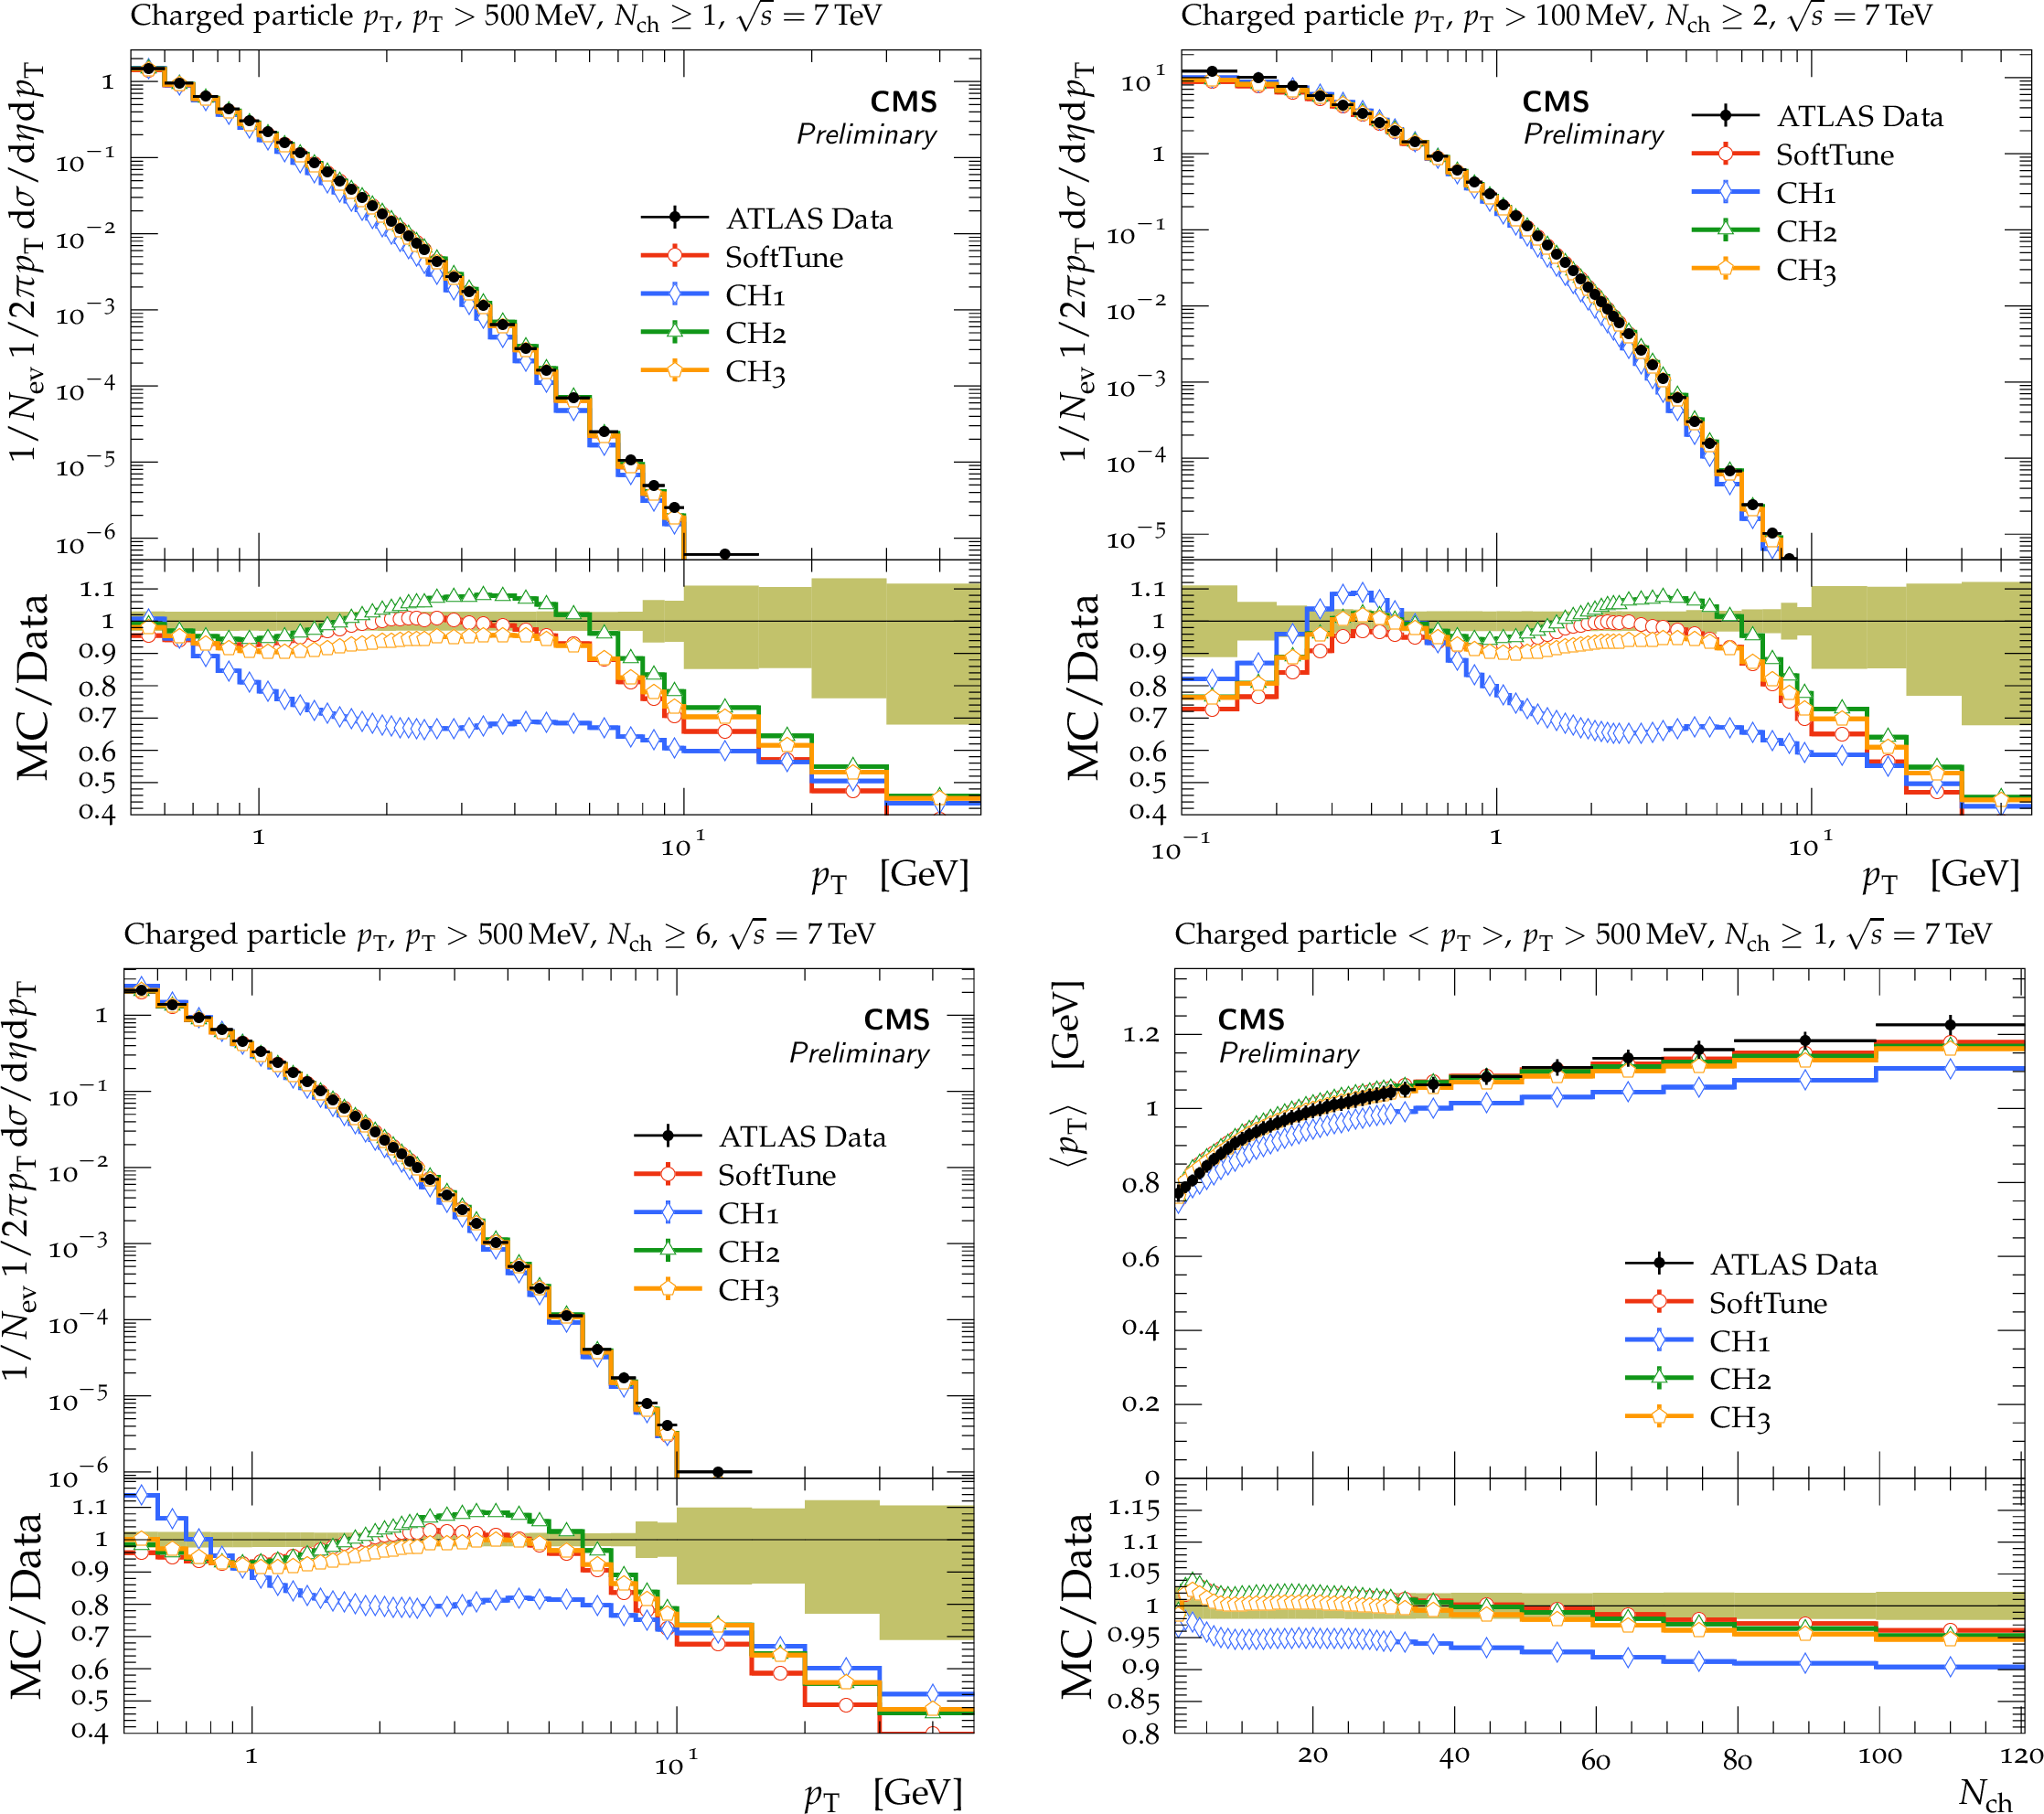
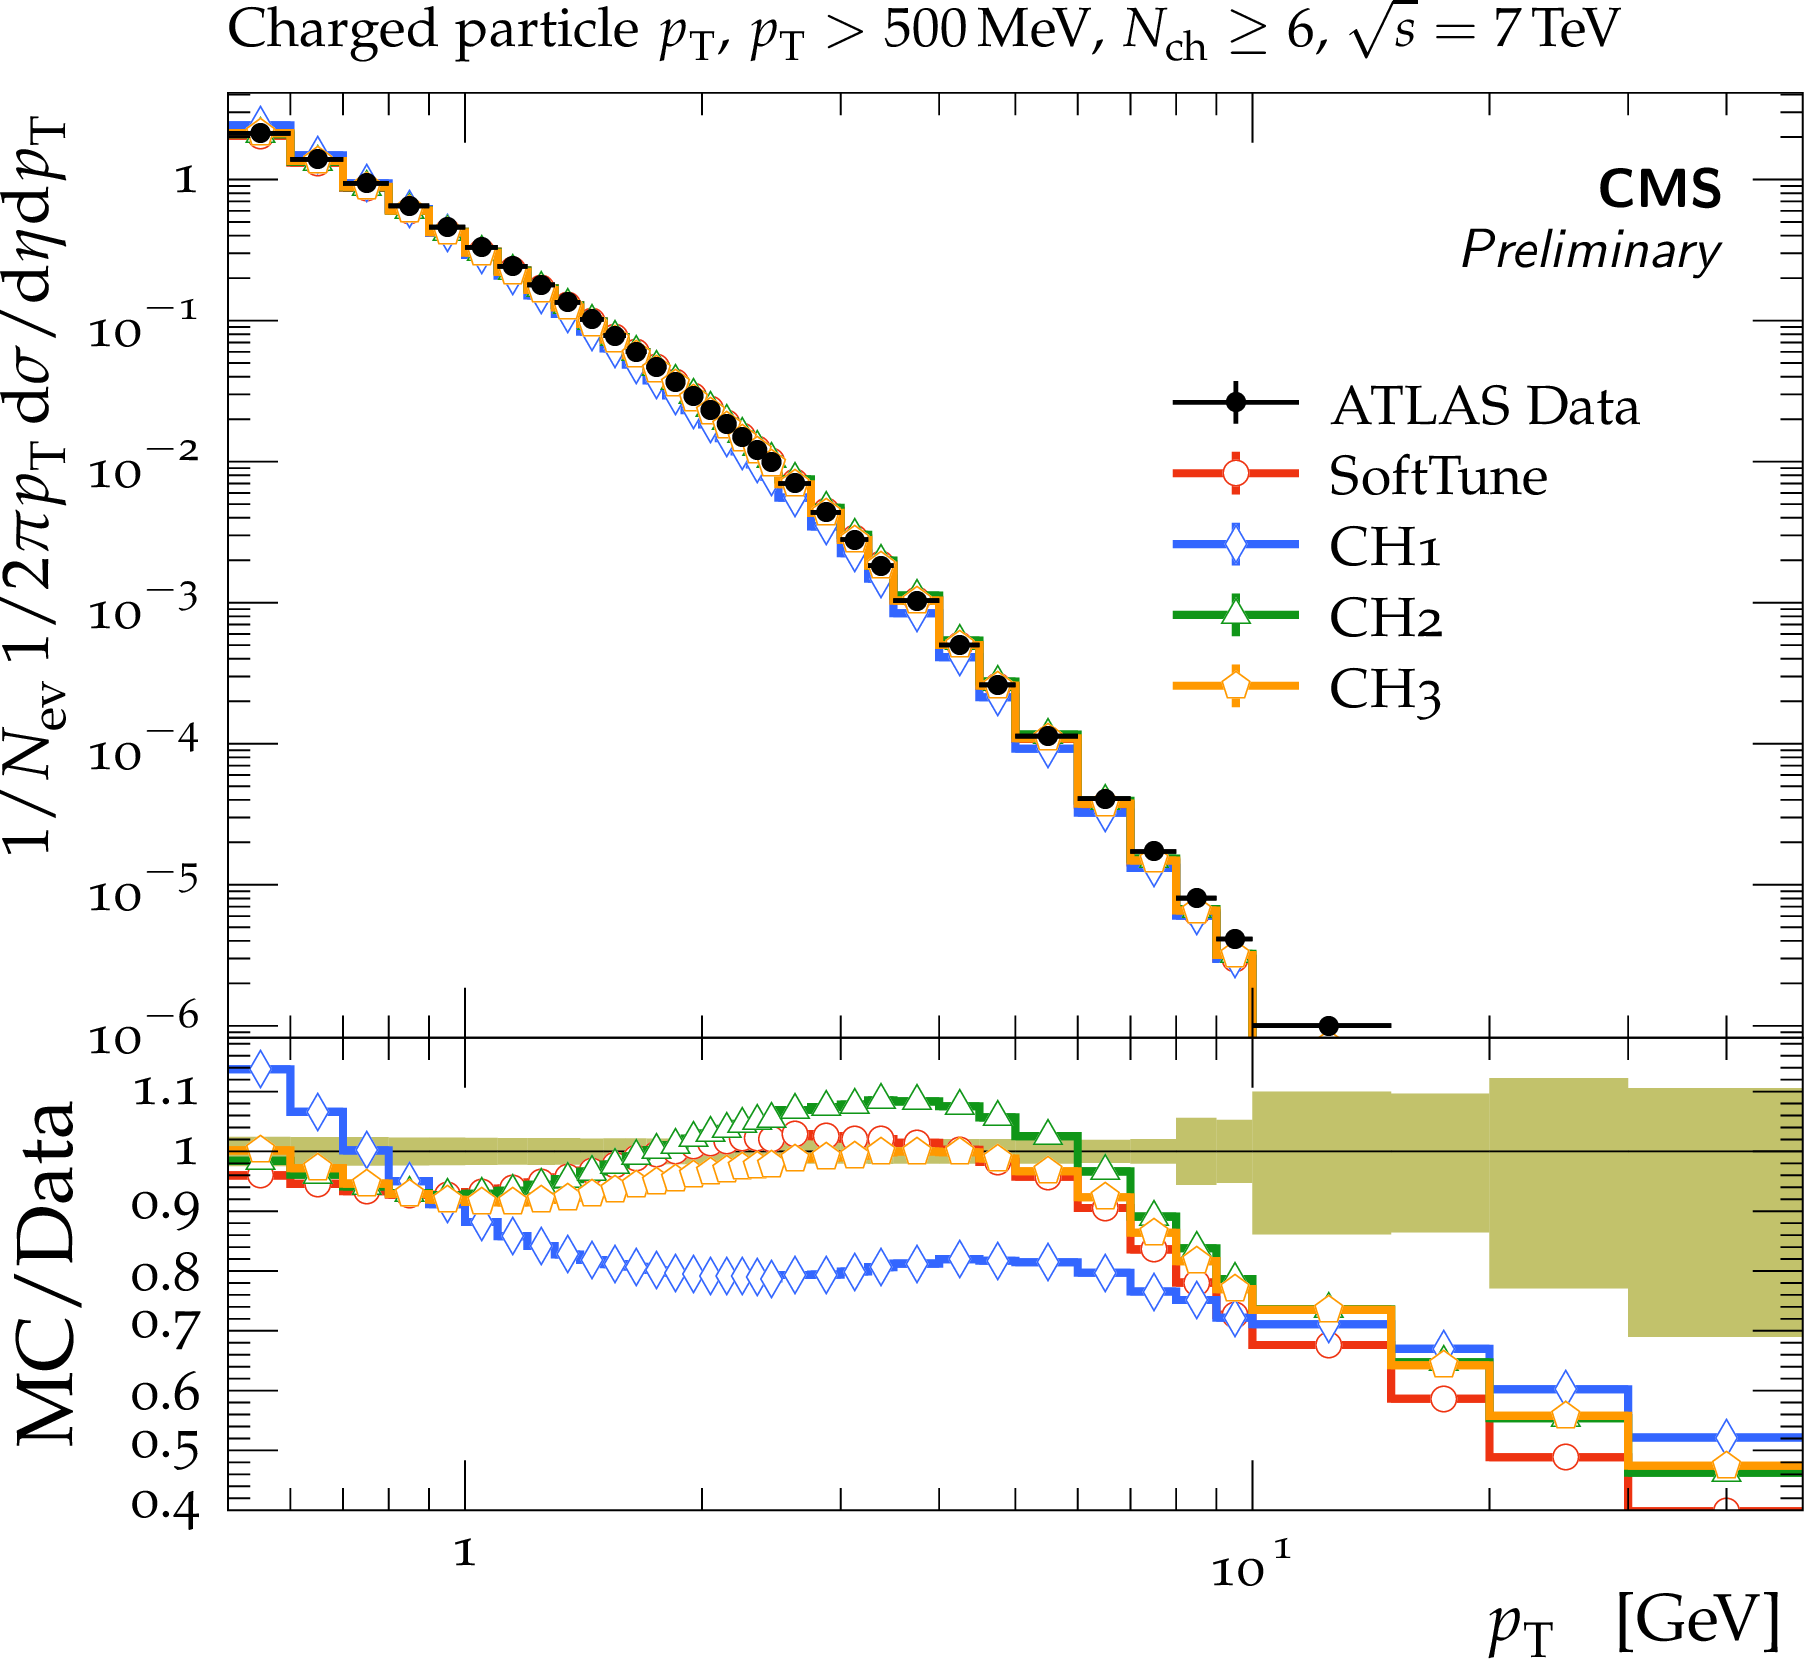
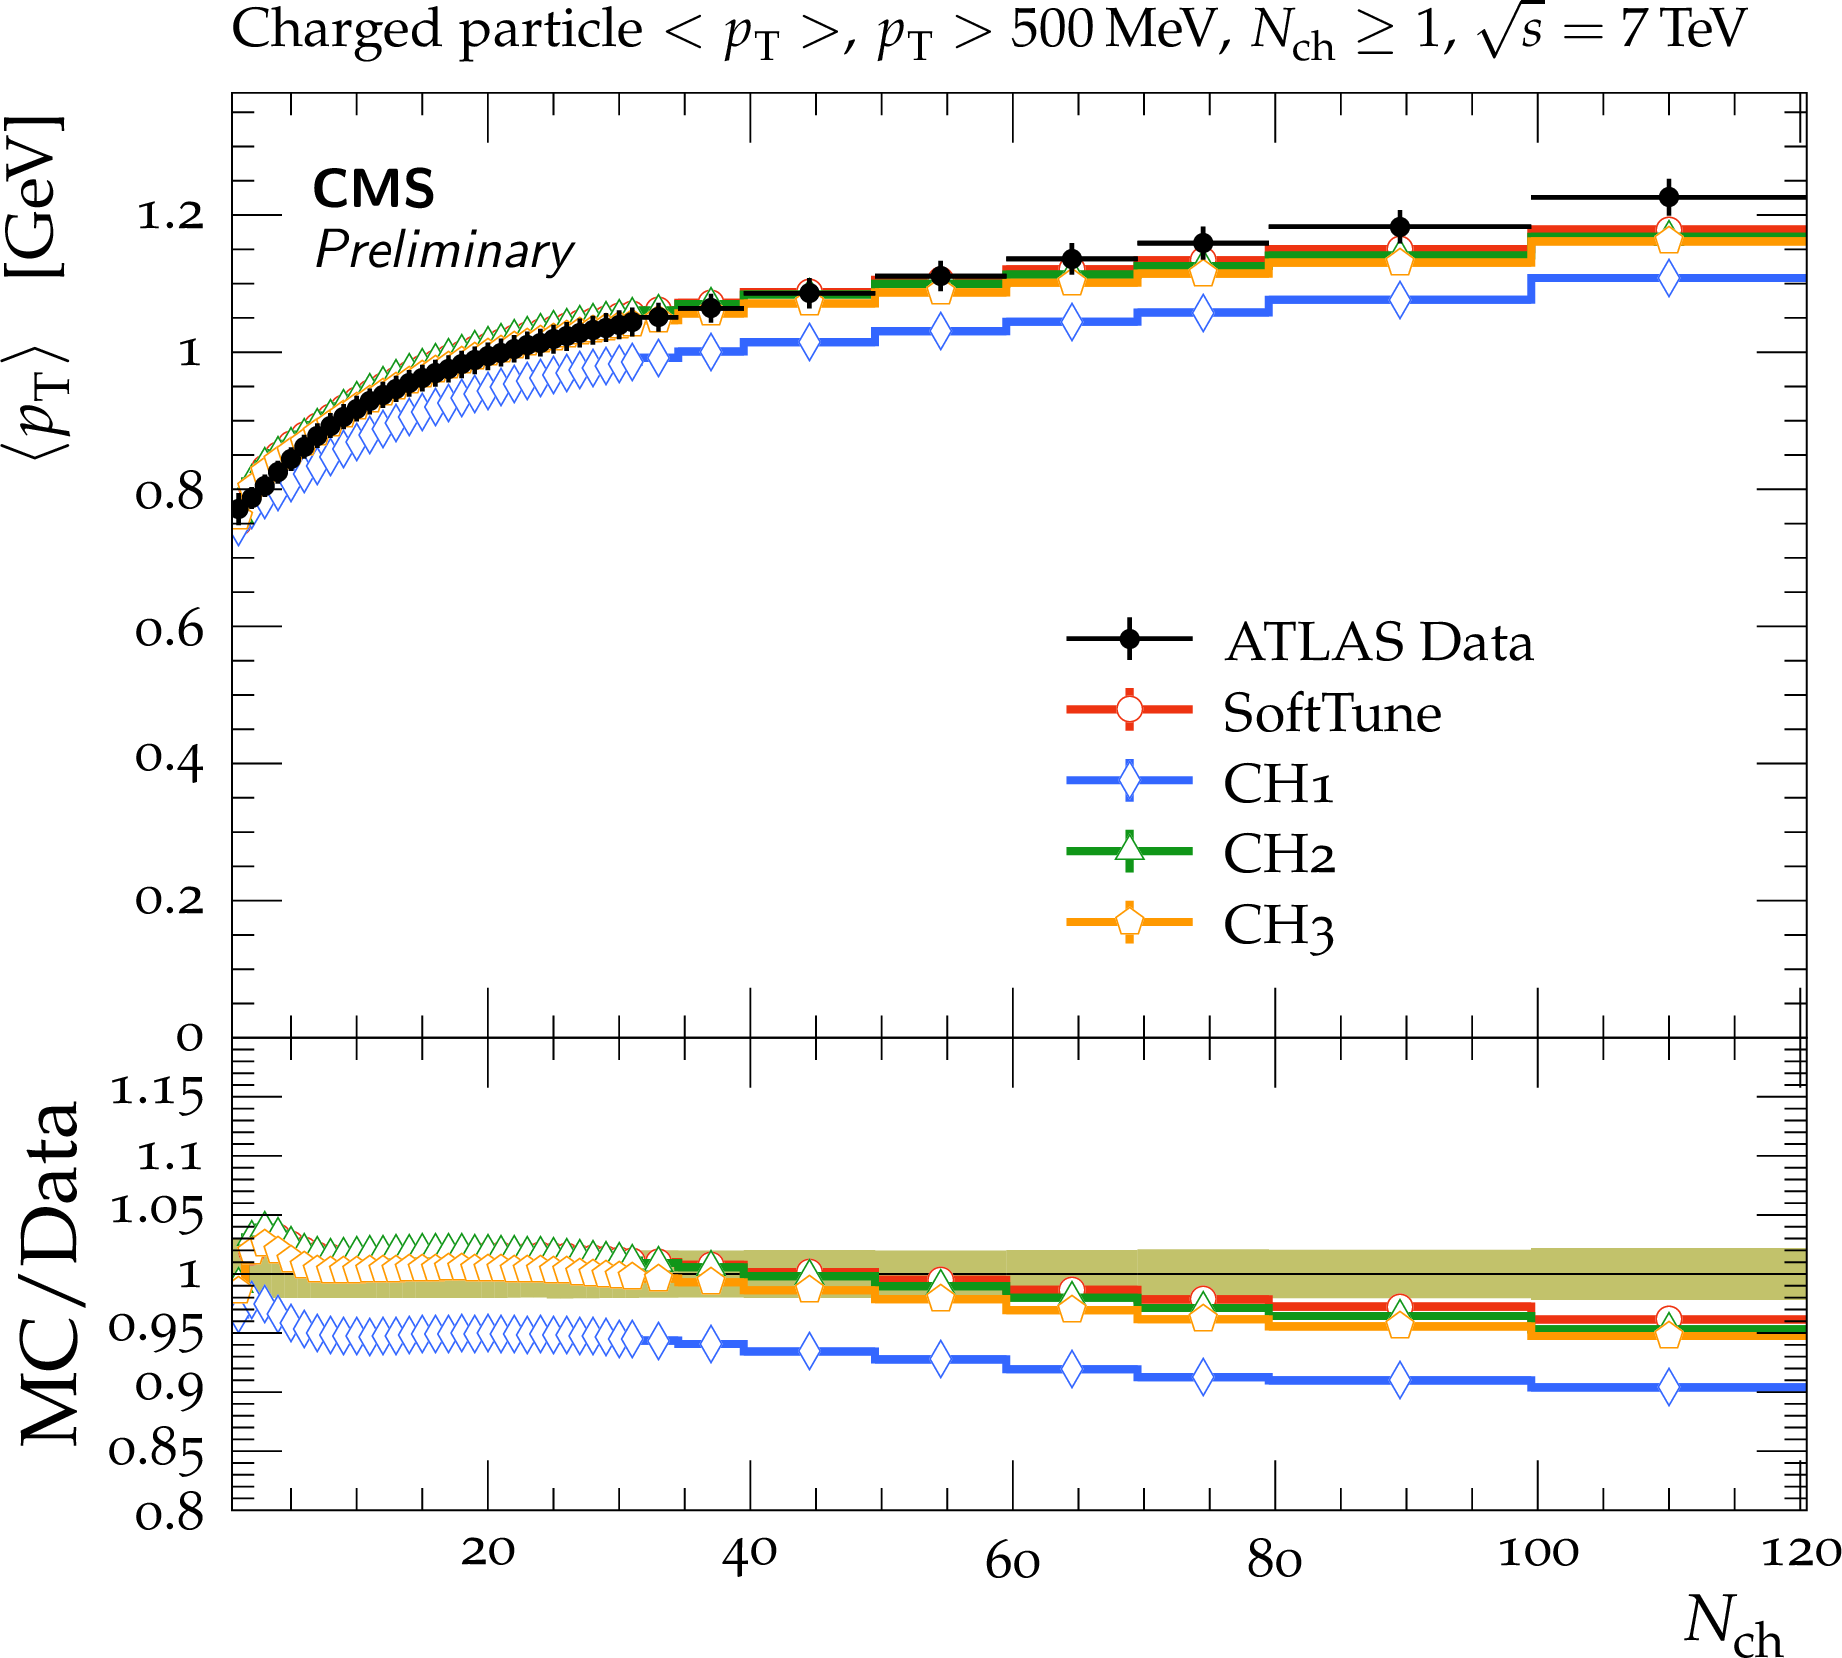
Figure 21:
ATLAS data at $ {\sqrt {s}} = $ 7 TeV [45] on the charged-particle ${p_{\mathrm {T}}}$ for $ {N_{\mathrm {ch}}} \ge $ 1 (upper left), $ {N_{\mathrm {ch}}} \ge $ 2 (upper right), $ {N_{\mathrm {ch}}} \ge $ 6 (lower left). The mean charged-particle ${p_{\mathrm {T}}}$ as a function of the charged-particle multiplicity is also shown (lower right). The data are compared to predictions from HERWIG 7, with the SoftTune and CH tunes. The coloured band in the ratios of the different predictions from simulation to the data represents the total experimental uncertainty in the data. |
png pdf |
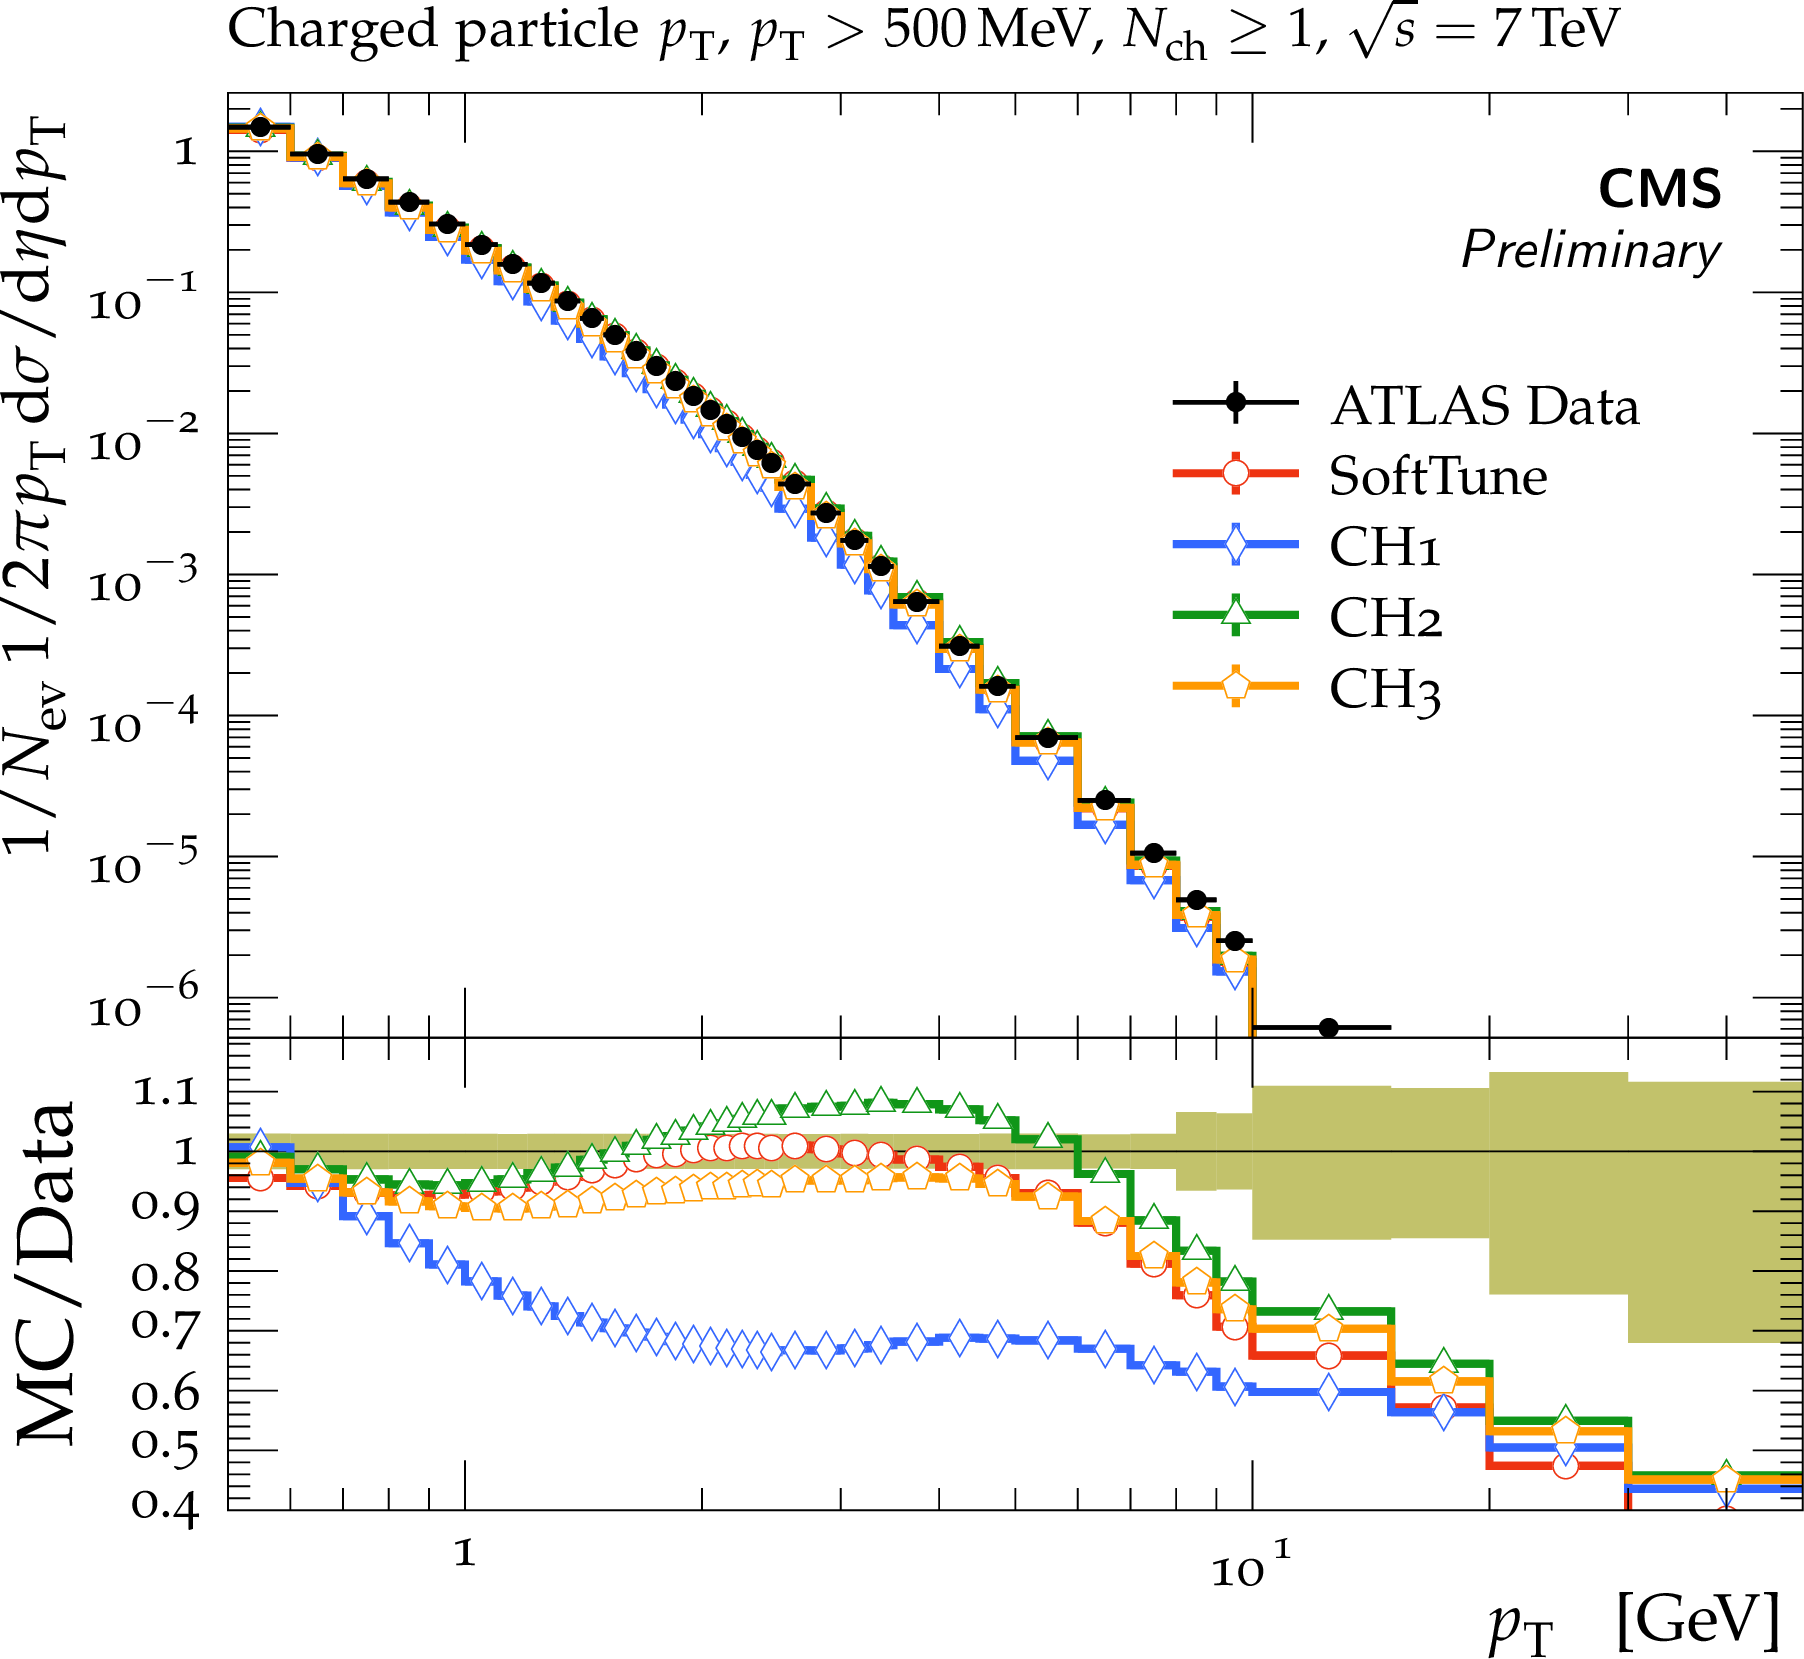
Figure 21-a:
ATLAS data at $ {\sqrt {s}} = $ 7 TeV [45] on the charged-particle ${p_{\mathrm {T}}}$ for $ {N_{\mathrm {ch}}} \ge $ 1 (upper left), $ {N_{\mathrm {ch}}} \ge $ 2 (upper right), $ {N_{\mathrm {ch}}} \ge $ 6 (lower left). The mean charged-particle ${p_{\mathrm {T}}}$ as a function of the charged-particle multiplicity is also shown (lower right). The data are compared to predictions from HERWIG 7, with the SoftTune and CH tunes. The coloured band in the ratios of the different predictions from simulation to the data represents the total experimental uncertainty in the data. |
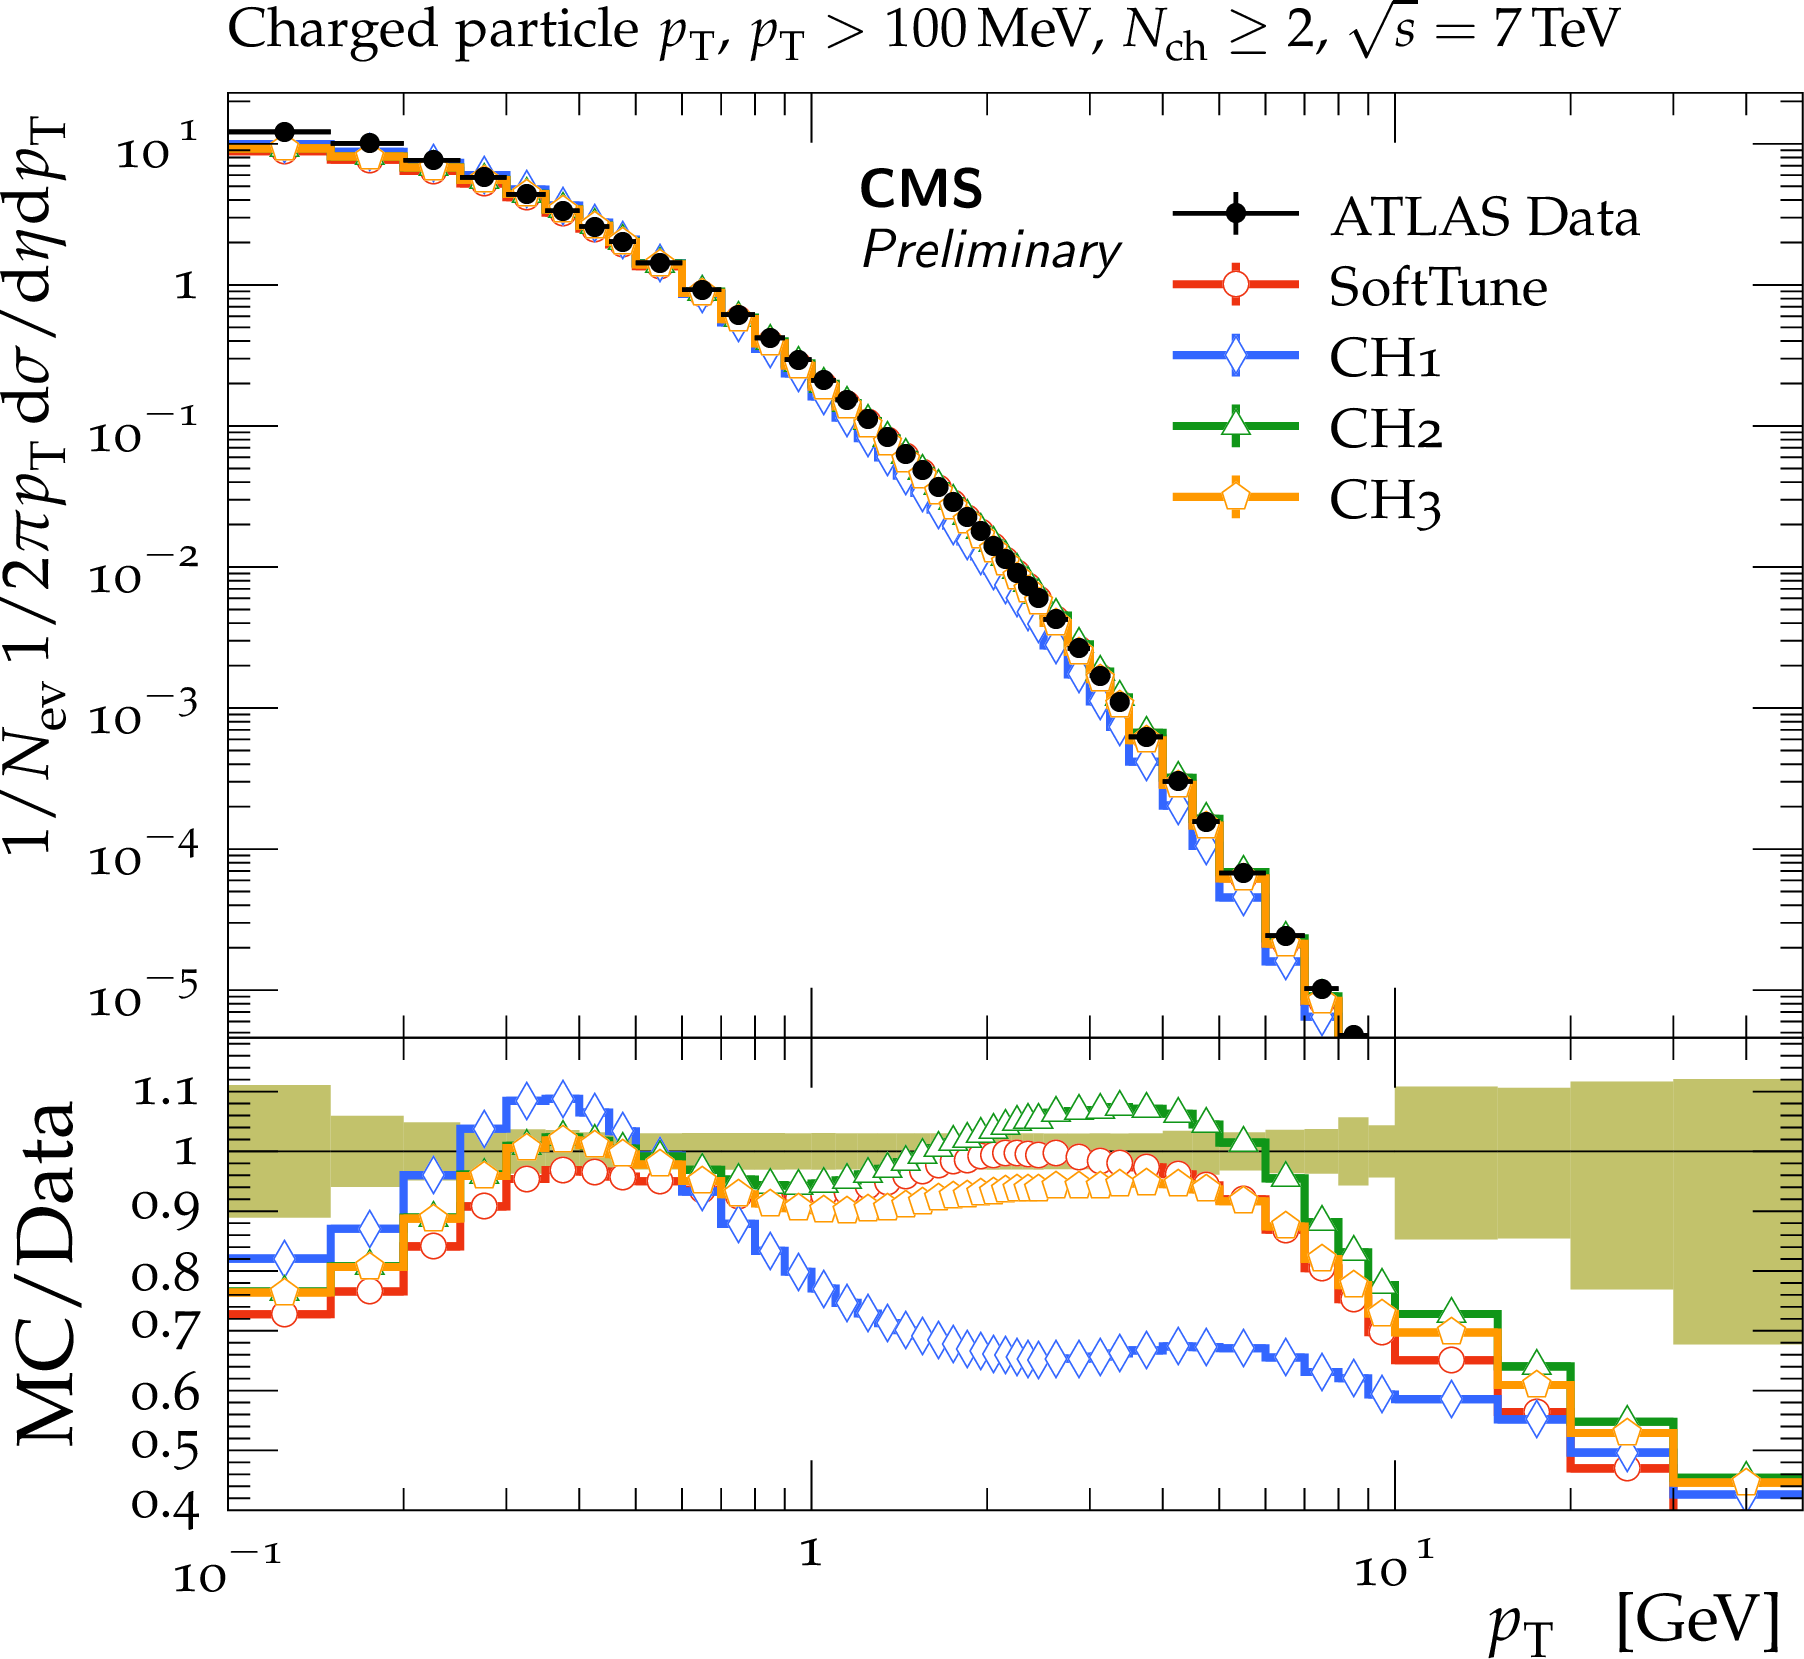
png pdf |
Figure 21-b:
ATLAS data at $ {\sqrt {s}} = $ 7 TeV [45] on the charged-particle ${p_{\mathrm {T}}}$ for $ {N_{\mathrm {ch}}} \ge $ 1 (upper left), $ {N_{\mathrm {ch}}} \ge $ 2 (upper right), $ {N_{\mathrm {ch}}} \ge $ 6 (lower left). The mean charged-particle ${p_{\mathrm {T}}}$ as a function of the charged-particle multiplicity is also shown (lower right). The data are compared to predictions from HERWIG 7, with the SoftTune and CH tunes. The coloured band in the ratios of the different predictions from simulation to the data represents the total experimental uncertainty in the data. |
png pdf |
Figure 21-c:
ATLAS data at $ {\sqrt {s}} = $ 7 TeV [45] on the charged-particle ${p_{\mathrm {T}}}$ for $ {N_{\mathrm {ch}}} \ge $ 1 (upper left), $ {N_{\mathrm {ch}}} \ge $ 2 (upper right), $ {N_{\mathrm {ch}}} \ge $ 6 (lower left). The mean charged-particle ${p_{\mathrm {T}}}$ as a function of the charged-particle multiplicity is also shown (lower right). The data are compared to predictions from HERWIG 7, with the SoftTune and CH tunes. The coloured band in the ratios of the different predictions from simulation to the data represents the total experimental uncertainty in the data. |
png pdf |
Figure 21-d:
ATLAS data at $ {\sqrt {s}} = $ 7 TeV [45] on the charged-particle ${p_{\mathrm {T}}}$ for $ {N_{\mathrm {ch}}} \ge $ 1 (upper left), $ {N_{\mathrm {ch}}} \ge $ 2 (upper right), $ {N_{\mathrm {ch}}} \ge $ 6 (lower left). The mean charged-particle ${p_{\mathrm {T}}}$ as a function of the charged-particle multiplicity is also shown (lower right). The data are compared to predictions from HERWIG 7, with the SoftTune and CH tunes. The coloured band in the ratios of the different predictions from simulation to the data represents the total experimental uncertainty in the data. |
png pdf |
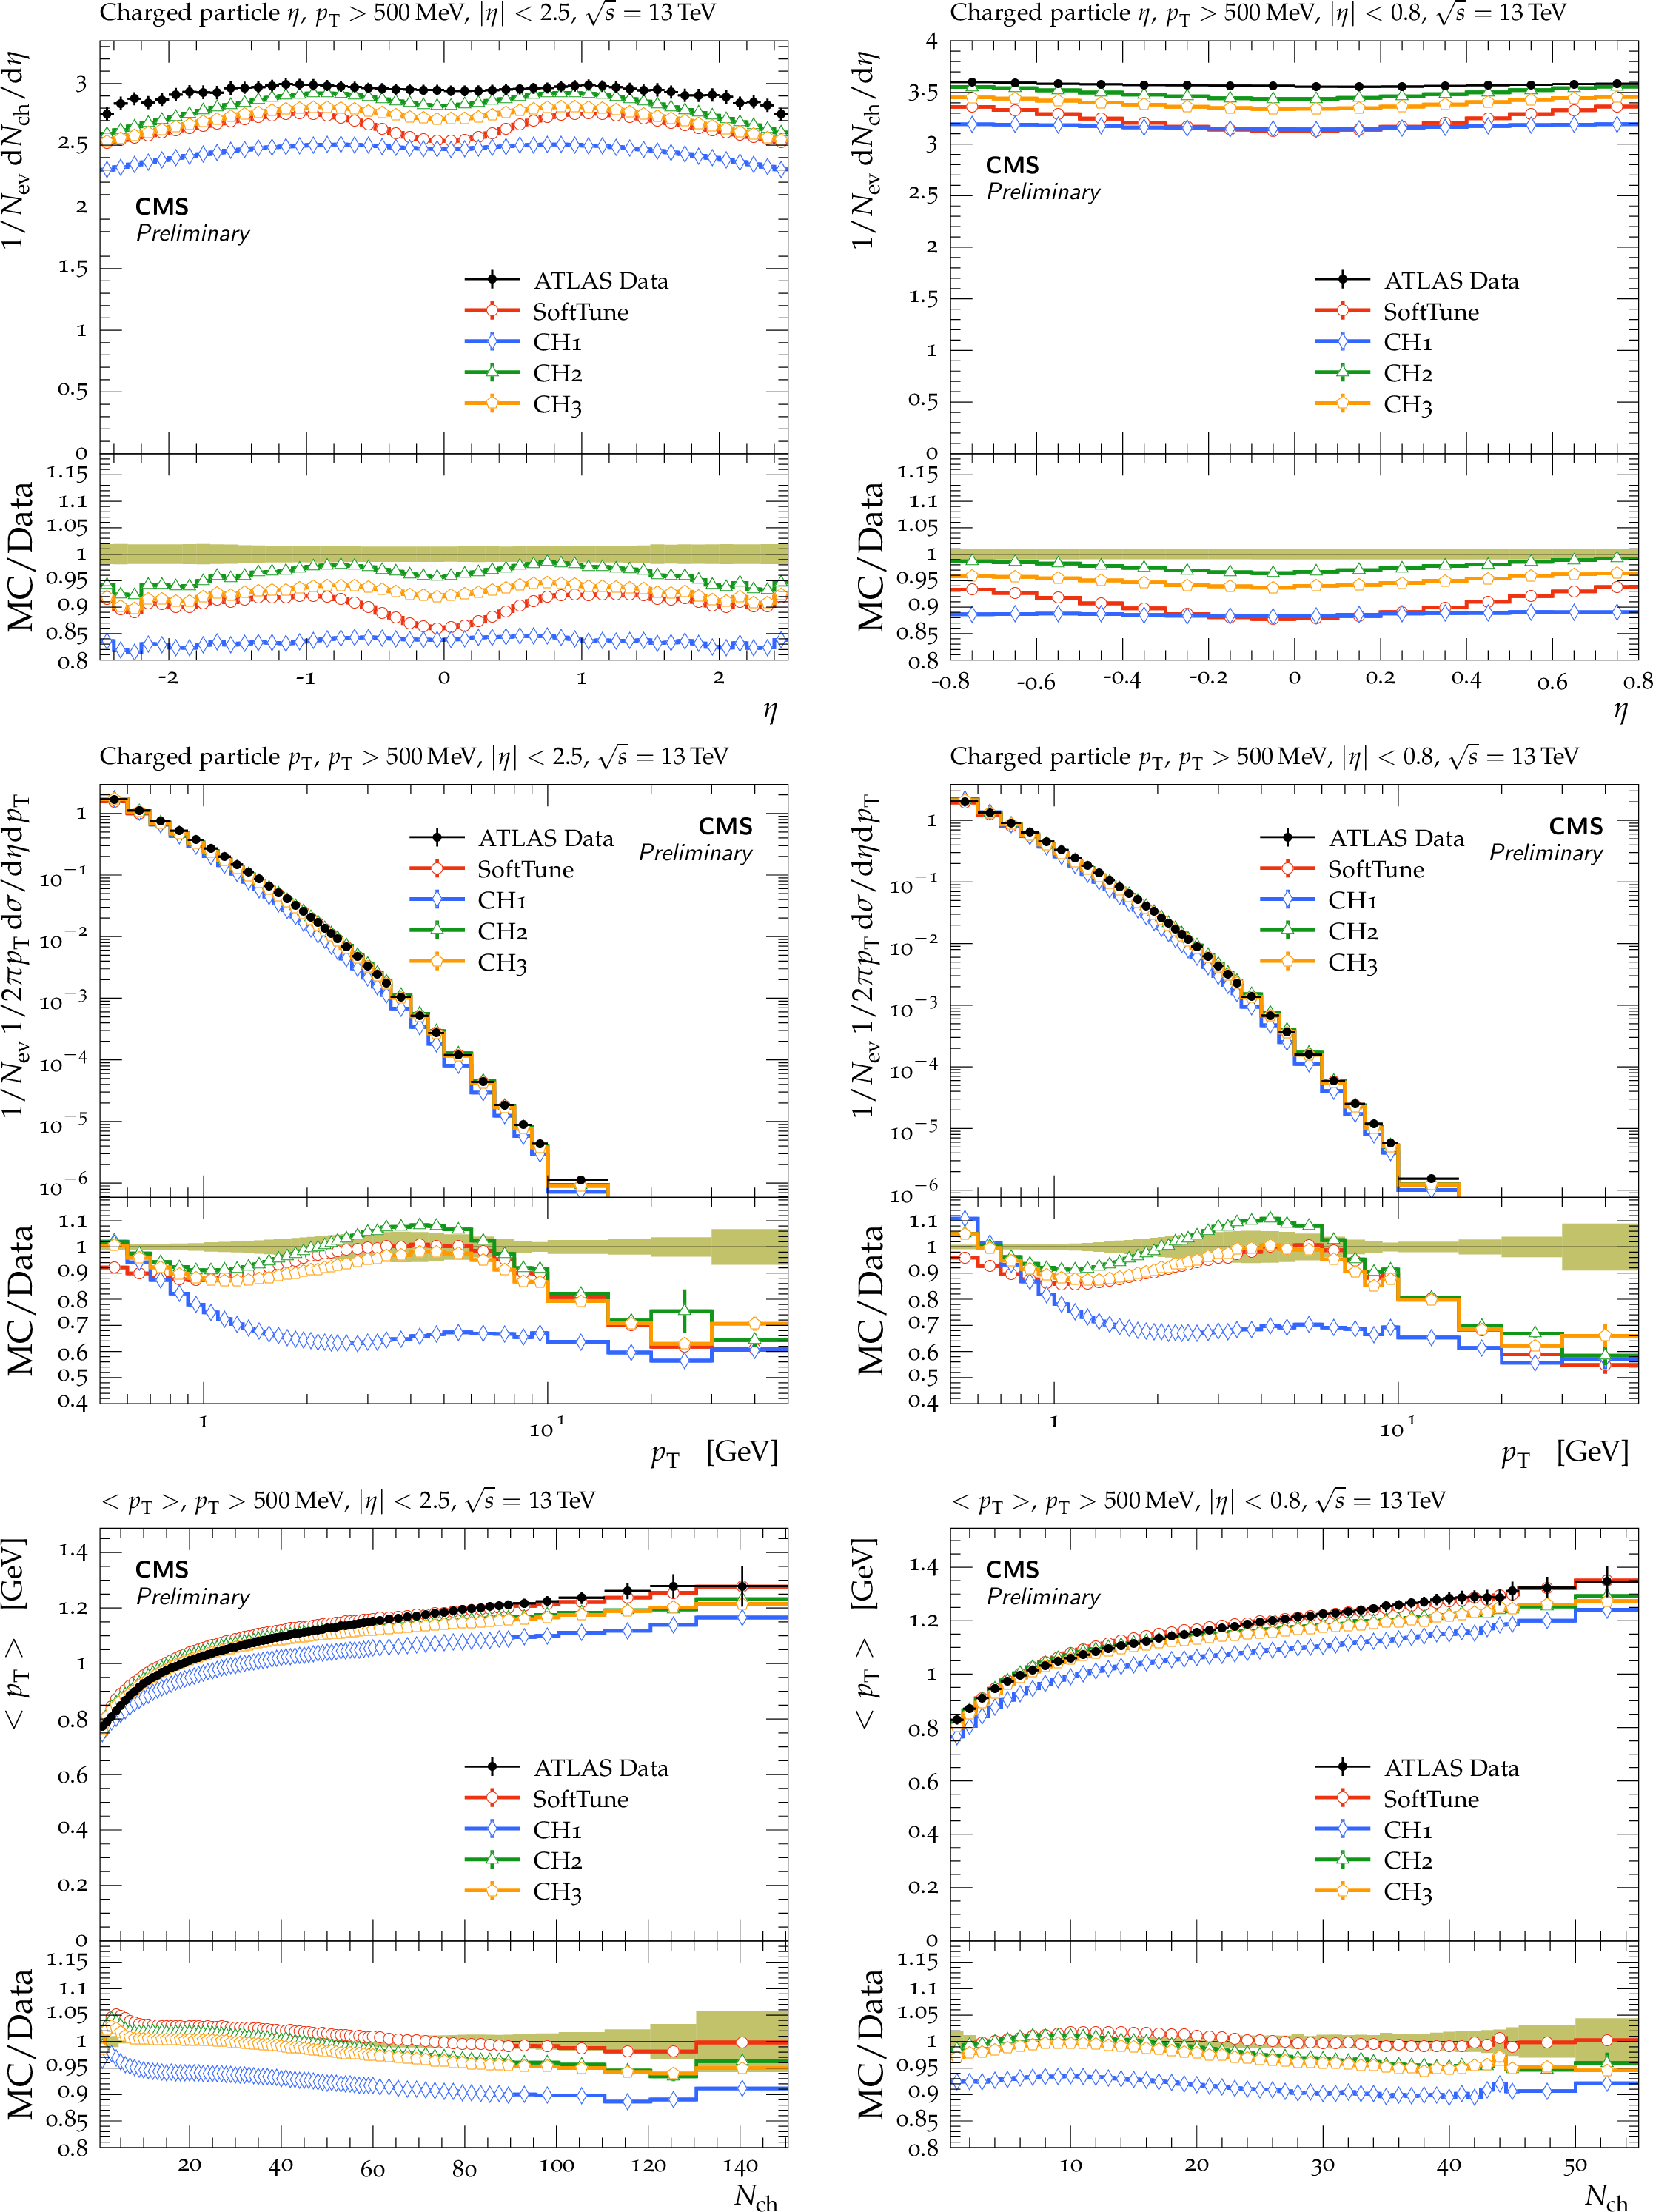
Figure 22:
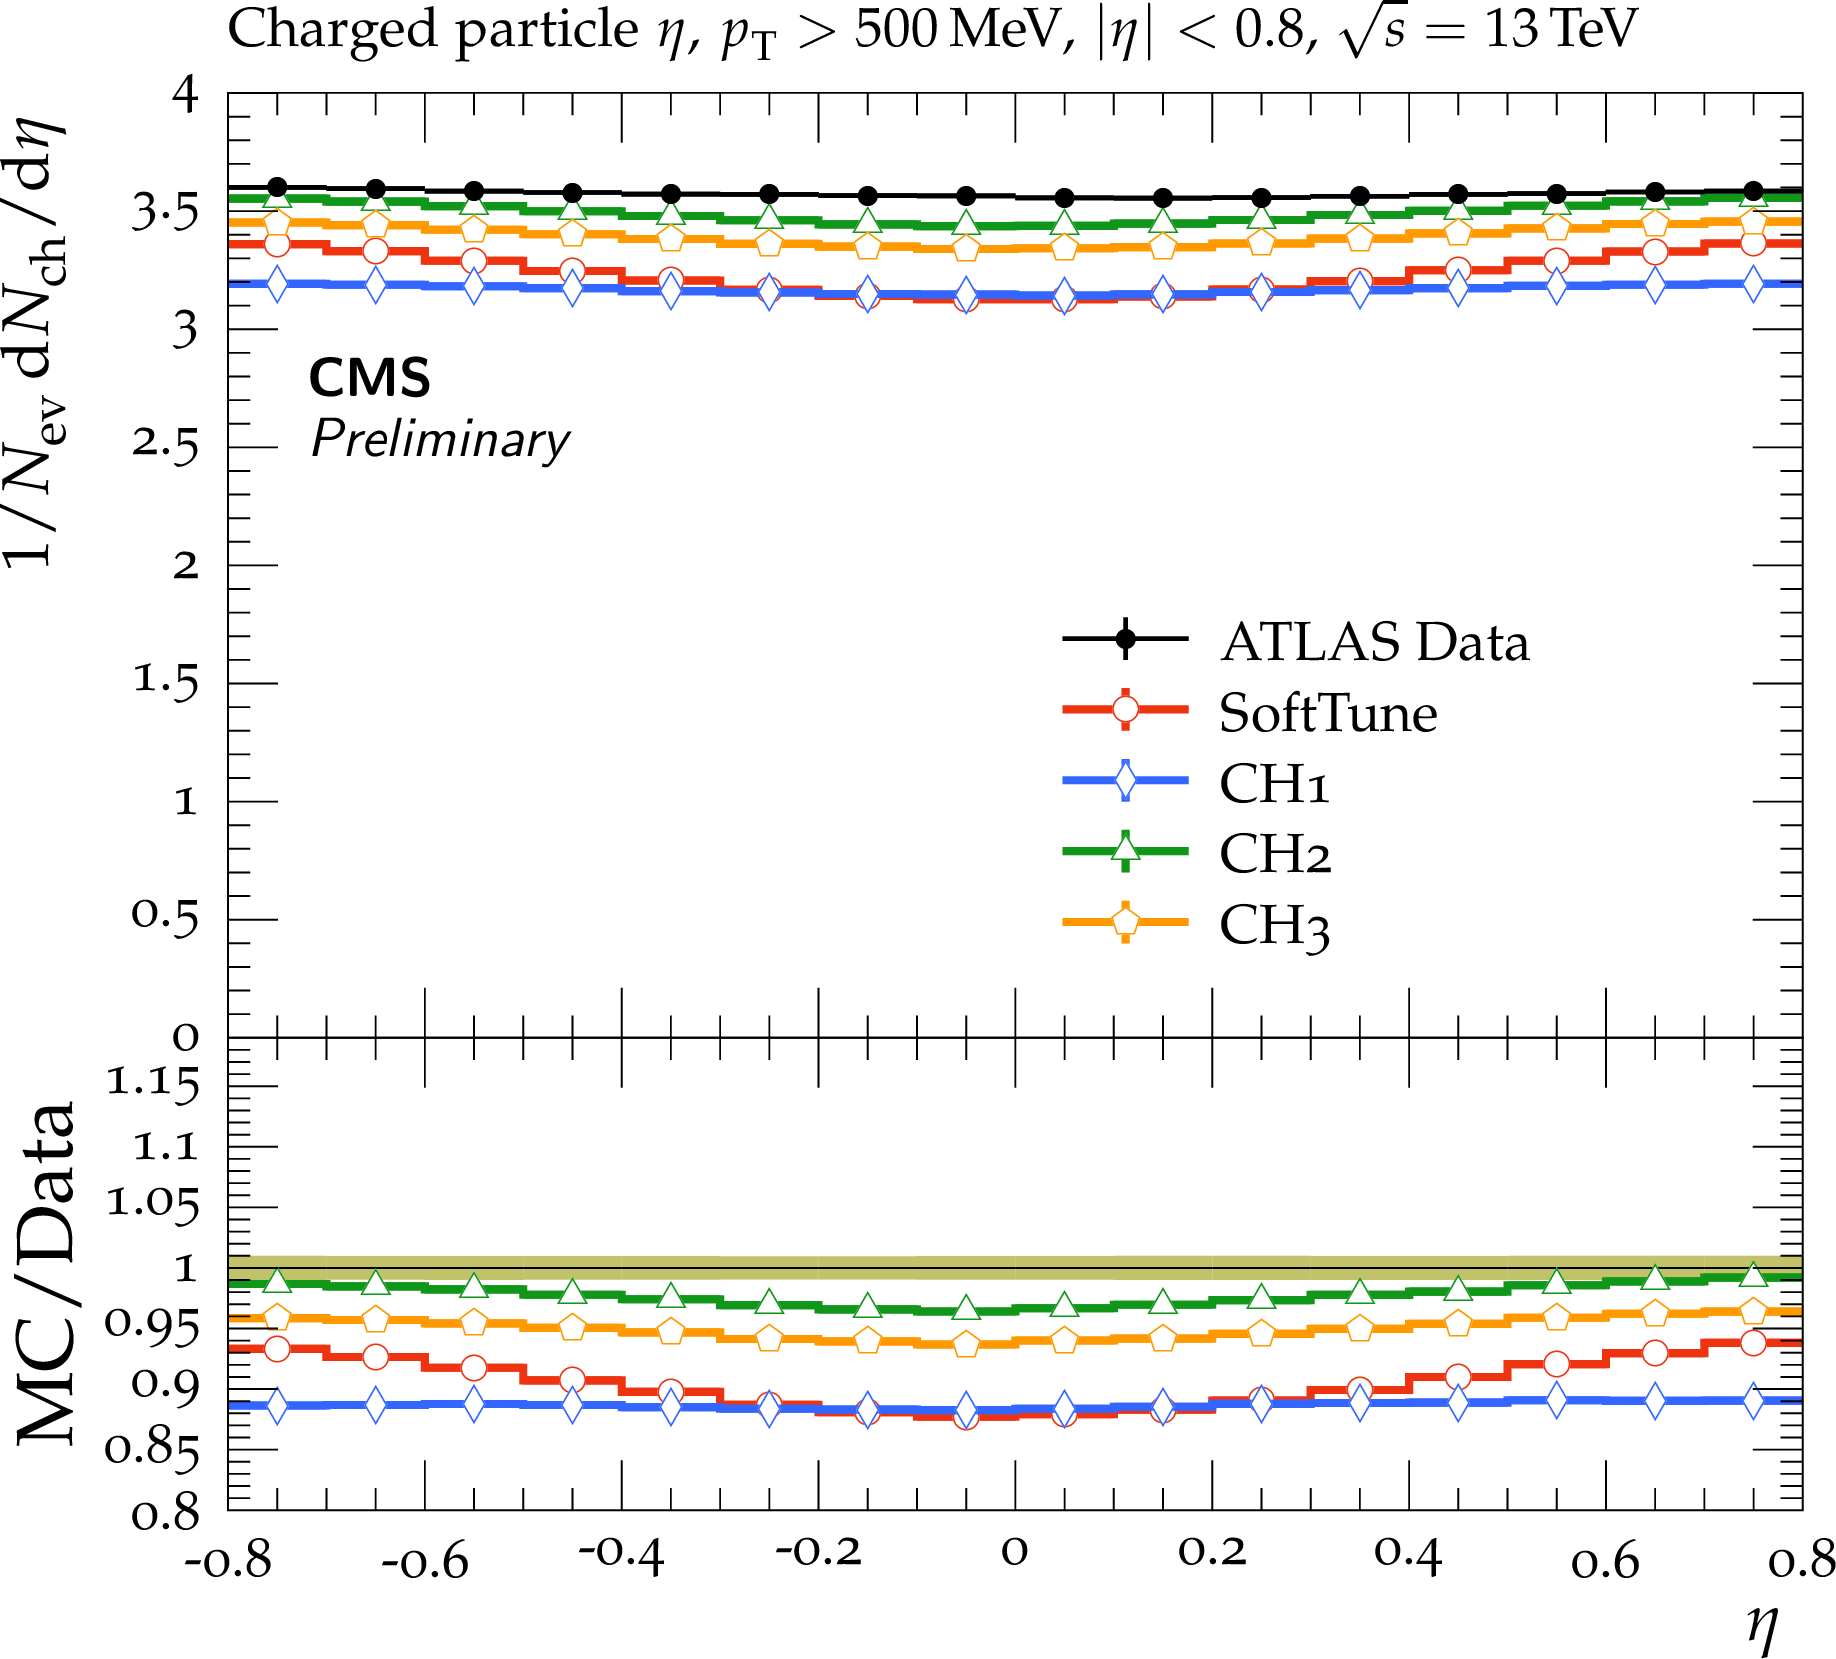
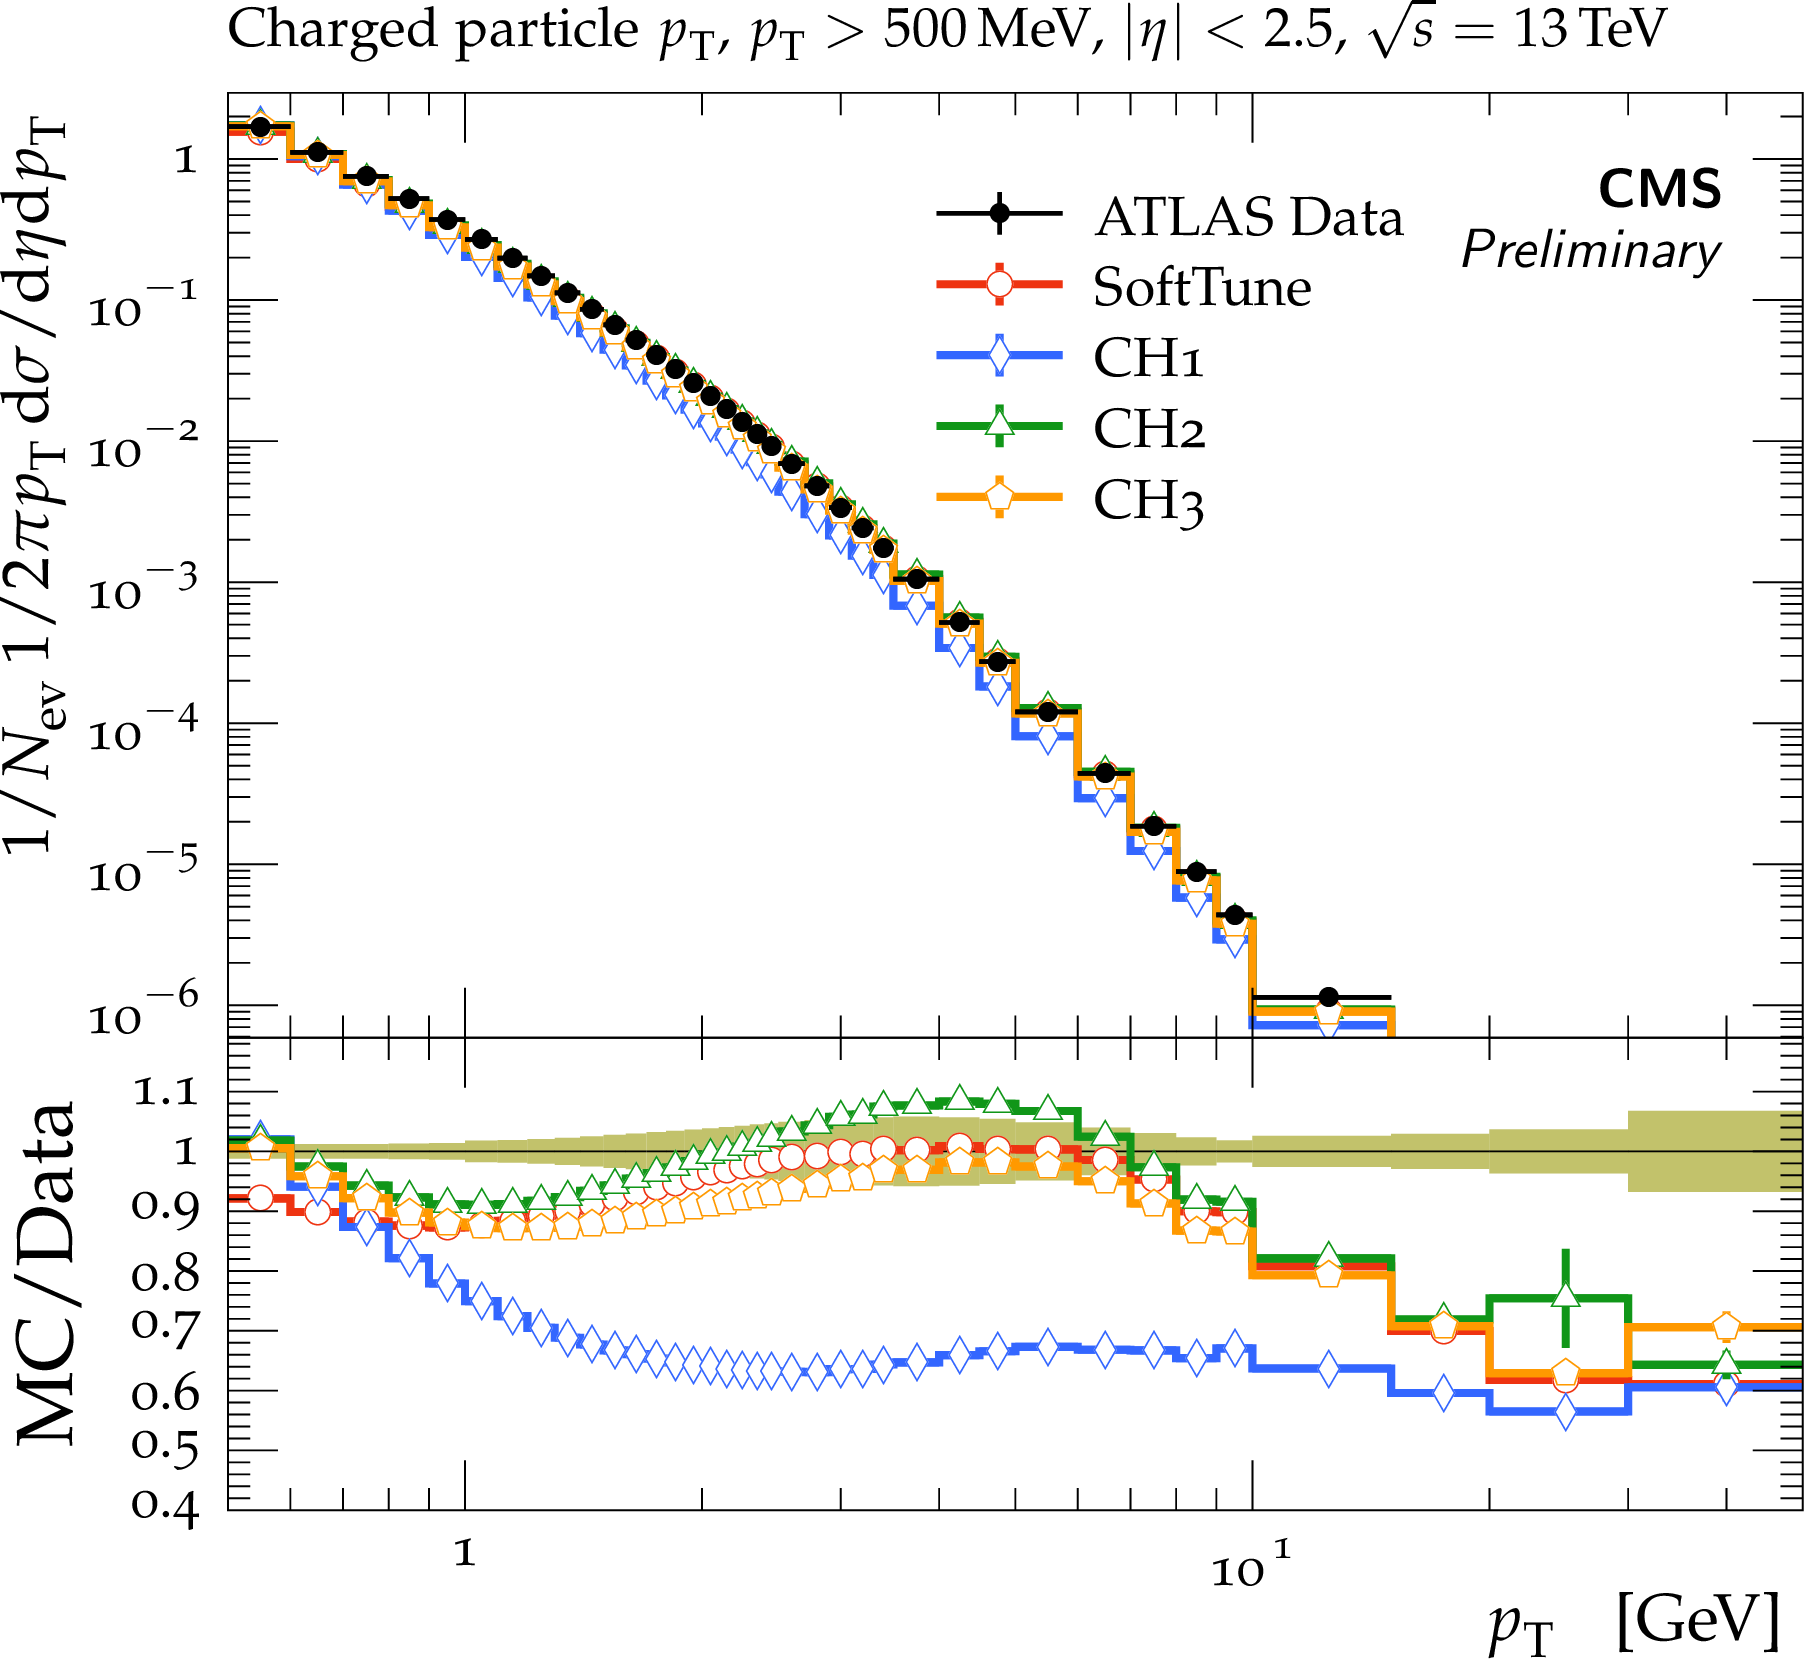
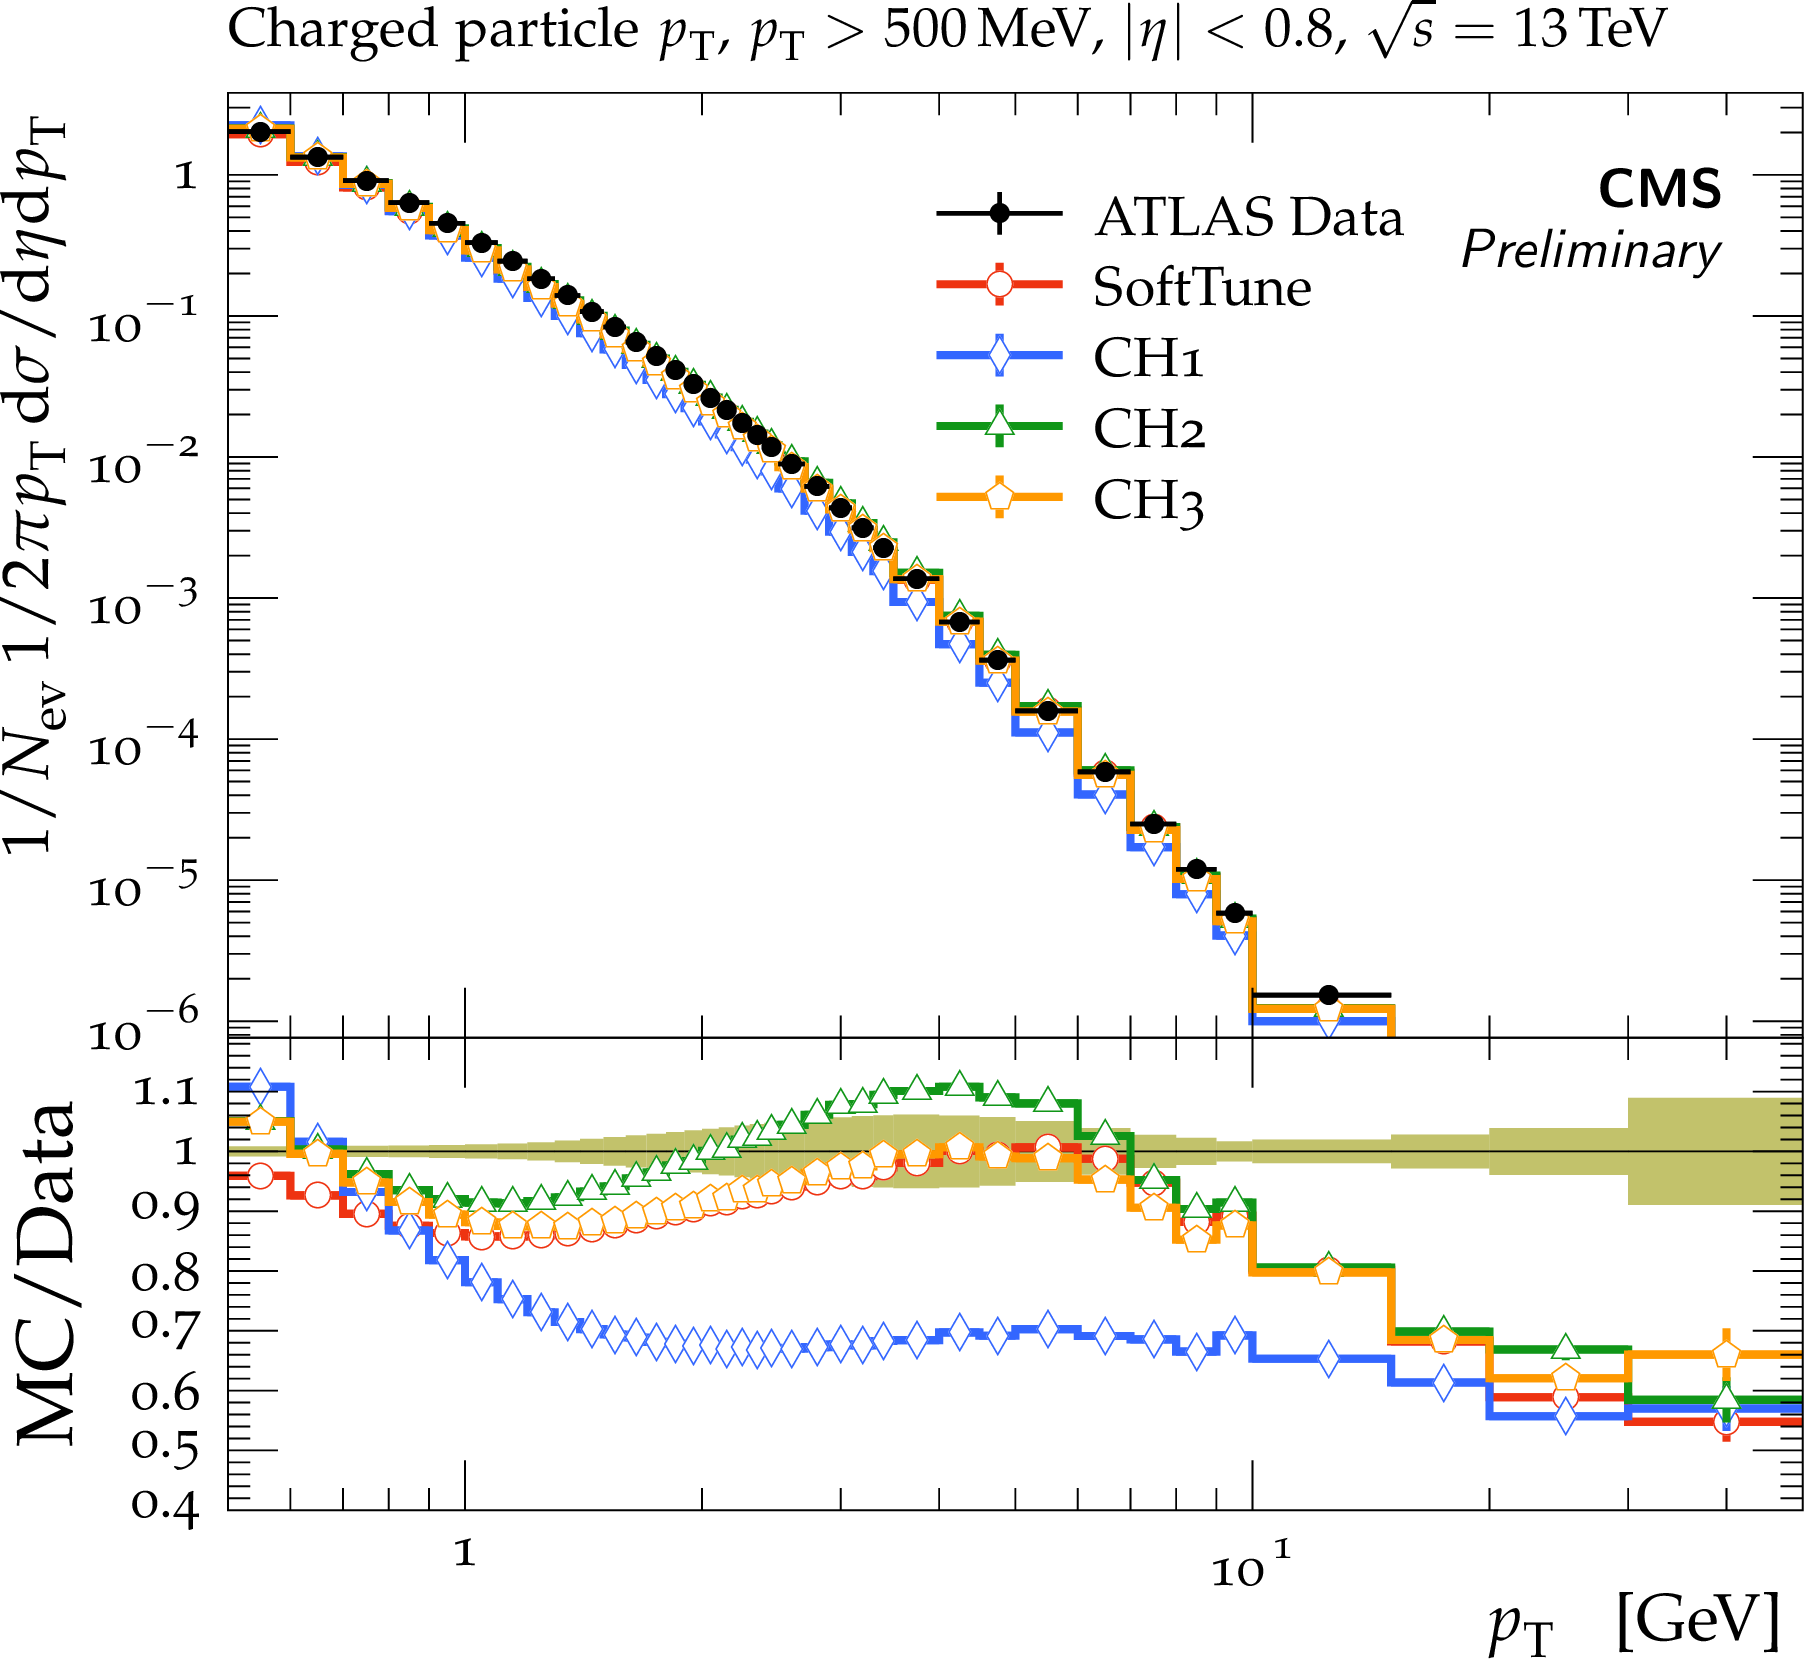
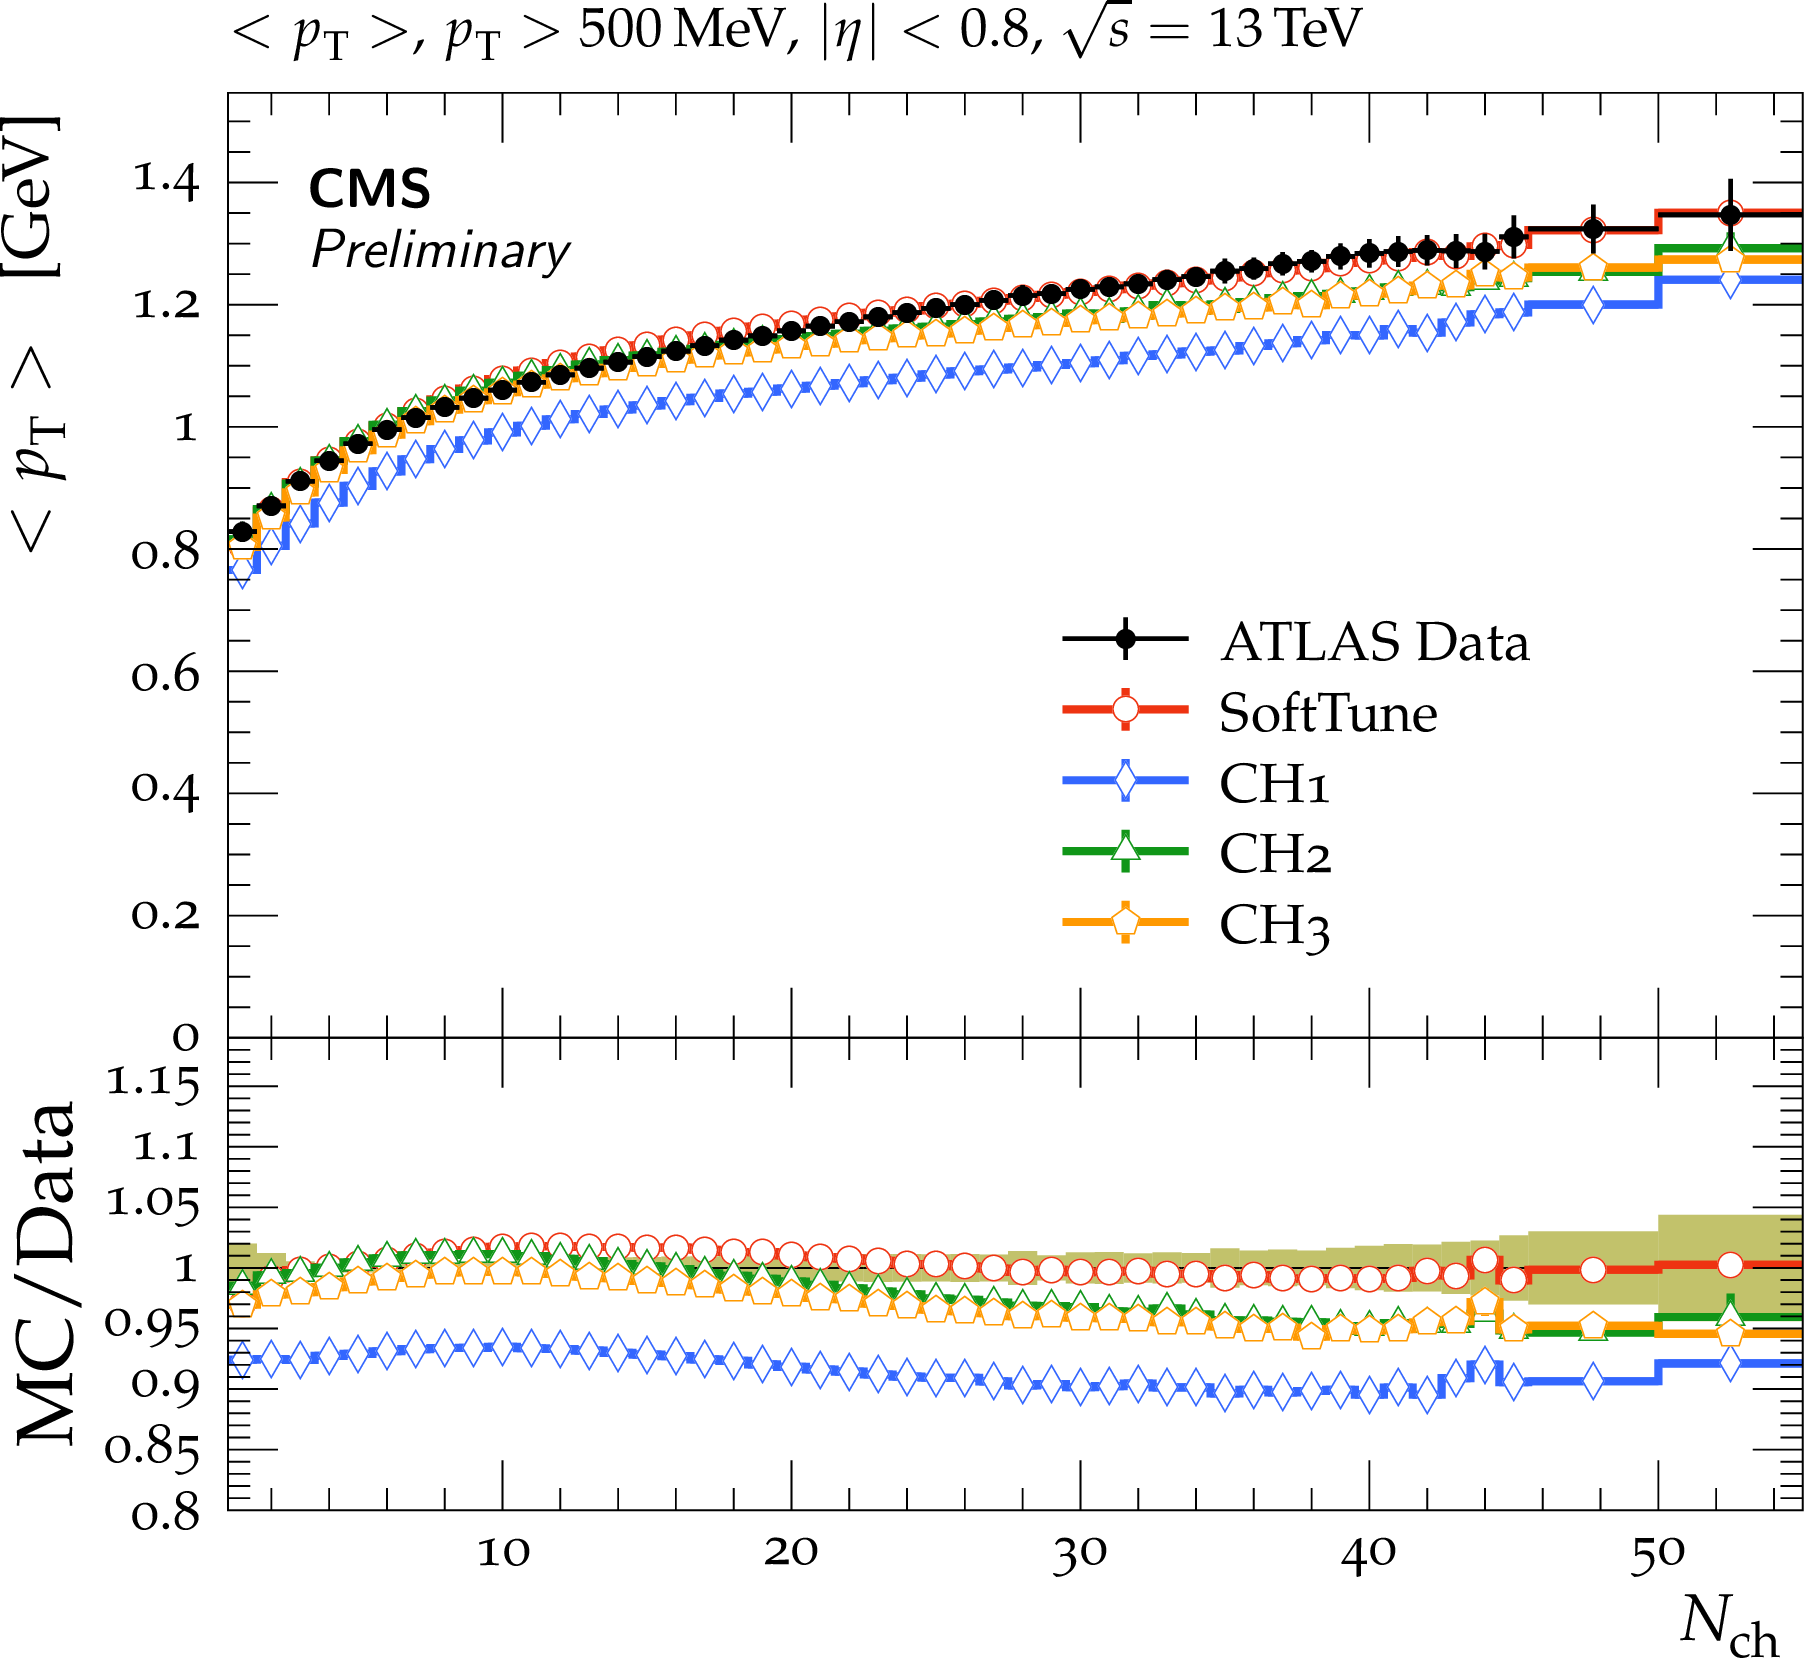
ATLAS data at $ {\sqrt {s}} = $ 13 TeV [46]. The upper row shows the pseudorapidity of charged particles for $|\eta | < 2.5$ (upper left), and $|\eta | < 0.8$ (upper right). The middle row shows the charged-particle ${p_{\mathrm {T}}}$ for $|\eta | < 2.5$ (middle left), and $|\eta | < 0.8$ (middle right). The final row shows the mean charged-particle ${p_{\mathrm {T}}}$ as a function of the charged-particle multiplicity the for $|\eta | < 2.5$ (lower left), and $|\eta | < 0.8$ (lower right). The data are compared to predictions from HERWIG 7, with the SoftTune and CH tunes. The coloured band in the ratios of the different predictions from simulation to the data represents the total experimental uncertainty in the data. |
png pdf |
Figure 22-a:
ATLAS data at $ {\sqrt {s}} = $ 13 TeV [46]. The upper row shows the pseudorapidity of charged particles for $|\eta | < 2.5$ (upper left), and $|\eta | < 0.8$ (upper right). The middle row shows the charged-particle ${p_{\mathrm {T}}}$ for $|\eta | < 2.5$ (middle left), and $|\eta | < 0.8$ (middle right). The final row shows the mean charged-particle ${p_{\mathrm {T}}}$ as a function of the charged-particle multiplicity the for $|\eta | < 2.5$ (lower left), and $|\eta | < 0.8$ (lower right). The data are compared to predictions from HERWIG 7, with the SoftTune and CH tunes. The coloured band in the ratios of the different predictions from simulation to the data represents the total experimental uncertainty in the data. |
png pdf |
Figure 22-b:
ATLAS data at $ {\sqrt {s}} = $ 13 TeV [46]. The upper row shows the pseudorapidity of charged particles for $|\eta | < 2.5$ (upper left), and $|\eta | < 0.8$ (upper right). The middle row shows the charged-particle ${p_{\mathrm {T}}}$ for $|\eta | < 2.5$ (middle left), and $|\eta | < 0.8$ (middle right). The final row shows the mean charged-particle ${p_{\mathrm {T}}}$ as a function of the charged-particle multiplicity the for $|\eta | < 2.5$ (lower left), and $|\eta | < 0.8$ (lower right). The data are compared to predictions from HERWIG 7, with the SoftTune and CH tunes. The coloured band in the ratios of the different predictions from simulation to the data represents the total experimental uncertainty in the data. |
png pdf |
Figure 22-c:
ATLAS data at $ {\sqrt {s}} = $ 13 TeV [46]. The upper row shows the pseudorapidity of charged particles for $|\eta | < 2.5$ (upper left), and $|\eta | < 0.8$ (upper right). The middle row shows the charged-particle ${p_{\mathrm {T}}}$ for $|\eta | < 2.5$ (middle left), and $|\eta | < 0.8$ (middle right). The final row shows the mean charged-particle ${p_{\mathrm {T}}}$ as a function of the charged-particle multiplicity the for $|\eta | < 2.5$ (lower left), and $|\eta | < 0.8$ (lower right). The data are compared to predictions from HERWIG 7, with the SoftTune and CH tunes. The coloured band in the ratios of the different predictions from simulation to the data represents the total experimental uncertainty in the data. |
png pdf |
Figure 22-d:
ATLAS data at $ {\sqrt {s}} = $ 13 TeV [46]. The upper row shows the pseudorapidity of charged particles for $|\eta | < 2.5$ (upper left), and $|\eta | < 0.8$ (upper right). The middle row shows the charged-particle ${p_{\mathrm {T}}}$ for $|\eta | < 2.5$ (middle left), and $|\eta | < 0.8$ (middle right). The final row shows the mean charged-particle ${p_{\mathrm {T}}}$ as a function of the charged-particle multiplicity the for $|\eta | < 2.5$ (lower left), and $|\eta | < 0.8$ (lower right). The data are compared to predictions from HERWIG 7, with the SoftTune and CH tunes. The coloured band in the ratios of the different predictions from simulation to the data represents the total experimental uncertainty in the data. |

png pdf |
Figure 22-e:
ATLAS data at $ {\sqrt {s}} = $ 13 TeV [46]. The upper row shows the pseudorapidity of charged particles for $|\eta | < 2.5$ (upper left), and $|\eta | < 0.8$ (upper right). The middle row shows the charged-particle ${p_{\mathrm {T}}}$ for $|\eta | < 2.5$ (middle left), and $|\eta | < 0.8$ (middle right). The final row shows the mean charged-particle ${p_{\mathrm {T}}}$ as a function of the charged-particle multiplicity the for $|\eta | < 2.5$ (lower left), and $|\eta | < 0.8$ (lower right). The data are compared to predictions from HERWIG 7, with the SoftTune and CH tunes. The coloured band in the ratios of the different predictions from simulation to the data represents the total experimental uncertainty in the data. |
png pdf |
Figure 22-f:
ATLAS data at $ {\sqrt {s}} = $ 13 TeV [46]. The upper row shows the pseudorapidity of charged particles for $|\eta | < 2.5$ (upper left), and $|\eta | < 0.8$ (upper right). The middle row shows the charged-particle ${p_{\mathrm {T}}}$ for $|\eta | < 2.5$ (middle left), and $|\eta | < 0.8$ (middle right). The final row shows the mean charged-particle ${p_{\mathrm {T}}}$ as a function of the charged-particle multiplicity the for $|\eta | < 2.5$ (lower left), and $|\eta | < 0.8$ (lower right). The data are compared to predictions from HERWIG 7, with the SoftTune and CH tunes. The coloured band in the ratios of the different predictions from simulation to the data represents the total experimental uncertainty in the data. |
png pdf |
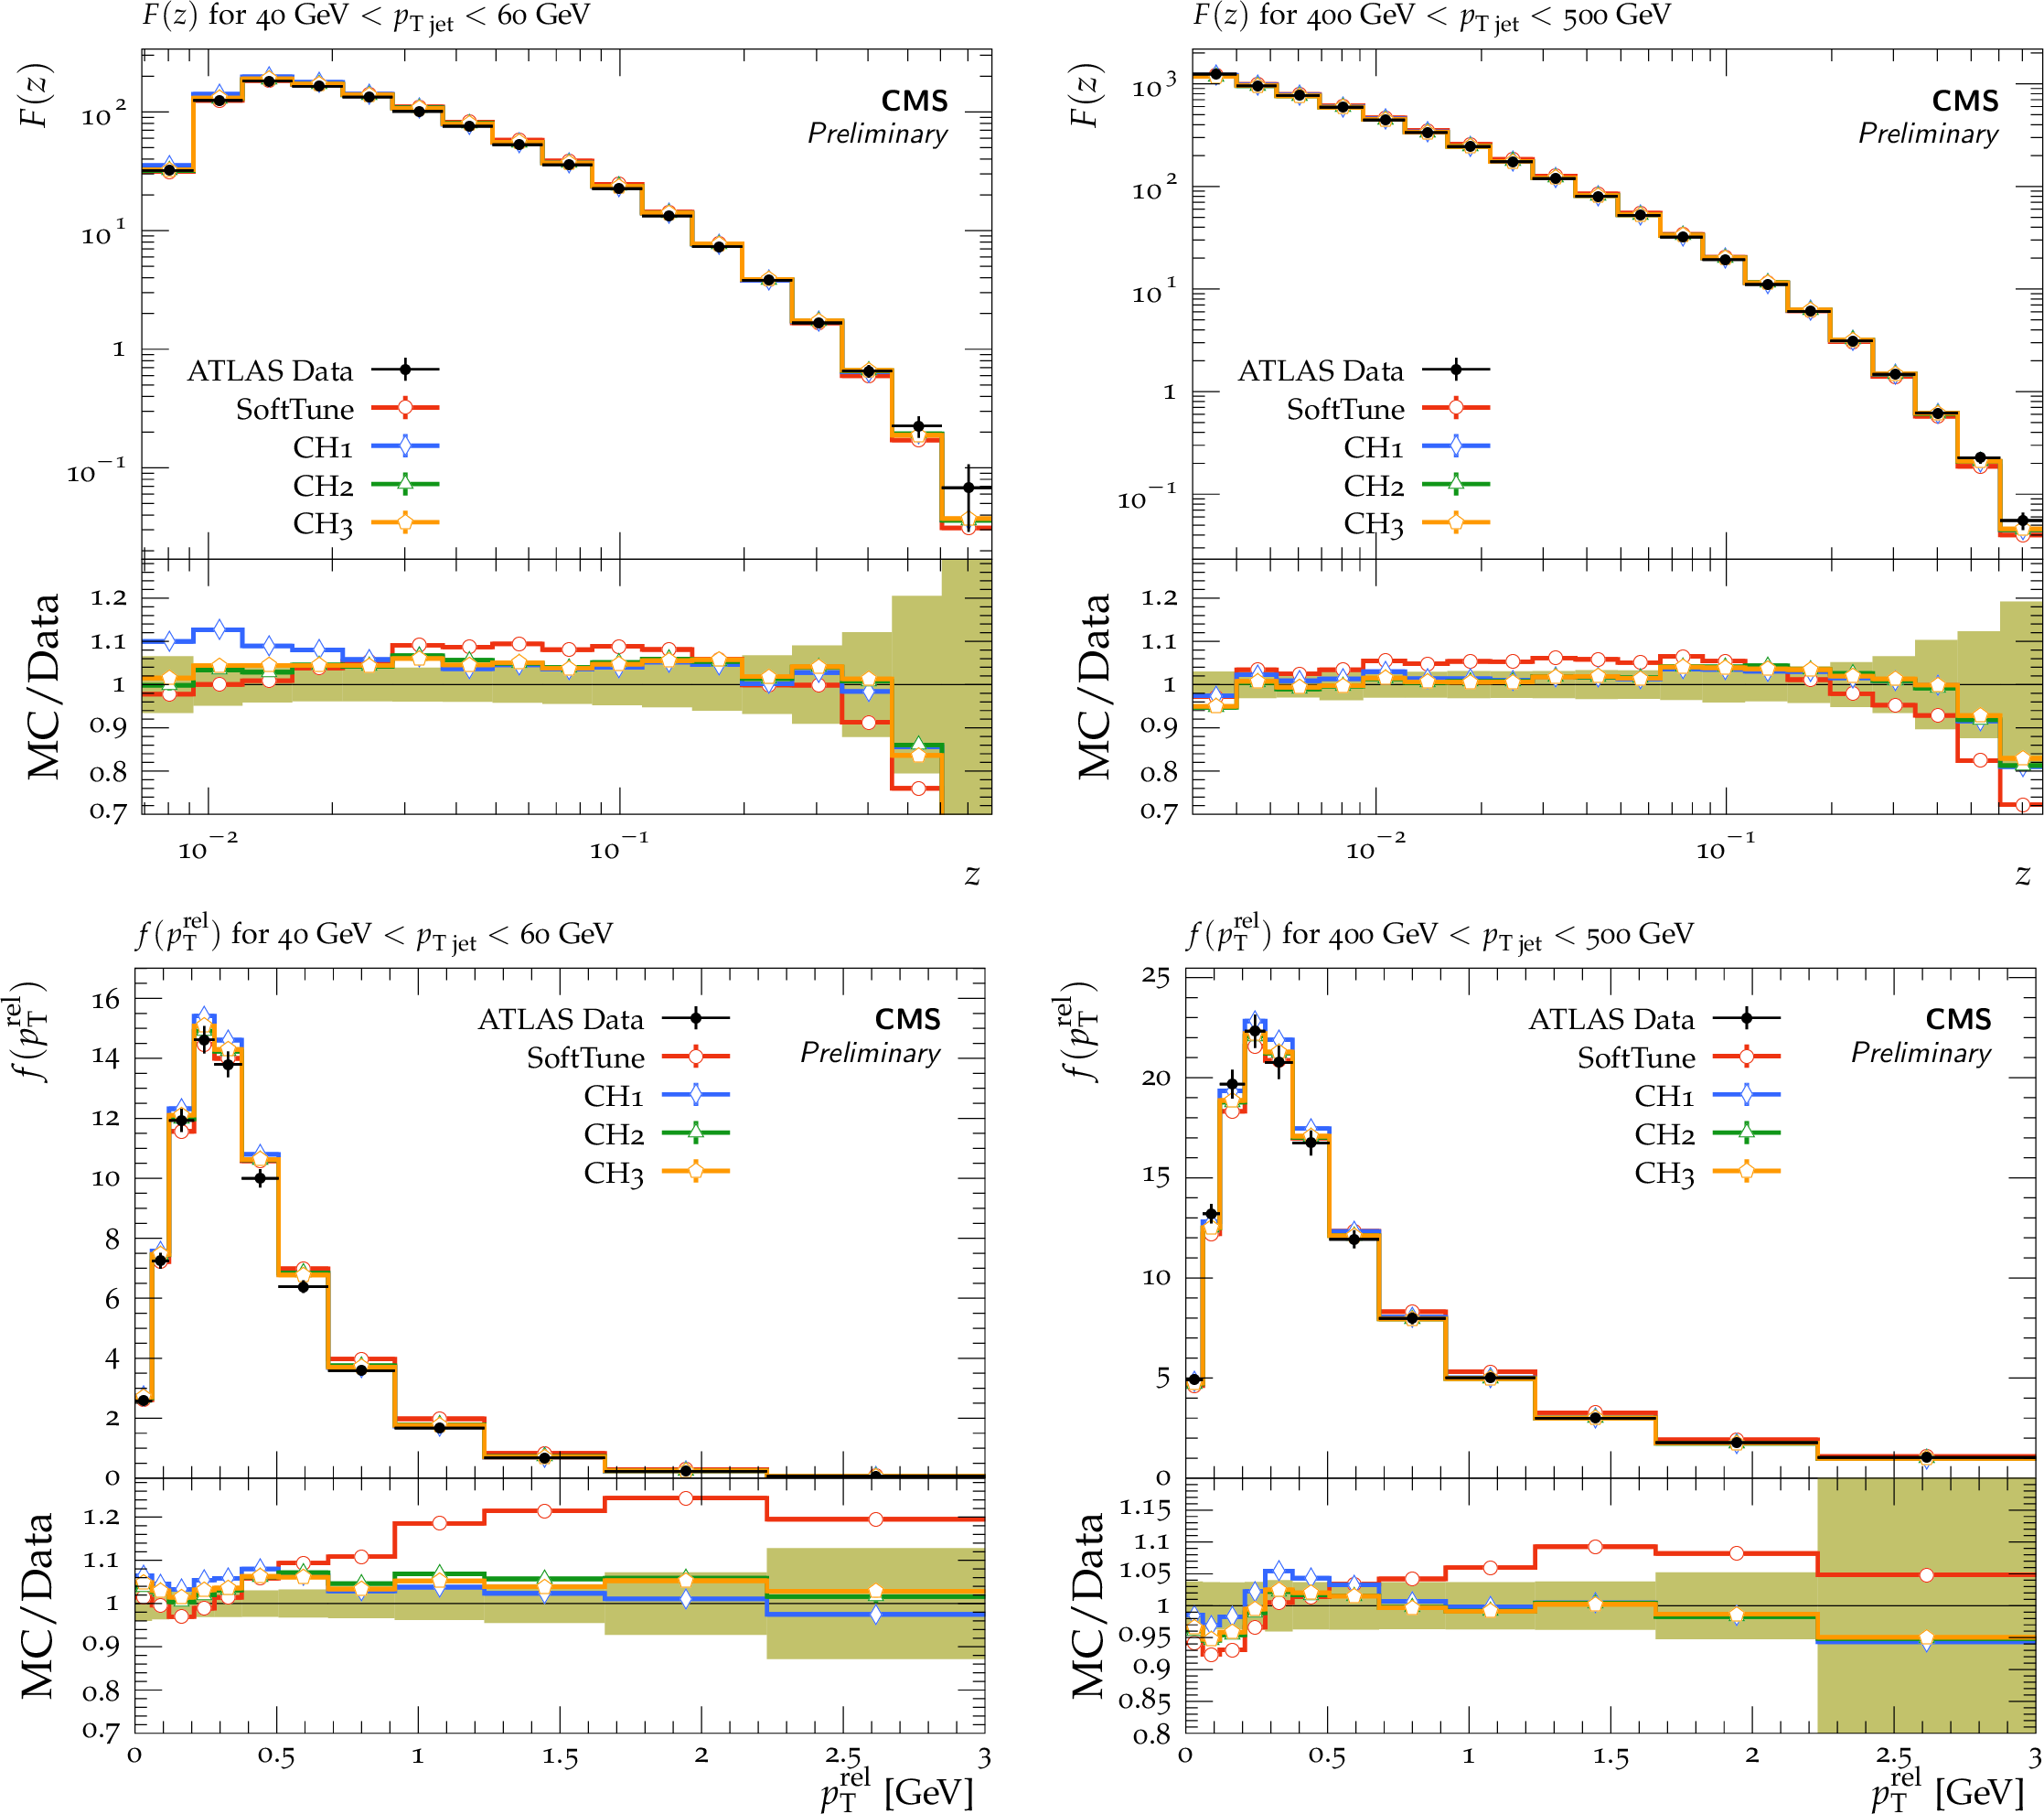
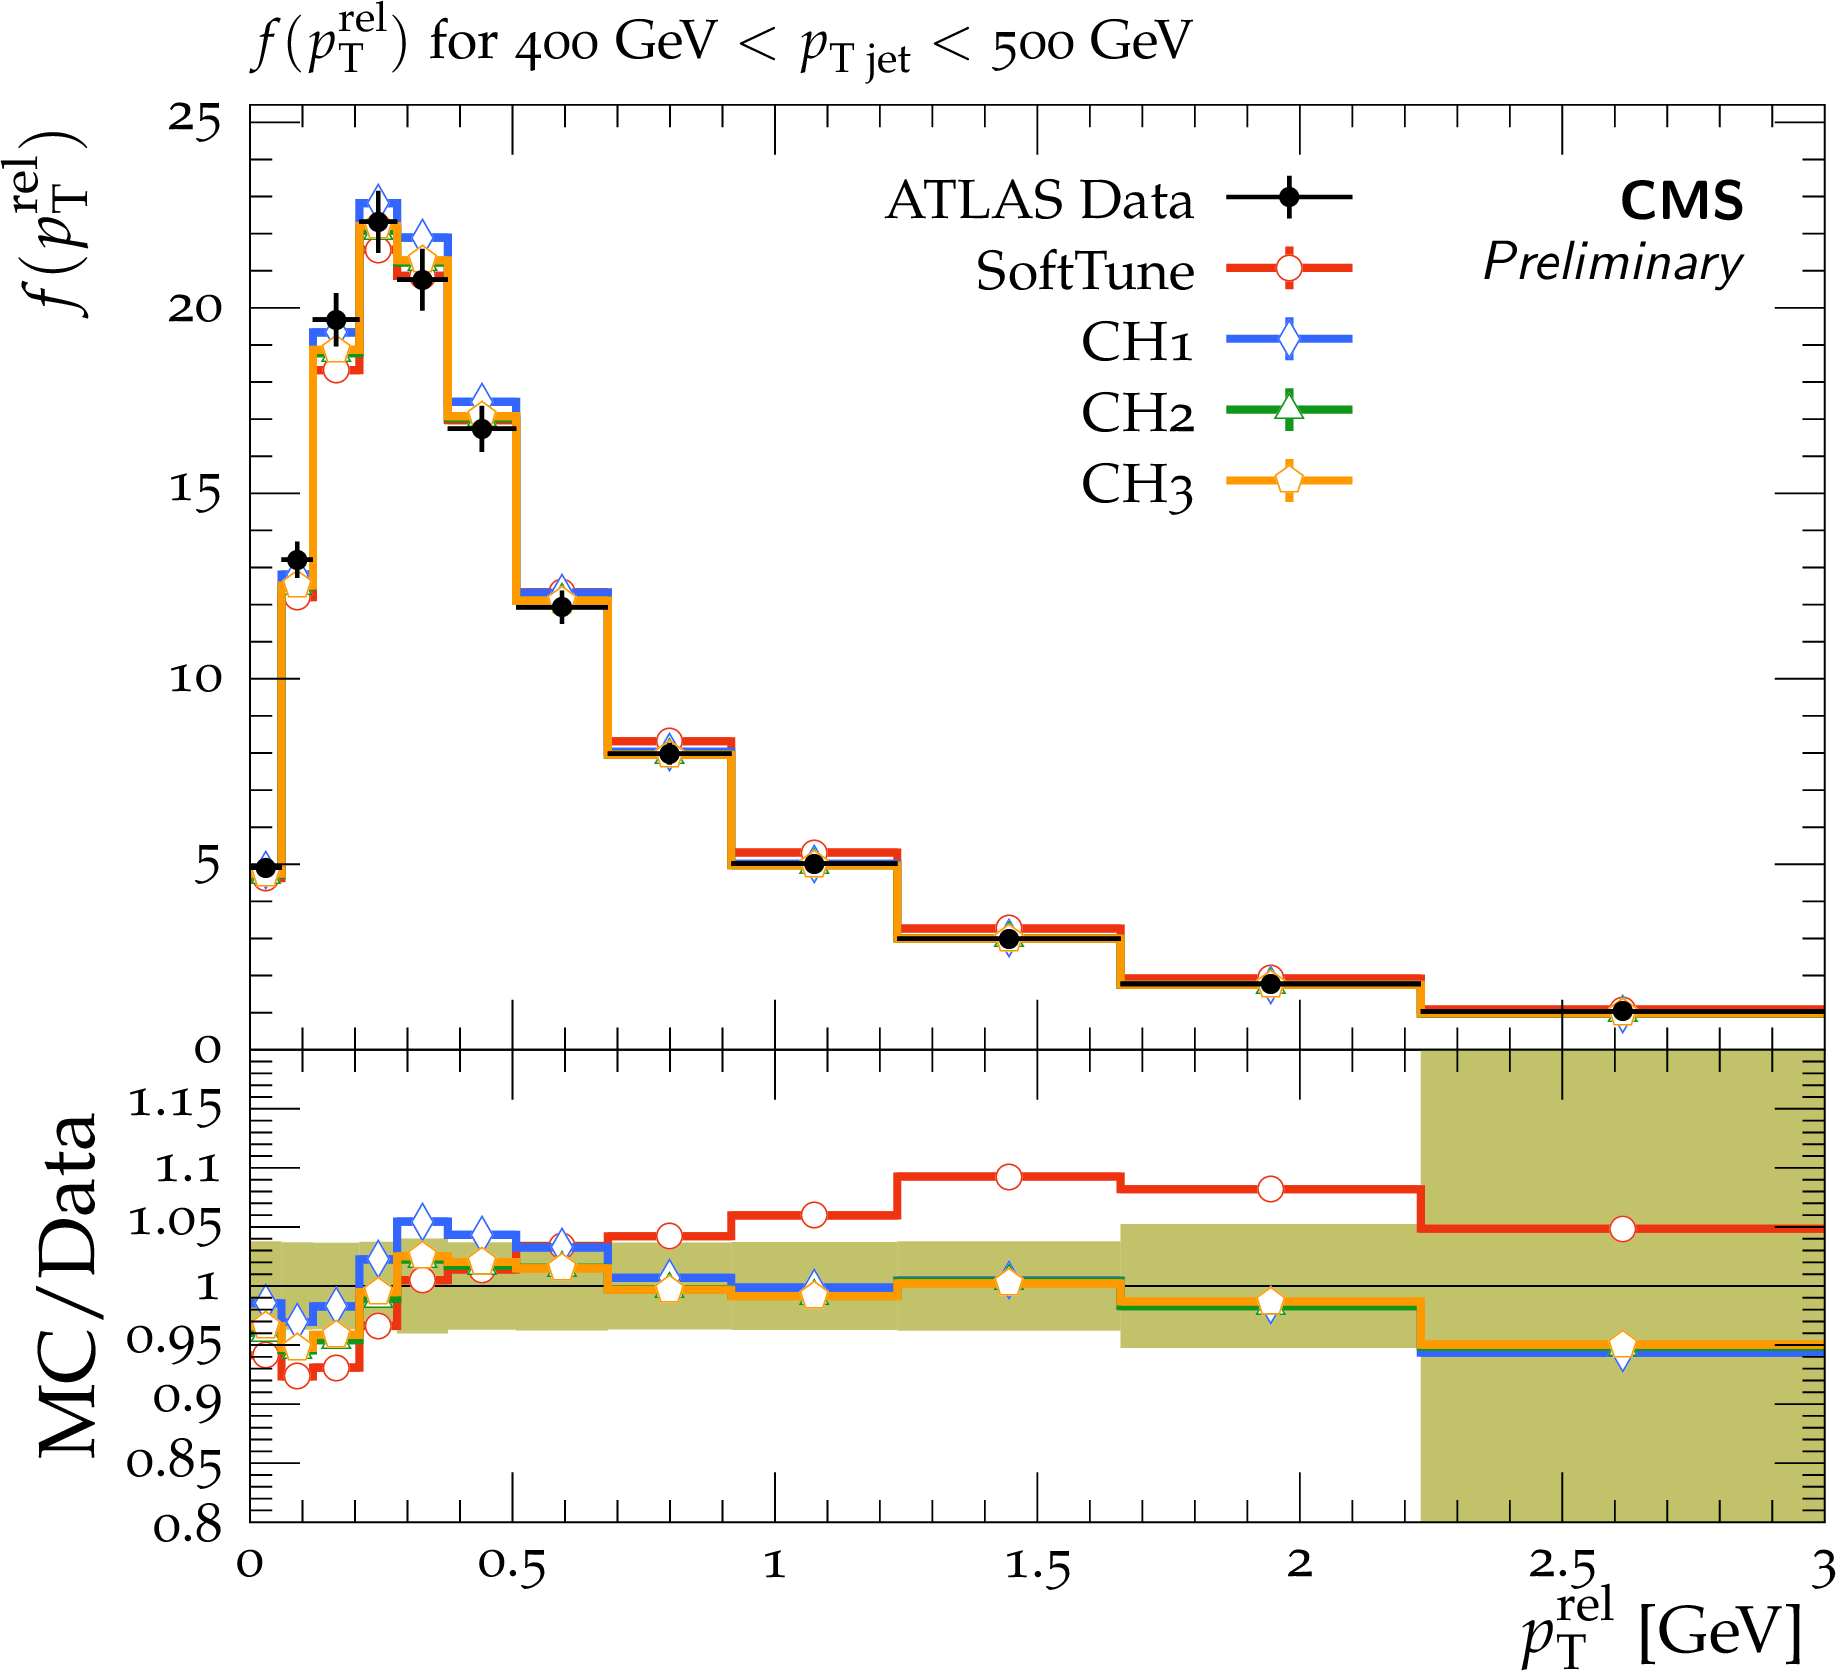
Figure 23:
ATLAS data at $ {\sqrt {s}} = $ 7 TeV on the ${F(z)}$ and ${f(p_{\mathrm {T}}^{\mathrm {rel}}})$ distributions [47]. The data are compared to predictions from HERWIG 7, with the SoftTune and CH tunes. The coloured band in the ratios of the different predictions from simulation to the data represents the total experimental uncertainty in the data. |
png pdf |
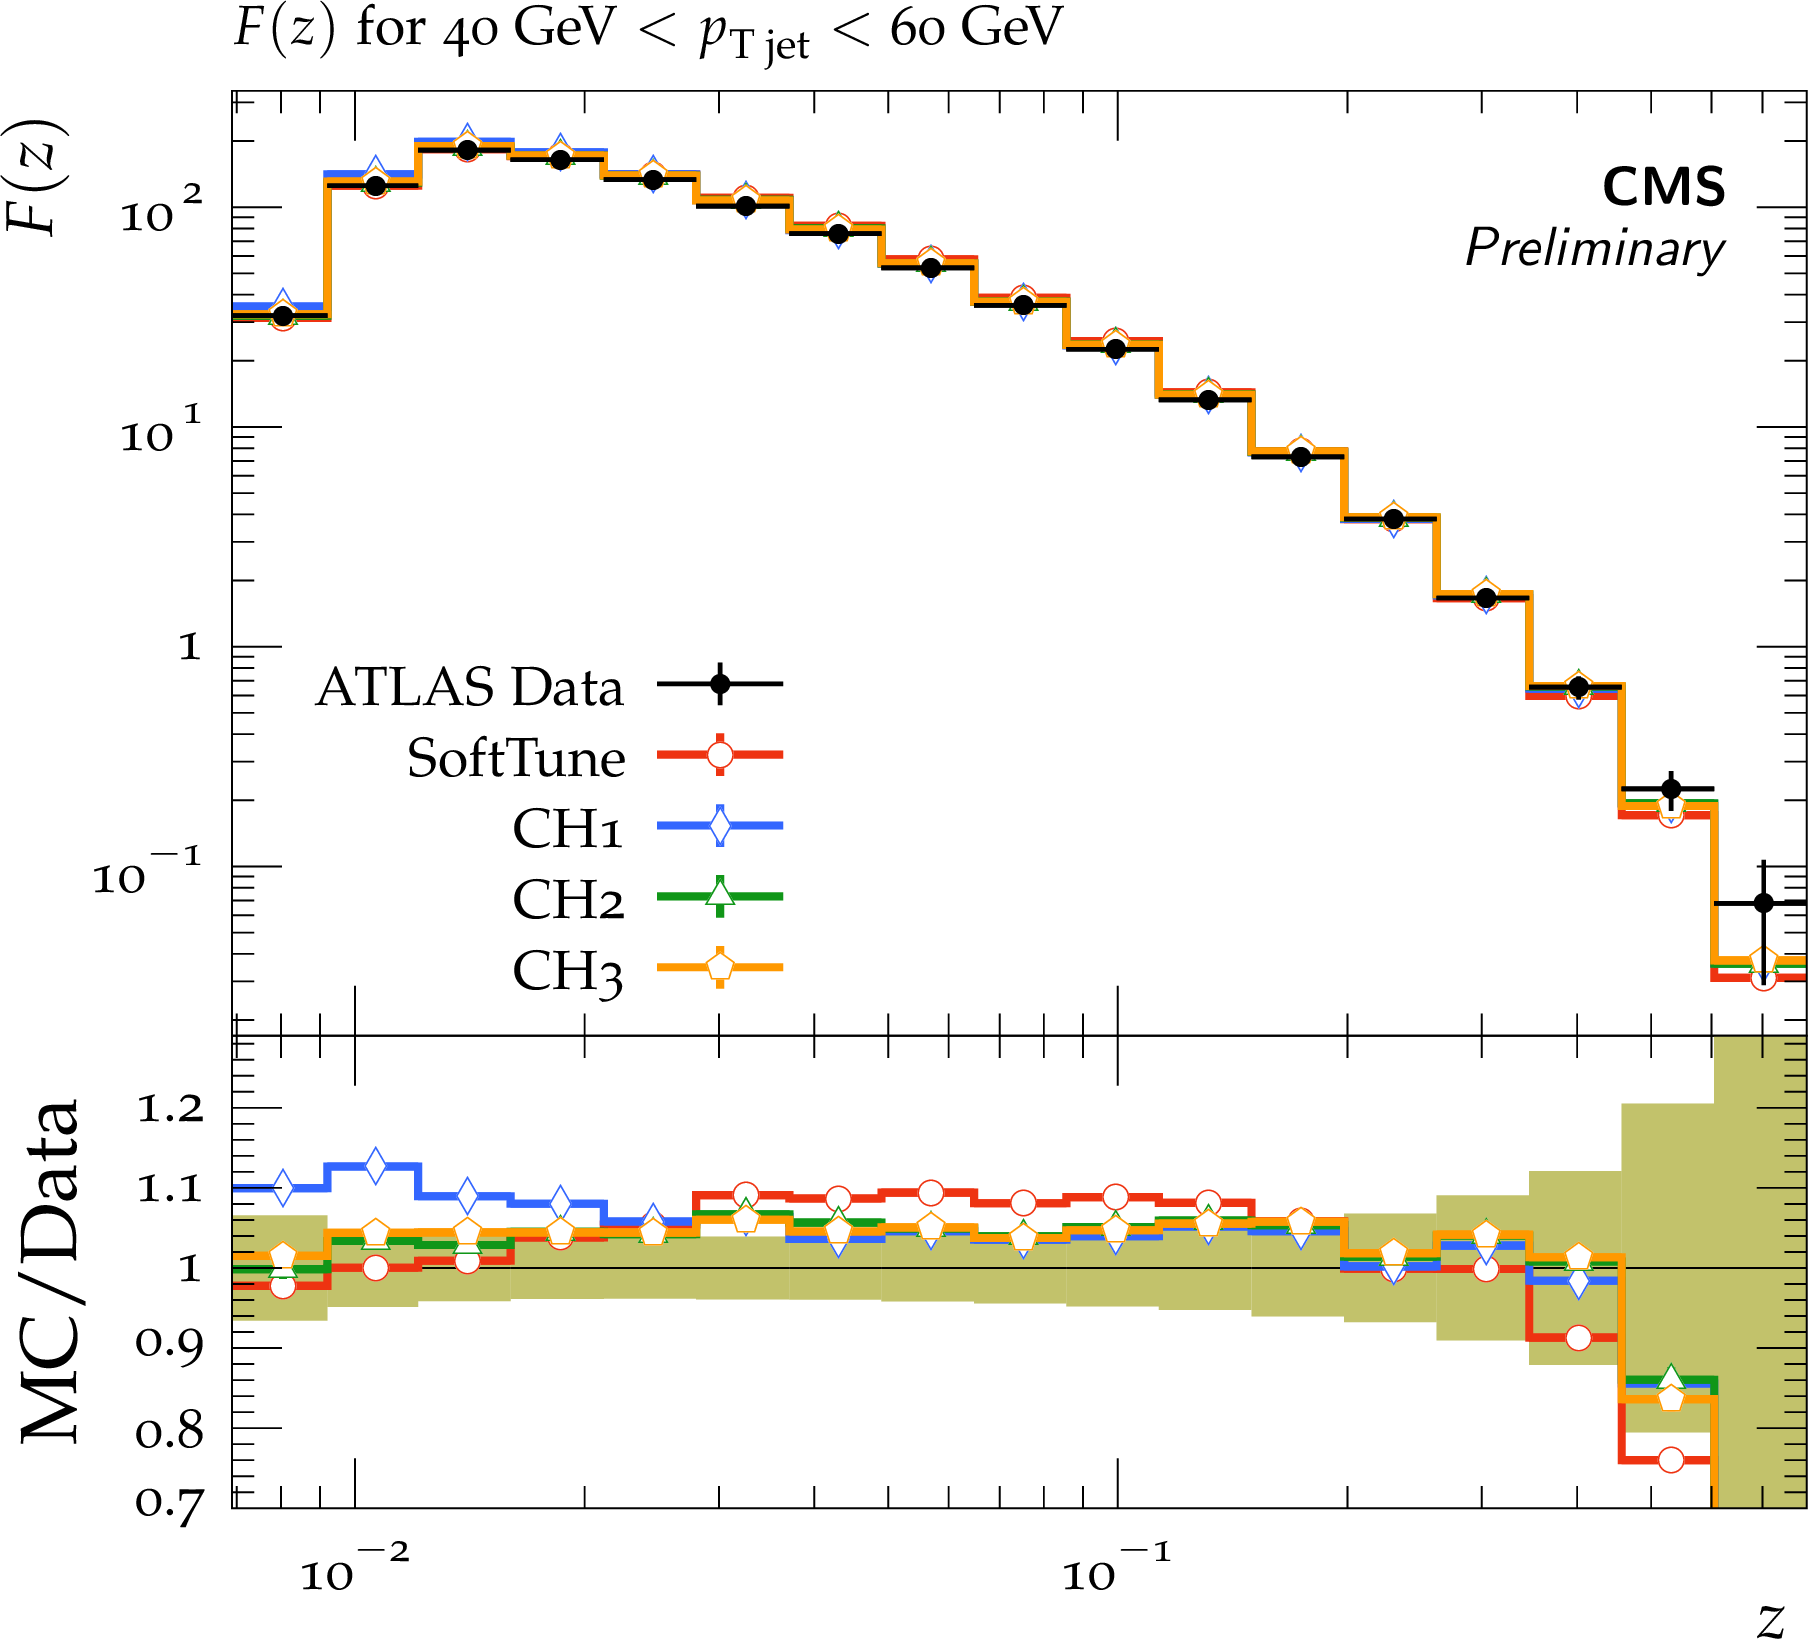
Figure 23-a:
ATLAS data at $ {\sqrt {s}} = $ 7 TeV on the ${F(z)}$ and ${f(p_{\mathrm {T}}^{\mathrm {rel}}})$ distributions [47]. The data are compared to predictions from HERWIG 7, with the SoftTune and CH tunes. The coloured band in the ratios of the different predictions from simulation to the data represents the total experimental uncertainty in the data. |
png pdf |
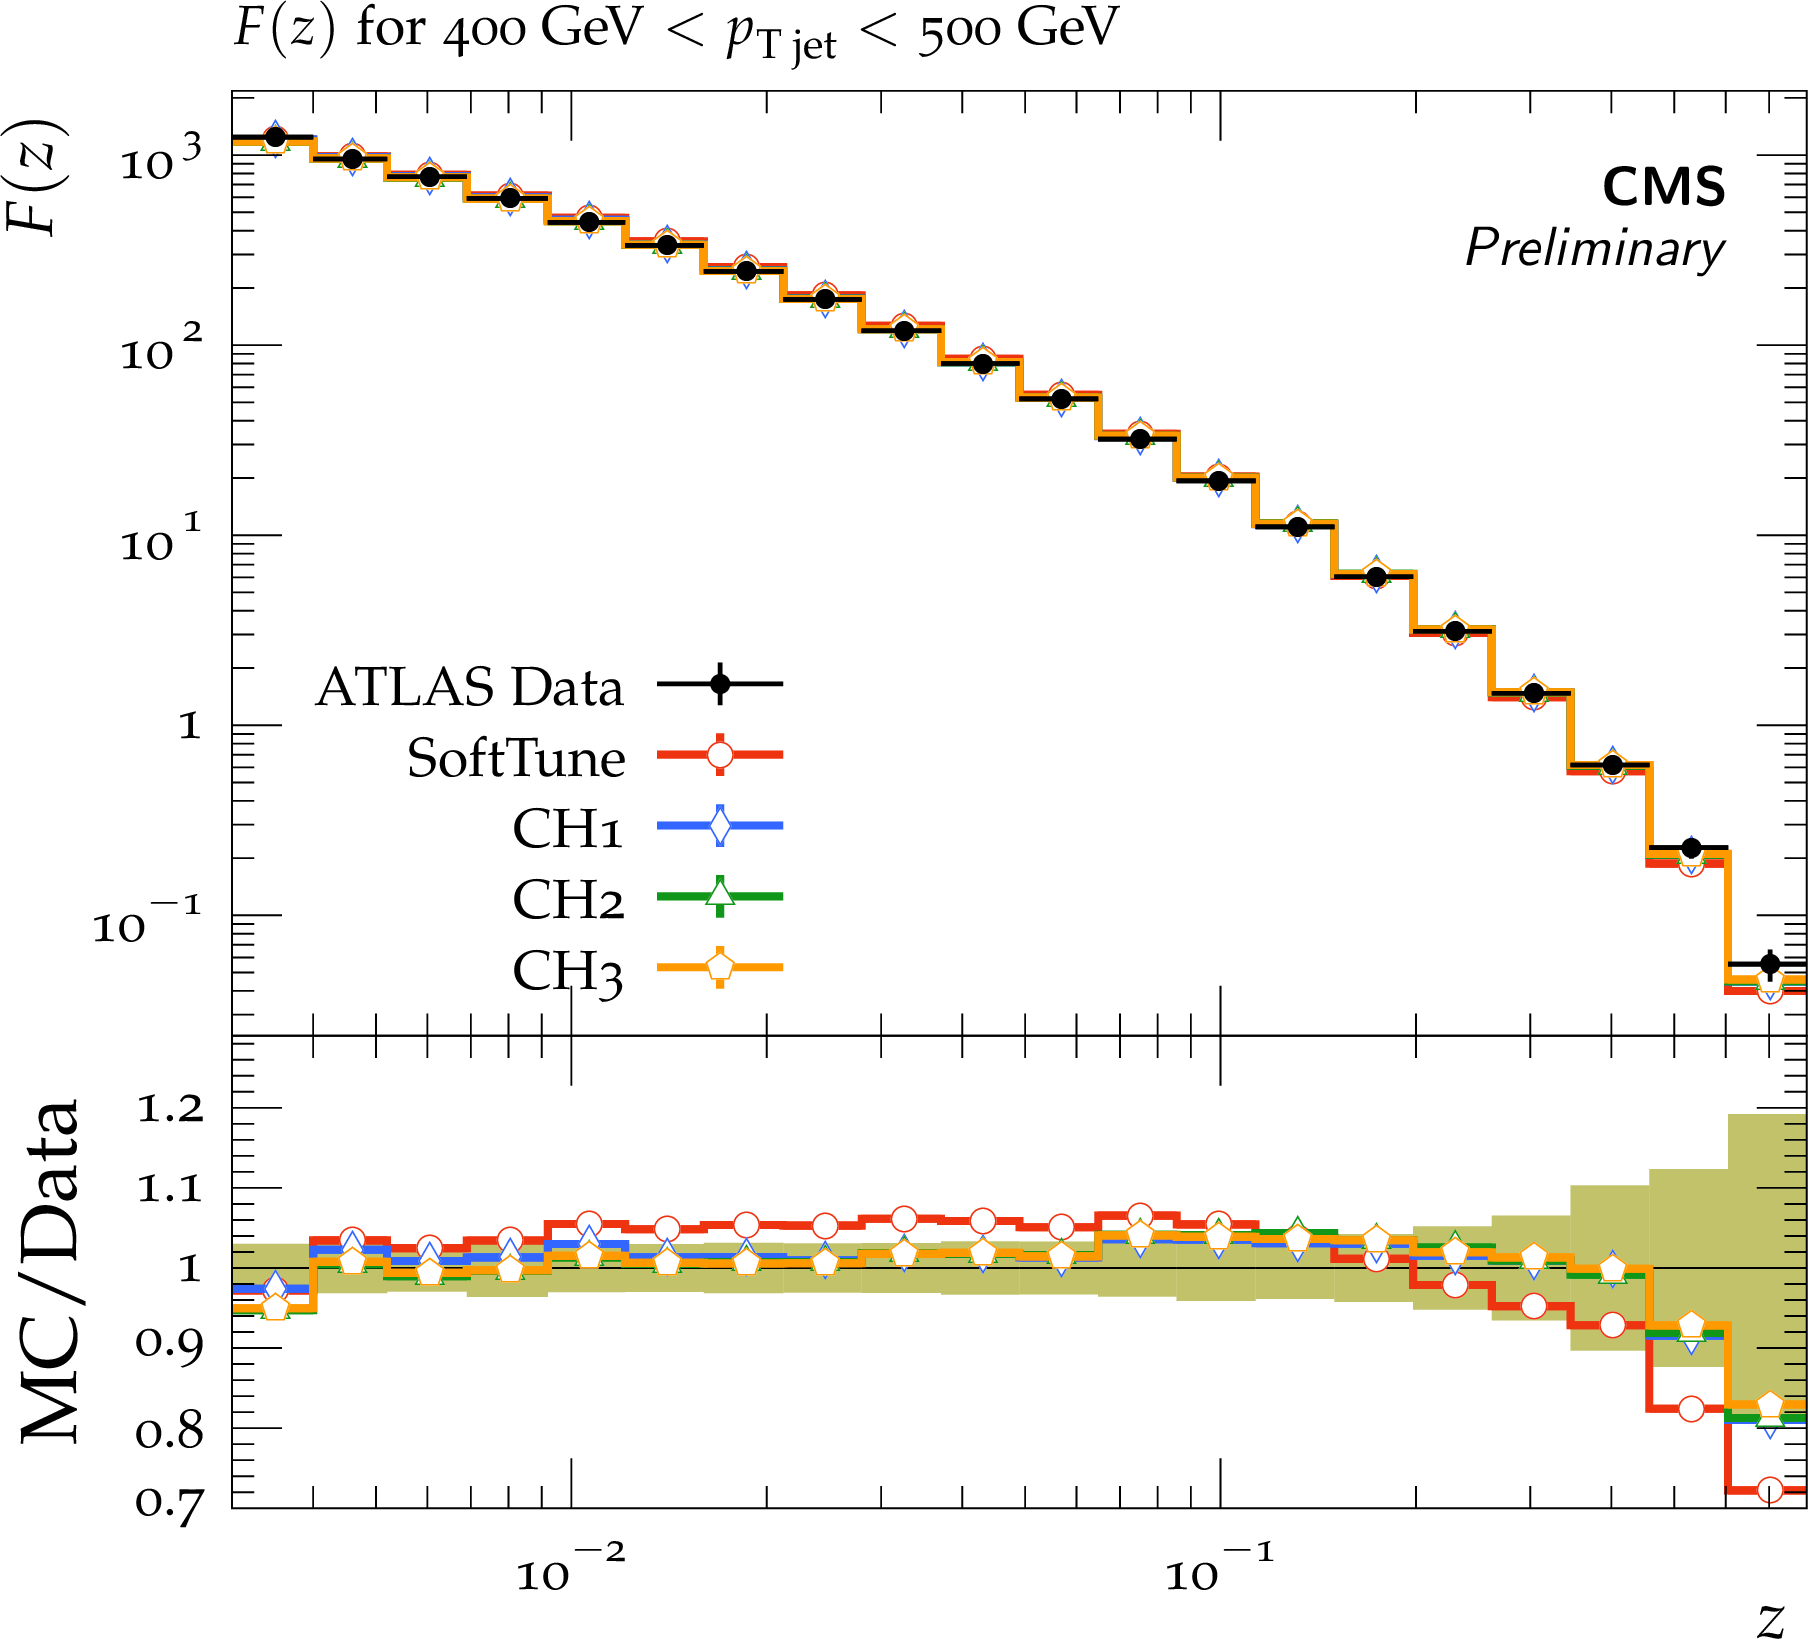
Figure 23-b:
ATLAS data at $ {\sqrt {s}} = $ 7 TeV on the ${F(z)}$ and ${f(p_{\mathrm {T}}^{\mathrm {rel}}})$ distributions [47]. The data are compared to predictions from HERWIG 7, with the SoftTune and CH tunes. The coloured band in the ratios of the different predictions from simulation to the data represents the total experimental uncertainty in the data. |
png pdf |
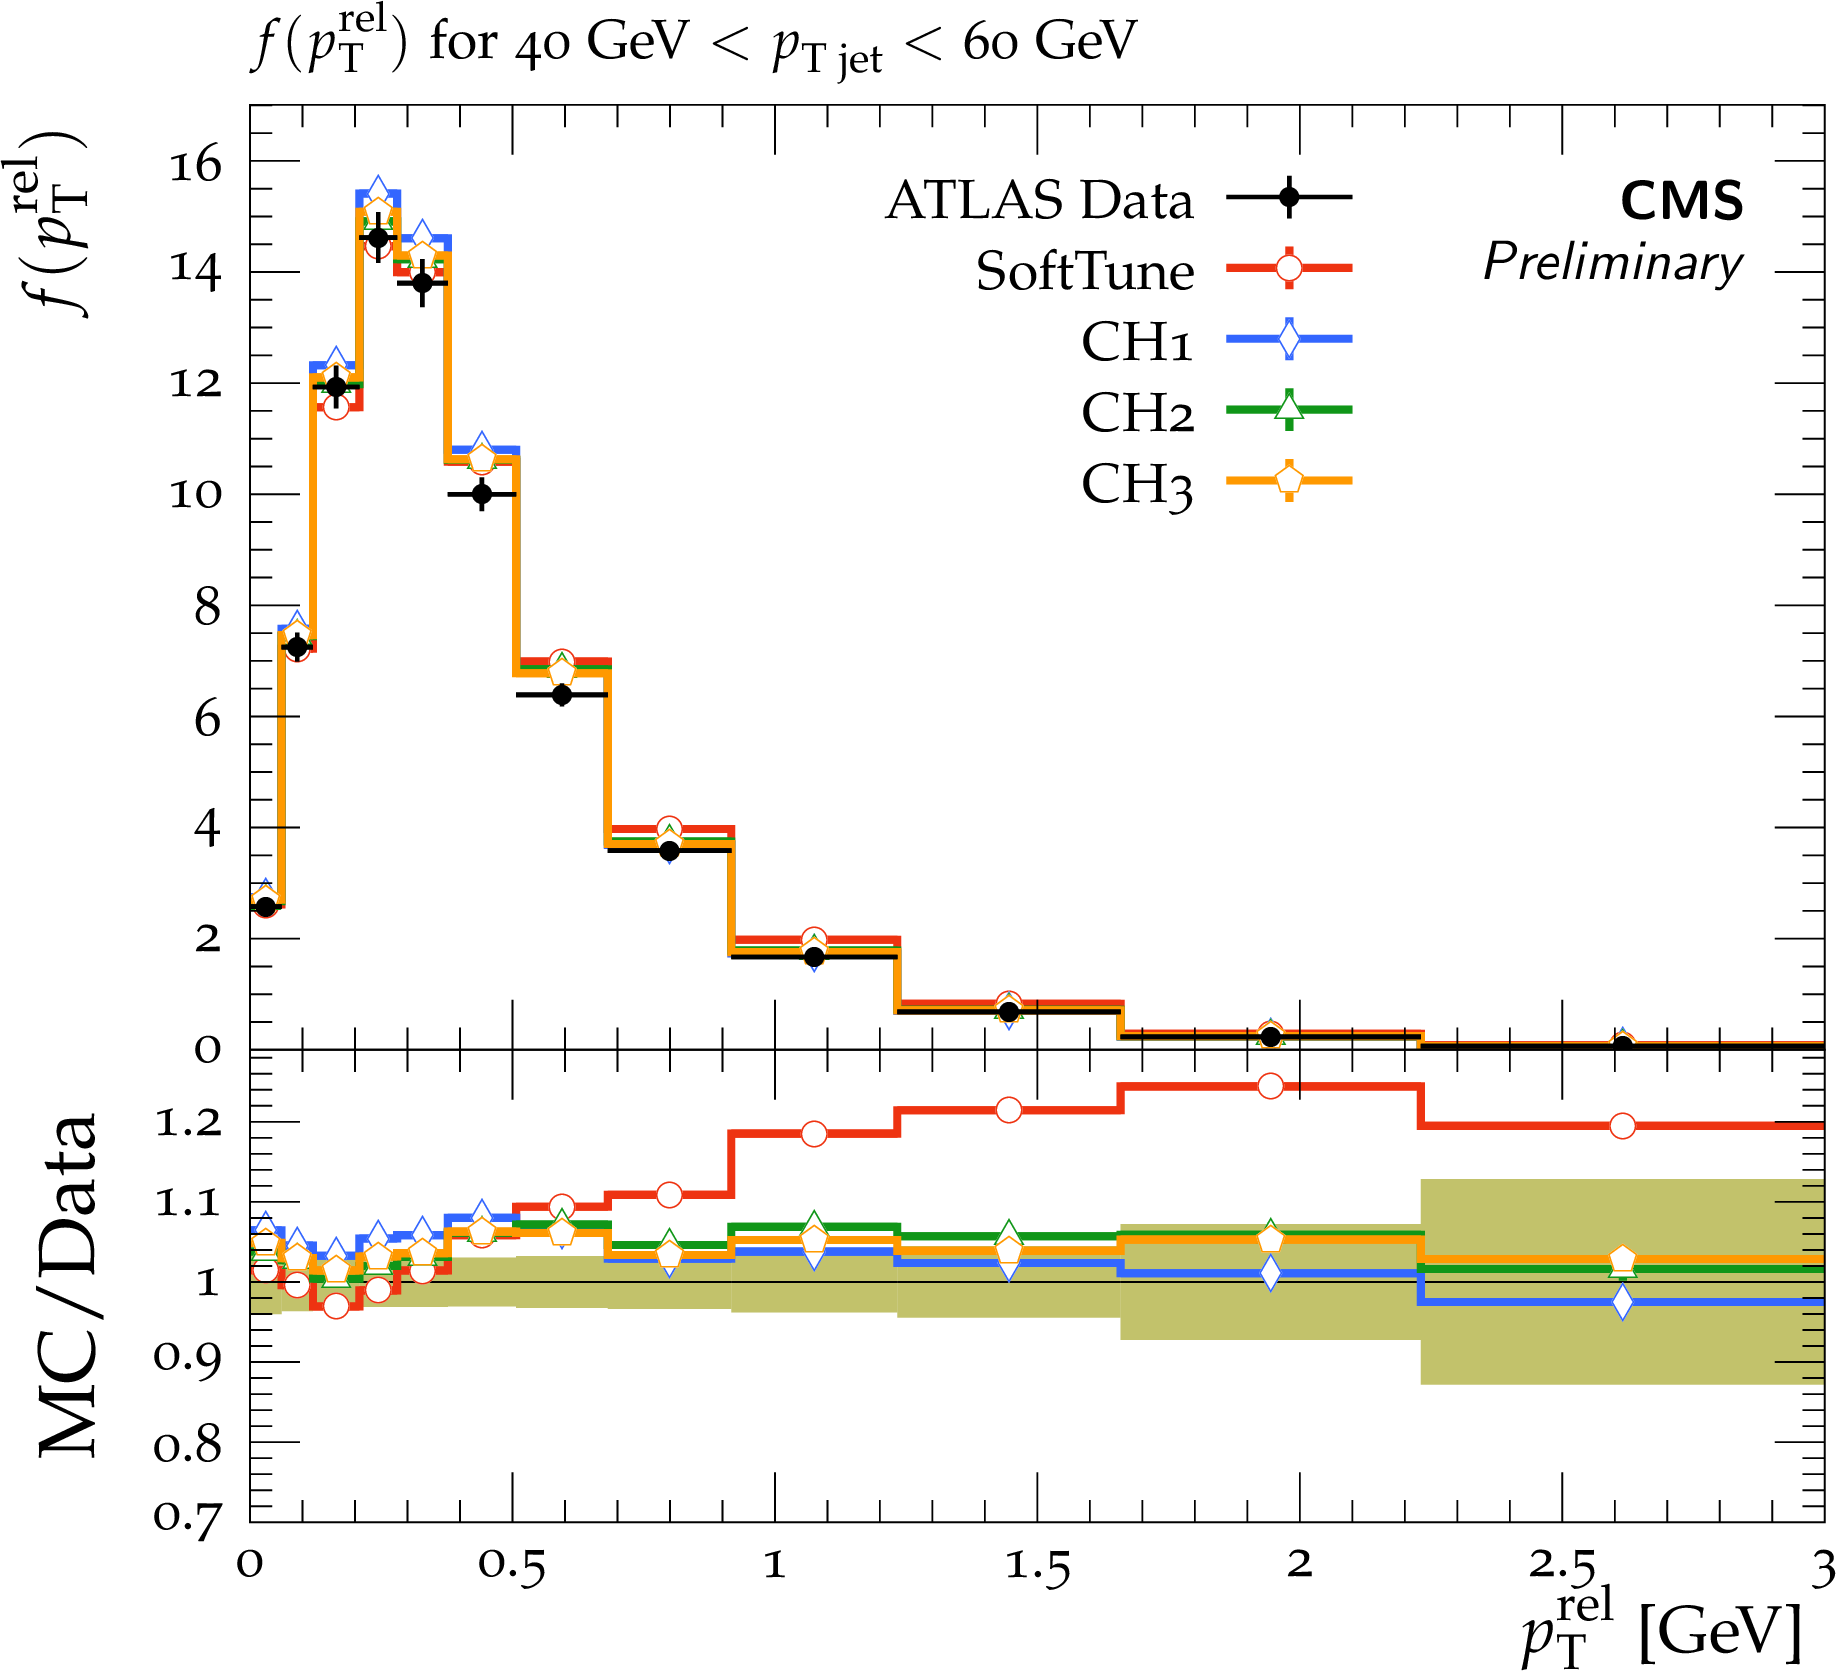
Figure 23-c:
ATLAS data at $ {\sqrt {s}} = $ 7 TeV on the ${F(z)}$ and ${f(p_{\mathrm {T}}^{\mathrm {rel}}})$ distributions [47]. The data are compared to predictions from HERWIG 7, with the SoftTune and CH tunes. The coloured band in the ratios of the different predictions from simulation to the data represents the total experimental uncertainty in the data. |
png pdf |
Figure 23-d:
ATLAS data at $ {\sqrt {s}} = $ 7 TeV on the ${F(z)}$ and ${f(p_{\mathrm {T}}^{\mathrm {rel}}})$ distributions [47]. The data are compared to predictions from HERWIG 7, with the SoftTune and CH tunes. The coloured band in the ratios of the different predictions from simulation to the data represents the total experimental uncertainty in the data. |
| Tables | |
png pdf |
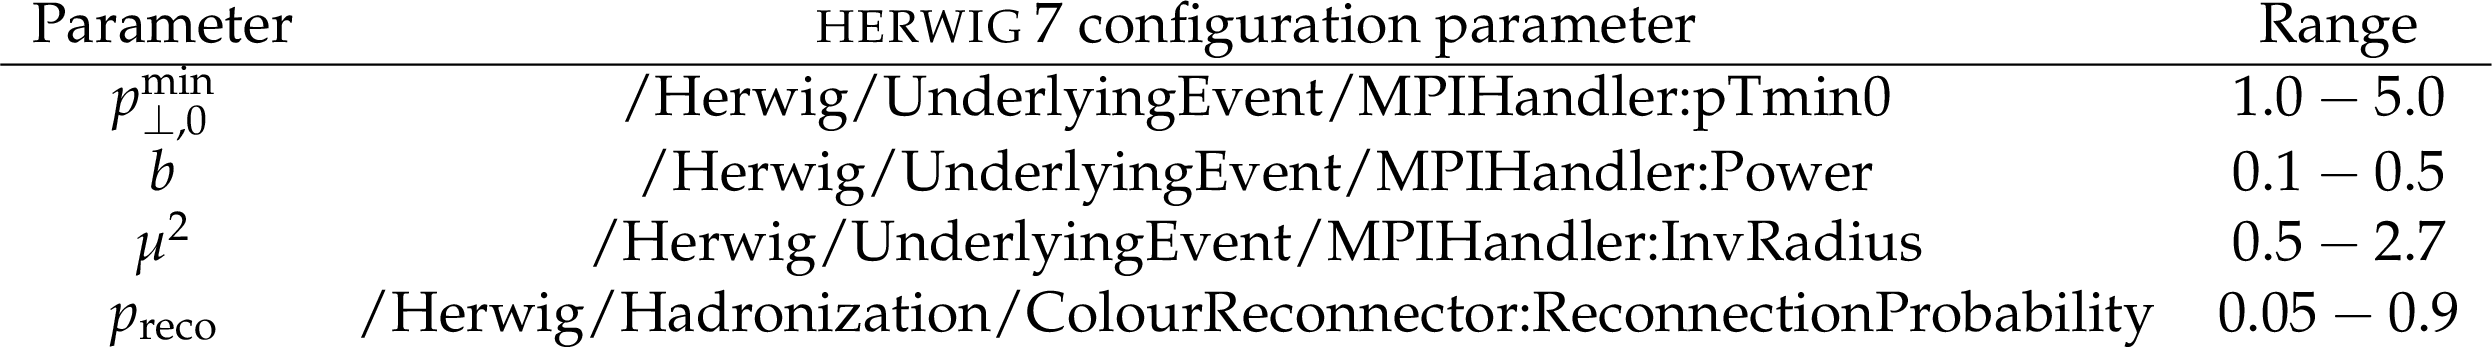
Table 1:
Parameters considered in the tuning, and their allowed ranges in the fit. |
png pdf |
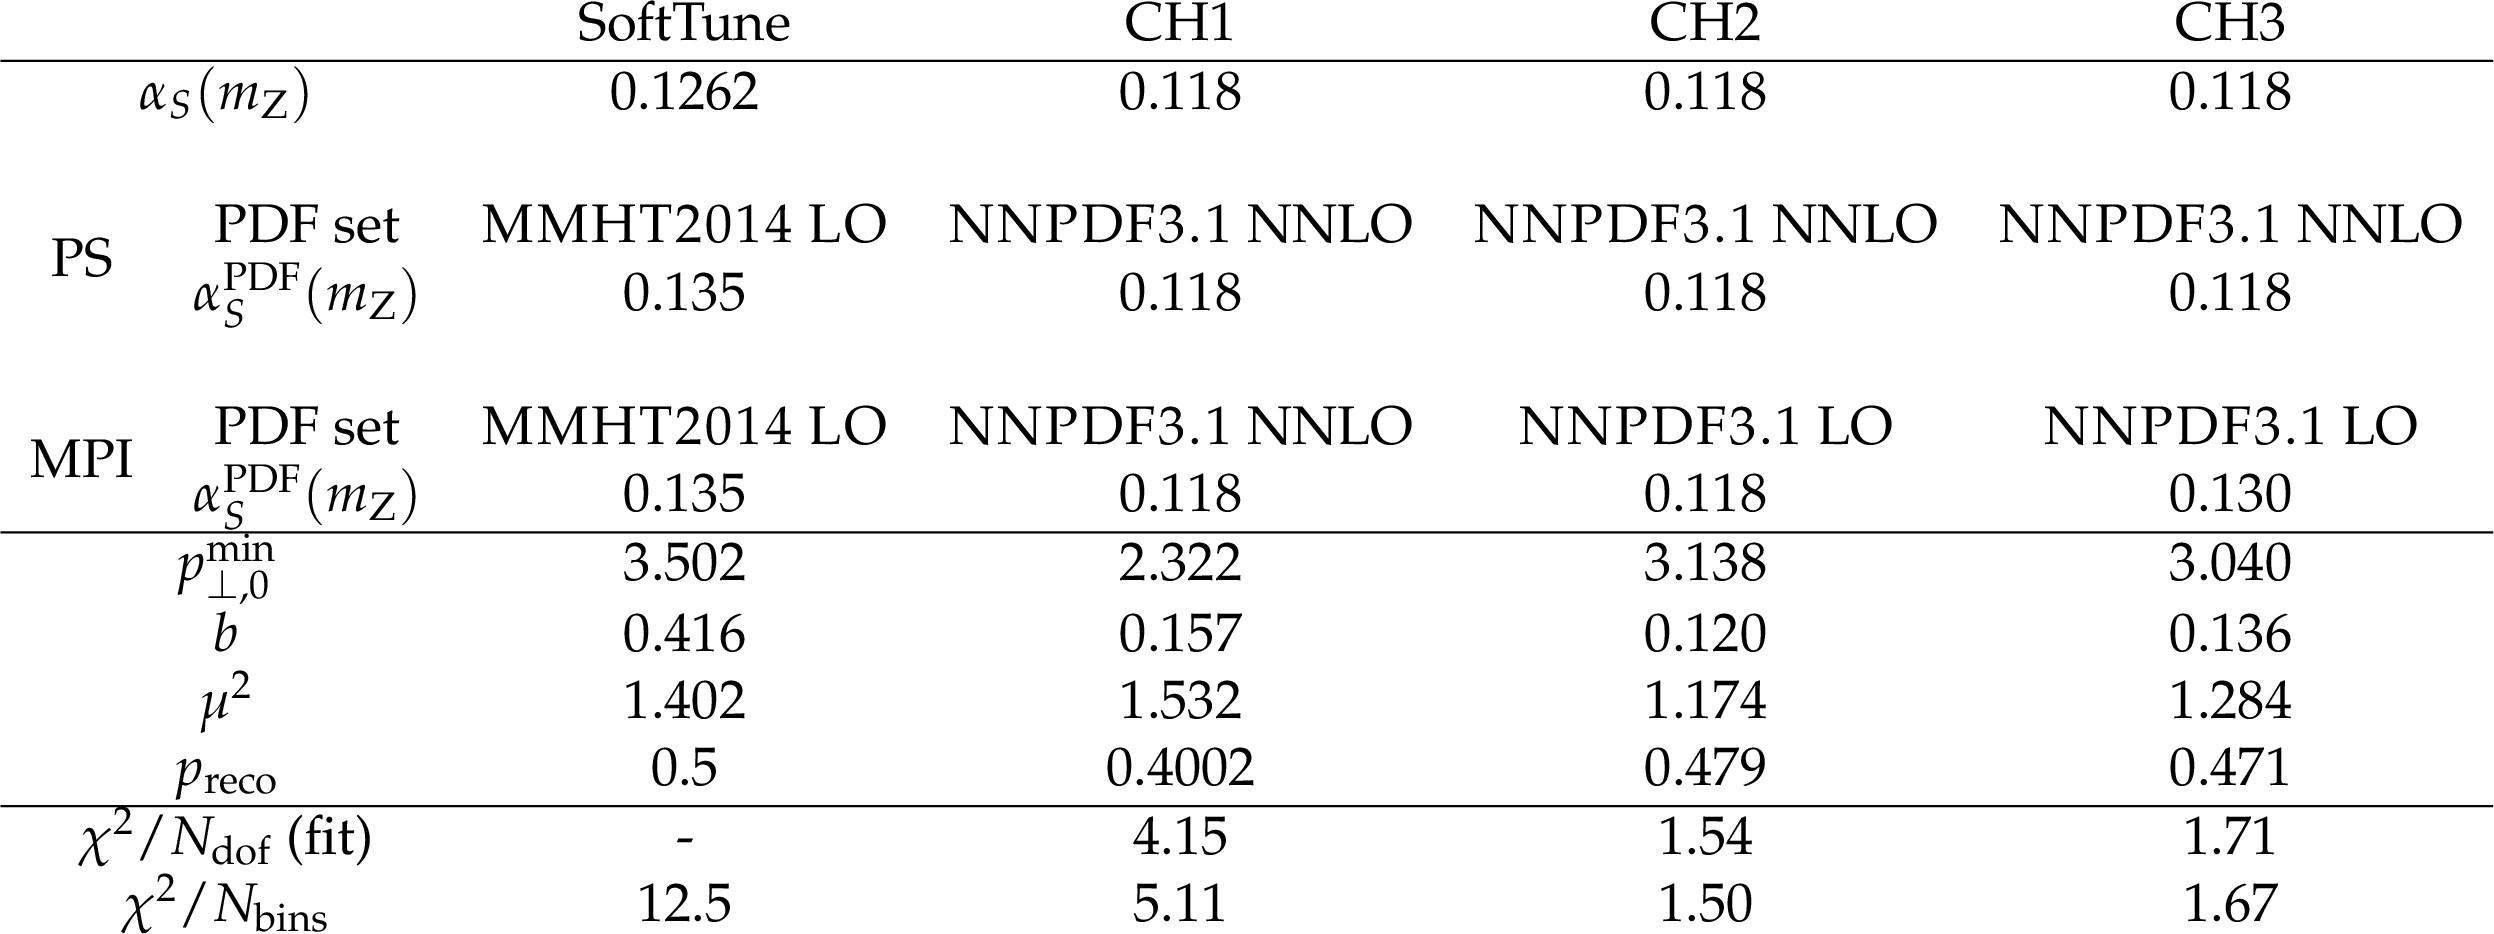
Table 2:
Values of the parameters for SoftTune [12,3], CH1, CH2, and CH3. |
png pdf |
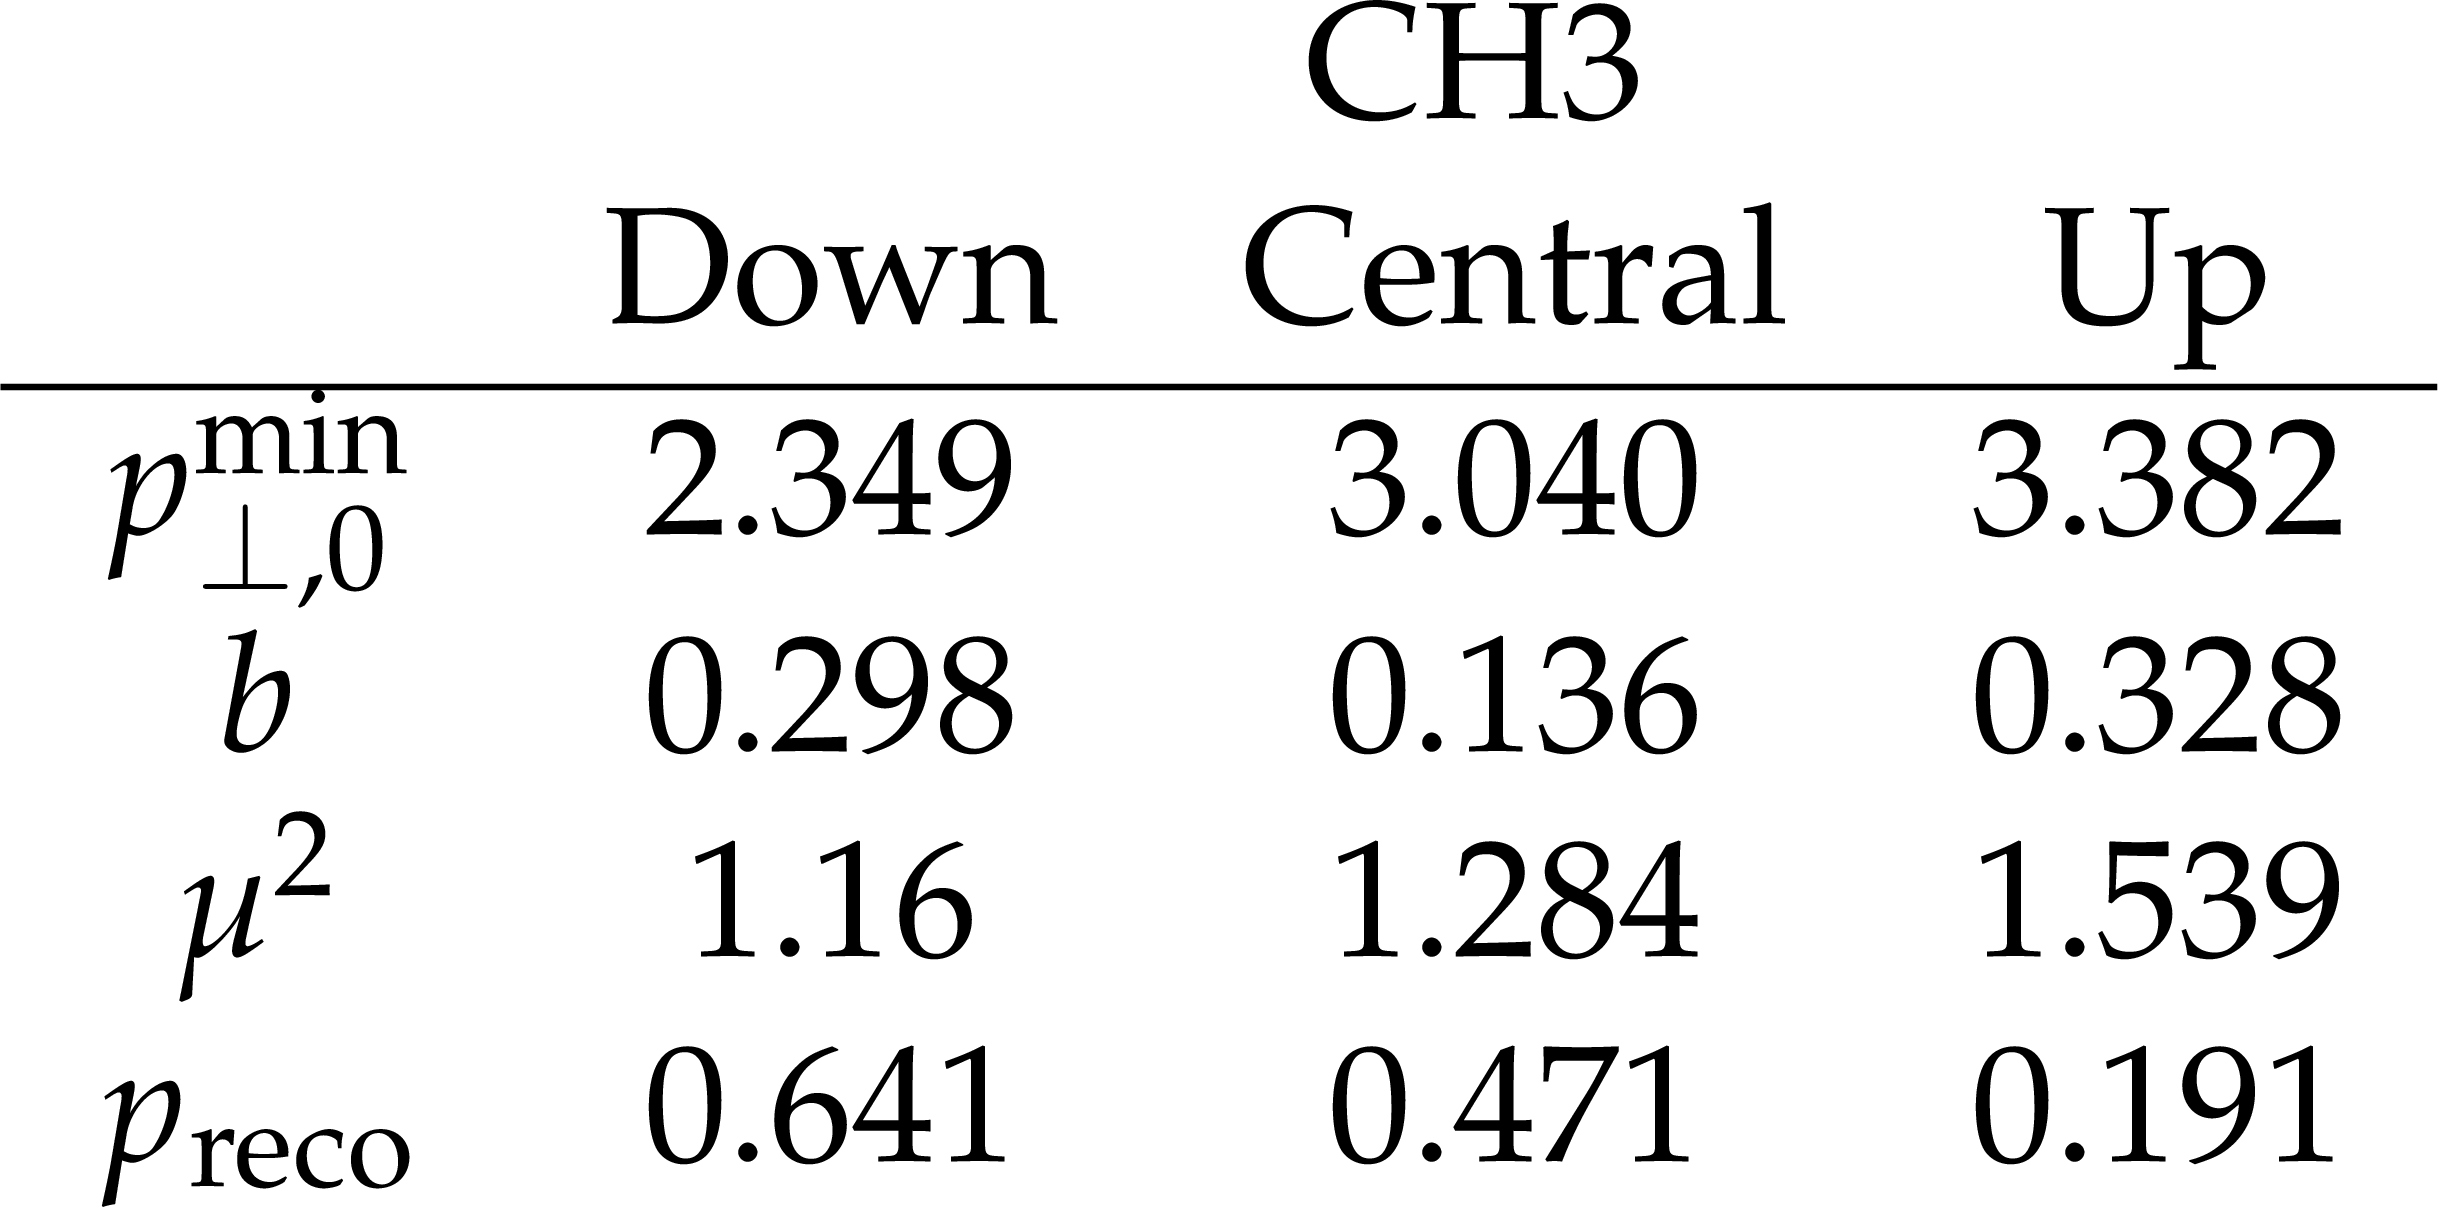
Table 3:
Parameters of the central, "up", and "down" variations of the CH3 tune. |
| Summary |
|
Three new tunes for the multiple-parton interaction (MPI) model of the HERWIG 7 generator have been derived from minimum-bias (MB) and underlying-event (UE) data collected by the CMS experiment. These tunes are based on the NNPDF3.1 PDF sets, and are labelled CH1, CH2, and CH3. All of the CH tunes are based on the NNLO NNPDF3.1 set for the simulation of the parton shower (PS) in HERWIG 7, and the value of the strong coupling is ${\alpha_S}(m_{\mathrm{Z}})=$ 0.118 with a two-loop evolution of ${\alpha_S}$. The configuration of the tunes differ in the PDF used for the simulation of MPI and beam remnants. The tune CH1 uses the same NNLO PDF set for these aspects of the HERWIG 7 simulation, whereas CH2 and CH3 use LO versions of the PDF set. The tune CH2 is based on a LO PDF set that was derived assuming ${\alpha_S}(m_{\mathrm{Z}})=$ 0.118, and CH3 on a LO PDF set assumixng ${\alpha_S}(m_{\mathrm{Z}})=$ 0.130. The parameters of the MPI model were optimised for each tune with the PROFESSOR framework to describe MB and UE data collected by CMS. The predictions using the tunes CH2 and CH3, where a LO PDF was used for the simulation of MPI, were found to provide the best description of the data. Furthermore, the differences in the predictions of CH2 and CH3 were observed to be small. Given the configuration of PDF sets in the tune CH3, where the LO PDF used for the simulation of MPI was derived with a value of ${\alpha_S}$ typically associated with LO PDF sets, this tune is the preferred choice between the two tunes CH2 and CH3. Two alternative tunes representing the uncertainties in the tuned parameters of CH3, based on the eigentunes provided by PROFESSOR from the tuning procedure, are also provided. These tunes allow the uncertainty in predictions using the CH3 tune to be estimated. Predictions using the three CH tunes are compared against a range of data beyond MB and UE events : event-shape data from LEP; data enriched in top quark pairs and weak bosons; and inclusive jet data. This validated the performance of HERWIG 7 using these tunes against a wide range of data sensitive to various aspects of the modelling by HERWIG 7, and in particular the modelling of the UE. Comparisons against event-shape observables measured at LEP, which are sensitive to the modelling of final-state radiation, are well described by HERWIG 7 with the new tunes. Predictions using the new tunes were also shown to describe the UE in events containing Z bosons, demonstrating the universality of the UE modelling in HERWIG 7 at different energy scales. The kinematics of top quarks, and the modelling of jets in $ \mathrm{t\bar{t}}$, Z boson, W boson, and inclusive dijet data was also shown to be well described by predictions using the new tunes. In general, predictions with the new CH tunes derived in this note provide a better description of measured observables than those using one of the default tunes available in HERWIG 7 referred to as SoftTune. |
| References | ||||
| 1 | M. Bahr et al. | HERWIG++ physics and manual | EPJC 58 (2008) 639 | 0803.0883 |
| 2 | J. Bellm et al. | HERWIG 7.0/HERWIG++ 3.0 release note | EPJC 76 (2016) 196 | 1512.01178 |
| 3 | J. Bellm et al. | HERWIG 7.1 release note | 1705.06919 | |
| 4 | T. Sjostrand et al. | An introduction to PYTHIA 8.2 | CPC 191 (2015) 159 | 1410.3012 |
| 5 | S. Platzer and S. Gieseke | Dipole showers and automated NLO matching in HERWIG++ | EPJC 72 (2012) 2187 | 1109.6256 |
| 6 | P. Nason | A new method for combining NLO QCD with shower Monte Carlo algorithms | JHEP 11 (2004) 040 | hep-ph/0409146 |
| 7 | S. Frixione, P. Nason, and C. Oleari | Matching NLO QCD computations with parton shower simulations: the POWHEG method | JHEP 11 (2007) 070 | 0709.2092 |
| 8 | S. Alioli, P. Nason, C. Oleari, and E. Re | A general framework for implementing NLO calculations in shower Monte Carlo programs: the POWHEG BOX | JHEP 06 (2010) 043 | 1002.2581 |
| 9 | J. Alwall et al. | The automated computation of tree-level and next-to-leading order differential cross sections, and their matching to parton shower simulations | JHEP 07 (2014) 079 | 1405.0301 |
| 10 | G. Corcella et al. | HERWIG 6: An event generator for hadron emission reactions with interfering gluons (including supersymmetric processes) | JHEP 01 (2001) 010 | hep-ph/0011363 |
| 11 | M. Bahr, S. Gieseke, and M. H. Seymour | Simulation of multiple partonic interactions in HERWIG++ | JHEP 07 (2008) 076 | 0803.3633 |
| 12 | S. Gieseke, F. Loshaj, and P. Kirchgae\sser | Soft and diffractive scattering with the cluster model in HERWIG | EPJC 77 (2017) 156 | 1612.04701 |
| 13 | S. Gieseke, C. Rohr, and A. Siodmok | Colour reconnections in HERWIG++ | EPJC 72 (2012) 2225 | 1206.0041 |
| 14 | ATLAS Collaboration | Rapidity gap cross sections measured with the ATLAS detector in pp collisions at $ \sqrt{s}= $ 7 TeV | EPJC 72 (2012) 1926 | 1201.2808 |
| 15 | CMS Collaboration | Measurement of diffraction dissociation cross sections in pp collisions at $ \sqrt{s} = $ 7 TeV | PRD 92 (2015) 012003 | CMS-FSQ-12-005 1503.08689 |
| 16 | L. A. Harland-Lang, A. D. Martin, P. Motylinski, and R. S. Thorne | Parton distributions in the LHC era: MMHT 2014 PDFs | EPJC 75 (2015) 204 | 1412.3989 |
| 17 | NNPDF Collaboration | Parton distributions from high-precision collider data | EPJC 77 (2017) 663 | 1706.00428 |
| 18 | CMS Collaboration | Extraction and validation of a new set of CMS PYTHIA 8 tunes from underlying-event measurements | EPJC 80 (2020) 4 | CMS-GEN-17-001 1903.12179 |
| 19 | CMS Collaboration | The CMS experiment at the CERN LHC | JINST 3 (2008) S08004 | CMS-00-001 |
| 20 | B. R. Webber | A QCD model for jet fragmentation including soft gluon interference | NPB 238 (1984) 492 | |
| 21 | A. Buckley et al. | Rivet user manual | 1003.0694 | |
| 22 | CMS Collaboration | Measurement of the underlying event activity at the LHC at 7 TeV and comparison with 0.9 TeV | CMS-PAS-FSQ-12-020 | |
| 23 | CMS Collaboration | Underlying event measurements with leading particles and jets in pp collisions at $ \sqrt{s} = $ 13 TeV | CMS-PAS-FSQ-15-007 | CMS-PAS-FSQ-15-007 |
| 24 | CMS Collaboration | Measurement of the underlying event activity at the LHC with $ \sqrt{s}= $ 7 TeV and comparison with $ \sqrt{s} = $ 0.9 TeV | JHEP 09 (2011) 109 | CMS-QCD-10-010 1107.0330 |
| 25 | M. Cacciari and G. P. Salam | Dispelling the $ N^{3} $ myth for the $ {k_{\mathrm{T}}} $ jet-finder | PLB 641 (2006) 57 | hep-ph/0512210 |
| 26 | CMS Collaboration | Pseudorapidity distribution of charged hadrons in proton-proton collisions at $ \sqrt{s} = $ 13 TeV | PLB 751 (2015) 143 | CMS-FSQ-15-001 1507.05915 |
| 27 | A. Buckley et al. | Systematic event generator tuning for the LHC | EPJC 65 (2010) 331 | 0907.2973 |
| 28 | CDF Collaboration | Study of the energy dependence of the underlying event in proton-antiproton collisions | PRD 92 (2015) 092009 | 1508.05340 |
| 29 | ALEPH Collaboration | Studies of QCD at e+ e- centre-of-mass energies between 91 GeV and 209 GeV | EPJC 35 (2004) 457 | |
| 30 | S. Catani, B. R. Webber, and G. Marchesini | QCD coherent branching and semi-inclusive processes at large x | NPB 349 (1991) 635 | |
| 31 | D. Reichelt, P. Richardson, and A. Siodmok | Improving the simulation of quark and gluon jets with HERWIG 7 | EPJC 77 (2017) 876 | 1708.01491 |
| 32 | S. Frixione, P. Nason, and G. Ridolfi | A positive-weight next-to-leading-order Monte Carlo for heavy flavour hadroproduction | JHEP 09 (2007) 126 | 0707.3088 |
| 33 | CMS Collaboration | Investigations of the impact of the parton shower tuning in PYTHIA 8 in the modelling of $ \mathrm{t\overline{t}} $ at $ \sqrt{s}= $ 8 and 13 TeV | CMS-PAS-TOP-16-021 | CMS-PAS-TOP-16-021 |
| 34 | B. Cooper et al. | Importance of a consistent choice of $ \alpha_S $ in the matching of AlpGen and PYTHIA | EPJC 72 (2012) 2078 | 1109.5295 |
| 35 | CMS Collaboration | Measurement of differential cross sections for the production of top quark pairs and of additional jets in lepton+jets events from pp collisions at $ \sqrt{s} = $ 13 ~TeV | PRD 97 (2018) 112003 | CMS-TOP-17-002 1803.08856 |
| 36 | M. Cacciari, G. P. Salam, and G. Soyez | The anti-$ {k_{\mathrm{T}}} $ jet clustering algorithm | JHEP 04 (2008) 063 | 0802.1189 |
| 37 | M. Cacciari, G. P. Salam, and G. Soyez | FastJet user manual | EPJC 72 (2012) 1896 | 1111.6097 |
| 38 | CMS Collaboration | Measurements of differential cross sections of top quark pair production as a function of kinematic event variables in proton-proton collisions at $ \sqrt{s} = $ 13 ~TeV | JHEP 06 (2018) 002 | CMS-TOP-16-014 1803.03991 |
| 39 | CMS Collaboration | Measurement of jet substructure observables in $ \mathrm{t\overline{t}} $ events from proton-proton collisions at $ \sqrt{s}= $ 13TeV | PRD 98 (2018) 092014 | CMS-TOP-17-013 1808.07340 |
| 40 | CMS Collaboration | Shape, transverse size, and charged hadron multiplicity of jets in pp collisions at 7 TeV | JHEP 06 (2012) 160 | CMS-QCD-10-029 1204.3170 |
| 41 | R. Frederix and S. Frixione | Merging meets matching in MC@NLO | JHEP 12 (2012) 061 | 1209.6215 |
| 42 | CMS Collaboration | Measurement of the underlying event activity in inclusive Z boson production in proton-proton collisions at $ \sqrt{s}= $ 13 TeV | JHEP 07 (2018) 032 | CMS-FSQ-16-008 1711.04299 |
| 43 | CMS Collaboration | Measurement of differential cross sections for Z boson production in association with jets in proton-proton collisions at $ \sqrt{s} = $ 13 TeV | EPJC 78 (2018) 965 | CMS-SMP-16-015 1804.05252 |
| 44 | CMS Collaboration | Measurement of the differential cross sections for the associated production of a $ W $ boson and jets in proton-proton collisions at $ \sqrt{s}= $ 13 TeV | PRD 96 (2017) 072005 | CMS-SMP-16-005 1707.05979 |
| 45 | ATLAS Collaboration | Charged-particle multiplicities in pp interactions measured with the ATLAS detector at the LHC | New J. Phys. 13 (2011) 053033 | 1012.5104 |
| 46 | ATLAS Collaboration | Charged-particle distributions in $ \sqrt{s} = $ 13 TeV pp interactions measured with the ATLAS detector at the LHC | PLB 758 (2016) 67 | 1602.01633 |
| 47 | ATLAS Collaboration | Measurement of the jet fragmentation function and transverse profile in proton-proton collisions at a center-of-mass energy of 7 TeV with the ATLAS detector | EPJC 71 (2011) 1795 | 1109.5816 |
|
|
Compact Muon Solenoid LHC, CERN |
|

|

|

|

|

|