

Compact Muon Solenoid
LHC, CERN
| CMS-PAS-GEN-17-002 | ||
| A new set of CMS tunes for novel colour reconnection models in PYTHIA8 based on underlying-event data | ||
| CMS Collaboration | ||
| September 2021 | ||
| Abstract: New sets of parameter tunes for two of the colour reconnection models implemented in the PYTHIA8 event generator, QCD-inspired and gluon move, are obtained based on the default CMS PYTHIA8 underlying-event tune, CP5. Measurements sensitive to underlying-event performed at $\sqrt{s}=$ 1.96, 7, and 13 TeV are used to constrain the parameters of the colour reconnection models and the multiple parton interactions simultaneously. The new colour reconnection tunes are compared to various measurements at a centre-of-mass energy of 1.96, 7, 8, and 13 TeV including measurements of underlying event, strange particle multiplicities, jet substructure observables, hadron ratios, jet shapes and colour flow in top quark pair events, and top quark mass. The new colour reconnection tunes can be used to estimate systematic uncertainties related to colour reconnection modelling. | ||
|
Links:
CDS record (PDF) ;
CADI line (restricted) ;
These preliminary results are superseded in this paper, Submitted to EPJC. The superseded preliminary plots can be found here. |
||
| Figures | |

png pdf |
Figure 1:
Display of the topology of a hadron-hadron collision in which a "hard'' parton-parton collision has occurred. The "toward'' region contains the "toward-side'' jet, while the "away'' region, on the average, contains the "away-side'' jet. |
png pdf |
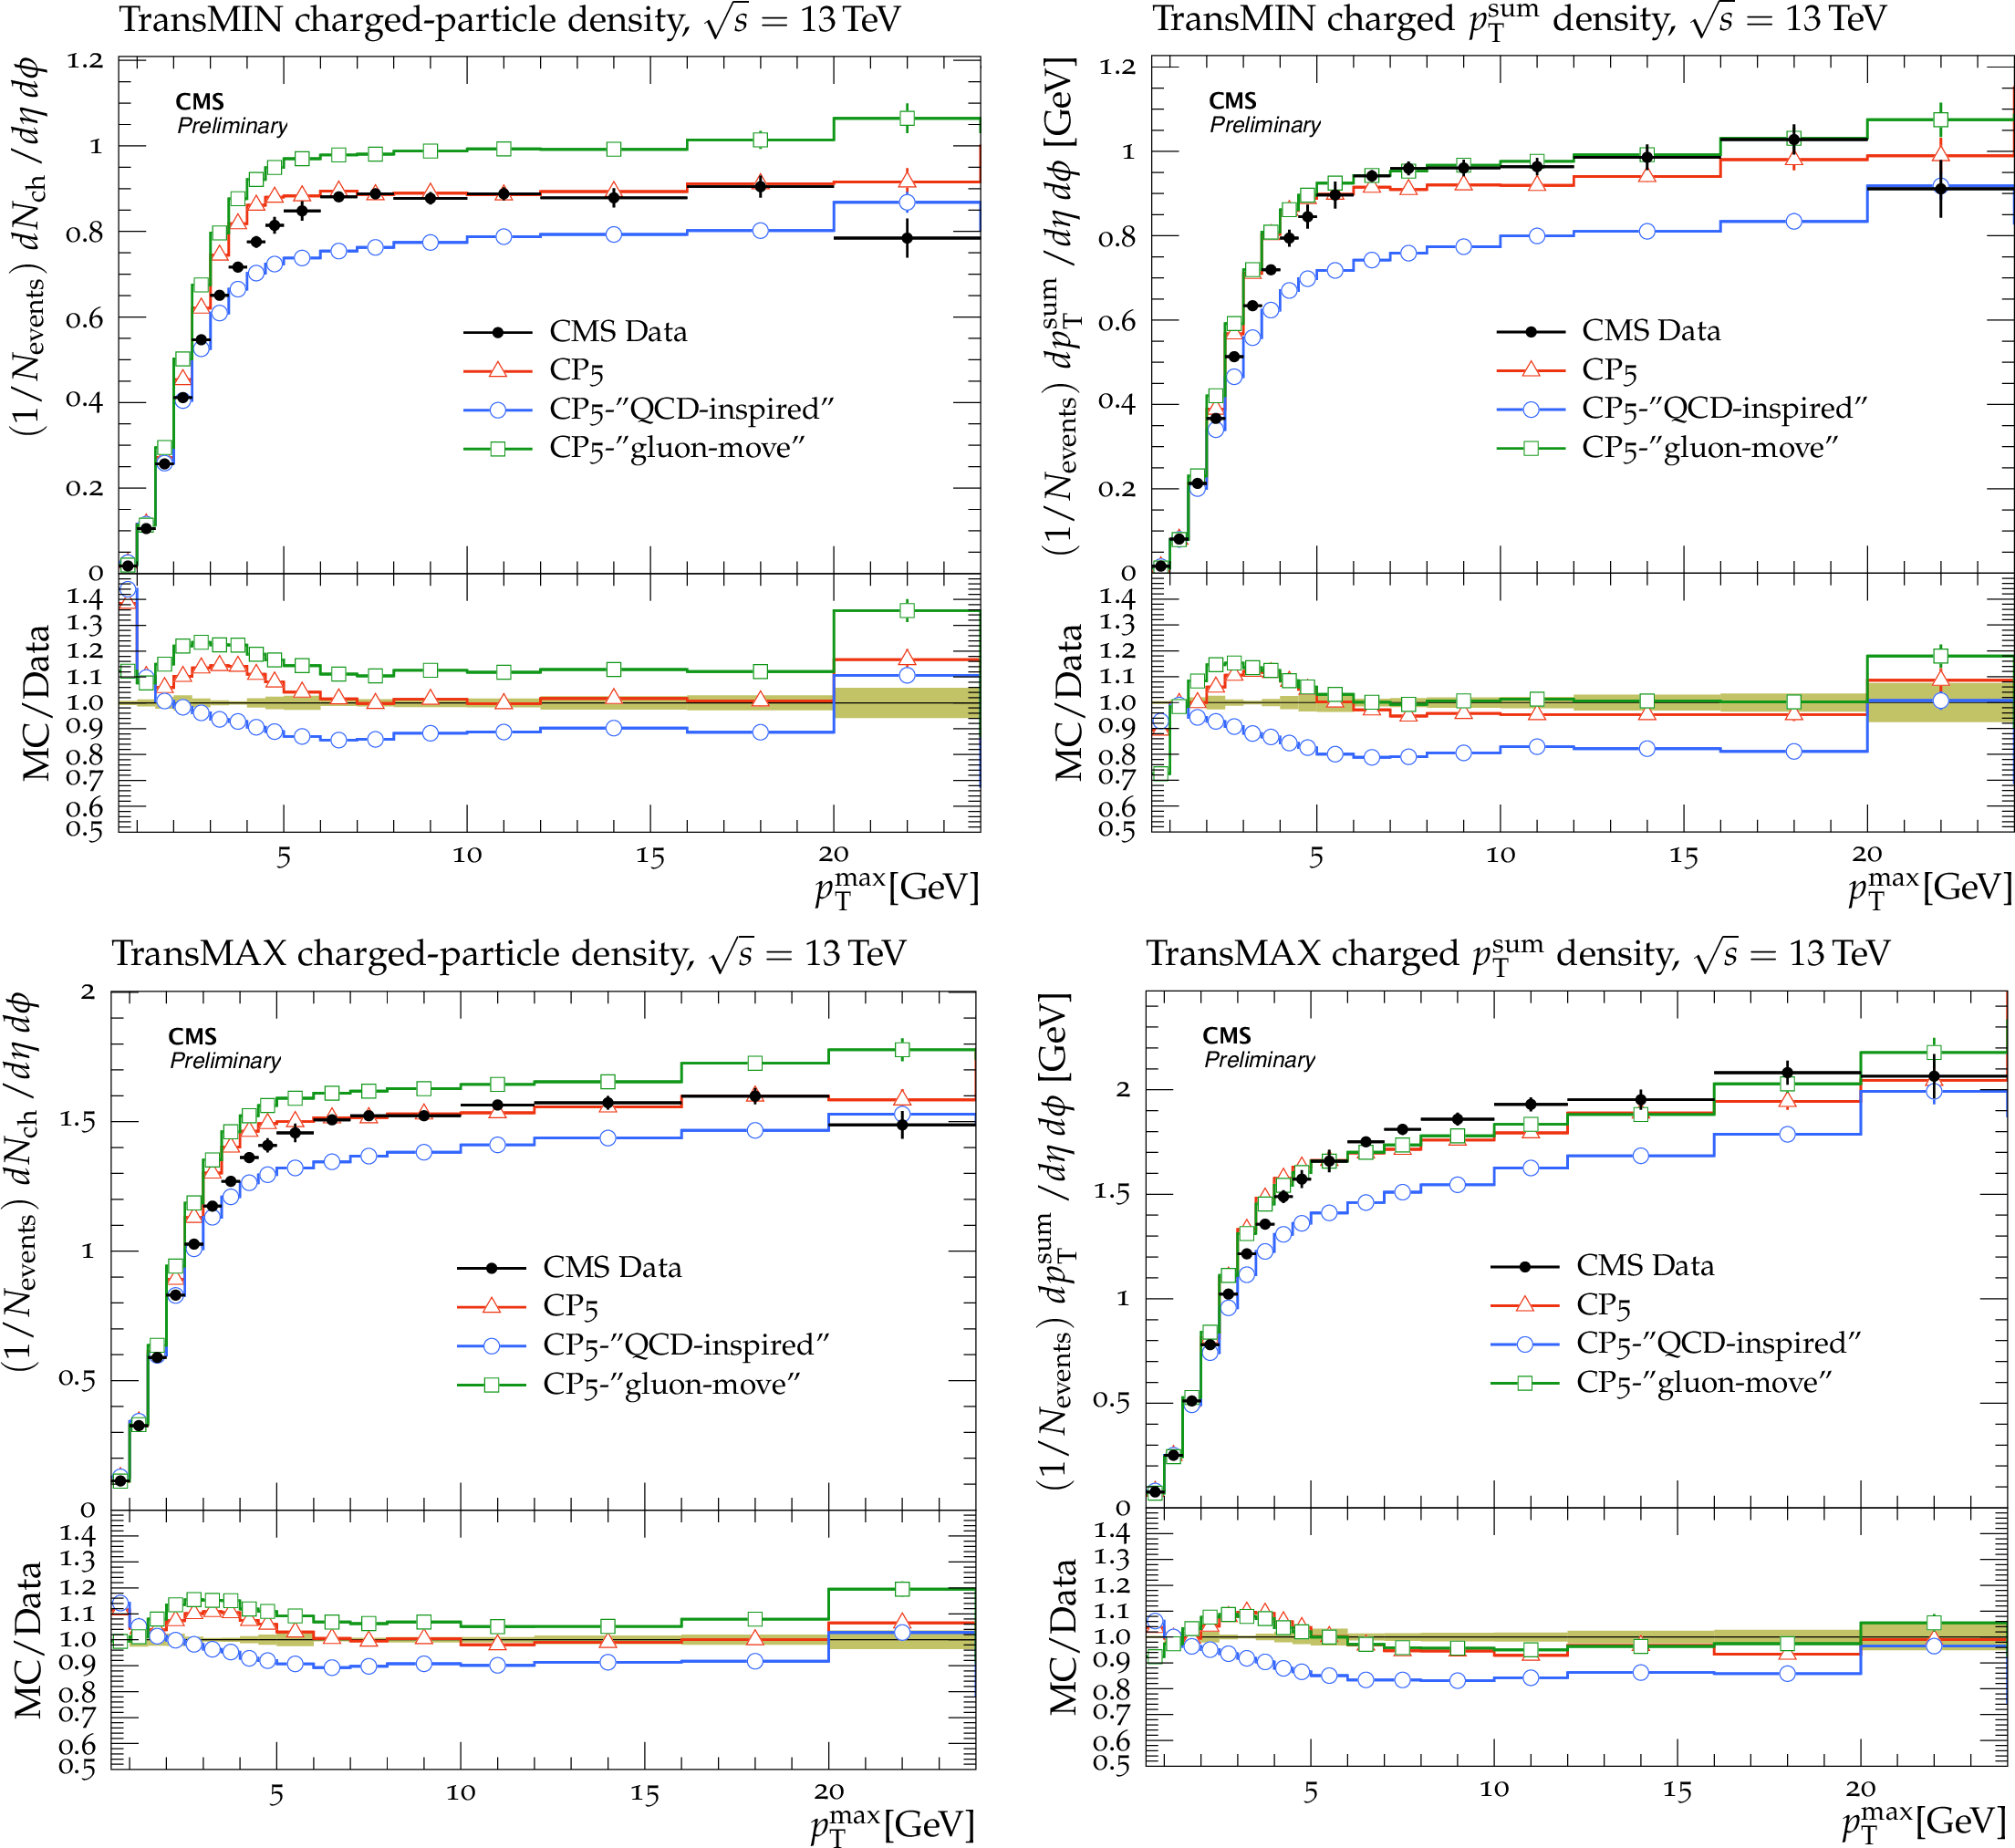
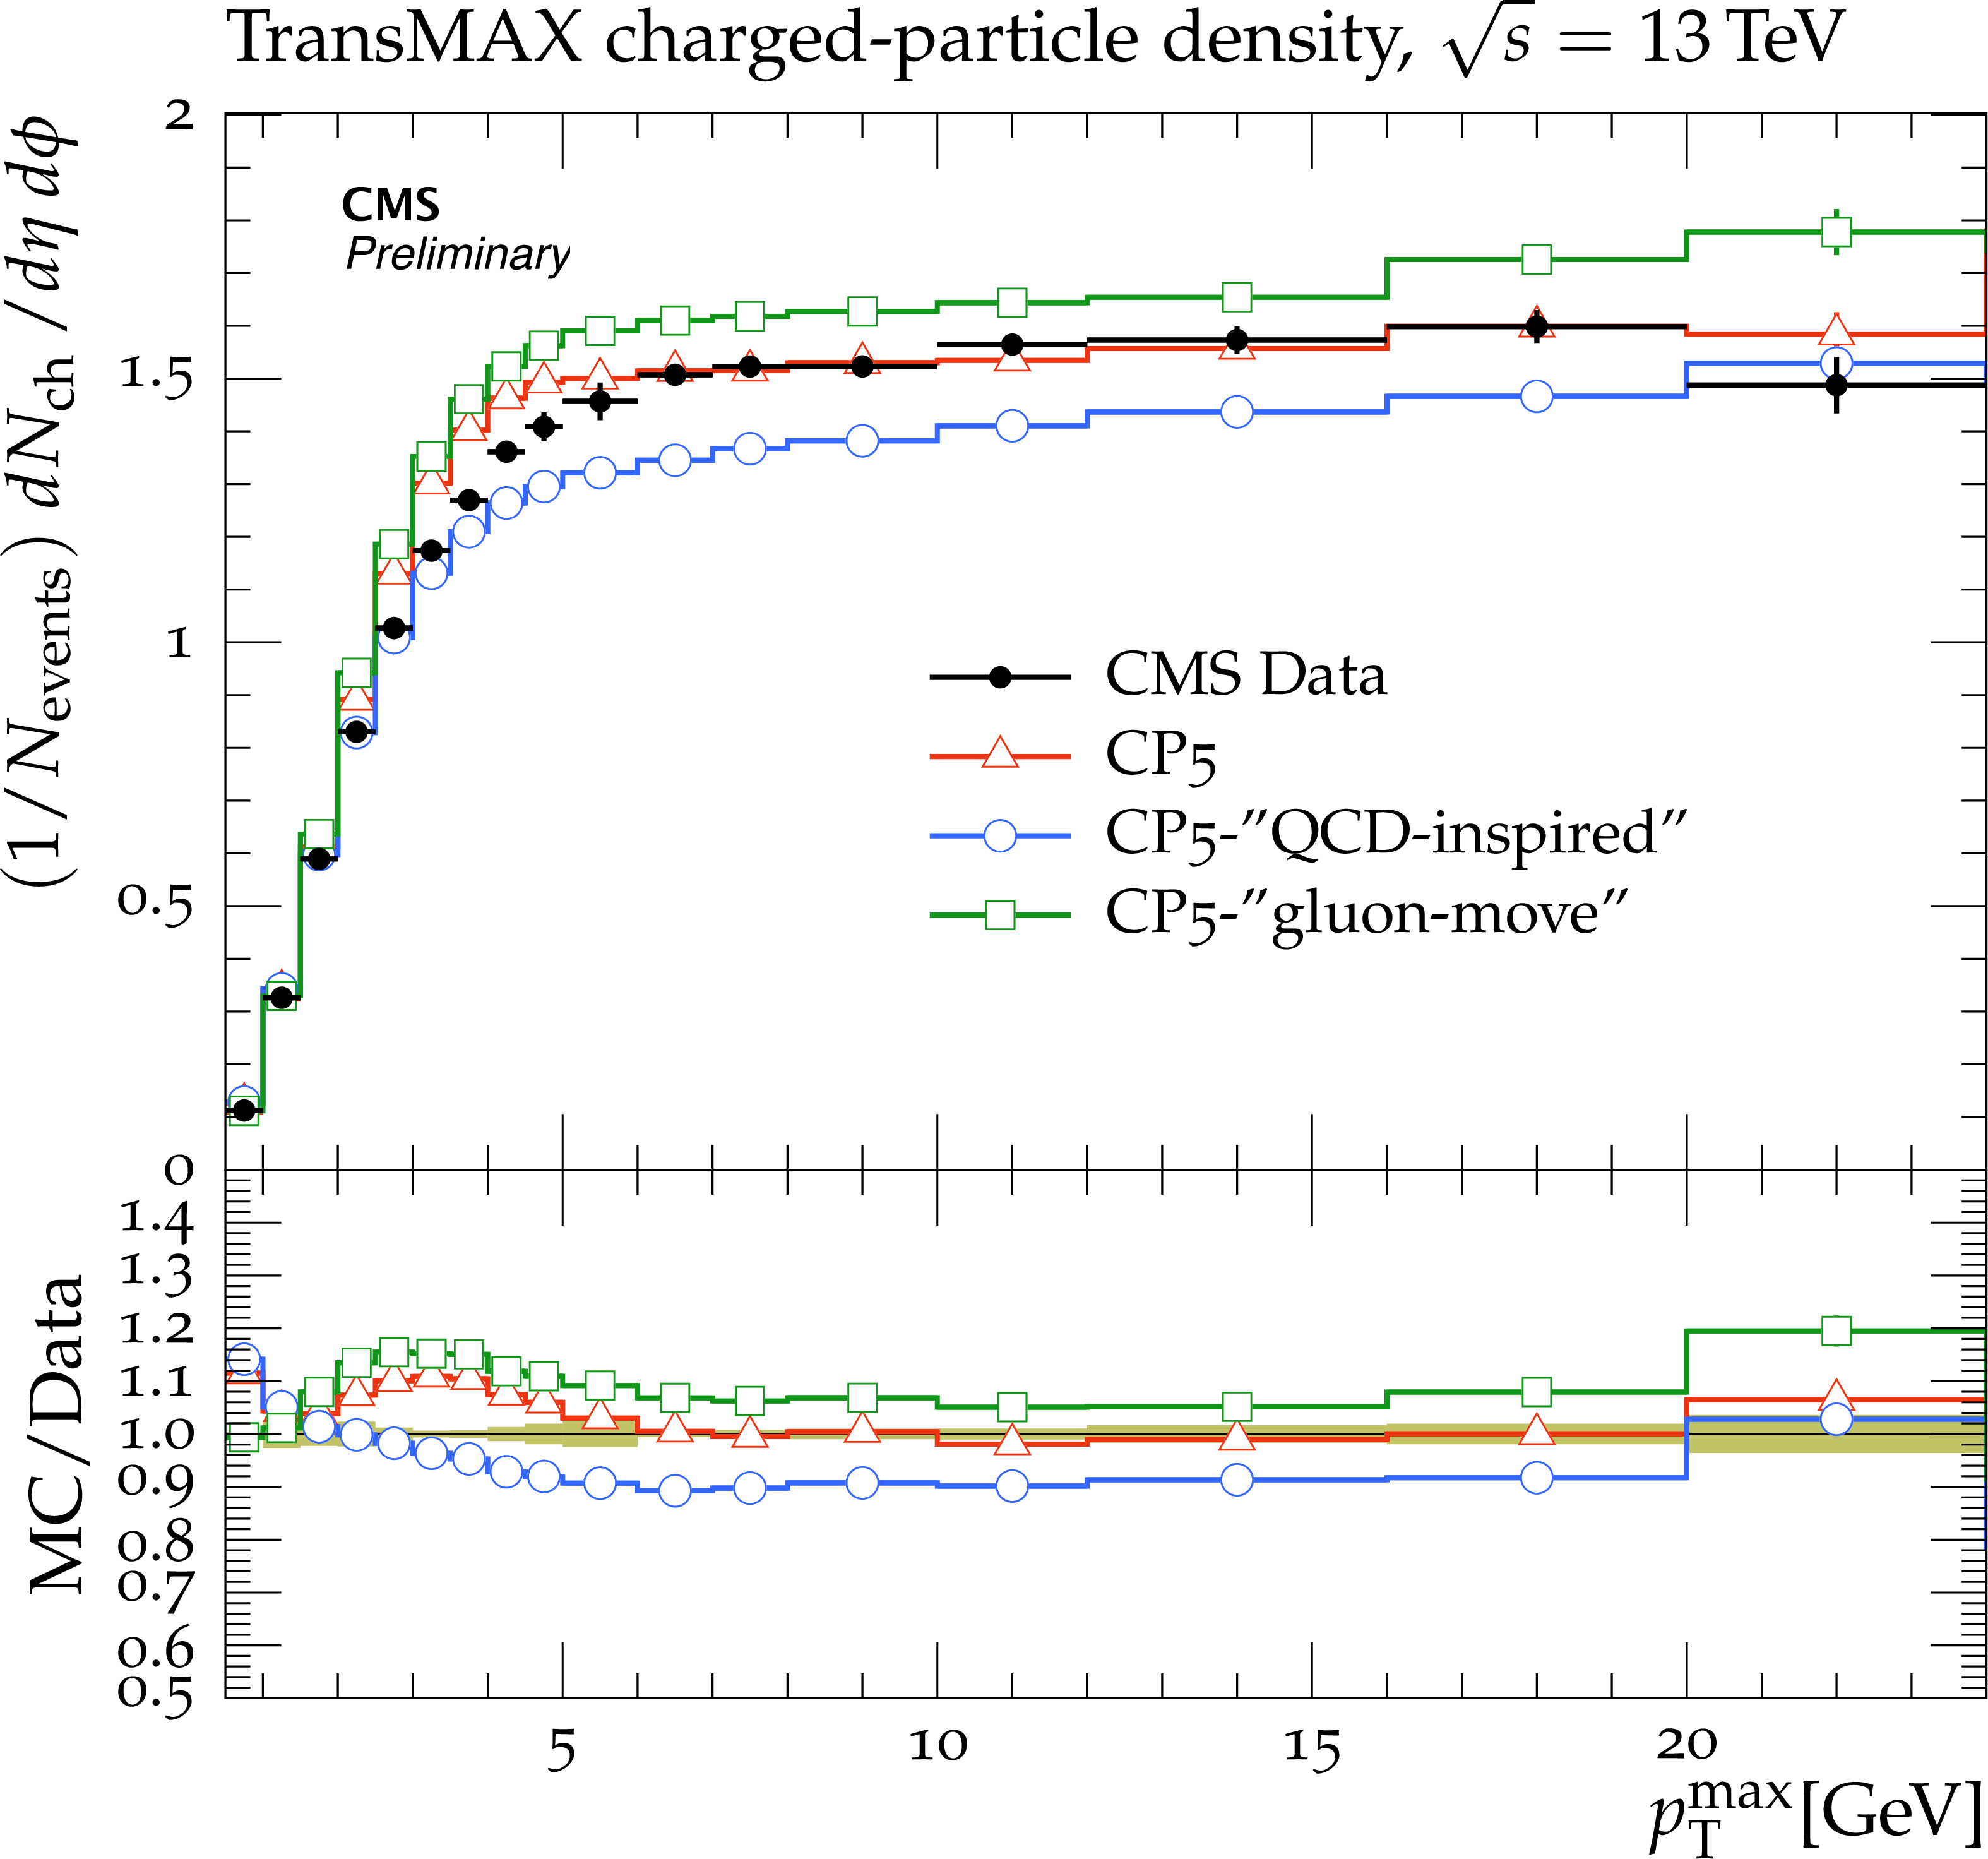
Figure 2:
The charged particle (left) and ${p_{\mathrm {T}}^{\mathrm {sum}}}$ densities (right) in the transMIN (upper) and transMAX (lower) regions, as a function of the ${p_{\mathrm {T}}}$ of the leading charged particle, ${p_{\mathrm {T}}^{\mathrm {max}}}$, measured by the CMS experiment at $\sqrt {s} = $ 13 TeV [9]. The predictions of the tunes CP5, CP5-"QCD-inspired'', and CP5-"gluon-move'' are compared to data. The coloured band represents the total experimental uncertainty in the data. |

png pdf |
Figure 2-a:
The charged particle (left) and ${p_{\mathrm {T}}^{\mathrm {sum}}}$ densities (right) in the transMIN (upper) and transMAX (lower) regions, as a function of the ${p_{\mathrm {T}}}$ of the leading charged particle, ${p_{\mathrm {T}}^{\mathrm {max}}}$, measured by the CMS experiment at $\sqrt {s} = $ 13 TeV [9]. The predictions of the tunes CP5, CP5-"QCD-inspired'', and CP5-"gluon-move'' are compared to data. The coloured band represents the total experimental uncertainty in the data. |

png pdf |
Figure 2-b:
The charged particle (left) and ${p_{\mathrm {T}}^{\mathrm {sum}}}$ densities (right) in the transMIN (upper) and transMAX (lower) regions, as a function of the ${p_{\mathrm {T}}}$ of the leading charged particle, ${p_{\mathrm {T}}^{\mathrm {max}}}$, measured by the CMS experiment at $\sqrt {s} = $ 13 TeV [9]. The predictions of the tunes CP5, CP5-"QCD-inspired'', and CP5-"gluon-move'' are compared to data. The coloured band represents the total experimental uncertainty in the data. |
png pdf |
Figure 2-c:
The charged particle (left) and ${p_{\mathrm {T}}^{\mathrm {sum}}}$ densities (right) in the transMIN (upper) and transMAX (lower) regions, as a function of the ${p_{\mathrm {T}}}$ of the leading charged particle, ${p_{\mathrm {T}}^{\mathrm {max}}}$, measured by the CMS experiment at $\sqrt {s} = $ 13 TeV [9]. The predictions of the tunes CP5, CP5-"QCD-inspired'', and CP5-"gluon-move'' are compared to data. The coloured band represents the total experimental uncertainty in the data. |

png pdf |
Figure 2-d:
The charged particle (left) and ${p_{\mathrm {T}}^{\mathrm {sum}}}$ densities (right) in the transMIN (upper) and transMAX (lower) regions, as a function of the ${p_{\mathrm {T}}}$ of the leading charged particle, ${p_{\mathrm {T}}^{\mathrm {max}}}$, measured by the CMS experiment at $\sqrt {s} = $ 13 TeV [9]. The predictions of the tunes CP5, CP5-"QCD-inspired'', and CP5-"gluon-move'' are compared to data. The coloured band represents the total experimental uncertainty in the data. |
png pdf |
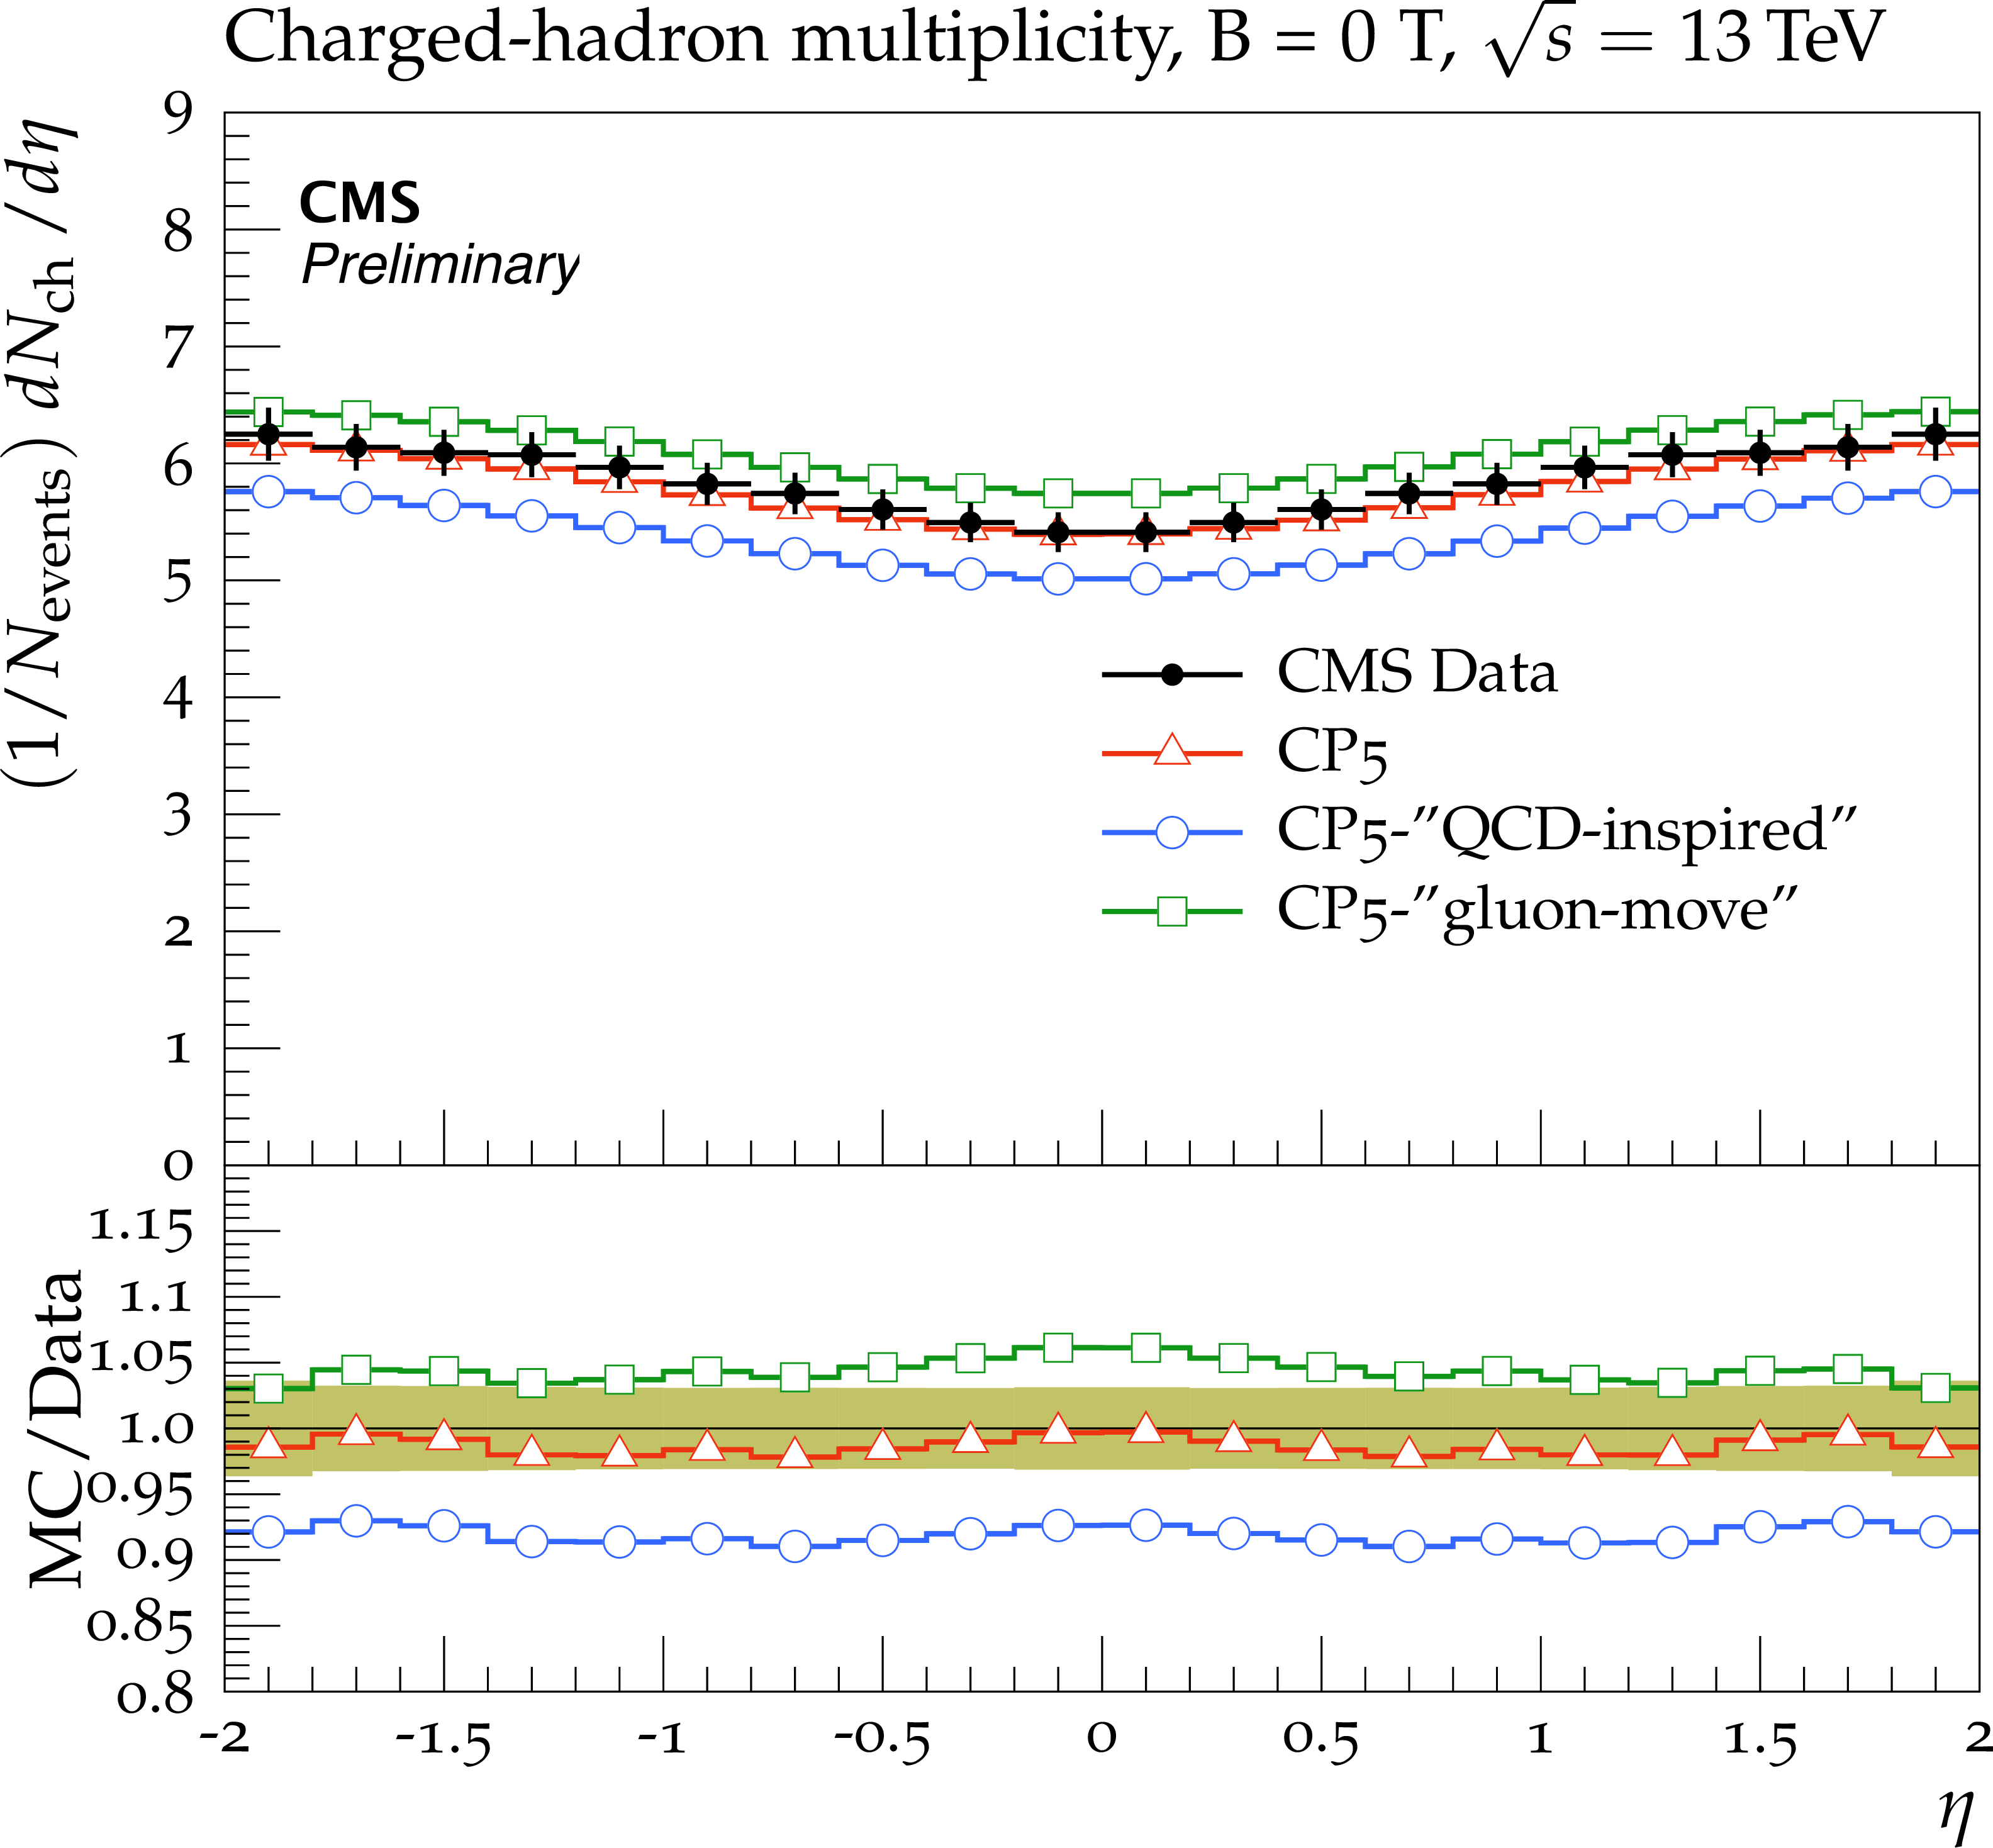
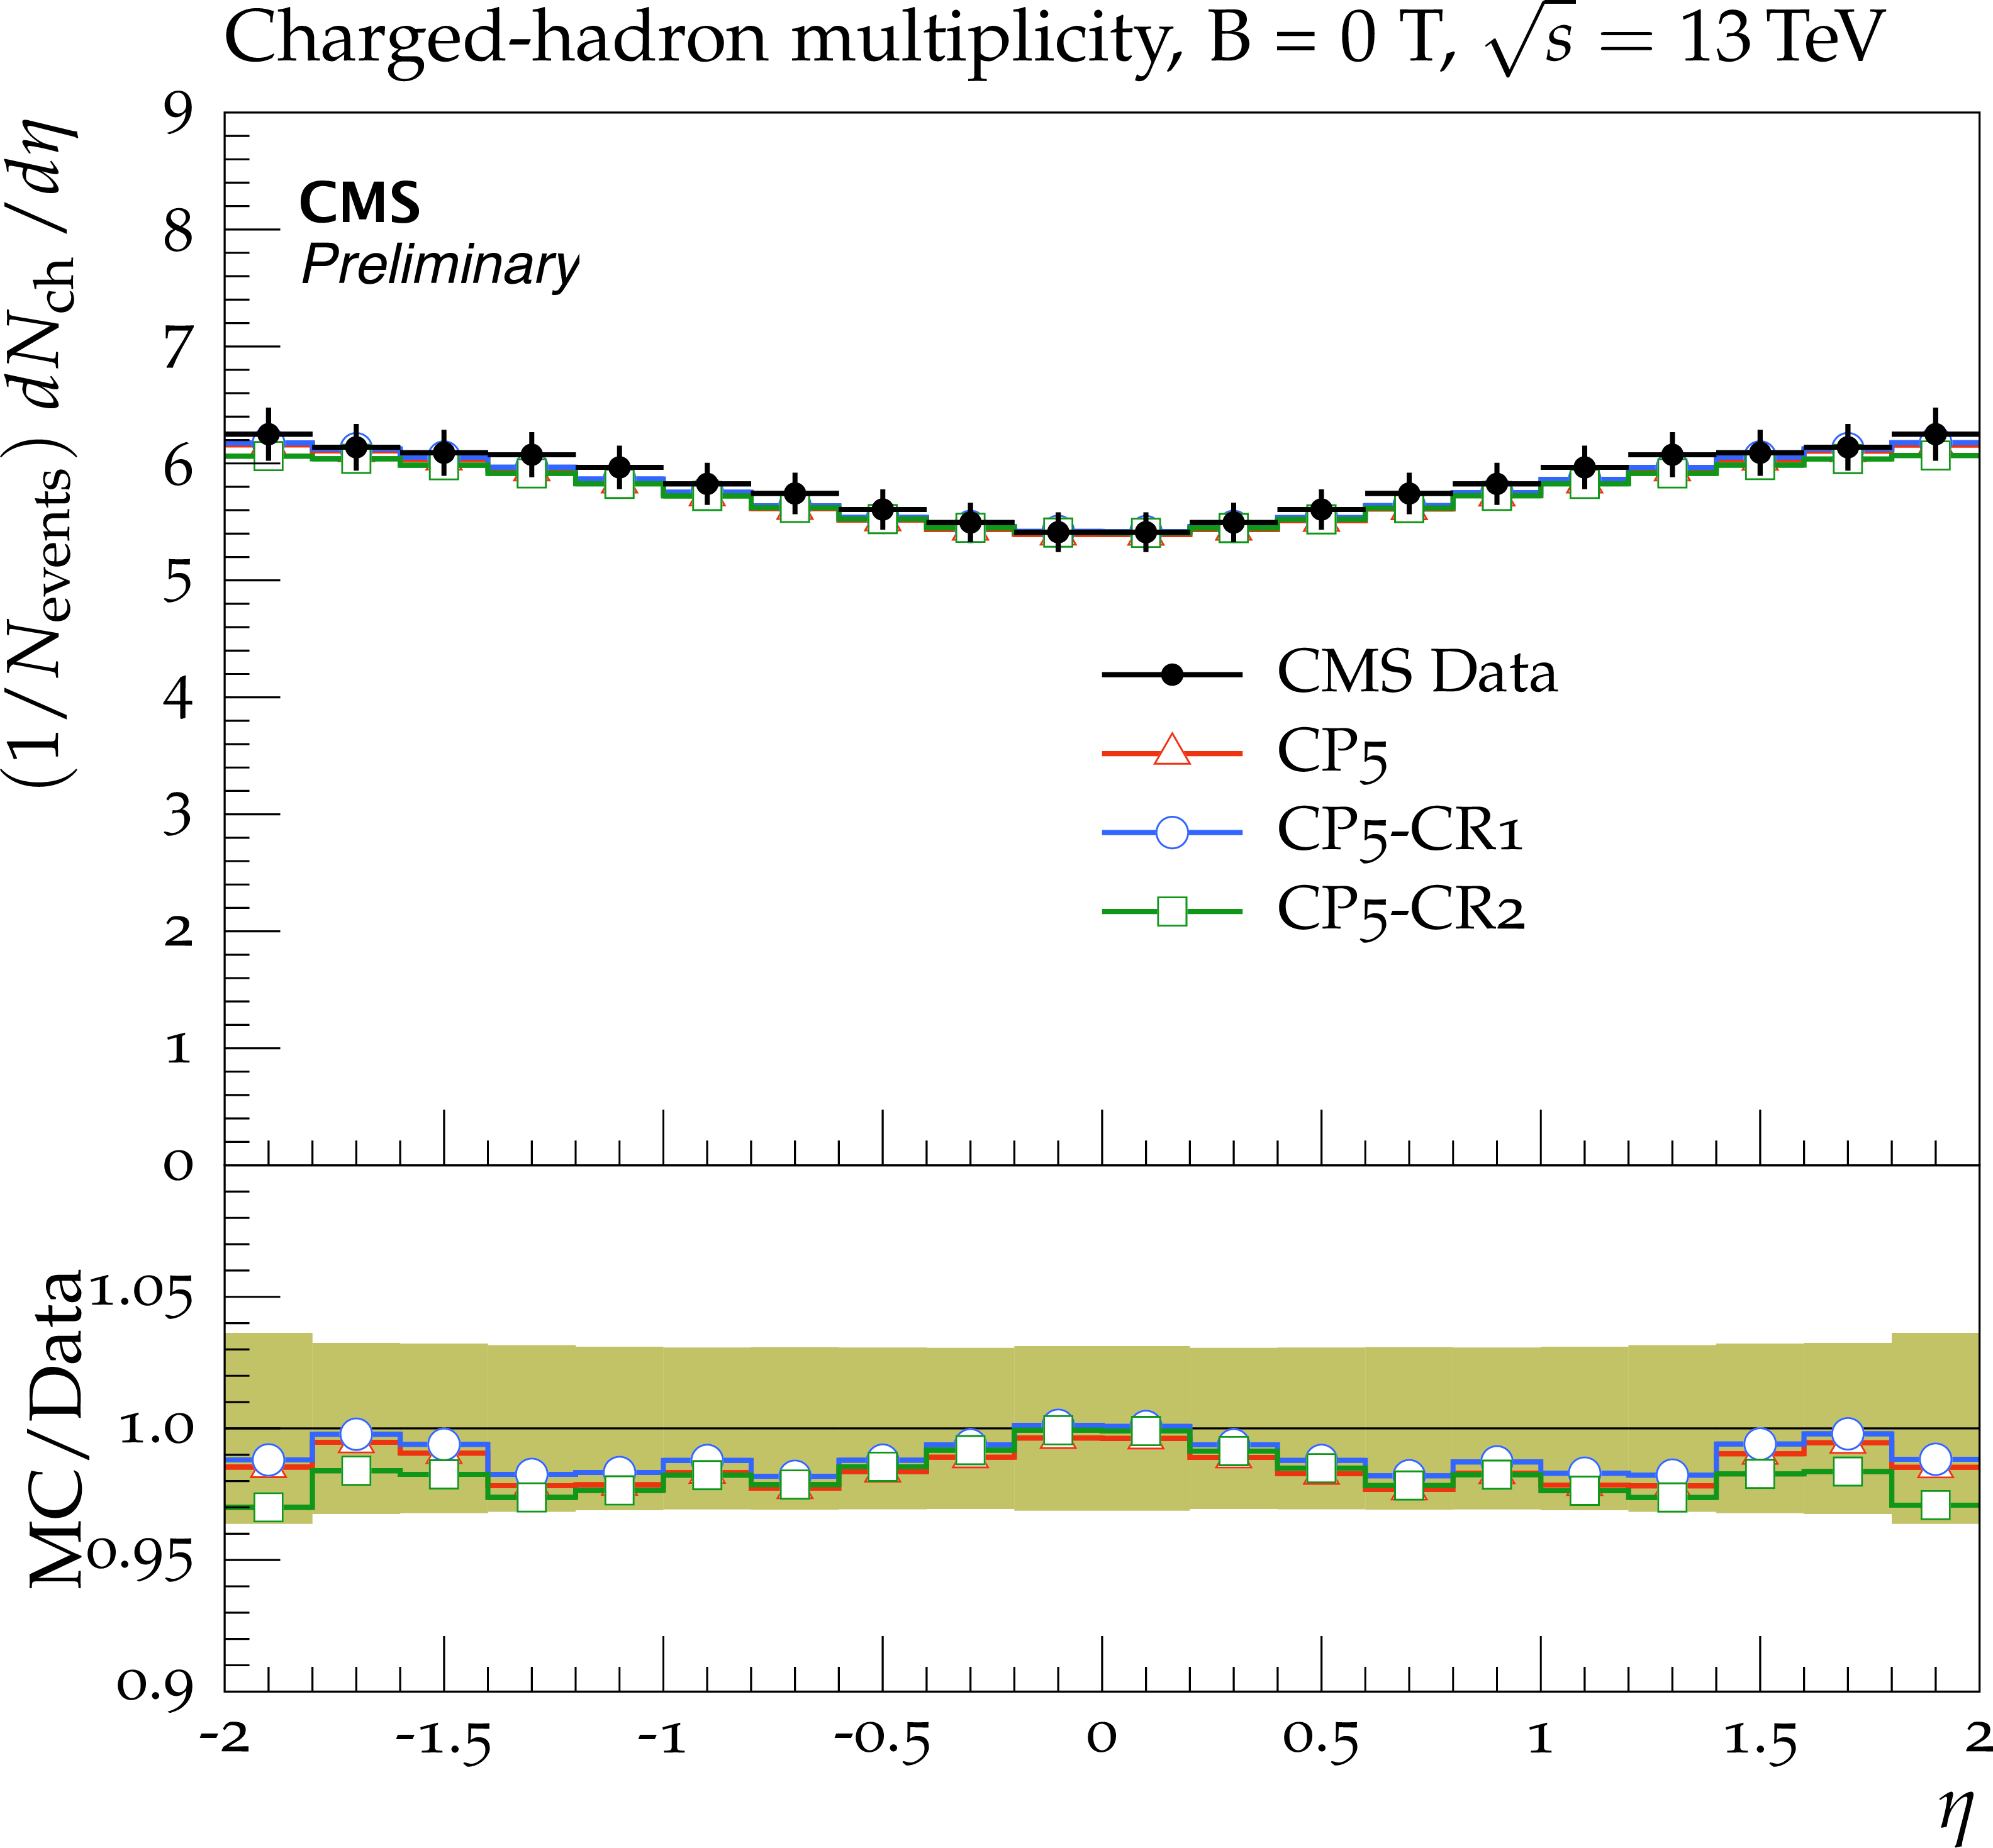
Figure 3:
The pseudorapidity of charged hadrons, ${dN_{\mathrm {ch}}/d\eta}$, measured in $|\eta | < $ 2 by the CMS experiment at $\sqrt {s} = $ 13 TeV [17]. The predictions of the tunes CP5, CP5-"QCD-inspired'', and CP5-"gluon-move'' are compared to data. The coloured band represents the total experimental uncertainty in the data. |

png pdf |
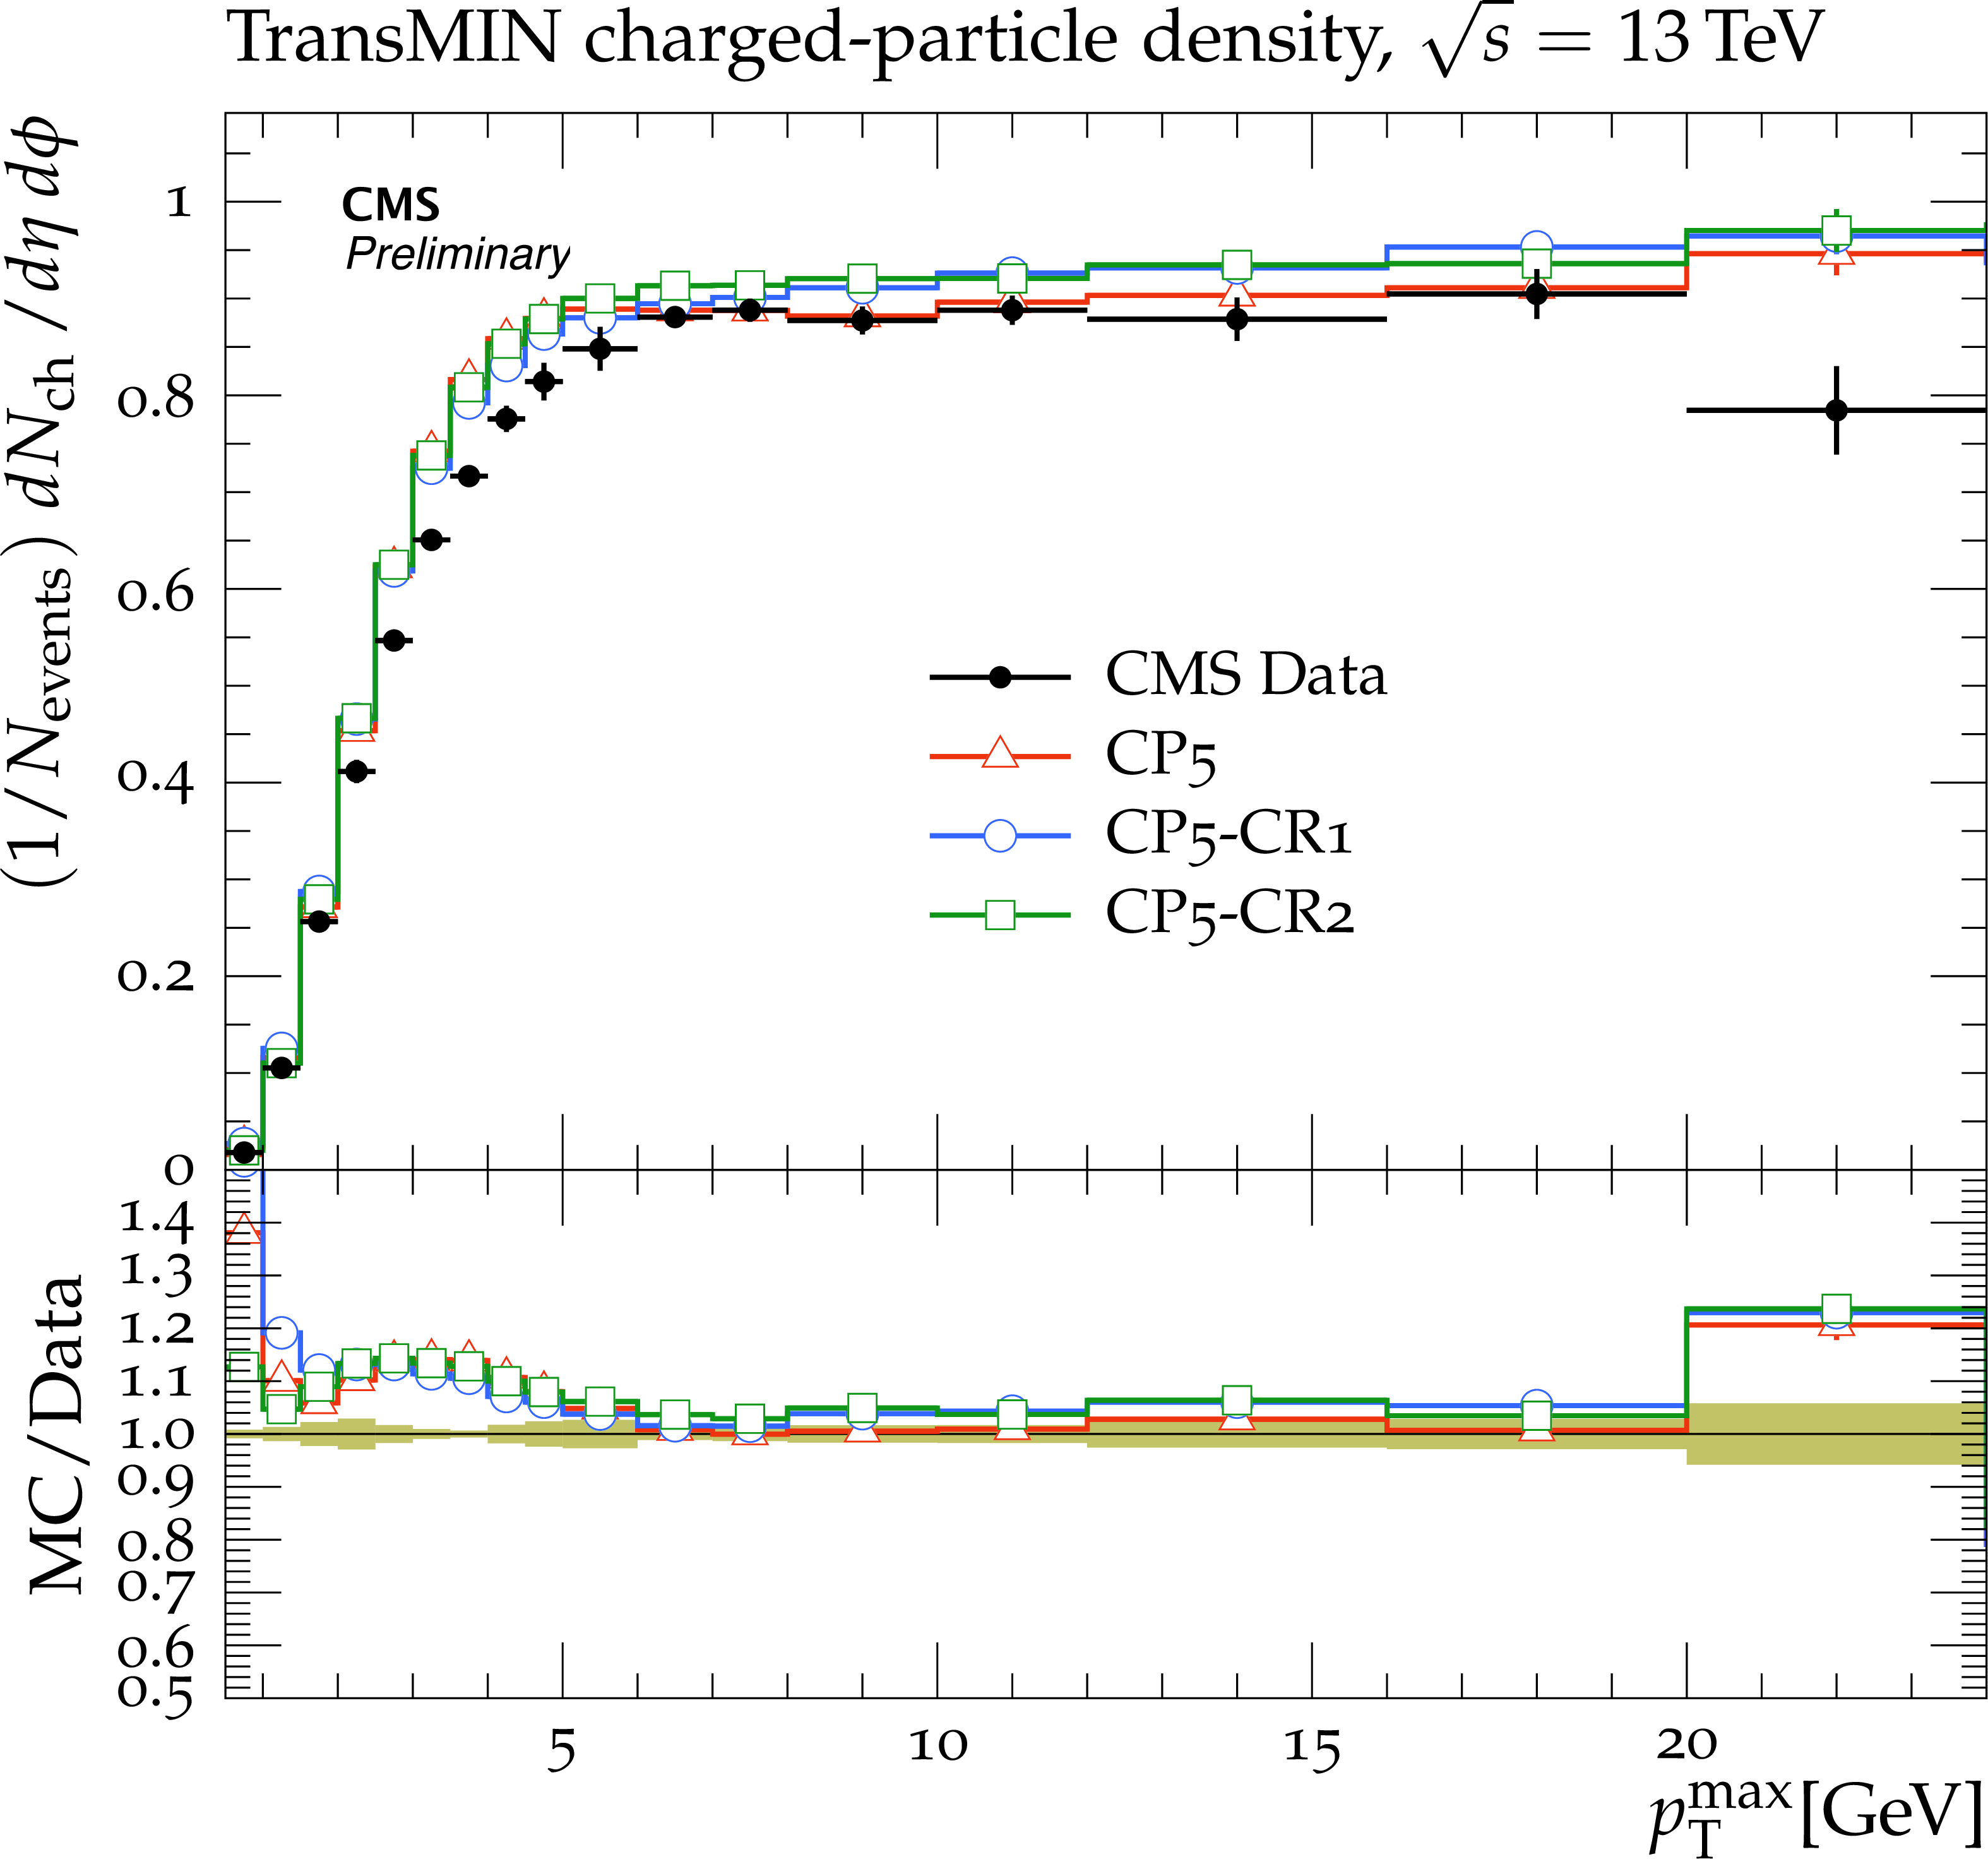
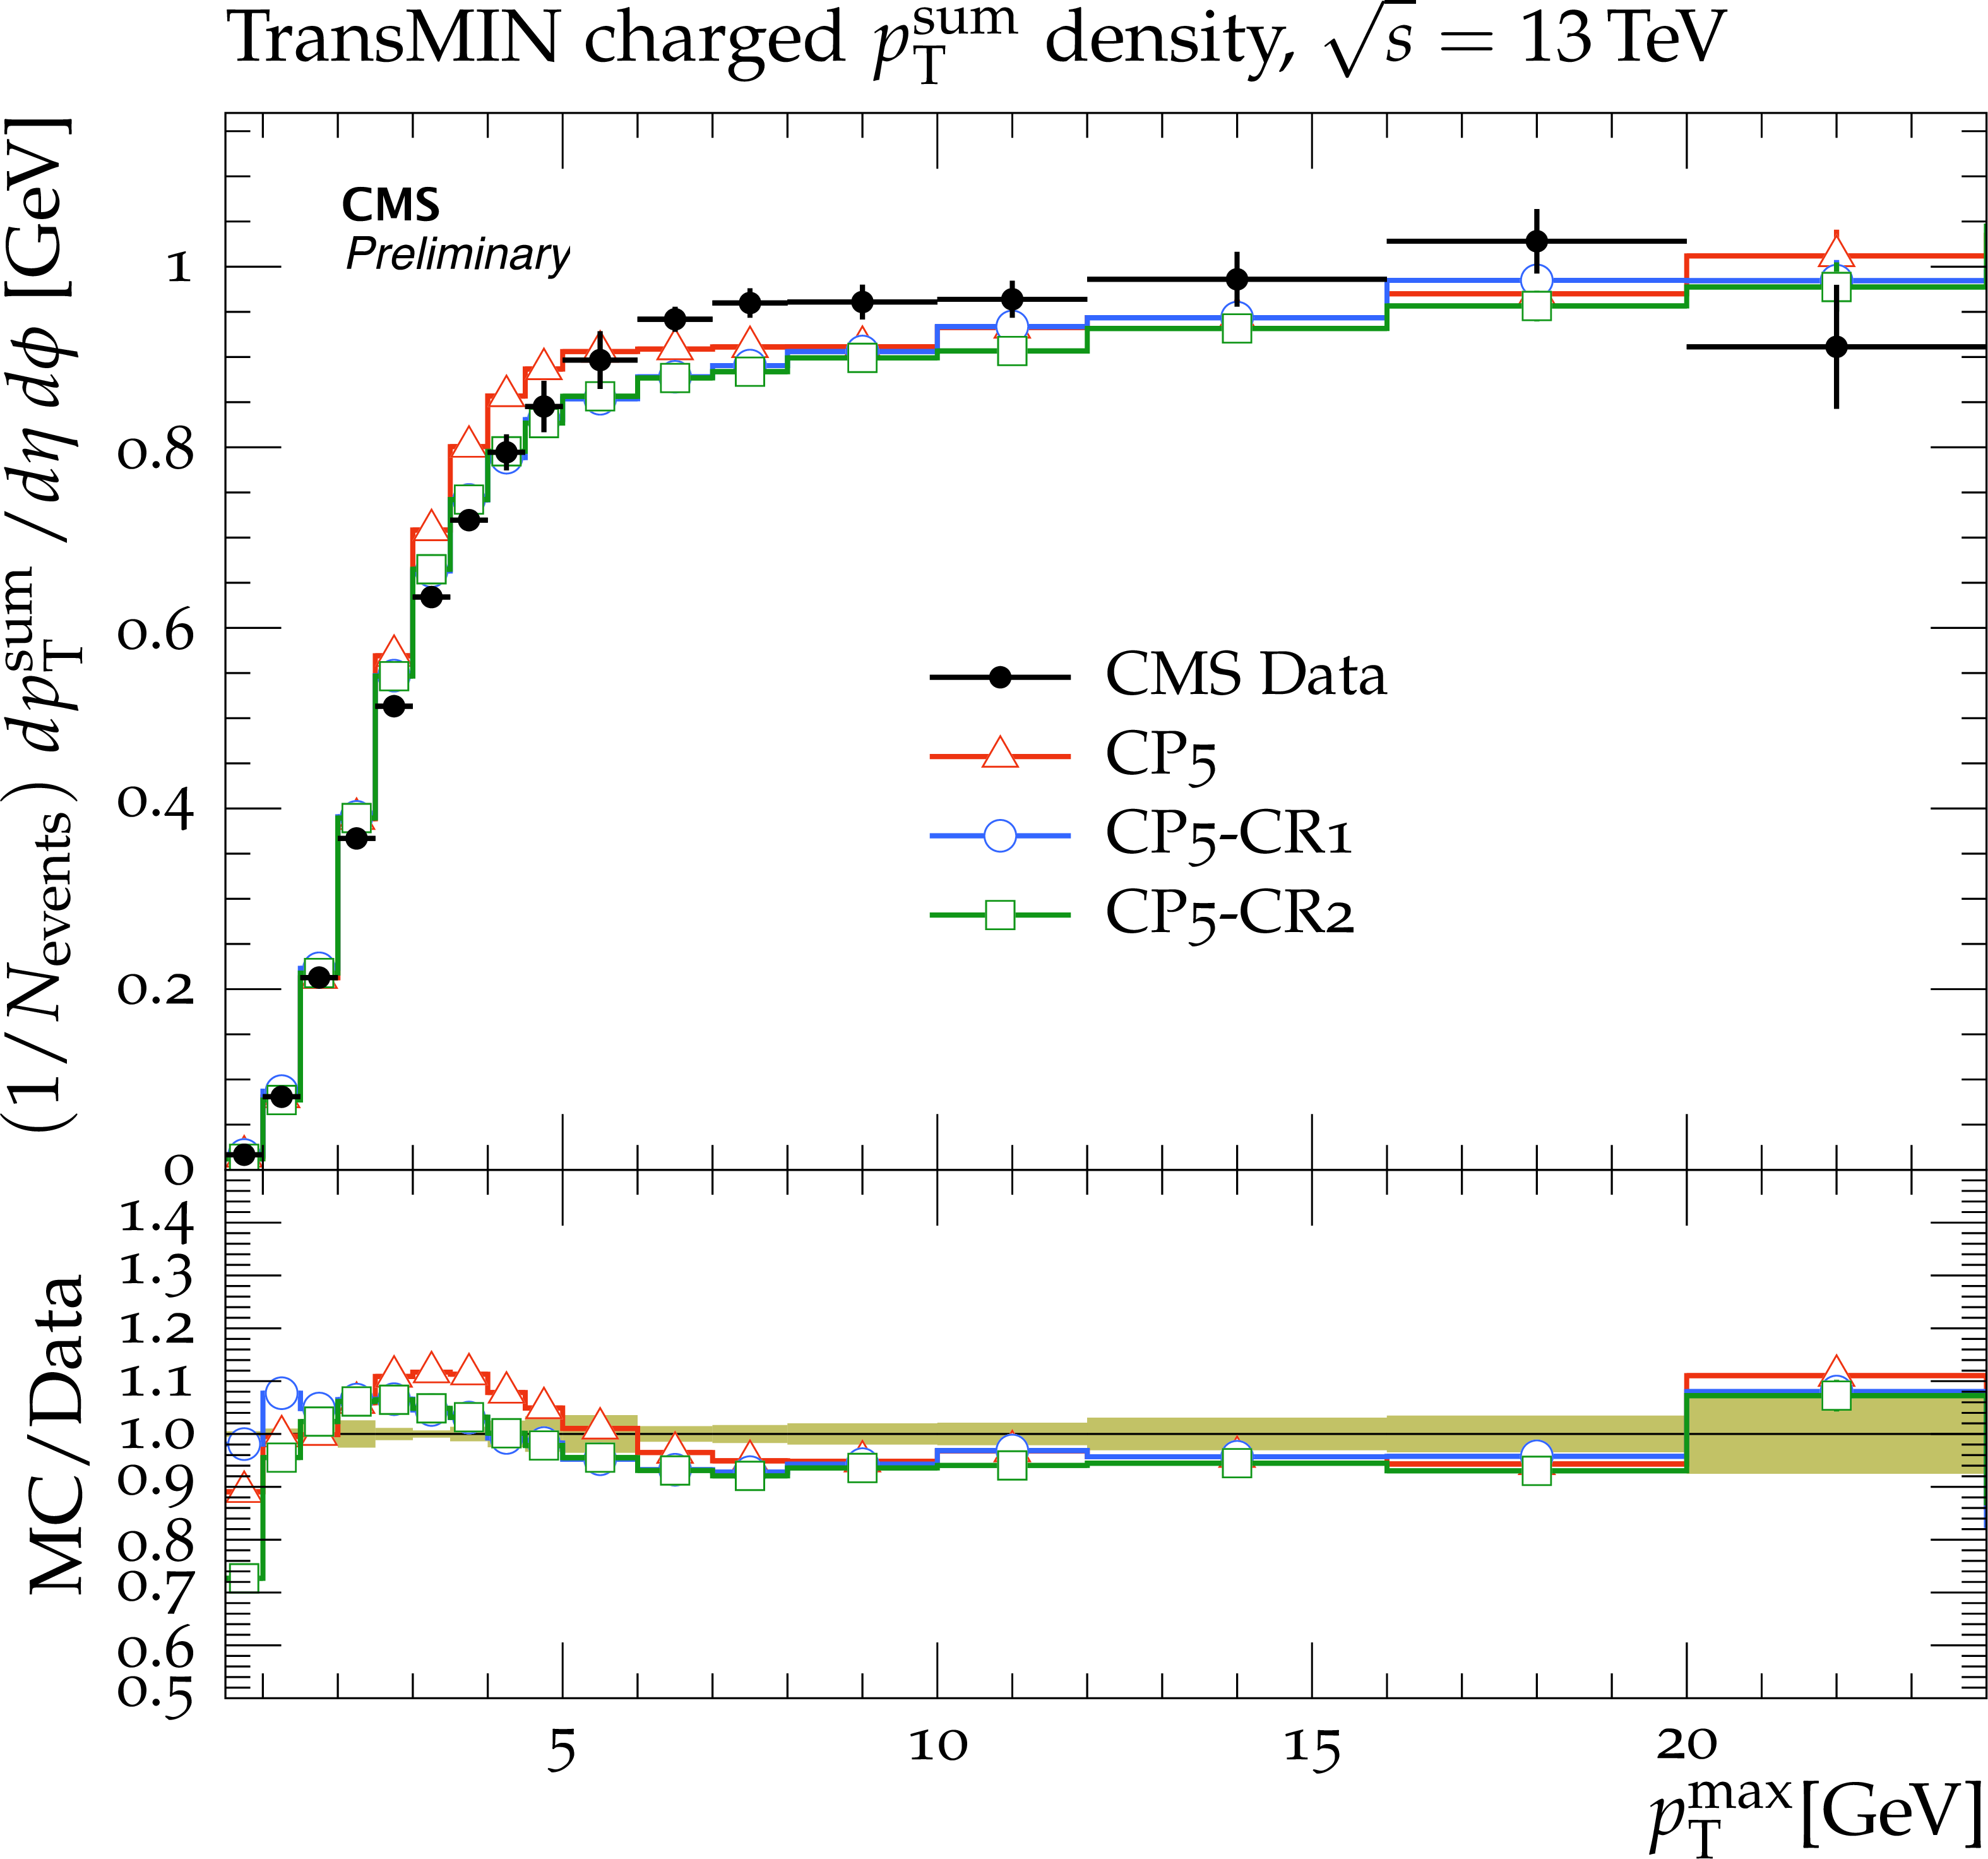
Figure 4:
The charged particle (left) and ${p_{\mathrm {T}}^{\mathrm {sum}}}$ (right) densities in the transMIN (upper) and transMAX (lower) regions, as a function of the ${p_{\mathrm {T}}}$ of the leading charged particle, ${p_{\mathrm {T}}^{\mathrm {max}}}$, measured by the CMS experiment at $\sqrt {s} = $ 13 TeV [9]. The predictions of the CP5 and CP5-CR tunes are compared to data. The coloured band represents the total experimental uncertainty in the data. |
png pdf |
Figure 4-a:
The charged particle (left) and ${p_{\mathrm {T}}^{\mathrm {sum}}}$ (right) densities in the transMIN (upper) and transMAX (lower) regions, as a function of the ${p_{\mathrm {T}}}$ of the leading charged particle, ${p_{\mathrm {T}}^{\mathrm {max}}}$, measured by the CMS experiment at $\sqrt {s} = $ 13 TeV [9]. The predictions of the CP5 and CP5-CR tunes are compared to data. The coloured band represents the total experimental uncertainty in the data. |
png pdf |
Figure 4-b:
The charged particle (left) and ${p_{\mathrm {T}}^{\mathrm {sum}}}$ (right) densities in the transMIN (upper) and transMAX (lower) regions, as a function of the ${p_{\mathrm {T}}}$ of the leading charged particle, ${p_{\mathrm {T}}^{\mathrm {max}}}$, measured by the CMS experiment at $\sqrt {s} = $ 13 TeV [9]. The predictions of the CP5 and CP5-CR tunes are compared to data. The coloured band represents the total experimental uncertainty in the data. |

png pdf |
Figure 4-c:
The charged particle (left) and ${p_{\mathrm {T}}^{\mathrm {sum}}}$ (right) densities in the transMIN (upper) and transMAX (lower) regions, as a function of the ${p_{\mathrm {T}}}$ of the leading charged particle, ${p_{\mathrm {T}}^{\mathrm {max}}}$, measured by the CMS experiment at $\sqrt {s} = $ 13 TeV [9]. The predictions of the CP5 and CP5-CR tunes are compared to data. The coloured band represents the total experimental uncertainty in the data. |

png pdf |
Figure 4-d:
The charged particle (left) and ${p_{\mathrm {T}}^{\mathrm {sum}}}$ (right) densities in the transMIN (upper) and transMAX (lower) regions, as a function of the ${p_{\mathrm {T}}}$ of the leading charged particle, ${p_{\mathrm {T}}^{\mathrm {max}}}$, measured by the CMS experiment at $\sqrt {s} = $ 13 TeV [9]. The predictions of the CP5 and CP5-CR tunes are compared to data. The coloured band represents the total experimental uncertainty in the data. |
png pdf |
Figure 5:
The pseudorapidity of charged hadrons, ${dN_{\mathrm {ch}}/d\eta}$, measured by the CMS experiment at $\sqrt {s} = $ 13 TeV [17]. The predictions of the CP5 and CP5-CR tunes are compared to data. The coloured band represents the total experimental uncertainty in the data. |

png pdf |
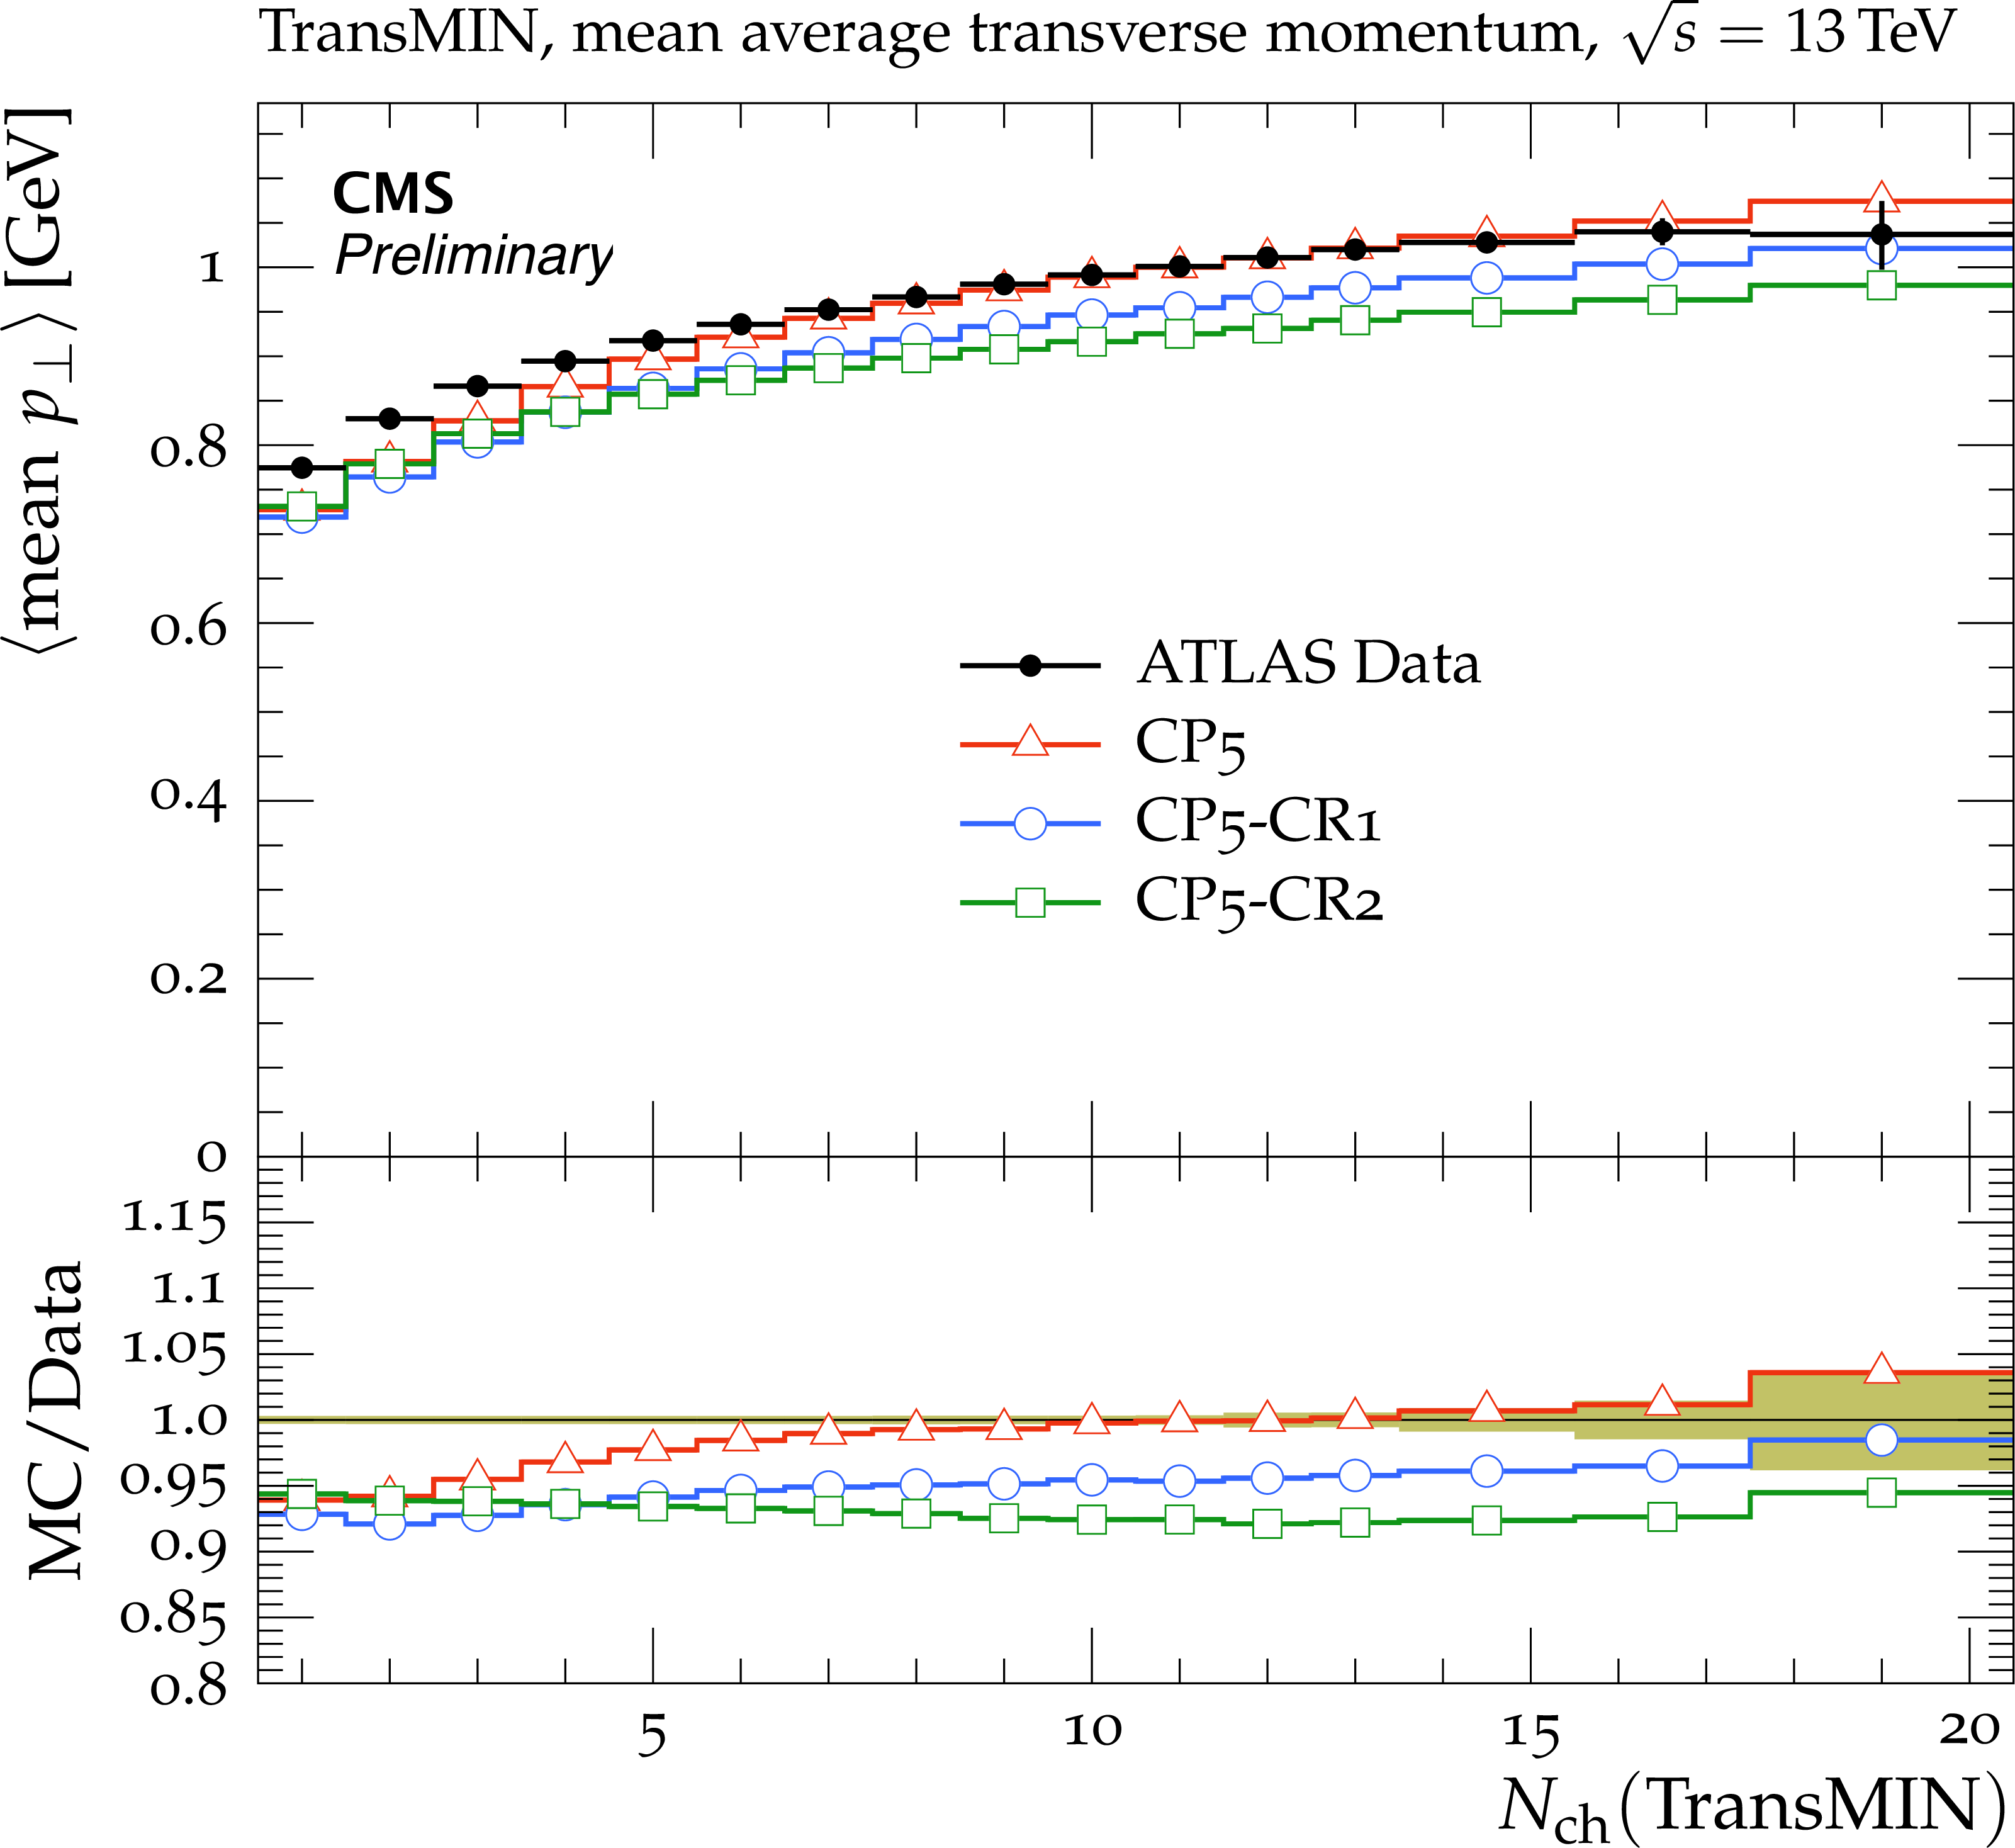
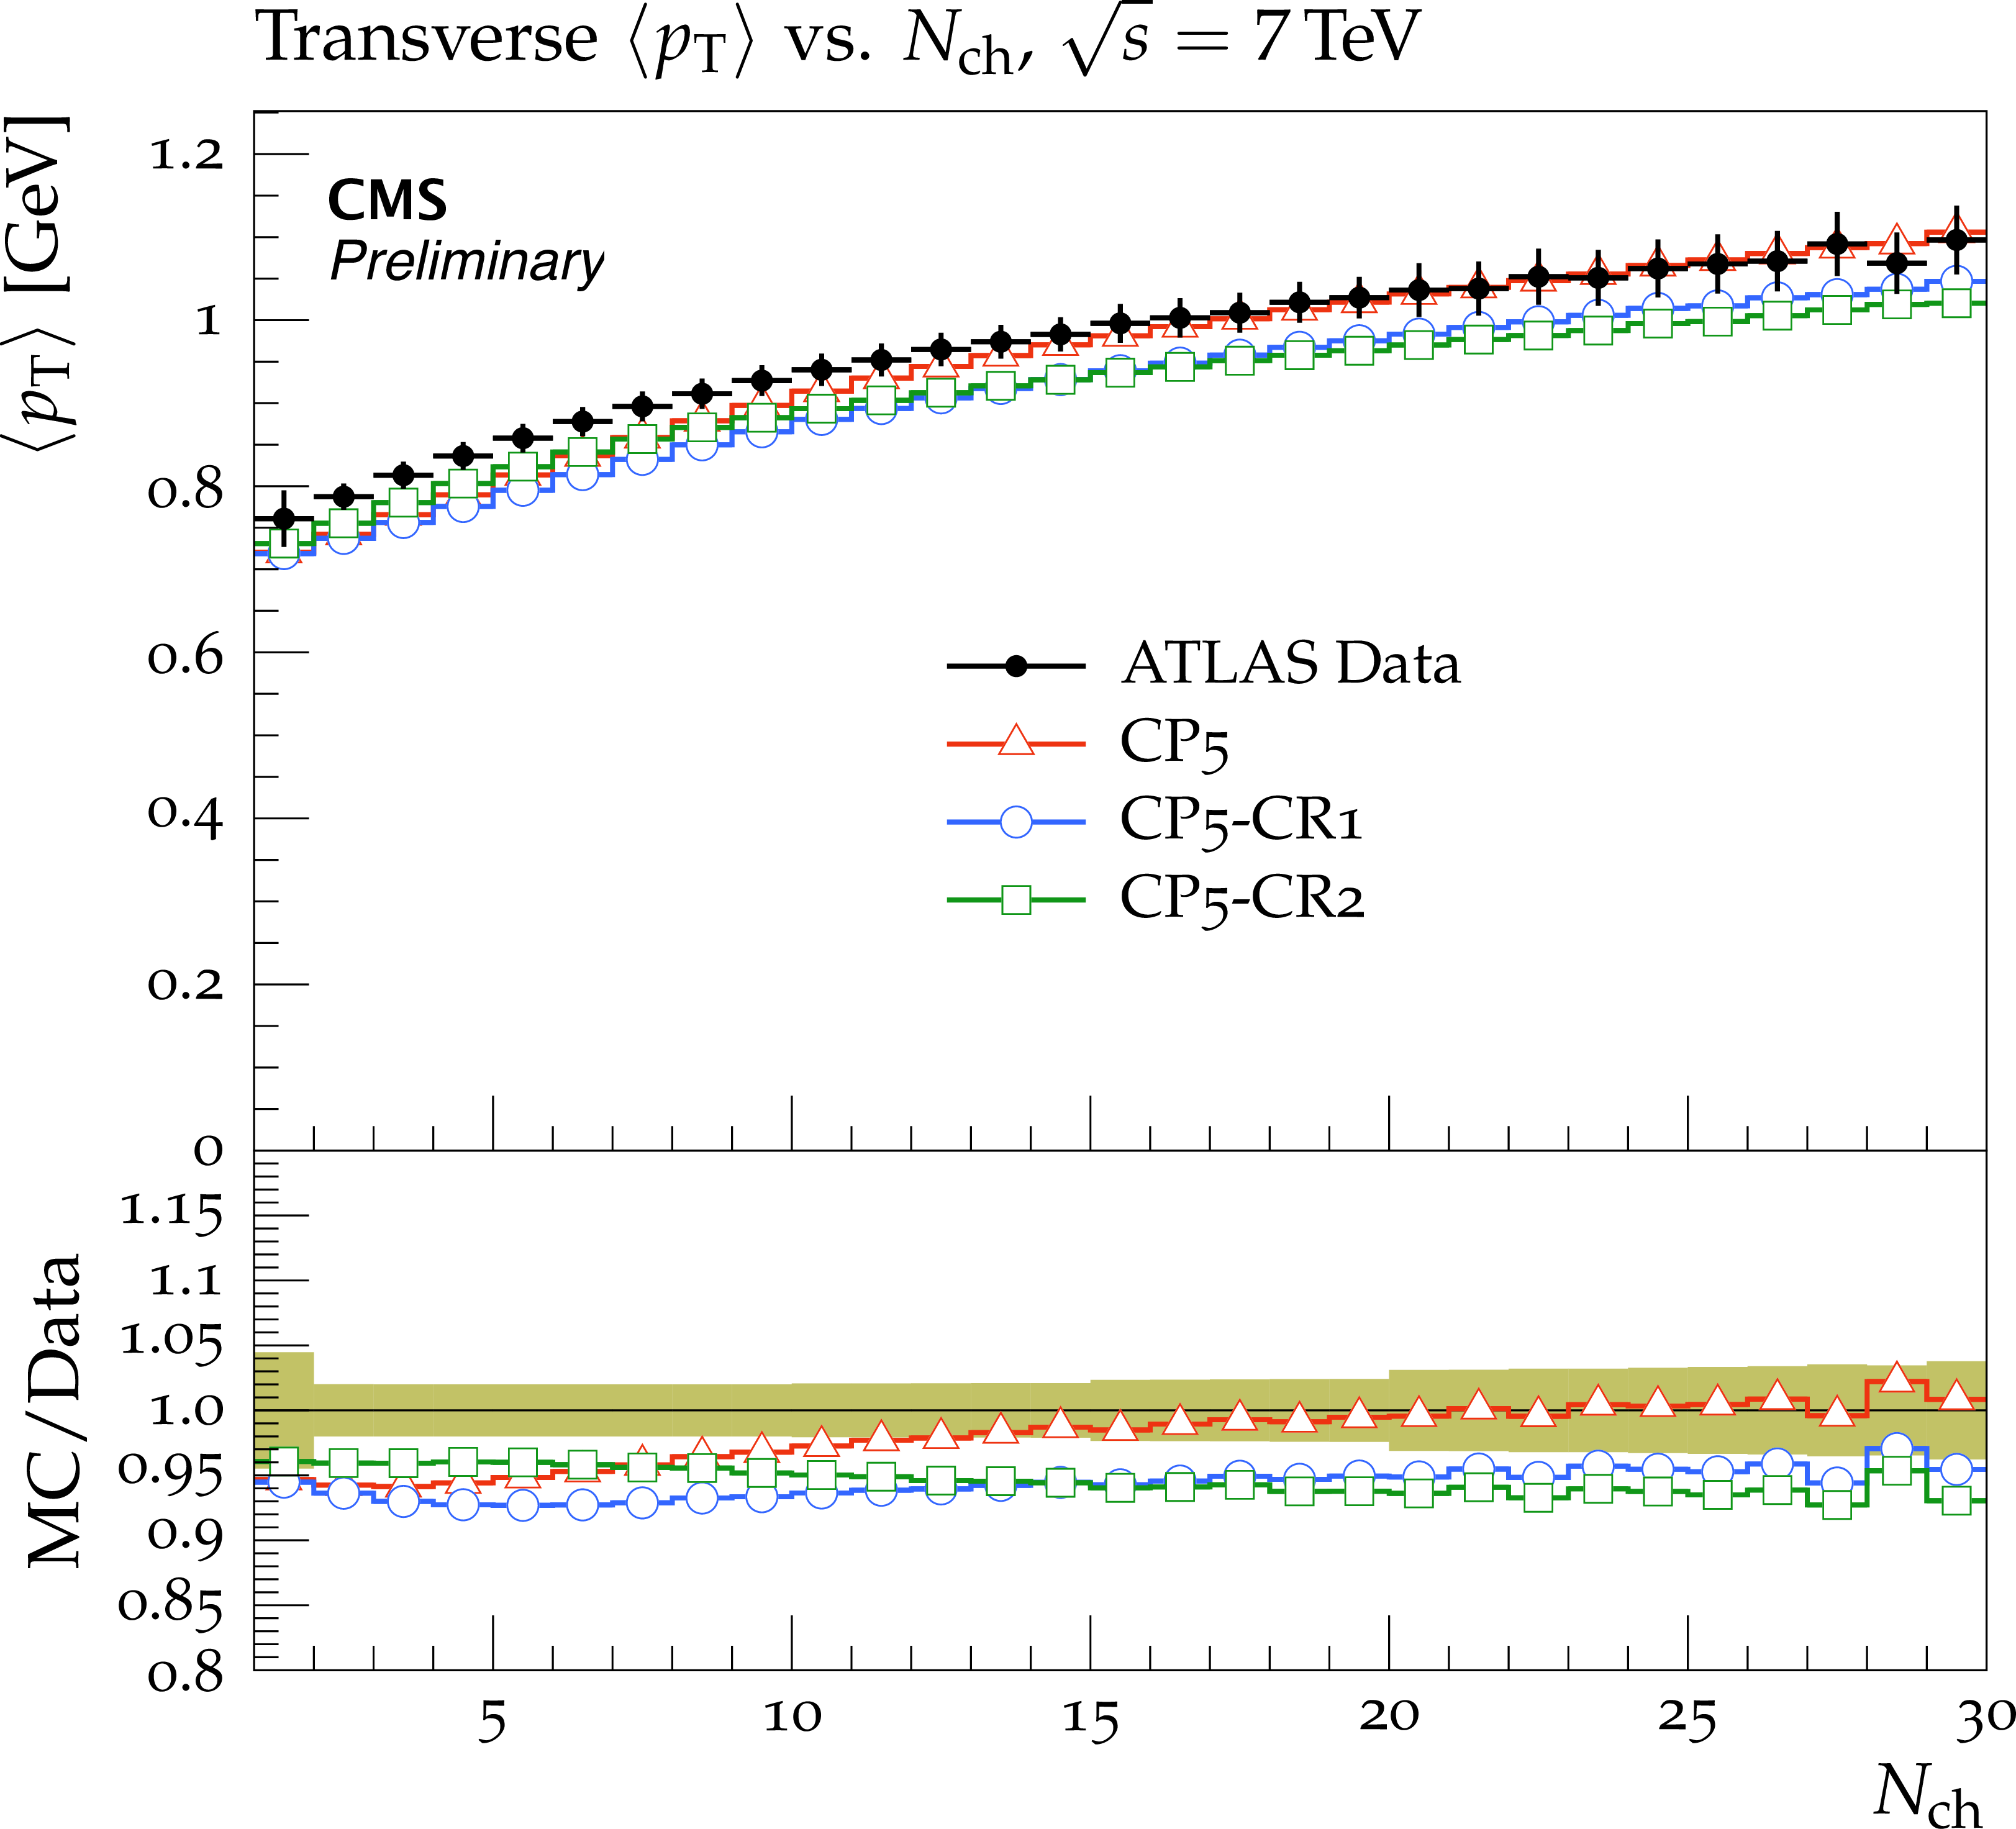
Figure 6:
The mean charged-particle average transverse momentum as a function of charged-particle multiplicity in transMAX (left) and transMIN (right) regions, measured by the ATLAS experiment at $\sqrt {s} = $ 13 TeV [10]. The predictions of the CP5 and CP5-CR tunes are compared to data. The coloured band represents the total experimental uncertainty in the data. |

png pdf |
Figure 6-a:
The mean charged-particle average transverse momentum as a function of charged-particle multiplicity in transMAX (left) and transMIN (right) regions, measured by the ATLAS experiment at $\sqrt {s} = $ 13 TeV [10]. The predictions of the CP5 and CP5-CR tunes are compared to data. The coloured band represents the total experimental uncertainty in the data. |
png pdf |
Figure 6-b:
The mean charged-particle average transverse momentum as a function of charged-particle multiplicity in transMAX (left) and transMIN (right) regions, measured by the ATLAS experiment at $\sqrt {s} = $ 13 TeV [10]. The predictions of the CP5 and CP5-CR tunes are compared to data. The coloured band represents the total experimental uncertainty in the data. |
png pdf |
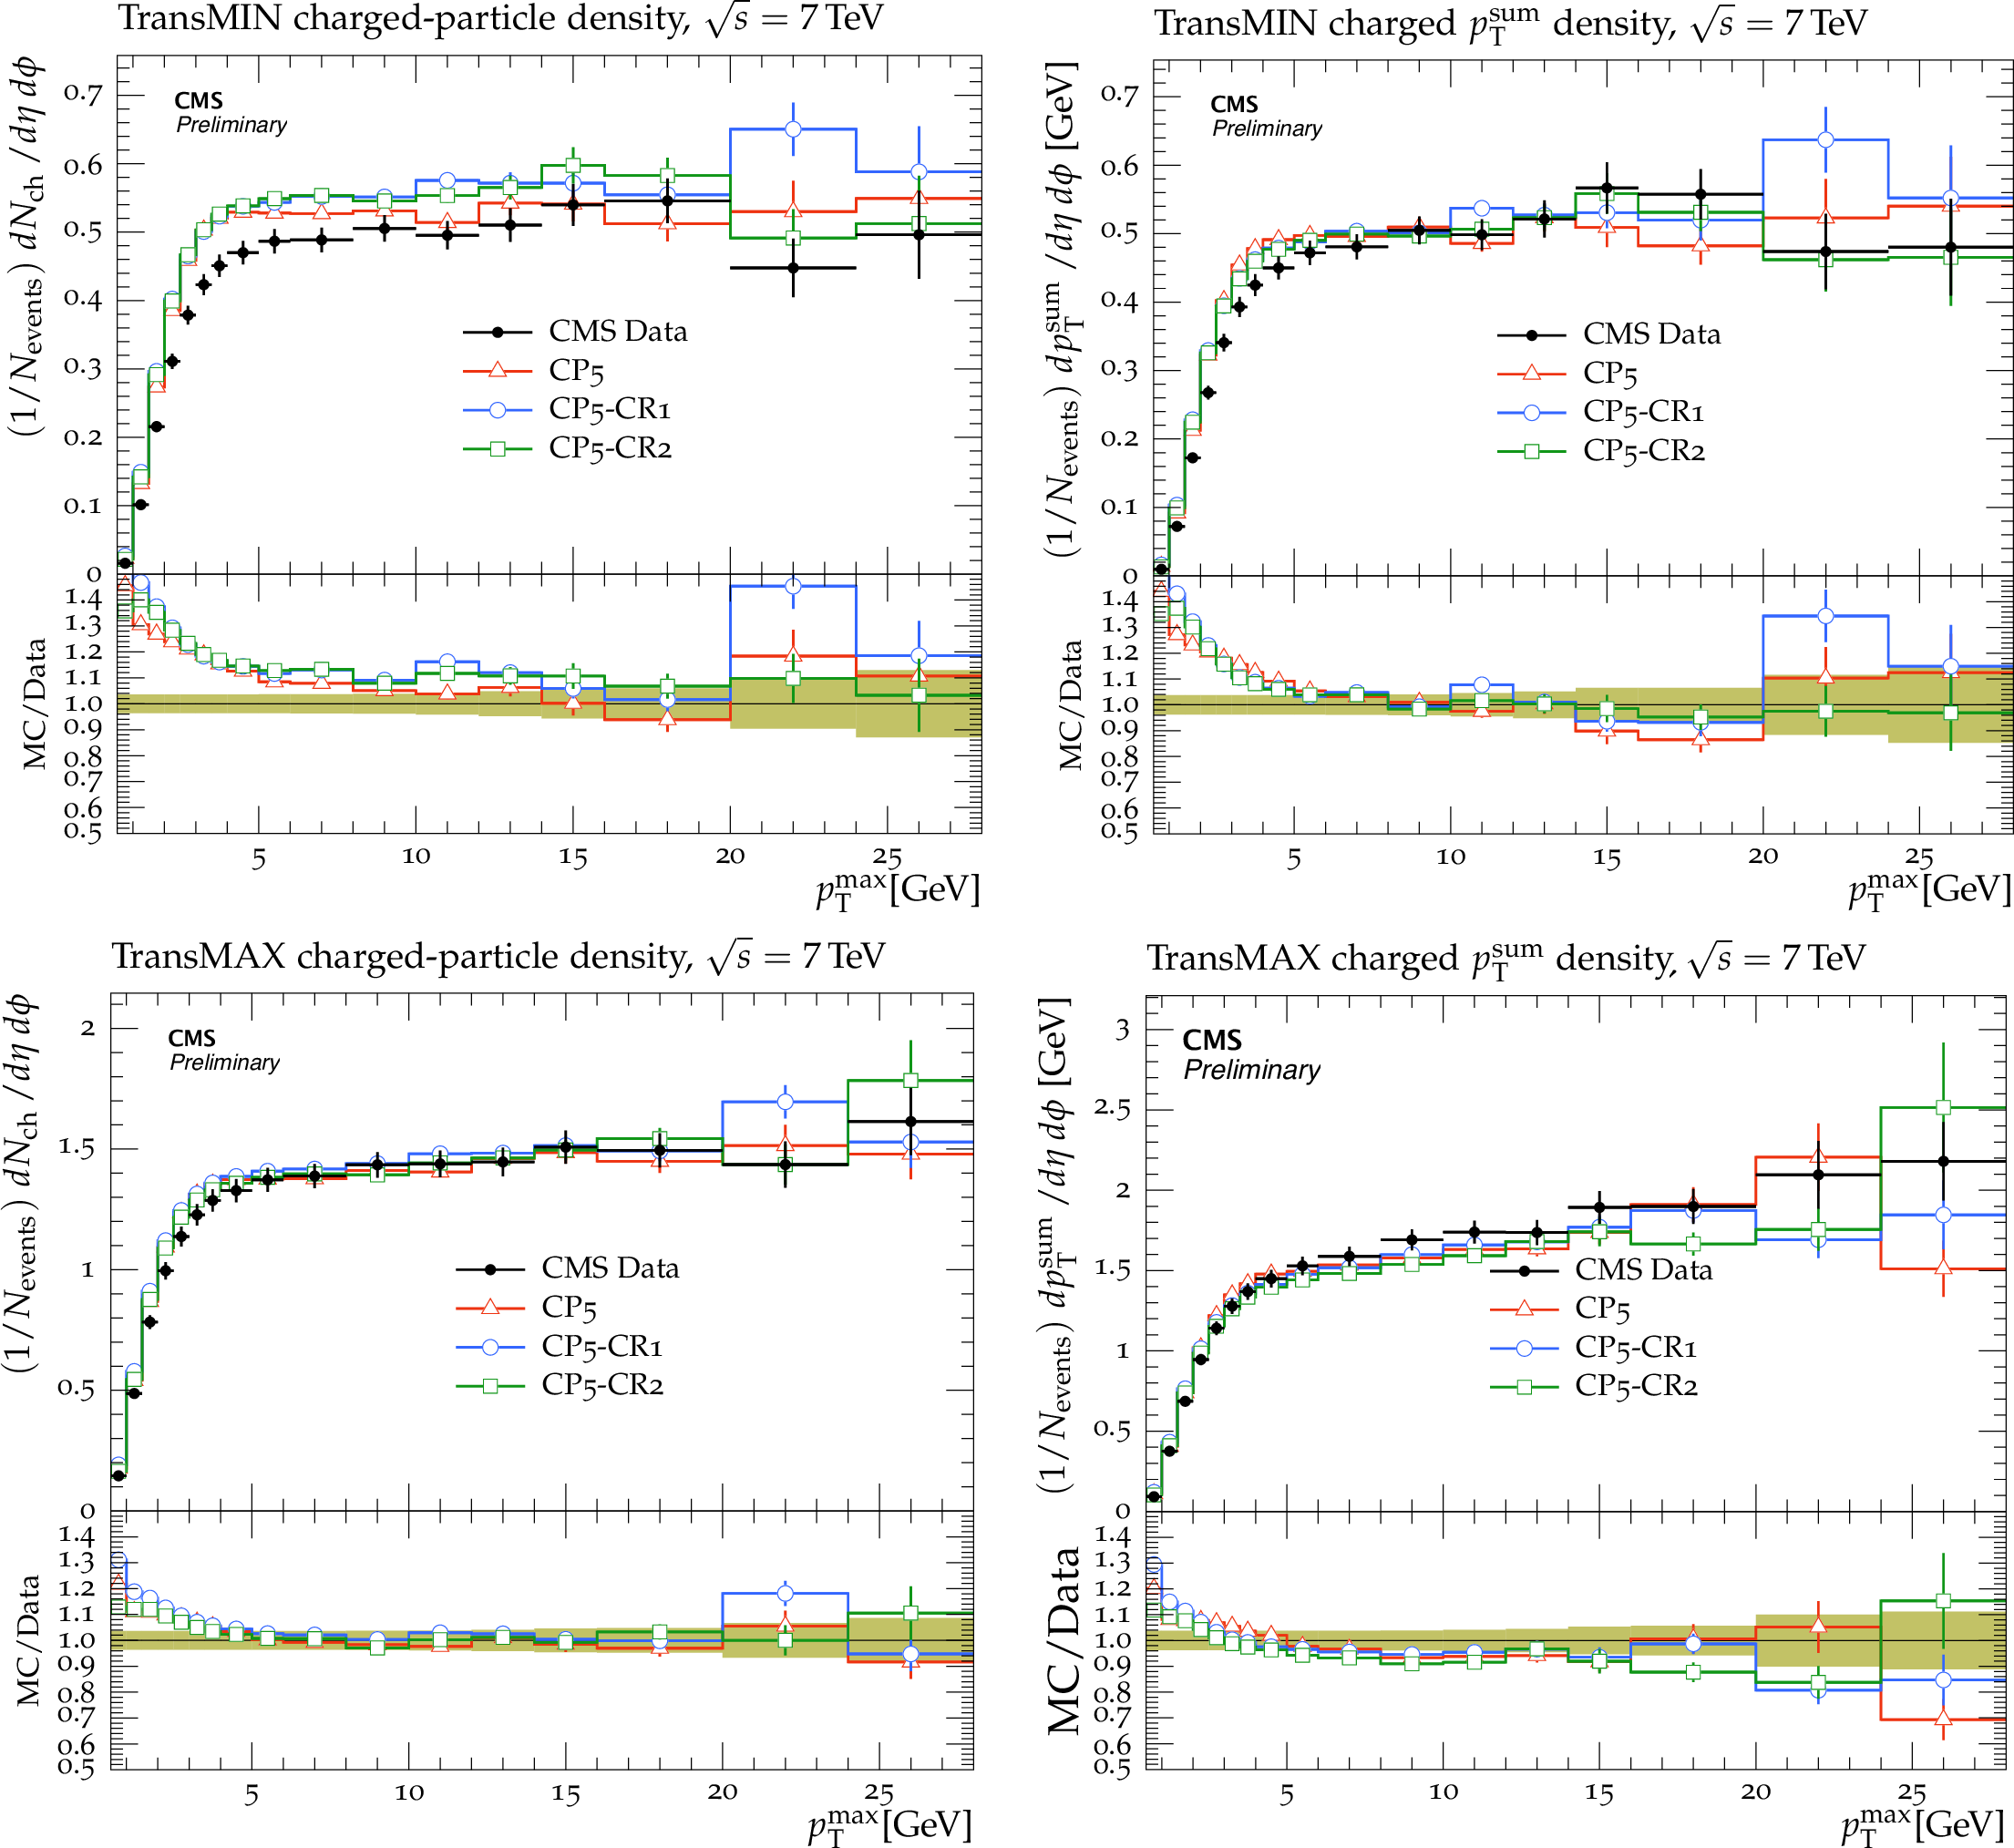
Figure 7:
The charged particle (left) and ${p_{\mathrm {T}}^{\mathrm {sum}}}$ (right) densities in the transMIN (upper) and transMAX (lower) regions, as a function of the ${p_{\mathrm {T}}}$ of the leading charged particle, ${p_{\mathrm {T}}^{\mathrm {max}}}$, measured by the CMS experiment at $\sqrt {s} = $ 7 TeV [11]. The predictions of the CP5 and CP5-CR tunes are compared to data. The coloured band represents the total experimental uncertainty in the data. |

png pdf |
Figure 7-a:
The charged particle (left) and ${p_{\mathrm {T}}^{\mathrm {sum}}}$ (right) densities in the transMIN (upper) and transMAX (lower) regions, as a function of the ${p_{\mathrm {T}}}$ of the leading charged particle, ${p_{\mathrm {T}}^{\mathrm {max}}}$, measured by the CMS experiment at $\sqrt {s} = $ 7 TeV [11]. The predictions of the CP5 and CP5-CR tunes are compared to data. The coloured band represents the total experimental uncertainty in the data. |
png pdf |
Figure 7-b:
The charged particle (left) and ${p_{\mathrm {T}}^{\mathrm {sum}}}$ (right) densities in the transMIN (upper) and transMAX (lower) regions, as a function of the ${p_{\mathrm {T}}}$ of the leading charged particle, ${p_{\mathrm {T}}^{\mathrm {max}}}$, measured by the CMS experiment at $\sqrt {s} = $ 7 TeV [11]. The predictions of the CP5 and CP5-CR tunes are compared to data. The coloured band represents the total experimental uncertainty in the data. |
png pdf |
Figure 7-c:
The charged particle (left) and ${p_{\mathrm {T}}^{\mathrm {sum}}}$ (right) densities in the transMIN (upper) and transMAX (lower) regions, as a function of the ${p_{\mathrm {T}}}$ of the leading charged particle, ${p_{\mathrm {T}}^{\mathrm {max}}}$, measured by the CMS experiment at $\sqrt {s} = $ 7 TeV [11]. The predictions of the CP5 and CP5-CR tunes are compared to data. The coloured band represents the total experimental uncertainty in the data. |

png pdf |
Figure 7-d:
The charged particle (left) and ${p_{\mathrm {T}}^{\mathrm {sum}}}$ (right) densities in the transMIN (upper) and transMAX (lower) regions, as a function of the ${p_{\mathrm {T}}}$ of the leading charged particle, ${p_{\mathrm {T}}^{\mathrm {max}}}$, measured by the CMS experiment at $\sqrt {s} = $ 7 TeV [11]. The predictions of the CP5 and CP5-CR tunes are compared to data. The coloured band represents the total experimental uncertainty in the data. |
png pdf |
Figure 8:
The charged-particle (upper left) and ${p_{\mathrm {T}}^{\mathrm {sum}}}$ densities (upper right) in the transverse region, as a function of the ${p_{\mathrm {T}}}$ of the leading charged particle, and on average transverse momentum in the transverse region as a function of the leading charged particle ${p_{\mathrm {T}}}$ (lower left) and of the charged particle multiplicity (lower right), measured by the ATLAS experiment at $\sqrt {s} = $ 7 TeV [12]. The predictions of the CP5 and CP5-CR tunes are compared to data. The coloured band represents the total experimental uncertainty in the data. |
png pdf |
Figure 8-a:
The charged-particle (upper left) and ${p_{\mathrm {T}}^{\mathrm {sum}}}$ densities (upper right) in the transverse region, as a function of the ${p_{\mathrm {T}}}$ of the leading charged particle, and on average transverse momentum in the transverse region as a function of the leading charged particle ${p_{\mathrm {T}}}$ (lower left) and of the charged particle multiplicity (lower right), measured by the ATLAS experiment at $\sqrt {s} = $ 7 TeV [12]. The predictions of the CP5 and CP5-CR tunes are compared to data. The coloured band represents the total experimental uncertainty in the data. |

png pdf |
Figure 8-b:
The charged-particle (upper left) and ${p_{\mathrm {T}}^{\mathrm {sum}}}$ densities (upper right) in the transverse region, as a function of the ${p_{\mathrm {T}}}$ of the leading charged particle, and on average transverse momentum in the transverse region as a function of the leading charged particle ${p_{\mathrm {T}}}$ (lower left) and of the charged particle multiplicity (lower right), measured by the ATLAS experiment at $\sqrt {s} = $ 7 TeV [12]. The predictions of the CP5 and CP5-CR tunes are compared to data. The coloured band represents the total experimental uncertainty in the data. |

png pdf |
Figure 8-c:
The charged-particle (upper left) and ${p_{\mathrm {T}}^{\mathrm {sum}}}$ densities (upper right) in the transverse region, as a function of the ${p_{\mathrm {T}}}$ of the leading charged particle, and on average transverse momentum in the transverse region as a function of the leading charged particle ${p_{\mathrm {T}}}$ (lower left) and of the charged particle multiplicity (lower right), measured by the ATLAS experiment at $\sqrt {s} = $ 7 TeV [12]. The predictions of the CP5 and CP5-CR tunes are compared to data. The coloured band represents the total experimental uncertainty in the data. |
png pdf |
Figure 8-d:
The charged-particle (upper left) and ${p_{\mathrm {T}}^{\mathrm {sum}}}$ densities (upper right) in the transverse region, as a function of the ${p_{\mathrm {T}}}$ of the leading charged particle, and on average transverse momentum in the transverse region as a function of the leading charged particle ${p_{\mathrm {T}}}$ (lower left) and of the charged particle multiplicity (lower right), measured by the ATLAS experiment at $\sqrt {s} = $ 7 TeV [12]. The predictions of the CP5 and CP5-CR tunes are compared to data. The coloured band represents the total experimental uncertainty in the data. |

png pdf |
Figure 9:
The pseudorapidity of charged particles, ${dN_{\mathrm {ch}}/d\eta}$, with at least one charged particle in $|\eta | < 2.4$, measured by the CMS experiment at $\sqrt {s} = $ 7 TeV [27]. The predictions of the CP5 and CP5-CR tunes are compared to data. The coloured band represents the total experimental uncertainty in the data. |
png pdf |
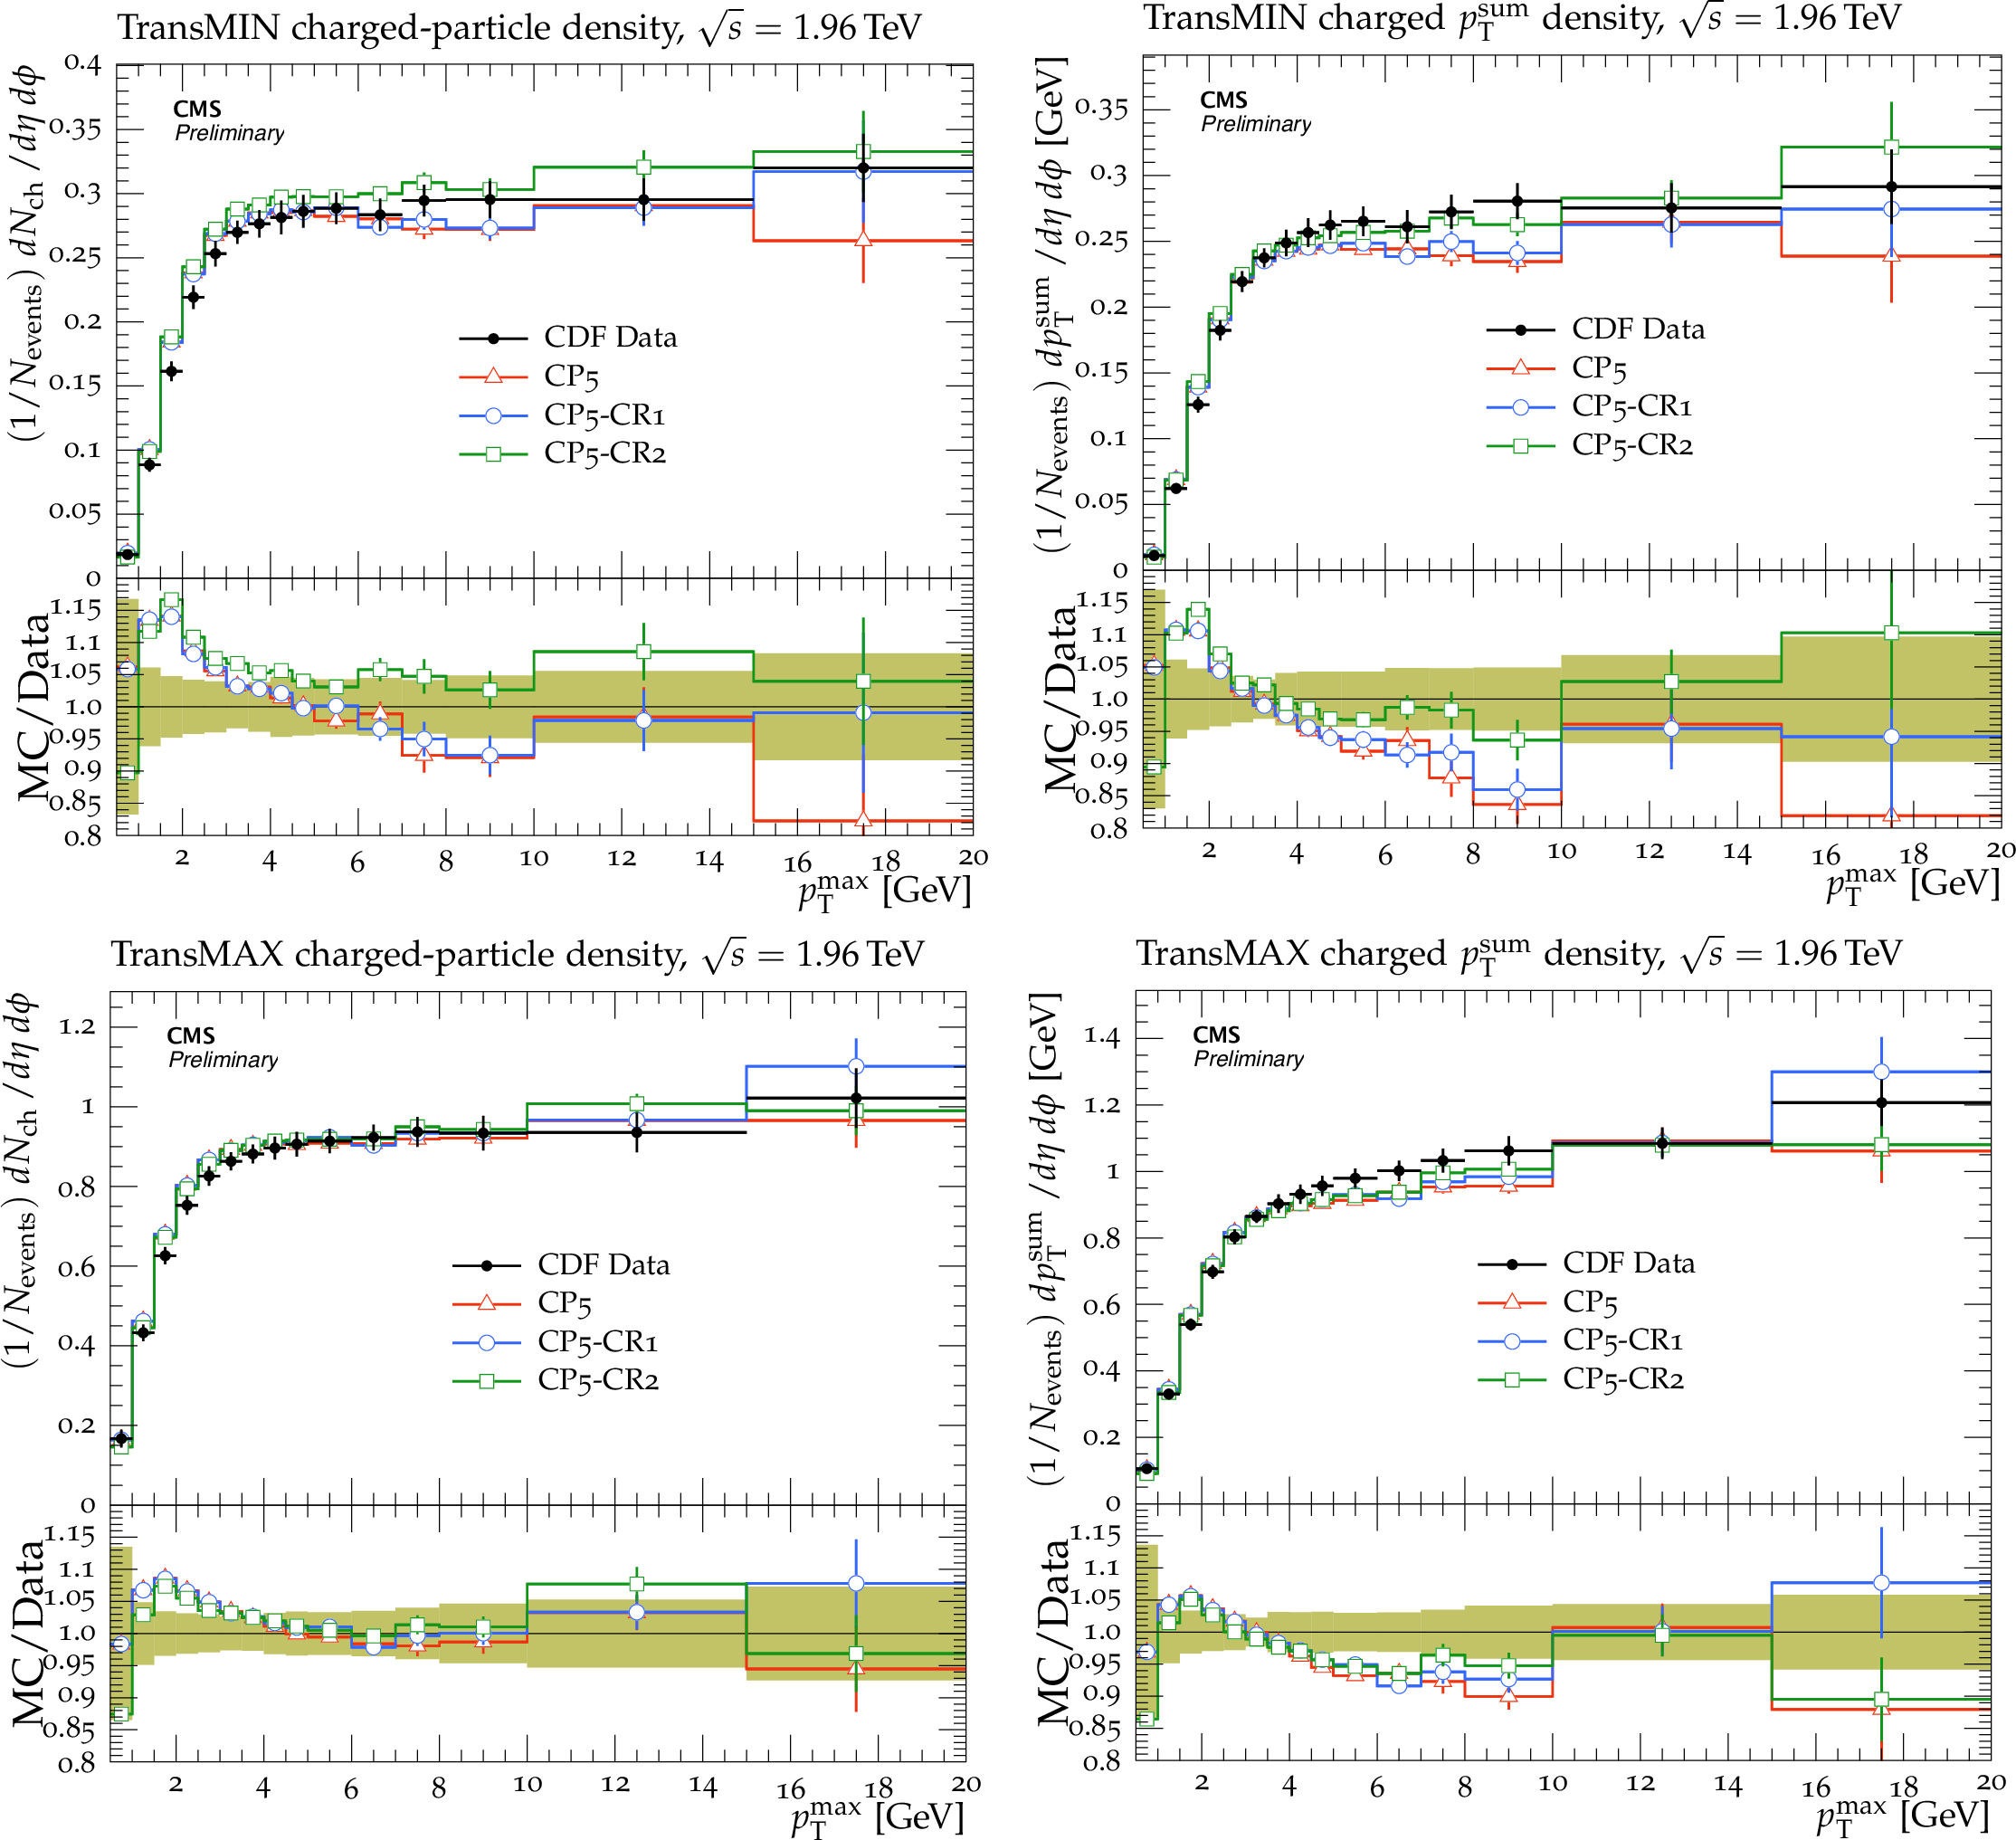
Figure 10:
The charged particle (left) and ${p_{\mathrm {T}}^{\mathrm {sum}}}$ densities (right) in the transMIN (upper) and transMAX (lower) regions, as a function of the ${p_{\mathrm {T}}}$ of the leading charged particle, ${p_{\mathrm {T}}^{\mathrm {max}}}$, measured by the CDF experiment at $\sqrt {s} = $ 1.96 TeV [13]. The predictions of the CP5 and CP5-CR tunes are compared to data. The coloured band represents the total experimental uncertainty in the data. |

png pdf |
Figure 10-a:
The charged particle (left) and ${p_{\mathrm {T}}^{\mathrm {sum}}}$ densities (right) in the transMIN (upper) and transMAX (lower) regions, as a function of the ${p_{\mathrm {T}}}$ of the leading charged particle, ${p_{\mathrm {T}}^{\mathrm {max}}}$, measured by the CDF experiment at $\sqrt {s} = $ 1.96 TeV [13]. The predictions of the CP5 and CP5-CR tunes are compared to data. The coloured band represents the total experimental uncertainty in the data. |
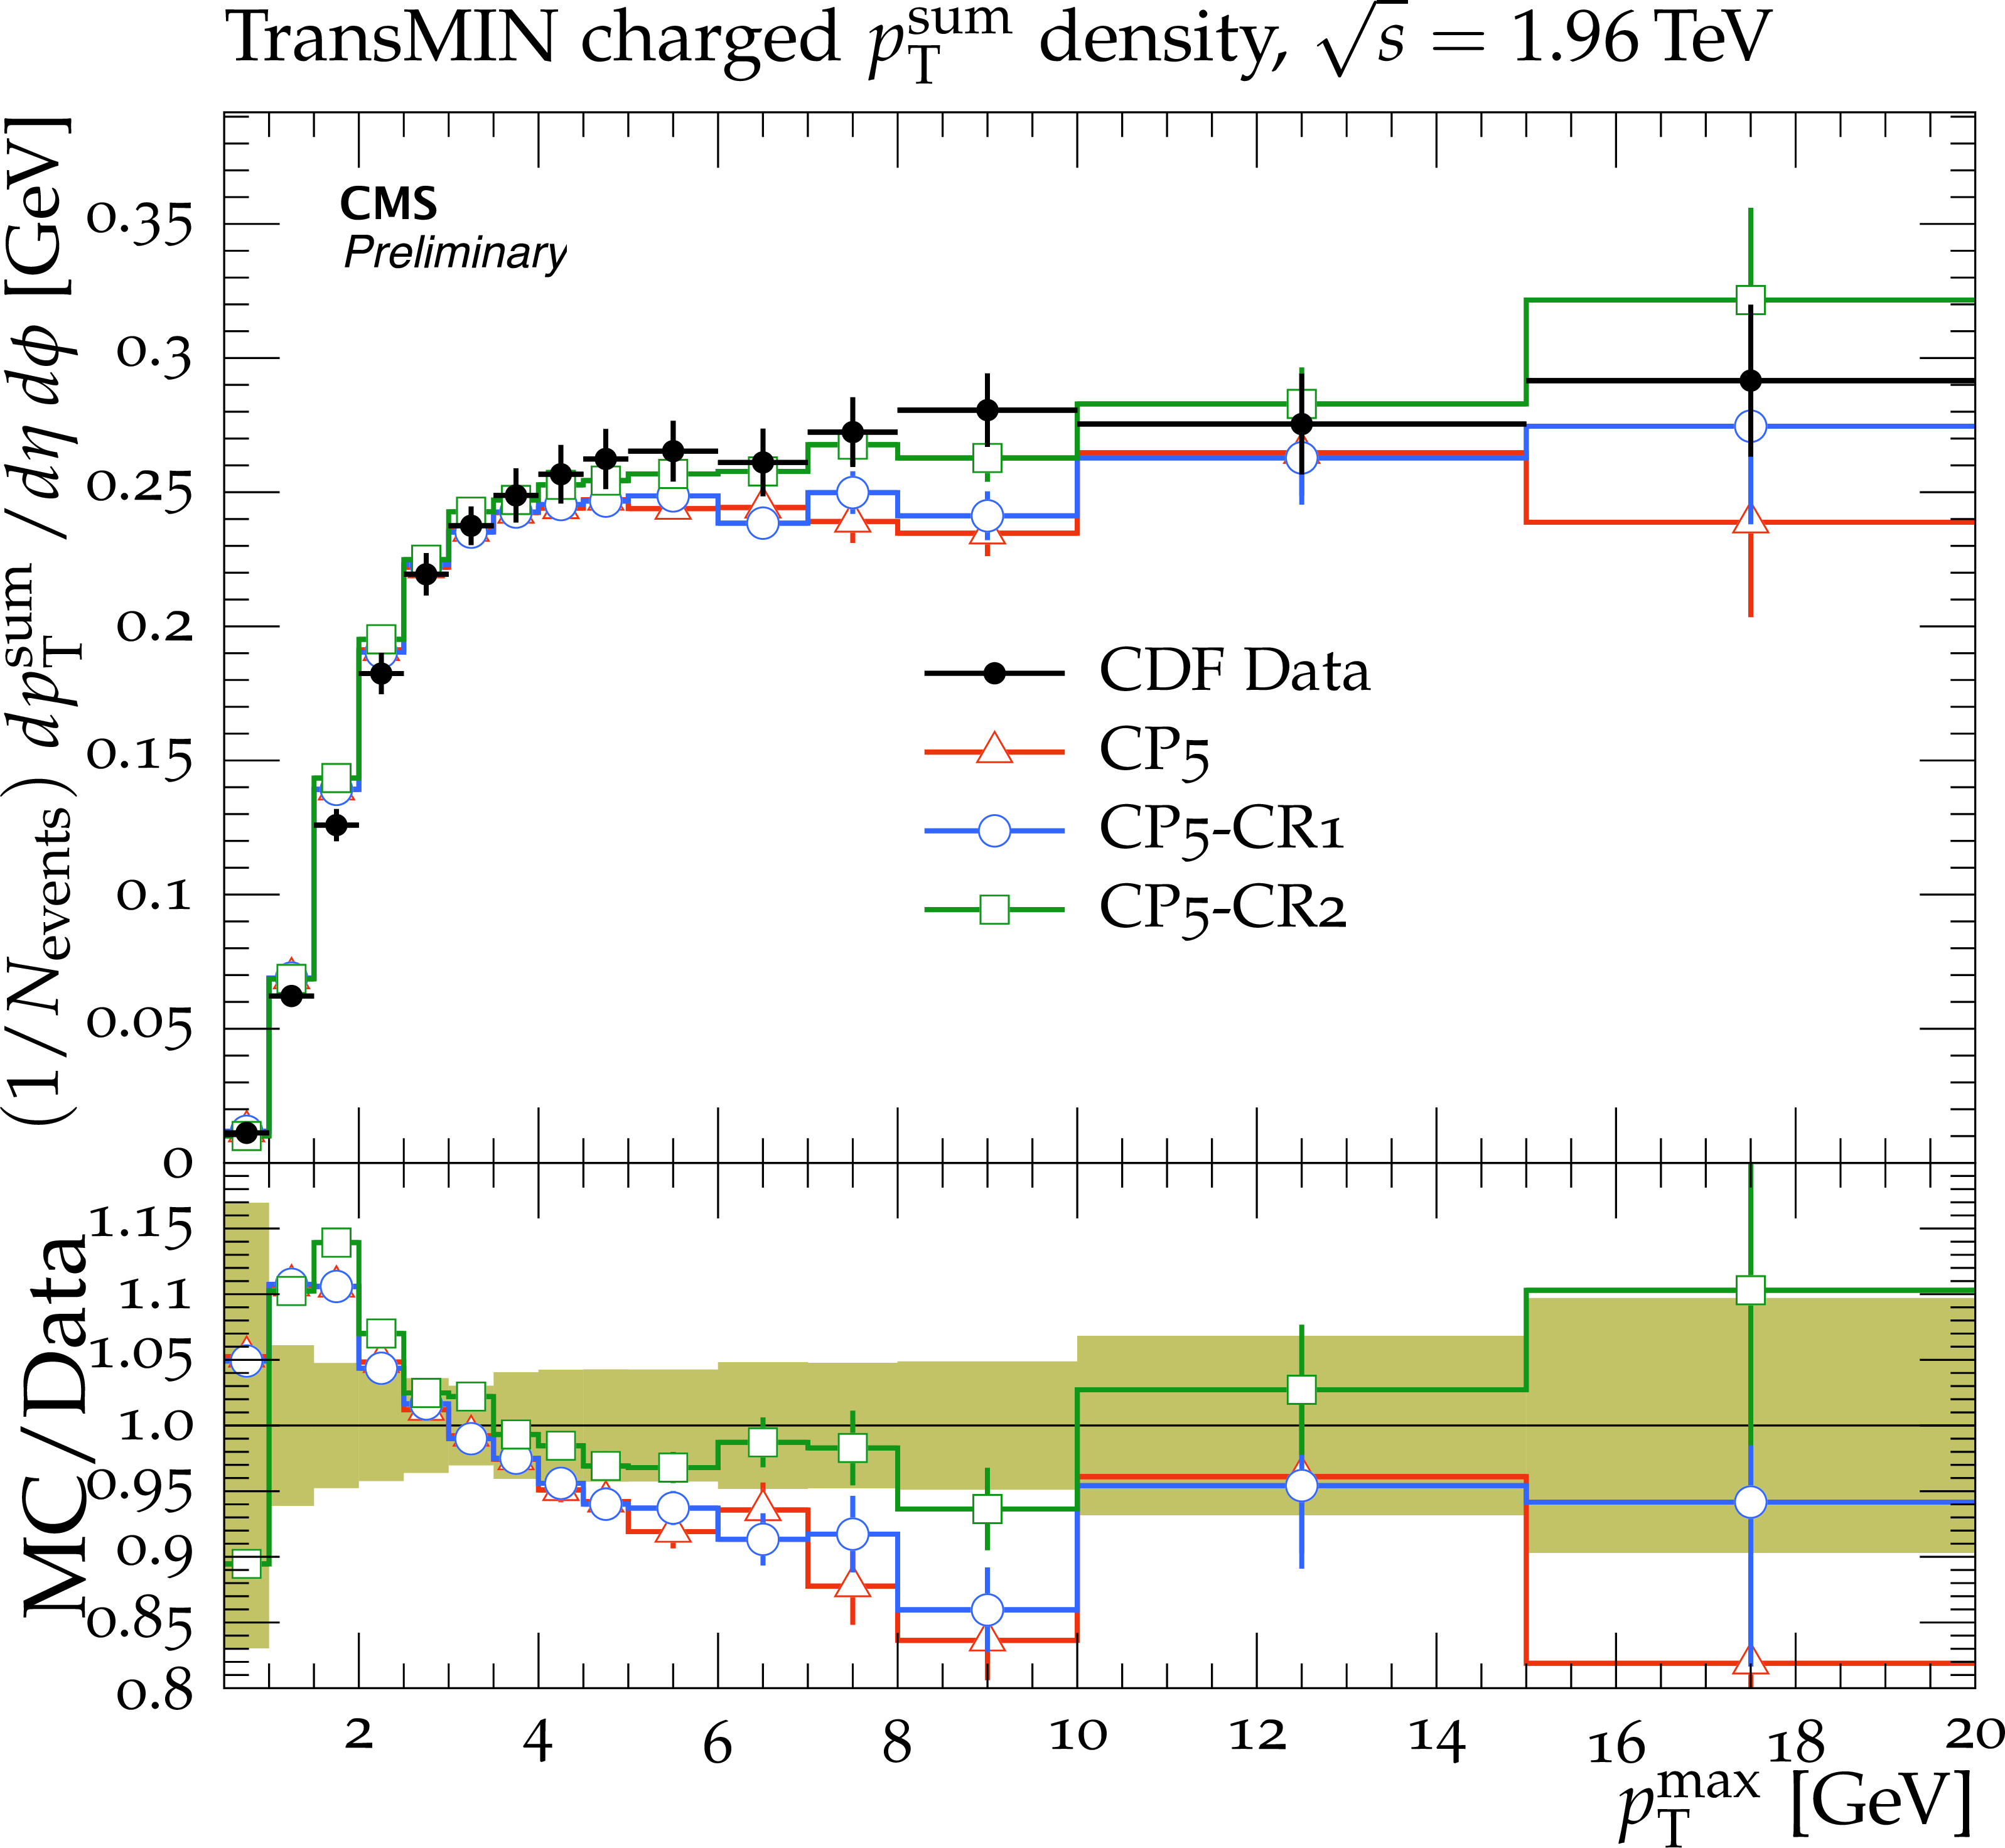
png pdf |
Figure 10-b:
The charged particle (left) and ${p_{\mathrm {T}}^{\mathrm {sum}}}$ densities (right) in the transMIN (upper) and transMAX (lower) regions, as a function of the ${p_{\mathrm {T}}}$ of the leading charged particle, ${p_{\mathrm {T}}^{\mathrm {max}}}$, measured by the CDF experiment at $\sqrt {s} = $ 1.96 TeV [13]. The predictions of the CP5 and CP5-CR tunes are compared to data. The coloured band represents the total experimental uncertainty in the data. |

png pdf |
Figure 10-c:
The charged particle (left) and ${p_{\mathrm {T}}^{\mathrm {sum}}}$ densities (right) in the transMIN (upper) and transMAX (lower) regions, as a function of the ${p_{\mathrm {T}}}$ of the leading charged particle, ${p_{\mathrm {T}}^{\mathrm {max}}}$, measured by the CDF experiment at $\sqrt {s} = $ 1.96 TeV [13]. The predictions of the CP5 and CP5-CR tunes are compared to data. The coloured band represents the total experimental uncertainty in the data. |
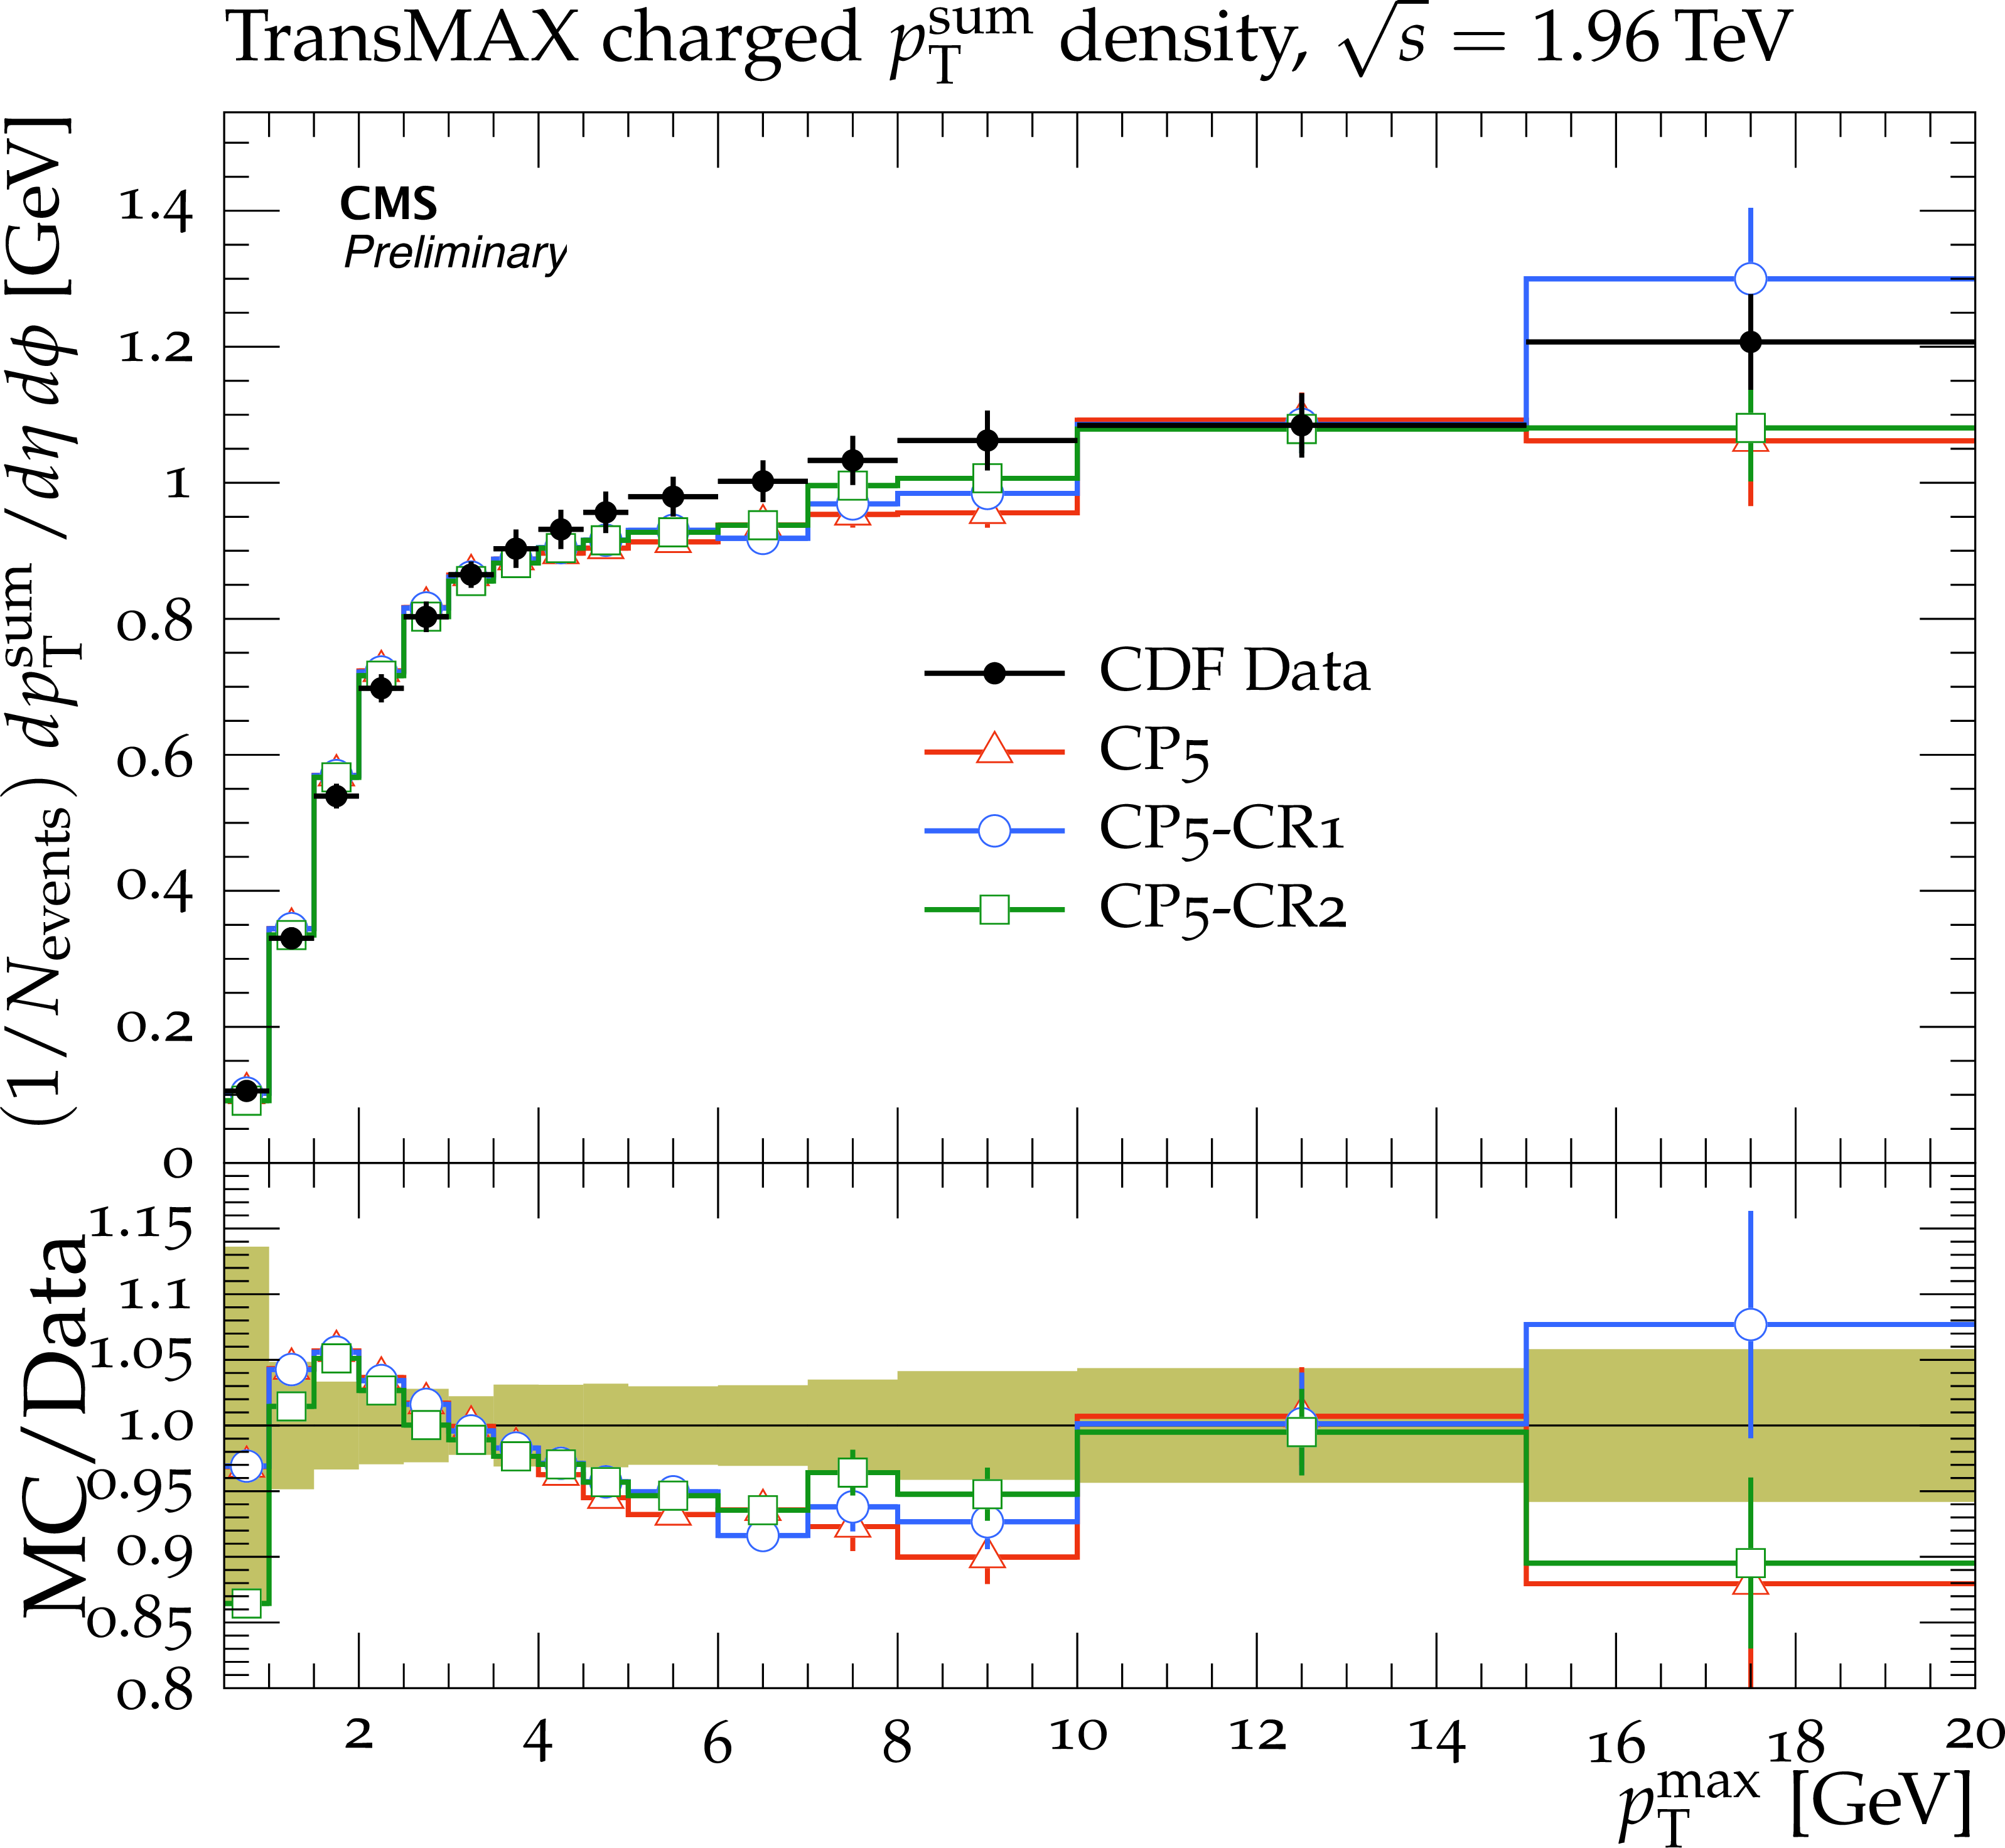
png pdf |
Figure 10-d:
The charged particle (left) and ${p_{\mathrm {T}}^{\mathrm {sum}}}$ densities (right) in the transMIN (upper) and transMAX (lower) regions, as a function of the ${p_{\mathrm {T}}}$ of the leading charged particle, ${p_{\mathrm {T}}^{\mathrm {max}}}$, measured by the CDF experiment at $\sqrt {s} = $ 1.96 TeV [13]. The predictions of the CP5 and CP5-CR tunes are compared to data. The coloured band represents the total experimental uncertainty in the data. |
png pdf |
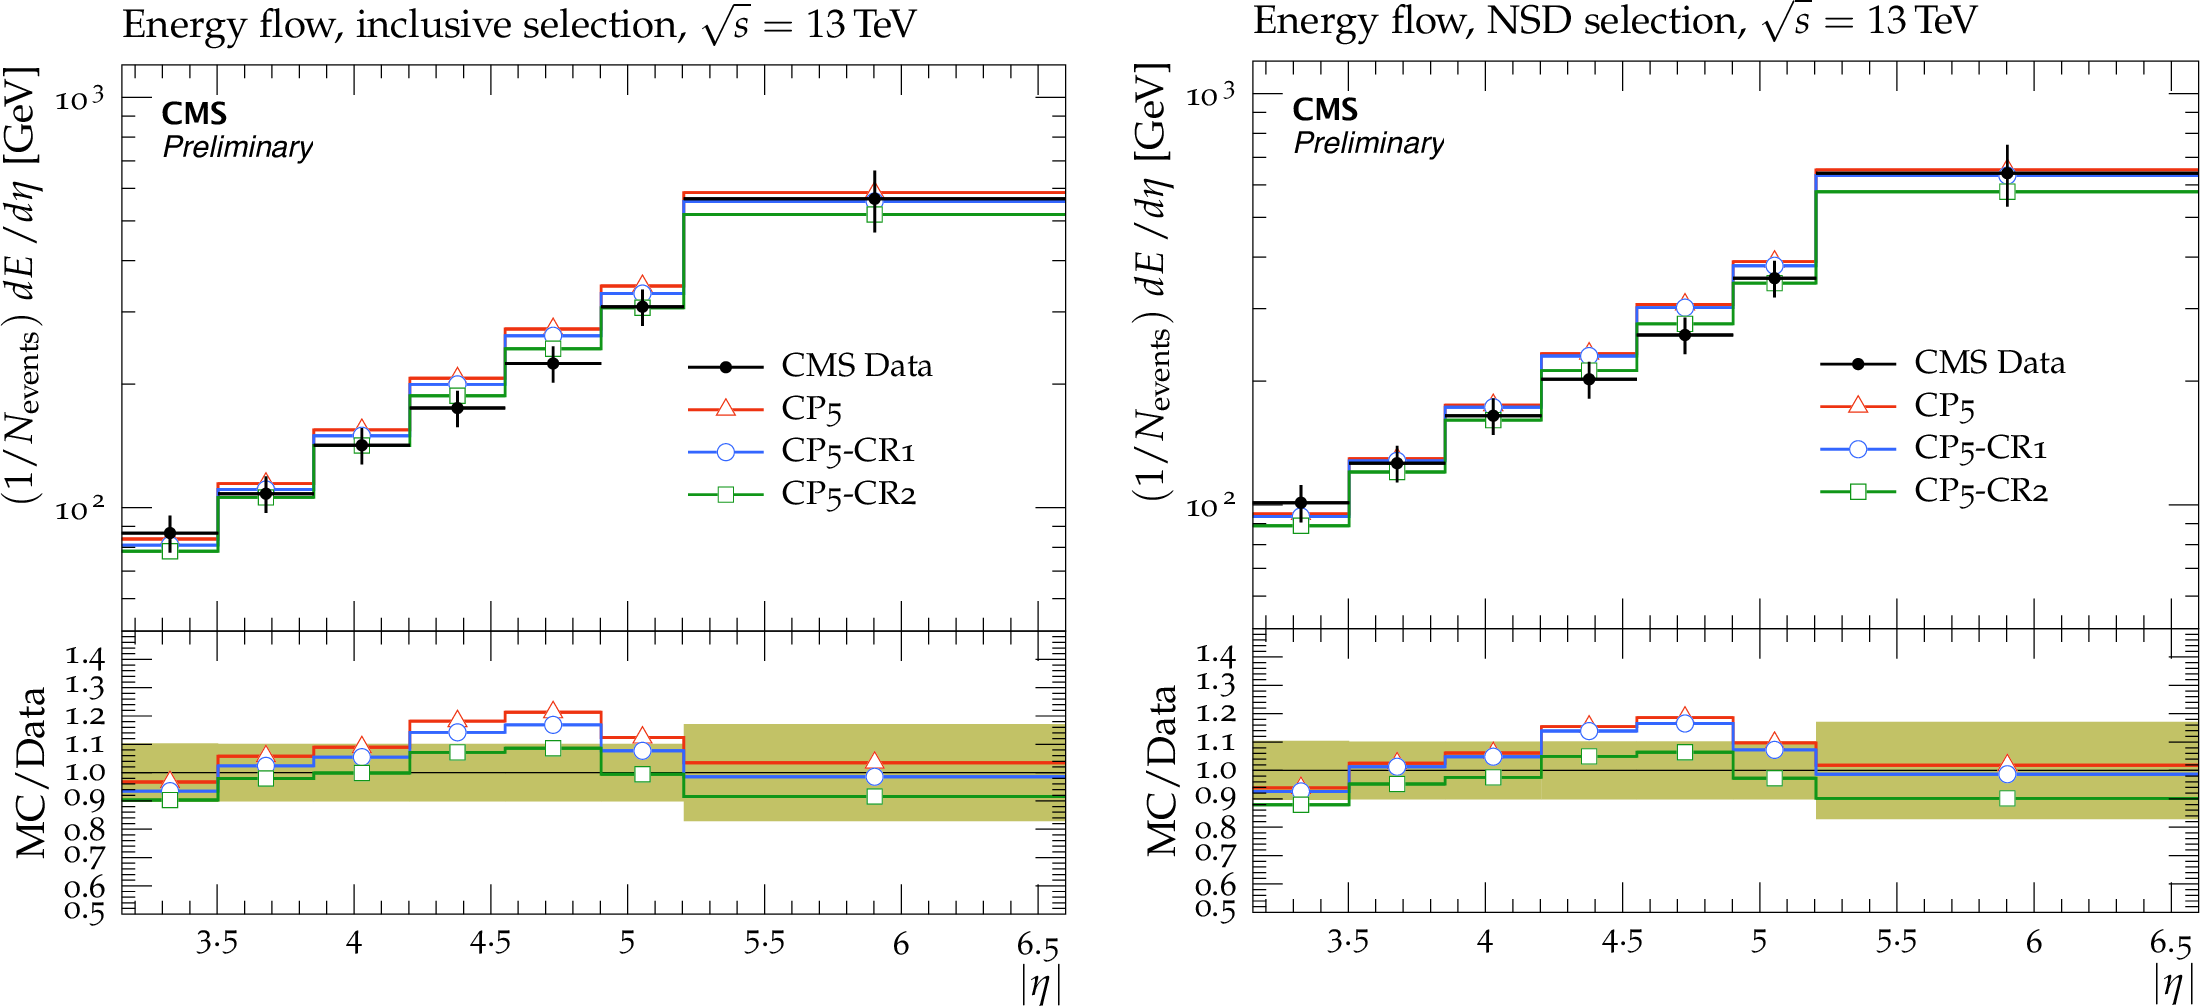
Figure 11:
The forward energy flow as a function of pseudorapidity in two different selections, in minimum-bias events (left) and in events with a presence of a hard dijet system (right), measured by the CMS experiment at $\sqrt {s} = $ 13 TeV [28]. The predictions of the CP5 and CP5-CR tunes are compared to data. The coloured band represents the total experimental uncertainty in the data. |
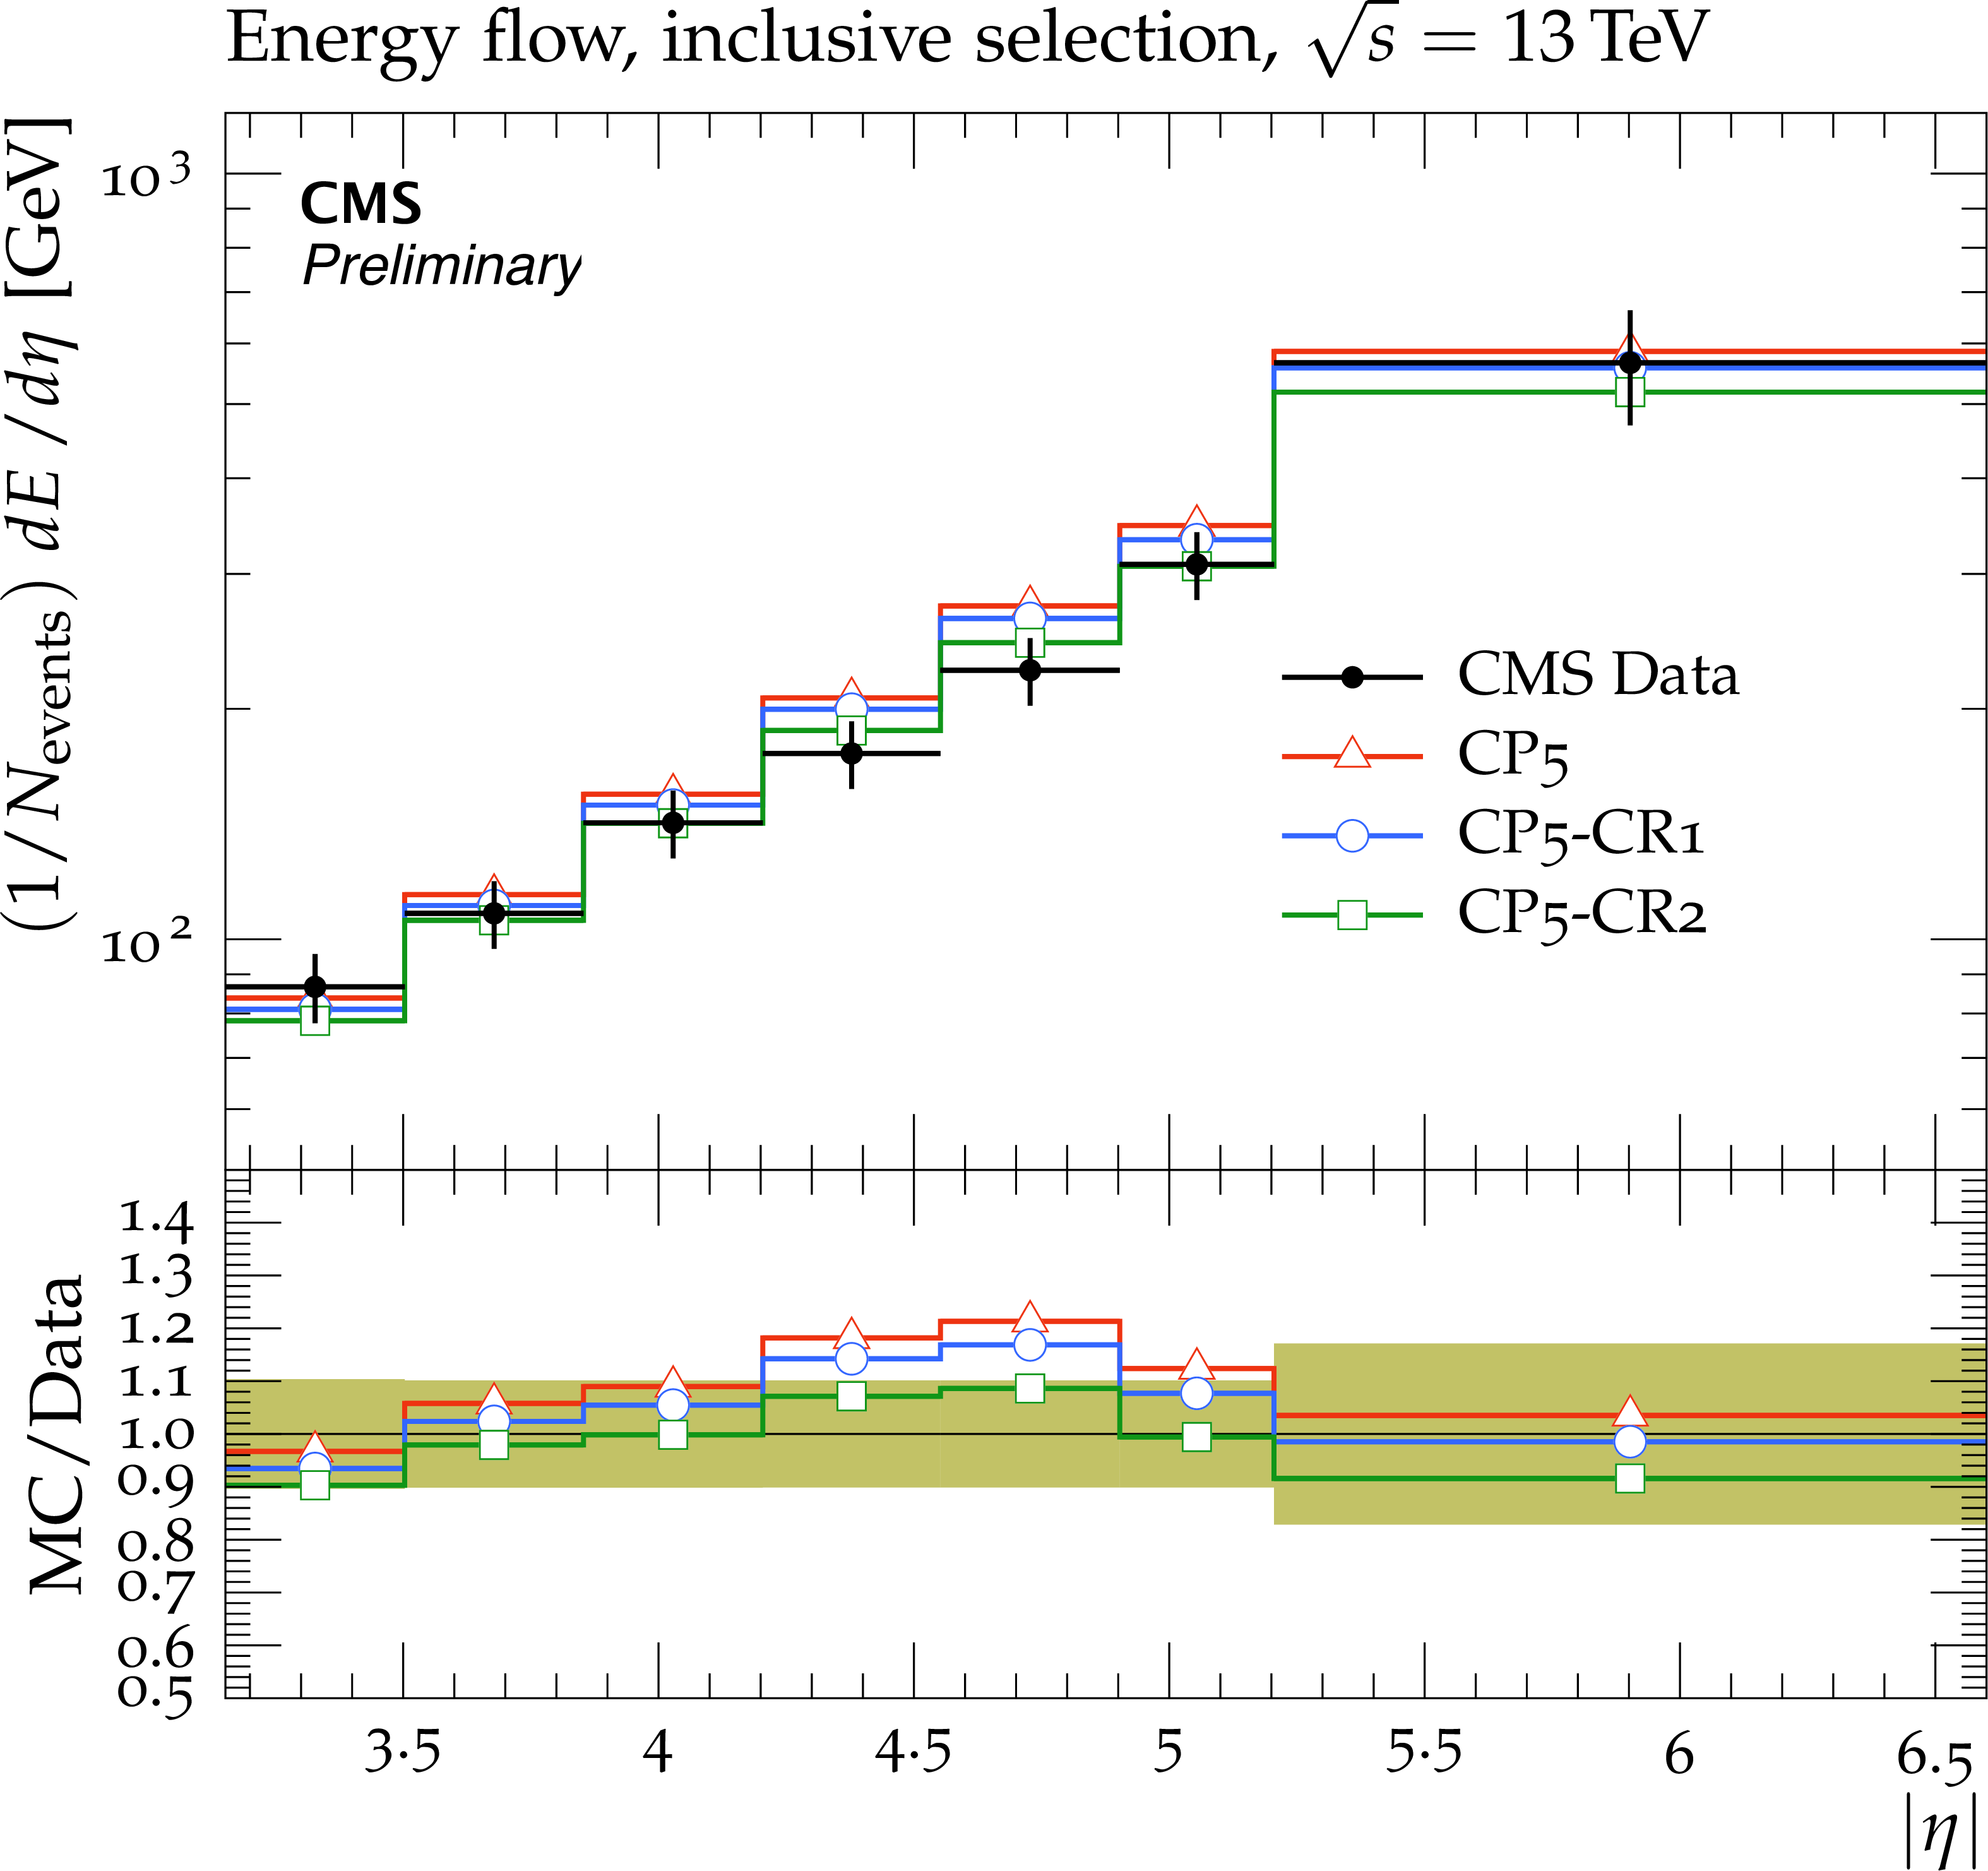
png pdf |
Figure 11-a:
The forward energy flow as a function of pseudorapidity in two different selections, in minimum-bias events (left) and in events with a presence of a hard dijet system (right), measured by the CMS experiment at $\sqrt {s} = $ 13 TeV [28]. The predictions of the CP5 and CP5-CR tunes are compared to data. The coloured band represents the total experimental uncertainty in the data. |
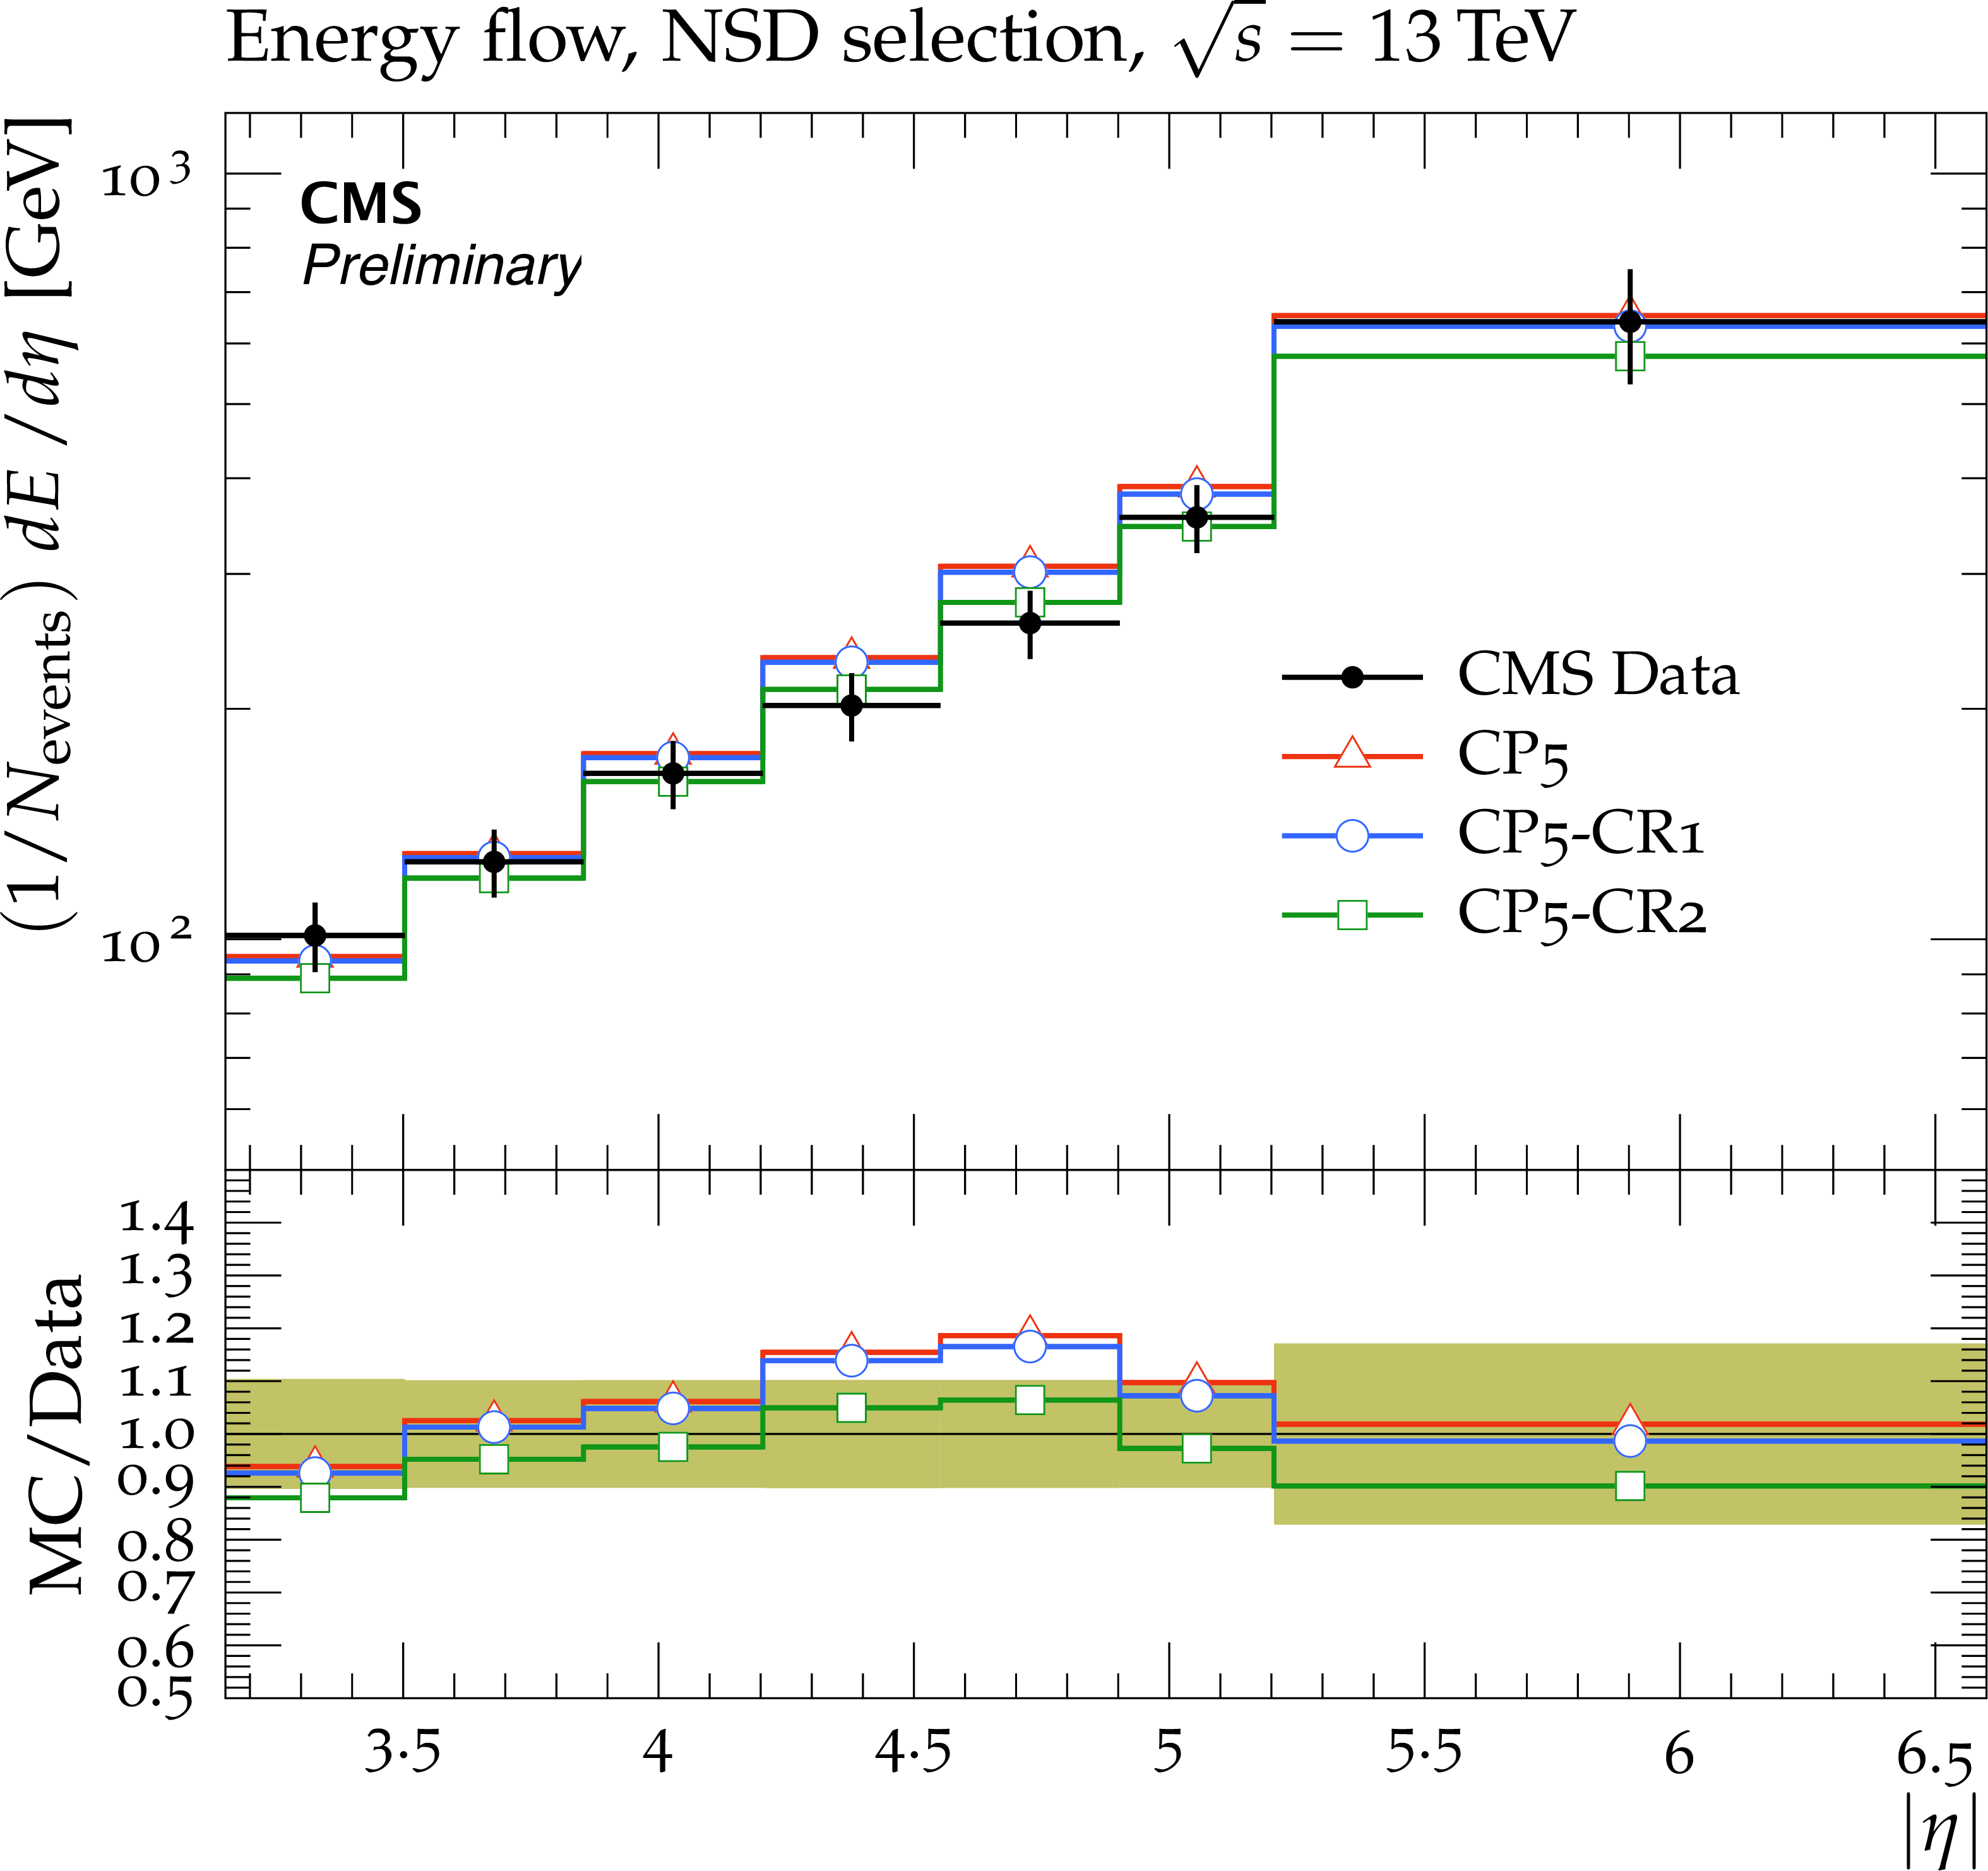
png pdf |
Figure 11-b:
The forward energy flow as a function of pseudorapidity in two different selections, in minimum-bias events (left) and in events with a presence of a hard dijet system (right), measured by the CMS experiment at $\sqrt {s} = $ 13 TeV [28]. The predictions of the CP5 and CP5-CR tunes are compared to data. The coloured band represents the total experimental uncertainty in the data. |
png pdf |
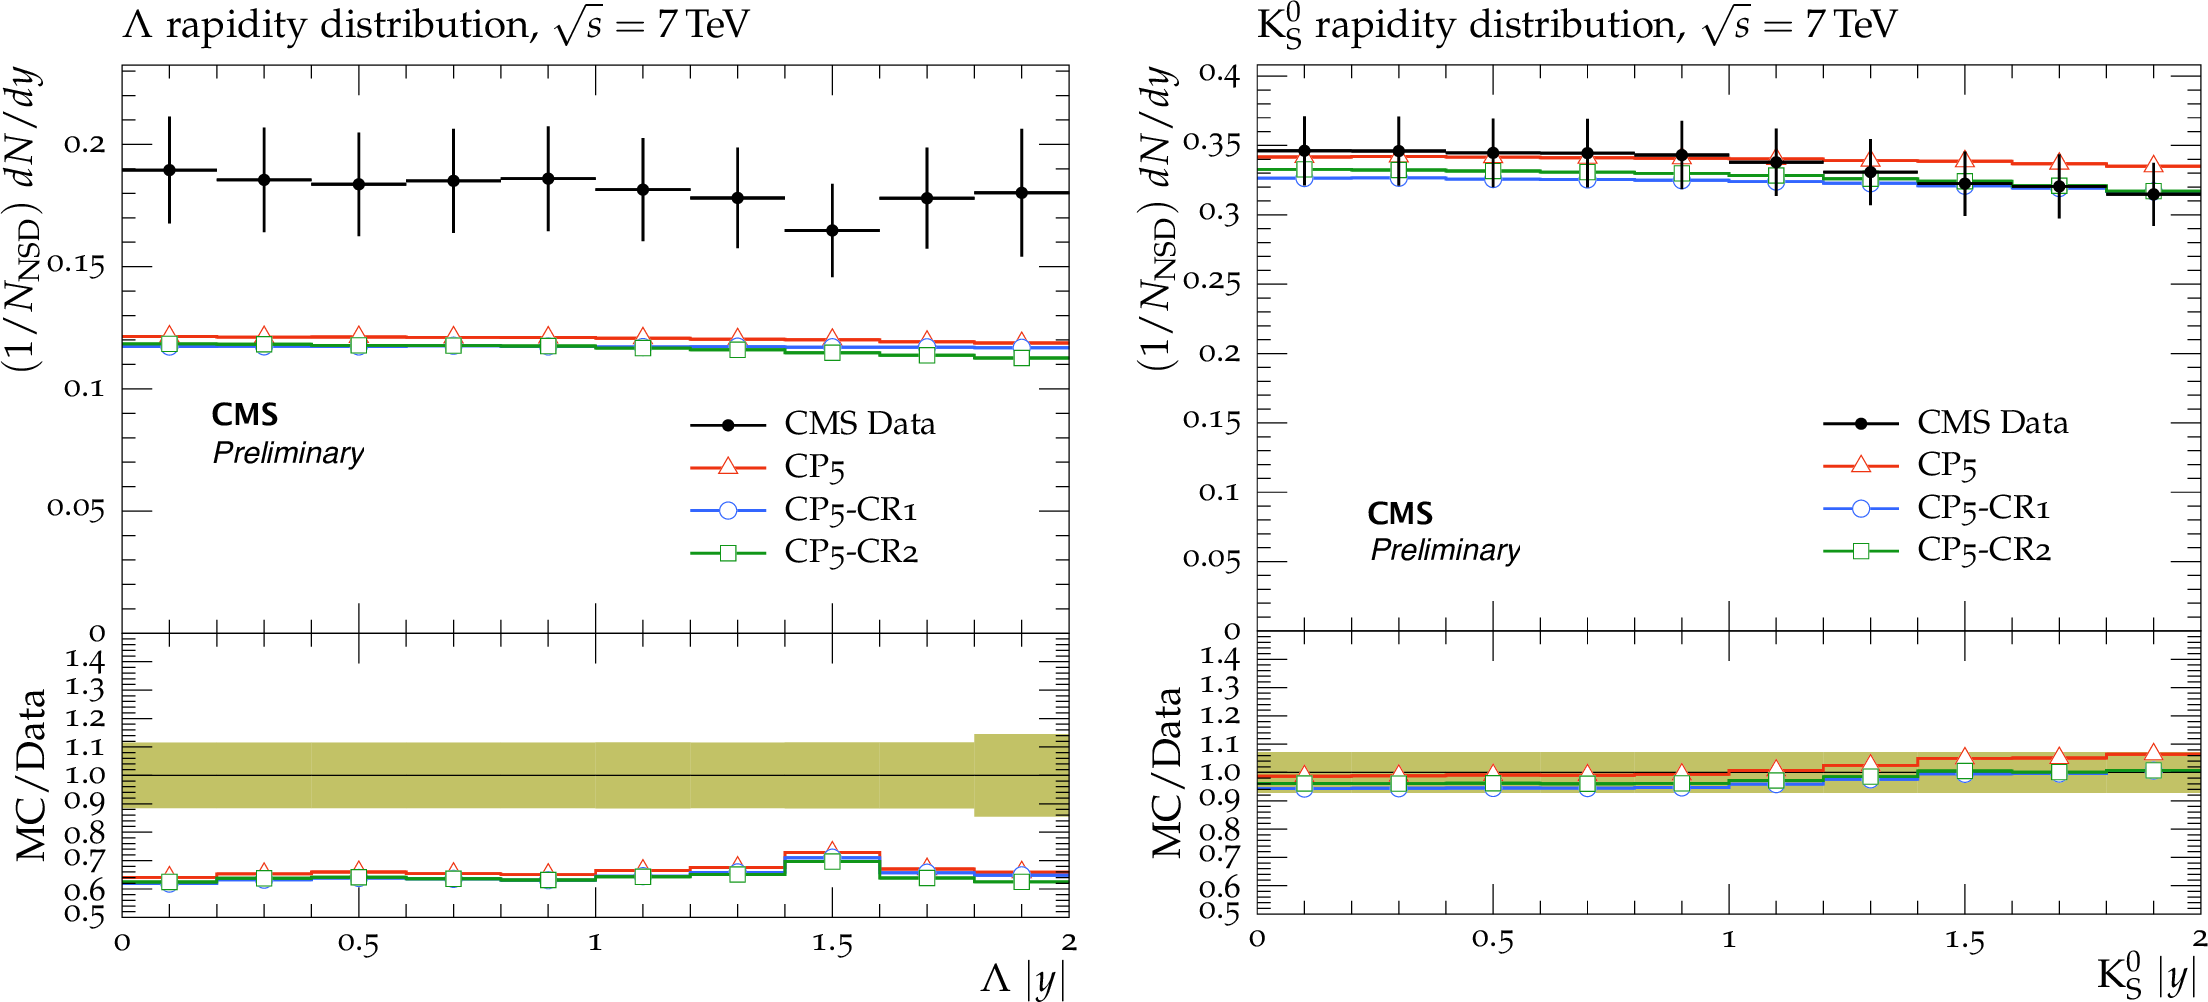
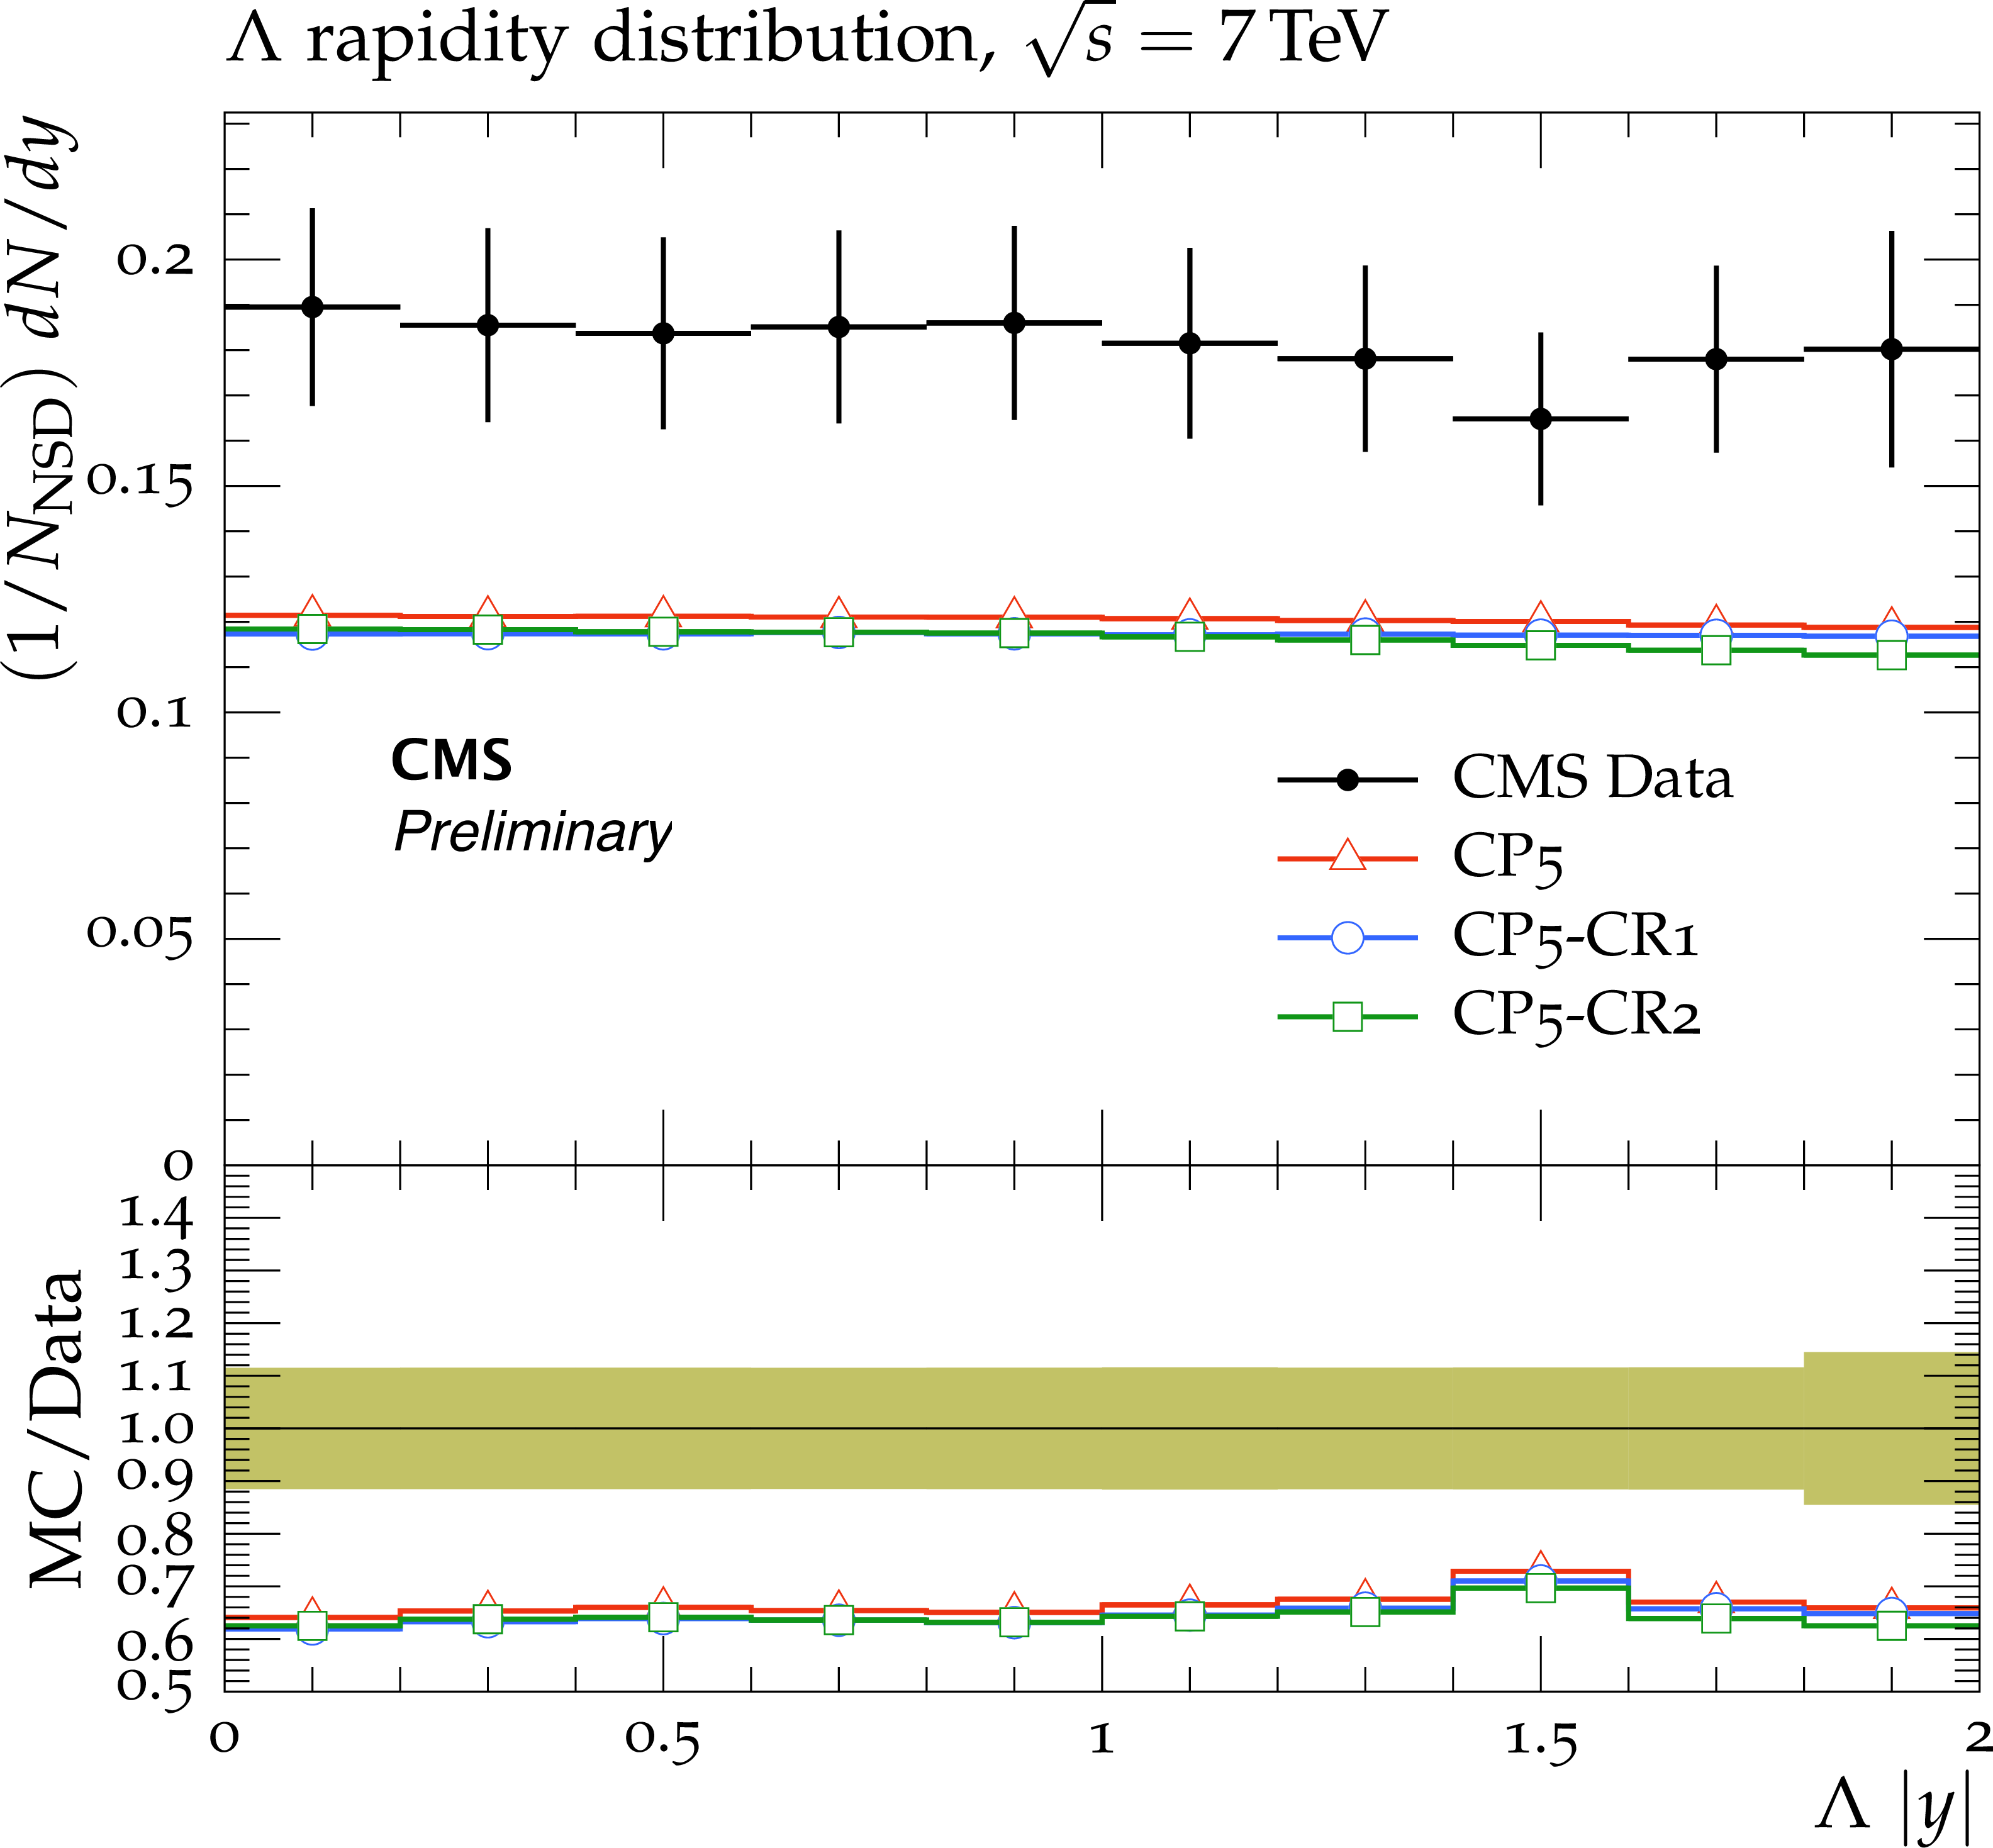
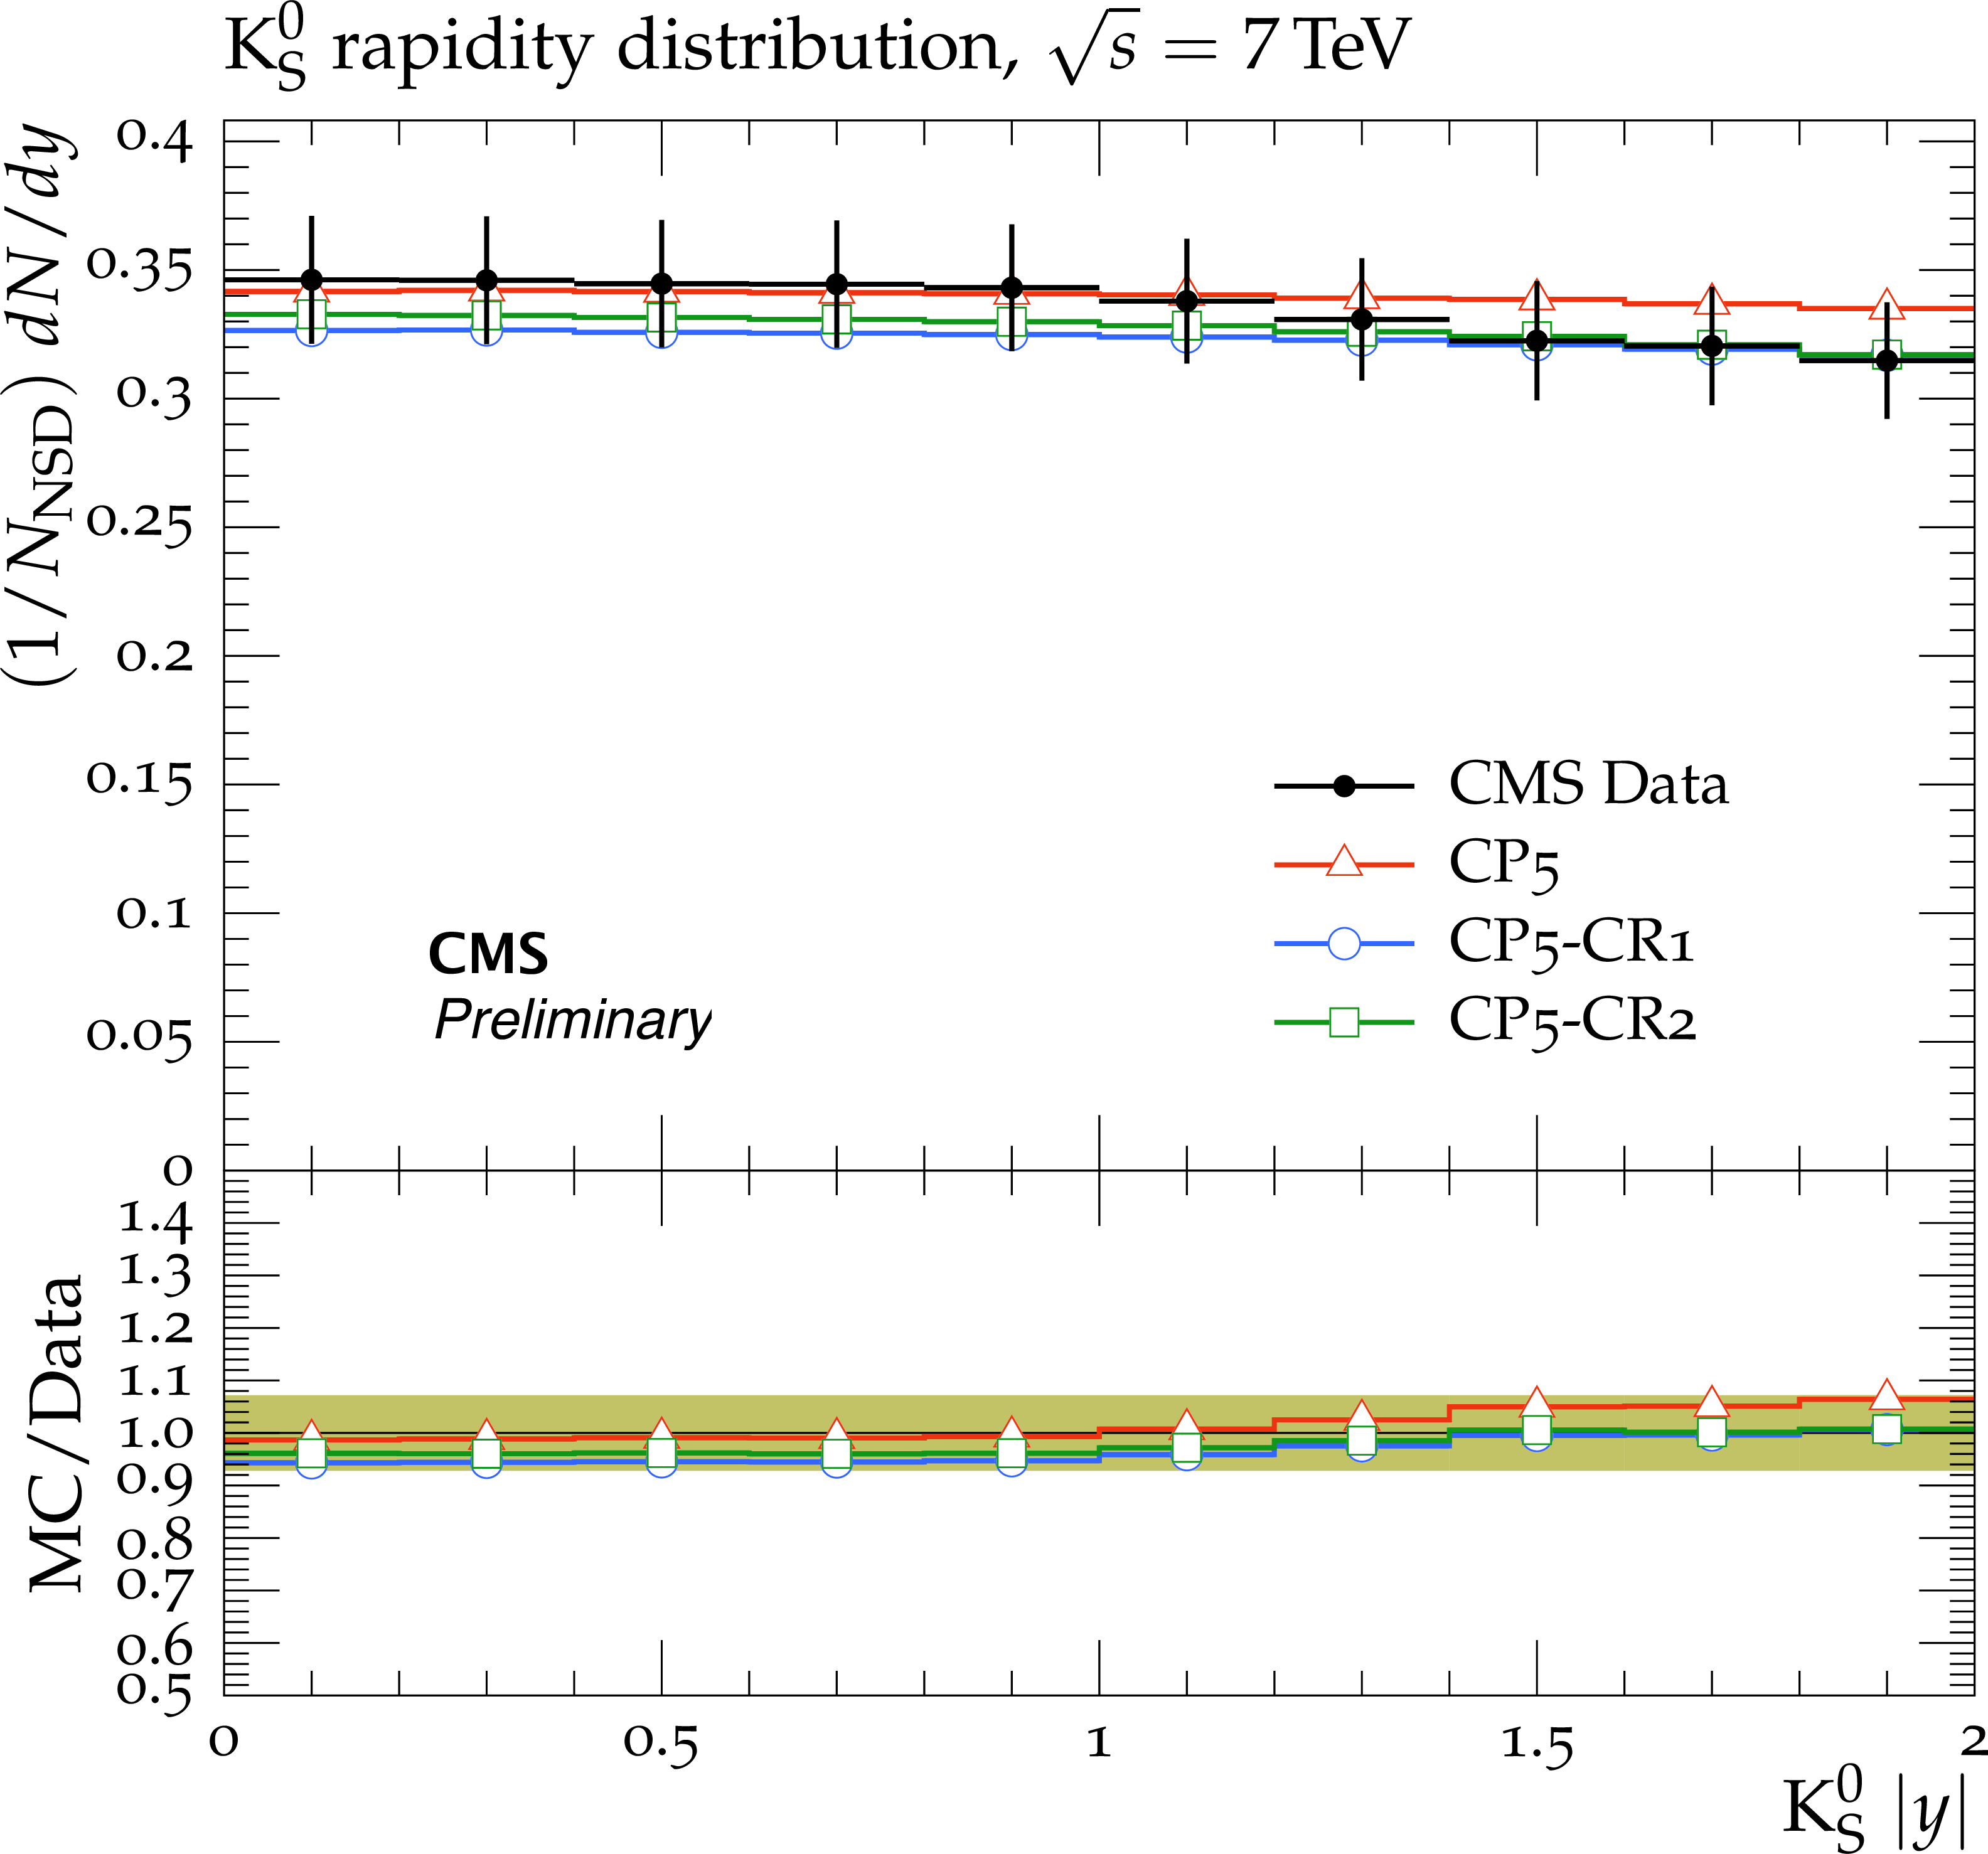
Figure 12:
The strange particle production, $\Lambda $ baryons (left) and $K_s^0$ mesons (right), as a function of rapidity, measured by the CMS experiment at $\sqrt {s} = $ 7 TeV [29]. The predictions of the CP5 and CP5-CR tunes are compared to data. The coloured band represents the total experimental uncertainty in the data. |
png pdf |
Figure 12-a:
The strange particle production, $\Lambda $ baryons (left) and $K_s^0$ mesons (right), as a function of rapidity, measured by the CMS experiment at $\sqrt {s} = $ 7 TeV [29]. The predictions of the CP5 and CP5-CR tunes are compared to data. The coloured band represents the total experimental uncertainty in the data. |
png pdf |
Figure 12-b:
The strange particle production, $\Lambda $ baryons (left) and $K_s^0$ mesons (right), as a function of rapidity, measured by the CMS experiment at $\sqrt {s} = $ 7 TeV [29]. The predictions of the CP5 and CP5-CR tunes are compared to data. The coloured band represents the total experimental uncertainty in the data. |
png pdf |
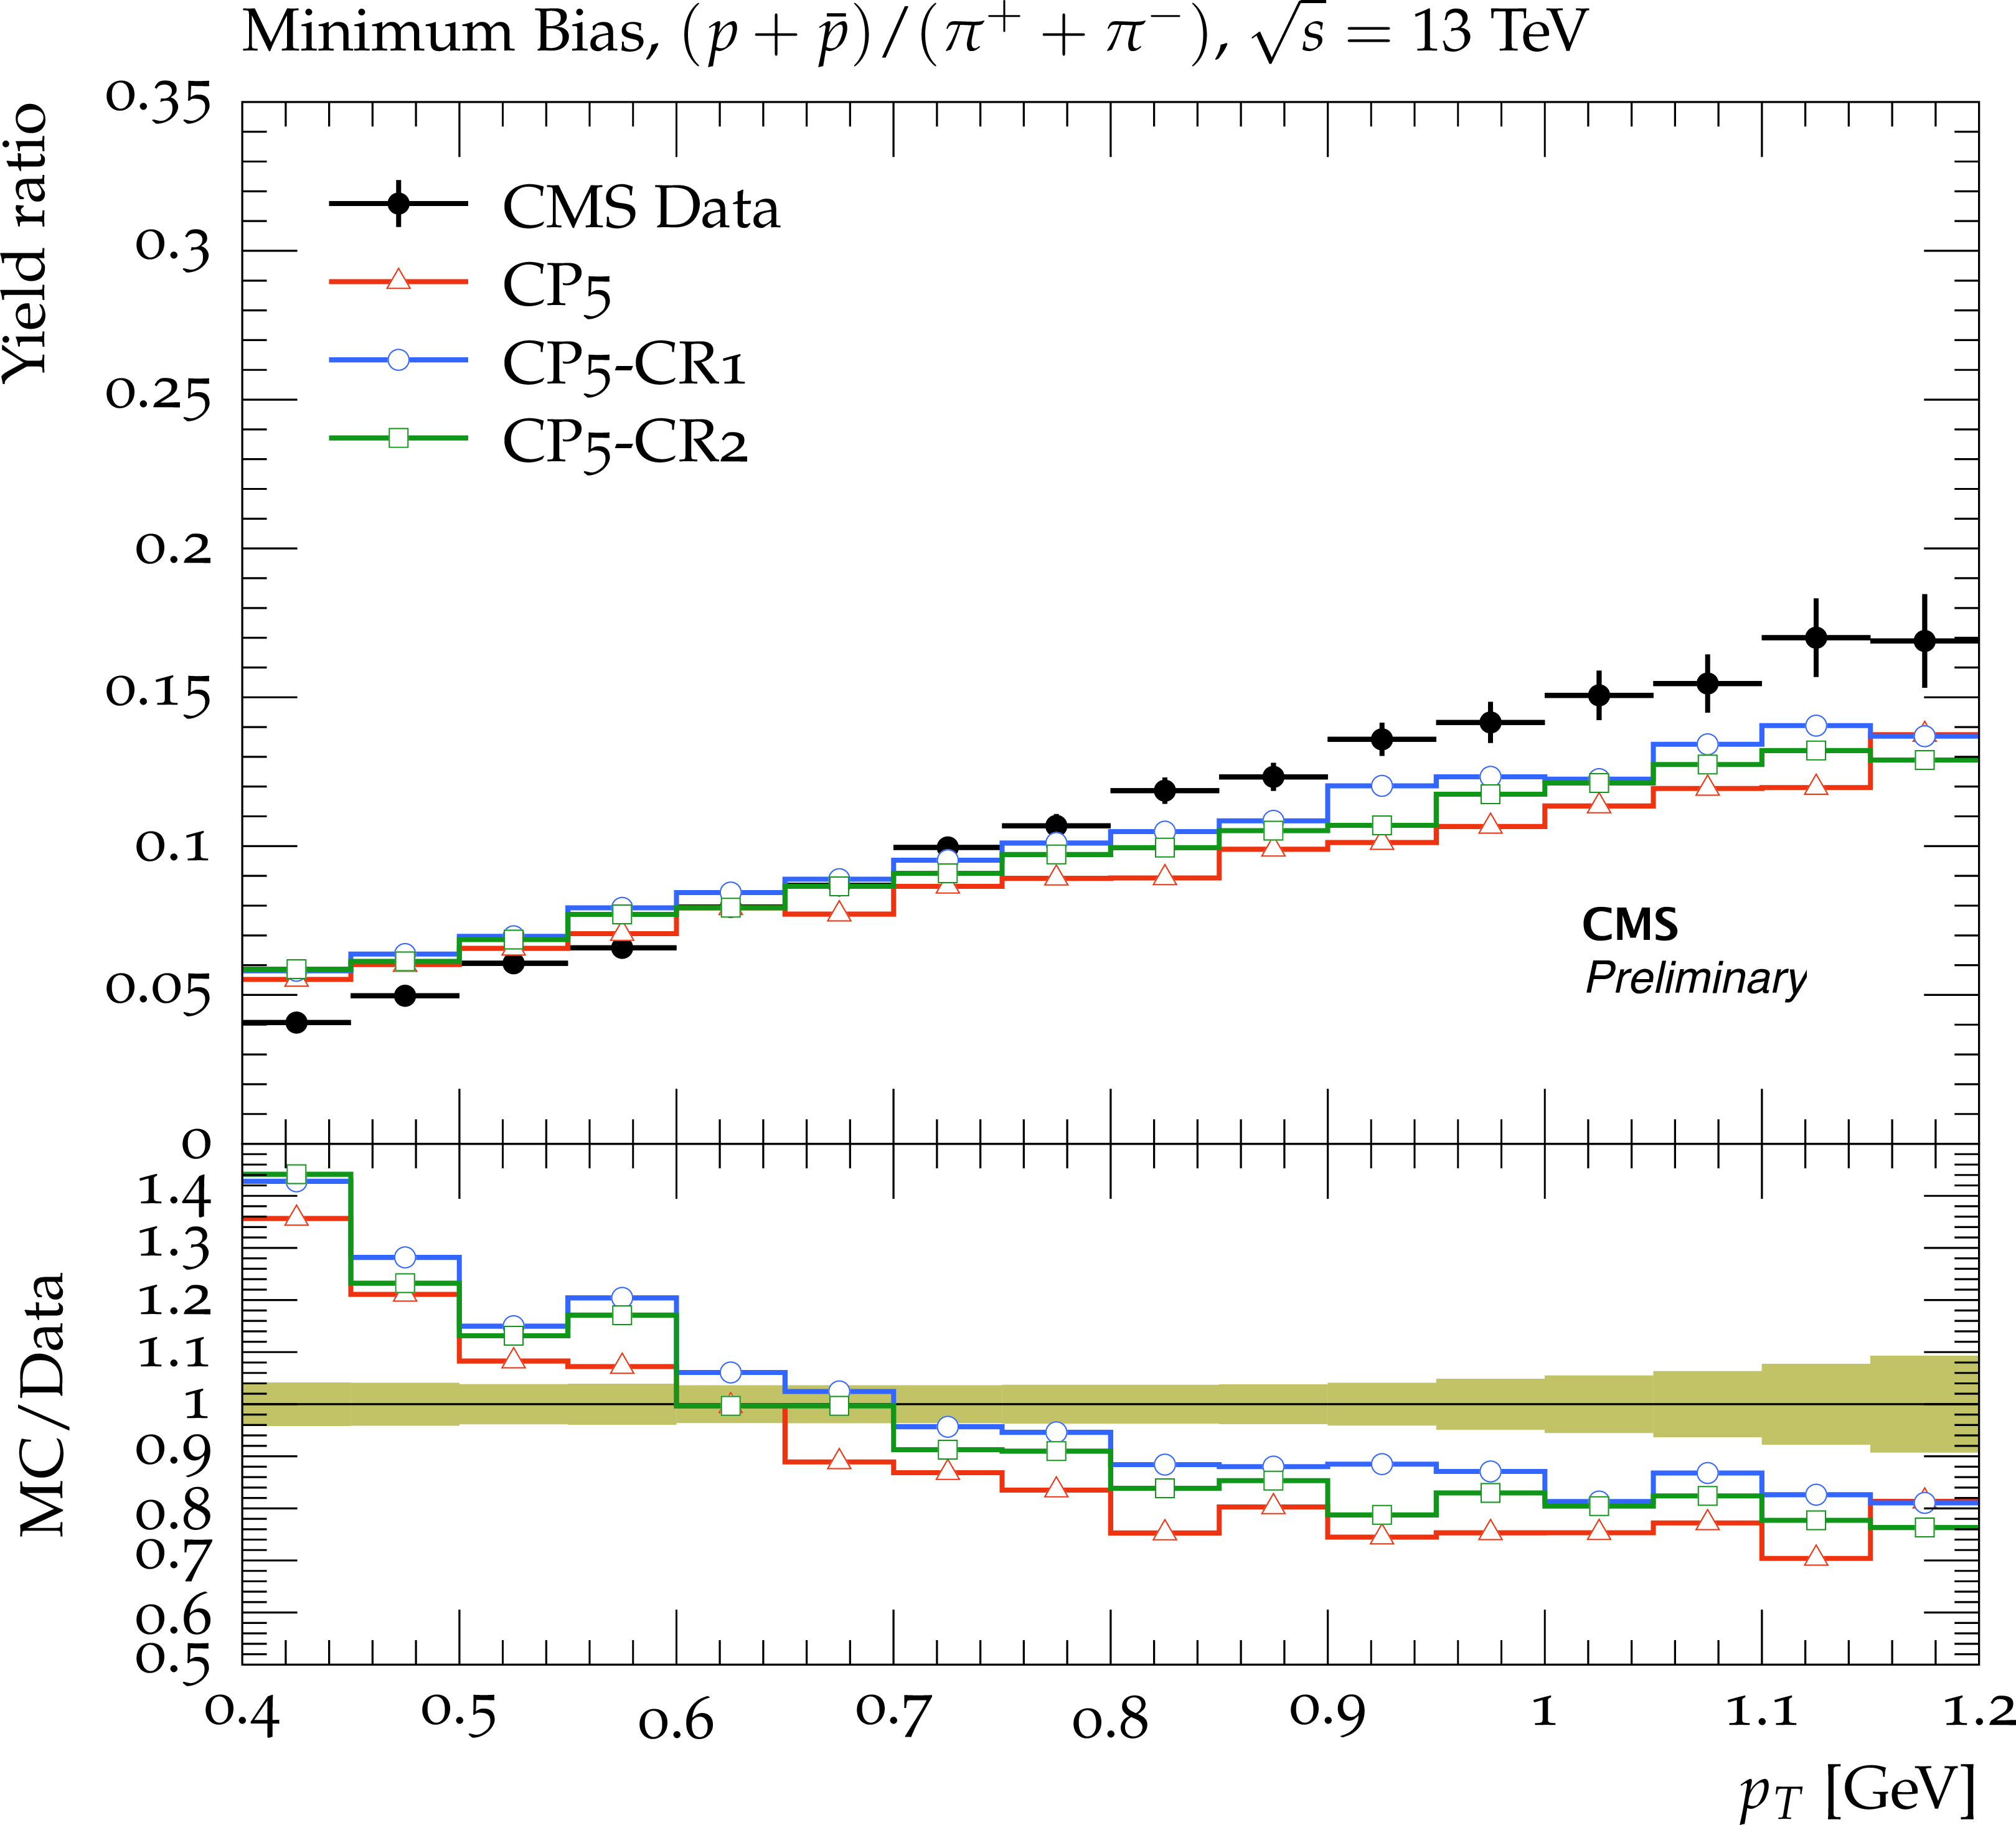
Figure 13:
Ratios of particle yields, $p/\pi $, as a function of transverse momentum in miminum bias events, measured by the CMS experiment at $\sqrt {s} = $ 13 TeV [32]. The predictions of the CP5 and CP5-CR tunes are compared to data. The coloured band represents the total experimental uncertainty in the data. |
png pdf |
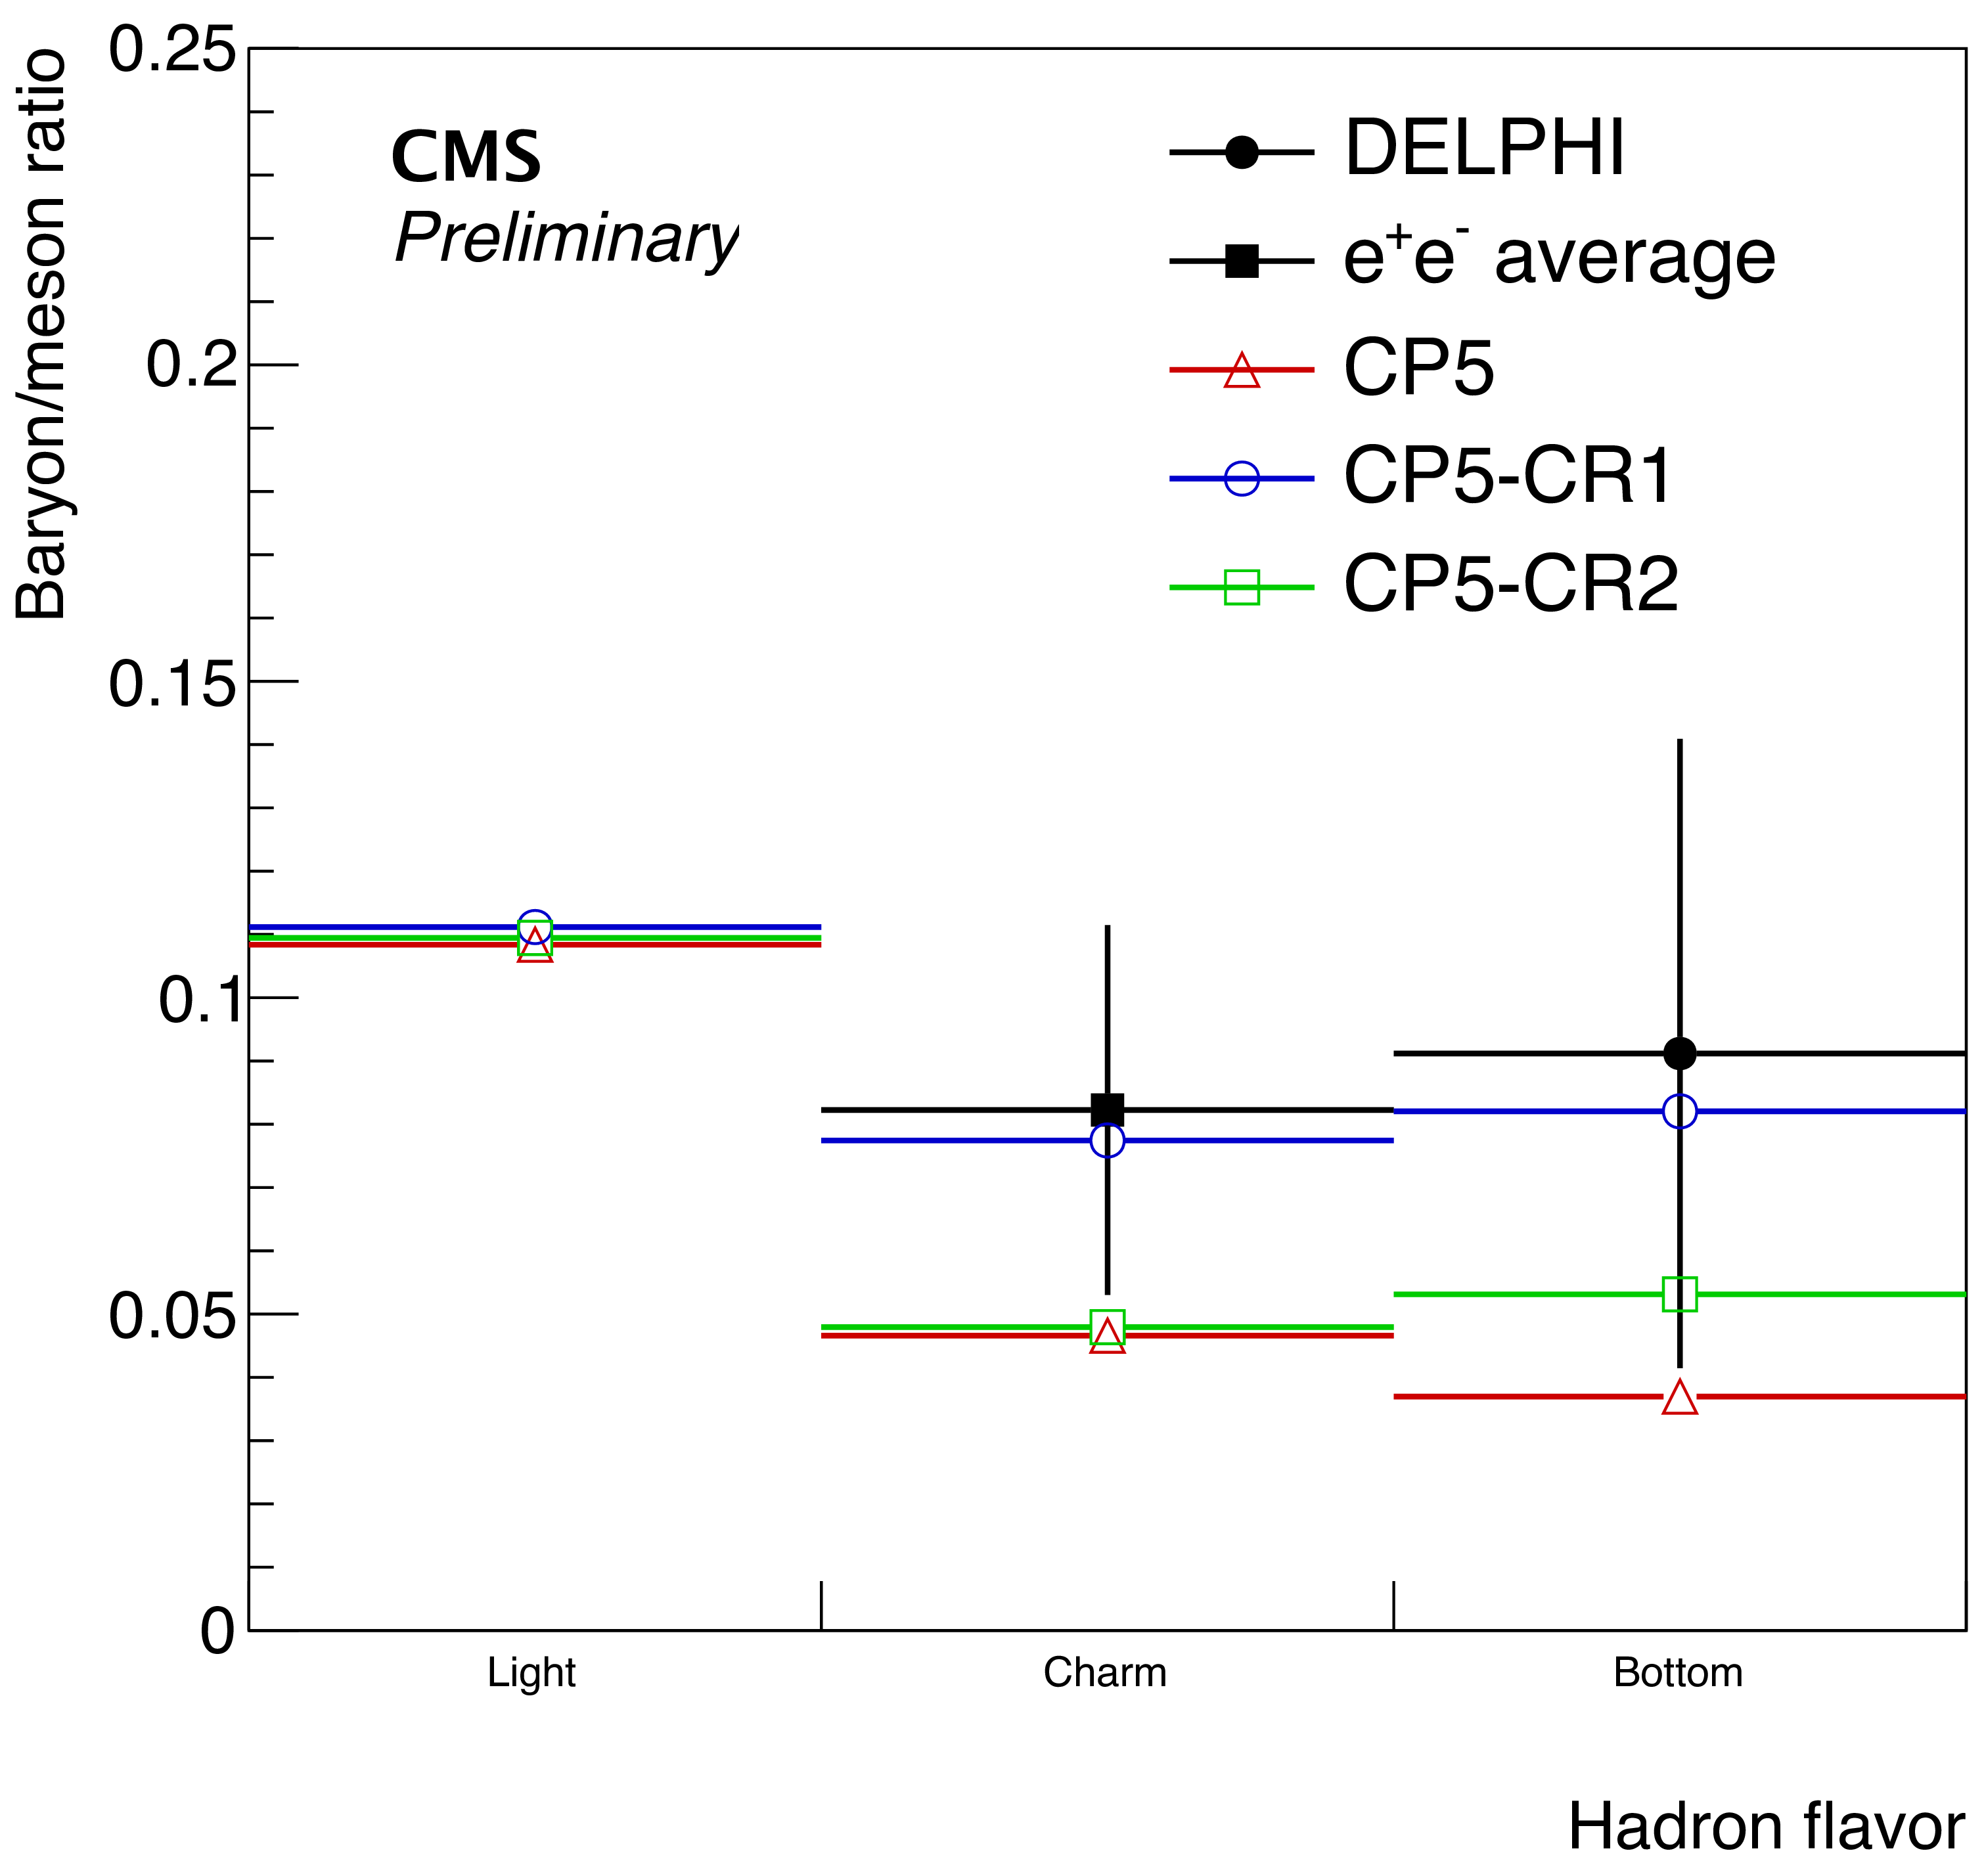
Figure 14:
Ratios of particle yields for light, charm, and bottom hadrons predicted by the the CP5 and CP5-CR tunes compared to data from $e^{+}e^{-}$ colliders [33] and the DELPHI collaboration [34]. |
png pdf |
Figure 15:
Average charged-hadron multiplicity as a function of the jet ${p_{\mathrm {T}}}$ for jets with rapidity $|y| < 1$, measured by the CMS experiment at $\sqrt {s} = $ 7 TeV [24]. The predictions of the CP5 and CP5-CR tunes are compared to data. The coloured band represents the total experimental uncertainty in the data. |
png pdf |
Figure 16:
Distributions of $F(z)$ for $25\text { GeV} < p_T^{\text {jet}} < 40\text { GeV}$ (left) and $400\text { GeV} < p_T^{\text {jet}} < 500\text { GeV}$ (right) for jets with pseudorapidity $|\eta _\text {jet}| < 1.2$, measured by the ATLAS experiment at $\sqrt {s} = $ 7 TeV [25]. The predictions of the CP5 and CP5-CR tunes are compared to data. The coloured band represents the total experimental uncertainty in the data. |
png pdf |
Figure 16-a:
Distributions of $F(z)$ for $25\text { GeV} < p_T^{\text {jet}} < 40\text { GeV}$ (left) and $400\text { GeV} < p_T^{\text {jet}} < 500\text { GeV}$ (right) for jets with pseudorapidity $|\eta _\text {jet}| < 1.2$, measured by the ATLAS experiment at $\sqrt {s} = $ 7 TeV [25]. The predictions of the CP5 and CP5-CR tunes are compared to data. The coloured band represents the total experimental uncertainty in the data. |
png pdf |
Figure 16-b:
Distributions of $F(z)$ for $25\text { GeV} < p_T^{\text {jet}} < 40\text { GeV}$ (left) and $400\text { GeV} < p_T^{\text {jet}} < 500\text { GeV}$ (right) for jets with pseudorapidity $|\eta _\text {jet}| < 1.2$, measured by the ATLAS experiment at $\sqrt {s} = $ 7 TeV [25]. The predictions of the CP5 and CP5-CR tunes are compared to data. The coloured band represents the total experimental uncertainty in the data. |
png pdf |
Figure 17:
Number of charged particles and ${p_{\mathrm {T}}}$ flow in the transverse region of DY events, measured by the CMS experiment at $\sqrt {s} = $ 13 TeV in bins of Z boson ${p_{\mathrm {T}}}$ [35]. The plots show the predictions of the CP5 and CP5-CR tunes compared to data. The coloured band represents the total experimental uncertainty in the data. |

png pdf |
Figure 17-a:
Number of charged particles and ${p_{\mathrm {T}}}$ flow in the transverse region of DY events, measured by the CMS experiment at $\sqrt {s} = $ 13 TeV in bins of Z boson ${p_{\mathrm {T}}}$ [35]. The plots show the predictions of the CP5 and CP5-CR tunes compared to data. The coloured band represents the total experimental uncertainty in the data. |

png pdf |
Figure 17-b:
Number of charged particles and ${p_{\mathrm {T}}}$ flow in the transverse region of DY events, measured by the CMS experiment at $\sqrt {s} = $ 13 TeV in bins of Z boson ${p_{\mathrm {T}}}$ [35]. The plots show the predictions of the CP5 and CP5-CR tunes compared to data. The coloured band represents the total experimental uncertainty in the data. |

png pdf |
Figure 18:
Distributions of the particle multiplicity (left) and the angle between two groomed subjets ($\Delta R_g$) (right) measured by the CMS experiment at $\sqrt {s} = $ 13 TeV [40]. The coloured band represents the total experimental uncertainty in the data. |

png pdf |
Figure 18-a:
Distributions of the particle multiplicity (left) and the angle between two groomed subjets ($\Delta R_g$) (right) measured by the CMS experiment at $\sqrt {s} = $ 13 TeV [40]. The coloured band represents the total experimental uncertainty in the data. |
png pdf |
Figure 18-b:
Distributions of the particle multiplicity (left) and the angle between two groomed subjets ($\Delta R_g$) (right) measured by the CMS experiment at $\sqrt {s} = $ 13 TeV [40]. The coloured band represents the total experimental uncertainty in the data. |

png pdf |
Figure 19:
Pull angle between jets from the W boson in top quark decays, calculated from the charged constituents of the jets, measured by the ATLAS experiment using $\sqrt {s} = $ 8 TeV data to investigate colour flow. The coloured band represents the total experimental uncertainty in the data. |
png pdf |
Figure 20:
The strange particle production, $\Lambda $ baryons (left) and $K_s^0$ mesons (right), as a function of rapidity, measured by the CMS experiment at $\sqrt {s} = $ 7 TeV [29]. The predictions of the CP1 and CP1-CR tunes (upper) and CP2 and CP2-CR tunes (lower) are compared to data. The coloured band represents the total experimental uncertainty in the data. |

png pdf |
Figure 20-a:
The strange particle production, $\Lambda $ baryons (left) and $K_s^0$ mesons (right), as a function of rapidity, measured by the CMS experiment at $\sqrt {s} = $ 7 TeV [29]. The predictions of the CP1 and CP1-CR tunes (upper) and CP2 and CP2-CR tunes (lower) are compared to data. The coloured band represents the total experimental uncertainty in the data. |
png pdf |
Figure 20-b:
The strange particle production, $\Lambda $ baryons (left) and $K_s^0$ mesons (right), as a function of rapidity, measured by the CMS experiment at $\sqrt {s} = $ 7 TeV [29]. The predictions of the CP1 and CP1-CR tunes (upper) and CP2 and CP2-CR tunes (lower) are compared to data. The coloured band represents the total experimental uncertainty in the data. |

png pdf |
Figure 20-c:
The strange particle production, $\Lambda $ baryons (left) and $K_s^0$ mesons (right), as a function of rapidity, measured by the CMS experiment at $\sqrt {s} = $ 7 TeV [29]. The predictions of the CP1 and CP1-CR tunes (upper) and CP2 and CP2-CR tunes (lower) are compared to data. The coloured band represents the total experimental uncertainty in the data. |

png pdf |
Figure 20-d:
The strange particle production, $\Lambda $ baryons (left) and $K_s^0$ mesons (right), as a function of rapidity, measured by the CMS experiment at $\sqrt {s} = $ 7 TeV [29]. The predictions of the CP1 and CP1-CR tunes (upper) and CP2 and CP2-CR tunes (lower) are compared to data. The coloured band represents the total experimental uncertainty in the data. |

png pdf |
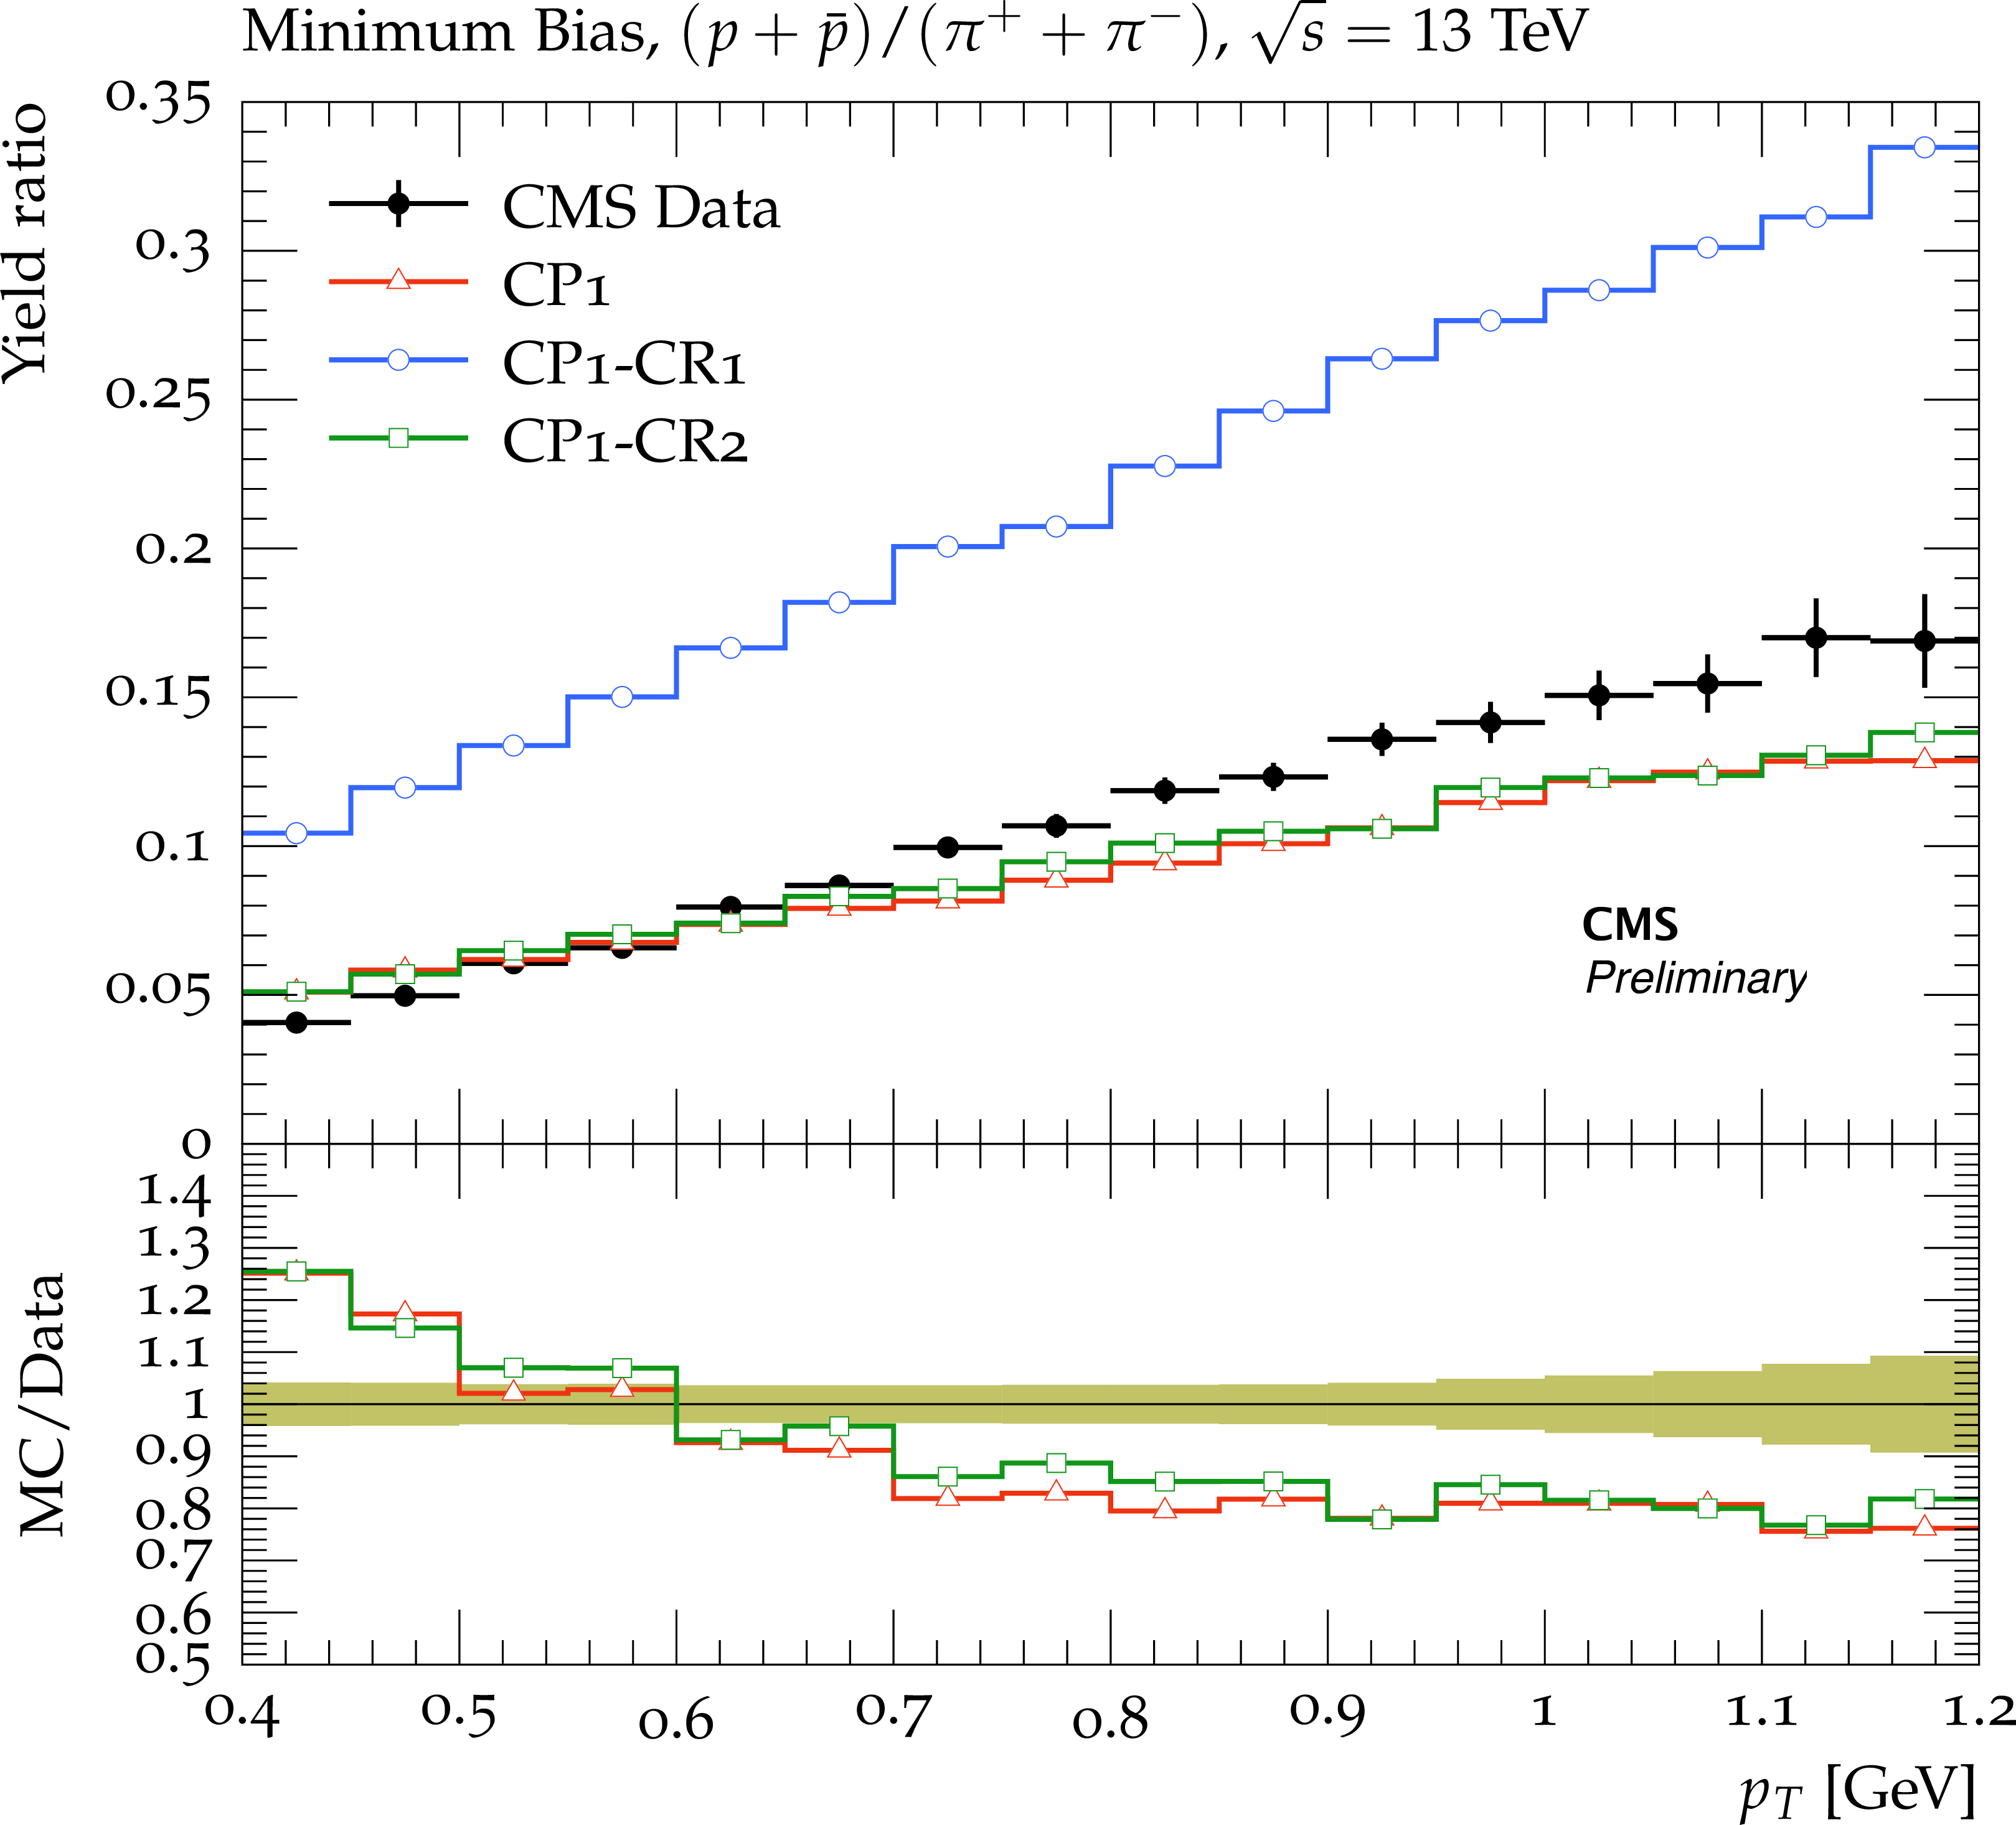
Figure 21:
Ratios of particle yields, $p/\pi $, as a function of transverse momentum in minimum bias events, measured by the CMS experiment at $\sqrt {s} = $ 13 TeV [32]. The predictions of the CP1 and CP1-CR tunes (left) and CP2 and CP2-CR tunes (right) are compared to data. The coloured band represents the total experimental uncertainty in the data. |
png pdf |
Figure 21-a:
Ratios of particle yields, $p/\pi $, as a function of transverse momentum in minimum bias events, measured by the CMS experiment at $\sqrt {s} = $ 13 TeV [32]. The predictions of the CP1 and CP1-CR tunes (left) and CP2 and CP2-CR tunes (right) are compared to data. The coloured band represents the total experimental uncertainty in the data. |

png pdf |
Figure 21-b:
Ratios of particle yields, $p/\pi $, as a function of transverse momentum in minimum bias events, measured by the CMS experiment at $\sqrt {s} = $ 13 TeV [32]. The predictions of the CP1 and CP1-CR tunes (left) and CP2 and CP2-CR tunes (right) are compared to data. The coloured band represents the total experimental uncertainty in the data. |

png pdf |
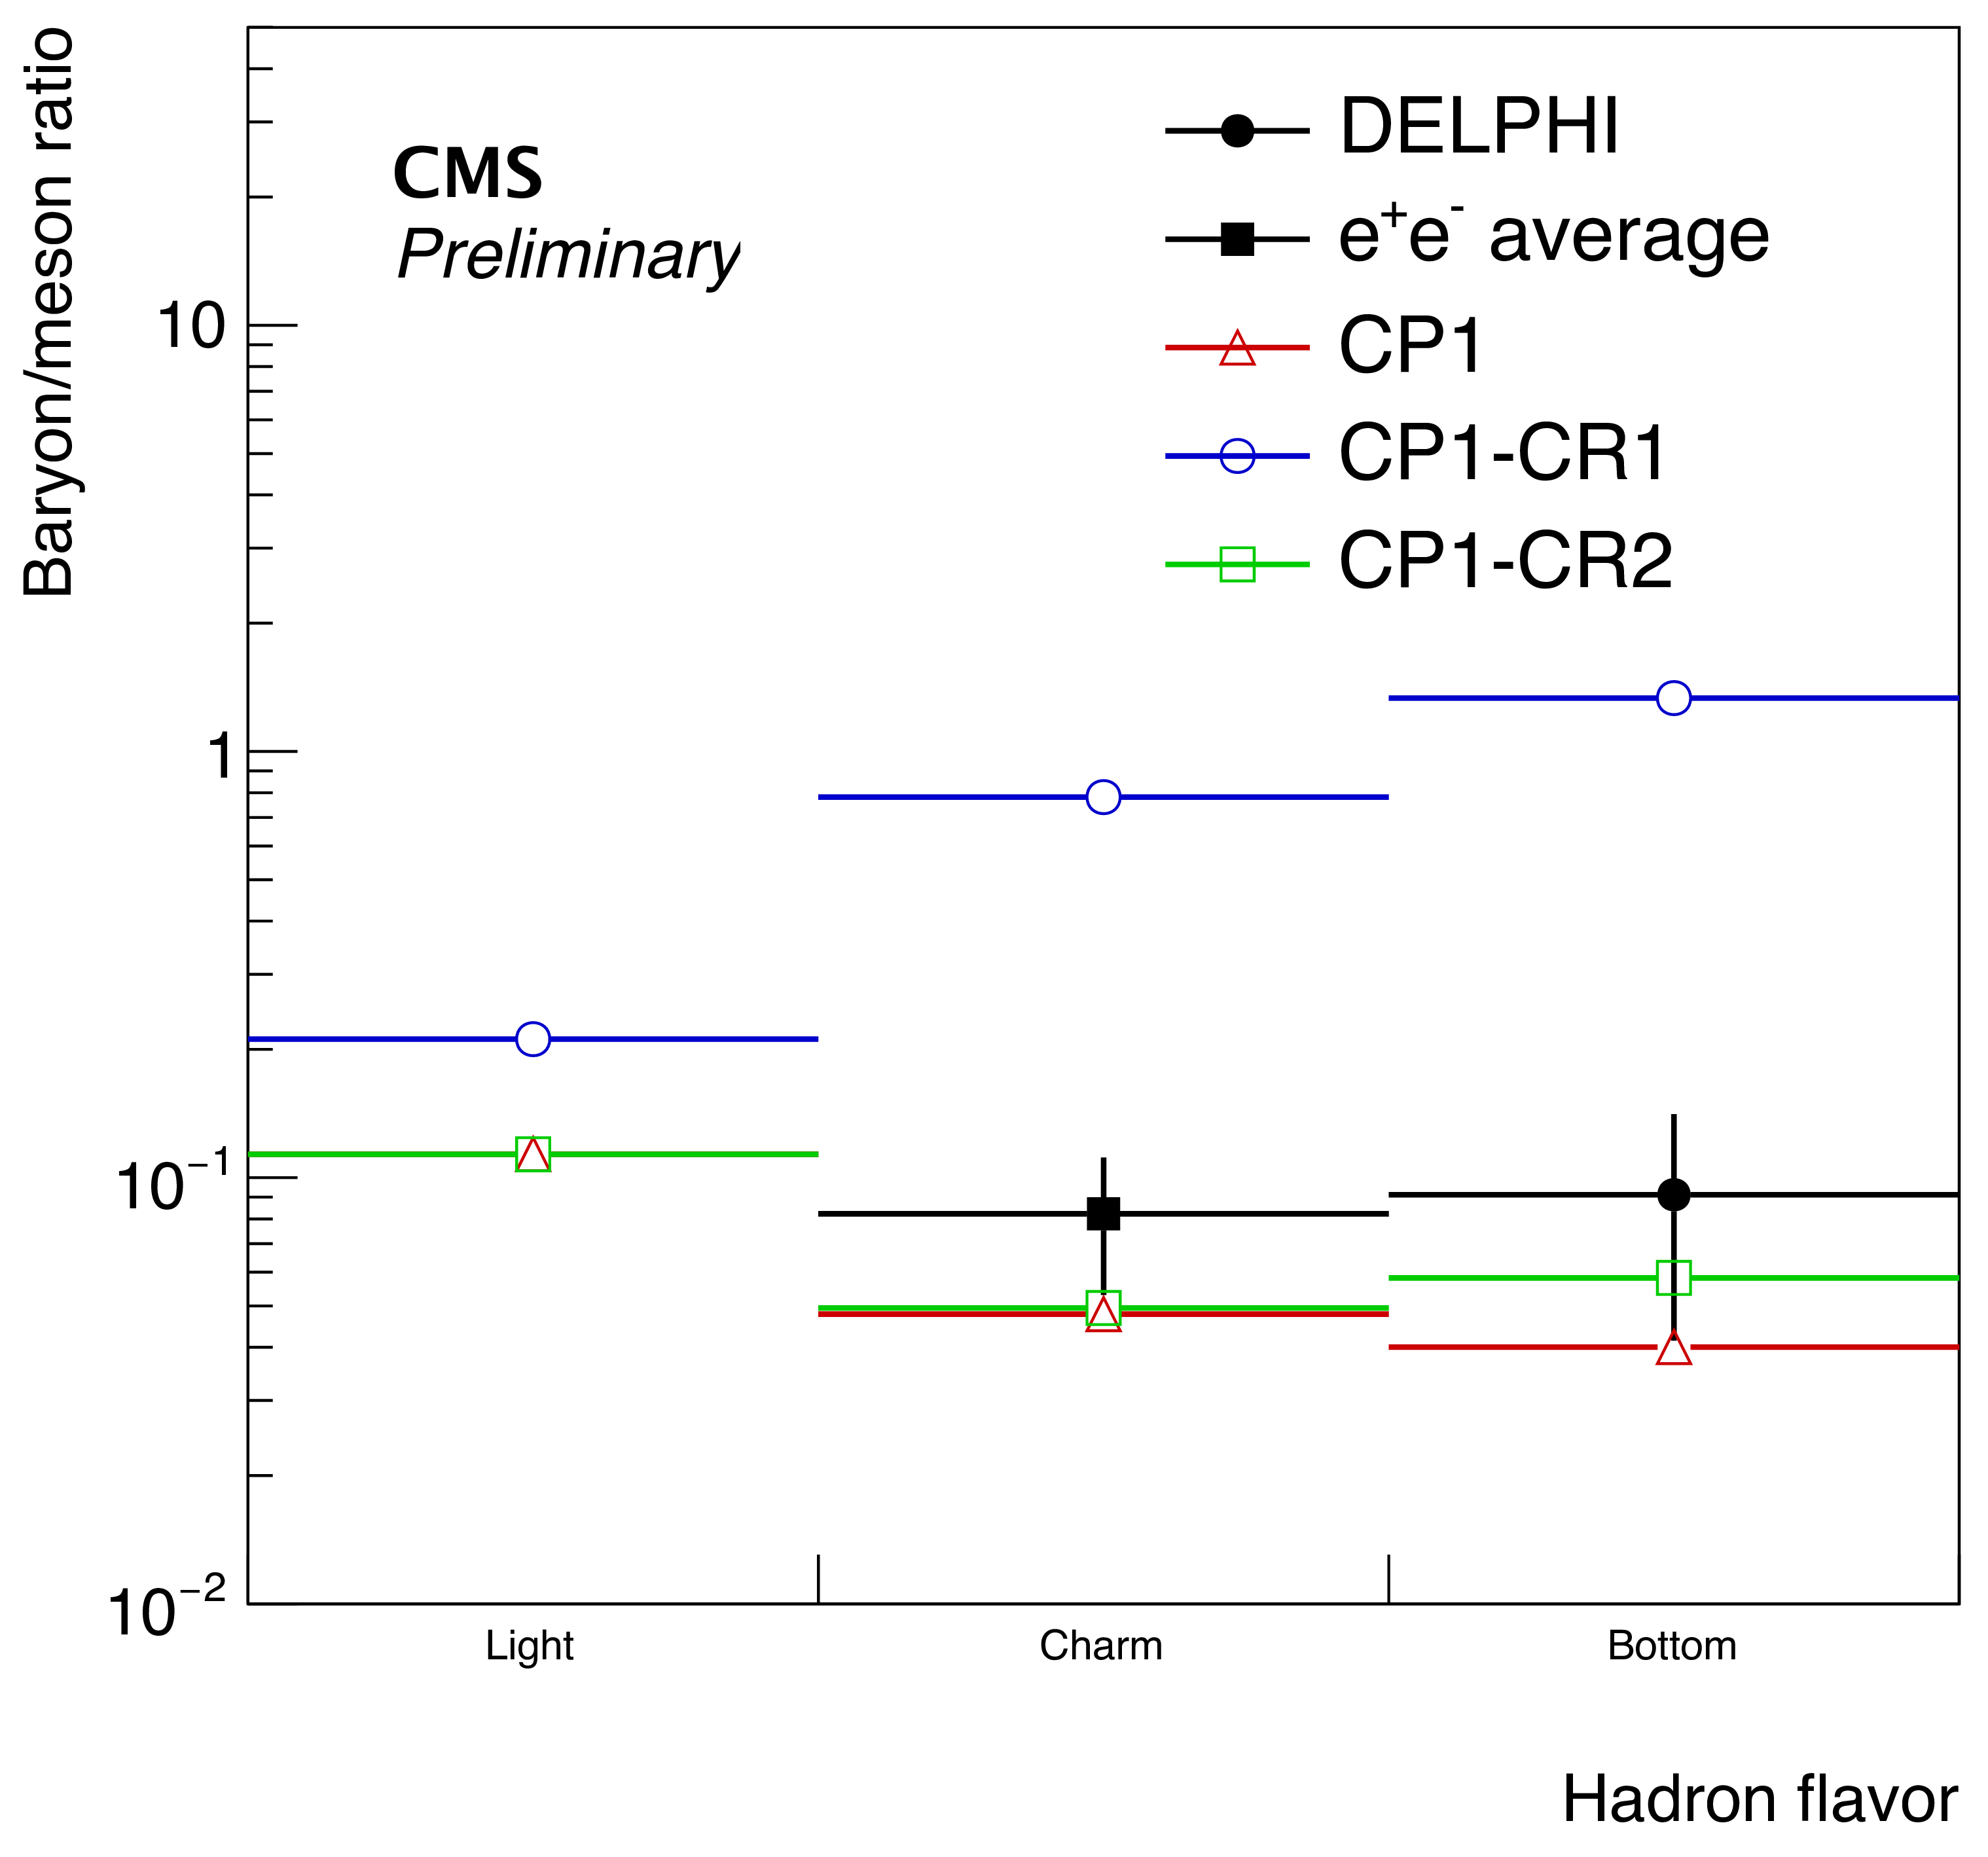
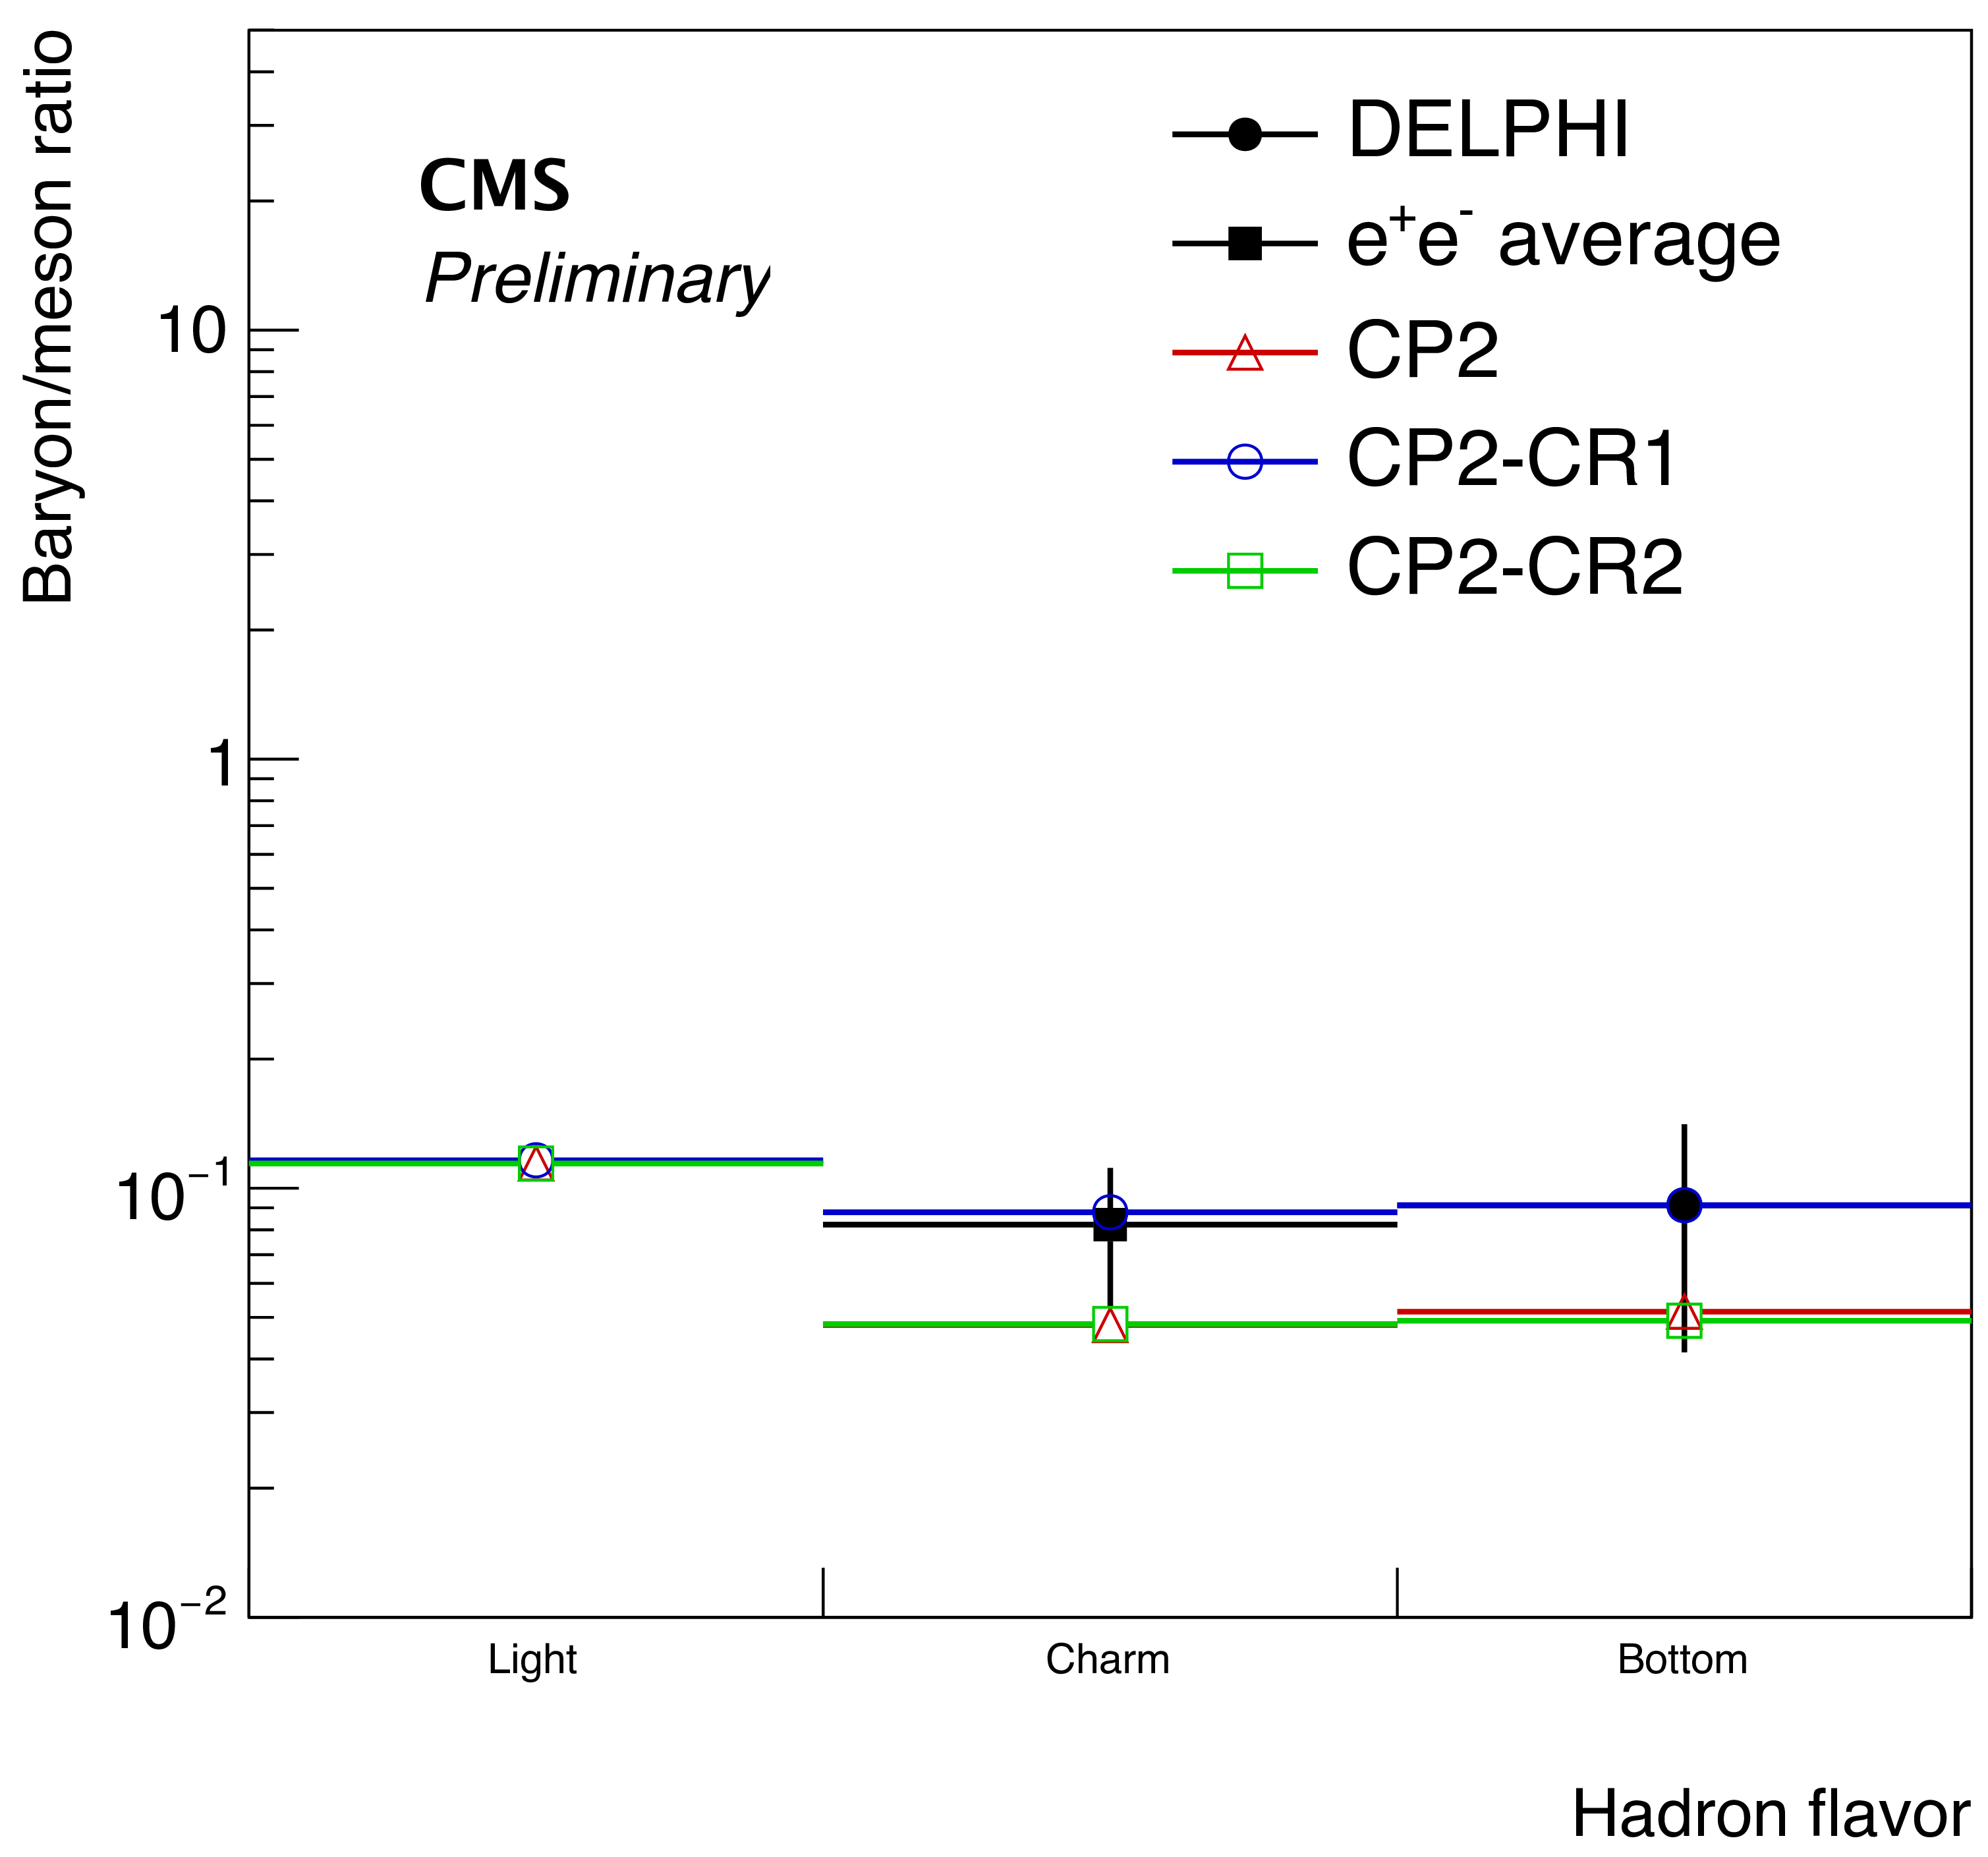
Figure 22:
Ratios of particle yields for light, charm, and bottom hadrons predicted by the different pythia8 tunes compared to data. The data are compared to predictions from the CP1 and CP1-CR tunes (left) and CP2 and CP2-CR tunes (right). |
png pdf |
Figure 22-a:
Ratios of particle yields for light, charm, and bottom hadrons predicted by the different pythia8 tunes compared to data. The data are compared to predictions from the CP1 and CP1-CR tunes (left) and CP2 and CP2-CR tunes (right). |
png pdf |
Figure 22-b:
Ratios of particle yields for light, charm, and bottom hadrons predicted by the different pythia8 tunes compared to data. The data are compared to predictions from the CP1 and CP1-CR tunes (left) and CP2 and CP2-CR tunes (right). |
| Tables | |

png pdf |
Table 1:
List of input RIVET routines, distributions, x-axis ranges, R of the distributions in the fit, number of bins and the centre-of-mass energy used in the fits to derive the CP5-CR1 and CP5-CR2 tunes. |
png pdf |
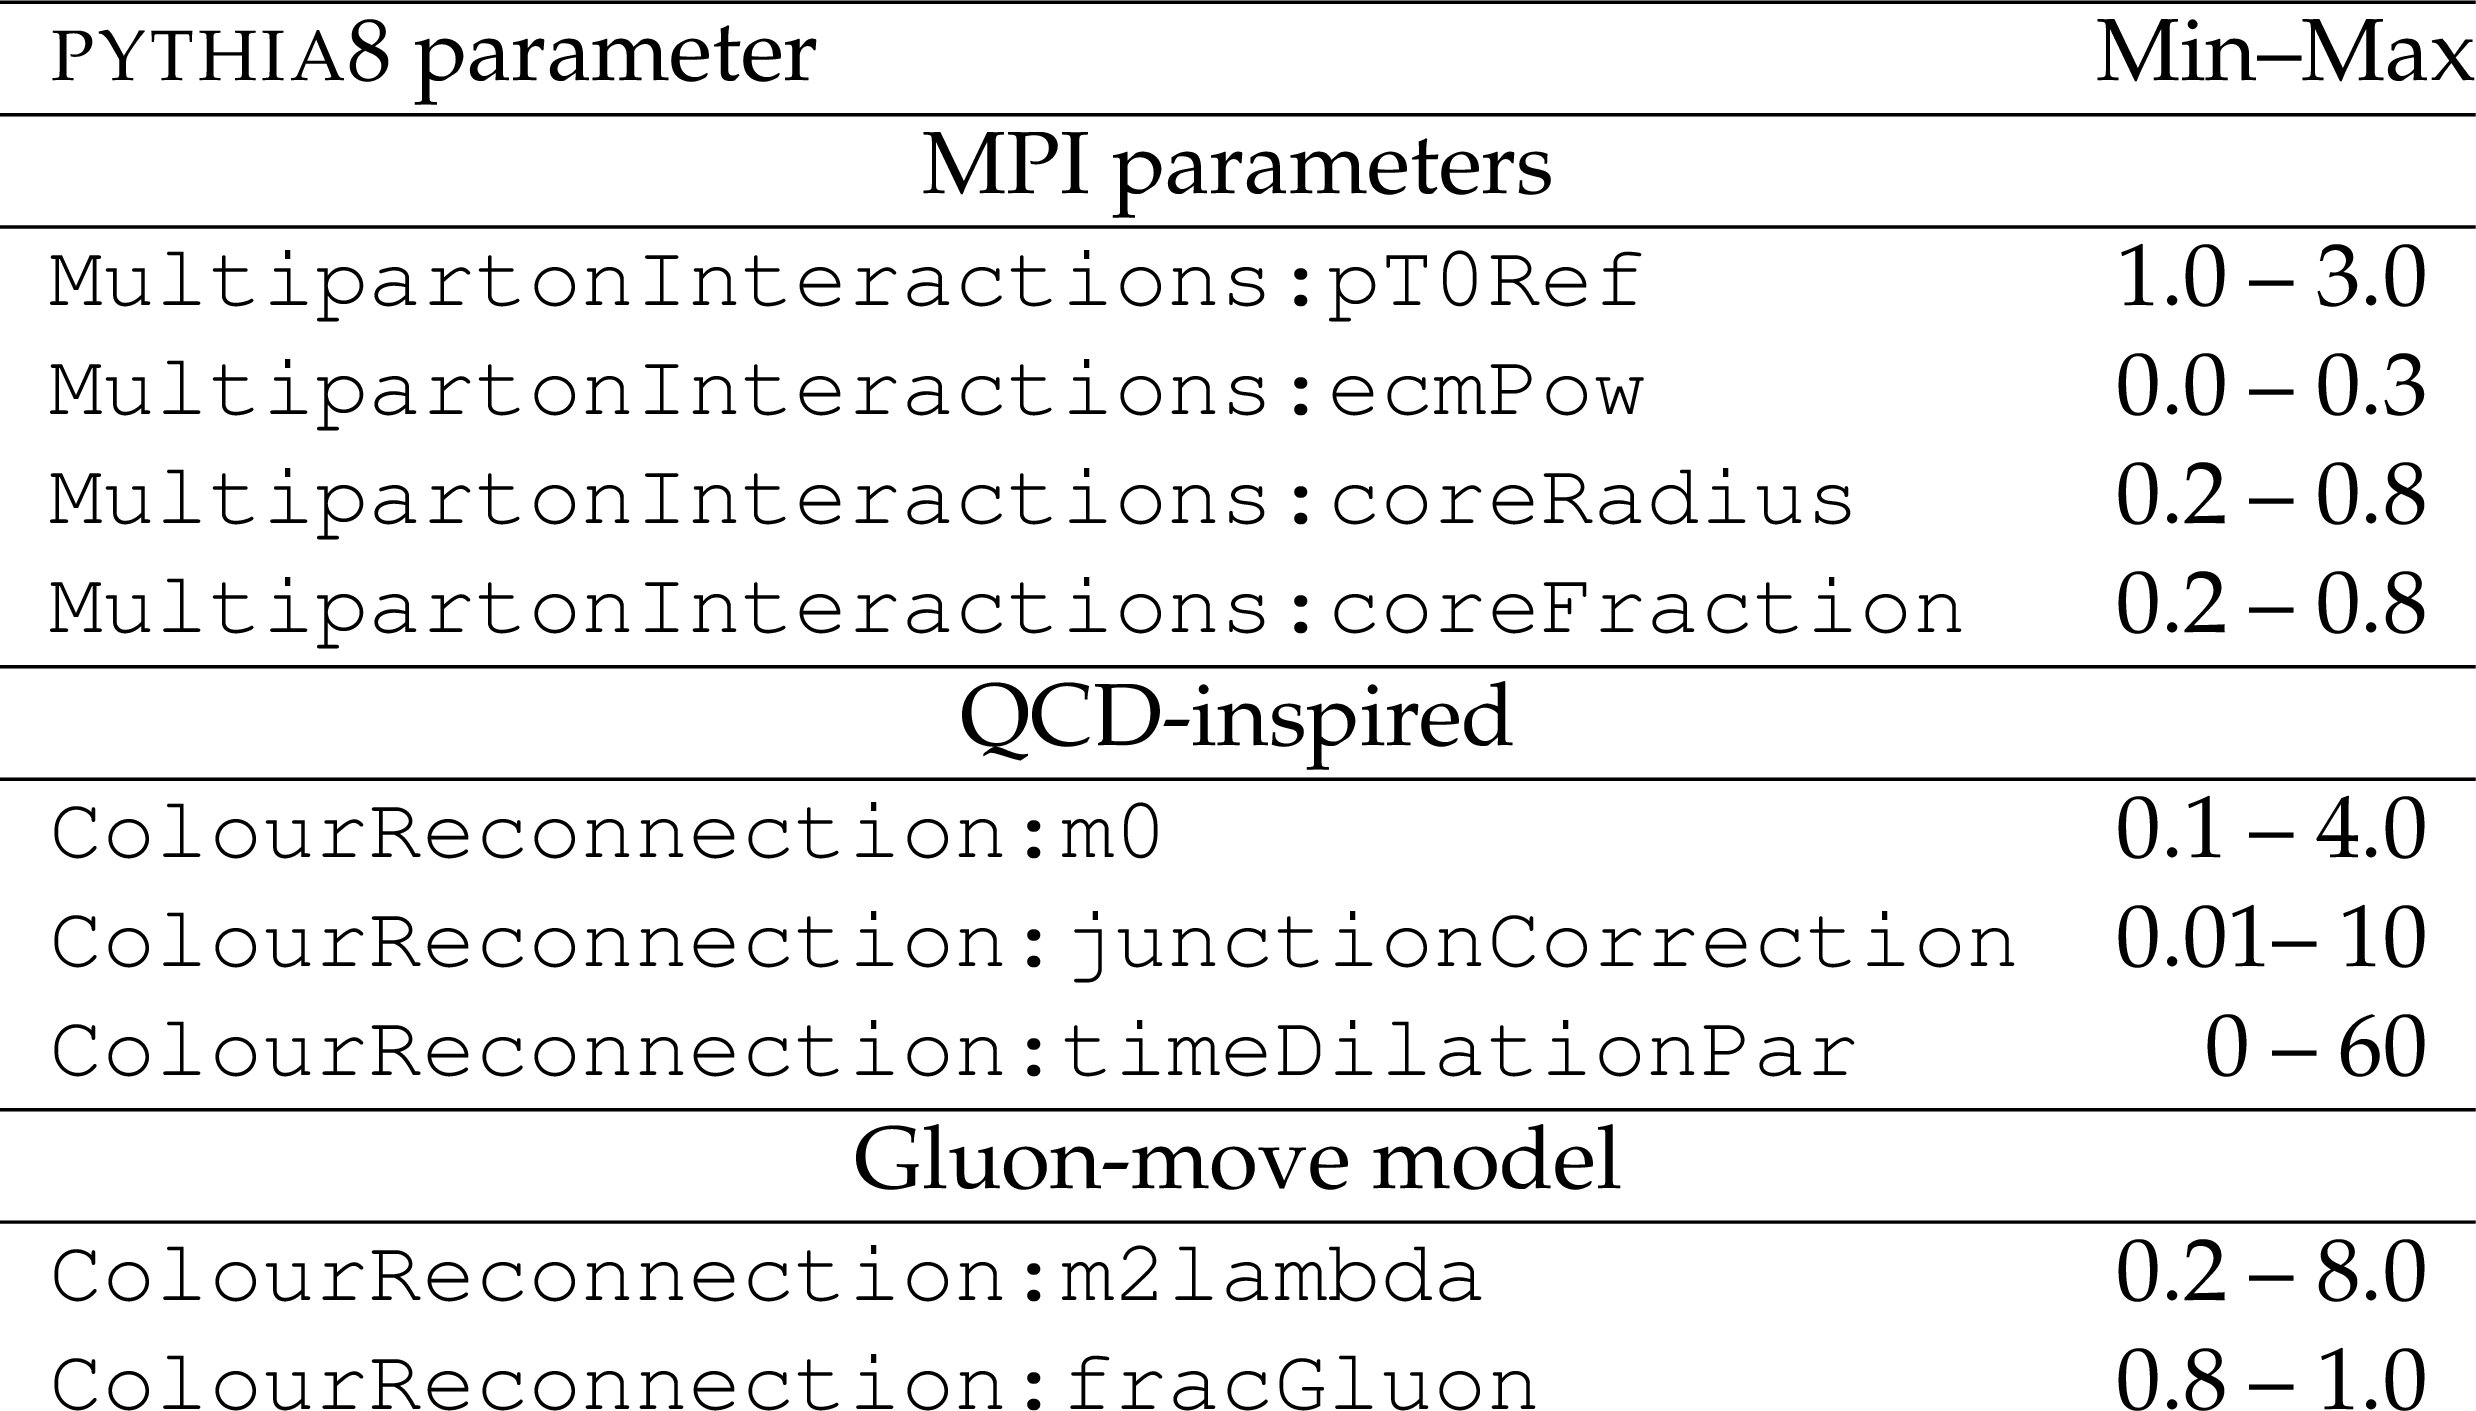
Table 2:
MPI and CR parameter ranges used in the tuning procedure. |

png pdf |
Table 3:
The parameters obtained in the fits of the CP5-CR1 and CP5-CR2 tunes, compared with that of the tune CP5. The upper part of the table displays the fixed input parameters of the tune, while the lower part shows the fitted tune parameters. The number of degrees of freedom ($N_\text {dof}$) and the goodness of fit divided by $N_\text {dof}$ are also shown. |

png pdf |
Table 4:
The top quark mass, ${m_{\mathrm{t}}}$, and $\mathrm{W} $ mass, ${m_{\mathrm{W}}}$, extracted by a fit to the predictions of the different pythia8 tunes. The uncertainties in the ${m_{\mathrm{t}}}$ and ${m_{\mathrm{W}}}$ values correspond to the uncertainty in the fitted ${m_{\mathrm{t}}}$ and ${m_{\mathrm{W}}}$. |

png pdf |
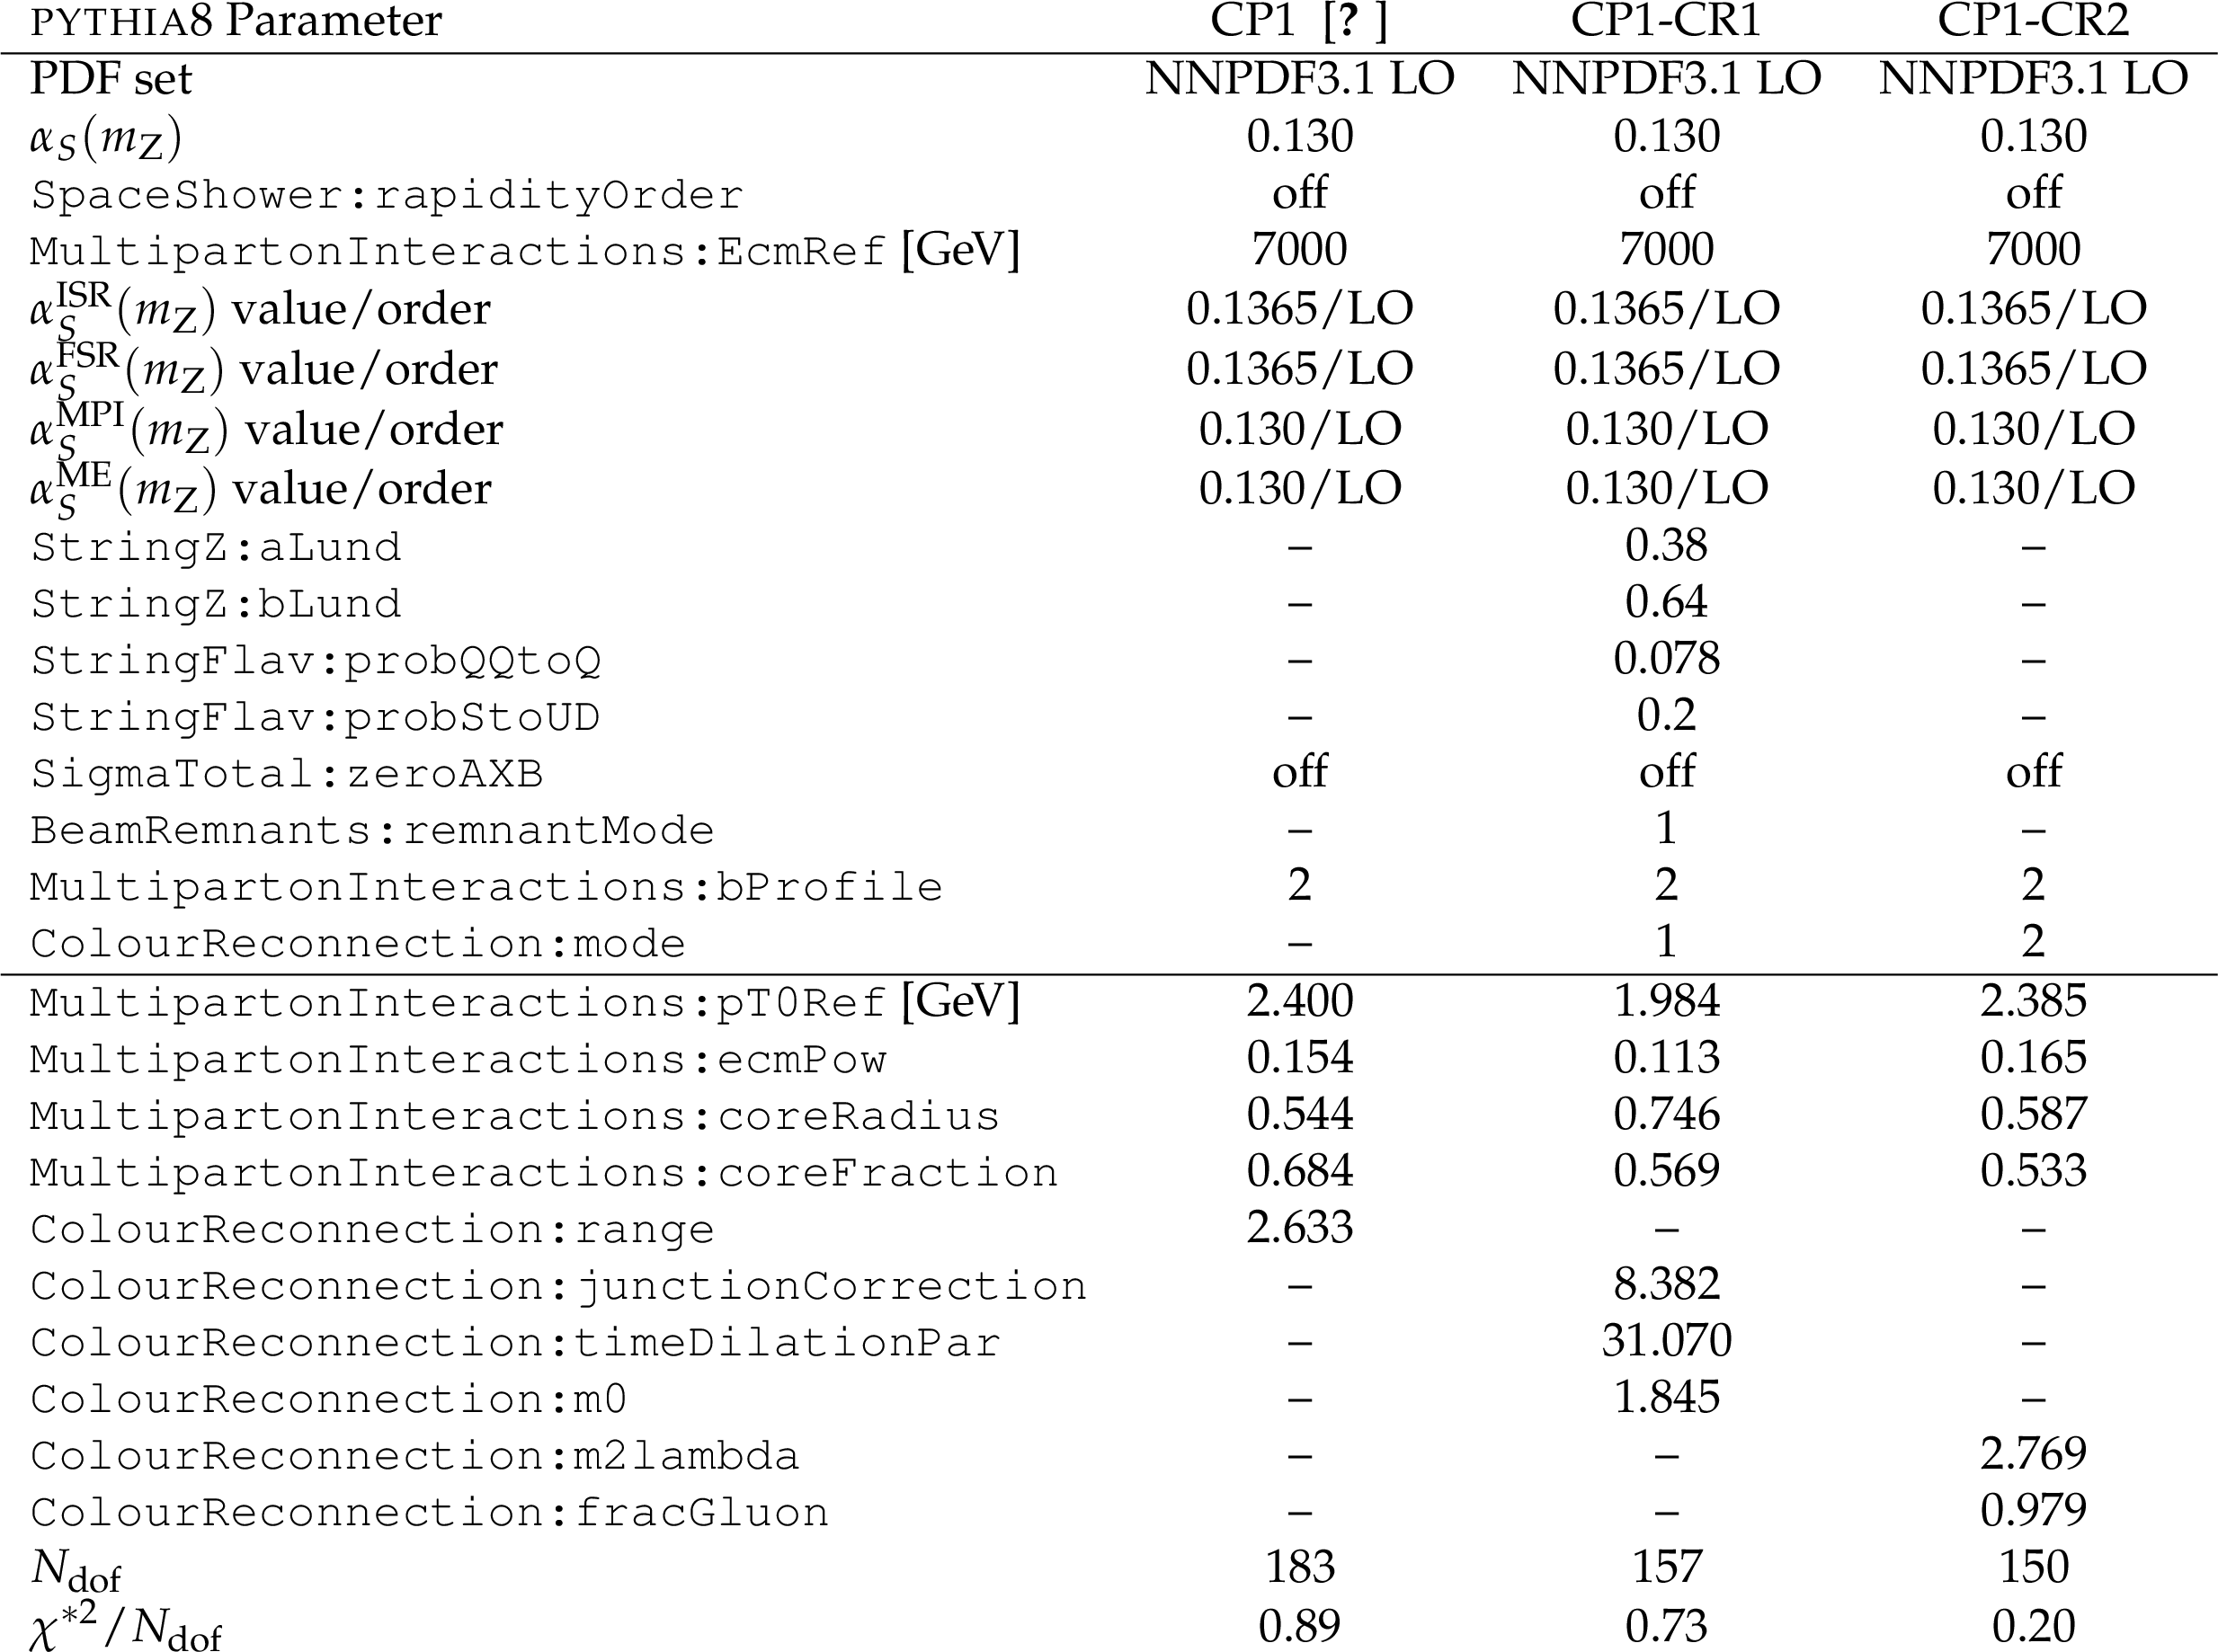
Table 5:
List of input RIVET routines, distributions, x-axis ranges, R of the distributions in the fit, number of bins and the centre-of-mass energy used in the fits to derive the CP1-CR1 and CP1-CR2 tunes. |
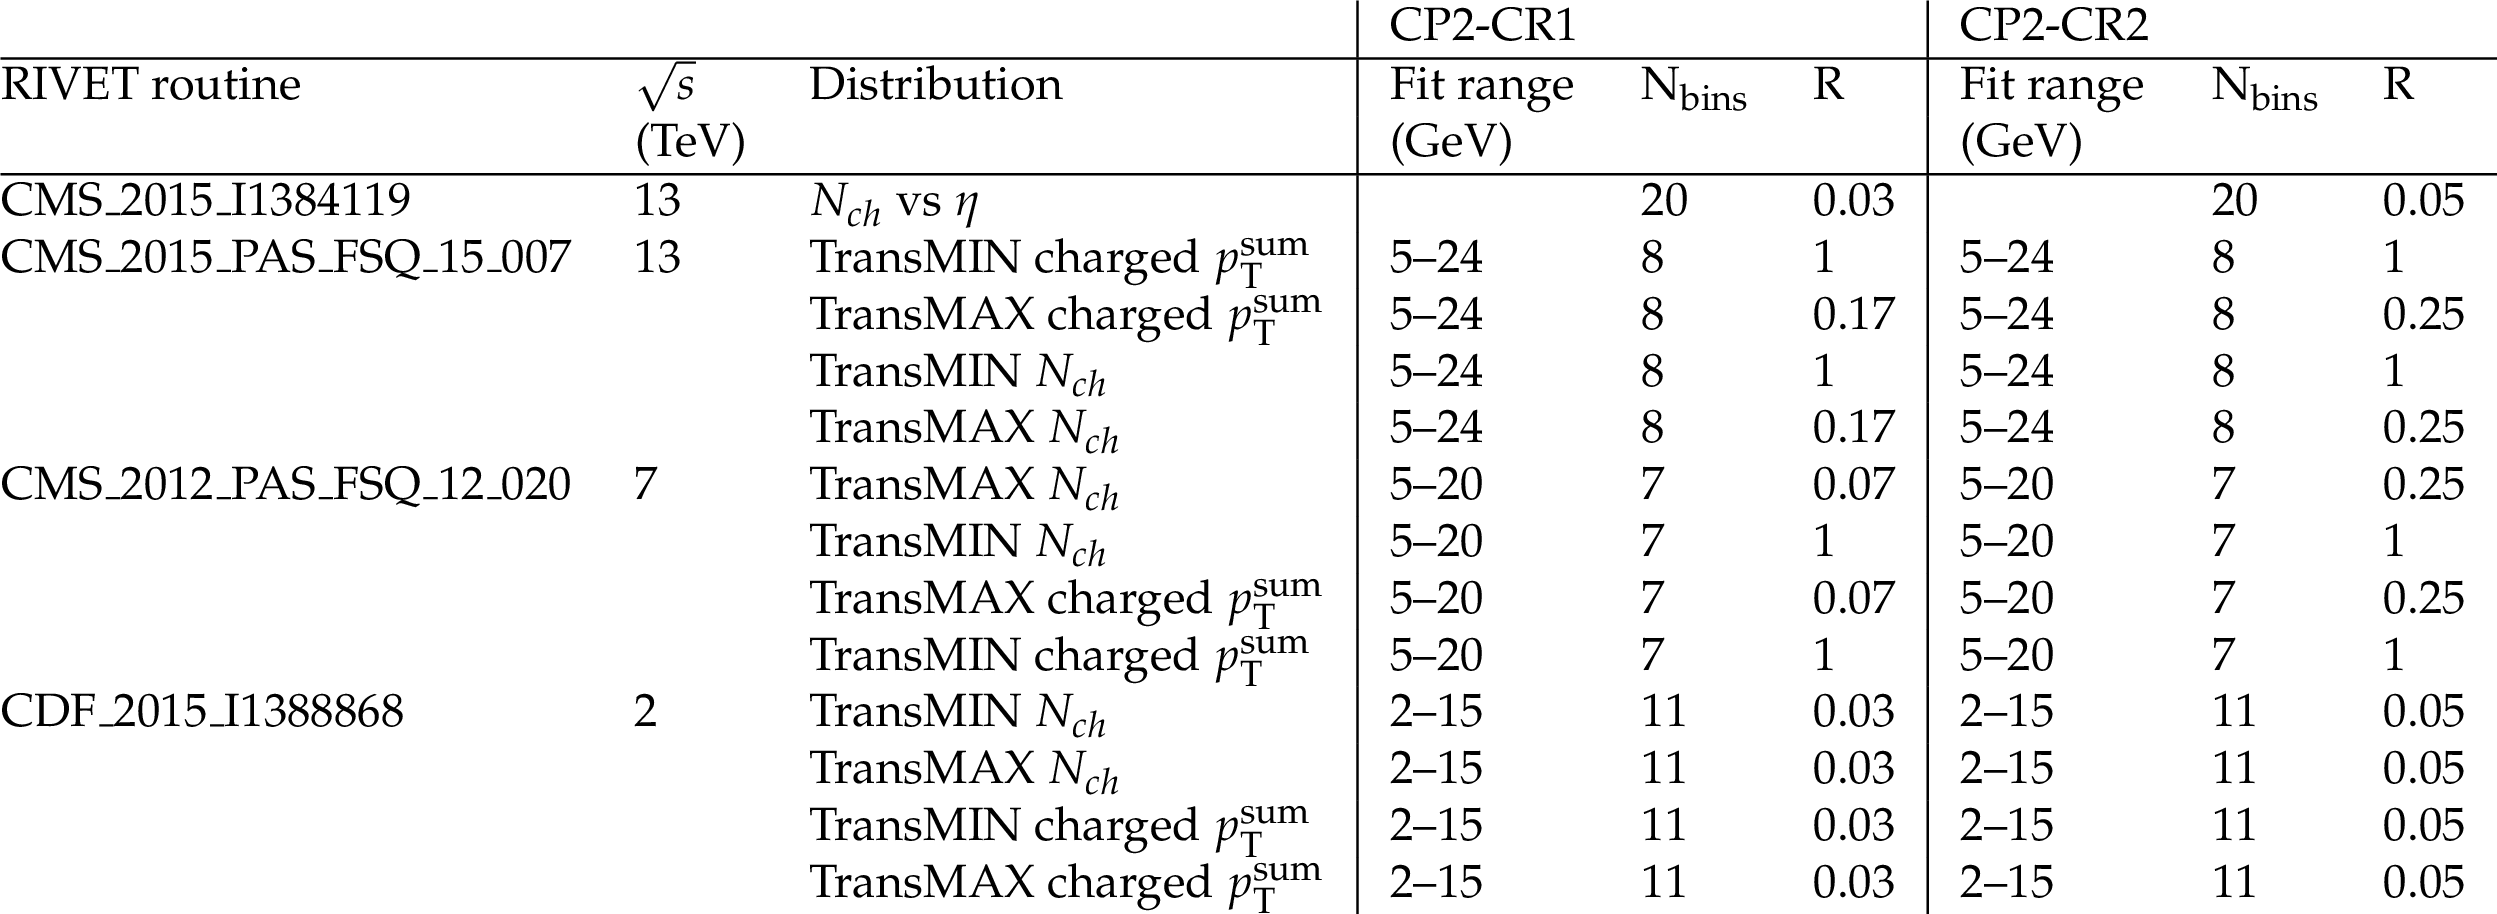
png pdf |
Table 6:
List of input RIVET routines, distributions, x-axis ranges, R of the distributions in the fit, number of bins and the centre-of-mass energy used in the fits to derive the CP2-CR1 and CP2-CR2 tunes. |
png pdf |
Table 7:
The parameters obtained in the fits of the CP1-CR1 and CP1-CR2 tunes, compared to the ones of the tune CP1. The upper part of the table displays the fixed input parameters of the tune, while the lower part shows the fitted tune parameters. The number of degrees of freedom ($N_\text {dof}$) and the goodness of fit divided by the number of degrees of freedom are also shown. |

png pdf |
Table 8:
The parameters obtained in the fits of the CP2-CR1 and CP2-CR2 tunes, compared to the ones of the tune CP2. The upper part of the table displays the fixed input parameters of the tune, while the lower part shows the fitted tune parameters. The number of degrees of freedom ($N_\text {dof}$) and the goodness of fit divided by the number of degrees of freedom are also shown. |
| Summary |
| New sets of parameters for two of the colour reconnection (CR) models, QCD-inspired and gluon-move, implemented in the PYTHIAviii event generator are obtained, based on the default CMS CP5 PYTHIAviii tune. Measurements sensitive to underlying-event (UE) contributions performed at $\sqrt{s}=$ 1.96, 7, and 13 TeV are used to constrain the parameters for the CR and for the multiple parton interactions simultaneously. Different measurements at a centre-of-mass energy of 1.96, 7, 8, and 13 TeV are used to evaluate the performance of the new tunes. The central values predicted by the new CR tunes for the UE and minimum-bias distributions significantly better describe the data than the CR models with their default parameters before tuning. The predictions of the new tunes are able to achieve a very good level of agreement against many underlying-event observables including UE data measured at forward pseudorapidities. However, it should be noted that the models after tuning perform no better than the CP5 tune for the observables presented in this study. The new CR tunes are also tested against measurements of strange particle multiplicities for $\Lambda$ baryons and $K_s^0$ mesons. It is shown that new CR models alone do not improve the description of the strange particle production versus rapidity distribution for $\Lambda$ baryons. It is observed that all CP5 tunes, irrespective of the CR model, describe particle production for $K_S^0$ versus rapidity very well. The predictions of the new tunes to jet shapes and colour flow measurements done with top quark pair events are also compared to data. None of the tunes describe the jet shapes distributions considered in this note well, and all tunes have similar predictions. Some differences are also observed with respect to the colour flow data which is particularly sensitive to the ERD option in the CR models. The differences between the predictions using the different tunes observed here indicate that the inclusion of observables such as the jet pull angle and other jet substructure observables could be beneficial in tuning studies. A study of uncertainty on the top quark mass measurement due to CR effects is also presented which shows that CR will continue to be one of the dominating uncertainty sources in the top quark mass measurements. |
| References | ||||
| 1 | T. Sjostrand et al. | An introduction to Pythia 8.2 | CPC 191 (2015) 159 | 1410.3012 |
| 2 | T. Sjostrand and M. van Zijl | A multiple interaction model for the event structure in hadron collisions | PRD 36 (1987) 2019 | |
| 3 | T. Sjostrand | Colour reconnection and its effects on precise measurements at the LHC | LU-TP 13-37 and MCnet-13-16 | 1310.8073 |
| 4 | S. Gieseke, C. Rohr, and A. Siodmok | Colour reconnections in Herwig++ | EPJC 72 (2012) 2225 | 1206.0041 |
| 5 | S. Gieseke, P. Kirchgae\sser, and S. Platzer | Baryon production from cluster hadronisation | EPJC 78 (2018) 99 | 1710.10906 |
| 6 | T. Sjostrand and P. Z. Skands | Multiple interactions and the structure of beam remnants | JHEP 03 (2004) 053 | hep-ph/0402078 |
| 7 | J. R. Christiansen and P. Z. Skands | String formation beyond leading colour | JHEP 08 (2015) 003 | 1505.01681 |
| 8 | S. Argyropoulos and T. Sjostrand | Effects of color reconnection on $ t\bar{t} $ final states at the LHC | JHEP 11 (2014) 043 | 1407.6653 |
| 9 | CMS Collaboration | Underlying event measurements with leading particles and jets in pp collisions at $ \sqrt{s} = $ 13 TeV | CMS-PAS-FSQ-15-007 | CMS-PAS-FSQ-15-007 |
| 10 | ATLAS Collaboration | Measurement of charged-particle distributions sensitive to the underlying event in $ \sqrt{s}= $ 13 TeV proton-proton collisions with the ATLAS detector at the LHC | JHEP 03 (2017) 157 | 1701.05390 |
| 11 | CMS Collaboration | Measurement of the underlying event activity in pp collisions at the LHC at 7 TeV and comparison with 0.9 TeV | CDS | |
| 12 | ATLAS Collaboration | Measurement of underlying event characteristics using charged particles in pp collisions at $ \sqrt{s} = $ 900 ~GeV and 7 TeV with the ATLAS detector | PRD 83 (2011) 112001 | 1012.0791 |
| 13 | CDF Collaboration | Study of the energy dependence of the underlying event in proton-antiproton collisions | PRD 92 (2015) 092009 | 1508.05340 |
| 14 | CMS Collaboration | Event generator tunes obtained from underlying event and multiparton scattering measurements | EPJC 76 (2016) 155 | CMS-GEN-14-001 1512.00815 |
| 15 | CMS Collaboration | Study of the underlying event in top quark pair production in $ \mathrm {p}\mathrm {p} $ collisions at 13 $ \text {Te}\text {V} $ | EPJC 79 (2019) 123 | CMS-TOP-17-015 1807.02810 |
| 16 | CMS Collaboration | Measurement of the top quark mass with lepton+jets final states using $ \mathrm {p} \mathrm {p} $ collisions at $ \sqrt{s}= $ 13 TeV | EPJC 78 (2018) 891 | CMS-TOP-17-007 1805.01428 |
| 17 | CMS Collaboration | Measurement of pseudorapidity distributions of charged particles in proton-proton collisions at $ \sqrt{s} = $ 13 TeV by the CMS experiment. | CMS-PAS-FSQ-15-008 | CMS-PAS-FSQ-15-008 |
| 18 | CMS Collaboration | Extraction and validation of a new set of CMS PYTHIA8 tunes from underlying-event measurements | EPJC 80 (2020) 4 | CMS-GEN-17-001 1903.12179 |
| 19 | NNPDF Collaboration | Parton distributions from high-precision collider data | EPJC 77 (2017) 663 | 1706.00428 |
| 20 | CMS Collaboration | Pseudorapidity distribution of charged hadrons in proton-proton collisions at $ \sqrt{s} = $ 13 TeV | PLB 751 (2015) 143 | CMS-FSQ-15-001 1507.05915 |
| 21 | P. Skands, S. Carrazza, and J. Rojo | Tuning PYTHIA 8.1: the Monash 2013 tune | EPJC 74 (2014) 3024 | 1404.5630 |
| 22 | A. Buckley et al. | Systematic event generator tuning for the LHC | EPJC 65 (2010) 331 | 0907.2973 |
| 23 | A. Buckley et al. | Rivet user manual | CPC 184 (2013) 2803 | 1003.0694 |
| 24 | CMS Collaboration | Shape, transverse size, and charged hadron multiplicity of jets in pp collisions at 7 TeV | JHEP 06 (2012) 160 | CMS-QCD-10-029 1204.3170 |
| 25 | ATLAS Collaboration | Measurement of the jet fragmentation function and transverse profile in proton-proton collisions at a center-of-mass energy of 7 TeV with the ATLAS detector | EPJC 71 (2011) 1795 | 1109.5816 |
| 26 | ATLAS Collaboration | Measurement of the charged-particle multiplicity inside jets from $ \sqrt{s}=8 TeV pp $ collisions with the ATLAS detector | EPJC 76 (2016) 322 | 1602.00988 |
| 27 | CMS Collaboration | Pseudorapidity distributions of charged particles in pp collisions at $ \sqrt{s}= $ 7 ~TeV with at least one central charged particles | ||
| 28 | CMS Collaboration | Measurement of the energy density as a function of pseudorapidity in proton-proton collisions at $ \sqrt{s} = $ 13 TeV | EPJC 79 (2019) 391 | CMS-FSQ-15-006 1812.04095 |
| 29 | CMS Collaboration | Strange particle production in pp collisions at $ \sqrt{s}= $ 0.9 and 7 TeV | JHEP 05 (2011) 064 | CMS-QCD-10-007 1102.4282 |
| 30 | C. Bierlich, G. Gustafson, and L. Lonnblad | A shoving model for collectivity in hadronic collisions | LU-TP 16-64 and MCnet-16-48 | 1612.05132 |
| 31 | C. Bierlich | Rope hadronization and strange particle production | EPJ Web Conf. 171 (2018) 14003 | 1710.04464 |
| 32 | CMS Collaboration | Measurement of charged pion, kaon, and proton production in proton-proton collisions at $ \sqrt{s}= $ 13 TeV | PRD 96 (2017) 112003 | CMS-FSQ-16-004 1706.10194 |
| 33 | L. Gladilin | Charm hadron production fractions | technical report, 12 | hep-ex/9912064 |
| 34 | DELPHI Collaboration | Tuning and test of fragmentation models based on identified particles and precision event shape data | Z. Phys. C 73 (1996) 11 | |
| 35 | CMS Collaboration | Measurement of the underlying event activity in inclusive Z boson production in proton-proton collisions at $ \sqrt{s}= $ 13 TeV | JHEP 07 (2018) 032 | CMS-FSQ-16-008 1711.04299 |
| 36 | J. Alwall et al. | The automated computation of tree-level and next-to-leading order differential cross sections, and their matching to parton shower simulations | JHEP 07 (2014) 079 | 1405.0301 |
| 37 | R. Frederix and S. Frixione | Merging meets matching in MC@NLO | JHEP 12 (2012) 061 | 1209.6215 |
| 38 | C. Bierlich, G. Gustafson, L. Lonnblad, and A. Tarasov | Effects of overlapping strings in pp collisions | JHEP 03 (2015) 148 | 1412.6259 |
| 39 | C. Bierlich and J. R. Christiansen | Effects of color reconnection on hadron flavor observables | PRD 92 (2015) 094010 | 1507.02091 |
| 40 | CMS Collaboration | Measurement of jet substructure observables in $ \mathrm{t\overline{t}} $ events from proton-proton collisions at $ \sqrt{s}= $ 13 TeV | PRD 98 (2018) 092014 | CMS-TOP-17-013 1808.07340 |
| 41 | M. Cacciari, G. P. Salam, and G. Soyez | The anti-$ k_t $ jet clustering algorithm | JHEP 04 (2008) 063 | 0802.1189 |
| 42 | M. Cacciari, G. P. Salam, and G. Soyez | FastJet user manual | EPJC 72 (2012) 1896 | 1111.6097 |
| 43 | M. Dasgupta, A. Fregoso, S. Marzani, and G. P. Salam | Towards an understanding of jet substructure | JHEP 09 (2013) | 1307.0007 |
| 44 | A. J. Larkoski, S. Marzani, G. Soyez, and J. Thaler | Soft drop | JHEP 05 (2014) 146 | 1402.2657 |
| 45 | ATLAS Collaboration | Measurement of colour flow with the jet pull angle in $ {\rm t\bar{t}} $ events using the ATLAS detector at $ \sqrt{s}= $ 8 TeV | PLB 750 (2015) 475 | 1506.05629 |
| 46 | ATLAS Collaboration | Measurement of colour flow using jet-pull observables in $ {\rm t\bar{t}} $ events with the ATLAS experiment at $ \sqrt{s} = 13 \hbox {TeV} $ | EPJC 78 (2018) 847 | 1805.02935 |
| 47 | ATLAS, CDF, CMS, D0 Collaboration | First combination of Tevatron and LHC measurements of the top-quark mass | atlas-conf-2014-008; cdf-note-11071; cms-pas-top-13-014; d0-note-6416; fermilab-tm-2582-e | 1403.4427 |
| 48 | ATLAS Collaboration | Measurement of the top-quark mass in the fully hadronic decay channel from ATLAS data at $ \sqrt{s}=7\mathrm{ TeV} $ | EPJC 75 (2015) 158 | 1409.0832 |
| 49 | ATLAS Collaboration | Measurement of the top quark mass in the $ {\rm t\bar{t}}\rightarrow \text{lepton+jets} $ and $ {\rm t\bar{t}}\rightarrow \text{dilepton} $ channels using $ \sqrt{s}= 7 {\mathrm {TeV}} $ ATLAS data | EPJC 75 (2015) 330 | 1503.05427 |
| 50 | ATLAS Collaboration | Measurement of the top quark mass in the $ {\rm t\bar{t}}\to $ dilepton channel from $ \sqrt{s}= $ 8 TeV ATLAS data | PLB 761 (2016) 350 | 1606.02179 |
| 51 | ATLAS Collaboration | Top-quark mass measurement in the all-hadronic $ {\rm t\overline{t}} $ decay channel at $ \sqrt{s}= $ 8 TeV with the ATLAS detector | JHEP 09 (2017) 118 | 1702.07546 |
| 52 | ATLAS Collaboration | Measurement of the top quark mass in the $ {\rm t\bar{t}}\rightarrow $ lepton+jets channel from $ \sqrt{s}= $ 8 TeV ATLAS data and combination with previous results | EPJC 79 (2019) 290 | 1810.01772 |
| 53 | CMS Collaboration | Measurement of the top quark mass using proton-proton data at $ {\sqrt{s}} = $ 7 and 8 TeV | PRD 93 (2016) 072004 | CMS-TOP-14-022 1509.04044 |
| 54 | CMS Collaboration | Measurement of the top-quark mass in $ {\rm t\bar{t}} $ events with lepton+jets final states in $ pp $ collisions at $ \sqrt{s}= $ 7 TeV | JHEP 12 (2012) 105 | CMS-TOP-11-015 1209.2319 |
| 55 | CMS Collaboration | Measurement of the Top-Quark Mass in $ {\rm t\bar{t}} $ Events with Dilepton Final States in $ pp $ Collisions at $ \sqrt{s}= $ 7 TeV | EPJC 72 (2012) 2202 | CMS-TOP-11-016 1209.2393 |
| 56 | CMS Collaboration | Measurement of the top-quark mass in all-jets $ {\rm t\bar{t}} $ events in pp collisions at $ \sqrt{s} = $ 7 TeV | EPJC 74 (2014) 2758 | CMS-TOP-11-017 1307.4617 |
| 57 | CMS Collaboration | Measurement of the top quark mass using single top quark events in proton-proton collisions at $ \sqrt{s}= $ 8 TeV | EPJC 77 (2017) 354 | CMS-TOP-15-001 1703.02530 |
| 58 | CMS Collaboration | Measurement of the $ \mathrm{t}\overline{\mathrm{t}} $ production cross section, the top quark mass, and the strong coupling constant using dilepton events in pp collisions at $ \sqrt{s} = $ 13 TeV | EPJC 79 (2019) 368 | CMS-TOP-17-001 1812.10505 |
| 59 | CMS Collaboration | Measurement of the top quark mass in the all-jets final state at $ \sqrt{s} = $ 13 TeV and combination with the lepton+jets channel | EPJC 79 (2019) 313 | CMS-TOP-17-008 1812.10534 |
| 60 | CMS Collaboration | Investigations of the impact of the parton shower tuning in PYTHIA 8 in the modelling of $ \mathrm{t\overline{t}} $ at $ \sqrt{s}= $ 8 and 13 TeV | CMS-PAS-TOP-16-021 | CMS-PAS-TOP-16-021 |
|
|
Compact Muon Solenoid LHC, CERN |
|

|

|

|

|

|