

Compact Muon Solenoid
LHC, CERN
| CMS-SUS-23-012 ; CERN-EP-2025-100 | ||
| Search for dark matter produced in association with a Higgs boson decaying to a $ \tau $ lepton pair in proton-proton collisions at $ \sqrt{s}= $ 13 TeV | ||
| CMS Collaboration | ||
| 4 June 2025 | ||
| JHEP 10 (2025) 170 | ||
| Abstract: A search for dark matter particles produced in association with a Higgs boson decaying into a pair of $ \tau $ leptons is performed using data collected in proton-proton collisions at a center-of-mass energy of 13 TeV with the CMS detector. The analysis is based on a data set corresponding to an integrated luminosity of 101 fb$ ^{-1} $ collected in 2017-2018. No significant excess over the expected standard model background is observed. This result is interpreted within the frameworks of the 2HDM+a and baryonic Z' benchmark simplified models. The 2HDM+a model is a type-II two-Higgs-doublet model featuring a heavy pseudoscalar with an additional light pseudoscalar. Upper limits at 95% confidence level are set on the product of the production cross section and the branching fraction for each of these two simplified models. Heavy pseudoscalar boson masses between 400 and 700 GeV are excluded for a light pseudoscalar mass of 100 GeV. For the baryonic Z' model, a statistical combination is made with an earlier search based on a data set of 36 fb$ ^{-1} $ collected in 2016. In this model, Z' boson masses up to 1050 GeV are excluded for a dark matter particle mass of 1 GeV. | ||
| Links: e-print arXiv:2506.04431 [hep-ex] (PDF) ; CDS record ; inSPIRE record ; CADI line (restricted) ; | ||
| Figures | |
png pdf |
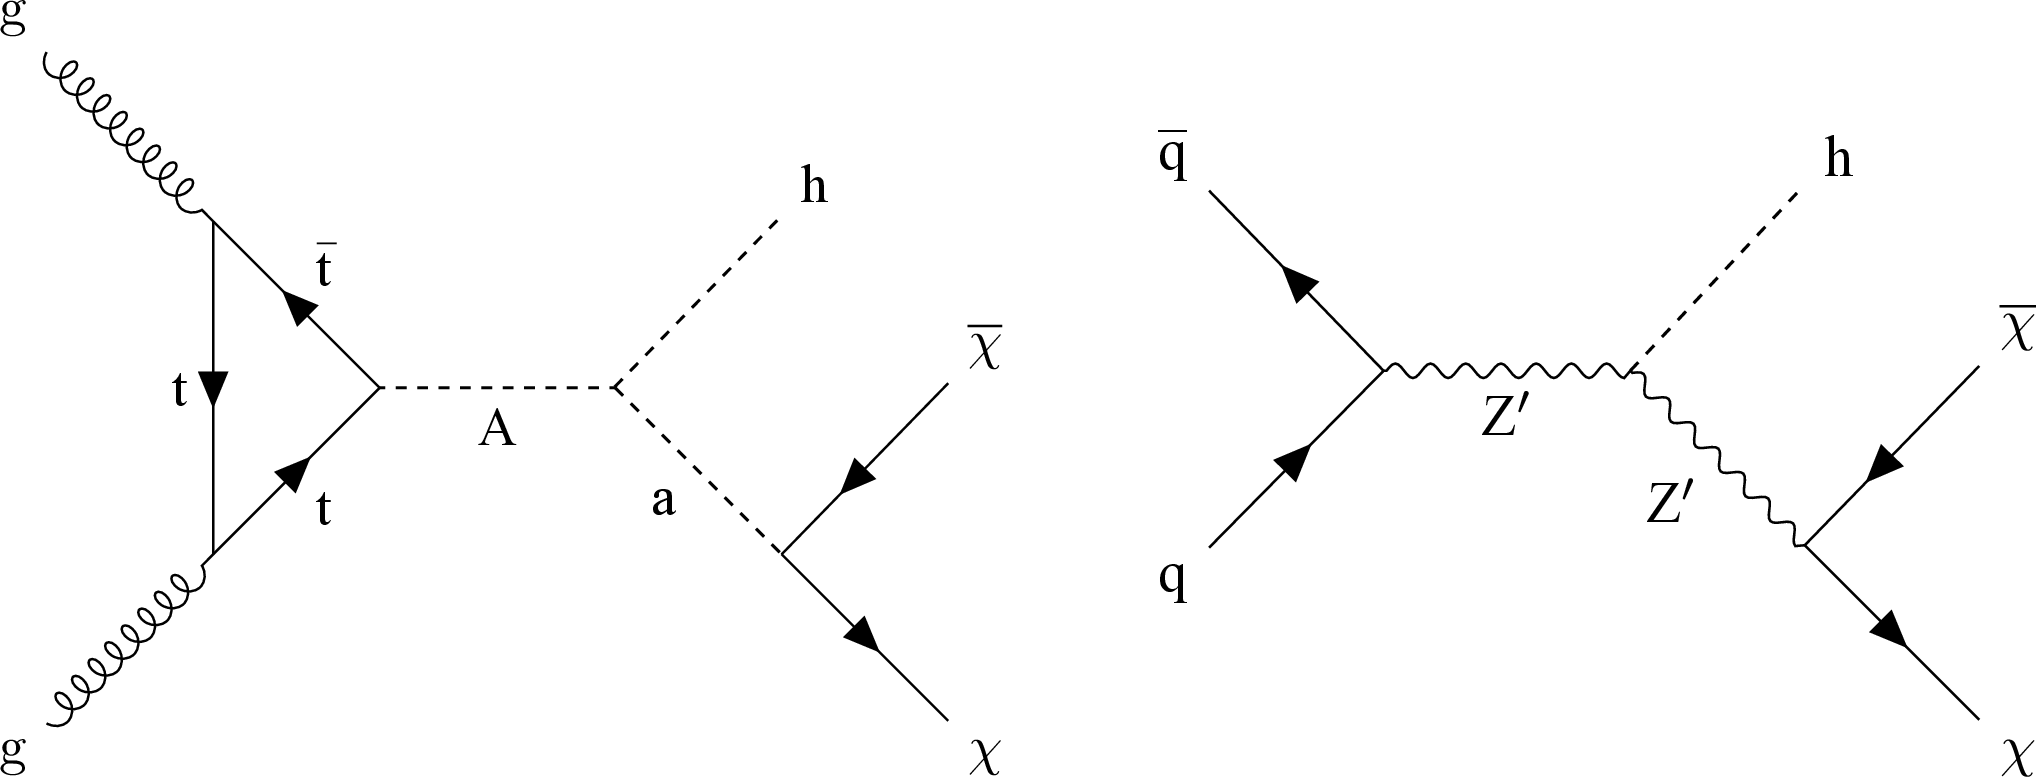
Figure 1:
Representative Feynman diagrams for leading order DM-associated production of a Higgs boson in the 2HDM+a} (left) and baryonic Z' (right) models. |
png pdf |
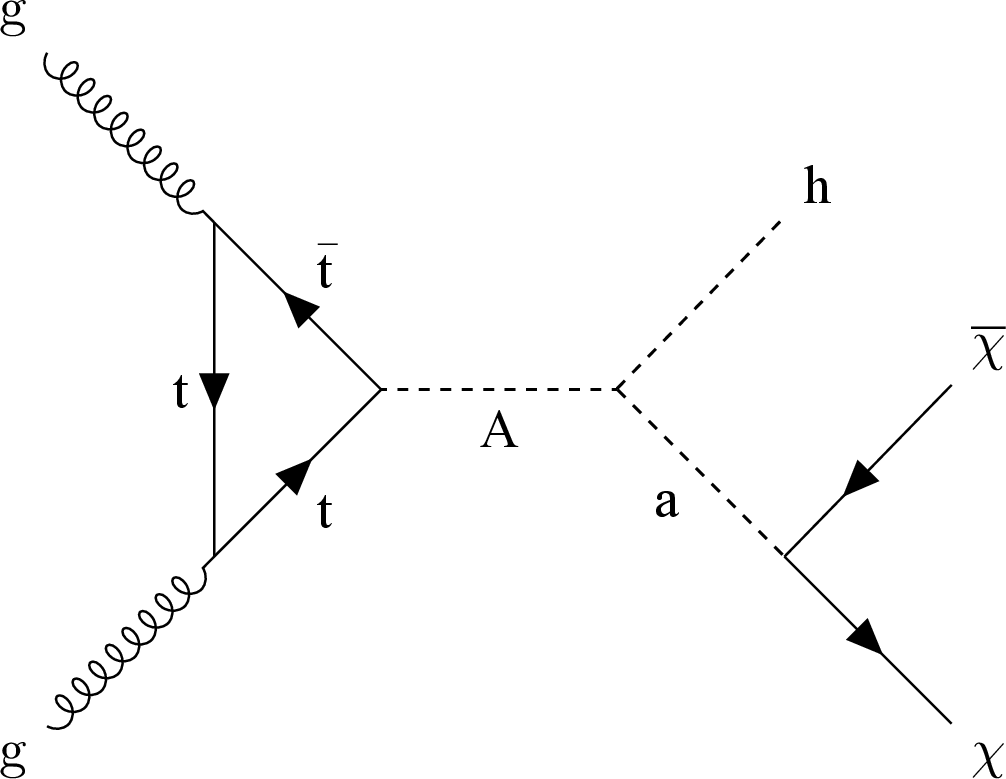
Figure 1-a:
Representative Feynman diagrams for leading order DM-associated production of a Higgs boson in the 2HDM+a} (left) and baryonic Z' (right) models. |
png pdf |
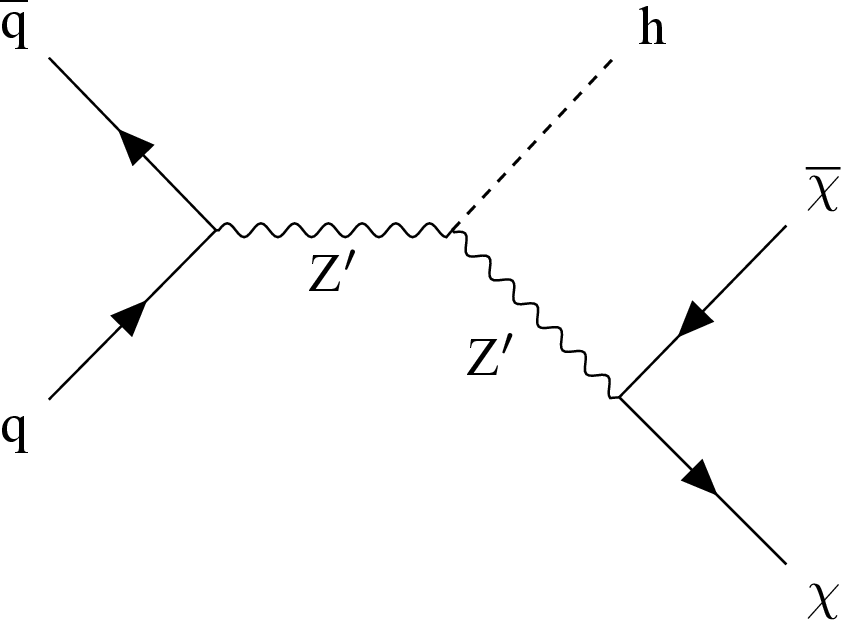
Figure 1-b:
Representative Feynman diagrams for leading order DM-associated production of a Higgs boson in the 2HDM+a} (left) and baryonic Z' (right) models. |
png pdf |
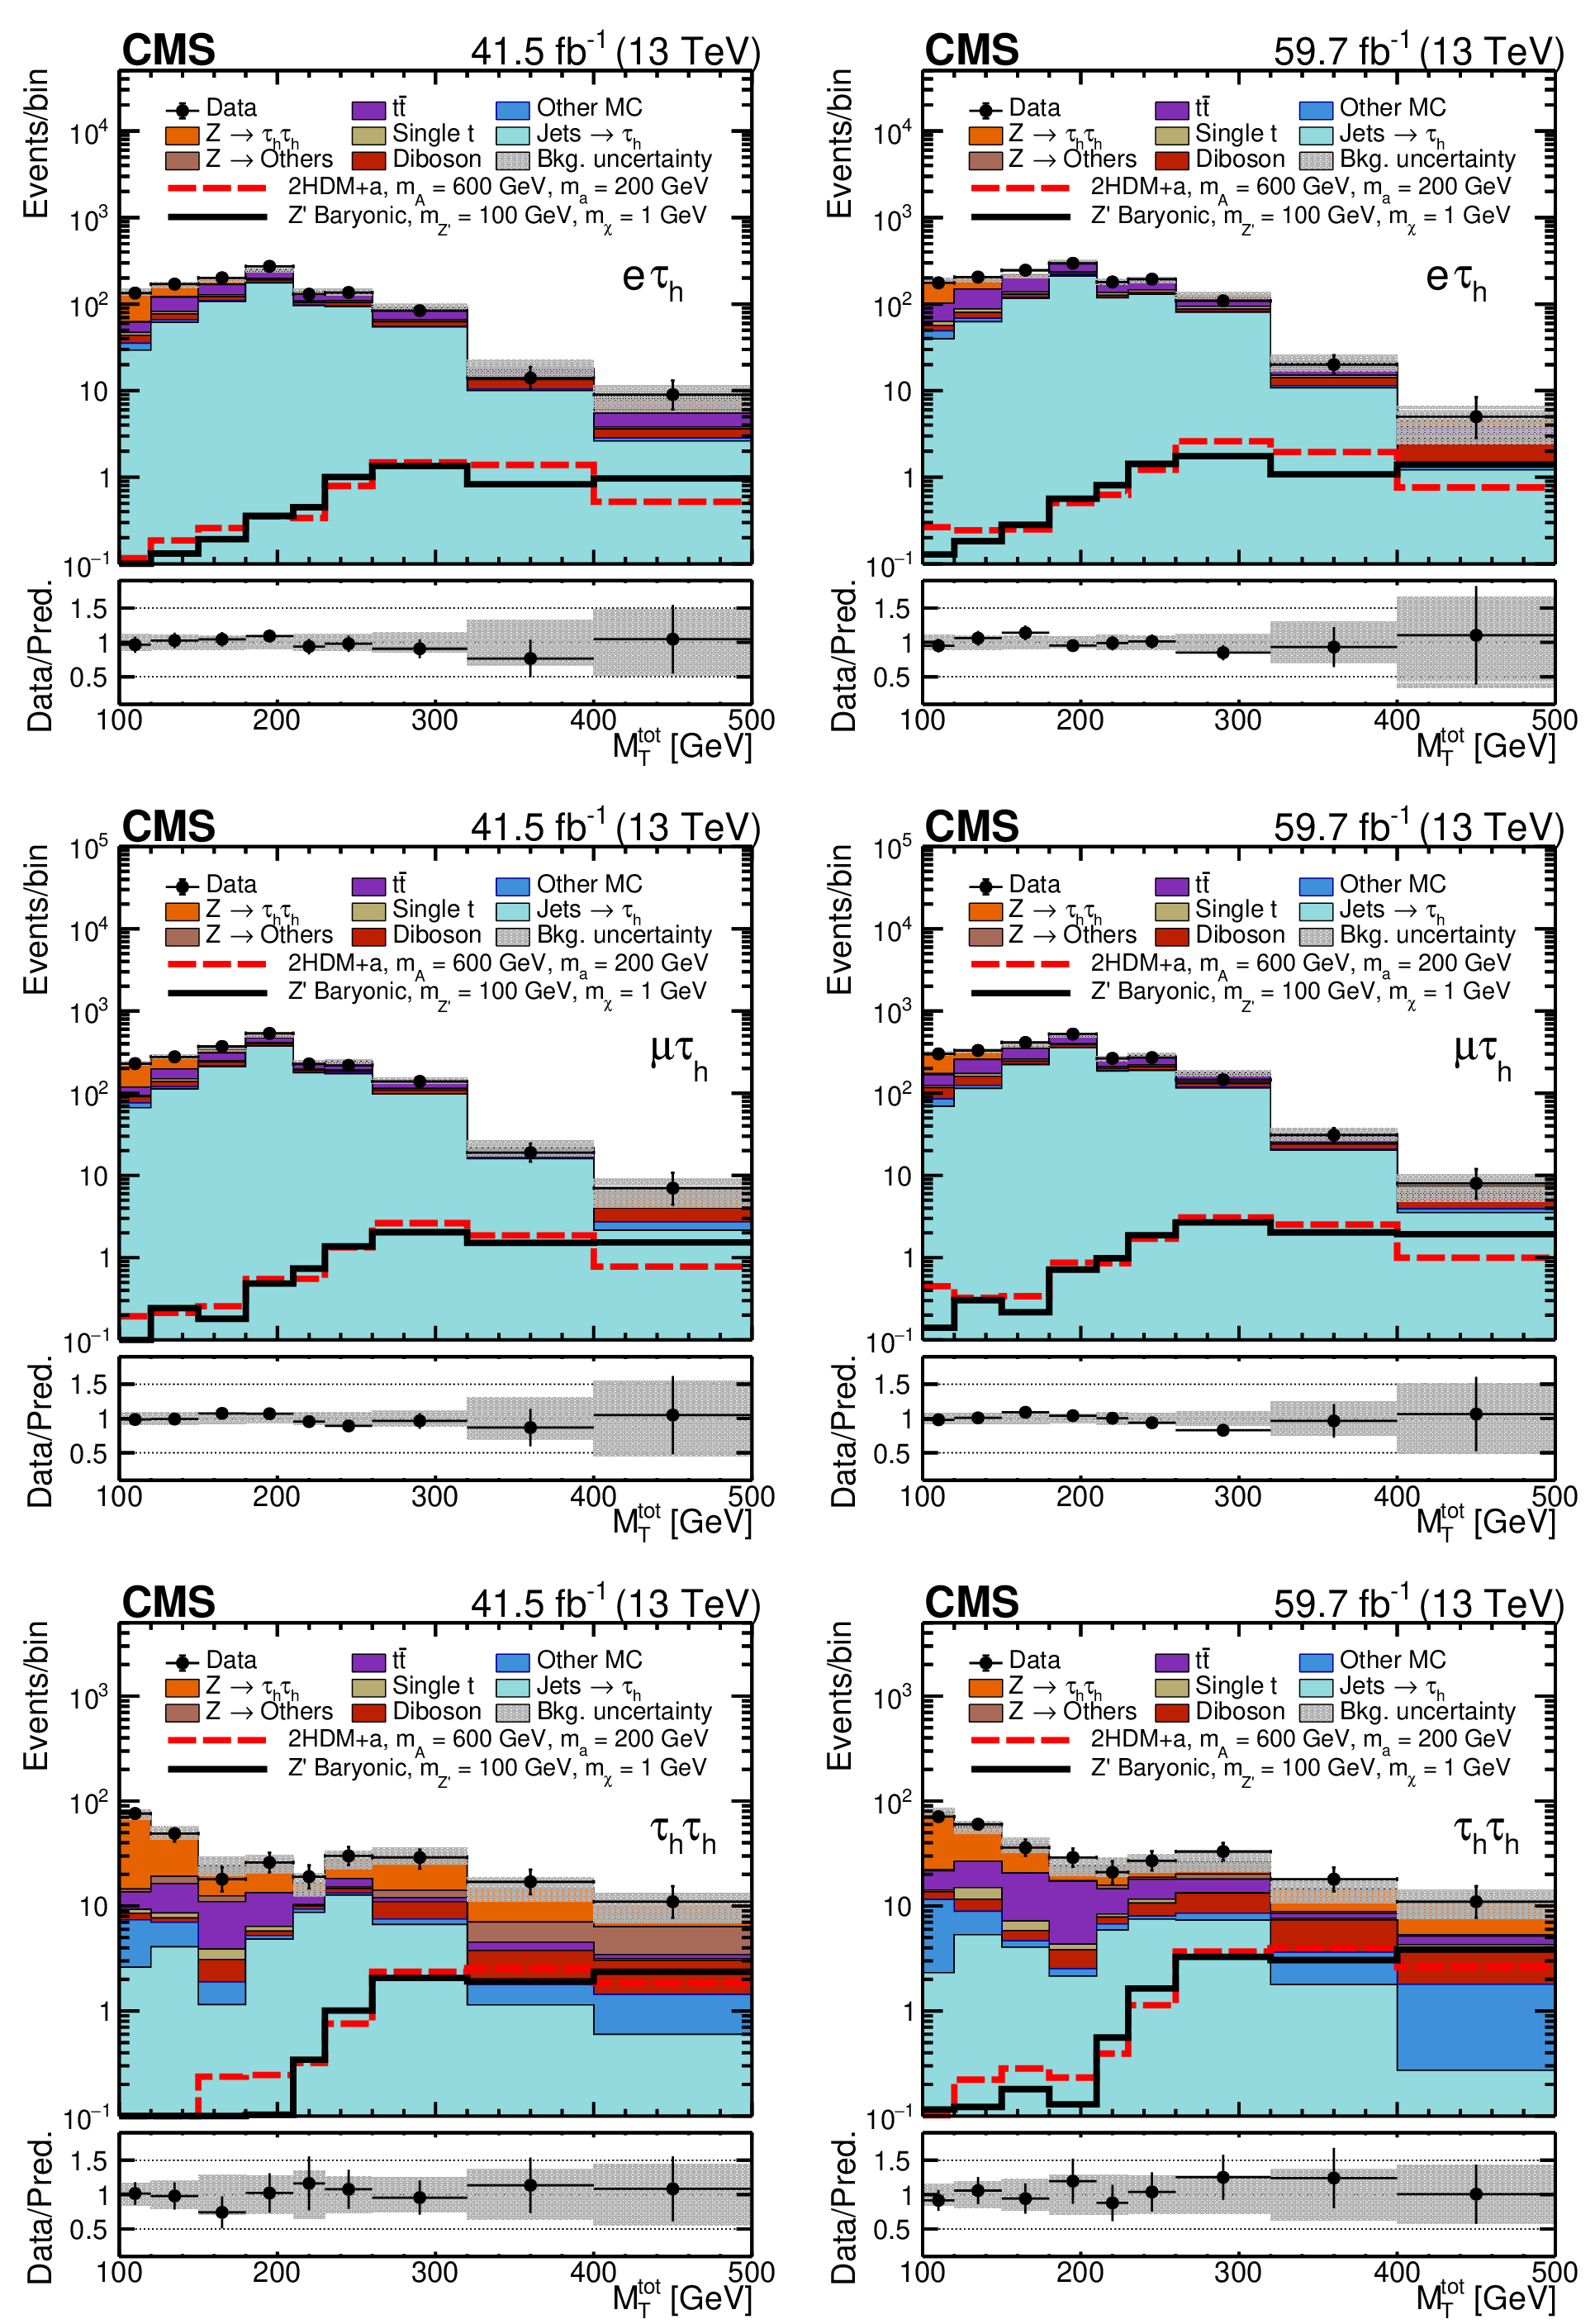
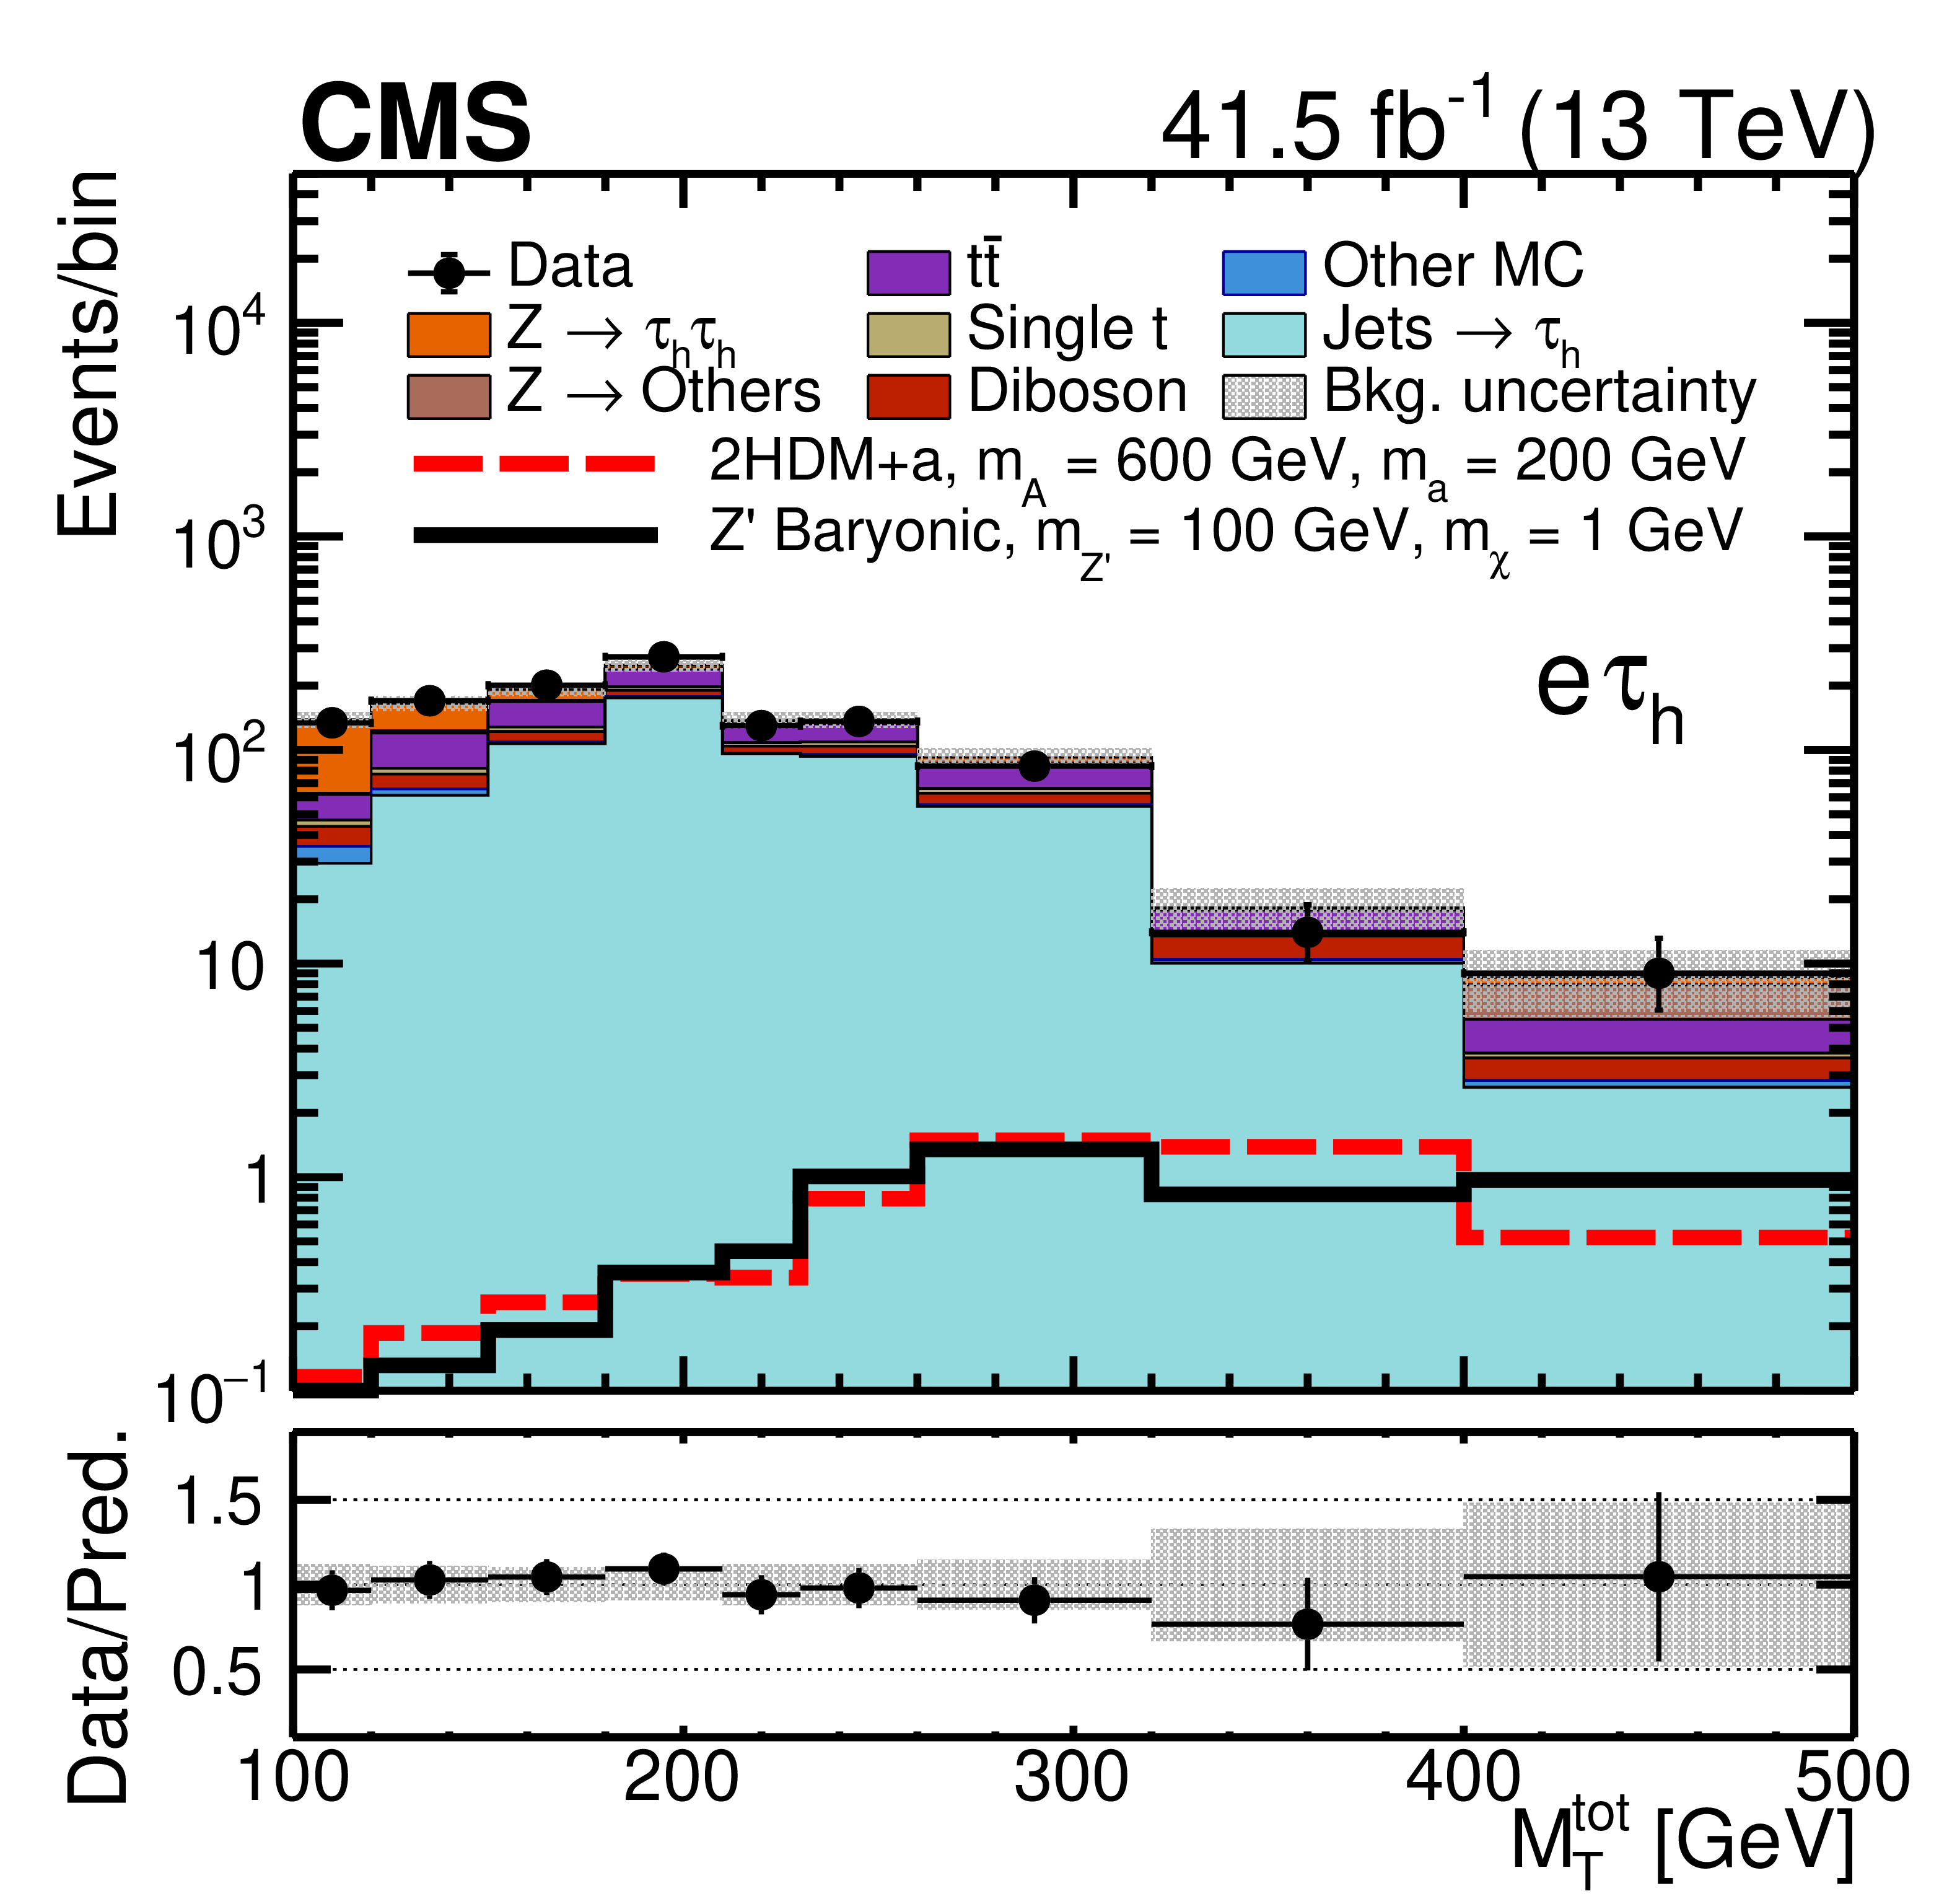
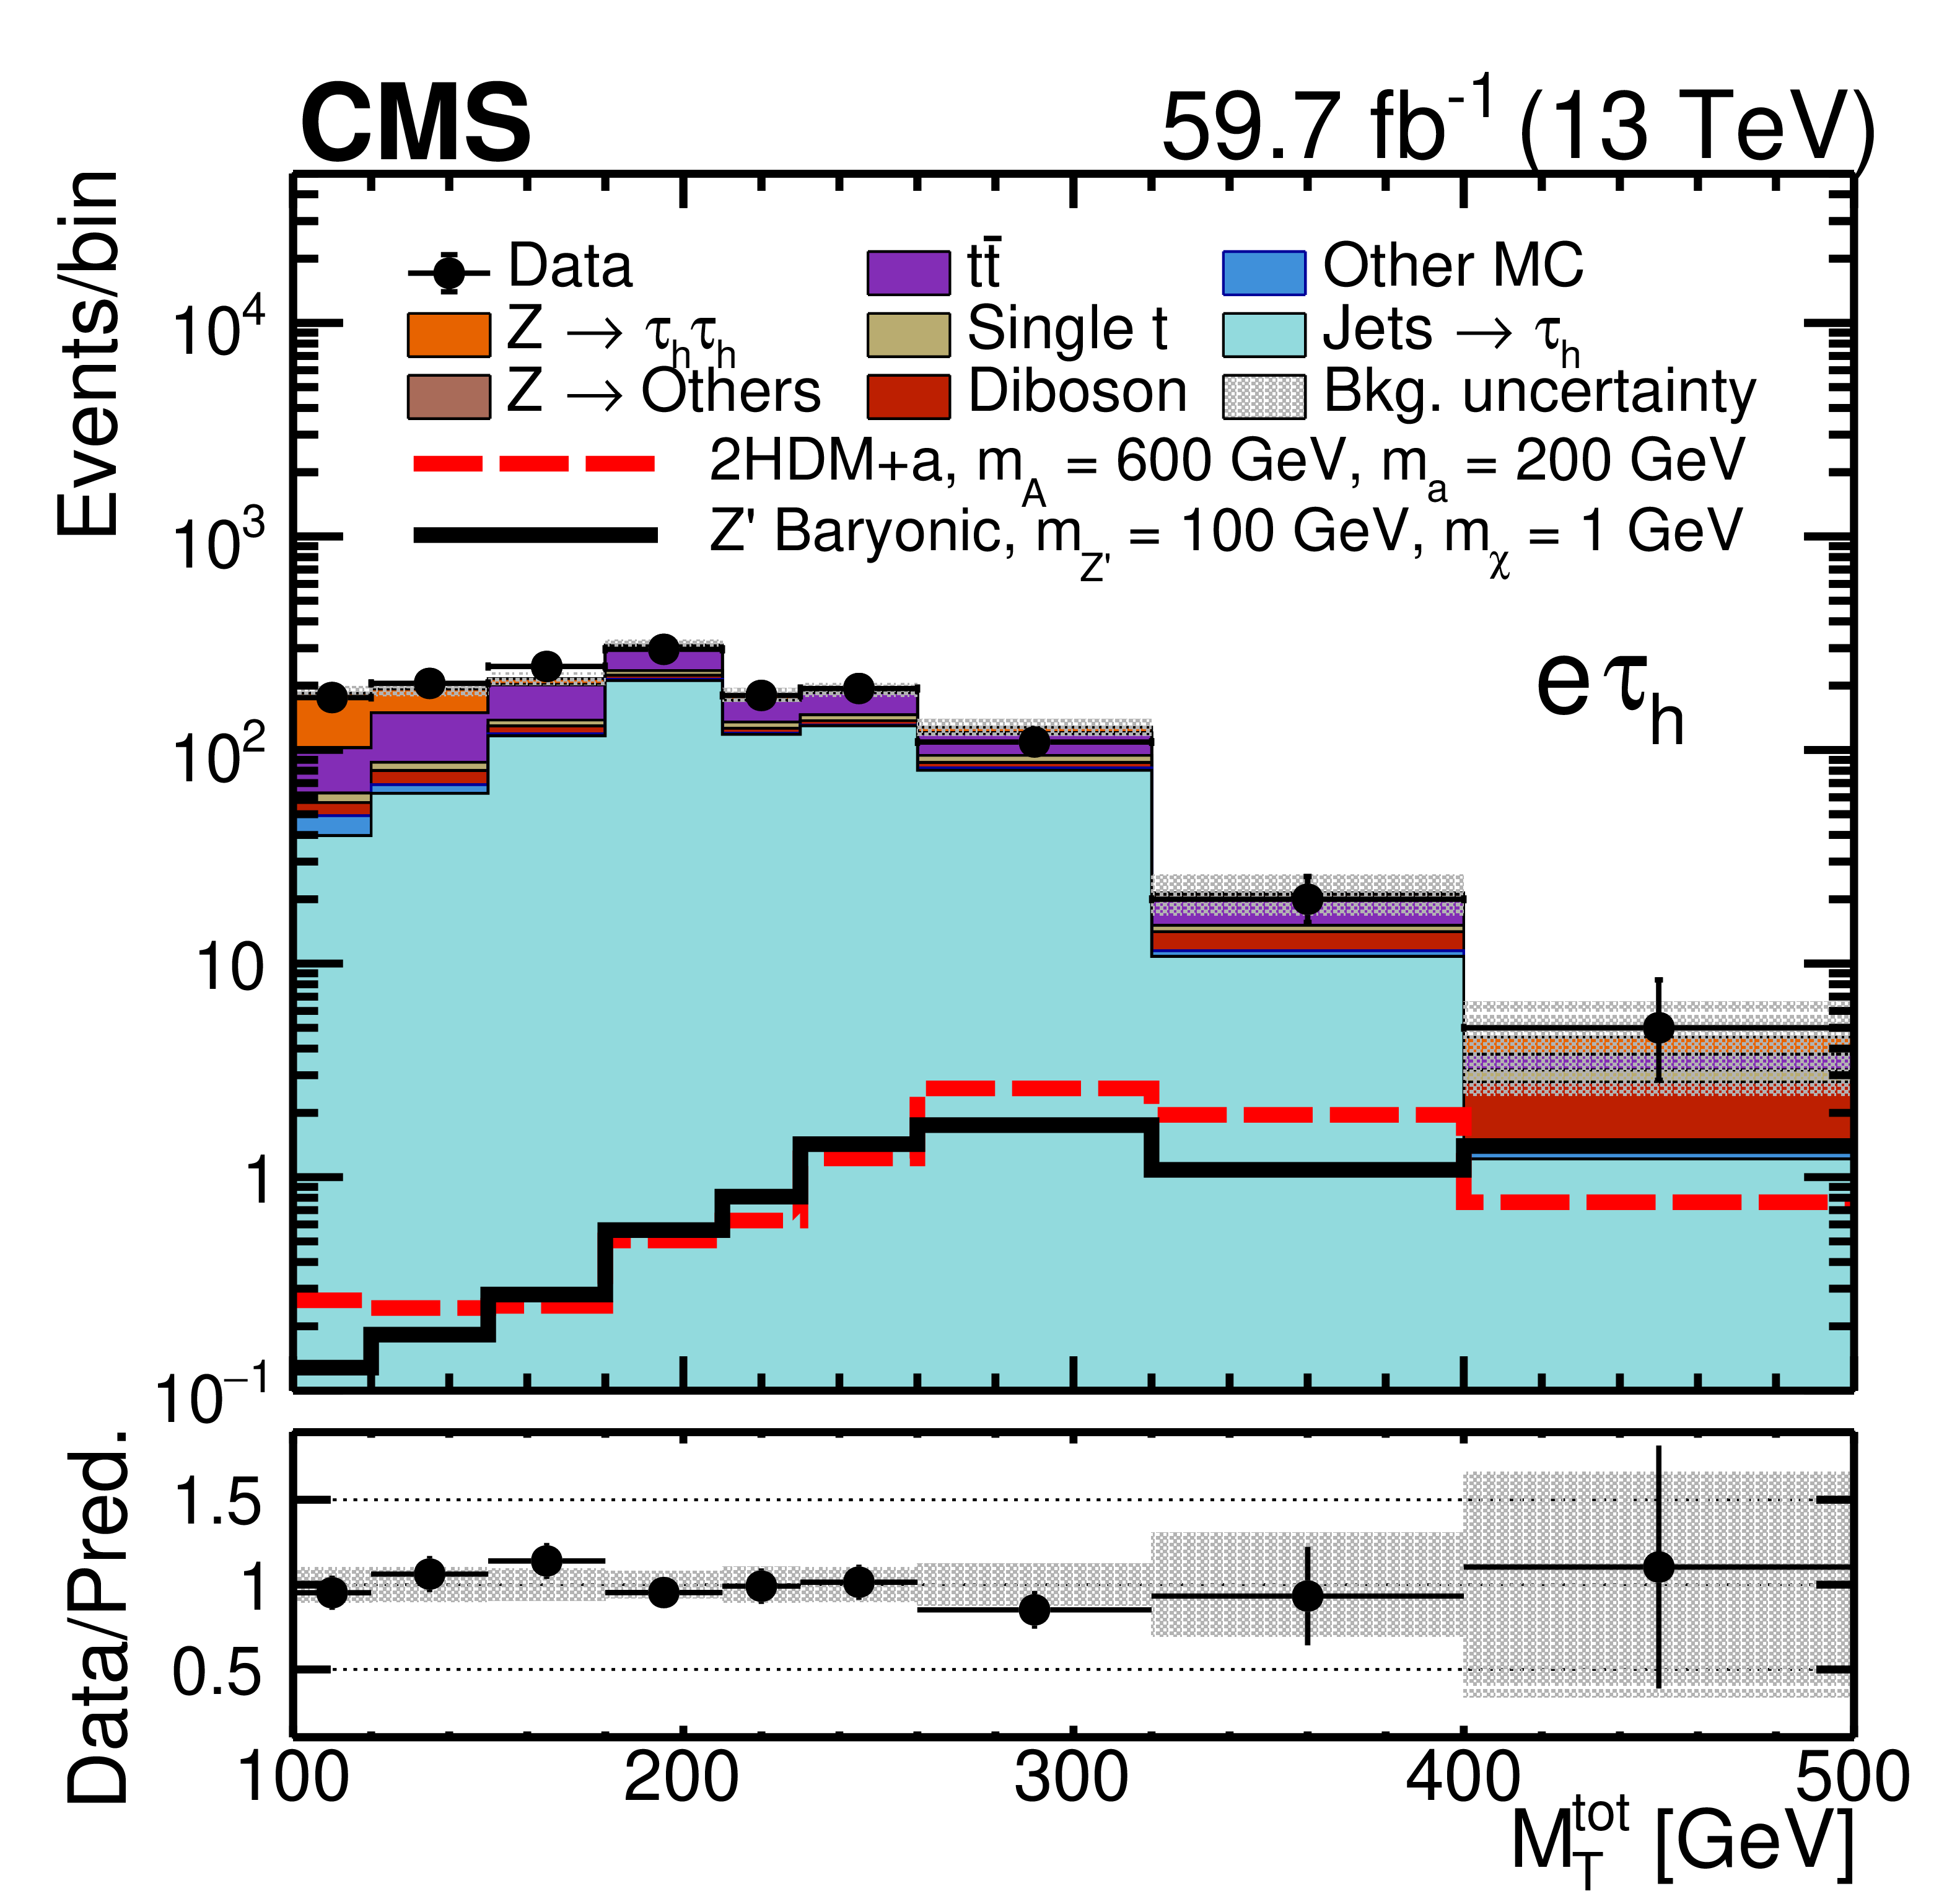
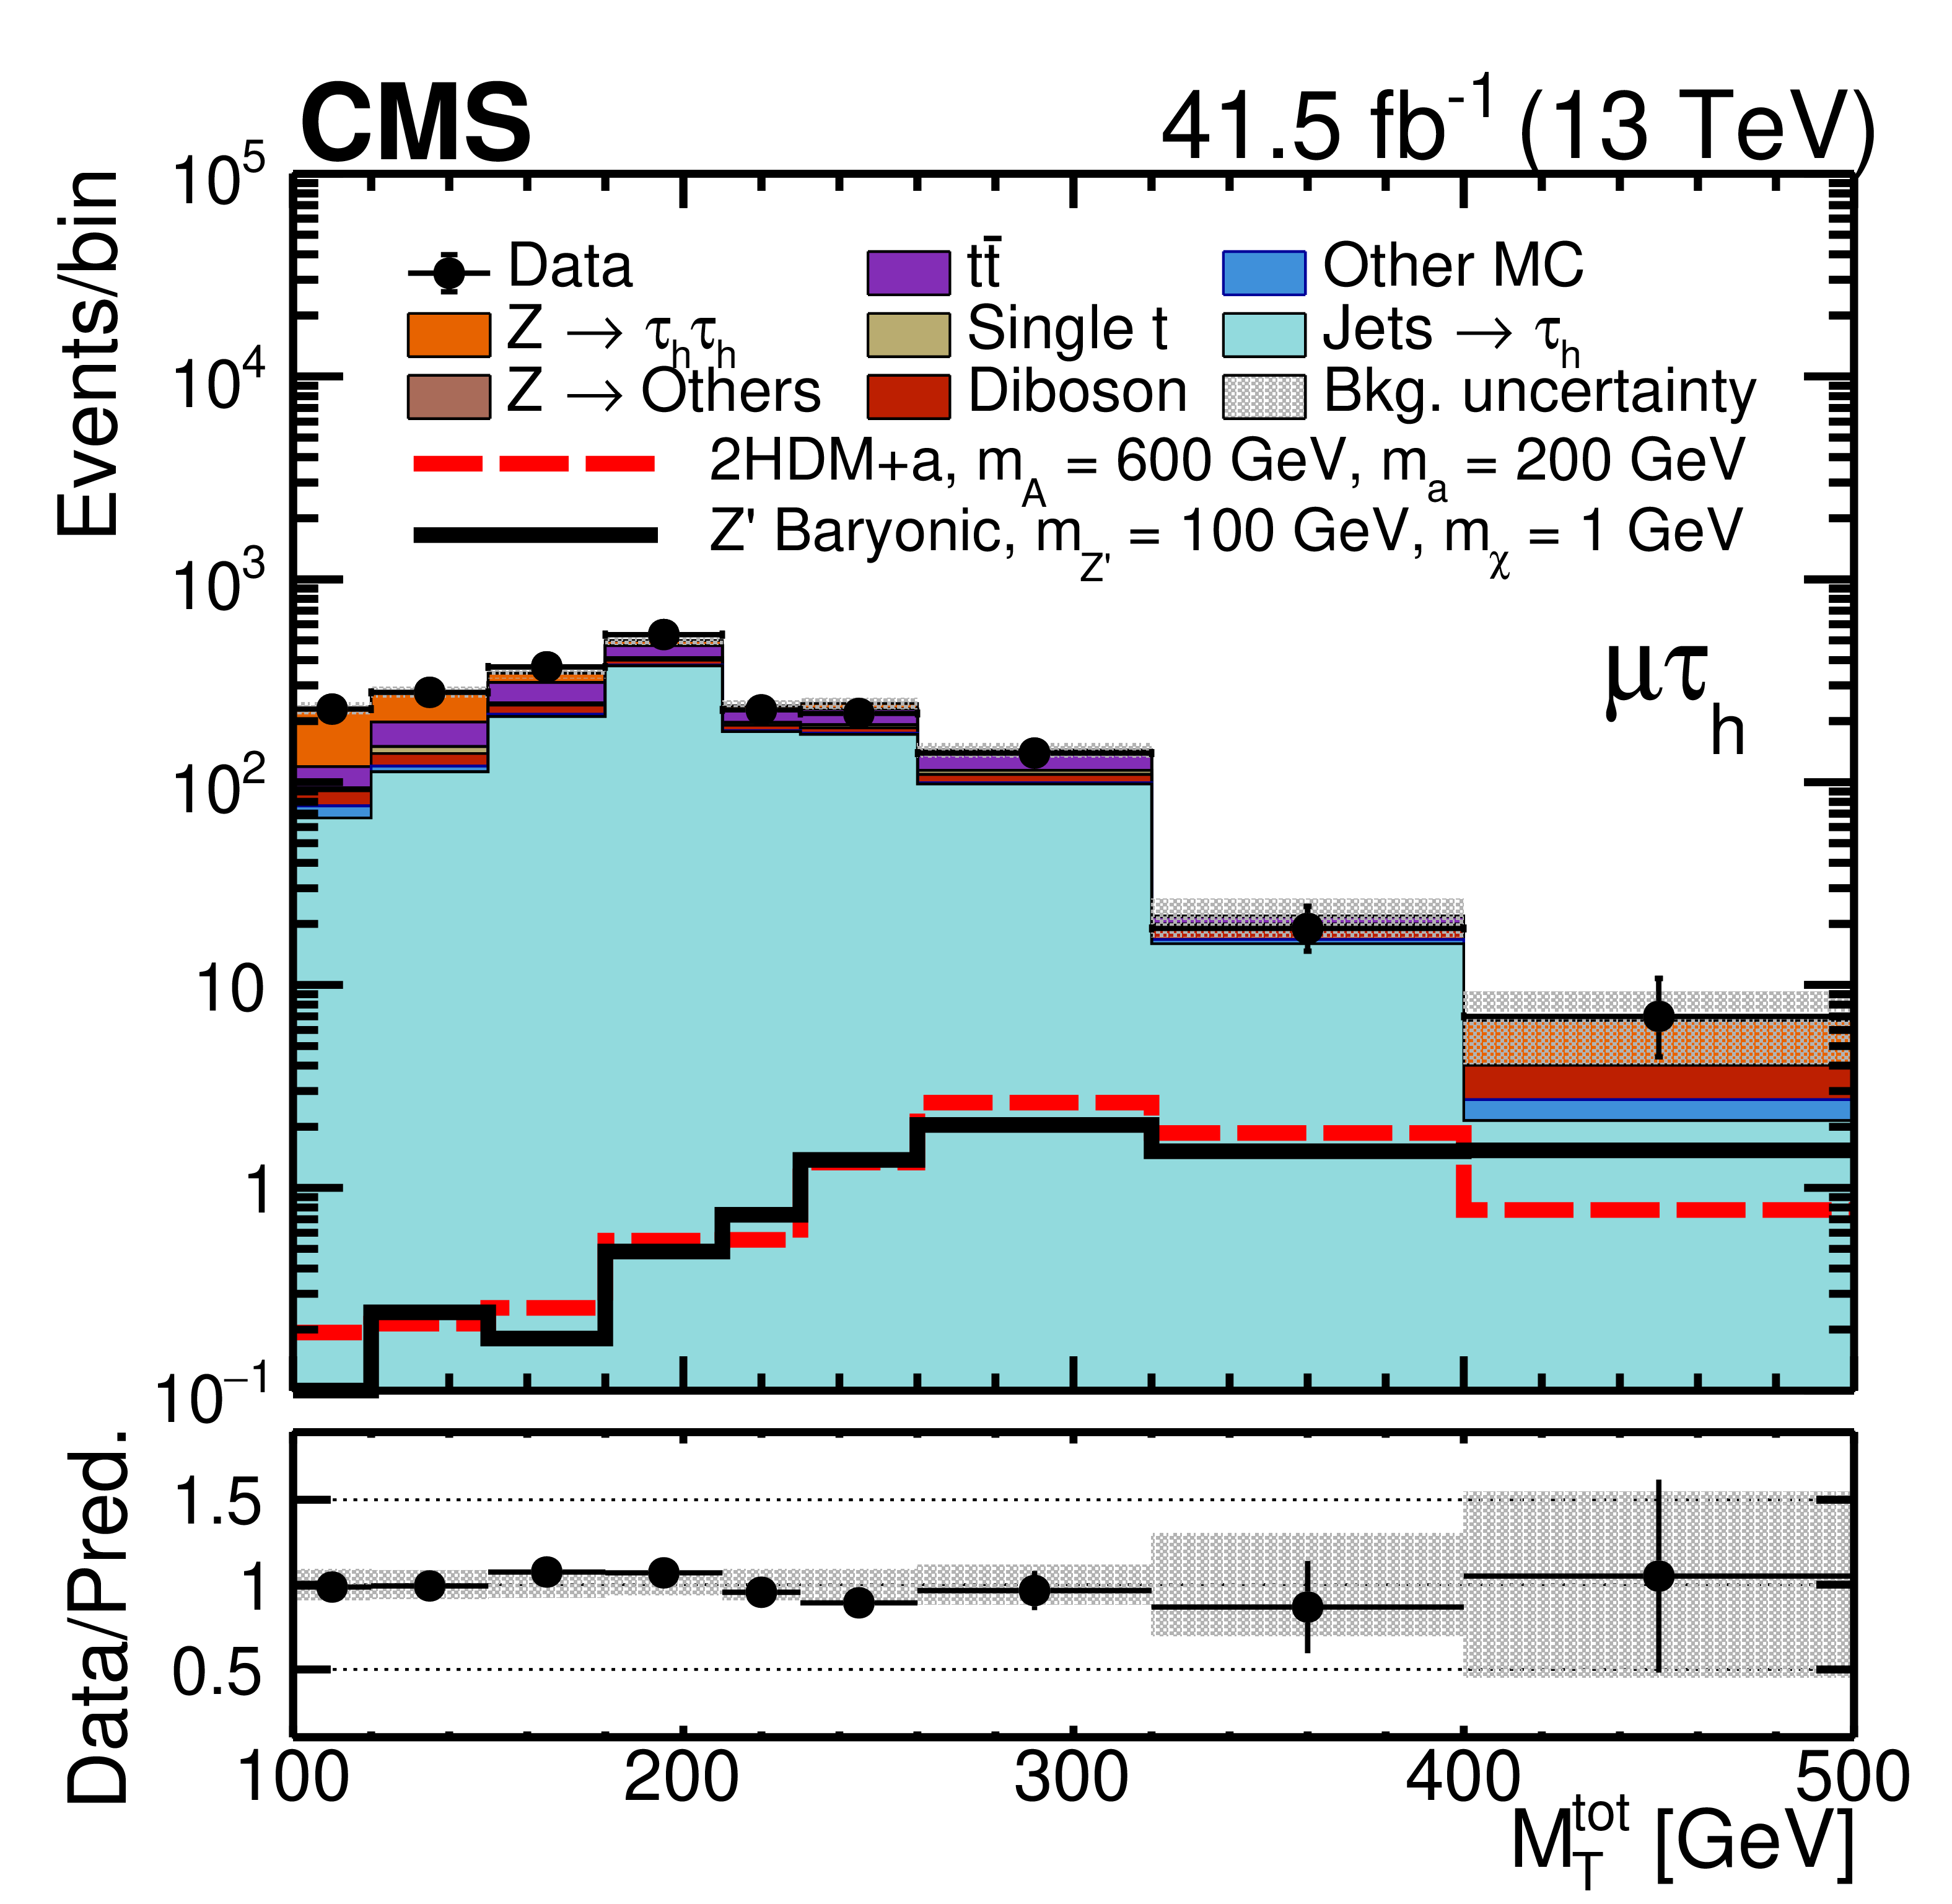
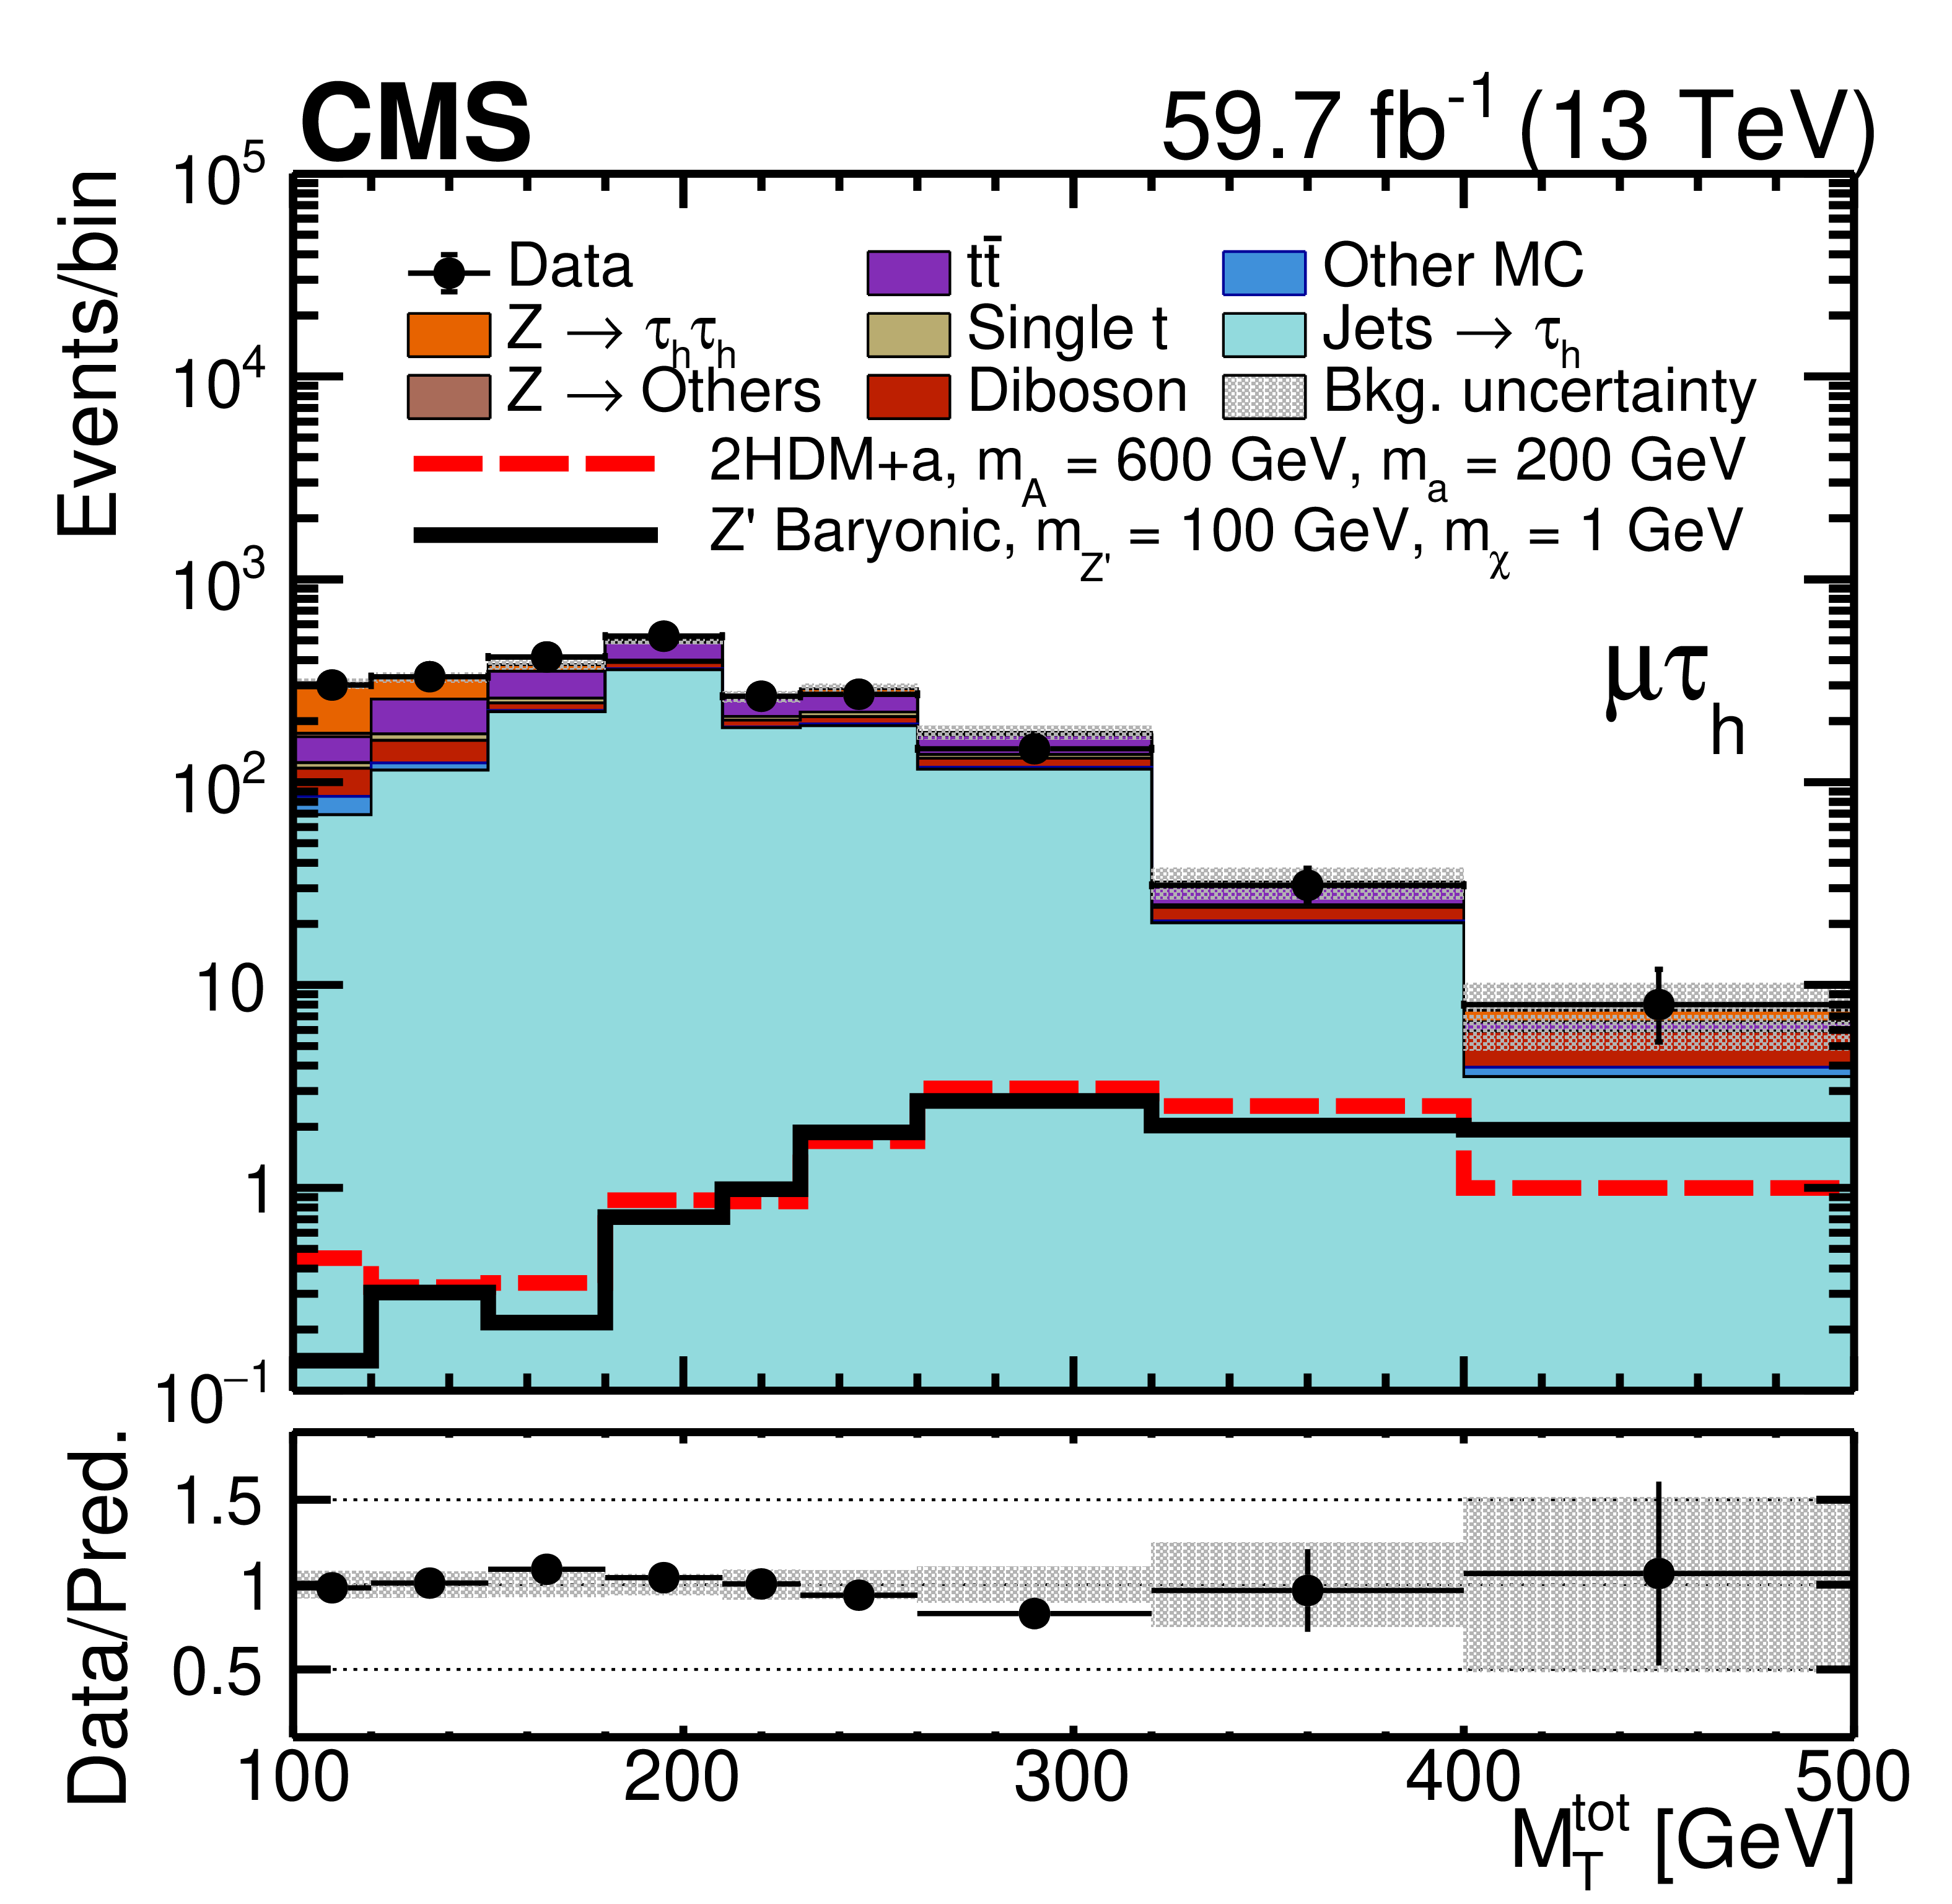
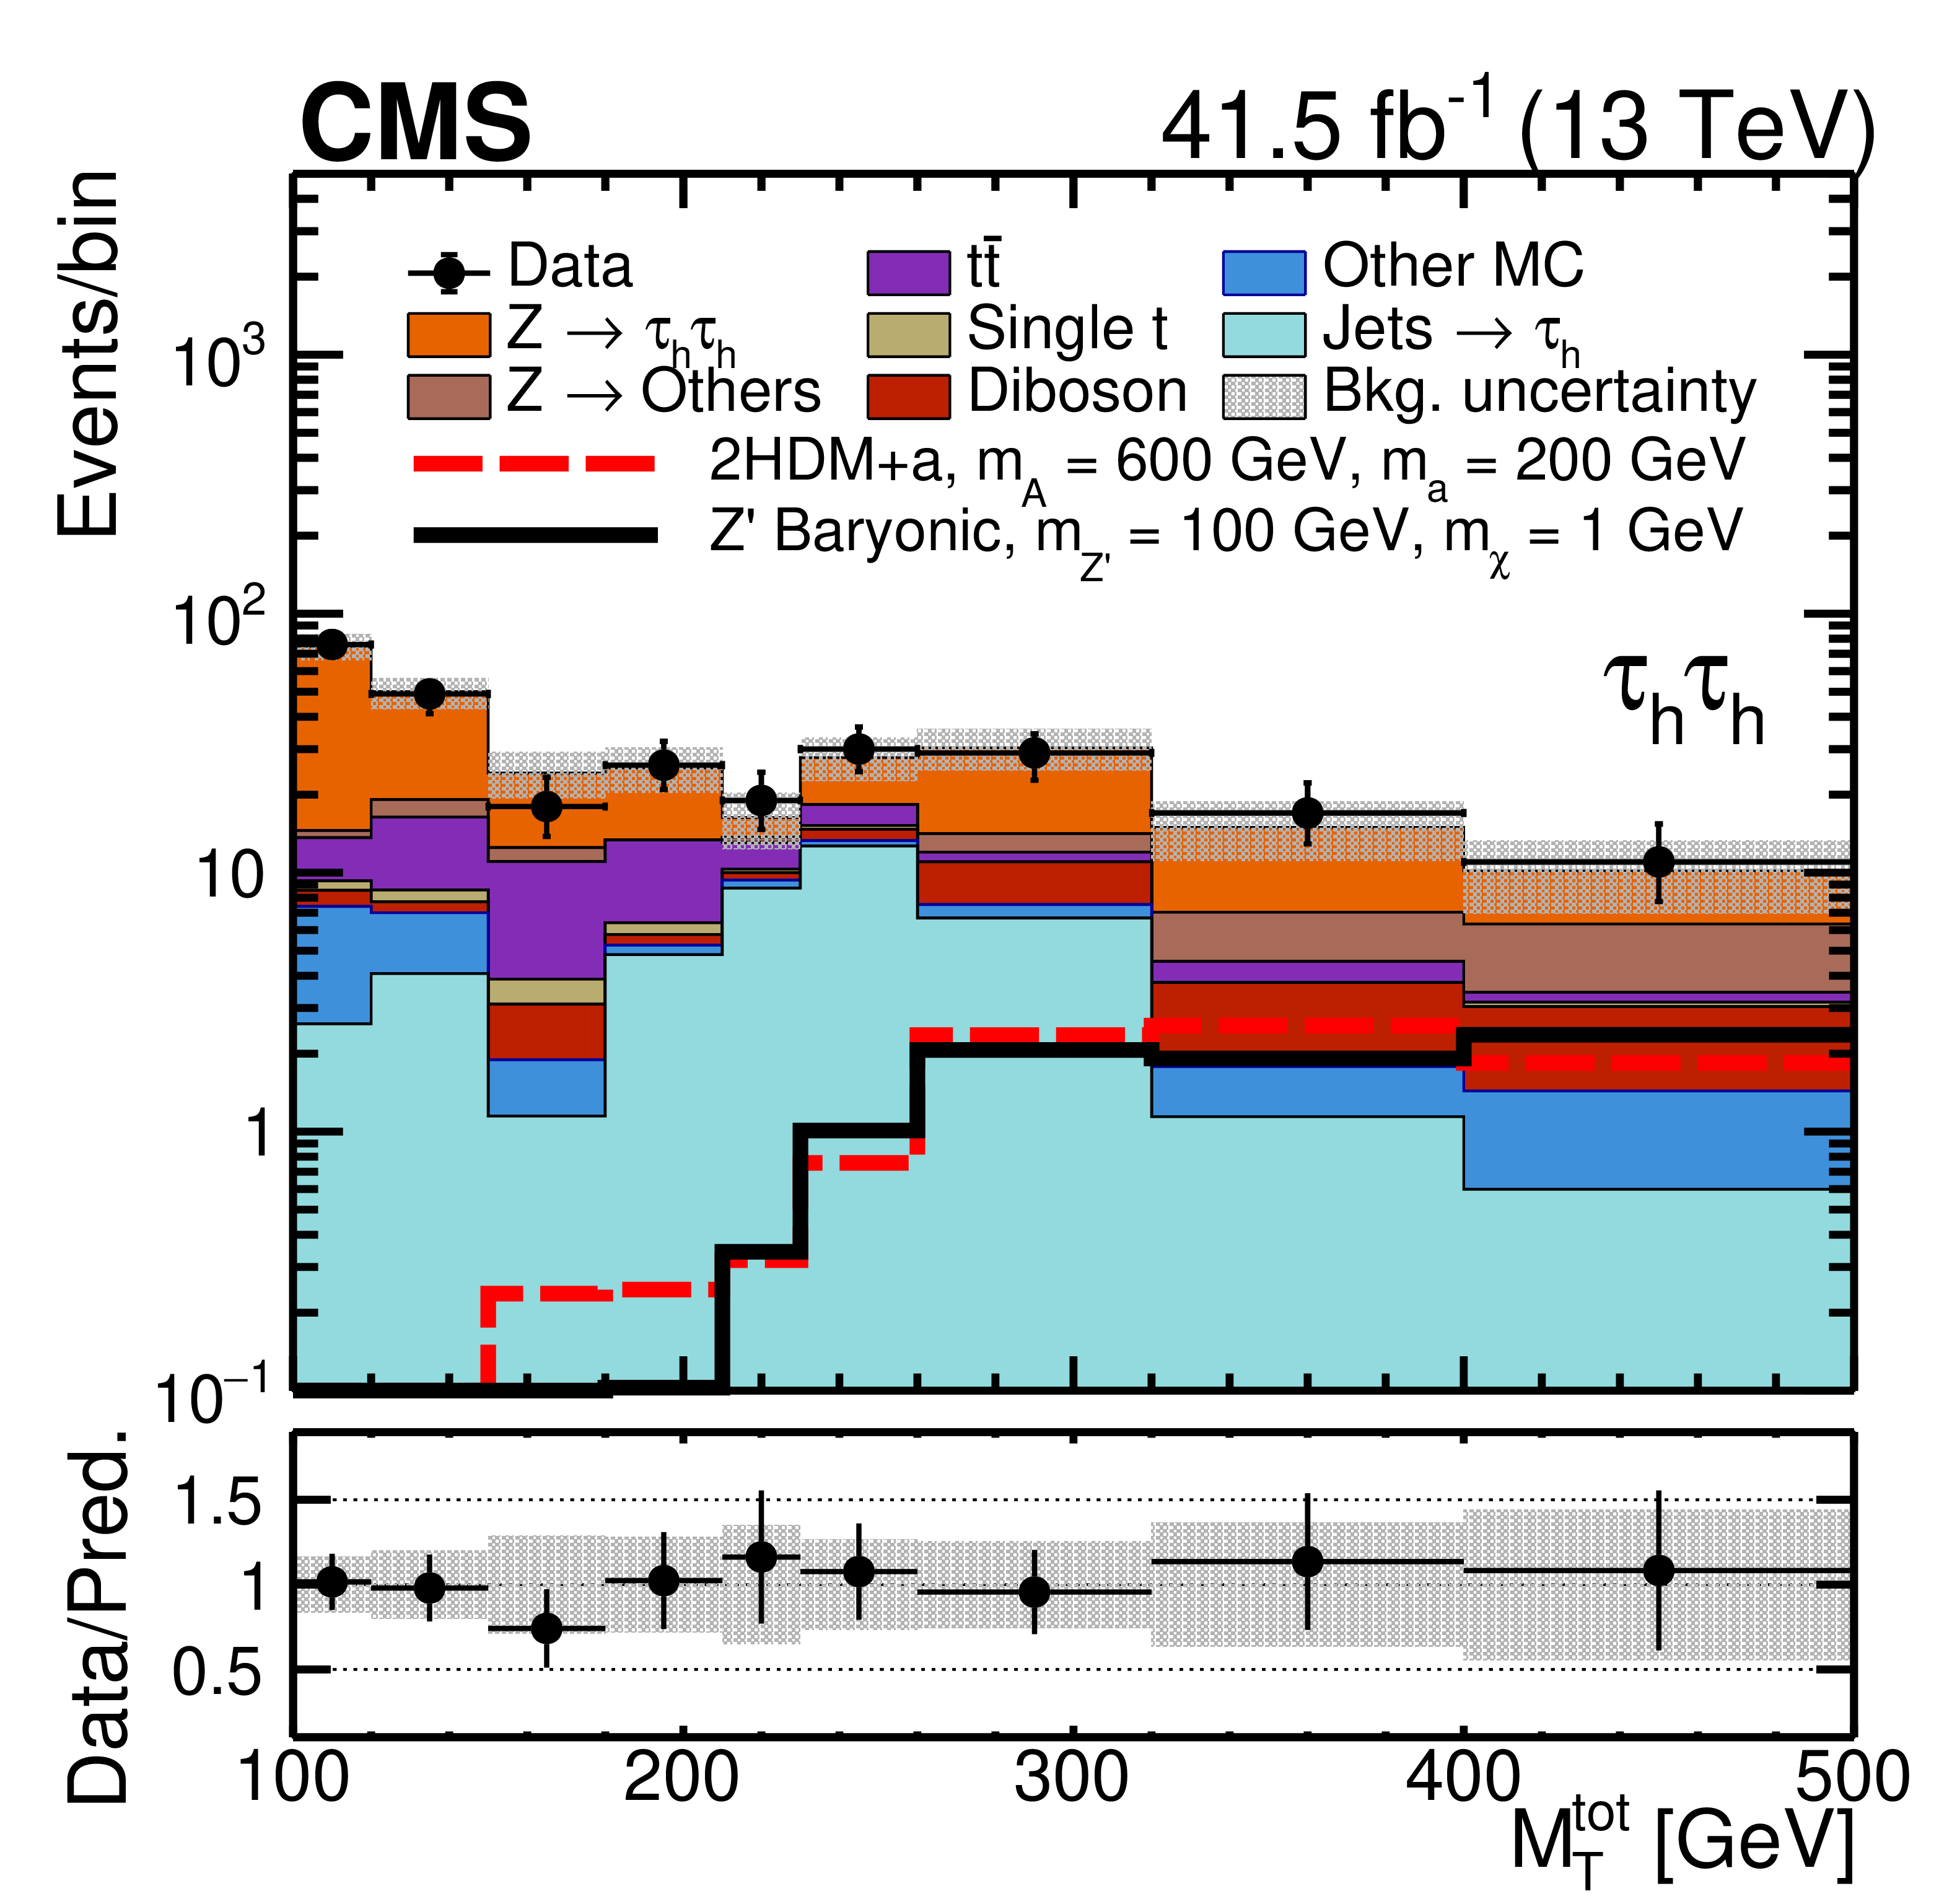
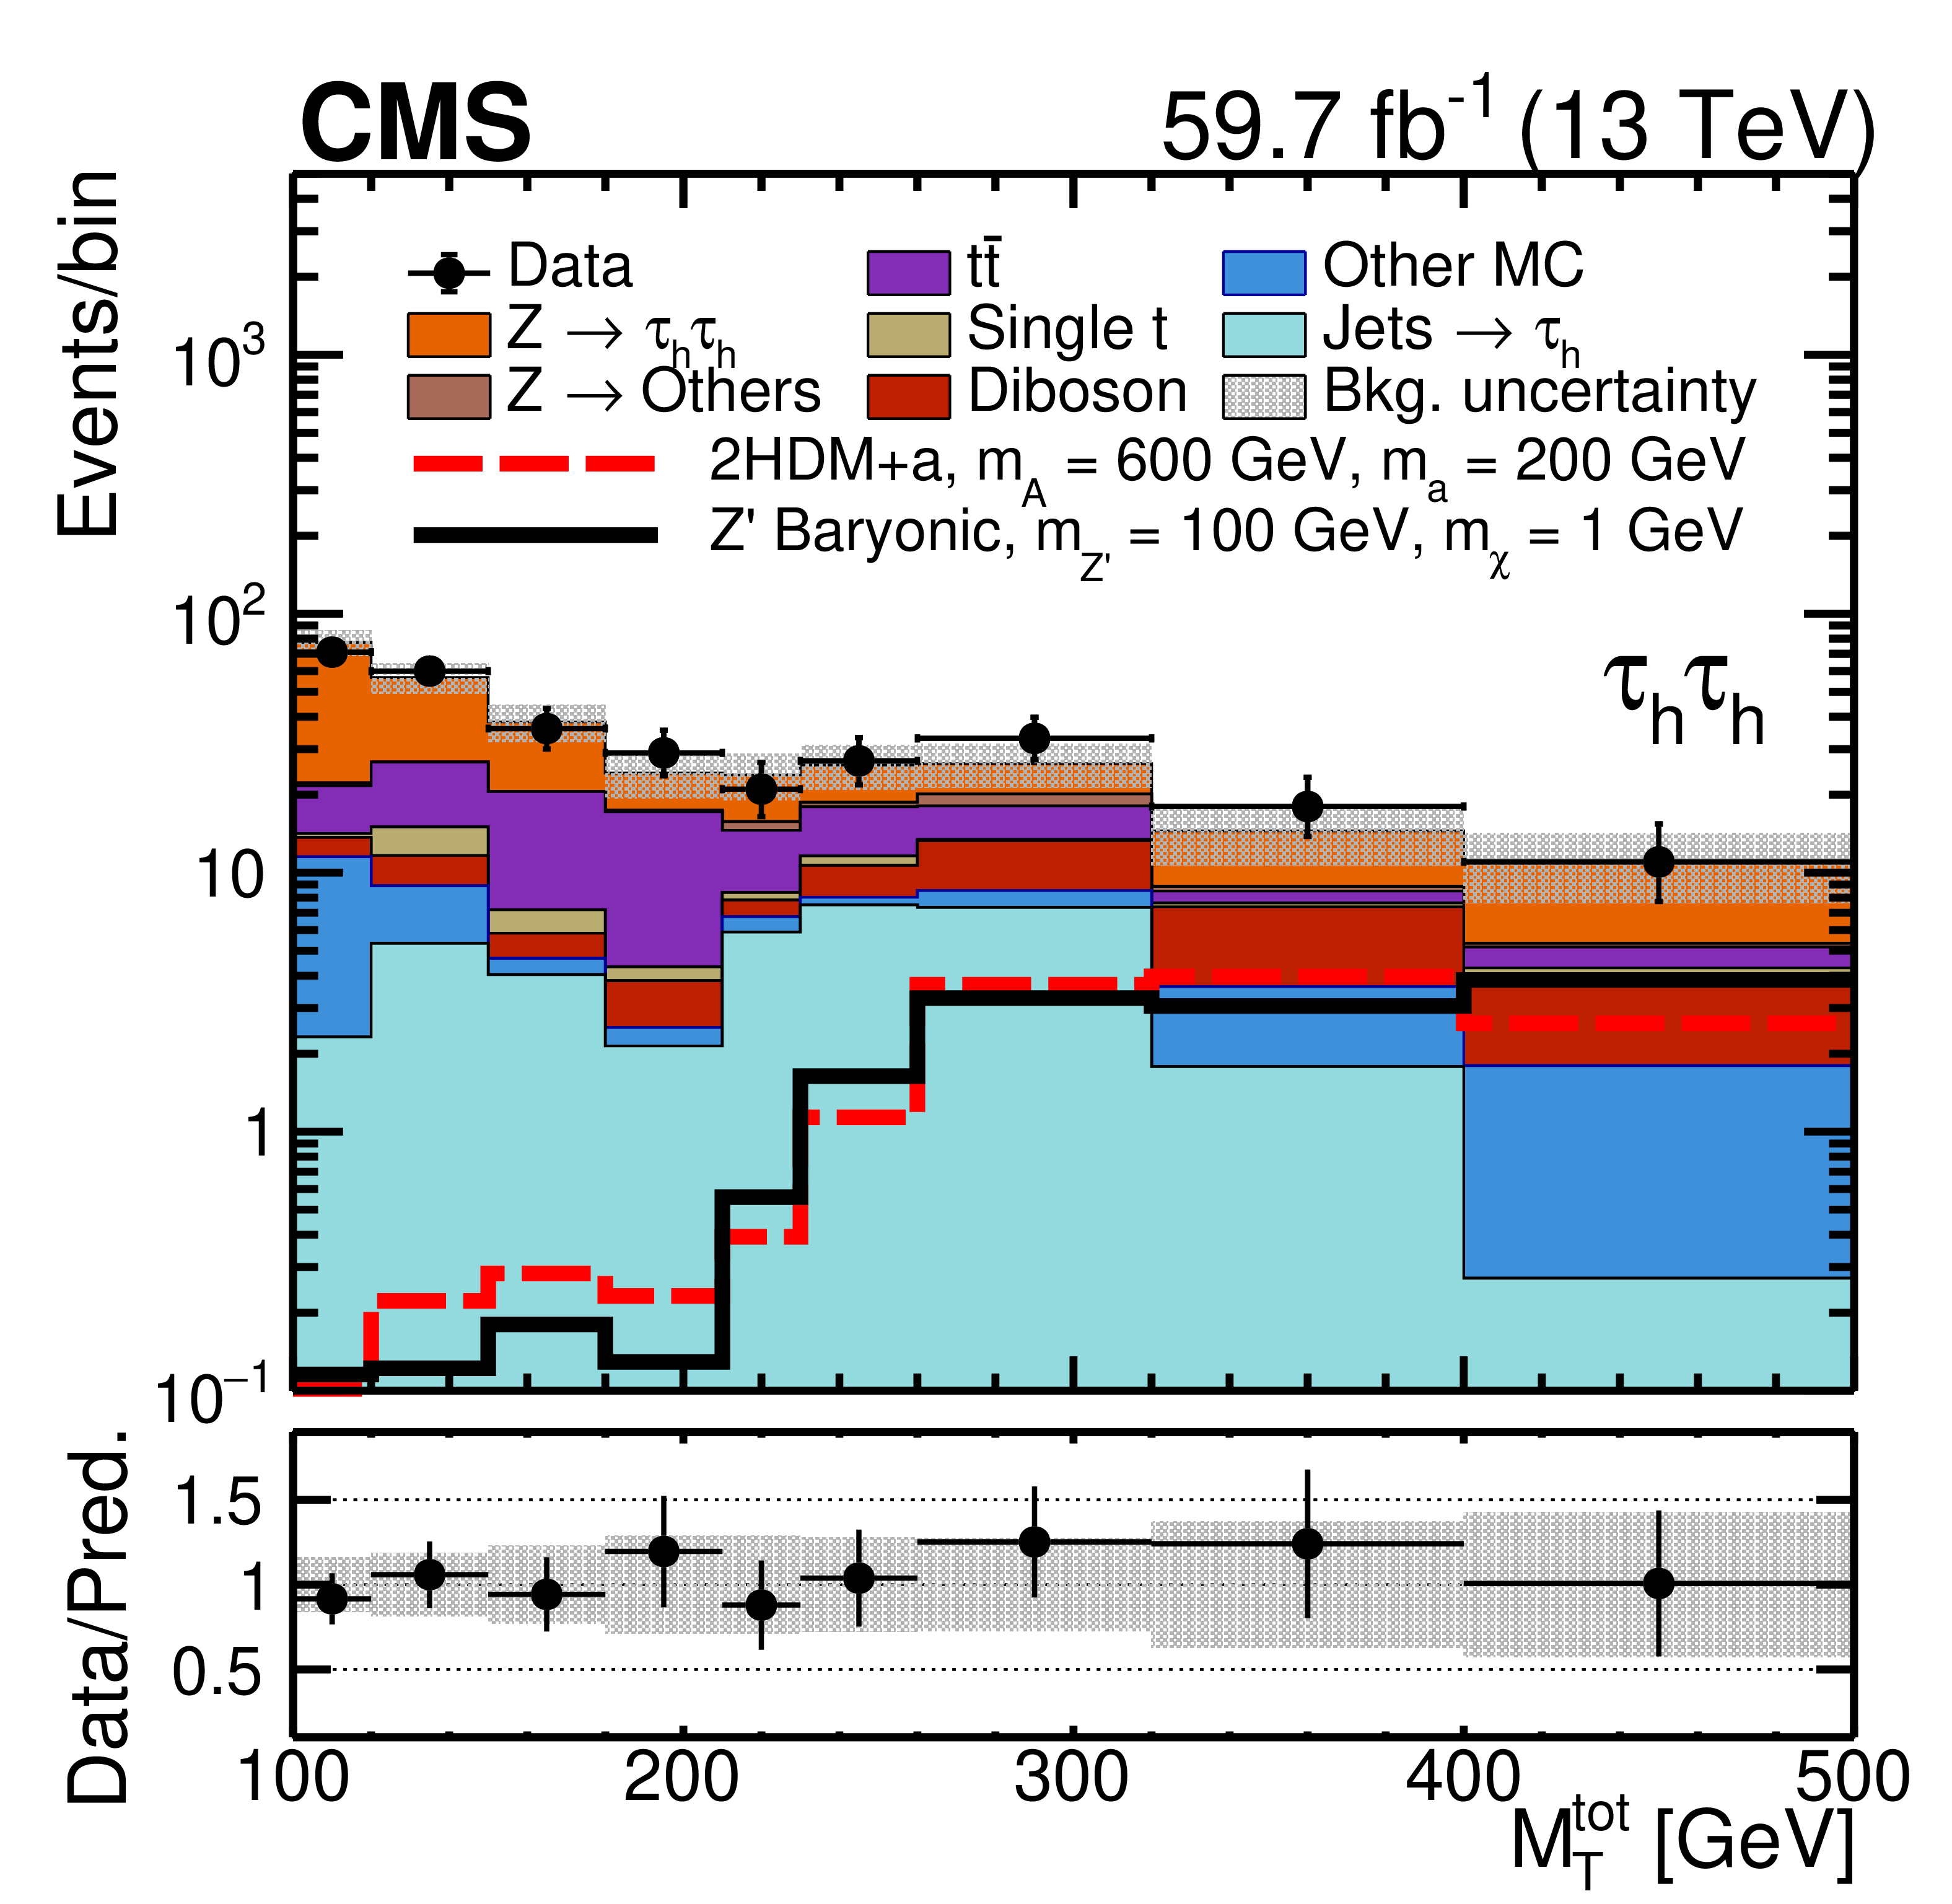
Figure 2:
Distributions of the total transverse mass $ M_\mathrm{T}^{\text{tot}} $ in the SRs, for observed data and SM prediction in the $ \mathrm{e}\tau_\mathrm{h} $ (upper), $ \mu\tau_\mathrm{h} $ (center), and $ \tau_\mathrm{h}\tau_\mathrm{h} $ (lower) final states in 2017 (left) and 2018 (right) after the simultaneous maximum likelihood fit. Representative signal distributions are shown for the 2HDM+a} (dashed red curve) and baryonic Z' (solid black curve) models. The data points are shown with their statistical uncertainties, and the last bin includes overflow. The ``Other MC'' background contribution includes events from ggh, VBF, $ \mathrm{W}\mathrm{h} $, $ \mathrm{Z}\mathrm{h} $, and electroweak vector boson production. The uncertainty band accounts for all systematic and statistical sources of uncertainty, after the fit to the data. |
png pdf |
Figure 2-a:
Distributions of the total transverse mass $ M_\mathrm{T}^{\text{tot}} $ in the SRs, for observed data and SM prediction in the $ \mathrm{e}\tau_\mathrm{h} $ (upper), $ \mu\tau_\mathrm{h} $ (center), and $ \tau_\mathrm{h}\tau_\mathrm{h} $ (lower) final states in 2017 (left) and 2018 (right) after the simultaneous maximum likelihood fit. Representative signal distributions are shown for the 2HDM+a} (dashed red curve) and baryonic Z' (solid black curve) models. The data points are shown with their statistical uncertainties, and the last bin includes overflow. The ``Other MC'' background contribution includes events from ggh, VBF, $ \mathrm{W}\mathrm{h} $, $ \mathrm{Z}\mathrm{h} $, and electroweak vector boson production. The uncertainty band accounts for all systematic and statistical sources of uncertainty, after the fit to the data. |
png pdf |
Figure 2-b:
Distributions of the total transverse mass $ M_\mathrm{T}^{\text{tot}} $ in the SRs, for observed data and SM prediction in the $ \mathrm{e}\tau_\mathrm{h} $ (upper), $ \mu\tau_\mathrm{h} $ (center), and $ \tau_\mathrm{h}\tau_\mathrm{h} $ (lower) final states in 2017 (left) and 2018 (right) after the simultaneous maximum likelihood fit. Representative signal distributions are shown for the 2HDM+a} (dashed red curve) and baryonic Z' (solid black curve) models. The data points are shown with their statistical uncertainties, and the last bin includes overflow. The ``Other MC'' background contribution includes events from ggh, VBF, $ \mathrm{W}\mathrm{h} $, $ \mathrm{Z}\mathrm{h} $, and electroweak vector boson production. The uncertainty band accounts for all systematic and statistical sources of uncertainty, after the fit to the data. |
png pdf |
Figure 2-c:
Distributions of the total transverse mass $ M_\mathrm{T}^{\text{tot}} $ in the SRs, for observed data and SM prediction in the $ \mathrm{e}\tau_\mathrm{h} $ (upper), $ \mu\tau_\mathrm{h} $ (center), and $ \tau_\mathrm{h}\tau_\mathrm{h} $ (lower) final states in 2017 (left) and 2018 (right) after the simultaneous maximum likelihood fit. Representative signal distributions are shown for the 2HDM+a} (dashed red curve) and baryonic Z' (solid black curve) models. The data points are shown with their statistical uncertainties, and the last bin includes overflow. The ``Other MC'' background contribution includes events from ggh, VBF, $ \mathrm{W}\mathrm{h} $, $ \mathrm{Z}\mathrm{h} $, and electroweak vector boson production. The uncertainty band accounts for all systematic and statistical sources of uncertainty, after the fit to the data. |
png pdf |
Figure 2-d:
Distributions of the total transverse mass $ M_\mathrm{T}^{\text{tot}} $ in the SRs, for observed data and SM prediction in the $ \mathrm{e}\tau_\mathrm{h} $ (upper), $ \mu\tau_\mathrm{h} $ (center), and $ \tau_\mathrm{h}\tau_\mathrm{h} $ (lower) final states in 2017 (left) and 2018 (right) after the simultaneous maximum likelihood fit. Representative signal distributions are shown for the 2HDM+a} (dashed red curve) and baryonic Z' (solid black curve) models. The data points are shown with their statistical uncertainties, and the last bin includes overflow. The ``Other MC'' background contribution includes events from ggh, VBF, $ \mathrm{W}\mathrm{h} $, $ \mathrm{Z}\mathrm{h} $, and electroweak vector boson production. The uncertainty band accounts for all systematic and statistical sources of uncertainty, after the fit to the data. |
png pdf |
Figure 2-e:
Distributions of the total transverse mass $ M_\mathrm{T}^{\text{tot}} $ in the SRs, for observed data and SM prediction in the $ \mathrm{e}\tau_\mathrm{h} $ (upper), $ \mu\tau_\mathrm{h} $ (center), and $ \tau_\mathrm{h}\tau_\mathrm{h} $ (lower) final states in 2017 (left) and 2018 (right) after the simultaneous maximum likelihood fit. Representative signal distributions are shown for the 2HDM+a} (dashed red curve) and baryonic Z' (solid black curve) models. The data points are shown with their statistical uncertainties, and the last bin includes overflow. The ``Other MC'' background contribution includes events from ggh, VBF, $ \mathrm{W}\mathrm{h} $, $ \mathrm{Z}\mathrm{h} $, and electroweak vector boson production. The uncertainty band accounts for all systematic and statistical sources of uncertainty, after the fit to the data. |
png pdf |
Figure 2-f:
Distributions of the total transverse mass $ M_\mathrm{T}^{\text{tot}} $ in the SRs, for observed data and SM prediction in the $ \mathrm{e}\tau_\mathrm{h} $ (upper), $ \mu\tau_\mathrm{h} $ (center), and $ \tau_\mathrm{h}\tau_\mathrm{h} $ (lower) final states in 2017 (left) and 2018 (right) after the simultaneous maximum likelihood fit. Representative signal distributions are shown for the 2HDM+a} (dashed red curve) and baryonic Z' (solid black curve) models. The data points are shown with their statistical uncertainties, and the last bin includes overflow. The ``Other MC'' background contribution includes events from ggh, VBF, $ \mathrm{W}\mathrm{h} $, $ \mathrm{Z}\mathrm{h} $, and electroweak vector boson production. The uncertainty band accounts for all systematic and statistical sources of uncertainty, after the fit to the data. |
png pdf |
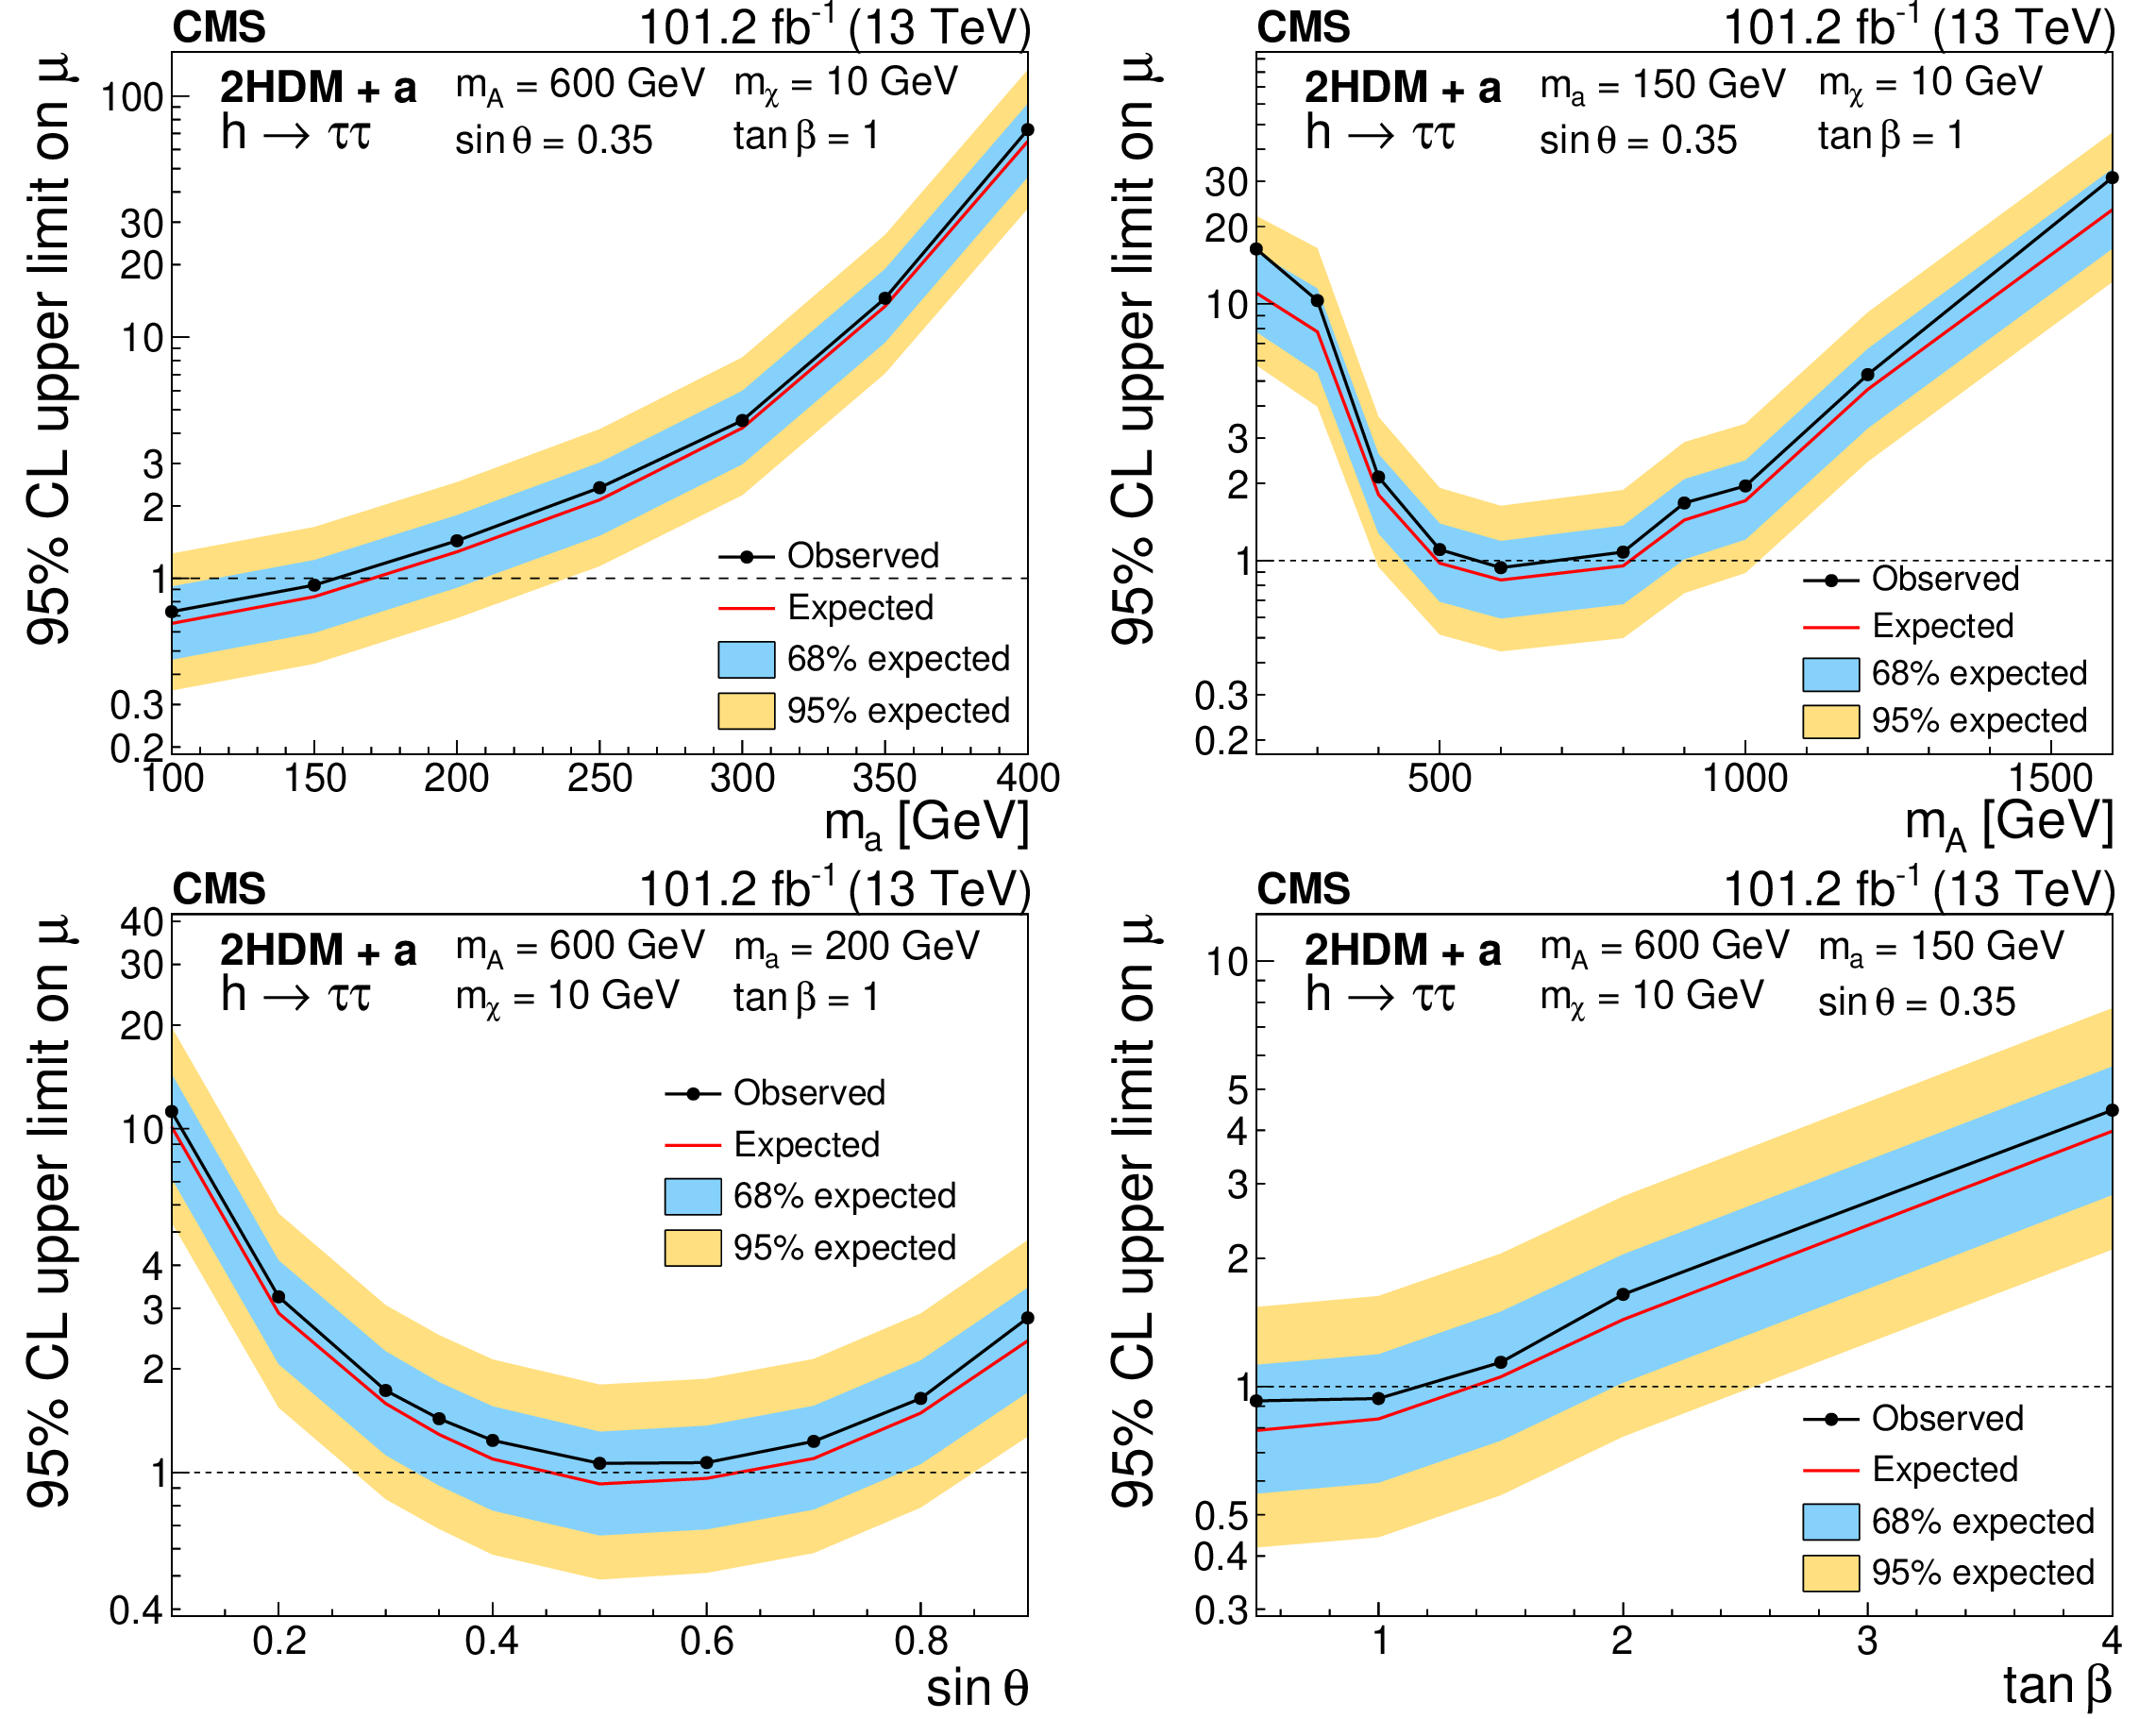
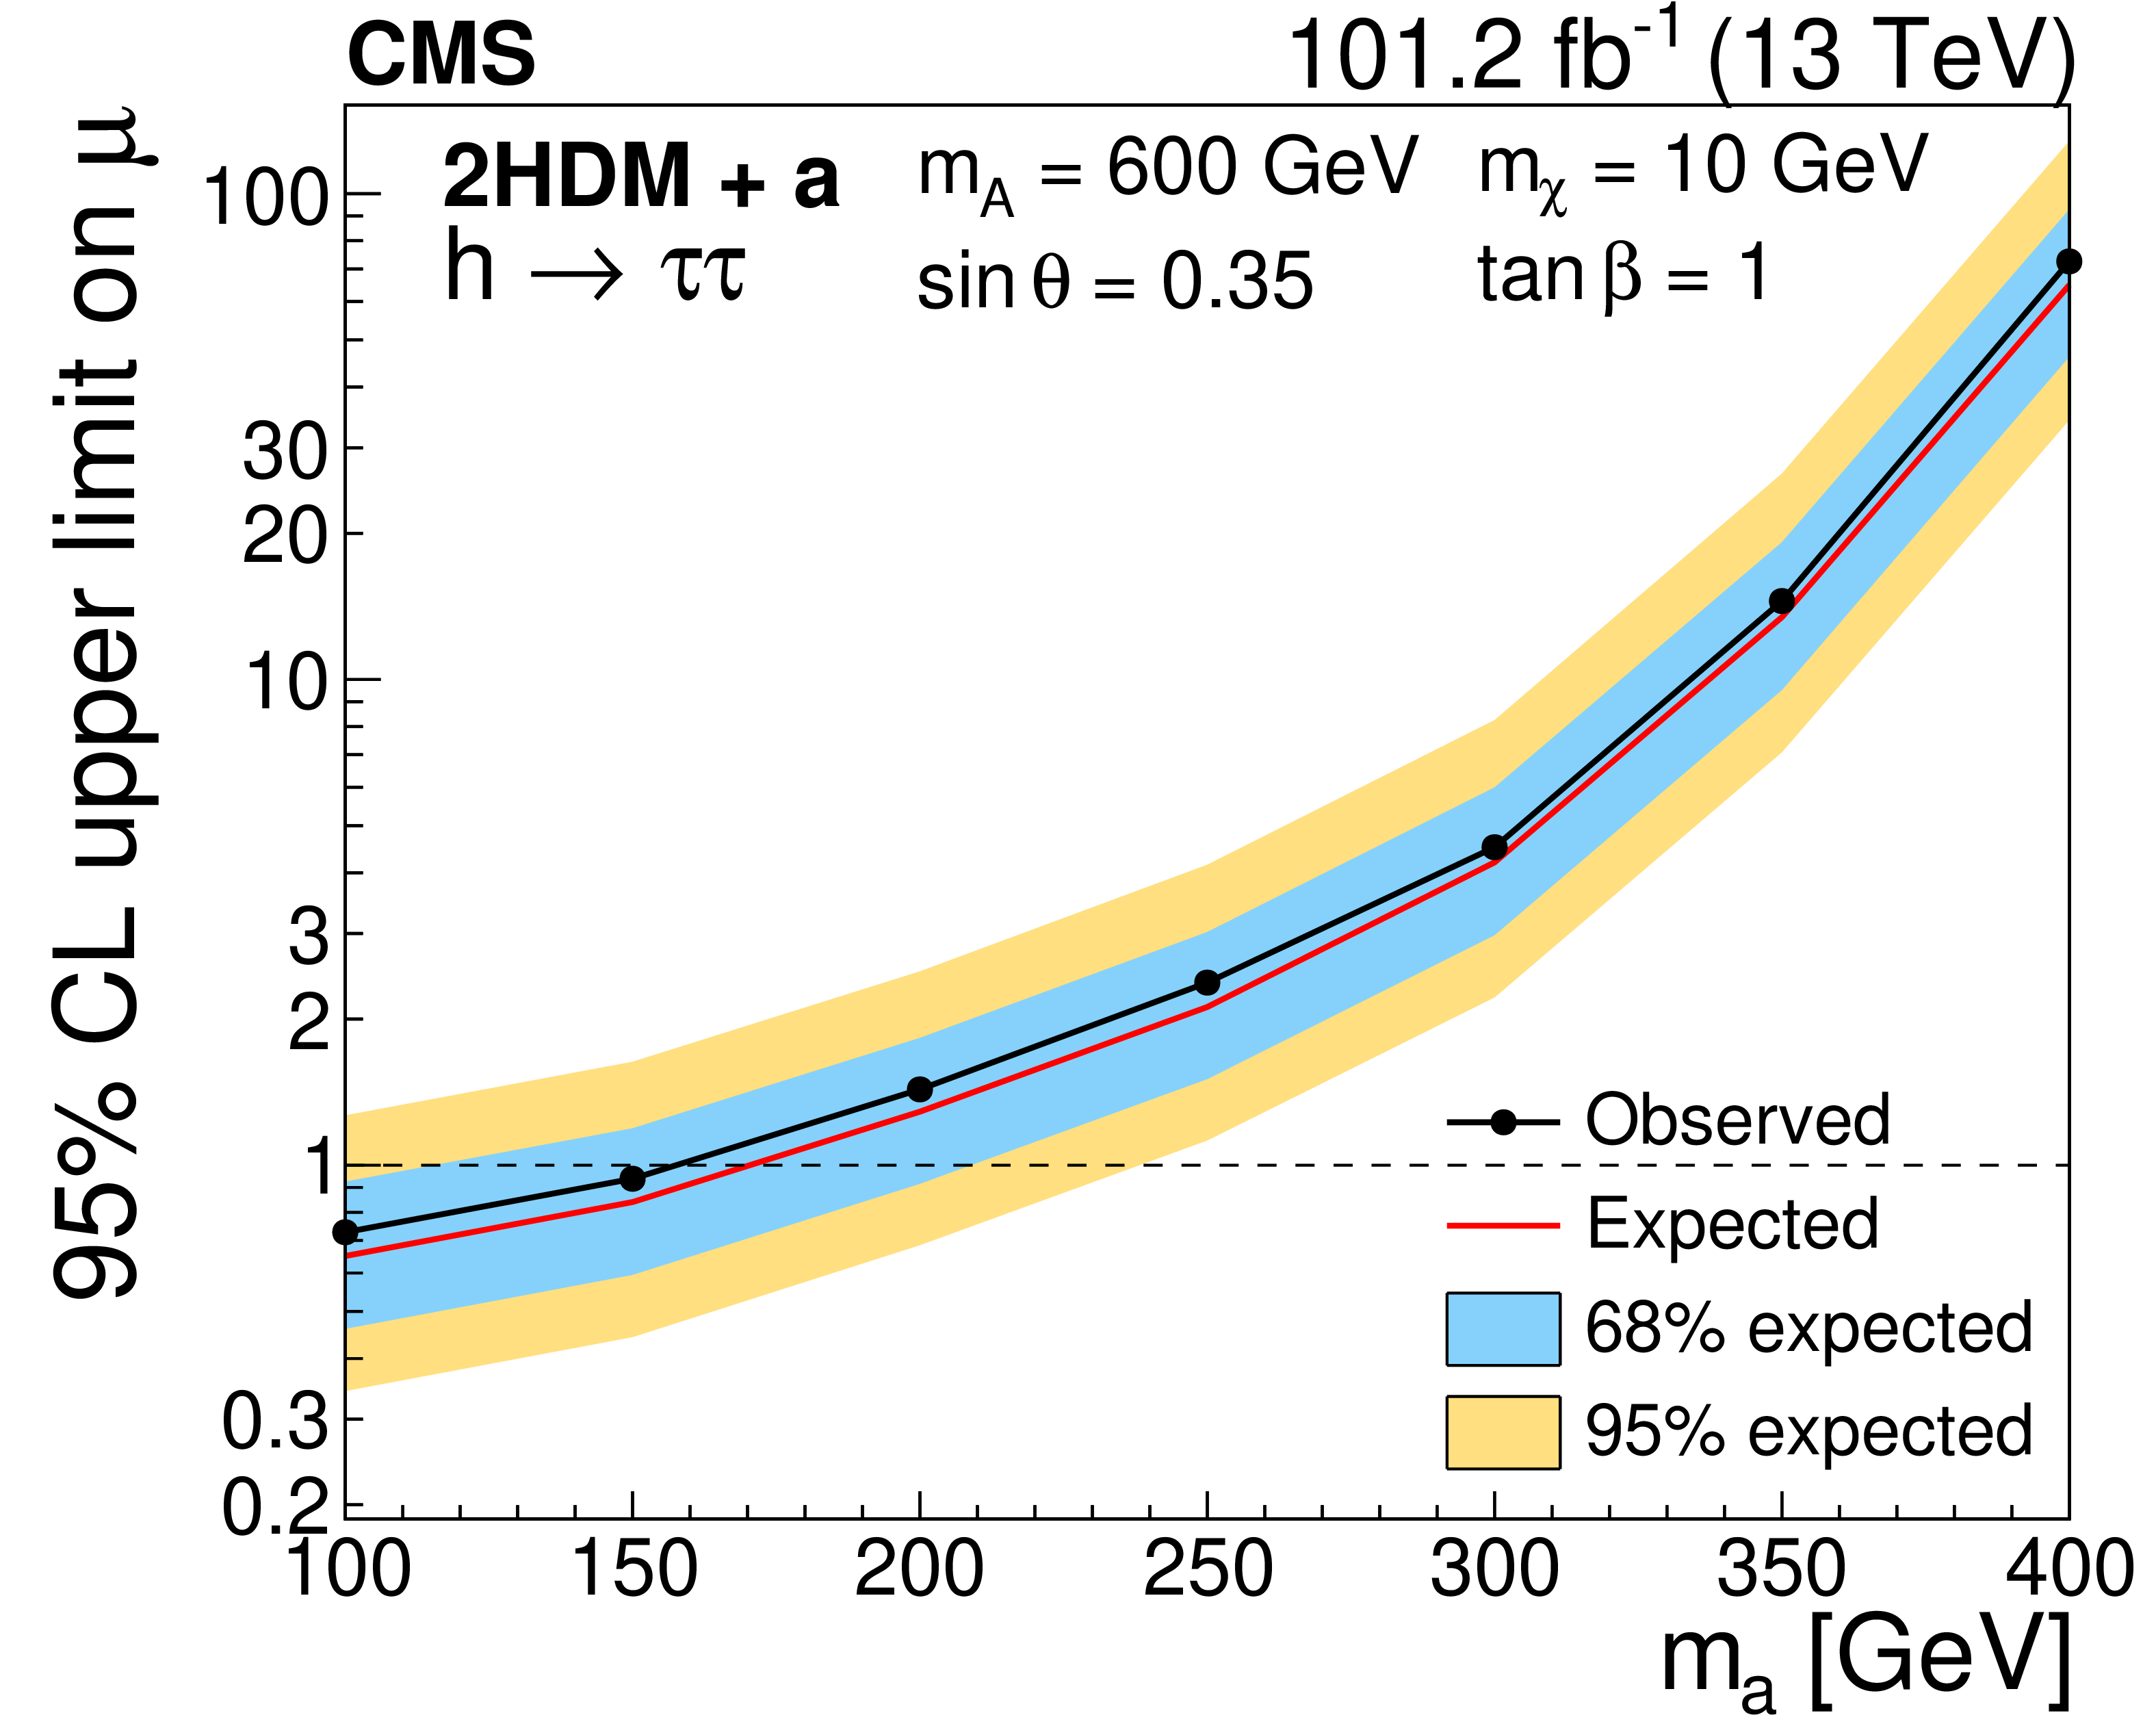
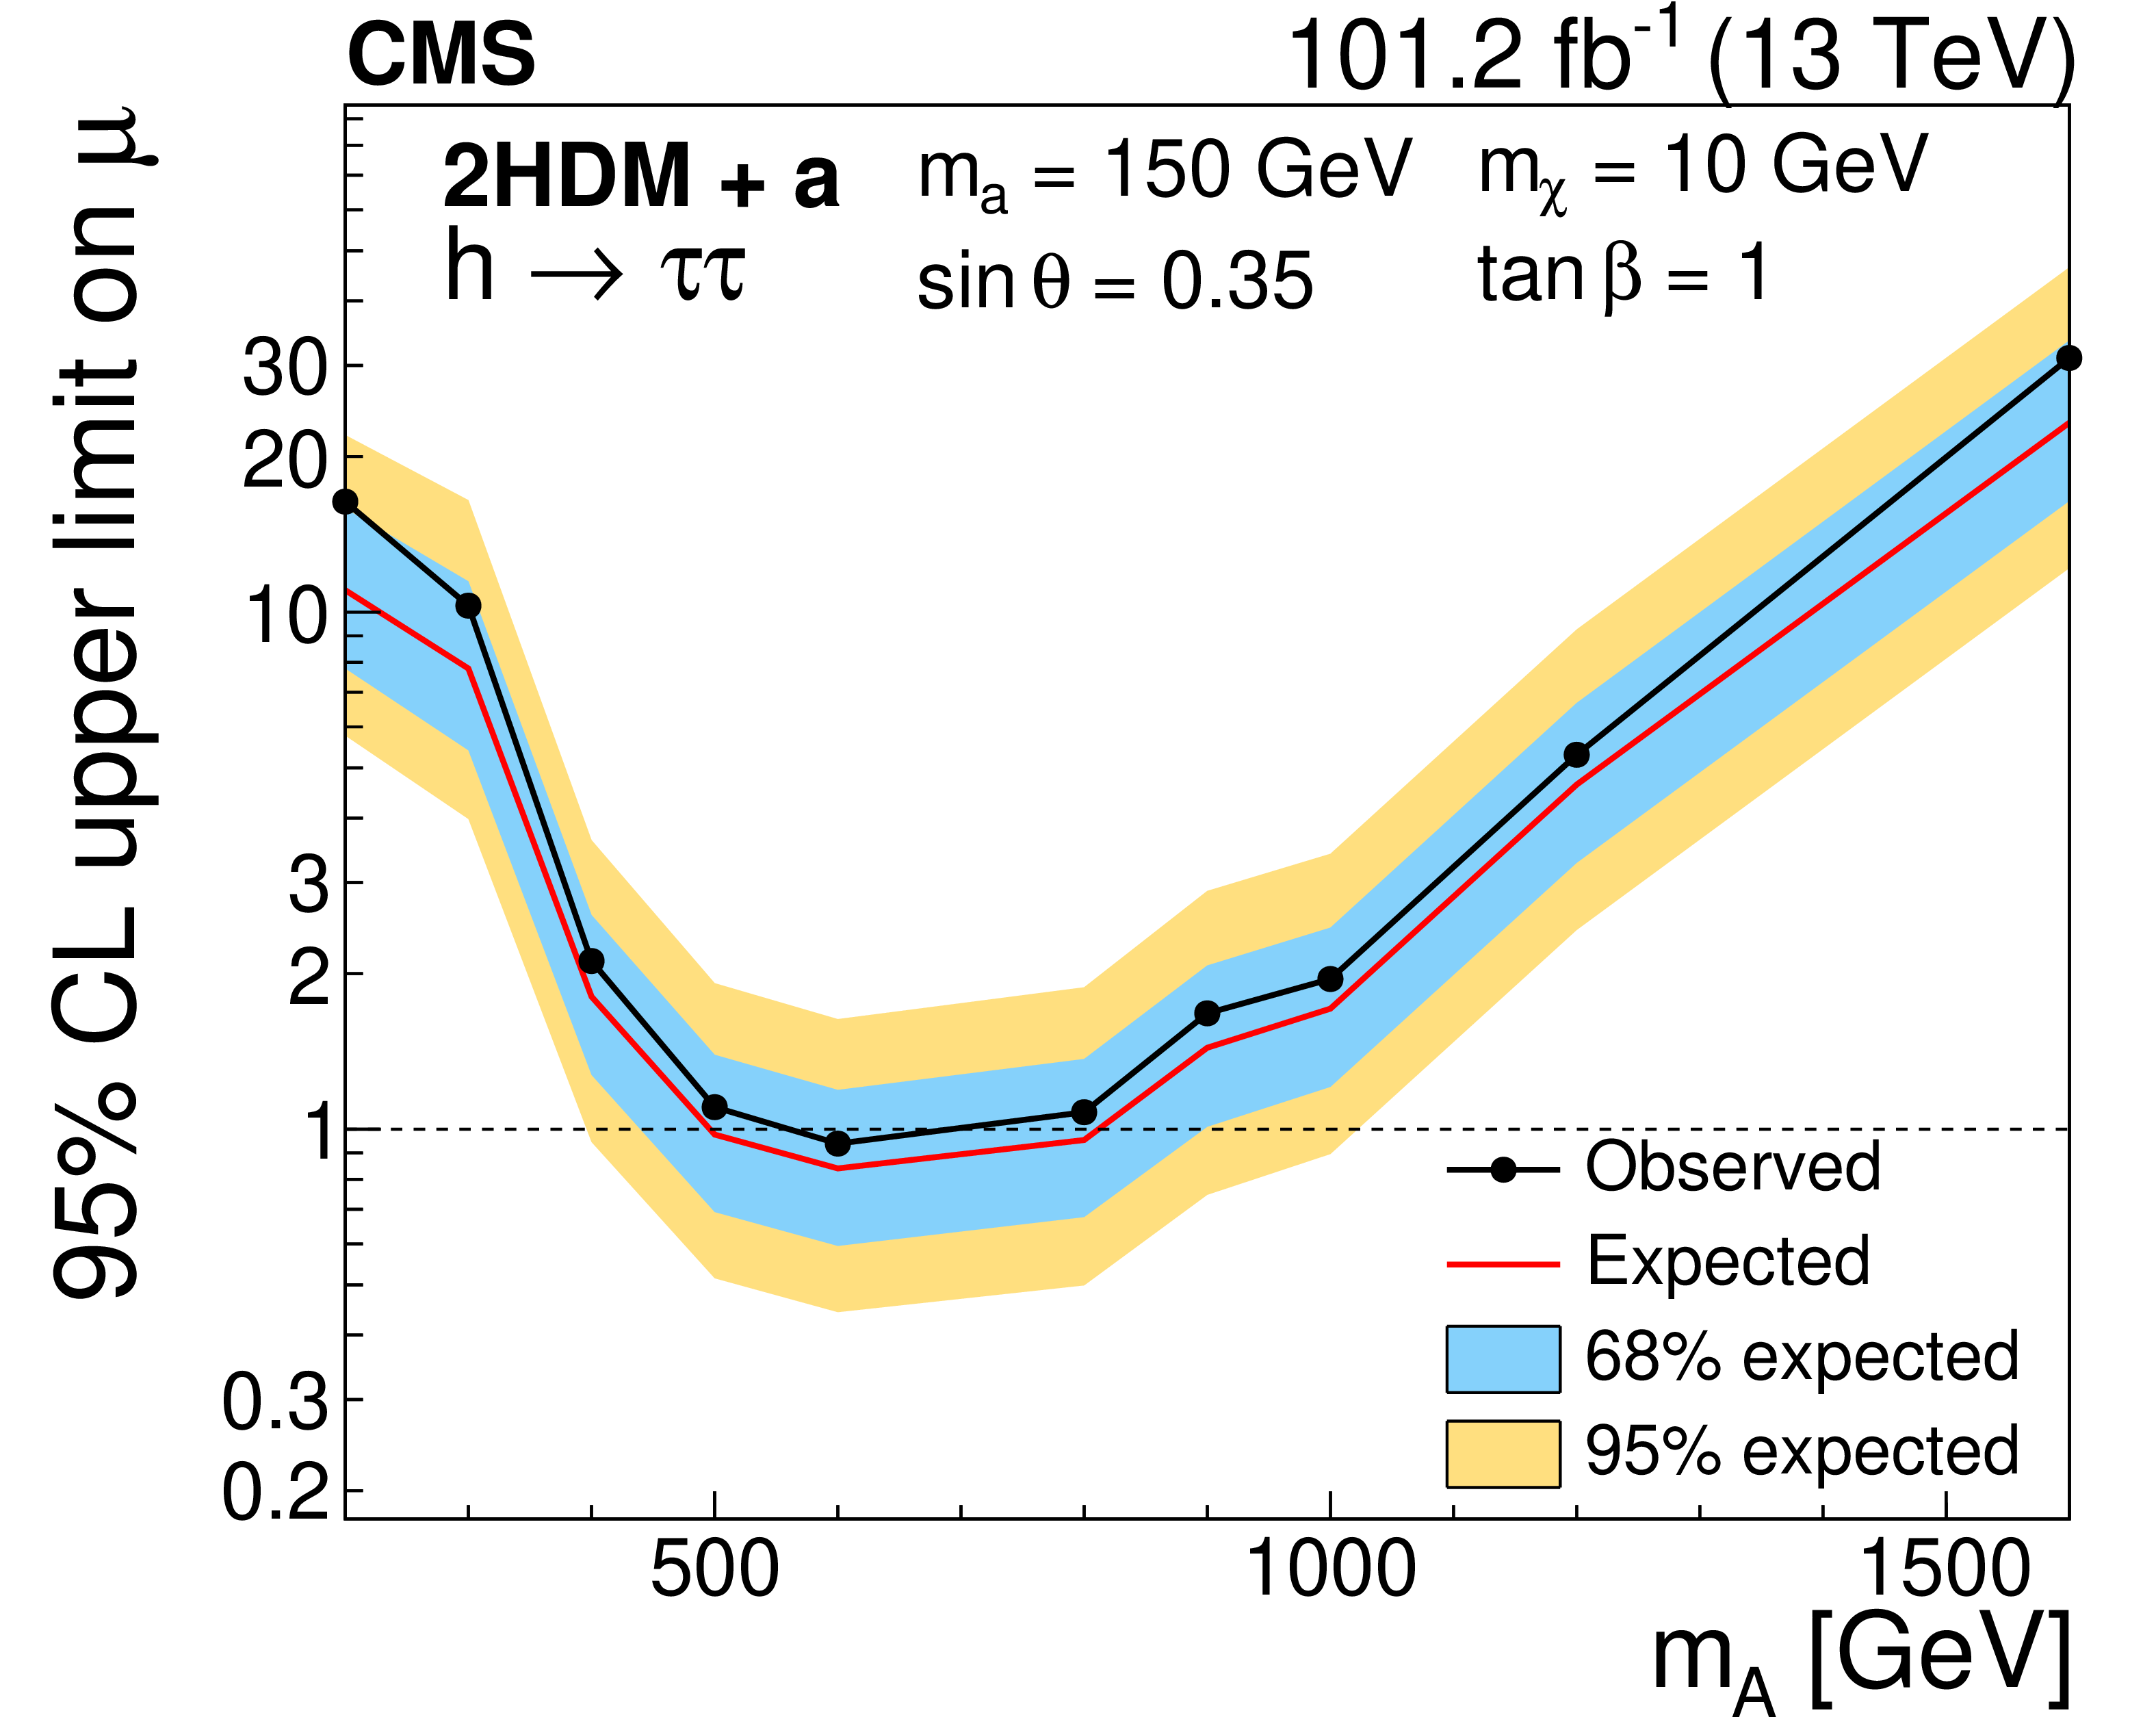
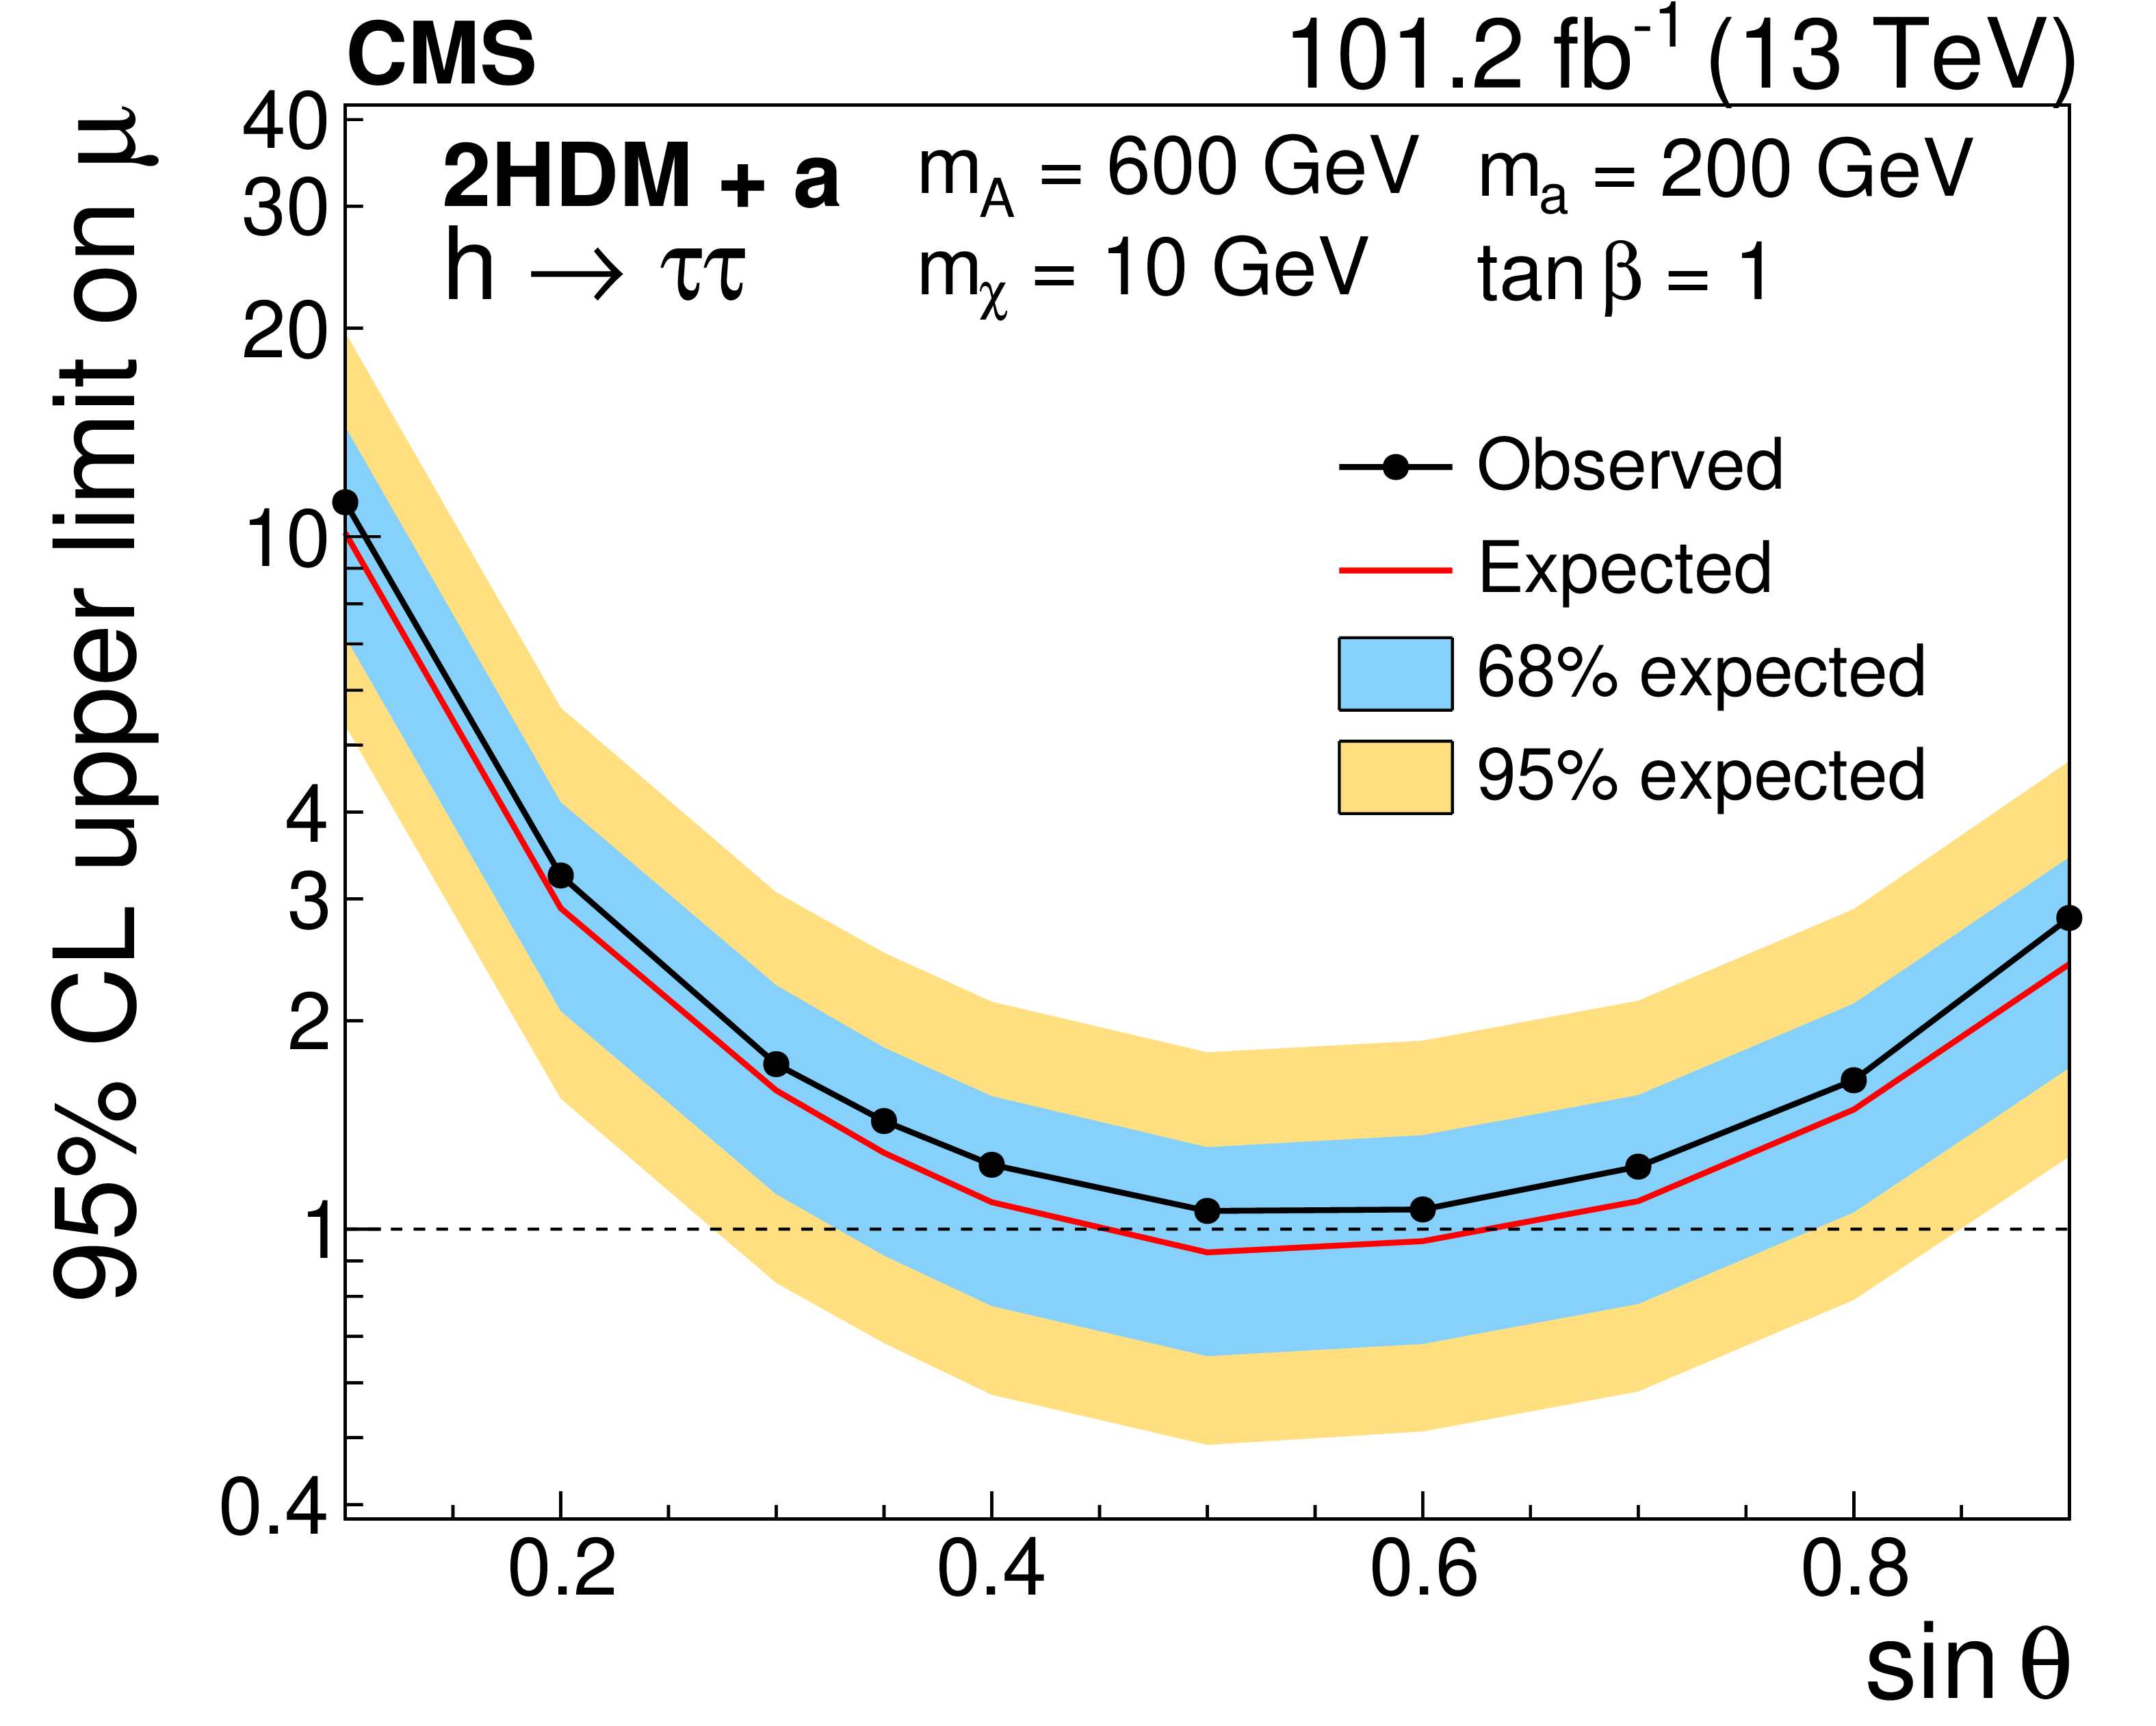
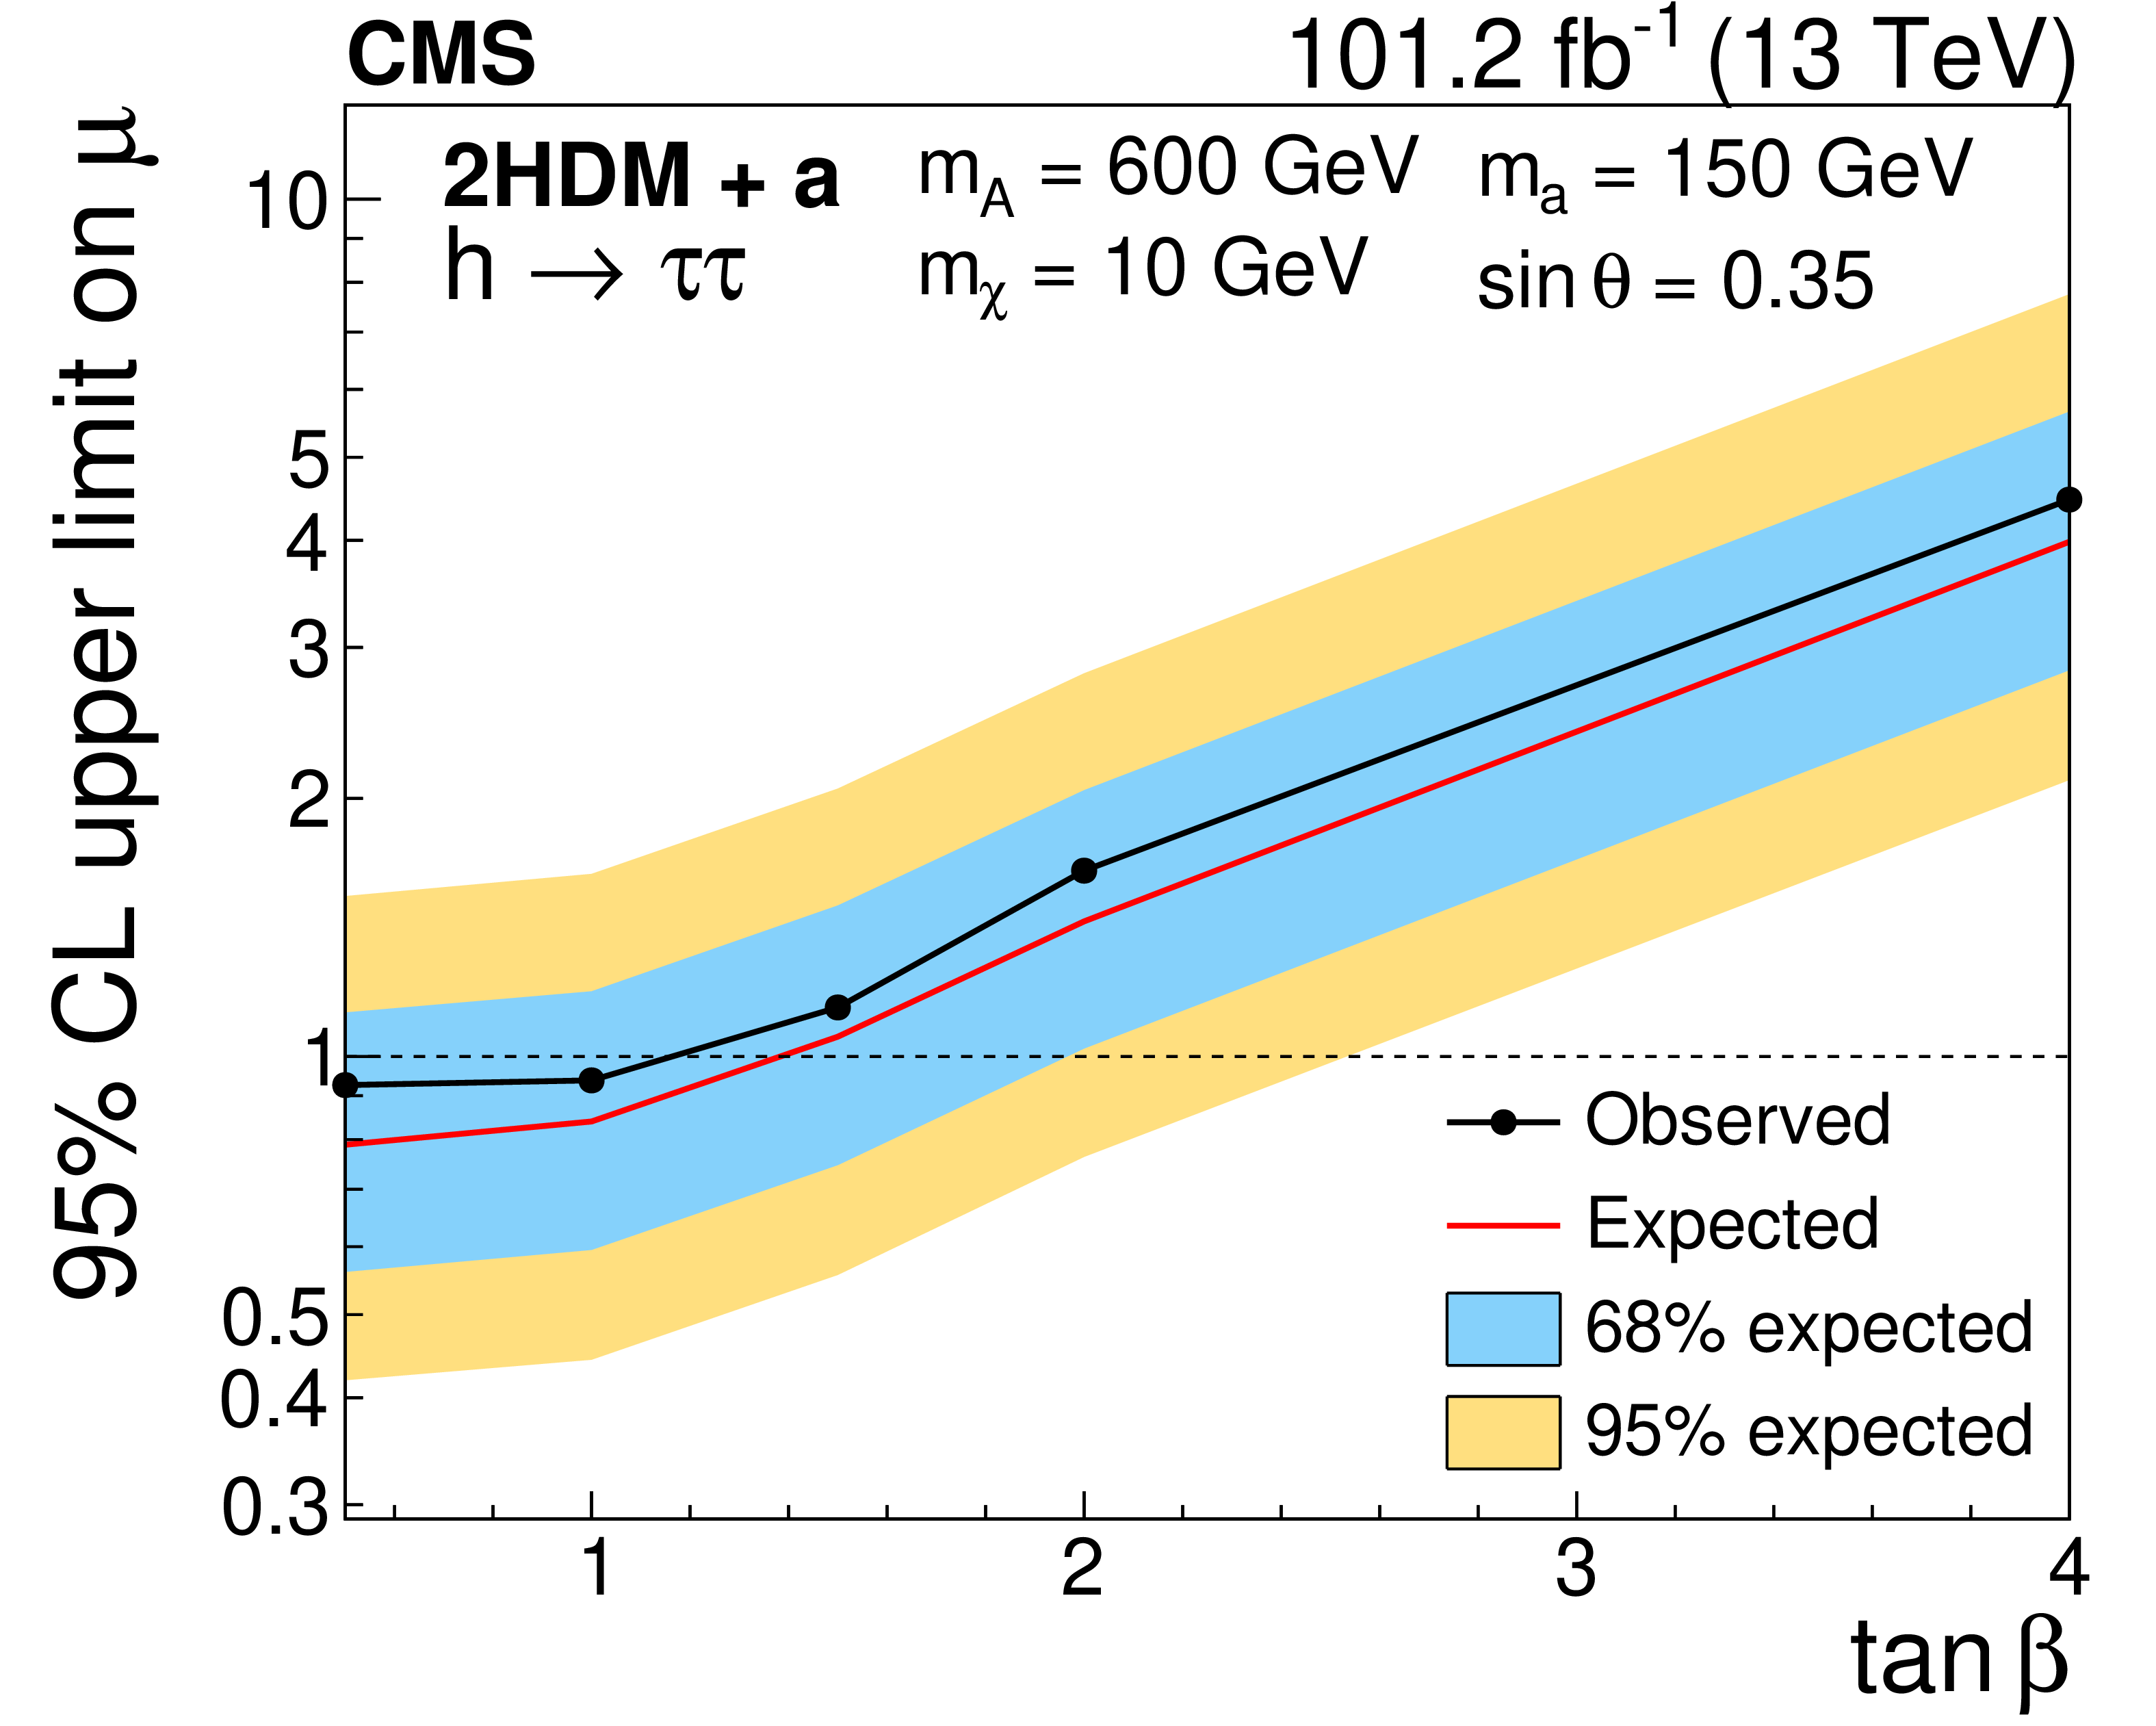
Figure 3:
The 95% CL upper limits on $ \mu $ for the 2HDM+a} model as a function of $ m_{\mathrm{a}} $ (upper let), $ m_{\mathrm{A}} $ (upper right), $ \sin\theta $ (lower left) and $ \tan\beta $ (lower right). The values assumed for the other parameters are shown on each figure. The interpolation between the points is linear. |
png pdf |
Figure 3-a:
The 95% CL upper limits on $ \mu $ for the 2HDM+a} model as a function of $ m_{\mathrm{a}} $ (upper let), $ m_{\mathrm{A}} $ (upper right), $ \sin\theta $ (lower left) and $ \tan\beta $ (lower right). The values assumed for the other parameters are shown on each figure. The interpolation between the points is linear. |
png pdf |
Figure 3-b:
The 95% CL upper limits on $ \mu $ for the 2HDM+a} model as a function of $ m_{\mathrm{a}} $ (upper let), $ m_{\mathrm{A}} $ (upper right), $ \sin\theta $ (lower left) and $ \tan\beta $ (lower right). The values assumed for the other parameters are shown on each figure. The interpolation between the points is linear. |
png pdf |
Figure 3-c:
The 95% CL upper limits on $ \mu $ for the 2HDM+a} model as a function of $ m_{\mathrm{a}} $ (upper let), $ m_{\mathrm{A}} $ (upper right), $ \sin\theta $ (lower left) and $ \tan\beta $ (lower right). The values assumed for the other parameters are shown on each figure. The interpolation between the points is linear. |
png pdf |
Figure 3-d:
The 95% CL upper limits on $ \mu $ for the 2HDM+a} model as a function of $ m_{\mathrm{a}} $ (upper let), $ m_{\mathrm{A}} $ (upper right), $ \sin\theta $ (lower left) and $ \tan\beta $ (lower right). The values assumed for the other parameters are shown on each figure. The interpolation between the points is linear. |
png pdf |
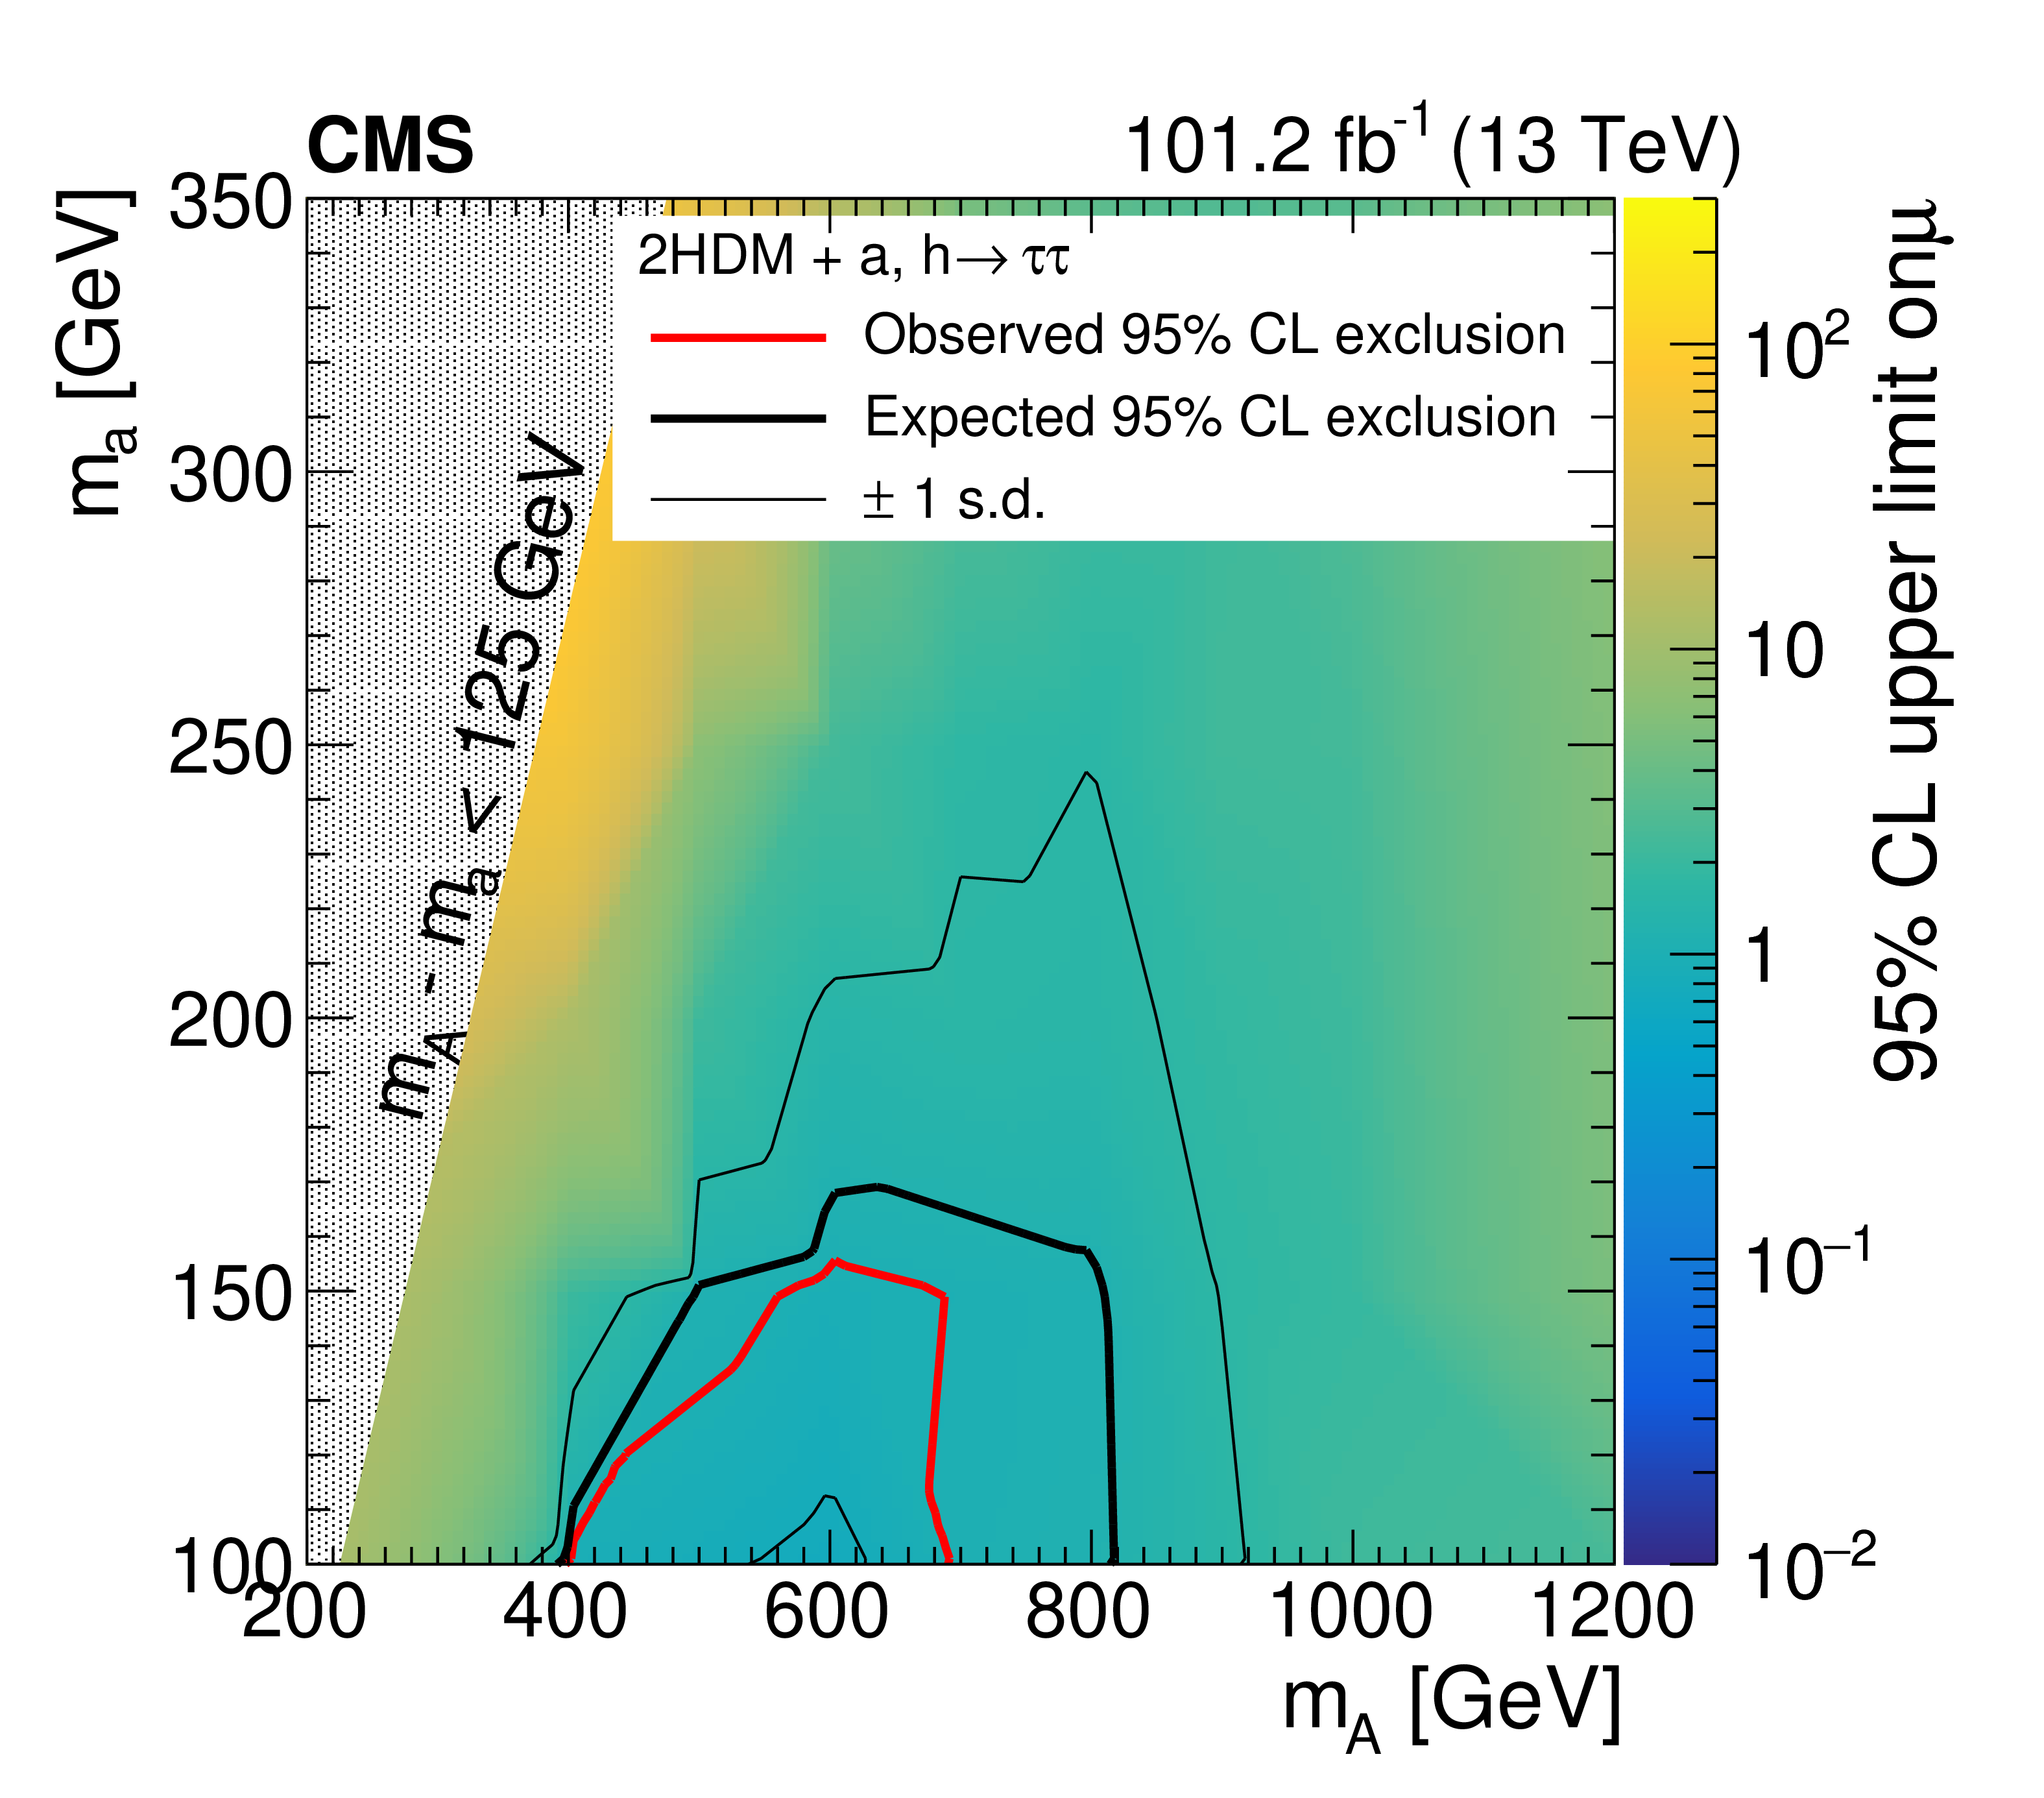
Figure 4:
The 95% CL upper limits on $ \mu $ in the ($ m_{\mathrm{A}} $,$ m_{\mathrm{a}} $) plane for the 2HDM+a} model. The regions inside the red and black curves correspond to the observed and expected exclusions at 95% CL, respectively. |
png pdf |
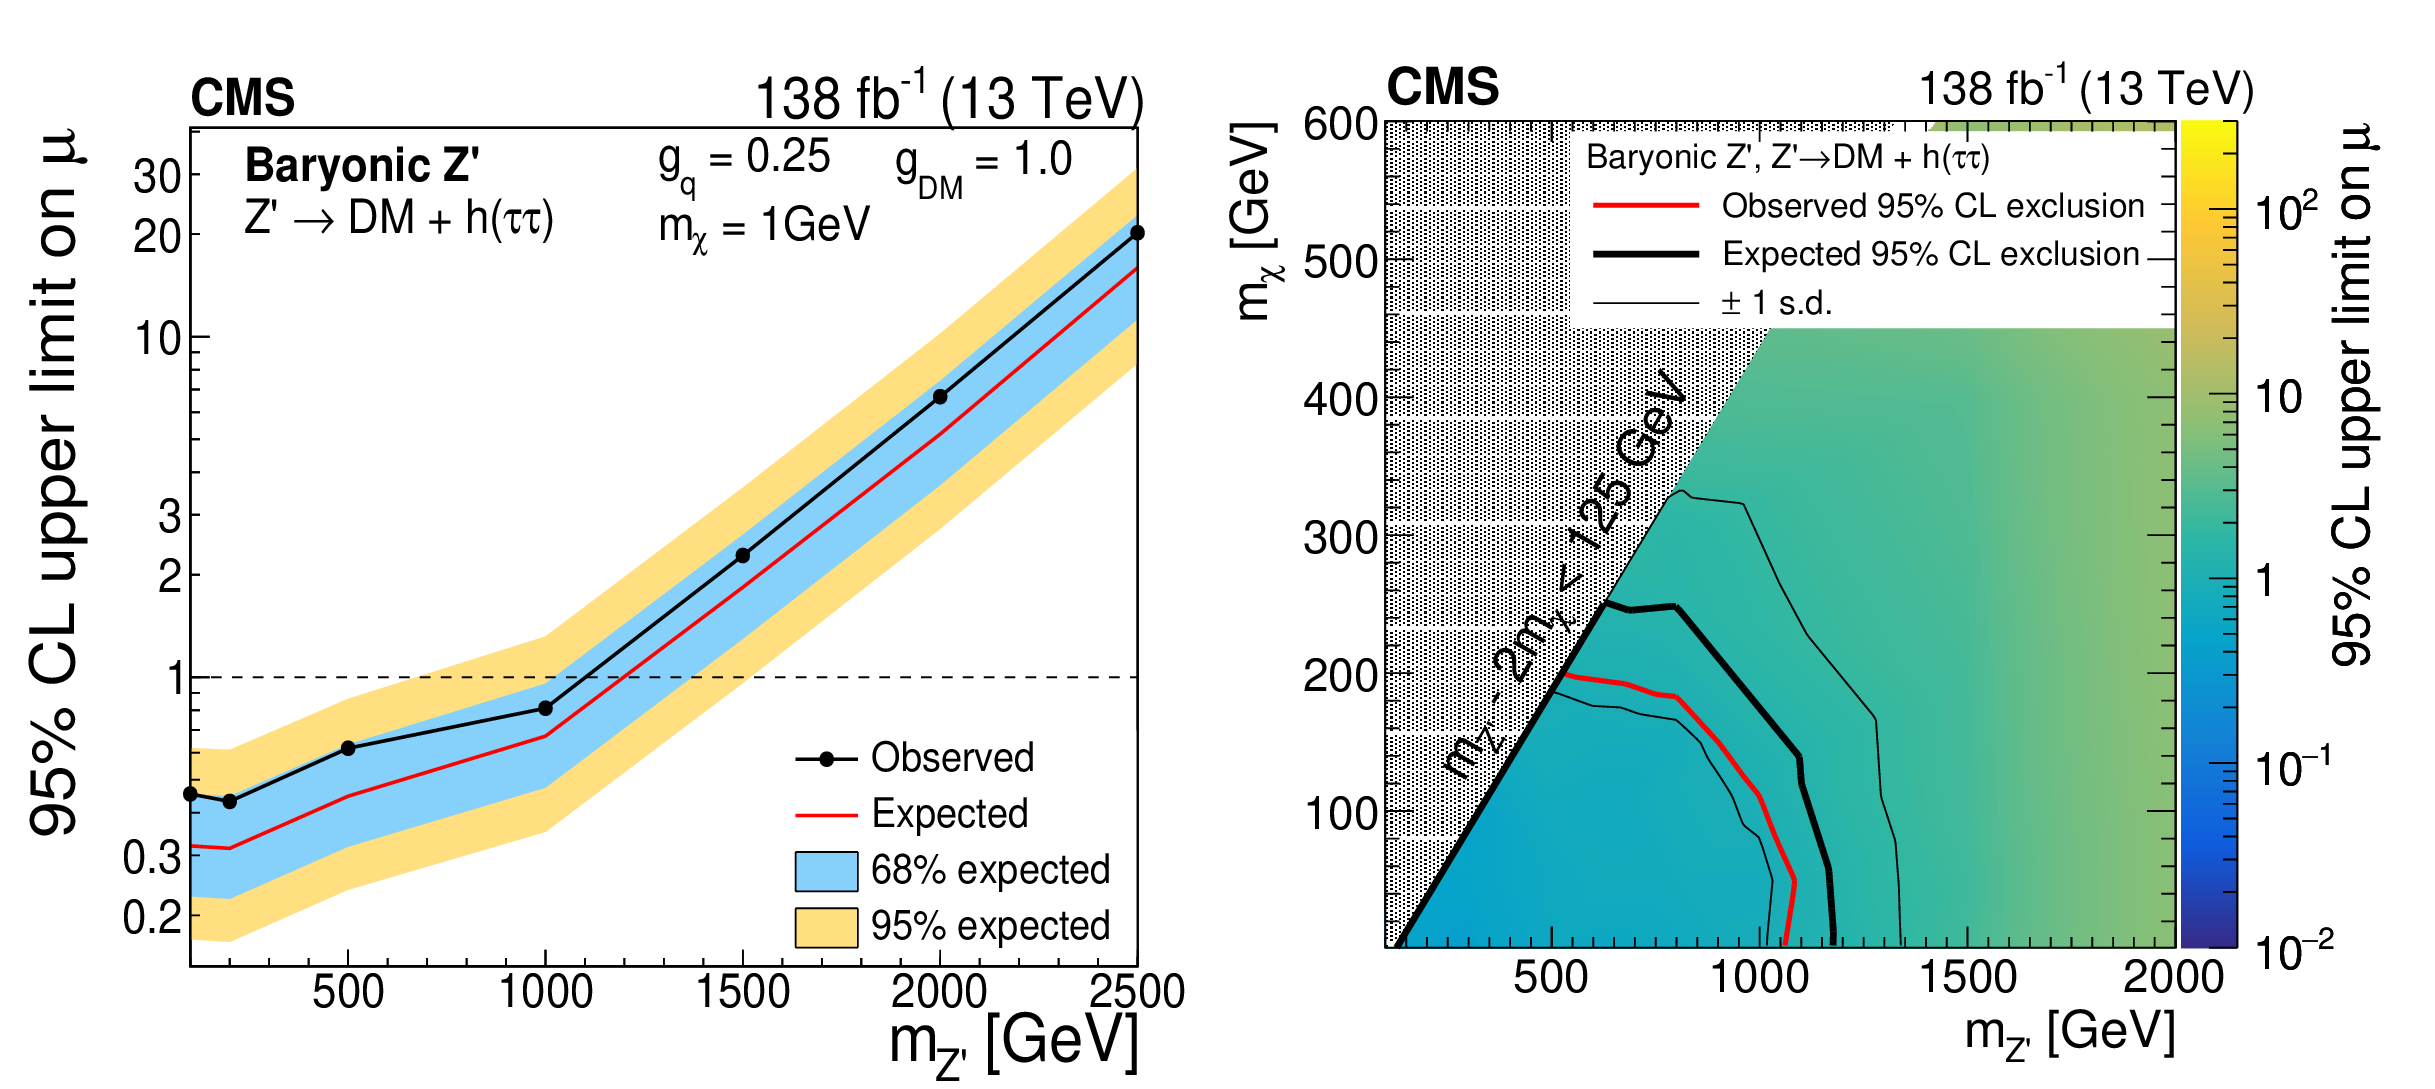
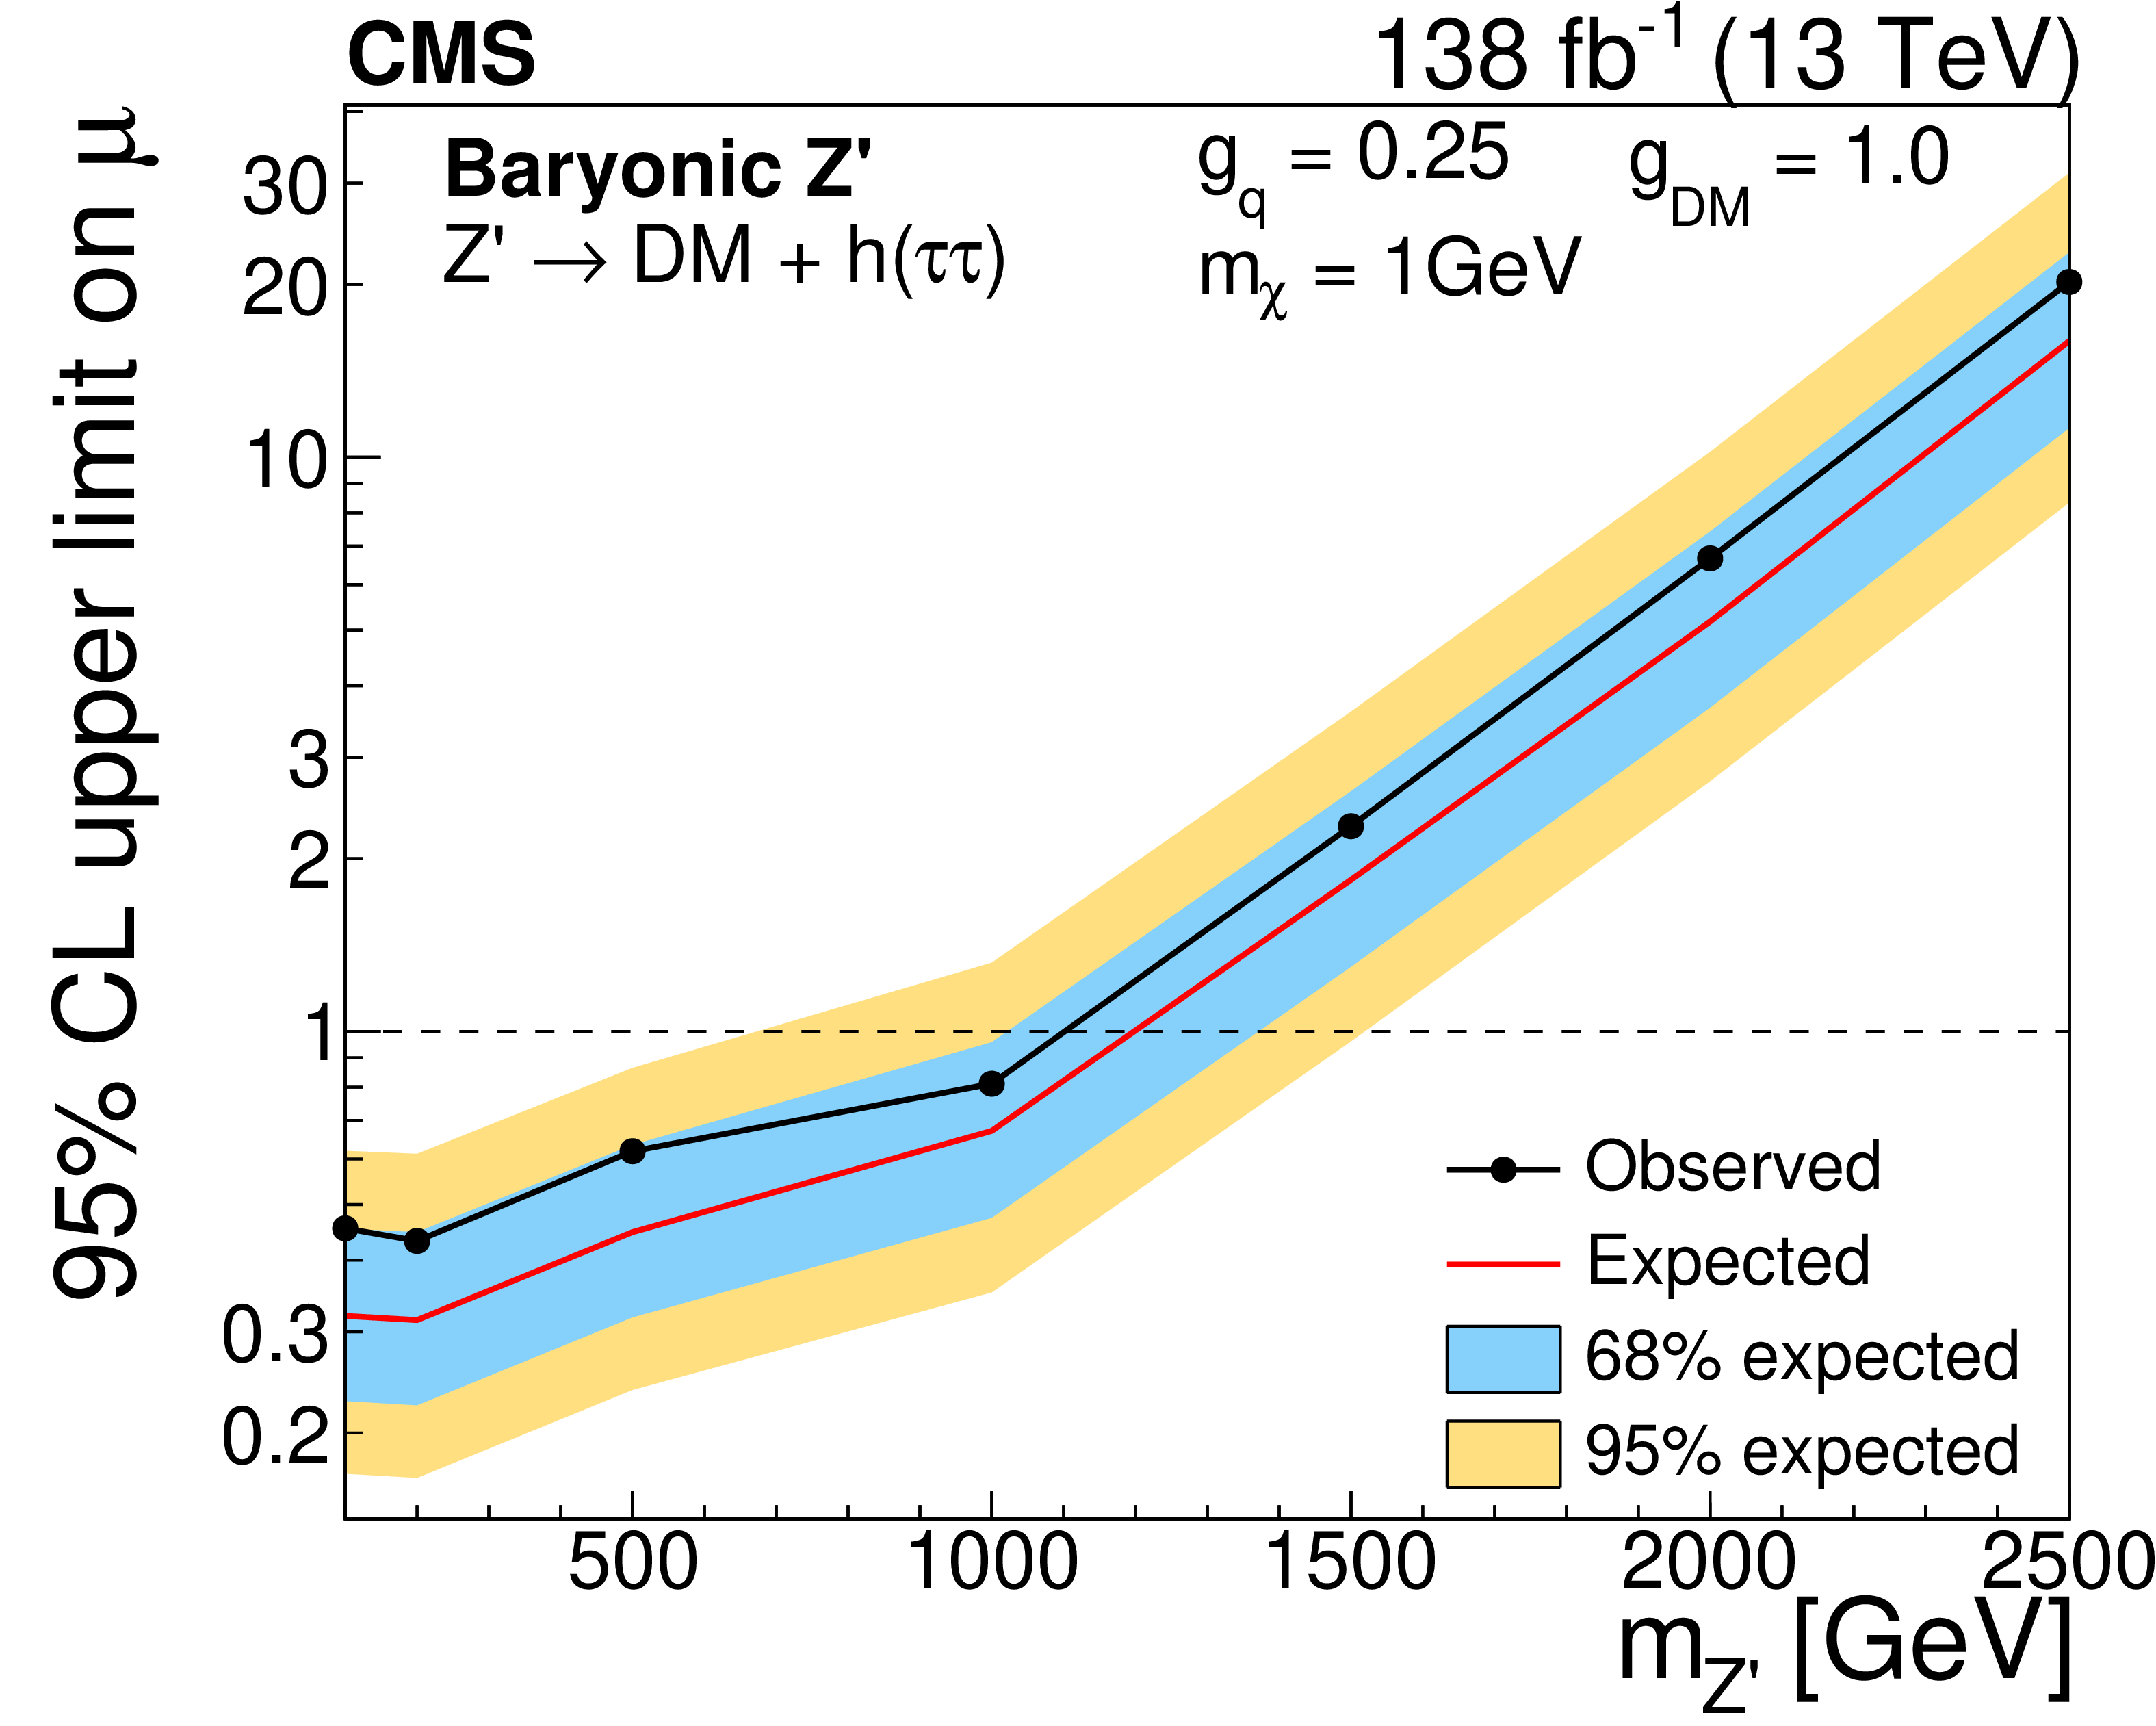
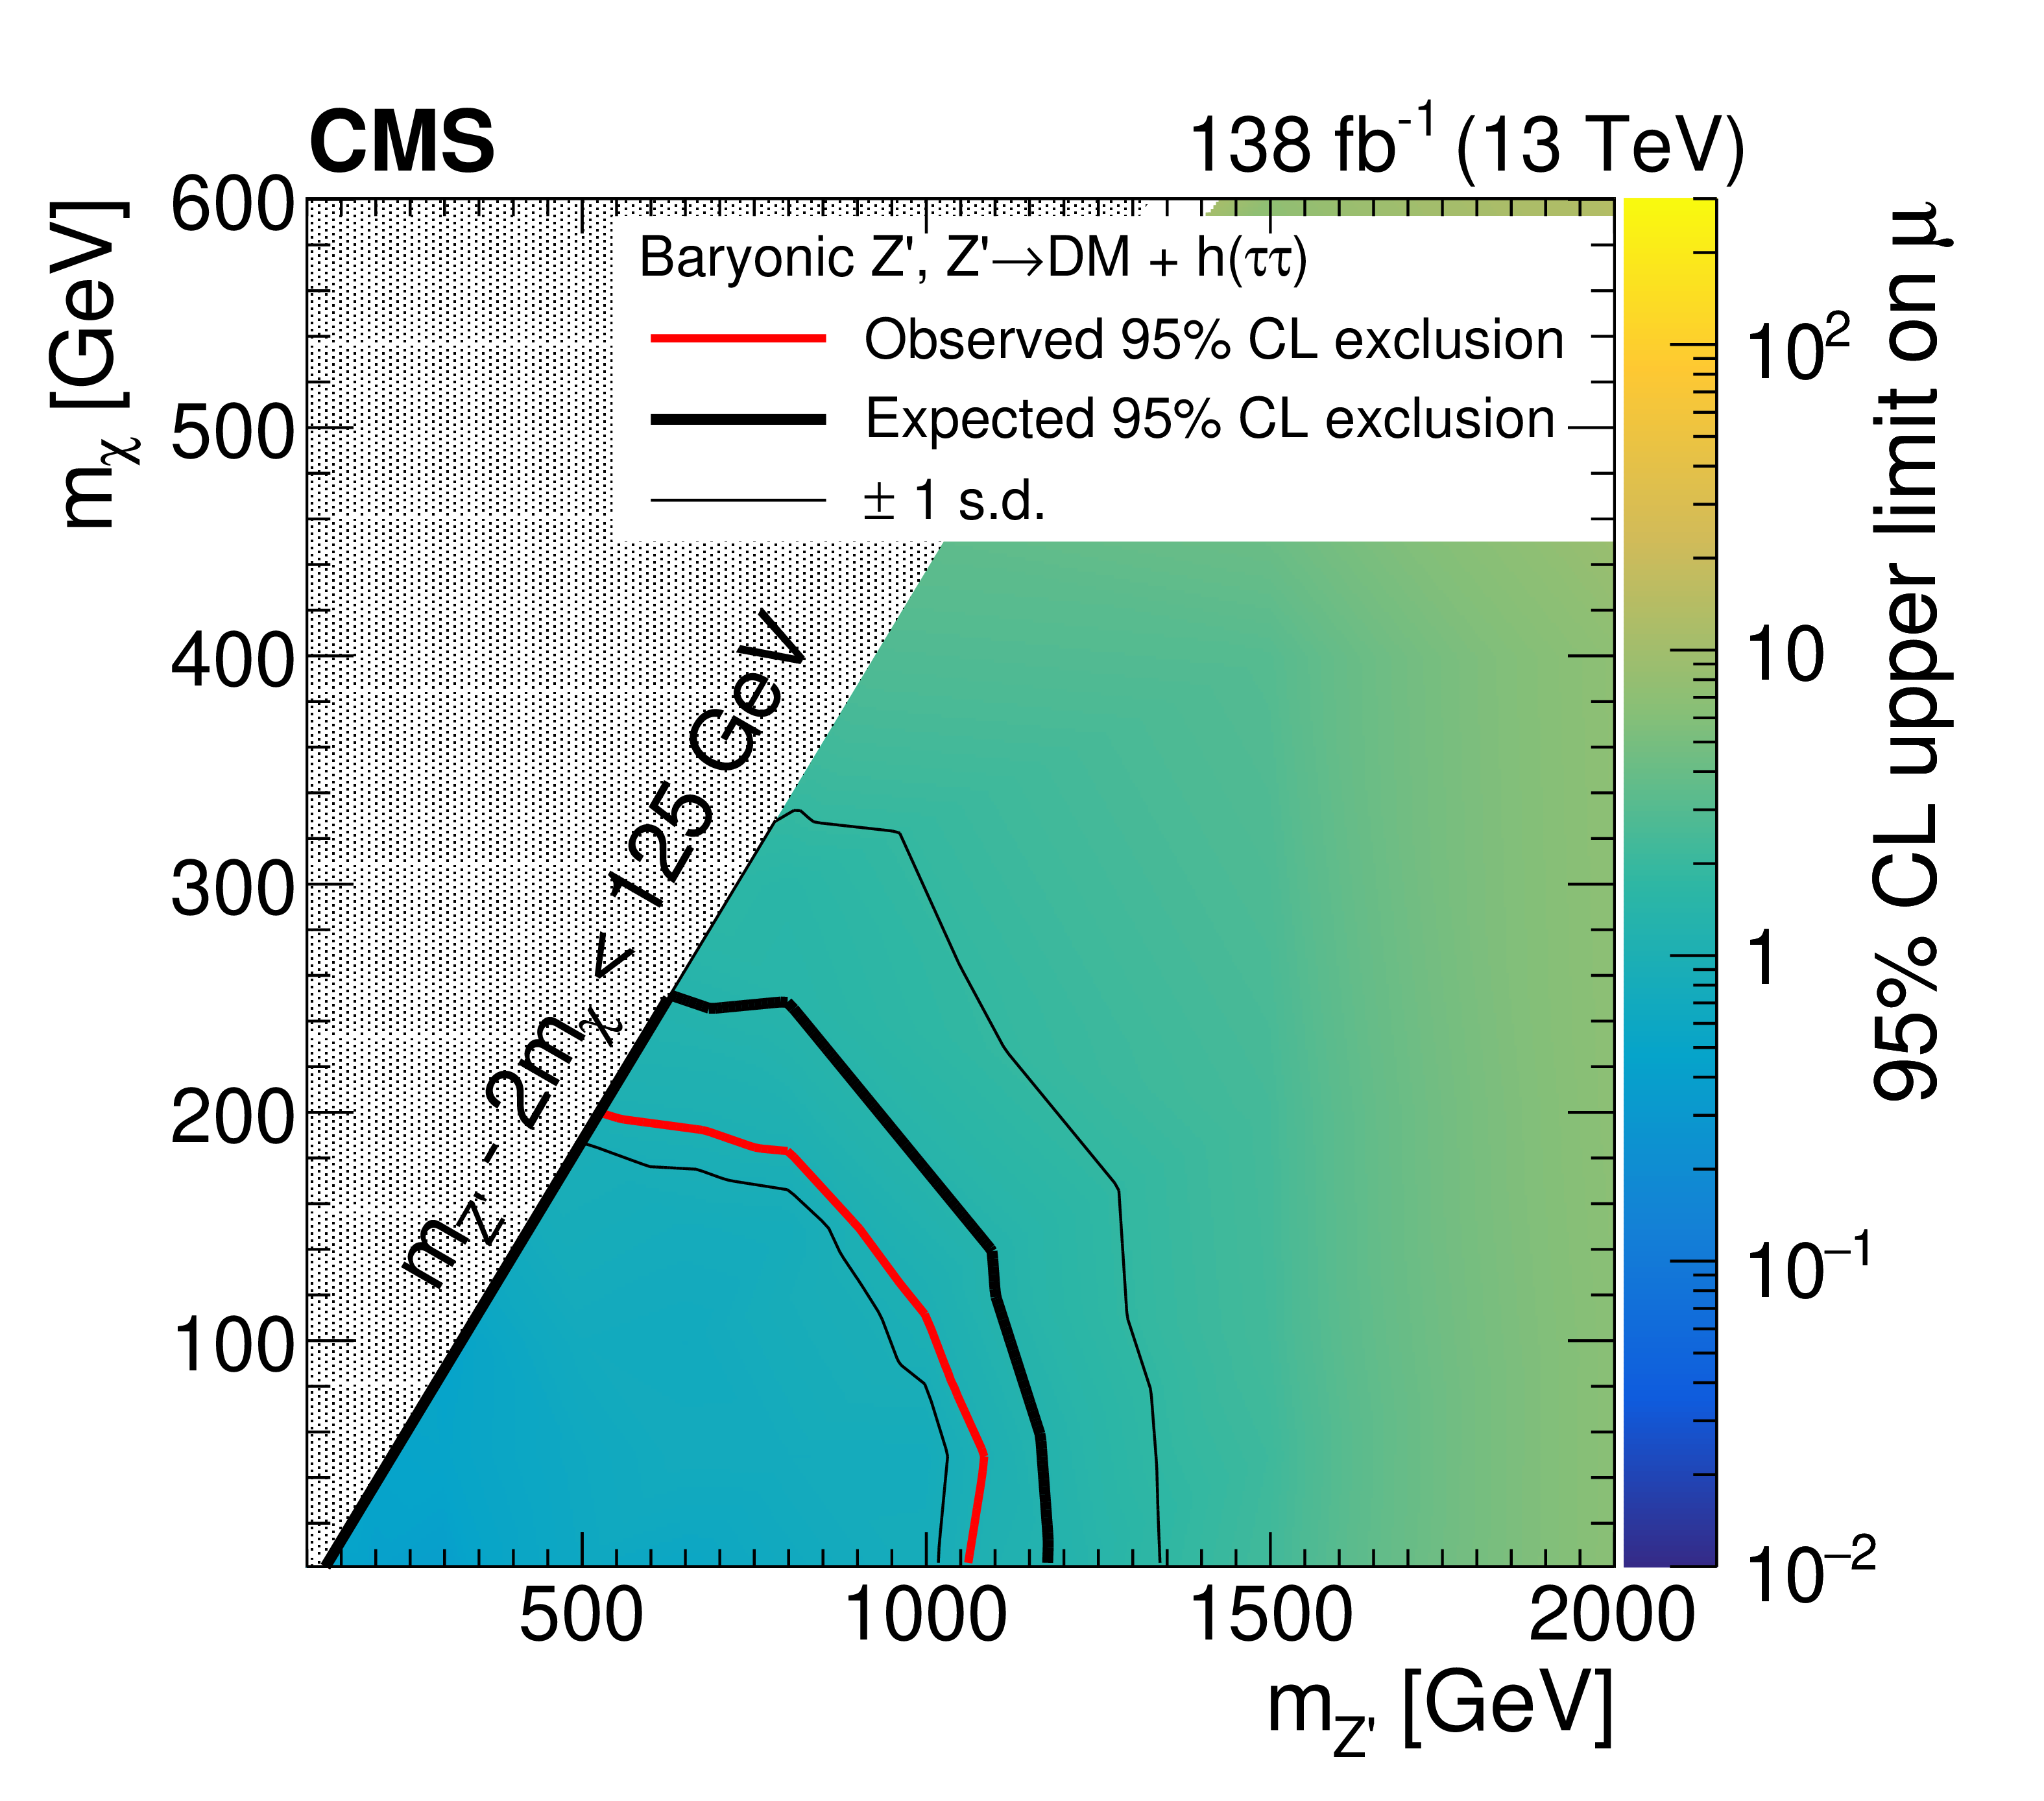
Figure 5:
The 95% CL upper limits on $ \mu $ for the baryonic Z' model. Left: Observed and expected 95% CL upper limits on $ \mu $ as a function of $ m_{\mathrm{Z}^{'}} $, using $ m_{\chi} $ = 1 GeV. Right: 95% CL upper limits on $ \mu $ in the ($ m_{\mathrm{Z}^{'}} $,$ m_{\chi} $) plane. The regions inside the red and black curve correspond to the observed and expected exclusions at 95% CL, respectively. |
png pdf |
Figure 5-a:
The 95% CL upper limits on $ \mu $ for the baryonic Z' model. Left: Observed and expected 95% CL upper limits on $ \mu $ as a function of $ m_{\mathrm{Z}^{'}} $, using $ m_{\chi} $ = 1 GeV. Right: 95% CL upper limits on $ \mu $ in the ($ m_{\mathrm{Z}^{'}} $,$ m_{\chi} $) plane. The regions inside the red and black curve correspond to the observed and expected exclusions at 95% CL, respectively. |
png pdf |
Figure 5-b:
The 95% CL upper limits on $ \mu $ for the baryonic Z' model. Left: Observed and expected 95% CL upper limits on $ \mu $ as a function of $ m_{\mathrm{Z}^{'}} $, using $ m_{\chi} $ = 1 GeV. Right: 95% CL upper limits on $ \mu $ in the ($ m_{\mathrm{Z}^{'}} $,$ m_{\chi} $) plane. The regions inside the red and black curve correspond to the observed and expected exclusions at 95% CL, respectively. |
| Tables | |
png pdf |
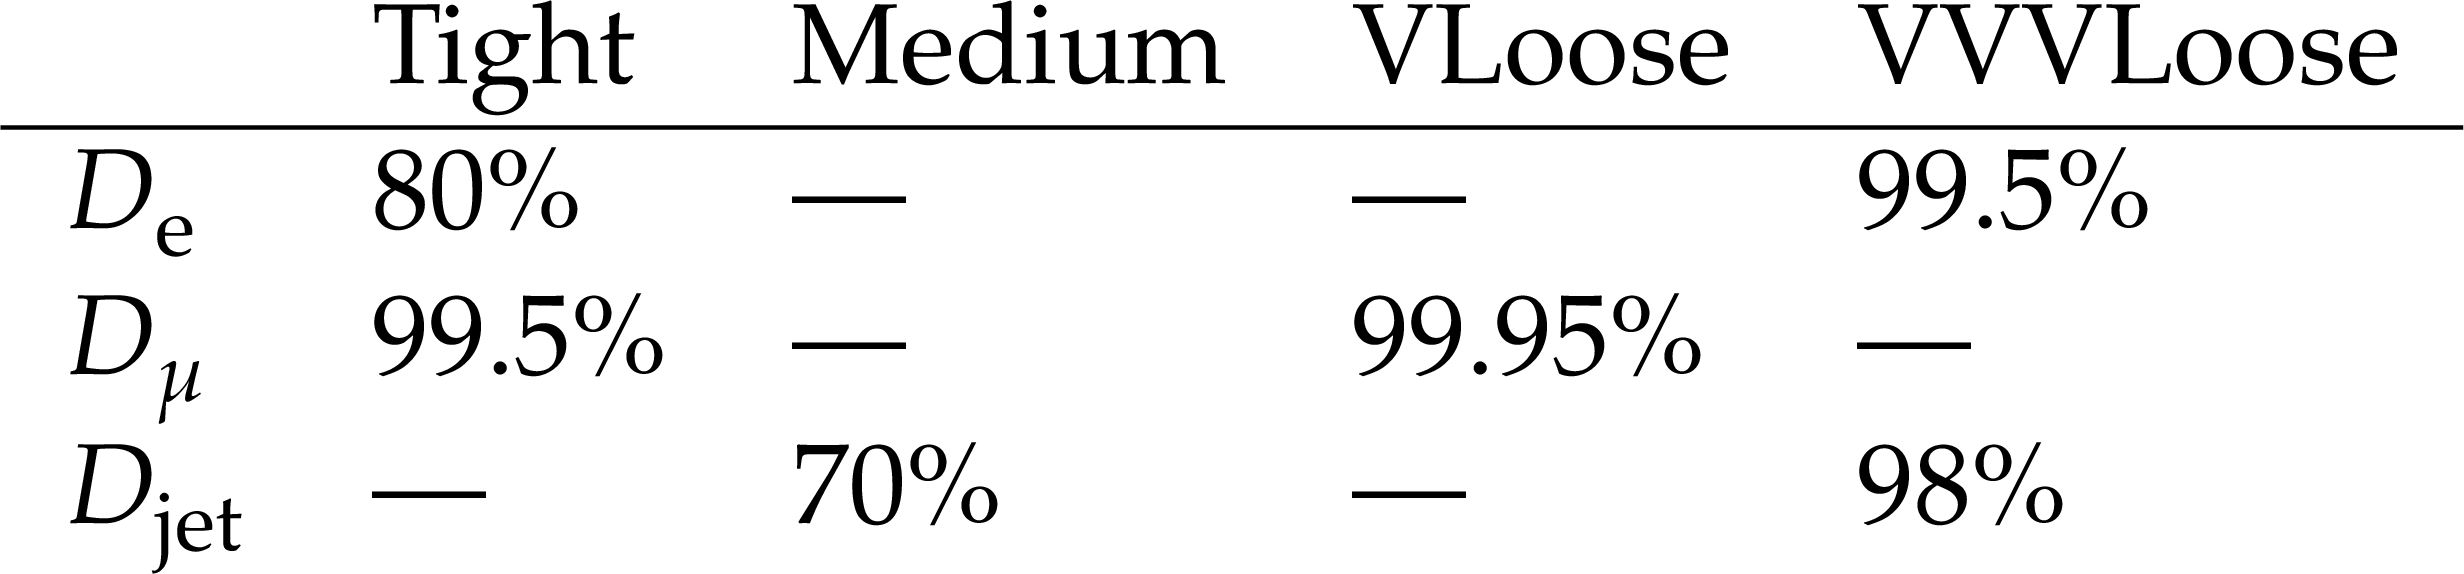
Table 1:
Target $ \tau_\mathrm{h} $ identification efficiencies for the different working points defined for the three different discriminants that are used in the analysis. These identification efficiencies are evaluated for genuine $ \tau_\mathrm{h} $ candidates in simulated $ \mathrm{H}\to\tau\tau $ events with $ p_{\mathrm{T}} \in $ [30, 70] GeV for $ \tau_\mathrm{h} $. |
png pdf |
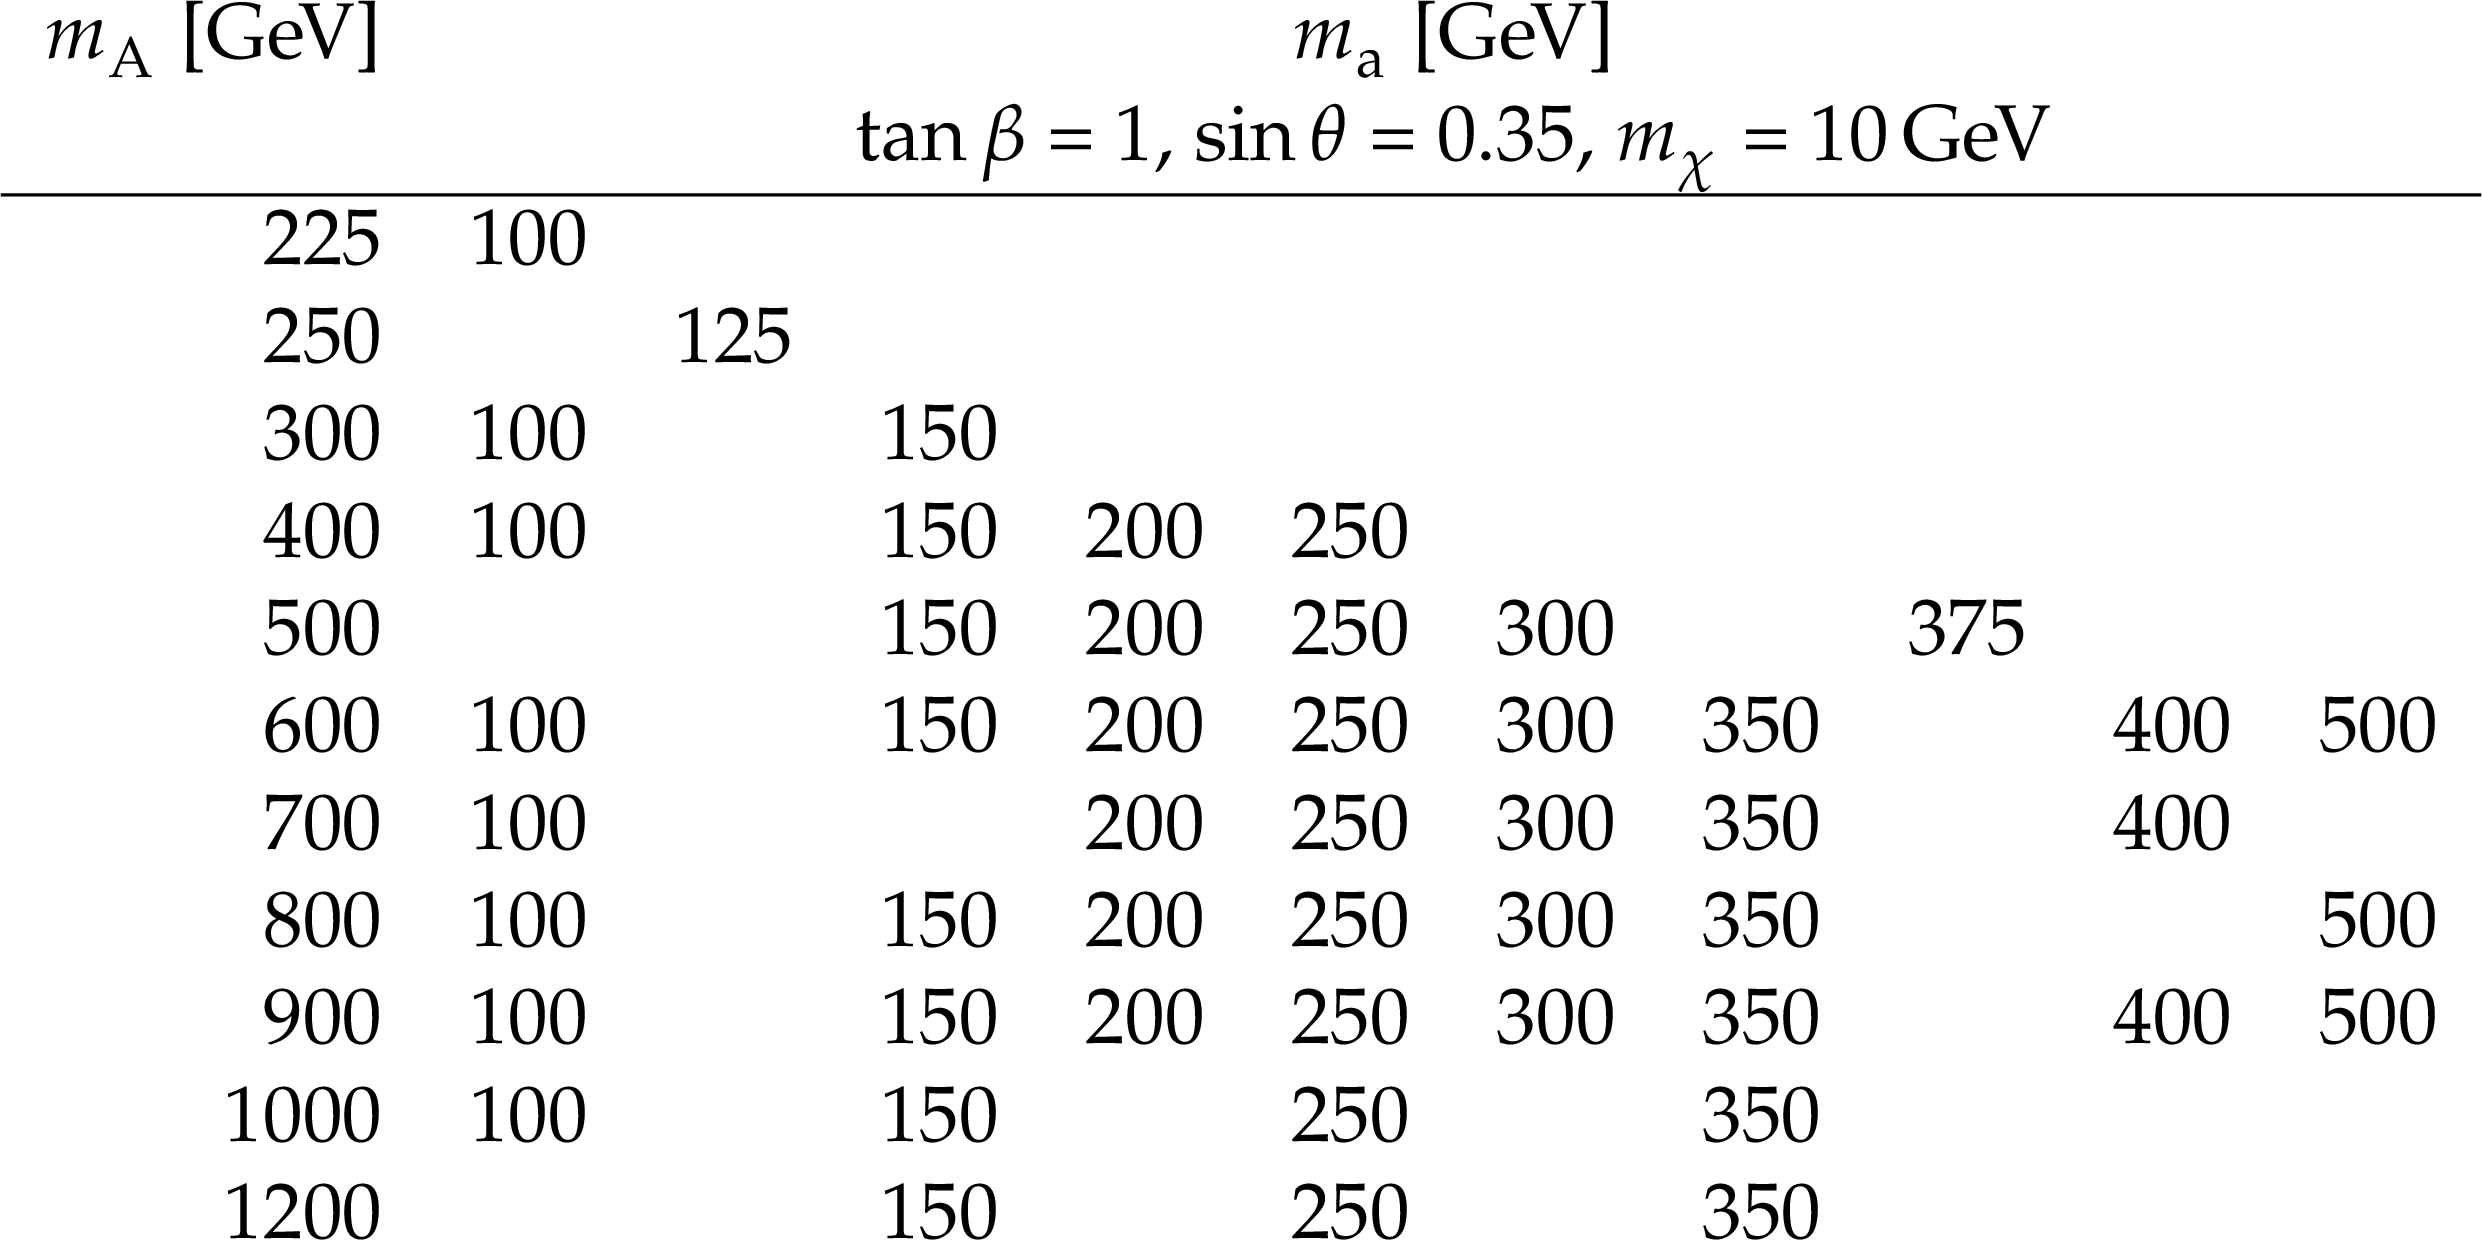
Table 2:
Mass values scanning the available phase space in the ($ m_{\mathrm{a}} $,$ m_{\mathrm{A}} $) plane, used in the simulation for the 2HDM+a} model. The phase space is limited by $ m_{\mathrm{A}} - m_{\mathrm{a}} < $ 125 GeV, where 125 GeV is the Higgs mass. |
png pdf |
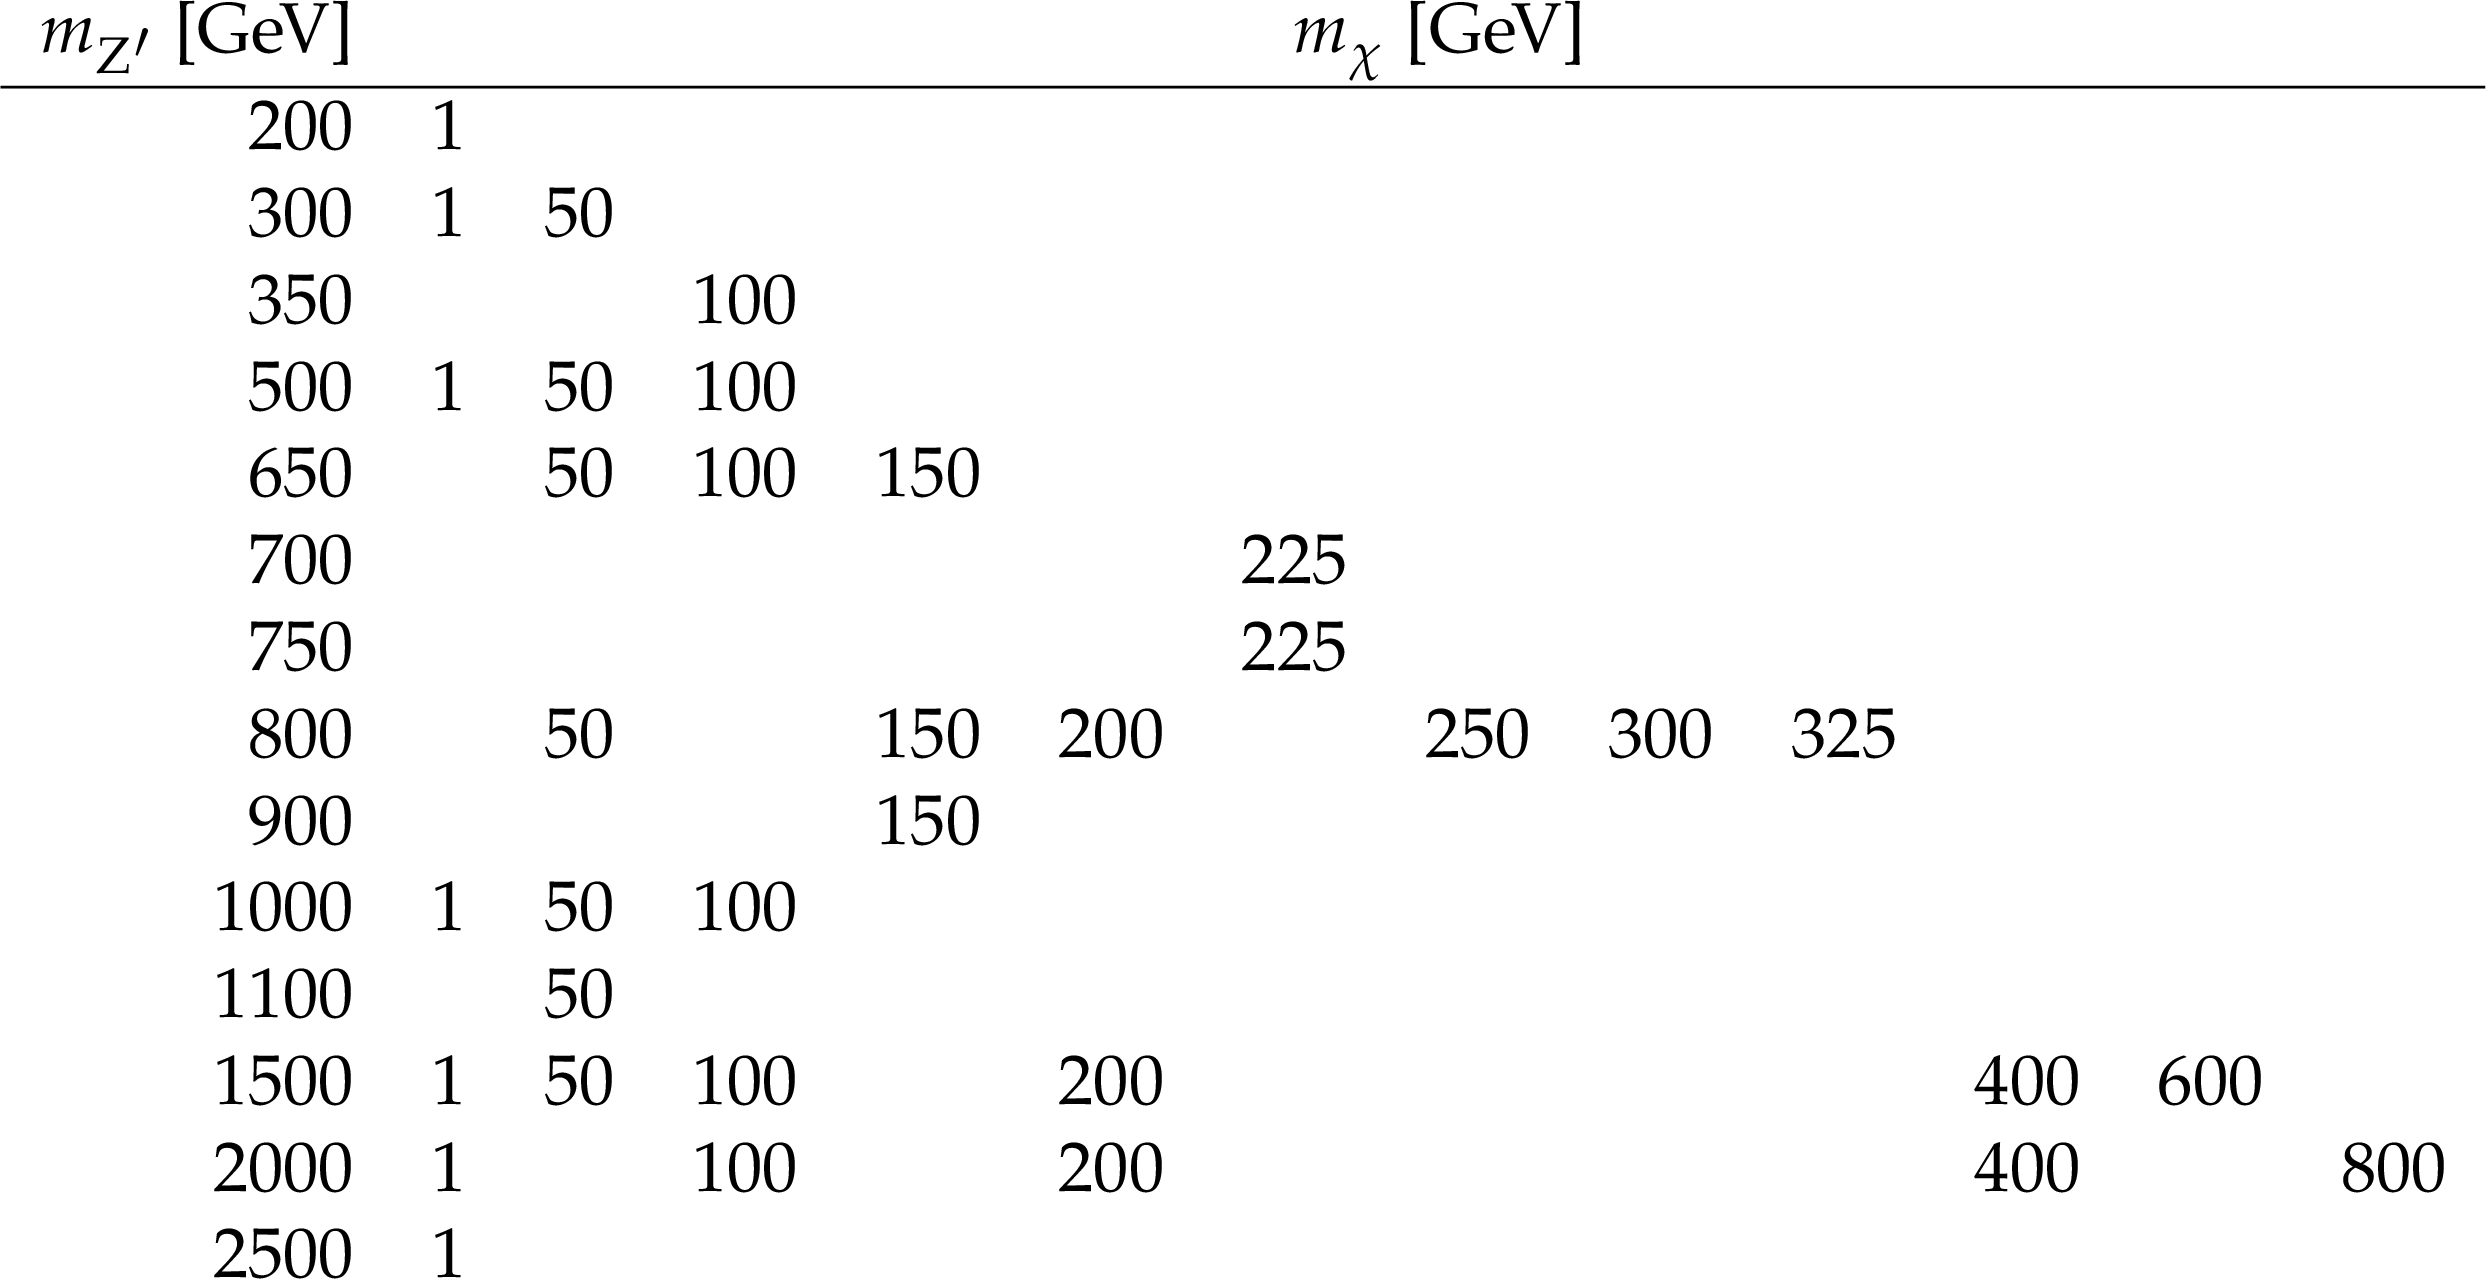
Table 3:
Mass values scanning the available phase space in the ($ m_{\chi} $,$ m_{\mathrm{Z}^{'}} $) plane, used in the simulation for the baryonic Z' model. The phase space is limited by $ m_{\mathrm{Z}^{'}} - m_{\chi} < $ 125 GeV, where 125 GeV is the Higgs mass, and by $ m_{\chi} < m_{\mathrm{Z}^{'}}/ $ 2. |
png pdf |
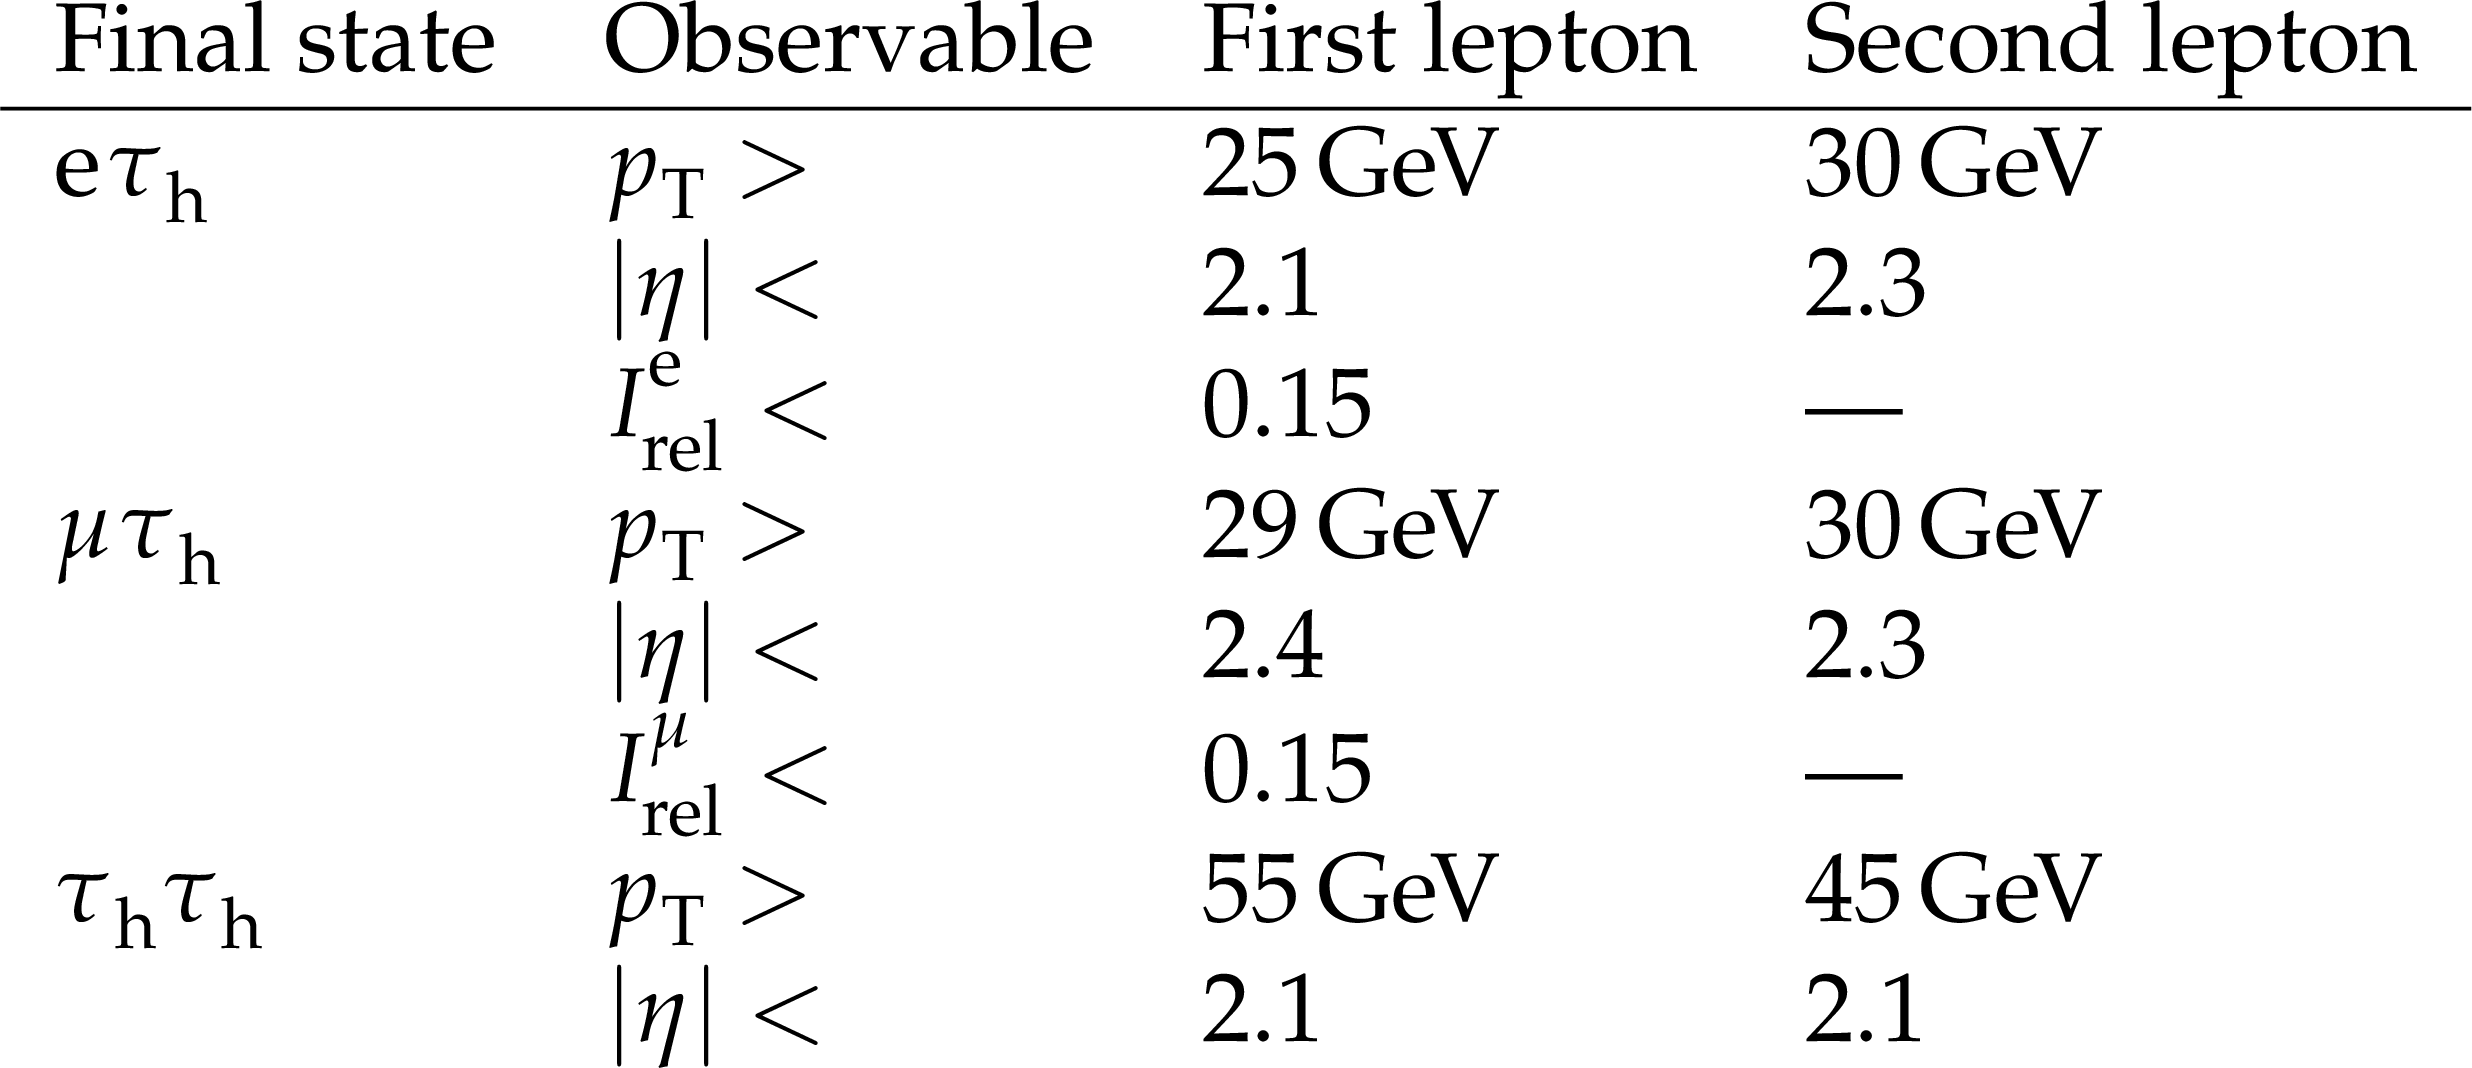
Table 4:
Offline selection requirements applied to e, $ \mu $, and $ \tau_\mathrm{h} $ candidates used for the selection of $ \tau $ pairs. The expressions ``first lepton" and ``second lepton" refer to the lepton order of the final state in the first column. |
png pdf |
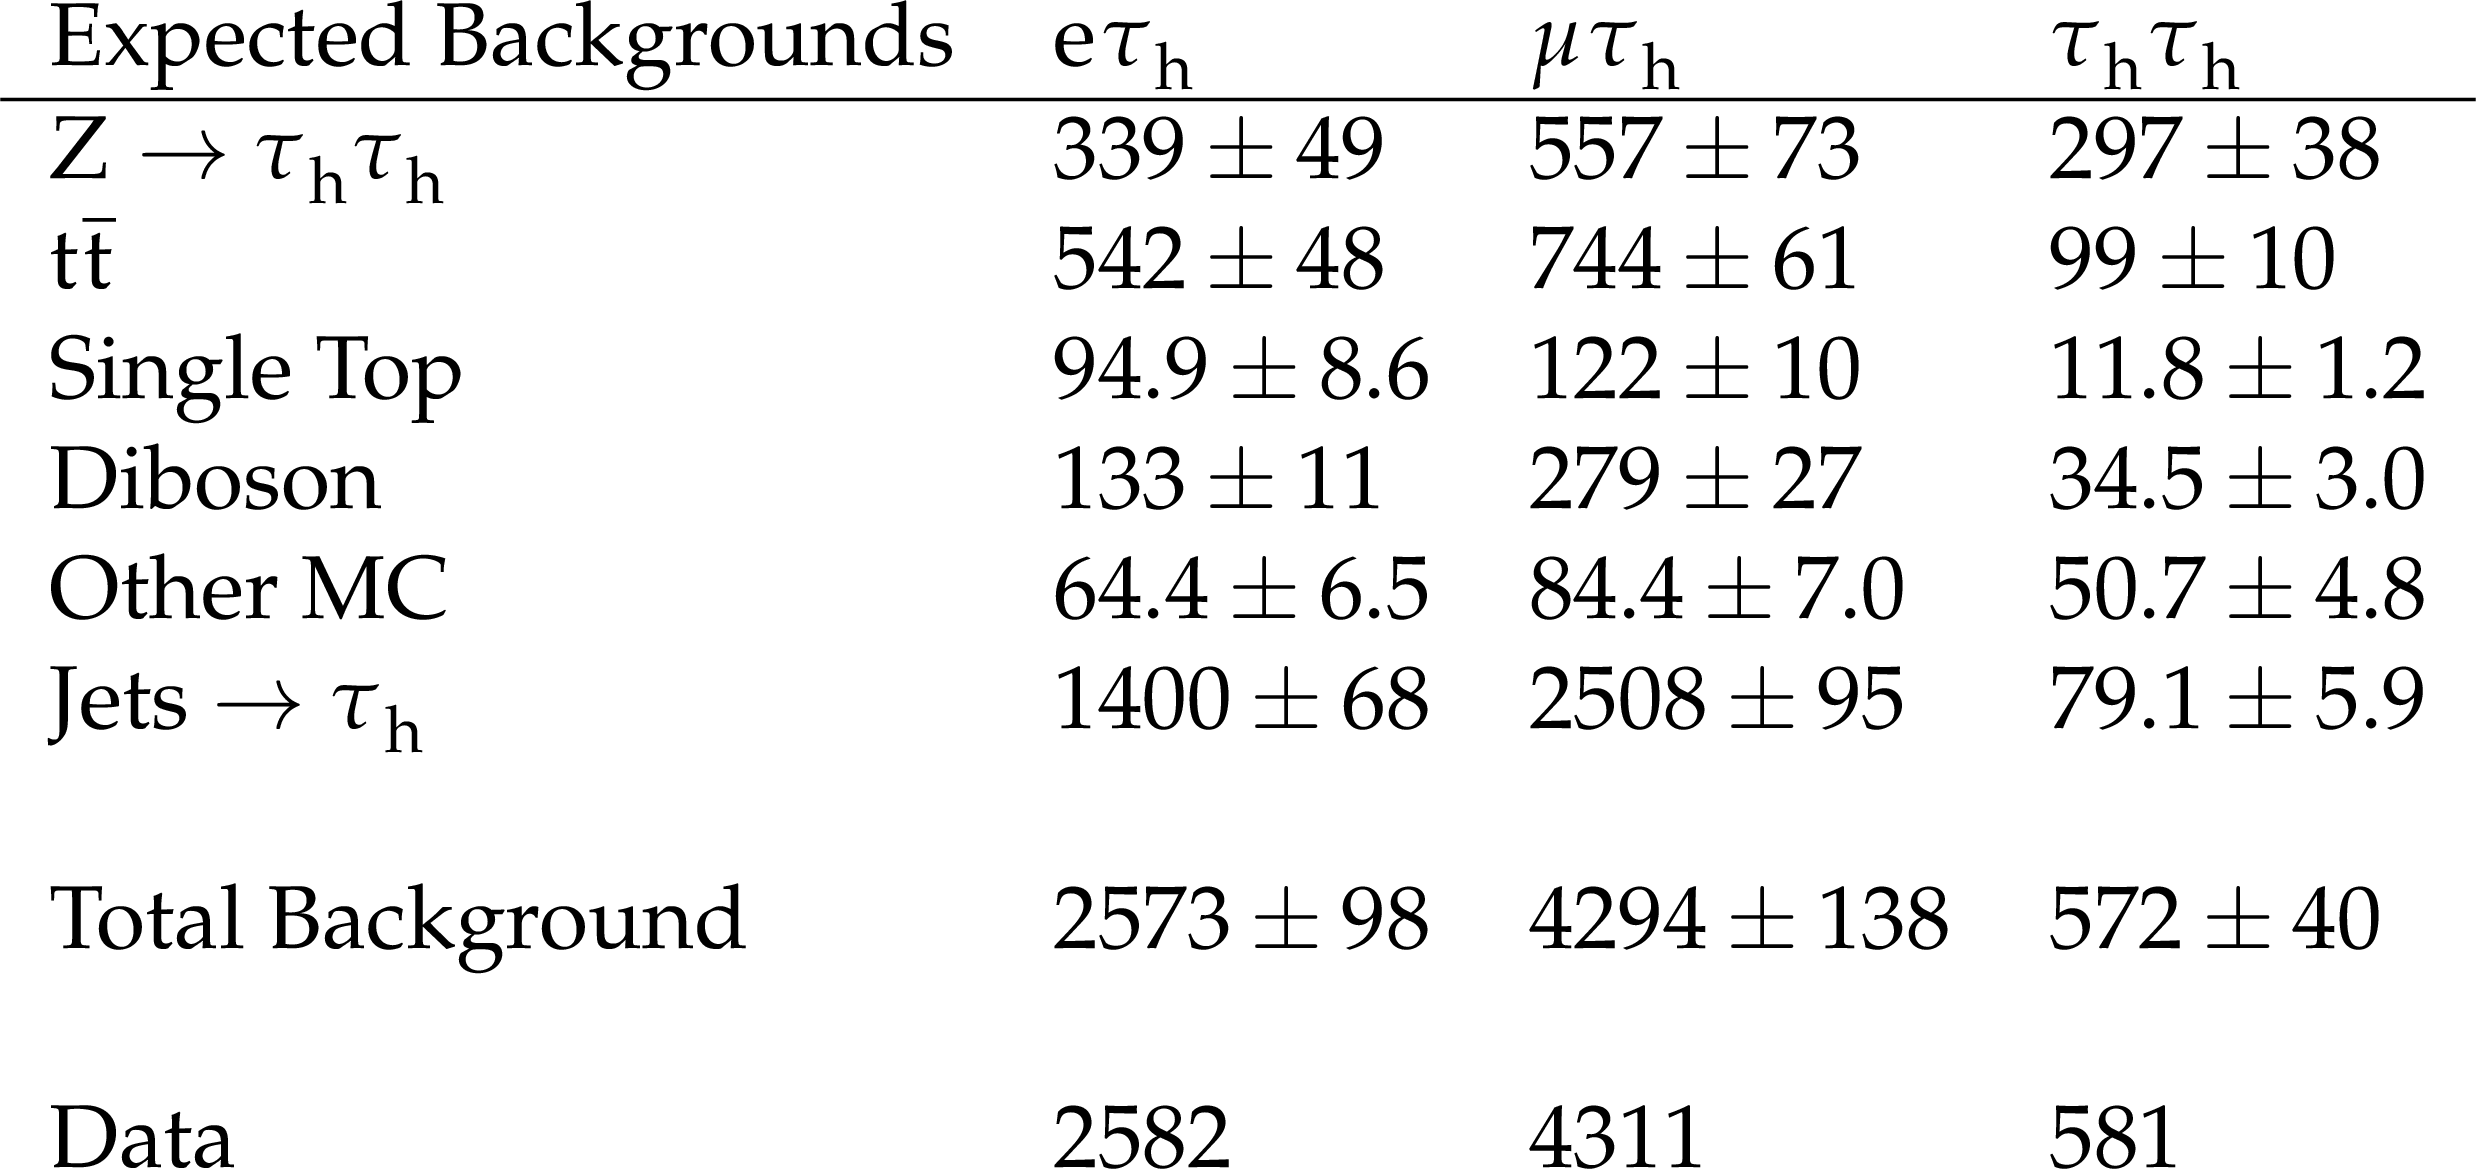
Table 5:
The post-fit estimated background yields and the observed number of events for the $ M_\mathrm{T}^{\text{tot}} $ distribution in the SR, combined for the 2017 and 2018 data. The ``Other MC'' background contribution includes events from ggh, VBF, $ \mathrm{W}\mathrm{h} $, $ \mathrm{Z}\mathrm{h} $, $ \mathrm{Z} \rightarrow $ Others, and electroweak vector boson production. The uncertainties in the total expected yields include both statistical and systematic contributions. |
png pdf |
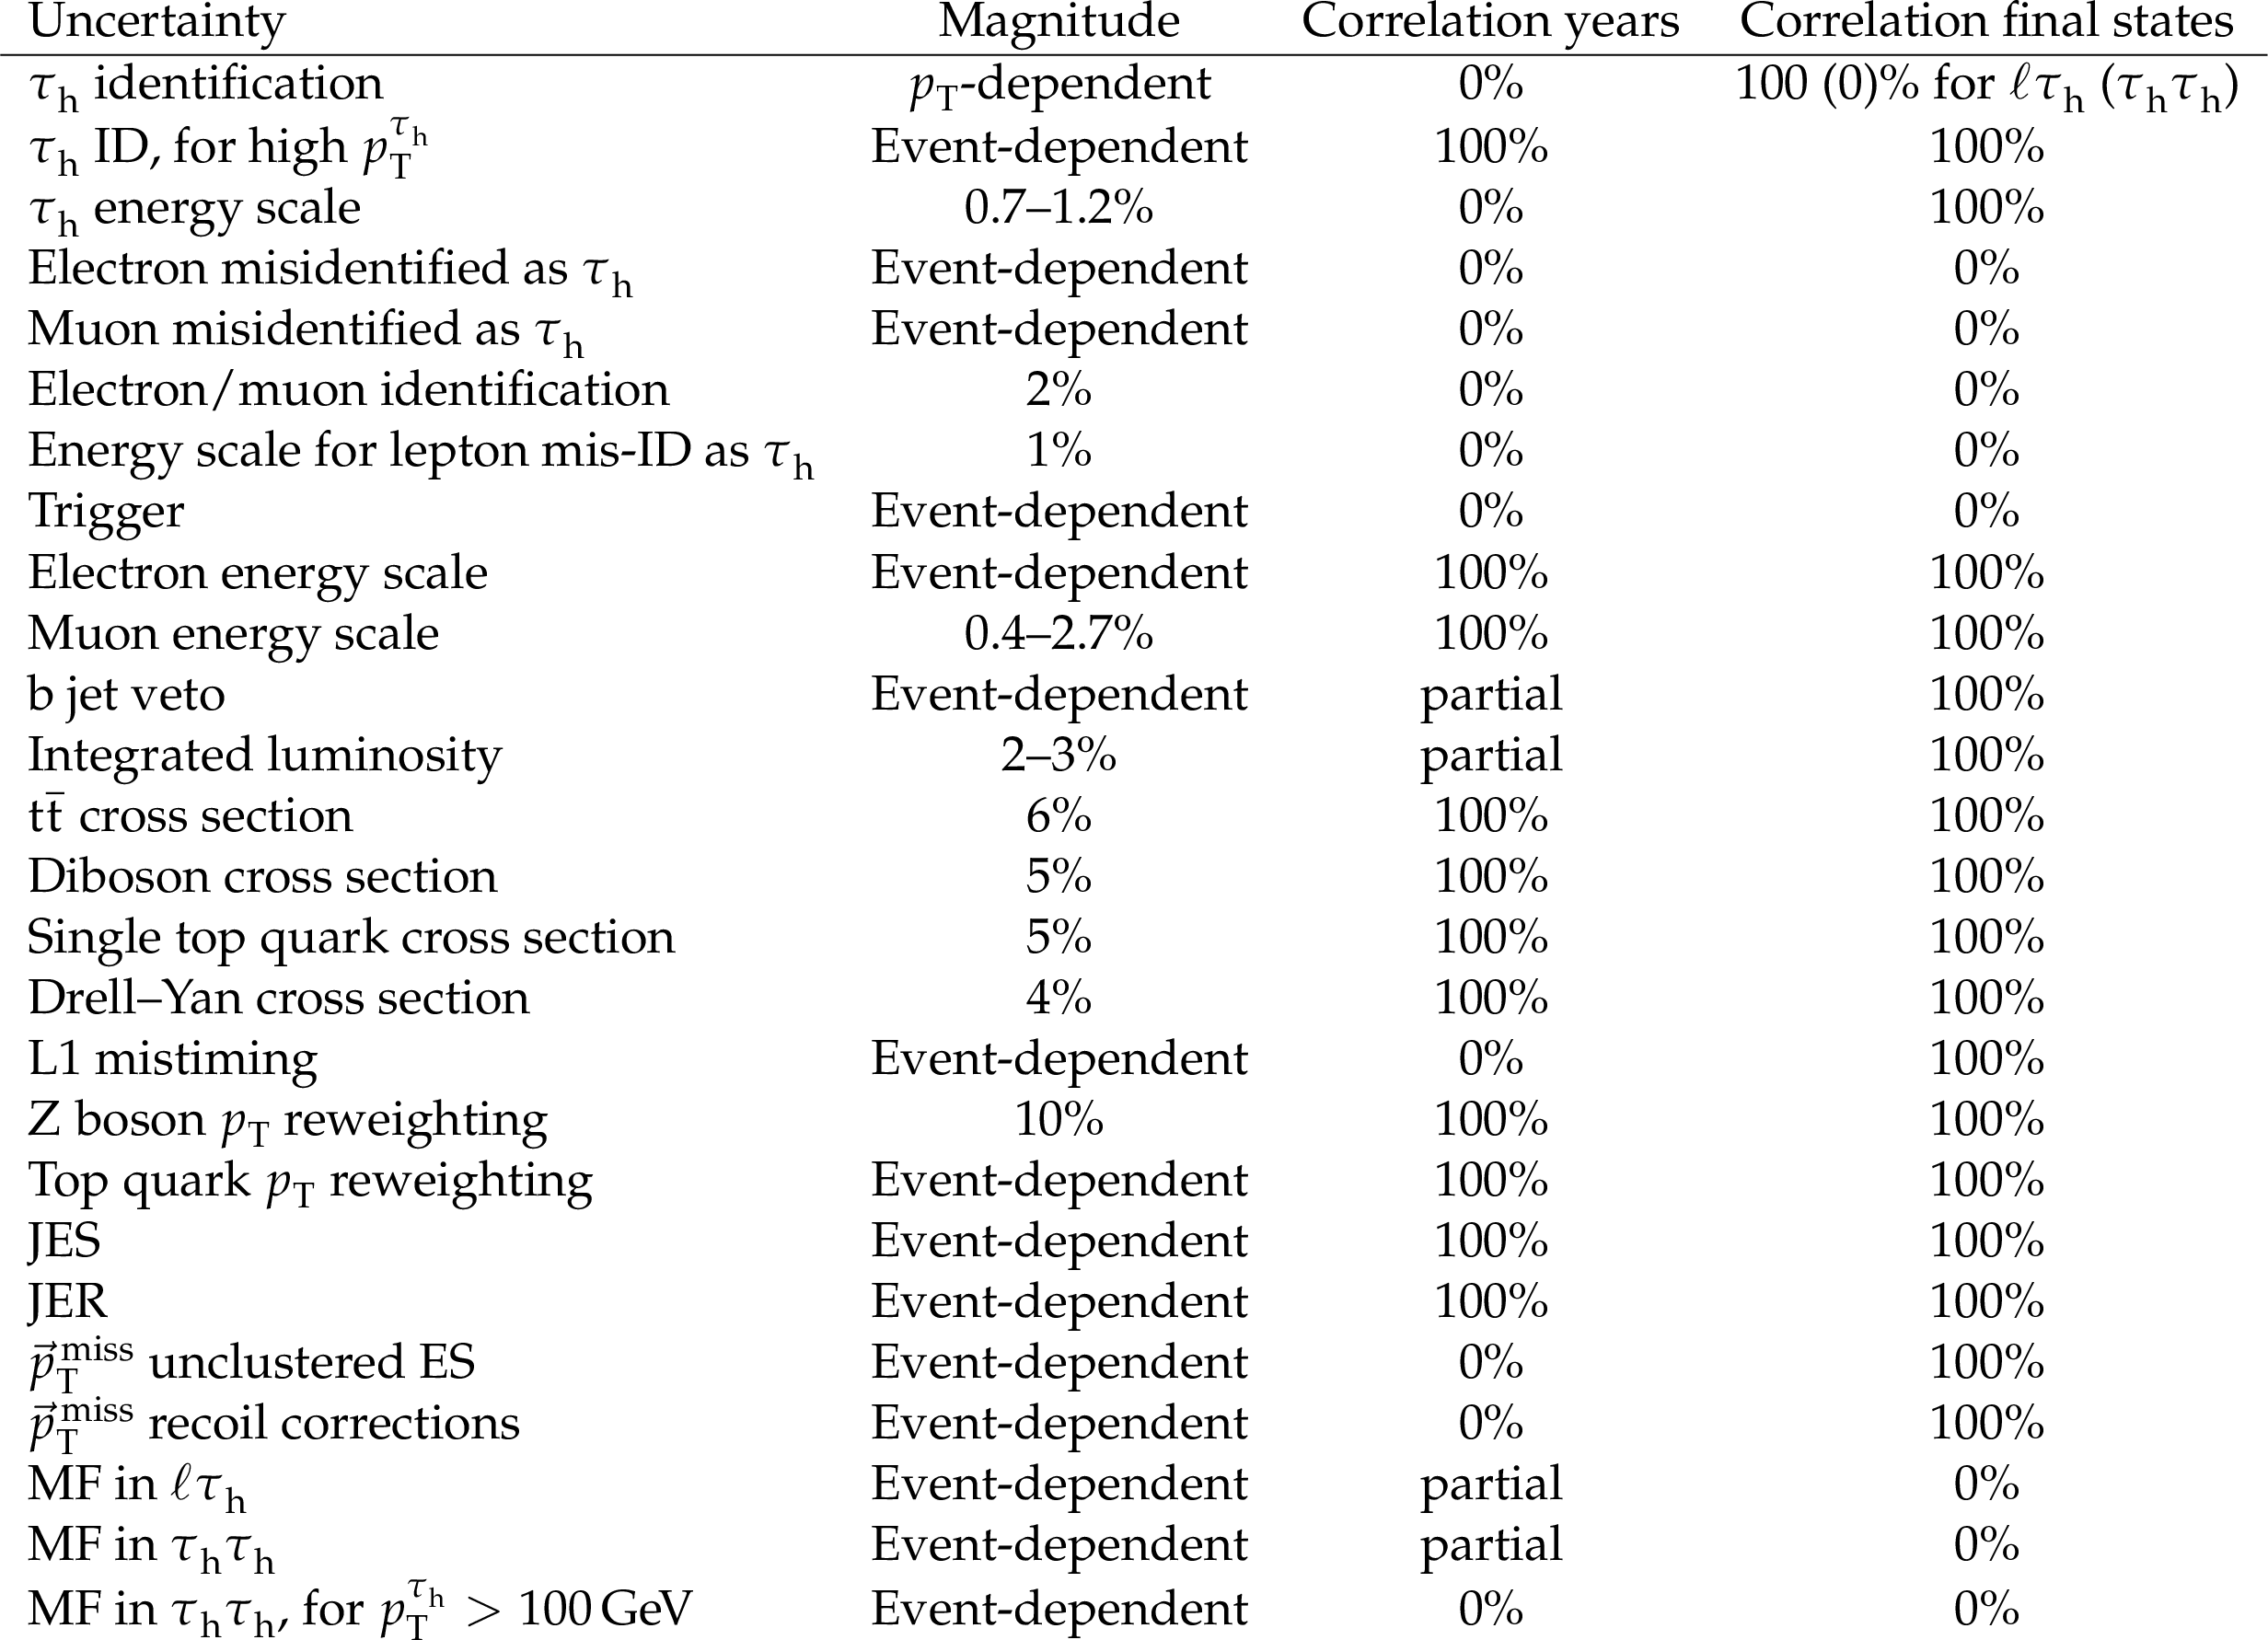
Table 6:
Systematic uncertainties with their source, magnitude and correlations between data samples from either different data-taking years or different final states |
| Summary |
| A search for dark matter produced in association with a Higgs boson decaying to a pair of $ \tau $ leptons has been performed using a data set of proton-proton collisions at a center-of-mass energy of 13 TeV, corresponding to an integrated luminosity of 101 fb$ ^{-1} $. The results are interpreted within the framework of two benchmark simplified models: the 2HDM+a model, where a heavy pseudoscalar couples to a Higgs boson and a lighter pseudoscalar that decays to dark matter particles, and the baryonic Z' model, where a high mass resonance ( Z') decays into a pair of dark matter particles and a standard model Higgs boson. Upper limits at the 95% confidence level are set on the product of the production cross section and branching fraction for both models. In the 2HDM+a model, heavy pseudoscalar masses between 400 and 700 GeV are excluded for a light pseudoscalar mass around 100 GeV. For the baryonic Z' model, the results are combined with those of an earlier search using an independent data set collected at the same center-of-mass energy, corresponding to an integrated luminosity of 36 fb$ ^{-1} $. Z' masses up to 1050 GeV are excluded for a dark matter particle mass of 1 GeV, based on a data sample corresponding to a total integrated luminosity of 138 fb$ ^{-1} $. |
| References | ||||
| 1 | J. L. Feng | Dark matter candidates from particle physics and methods of detection | Ann. Rev. Astron. Astrophys. 48 (2010) 495 | 1003.0904 |
| 2 | T. A. Porter, R. P. Johnson, and P. W. Graham | Dark matter searches with astroparticle data | Ann. Rev. Astron. Astrophys. 49 (2011) 155 | 1104.2836 |
| 3 | D. Clowe, A. Gonzalez, and M. Markevitch | Weak lensing mass reconstruction of the interacting cluster 1e0657-558: Direct evidence for the existence of dark matter | Astrophys. J. 604 (2004) 596 | astro-ph/0312273 |
| 4 | Planck Collaboration | Planck 2015 results. XIII. Cosmological parameters | Astron. Astrophys. 594 (2016) A13 | 1502.01589 |
| 5 | CMS Collaboration | Search for dark matter produced in association with a Higgs boson decaying to $ \gamma\gamma $ or $ \tau^+\tau^- $ at $ \sqrt{s} = $ 13 TeV | JHEP 09 (2018) 046 | CMS-EXO-16-055 1806.04771 |
| 6 | G. Bertone, D. Hooper, and J. Silk | Particle dark matter: Evidence, candidates and constraints | Phys. Rept. 405 (2005) 279 | hep-ph/0404175 |
| 7 | C. P. Burgess, M. Pospelov, and T. ter Veldhuis | The minimal model of nonbaryonic dark matter: A singlet scalar | NPB 619 (2001) 709 | hep-ph/0011335 |
| 8 | J. March-Russell, S. M. West, D. Cumberbatch, and D. Hooper | Heavy dark matter through the Higgs portal | JHEP 07 (2008) 058 | 0801.3440 |
| 9 | L. Carpenter et al. | Mono-Higgs-boson: A new collider probe of dark matter | PRD 89 (2014) 075017 | 1312.2592 |
| 10 | A. Berlin, T. Lin, and L.-T. Wang | Mono-Higgs detection of dark matter at the LHC | JHEP 06 (2014) 078 | 1402.7074 |
| 11 | A. A. Petrov and W. Shepherd | Searching for dark matter at LHC with mono-Higgs production | PLB 730 (2014) 178 | 1311.1511 |
| 12 | D. Abercrombie et al. | Dark Matter benchmark models for early LHC Run-2 Searches: Report of the ATLAS/CMS Dark Matter Forum | Phys. Dark Univ. 27 (2020) 100371 | 1507.00966 |
| 13 | T. Abe et al. | LHC Dark Matter Working Group: Next-generation spin-0 dark matter models | Phys. Dark Univ. 27 (2020) 100351 | 1810.09420 |
| 14 | M. Bauer, U. Haisch, and F. Kahlhoefer | Simplified dark matter models with two Higgs doublets: I. Pseudoscalar mediators | JHEP 05 (2017) 138 | 1701.07427 |
| 15 | A. Boveia et al. | Recommendations on presenting LHC searches for missing transverse energy signals using simplified $ s $-channel models of dark matter | Phys. Dark Univ. 27 (2020) 100365 | 1603.04156 |
| 16 | ATLAS Collaboration | Search for dark matter produced in association with a Higgs boson decaying to tau leptons at $ \sqrt{s} = $ 13 TeV with the ATLAS detector | JHEP 09 (2023) 189 | 2305.12938 |
| 17 | CMS Collaboration | Search for additional neutral MSSM Higgs bosons in the $ \tau\tau $ final state in proton-proton collisions at $ \sqrt{s}= $ 13 TeV | JHEP 09 (2018) 007 | CMS-HIG-17-020 1803.06553 |
| 18 | CMS Collaboration | Measurement of the $ \mathrm{Z}\gamma^{*} \to \tau\tau $ cross section in pp collisions at $ \sqrt{s} = $ 13 TeV and validation of $ \tau $ lepton analysis techniques | EPJC 78 (2018) 708 | CMS-HIG-15-007 1801.03535 |
| 19 | CMS Collaboration | HEPData record for this analysis | link | |
| 20 | CMS Collaboration | Performance of the CMS level-1 trigger in proton-proton collisions at $ \sqrt{s} = $ 13\,TeV | JINST 15 (2020) P10017 | CMS-TRG-17-001 2006.10165 |
| 21 | CMS Collaboration | The CMS trigger system | JINST 12 (2017) P01020 | CMS-TRG-12-001 1609.02366 |
| 22 | CMS Collaboration | Performance of the CMS high-level trigger during LHC Run 2 | JINST 19 (2024) P11021 | CMS-TRG-19-001 2410.17038 |
| 23 | CMS Collaboration | The CMS experiment at the CERN LHC | JINST 3 (2008) S08004 | |
| 24 | CMS Collaboration | Development of the CMS detector for the CERN LHC Run 3 | JINST 19 (2024) P05064 | CMS-PRF-21-001 2309.05466 |
| 25 | CMS Collaboration | Particle-flow reconstruction and global event description with the CMS detector | JINST 12 (2017) P10003 | CMS-PRF-14-001 1706.04965 |
| 26 | CMS Collaboration | Electron and photon reconstruction and identification with the CMS experiment at the CERN LHC | JINST 16 (2021) P05014 | CMS-EGM-17-001 2012.06888 |
| 27 | CMS Collaboration | Performance of the CMS muon detector and muon reconstruction with proton-proton collisions at $ \sqrt{s}= $ 13 TeV | JINST 13 (2018) P06015 | CMS-MUO-16-001 1804.04528 |
| 28 | M. Cacciari, G. P. Salam, and G. Soyez | The anti-$ k_{\mathrm{T}} $ jet clustering algorithm | JHEP 04 (2008) 063 | 0802.1189 |
| 29 | M. Cacciari, G. P. Salam, and G. Soyez | Fastjet user manual | EPJC 72 (2012) 1896 | 1111.6097 |
| 30 | CMS Collaboration | Jet energy scale and resolution in the CMS experiment in pp collisions at 8 TeV | JINST 12 (2017) P02014 | CMS-JME-13-004 1607.03663 |
| 31 | CMS Collaboration | Identification of heavy-flavour jets with the CMS detector in pp collisions at 13 TeV | JINST 13 (2018) P05011 | CMS-BTV-16-002 1712.07158 |
| 32 | E. Bols et al. | Jet flavour classification using DeepJet | JINST 15 (2020) P12012 | 2008.10519 |
| 33 | CMS Collaboration | Jet algorithms performance in 13 TeV data | CMS Physics Analysis Summary, 2017 CMS-PAS-JME-16-003 |
CMS-PAS-JME-16-003 |
| 34 | CMS Collaboration | Performance of reconstruction and identification of $ \tau $ leptons decaying to hadrons and $ \nu_\tau $ in pp collisions at $ \sqrt{s}= $ 13 TeV | JINST 13 (2018) P10005 | CMS-TAU-16-003 1809.02816 |
| 35 | CMS Collaboration | Identification of hadronic tau lepton decays using a deep neural network | JINST 17 (2022) P07023 | CMS-TAU-20-001 2201.08458 |
| 36 | CMS Collaboration | Performance of missing transverse momentum reconstruction in proton-proton collisions at $ \sqrt{s} = $ 13\,TeV using the CMS detector | JINST 14 (2019) P07004 | CMS-JME-17-001 1903.06078 |
| 37 | J. Alwall et al. | The automated computation of tree-level and next-to-leading order differential cross sections, and their matching to parton shower simulations | JHEP 07 (2014) 079 | 1405.0301 |
| 38 | T. Sjöstrand et al. | An introduction to PYTHIA8.2 | Comput. Phys. Commun. 191 (2015) 159 | 1410.3012 |
| 39 | CMS Collaboration | Extraction and validation of a new set of CMS PYTHIA8 tunes from underlying-event measurements | EPJC 80 (2020) 4 | CMS-GEN-17-001 1903.12179 |
| 40 | J. Alwall et al. | Comparative study of various algorithms for the merging of parton showers and matrix elements in hadronic collisions | EPJC 53 (2008) 473 | 0706.2569 |
| 41 | K. Melnikov and F. Petriello | Electroweak gauge boson production at hadron colliders through $ o(\alpha_s^2) $ | PRD 74 (2006) 114017 | hep-ph/0609070 |
| 42 | CMS Collaboration | Observation of the Higgs boson decay to a pair of $ \tau $ leptons with the CMS detector | PLB 779 (2018) 283 | CMS-HIG-16-043 1708.00373 |
| 43 | S. Frixione, P. Nason, and C. Oleari | Matching NLO QCD computations with parton shower simulations: the POWHEG method | JHEP 11 (2007) 070 | 0709.2092 |
| 44 | S. Alioli, P. Nason, C. Oleari, and E. Re | A general framework for implementing NLO calculations in shower Monte Carlo programs: the POWHEG BOX | JHEP 06 (2010) 043 | 1002.2581 |
| 45 | S. Alioli et al. | Jet pair production in POWHEG | JHEP 04 (2011) 081 | 1012.3380 |
| 46 | S. Alioli, P. Nason, C. Oleari, and E. Re | NLO Higgs boson production via gluon fusion matched with shower in POWHEG | JHEP 04 (2009) 002 | 0812.0578 |
| 47 | R. Frederix and S. Frixione | Merging meets matching in MC@NLO | JHEP 12 (2012) 061 | 1209.6215 |
| 48 | NNPDF Collaboration | Parton distributions from high-precision collider data | EPJC 77 (2017) 663 | 1706.00428 |
| 49 | P. Skands, S. Carrazza, and J. Rojo | Tuning PYTHIA8.1: the Monash 2013 tune | EPJC 74 (2014) 3024 | 1404.5630 |
| 50 | GEANT4 Collaboration | GEANT 4---a simulation toolkit | NIM A 506 (2003) 250 | |
| 51 | CMS Collaboration | Measurement of differential cross sections for the production of top quark pairs and of additional jets in lepton+jets events from pp collisions at $ \sqrt{s} = $ 13 TeV | PRD 97 (2018) 112003 | CMS-TOP-17-002 1803.08856 |
| 52 | CMS Collaboration | Cross section measurement of $ t $-channel single top quark production in pp collisions at $ \sqrt{s} = $ 13 tev | PLB 772 (2017) 752 | CMS-TOP-16-003 1610.00678 |
| 53 | CMS Collaboration | Measurements of Higgs boson production in the decay channel with a pair of $ \tau $ leptons in proton-proton collisions at $ \sqrt{s}= $ 13 TeV | EPJC 83 (2023) 562 | CMS-HIG-19-010 2204.12957 |
| 54 | CMS Collaboration | Performance of CMS muon reconstruction in pp collision events at $ \sqrt{s}= $ 7 TeV | JINST 7 (2012) P10002 | CMS-MUO-10-004 1206.4071 |
| 55 | N. Kidonakis | Top quark production | in Helmholtz International Summer School on Physics of Heavy Quarks and Hadrons, 2014 link |
1311.0283 |
| 56 | J. M. Campbell, R. K. Ellis, and C. Williams | Vector boson pair production at the LHC | JHEP 07 (2011) 018 | 1105.0020 |
| 57 | T. Gehrmann et al. | $ W^+W^- $ production at hadron colliders in next to next to leading order QCD | PRL 113 (2014) 212001 | 1408.5243 |
| 58 | M. Czakon and A. Mitov | Top++: A program for the calculation of the top-pair cross-section at hadron colliders | Comput. Phys. Commun. 185 (2014) 2930 | 1112.5675 |
| 59 | CMS Collaboration | CMS luminosity measurement for the 2017 data-taking period at $ \sqrt{s} = $ 13 TeV | CMS Physics Analysis Summary, 2018 link |
CMS-PAS-LUM-17-004 |
| 60 | CMS Collaboration | CMS luminosity measurement for the 2018 data-taking period at $ \sqrt{s} = $ 13 TeV | CMS Physics Analysis Summary, 2019 link |
CMS-PAS-LUM-18-002 |
| 61 | CMS Collaboration | Measurement of the production cross section of a Higgs boson with large transverse momentum in its decays to a pair of $ \tau $ leptons in proton-proton collisions at $ \sqrt{s} = $ 13 TeV | PLB 857 (2024) 138964 | CMS-HIG-21-017 2403.20201 |
| 62 | CMS Collaboration | The CMS statistical analysis and combination tool: \textscCombine | Comput. Softw. Big Sci. 8 (2024) 19 | CMS-CAT-23-001 2404.06614 |
| 63 | T. Junk | Confidence level computation for combining searches with small statistics | NIM A 434 (1999) 435 | hep-ex/9902006 |
| 64 | A. L. Read | Presentation of search results: The CL$ _s $ technique | JPG 28 (2002) 2693 | |
| 65 | G. Cowan, K. Cranmer, E. Gross, and O. Vitells | Asymptotic formulae for likelihood-based tests of new physics | EPJC 71 (2011) 1554 | 1007.1727 |
|
|
Compact Muon Solenoid LHC, CERN |
|

|

|

|

|

|