

Compact Muon Solenoid
LHC, CERN
| CMS-SMP-22-011 ; CERN-EP-2025-147 | ||
| Vector boson scattering and anomalous quartic couplings in final states with $ \ell\nu\mathrm{q}\mathrm{q} $ or $ \ell\ell\mathrm{q}\mathrm{q} $ plus jets using proton-proton collisions at $ \sqrt{s} = $ 13 TeV | ||
| CMS Collaboration | ||
| 30 September 2025 | ||
| JHEP 03 (2026) 022 | ||
| Abstract: A measurement is presented of the electroweak vector boson scattering production of ZV (V $ = $ W, Z) boson pairs associated with two jets in proton-proton collisions at a center-of-mass energy of 13 TeV. The data, corresponding to an integrated luminosity of 138 fb$ ^{-1} $, were collected at the CERN LHC with the CMS detector during the 2016--2018 data-taking period. The analysis targets final states with a pair of isolated electrons or muons from Z boson decays and three or four jets, depending on the momentum of the vector boson that decays into quarks. Signal strength is measured for events characterized by a large invariant mass of two forward jets with a wide pseudorapidity gap between them. The electroweak production of ZV in association with two jets is measured with an observed (expected) significance of 1.3 (1.8) standard deviations. A combination of the analyses of ZV channel and the previously published WV channel in the lepton plus jets final state places constraints on effective field theory parameters that describe anomalous electroweak production of WW, WZ, and ZZ boson pairs in association with two jets. Several world best limits are set on anomalous quartic gauge couplings in terms of dimension-8 standard model effective field theory operators. | ||
| Links: e-print arXiv:2510.00118 [hep-ex] (PDF) ; CDS record ; inSPIRE record ; HepData record ; CADI line (restricted) ; | ||
| Figures | |
png pdf |
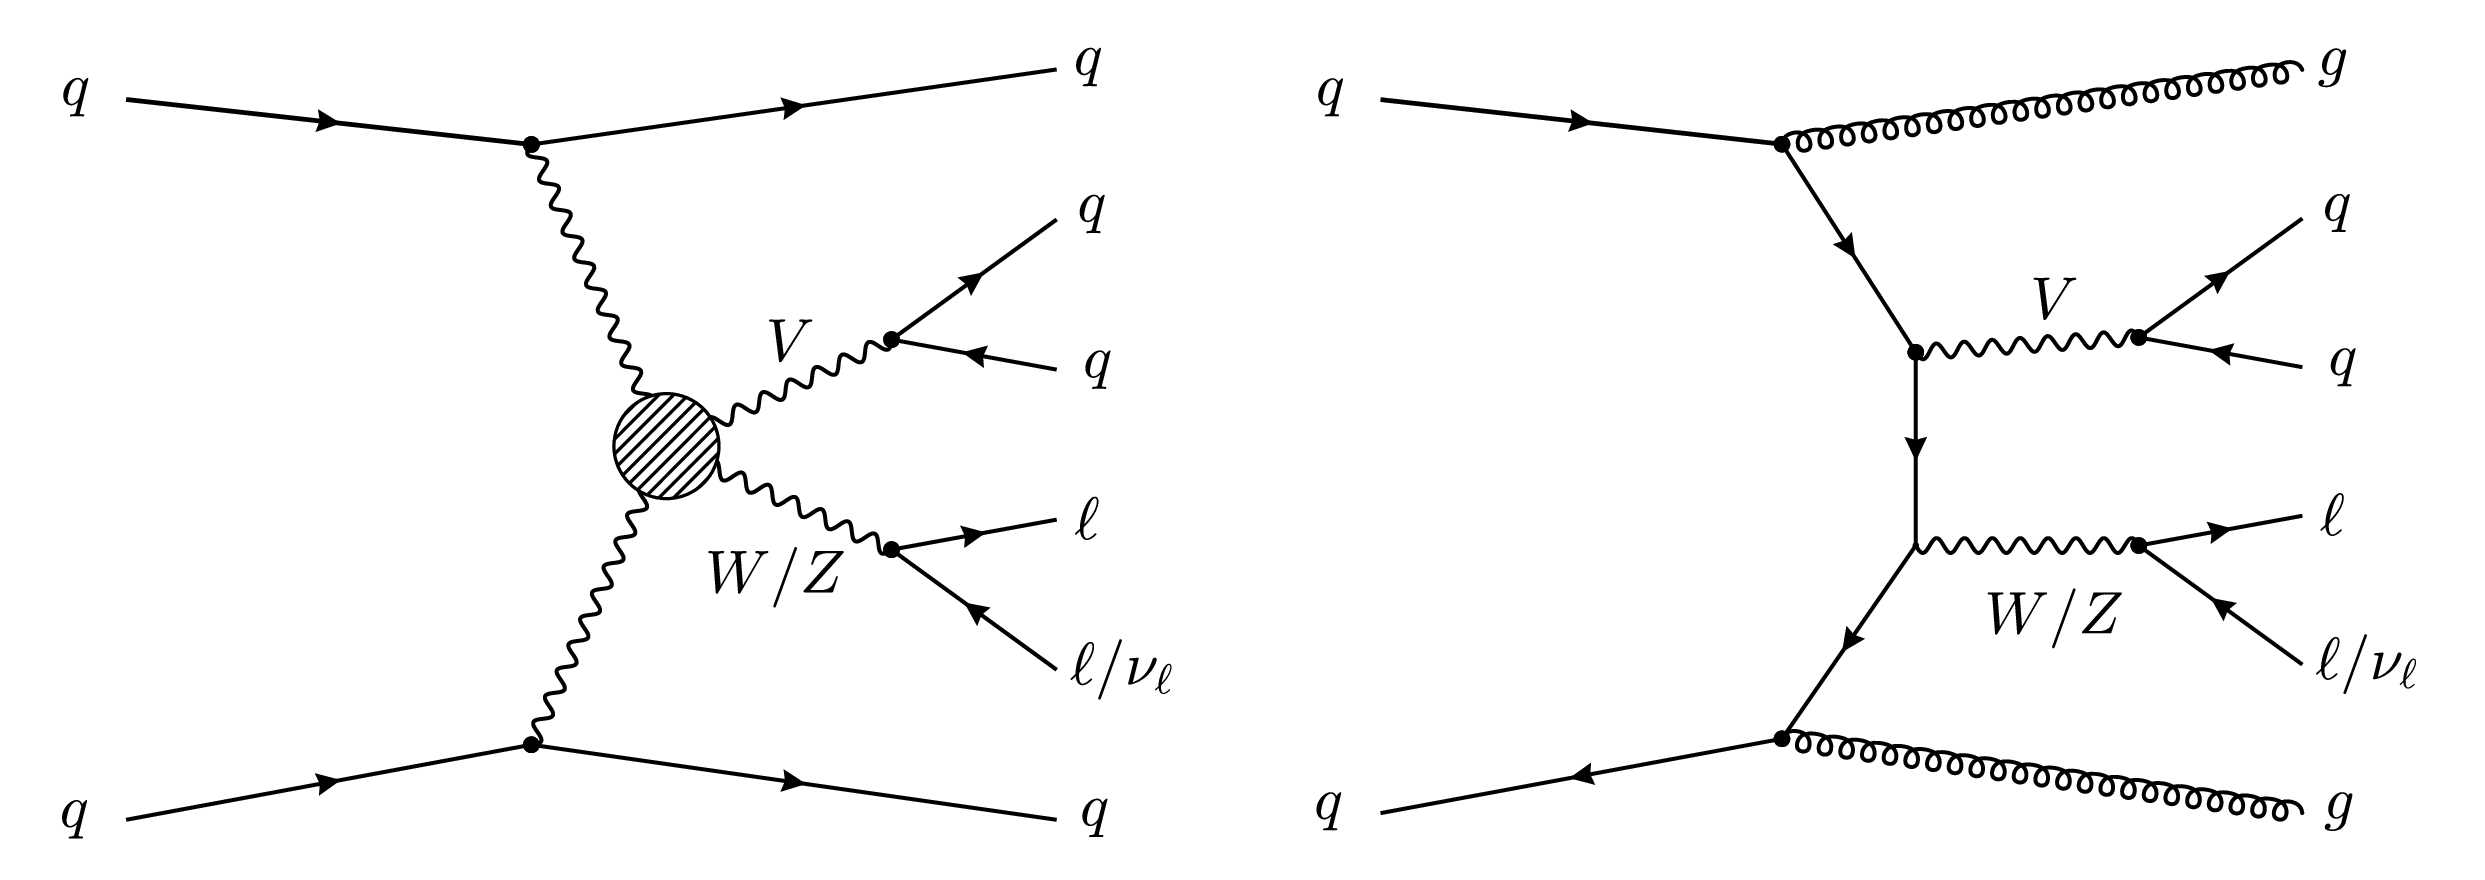
Figure 1:
Examples of Feynman diagrams contributing to the analyzed final state. On the left, an illustrative diagram for the VBS process contributing to the EW production of events containing one vector boson that decays into leptons, one that decays hadronically (V $ = $ W, Z) and two forward jets. The BSM contributions (represented by a hatched circle) can modify the EW diboson production. On the right, an example of irreducible QCD background is presented. |
png pdf |
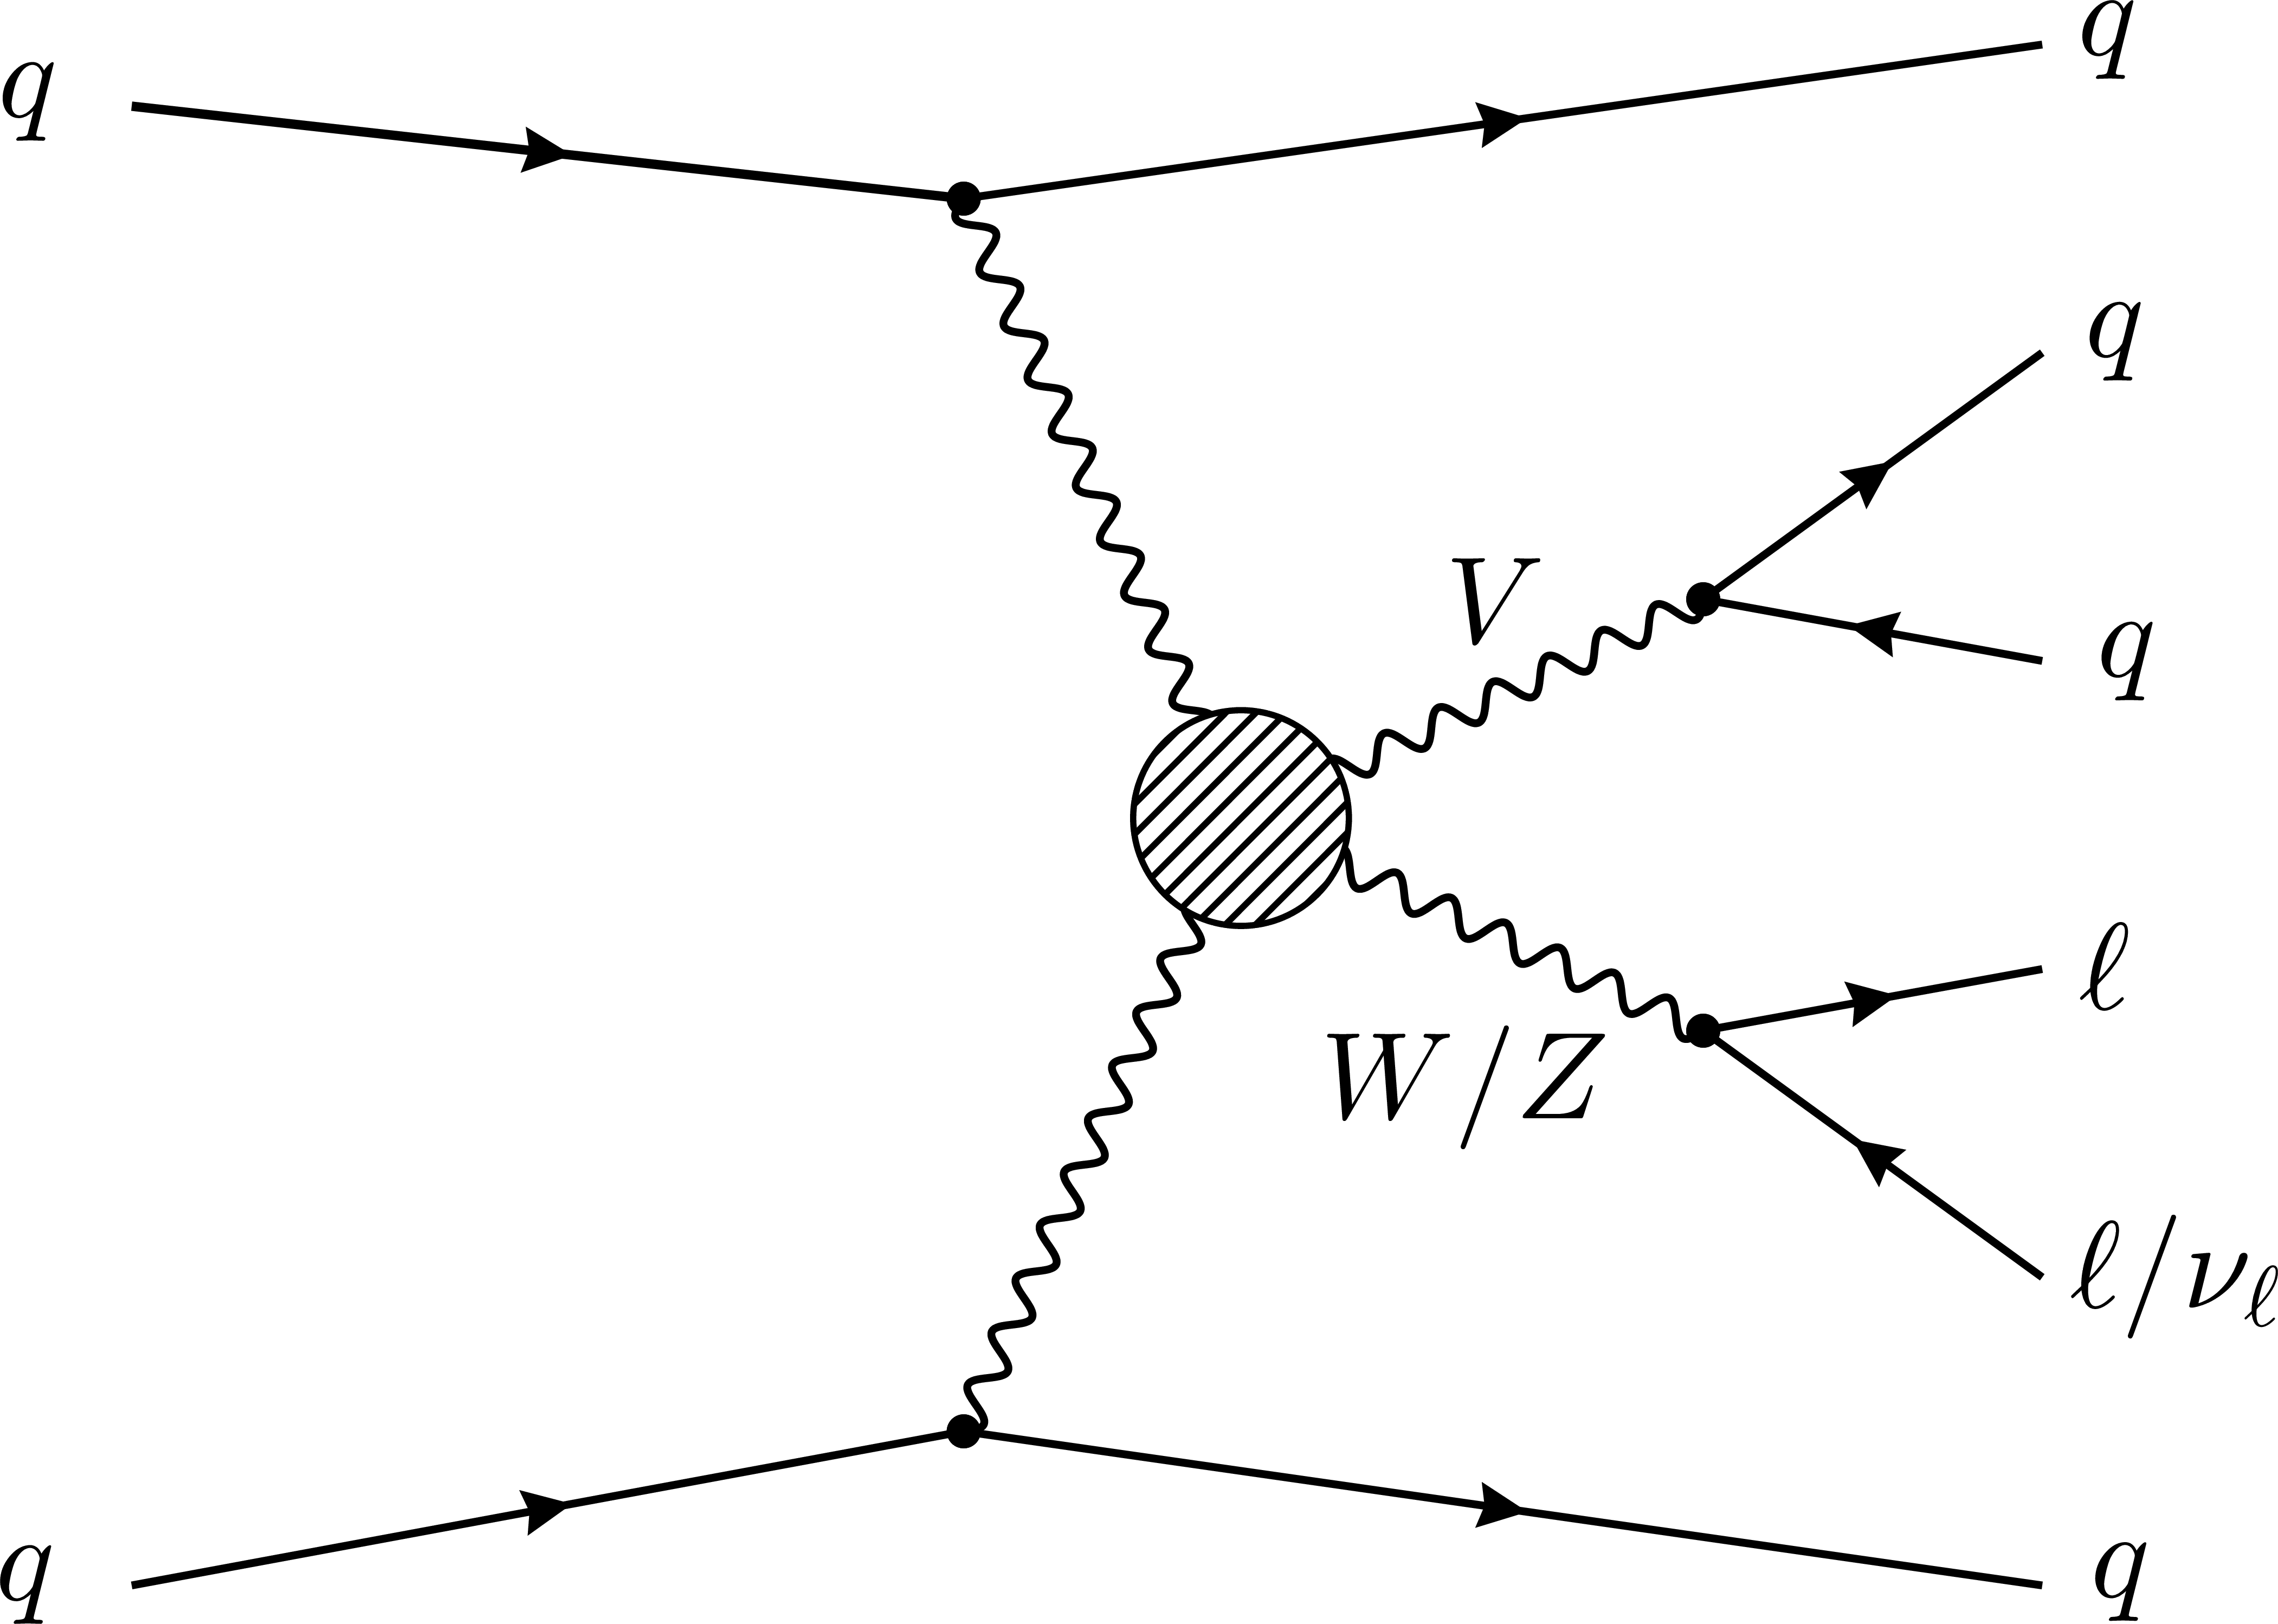
Figure 1-a:
Examples of Feynman diagrams contributing to the analyzed final state. On the left, an illustrative diagram for the VBS process contributing to the EW production of events containing one vector boson that decays into leptons, one that decays hadronically (V $ = $ W, Z) and two forward jets. The BSM contributions (represented by a hatched circle) can modify the EW diboson production. On the right, an example of irreducible QCD background is presented. |
png pdf |
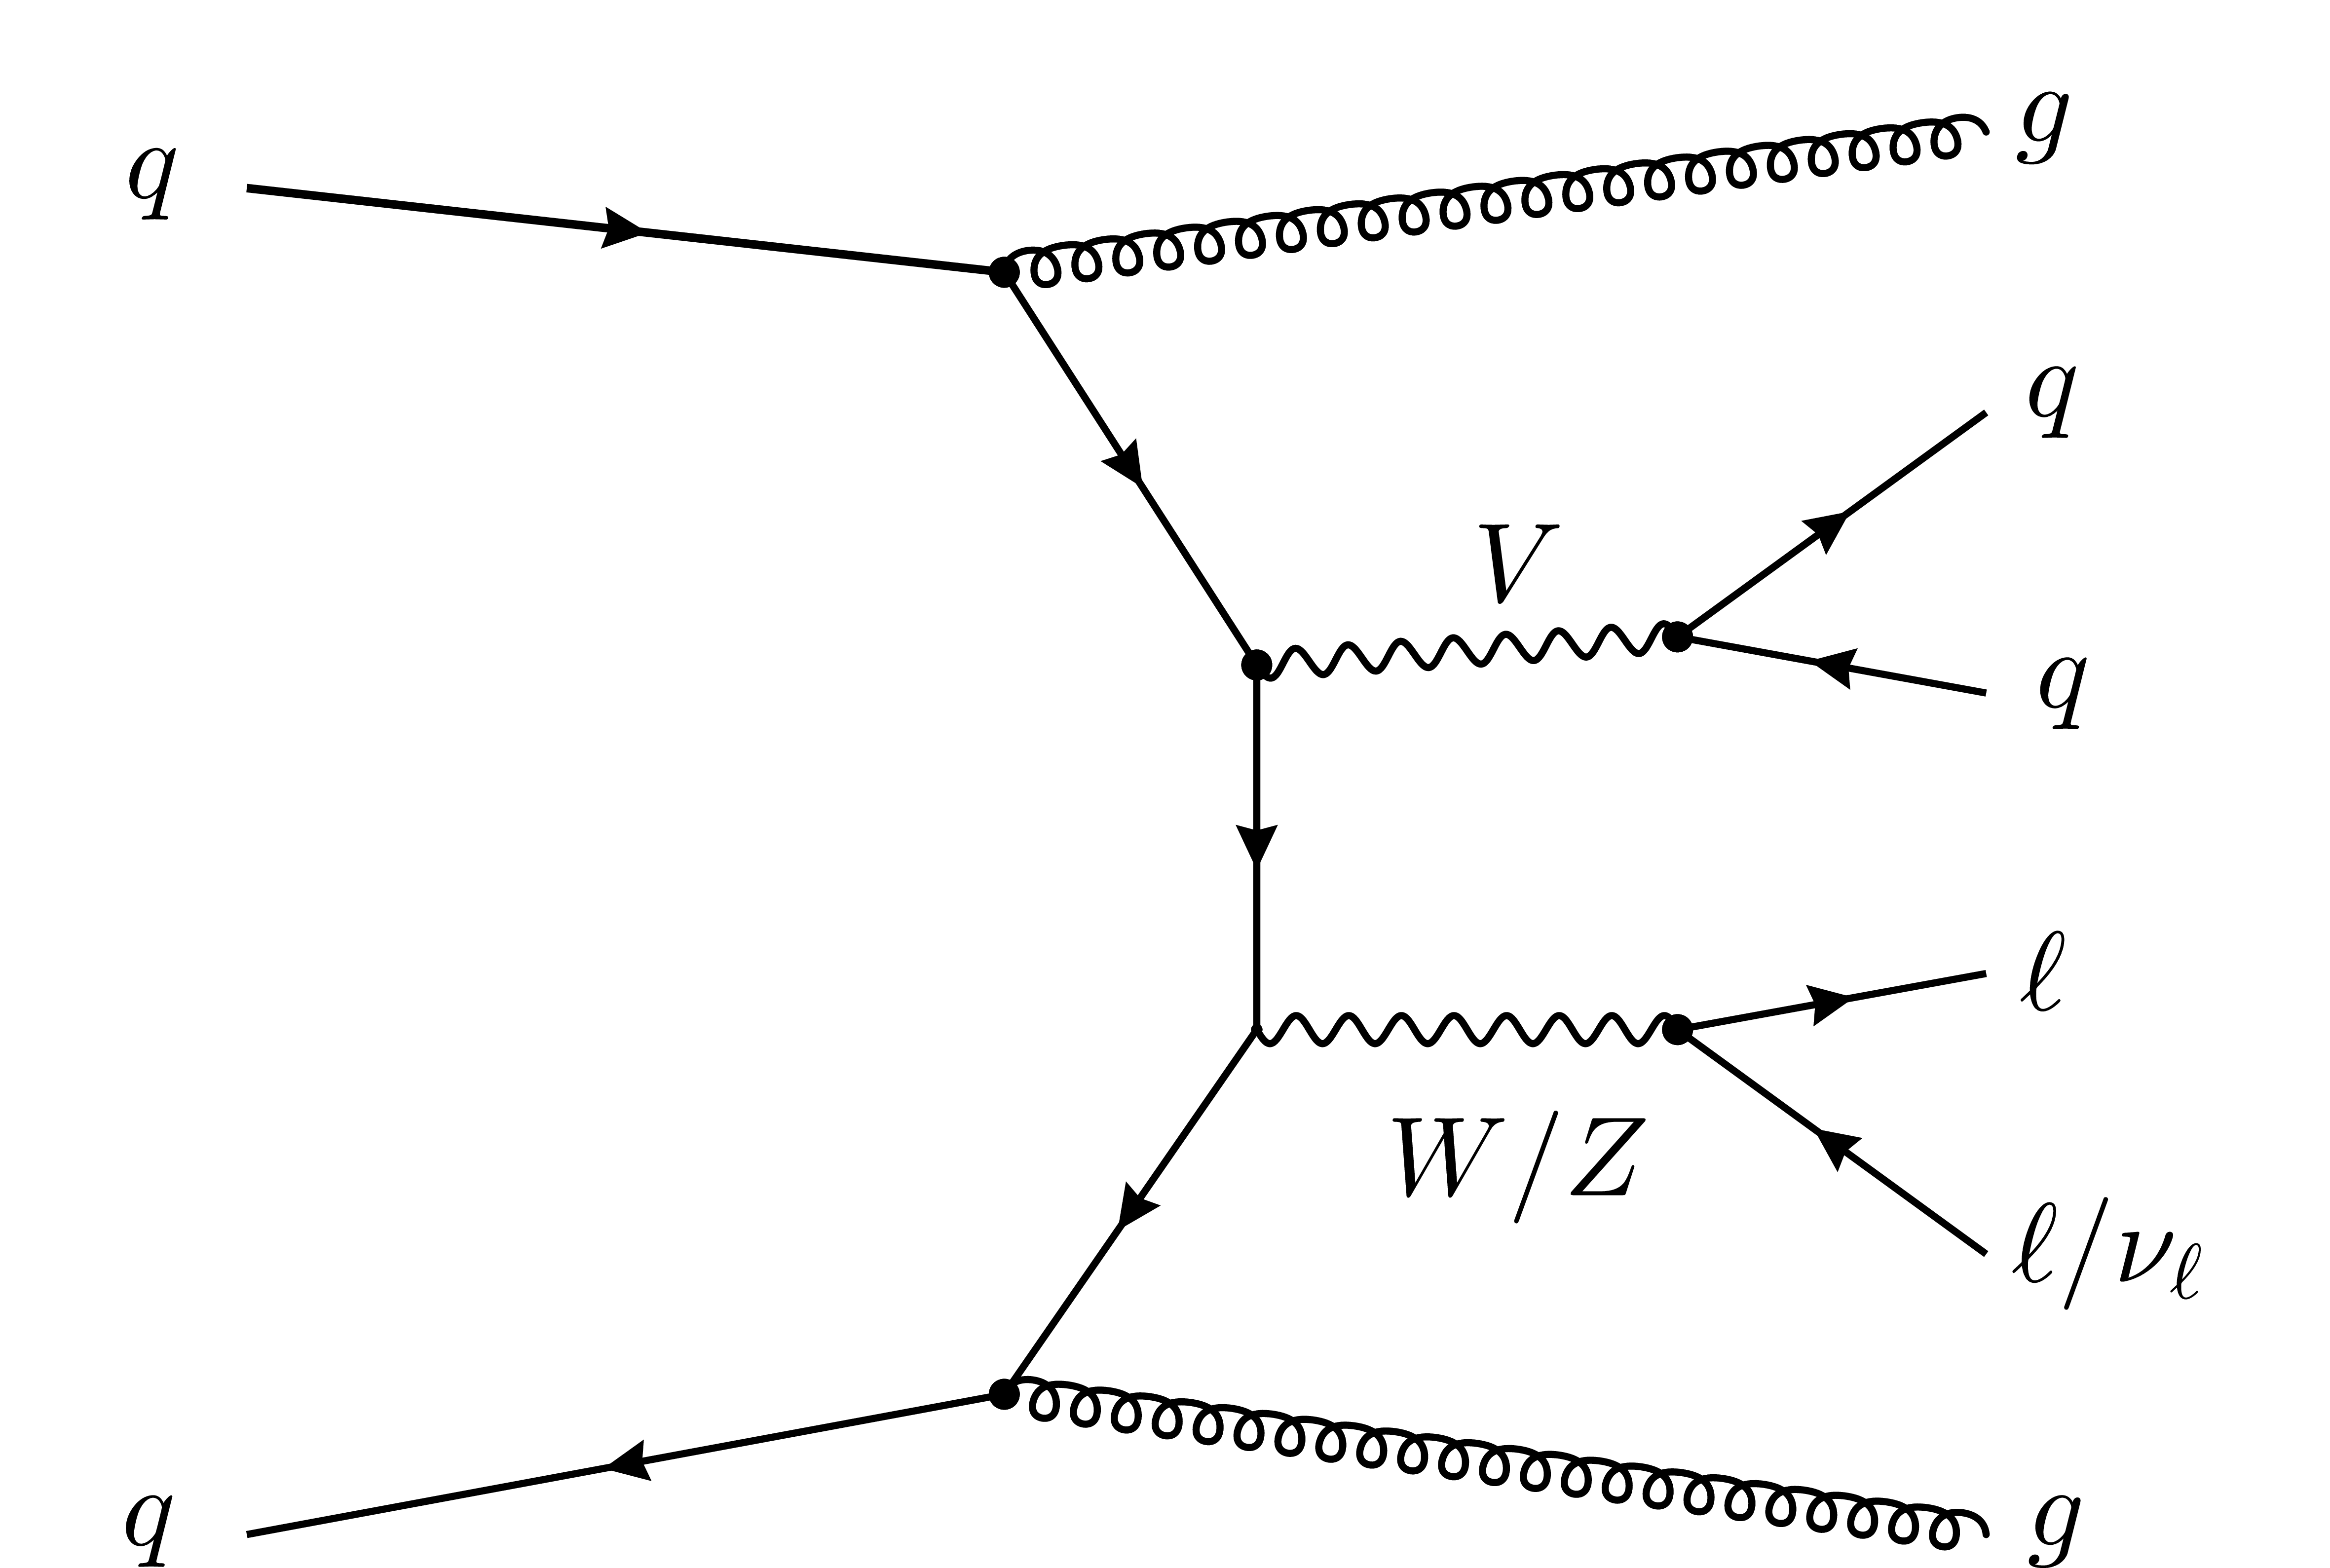
Figure 1-b:
Examples of Feynman diagrams contributing to the analyzed final state. On the left, an illustrative diagram for the VBS process contributing to the EW production of events containing one vector boson that decays into leptons, one that decays hadronically (V $ = $ W, Z) and two forward jets. The BSM contributions (represented by a hatched circle) can modify the EW diboson production. On the right, an example of irreducible QCD background is presented. |
png pdf |
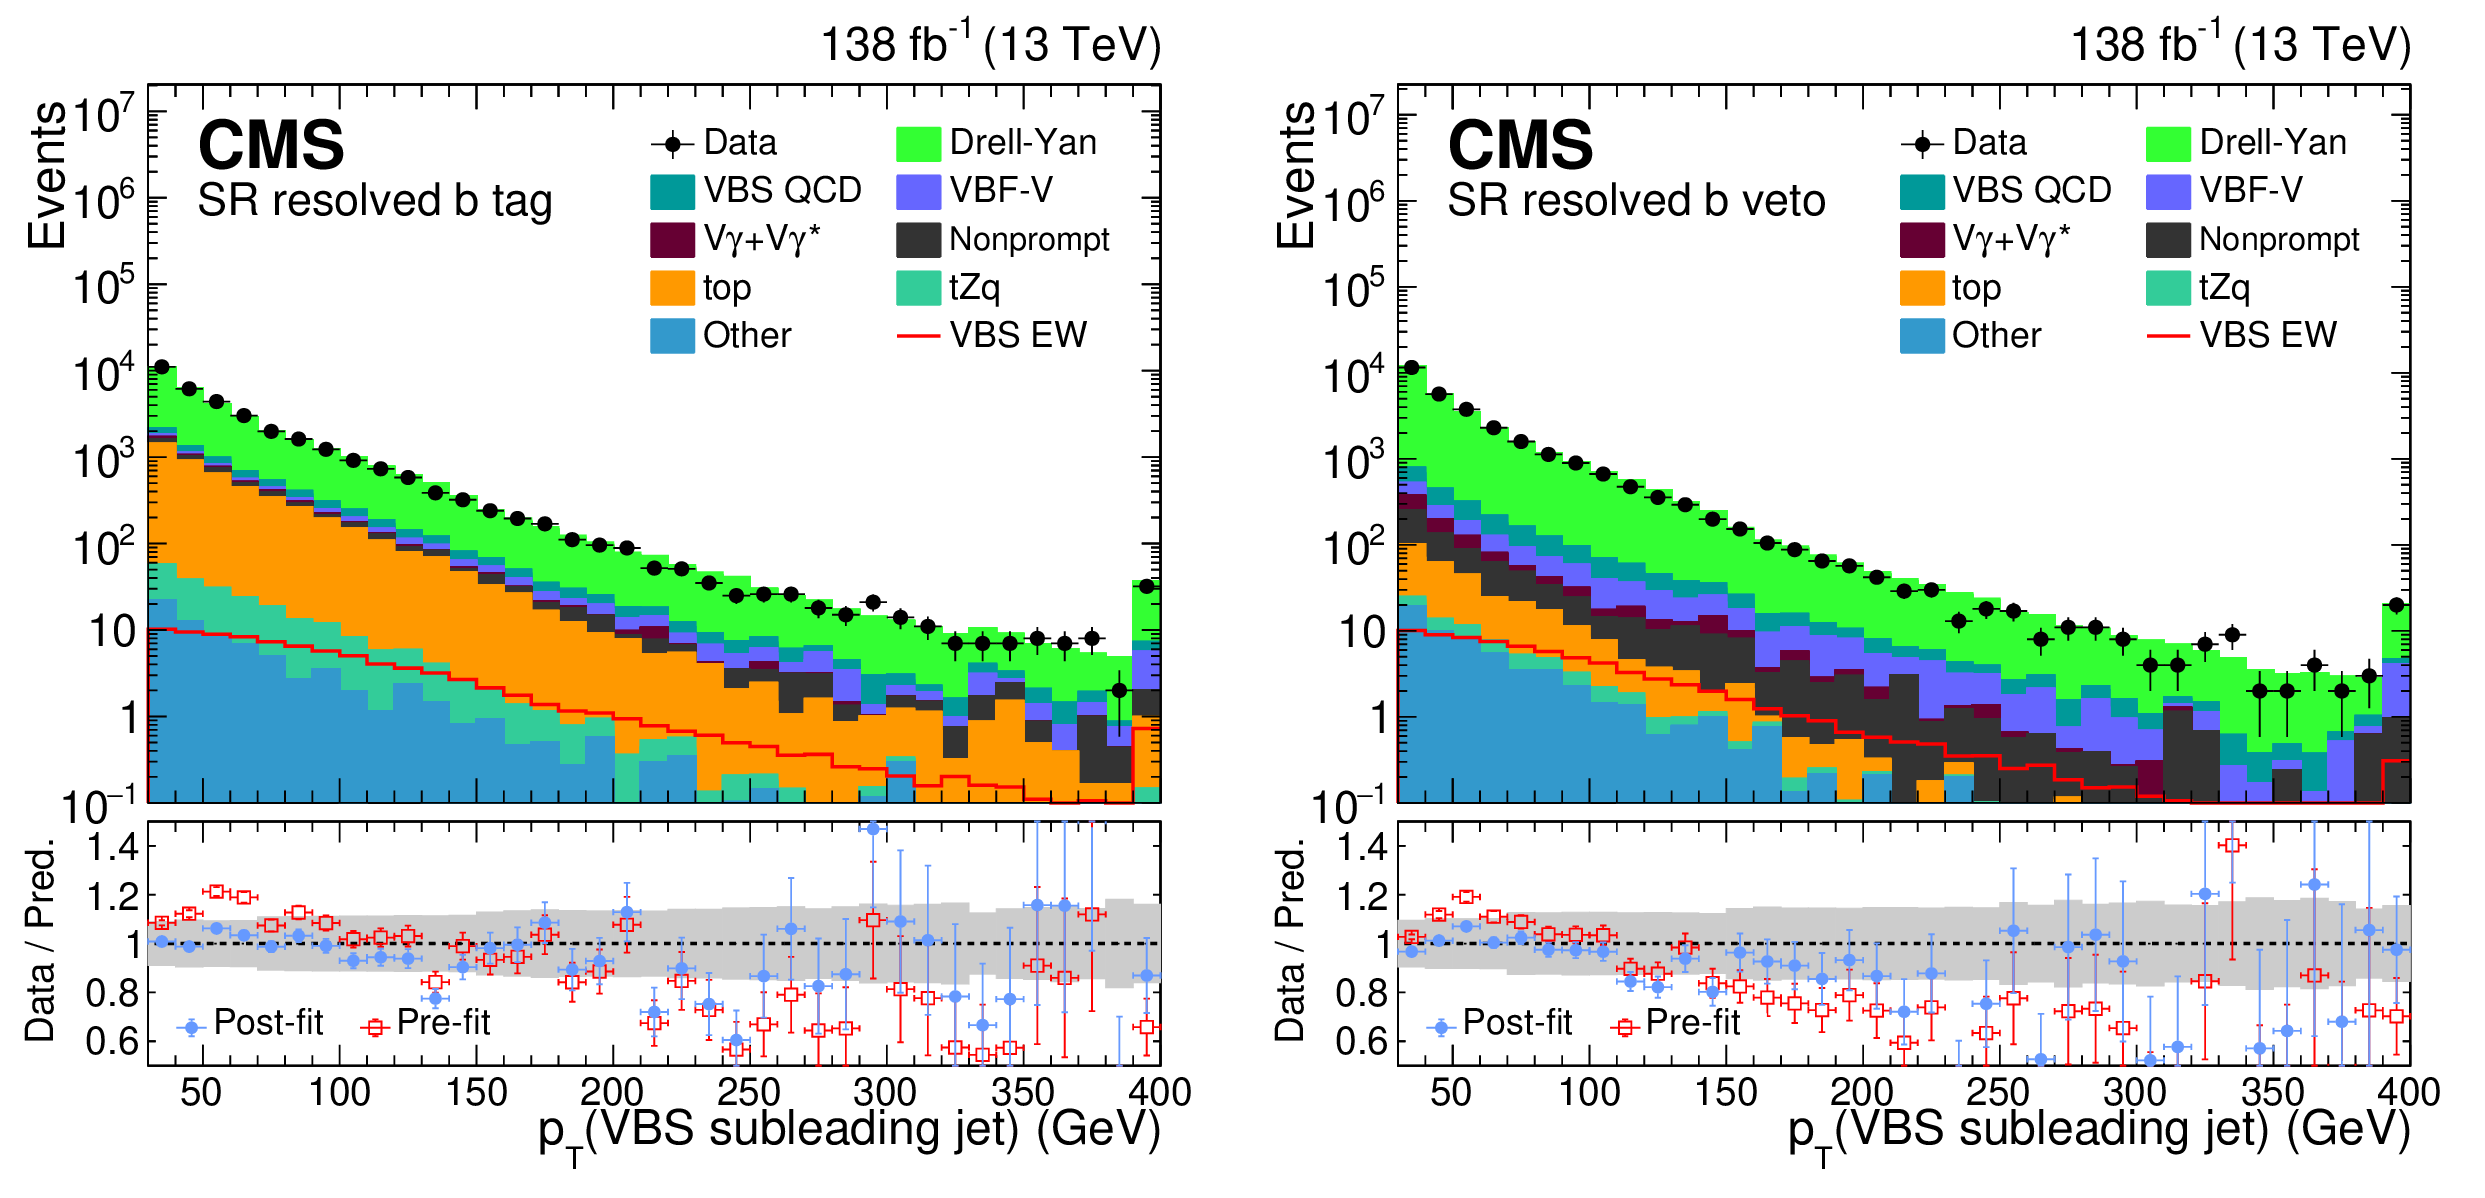
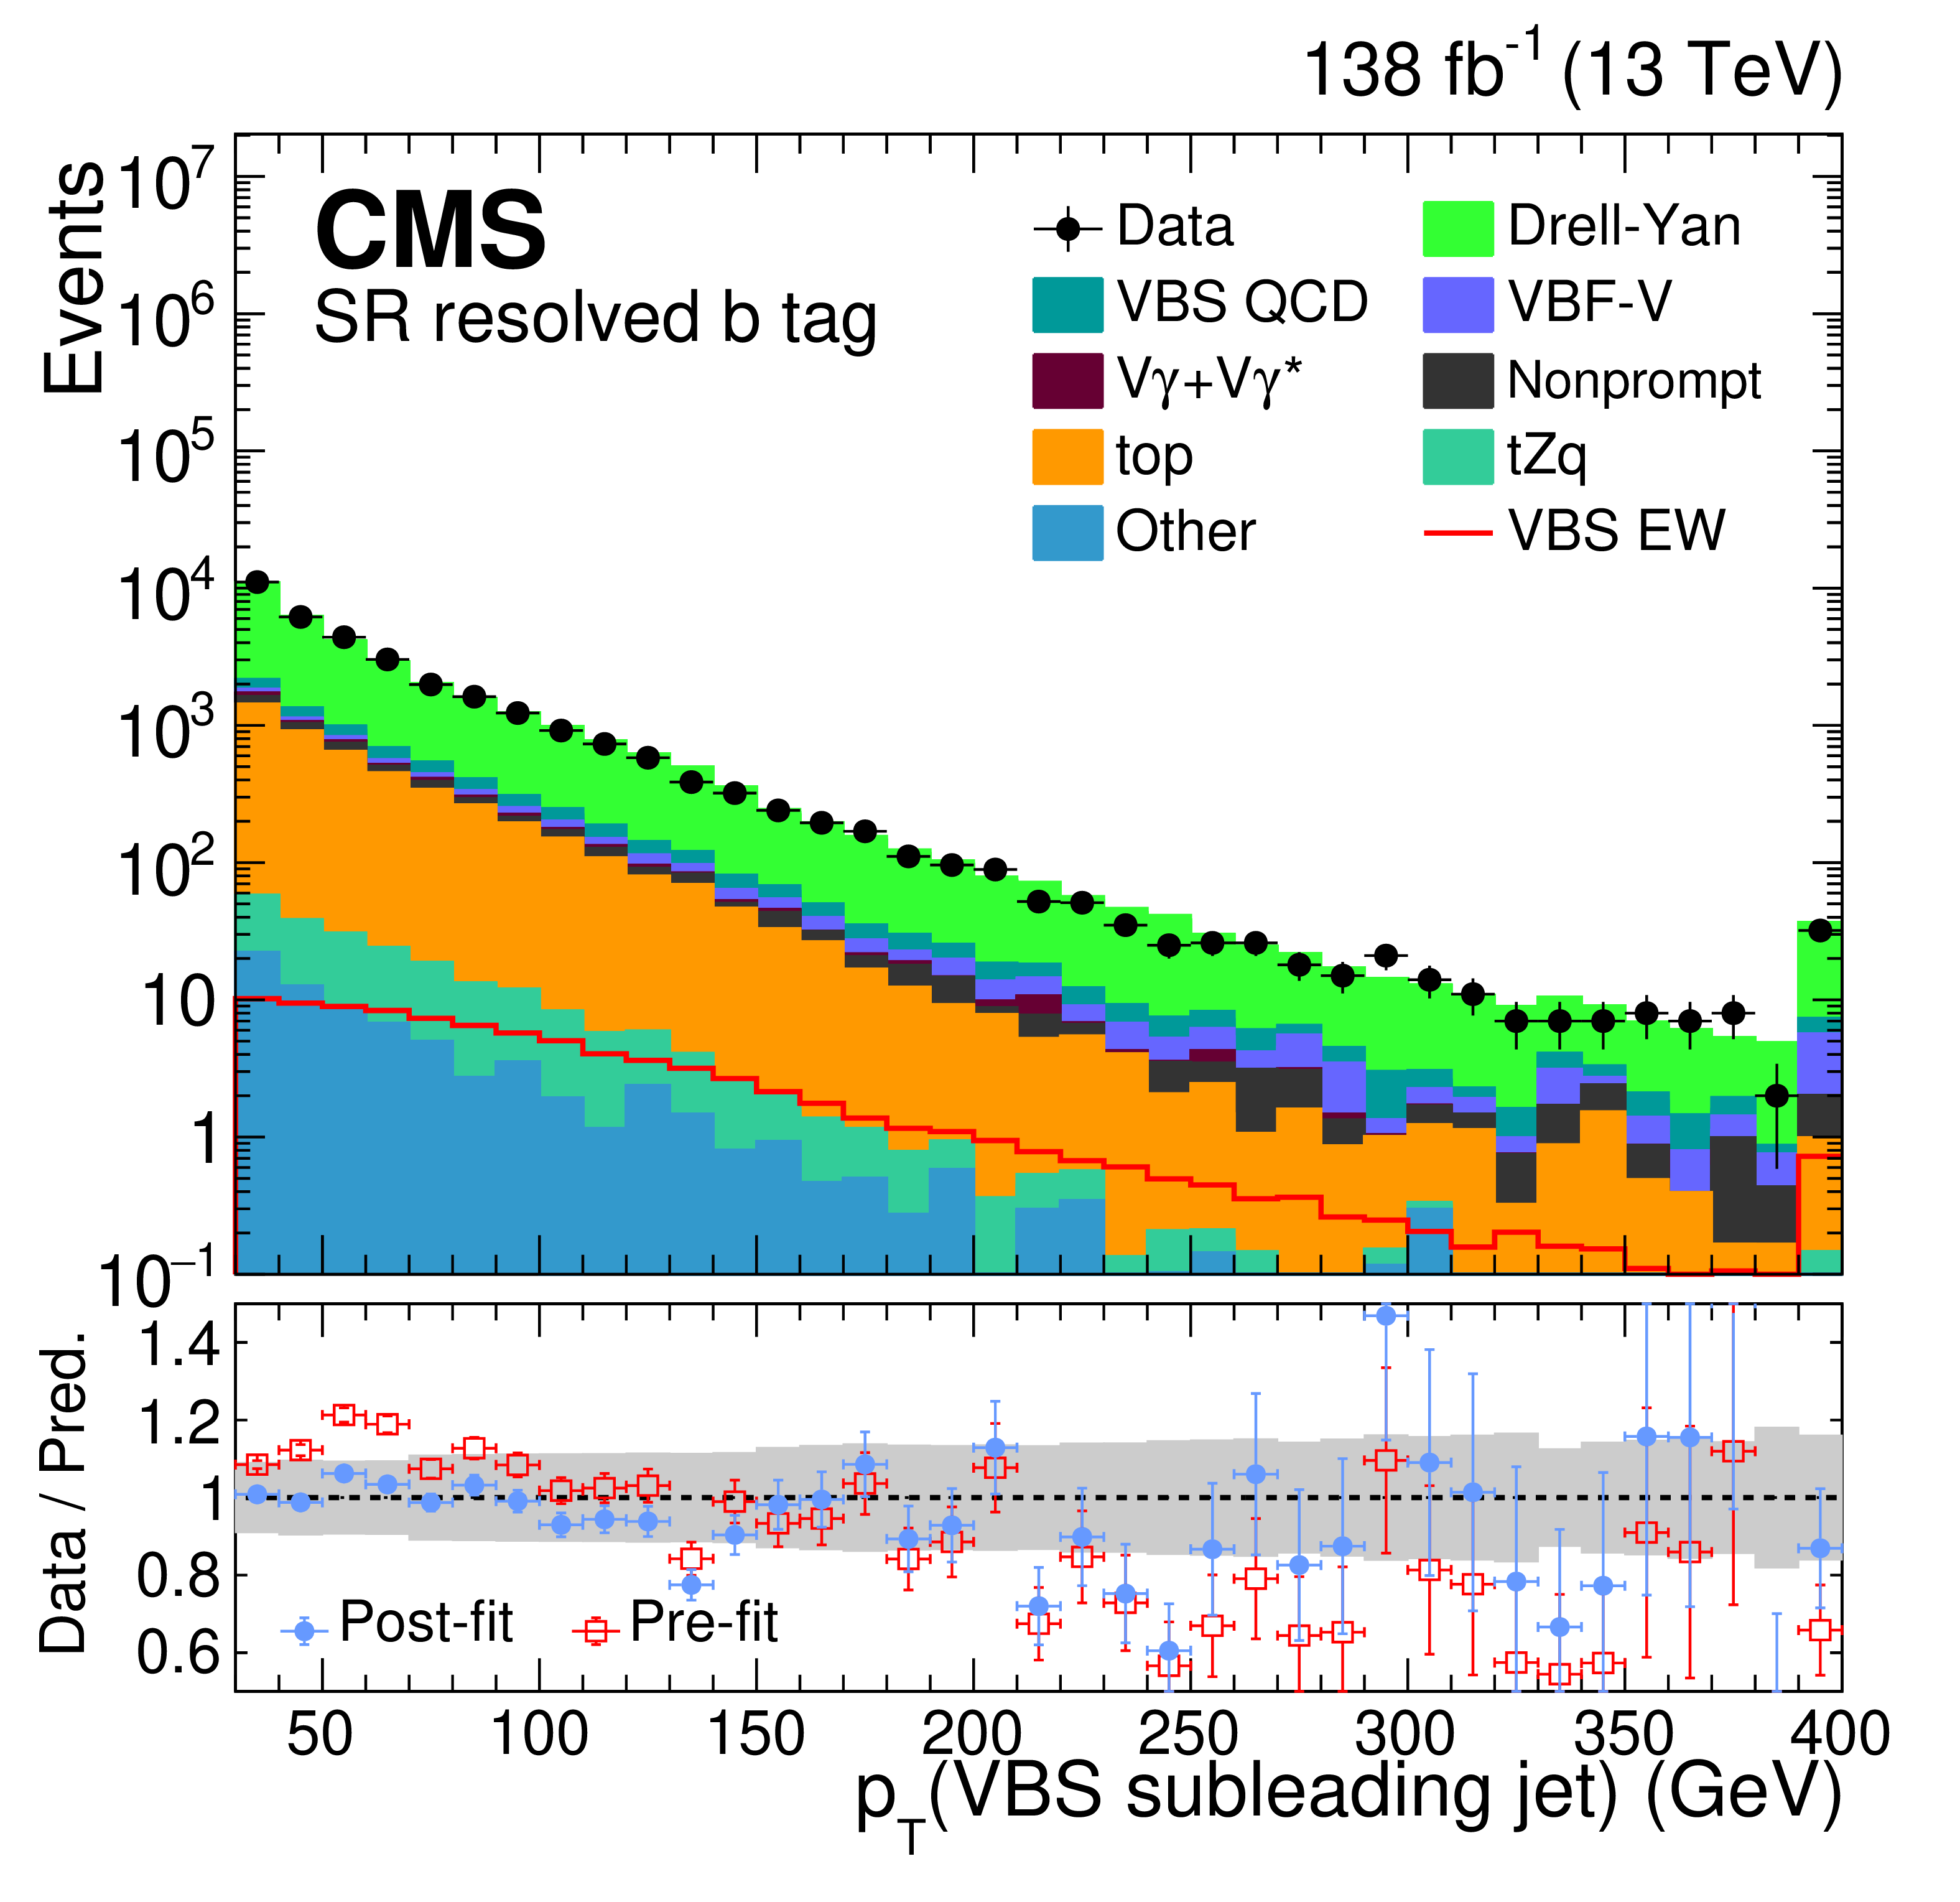
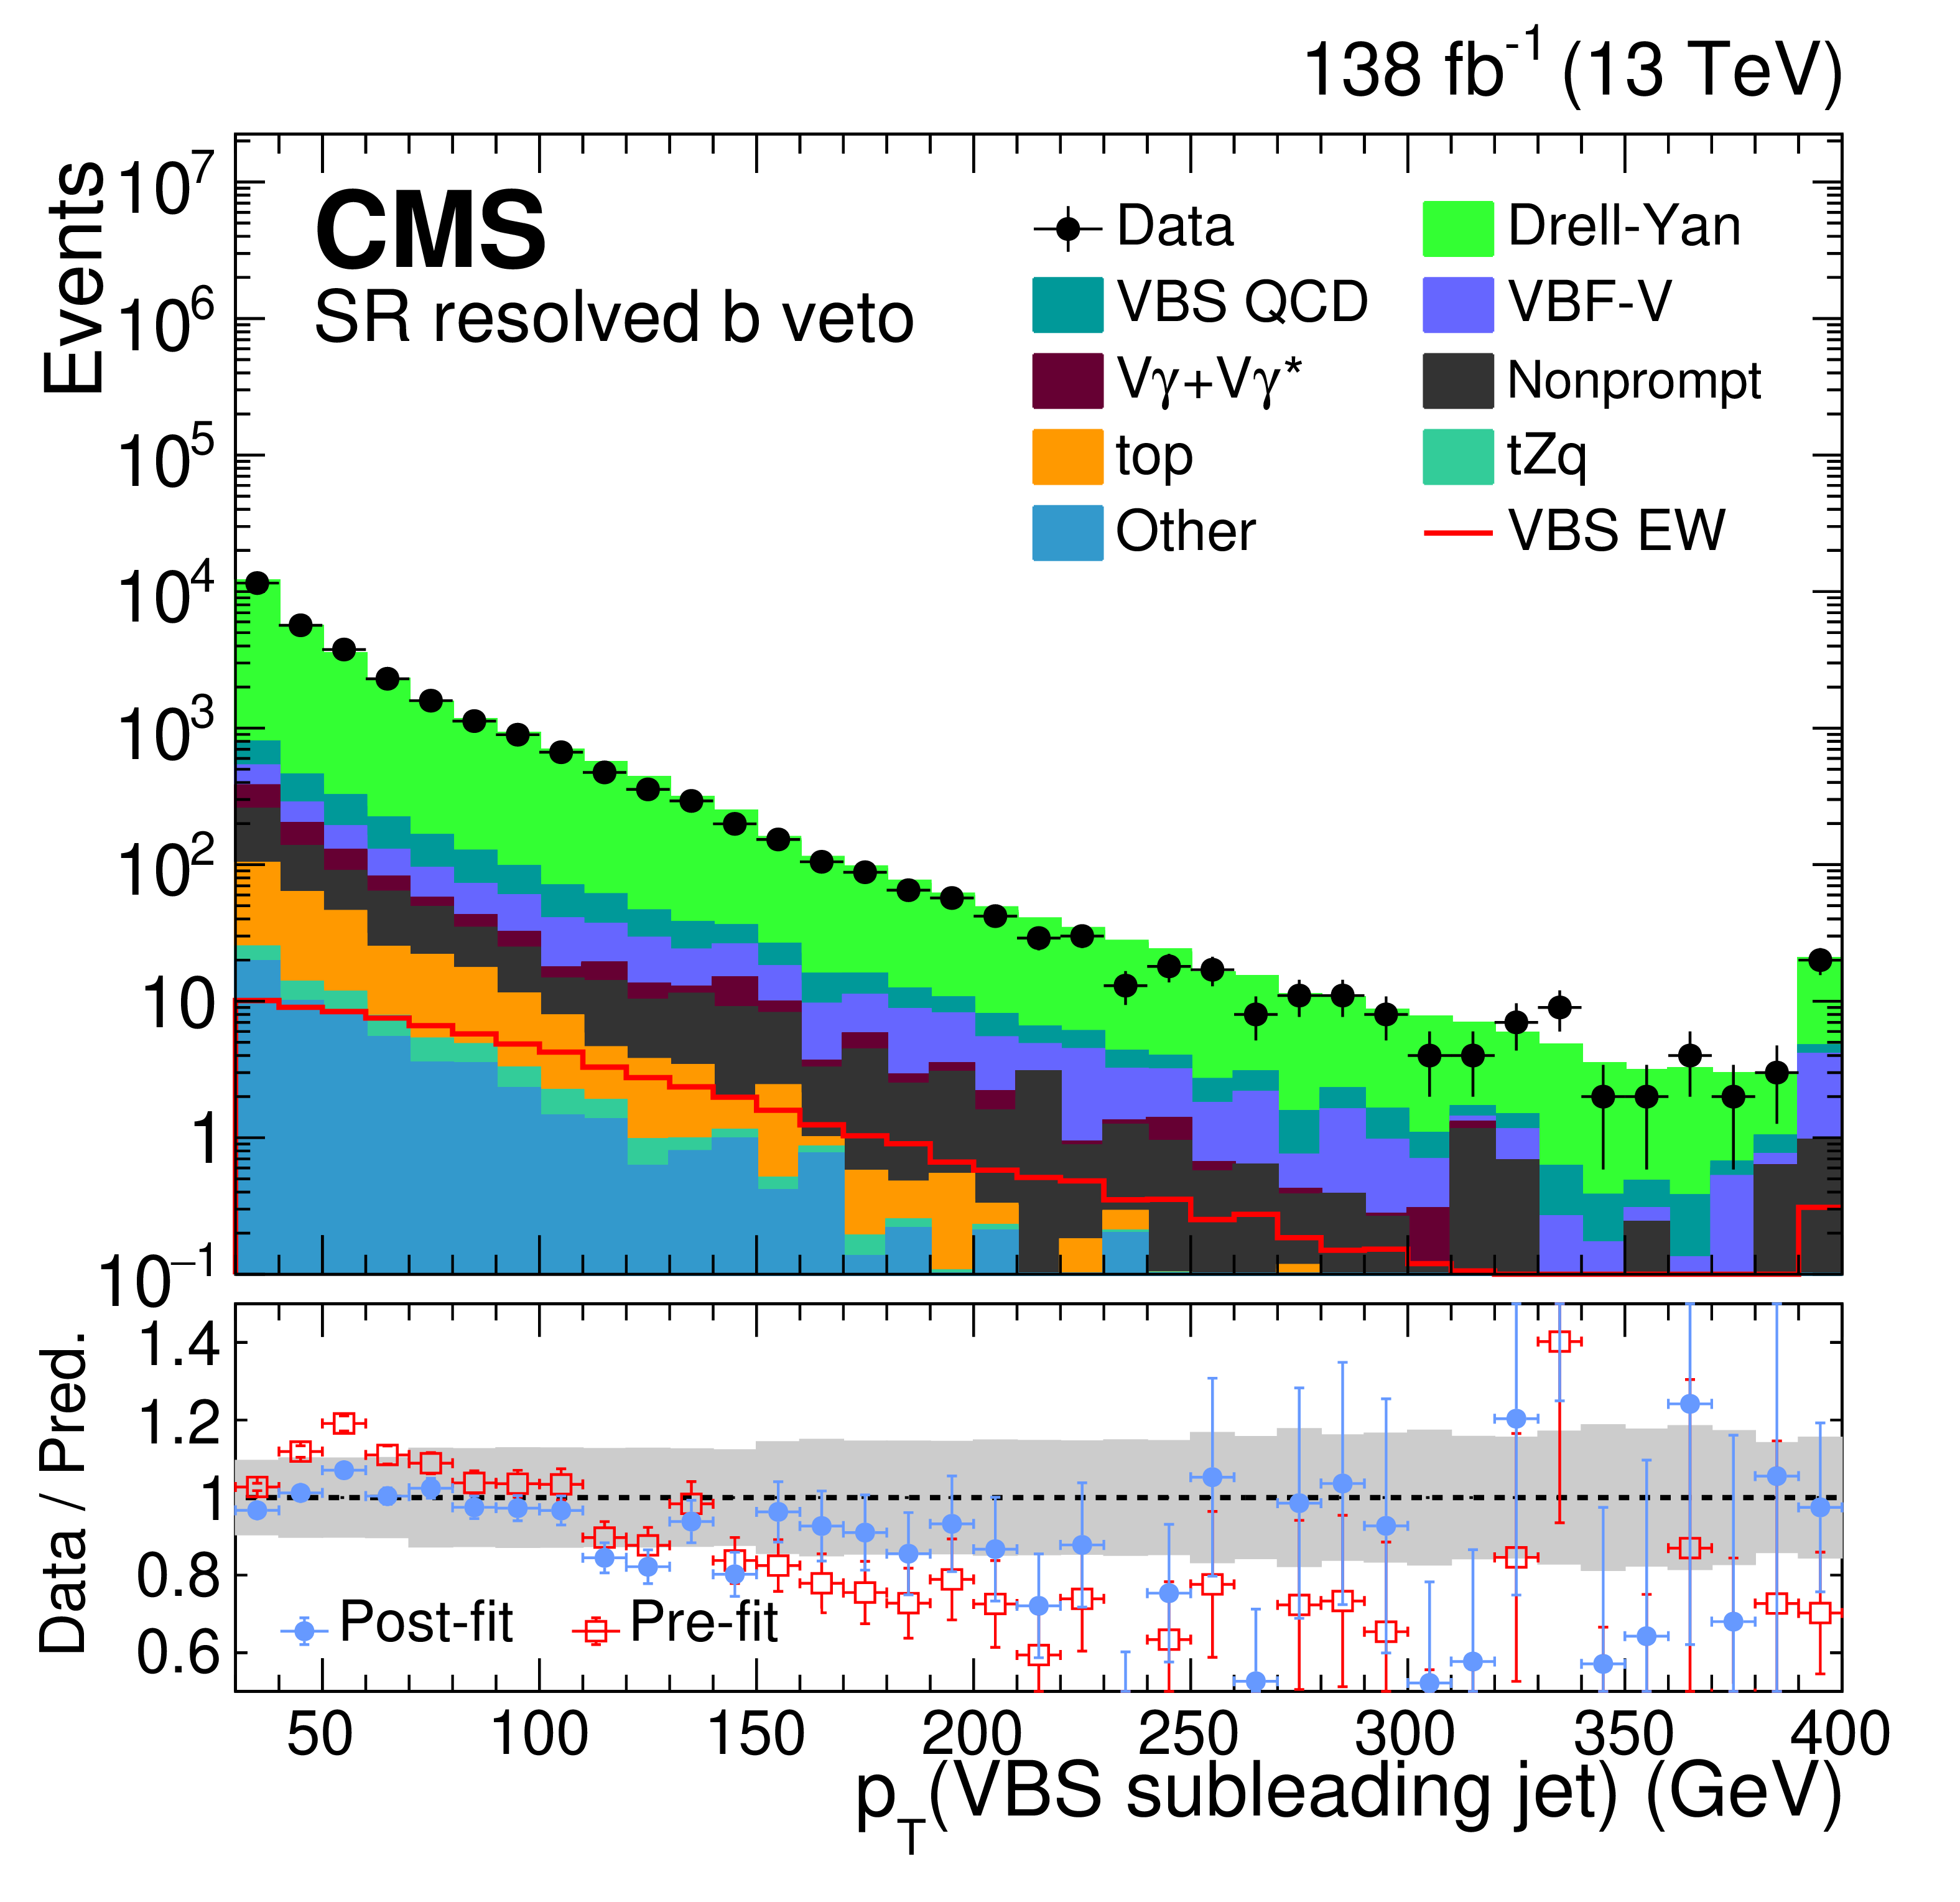
Figure 2:
Distributions of subleading VBS jet $ p_{\mathrm{T}} $ for the data and post-fit backgrounds (stacked histograms), in the SRs of the ZV channel for the resolved b tag (left) and the resolved b veto (right) categories. The post-fit VBS EW ZV signal is shown overlaid as a red solid line. The overflow is included in the last bin. The lower panels show the ratios of the data to the pre-fit background prediction and post-fit background yield as red open squares and blue points, respectively. The gray band in the lower panels indicates the systematic component of the post-fit background uncertainty. The vertical bars on the data points represent statistical uncertainties. |
png pdf |
Figure 2-a:
Distributions of subleading VBS jet $ p_{\mathrm{T}} $ for the data and post-fit backgrounds (stacked histograms), in the SRs of the ZV channel for the resolved b tag (left) and the resolved b veto (right) categories. The post-fit VBS EW ZV signal is shown overlaid as a red solid line. The overflow is included in the last bin. The lower panels show the ratios of the data to the pre-fit background prediction and post-fit background yield as red open squares and blue points, respectively. The gray band in the lower panels indicates the systematic component of the post-fit background uncertainty. The vertical bars on the data points represent statistical uncertainties. |
png pdf |
Figure 2-b:
Distributions of subleading VBS jet $ p_{\mathrm{T}} $ for the data and post-fit backgrounds (stacked histograms), in the SRs of the ZV channel for the resolved b tag (left) and the resolved b veto (right) categories. The post-fit VBS EW ZV signal is shown overlaid as a red solid line. The overflow is included in the last bin. The lower panels show the ratios of the data to the pre-fit background prediction and post-fit background yield as red open squares and blue points, respectively. The gray band in the lower panels indicates the systematic component of the post-fit background uncertainty. The vertical bars on the data points represent statistical uncertainties. |
png pdf |
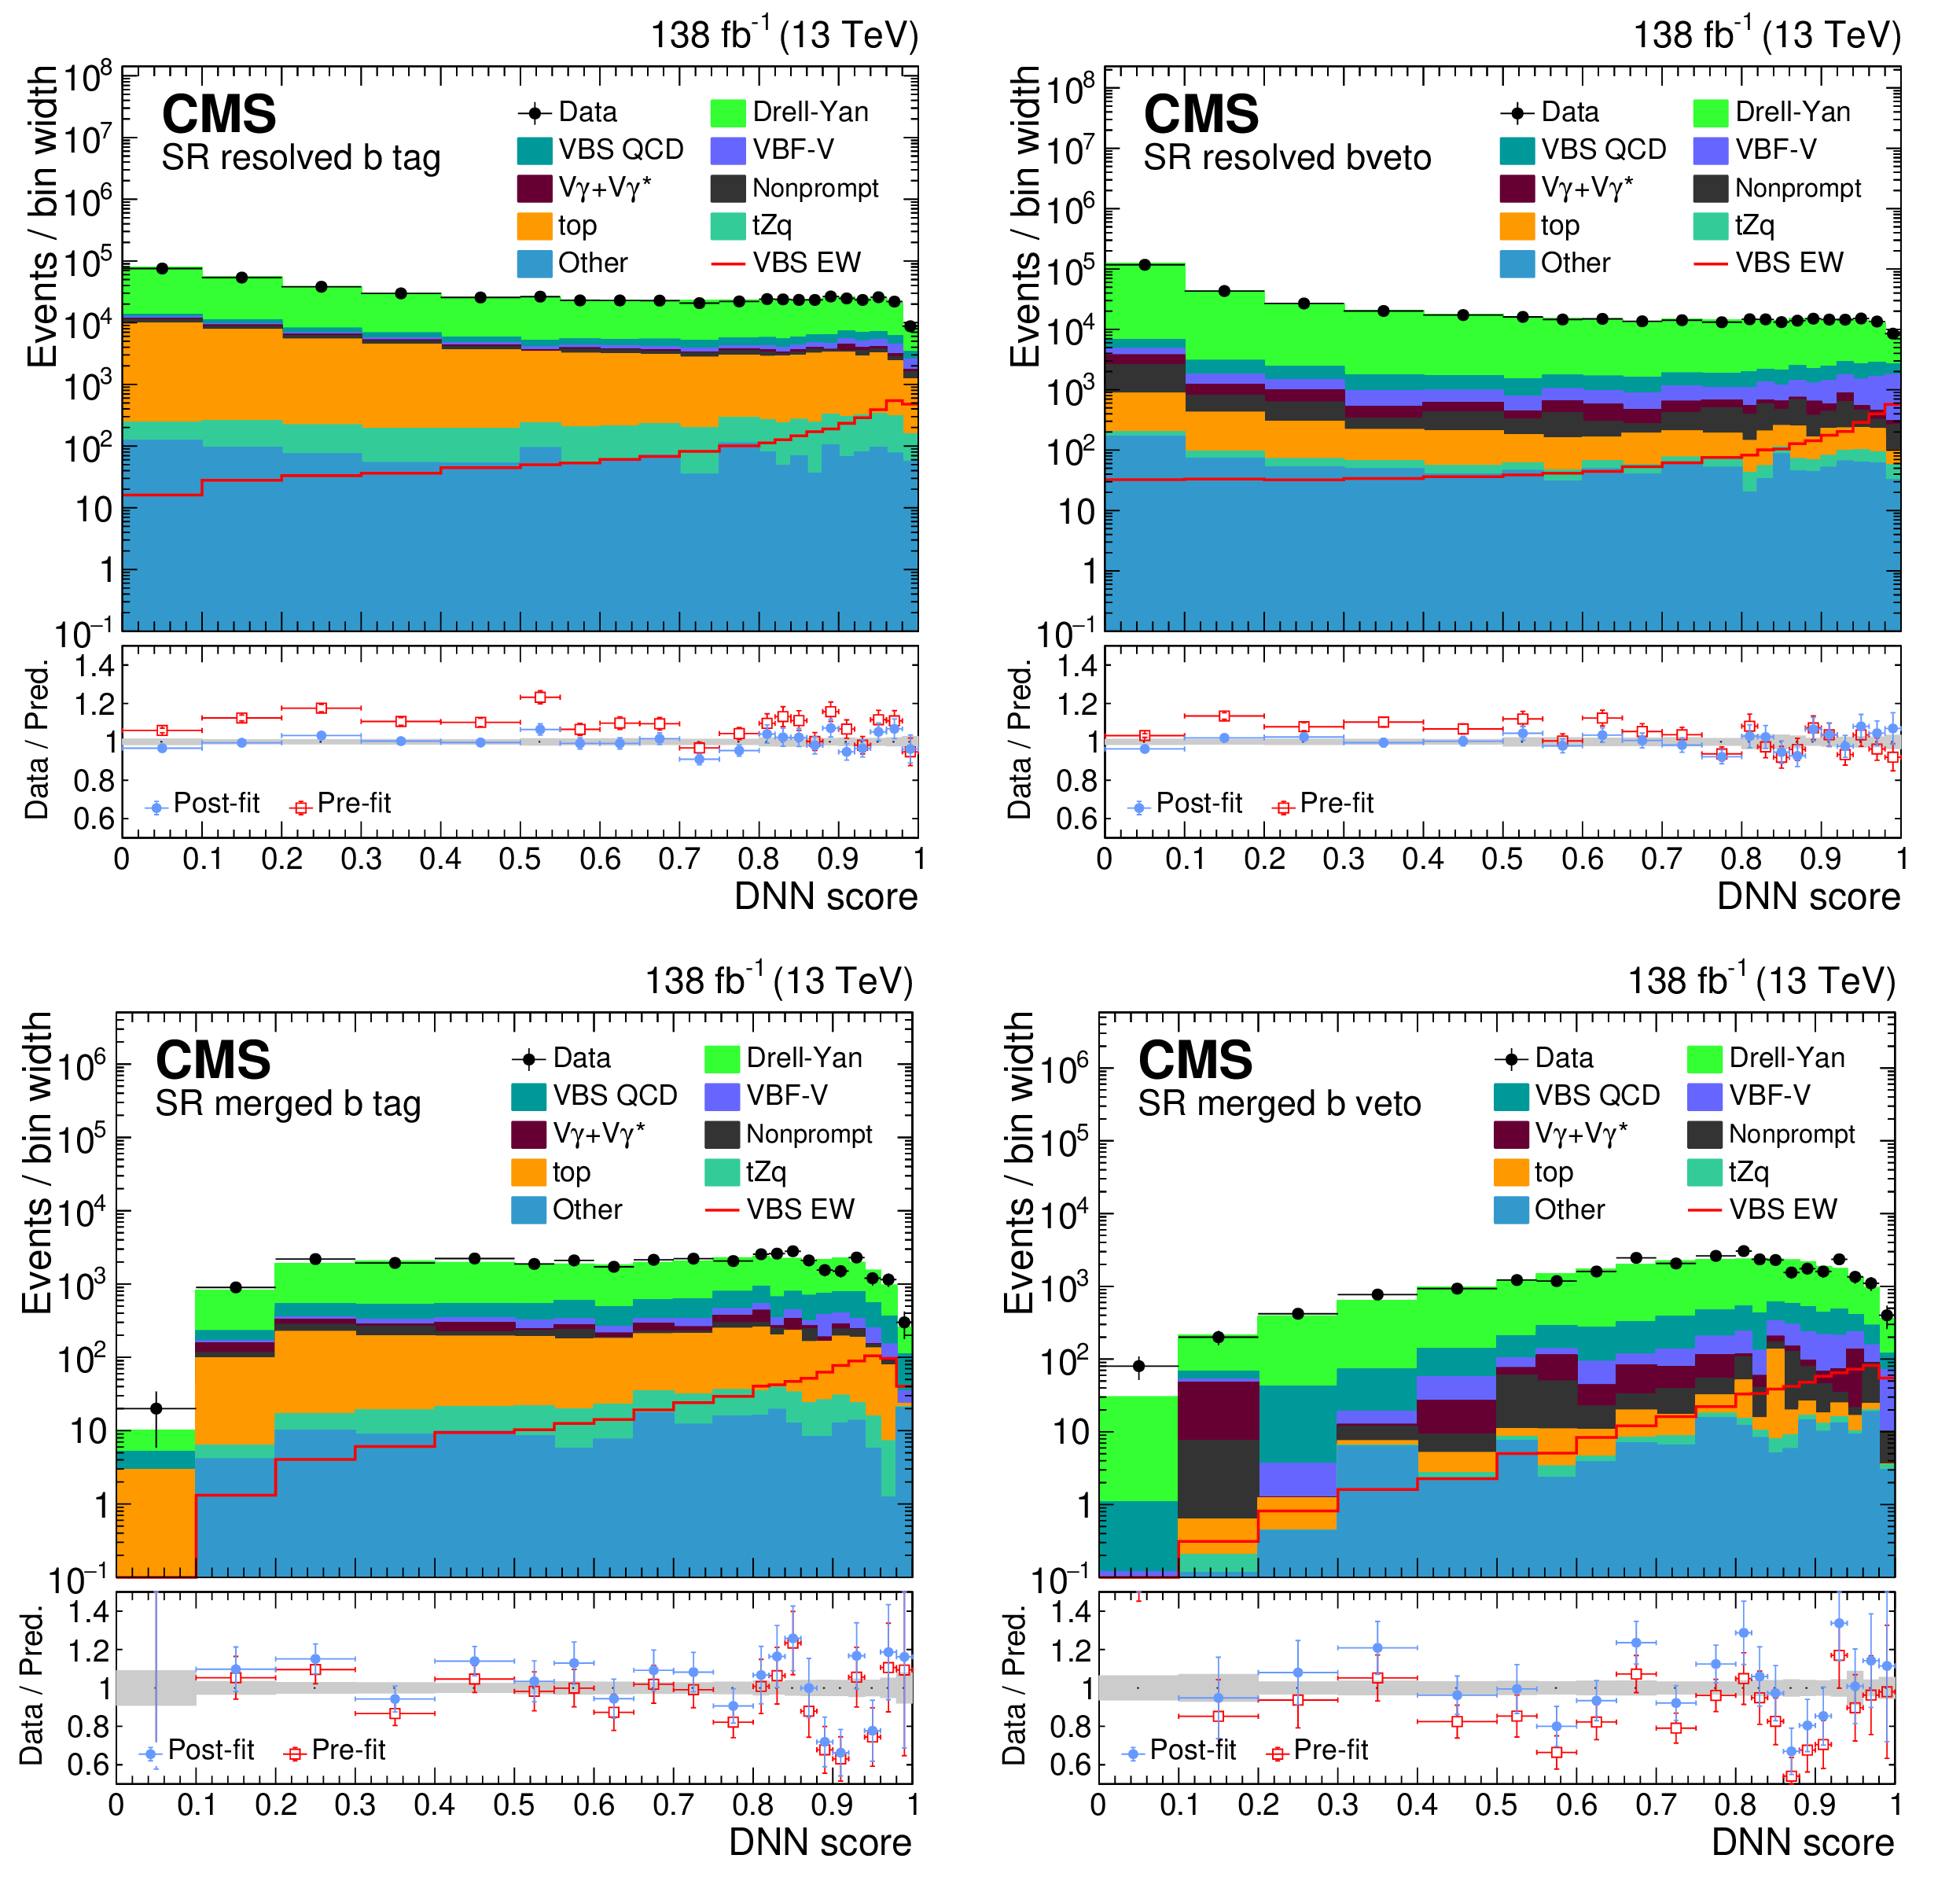
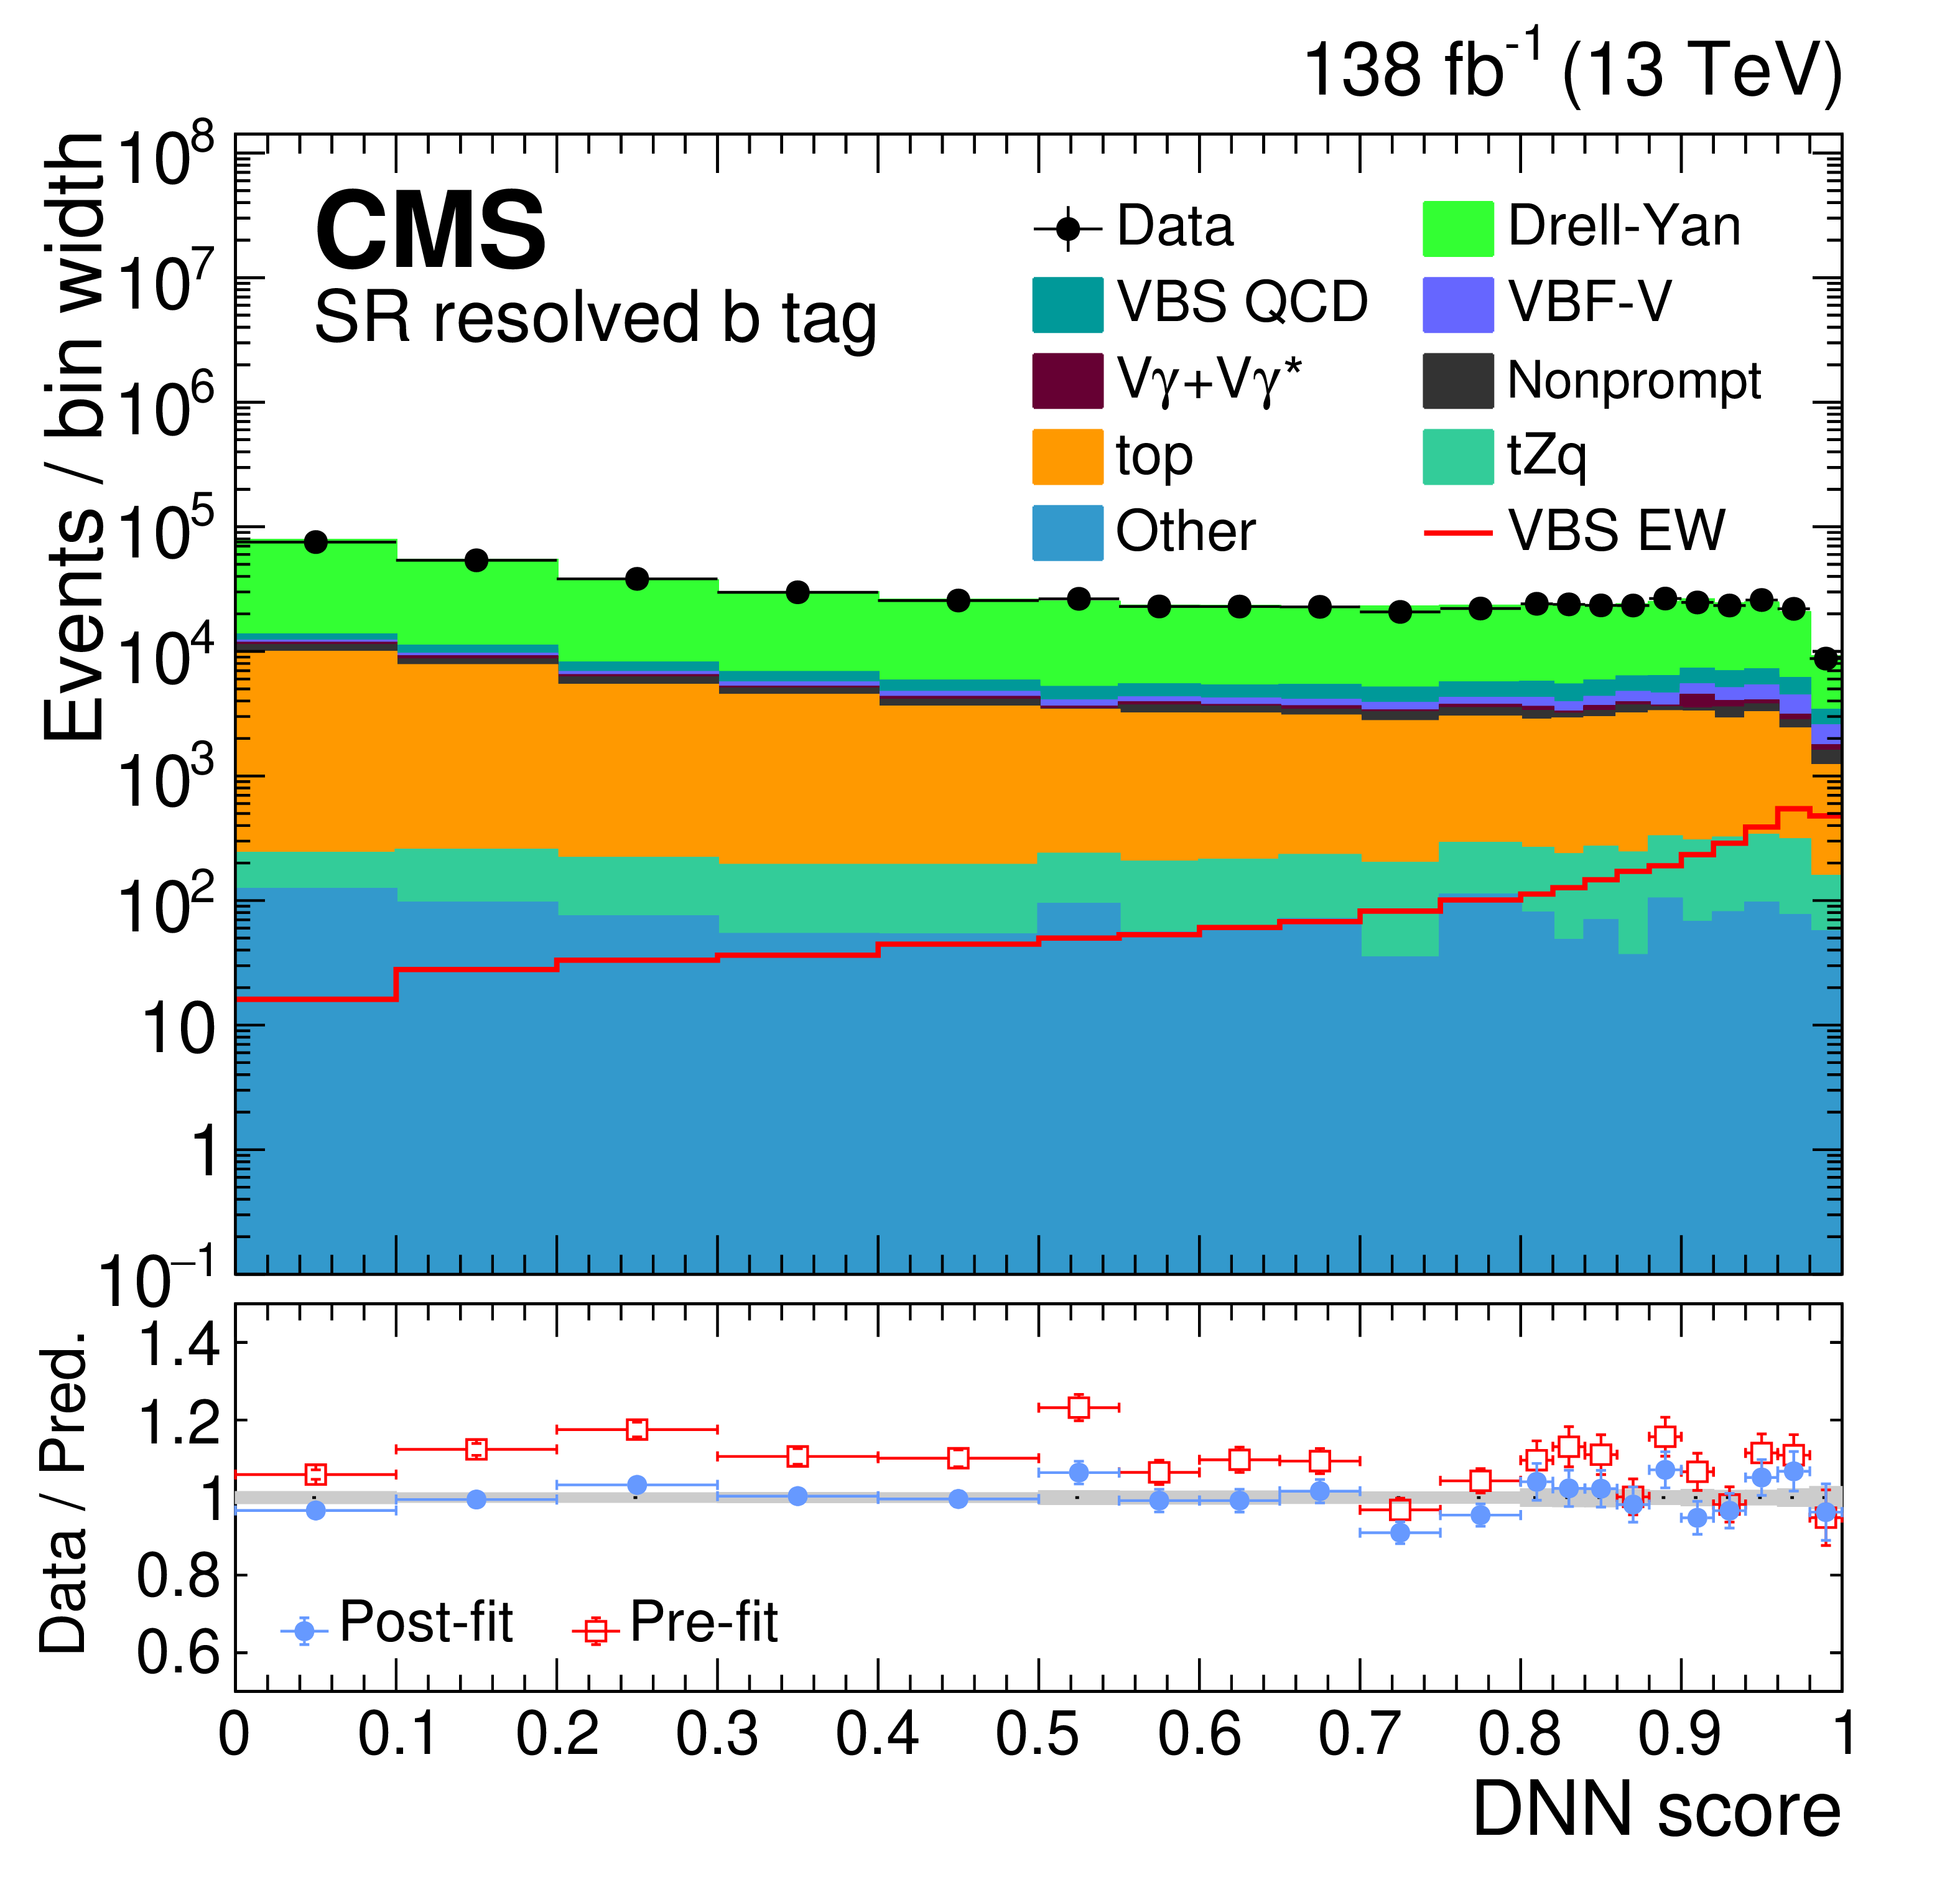
Figure 3:
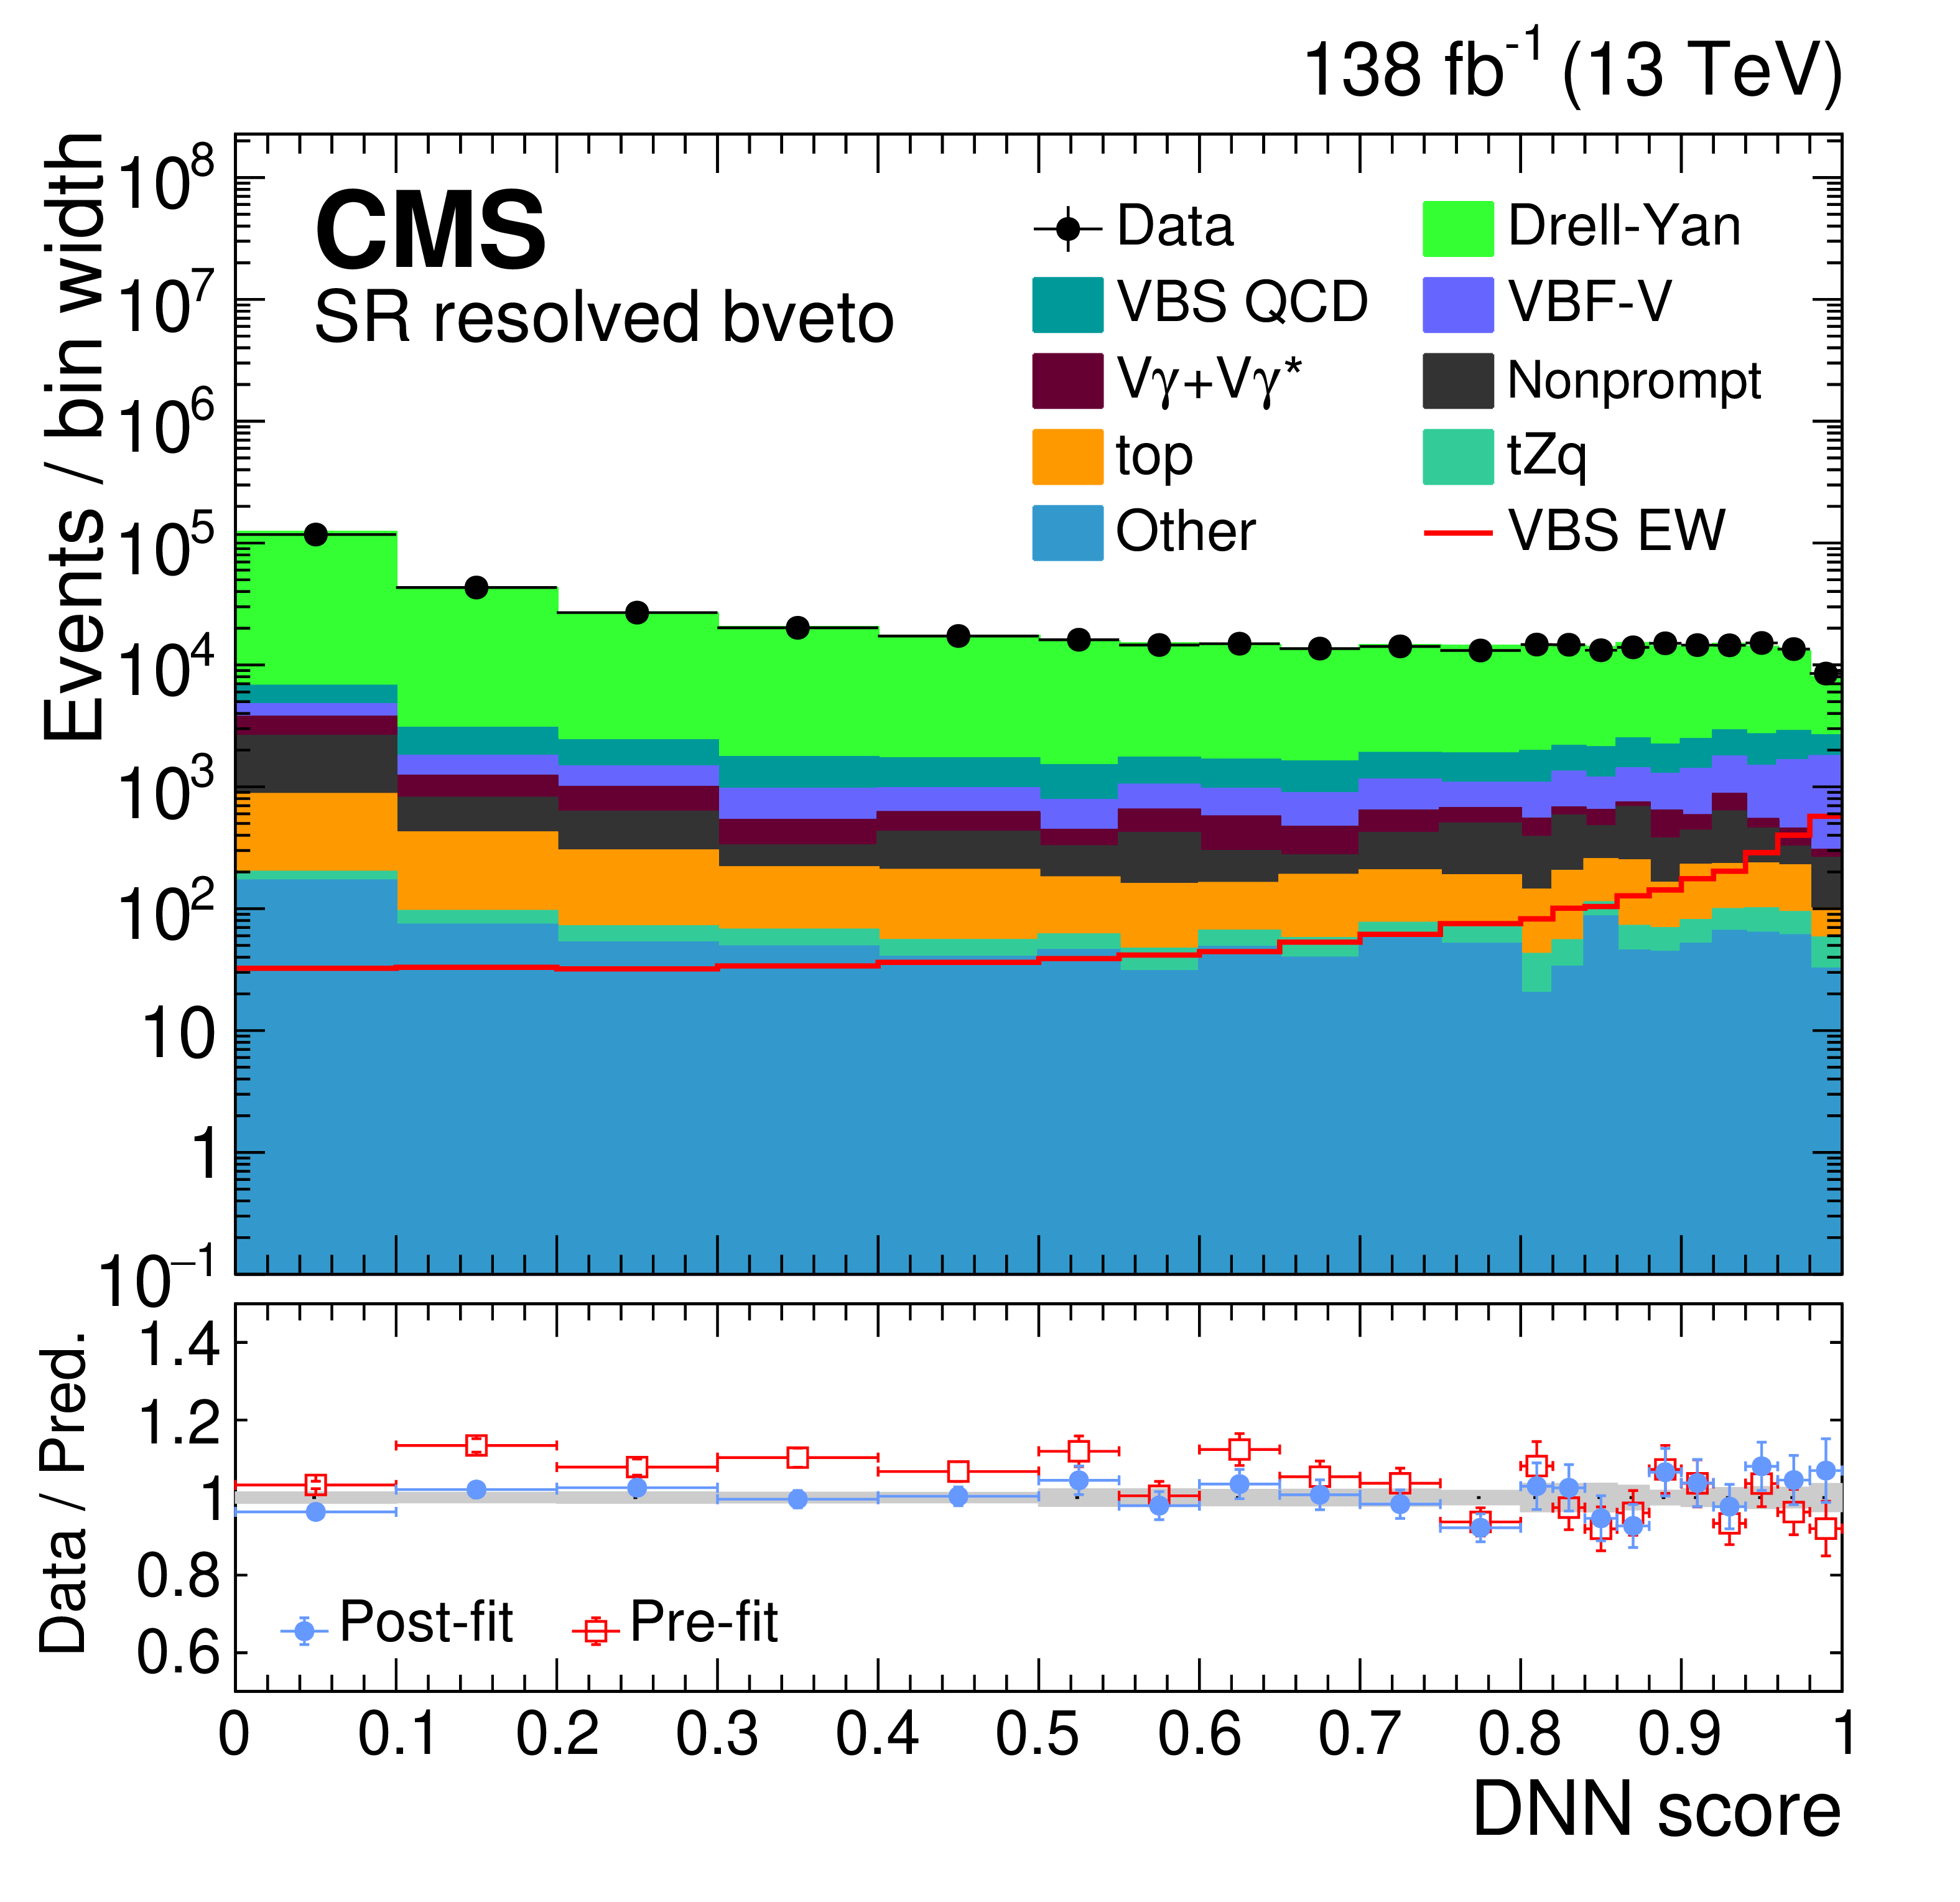
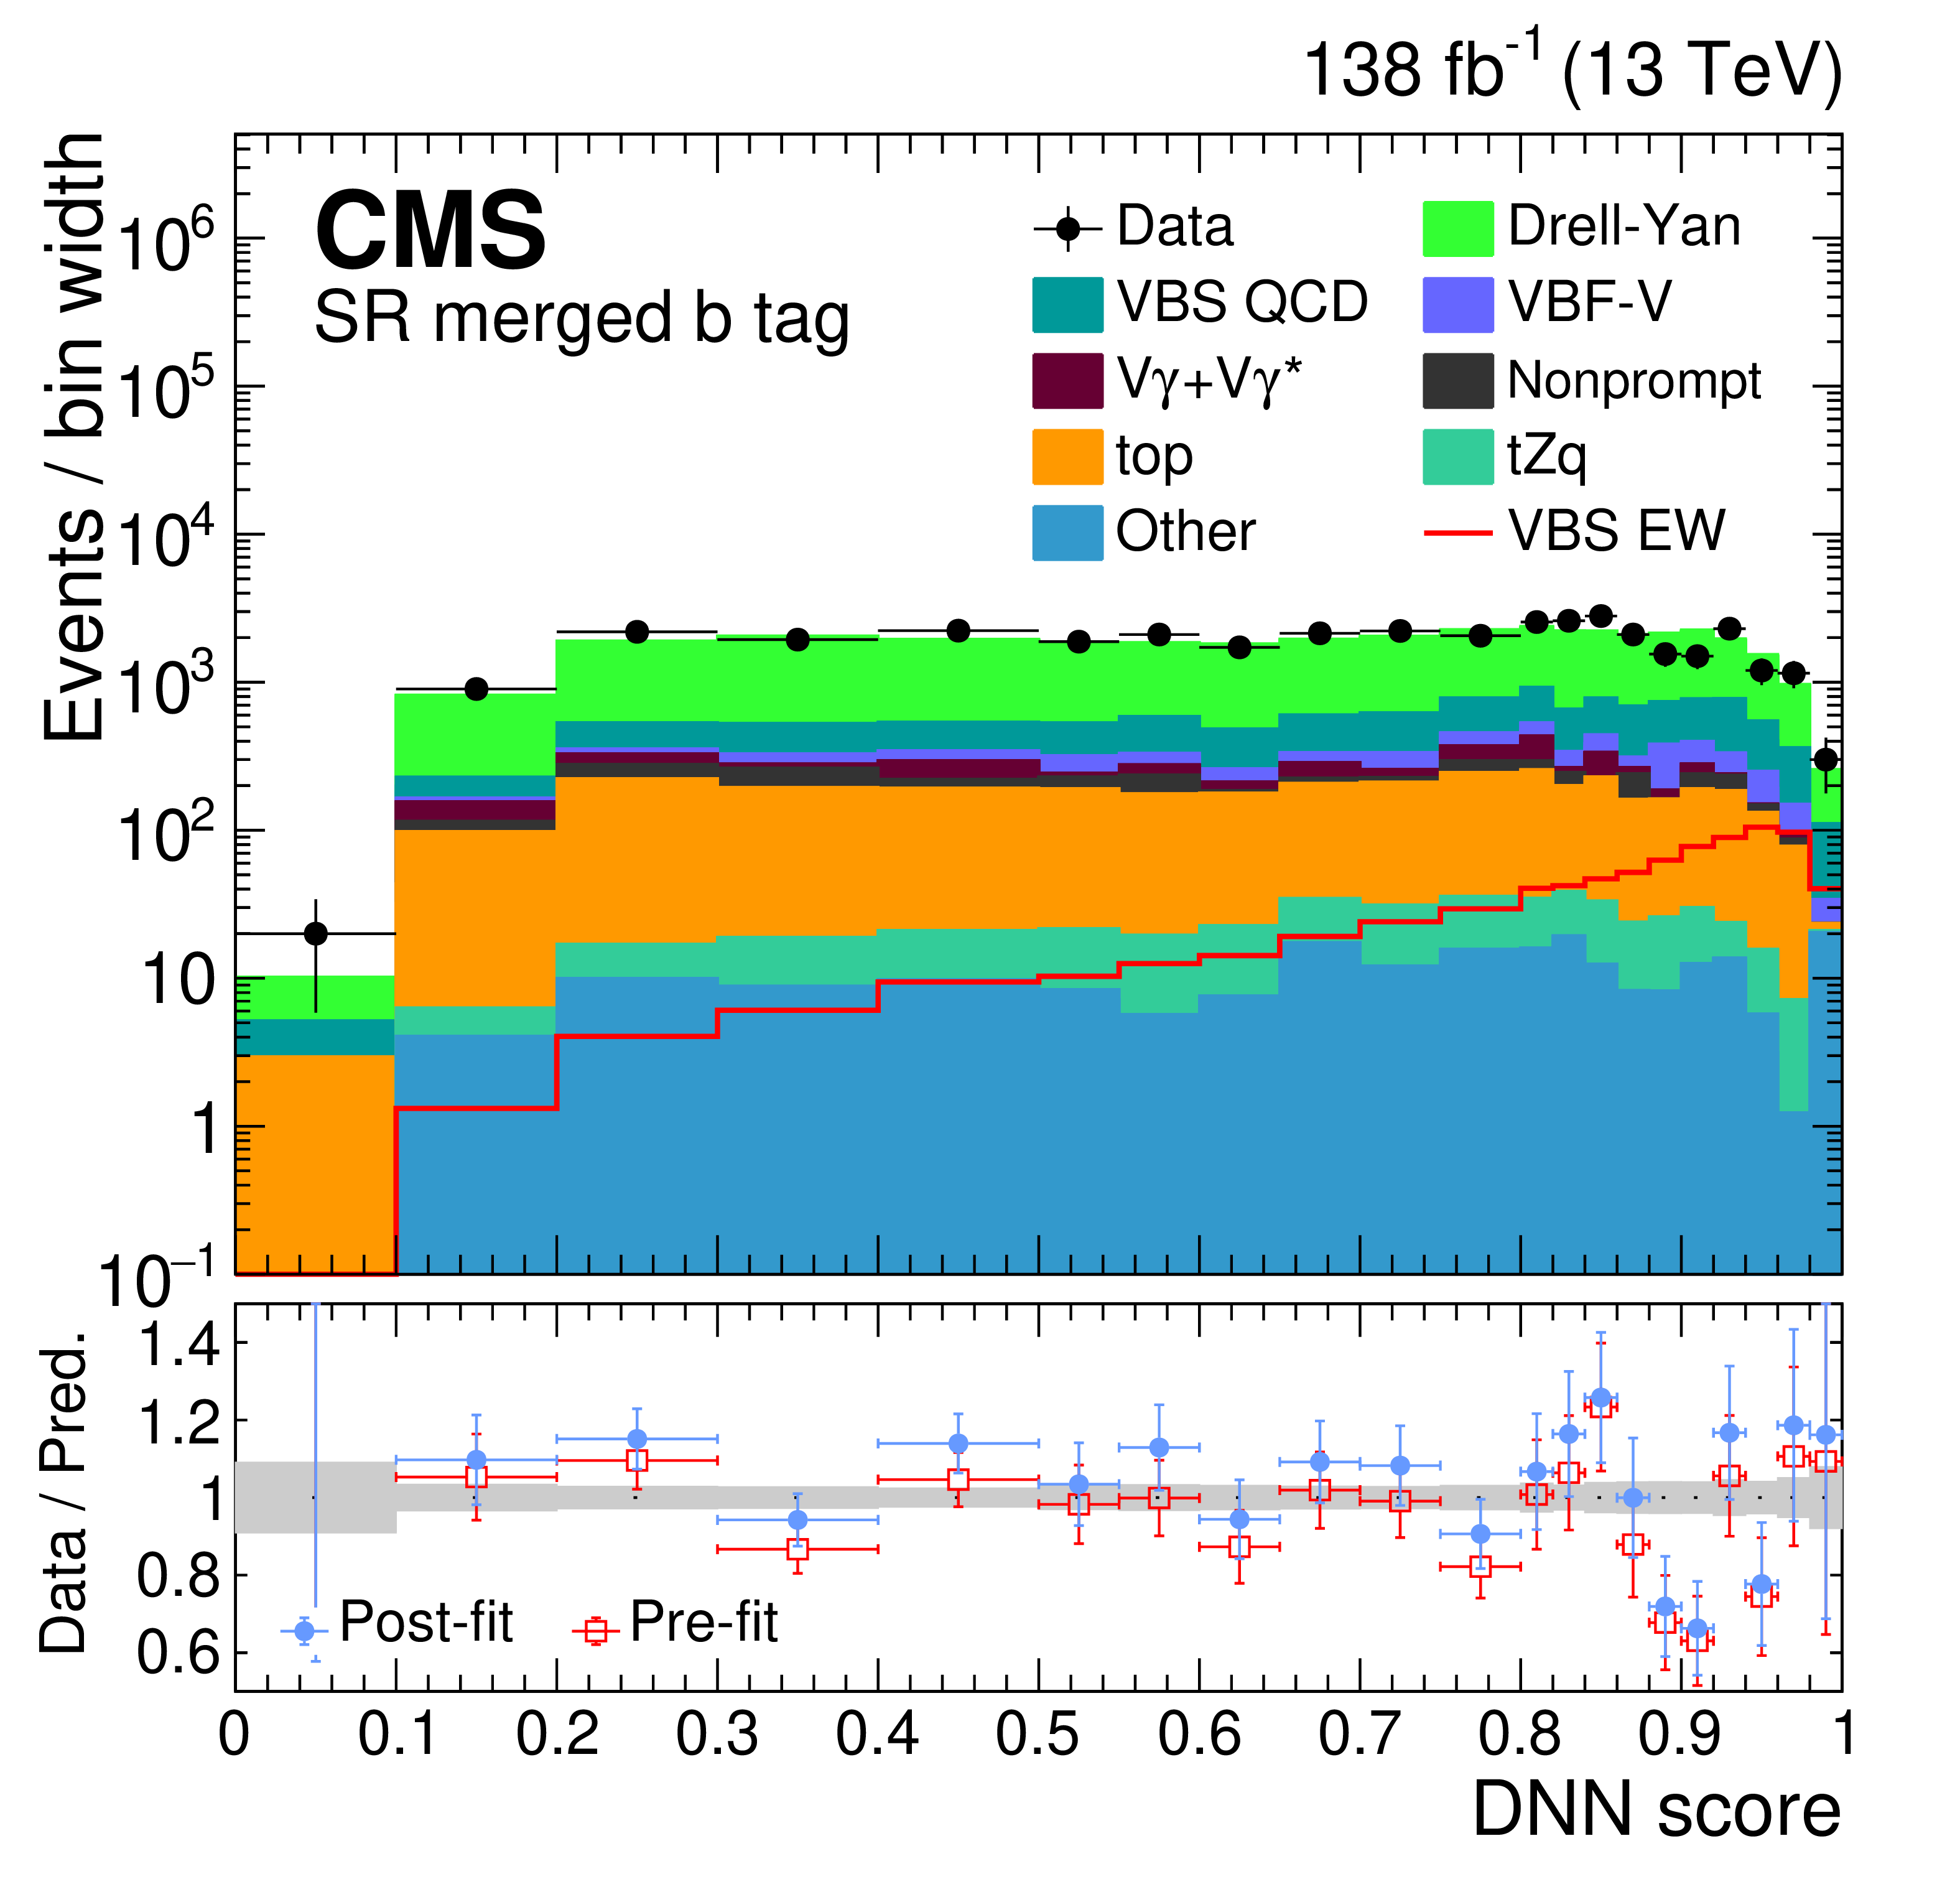
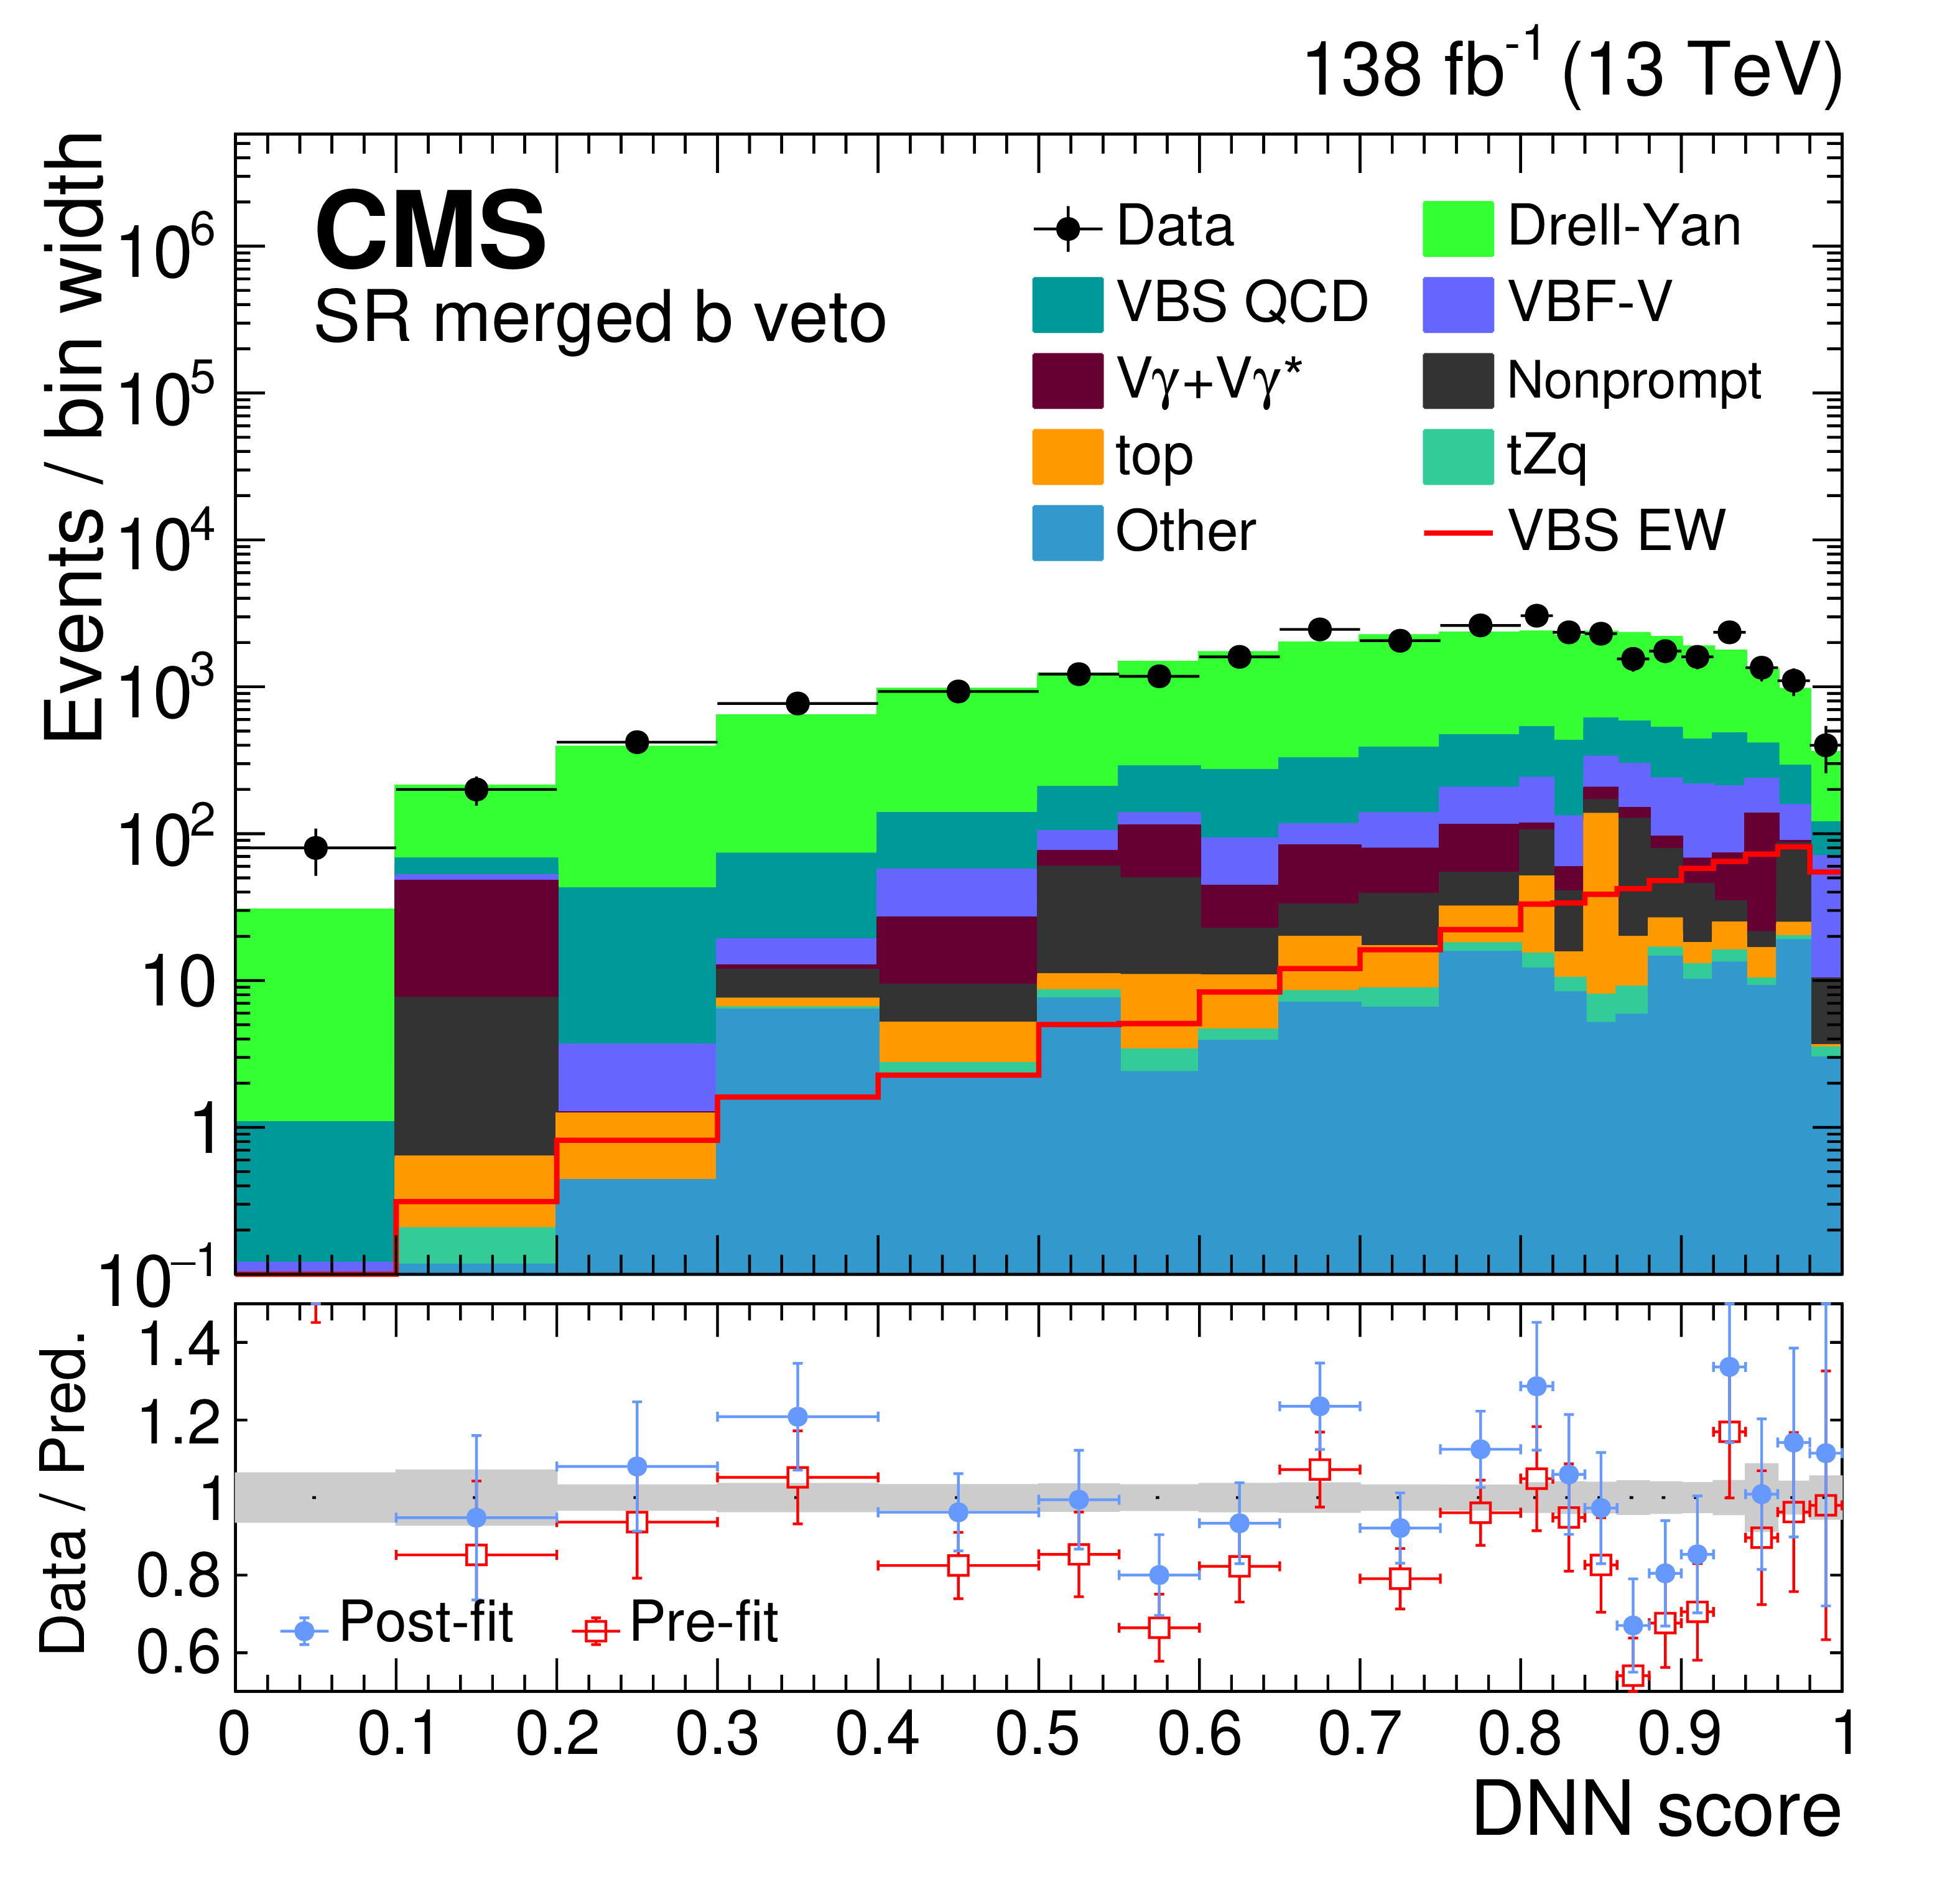
Distributions of DNN score for the data and post-fit backgrounds (stacked histograms), in the SRs of the ZV channel for the b tag (left) and the b veto (right) channels, for the resolved (merged) category in the first (second) row. The post-fit VBS EW ZV signal is shown overlaid as a red solid line. The overflow is included in the last bin. The lower panels show the ratios of the data to the pre-fit background prediction and post-fit background yield as red open squares and blue points, respectively. The gray band in the lower panels indicates the systematic component of the post-fit background uncertainty. The vertical bars on the data points represent statistical uncertainties. |
png pdf |
Figure 3-a:
Distributions of DNN score for the data and post-fit backgrounds (stacked histograms), in the SRs of the ZV channel for the b tag (left) and the b veto (right) channels, for the resolved (merged) category in the first (second) row. The post-fit VBS EW ZV signal is shown overlaid as a red solid line. The overflow is included in the last bin. The lower panels show the ratios of the data to the pre-fit background prediction and post-fit background yield as red open squares and blue points, respectively. The gray band in the lower panels indicates the systematic component of the post-fit background uncertainty. The vertical bars on the data points represent statistical uncertainties. |
png pdf |
Figure 3-b:
Distributions of DNN score for the data and post-fit backgrounds (stacked histograms), in the SRs of the ZV channel for the b tag (left) and the b veto (right) channels, for the resolved (merged) category in the first (second) row. The post-fit VBS EW ZV signal is shown overlaid as a red solid line. The overflow is included in the last bin. The lower panels show the ratios of the data to the pre-fit background prediction and post-fit background yield as red open squares and blue points, respectively. The gray band in the lower panels indicates the systematic component of the post-fit background uncertainty. The vertical bars on the data points represent statistical uncertainties. |
png pdf |
Figure 3-c:
Distributions of DNN score for the data and post-fit backgrounds (stacked histograms), in the SRs of the ZV channel for the b tag (left) and the b veto (right) channels, for the resolved (merged) category in the first (second) row. The post-fit VBS EW ZV signal is shown overlaid as a red solid line. The overflow is included in the last bin. The lower panels show the ratios of the data to the pre-fit background prediction and post-fit background yield as red open squares and blue points, respectively. The gray band in the lower panels indicates the systematic component of the post-fit background uncertainty. The vertical bars on the data points represent statistical uncertainties. |
png pdf |
Figure 3-d:
Distributions of DNN score for the data and post-fit backgrounds (stacked histograms), in the SRs of the ZV channel for the b tag (left) and the b veto (right) channels, for the resolved (merged) category in the first (second) row. The post-fit VBS EW ZV signal is shown overlaid as a red solid line. The overflow is included in the last bin. The lower panels show the ratios of the data to the pre-fit background prediction and post-fit background yield as red open squares and blue points, respectively. The gray band in the lower panels indicates the systematic component of the post-fit background uncertainty. The vertical bars on the data points represent statistical uncertainties. |
png pdf |
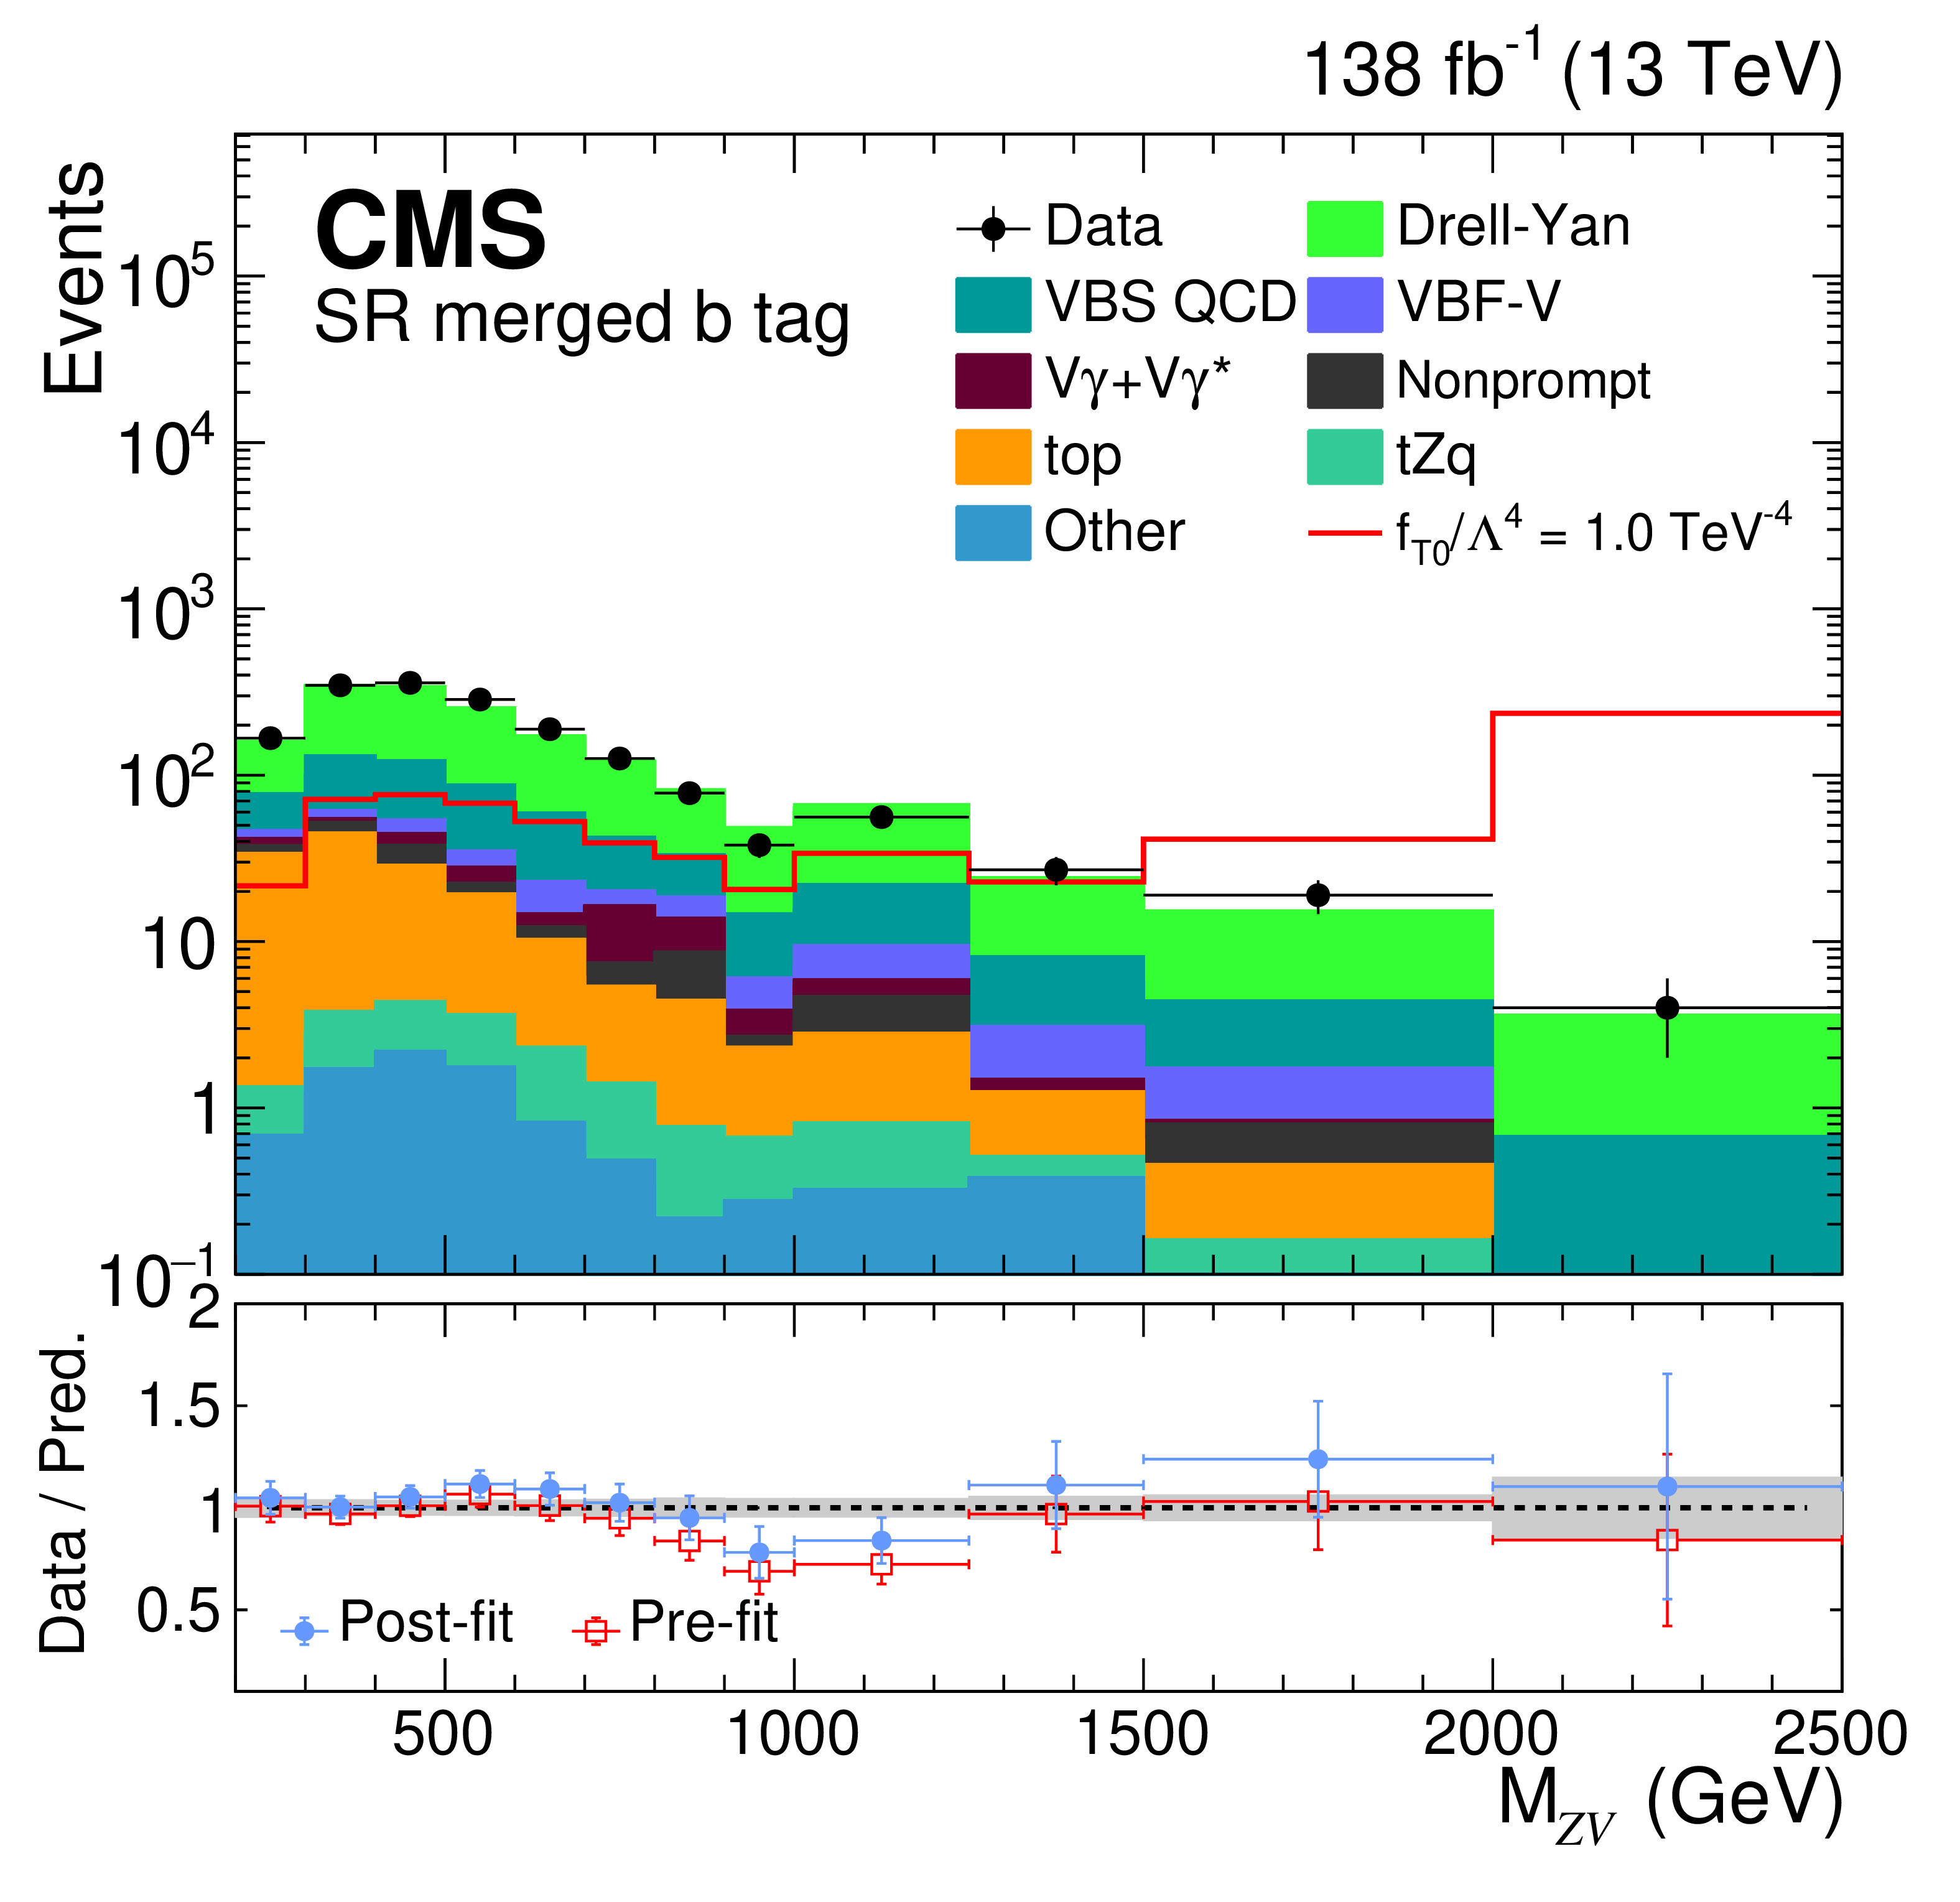
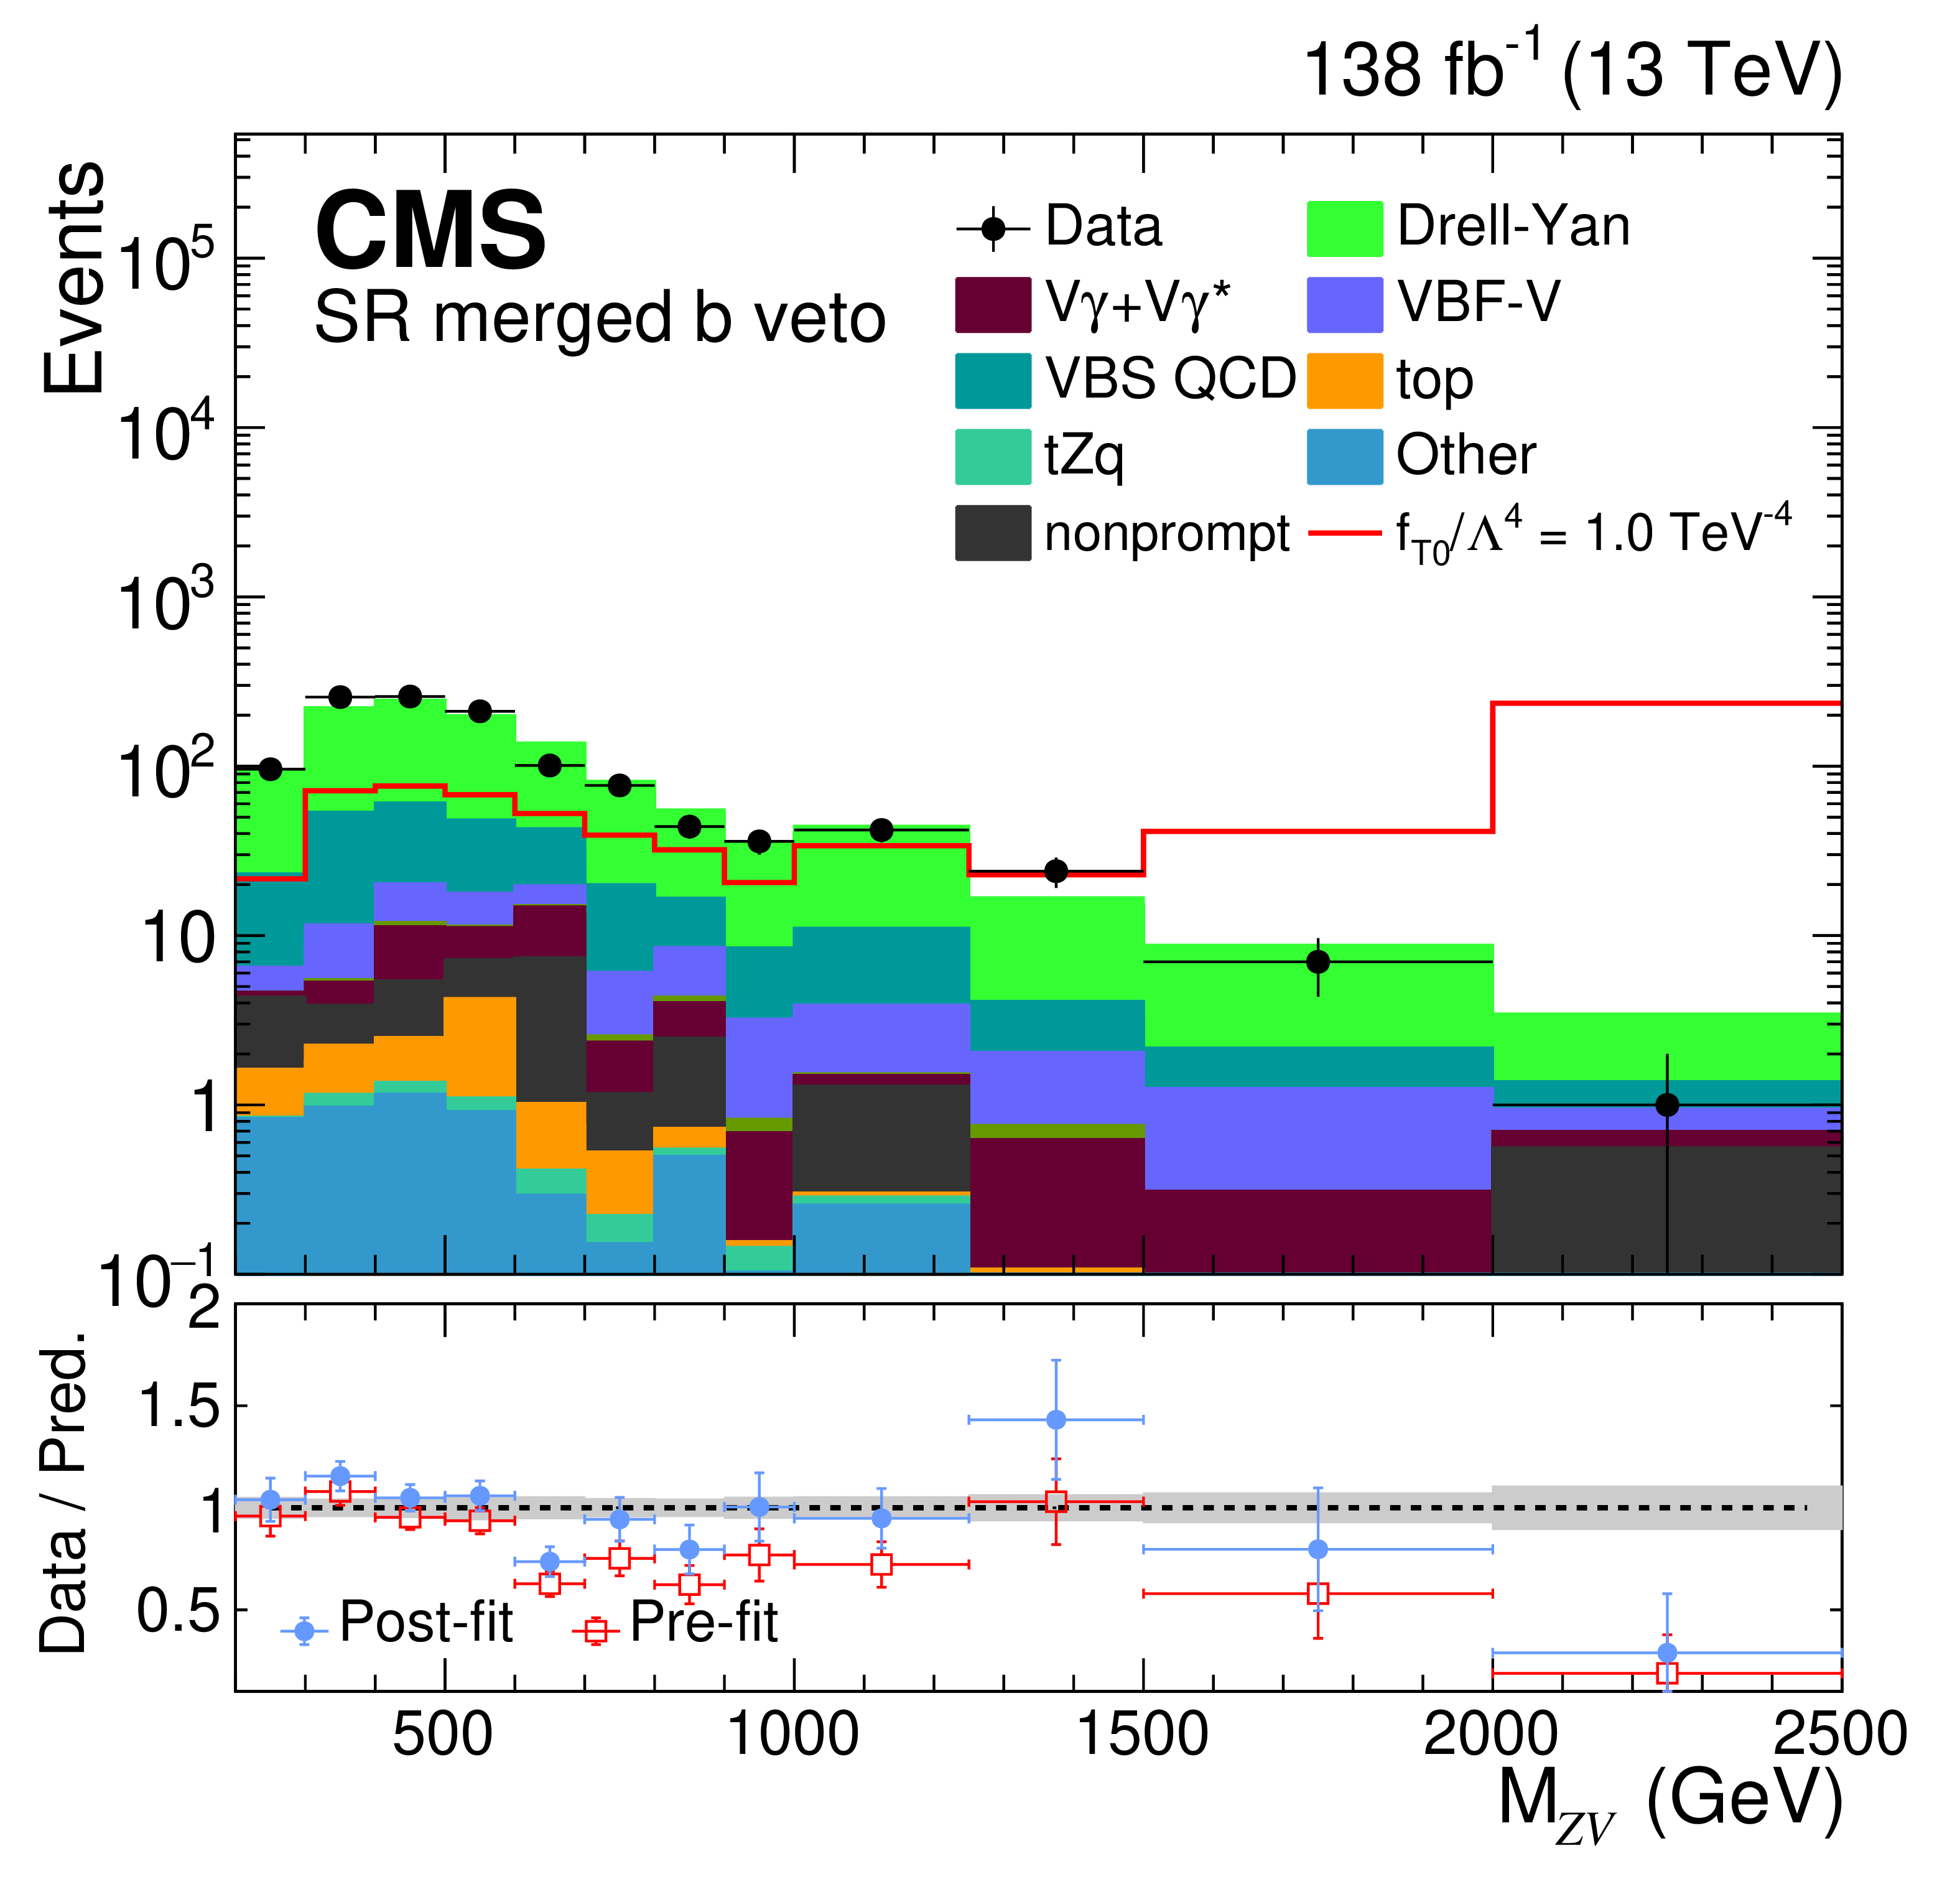
Figure 4:
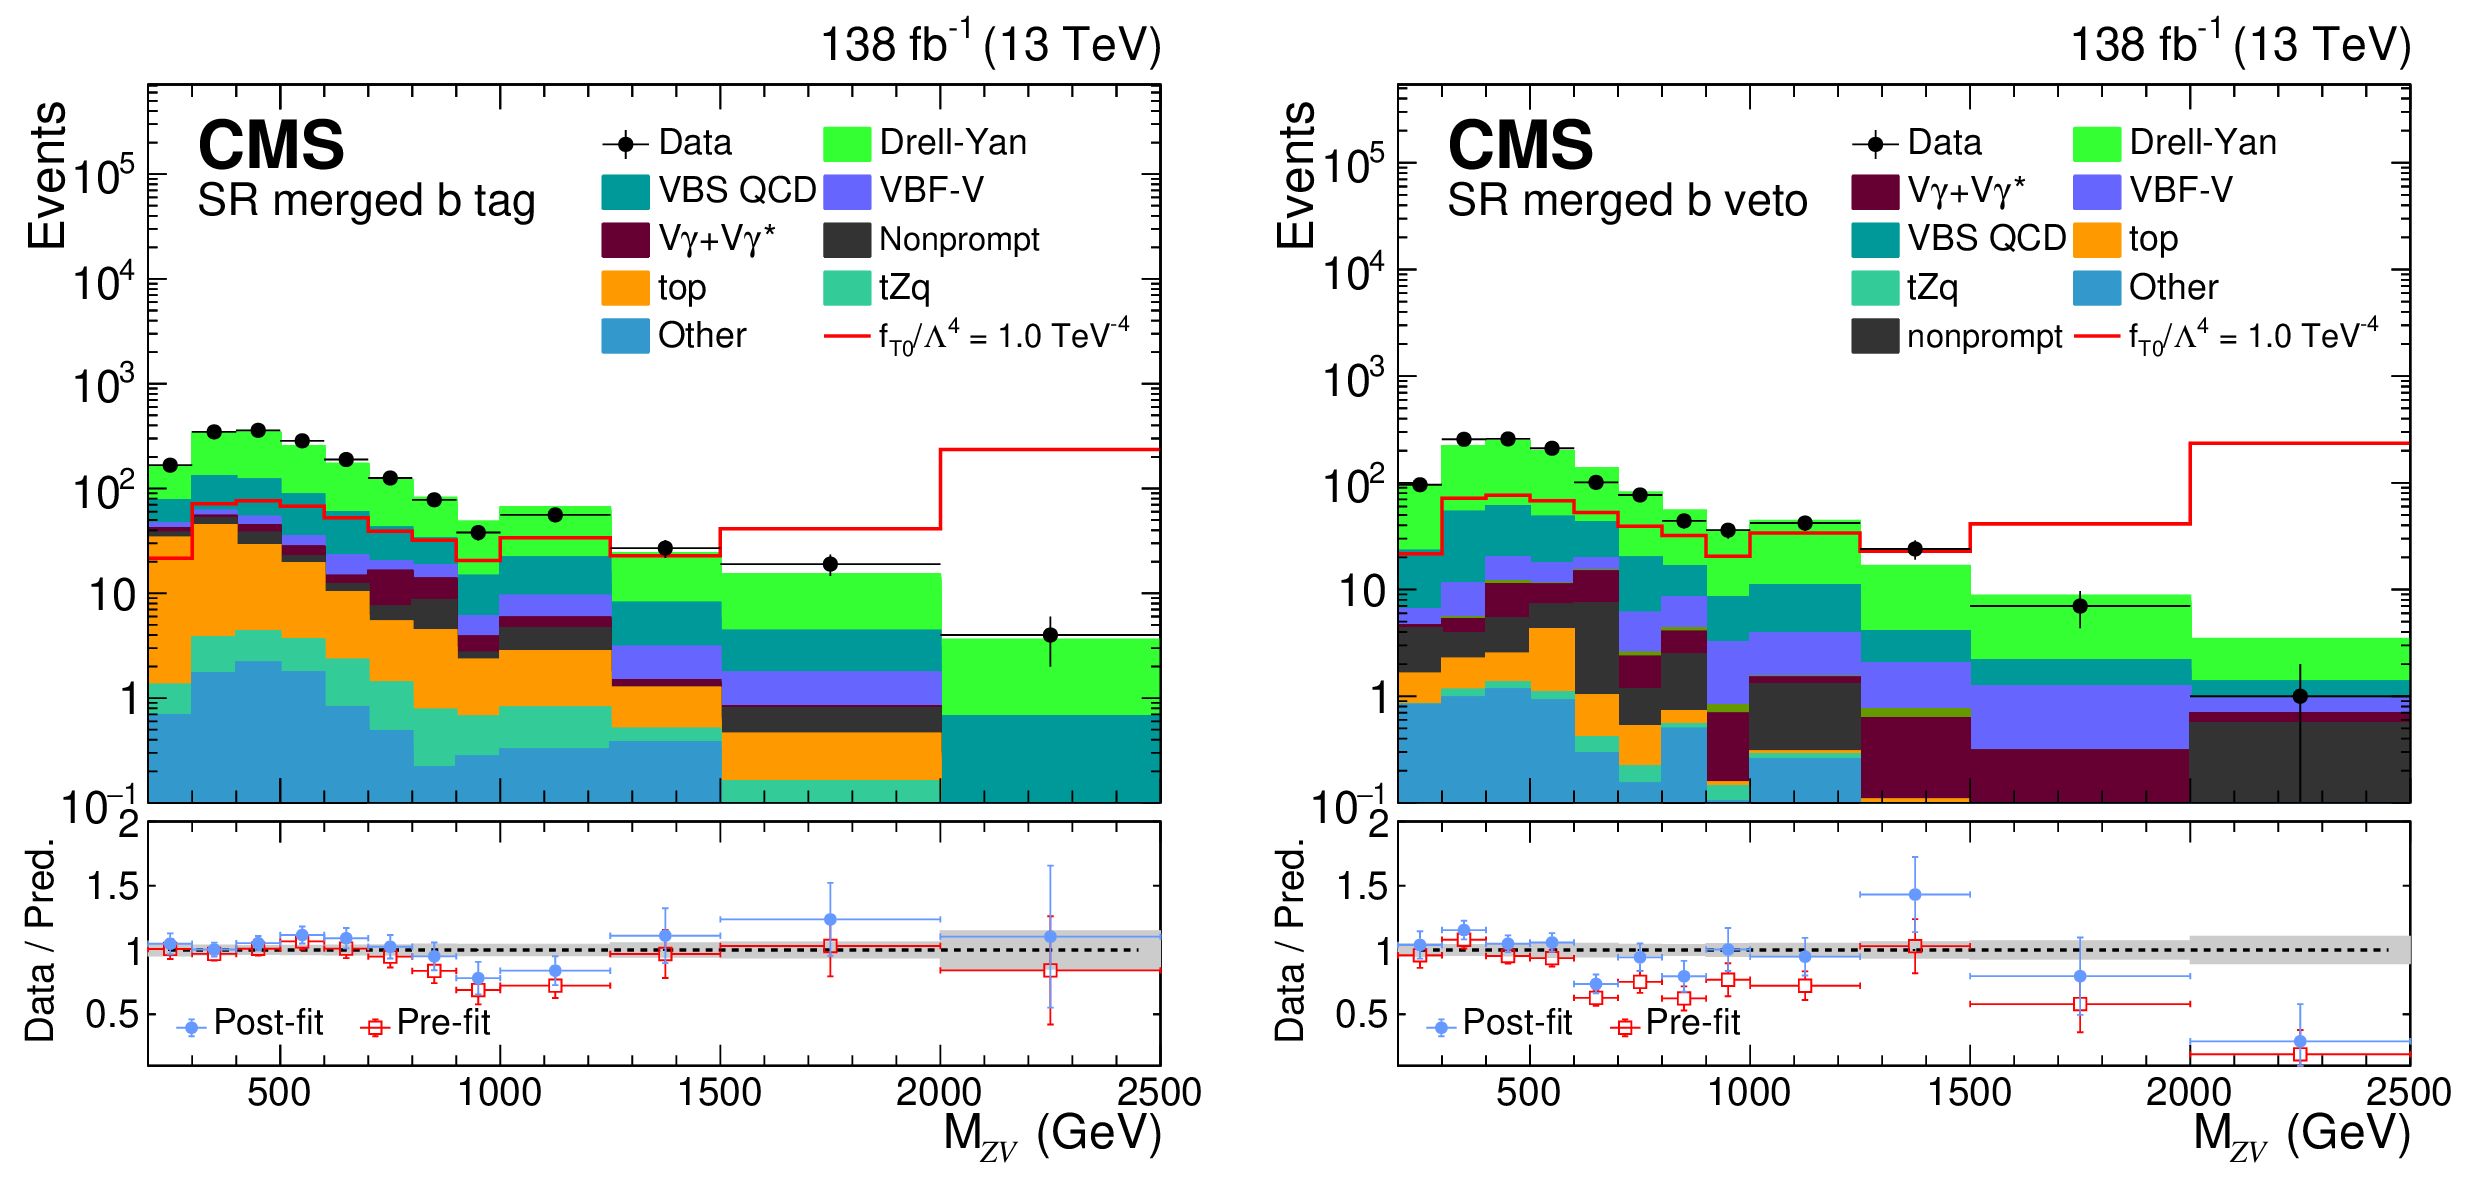
Distributions of $ M_{\mathrm{Z}\mathrm{V}} $ for the data and post-fit backgrounds (stacked histograms), in the SRs of the merged b tag (left) and the merged b veto (right) channels. The template for one signal hypothesis is shown overlaid as a red solid line. The overflow is included in the last bin. The lower panels show the ratios of the data to the pre-fit background prediction and post-fit background yield as red open squares and blue points, respectively. The gray band in the lower panels indicates the systematic component of the post-fit background uncertainty. The vertical bars on the data points represent statistical uncertainties. |
png pdf |
Figure 4-a:
Distributions of $ M_{\mathrm{Z}\mathrm{V}} $ for the data and post-fit backgrounds (stacked histograms), in the SRs of the merged b tag (left) and the merged b veto (right) channels. The template for one signal hypothesis is shown overlaid as a red solid line. The overflow is included in the last bin. The lower panels show the ratios of the data to the pre-fit background prediction and post-fit background yield as red open squares and blue points, respectively. The gray band in the lower panels indicates the systematic component of the post-fit background uncertainty. The vertical bars on the data points represent statistical uncertainties. |
png pdf |
Figure 4-b:
Distributions of $ M_{\mathrm{Z}\mathrm{V}} $ for the data and post-fit backgrounds (stacked histograms), in the SRs of the merged b tag (left) and the merged b veto (right) channels. The template for one signal hypothesis is shown overlaid as a red solid line. The overflow is included in the last bin. The lower panels show the ratios of the data to the pre-fit background prediction and post-fit background yield as red open squares and blue points, respectively. The gray band in the lower panels indicates the systematic component of the post-fit background uncertainty. The vertical bars on the data points represent statistical uncertainties. |
png pdf |
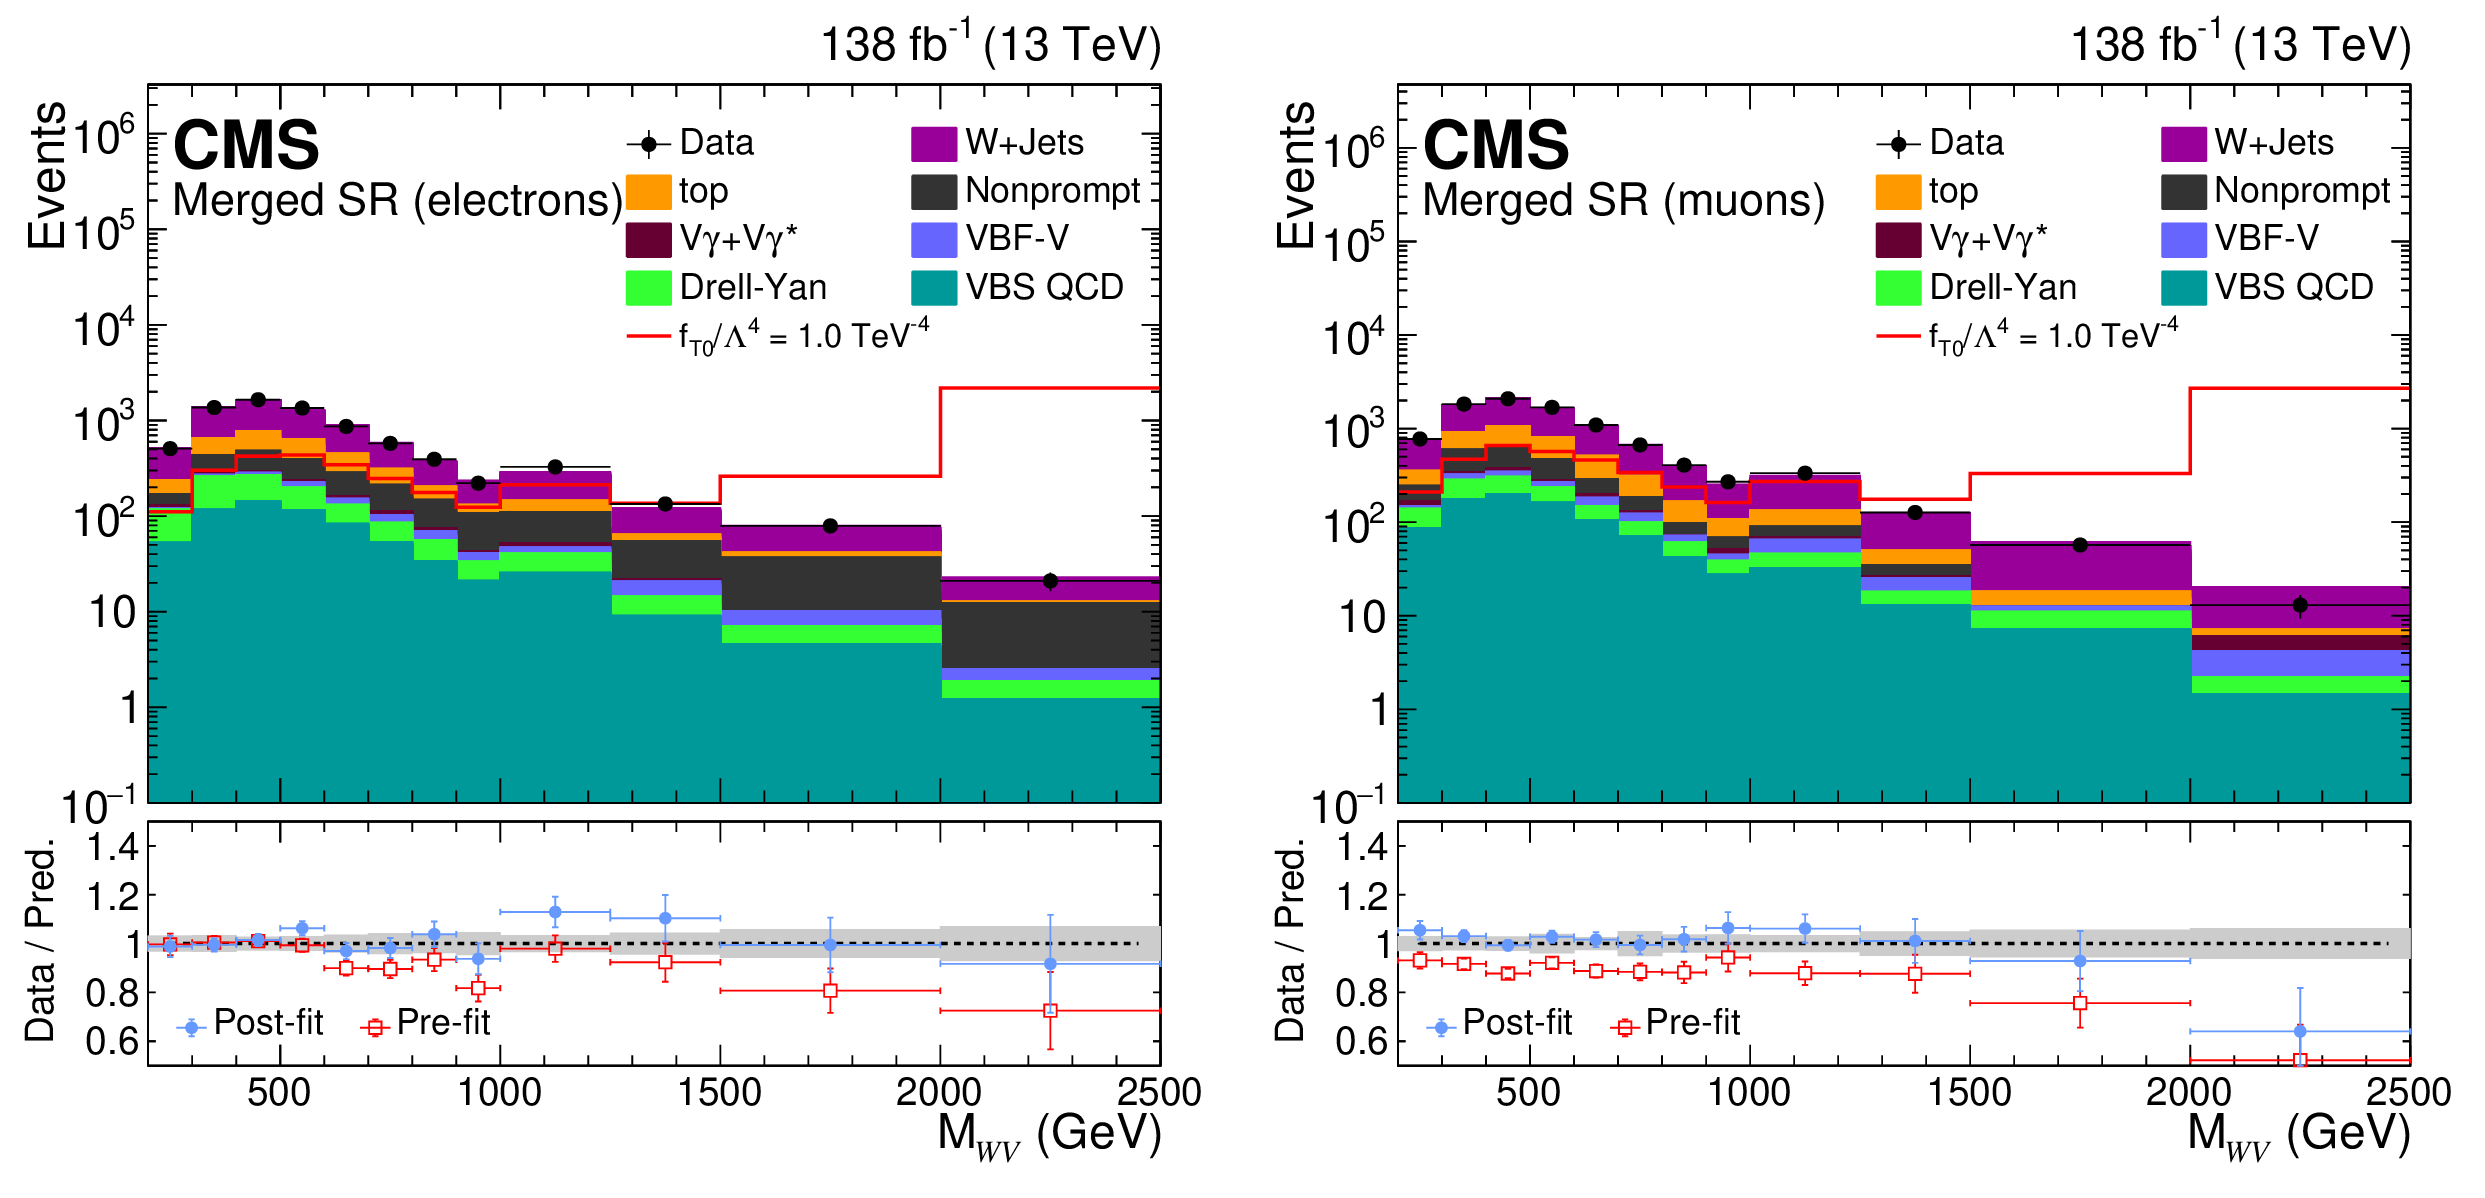
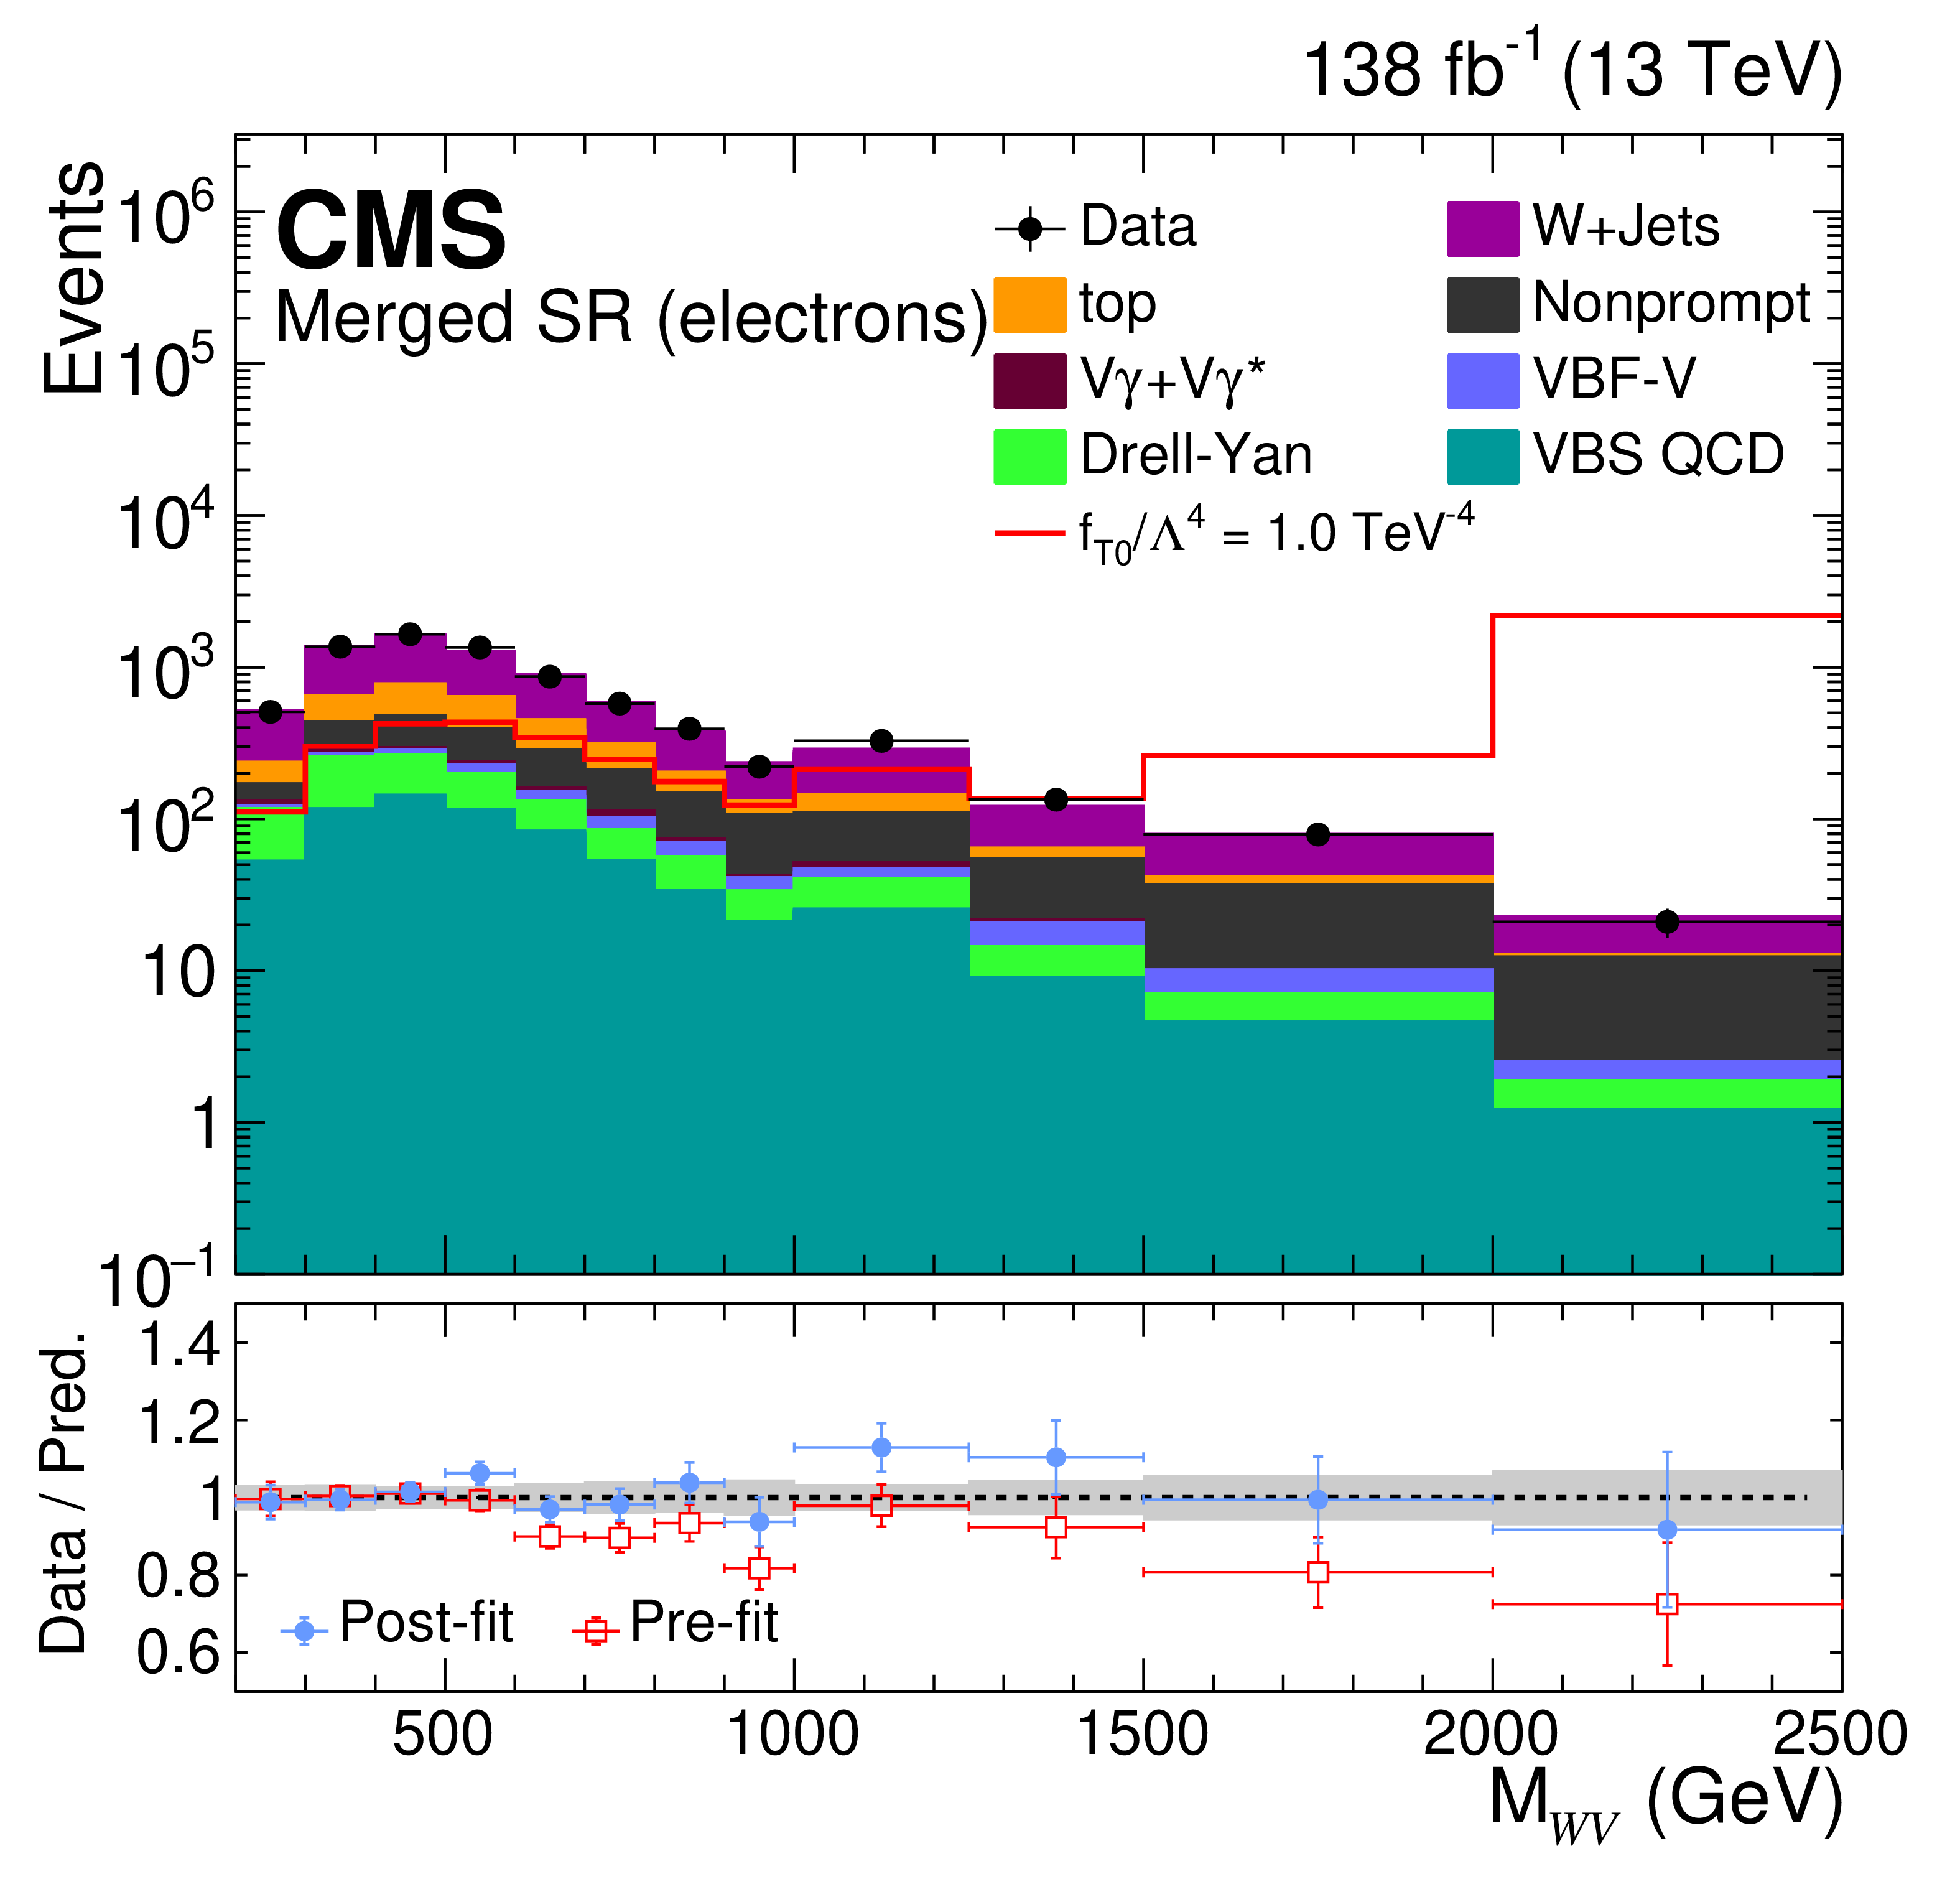
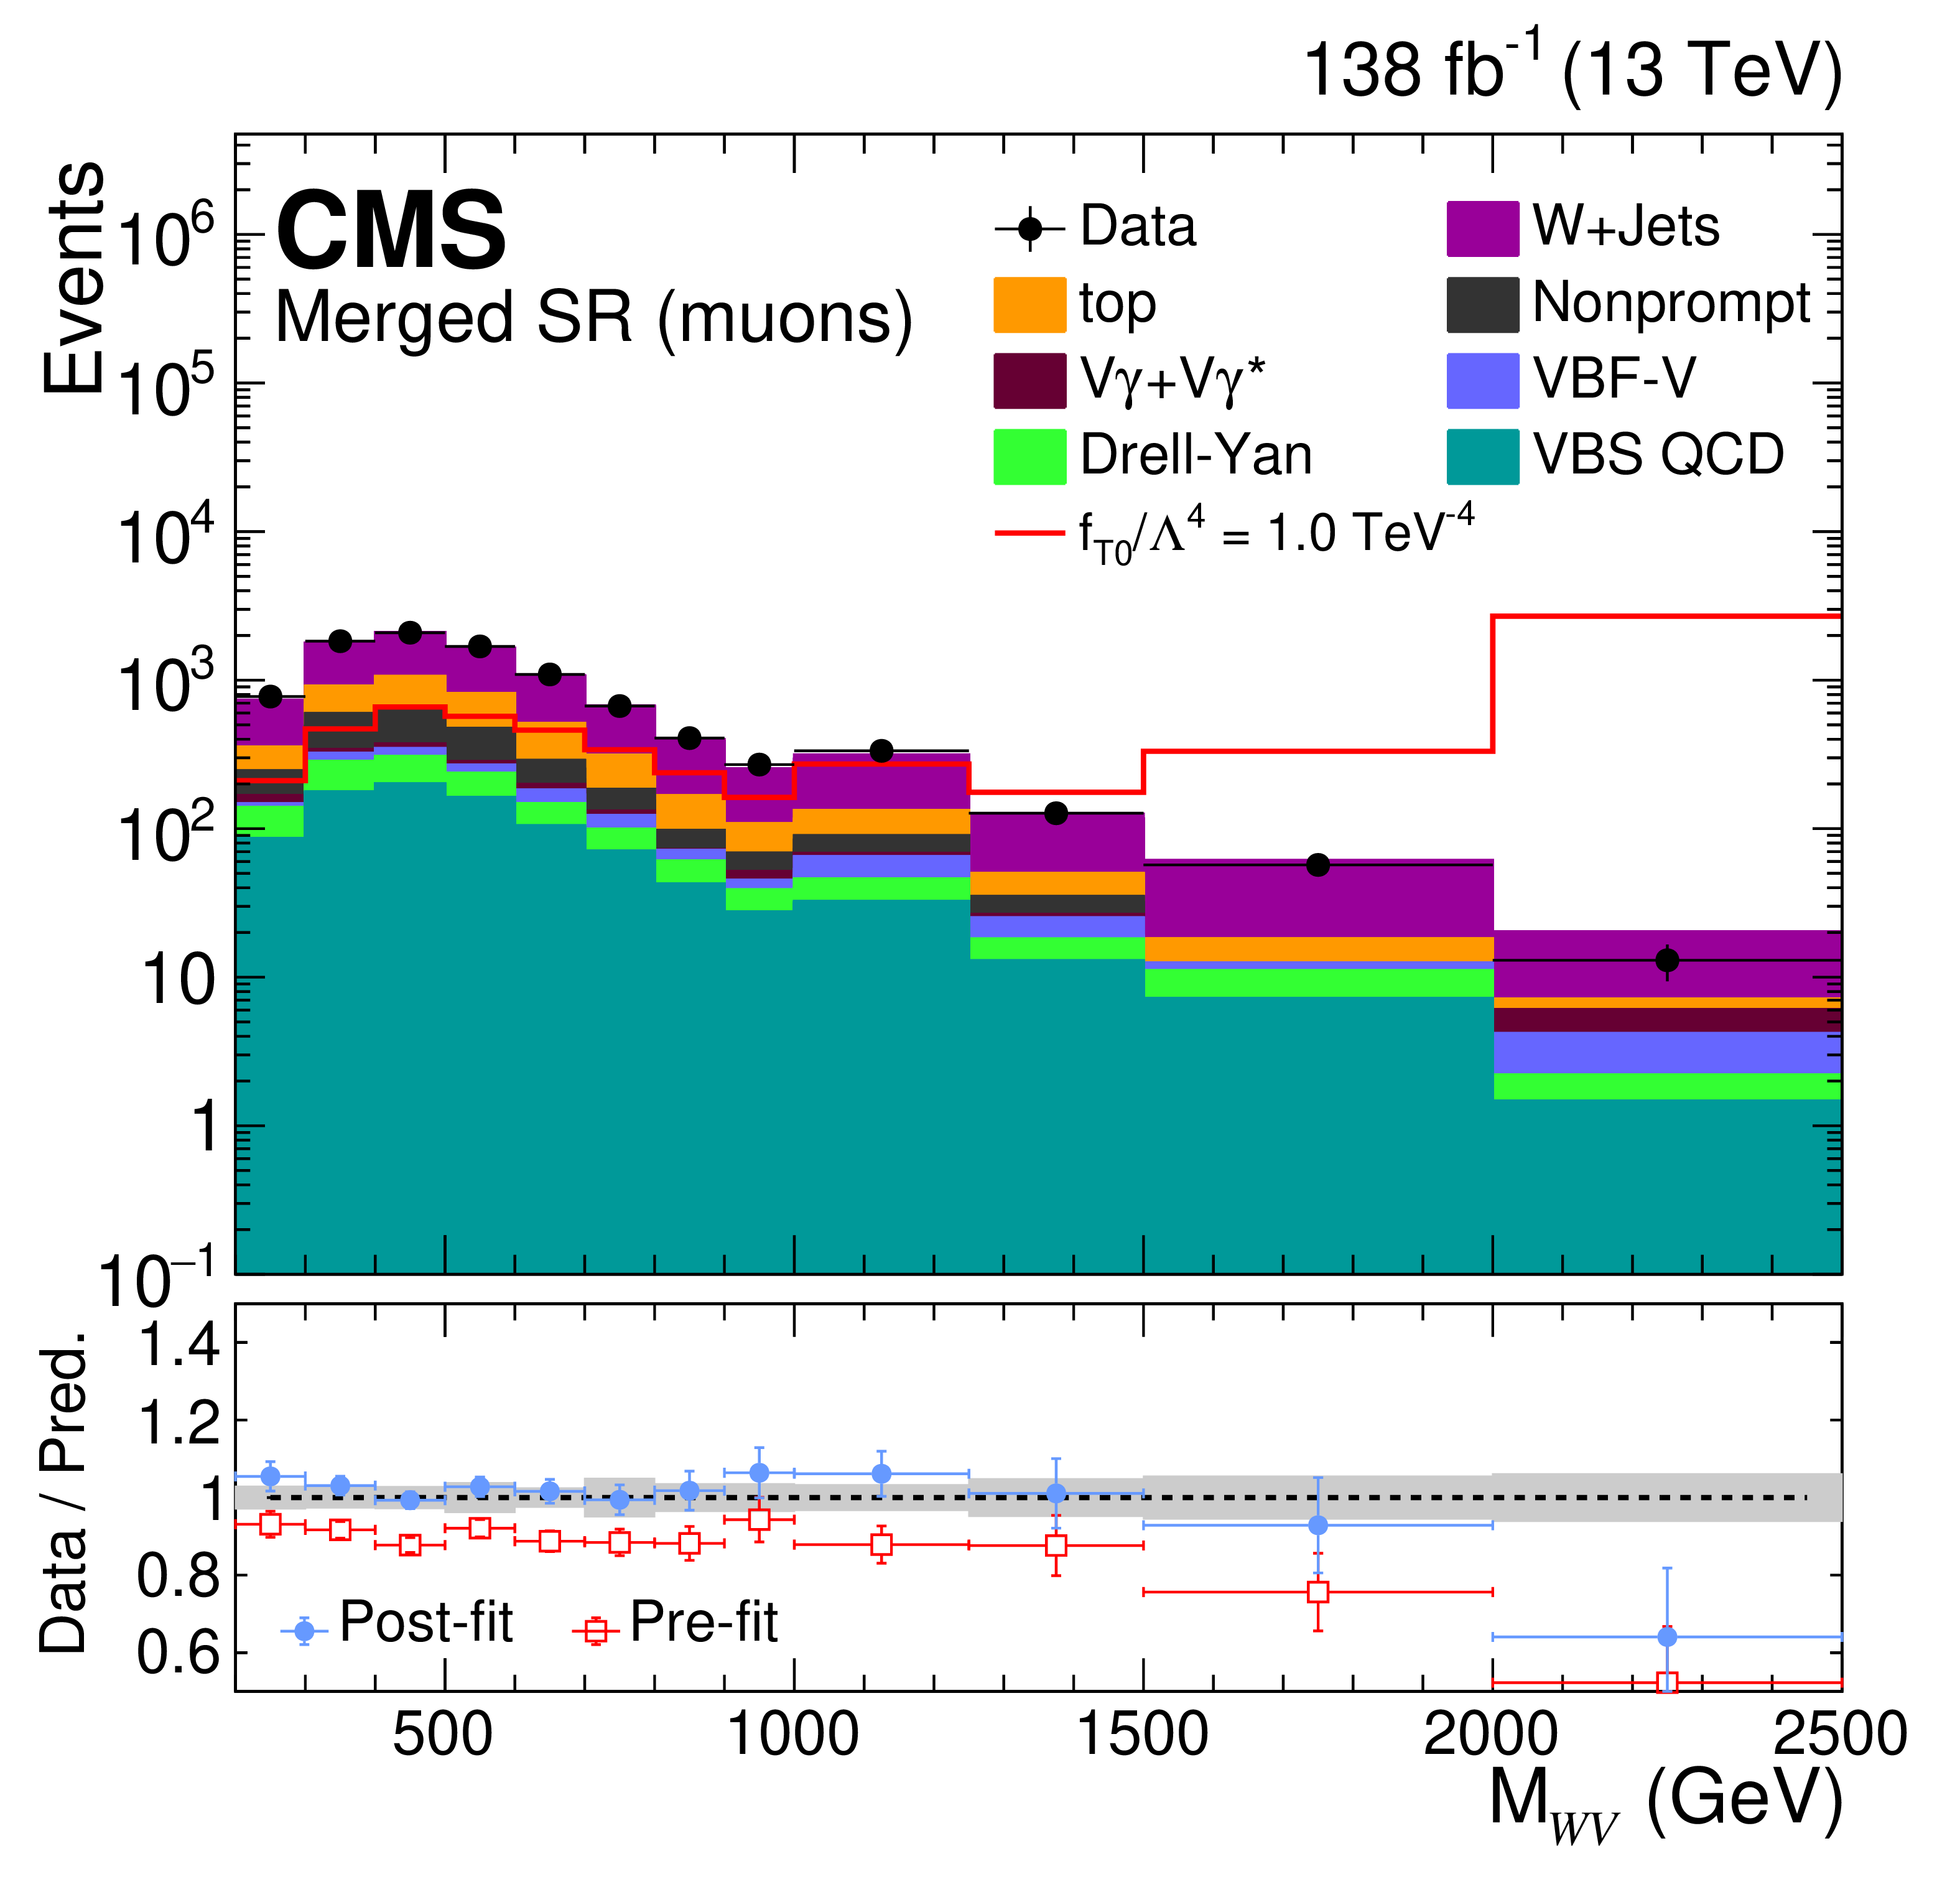
Figure 5:
Distributions of $ M_{\mathrm{W}\mathrm{V}} $ for the data and post-fit backgrounds (stacked histograms), in the SRs of the electron (left) and muon (right) channels in the merged regime. The template for one signal hypothesis is shown overlaid as a red solid line. The overflow is included in the last bin. The lower panels show the ratios of the data to the pre-fit background prediction and post-fit background yield as red open squares and blue points, respectively. The gray band in the lower panels indicates the systematic component of the post-fit background uncertainty. The vertical bars on the data points represent statistical uncertainties. |
png pdf |
Figure 5-a:
Distributions of $ M_{\mathrm{W}\mathrm{V}} $ for the data and post-fit backgrounds (stacked histograms), in the SRs of the electron (left) and muon (right) channels in the merged regime. The template for one signal hypothesis is shown overlaid as a red solid line. The overflow is included in the last bin. The lower panels show the ratios of the data to the pre-fit background prediction and post-fit background yield as red open squares and blue points, respectively. The gray band in the lower panels indicates the systematic component of the post-fit background uncertainty. The vertical bars on the data points represent statistical uncertainties. |
png pdf |
Figure 5-b:
Distributions of $ M_{\mathrm{W}\mathrm{V}} $ for the data and post-fit backgrounds (stacked histograms), in the SRs of the electron (left) and muon (right) channels in the merged regime. The template for one signal hypothesis is shown overlaid as a red solid line. The overflow is included in the last bin. The lower panels show the ratios of the data to the pre-fit background prediction and post-fit background yield as red open squares and blue points, respectively. The gray band in the lower panels indicates the systematic component of the post-fit background uncertainty. The vertical bars on the data points represent statistical uncertainties. |
png pdf |
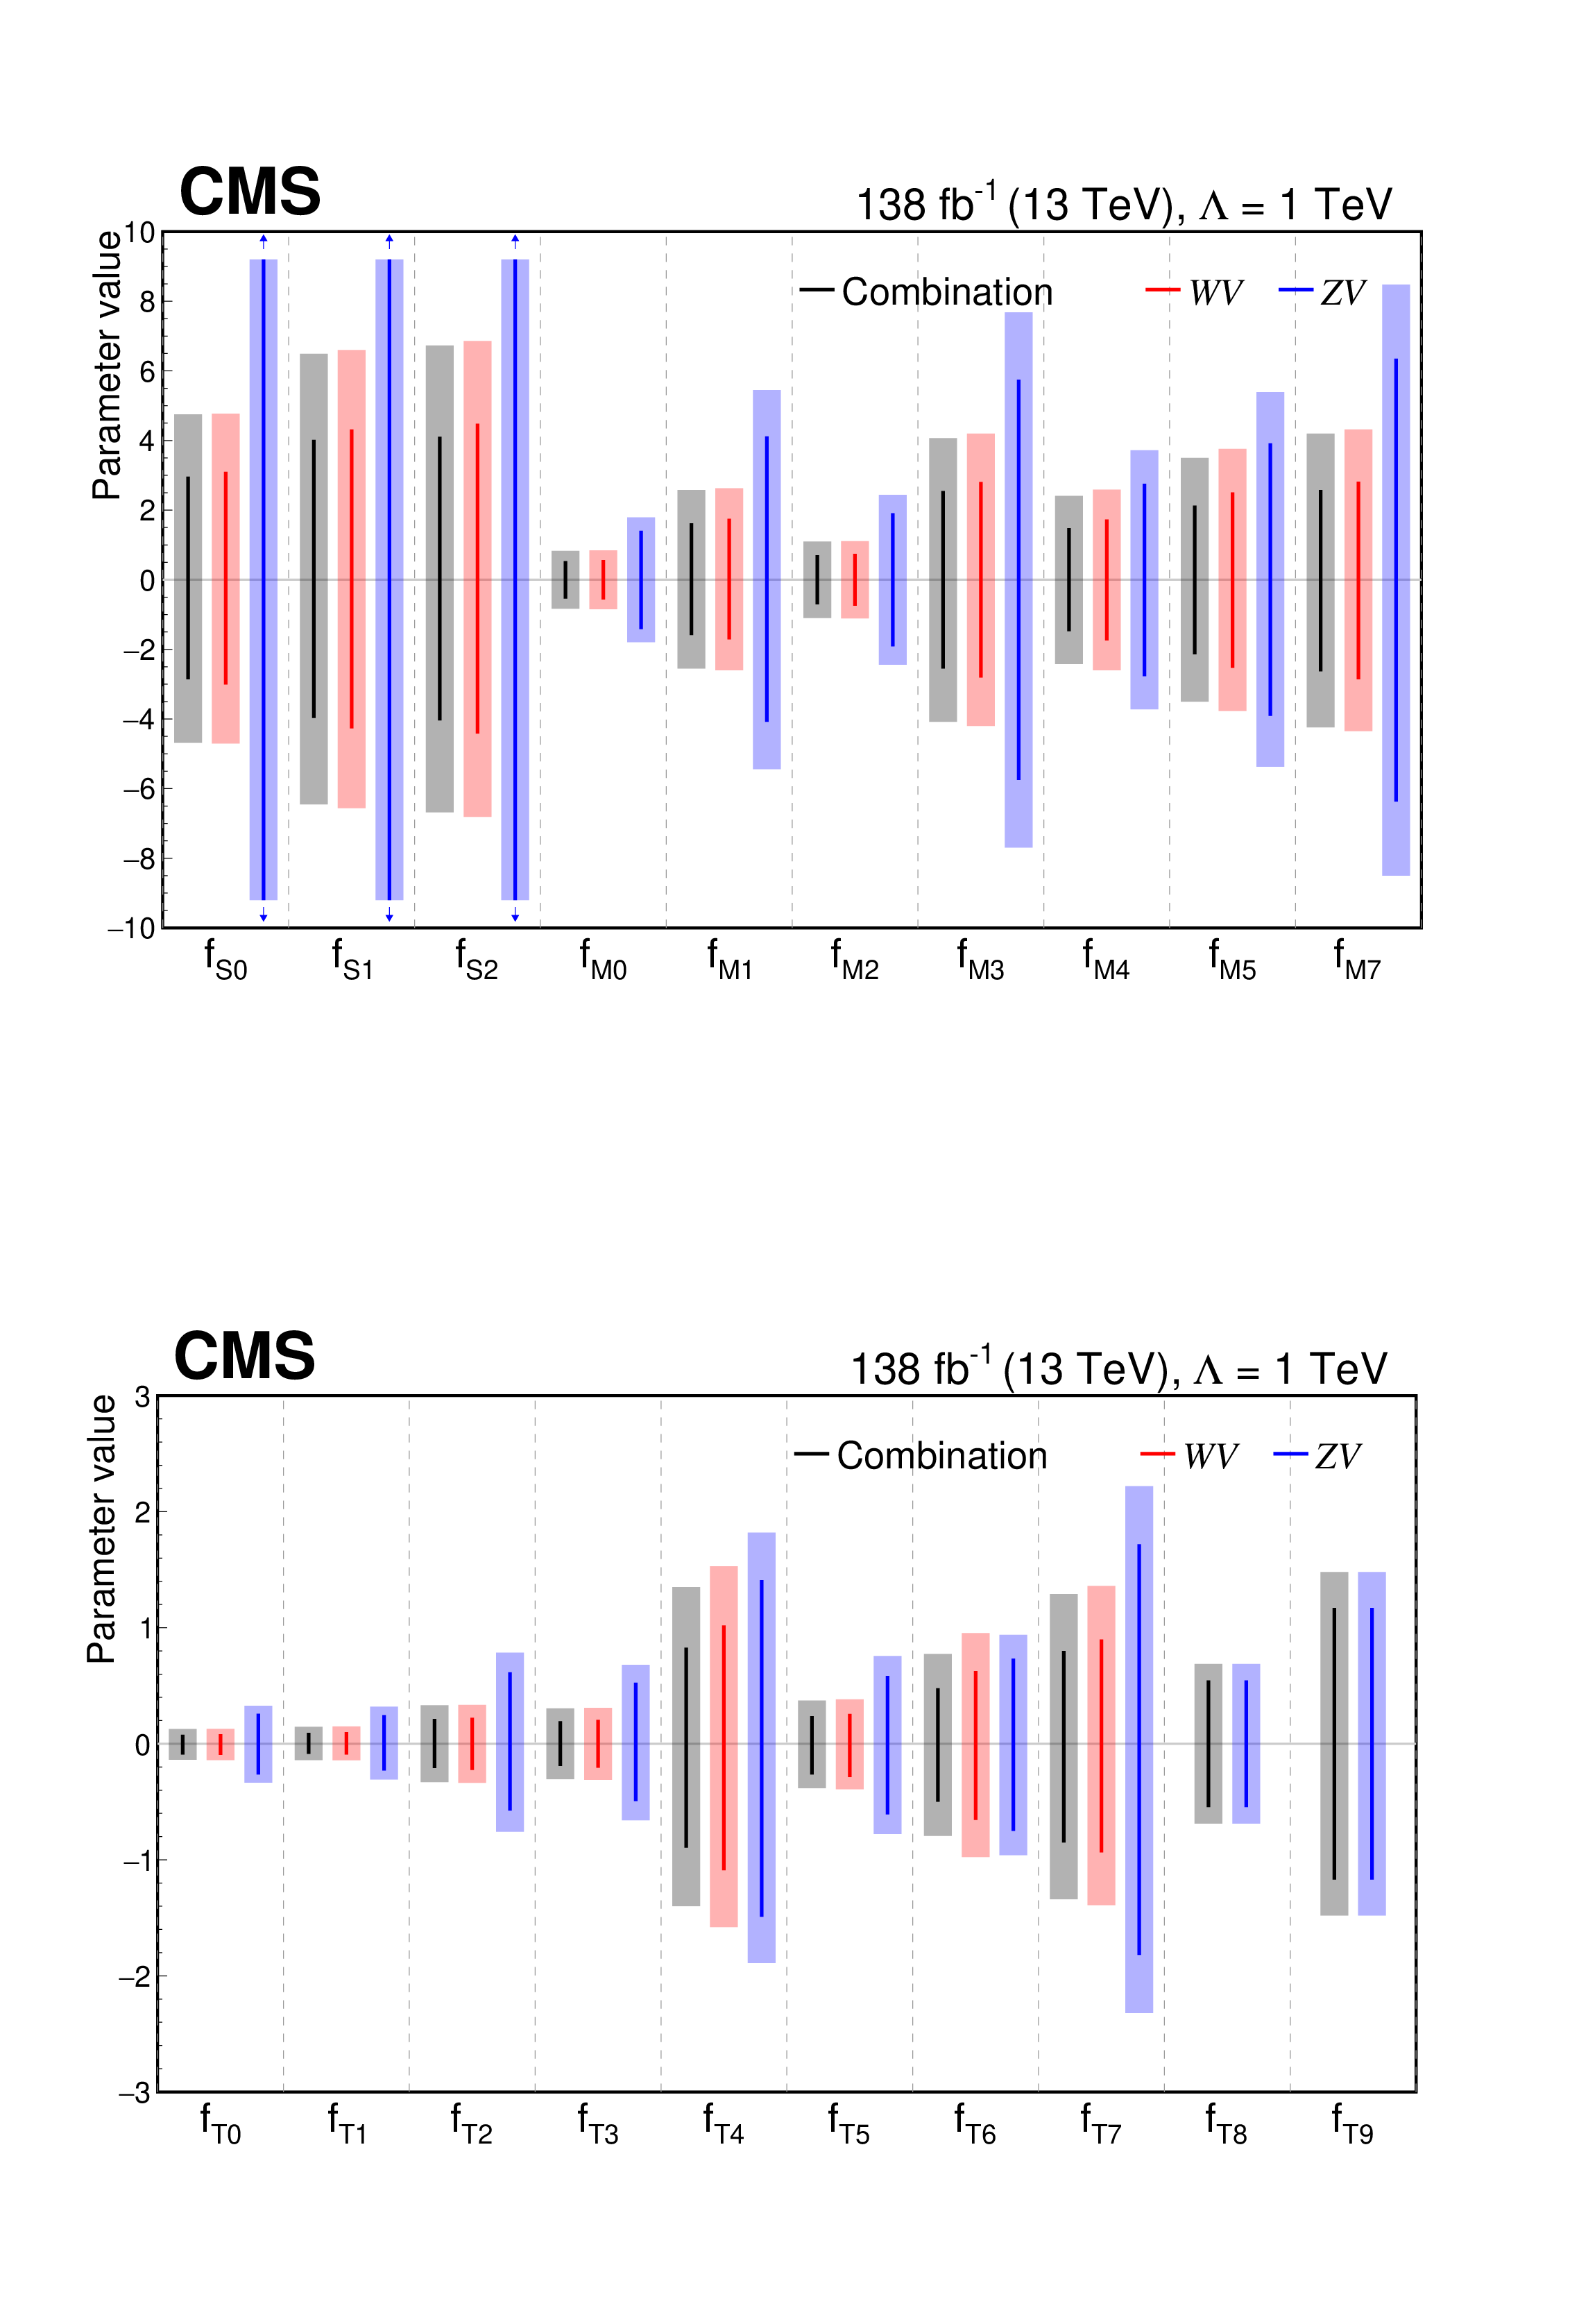
Figure 6:
Constraints on dimension-8 Wilson coefficients derived from the WV, ZV, and their combined results. The shaded areas represent the expected 95% CL intervals, whereas the solid lines indicate the observed 95% CL limits. The top panel shows constraints on scalar and mixed operators, whereas the bottom panel shows transverse operators. |
png pdf |
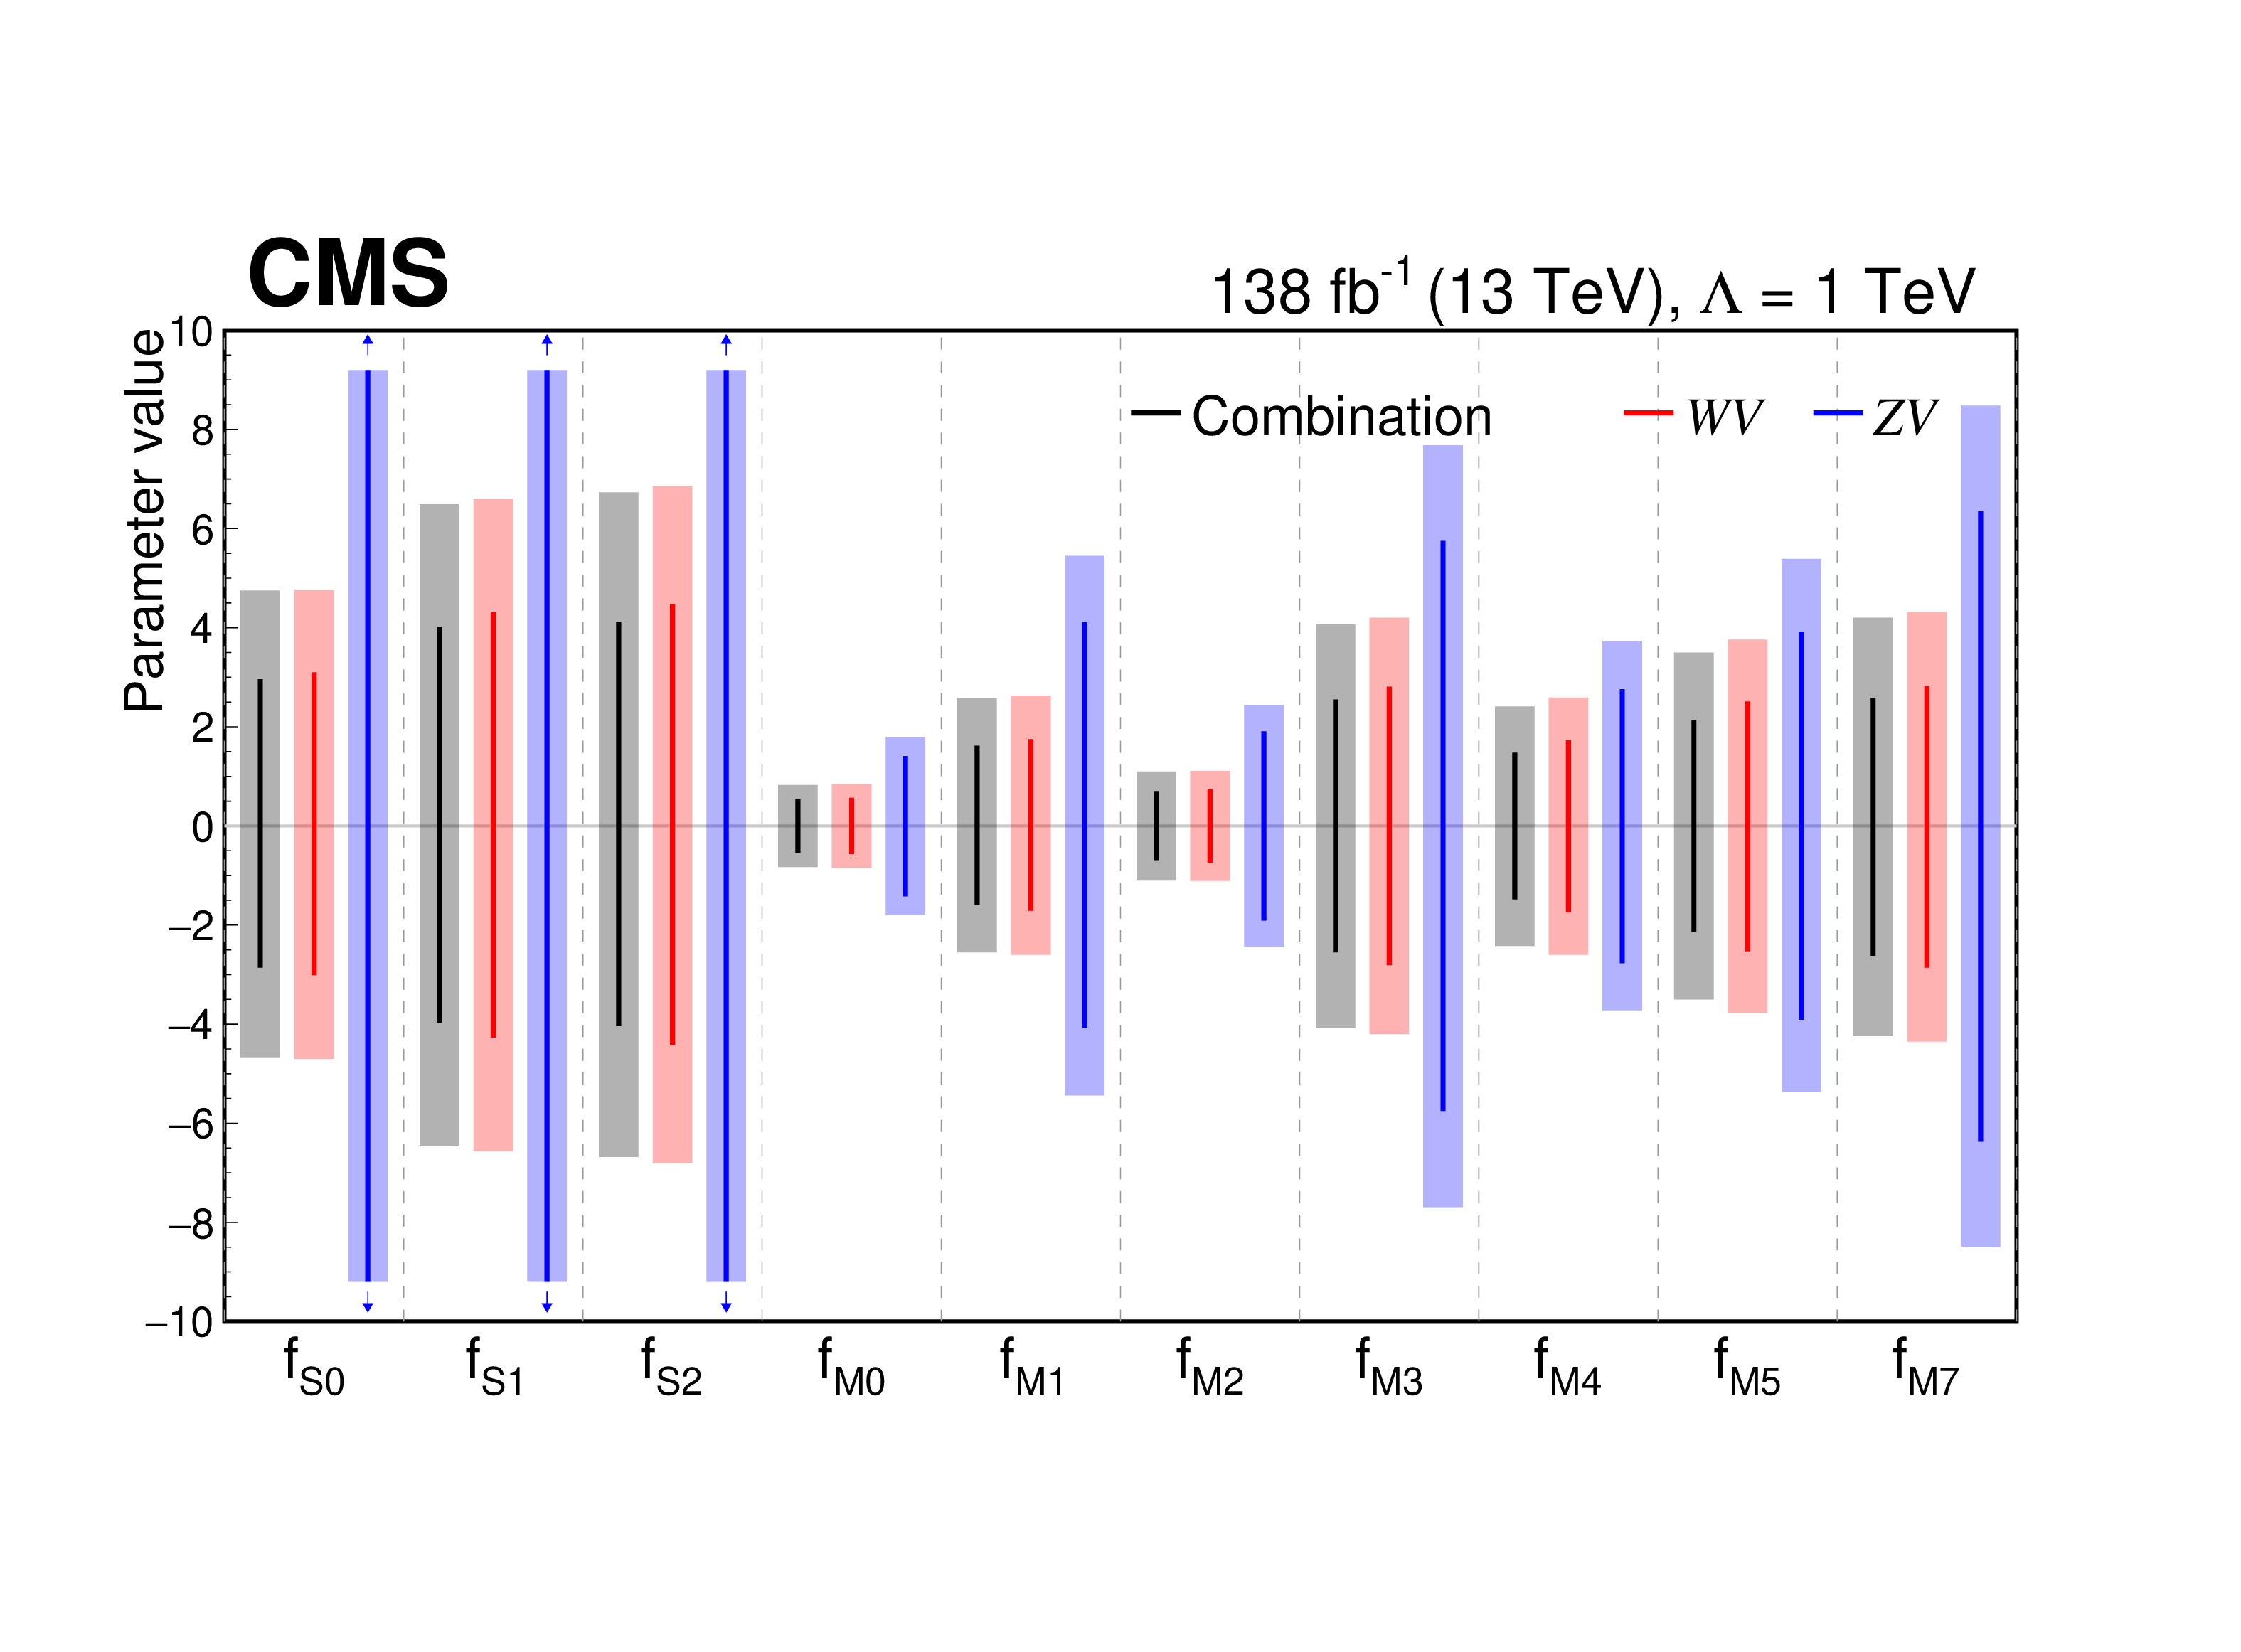
Figure 6-a:
Constraints on dimension-8 Wilson coefficients derived from the WV, ZV, and their combined results. The shaded areas represent the expected 95% CL intervals, whereas the solid lines indicate the observed 95% CL limits. The top panel shows constraints on scalar and mixed operators, whereas the bottom panel shows transverse operators. |
png pdf |
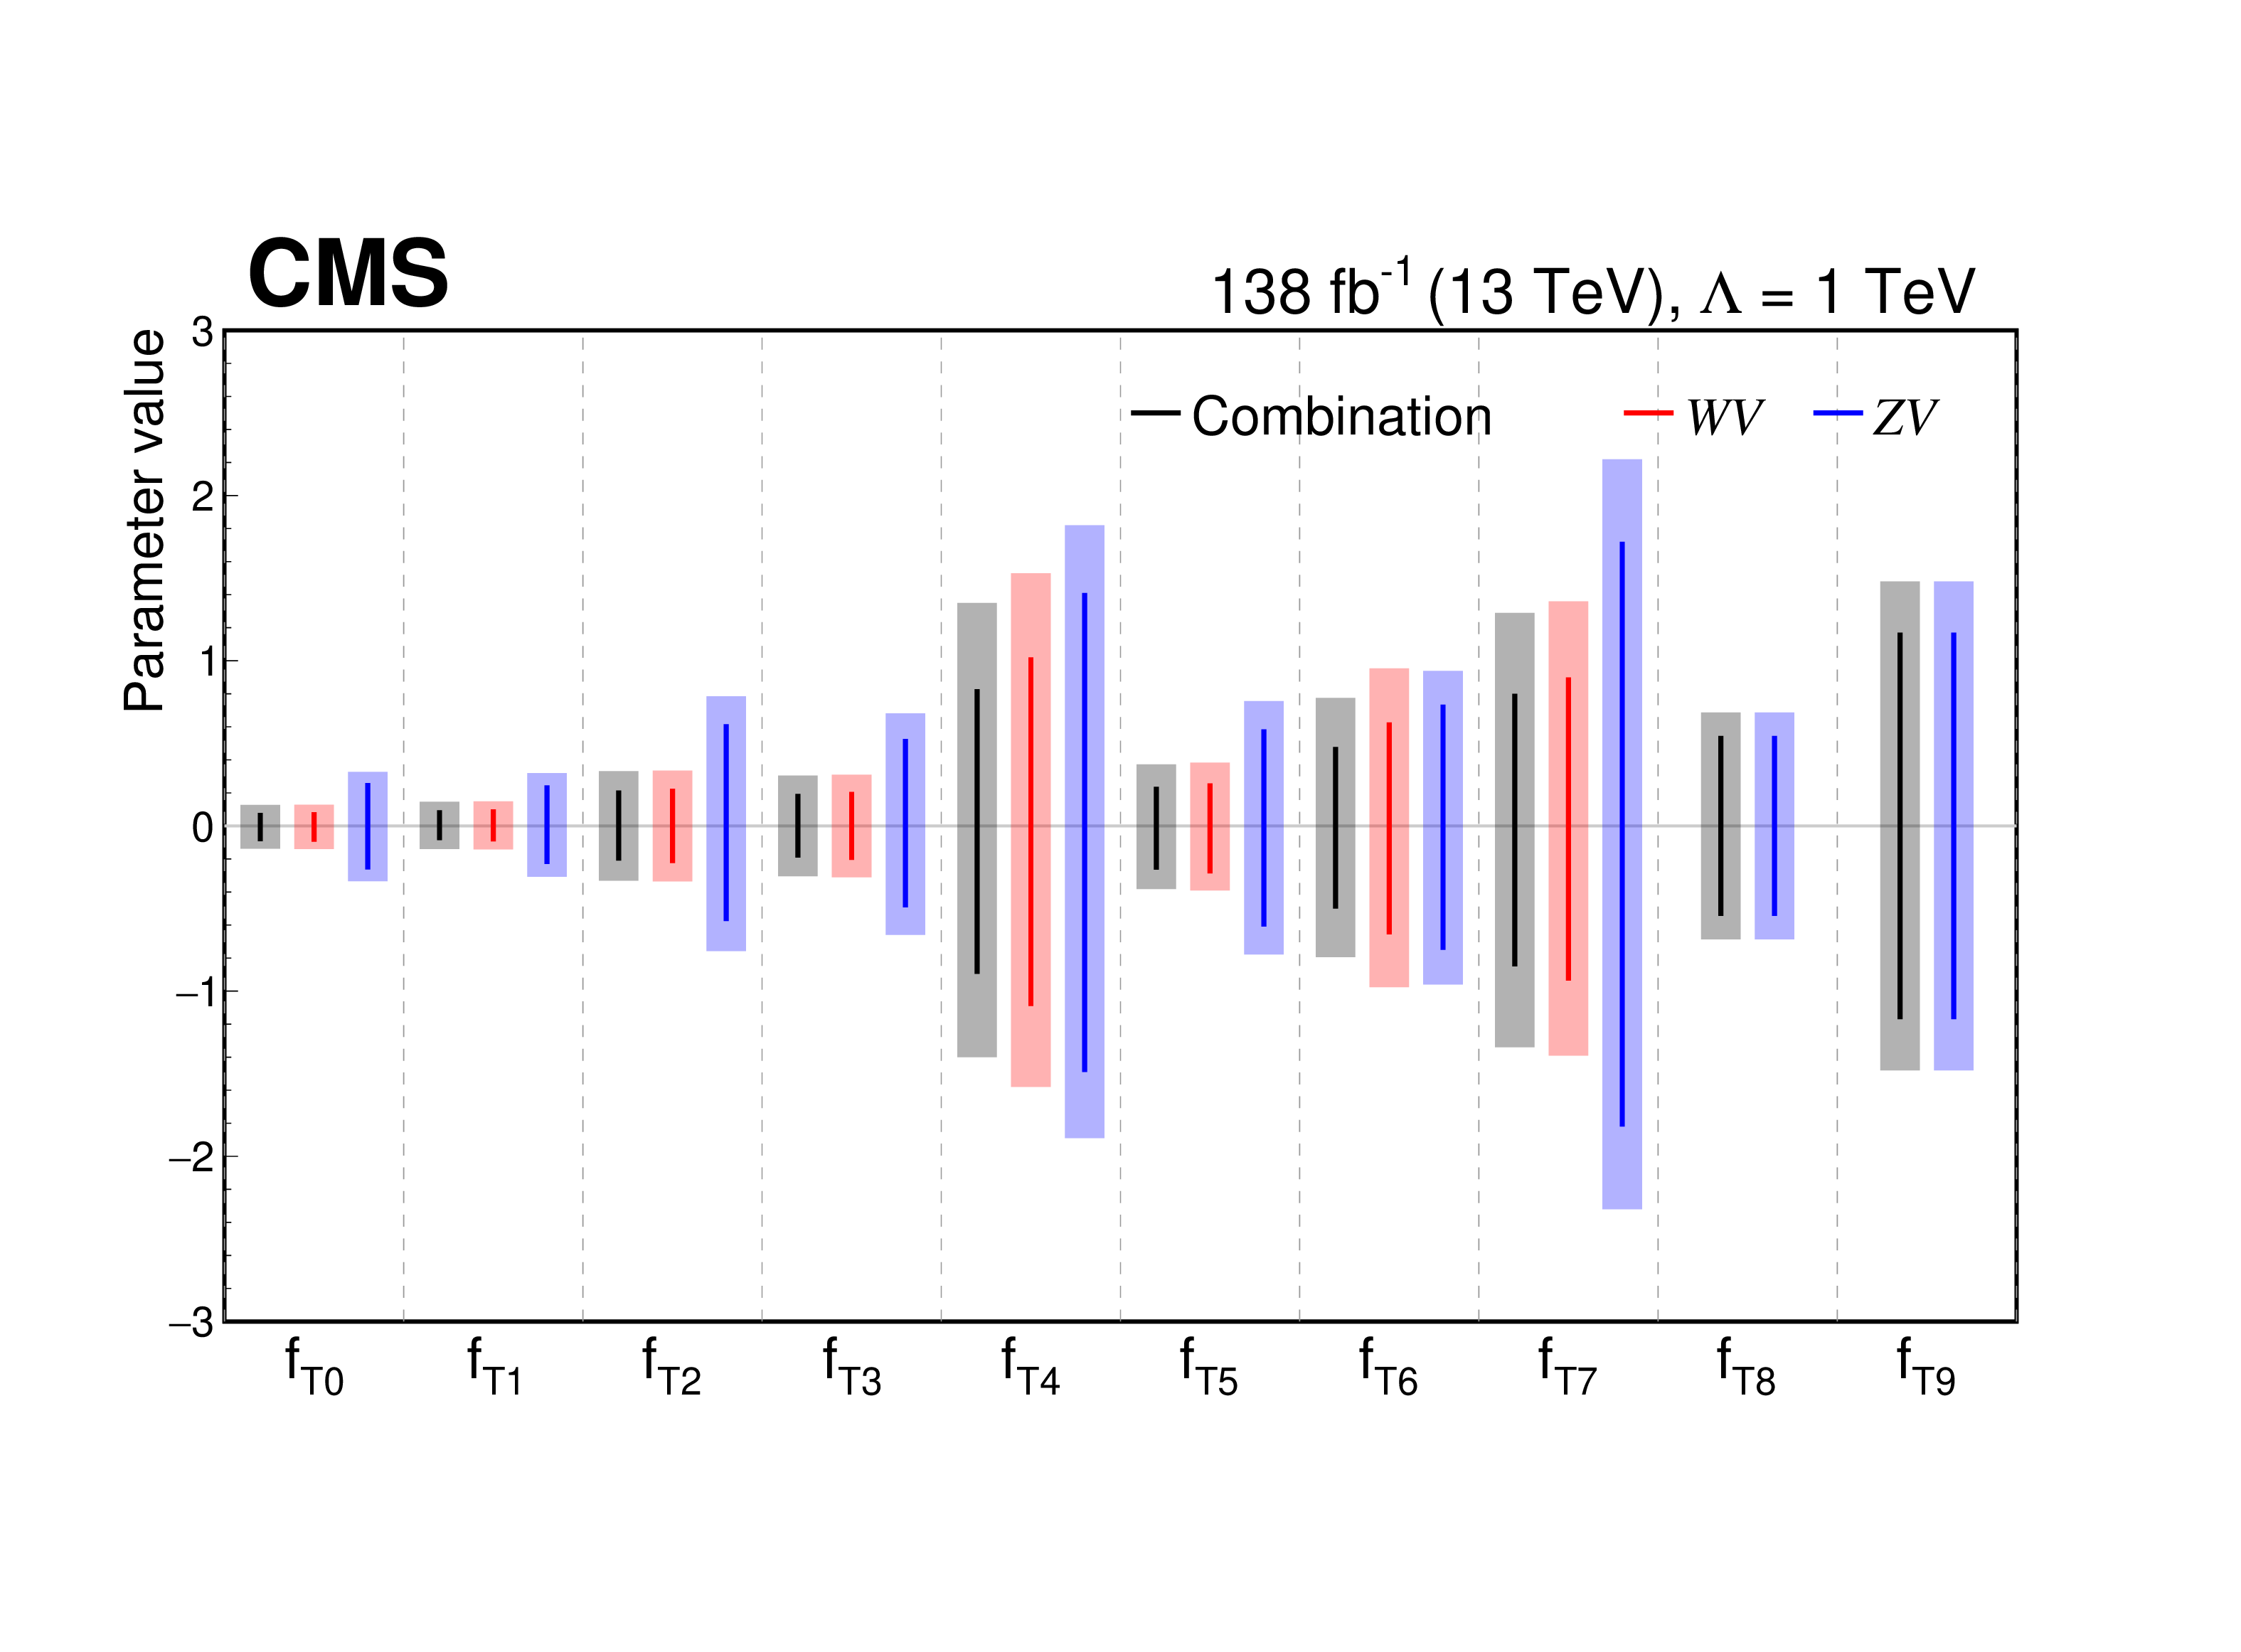
Figure 6-b:
Constraints on dimension-8 Wilson coefficients derived from the WV, ZV, and their combined results. The shaded areas represent the expected 95% CL intervals, whereas the solid lines indicate the observed 95% CL limits. The top panel shows constraints on scalar and mixed operators, whereas the bottom panel shows transverse operators. |
| Tables | |
png pdf |
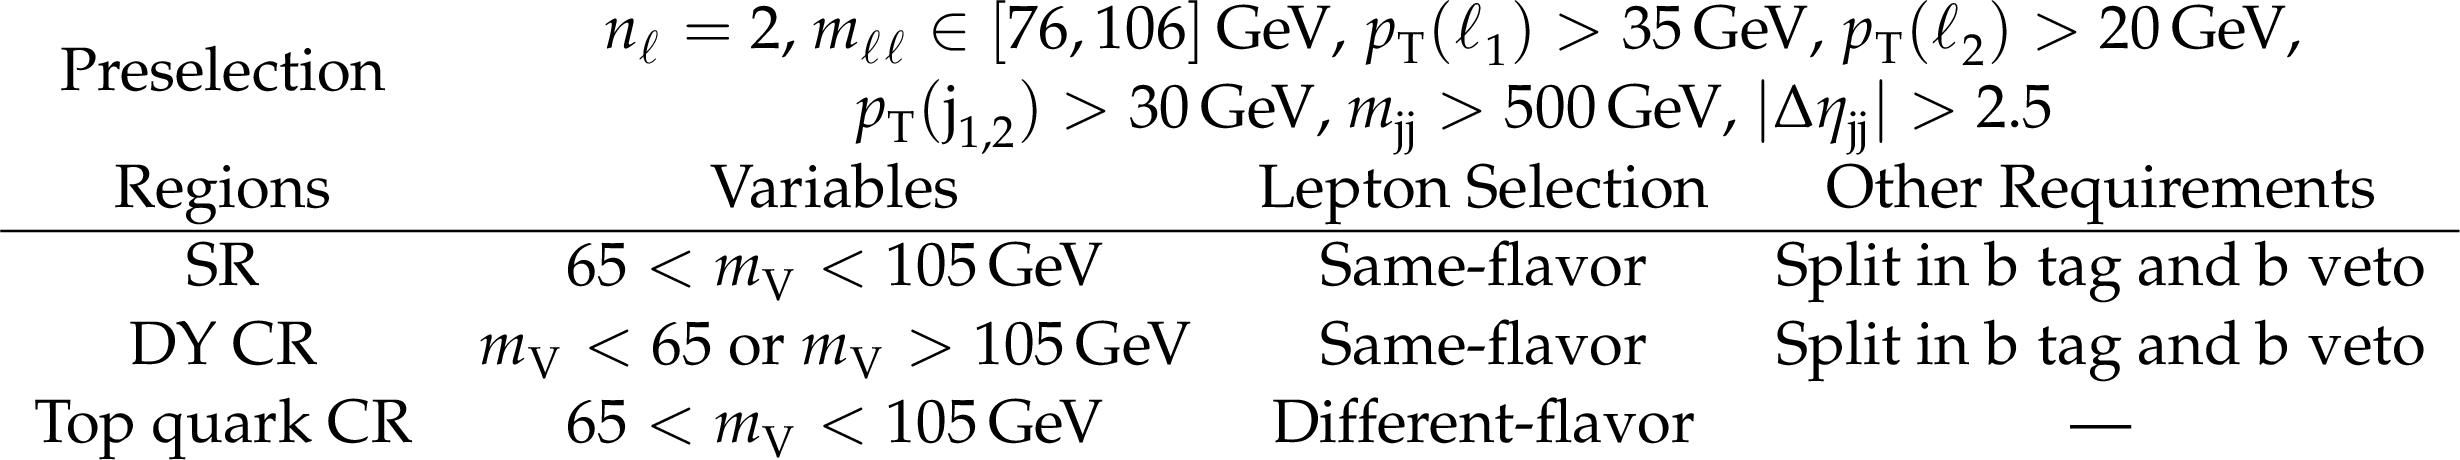
Table 1:
Definitions of the SRs and the CRs for the VBS ZV analysis for both resolved and merged categories. Lepton candidates are required to be of opposite charge. |
png pdf |
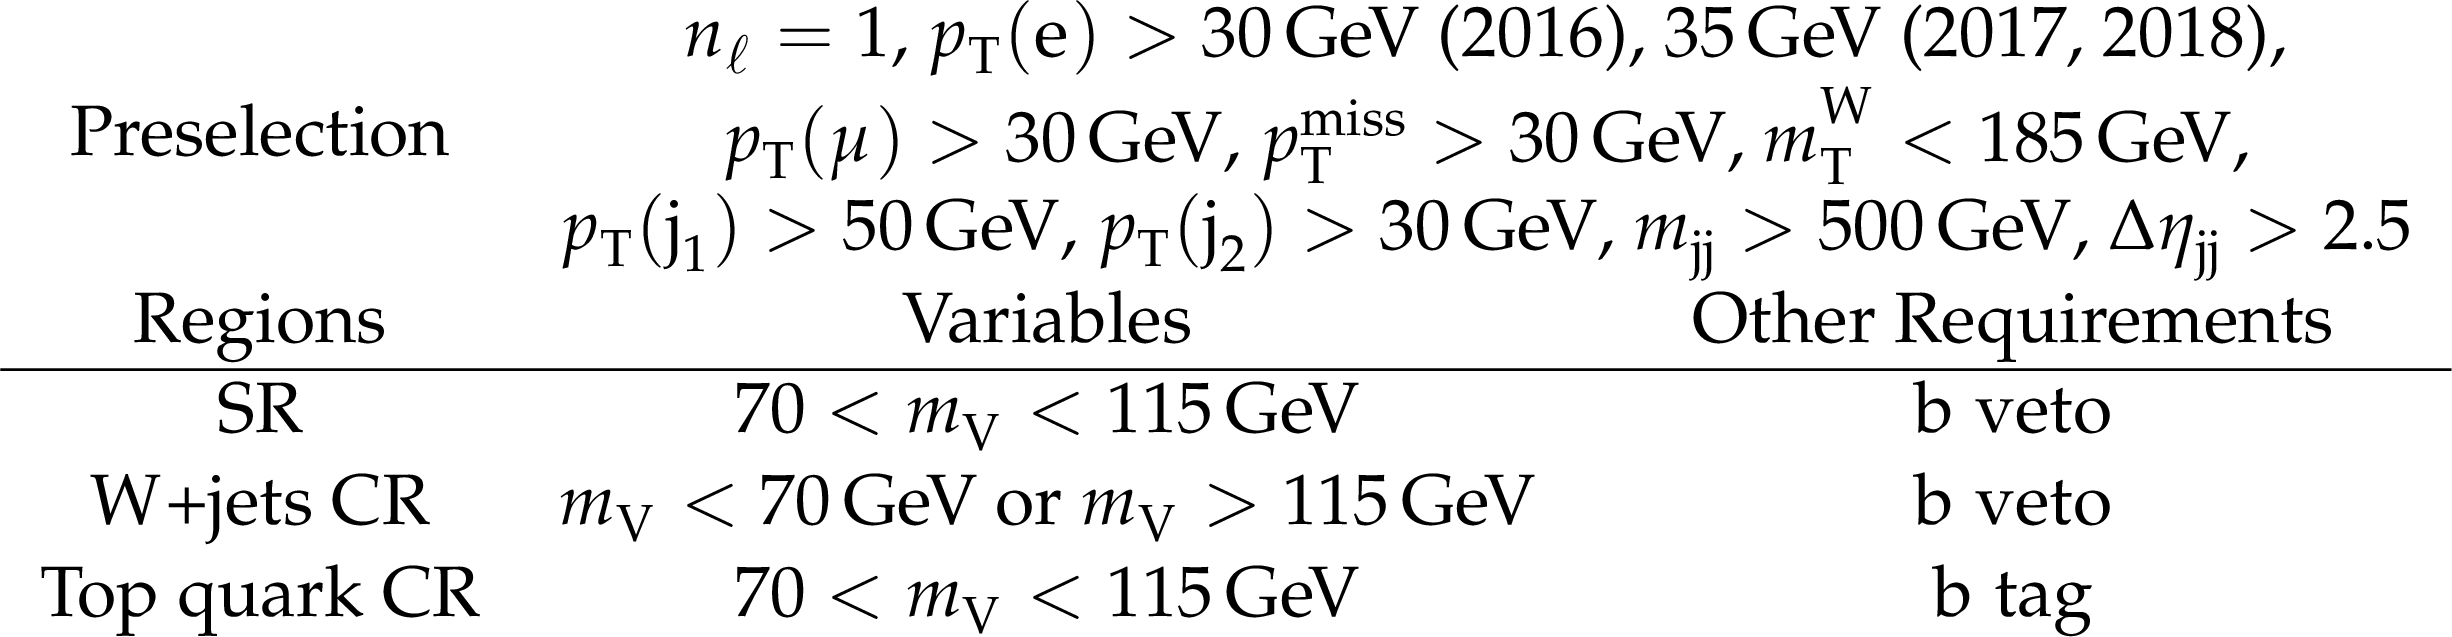
Table 2:
Definitions of the SRs and the CRs for the VBS WV analysis for the merged categories. The transverse mass of the leptonically decaying W, defined as $ m_{\mathrm{T}}^{\mathrm{W}}= \sqrt{\smash[b]{2 p_{\mathrm{T}}(\ell) p_{\mathrm{T}}^\text{miss}[1-\cos (\Delta \varphi[\vec{\ell}, {\vec p}_{\mathrm{T}}^{\,\text{miss}}])]}} $, where $ p_{\mathrm{T}}(\ell) $ is the $ p_{\mathrm{T}} $ of the lepton and $ \Delta \varphi(\vec{\ell}, {\vec p}_{\mathrm{T}}^{\,\text{miss}}) $ is the azimuthal distance between the lepton and the $ {\vec p}_{\mathrm{T}}^{\,\text{miss}} $. |
png pdf |
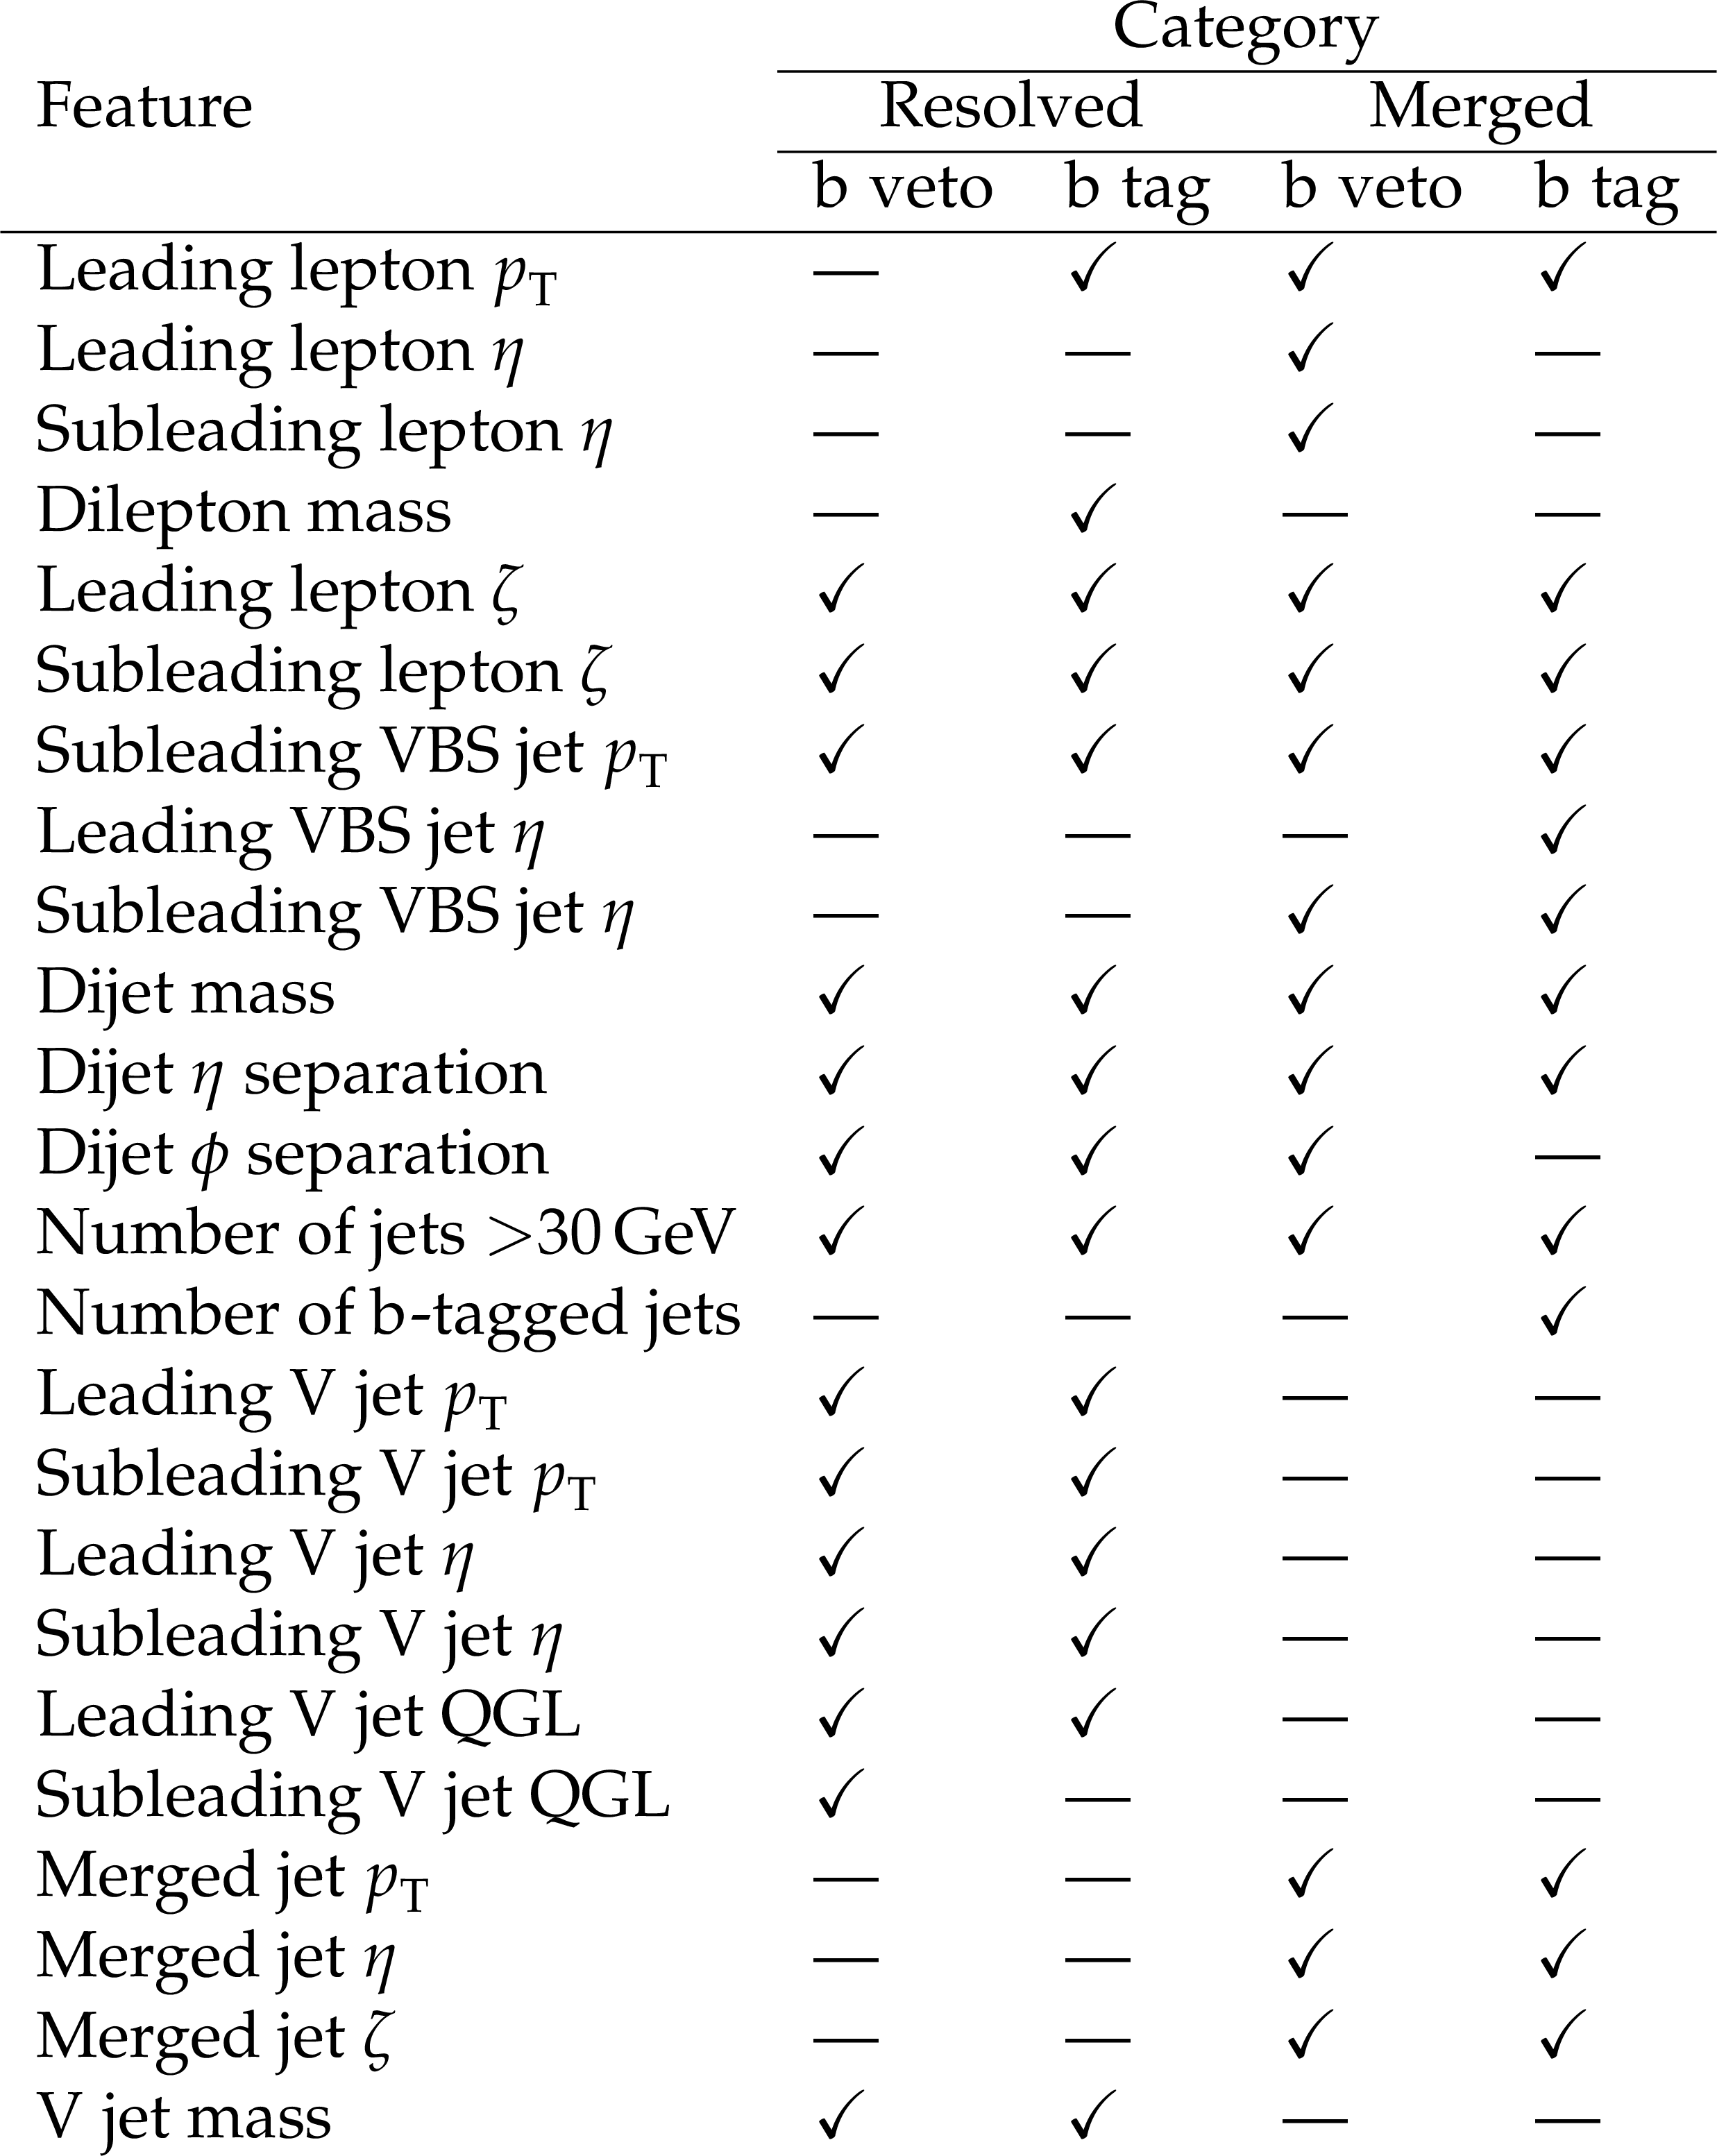
Table 3:
Variables used as input to the DNN for the resolved and merged models in the two b-tagged categories. The check mark indicates that the variable is included in the DNN model identified in the column header. |
png pdf |
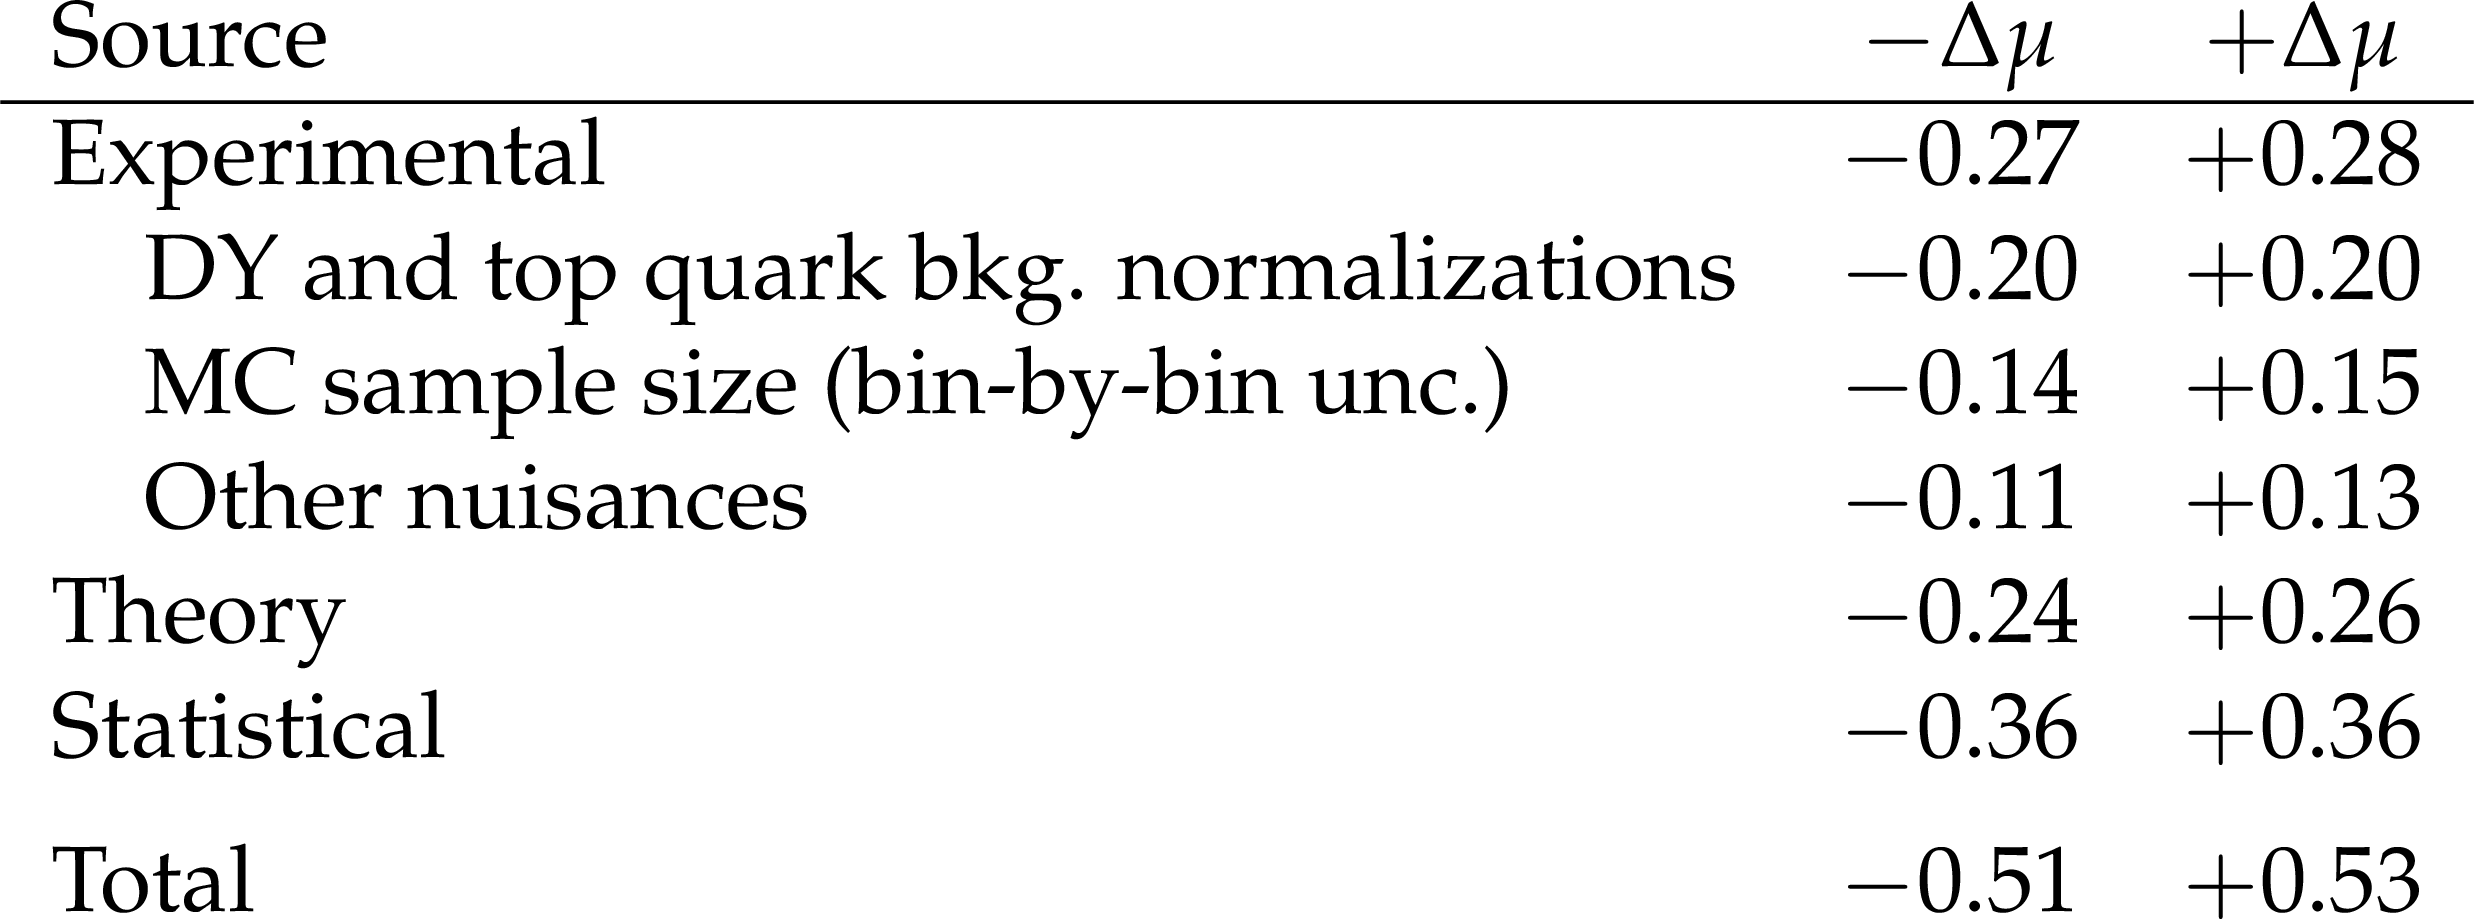
Table 4:
The impact of each systematic uncertainty, together with the impact of the collected data statistical uncertainty, on the signal strength $ \mu $, as extracted from the fit to measure the EW ZV VBS signal with the DNN output distributions. Upper and lower uncertainties are given for the various sources. The theory uncertainty includes contributions from both the signal and backgrounds. |
png pdf |
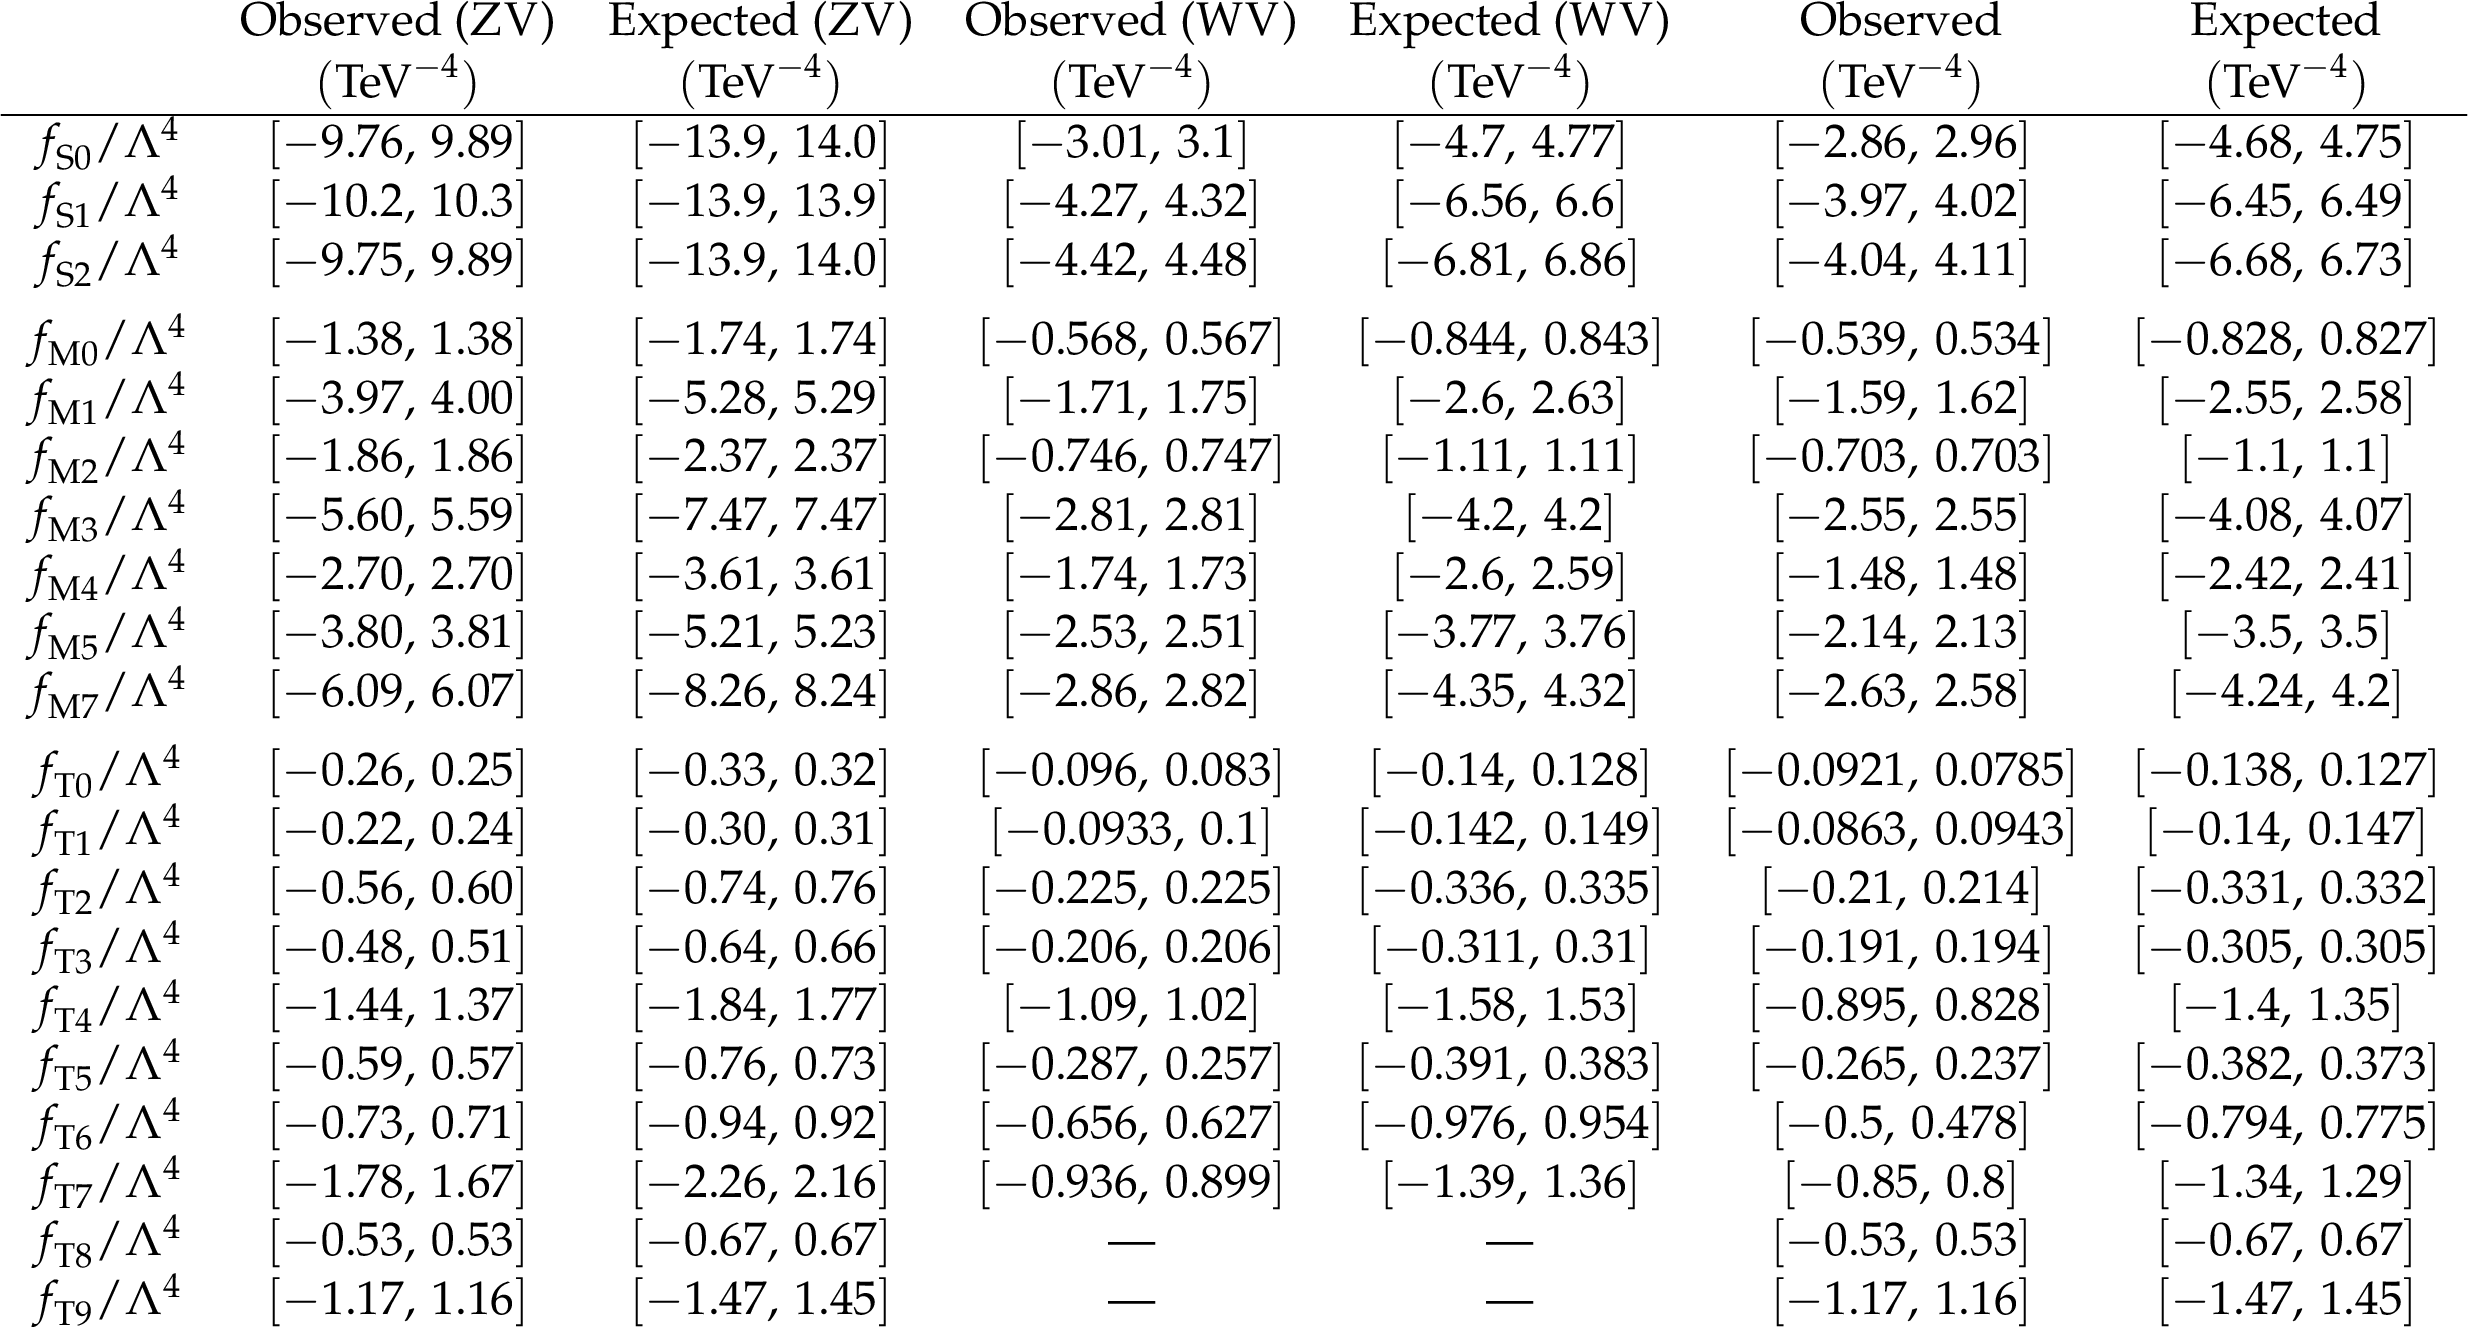
Table 5:
Observed and expected 95% CL intervals on the parameters of the quartic operators in the WV and ZV channels. The last two columns show the observed and expected limits for the combination of the WV and ZV channels. |
| Summary |
| A study was performed of the electroweak vector boson scattering production of ZV (V $ = $ W, Z) boson pairs in lepton + jets decays in association with two forward jets in proton-proton collisions at 13 TeV. The analysis uses proton-proton collision events recorded by the CMS experiment at the LHC in 2016--2018, corresponding to an integrated luminosity of 138 fb$ ^{-1} $. The signal strength is measured in a region characterized by large invariant mass and pseudorapidity gap of the two forward jets using feed-forward deep neural network discriminators. The measured signal strength for electroweak ZV vector boson scattering process is 0.63$ ^{+0.53}_{-0.51} $. Constraints are then established by combining ZV and WV data on coefficients of new operators from an effective field theory sensitive to an anomalous electroweak production of WW, WZ, and ZZ boson pairs in association with two jets. Several world best limits are set on anomalous quartic gauge couplings in terms of dimension-8 standard model effective field theory operators. |
| References | ||||
| 1 | D. R. Green, P. Meade, and M.-A. Pleier | Multiboson interactions at the LHC | Rev. Mod. Phys. 89 (2017) 035008 | 1610.07572 |
| 2 | C. F. Anders et al. | Vector boson scattering: Recent experimental and theory developments | Rev. Phys. 3 (2018) 44 | 1801.04203 |
| 3 | ATLAS Collaboration | Search for anomalous electroweak production of $ WW/WZ $ in association with a high-mass dijet system in pp collisions at $ \sqrt{s}= $ 8 TeV with the ATLAS detector | PRD 95 (2017) 032001 | 1609.05122 |
| 4 | CMS Collaboration | Measurement of vector boson scattering and constraints on anomalous quartic couplings from events with four leptons and two jets in proton-proton collisions at $ \sqrt{s}= $ 13 TeV | PLB 774 (2017) 682 | CMS-SMP-17-006 1708.02812 |
| 5 | ATLAS Collaboration | Combined effective field theory interpretation of Higgs boson and weak boson production and decay with ATLAS data and electroweak precision observables | technical report, CERN, 2022 | |
| 6 | ATLAS Collaboration | Top EFT summary plots April 2024 | technical report, CERN, 2024 | |
| 7 | R. Covarelli, M. Pellen, and M. Zaro | Vector-boson scattering at the LHC: Unraveling the electroweak sector | Int. J. Mod. Phys. A 36 (2021) 2130009 | 2102.10991 |
| 8 | CMS Collaboration | Measurement of W$ ^\pm\gamma $ differential cross sections in proton-proton collisions at $ \sqrt{s} = $ 13 TeV and effective field theory constraints | PRD 105 (2022) 052003 | CMS-SMP-20-005 2111.13948 |
| 9 | CMS Collaboration | Observation of $ \gamma\gamma\to\tau\tau $ in proton-proton collisions and limits on the anomalous electromagnetic moments of the $ \tau $ lepton | Rept. Prog. Phys. 87 (2024) 107801 | CMS-SMP-23-005 2406.03975 |
| 10 | ATLAS Collaboration | Observation of electroweak production of W$ ^{+} $W$ ^{-} $ in association with jets in proton-proton collisions at $ \sqrt{s} = $ 13 TeV with the ATLAS detector | JHEP 07 (2024) 254 | 2403.04869 |
| 11 | ATLAS Collaboration | Observation of electroweak $ W^{\pm}Z $ boson pair production in association with two jets in $ pp $ collisions at $ \sqrt{s} = $ 13 TeV with the ATLAS detector | PLB 793 (2019) 469 | 1812.09740 |
| 12 | CMS Collaboration | Measurements of production cross sections of polarized same-sign W boson pairs in association with two jets in proton-proton collisions at $ \sqrt{s} = $ 13 TeV | PLB 812 (2021) 136018 | CMS-SMP-20-006 2009.09429 |
| 13 | CMS Collaboration | Evidence for electroweak production of four charged leptons and two jets in proton-proton collisions at $ \sqrt {s} = $ 13 TeV | PLB 812 (2021) 135992 | CMS-SMP-20-001 2008.07013 |
| 14 | CMS Collaboration | Measurements of production cross sections of WZ and same-sign WW boson pairs in association with two jets in proton-proton collisions at $ \sqrt{s} = $ 13 TeV | PLB 809 (2020) 135710 | CMS-SMP-19-012 2005.01173 |
| 15 | ATLAS Collaboration | Observation of electroweak production of two jets and a Z-boson pair | Nature Phys. 19 (2023) 237 | 2004.10612 |
| 16 | CMS Collaboration | Observation of electroweak W$ ^+ $W$ ^- $ pair production in association with two jets in proton-proton collisions at $ \sqrt{s}= $ 13 TeV | PLB 841 (2023) 137495 | CMS-SMP-21-001 2205.05711 |
| 17 | ATLAS Collaboration | Measurement and interpretation of same-sign W boson pair production in association with two jets in pp collisions at $ \sqrt{s} = $ 13 TeV with the ATLAS detector | JHEP 04 (2024) 026 | 2312.00420 |
| 18 | CMS Collaboration | Observation of electroweak production of same-sign $ W $ boson pairs in the two jet and two same-sign lepton final state in proton-proton collisions at $ \sqrt{s} = $ 13 TeV | PRL 120 (2018) 081801 | CMS-SMP-17-004 1709.05822 |
| 19 | ATLAS Collaboration | Observation of electroweak production of a same-sign $ W $ boson pair in association with two jets in pp collisions at $ \sqrt{s}= $ 13 TeV with the ATLAS detector | PRL 123 (2019) 161801 | 1906.03203 |
| 20 | ATLAS Collaboration | Search for the electroweak diboson production in association with a high-mass dijet system in semileptonic final states in pp collisions at $ \sqrt{s}= $ 13 TeV with the ATLAS detector | PRD 100 (2019) 032007 | 1905.07714 |
| 21 | CMS Collaboration | Search for anomalous electroweak production of vector boson pairs in association with two jets in proton-proton collisions at 13 TeV | PLB 798 (2019) 134985 | CMS-SMP-18-006 1905.07445 |
| 22 | CMS Collaboration | Evidence for WW/WZ vector boson scattering in the decay channel \ensuremath\ell\ensuremath\nuqq produced in association with two jets in proton-proton collisions at $ \sqrt{s}= $ 13 TeV | PLB 834 (2022) 137438 | CMS-SMP-20-013 2112.05259 |
| 23 | W. Buchmuller and D. Wyler | Effective lagrangian analysis of new interactions and flavour conservation | NPB 268 (1986) 621 | |
| 24 | B. Grzadkowski, M. Iskrzynski, M. Misiak, and J. Rosiek | Dimension-six terms in the Standard Model Lagrangian | JHEP 10 (2010) 085 | 1008.4884 |
| 25 | O. J. P. Éboli and M. C. Gonzalez-Garcia | Classifying the bosonic quartic couplings | PRD 93 (2016) 093013 | 1604.03555 |
| 26 | A. Falkowski et al. | Anomalous triple gauge couplings in the effective field theory approach at the LHC | JHEP 02 (2017) 115 | 1609.06312 |
| 27 | G. Durieux et al. | LHC EFT WG note: Basis for anomalous quartic gauge couplings | SciPost Phys. Comm. Rep. (11, ), 2024 link |
2411.02483 |
| 28 | E. d. S. Almeida, O. J. P. Éboli, and M. C. Gonzalez Garcia | Unitarity constraints on anomalous quartic couplings | PRD 101 (2020) 113003 | 2004.05174 |
| 29 | CMS Collaboration | HEPData record for this analysis | link | |
| 30 | CMS Collaboration | The CMS experiment at the CERN LHC | JINST 3 (2008) 8004 | |
| 31 | CMS Collaboration | Development of the CMS detector for the CERN LHC Run 3 | JINST 19 (2024) P05064 | CMS-PRF-21-001 2309.05466 |
| 32 | CMS Collaboration | Performance of the CMS Level-1 trigger in proton-proton collisions at $ \sqrt{s} = $ 13 TeV | JINST 15 (2020) P10017 | CMS-TRG-17-001 2006.10165 |
| 33 | CMS Collaboration | The CMS trigger system | JINST 12 (2017) P01020 | CMS-TRG-12-001 1609.02366 |
| 34 | CMS Collaboration | Performance of the CMS high-level trigger during LHC Run 2 | JINST 19 (2024) P11021 | CMS-TRG-19-001 2410.17038 |
| 35 | CMS Collaboration | Electron and photon reconstruction and identification with the CMS experiment at the CERN LHC | JINST 16 (2021) P05014 | CMS-EGM-17-001 2012.06888 |
| 36 | CMS Collaboration | Performance of the CMS muon detector and muon reconstruction with proton-proton collisions at $ \sqrt{s}= $ 13 TeV | JINST 13 (2018) P06015 | CMS-MUO-16-001 1804.04528 |
| 37 | CMS Collaboration | Description and performance of track and primary-vertex reconstruction with the CMS tracker | JINST 9 (2014) 10009 | CMS-TRK-11-001 1405.6569 |
| 38 | J. Alwall et al. | The automated computation of tree-level and next-to-leading order differential cross sections, and their matching to parton shower simulations | JHEP 07 (2014) 079 | 1405.0301 |
| 39 | O. Mattelaer | On the maximal use of Monte Carlo samples: reweighting events at NLO accuracy | EPJC 76 (2016) 674 | 1607.00763 |
| 40 | A. Belvedere et al. | LHC EFT WG note: SMEFT predictions, event reweighting, and simulation | SciPost Phys. Comm. Rep. () 4, 2024 link |
2406.14620 |
| 41 | R. Frederix and S. Frixione | Merging meets matching in MC@NLO | JHEP 12 (2012) 061 | 1209.6215 |
| 42 | S. Alioli, P. Nason, C. Oleari, and E. Re | A general framework for implementing NLO calculations in shower Monte Carlo programs: the POWHEG BOX | JHEP 06 (2010) 043 | 1002.2581 |
| 43 | M. Czakon et al. | Top-pair production at the LHC through NNLO QCD and NLO EW | JHEP 10 (2017) 186 | 1705.04105 |
| 44 | CMS Collaboration | Measurement of differential cross sections for top quark pair production using the lepton + jets final state in proton-proton collisions at 13 TeV | PRD 95 (2017) 092001 | CMS-TOP-16-008 1610.04191 |
| 45 | CMS Collaboration | Measurements of differential Z boson production cross sections in proton-proton collisions at $ \sqrt{s} = $ 13 TeV | JHEP 12 (2019) 061 | CMS-SMP-17-010 1909.04133 |
| 46 | P. Nason and G. Zanderighi | $ W^+ W^- $, $ W Z $ and $ Z Z $ production in the POWHEG-BOX-V2 | EPJC 74 (2014) 2702 | 1311.1365 |
| 47 | NNPDF Collaboration | Parton distributions for the LHC Run II | JHEP 04 (2015) 040 | 1410.8849 |
| 48 | NNPDF Collaboration | Parton distributions from high-precision collider data | EPJC 77 (2017) 663 | 1706.00428 |
| 49 | T. Sjostrand et al. | An Introduction to PYTHIA 8.2 | Comput. Phys. Commun. 191 (2015) 159 | 1410.3012 |
| 50 | CMS Collaboration | Event generator tunes obtained from underlying event and multiparton scattering measurements | EPJC 76 (2016) 155 | CMS-GEN-14-001 1512.00815 |
| 51 | CMS Collaboration | Extraction and validation of a new set of CMS PYTHIA8 tunes from underlying-event measurements | EPJC 80 (2020) 4 | CMS-GEN-17-001 1903.12179 |
| 52 | A. Ballestrero et al. | Precise predictions for same-sign W-boson scattering at the LHC | EPJC 78 (2018) 671 | 1803.07943 |
| 53 | B. Jäger et al. | Parton-shower effects in Higgs production via vector-boson fusion | EPJC 80 (2020) 756 | 2003.12435 |
| 54 | GEANT4 Collaboration | GEANT4: A simulation toolkit | NIM A 506 (2003) 250 | |
| 55 | CMS Collaboration | Particle-flow reconstruction and global event description with the CMS detector | JINST 12 (2017) P10003 | CMS-PRF-14-001 1706.04965 |
| 56 | CMS Collaboration | Measurements of the Higgs boson production cross section and couplings in the W boson pair decay channel in proton-proton collisions at $ \sqrt{s}=$ 13 TeV | EPJC 83 (2023) 667 | CMS-HIG-20-013 2206.09466 |
| 57 | CMS Collaboration | Performance of electron reconstruction and selection with the CMS detector in proton-proton collisions at \ensuremath\sqrts = 8 TeV | JINST 10 (2015) P06005 | CMS-EGM-13-001 1502.02701 |
| 58 | CMS Collaboration | Muon identification using multivariate techniques in the CMS experiment in proton-proton collisions at sqrt(s) = 13 TeV | JINST 19 (2024) P02031 | CMS-MUO-22-001 2310.03844 |
| 59 | M. Cacciari, G. P. Salam, and G. Soyez | The anti-$ k_{\mathrm{T}} $ jet clustering algorithm | JHEP 04 (2008) 063 | 0802.1189 |
| 60 | M. Cacciari, G. P. Salam, and G. Soyez | FastJet user manual | EPJC 72 (2012) 1896 | 1111.6097 |
| 61 | M. Cacciari and G. P. Salam | Pileup subtraction using jet areas | PLB 659 (2008) 119 | 0707.1378 |
| 62 | D. Bertolini, P. Harris, M. Low, and N. Tran | Pileup per particle identification | JHEP 10 (2014) 059 | 1407.6013 |
| 63 | M. Dasgupta, A. Fregoso, S. Marzani, and G. P. Salam | Towards an understanding of jet substructure | JHEP 09 (2013) 029 | 1307.0007 |
| 64 | A. J. Larkoski, S. Marzani, G. Soyez, and J. Thaler | Soft drop | JHEP 05 (2014) 146 | 1402.2657 |
| 65 | J. Thaler and K. Van Tilburg | Identifying boosted objects with $ N $-subjettiness | JHEP 03 (2011) 015 | 1011.2268 |
| 66 | CMS Collaboration | Pileup mitigation at CMS in 13 TeV data | JINST 15 (2020) P09018 | CMS-JME-18-001 2003.00503 |
| 67 | CMS Collaboration | Identification of heavy-flavour jets with the CMS detector in pp collisions at 13 TeV | JINST 13 (2018) P05011 | CMS-BTV-16-002 1712.07158 |
| 68 | CMS Collaboration | Measurement of the single top quark and antiquark production cross sections in the $ t $ channel and their ratio in proton-proton collisions at $ \sqrt{s}= $ 13 TeV | PLB 800 (2020) 135042 | CMS-TOP-17-011 1812.10514 |
| 69 | Particle Data Group , S. Navas et al. | Review of particle physics | PRD 110 (2024) 030001 | |
| 70 | J. M. Lindert et al. | Precise predictions for $ V+ $jets dark matter backgrounds | EPJC 77 (2017) 829 | 1705.04664 |
| 71 | CMS Collaboration | Measurements of properties of the Higgs boson decaying to a W boson pair in pp collisions at $ \sqrt{s}= $ 13 TeV | PLB 791 (2019) 96 | CMS-HIG-16-042 1806.05246 |
| 72 | F. Chollet et al. | Keras | link | |
| 73 | M. Abadi et al. | TensorFlow: Large-scale machine learning on heterogeneous systems | 1603.04467 | |
| 74 | D. P. Kingma and J. Ba | Adam: A method for stochastic optimization | Proceedings of the 3rd International Conference for Learning Representations, San Diego, 2017 link |
1412.6980 |
| 75 | A. F. Agarap | Deep learning using rectified linear units (ReLU) | 1803.08375 | |
| 76 | I. Goodfellow, Y. Bengio, and A. Courville | Deep learning | MIT Press,. ISBN 026618, 2016 link |
|
| 77 | F. Nogueira | Bayesian optimization: Open source constrained global optimization tool for Python | link | |
| 78 | S. M. Lundberg and S.-I. Lee | A unified approach to interpreting model predictions | in Proceedings of the 31st International Conference on Neural Information Processing Systems, NIPS'17, p. 4768. Curran Associates Inc., Red Hook, NY, USA, 2017 | 1705.07874 |
| 79 | D. L. Rainwater, R. Szalapski, and D. Zeppenfeld | Probing color singlet exchange in $ Z $ + 2-jet events at the CERN LHC | PRD 54 (1996) 6680 | hep-ph/9605444 |
| 80 | CMS Collaboration | Performance of quark/gluon discrimination in 8 TeV pp data | CMS Physics Analysis Summary, 2013 CMS-PAS-JME-13-002 |
CMS-PAS-JME-13-002 |
| 81 | CMS Collaboration | Performance of quark/gluon discrimination in 13 TeV data | CMS Detector Performance Summary CMS-DP-2016-070, 2016 CDS |
|
| 82 | G. Cowan, K. Cranmer, E. Gross, and O. Vitells | Asymptotic formulae for likelihood-based tests of new physics | EPJC 71 (2011) 1554 | 1007.1727 |
| 83 | CMS Collaboration | The CMS statistical analysis and combination tool: COMBINE | Comput. Softw. Big Sci. 8 (2024) 19 | CMS-CAT-23-001 2404.06614 |
| 84 | W. Verkerke and D. P. Kirkby | The RooFit toolkit for data modeling | in Proceedings of the 13th International Conference for Computing in High-Energy and Nuclear Physics (CHEP03). 2003.. [eConf C0303241, MOLT007] link |
physics/0306116 |
| 85 | L. Moneta et al. | The RooStats project | PoS ACAT 057, 2010 link |
1009.1003 |
| 86 | CMS Collaboration | Precision luminosity measurement in proton-proton collisions at $ \sqrt{s}= $ 13 TeV in 2015 and 2016 at CMS | EPJC 81 (2021) 800 | CMS-LUM-17-003 2104.01927 |
| 87 | CMS Collaboration | CMS luminosity measurement for the 2017 data-taking period at $ \sqrt{s}= $ 13 TeV | CMS Physics Analysis Summary, 2018 CMS-PAS-LUM-17-004 |
CMS-PAS-LUM-17-004 |
| 88 | CMS Collaboration | CMS luminosity measurement for the 2018 data-taking period at $ \sqrt{s}= $ 13 TeV | CMS Physics Analysis Summary, 2019 CMS-PAS-LUM-18-002 |
CMS-PAS-LUM-18-002 |
| 89 | CMS Collaboration | Measurement of the inelastic proton-proton cross section at $ \sqrt{s}= $ 13 TeV | JHEP 07 (2018) 161 | CMS-FSQ-15-005 1802.02613 |
| 90 | CMS Collaboration | Performance of the CMS electromagnetic calorimeter in pp collisions at $ \sqrt{s}= $ 13 TeV | JINST 19 (2024) P09004 | CMS-EGM-18-002 2403.15518 |
| 91 | CMS Collaboration | Jet energy scale and resolution in the CMS experiment in pp collisions at 8 TeV | JINST 12 (2017) P02014 | CMS-JME-13-004 1607.03663 |
| 92 | CMS Collaboration | Identification techniques for highly boosted W bosons that decay into hadrons | JHEP 12 (2014) 017 | CMS-JME-13-006 1410.4227 |
| 93 | A. Kalogeropoulos and J. Alwall | The SysCalc code: A tool to derive theoretical systematic uncertainties | 1801.08401 | |
| 94 | J. Rojo | PDF4LHC recommendations for Run II | PoS DIS 018, 2016 link |
1606.08243 |
| 95 | J. S. Conway | Incorporating nuisance parameters in likelihoods for multisource spectra | 115, 2011 PHYSTAT 201 (2011) 1 |
1103.0354 |
| 96 | F. U. Bernlochner, D. C. Fry, S. B. Menary, and E. Persson | Cover your bases: asymptotic distributions of the profile likelihood ratio when constraining effective field theories in high-energy physics | SciPost Phys. Core 6 (2023) 013 | 2207.01350 |
| 97 | ATLAS Collaboration | Measurement of electroweak $ Z\left(\nu \overline{\nu}\right)\gamma jj $ production and limits on anomalous quartic gauge couplings in pp collisions at $ \sqrt{s} = $ 13 TeV with the ATLAS detector | JHEP 06 (2023) 082 | 2208.12741 |
|
|
Compact Muon Solenoid LHC, CERN |
|

|

|

|

|

|