

Compact Muon Solenoid
LHC, CERN
| CMS-HIG-23-003 ; CERN-EP-2024-186 | ||
| Search for bottom quark associated production of the standard model Higgs boson in final states with leptons in proton-proton collisions at $ \sqrt{s}= $ 13 TeV | ||
| CMS Collaboration | ||
| 2 August 2024 | ||
| PLB 860 (2024) 139173 | ||
| Abstract: This Letter presents the first search for bottom quark associated production of the standard model Higgs boson, in final states with leptons. Higgs boson decays to pairs of tau leptons and pairs of leptonically decaying W bosons are considered. The search is performed using data collected from 2016 to 2018 by the CMS experiment in proton-proton collisions at a centre-of-mass energy of 13 TeV, corresponding to an integrated luminosity of 138 fb$ ^{-1} $. Upper limits at the 95% confidence level are placed on the signal strength for Higgs boson production in association with bottom quarks; the observed (expected) upper limit is 3.7 (6.1) times the standard model prediction. | ||
| Links: e-print arXiv:2408.01344 [hep-ex] (PDF) ; CDS record ; inSPIRE record ; HepData record ; CADI line (restricted) ; | ||
| Figures & Tables | Summary | Additional Figures & Tables | References | CMS Publications |
|---|
| Figures | |
png pdf |
Figure 1:
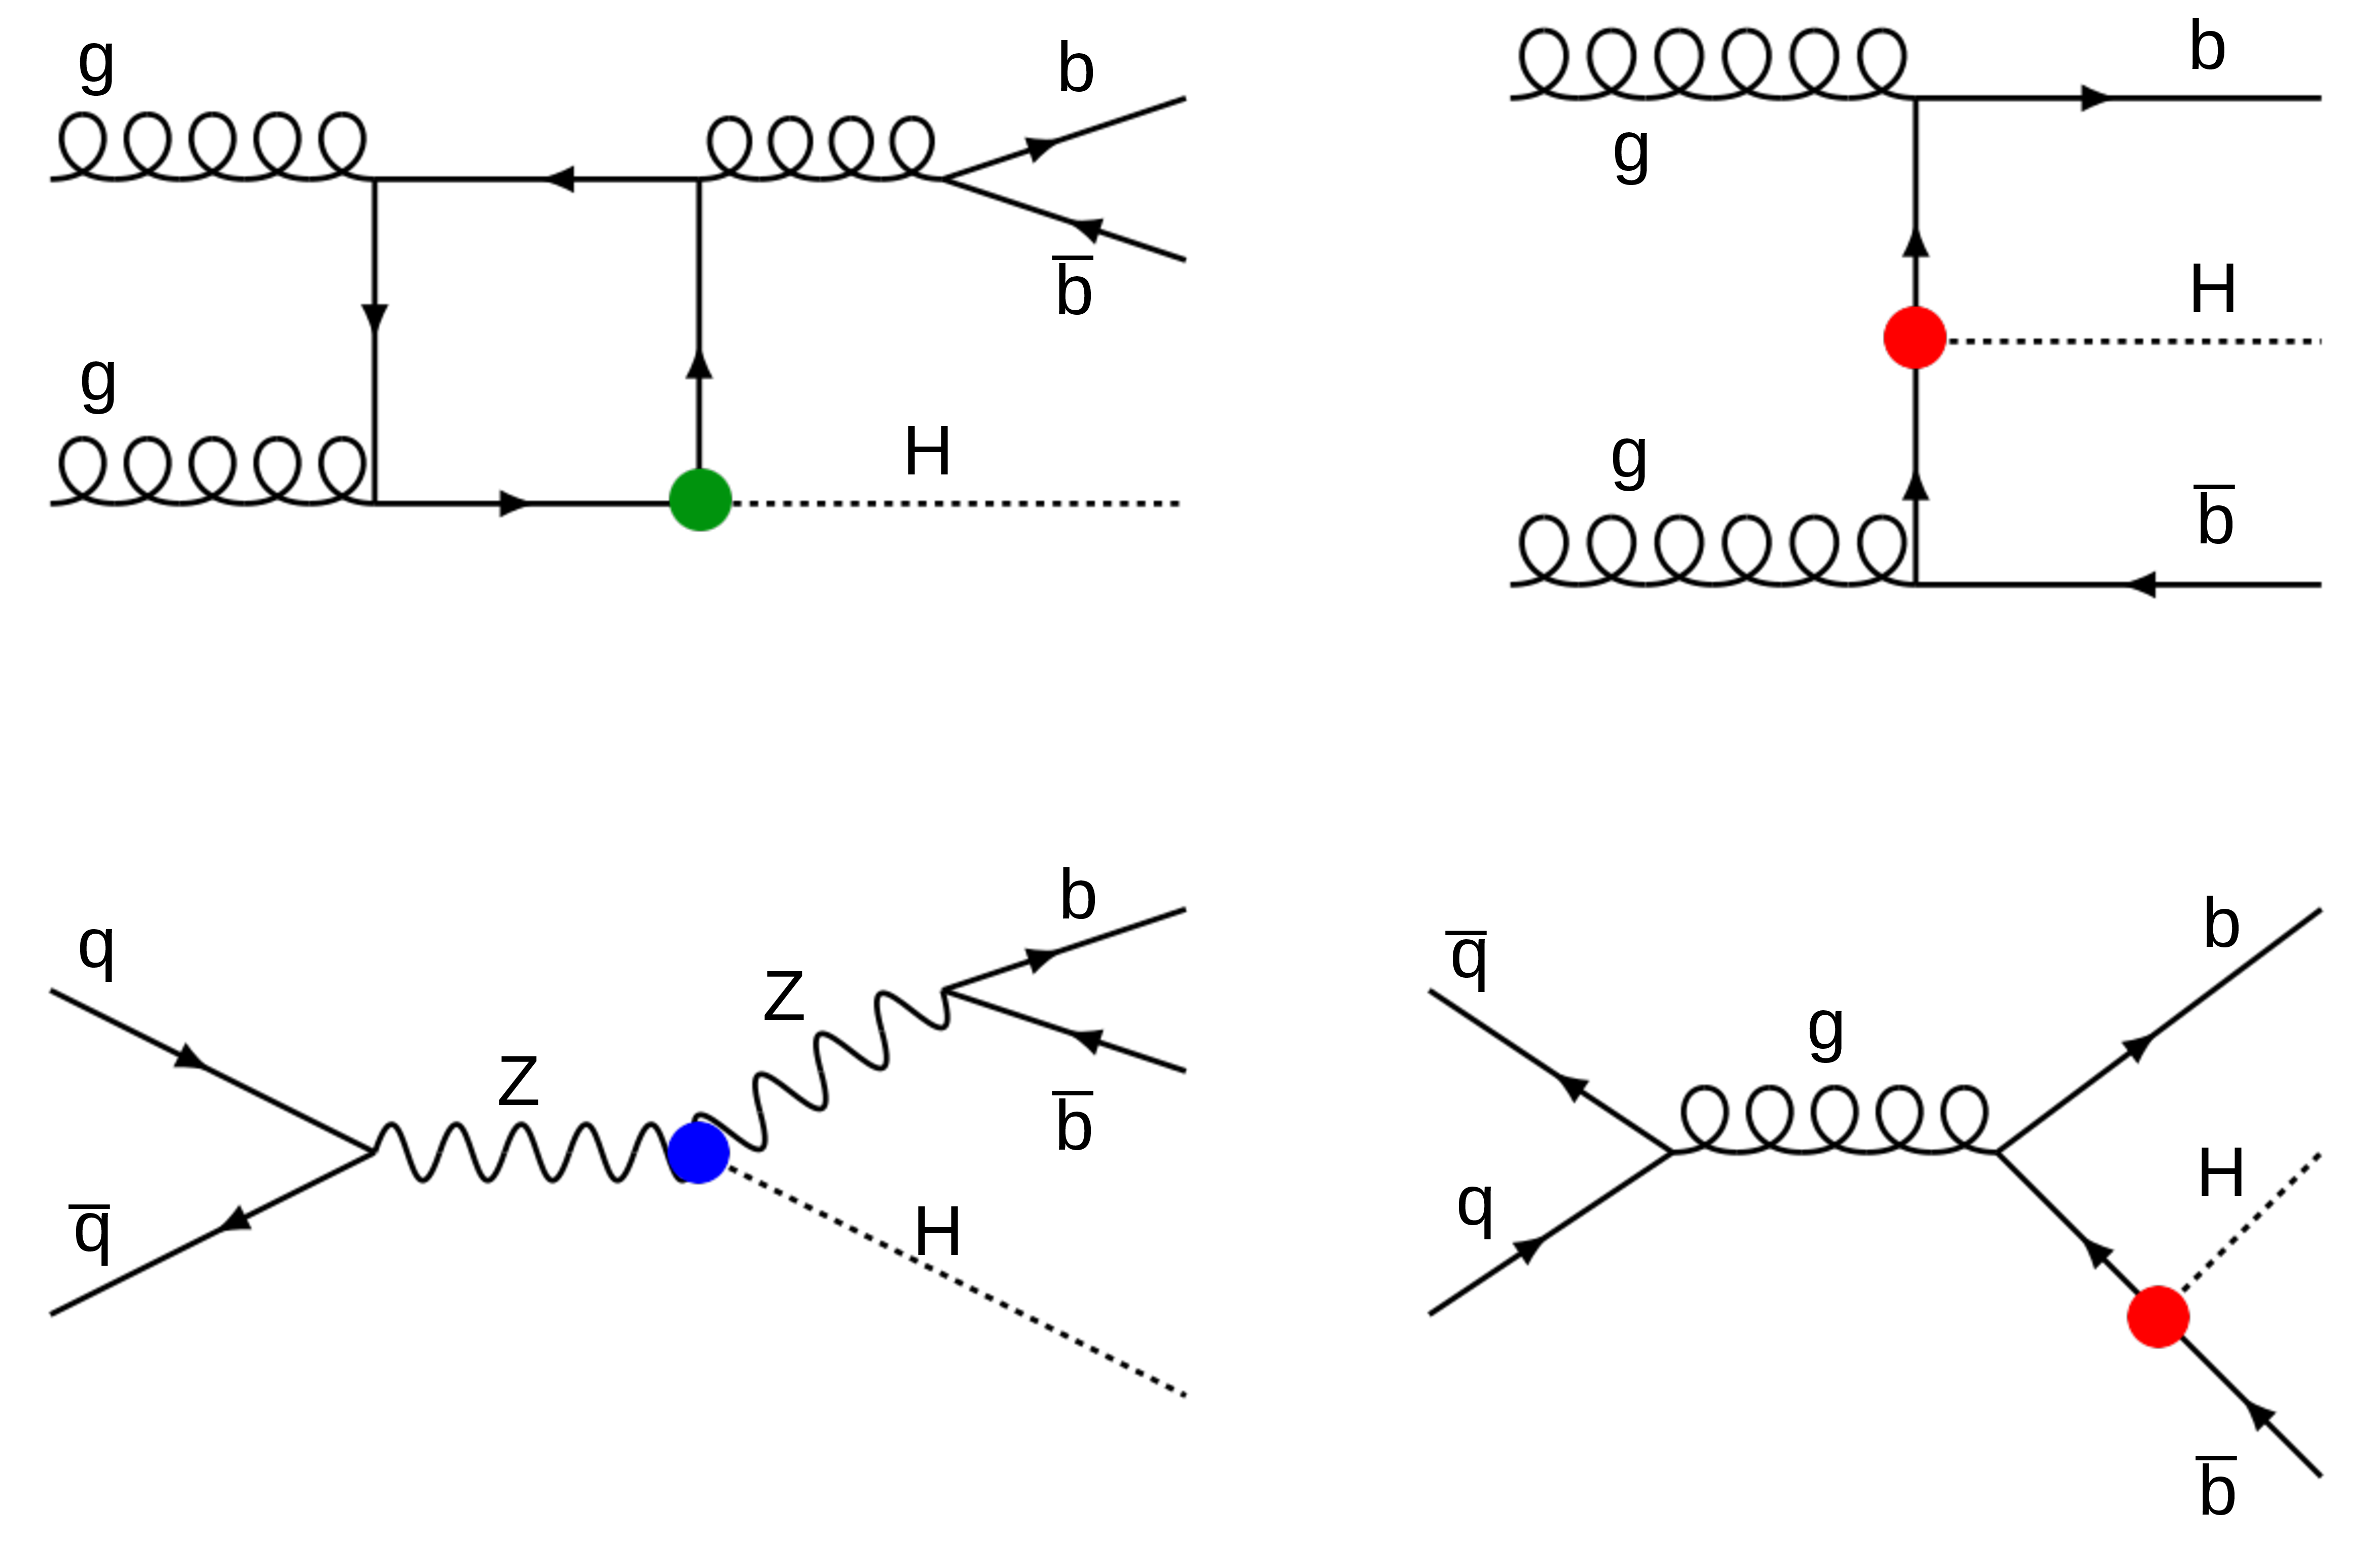
Dominant Feynman diagrams contributing to Higgs boson production in association with b quarks [18,22]. The diagrams initiated by gluons (quarks) are shown in the upper (lower) row. The red circle is used to mark the Higgs boson coupling to b quarks, the green circle marks the Higgs boson coupling to top quarks, and the blue circle marks the coupling between the Higgs boson and vector bosons. In the $ \mathrm{g}\mathrm{g}\mathrm{H} $ diagram (upper left), the additional gluon is radiated from within the quark loop, although it can equivalently radiate from one of the initial-state gluons. |
png pdf |
Figure 2:
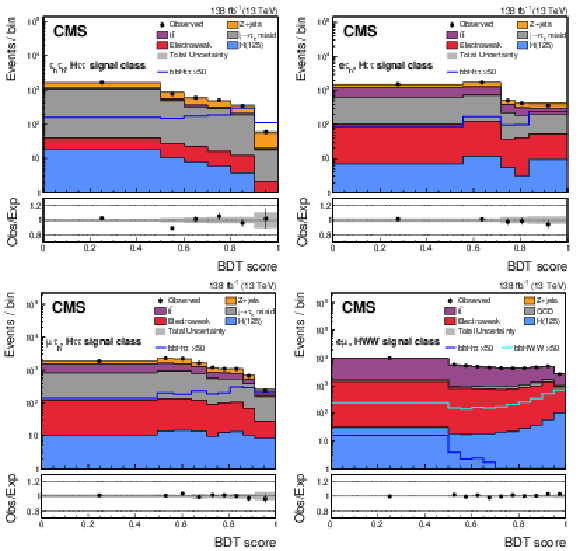
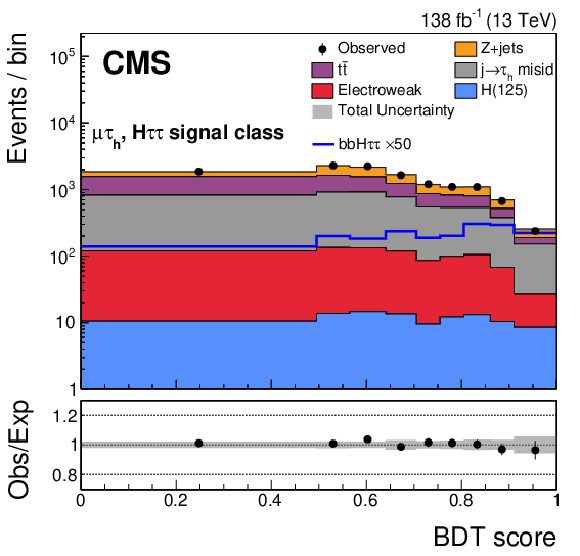
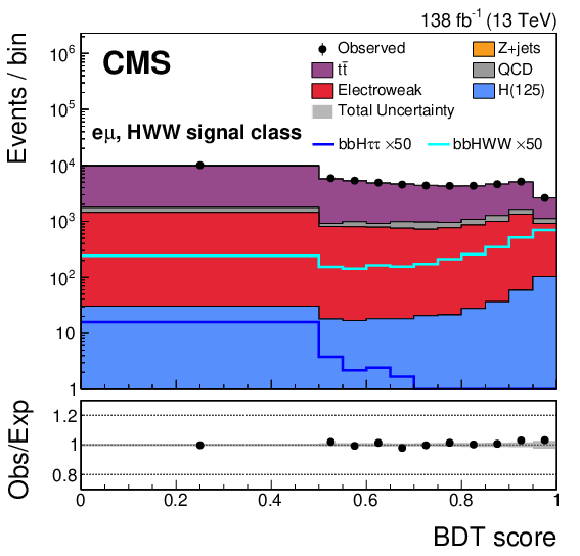
The BDT $ \mathrm{H}\to\tau\tau $ class output score distributions for the $ \tau_\mathrm{h}\tau_\mathrm{h} $ (upper left), $ \mathrm{e}\tau_\mathrm{h} $ (upper right), and $ \mu\tau_\mathrm{h} $ (lower left) channels; and the $ \mathrm{H}\to \mathrm{W}\mathrm{W} $ output score for the $ \mathrm{e}\mu $ channel (lower right). The $ \mathrm{b}\overline{\mathrm{b}}\mathrm{H} $ signal is multiplied by a factor of 50, while all other processes are scaled according to a combined fit of all BDT categories for all channels and years used in this analysis. The total uncertainty includes the statistical and systematic uncertainties. Electroweak processes in the figure include diboson, W+jets, and single top quark production. For channels involving $ \tau_\mathrm{h} $ candidates, the $ \mathrm{j}\to\tau_\mathrm{h} $ misid contribution is estimated from data with the $ F_{\mathrm{F}} $ method and grouped together. Simulated events with jets misidentified as $ \tau_\mathrm{h} $ candidates are removed from the electroweak, $ \text{DY+jets} $, and $ \mathrm{t} \overline{\mathrm{t}} $ groups. For the $ \mathrm{e}\mu $ channel, the QCD multijet process is estimated using the ``ABCD'' method. The H(125) group includes processes where a Higgs boson is produced not in association with b quarks, including the top quark associated production and Higgs-strahlung processes, since the b jets in these events originate from the top quark and vector boson decays. |
png pdf |
Figure 2-a:
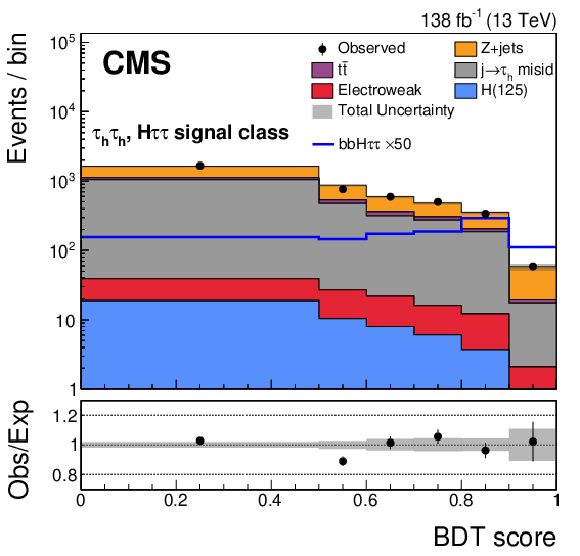
The BDT $ \mathrm{H}\to\tau\tau $ class output score distributions for the $ \tau_\mathrm{h}\tau_\mathrm{h} $ (upper left), $ \mathrm{e}\tau_\mathrm{h} $ (upper right), and $ \mu\tau_\mathrm{h} $ (lower left) channels; and the $ \mathrm{H}\to \mathrm{W}\mathrm{W} $ output score for the $ \mathrm{e}\mu $ channel (lower right). The $ \mathrm{b}\overline{\mathrm{b}}\mathrm{H} $ signal is multiplied by a factor of 50, while all other processes are scaled according to a combined fit of all BDT categories for all channels and years used in this analysis. The total uncertainty includes the statistical and systematic uncertainties. Electroweak processes in the figure include diboson, W+jets, and single top quark production. For channels involving $ \tau_\mathrm{h} $ candidates, the $ \mathrm{j}\to\tau_\mathrm{h} $ misid contribution is estimated from data with the $ F_{\mathrm{F}} $ method and grouped together. Simulated events with jets misidentified as $ \tau_\mathrm{h} $ candidates are removed from the electroweak, $ \text{DY+jets} $, and $ \mathrm{t} \overline{\mathrm{t}} $ groups. For the $ \mathrm{e}\mu $ channel, the QCD multijet process is estimated using the ``ABCD'' method. The H(125) group includes processes where a Higgs boson is produced not in association with b quarks, including the top quark associated production and Higgs-strahlung processes, since the b jets in these events originate from the top quark and vector boson decays. |
png pdf |
Figure 2-b:
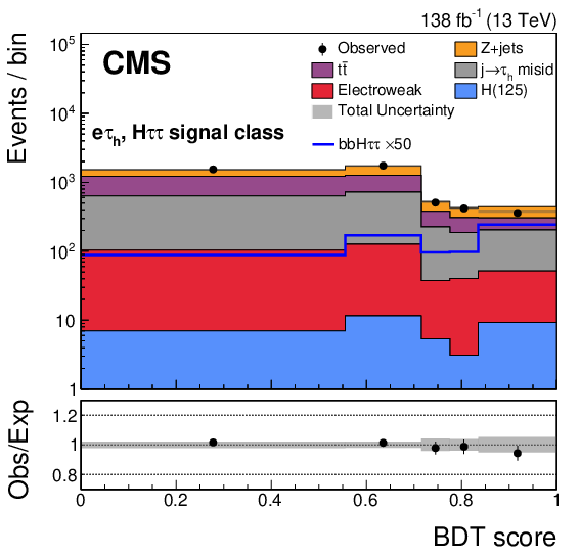
The BDT $ \mathrm{H}\to\tau\tau $ class output score distributions for the $ \tau_\mathrm{h}\tau_\mathrm{h} $ (upper left), $ \mathrm{e}\tau_\mathrm{h} $ (upper right), and $ \mu\tau_\mathrm{h} $ (lower left) channels; and the $ \mathrm{H}\to \mathrm{W}\mathrm{W} $ output score for the $ \mathrm{e}\mu $ channel (lower right). The $ \mathrm{b}\overline{\mathrm{b}}\mathrm{H} $ signal is multiplied by a factor of 50, while all other processes are scaled according to a combined fit of all BDT categories for all channels and years used in this analysis. The total uncertainty includes the statistical and systematic uncertainties. Electroweak processes in the figure include diboson, W+jets, and single top quark production. For channels involving $ \tau_\mathrm{h} $ candidates, the $ \mathrm{j}\to\tau_\mathrm{h} $ misid contribution is estimated from data with the $ F_{\mathrm{F}} $ method and grouped together. Simulated events with jets misidentified as $ \tau_\mathrm{h} $ candidates are removed from the electroweak, $ \text{DY+jets} $, and $ \mathrm{t} \overline{\mathrm{t}} $ groups. For the $ \mathrm{e}\mu $ channel, the QCD multijet process is estimated using the ``ABCD'' method. The H(125) group includes processes where a Higgs boson is produced not in association with b quarks, including the top quark associated production and Higgs-strahlung processes, since the b jets in these events originate from the top quark and vector boson decays. |
png pdf |
Figure 2-c:
The BDT $ \mathrm{H}\to\tau\tau $ class output score distributions for the $ \tau_\mathrm{h}\tau_\mathrm{h} $ (upper left), $ \mathrm{e}\tau_\mathrm{h} $ (upper right), and $ \mu\tau_\mathrm{h} $ (lower left) channels; and the $ \mathrm{H}\to \mathrm{W}\mathrm{W} $ output score for the $ \mathrm{e}\mu $ channel (lower right). The $ \mathrm{b}\overline{\mathrm{b}}\mathrm{H} $ signal is multiplied by a factor of 50, while all other processes are scaled according to a combined fit of all BDT categories for all channels and years used in this analysis. The total uncertainty includes the statistical and systematic uncertainties. Electroweak processes in the figure include diboson, W+jets, and single top quark production. For channels involving $ \tau_\mathrm{h} $ candidates, the $ \mathrm{j}\to\tau_\mathrm{h} $ misid contribution is estimated from data with the $ F_{\mathrm{F}} $ method and grouped together. Simulated events with jets misidentified as $ \tau_\mathrm{h} $ candidates are removed from the electroweak, $ \text{DY+jets} $, and $ \mathrm{t} \overline{\mathrm{t}} $ groups. For the $ \mathrm{e}\mu $ channel, the QCD multijet process is estimated using the ``ABCD'' method. The H(125) group includes processes where a Higgs boson is produced not in association with b quarks, including the top quark associated production and Higgs-strahlung processes, since the b jets in these events originate from the top quark and vector boson decays. |
png pdf |
Figure 2-d:
The BDT $ \mathrm{H}\to\tau\tau $ class output score distributions for the $ \tau_\mathrm{h}\tau_\mathrm{h} $ (upper left), $ \mathrm{e}\tau_\mathrm{h} $ (upper right), and $ \mu\tau_\mathrm{h} $ (lower left) channels; and the $ \mathrm{H}\to \mathrm{W}\mathrm{W} $ output score for the $ \mathrm{e}\mu $ channel (lower right). The $ \mathrm{b}\overline{\mathrm{b}}\mathrm{H} $ signal is multiplied by a factor of 50, while all other processes are scaled according to a combined fit of all BDT categories for all channels and years used in this analysis. The total uncertainty includes the statistical and systematic uncertainties. Electroweak processes in the figure include diboson, W+jets, and single top quark production. For channels involving $ \tau_\mathrm{h} $ candidates, the $ \mathrm{j}\to\tau_\mathrm{h} $ misid contribution is estimated from data with the $ F_{\mathrm{F}} $ method and grouped together. Simulated events with jets misidentified as $ \tau_\mathrm{h} $ candidates are removed from the electroweak, $ \text{DY+jets} $, and $ \mathrm{t} \overline{\mathrm{t}} $ groups. For the $ \mathrm{e}\mu $ channel, the QCD multijet process is estimated using the ``ABCD'' method. The H(125) group includes processes where a Higgs boson is produced not in association with b quarks, including the top quark associated production and Higgs-strahlung processes, since the b jets in these events originate from the top quark and vector boson decays. |
png pdf |
Figure 3:
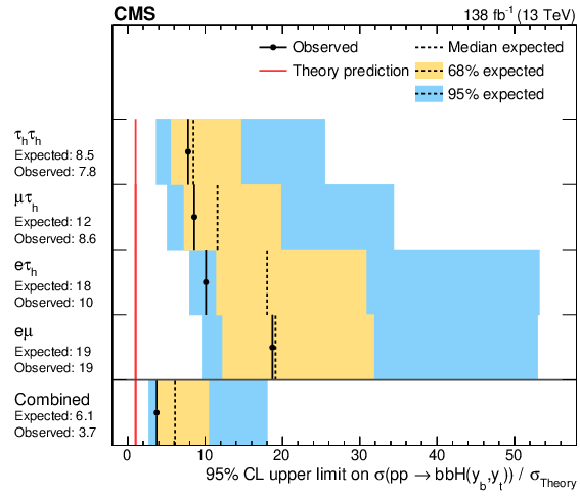
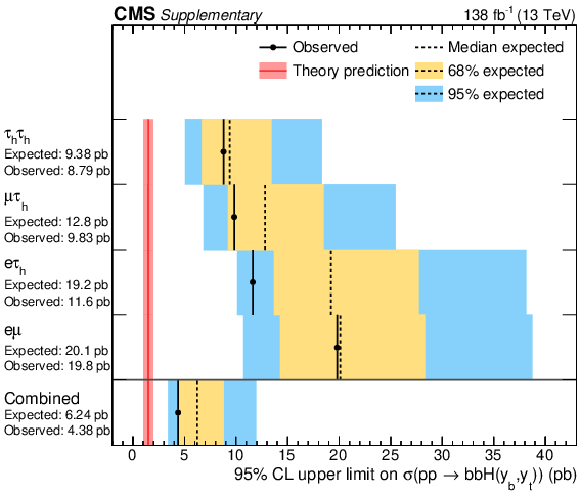
Upper limits at the 95% CL on the signal strength for the the $ \mathrm{p}\mathrm{p}\to \mathrm{b}\overline{\mathrm{b}}\mathrm{H}(y_\mathrm{b},y_\mathrm{t}) $ process. The terms in which the Higgs boson is produced via Yukawa couplings with top or bottom quarks contribute to the estimated relative production cross sections. The interference term between these contributions is also accounted for. The $ \mathrm{p}\mathrm{p}\to \mathrm{Z}(\to \mathrm{b}\overline{\mathrm{b}})\mathrm{H} $ process is treated as a background in this search. The theoretical prediction, shown as a red line placed at 1, corresponds to the estimated production cross section of 1.489\unitpb. The black markers show the observed limits, and the dashed lines with the yellow and blue uncertainty bands represent the expected upper limits with their 68% and 95% central intervals. |
png pdf |
Figure 4:
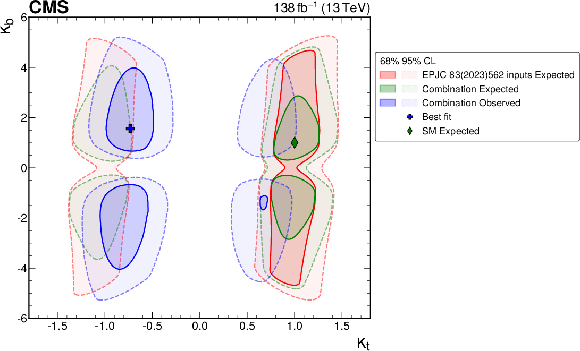
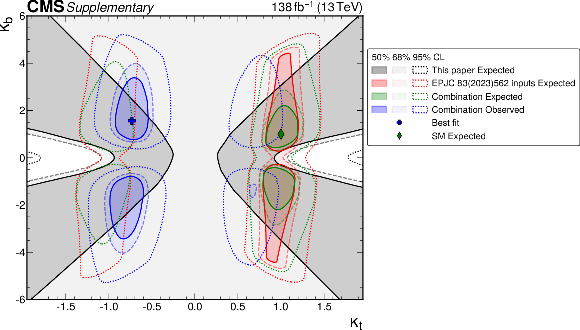
Two-dimensional confidence intervals on the $ \kappa_\mathrm{b} $ and $ \kappa_\mathrm{t} $ parameters for the channels studied in this search. Expected limits are shown in red for the $ \mathrm{H}\to\tau\tau $ cross section measurement [70] performed for other Higgs boson production mechanisms and in green for the combination with the analysis presented in this Letter. The observed constraints are shown in blue, with a cross marking the best fit point. A green diamond is placed to mark the SM expectation. Solid lines with shaded areas mark the 68% confidence interval contours, and dashed lines mark the 95% confidence interval. |
| Tables | |

png pdf |
Table 1:
Summary of the BDT categories defined for each channel. |
png pdf |
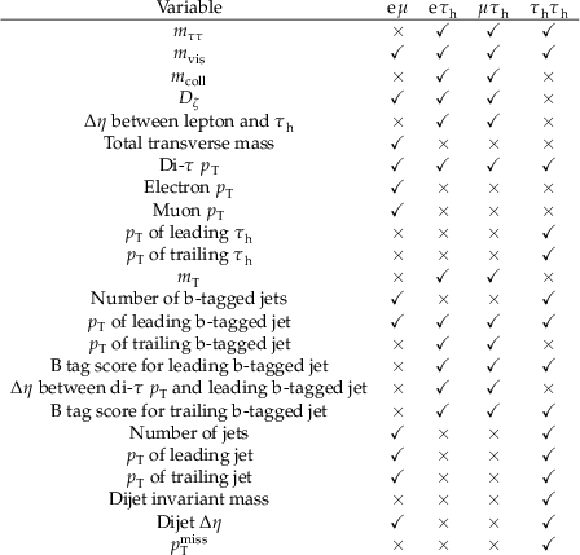
Table 2:
Input features to the BDT classifiers used in each of the studied channels. Each variable is marked with the $ \checkmark $ symbol if it is used for the training of the BDT models in a particular channel, or the $ \times $ symbol if it is not used. |

png pdf |
Table 3:
Summary table of the systematic uncertainties affecting the background processes. For uncertainties that vary significantly depending on the kinematic properties of the event, the label \textitevent-dep. is used. The labels `lnN' and `shape' are used, respectively, for uncertainties affecting only the process normalization or having a shape-altering effects. |
| Summary |
| A search for the 125 GeV Higgs boson produced in association with bottom quarks and decaying into a pair of tau leptons or W bosons has been presented. The search was performed on data collected by the CMS experiment in the period 2016--2018 at a centre-of-mass energy of $ \sqrt{s}= $ 13 TeV, corresponding to an integrated luminosity of 138 fb$ ^{-1} $. This search was performed in four final states: $ \tau_\mathrm{h}\tau_\mathrm{h} $, $ \mathrm{e}\tau_\mathrm{h} $, $ \mu\tau_\mathrm{h} $, and $ \mathrm{e}\mu $. Higgs boson decays to tau leptons were targeted in all four final states, while $ \mathrm{H}\to\mathrm{W}\mathrm{W} $ decays contributed only in the $ \mathrm{e}\mu $ channel as a result of the kinematical similarities between the two decay processes. At the current level of precision, the background processes provide an adequate description of the observed data, and no significant excess above the background-only expectation was found. The observed (expected) upper limit at the 95% confidence level (CL) on the $ \mathrm{b}\overline{\mathrm{b}}\mathrm{H} $ production cross section is 3.7 (6.1) times the standard model prediction. The search also constrained the Higgs Yukawa couplings to bottom and top quarks in the $ \kappa $-model interpretation. The best fit value for the coupling modifiers was found to be $ (\kappa_\mathrm{t},\kappa_\mathrm{b})=(-0.73,1.58) $. The observed constraints are compatible with the standard model expectation at the 95% CL. |
| Additional Figures | |

png pdf |
Additional Figure 1:
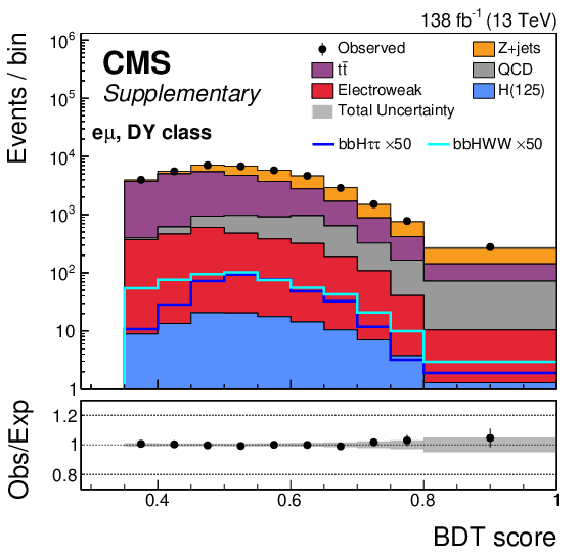
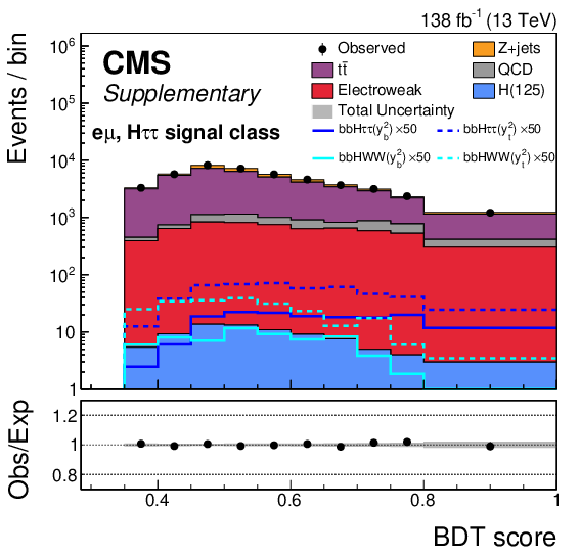
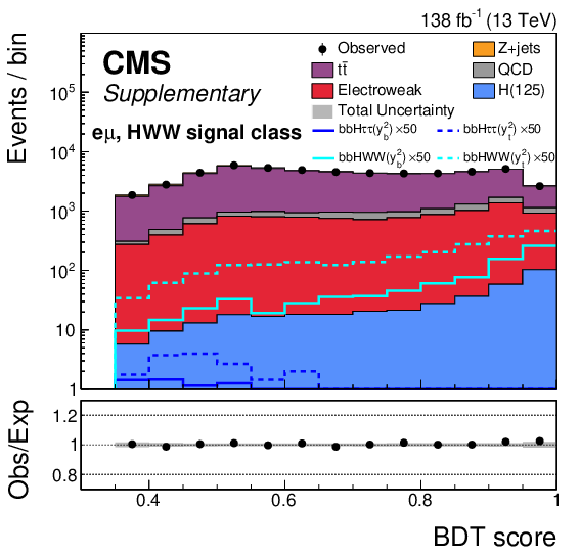
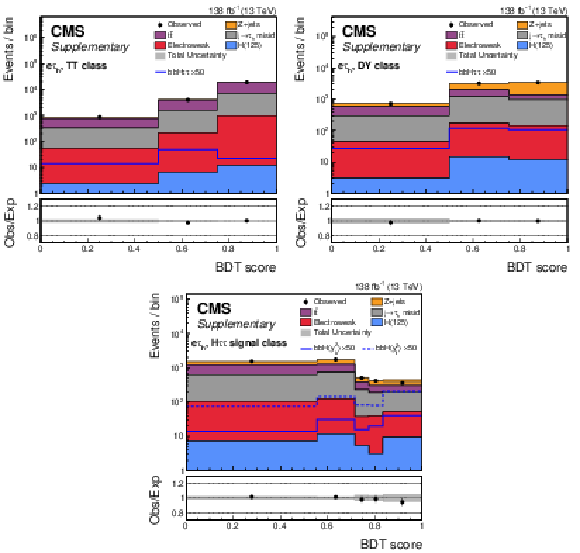
Additional BDT score distributions for the $ \mathrm{e}\mu $ channel. The training was performed on 4 classes, the $ H\to WW $ signal category is shown in the lower right part of Fig. 2 in the main body of the letter. Here the TT and DY background categories are shown on the upper left and right respectively, while the $ H\to\tau\tau $ signal category is shown below. |

png pdf |
Additional Figure 1-a:
Additional BDT score distributions for the $ \mathrm{e}\mu $ channel. The training was performed on 4 classes, the $ H\to WW $ signal category is shown in the lower right part of Fig. 2 in the main body of the letter. Here the TT and DY background categories are shown on the upper left and right respectively, while the $ H\to\tau\tau $ signal category is shown below. |
png pdf |
Additional Figure 1-b:
Additional BDT score distributions for the $ \mathrm{e}\mu $ channel. The training was performed on 4 classes, the $ H\to WW $ signal category is shown in the lower right part of Fig. 2 in the main body of the letter. Here the TT and DY background categories are shown on the upper left and right respectively, while the $ H\to\tau\tau $ signal category is shown below. |
png pdf |
Additional Figure 1-c:
Additional BDT score distributions for the $ \mathrm{e}\mu $ channel. The training was performed on 4 classes, the $ H\to WW $ signal category is shown in the lower right part of Fig. 2 in the main body of the letter. Here the TT and DY background categories are shown on the upper left and right respectively, while the $ H\to\tau\tau $ signal category is shown below. |
png pdf |
Additional Figure 1-d:
Additional BDT score distributions for the $ \mathrm{e}\mu $ channel. The training was performed on 4 classes, the $ H\to WW $ signal category is shown in the lower right part of Fig. 2 in the main body of the letter. Here the TT and DY background categories are shown on the upper left and right respectively, while the $ H\to\tau\tau $ signal category is shown below. |
png pdf |
Additional Figure 2:
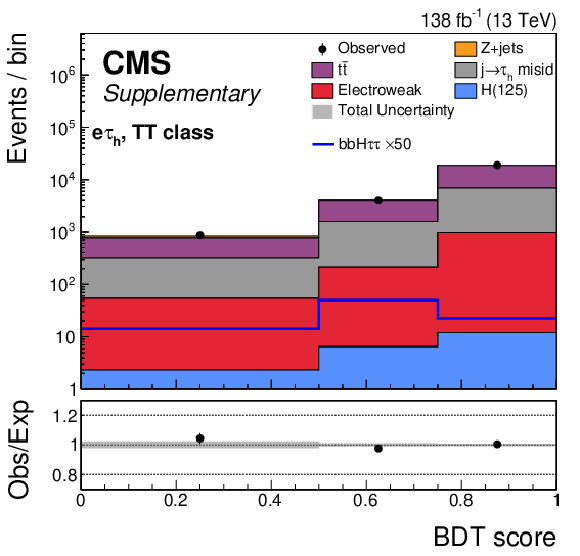
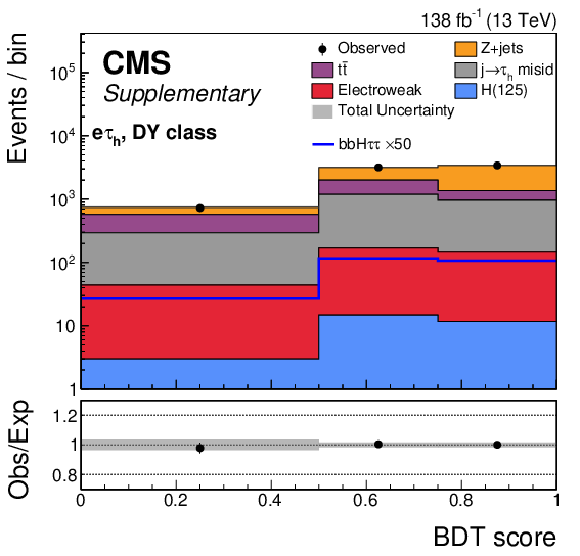
Additional BDT score distributions for the $ \mathrm{e}\tau_{h} $ channel. The training was performed on 3 classes, the $ H\to \tau\tau $ signal category is shown in the upper left part of Fig. 2 in the main body of the letter. Here the TT and DY background categories are shown on the left and right respectively. |
png pdf |
Additional Figure 2-a:
Additional BDT score distributions for the $ \mathrm{e}\tau_{h} $ channel. The training was performed on 3 classes, the $ H\to \tau\tau $ signal category is shown in the upper left part of Fig. 2 in the main body of the letter. Here the TT and DY background categories are shown on the left and right respectively. |
png pdf |
Additional Figure 2-b:
Additional BDT score distributions for the $ \mathrm{e}\tau_{h} $ channel. The training was performed on 3 classes, the $ H\to \tau\tau $ signal category is shown in the upper left part of Fig. 2 in the main body of the letter. Here the TT and DY background categories are shown on the left and right respectively. |

png pdf |
Additional Figure 2-c:
Additional BDT score distributions for the $ \mathrm{e}\tau_{h} $ channel. The training was performed on 3 classes, the $ H\to \tau\tau $ signal category is shown in the upper left part of Fig. 2 in the main body of the letter. Here the TT and DY background categories are shown on the left and right respectively. |
png pdf |
Additional Figure 3:
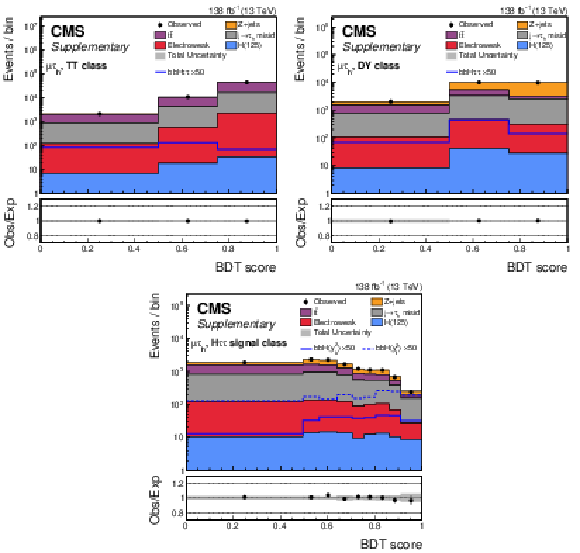
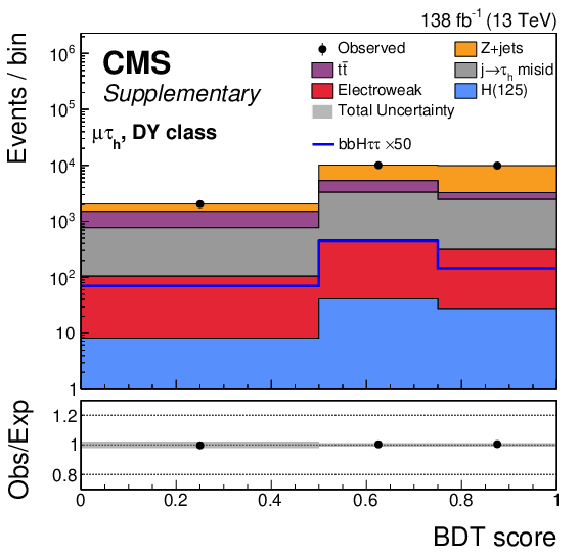
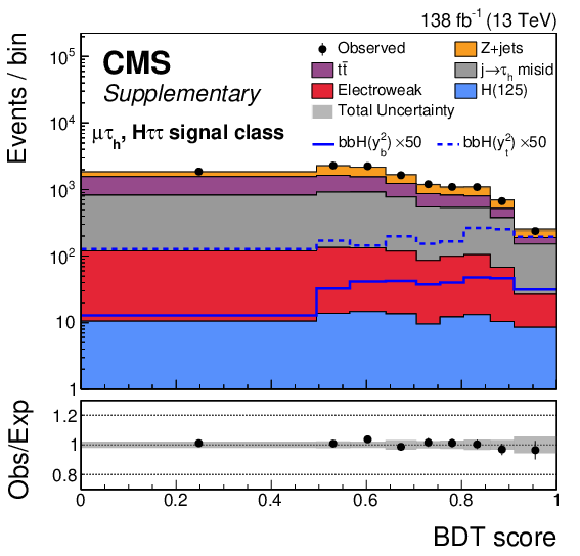
Additional BDT score distributions for the $ \mu\tau_{h} $ channel. The training was performed on 3 classes, the $ H\to \tau\tau $ signal category is shown in the upper right part of Fig. 2 in the main body of the letter. Here the TT and DY background categories are shown on the left and right respectively. |

png pdf |
Additional Figure 3-a:
Additional BDT score distributions for the $ \mu\tau_{h} $ channel. The training was performed on 3 classes, the $ H\to \tau\tau $ signal category is shown in the upper right part of Fig. 2 in the main body of the letter. Here the TT and DY background categories are shown on the left and right respectively. |
png pdf |
Additional Figure 3-b:
Additional BDT score distributions for the $ \mu\tau_{h} $ channel. The training was performed on 3 classes, the $ H\to \tau\tau $ signal category is shown in the upper right part of Fig. 2 in the main body of the letter. Here the TT and DY background categories are shown on the left and right respectively. |
png pdf |
Additional Figure 3-c:
Additional BDT score distributions for the $ \mu\tau_{h} $ channel. The training was performed on 3 classes, the $ H\to \tau\tau $ signal category is shown in the upper right part of Fig. 2 in the main body of the letter. Here the TT and DY background categories are shown on the left and right respectively. |

png pdf |
Additional Figure 4:
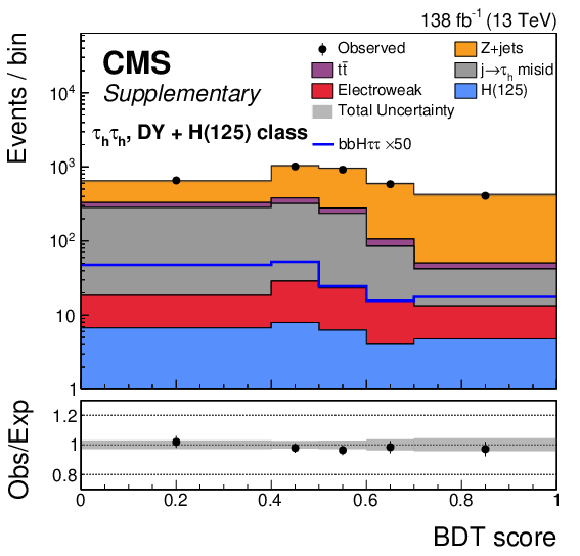
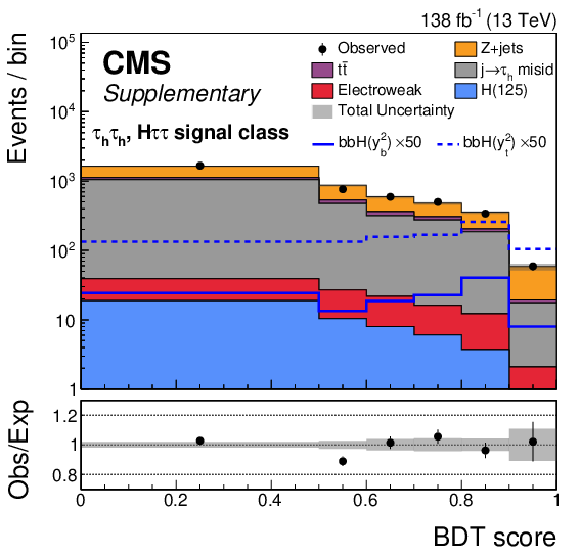
Additional BDT score distributions for the $ \tau_{h}\tau_{h} $ channel. The training was performed on 5 classes, the $ H\to \tau\tau $ signal category is shown in the lower left part of Fig. 2 in the main body of the letter. Here the TT and Jet fakes background categories are shown on the upper left and right respectively, while the DY and H(125) are shown below merged in one distribution. |

png pdf |
Additional Figure 4-a:
Additional BDT score distributions for the $ \tau_{h}\tau_{h} $ channel. The training was performed on 5 classes, the $ H\to \tau\tau $ signal category is shown in the lower left part of Fig. 2 in the main body of the letter. Here the TT and Jet fakes background categories are shown on the upper left and right respectively, while the DY and H(125) are shown below merged in one distribution. |

png pdf |
Additional Figure 4-b:
Additional BDT score distributions for the $ \tau_{h}\tau_{h} $ channel. The training was performed on 5 classes, the $ H\to \tau\tau $ signal category is shown in the lower left part of Fig. 2 in the main body of the letter. Here the TT and Jet fakes background categories are shown on the upper left and right respectively, while the DY and H(125) are shown below merged in one distribution. |
png pdf |
Additional Figure 4-c:
Additional BDT score distributions for the $ \tau_{h}\tau_{h} $ channel. The training was performed on 5 classes, the $ H\to \tau\tau $ signal category is shown in the lower left part of Fig. 2 in the main body of the letter. Here the TT and Jet fakes background categories are shown on the upper left and right respectively, while the DY and H(125) are shown below merged in one distribution. |
png pdf |
Additional Figure 4-d:
Additional BDT score distributions for the $ \tau_{h}\tau_{h} $ channel. The training was performed on 5 classes, the $ H\to \tau\tau $ signal category is shown in the lower left part of Fig. 2 in the main body of the letter. Here the TT and Jet fakes background categories are shown on the upper left and right respectively, while the DY and H(125) are shown below merged in one distribution. |
png pdf |
Additional Figure 5:
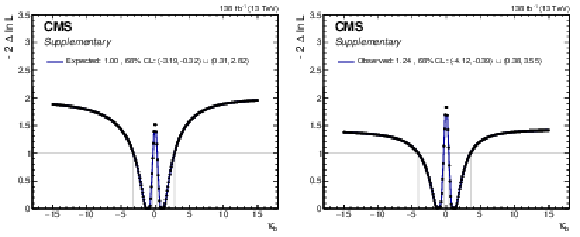
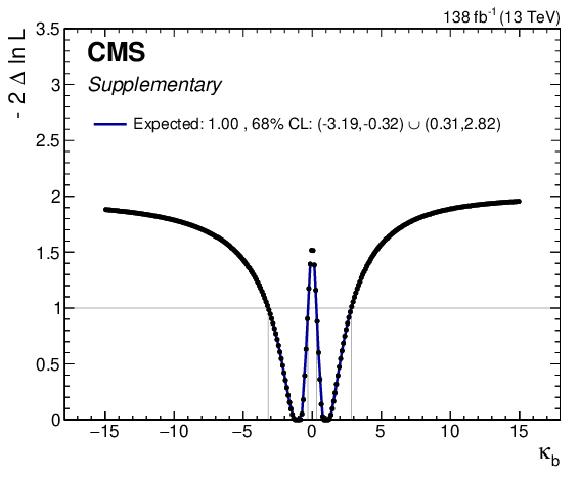
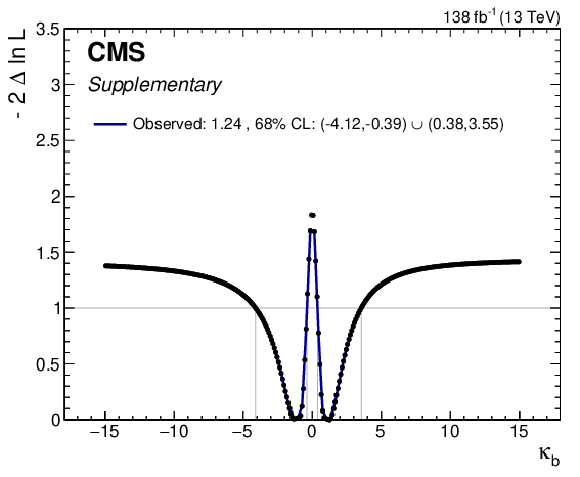
Likelihood scan with respect to $ \kappa_\mathrm{b} $ based on this work keeping $ \kappa_\mathrm{t} $ frozen to 1. On the left the likelihood function is profiled with respect to an Asimov dataset, on the right the fit to data is profiled. |
png pdf |
Additional Figure 5-a:
Likelihood scan with respect to $ \kappa_\mathrm{b} $ based on this work keeping $ \kappa_\mathrm{t} $ frozen to 1. On the left the likelihood function is profiled with respect to an Asimov dataset, on the right the fit to data is profiled. |
png pdf |
Additional Figure 5-b:
Likelihood scan with respect to $ \kappa_\mathrm{b} $ based on this work keeping $ \kappa_\mathrm{t} $ frozen to 1. On the left the likelihood function is profiled with respect to an Asimov dataset, on the right the fit to data is profiled. |
png pdf |
Additional Figure 6:
Upper limits at 95% CL on the bottom-associated production of the Higgs boson mediated via Yukawa coupling to t and b quarks. Limits are obtained by performing a separate fit on data removing the theory normalization uncertainties. The red line shows the theoretical prediction with the uncertainties on the different terms treated as independent in a conservative approach. |
png pdf |
Additional Figure 7:
Two-dimensional confidence intervals on the $ \kappa_\mathrm{b} $ and $ \kappa_\mathrm{t} $ parameters for the channels studied in this search. Expected limits are shown in red for the $ H\to\tau\tau $ cross section measurement performed on other production mechanisms, in black for this analysis, and in green for the combination of the two. The observed limits on data are shown in blue, with a cross marking the best-fit point. A green diamond is placed to mark the SM expectation. Solid lines with shaded areas mark the 50% CL contours, while lighter shaded areas delimited by dashed lines mark the 68% CL ones, and the dotted lines mark the 95% CL contours. |

png pdf |
Additional Figure 8:
Two-dimensional confidence intervals on the $ \kappa_\mathrm{b} $ and $ \kappa_\mathrm{t} $ parameters for the channels studied in this search. Expected limits are shown in red for the $ H\to\tau\tau $ cross section measurement performed on other production mechanisms, in black for this analysis, and green for the combination of the two. A green diamond is placed to mark the SM expectation. Solid lines with shaded areas mark the 50% CL contours, while lighter shaded areas delimited by dashed lines mark the 68% CL ones, and the dotted lines mark the 95% CL contours. |

png pdf |
Additional Figure 9:
Two-dimensional confidence intervals on the $ \kappa_\mathrm{b} $ and $ \kappa_\mathrm{t} $ parameters for the channels studied in this search. Observed limits are shown in purple for the $ H\to\tau\tau $ cross section measurement performed on other production mechanisms, in gold for this analysis, and blue for the combination of the two. A green diamond is placed to mark the SM expectation, while a cross is used to mark the best-fit points. Solid lines with shaded areas mark the 50% CL contours, while lighter shaded areas delimited by dashed lines mark the 68% CL ones, and the dotted lines mark the 95% CL contours. |
| Additional Tables | |

png pdf |
Additional Table 1:
Expected and observed upper limits on the signal strength modifier calculated using bbH($ y_\mathrm{b}^2 $) as the signal, bbH($ y_\mathrm{t}^2 $) as background, and neglecting the interference term. The limits were obtained without a dedicated optimization of the analysis techniques to target the bbH($ y_\mathrm{b}^2 $) signal and reduce the bbH($ y_\mathrm{t}^2 $) contribution to the analysis region. |
png pdf |
Additional Table 2:
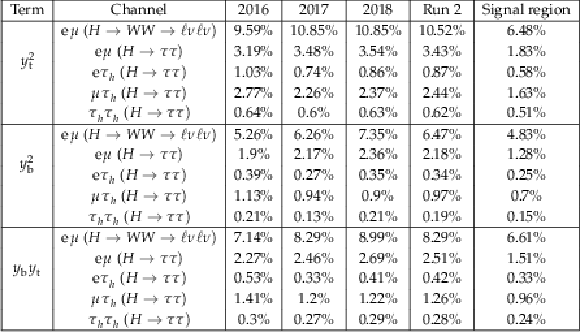
Fraction of simulated events for each signal term selected in each year after the baseline selection in this analysis. The last two columns show the cumulative fraction of events selected across all simulated events in the full analysis region and the signal region targeting the bbH process respectively. |

png pdf |
Additional Table 3:
Fraction of simulated events for each signal term for 2016 with/without the higher pt cut from 2017. |
| References | ||||
| 1 | ATLAS Collaboration | Observation of a new particle in the search for the standard model Higgs boson with the ATLAS detector at the LHC | PLB 716 (2012) 1 | 1207.7214 |
| 2 | CMS Collaboration | Observation of a new boson at a mass of 125 GeV with the CMS experiment at the LHC | PLB 716 (2012) 30 | CMS-HIG-12-028 1207.7235 |
| 3 | CMS Collaboration | Observation of a new boson with mass near 125 GeV in $ pp $ collisions at $ \sqrt{s} = $ 7 and 8 TeV | JHEP 06 (2013) 081 | CMS-HIG-12-036 1303.4571 |
| 4 | ATLAS Collaboration | The ATLAS experiment at the CERN Large Hadron Collider | JINST 3 (2008) S08003 | |
| 5 | CMS Collaboration | The CMS experiment at the CERN LHC | JINST 3 (2008) S08004 | |
| 6 | ATLAS Collaboration | A detailed map of Higgs boson interactions by the ATLAS experiment ten years after the discovery | Nature 607 (2022) 52 | 2207.00092 |
| 7 | CMS Collaboration | A portrait of the Higgs boson by the CMS experiment ten years after the discovery | Nature 607 (2022) 60 | CMS-HIG-22-001 2207.00043 |
| 8 | LHC Higgs Cross Section Working Group | Handbook of LHC Higgs Cross Sections: 4. Deciphering the Nature of the Higgs Sector | , , volume 2/. CERN, 10, 2017 link |
|
| 9 | S. Dawson, C. B. Jackson, L. Reina, and D. Wackeroth | Exclusive Higgs boson production with bottom quarks at hadron colliders | PRD 69 (2004) 074027 | |
| 10 | S. Dittmaier, M. Krämer, and M. Spira | Higgs radiation off bottom quarks at the Fermilab Tevatron and the CERN LHC | PRD 70 (2004) 074010 | |
| 11 | R. V. Harlander and W. B. Kilgore | Higgs boson production in bottom quark fusion at next-to-next-to-leading order | PRD 68 (2003) 013001 | |
| 12 | S. Forte, D. Napoletano, and M. Ubiali | Higgs production in bottom-quark fusion in a matched scheme | PLB 751 (2015) 331 | |
| 13 | S. Forte, D. Napoletano, and M. Ubiali | Higgs production in bottom-quark fusion: Matching beyond leading order | PLB 763 (2016) 190 | |
| 14 | M. Bonvini, A. S. Papanastasiou, and F. J. Tackmann | Resummation and matching of b-quark mass effects in $ b\overline{b}H $ production | JHEP 11 (2015) 196 | 1508.03288 |
| 15 | M. Bonvini, A. S. Papanastasiou, and F. J. Tackmann | Matched predictions for the $ b\overline{b}H $ cross section at the 13 TeV LHC | JHEP 10 (2016) 053 | 1605.01733 |
| 16 | ATLAS Collaboration | Observation of Higgs boson production in association with a top quark pair at the LHC with the ATLAS detector | PLB 784 (2018) 173 | 1806.00425 |
| 17 | CMS Collaboration | Observation of $ \mathrm{t\overline{t}} $H production | PRL 120 (2018) 231801 | CMS-HIG-17-035 1804.02610 |
| 18 | D. Pagani, H.-S. Shao, and M. Zaro | RIP $ {H}b\overline{b} $: how other Higgs production modes conspire to kill a rare signal at the LHC | JHEP 11 (2020) 036 | 2005.10277 |
| 19 | CMS Collaboration | Search for additional neutral MSSM Higgs bosons in the $ \tau\tau $ final state in proton-proton collisions at $ \sqrt{s}= $ 13 TeV | JHEP 09 (2018) 007 | CMS-HIG-17-020 1803.06553 |
| 20 | CMS Collaboration | Searches for additional Higgs bosons and for vector leptoquarks in $ \tau\tau $ final states in proton-proton collisions at $ \sqrt{s} = $ 13 TeV | JHEP 07 (2023) 073 | CMS-HIG-21-001 2208.02717 |
| 21 | CMS Collaboration | HEPData record for this analysis | link | |
| 22 | N. Deutschmann, F. Maltoni, M. Wiesemann, and M. Zaro | Top-Yukawa contributions to bbH production at the LHC | JHEP 07 (2019) 054 | 1808.01660 |
| 23 | CMS Collaboration | Performance of the CMS Level-1 trigger in proton-proton collisions at $ \sqrt{s} = $ 13 TeV | JINST 15 (2020) P10017 | CMS-TRG-17-001 2006.10165 |
| 24 | CMS Collaboration | The CMS trigger system | JINST 12 (2017) P01020 | CMS-TRG-12-001 1609.02366 |
| 25 | CMS Collaboration | Electron and photon reconstruction and identification with the CMS experiment at the CERN LHC | JINST 16 (2021) P05014 | CMS-EGM-17-001 2012.06888 |
| 26 | CMS Collaboration | Performance of the CMS muon detector and muon reconstruction with proton-proton collisions at $ \sqrt{s}= $ 13 TeV | JINST 13 (2018) P06015 | CMS-MUO-16-001 1804.04528 |
| 27 | CMS Collaboration | Description and performance of track and primary-vertex reconstruction with the CMS tracker | JINST 9 (2014) P10009 | CMS-TRK-11-001 1405.6569 |
| 28 | CMS Collaboration | Particle-flow reconstruction and global event description with the CMS detector | JINST 12 (2017) P10003 | CMS-PRF-14-001 1706.04965 |
| 29 | CMS Collaboration | Performance of reconstruction and identification of $ \tau $ leptons decaying to hadrons and $ \nu_\tau $ in pp collisions at $ \sqrt{s}= $ 13 TeV | JINST 13 (2018) P10005 | CMS-TAU-16-003 1809.02816 |
| 30 | CMS Collaboration | Jet energy scale and resolution in the CMS experiment in pp collisions at 8 TeV | JINST 12 (2017) P02014 | CMS-JME-13-004 1607.03663 |
| 31 | CMS Collaboration | Performance of missing transverse momentum reconstruction in proton-proton collisions at $ \sqrt{s} = $ 13 TeV using the CMS detector | JINST 14 (2019) P07004 | CMS-JME-17-001 1903.06078 |
| 32 | J. Alwall et al. | The automated computation of tree-level and next-to-leading order differential cross sections, and their matching to parton shower simulations | JHEP 07 (2014) 079 | 1405.0301 |
| 33 | S. Frixione, P. Nason, and C. Oleari | Matching NLO QCD computations with parton shower simulations: the POWHEG method | JHEP 11 (2007) 070 | 0709.2092 |
| 34 | S. Alioli, P. Nason, C. Oleari, and E. Re | A general framework for implementing NLO calculations in shower Monte Carlo programs: the POWHEG BOX | JHEP 06 (2010) 043 | 1002.2581 |
| 35 | P. Nason | A new method for combining NLO QCD with shower Monte Carlo algorithms | JHEP 11 (2004) 040 | hep-ph/0409146 |
| 36 | NNPDF Collaboration | Parton distributions from high-precision collider data | EPJC 77 (2017) 663 | 1706.00428 |
| 37 | T. Sjöstrand et al. | An introduction to PYTHIA 8.2 | Comput. Phys. Commun. 191 (2015) 159 | 1410.3012 |
| 38 | CMS Collaboration | Extraction and validation of a new set of CMS PYTHIA8 tunes from underlying-event measurements | EPJC 80 (2020) 4 | CMS-GEN-17-001 1903.12179 |
| 39 | GEANT4 Collaboration | GEANT 4---a simulation toolkit | NIM A 506 (2003) 250 | |
| 40 | R. Frederix and S. Frixione | Merging meets matching in MC@NLO | JHEP 12 (2012) 061 | 1209.6215 |
| 41 | E. Bols et al. | Jet flavour classification using DeepJet | JINST 15 (2020) P12012 | |
| 42 | CMS Collaboration | Identification of hadronic tau lepton decays using a deep neural network | JINST 17 (2022) P07023 | CMS-TAU-20-001 2201.08458 |
| 43 | CMS Collaboration | Measurement of the $ \mathrm{Z}\gamma^{*} \to \tau\tau $ cross section in pp collisions at $ \sqrt{s} = $ 13 TeV and validation of $ \tau $ lepton analysis techniques | EPJC 78 (2018) 708 | CMS-HIG-15-007 1801.03535 |
| 44 | CDF Collaboration | A measurement of the ratio $ \sigma \times {B}(p\bar{p} \to {W} \to e \nu) / \sigma \times {B}(p\bar{p} \to {Z}^0 \to e e) $ in $ p\bar{p} $ collisions at $ \sqrt{s} = $ 1800 GeV | PRD 52 (1995) 2624 | |
| 45 | CMS Collaboration | Observation of the Higgs boson decay to a pair of $ \tau $ leptons with the CMS detector | PLB 779 (2018) 283 | CMS-HIG-16-043 1708.00373 |
| 46 | CMS Collaboration | Pileup mitigation at CMS in 13 TeV data | JINST 15 (2020) P09018 | CMS-JME-18-001 2003.00503 |
| 47 | CMS Collaboration | Identification of heavy-flavour jets with the CMS detector in pp collisions at 13 TeV | JINST 13 (2018) P05011 | CMS-BTV-16-002 1712.07158 |
| 48 | CMS Collaboration | Measurement of the Higgs boson production rate in association with top quarks in final states with electrons, muons, and hadronically decaying tau leptons at $ \sqrt{s} = $ 13 TeV | EPJC 81 (2021) 378 | CMS-HIG-19-008 2011.03652 |
| 49 | L. Bianchini, J. Conway, E. K. Friis, and C. Veelken | Reconstruction of the Higgs mass in $ {H} \to \tau\tau $ events by dynamical likelihood techniques | J. Phys. Conf. Ser. 513 (2014) 022035 | |
| 50 | A. Elagin, P. Murat, A. Pranko, and A. Safonov | A new mass reconstruction technique for resonances decaying to di-tau | NIM A 654 (2011) 481 | 1012.4686 |
| 51 | CDF Collaboration | Search for neutral MSSM Higgs bosons decaying to tau pairs in $ p\bar{p} $ collisions at $ \sqrt{s} = $ 1.96 TeV | PRL 96 (2006) 011802 | hep-ex/0508051 |
| 52 | CMS Collaboration | Precision luminosity measurement in proton-proton collisions at $ \sqrt{s} = $ 13 TeV in 2015 and 2016 at CMS | EPJC 81 (2021) 800 | CMS-LUM-17-003 2104.01927 |
| 53 | CMS Collaboration | CMS luminosity measurement for the 2017 data-taking period at $ \sqrt{s} = $ 13 TeV | CMS Physics Analysis Summary, 2018 link |
CMS-PAS-LUM-17-004 |
| 54 | CMS Collaboration | CMS luminosity measurement for the 2018 data-taking period at $ \sqrt{s} = $ 13 TeV | CMS Physics Analysis Summary, 2019 link |
CMS-PAS-LUM-18-002 |
| 55 | J. M. Campbell, R. K. Ellis, and C. Williams | Vector boson pair production at the LHC | JHEP 07 (2011) 018 | 1105.0020 |
| 56 | T. Gehrmann et al. | $ W^+W^- $ production at hadron colliders in next to next to leading order QCD | PRL 113 (2014) 212001 | 1408.5243 |
| 57 | M. Czakon and A. Mitov | Top++: A program for the calculation of the top-pair cross-section at hadron colliders | Comput. Phys. Commun. 185 (2014) 2930 | 1112.5675 |
| 58 | N. Kidonakis | Top quark production | in Helmholtz International Summer School on Physics of Heavy Quarks and Hadrons, 2014 link |
1311.0283 |
| 59 | K. Melnikov and F. Petriello | Electroweak gauge boson production at hadron colliders through $ O(\alpha_s^2) $ | PRD 74 (2006) 114017 | hep-ph/0609070 |
| 60 | R. Gavin, Y. Li, F. Petriello, and S. Quackenbush | FEWZ 2.0: A code for hadronic z production at next-to-next-to-leading order | Computer Physics Communications 182 (2011) 2388 | |
| 61 | CMS Collaboration | Measurement of the cross section for top quark pair production in association with a W or Z boson in proton-proton collisions at $ \sqrt{s} = $ 13 TeV | JHEP 08 (2018) 011 | CMS-TOP-17-005 1711.02547 |
| 62 | CMS Collaboration | Differential cross section measurements for the production of top quark pairs and of additional jets using dilepton events from pp collisions at $ \sqrt{s} = $ 13 TeV | Submitted to the JHEP, 2024 | CMS-TOP-20-006 2402.08486 |
| 63 | R. J. Barlow and C. Beeston | Fitting using finite Monte Carlo samples | Comput. Phys. Commun. 77 (1993) 219 | |
| 64 | J. S. Conway | Incorporating nuisance parameters in likelihoods for multisource spectra | PHYSTAT (2011) 115 | 1103.0354 |
| 65 | CMS Collaboration | The CMS statistical analysis and combination tool: Combine | Accepted by Comput. Softw. Big Sci, 2024 | CMS-CAT-23-001 2404.06614 |
| 66 | T. Junk | Confidence level computation for combining searches with small statistics | NIM A 434 (1999) 435 | hep-ex/9902006 |
| 67 | A. L. Read | Presentation of search results: The CL$ _{\text{s}} $ technique | JPG 28 (2002) 2693 | |
| 68 | The ATLAS Collaboration, The CMS Collaboration, The LHC Higgs Combination Group | Procedure for the LHC Higgs boson search combination in Summer 2011 | Technical Report CMS-NOTE-2011-005, ATL-PHYS-PUB-2011-11, 2011 | |
| 69 | G. Cowan, K. Cranmer, E. Gross, and O. Vitells | Asymptotic formulae for likelihood-based tests of new physics | EPJC 71 (2011) 1554 | 1007.1727 |
| 70 | CMS Collaboration | Measurements of Higgs boson production in the decay channel with a pair of $ \tau $ leptons in proton-proton collisions at $ \sqrt{s}= $ 13 TeV | EPJC 83 (2023) 562 | CMS-HIG-19-010 2204.12957 |

|
Compact Muon Solenoid LHC, CERN |

|

|

|

|

|

|