

Compact Muon Solenoid
LHC, CERN
| CMS-B2G-23-009 ; CERN-EP-2025-228 | ||
| Search for single production of a vector-like T quark decaying to a top quark and a neutral scalar boson in the lepton+jets final state in proton-proton collisions at $ \sqrt{s} = $ 13 TeV | ||
| CMS Collaboration | ||
| 29 October 2025 | ||
| JHEP 07 (2026) 041 | ||
| Abstract: A search for single production of a vector-like T quark with charge 2$ e$/3, decaying to a top quark and a neutral scalar boson is presented. The boson can be a standard model Higgs boson (H) or a new scalar boson ($ \phi $). In the first case, a branching fraction of 25% is assumed for the decay $ \mathrm{T} \to\mathrm{t} \mathrm{H} $, while in the second case the T quark is assumed to decay exclusively to $ \mathrm{t} \phi $. The top quark is identified via its lepton+jets decay, and the neutral boson via its decay into a bottom quark-antiquark pair. Final states with Lorentz-boosted topologies are considered and machine-learning techniques are exploited for optimal event classification. The analysis uses data collected by the CMS experiment in proton-proton collisions at a center-of-mass energy of 13 TeV, corresponding to an integrated luminosity of 138 fb$ ^{-1} $ recorded at the CERN LHC in 2016-2018. Upper limits at 95% confidence level are set on the product of cross section and branching fraction for a T quark in a narrow-width approximation. They vary between 14.8 and 0.1 fb, for T quark masses in the range 1-3 TeV and $ \phi $ boson masses in the range 25-250 GeV. These are the first exclusion limits set on the production of a single T quark decaying into a top quark and a new neutral scalar boson. For the decay channel into a top quark and a standard model Higgs boson, the results provide the best limits on production cross sections to date, for T quark masses above 2 TeV. | ||
| Links: e-print arXiv:2510.25874 [hep-ex] (PDF) ; CDS record ; inSPIRE record ; CADI line (restricted) ; | ||
| Figures | |

png pdf |
Figure 1:
A representative leading-order Feynman diagram for the production of a single vector-like quark T decaying into a top quark and a neutral scalar boson, which may be a new scalar boson or an SM Higgs boson. Associated production with a bottom quark in the final state is shown. |
png pdf |
Figure 2:
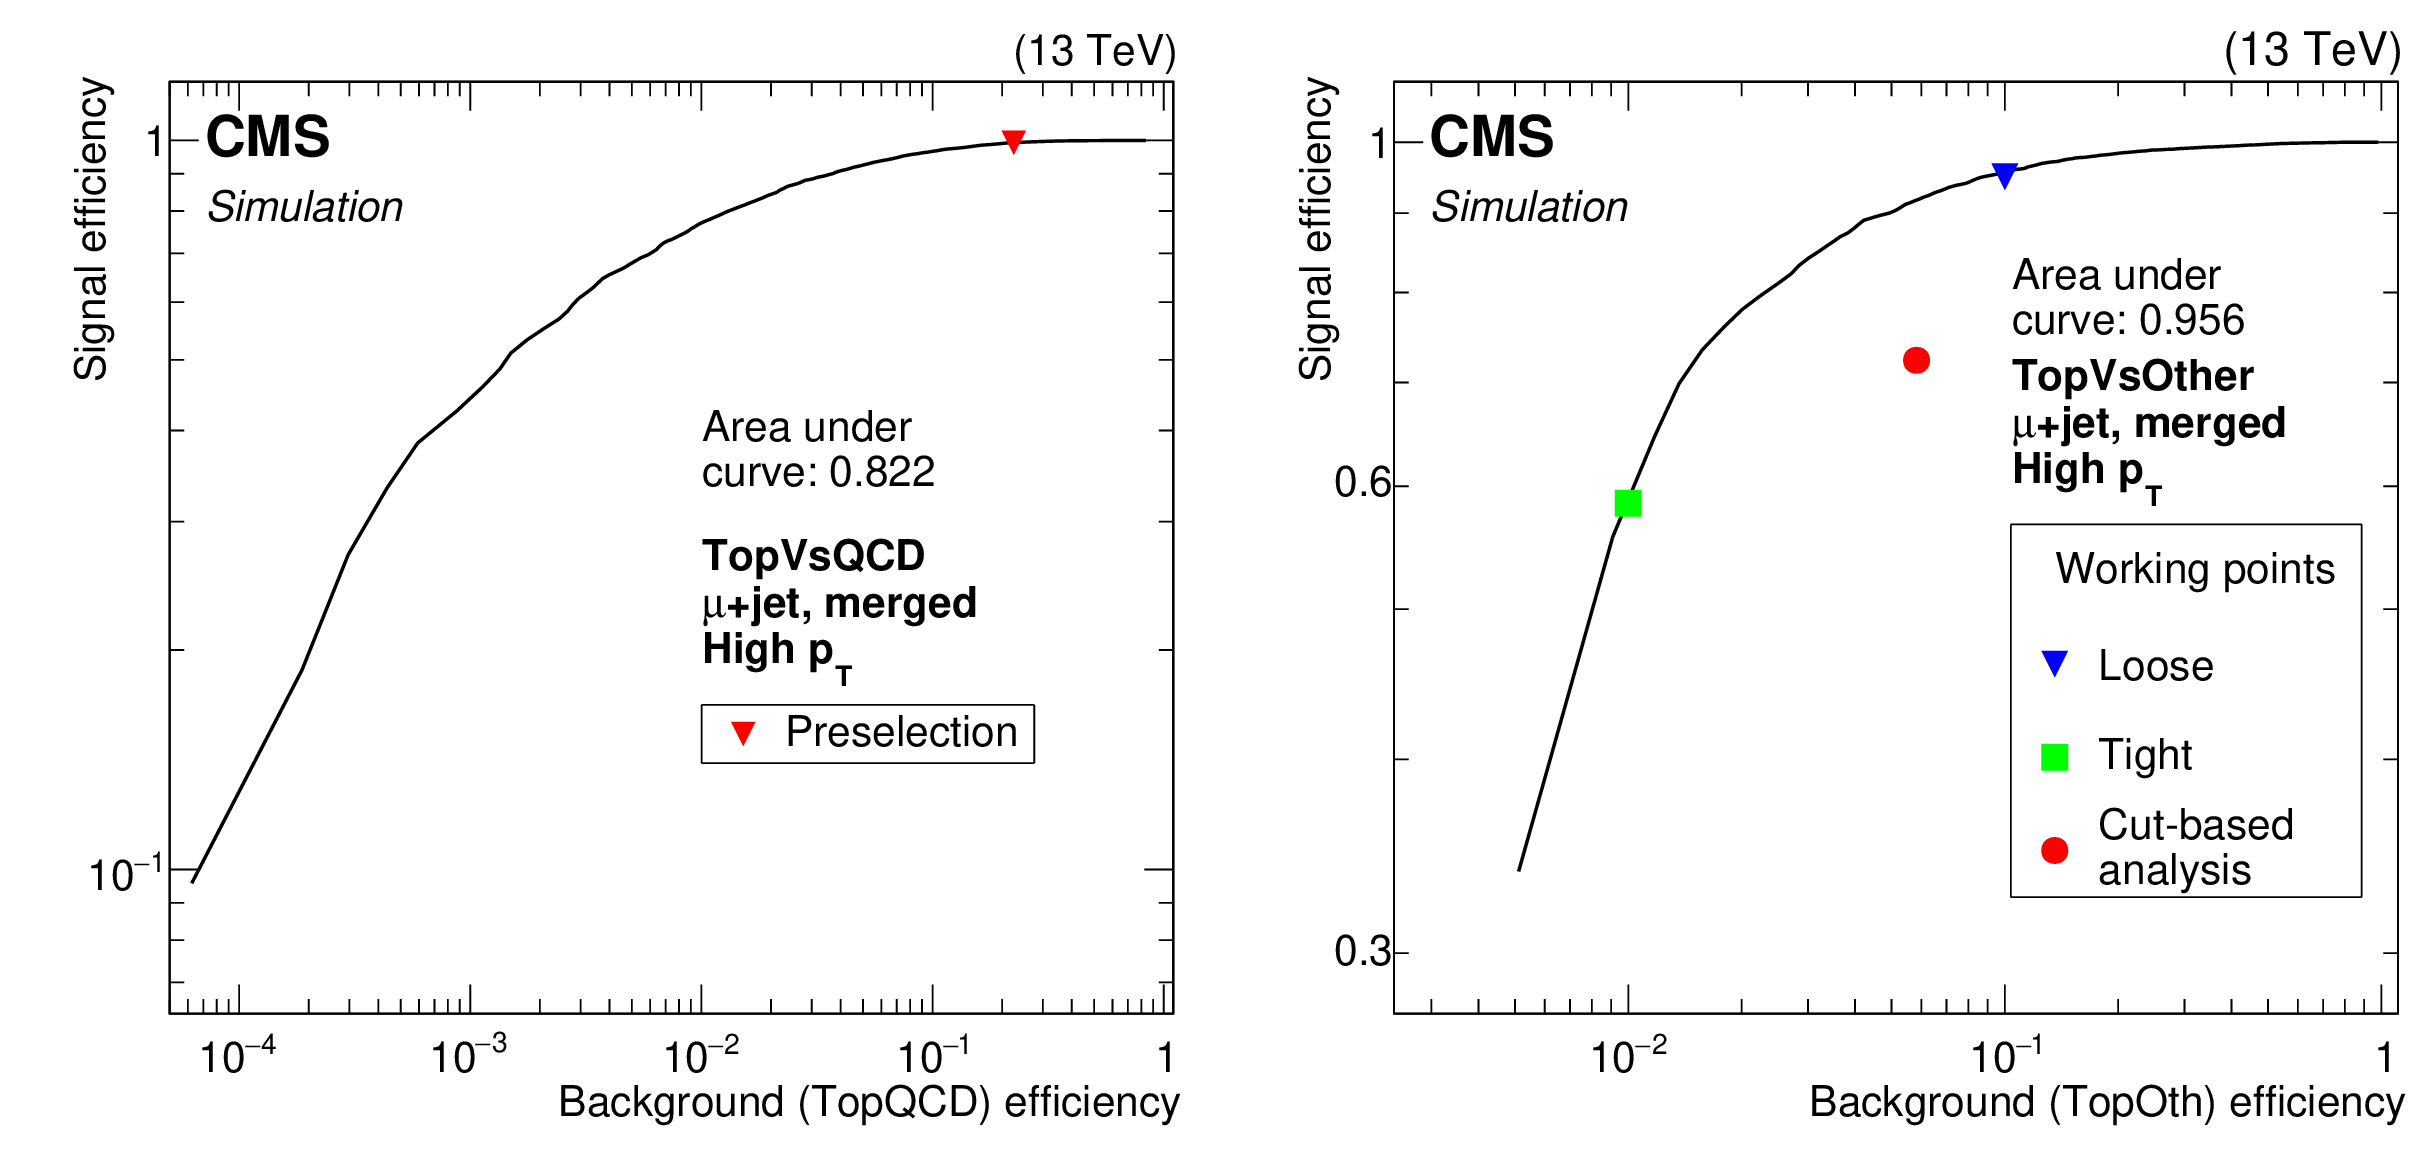
The receiver operating characteristic curve for the TopVsQCD (left) and TopVsOther (right) top quark taggers. The signal efficiency and background misidentification rate are evaluated on top quark candidates with an associated muon, with $ p_{\mathrm{T}} > $ 500 GeV and in the merged configuration in simulated $ \mathrm{t} \overline{\mathrm{T}} $ events. The red triangle in the left plot corresponds to the requirement on the TopVsQCD variable providing a signal efficiency of 99%; the blue triangle and the green square in the right plot correspond to the loose and tight WP of the TopVsOther tagger, respectively. A comparison with a cut-based selection (red point) is also shown in the TopVsOther case. |
png pdf |
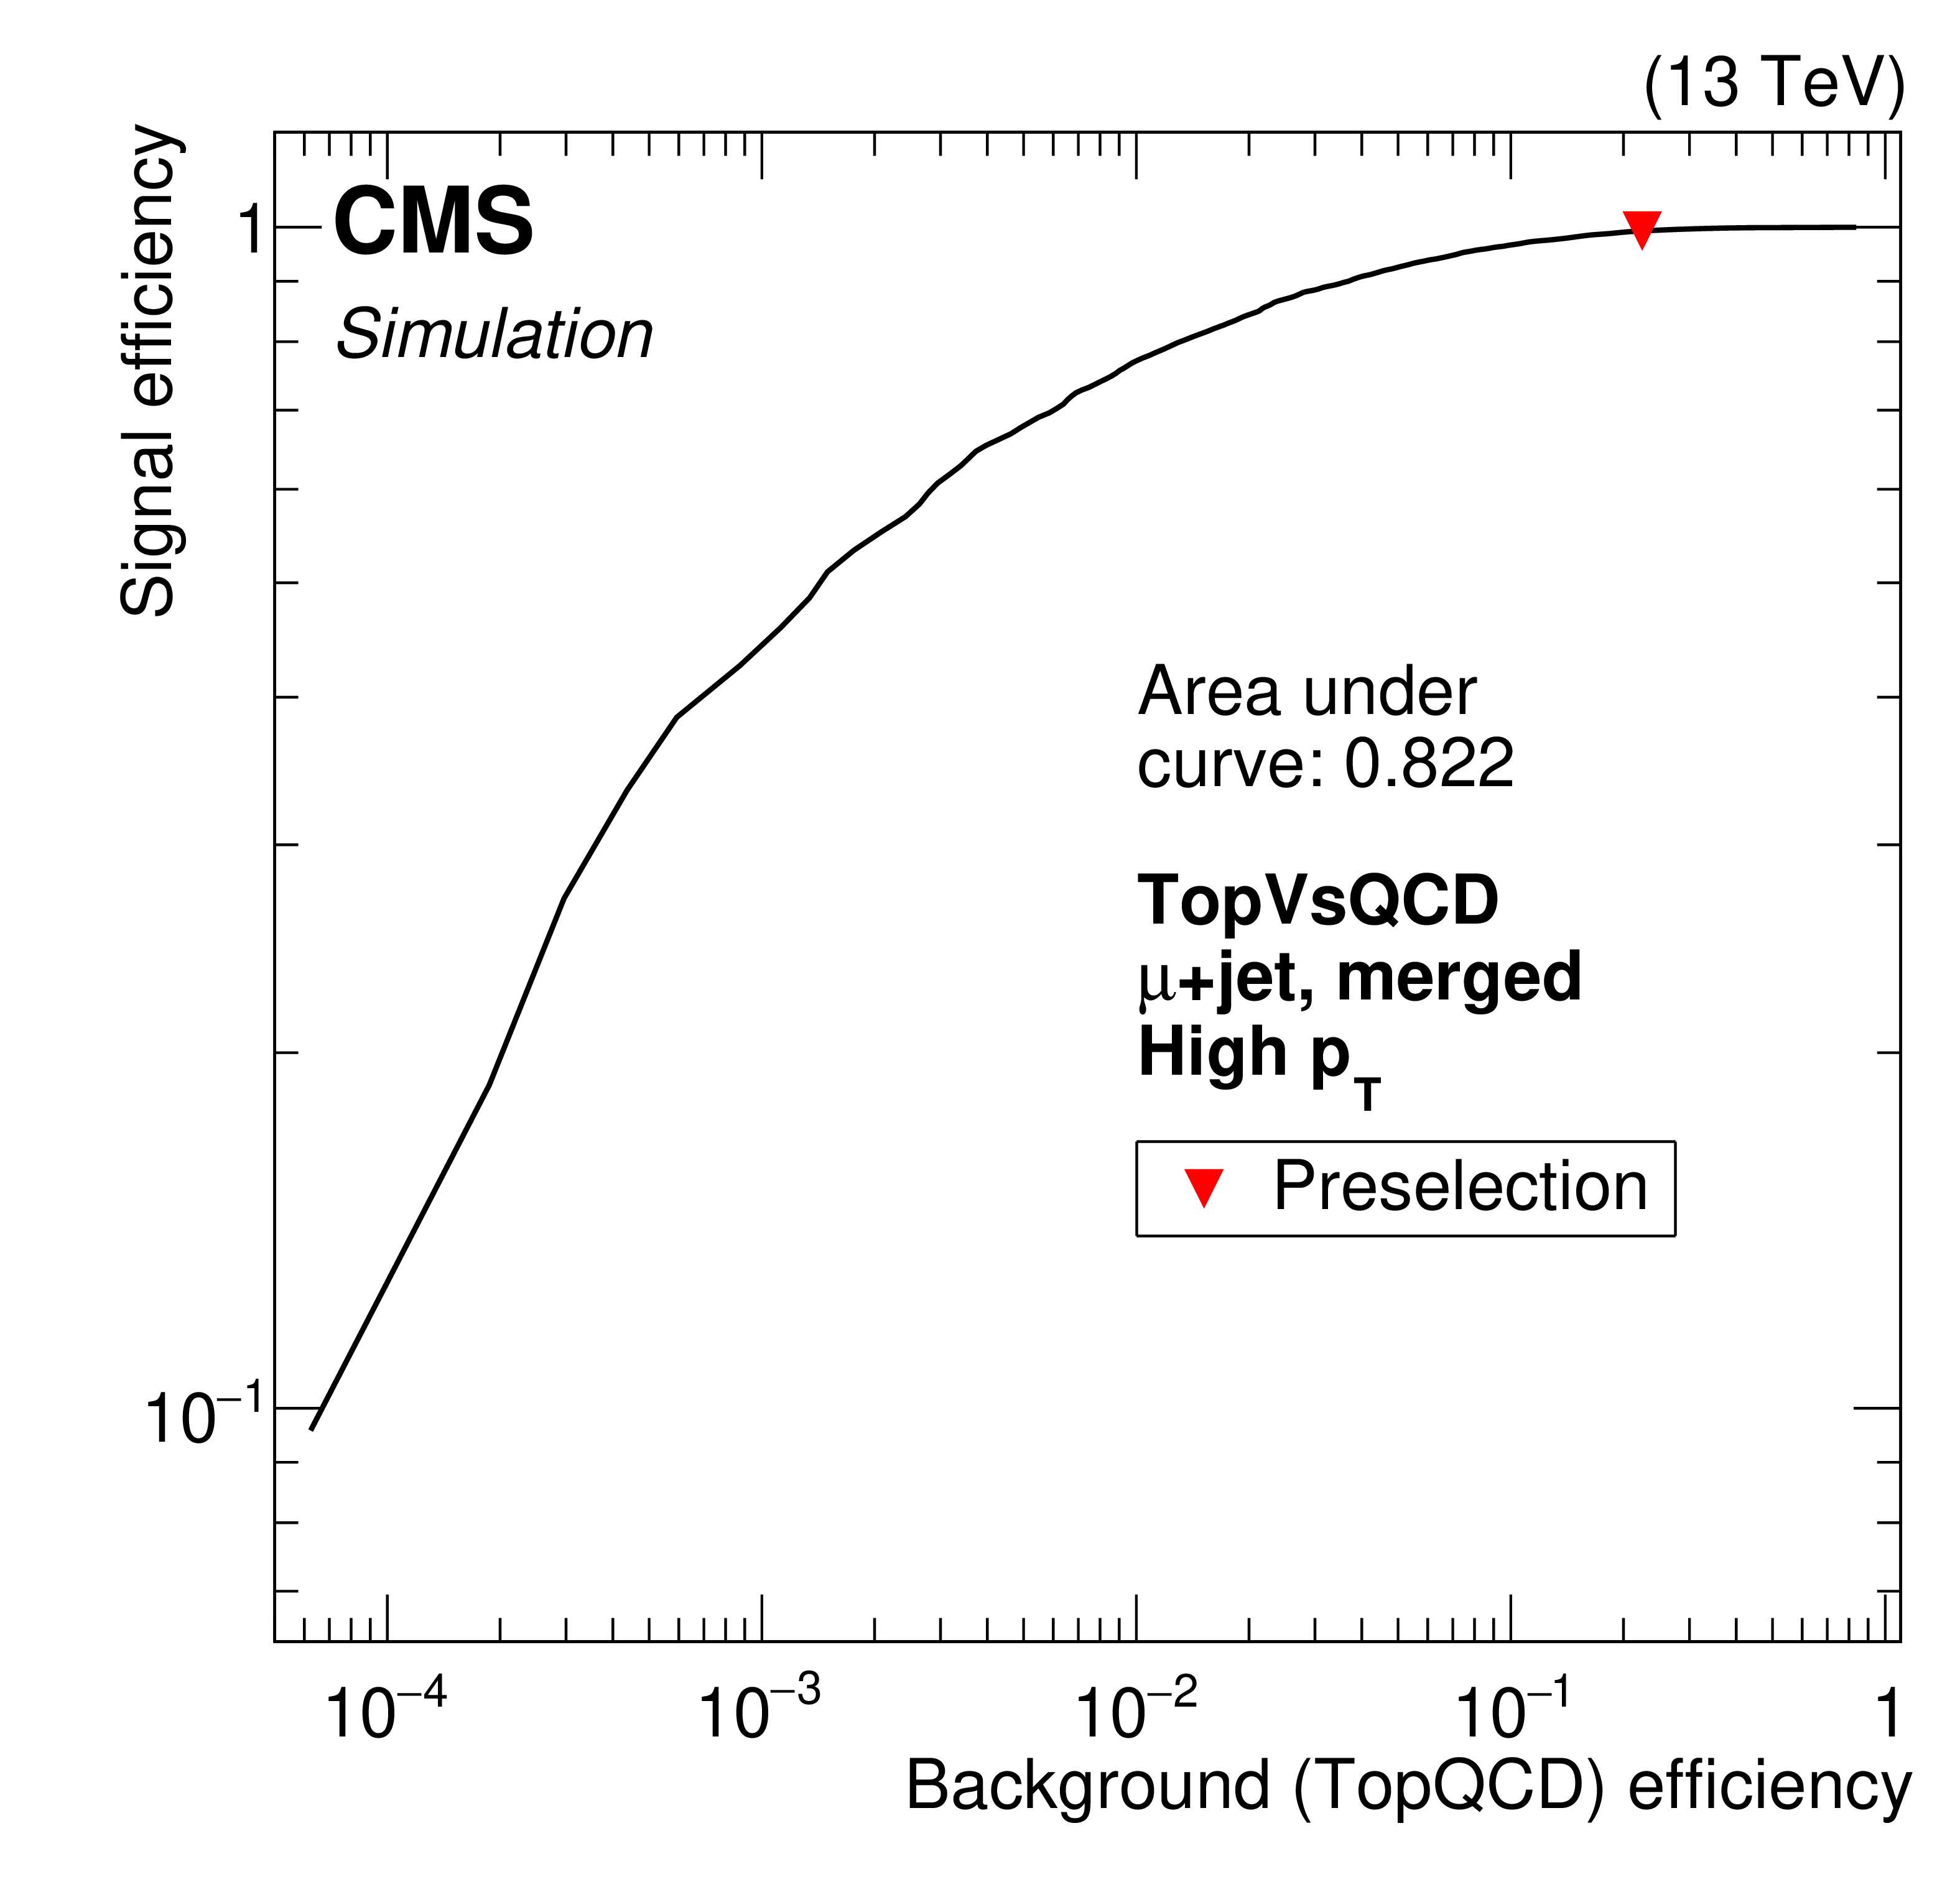
Figure 2-a:
The receiver operating characteristic curve for the TopVsQCD (left) and TopVsOther (right) top quark taggers. The signal efficiency and background misidentification rate are evaluated on top quark candidates with an associated muon, with $ p_{\mathrm{T}} > $ 500 GeV and in the merged configuration in simulated $ \mathrm{t} \overline{\mathrm{T}} $ events. The red triangle in the left plot corresponds to the requirement on the TopVsQCD variable providing a signal efficiency of 99%; the blue triangle and the green square in the right plot correspond to the loose and tight WP of the TopVsOther tagger, respectively. A comparison with a cut-based selection (red point) is also shown in the TopVsOther case. |
png pdf |
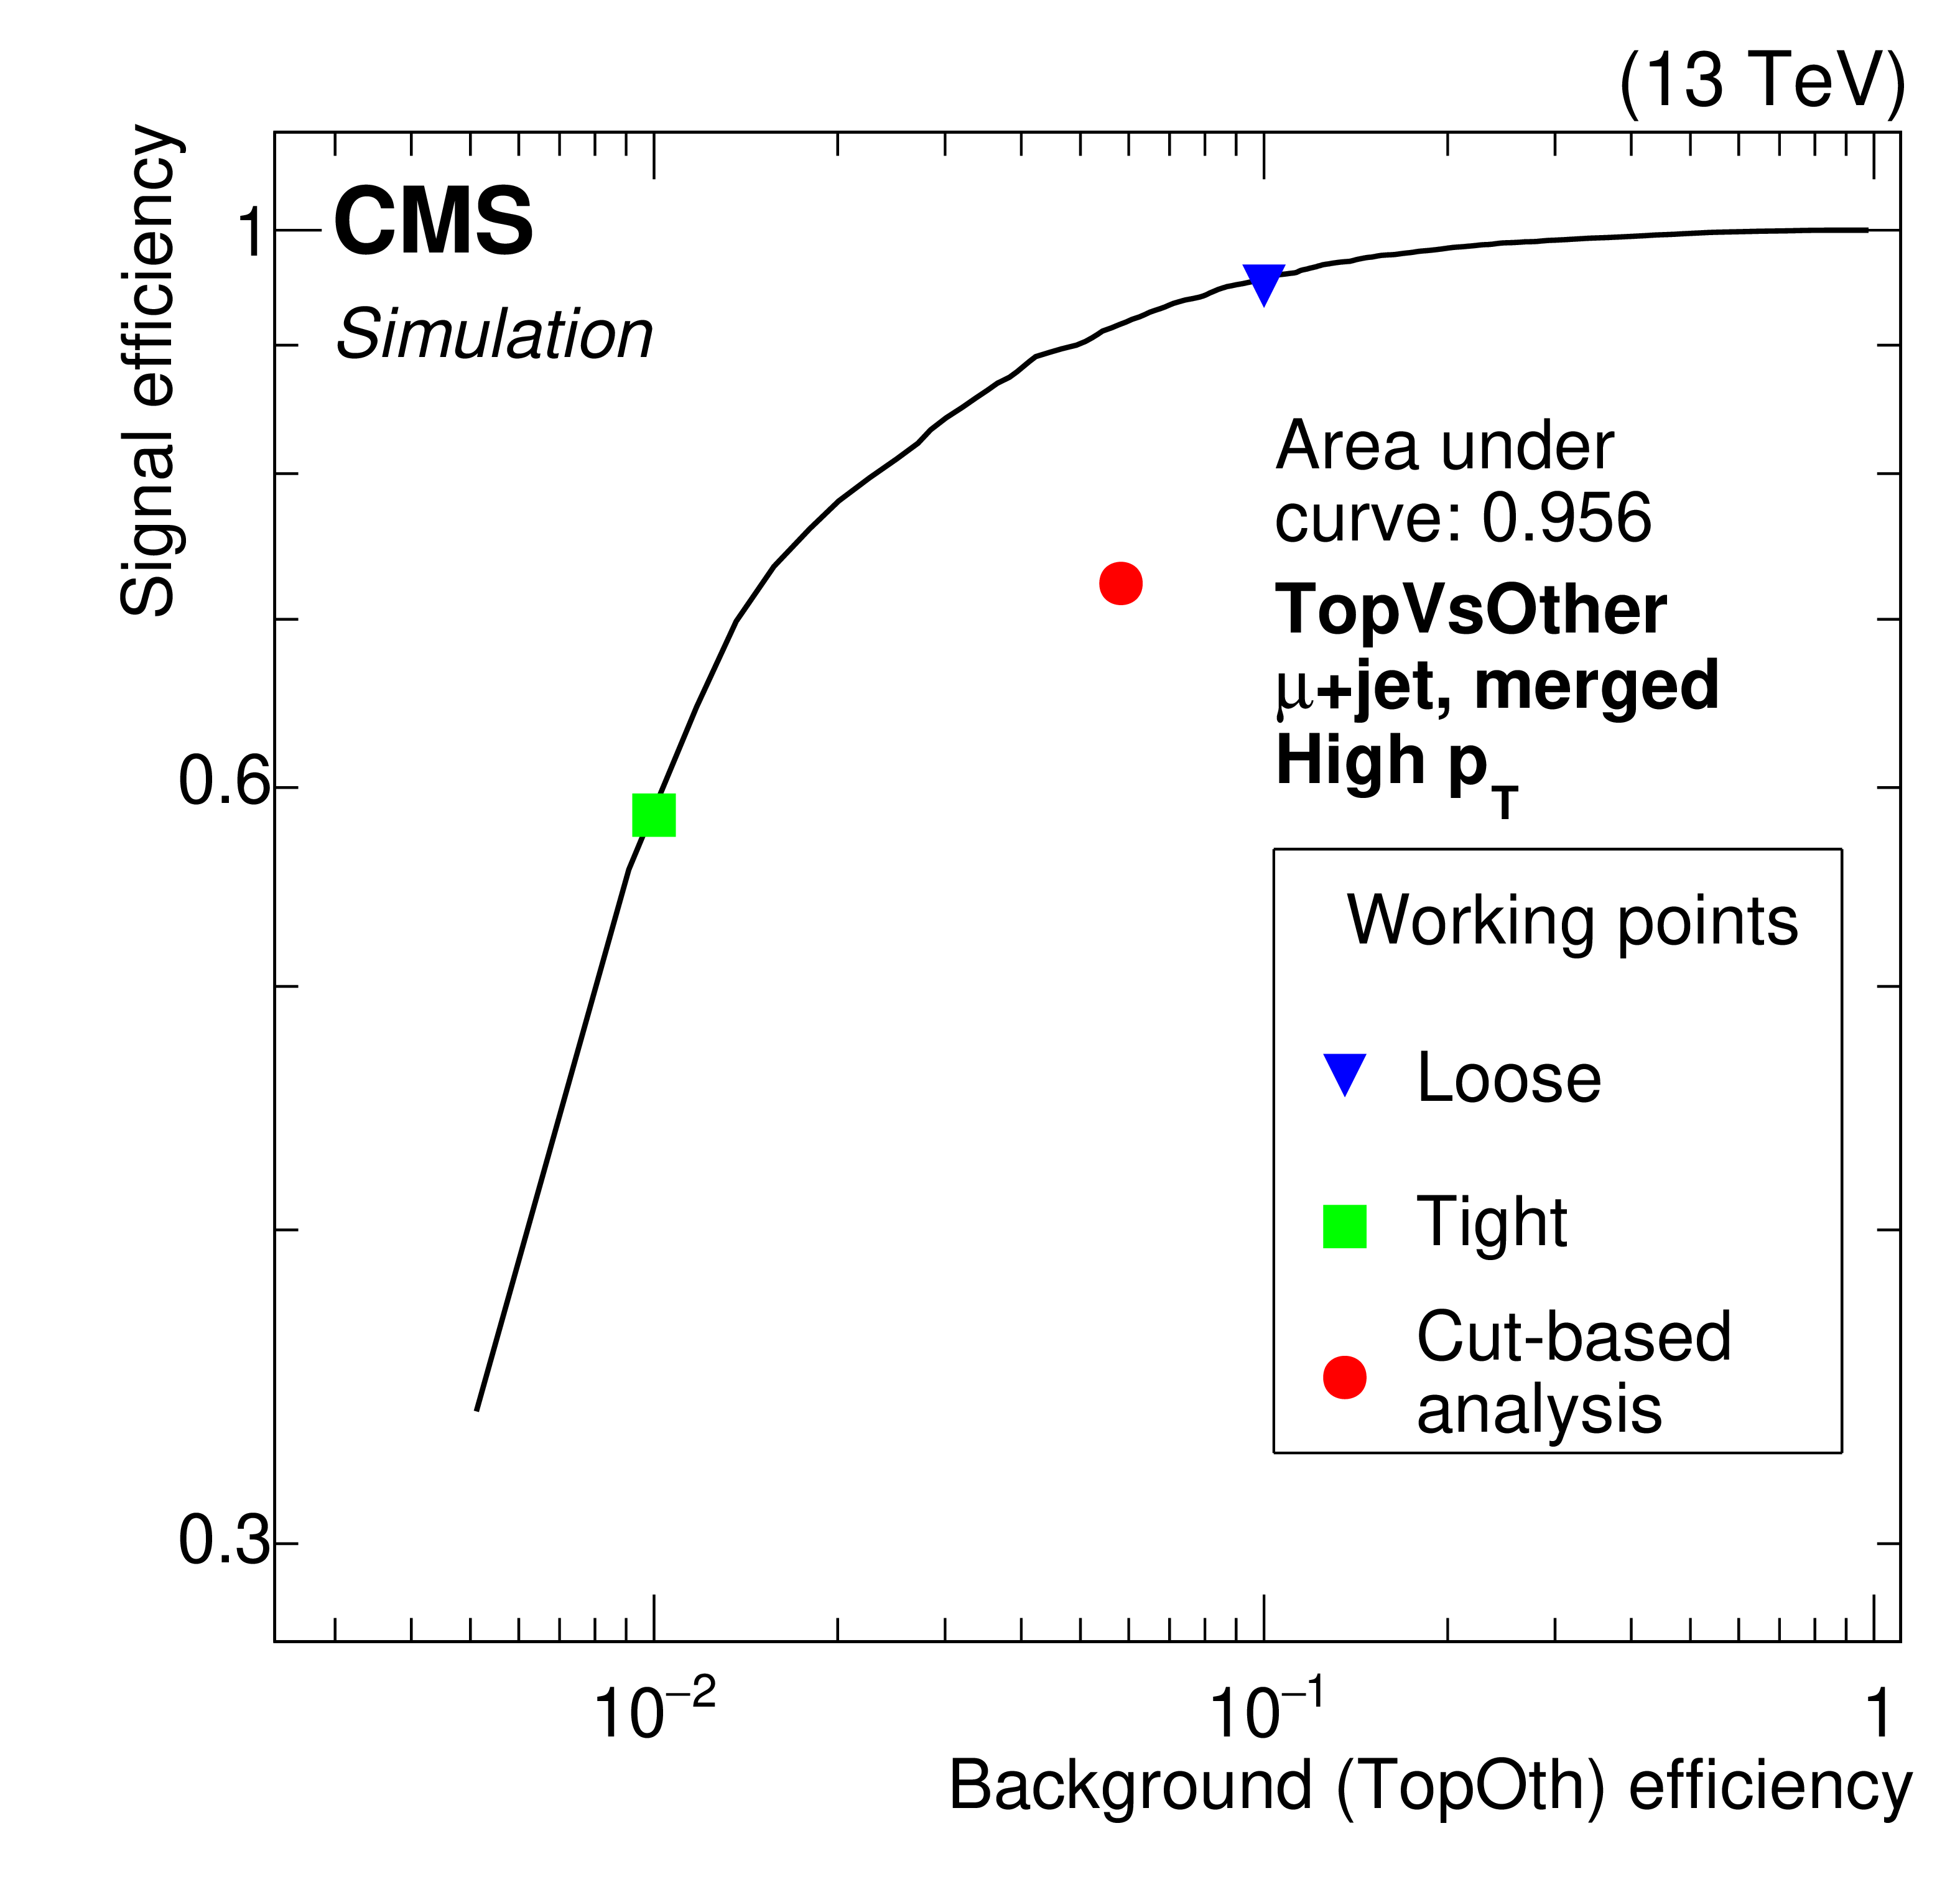
Figure 2-b:
The receiver operating characteristic curve for the TopVsQCD (left) and TopVsOther (right) top quark taggers. The signal efficiency and background misidentification rate are evaluated on top quark candidates with an associated muon, with $ p_{\mathrm{T}} > $ 500 GeV and in the merged configuration in simulated $ \mathrm{t} \overline{\mathrm{T}} $ events. The red triangle in the left plot corresponds to the requirement on the TopVsQCD variable providing a signal efficiency of 99%; the blue triangle and the green square in the right plot correspond to the loose and tight WP of the TopVsOther tagger, respectively. A comparison with a cut-based selection (red point) is also shown in the TopVsOther case. |
png pdf |
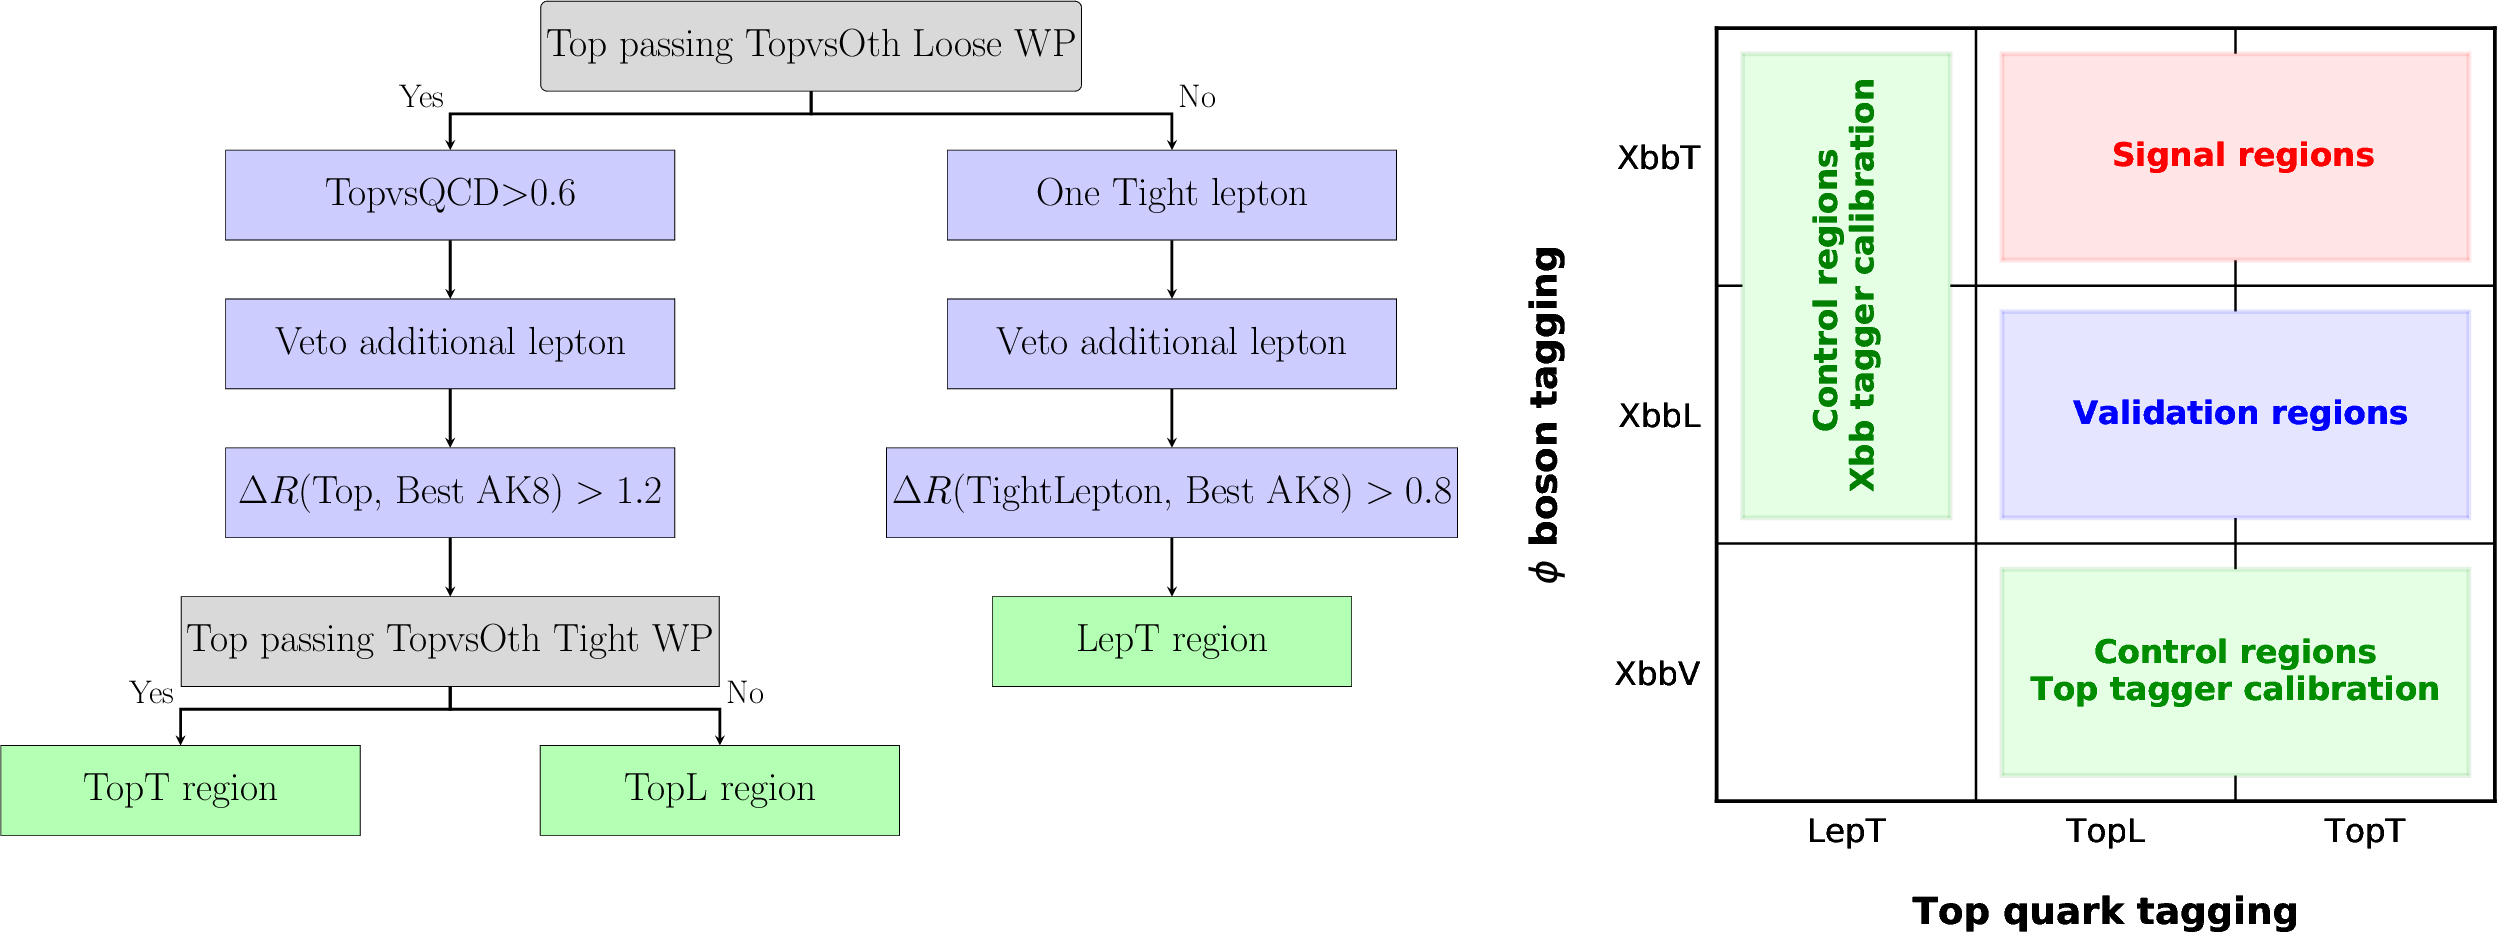
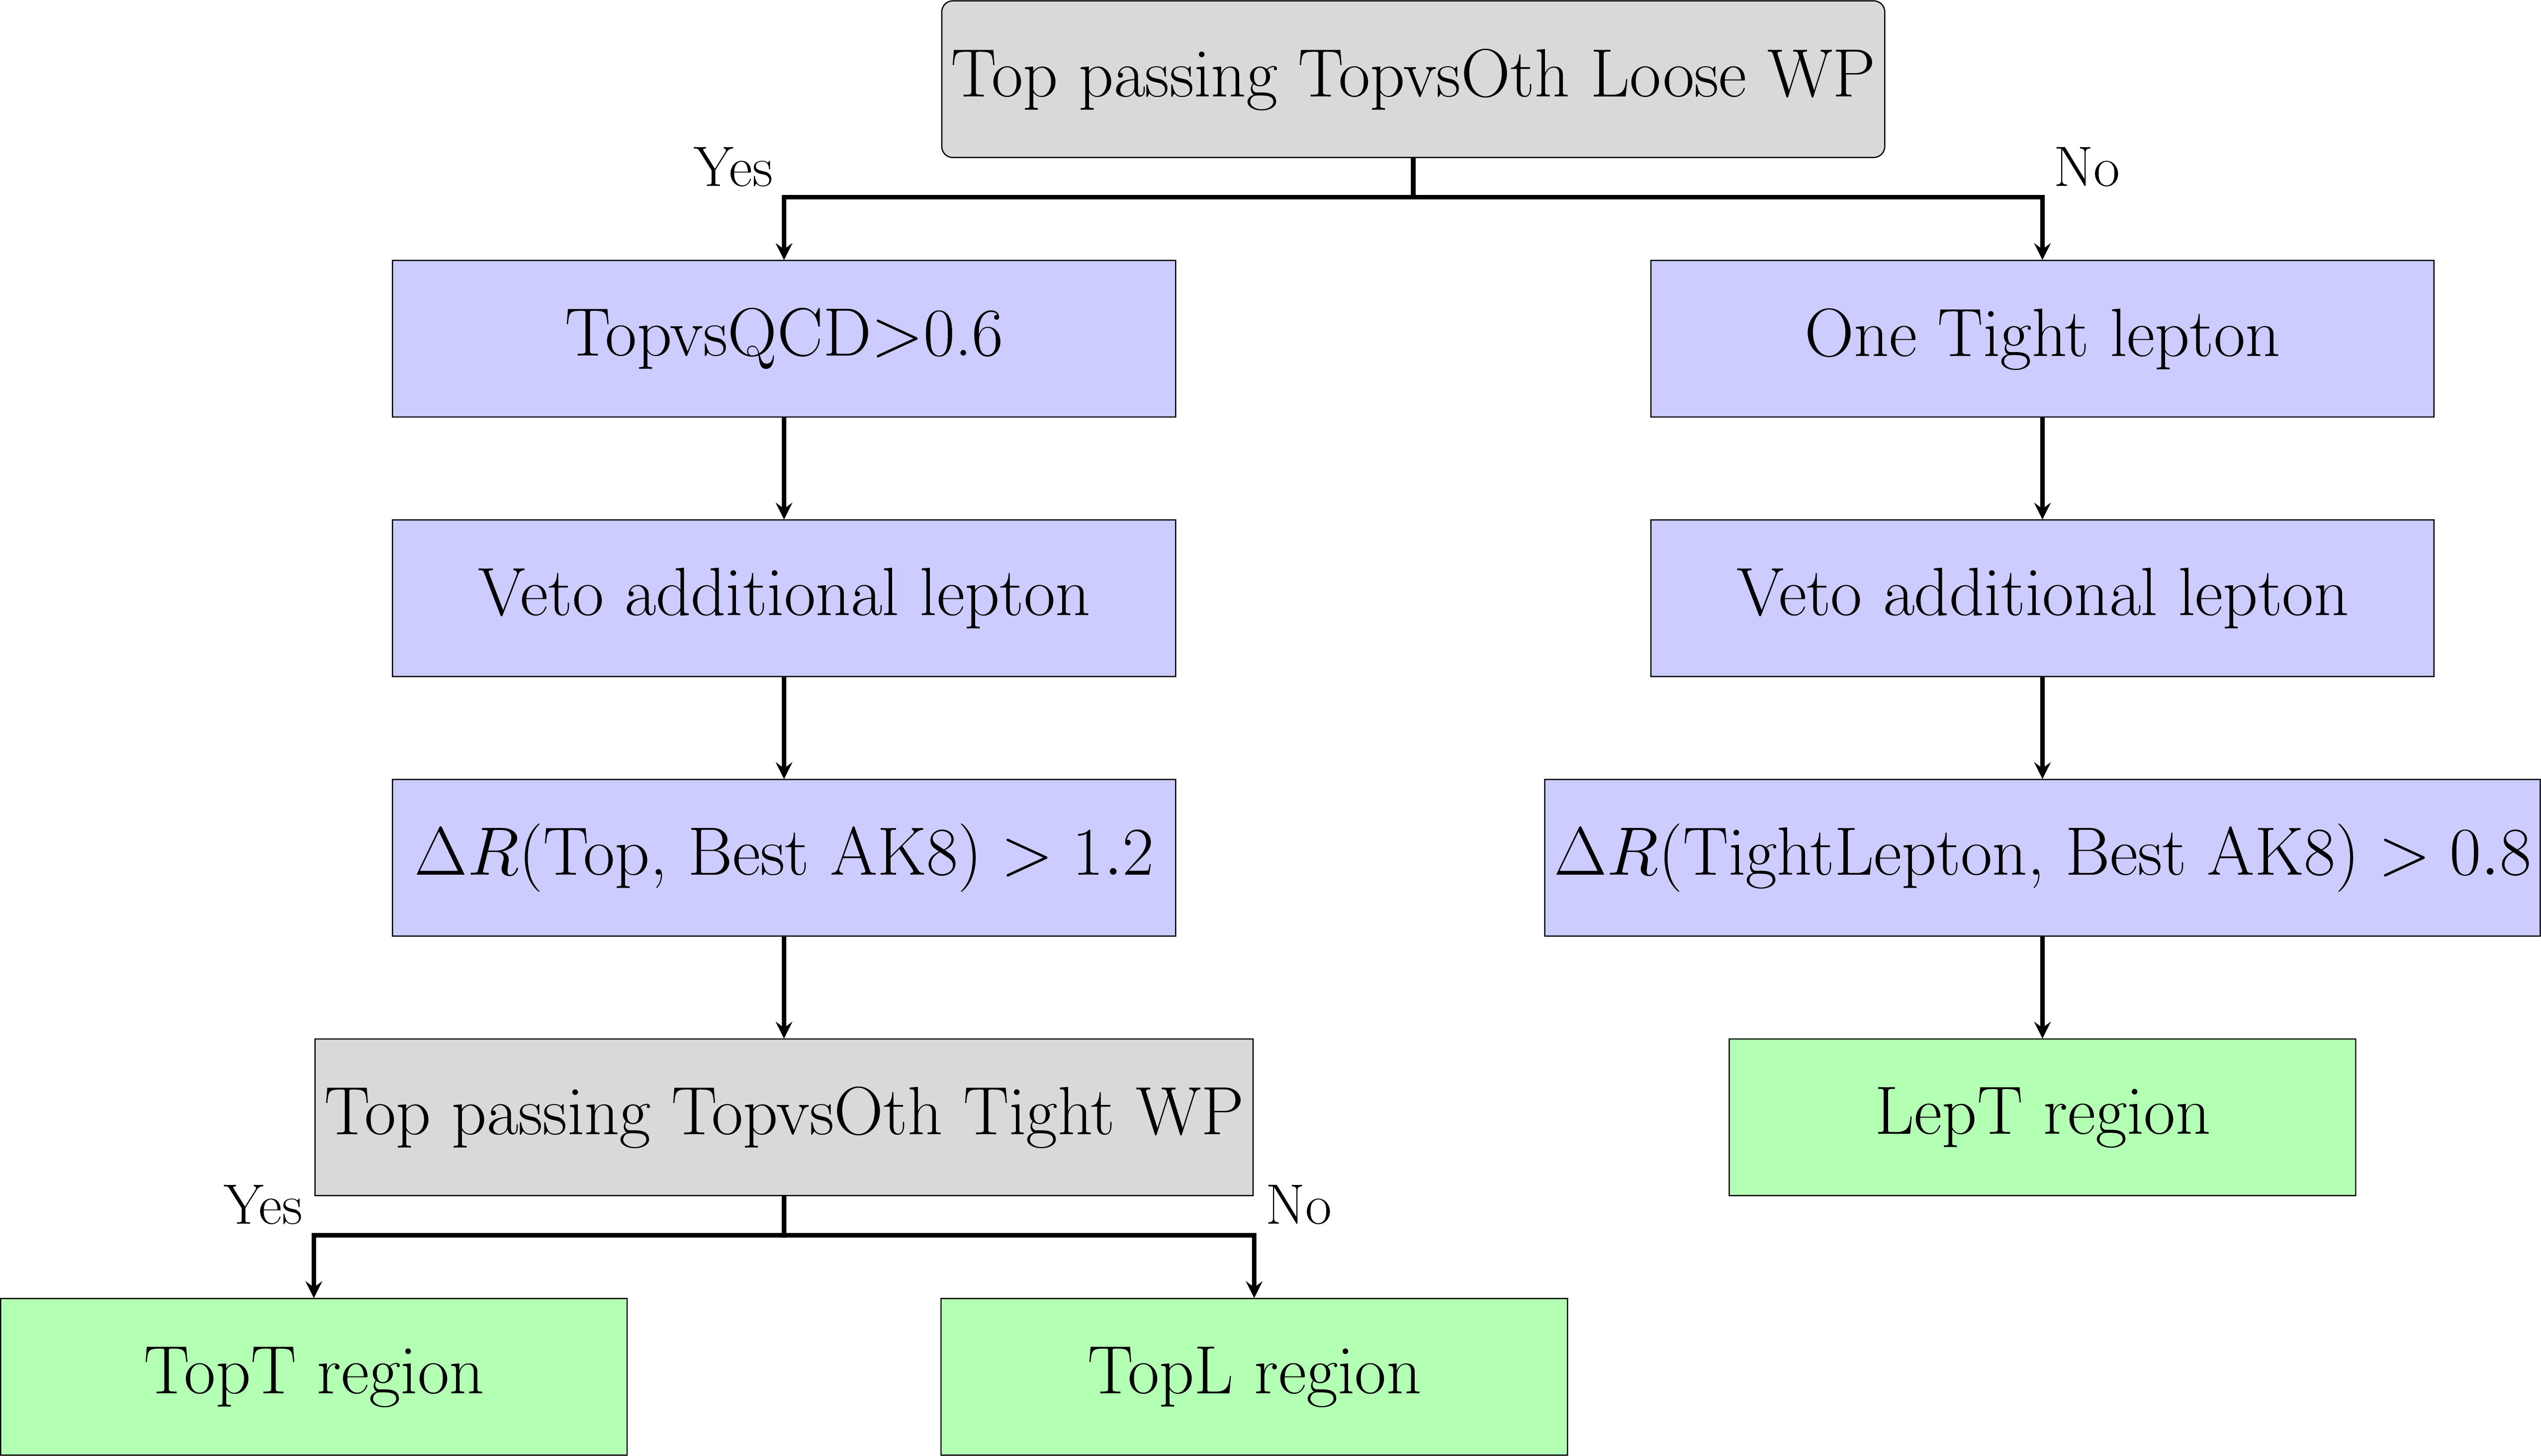
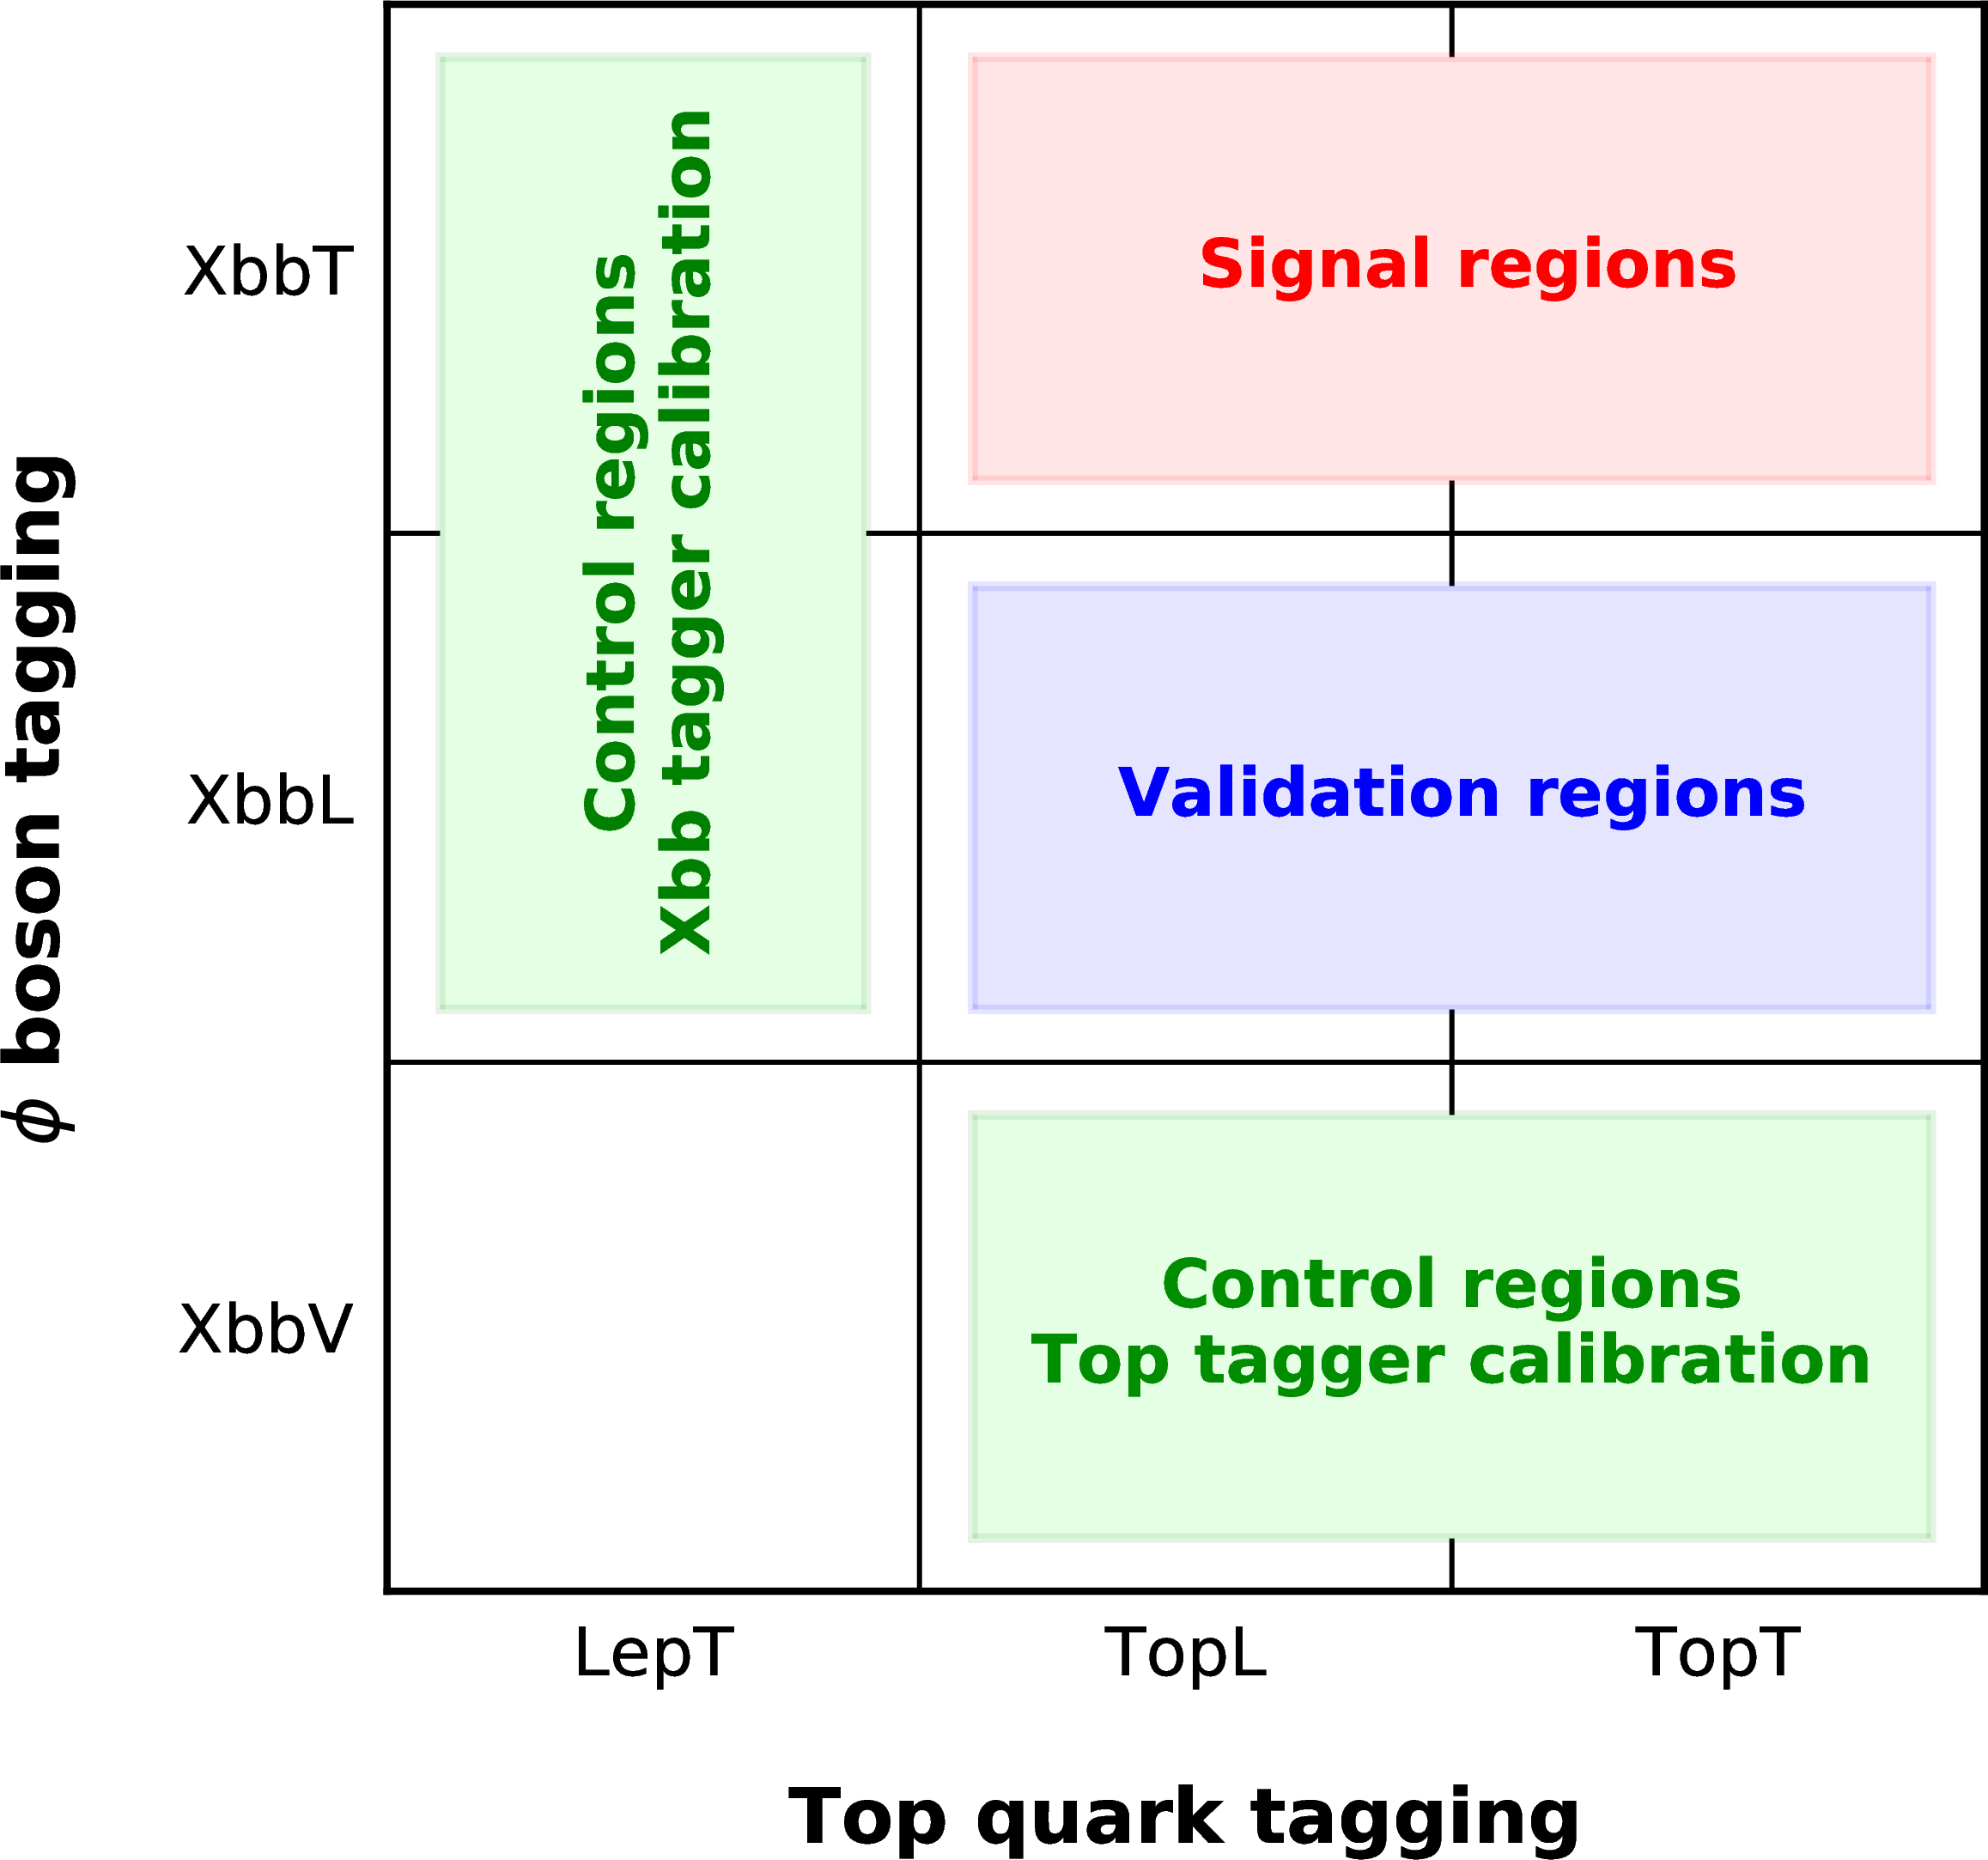
Figure 3:
Left: block diagram showing the event classification based on top quark tagging. Right: schematic view of the signal, validation, and control regions defined in the analysis. The labels TopT (Top Tight) and TopL (Top Loose) refer to events where there is a top quark passing a tight working point for the TopVsOther tagger with a background rejection of 99%, or a loose working point with a background rejection of 90% while vetoing the tight working point to ensure statistical independence of the categories. The label LepT refers to events that are neither in the TopT or TopL categories, but where a top quark candidate is built via a lepton and b-jet pair. The XbbT, XbbL, and XbbV labels refer to the fact that the largest score of the XbbVsQCD tagger evaluated on AK8 jets selected in the event is in the XbbVsQCD range of ($ {>} $ 0.98), (0.80-0.98), or ($ {<} $ 0.80), respectively. Additionally, for the event to be included in the XbbV category, the mass of the jet with the largest score is required to be in the 60-220 GeV range. |
png pdf |
Figure 3-a:
Left: block diagram showing the event classification based on top quark tagging. Right: schematic view of the signal, validation, and control regions defined in the analysis. The labels TopT (Top Tight) and TopL (Top Loose) refer to events where there is a top quark passing a tight working point for the TopVsOther tagger with a background rejection of 99%, or a loose working point with a background rejection of 90% while vetoing the tight working point to ensure statistical independence of the categories. The label LepT refers to events that are neither in the TopT or TopL categories, but where a top quark candidate is built via a lepton and b-jet pair. The XbbT, XbbL, and XbbV labels refer to the fact that the largest score of the XbbVsQCD tagger evaluated on AK8 jets selected in the event is in the XbbVsQCD range of ($ {>} $ 0.98), (0.80-0.98), or ($ {<} $ 0.80), respectively. Additionally, for the event to be included in the XbbV category, the mass of the jet with the largest score is required to be in the 60-220 GeV range. |
png pdf |
Figure 3-b:
Left: block diagram showing the event classification based on top quark tagging. Right: schematic view of the signal, validation, and control regions defined in the analysis. The labels TopT (Top Tight) and TopL (Top Loose) refer to events where there is a top quark passing a tight working point for the TopVsOther tagger with a background rejection of 99%, or a loose working point with a background rejection of 90% while vetoing the tight working point to ensure statistical independence of the categories. The label LepT refers to events that are neither in the TopT or TopL categories, but where a top quark candidate is built via a lepton and b-jet pair. The XbbT, XbbL, and XbbV labels refer to the fact that the largest score of the XbbVsQCD tagger evaluated on AK8 jets selected in the event is in the XbbVsQCD range of ($ {>} $ 0.98), (0.80-0.98), or ($ {<} $ 0.80), respectively. Additionally, for the event to be included in the XbbV category, the mass of the jet with the largest score is required to be in the 60-220 GeV range. |
png pdf |
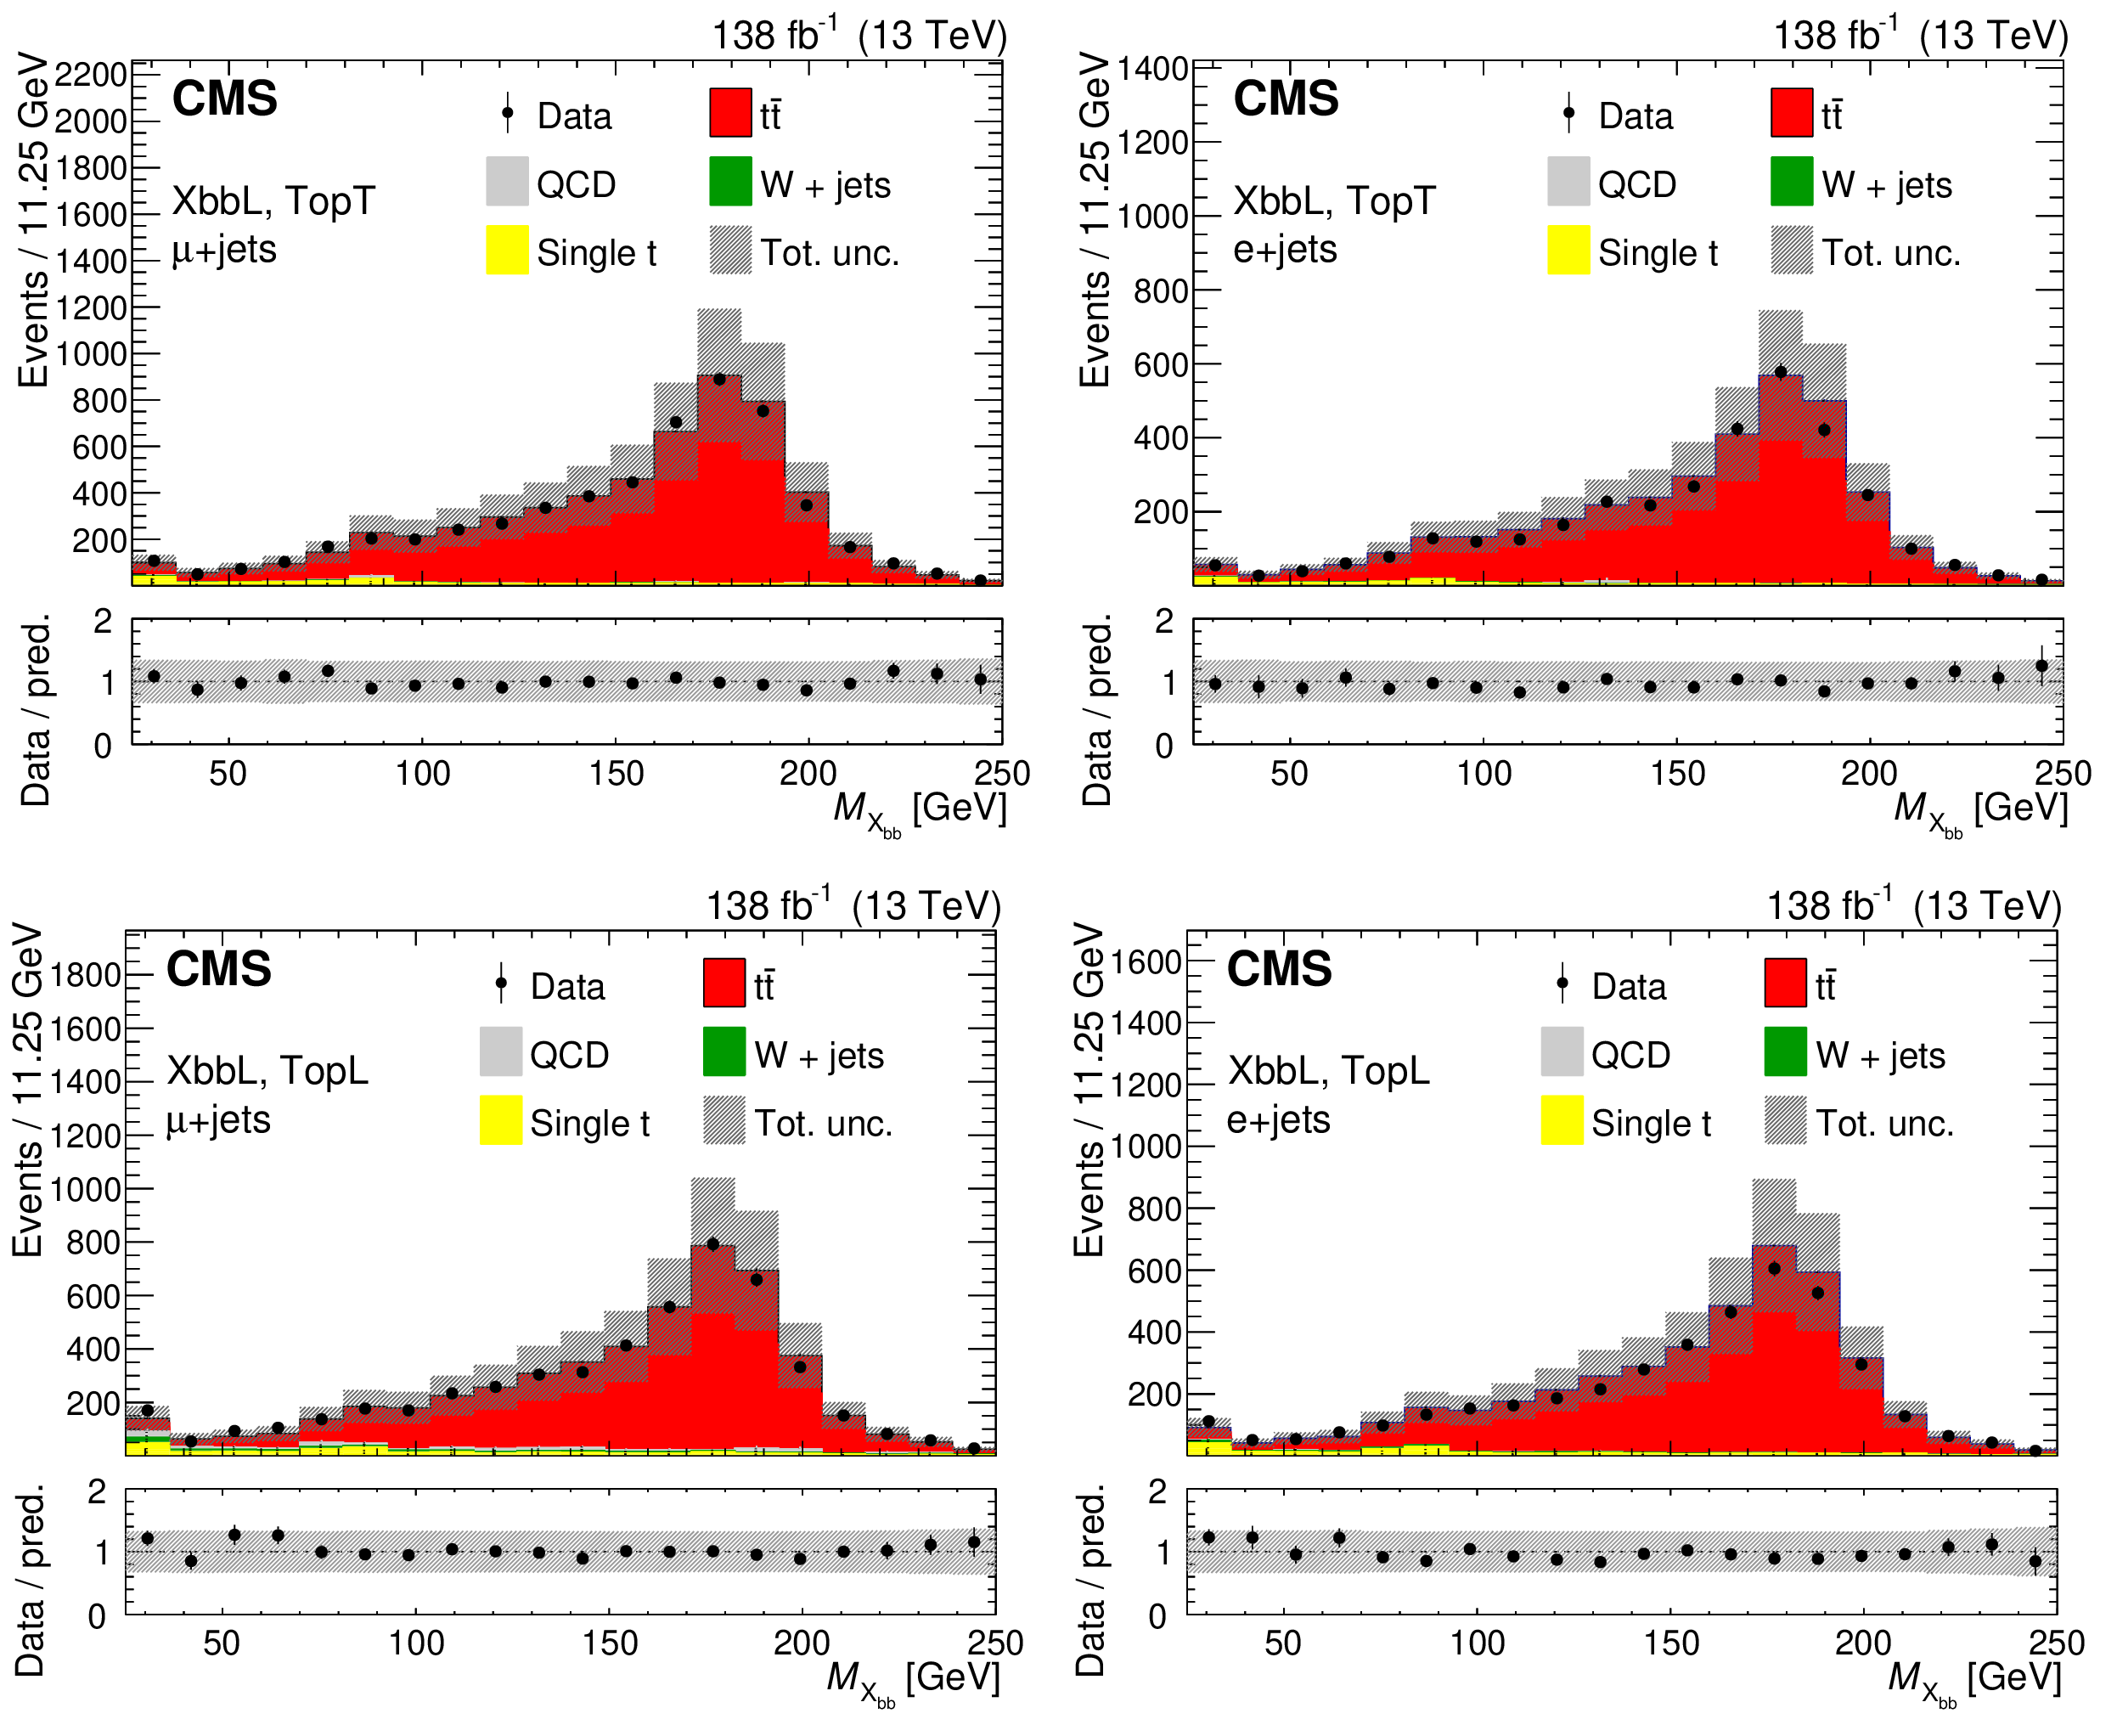
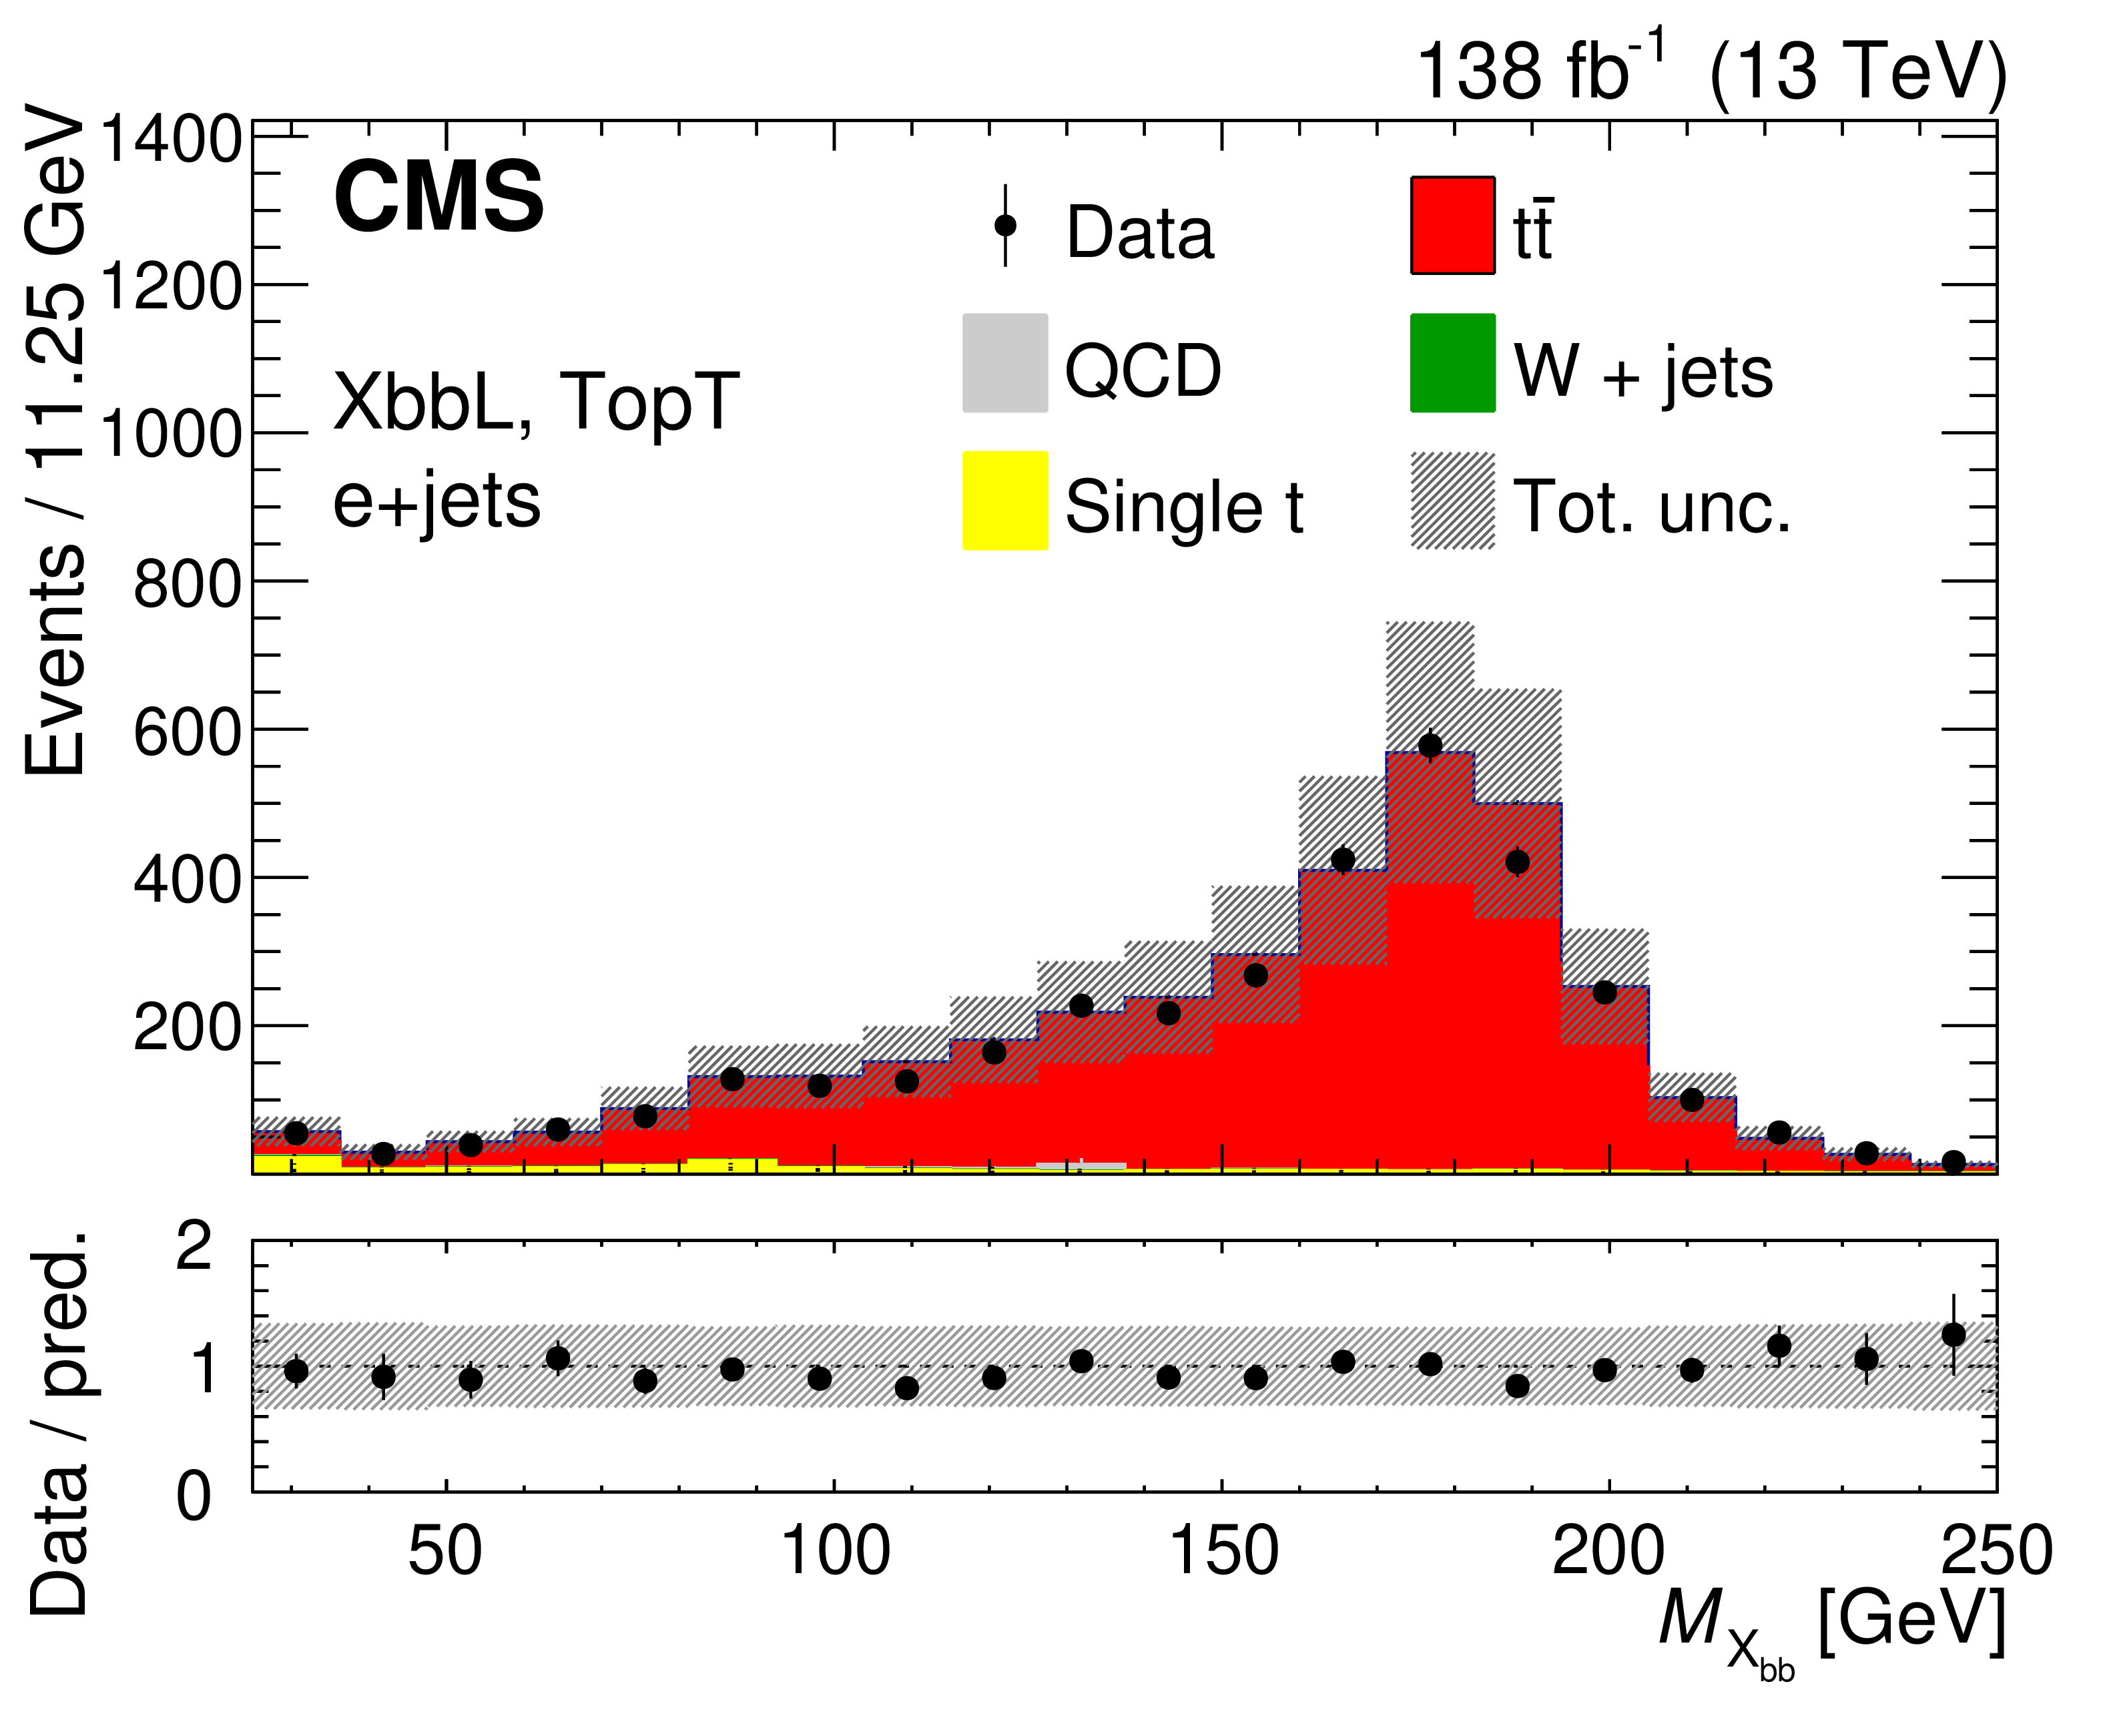
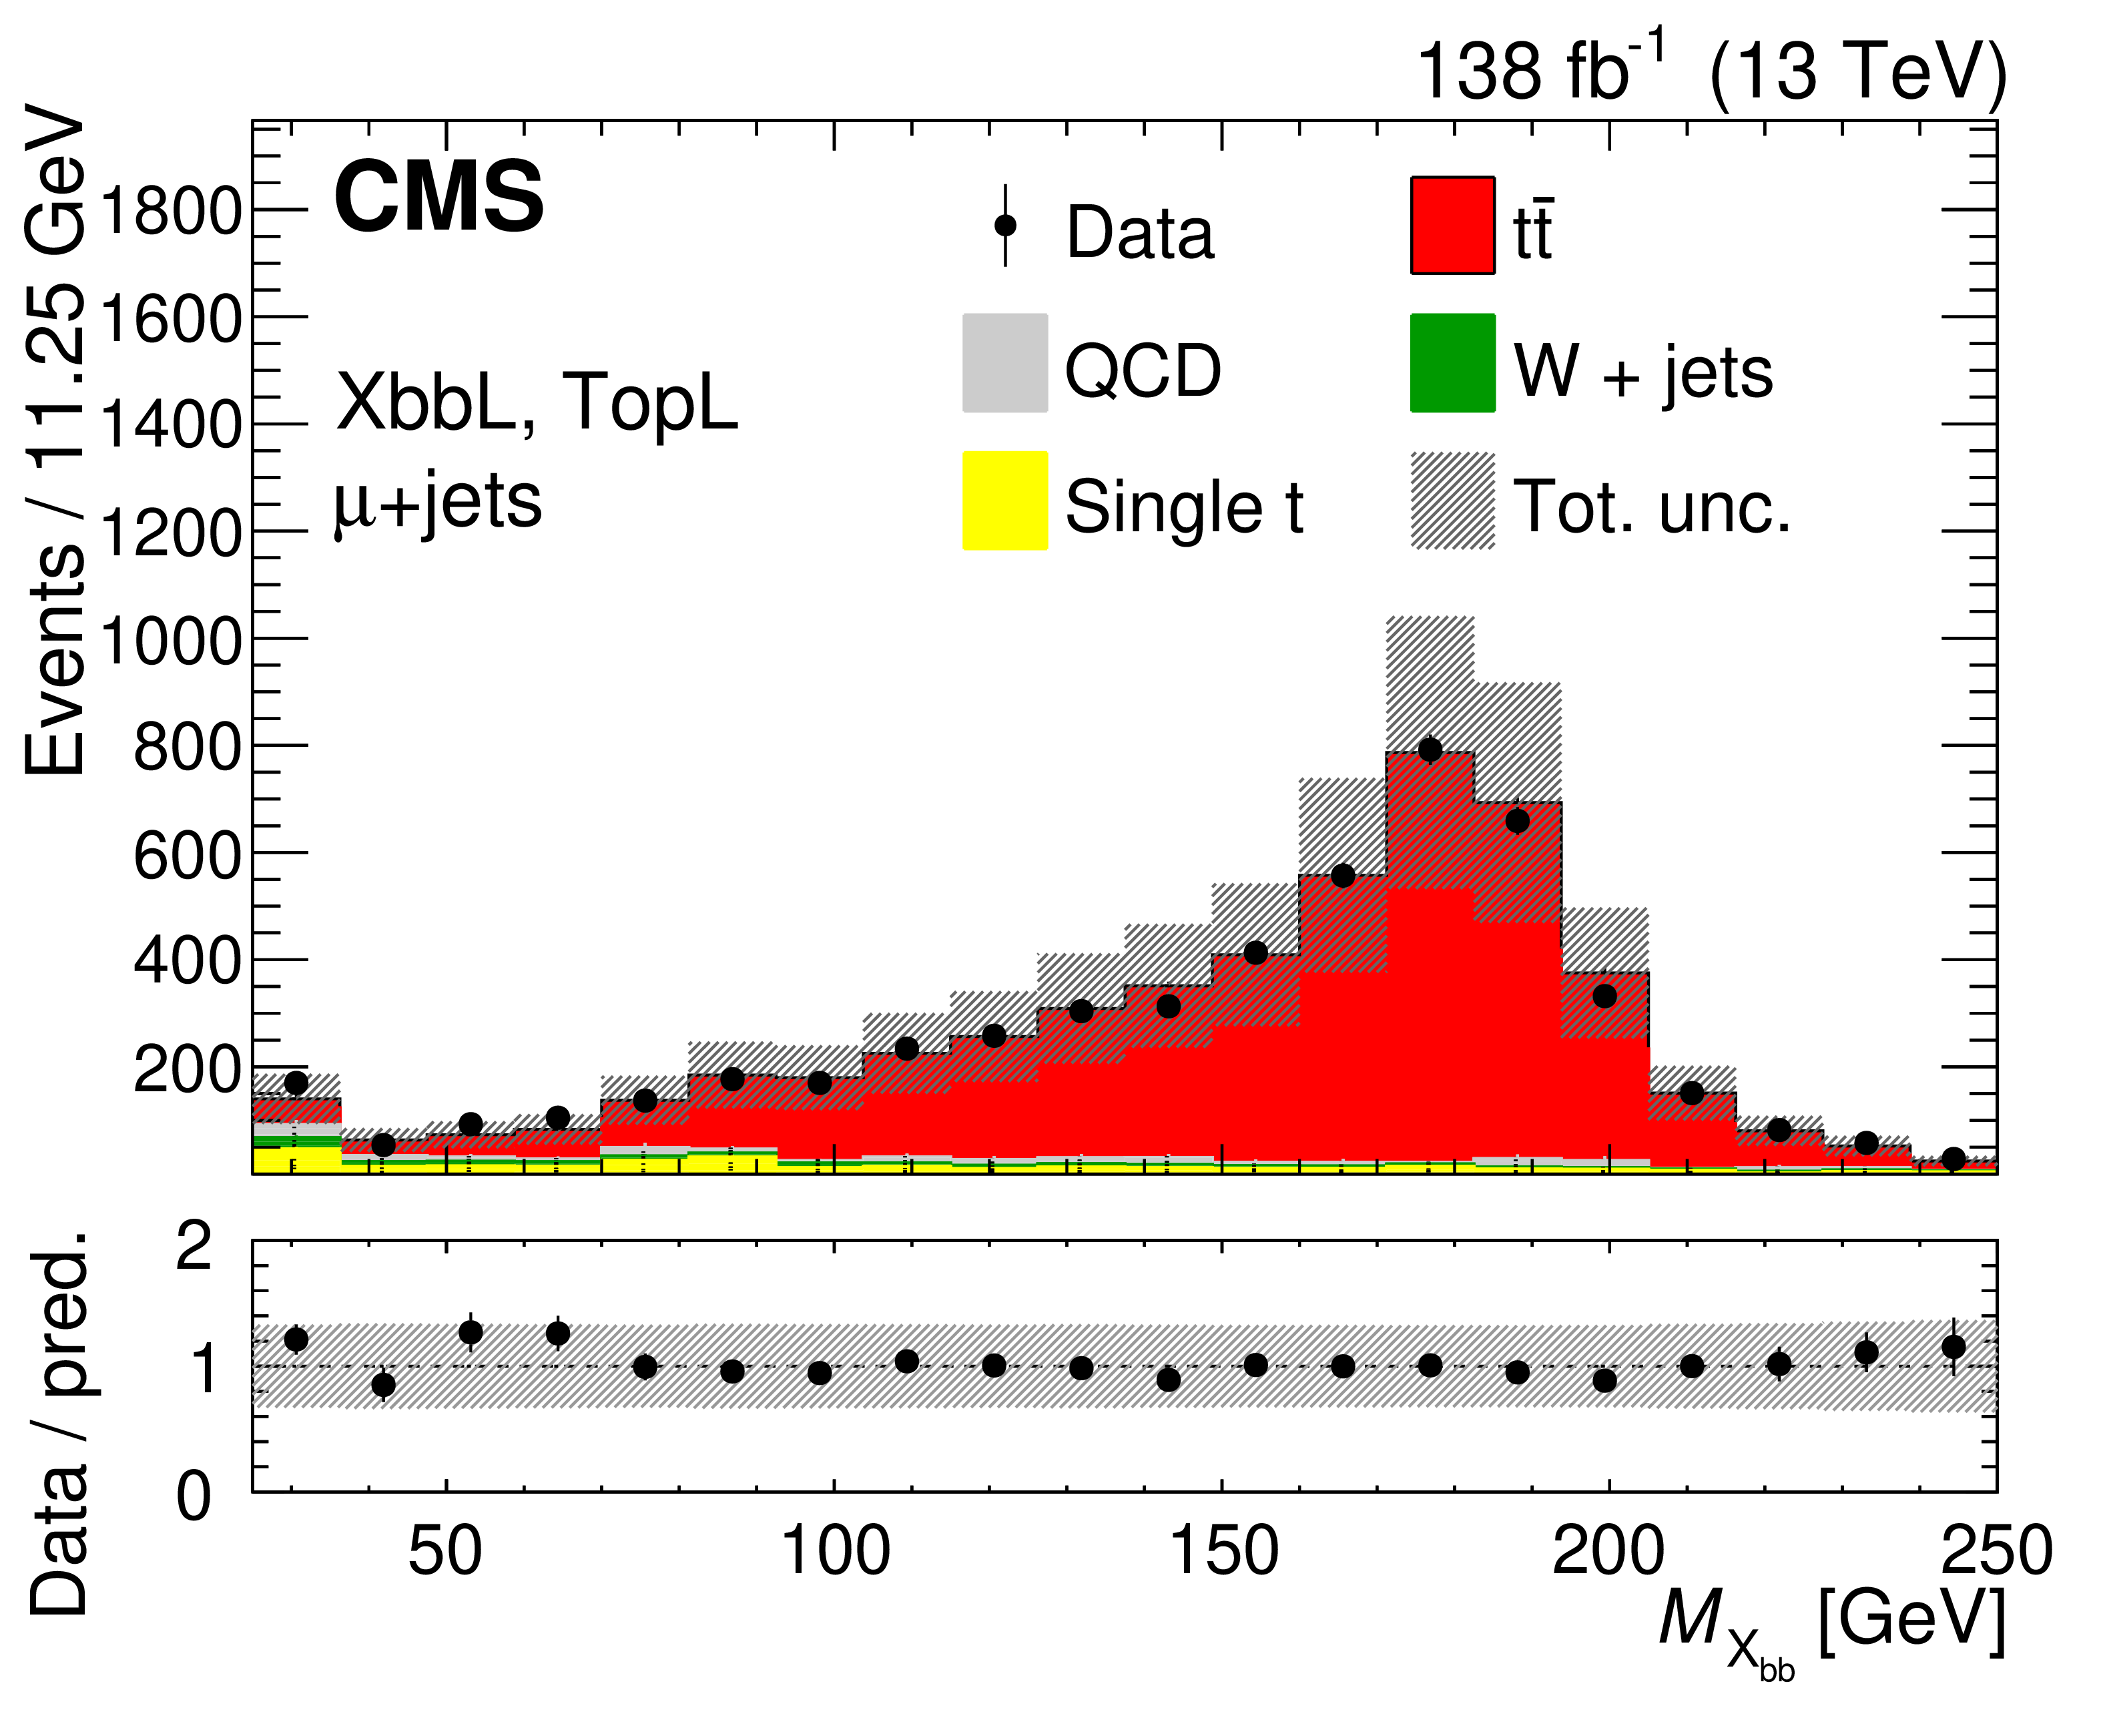
Figure 4:
Distribution of the $ M_{\mathrm{X}_{\mathrm{b}\mathrm{b}}} $ mass of the AK8 jet selected as the $ \phi $ boson candidate for data and simulated background events in the (TopT, XbbL) (upper), in the (TopL, XbbL) (lower) VRs, for the muon (left) and electron channels (right). The distributions are shown before the final fit for signal extraction. |

png pdf |
Figure 4-a:
Distribution of the $ M_{\mathrm{X}_{\mathrm{b}\mathrm{b}}} $ mass of the AK8 jet selected as the $ \phi $ boson candidate for data and simulated background events in the (TopT, XbbL) (upper), in the (TopL, XbbL) (lower) VRs, for the muon (left) and electron channels (right). The distributions are shown before the final fit for signal extraction. |
png pdf |
Figure 4-b:
Distribution of the $ M_{\mathrm{X}_{\mathrm{b}\mathrm{b}}} $ mass of the AK8 jet selected as the $ \phi $ boson candidate for data and simulated background events in the (TopT, XbbL) (upper), in the (TopL, XbbL) (lower) VRs, for the muon (left) and electron channels (right). The distributions are shown before the final fit for signal extraction. |
png pdf |
Figure 4-c:
Distribution of the $ M_{\mathrm{X}_{\mathrm{b}\mathrm{b}}} $ mass of the AK8 jet selected as the $ \phi $ boson candidate for data and simulated background events in the (TopT, XbbL) (upper), in the (TopL, XbbL) (lower) VRs, for the muon (left) and electron channels (right). The distributions are shown before the final fit for signal extraction. |

png pdf |
Figure 4-d:
Distribution of the $ M_{\mathrm{X}_{\mathrm{b}\mathrm{b}}} $ mass of the AK8 jet selected as the $ \phi $ boson candidate for data and simulated background events in the (TopT, XbbL) (upper), in the (TopL, XbbL) (lower) VRs, for the muon (left) and electron channels (right). The distributions are shown before the final fit for signal extraction. |
png pdf |
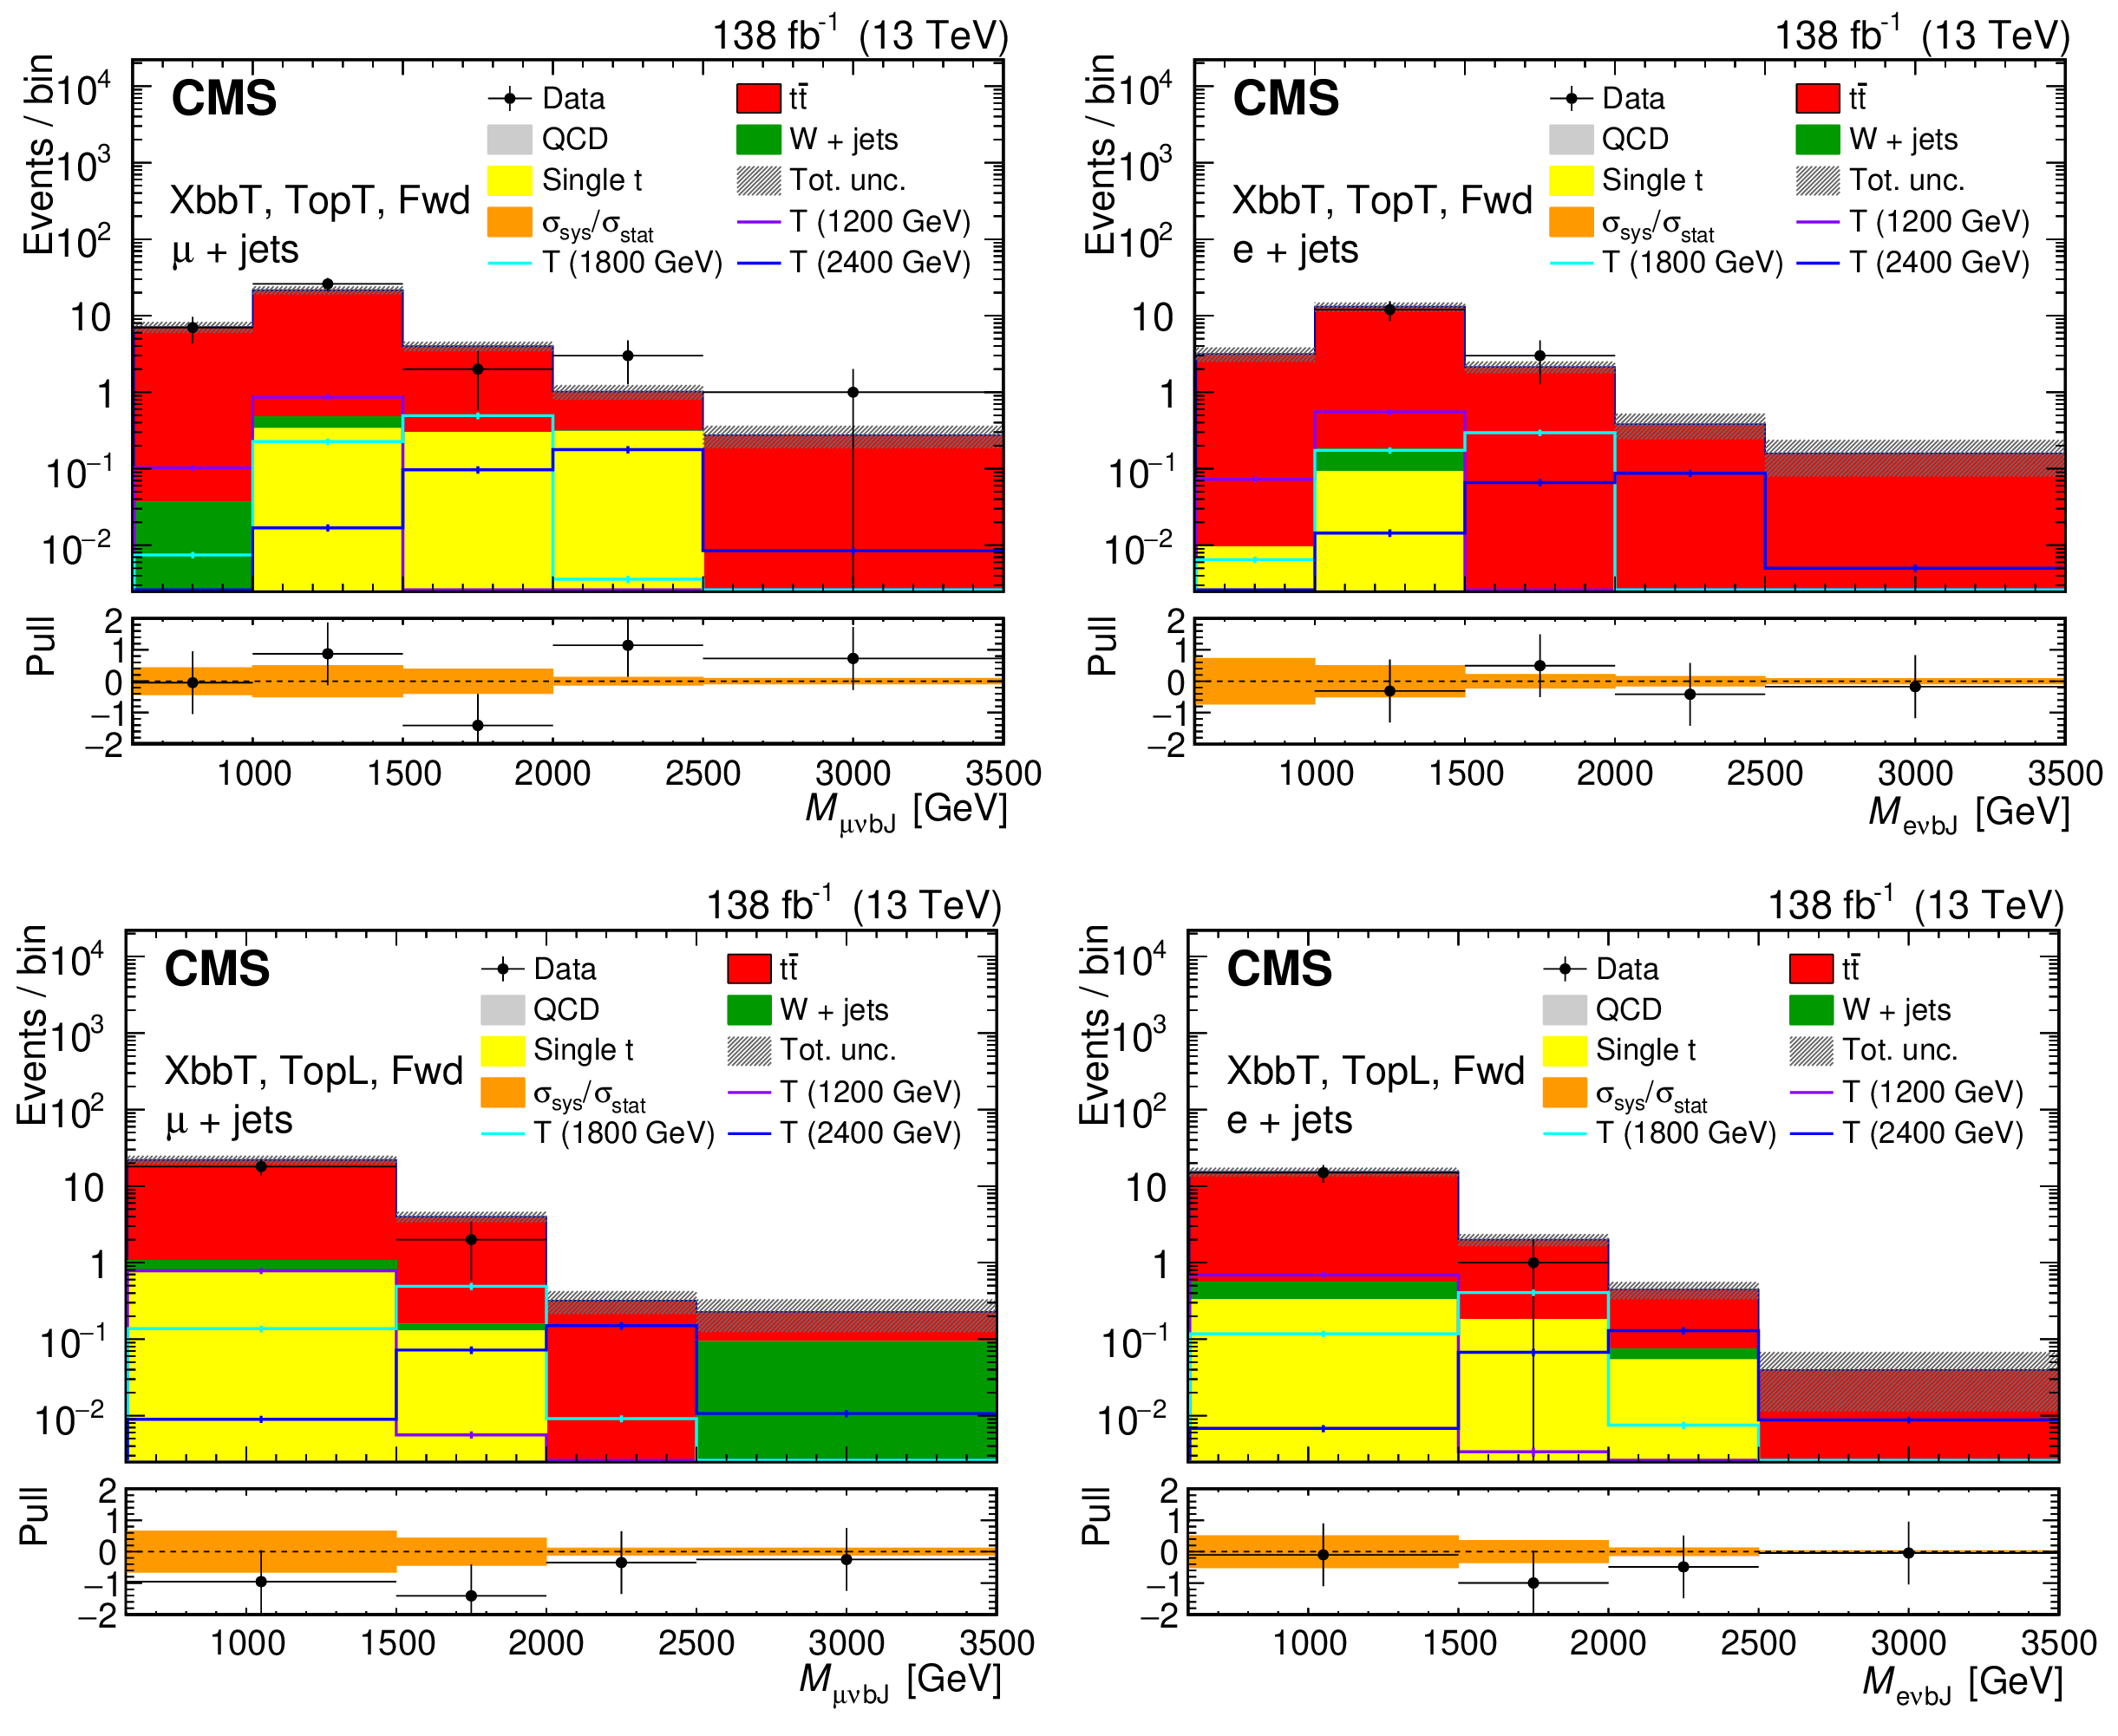
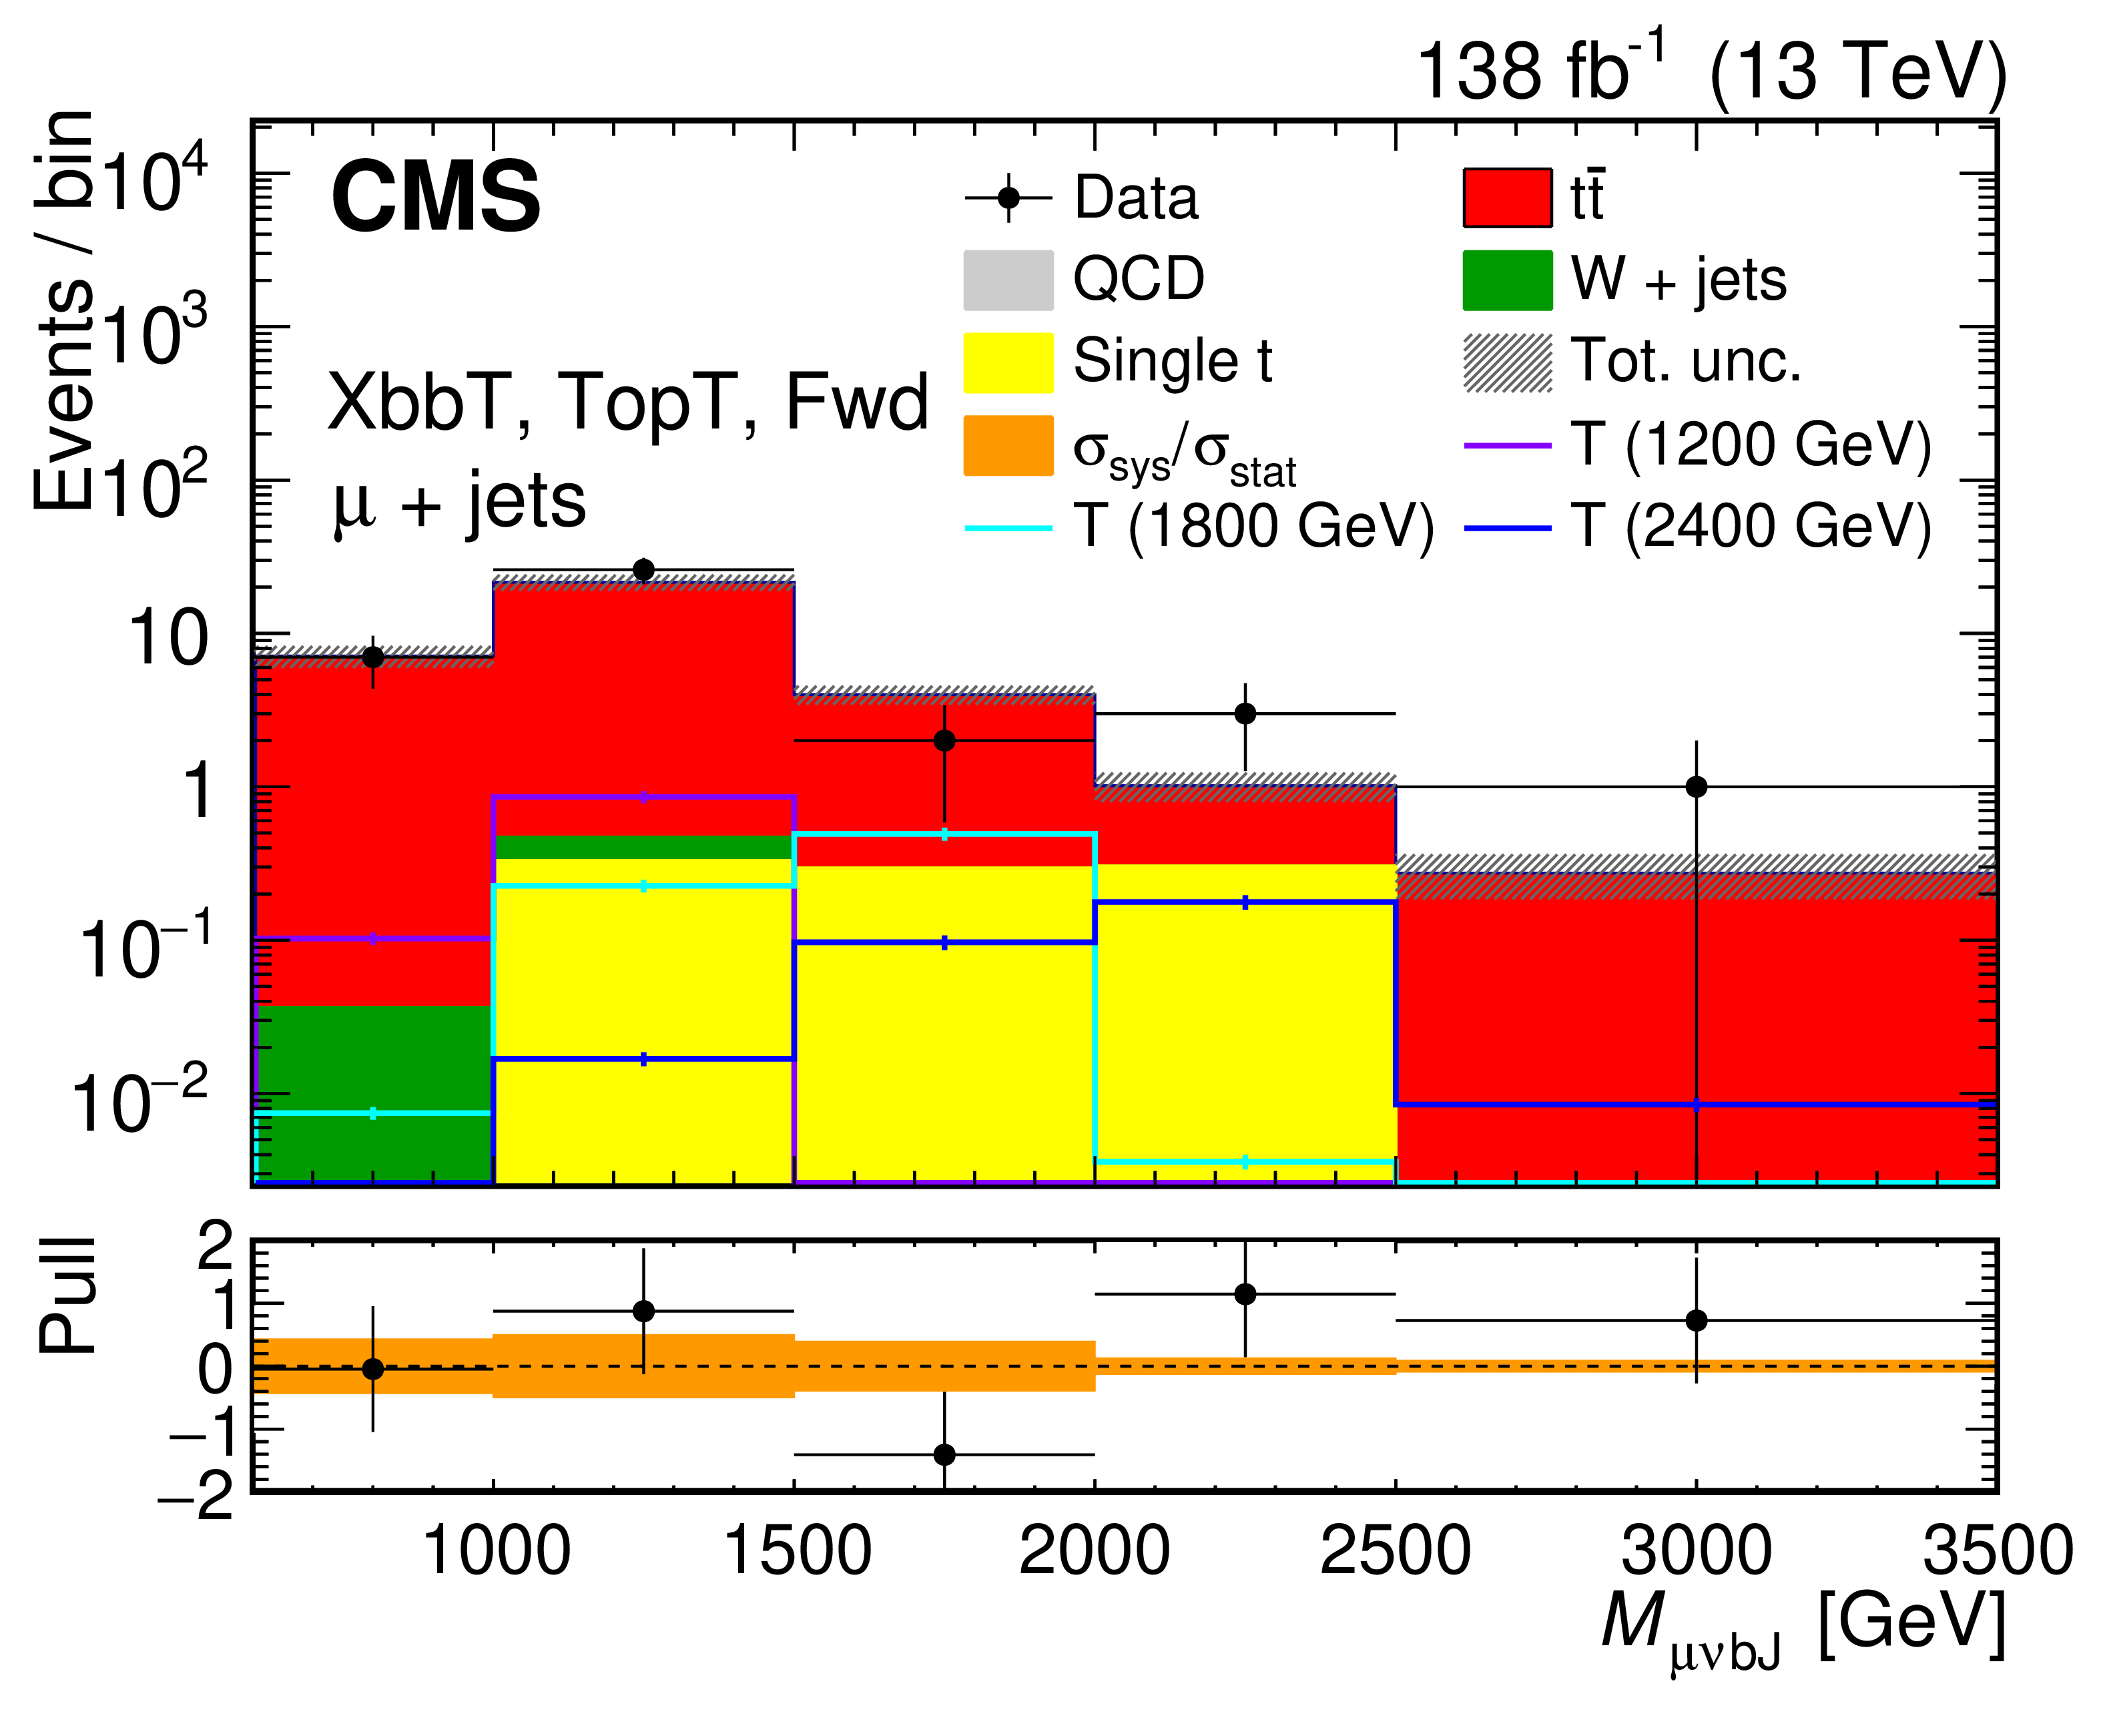
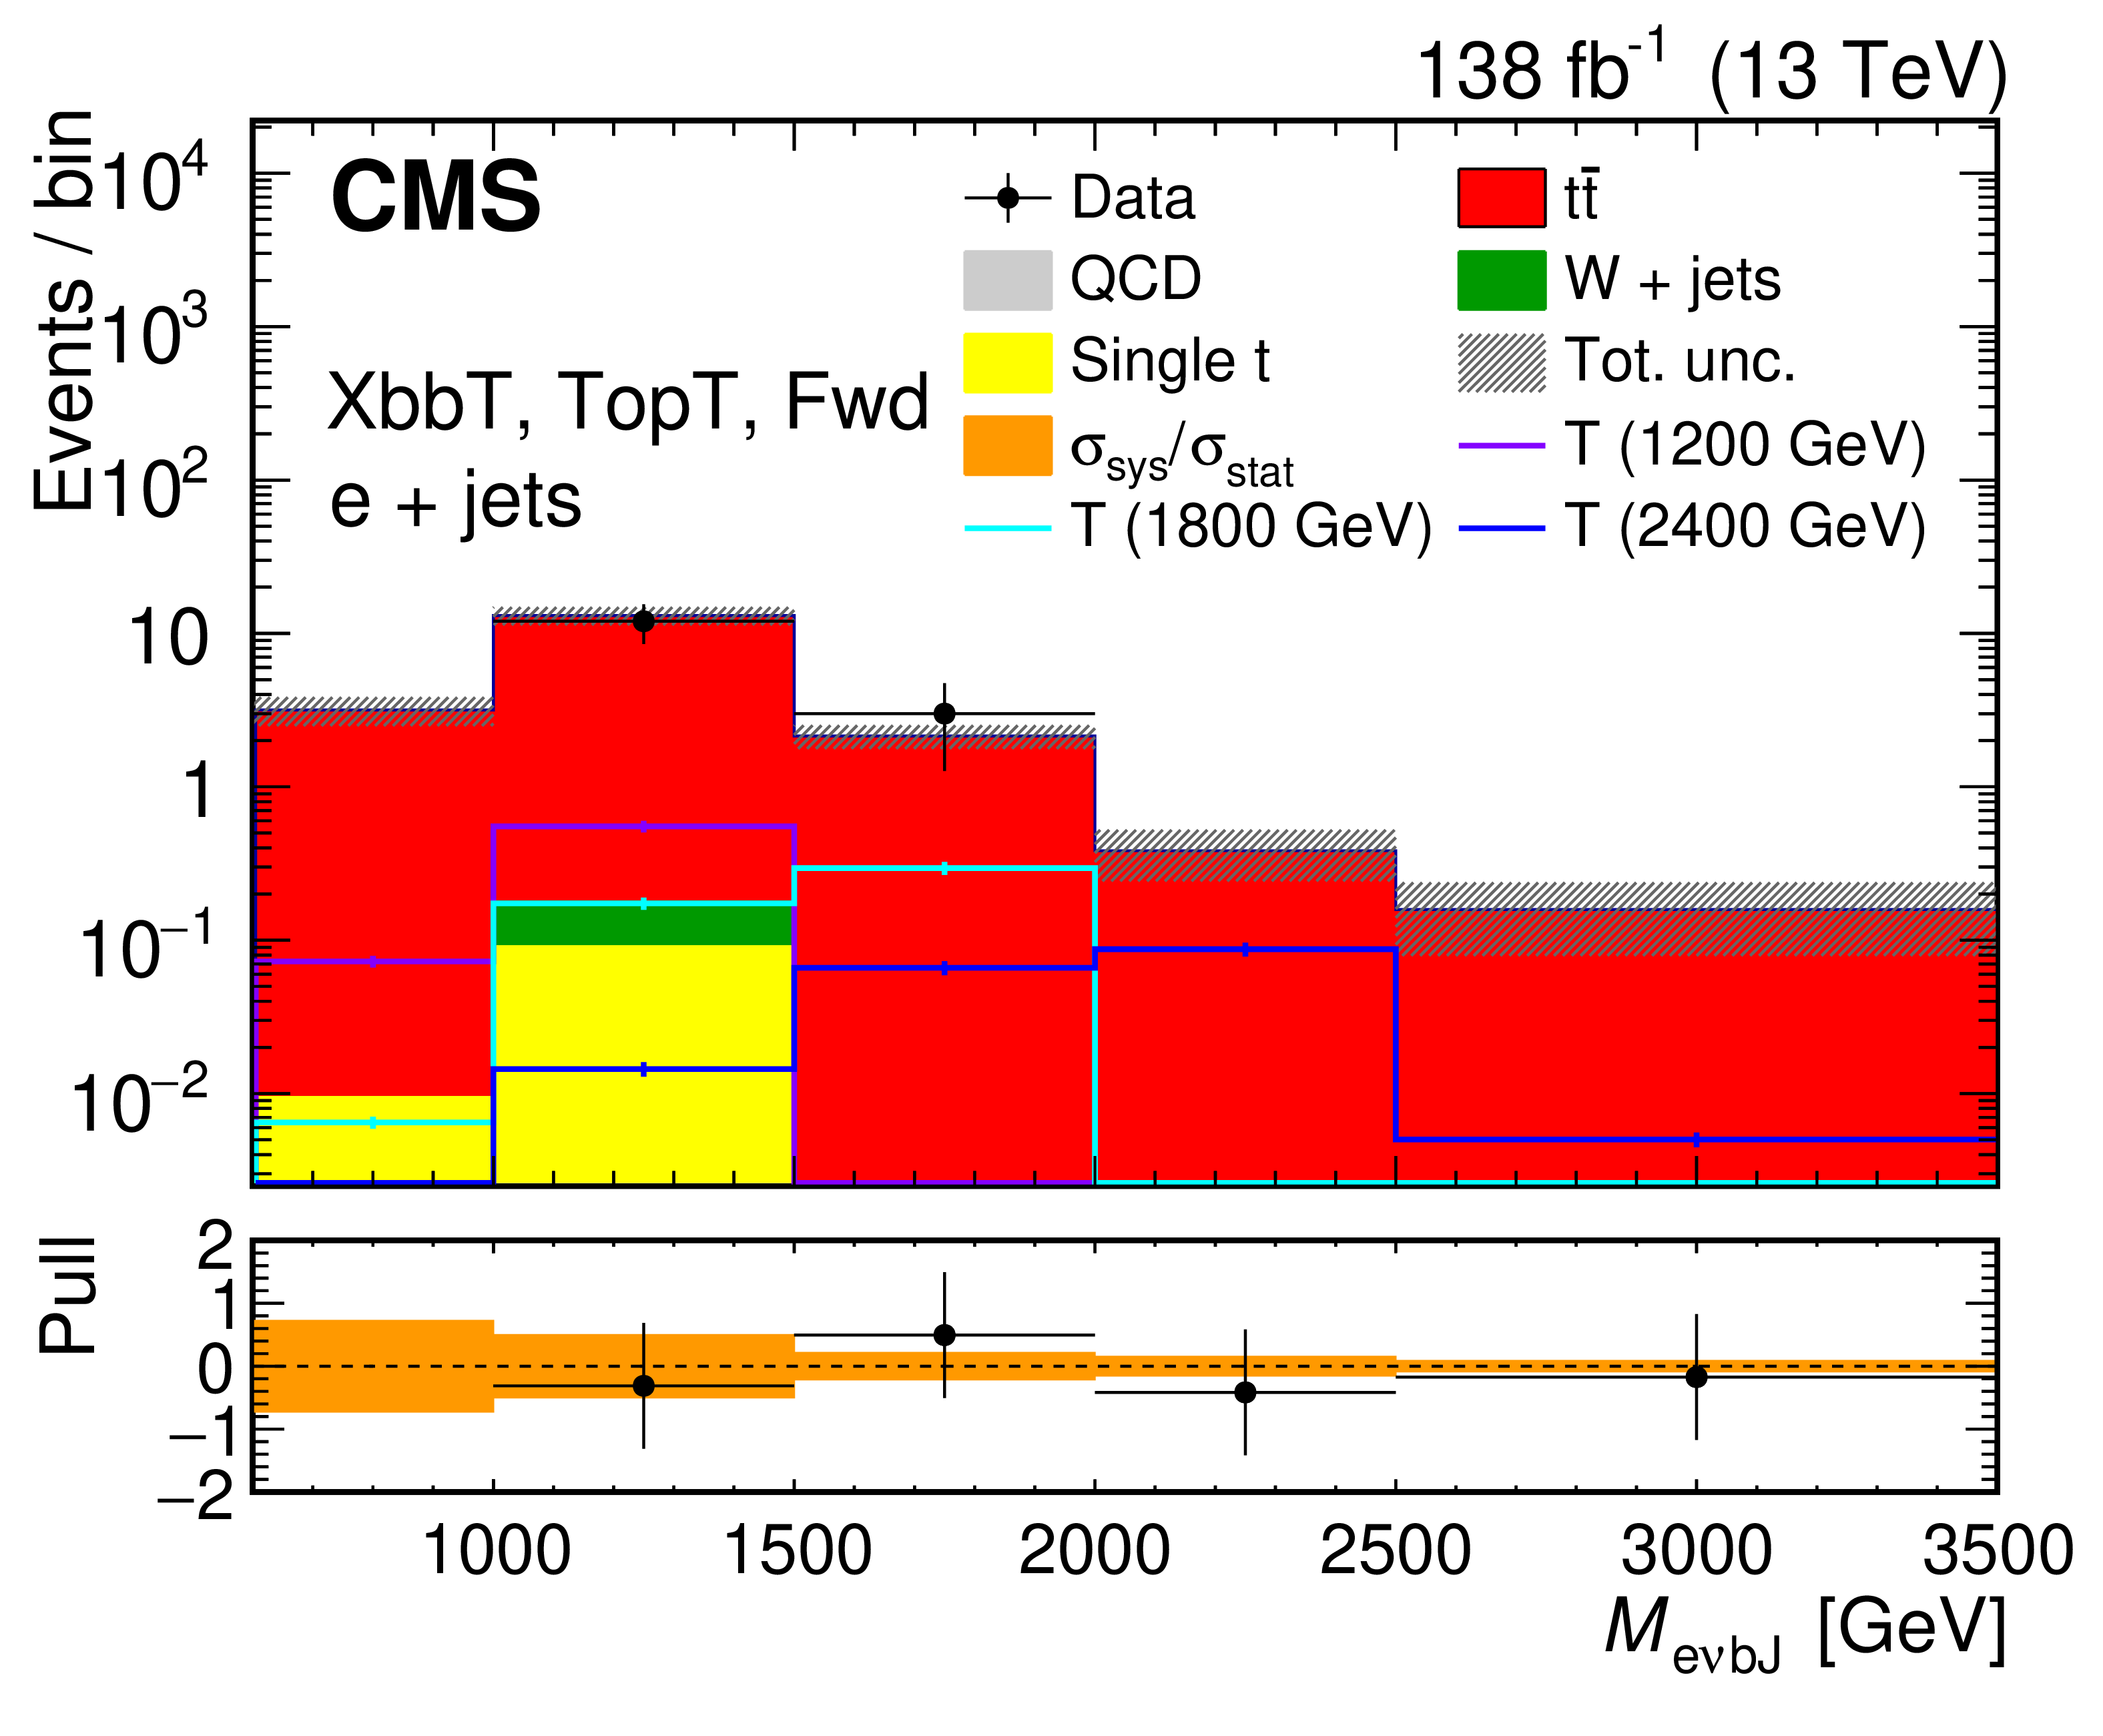
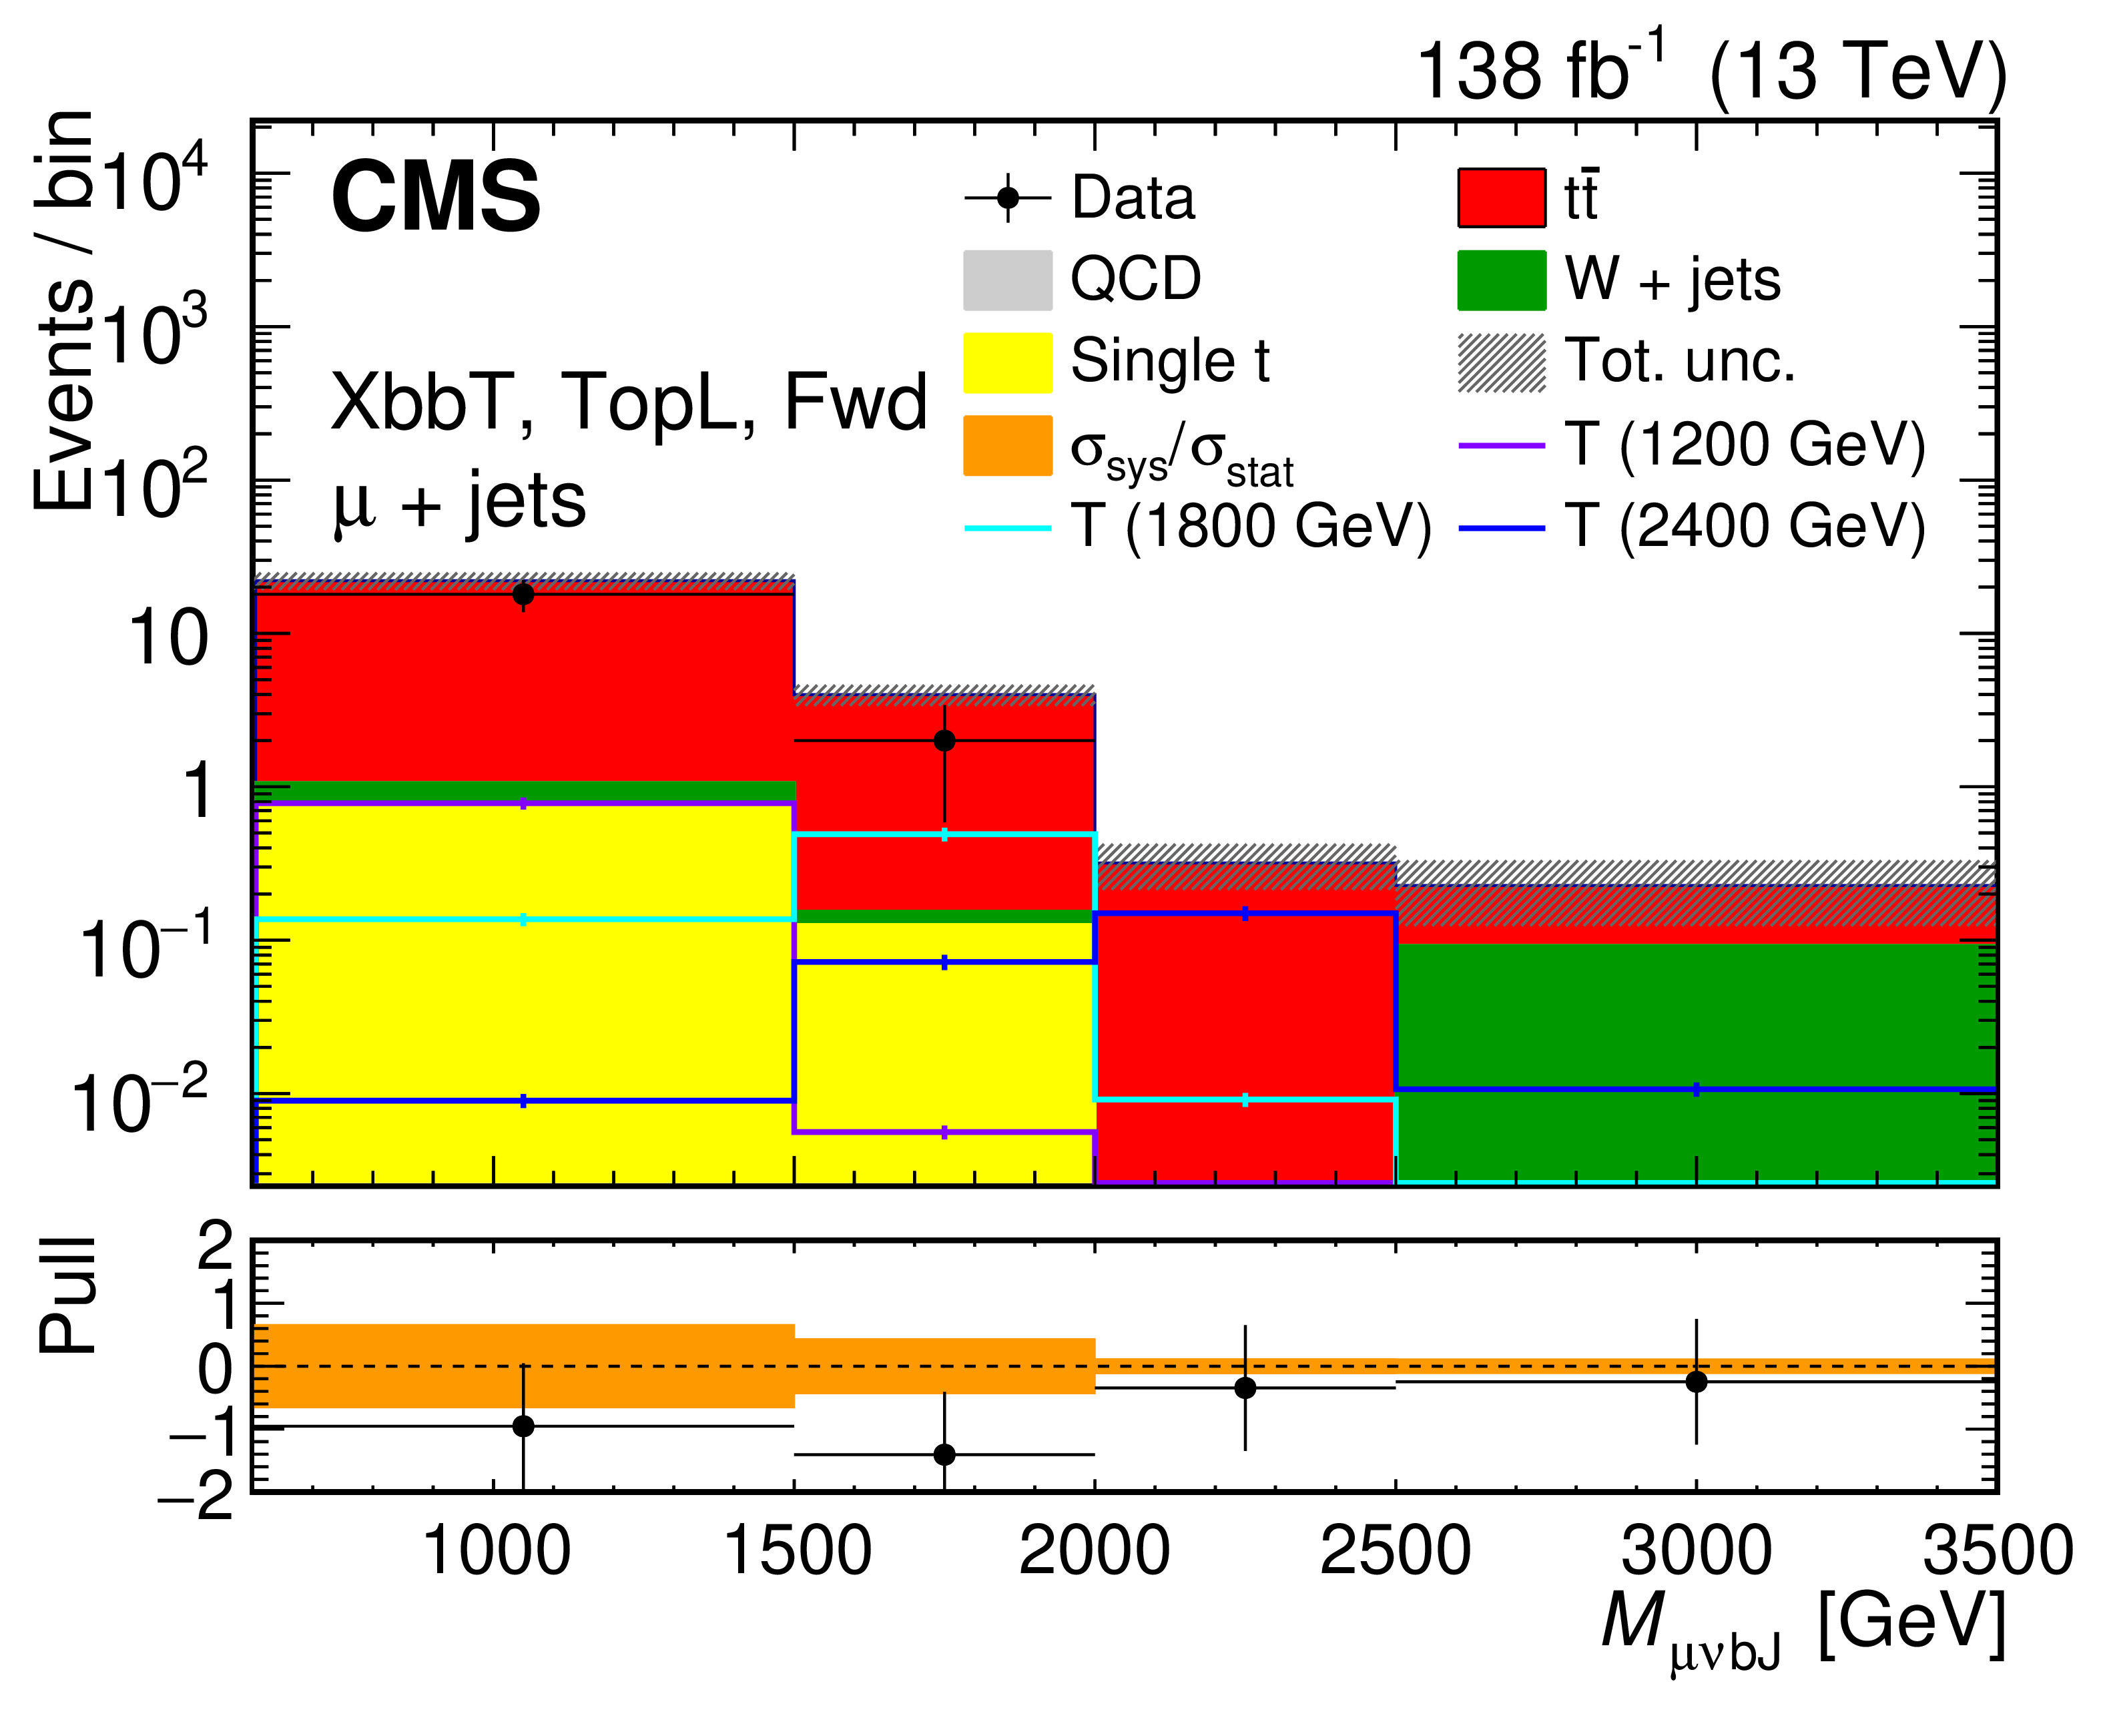
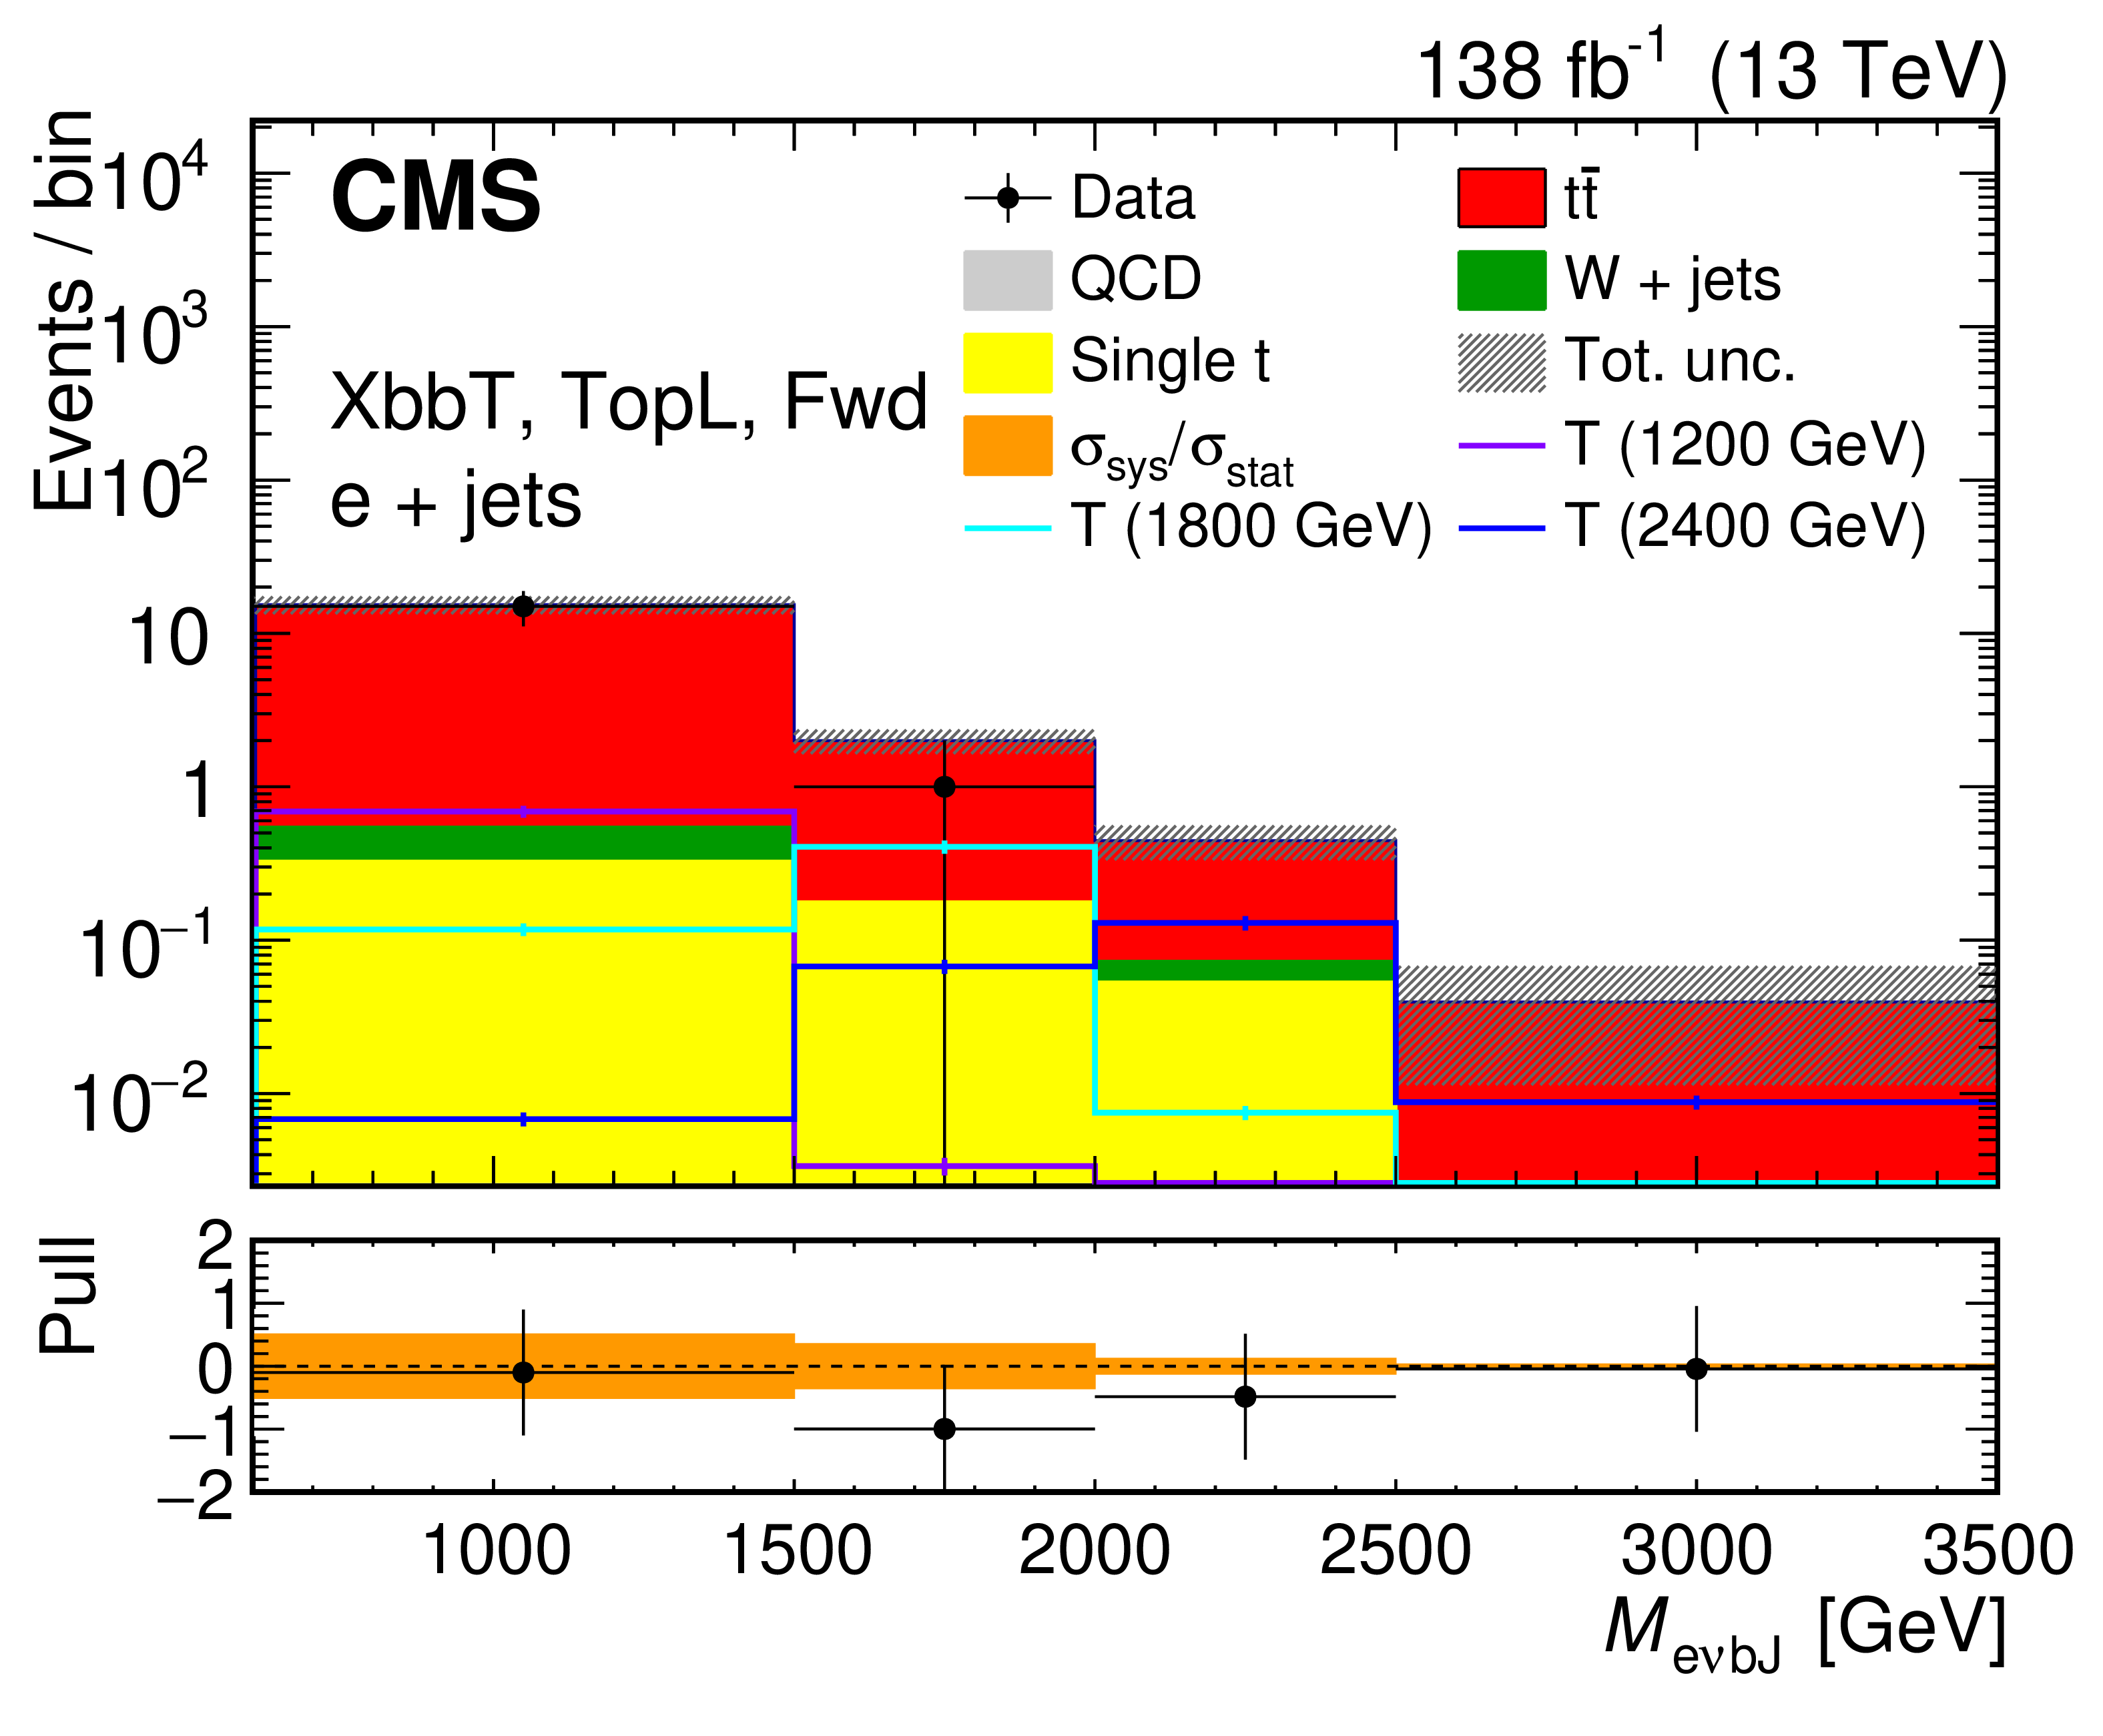
Figure 5:
Invariant mass distribution of the $ \mathrm{T} $ quark candidates selected in the $ \mathrm{T} \to\mathrm{t}\mathrm{H} $ channel, for events with at least one forward jet and in the SRs for (TopT, XbbT) (upper) and (TopL, XbbT) (lower). For these events, the reconstructed mass of the Higgs boson candidate is required to be between 110 and 140 GeV. Distributions are shown for events in the muon (left) and electron (right) channel. The first (last) bin of each distribution also includes underflow (overflow) events. The lower panels show the difference between the number of events in data and that expected, normalized to the statistical uncertainty of the data. The orange band represents the systematic uncertainties, also normalized to the statistical uncertainty of the data. |
png pdf |
Figure 5-a:
Invariant mass distribution of the $ \mathrm{T} $ quark candidates selected in the $ \mathrm{T} \to\mathrm{t}\mathrm{H} $ channel, for events with at least one forward jet and in the SRs for (TopT, XbbT) (upper) and (TopL, XbbT) (lower). For these events, the reconstructed mass of the Higgs boson candidate is required to be between 110 and 140 GeV. Distributions are shown for events in the muon (left) and electron (right) channel. The first (last) bin of each distribution also includes underflow (overflow) events. The lower panels show the difference between the number of events in data and that expected, normalized to the statistical uncertainty of the data. The orange band represents the systematic uncertainties, also normalized to the statistical uncertainty of the data. |
png pdf |
Figure 5-b:
Invariant mass distribution of the $ \mathrm{T} $ quark candidates selected in the $ \mathrm{T} \to\mathrm{t}\mathrm{H} $ channel, for events with at least one forward jet and in the SRs for (TopT, XbbT) (upper) and (TopL, XbbT) (lower). For these events, the reconstructed mass of the Higgs boson candidate is required to be between 110 and 140 GeV. Distributions are shown for events in the muon (left) and electron (right) channel. The first (last) bin of each distribution also includes underflow (overflow) events. The lower panels show the difference between the number of events in data and that expected, normalized to the statistical uncertainty of the data. The orange band represents the systematic uncertainties, also normalized to the statistical uncertainty of the data. |
png pdf |
Figure 5-c:
Invariant mass distribution of the $ \mathrm{T} $ quark candidates selected in the $ \mathrm{T} \to\mathrm{t}\mathrm{H} $ channel, for events with at least one forward jet and in the SRs for (TopT, XbbT) (upper) and (TopL, XbbT) (lower). For these events, the reconstructed mass of the Higgs boson candidate is required to be between 110 and 140 GeV. Distributions are shown for events in the muon (left) and electron (right) channel. The first (last) bin of each distribution also includes underflow (overflow) events. The lower panels show the difference between the number of events in data and that expected, normalized to the statistical uncertainty of the data. The orange band represents the systematic uncertainties, also normalized to the statistical uncertainty of the data. |
png pdf |
Figure 5-d:
Invariant mass distribution of the $ \mathrm{T} $ quark candidates selected in the $ \mathrm{T} \to\mathrm{t}\mathrm{H} $ channel, for events with at least one forward jet and in the SRs for (TopT, XbbT) (upper) and (TopL, XbbT) (lower). For these events, the reconstructed mass of the Higgs boson candidate is required to be between 110 and 140 GeV. Distributions are shown for events in the muon (left) and electron (right) channel. The first (last) bin of each distribution also includes underflow (overflow) events. The lower panels show the difference between the number of events in data and that expected, normalized to the statistical uncertainty of the data. The orange band represents the systematic uncertainties, also normalized to the statistical uncertainty of the data. |
png pdf |
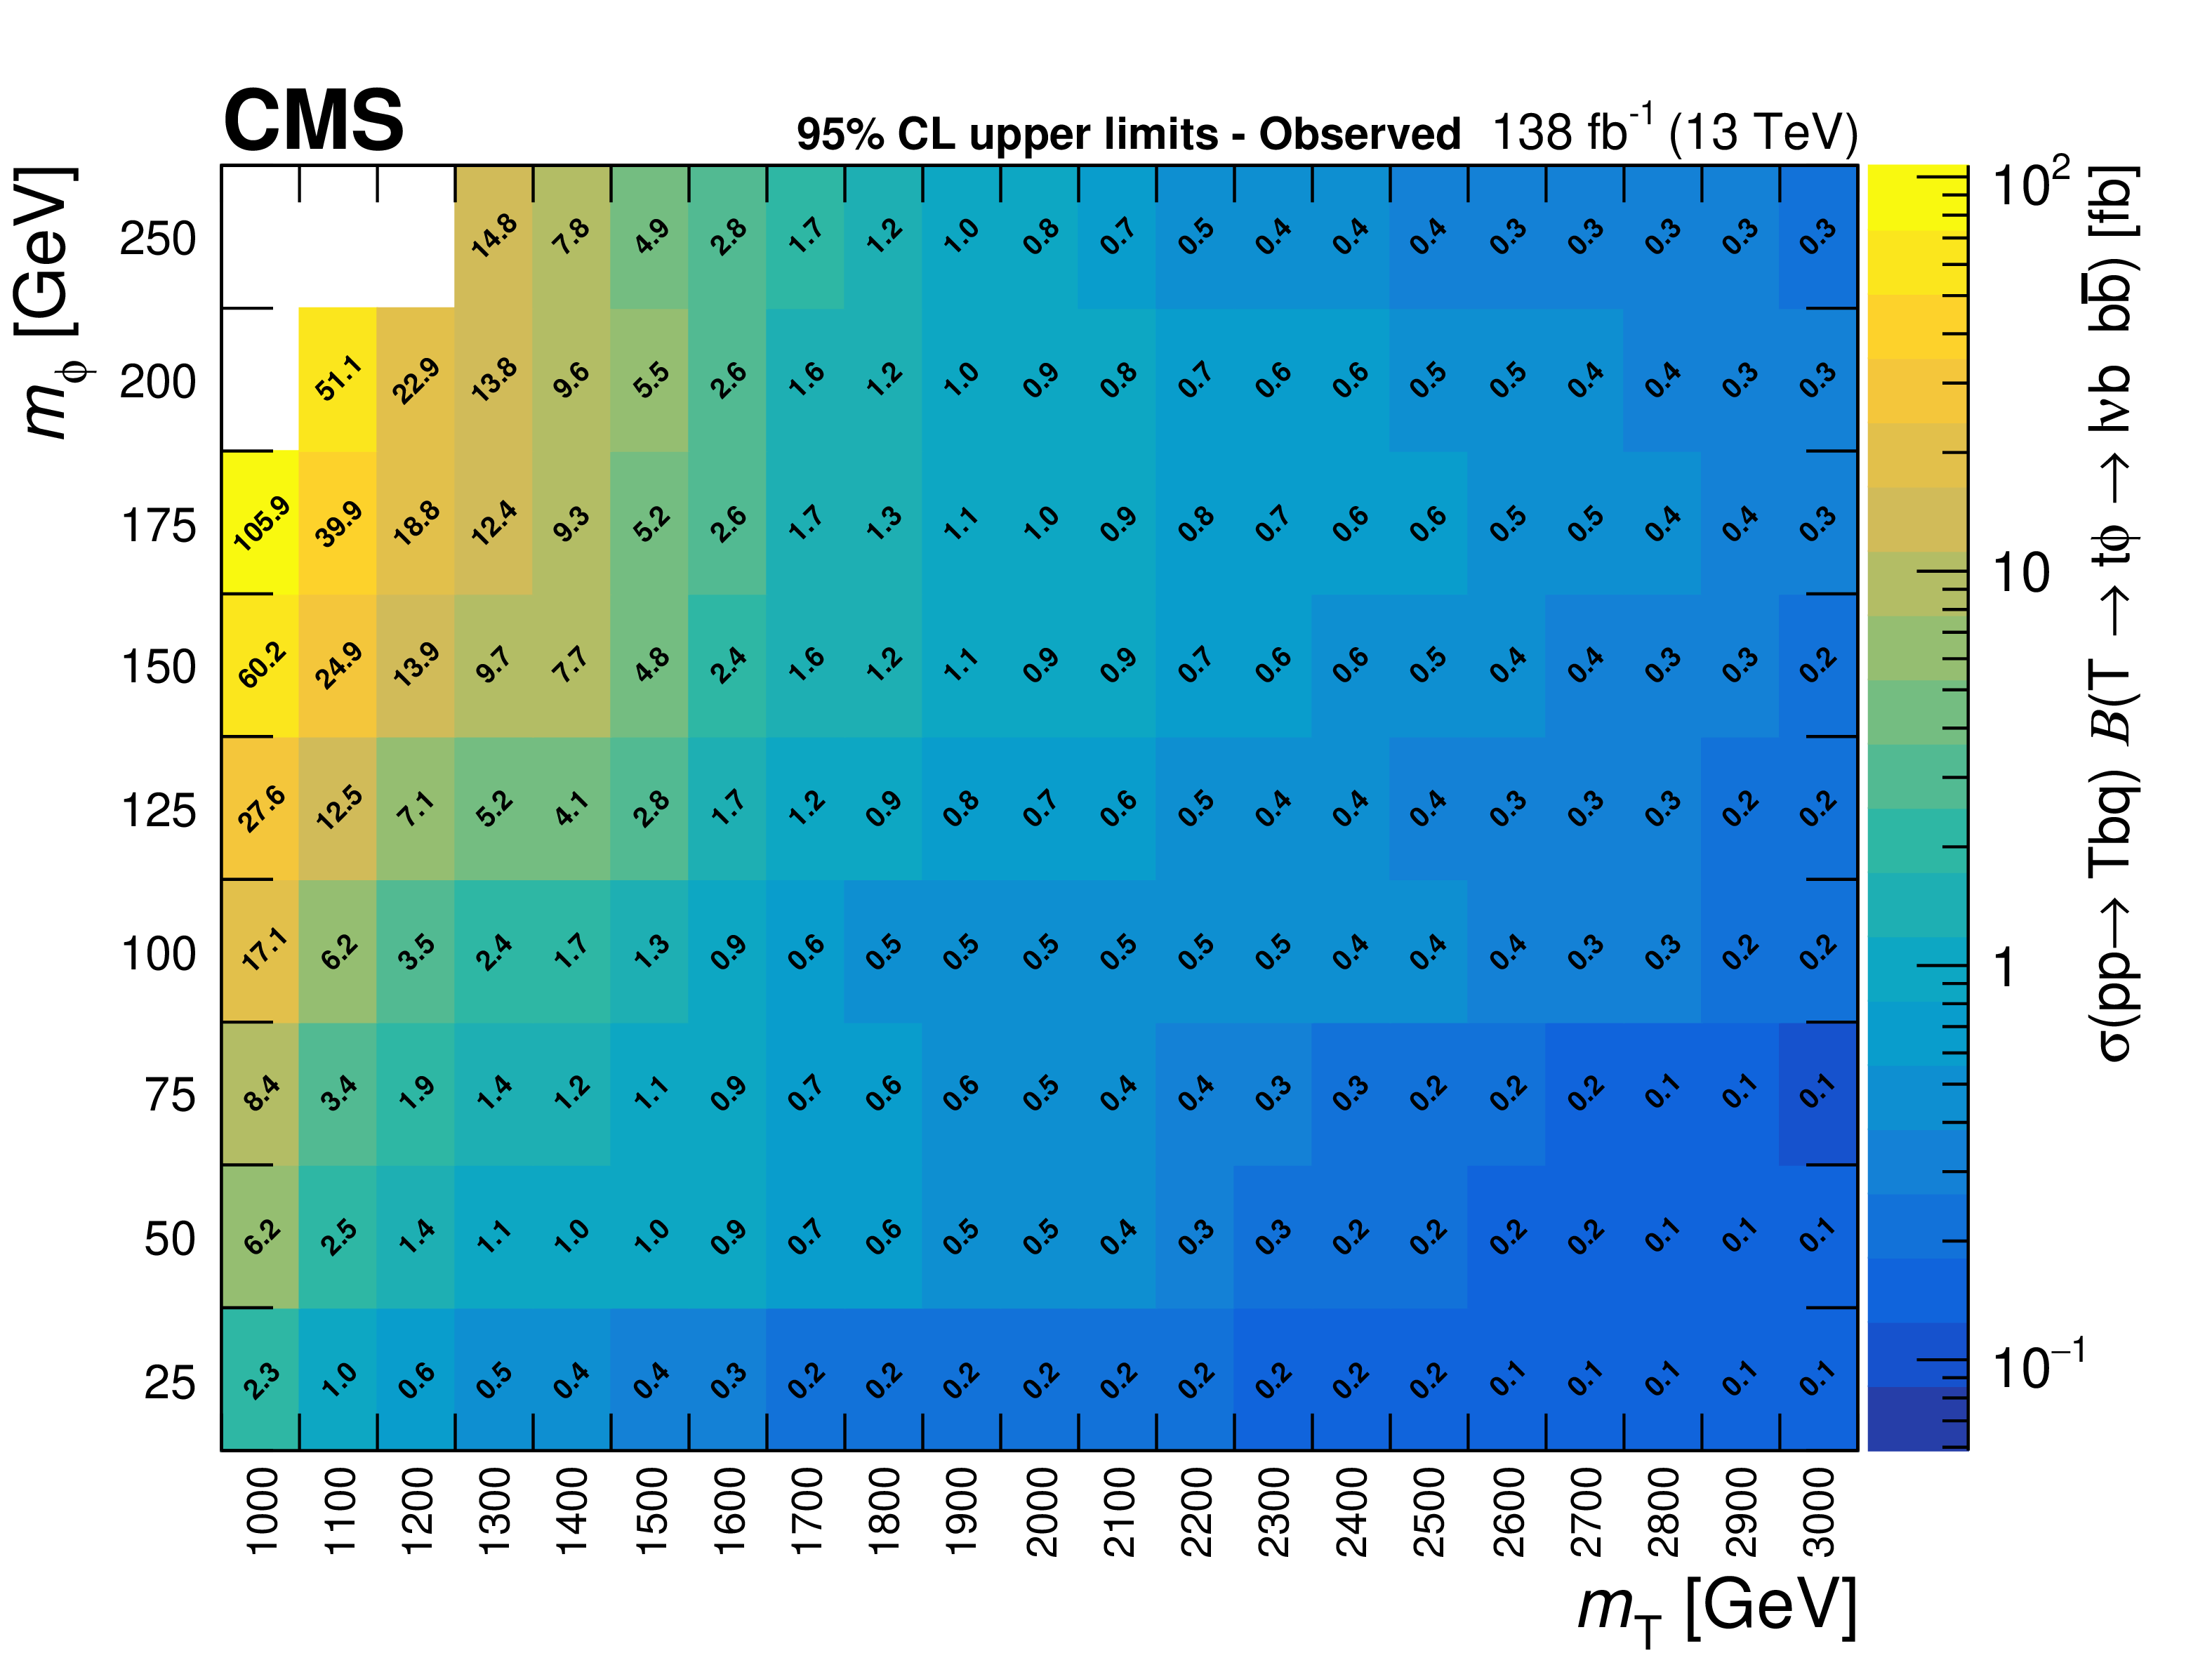
Figure 6:
Observed 95% CL upper limits on the single T quark product of cross section and branching ratio for the $ \mathrm{T} \to\mathrm{t}\phi \to \mathrm{b}\ell\nu \mathrm{b}\overline{\mathrm{b}} $ channel, as a function of $ m_{\mathrm{T} } $ and $ m_{\phi} $ masses. |
png pdf |
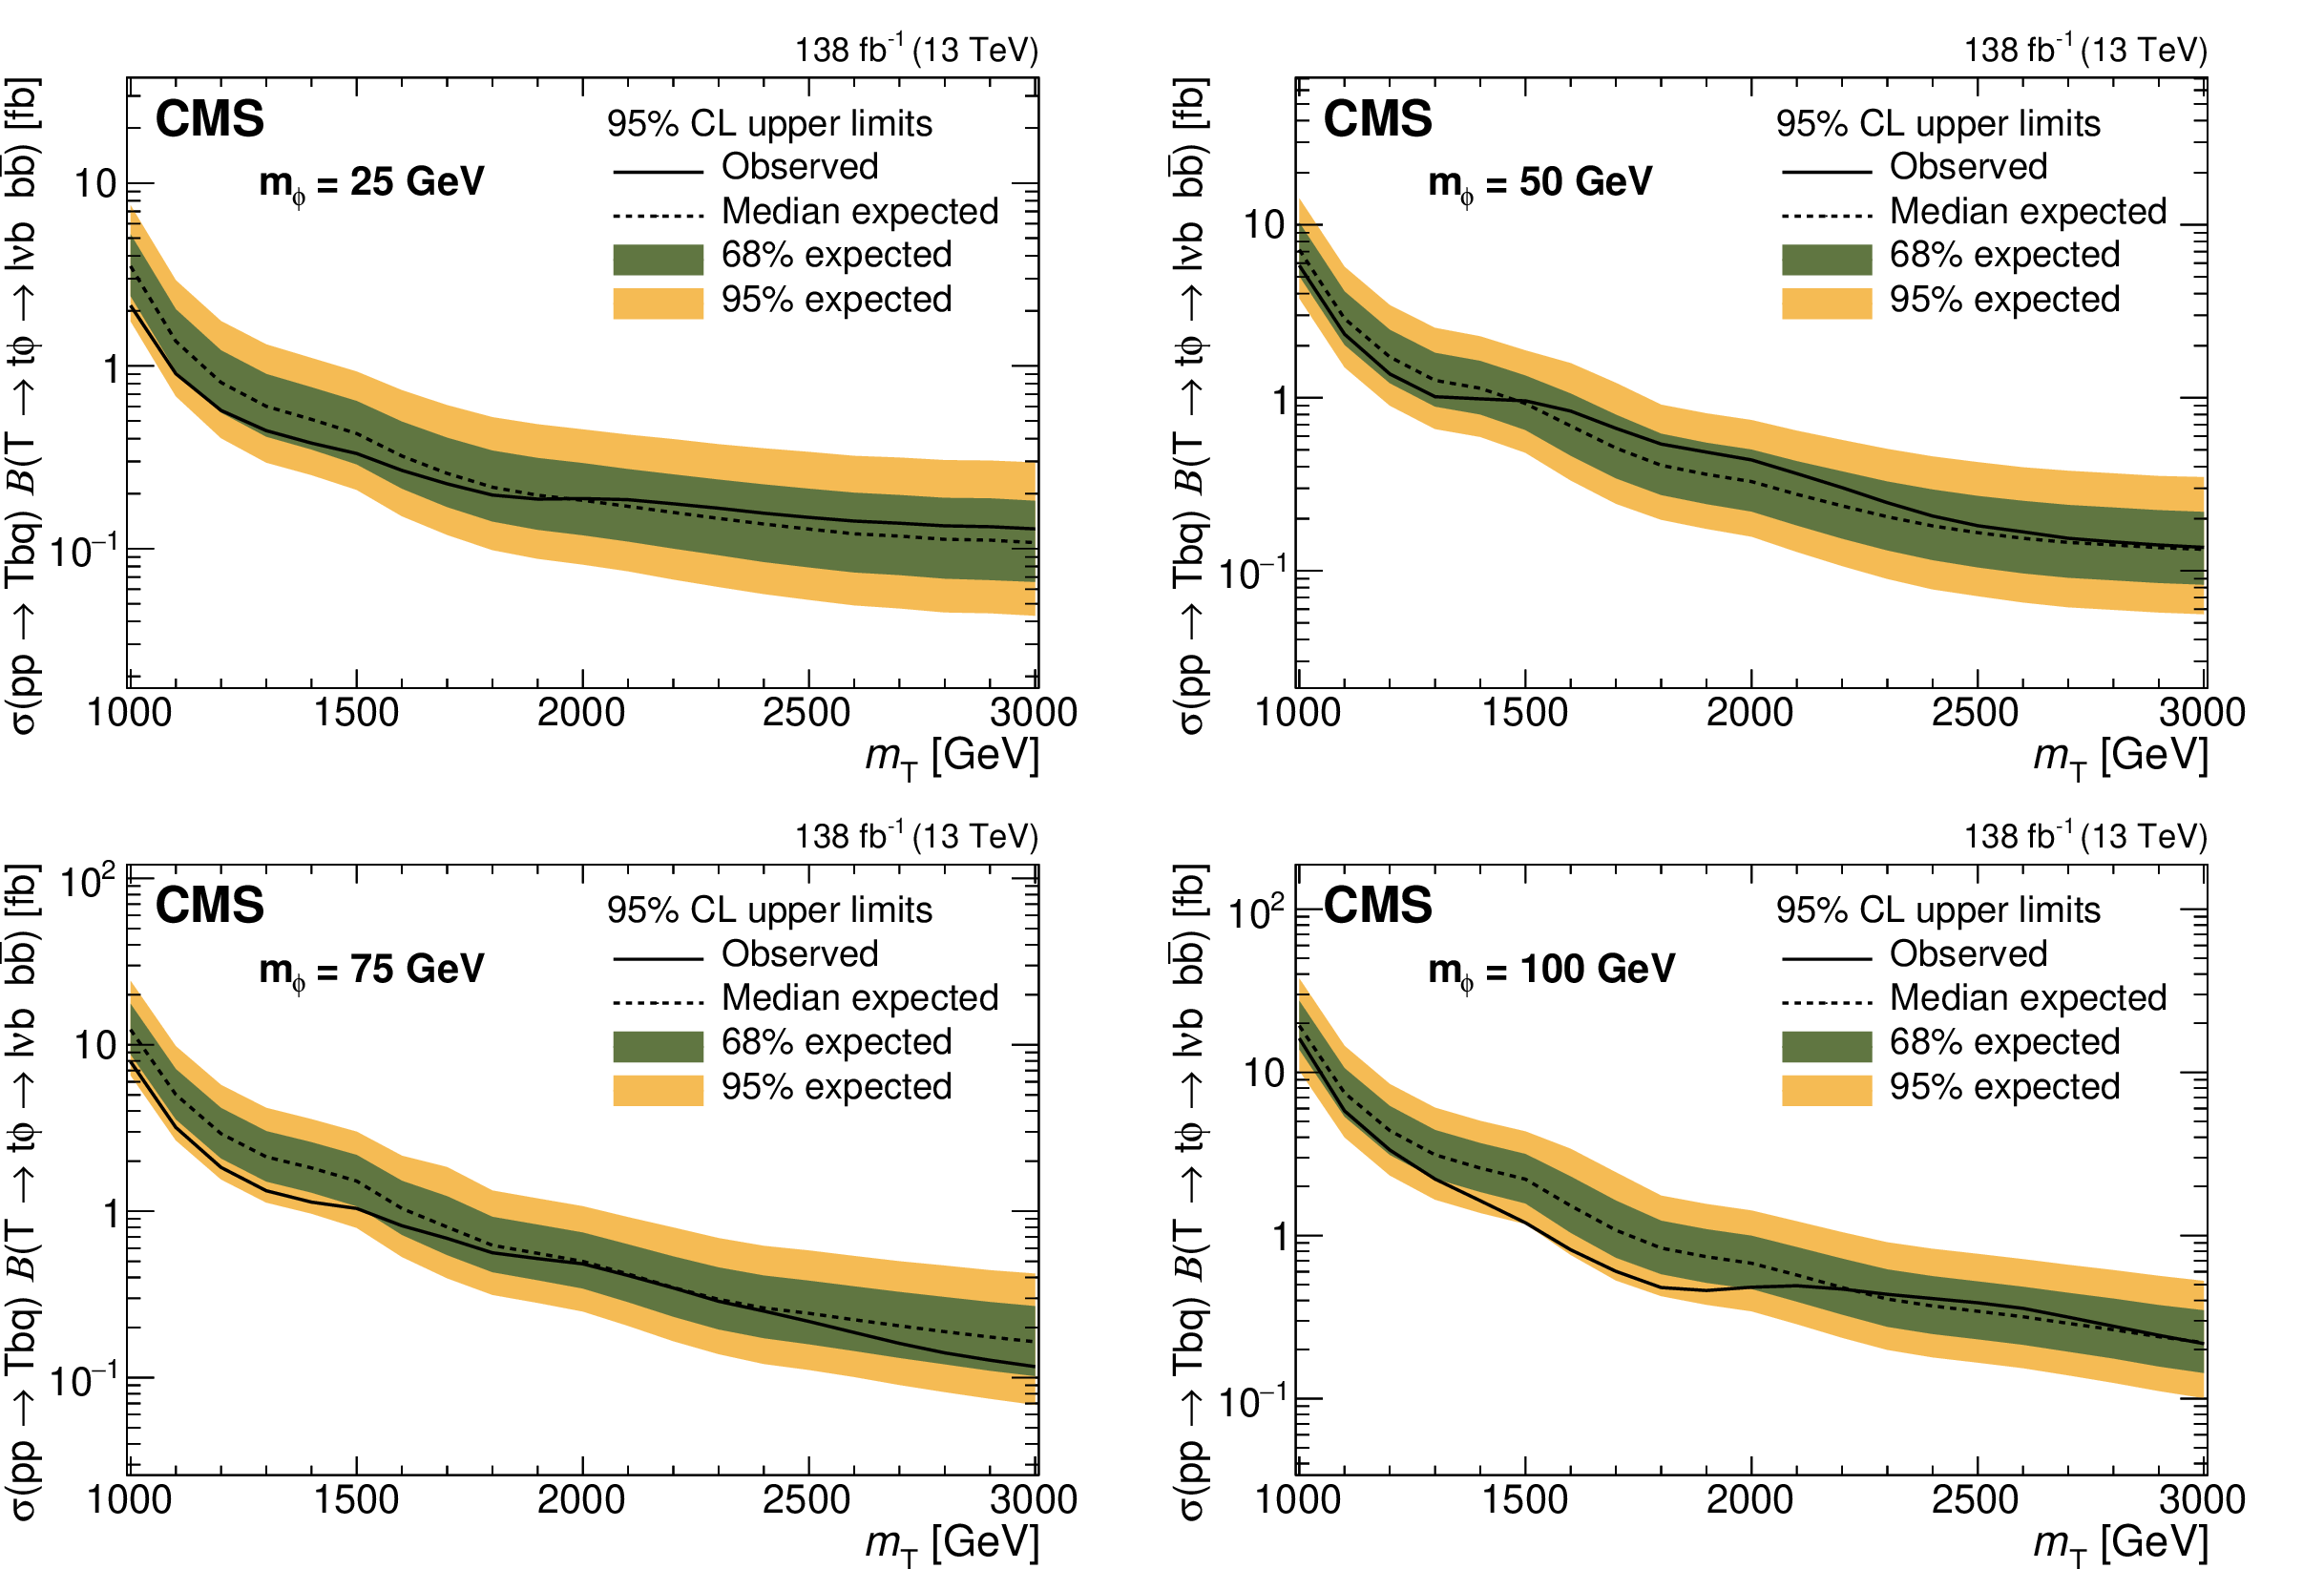
Figure 7:
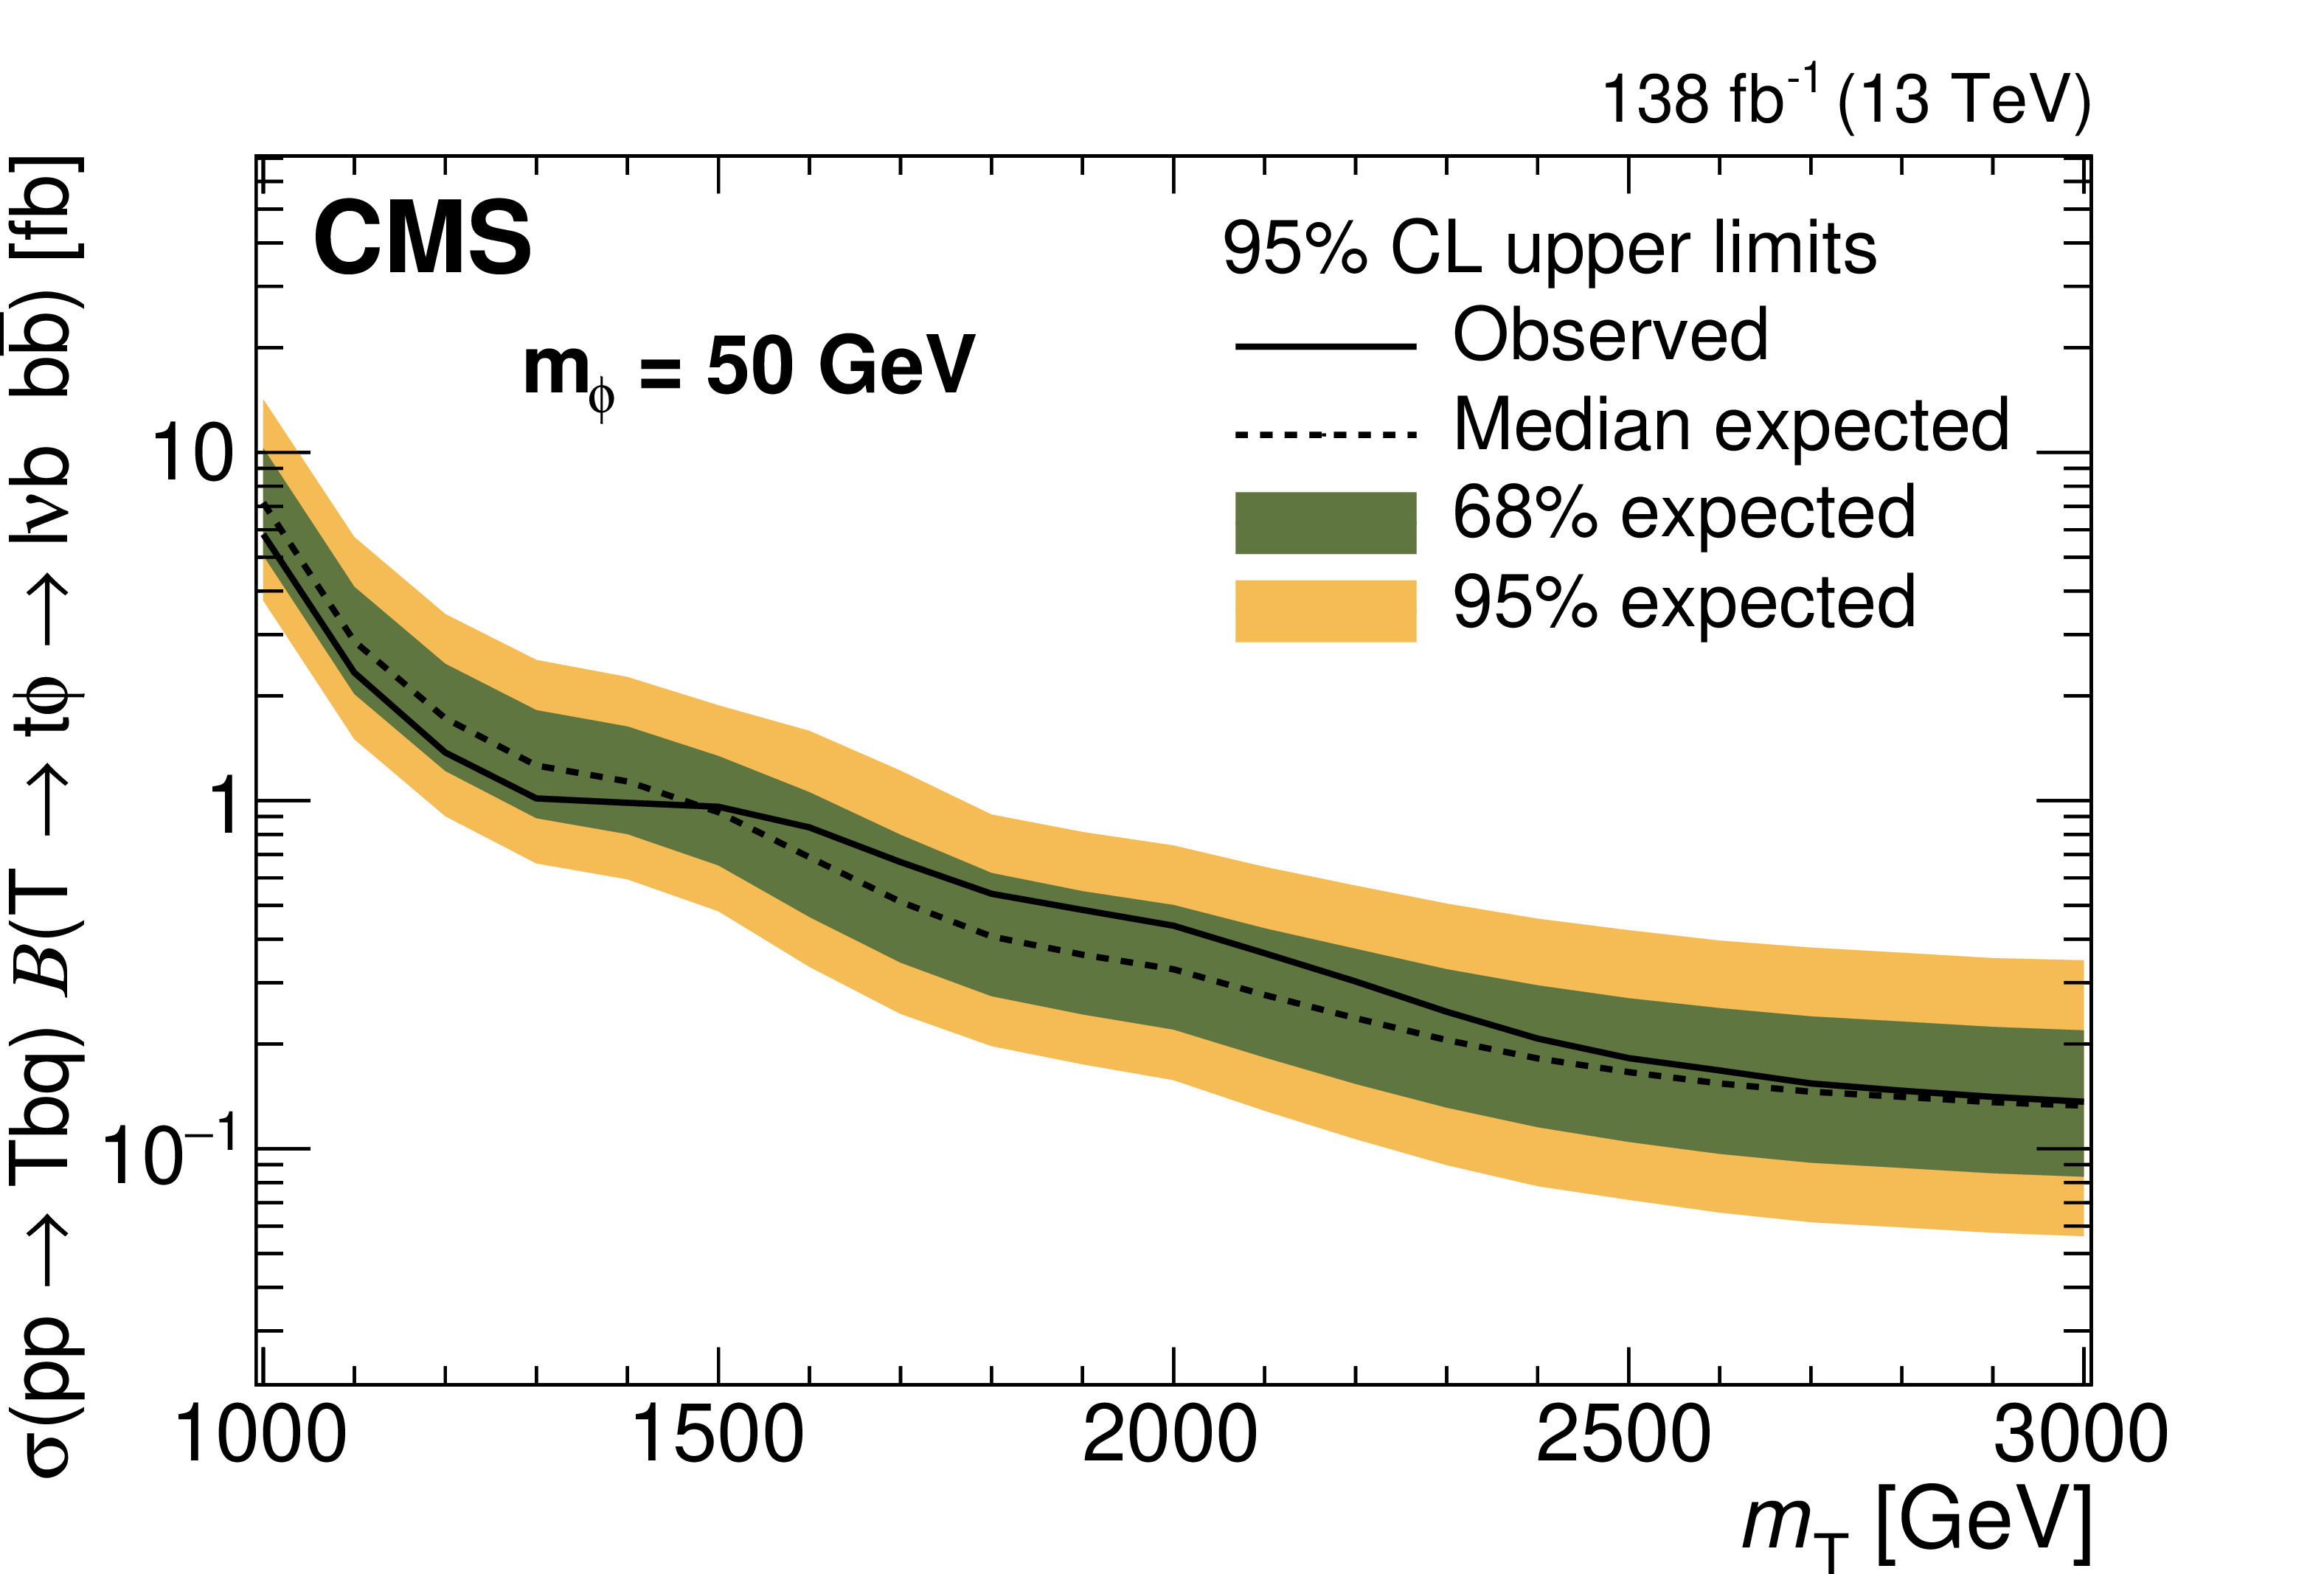
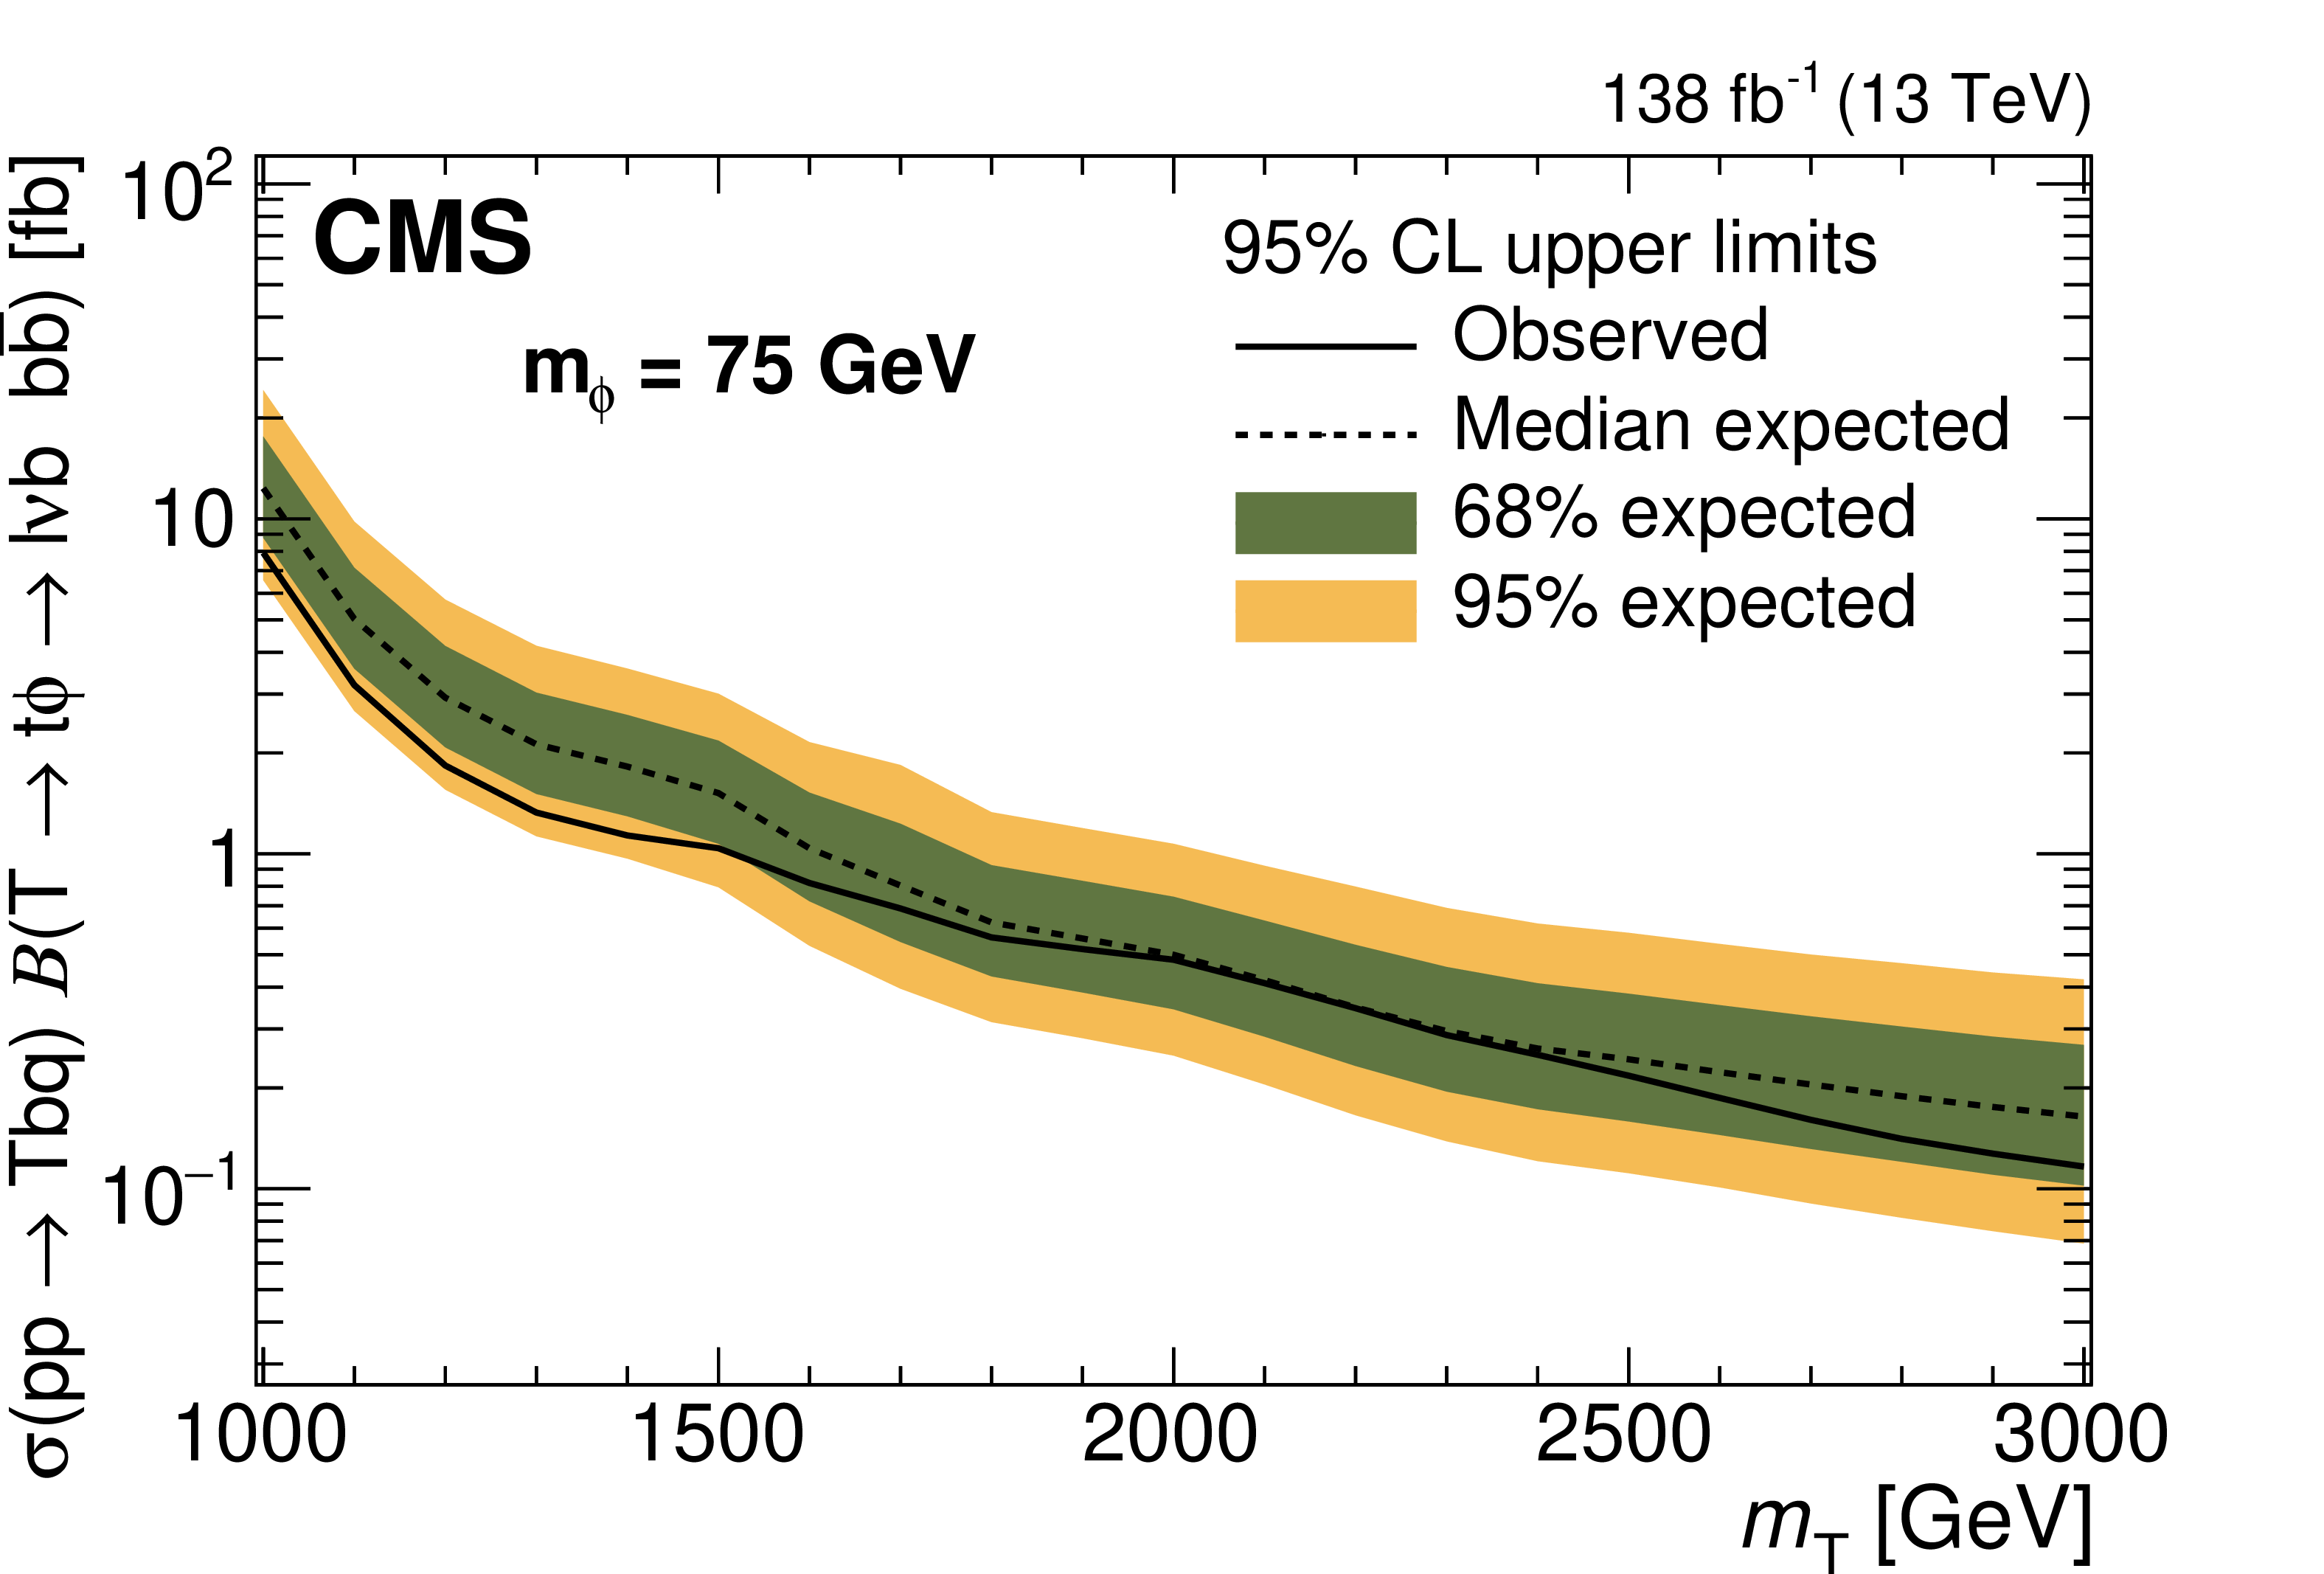
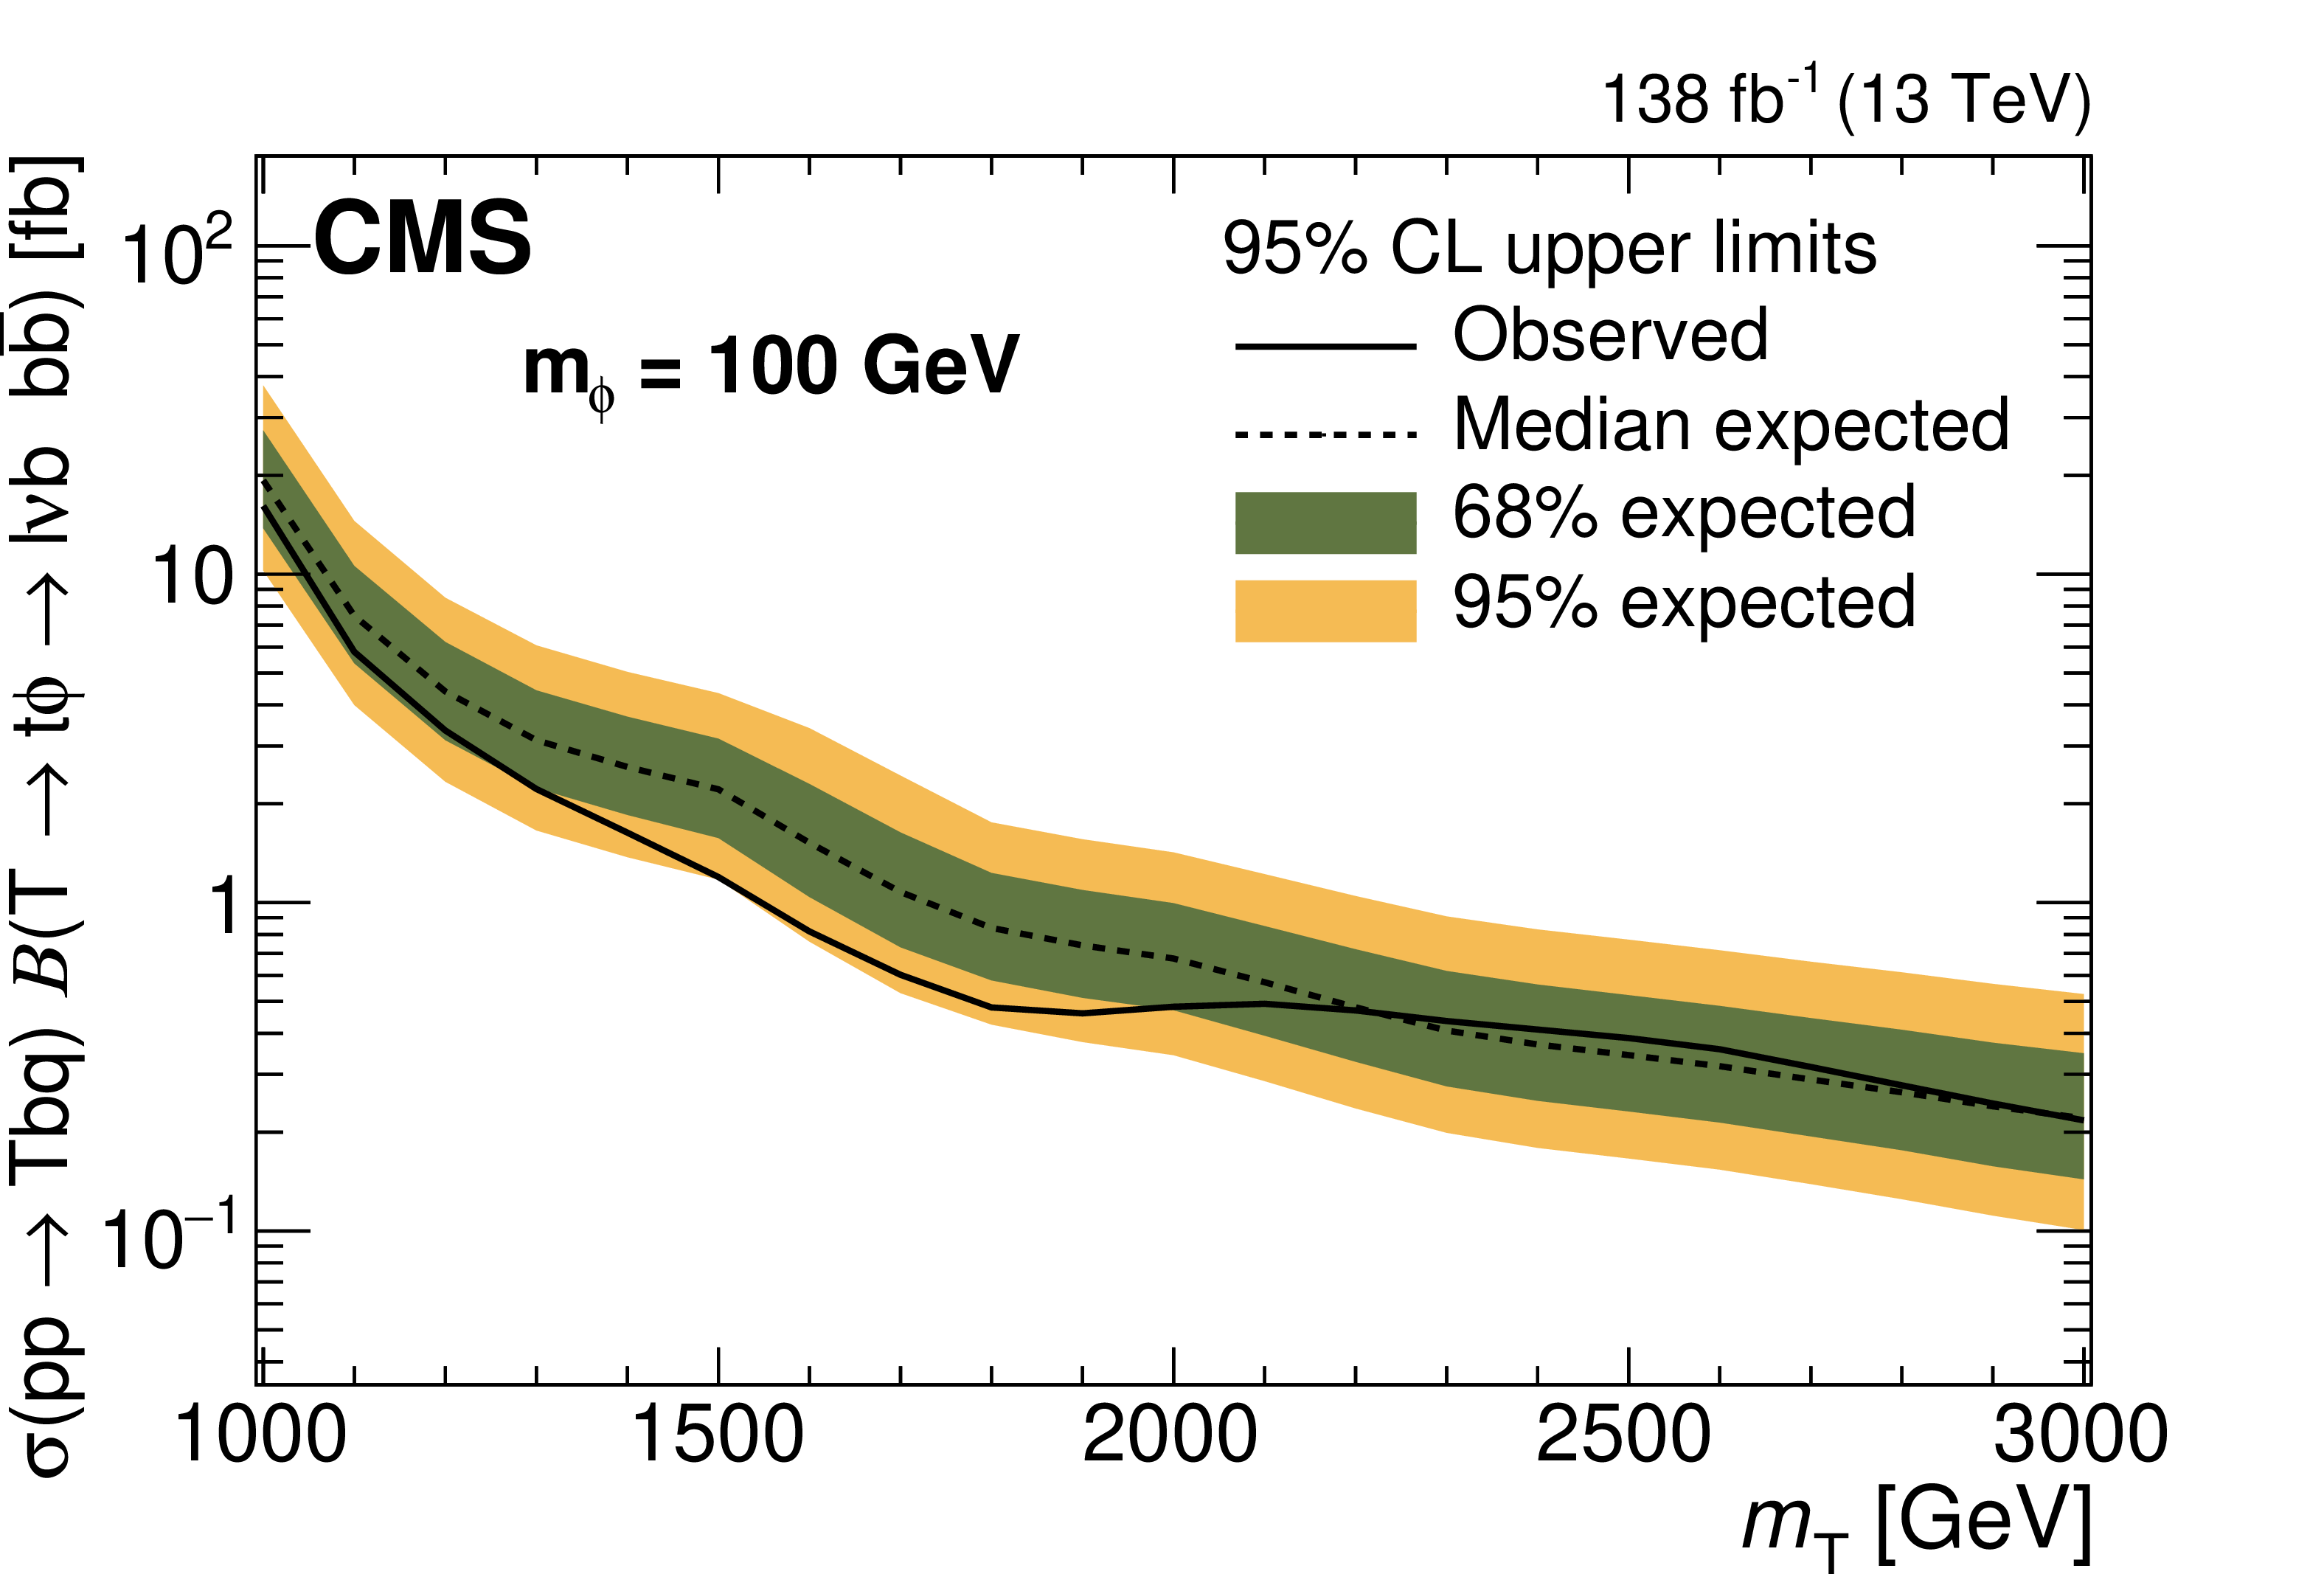
Observed (solid lines) and expected (dashed lines) 95% CL upper limits on the single T quark product of cross section and branching ratio for the $ \mathrm{T} \to\mathrm{t}\phi \to \mathrm{b}\ell\nu \mathrm{b}\overline{\mathrm{b}} $ channel as a function of $ m_{\mathrm{T} } $, for fixed values of $ m_{\phi} $, from 25 up to 100 GeV. The inner (green) and outer (yellow) bands represent the regions containing 68 and 95%, respectively, of the limit values expected under the background-only hypothesis. |
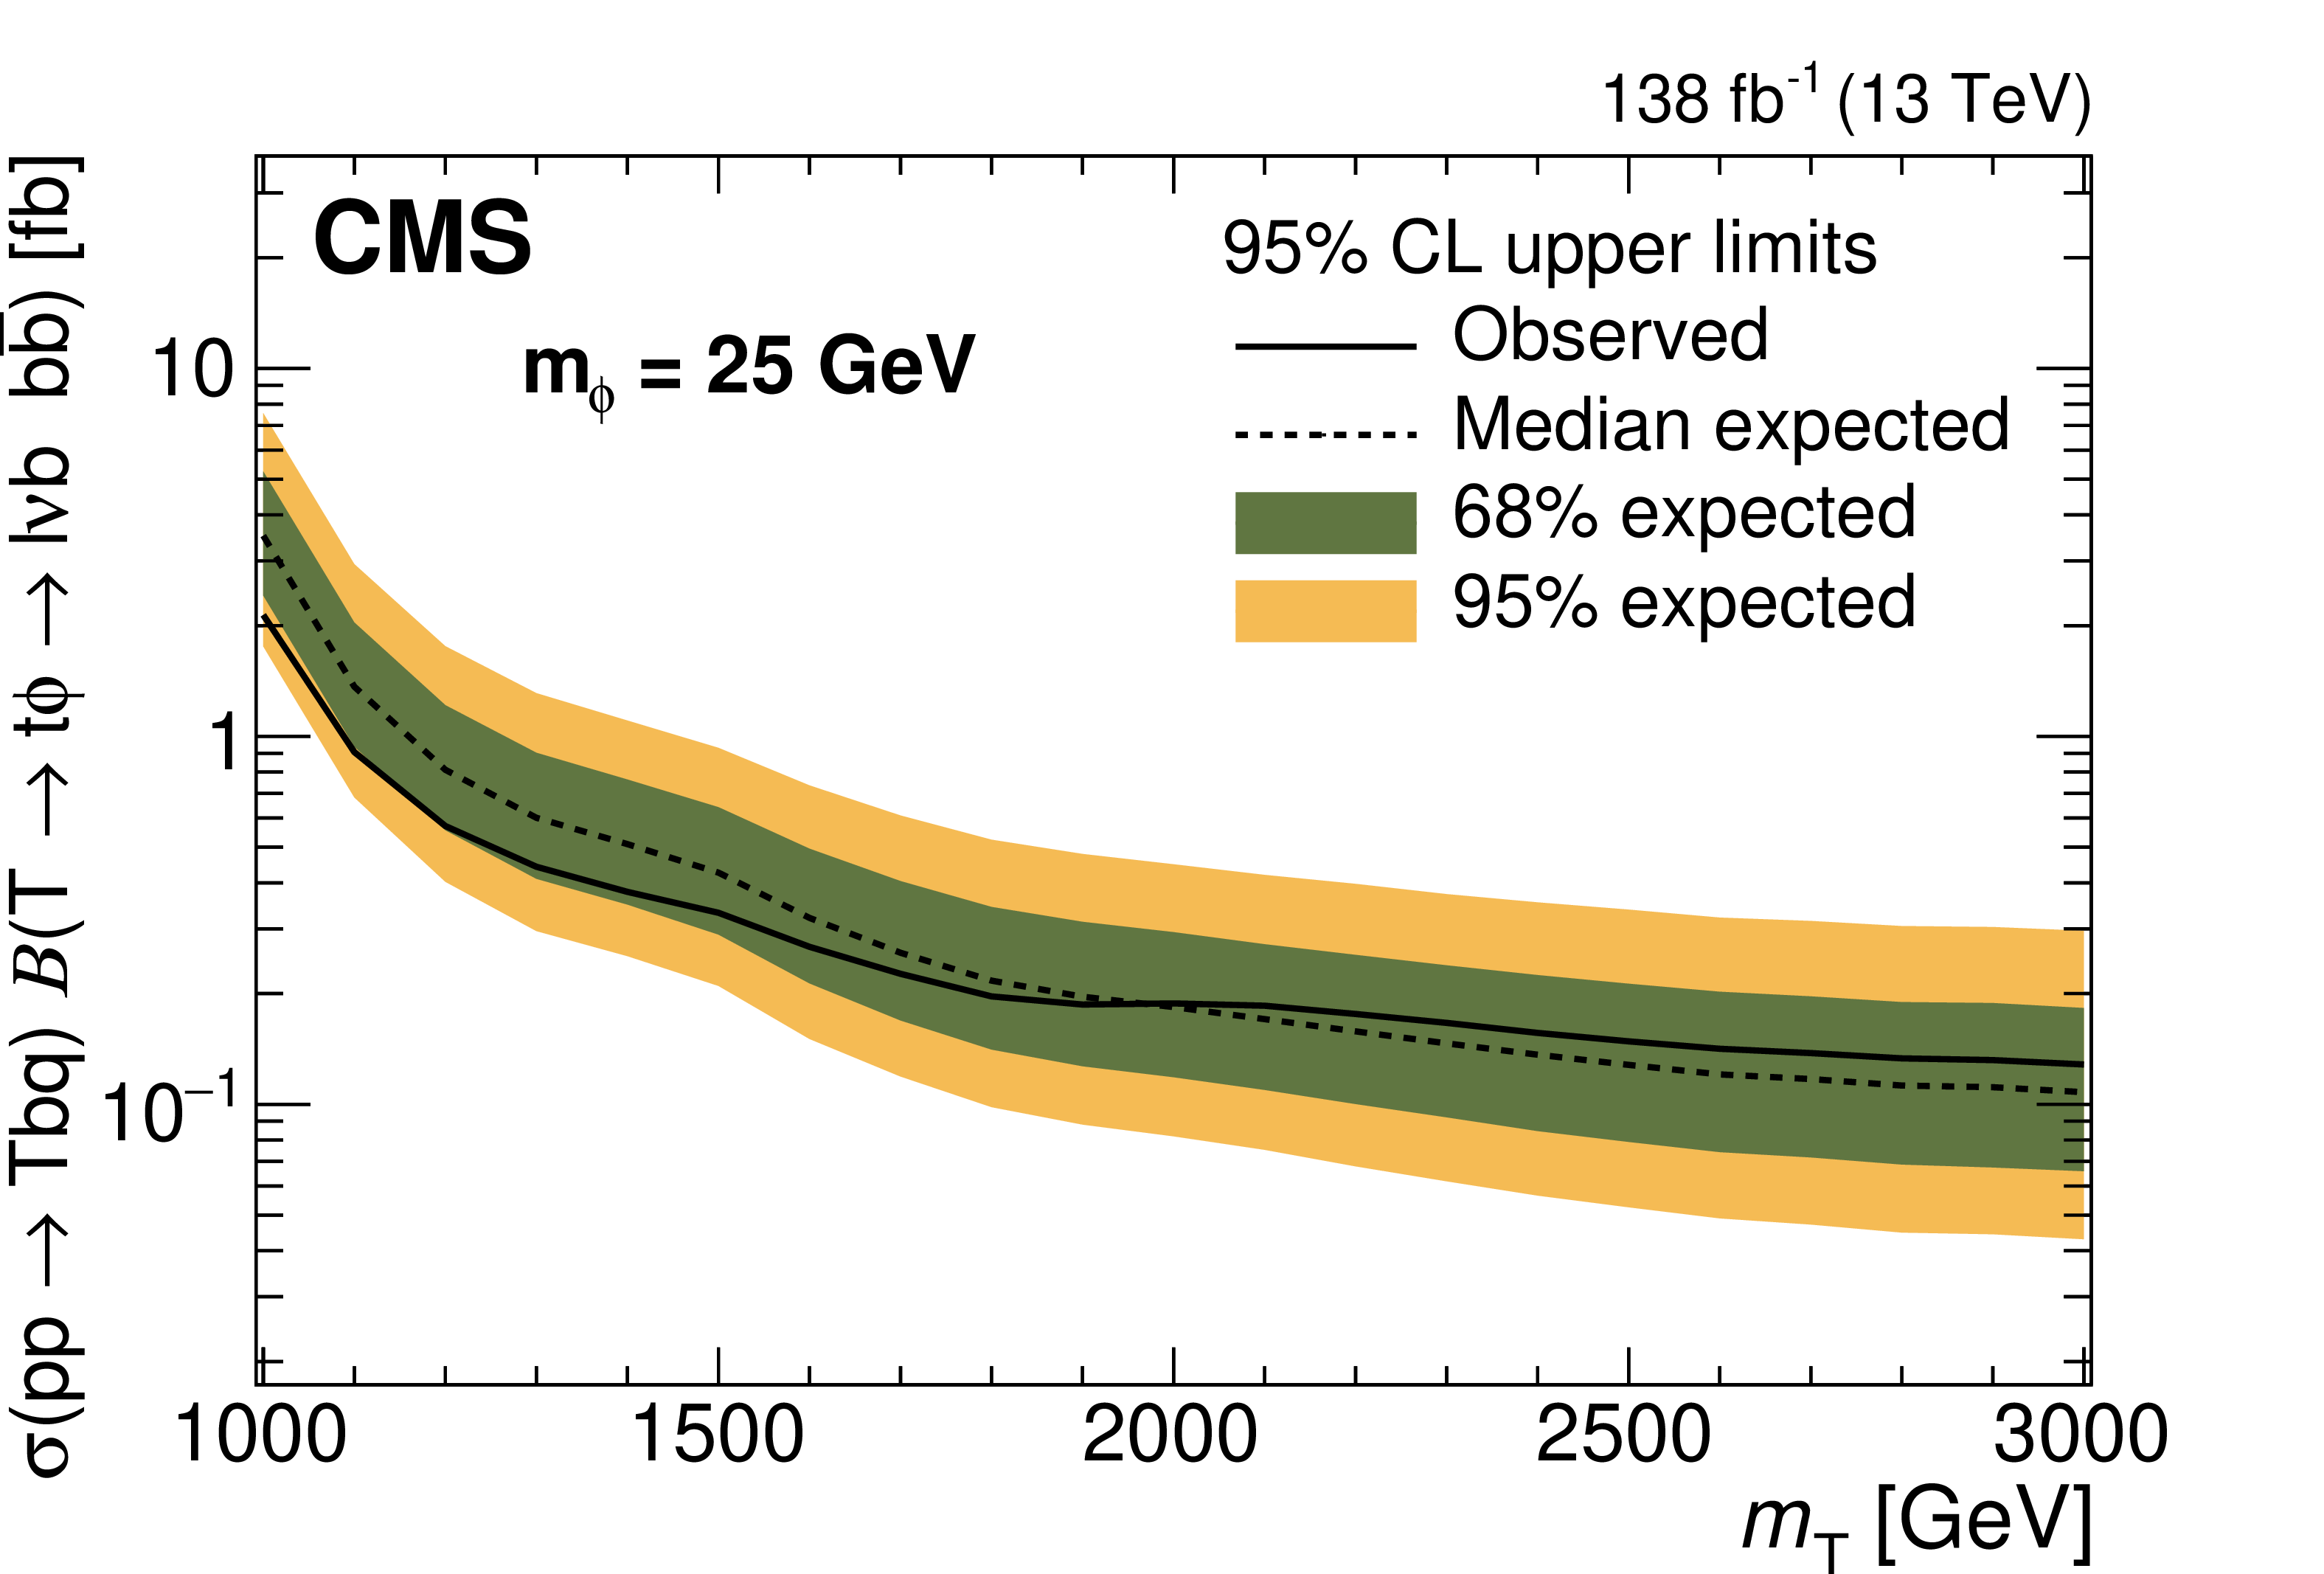
png pdf |
Figure 7-a:
Observed (solid lines) and expected (dashed lines) 95% CL upper limits on the single T quark product of cross section and branching ratio for the $ \mathrm{T} \to\mathrm{t}\phi \to \mathrm{b}\ell\nu \mathrm{b}\overline{\mathrm{b}} $ channel as a function of $ m_{\mathrm{T} } $, for fixed values of $ m_{\phi} $, from 25 up to 100 GeV. The inner (green) and outer (yellow) bands represent the regions containing 68 and 95%, respectively, of the limit values expected under the background-only hypothesis. |
png pdf |
Figure 7-b:
Observed (solid lines) and expected (dashed lines) 95% CL upper limits on the single T quark product of cross section and branching ratio for the $ \mathrm{T} \to\mathrm{t}\phi \to \mathrm{b}\ell\nu \mathrm{b}\overline{\mathrm{b}} $ channel as a function of $ m_{\mathrm{T} } $, for fixed values of $ m_{\phi} $, from 25 up to 100 GeV. The inner (green) and outer (yellow) bands represent the regions containing 68 and 95%, respectively, of the limit values expected under the background-only hypothesis. |
png pdf |
Figure 7-c:
Observed (solid lines) and expected (dashed lines) 95% CL upper limits on the single T quark product of cross section and branching ratio for the $ \mathrm{T} \to\mathrm{t}\phi \to \mathrm{b}\ell\nu \mathrm{b}\overline{\mathrm{b}} $ channel as a function of $ m_{\mathrm{T} } $, for fixed values of $ m_{\phi} $, from 25 up to 100 GeV. The inner (green) and outer (yellow) bands represent the regions containing 68 and 95%, respectively, of the limit values expected under the background-only hypothesis. |
png pdf |
Figure 7-d:
Observed (solid lines) and expected (dashed lines) 95% CL upper limits on the single T quark product of cross section and branching ratio for the $ \mathrm{T} \to\mathrm{t}\phi \to \mathrm{b}\ell\nu \mathrm{b}\overline{\mathrm{b}} $ channel as a function of $ m_{\mathrm{T} } $, for fixed values of $ m_{\phi} $, from 25 up to 100 GeV. The inner (green) and outer (yellow) bands represent the regions containing 68 and 95%, respectively, of the limit values expected under the background-only hypothesis. |
png pdf |
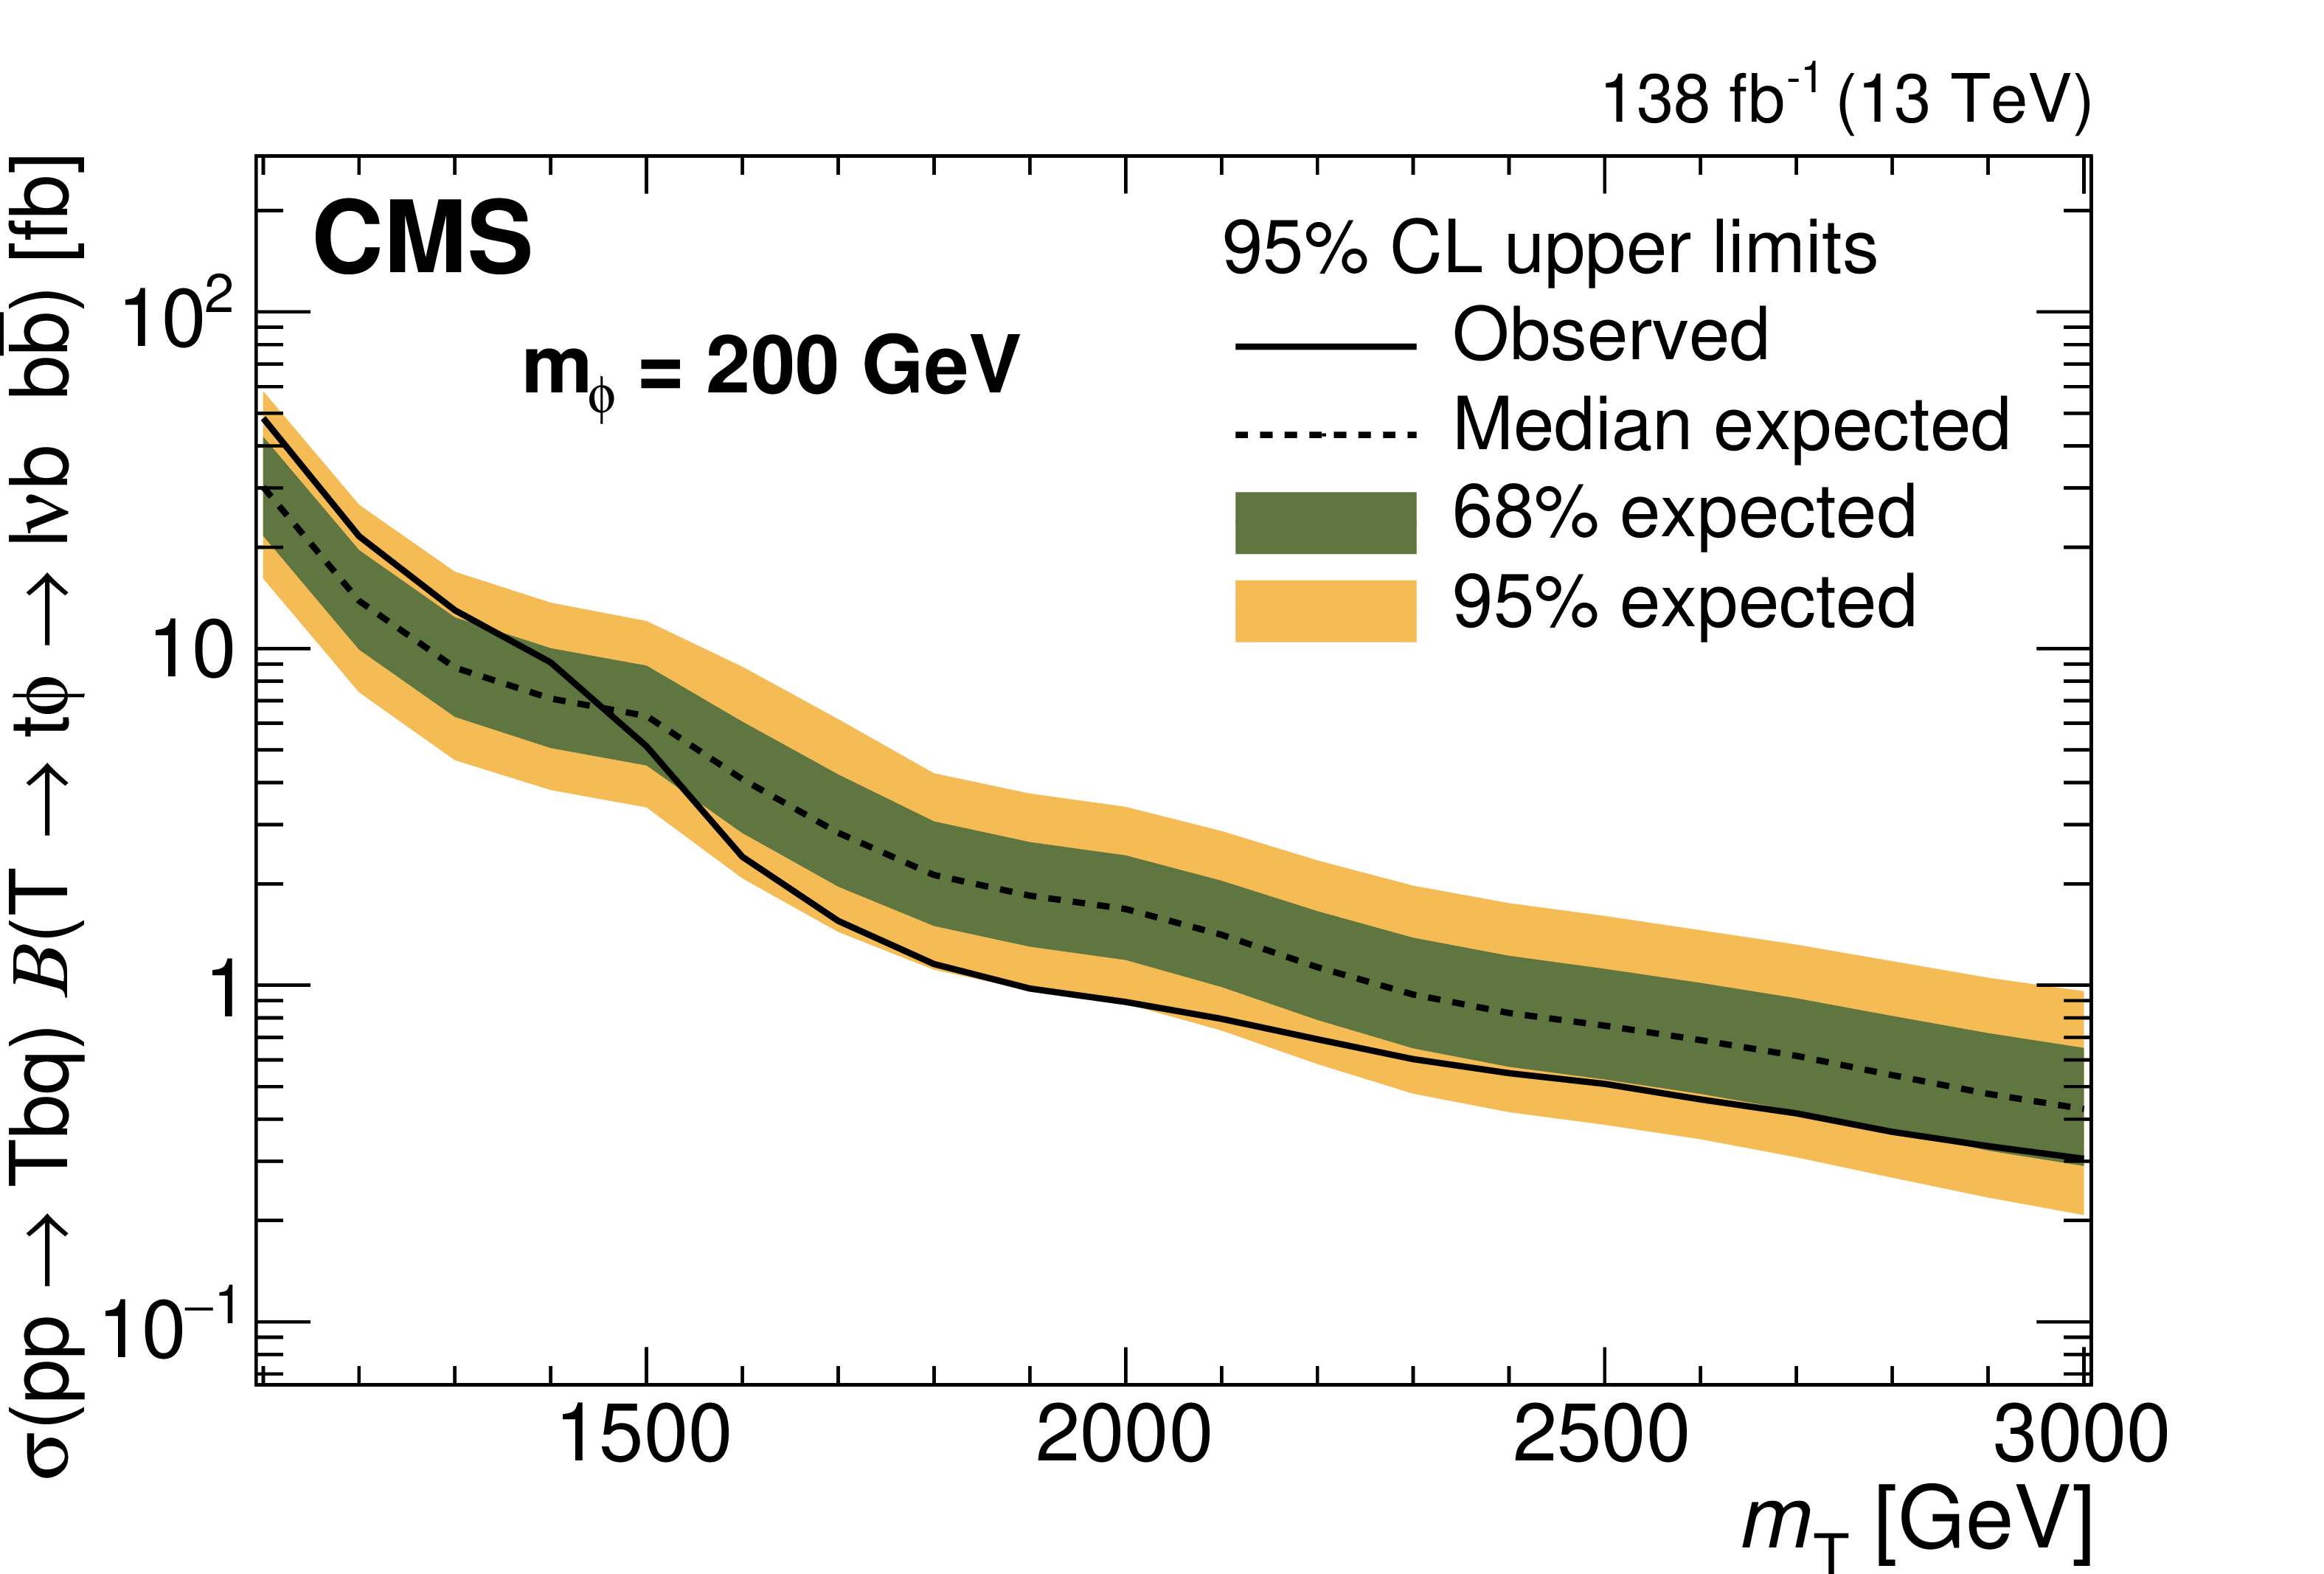
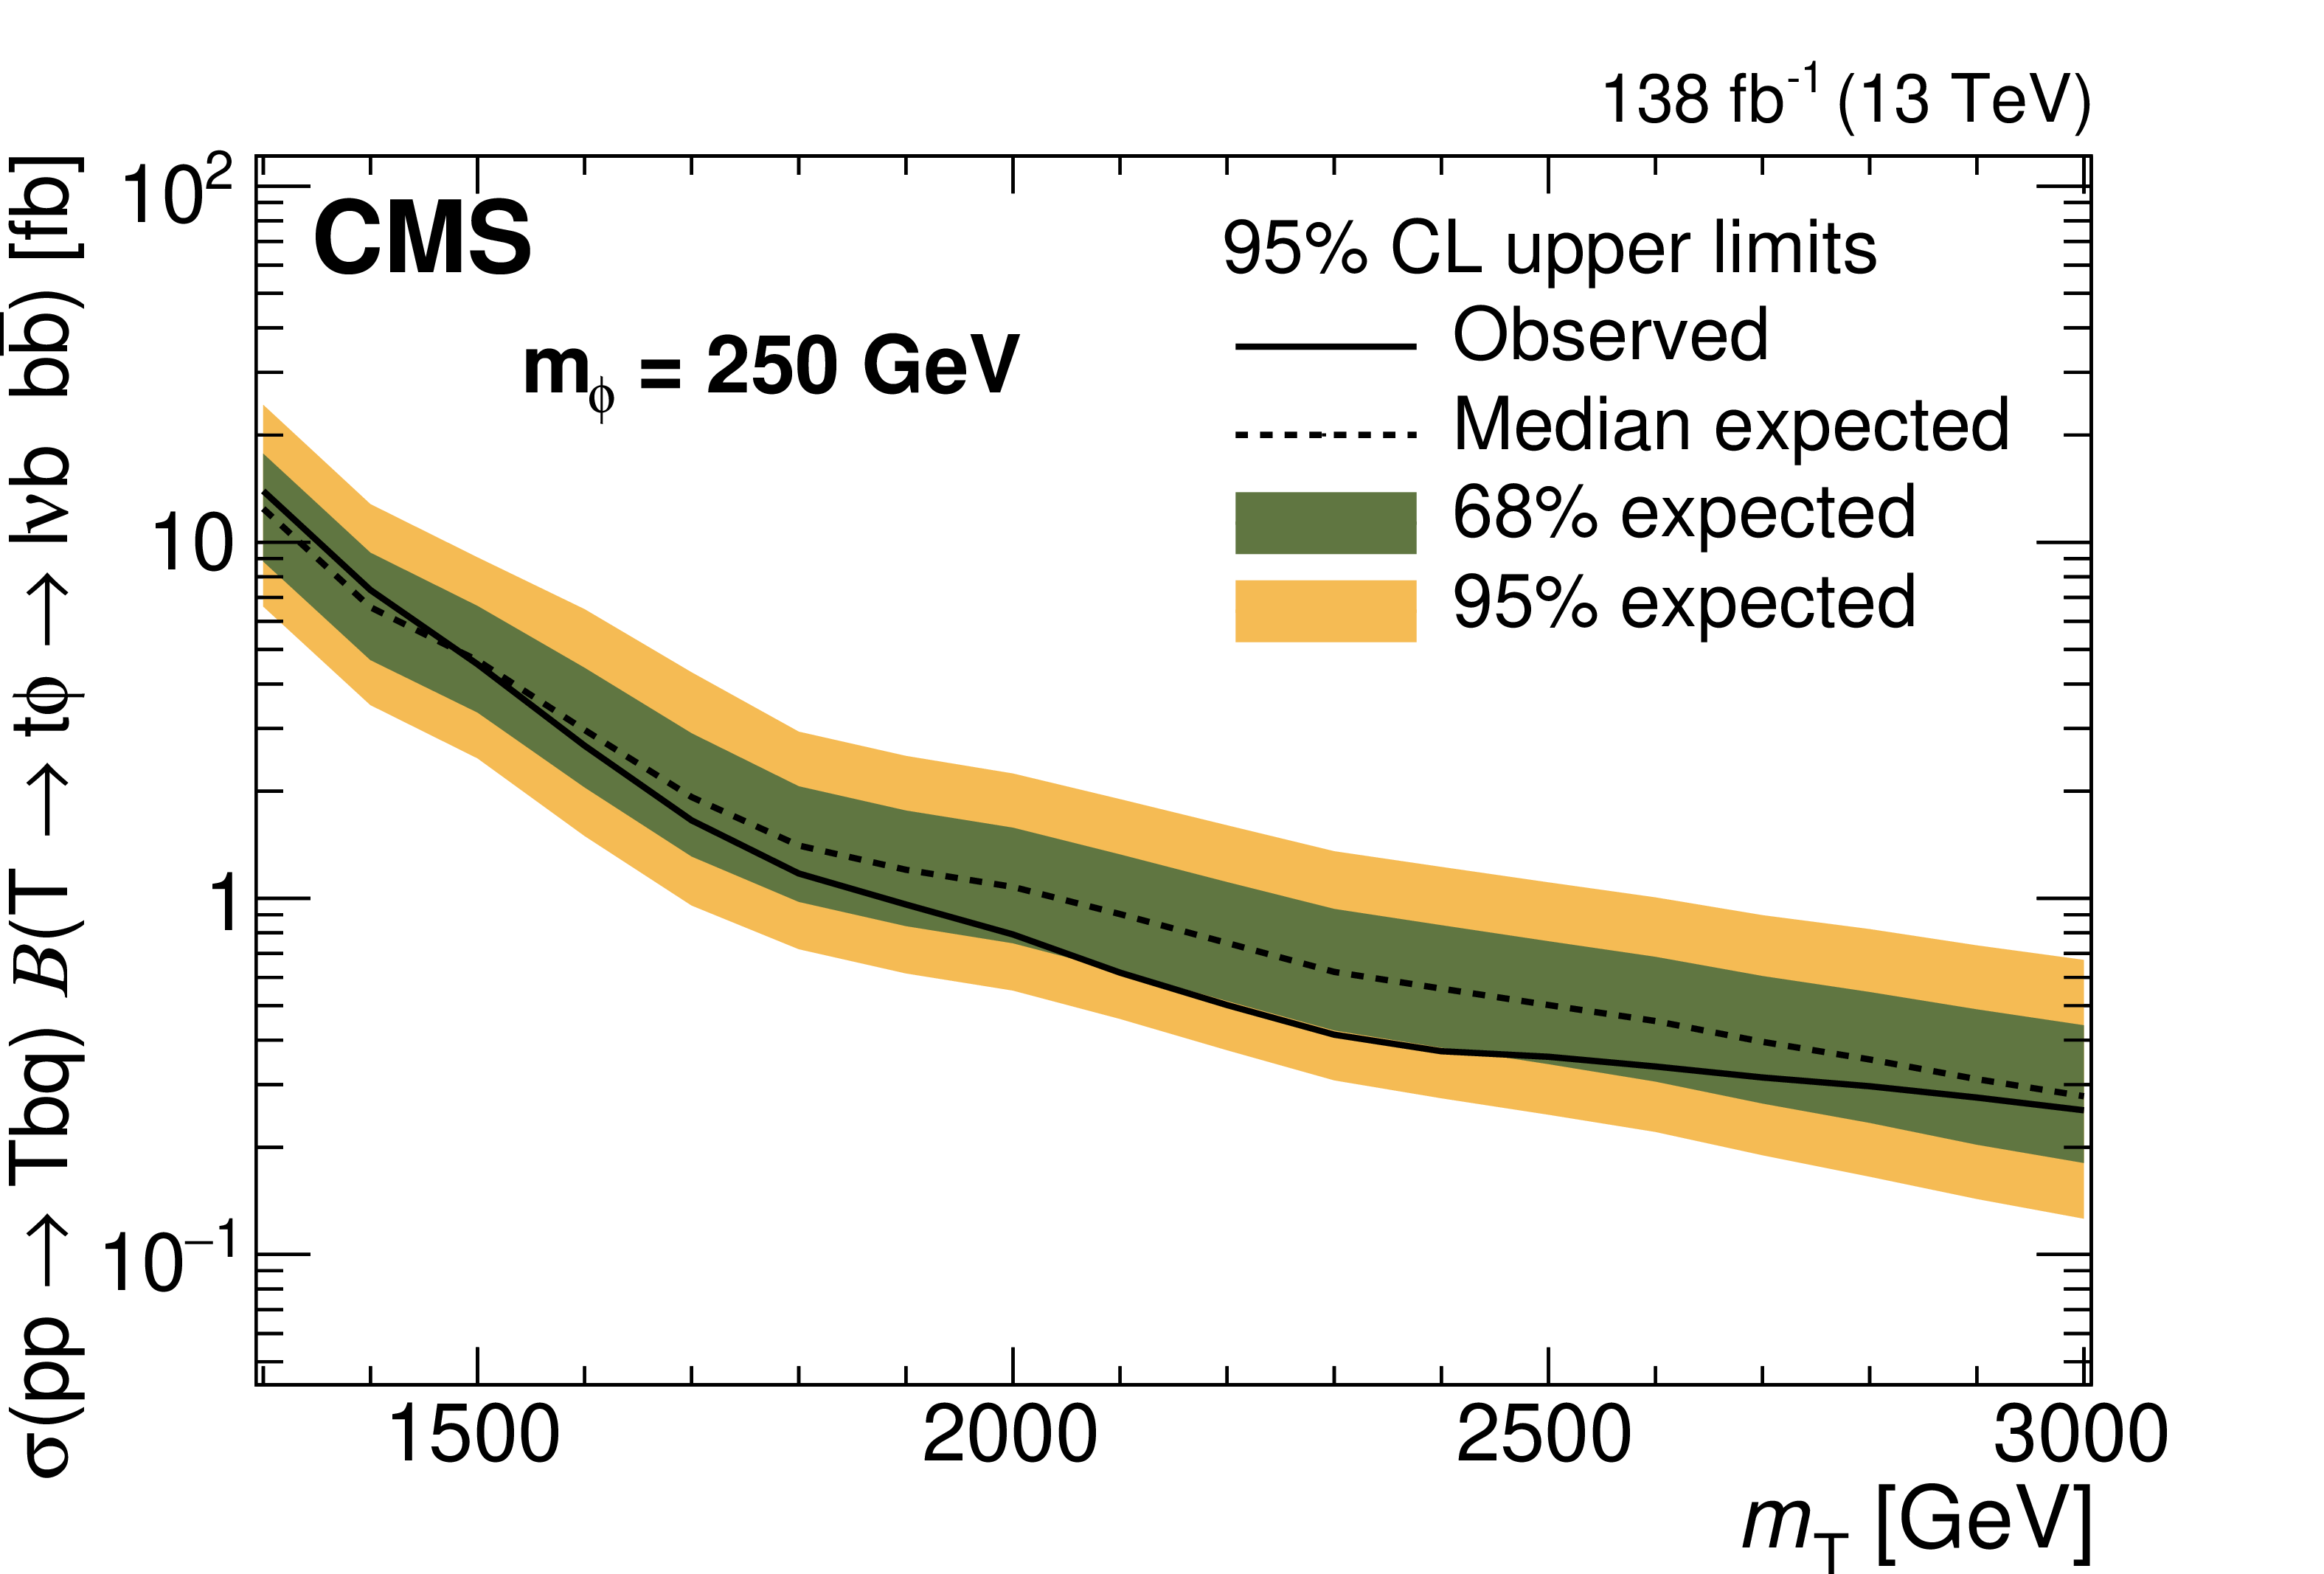
Figure 8:
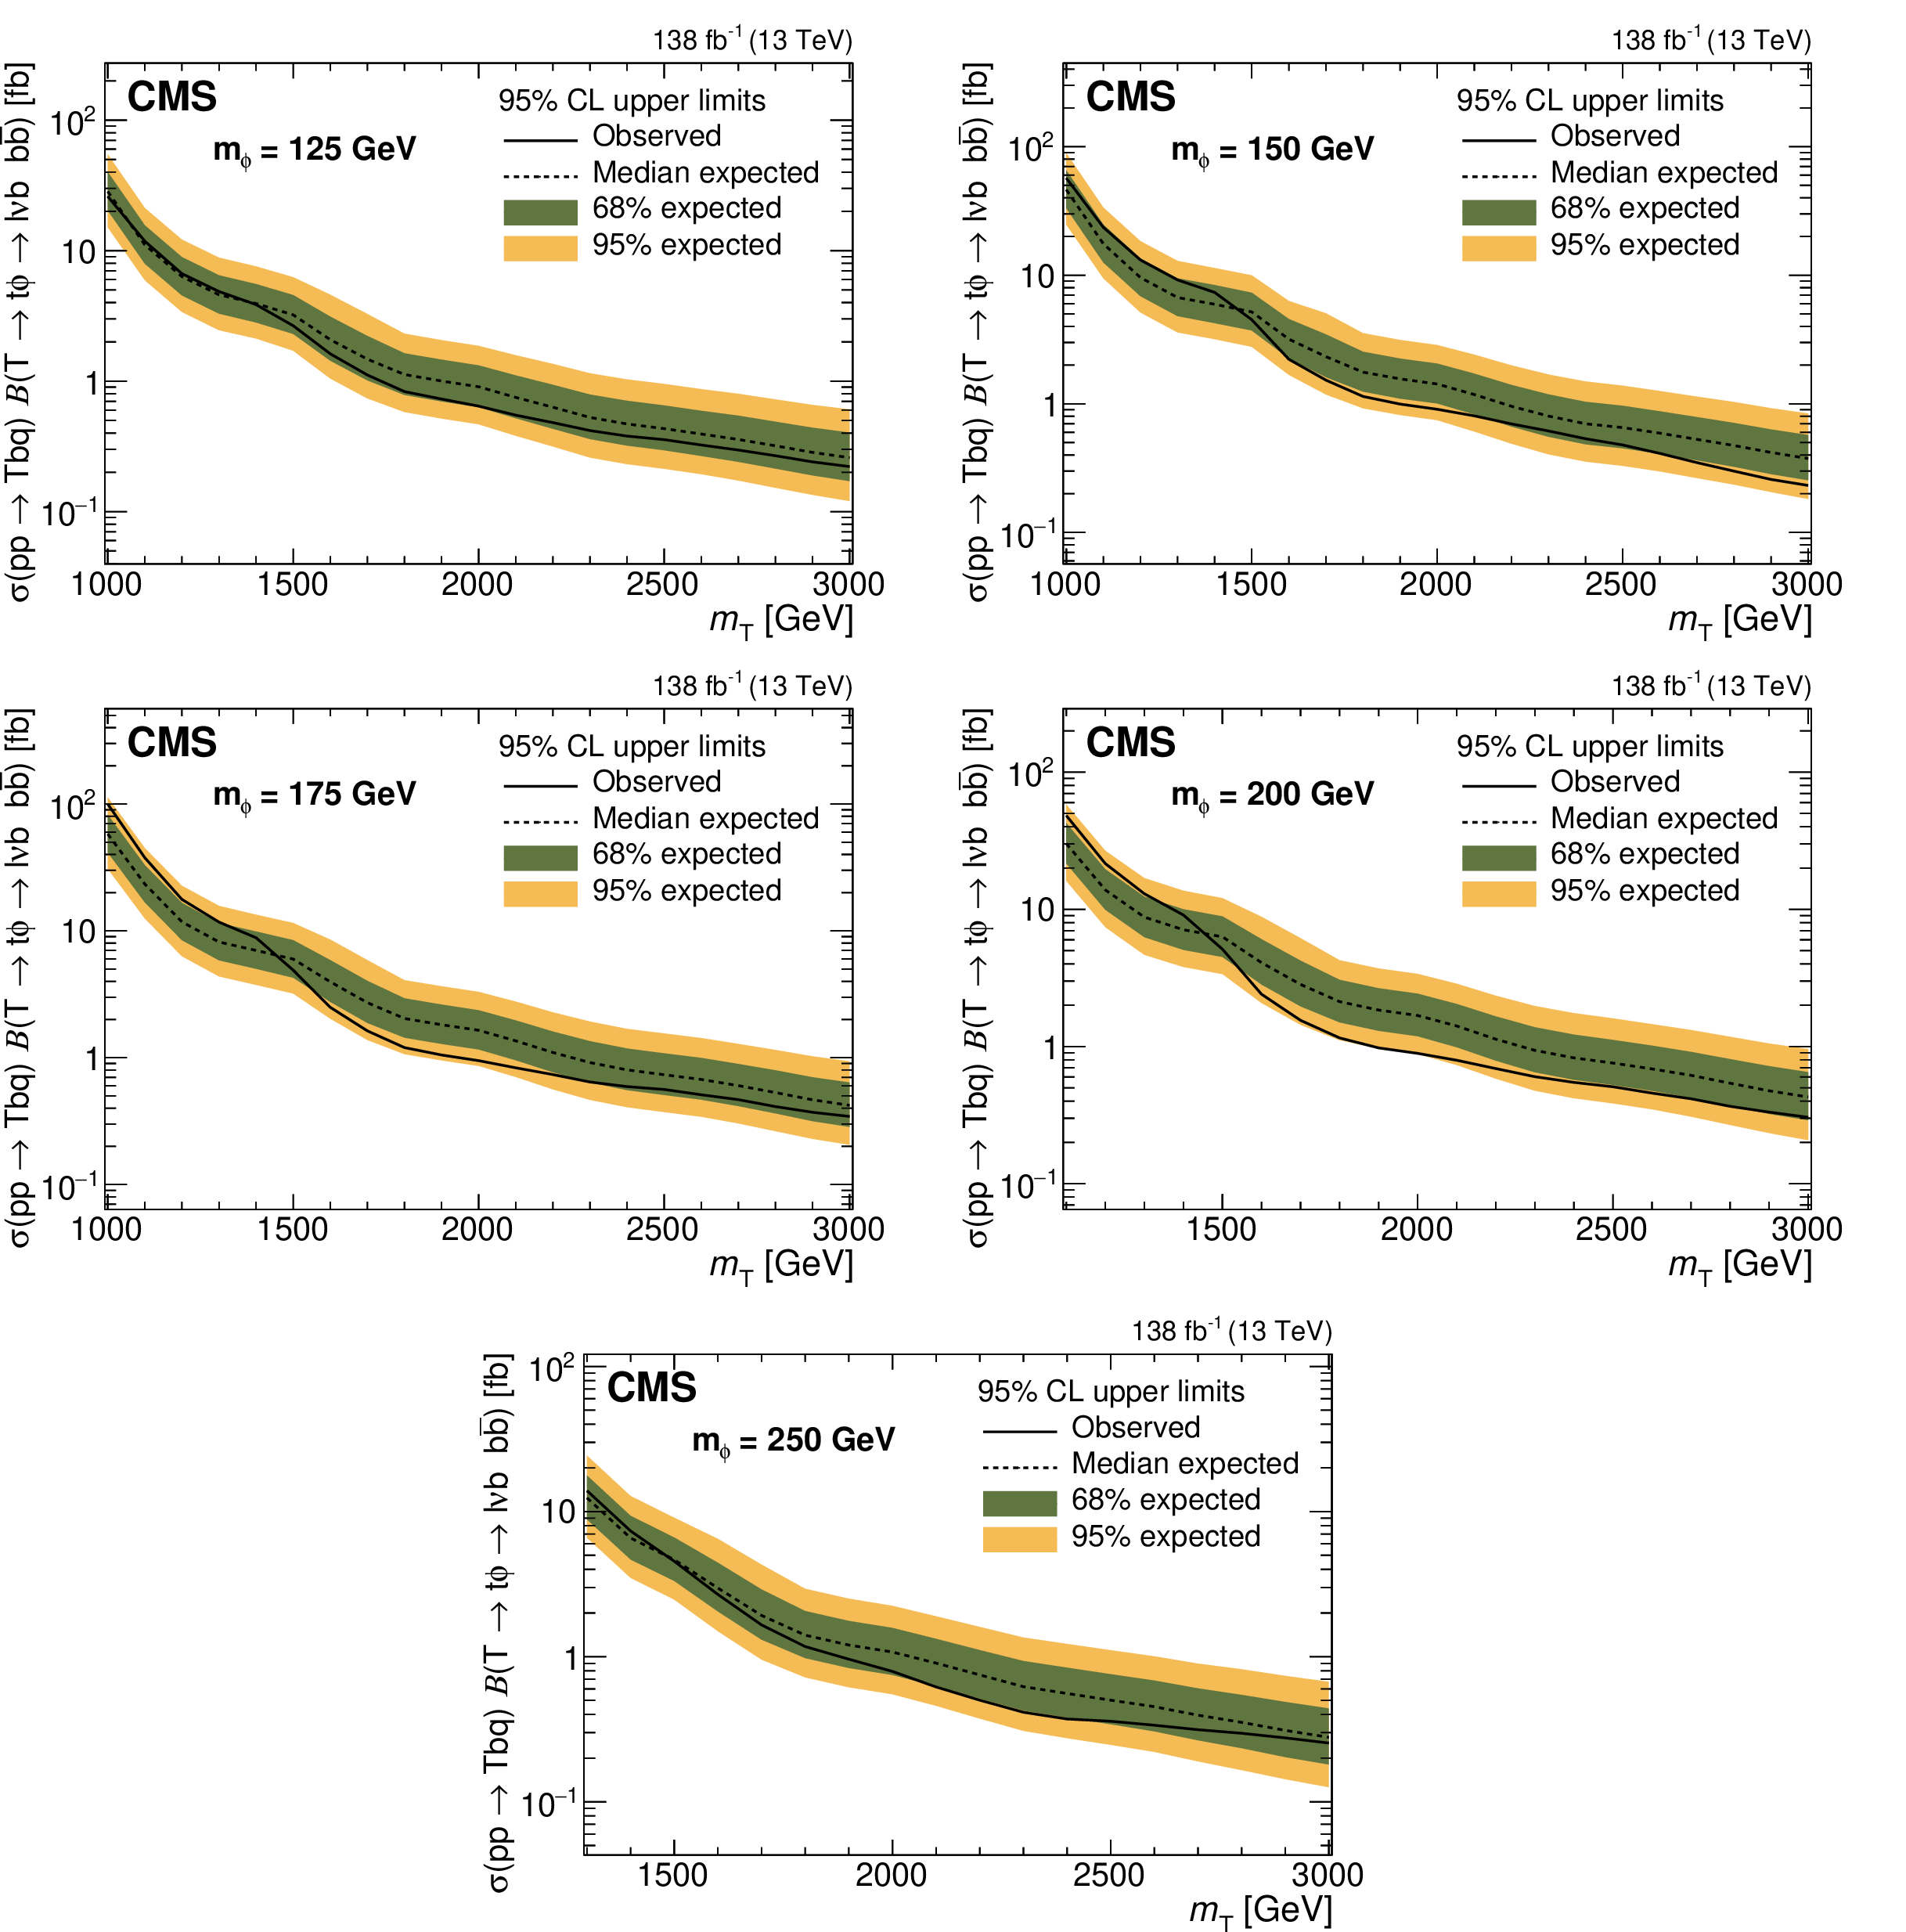
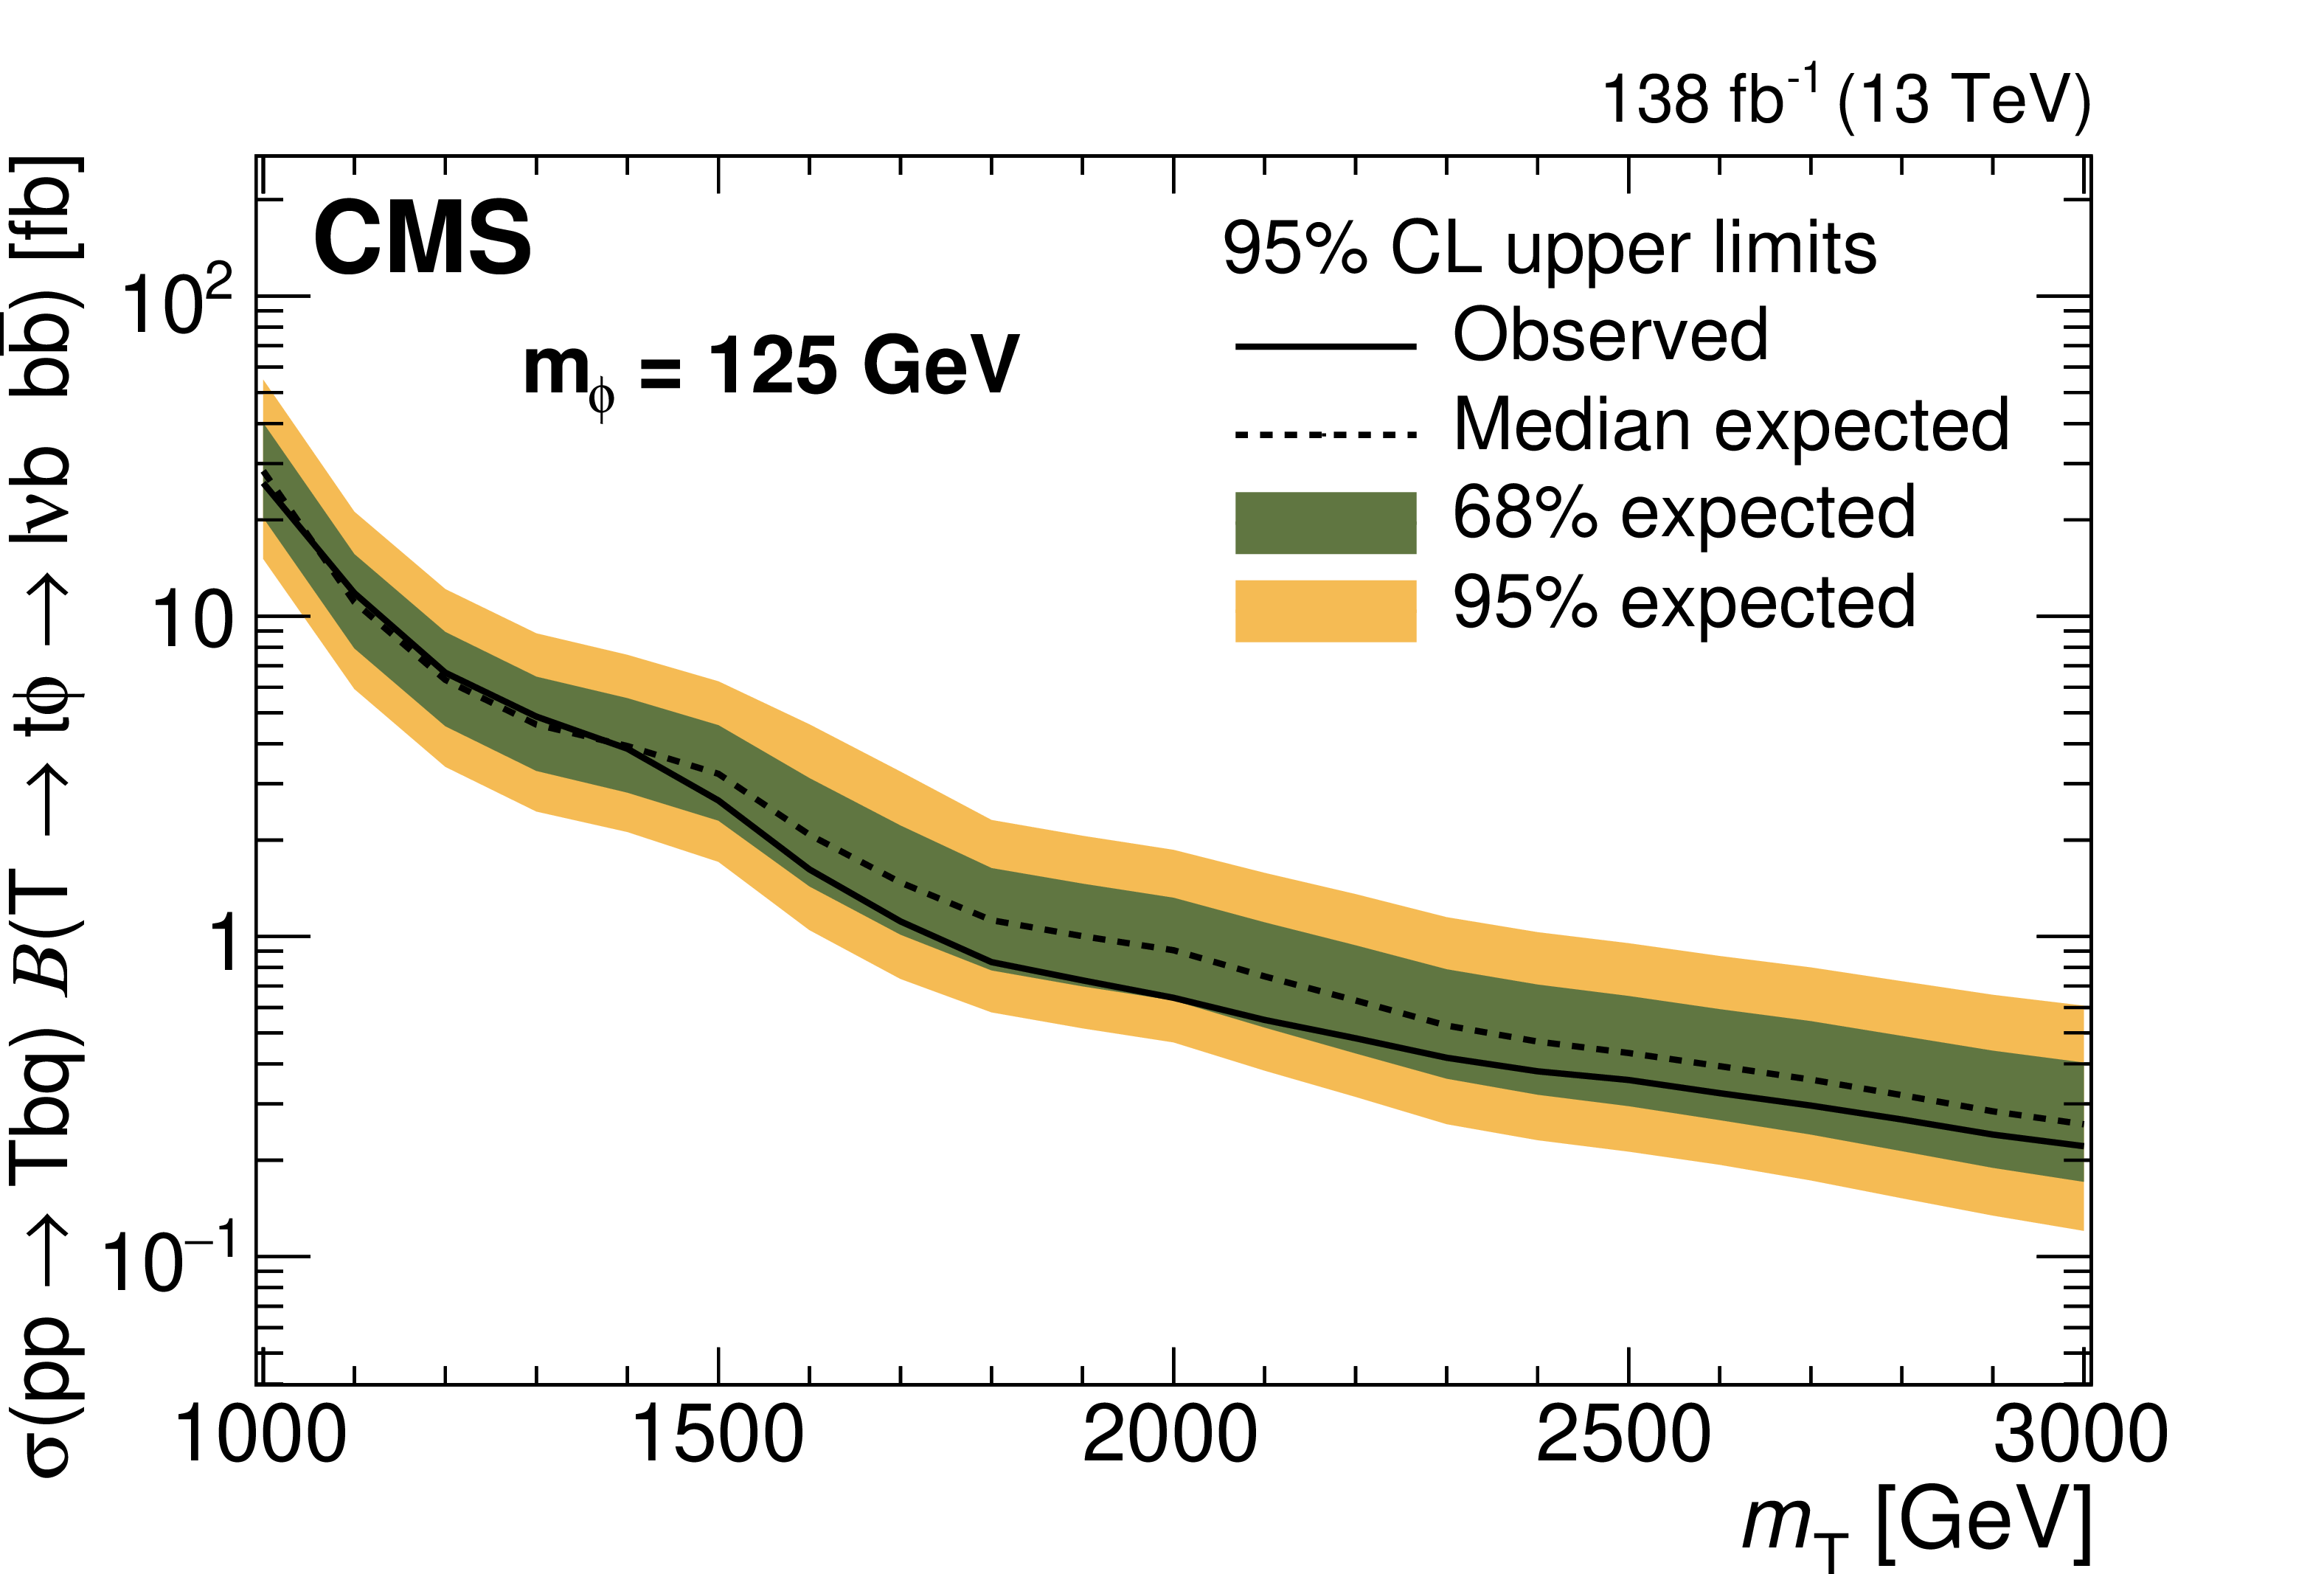
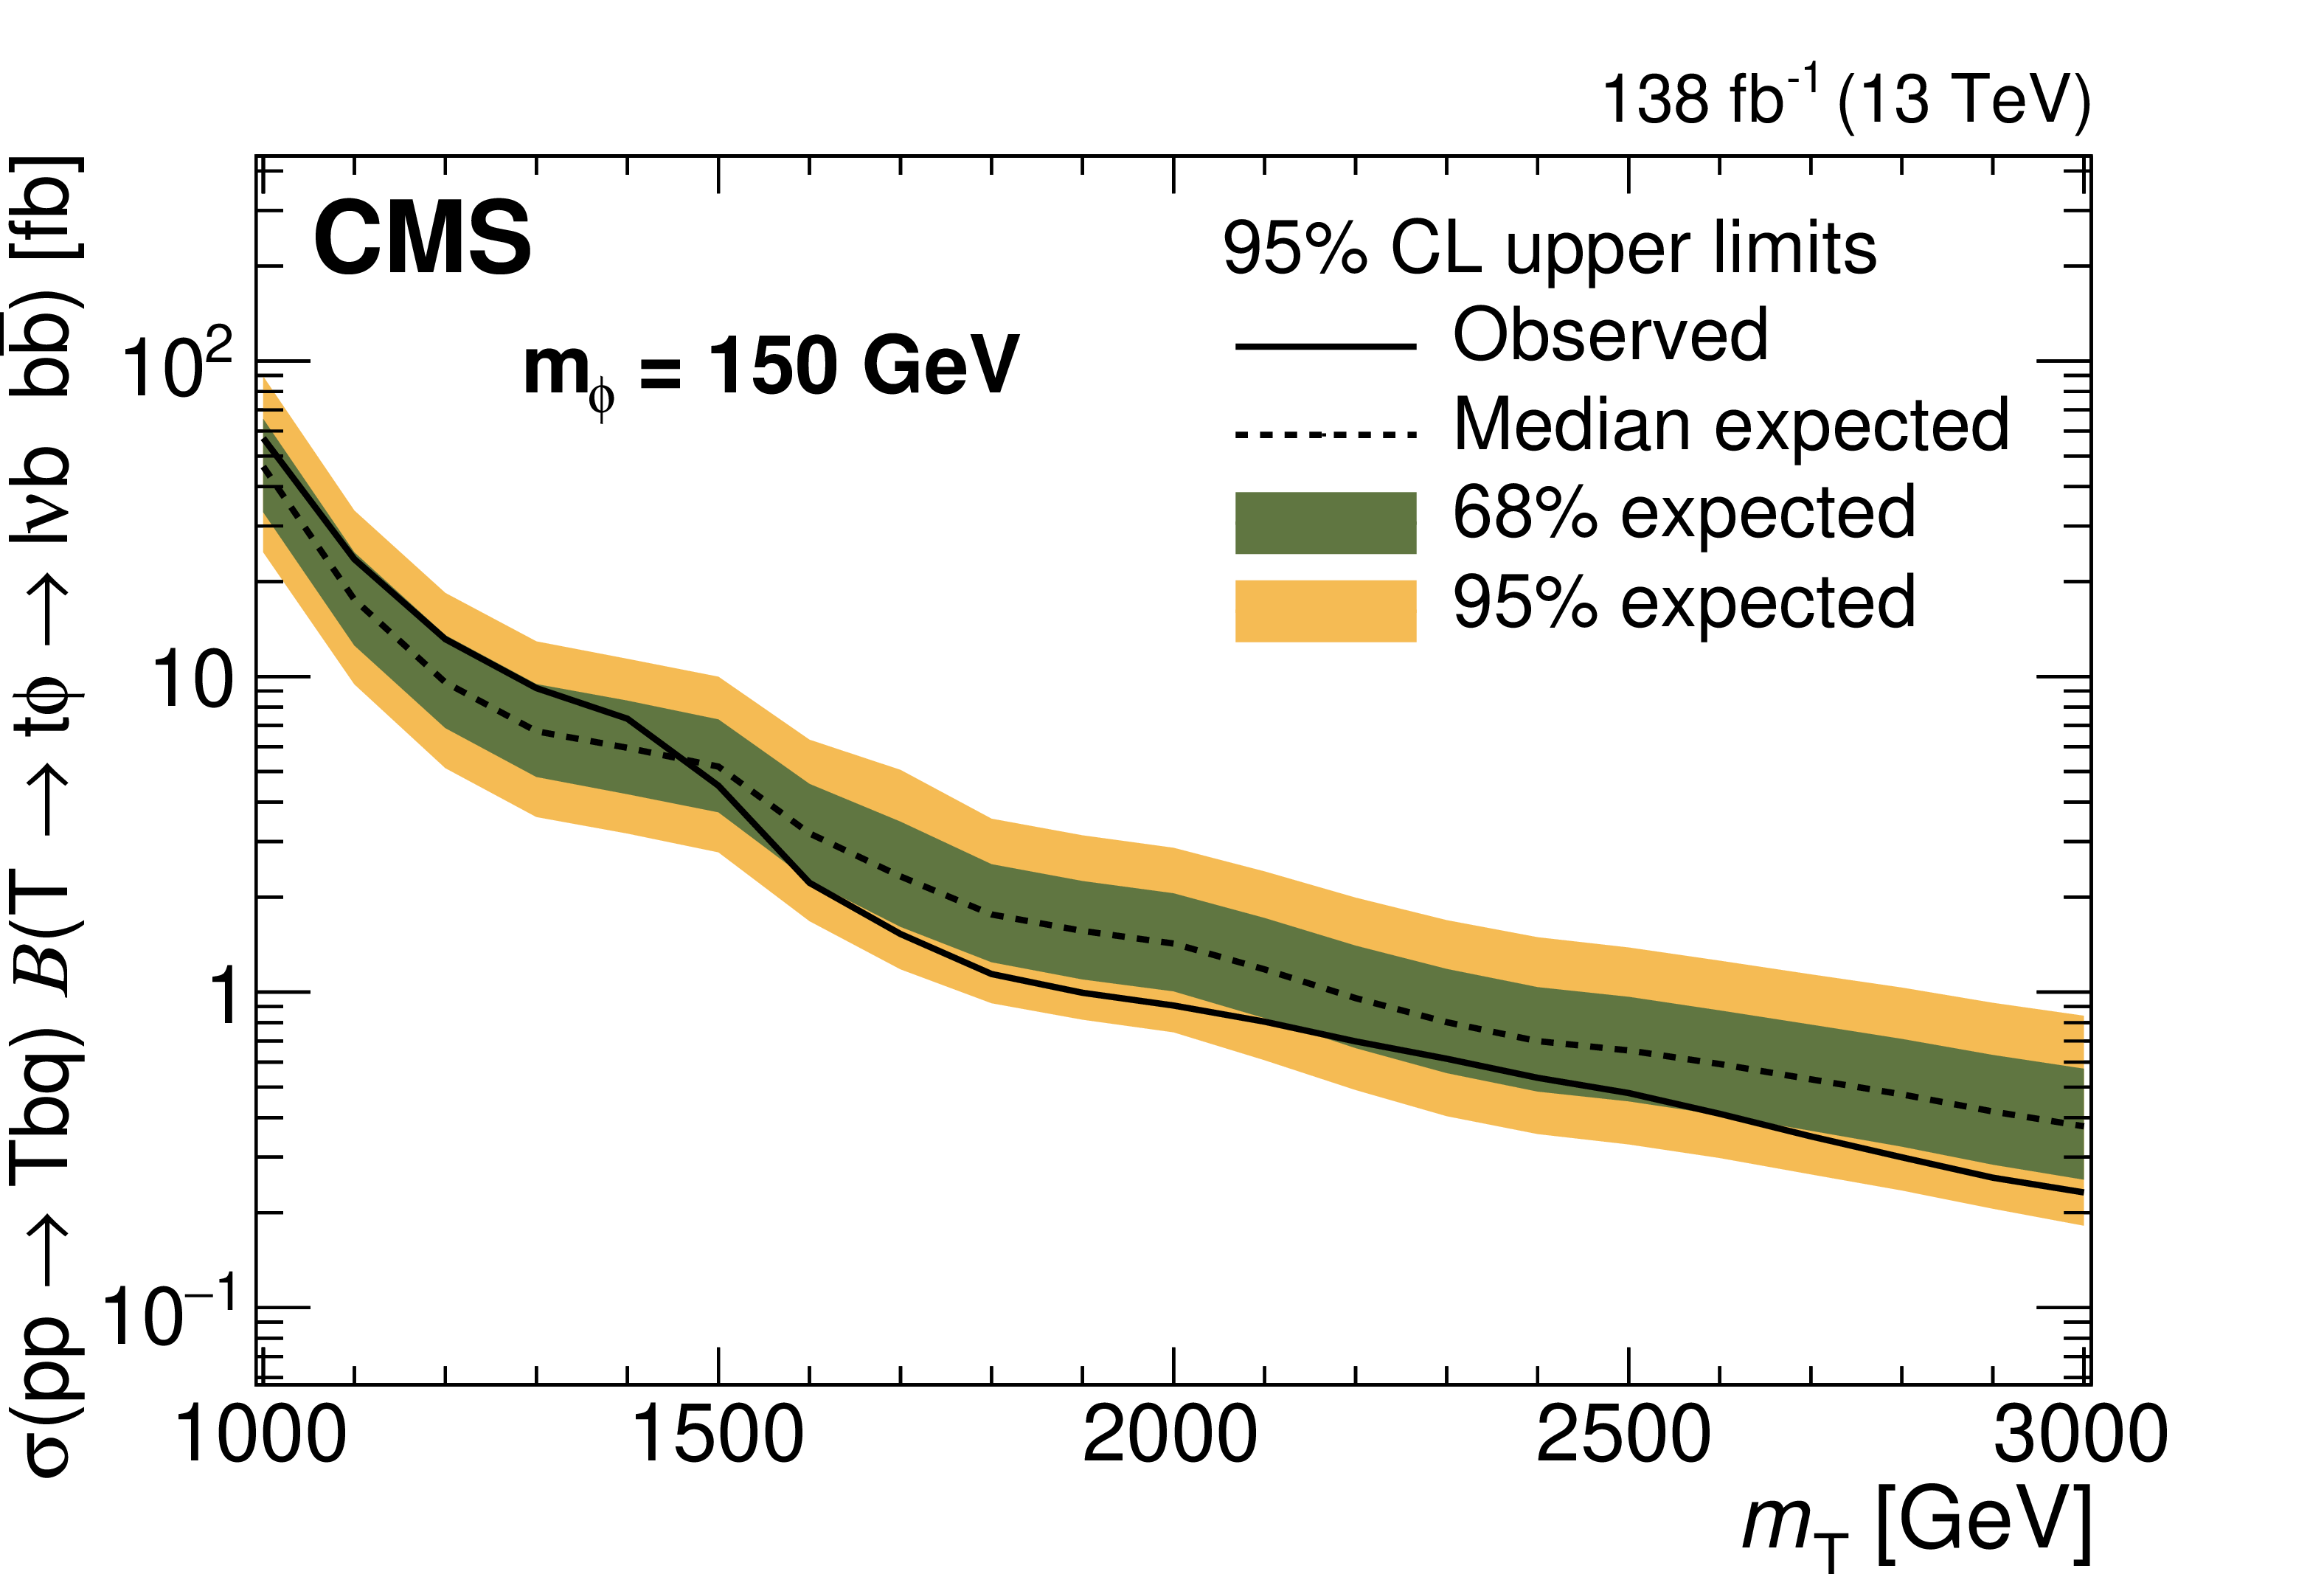
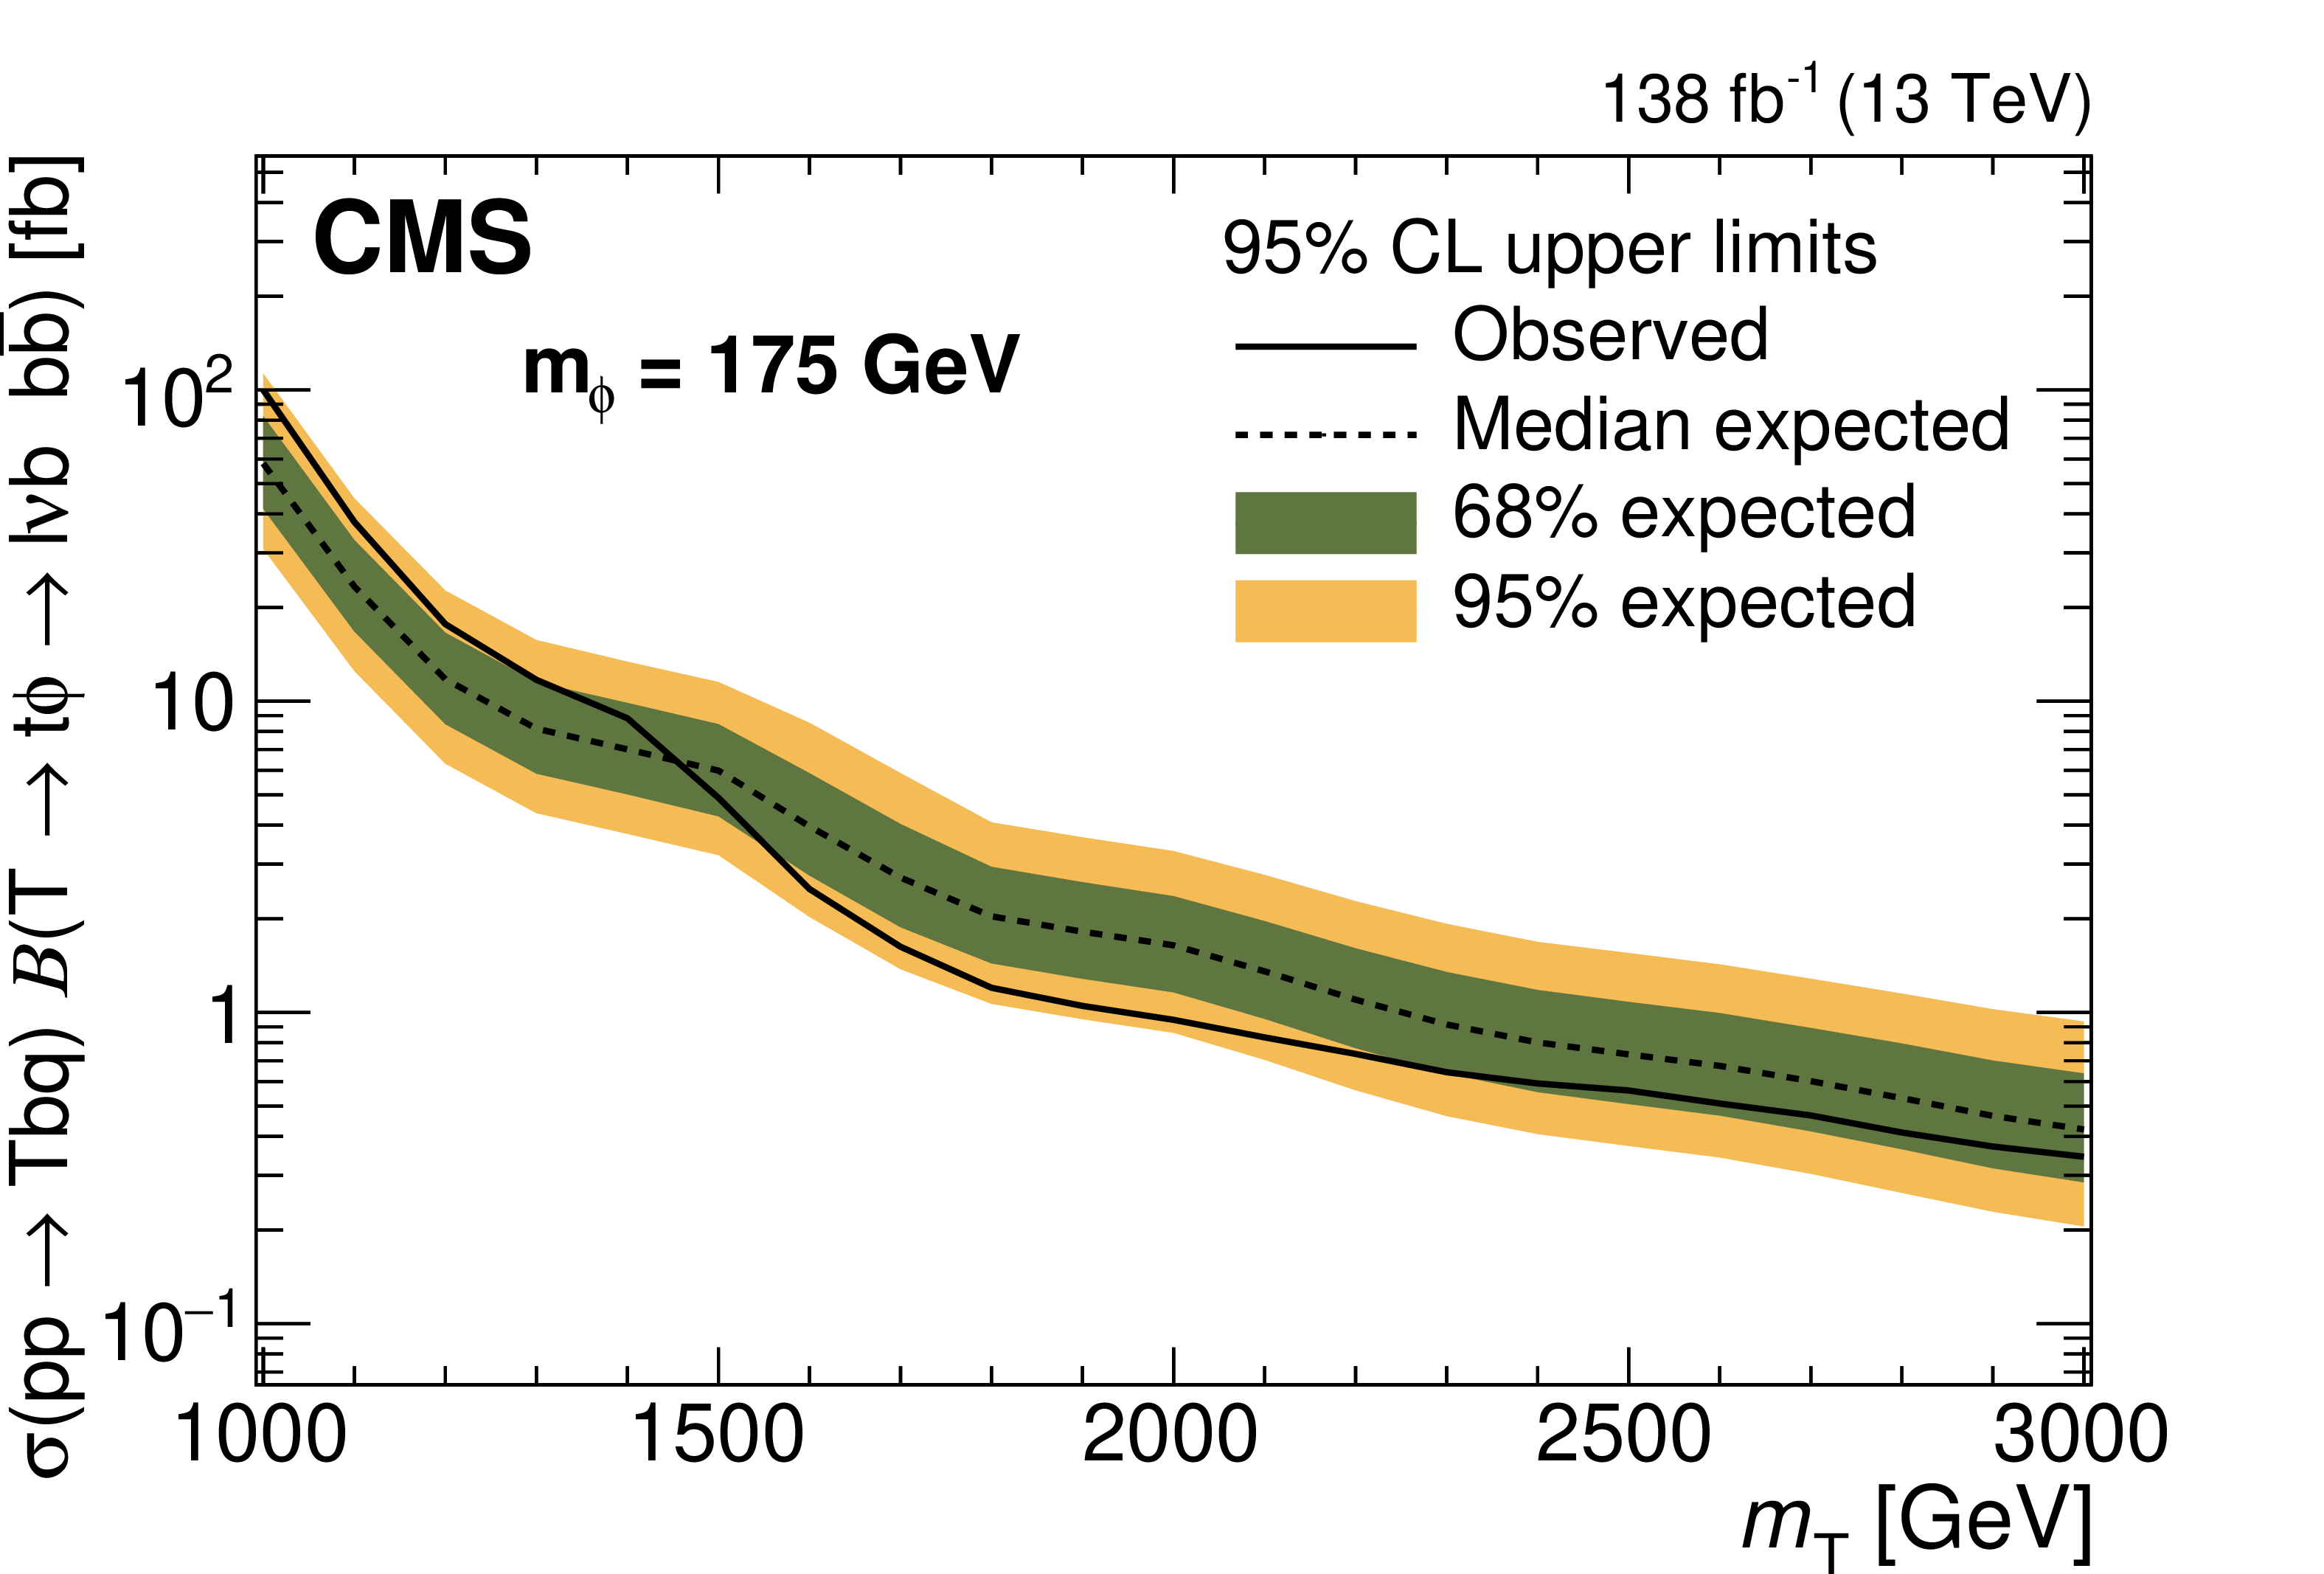
Observed (solid lines) and expected (dashed lines) 95% CL upper limits on the single T quark product of cross section and branching ratio for the $ \mathrm{T} \to\mathrm{t}\phi \to \mathrm{b}\ell\nu \mathrm{b}\overline{\mathrm{b}} $ channel as a function of $ m_{\mathrm{T} } $, for fixed values of $ m_{\phi} $, from 125 up to 250 GeV. The inner (green) and outer (yellow) bands represent the regions containing 68 and 95%, respectively, of the limit values expected under the background-only hypothesis. |
png pdf |
Figure 8-a:
Observed (solid lines) and expected (dashed lines) 95% CL upper limits on the single T quark product of cross section and branching ratio for the $ \mathrm{T} \to\mathrm{t}\phi \to \mathrm{b}\ell\nu \mathrm{b}\overline{\mathrm{b}} $ channel as a function of $ m_{\mathrm{T} } $, for fixed values of $ m_{\phi} $, from 125 up to 250 GeV. The inner (green) and outer (yellow) bands represent the regions containing 68 and 95%, respectively, of the limit values expected under the background-only hypothesis. |
png pdf |
Figure 8-b:
Observed (solid lines) and expected (dashed lines) 95% CL upper limits on the single T quark product of cross section and branching ratio for the $ \mathrm{T} \to\mathrm{t}\phi \to \mathrm{b}\ell\nu \mathrm{b}\overline{\mathrm{b}} $ channel as a function of $ m_{\mathrm{T} } $, for fixed values of $ m_{\phi} $, from 125 up to 250 GeV. The inner (green) and outer (yellow) bands represent the regions containing 68 and 95%, respectively, of the limit values expected under the background-only hypothesis. |
png pdf |
Figure 8-c:
Observed (solid lines) and expected (dashed lines) 95% CL upper limits on the single T quark product of cross section and branching ratio for the $ \mathrm{T} \to\mathrm{t}\phi \to \mathrm{b}\ell\nu \mathrm{b}\overline{\mathrm{b}} $ channel as a function of $ m_{\mathrm{T} } $, for fixed values of $ m_{\phi} $, from 125 up to 250 GeV. The inner (green) and outer (yellow) bands represent the regions containing 68 and 95%, respectively, of the limit values expected under the background-only hypothesis. |
png pdf |
Figure 8-d:
Observed (solid lines) and expected (dashed lines) 95% CL upper limits on the single T quark product of cross section and branching ratio for the $ \mathrm{T} \to\mathrm{t}\phi \to \mathrm{b}\ell\nu \mathrm{b}\overline{\mathrm{b}} $ channel as a function of $ m_{\mathrm{T} } $, for fixed values of $ m_{\phi} $, from 125 up to 250 GeV. The inner (green) and outer (yellow) bands represent the regions containing 68 and 95%, respectively, of the limit values expected under the background-only hypothesis. |
png pdf |
Figure 8-e:
Observed (solid lines) and expected (dashed lines) 95% CL upper limits on the single T quark product of cross section and branching ratio for the $ \mathrm{T} \to\mathrm{t}\phi \to \mathrm{b}\ell\nu \mathrm{b}\overline{\mathrm{b}} $ channel as a function of $ m_{\mathrm{T} } $, for fixed values of $ m_{\phi} $, from 125 up to 250 GeV. The inner (green) and outer (yellow) bands represent the regions containing 68 and 95%, respectively, of the limit values expected under the background-only hypothesis. |
png pdf |
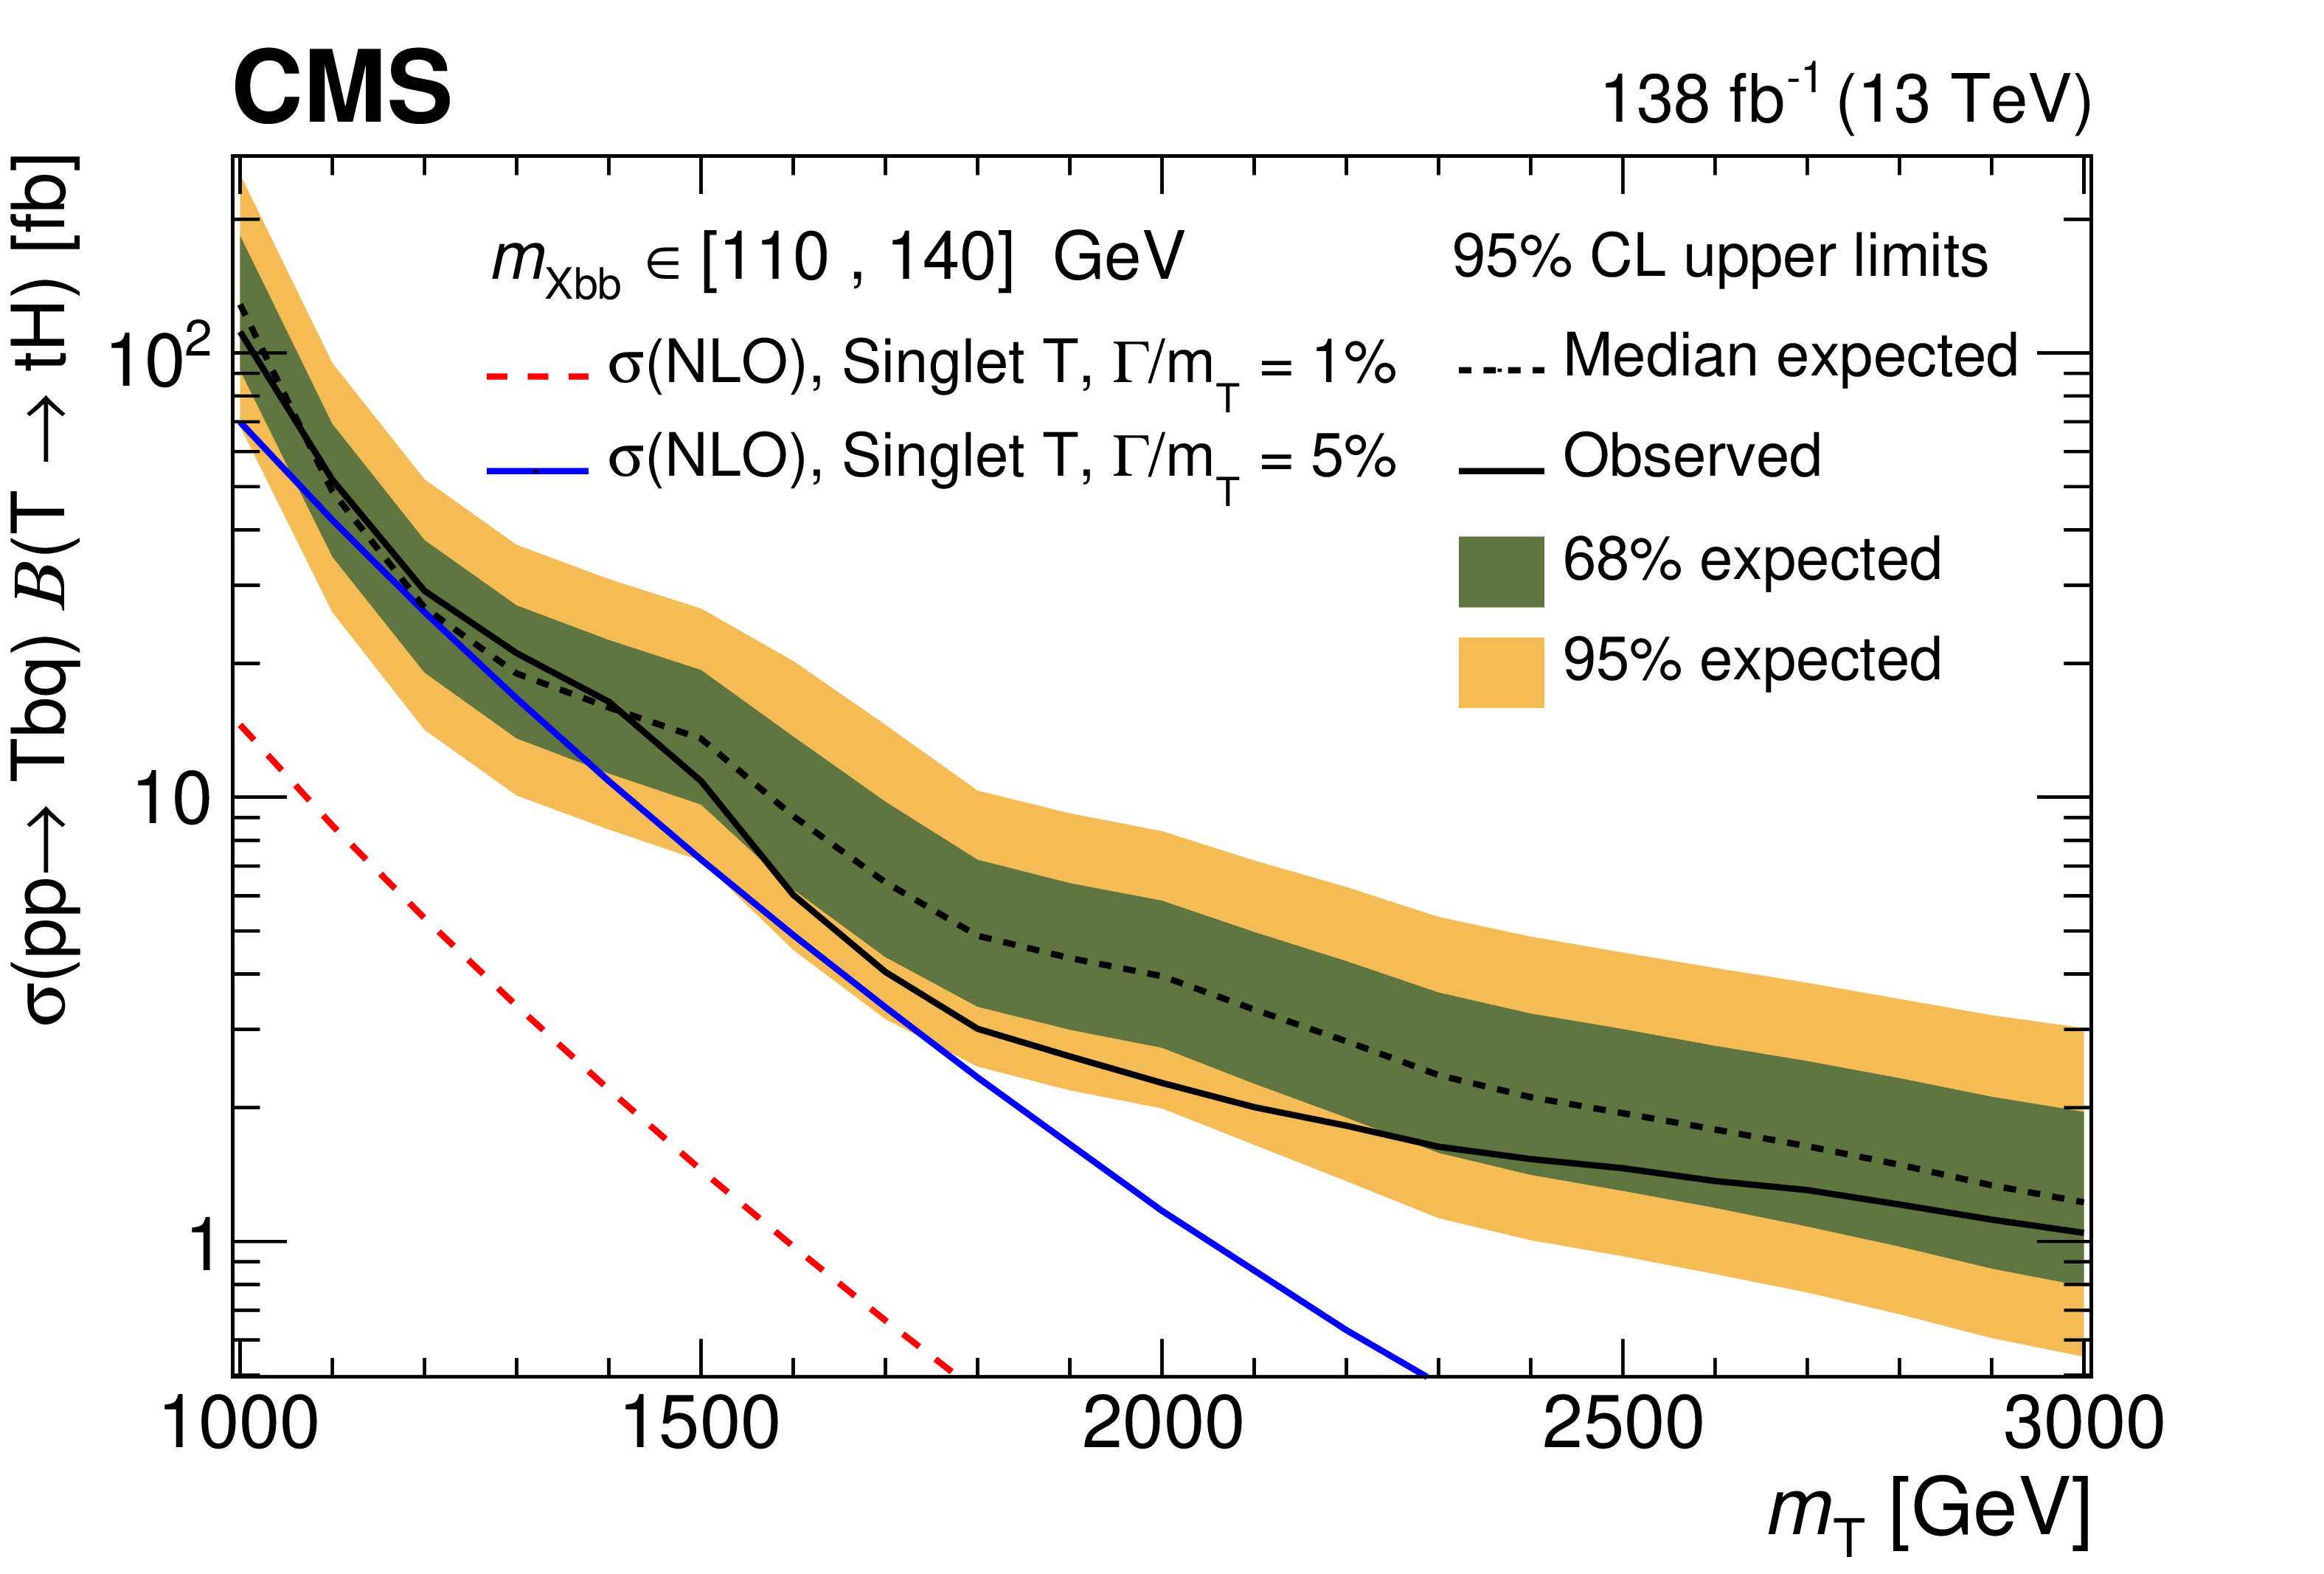
Figure 9:
Observed (solid black line) and expected (dashed line) 95% CL upper limit on the single T quark production cross section times branching fraction for the $ \mathrm{T} \to\mathrm{t}\mathrm{H} $ channel as a function of the $ m_{\mathrm{T} } $ mass. The inner (green) and outer (yellow) bands represent the region containing 68 and 95%, respectively, of the limit values expected under the background-only hypothesis. The solid blue (dashed red) curve shows the theoretical expectation at NLO for a singlet T quark assuming a narrow resonance with width 5% (1%) of the resonance mass [6,7]. |
| Tables | |
png pdf |
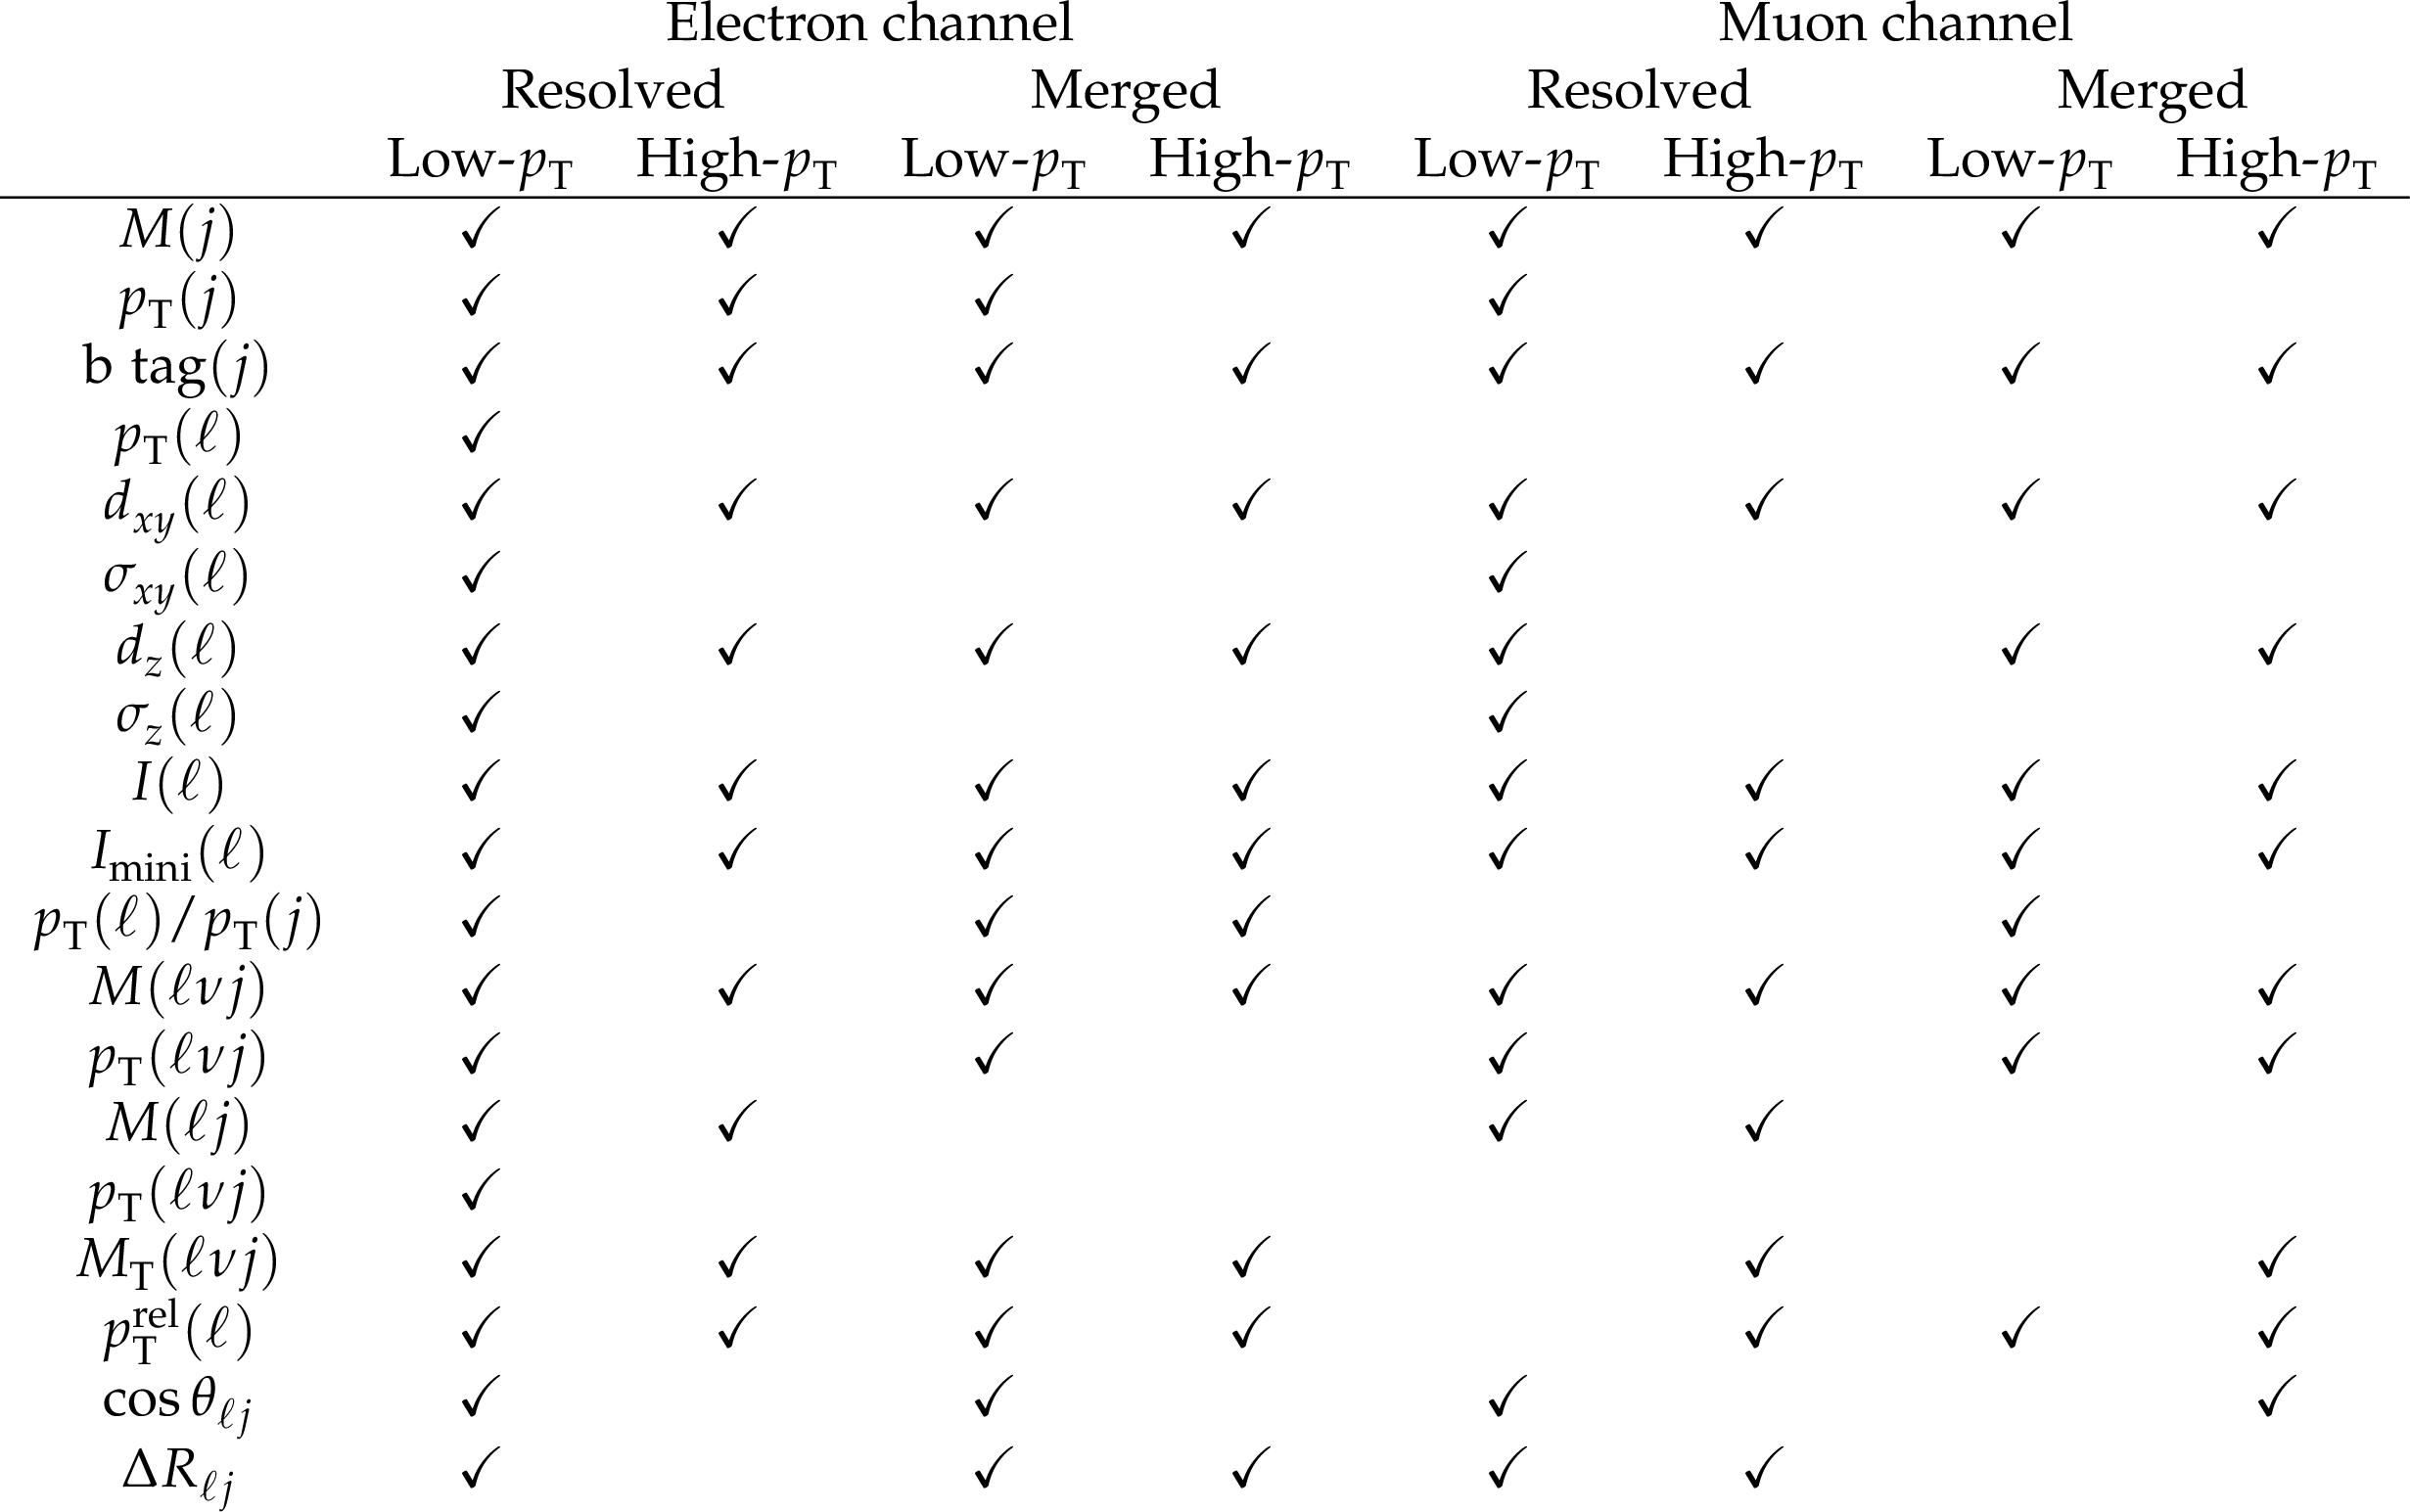
Table 1:
List of the variables employed for each of the eight trainings of the multiclass BDT algorithm for top quark candidate identification. The trainings are different for each lepton channel, for the merged or resolved configuration of the top quark candidate, and for the $ p_{\mathrm{T}} $ range of the top quark candidate with a threshold of 500 GeV. |
png pdf |
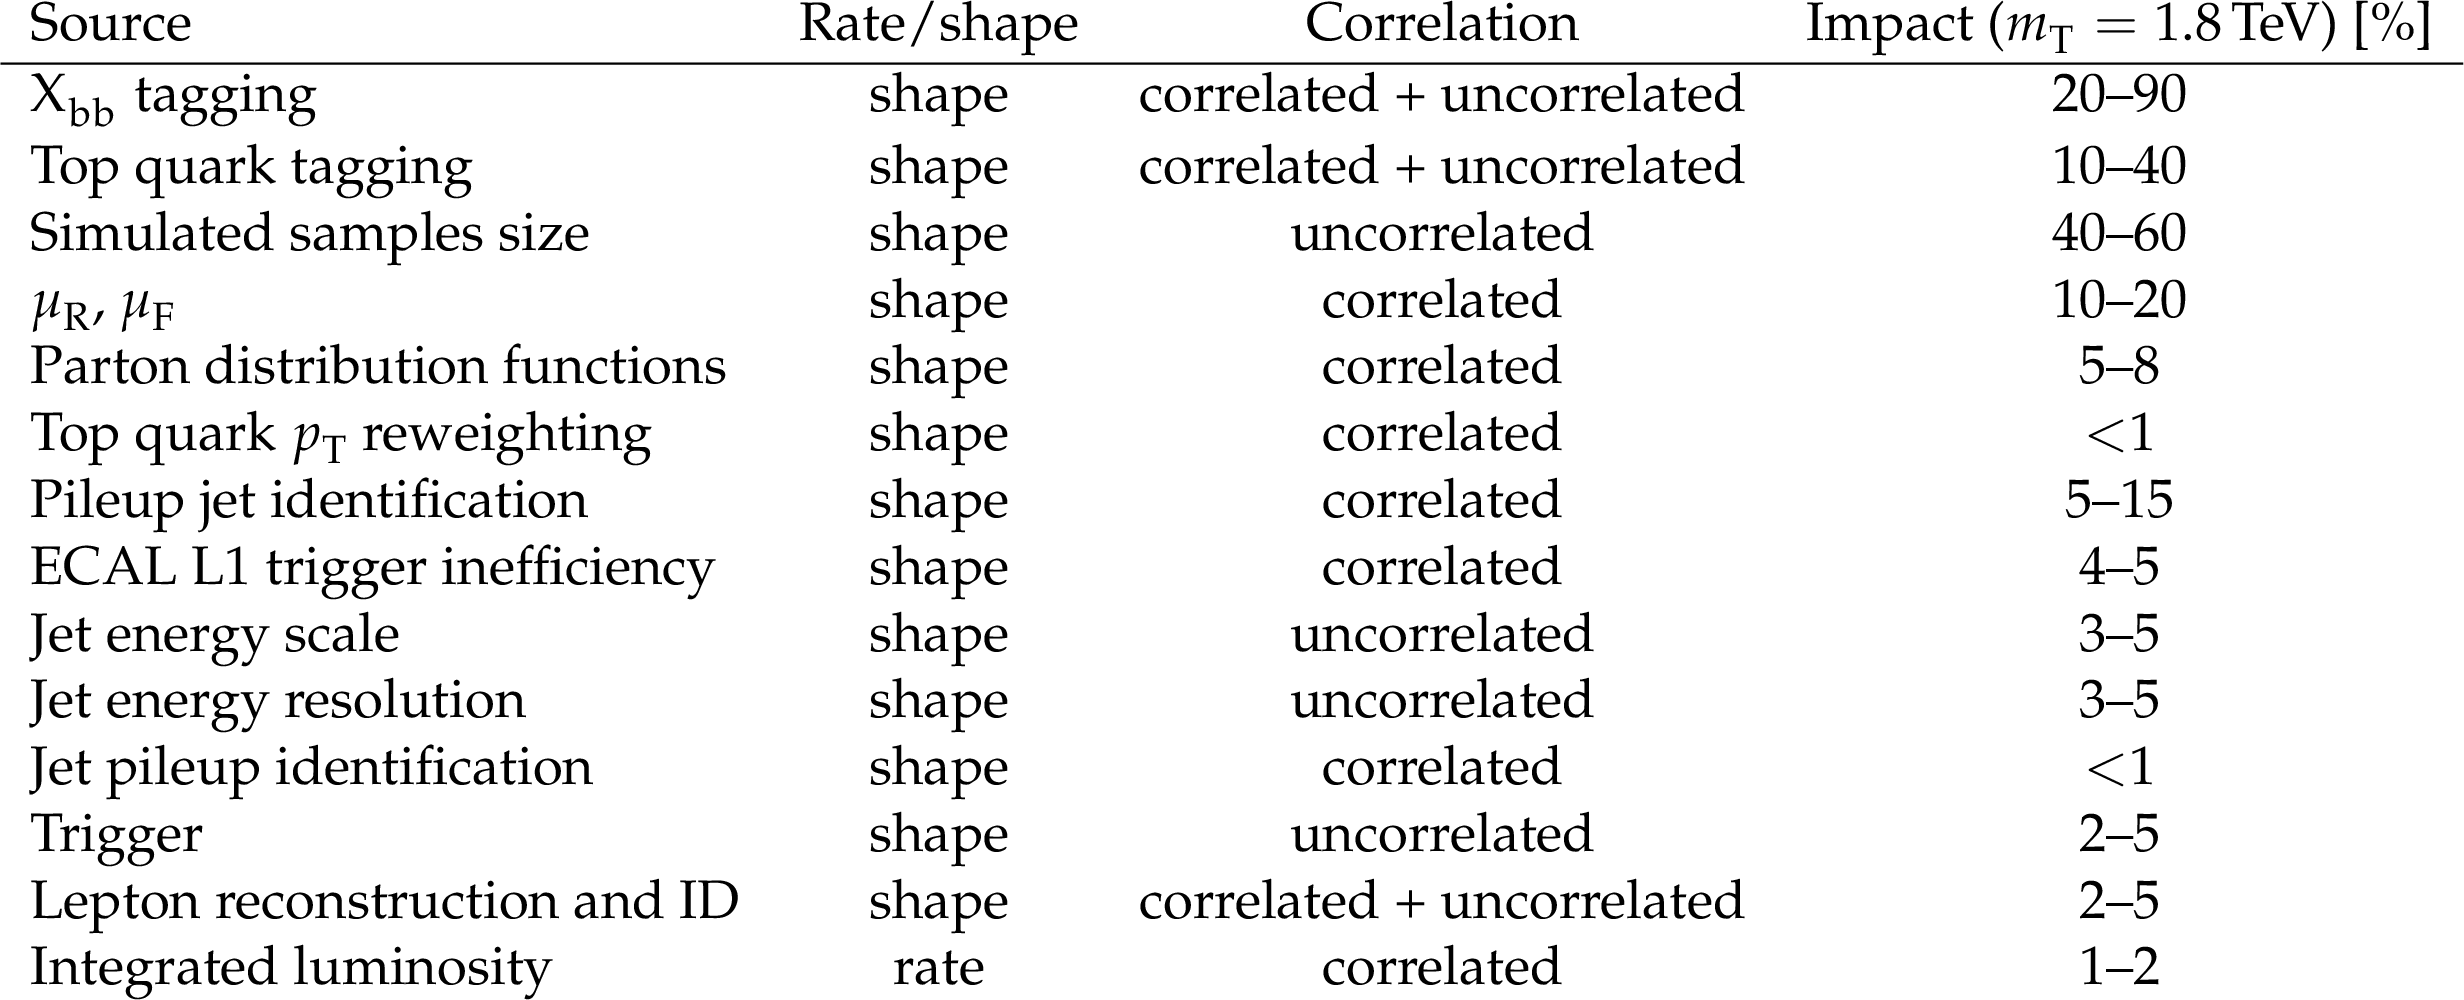
Table 2:
List of systematic uncertainties, showing whether a source modifies the event rate or the distribution shape, and whether the effect is correlated or uncorrelated across the years of data taking. All the listed sources affect both signal and background processes. The relative impact on the postfit signal strength is shown for a representative set of signals with a T mass $ (m_{\mathrm{T} }) $ hypothesis of 1.8 TeV and varying the mass of $ \phi $ boson. |
png pdf |
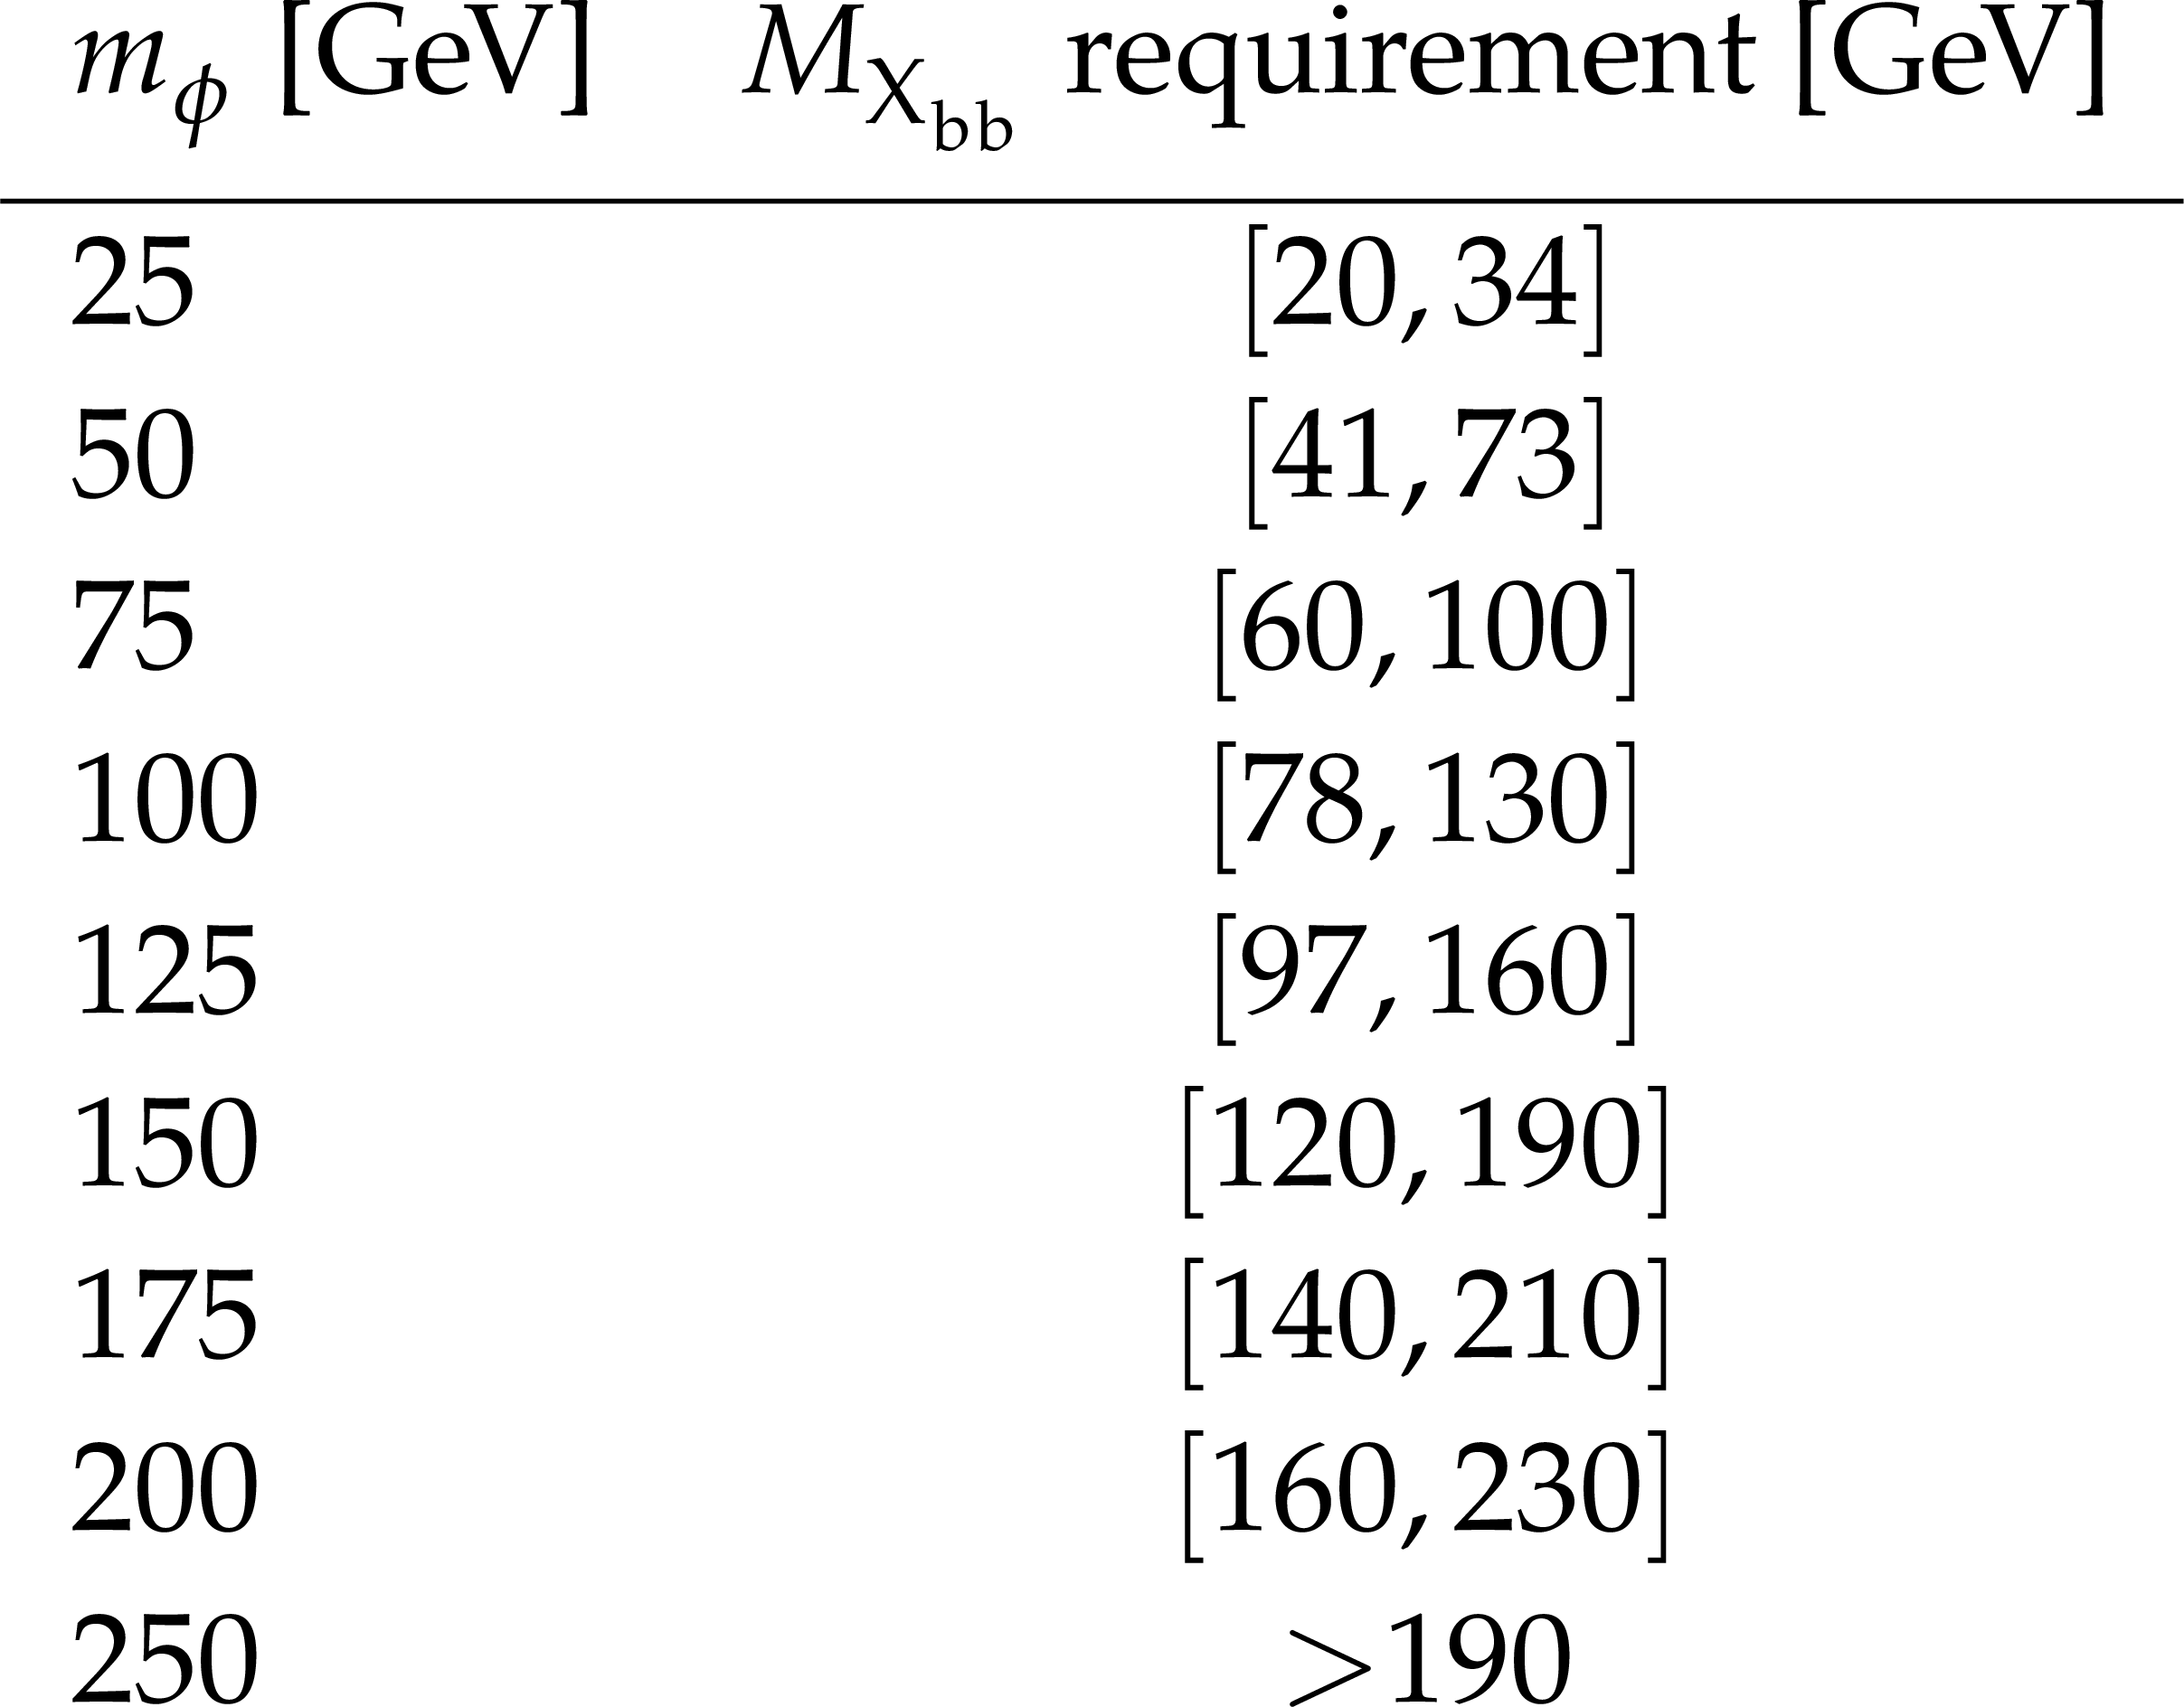
Table 3:
Requirement on the reconstructed $ M_{\mathrm{X}_{\mathrm{b}\mathrm{b}}} $ mass of the $ \phi $ boson candidate, as a function of the $ m_{\phi} $ boson mass hypothesis being tested. The $ M_{\mathrm{X}_{\mathrm{b}\mathrm{b}}} $ mass must fall within the specified interval. |
| Summary |
| A search for the single production of a vector-like quark T with charge 2$ e$/3 decaying to a top quark and a neutral scalar boson, which can be a standard model Higgs boson (H) or a new scalar boson ($ \phi $), has been presented. In the first case, a branching fraction of 25% is assumed for the decay $ \mathrm{T} \to\mathrm{t} \mathrm{H} $, while in the second case the T quark is assumed to decay exclusively to $ \mathrm{t} \phi $. Final states where the top quark decays in the lepton+jets channel and the neutral scalar boson decays into a bottom quark-antiquark pair are considered. The analysis is based on LHC proton-proton collision data, corresponding to an integrated luminosity of 138 fb$ ^{-1} $. No significant deviation is observed between the data and the expected background. Upper limits at 95% confidence level (CL) are set on the product of the production cross section and $ \mathrm{T} \to \mathrm{t}\phi \to \mathrm{b}\ell\nu\mathrm{b}\overline{\mathrm{b}} $ branching fraction as functions of the masses of T quark ($ m_{\mathrm{T} } $) and of $ \phi $ boson ($ m_{\phi} $), and assuming a T quark in a narrow-width approximation produced in association with a bottom quark. For an $ m_{\phi} $ of 25 (250) GeV, values greater than 2.3 to 0.1 (14.8 to 0.3) fb are excluded at 95% CL for $ m_{\mathrm{T} } $ between 1.0 and 3.0 (1.3 and 3.0) TeV. These are the first exclusion limits set on the production of a single T quark decaying into a top quark and a new neutral scalar boson. The case of a vector-like quark T decaying to a top quark and a standard model Higgs boson has been studied as well, and upper limits at 95% CL are set on the product of the production cross section and $ \mathrm{T} \to\mathrm{t}\mathrm{H} $ branching fraction: values greater than 100 to 1.0 fb are excluded at 95% CL for $ m_{\mathrm{T} } $ between 1.0 and 3.0 TeV. These results provide the best exclusion limits to date for $ m_{\mathrm{T} } > $ 2 TeV. |
| References | ||||
| 1 | J. A. Aguilar-Saavedra, R. Benbrik, S. Heinemeyer, and M. Perez-Victoria | Handbook of vectorlike quarks: mixing and single production | PRD 88 (2013) 094010 | 1306.0572 |
| 2 | Y. Okada and L. Panizzi | LHC signatures of vector-like quarks | Adv. High Energy Phys. 2013 (2013) 364936 | 1207.5607 |
| 3 | J. A. Aguilar-Saavedra | Identifying top partners at LHC | JHEP 11 (2009) 030 | 0907.3155 |
| 4 | A. De Simone, O. Matsedonskyi, R. Rattazzi, and A. Wulzer | A first top partner hunter's guide | JHEP 04 (2013) 004 | 1211.5663 |
| 5 | O. Matsedonskyi, G. Panico, and A. Wulzer | On the interpretation of top partners searches | JHEP 12 (2014) 097 | 1409.0100 |
| 6 | M. Buchkremer, G. Cacciapaglia, A. Deandrea, and L. Panizzi | Model independent framework for searches of top partners | NPB 876 (2013) 376 | 1305.4172 |
| 7 | A. Carvalho et al. | Single production of vectorlike quarks with large width at the Large Hadron Collider | PRD 98 (2018) 015029 | 1805.06402 |
| 8 | O. Eberhardt et al. | Joint analysis of Higgs decays and electroweak precision observables in the standard model with a sequential fourth generation | PRD 86 (2012) 013011 | 1204.3872 |
| 9 | CMS Collaboration | Review of searches for vector-like quarks, vector-like leptons, and heavy neutral leptons in proton-proton collisions at $ \sqrt{s}= $ 13 TeV at the CMS experiment | Phys. Rept. 1115 (2025) 570 | CMS-EXO-23-006 2405.17605 |
| 10 | J. A. Aguilar-Saavedra, J. Alonso-Gonzalez, L. Merlo, and J. M. No | Exotic vectorlike quark phenomenology in the minimal linear \ensuremath\sigma model | PRD 101 (2020) 035015 | 1911.10202 |
| 11 | R. Benbrik et al. | Signatures of vector-like top partners decaying into new neutral scalar or pseudoscalar bosons | JHEP 05 (2020) 028 | 1907.05929 |
| 12 | G. Cacciapaglia, T. Flacke, M. Park, and M. Zhang | Exotic decays of top partners: mind the search gap | PLB 798 (2019) 135015 | 1908.07524 |
| 13 | ATLAS Collaboration | Exploration at the high-energy frontier: ATLAS Run 2 searches investigating the exotic jungle beyond the Standard Model | Phys. Rept. 1116 (2025) 301 | 2403.09292 |
| 14 | ATLAS Collaboration | Search for pair production of vector-like top quarks in events with one lepton, jets, and missing transverse momentum in $ \sqrt{s} = $ 13 TeV pp collisions with the ATLAS detector | JHEP 08 (2017) 052 | 1705.10751 |
| 15 | ATLAS Collaboration | Search for pair production of heavy vector-like quarks decaying to high-$ p_{\mathrm{T}} \mathrm{W} $ bosons and b quarks in the lepton-plus-jets final state in pp collisions at $ \sqrt{s}= $ 13 TeV with the ATLAS detector | JHEP 10 (2017) 141 | 1707.03347 |
| 16 | ATLAS Collaboration | Search for pair- and single-production of vector-like quarks in final states with at least one Z boson decaying into a pair of electrons or muons in pp collision data collected with the ATLAS detector at $ \sqrt{s} = $ 13 TeV | PRD 98 (2018) 112010 | 1806.10555 |
| 17 | ATLAS Collaboration | Search for pair production of heavy vector-like quarks decaying into hadronic final states in pp collisions at $ \sqrt{s} = $ 13 TeV with the ATLAS detector | PRD 98 (2018) 092005 | 1808.01771 |
| 18 | ATLAS Collaboration | Search for pair production of up-type vector-like quarks and for four-top-quark events in final states with multiple b-jets with the ATLAS detector | JHEP 07 (2018) 089 | 1803.09678 |
| 19 | ATLAS Collaboration | Combination of the searches for pair-produced vector-like partners of the third-generation quarks at $ \sqrt{s} = $ 13 TeV with the ATLAS detector | PRL 121 (2018) 211801 | 1808.02343 |
| 20 | ATLAS Collaboration | Search for pair-produced vector-like top and bottom partners in events with large missing transverse momentum in pp collisions with the ATLAS detector | EPJC 83 (2023) 719 | 2212.05263 |
| 21 | ATLAS Collaboration | Search for pair-production of vector-like quarks in pp collision events at $ \sqrt{s} = $ 13 TeV with at least one leptonically decaying Z boson and a third-generation quark with the ATLAS detector | PLB 843 (2023) 138019 | 2210.15413 |
| 22 | ATLAS Collaboration | Search for pair-production of vector-like quarks in lepton+jets final states containing at least one b-tagged jet using the Run 2 data from the ATLAS experiment | PLB 854 (2024) 138743 | 2401.17165 |
| 23 | ATLAS Collaboration | Search for pair-produced vectorlike quarks coupling to light quarks in the lepton plus jets final state using 13 TeV pp collisions with the ATLAS detector | PRD 110 (2024) 052009 | 2405.19862 |
| 24 | CMS Collaboration | Search for pair production of vector-like {\HepParticleT} and {\HepParticleB} quarks in single-lepton final states using boosted jet substructure in proton-proton collisions at $ \sqrt{s}= $ 13 TeV | JHEP 11 (2017) 085 | 1706.03408 |
| 25 | CMS Collaboration | Search for pair production of vector-like quarks in the $ \mathrm{b} \mathrm{W} \overline{\mathrm{b}} \mathrm{W} $ channel from proton-proton collisions at $ \sqrt{s} = $ 13 TeV | PLB 779 (2018) 82 | 1710.01539 |
| 26 | CMS Collaboration | Search for vector-like {\HepParticleT} and {\HepParticleB} quark pairs in final states with leptons at $ \sqrt{s} = $ 13 TeV | JHEP 08 (2018) 177 | 1805.04758 |
| 27 | CMS Collaboration | Search for vector-like quarks in events with two oppositely charged leptons and jets in proton-proton collisions at $ \sqrt{s} = $ 13 TeV | EPJC 79 (2019) 364 | 1812.09768 |
| 28 | CMS Collaboration | Search for pair production of vector-like quarks in the fully hadronic final state | PRD 100 (2019) 072001 | 1906.11903 |
| 29 | CMS Collaboration | Search for pair production of vector-like quarks in leptonic final states in proton-proton collisions at $ \sqrt{s}= $ 13 TeV | JHEP 07 (2023) 020 | 2209.07327 |
| 30 | ATLAS Collaboration | Search for single production of a vectorlike $ T $ quark decaying into a Higgs boson and top quark with fully hadronic final states using the ATLAS detector | PRD 105 (2022) 092012 | 2201.07045 |
| 31 | CMS Collaboration | Search for electroweak production of a vector-like {\HepParticleT} quark using fully hadronic final states | JHEP 01 (2020) 036 | 1909.04721 |
| 32 | CMS Collaboration | Search for production of a single vectorlike quark decaying to tH or tZ in the all-hadronic final state in pp collisions at $ \sqrt{s}= $ 13 TeV | PRD 110 (2024) 072012 | 2405.05071 |
| 33 | ATLAS Collaboration | Search for single production of vector-like T quarks decaying into Ht or Zt in pp collisions at $ \sqrt{s}= $ 13 TeV with the ATLAS detector | JHEP 08 (2023) 153 | 2305.03401 |
| 34 | CMS Collaboration | Search for a vector-like quark T$ ' \to $ tH via the diphoton decay mode of the Higgs boson in proton-proton collisions at $ \sqrt{s}= $ 13 TeV | JHEP 09 (2023) 057 | 2302.12802 |
| 35 | ATLAS Collaboration | Search for large missing transverse momentum in association with one top-quark in proton-proton collisions at $ \sqrt{s} = $ 13 TeV with the ATLAS detector | JHEP 05 (2019) 041 | 1812.09743 |
| 36 | ATLAS Collaboration | Search for single production of vector-like quarks decaying into $ \mathrm{W}\mathrm{b} $ in pp collisions at $ \sqrt{s} = $ 13 TeV with the ATLAS detector | JHEP 05 (2019) 164 | 1812.07343 |
| 37 | ATLAS Collaboration | Search for singly produced vectorlike top partners in multilepton final states with 139 fb$^{-1}$ of pp collision data at $ \sqrt{s}= $ 13 TeV with the ATLAS detector | PRD 109 (2024) 112012 | 2307.07584 |
| 38 | ATLAS Collaboration | Search for new particles in final states with a boosted top quark and missing transverse momentum in proton-proton collisions at $ \sqrt{s}= $ 13 TeV with the ATLAS detector | JHEP 05 (2024) 263 | 2402.16561 |
| 39 | ATLAS Collaboration | Search for single-production of vector-like quarks decaying into $ Wb $ in the fully hadronic final state in $ pp $ collisions at $ \sqrt{s}= $ 13 TeV with the ATLAS detector | JHEP 02 (2025) 075 | 2409.20273 |
| 40 | CMS Collaboration | Search for single production of a vector-like {\HepParticleT} quark decaying to a Z boson and a top quark in proton-proton collisions at $ \sqrt{s} = $ 13 TeV | PLB 781 (2018) 574 | 1708.01062 |
| 41 | CMS Collaboration | Search for single production of a vector-like T quark decaying to a top quark and a Z boson in the final state with jets and missing transverse momentum at $ \sqrt{s}= $ 13 TeV | JHEP 05 (2022) 093 | 2201.02227 |
| 42 | CMS Collaboration | Search for single production of vector-like quarks decaying into a b quark and a W boson in proton-proton collisions at $ \sqrt{s} = $ 13 TeV | PLB 772 (2017) 634 | 1701.08328 |
| 43 | CMS Collaboration | HEPData record for this analysis | link | |
| 44 | CMS Collaboration | The CMS experiment at the CERN LHC | JINST 3 (2008) S08004 | |
| 45 | CMS Collaboration | Development of the CMS detector for the CERN LHC Run 3 | JINST 19 (2024) P05064 | CMS-PRF-21-001 2309.05466 |
| 46 | CMS Collaboration | Performance of the CMS Level-1 trigger in proton-proton collisions at $ \sqrt{s}= $ 13 TeV | JINST 15 (2020) P10017 | CMS-TRG-17-001 2006.10165 |
| 47 | CMS Collaboration | The CMS trigger system | JINST 12 (2017) P01020 | CMS-TRG-12-001 1609.02366 |
| 48 | CMS Collaboration | Performance of the CMS high-level trigger during LHC Run 2 | JINST 19 (2024) P11021 | CMS-TRG-19-001 2410.17038 |
| 49 | J. Alwall et al. | The automated computation of tree-level and next-to-leading order differential cross sections, and their matching to parton shower simulations | JHEP 07 (2014) 079 | 1405.0301 |
| 50 | P. Nason | A new method for combining NLO QCD with shower Monte Carlo algorithms | JHEP 11 (2004) 040 | hep-ph/0409146 |
| 51 | S. Frixione, P. Nason, and C. Oleari | Matching NLO QCD computations with parton shower simulations: the POWHEG method | JHEP 11 (2007) 070 | 0709.2092 |
| 52 | S. Alioli, P. Nason, C. Oleari, and E. Re | A general framework for implementing NLO calculations in shower Monte Carlo programs: the POWHEG BOX | JHEP 06 (2010) 043 | 1002.2581 |
| 53 | S. Frixione, P. Nason, and G. Ridolfi | A positive-weight next-to-leading-order Monte Carlo for heavy flavour hadroproduction | JHEP 09 (2007) 126 | 0707.3088 |
| 54 | R. Frederix, E. Re, and P. Torrielli | Single-top $ t $-channel hadroproduction in the four-flavour scheme with POWHEG and aMC@NLO | JHEP 09 (2012) 130 | 1207.5391 |
| 55 | E. Re | Single-top Wt-channel production matched with parton showers using the POWHEG method | EPJC 71 (2011) 1547 | 1009.2450 |
| 56 | T. Sjostrand et al. | An introduction to PYTHIA 8.2 | Comput. Phys. Commun. 191 (2015) 159 | 1410.3012 |
| 57 | CMS Collaboration | Extraction and validation of a new set of CMS PYTHIA8 tunes from underlying-event measurements | EPJC 80 (2020) 155 | CMS-GEN-17-001 1903.12179 |
| 58 | M. Czakon and A. Mitov | Top++: A program for the calculation of the top-pair cross-section at hadron colliders | Comput. Phys. Commun. 185 (2014) 2930 | 1112.5675 |
| 59 | M. Aliev et al. | HATHOR -- HAdronic Top and Heavy quarks crOss section calculatoR | Comput. Phys. Commun. 182 (2011) 1034 | 1007.1327 |
| 60 | J. M. Lindert et al. | Precise predictions for v+jets dark matter backgrounds | EPJC 77 (2017) 829 | 1705.04664 |
| 61 | G. Cacciapaglia et al. | Heavy vector-like top partners at the LHC and flavour constraints | JHEP 03 (2012) 070 | 1108.6329 |
| 62 | NNPDF Collaboration | Parton distributions for the LHC Run II | JHEP 04 (2015) 040 | 1410.8849 |
| 63 | GEANT4 Collaboration | GEANT 4---a simulation toolkit | NIM A 506 (2003) 250 | |
| 64 | J. Allison et al. | GEANT 4 developments and applications | IEEE Trans. Nucl. Sci. 53 (2006) 270 | |
| 65 | CMS Collaboration | Technical proposal for the Phase-II upgrade of the Compact Muon Solenoid | CMS Technical Proposal CERN-LHCC-2015-010, CMS-TDR-15-02, 2015 CDS |
|
| 66 | CMS Collaboration | Particle-flow reconstruction and global event description with the CMS detector | JINST 12 (2017) P10003 | CMS-PRF-14-001 1706.04965 |
| 67 | M. Cacciari, G. P. Salam, and G. Soyez | The anti-$ k_{\mathrm{T}} $ jet clustering algorithm | JHEP 04 (2008) 063 | 0802.1189 |
| 68 | M. Cacciari, G. P. Salam, and G. Soyez | FastJet user manual | EPJC 72 (2012) 1896 | 1111.6097 |
| 69 | CMS Collaboration | Pileup mitigation at CMS in 13 TeV data | JINST 15 (2020) P09018 | CMS-JME-18-001 2003.00503 |
| 70 | D. Bertolini, P. Harris, M. Low, and N. Tran | Pileup per particle identification | JHEP 10 (2014) 059 | 1407.6013 |
| 71 | CMS Collaboration | Jet energy scale and resolution in the CMS experiment in pp collisions at 8 TeV | JINST 12 (2017) P02014 | CMS-JME-13-004 1607.03663 |
| 72 | CMS Collaboration | Electron and photon reconstruction and identification with the CMS experiment at the CERN LHC | JINST 16 (2021) P05014 | CMS-EGM-17-001 2012.06888 |
| 73 | CMS Collaboration | Performance of the CMS muon detector and muon reconstruction with proton-proton collisions at $ \sqrt{s}= $ 13 TeV | JINST 13 (2018) P06015 | CMS-MUO-16-001 1804.04528 |
| 74 | K. Rehermann and B. Tweedie | Efficient identification of boosted semileptonic top quarks at the LHC | JHEP 03 (2011) 059 | 1007.2221 |
| 75 | CMS Collaboration | Performance of missing transverse momentum reconstruction in proton-proton collisions at $ \sqrt{s}= $ 13 TeV using the CMS detector | JINST 14 (2019) P07004 | CMS-JME-17-001 1903.06078 |
| 76 | H. Qu and L. Gouskos | ParticleNet: jet tagging via particle clouds | PRD 101 (2020) 056019 | 1902.08570 |
| 77 | CMS Collaboration | Measurement of the single top quark and antiquark production cross sections in the $ t $ channel and their ratio in proton-proton collisions at $ \sqrt{s}= $ 13 TeV | PLB 800 (2019) 135042 | CMS-TOP-17-011 1812.10514 |
| 78 | Particle Data Group , S. Navas et al. | Review of particle physics | PRD 110 (2024) 030001 | |
| 79 | CMS Collaboration | Identification of heavy-flavour jets with the CMS detector in pp collisions at 13 TeV | JINST 13 (2018) P05011 | CMS-BTV-16-002 1712.07158 |
| 80 | E. Bols et al. | Jet flavour classification using DeepJet | JINST 15 (2020) P12012 | 2008.10519 |
| 81 | CMS Collaboration | Performance of the DeepJet b tagging algorithm using 41.9 fb$^{-1}$ of data from proton-proton collisions at 13 $ { \text{Te\hspace{-.08em}V}} $ with Phase 1 CMS detector | CMS Detector Performance Note CMS-DP-2018-058, 2018 CDS |
|
| 82 | T. Chen and C. Guestrin | XGBoost: A scalable tree boosting system | in Proc. 22nd ACM SIGKDD Int. Conf. Know. Discov. Data Min., p. 785. 2016 link |
|
| 83 | CMS Collaboration | Performance of heavy-flavour jet identification in boosted topologies in proton-proton collisions at $ \sqrt{s}= $ 13 TeV | CMS Physics Analysis Summary, 2023 CMS-PAS-BTV-22-001 |
CMS-PAS-BTV-22-001 |
| 84 | CMS Collaboration | Precision luminosity measurement in proton-proton collisions at $ \sqrt{s}= $ 13 TeV in 2015 and 2016 at CMS | EPJC 81 (2021) 800 | CMS-LUM-17-003 2104.01927 |
| 85 | CMS Collaboration | CMS luminosity measurement for the 2017 data-taking period at $ \sqrt{s}= $ 13 TeV | CMS Physics Analysis Summary, 2018 link |
CMS-PAS-LUM-17-004 |
| 86 | CMS Collaboration | CMS luminosity measurement for the 2018 data-taking period at $ \sqrt{s}= $ 13 TeV | CMS Physics Analysis Summary, 2019 link |
CMS-PAS-LUM-18-002 |
| 87 | CMS Collaboration | Measurement of the inelastic proton-proton cross section at $ \sqrt{s}= $ 13 TeV | JHEP 07 (2018) 161 | CMS-FSQ-15-005 1802.02613 |
| 88 | J. Butterworth et al. | PDF4LHC recommendations for LHC Run II | JPG 43 (2016) 023001 | 1510.03865 |
| 89 | CMS Collaboration | Measurement of differential cross sections for top quark pair production using the lepton+jets final state in proton-proton collisions at 13 TeV | PRD 95 (2017) 092001 | CMS-TOP-16-008 1610.04191 |
| 90 | R. Barlow and C. Beeston | Fitting using finite Monte Carlo samples | Comput. Phys. Commun. 77 (1993) 219 | |
| 91 | J. S. Conway | Incorporating nuisance parameters in likelihoods for multisource spectra | in Proc. PHYSTAT 2011 Int. Conf., p. 115. 2011 link |
1103.0354 |
| 92 | CMS Collaboration | The CMS statistical analysis and combination tool: Combine | Comput. Softw. Big Sci. 8 (2024) 19 | CMS-CAT-23-001 2404.06614 |
| 93 | W. Verkerke and D. P. Kirkby | The RooFit toolkit for data modeling | in Proc. 13th Int. Conf. for Computing in High-Energy and Nuclear Physics (CHEP03). 2003 link |
physics/0306116 |
| 94 | L. Moneta et al. | The RooStats project | in Proc. 13th Int. Workshop on Advanced Computing and Analysis Techniques in Physics Research (ACAT 2010). 2010.. [ PoS(ACAT2010)057] link |
1009.1003 |
| 95 | T. Junk | Confidence level computation for combining searches with small statistics | NIM A 434 (1999) 435 | hep-ex/9902006 |
| 96 | A. L. Read | Presentation of search results: the $ \text{CL}_\text{s} $ technique | JPG 28 (2002) 2693 | |
| 97 | G. Cowan, K. Cranmer, E. Gross, and O. Vitells | Asymptotic formulae for likelihood-based tests of new physics | EPJC 71 (2011) 1554 | 1007.1727 |
| 98 | ATLAS and CMS Collaborations, and LHC Higgs Combination Group | Procedure for the LHC Higgs boson search combination in Summer 2011 | Technical Report CMS-NOTE-2011-005, ATL-PHYS-PUB-2011-11, 2011 | |
|
|
Compact Muon Solenoid LHC, CERN |
|

|

|

|

|

|