

Compact Muon Solenoid
LHC, CERN
| CMS-PAS-HIG-25-015 | ||
| Measurements of inclusive and differential cross sections for Higgs boson production with decay to four leptons in proton-proton collisions at 13.6 TeV | ||
| CMS Collaboration | ||
| 2026-04-03 | ||
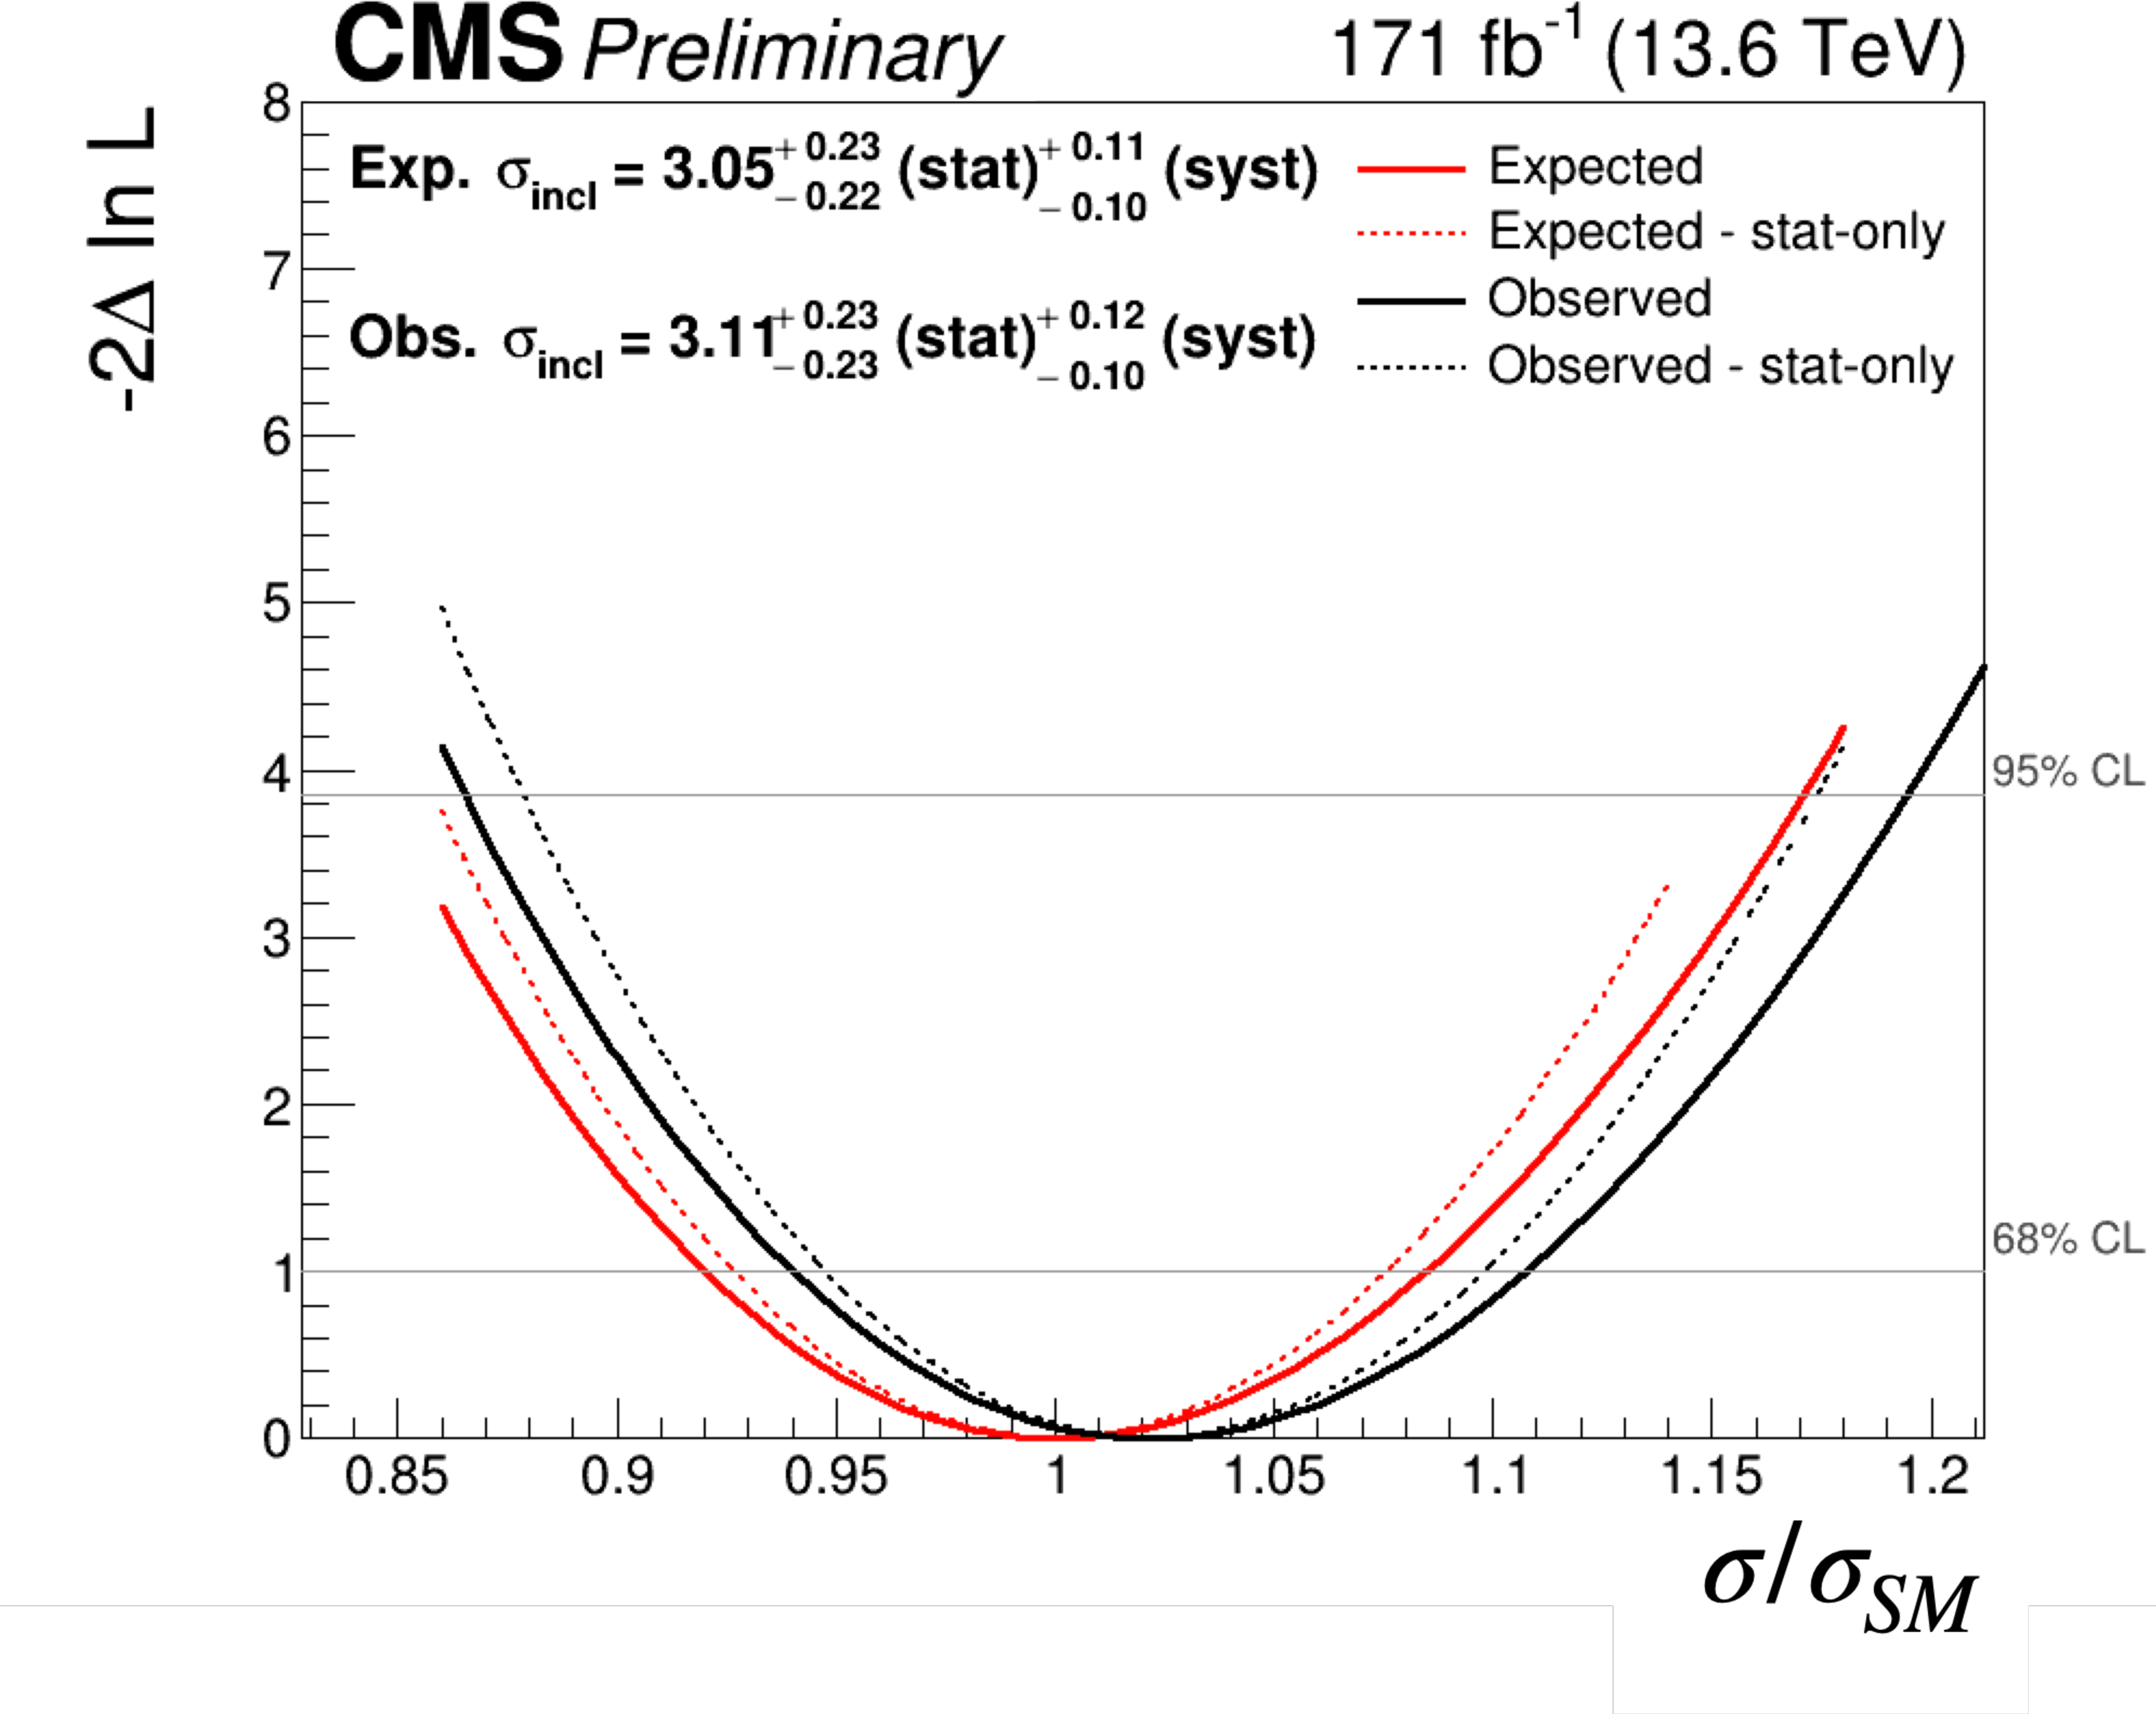
| Abstract: Measurements of Higgs boson (H) production cross sections in the four-lepton (4 $ \ell, \ell=\mathrm{e},\mu $) final state at a center-of-mass energy $ \sqrt{s}= $ 13.6 TeV are presented. These measurements are based on data collected with the CMS detector at the CERN LHC between 2022 and 2024, corresponding to an integrated luminosity of 171 fb$ ^{-1} $. Cross sections are measured in a fiducial region closely matching the experimental acceptance, both inclusively and differentially, as a function of a range of observables. Dedicated measurements targeting the production of the Higgs boson via vector boson fusion are also performed. The $ \mathrm{H}\to\mathrm{ZZ}\to 4\ell $ inclusive fiducial cross section is measured to be $ \sigma_\mathrm{fid} = $ 3.11 $ ^{+0.22}_{-0.22} $ ($ \mathrm{stat.} )^{+0.14}_{-0.12}( \mathrm{syst.} $) $ \mathrm{fb} $, in agreement with the standard model expectation of 3.05 $ ^{+0.17}_{-0.22} $ $ \mathrm{fb} $. | ||
| Links: CDS record (PDF) ; Physics Briefing ; CADI line (restricted) ; | ||
| Figures | |
png pdf |
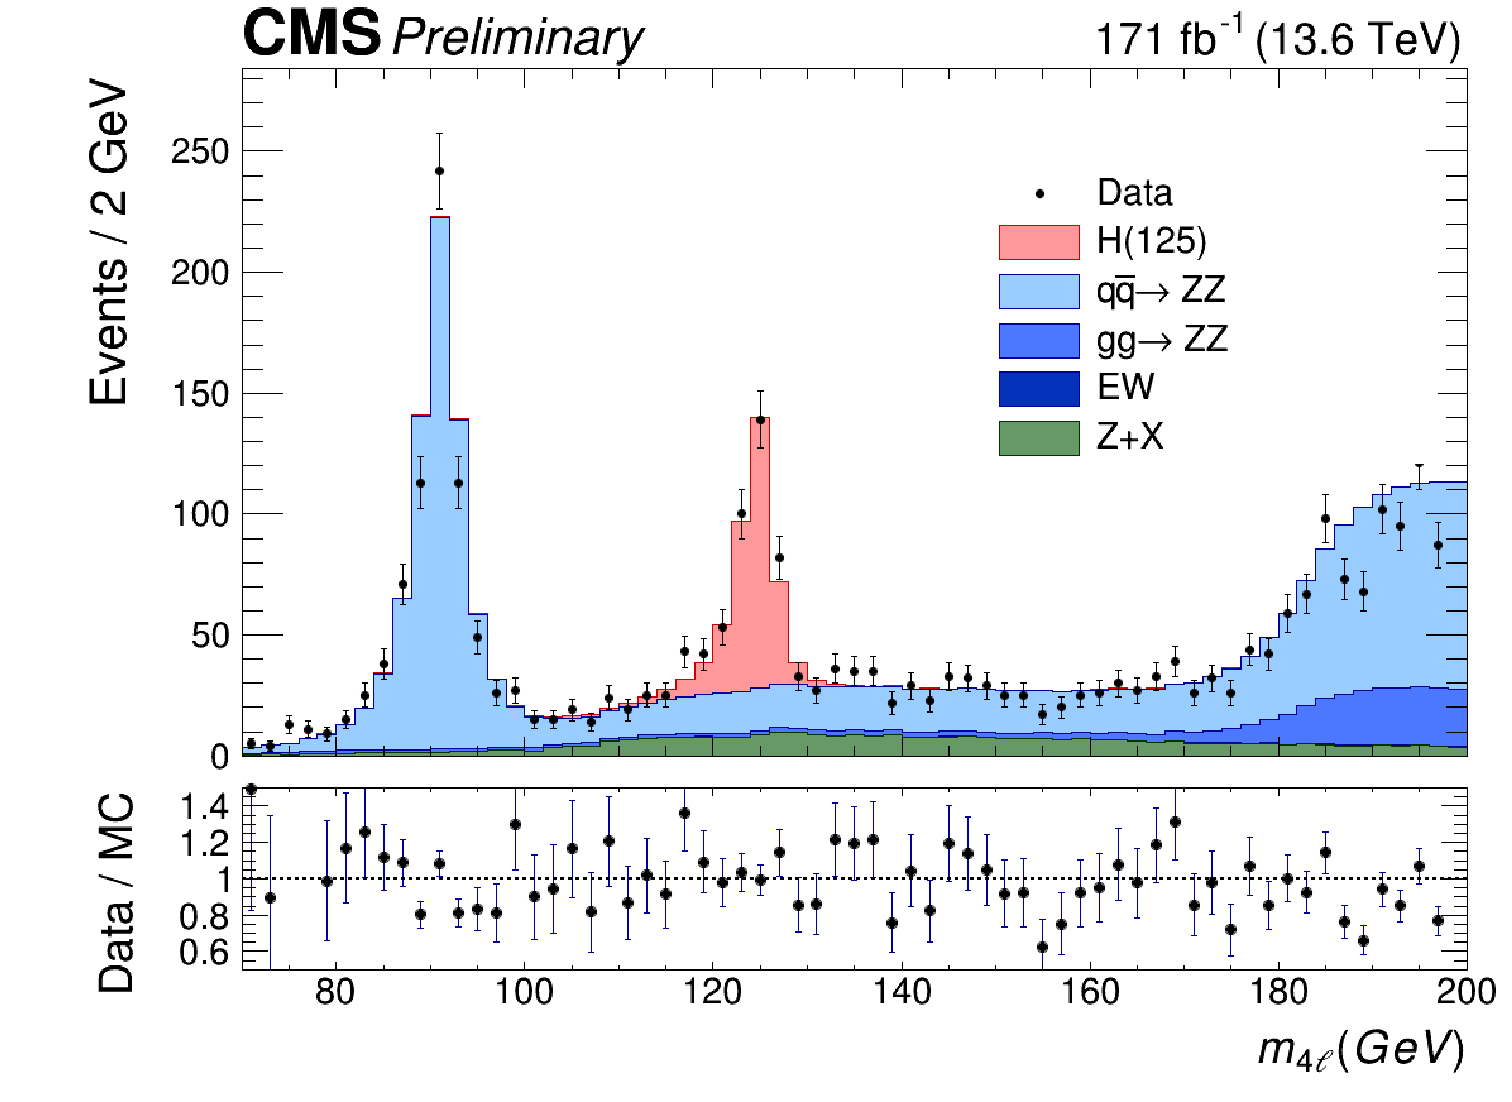
Figure 1:
Distribution of the $ m_{4\ell} $ invariant mass in the ranges 70--200 GeV for the 2022--2024 data--taking period. The black points with error bars represent the data. The colored histograms show the signal (pink histogram) and the background contributions. |
png pdf |
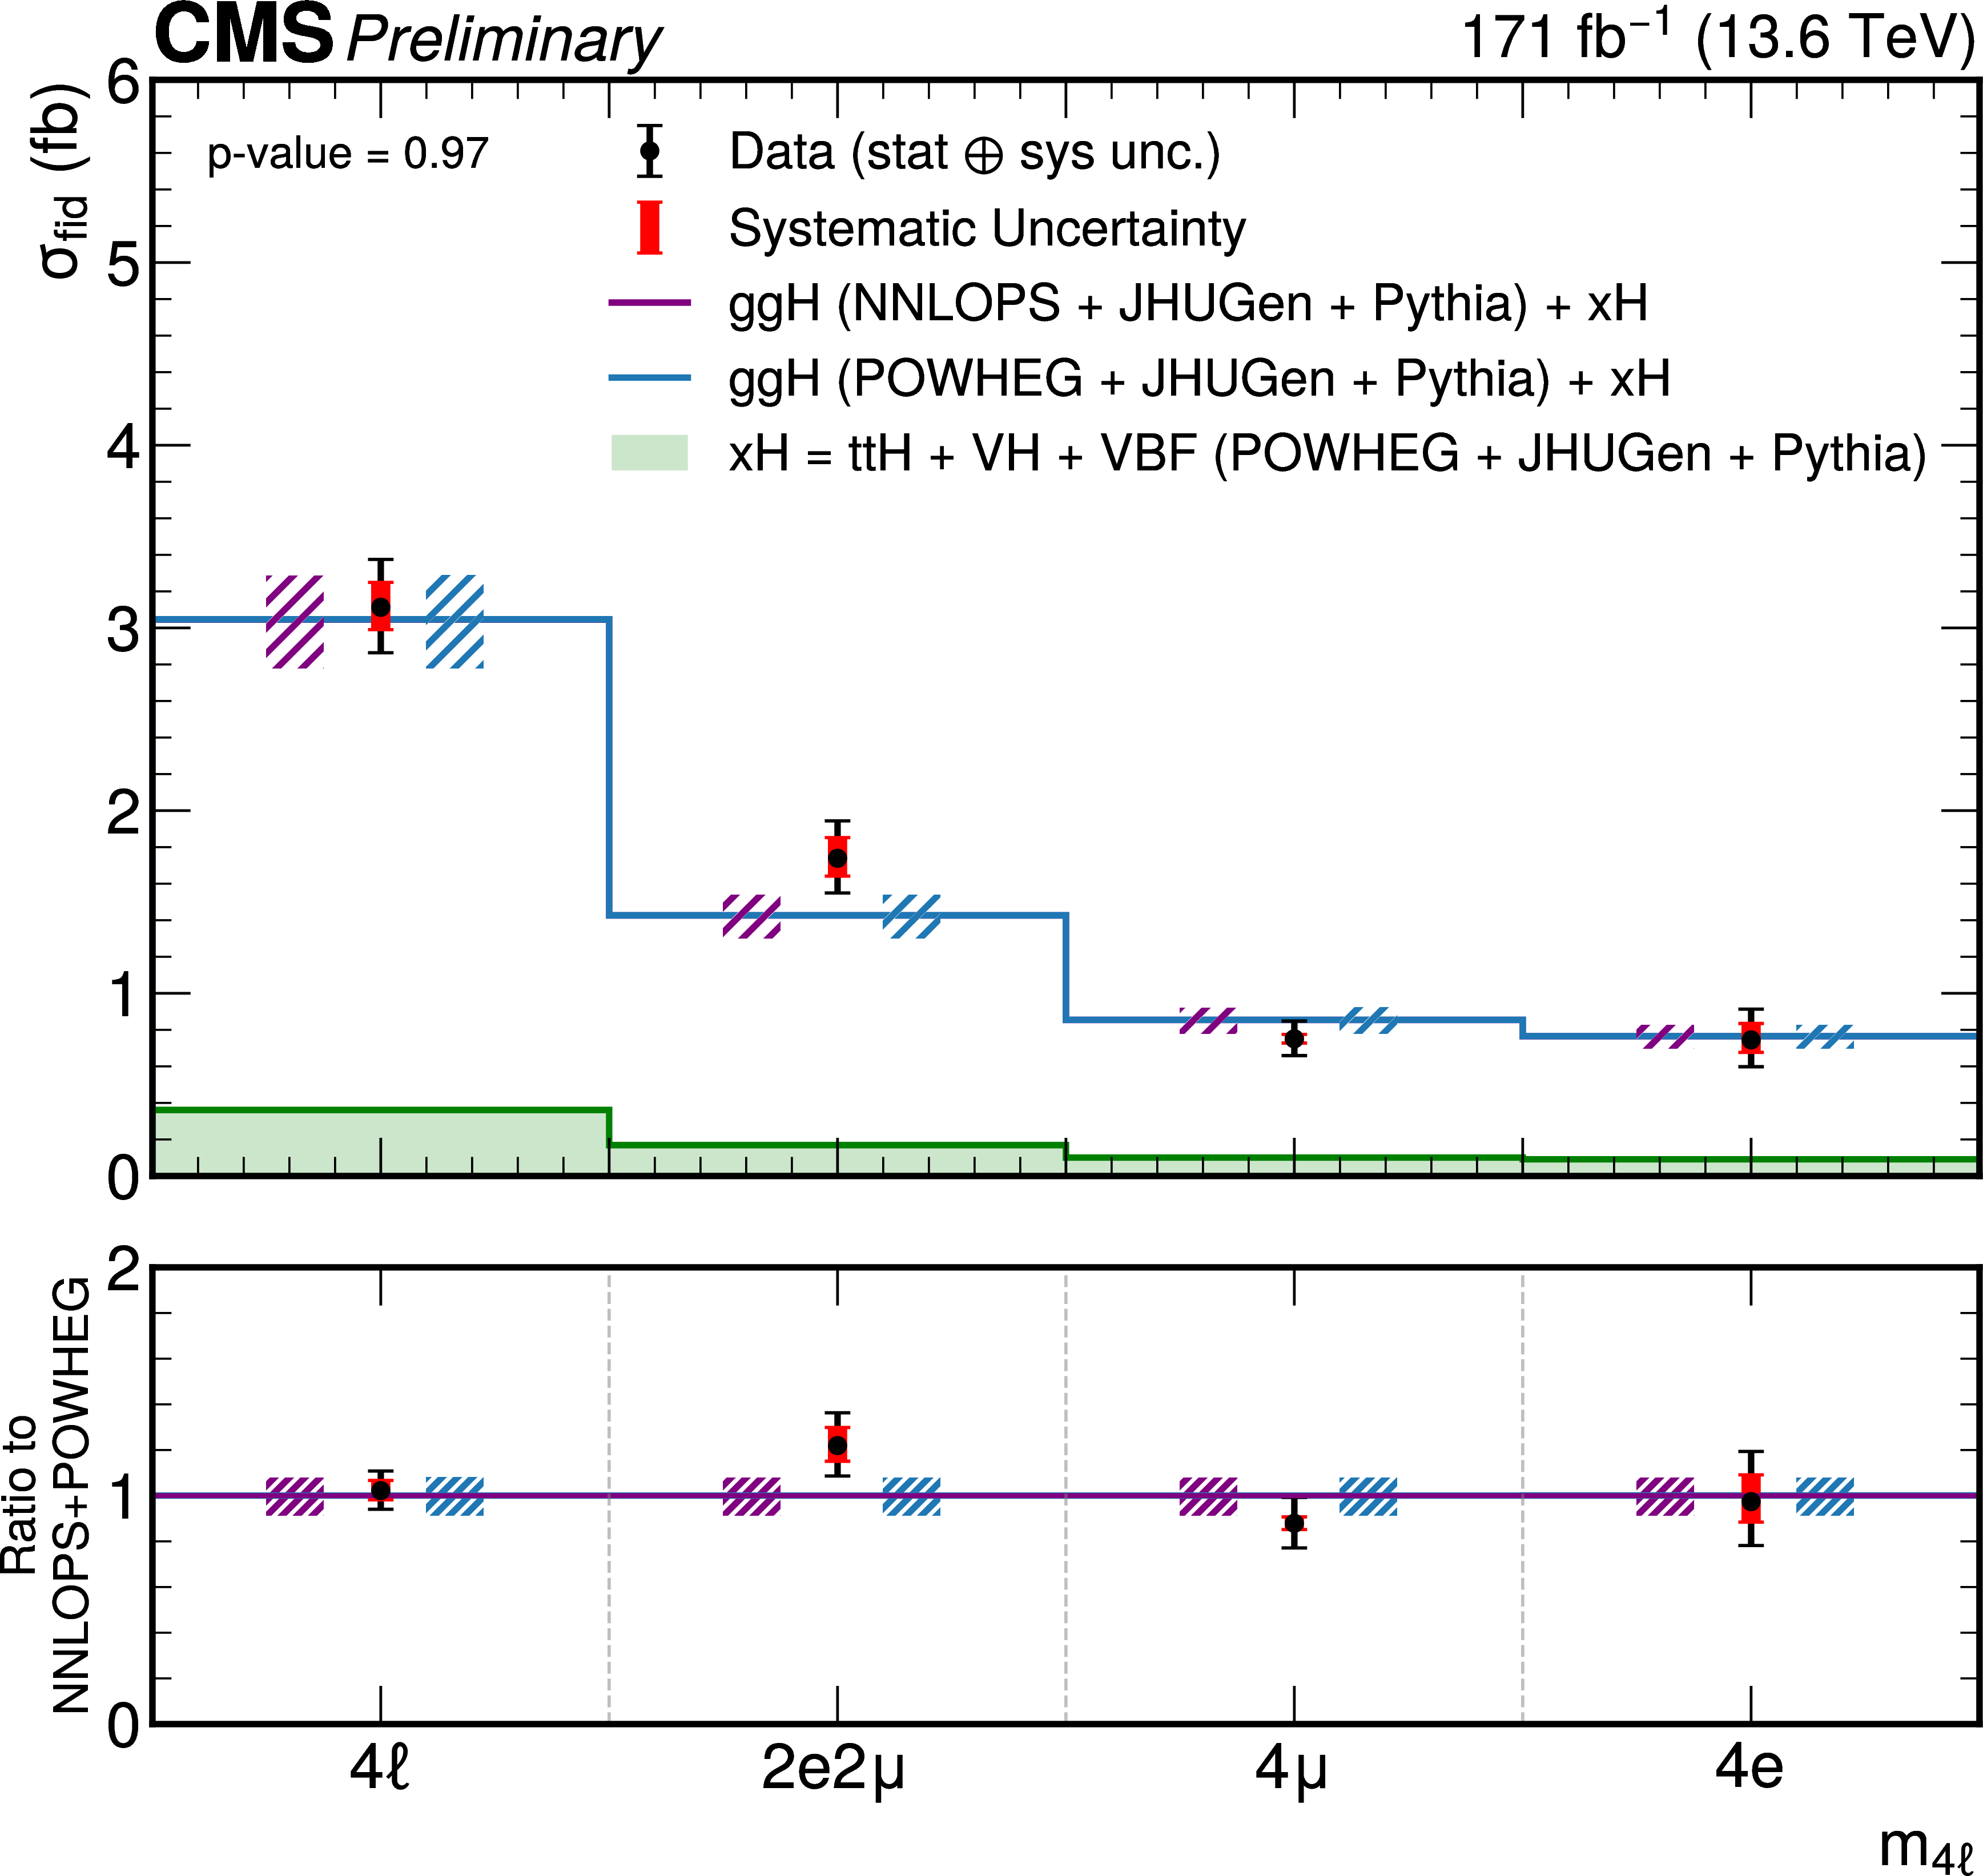
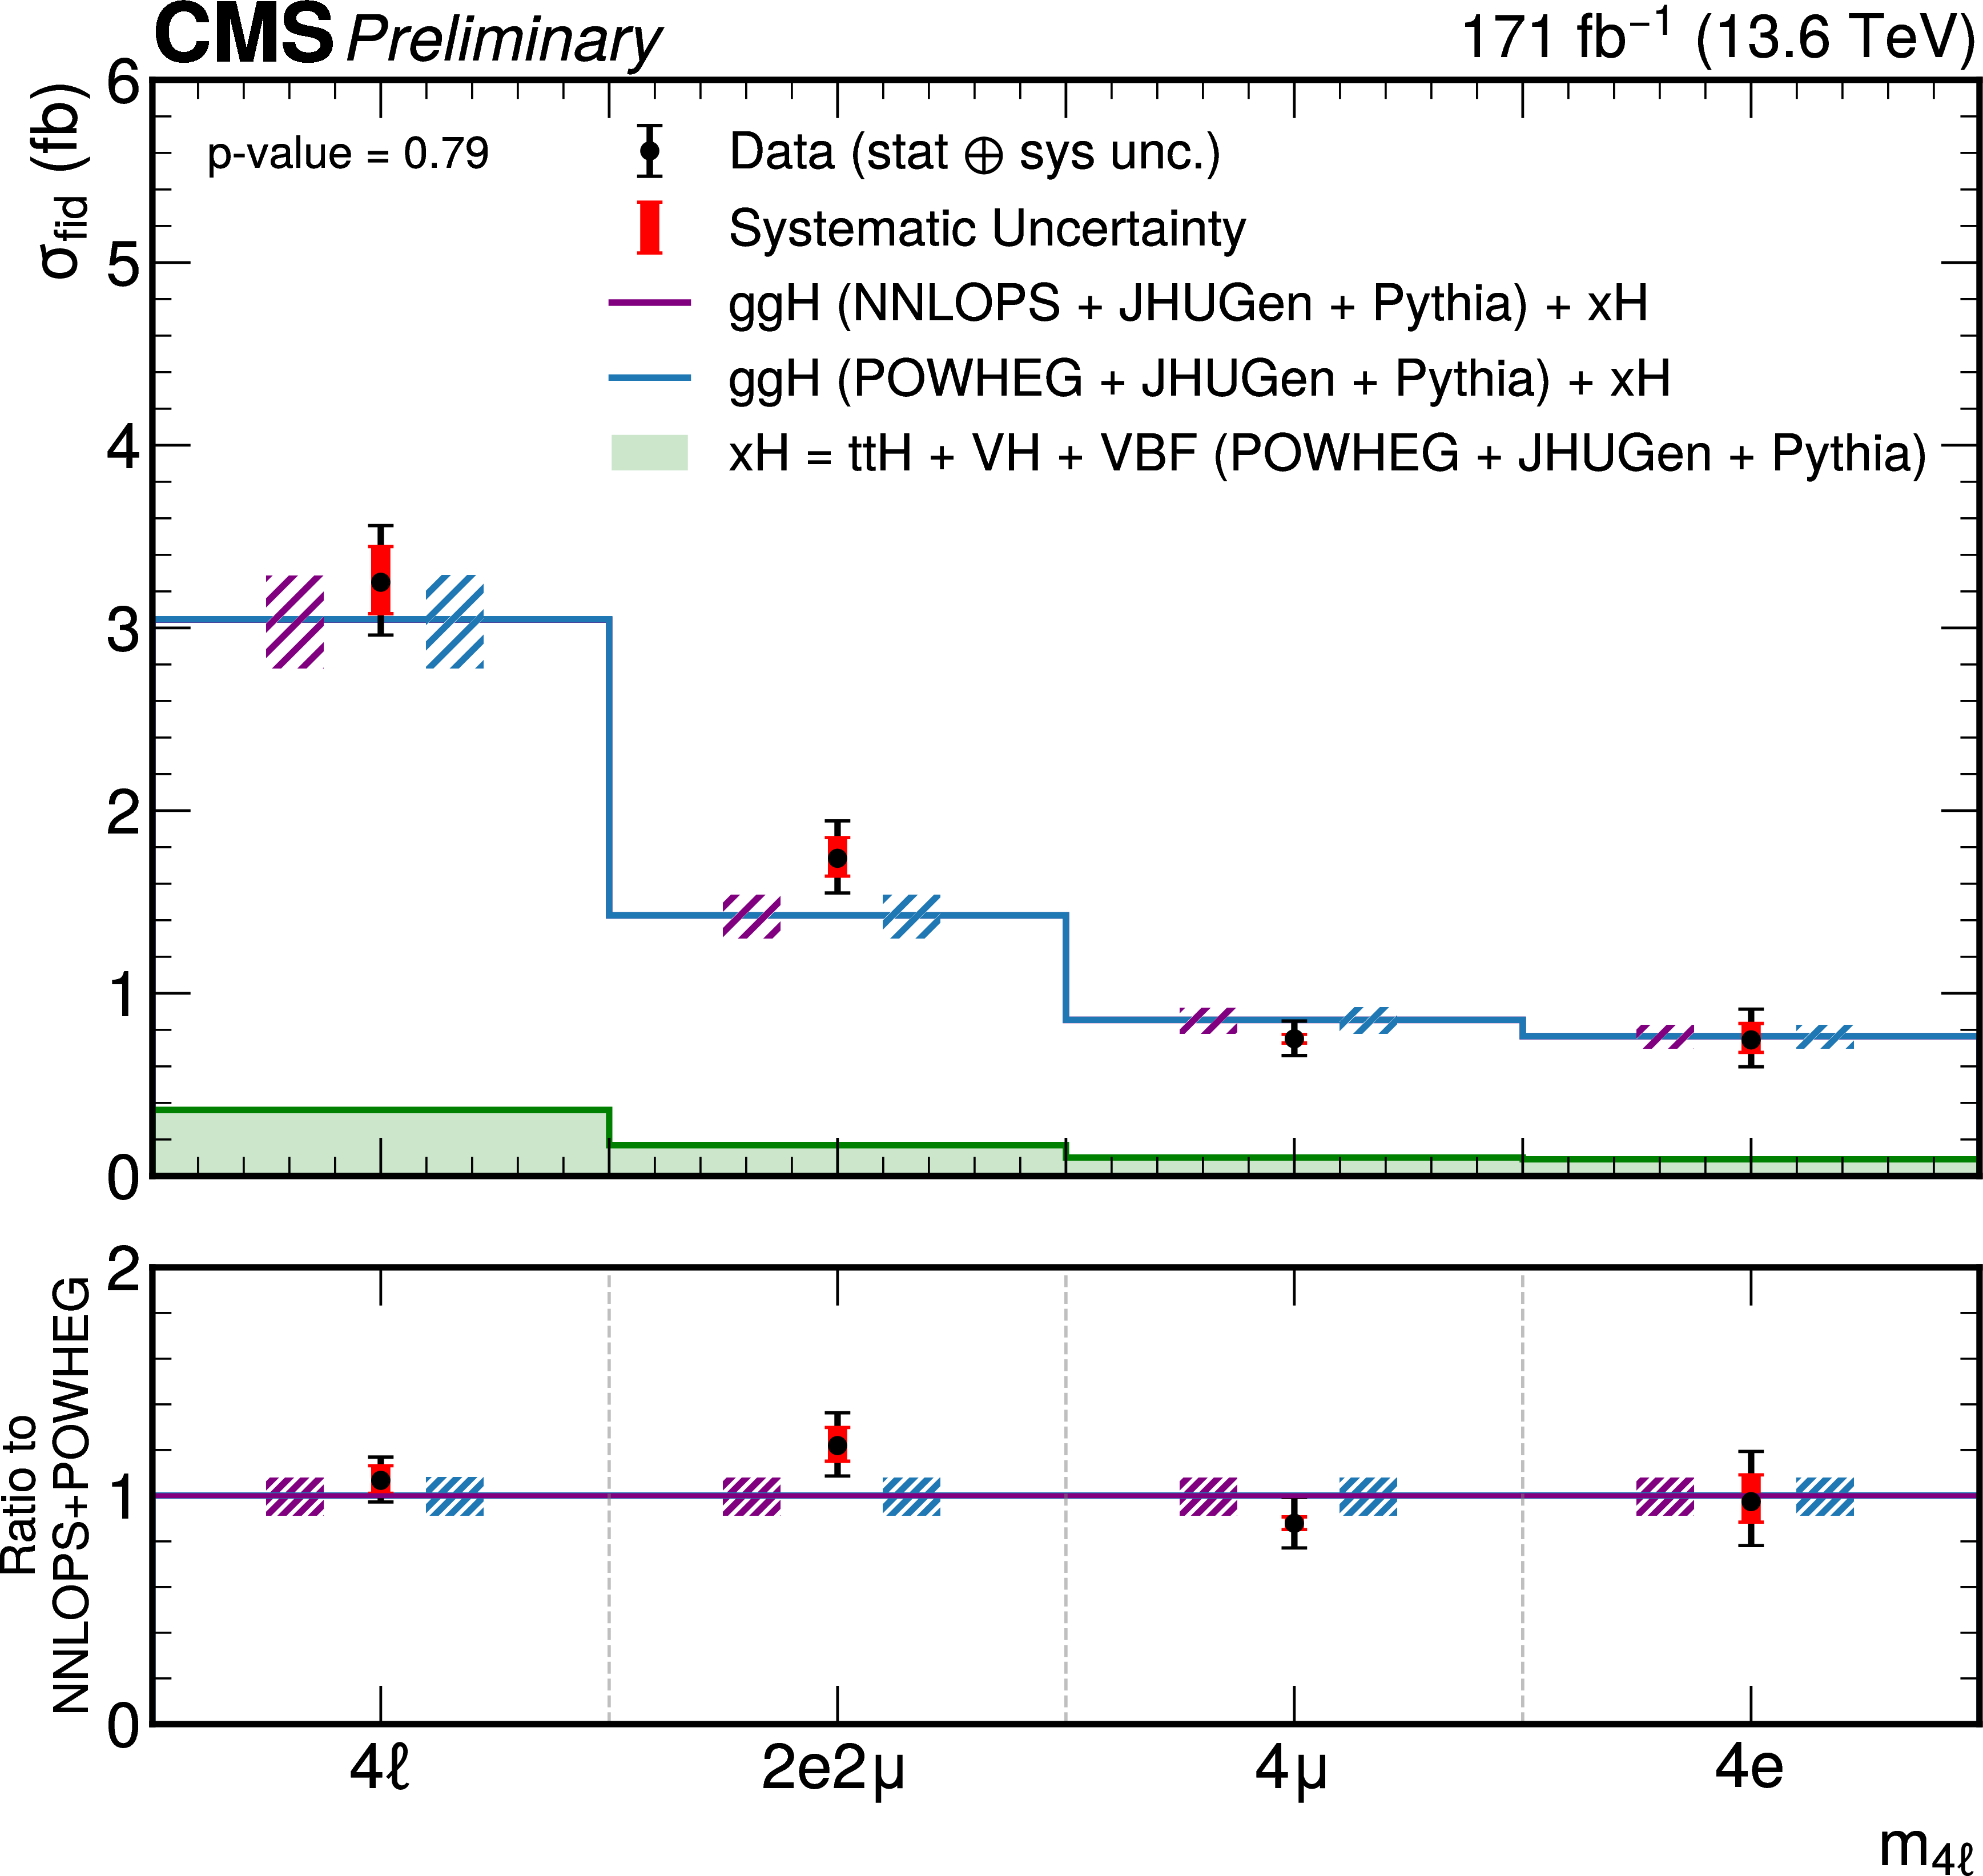
Figure 2:
Measured inclusive fiducial cross sections for the $ \mathrm{H}\to\mathrm{Z}\mathrm{Z}\to4\ell $ process for the different final states, for the scenario in which the Higgs boson branching ratios to 2 $ e2\mu $, 4 $ e $, and 4 $ \mu $ are fixed to the Standard Model values. The gg $ \to $ H predictions are shown for two different generators, POWHEG (blue) and NNLOPS (purple), normalized to the total cross section computed at next-to-next-to-next-to-leading order (N3LO), separately stacked over the the subdominant component of the signal from VBF + VH + t\=tH, denoted as xH (green). The hatched areas correspond to the systematic uncertainties in the theoretical predictions. Black points represent the measured fiducial cross sections in each bin, black error bars indicate the total uncertainty in each measurement, and red boxes denote the systematic uncertainties. The lower panels display the ratios of the measured cross sections and of the POWHEG gg $ \to $ H + xH theoretical prediction to the NNLOPS gg $ \to $ H + POWHEG xH theoretical predictions. |
png pdf |
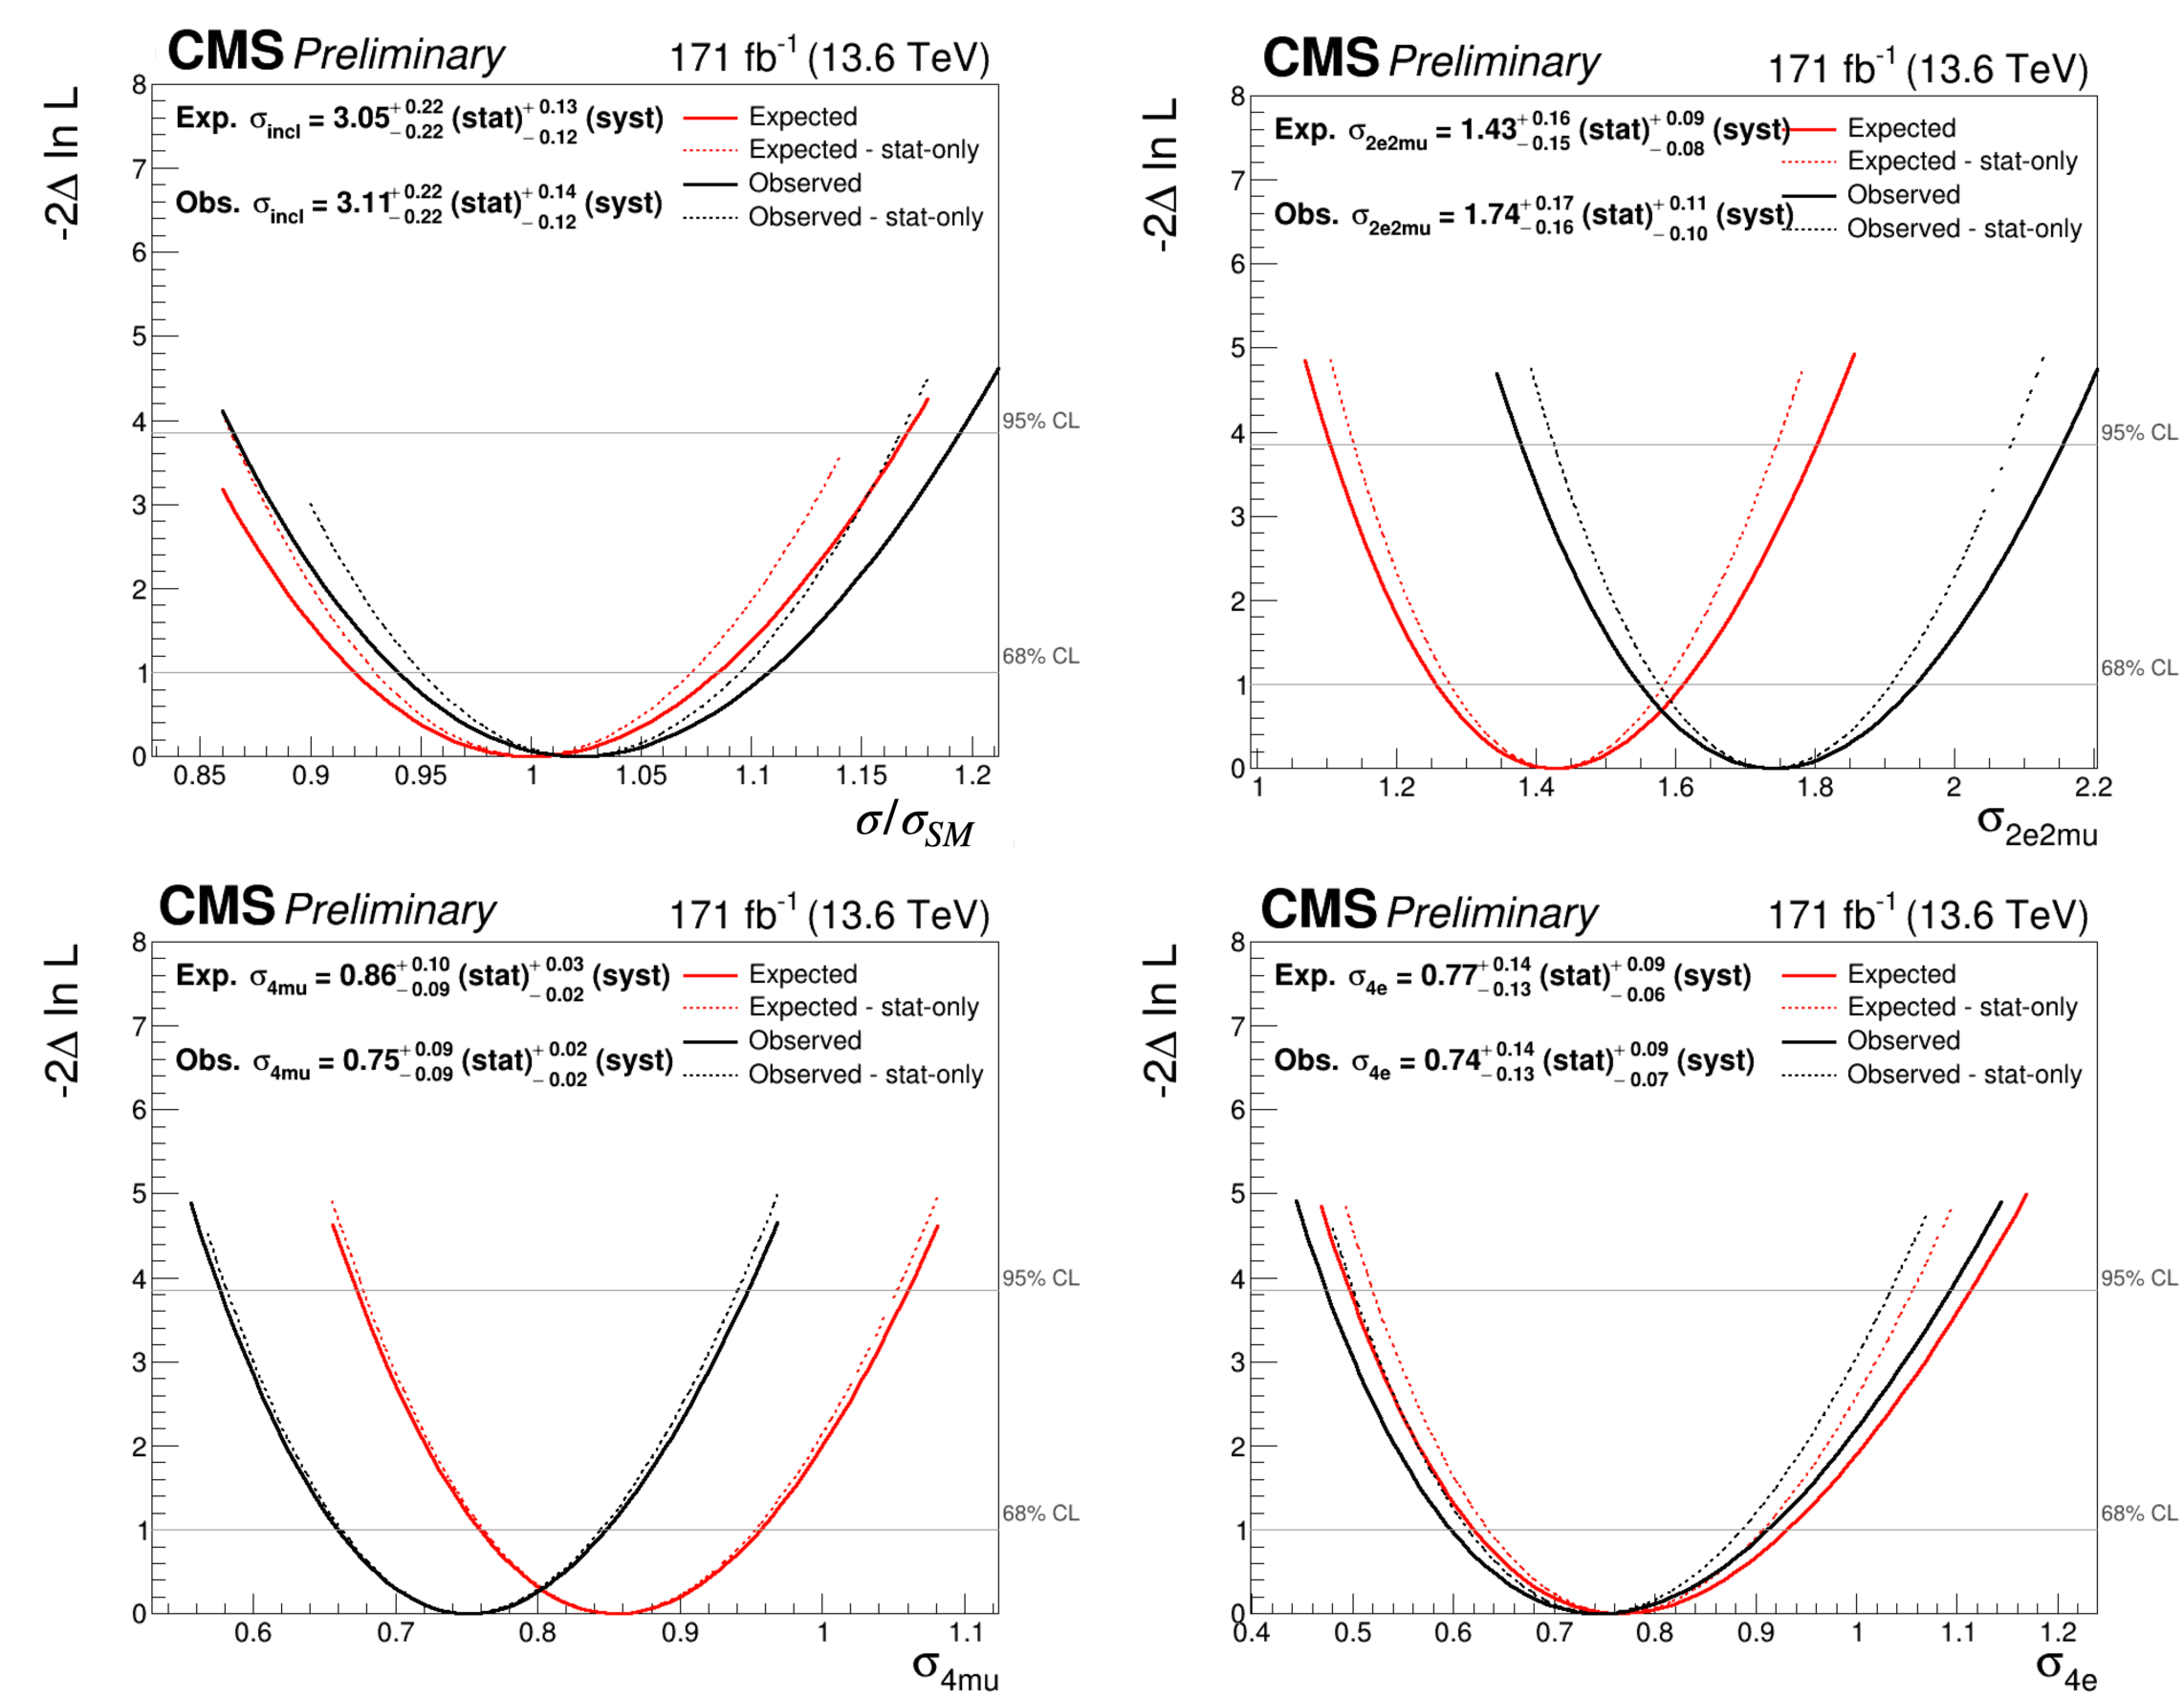
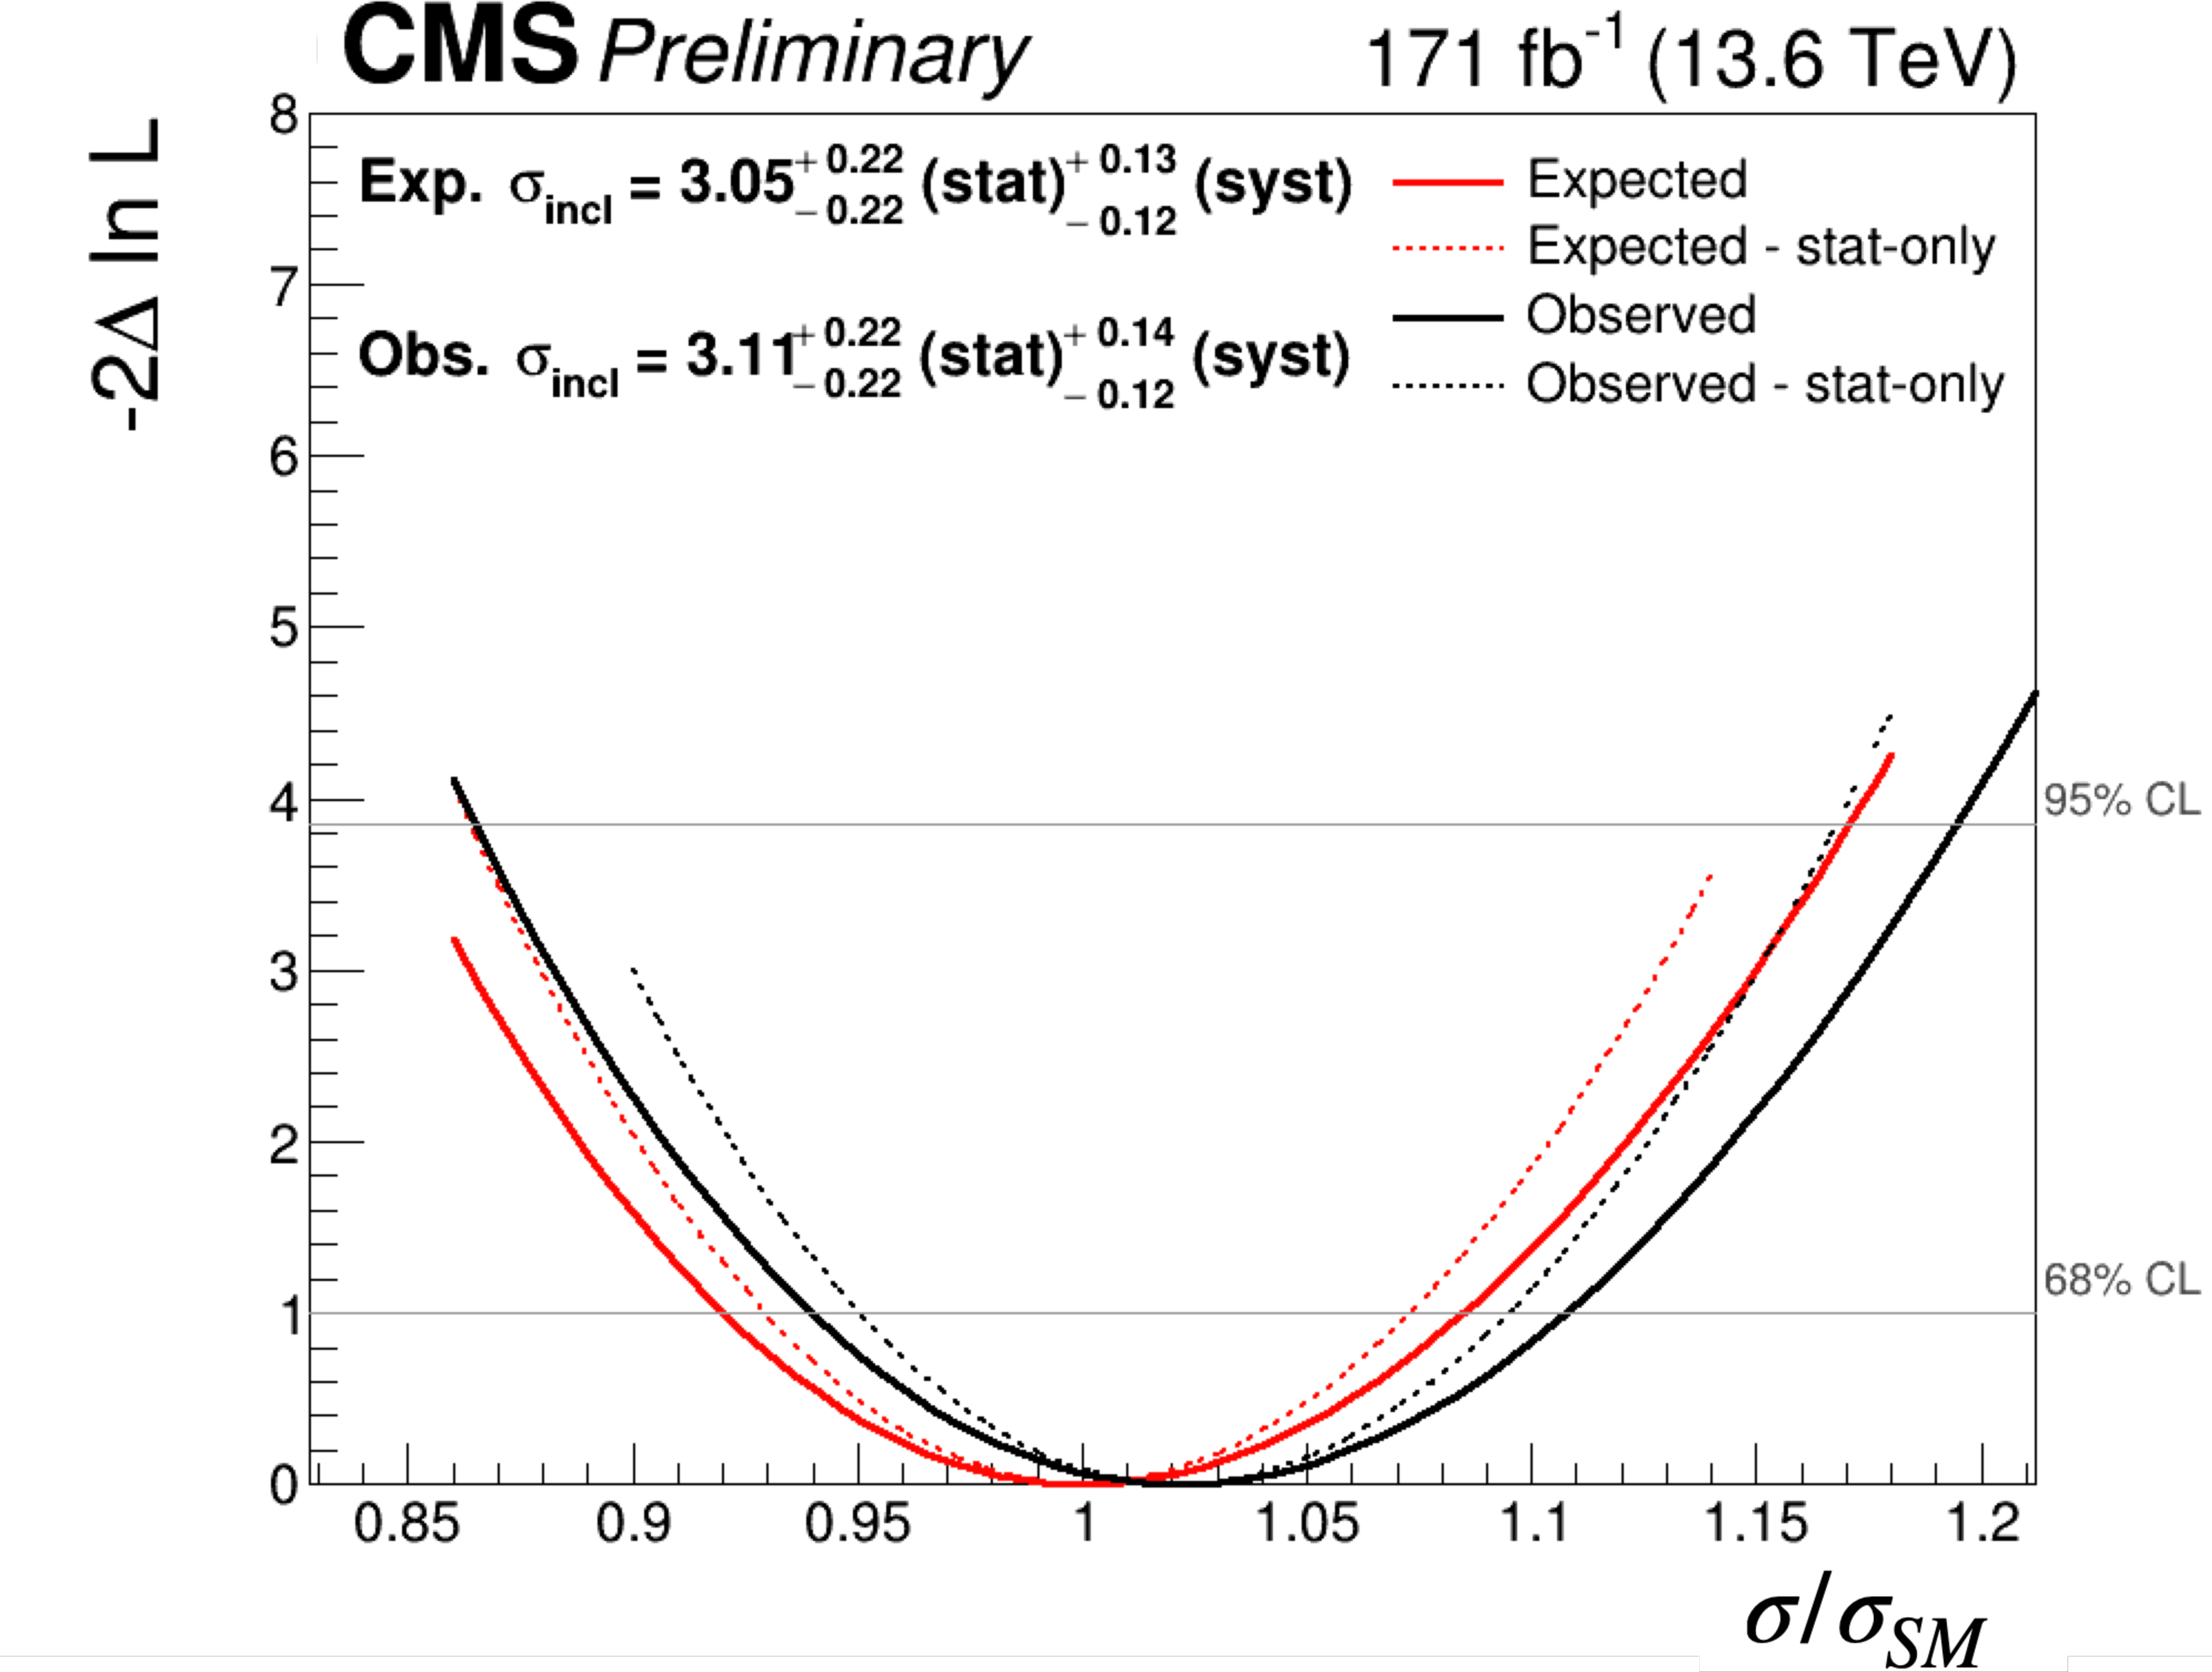
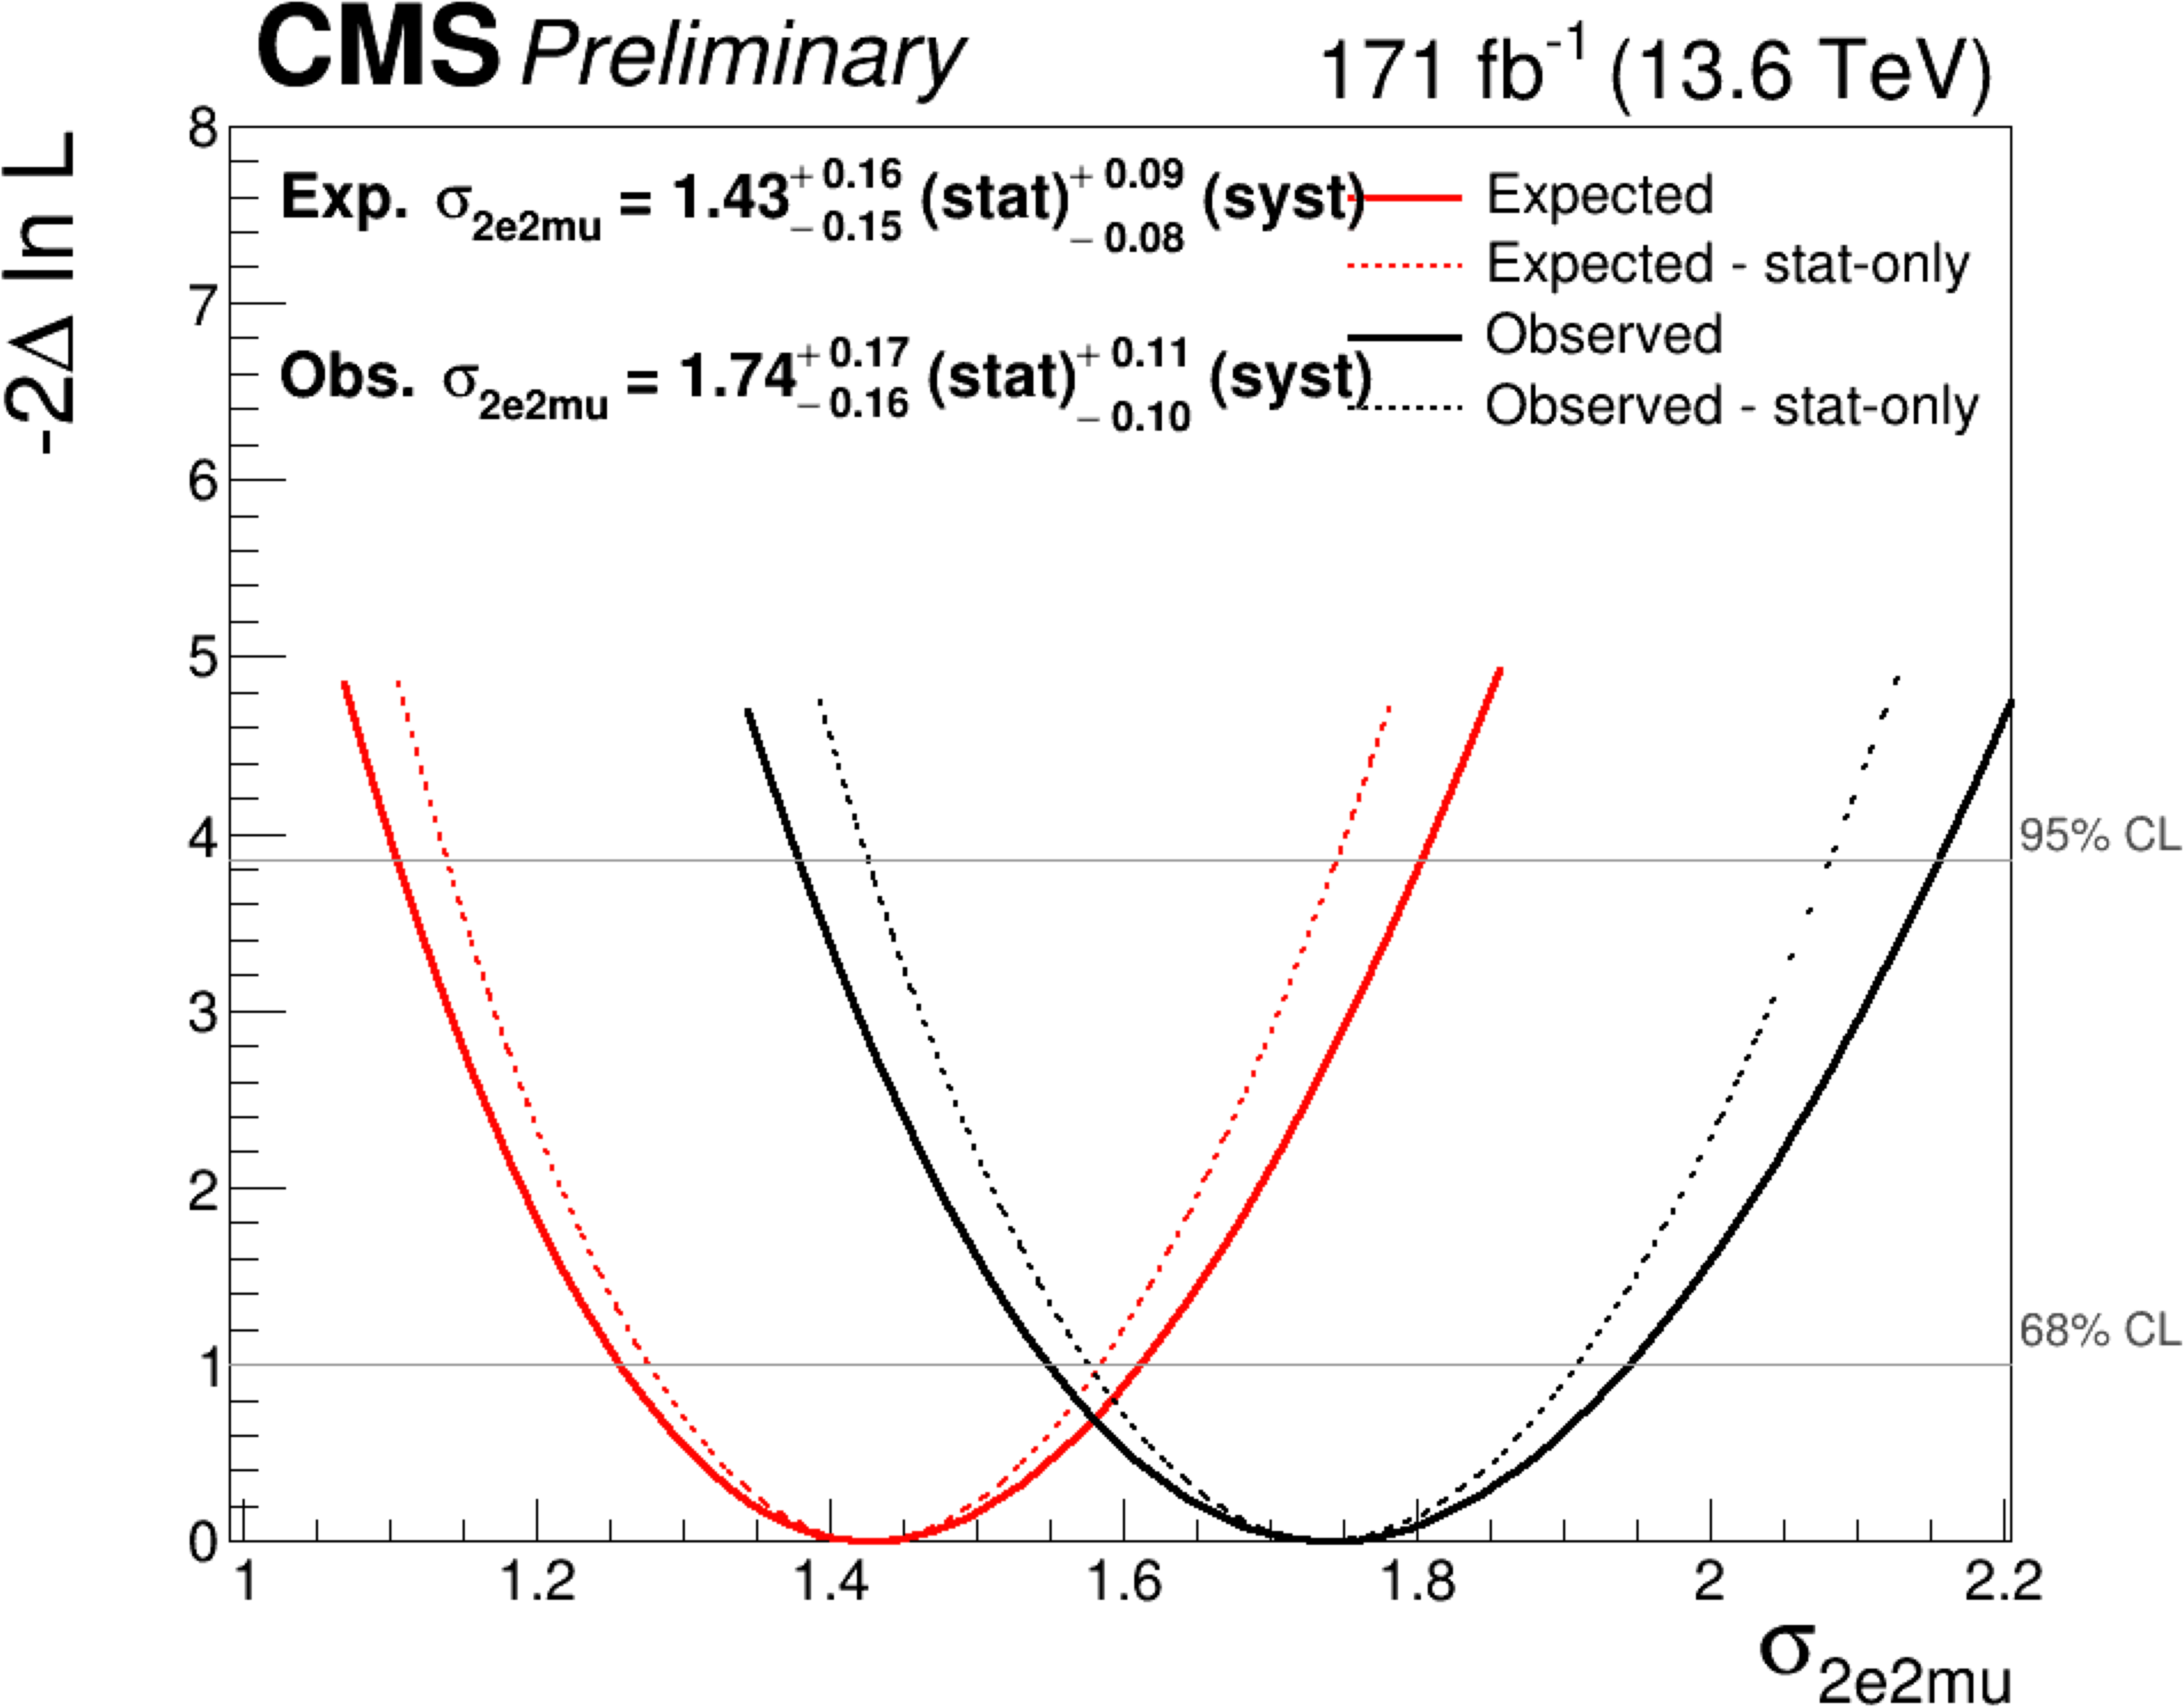
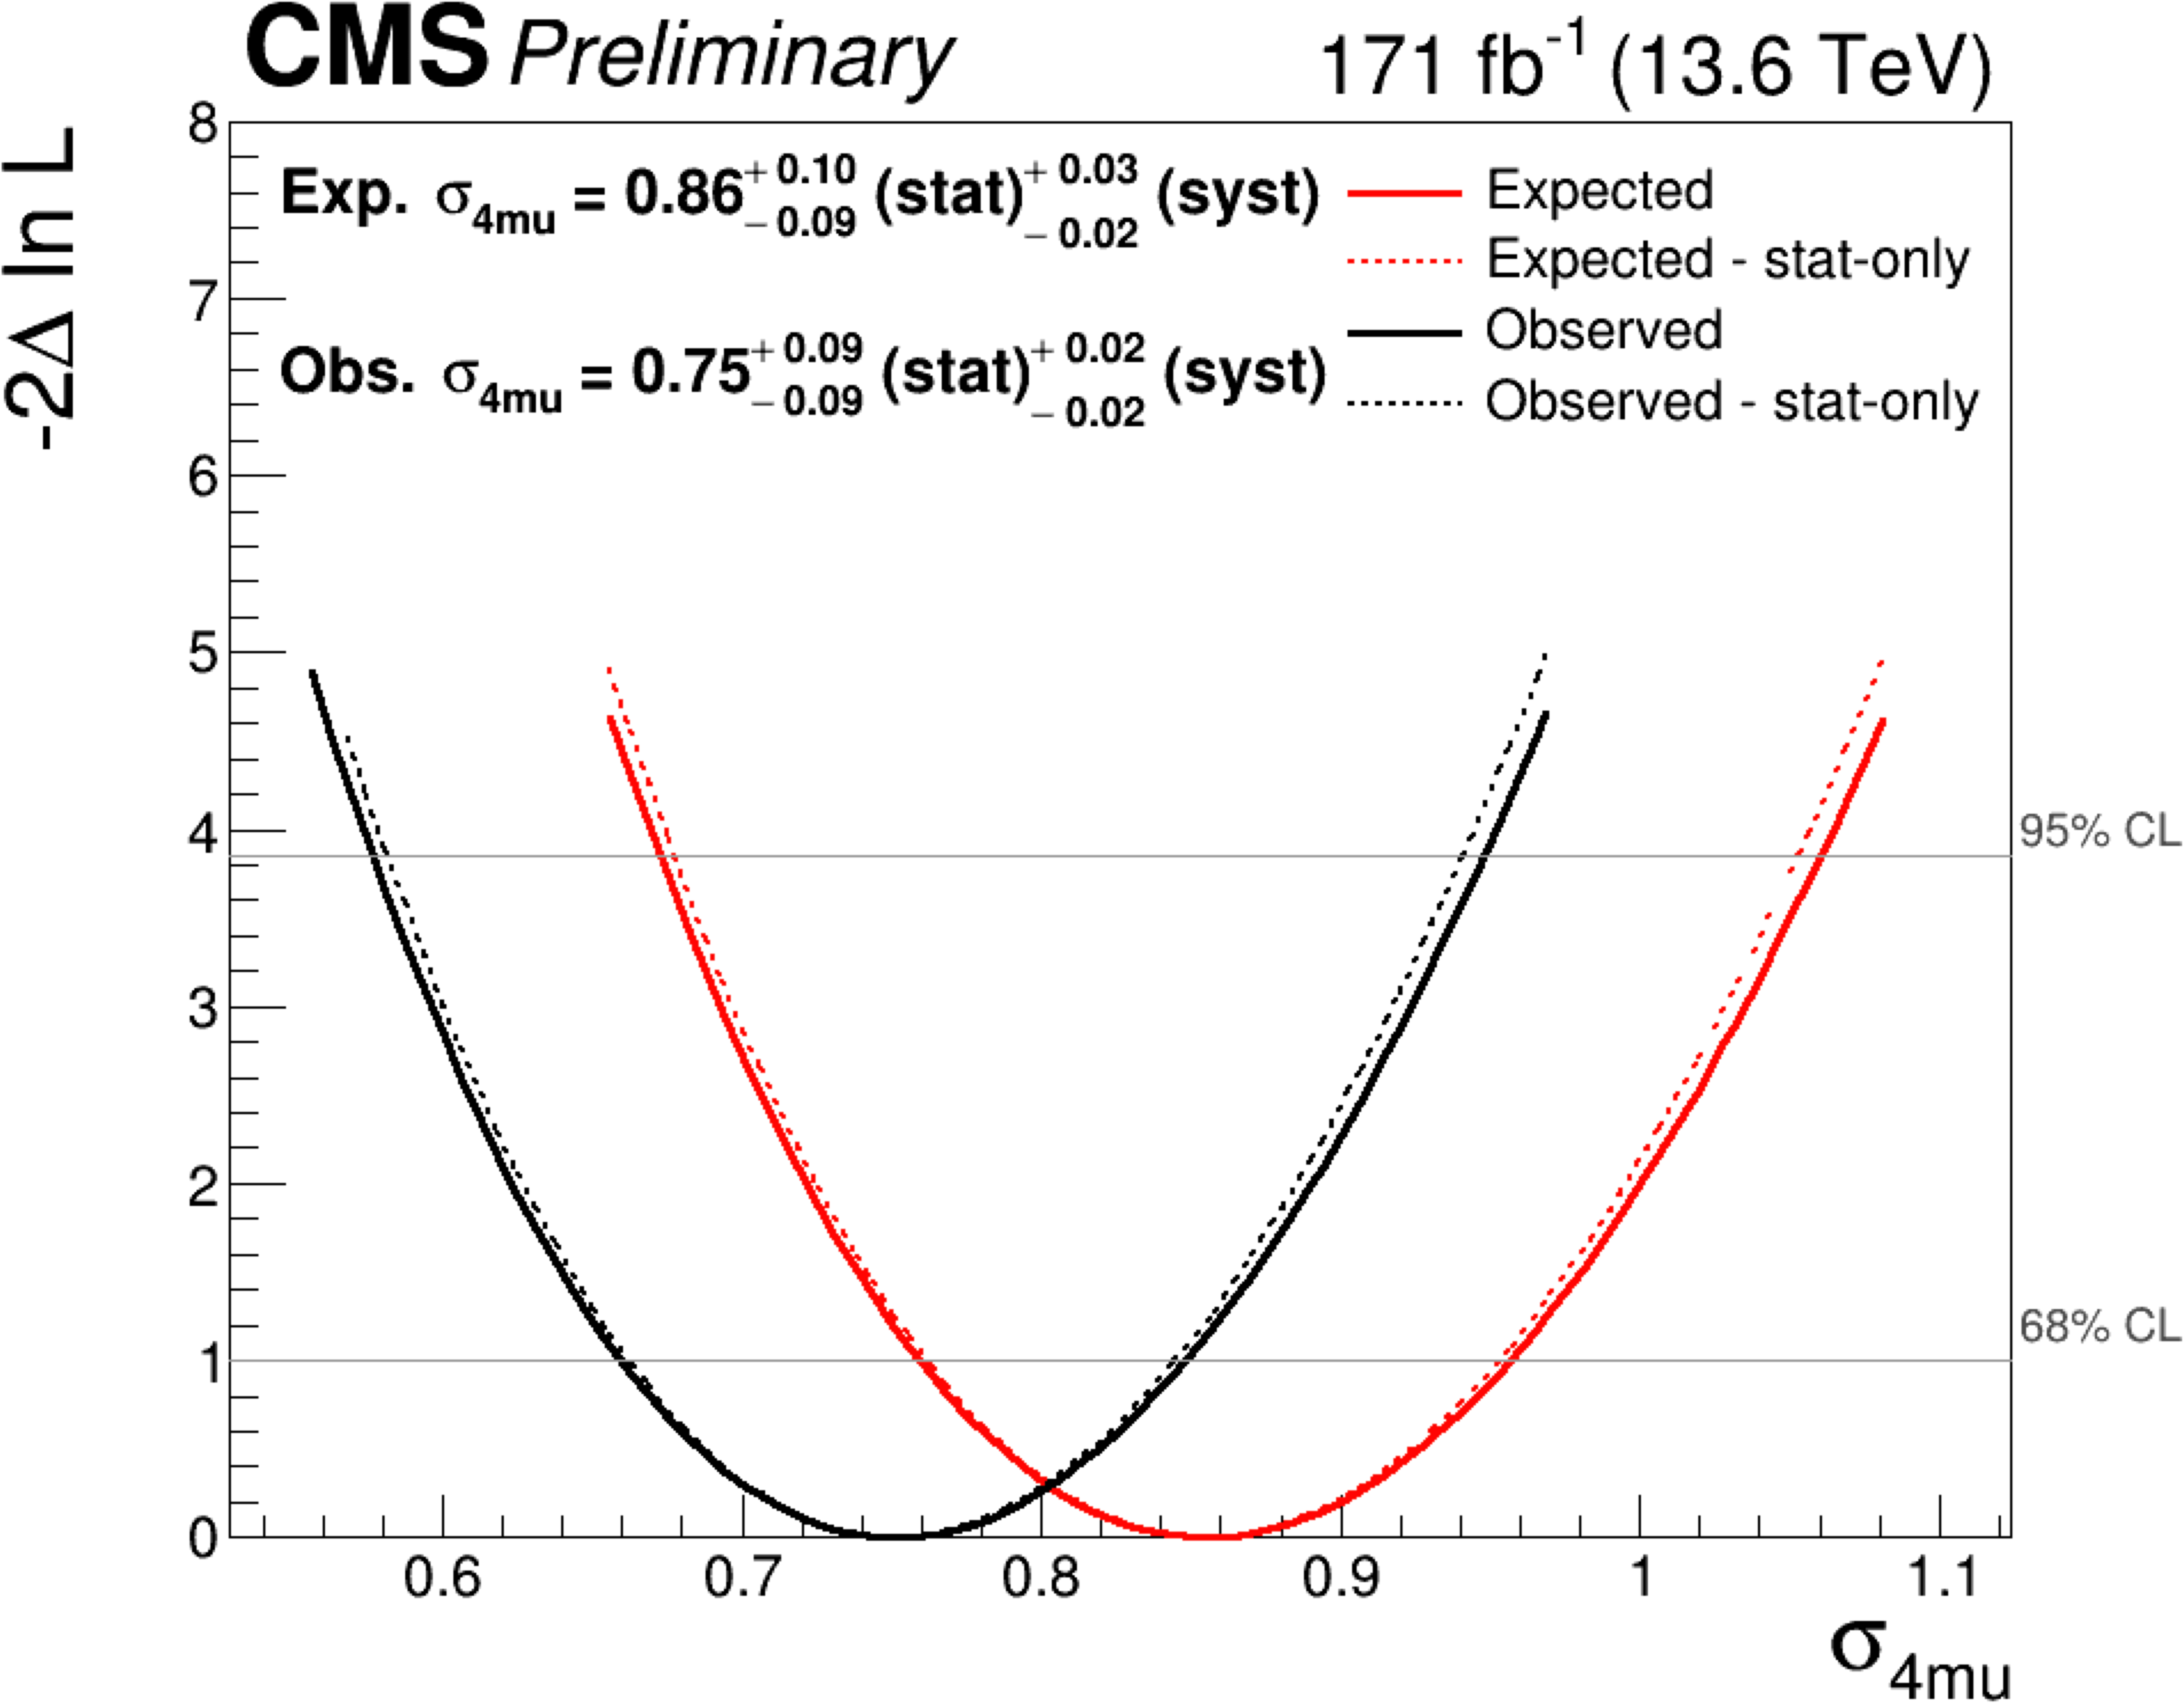
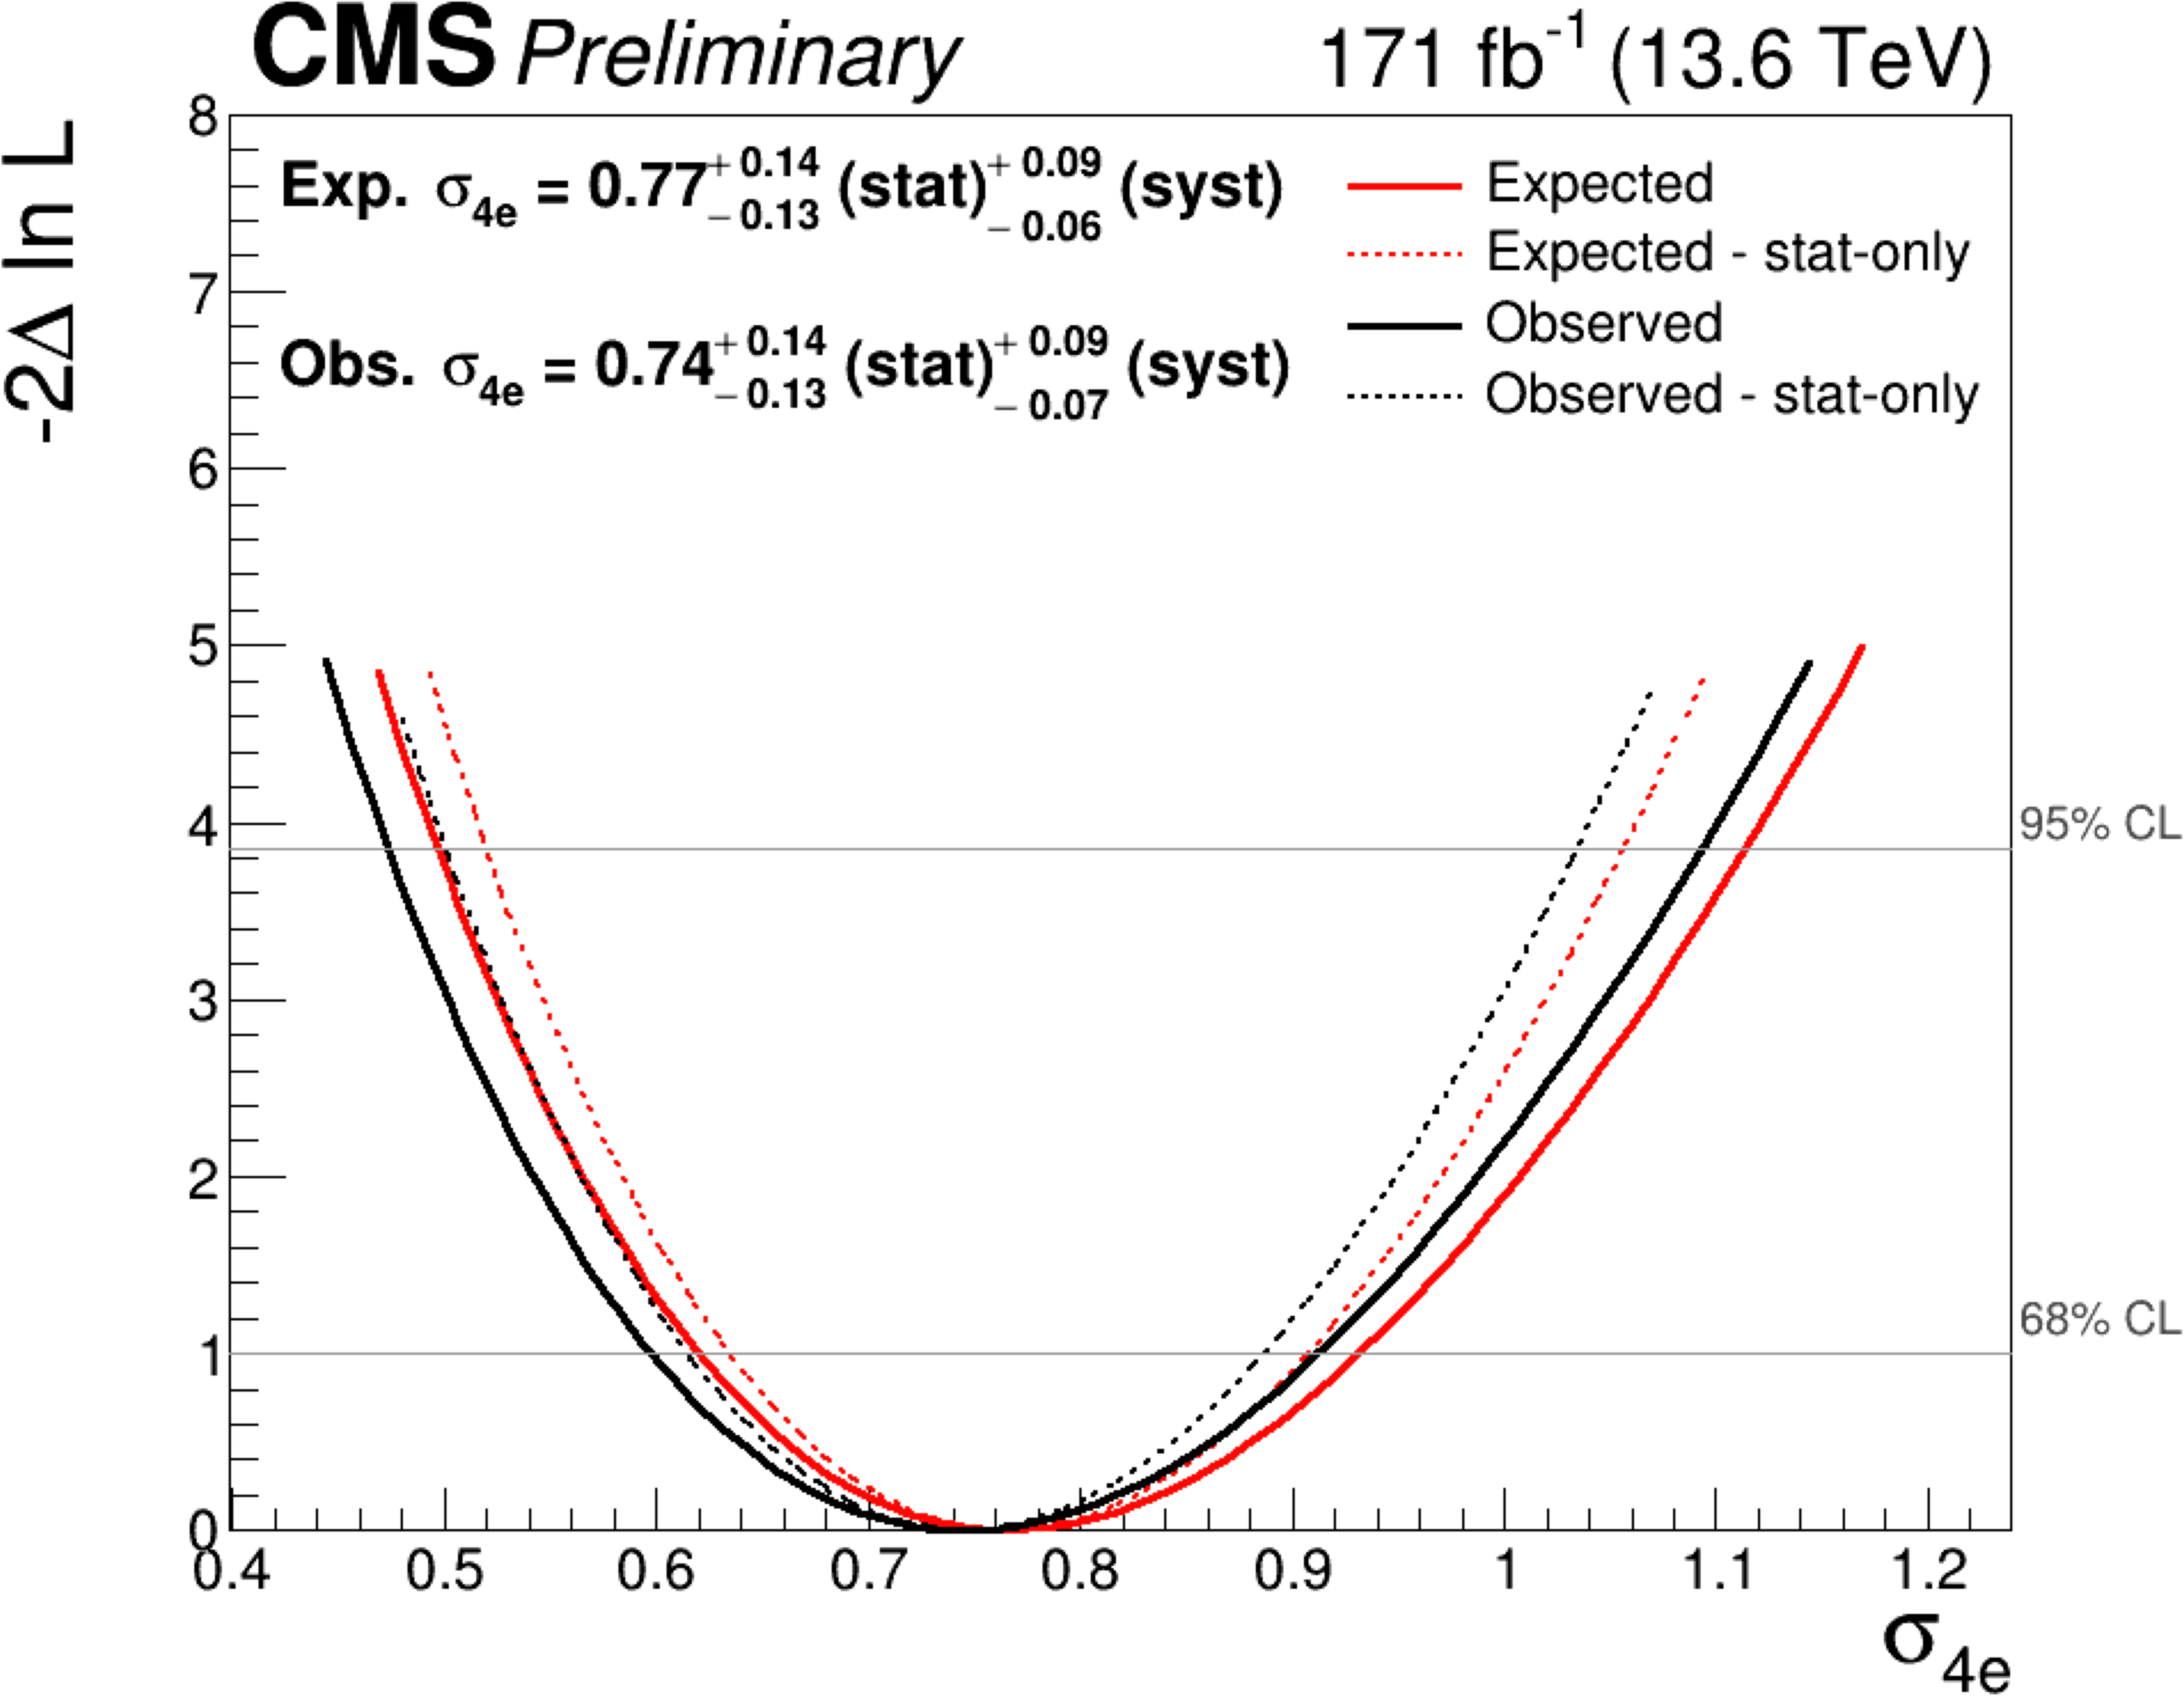
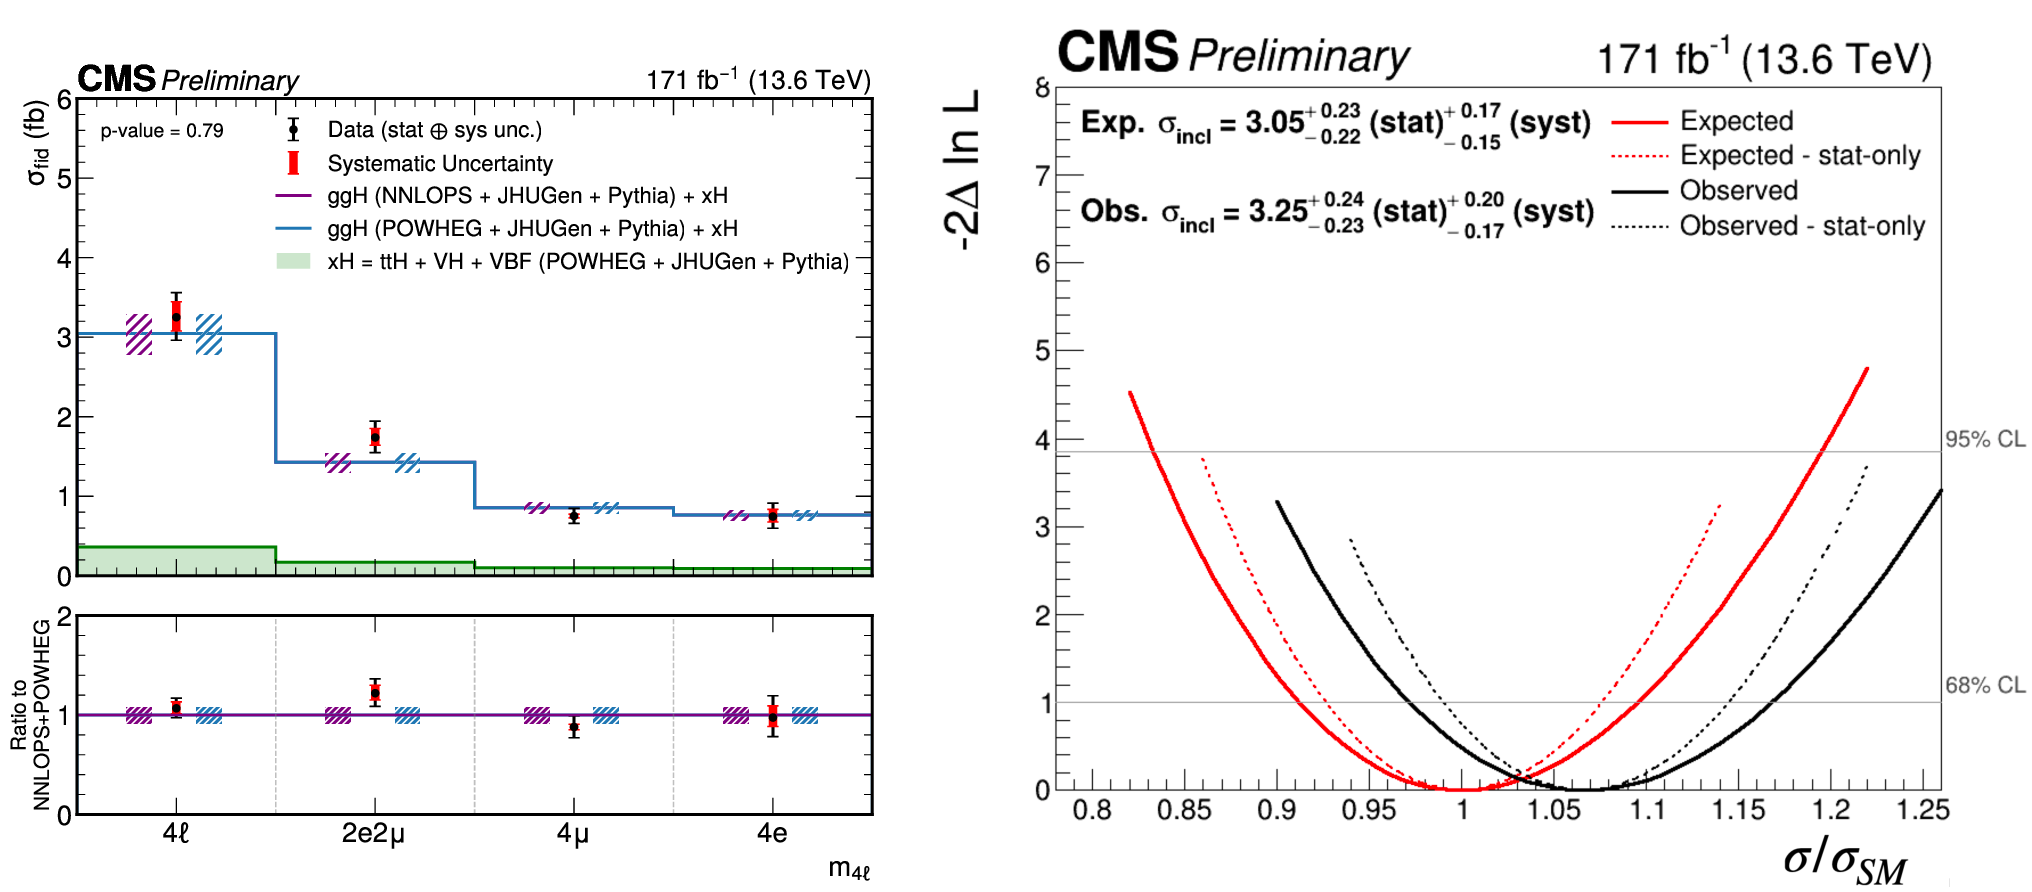
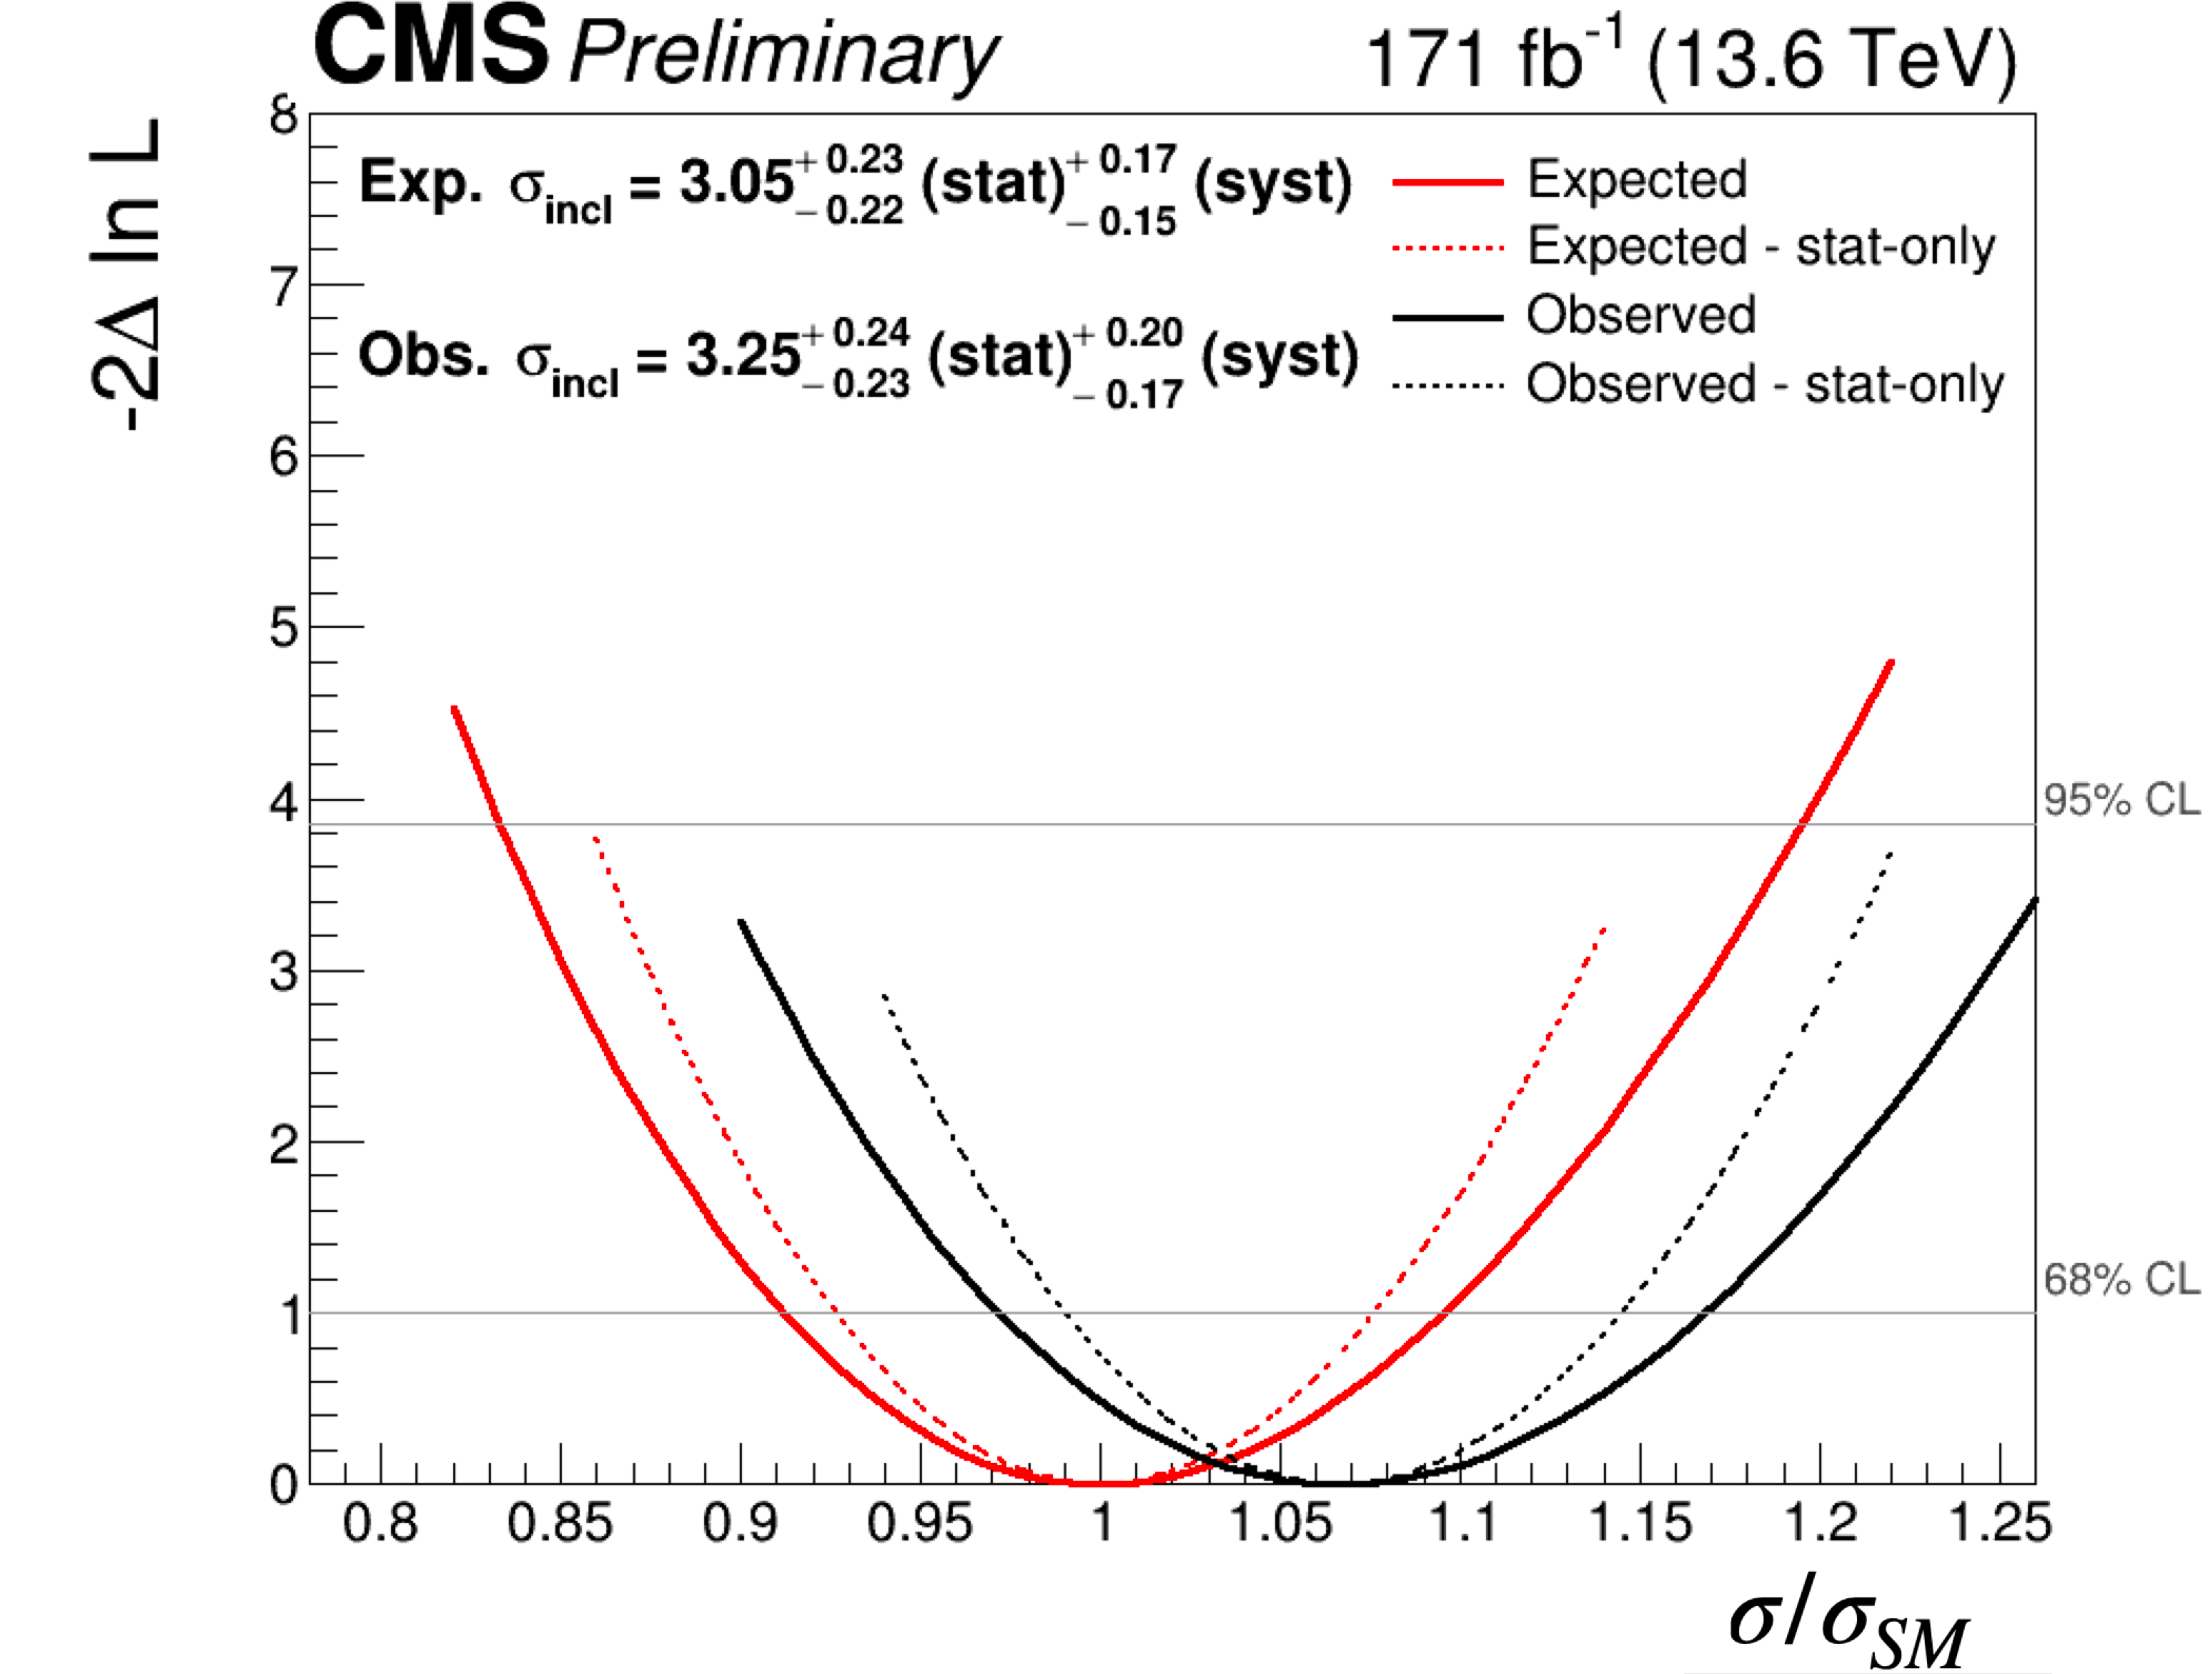
Figure 3:
Likelihood scans of the expected and observed cross sections for the inclusive final state, where the Higgs boson branching ratios to 2 $ e2\mu $, 4 $ e $, and 4 $ \mu $ are fixed to the Standard Model values, and for the three individual final states (2 $ \mu 2e $, 4 $ \mu $, 4 $ e $), illustrating the impact of statistical and systematic uncertainties. |
png pdf |
Figure 3-a:
Likelihood scans of the expected and observed cross sections for the inclusive final state, where the Higgs boson branching ratios to 2 $ e2\mu $, 4 $ e $, and 4 $ \mu $ are fixed to the Standard Model values, and for the three individual final states (2 $ \mu 2e $, 4 $ \mu $, 4 $ e $), illustrating the impact of statistical and systematic uncertainties. |
png pdf |
Figure 3-b:
Likelihood scans of the expected and observed cross sections for the inclusive final state, where the Higgs boson branching ratios to 2 $ e2\mu $, 4 $ e $, and 4 $ \mu $ are fixed to the Standard Model values, and for the three individual final states (2 $ \mu 2e $, 4 $ \mu $, 4 $ e $), illustrating the impact of statistical and systematic uncertainties. |
png pdf |
Figure 3-c:
Likelihood scans of the expected and observed cross sections for the inclusive final state, where the Higgs boson branching ratios to 2 $ e2\mu $, 4 $ e $, and 4 $ \mu $ are fixed to the Standard Model values, and for the three individual final states (2 $ \mu 2e $, 4 $ \mu $, 4 $ e $), illustrating the impact of statistical and systematic uncertainties. |
png pdf |
Figure 3-d:
Likelihood scans of the expected and observed cross sections for the inclusive final state, where the Higgs boson branching ratios to 2 $ e2\mu $, 4 $ e $, and 4 $ \mu $ are fixed to the Standard Model values, and for the three individual final states (2 $ \mu 2e $, 4 $ \mu $, 4 $ e $), illustrating the impact of statistical and systematic uncertainties. |
png pdf |
Figure 4:
Measured inclusive fiducial cross sections for the $ \mathrm{H}\to\mathrm{Z}\mathrm{Z}\to4\ell $ process for the different final states (left) and likelihood scan (right) of the expected and observed cross section for the inclusive final state, for the scenario in which the Higgs boson branching ratios to 2 $ e2\mu $, 4 $ e $, and 4 $ \mu $ are treated as free parameters in the fit. The gg $ \to $ H predictions are shown for two different generators, POWHEG (blue) and NNLOPS (purple), normalized to the total cross section computed at next-to-next-to-next-to-leading order (N3LO), separately stacked over the the subdominant component of the signal from VBF + VH + t\=tH, denoted as xH (green). The hatched areas correspond to the systematic uncertainties in the theoretical predictions. Black points represent the measured fiducial cross sections in each bin, black error bars indicate the total uncertainty in each measurement, and red boxes denote the systematic uncertainties. The lower panels display the ratios of the measured cross sections and of the POWHEG gg $ \to $ H + xH theoretical prediction to the NNLOPS gg $ \to $ H + POWHEG xH theoretical predictions. |
png pdf |
Figure 4-a:
Measured inclusive fiducial cross sections for the $ \mathrm{H}\to\mathrm{Z}\mathrm{Z}\to4\ell $ process for the different final states (left) and likelihood scan (right) of the expected and observed cross section for the inclusive final state, for the scenario in which the Higgs boson branching ratios to 2 $ e2\mu $, 4 $ e $, and 4 $ \mu $ are treated as free parameters in the fit. The gg $ \to $ H predictions are shown for two different generators, POWHEG (blue) and NNLOPS (purple), normalized to the total cross section computed at next-to-next-to-next-to-leading order (N3LO), separately stacked over the the subdominant component of the signal from VBF + VH + t\=tH, denoted as xH (green). The hatched areas correspond to the systematic uncertainties in the theoretical predictions. Black points represent the measured fiducial cross sections in each bin, black error bars indicate the total uncertainty in each measurement, and red boxes denote the systematic uncertainties. The lower panels display the ratios of the measured cross sections and of the POWHEG gg $ \to $ H + xH theoretical prediction to the NNLOPS gg $ \to $ H + POWHEG xH theoretical predictions. |
png pdf |
Figure 4-b:
Measured inclusive fiducial cross sections for the $ \mathrm{H}\to\mathrm{Z}\mathrm{Z}\to4\ell $ process for the different final states (left) and likelihood scan (right) of the expected and observed cross section for the inclusive final state, for the scenario in which the Higgs boson branching ratios to 2 $ e2\mu $, 4 $ e $, and 4 $ \mu $ are treated as free parameters in the fit. The gg $ \to $ H predictions are shown for two different generators, POWHEG (blue) and NNLOPS (purple), normalized to the total cross section computed at next-to-next-to-next-to-leading order (N3LO), separately stacked over the the subdominant component of the signal from VBF + VH + t\=tH, denoted as xH (green). The hatched areas correspond to the systematic uncertainties in the theoretical predictions. Black points represent the measured fiducial cross sections in each bin, black error bars indicate the total uncertainty in each measurement, and red boxes denote the systematic uncertainties. The lower panels display the ratios of the measured cross sections and of the POWHEG gg $ \to $ H + xH theoretical prediction to the NNLOPS gg $ \to $ H + POWHEG xH theoretical predictions. |
png pdf |
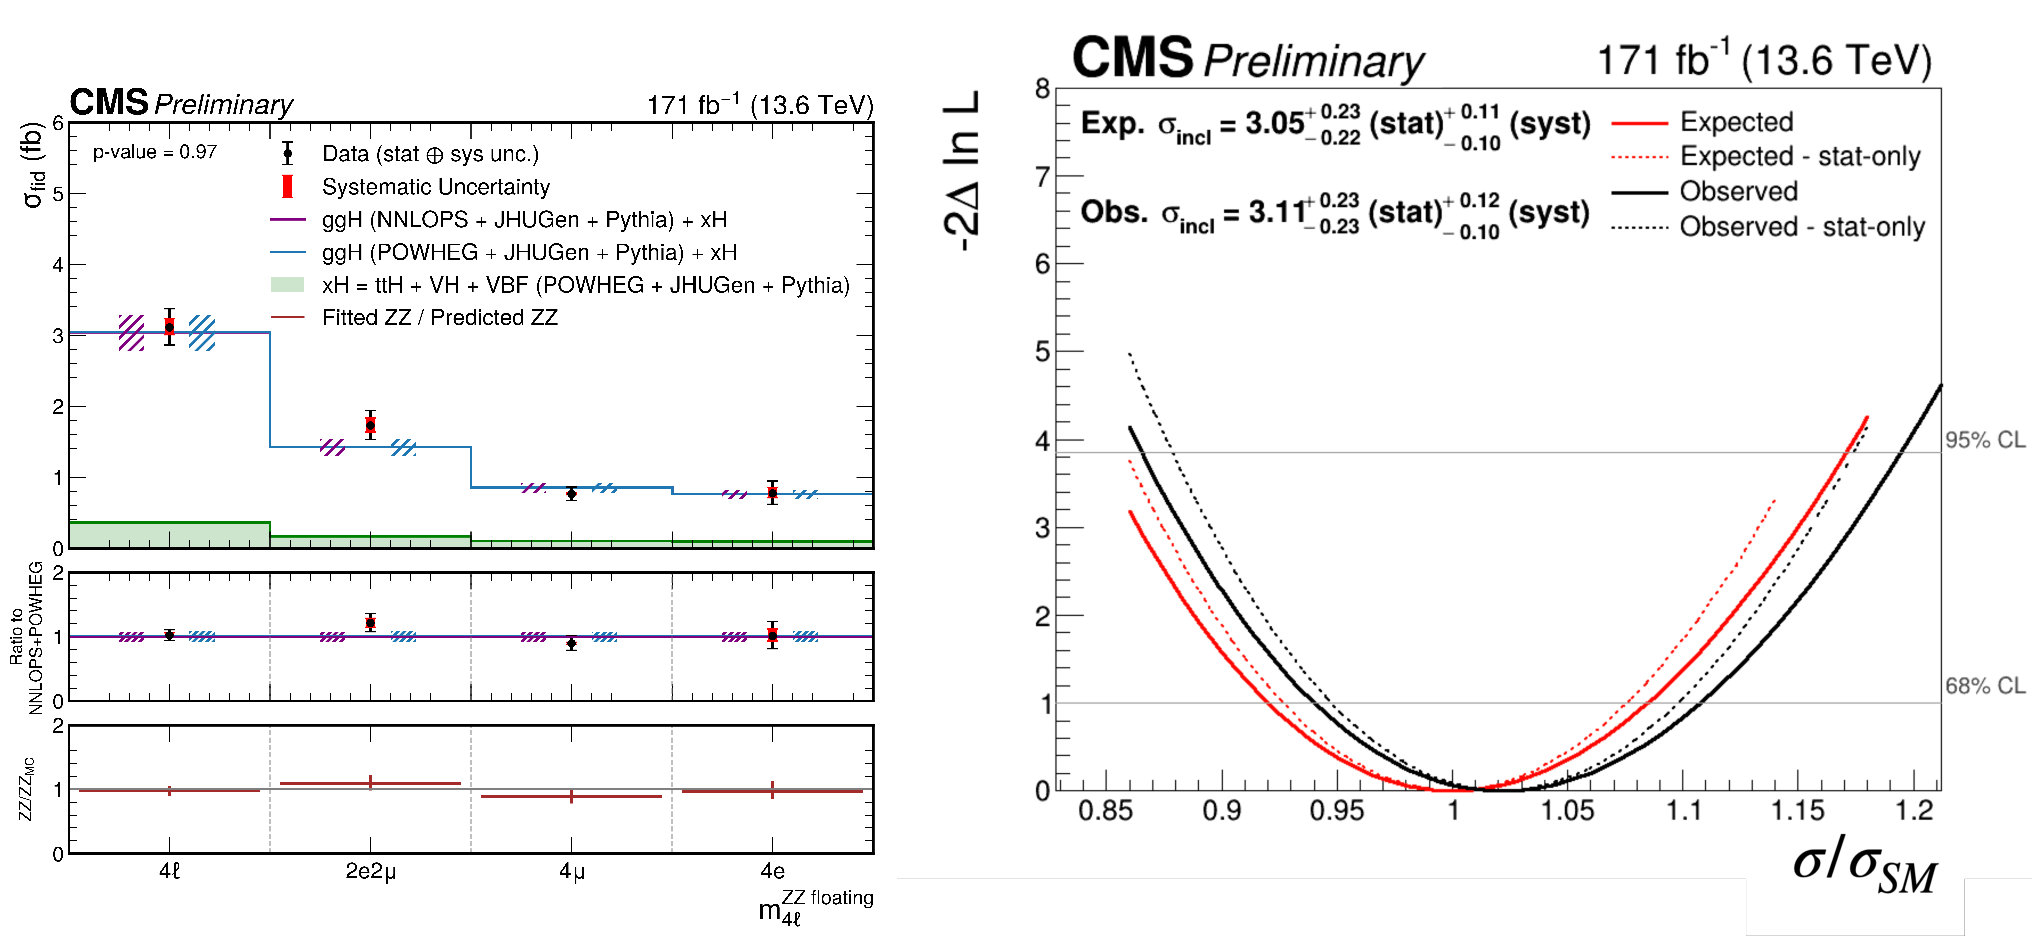
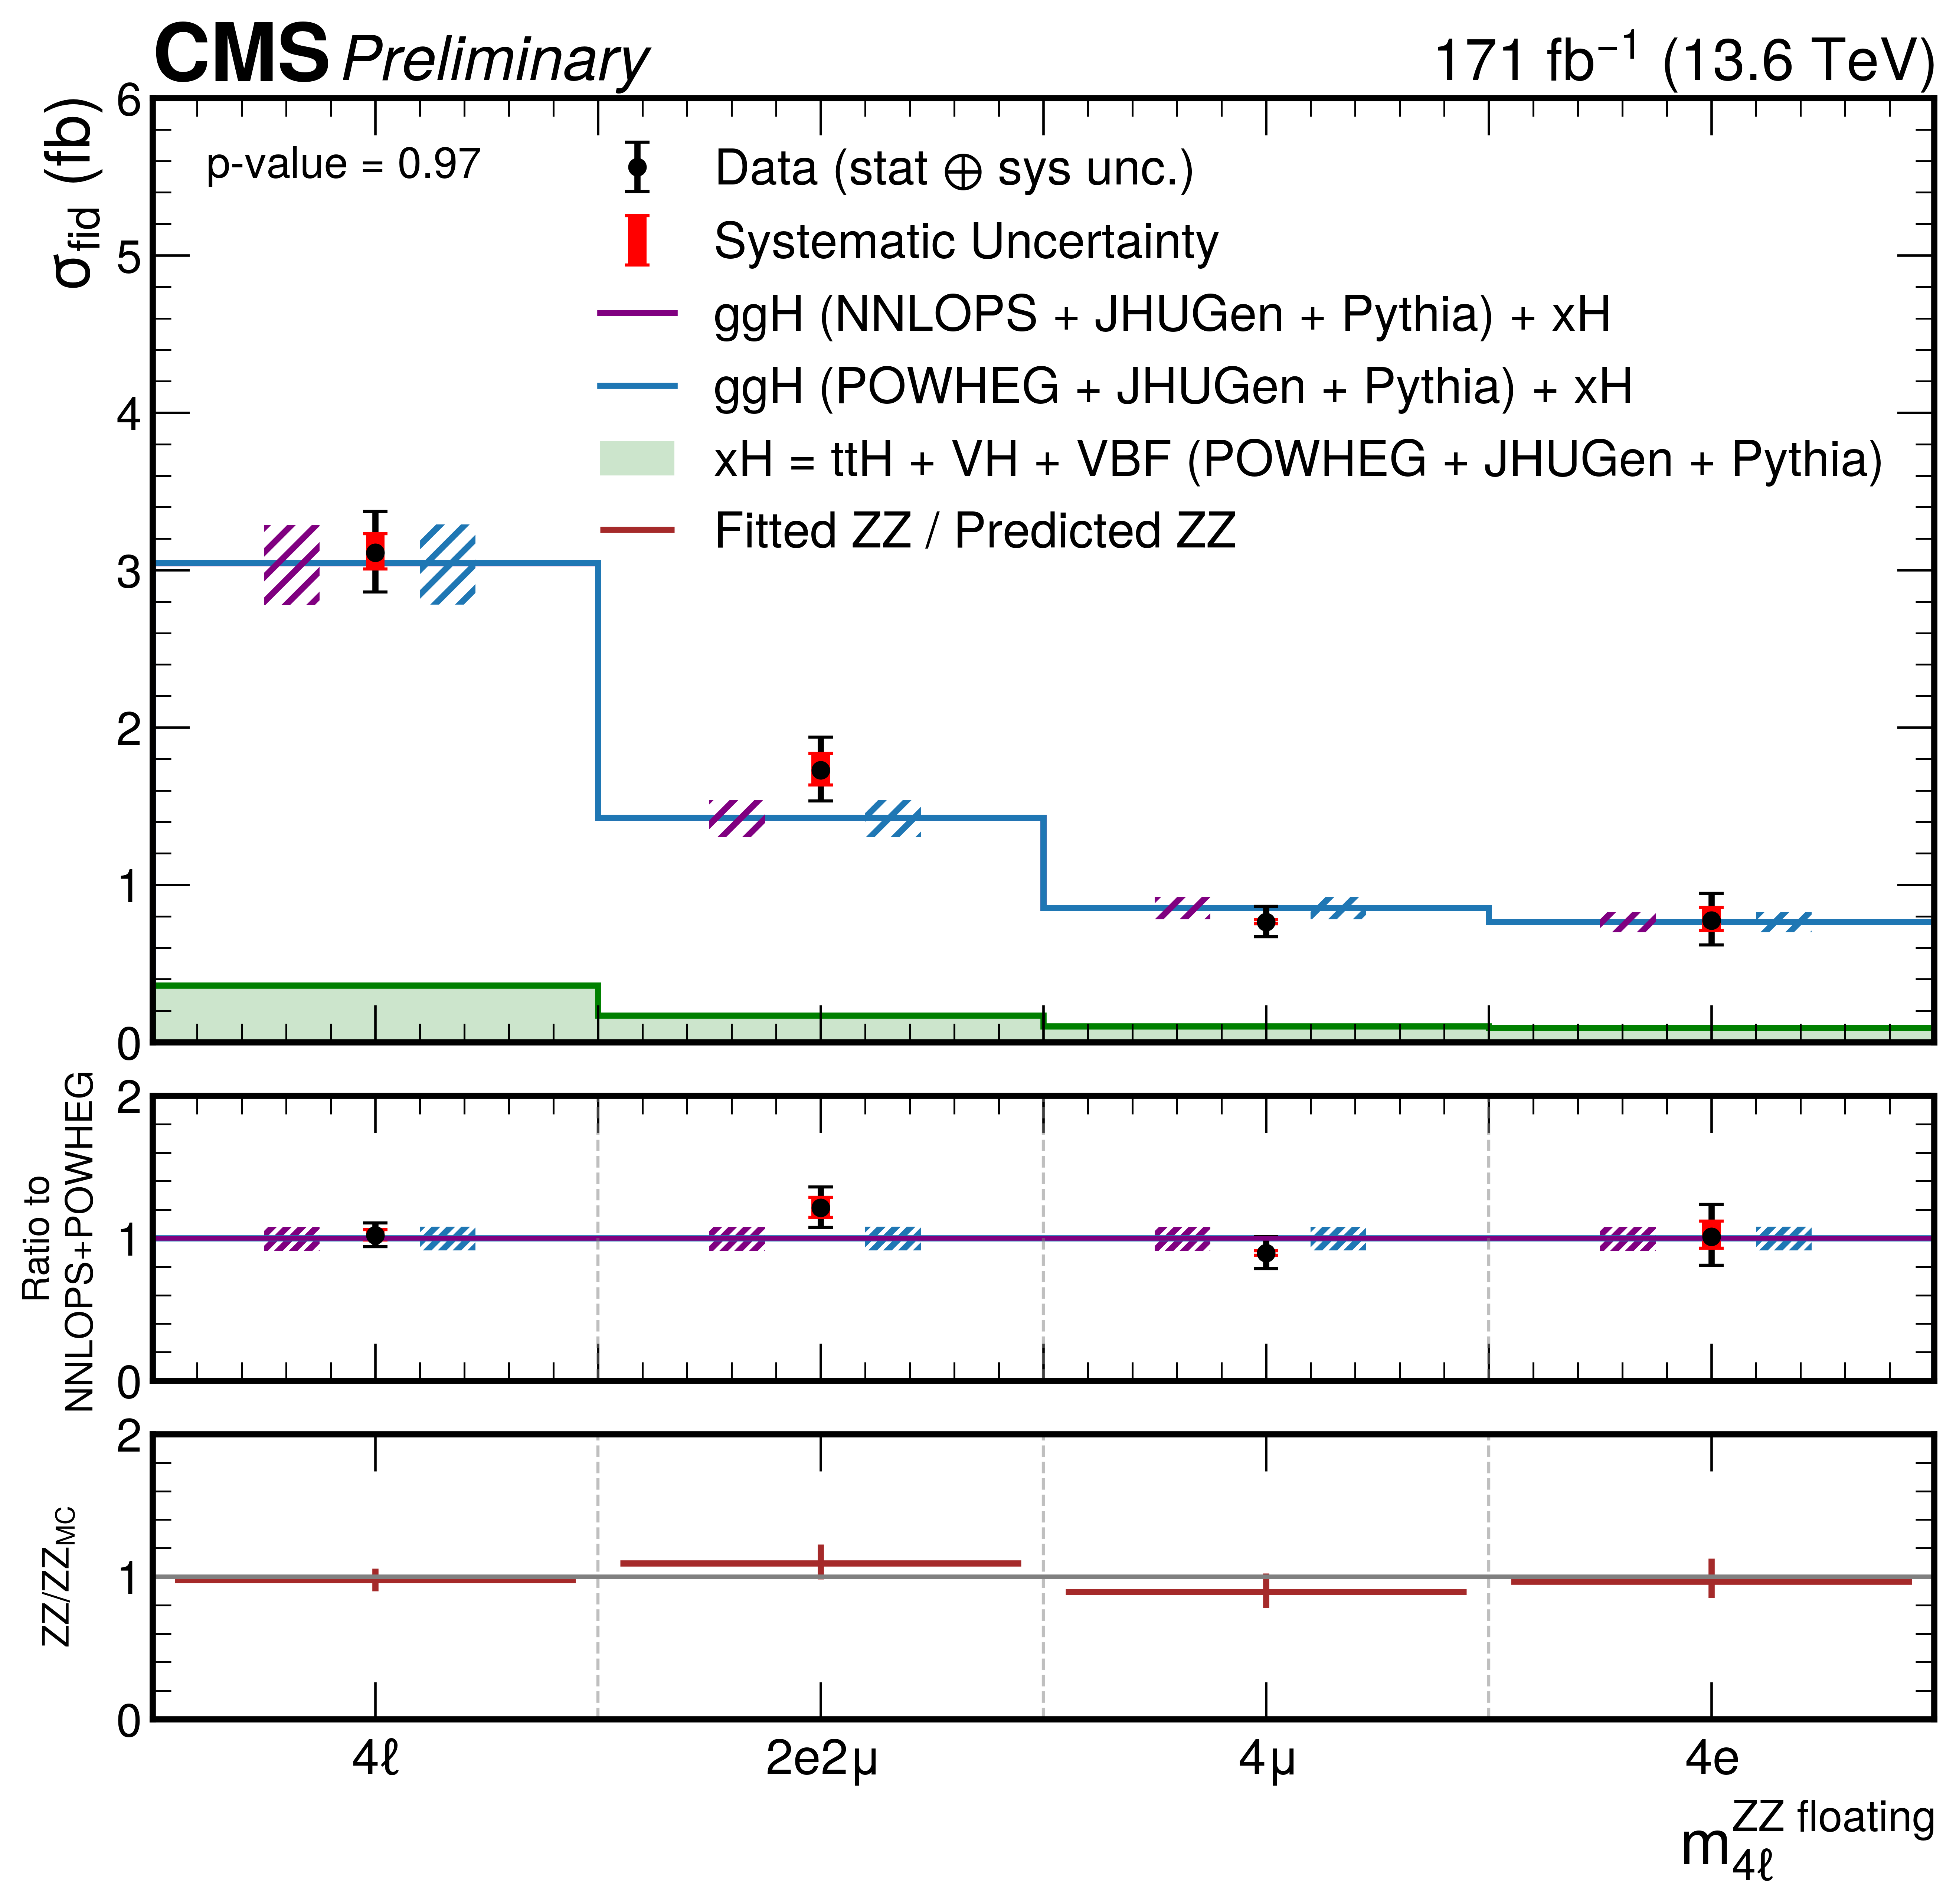
Figure 5:
Measured inclusive fiducial cross sections for the $ \mathrm{H}\to\mathrm{Z}\mathrm{Z}\to4\ell $ process for the different final states (left) and likelihood scan (right) of the expected and observed cross section for the inclusive final state, with the ZZ normalization treated as an unconstrained parameter. The gg $ \to $ H predictions are shown for two different generators, POWHEG (blue) and NNLOPS (purple), normalized to the total cross section computed at next-to-next-to-next-to-leading order (N3LO), separately stacked over the the subdominant component of the signal from VBF + VH + t\=tH, denoted as xH (green). The hatched areas correspond to the systematic uncertainties in the theoretical predictions. Black points represent the measured fiducial cross sections in each bin, black error bars indicate the total uncertainty in each measurement, and red boxes denote the systematic uncertainties. The lower panels display the ratios of the measured cross sections and of the POWHEG gg $ \to $ H + xH theoretical prediction to the NNLOPS gg $ \to $ H + POWHEG xH theoretical predictions. |
png |
Figure 5-a:
Measured inclusive fiducial cross sections for the $ \mathrm{H}\to\mathrm{Z}\mathrm{Z}\to4\ell $ process for the different final states (left) and likelihood scan (right) of the expected and observed cross section for the inclusive final state, with the ZZ normalization treated as an unconstrained parameter. The gg $ \to $ H predictions are shown for two different generators, POWHEG (blue) and NNLOPS (purple), normalized to the total cross section computed at next-to-next-to-next-to-leading order (N3LO), separately stacked over the the subdominant component of the signal from VBF + VH + t\=tH, denoted as xH (green). The hatched areas correspond to the systematic uncertainties in the theoretical predictions. Black points represent the measured fiducial cross sections in each bin, black error bars indicate the total uncertainty in each measurement, and red boxes denote the systematic uncertainties. The lower panels display the ratios of the measured cross sections and of the POWHEG gg $ \to $ H + xH theoretical prediction to the NNLOPS gg $ \to $ H + POWHEG xH theoretical predictions. |
png pdf |
Figure 5-b:
Measured inclusive fiducial cross sections for the $ \mathrm{H}\to\mathrm{Z}\mathrm{Z}\to4\ell $ process for the different final states (left) and likelihood scan (right) of the expected and observed cross section for the inclusive final state, with the ZZ normalization treated as an unconstrained parameter. The gg $ \to $ H predictions are shown for two different generators, POWHEG (blue) and NNLOPS (purple), normalized to the total cross section computed at next-to-next-to-next-to-leading order (N3LO), separately stacked over the the subdominant component of the signal from VBF + VH + t\=tH, denoted as xH (green). The hatched areas correspond to the systematic uncertainties in the theoretical predictions. Black points represent the measured fiducial cross sections in each bin, black error bars indicate the total uncertainty in each measurement, and red boxes denote the systematic uncertainties. The lower panels display the ratios of the measured cross sections and of the POWHEG gg $ \to $ H + xH theoretical prediction to the NNLOPS gg $ \to $ H + POWHEG xH theoretical predictions. |
png pdf |
Figure 6:
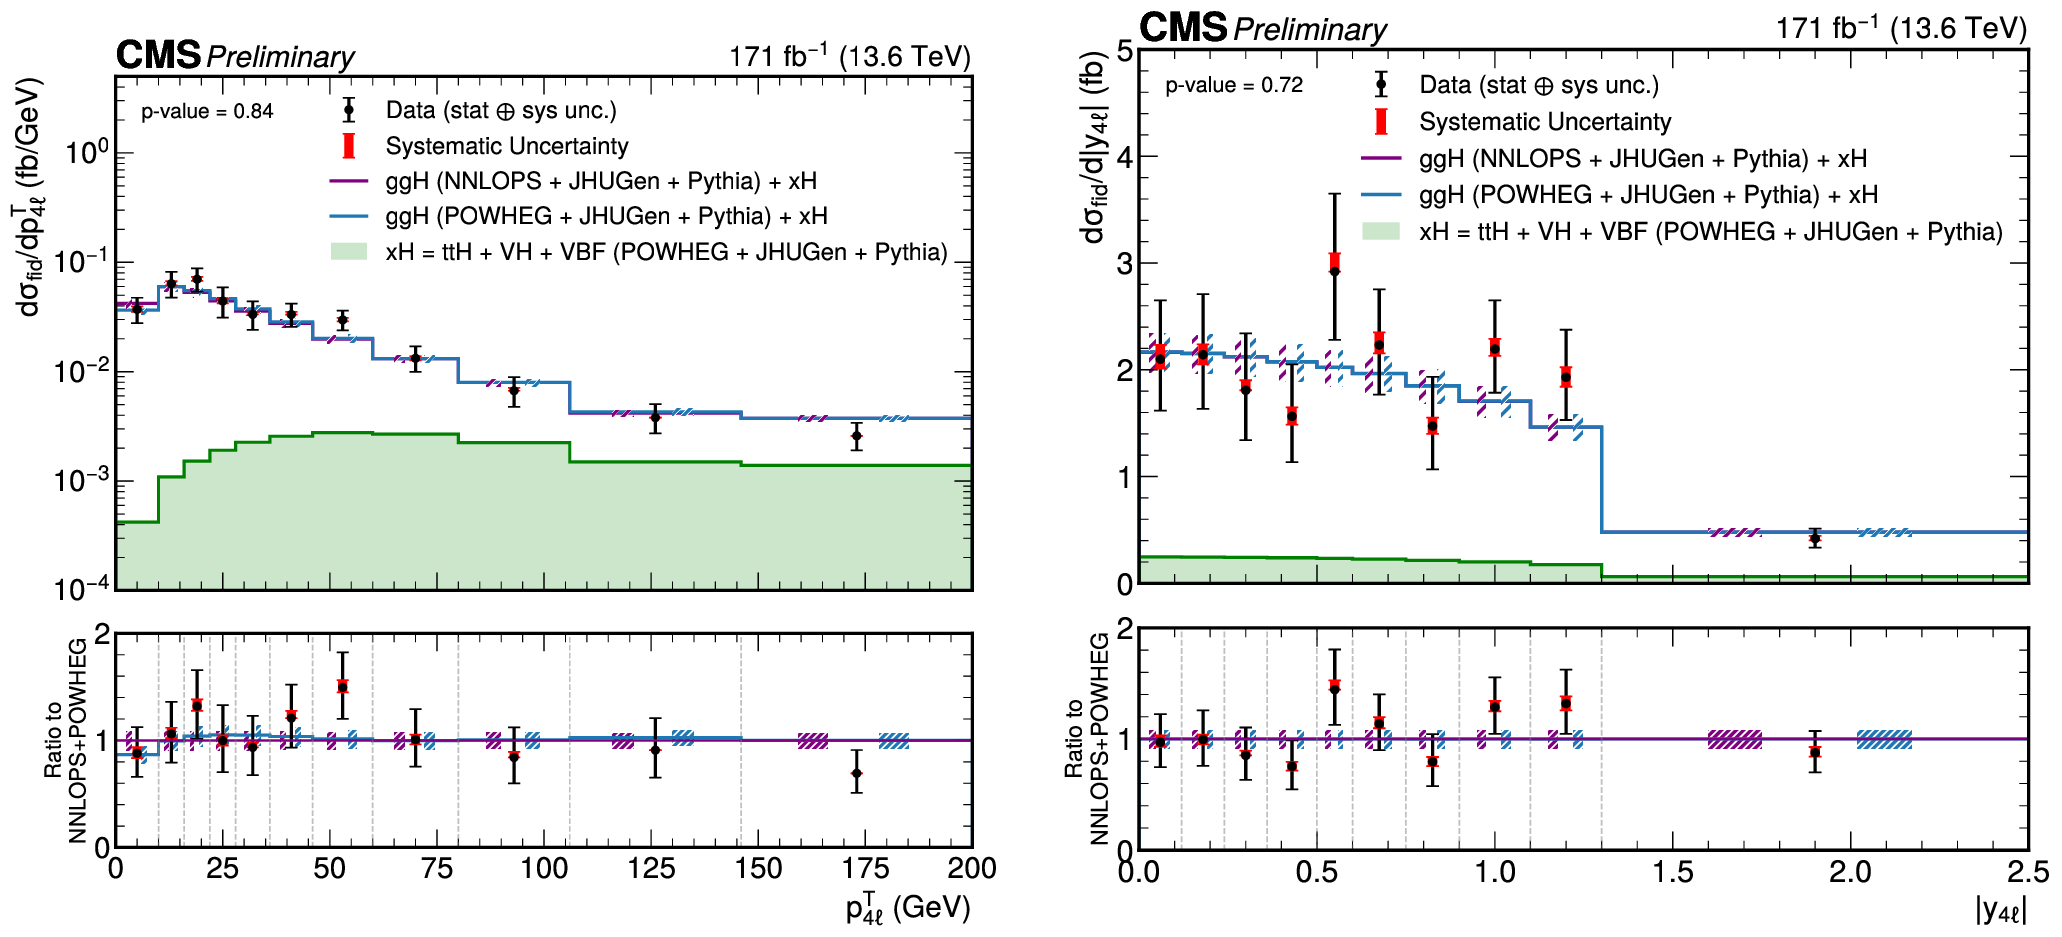
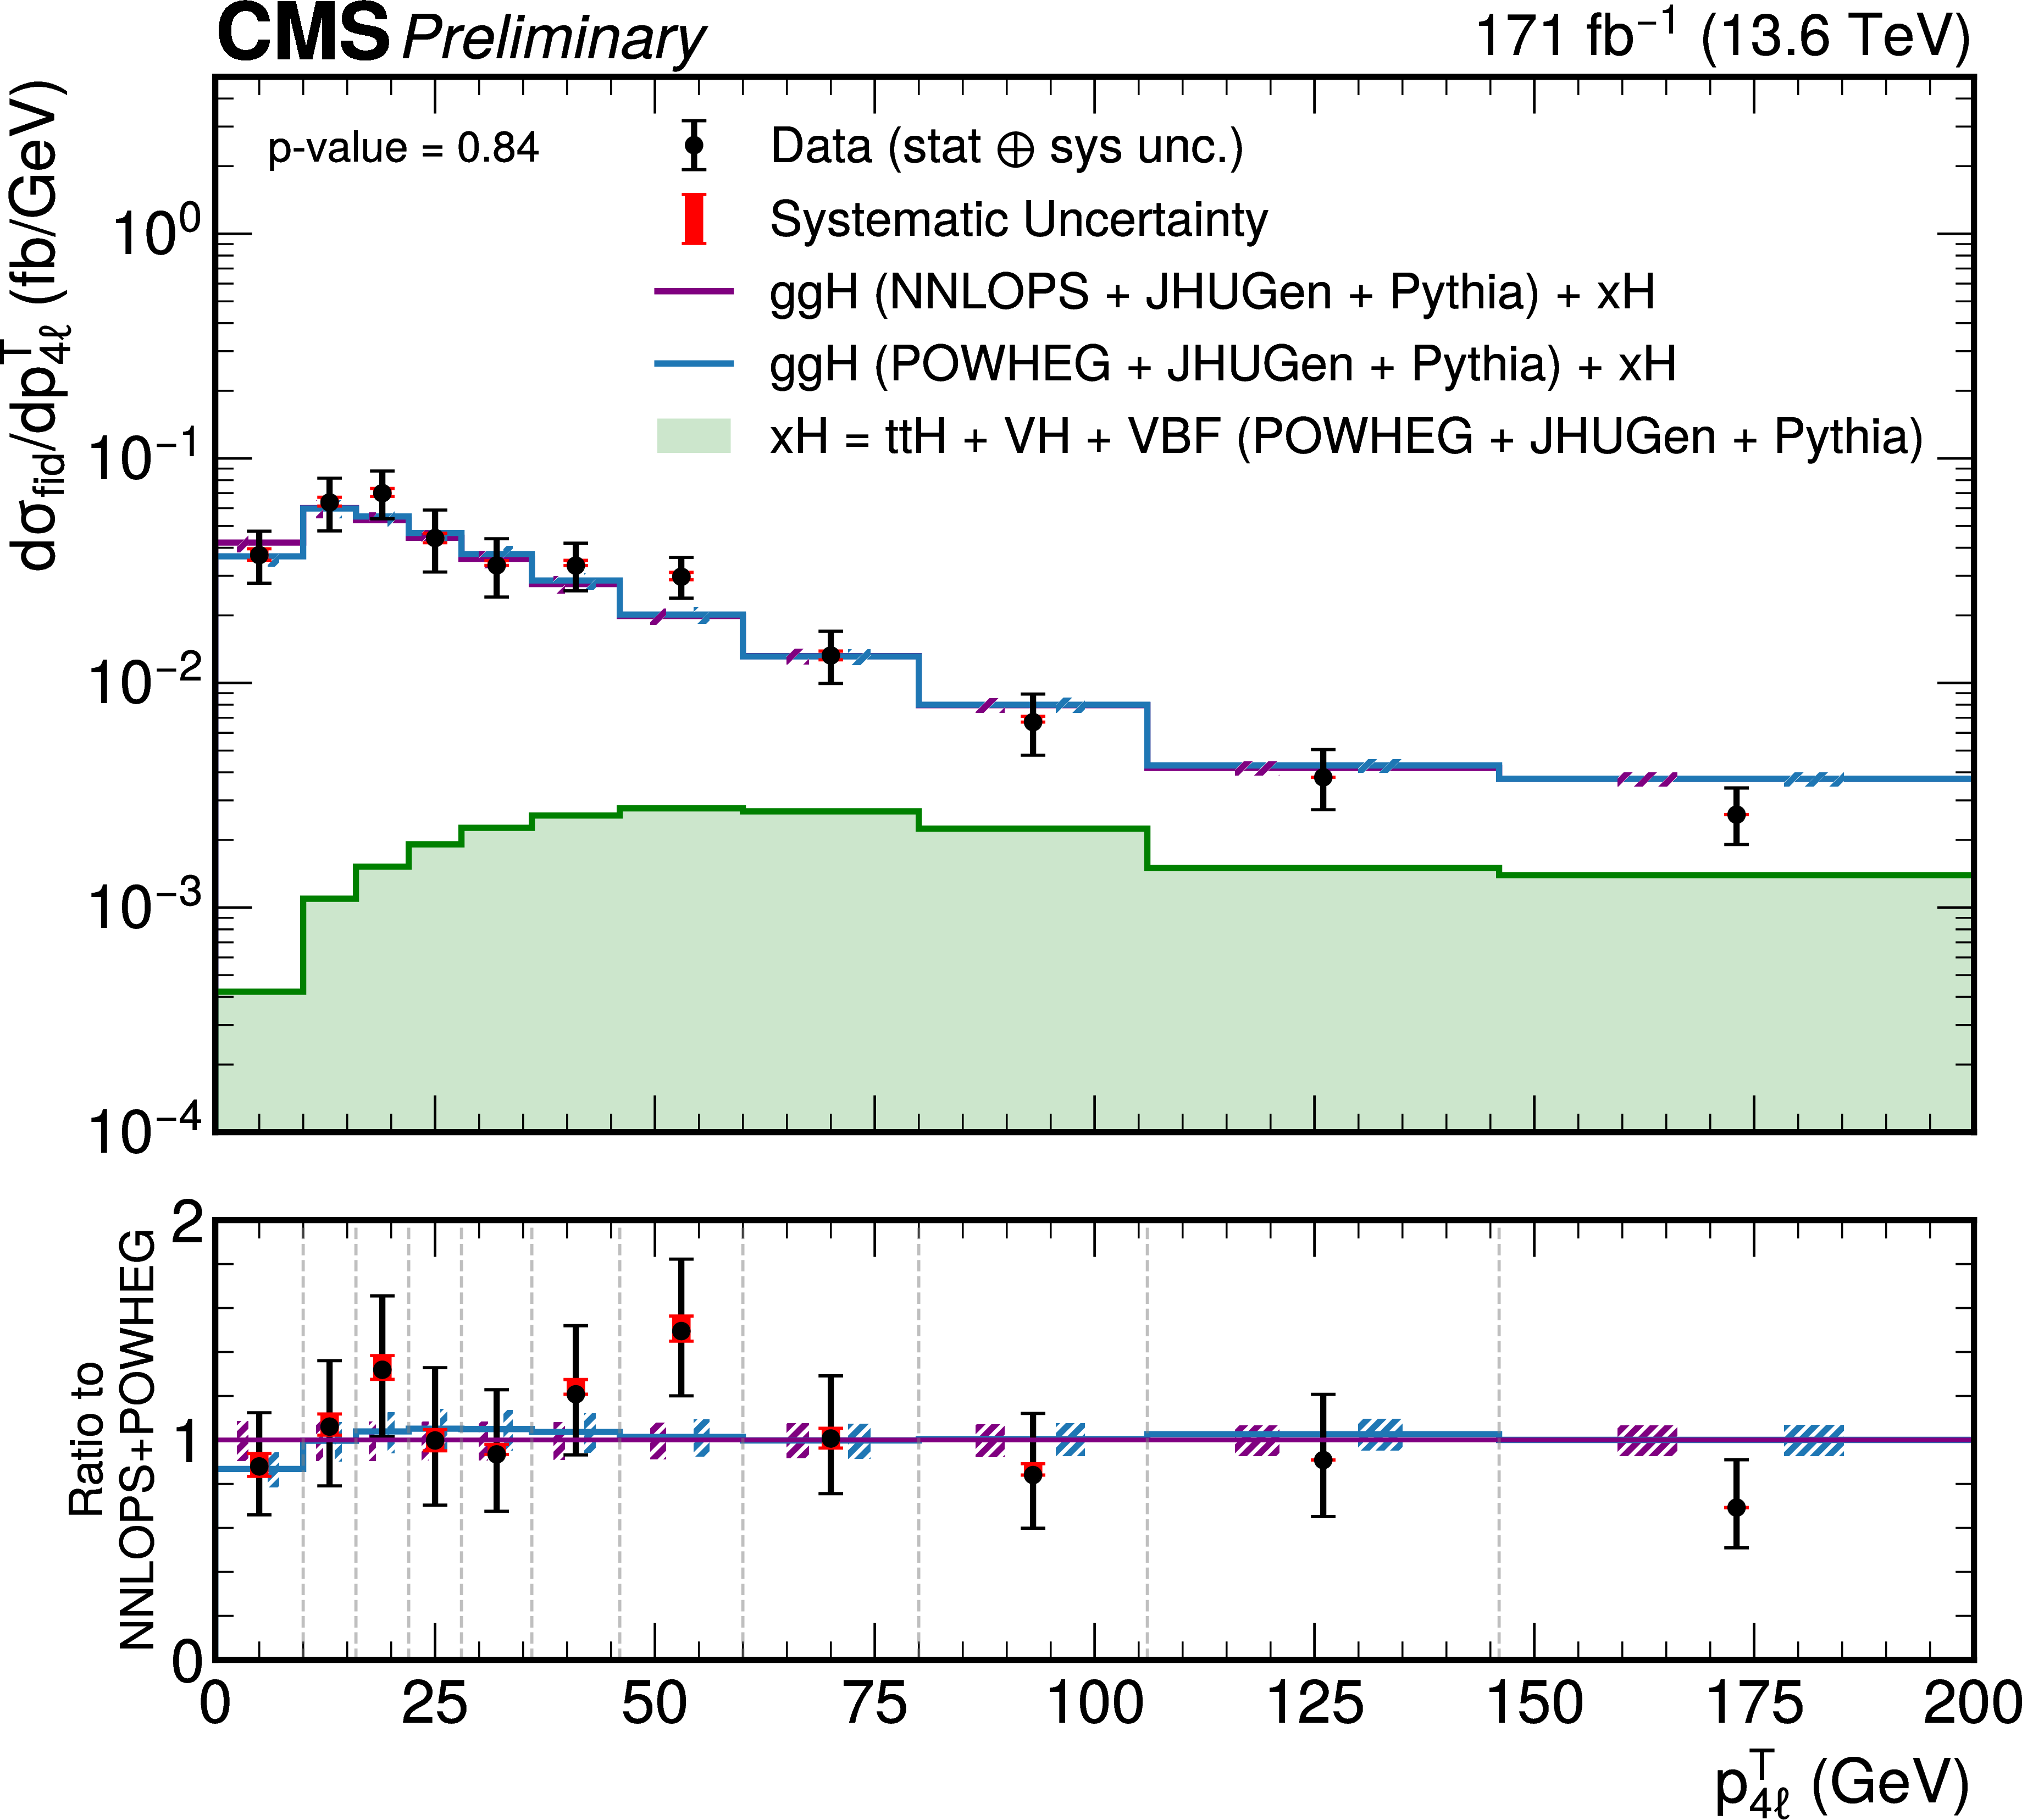
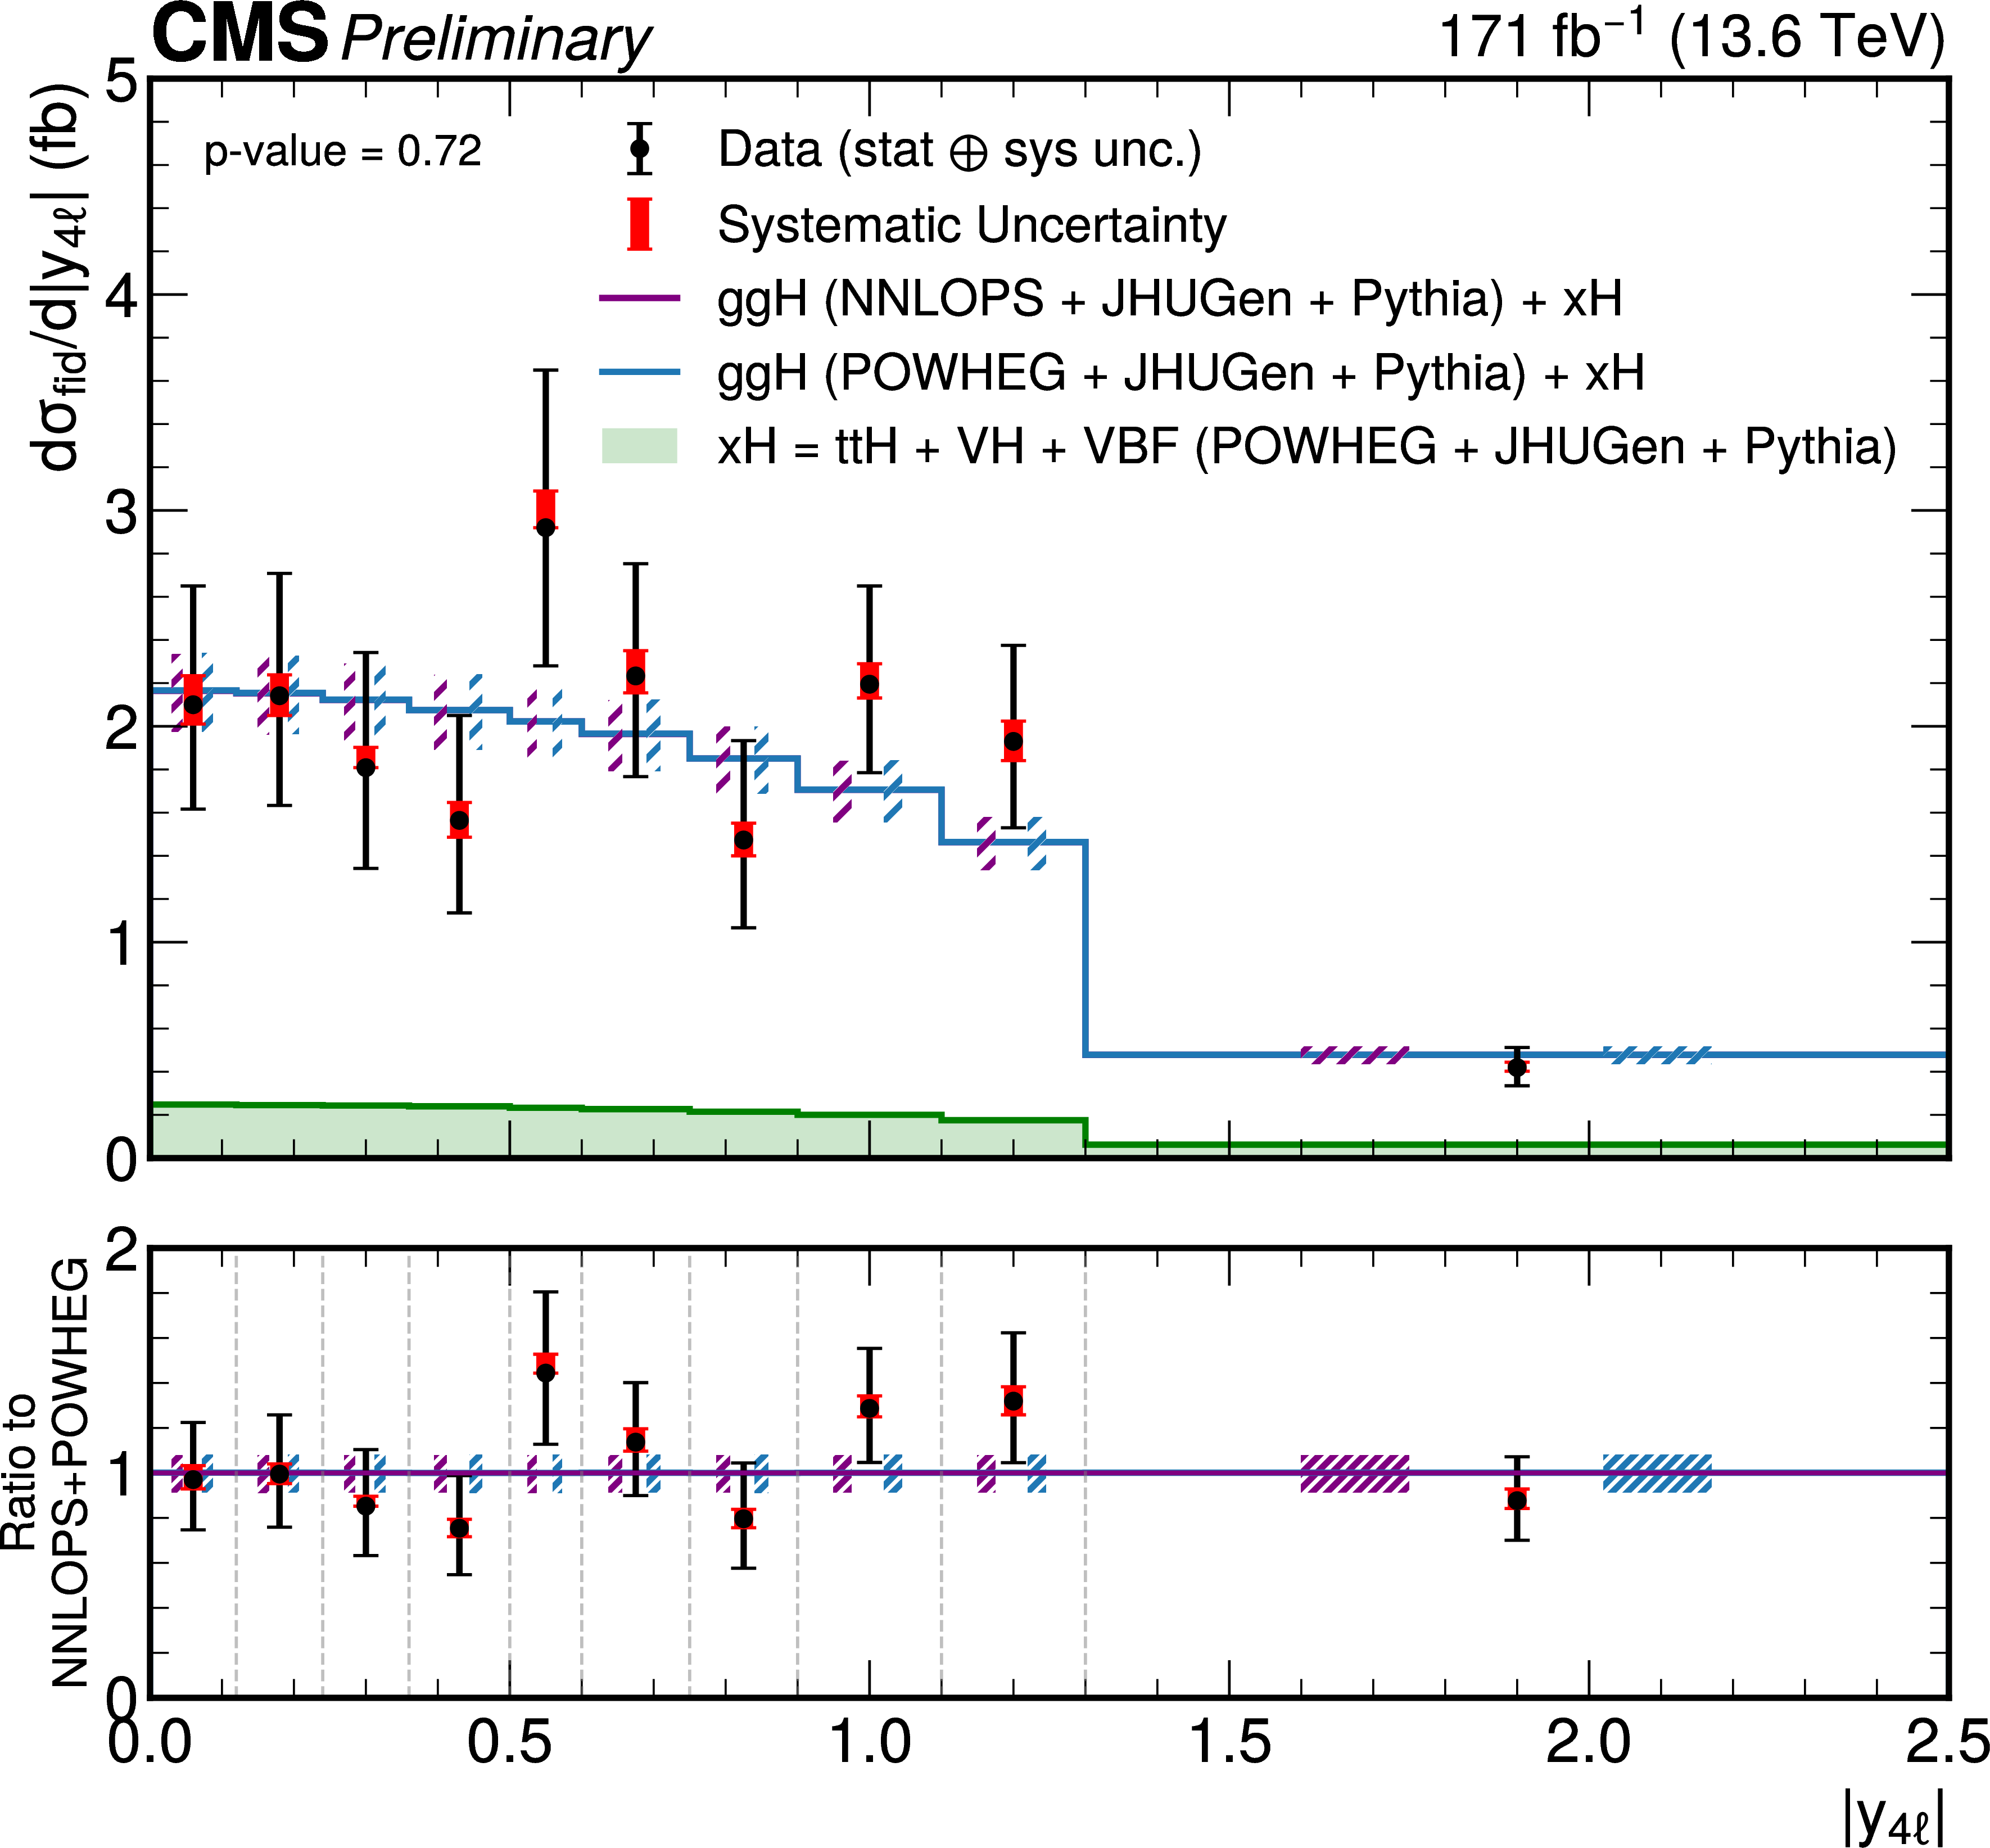
Observed differential fiducial cross sections for the $ \mathrm{H}\to\mathrm{Z}\mathrm{Z}\to4\ell $ process as a function of the four-lepton transverse momentum $ p_{\mathrm{T}}^{4\ell} $ (left) and the four-lepton rapidity $ |y_{4\ell}| $ (right). The gg $ \to $ H predictions are shown for two different generators, POWHEG (blue) and NNLOPS (purple), normalized to the total cross section computed at next-to-next-to-next-to-leading order (N3LO), separately stacked over the the subdominant component of the signal from VBF + VH + t\=tH, denoted as xH (green). The hatched areas correspond to the systematic uncertainties in the theoretical predictions. Black points represent the measured fiducial cross sections in each bin, black error bars indicate the total uncertainty in each measurement, and red boxes denote the systematic uncertainties. The lower panels display the ratios of the measured cross sections and of the POWHEG gg $ \to $ H + xH theoretical prediction to the NNLOPS gg $ \to $ H + POWHEG xH theoretical predictions. |
png pdf |
Figure 6-a:
Observed differential fiducial cross sections for the $ \mathrm{H}\to\mathrm{Z}\mathrm{Z}\to4\ell $ process as a function of the four-lepton transverse momentum $ p_{\mathrm{T}}^{4\ell} $ (left) and the four-lepton rapidity $ |y_{4\ell}| $ (right). The gg $ \to $ H predictions are shown for two different generators, POWHEG (blue) and NNLOPS (purple), normalized to the total cross section computed at next-to-next-to-next-to-leading order (N3LO), separately stacked over the the subdominant component of the signal from VBF + VH + t\=tH, denoted as xH (green). The hatched areas correspond to the systematic uncertainties in the theoretical predictions. Black points represent the measured fiducial cross sections in each bin, black error bars indicate the total uncertainty in each measurement, and red boxes denote the systematic uncertainties. The lower panels display the ratios of the measured cross sections and of the POWHEG gg $ \to $ H + xH theoretical prediction to the NNLOPS gg $ \to $ H + POWHEG xH theoretical predictions. |
png pdf |
Figure 6-b:
Observed differential fiducial cross sections for the $ \mathrm{H}\to\mathrm{Z}\mathrm{Z}\to4\ell $ process as a function of the four-lepton transverse momentum $ p_{\mathrm{T}}^{4\ell} $ (left) and the four-lepton rapidity $ |y_{4\ell}| $ (right). The gg $ \to $ H predictions are shown for two different generators, POWHEG (blue) and NNLOPS (purple), normalized to the total cross section computed at next-to-next-to-next-to-leading order (N3LO), separately stacked over the the subdominant component of the signal from VBF + VH + t\=tH, denoted as xH (green). The hatched areas correspond to the systematic uncertainties in the theoretical predictions. Black points represent the measured fiducial cross sections in each bin, black error bars indicate the total uncertainty in each measurement, and red boxes denote the systematic uncertainties. The lower panels display the ratios of the measured cross sections and of the POWHEG gg $ \to $ H + xH theoretical prediction to the NNLOPS gg $ \to $ H + POWHEG xH theoretical predictions. |
png pdf |
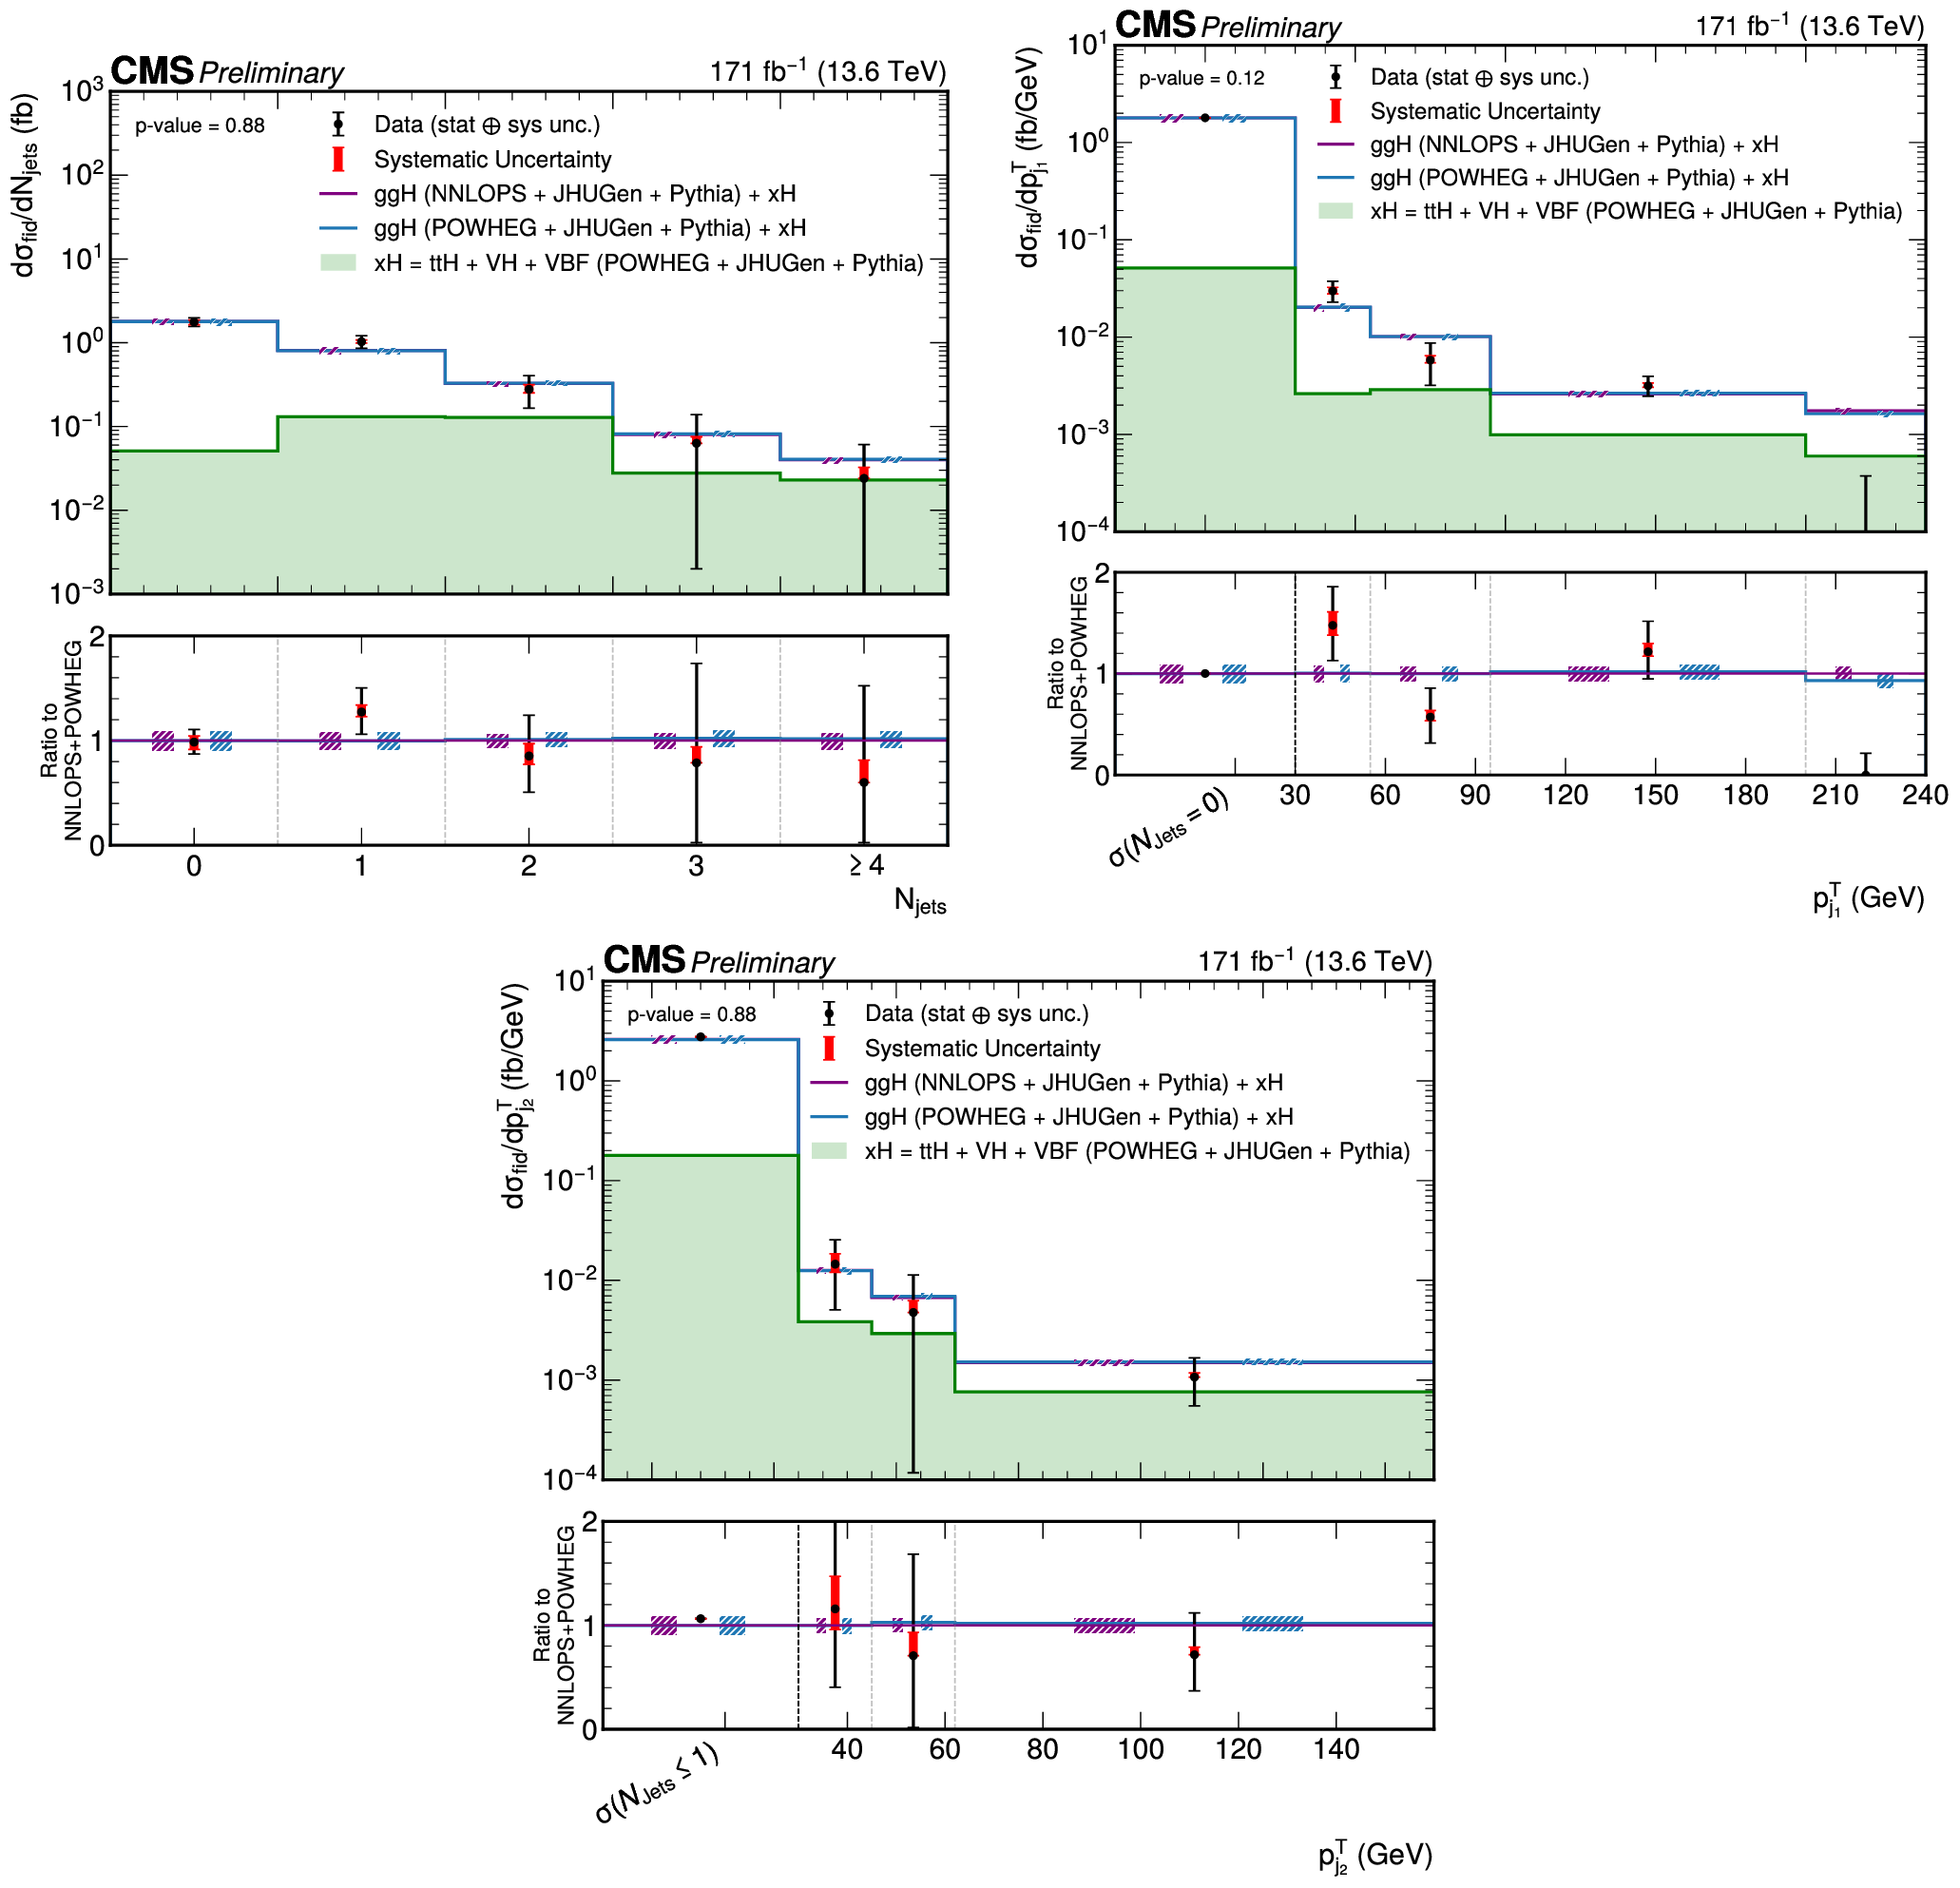
Figure 7:
Differential fiducial cross sections for the $ \mathrm{H}\to\mathrm{Z}\mathrm{Z}\to4\ell $ process as a function of the number of jets $ N_{j} $ (top left), transverse momentum of the leading jet $ p_T^{j1} $ (top right), and the invariant mass of the dijet system $ p_T^{j2} $ (bottom). The gg $ \to $ H predictions are shown for two different generators, POWHEG (blue) and NNLOPS (purple), normalized to the total cross section computed at next-to-next-to-next-to-leading order (N3LO), separately stacked over the the subdominant component of the signal from VBF + VH + t\=tH, denoted as xH (green). The hatched areas correspond to the systematic uncertainties in the theoretical predictions. Black points represent the measured fiducial cross sections in each bin, black error bars indicate the total uncertainty in each measurement, and red boxes denote the systematic uncertainties. The lower panels display the ratios of the measured cross sections and of the POWHEG gg $ \to $ H + xH theoretical prediction to the NNLOPS gg $ \to $ H + POWHEG xH theoretical predictions. |
png pdf |
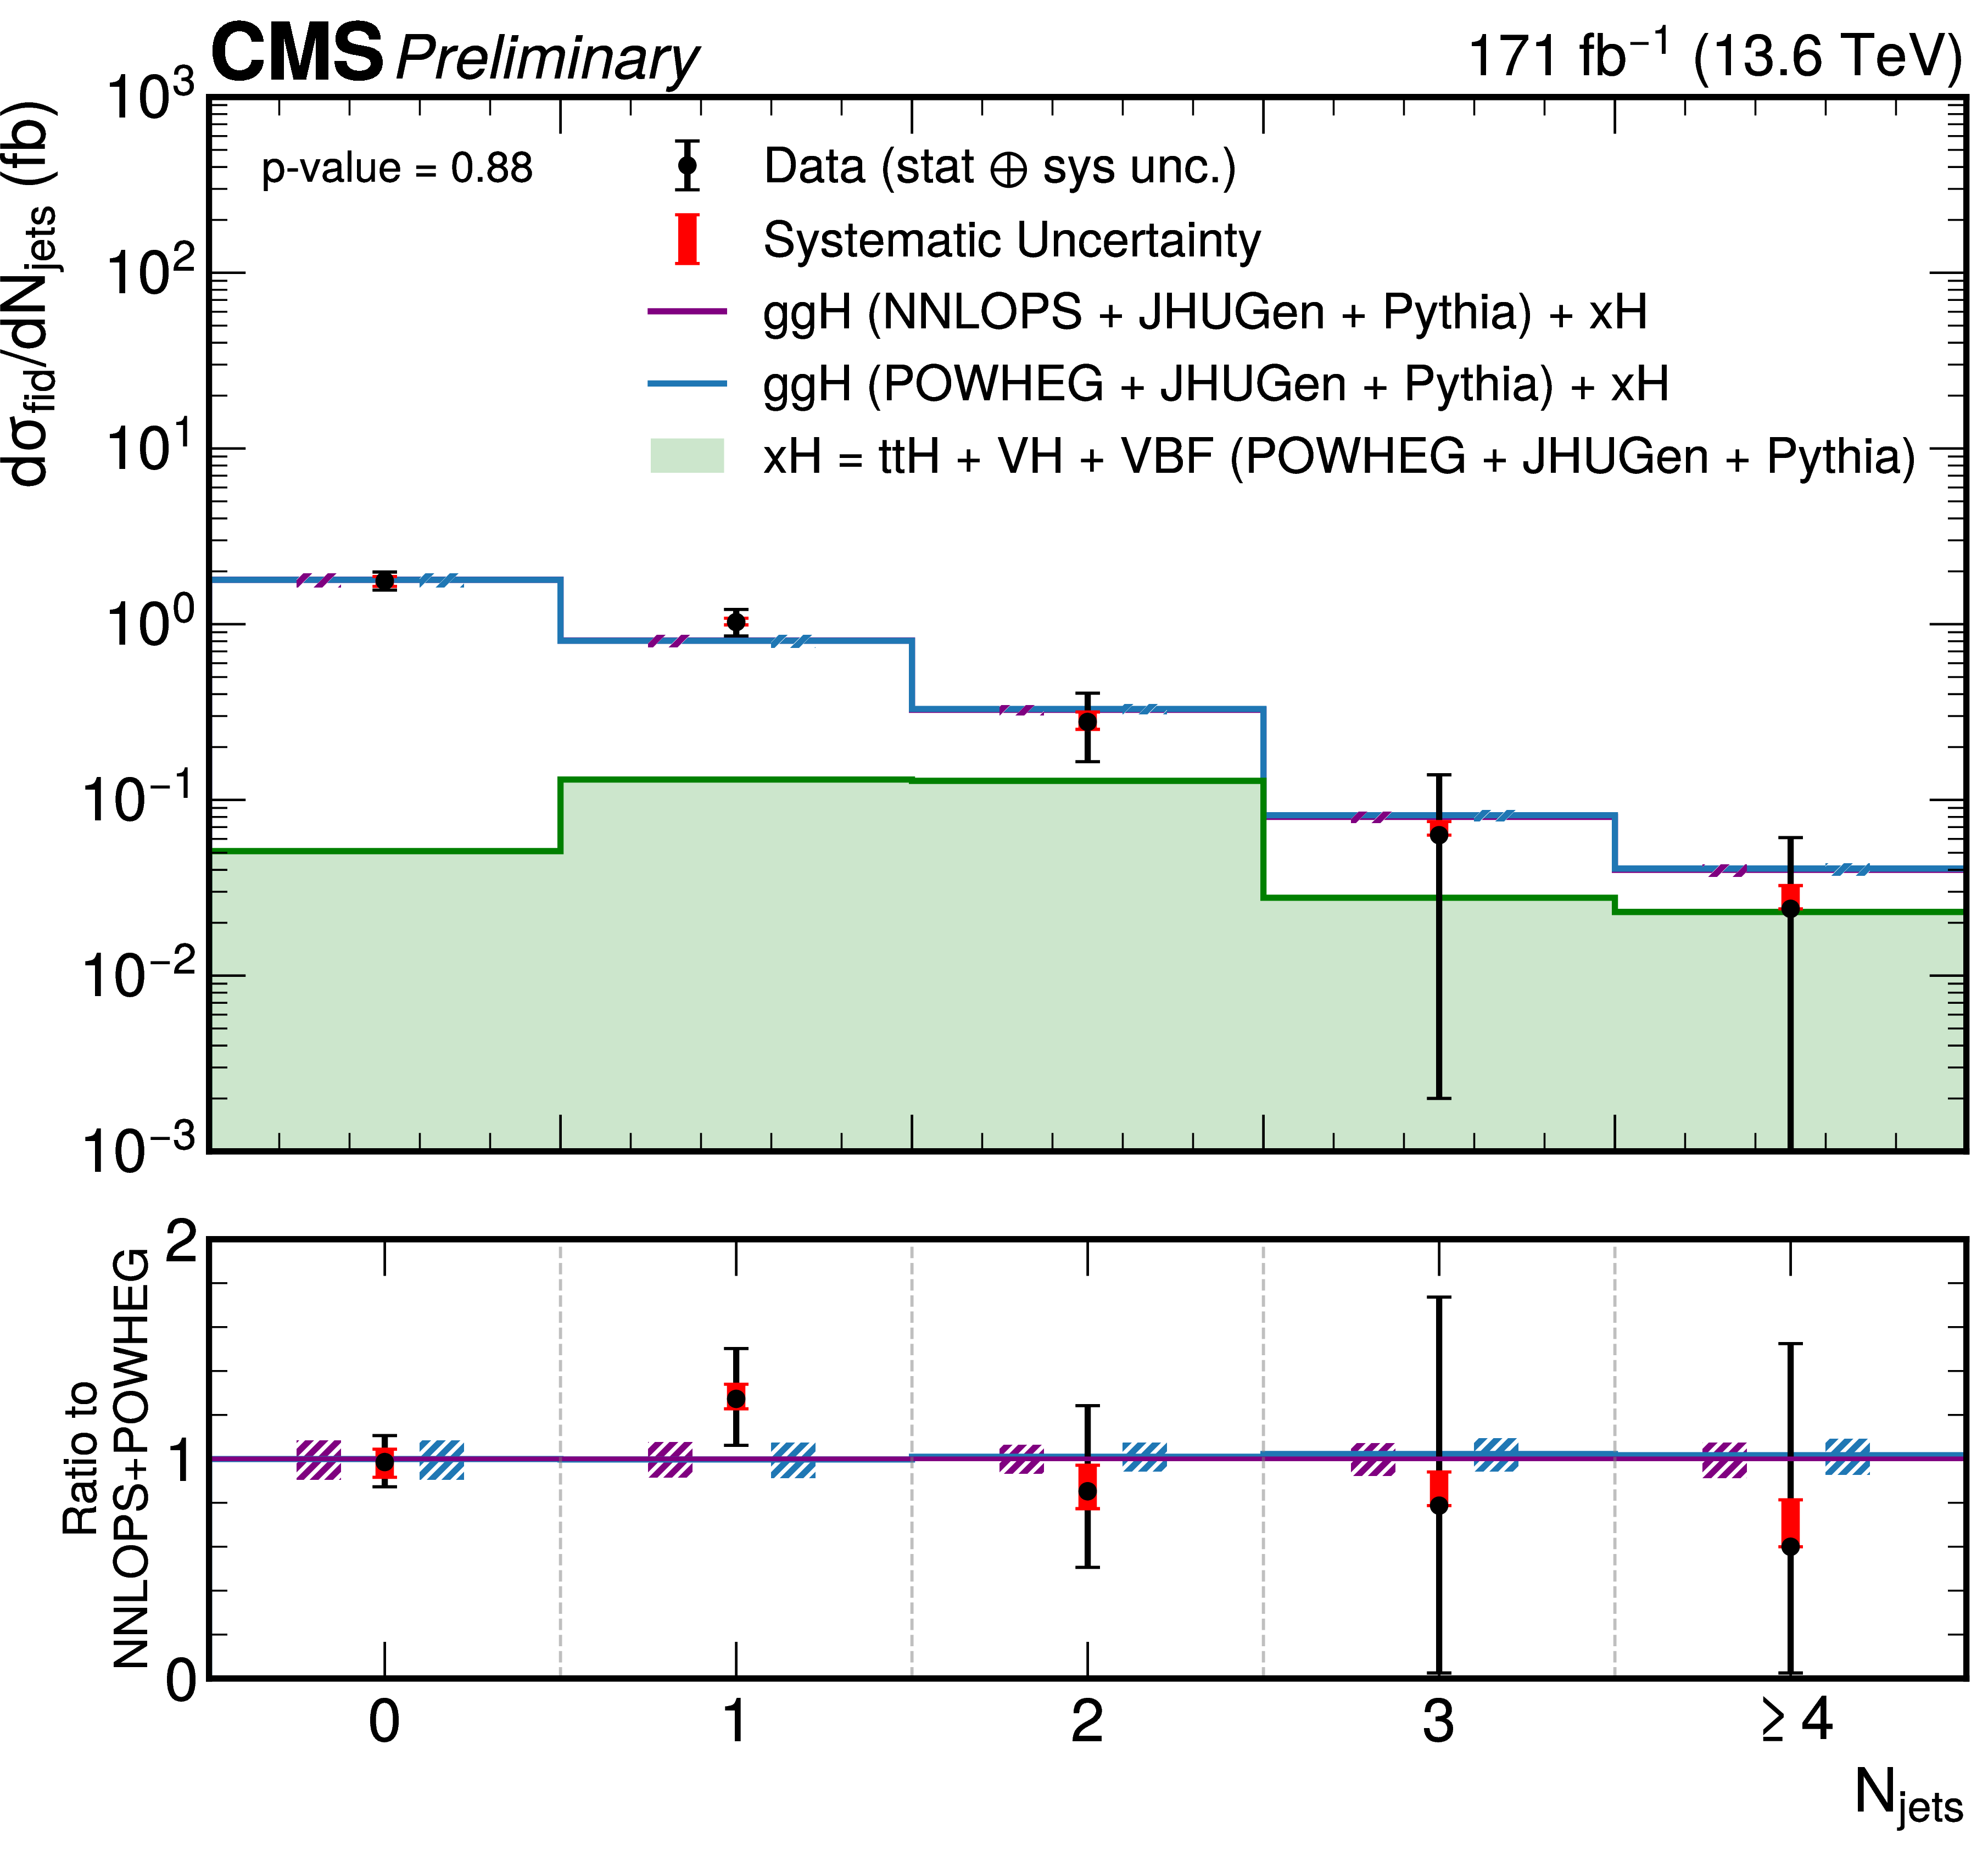
Figure 7-a:
Differential fiducial cross sections for the $ \mathrm{H}\to\mathrm{Z}\mathrm{Z}\to4\ell $ process as a function of the number of jets $ N_{j} $ (top left), transverse momentum of the leading jet $ p_T^{j1} $ (top right), and the invariant mass of the dijet system $ p_T^{j2} $ (bottom). The gg $ \to $ H predictions are shown for two different generators, POWHEG (blue) and NNLOPS (purple), normalized to the total cross section computed at next-to-next-to-next-to-leading order (N3LO), separately stacked over the the subdominant component of the signal from VBF + VH + t\=tH, denoted as xH (green). The hatched areas correspond to the systematic uncertainties in the theoretical predictions. Black points represent the measured fiducial cross sections in each bin, black error bars indicate the total uncertainty in each measurement, and red boxes denote the systematic uncertainties. The lower panels display the ratios of the measured cross sections and of the POWHEG gg $ \to $ H + xH theoretical prediction to the NNLOPS gg $ \to $ H + POWHEG xH theoretical predictions. |
png pdf |
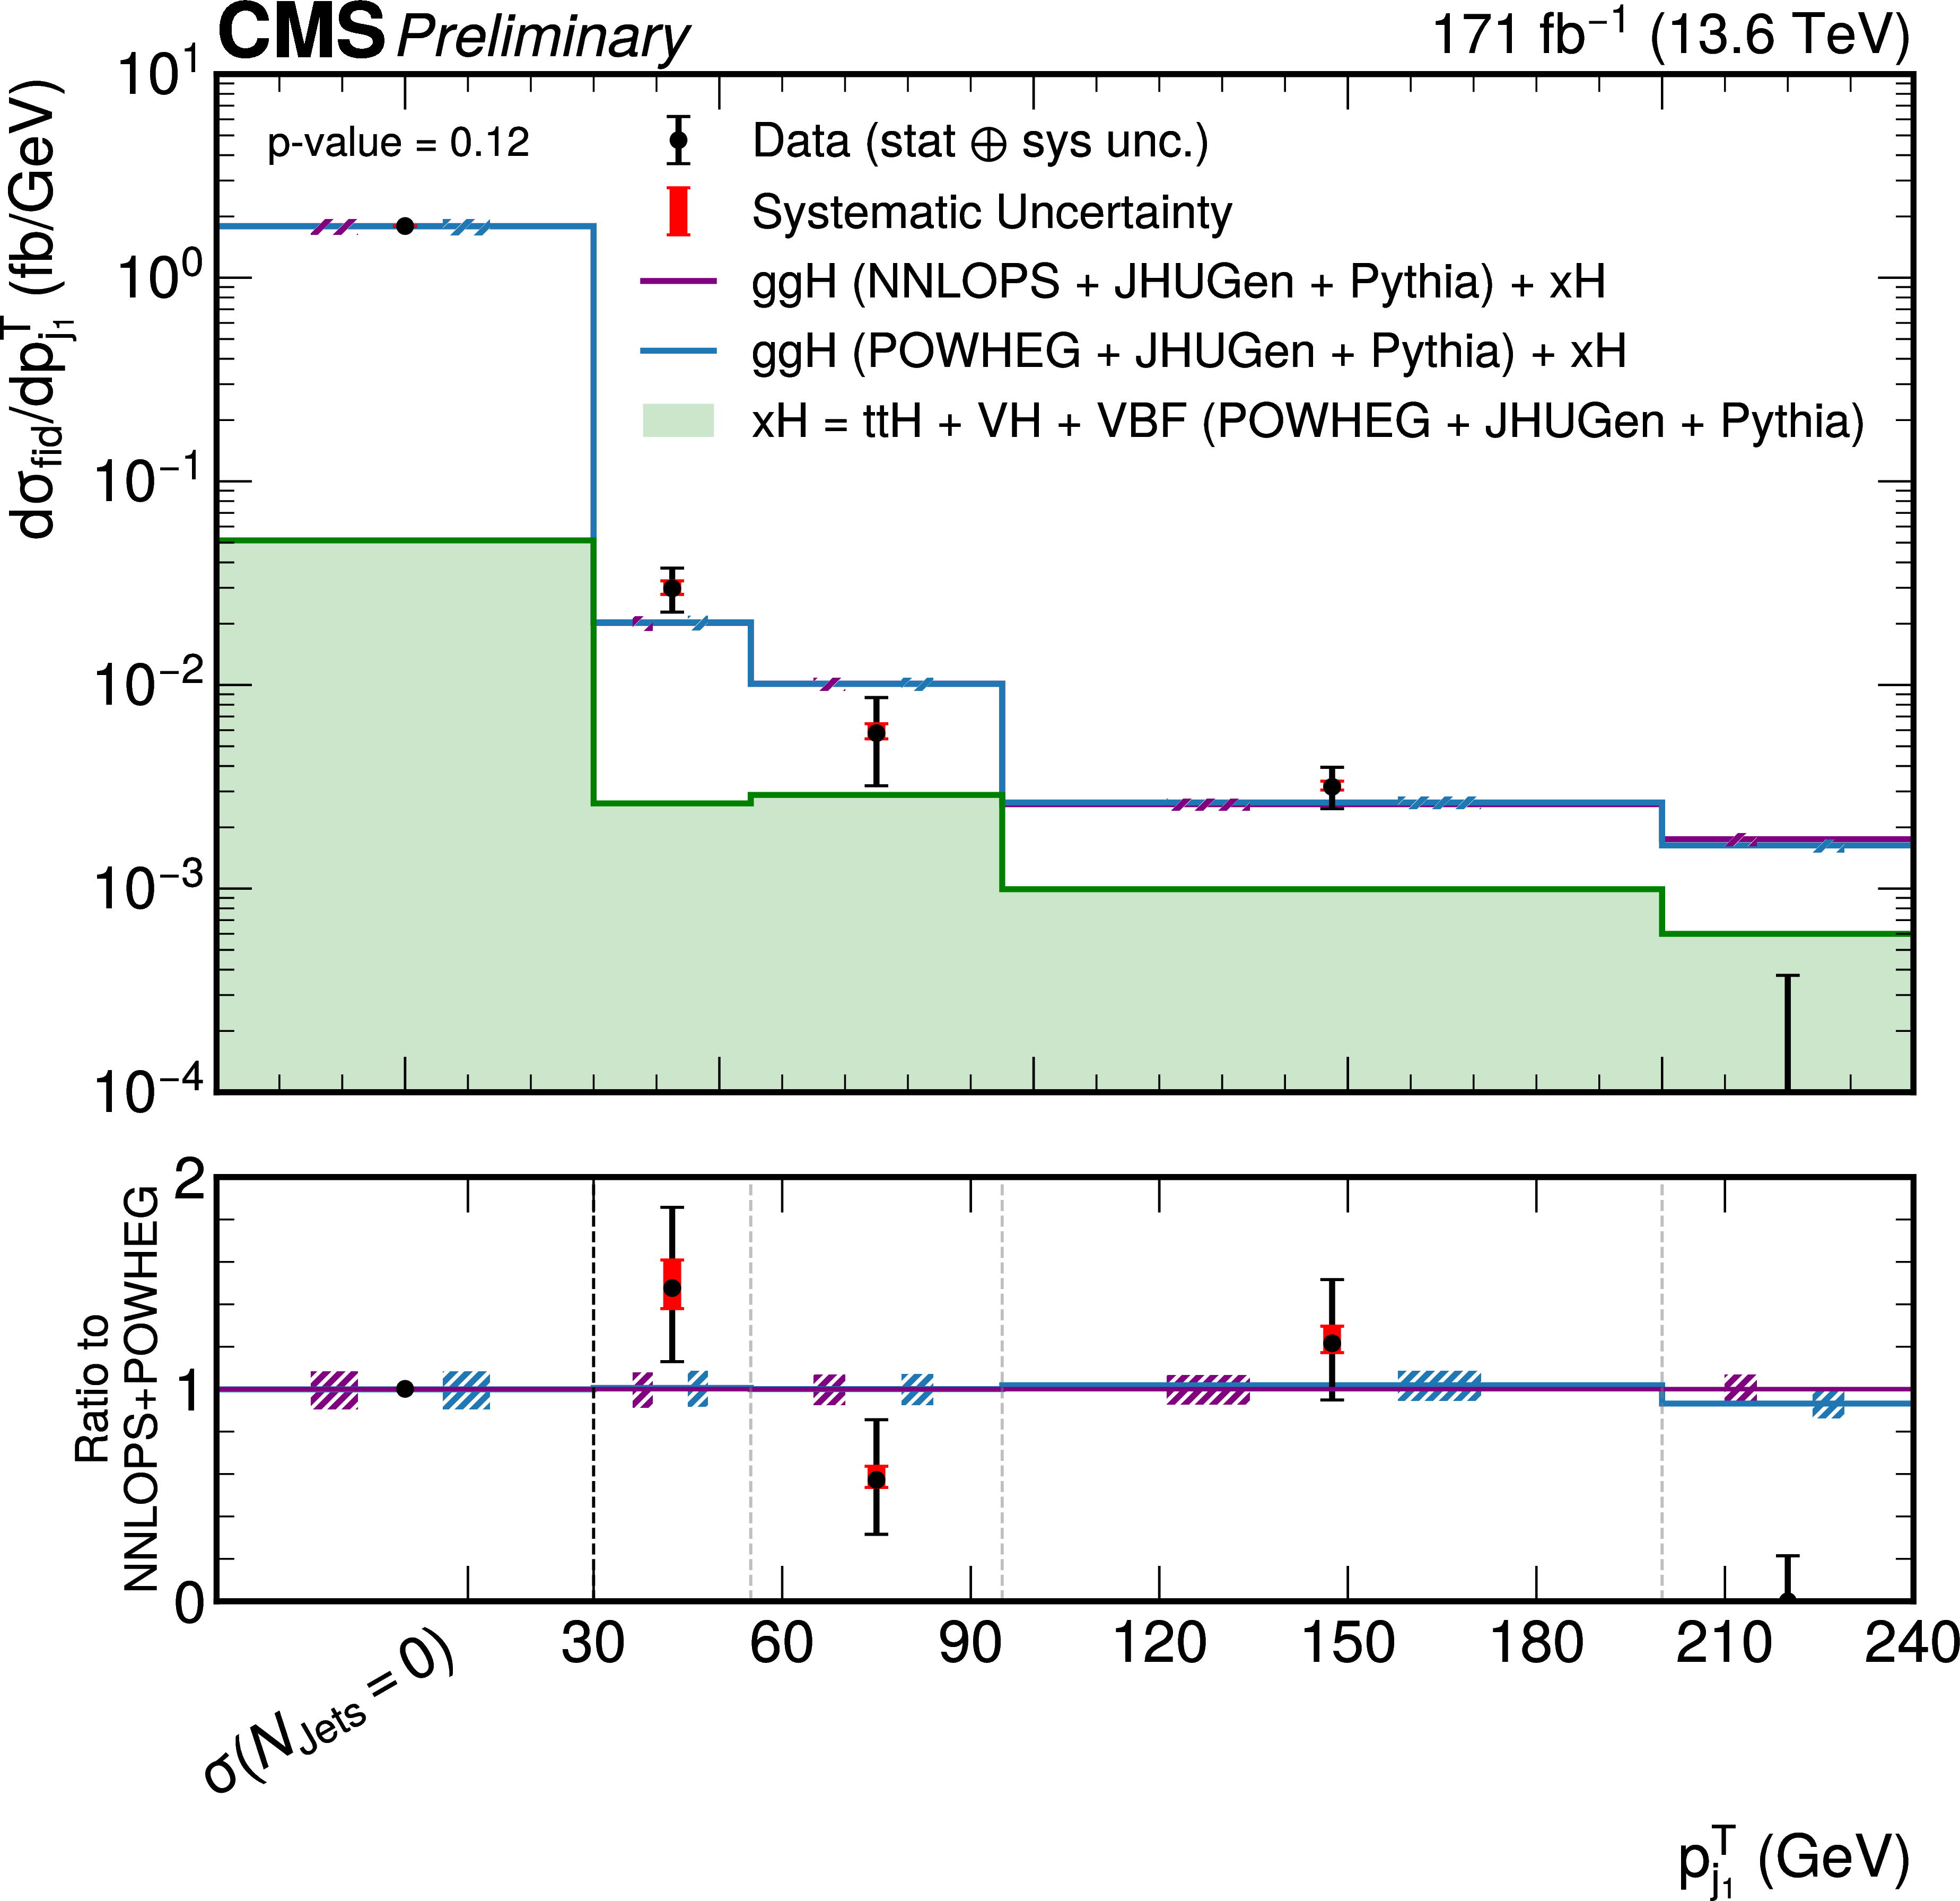
Figure 7-b:
Differential fiducial cross sections for the $ \mathrm{H}\to\mathrm{Z}\mathrm{Z}\to4\ell $ process as a function of the number of jets $ N_{j} $ (top left), transverse momentum of the leading jet $ p_T^{j1} $ (top right), and the invariant mass of the dijet system $ p_T^{j2} $ (bottom). The gg $ \to $ H predictions are shown for two different generators, POWHEG (blue) and NNLOPS (purple), normalized to the total cross section computed at next-to-next-to-next-to-leading order (N3LO), separately stacked over the the subdominant component of the signal from VBF + VH + t\=tH, denoted as xH (green). The hatched areas correspond to the systematic uncertainties in the theoretical predictions. Black points represent the measured fiducial cross sections in each bin, black error bars indicate the total uncertainty in each measurement, and red boxes denote the systematic uncertainties. The lower panels display the ratios of the measured cross sections and of the POWHEG gg $ \to $ H + xH theoretical prediction to the NNLOPS gg $ \to $ H + POWHEG xH theoretical predictions. |
png pdf |
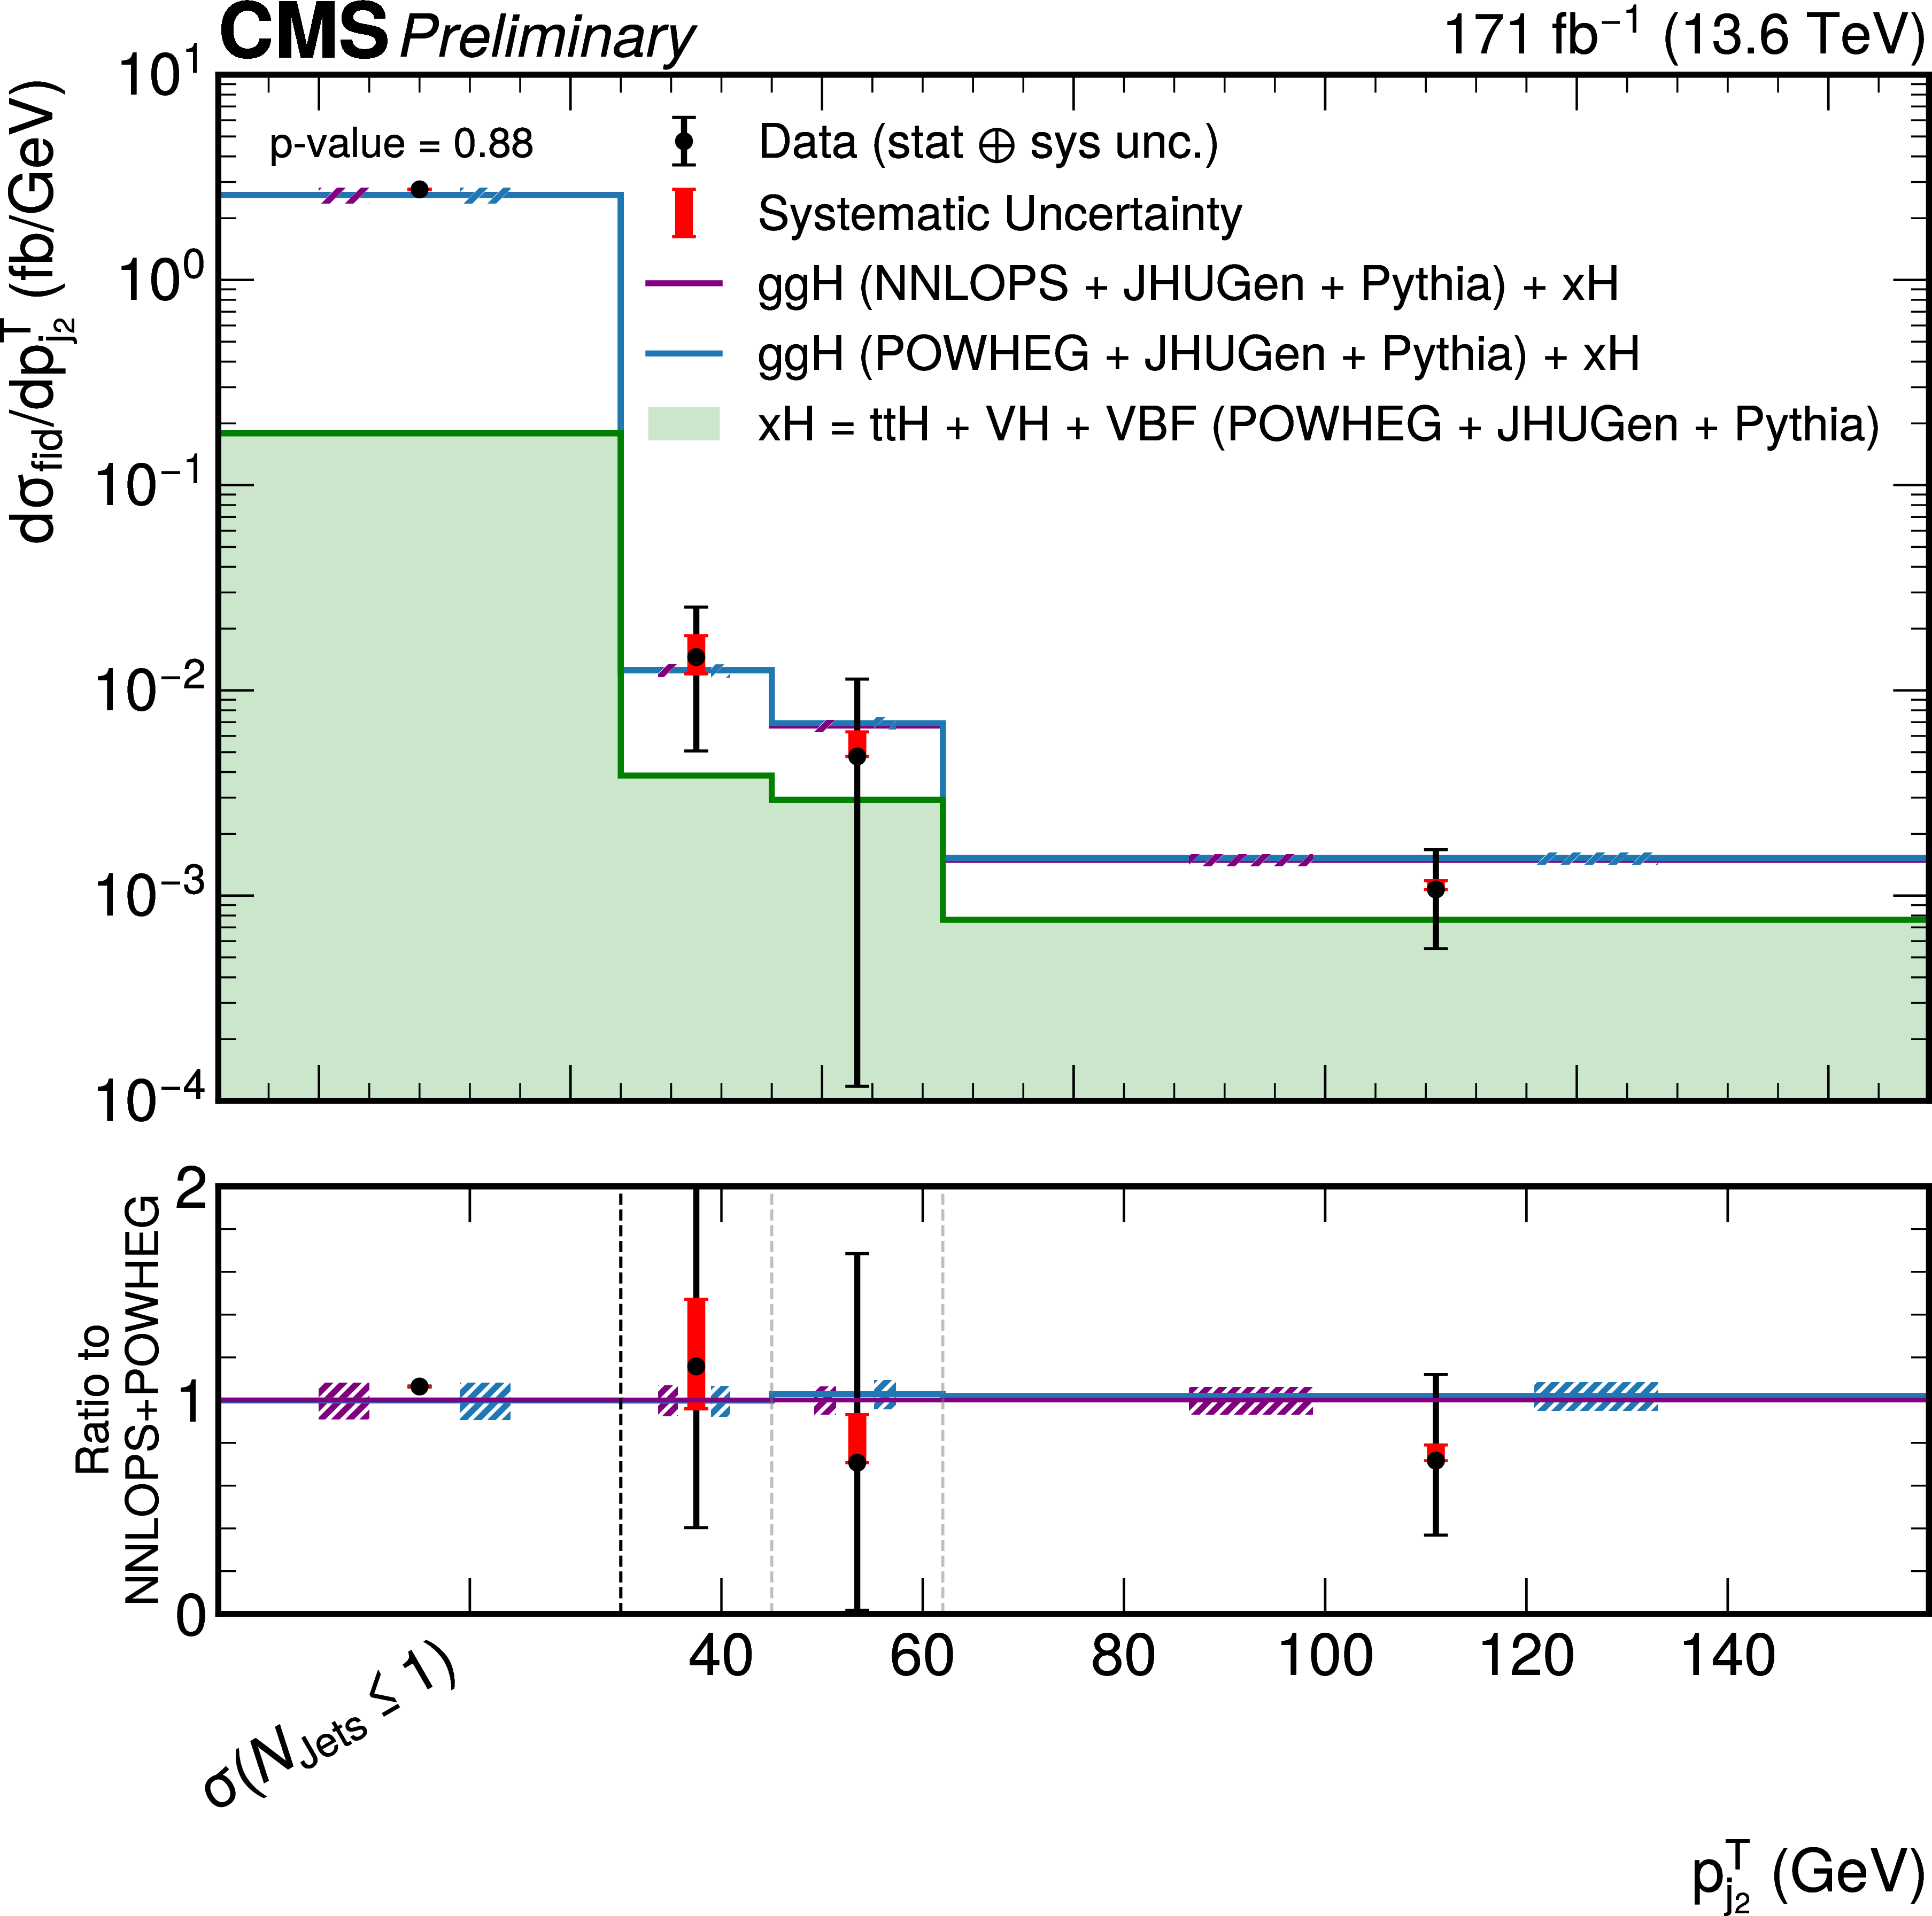
Figure 7-c:
Differential fiducial cross sections for the $ \mathrm{H}\to\mathrm{Z}\mathrm{Z}\to4\ell $ process as a function of the number of jets $ N_{j} $ (top left), transverse momentum of the leading jet $ p_T^{j1} $ (top right), and the invariant mass of the dijet system $ p_T^{j2} $ (bottom). The gg $ \to $ H predictions are shown for two different generators, POWHEG (blue) and NNLOPS (purple), normalized to the total cross section computed at next-to-next-to-next-to-leading order (N3LO), separately stacked over the the subdominant component of the signal from VBF + VH + t\=tH, denoted as xH (green). The hatched areas correspond to the systematic uncertainties in the theoretical predictions. Black points represent the measured fiducial cross sections in each bin, black error bars indicate the total uncertainty in each measurement, and red boxes denote the systematic uncertainties. The lower panels display the ratios of the measured cross sections and of the POWHEG gg $ \to $ H + xH theoretical prediction to the NNLOPS gg $ \to $ H + POWHEG xH theoretical predictions. |
png pdf |
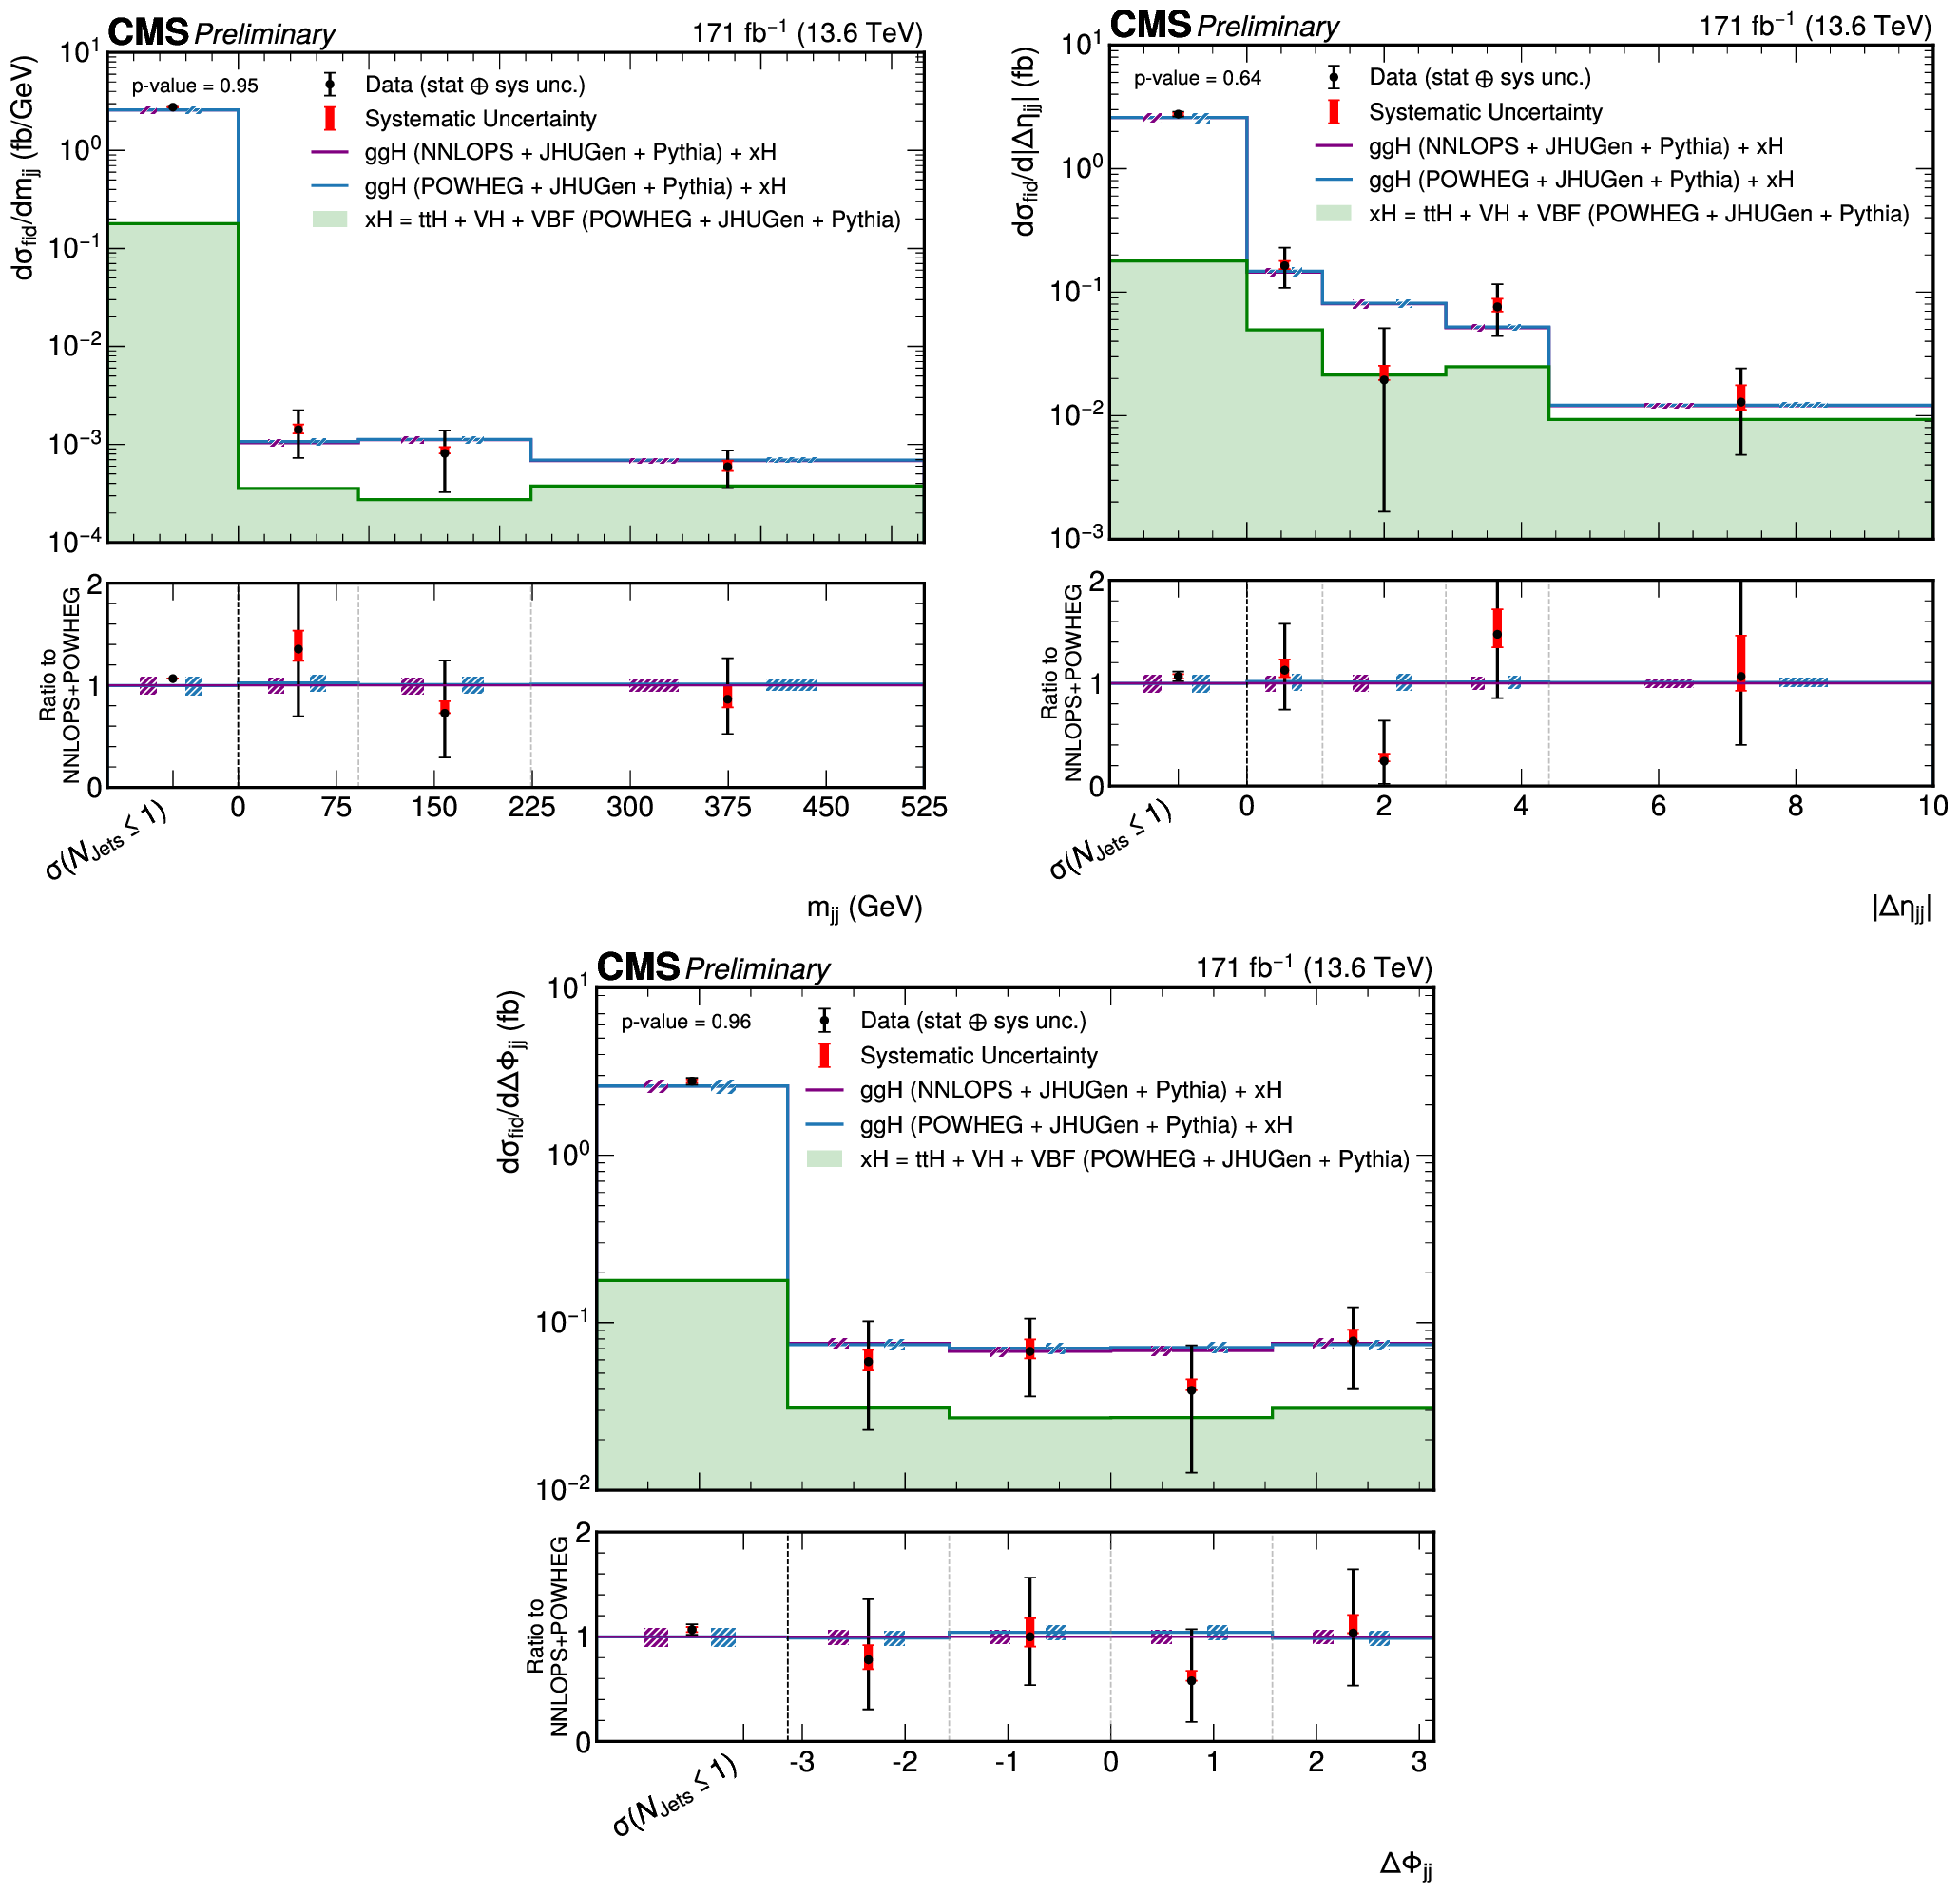
Figure 8:
Differential fiducial cross sections for the $ \mathrm{H}\to\mathrm{Z}\mathrm{Z}\to4\ell $ process as a function of the invariant mass of the two leading jets $ m_{jj} $ (top left), the absolute pseudorapidity separation between the two leading jets $ |\Delta \eta_{jj}| $ (top right) and the azimuthal angle difference between the two leading jets $ \Delta \phi_{jj} $ (bottom). The gg $ \to $ H predictions are shown for two different generators, POWHEG (blue) and NNLOPS (purple), normalized to the total cross section computed at next-to-next-to-next-to-leading order (N3LO), separately stacked over the the subdominant component of the signal from VBF + VH + t\=tH, denoted as xH (green). The hatched areas correspond to the systematic uncertainties in the theoretical predictions. Black points represent the measured fiducial cross sections in each bin, black error bars indicate the total uncertainty in each measurement, and red boxes denote the systematic uncertainties. The lower panels display the ratios of the measured cross sections and of the POWHEG gg $ \to $ H + xH theoretical prediction to the NNLOPS gg $ \to $ H + POWHEG xH theoretical predictions. |
png pdf |
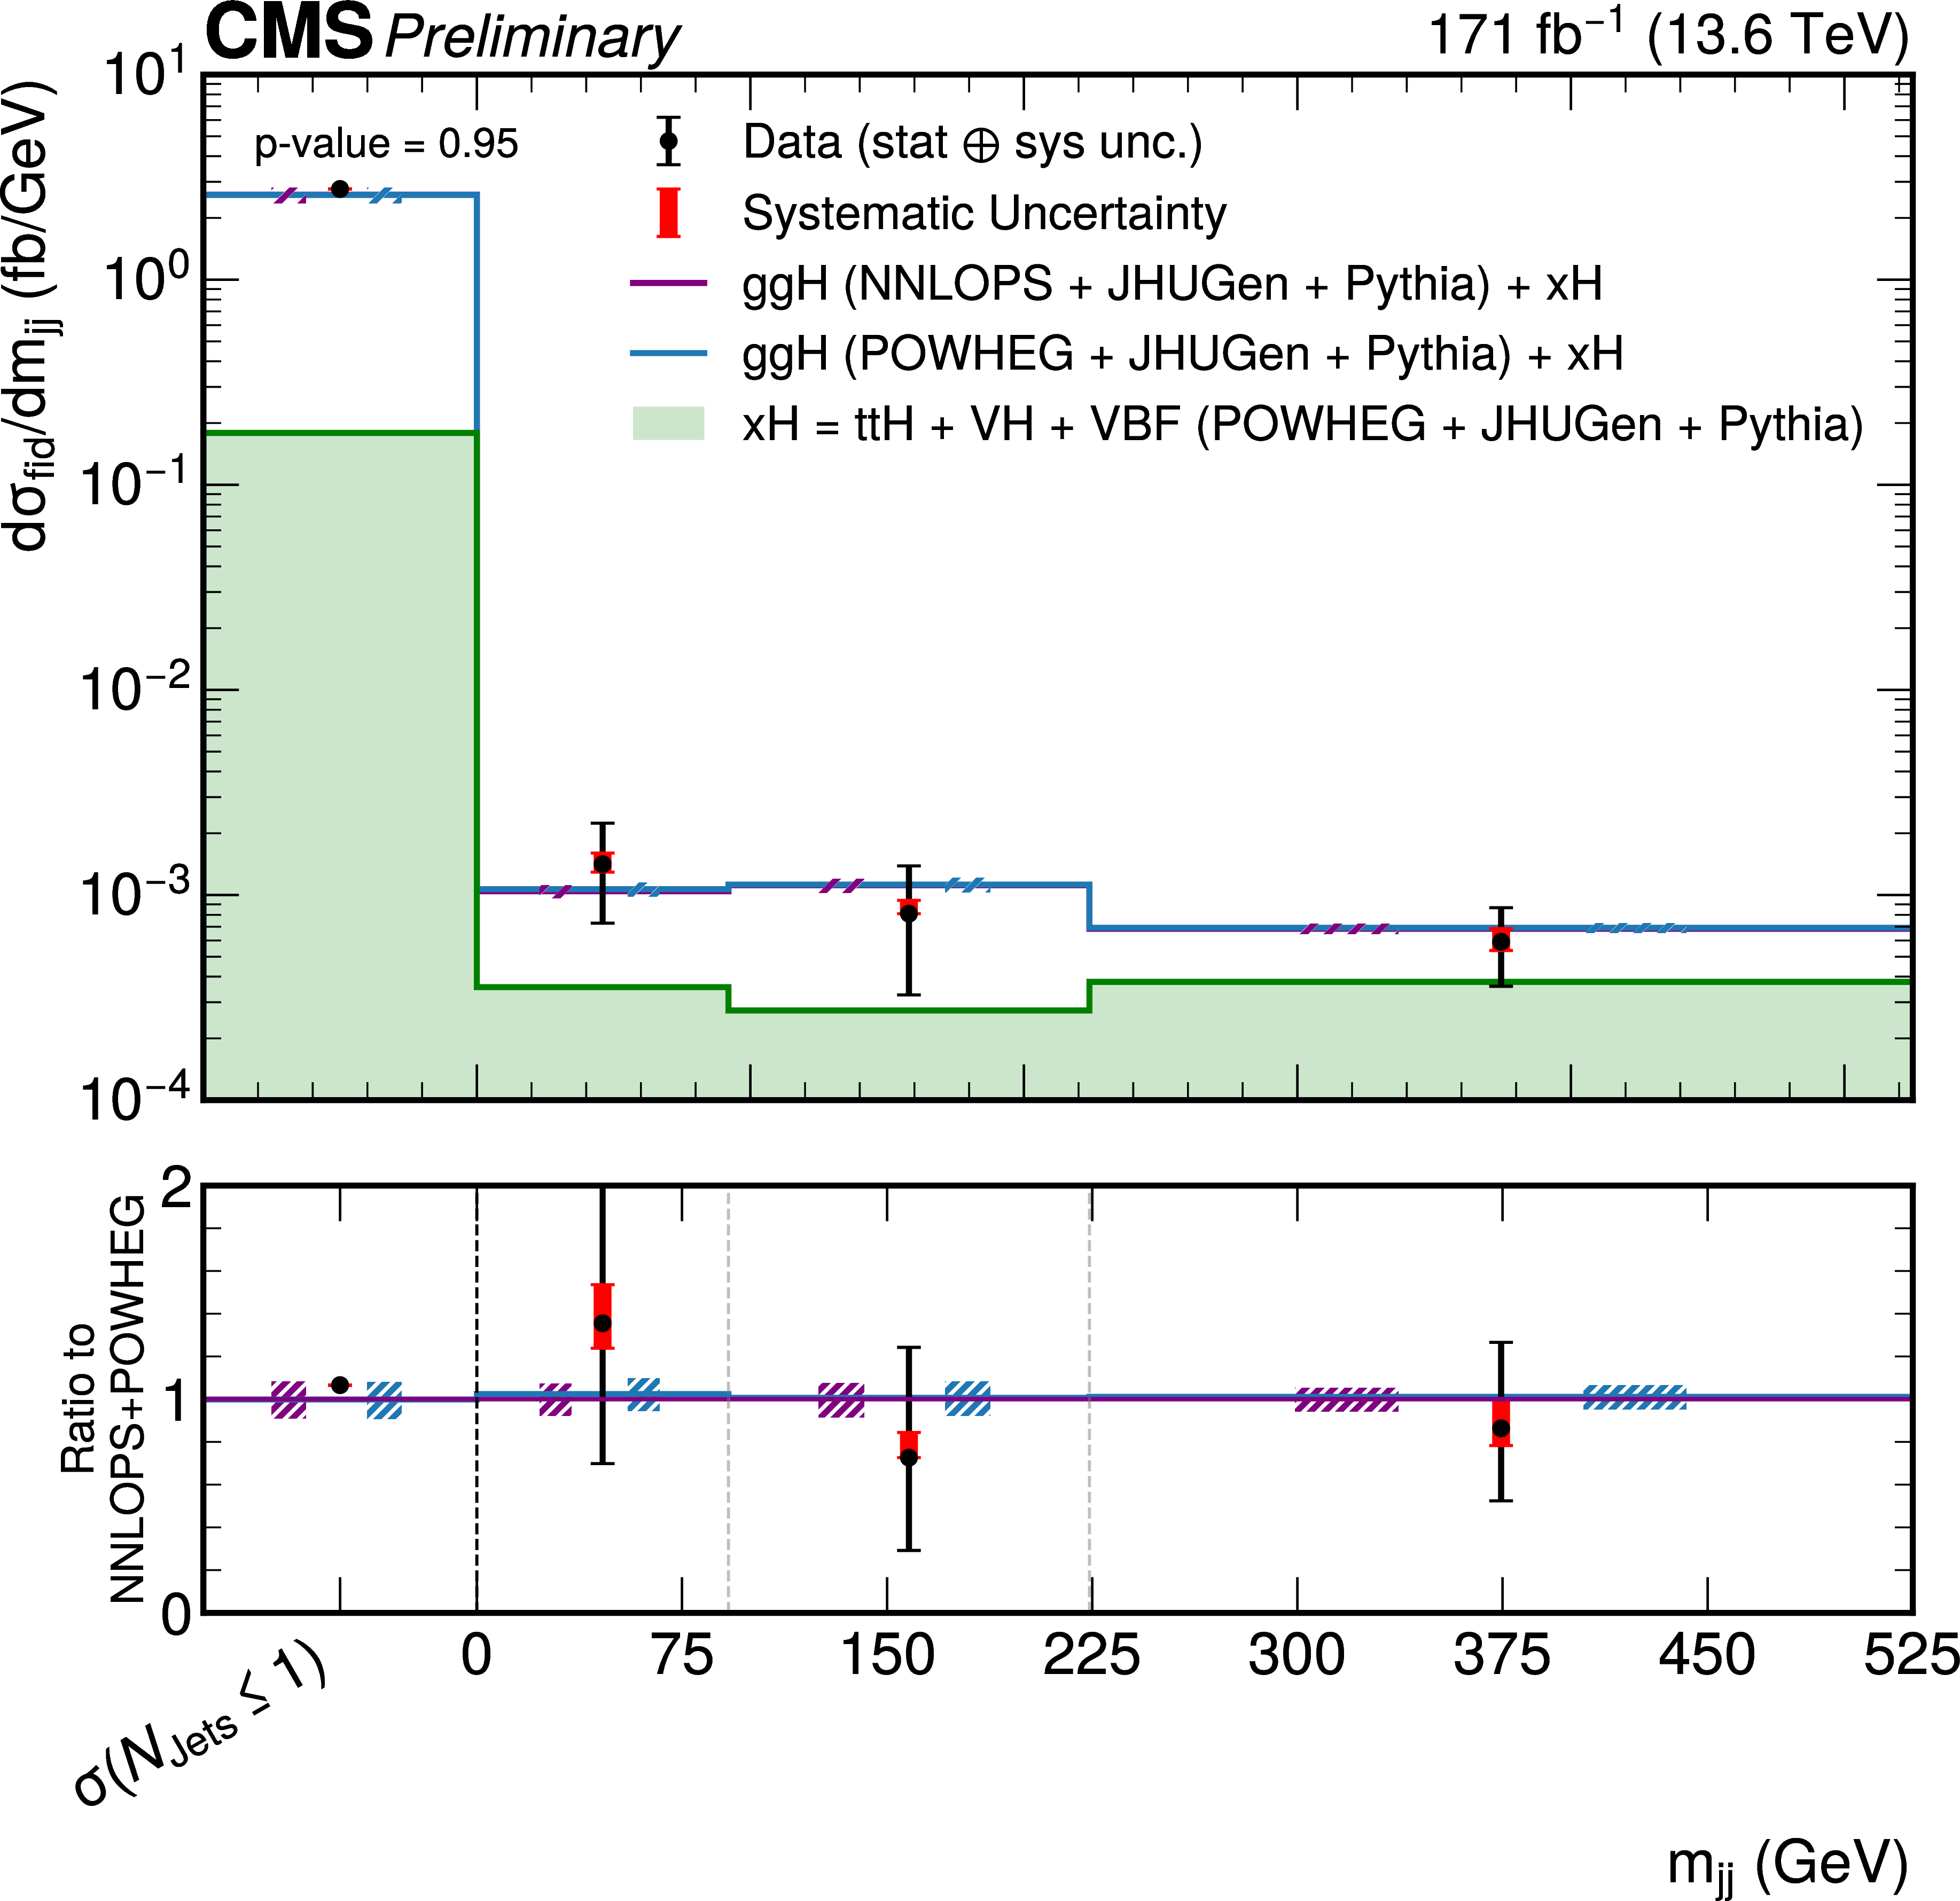
Figure 8-a:
Differential fiducial cross sections for the $ \mathrm{H}\to\mathrm{Z}\mathrm{Z}\to4\ell $ process as a function of the invariant mass of the two leading jets $ m_{jj} $ (top left), the absolute pseudorapidity separation between the two leading jets $ |\Delta \eta_{jj}| $ (top right) and the azimuthal angle difference between the two leading jets $ \Delta \phi_{jj} $ (bottom). The gg $ \to $ H predictions are shown for two different generators, POWHEG (blue) and NNLOPS (purple), normalized to the total cross section computed at next-to-next-to-next-to-leading order (N3LO), separately stacked over the the subdominant component of the signal from VBF + VH + t\=tH, denoted as xH (green). The hatched areas correspond to the systematic uncertainties in the theoretical predictions. Black points represent the measured fiducial cross sections in each bin, black error bars indicate the total uncertainty in each measurement, and red boxes denote the systematic uncertainties. The lower panels display the ratios of the measured cross sections and of the POWHEG gg $ \to $ H + xH theoretical prediction to the NNLOPS gg $ \to $ H + POWHEG xH theoretical predictions. |
png pdf |
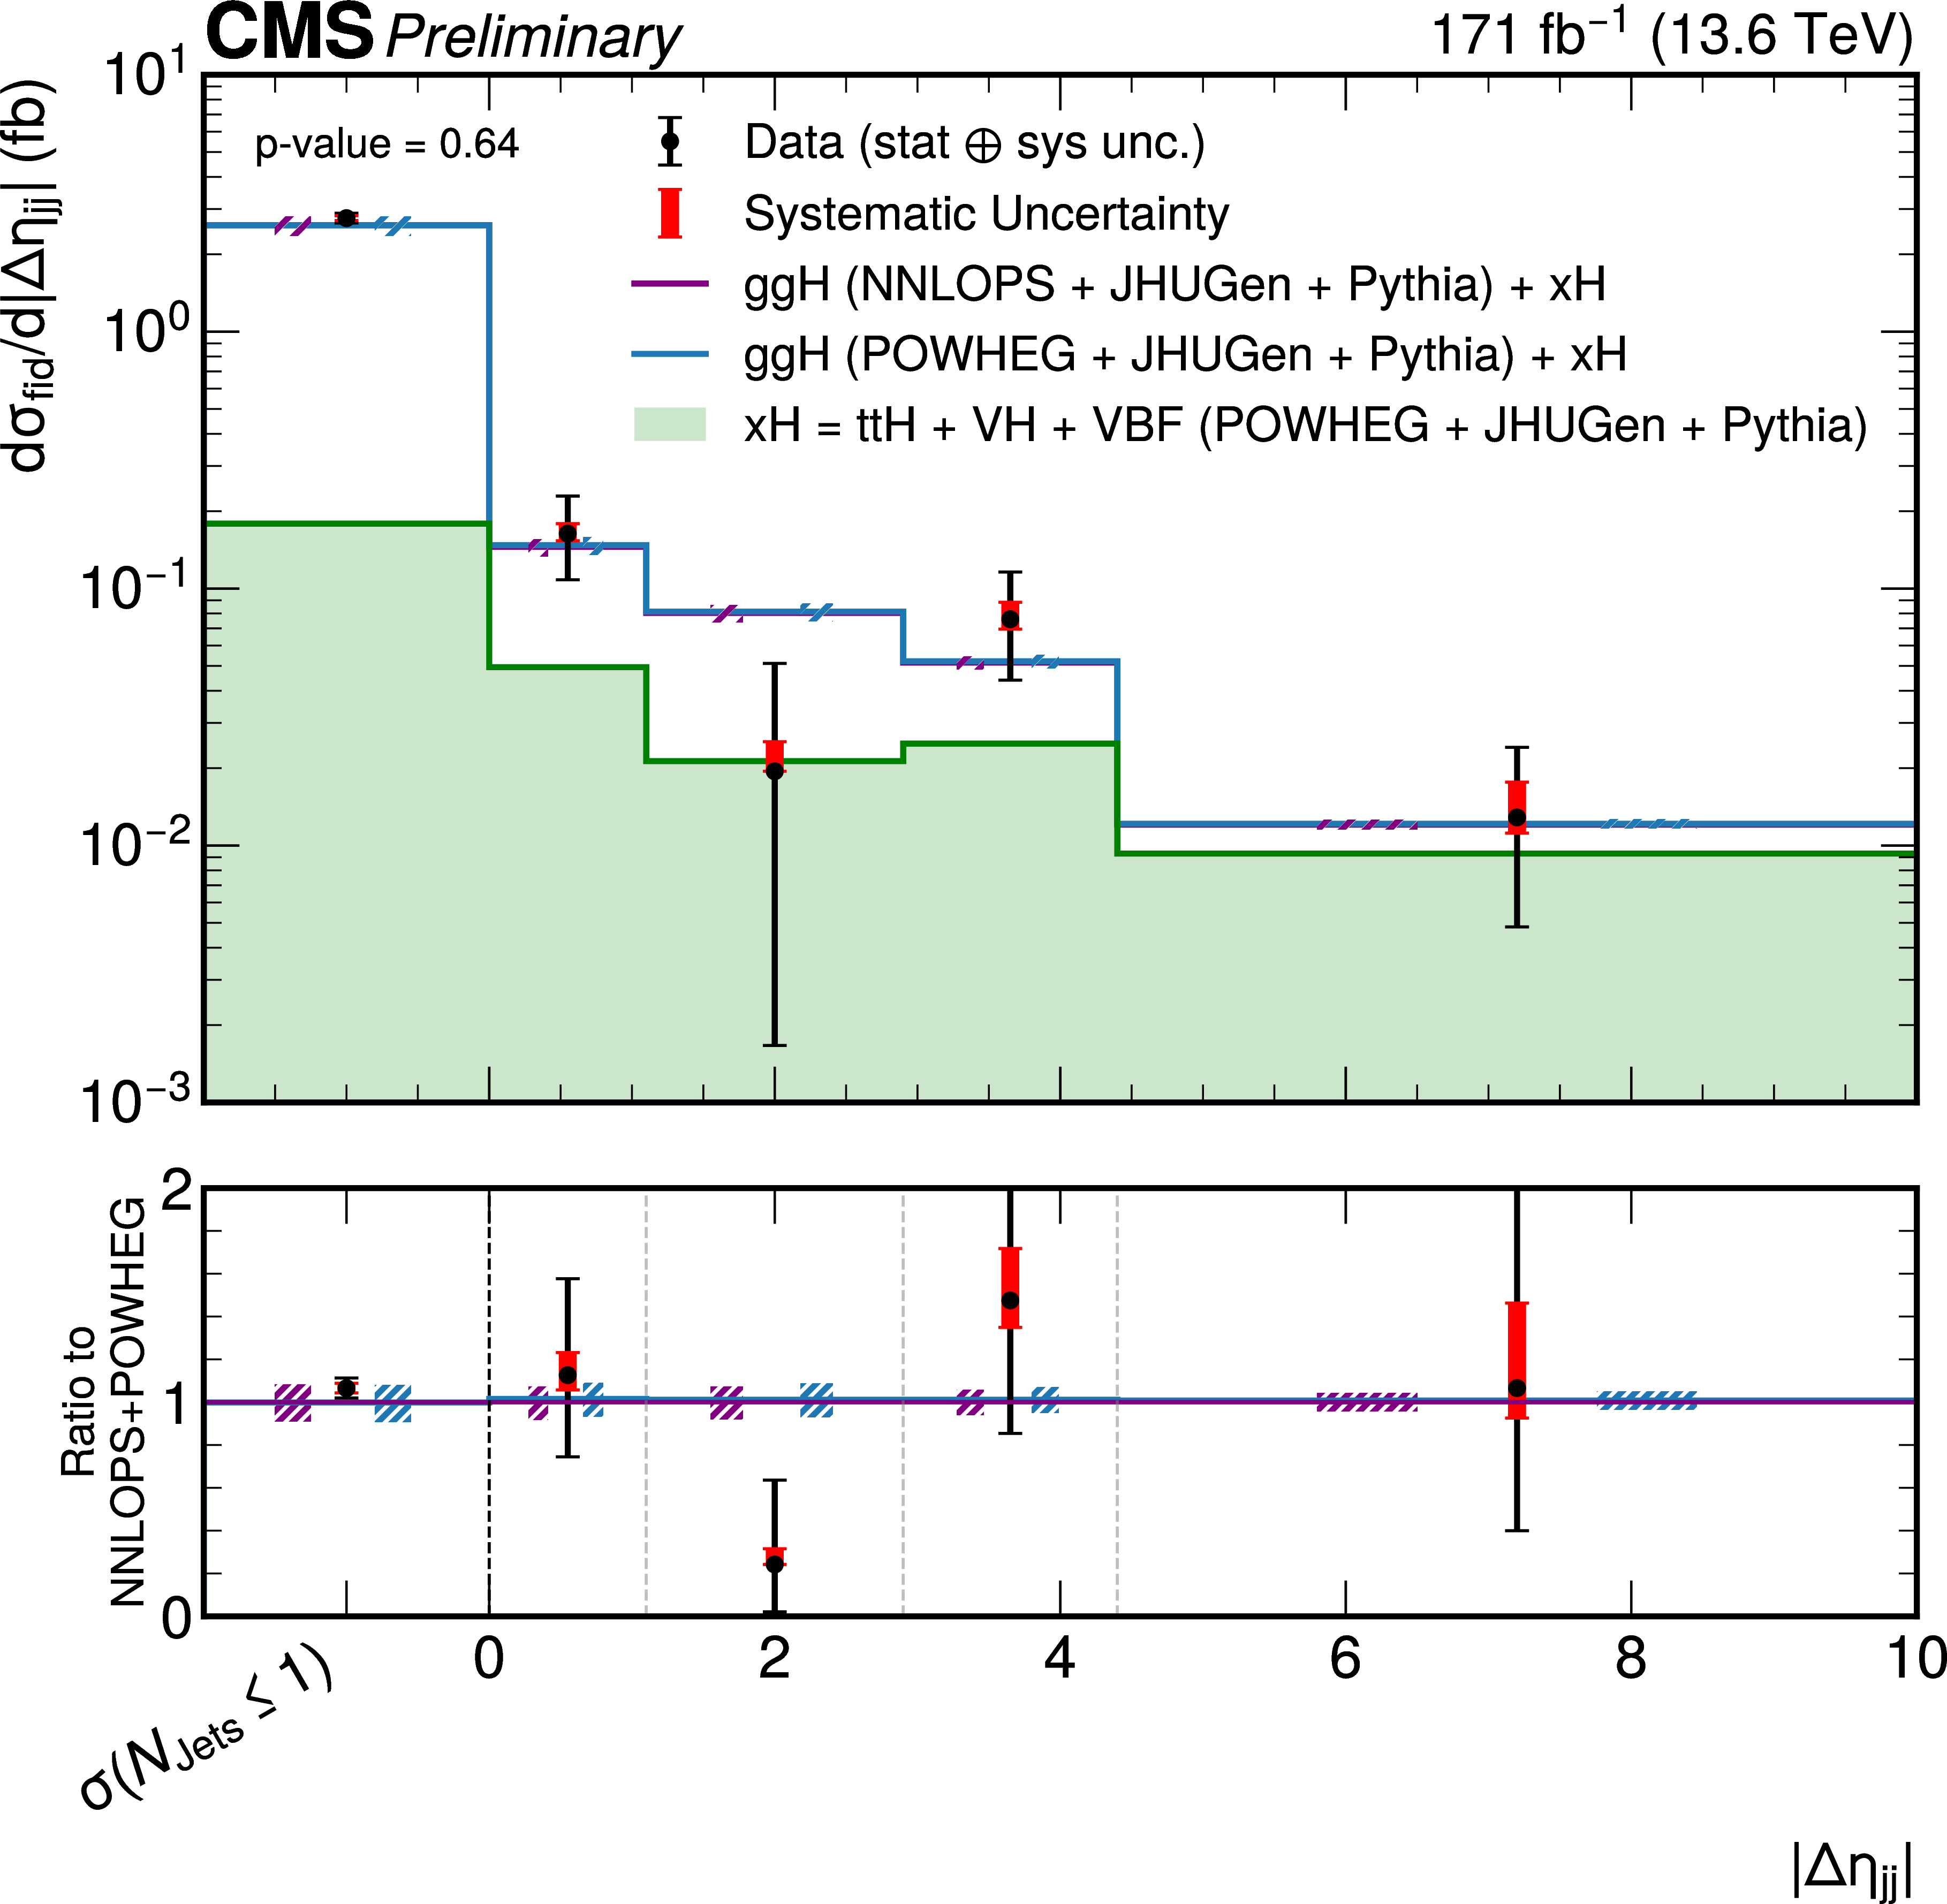
Figure 8-b:
Differential fiducial cross sections for the $ \mathrm{H}\to\mathrm{Z}\mathrm{Z}\to4\ell $ process as a function of the invariant mass of the two leading jets $ m_{jj} $ (top left), the absolute pseudorapidity separation between the two leading jets $ |\Delta \eta_{jj}| $ (top right) and the azimuthal angle difference between the two leading jets $ \Delta \phi_{jj} $ (bottom). The gg $ \to $ H predictions are shown for two different generators, POWHEG (blue) and NNLOPS (purple), normalized to the total cross section computed at next-to-next-to-next-to-leading order (N3LO), separately stacked over the the subdominant component of the signal from VBF + VH + t\=tH, denoted as xH (green). The hatched areas correspond to the systematic uncertainties in the theoretical predictions. Black points represent the measured fiducial cross sections in each bin, black error bars indicate the total uncertainty in each measurement, and red boxes denote the systematic uncertainties. The lower panels display the ratios of the measured cross sections and of the POWHEG gg $ \to $ H + xH theoretical prediction to the NNLOPS gg $ \to $ H + POWHEG xH theoretical predictions. |
png pdf |
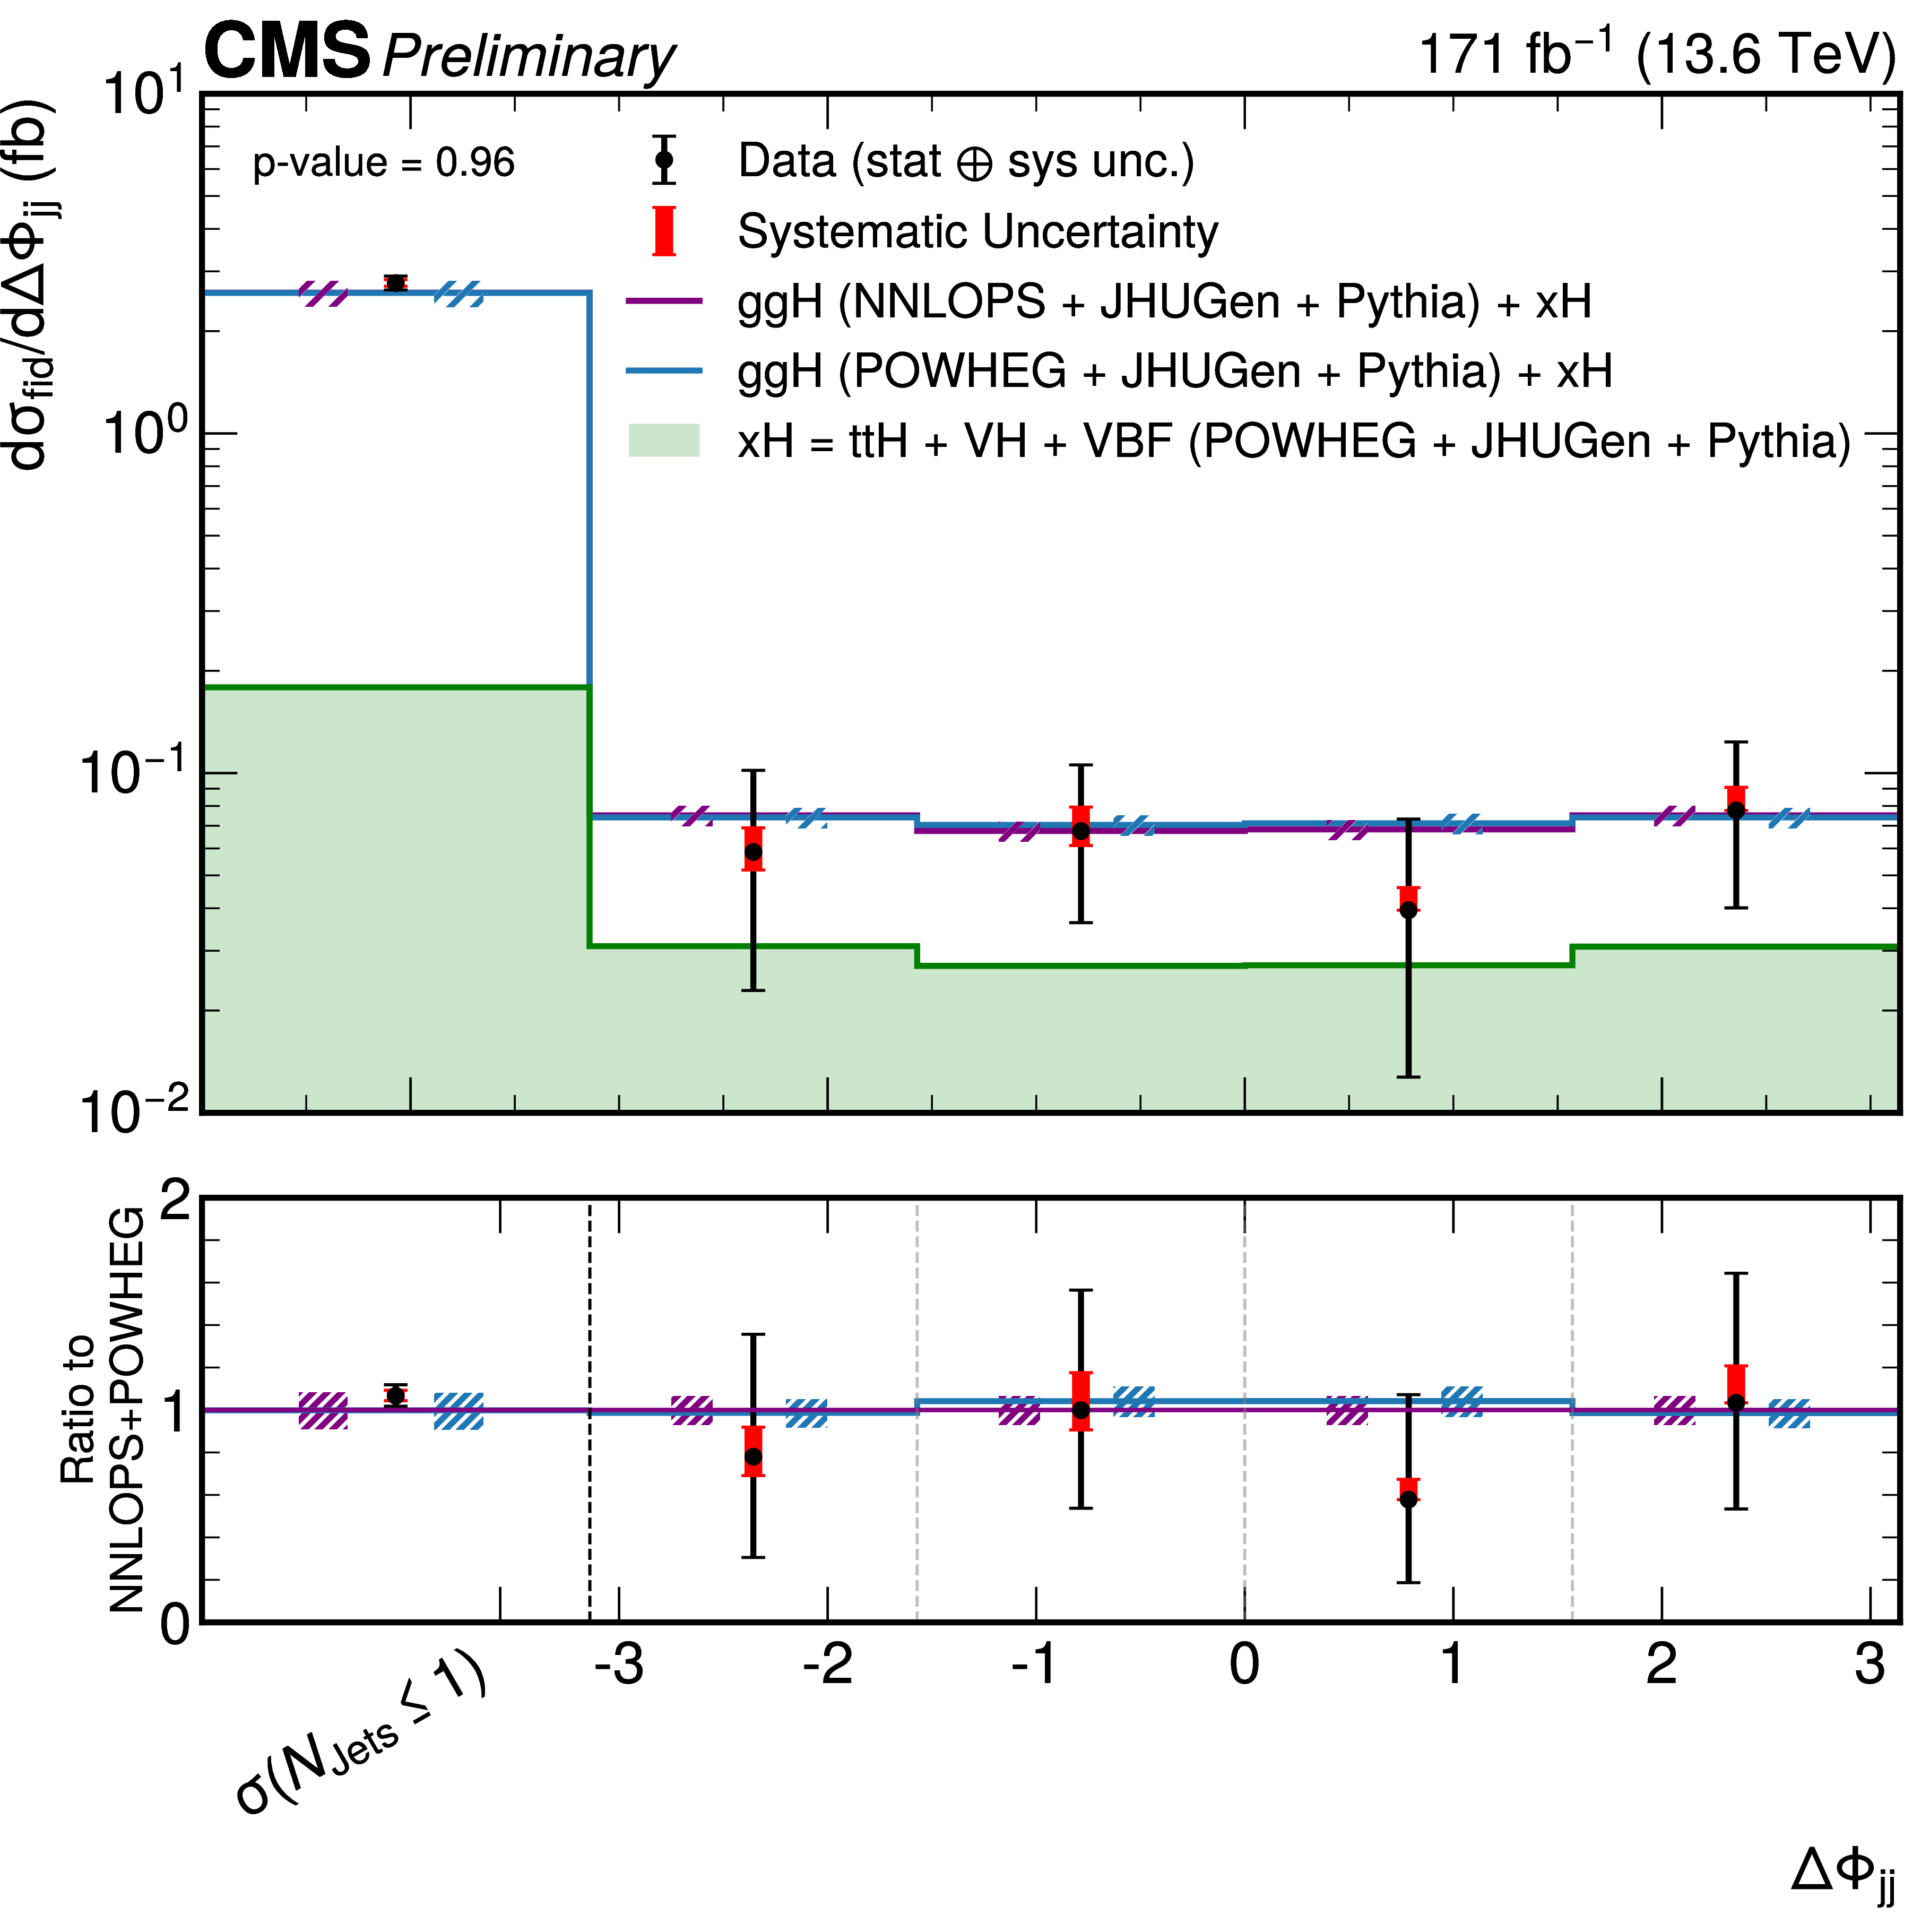
Figure 8-c:
Differential fiducial cross sections for the $ \mathrm{H}\to\mathrm{Z}\mathrm{Z}\to4\ell $ process as a function of the invariant mass of the two leading jets $ m_{jj} $ (top left), the absolute pseudorapidity separation between the two leading jets $ |\Delta \eta_{jj}| $ (top right) and the azimuthal angle difference between the two leading jets $ \Delta \phi_{jj} $ (bottom). The gg $ \to $ H predictions are shown for two different generators, POWHEG (blue) and NNLOPS (purple), normalized to the total cross section computed at next-to-next-to-next-to-leading order (N3LO), separately stacked over the the subdominant component of the signal from VBF + VH + t\=tH, denoted as xH (green). The hatched areas correspond to the systematic uncertainties in the theoretical predictions. Black points represent the measured fiducial cross sections in each bin, black error bars indicate the total uncertainty in each measurement, and red boxes denote the systematic uncertainties. The lower panels display the ratios of the measured cross sections and of the POWHEG gg $ \to $ H + xH theoretical prediction to the NNLOPS gg $ \to $ H + POWHEG xH theoretical predictions. |
png pdf |
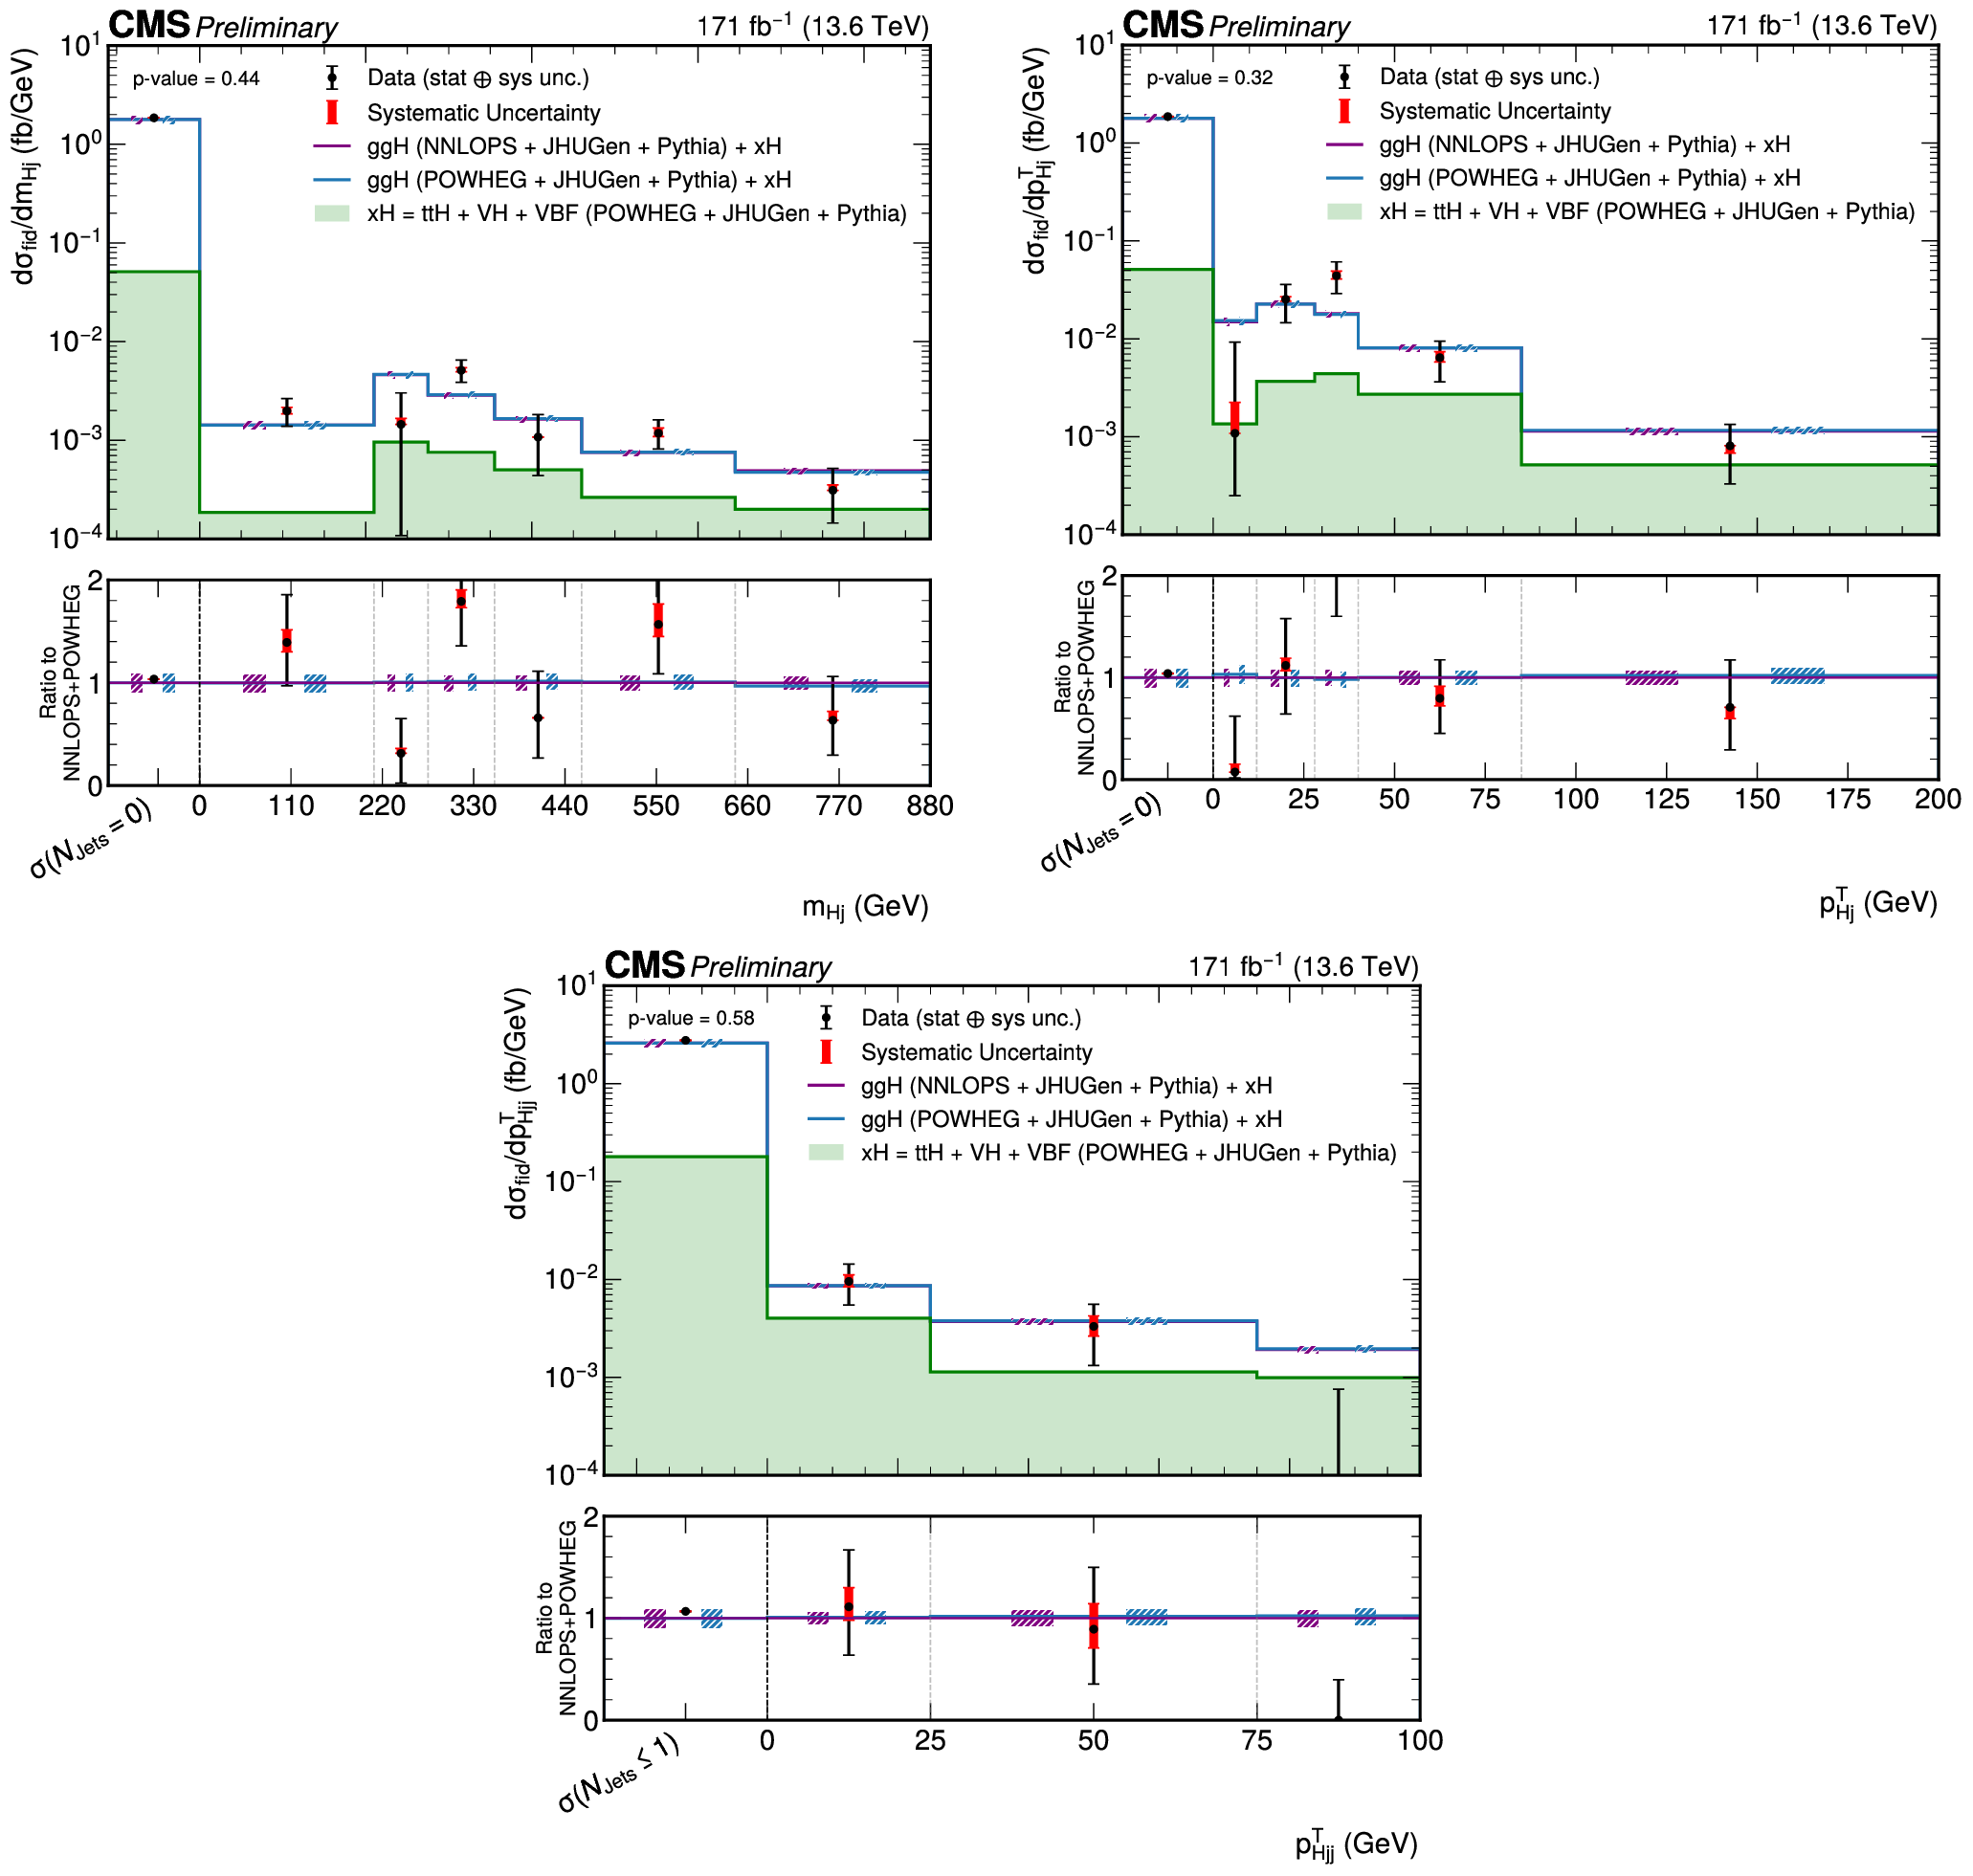
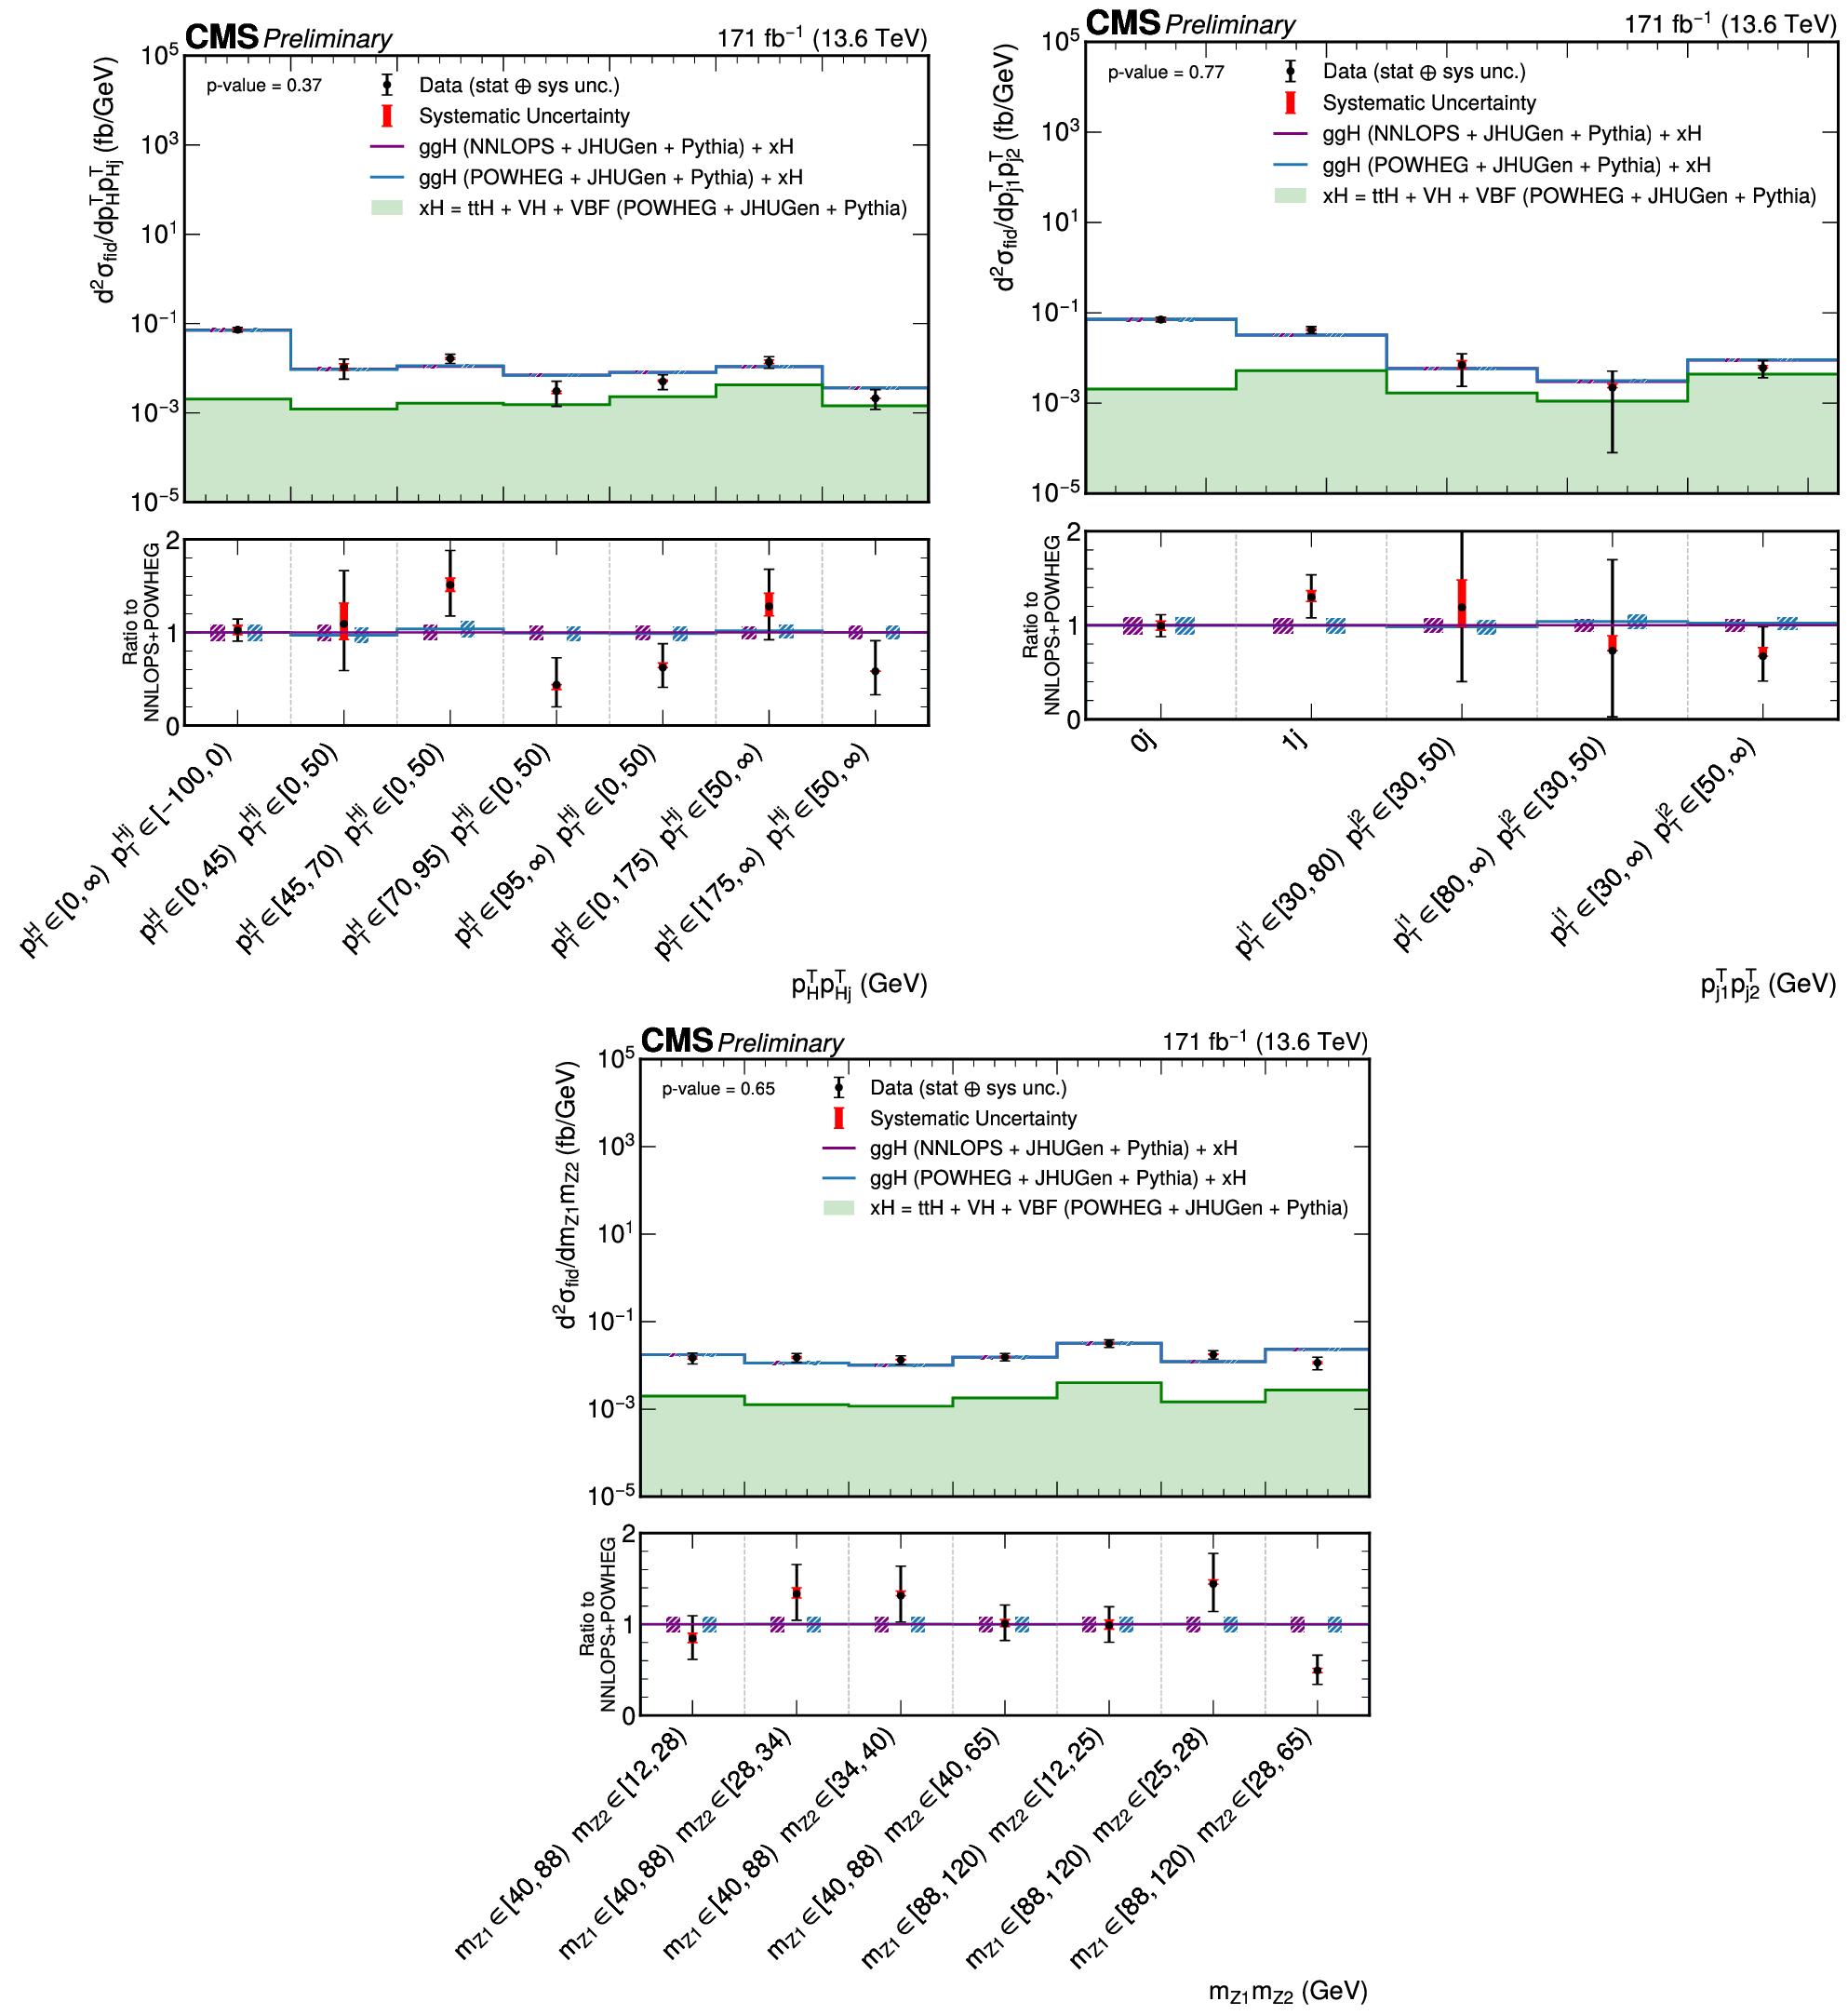
Figure 9:
Differential fiducial cross sections for the $ \mathrm{H}\to\mathrm{Z}\mathrm{Z}\to4\ell $ process as a function of the invariant mass of the $ \mathrm{H}+j $ system $ m_{\mathrm{H} j} $ (top left), where j is the leading jet in the event, the transverse momentum of the $ \mathrm{H}+j $ system $ p_{\mathrm{T}}^{\mathrm{H} j} $(top right) and the transverse momentum of the $ \mathrm{H}+jj $ system $ p_{\mathrm{T}}^{\mathrm{H} jj} $ (bottom). The gg $ \to $ H predictions are shown for two different generators, POWHEG (blue) and NNLOPS (purple), normalized to the total cross section computed at next-to-next-to-next-to-leading order (N3LO), separately stacked over the the subdominant component of the signal from VBF + VH + t\=tH, denoted as xH (green). The hatched areas correspond to the systematic uncertainties in the theoretical predictions. Black points represent the measured fiducial cross sections in each bin, black error bars indicate the total uncertainty in each measurement, and red boxes denote the systematic uncertainties. The lower panels display the ratios of the measured cross sections and of the POWHEG gg $ \to $ H + xH theoretical prediction to the NNLOPS gg $ \to $ H + POWHEG xH theoretical predictions. |
png pdf |
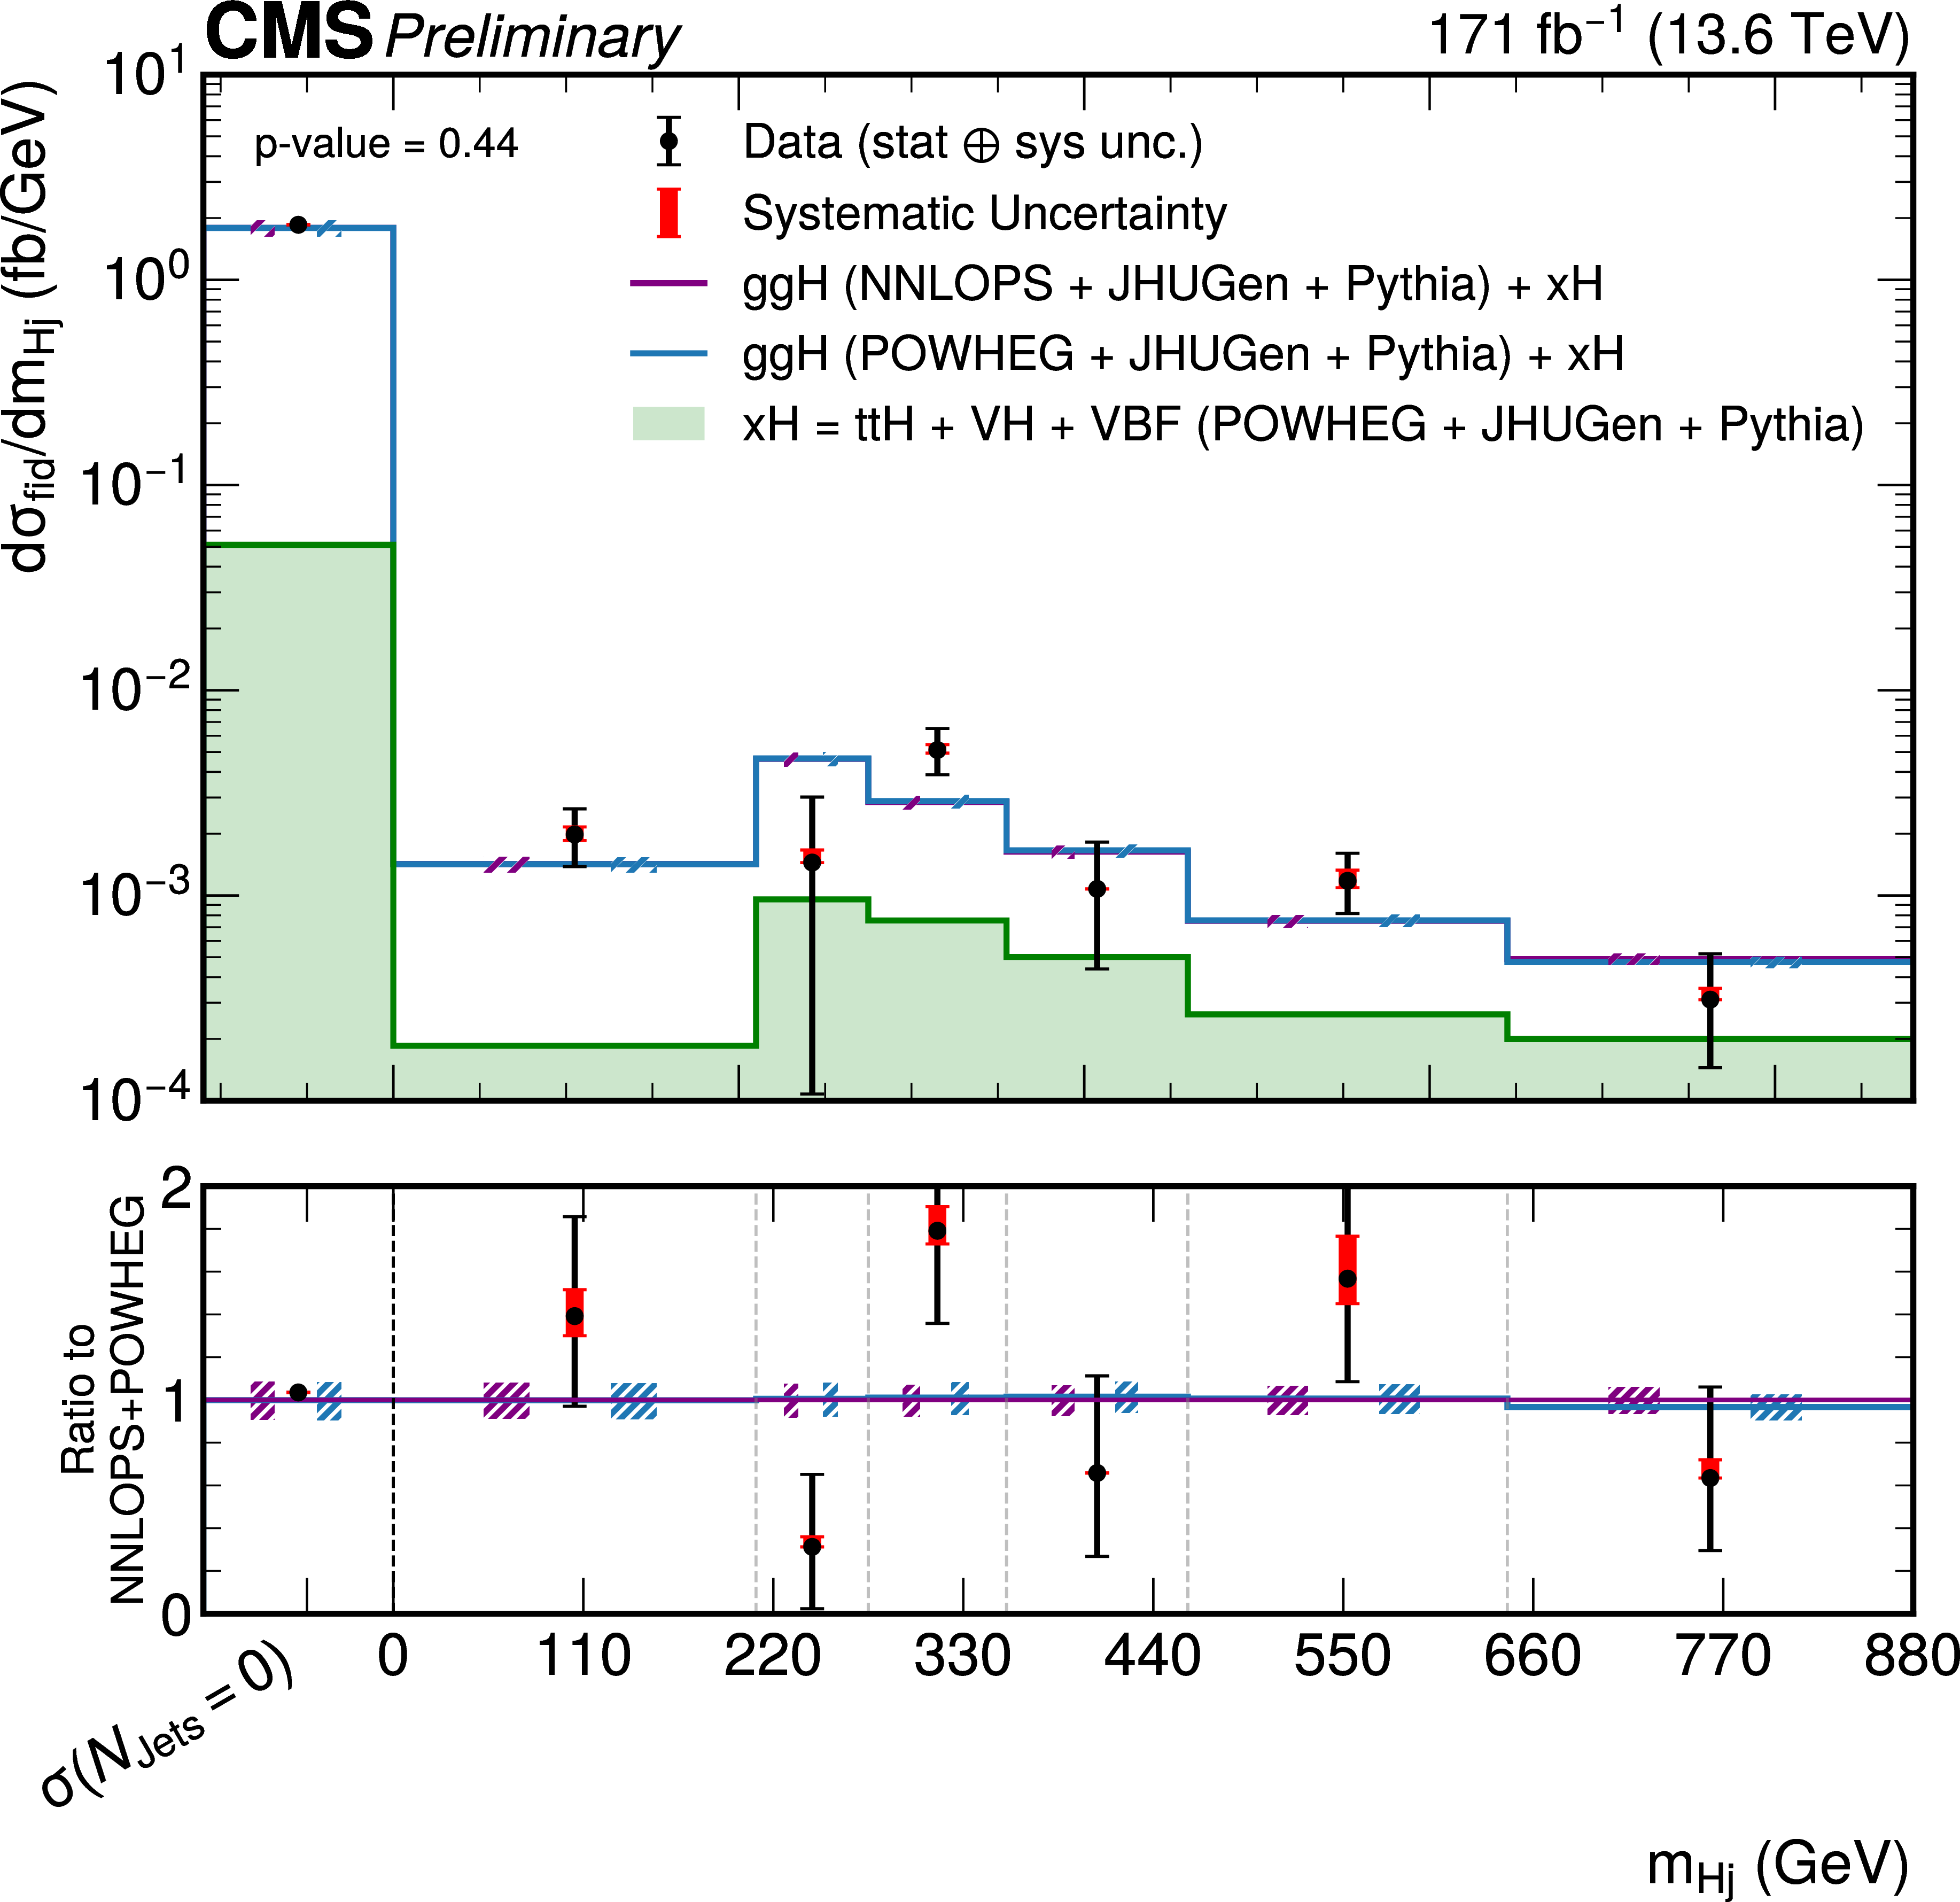
Figure 9-a:
Differential fiducial cross sections for the $ \mathrm{H}\to\mathrm{Z}\mathrm{Z}\to4\ell $ process as a function of the invariant mass of the $ \mathrm{H}+j $ system $ m_{\mathrm{H} j} $ (top left), where j is the leading jet in the event, the transverse momentum of the $ \mathrm{H}+j $ system $ p_{\mathrm{T}}^{\mathrm{H} j} $(top right) and the transverse momentum of the $ \mathrm{H}+jj $ system $ p_{\mathrm{T}}^{\mathrm{H} jj} $ (bottom). The gg $ \to $ H predictions are shown for two different generators, POWHEG (blue) and NNLOPS (purple), normalized to the total cross section computed at next-to-next-to-next-to-leading order (N3LO), separately stacked over the the subdominant component of the signal from VBF + VH + t\=tH, denoted as xH (green). The hatched areas correspond to the systematic uncertainties in the theoretical predictions. Black points represent the measured fiducial cross sections in each bin, black error bars indicate the total uncertainty in each measurement, and red boxes denote the systematic uncertainties. The lower panels display the ratios of the measured cross sections and of the POWHEG gg $ \to $ H + xH theoretical prediction to the NNLOPS gg $ \to $ H + POWHEG xH theoretical predictions. |
png pdf |
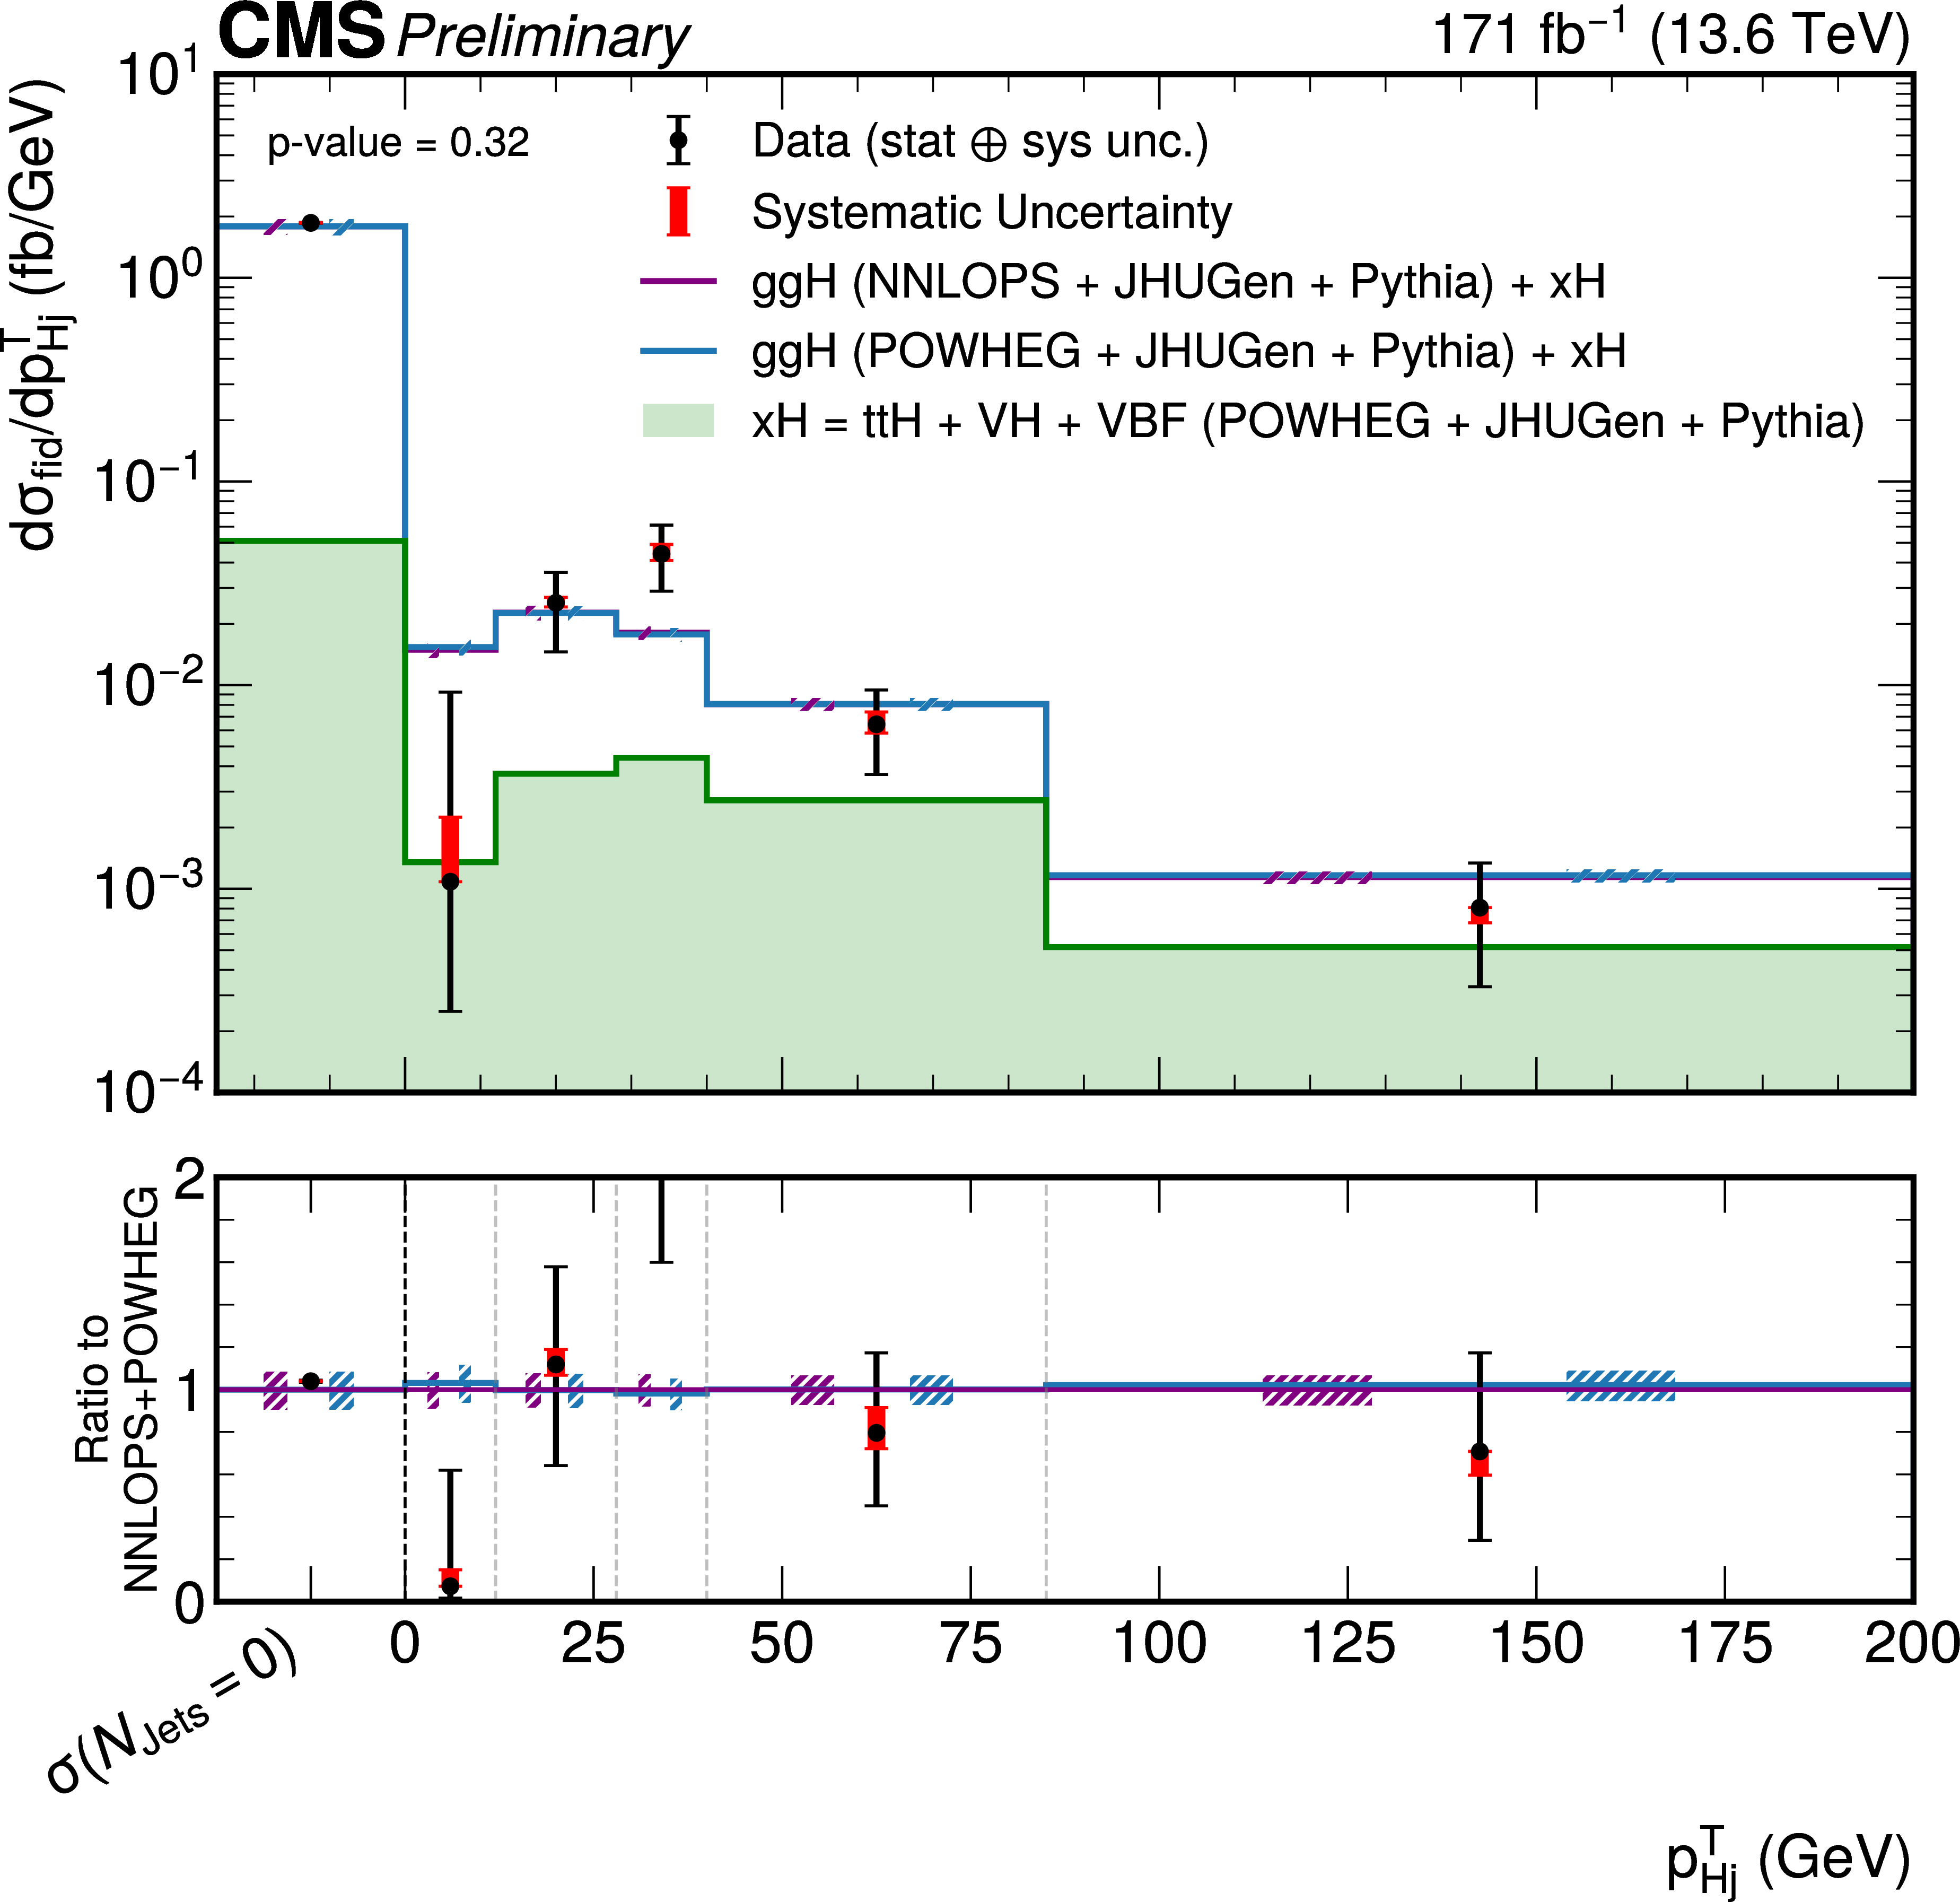
Figure 9-b:
Differential fiducial cross sections for the $ \mathrm{H}\to\mathrm{Z}\mathrm{Z}\to4\ell $ process as a function of the invariant mass of the $ \mathrm{H}+j $ system $ m_{\mathrm{H} j} $ (top left), where j is the leading jet in the event, the transverse momentum of the $ \mathrm{H}+j $ system $ p_{\mathrm{T}}^{\mathrm{H} j} $(top right) and the transverse momentum of the $ \mathrm{H}+jj $ system $ p_{\mathrm{T}}^{\mathrm{H} jj} $ (bottom). The gg $ \to $ H predictions are shown for two different generators, POWHEG (blue) and NNLOPS (purple), normalized to the total cross section computed at next-to-next-to-next-to-leading order (N3LO), separately stacked over the the subdominant component of the signal from VBF + VH + t\=tH, denoted as xH (green). The hatched areas correspond to the systematic uncertainties in the theoretical predictions. Black points represent the measured fiducial cross sections in each bin, black error bars indicate the total uncertainty in each measurement, and red boxes denote the systematic uncertainties. The lower panels display the ratios of the measured cross sections and of the POWHEG gg $ \to $ H + xH theoretical prediction to the NNLOPS gg $ \to $ H + POWHEG xH theoretical predictions. |
png pdf |
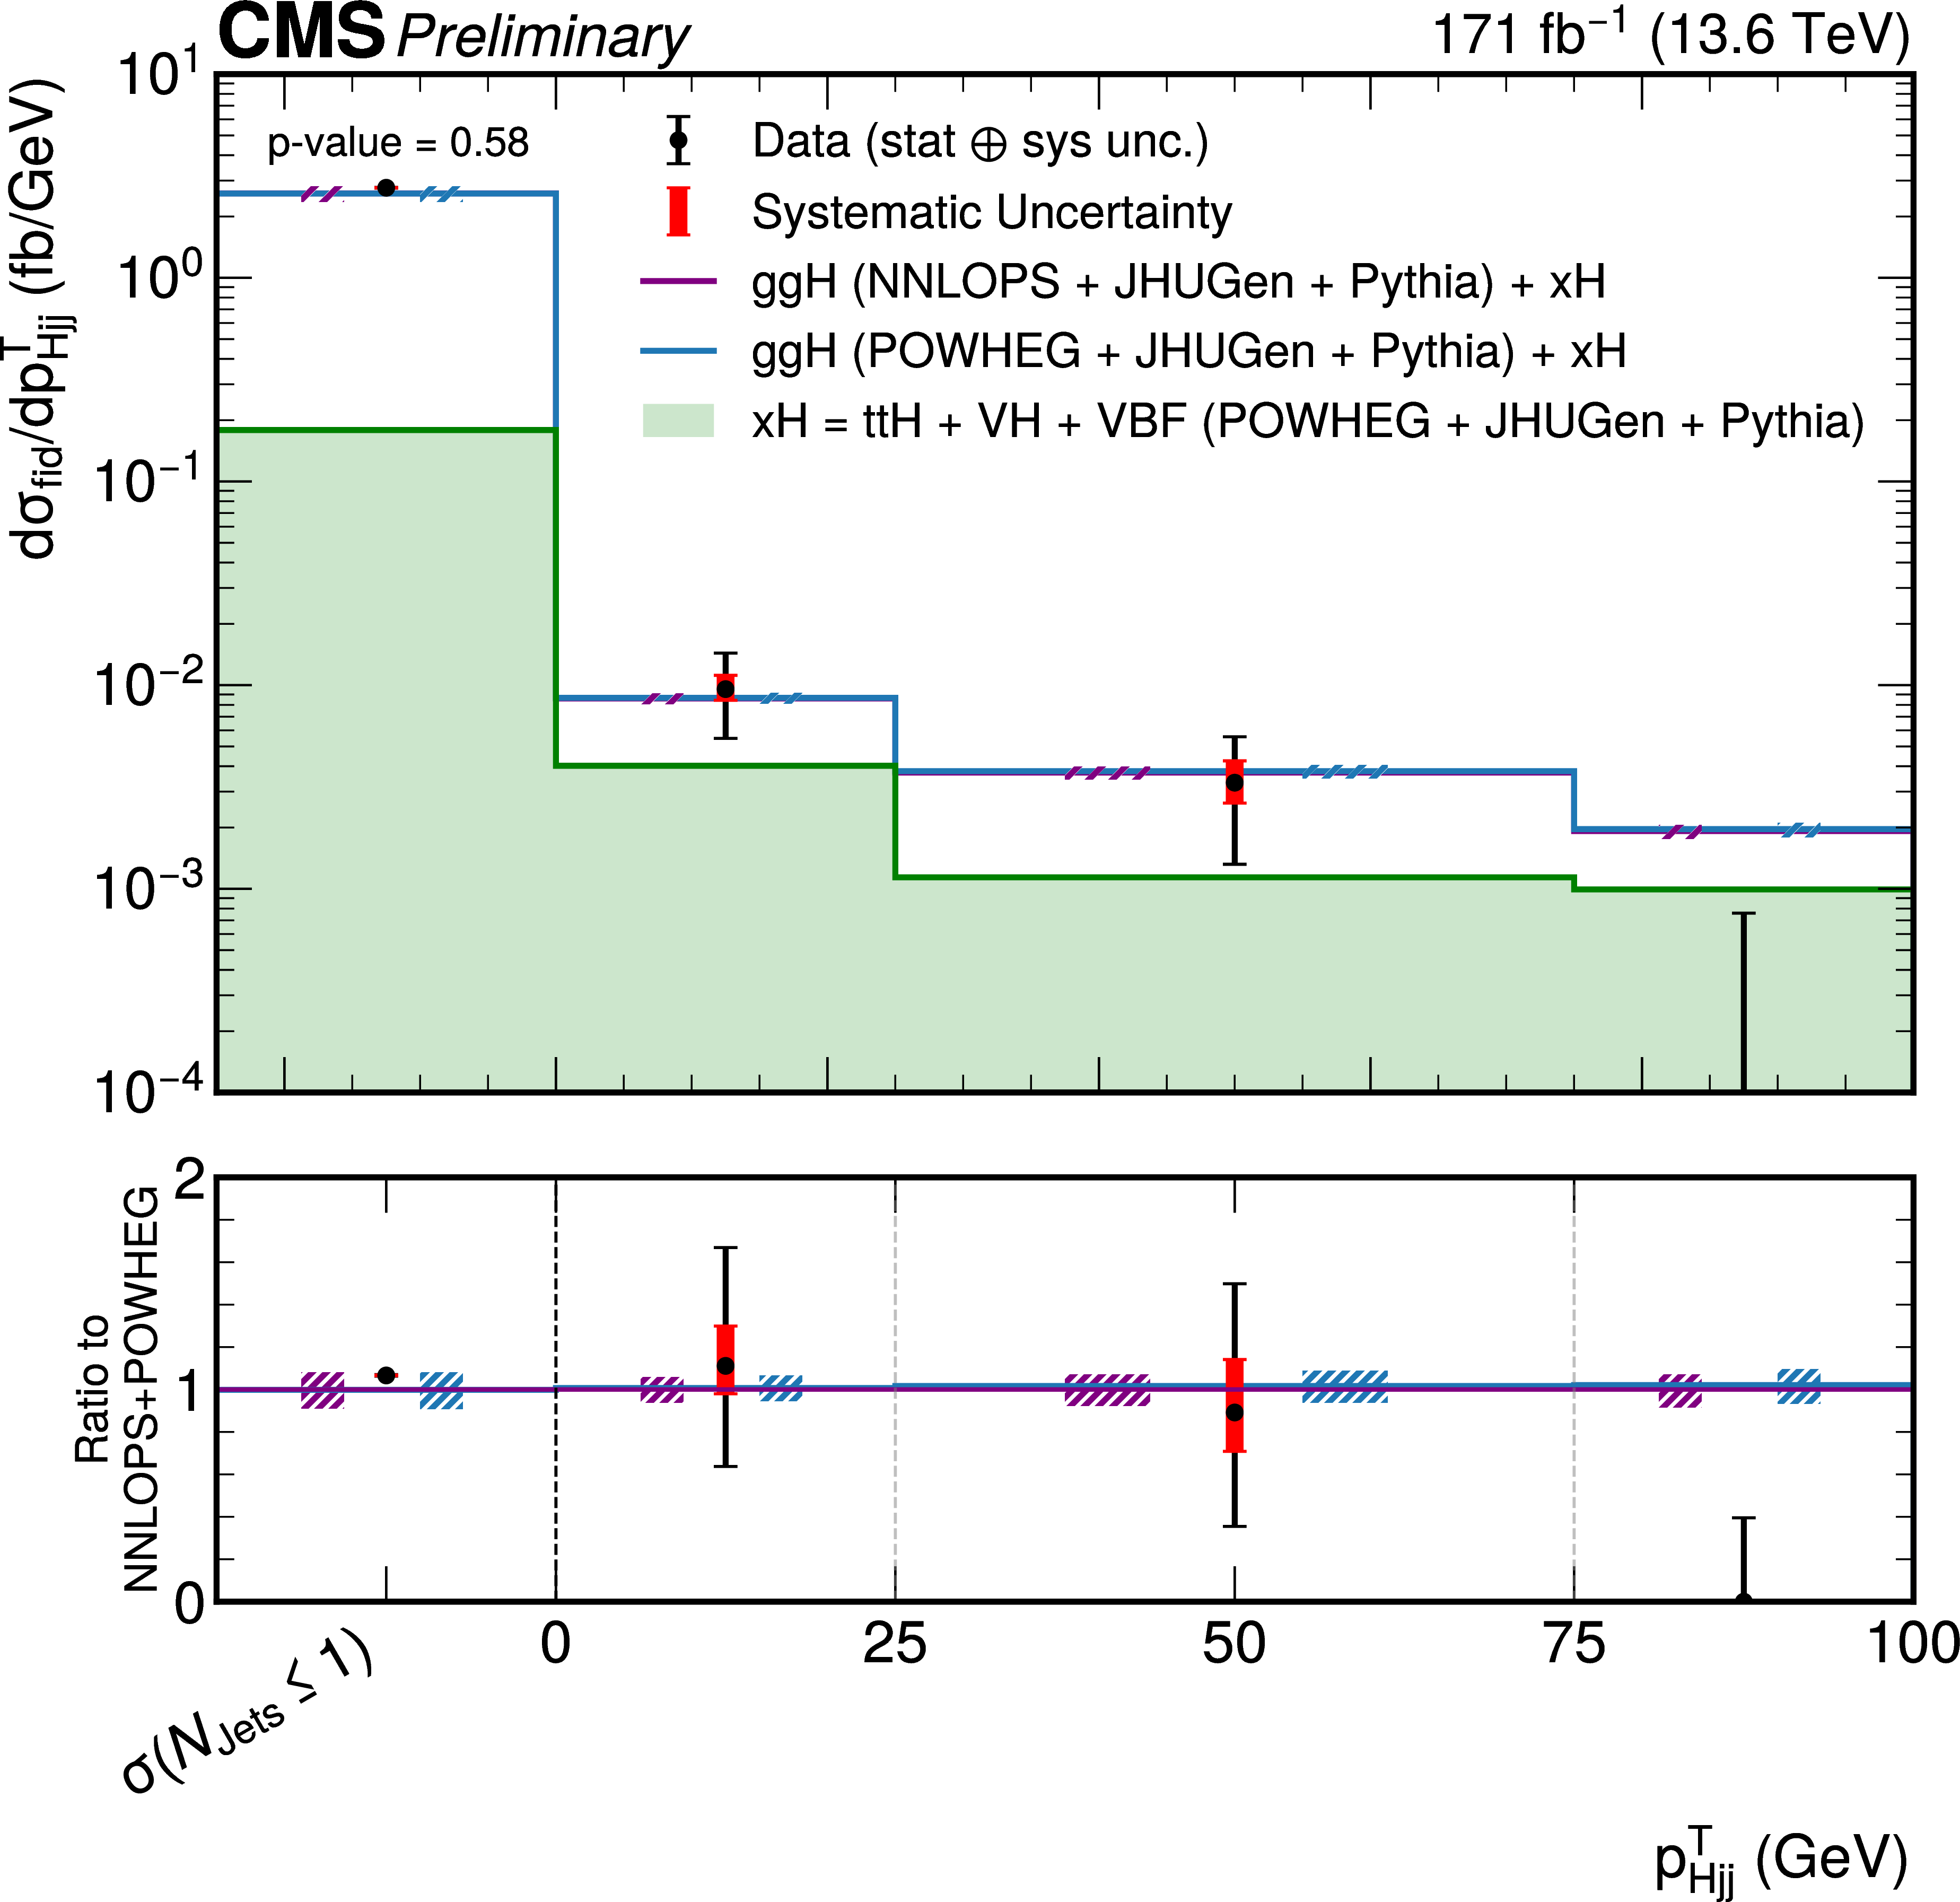
Figure 9-c:
Differential fiducial cross sections for the $ \mathrm{H}\to\mathrm{Z}\mathrm{Z}\to4\ell $ process as a function of the invariant mass of the $ \mathrm{H}+j $ system $ m_{\mathrm{H} j} $ (top left), where j is the leading jet in the event, the transverse momentum of the $ \mathrm{H}+j $ system $ p_{\mathrm{T}}^{\mathrm{H} j} $(top right) and the transverse momentum of the $ \mathrm{H}+jj $ system $ p_{\mathrm{T}}^{\mathrm{H} jj} $ (bottom). The gg $ \to $ H predictions are shown for two different generators, POWHEG (blue) and NNLOPS (purple), normalized to the total cross section computed at next-to-next-to-next-to-leading order (N3LO), separately stacked over the the subdominant component of the signal from VBF + VH + t\=tH, denoted as xH (green). The hatched areas correspond to the systematic uncertainties in the theoretical predictions. Black points represent the measured fiducial cross sections in each bin, black error bars indicate the total uncertainty in each measurement, and red boxes denote the systematic uncertainties. The lower panels display the ratios of the measured cross sections and of the POWHEG gg $ \to $ H + xH theoretical prediction to the NNLOPS gg $ \to $ H + POWHEG xH theoretical predictions. |
png pdf |
Figure 10:
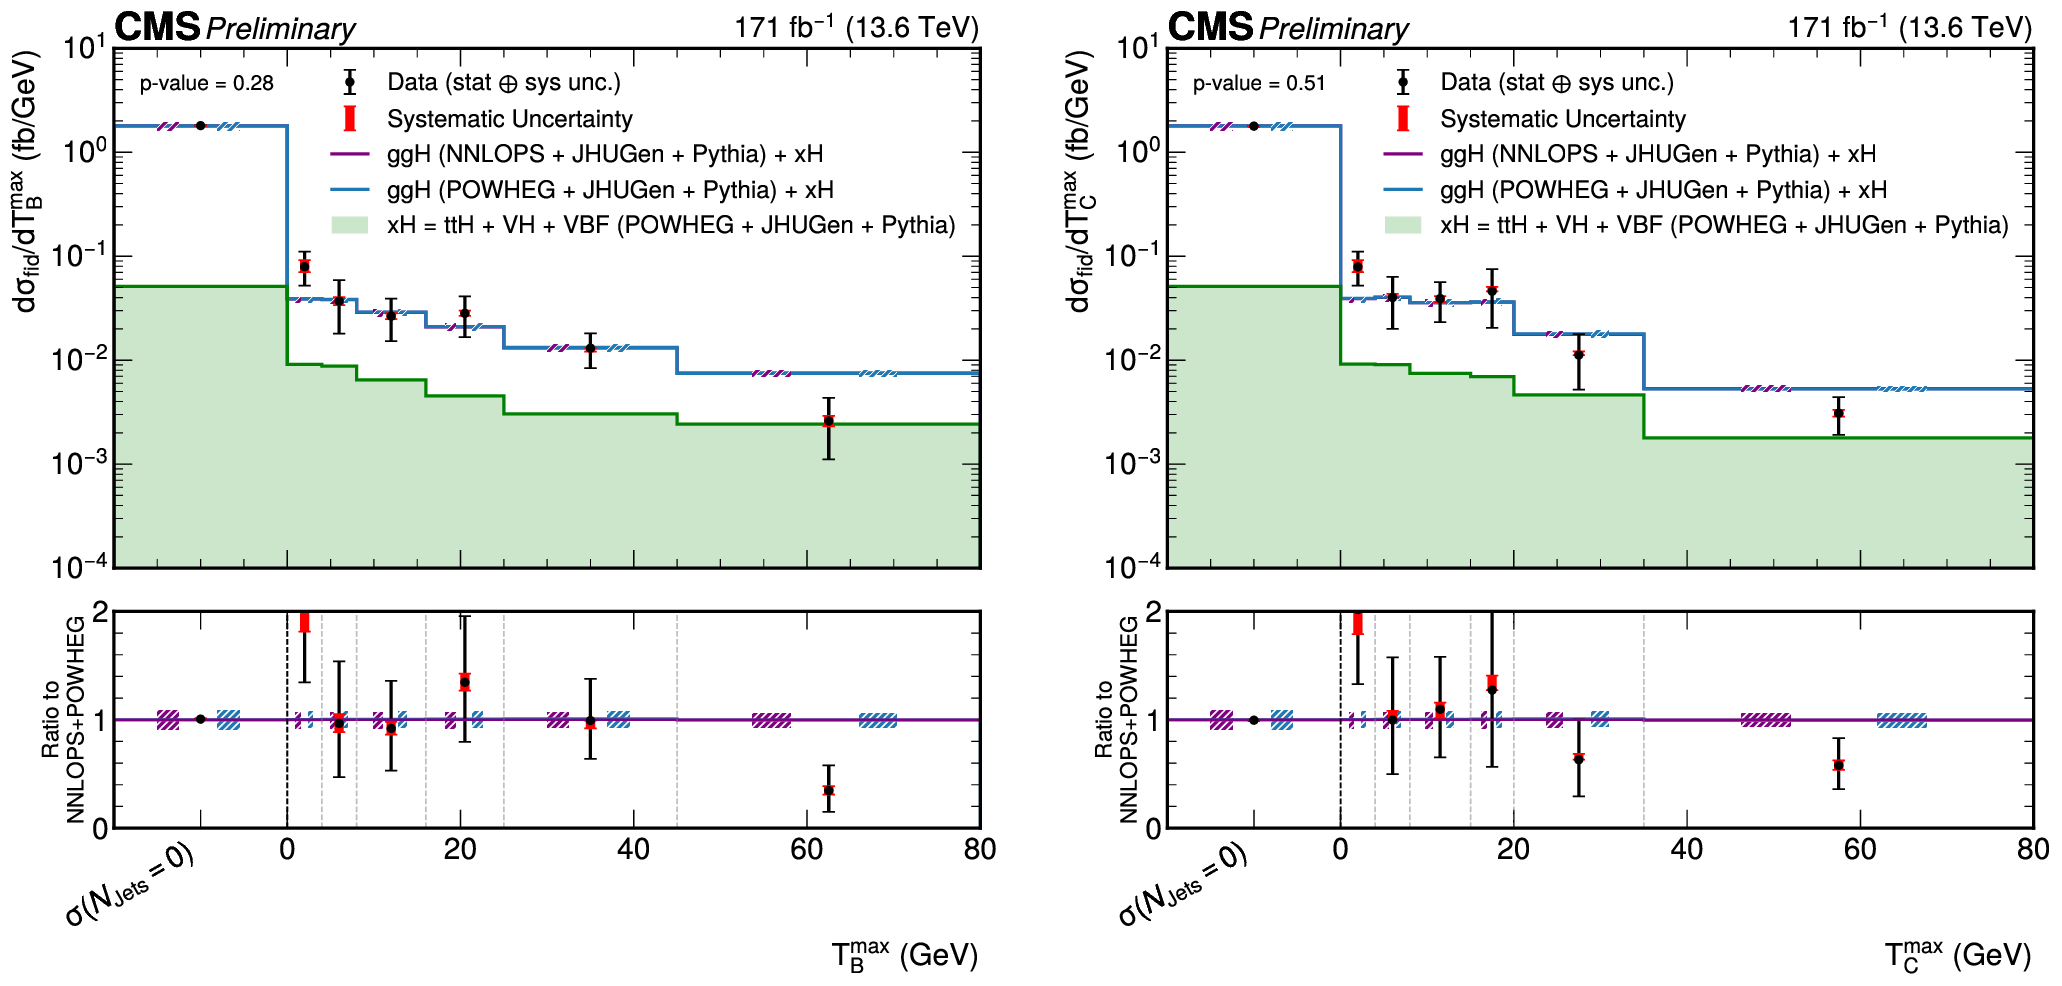
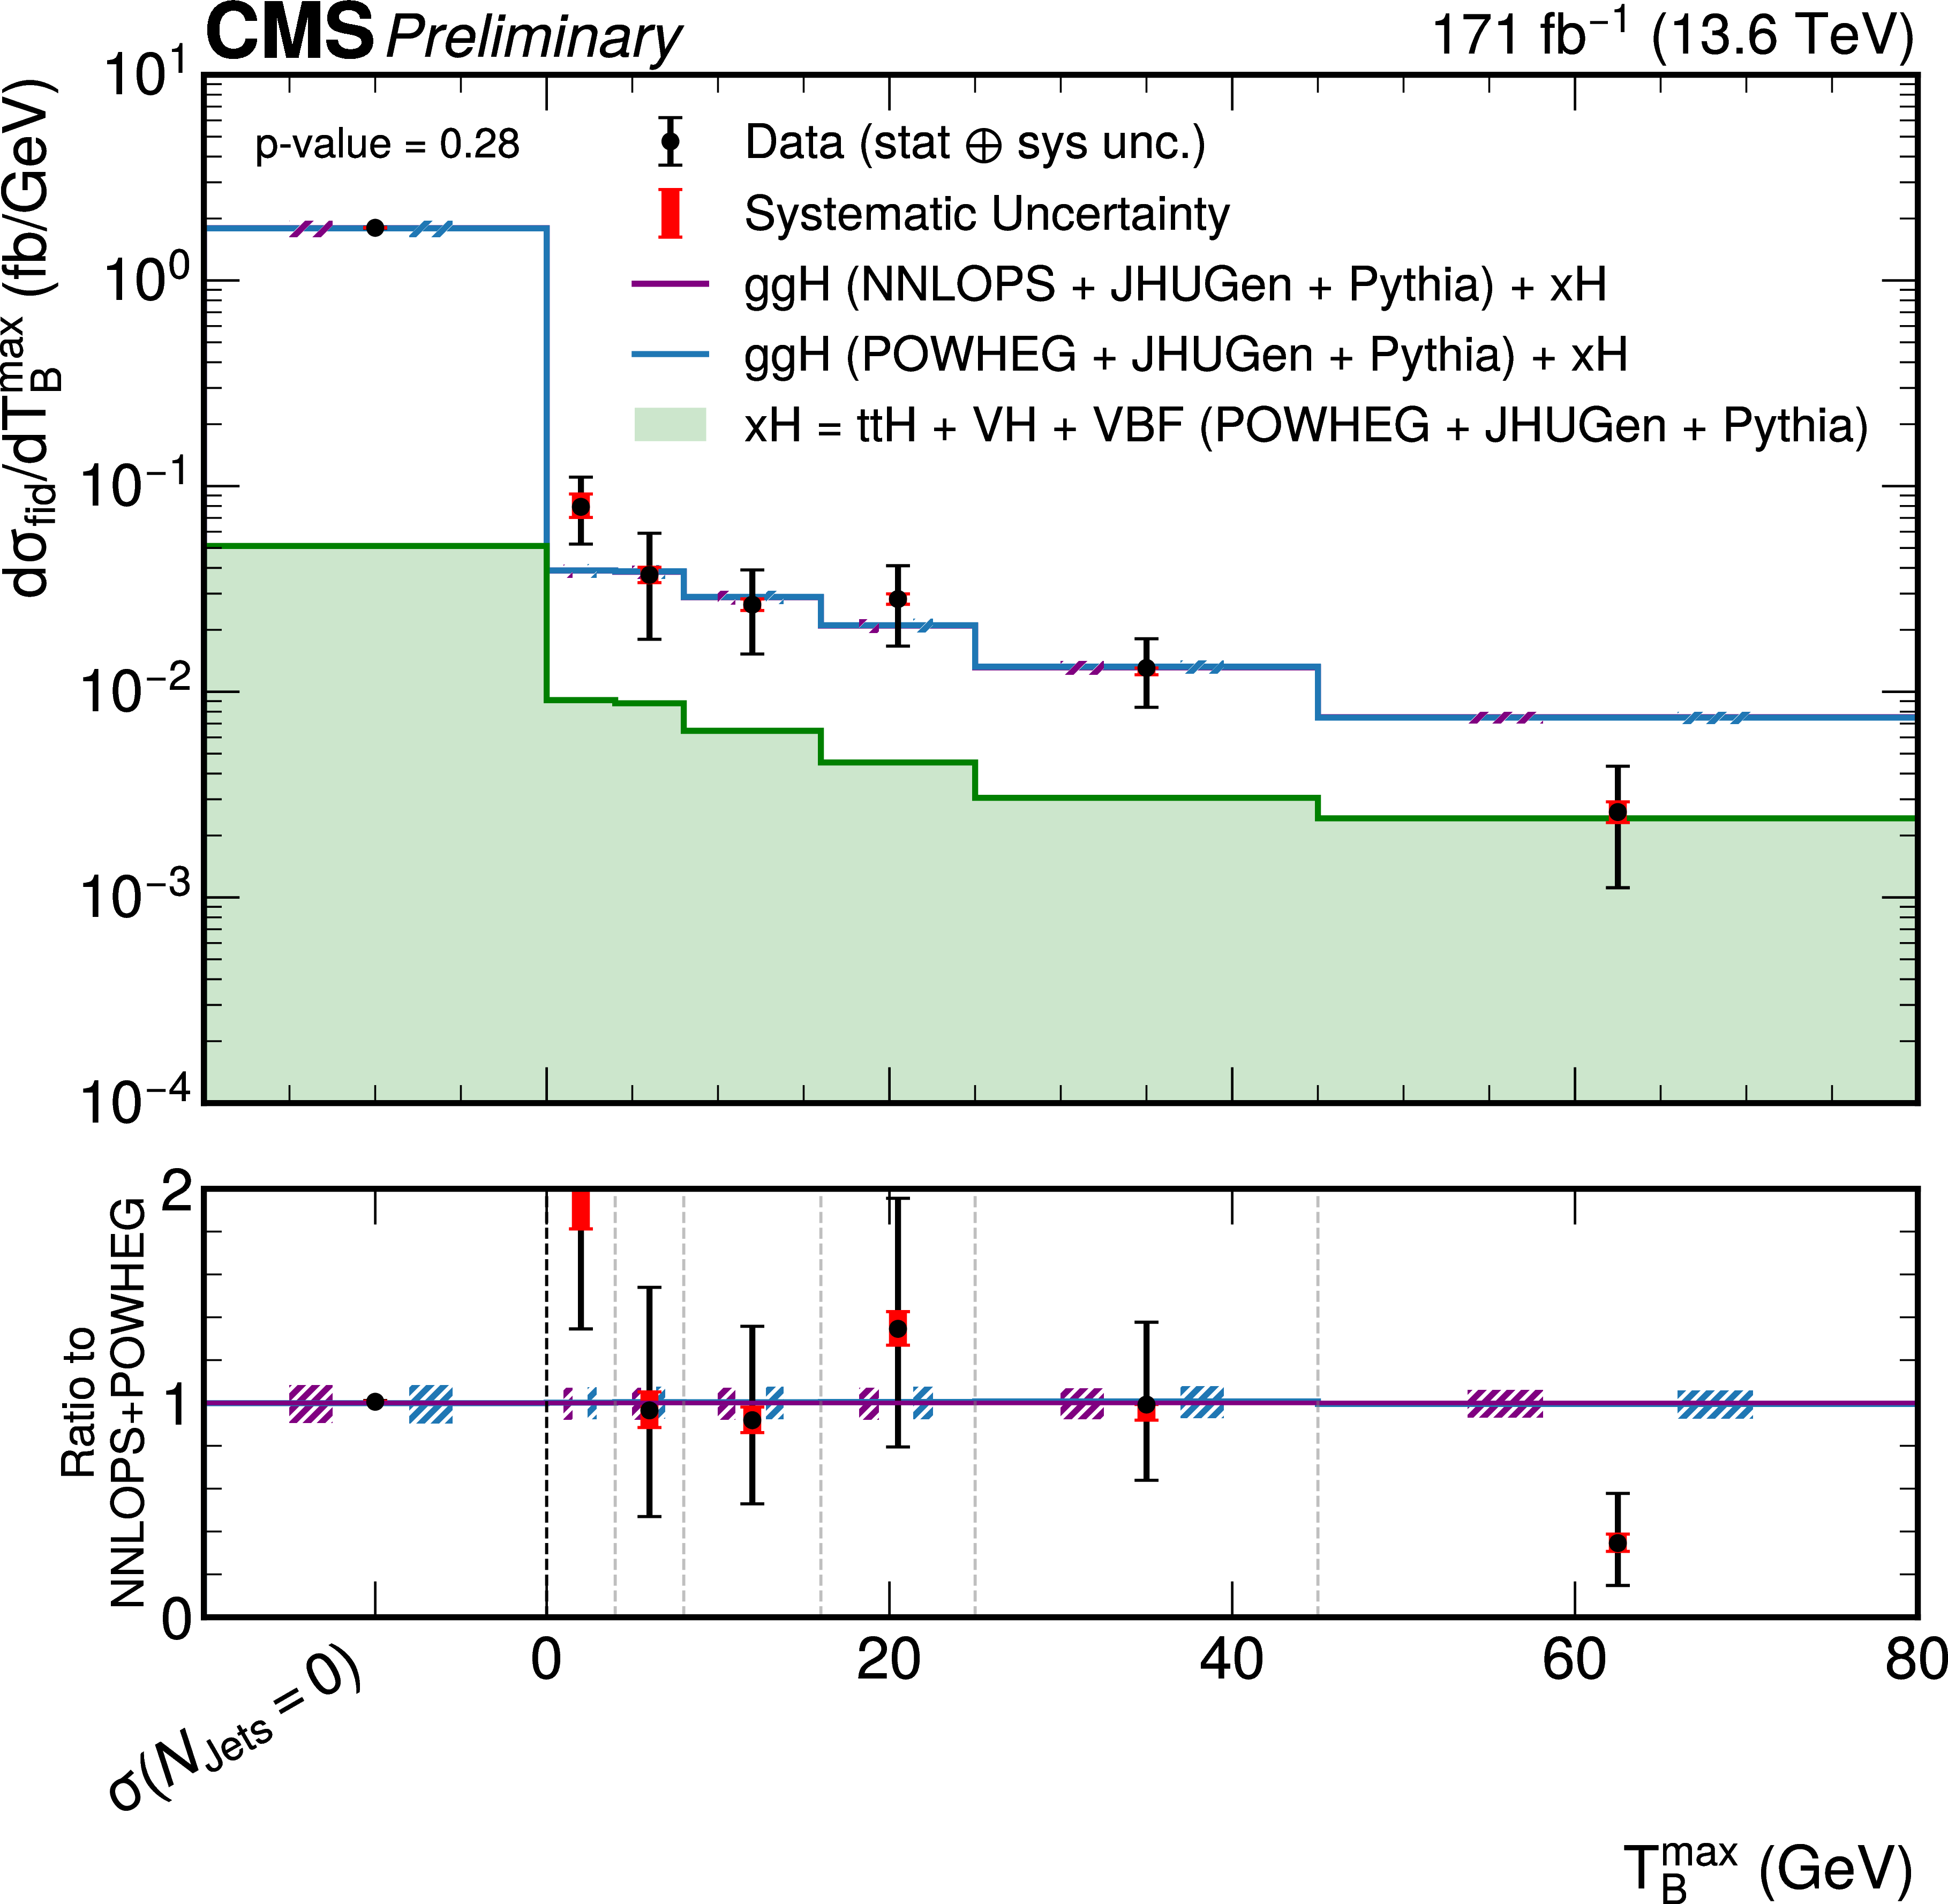
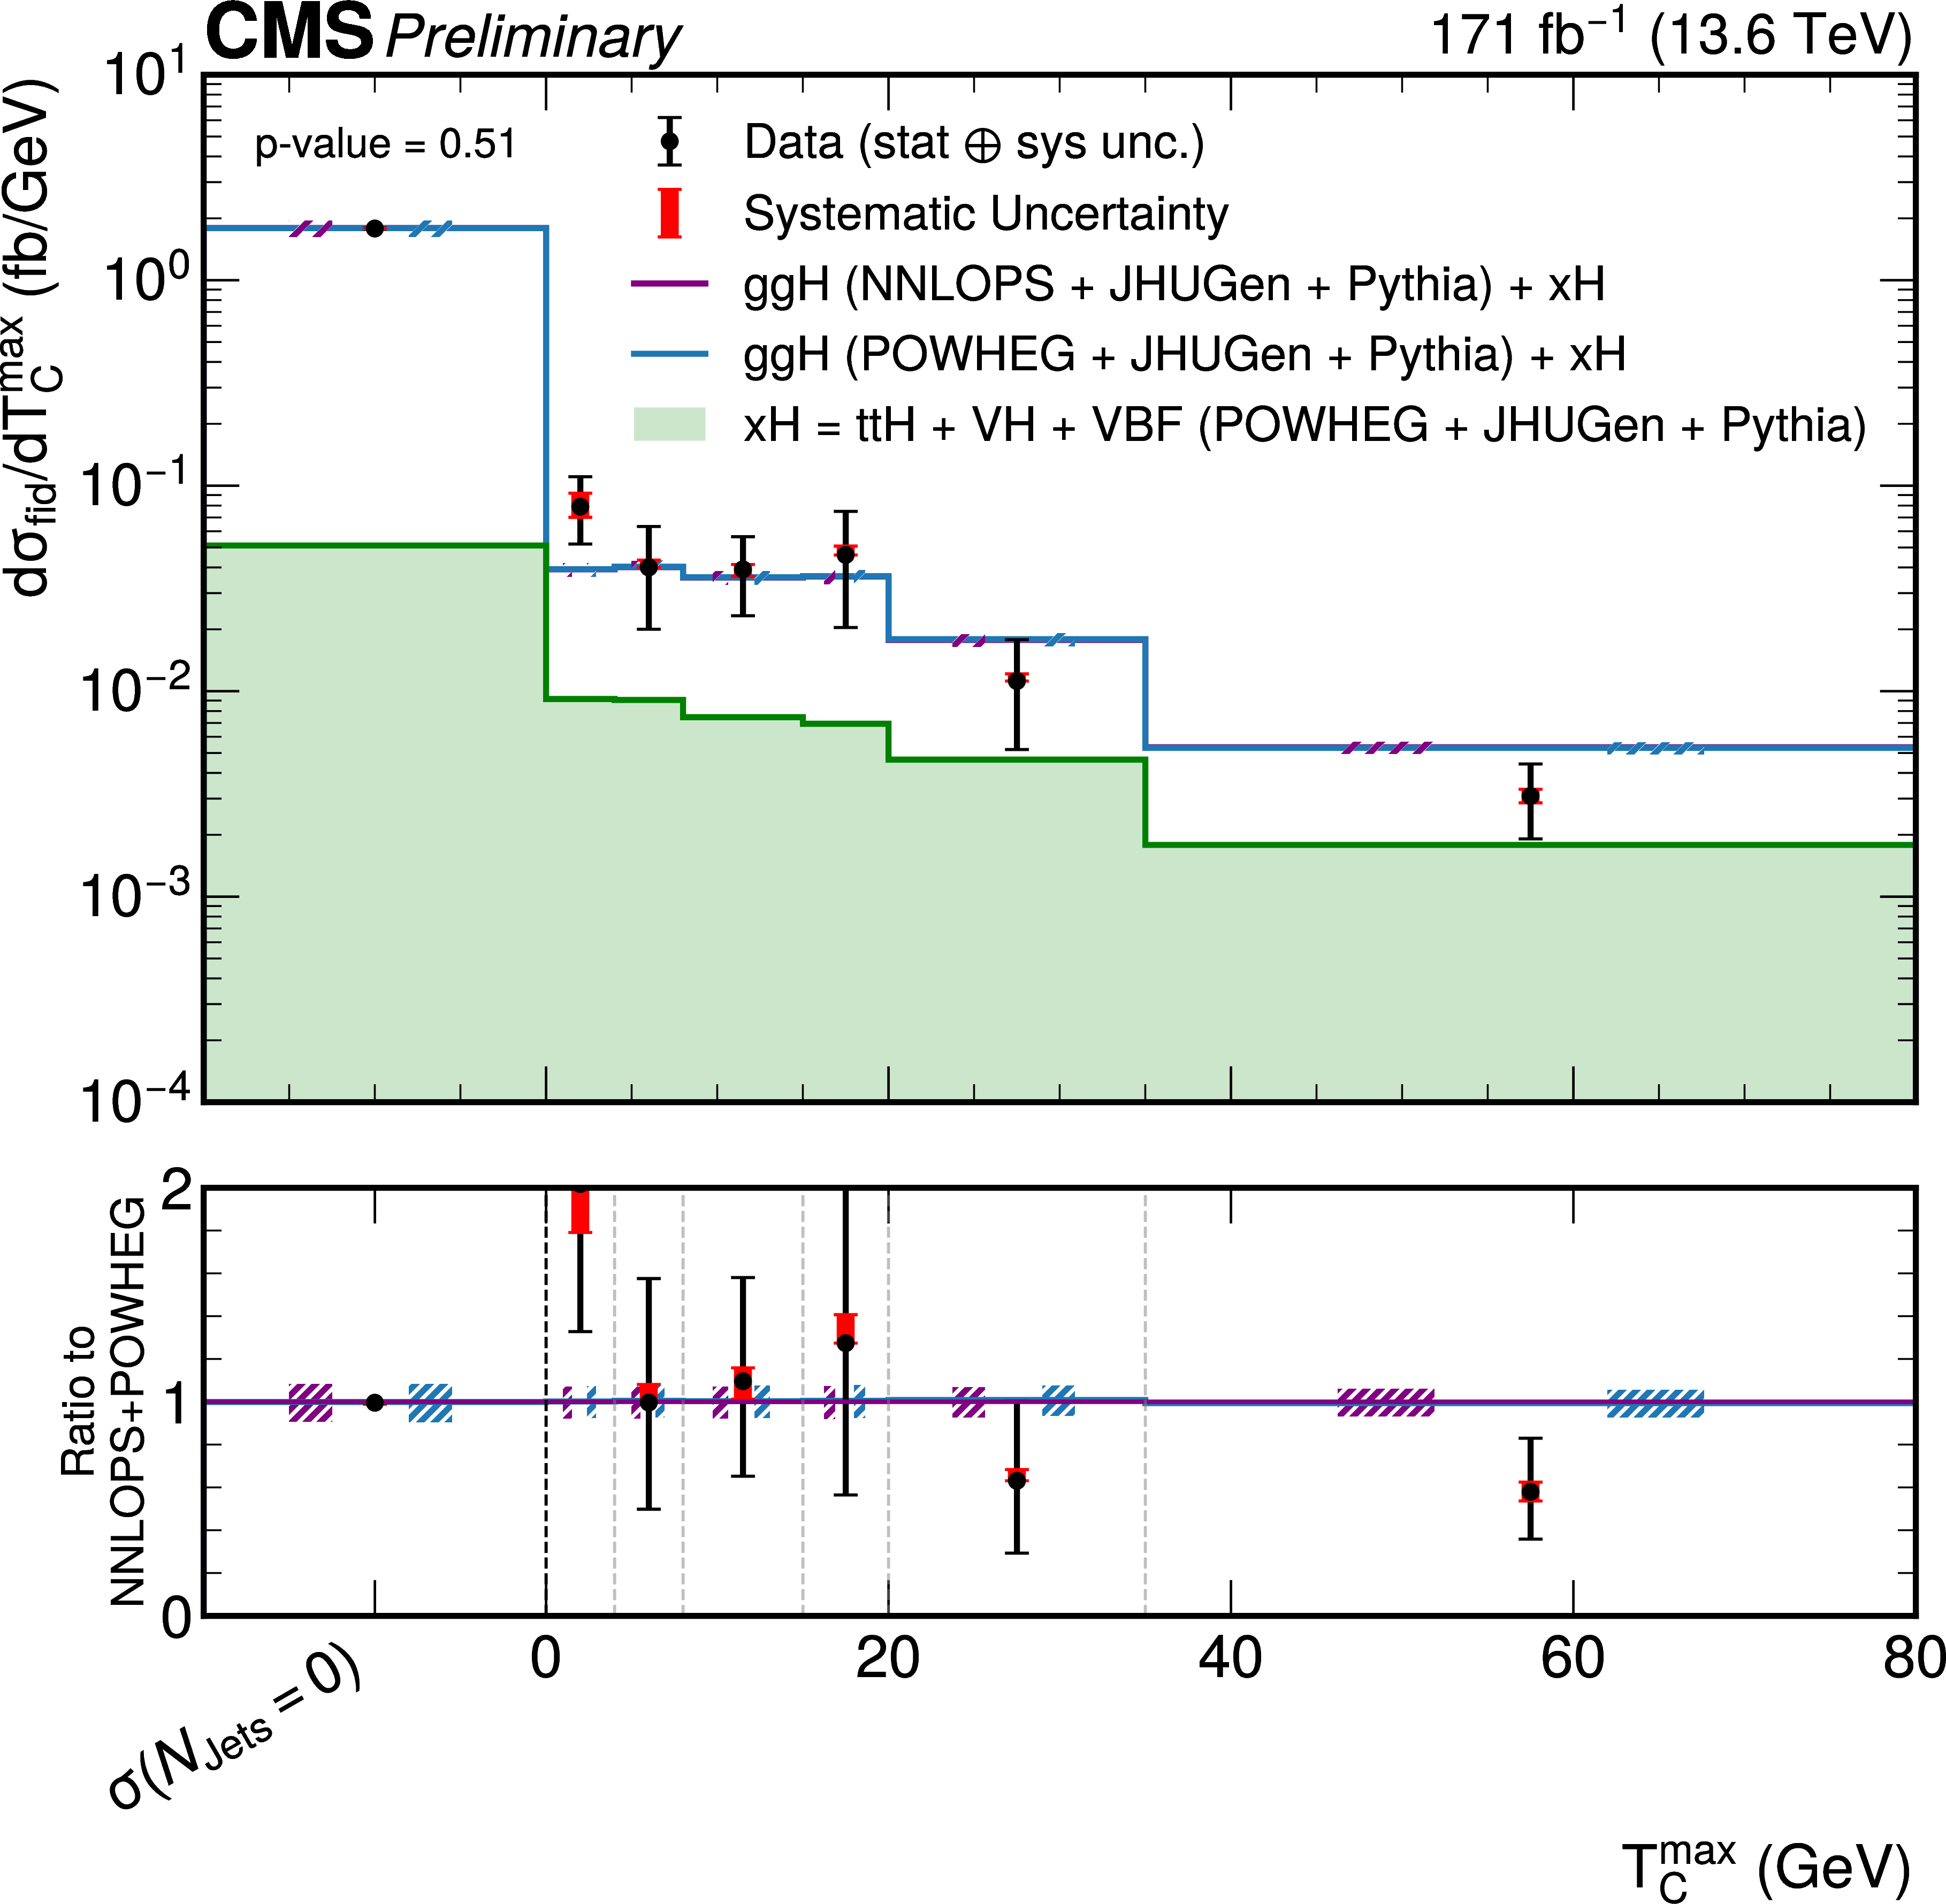
Differential fiducial cross sections for the $ \mathrm{H}\to\mathrm{Z}\mathrm{Z}\to4\ell $ process as a function of the rapidity-weighed jet-observables \texttt\(\mathcalT_B^\textmax\) (left) and \texttt\(\mathcalT_C^\textmax\) (right). The gg $ \to $ H predictions are shown for two different generators, POWHEG (blue) and NNLOPS (purple), normalized to the total cross section computed at next-to-next-to-next-to-leading order (N3LO), separately stacked over the the subdominant component of the signal from VBF + VH + t\=tH, denoted as xH (green). The hatched areas correspond to the systematic uncertainties in the theoretical predictions. Black points represent the measured fiducial cross sections in each bin, black error bars indicate the total uncertainty in each measurement, and red boxes denote the systematic uncertainties. The lower panels display the ratios of the measured cross sections and of the POWHEG gg $ \to $ H + xH theoretical prediction to the NNLOPS gg $ \to $ H + POWHEG xH theoretical predictions. |
png pdf |
Figure 10-a:
Differential fiducial cross sections for the $ \mathrm{H}\to\mathrm{Z}\mathrm{Z}\to4\ell $ process as a function of the rapidity-weighed jet-observables \texttt\(\mathcalT_B^\textmax\) (left) and \texttt\(\mathcalT_C^\textmax\) (right). The gg $ \to $ H predictions are shown for two different generators, POWHEG (blue) and NNLOPS (purple), normalized to the total cross section computed at next-to-next-to-next-to-leading order (N3LO), separately stacked over the the subdominant component of the signal from VBF + VH + t\=tH, denoted as xH (green). The hatched areas correspond to the systematic uncertainties in the theoretical predictions. Black points represent the measured fiducial cross sections in each bin, black error bars indicate the total uncertainty in each measurement, and red boxes denote the systematic uncertainties. The lower panels display the ratios of the measured cross sections and of the POWHEG gg $ \to $ H + xH theoretical prediction to the NNLOPS gg $ \to $ H + POWHEG xH theoretical predictions. |
png pdf |
Figure 10-b:
Differential fiducial cross sections for the $ \mathrm{H}\to\mathrm{Z}\mathrm{Z}\to4\ell $ process as a function of the rapidity-weighed jet-observables \texttt\(\mathcalT_B^\textmax\) (left) and \texttt\(\mathcalT_C^\textmax\) (right). The gg $ \to $ H predictions are shown for two different generators, POWHEG (blue) and NNLOPS (purple), normalized to the total cross section computed at next-to-next-to-next-to-leading order (N3LO), separately stacked over the the subdominant component of the signal from VBF + VH + t\=tH, denoted as xH (green). The hatched areas correspond to the systematic uncertainties in the theoretical predictions. Black points represent the measured fiducial cross sections in each bin, black error bars indicate the total uncertainty in each measurement, and red boxes denote the systematic uncertainties. The lower panels display the ratios of the measured cross sections and of the POWHEG gg $ \to $ H + xH theoretical prediction to the NNLOPS gg $ \to $ H + POWHEG xH theoretical predictions. |
png pdf |
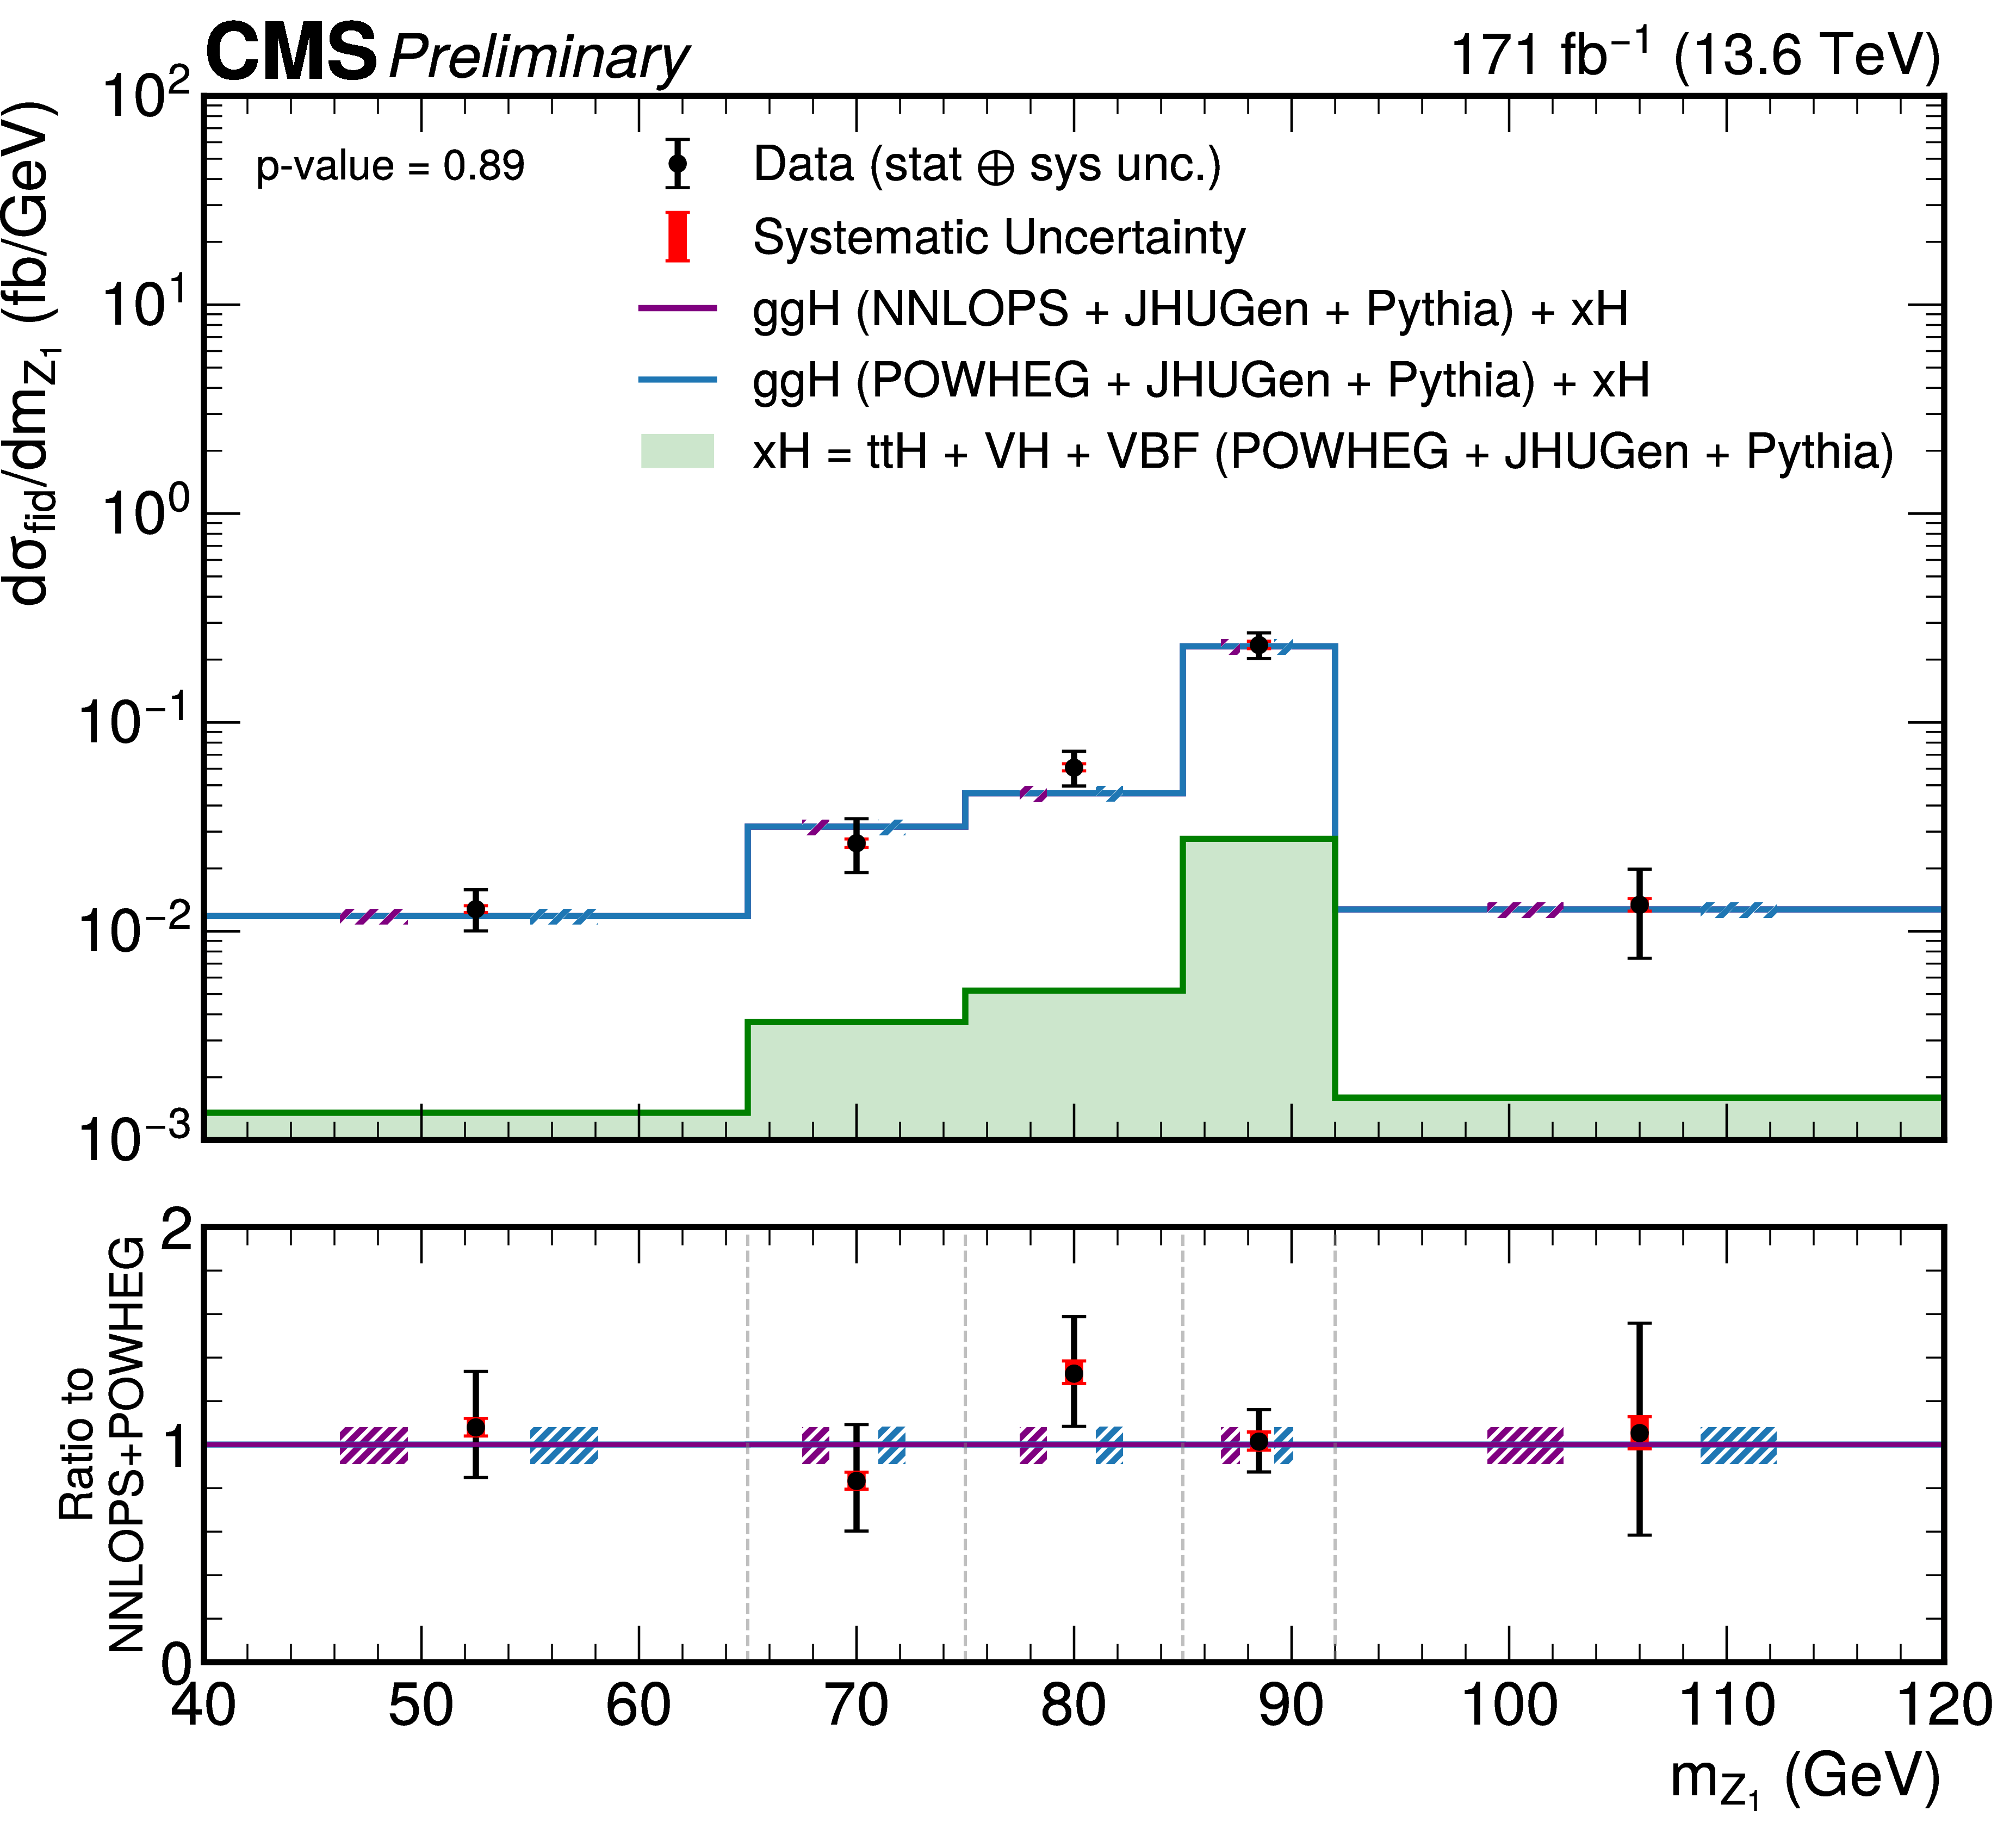
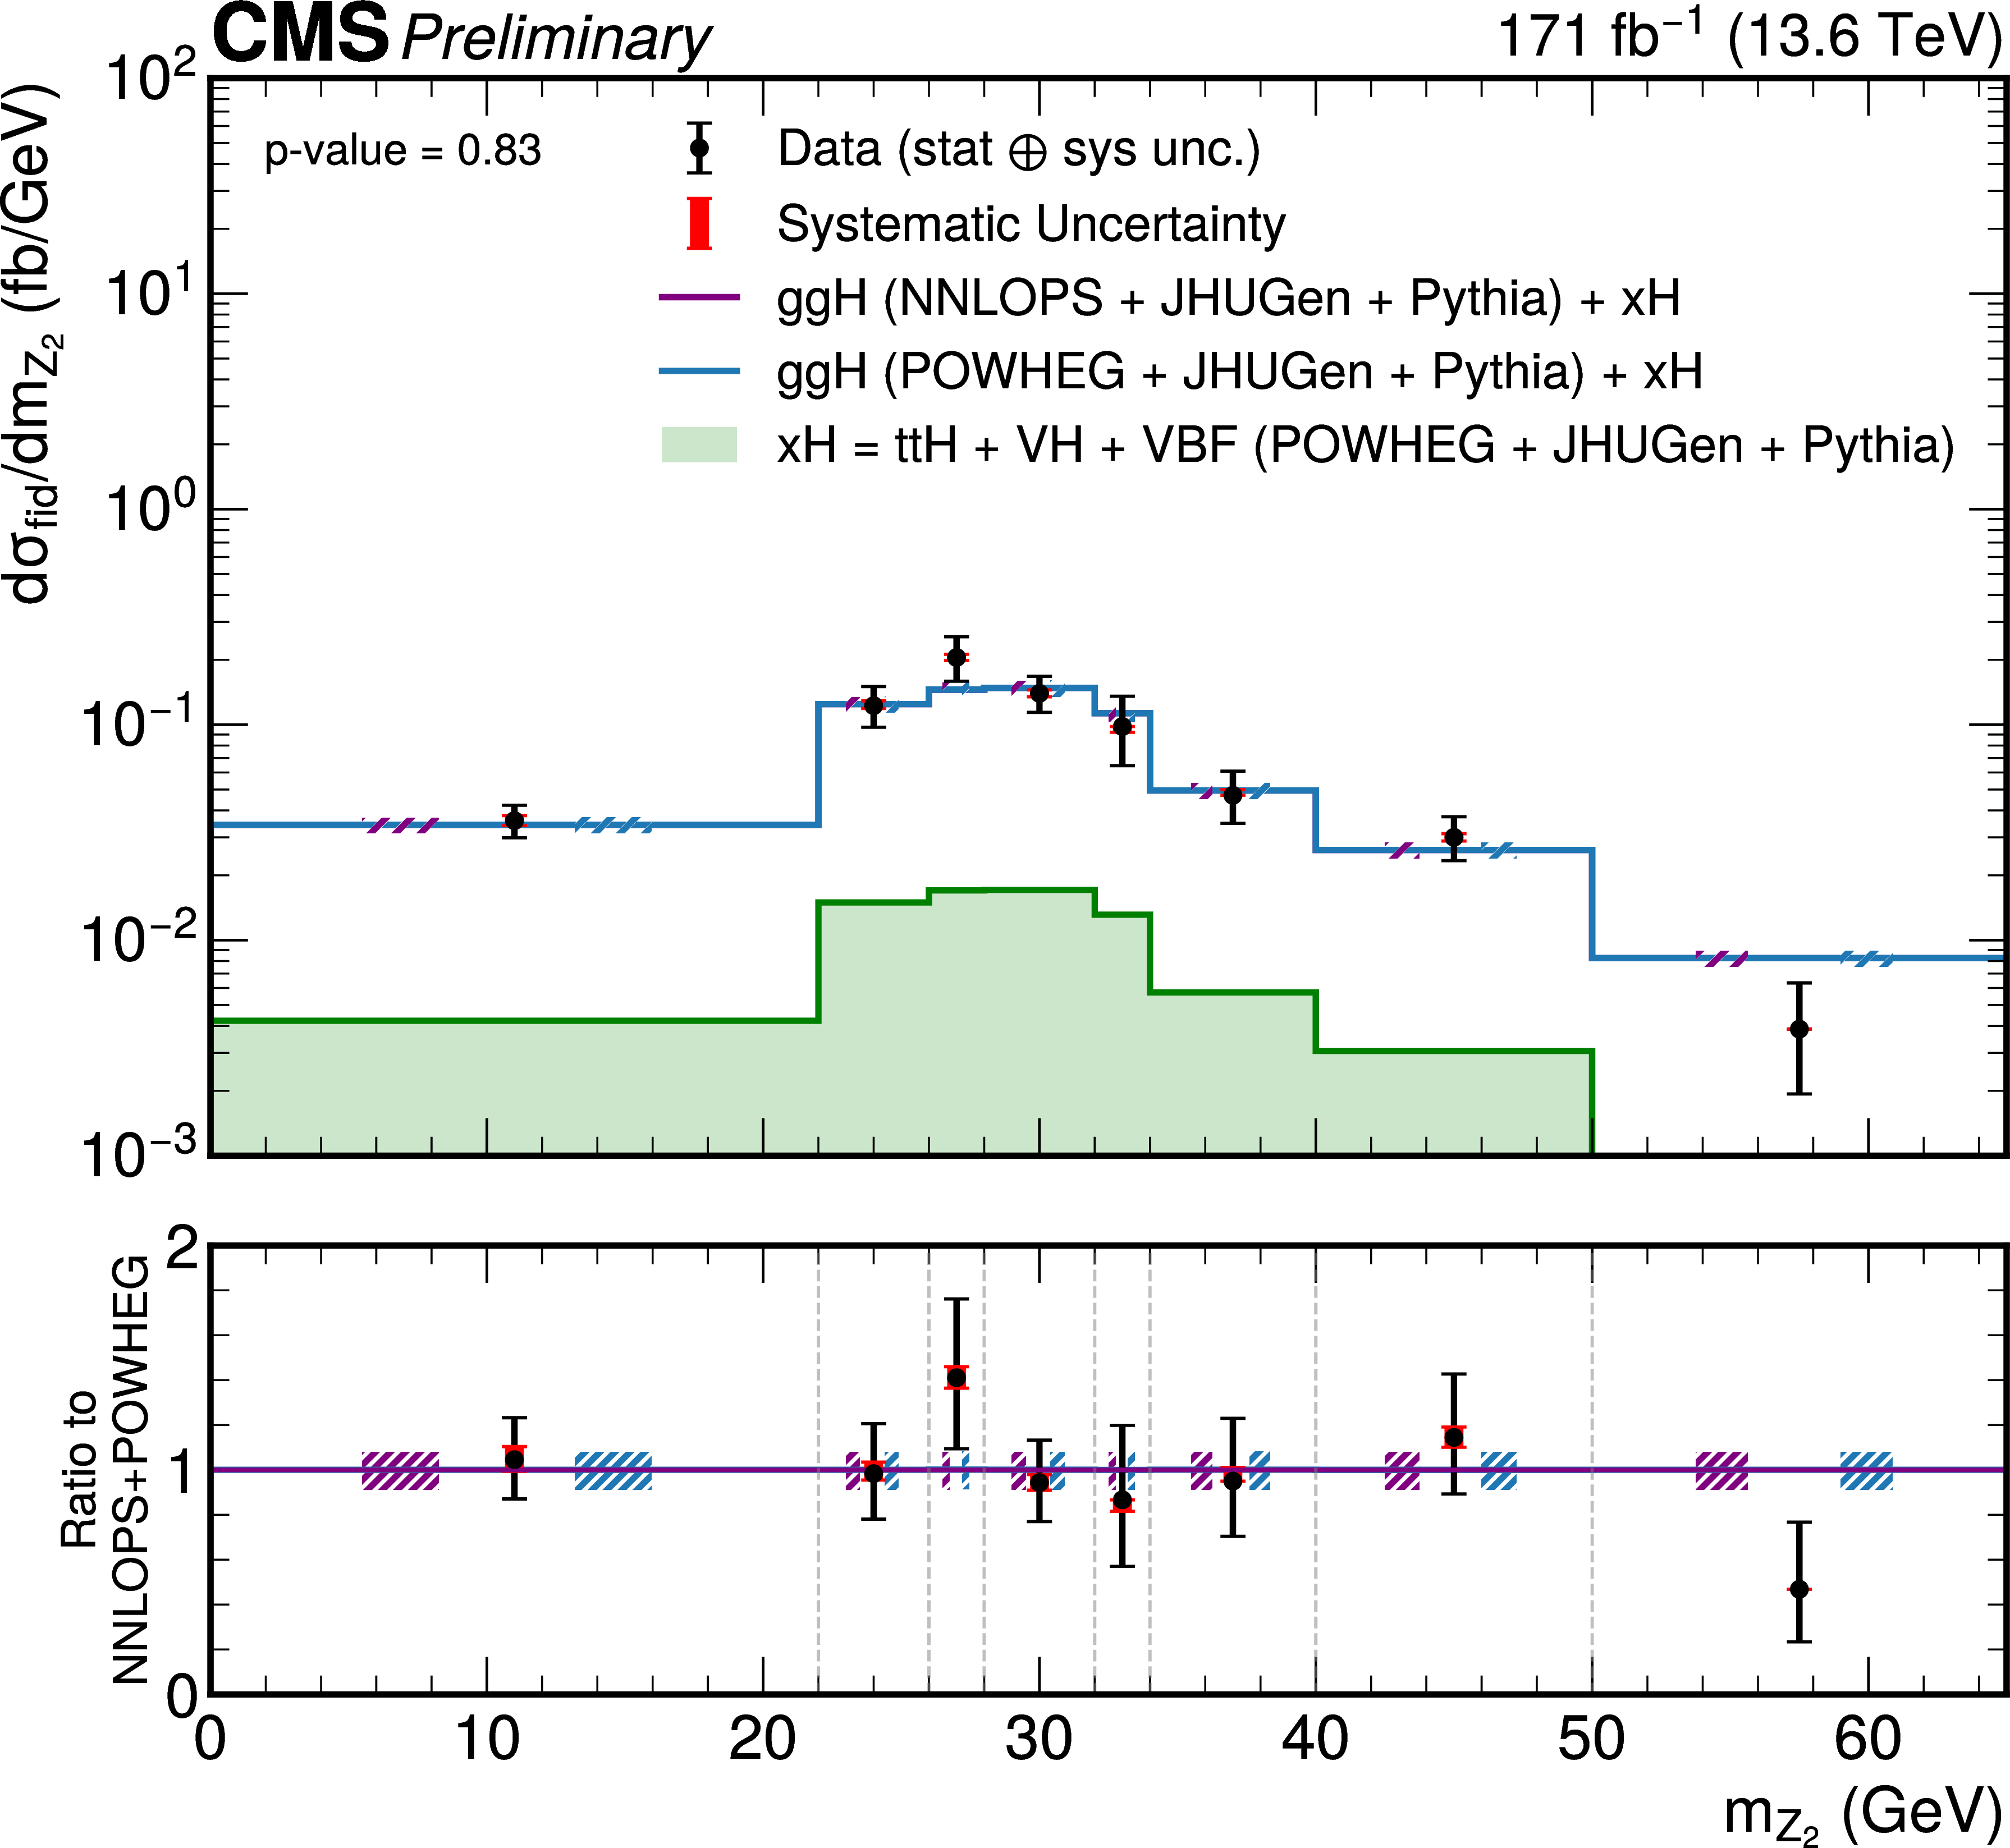
Figure 11:
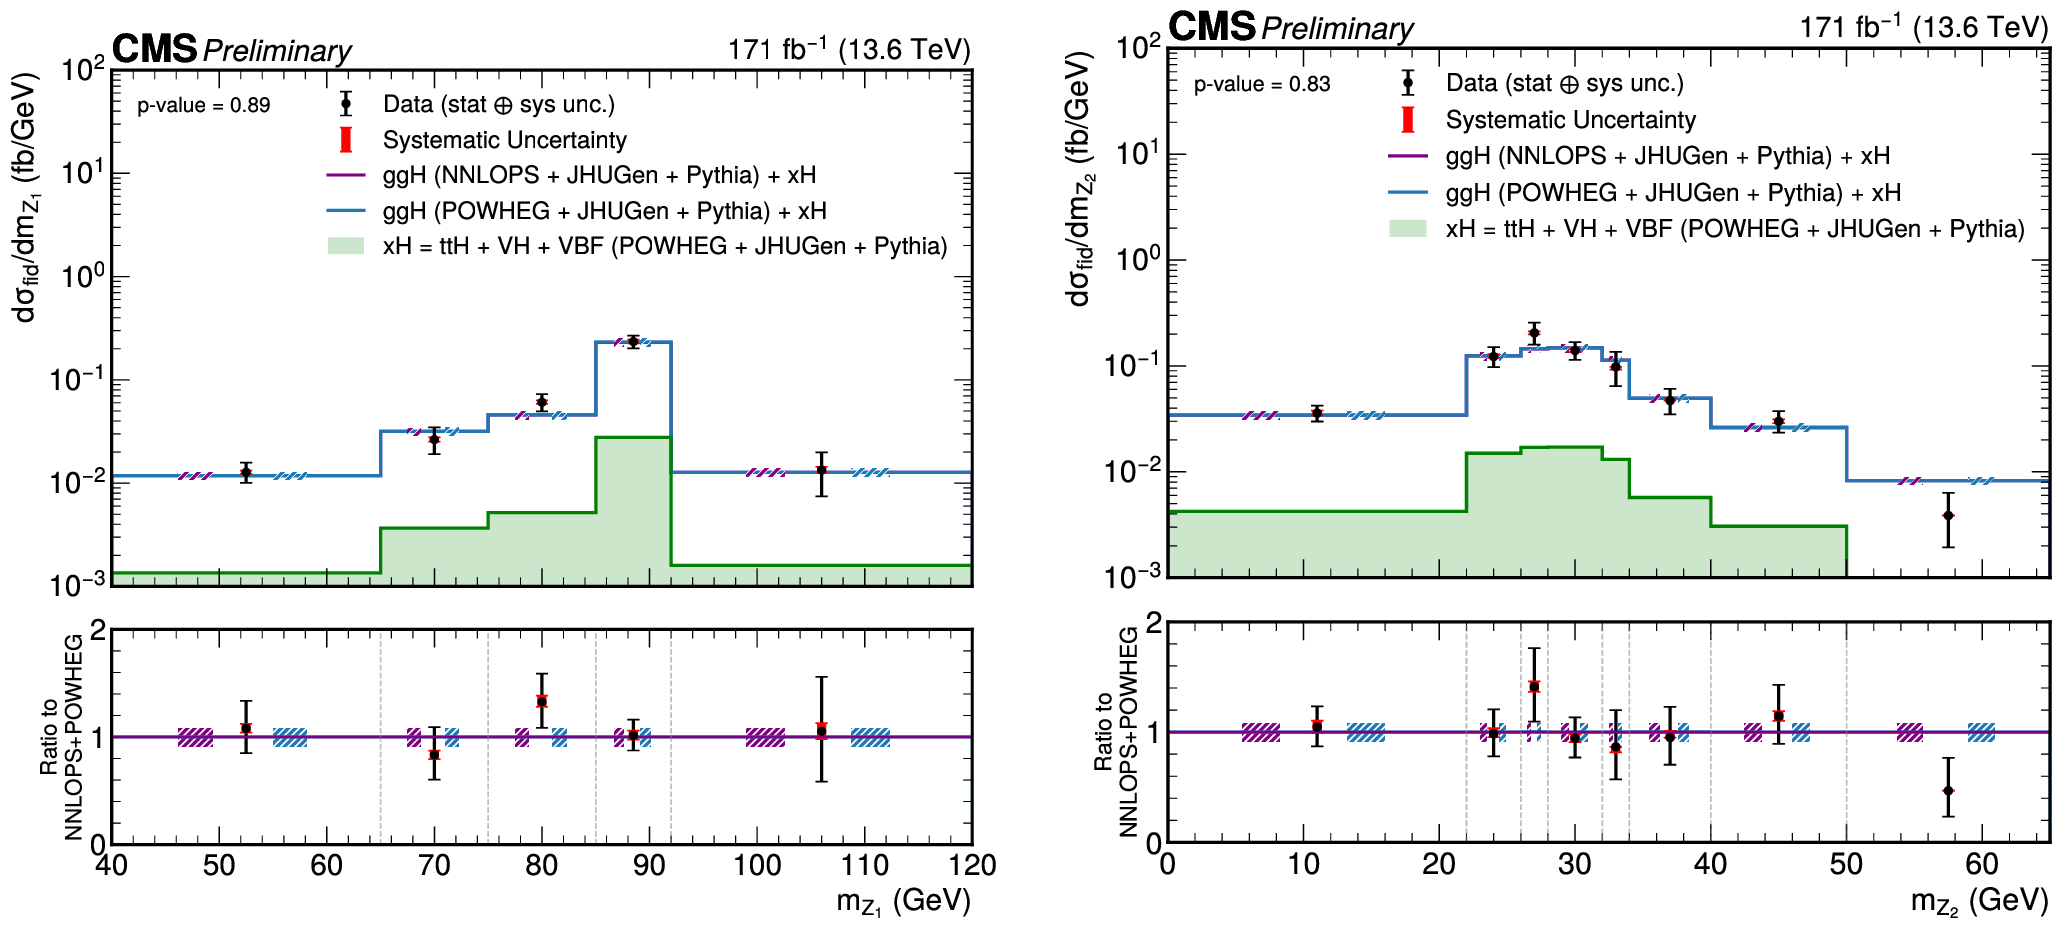
Differential fiducial cross sections for the $ \mathrm{H}\to\mathrm{Z}\mathrm{Z}\to4\ell $ process as a function the invariant mass of the leading $ Z $ candidate $ m_{Z_1} $ (left), and the invariant mass of the subleading $ Z $ candidate $ m_{Z_2} $ (right). The gg $ \to $ H predictions are shown for two different generators, POWHEG (blue) and NNLOPS (purple), normalized to the total cross section computed at next-to-next-to-next-to-leading order (N3LO), separately stacked over the the subdominant component of the signal from VBF + VH + t\=tH, denoted as xH (green). The hatched areas correspond to the systematic uncertainties in the theoretical predictions. Black points represent the measured fiducial cross sections in each bin, black error bars indicate the total uncertainty in each measurement, and red boxes denote the systematic uncertainties. The lower panels display the ratios of the measured cross sections and of the POWHEG gg $ \to $ H + xH theoretical prediction to the NNLOPS gg $ \to $ H + POWHEG xH theoretical predictions. |
png pdf |
Figure 11-a:
Differential fiducial cross sections for the $ \mathrm{H}\to\mathrm{Z}\mathrm{Z}\to4\ell $ process as a function the invariant mass of the leading $ Z $ candidate $ m_{Z_1} $ (left), and the invariant mass of the subleading $ Z $ candidate $ m_{Z_2} $ (right). The gg $ \to $ H predictions are shown for two different generators, POWHEG (blue) and NNLOPS (purple), normalized to the total cross section computed at next-to-next-to-next-to-leading order (N3LO), separately stacked over the the subdominant component of the signal from VBF + VH + t\=tH, denoted as xH (green). The hatched areas correspond to the systematic uncertainties in the theoretical predictions. Black points represent the measured fiducial cross sections in each bin, black error bars indicate the total uncertainty in each measurement, and red boxes denote the systematic uncertainties. The lower panels display the ratios of the measured cross sections and of the POWHEG gg $ \to $ H + xH theoretical prediction to the NNLOPS gg $ \to $ H + POWHEG xH theoretical predictions. |
png pdf |
Figure 11-b:
Differential fiducial cross sections for the $ \mathrm{H}\to\mathrm{Z}\mathrm{Z}\to4\ell $ process as a function the invariant mass of the leading $ Z $ candidate $ m_{Z_1} $ (left), and the invariant mass of the subleading $ Z $ candidate $ m_{Z_2} $ (right). The gg $ \to $ H predictions are shown for two different generators, POWHEG (blue) and NNLOPS (purple), normalized to the total cross section computed at next-to-next-to-next-to-leading order (N3LO), separately stacked over the the subdominant component of the signal from VBF + VH + t\=tH, denoted as xH (green). The hatched areas correspond to the systematic uncertainties in the theoretical predictions. Black points represent the measured fiducial cross sections in each bin, black error bars indicate the total uncertainty in each measurement, and red boxes denote the systematic uncertainties. The lower panels display the ratios of the measured cross sections and of the POWHEG gg $ \to $ H + xH theoretical prediction to the NNLOPS gg $ \to $ H + POWHEG xH theoretical predictions. |
png pdf |
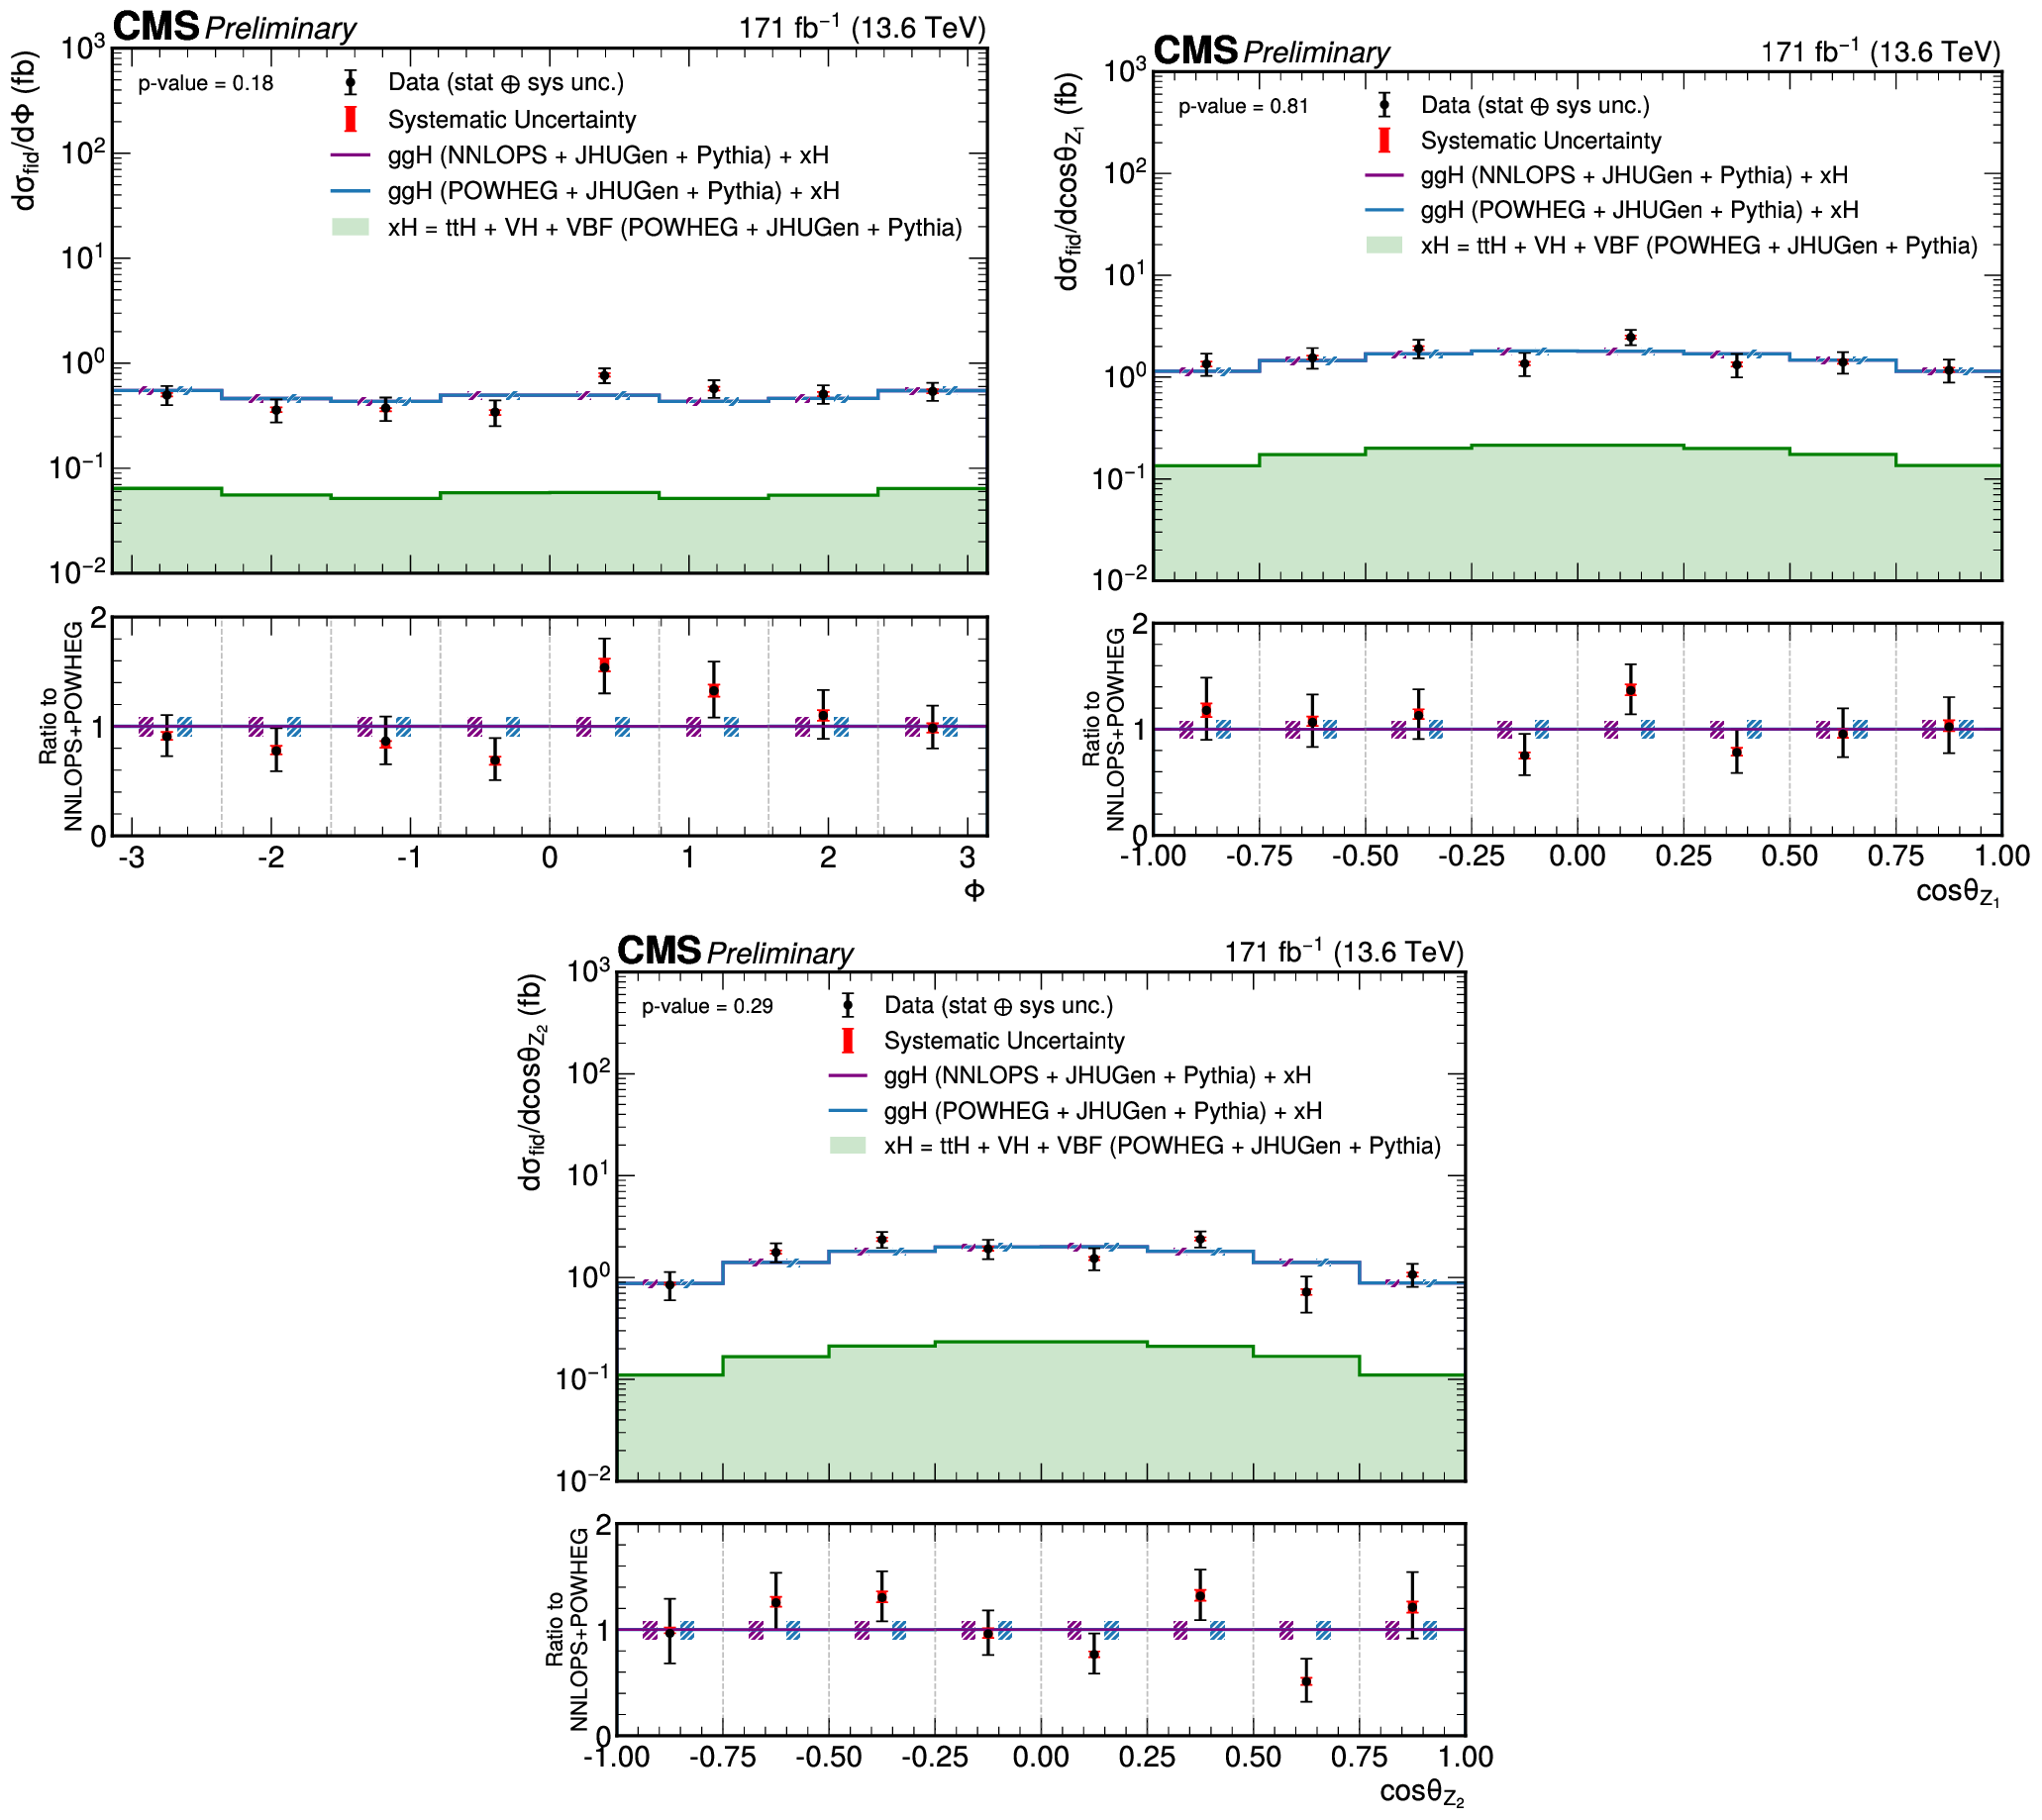
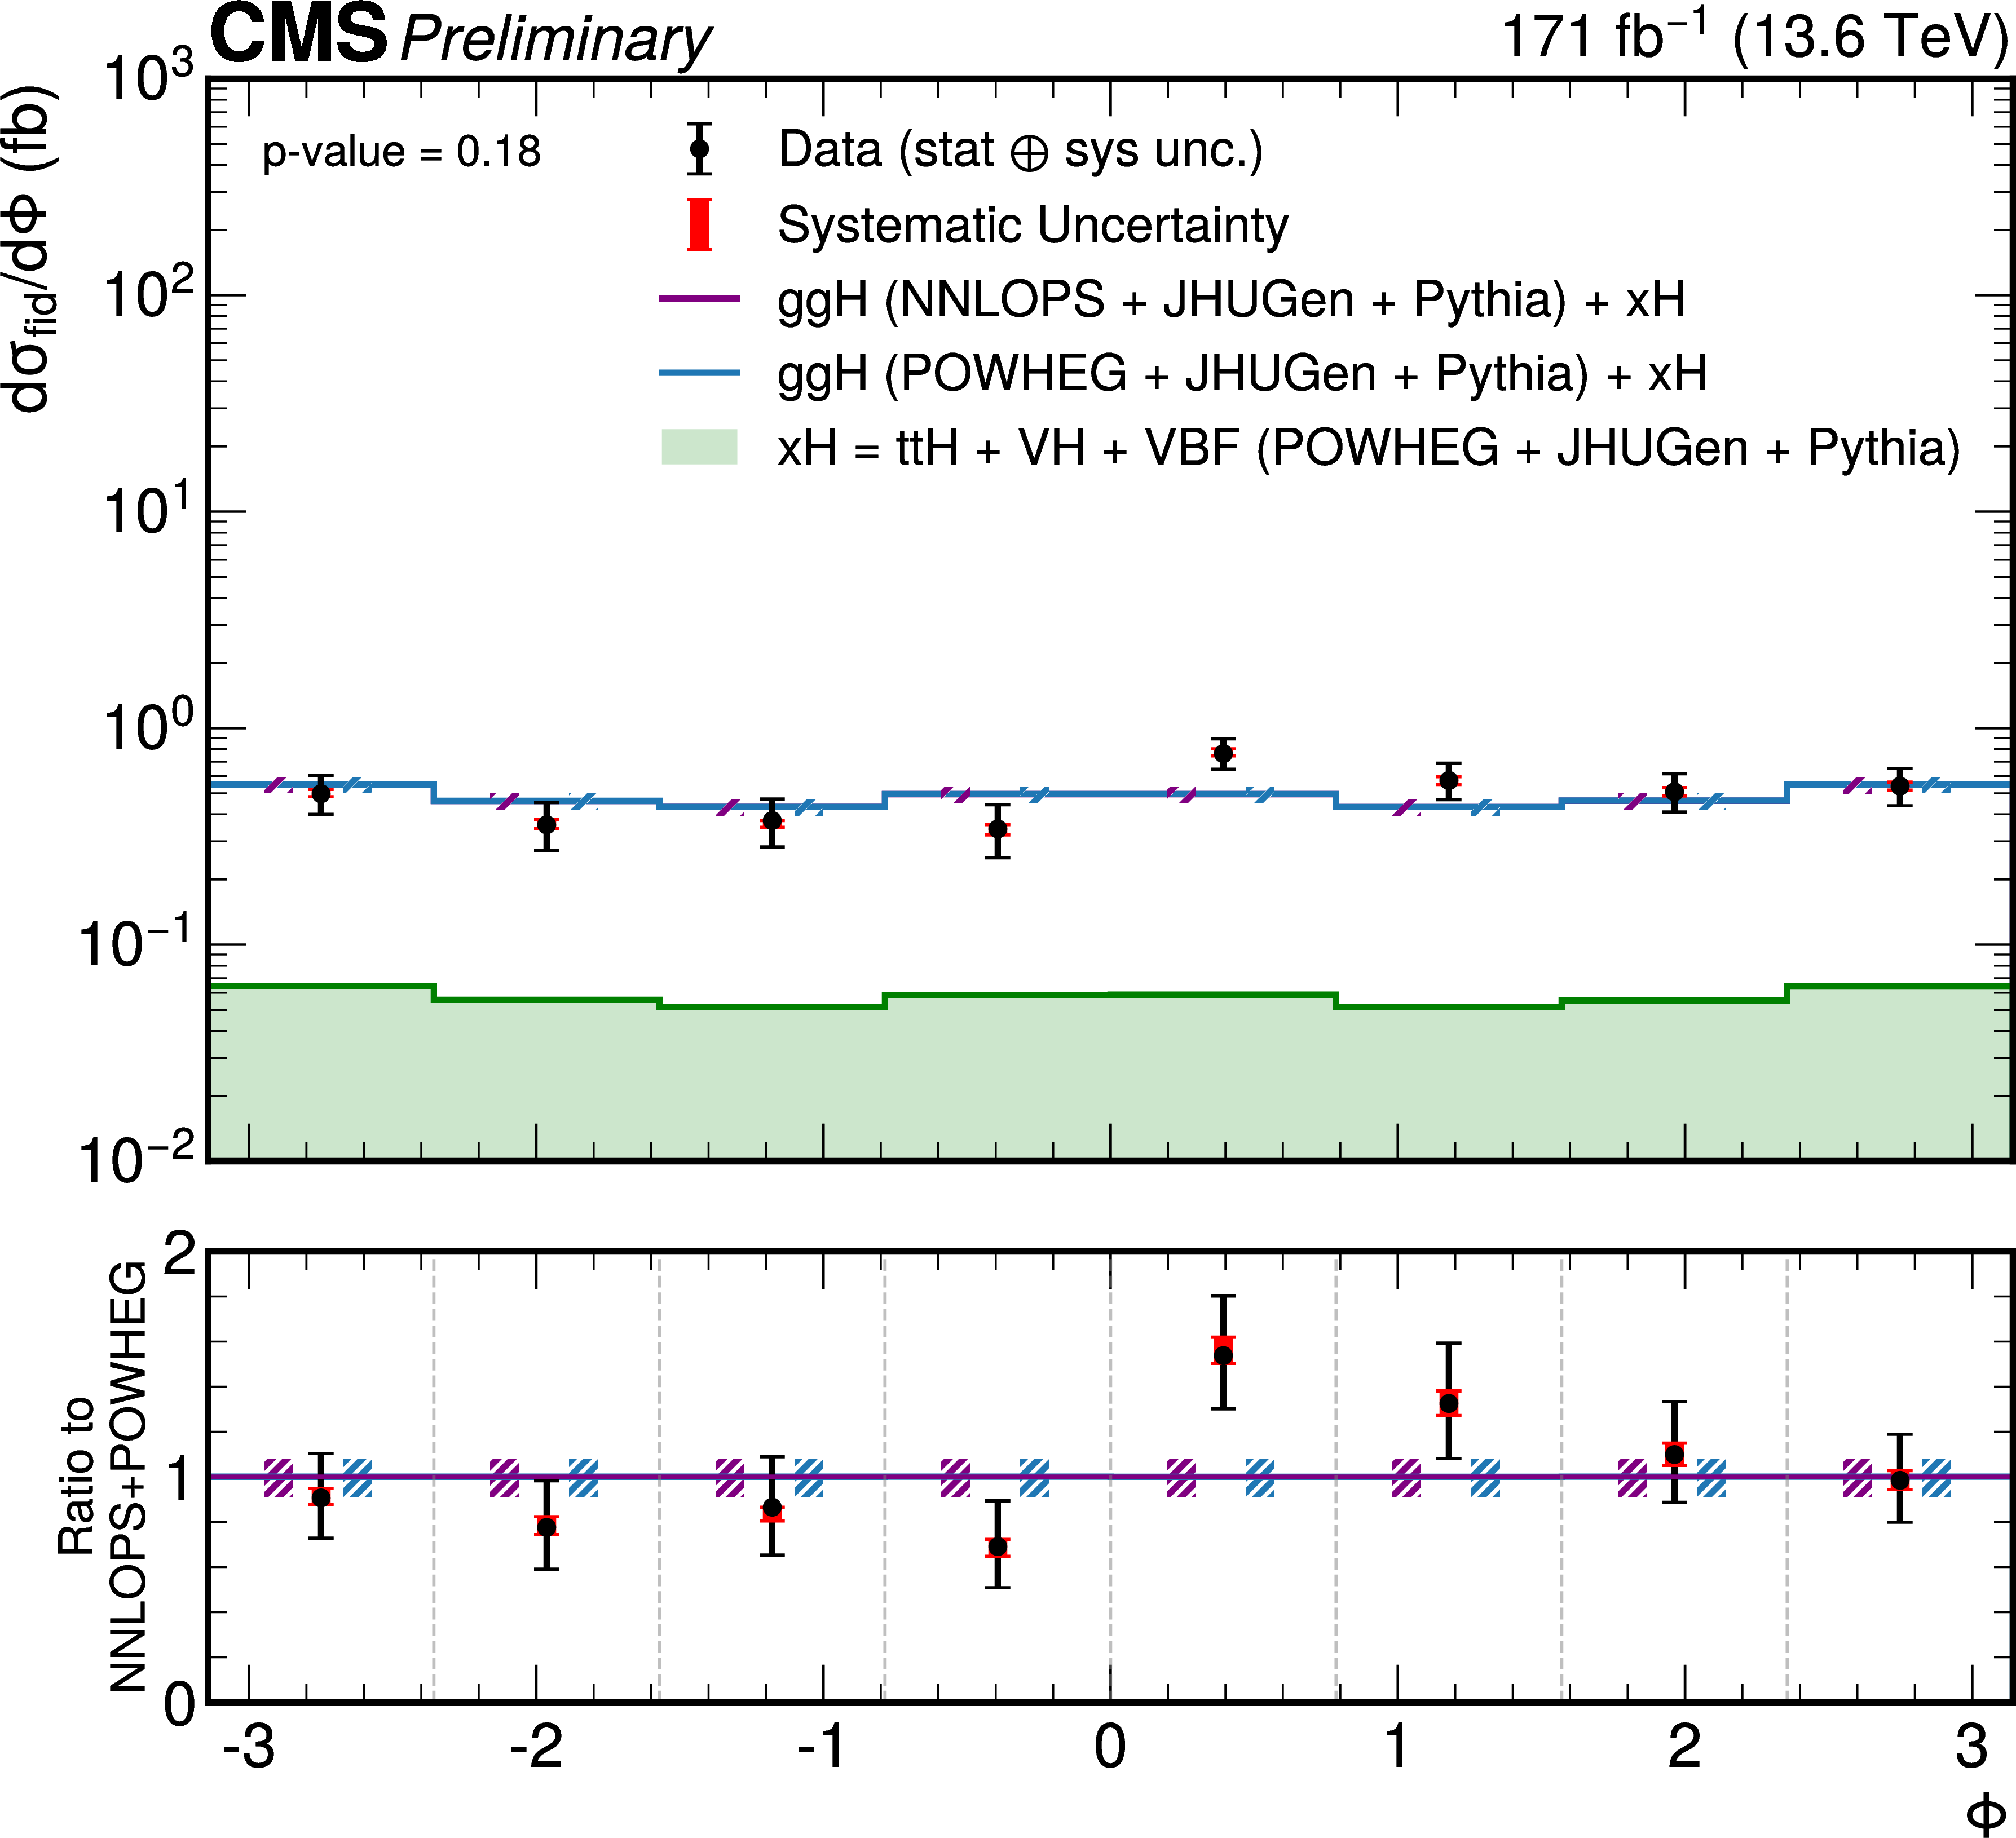
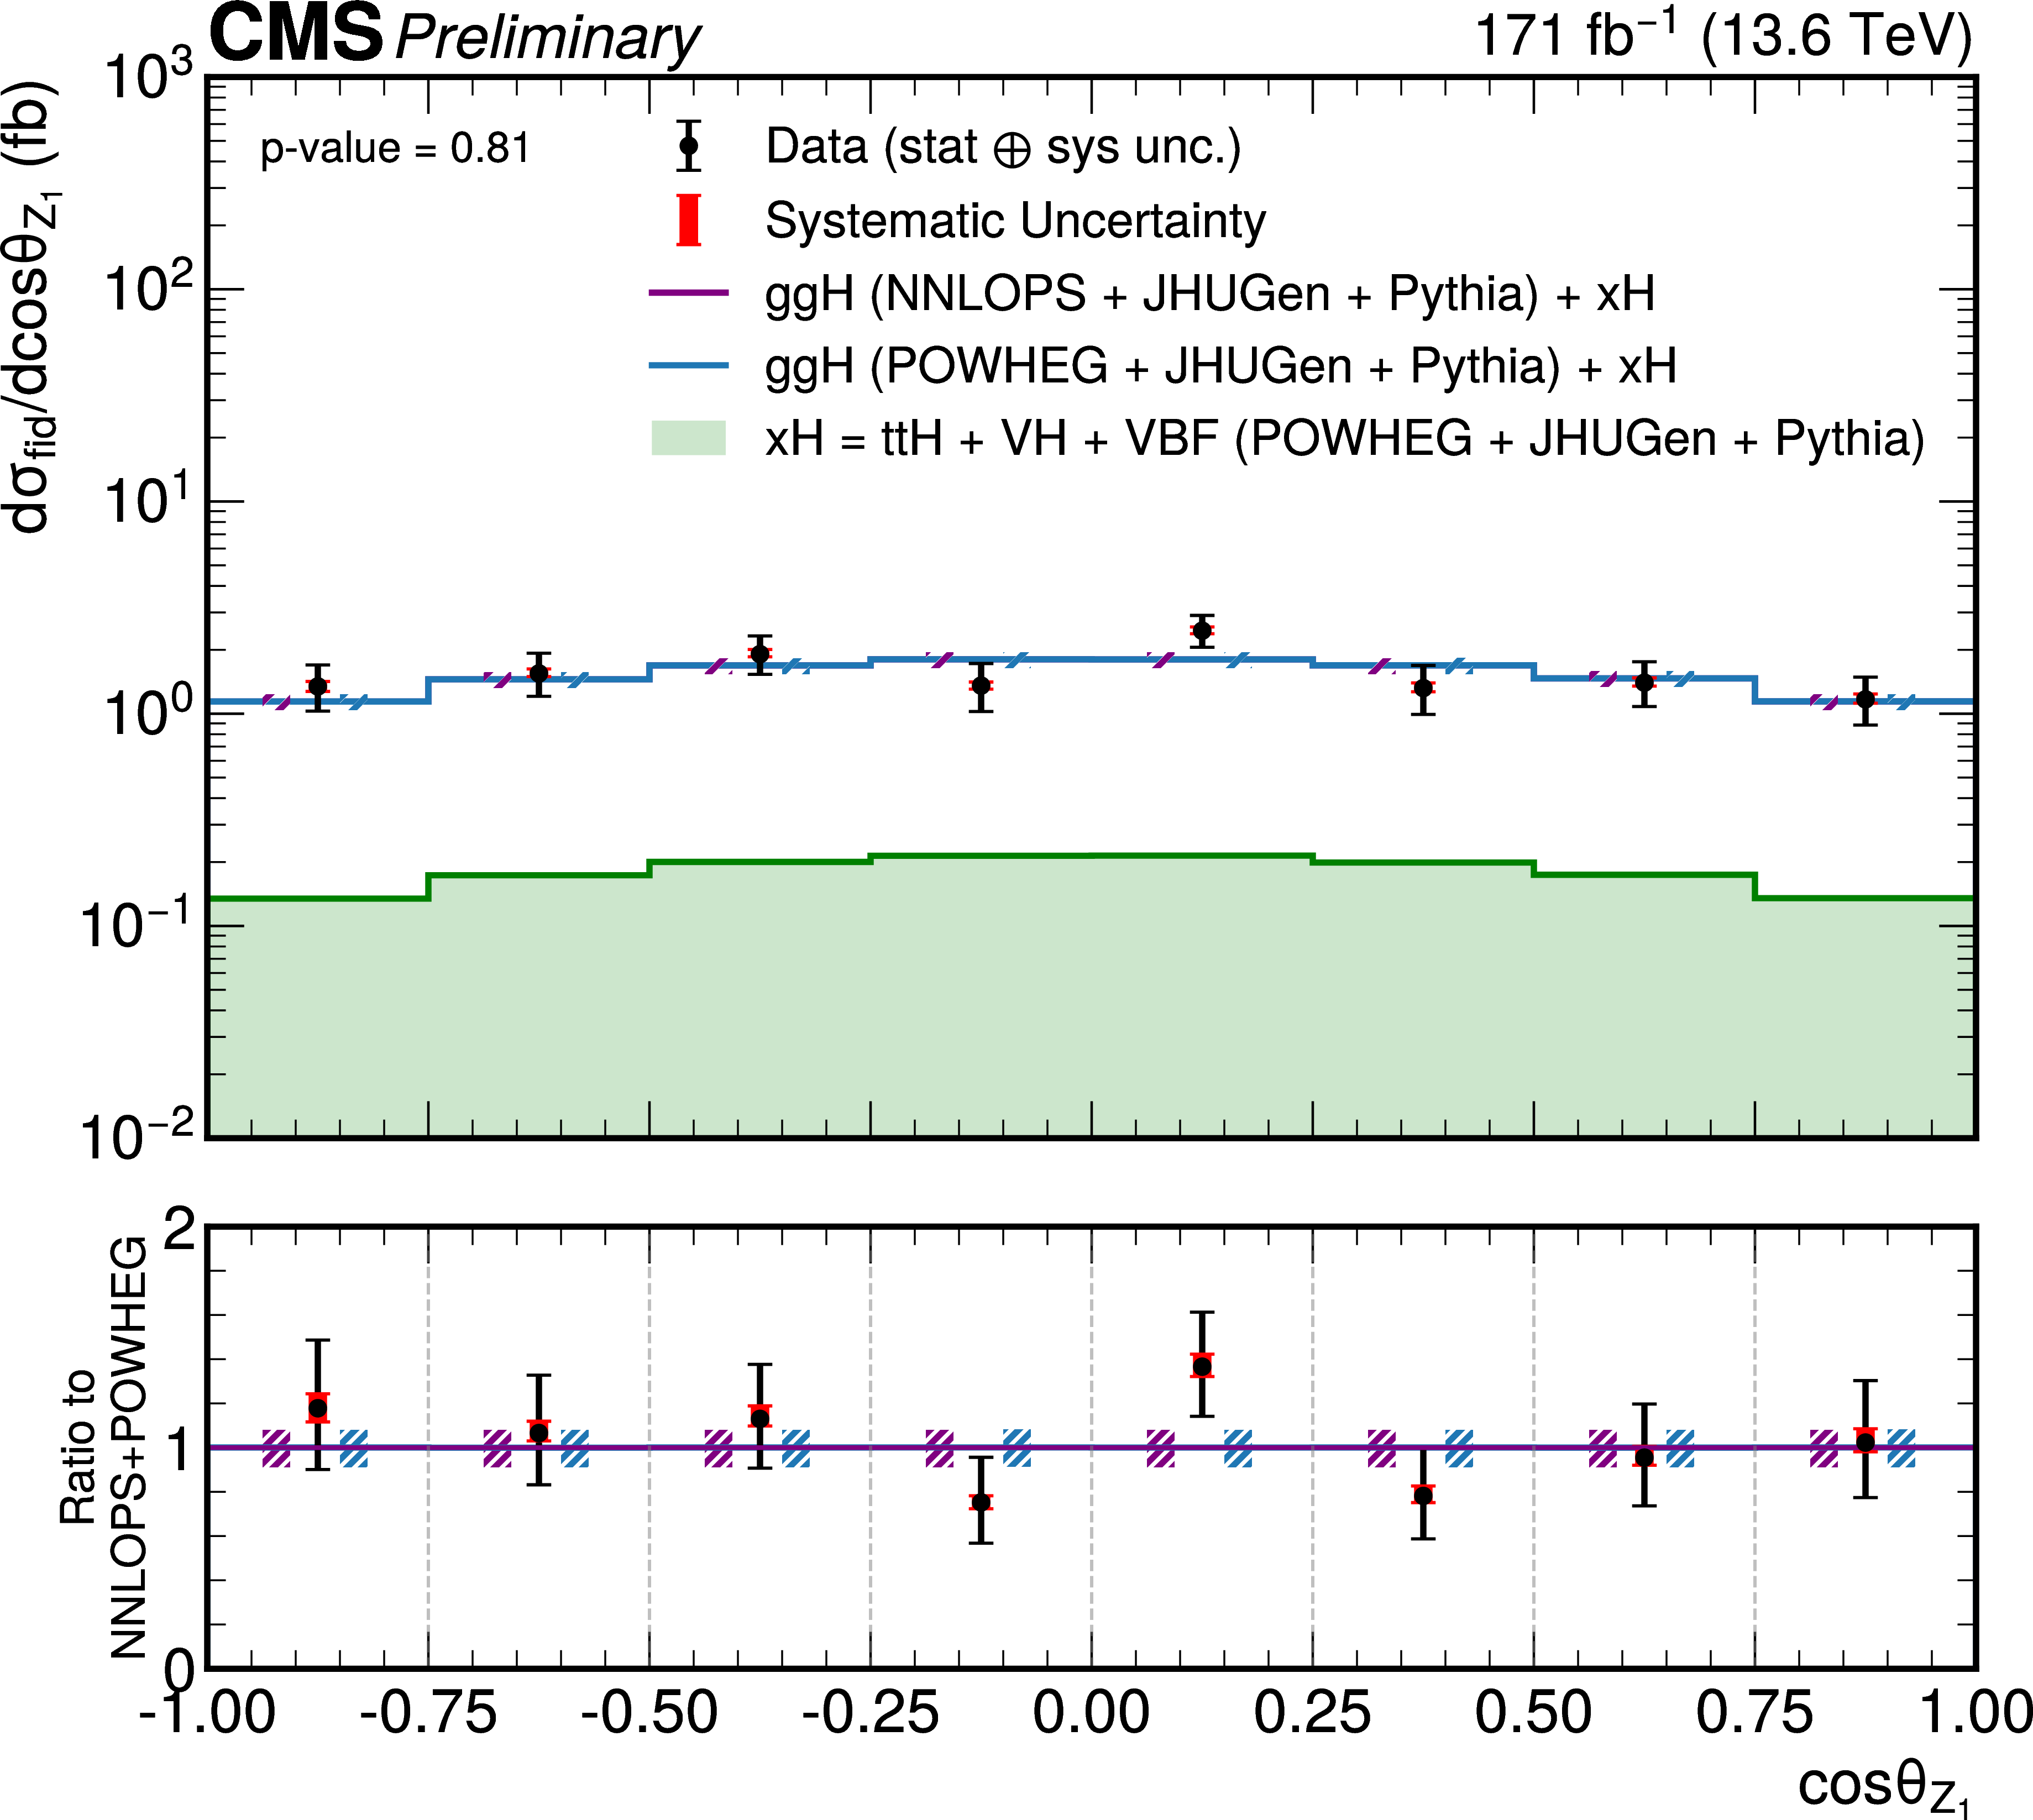
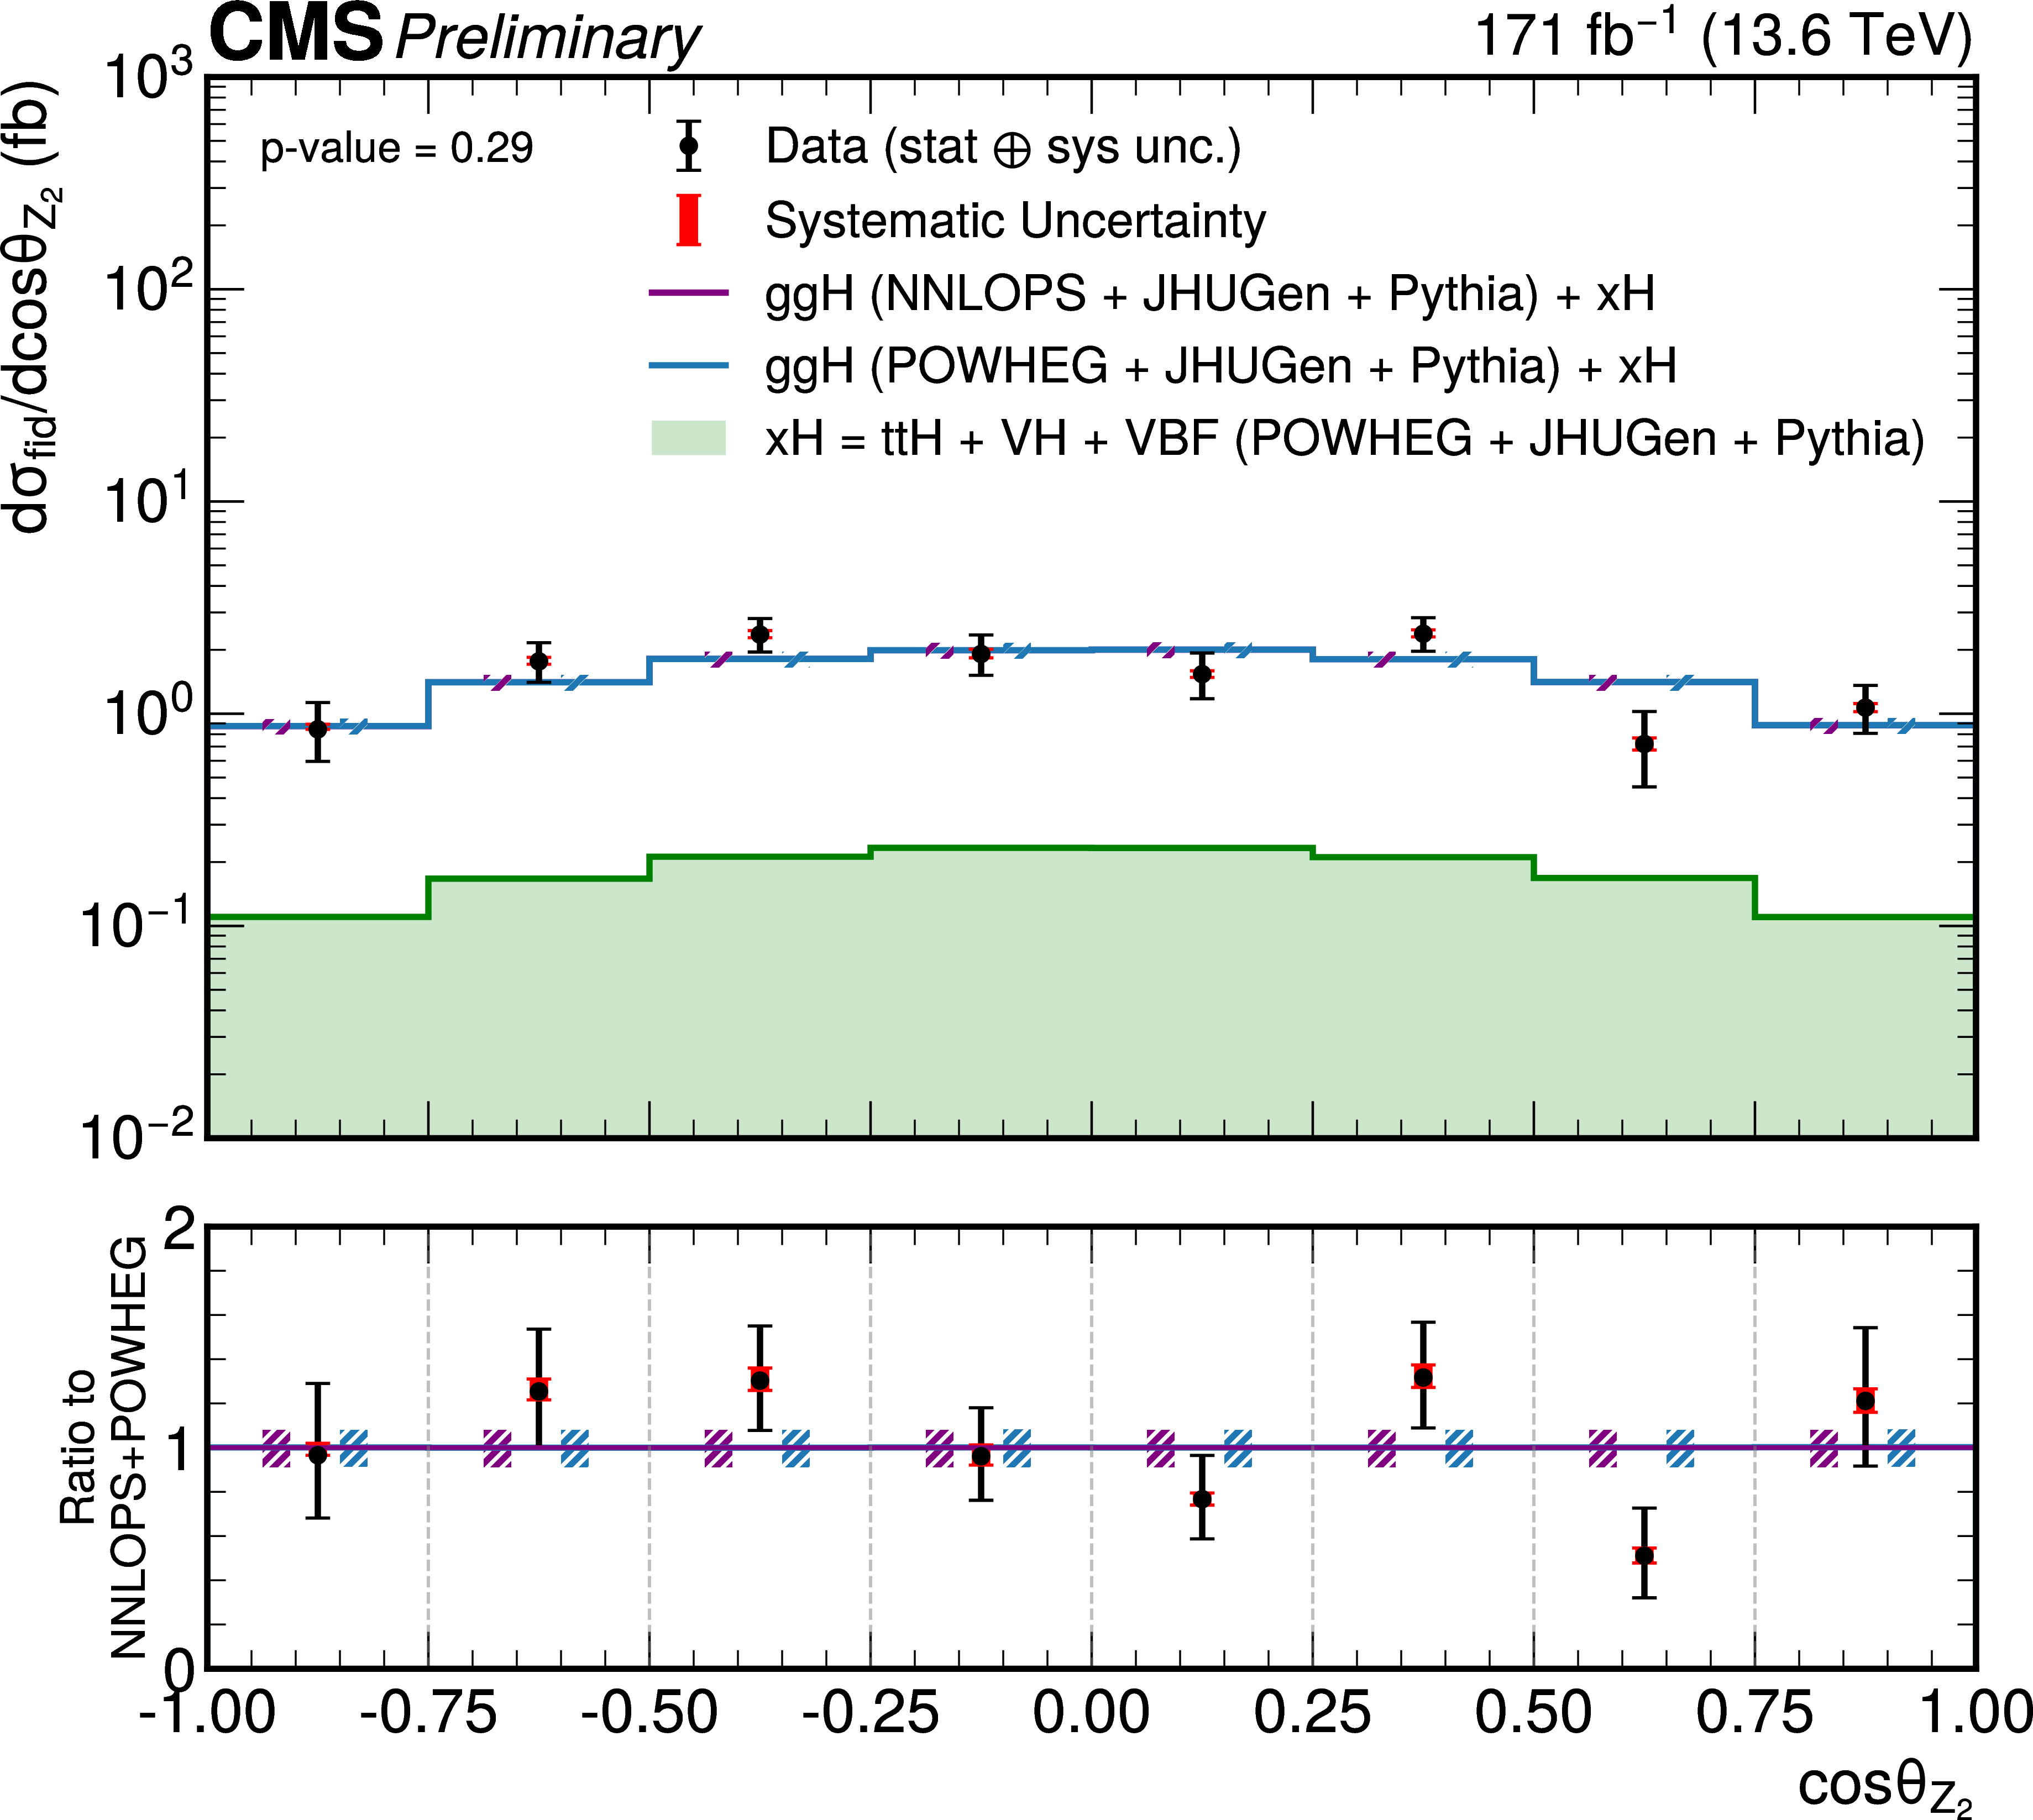
Figure 12:
Differential fiducial cross sections for the $ \mathrm{H}\to\mathrm{Z}\mathrm{Z}\to4\ell $ process as a function of the angular variables describing the Z boson decay, $ \Phi $ (top left) cos$ \theta_1 $ (top right) and cos$ \theta_2 $ (bottom). The gg $ \to $ H predictions are shown for two different generators, POWHEG (blue) and NNLOPS (purple), normalized to the total cross section computed at next-to-next-to-next-to-leading order (N3LO), separately stacked over the the subdominant component of the signal from VBF + VH + t\=tH, denoted as xH (green). The hatched areas correspond to the systematic uncertainties in the theoretical predictions. Black points represent the measured fiducial cross sections in each bin, black error bars indicate the total uncertainty in each measurement, and red boxes denote the systematic uncertainties. The lower panels display the ratios of the measured cross sections and of the POWHEG gg $ \to $ H + xH theoretical prediction to the NNLOPS gg $ \to $ H + POWHEG xH theoretical predictions. |
png pdf |
Figure 12-a:
Differential fiducial cross sections for the $ \mathrm{H}\to\mathrm{Z}\mathrm{Z}\to4\ell $ process as a function of the angular variables describing the Z boson decay, $ \Phi $ (top left) cos$ \theta_1 $ (top right) and cos$ \theta_2 $ (bottom). The gg $ \to $ H predictions are shown for two different generators, POWHEG (blue) and NNLOPS (purple), normalized to the total cross section computed at next-to-next-to-next-to-leading order (N3LO), separately stacked over the the subdominant component of the signal from VBF + VH + t\=tH, denoted as xH (green). The hatched areas correspond to the systematic uncertainties in the theoretical predictions. Black points represent the measured fiducial cross sections in each bin, black error bars indicate the total uncertainty in each measurement, and red boxes denote the systematic uncertainties. The lower panels display the ratios of the measured cross sections and of the POWHEG gg $ \to $ H + xH theoretical prediction to the NNLOPS gg $ \to $ H + POWHEG xH theoretical predictions. |
png pdf |
Figure 12-b:
Differential fiducial cross sections for the $ \mathrm{H}\to\mathrm{Z}\mathrm{Z}\to4\ell $ process as a function of the angular variables describing the Z boson decay, $ \Phi $ (top left) cos$ \theta_1 $ (top right) and cos$ \theta_2 $ (bottom). The gg $ \to $ H predictions are shown for two different generators, POWHEG (blue) and NNLOPS (purple), normalized to the total cross section computed at next-to-next-to-next-to-leading order (N3LO), separately stacked over the the subdominant component of the signal from VBF + VH + t\=tH, denoted as xH (green). The hatched areas correspond to the systematic uncertainties in the theoretical predictions. Black points represent the measured fiducial cross sections in each bin, black error bars indicate the total uncertainty in each measurement, and red boxes denote the systematic uncertainties. The lower panels display the ratios of the measured cross sections and of the POWHEG gg $ \to $ H + xH theoretical prediction to the NNLOPS gg $ \to $ H + POWHEG xH theoretical predictions. |
png pdf |
Figure 12-c:
Differential fiducial cross sections for the $ \mathrm{H}\to\mathrm{Z}\mathrm{Z}\to4\ell $ process as a function of the angular variables describing the Z boson decay, $ \Phi $ (top left) cos$ \theta_1 $ (top right) and cos$ \theta_2 $ (bottom). The gg $ \to $ H predictions are shown for two different generators, POWHEG (blue) and NNLOPS (purple), normalized to the total cross section computed at next-to-next-to-next-to-leading order (N3LO), separately stacked over the the subdominant component of the signal from VBF + VH + t\=tH, denoted as xH (green). The hatched areas correspond to the systematic uncertainties in the theoretical predictions. Black points represent the measured fiducial cross sections in each bin, black error bars indicate the total uncertainty in each measurement, and red boxes denote the systematic uncertainties. The lower panels display the ratios of the measured cross sections and of the POWHEG gg $ \to $ H + xH theoretical prediction to the NNLOPS gg $ \to $ H + POWHEG xH theoretical predictions. |
png pdf |
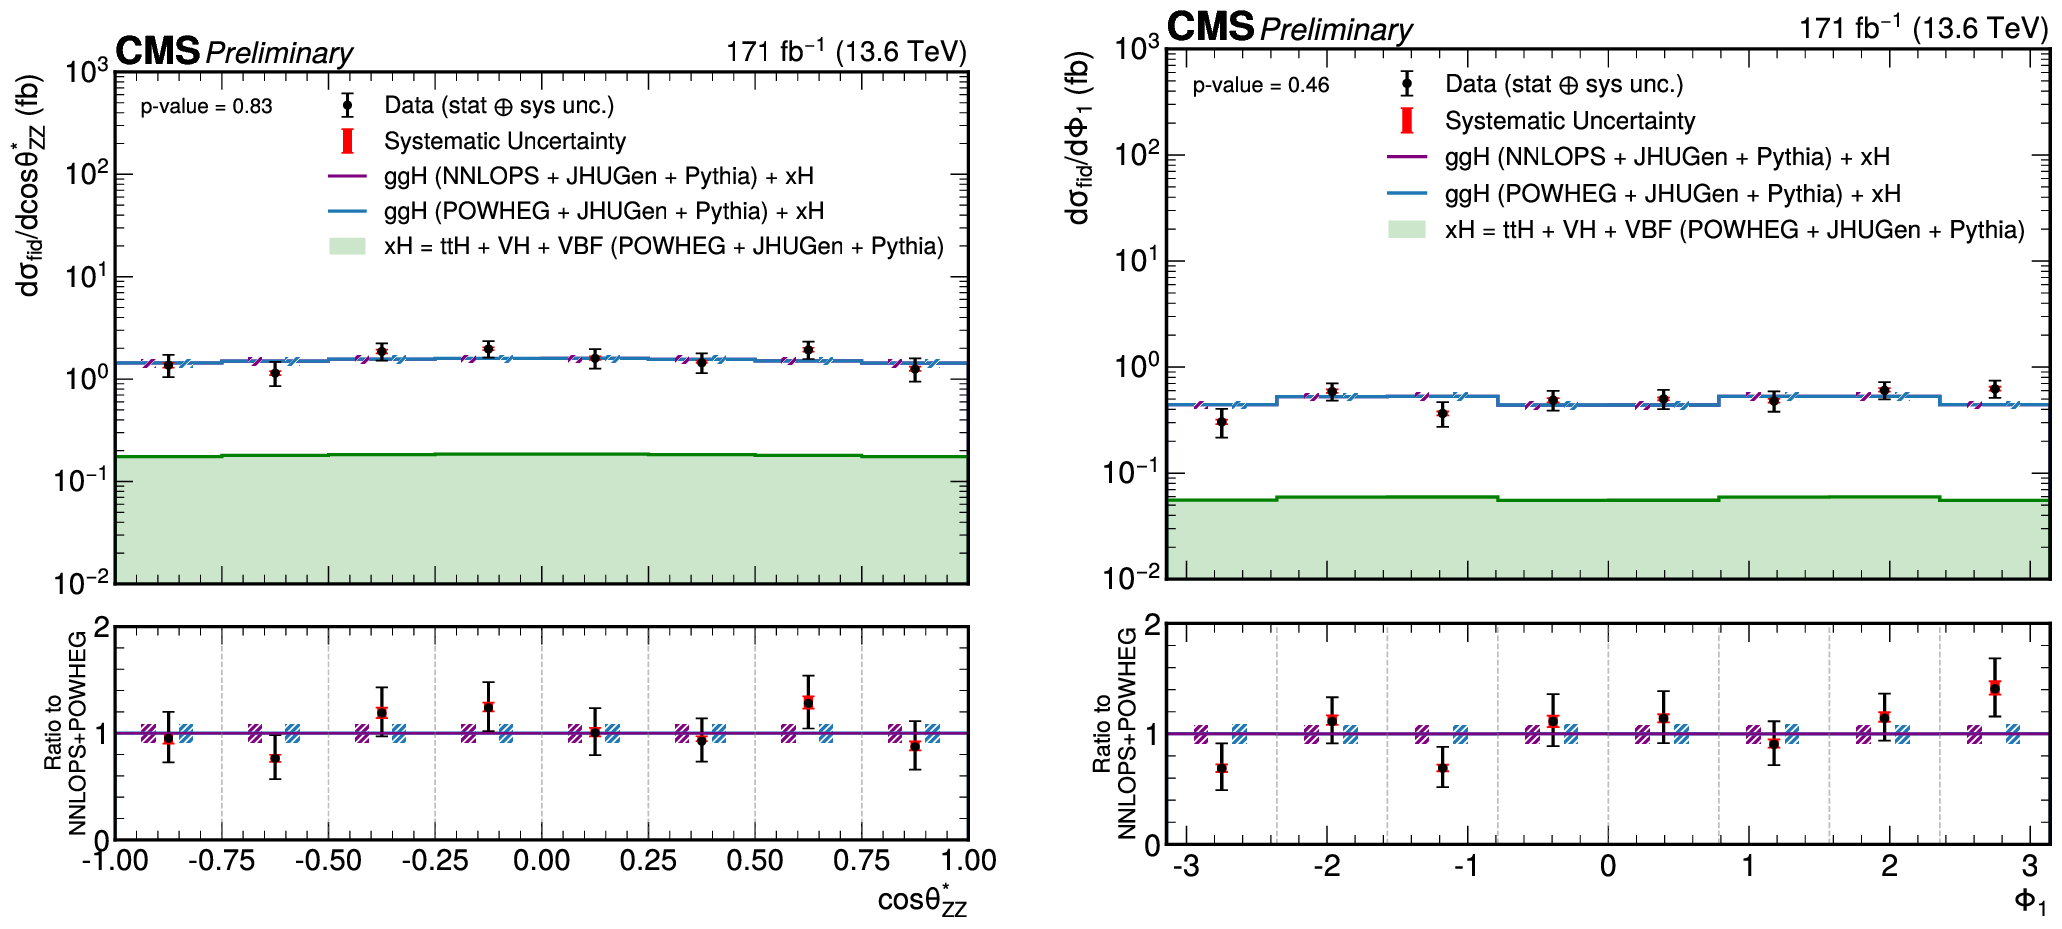
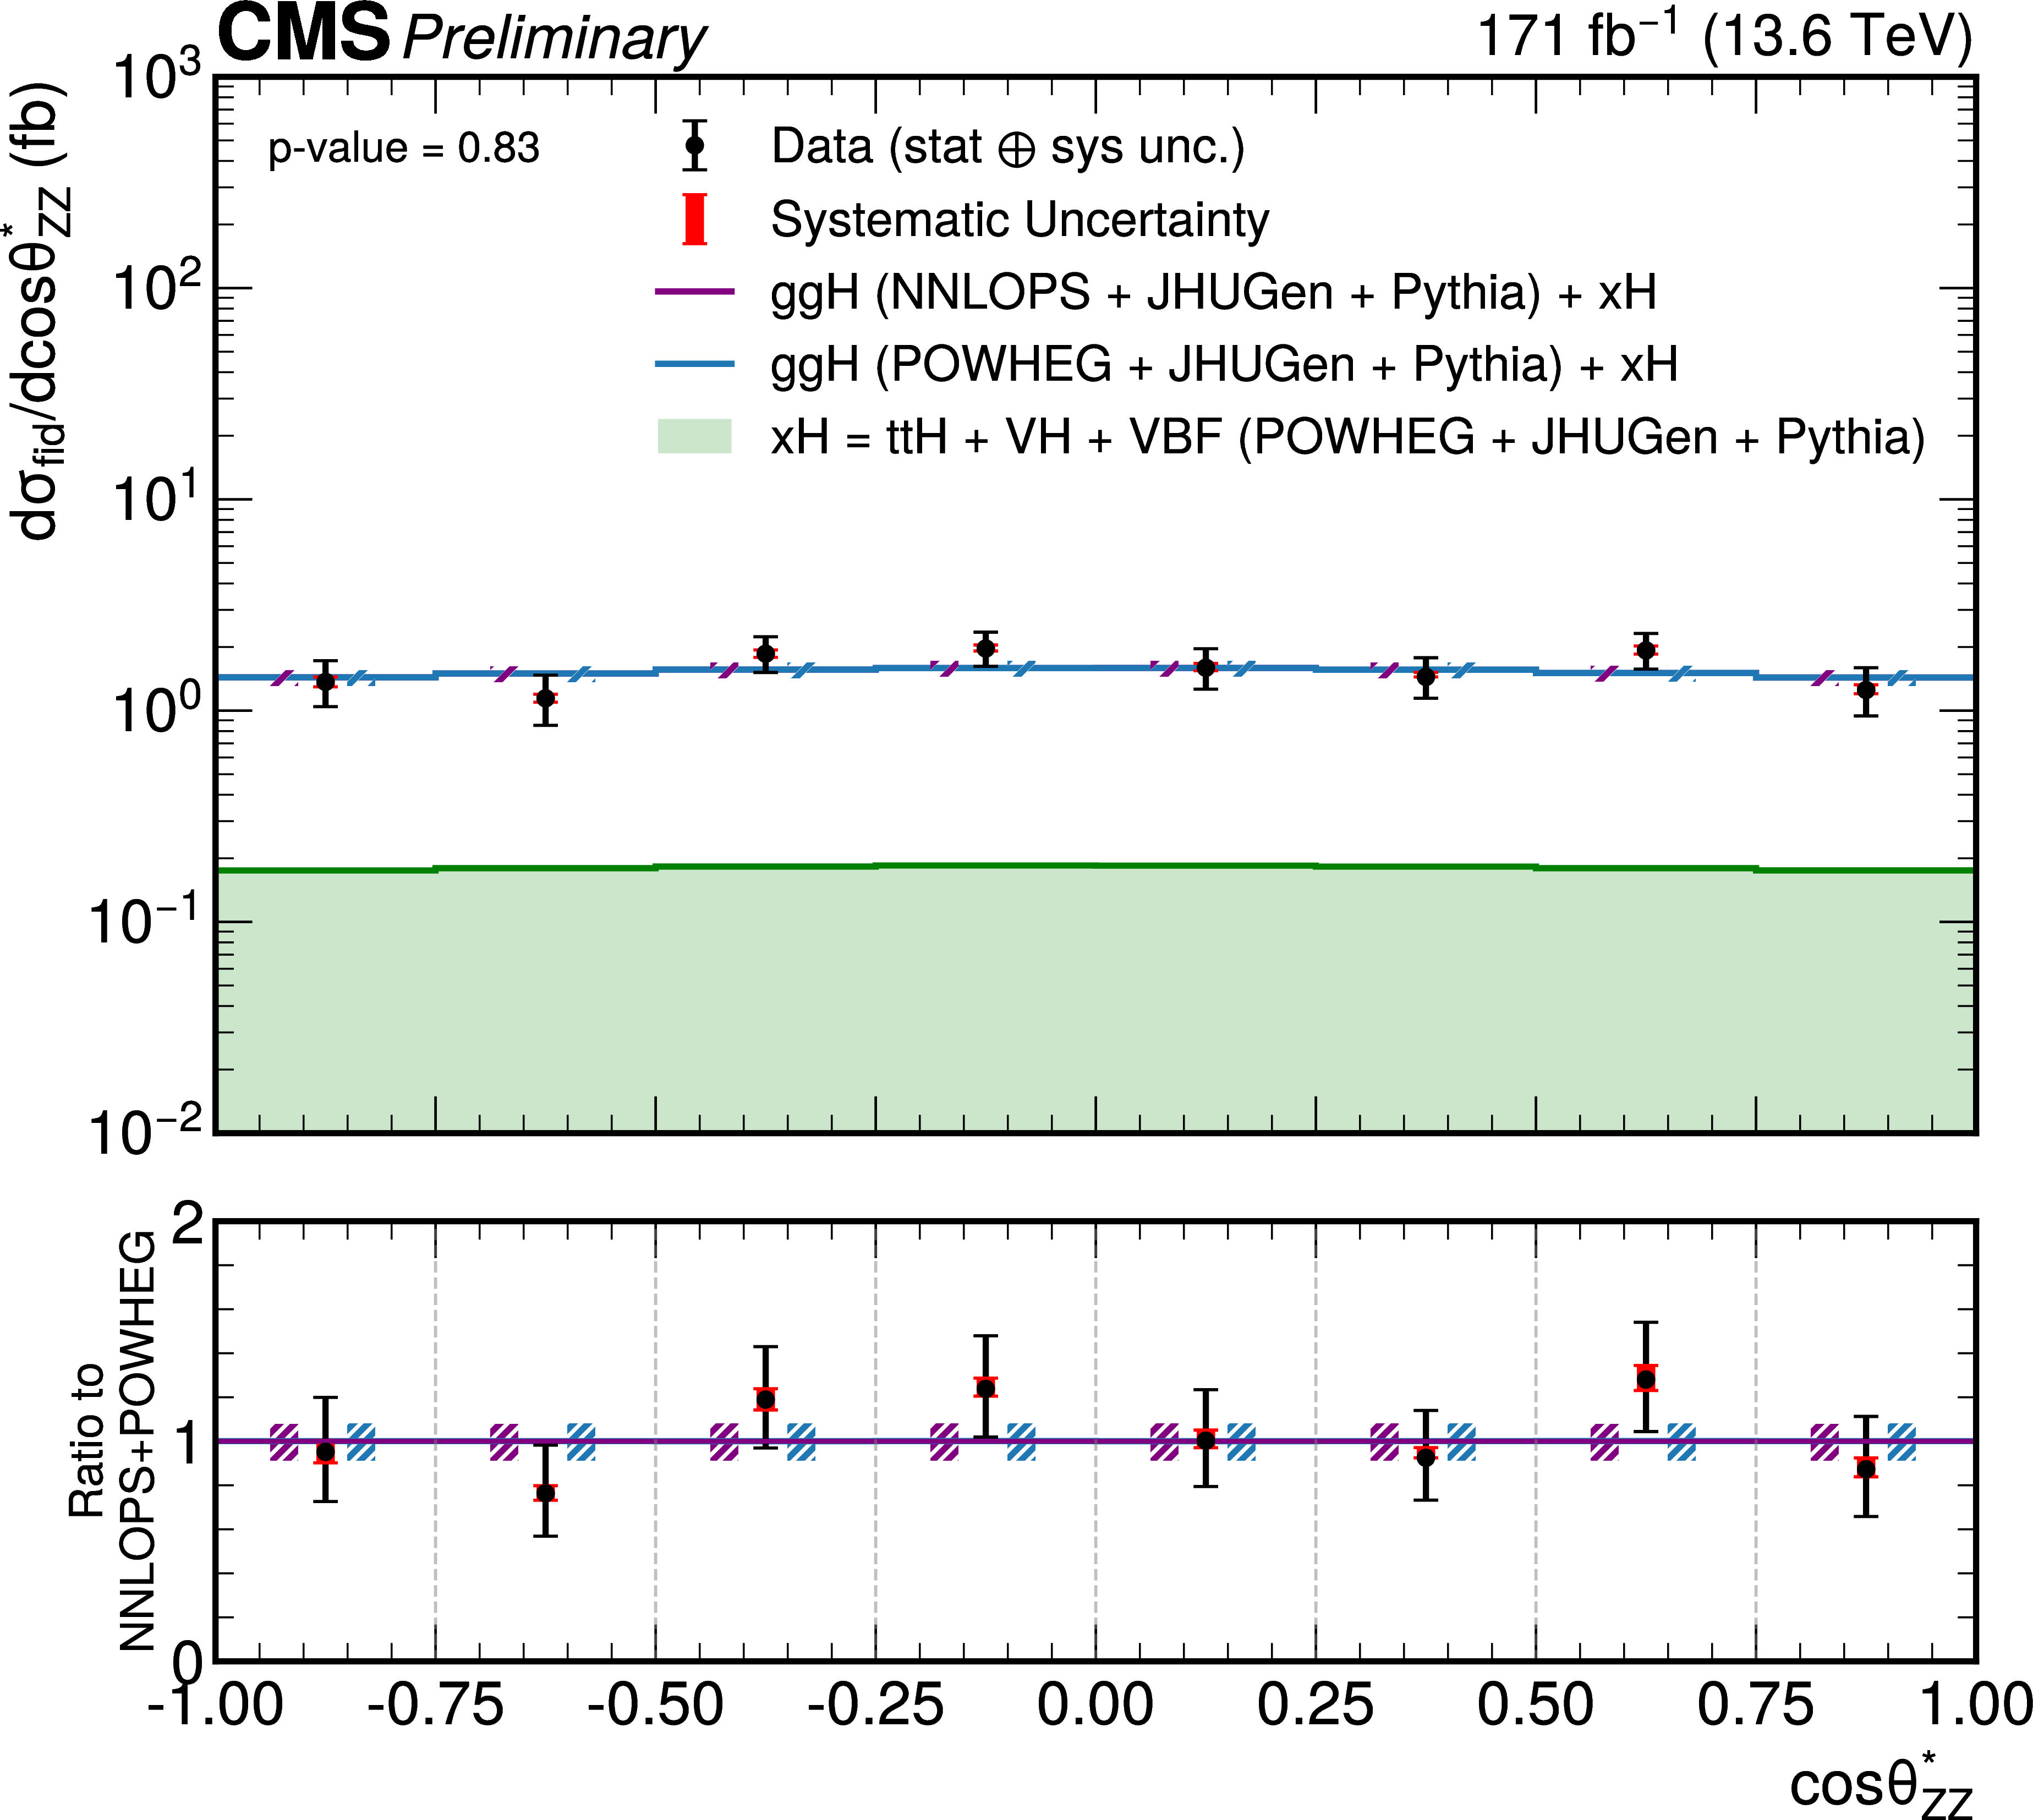
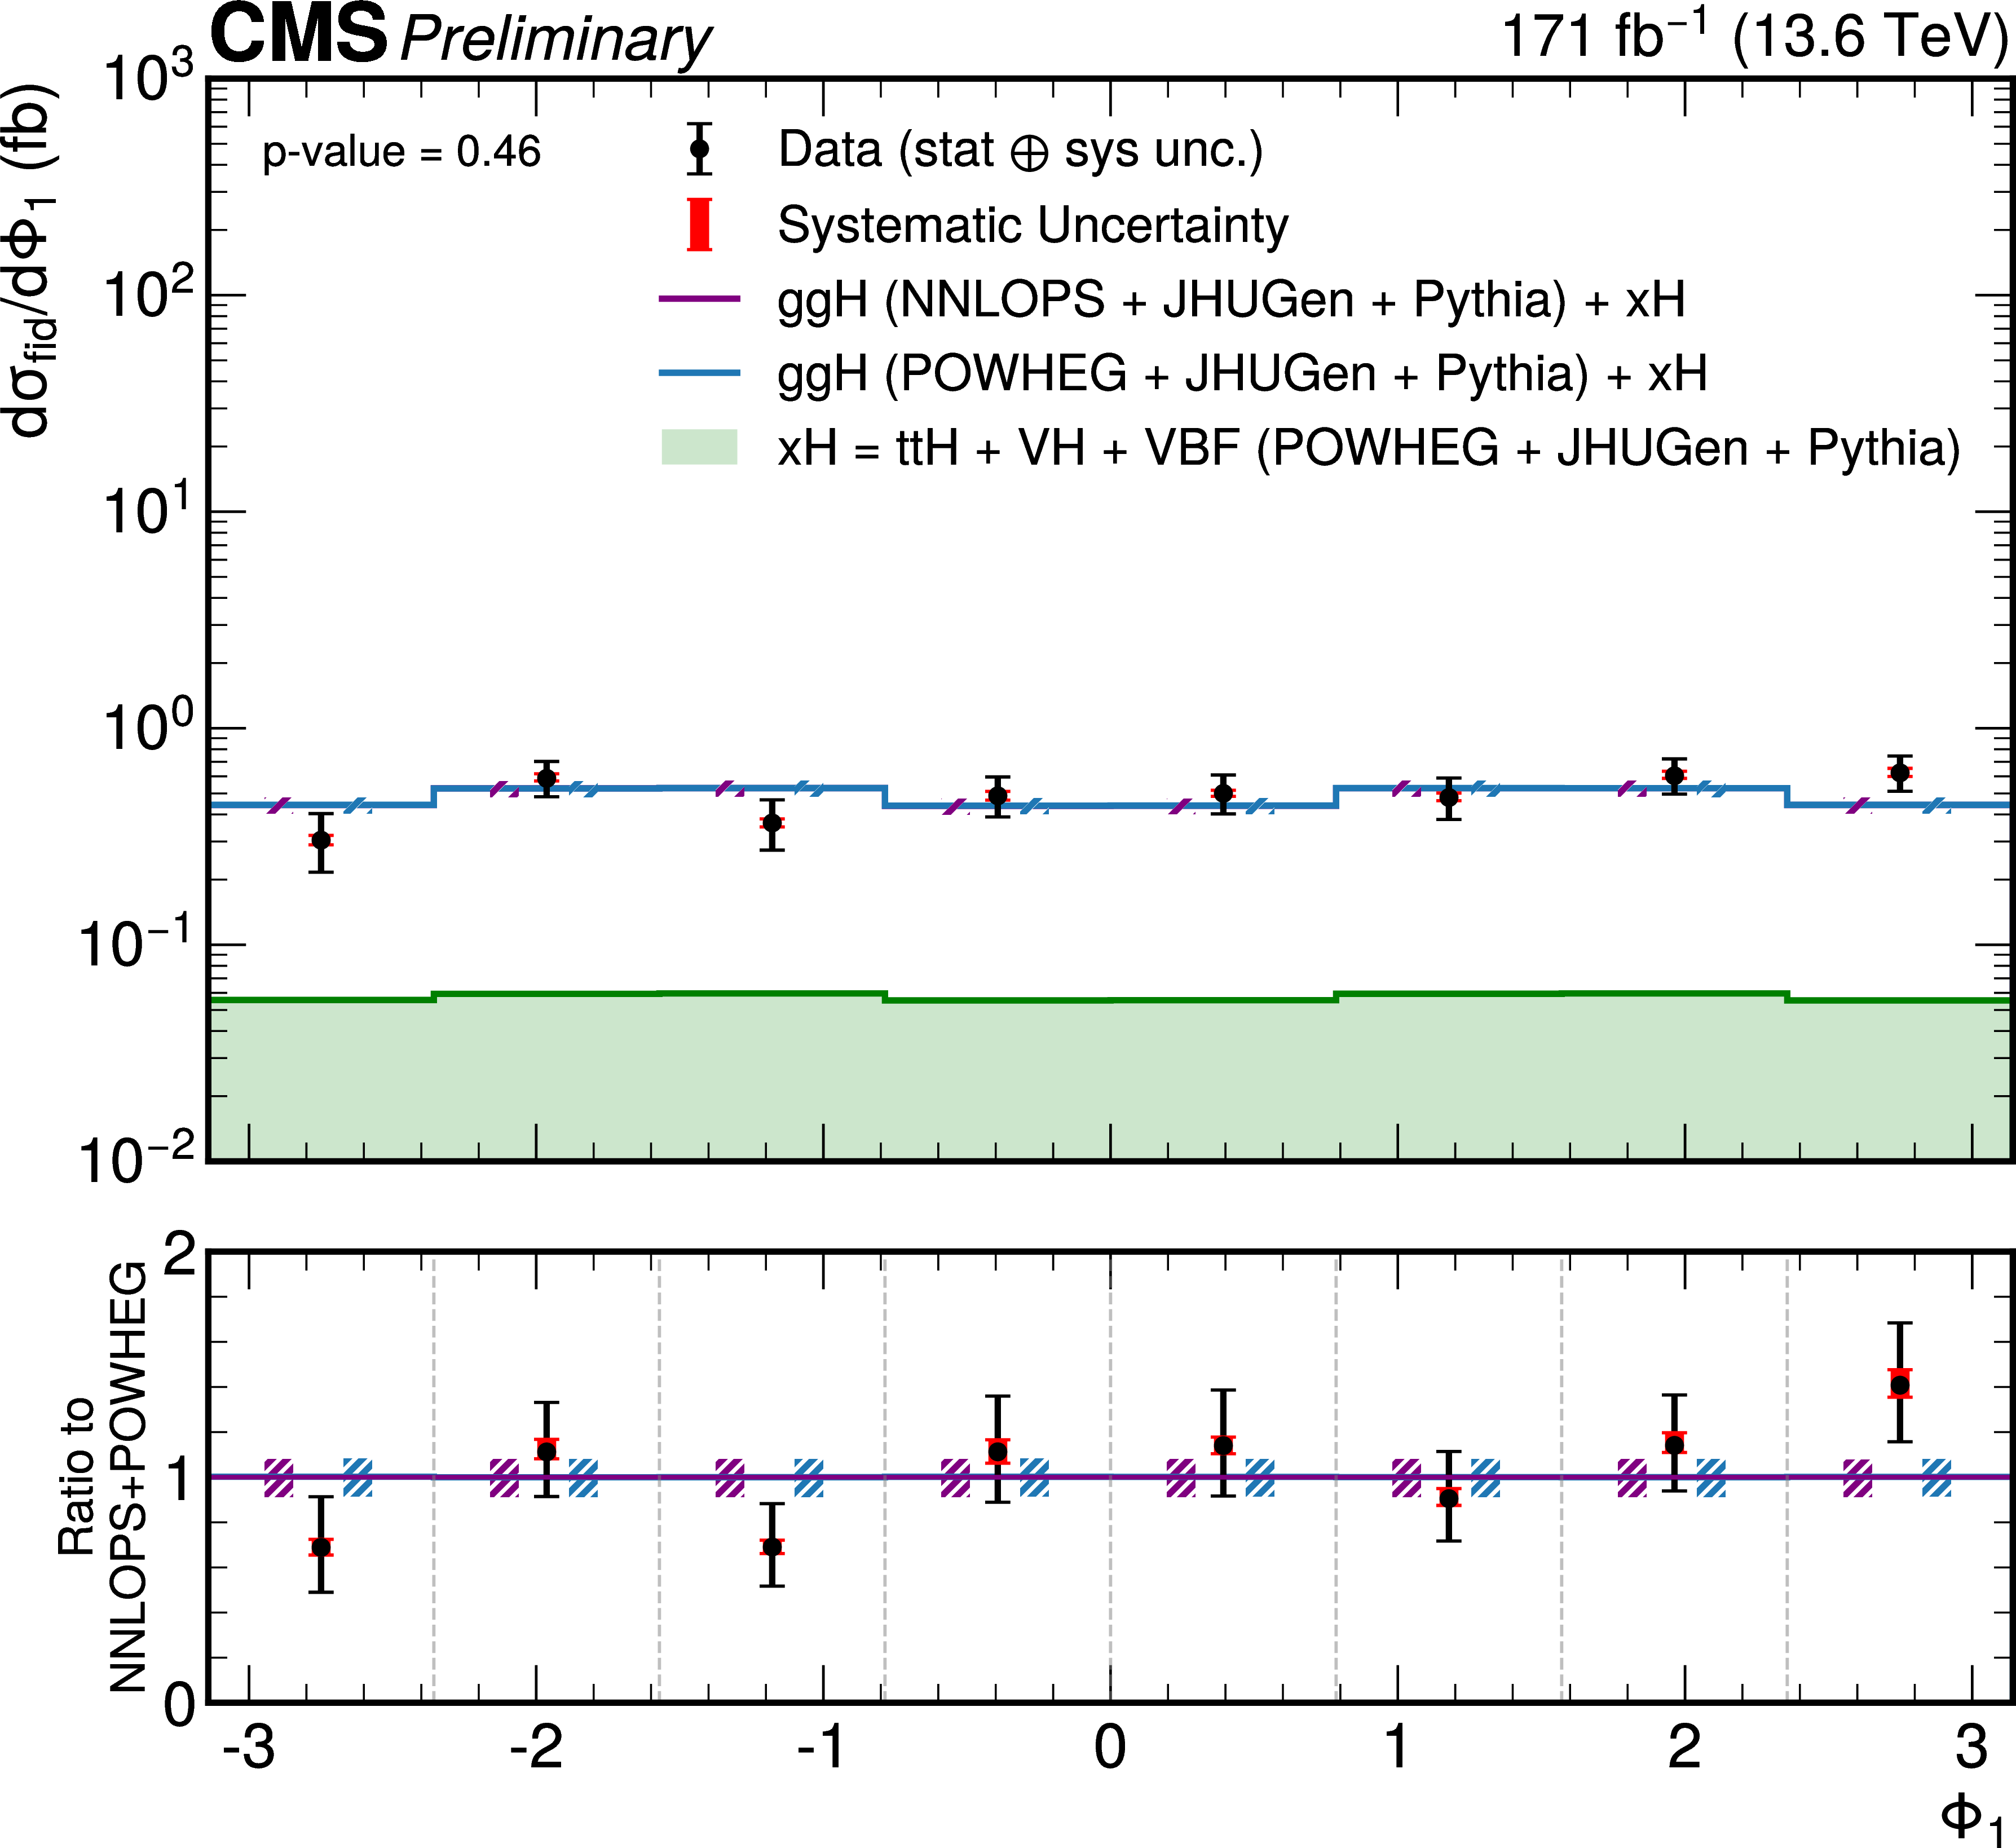
Figure 13:
Differential fiducial cross sections for the $ H \rightarrow ZZ \rightarrow 4\ell $ process as a function of the angular variables connecting the production and decay processes, cos$ \theta^{\ast} $ (left) and $ \Phi_1 $(right). The gg $ \to $ H predictions are shown for two different generators, POWHEG (blue) and NNLOPS (purple), normalized to the total cross section computed at next-to-next-to-next-to-leading order (N3LO), separately stacked over the the subdominant component of the signal from VBF + VH + t\=tH, denoted as xH (green). The hatched areas correspond to the systematic uncertainties in the theoretical predictions. Black points represent the measured fiducial cross sections in each bin, black error bars indicate the total uncertainty in each measurement, and red boxes denote the systematic uncertainties. The lower panels display the ratios of the measured cross sections and of the POWHEG gg $ \to $ H + xH theoretical prediction to the NNLOPS gg $ \to $ H + POWHEG xH theoretical predictions. |
png pdf |
Figure 13-a:
Differential fiducial cross sections for the $ H \rightarrow ZZ \rightarrow 4\ell $ process as a function of the angular variables connecting the production and decay processes, cos$ \theta^{\ast} $ (left) and $ \Phi_1 $(right). The gg $ \to $ H predictions are shown for two different generators, POWHEG (blue) and NNLOPS (purple), normalized to the total cross section computed at next-to-next-to-next-to-leading order (N3LO), separately stacked over the the subdominant component of the signal from VBF + VH + t\=tH, denoted as xH (green). The hatched areas correspond to the systematic uncertainties in the theoretical predictions. Black points represent the measured fiducial cross sections in each bin, black error bars indicate the total uncertainty in each measurement, and red boxes denote the systematic uncertainties. The lower panels display the ratios of the measured cross sections and of the POWHEG gg $ \to $ H + xH theoretical prediction to the NNLOPS gg $ \to $ H + POWHEG xH theoretical predictions. |
png pdf |
Figure 13-b:
Differential fiducial cross sections for the $ H \rightarrow ZZ \rightarrow 4\ell $ process as a function of the angular variables connecting the production and decay processes, cos$ \theta^{\ast} $ (left) and $ \Phi_1 $(right). The gg $ \to $ H predictions are shown for two different generators, POWHEG (blue) and NNLOPS (purple), normalized to the total cross section computed at next-to-next-to-next-to-leading order (N3LO), separately stacked over the the subdominant component of the signal from VBF + VH + t\=tH, denoted as xH (green). The hatched areas correspond to the systematic uncertainties in the theoretical predictions. Black points represent the measured fiducial cross sections in each bin, black error bars indicate the total uncertainty in each measurement, and red boxes denote the systematic uncertainties. The lower panels display the ratios of the measured cross sections and of the POWHEG gg $ \to $ H + xH theoretical prediction to the NNLOPS gg $ \to $ H + POWHEG xH theoretical predictions. |
png pdf |
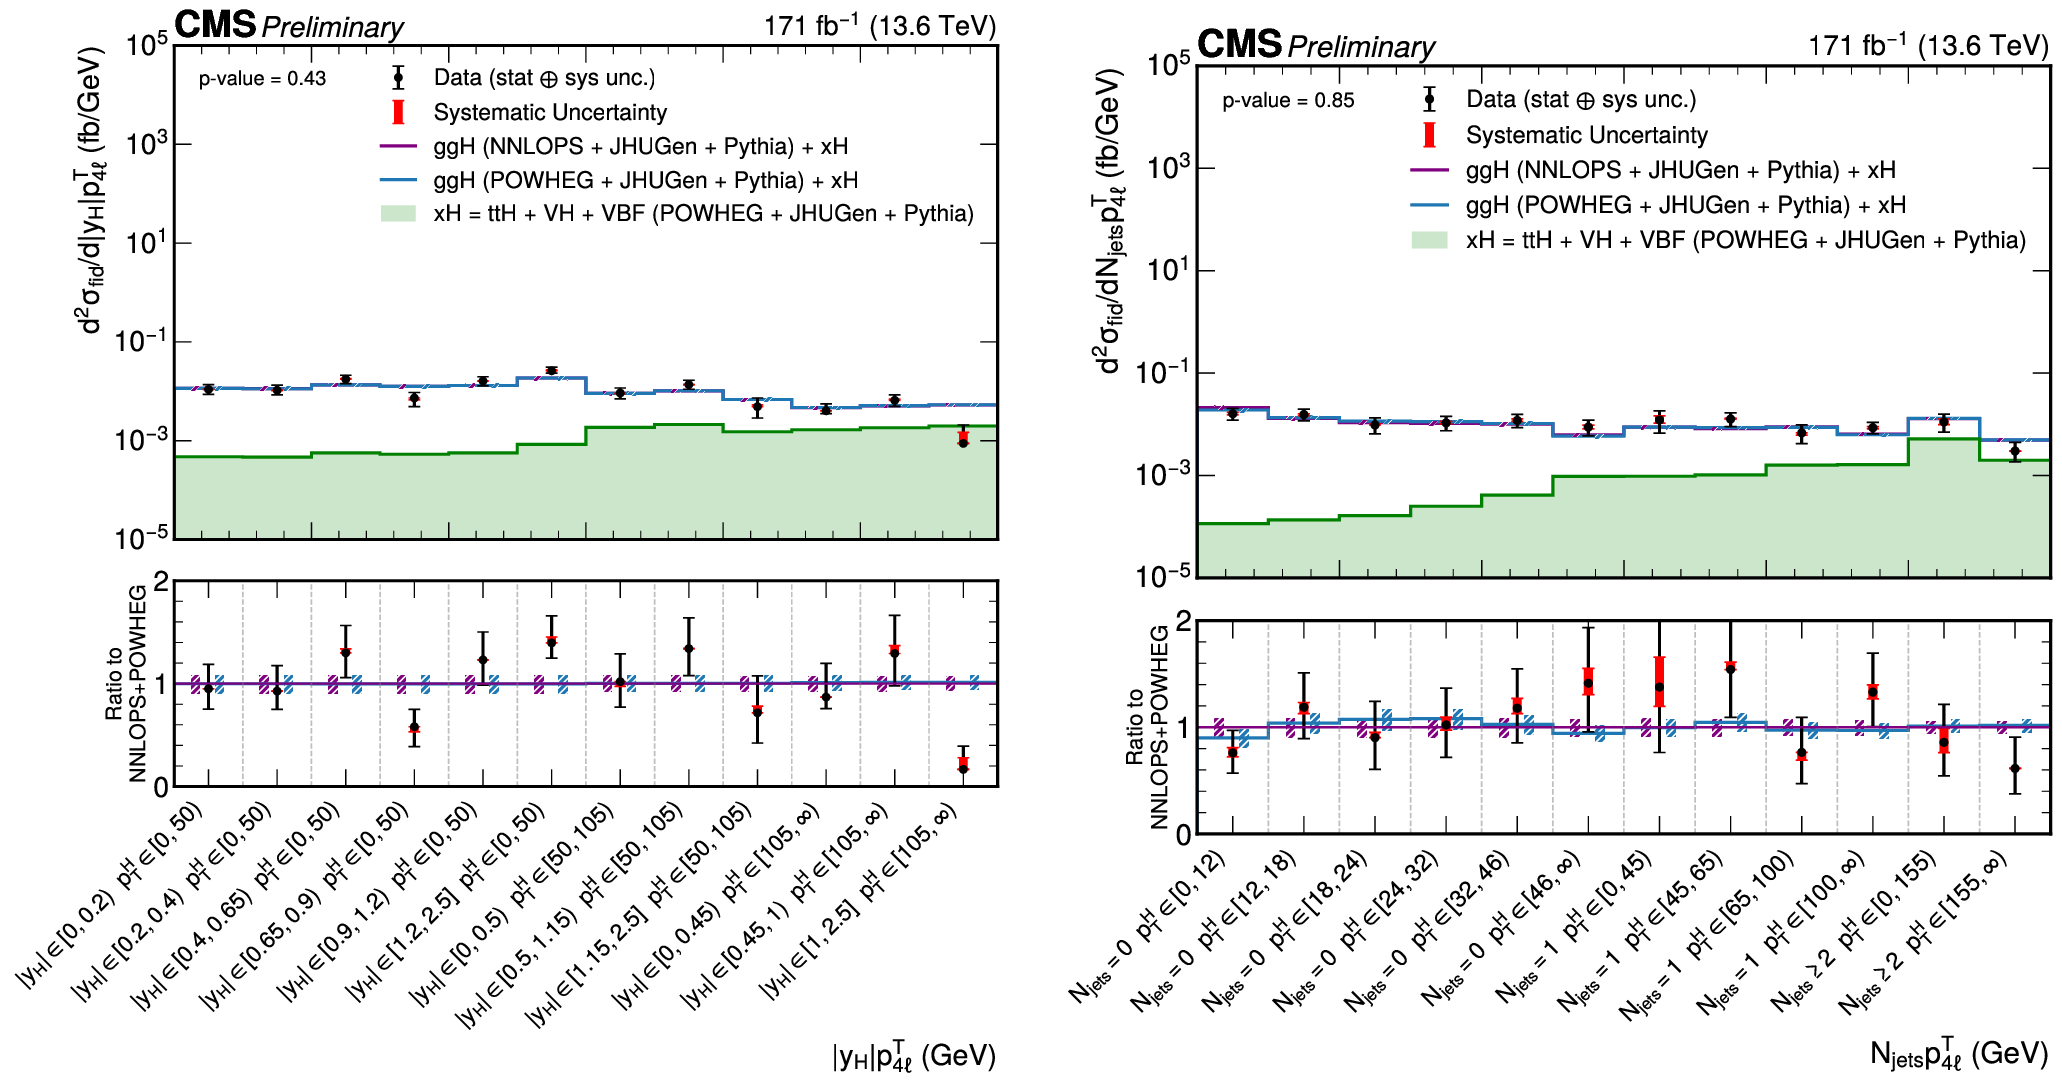
Figure 14:
Double differential cross sections in bins of $ |y_{\mathrm{H}}| $ vs. $ p_{\mathrm{T}}^{\mathrm{H}} $ (left) and $ {N_{j}} $ vs. $ p_{\mathrm{T}}^{\mathrm{H}} $ (right). The gg $ \to $ H predictions are shown for two different generators, POWHEG (blue) and NNLOPS (purple), normalized to the total cross section computed at next-to-next-to-next-to-leading order (N3LO), separately stacked over the the subdominant component of the signal from VBF + VH + t\=tH, denoted as xH (green). The hatched areas correspond to the systematic uncertainties in the theoretical predictions. Black points represent the measured fiducial cross sections in each bin, black error bars indicate the total uncertainty in each measurement, and red boxes denote the systematic uncertainties. The lower panels display the ratios of the measured cross sections and of the POWHEG gg $ \to $ H + xH theoretical prediction to the NNLOPS gg $ \to $ H + POWHEG xH theoretical predictions. |
png pdf |
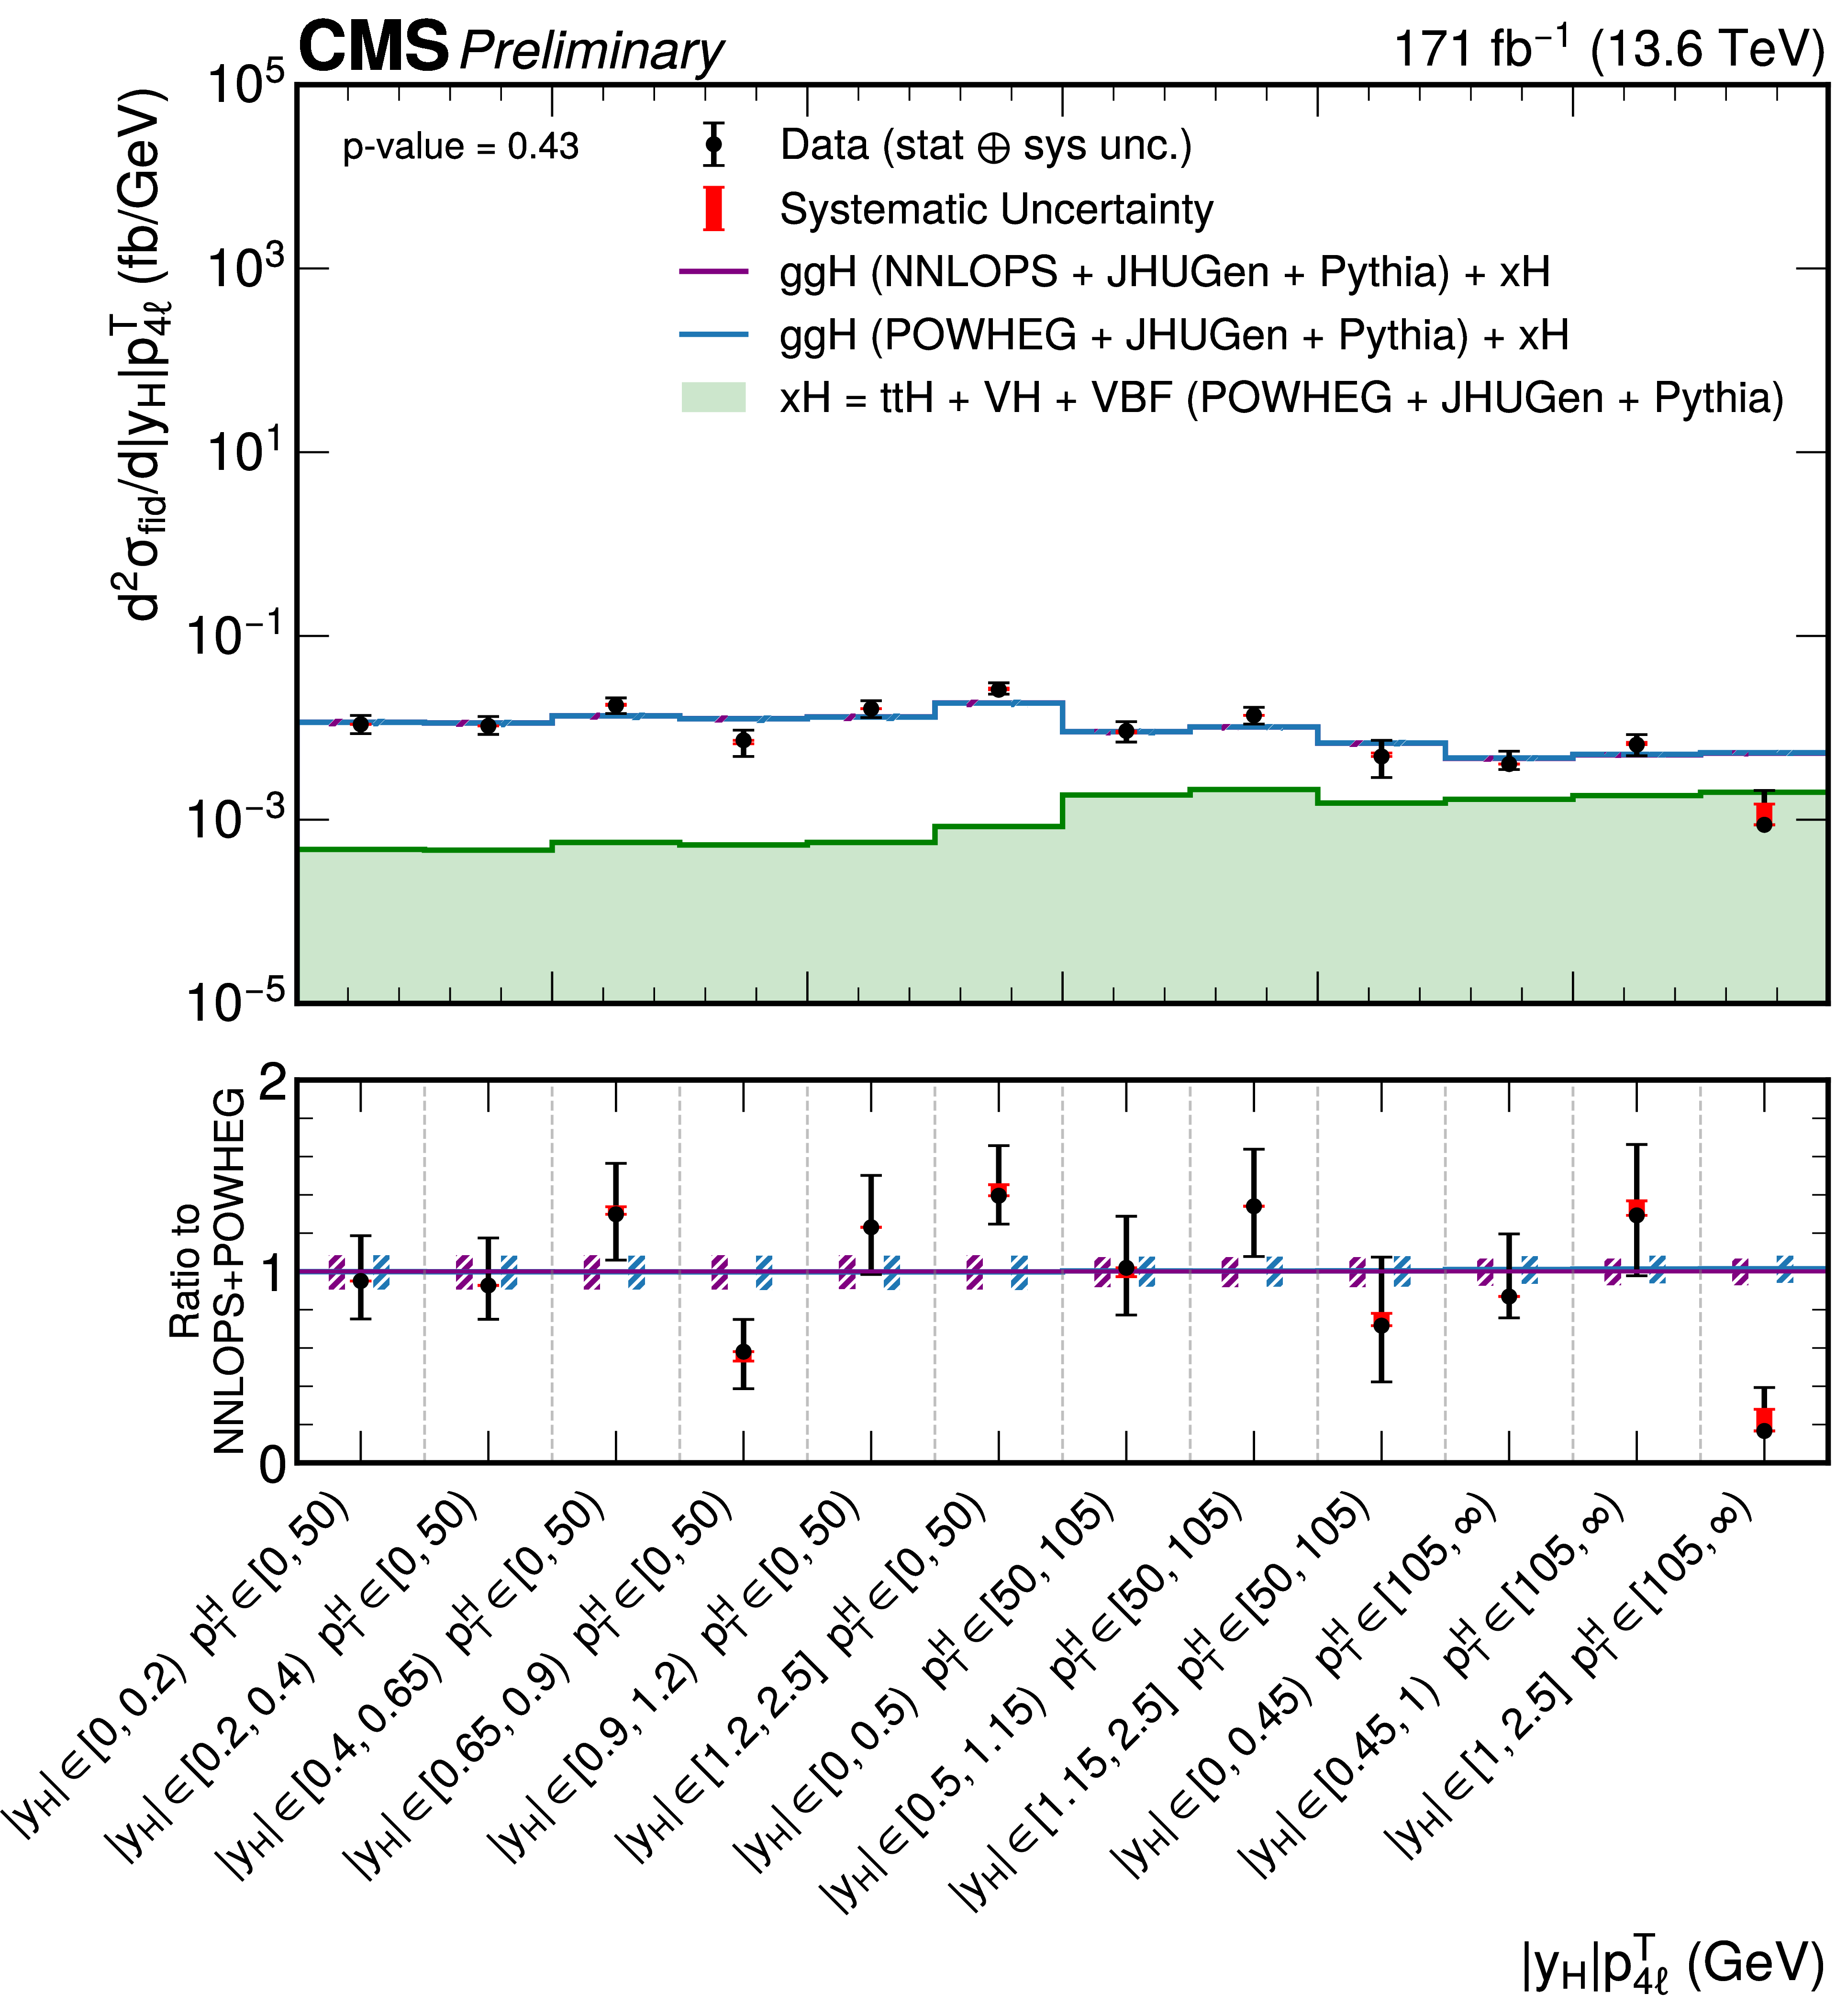
Figure 14-a:
Double differential cross sections in bins of $ |y_{\mathrm{H}}| $ vs. $ p_{\mathrm{T}}^{\mathrm{H}} $ (left) and $ {N_{j}} $ vs. $ p_{\mathrm{T}}^{\mathrm{H}} $ (right). The gg $ \to $ H predictions are shown for two different generators, POWHEG (blue) and NNLOPS (purple), normalized to the total cross section computed at next-to-next-to-next-to-leading order (N3LO), separately stacked over the the subdominant component of the signal from VBF + VH + t\=tH, denoted as xH (green). The hatched areas correspond to the systematic uncertainties in the theoretical predictions. Black points represent the measured fiducial cross sections in each bin, black error bars indicate the total uncertainty in each measurement, and red boxes denote the systematic uncertainties. The lower panels display the ratios of the measured cross sections and of the POWHEG gg $ \to $ H + xH theoretical prediction to the NNLOPS gg $ \to $ H + POWHEG xH theoretical predictions. |
png pdf |
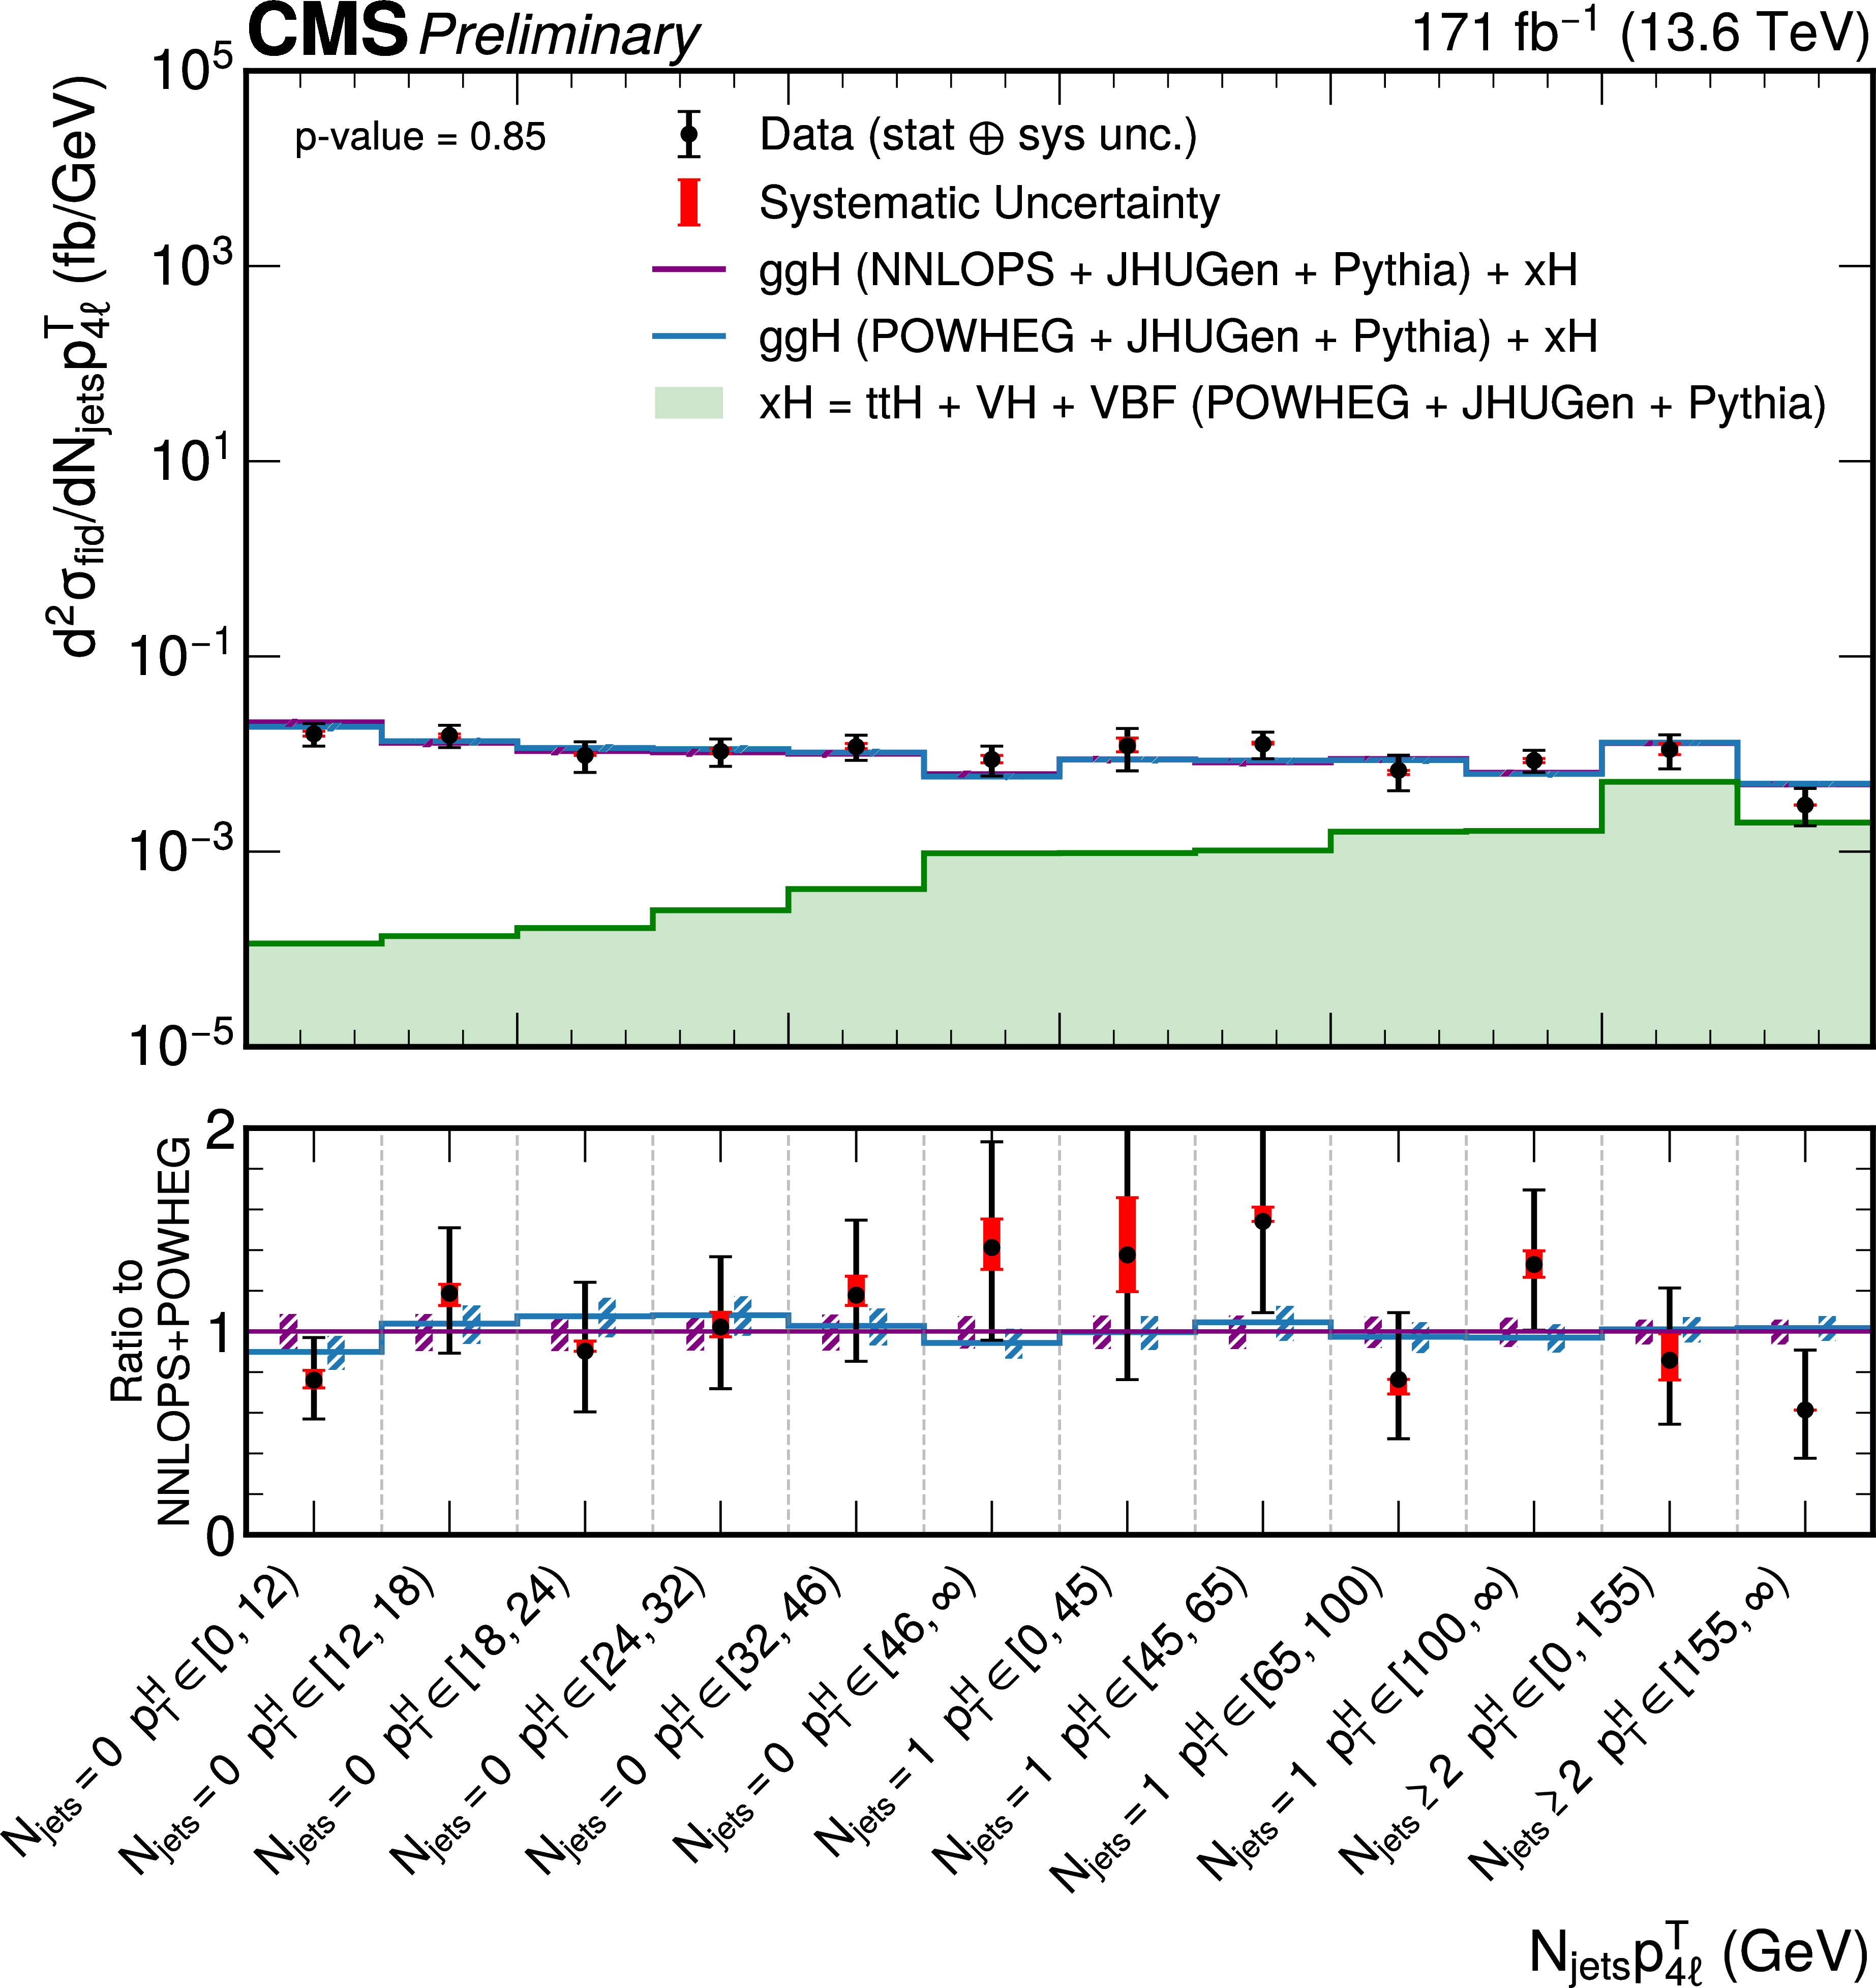
Figure 14-b:
Double differential cross sections in bins of $ |y_{\mathrm{H}}| $ vs. $ p_{\mathrm{T}}^{\mathrm{H}} $ (left) and $ {N_{j}} $ vs. $ p_{\mathrm{T}}^{\mathrm{H}} $ (right). The gg $ \to $ H predictions are shown for two different generators, POWHEG (blue) and NNLOPS (purple), normalized to the total cross section computed at next-to-next-to-next-to-leading order (N3LO), separately stacked over the the subdominant component of the signal from VBF + VH + t\=tH, denoted as xH (green). The hatched areas correspond to the systematic uncertainties in the theoretical predictions. Black points represent the measured fiducial cross sections in each bin, black error bars indicate the total uncertainty in each measurement, and red boxes denote the systematic uncertainties. The lower panels display the ratios of the measured cross sections and of the POWHEG gg $ \to $ H + xH theoretical prediction to the NNLOPS gg $ \to $ H + POWHEG xH theoretical predictions. |
png pdf |
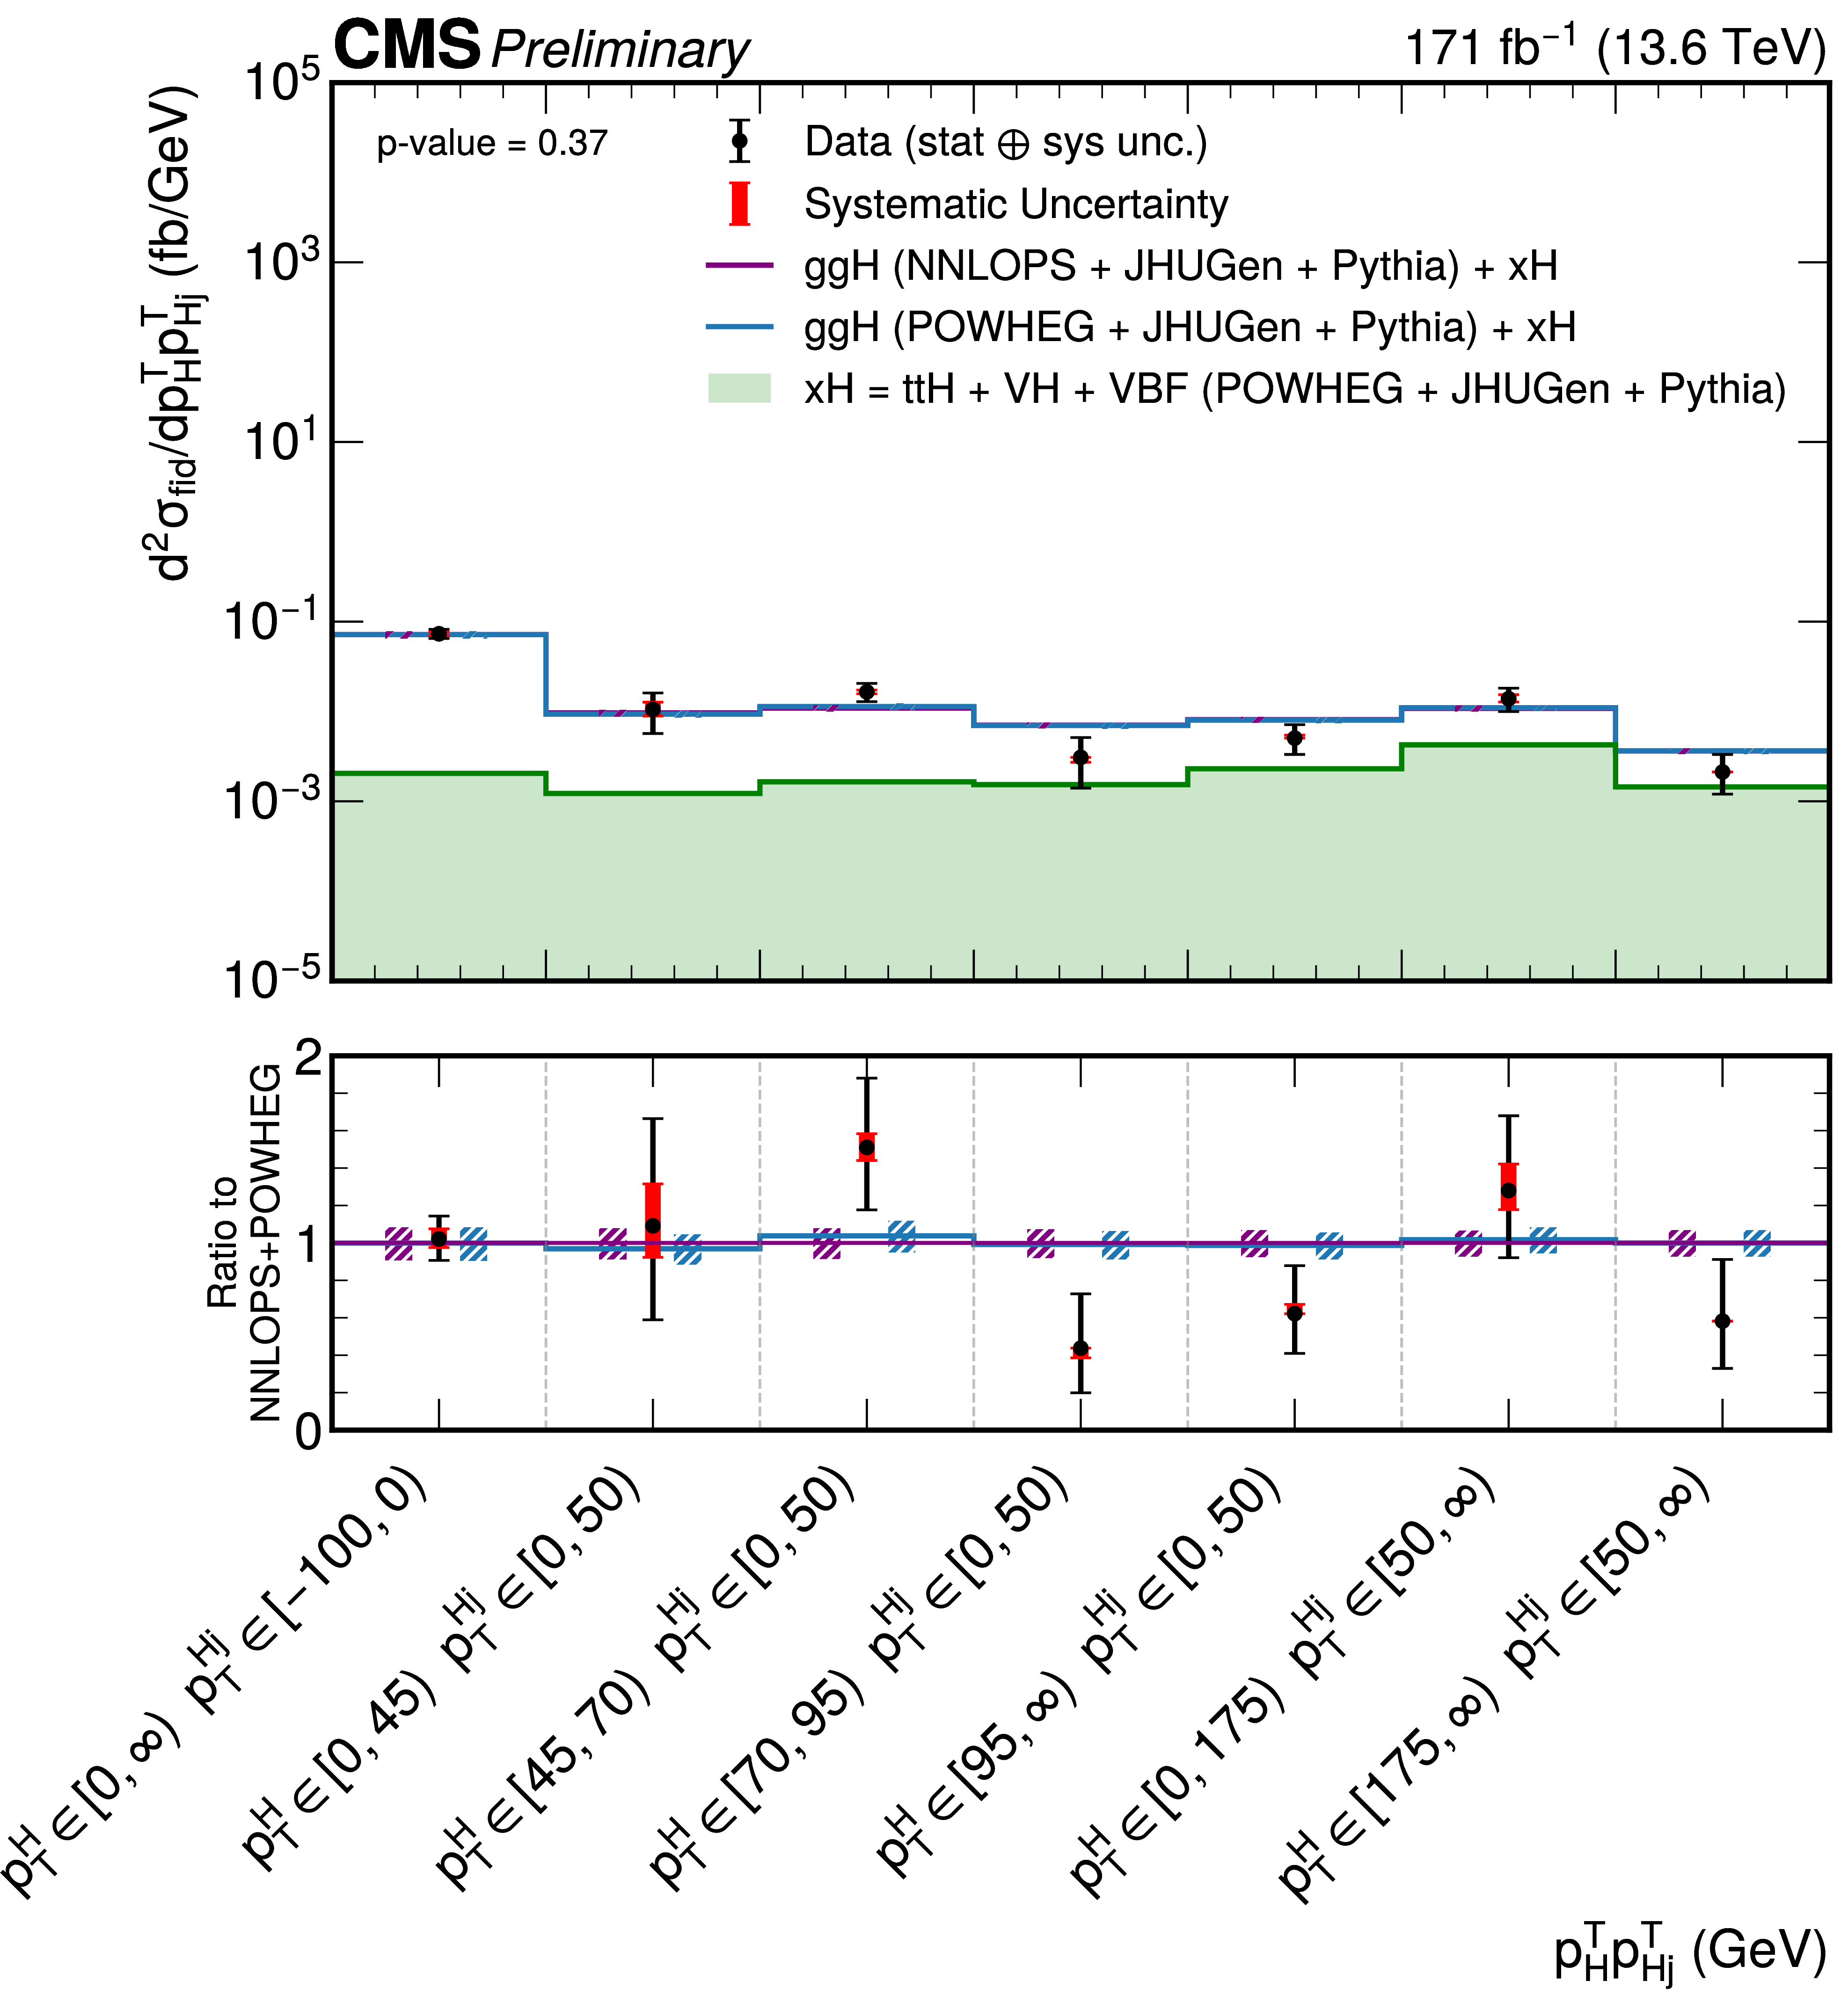
Figure 15:
Double differential cross sections in bins of $ p_{\mathrm{T}}^{\mathrm{H} \text{j}} $ vs. $ p_{\mathrm{T}}^{\mathrm{H}} $ (upper left), $ p_{\mathrm{T}} $ of the leading vs. subleading jet (upper right) and $ m_{\mathrm{Z}_{1}} $ vs. $ m_{\mathrm{Z}_{2}} $ (bottom). The gg $ \to $ H predictions are shown for two different generators, POWHEG (blue) and NNLOPS (purple), normalized to the total cross section computed at next-to-next-to-next-to-leading order (N3LO), separately stacked over the the subdominant component of the signal from VBF + VH + t\=tH, denoted as xH (green). The hatched areas correspond to the systematic uncertainties in the theoretical predictions. Black points represent the measured fiducial cross sections in each bin, black error bars indicate the total uncertainty in each measurement, and red boxes denote the systematic uncertainties. The lower panels display the ratios of the measured cross sections and of the POWHEG gg $ \to $ H + xH theoretical prediction to the NNLOPS gg $ \to $ H + POWHEG xH theoretical predictions. |
png pdf |
Figure 15-a:
Double differential cross sections in bins of $ p_{\mathrm{T}}^{\mathrm{H} \text{j}} $ vs. $ p_{\mathrm{T}}^{\mathrm{H}} $ (upper left), $ p_{\mathrm{T}} $ of the leading vs. subleading jet (upper right) and $ m_{\mathrm{Z}_{1}} $ vs. $ m_{\mathrm{Z}_{2}} $ (bottom). The gg $ \to $ H predictions are shown for two different generators, POWHEG (blue) and NNLOPS (purple), normalized to the total cross section computed at next-to-next-to-next-to-leading order (N3LO), separately stacked over the the subdominant component of the signal from VBF + VH + t\=tH, denoted as xH (green). The hatched areas correspond to the systematic uncertainties in the theoretical predictions. Black points represent the measured fiducial cross sections in each bin, black error bars indicate the total uncertainty in each measurement, and red boxes denote the systematic uncertainties. The lower panels display the ratios of the measured cross sections and of the POWHEG gg $ \to $ H + xH theoretical prediction to the NNLOPS gg $ \to $ H + POWHEG xH theoretical predictions. |
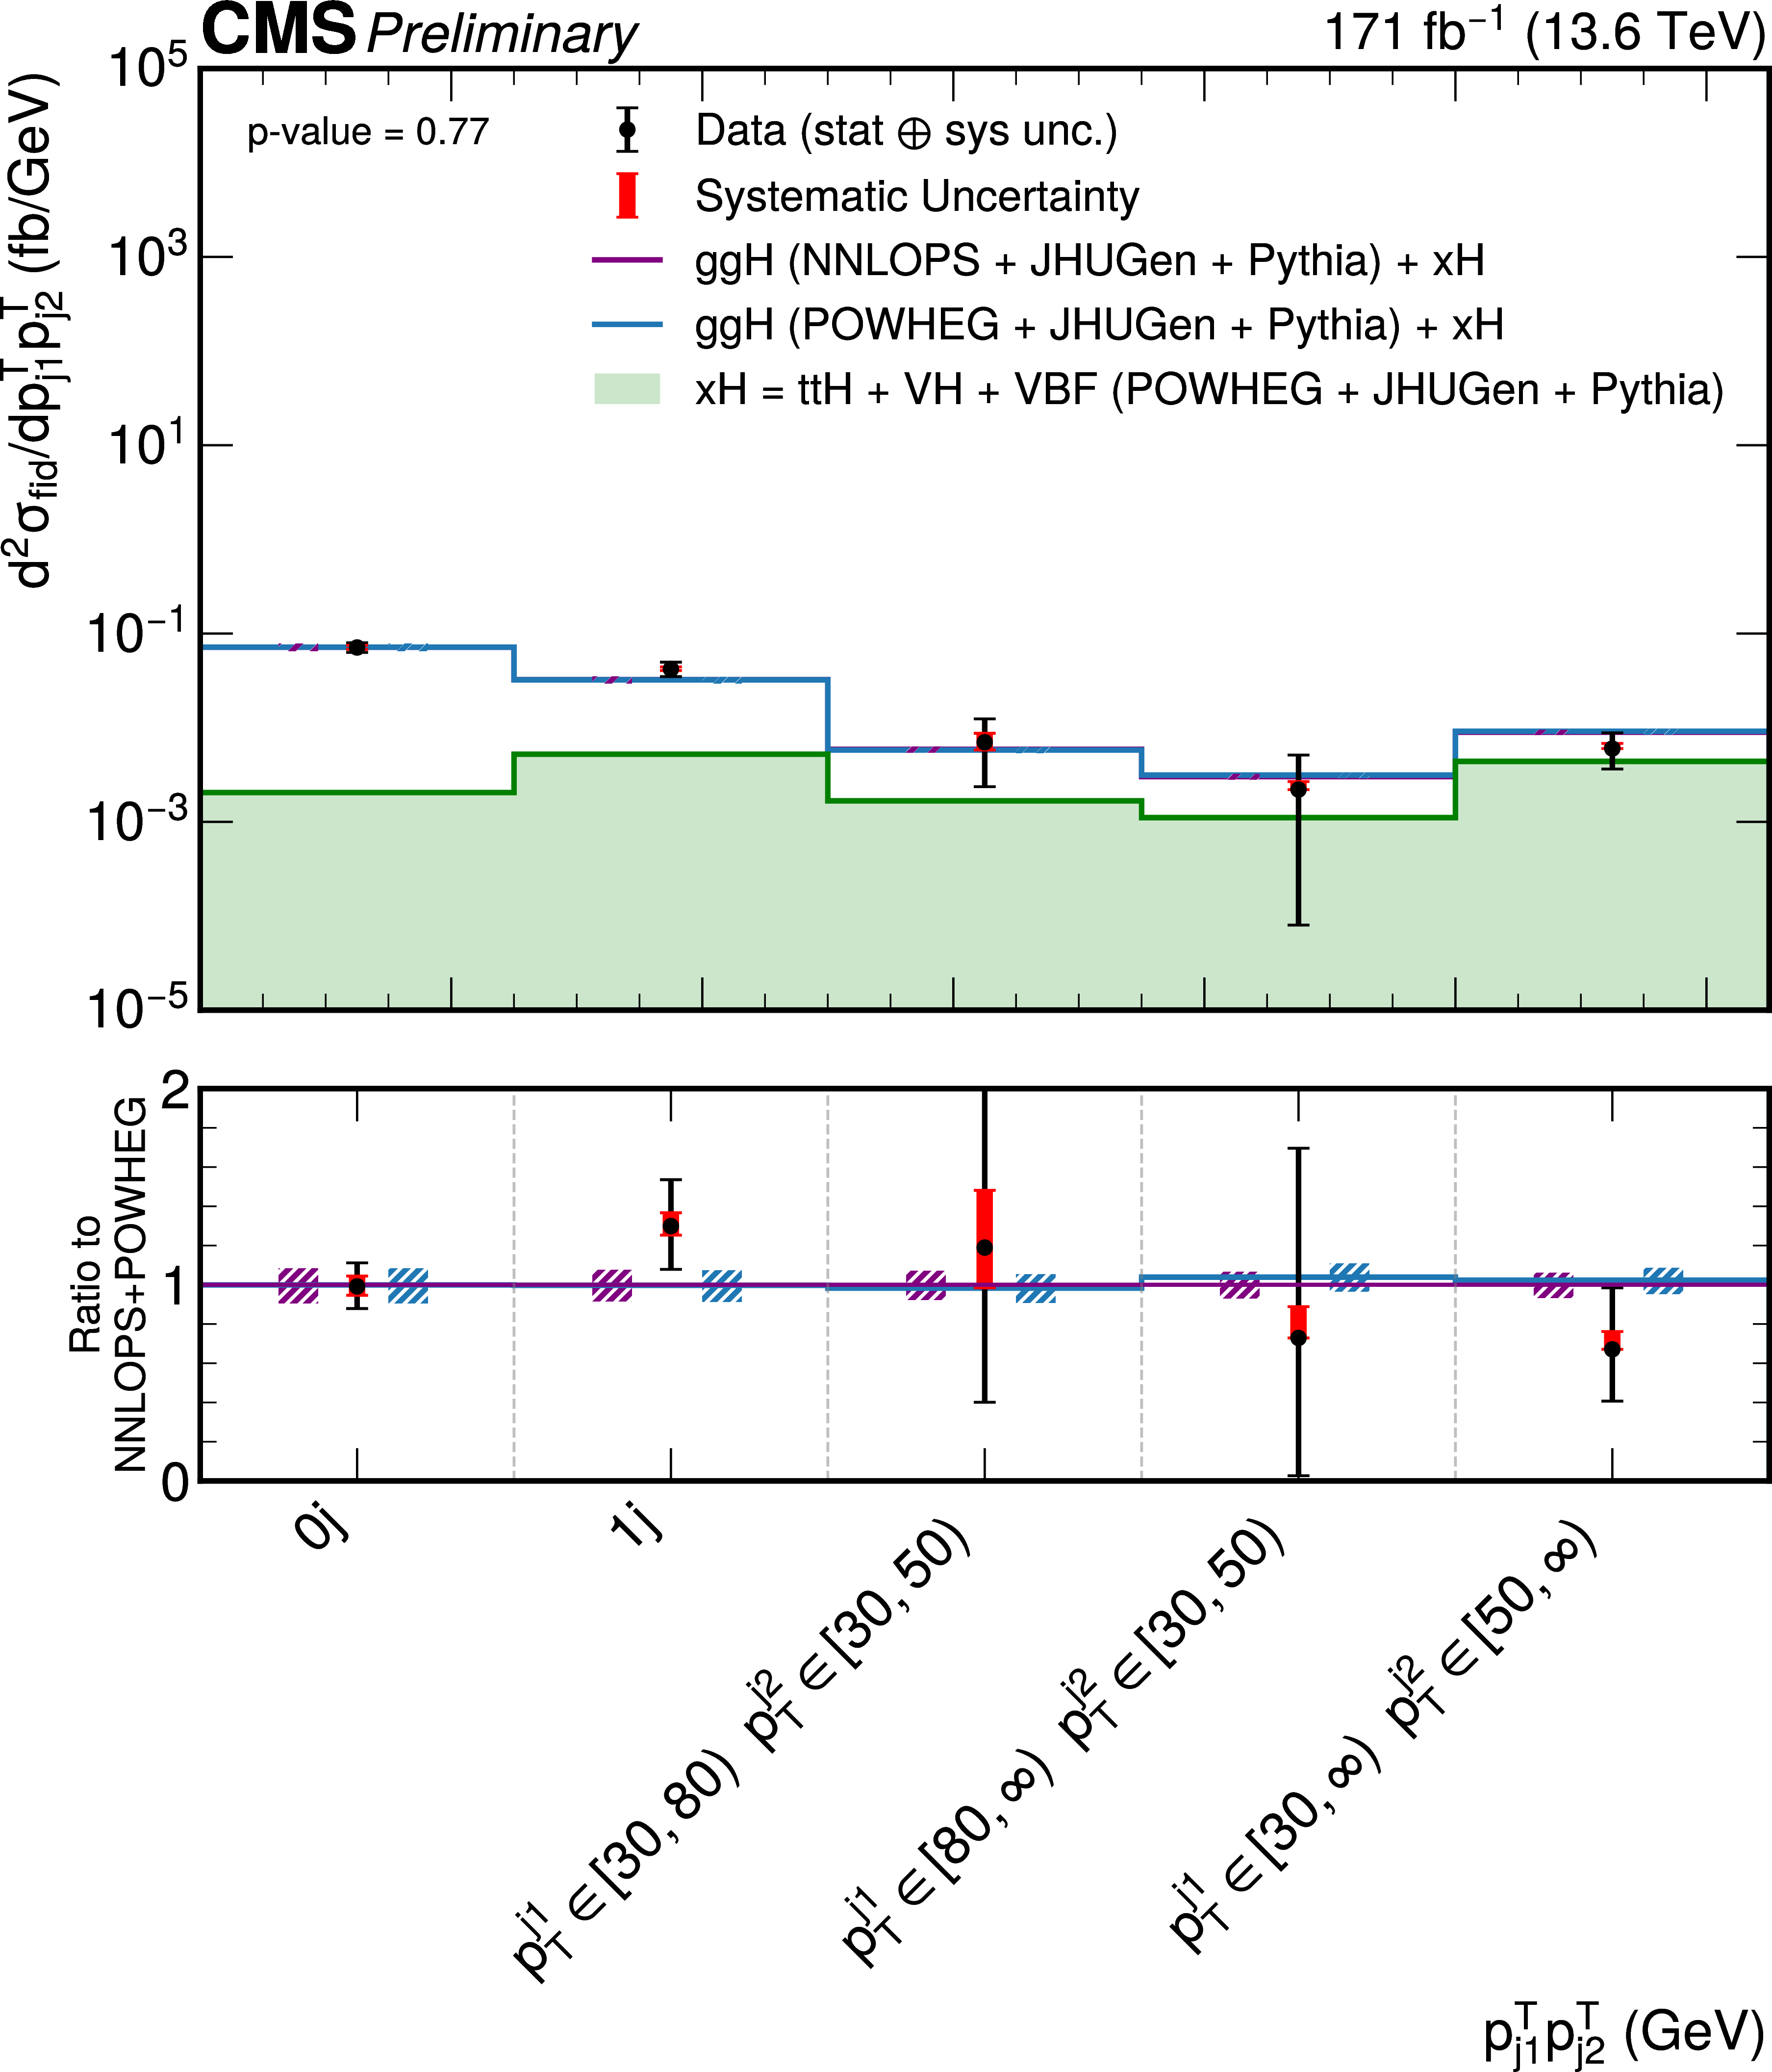
png pdf |
Figure 15-b:
Double differential cross sections in bins of $ p_{\mathrm{T}}^{\mathrm{H} \text{j}} $ vs. $ p_{\mathrm{T}}^{\mathrm{H}} $ (upper left), $ p_{\mathrm{T}} $ of the leading vs. subleading jet (upper right) and $ m_{\mathrm{Z}_{1}} $ vs. $ m_{\mathrm{Z}_{2}} $ (bottom). The gg $ \to $ H predictions are shown for two different generators, POWHEG (blue) and NNLOPS (purple), normalized to the total cross section computed at next-to-next-to-next-to-leading order (N3LO), separately stacked over the the subdominant component of the signal from VBF + VH + t\=tH, denoted as xH (green). The hatched areas correspond to the systematic uncertainties in the theoretical predictions. Black points represent the measured fiducial cross sections in each bin, black error bars indicate the total uncertainty in each measurement, and red boxes denote the systematic uncertainties. The lower panels display the ratios of the measured cross sections and of the POWHEG gg $ \to $ H + xH theoretical prediction to the NNLOPS gg $ \to $ H + POWHEG xH theoretical predictions. |
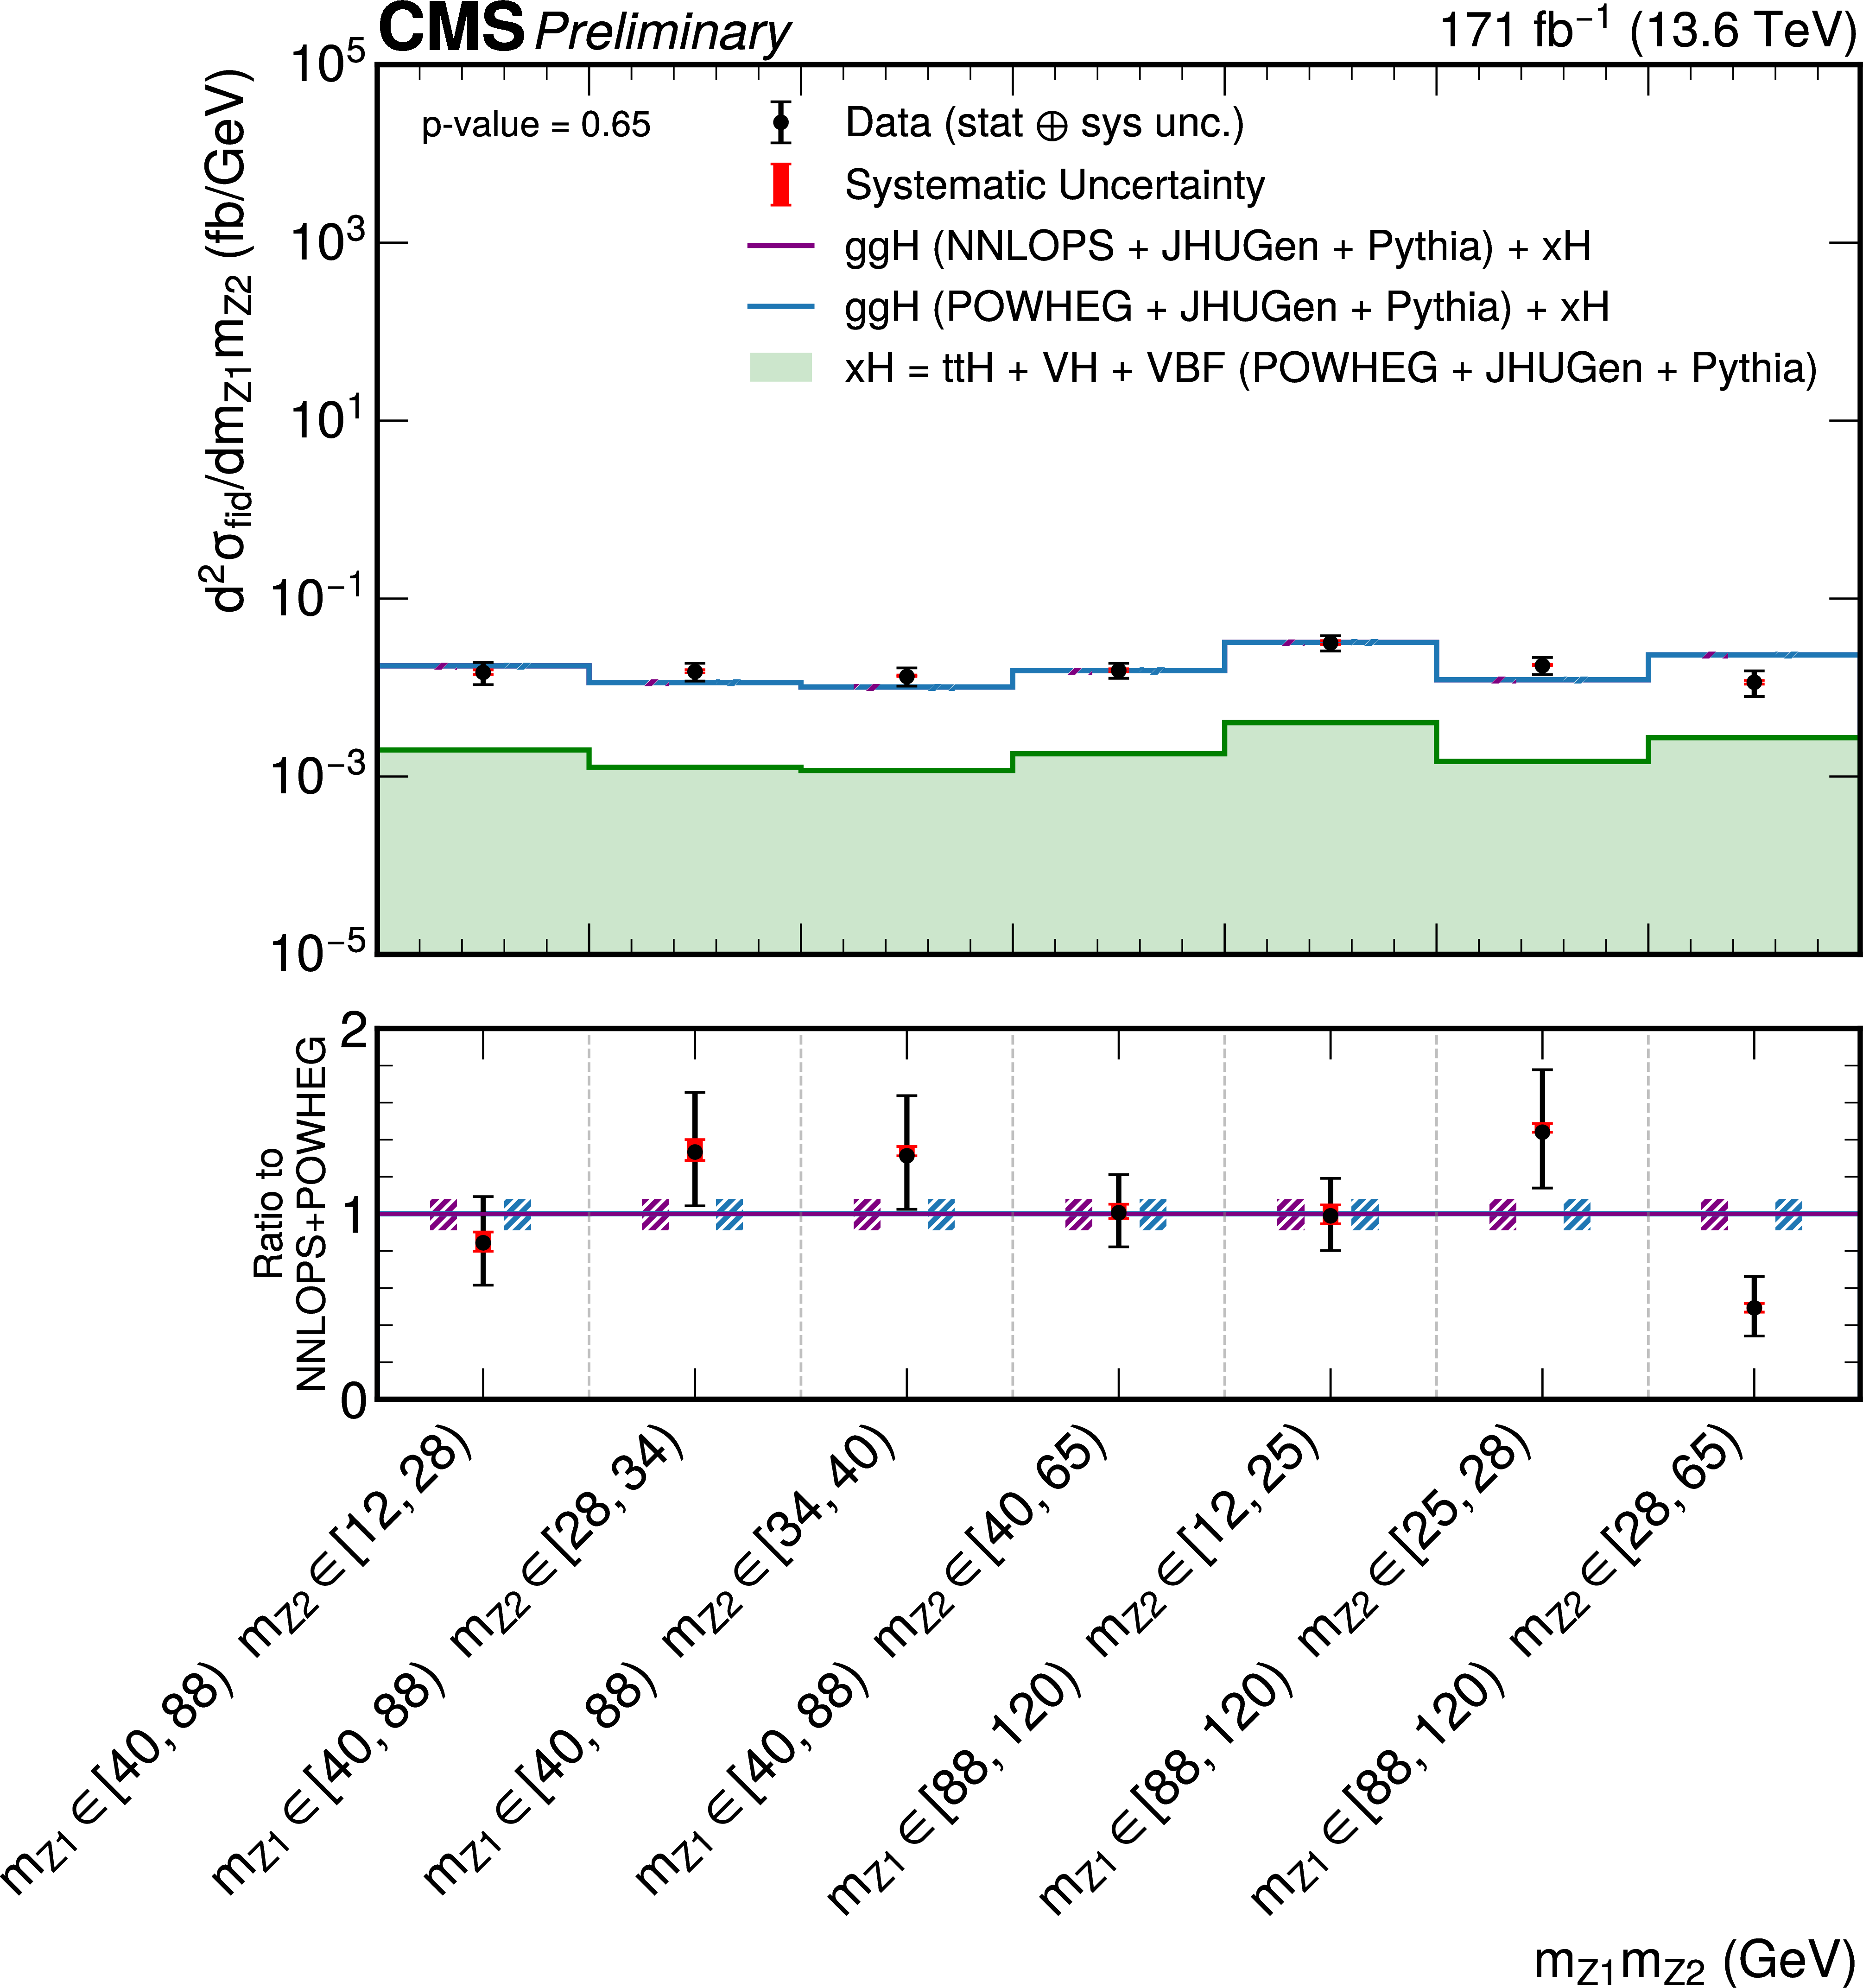
png pdf |
Figure 15-c:
Double differential cross sections in bins of $ p_{\mathrm{T}}^{\mathrm{H} \text{j}} $ vs. $ p_{\mathrm{T}}^{\mathrm{H}} $ (upper left), $ p_{\mathrm{T}} $ of the leading vs. subleading jet (upper right) and $ m_{\mathrm{Z}_{1}} $ vs. $ m_{\mathrm{Z}_{2}} $ (bottom). The gg $ \to $ H predictions are shown for two different generators, POWHEG (blue) and NNLOPS (purple), normalized to the total cross section computed at next-to-next-to-next-to-leading order (N3LO), separately stacked over the the subdominant component of the signal from VBF + VH + t\=tH, denoted as xH (green). The hatched areas correspond to the systematic uncertainties in the theoretical predictions. Black points represent the measured fiducial cross sections in each bin, black error bars indicate the total uncertainty in each measurement, and red boxes denote the systematic uncertainties. The lower panels display the ratios of the measured cross sections and of the POWHEG gg $ \to $ H + xH theoretical prediction to the NNLOPS gg $ \to $ H + POWHEG xH theoretical predictions. |
png pdf |
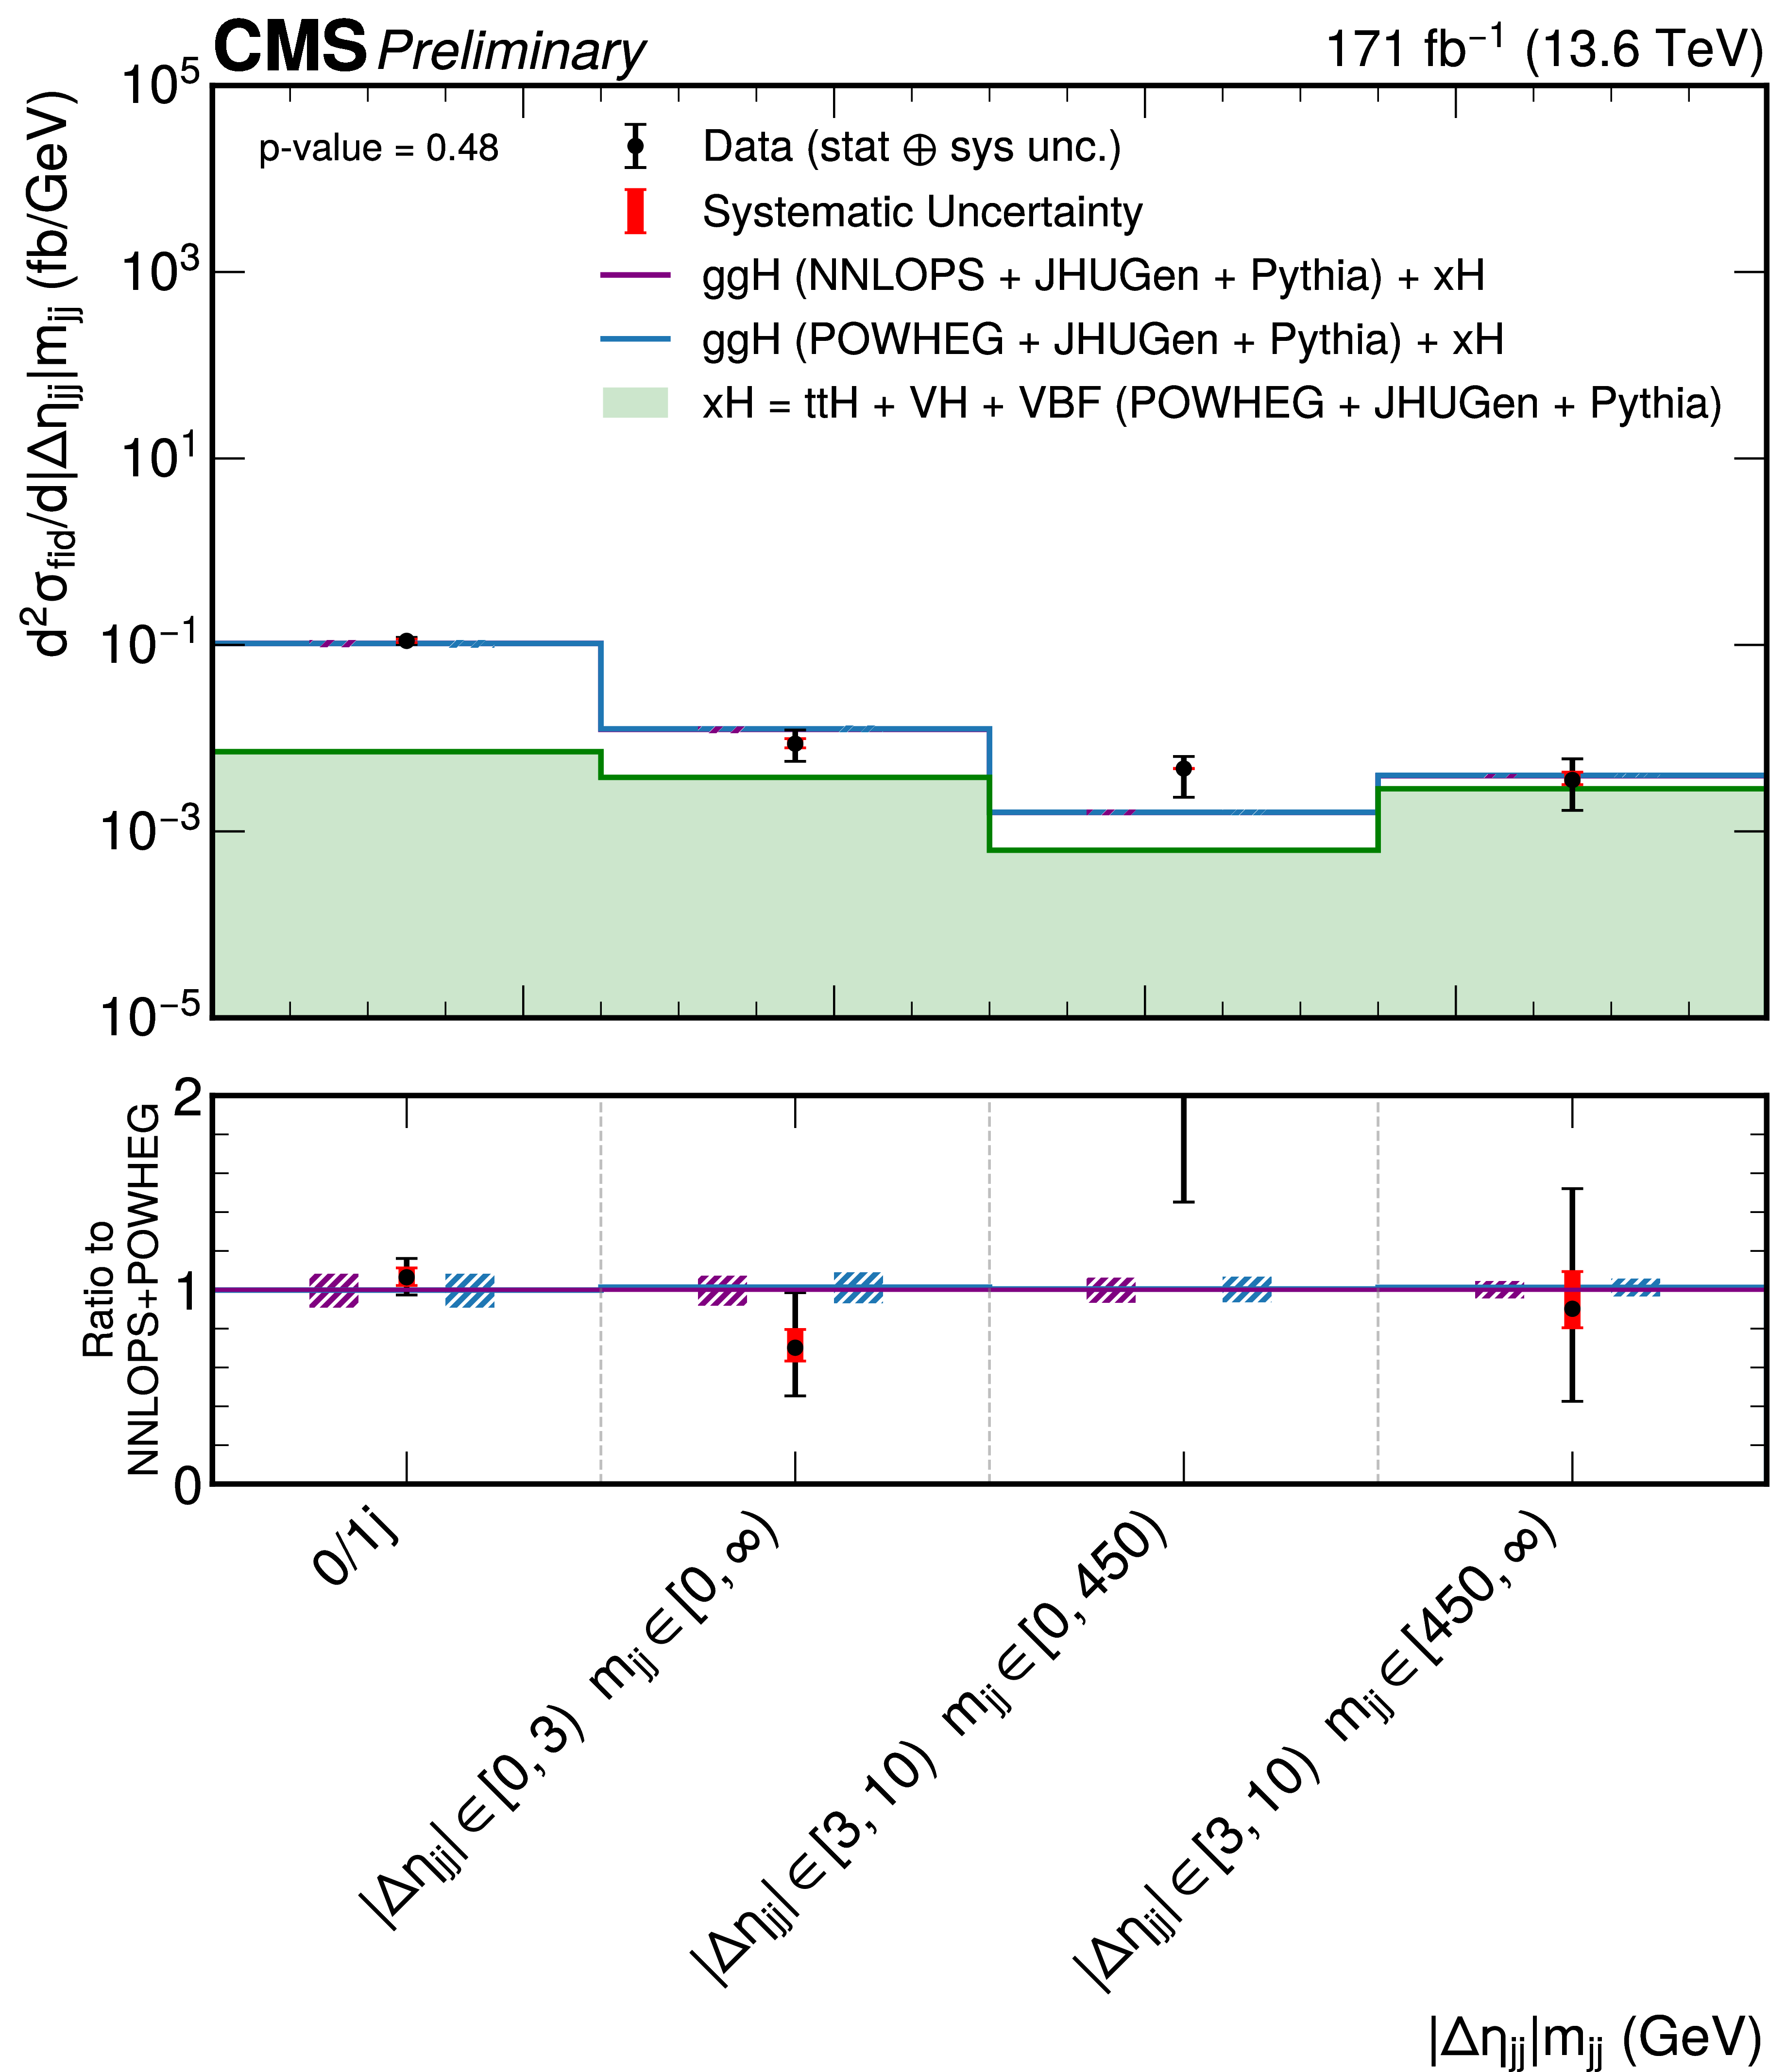
Figure 16:
Double differential cross sections in bins of $ |\Delta \eta_{jj}| $ vs. $ m_{jj} $. The gg $ \to $ H predictions are shown for two different generators, POWHEG (blue) and NNLOPS (purple), normalized to the total cross section computed at next-to-next-to-next-to-leading order (N3LO), separately stacked over the the subdominant component of the signal from VBF + VH + t\=tH, denoted as xH (green). The hatched areas correspond to the systematic uncertainties in the theoretical predictions. Black points represent the measured fiducial cross sections in each bin, black error bars indicate the total uncertainty in each measurement, and red boxes denote the systematic uncertainties. The lower panels display the ratios of the measured cross sections and of the POWHEG gg $ \to $ H + xH theoretical prediction to the NNLOPS gg $ \to $ H + POWHEG xH theoretical predictions. |
png pdf |
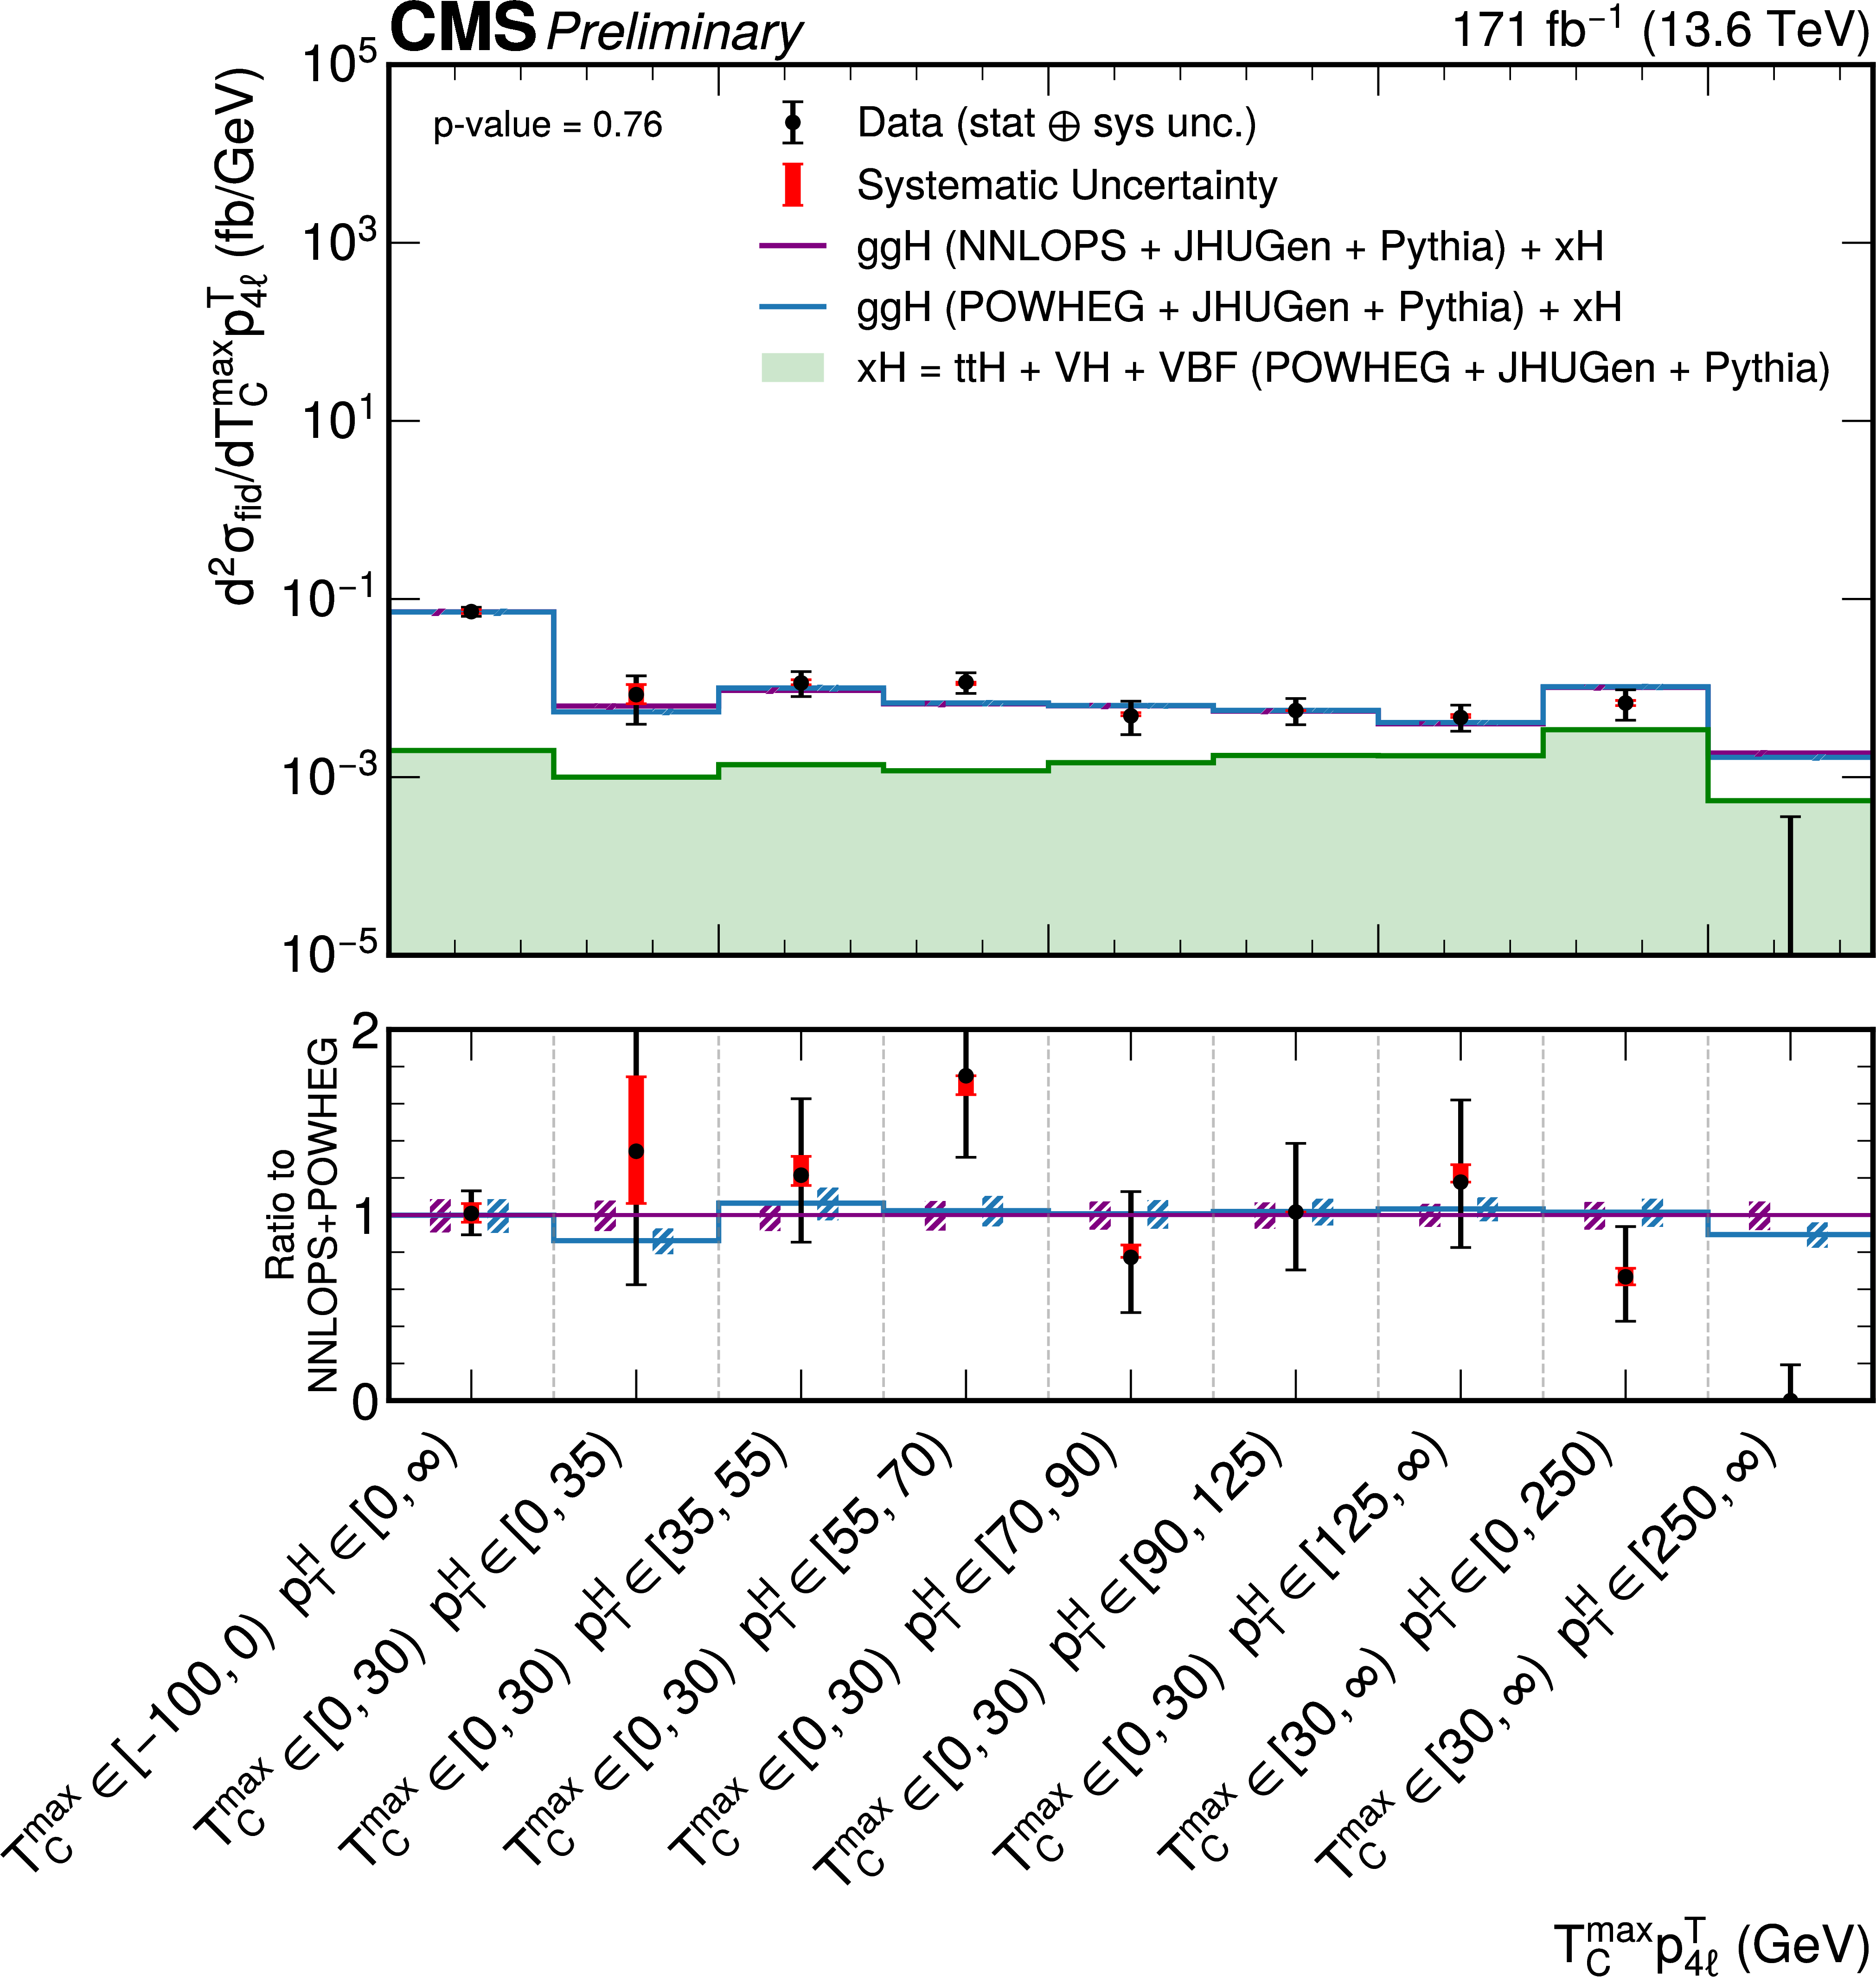
Figure 17:
Double differential cross sections in bins of \texttt\(\mathcalT_C^\textmax\) vs. $ p_{\mathrm{T}}^{\mathrm{H}} $. The gg $ \to $ H predictions are shown for two different generators, POWHEG (blue) and NNLOPS (purple), normalized to the total cross section computed at next-to-next-to-next-to-leading order (N3LO), separately stacked over the the subdominant component of the signal from VBF + VH + t\=tH, denoted as xH (green). The hatched areas correspond to the systematic uncertainties in the theoretical predictions. Black points represent the measured fiducial cross sections in each bin, black error bars indicate the total uncertainty in each measurement, and red boxes denote the systematic uncertainties. The lower panels display the ratios of the measured cross sections and of the POWHEG gg $ \to $ H + xH theoretical prediction to the NNLOPS gg $ \to $ H + POWHEG xH theoretical predictions. |
| Tables | |
png pdf |
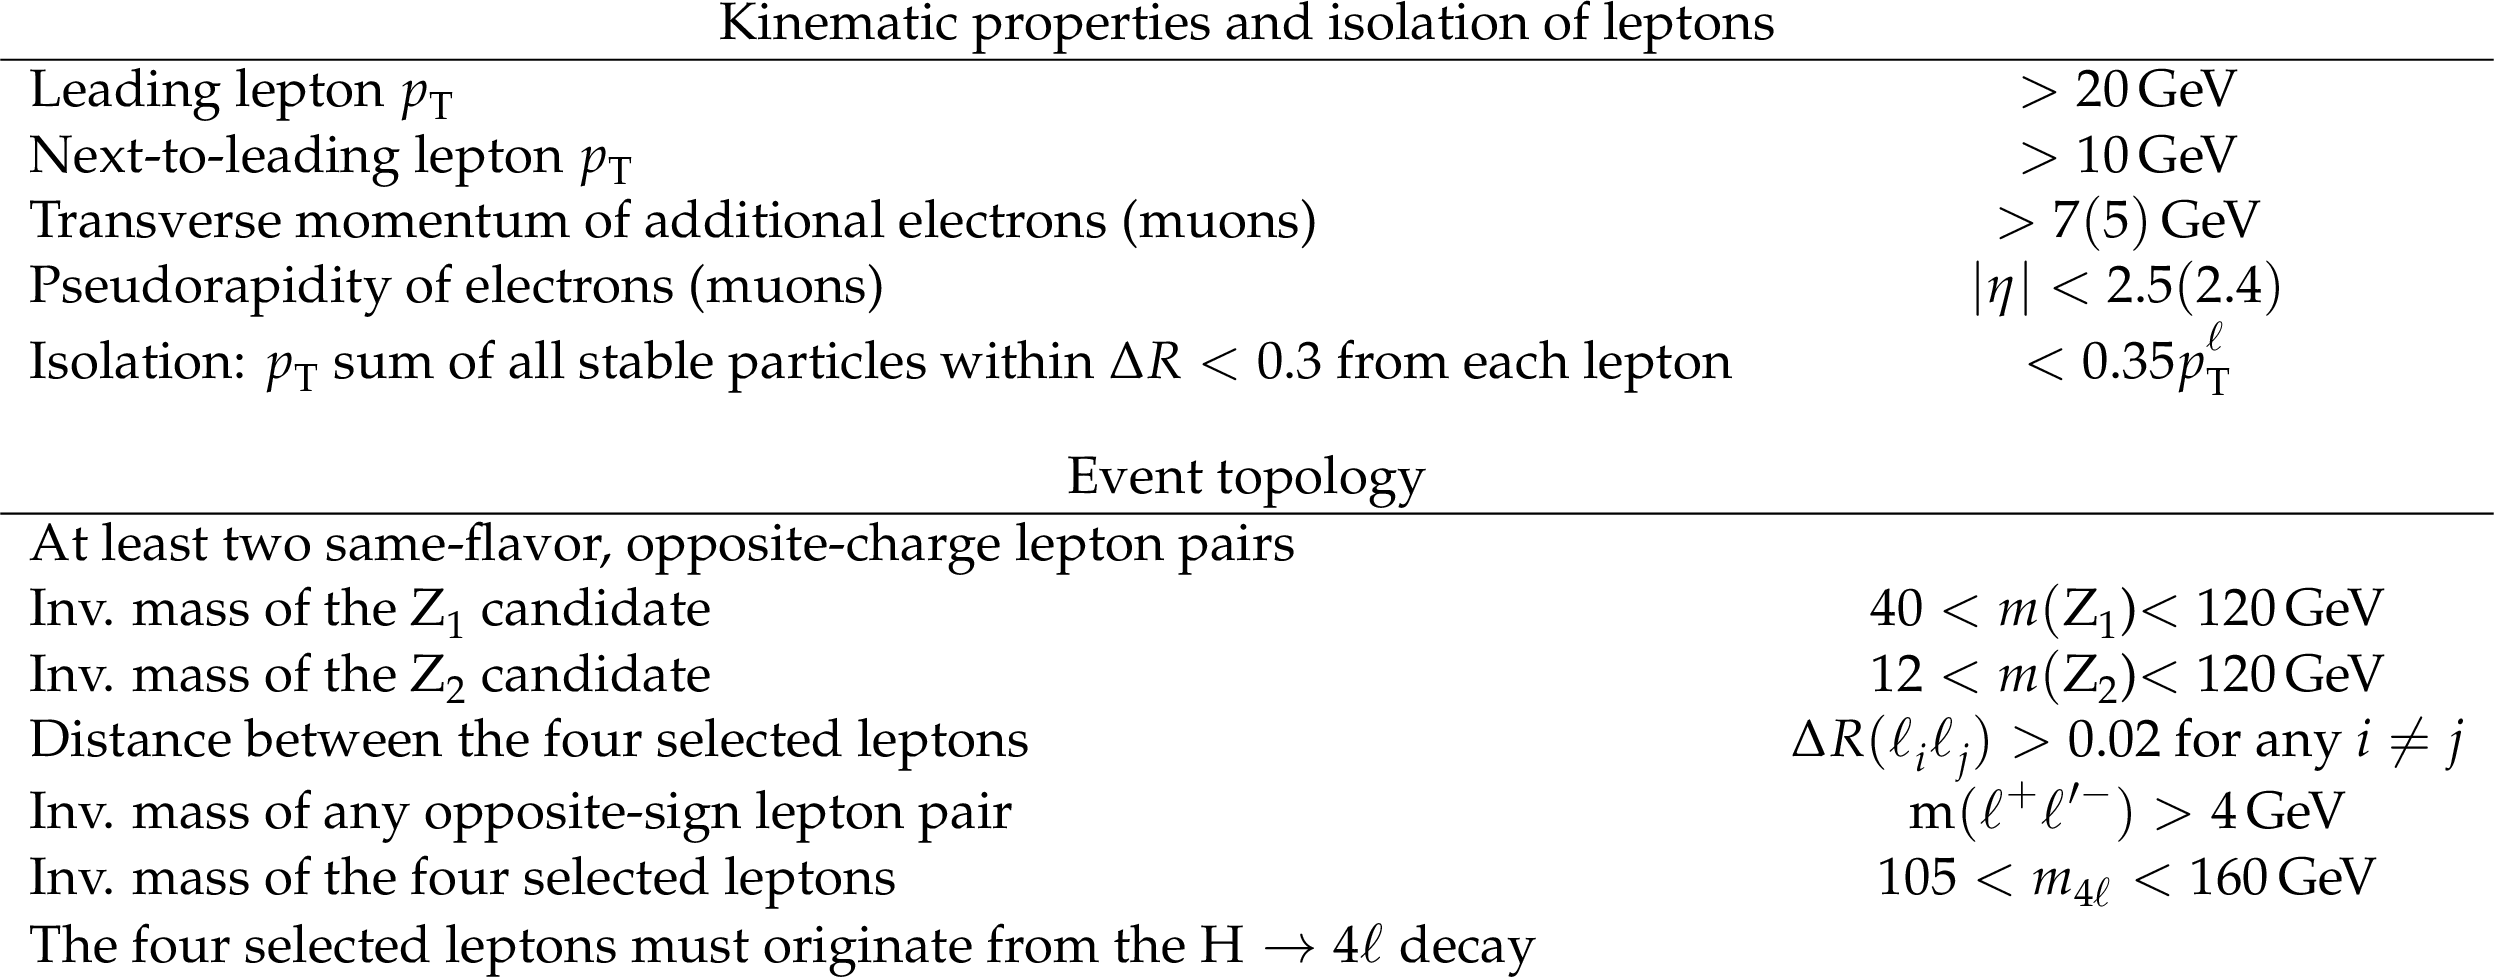
Table 1:
Summary of requirements used in the definition of the fiducial phase space for the $ \mathrm{H}\to4\ell $ cross section measurements. |
png pdf |
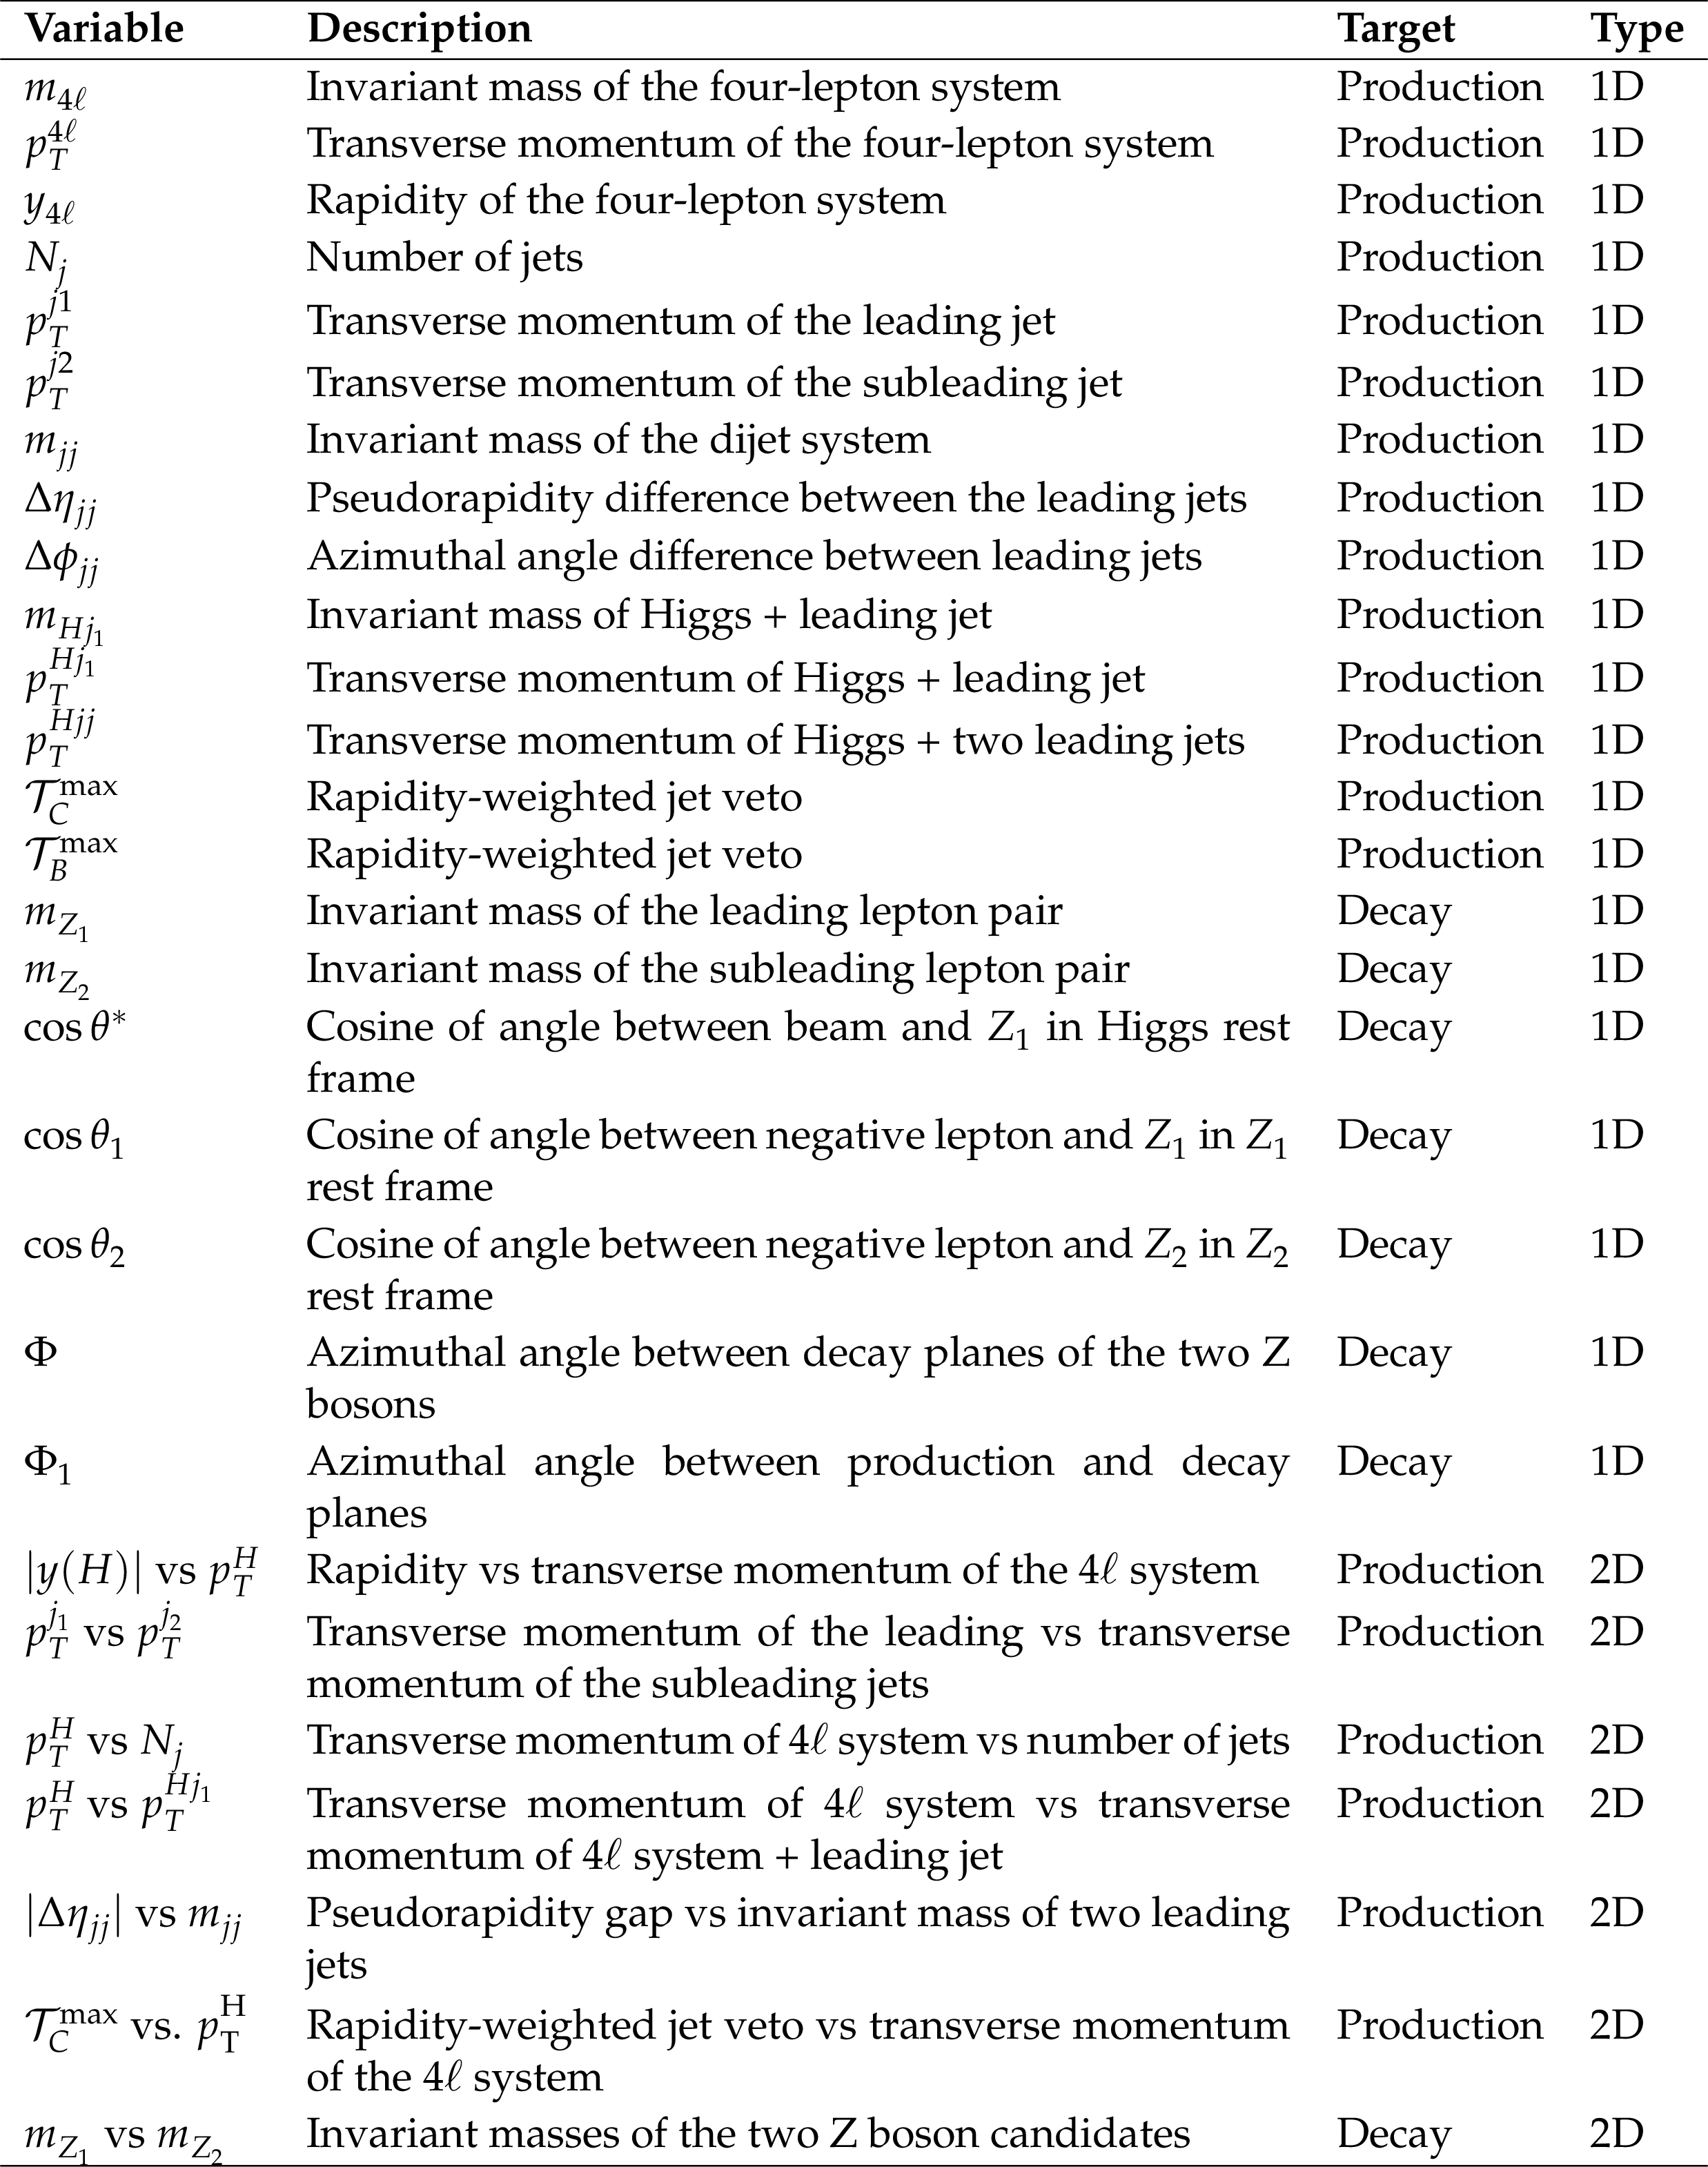
Table 2:
The differential cross sections measured in the analysis, including their descriptions and physics target (production or decay). |
png pdf |
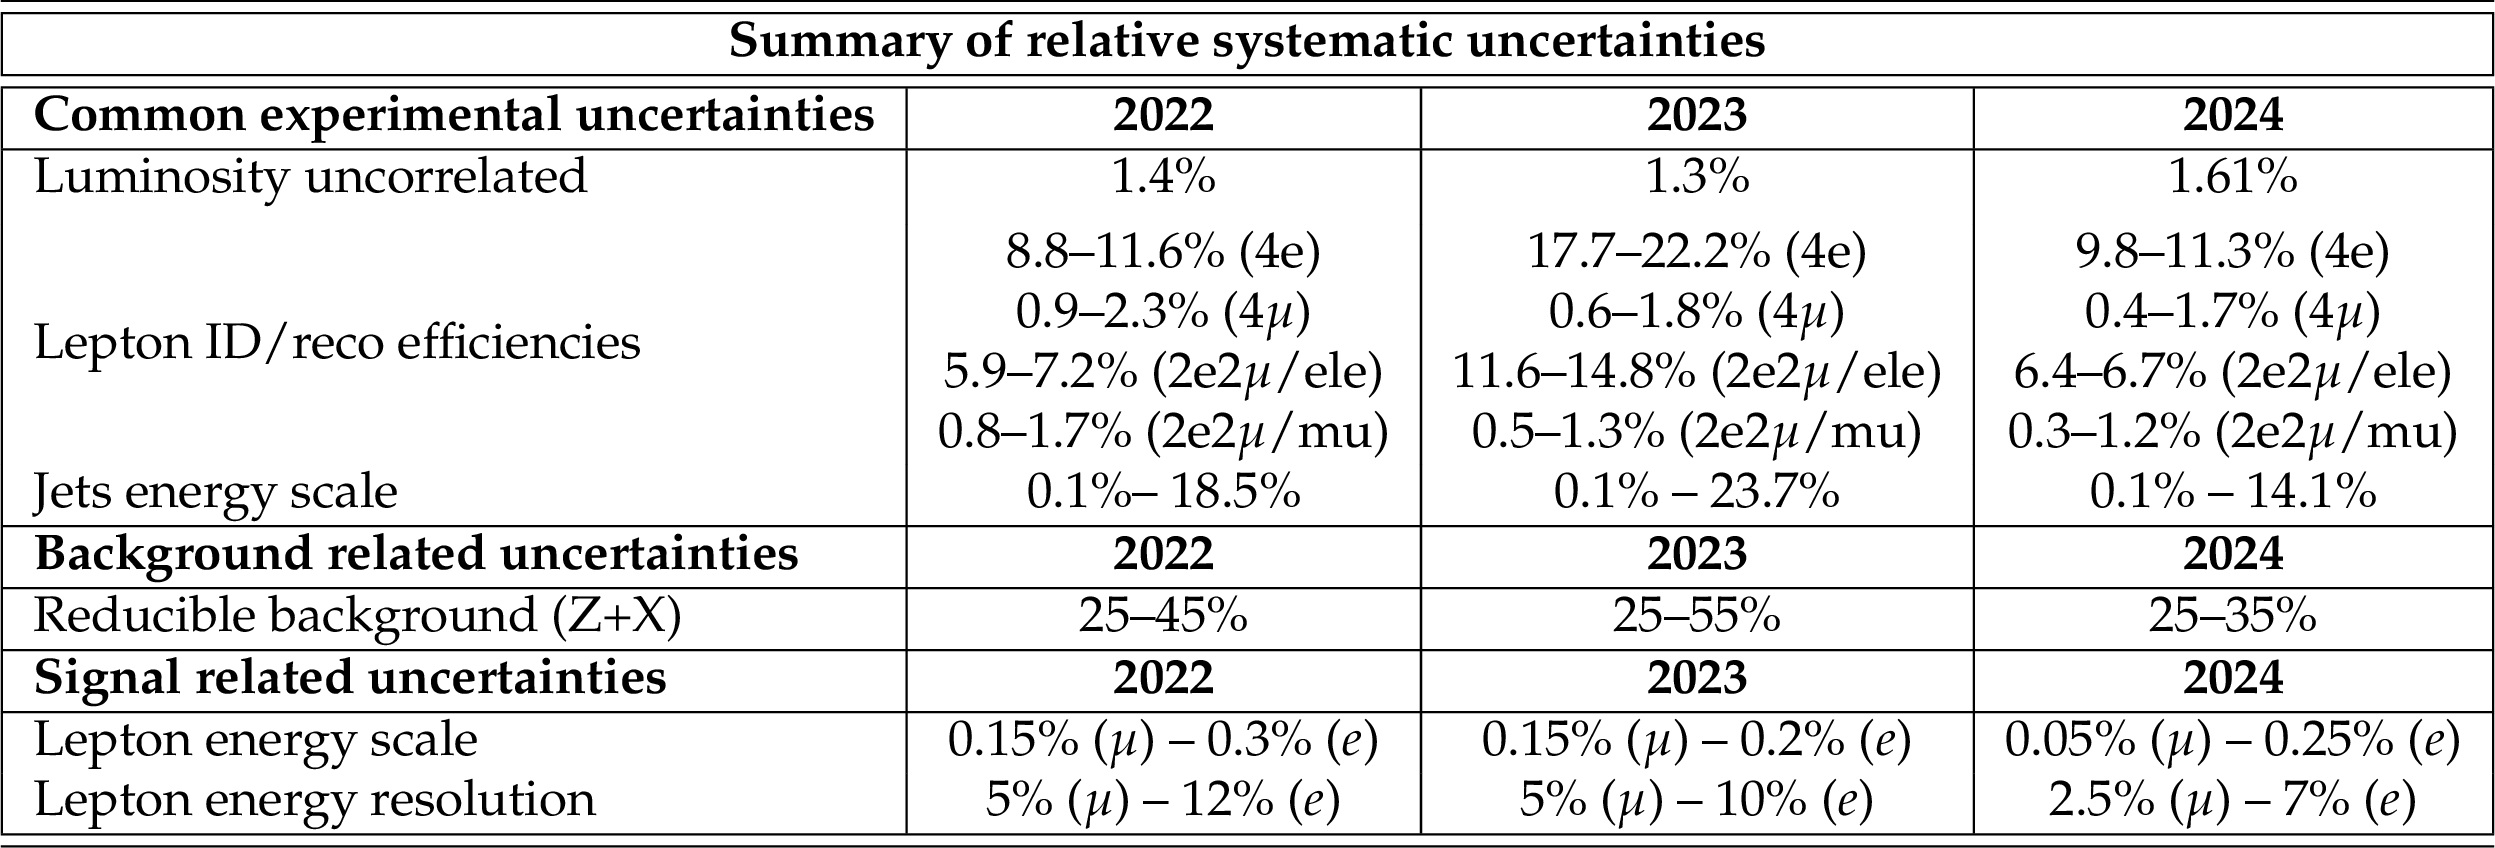
Table 3:
Summary of relative systematic uncertainties considered in the analysis for 2022, 2023 and 2024. |
png pdf |
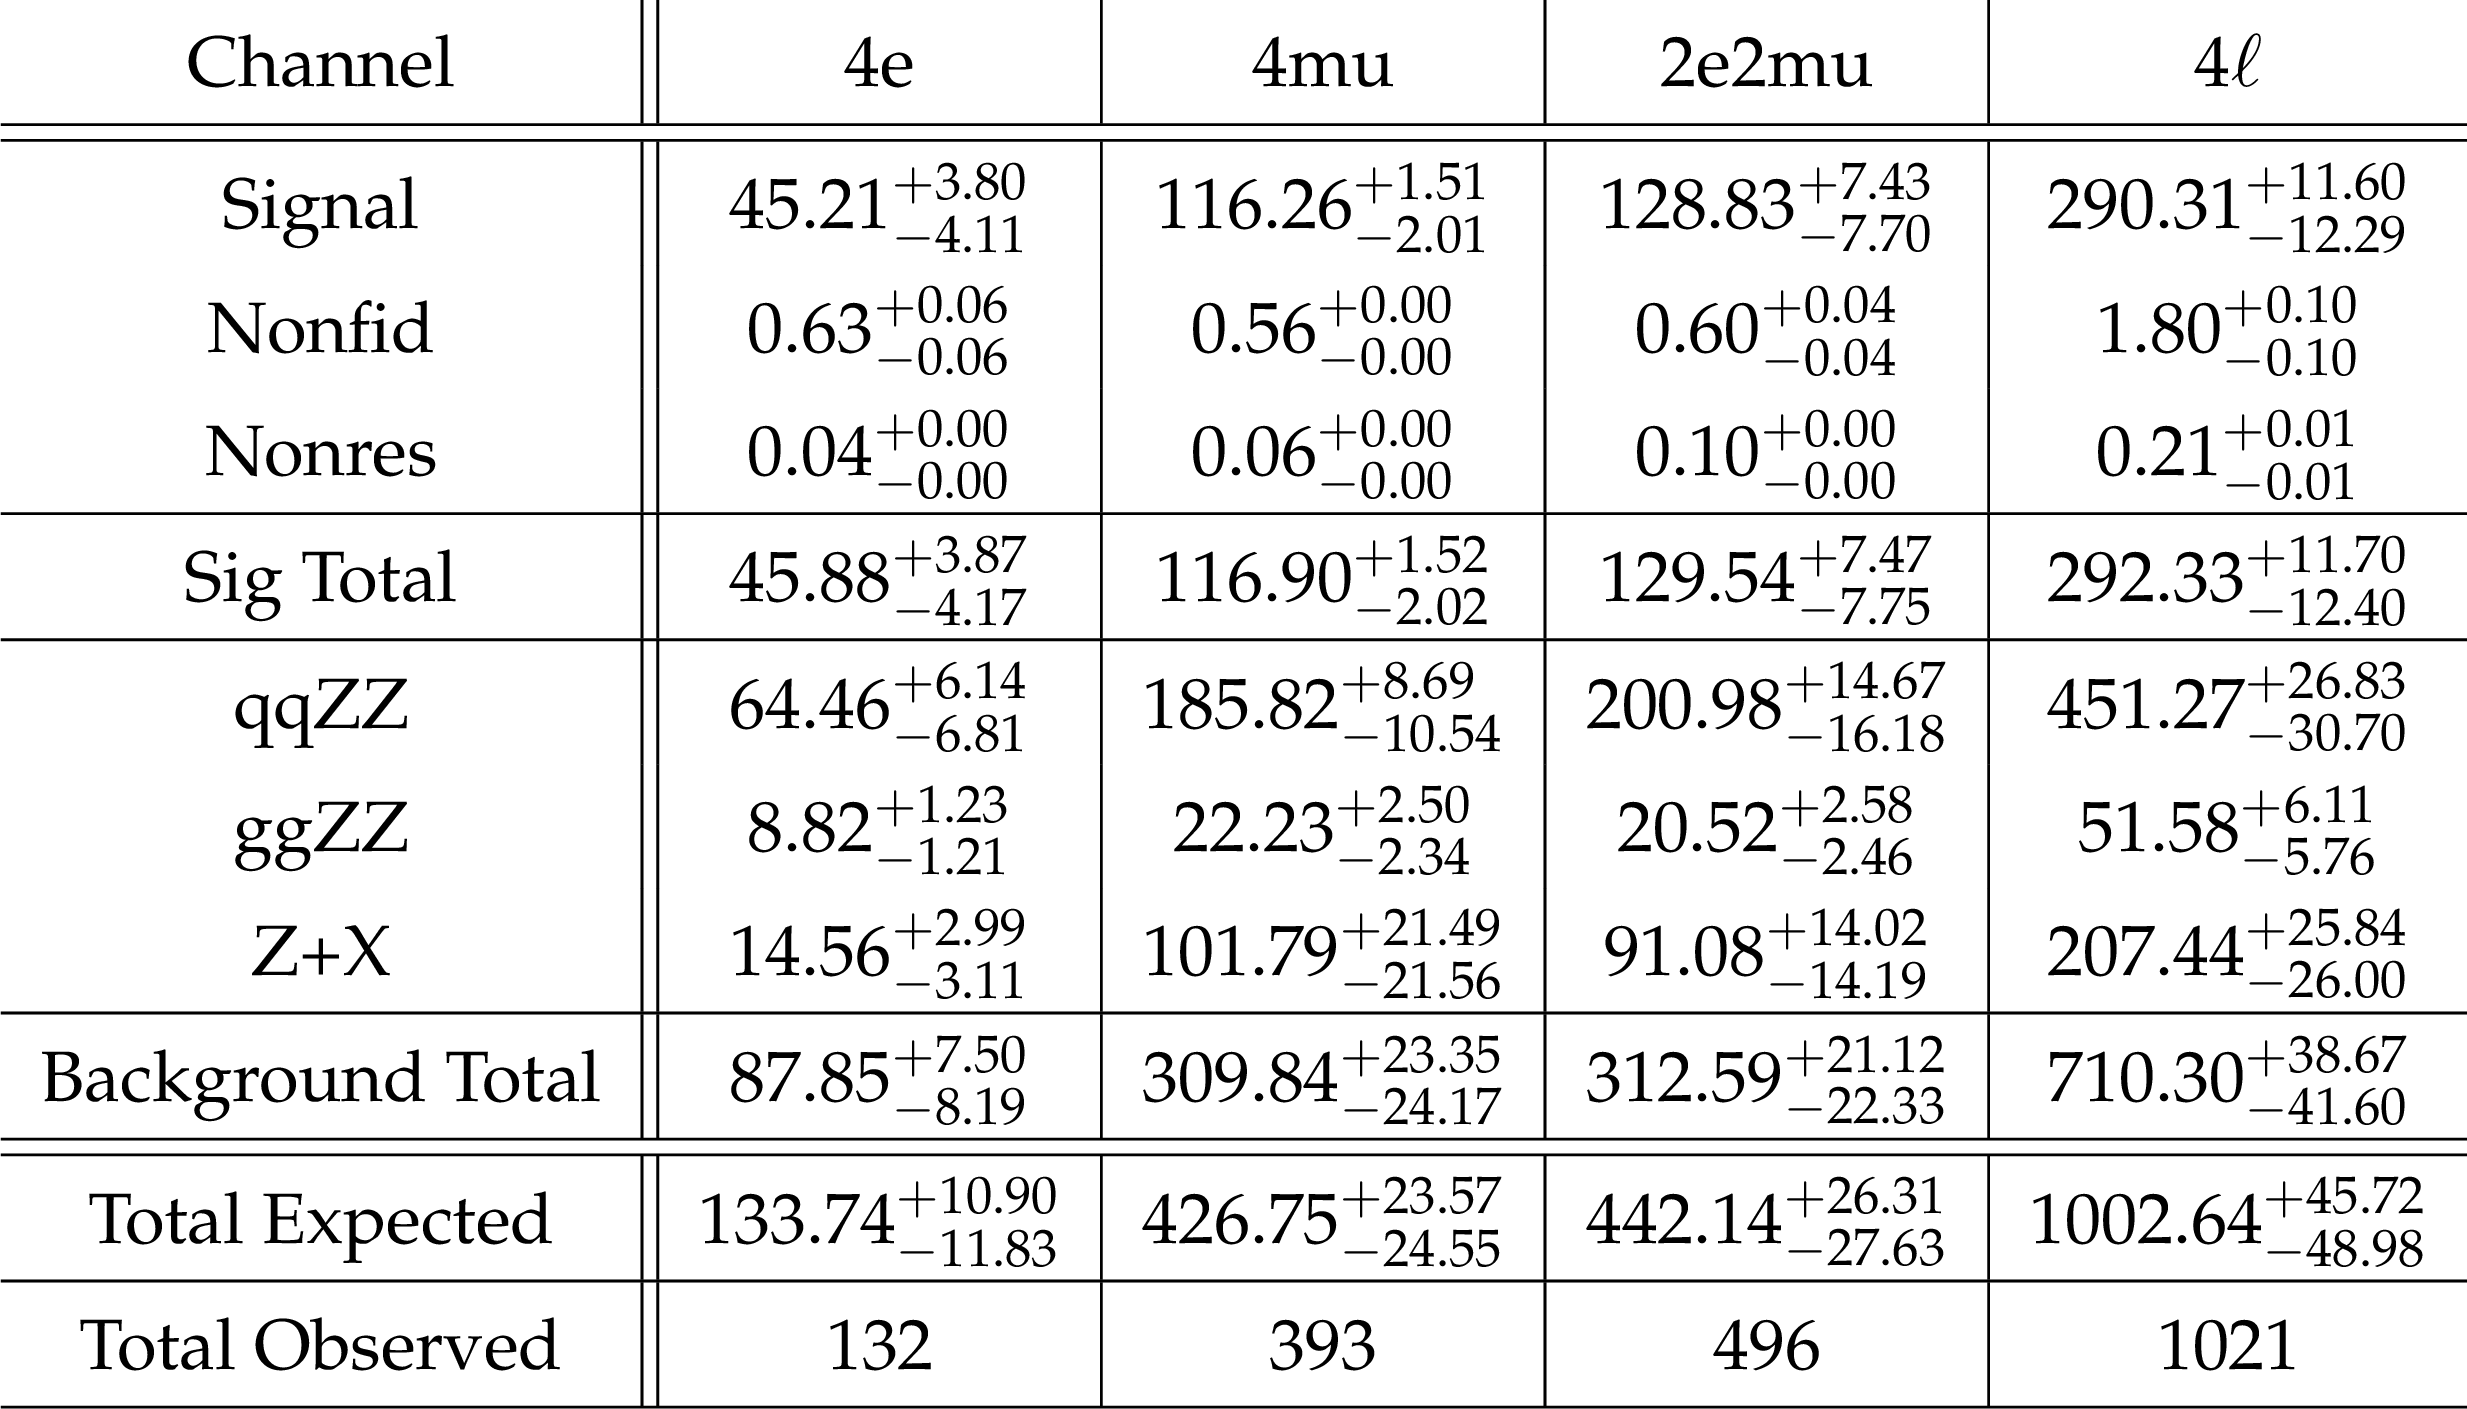
Table 4:
Post-fit yields for the four final states in the signal region (105 $ < m_{4\ell} < $ 160 GeV) are presented. The \textitnonfid contribution arises from signal events that do not originate within the fiducial volume but still satisfy the analysis selection criteria. The \textitnonres contribution corresponds to signal events from VH or t\=tH processes in which one of the leptons from the Higgs boson decay is either not reconstructed or fails the selection requirements (see Section 6 for details). The contributions from signal, \textitnonfid, and \textitnonres events are estimated assuming $ m_H = $ 125.38 GeV. |
png pdf |
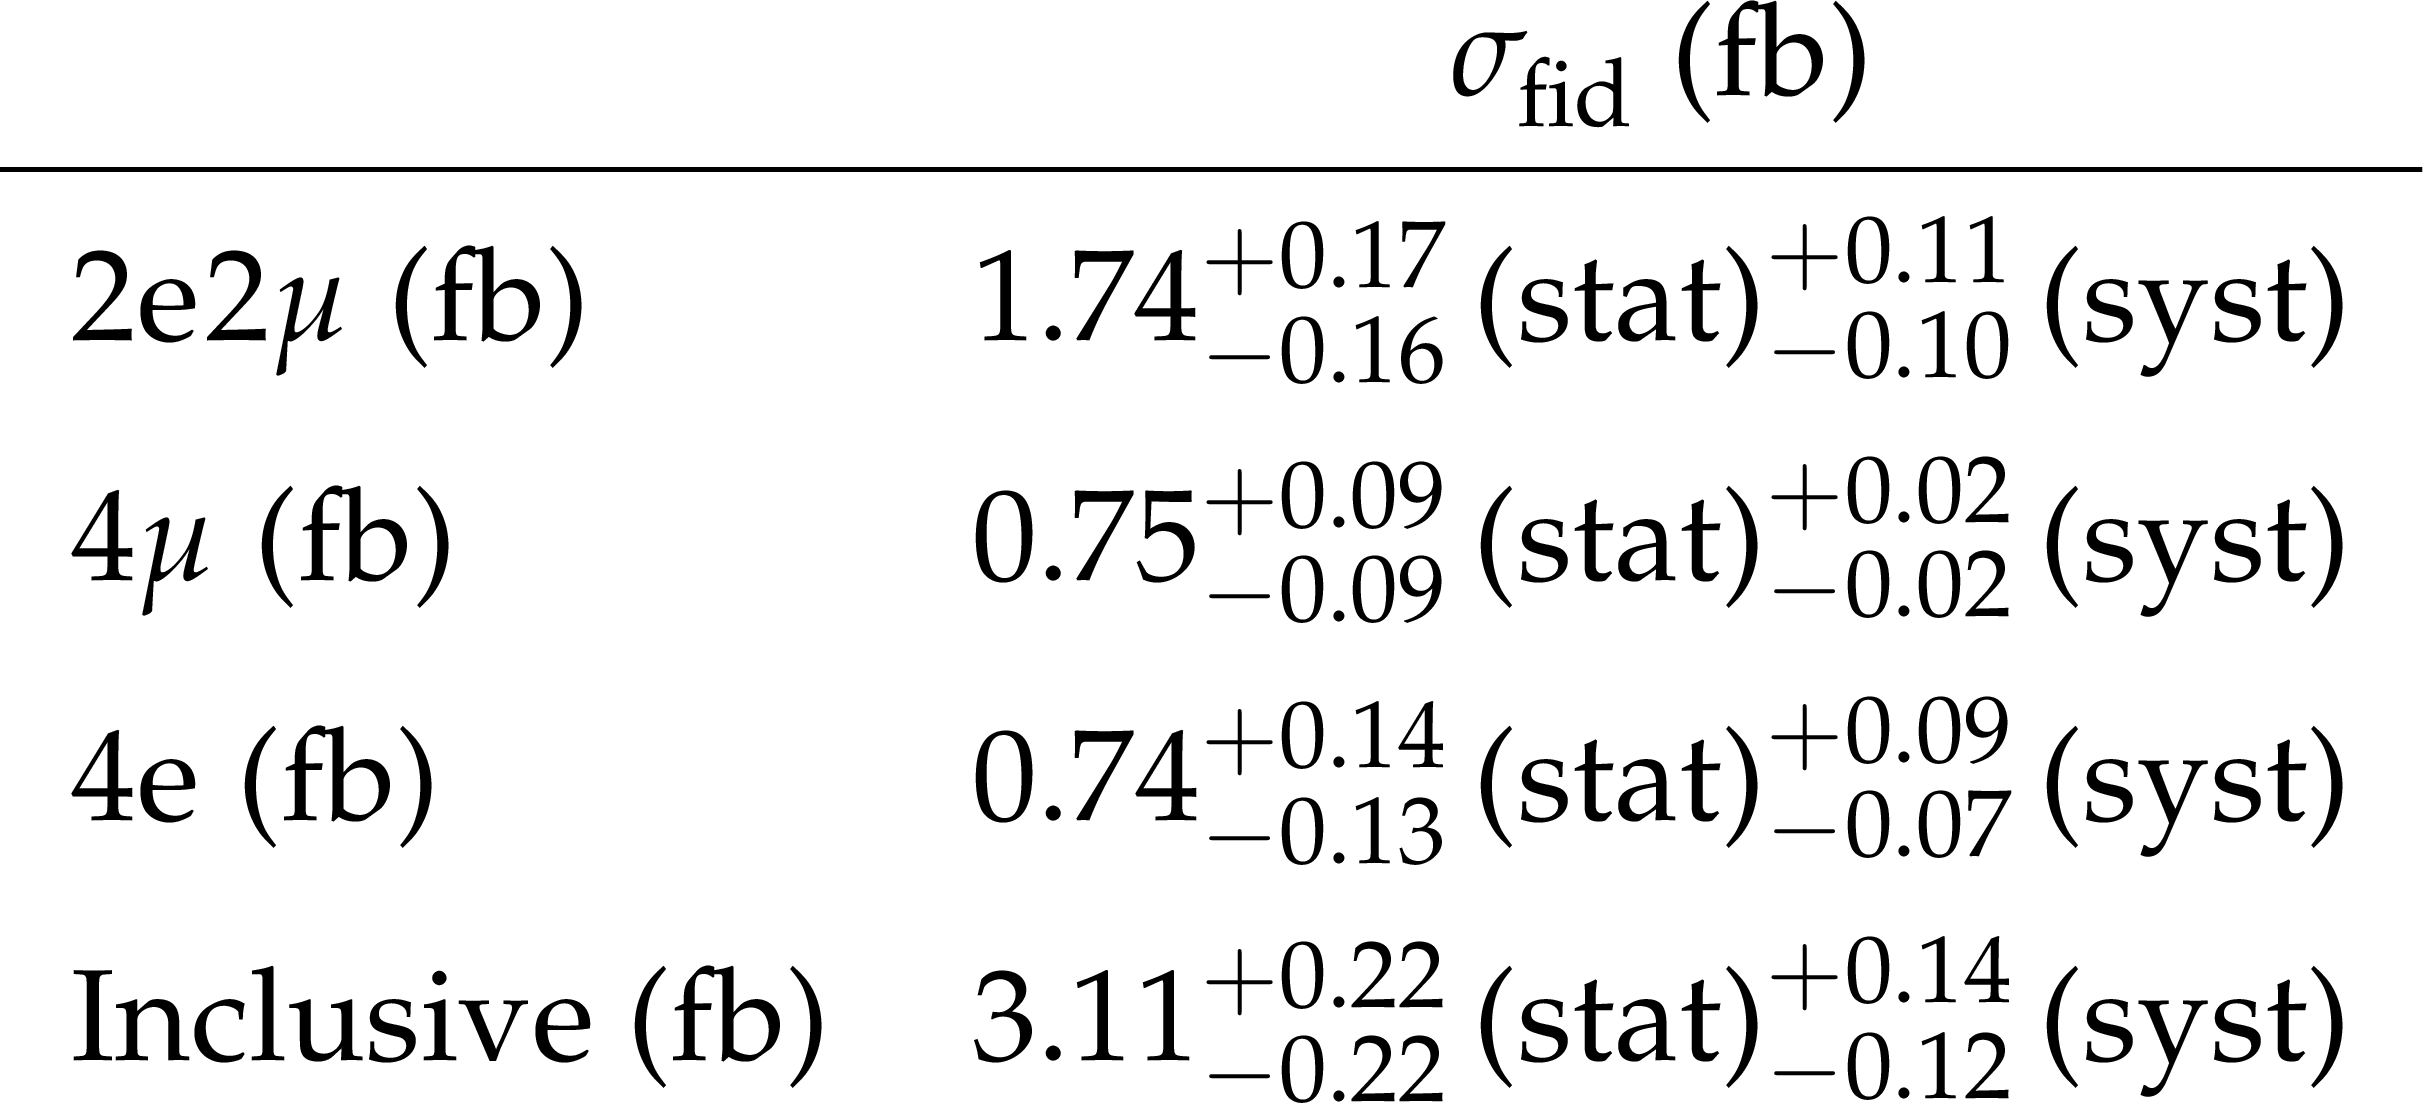
Table 5:
Measured inclusive fiducial cross section and the corresponding uncertainties for different final states at $ m_{\mathrm{H}}= $ 125.38 GeV. |
| Summary |
| This paper presents a detailed characterization of the $ \mathrm{H}\to\mathrm{Z}\mathrm{Z}\to4\ell $ decay channel through measurements of fiducial differential cross sections as functions of several kinematic observables. The production of the H boson is studied via differential cross sections in bins of $ p_{\mathrm{T}}^\mathrm{H} $ and $ |y_\mathrm{H}| $, number of associated jets, the transverse momentum of the leading and subleading jets, and observables of the dijet system in events with associated jets. The evolution of the renormalization and factorization scales, as well as resummation effects, is probed by measuring cross sections in bins of the H plus jets system. Fiducial cross sections are measured in bins of the seven kinematic observables that fully describe the four-lepton decay: the invariant mass of the two Z bosons and the five angles that characterize the kinematics of the final-state fermions and the relative orientation of the production and decay planes. An extensive set of double-differential measurements provides a comprehensive coverage of the explored phase space. The inclusive fiducial cross section for $ \mathrm{H}\to\mathrm{Z}\mathrm{Z}\to4\ell $ is $ \sigma_\mathrm{fid} = $ 3.11 $ ^{+0.23}_{-0.22} $ (stat) $^{+0.14}_{-0.11}$ (syst) fb, consistent with the standard model expectation of 3.05 $ ^{+0.17}_{-0.22} $ fb. All results are found to be in agreement with standard model predictions for the $ \mathrm{H}\to\mathrm{Z}\mathrm{Z}\to4\ell $ decay channel in the considered fiducial phase space. |
| References | ||||
| 1 | ATLAS Collaboration | Observation of a new particle in the search for the standard model Higgs boson with the ATLAS detector at the LHC | PLB 716 (2012) 1 | 1207.7214 |
| 2 | CMS Collaboration | Observation of a new boson at a mass of 125 GeV with the CMS experiment at the LHC | PLB 716 (2012) 30 | CMS-HIG-12-028 1207.7235 |
| 3 | CMS Collaboration | Observation of a new boson with mass near 125 GeV in pp collisions at $ \sqrt{s} = $ 7 and 8 TeV | JHEP 06 (2013) 081 | CMS-HIG-12-036 1303.4571 |
| 4 | ATLAS Collaboration | Measurements of the Higgs boson production and decay rates and coupling strengths using pp collision data at $ \sqrt{s}= $ 7 and 8 TeV in the ATLAS experiment | EPJC 76 (2016) 6 | 1507.04548 |
| 5 | CMS Collaboration | Precise determination of the mass of the Higgs boson and tests of compatibility of its couplings with the standard model predictions using proton collisions at 7 and 8 $ \text {TeV} $ | EPJC 75 (2015) 212 | CMS-HIG-14-009 1412.8662 |
| 6 | ATLAS and CMS Collaborations | Combined measurement of the Higgs boson mass in pp collisions at $ \sqrt{s}= $ 7 and 8 TeV with the ATLAS and CMS experiments | PRL 114 (2015) 191803 | 1503.07589 |
| 7 | ATLAS and CMS Collaborations | Measurements of the Higgs boson production and decay rates and constraints on its couplings from a combined ATLAS and CMS analysis of the LHC pp collision data at $ \sqrt{s}= $ 7 and 8 TeV | JHEP 08 (2016) 045 | 1606.02266 |
| 8 | ATLAS Collaboration | A detailed map of Higgs boson interactions by the ATLAS experiment ten years after the discovery | Nature 607 (2022) 52 | 2207.00092 |
| 9 | CMS Collaboration | A portrait of the Higgs boson by the CMS experiment ten years after the discovery. | Nature 607 (2022) 60 | CMS-HIG-22-001 2207.00043 |
| 10 | ATLAS Collaboration | Measurements of Higgs boson production and couplings in the four-lepton channel in pp collisions at center-of-mass energies of 7 and 8 TeV with the ATLAS detector | PRD 91 (2015) 012006 | 1408.5191 |
| 11 | CMS Collaboration | Measurement of the properties of a Higgs boson in the four-lepton final state | PRD 89 (2014) 092007 | CMS-HIG-13-002 1312.5353 |
| 12 | CMS Collaboration | Study of the mass and spin-parity of the Higgs boson candidate via its decays to $ Z $ boson pairs | PRL 110 (2013) 081803 | CMS-HIG-12-041 1212.6639 |
| 13 | CMS Collaboration | Constraints on the spin-parity and anomalous HVV couplings of the Higgs boson in proton collisions at 7 and 8 TeV | PRD 92 (2015) 012004 | CMS-HIG-14-018 1411.3441 |
| 14 | CMS Collaboration | Measurements of properties of the Higgs boson decaying into the four-lepton final state in pp collisions at $ \sqrt{s}= $ 13 TeV | JHEP 11 (2017) 047 | CMS-HIG-16-041 1706.09936 |
| 15 | ATLAS Collaboration | Measurement of the Higgs boson coupling properties in the $ H\rightarrow ZZ^{*} \rightarrow 4\ell $ decay channel at $ \sqrt{s} = $ 13 TeV with the ATLAS detector | JHEP 03 (2018) 095 | 1712.02304 |
| 16 | CMS Collaboration | Measurement of the Higgs boson mass and width using the four-lepton final state in proton-proton collisions at $ \sqrt{s} = $ 13 TeV | Submitted to PRD, 2024 | CMS-HIG-21-019 2409.13663 |
| 17 | CMS Collaboration | Constraints on the Higgs boson width from off-shell production and decay to Z-boson pairs | PLB 736 (2014) 64 | CMS-HIG-14-002 1405.3455 |
| 18 | CMS Collaboration | Limits on the Higgs boson lifetime and width from its decay to four charged leptons | PRD 92 (2015) 072010 | CMS-HIG-14-036 1507.06656 |
| 19 | ATLAS Collaboration | Constraints on the off-shell Higgs boson signal strength in the high-mass $ ZZ $ and $ WW $ final states with the ATLAS detector | EPJC 75 (2015) 335 | 1503.01060 |
| 20 | ATLAS Collaboration | Constraints on off-shell Higgs boson production and the Higgs boson total width in $ ZZ\to4\ell $ and $ ZZ\to2\ell2\nu $ final states with the ATLAS detector | PLB 786 (2018) 223 | 1808.01191 |
| 21 | ATLAS Collaboration | Fiducial and differential cross sections of Higgs boson production measured in the four-lepton decay channel in pp collisions at $ \sqrt{s}= $ 8 TeV with the ATLAS detector | PLB 738 (2014) 234 | 1408.3226 |
| 22 | CMS Collaboration | Measurement of differential and integrated fiducial cross sections for Higgs boson production in the four-lepton decay channel in pp collisions at $ \sqrt{s}= $ 7 and 8 TeV | JHEP 04 (2016) 005 | CMS-HIG-14-028 1512.08377 |
| 23 | CMS Collaboration | Measurements of inclusive and differential cross sections for the Higgs boson production and decay to four-leptons in proton-proton collisions at $ \sqrt{s} = $ 13 TeV | JHEP 08 (2023) 040 | CMS-HIG-21-009 2305.07532 |
| 24 | ATLAS Collaboration | Measurement of inclusive and differential cross sections in the $ H \rightarrow ZZ^* \rightarrow 4\ell $ decay channel in pp collisions at $ \sqrt{s}= $ 13 TeV with the ATLAS detector | JHEP 10 (2017) 132 | 1708.02810 |
| 25 | ATLAS Collaboration | Higgs boson production cross-section measurements and their EFT interpretation in the 4 $ \ell $ decay channel at $ \sqrt{s}= $ 13 TeV with the ATLAS detector | \hrefhttp://www.arXiv.org/abs/.03447v2\textttarXiv:.03447v2, 2020 EPJC 80 (2020) 957 |
|
| 26 | ATLAS Collaboration | Measurements of the Higgs boson inclusive and differential fiducial cross sections in the 4$ \ell $ decay channel at $ \sqrt{s}= $ 13 TeV | \hrefhttp://www.arXiv.org/abs/arXiv:.03969v3\textttarXiv:arXiv:.03969v3, 2020 EPJC 80 (2020) 941 |
|
| 27 | CMS Collaboration | Constraints on anomalous Higgs boson couplings to vector bosons and fermions in its production and decay using the four-lepton final state | PRD 104 (2021) 052004 | CMS-HIG-19-009 2104.12152 |
| 28 | ATLAS Collaboration | Measurements of the Higgs boson inclusive and differential fiducial cross-sections in the diphoton decay channel with pp collisions at $ \sqrt{s} = $ 13 TeV with the ATLAS detector | JHEP 08 (2022) 027 | 2202.00487 |
| 29 | CMS Collaboration | Measurement of the Higgs boson inclusive and differential fiducial production cross sections in the diphoton decay channel with pp collisions at $ \sqrt{s} = $ 13 TeV | JHEP 07 (2023) 091 | CMS-HIG-19-016 2208.12279 |
| 30 | ATLAS Collaboration | Measurements of differential cross sections of Higgs boson production through gluon fusion in the $ H\rightarrow WW^{*}\rightarrow e\nu \mu \nu $ final state at $ \sqrt{s} = $ 13 TeV with the ATLAS detector | EPJC 83 (2023) 774 | 2301.06822 |
| 31 | ATLAS Collaboration | Fiducial and differential cross-section measurements for the vector-boson-fusion production of the Higgs boson in the $ H \rightarrow WW^{\ast} \rightarrow e\nu\mu\nu $ decay channel at 13 $ \text{TeV} $ with the ATLAS detector | PRD 108 (2023) 072003 | 2304.03053 |
| 32 | CMS Collaboration | Measurement of the inclusive and differential Higgs boson production cross sections in the leptonic WW decay mode at $ \sqrt{s} = $ 13 TeV | JHEP 03 (2021) 003 | CMS-HIG-19-002 2007.01984 |
| 33 | CMS Collaboration | Measurements of production cross sections of the Higgs boson in the four-lepton final state in proton-proton collisions at $ \sqrt{s} = 13 \text {Te}\text {V} $ | EPJC 81 (2021) 488 | CMS-HIG-19-001 2103.04956 |
| 34 | CMS Collaboration | Combination and interpretation of fiducial differential Higgs boson production cross sections at $ \sqrt{s}= $ 13 TeV | CMS Physics Analysis Summary, to be submitted to JHEP, 2024 CMS-PAS-HIG-23-013 |
CMS-PAS-HIG-23-013 |
| 35 | ATLAS Collaboration | Constraints on Higgs boson production with large transverse momentum using H to bb decays in the ATLAS detector | PRD 105 (2022) 092003 | 2111.08340 |
| 36 | CMS Collaboration | Inclusive search for highly boosted Higgs bosons decaying to bottom quark-antiquark pairs in proton-proton collisions at $ \sqrt{s} = $ 13 TeV | JHEP 12 (2020) 085 | CMS-HIG-19-003 2006.13251 |
| 37 | CMS Collaboration | Measurement of the inclusive and differential Higgs boson production cross sections in the decay mode to a pair of $ \tau $ leptons in pp collisions at $ \sqrt{s} = $ 13 TeV | PRL 128 (2022) 081805 | CMS-HIG-20-015 2107.11486 |
| 38 | ATLAS Collaboration | Measurement of the total and differential Higgs boson production cross-sections at $ \sqrt{s} = $ 13 TeV with the ATLAS detector by combining the $ H \rightarrow ZZ^* \rightarrow 4\ell $ and $ H \rightarrow \gamma \gamma $ decay channels | JHEP 05 (2023) 028 | 2207.08615 |
| 39 | ATLAS Collaboration | Measurement of the $ H \rightarrow \gamma \gamma $ and $ H \rightarrow ZZ^* \rightarrow 4 \ell $ cross-sections in pp collisions at $ \sqrt{s}= $ 13.6 TeV with the ATLAS detector | EPJC 84 (2024) 78 | 2306.11379 |
| 40 | CMS Collaboration | Measurements of the Higgs boson production cross section in the four-lepton final state in proton-proton collisions at $ \sqrt{s} = $ 13.6 TeV | JHEP 05 (2025) 079 | CMS-HIG-24-013 2501.14849 |
| 41 | CMS Collaboration | The CMS experiment at the CERN LHC | JINST 3 (2008) S08004 | |
| 42 | CMS Collaboration | Development of the CMS detector for the CERN LHC Run 3 | JINST 19 (2024) P05064 | |
| 43 | CMS Collaboration | Performance of the CMS Level-1 trigger in proton-proton collisions at $ \sqrt{s} = $ 13 TeV | JINST 15 (2020) P10017 | CMS-TRG-17-001 2006.10165 |
| 44 | CMS Collaboration | The CMS trigger system | JINST 12 (2017) P01020 | CMS-TRG-12-001 1609.02366 |
| 45 | CMS Collaboration | Performance of the CMS high-level trigger during LHC Run 2 | JINST 19 (2024) P11021 | CMS-TRG-19-001 2410.17038 |
| 46 | CMS Collaboration | Electron and photon reconstruction and identification with the CMS experiment at the CERN LHC | JINST 16 (2021) P05014 | CMS-EGM-17-001 2012.06888 |
| 47 | CMS Collaboration | Performance of the CMS muon detector and muon reconstruction with proton-proton collisions at $ \sqrt{s}= $ 13 TeV | JINST 13 (2018) P06015 | CMS-MUO-16-001 1804.04528 |
| 48 | CMS Collaboration | Description and performance of track and primary-vertex reconstruction with the CMS tracker | JINST 9 (2014) P10009 | CMS-TRK-11-001 1405.6569 |
| 49 | CMS Collaboration | Luminosity measurement in proton-proton collisions at 13.6 TeV in 2022 at CMS | CMS Physics Analysis Summary, 2024 CMS-PAS-LUM-22-001 |
CMS-PAS-LUM-22-001 |
| 50 | CMS Collaboration | Measurement of the offline integrated luminosity for the cms proton-proton collision dataset recorded in 2023 | CMS Detector Performance Note CMS-DP-2024-068, 2024 CDS |
|
| 51 | CMS Collaboration | Measurement of the integrated luminosity with the cms proton-proton dataset at sqrt(s) = 13.6 tev recorded in 2024 | CMS Detector Performance Note CMS-DP-2026-003, 2026 CDS |
|
| 52 | P. Nason | A new method for combining NLO QCD with shower Monte Carlo algorithms | JHEP 11 (2004) 040 | hep-ph/0409146 |
| 53 | S. Frixione, P. Nason, and C. Oleari | Matching NLO QCD computations with parton shower simulations: the POWHEG method | JHEP 11 (2007) 070 | 0709.2092 |
| 54 | S. Alioli, P. Nason, C. Oleari, and E. Re | A general framework for implementing NLO calculations in shower Monte Carlo programs: the POWHEG BOX | JHEP 06 (2010) 043 | 1002.2581 |
| 55 | S. Alioli, P. Nason, C. Oleari, and E. Re | NLO Higgs boson production via gluon fusion matched with shower in POWHEG | JHEP 04 (2009) 002 | 0812.0578 |
| 56 | E. Bagnaschi, G. Degrassi, P. Slavich, and A. Vicini | Higgs production via gluon fusion in the POWHEG approach in the SM and in the MSSM | JHEP 02 (2012) 088 | 1111.2854 |
| 57 | P. Nason and C. Oleari | NLO Higgs boson production via vector-boson fusion matched with shower in POWHEG | JHEP 02 (2010) 037 | 0911.5299 |
| 58 | G. Luisoni, P. Nason, C. Oleari, and F. Tramontano | HW$ ^{\pm} $/HZ + 0 and 1 jet at NLO with the POWHEG BOX interfaced to GoSam and their merging within MiNLO | JHEP 10 (2013) 083 | 1306.2542 |
| 59 | H. B. Hartanto, B. Jager, L. Reina, and D. Wackeroth | Higgs boson production in association with top quarks in the POWHEG BOX | PRD 91 (2015) 094003 | 1501.04498 |
| 60 | K. Hamilton, P. Nason, E. Re, and G. Zanderighi | NNLOPS simulation of Higgs boson production | JHEP 10 (2013) 222 | 1309.0017 |
| 61 | Y. Gao et al. | Spin determination of single-produced resonances at hadron colliders | PRD 81 (2010) 075022 | 1001.3396 |
| 62 | S. Bolognesi et al. | On the spin and parity of a single-produced resonance at the LHC | PRD 86 (2012) 095031 | 1208.4018 |
| 63 | I. Anderson et al. | Constraining anomalous $ HVV $ interactions at proton and lepton colliders | PRD 89 (2014) 035007 | 1309.4819 |
| 64 | A. V. Gritsan, R. Röntsch, M. Schulze, and M. Xiao | Constraining anomalous Higgs boson couplings to the heavy flavor fermions using matrix element techniques | PRD 94 (2016) 055023 | 1606.03107 |
| 65 | A. V. Gritsan et al. | New features in the JHU generator framework: constraining Higgs boson properties from on-shell and off-shell production | PRD 102 (2020) 056022 | 2002.09888 |
| 66 | NNPDF Collaboration | Parton distributions for the LHC Run II | JHEP 04 (2015) 040 | 1410.8849 |
| 67 | C. Anastasiou et al. | Higgs boson gluon-fusion production in QCD at three loops | PRL 114 (2015) 212001 | 1503.06056 |
| 68 | C. Anastasiou et al. | High precision determination of the gluon fusion Higgs boson cross-section at the LHC | JHEP 05 (2016) 058 | 1602.00695 |
| 69 | M. Ciccolini, A. Denner, and S. Dittmaier | Strong and electroweak corrections to the production of a Higgs boson+2 jets via weak interactions at the Large Hadron Collider | PRL 99 (2007) 161803 | 0707.0381 |
| 70 | M. Ciccolini, A. Denner, and S. Dittmaier | Electroweak and QCD corrections to Higgs production via vector-boson fusion at the LHC | PRD 77 (2008) 013002 | 0710.4749 |
| 71 | P. Bolzoni, F. Maltoni, S.-O. Moch, and M. Zaro | Higgs production via vector-boson fusion at NNLO in QCD | PRL 105 (2010) 011801 | 1003.4451 |
| 72 | P. Bolzoni, F. Maltoni, S.-O. Moch, and M. Zaro | Vector boson fusion at next-to-next-to-leading order in QCD: Standard model Higgs boson and beyond | PRD 85 (2012) 035002 | 1109.3717 |
| 73 | O. Brein, A. Djouadi, and R. Harlander | NNLO QCD corrections to the Higgs-strahlung processes at hadron colliders | PLB 579 (2004) 149 | hep-ph/0307206 |
| 74 | M. L. Ciccolini, S. Dittmaier, and M. Kr ä mer | Electroweak radiative corrections to associated $ WH $ and $ ZH $ production at hadron colliders | PRD 68 (2003) 073003 | hep-ph/0306234 |
| 75 | W. Beenakker et al. | Higgs radiation off top quarks at the Tevatron and the LHC | PRL 87 (2001) 201805 | hep-ph/0107081 |
| 76 | W. Beenakker et al. | NLO QCD corrections to $ {\mathrm{t}\overline{\mathrm{t}}} $ H production in hadron collisions. | NPB 653 (2003) 151 | hep-ph/0211352 |
| 77 | S. Dawson, L. H. Orr, L. Reina, and D. Wackeroth | Associated top quark Higgs boson production at the LHC | PRD 67 (2003) 071503 | hep-ph/0211438 |
| 78 | S. Dawson et al. | Associated Higgs production with top quarks at the Large Hadron Collider: NLO QCD corrections | PRD 68 (2003) 034022 | hep-ph/0305087 |
| 79 | Z. Yu et al. | QCD NLO and EW NLO corrections to $ t\bar{t}H $ production with top quark decays at hadron collider | PLB 738 (2014) 1 | 1407.1110 |
| 80 | S. S. Frixione et al. | Weak corrections to Higgs hadroproduction in association with a top-quark pair | JHEP 09 (2014) 065 | 1407.0823 |
| 81 | F. Demartin, F. Maltoni, K. Mawatari, and M. Zaro | Higgs production in association with a single top quark at the LHC | EPJC 75 (2015) 267 | 1504.0611 |
| 82 | F. Demartin et al. | tWH associated production at the LHC | EPJC 77 (2017) 34 | 1607.05862 |
| 83 | A. Denner et al. | Standard model Higgs-boson branching ratios with uncertainties | EPJC 71 (2011) 1753 | 1107.5909 |
| 84 | HDECAY Collaboration | HDECAY: Twenty$ _{++} $ years after | Comput. Phys. Commun. 238 (2019) 214 | 1801.09506 |
| 85 | A. Bredenstein, A. Denner, S. Dittmaier, and M. M. Weber | Precise predictions for the Higgs-boson decay H $ \rightarrow $ WW/ZZ $ \rightarrow $ 4 leptons | PRD 74 (2006) 013004 | hep-ph/0604011 |
| 86 | A. Bredenstein, A. Denner, S. Dittmaier, and M. M. Weber | Radiative corrections to the semileptonic and hadronic Higgs-boson decays H $ \rightarrow $WW/ZZ$ \rightarrow $ 4 fermions | JHEP 02 (2007) 080 | hep-ph/0611234 |
| 87 | S. Boselli et al. | Higgs boson decay into four leptons at NLOPS electroweak accuracy | JHEP 06 (2015) 023 | 1503.07394 |
| 88 | S. Actis, G. Passarino, C. Sturm, and S. Uccirati | NNLO computational techniques: the cases $ H \to \gamma \gamma $ and $ H \to g g $ | NPB 811 (2009) 182 | 0809.3667 |
| 89 | LHC Higgs Cross Section Working Group | Handbook of LHC Higgs Cross Sections: 4. Deciphering the Nature of the Higgs Sector | technical report, 2016 link |
1610.07922 |
| 90 | A. Karlberg et al. | Ad interim recommendations for the Higgs boson production cross sections at $ \sqrt{s} = $ 13.6 TeV | 2402.09955 | |
| 91 | T. Melia, P. Nason, R. Rontsch, and G. Zanderighi | W$ ^{+} $W$ ^{-} $, WZ and ZZ production in the POWHEG BOX | JHEP 11 (2011) 078 | 1107.5051 |
| 92 | J. M. Campbell and R. K. Ellis | MCFM for the Tevatron and the LHC | Nucl. Phys. Proc. Suppl. 20 (2010) 5--206 | 1007.3492 |
| 93 | J. M. Campbell, R. K. Ellis, and C. Williams | Vector boson pair production at the LHC | JHEP 07 (2011) 018 | 1105.0020 |
| 94 | J. M. Campbell, R. K. Ellis, and C. Williams | Bounding the Higgs width at the LHC using full analytic results for $ \mathrm{g}\mathrm{g}\to \mathrm{e}^{-}\mathrm{e}^{+} \mu^{-} \mu^{+} $ | JHEP 04 (2014) 060 | 1311.3589 |
| 95 | J. M. Campbell and R. K. Ellis | Higgs constraints from vector boson fusion and scattering | JHEP 04 (2015) 030 | 1502.02990 |
| 96 | M. Grazzini, S. Kallweit, and D. Rathlev | ZZ production at the LHC: Fiducial cross sections and distributions in NNLO QCD | PLB 750 (2015) 407 | 1507.06257 |
| 97 | A. Bierweiler, T. Kasprzik, and J. H. K \"u hn | Vector-boson pair production at the LHC to $ \mathcal{O}(\alpha^3) $ accuracy | JHEP 12 (2013) 071 | 1305.5402 |
| 98 | M. Bonvini et al. | Signal-background interference effects in $ gg \to H \to WW $ beyond leading order | PRD 88 (2013) 034032 | 1304.3053 |
| 99 | K. Melnikov and M. Dowling | Production of two Z-bosons in gluon fusion in the heavy top quark approximation | PLB 744 (2015) 43 | 1503.01274 |
| 100 | C. S. Li, H. T. Li, D. Y. Shao, and J. Wang | Soft gluon resummation in the signal-background interference process of gg($ \rightarrow $ h$ ^{*} $) $ \rightarrow $ ZZ | JHEP 08 (2015) 065 | 1504.02388 |
| 101 | G. Passarino | Higgs CAT | EPJC 74 (2014) 2866 | 1312.2397 |
| 102 | S. Catani and M. Grazzini | An NNLO subtraction formalism in hadron collisions and its application to Higgs boson production at the LHC | PRL 98 (2007) 222002 | hep-ph/0703012 |
| 103 | M. Grazzini | NNLO predictions for the Higgs boson signal in the H $ \to $ WW $ \to\ell\nu\ell\nu $ and H$ \to $ ZZ $ \to4\ell $ decay channels | JHEP 02 (2008) 043 | 0801.3232 |
| 104 | M. Grazzini and H. Sargsyan | Heavy-quark mass effects in Higgs boson production at the LHC | JHEP 09 (2013) 129 | 1306.4581 |
| 105 | J. Alwall et al. | The automated computation of tree-level and next-to-leading order differential cross sections, and their matching to parton shower simulations | JHEP 07 (2014) 079 | 1405.0301 |
| 106 | T. Sjöstrand et al. | An introduction to PYTHIA 8.2 | Comput. Phys. Commun. 191 (2015) 159 | 1410.3012 |
| 107 | CMS Collaboration | Extraction and validation of a new set of CMS PYTHIA8 tunes from underlying-event measurements | EPJC 80 (2020) 4 | CMS-GEN-17-001 1903.12179 |
| 108 | \GEANTfour Collaboration | GEANT 4: a simulation toolkit | NIM A 506 (2003) 250 | |
| 109 | J. Allison et al. | GEANT 4 developments and applications | IEEE Trans. Nucl. Sci. 53 (2006) 270 | |
| 110 | CMS Collaboration | Particle-flow reconstruction and global event description with the CMS detector | JINST 12 (2017) P10003 | CMS-PRF-14-001 1706.04965 |
| 111 | CMS Collaboration | Technical proposal for the phase-II upgrade of the compact muon solenoid | CMS Technical proposal CERN-LHCC-2015-010, CMS-TDR-15-02, 2015 CDS |
|
| 112 | CMS Collaboration | Pileup mitigation at CMS in 13 TeV data | JINST 15 (2020) P09018 | CMS-JME-18-001 2003.00503 |
| 113 | D. Bertolini, P. Harris, M. Low, and N. Tran | Pileup per particle identification | JHEP 10 (2014) 059 | 1407.6013 |
| 114 | CMS Collaboration | Jet energy scale and resolution in the CMS experiment in pp collisions at 8 TeV | JINST 12 (2017) P02014 | CMS-JME-13-004 1607.03663 |
| 115 | CMS Collaboration | Measurement of the Inclusive $ W $ and $ Z $ Production Cross Sections in pp Collisions at $ \sqrt{s}= $ 7 TeV | JHEP 10 (2011) 132 | CMS-EWK-10-005 1107.4789 |
| 116 | Particle Data Group Collaboration | Review of particle physics | PRD 110 (2024) 030001 | |
| 117 | S. Gangal, M. Stahlhofen, and F. J. Tackmann | Rapidity-dependent jet vetoes | Physical Review D 91 (2015) | |
| 118 | CMS Collaboration | A measurement of the Higgs boson mass in the diphoton decay channel | PLB 805 (2020) 135425 | CMS-HIG-19-004 2002.06398 |
| 119 | J. E. Gaiser | Charmonium Spectroscopy From Radiative Decays of the $ J/\psi $ and $ \psi^\prime $ | Master's thesis, SLAC, 1982 | |
| 120 | M. Oreglia | A Study of the Reactions $ \psi^\prime \to \gamma \gamma \psi $ | Master's thesis, SLAC, 1980 | |
| 121 | T.~Skwarnicki | A study of the radiative CASCADE transitions between the Upsilon-Prime and Upsilon resonances | T. Skwarnicki, PhD thesis, Cracow, INP, 1986 | |
| 122 | CMS Collaboration | The CMS Statistical Analysis and Combination Tool: Combine | Comput. Softw. Big Sci. 8 (2024) 19 | CMS-CAT-23-001 2404.06614 |
| 123 | W. Verkerke and D. Kirkby | The RooFit toolkit for data modeling | in the International Conference on Computing in High Energy and Nuclear Physics (CHEP ): La Jolla CA, United States, March 24--28,.. [eConf C0303241 MOLT007], 2003 Proc. 1 (2003) 3 |
physics/0306116 |
| 124 | L. Moneta et al. | The RooStats project | in the International Workshop on Advanced Computing and Analysis Techniques in Physics Research (ACAT ): Jaipur, India, February 22--27,.. [PoS (ACAT) 057], 2010 Proc. 1 (2010) 3 |
1009.1003 |
|
|
Compact Muon Solenoid LHC, CERN |
|

|

|

|

|

|