

Compact Muon Solenoid
LHC, CERN
 Visit us: CMS Public Website, CMS Physics ;
Contact us: CMS Publications Committee
Visit us: CMS Public Website, CMS Physics ;
Contact us: CMS Publications Committee
| CMS-PAS-B2G-24-002 | ||
| Search for heavy Higgs bosons in the $ \mathrm{A}\to{\mathrm{Z}(\to\ell\ell)}{\mathrm{H}(\to{\mathrm{t}\bar{\mathrm{t}}}\ \mathrm{semileptonic})} $ channel | ||
| CMS Collaboration | ||
| 2026-08-07 | ||
| Abstract: This note presents a direct search for a heavy pseudoscalar boson, $ \mathrm{A} $, decaying into a lighter scalar boson, H, and a Z boson, with the Z boson decaying to leptons and the H boson to a top quark pair. The data used for this search were collected at $ \sqrt{s} = $ 13 TeV by the CMS detector at the LHC corresponding to an integrated luminosity of 138 fb$ ^{-1} $. A search is conducted using events with three charged leptons (electrons or muons), two from the Z boson decay and one from a top quark decay. The results are combined with those of a similar search for $ \mathrm{A} \to \mathrm{ZH} $ with $ \mathrm{H} \to \mathrm{t\bar{t}} $ using top quark pairs decaying entirely to hadrons. The observed data are consistent with the standard model background prediction. Upper limits at 95% confidence level are set on the product of the production cross section and branching fraction for this signature, under the assumption that both new particles have narrow widths, for $ \mathrm{A} $ masses up to 2.1 TeV and H masses up to 1.9 TeV. The two-Higgs-doublet model interpretation is used to exclude regions of parameter space in the $ (m_\mathrm{A}, m_\mathrm{H}) $ plane as a function of $ \tan\beta $ and $ \cos(\beta - \alpha) $. | ||
| Links: CDS record (PDF) ; CADI line (restricted) ; | ||
| Figures | |
png pdf |
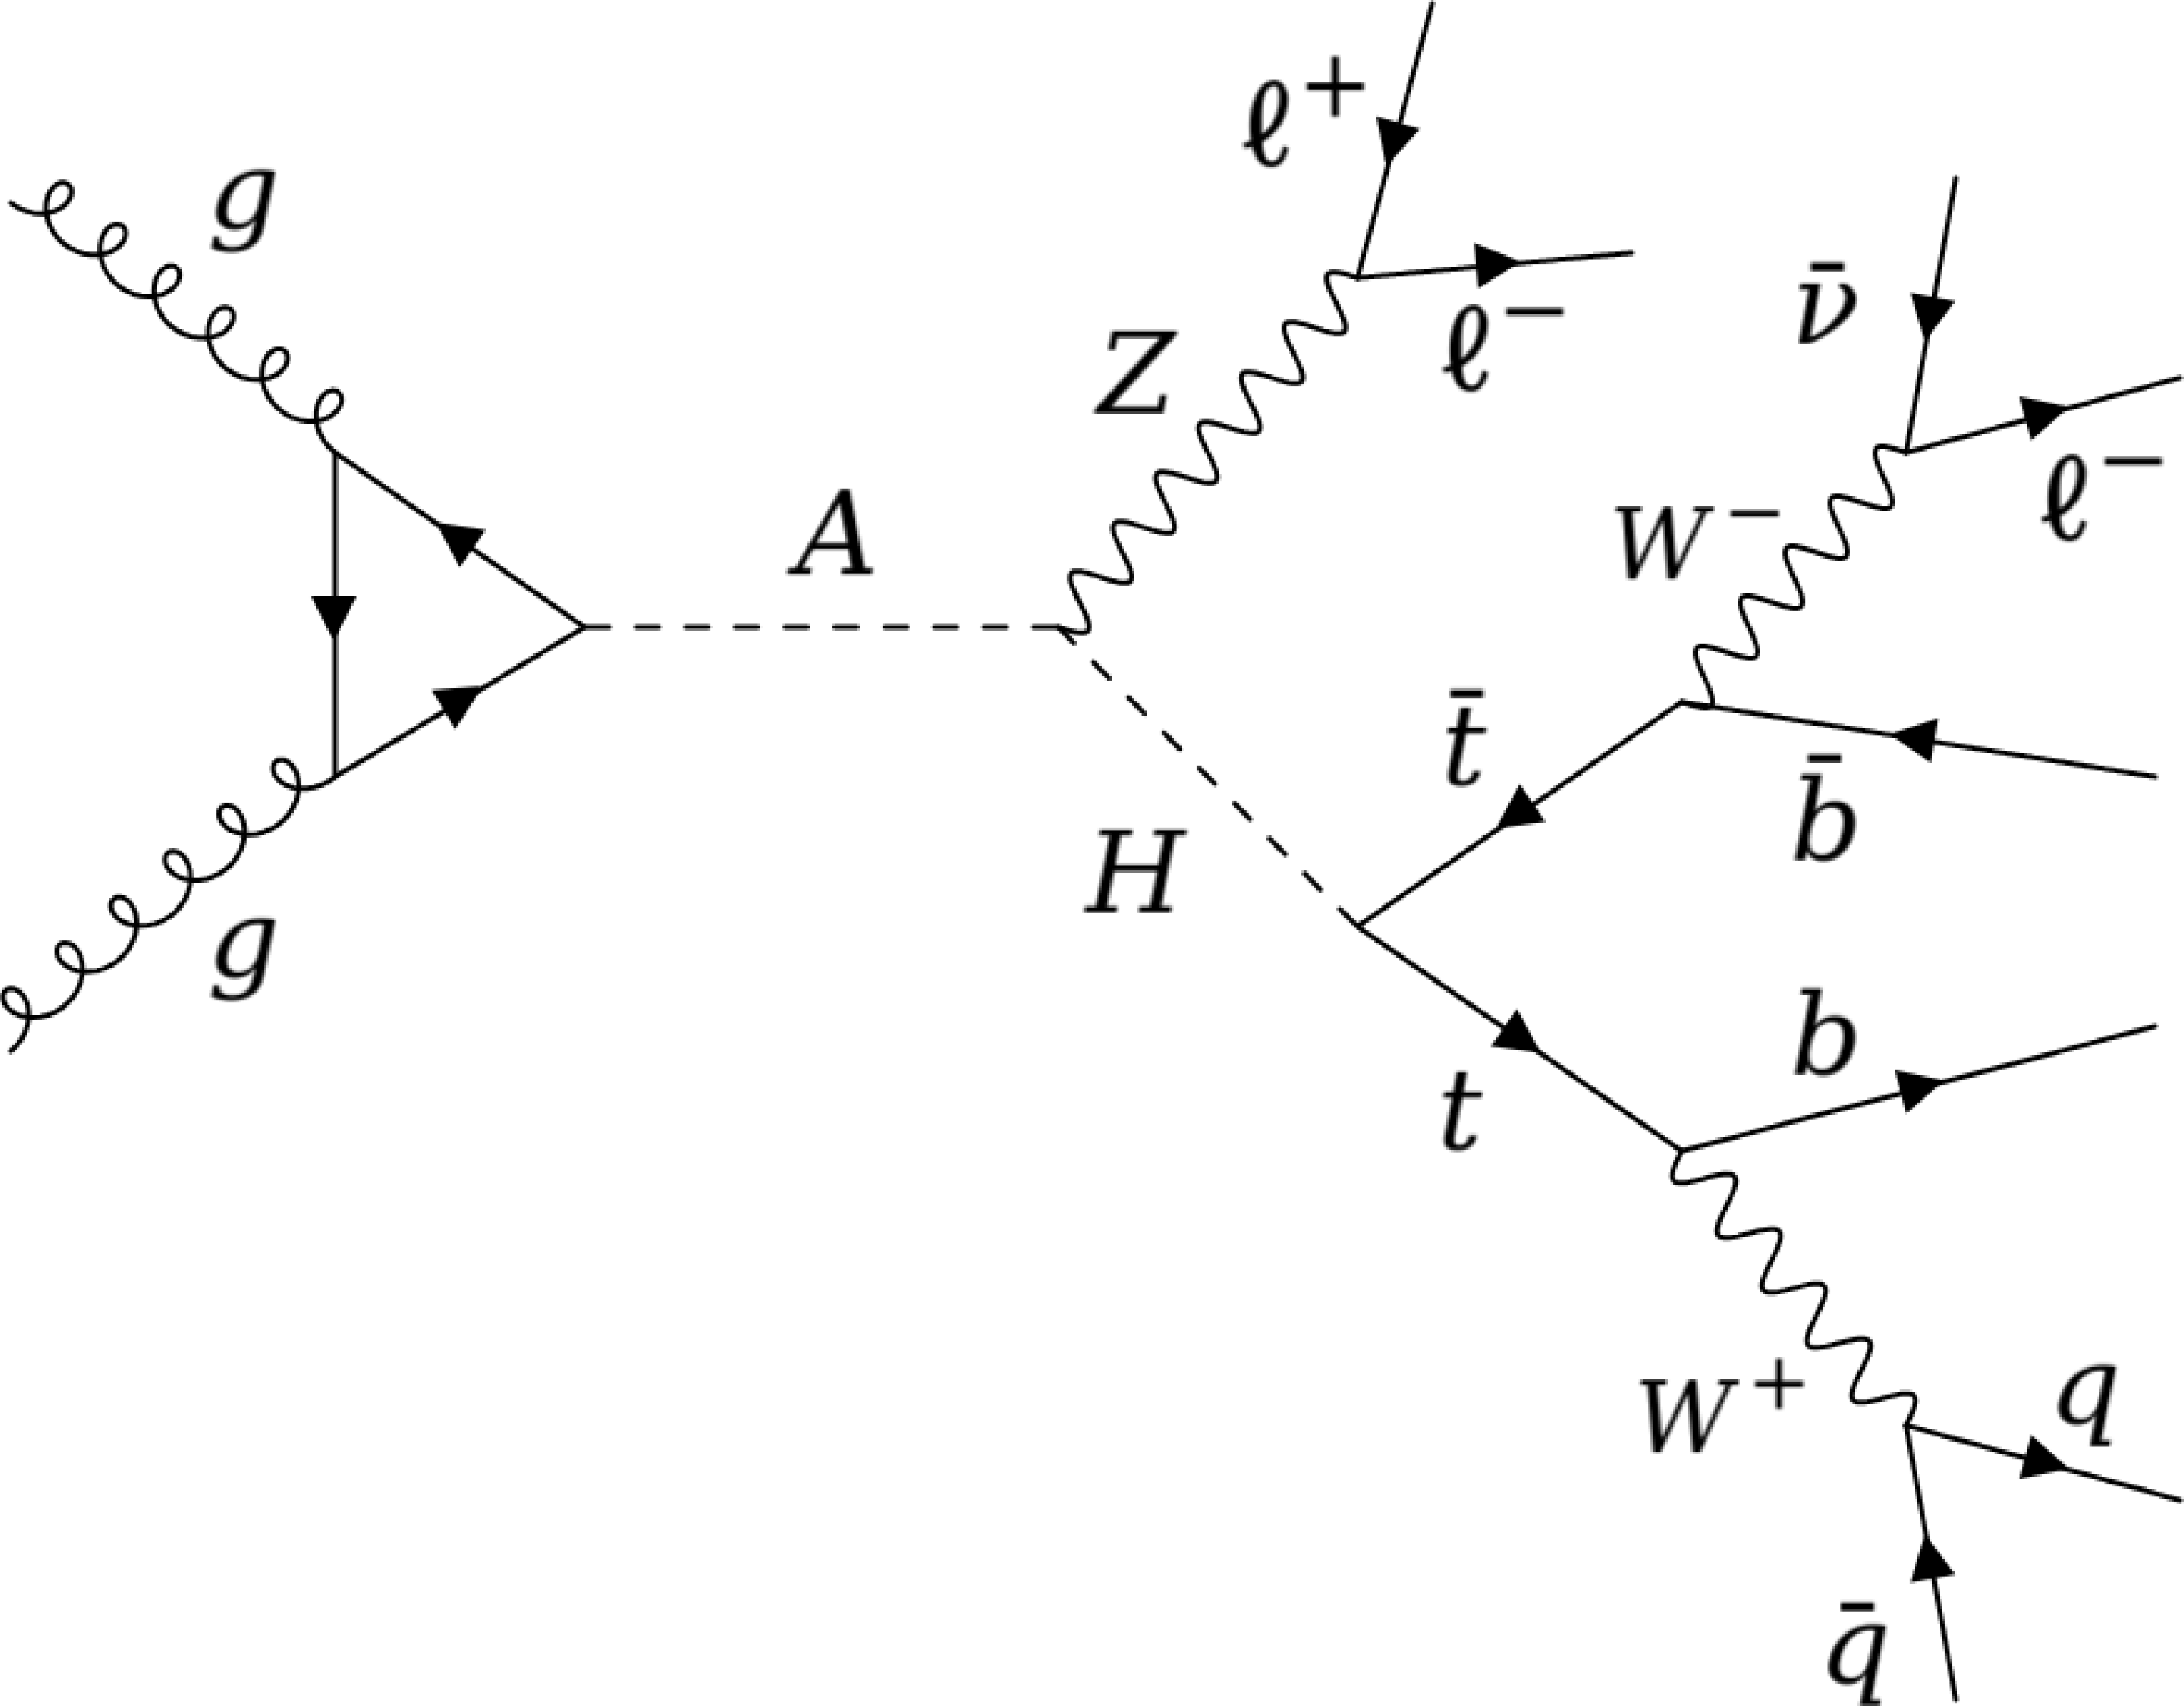
Figure 1:
Example of a Feynman diagram for gluon-gluon fusion production of an $ \mathrm{A} $ boson which then decays into ZH, where the Z boson decays to a pair of leptons ($ \mathrm{Z} \to \ell\ell,\ \ell = \mathrm{e},\mu $) and the top quark pair decays semileptonically $ {\mathrm{t}\overline{\mathrm{t}}} \to (\ell\nu\mathrm{b})(\mathrm{q}\mathrm{q}\mathrm{b}) $. |
png pdf |
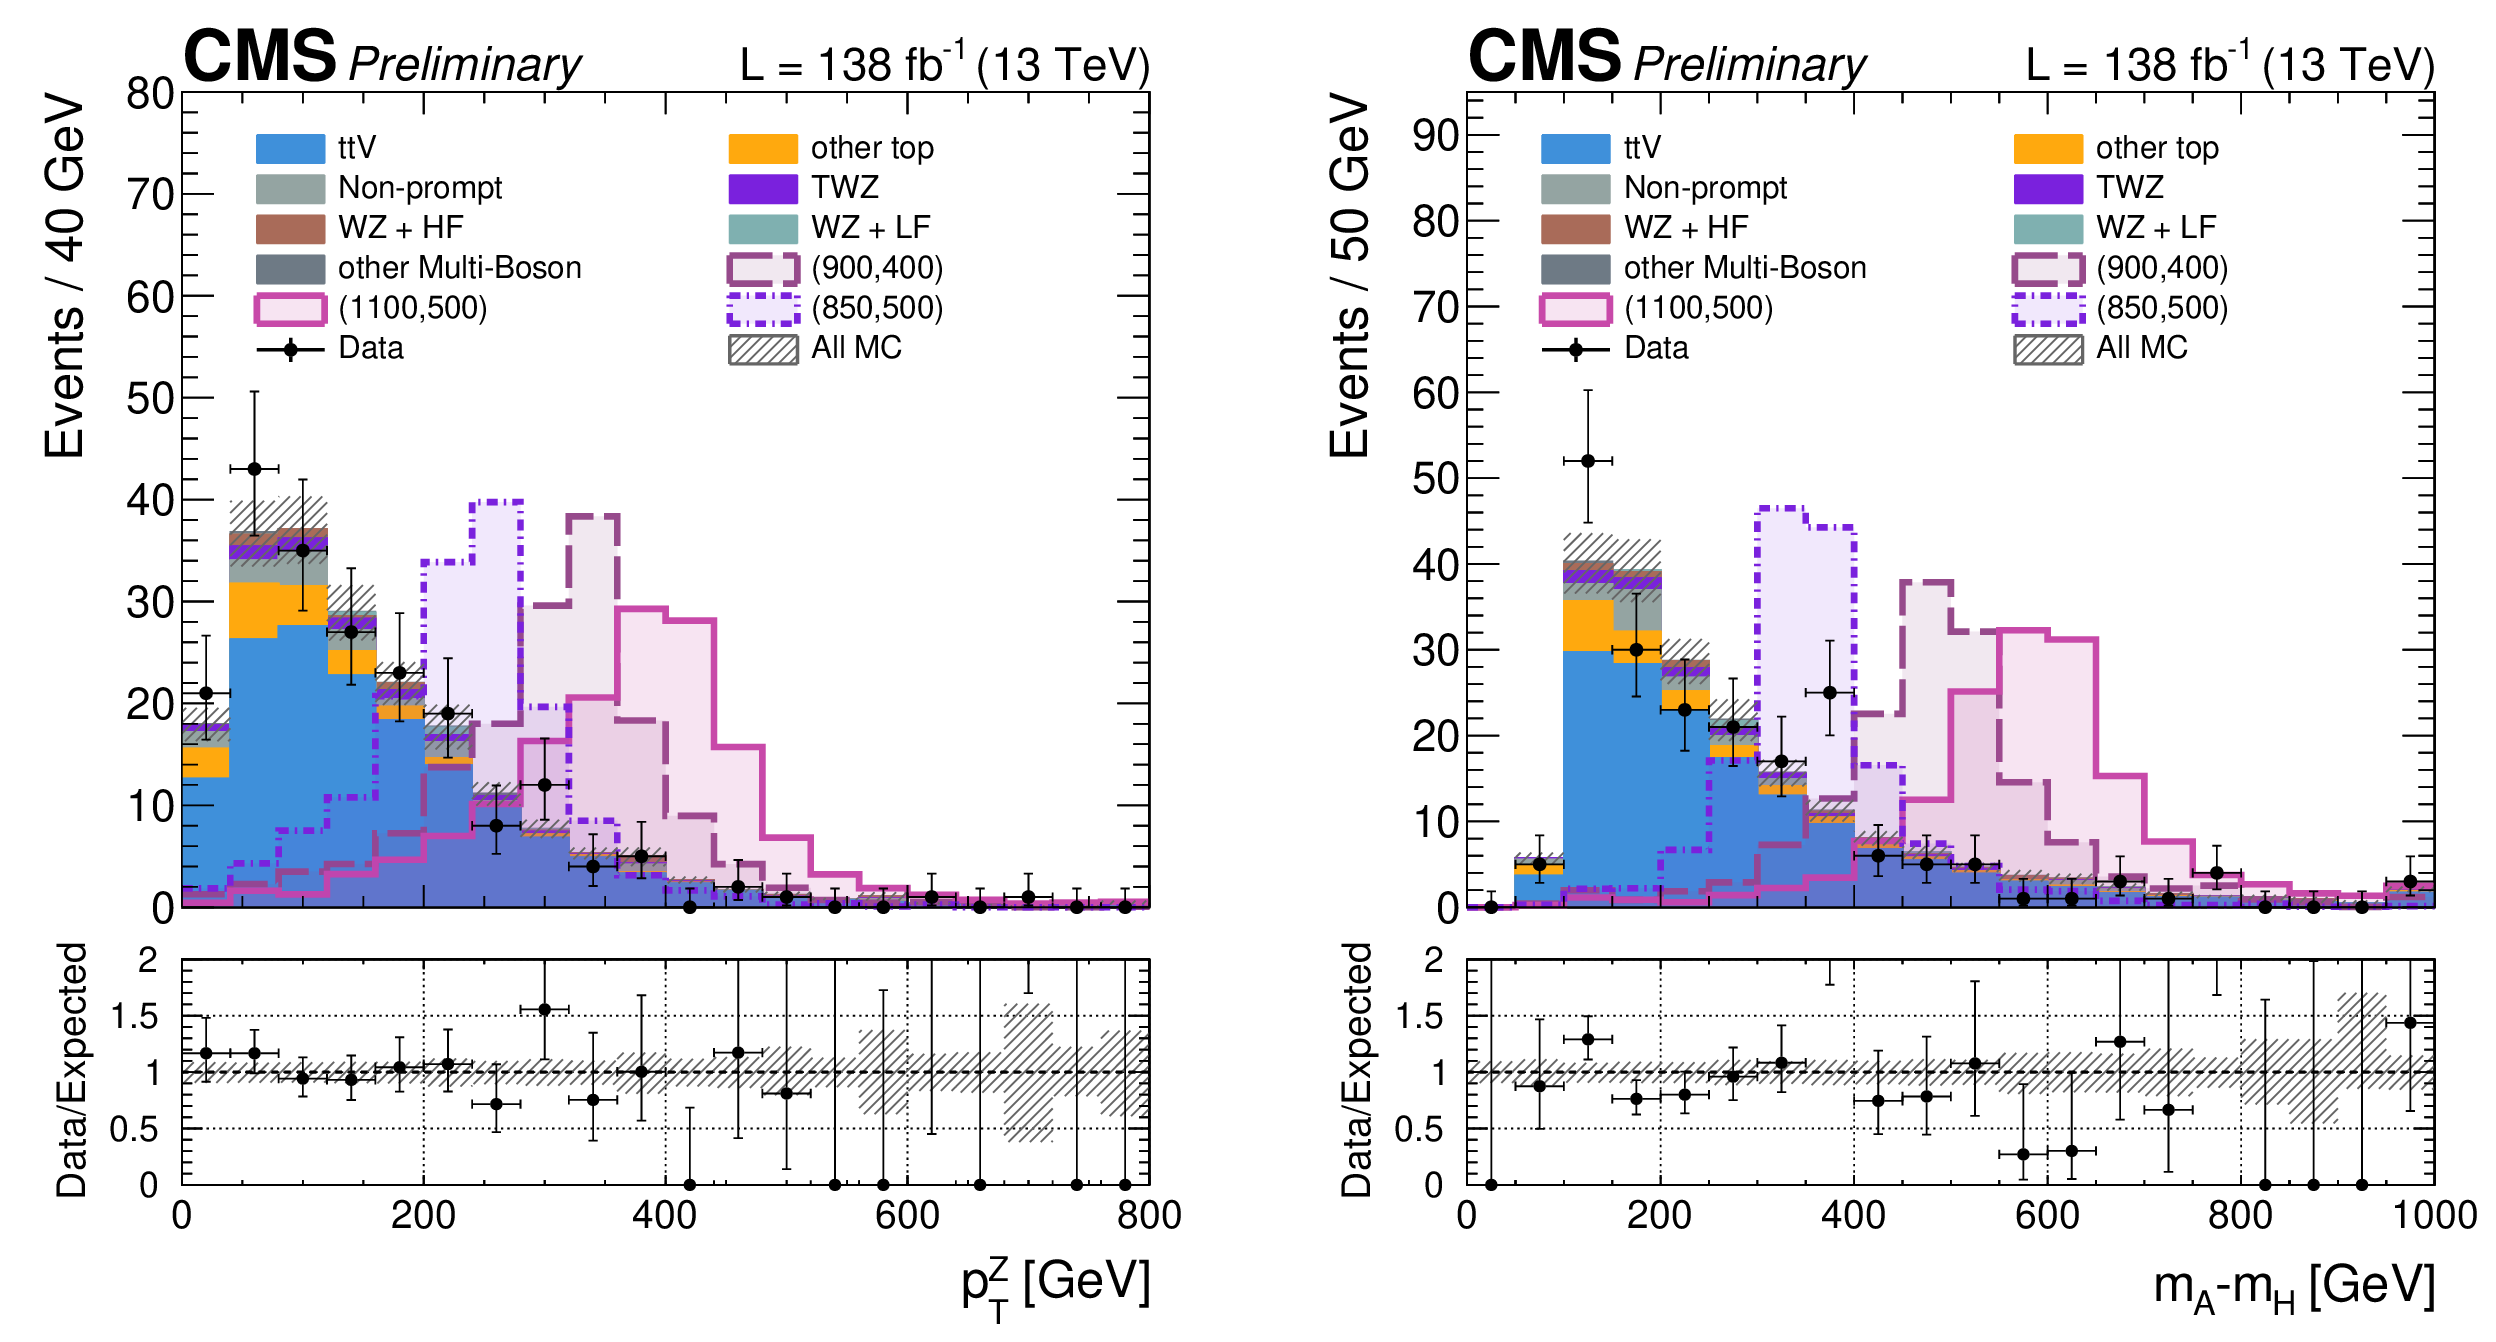
Figure 2:
Distributions of the two key discriminants $ p_{\mathrm{T}}^{\mathrm{Z}} $ and $ \Delta m $ in the $ \geq $2b signal regions. The expected signal is shown for the mass hypotheses ($ m_{\mathrm{A}} $,$ m_{\mathrm{H}} $) = (850, 500) GeV, (900, 400) GeV, and (1100, 500) GeV. The signal event yields are normalized to the yield of $ \mathrm{t} \overline{\mathrm{t}} $ V for shape comparison between signal and background. |
png pdf |
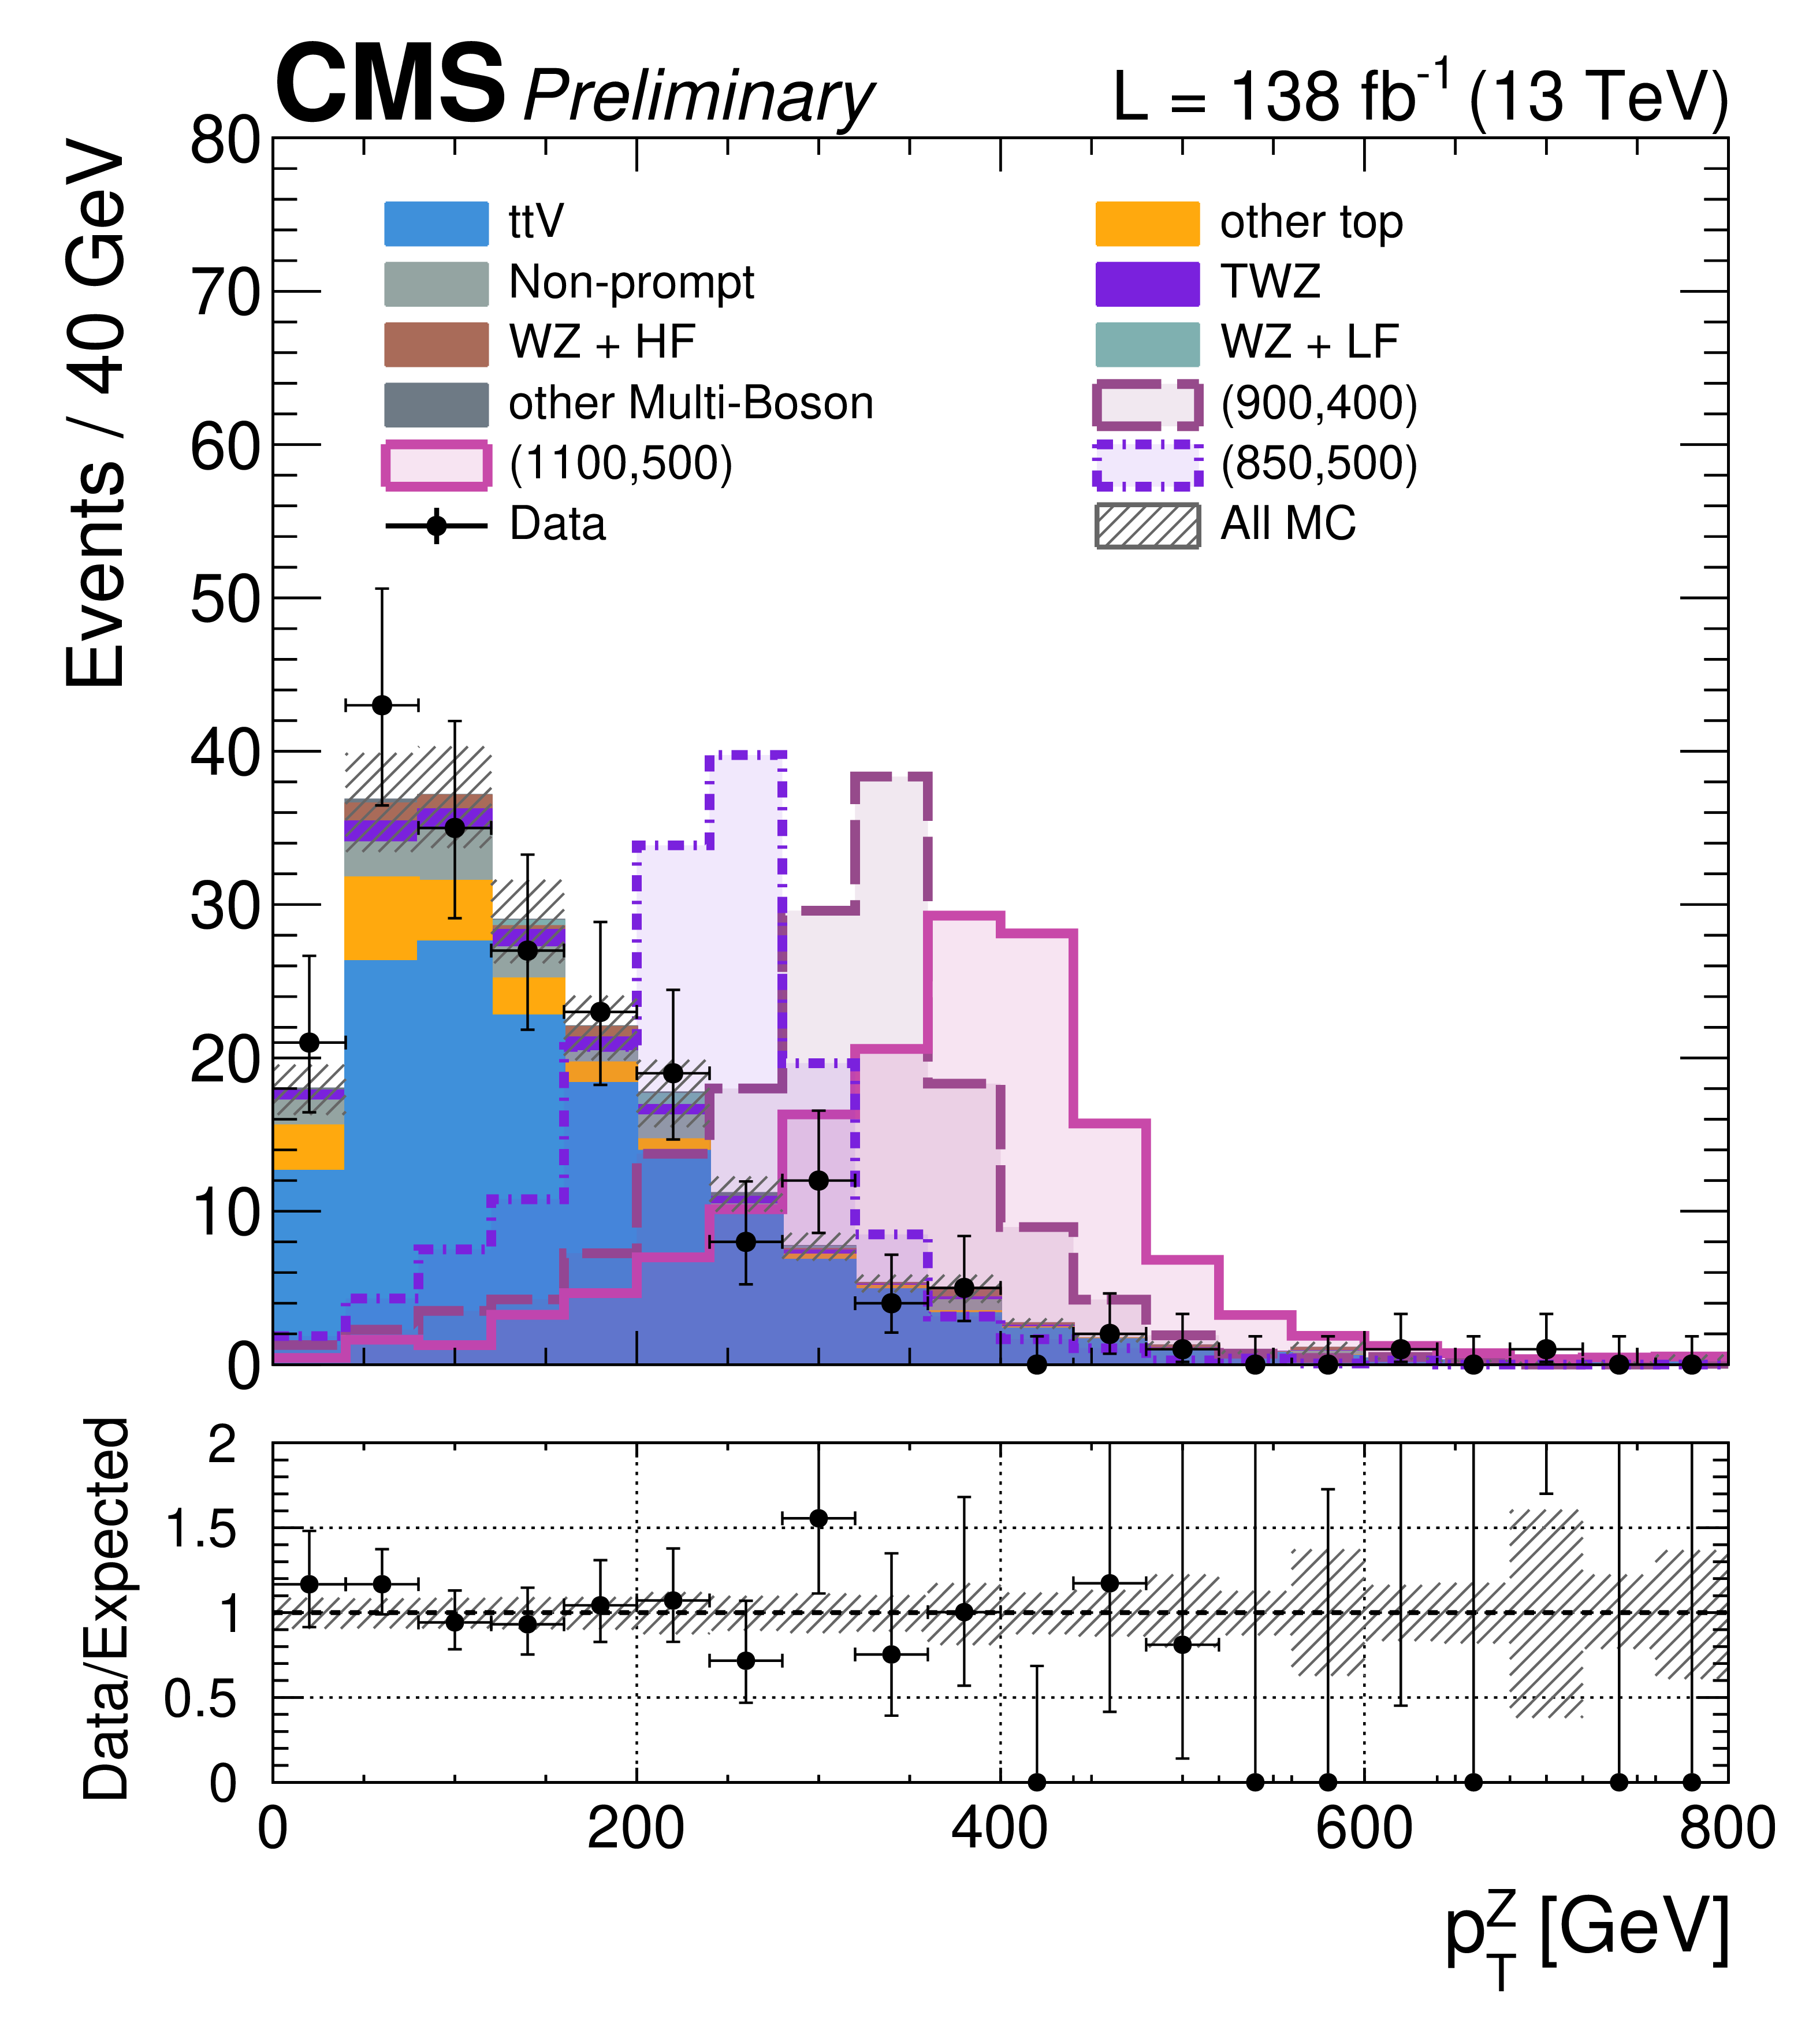
Figure 2-a:
Distributions of the two key discriminants $ p_{\mathrm{T}}^{\mathrm{Z}} $ and $ \Delta m $ in the $ \geq $2b signal regions. The expected signal is shown for the mass hypotheses ($ m_{\mathrm{A}} $,$ m_{\mathrm{H}} $) = (850, 500) GeV, (900, 400) GeV, and (1100, 500) GeV. The signal event yields are normalized to the yield of $ \mathrm{t} \overline{\mathrm{t}} $ V for shape comparison between signal and background. |
png pdf |
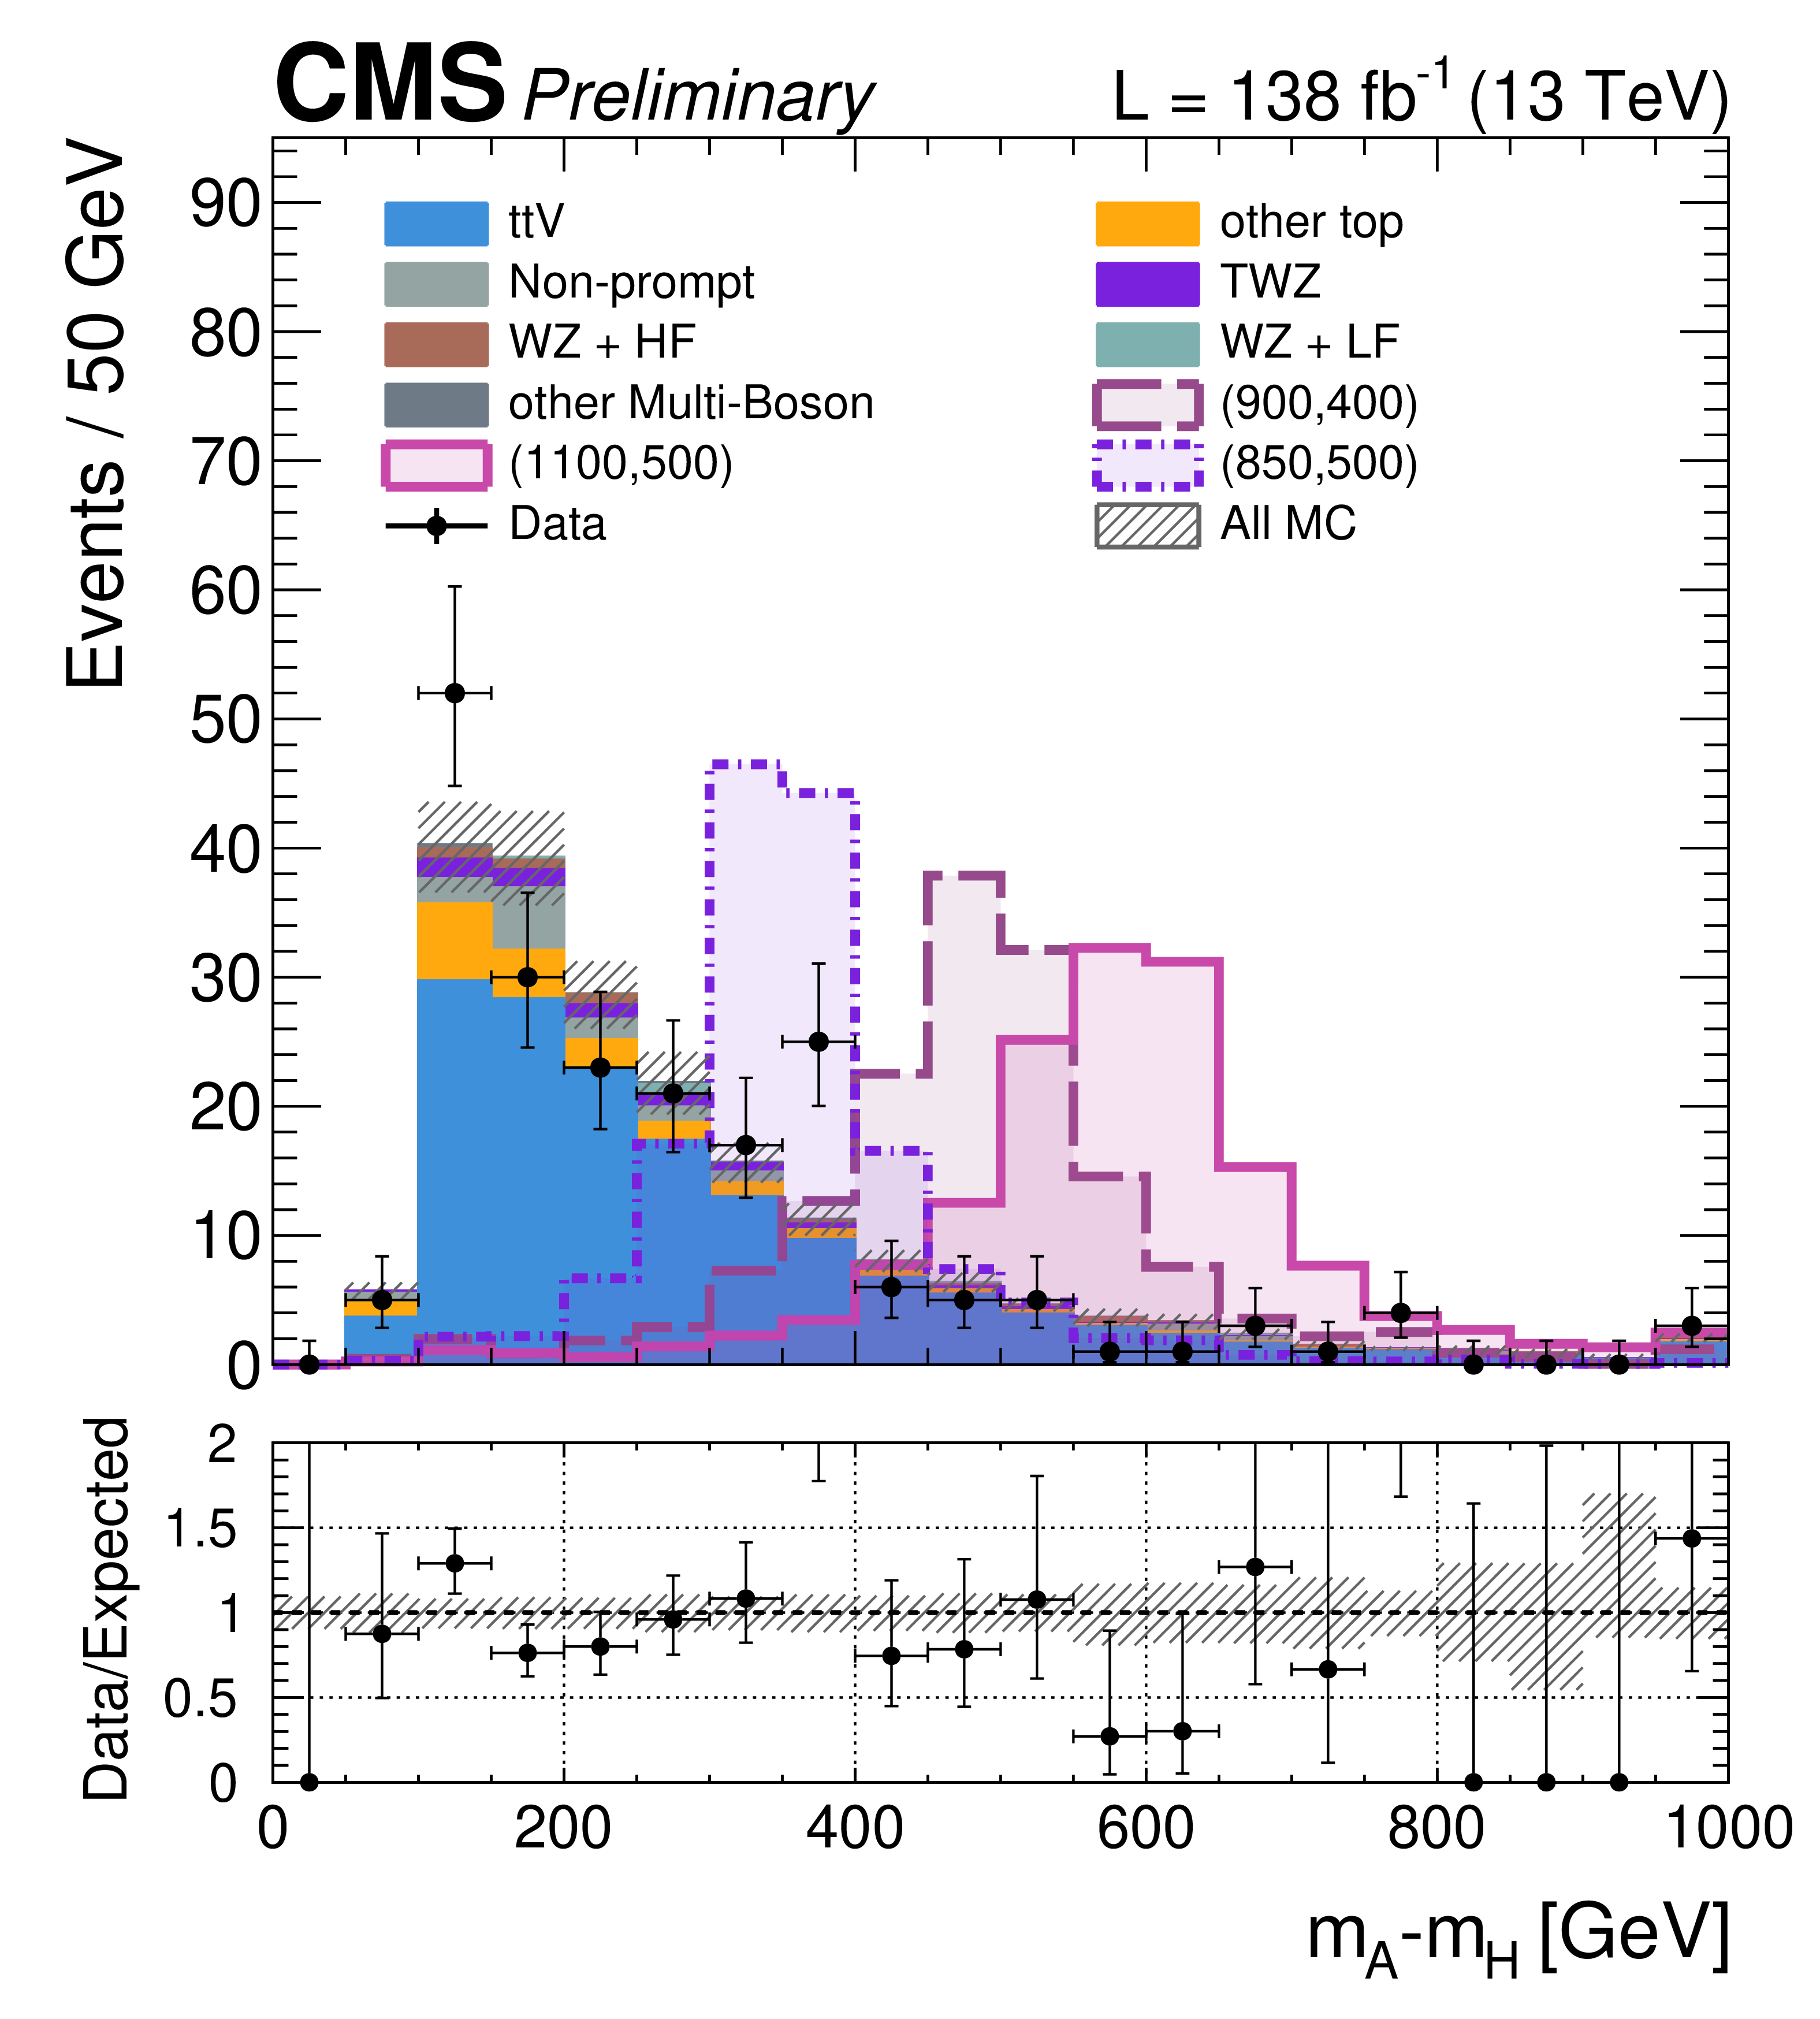
Figure 2-b:
Distributions of the two key discriminants $ p_{\mathrm{T}}^{\mathrm{Z}} $ and $ \Delta m $ in the $ \geq $2b signal regions. The expected signal is shown for the mass hypotheses ($ m_{\mathrm{A}} $,$ m_{\mathrm{H}} $) = (850, 500) GeV, (900, 400) GeV, and (1100, 500) GeV. The signal event yields are normalized to the yield of $ \mathrm{t} \overline{\mathrm{t}} $ V for shape comparison between signal and background. |
png pdf |
Figure 3:
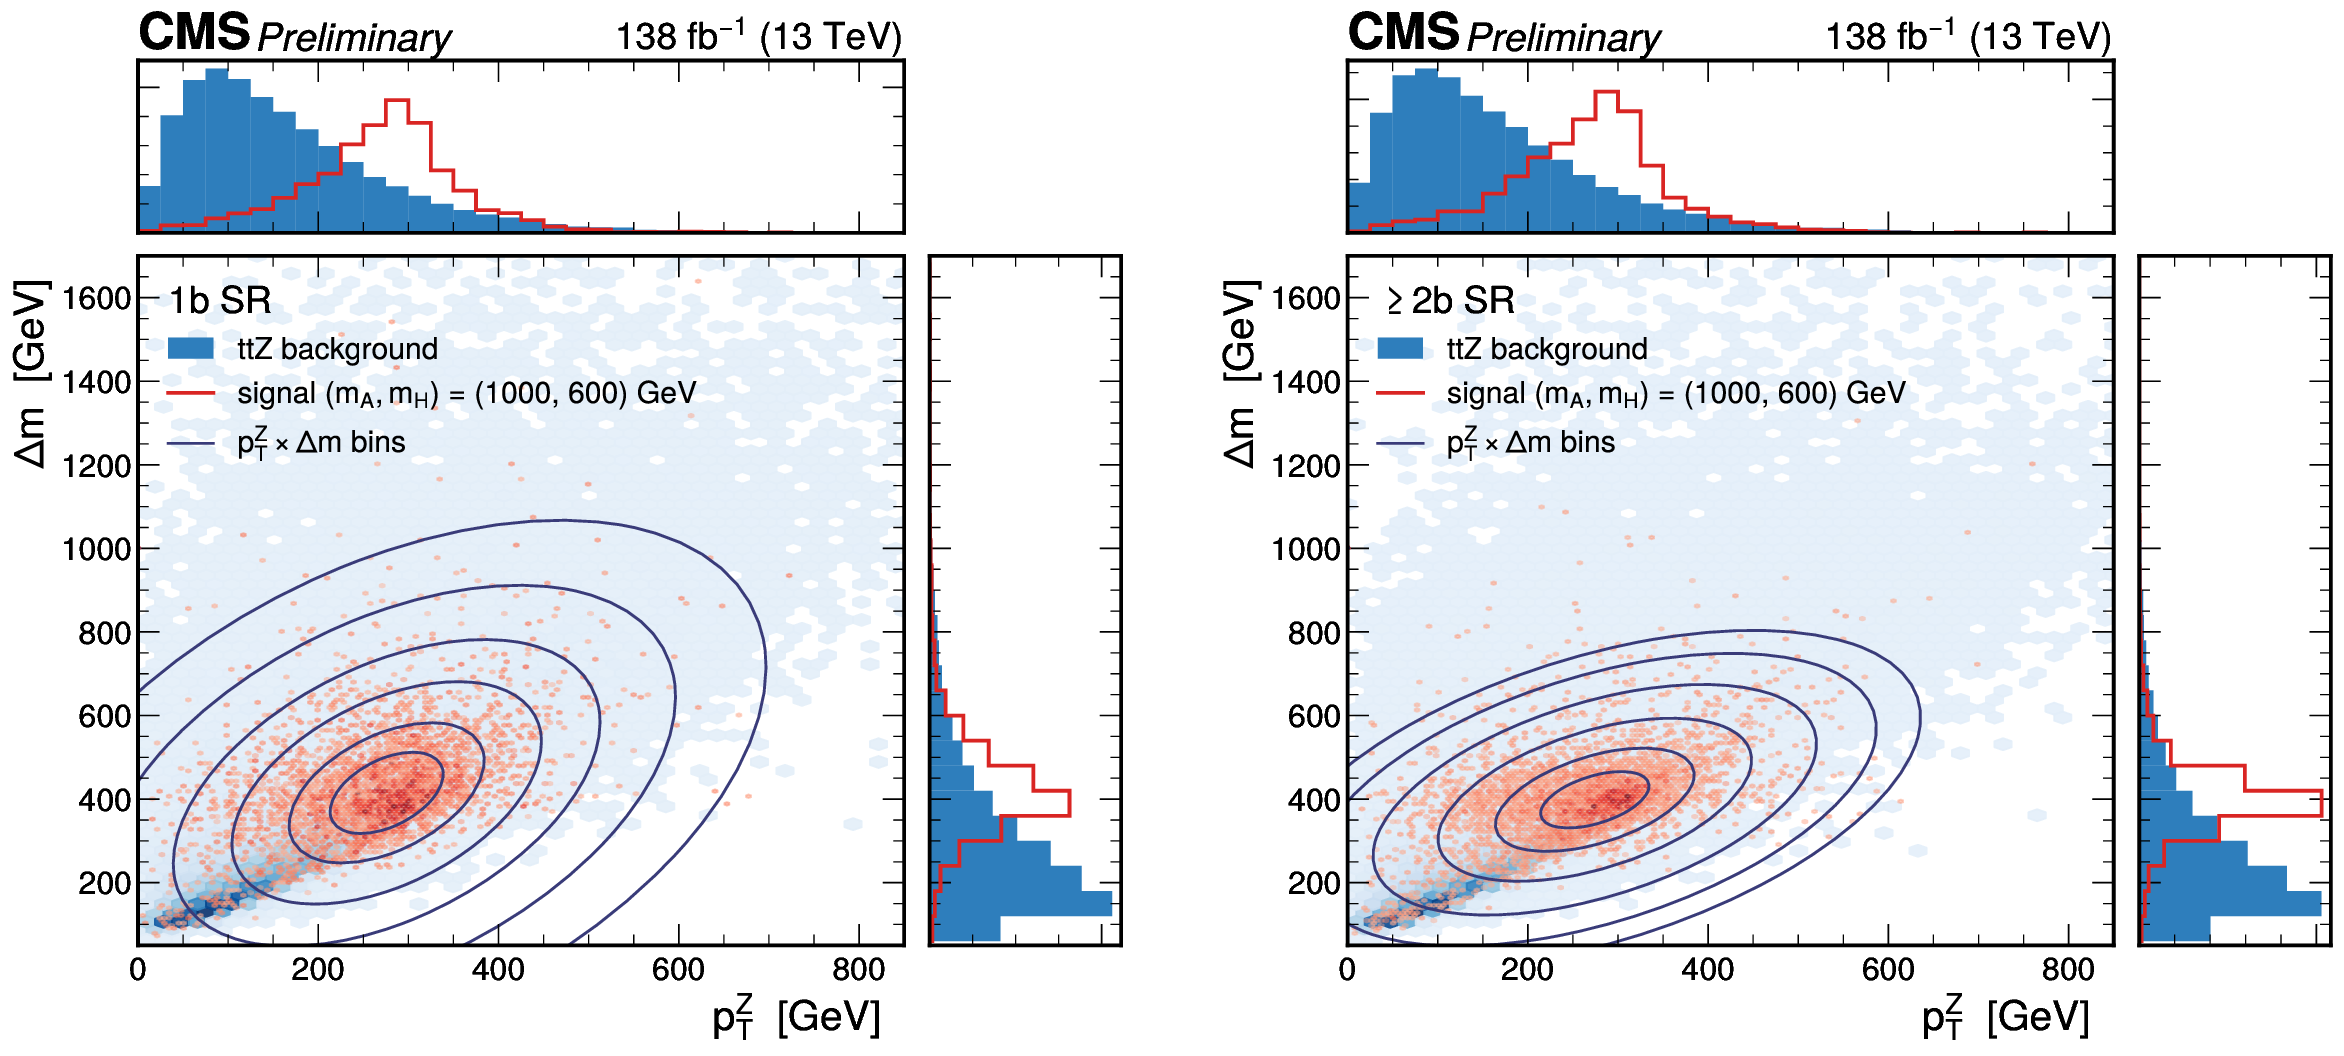
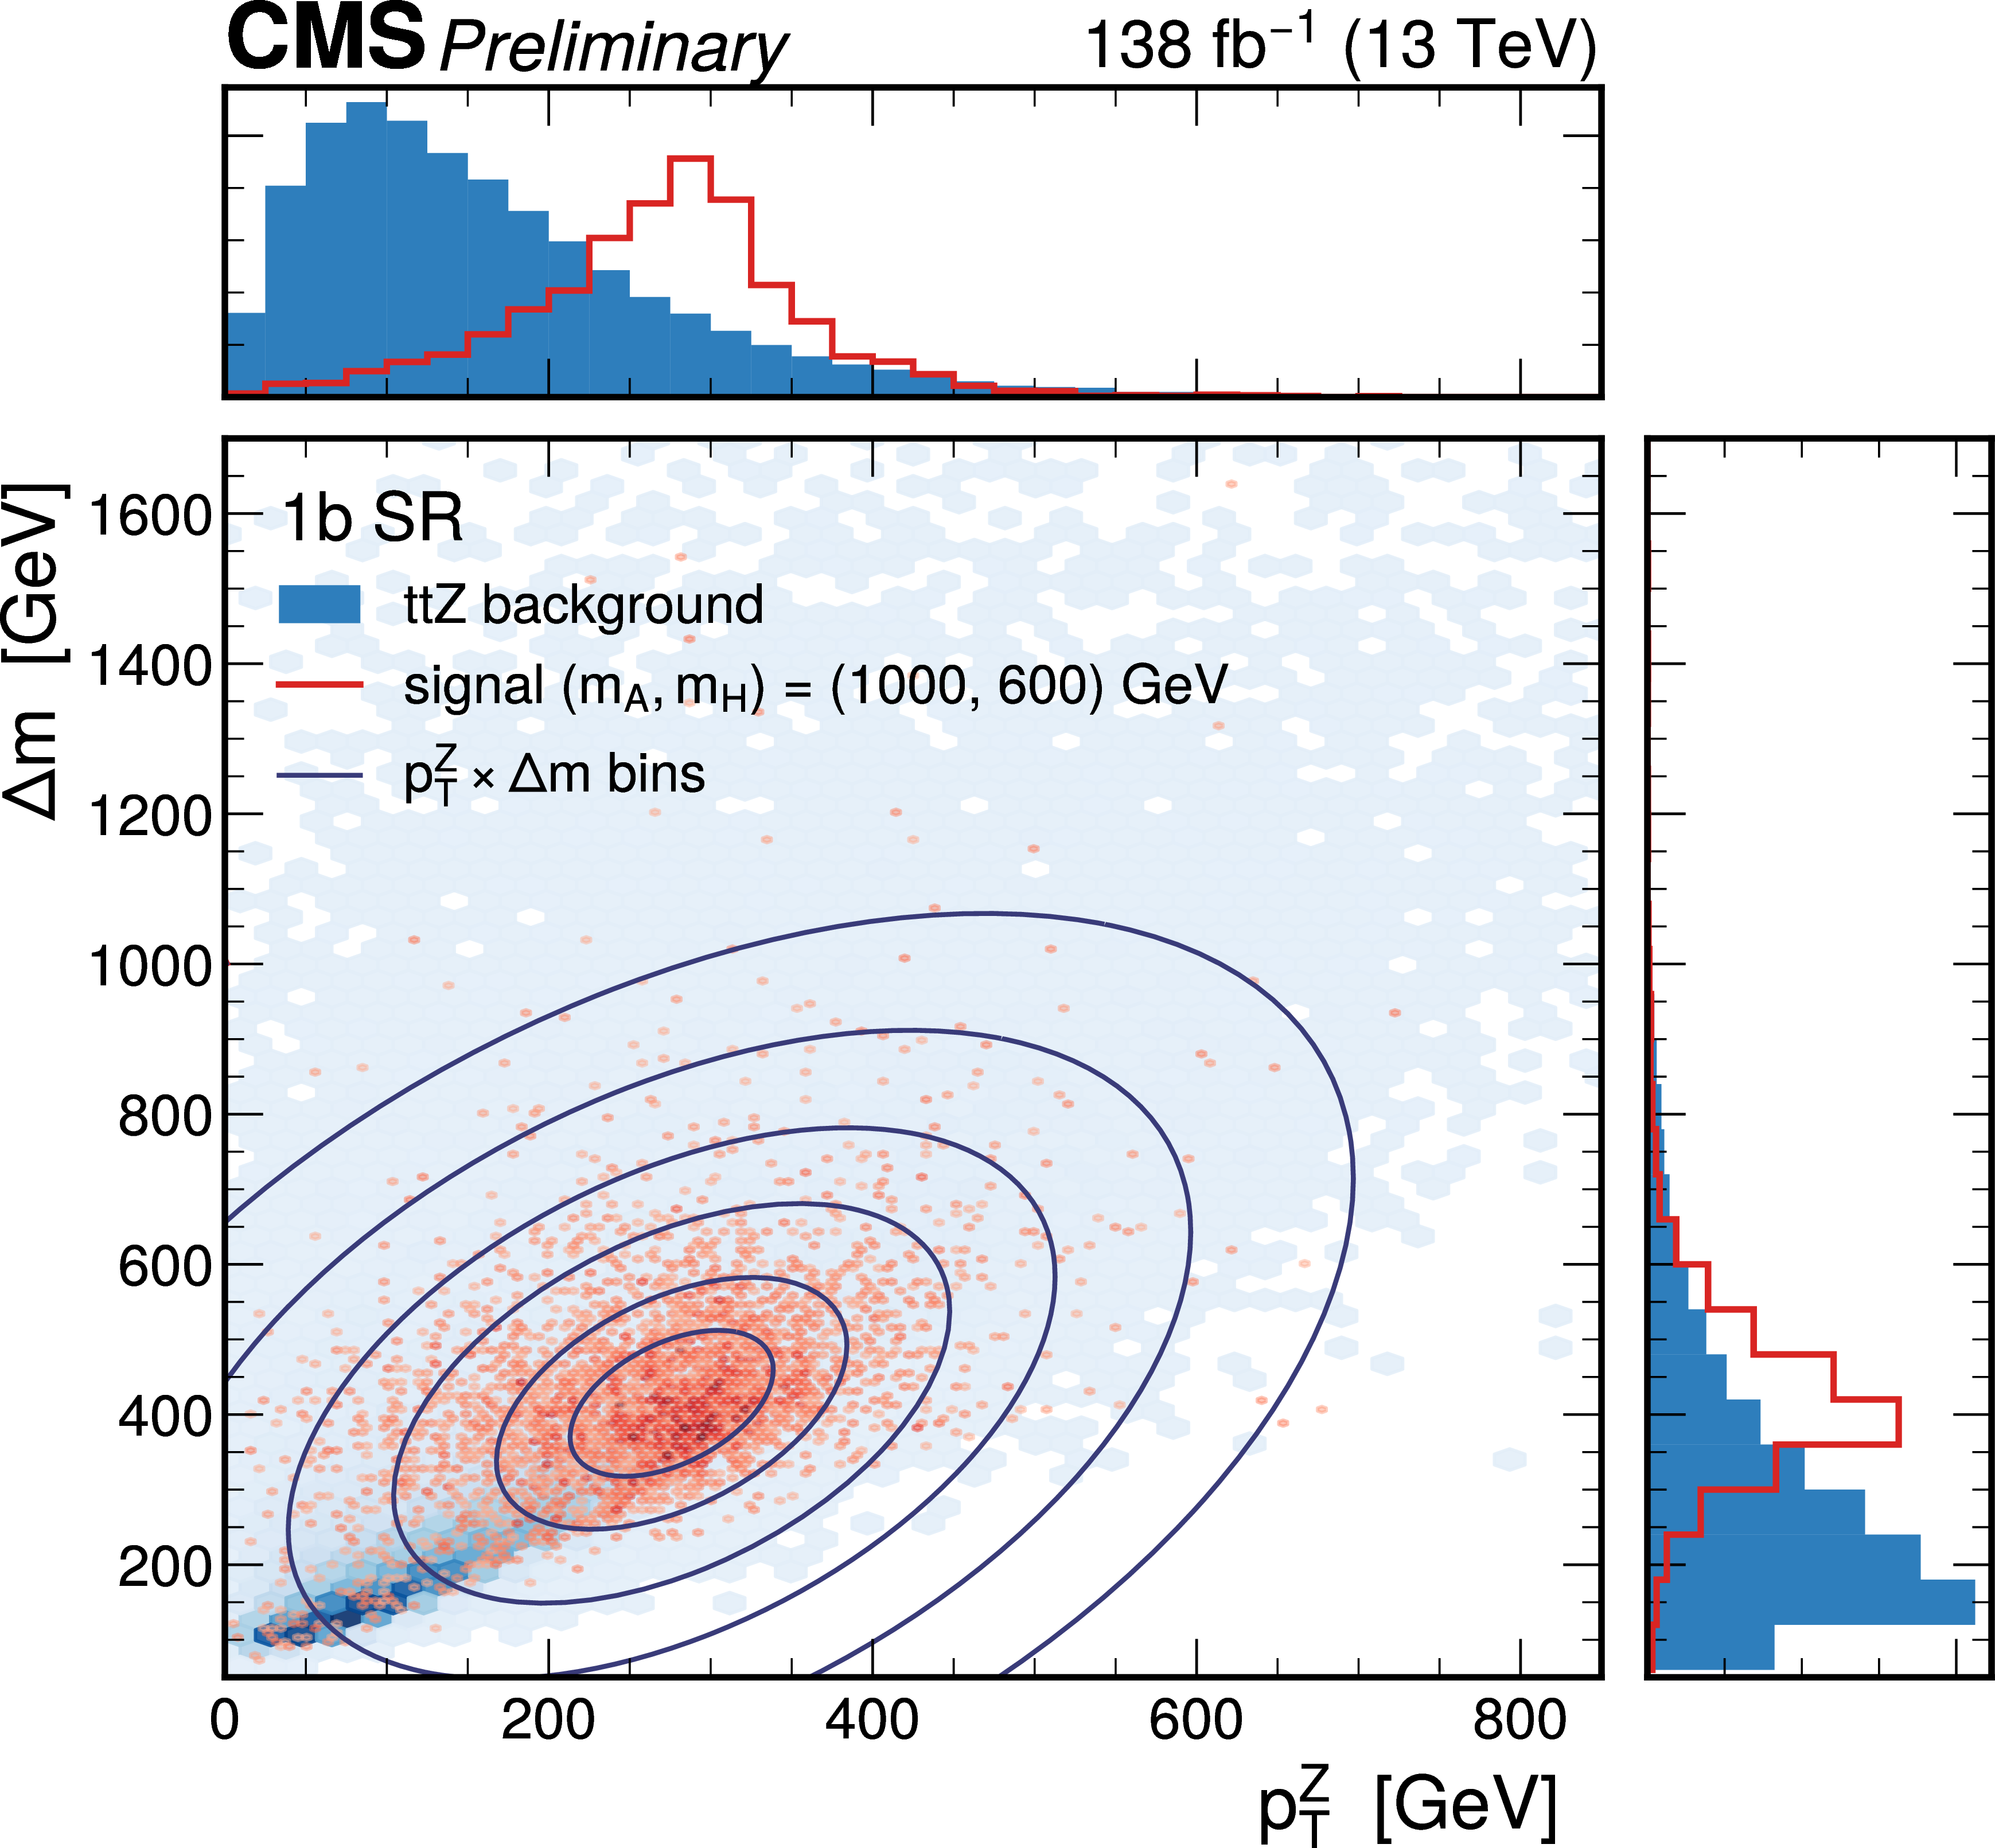
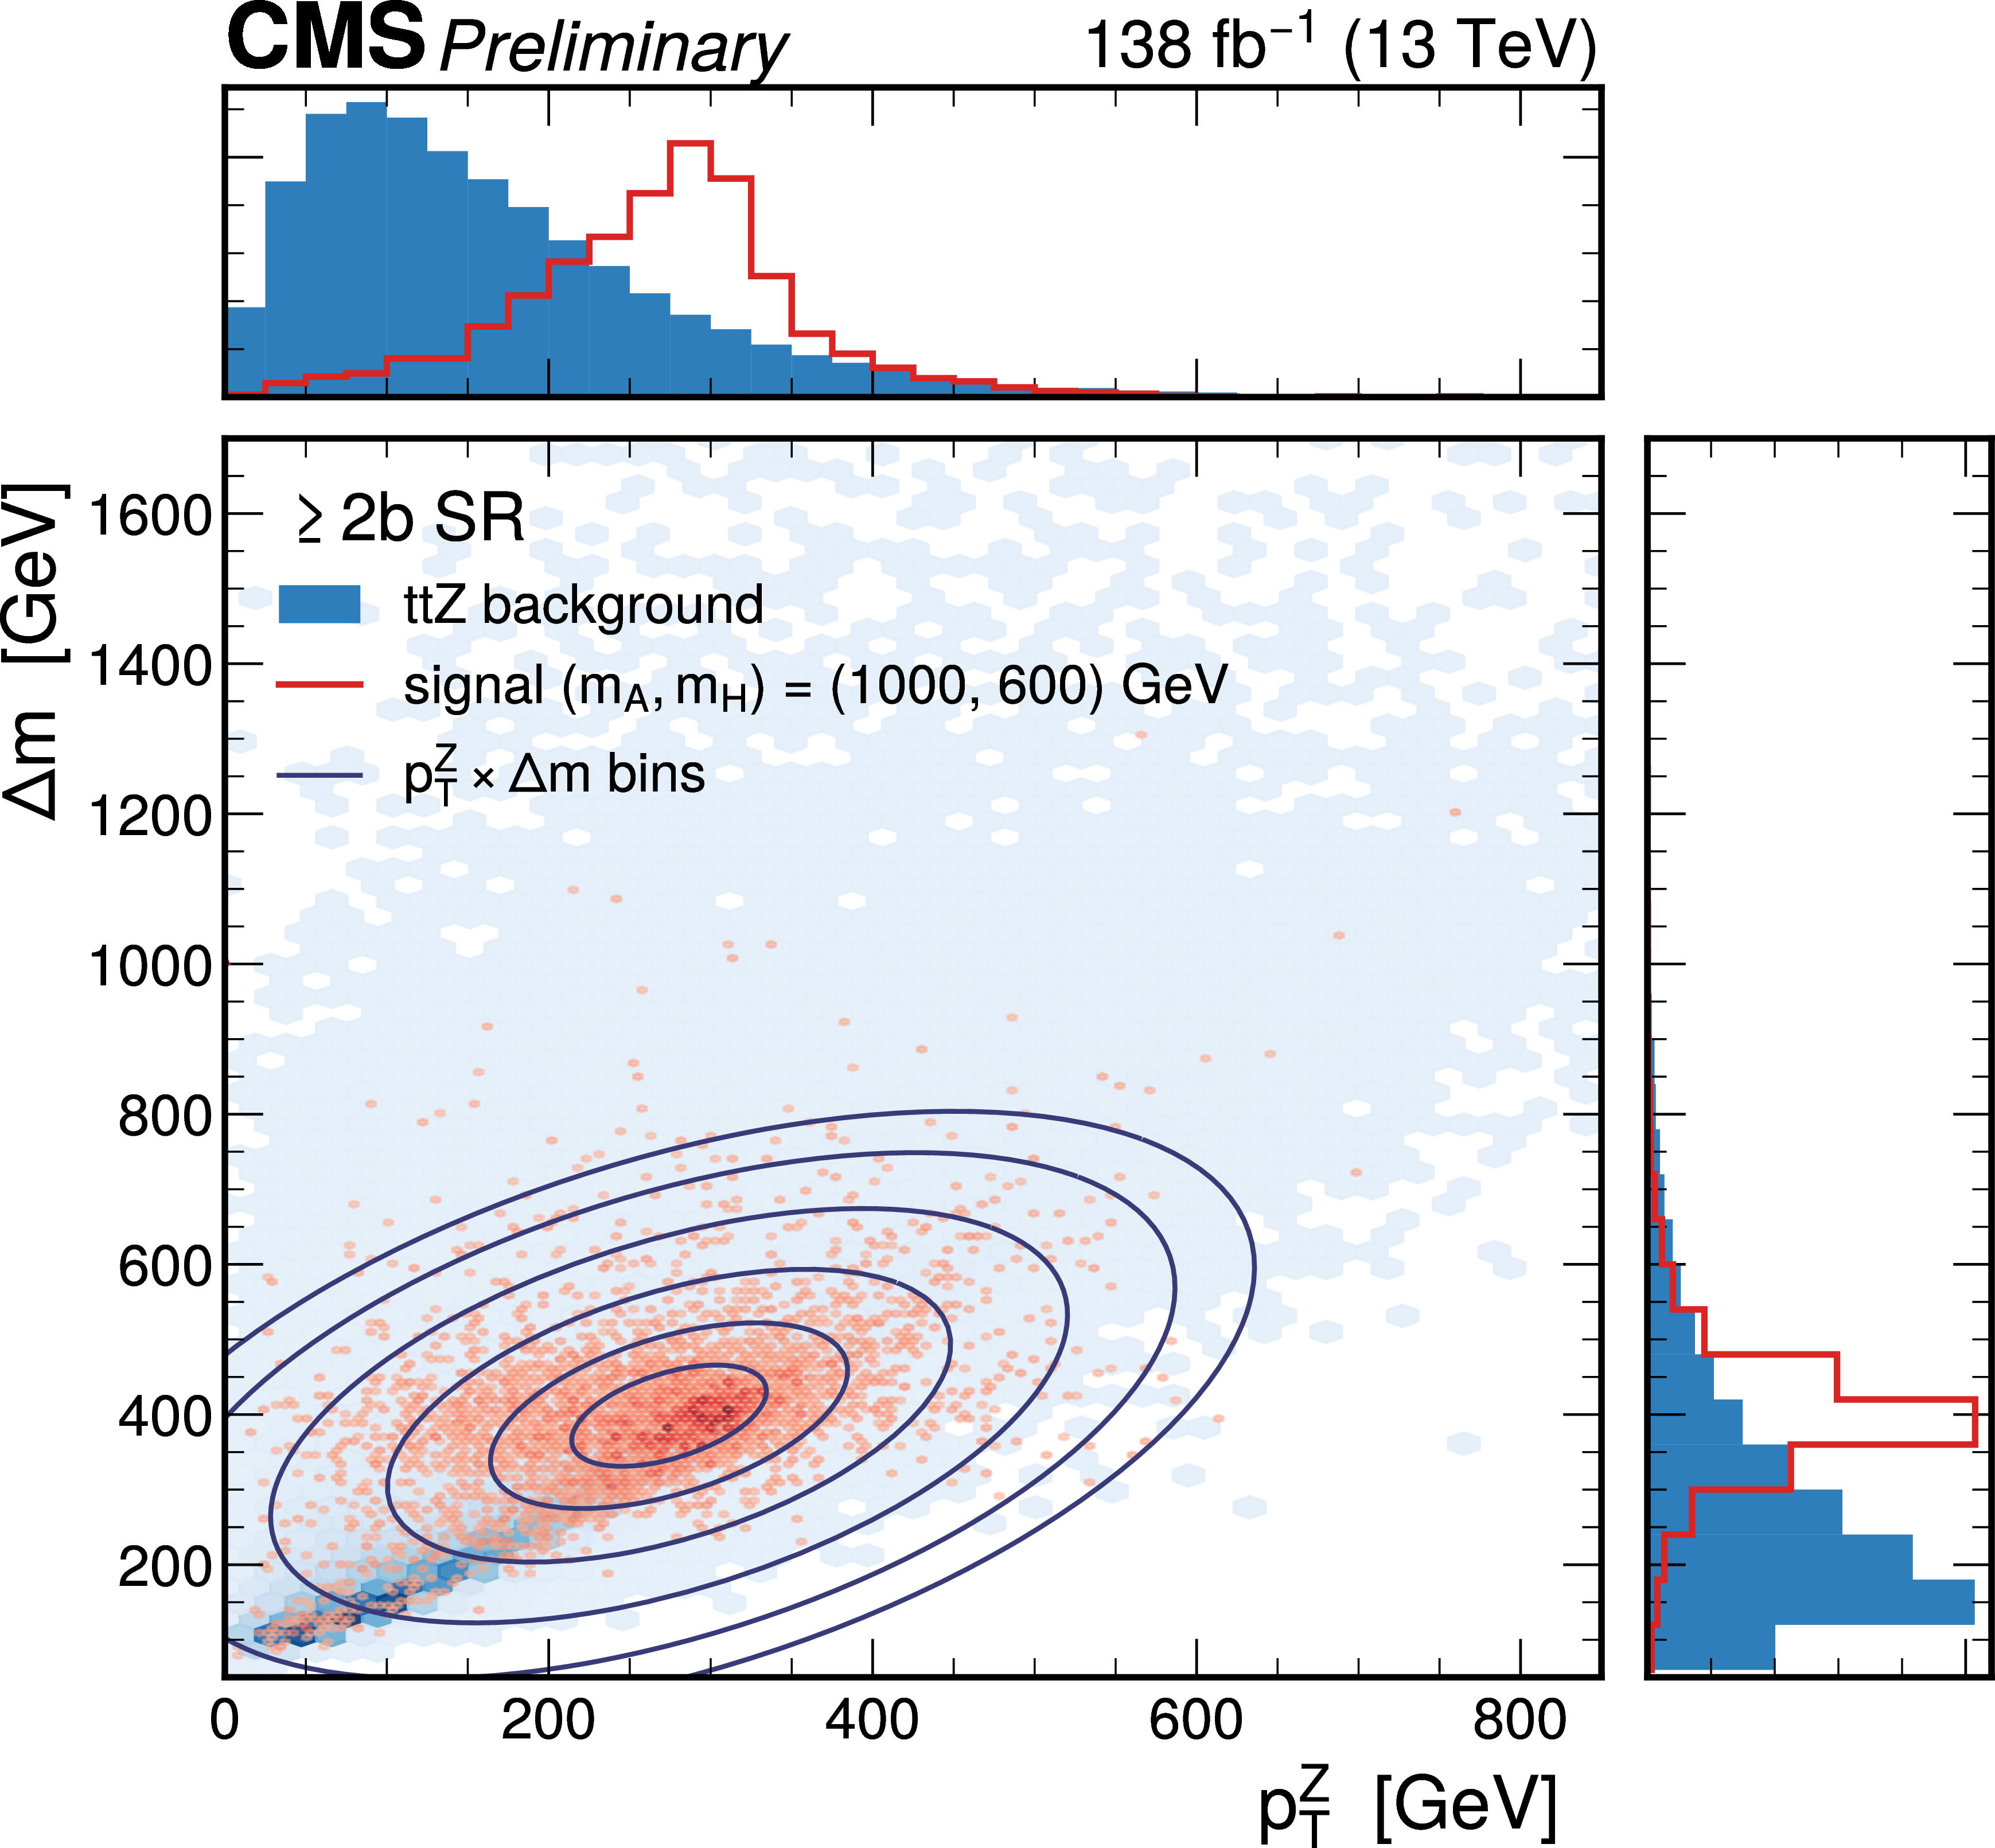
Expected distributions of $ p_{\mathrm{T}}^{\mathrm{Z}}\times\Delta m $ in the 1b SR (left) and $ \geq $2b signal region (right) for a signal with ($ m_{\mathrm{A}} $,$ m_{\mathrm{H}} $) = (1000, 600) GeV (red) and the main background ttZ (blue). |
png pdf |
Figure 3-a:
Expected distributions of $ p_{\mathrm{T}}^{\mathrm{Z}}\times\Delta m $ in the 1b SR (left) and $ \geq $2b signal region (right) for a signal with ($ m_{\mathrm{A}} $,$ m_{\mathrm{H}} $) = (1000, 600) GeV (red) and the main background ttZ (blue). |
png pdf |
Figure 3-b:
Expected distributions of $ p_{\mathrm{T}}^{\mathrm{Z}}\times\Delta m $ in the 1b SR (left) and $ \geq $2b signal region (right) for a signal with ($ m_{\mathrm{A}} $,$ m_{\mathrm{H}} $) = (1000, 600) GeV (red) and the main background ttZ (blue). |
png pdf |
Figure 4:
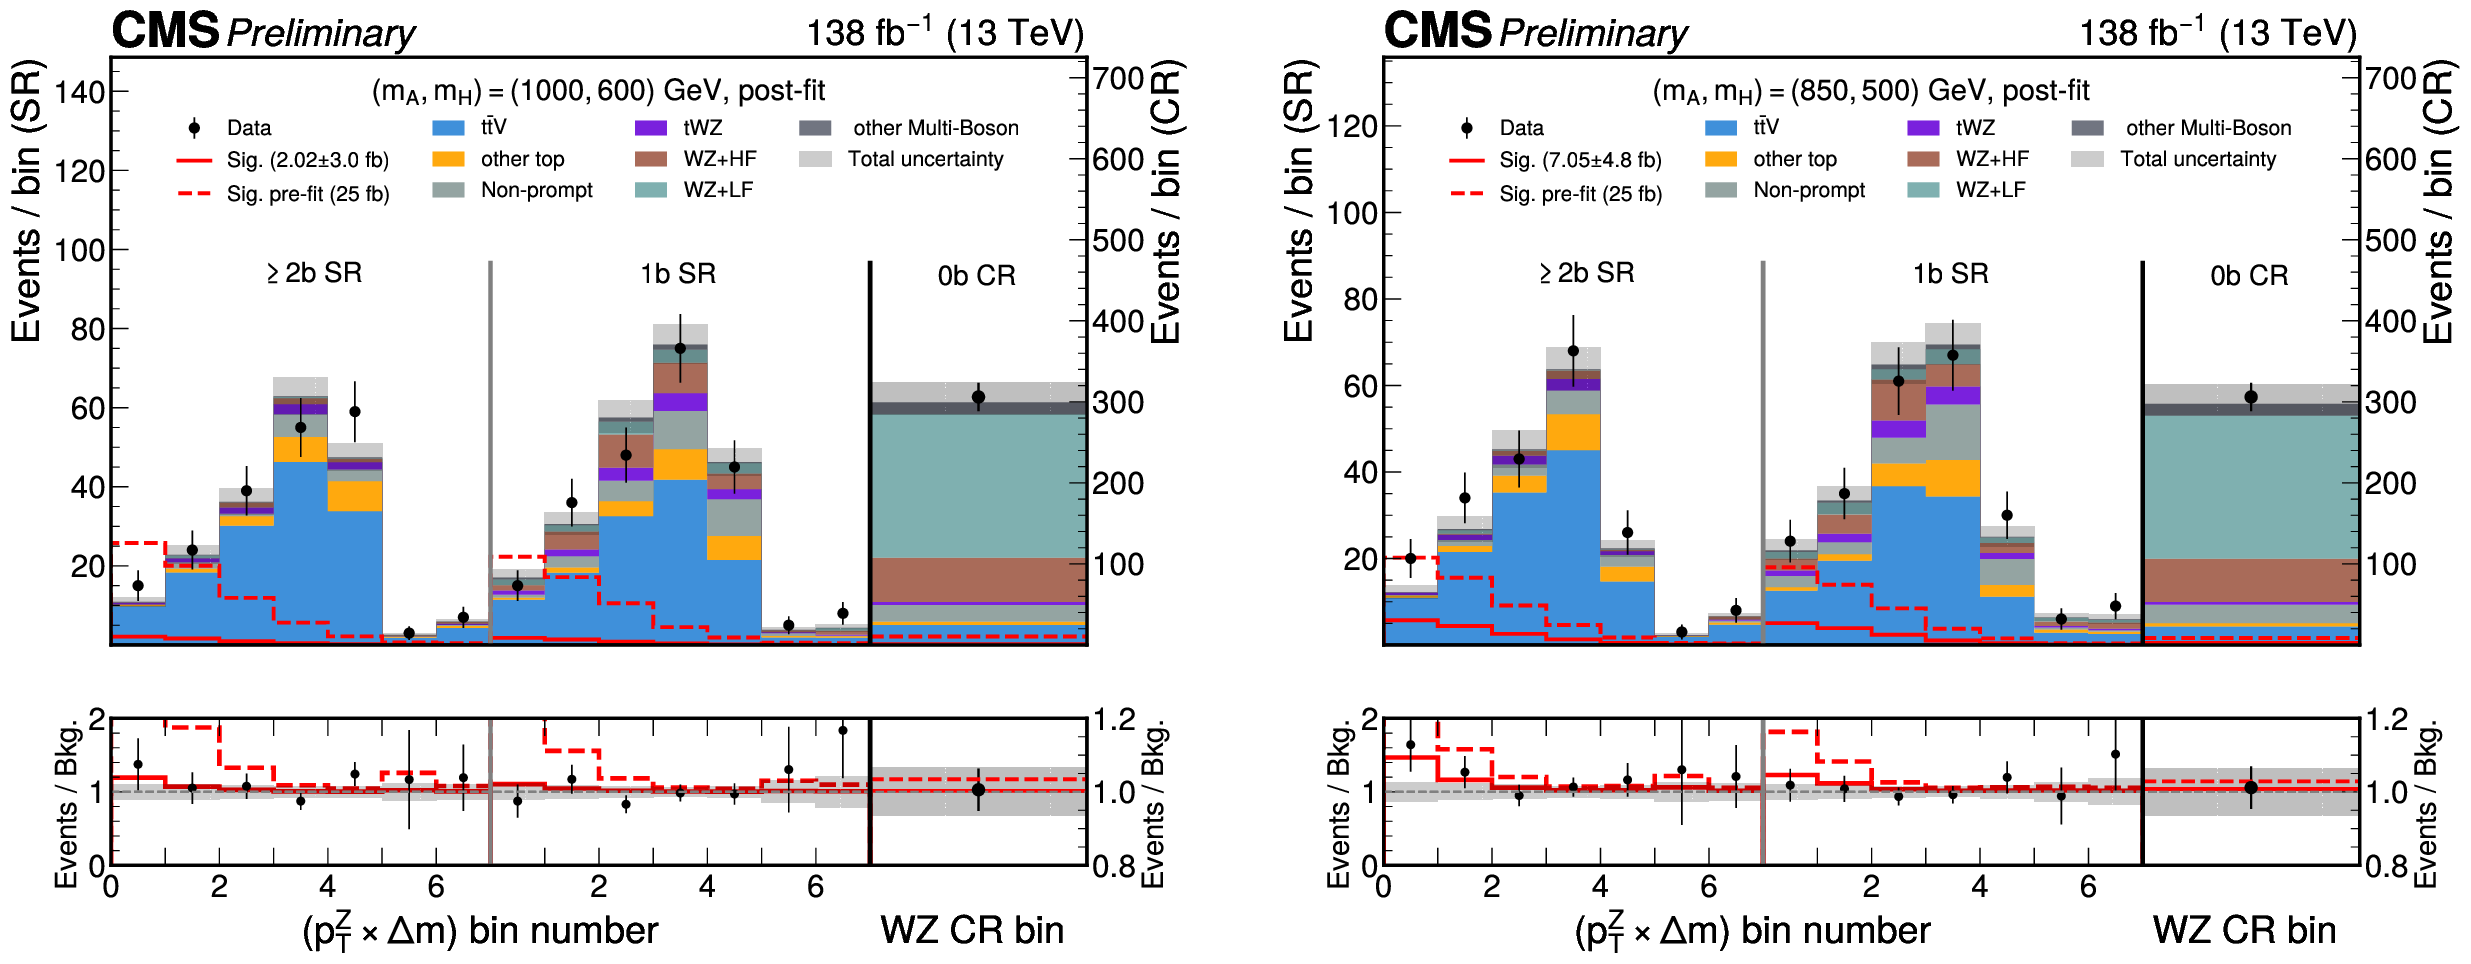
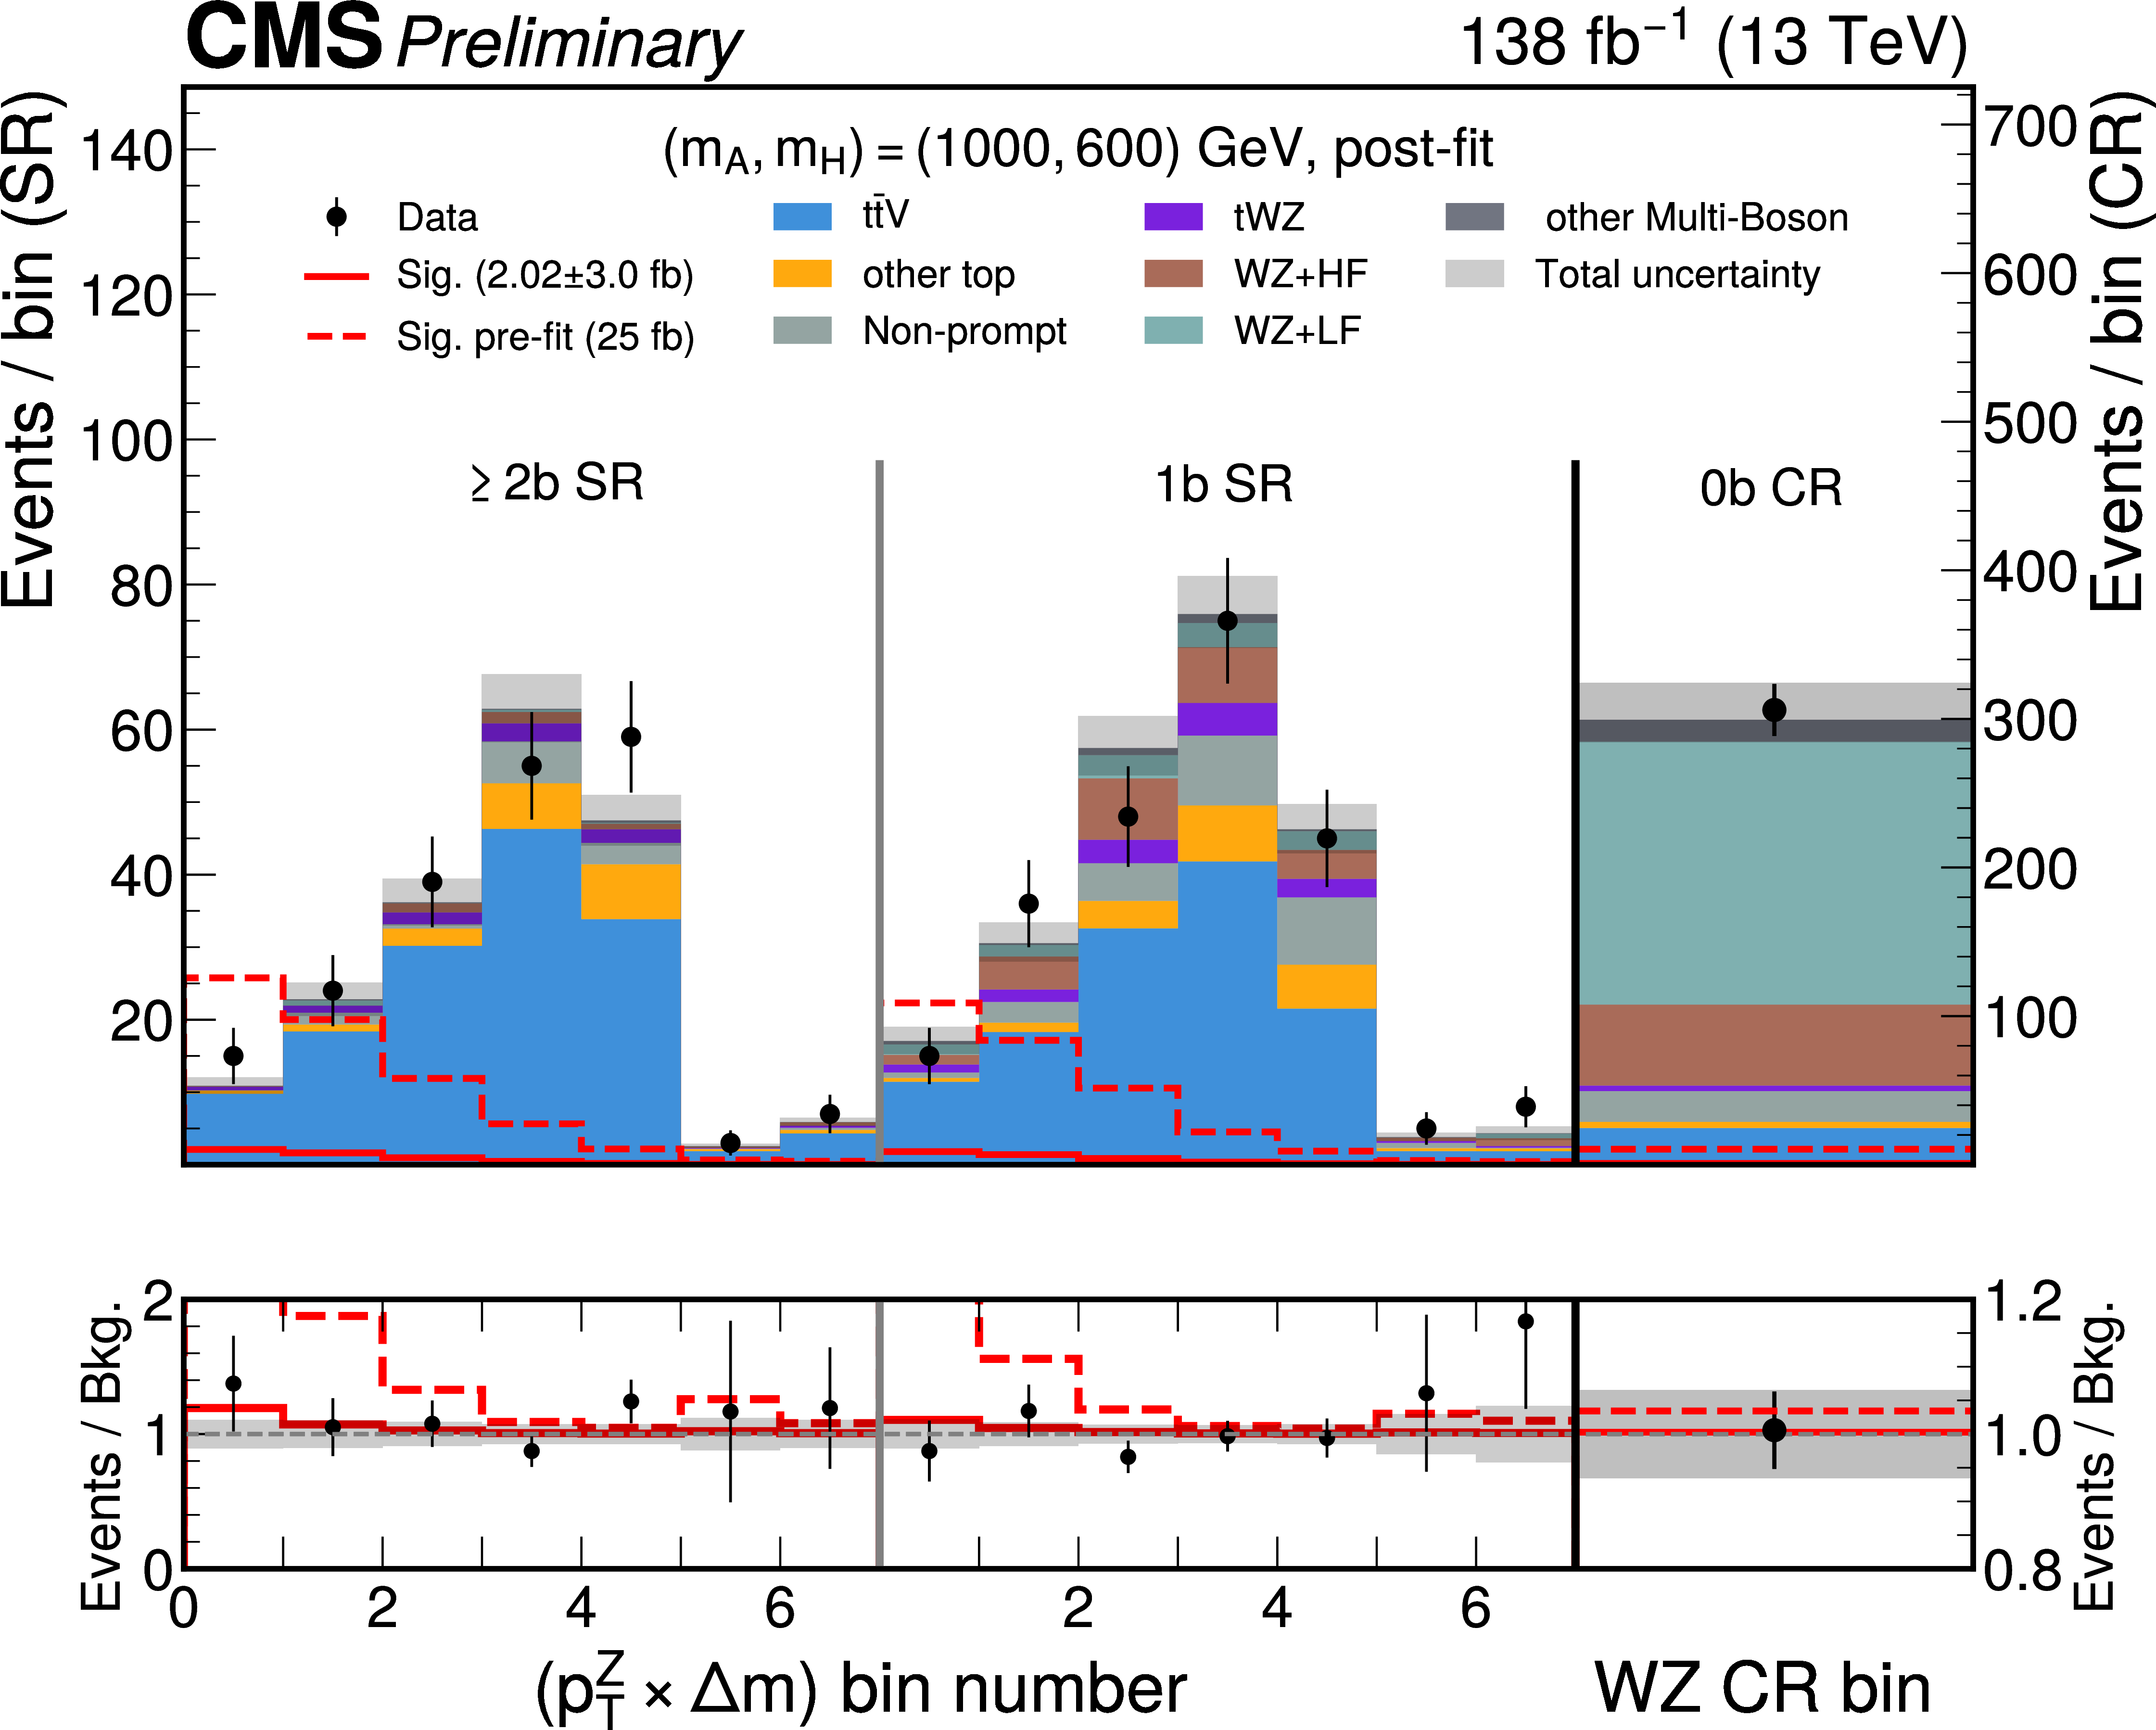
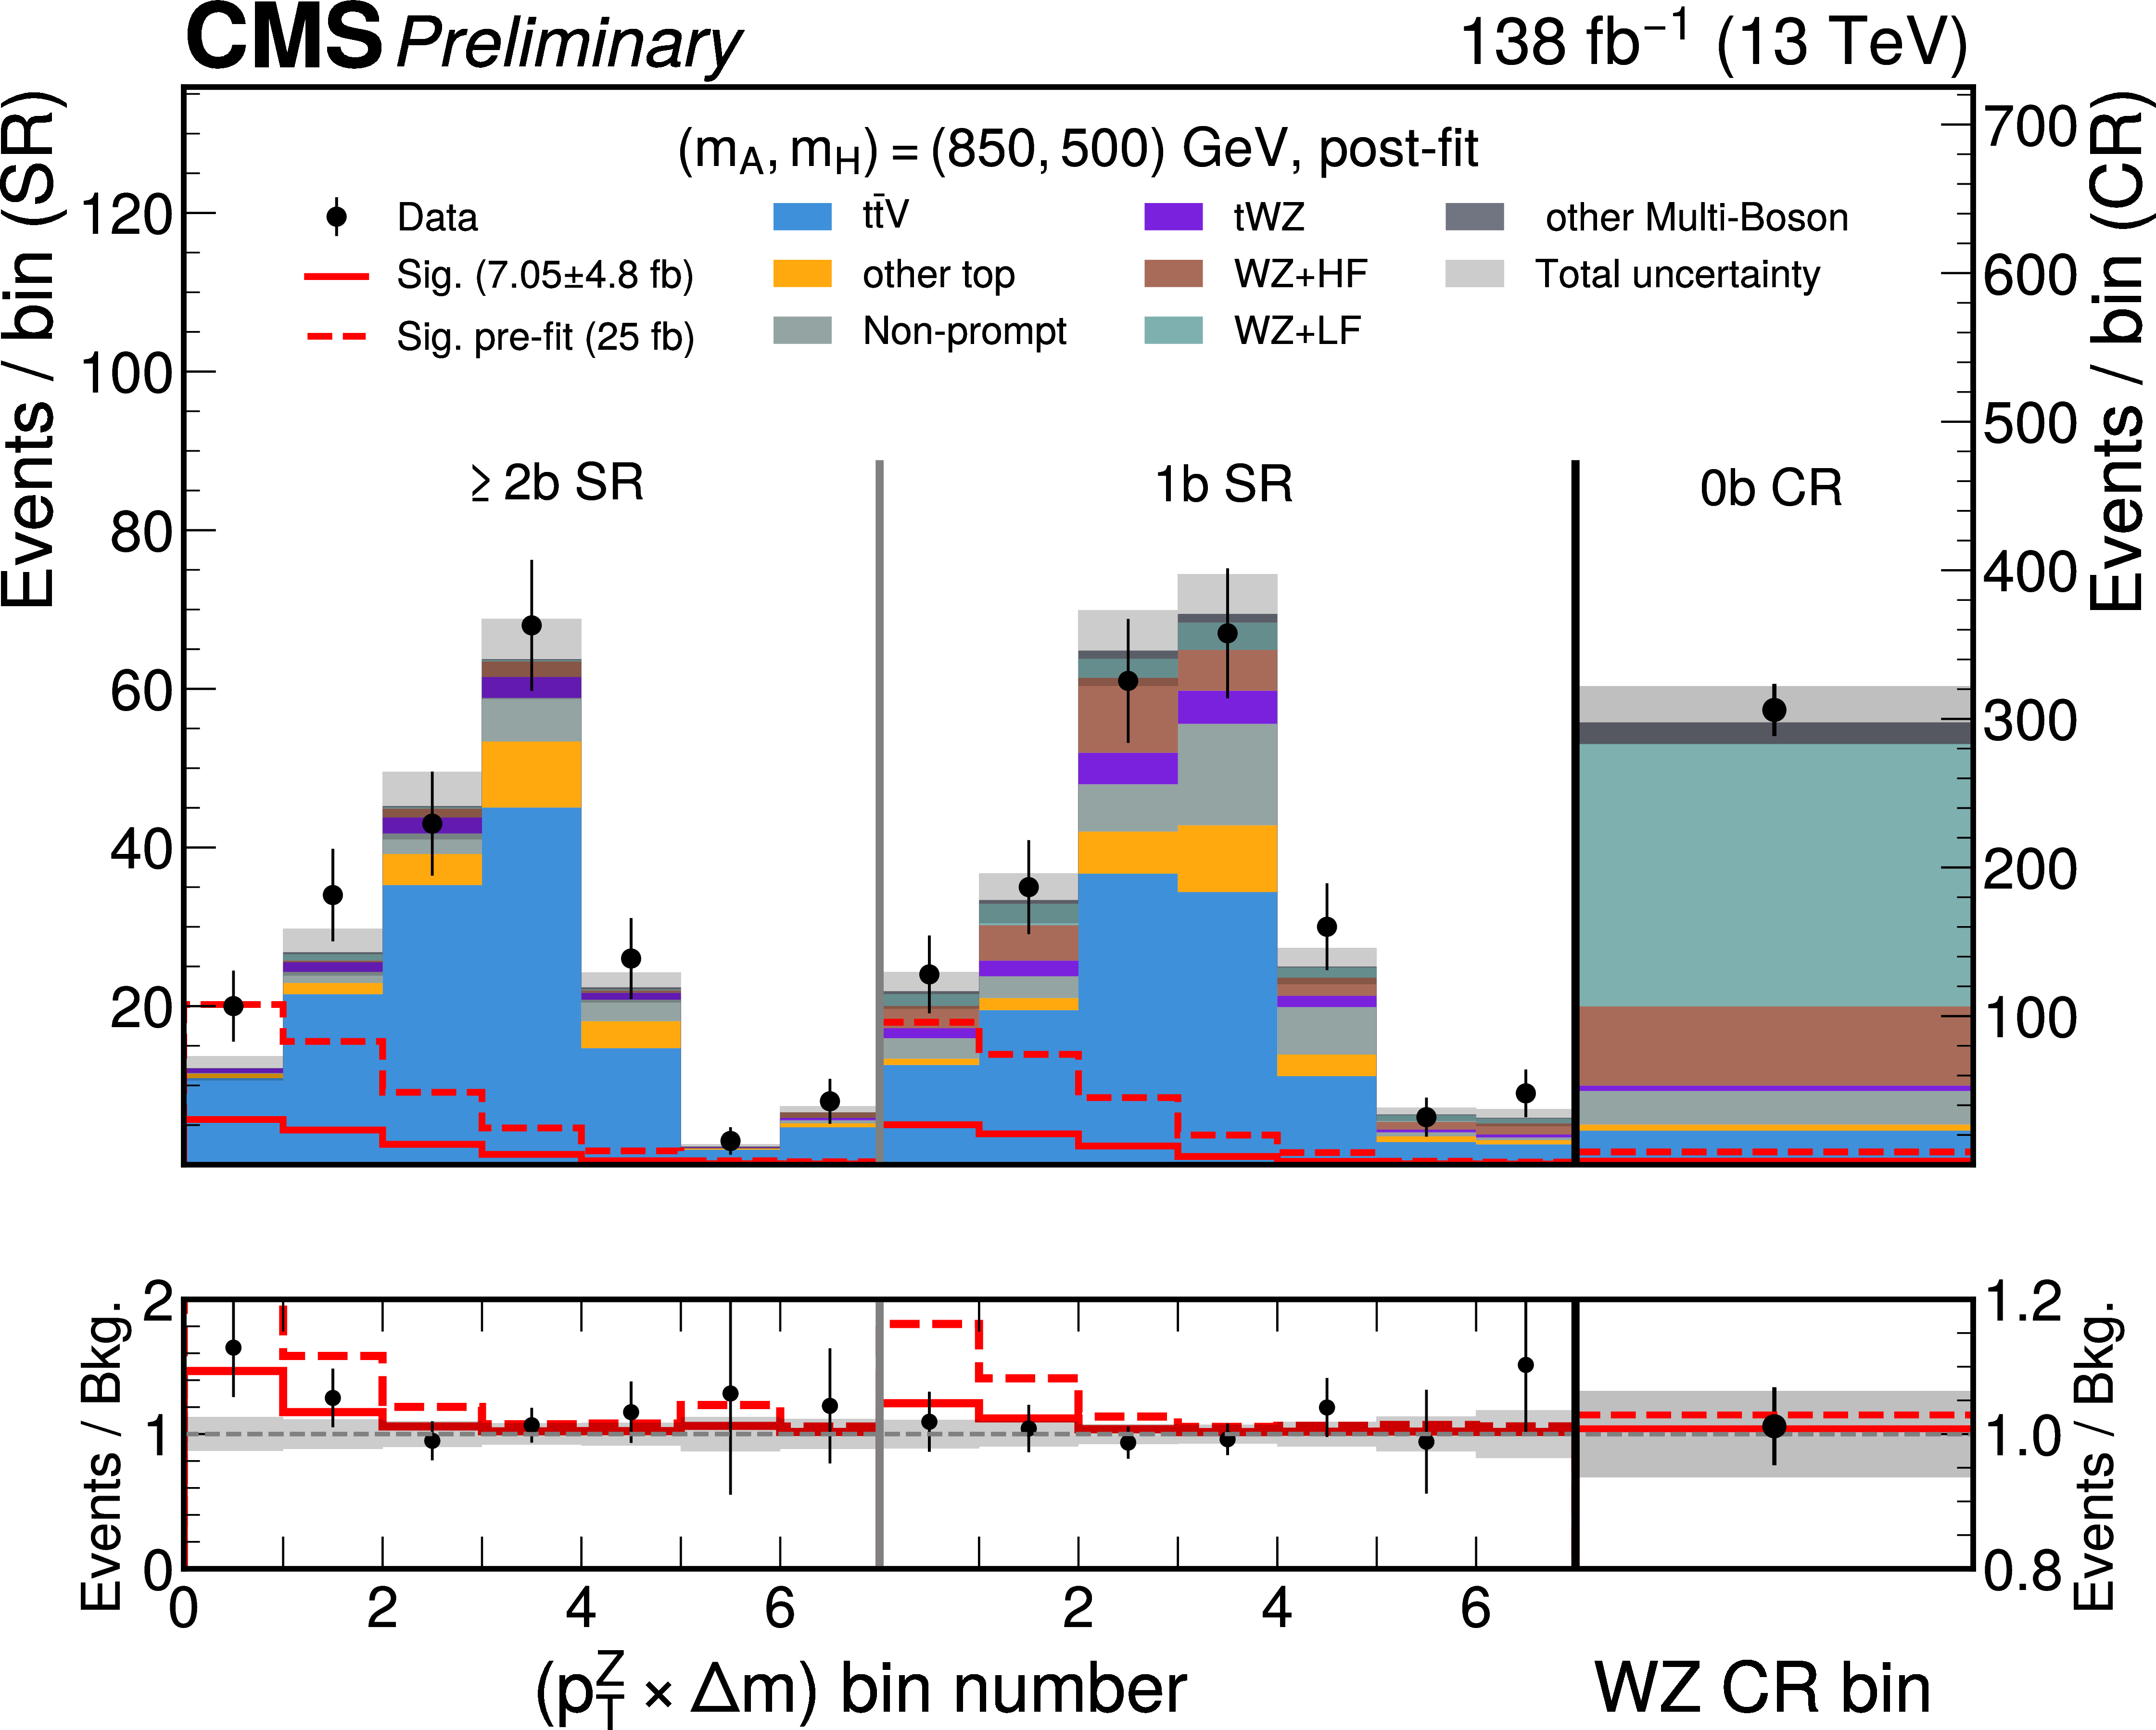
Distributions of $ p_{\mathrm{T}}^{\mathrm{Z}}\times\Delta m $ after a simultaneous fit to data in the SRs and the WZ control region, for ($ m_{\mathrm{A}} $, $ m_{\mathrm{H}} $) = (1000, 600) GeV (left) and (850, 500) GeV (right). The pre-fit signal predictions (dashed red lines) are normalized to an arbitrarily chosen cross section of 25 fb. A small data excess is observed for ($ m_{\mathrm{A}} $, $ m_{\mathrm{H}} $) = (850, 500) GeV with a local significance of 1.5 $ \sigma $. It is the largest fluctuation observed. |
png pdf |
Figure 4-a:
Distributions of $ p_{\mathrm{T}}^{\mathrm{Z}}\times\Delta m $ after a simultaneous fit to data in the SRs and the WZ control region, for ($ m_{\mathrm{A}} $, $ m_{\mathrm{H}} $) = (1000, 600) GeV (left) and (850, 500) GeV (right). The pre-fit signal predictions (dashed red lines) are normalized to an arbitrarily chosen cross section of 25 fb. A small data excess is observed for ($ m_{\mathrm{A}} $, $ m_{\mathrm{H}} $) = (850, 500) GeV with a local significance of 1.5 $ \sigma $. It is the largest fluctuation observed. |
png pdf |
Figure 4-b:
Distributions of $ p_{\mathrm{T}}^{\mathrm{Z}}\times\Delta m $ after a simultaneous fit to data in the SRs and the WZ control region, for ($ m_{\mathrm{A}} $, $ m_{\mathrm{H}} $) = (1000, 600) GeV (left) and (850, 500) GeV (right). The pre-fit signal predictions (dashed red lines) are normalized to an arbitrarily chosen cross section of 25 fb. A small data excess is observed for ($ m_{\mathrm{A}} $, $ m_{\mathrm{H}} $) = (850, 500) GeV with a local significance of 1.5 $ \sigma $. It is the largest fluctuation observed. |
png pdf |
Figure 5:
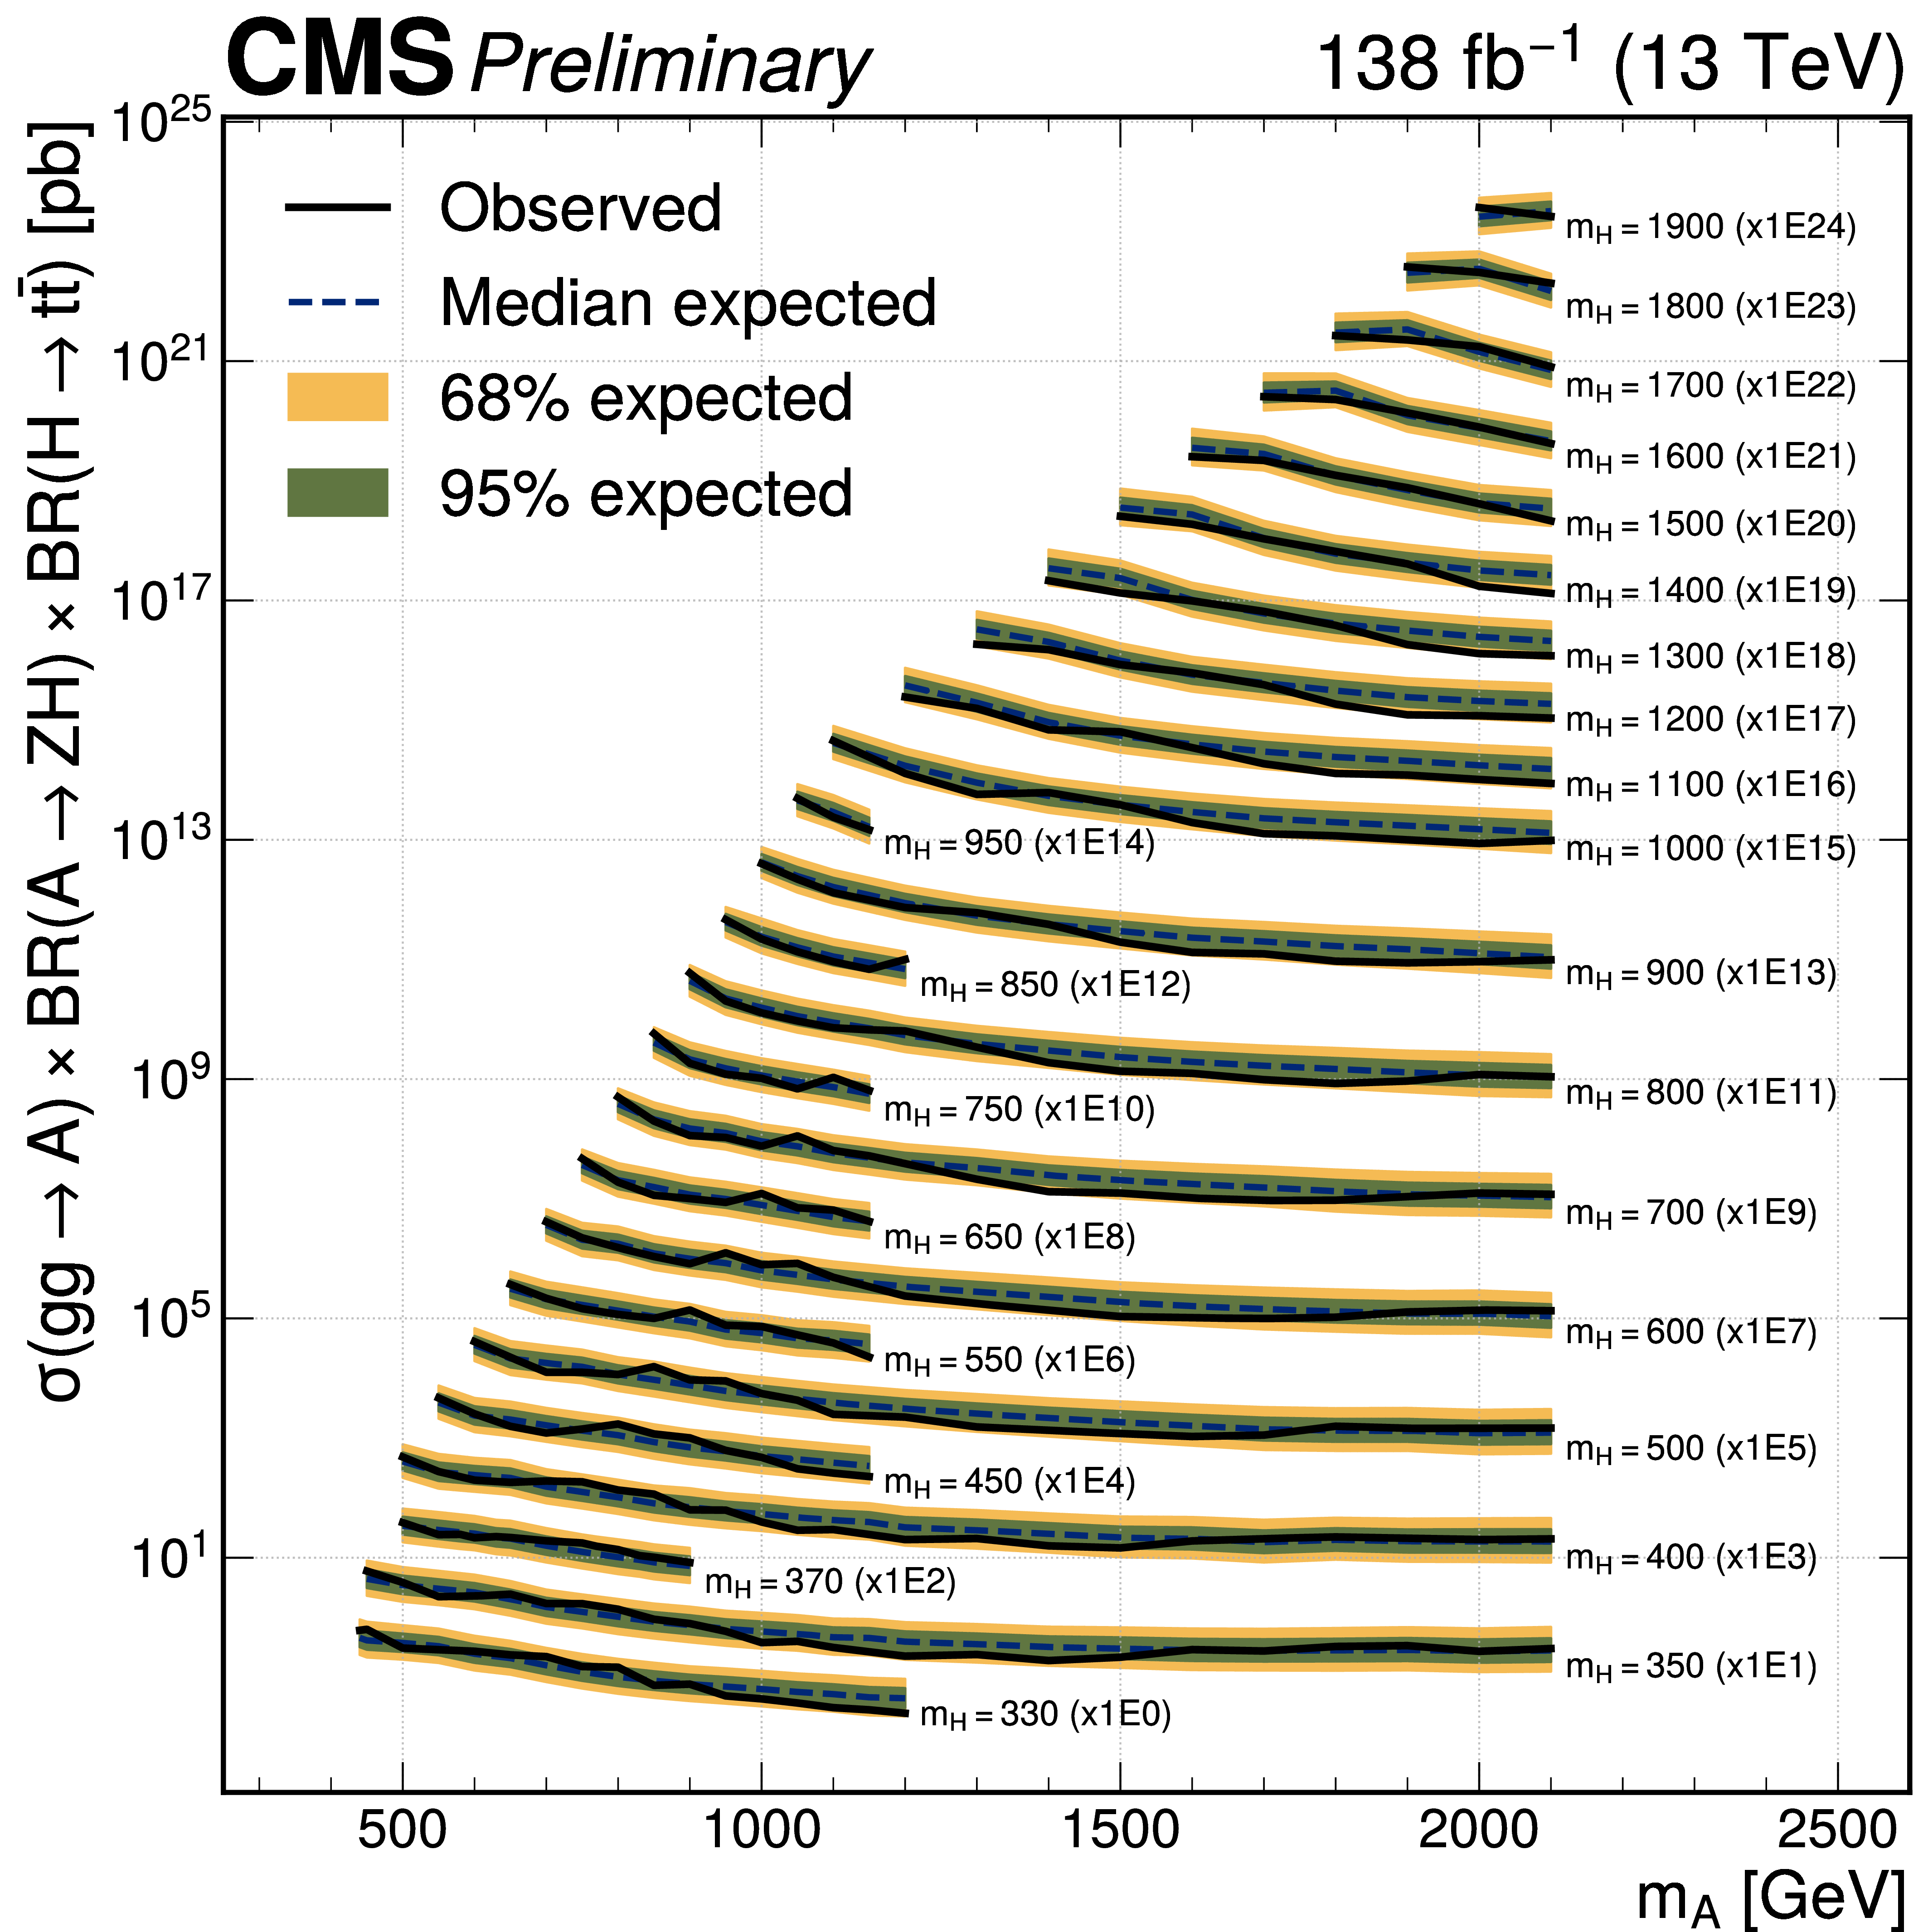
Observed (solid lines) and expected (dashed lines) 95% CL upper limits as a function of $ m_{\mathrm{A}} $, stacked across all tested $ m_{\mathrm{H}} $ hypotheses to span the full ($ m_{\mathrm{A}} $, $ m_{\mathrm{H}} $) plane. The green and yellow bands denote the $ \pm1\sigma $ and $ \pm2\sigma $ expected bands, respectively. |
png pdf |
Figure 6:
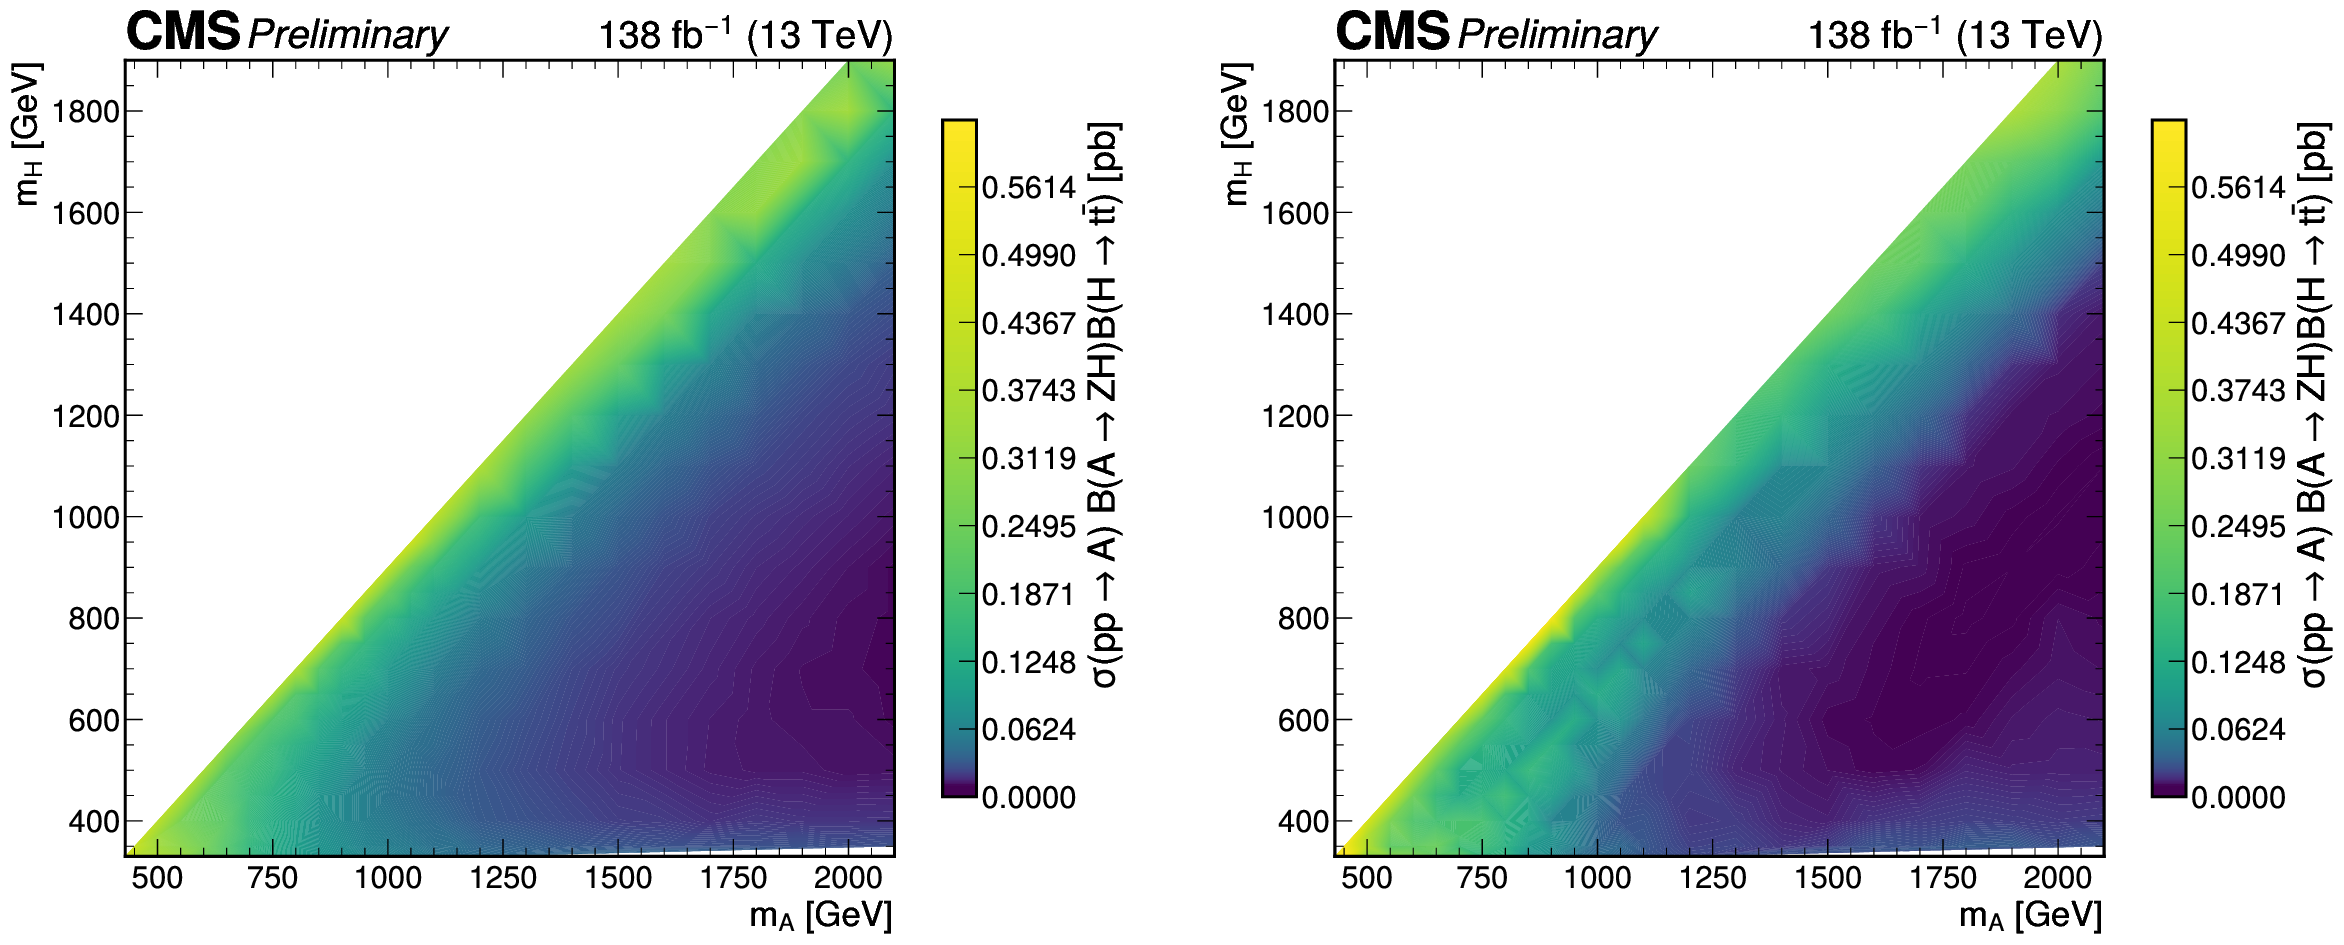
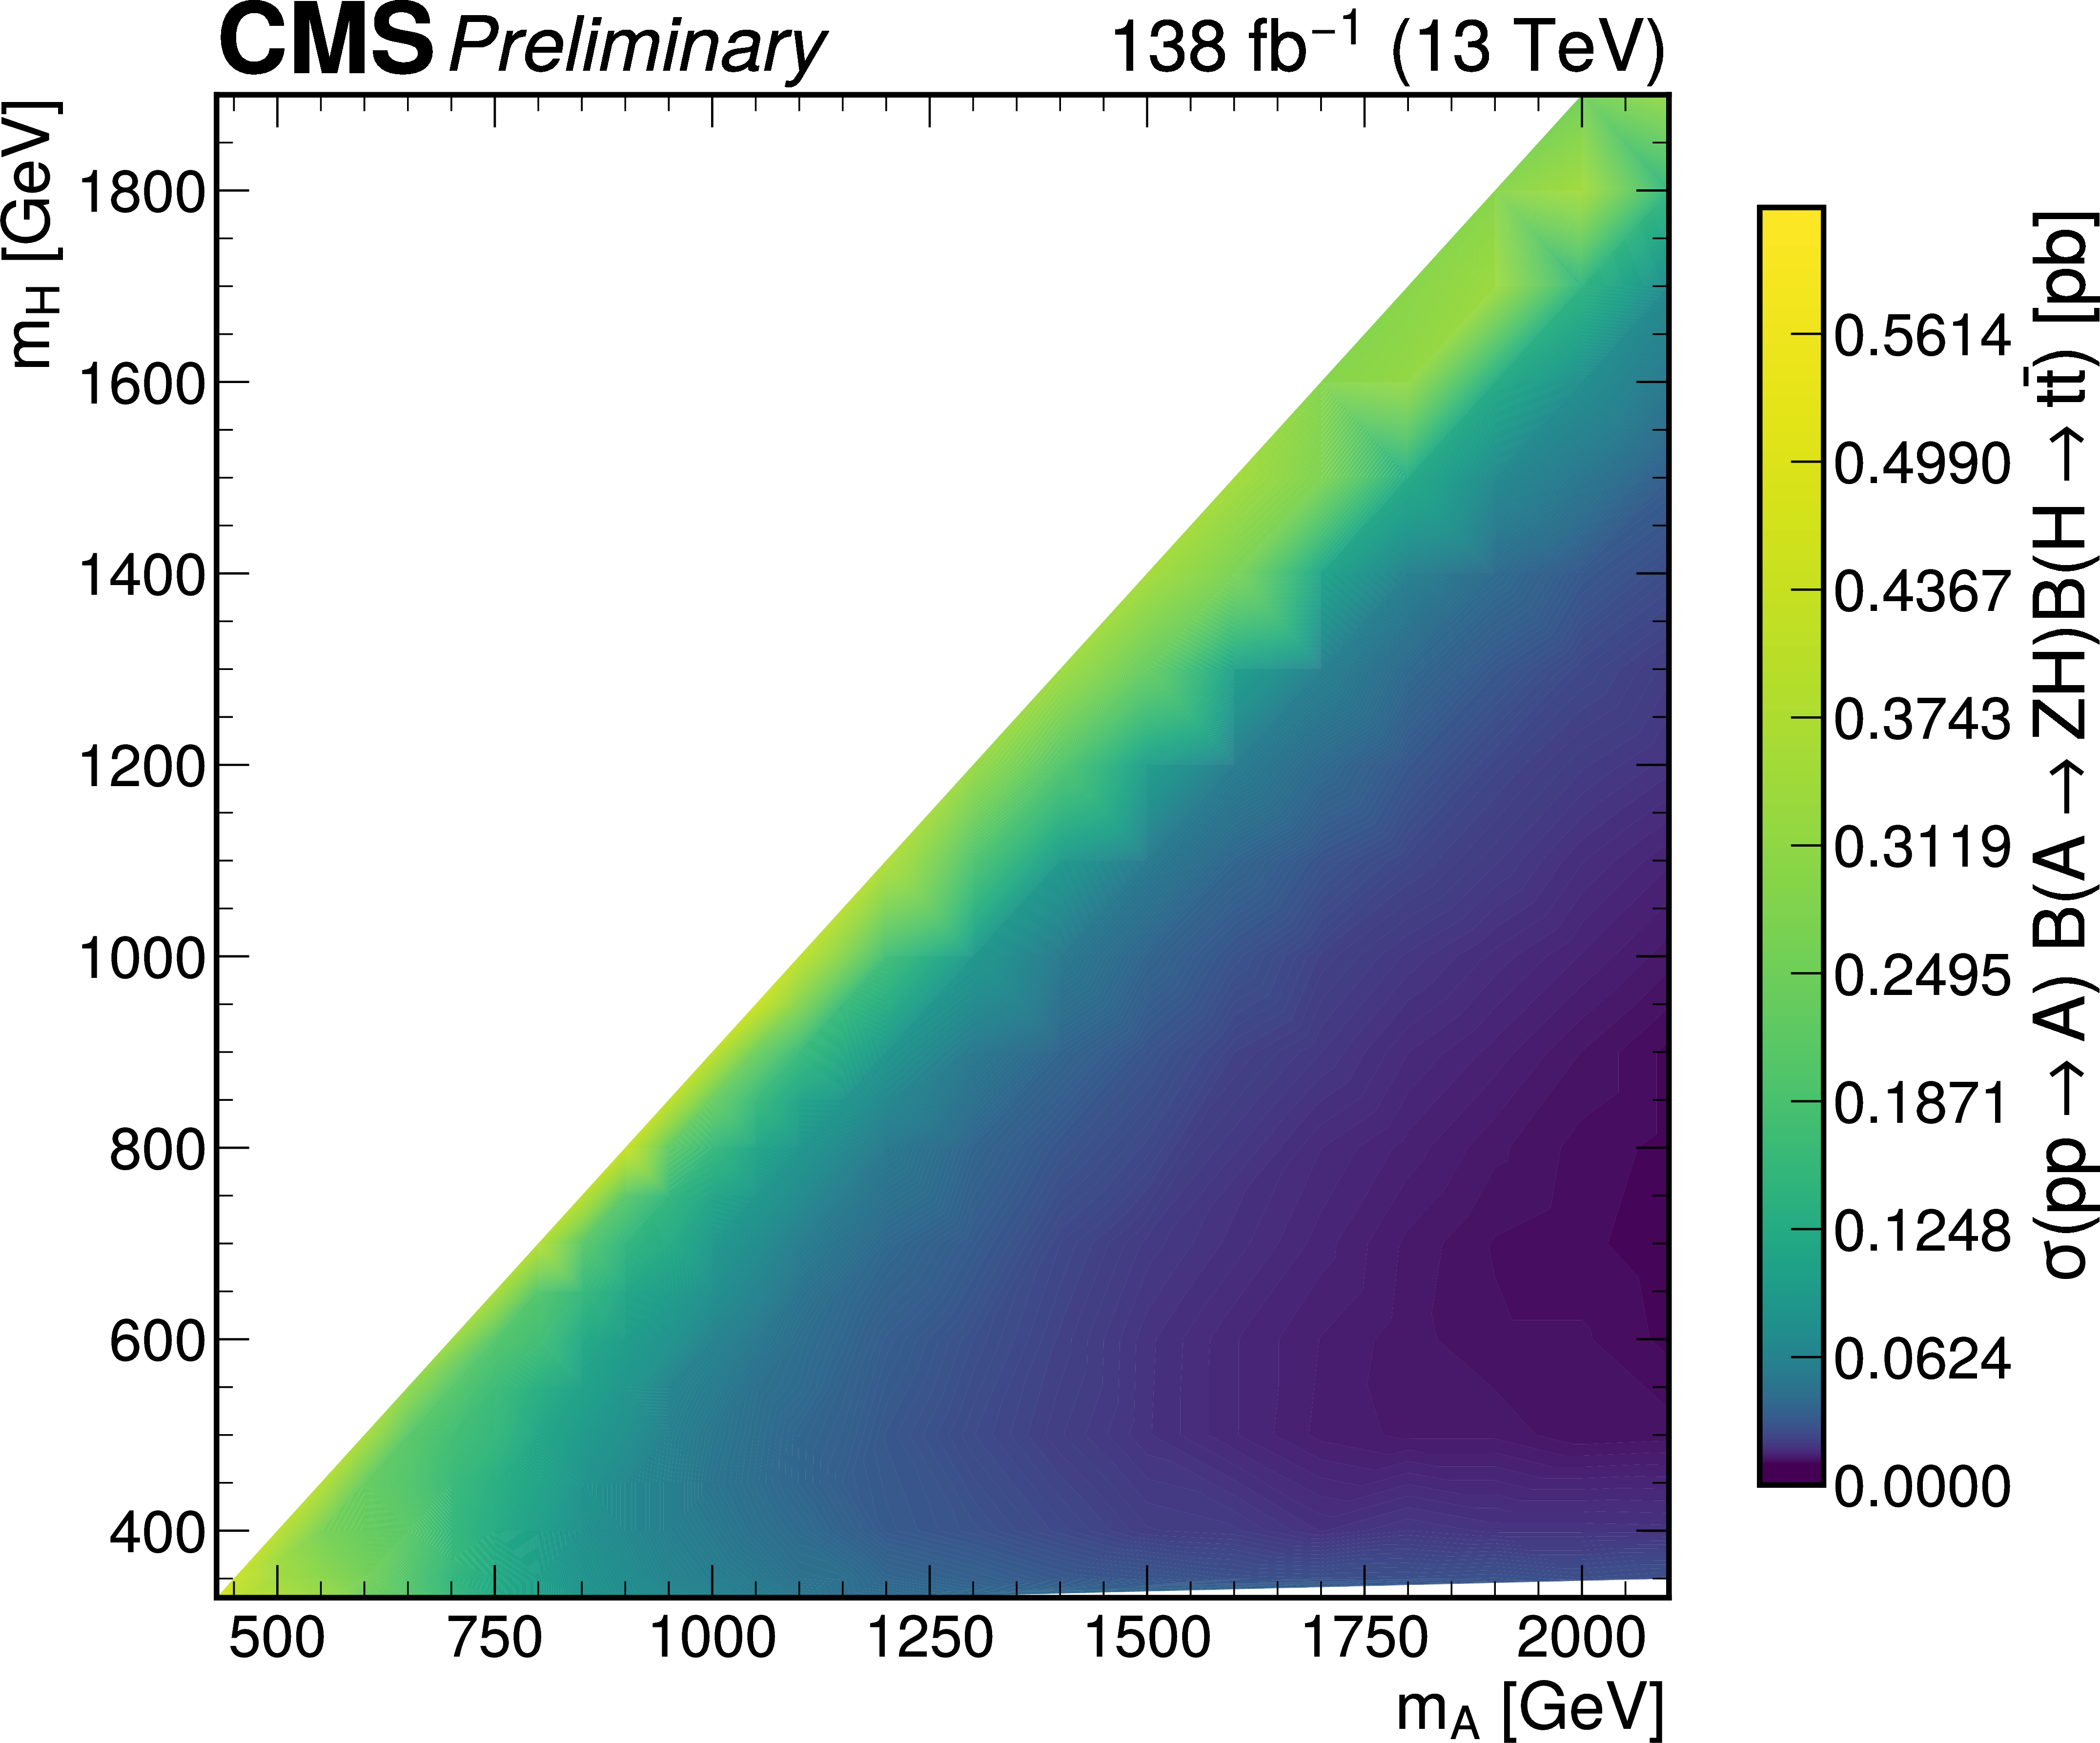
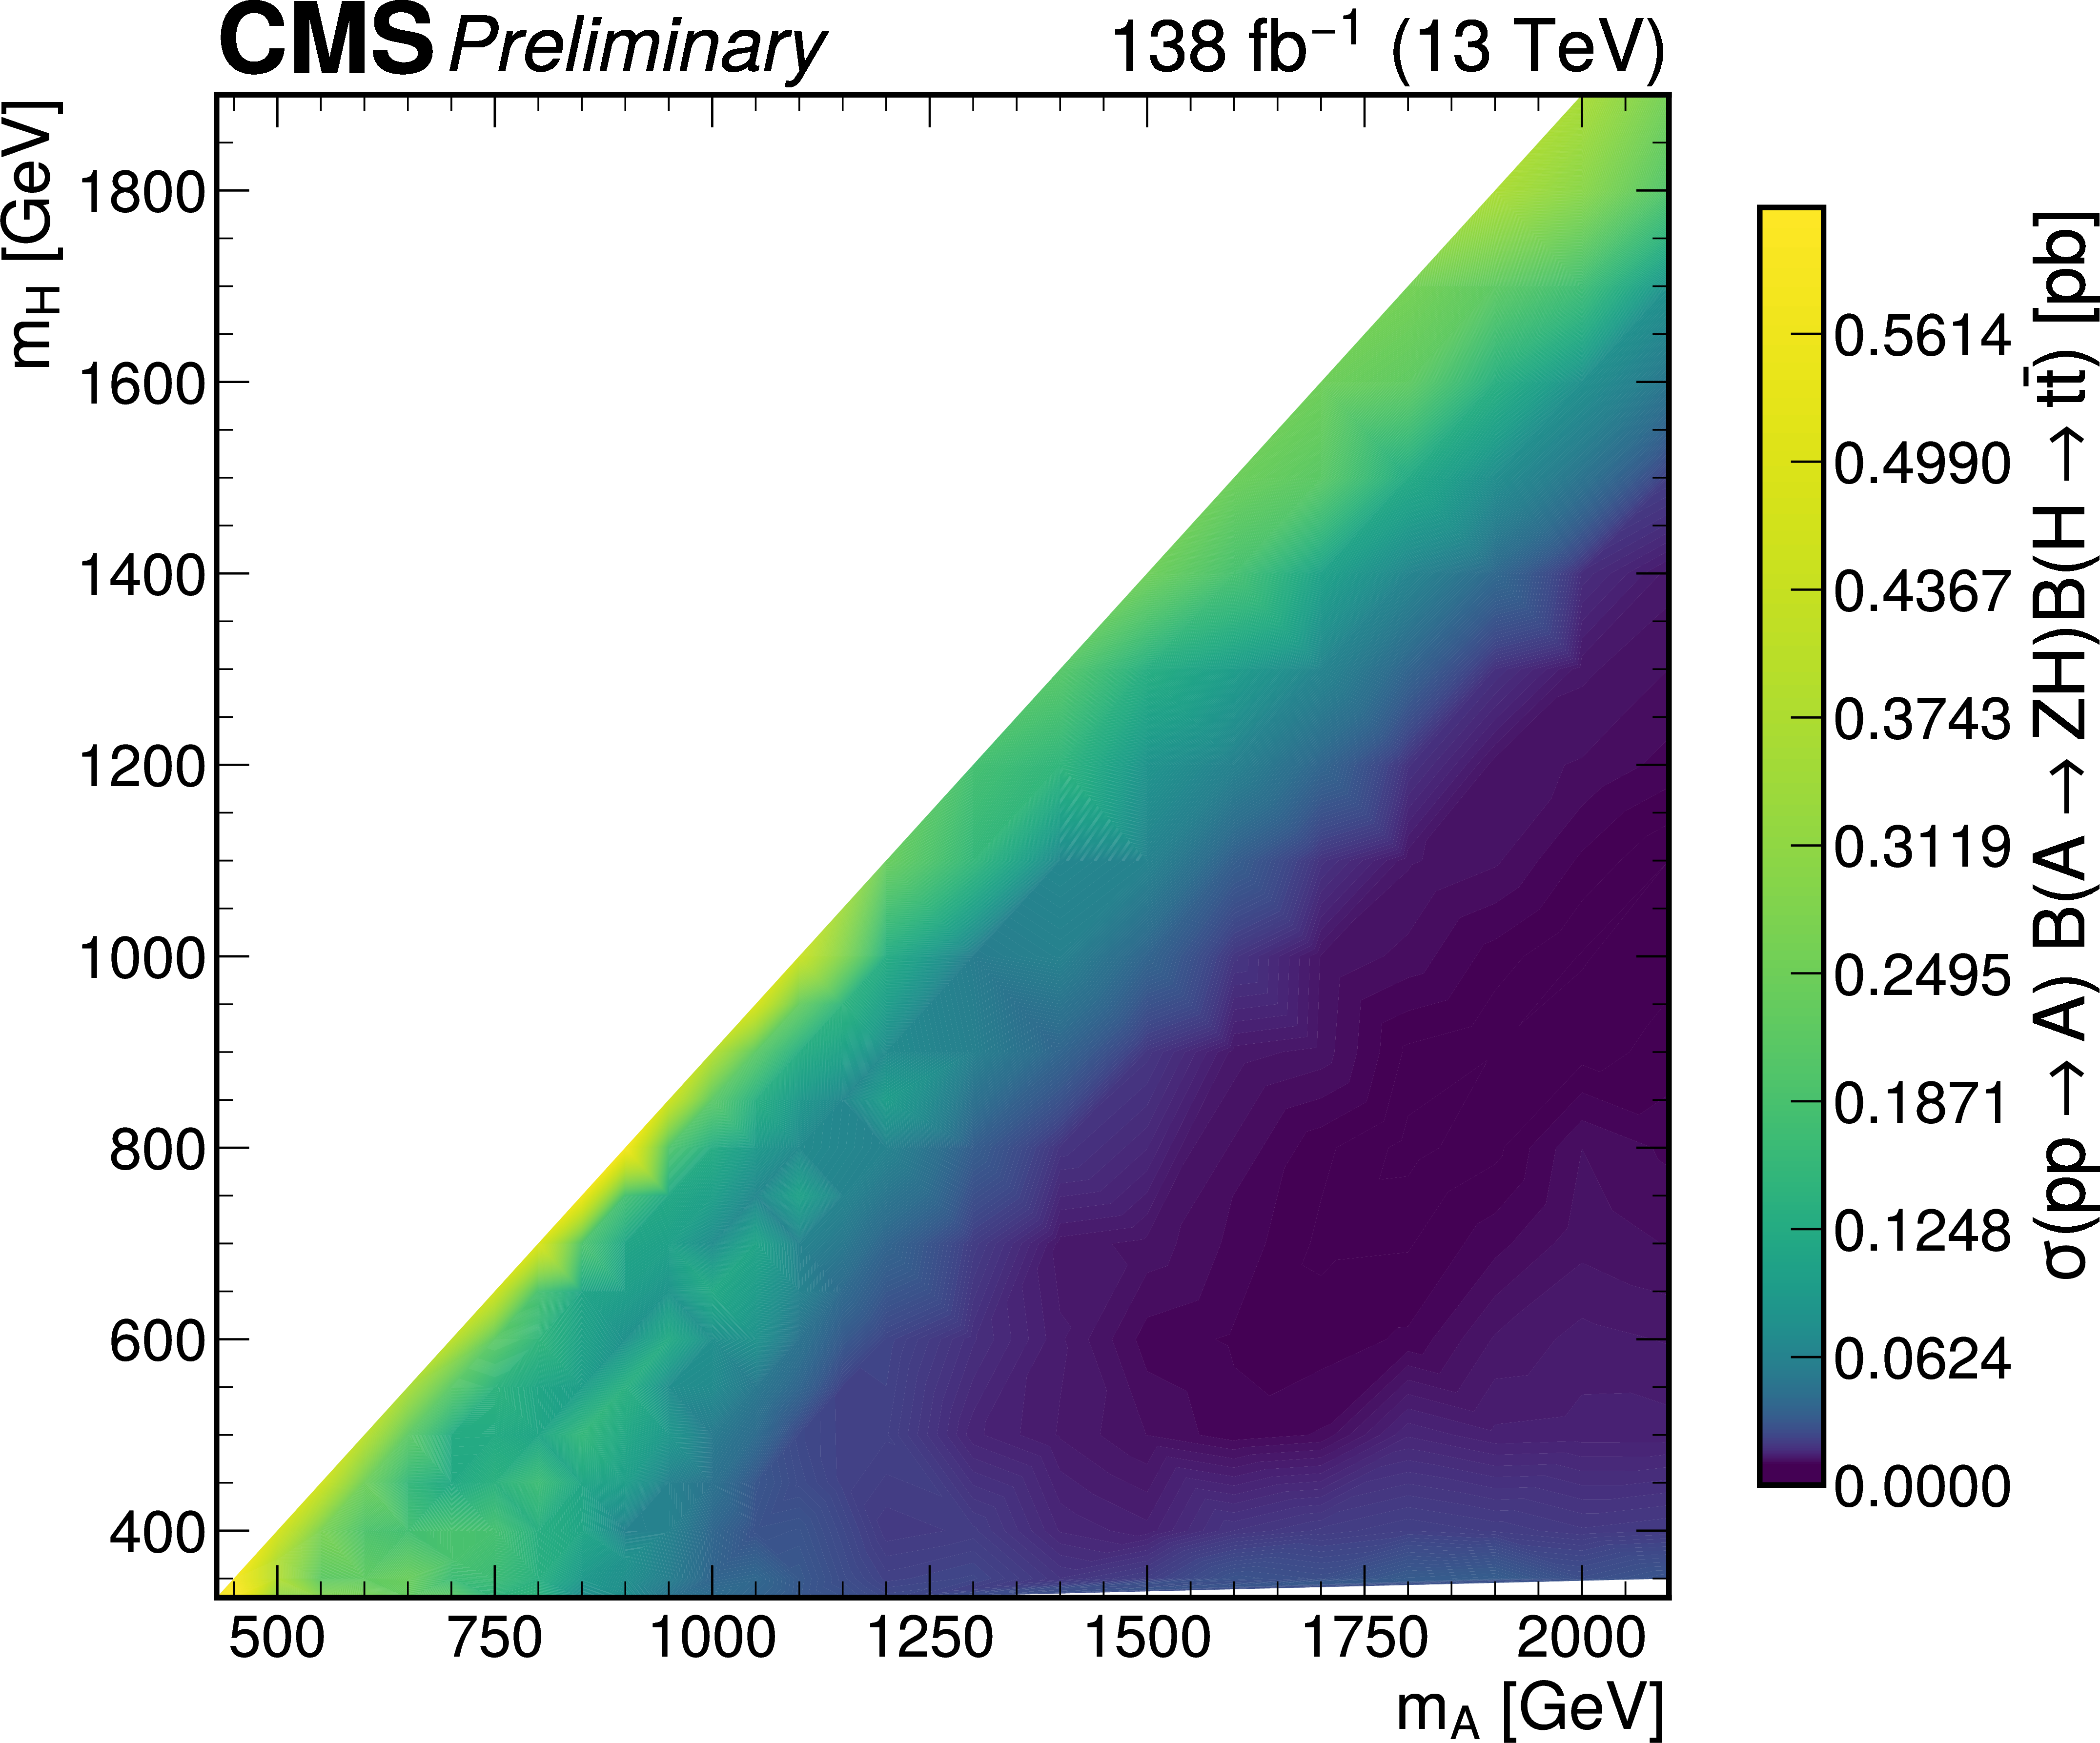
Median expected(left) and observed (right) upper limits at 95% CL on the production $ \sigma(\mathrm{p}\mathrm{p}\to\mathrm{A})\mathcal{B}(\mathrm{A}\to\mathrm{Z}\mathrm{H})\mathcal{B}(\mathrm{H}\to{\mathrm{t}\overline{\mathrm{t}}} ) $ in the ($ m_{\mathrm{A}} $,$ m_{\mathrm{H}} $) plane. |
png pdf |
Figure 6-a:
Median expected(left) and observed (right) upper limits at 95% CL on the production $ \sigma(\mathrm{p}\mathrm{p}\to\mathrm{A})\mathcal{B}(\mathrm{A}\to\mathrm{Z}\mathrm{H})\mathcal{B}(\mathrm{H}\to{\mathrm{t}\overline{\mathrm{t}}} ) $ in the ($ m_{\mathrm{A}} $,$ m_{\mathrm{H}} $) plane. |
png pdf |
Figure 6-b:
Median expected(left) and observed (right) upper limits at 95% CL on the production $ \sigma(\mathrm{p}\mathrm{p}\to\mathrm{A})\mathcal{B}(\mathrm{A}\to\mathrm{Z}\mathrm{H})\mathcal{B}(\mathrm{H}\to{\mathrm{t}\overline{\mathrm{t}}} ) $ in the ($ m_{\mathrm{A}} $,$ m_{\mathrm{H}} $) plane. |
png pdf |
Figure 7:
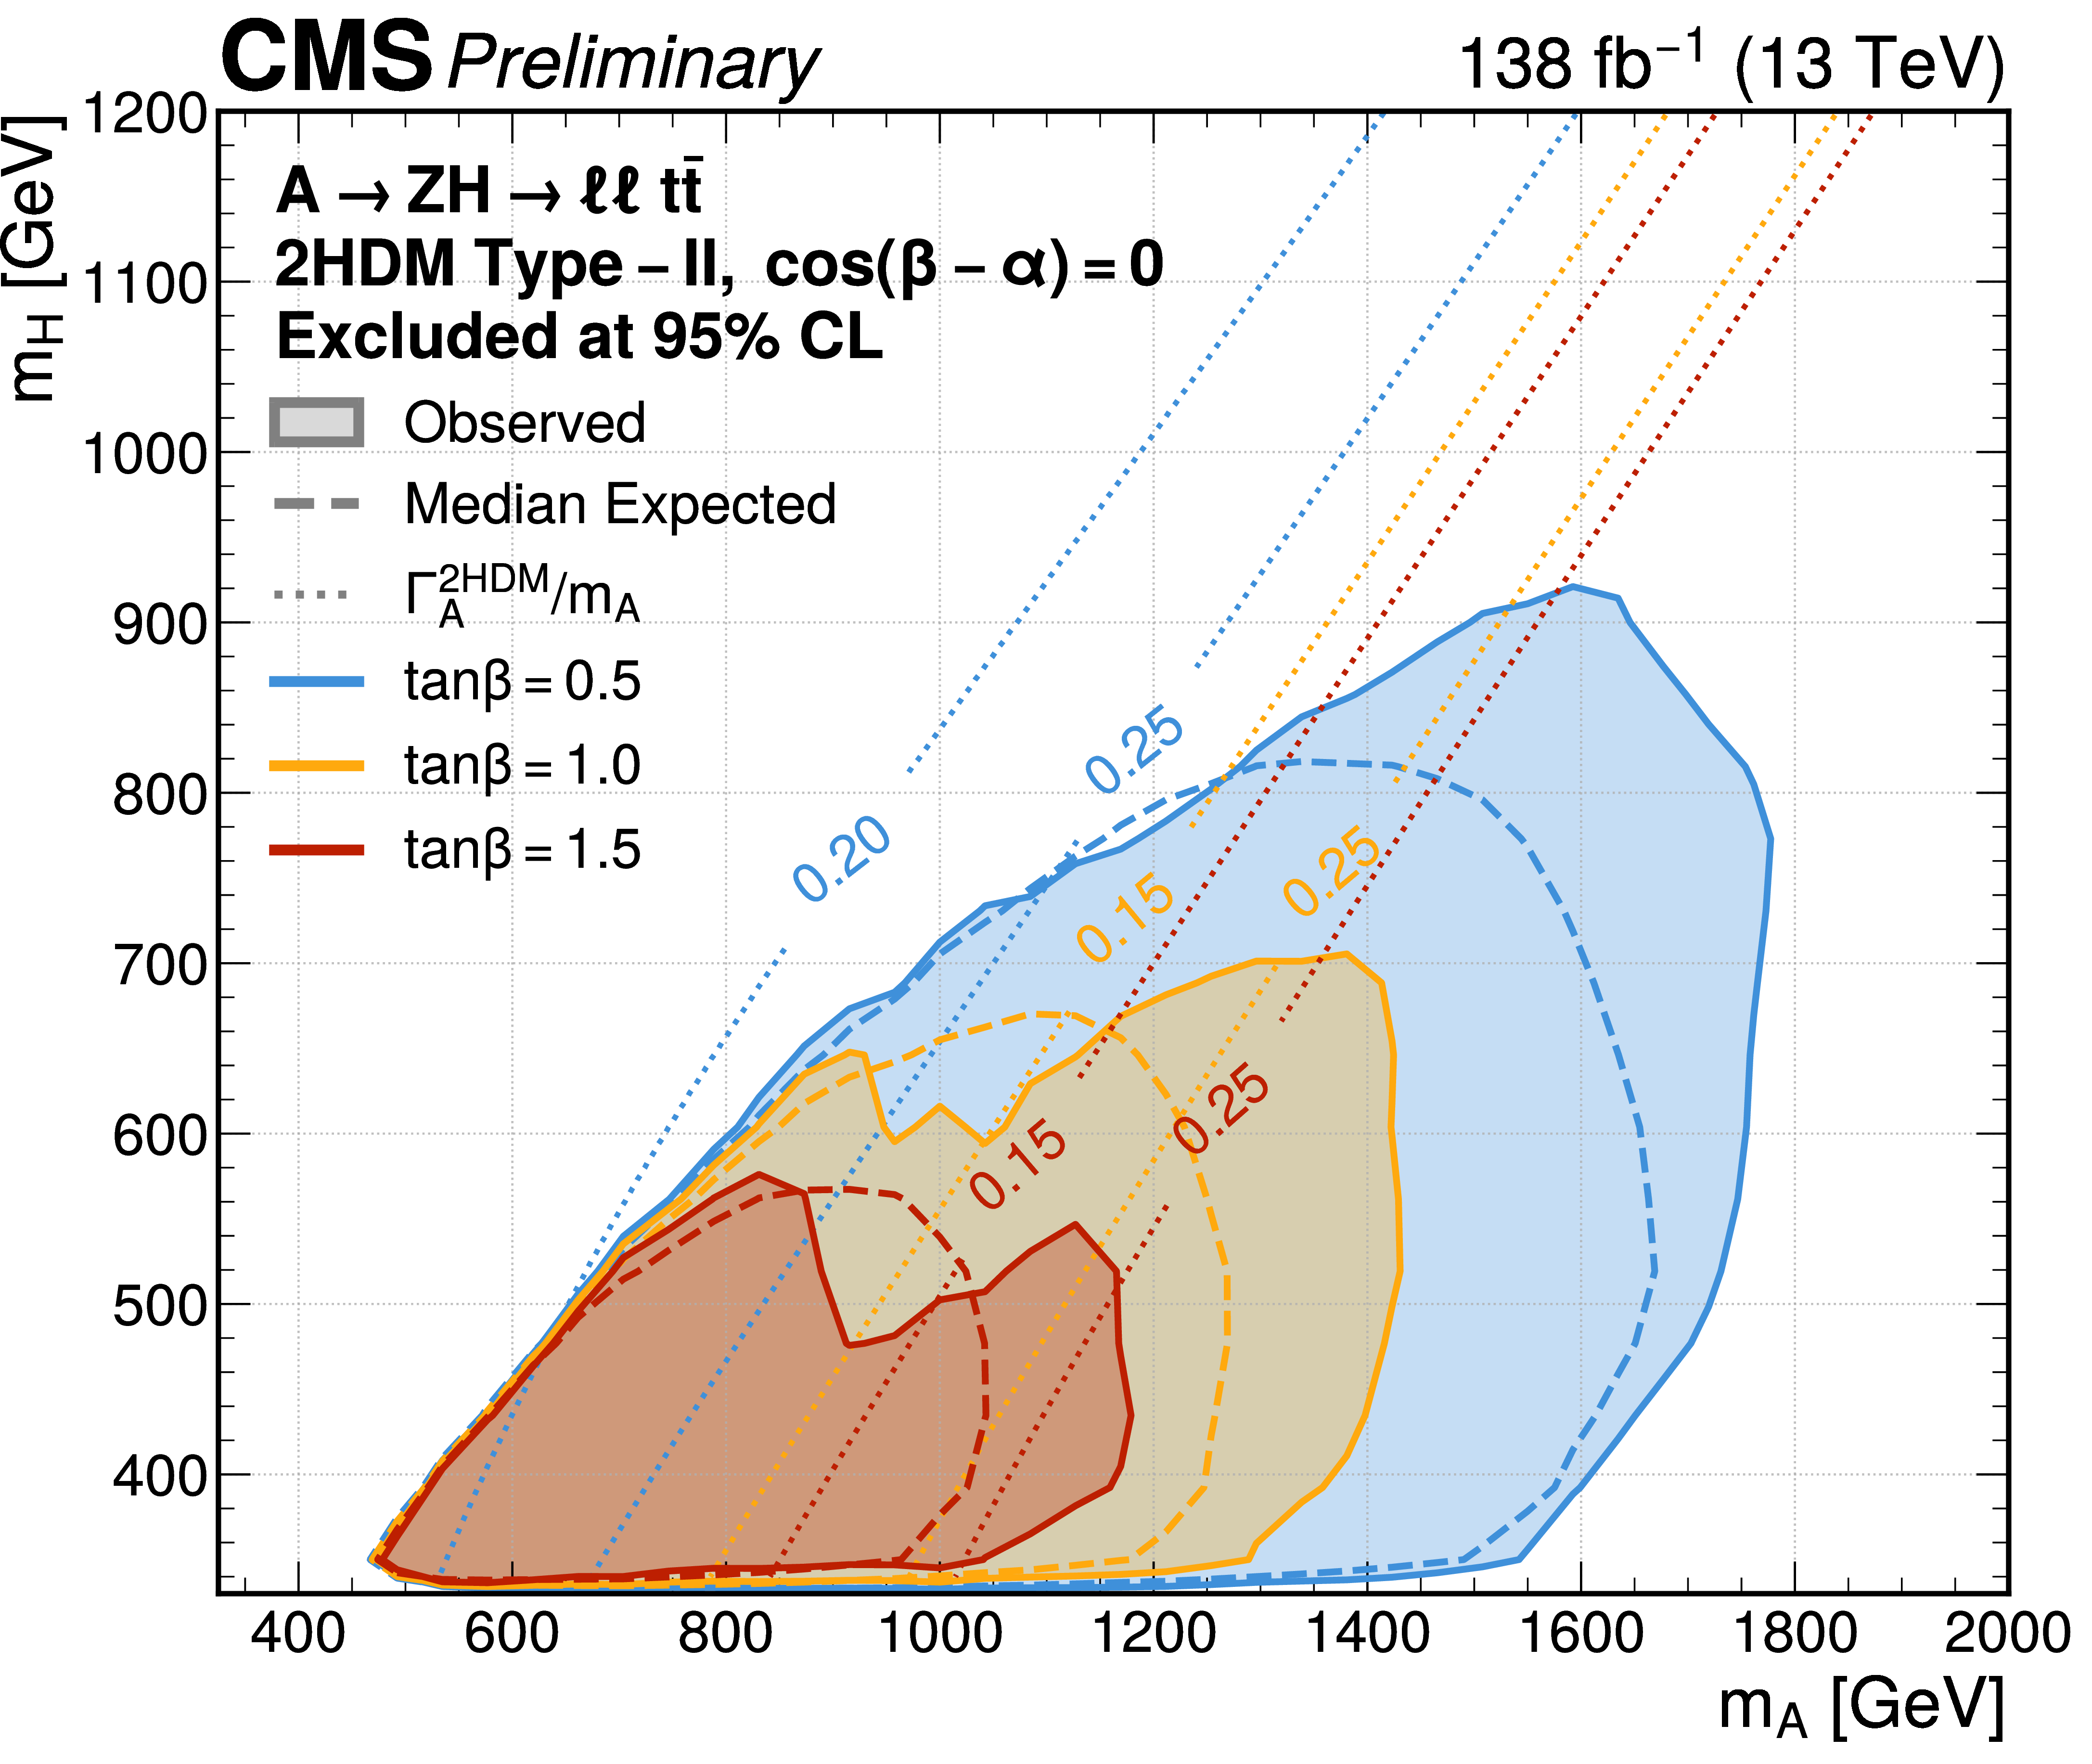
Median expected (dashed lines) and observed (filled contours) excluded regions in the ($ m_{\mathrm{A}} $, $ m_{\mathrm{H}} $) parameter space of a type-II 2HDM with $ \tan\beta = $ 0.5 (blue), 1 (orange),and 2 (red). The excluded regions are derived for narrow resonances. The dotted contour lines correspond to constant decay width of the $ \mathrm{A} $ boson for each value of $ \tan\beta $. |
png pdf |
Figure 8:
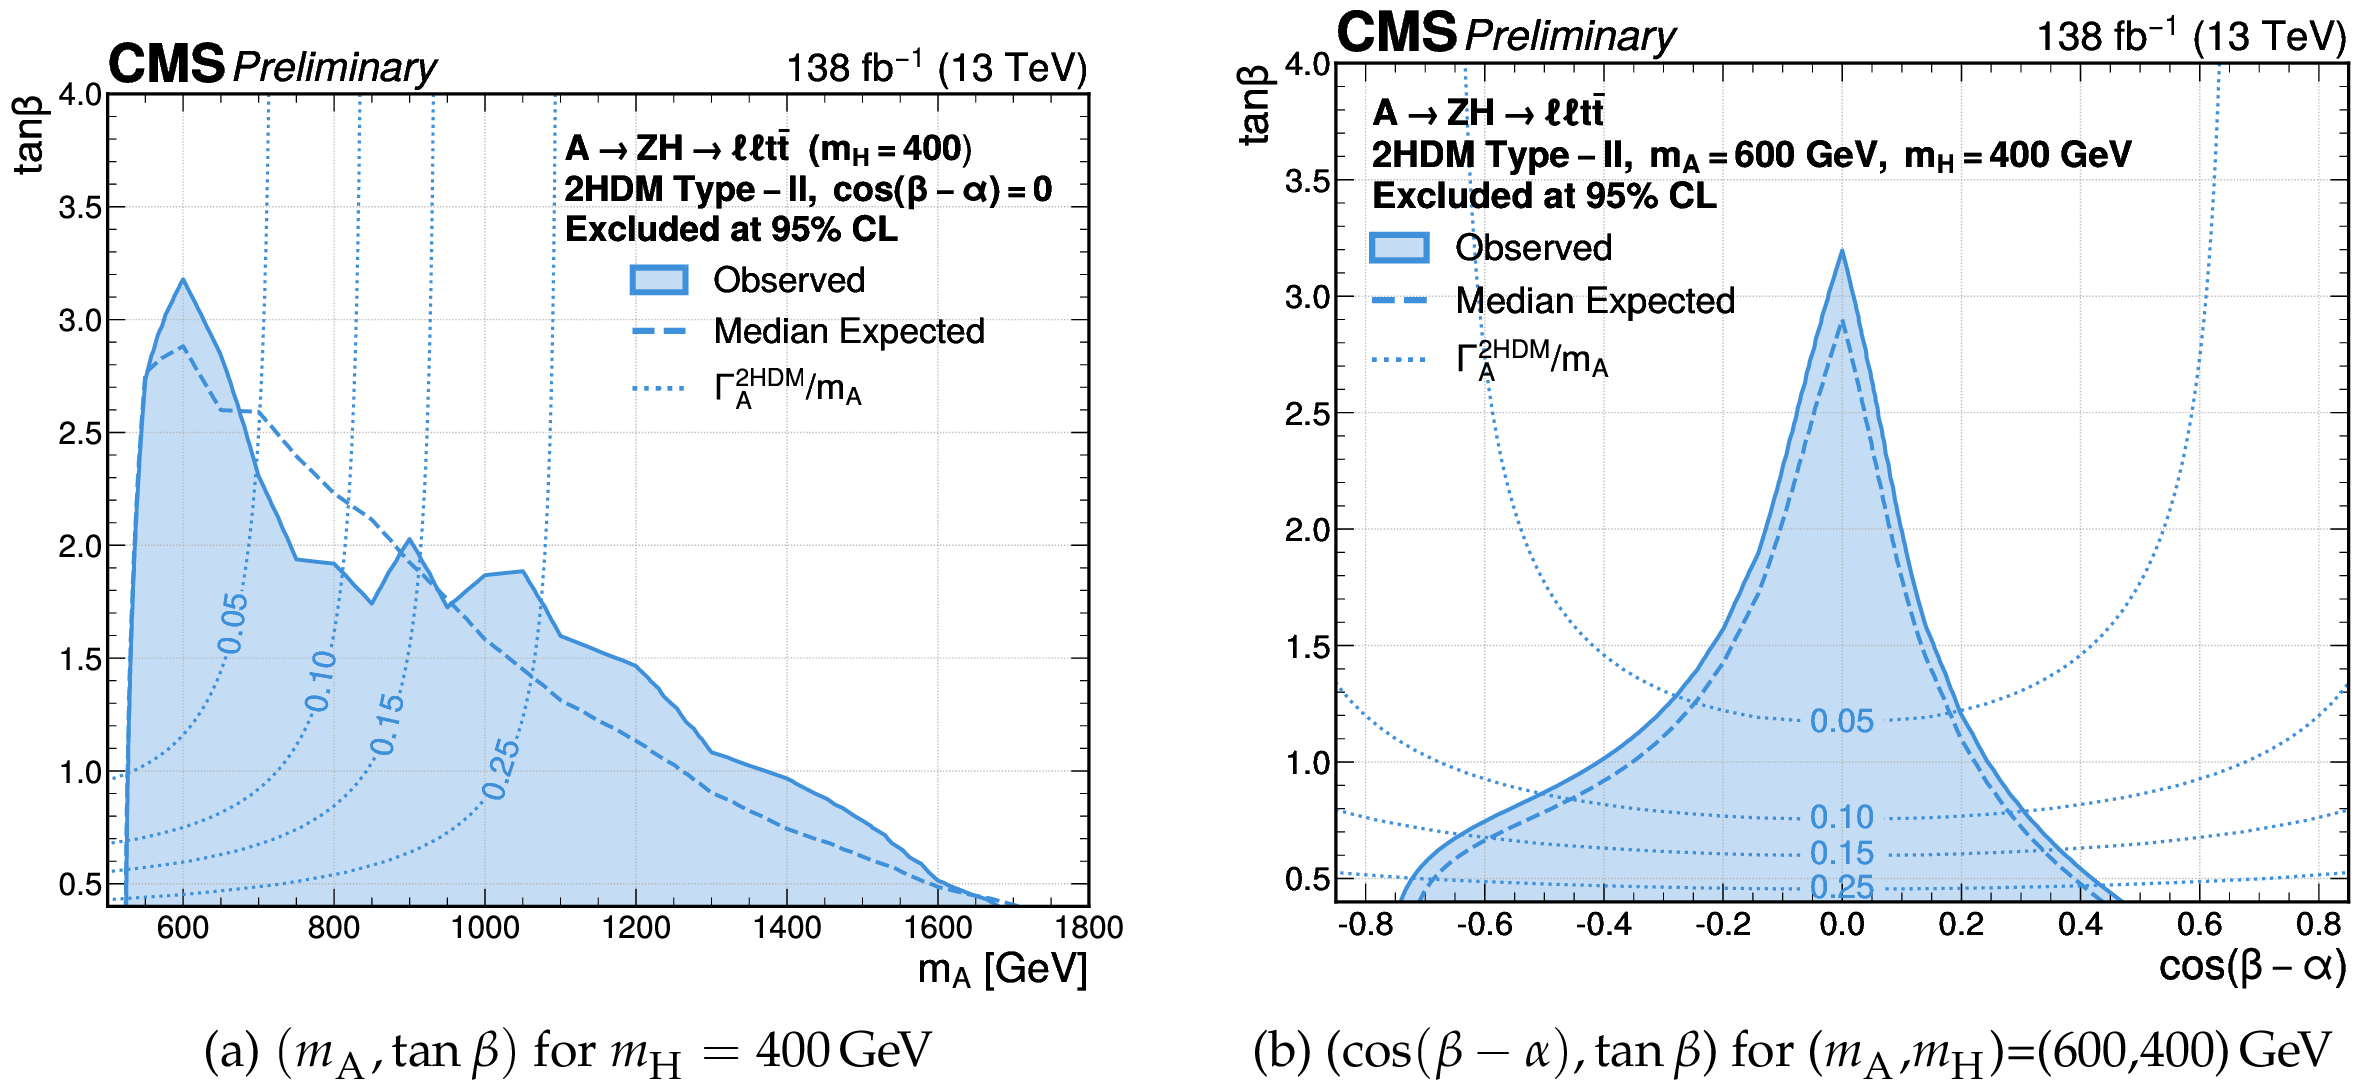
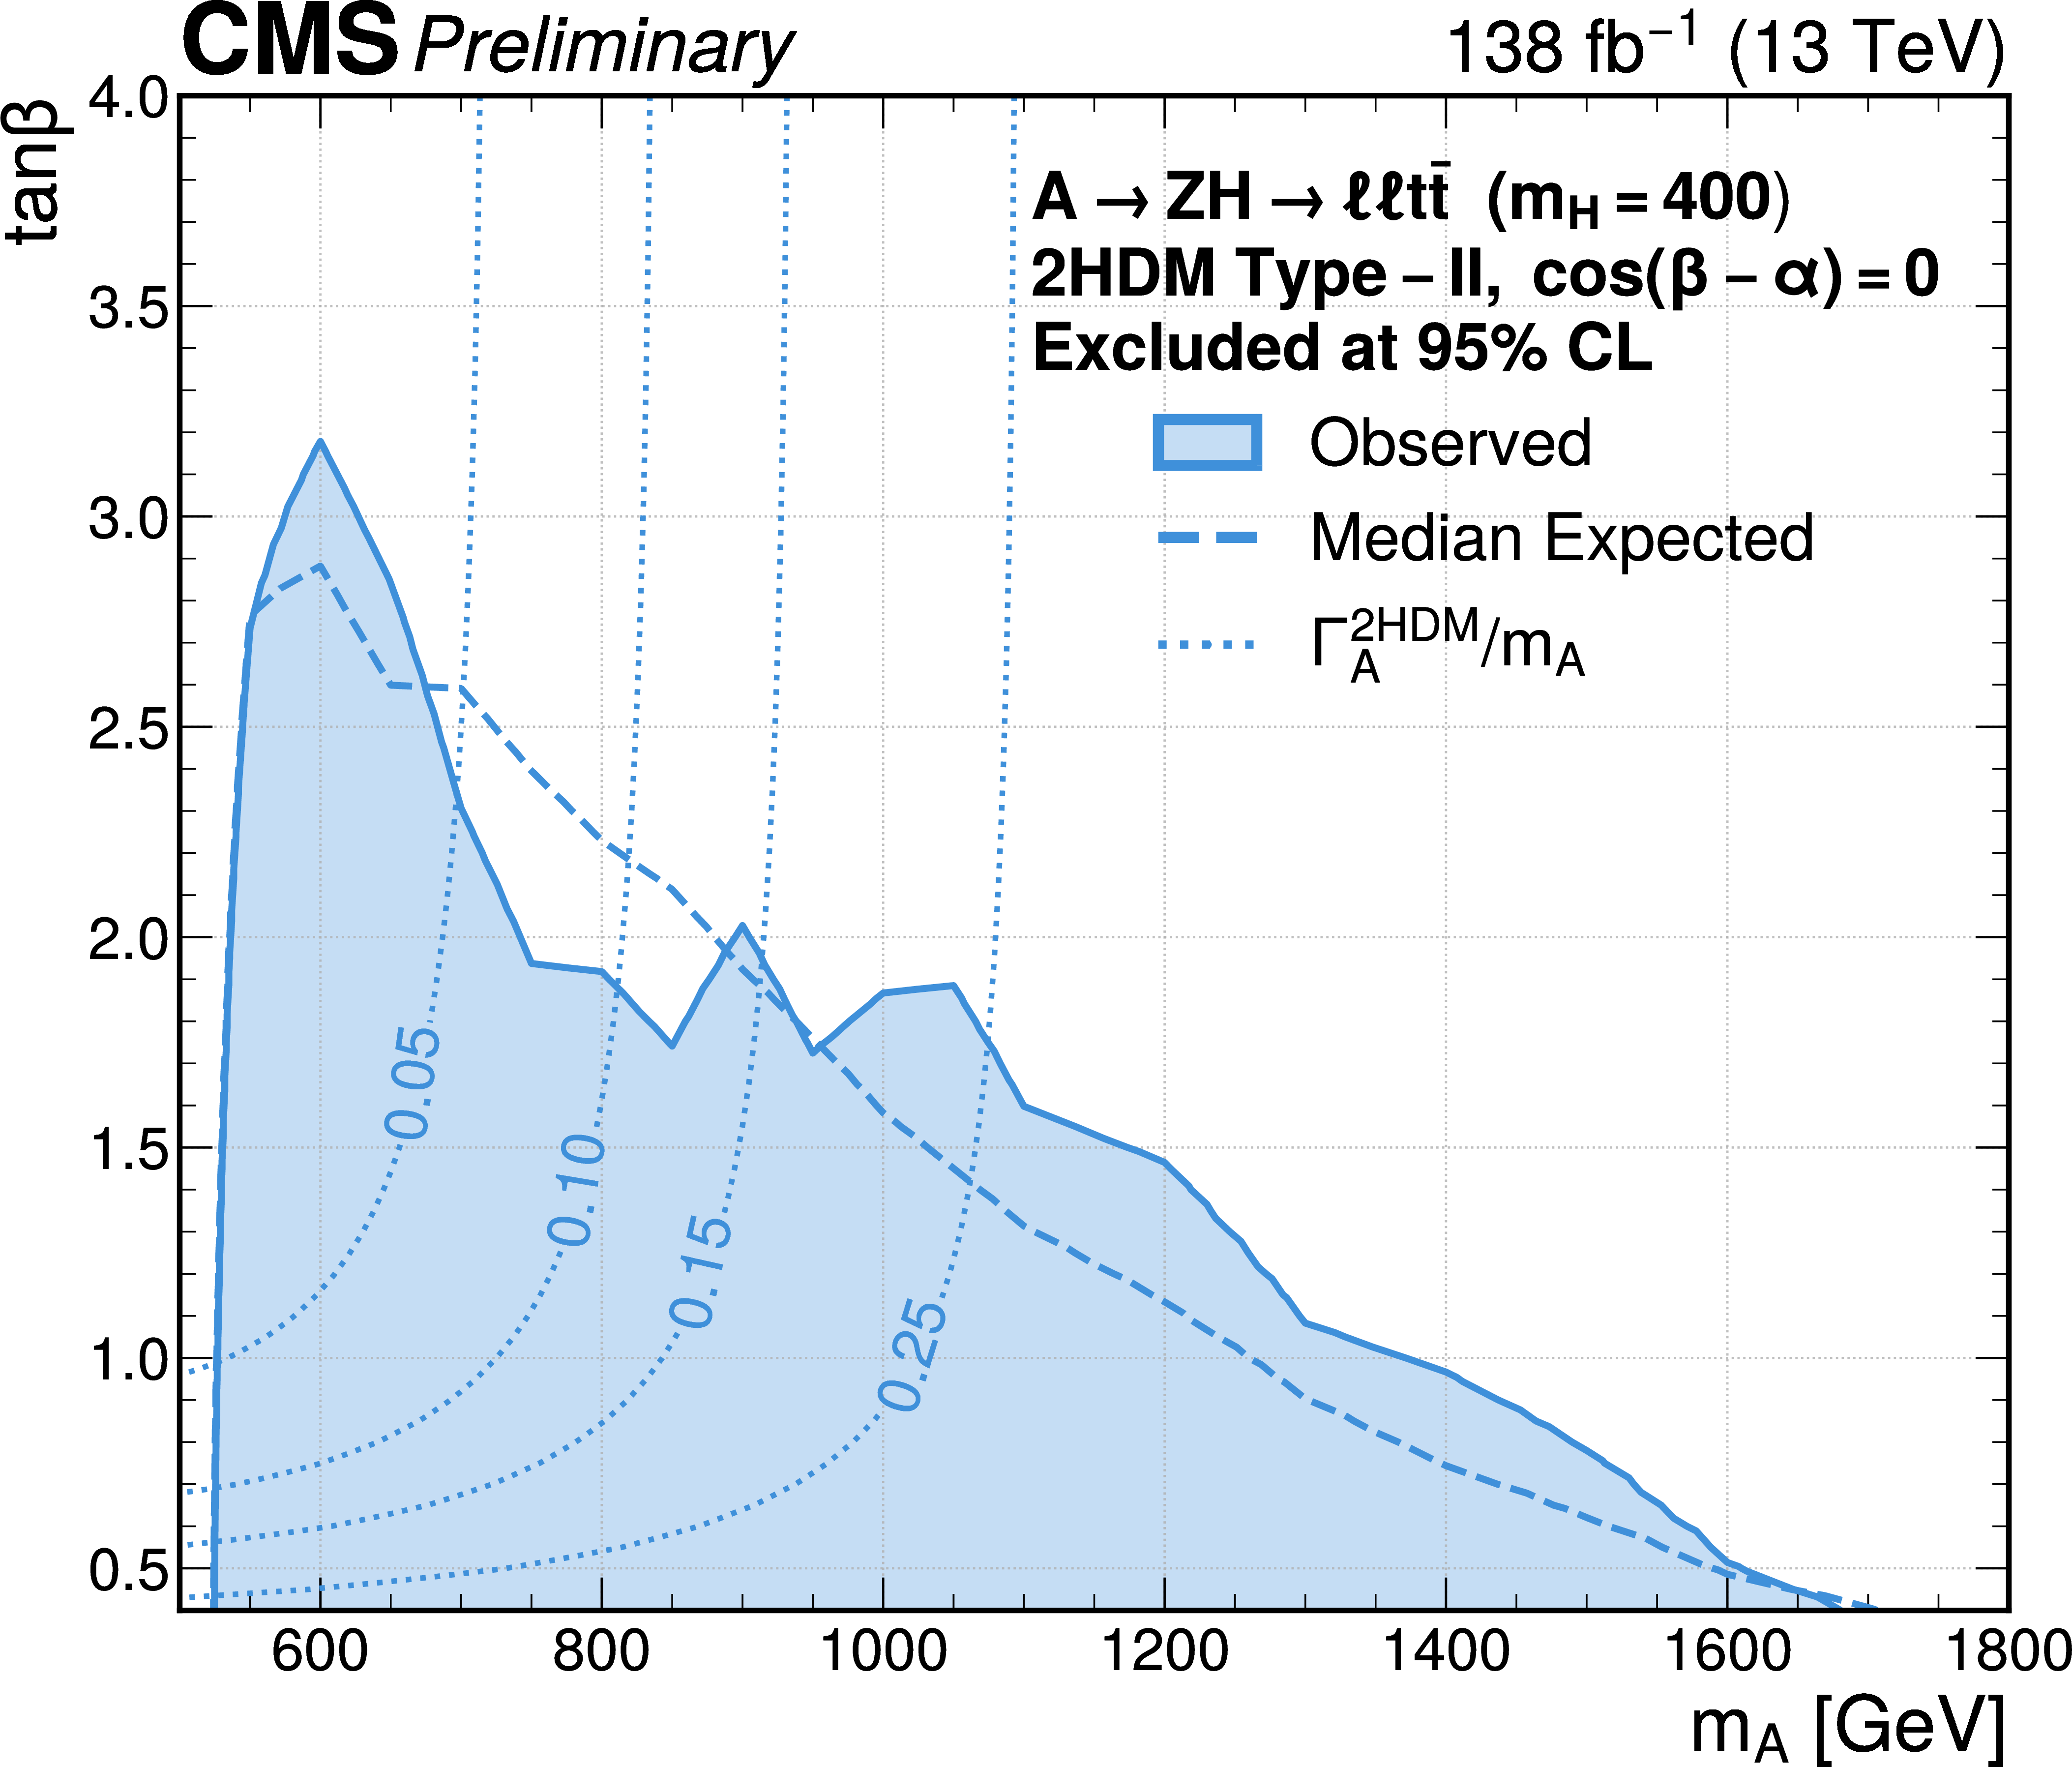
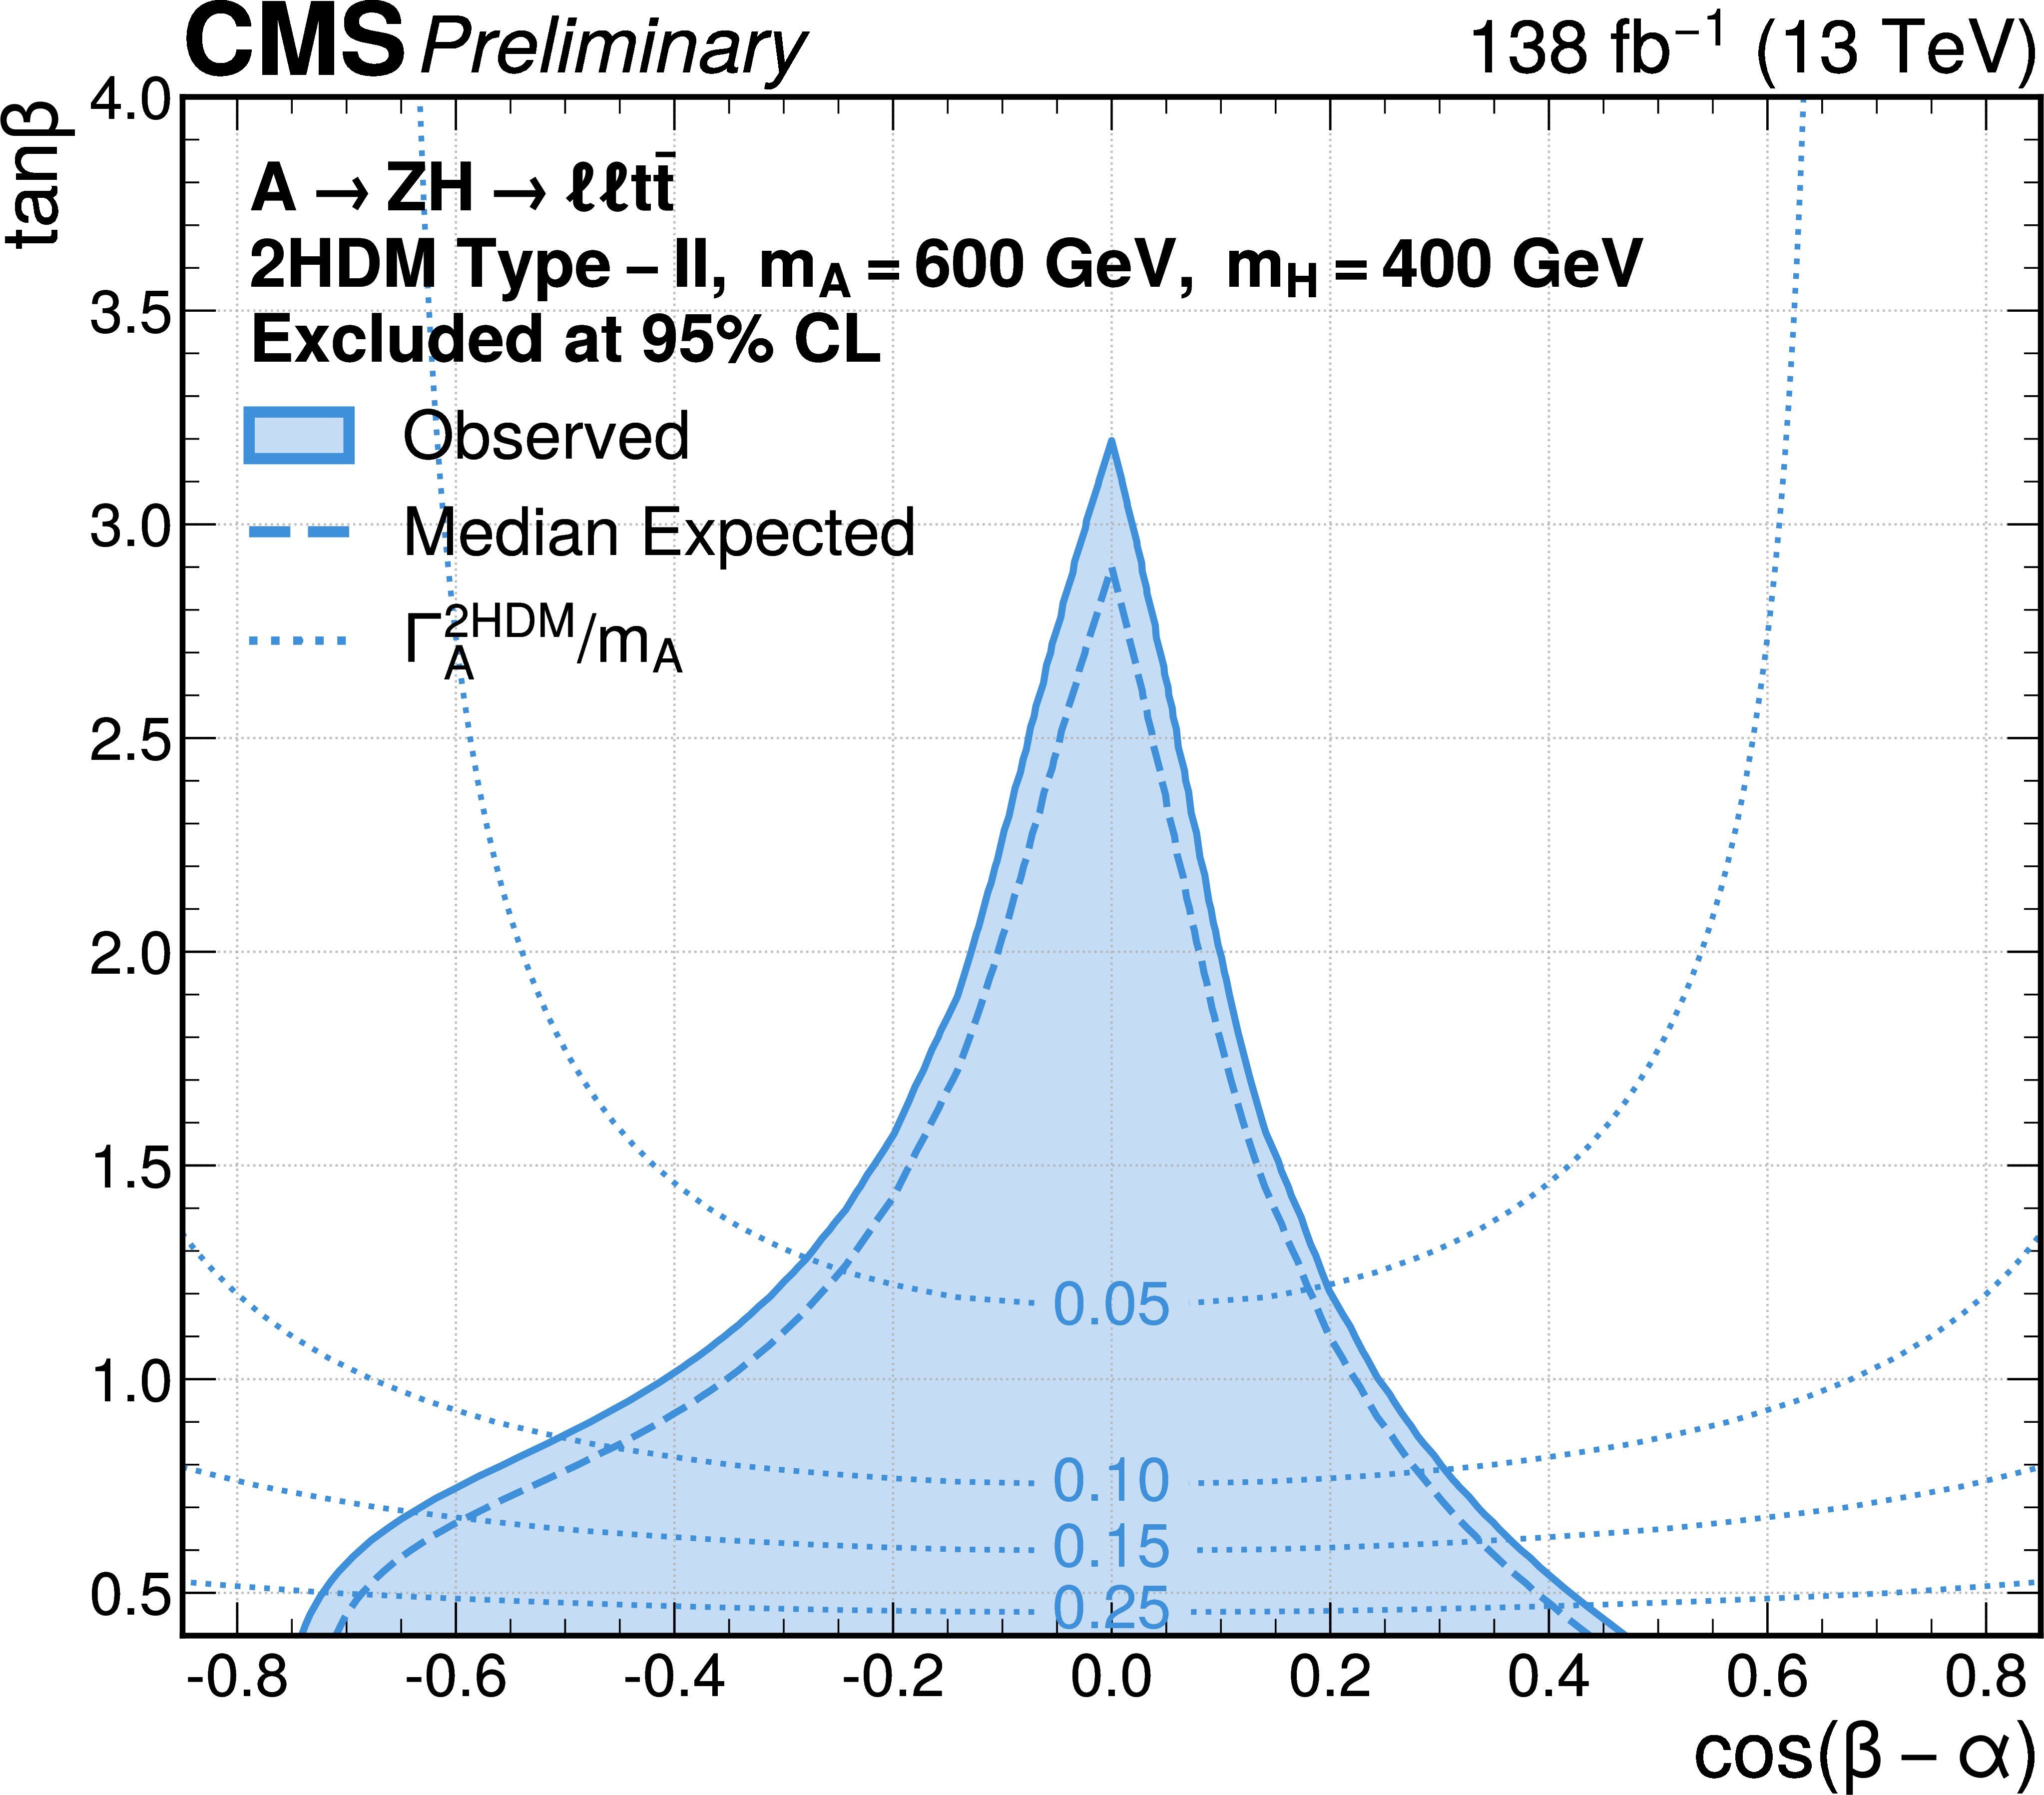
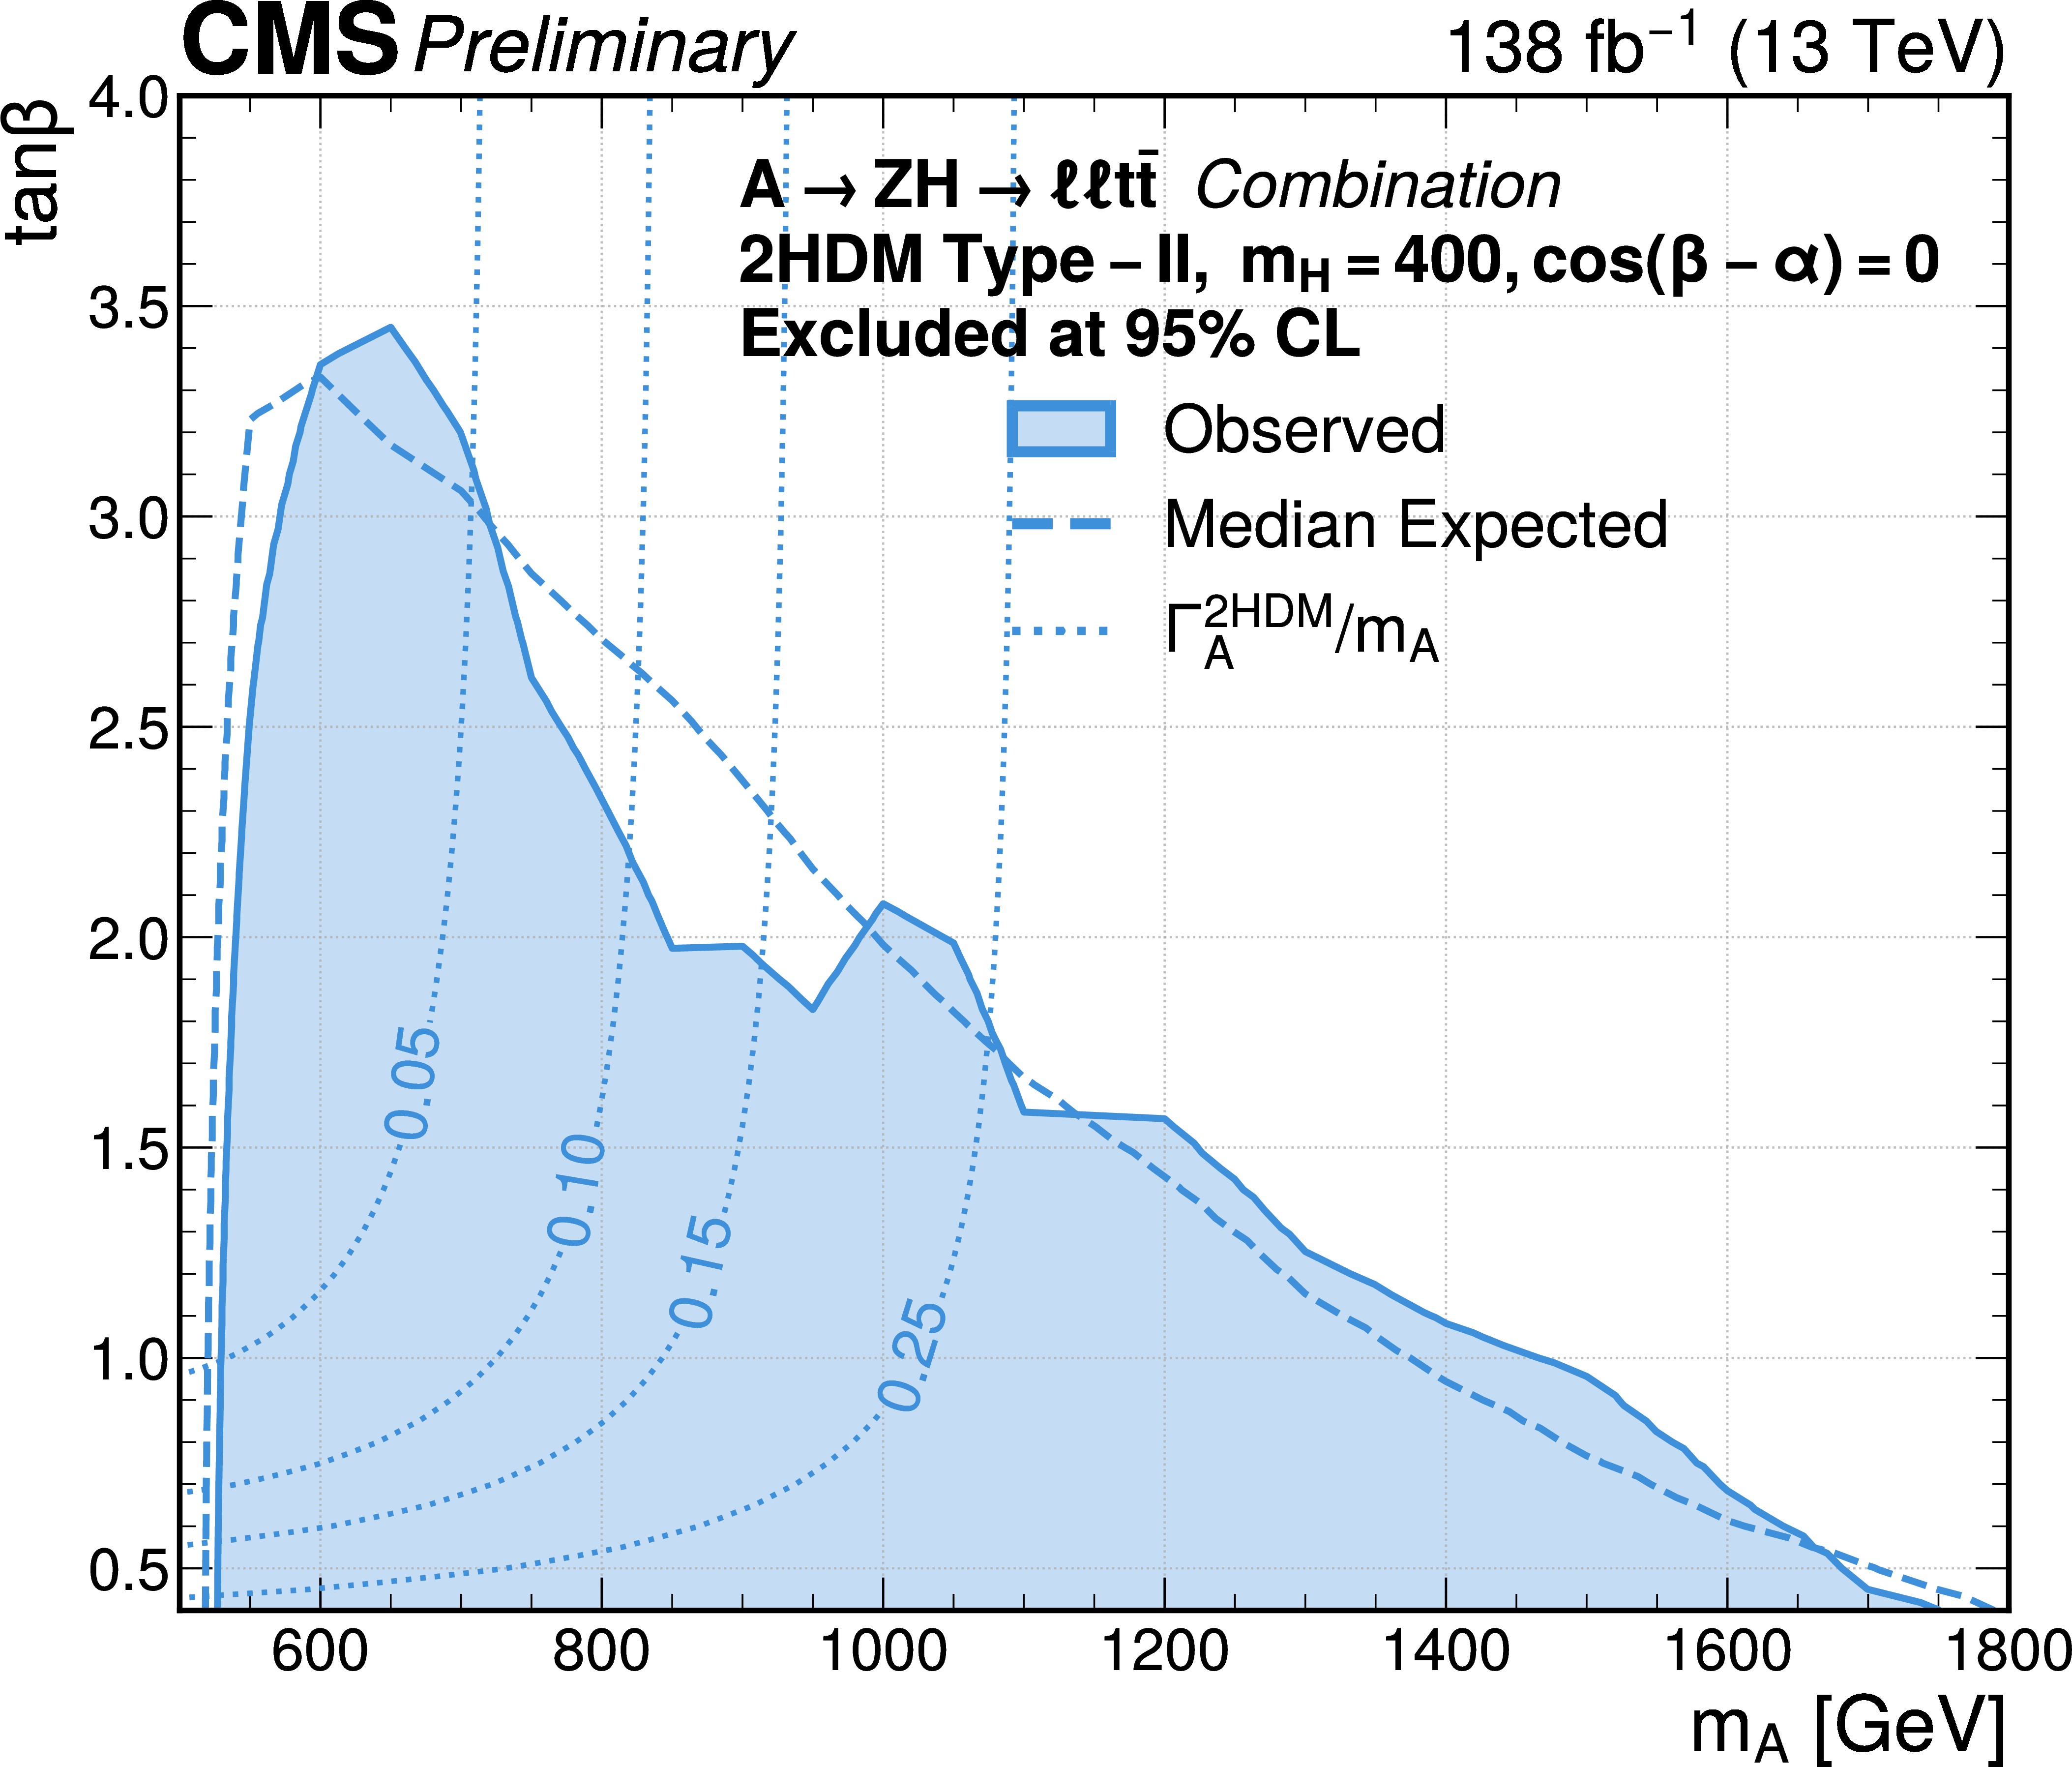
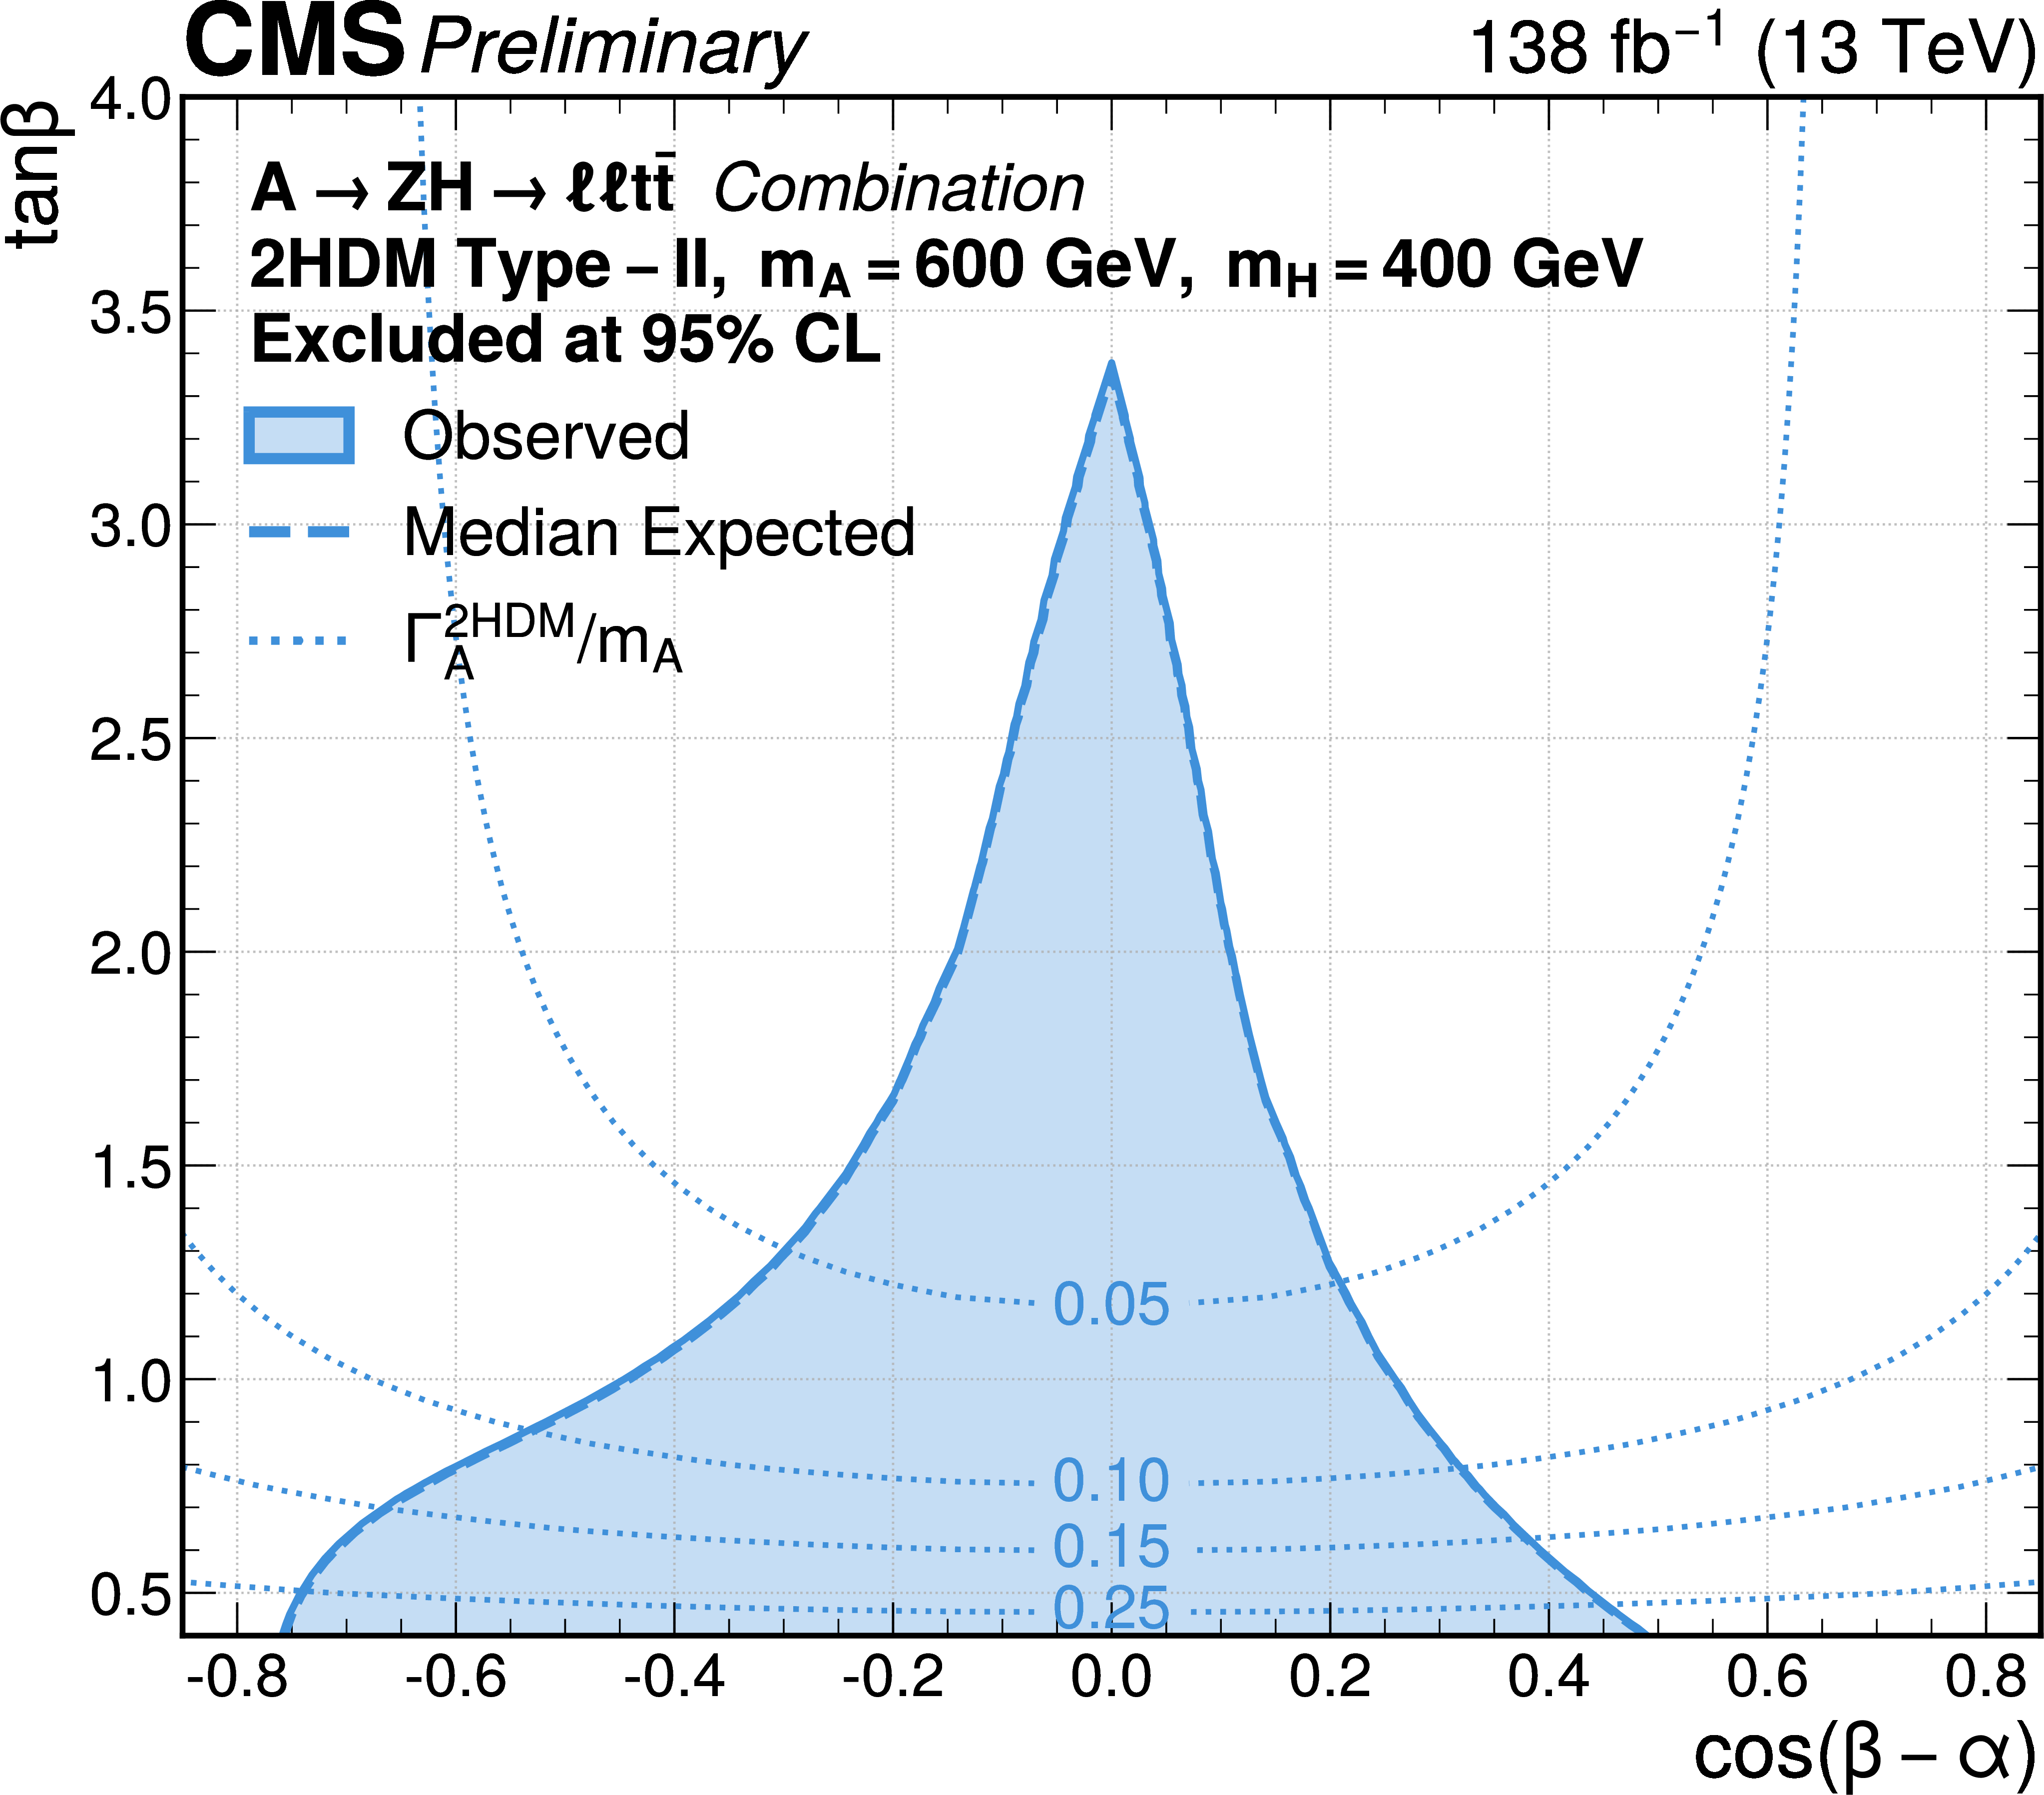
Median expected (dashed lines) and observed (filled contours) excluded regions of the type-II 2HDM parameter space in the ($ m_{\mathrm{A}} $, $ \tan\beta $) plane for a fixed $ m_{\mathrm{H}}= $ 400 GeV (left), and in the $ \cos(\beta-\alpha), \tan\beta) $ plane for the mass hypothesis ($ m_{\mathrm{A}} $, $ m_{\mathrm{H}} $)=(600, 400) GeV (right) The excluded regions are derived for narrow resonances. The dotted contour lines correspond to constant decay width of the $ \mathrm{A} $ boson. |
png pdf |
Figure 8-a:
Median expected (dashed lines) and observed (filled contours) excluded regions of the type-II 2HDM parameter space in the ($ m_{\mathrm{A}} $, $ \tan\beta $) plane for a fixed $ m_{\mathrm{H}}= $ 400 GeV (left), and in the $ \cos(\beta-\alpha), \tan\beta) $ plane for the mass hypothesis ($ m_{\mathrm{A}} $, $ m_{\mathrm{H}} $)=(600, 400) GeV (right) The excluded regions are derived for narrow resonances. The dotted contour lines correspond to constant decay width of the $ \mathrm{A} $ boson. |
png pdf |
Figure 8-b:
Median expected (dashed lines) and observed (filled contours) excluded regions of the type-II 2HDM parameter space in the ($ m_{\mathrm{A}} $, $ \tan\beta $) plane for a fixed $ m_{\mathrm{H}}= $ 400 GeV (left), and in the $ \cos(\beta-\alpha), \tan\beta) $ plane for the mass hypothesis ($ m_{\mathrm{A}} $, $ m_{\mathrm{H}} $)=(600, 400) GeV (right) The excluded regions are derived for narrow resonances. The dotted contour lines correspond to constant decay width of the $ \mathrm{A} $ boson. |
png pdf |
Figure 9:
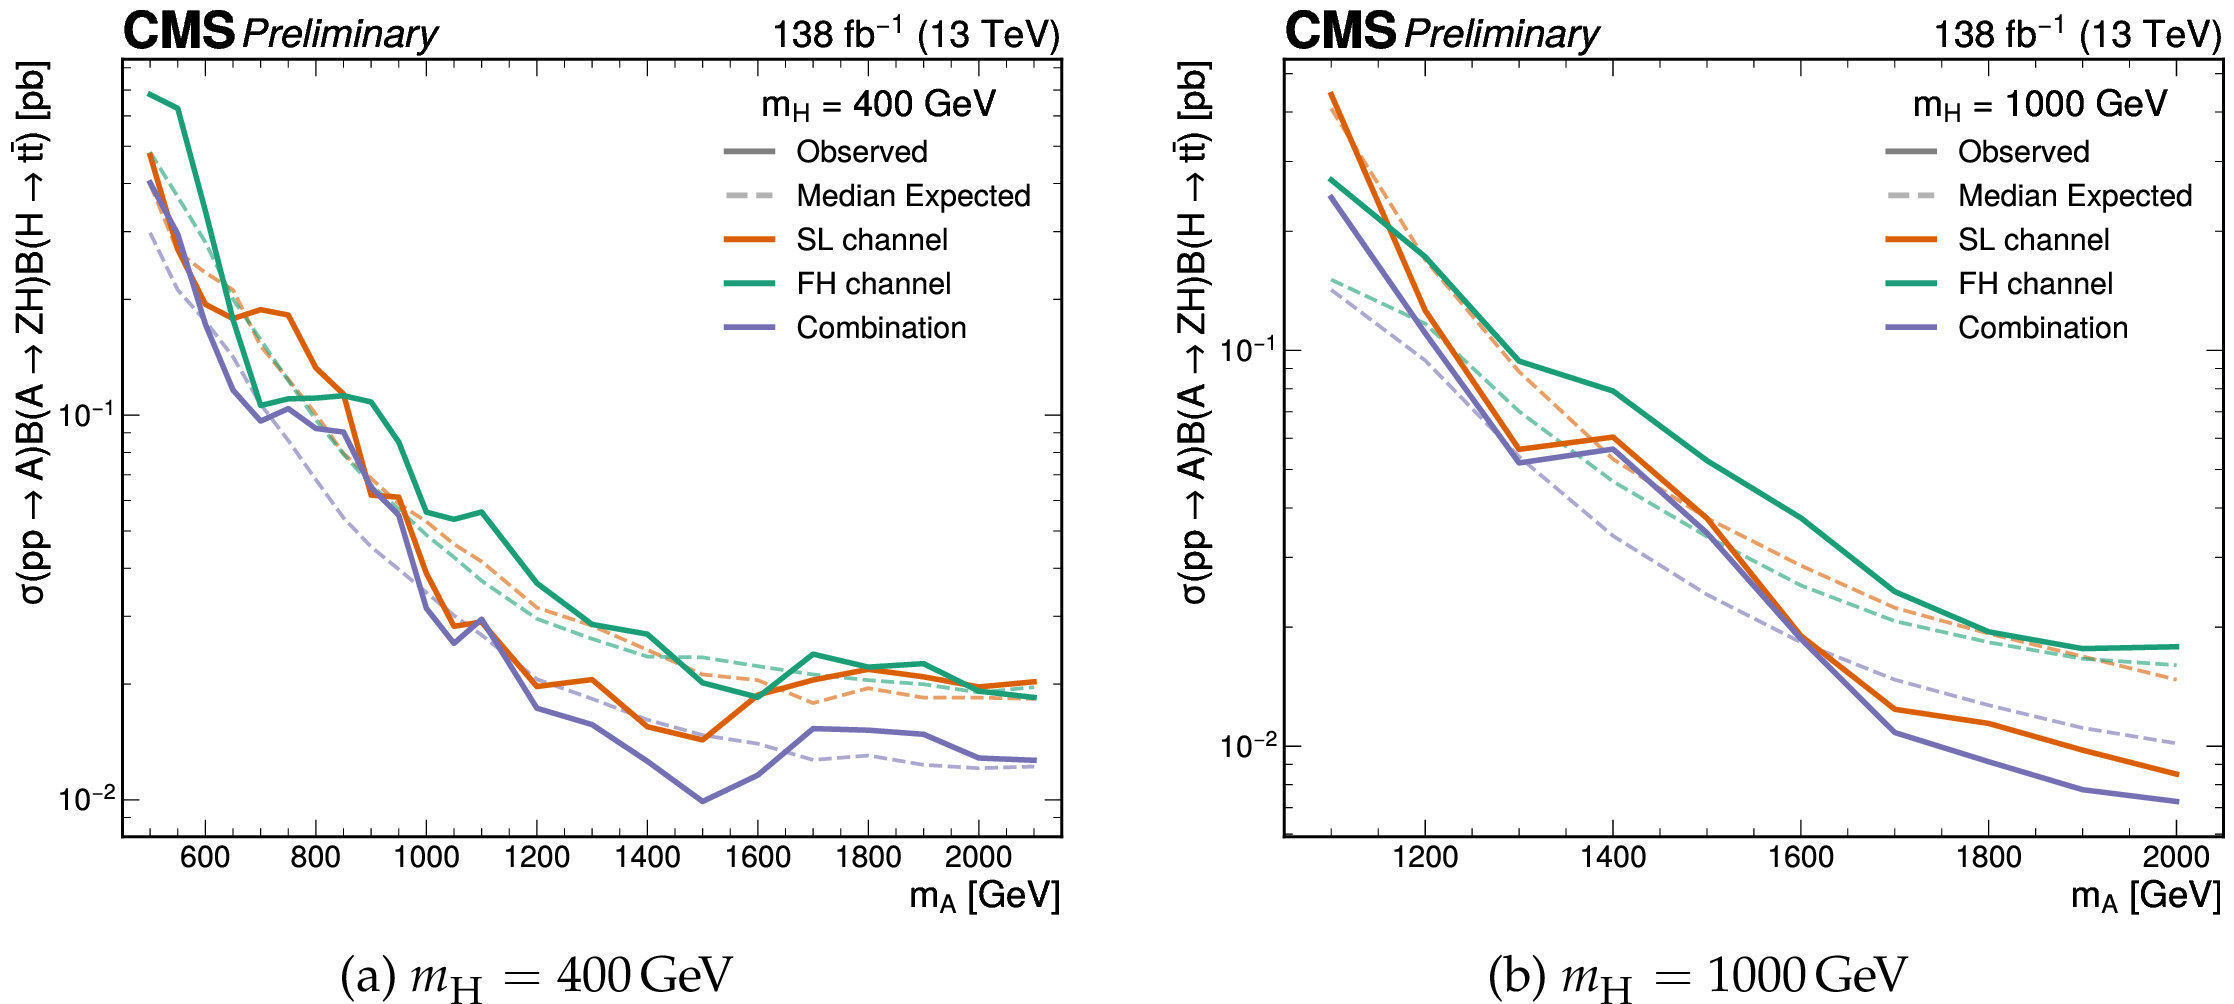
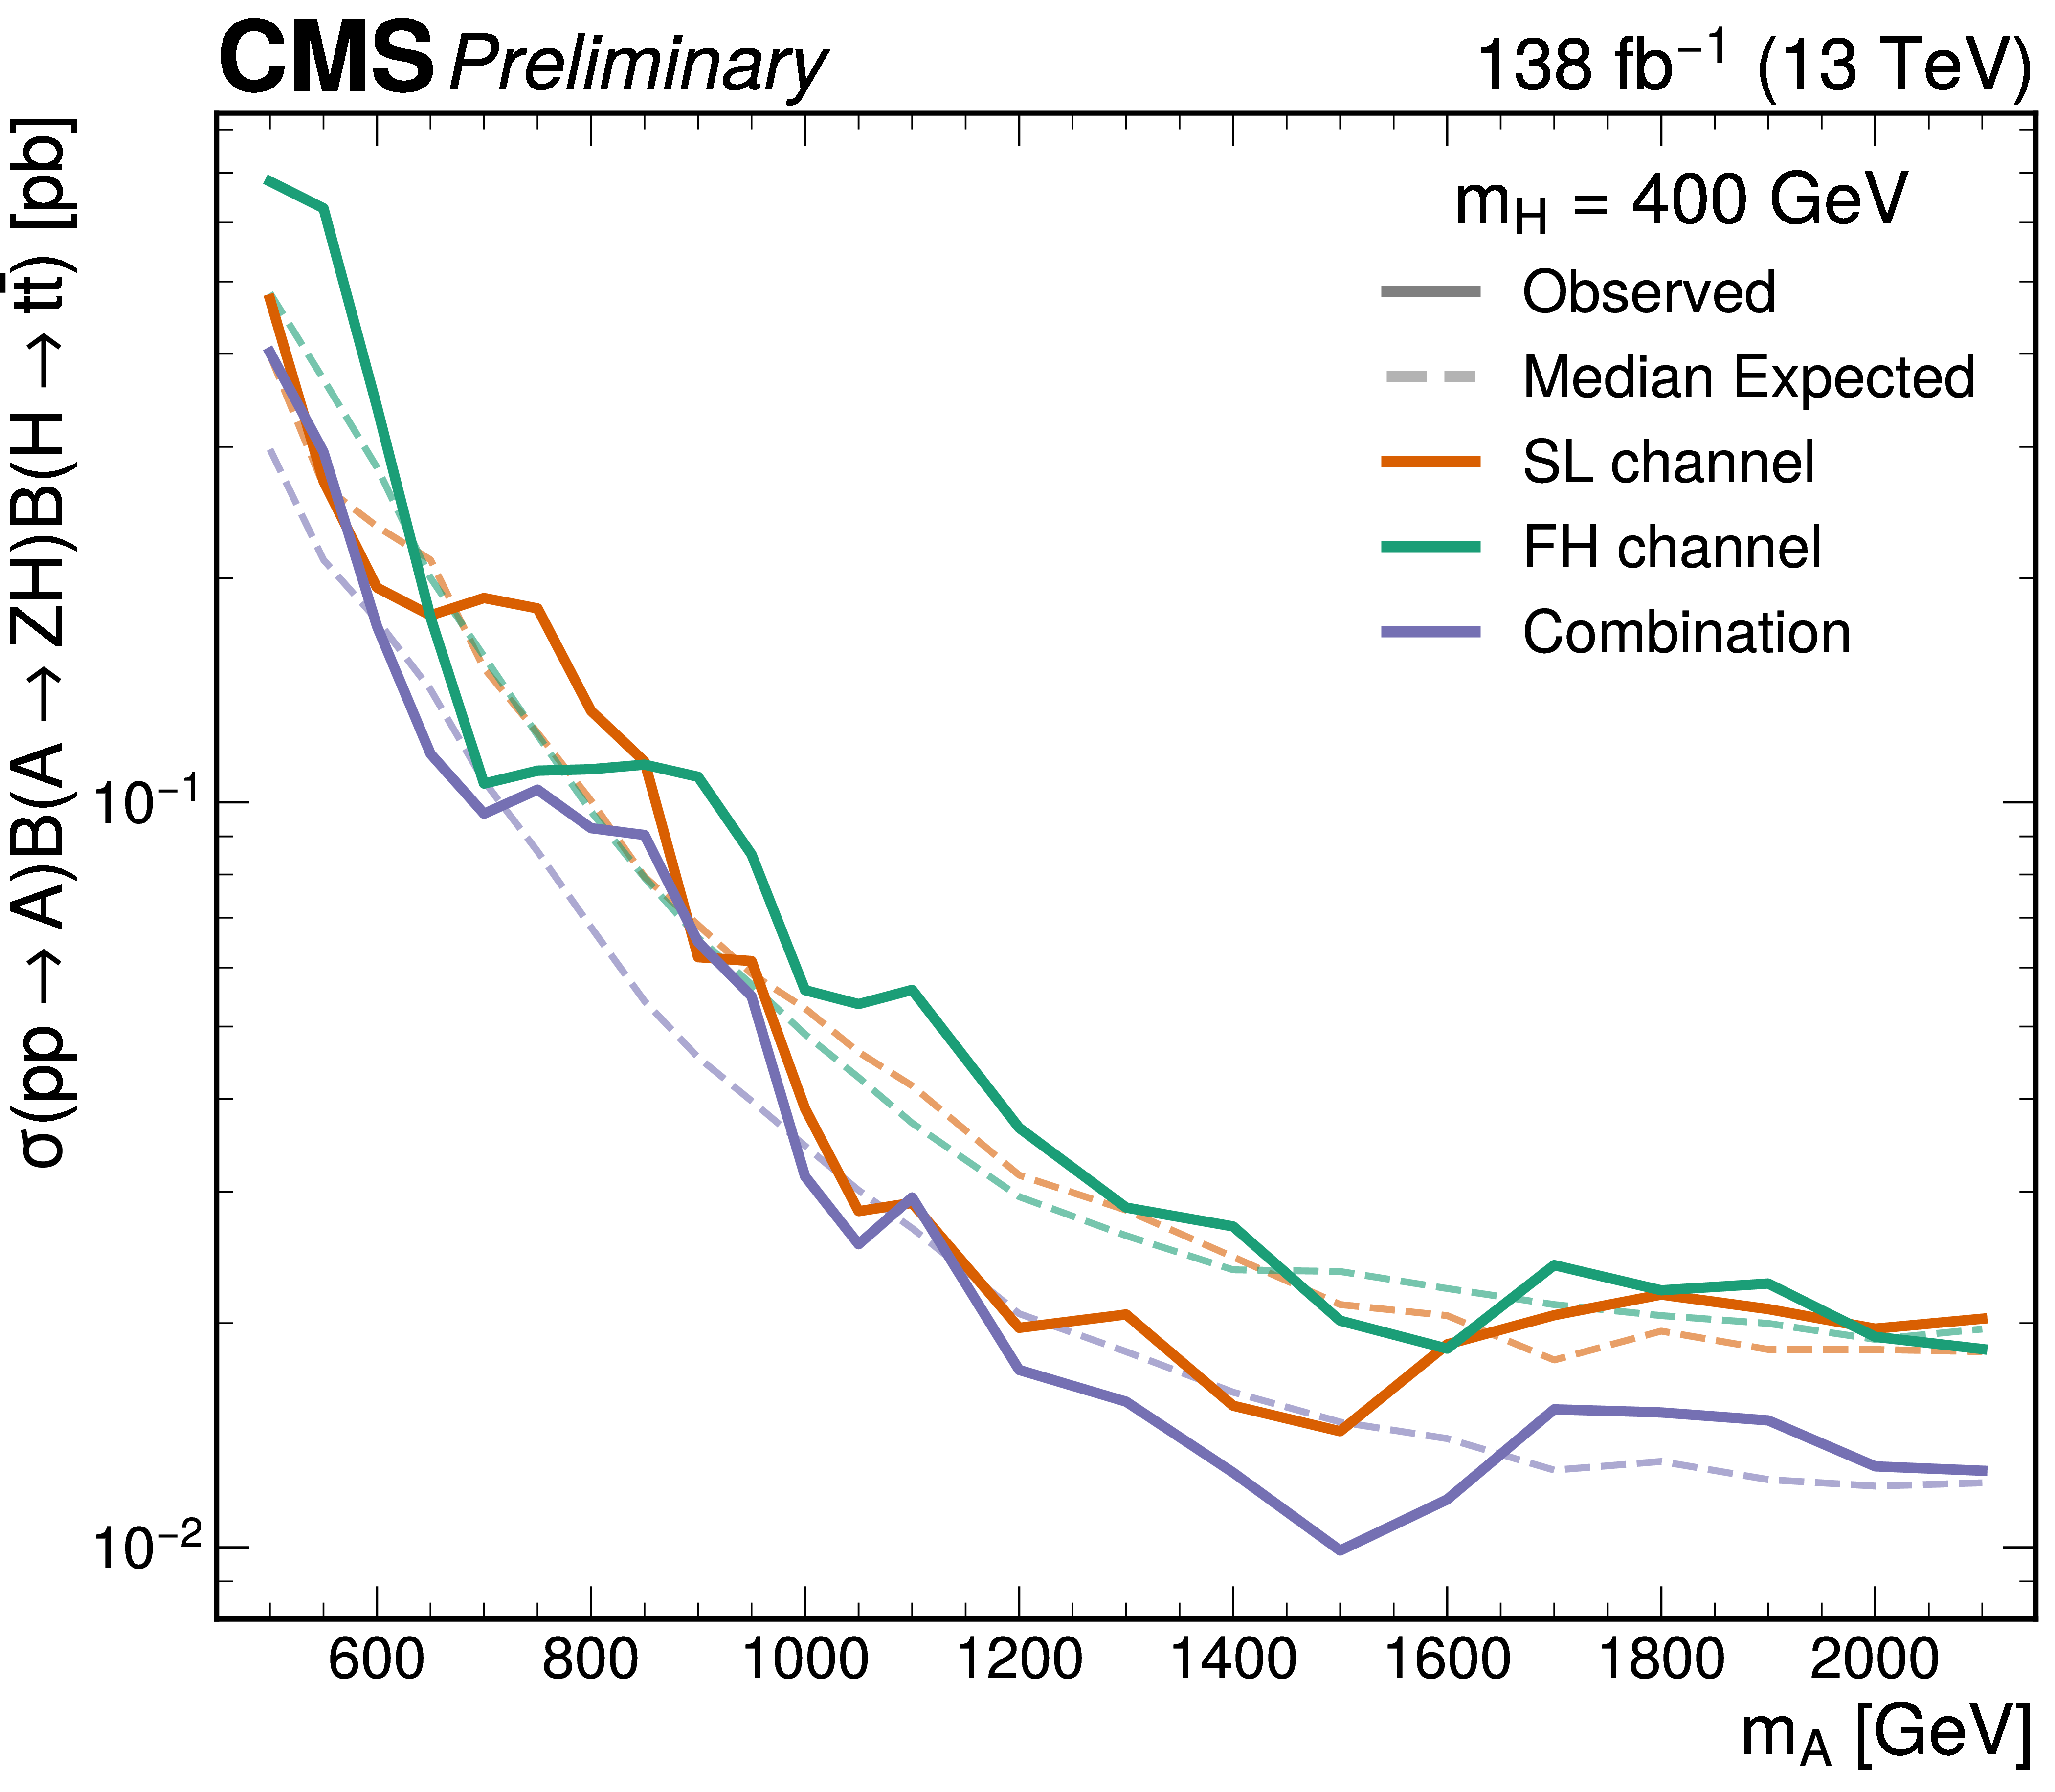
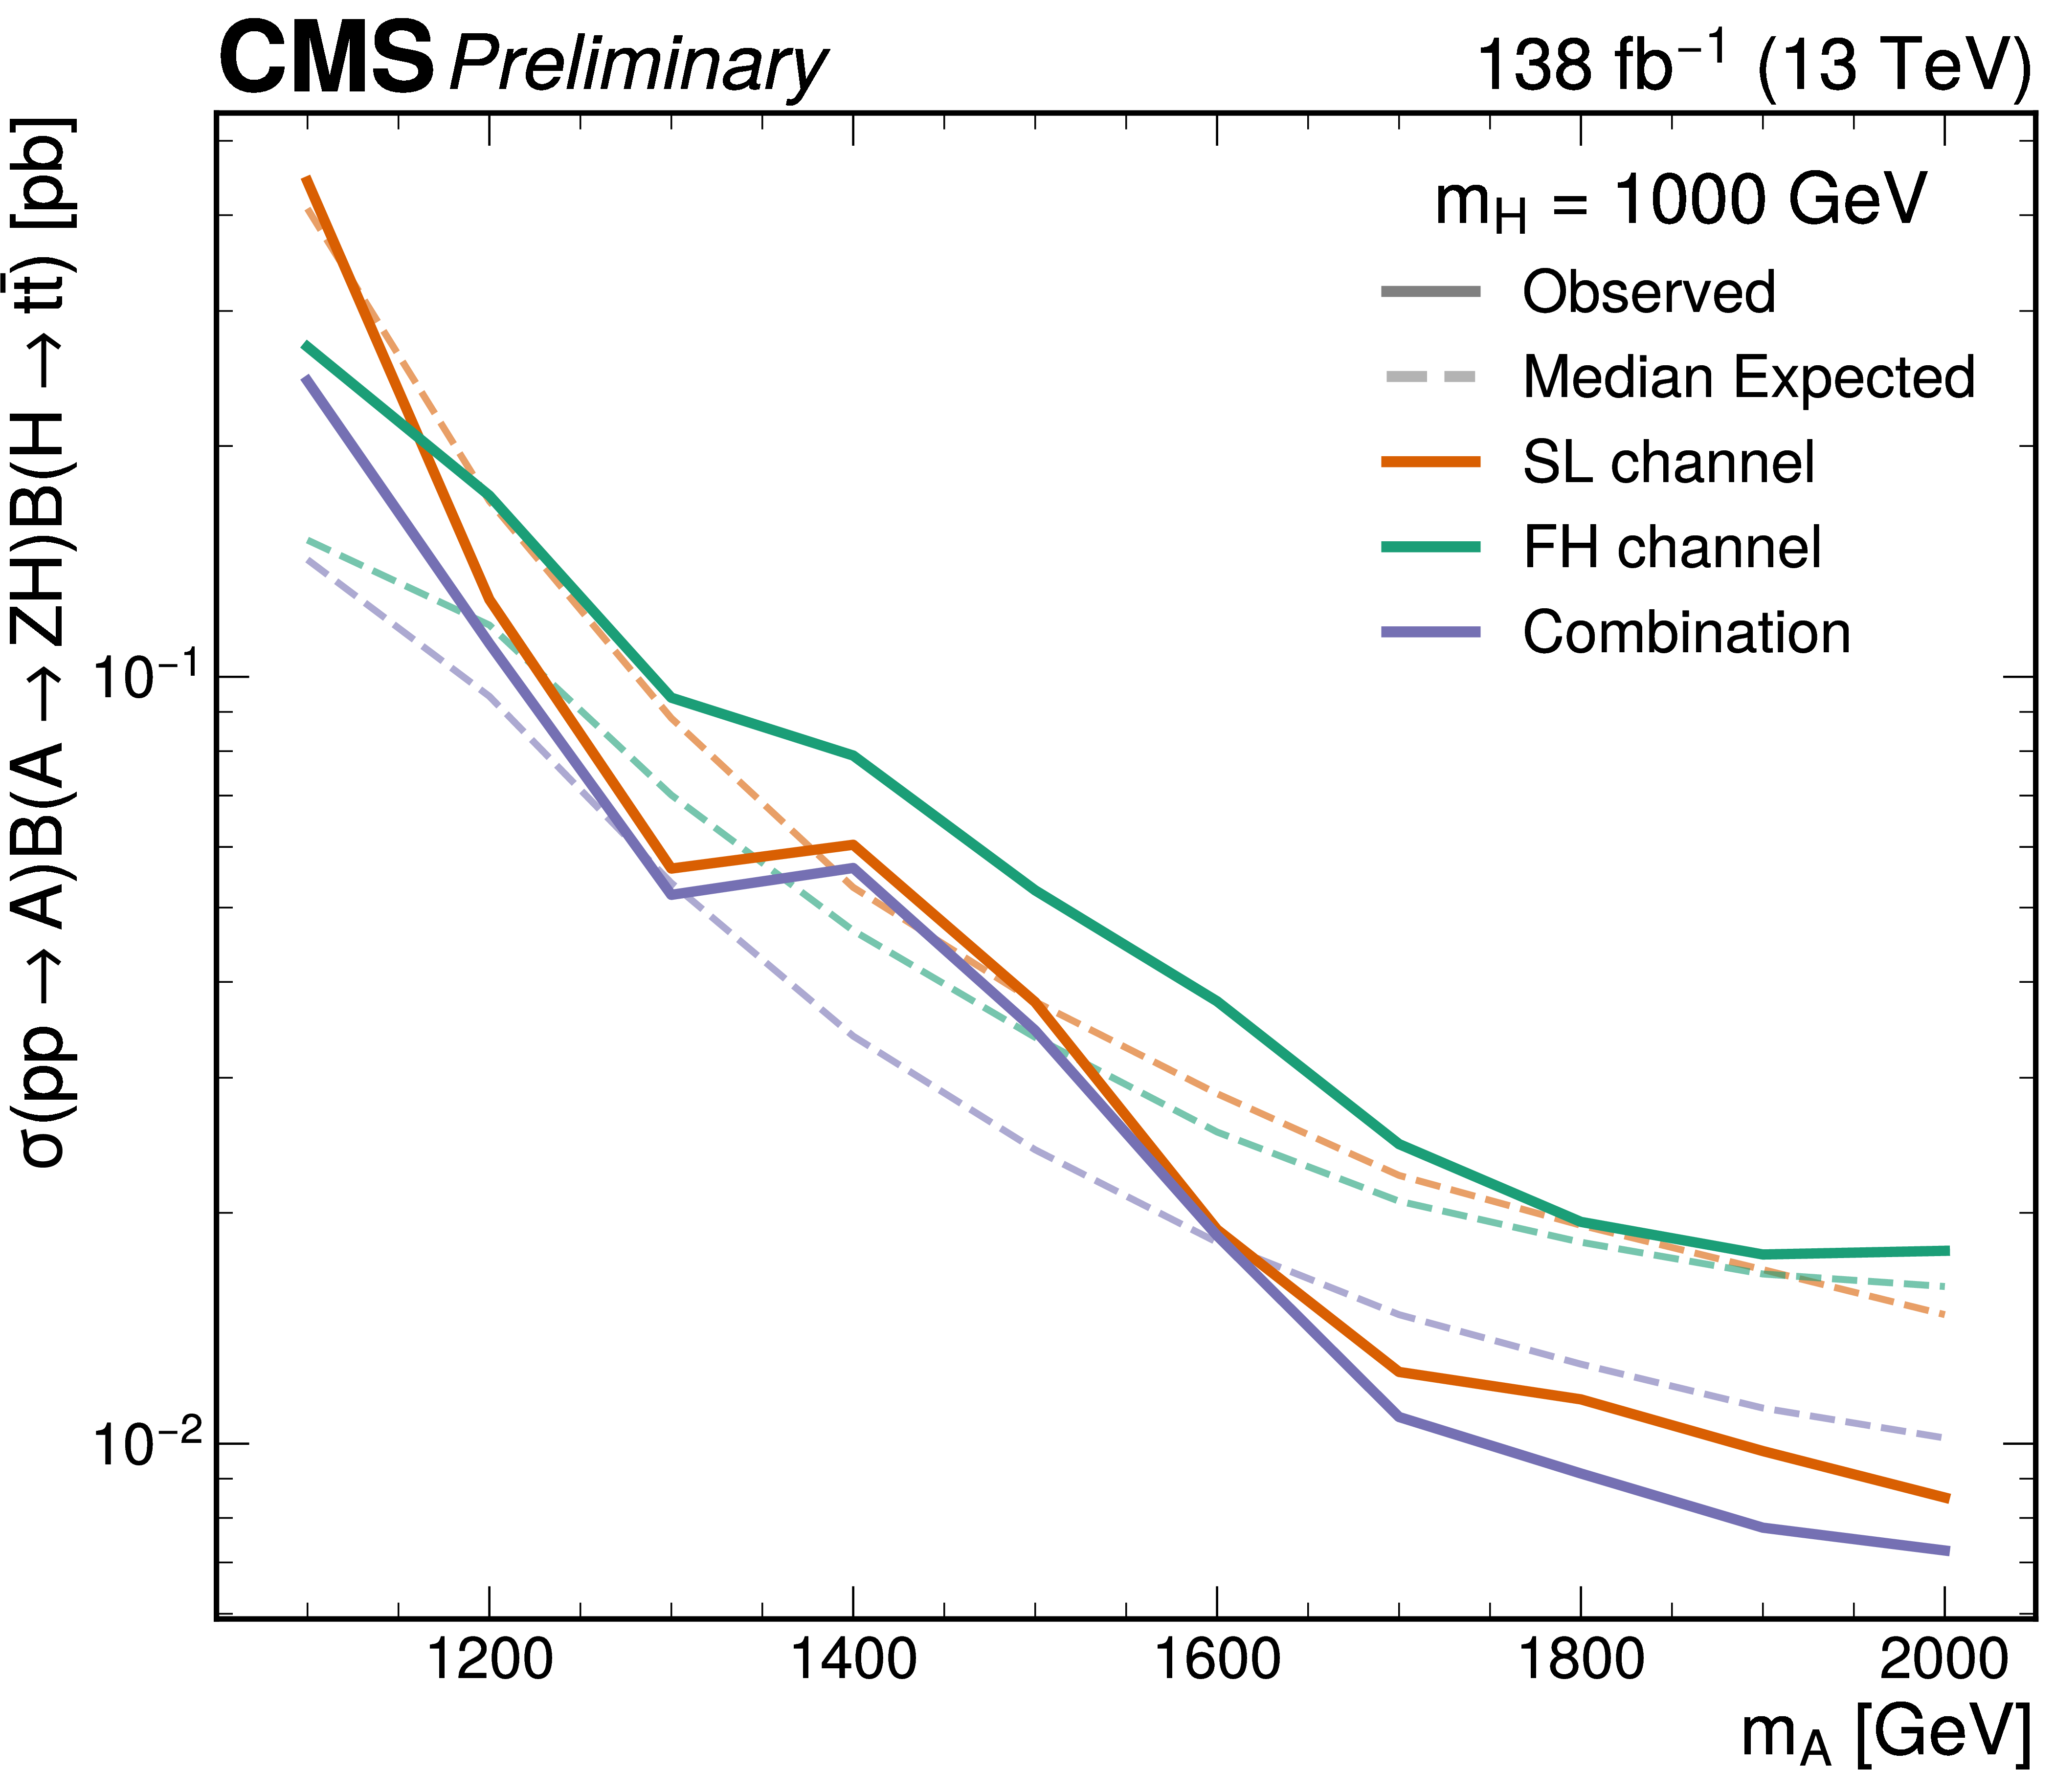
Comparisons of the median expected (dashed lines) and observed (solid lines) upper limits at 95% CL on the production $ \sigma(\mathrm{p}\mathrm{p}\to\mathrm{A})\mathcal{B}(\mathrm{A}\to\mathrm{Z}\mathrm{H})\mathcal{B}(\mathrm{H}\to{\mathrm{t}\overline{\mathrm{t}}} ) $, for the semi-leptonic (orange) fully-hadronic (green), and combined (purple) searches. Limits are shown as a function of $ m_{\mathrm{A}} $ for $ m_{\mathrm{H}}= $ 400 GeV (left) and for $ m_{\mathrm{H}}= $ 1000 GeV (right). |
png pdf |
Figure 9-a:
Comparisons of the median expected (dashed lines) and observed (solid lines) upper limits at 95% CL on the production $ \sigma(\mathrm{p}\mathrm{p}\to\mathrm{A})\mathcal{B}(\mathrm{A}\to\mathrm{Z}\mathrm{H})\mathcal{B}(\mathrm{H}\to{\mathrm{t}\overline{\mathrm{t}}} ) $, for the semi-leptonic (orange) fully-hadronic (green), and combined (purple) searches. Limits are shown as a function of $ m_{\mathrm{A}} $ for $ m_{\mathrm{H}}= $ 400 GeV (left) and for $ m_{\mathrm{H}}= $ 1000 GeV (right). |
png pdf |
Figure 9-b:
Comparisons of the median expected (dashed lines) and observed (solid lines) upper limits at 95% CL on the production $ \sigma(\mathrm{p}\mathrm{p}\to\mathrm{A})\mathcal{B}(\mathrm{A}\to\mathrm{Z}\mathrm{H})\mathcal{B}(\mathrm{H}\to{\mathrm{t}\overline{\mathrm{t}}} ) $, for the semi-leptonic (orange) fully-hadronic (green), and combined (purple) searches. Limits are shown as a function of $ m_{\mathrm{A}} $ for $ m_{\mathrm{H}}= $ 400 GeV (left) and for $ m_{\mathrm{H}}= $ 1000 GeV (right). |
png pdf |
Figure 10:
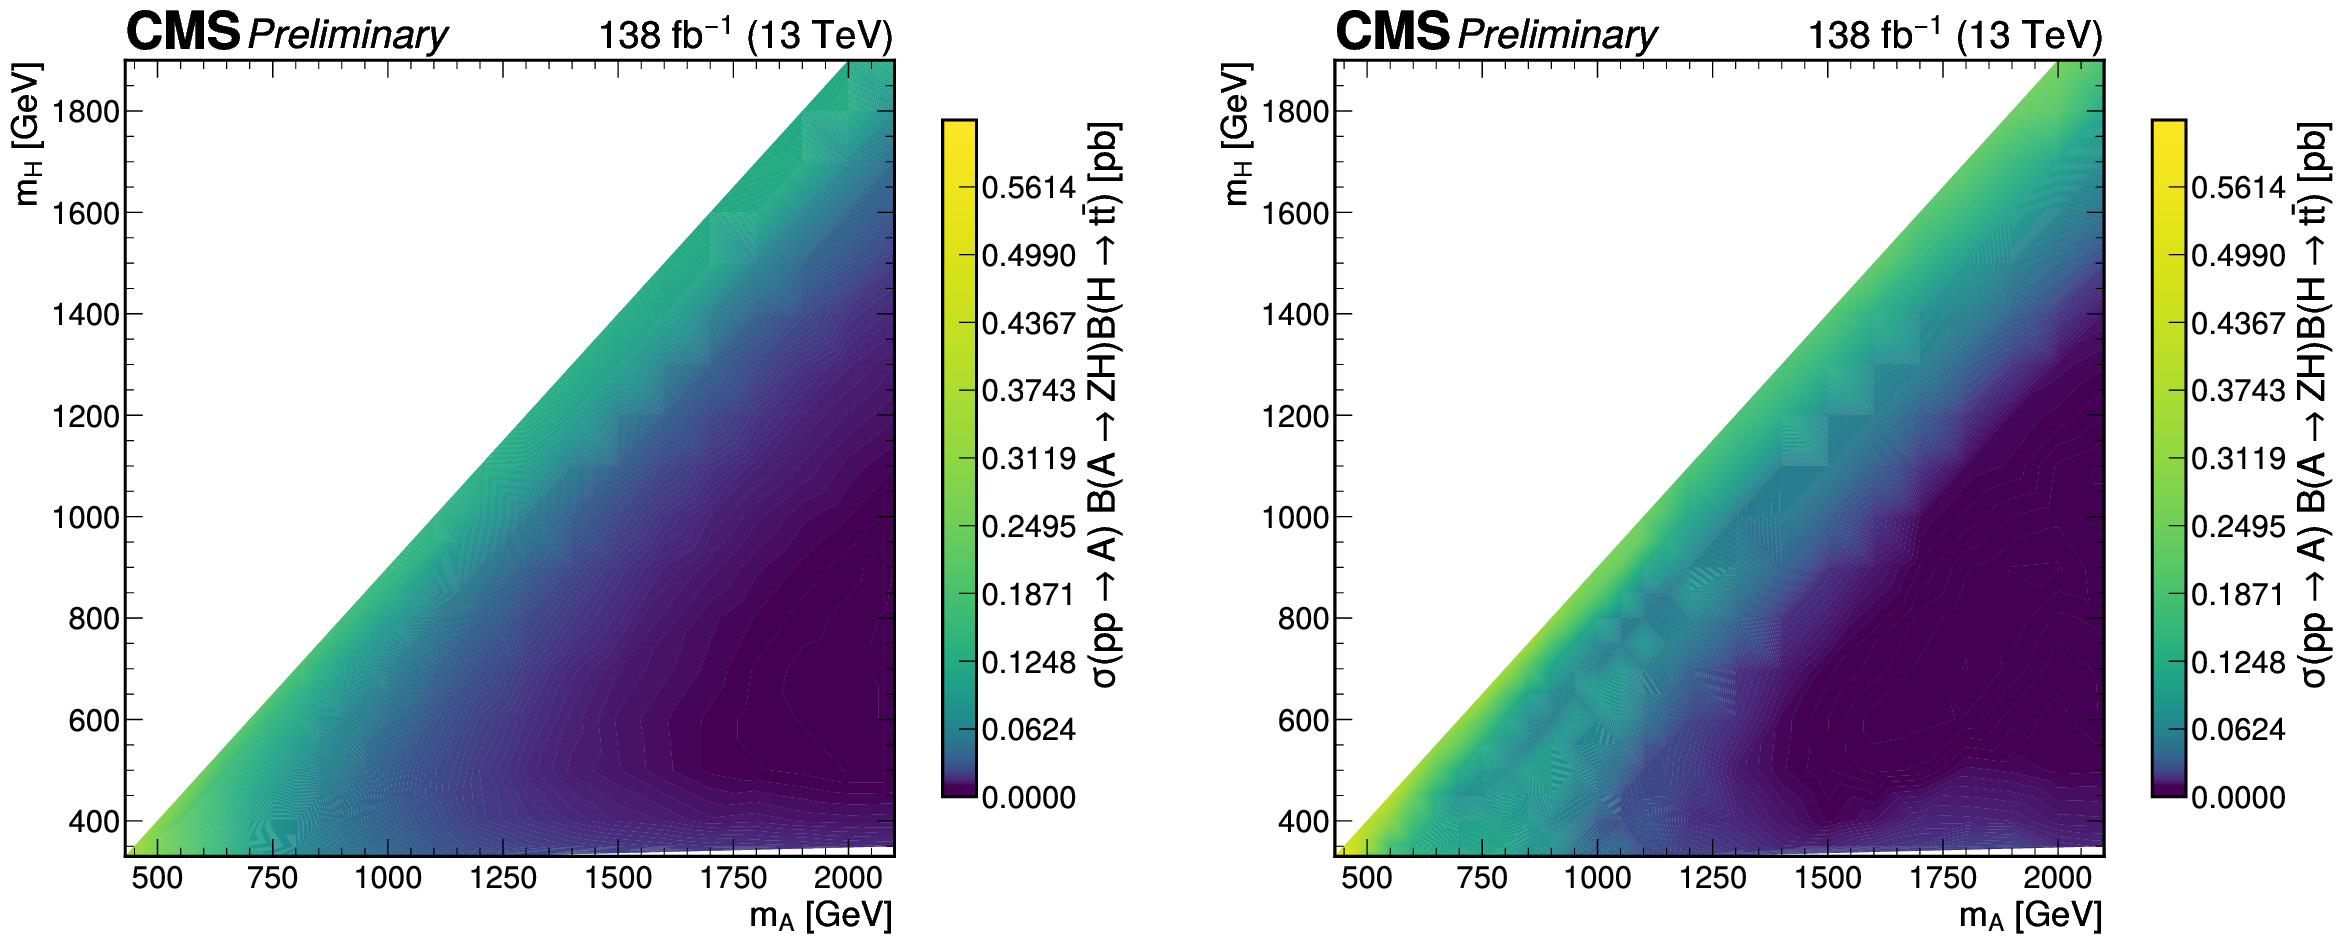
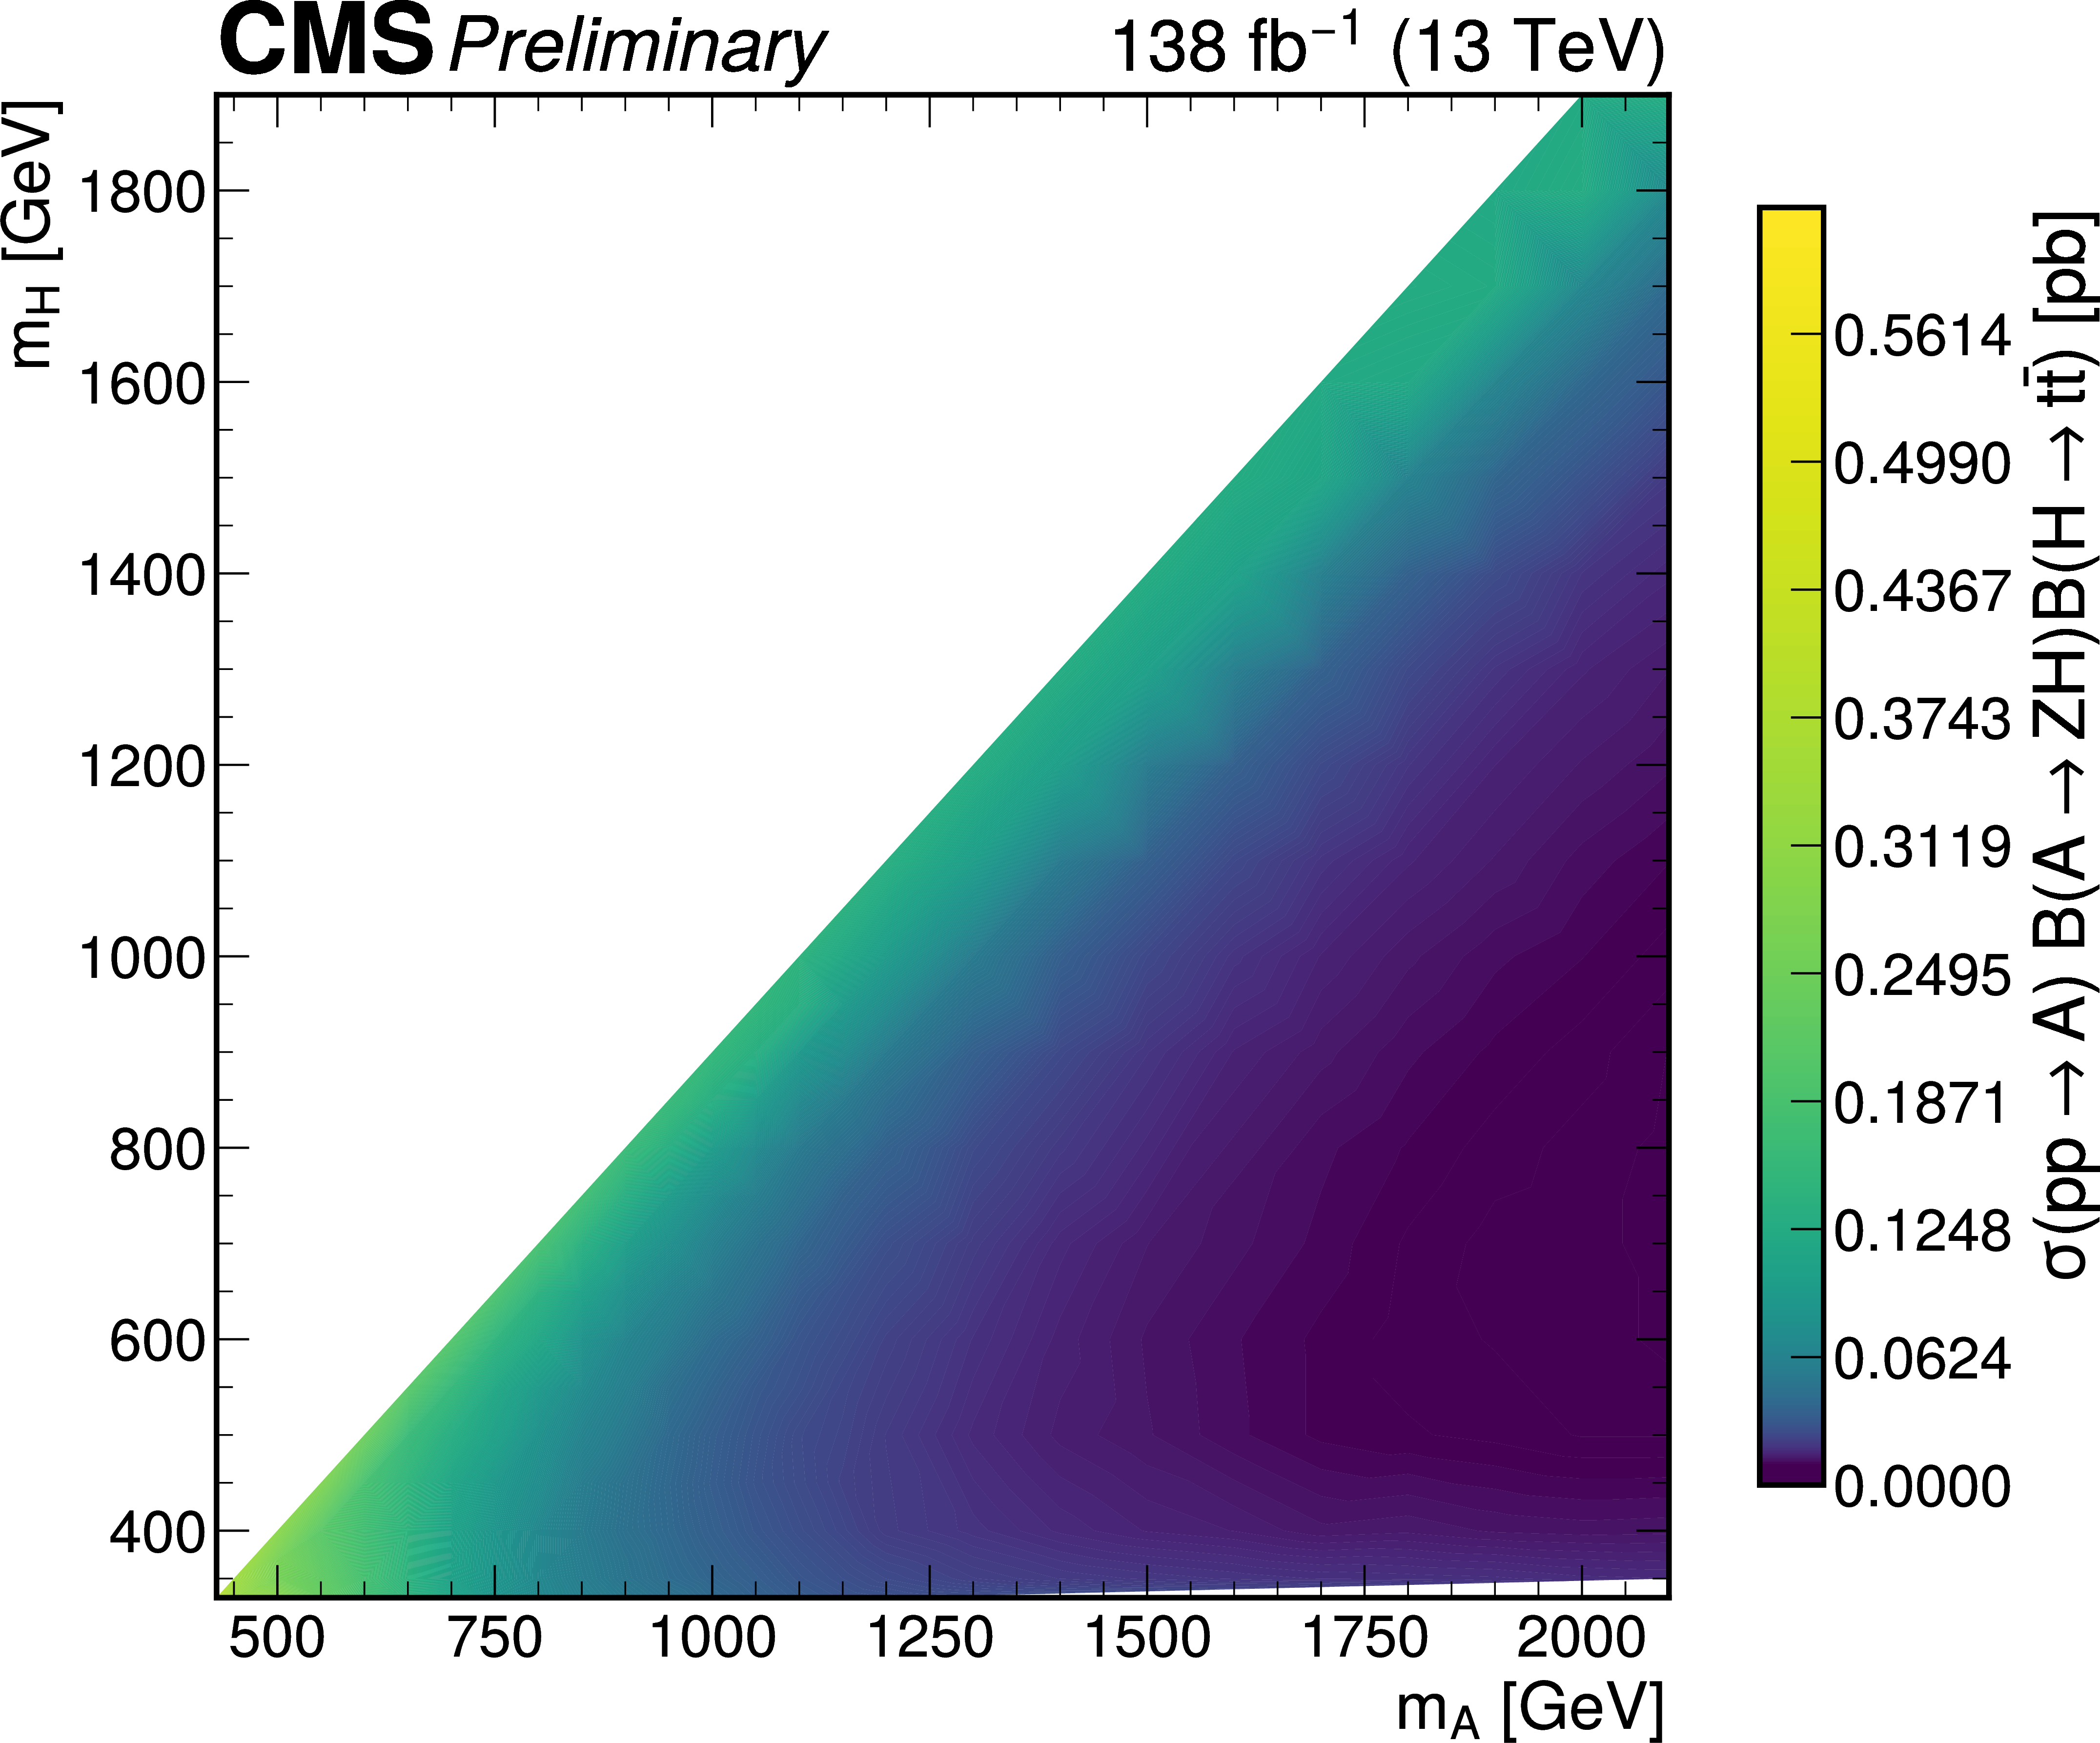
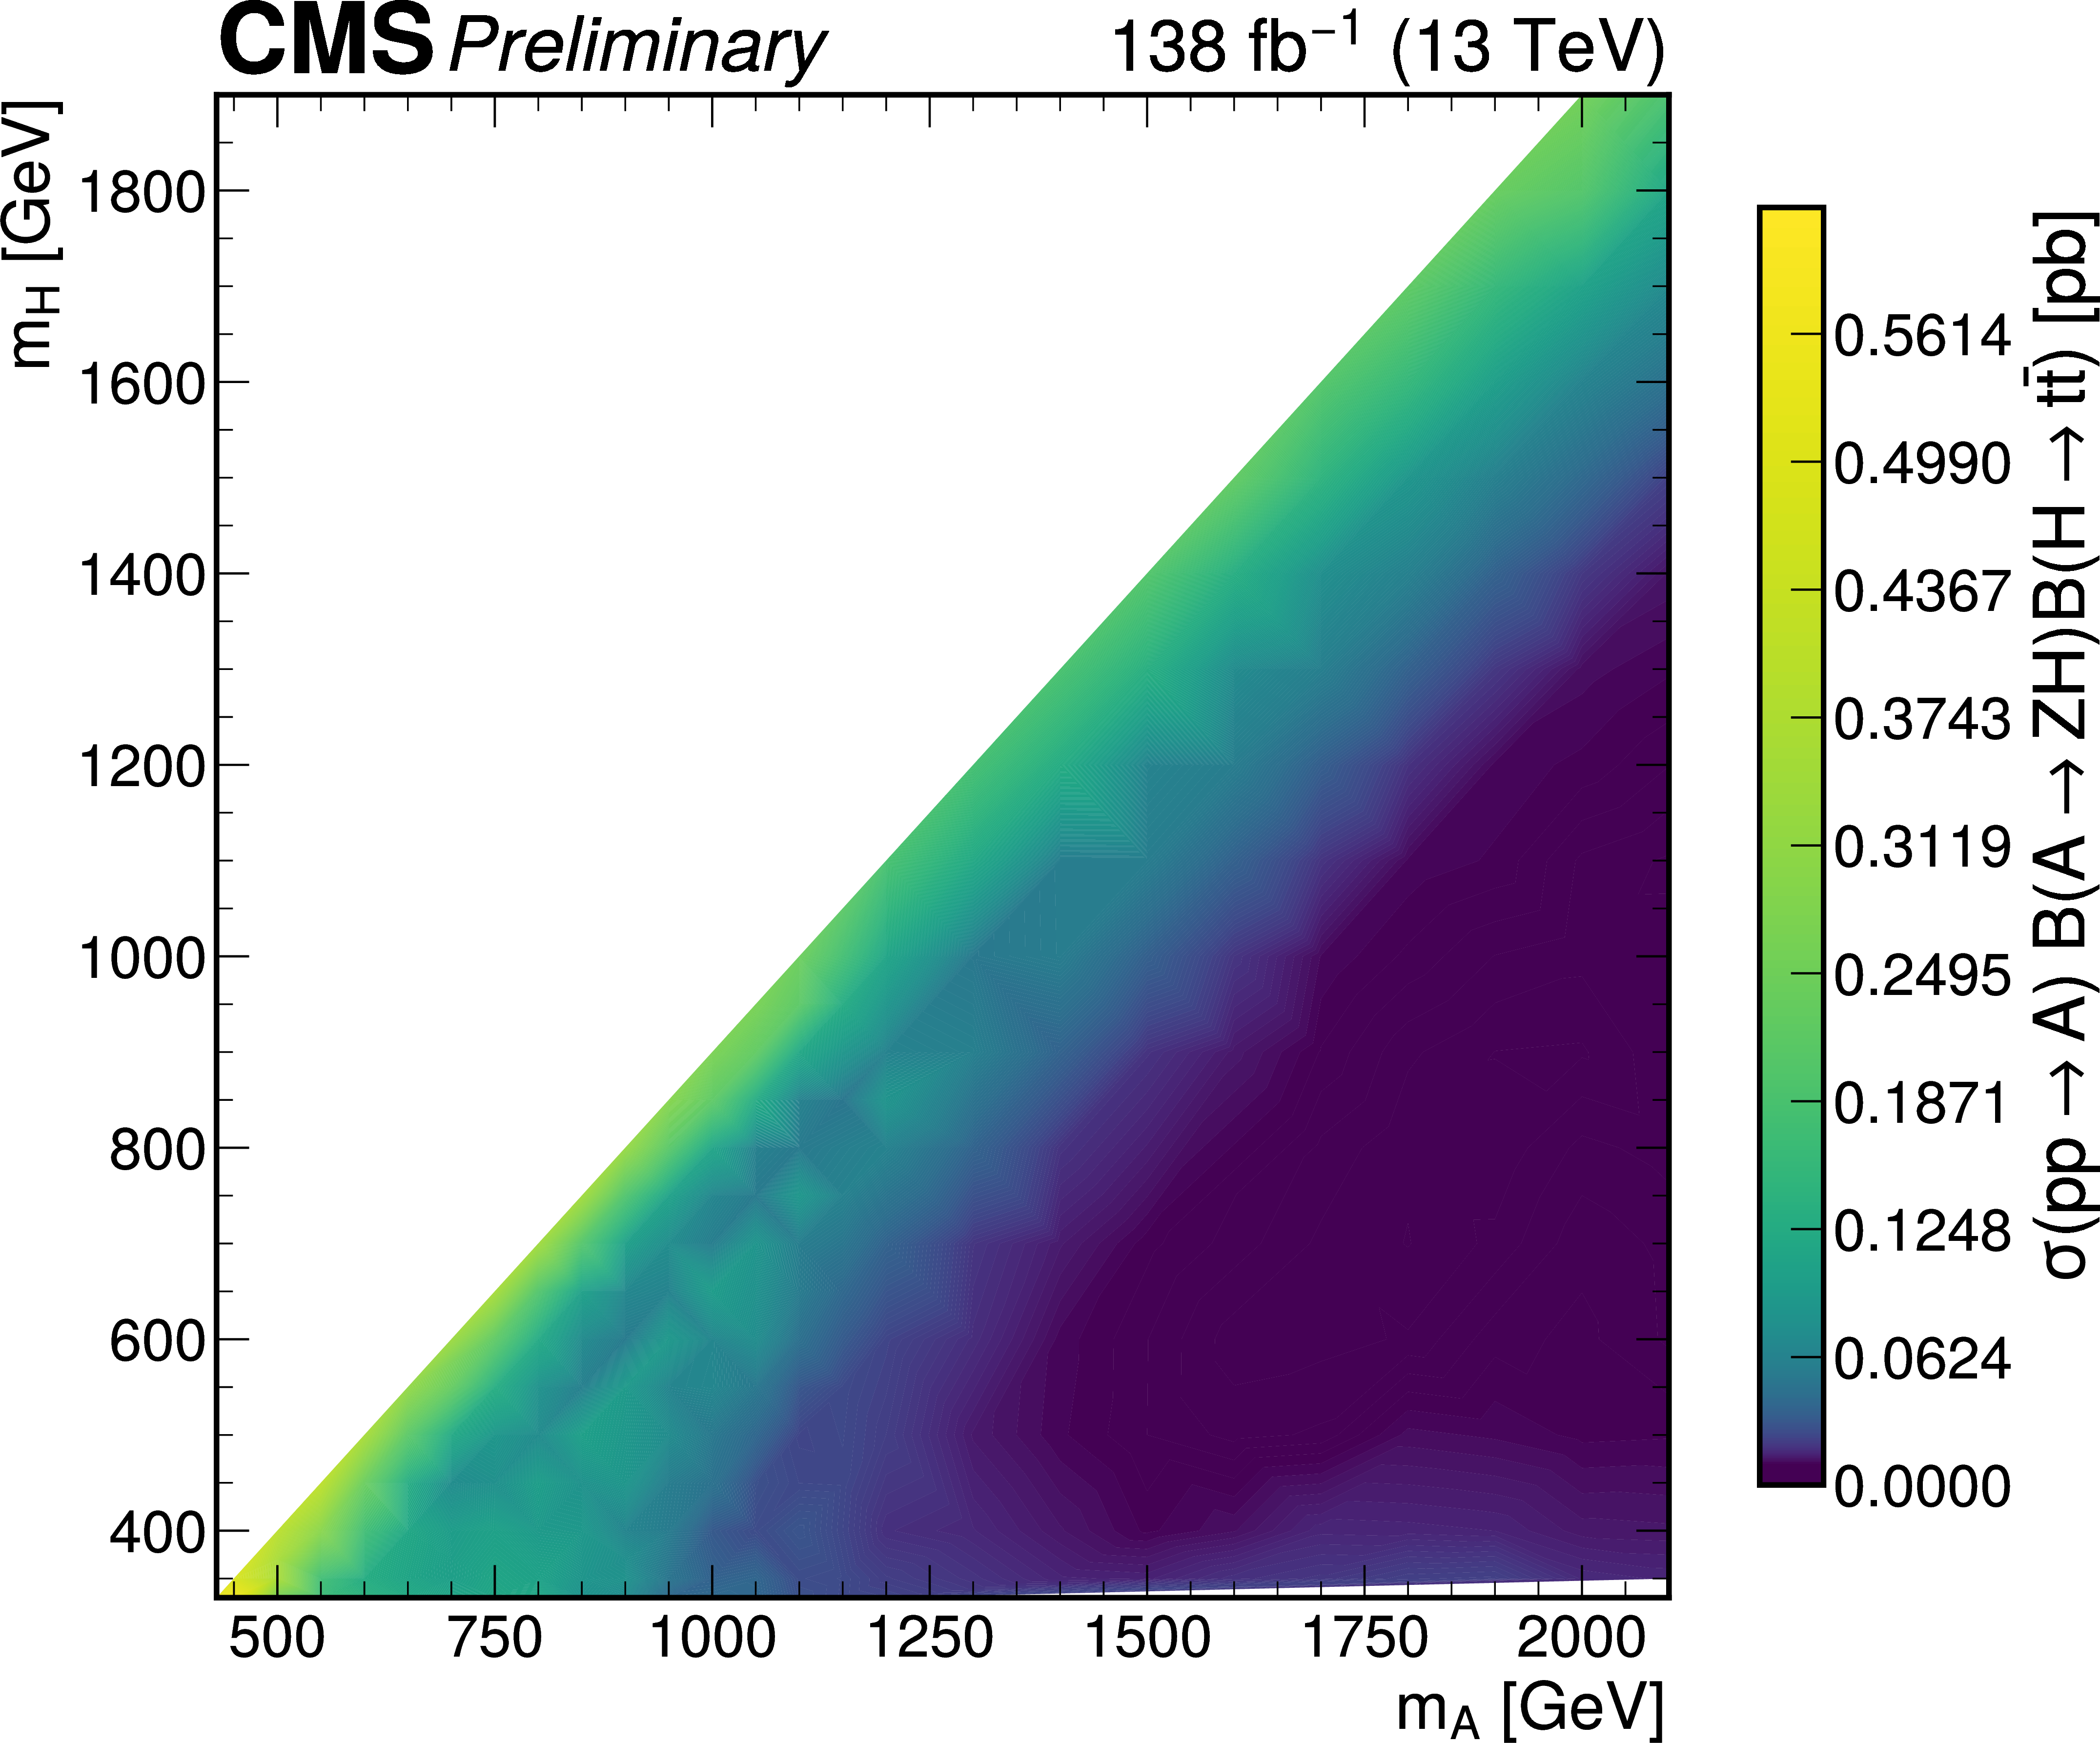
Median expected(left) and observed (right) upper limits at 95% CL on the production $ \sigma(\mathrm{p}\mathrm{p}\to\mathrm{A})\mathcal{B}(\mathrm{A}\to\mathrm{Z}\mathrm{H})\mathcal{B}(\mathrm{H}\to{\mathrm{t}\overline{\mathrm{t}}} ) $ in the ($ m_{\mathrm{A}} $,$ m_{\mathrm{H}} $) plane. |
png pdf |
Figure 10-a:
Median expected(left) and observed (right) upper limits at 95% CL on the production $ \sigma(\mathrm{p}\mathrm{p}\to\mathrm{A})\mathcal{B}(\mathrm{A}\to\mathrm{Z}\mathrm{H})\mathcal{B}(\mathrm{H}\to{\mathrm{t}\overline{\mathrm{t}}} ) $ in the ($ m_{\mathrm{A}} $,$ m_{\mathrm{H}} $) plane. |
png pdf |
Figure 10-b:
Median expected(left) and observed (right) upper limits at 95% CL on the production $ \sigma(\mathrm{p}\mathrm{p}\to\mathrm{A})\mathcal{B}(\mathrm{A}\to\mathrm{Z}\mathrm{H})\mathcal{B}(\mathrm{H}\to{\mathrm{t}\overline{\mathrm{t}}} ) $ in the ($ m_{\mathrm{A}} $,$ m_{\mathrm{H}} $) plane. |
png pdf |
Figure 11:
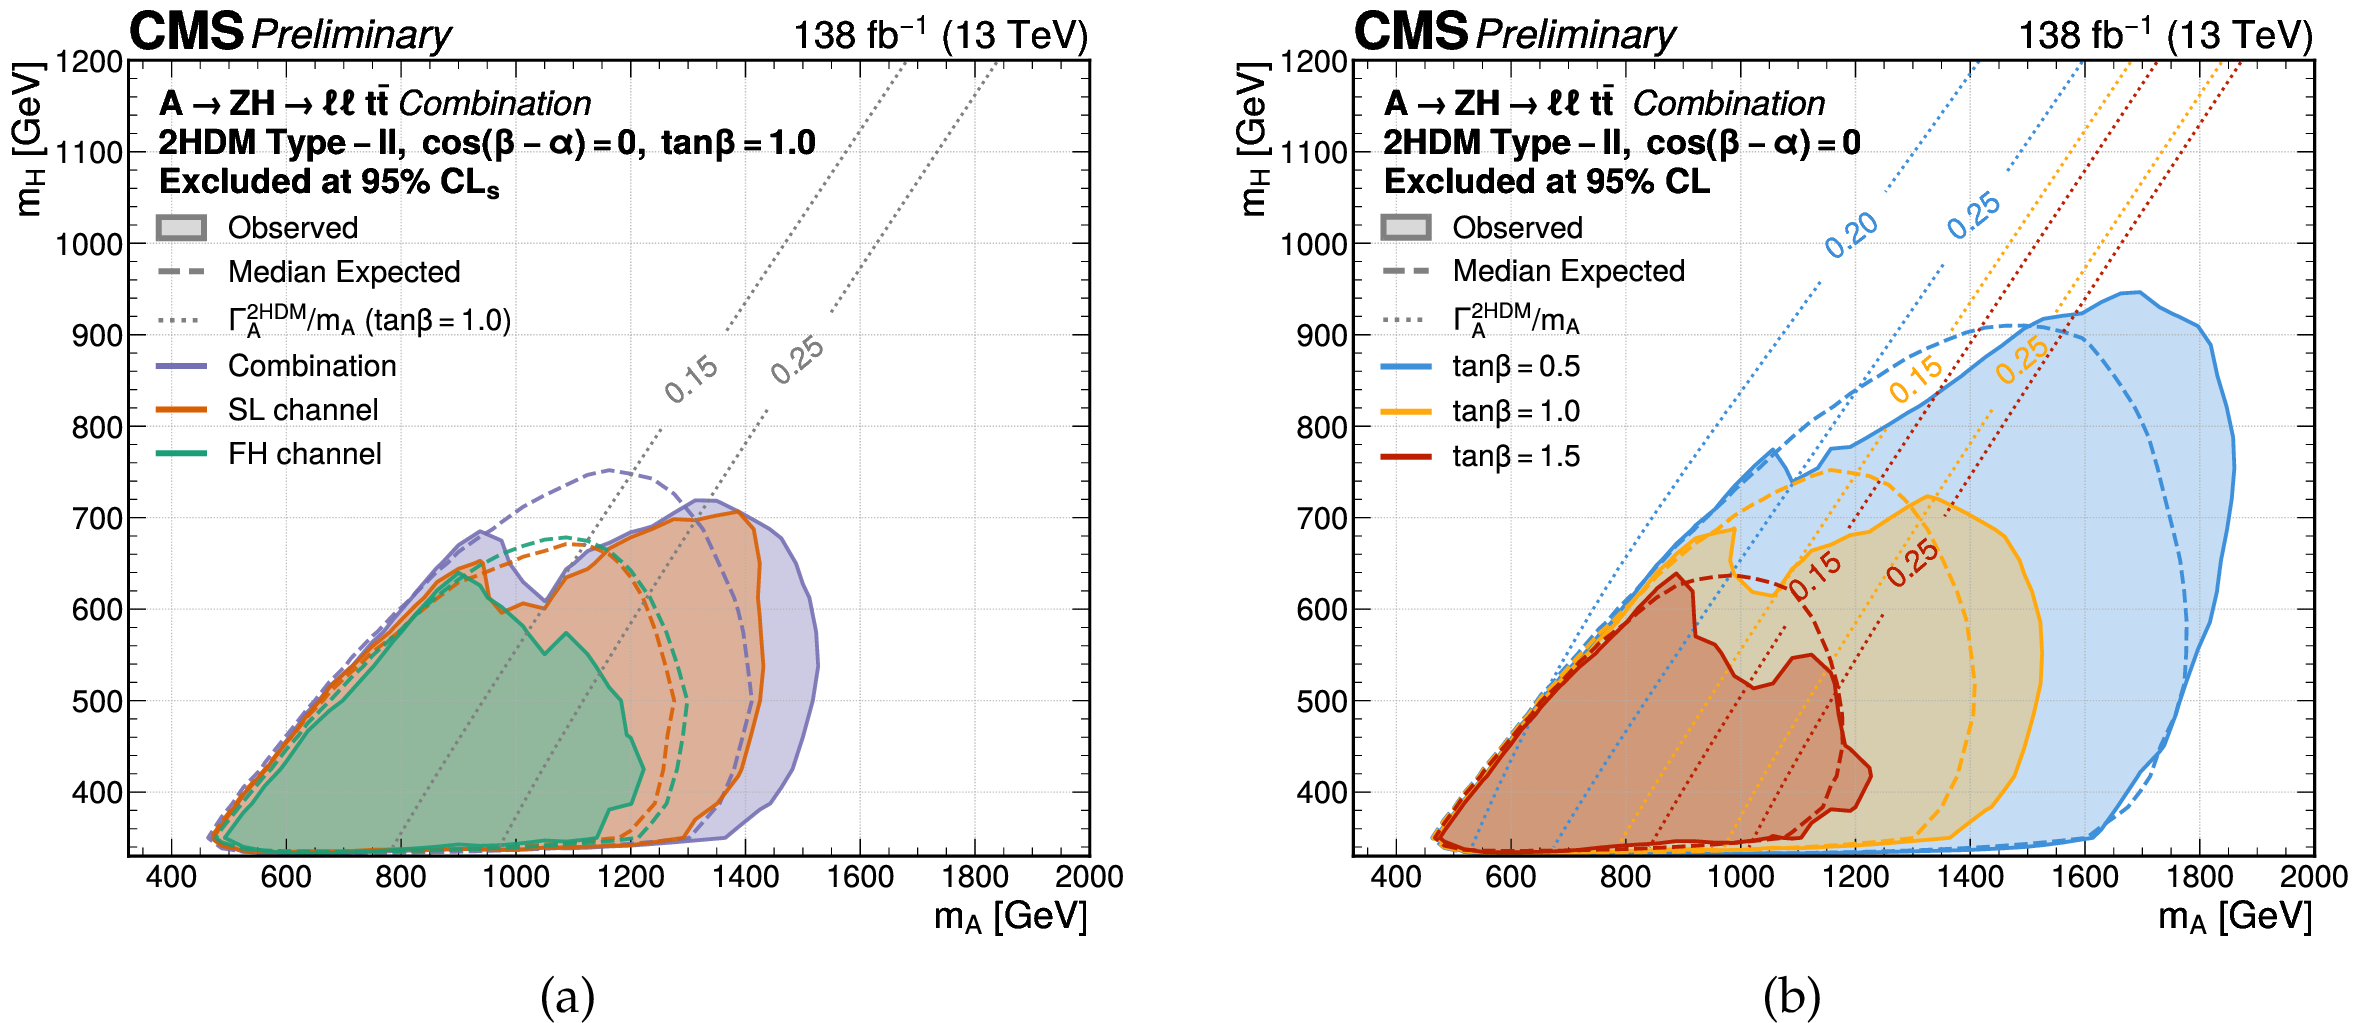
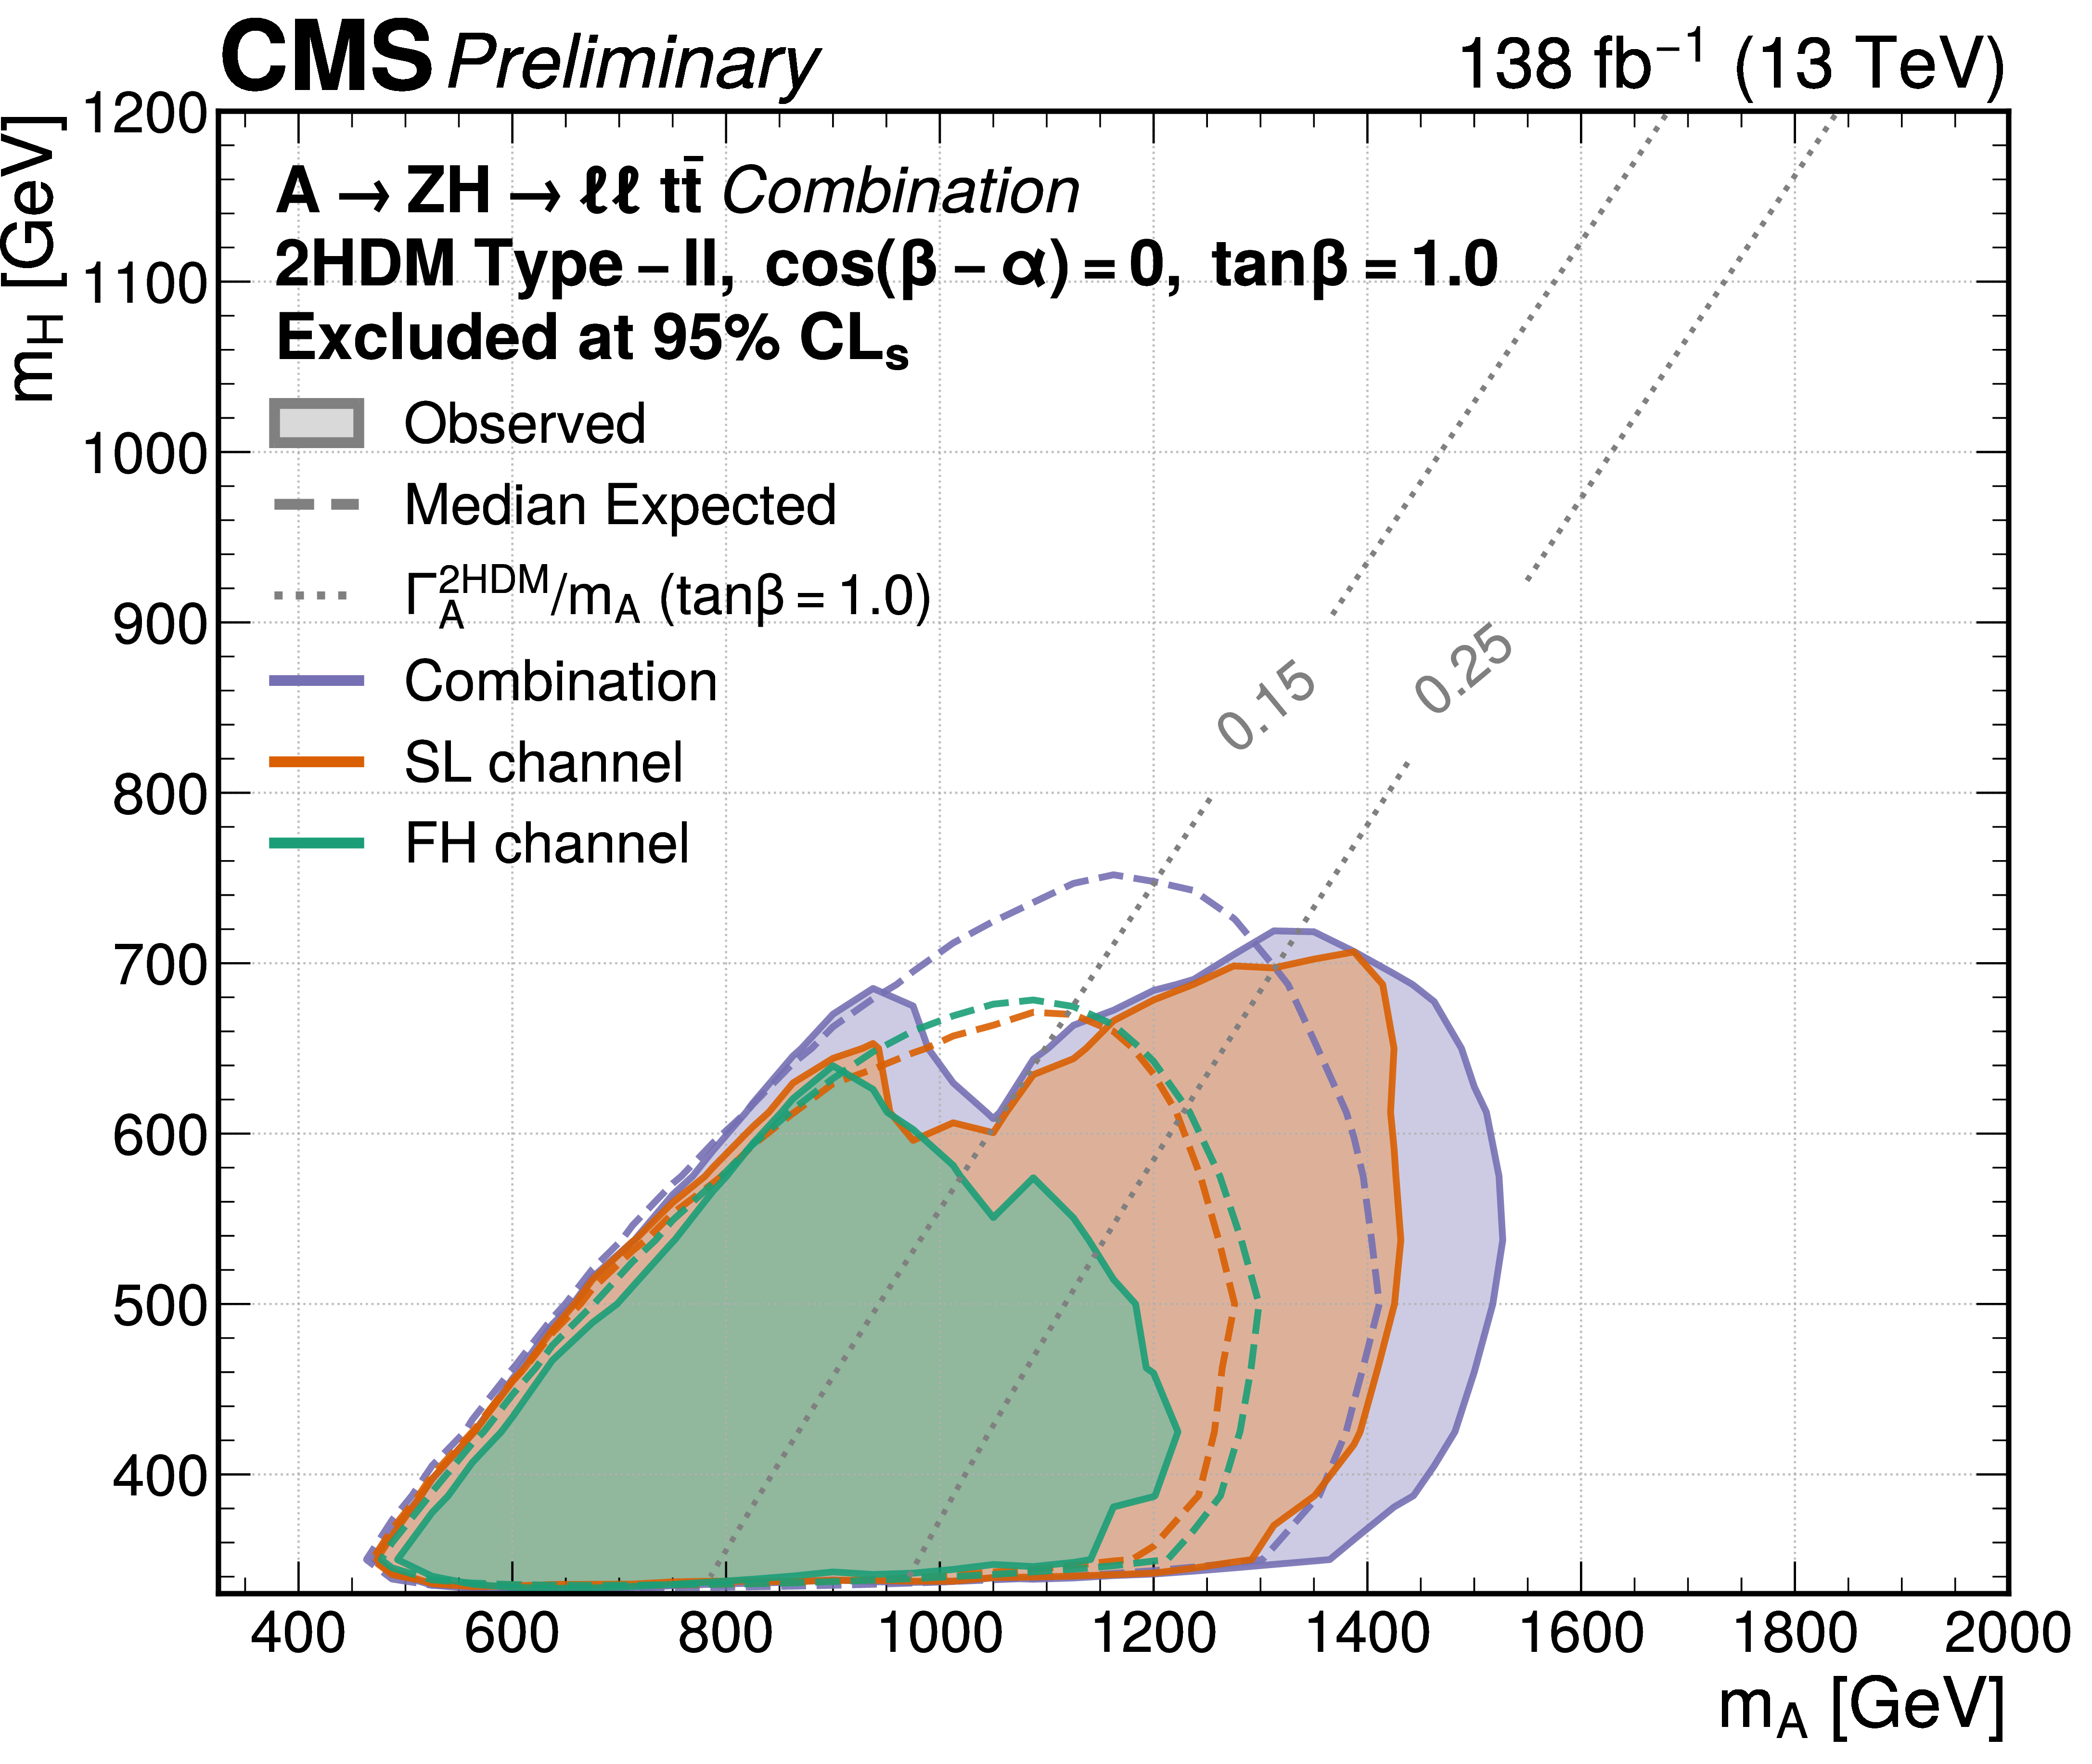
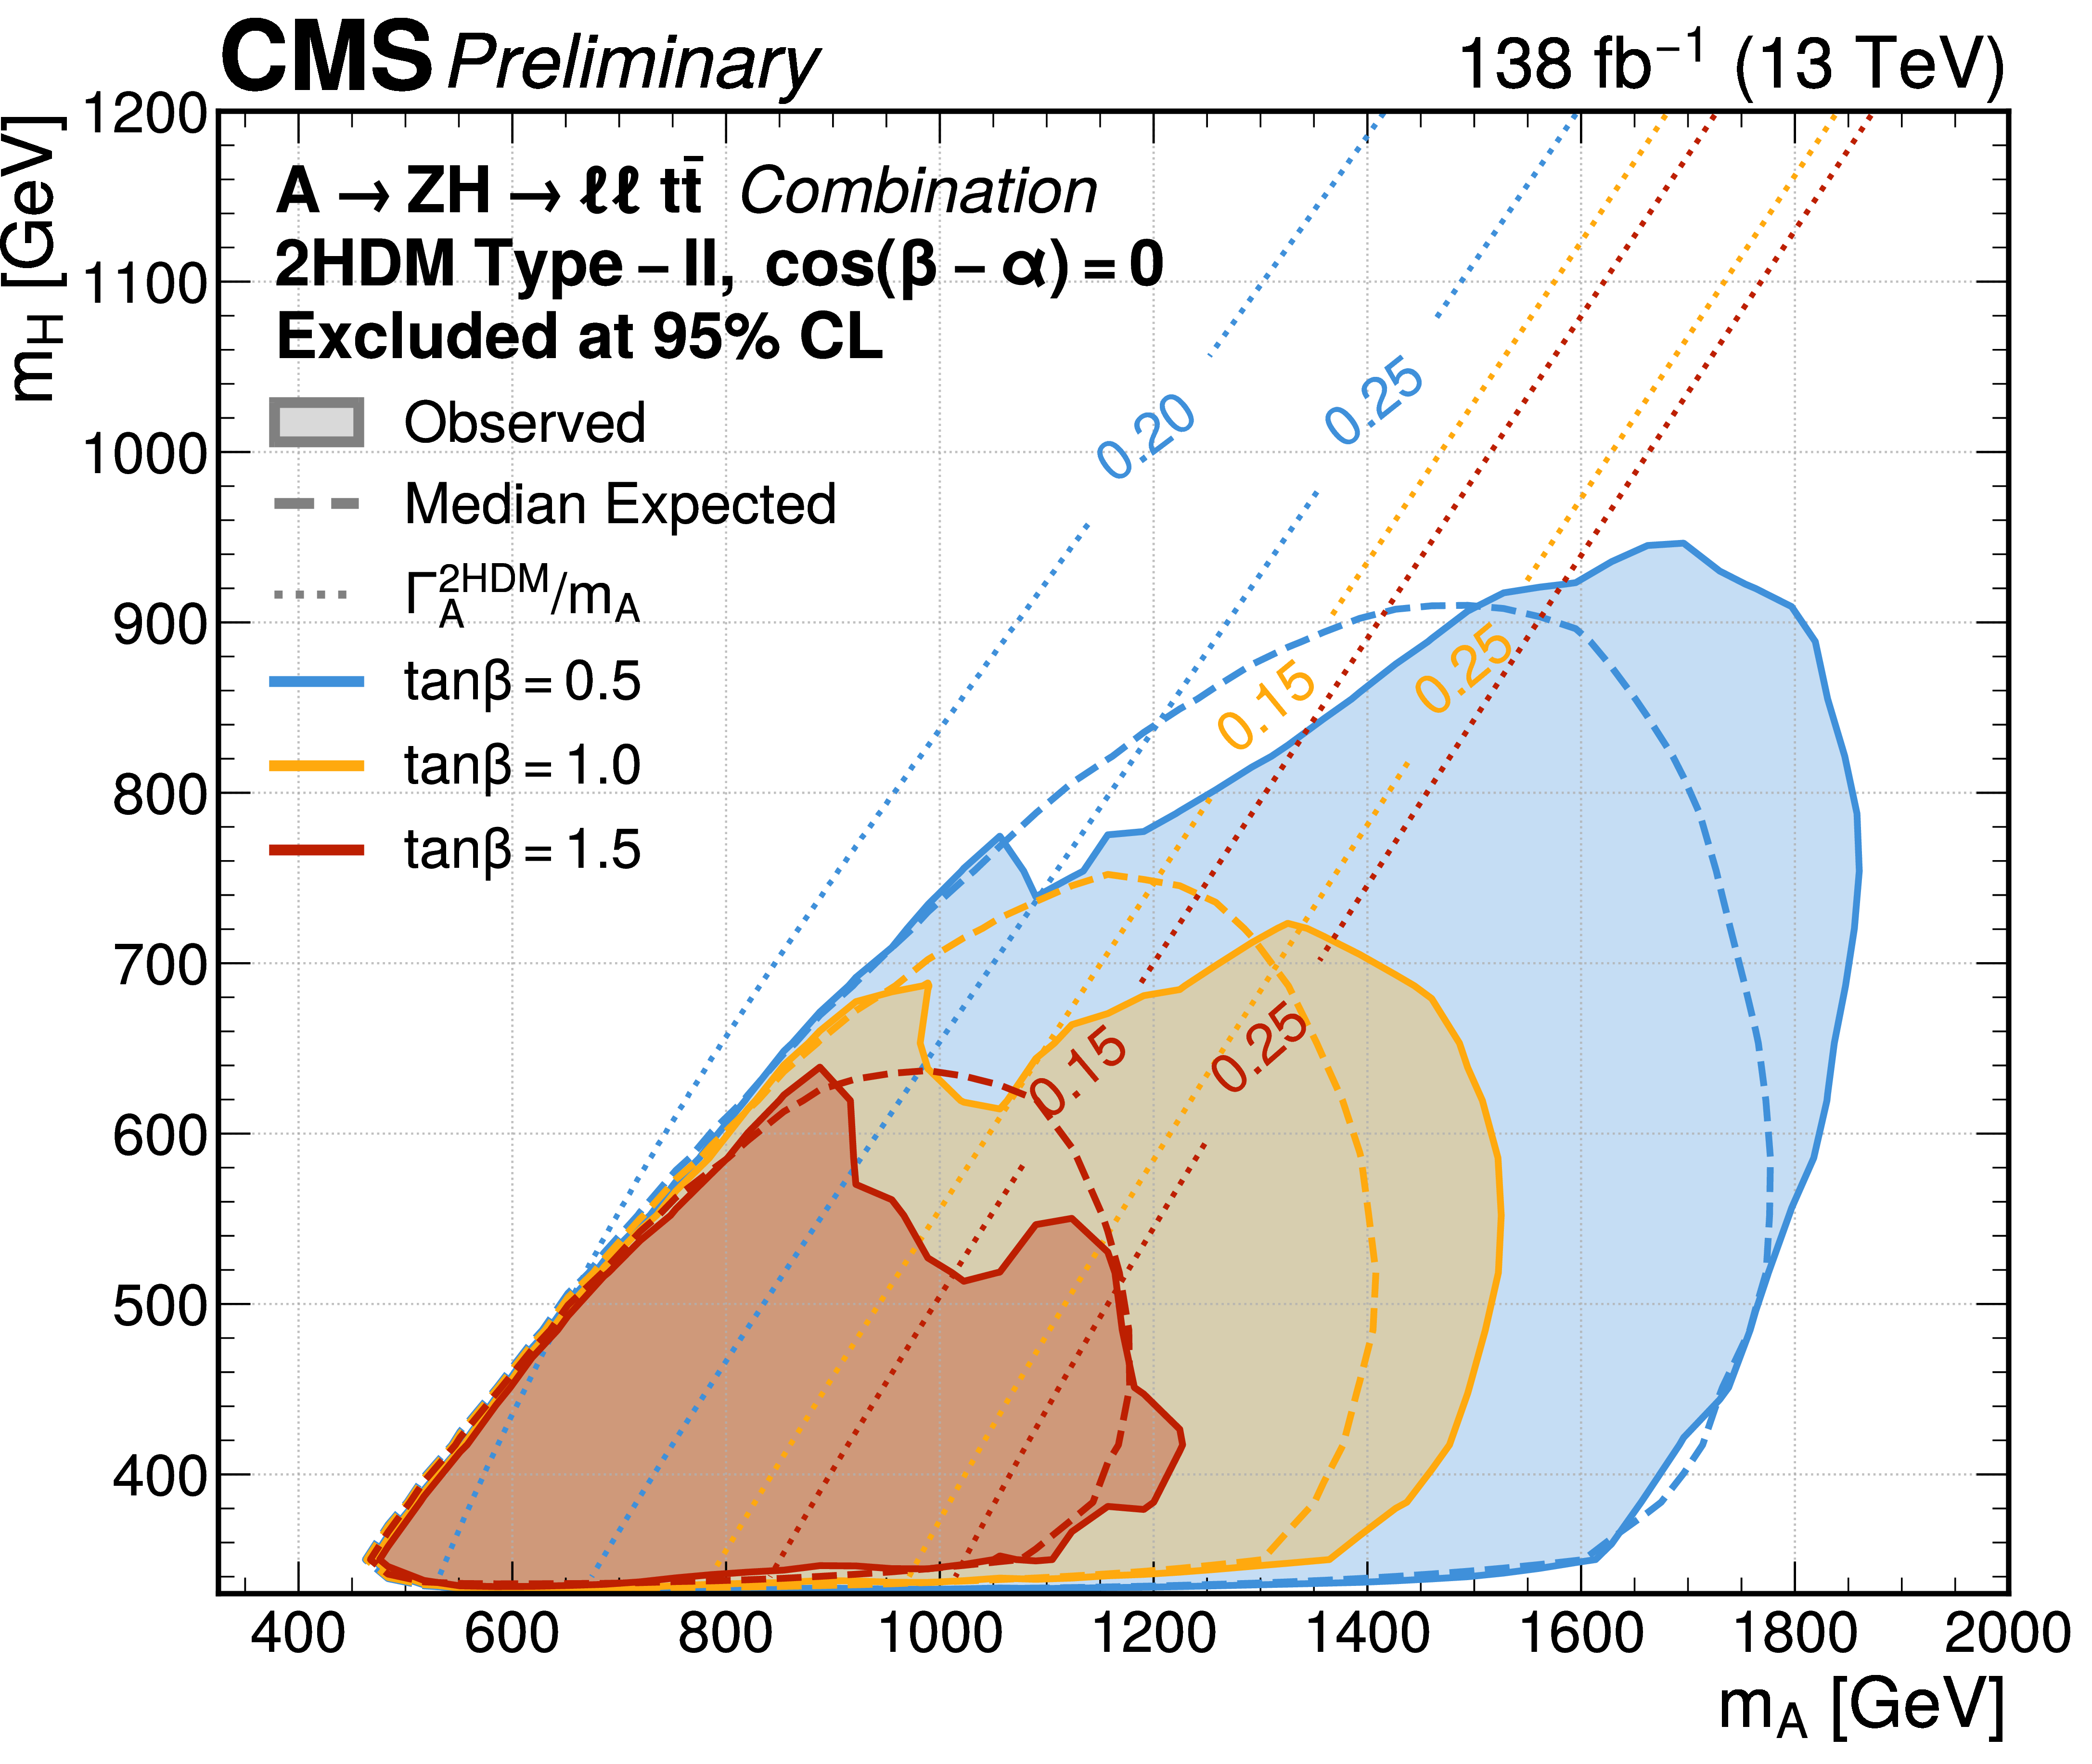
Median expected (dashed lines) and observed (filled contours) excluded regions of the 2D ($ m_{\mathrm{A}} $, $ m_{\mathrm{H}} $) plane for various type-II 2HDM scenarios. In Fig. fig:compare_obs_int_ma-mh, the results of the combined analysis (purple) are compared to the results of the semileptonic (orange) and fully-hadronic (green) decay channels. In Fig. fig:obs_int_ma-mh_CombRunII, combined results are presented for $ \tan\beta = $ 0.5 (blue), 1 (orange), and 2 (red). The excluded regions are derived for narrow resonances. The dotted lines correspond to constant decay width of the $ \mathrm{A} $ boson for different values of $ \tan\beta $. |
png pdf |
Figure 11-a:
Median expected (dashed lines) and observed (filled contours) excluded regions of the 2D ($ m_{\mathrm{A}} $, $ m_{\mathrm{H}} $) plane for various type-II 2HDM scenarios. In Fig. fig:compare_obs_int_ma-mh, the results of the combined analysis (purple) are compared to the results of the semileptonic (orange) and fully-hadronic (green) decay channels. In Fig. fig:obs_int_ma-mh_CombRunII, combined results are presented for $ \tan\beta = $ 0.5 (blue), 1 (orange), and 2 (red). The excluded regions are derived for narrow resonances. The dotted lines correspond to constant decay width of the $ \mathrm{A} $ boson for different values of $ \tan\beta $. |
png pdf |
Figure 11-b:
Median expected (dashed lines) and observed (filled contours) excluded regions of the 2D ($ m_{\mathrm{A}} $, $ m_{\mathrm{H}} $) plane for various type-II 2HDM scenarios. In Fig. fig:compare_obs_int_ma-mh, the results of the combined analysis (purple) are compared to the results of the semileptonic (orange) and fully-hadronic (green) decay channels. In Fig. fig:obs_int_ma-mh_CombRunII, combined results are presented for $ \tan\beta = $ 0.5 (blue), 1 (orange), and 2 (red). The excluded regions are derived for narrow resonances. The dotted lines correspond to constant decay width of the $ \mathrm{A} $ boson for different values of $ \tan\beta $. |
png pdf |
Figure 12:
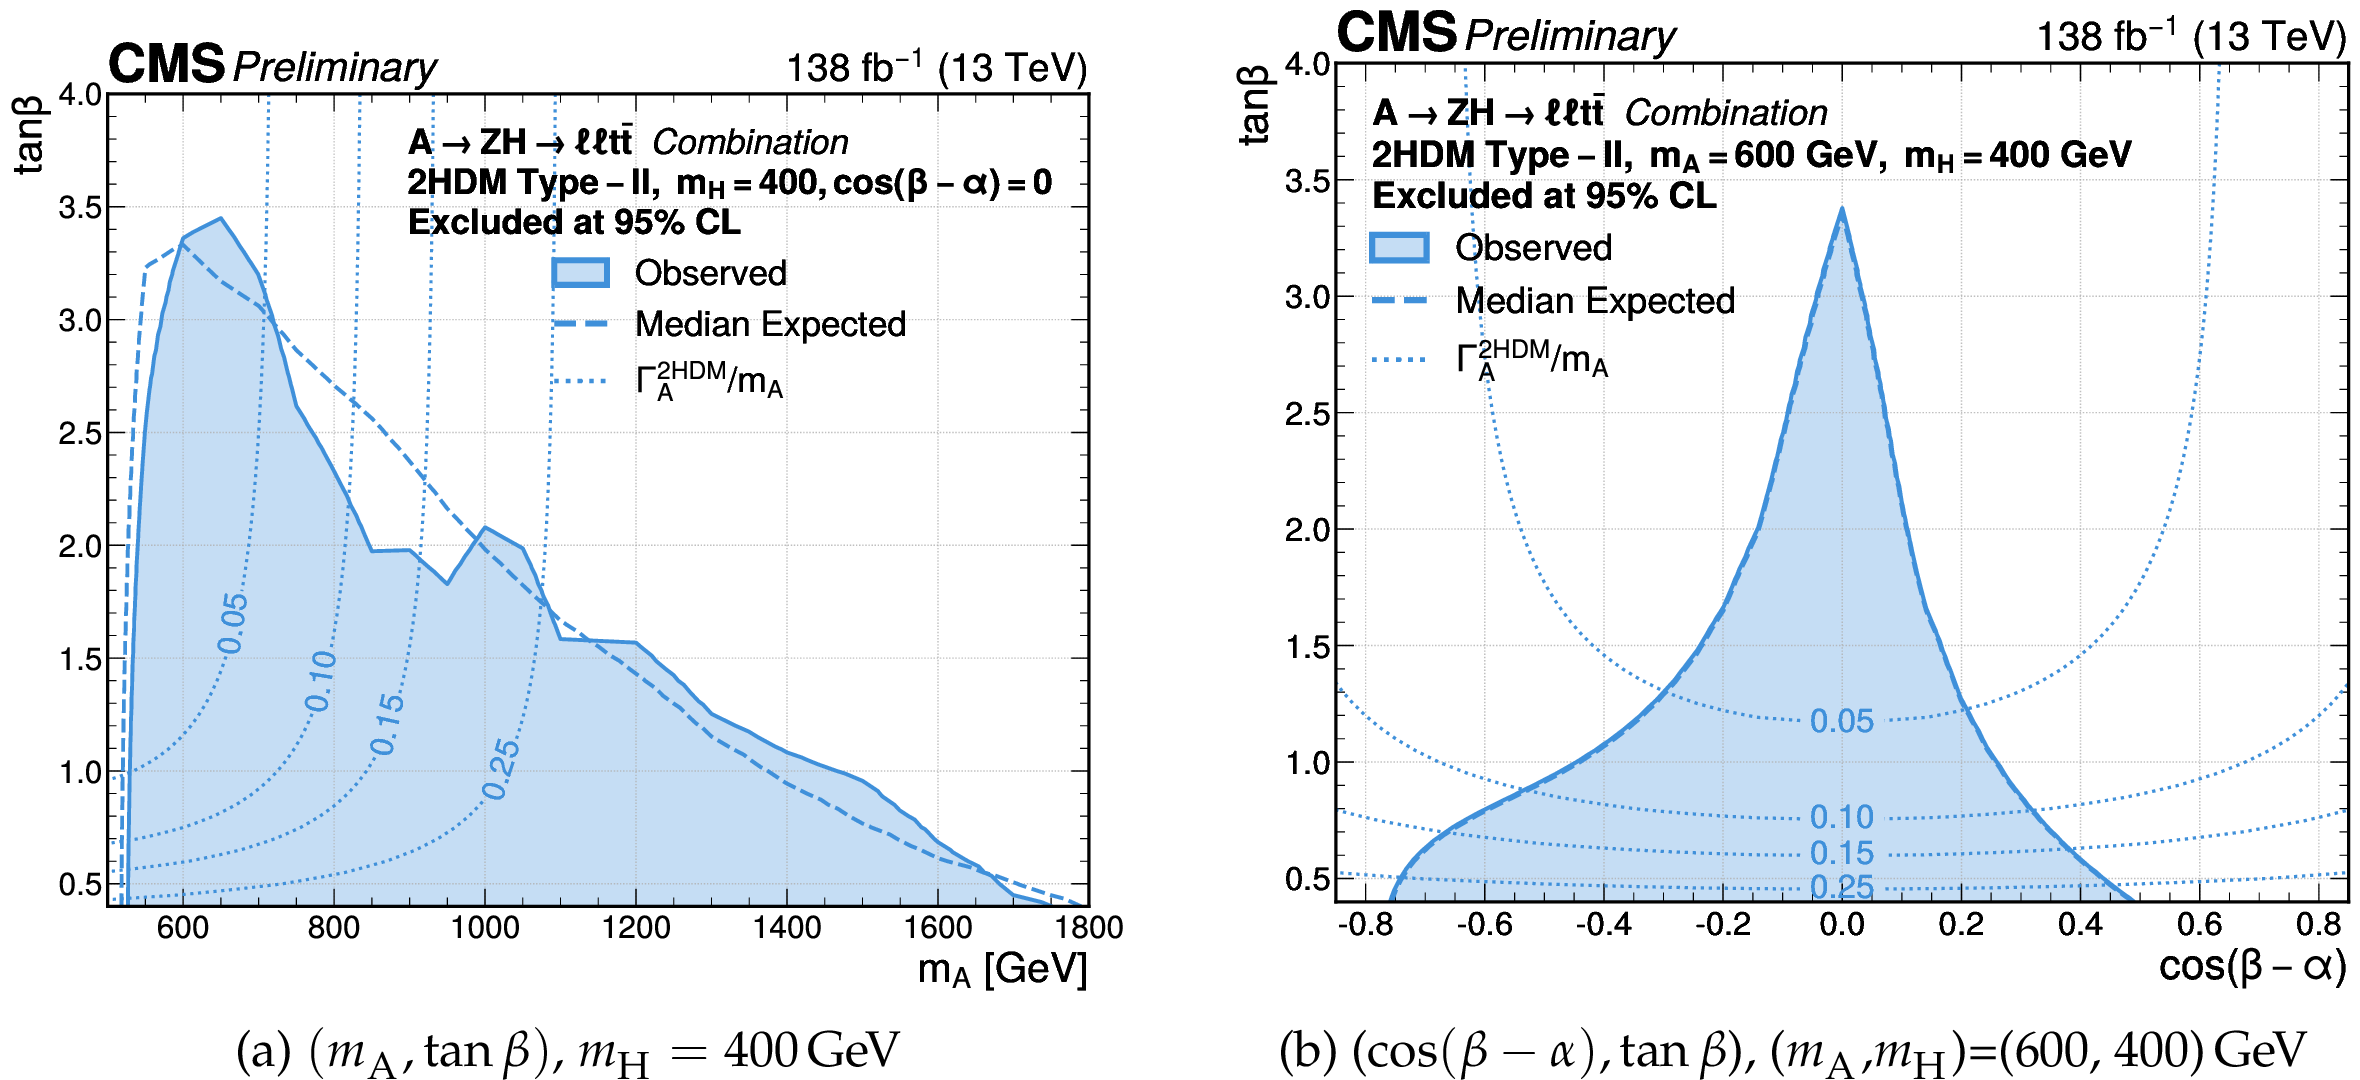
Median expected (dashed lines) and observed (filled contours) excluded regions for the conbined analysis, for different regions of the type-II 2HDM parameter space. The excluded regions are derived for narrow resonances. The dotted lines correspond to constant decay width of the $ \mathrm{A} $ boson. |
png pdf |
Figure 12-a:
Median expected (dashed lines) and observed (filled contours) excluded regions for the conbined analysis, for different regions of the type-II 2HDM parameter space. The excluded regions are derived for narrow resonances. The dotted lines correspond to constant decay width of the $ \mathrm{A} $ boson. |
png pdf |
Figure 12-b:
Median expected (dashed lines) and observed (filled contours) excluded regions for the conbined analysis, for different regions of the type-II 2HDM parameter space. The excluded regions are derived for narrow resonances. The dotted lines correspond to constant decay width of the $ \mathrm{A} $ boson. |
| Tables | |
png pdf |
Table 1:
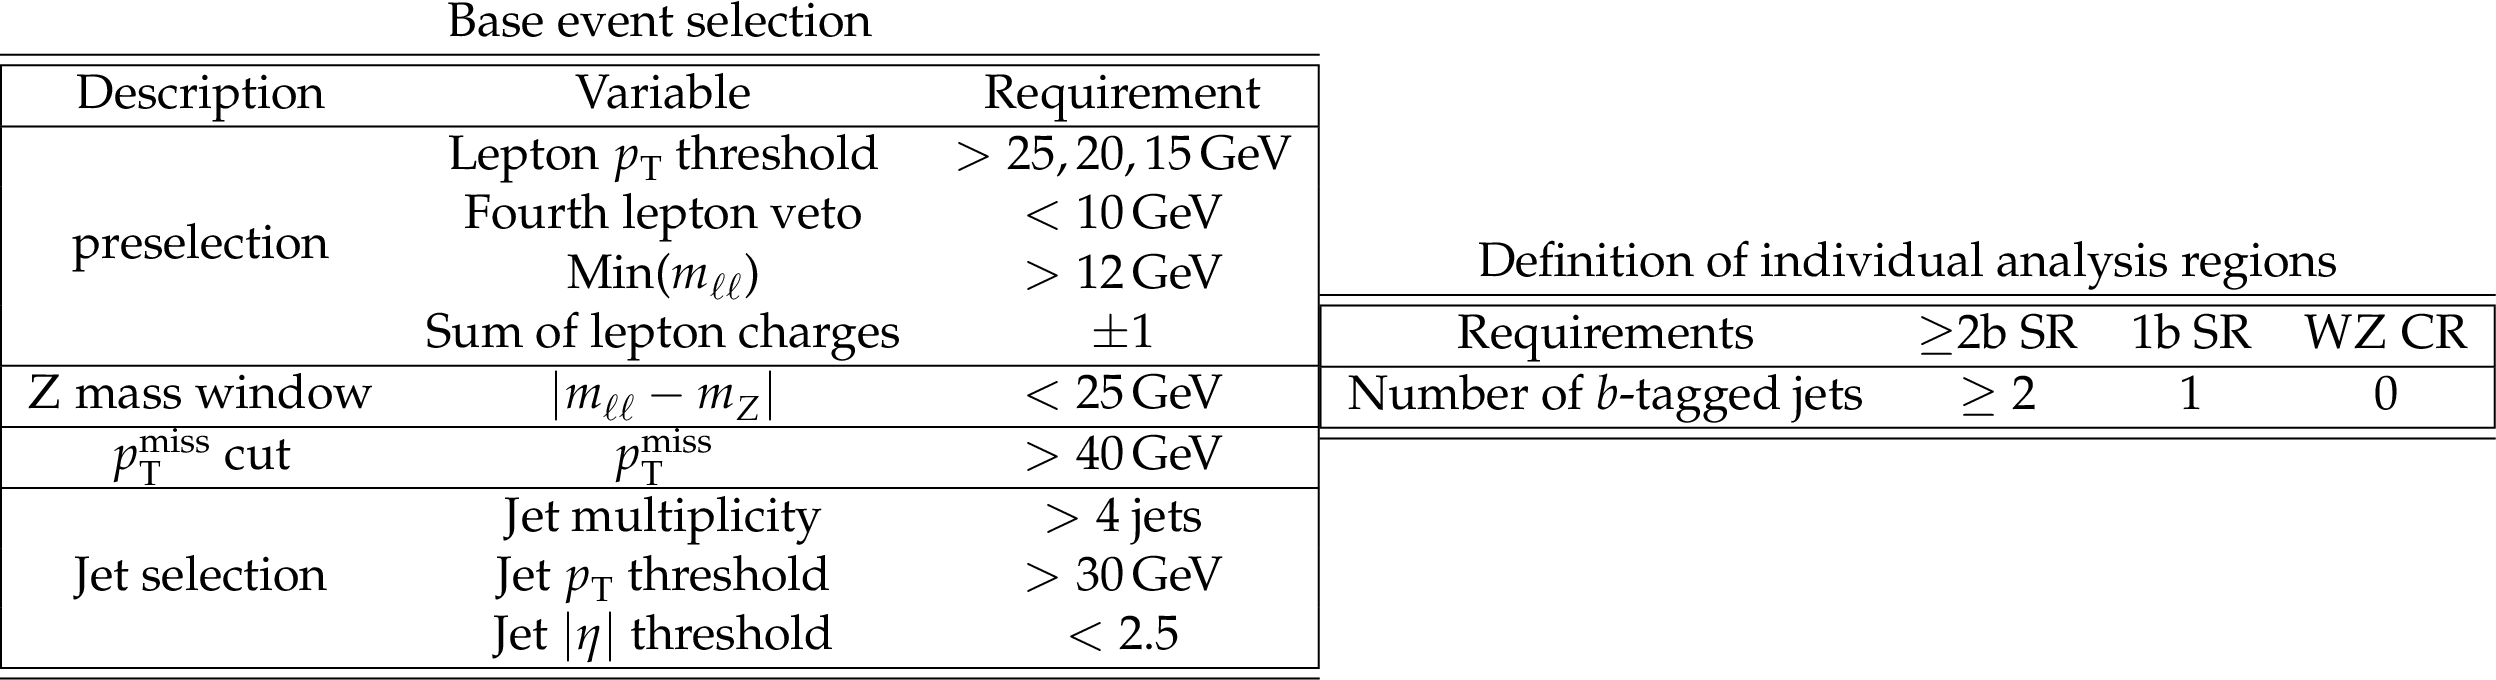
Full event selection of signal and control regions. |
| Summary |
| A search for narrow, heavy resonances $ \mathrm{A} $ and H was performed with proton-proton collision data collected by the CMS experiment at a center-of-mass energy of 13 TeV during 2016--2018, corresponding to a total integrated luminosity of 138 fb$^{-1}$. The search targets $ \mathrm{A}\to\mathrm{Z}\mathrm{H} $ with $ \mathrm{H}\to{\mathrm{t}\overline{\mathrm{t}}} $, in which the Z boson decays to leptons and the $ \mathrm{t} \overline{\mathrm{t}} $ system decays semileptonically to $ (\ell\nu\mathrm{b})(\mathrm{q}\mathrm{q}\mathrm{b}) $. The final observable is constructed using elliptical binning in the two-dimensional distribution of the two sensitive variables, $ p_{\mathrm{T}}^{\mathrm{Z}} $ and $ \Delta m $. Upper limits on the production cross section times branching ratio $ \sigma(\mathrm{p}\mathrm{p}\to\mathrm{A})\mathcal{B}(\mathrm{A}\to\mathrm{Z}\mathrm{H})\mathcal{B}(\mathrm{H}\to{\mathrm{t}\overline{\mathrm{t}}} ) $ were derived for generic resonances $ \mathrm{A} $ and H at 95% confidence level, considering masses of $ m_{\mathrm{A}} $ and $ m_{\mathrm{H}} $ between 430--2100 GeV and 330--2000 GeV respectively. The limits have been interpreted in the context of a type-II two-Higgs-doublet model to obtain model dependent exclusion limits as a function of the masses $ m_{\mathrm{A}} $ and $ m_{\mathrm{H}} $, and as a function of the $ \tan\beta $ and $ \cos(\beta-\alpha) $ parameters. The results are then combined with a previously published search targeting the decay channel in which the $ \mathrm{t} \overline{\mathrm{t}} $ system decays fully-hadronically to $ (\mathrm{q}\mathrm{q}\mathrm{b})(\mathrm{q}\mathrm{q}\mathrm{b}) $, which has a similar sensitivity. Stringent limits are set on the cross section times branching ratio of $ \mathrm{A}\to\mathrm{Z}\mathrm{H} $ with $ \mathrm{H}\to{\mathrm{t}\overline{\mathrm{t}}} $. The results of the combined searches extends the reach of the individual channels, setting stringent limits on the cross section times branching ratio of $ \mathrm{A}\to\mathrm{Z}\mathrm{H} $ with $ \mathrm{H}\to{\mathrm{t}\overline{\mathrm{t}}} $, further constraining the parameter regions relevant for models explaining baryogenesis. |
| References | ||||
| 1 | H. E. Haber and G. L. Kane | The search for Supersymmetry: Probing physics beyond the standard model | Phys. Rept. 117 (1985) 75 | |
| 2 | J. E. Kim | Light pseudoscalars, particle physics and cosmology | Physics Reports 150 (1987) 1 | |
| 3 | M. Bauer, U. Haisch, and F. Kahlhoefer | Simplified dark matter models with two Higgs doublets: I. pseudoscalar mediators | JHEP 05 (2017) 138 | 1701.07427 |
| 4 | M. Trodden | Electroweak baryogenesis: A brief review | in 33rd Rencontres de Moriond: Electroweak Interactions and Unified Theories, 1998 | hep-ph/9805252 |
| 5 | T. Biekötter et al. | The trap in the early universe: impact on the interplay between gravitational waves and LHC physics in the 2HDM | JCAP 03 (2023) 031 | 2208.14466 |
| 6 | T. D. Lee | A theory of spontaneous T violation | PRD 8 (1973) 1226 | |
| 7 | G. C. Branco et al. | Theory and phenomenology of two-Higgs-doublet models | Phys. Rept. 516 (2012) 1 | 1106.0034 |
| 8 | F. Kling, S. Su, and W. Su | 2hdm neutral scalars under the lhc | Journal of High Energy Physics 2020 (2020) | |
| 9 | U. Haisch and G. Polesello | Searching for heavy Higgs bosons in the ttZ and tbW final states | Journal of High Energy Physics 2018 (2018) 151 | |
| 10 | CMS Collaboration | Combined measurements of Higgs boson couplings in proton-proton collisions at $ \sqrt{s}=13 \text {Te}\text {V} $ | EPJC 79 (2019) 421 | CMS-HIG-17-031 1809.10733 |
| 11 | ATLAS Collaboration | Combined measurements of Higgs boson production and decay using up to 80 fb$ ^{-1} $ of proton-proton collision data at $ \sqrt{s}= $ 13 TeV collected with the ATLAS experiment | PRD 101 (2020) 012002 | 1909.02845 |
| 12 | ATLAS Collaboration | Search for heavy neutral Higgs bosons decaying into a top quark pair in 140 fb$^{-1}$ of proton-proton collision data at $ \sqrt{s}= $ 13 TeV with the ATLAS detector | JHEP 08 (2024) 013 | 2404.18986 |
| 13 | CMS Collaboration | Search for heavy pseudoscalar and scalar bosons decaying to a top quark pair in proton-proton collisions at $ \sqrt{s} = 13 \textrm{TeV} $ | Rept. Prog. Phys. 88 (2025) 127801 | CMS-HIG-22-013 2507.05119 |
| 14 | CMS Collaboration | Search for production of four top quarks in final states with same-sign or multiple leptons in proton-proton collisions at $ \sqrt{s}= $ 13 TeV | EPJC 80 (2020) 75 | CMS-TOP-18-003 1908.06463 |
| 15 | ATLAS Collaboration | Search for new phenomena in events with same-charge leptons and b-jets in pp collisions at $ \sqrt{s}= $ 13 TeV with the ATLAS detector | JHEP 12 (2018) 039 | 1807.11883 |
| 16 | ATLAS Collaboration | Search for a heavy Higgs boson decaying into a Z boson and another heavy Higgs boson in the $ \ell\ell\mathrm{b}\mathrm{b} $ and $ \ell\ell\mathrm{W}\mathrm{W} $ final states in pp collisions at $ \sqrt{s}= $ 13 TeV with the ATLAS detector | EPJC 81 (2021) 396 | 2011.05639 |
| 17 | CMS Collaboration | Search for new neutral Higgs bosons through the $ \mathrm{H}\to\mathrm{Z}\mathrm{A}\to\ell^{+}\ell^{-}\mathrm{b}\overline{\mathrm{b}} $ process in pp collisions at $ \sqrt{s}= $ 13 TeV | JHEP 03 (2020) 055 | CMS-HIG-18-012 1911.03781 |
| 18 | CMS Collaboration | Search for neutral resonances decaying into a Z boson and a pair of b jets or $ \tau $ leptons | PLB 759 (2016) 369 | CMS-HIG-15-001 1603.02991 |
| 19 | ATLAS Collaboration | Search for a CP-odd Higgs boson decaying to a heavy CP-even Higgs boson and a Z boson in the $ \ell\ell{\mathrm{t}\overline{\mathrm{t}}} $ and $ \nu\overline{\nu}\mathrm{b}\overline{\mathrm{b}} $ final states using 140 fb$^{-1}$ of data collected with the ATLAS detector | JHEP 02 (2024) 197 | 2311.04033 |
| 20 | CMS Collaboration | Search for heavy neutral higgs bosons a and h in the $ \mathrm{t\bar{t}} $z channel in proton-proton collisions at 13 TeV | Physics Letters B 866 (2025) 139568 | 2412.00570 |
| 21 | CMS Collaboration | Precision luminosity measurement in proton-proton collisions at $ \sqrt{s} = $ 13 TeV in 2015 and 2016 at CMS | EPJC 81 (2021) 800 | CMS-LUM-17-003 2104.01927 |
| 22 | CMS Collaboration | CMS luminosity measurement for the 2017 data-taking period at $ \sqrt{s} = $ 13 TeV | CMS Physics Analysis Summary, 2017 CMS-PAS-LUM-17-004 |
CMS-PAS-LUM-17-004 |
| 23 | CMS Collaboration | CMS luminosity measurement for the 2018 data-taking period at $ \sqrt{s} = $ 13 TeV | CMS Physics Analysis Summary, 2019 CMS-PAS-LUM-18-002 |
CMS-PAS-LUM-18-002 |
| 24 | CMS Collaboration | The CMS experiment at the CERN LHC | JINST 3 (2008) S08004 | |
| 25 | CMS Collaboration | The CMS trigger system | JINST 12 (2017) P01020 | CMS-TRG-12-001 1609.02366 |
| 26 | CMS Collaboration | Performance of the CMS level-1 trigger in proton-proton collisions at $ \sqrt{s}= $ 13 TeV | JINST 15 (2020) P10017 | CMS-TRG-17-001 2006.10165 |
| 27 | W. Waltenberger, R. Fr \"u hwirth, and P. Vanlaer | Adaptive vertex fitting | JPG 34 (2007) N343 | |
| 28 | CMS Collaboration | Technical proposal for the Phase-II upgrade of the Compact Muon Solenoid | CMS Technical Proposal CERN-LHCC-2015-010, CMS-TDR-15-02, 2015 CDS |
|
| 29 | CMS Collaboration | Particle-flow reconstruction and global event description with the CMS detector | JINST 12 (2017) P10003 | CMS-PRF-14-001 1706.04965 |
| 30 | CMS Collaboration | Electron and photon reconstruction and identification with the CMS experiment at the CERN LHC | JINST 16 (2021) P05014 | CMS-EGM-17-001 2012.06888 |
| 31 | CMS Collaboration | ECAL 2016 refined calibration and Run2 summary plots | CMS Detector Performance Summary CMS-DP-2020-021, 2020 CDS |
|
| 32 | CMS Collaboration | Performance of the CMS muon detector and muon reconstruction with proton-proton collisions at $ \sqrt{s}= $ 13 TeV | JINST 13 (2018) P06015 | CMS-MUO-16-001 1804.04528 |
| 33 | CMS Collaboration | Pileup mitigation at CMS in 13 TeV data | JINST 15 (2020) P09018 | CMS-JME-18-001 2003.00503 |
| 34 | CMS Collaboration | Measurement of the Higgs boson production rate in association with top quarks in final states with electrons, muons, and hadronically decaying tau leptons at $ \sqrt{s} = $ 13 TeV | EPJC 81 (2021) 378 | CMS-HIG-19-008 2011.03652 |
| 35 | M. Cacciari, G. P. Salam, and G. Soyez | The anti-$ k_{\mathrm{T}} $ jet clustering algorithm | JHEP 04 (2008) 063 | 0802.1189 |
| 36 | M. Cacciari, G. P. Salam, and G. Soyez | FastJet user manual | EPJC 72 (2012) 1896 | 1111.6097 |
| 37 | CMS Collaboration | Jet energy scale and resolution in the CMS experiment in pp collisions at 8 TeV | JINST 12 (2017) P02014 | CMS-JME-13-004 1607.03663 |
| 38 | CMS Collaboration | Jet energy scale and resolution performance with 13 TeV data collected by CMS in 2016-2018 | CMS Detector Performance Summary CMS-DP-2020-019, 2020 CDS |
|
| 39 | CMS Collaboration | Identification of heavy-flavour jets with the CMS detector in pp collisions at 13 TeV | JINST 13 (2018) P05011 | CMS-BTV-16-002 1712.07158 |
| 40 | CMS Collaboration | CMS Phase 1 heavy flavour identification performance and developments | CMS Detector Performance Summary CMS-DP-2017-013, 2017 CDS |
|
| 41 | E. Bols et al. | Jet flavour classification using DeepJet | JINST 15 (2020) P12012 | 2008.10519 |
| 42 | CMS Collaboration | Performance of the DeepJet b tagging algorithm using 41.9/fb of data from proton-proton collisions at 13 TeV with Phase 1 CMS detector | CMS Detector Performance Summary CMS-DP-2018-058, 2018 CDS |
|
| 43 | CMS Collaboration | Performance of missing transverse momentum reconstruction in proton-proton collisions at $ \sqrt{s} = $ 13 TeV using the CMS detector | JINST 14 (2019) P07004 | CMS-JME-17-001 1903.06078 |
| 44 | D. Bertolini, P. Harris, M. Low, and N. Tran | Pileup per particle identification | JHEP 10 (2014) 059 | 1407.6013 |
| 45 | J. Butterworth et al. | PDF4LHC recommendations for LHC Run II | JPG 43 (2016) 023001 | 1510.03865 |
| 46 | NNPDF Collaboration | Parton distributions from high-precision collider data | EPJC 77 (2017) 663 | 1706.00428 |
| 47 | T. Sjöstrand et al. | An introduction to PYTHIA 8.2 | Comput. Phys. Commun. 191 (2015) 159 | 1410.3012 |
| 48 | CMS Collaboration | Extraction and validation of a new set of CMS PYTHIA8 tunes from underlying-event measurements | EPJC 80 (2020) 4 | CMS-GEN-17-001 1903.12179 |
| 49 | CMS Collaboration | CMS PYTHIA8 colour reconnection tunes based on underlying-event data | EPJC 83 (2023) 587 | CMS-GEN-17-002 2205.02905 |
| 50 | J. Alwall et al. | The automated computation of tree-level and next-to-leading order differential cross sections, and their matching to parton shower simulations | Journal of High Energy Physics 2014 (2014) | 1405.0301 |
| 51 | C. Degrande | Automatic evaluation of UV and R2 terms for beyond the standard model Lagrangians: a proof-of-principle | Comput. Phys. Commun. 197 (2015) 239 | 1406.3030 |
| 52 | C. Degrande et al. | UFO -- the Universal FeynRules Output | Comput. Phys. Commun. 183 (2012) 1201 | 1108.2040 |
| 53 | C. Degrande | Automated two higgs doublet model at nlo | link | |
| 54 | R. Frederix and S. Frixione | Merging meets matching in mc@nlo | Journal of High Energy Physics 2012 (2012) | 1209.6215 |
| 55 | P. Nason | A new method for combining NLO QCD with shower Monte Carlo algorithms | JHEP 11 (2004) 040 | hep-ph/0409146 |
| 56 | S. Frixione, P. Nason, and C. Oleari | Matching NLO QCD computations with parton shower simulations: the POWHEG method | JHEP 11 (2007) 070 | 0709.2092 |
| 57 | S. Alioli, P. Nason, C. Oleari, and E. Re | A general framework for implementing NLO calculations in shower Monte Carlo programs: the POWHEG BOX | JHEP 06 (2010) 043 | 1002.2581 |
| 58 | S. Alioli, P. Nason, C. Oleari, and E. Re | NLO single-top production matched with shower in POWHEG: $ s $- and $ t $-channel contributions | JHEP 09 (2009) 111 | 0907.4076 |
| 59 | E. Re | Single-top Wt-channel production matched with parton showers using the POWHEG method | EPJC 71 (2011) 1547 | 1009.2450 |
| 60 | P. Nason and G. Zanderighi | $ W^+ W^- $, $ W Z $ and $ Z Z $ production in the POWHEG-BOX-V2 | EPJC 74 (2014) 2702 | 1311.1365 |
| 61 | GEANT4 Collaboration | GEANT 4---a simulation toolkit | NIM A 506 (2003) 250 | |
| 62 | CMS Collaboration | Measurement of the inelastic proton-proton cross section at $ \sqrt{s}= $ 13 TeV | JHEP 07 (2018) 161 | CMS-FSQ-15-005 1802.02613 |
| 63 | CMS Collaboration | Measurements of properties of the higgs boson decaying to a w boson pair in pp collisions at $ \sqrt{s} = $ 13 TeV | Physics Letters B 791 (2019) 96 | CMS-HIG-16-042 1806.05246 |
| 64 | M. Czakon et al. | Top-pair production at the LHC through NNLO QCD and NLO EW | JHEP 10 (2017) 186 | 1705.04105 |
| 65 | CMS Collaboration | Measurement of the inclusive WZ production cross section in pp collisions at $ \sqrt{\textrm{s}} = $ 13.6 TeV | JHEP 04 (2025) 115 | CMS-SMP-24-005 2412.02477 |
| 66 | R. J. Barlow and C. Beeston | Fitting using finite Monte Carlo samples | Comput. Phys. Commun. 77 (1993) 219 | |
| 67 | J. S. Conway | Incorporating nuisance parameters in likelihoods for multisource spectra | ||
| 68 | M. Grazzini, S. Kallweit, D. Rathlev, and M. Wiesemann | $ W^{\pm}Z $ production at hadron colliders in NNLO QCD | PLB 761 (2016) 179 | 1604.08576 |
| 69 | G. Heinrich et al. | NNLO predictions for Z-boson pair production at the LHC | JHEP 03 (2018) 142 | 1710.06294 |
| 70 | F. Cascioli et al. | ZZ production at hadron colliders in NNLO QCD | PLB 735 (2014) 311 | 1405.2219 |
| 71 | A. Kulesza et al. | Associated production of a top quark pair with a heavy electroweak gauge boson at NLO$ + $NNLL accuracy | EPJC 79 (2019) 249 | 1812.08622 |
| 72 | LHC Higgs Cross Section Working Group | Handbook of LHC Higgs cross sections: 4. Deciphering the nature of the Higgs sector | CERN Report CERN-2017-002-M, 2016 link |
1610.07922 |
| 73 | M. Cacciari et al. | The t anti-t cross-section at 1.8-TeV and 1.96-TeV: A Study of the systematics due to parton densities and scale dependence | JHEP 04 (2004) 068 | hep-ph/0303085 |
| 74 | S. Catani, D. de Florian, M. Grazzini, and P. Nason | Soft gluon resummation for Higgs boson production at hadron colliders | JHEP 07 (2003) 028 | hep-ph/0306211 |
| 75 | CMS Collaboration | The CMS statistical analysis and combination tool: Combine | Comput. Softw. Big Sci. 8 (2024) 19 | CMS-CAT-23-001 2404.06614 |
| 76 | W. Verkerke and D. P. Kirkby | The RooFit toolkit for data modeling | in Proc. Int. Conf. on Computing in High Energy and Nuclear Physics (CHEP03), L. Lyons and M. Karagoz, eds., p. MOLT007, 2003 | physics/0306116 |
| 77 | L. Moneta et al. | The RooStats project | in the Int. Workshop on Advanced Computing and Analysis Techniques in Physics Research, T. Speer et al., eds., volume ACAT, 2010 Proc. 1 (2010) 057 |
1009.1003 |
| 78 | T. Junk | Confidence level computation for combining searches with small statistics | NIM A 434 (1999) 435 | hep-ex/9902006 |
| 79 | A. L. Read | Presentation of search results: The $ \text{CL}_\text{s} $ technique | JPG 28 (2002) 2693 | |
| 80 | ATLAS and CMS Collaborations, and LHC Higgs Combination Group | Procedure for the LHC Higgs boson search combination in Summer 2011 | Technical Report CMS-NOTE-2011-005, ATL-PHYS-PUB-2011-11, 2011 | |
| 81 | G. Cowan, K. Cranmer, E. Gross, and O. Vitells | Asymptotic formulae for likelihood-based tests of new physics | EPJC 71 (2011) 1554 | 1007.1727 |
| 82 | J. Bernon et al. | Scrutinizing the alignment limit in two-Higgs-doublet models: m$ _h = $ 125 GeV | PRD 92 (2015) 075004 | 1507.00933 |
| 83 | D. Eriksson, J. Rathsman, and O. St\r a l | 2hdmc - two-higgs-doublet model calculator | Computer Physics Communications 181 (2010) 189 | 0902.0851 |
|
|
Compact Muon Solenoid LHC, CERN |

|

|

|

|

|

|