

Compact Muon Solenoid
LHC, CERN
| CMS-PAS-TOP-21-011 | ||
| Measurement of the cross section of top quark-antiquark pair production in association with a W boson in proton-proton collisions at $\sqrt{s}=$ 13 TeV | ||
| CMS Collaboration | ||
| March 2022 | ||
| Abstract: The cross section for the production of a top quark-antiquark pair in association with a W boson in proton-proton collisions at a center-of-mass energy of 13 TeV is measured in a data sample recorded by the CMS experiment that corresponds to an integrated luminosity of 138 fb$^{-1}$. Events with two or three leptons, electrons or muons, and additional jets are selected. A cross section of 868 $\pm$ 40 (stat) $^{+52}_{-50}$ (syst) fb is measured. The production cross sections of a top quark pair with a W$^{+}$ and a W$^{-}$ boson are measured as 553$^{+30}_{-29}$ (stat) $^{+31}_{-30}$ (syst) fb and 343 $\pm$ 26 (stat) $\pm$ 25 (syst) fb, respectively, and the corresponding ratio of the two cross sections is 1.61$^{+0.15}_{-0.14}$ (stat) $^{+0.07}_{-0.05}$ (syst). The measured cross sections for the studied processes are in agreement with standard model predictions within two standard deviations. | ||
|
Links:
CDS record (PDF) ;
CADI line (restricted) ;
These preliminary results are superseded in this paper, Submitted to JHEP. The superseded preliminary plots can be found here. |
||
| Figures | |
png pdf |
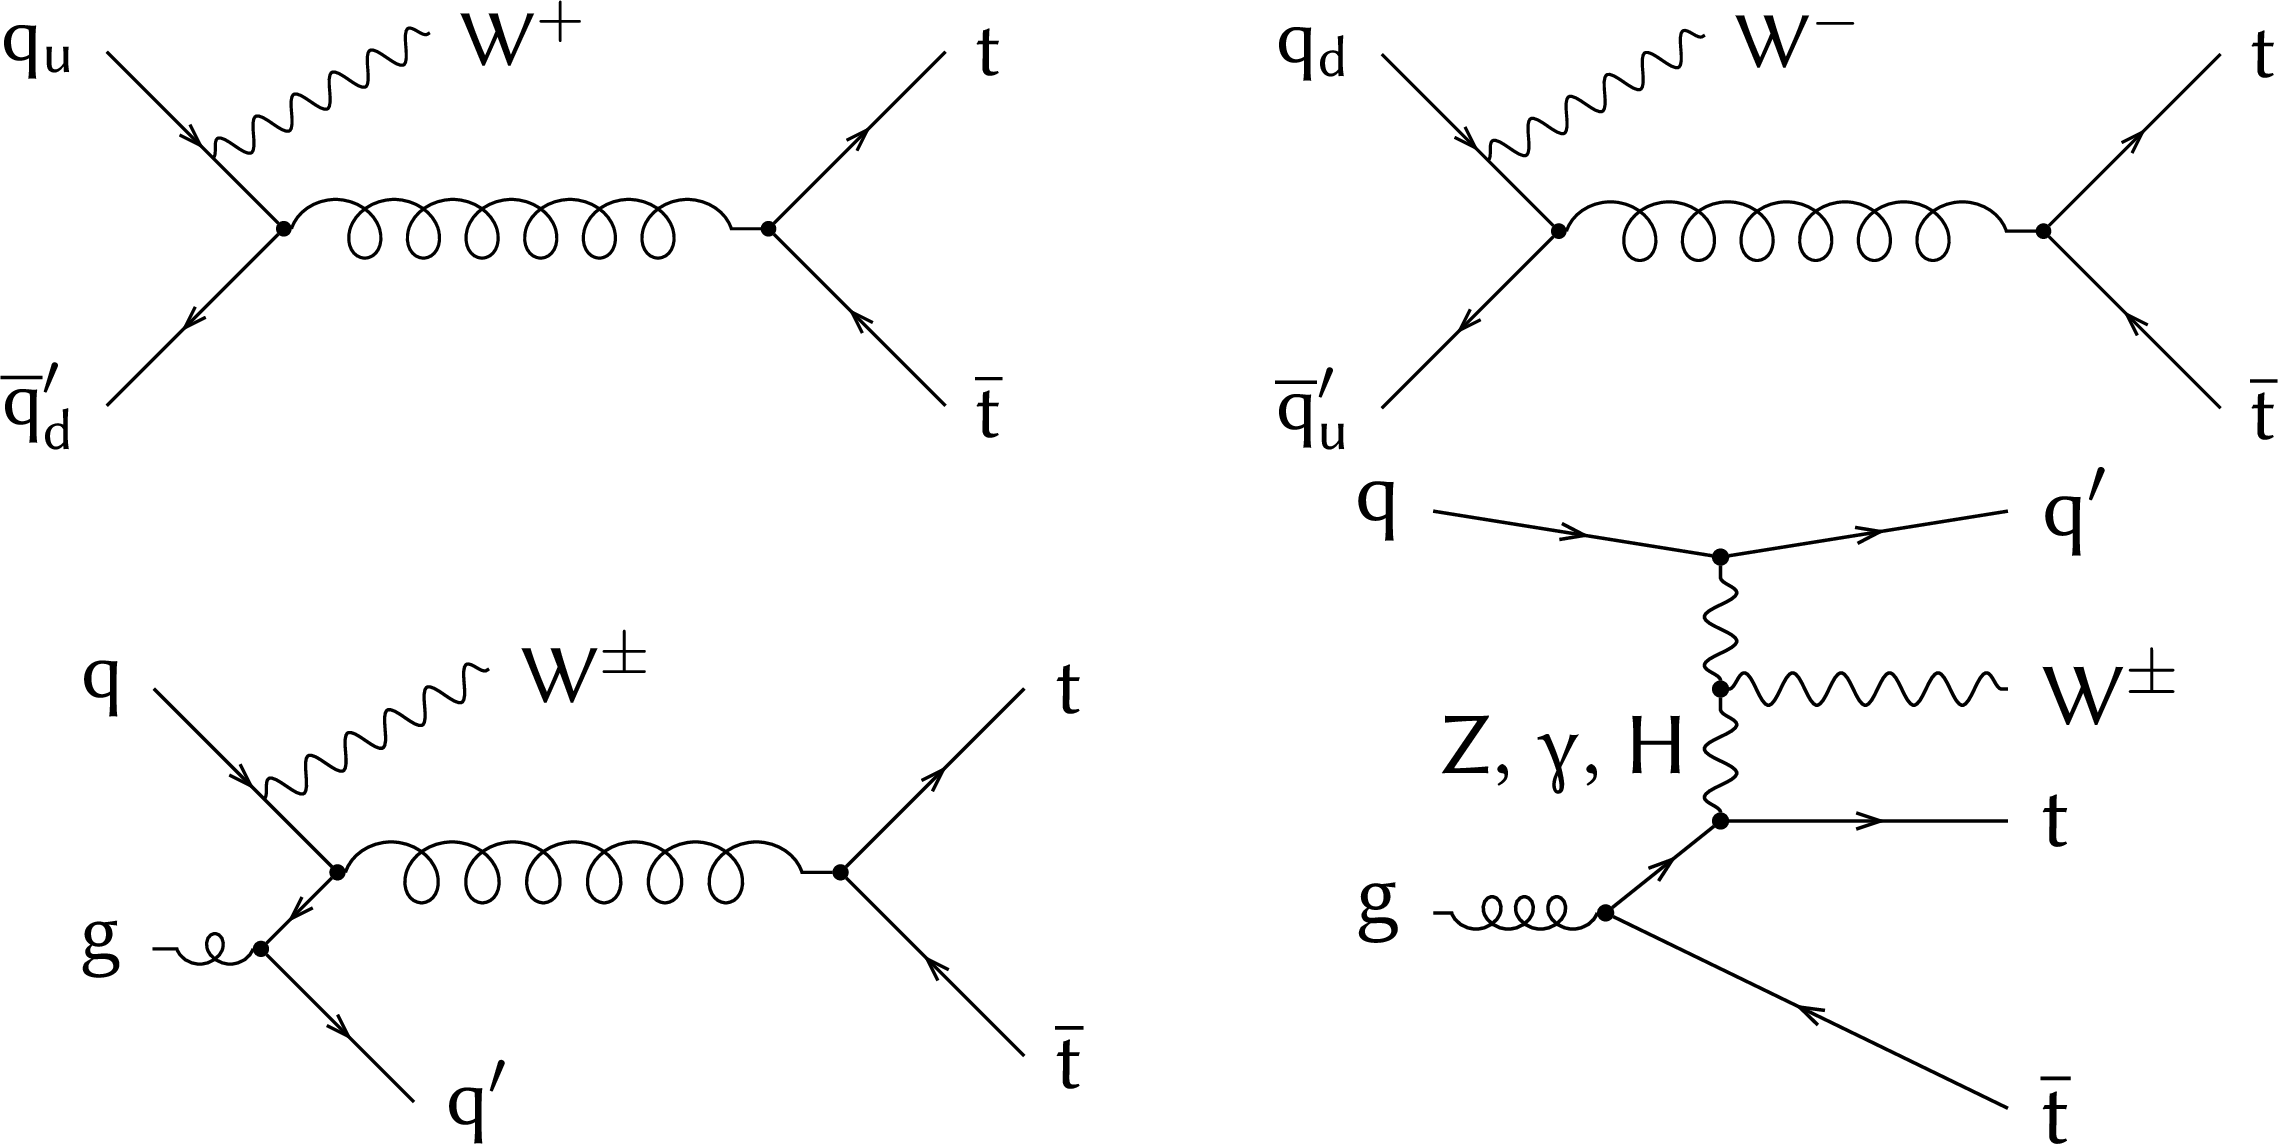
Figure 1:
Representative Feynman diagrams that contribute to the $\mathrm{t\bar{t}}$W production at LO (top) and NLO (bottom), where "${\rm q_u}$'' and "${\rm q_d}$'' refer to up- and down-type quarks, respectively. |
png pdf |
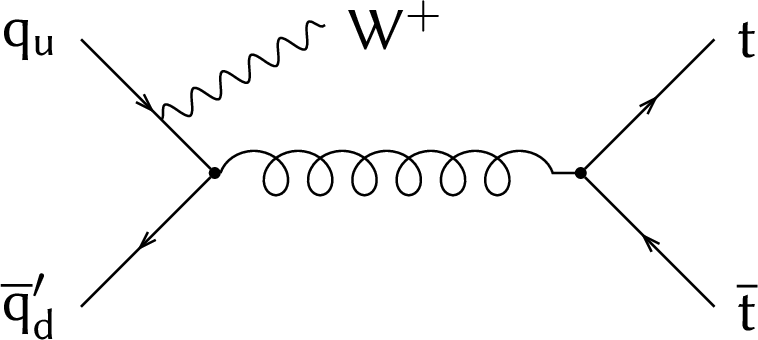
Figure 1-a:
Representative Feynman diagrams that contribute to the $\mathrm{t\bar{t}}$W production at LO (top) and NLO (bottom), where "${\rm q_u}$'' and "${\rm q_d}$'' refer to up- and down-type quarks, respectively. |
png pdf |
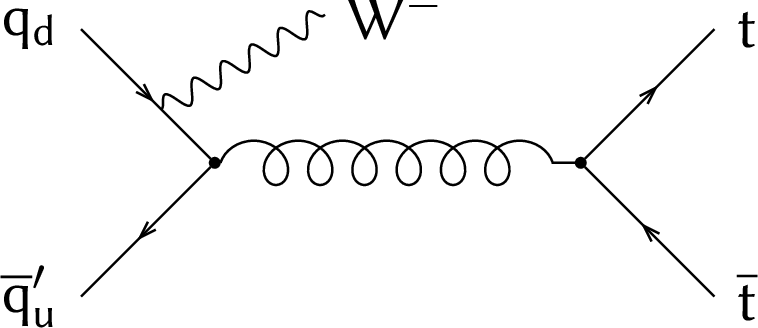
Figure 1-b:
Representative Feynman diagrams that contribute to the $\mathrm{t\bar{t}}$W production at LO (top) and NLO (bottom), where "${\rm q_u}$'' and "${\rm q_d}$'' refer to up- and down-type quarks, respectively. |

png pdf |
Figure 1-c:
Representative Feynman diagrams that contribute to the $\mathrm{t\bar{t}}$W production at LO (top) and NLO (bottom), where "${\rm q_u}$'' and "${\rm q_d}$'' refer to up- and down-type quarks, respectively. |
png pdf |
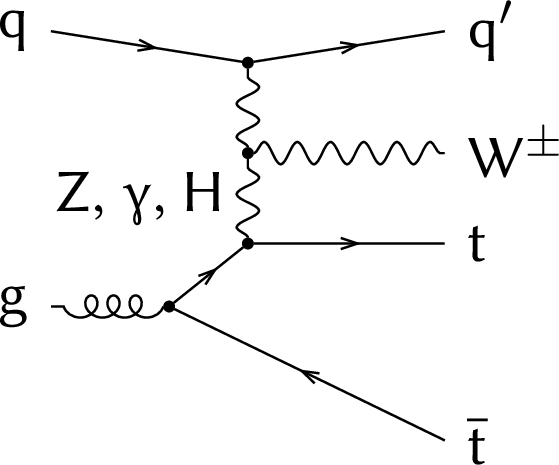
Figure 1-d:
Representative Feynman diagrams that contribute to the $\mathrm{t\bar{t}}$W production at LO (top) and NLO (bottom), where "${\rm q_u}$'' and "${\rm q_d}$'' refer to up- and down-type quarks, respectively. |
png pdf |
Figure 2:
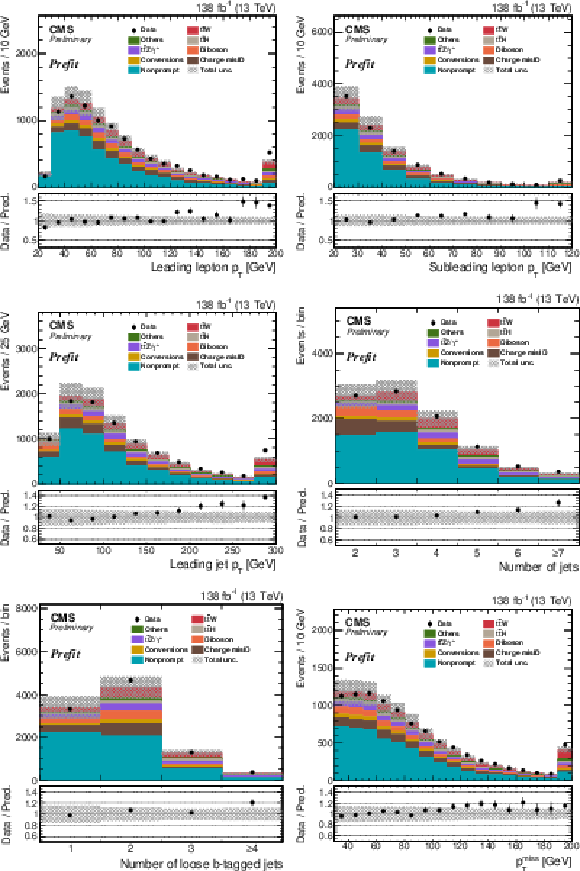
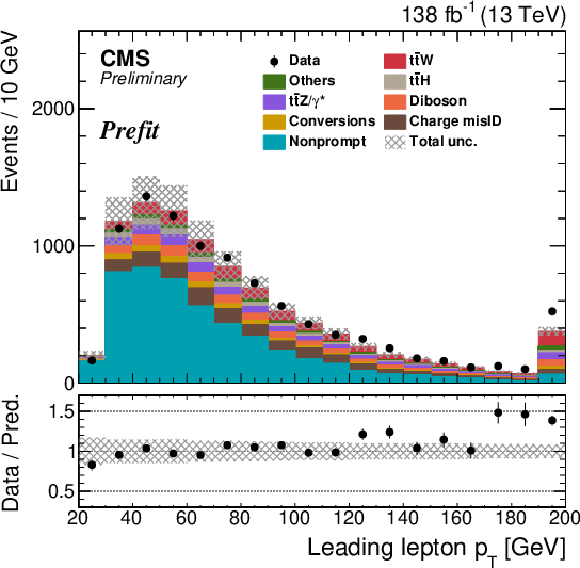
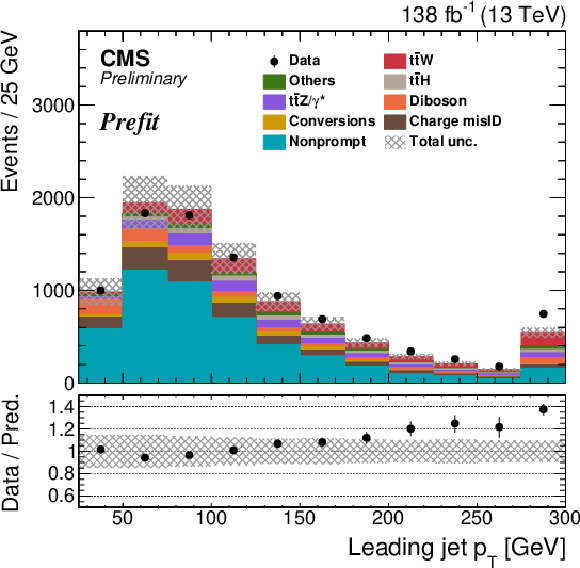
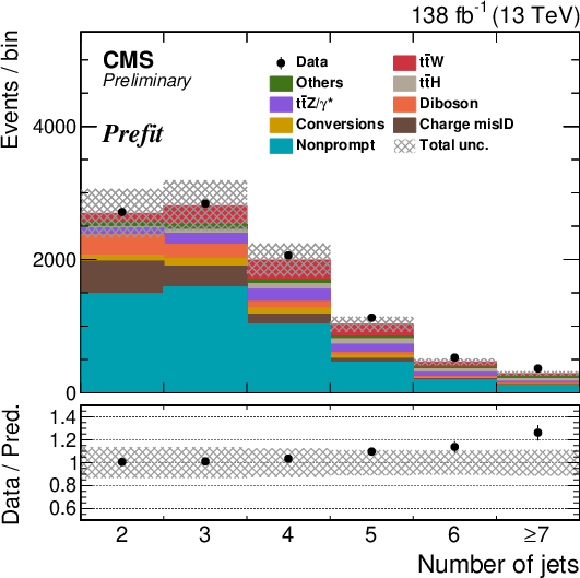
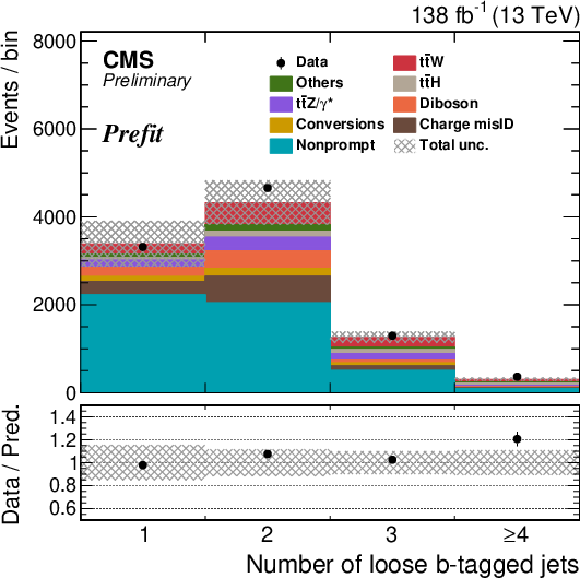
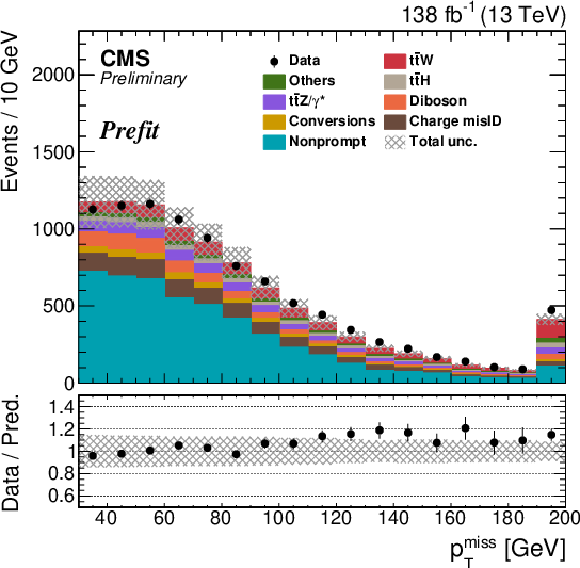
Comparison between the number of observed and predicted events for the leading (upper left) and the subleading (upper right) lepton ${p_{\mathrm {T}}}$, the leading jet ${p_{\mathrm {T}}}$ (middle left), the total number of jets (middle right), the number of loose b-tagged jets (lower left), and ${{p_{\mathrm {T}}} ^\text {miss}}$ (lower right) in same-sign dileptonic events. The lower panels of each plot show the ratio between the number of observed events in data and the total number of predicted events. The error bars show the statistical uncertainty in data, whereas the hatched bands represent the total systematic uncertainty. The last bins include the overflows. |
png pdf |
Figure 2-a:
Comparison between the number of observed and predicted events for the leading (upper left) and the subleading (upper right) lepton ${p_{\mathrm {T}}}$, the leading jet ${p_{\mathrm {T}}}$ (middle left), the total number of jets (middle right), the number of loose b-tagged jets (lower left), and ${{p_{\mathrm {T}}} ^\text {miss}}$ (lower right) in same-sign dileptonic events. The lower panels of each plot show the ratio between the number of observed events in data and the total number of predicted events. The error bars show the statistical uncertainty in data, whereas the hatched bands represent the total systematic uncertainty. The last bins include the overflows. |

png pdf |
Figure 2-b:
Comparison between the number of observed and predicted events for the leading (upper left) and the subleading (upper right) lepton ${p_{\mathrm {T}}}$, the leading jet ${p_{\mathrm {T}}}$ (middle left), the total number of jets (middle right), the number of loose b-tagged jets (lower left), and ${{p_{\mathrm {T}}} ^\text {miss}}$ (lower right) in same-sign dileptonic events. The lower panels of each plot show the ratio between the number of observed events in data and the total number of predicted events. The error bars show the statistical uncertainty in data, whereas the hatched bands represent the total systematic uncertainty. The last bins include the overflows. |
png pdf |
Figure 2-c:
Comparison between the number of observed and predicted events for the leading (upper left) and the subleading (upper right) lepton ${p_{\mathrm {T}}}$, the leading jet ${p_{\mathrm {T}}}$ (middle left), the total number of jets (middle right), the number of loose b-tagged jets (lower left), and ${{p_{\mathrm {T}}} ^\text {miss}}$ (lower right) in same-sign dileptonic events. The lower panels of each plot show the ratio between the number of observed events in data and the total number of predicted events. The error bars show the statistical uncertainty in data, whereas the hatched bands represent the total systematic uncertainty. The last bins include the overflows. |
png pdf |
Figure 2-d:
Comparison between the number of observed and predicted events for the leading (upper left) and the subleading (upper right) lepton ${p_{\mathrm {T}}}$, the leading jet ${p_{\mathrm {T}}}$ (middle left), the total number of jets (middle right), the number of loose b-tagged jets (lower left), and ${{p_{\mathrm {T}}} ^\text {miss}}$ (lower right) in same-sign dileptonic events. The lower panels of each plot show the ratio between the number of observed events in data and the total number of predicted events. The error bars show the statistical uncertainty in data, whereas the hatched bands represent the total systematic uncertainty. The last bins include the overflows. |
png pdf |
Figure 2-e:
Comparison between the number of observed and predicted events for the leading (upper left) and the subleading (upper right) lepton ${p_{\mathrm {T}}}$, the leading jet ${p_{\mathrm {T}}}$ (middle left), the total number of jets (middle right), the number of loose b-tagged jets (lower left), and ${{p_{\mathrm {T}}} ^\text {miss}}$ (lower right) in same-sign dileptonic events. The lower panels of each plot show the ratio between the number of observed events in data and the total number of predicted events. The error bars show the statistical uncertainty in data, whereas the hatched bands represent the total systematic uncertainty. The last bins include the overflows. |
png pdf |
Figure 2-f:
Comparison between the number of observed and predicted events for the leading (upper left) and the subleading (upper right) lepton ${p_{\mathrm {T}}}$, the leading jet ${p_{\mathrm {T}}}$ (middle left), the total number of jets (middle right), the number of loose b-tagged jets (lower left), and ${{p_{\mathrm {T}}} ^\text {miss}}$ (lower right) in same-sign dileptonic events. The lower panels of each plot show the ratio between the number of observed events in data and the total number of predicted events. The error bars show the statistical uncertainty in data, whereas the hatched bands represent the total systematic uncertainty. The last bins include the overflows. |
png pdf |
Figure 3:
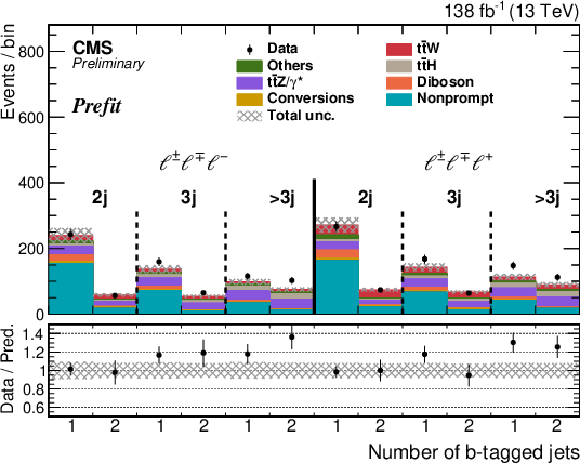
Comparison between the observed and predicted number of events in the trileptonic channel. Events with positive or negative sum of lepton charges are categorized by the number of jets j and b-tagged jets. The lower panels of each plot show the ratio between the number of observed events in data and the total number of predicted events. The error bars show the statistical uncertainty in data, whereas the hatched bands represent the total systematic uncertainty. |
png pdf |
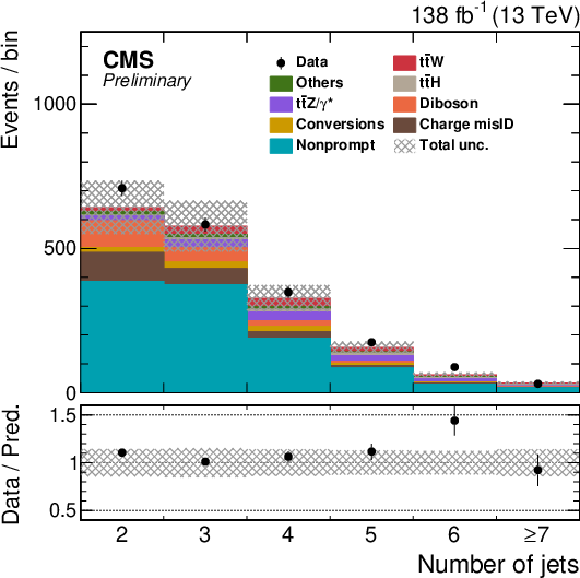
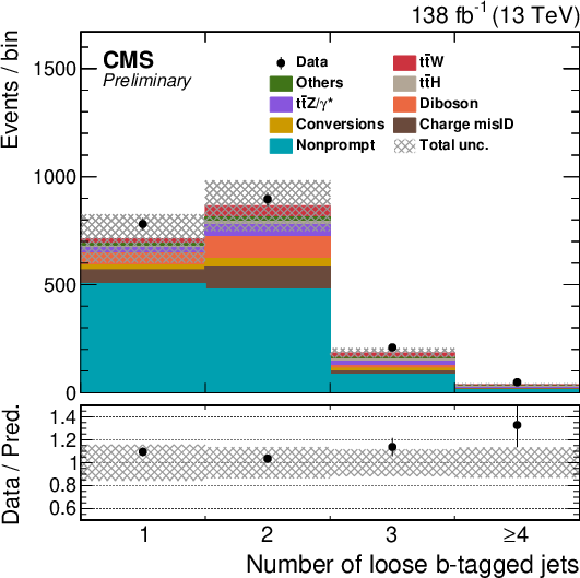
Figure 4:
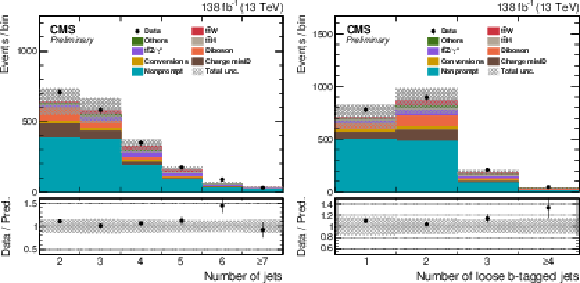
Expected and observed number of events in the validation region enriched in nonprompt leptons. The distributions of the total number of jets (left) and loose b-tagged jets (right) are shown. The lower panel shows the ratio between the number of observed events in data and the total number of predicted events. The error bars represent statistical uncertainty in data, whereas the hatched bands refer to the total systematic uncertainty. |
png pdf |
Figure 4-a:
Expected and observed number of events in the validation region enriched in nonprompt leptons. The distributions of the total number of jets (left) and loose b-tagged jets (right) are shown. The lower panel shows the ratio between the number of observed events in data and the total number of predicted events. The error bars represent statistical uncertainty in data, whereas the hatched bands refer to the total systematic uncertainty. |
png pdf |
Figure 4-b:
Expected and observed number of events in the validation region enriched in nonprompt leptons. The distributions of the total number of jets (left) and loose b-tagged jets (right) are shown. The lower panel shows the ratio between the number of observed events in data and the total number of predicted events. The error bars represent statistical uncertainty in data, whereas the hatched bands refer to the total systematic uncertainty. |
png pdf |
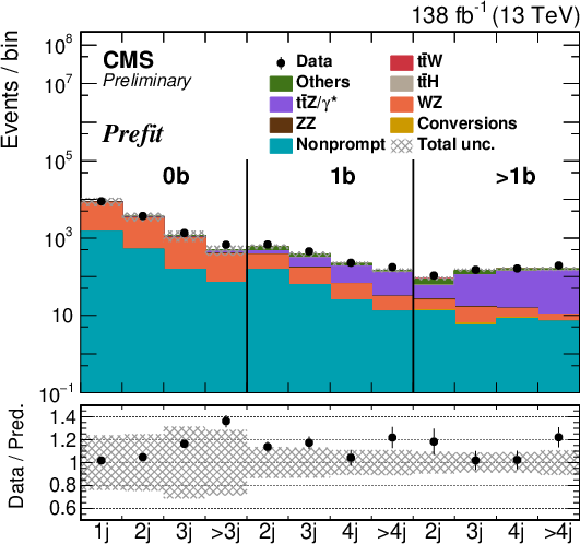
Figure 5:
Expected and observed number of events in the control region enriched in WZ and $\mathrm{t\bar{t}}$Z events. Events are categorized by the number of jets (j) and b-tagged jets (b). The lower panel shows the ratio between the number of observed events in data and the total number of predicted events. The error bars represent statistical uncertainty in data, whereas the hatched bands refer to the total systematic uncertainty. |
png pdf |
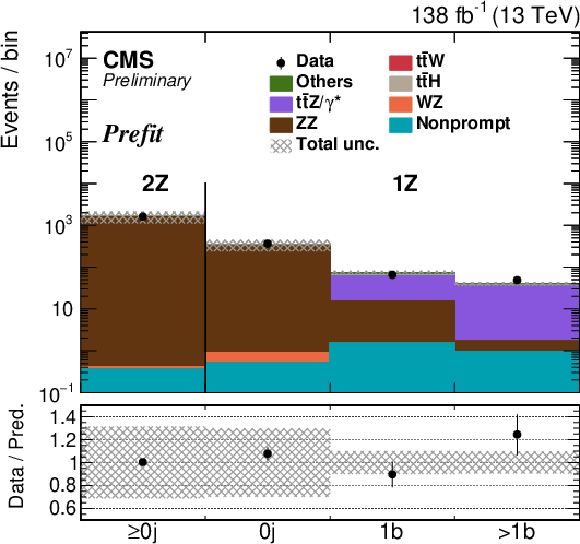
Figure 6:
Comparison for the number of selected events in the ZZ control region between data and prediction. Events with two Z boson candidates are included in the first bin, while the other bins contain events with one Z boson candidate and no selected jets, exactly one b-tagged jet, and more than one b-tagged jet. The lower panel shows the ratio between the number of observed events in data and the total number of events expected from the prediction. The error bars show the statistical uncertainty in data, whereas the hatched bands represent the total systematic uncertainty. Small contribution from background processes with nonprompt leptons is estimated using simulation. |
png pdf |
Figure 7:
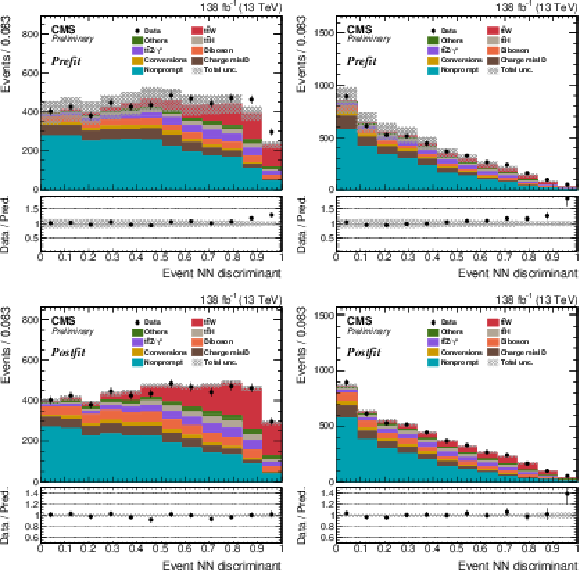
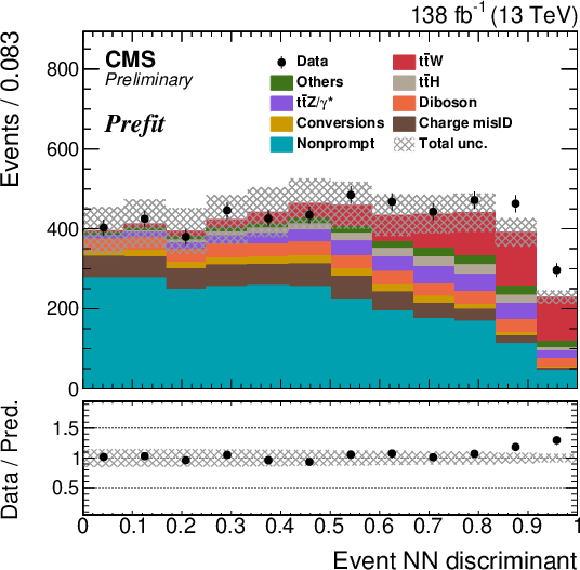
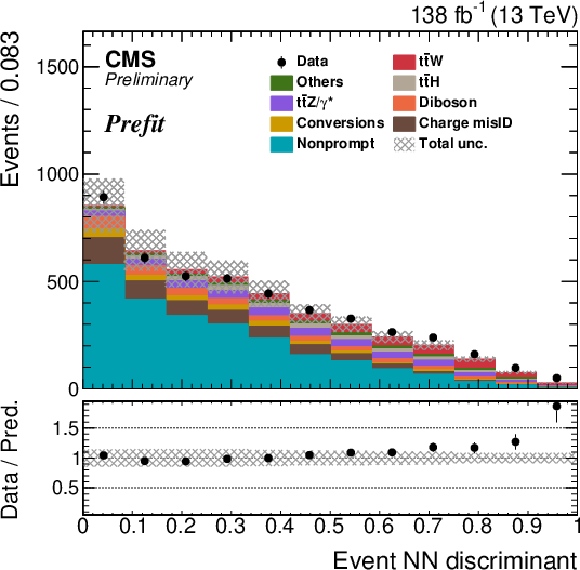
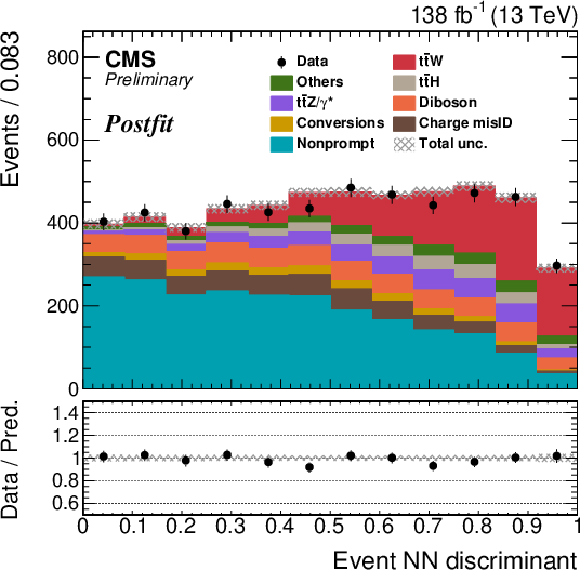
Comparison between observed and predicted events for the NN output score distributions in final states with two leptons of positive (left) and negative (right) charges. The results are shown before (top) and after (bottom) the fit. The lower panels show the ratio between the number of observed events in data, and the total number of predicted events. The error bars show the statistical uncertainty in data, whereas the hatched bands represent the total systematic uncertainty. |
png pdf |
Figure 7-a:
Comparison between observed and predicted events for the NN output score distributions in final states with two leptons of positive (left) and negative (right) charges. The results are shown before (top) and after (bottom) the fit. The lower panels show the ratio between the number of observed events in data, and the total number of predicted events. The error bars show the statistical uncertainty in data, whereas the hatched bands represent the total systematic uncertainty. |
png pdf |
Figure 7-b:
Comparison between observed and predicted events for the NN output score distributions in final states with two leptons of positive (left) and negative (right) charges. The results are shown before (top) and after (bottom) the fit. The lower panels show the ratio between the number of observed events in data, and the total number of predicted events. The error bars show the statistical uncertainty in data, whereas the hatched bands represent the total systematic uncertainty. |
png pdf |
Figure 7-c:
Comparison between observed and predicted events for the NN output score distributions in final states with two leptons of positive (left) and negative (right) charges. The results are shown before (top) and after (bottom) the fit. The lower panels show the ratio between the number of observed events in data, and the total number of predicted events. The error bars show the statistical uncertainty in data, whereas the hatched bands represent the total systematic uncertainty. |
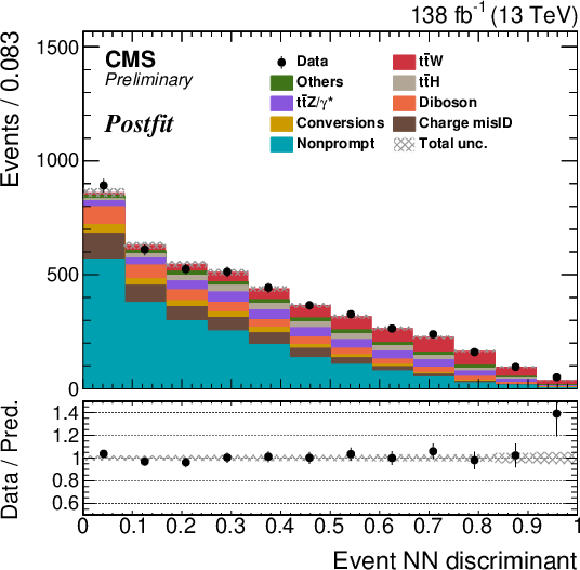
png pdf |
Figure 7-d:
Comparison between observed and predicted events for the NN output score distributions in final states with two leptons of positive (left) and negative (right) charges. The results are shown before (top) and after (bottom) the fit. The lower panels show the ratio between the number of observed events in data, and the total number of predicted events. The error bars show the statistical uncertainty in data, whereas the hatched bands represent the total systematic uncertainty. |
png pdf |
Figure 8:
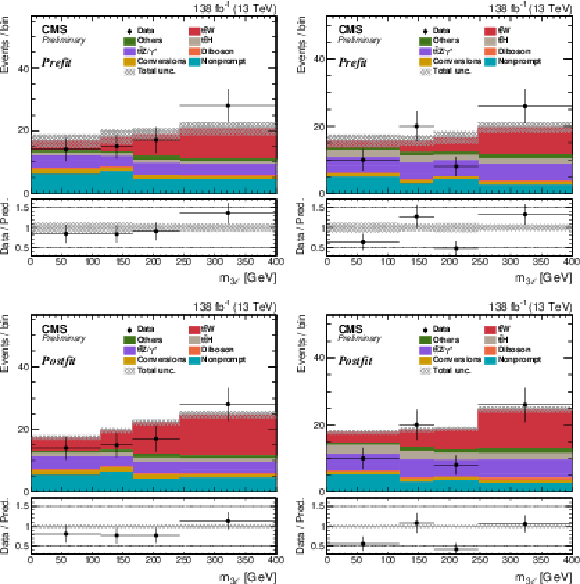
Distributions of the invariant mass of three leptons in events with two (left) and three (right) jets, with two additional b-tagged jets for the positive sum of lepton charges. The results are shown before (top) and after (bottom) the fit. The last bins include the overflows. |

png pdf |
Figure 8-a:
Distributions of the invariant mass of three leptons in events with two (left) and three (right) jets, with two additional b-tagged jets for the positive sum of lepton charges. The results are shown before (top) and after (bottom) the fit. The last bins include the overflows. |
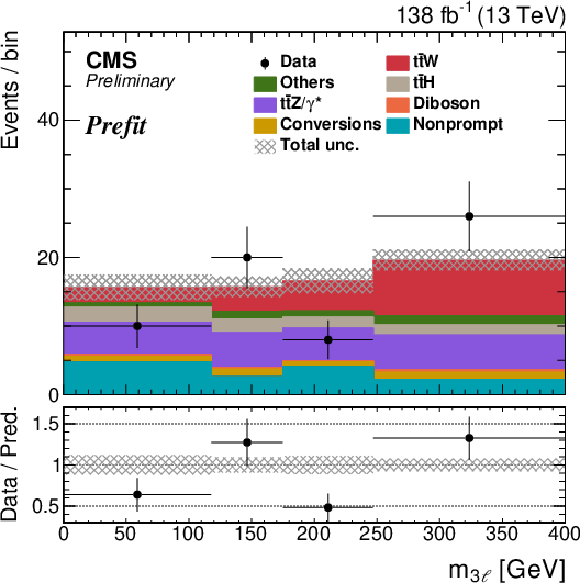
png pdf |
Figure 8-b:
Distributions of the invariant mass of three leptons in events with two (left) and three (right) jets, with two additional b-tagged jets for the positive sum of lepton charges. The results are shown before (top) and after (bottom) the fit. The last bins include the overflows. |

png pdf |
Figure 8-c:
Distributions of the invariant mass of three leptons in events with two (left) and three (right) jets, with two additional b-tagged jets for the positive sum of lepton charges. The results are shown before (top) and after (bottom) the fit. The last bins include the overflows. |
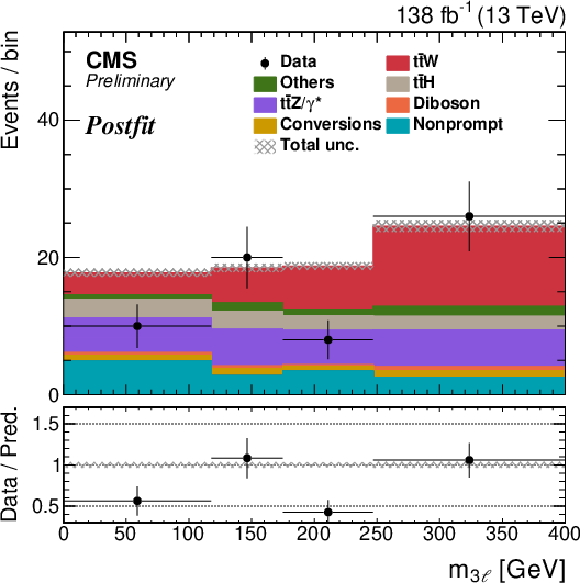
png pdf |
Figure 8-d:
Distributions of the invariant mass of three leptons in events with two (left) and three (right) jets, with two additional b-tagged jets for the positive sum of lepton charges. The results are shown before (top) and after (bottom) the fit. The last bins include the overflows. |
png pdf |
Figure 9:
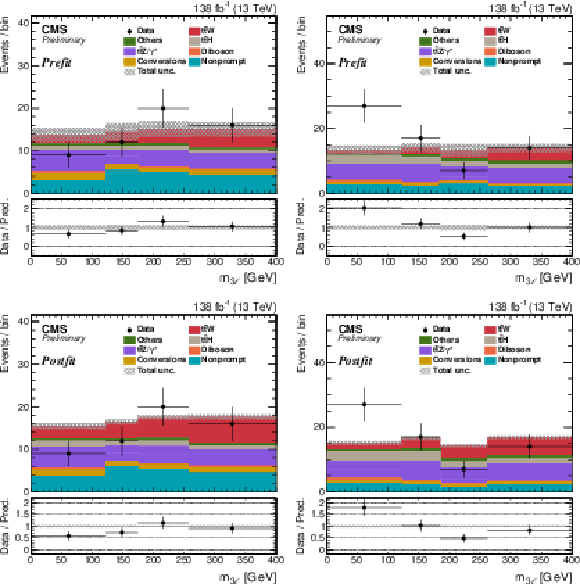
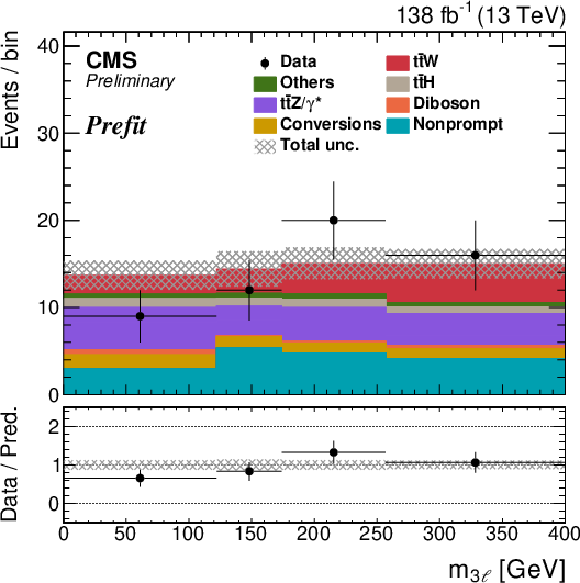
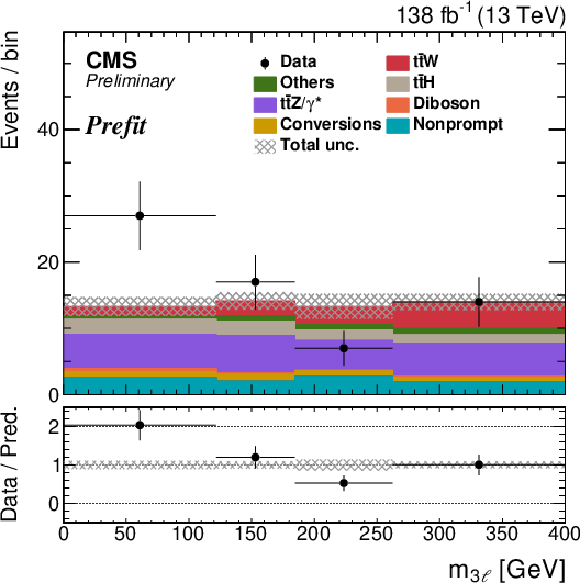
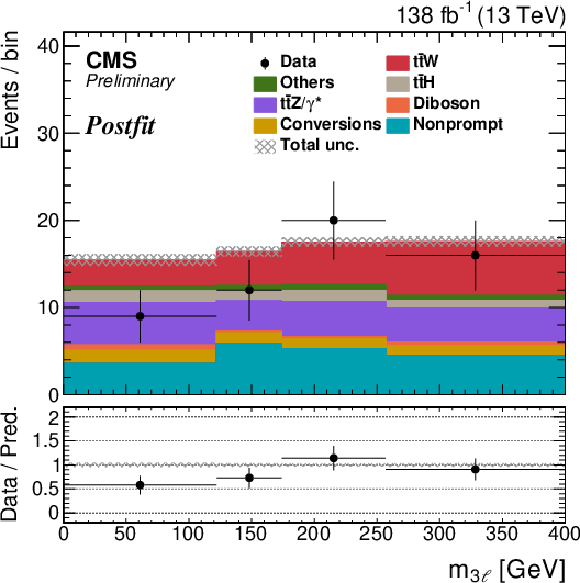
Distributions of the invariant mass of three leptons in events with two (left) and three (right) jets, with two additional b-tagged jets for the negative sum of lepton charges. The results are shown before (top) and after (bottom) the fit. The last bins include the overflows. |
png pdf |
Figure 9-a:
Distributions of the invariant mass of three leptons in events with two (left) and three (right) jets, with two additional b-tagged jets for the negative sum of lepton charges. The results are shown before (top) and after (bottom) the fit. The last bins include the overflows. |
png pdf |
Figure 9-b:
Distributions of the invariant mass of three leptons in events with two (left) and three (right) jets, with two additional b-tagged jets for the negative sum of lepton charges. The results are shown before (top) and after (bottom) the fit. The last bins include the overflows. |
png pdf |
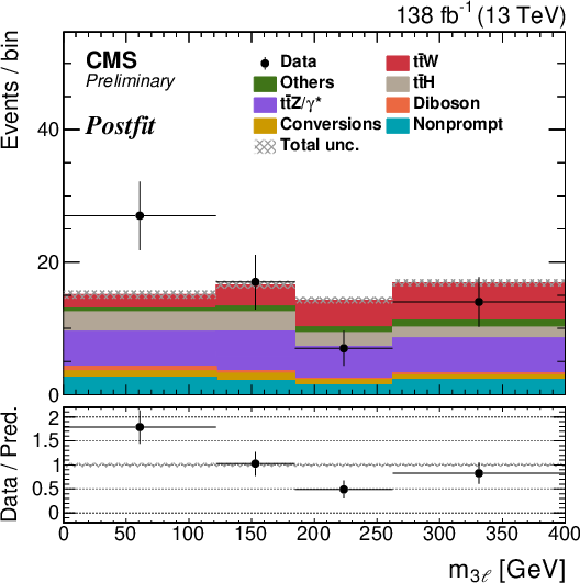
Figure 9-c:
Distributions of the invariant mass of three leptons in events with two (left) and three (right) jets, with two additional b-tagged jets for the negative sum of lepton charges. The results are shown before (top) and after (bottom) the fit. The last bins include the overflows. |
png pdf |
Figure 9-d:
Distributions of the invariant mass of three leptons in events with two (left) and three (right) jets, with two additional b-tagged jets for the negative sum of lepton charges. The results are shown before (top) and after (bottom) the fit. The last bins include the overflows. |

png pdf |
Figure 10:
Measured cross sections for the $\mathrm{t\bar{t}}$W production in different final states are compared to theoretical predictions [12,16]. The cross sections are measured in dilepton (ee, $\mu \mu $, e$\mu $) and trilepton events, as well as in combination of channels. |

png pdf |
Figure 11:
The 68% and 95% CL intervals in the likelihood fit with the $\mathrm{t\bar{t}}$W$^{+}$ and $\mathrm{t\bar{t}}$W$^{-}$ cross sections measured independently. The intervals are shown as contours. The best fit value is indicated by the black cross, while the predicted value [11] is shown as the red circle. The prediction that is used in the presented comparison does not include the improved FxFx matrix element merging procedure, which is described in Ref. [16]. |

png pdf |
Figure 12:
Distributions of the negative log-likelihood value difference from the best fit value for the scan of the ratio of the $\mathrm{t\bar{t}}$W$^{+}$ and $\mathrm{t\bar{t}}$W$^{-}$ cross sections. The blue (green) bands indicate the 68% and 95% CL limits on the ratio of the cross sections. The SM prediction (red line) and its uncertainty (red band) are taken from Ref. [11]. |
| Tables | |
png pdf |
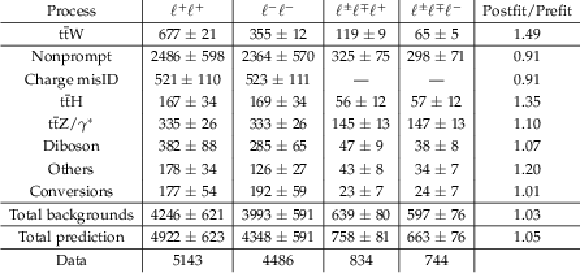
Table 1:
Number of predicted and observed events in the signal regions after the dileptonic and trileptonic selections. The last column shows the ratio between the number of predicted events after and before the fit. The total uncertainty in the number of predicted events is shown. The symbol "--'' indicates that the corresponding background does not apply. |
png pdf |
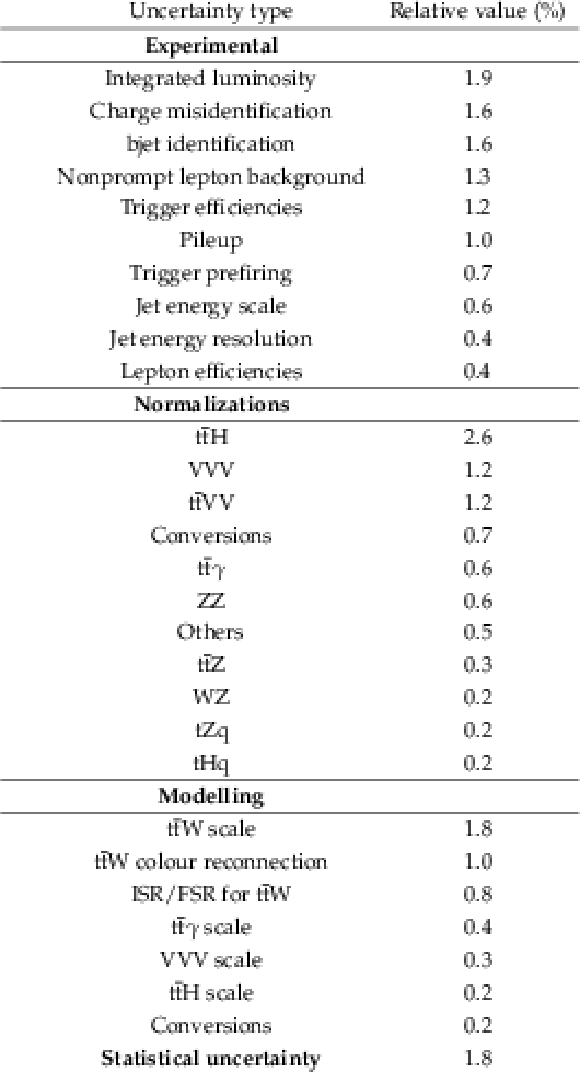
Table 2:
Uncertainties in predicted signal and background events and their impacts on the measured cross section of the $\mathrm{t\bar{t}}$W process. Relative variations of uncertainties are shown when fixing the nuisance parameters associated with that uncertainty in the fit. Systematic uncertainties with an impact larger than 0.1% are shown. Production cross sections of the $\mathrm{t\bar{t}}$W, WZ, ZZ and $\mathrm{t\bar{t}}$Z processes are simultaneously constrained in the fit. |
| Summary |
| The cross section for the associated production of a W boson with a pair of top quarks ($\mathrm{t\bar{t}}$W) in proton-proton collisions at a center-of-mass energy of 13 TeV is measured using 138 fb$^{-1}$ of data collected by the CMS detector. The measurement is performed in final states with two or three leptons. The measured cross section is 868 $\pm$ 40 (stat) $^{+52}_{-50}$ (syst) fb. The cross sections for the associated production of a top quark pair with a W$^{+}$ and a W$^{-}$ boson are 553$^{+30}_{-29}$ (stat) $^{+31}_{-30}$ (syst) fb and 343 $\pm$ 26 (stat) $\pm$ 25 (syst) fb, respectively. The measured ratio between these production cross sections is 1.61$^{+0.15}_{-0.14}$ (stat) $^{+0.07}_{-0.05}$ (syst). The obtained results are in agreement with standard model predictions within two standard deviations. |
| References | ||||
| 1 | O. Bessidskaia Bylund et al. | Probing top quark neutral couplings in the Standard Model Effective Field Theory at NLO QCD | JHEP 05 (2016) 052 | 1601.08193 |
| 2 | J. A. Dror, M. Farina, E. Salvioni, and J. Serra | Strong tW Scattering at the LHC | JHEP 01 (2016) 071 | 1511.03674 |
| 3 | A. Buckley et al. | Constraining top quark effective theory in the LHC Run II era | JHEP 04 (2016) 015 | 1512.03360 |
| 4 | F. Maltoni, M. L. Mangano, I. Tsinikos, and M. Zaro | Top-quark charge asymmetry and polarization in $ {\rm t\overline{t}W^\pm} $ production at the LHC | PLB 736 (2014) 252 | 1406.3262 |
| 5 | CMS Collaboration | Measurement of the cross section for top quark pair production in association with a W or Z boson in proton-proton collisions at $ \sqrt{s} = $ 13 TeV | JHEP 08 (2018) 011 | CMS-TOP-17-005 1711.02547 |
| 6 | ATLAS Collaboration | Measurement of the $ {\rm t\bar{t}Z} $ and $ {\rm t\bar{t}W} $ cross sections in proton-proton collisions at $ \sqrt{s}= $ 13 TeV with the ATLAS detector | PRD 99 (2019) 072009 | 1901.03584 |
| 7 | ATLAS Collaboration | Analysis of $ {\rm t\bar{t}H} $ and $ {\rm t\bar{t}W} $ production in multilepton final states with the ATLAS detector | ATLAS Conference Note ATLAS-CONF-2019-045 | |
| 8 | CMS Collaboration | Measurement of the Higgs boson production rate in association with top quarks in final states with electrons, muons, and hadronically decaying tau leptons at $ \sqrt{s} = $ 13 TeV | EPJC 81 (2021) 378 | CMS-HIG-19-008 2011.03652 |
| 9 | CMS Collaboration | Search for production of four top quarks in final states with same-sign or multiple leptons in proton-proton collisions at $ \sqrt{s}= $ 13 TeV | EPJC 80 (2020) 75 | CMS-TOP-18-003 1908.06463 |
| 10 | ATLAS Collaboration | Evidence for $ {\rm t\bar{t}t\bar{t}} $ production in the multilepton final state in proton-proton collisions at $ \sqrt{s}= $ 13 TeV with the ATLAS detector | EPJC 80 (2020) 1085 | 2007.14858 |
| 11 | A. Broggio et al. | Top-quark pair hadroproduction in association with a heavy boson at NLO+NNLL including EW corrections | JHEP 08 (2019) 039 | 1907.04343 |
| 12 | A. Kulesza et al. | Associated top quark pair production with a heavy boson: differential cross sections at NLO+NNLL accuracy | EPJC 80 (2020) 428 | 2001.03031 |
| 13 | G. Bevilacqua et al. | NLO QCD corrections to off-shell $ {\rm t\bar{t}W^\pm} $ production at the LHC: Correlations and Asymmetries | EPJC 81 (2021) 675 | 2012.01363 |
| 14 | S. von Buddenbrock, R. Ruiz, and B. Mellado | Anatomy of inclusive $ {\rm t\bar t W} $ production at hadron colliders | PLB 811 (2020) 135964 | 2009.00032 |
| 15 | R. Frederix and I. Tsinikos | Subleading EW corrections and spin-correlation effects in $ {\rm t\bar{t}W} $ multi-lepton signatures | EPJC 80 (2020) 803 | 2004.09552 |
| 16 | R. Frederix and I. Tsinikos | On improving NLO merging for $ \mathrm{t}\overline{\mathrm{t}}\mathrm{W} $ production | JHEP 11 (2021) 29 | 2108.07826 |
| 17 | CMS Collaboration | The CMS trigger system | JINST 12 (2017) P01020 | CMS-TRG-12-001 1609.02366 |
| 18 | J. Alwall et al. | The automated computation of tree-level and next-to-leading order differential cross sections, and their matching to parton shower simulations | JHEP 07 (2014) 079 | 1405.0301 |
| 19 | G. Bevilacqua et al. | The simplest of them all: $ {\rm t\bar{t} W^\pm} $ at NLO accuracy in QCD | JHEP 08 (2020) 043 | 2005.09427 |
| 20 | CMS Collaboration | A new set of CMS tunes for novel colour reconnection models in PYTHIA8 based on underlying-event data | CMS-PAS-GEN-17-002 | CMS-PAS-GEN-17-002 |
| 21 | P. Nason | A new method for combining NLO QCD with shower Monte Carlo algorithms | JHEP 11 (2004) 040 | hep-ph/0409146 |
| 22 | S. Frixione, P. Nason, and C. Oleari | Matching NLO QCD computations with parton shower simulations: the POWHEG method | JHEP 11 (2007) 070 | 0709.2092 |
| 23 | S. Alioli, P. Nason, C. Oleari, and E. Re | A general framework for implementing NLO calculations in shower Monte Carlo programs: the POWHEG | JHEP 06 (2010) 043 | 1002.2581 |
| 24 | T. Sjostrand et al. | An introduction to PYTHIA 8.2 | CPC 191 (2015) 159 | 1410.3012 |
| 25 | P. Skands, S. Carrazza, and J. Rojo | Tuning PYTHIA 8.1: the Monash 2013 tune | EPJC 74 (2014) 3024 | 1404.5630 |
| 26 | CMS Collaboration | Extraction and validation of a new set of CMS PYTHIA8 tunes from underlying-event measurements | EPJC 80 (2020) | CMS-GEN-17-001 1903.12179 |
| 27 | CMS Collaboration | Event generator tunes obtained from underlying event and multiparton scattering measurements | EPJC 76 (2016) 155 | CMS-GEN-14-001 1512.00815 |
| 28 | CMS Collaboration | Investigations of the impact of the parton shower tuning in Pythia 8 in the modelling of $ \mathrm{t\overline{t}} $ at $ \sqrt{s}= $ 8 and 13 TeV | CMS-PAS-TOP-16-021 | CMS-PAS-TOP-16-021 |
| 29 | R. Frederix and S. Frixione | Merging meets matching in MC@NLO | JHEP 12 (2012) 61 | 1209.6215 |
| 30 | NNPDF Collaboration | Parton distributions from high-precision collider data | EPJC 77 (2017) 663 | 1706.00428 |
| 31 | GEANT4 Collaboration | GEANT4---a simulation toolkit | NIMA 506 (2003) 250 | |
| 32 | CMS Collaboration | Particle-flow reconstruction and global event description with the CMS detector | JINST 12 (2017) P10003 | CMS-PRF-14-001 1706.04965 |
| 33 | CMS Collaboration | Performance of reconstruction and identification of $ \tau $ leptons decaying to hadrons and $ \nu_\tau $ in pp collisions at $ \sqrt{s}= $ 13 TeV | JINST 13 (2018), no. 10, P10005 | CMS-TAU-16-003 1809.02816 |
| 34 | CMS Collaboration | Jet energy scale and resolution in the CMS experiment in pp collisions at 8 TeV | JINST 12 (2017) P02014 | CMS-JME-13-004 1607.03663 |
| 35 | CMS Collaboration | Performance of missing transverse momentum reconstruction in proton-proton collisions at $ \sqrt{s} = $ 13 TeV using the CMS detector | JINST 14 (2019) P07004 | CMS-JME-17-001 1903.06078 |
| 36 | M. Cacciari, G. P. Salam, and G. Soyez | The anti-$ {k_{\mathrm{T}}} $ jet clustering algorithm | JHEP 04 (2008) 063 | 0802.1189 |
| 37 | M. Cacciari, G. P. Salam, and G. Soyez | FastJet User Manual | EPJC 72 (2012) 1896 | 1111.6097 |
| 38 | CMS Collaboration | Performance of electron reconstruction and selection with the CMS detector in proton-proton collisions at $ \sqrt{s} = $ 8 TeV | JINST 10 (2015) P06005 | CMS-EGM-13-001 1502.02701 |
| 39 | CMS Collaboration | Performance of the CMS muon detector and muon reconstruction with proton-proton collisions at $ \sqrt{s} = $ 13 TeV | JINST 13 (2018) P06015 | CMS-MUO-16-001 1804.04528 |
| 40 | CMS Collaboration | Search for new physics in same-sign dilepton events in proton-proton collisions at $ \sqrt{s} = $ 13 TeV | EPJC 76 (2016) 8 | CMS-SUS-15-008 1605.03171 |
| 41 | CMS Collaboration | Observation of single top quark production in association with a Z boson in proton-proton collisions at $ \sqrt{s} = $ 13 TeV | PRL 122 (2019) 132003 | CMS-TOP-18-008 1812.05900 |
| 42 | CMS Collaboration | Inclusive and differential cross section measurements of single top quark production in association with a Z boson in proton-proton collisions at $ \sqrt{s} = $ 13 TeV | JHEP 02 (2022) 107 | CMS-TOP-20-010 2111.02860 |
| 43 | CMS Collaboration | Pileup mitigation at cms in 13 tev data | JINST 15 (2020) P09018 | CMS-JME-18-001 2003.00503 |
| 44 | CMS Collaboration | Identification of heavy-flavour jets with the CMS detector in pp collisions at 13 TeV | JINST 13 (2018) P05011 | CMS-BTV-16-002 1712.07158 |
| 45 | E. Bols et al. | Jet Flavour Classification Using DeepJet | JINST 15 (2020) P12012 | 2008.10519 |
| 46 | CMS Collaboration | Performance of the DeepJet b tagging algorithm using 41.9~fb$ ^{-1} $ of data from proton-proton collisions at 13 TeV with Phase 1 CMS detector | CDS | |
| 47 | Particle Data Group, P. A. Zyla et al. | Review of particle physics | Prog. Theor. Exp. Phys. 2020 (2020) 083C01 | |
| 48 | CMS Collaboration | Evidence for associated production of a Higgs boson with a top quark pair in final states with electrons, muons, and hadronically decaying $ \tau $ leptons at $ \sqrt{s} = $ 13 TeV | JHEP 08 (2018) 066 | CMS-HIG-17-018 1803.05485 |
| 49 | CMS Collaboration | Precision luminosity measurement in proton-proton collisions at $ \sqrt{s} = $ 13 TeV in 2015 and 2016 at CMS | EPJC 81 (2021) 800 | CMS-LUM-17-003 2104.01927 |
| 50 | CMS Collaboration | CMS luminosity measurement for the 2017 data-taking period at $ \sqrt{s} = $ 13 TeV | CMS-PAS-LUM-17-004 | CMS-PAS-LUM-17-004 |
| 51 | CMS Collaboration | CMS luminosity measurement for the 2018 data-taking period at $ \sqrt{s} = $ 13 TeV | CMS-PAS-LUM-18-002 | CMS-PAS-LUM-18-002 |
| 52 | CMS Collaboration | Measurement of the inclusive and differential $ t\bar{t}\gamma $ cross sections in the single-lepton channel and EFT interpretation at $ \sqrt{s} = $ 13 TeV | JHEP 12 (2021) 80 | CMS-TOP-18-010 2107.01508 |
| 53 | CMS Collaboration | Search for electroweak production of charginos and neutralinos in multilepton final states in proton-proton collisions at $ \sqrt{s}= $ 13 TeV | JHEP 03 (2018) 166 | CMS-SUS-16-039 1709.05406 |
| 54 | CMS Collaboration | Search for standard model production of four top quarks with same-sign and multilepton final states in proton-proton collisions at $ \sqrt{s} = $ 13 TeV | EPJC 78 (2018) 140 | CMS-TOP-17-009 1710.10614 |
| 55 | CMS Collaboration | Observation of the Production of Three Massive Gauge Bosons at $ \sqrt {s} = $ 13 TeV | PRL 125 (2020) 151802 | CMS-SMP-19-014 2006.11191 |
| 56 | ATLAS Collaboration, CMS Collaboration, and LHC Higgs Combination Group | Procedure for the LHC Higgs boson search combination in Summer 2011 | CMS-NOTE-2011-005 | |
| 57 | G. Cowan, K. Cranmer, E. Gross, and O. Vitells | Asymptotic formulae for likelihood-based tests of new physics | EPJC 71 (2011) 1554 | 1007.1727 |
| 58 | R. J. Barlow and C. Beeston | Fitting using finite Monte Carlo samples | CPC 77 (1993) 219 | |

|
Compact Muon Solenoid LHC, CERN |

|

|

|

|

|

|