

Compact Muon Solenoid
LHC, CERN
| CMS-TOP-24-011 ; CERN-EP-2025-289 | ||
| Measurement of the $ t $-channel single top quark cross section in proton-proton collisions at $ \sqrt{s}= $ 5.02 TeV | ||
| CMS Collaboration | ||
| 13 March 2026 | ||
| Submitted to the Journal of High Energy Physics | ||
| Abstract: The single top quark $ t $-channel production cross section is measured in proton-proton collisions at the CERN LHC at $ \sqrt{s}= $ 5.02 TeV, using data recorded with the CMS detector in 2017, corresponding to an integrated luminosity of 302$ \text{pb}^{-1}$, and resulting in the first CMS measurement of the process at that energy. Events with one electron or muon and two or more jets, among which at least one is identified as originating from a b quark fragmentation, are analyzed. The combined cross section of single top quark ($ \mathrm{t}\mathrm{q} $) and single top antiquark ($ \overline{\mathrm{t}}\mathrm{q} $) production is $ \sigma(\mathrm{t}\mathrm{q}\text{+}\overline{\mathrm{t}}\mathrm{q})=25.4 ^{+3.6}_{-3.5} $ (stat) $ ^{+4.2}_{-3.9} $ (syst) $ \pm $ 0.5 (lumi) pb. The individual cross sections are measured to be $ \sigma(\mathrm{t}\mathrm{q})=17.6 ^{+2.8}_{-2.7} $ (stat) $ ^{+2.6}_{-2.4} $ (syst) $ \pm $ 0.3 (lumi) pb and $ \sigma(\overline{\mathrm{t}}\mathrm{q})=6.6 ^{+2.4}_{-1.6} $ (stat) $ ^{+2.1}_{-2.5} $ (syst) $ \pm $ 0.1 (lumi) pb. Their ratio is measured to be $ \mathcal{R}_{\mathrm{t-ch}} =2.7 ^{+1.5}_{-0.8} $ (stat) $ ^{+1.3}_{-0.3} $ (syst). The absolute value of the Cabibbo--Kobayashi--Maskawa matrix element is found to be $ |f_{\text{LV}}V_{\mathrm{t}\mathrm{b}}|= $ 0.92 $ \pm $ 0.09 (exp) $ \pm $ 0.01 (theo). The measurements are in good agreement with the standard model predictions at next-to-next-to-leading order accuracy in quantum chromodynamics. | ||
| Links: e-print arXiv:2603.13592 [hep-ex] (PDF) ; CDS record ; inSPIRE record ; HepData record ; Physics Briefing ; CADI line (restricted) ; | ||
| Figures | |
png pdf |
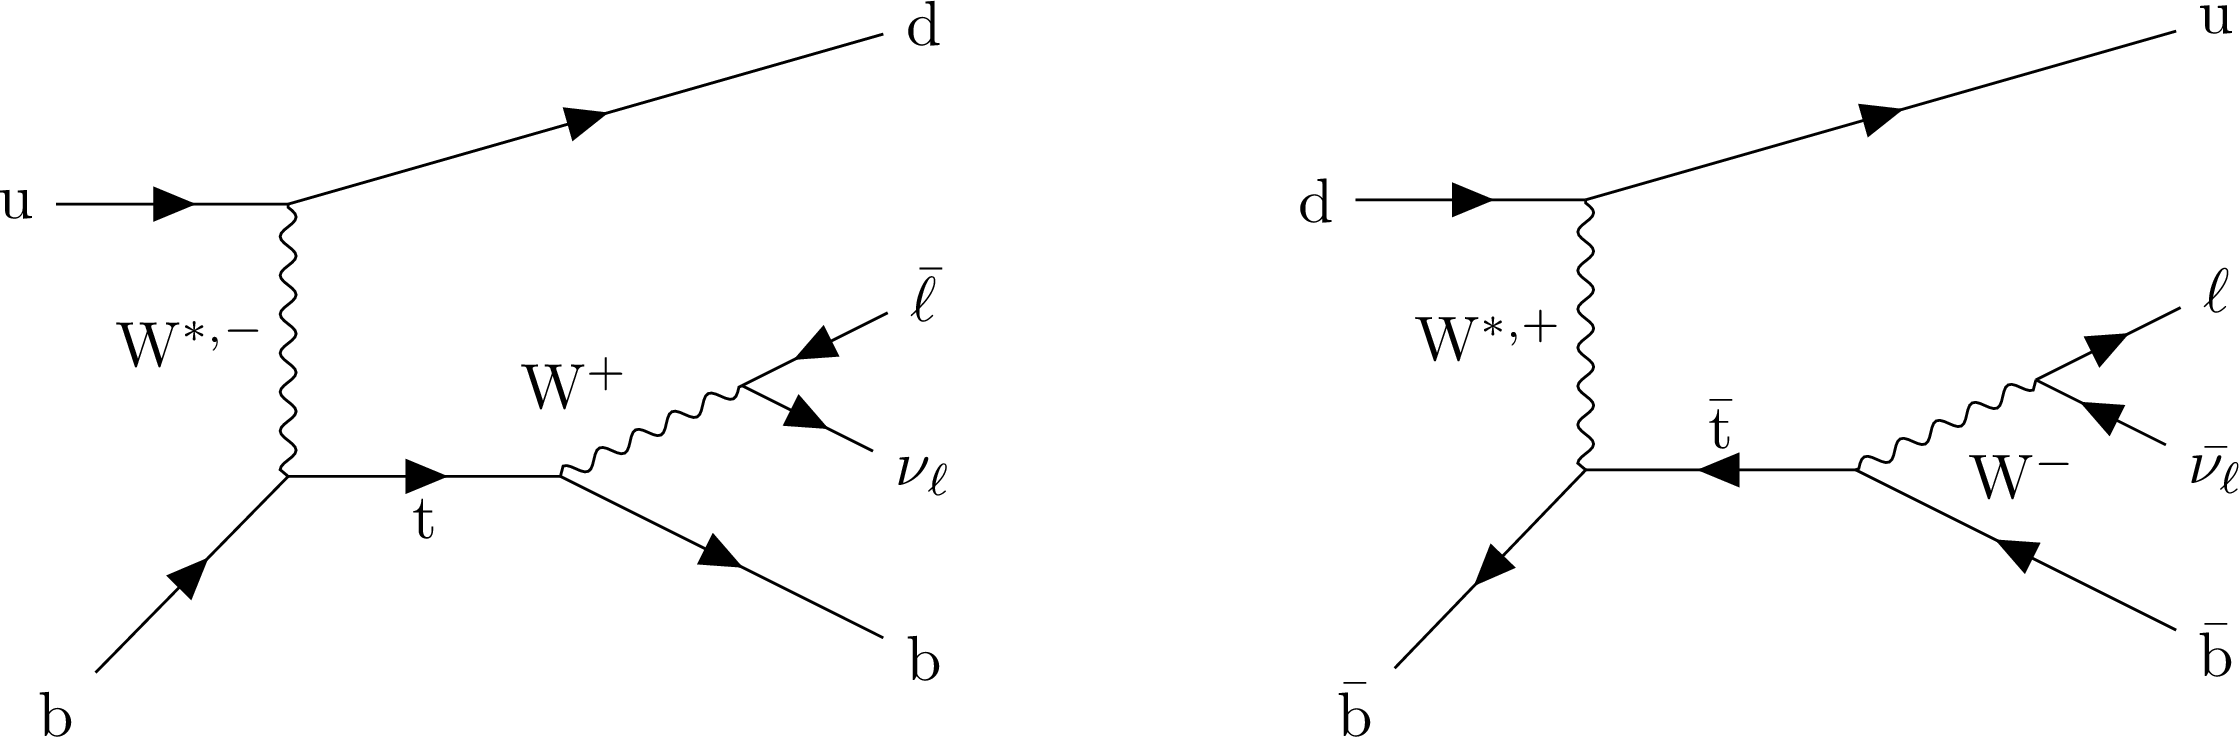
Figure 1:
Representative leading-order Feynman diagrams for single top quark (left) and antiquark (right) production via the $ t $ channel. |
png pdf |
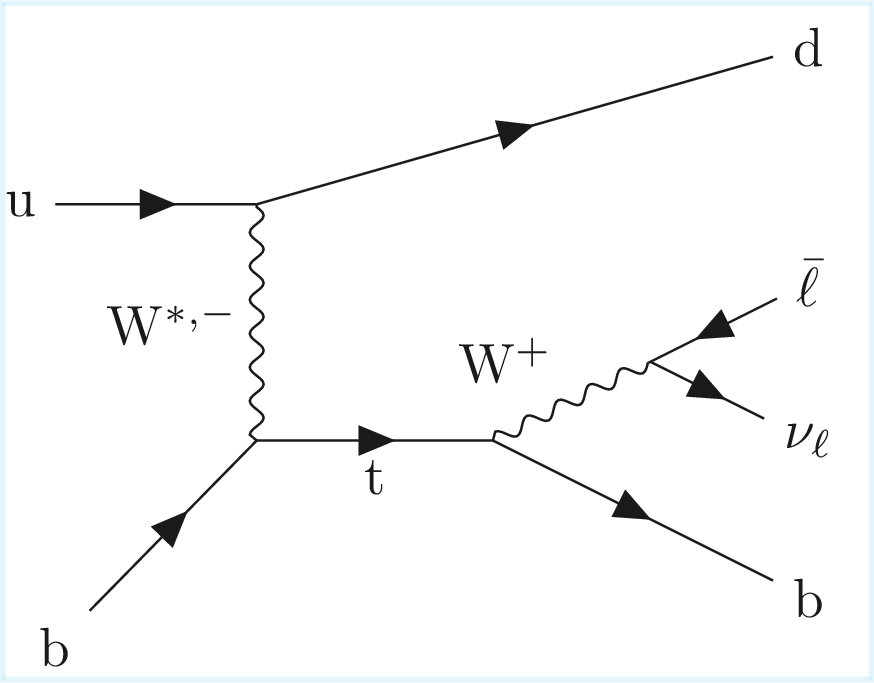
Figure 1-a:
Representative leading-order Feynman diagrams for single top quark (left) and antiquark (right) production via the $ t $ channel. |
png pdf |
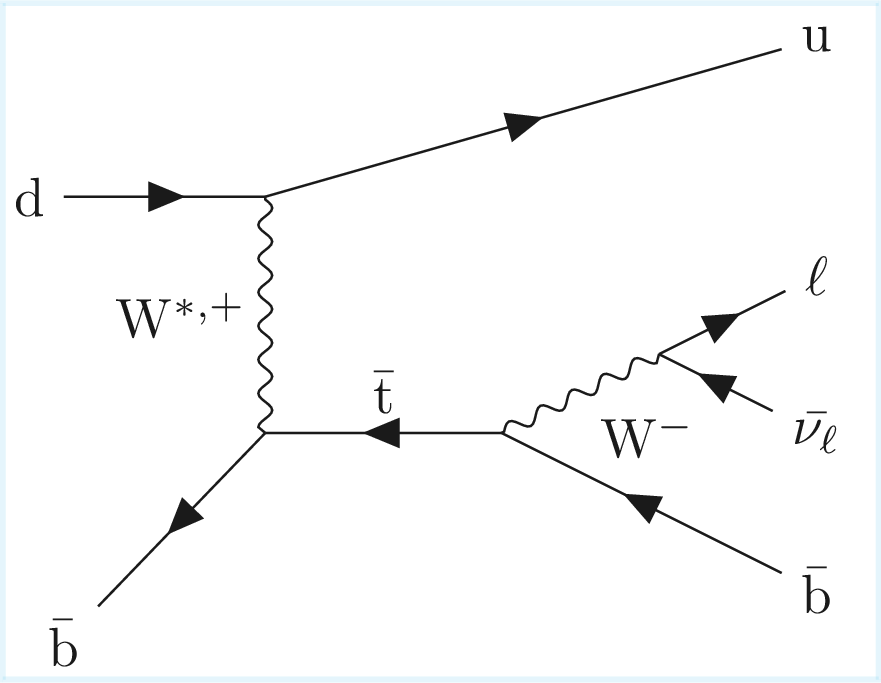
Figure 1-b:
Representative leading-order Feynman diagrams for single top quark (left) and antiquark (right) production via the $ t $ channel. |
png pdf |
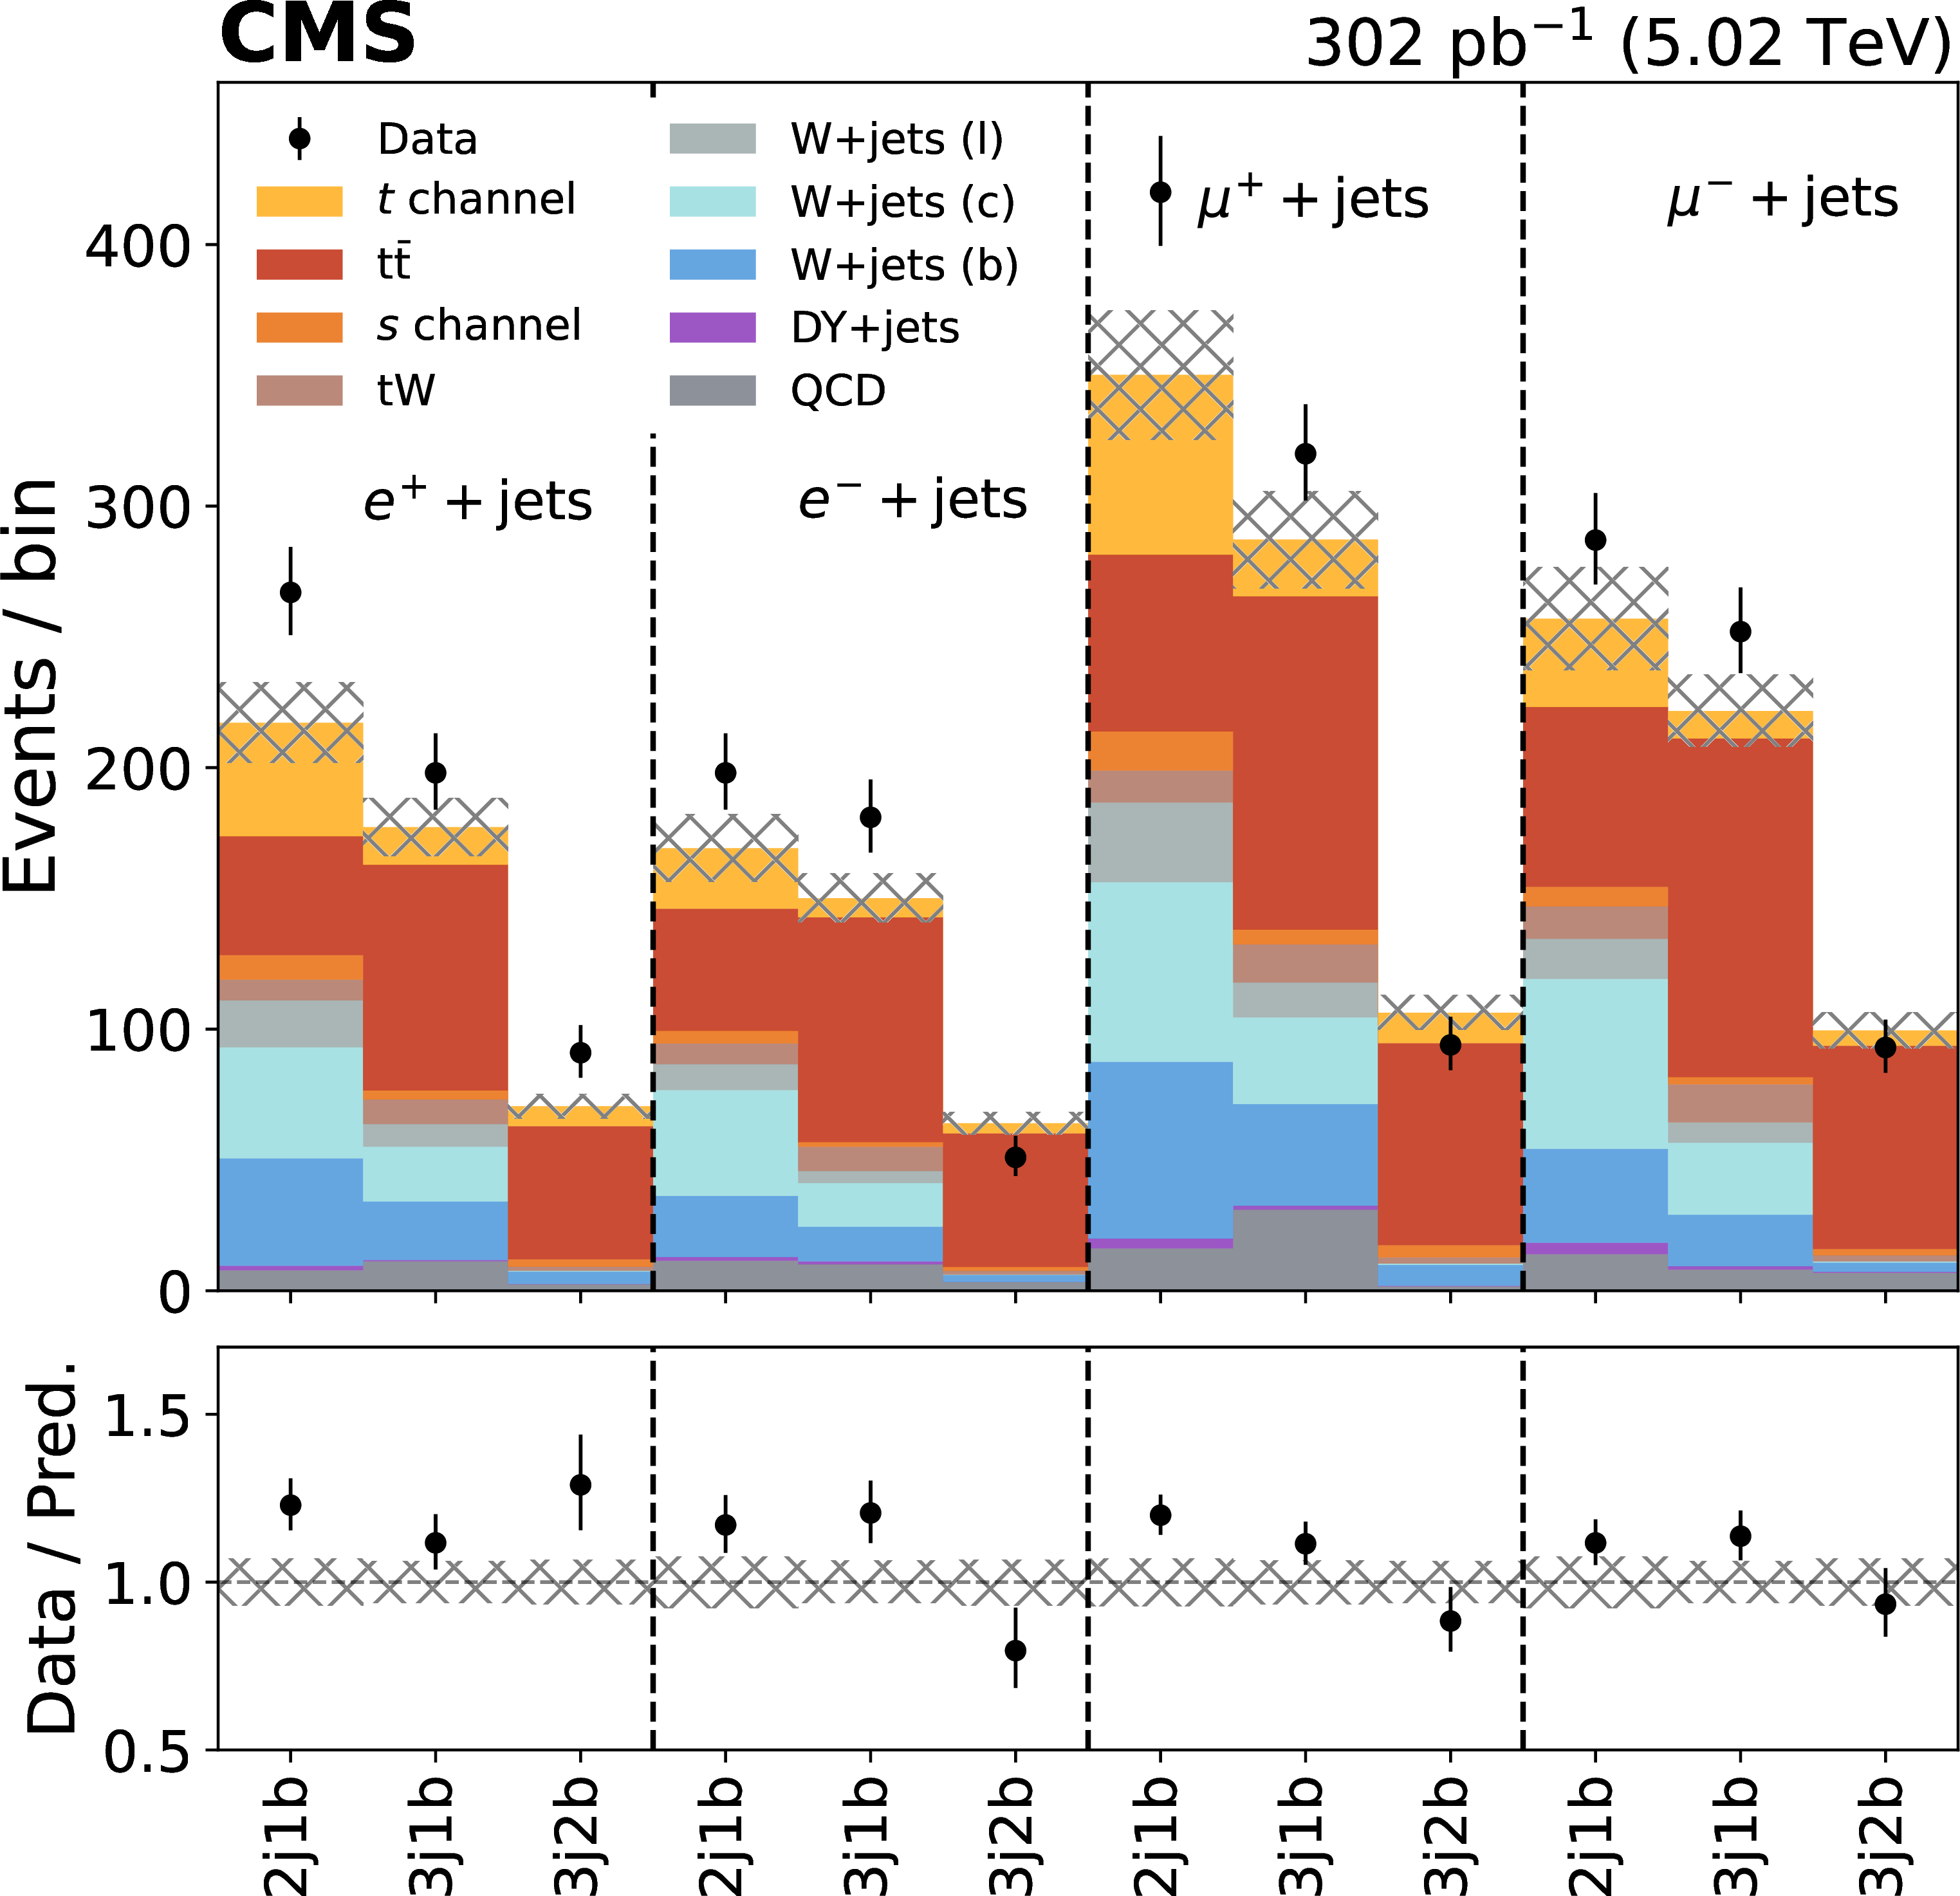
Figure 2:
Observed and predicted number of events in each of the twelve categories considered in the analysis, before the ML fit. The vertical error bars represent the statistical uncertainty associated to the data, and the hatched band the uncertainty in the prediction. All uncertainties considered in the analysis are included in the uncertainty band. The lower panels show the data-to-prediction ratio. The normalizations of the processes are those of the SM predictions except for QCD, which is estimated from data. The W+jets background is split as explained in Section 5. |
png pdf |
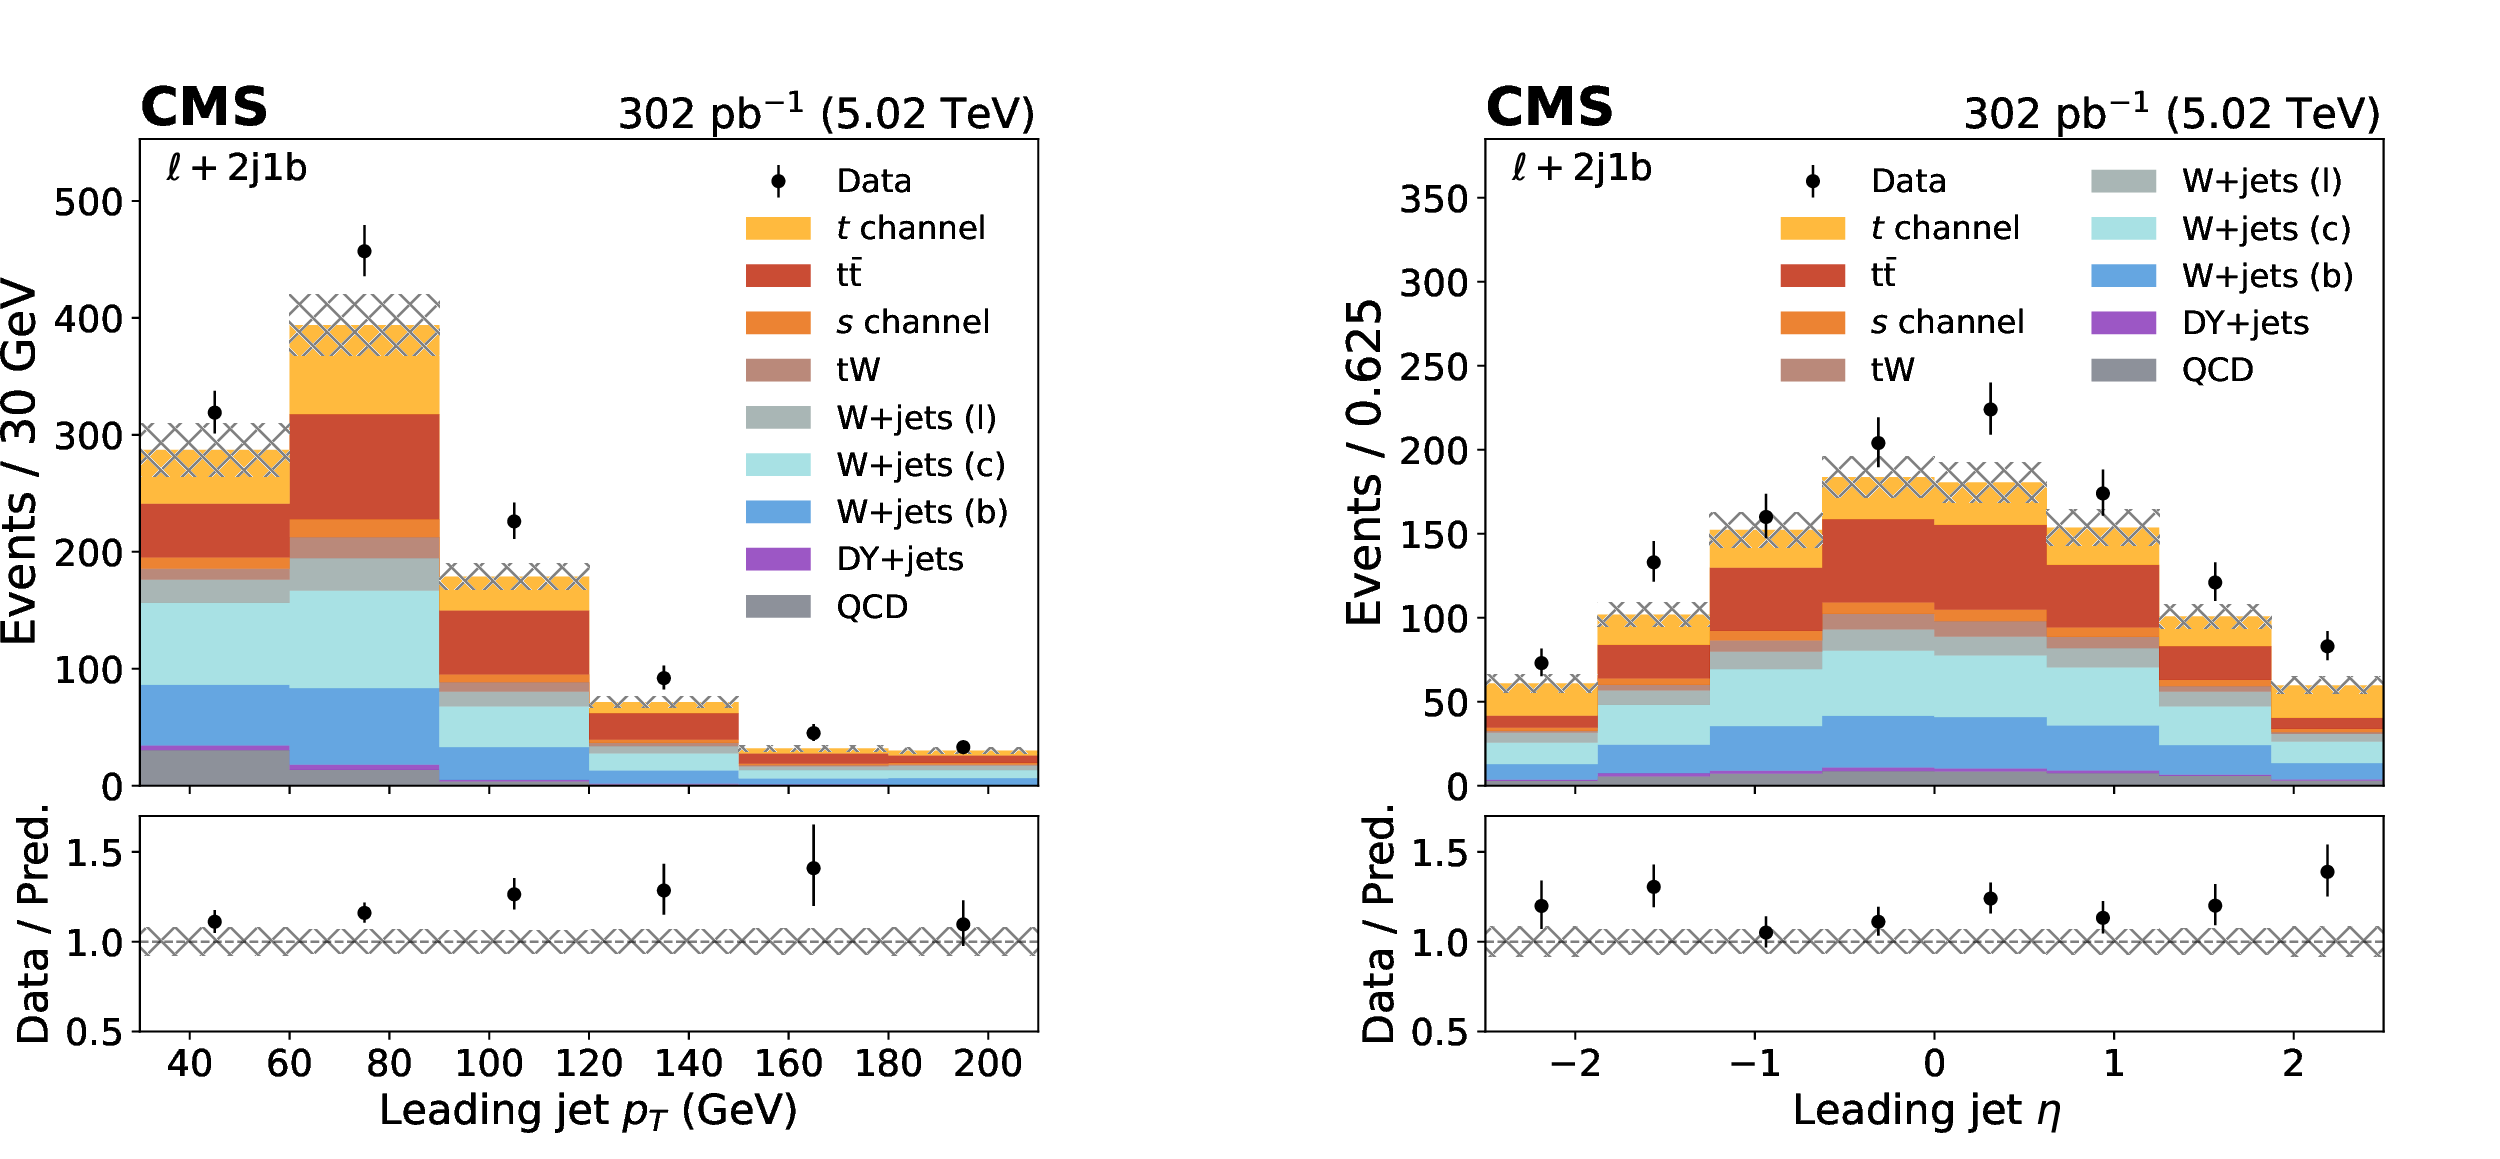
Figure 3:
Observed and predicted distributions of the leading jet $ p_{\mathrm{T}} $ (left) and $ \eta $ (right), in the 2j1b category, before the ML fit. The vertical error bars represent the statistical uncertainty associated to the data, and the hatched band the uncertainty in the prediction. The lower panels show the data-to-prediction ratio. The first and last bins in each distribution include underflow and overflow events, respectively. The normalizations of the processes are those of the SM predictions except for QCD, which is estimated from data. The W+jets background is split as explained in Section 5. |
png pdf |
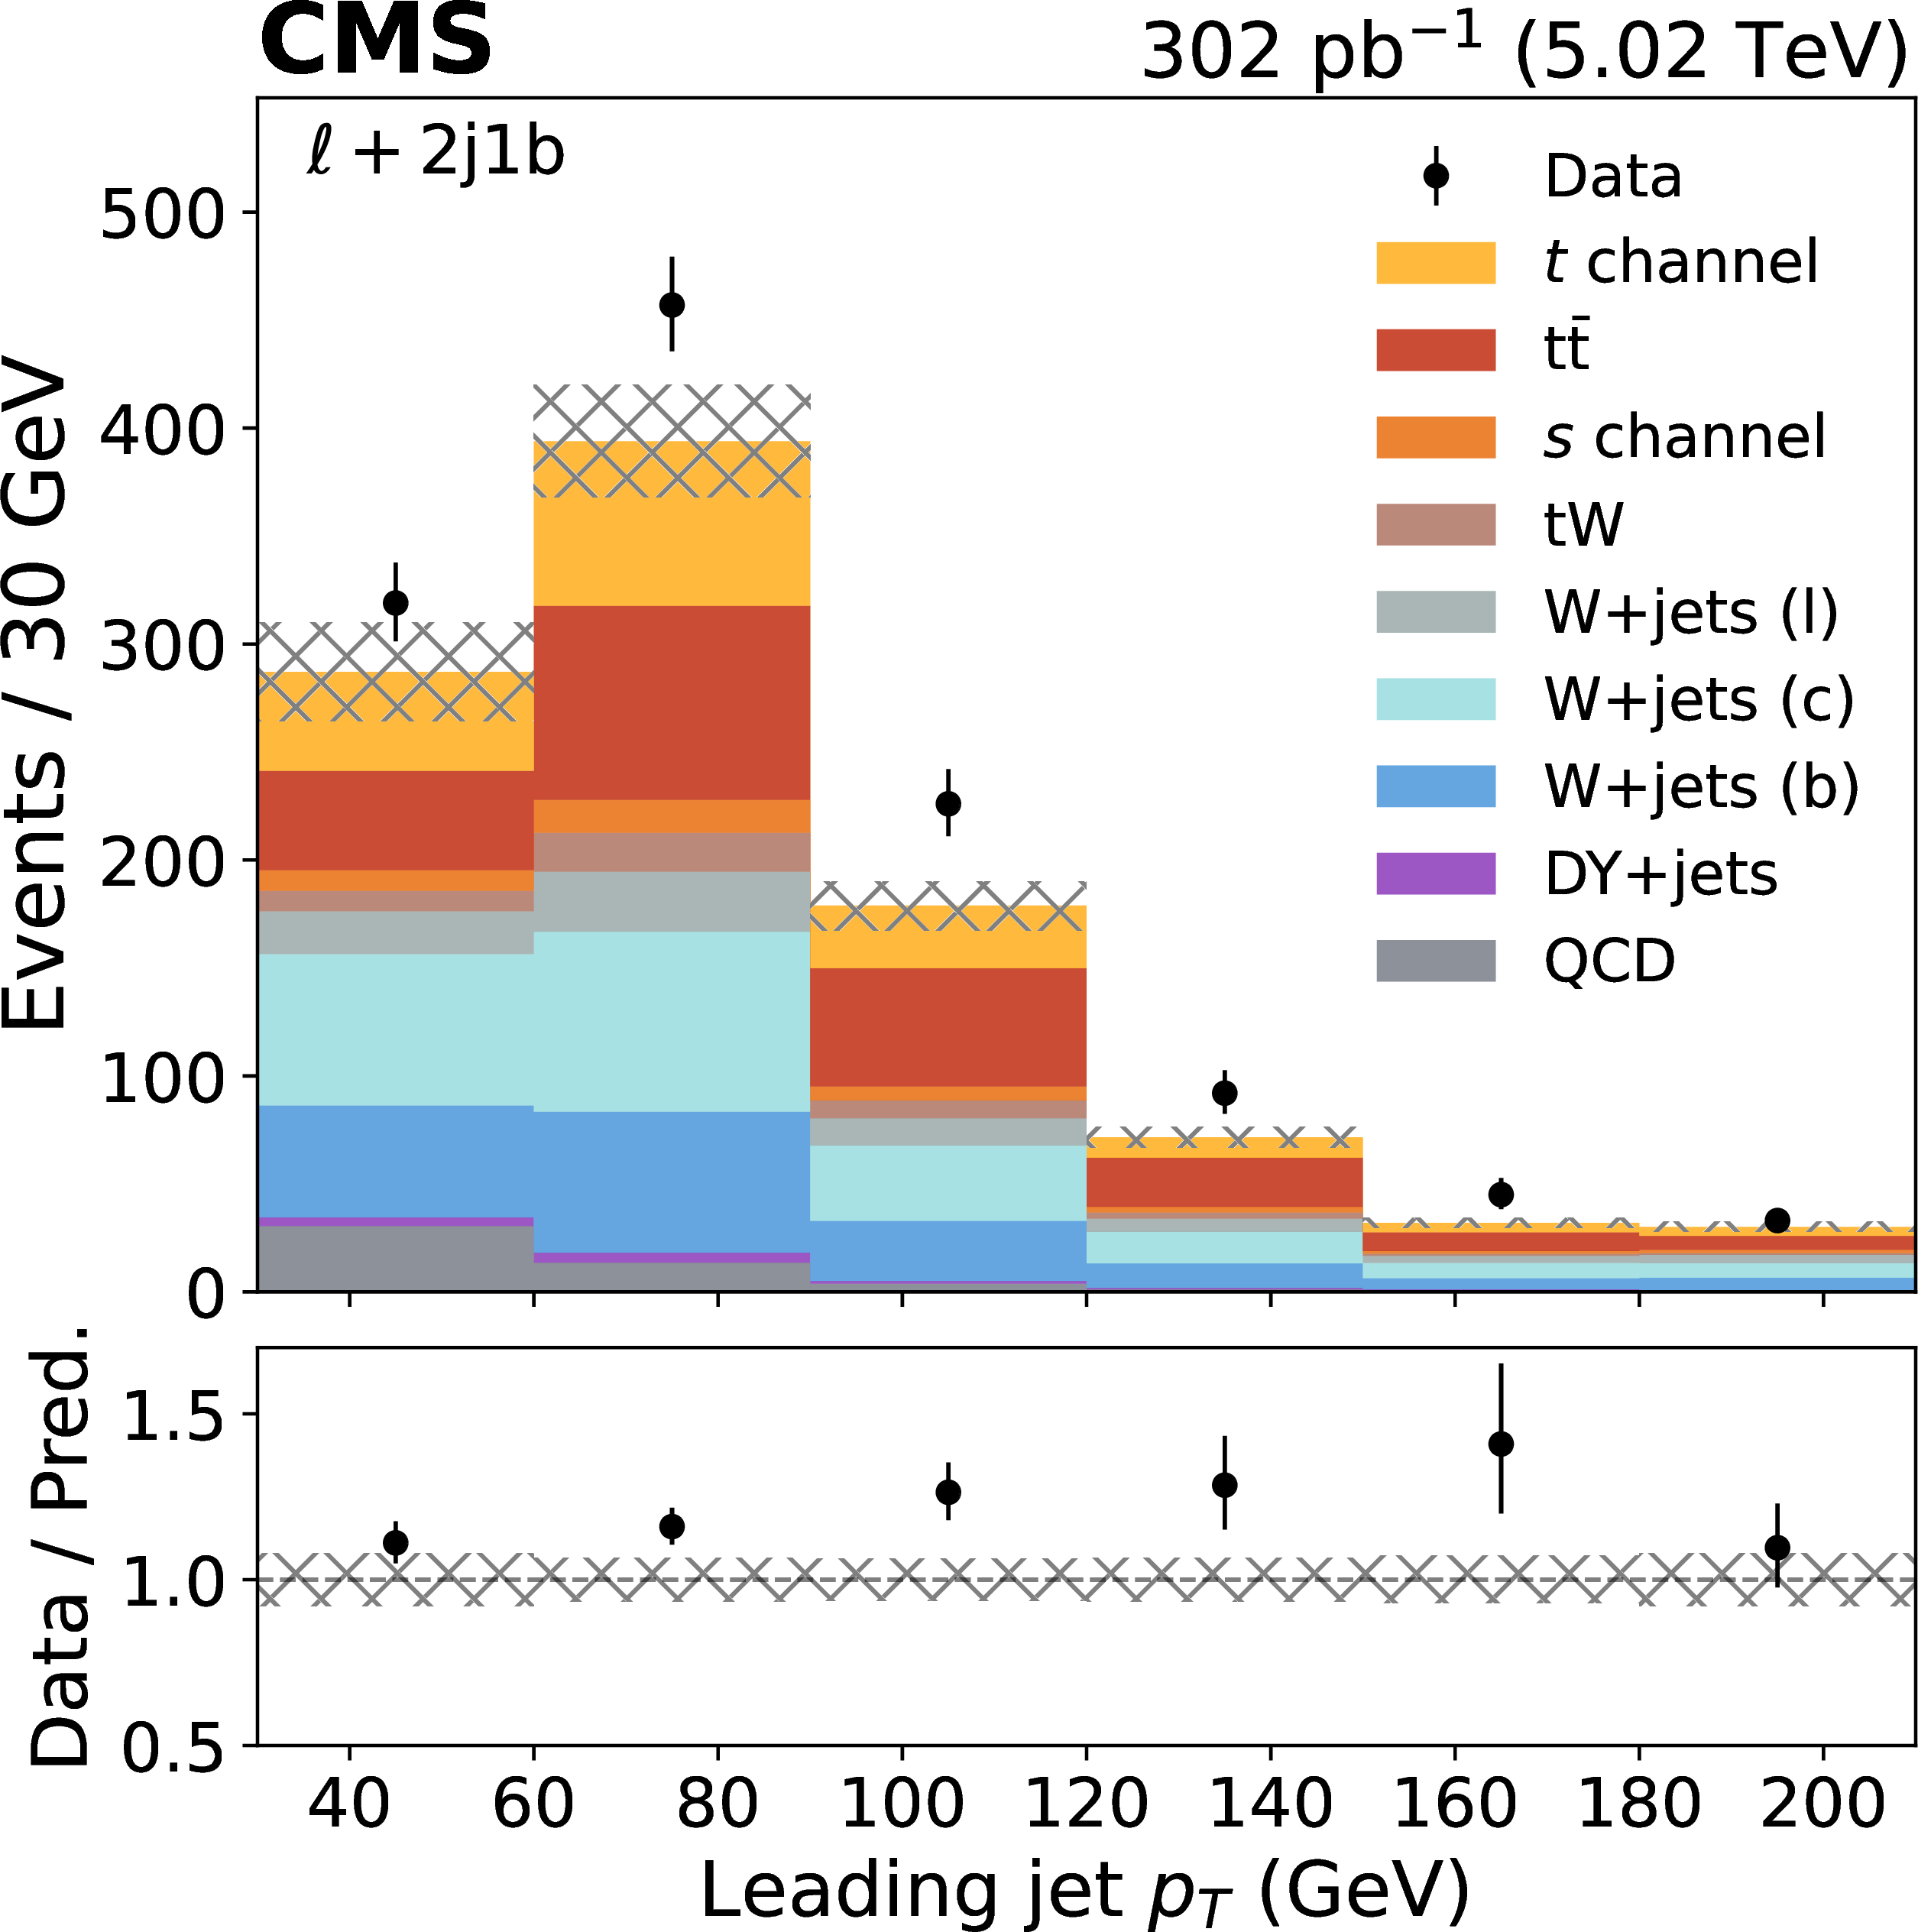
Figure 3-a:
Observed and predicted distributions of the leading jet $ p_{\mathrm{T}} $ (left) and $ \eta $ (right), in the 2j1b category, before the ML fit. The vertical error bars represent the statistical uncertainty associated to the data, and the hatched band the uncertainty in the prediction. The lower panels show the data-to-prediction ratio. The first and last bins in each distribution include underflow and overflow events, respectively. The normalizations of the processes are those of the SM predictions except for QCD, which is estimated from data. The W+jets background is split as explained in Section 5. |
png pdf |
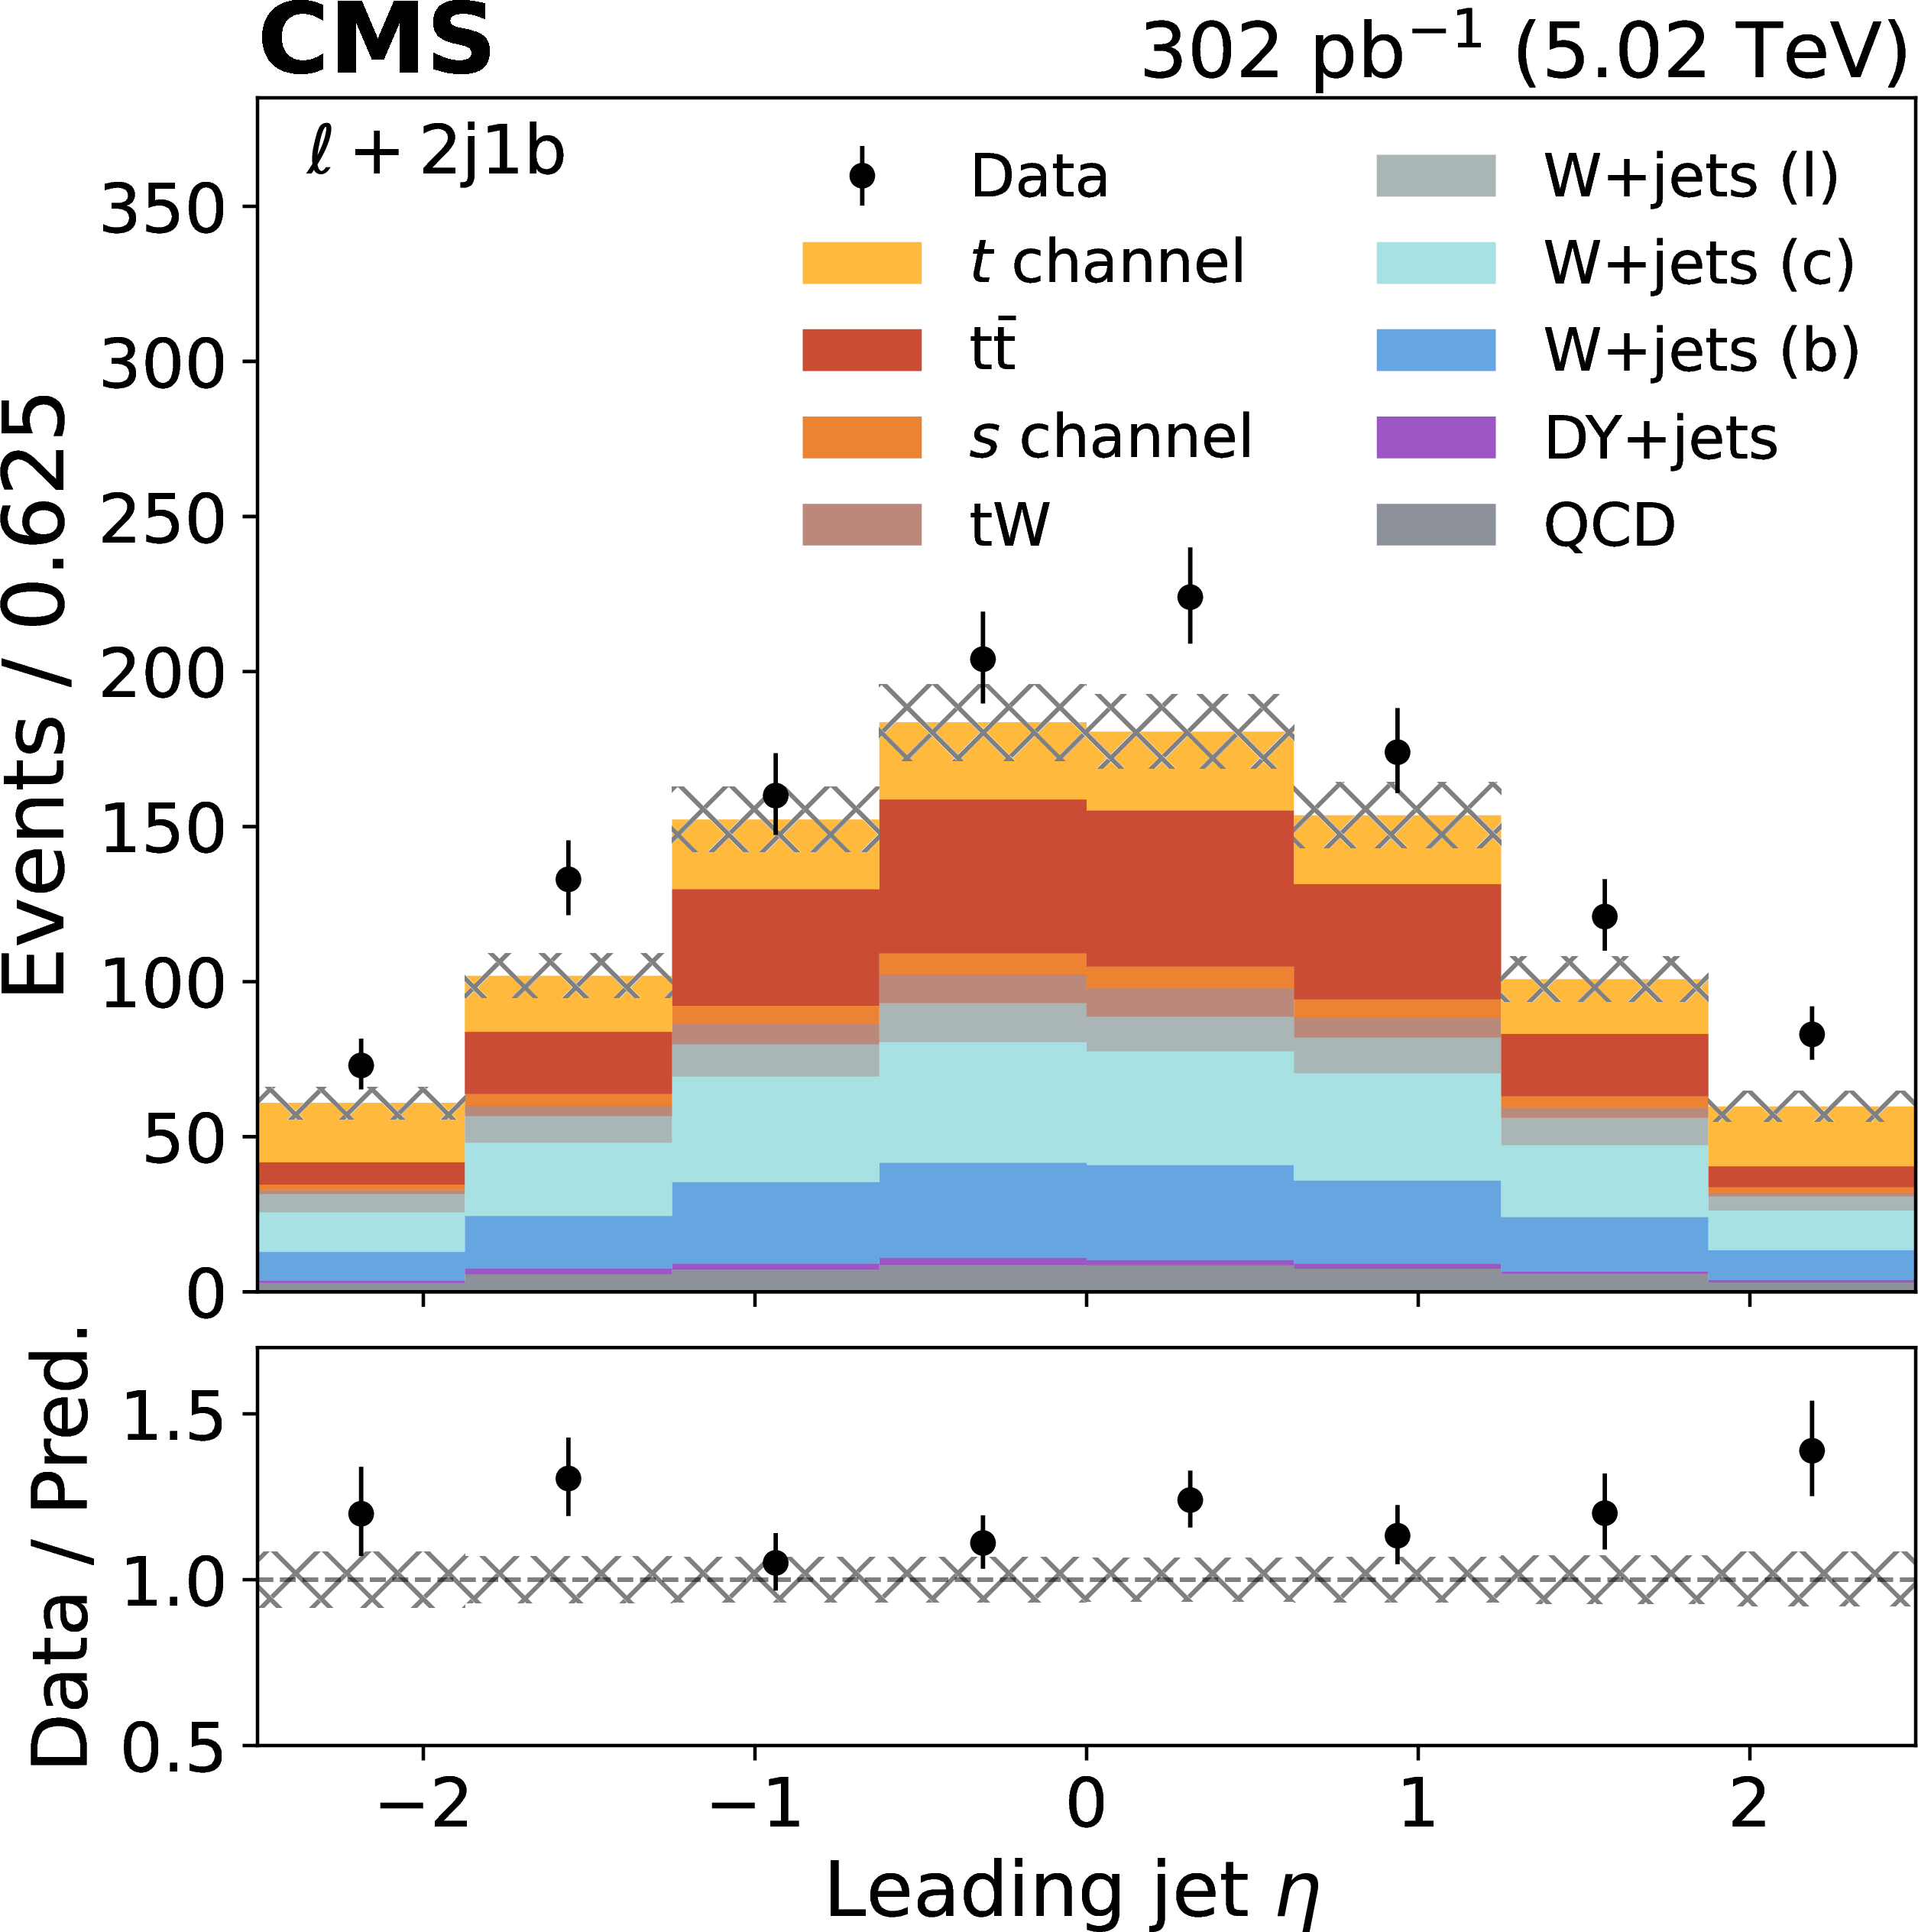
Figure 3-b:
Observed and predicted distributions of the leading jet $ p_{\mathrm{T}} $ (left) and $ \eta $ (right), in the 2j1b category, before the ML fit. The vertical error bars represent the statistical uncertainty associated to the data, and the hatched band the uncertainty in the prediction. The lower panels show the data-to-prediction ratio. The first and last bins in each distribution include underflow and overflow events, respectively. The normalizations of the processes are those of the SM predictions except for QCD, which is estimated from data. The W+jets background is split as explained in Section 5. |
png pdf |
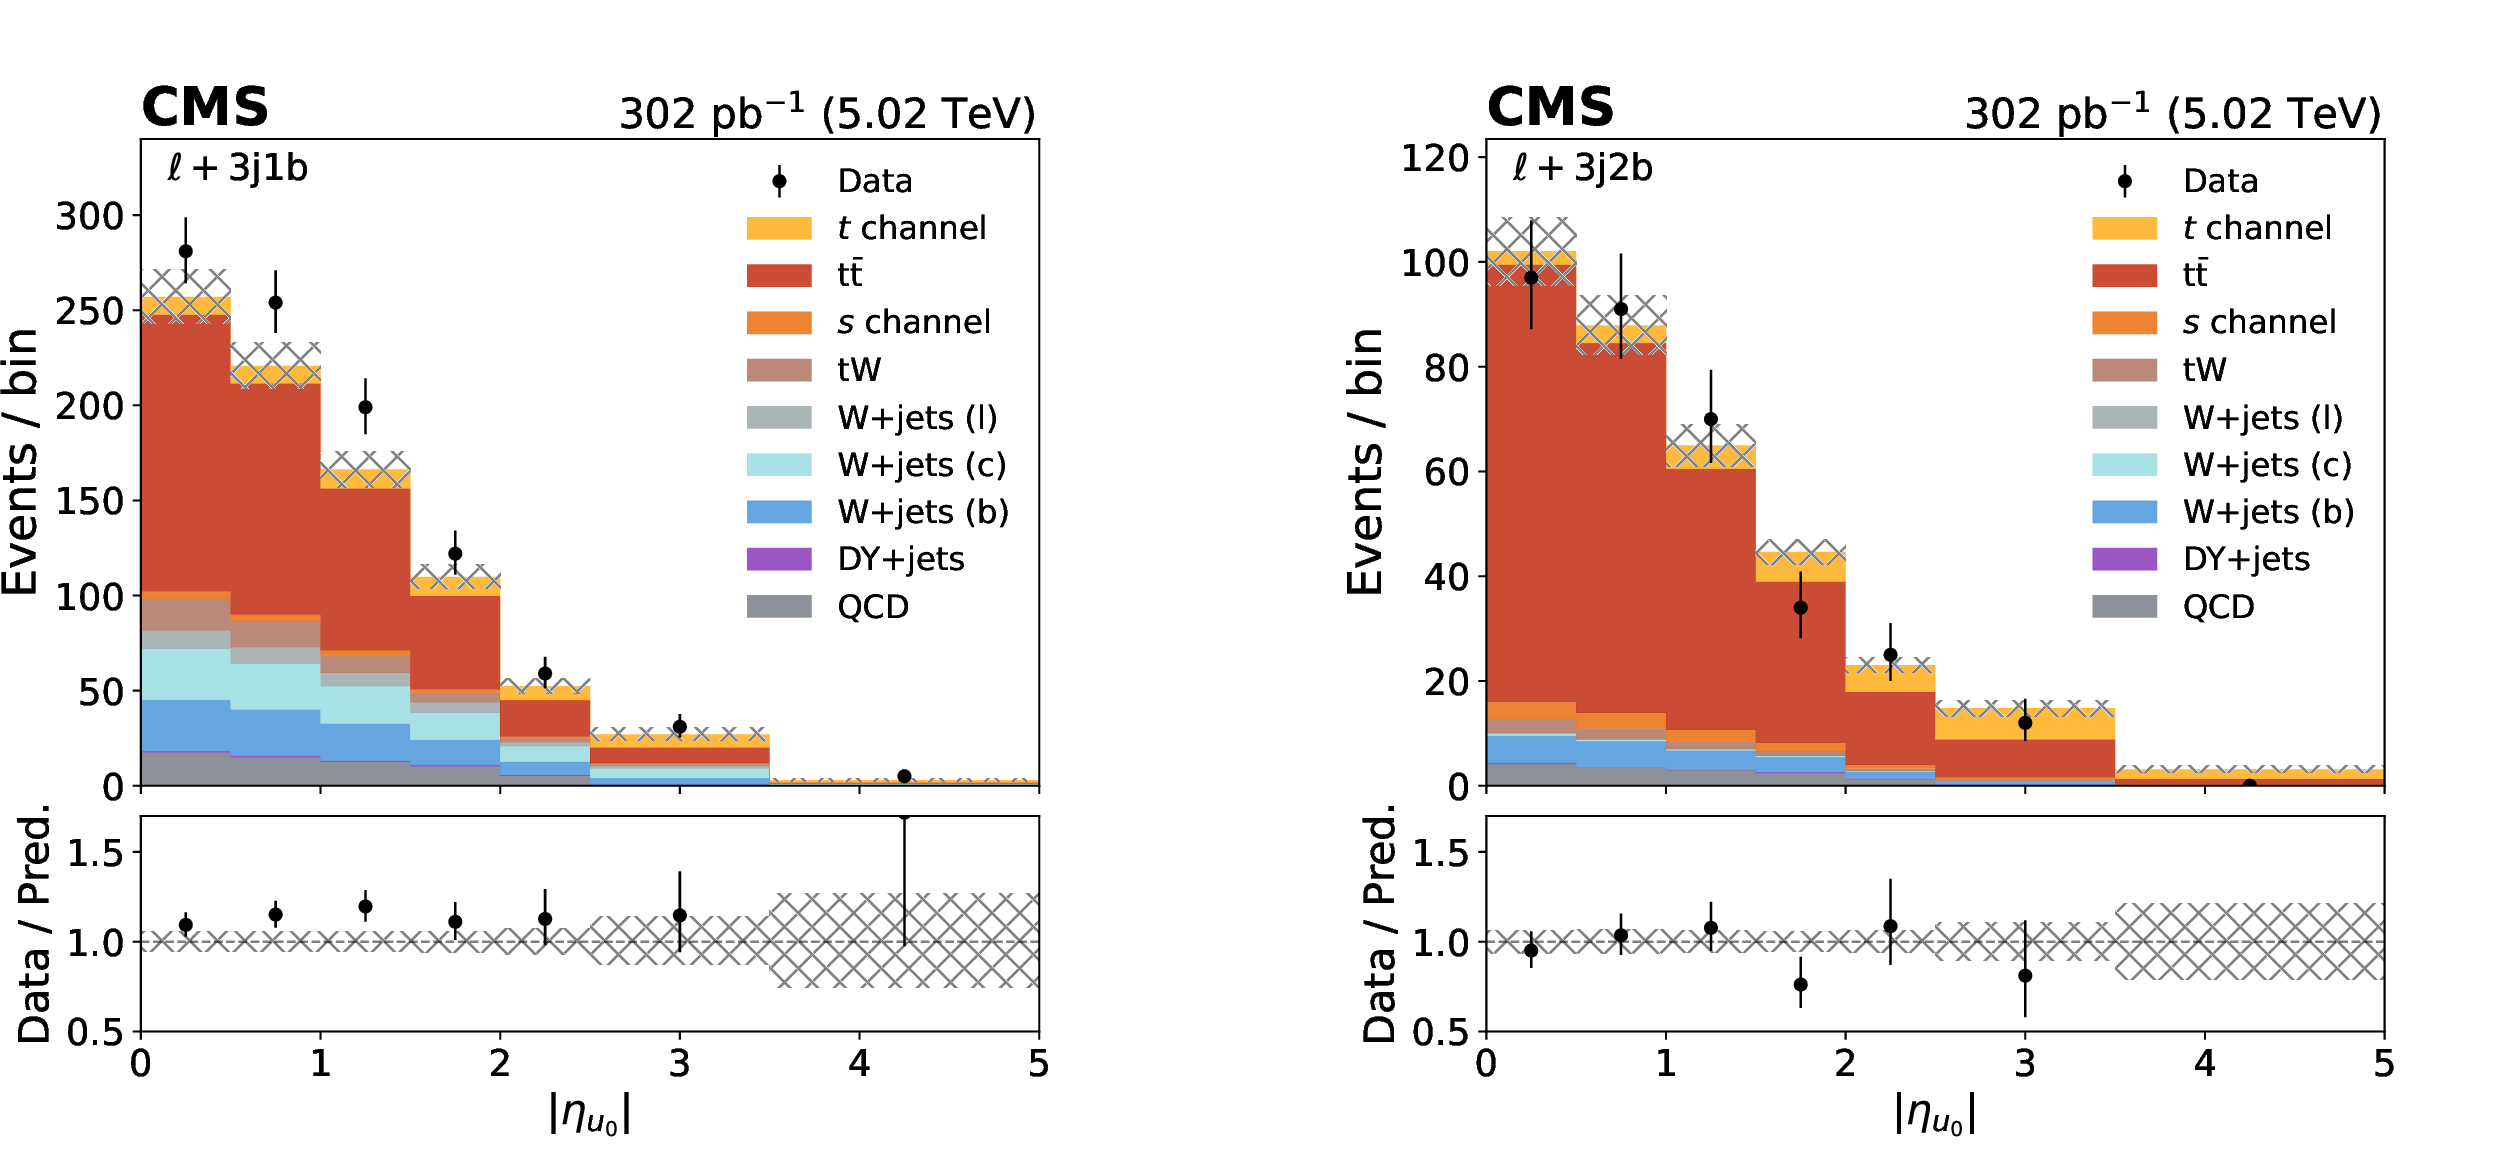
Figure 4:
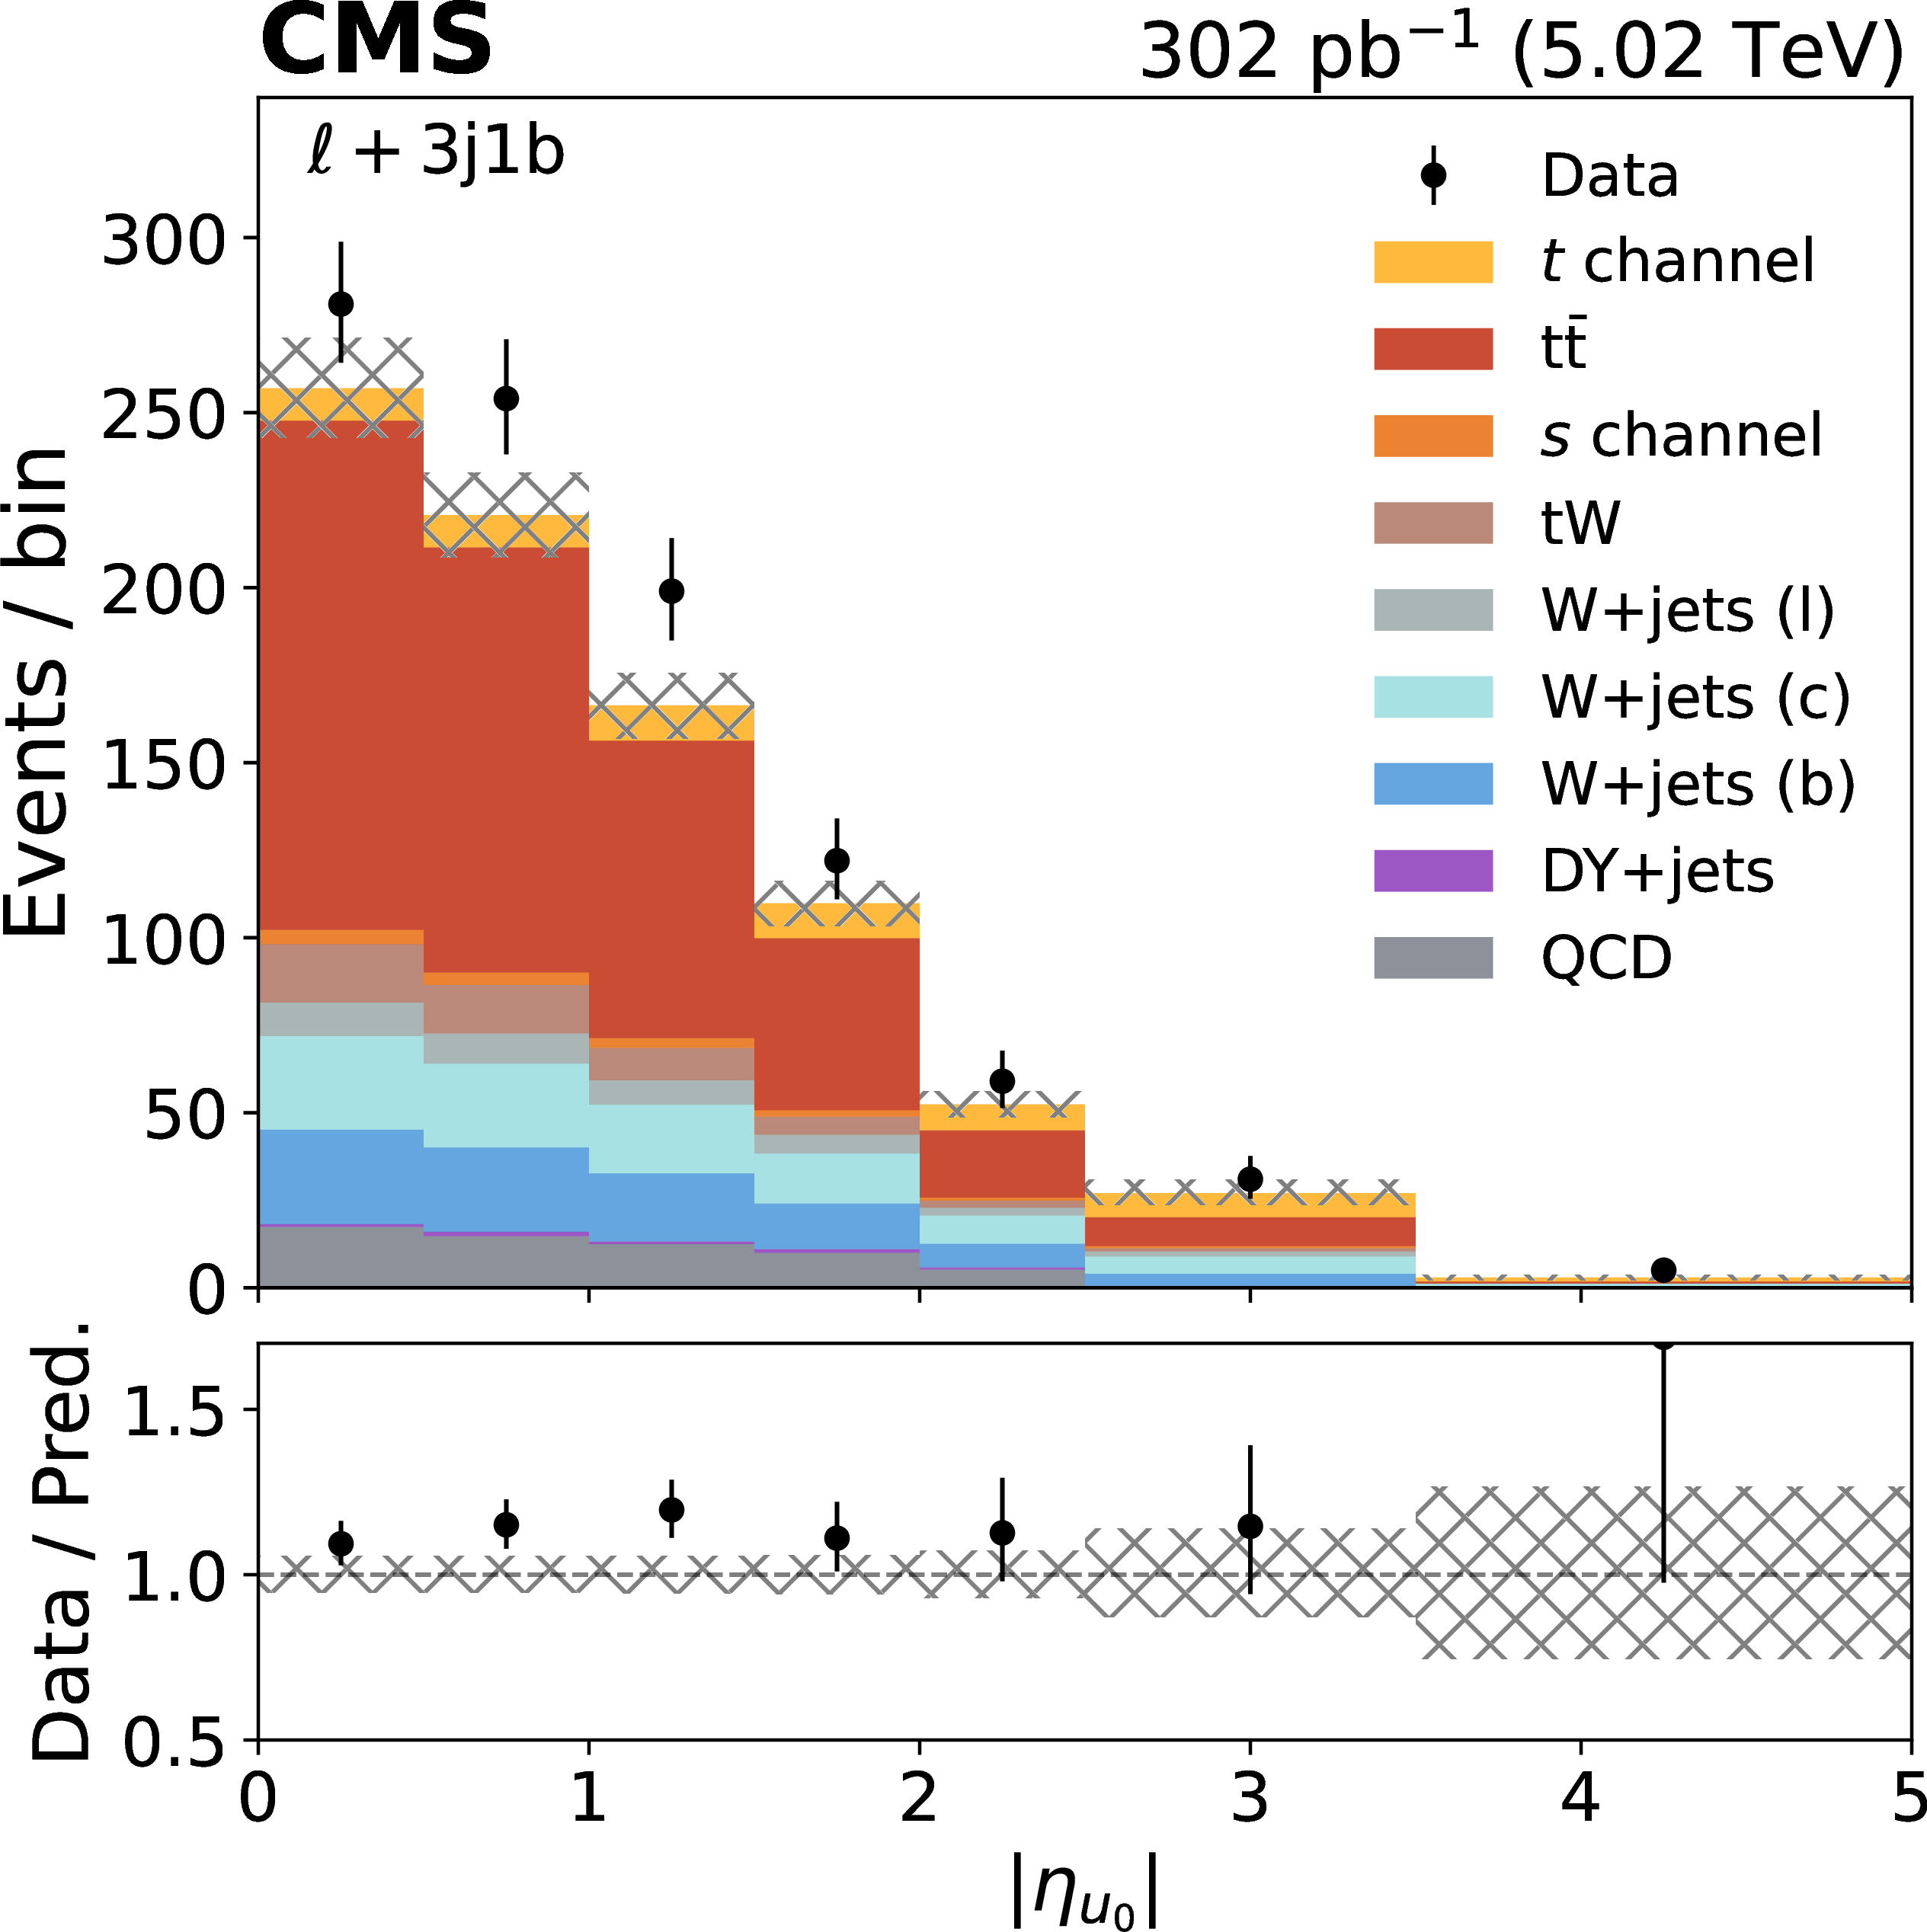
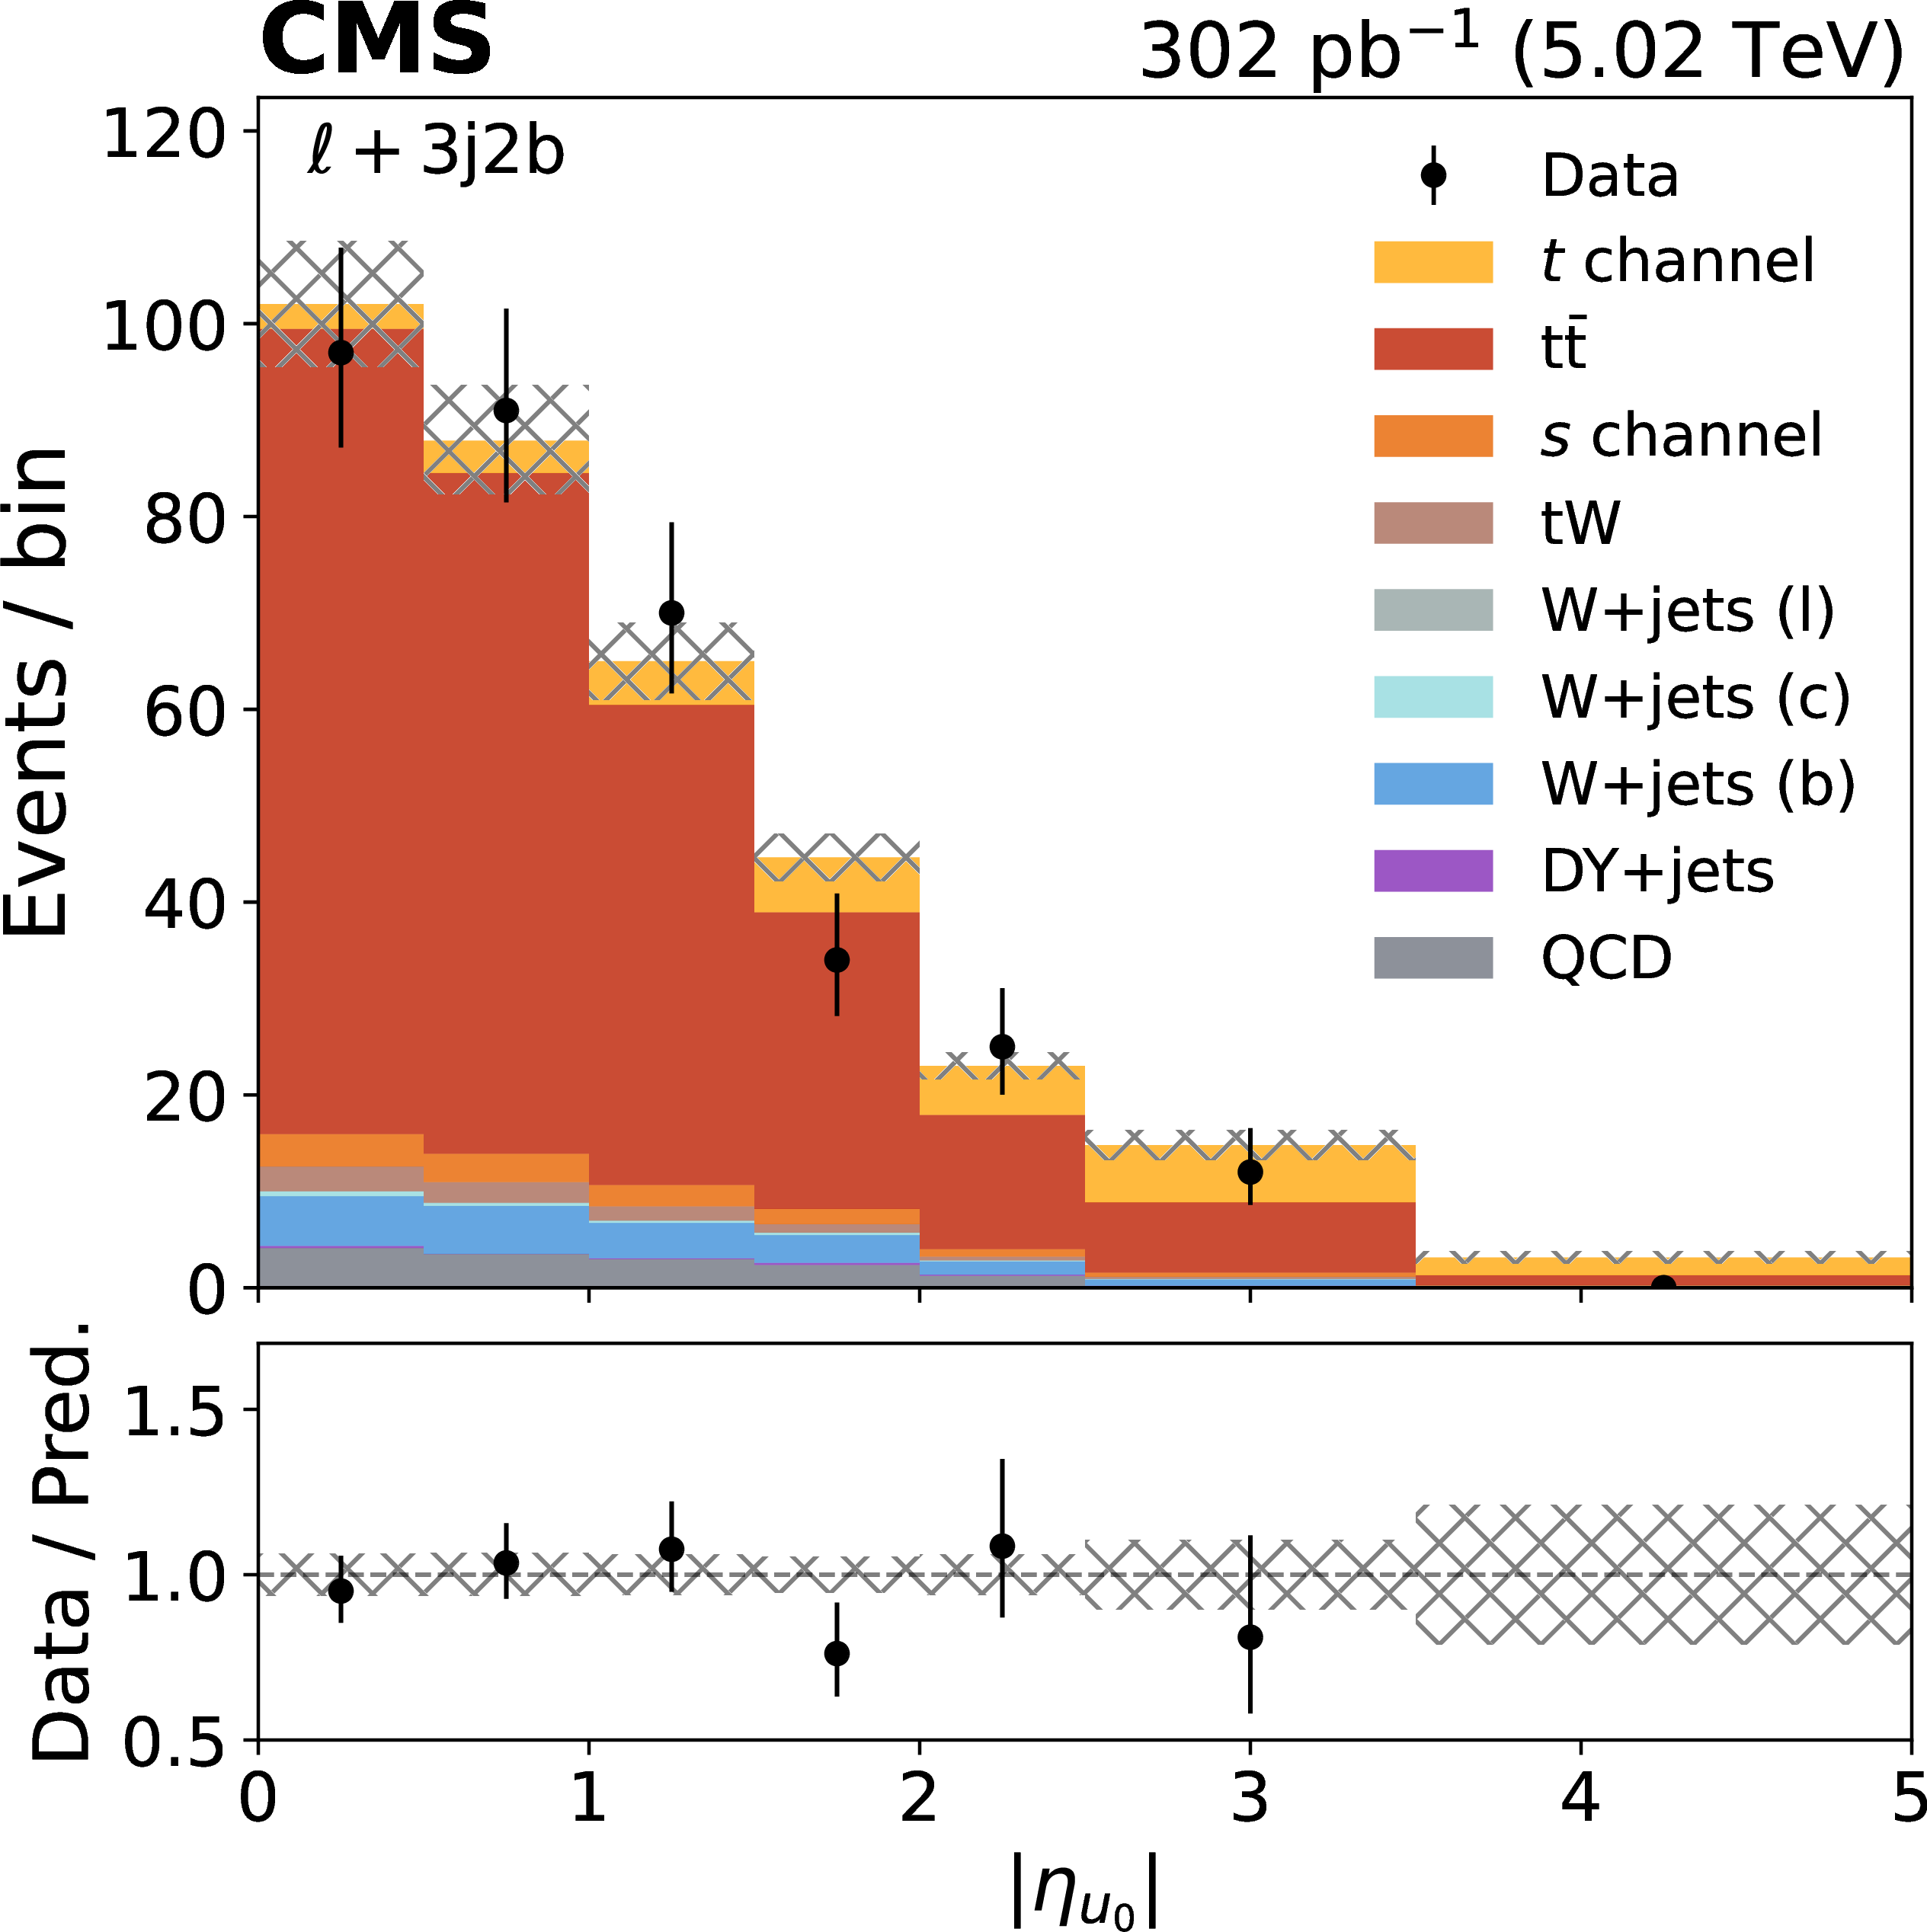
Observed and predicted distributions of $ |\eta_{\mathrm{u}_0}| $ in the 3j1b (left) and 3j2b (right) categories, before the ML fit. The vertical error bars represent the statistical uncertainty associated to the data, and the hatched band the uncertainty in the prediction. The lower panels show the data-to-prediction ratio. The normalizations of the processes are those of the SM predictions except for QCD, which is estimated from data. The W+jets background is split as explained in Section 5. |
png pdf |
Figure 4-a:
Observed and predicted distributions of $ |\eta_{\mathrm{u}_0}| $ in the 3j1b (left) and 3j2b (right) categories, before the ML fit. The vertical error bars represent the statistical uncertainty associated to the data, and the hatched band the uncertainty in the prediction. The lower panels show the data-to-prediction ratio. The normalizations of the processes are those of the SM predictions except for QCD, which is estimated from data. The W+jets background is split as explained in Section 5. |
png pdf |
Figure 4-b:
Observed and predicted distributions of $ |\eta_{\mathrm{u}_0}| $ in the 3j1b (left) and 3j2b (right) categories, before the ML fit. The vertical error bars represent the statistical uncertainty associated to the data, and the hatched band the uncertainty in the prediction. The lower panels show the data-to-prediction ratio. The normalizations of the processes are those of the SM predictions except for QCD, which is estimated from data. The W+jets background is split as explained in Section 5. |
png pdf |
Figure 5:
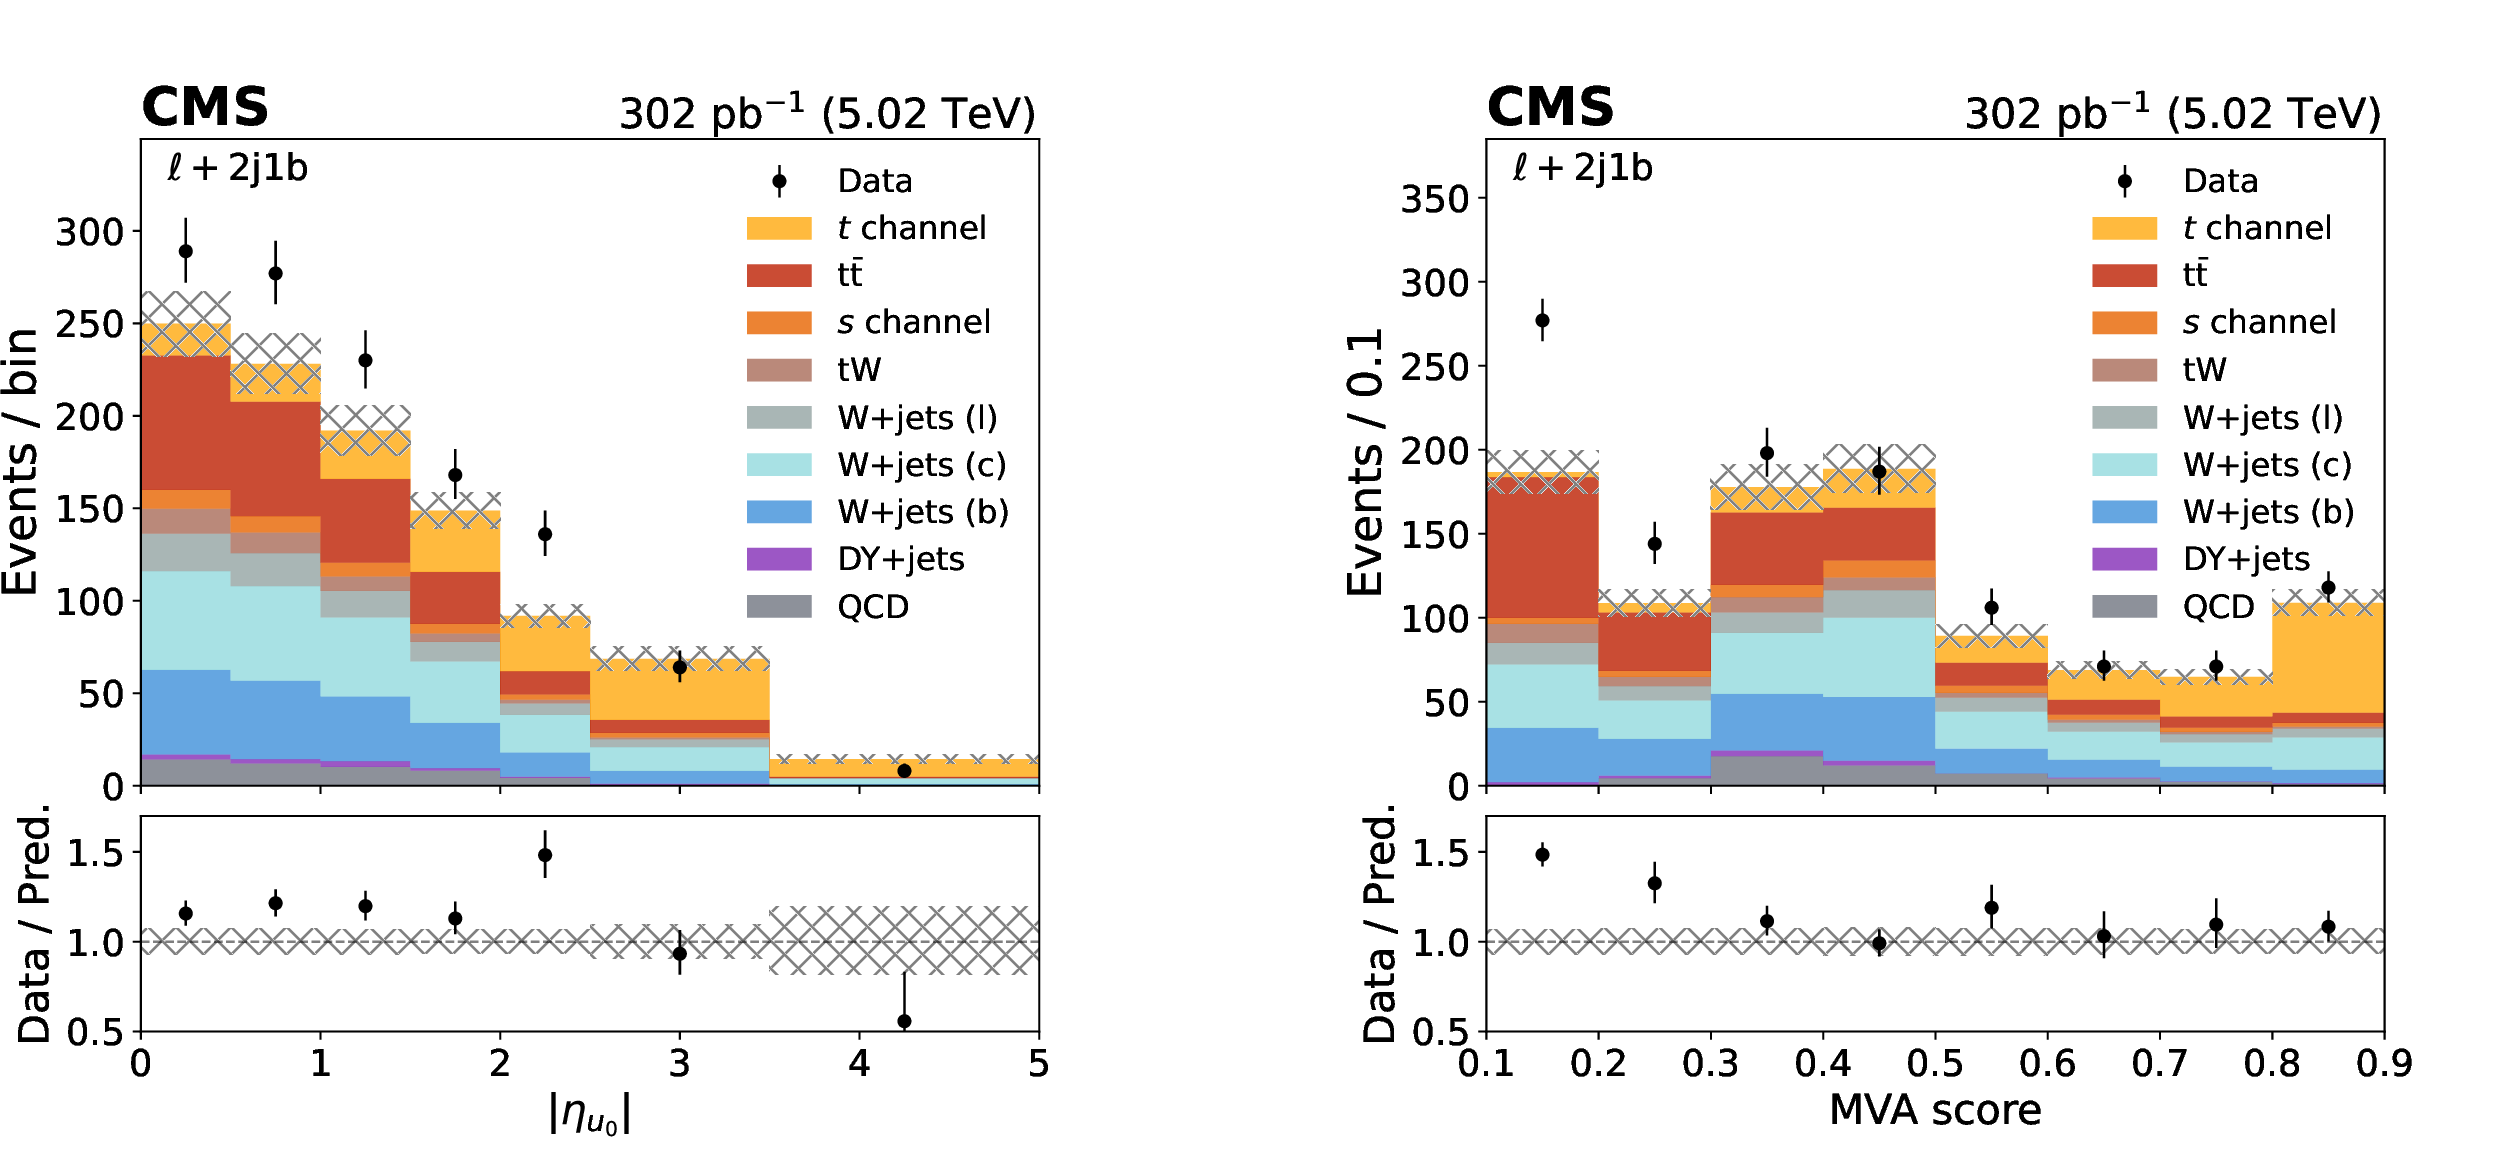
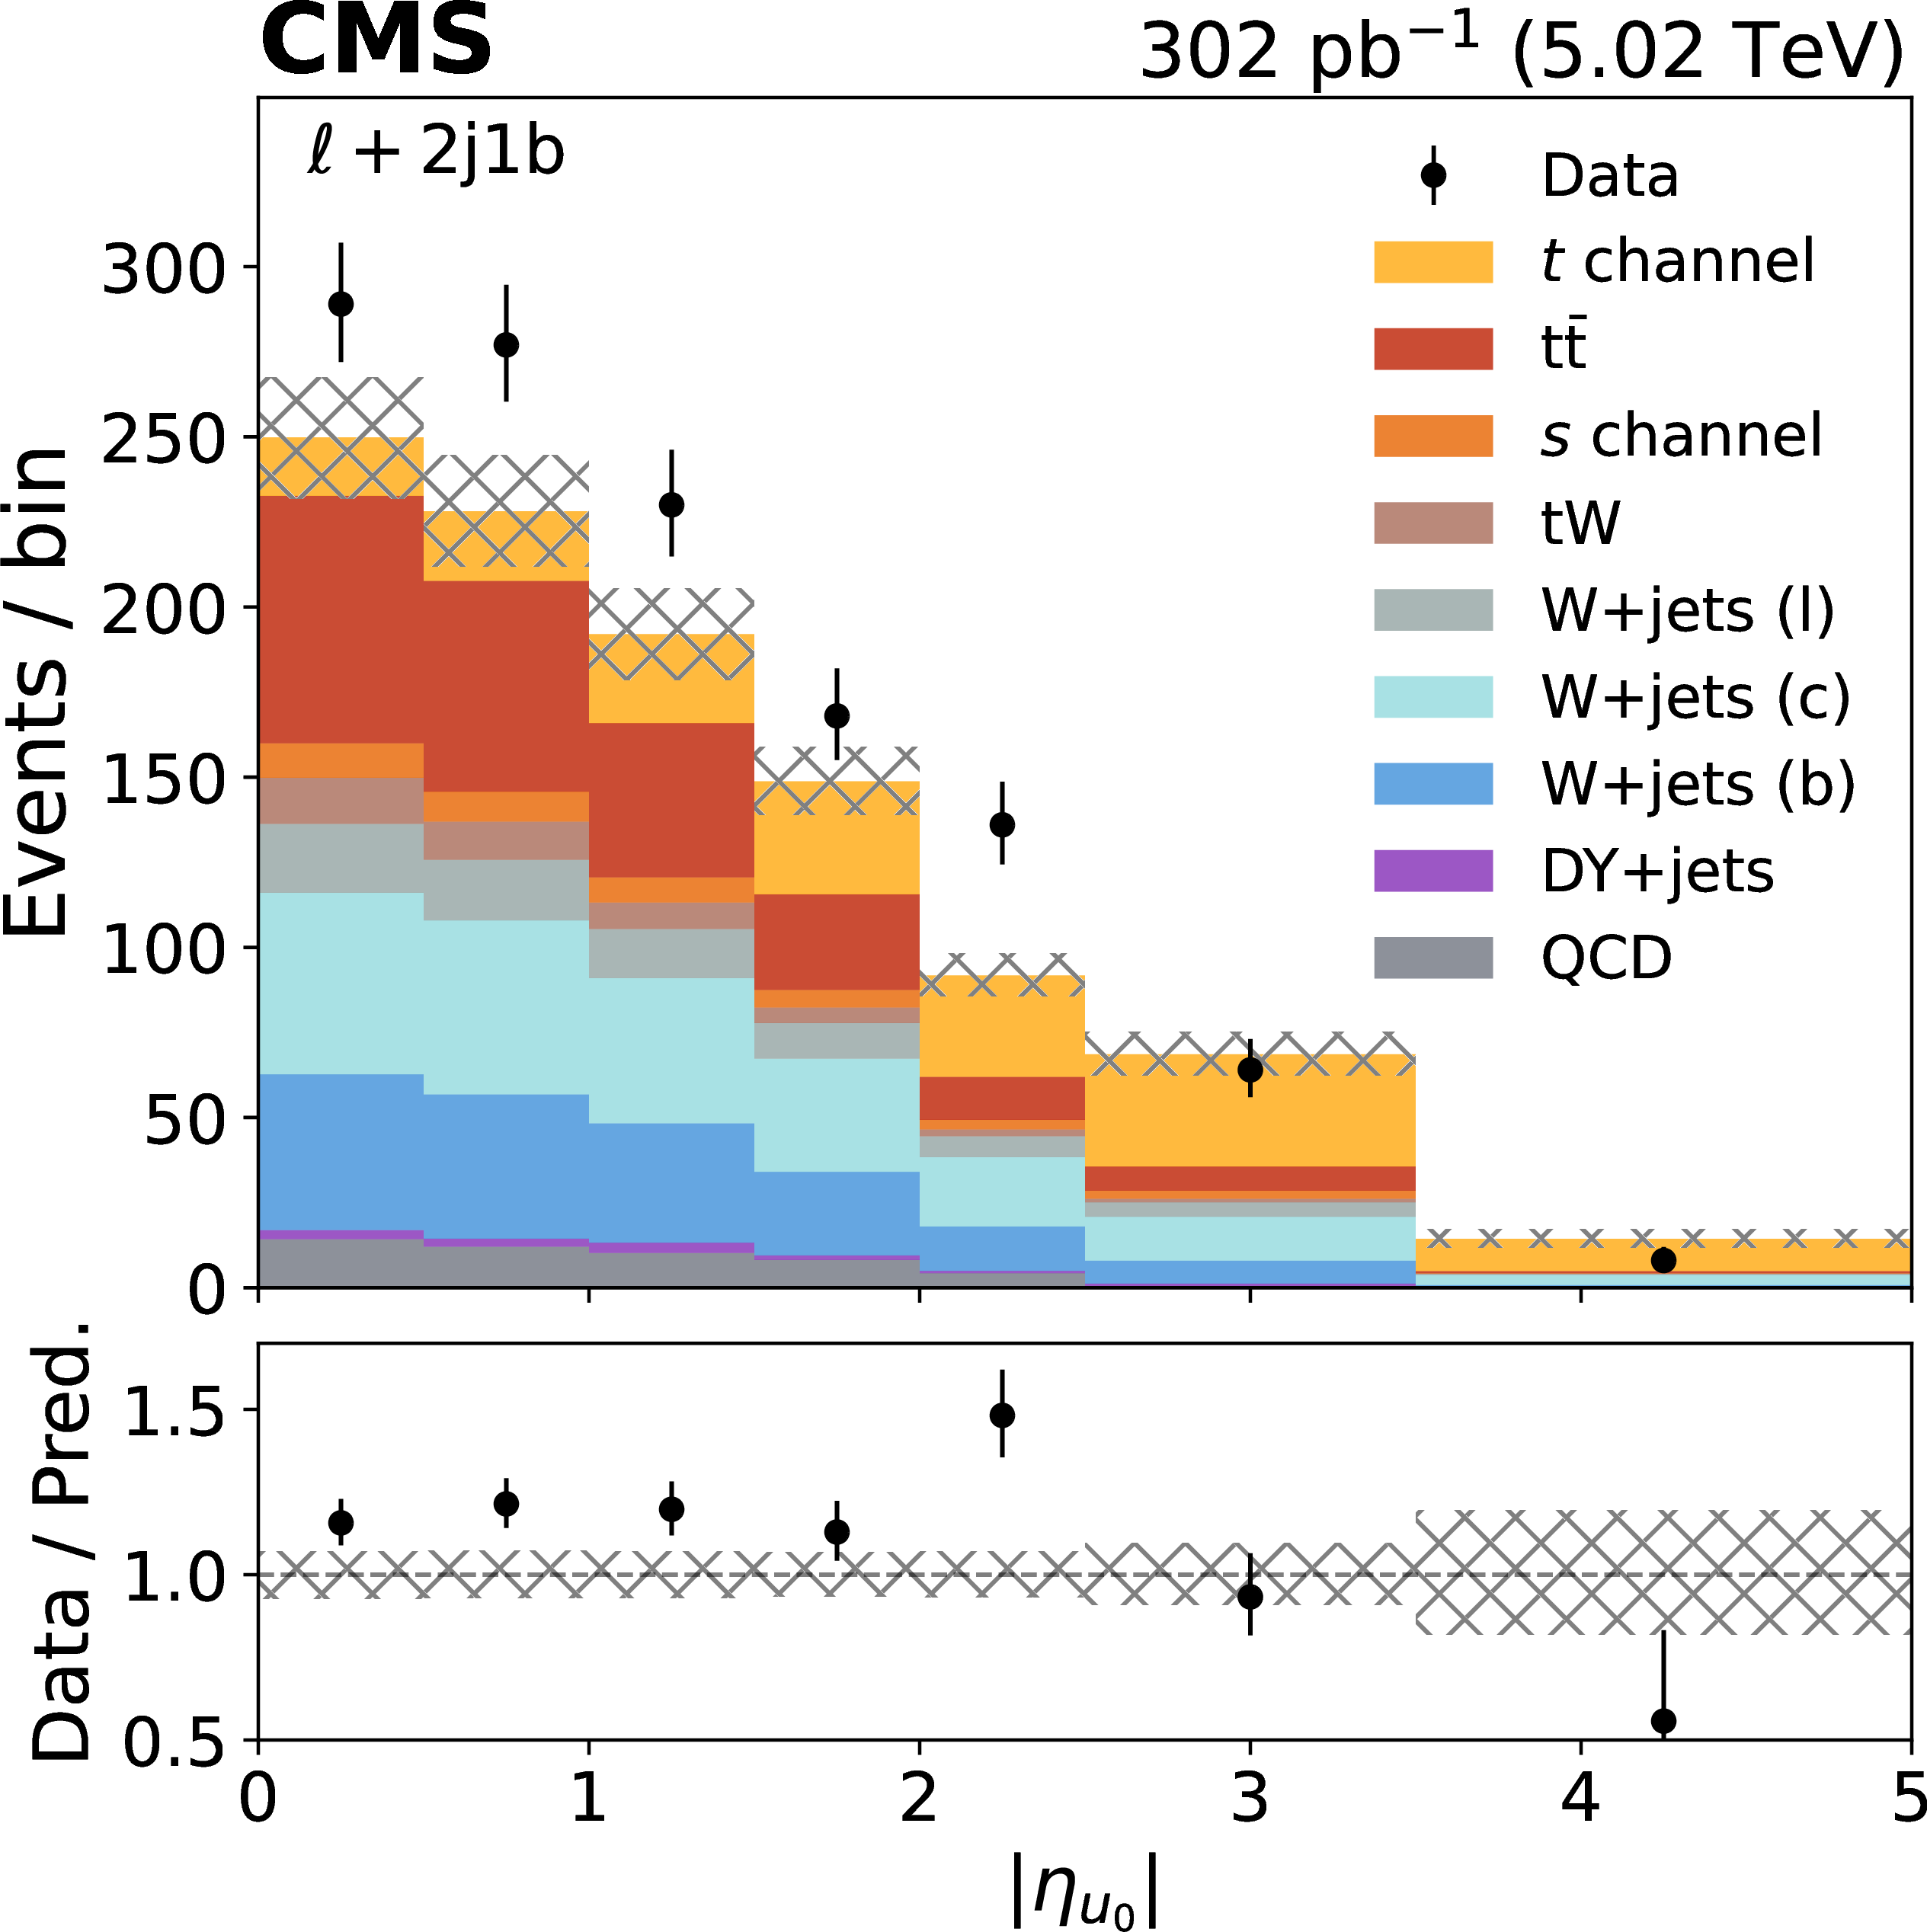
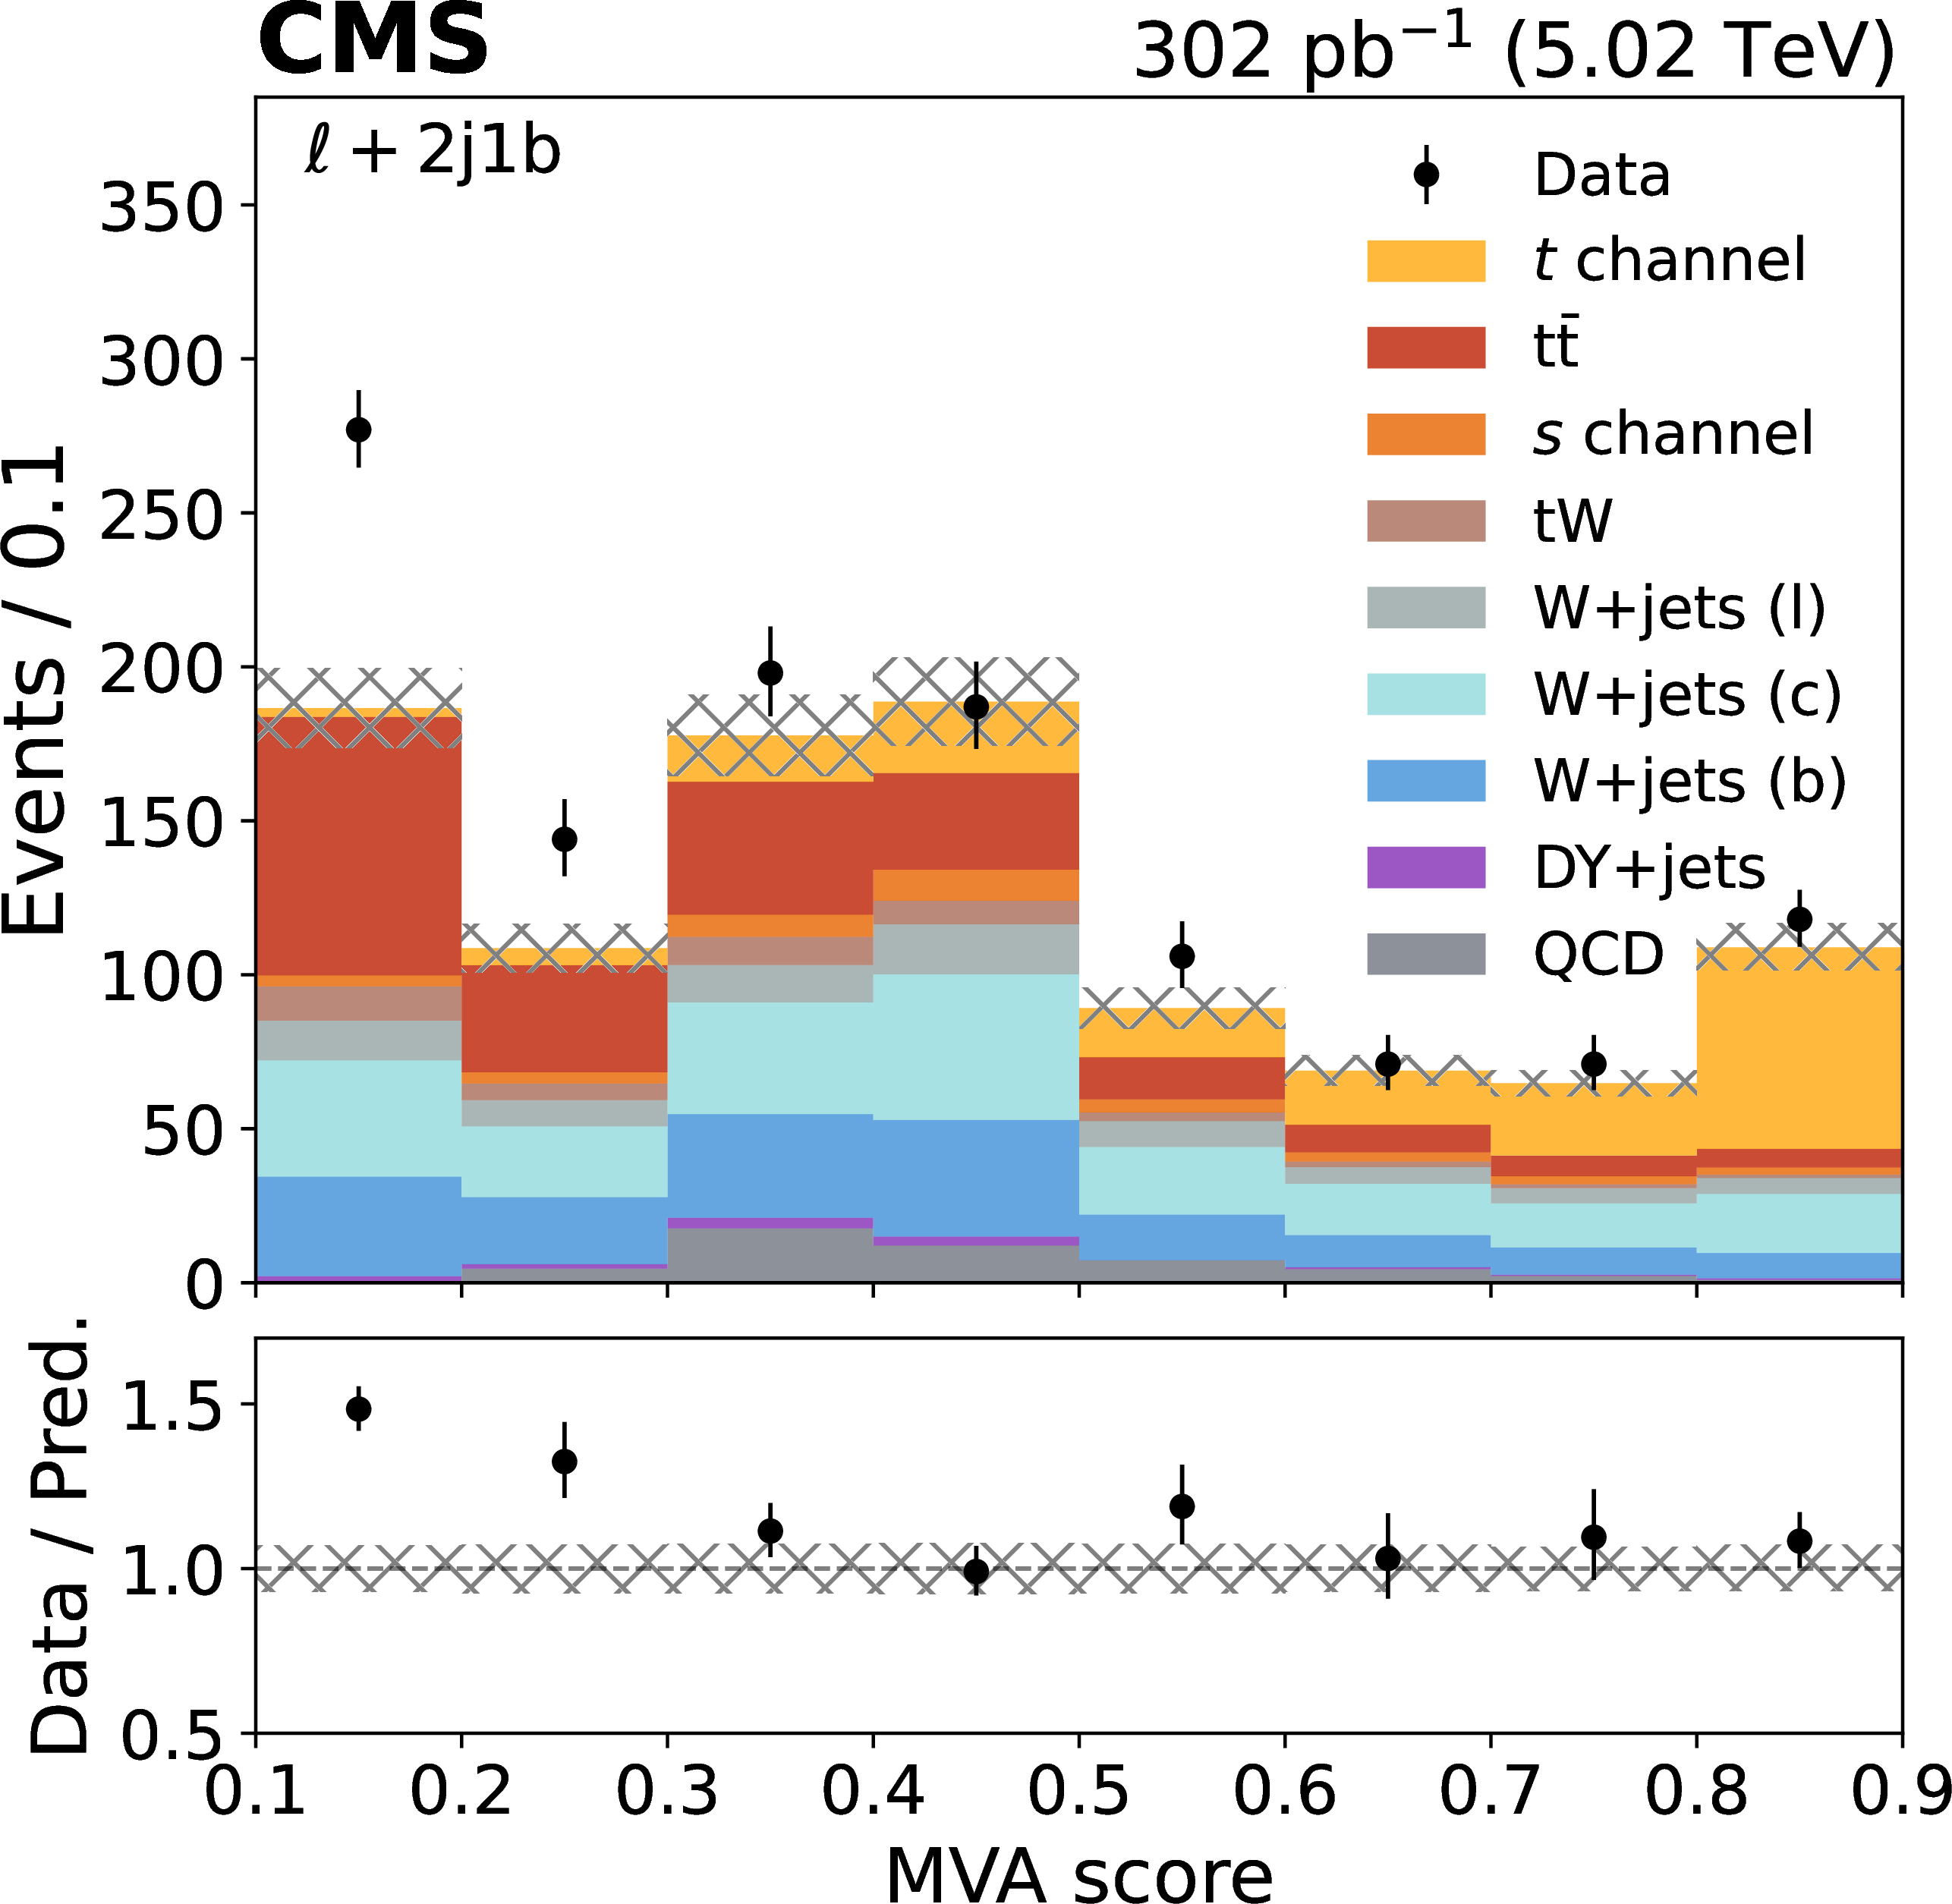
Observed and predicted distributions of the most discriminating input variable used in the random forest training, $ |\eta_{\mathrm{u}_0}| $ (left), and the output MVA discriminator (right), in the 2j1b category, before the ML fit. The vertical error bars represent the statistical uncertainty associated to the data, and the hatched band the uncertainty in the prediction. The lower panels show the data-to-prediction ratio. The first and last bins in the MVA output distribution include underflow and overflow events, respectively. The normalizations of the processes are those of the SM predictions except for QCD, which is estimated from data. The W+jets background is split as explained in Section 5. |
png pdf |
Figure 5-a:
Observed and predicted distributions of the most discriminating input variable used in the random forest training, $ |\eta_{\mathrm{u}_0}| $ (left), and the output MVA discriminator (right), in the 2j1b category, before the ML fit. The vertical error bars represent the statistical uncertainty associated to the data, and the hatched band the uncertainty in the prediction. The lower panels show the data-to-prediction ratio. The first and last bins in the MVA output distribution include underflow and overflow events, respectively. The normalizations of the processes are those of the SM predictions except for QCD, which is estimated from data. The W+jets background is split as explained in Section 5. |
png pdf |
Figure 5-b:
Observed and predicted distributions of the most discriminating input variable used in the random forest training, $ |\eta_{\mathrm{u}_0}| $ (left), and the output MVA discriminator (right), in the 2j1b category, before the ML fit. The vertical error bars represent the statistical uncertainty associated to the data, and the hatched band the uncertainty in the prediction. The lower panels show the data-to-prediction ratio. The first and last bins in the MVA output distribution include underflow and overflow events, respectively. The normalizations of the processes are those of the SM predictions except for QCD, which is estimated from data. The W+jets background is split as explained in Section 5. |
png pdf |
Figure 6:
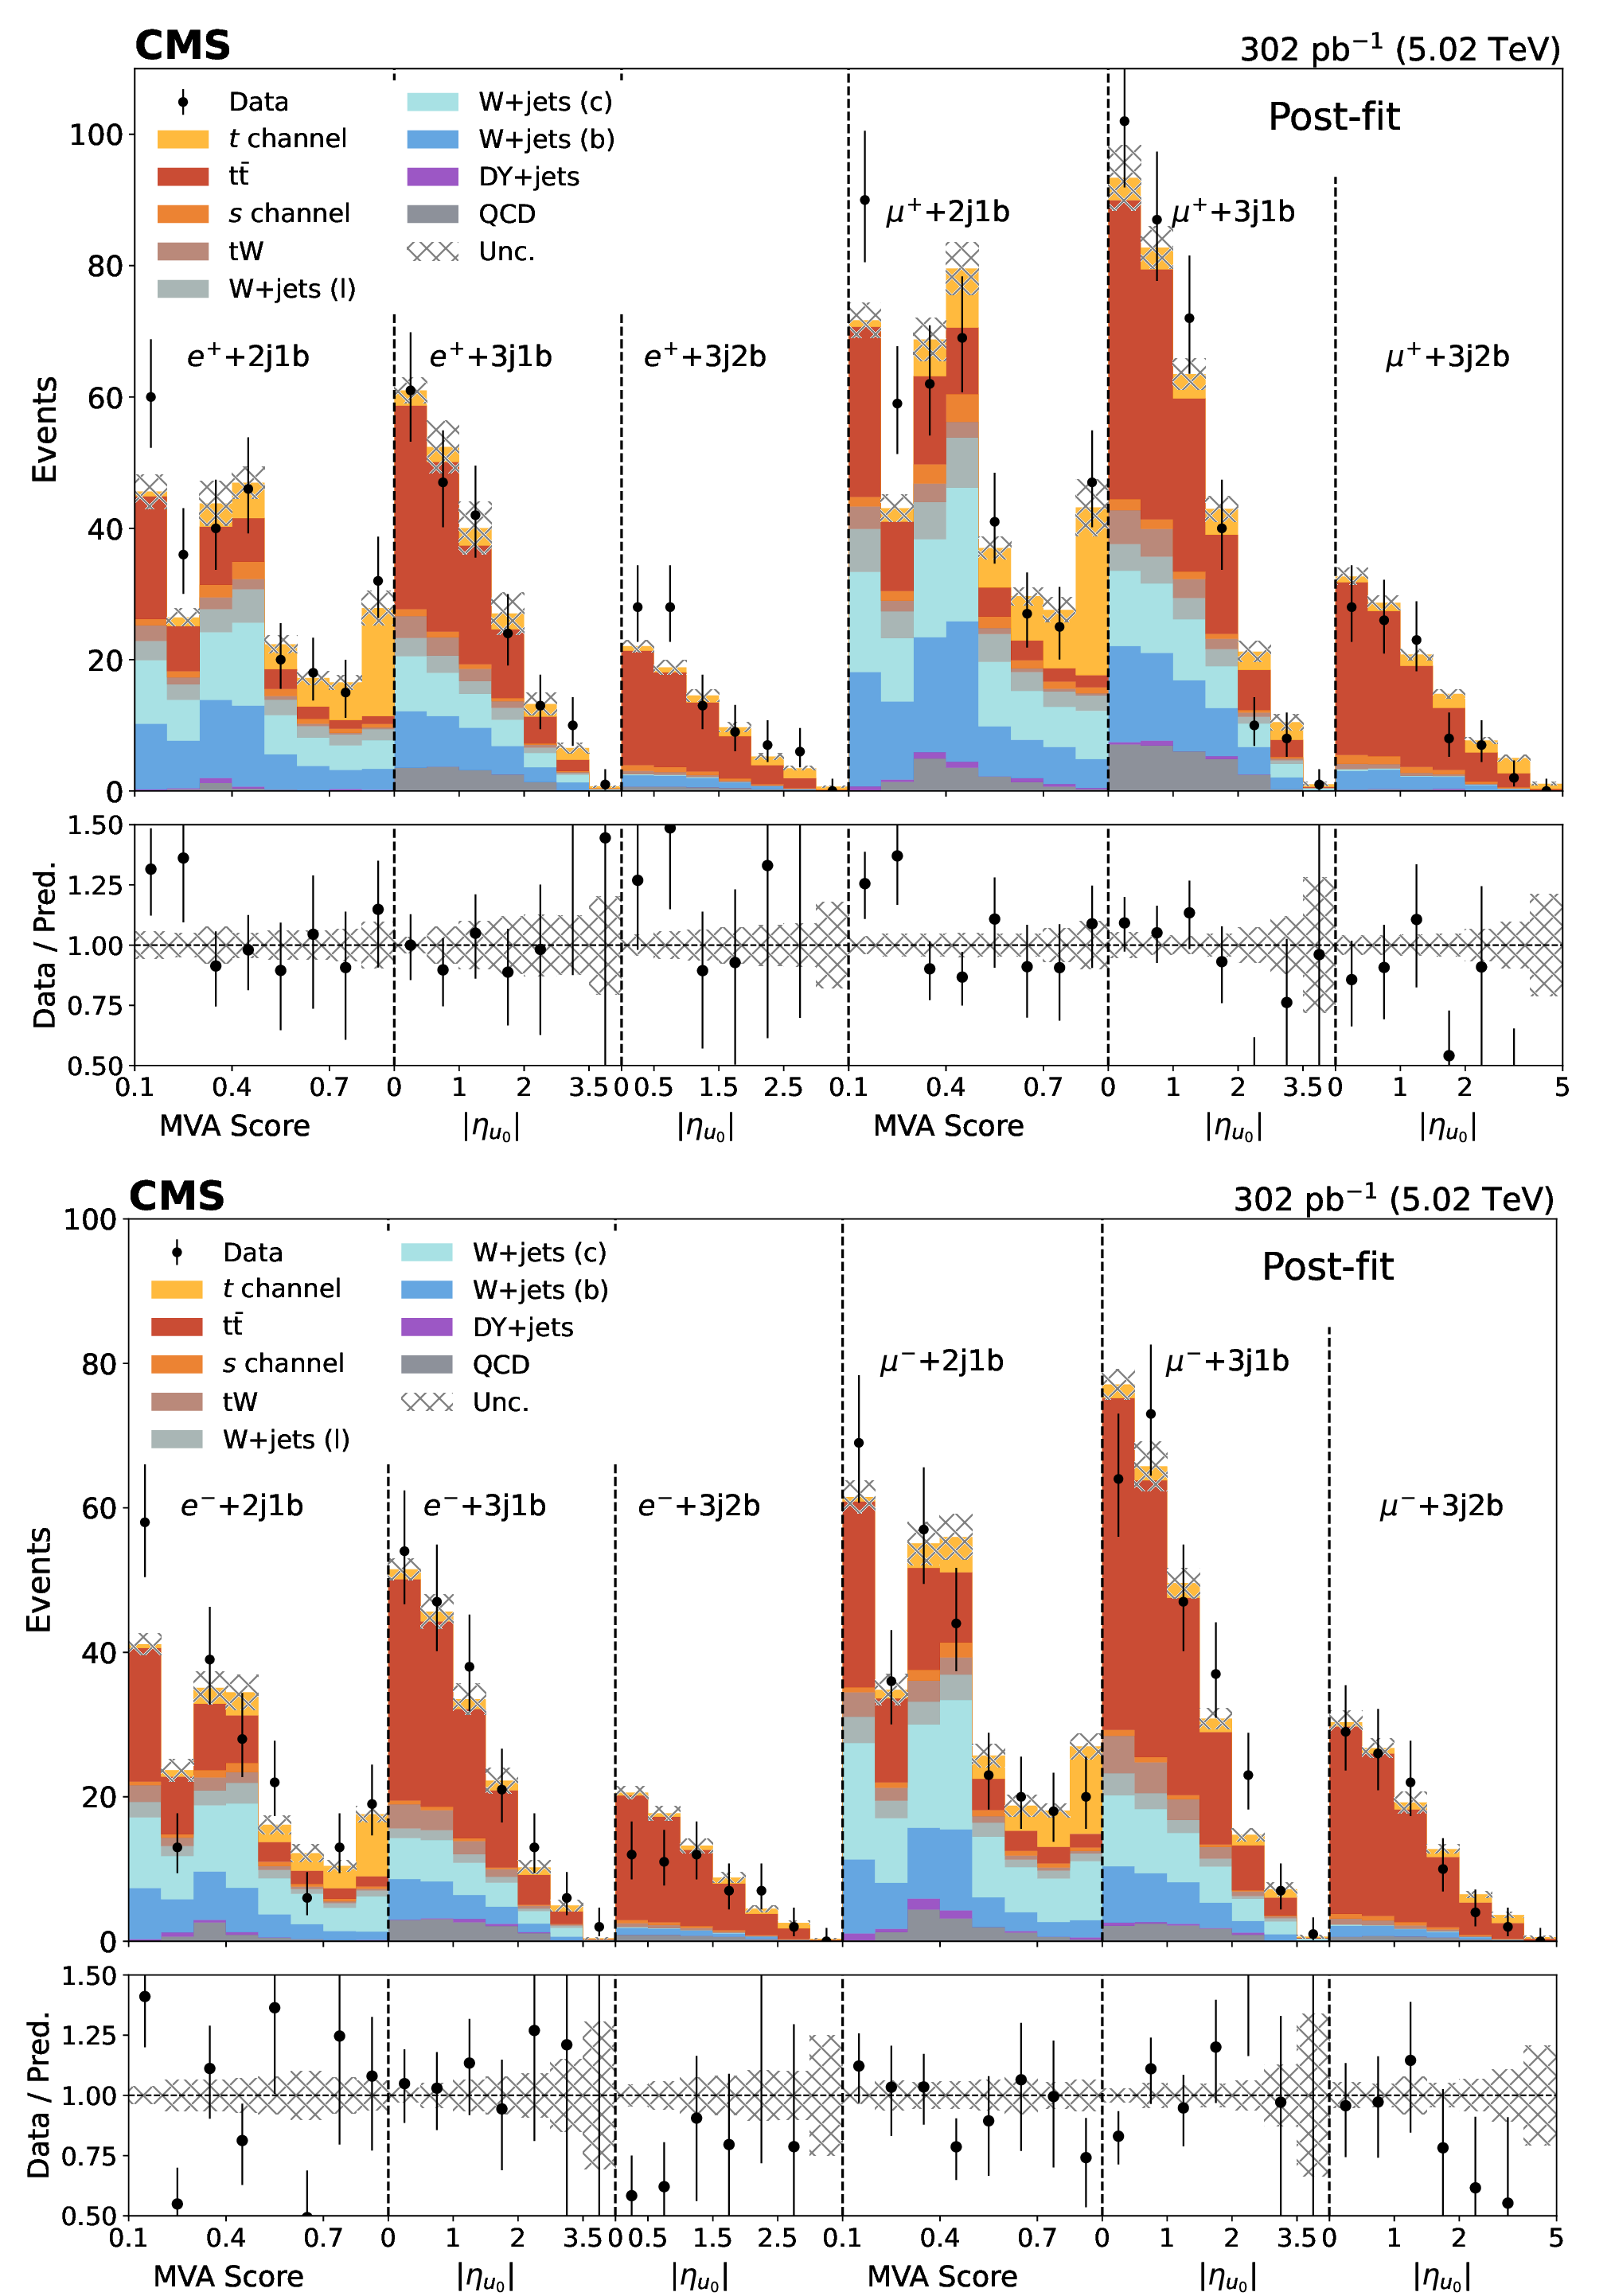
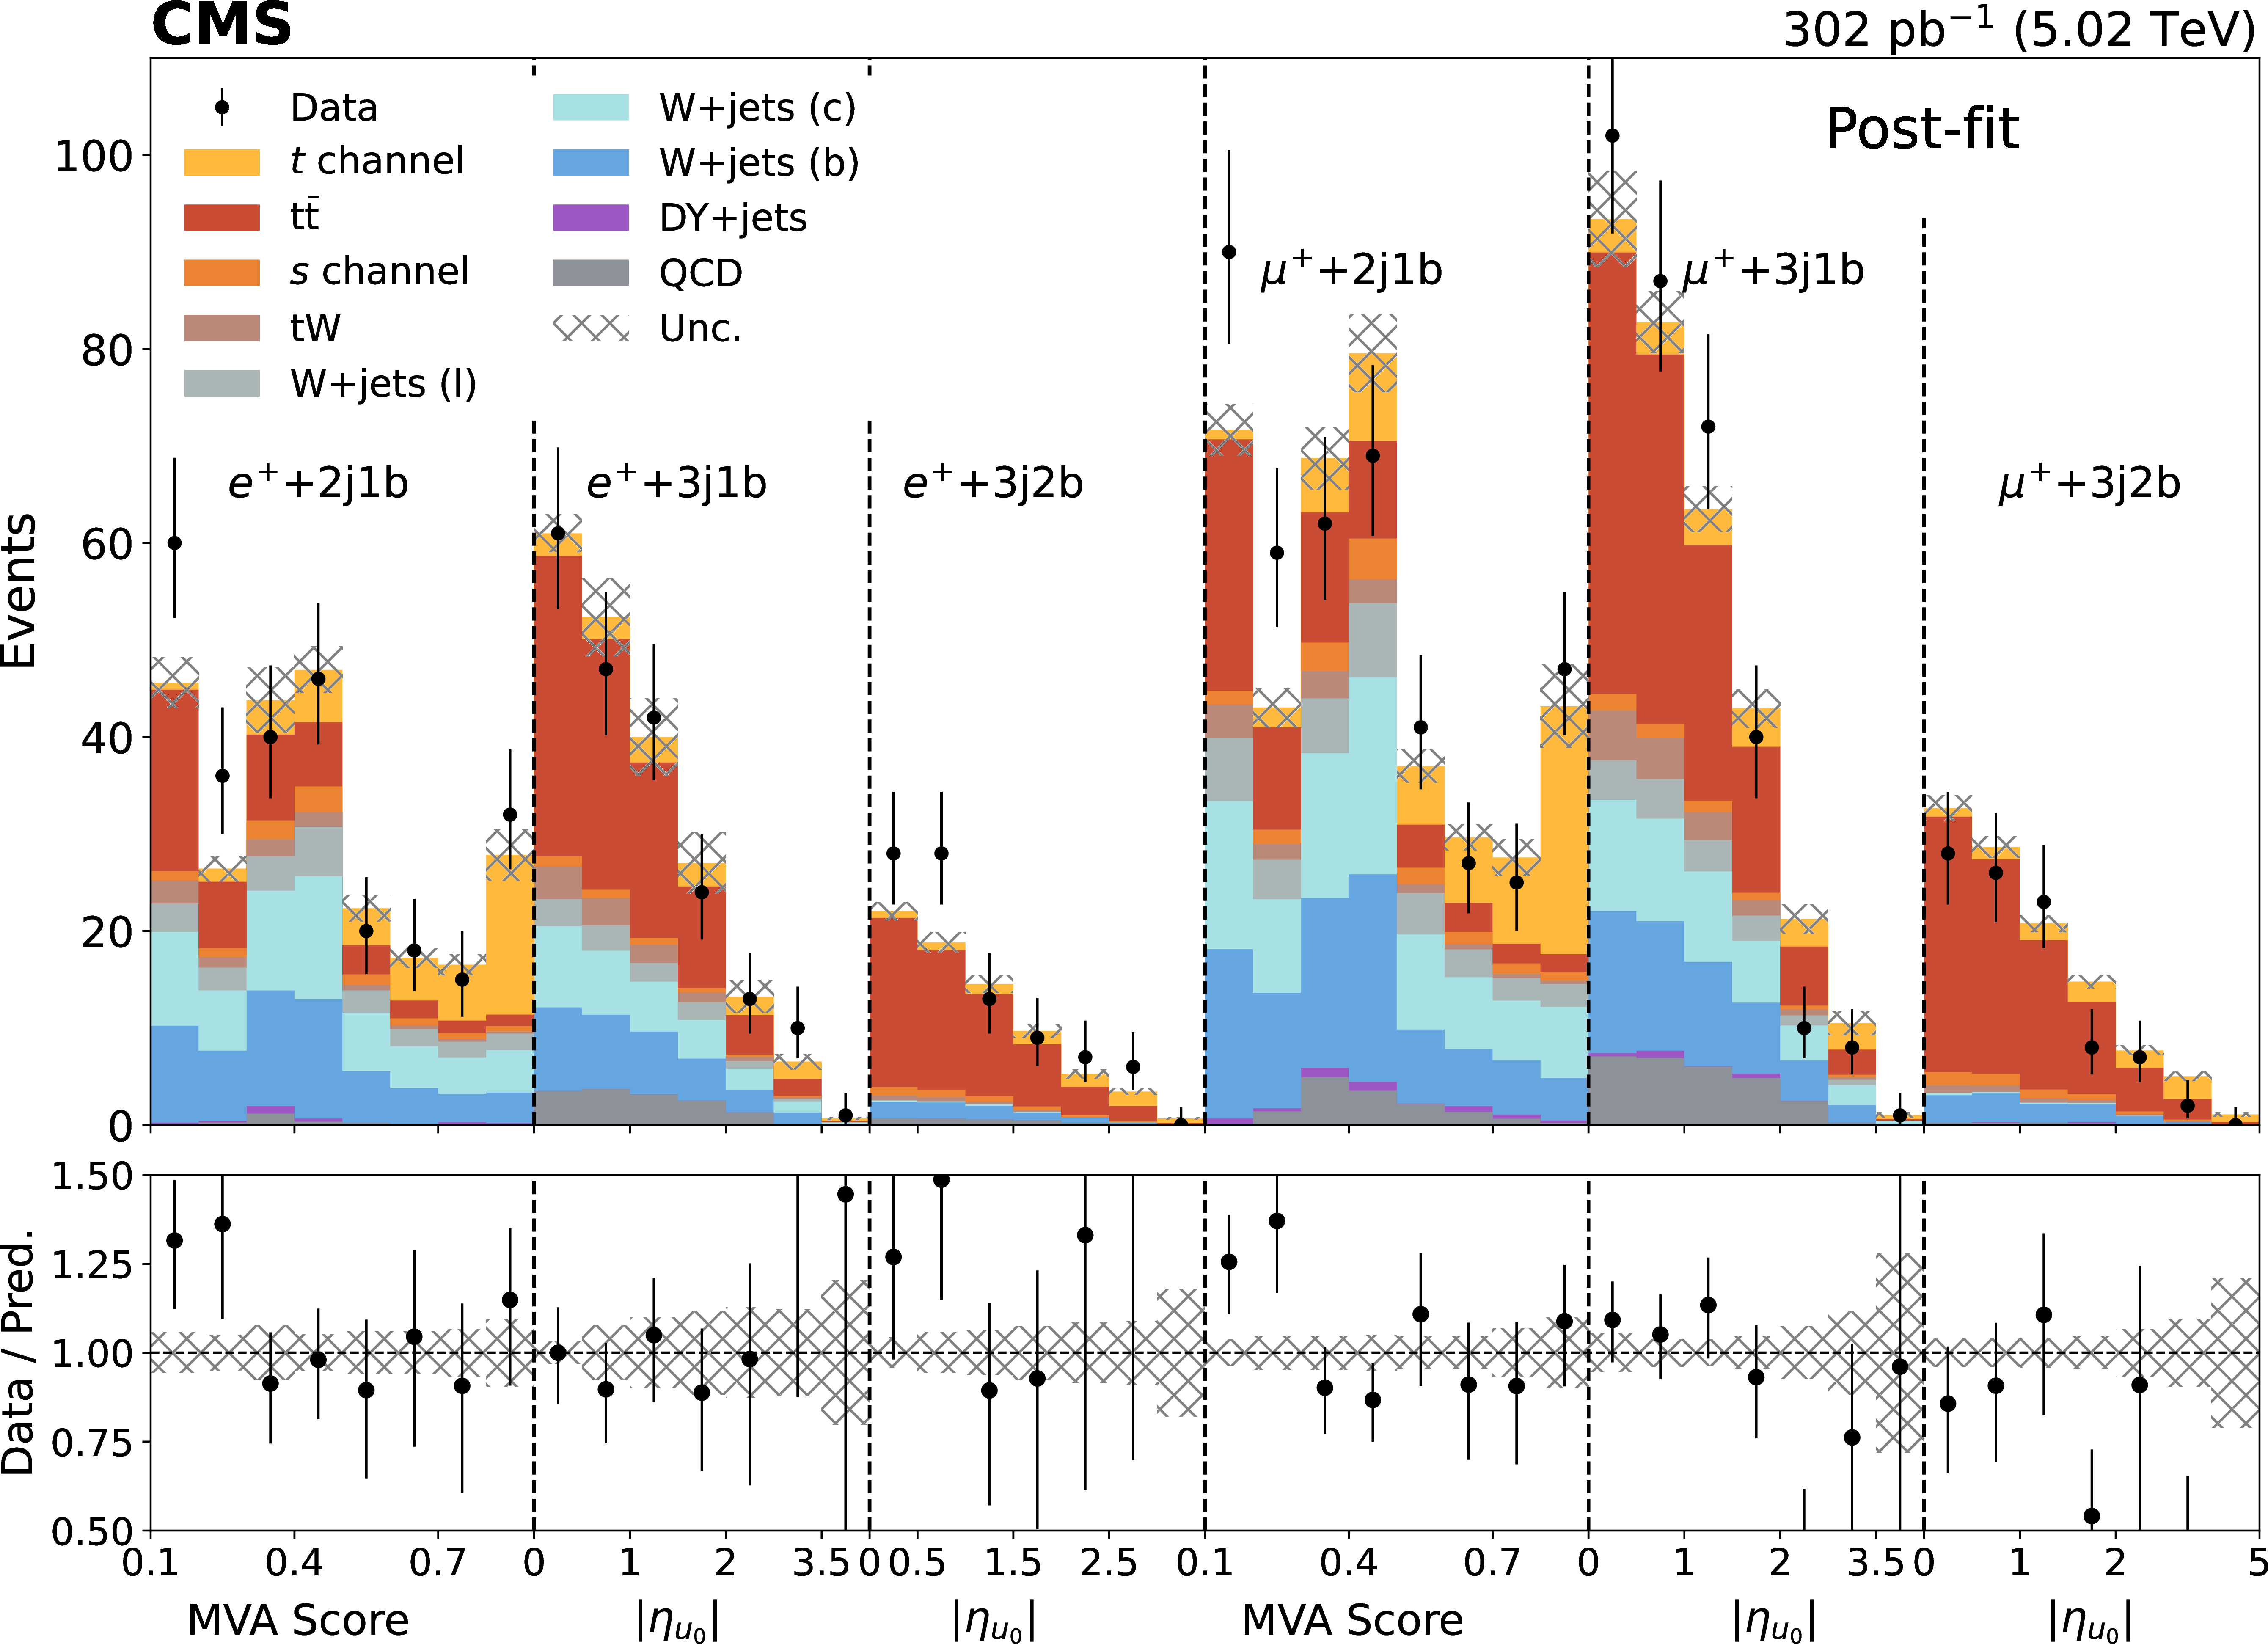
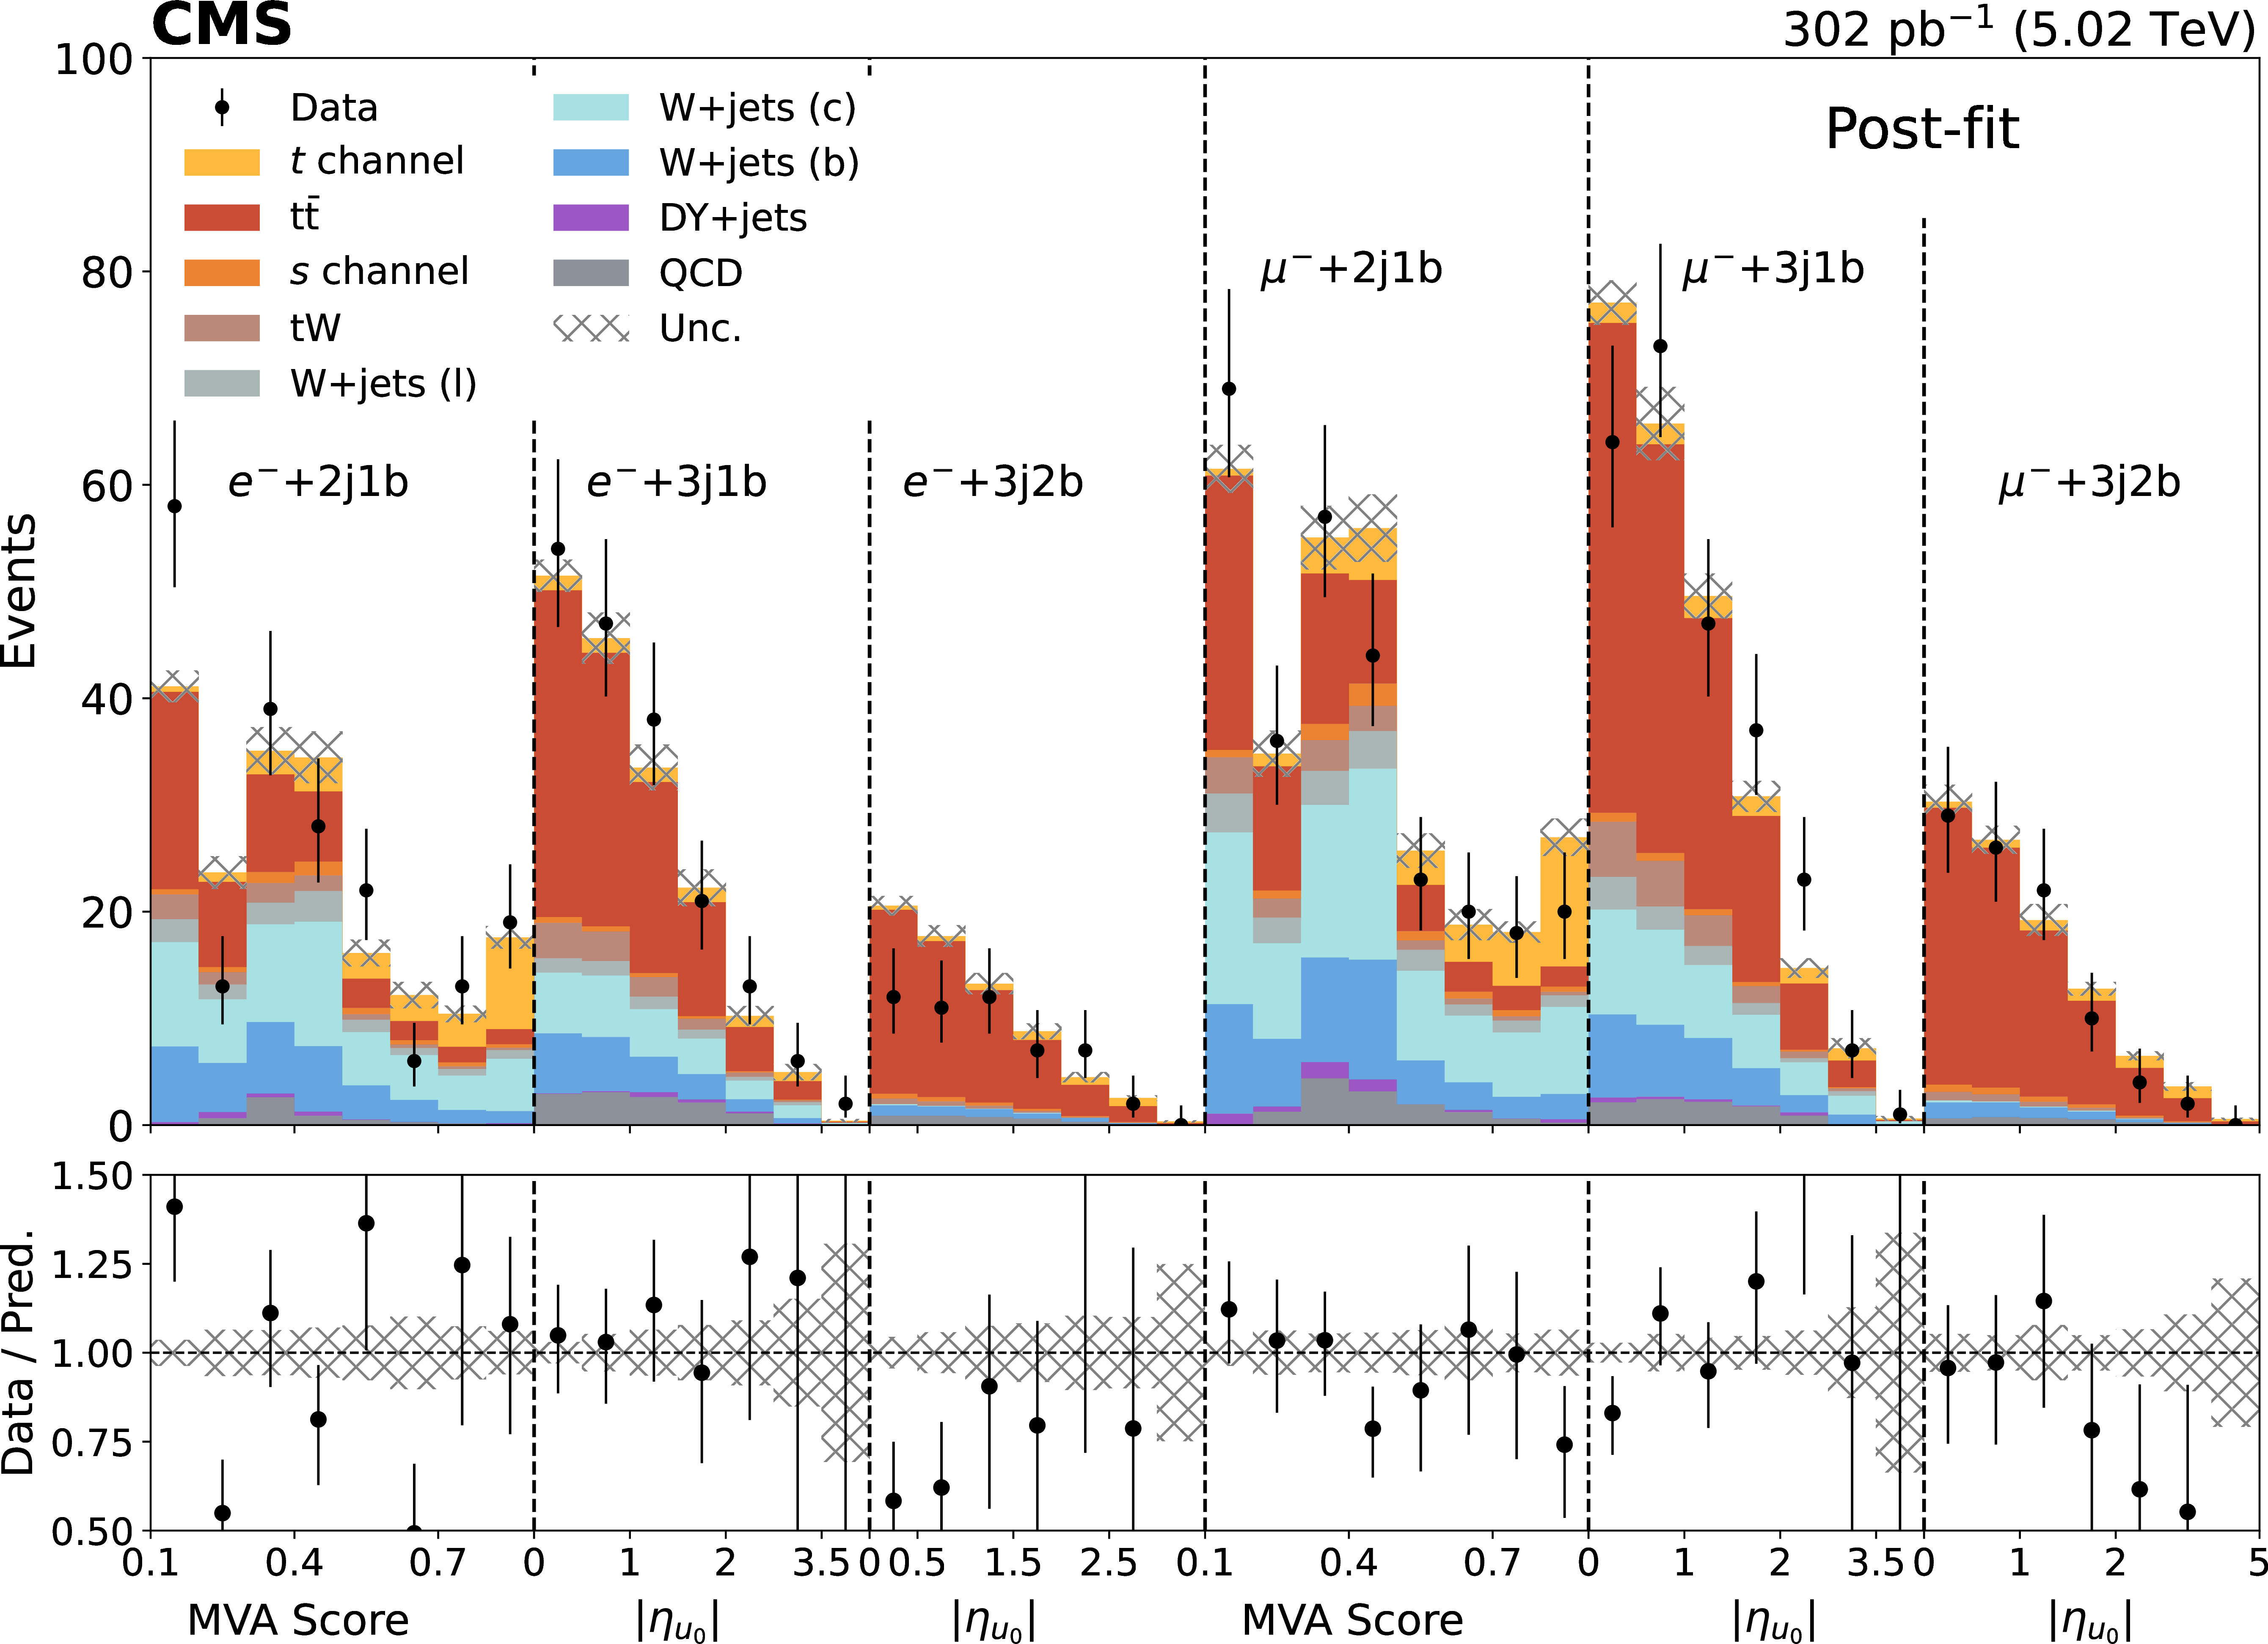
Distributions for the $ \ell^+ $+jets (upper) and $ \ell^- $+jets (lower) categories where the prediction parameters are set to the values obtained in the fit. They show the MVA score and $ |\eta_{\mathrm{u}_0}| $ distributions, which are the fitted variables in the ML fit in the 2j1b category and the categories with three jets, respectively. The vertical error bars represent the statistical uncertainty associated to the data, and the hatched band the uncertainty of the prediction, after the fit. All uncertainties considered in the analysis are included in the uncertainty band. The lower panels show the ratio of data to prediction. The first and last bins in the MVA output distributions include underflow and overflow events, respectively. |
png pdf |
Figure 6-a:
Distributions for the $ \ell^+ $+jets (upper) and $ \ell^- $+jets (lower) categories where the prediction parameters are set to the values obtained in the fit. They show the MVA score and $ |\eta_{\mathrm{u}_0}| $ distributions, which are the fitted variables in the ML fit in the 2j1b category and the categories with three jets, respectively. The vertical error bars represent the statistical uncertainty associated to the data, and the hatched band the uncertainty of the prediction, after the fit. All uncertainties considered in the analysis are included in the uncertainty band. The lower panels show the ratio of data to prediction. The first and last bins in the MVA output distributions include underflow and overflow events, respectively. |
png pdf |
Figure 6-b:
Distributions for the $ \ell^+ $+jets (upper) and $ \ell^- $+jets (lower) categories where the prediction parameters are set to the values obtained in the fit. They show the MVA score and $ |\eta_{\mathrm{u}_0}| $ distributions, which are the fitted variables in the ML fit in the 2j1b category and the categories with three jets, respectively. The vertical error bars represent the statistical uncertainty associated to the data, and the hatched band the uncertainty of the prediction, after the fit. All uncertainties considered in the analysis are included in the uncertainty band. The lower panels show the ratio of data to prediction. The first and last bins in the MVA output distributions include underflow and overflow events, respectively. |
png pdf |
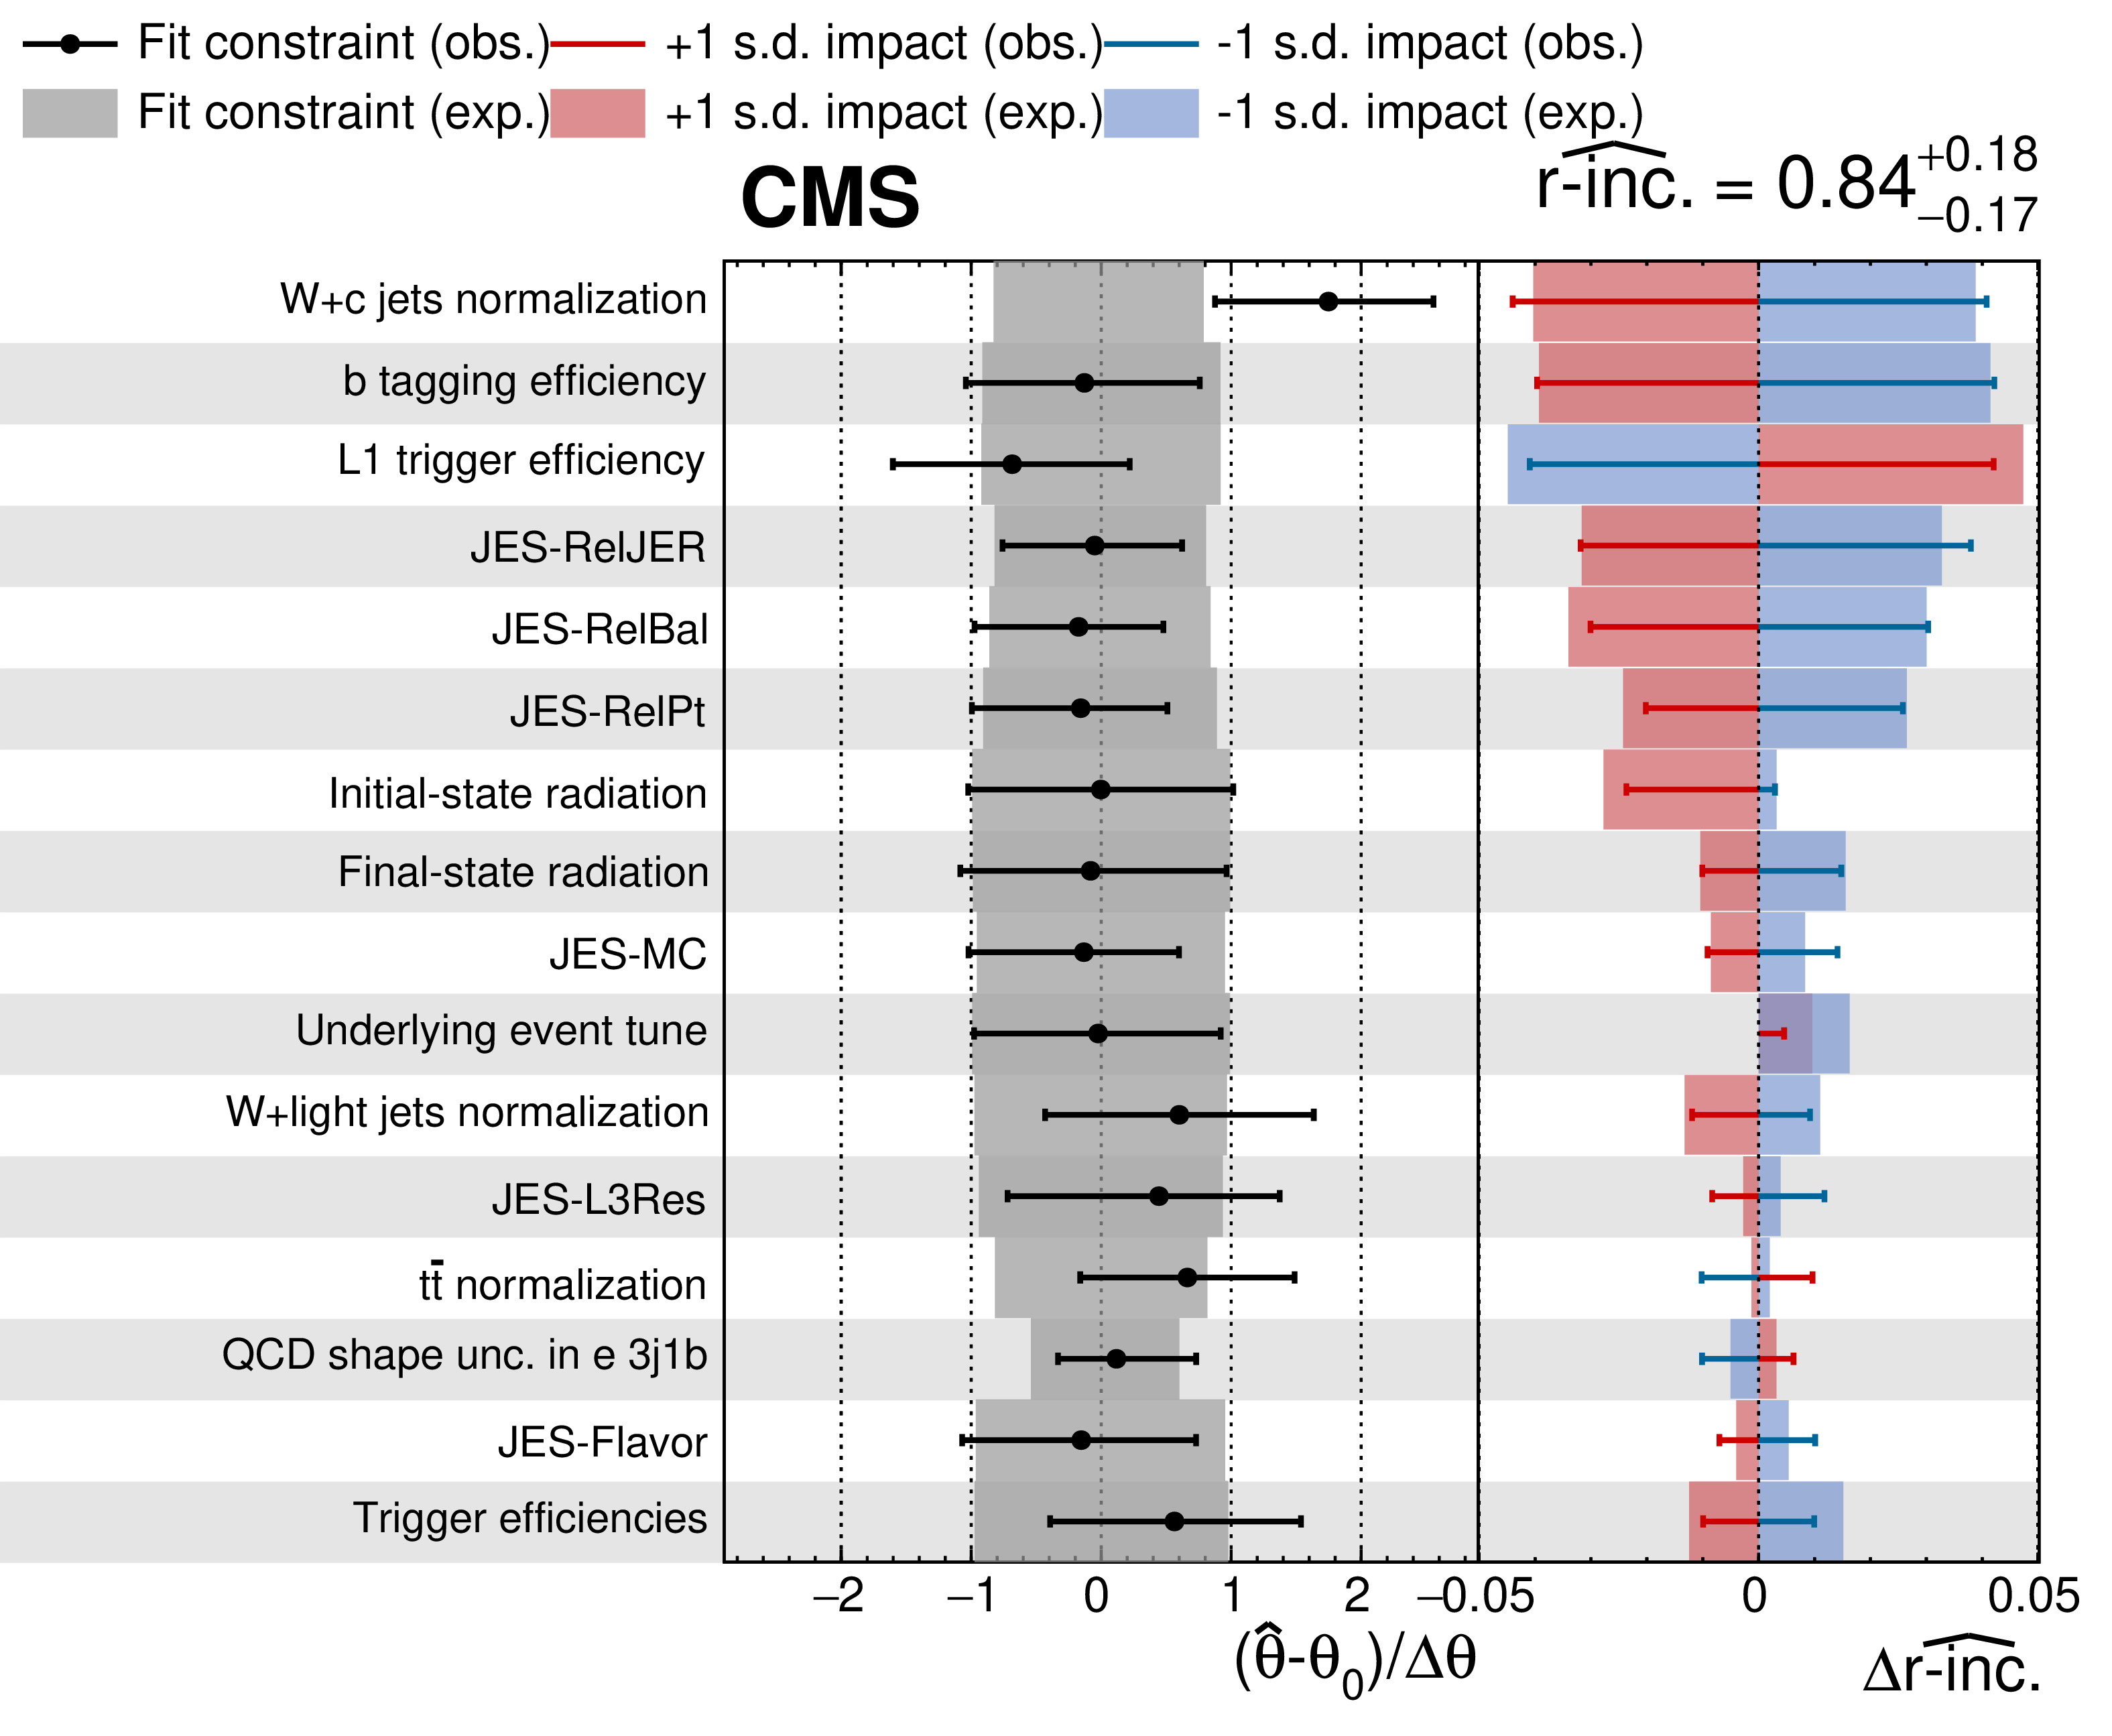
Figure 7:
The largest impacts of nuisance parameters on the signal strength, $ \Delta\widehat{\text{r-inc.}} $ (right column) and ratios $ (\hat{\theta}-\theta_0)/\Delta\theta $ (middle column) for the nuisance parameters listed in the left column from the ML fit used to determine the measured $ \mathrm{t}\mathrm{q}\text{+}\overline{\mathrm{t}}\mathrm{q} $ cross section. The horizontal bars in the middle column show the ratio of the uncertainties of the fit result to the pre-fit ones, indicating the constraint on the nuisance parameter. The JES uncertainties are divided into several sources related to the various methods used to extract the uncertainties as described in Ref. [29]. |
png pdf |
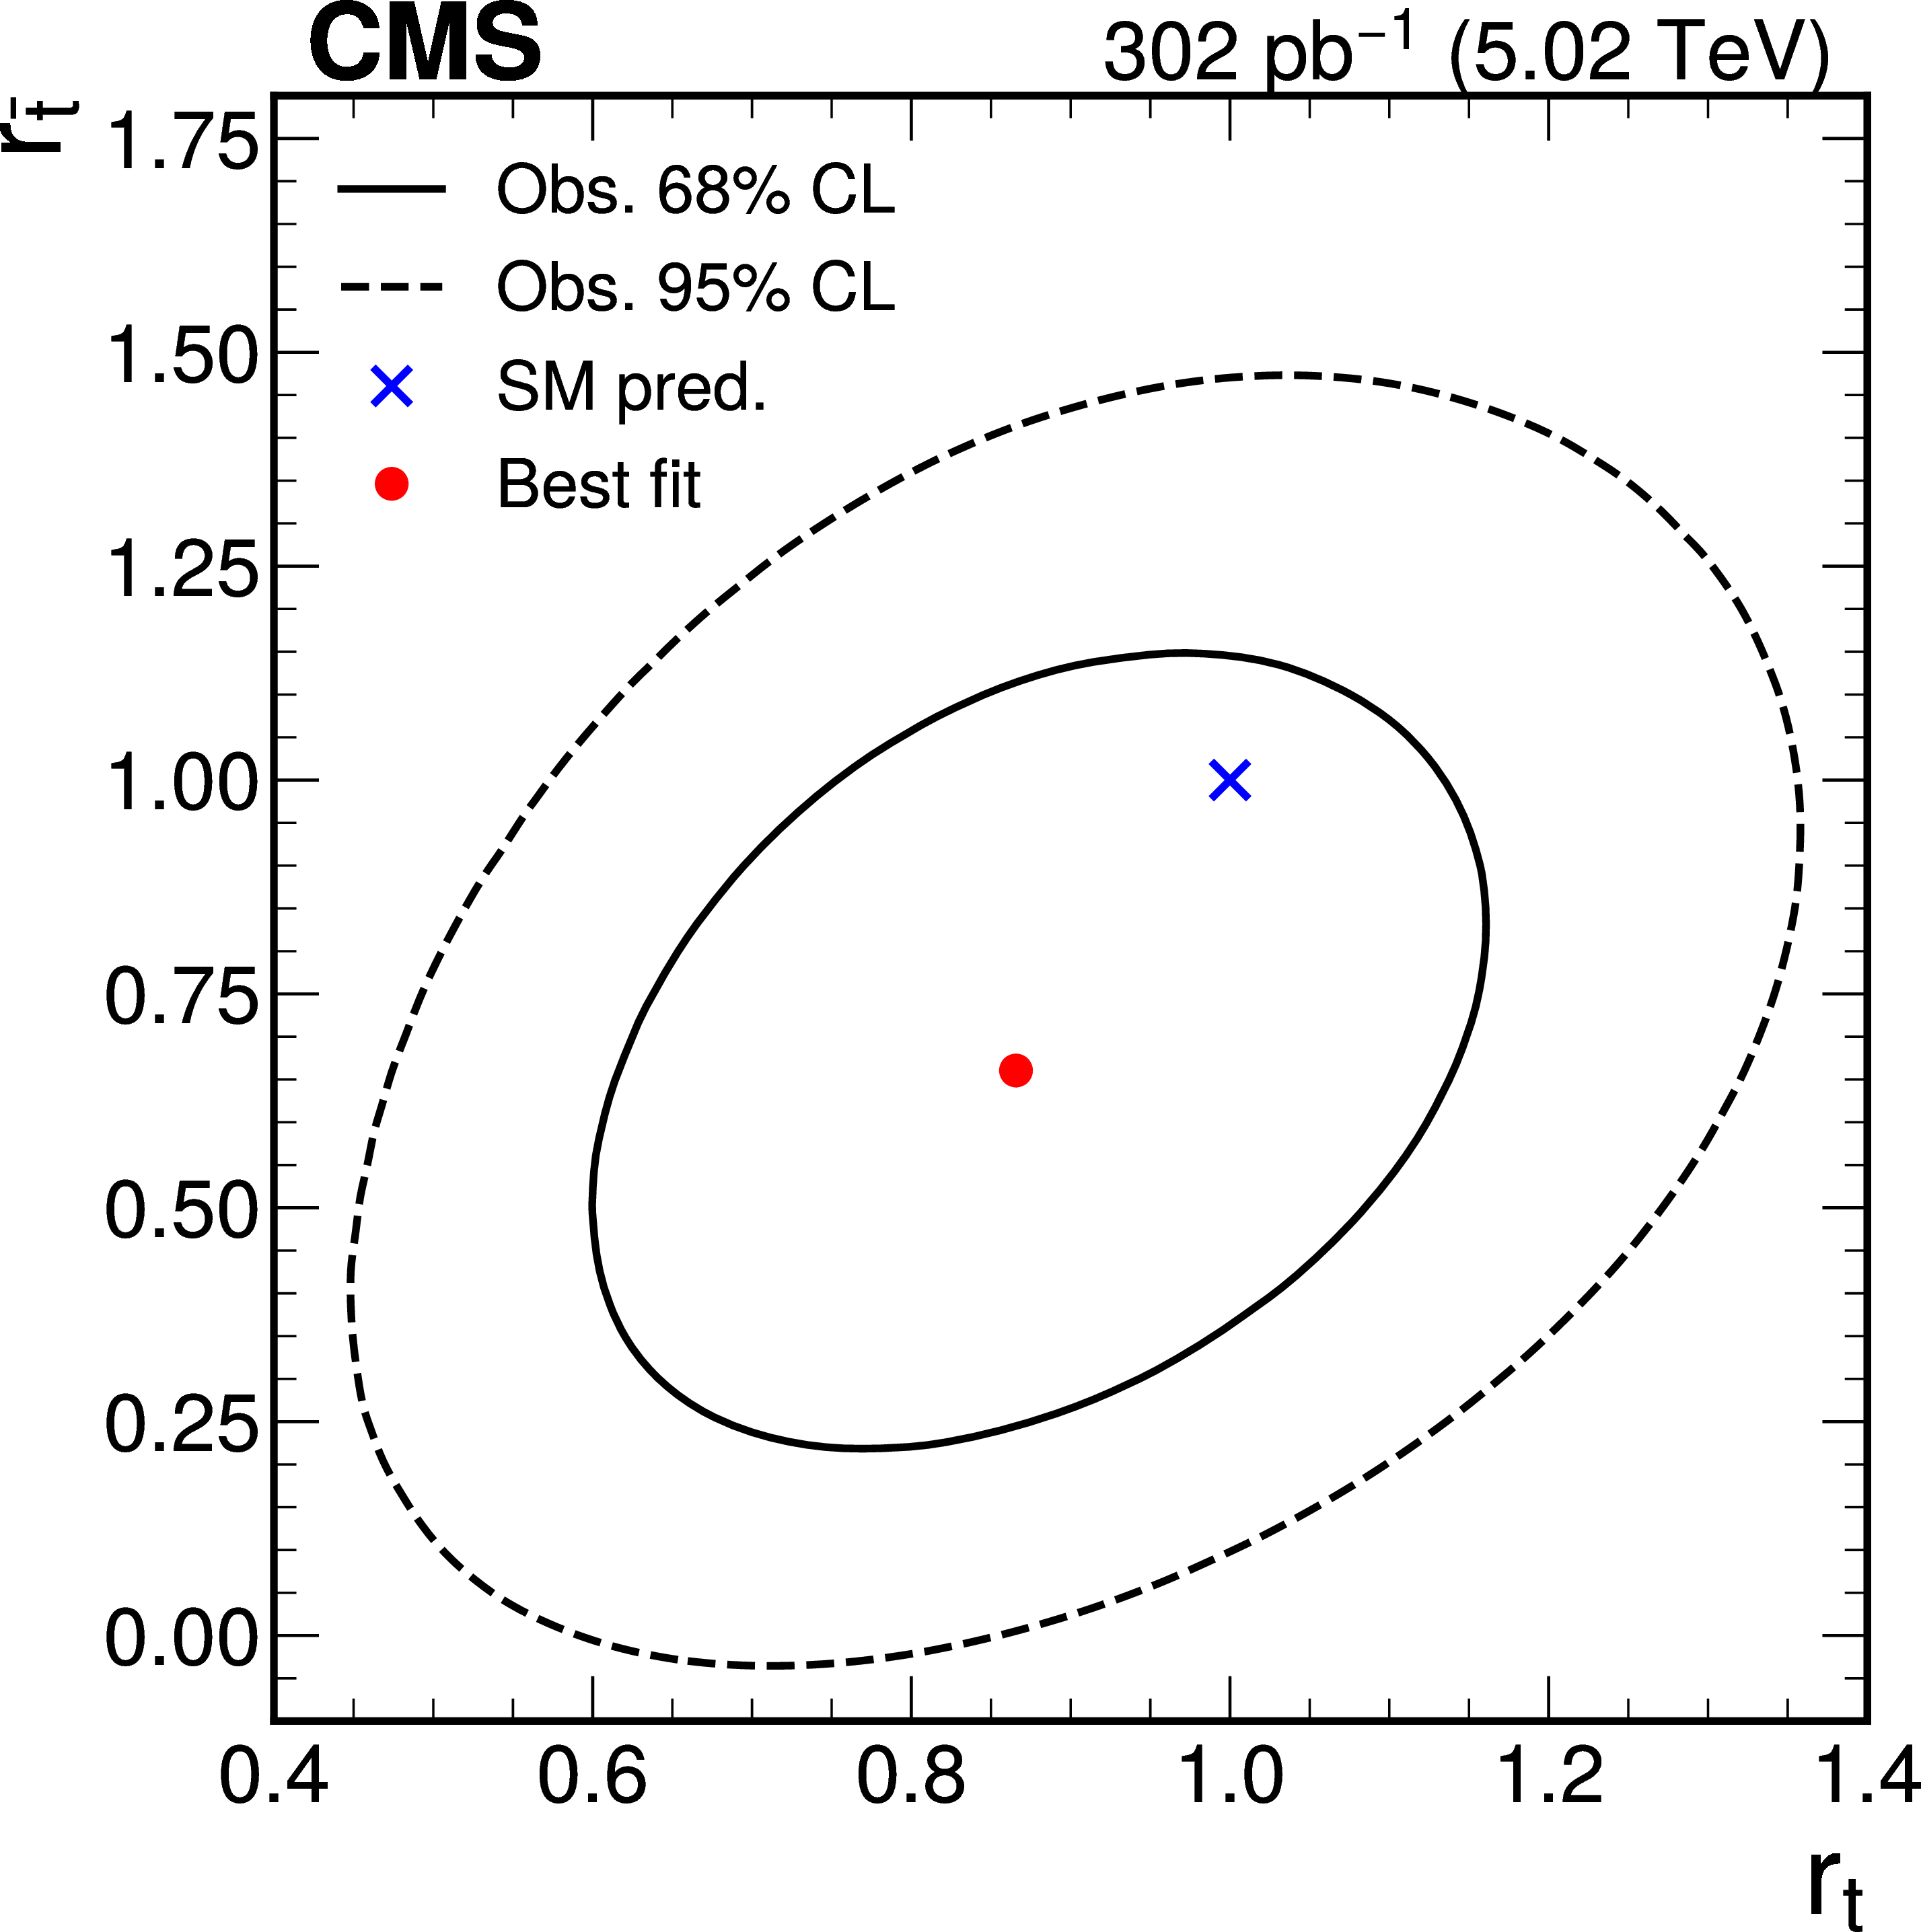
Figure 8:
Two-dimensional 68 and 95% confidence level regions for the signal strengths modifying the top quark ($ r_{\mathrm{t}} $) and antiquark ($ r_{\overline{\mathrm{t}}} $) cross sections individually, represented by the solid and dashed lines respectively. The blue cross indicates the SM prediction and the red dot, the best fit for both signal strengths. |
png pdf |
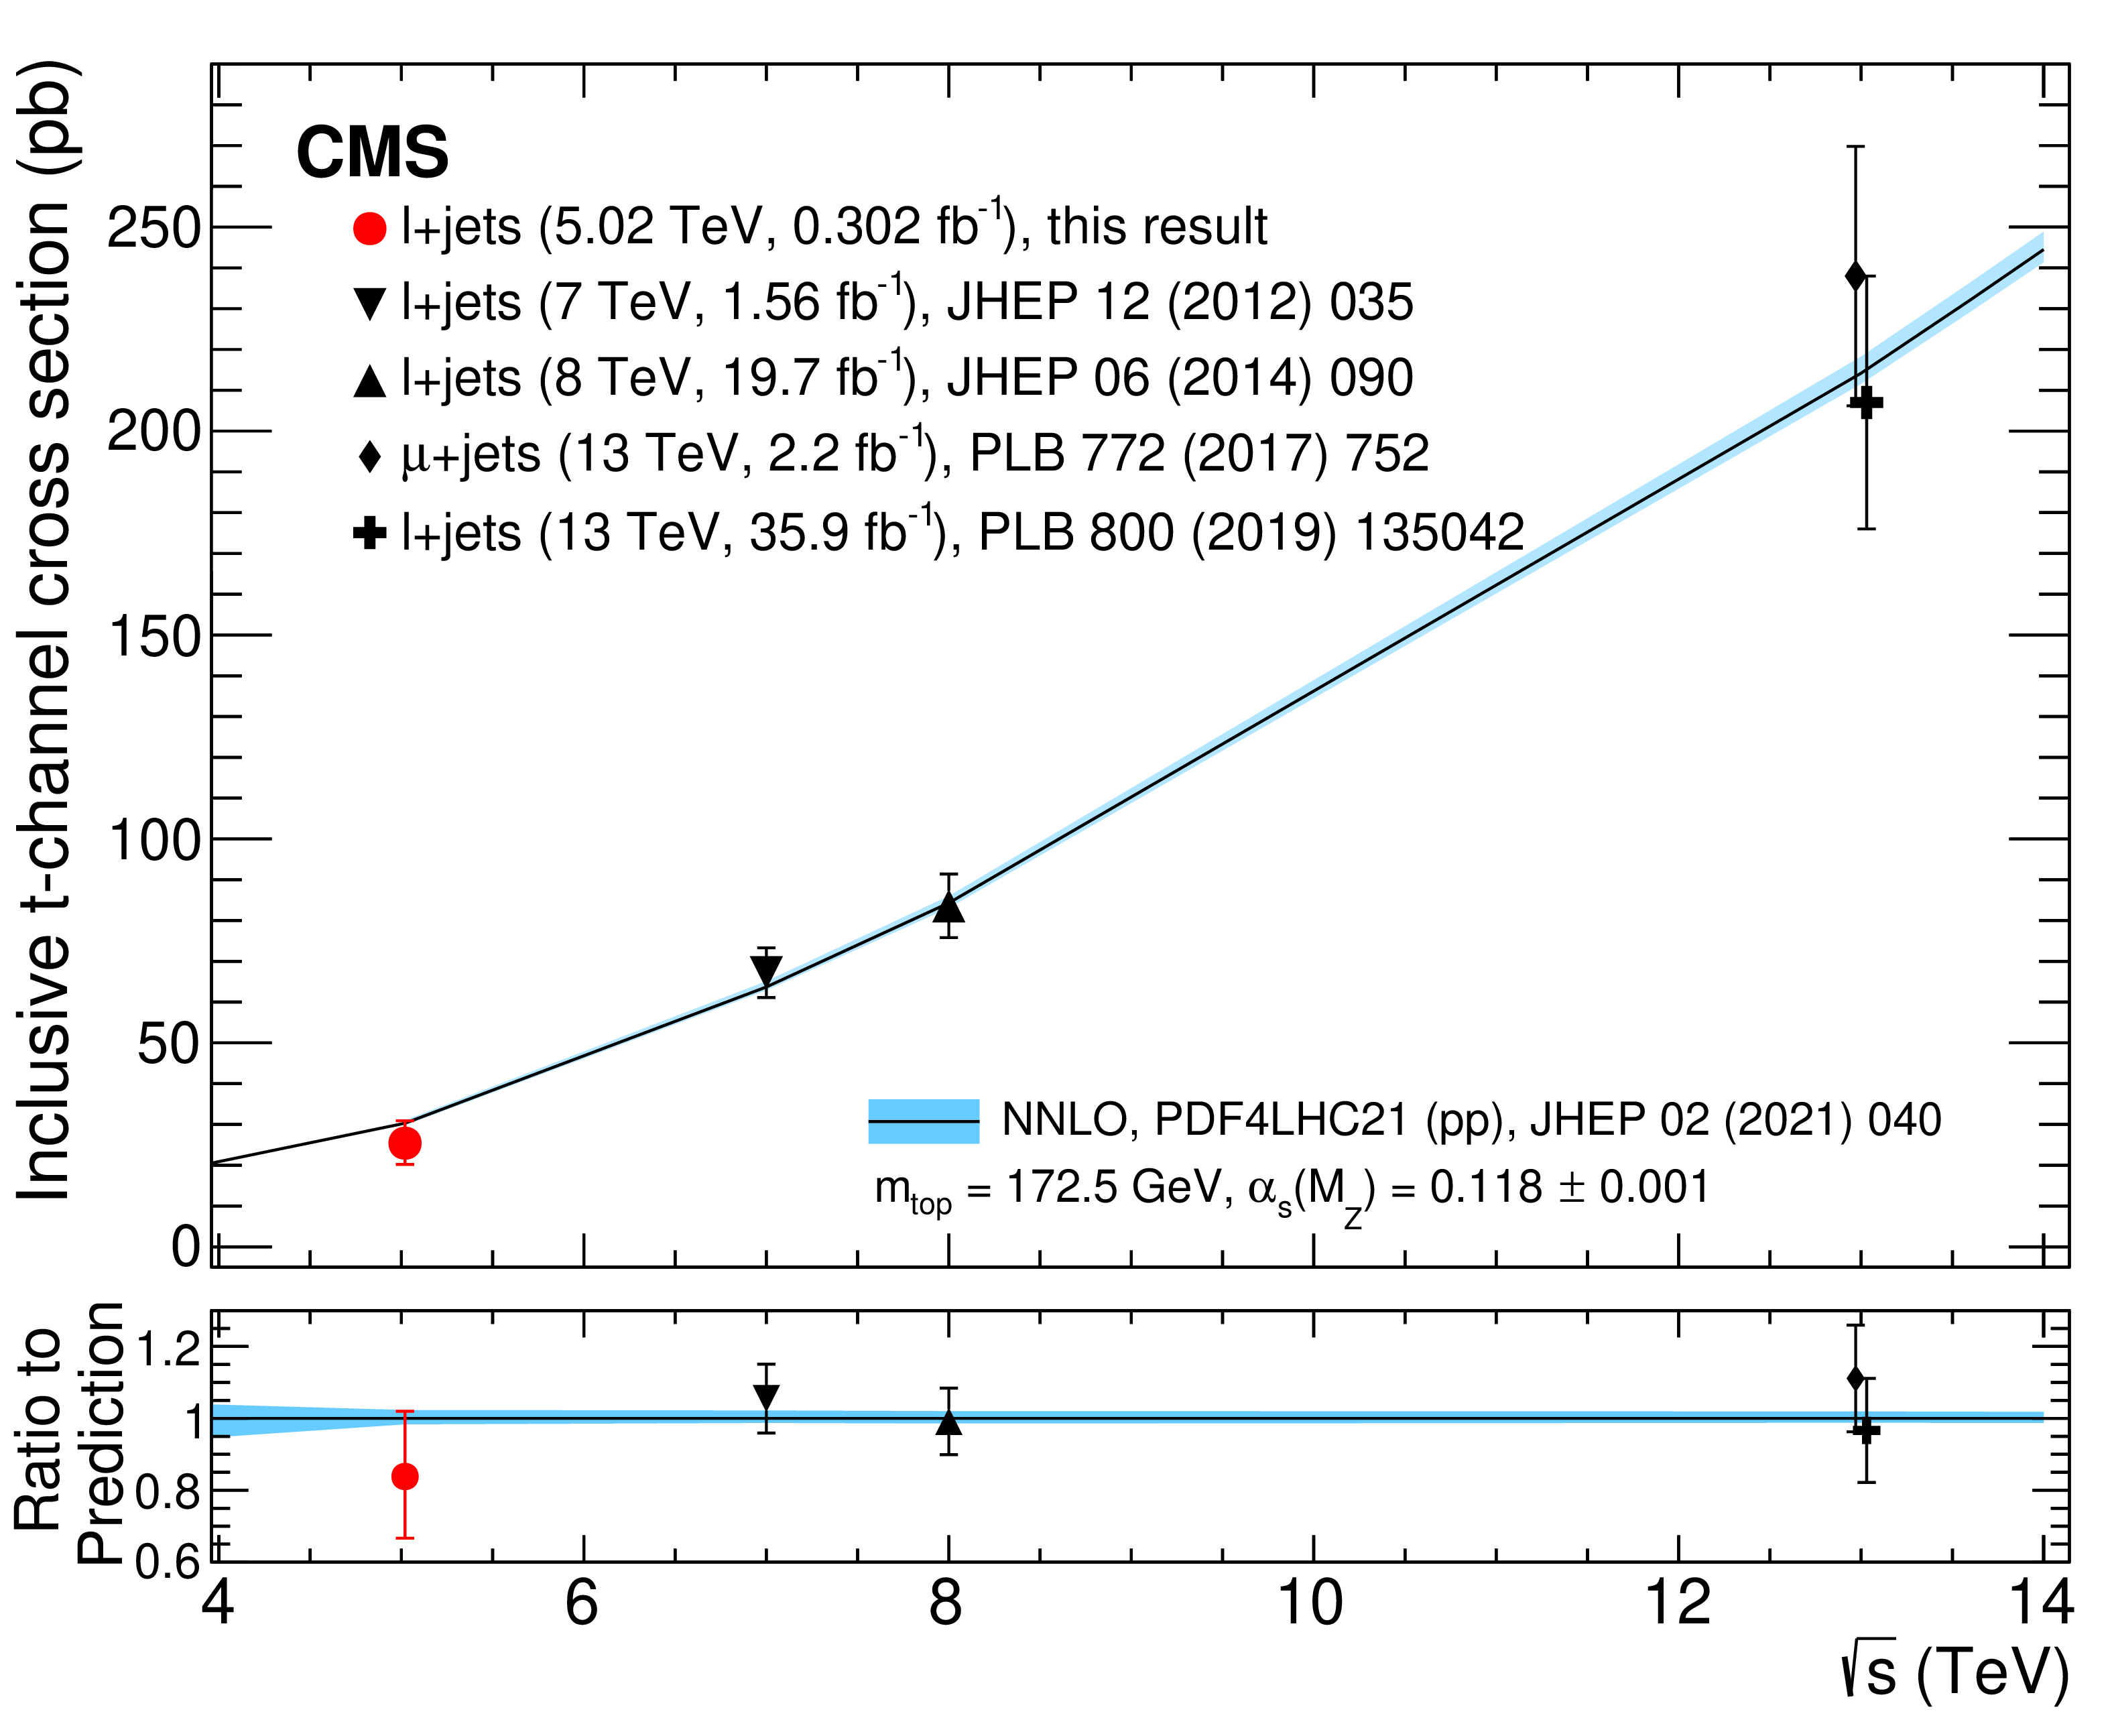
Figure 9:
Summary of the CMS measurements of the $ t $-channel single top quark production cross section as a function of $ \sqrt{s} $. |
png pdf |
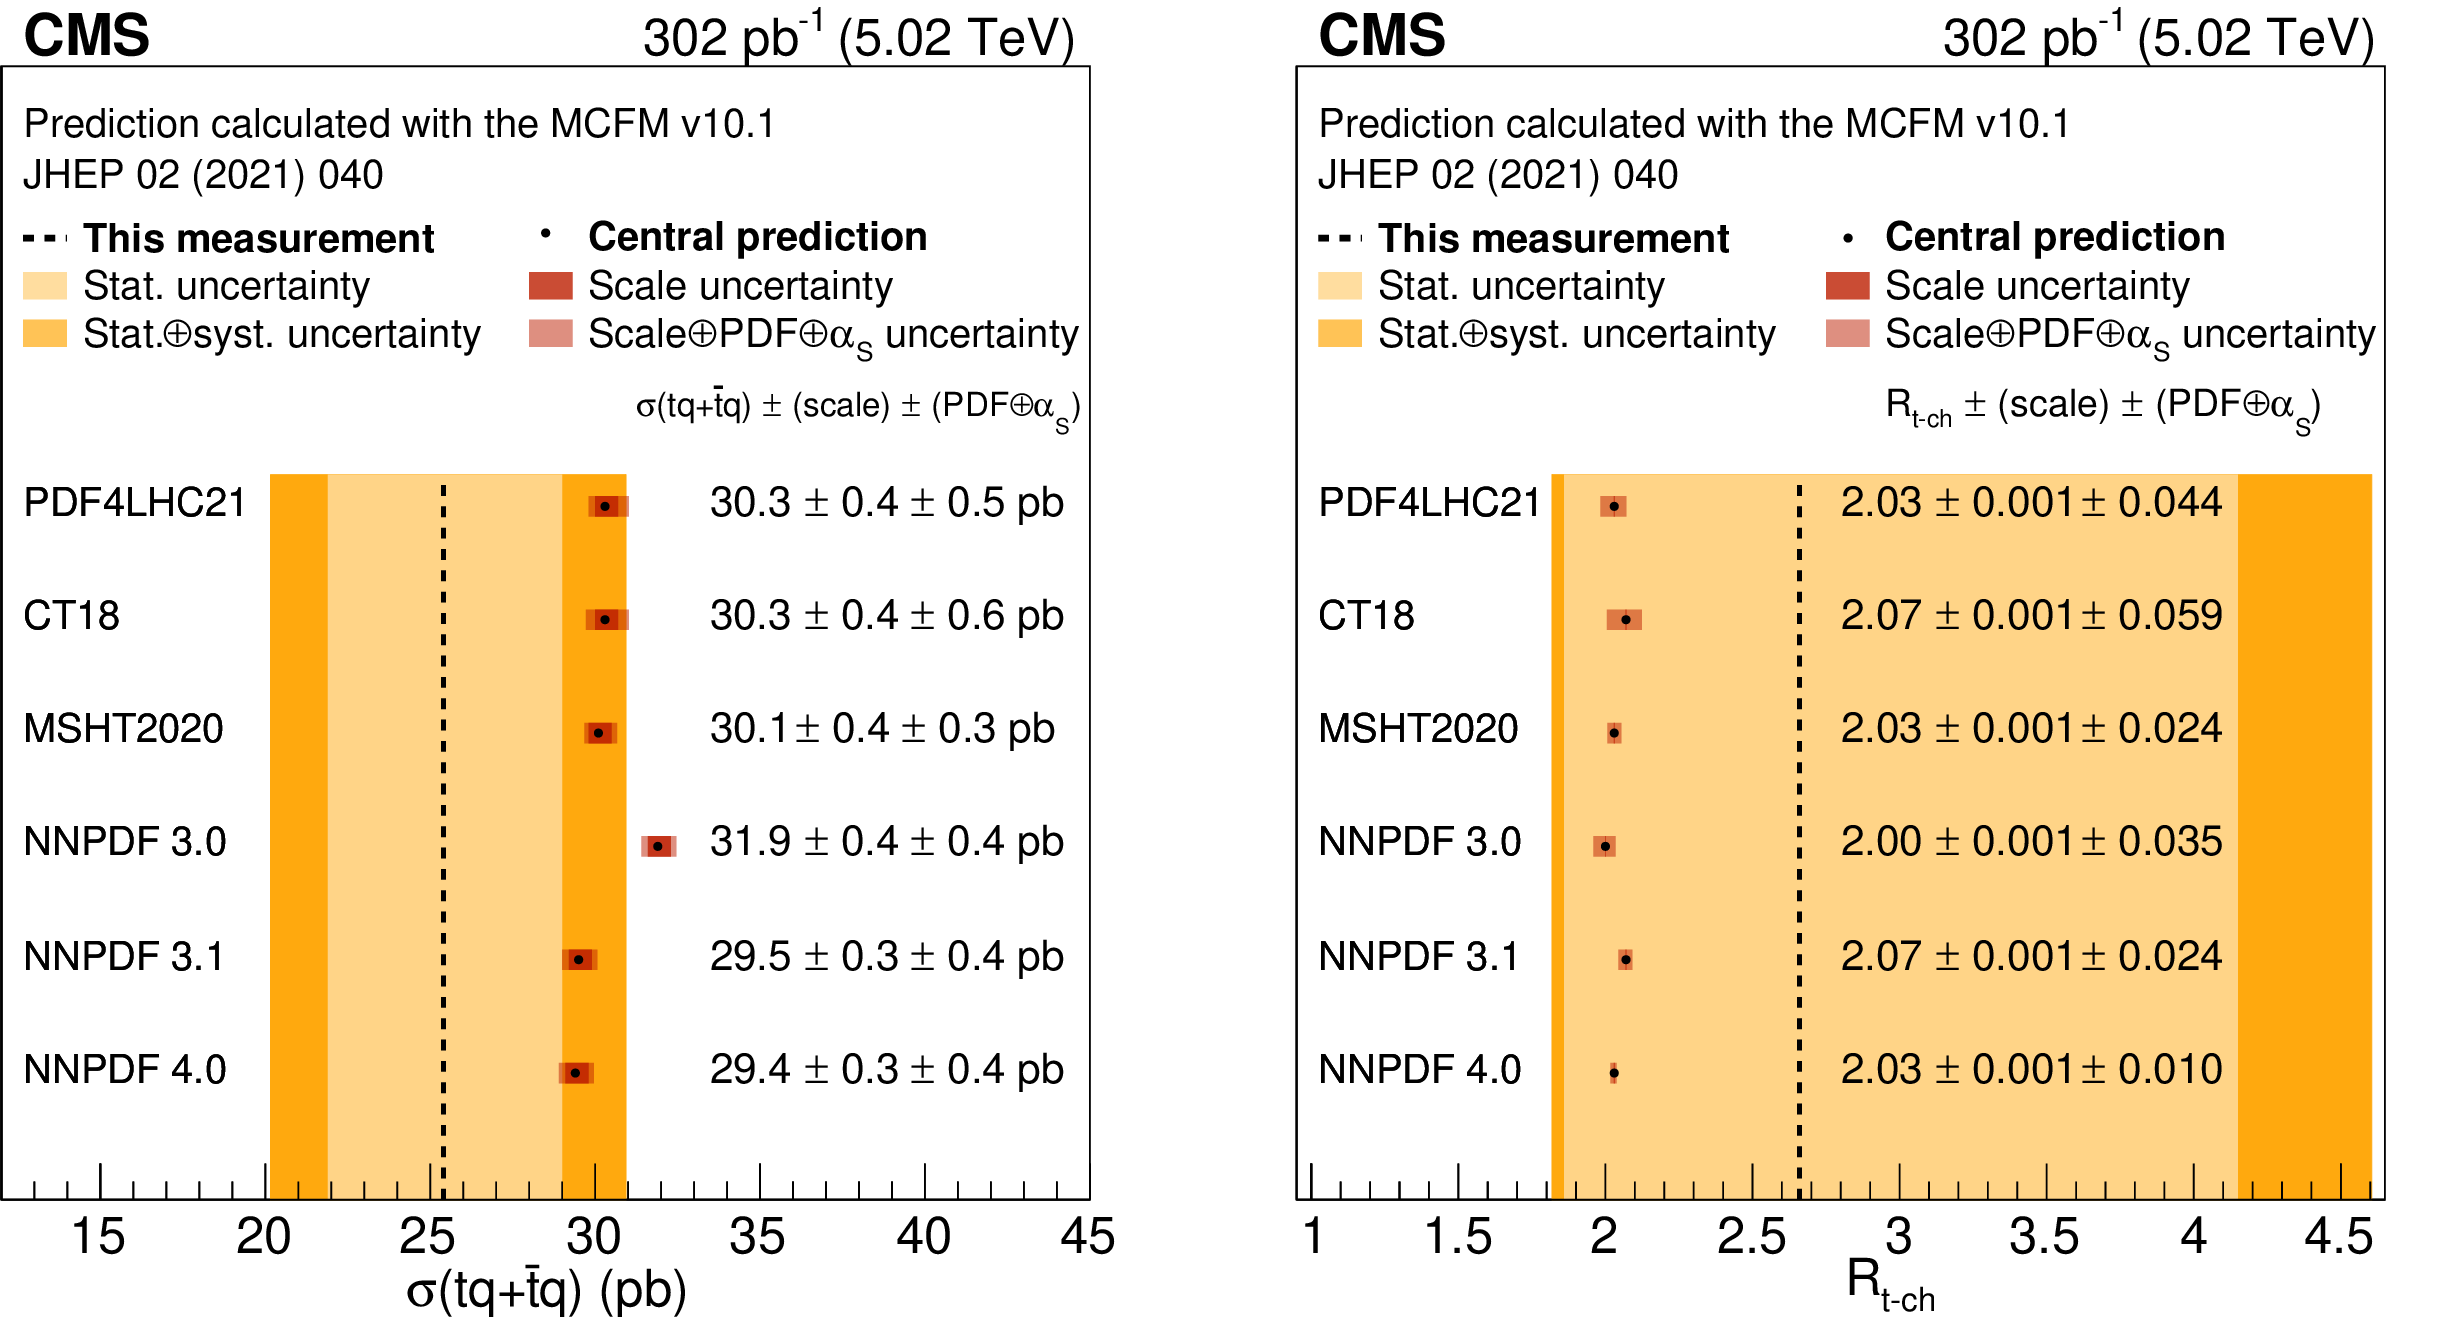
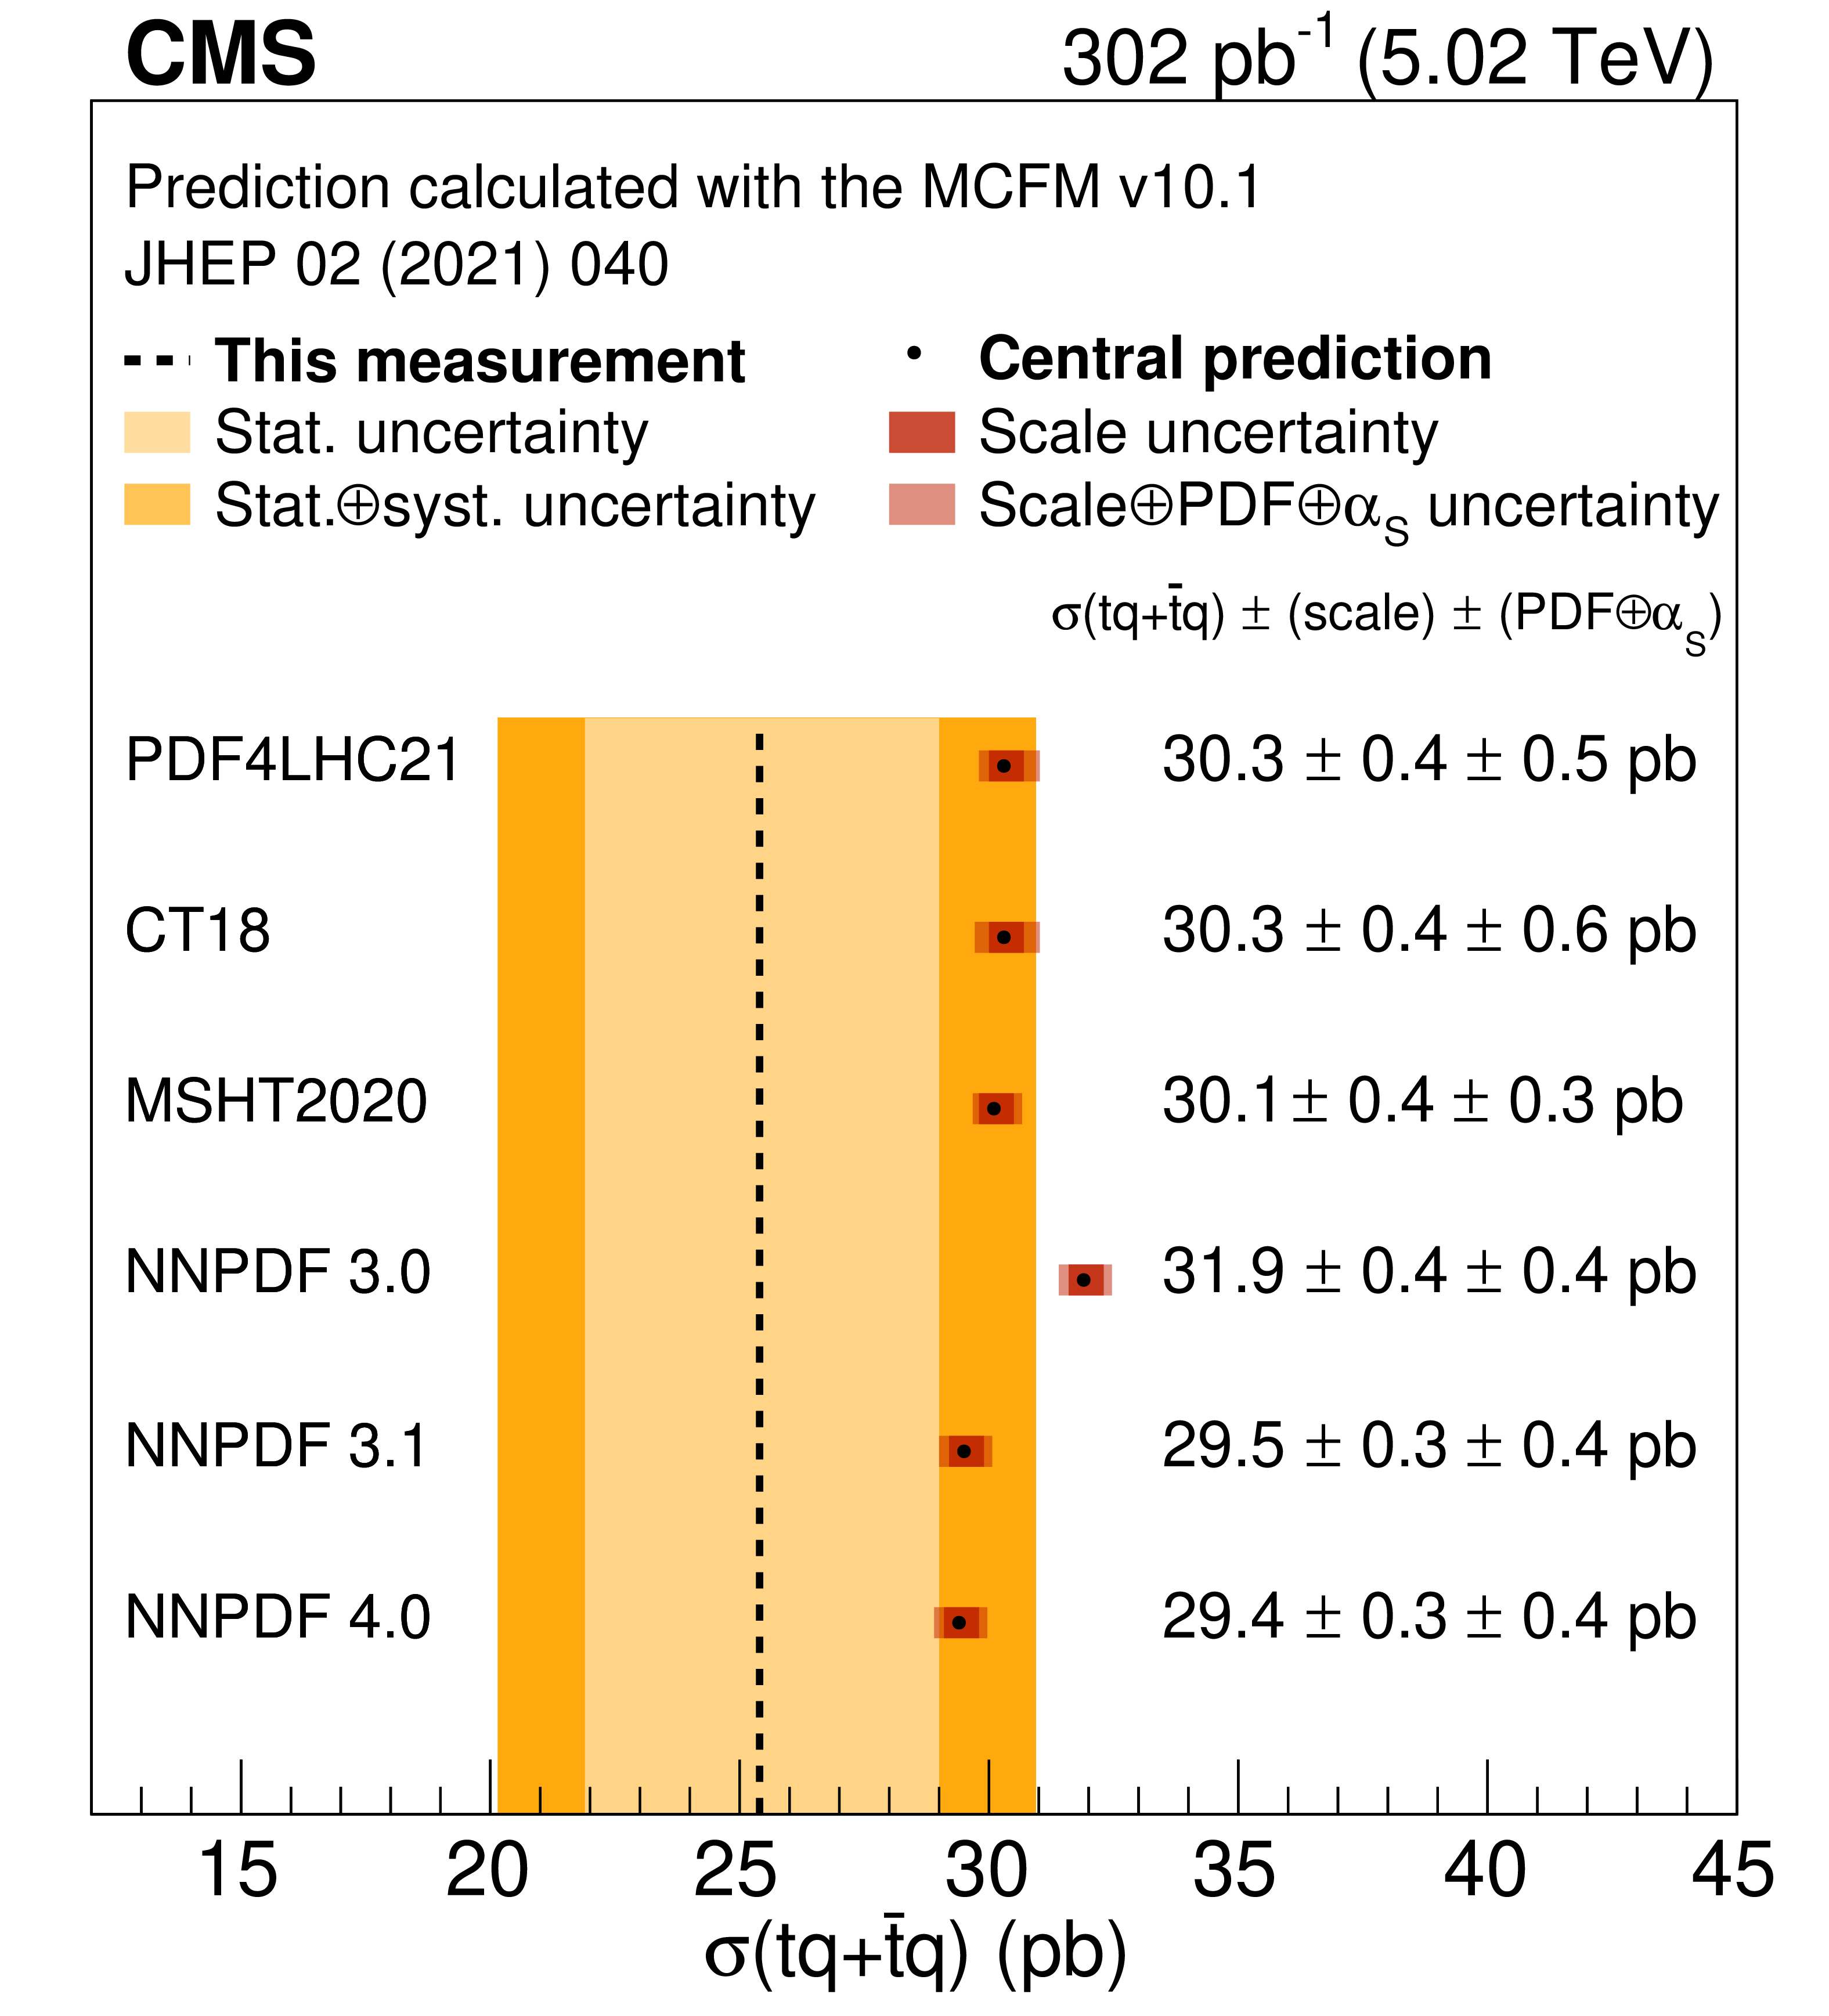
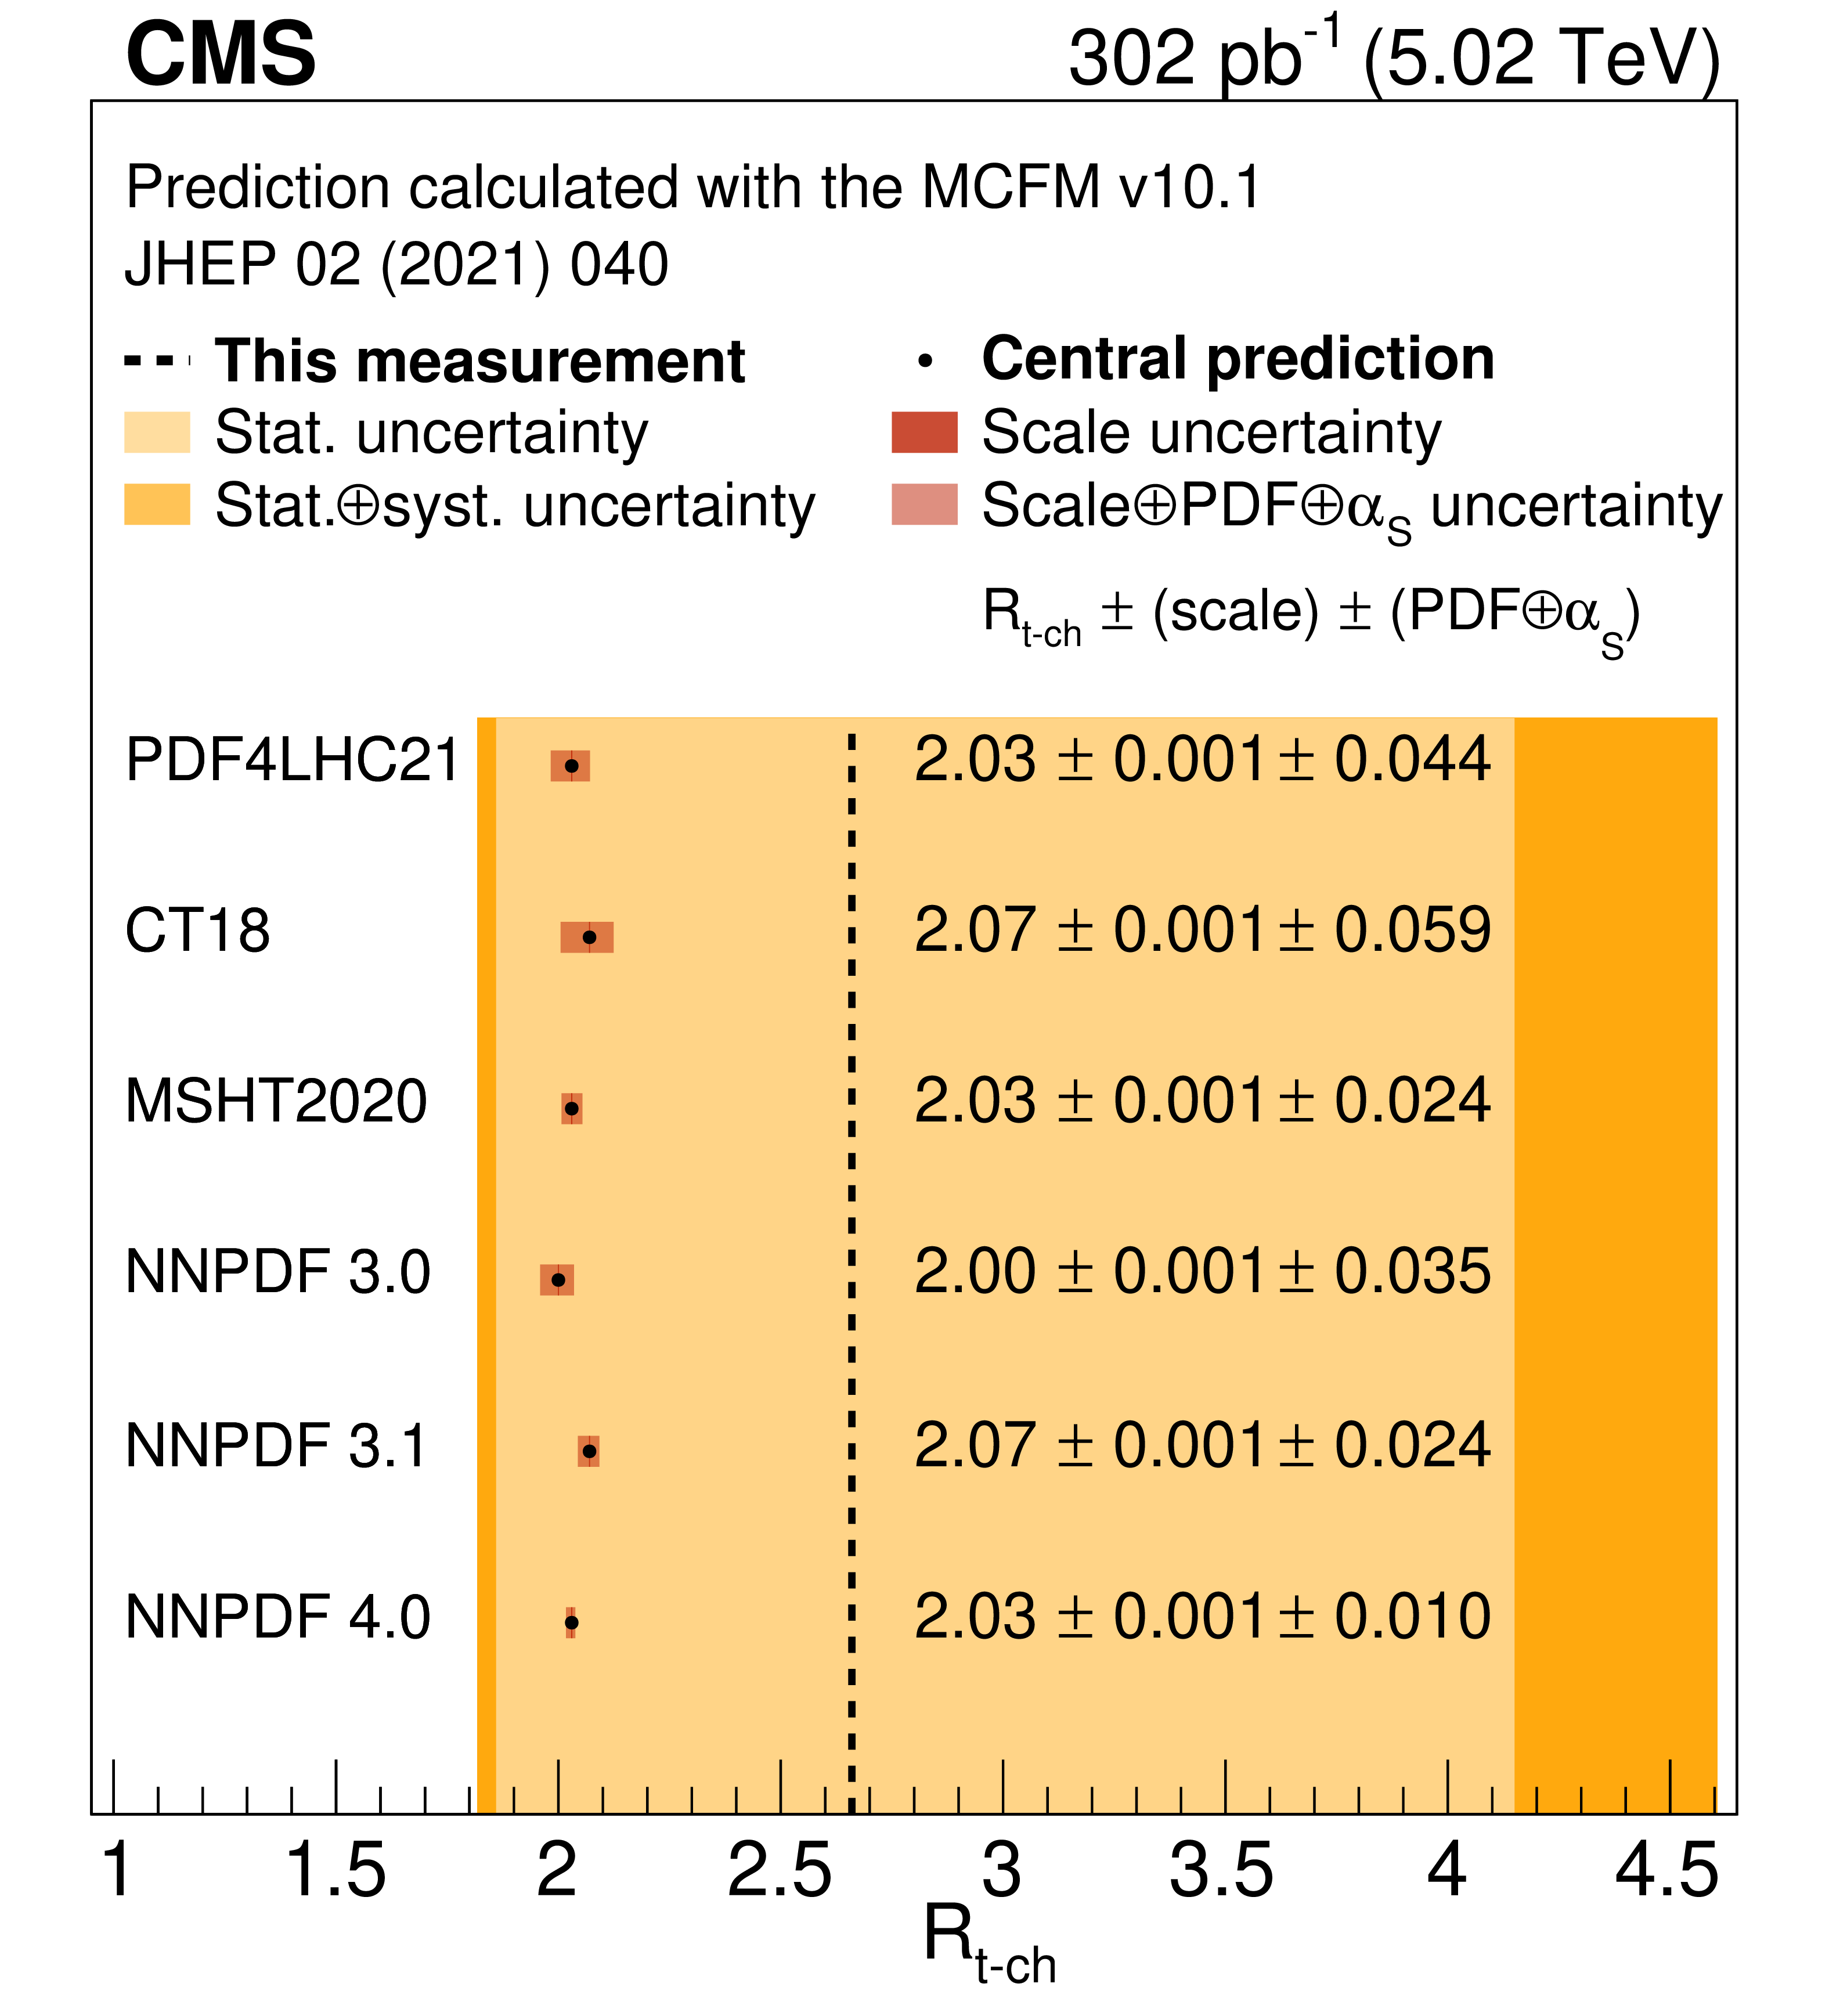
Figure 10:
Comparison of the measured values at $ \sqrt{s}= $ 5.02 TeV with predictions using different PDF sets, calculated with the MCFM program [51] for $ \sigma(\mathrm{t}\mathrm{q}\text{+}\overline{\mathrm{t}}\mathrm{q}) $ (left) and $ \mathcal{R}_{\mathrm{t-ch}} $ (right). |
png pdf |
Figure 10-a:
Comparison of the measured values at $ \sqrt{s}= $ 5.02 TeV with predictions using different PDF sets, calculated with the MCFM program [51] for $ \sigma(\mathrm{t}\mathrm{q}\text{+}\overline{\mathrm{t}}\mathrm{q}) $ (left) and $ \mathcal{R}_{\mathrm{t-ch}} $ (right). |
png pdf |
Figure 10-b:
Comparison of the measured values at $ \sqrt{s}= $ 5.02 TeV with predictions using different PDF sets, calculated with the MCFM program [51] for $ \sigma(\mathrm{t}\mathrm{q}\text{+}\overline{\mathrm{t}}\mathrm{q}) $ (left) and $ \mathcal{R}_{\mathrm{t-ch}} $ (right). |
| Tables | |
png pdf |
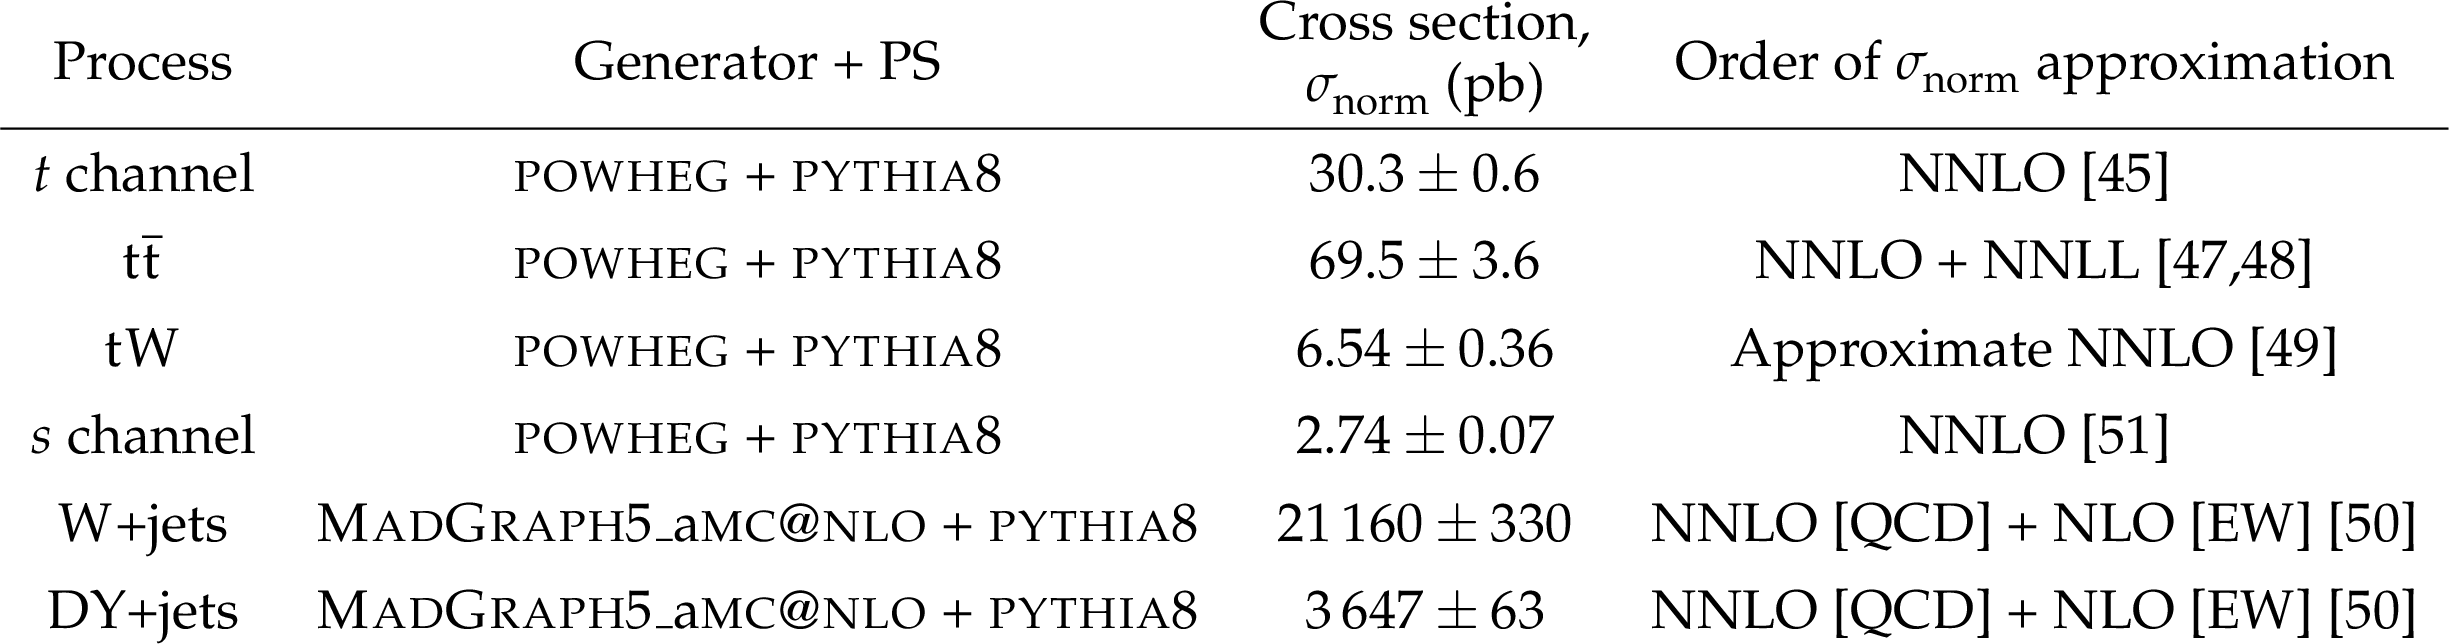
Table 1:
Summary of simulated samples used to model the signal and background processes. The last column corresponds to the pQCD and EW order of approximation used to normalize the distributions provided by the generators. |
png pdf |
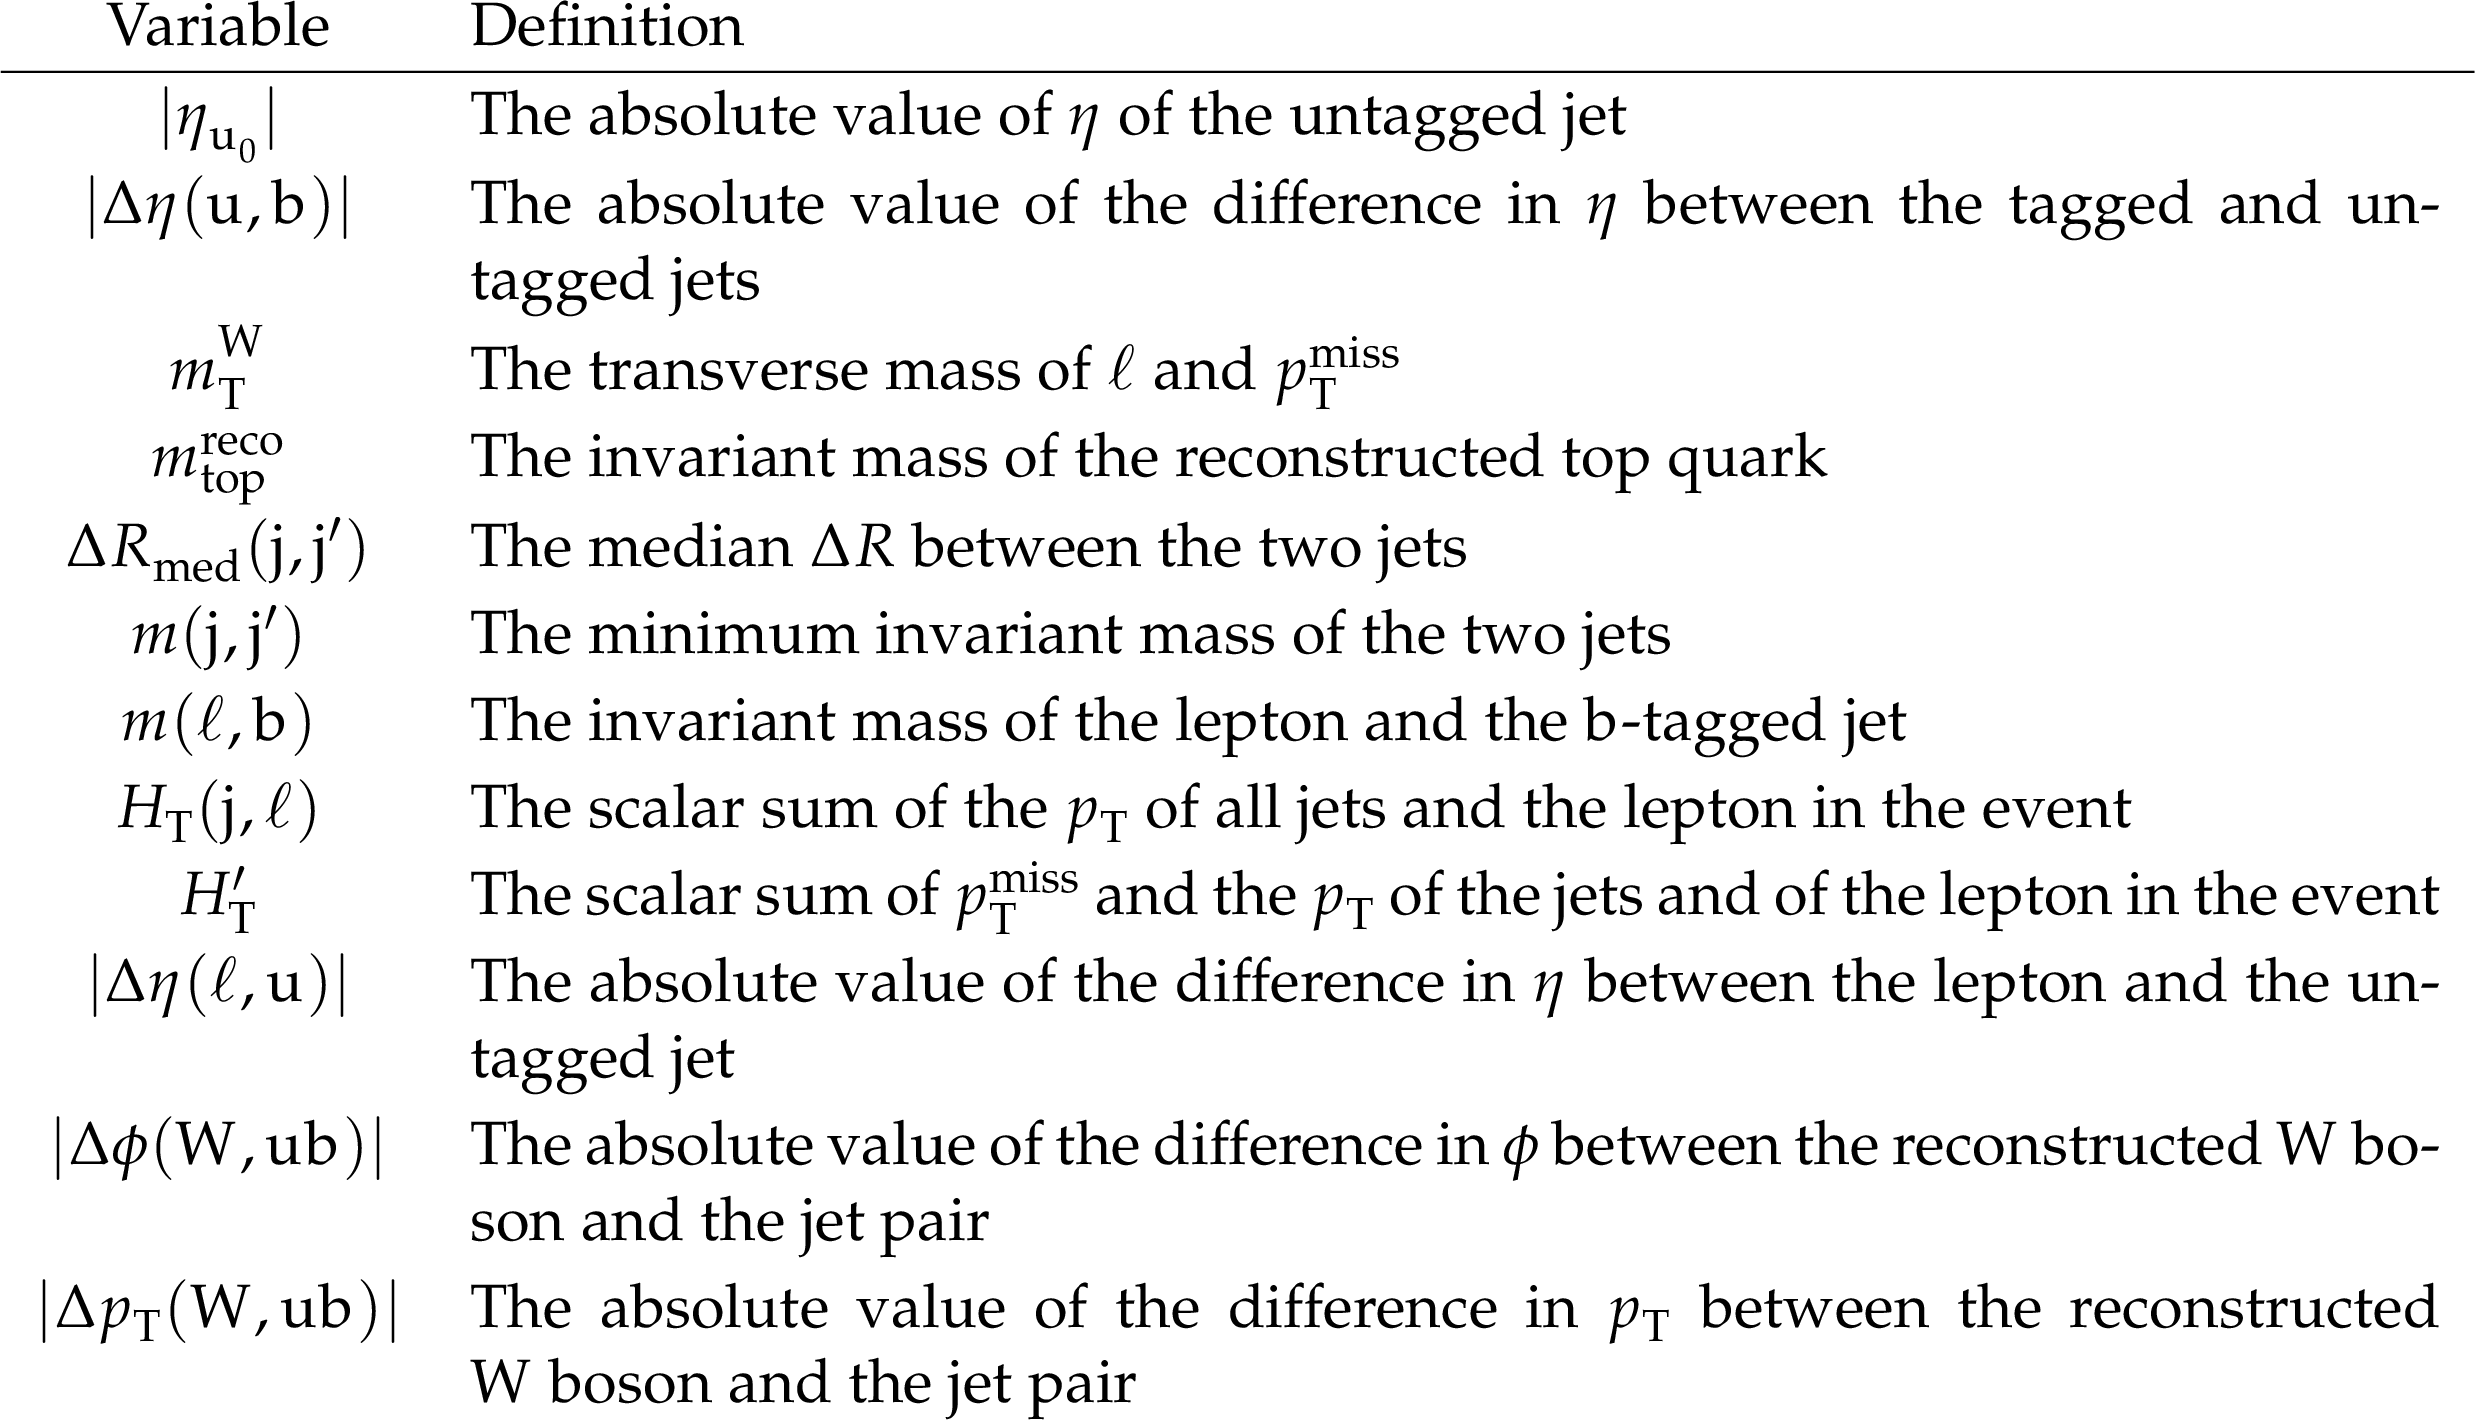
Table 2:
Summary of the variables used for training the MVA classifier in the 2j1b categories. The variables are ordered according to their discriminating power, assessed via the mean decrease in impurity method [52]. ``Leading'' jet refers to the jet with the highest $ p_{\mathrm{T}} $ in the event. |
| Summary |
| A measurement of the single top quark $ t $-channel production cross section in proton-proton collisions at a centre-of-mass energy of 5.02 TeV is performed for events with one electron or one muon and multiple jets using data collected by the CMS experiment in 2017 in conditions of low number of additional interactions per bunch crossing, corresponding to an integrated luminosity of 302$ \text{pb}^{-1}$. This represents the first CMS measurement of the process at that energy. The main background in the analysis originates from W+jets and top quark pair production, both estimated using simulation. Smaller contributions from quantum chromodynamics multijet events are derived from data. The cross section is measured through a maximum likelihood fit to the observed event yields in twelve categories defined in terms of the number of jets and b-tagged jets, the lepton flavour and electric charge. The cross sections are found to be $ \sigma(\mathrm{t}\mathrm{q}\text{+}\overline{\mathrm{t}}\mathrm{q})=25.4 ^{+3.6}_{-3.5} $ (stat) $ ^{+4.2}_{-3.9} $ (syst) $ \pm $ 0.5 (lumi) pb, $ \sigma(\mathrm{t}\mathrm{q})=17.6 ^{+2.8}_{-2.7} $ (stat) $ ^{+2.6}_{-2.4} $ (syst) $ \pm $ 0.3 (lumi) pb, and $ \sigma(\overline{\mathrm{t}}\mathrm{q})=6.6 ^{+2.4}_{-1.6} $ (stat) $ ^{+2.1}_{-2.5} $ (syst) $ \pm $ 0.1 (lumi) pb. The ratio between the individual cross sections is found to be $ \mathcal{R}_{\mathrm{t-ch}} =2.7 ^{+1.5}_{-0.8} $ (stat) $ ^{+1.3}_{-0.3} $ (syst). These results are used to calculate the absolute value of the Cabibbo--Kobayashi--Maskawa matrix element, which is found to be $ |f_{\text{LV}}V_{\mathrm{t}\mathrm{b}}|= $ 0.92 $ \pm $ 0.09 (exp) $ \pm $ 0.01 (theo). All the results are in good agreement with the standard model predictions. |
| References | ||||
| 1 | J. Alwall et al. | Is $ {V}_{\mathrm{t}\mathrm{b}}\simeq $ 1? | EPJC 49 (2007) 791 | hep-ph/0607115 |
| 2 | B. Holdom et al. | Four statements about the fourth generation | PMC Phys. A 3 (2009) 4 | 0904.4698 |
| 3 | \DZERO Collaboration | Model-independent measurement of $ t $-channel single top quark production in $ {\mathrm{p}\overline{\mathrm{p}}} $ collisions at $ \sqrt{s}= $ 1.96 TeV | PLB 705 (2011) 313 | 1105.2788 |
| 4 | CMS Collaboration | Measurement of the $ t $-channel single top quark production cross section in $ {\mathrm{p}\mathrm{p}} $ collisions at $ \sqrt{s}= $ 7 TeV | PRL 107 (2011) 091802 | CMS-TOP-10-008 1106.3052 |
| 5 | CMS Collaboration | Measurement of the single-top-quark $ t $-channel cross section in $ {\mathrm{p}\mathrm{p}} $ collisions at $ \sqrt{s}= $ 7 TeV | JHEP 12 (2012) 035 | CMS-TOP-11-021 1209.4533 |
| 6 | ATLAS Collaboration | Comprehensive measurements of $ t $-channel single top-quark production cross sections at $ \sqrt{s}= $ 7 TeV with the ATLAS detector | PRD 90 (2014) 112006 | 1406.7844 |
| 7 | CMS Collaboration | Measurement of the $ t $-channel single-top-quark production cross section and of the $ |V_{\mathrm{t}\mathrm{b}}| $ CKM matrix element in $ {\mathrm{p}\mathrm{p}} $ collisions at $ \sqrt{s}= $ 8 TeV | JHEP 06 (2014) 090 | CMS-TOP-12-038 1403.7366 |
| 8 | ATLAS Collaboration | Fiducial, total and differential cross-section measurements of $ t $-channel single top-quark production in $ {\mathrm{p}\mathrm{p}} $ collisions at 8 TeV using data collected by the ATLAS detector | EPJC 77 (2017) 531 | 1702.02859 |
| 9 | CMS Collaboration | Cross section measurement of $ t $-channel single top quark production in $ {\mathrm{p}\mathrm{p}} $ collisions at $ \sqrt{s}= $ 13 TeV | PLB 772 (2017) 752 | CMS-TOP-16-003 1610.00678 |
| 10 | CMS Collaboration | Measurement of the single top quark and antiquark production cross sections in the $ t $ channel and their ratio in proton-proton collisions at $ \sqrt{s}= $ 13 TeV | PLB 800 (2020) 135042 | CMS-TOP-17-011 1812.10514 |
| 11 | ATLAS Collaboration | Measurement of $ t $-channel production of single top quarks and antiquarks in $ {\mathrm{p}\mathrm{p}} $ collisions at 13 TeV using the full ATLAS \mboxRun 2 data sample | JHEP 05 (2024) 305 | 2403.02126 |
| 12 | ATLAS Collaboration | Measurement of $ t $-channel single-top-quark production in $ {\mathrm{p}\mathrm{p}} $ collisions at $ \sqrt{s}= $ 5.02 TeV with the ATLAS detector | PLB 854 (2024) 138726 | 2310.01518 |
| 13 | CMS Collaboration | Measurements of the electroweak diboson production cross sections in proton-proton collisions at $ \sqrt{s}= $ 5.02 TeV using leptonic decays | PRL 127 (2021) 191801 | CMS-SMP-20-012 2107.01137 |
| 14 | CMS Collaboration | Measurement of the inclusive $ \mathrm{t} \overline{\mathrm{t}} $ production cross section in proton-proton collisions at $ \sqrt{s}= $ 5.02 TeV | JHEP 04 (2022) 144 | CMS-TOP-20-004 2112.09114 |
| 15 | CMS Collaboration | Measurement of the inclusive $ \mathrm{t} \overline{\mathrm{t}} $ cross section in final states with at least one lepton and additional jets with 302$ \text{pb}^{-1}$ of $ {\mathrm{p}\mathrm{p}} $ collisions at $ \sqrt{s}= $ 5.02 TeV | JHEP 04 (2025) 099 | CMS-TOP-23-005 2410.21631 |
| 16 | CMS Collaboration | HEPData record for this analysis | link | |
| 17 | CMS Collaboration | The CMS experiment at the CERN LHC | JINST 3 (2008) S08004 | |
| 18 | CMS Collaboration | Development of the CMS detector for the CERN LHC \mboxRun 3 | JINST 19 (2024) P05064 | CMS-PRF-21-001 2309.05466 |
| 19 | CMS Collaboration | Performance of the CMS Level-1 trigger in proton-proton collisions at $ \sqrt{s}= $ 13 TeV | JINST 15 (2020) P10017 | CMS-TRG-17-001 2006.10165 |
| 20 | CMS Collaboration | The CMS trigger system | JINST 12 (2017) P01020 | CMS-TRG-12-001 1609.02366 |
| 21 | CMS Collaboration | Performance of the CMS high-level trigger during LHC \mboxRun 2 | JINST 19 (2024) P11021 | CMS-TRG-19-001 2410.17038 |
| 22 | CMS Collaboration | Electron and photon reconstruction and identification with the CMS experiment at the CERN LHC | JINST 16 (2021) P05014 | CMS-EGM-17-001 2012.06888 |
| 23 | CMS Collaboration | Performance of the CMS muon detector and muon reconstruction with proton-proton collisions at $ \sqrt{s}= $ 13 TeV | JINST 13 (2018) P06015 | CMS-MUO-16-001 1804.04528 |
| 24 | CMS Collaboration | Description and performance of track and primary-vertex reconstruction with the CMS tracker | JINST 9 (2014) P10009 | CMS-TRK-11-001 1405.6569 |
| 25 | CMS Collaboration | Particle-flow reconstruction and global event description with the CMS detector | JINST 12 (2017) P10003 | CMS-PRF-14-001 1706.04965 |
| 26 | CMS Collaboration | Performance of missing transverse momentum reconstruction in proton-proton collisions at $ \sqrt{s}= $ 13 TeV using the CMS detector | JINST 14 (2019) P07004 | CMS-JME-17-001 1903.06078 |
| 27 | M. Cacciari, G. P. Salam, and G. Soyez | The anti-$ k_{\mathrm{T}} $ jet clustering algorithm | JHEP 04 (2008) 063 | 0802.1189 |
| 28 | M. Cacciari, G. P. Salam, and G. Soyez | FASTJET user manual | EPJC 72 (2012) 1896 | 1111.6097 |
| 29 | CMS Collaboration | Jet energy scale and resolution in the CMS experiment in $ {\mathrm{p}\mathrm{p}} $ collisions at 8 TeV | JINST 12 (2017) P02014 | CMS-JME-13-004 1607.03663 |
| 30 | CMS Collaboration | Jet algorithms performance in 13 TeV data | CMS Physics Analysis Summary, 2017 CMS-PAS-JME-16-003 |
CMS-PAS-JME-16-003 |
| 31 | CMS Collaboration | Identification of heavy-flavour jets with the CMS detector in $ {\mathrm{p}\mathrm{p}} $ collisions at 13 TeV | JINST 13 (2018) P05011 | CMS-BTV-16-002 1712.07158 |
| 32 | CMS Collaboration | Technical proposal for the Phase-II upgrade of the Compact Muon Solenoid | CMS Technical Proposal CERN-LHCC-2015-010, CMS-TDR-15-02, 2015 link |
|
| 33 | CMS Collaboration | Muon identification using multivariate techniques in the CMS experiment in proton-proton collisions at $ \sqrt{s}= $ 13 TeV | JINST 19 (2024) P02031 | CMS-MUO-22-001 2310.03844 |
| 34 | CMS Collaboration | Measurement of the Higgs boson production rate in association with top quarks in final states with electrons, muons, and hadronically decaying tau leptons at $ \sqrt{s}= $ 13 TeV | EPJC 81 (2021) 378 | CMS-HIG-19-008 2011.03652 |
| 35 | GEANT4 Collaboration | GEANT 4---a simulation toolkit | NIM A 506 (2003) 250 | |
| 36 | S. Frixione, P. Nason, and C. Oleari | Matching NLO QCD computations with parton shower simulations: the POWHEG method | JHEP 11 (2007) 070 | 0709.2092 |
| 37 | S. Alioli, P. Nason, C. Oleari, and E. Re | A general framework for implementing NLO calculations in shower Monte Carlo programs: the POWHEG box | JHEP 06 (2010) 043 | 1002.2581 |
| 38 | S. Frixione, G. Ridolfi, and P. Nason | A positive-weight next-to-leading-order Monte Carlo for heavy flavour hadroproduction | JHEP 09 (2007) 126 | 0707.3088 |
| 39 | P. Nason | A new method for combining NLO QCD with shower Monte Carlo algorithms | JHEP 11 (2004) 040 | hep-ph/0409146 |
| 40 | NNPDF Collaboration | Parton distributions from high-precision collider data | EPJC 77 (2017) 663 | 1706.00428 |
| 41 | J. Alwall et al. | The automated computation of tree-level and next-to-leading order differential cross sections, and their matching to parton shower simulations | JHEP 07 (2014) 079 | 1405.0301 |
| 42 | R. Frederix and S. Frixione | Merging meets matching in MC@NLO | JHEP 12 (2012) 061 | 1209.6215 |
| 43 | T. Sjöstrand et al. | An introduction to PYTHIA8.2 | Comput. Phys. Commun. 191 (2015) 159 | 1410.3012 |
| 44 | CMS Collaboration | Extraction and validation of a new set of CMS PYTHIA8 tunes from underlying-event measurements | EPJC 80 (2020) 4 | CMS-GEN-17-001 1903.12179 |
| 45 | J. Campbell, T. Neumann, and Z. Sullivan | Single-top-quark production in the $ t $-channel at NNLO | JHEP 02 (2021) 040 | 2012.01574 |
| 46 | PDF4LHC Working Group , R. D. Ball et al. | The PDF4LHC21 combination of global PDF fits for the LHC \mboxRun 3 | JPG 49 (2022) 080501 | 2203.05506 |
| 47 | M. Czakon and A. Mitov | top++: a program for the calculation of the top-pair cross-section at hadron colliders | Comput. Phys. Commun. 185 (2014) 2930 | 1112.5675 |
| 48 | M. Czakon, P. Fiedler, and A. Mitov | Total top-quark pair-production cross section at hadron colliders through $ \mathcal{O}({\alpha_\mathrm{S}}^4) $ | PRL 110 (2013) 252004 | 1303.6254 |
| 49 | N. Kidonakis and N. Yamanaka | Higher-order corrections for $ {\mathrm{t}\mathrm{W}} $ production at high-energy hadron colliders | JHEP 05 (2021) 278 | 2102.11300 |
| 50 | K. Melnikov and F. Petriello | Electroweak gauge boson production at hadron colliders through $ \mathcal{O}({\alpha_\mathrm{S}^2}) $ | PRD 74 (2006) 114017 | hep-ph/0609070 |
| 51 | ATLAS Collaboration | Reference single top-quark cross-sections for ATLAS and CMS analyses | ATLAS PUB Note ATL-PHYS-PUB-2025-035, 2025 | |
| 52 | L. Breiman | Random forests | Mach. Learn. 45 (2001) 5 | |
| 53 | J. S. Conway | Incorporating nuisance parameters in likelihoods for multisource spectra | in orkshop on Statistical Issues Related to Discovery Claims in Search Experiments and Unfolding (PHYSTAT ): Geneva, Switzerland, January 17--20,, 2011 Proc. 2011 (2011) W |
1103.0354 |
| 54 | CMS Collaboration | Measurements of inclusive W and Z cross sections in $ {\mathrm{p}\mathrm{p}} $ collisions at $ \sqrt{s}= $ 7 TeV | JHEP 01 (2011) 080 | CMS-EWK-10-002 1012.2466 |
| 55 | C. J. Clopper and E. S. Pearson | The use of confidence or fiducial limits illustrated in the case of the binomial | Biometrika 26 (1934) 404 | |
| 56 | W. S. Cleveland | Robust locally weighted regression and smoothing scatterplots | J. Am. Stat. Assoc. 74 (1979) 829 | |
| 57 | J. Butterworth et al. | PDF4LHC recommendations for LHC \mboxRun 2 | JPG 43 (2016) 023001 | 1510.03865 |
| 58 | CMS Collaboration | Measurement of the inclusive $ \mathrm{t} \overline{\mathrm{t}} $ cross section in $ {\mathrm{p}\mathrm{p}} $ collisions at $ \sqrt{s}= $ 5.02 TeV using final states with at least one charged lepton | JHEP 03 (2018) 115 | CMS-TOP-16-023 1711.03143 |
| 59 | CMS Collaboration | Luminosity measurement in proton-proton collisions at 5.02 TeV in 2017 at CMS | CMS Physics Analysis Summary, 2021 CMS-PAS-LUM-19-001 |
CMS-PAS-LUM-19-001 |
| 60 | CMS Collaboration | Precision luminosity measurement in proton-proton collisions at $ \sqrt{s}= $ 13 TeV in 2015 and 2016 at CMS | EPJC 81 (2021) 800 | CMS-LUM-17-003 2104.01927 |
| 61 | CMS Collaboration | The CMS statistical analysis and combination tool: combine | Comput. Softw. Big Sci. 8 (2024) 19 | CMS-CAT-23-001 2404.06614 |
|
|
Compact Muon Solenoid LHC, CERN |
|

|

|

|

|

|