

Compact Muon Solenoid
LHC, CERN
| CMS-PAS-LUM-19-001 | ||
| Luminosity measurement in proton-proton collisions at 5.02 TeV in 2017 at CMS | ||
| CMS Collaboration | ||
| May 2021 | ||
| Abstract: The measurement of the integrated luminosity for the proton-proton collisions run at a center-of-mass energy of 5.02 TeV in 2017 with the CMS experiment is reported. The absolute luminosity scale is calibrated with the van der Meer scan method. The precision of the calibration is limited by the estimation of the beam separation, the description of electromagnetic interactions between colliding proton bunches, and the uncertainty in the estimated factorization bias. Continuous rate measurements with the forward hadron calorimeter and the Pixel Luminosity Telescope provide a very stable and linear luminosity measurement. The integrated luminosity recorded by the CMS experiment when the detector was fully operational is measured to be 302 pb$^{-1}$, with a relative uncertainty of 1.9%. | ||
| Links: CDS record (PDF) ; inSPIRE record ; CADI line (restricted) ; | ||
| Figures | |

png pdf |
Figure 1:
Horizontal and vertical positions of the proton beams measured with the DOROS BPMs during LHC fill 6380. The full vdM data set consists of four beam-imaging scans and one vdM scan pair, delineated by gray vertical lines. The origin of time corresponds to 11 Nov 2017, 07:42 GMT. |
png pdf |
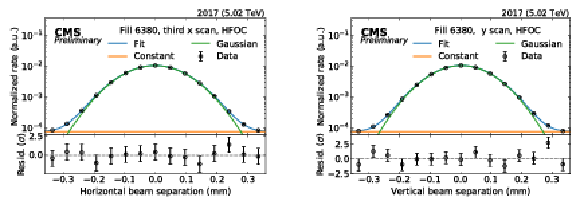
Figure 2:
Single-Gaussian plus constant fits to the HFOC data recorded during the third $x$ (left) and $y$ (right) scans. The constant term accounts for background. In the bottom panels, the difference between the measured rate and the fit divided by the statistical uncertainty is shown. |
png pdf |
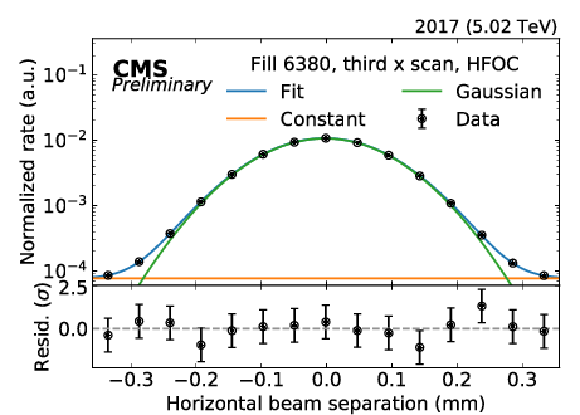
Figure 2-a:
Single-Gaussian plus constant fits to the HFOC data recorded during the third $x$ scan. The constant term accounts for background. In the bottom panel, the difference between the measured rate and the fit divided by the statistical uncertainty is shown. |
png pdf |
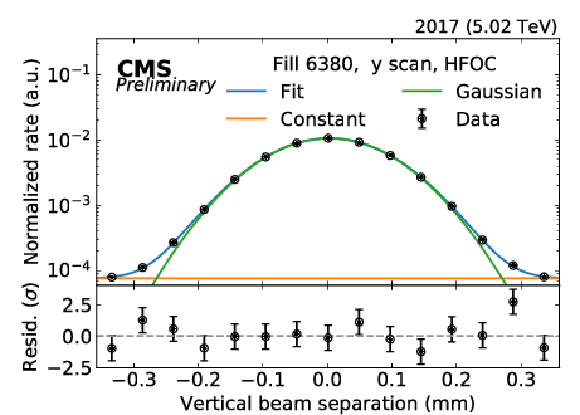
Figure 2-b:
Single-Gaussian plus constant fits to the HFOC data recorded during the third $y$ scan. The constant term accounts for background. In the bottom panel, the difference between the measured rate and the fit divided by the statistical uncertainty is shown. |
png pdf |
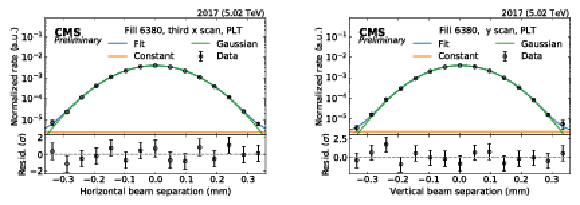
Figure 3:
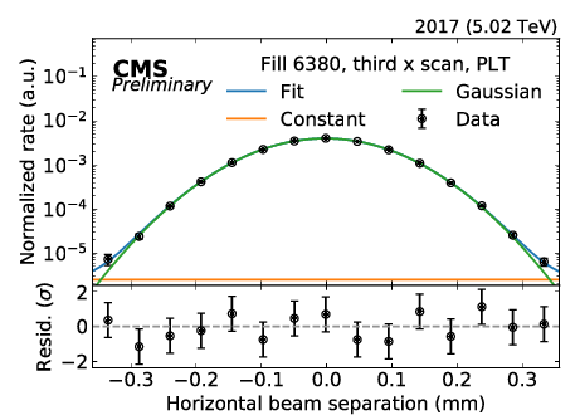
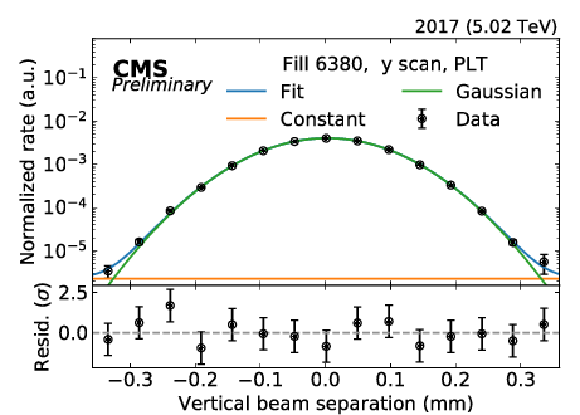
Single-Gaussian plus constant fits to the PLT data recorded during the third $x$ (left) and $y$ (right) scans. The constant term accounts for background. In the bottom panels, the difference between the measured rate and the fit divided by the statistical uncertainty is shown. |
png pdf |
Figure 3-a:
Single-Gaussian plus constant fits to the PLT data recorded during the third $x$ scan. The constant term accounts for background. In the bottom panel, the difference between the measured rate and the fit divided by the statistical uncertainty is shown. |
png pdf |
Figure 3-b:
Single-Gaussian plus constant fits to the PLT data recorded during the third $y$ scan. The constant term accounts for background. In the bottom panel, the difference between the measured rate and the fit divided by the statistical uncertainty is shown. |
png pdf |
Figure 4:
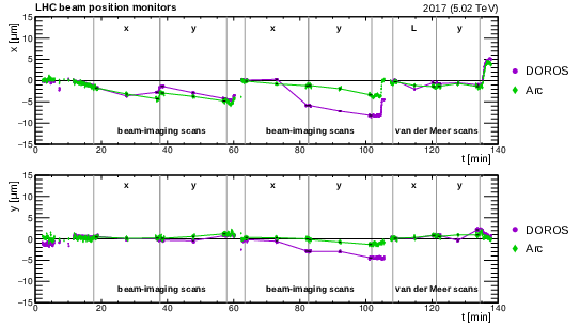
Orbit drift measurements in $x$ (top) and $y$ (bottom) during LHC fill 6380. Points correspond to beam positions measured by the DOROS and arc BPMs in $\mu $m at three instances where the beams collide head-on, i.e., before, during (at the head-on step), and after each scan. Lines correspond to linear fits from which the orbit drift at each scan step is estimated. The origin of time corresponds to 11 Nov 2017, 07:42 GMT. |

png pdf |
Figure 5:
Horizontal and vertical positions of the proton beams measured by the DOROS BPMs during LHC fill 6381, where a length scale scan pair and an emittance scan, a short variant of a vdM scan [22], was performed. The origin of time corresponds to 12 Nov 2017, 10:00 GMT. |
png pdf |
Figure 6:
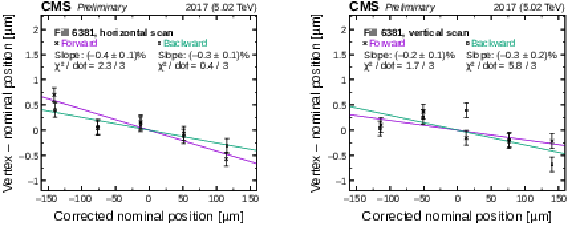
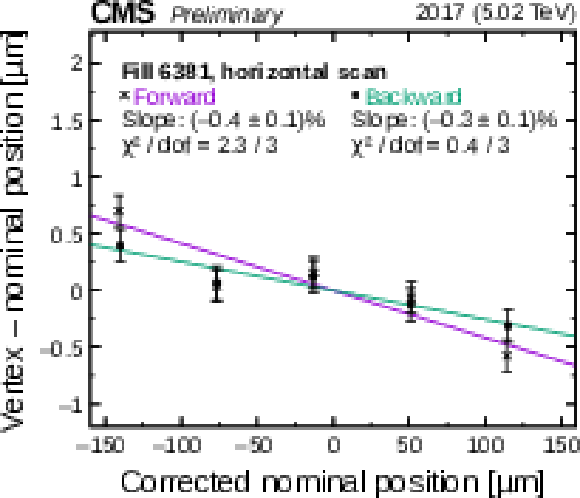
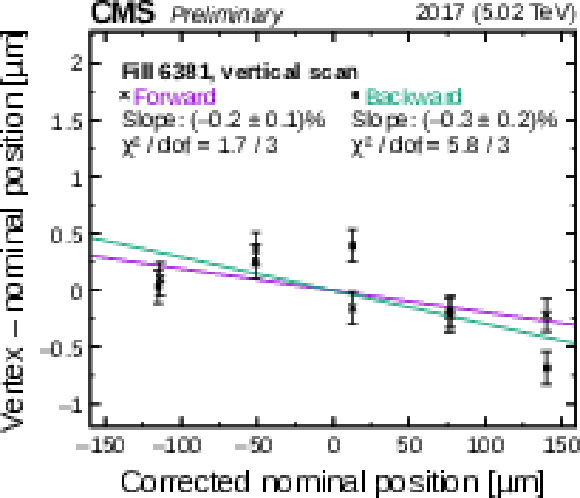
Difference between the reconstructed beamspot and the nominal positions, as a function of the latter, during the length scale scans. The results are shown for the $x$ (left) and $y$ (right) scans, separately for the forward (purple) and backward (green) directions. Nominal positions are corrected for orbit drift. The lines denote linear fits with slope and $\chi ^2$/dof values shown in the legend. |
png pdf |
Figure 6-a:
Difference between the reconstructed beamspot and the nominal positions, as a function of the latter, during the length scale scans. The results are shown for the $x$ scan, separately for the forward (purple) and backward (green) directions. Nominal positions are corrected for orbit drift. The lines denote linear fits with slope and $\chi ^2$/dof values shown in the legend. |
png pdf |
Figure 6-b:
Difference between the reconstructed beamspot and the nominal positions, as a function of the latter, during the length scale scans. The results are shown for the $y$ scan, separately for the forward (purple) and backward (green) directions. Nominal positions are corrected for orbit drift. The lines denote linear fits with slope and $\chi ^2$/dof values shown in the legend. |

png pdf |
Figure 7:
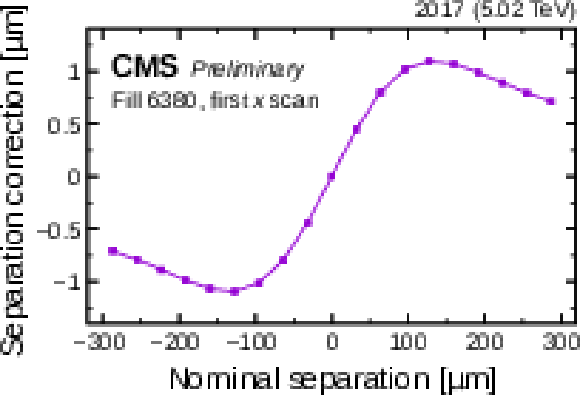
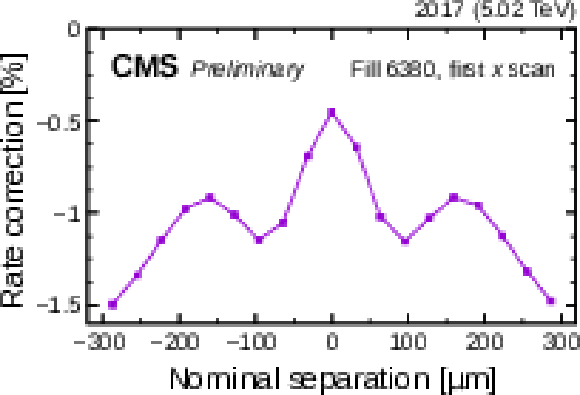
Correction on the beam separation from beam-beam deflection (left), and correction on the rate measurement from the incoherent beam-beam effect (right). The corrections are shown for the first $x$ scan. |
png pdf |
Figure 7-a:
Correction on the beam separation from beam-beam deflection. The corrections are shown for the first $x$ scan. |
png pdf |
Figure 7-b:
Correction on the rate measurement from the incoherent beam-beam effect. The corrections are shown for the first $x$ scan. |

png pdf |
Figure 8:
Residual horizontal and vertical positions of the proton beams measured by the arc BPMs during LHC fill 6380, after the orbit drift correction has been subtracted. The origin of time corresponds to 11 Nov 2017, 07:42 GMT. |
png pdf |
Figure 9:
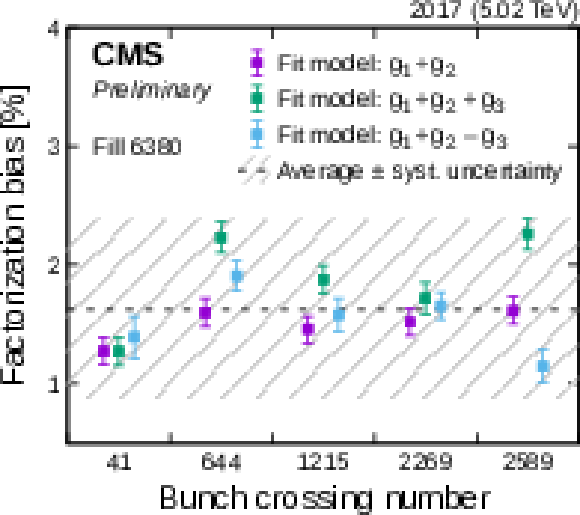
Factorization bias derived from the beam-imaging fit results obtained for different bunch crossings and fit models. The horizontal line denotes the mean value of 1.6%, and the shaded region the uncertainty of 0.8%. The fit models are defined in Ref. [29]. |

png pdf |
Figure 10:
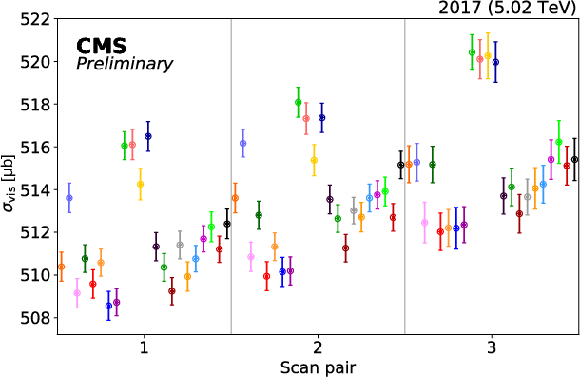
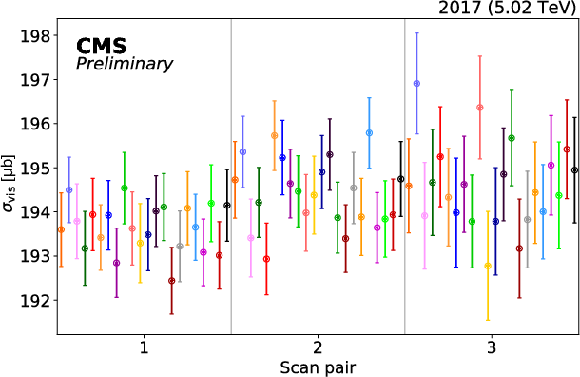
Visible cross section results using the HFOC (left) and PLT (right) measurements, shown chronologically for all $x$-$y$ scan pairs (where 1 and 2 are the beam-imaging scans), and evaluated for different bunch crossings. All corrections are applied. |
png pdf |
Figure 10-a:
Visible cross section results using the HFOC measurement, shown chronologically for all $x$-$y$ scan pairs (where 1 and 2 are the beam-imaging scans), and evaluated for different bunch crossings. All corrections are applied. |
png pdf |
Figure 10-b:
Visible cross section results using the PLT measurement, shown chronologically for all $x$-$y$ scan pairs (where 1 and 2 are the beam-imaging scans), and evaluated for different bunch crossings. All corrections are applied. |
png pdf |
Figure 10-c:
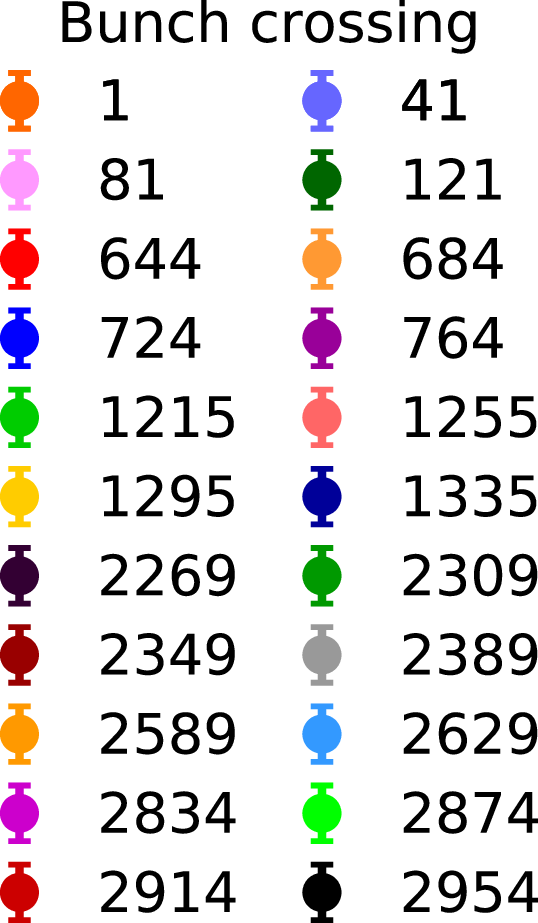
Legend of Figure 10. |
png pdf |
Figure 11:
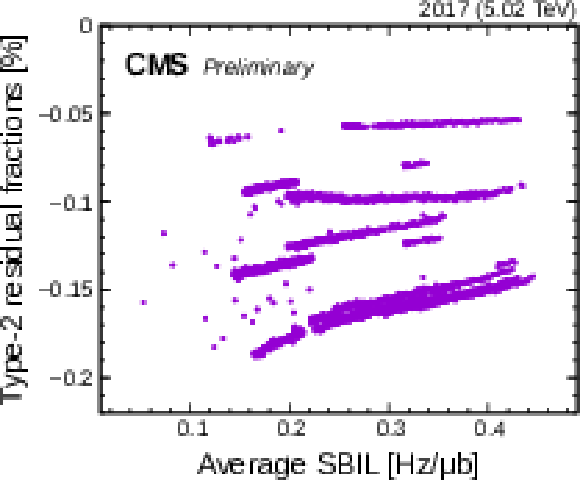
Type-2 residual fractions of the OOT pileup correction to the HFOC response, evaluated as the ratio of the luminosity of the second and following bunches after a colliding bunch to the luminosity of the colliding bunch, after the corrections are applied, for the entire data-taking period at 5.02 TeV in 2017. The fractions are shown as a function of the average single-bunch instantaneous luminosity. |
png pdf |
Figure 12:
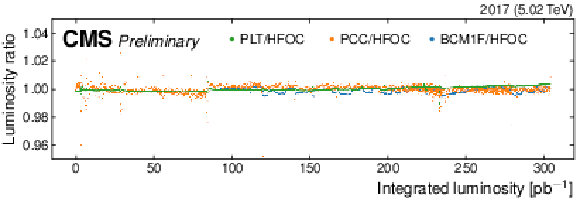
Ratio of the instantaneous luminosity measurement between PLT and HFOC (green), BCM1F and HFOC (blue), and PCC and HFOC (orange) as a function of the integrated luminosity, for the entire data-taking period at 5.02 TeV in 2017. |

png pdf |
Figure 13:
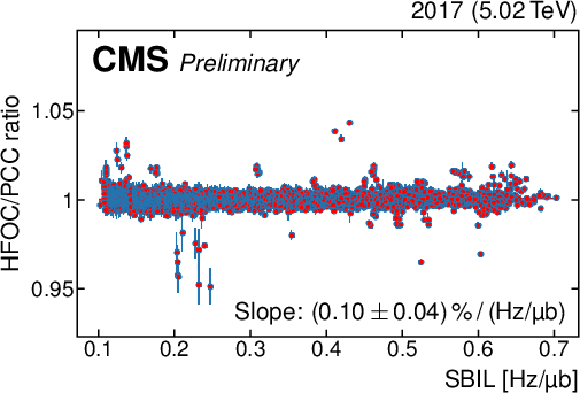
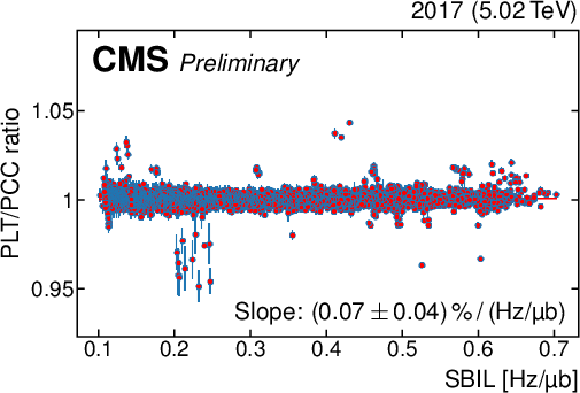
Ratio of the instantaneous luminosity measurement between HFOC and PCC (left), and between PLT and PCC (right) as a function of the single-bunch instantaneous luminosity (SBIL) measured with PCC, for the entire data-taking period at 5.02 TeV in 2017. The slopes and their statistical uncertainties from linear fits to the data are given. |
png pdf |
Figure 13-a:
Ratio of the instantaneous luminosity measurement between HFOC and PCC as a function of the single-bunch instantaneous luminosity (SBIL) measured with PCC, for the entire data-taking period at 5.02 TeV in 2017. The slopes and their statistical uncertainties from linear fits to the data are given. |
png pdf |
Figure 13-b:
Ratio of the instantaneous luminosity measurement between PLT and PCC as a function of the single-bunch instantaneous luminosity (SBIL) measured with PCC, for the entire data-taking period at 5.02 TeV in 2017. The slopes and their statistical uncertainties from linear fits to the data are given. |
| Tables | |
png pdf |
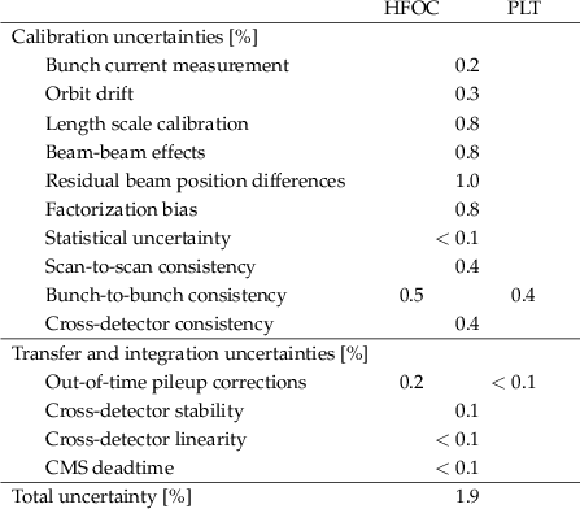
Table 1:
Summary of contributions to the systematic uncertainty of the integrated luminosity measurement for the proton-proton data-taking period at 5.02 TeV in 2017. |
| Summary |
| The integrated luminosity for the proton-proton data-taking period at a center-of-mass energy of 5.02 TeV in 2017 is measured with the HFOC method and the PLT detector. The absolute luminosity scale is obtained from the van der Meer method. The integrated luminosity delivered to the CMS experiment is measured to be 341 pb$^{-1}$. Excluding all periods where the CMS detector was not fully operational, a recorded integrated luminosity of 302 pb$^{-1}$ is estimated. The relative uncertainty of the integrated luminosity measurement is 1.9%, as detailed in Table 1. The dominant contribution to the systematic uncertainty arises from the calibration of the absolute scale of the beam separation, the calculation of electromagnetic interactions between colliding proton bunches, residual beam position differences, and the estimation of the factorization bias. |
| References | ||||
| 1 | S. van der Meer | Calibration of the effective beam height in the ISR | ISR Report CERN-ISR-PO-68-31 | |
| 2 | CMS Collaboration | CMS luminosity calibration for the pp reference run at $ \sqrt{s} = $ 5.02 TeV | CMS-PAS-LUM-16-001 | CMS-PAS-LUM-16-001 |
| 3 | CMS Collaboration | CMS luminosity measurement for the 2017 data-taking period at $ \sqrt{s} = $ 13 TeV | CMS-PAS-LUM-17-004 | CMS-PAS-LUM-17-004 |
| 4 | CMS Collaboration | CMS luminosity measurement for the 2018 data-taking period at $ \sqrt{s} = $ 13 TeV | CMS-PAS-LUM-18-002 | CMS-PAS-LUM-18-002 |
| 5 | CMS Collaboration | Precision luminosity measurement in proton-proton collisions at $ \sqrt{s}= $ 13 TeV in 2015 and 2016 at CMS | Submitted to EPJC | CMS-LUM-17-003 2104.01927 |
| 6 | ALICE Collaboration | Measurement of visible cross sections in proton-lead collisions at $ \sqrt{s_{\mathrm{NN}}} = $ 5.02 TeV in van der Meer scans with the ALICE detector | JINST 9 (2014) P11003 | 1405.1849 |
| 7 | ALICE Collaboration | ALICE luminosity determination for pp collisions at $ \sqrt{s}= $ 5 TeV | ALICE-PUBLIC-2016-005 | |
| 8 | ALICE Collaboration | ALICE 2017 luminosity determination for pp collisions at $ \sqrt{s}= $ 5 TeV | ALICE-PUBLIC-2018-014 | |
| 9 | ATLAS Collaboration | Luminosity determination in pp collisions at $ \sqrt{s}= $ 8 TeV using the ATLAS detector at the LHC | EPJC 76 (2016) 653 | 1608.03953 |
| 10 | LHCb Collaboration | Precision luminosity measurements at LHCb | JINST 9 (2014) P12005 | 1410.0149 |
| 11 | P. Grafstrom and W. Kozanecki | Luminosity determination at proton colliders | Prog. Part. NP 81 (2015) 97 | |
| 12 | CMS Collaboration | The CMS experiment at the CERN LHC | JINST 3 (2008) S08004 | CMS-00-001 |
| 13 | CMS Collaboration, P. Lujan | Performance of the Pixel Luminosity Telescope for luminosity measurement at CMS during Run 2 | in Proceedings, 2017 European Physical Society Conference on High Energy Physics (EPS-HEP 2017): Venice, Italy, 2017 | |
| 14 | CMS Collaboration, M. Guthoff | The new fast beam condition monitor using poly-crystalline diamond sensors for luminosity measurement at CMS | in Proceedings, 14th Pisa Meeting on Advanced Detectors: Frontier Detectors for Frontier Physics (Pisameet): La Biodola-Isola d'Elba, Livorno, Italy, 2018 | |
| 15 | M. Gasior, J. Olexa, and R. Steinhagen | BPM electronics based on compensated diode detectors---results from development systems | in Proceedings of the 2012 Beam Instrumentation Workshop (BIW'12), (MOPG010) 2012 | |
| 16 | T. Persson et al. | LHC optics corrections in Run 2 | in Proceedings, 9th Evian Workshop on LHC beam operation, 2019 | |
| 17 | CMS Collaboration | Description and performance of track and primary-vertex reconstruction with the CMS tracker | JINST 9 (2014) P10009 | CMS-TRK-11-001 1405.6569 |
| 18 | G. Anders et al. | Study of the relative LHC bunch populations for luminosity calibration | CERN-ATS-Note-2012-028 PERF | |
| 19 | C. Barschel et al. | Results of the LHC DCCT calibration studies | CERN-ATS-Note-2012-026 PERF | |
| 20 | A. Alici et al. | Study of the LHC ghost charge and satellite bunches for luminosity calibration. | CERN-ATS-Note-2012-029 PERF | |
| 21 | C. Barschel | Precision luminosity measurement at LHCb with beam–gas imaging | PhD thesis, RWTH Aachen University, 2014 CERN-THESIS-2013-301 | |
| 22 | CMS Collaboration, O. Karacheban | Long-term monitoring of delivered luminosity and calibration stability in the CMS experiment | in Proceedings, LHC Lumi Days 2019: Prévessin, France, 2019 | |
| 23 | CMS Collaboration | The CMS trigger system | JINST 12 (2017) P01020 | CMS-TRG-12-001 1609.02366 |
| 24 | W. Kozanecki, T. Pieloni, and J. Wenninger | Observation of beam-beam deflections with LHC orbit data | CERN Accelerator Note CERN-ACC-NOTE-2013-0006 | |
| 25 | A. A. Babaev | Coherent deflection of elliptic bunches colliding at crossing angle | 2104.02595 | |
| 26 | V. Balagura | Van der Meer scan luminosity measurement and beam-beam correction | EPJC 81 (2021) 26 | 2012.07752 |
| 27 | A. Babaev et al. | Impact of beam-beam effects on absolute luminosity calibrations at the CERN Large Hadron Collider | To be submitted to PRST Accel. Beams | |
| 28 | M. Klute, C. Medlock, and J. Salfeld-Nebgen | Beam imaging and luminosity calibration | JINST 12 (2017) P03018 | 1603.03566 |
| 29 | J. Knolle | Measuring luminosity and the ttZ production cross section with the CMS experiment | PhD thesis, Universität Hamburg, 2020 CERN-THESIS-2020-185, DESY-THESIS-2020-020 | |

|
Compact Muon Solenoid LHC, CERN |

|

|

|

|

|

|