

Compact Muon Solenoid
LHC, CERN
| CMS-SUS-24-012 ; CERN-EP-2026-103 | ||
| Search for electroweakinos in compressed-spectrum scenarios with low-momentum isolated tracks in proton-proton collisions at $ \sqrt{s} = $ 13 TeV | ||
| CMS Collaboration | ||
| 28 April 2026 | ||
| Submitted to Physical Review Letters | ||
| Abstract: A search for supersymmetric electroweakinos is performed using events with a low-momentum (soft) isolated track and large missing transverse momentum, targeting nearly mass-degenerate higgsino-like charginos and neutralinos. For mass splittings of 0.3--1 GeV, the chargino decays to the lightest neutralino and a low-momentum pion, which can produce a soft, potentially displaced track. A parameterized neural network separates signal from background using kinematic and impact parameter information. The analysis uses 138 fb$ ^{-1} $ of proton--proton collision data at a center-of-mass energy of 13 TeV recorded with the CMS detector. No significant excess above the standard model expectation is observed. At 95% confidence level, the considered higgsino model is excluded for mass splittings in the range 0.28--1.15 GeV and for chargino masses up to 185 GeV, setting stringent constraints on natural supersymmetry scenarios. | ||
| Links: e-print arXiv:2604.25604 [hep-ex] (PDF) ; CDS record ; inSPIRE record ; HepData record ; CADI line (restricted) ; | ||
| Figures | |
png pdf |
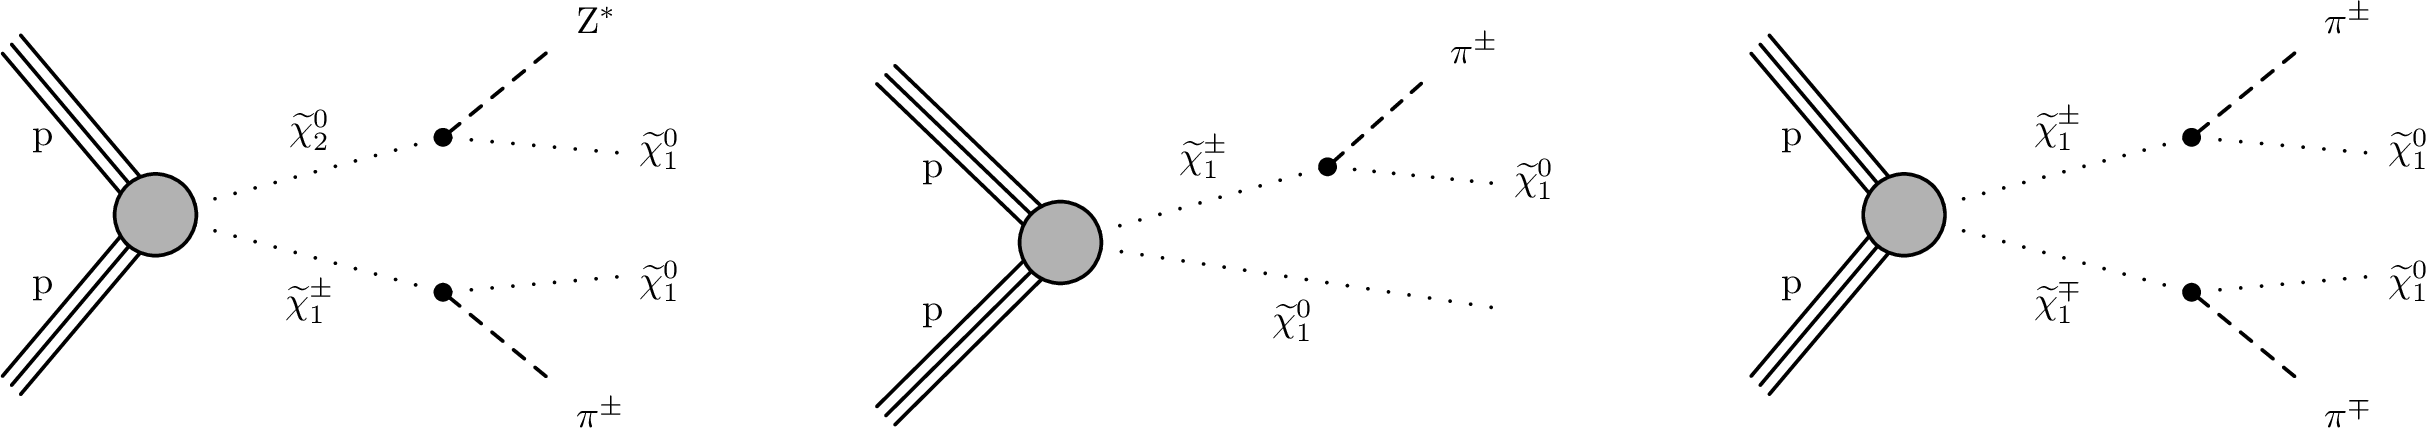
Figure 1:
Representative diagrams for the production of signal events. The signature considered in the analysis also involves one or more jets from initial state radiation with significant $ p_{\mathrm{T}} $ in the final state, which are not shown in the figure. All processes are included in the interpretation of the search. |
png pdf |
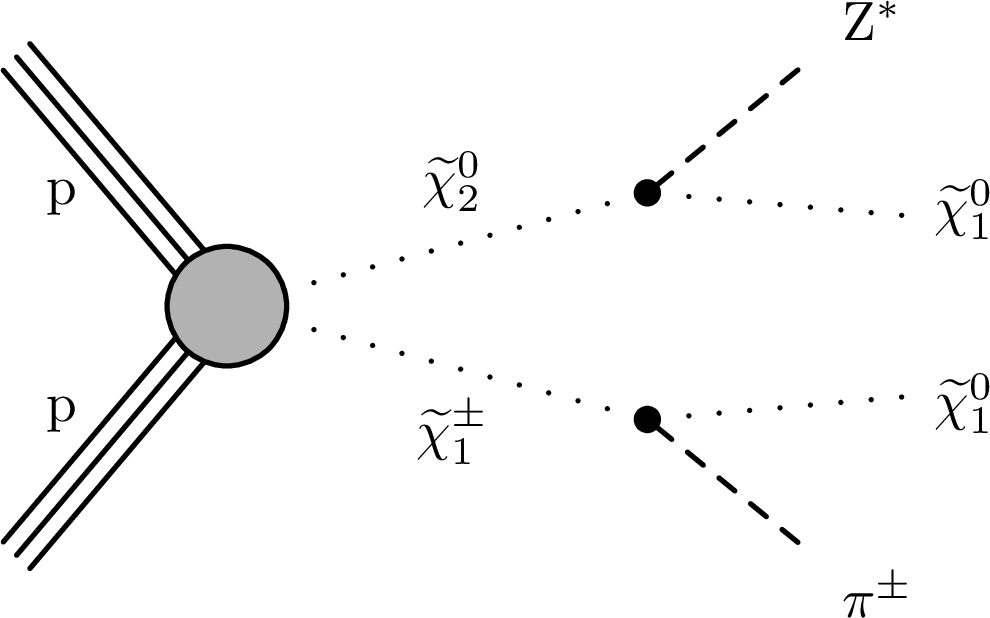
Figure 1-a:
Representative diagrams for the production of signal events. The signature considered in the analysis also involves one or more jets from initial state radiation with significant $ p_{\mathrm{T}} $ in the final state, which are not shown in the figure. All processes are included in the interpretation of the search. |
png pdf |
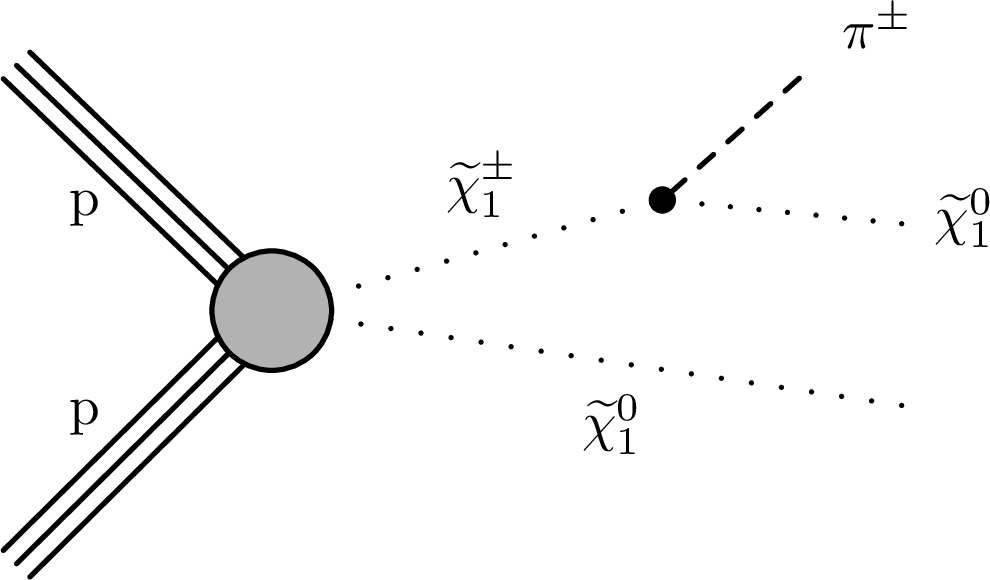
Figure 1-b:
Representative diagrams for the production of signal events. The signature considered in the analysis also involves one or more jets from initial state radiation with significant $ p_{\mathrm{T}} $ in the final state, which are not shown in the figure. All processes are included in the interpretation of the search. |
png pdf |
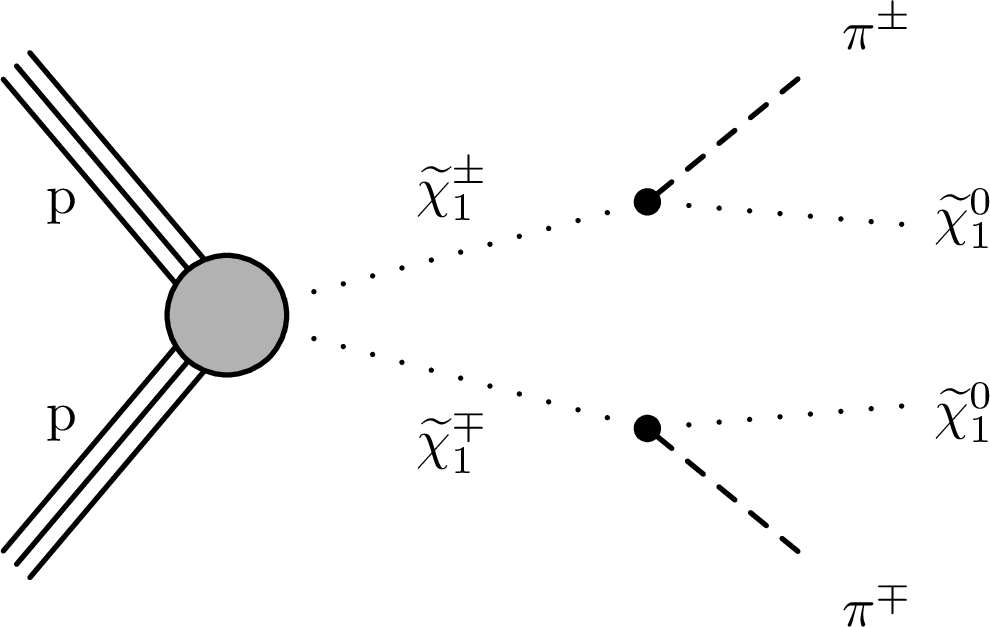
Figure 1-c:
Representative diagrams for the production of signal events. The signature considered in the analysis also involves one or more jets from initial state radiation with significant $ p_{\mathrm{T}} $ in the final state, which are not shown in the figure. All processes are included in the interpretation of the search. |
png pdf |
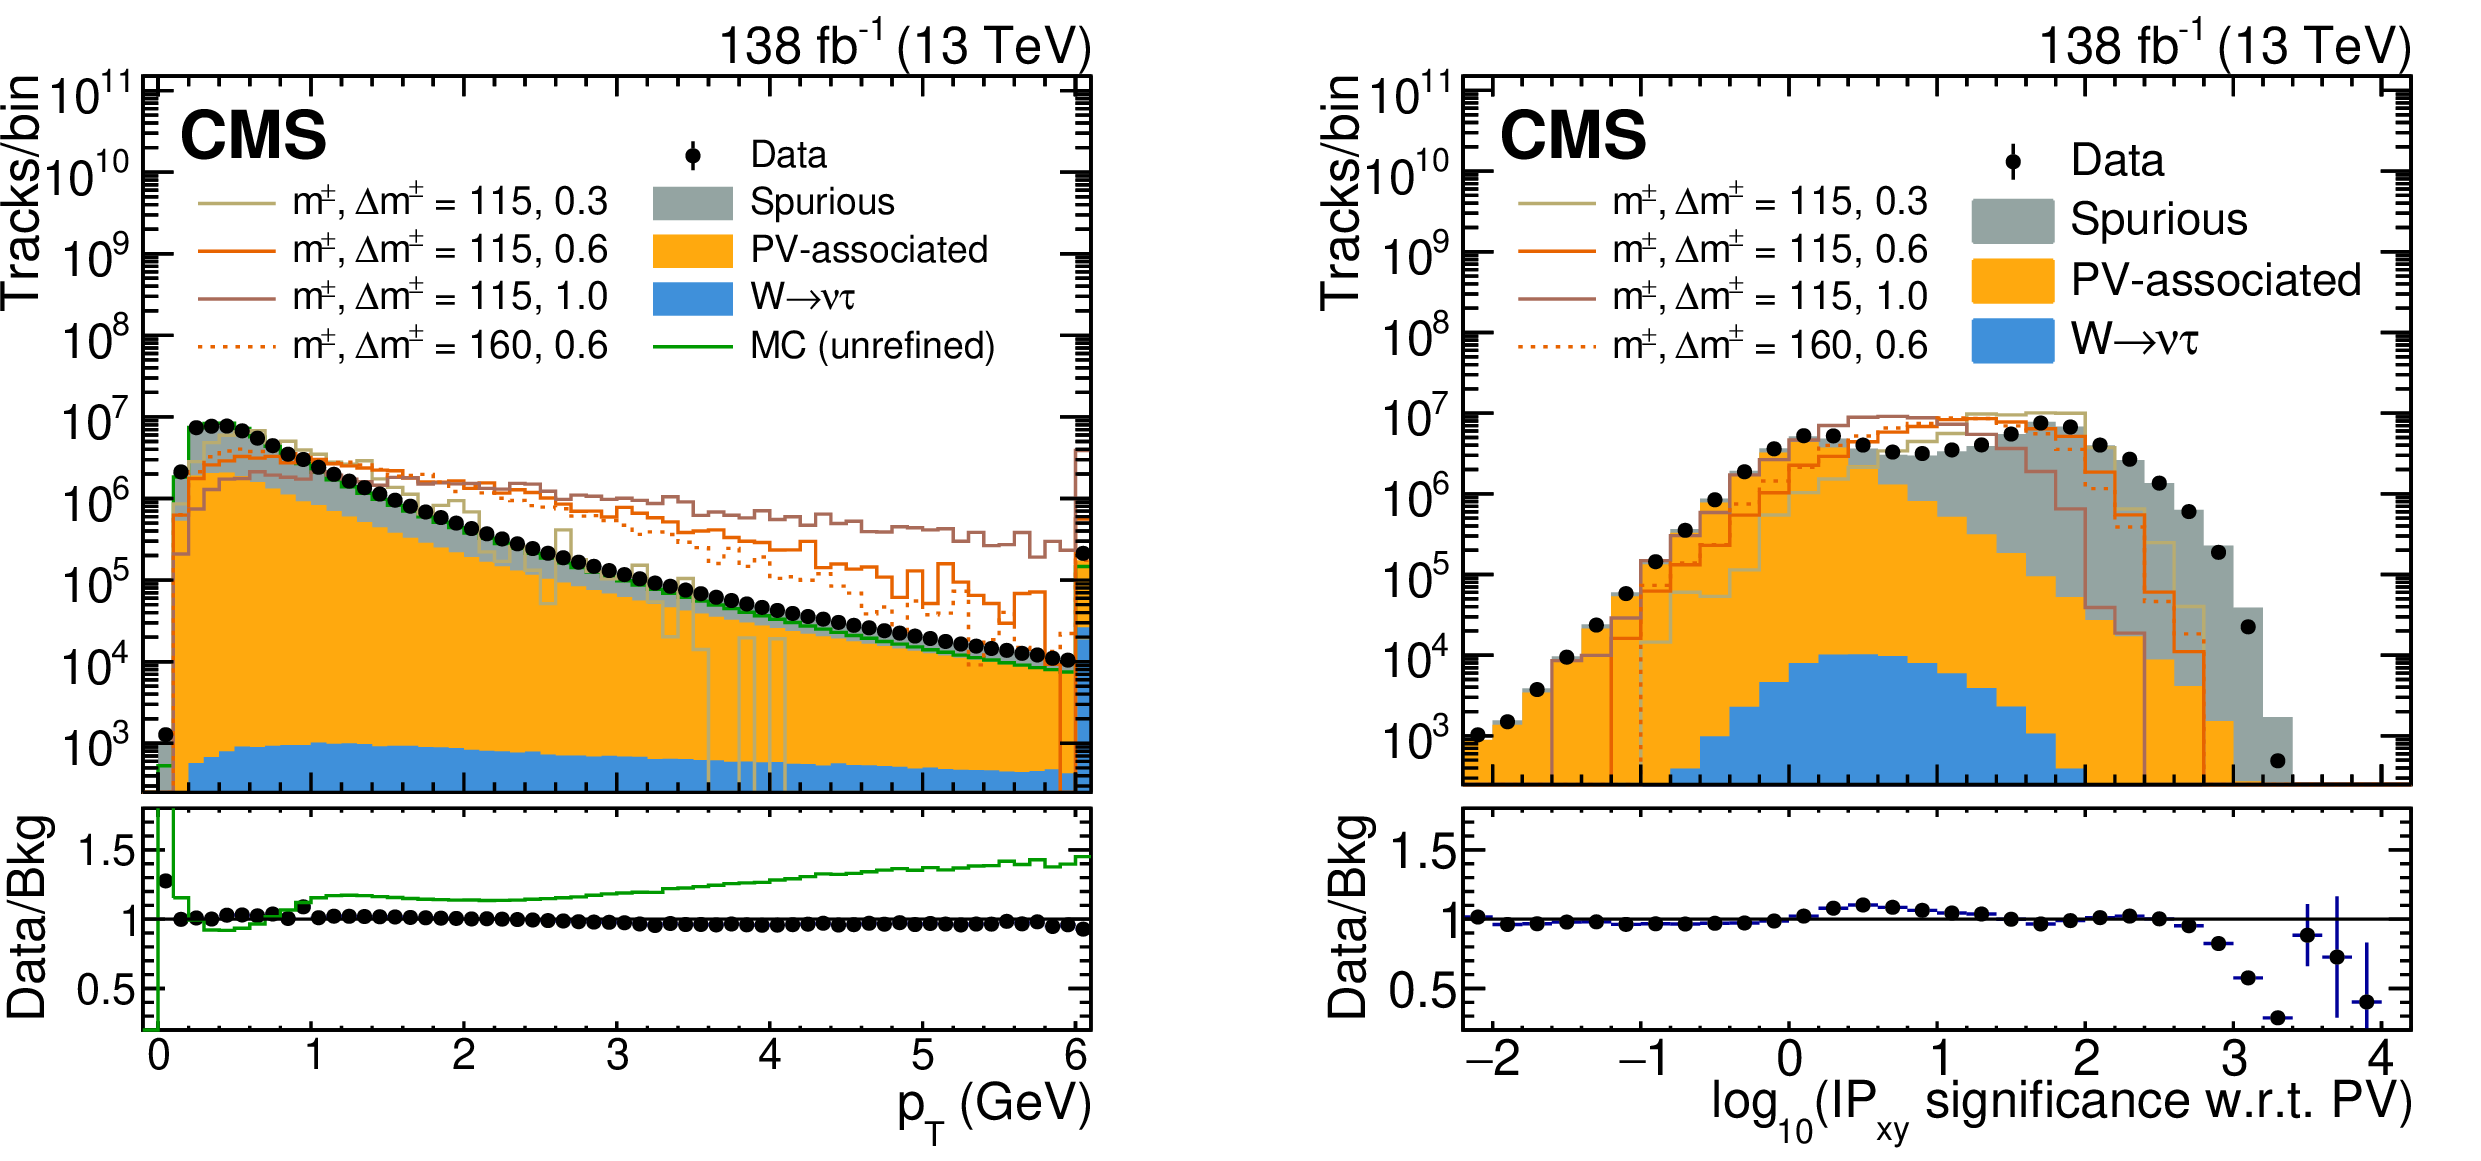
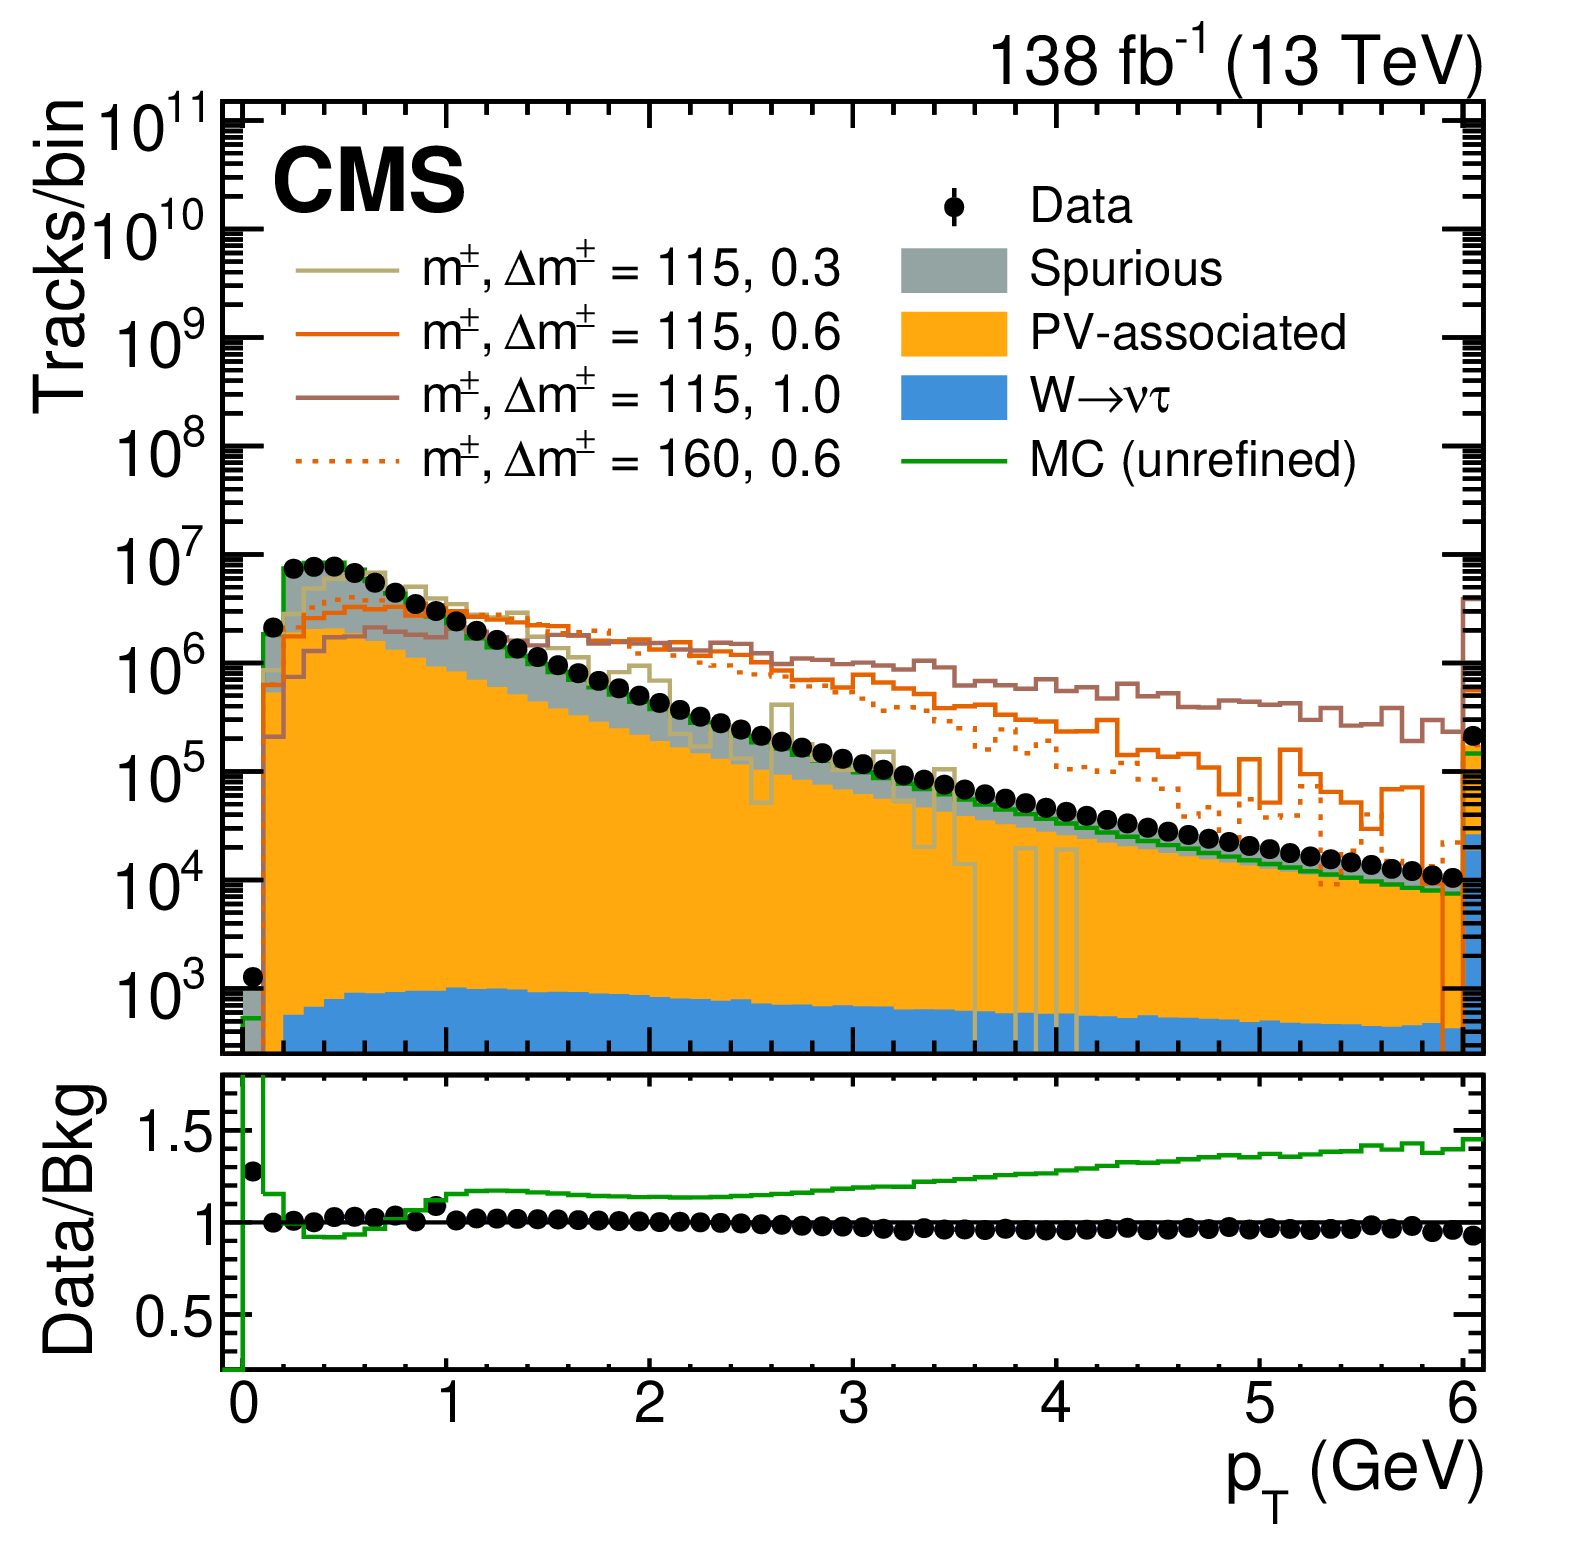
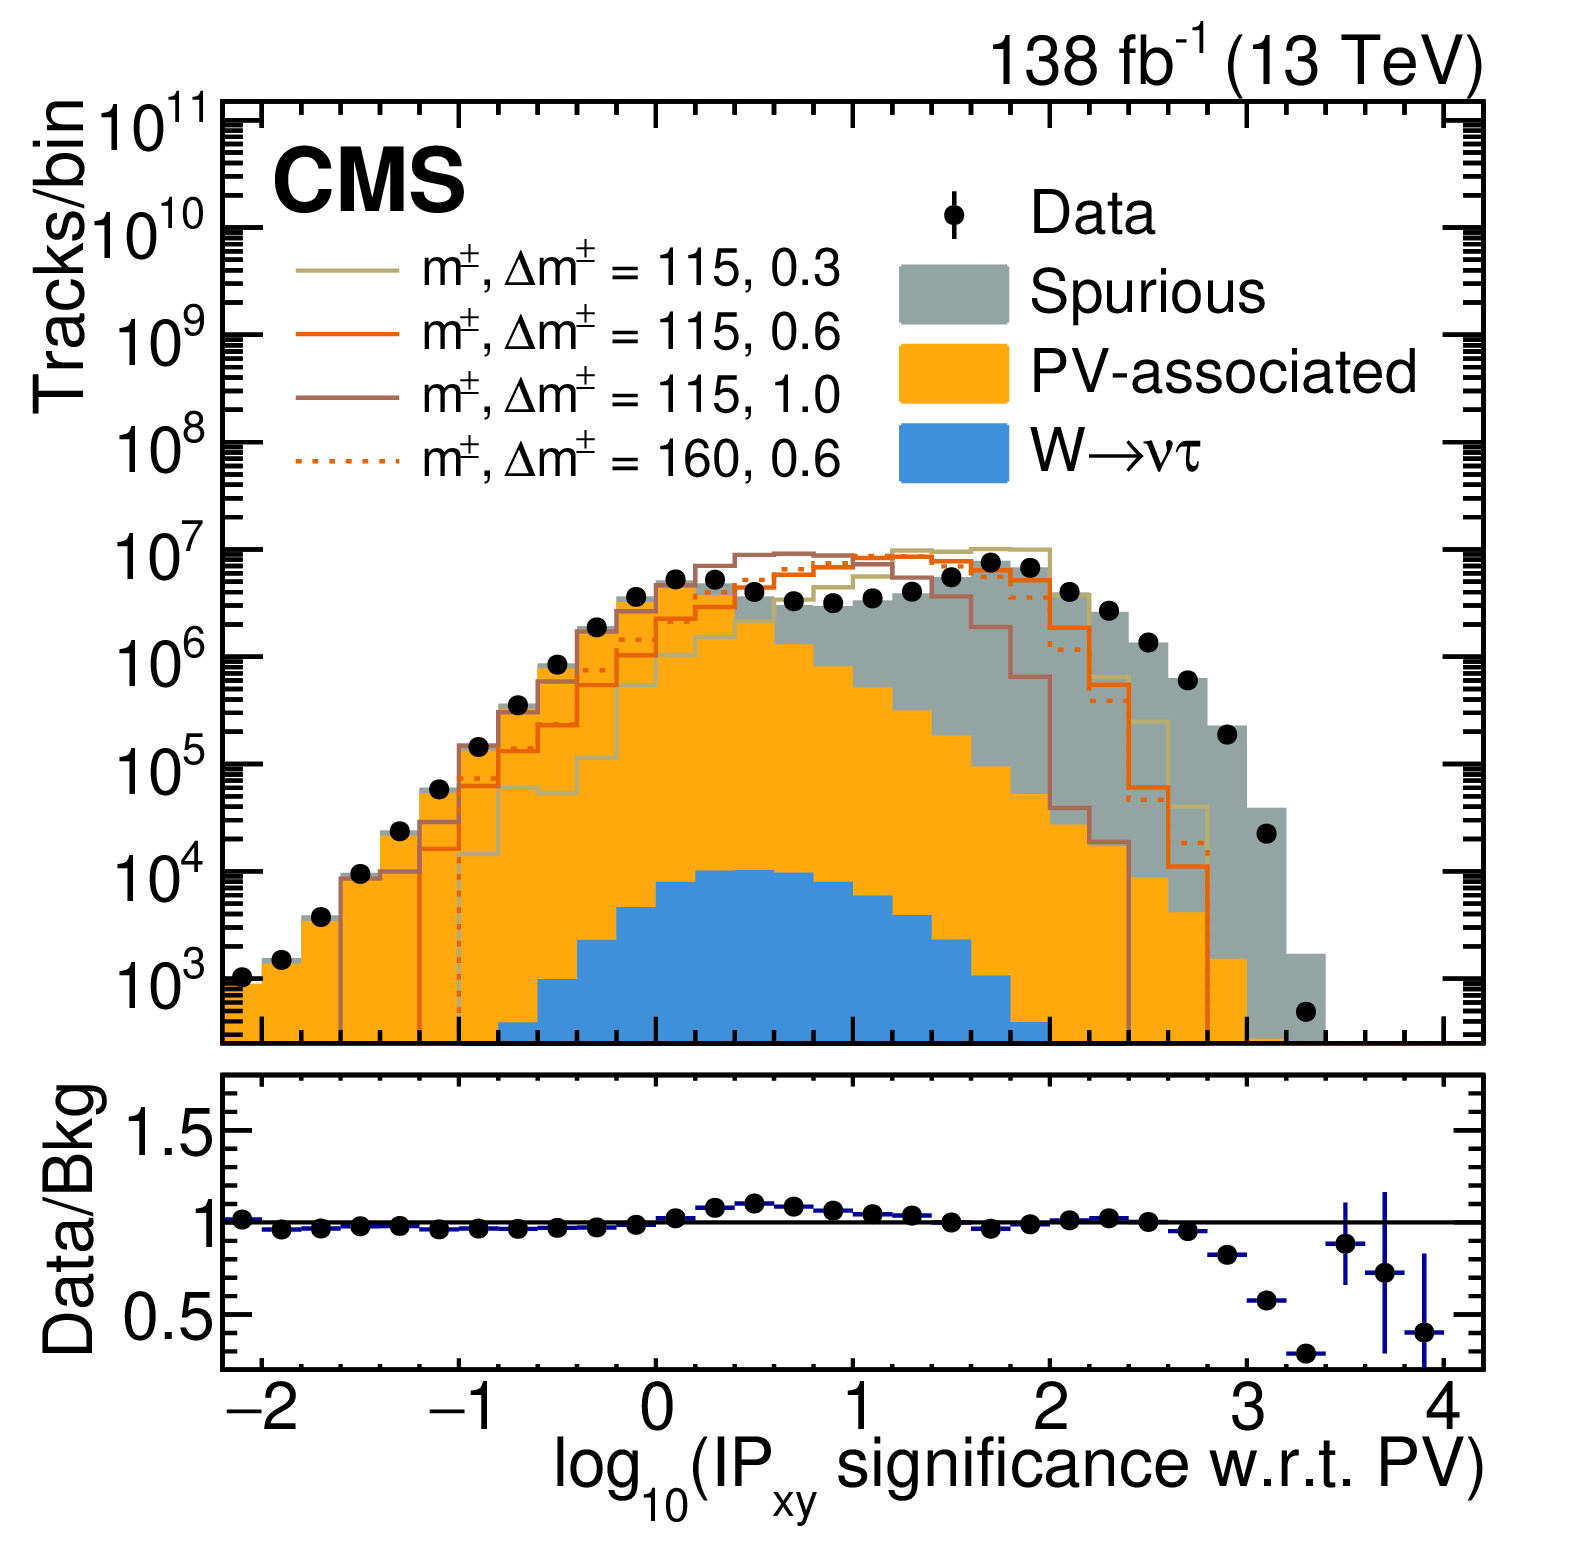
Figure 2:
Distributions of example kinematic track observables for data and simulation. The filled histograms show tracks in background events, with negligible statistical uncertainty. Simulated tracks matched to charginos from selected benchmark models, indicated by the chargino mass labels $ m^{\pm} $ and $ \Delta m^{\pm} $ in GeVns, are shown as colored open histograms normalized to the total background yield. The green line in the lower panel of the left plot indicates the ratio of the data to the background simulation before the refinement procedure is applied. |
png pdf |
Figure 2-a:
Distributions of example kinematic track observables for data and simulation. The filled histograms show tracks in background events, with negligible statistical uncertainty. Simulated tracks matched to charginos from selected benchmark models, indicated by the chargino mass labels $ m^{\pm} $ and $ \Delta m^{\pm} $ in GeVns, are shown as colored open histograms normalized to the total background yield. The green line in the lower panel of the left plot indicates the ratio of the data to the background simulation before the refinement procedure is applied. |
png pdf |
Figure 2-b:
Distributions of example kinematic track observables for data and simulation. The filled histograms show tracks in background events, with negligible statistical uncertainty. Simulated tracks matched to charginos from selected benchmark models, indicated by the chargino mass labels $ m^{\pm} $ and $ \Delta m^{\pm} $ in GeVns, are shown as colored open histograms normalized to the total background yield. The green line in the lower panel of the left plot indicates the ratio of the data to the background simulation before the refinement procedure is applied. |
png pdf |
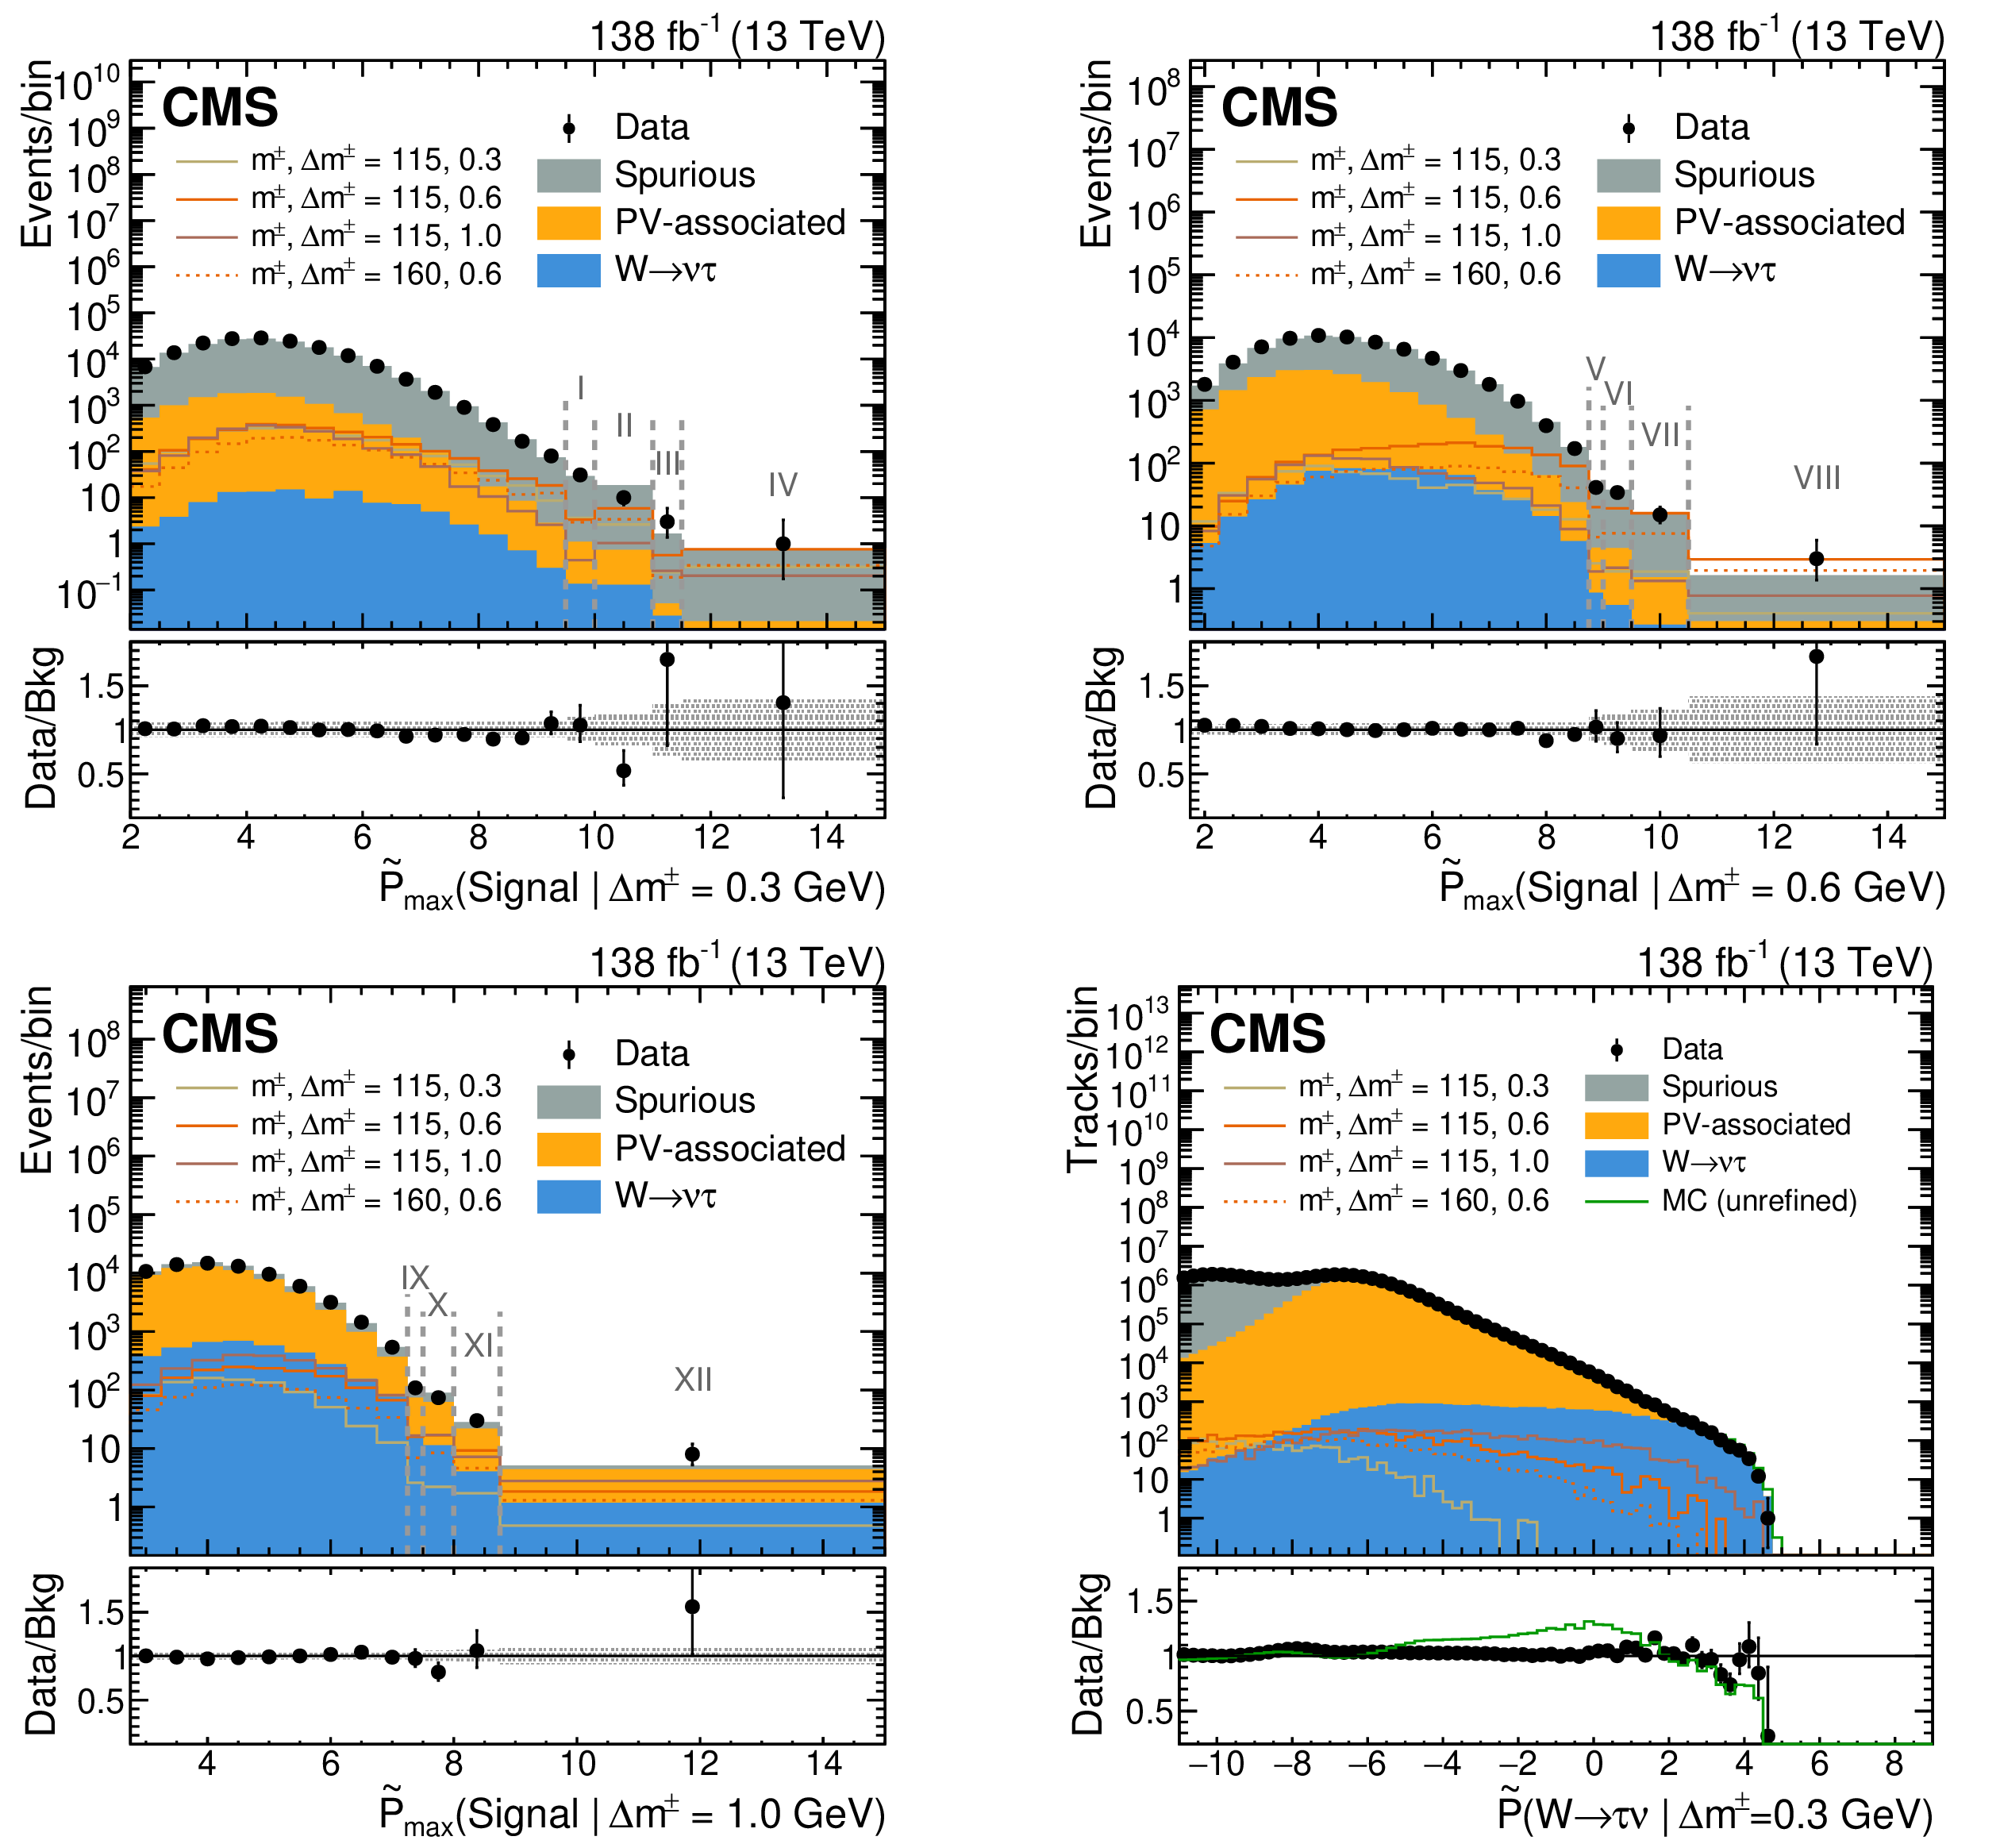
Figure 3:
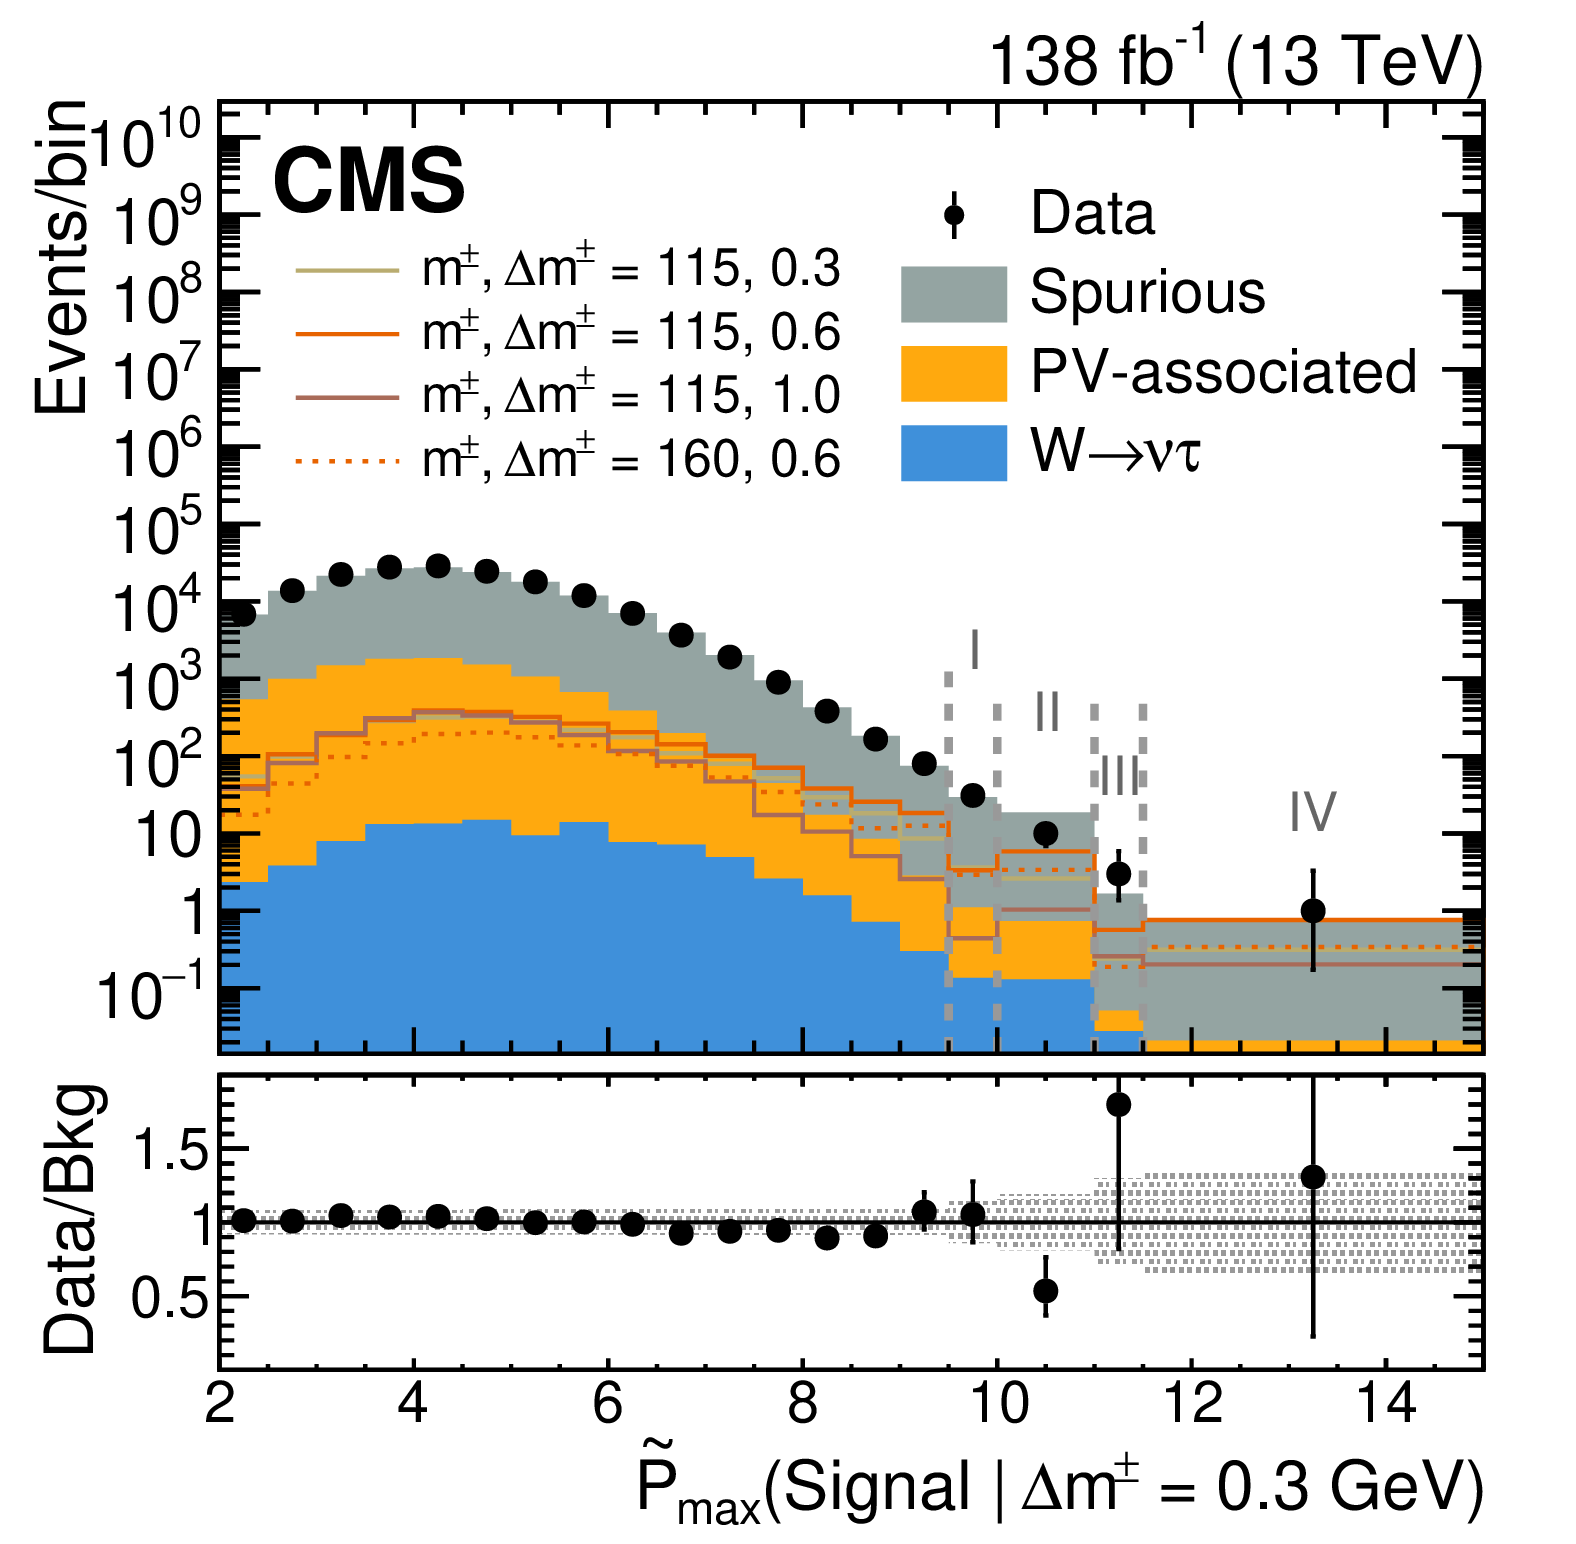
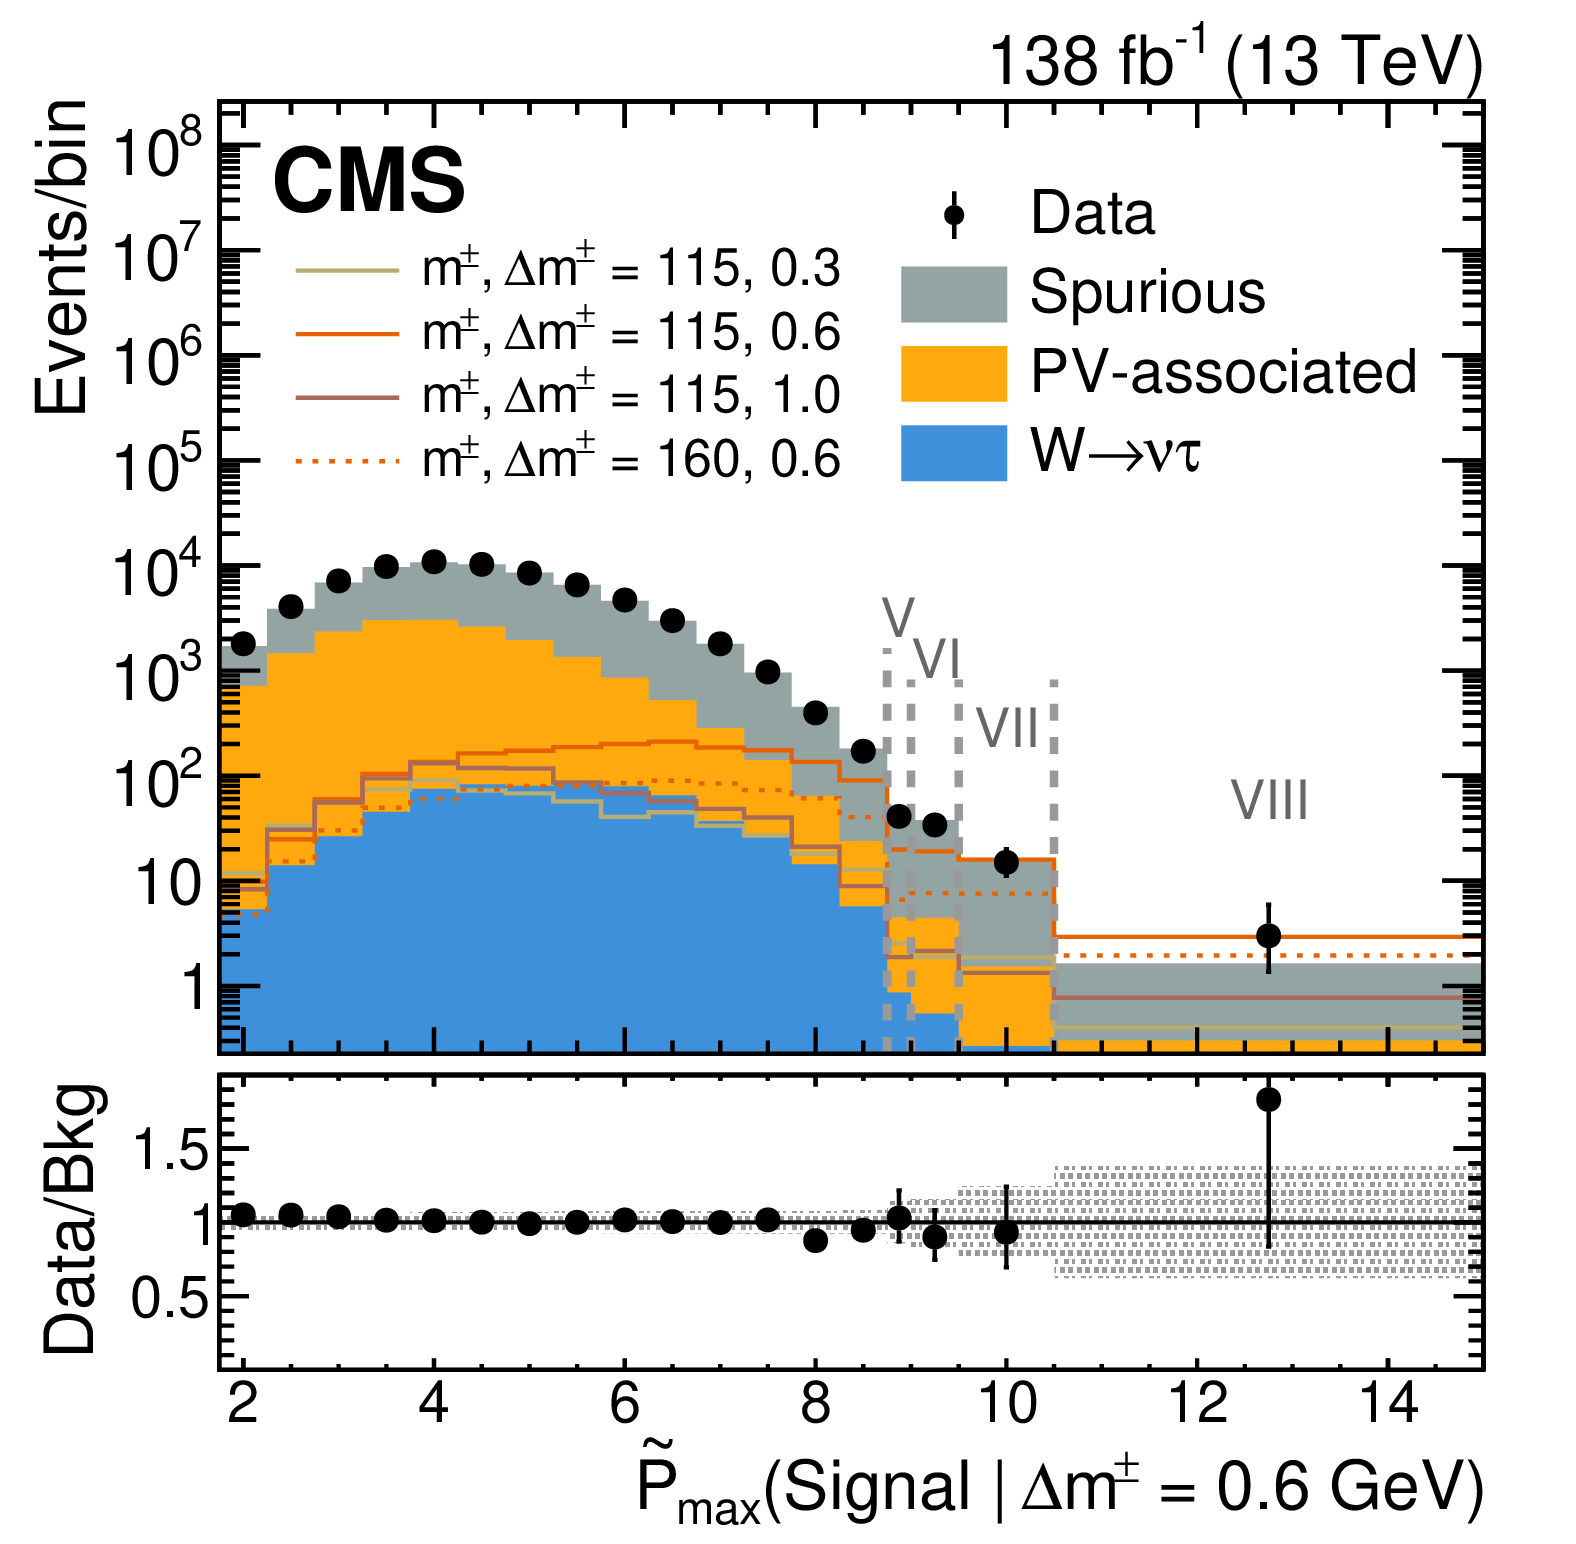
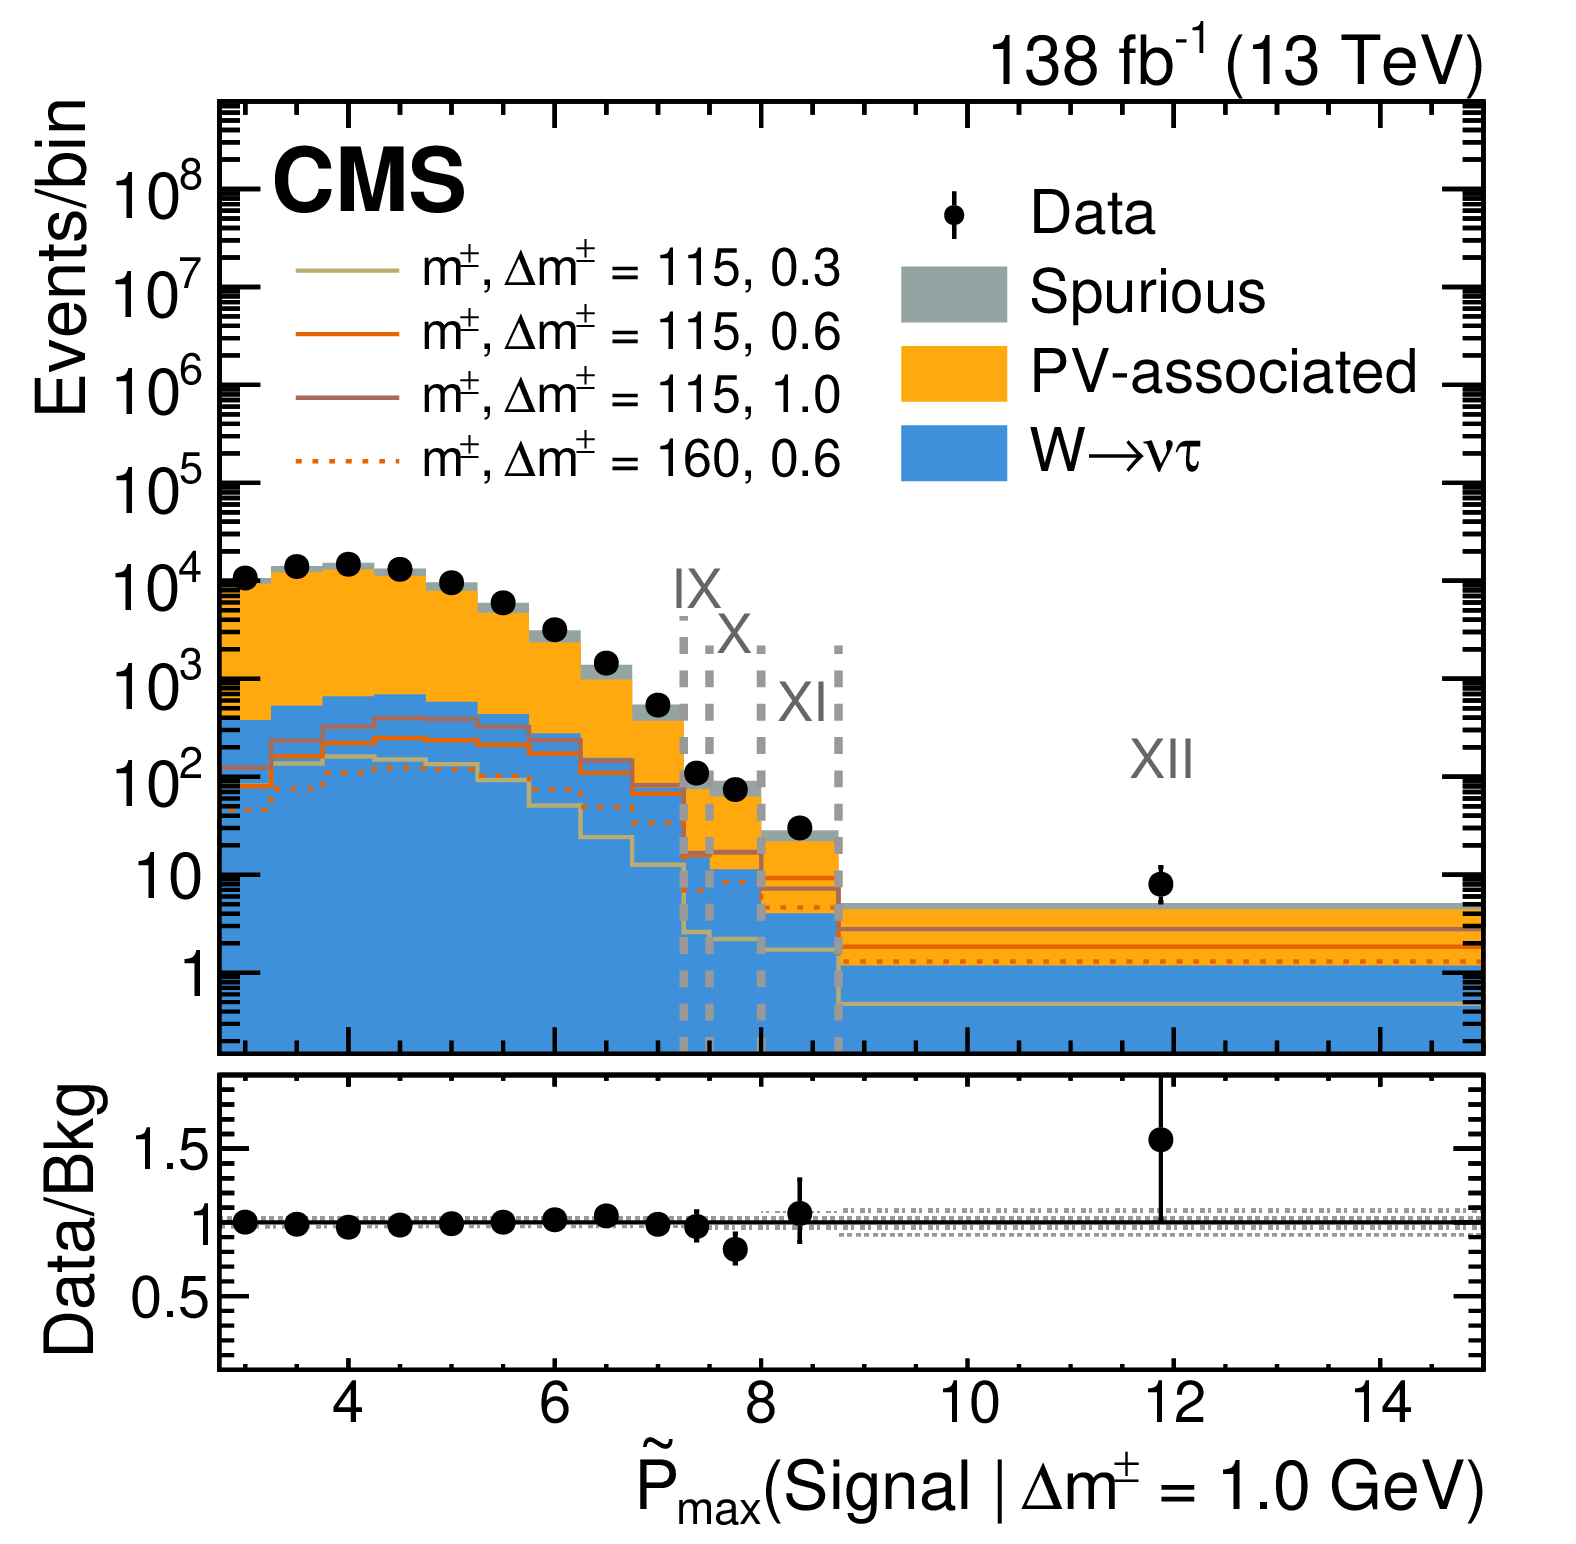
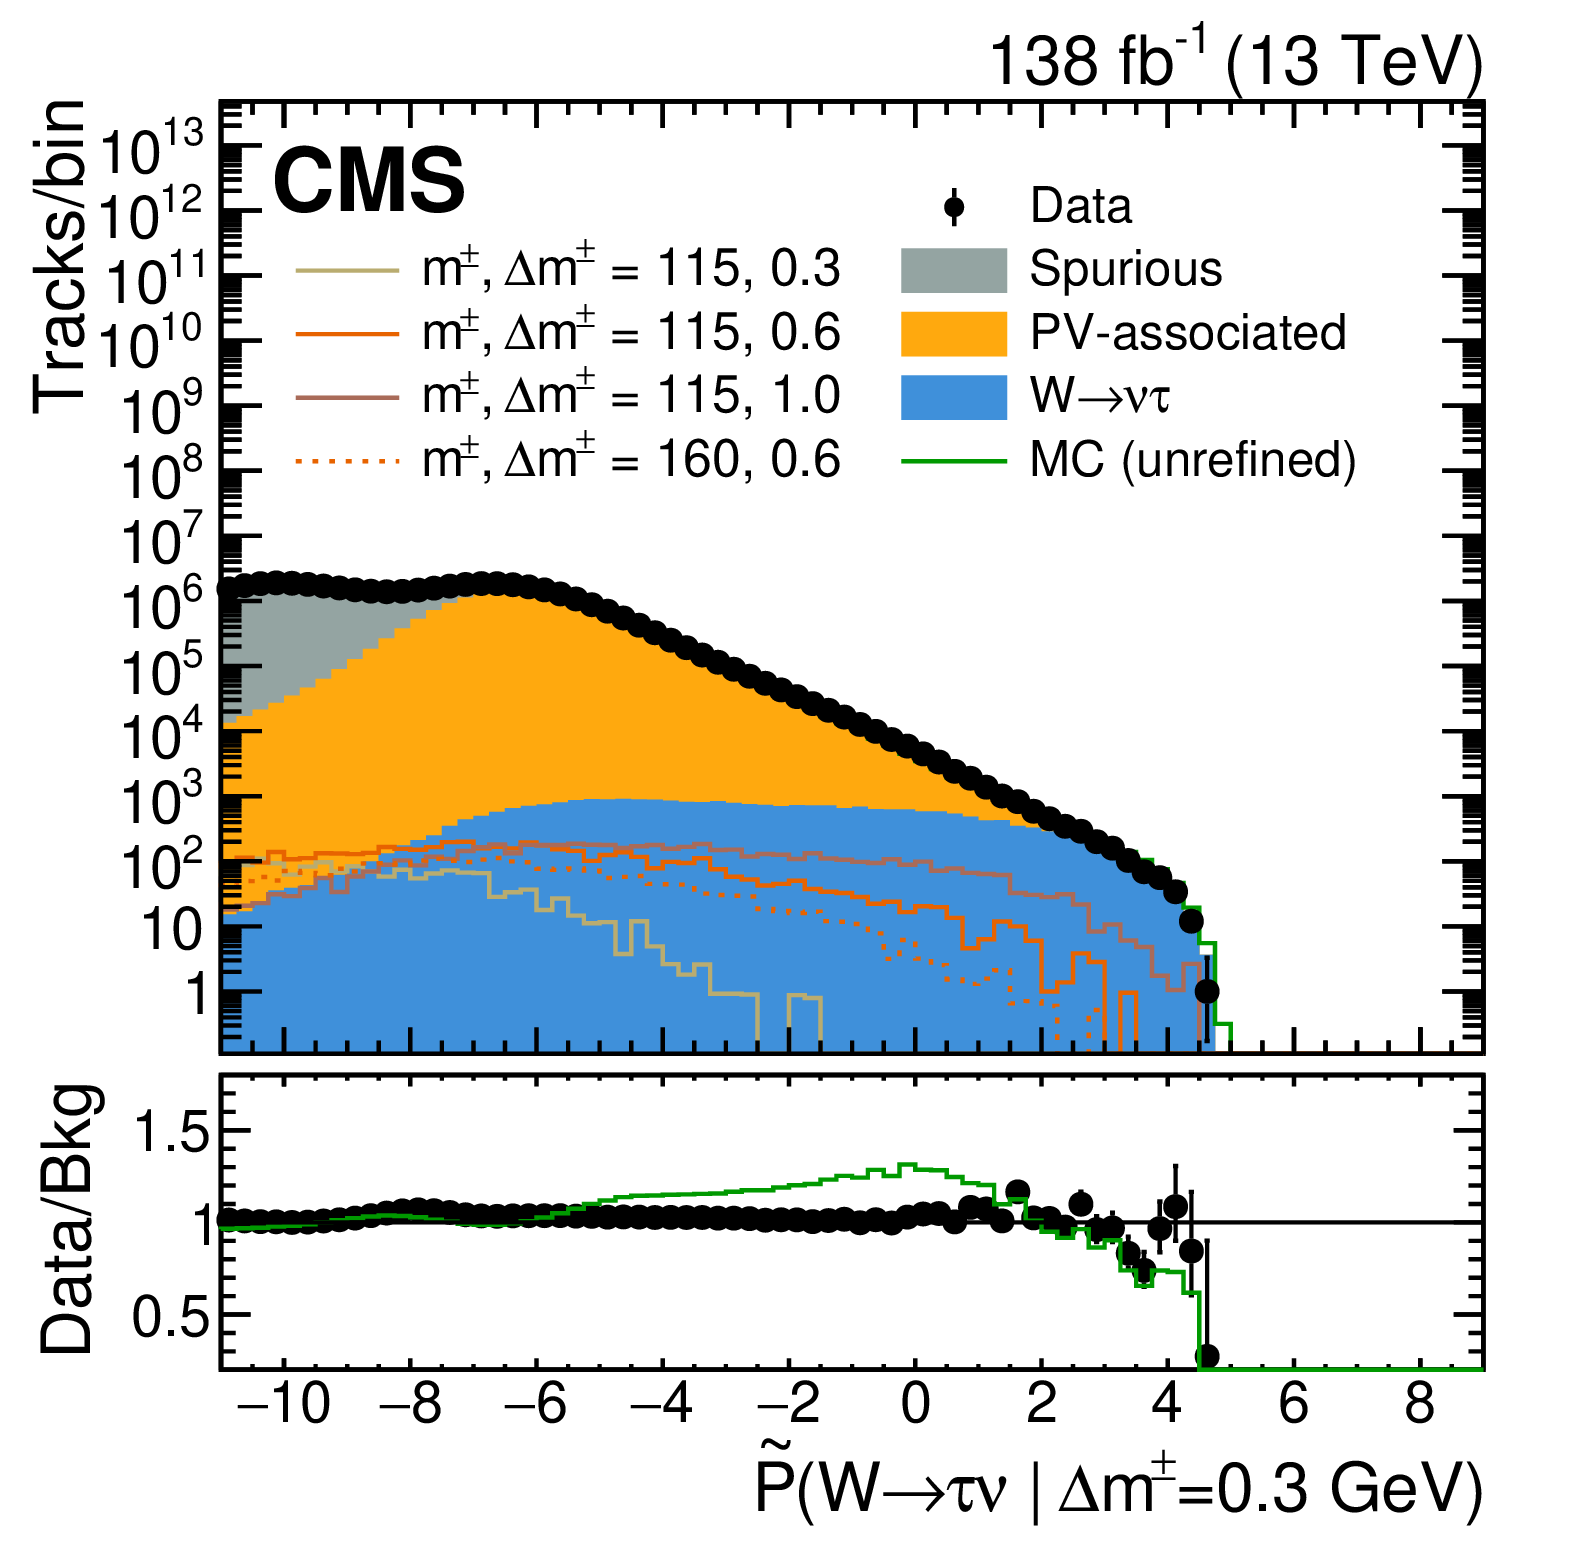
The expected and observed yields as a function of the 0.3 GeV (upper left), 0.6 GeV (upper right), and 1.0 GeV (lower left) NN signal node, where the Roman numerals indicate the SR bin. In the upper panels, uncertainties shown are statistical only, while in the lower panels, shaded regions indicate the relative systematic uncertainty in the background yields and black vertical bars show the total statistical uncertainty in the ratio. The lower-right plot shows the distributions in the $ \tau $-lepton node of tracks after a selection of $ {\widetilde{P}(\text{Signal}\,\vert\,\Delta m_{in}^{\pm}=0.3 GeV)} > - $ 2, where the green line in the lower panel shows the ratio of the data to background simulation before the refinement procedure. The colored open histograms are as in Fig. 2, except normalized to the integrated luminosity. |
png pdf |
Figure 3-a:
The expected and observed yields as a function of the 0.3 GeV (upper left), 0.6 GeV (upper right), and 1.0 GeV (lower left) NN signal node, where the Roman numerals indicate the SR bin. In the upper panels, uncertainties shown are statistical only, while in the lower panels, shaded regions indicate the relative systematic uncertainty in the background yields and black vertical bars show the total statistical uncertainty in the ratio. The lower-right plot shows the distributions in the $ \tau $-lepton node of tracks after a selection of $ {\widetilde{P}(\text{Signal}\,\vert\,\Delta m_{in}^{\pm}=0.3 GeV)} > - $ 2, where the green line in the lower panel shows the ratio of the data to background simulation before the refinement procedure. The colored open histograms are as in Fig. 2, except normalized to the integrated luminosity. |
png pdf |
Figure 3-b:
The expected and observed yields as a function of the 0.3 GeV (upper left), 0.6 GeV (upper right), and 1.0 GeV (lower left) NN signal node, where the Roman numerals indicate the SR bin. In the upper panels, uncertainties shown are statistical only, while in the lower panels, shaded regions indicate the relative systematic uncertainty in the background yields and black vertical bars show the total statistical uncertainty in the ratio. The lower-right plot shows the distributions in the $ \tau $-lepton node of tracks after a selection of $ {\widetilde{P}(\text{Signal}\,\vert\,\Delta m_{in}^{\pm}=0.3 GeV)} > - $ 2, where the green line in the lower panel shows the ratio of the data to background simulation before the refinement procedure. The colored open histograms are as in Fig. 2, except normalized to the integrated luminosity. |
png pdf |
Figure 3-c:
The expected and observed yields as a function of the 0.3 GeV (upper left), 0.6 GeV (upper right), and 1.0 GeV (lower left) NN signal node, where the Roman numerals indicate the SR bin. In the upper panels, uncertainties shown are statistical only, while in the lower panels, shaded regions indicate the relative systematic uncertainty in the background yields and black vertical bars show the total statistical uncertainty in the ratio. The lower-right plot shows the distributions in the $ \tau $-lepton node of tracks after a selection of $ {\widetilde{P}(\text{Signal}\,\vert\,\Delta m_{in}^{\pm}=0.3 GeV)} > - $ 2, where the green line in the lower panel shows the ratio of the data to background simulation before the refinement procedure. The colored open histograms are as in Fig. 2, except normalized to the integrated luminosity. |
png pdf |
Figure 3-d:
The expected and observed yields as a function of the 0.3 GeV (upper left), 0.6 GeV (upper right), and 1.0 GeV (lower left) NN signal node, where the Roman numerals indicate the SR bin. In the upper panels, uncertainties shown are statistical only, while in the lower panels, shaded regions indicate the relative systematic uncertainty in the background yields and black vertical bars show the total statistical uncertainty in the ratio. The lower-right plot shows the distributions in the $ \tau $-lepton node of tracks after a selection of $ {\widetilde{P}(\text{Signal}\,\vert\,\Delta m_{in}^{\pm}=0.3 GeV)} > - $ 2, where the green line in the lower panel shows the ratio of the data to background simulation before the refinement procedure. The colored open histograms are as in Fig. 2, except normalized to the integrated luminosity. |
png pdf |
Figure 4:
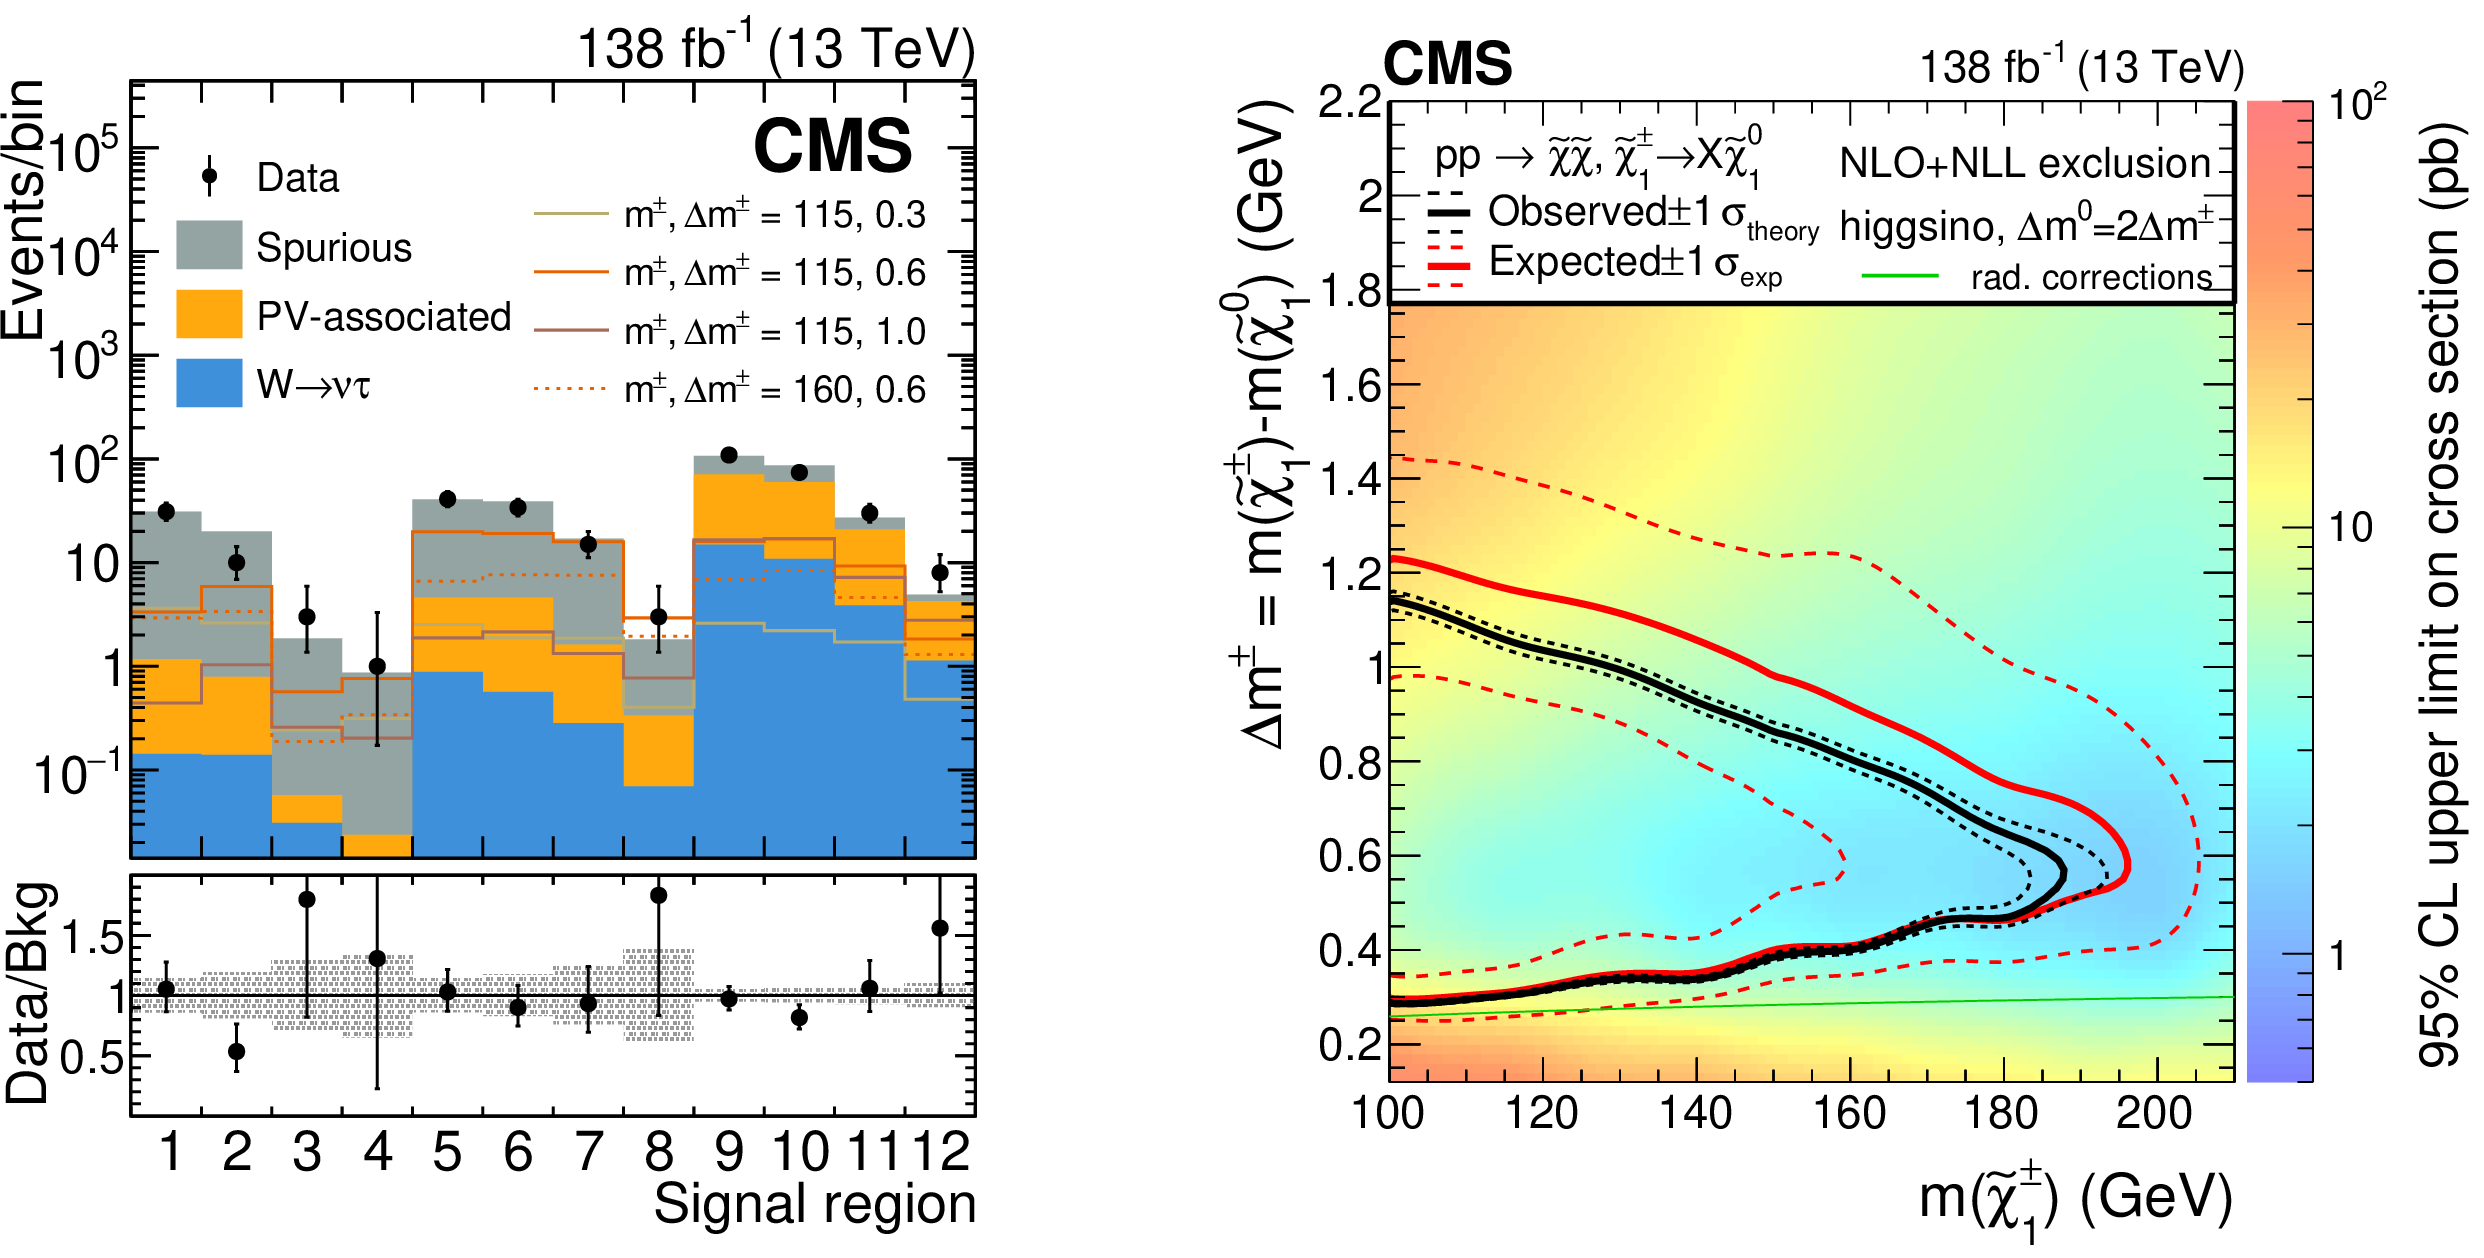
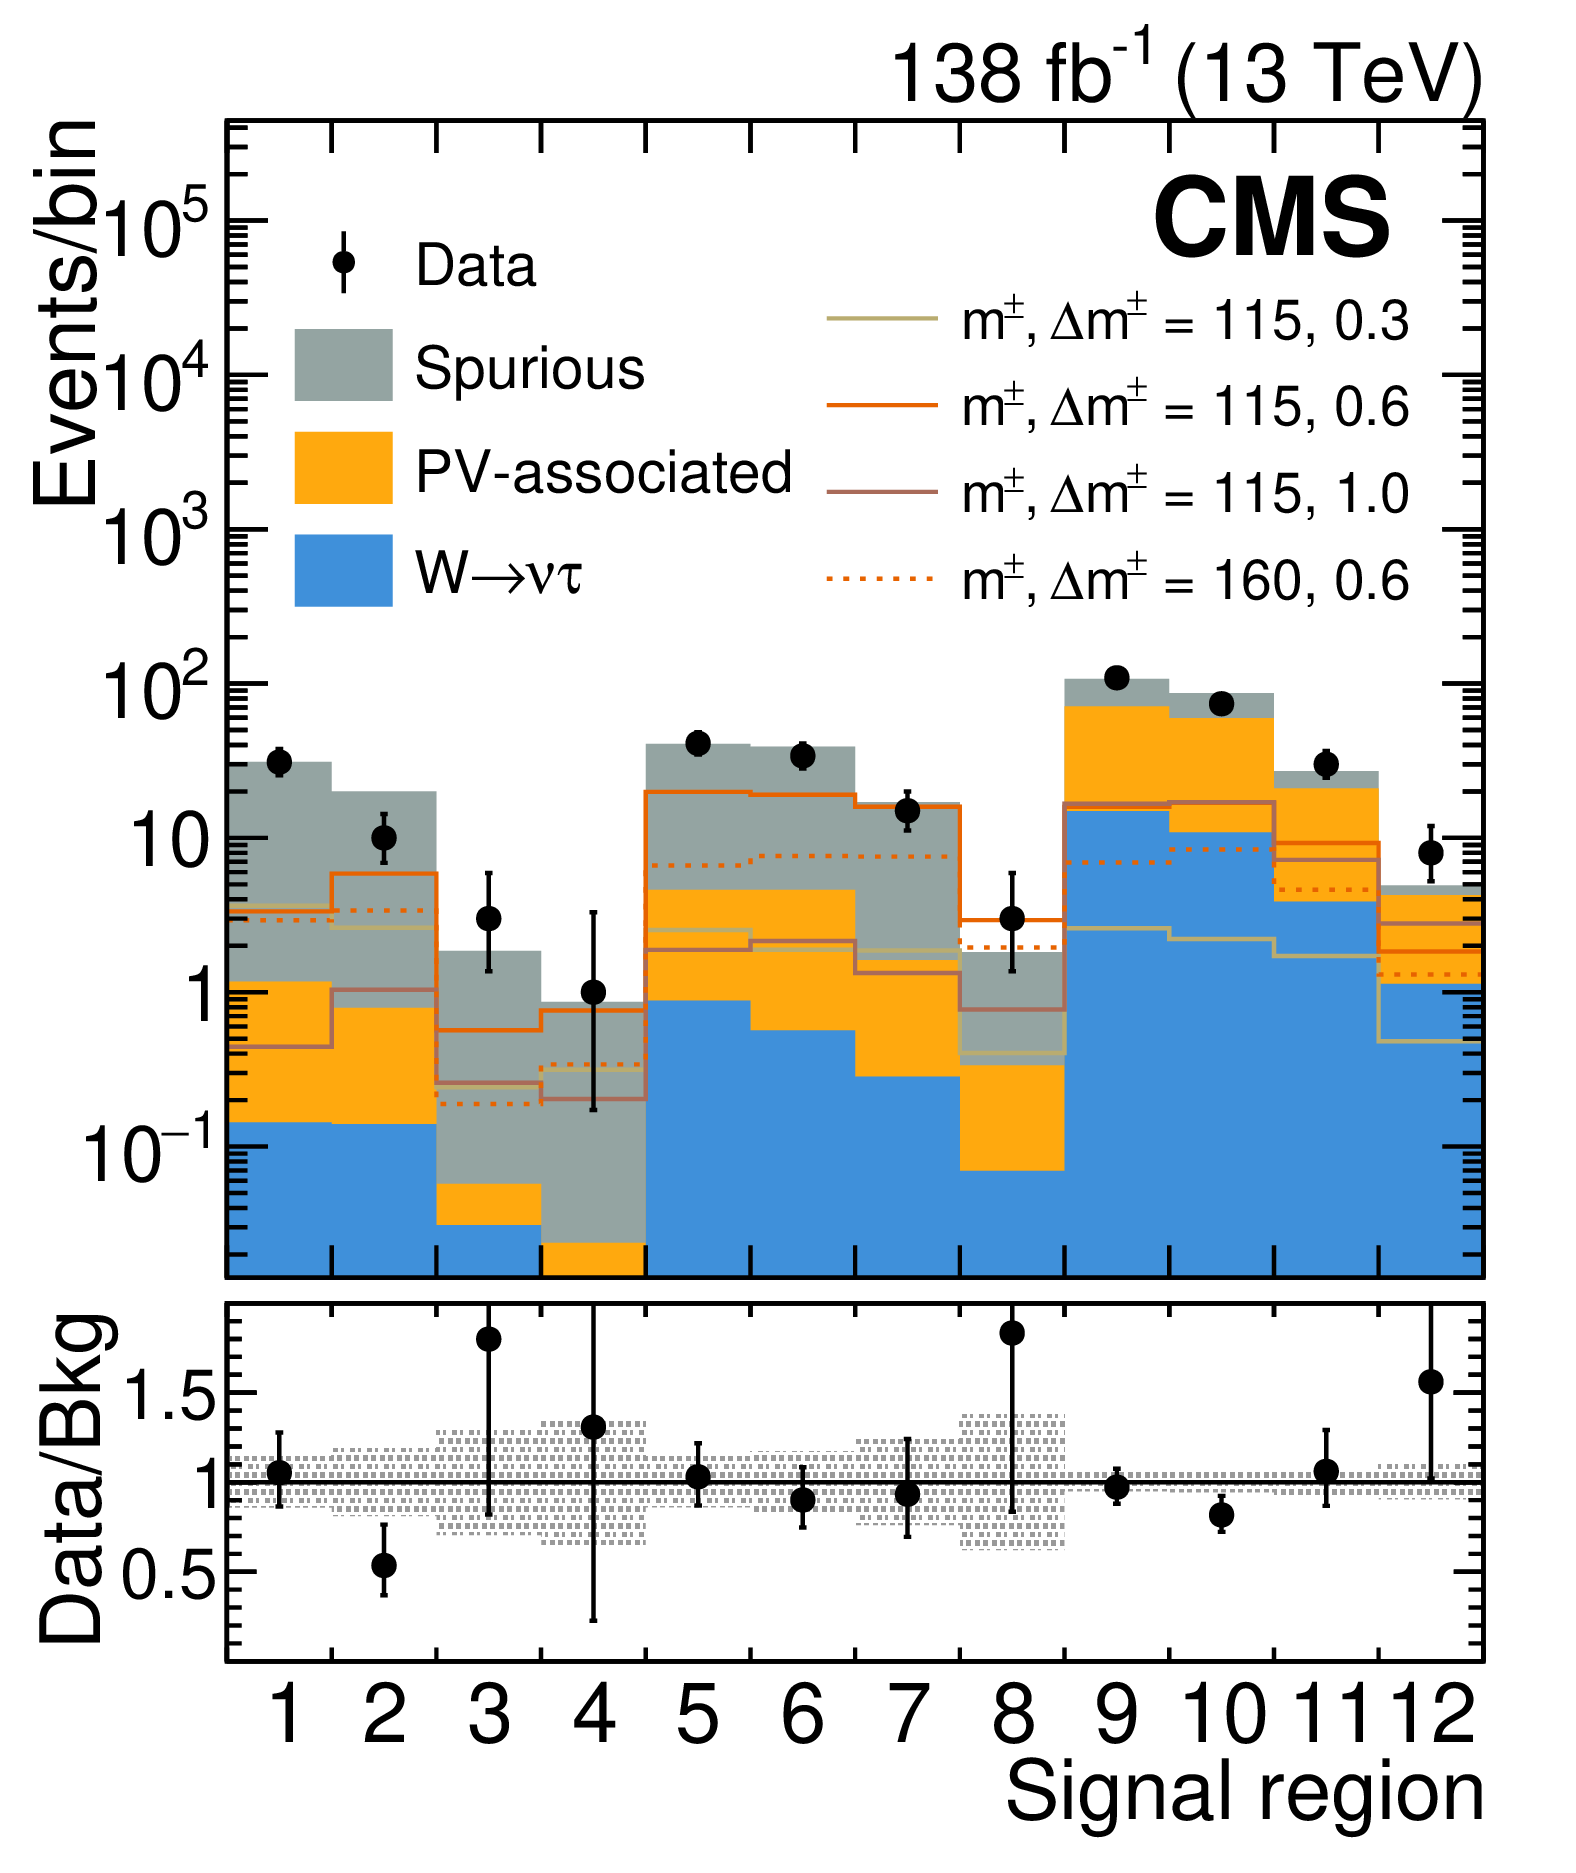
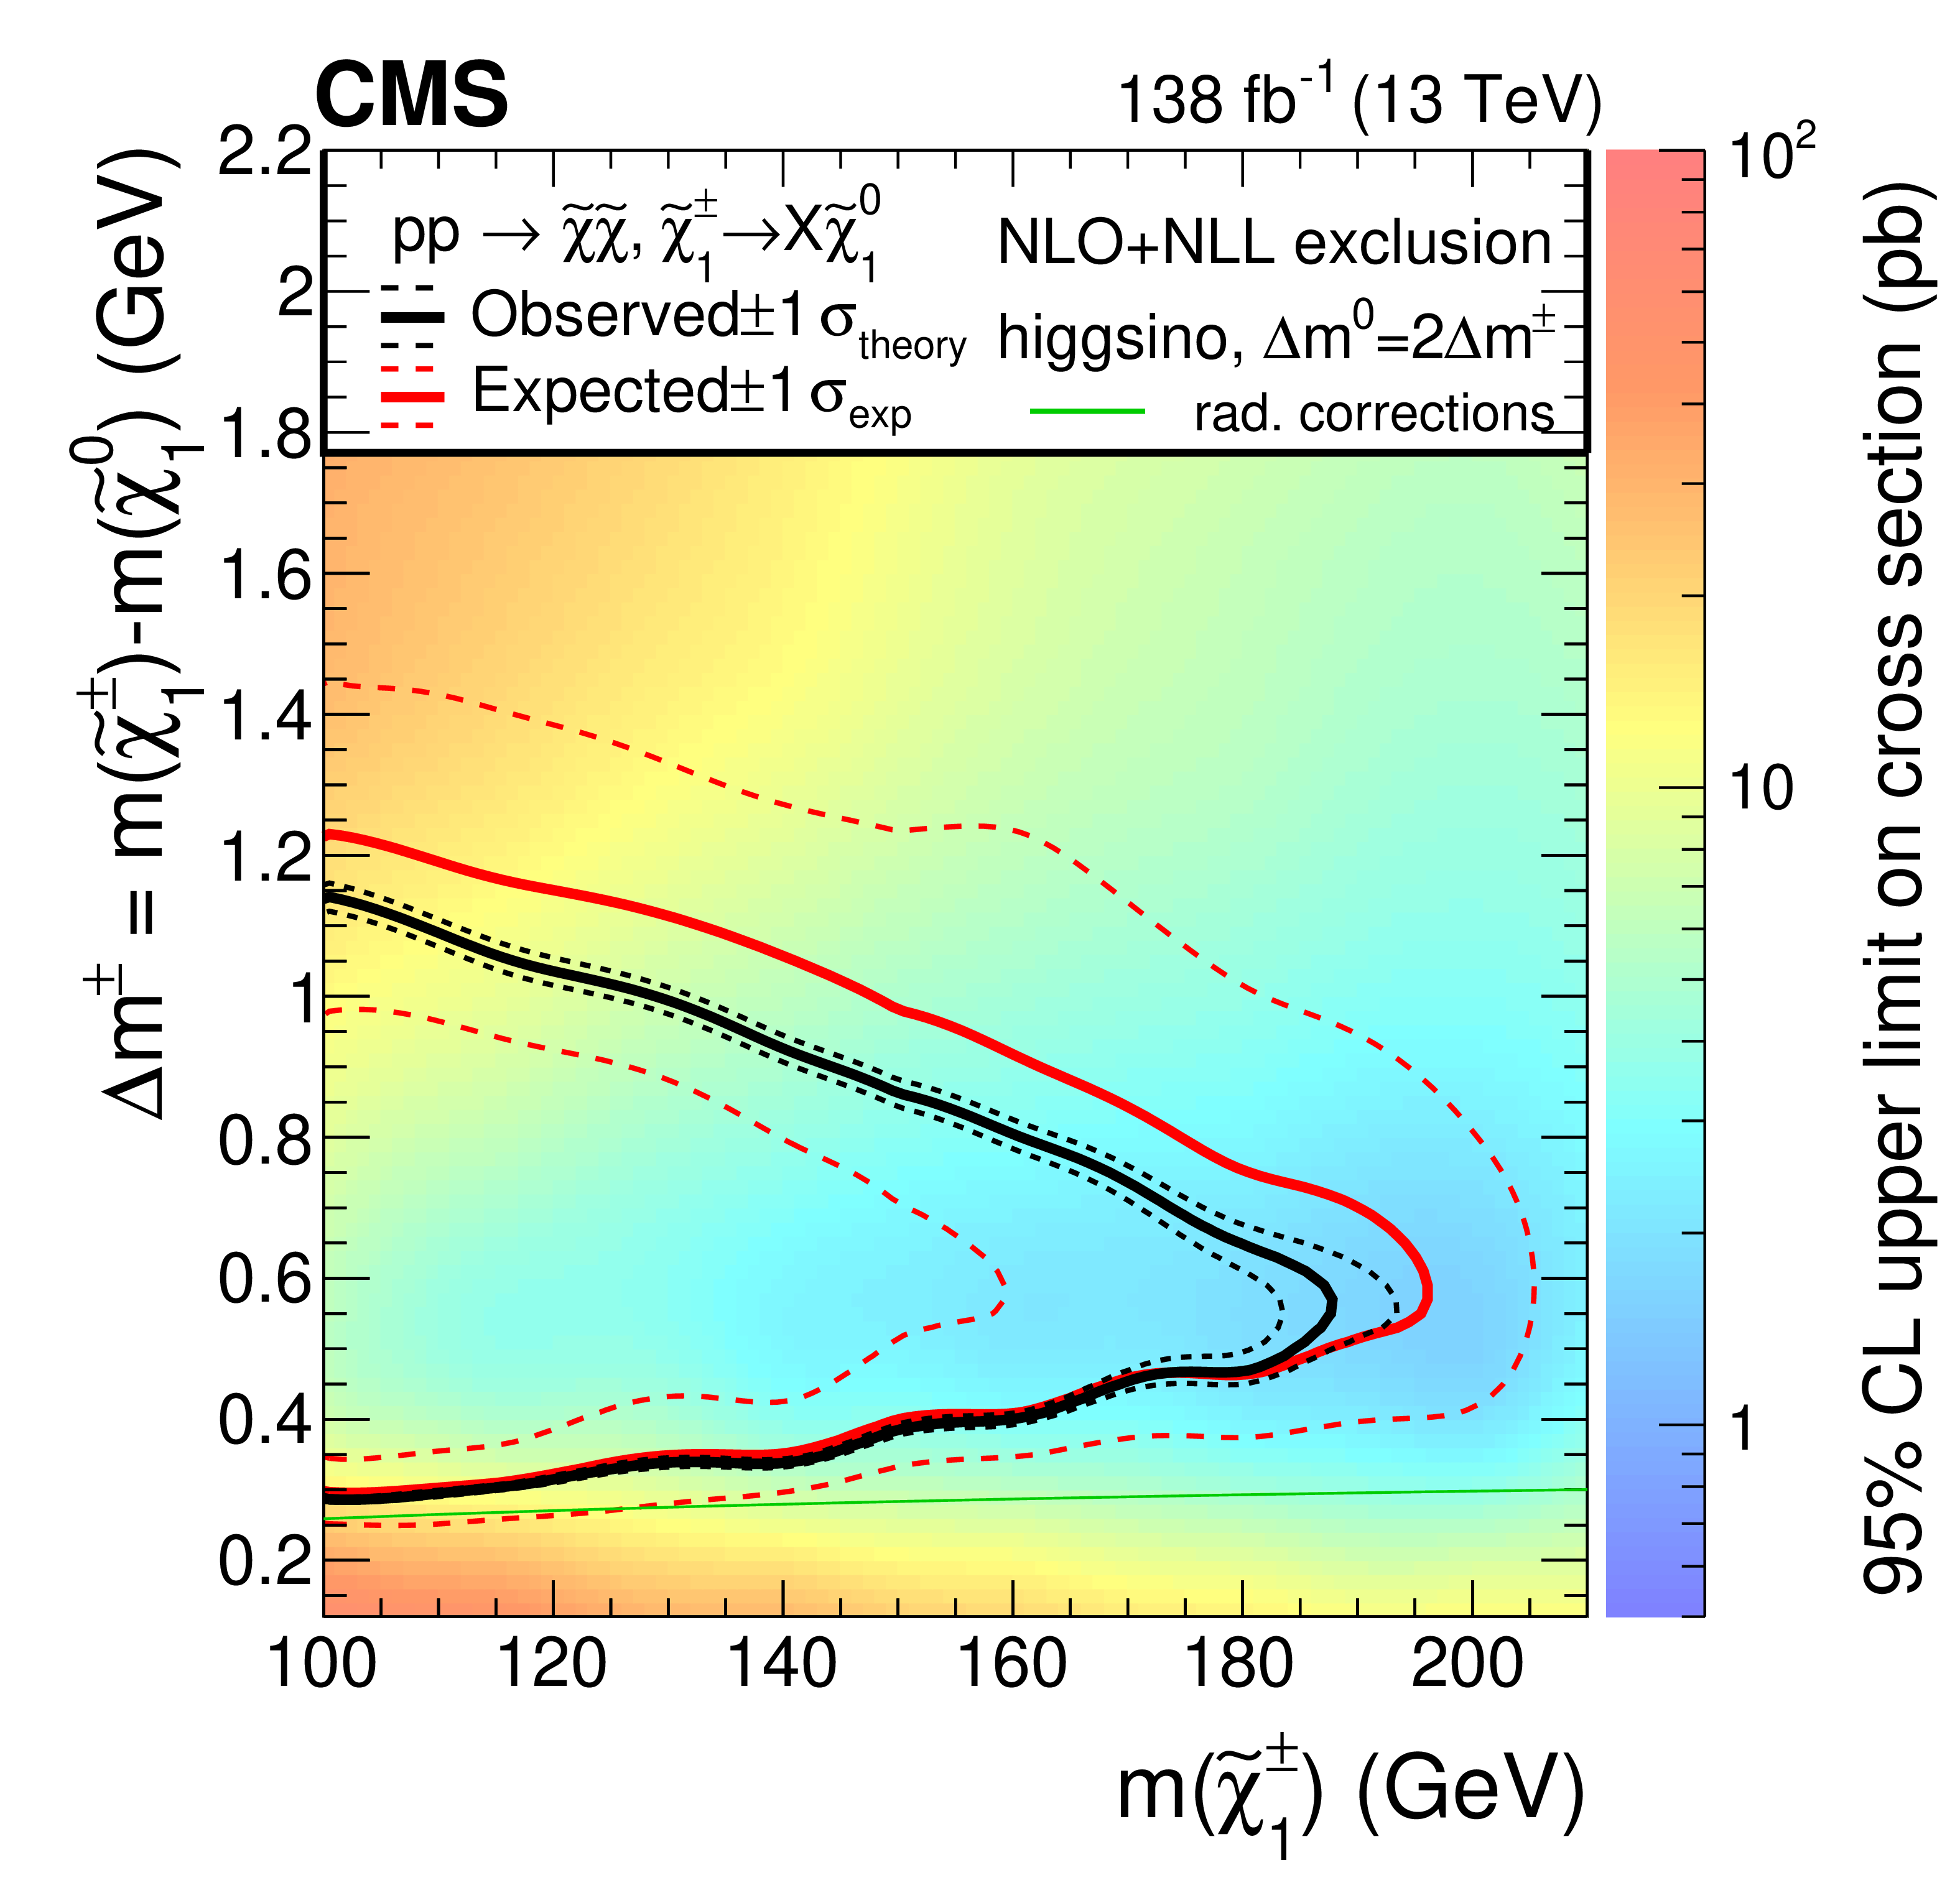
The expected and observed data yields in the 12 SRs (left), where the uncertainties in the upper panel are statistical only, while in the lower panel the shaded region indicates the relative systematic uncertainty in the background yields and the black vertical bars show the total statistical uncertainty in the ratio. The colored open histograms are as in Fig. 3. The right plot shows the observed 95% CL upper limit on the cross section, accounting for all production modes of the higgsino model. The expected (red) and observed (black) solid contours indicate the region excluded to the left of the curves, assuming NLO+NLL cross sections [58,59]. Dashed lines show the variation in the expected (observed) limits arising from experimental (theoretical) uncertainties. The chargino branching fractions and the minimum $ \Delta m^{\pm} $ allowed by radiative corrections (green line) are taken from Ref. [60]. |
png pdf |
Figure 4-a:
The expected and observed data yields in the 12 SRs (left), where the uncertainties in the upper panel are statistical only, while in the lower panel the shaded region indicates the relative systematic uncertainty in the background yields and the black vertical bars show the total statistical uncertainty in the ratio. The colored open histograms are as in Fig. 3. The right plot shows the observed 95% CL upper limit on the cross section, accounting for all production modes of the higgsino model. The expected (red) and observed (black) solid contours indicate the region excluded to the left of the curves, assuming NLO+NLL cross sections [58,59]. Dashed lines show the variation in the expected (observed) limits arising from experimental (theoretical) uncertainties. The chargino branching fractions and the minimum $ \Delta m^{\pm} $ allowed by radiative corrections (green line) are taken from Ref. [60]. |
png pdf |
Figure 4-b:
The expected and observed data yields in the 12 SRs (left), where the uncertainties in the upper panel are statistical only, while in the lower panel the shaded region indicates the relative systematic uncertainty in the background yields and the black vertical bars show the total statistical uncertainty in the ratio. The colored open histograms are as in Fig. 3. The right plot shows the observed 95% CL upper limit on the cross section, accounting for all production modes of the higgsino model. The expected (red) and observed (black) solid contours indicate the region excluded to the left of the curves, assuming NLO+NLL cross sections [58,59]. Dashed lines show the variation in the expected (observed) limits arising from experimental (theoretical) uncertainties. The chargino branching fractions and the minimum $ \Delta m^{\pm} $ allowed by radiative corrections (green line) are taken from Ref. [60]. |
| Summary |
| In summary, a search for electroweakinos in compressed-spectrum scenarios has been performed using events containing a soft, isolated track and large missing transverse momentum. The results of the analysis are tabulated in [63]. A parameterized neural network was employed to optimize sensitivity across a range of models not previously probed. No significant excess above the standard model prediction was observed. The resulting 95% confidence level limits exclude chargino masses up to 185 GeV for a mass splitting between the chargino and lightest neutralino of 0.55 GeV, and mass splittings between 0.28 and 1.15 GeV for a chargino mass of 100 GeV, placing stringent constraints on natural supersymmetry scenarios. |
| References | ||||
| 1 | P. Ramond | Dual theory for free fermions | PRD 3 (1971) 2415 | |
| 2 | Y. A. Gol'fand and E. P. Likhtman | Extension of the algebra of Poincare group generators and violation of $ {P} $ invariance | JETP Lett. 13 (1971) 323 | |
| 3 | A. Neveu and J. H. Schwarz | Factorizable dual model of pions | NPB 31 (1971) 86 | |
| 4 | D. V. Volkov and V. P. Akulov | Possible universal neutrino interaction | JETP Lett. 16 (1972) 438 | |
| 5 | J. Wess and B. Zumino | A Lagrangian model invariant under supergauge transformations | PLB 49 (1974) 52 | |
| 6 | J. Wess and B. Zumino | Supergauge transformations in four dimensions | NPB 70 (1974) 39 | |
| 7 | P. Fayet | Supergauge invariant extension of the Higgs mechanism and a model for the electron and its neutrino | NPB 90 (1975) 104 | |
| 8 | P. Fayet and S. Ferrara | Supersymmetry | Phys. Rept. 32 (1977) 249 | |
| 9 | H. Nilles | Supersymmetry, supergravity and particle physics | Phys. Rept. 110 (1984) 1 | |
| 10 | F. Zwicky | On the masses of nebulae and of clusters of nebulae | Astrophys. J. 86 (1937) 217 | |
| 11 | V. C. Rubin and W. K. Ford, Jr. | Rotation of the Andromeda Nebula from a spectroscopic survey of emission regions | Astrophys. J. 159 (1970) 379 | |
| 12 | R. Barbieri and G. F. Giudice | Upper bounds on supersymmetric particle masses | NPB 306 (1988) 63 | |
| 13 | S. P. Martin | A supersymmetry primer | Adv. Ser. Direct. High Energy Phys. 21 (2010) 1 | hep-ph/9709356 |
| 14 | N. Nagata and S. Shirai | Higgsino dark matter in high-scale supersymmetry | JHEP 01 (2015) 029 | 1410.4549 |
| 15 | ATLAS Collaboration | Searches for electroweak production of supersymmetric particles with compressed mass spectra in $ \sqrt{s}= $ 13 TeV $ {\mathrm{p}\mathrm{p}} $ collisions with the ATLAS detector | PRD 101 (2020) 052005 | 1911.12606 |
| 16 | CMS Collaboration | Search for supersymmetry in final states with two or three soft leptons and missing transverse momentum in proton-proton collisions at $ \sqrt{s}= $ 13 TeV | JHEP 04 (2022) 091 | CMS-SUS-18-004 2111.06296 |
| 17 | CMS Collaboration | Search for disappearing tracks in proton-proton collisions at $ \sqrt{s}= $ 13 TeV | PLB 806 (2020) 135502 | CMS-EXO-19-010 2004.05153 |
| 18 | ATLAS Collaboration | Search for long-lived charginos based on a disappearing-track signature using 136 fb$ ^{-1} $ of $ {\mathrm{p}\mathrm{p}} $ collisions at $ \sqrt{s}= $ 13 TeV with the ATLAS detector | EPJC 82 (2022) 606 | 2201.02472 |
| 19 | CMS Collaboration | Search for supersymmetry in final states with disappearing tracks in proton-proton collisions at $ \sqrt{s}= $ 13 TeV | PRD 109 (2024) 072007 | CMS-SUS-21-006 2309.16823 |
| 20 | CMS Collaboration | Description and performance of track and primary-vertex reconstruction with the CMS tracker | JINST 9 (2014) P10009 | CMS-TRK-11-001 1405.6569 |
| 21 | R. Mahbubani, P. Schwaller, and J. Zurita | Closing the window for compressed dark sectors with disappearing charged tracks | Erratum doi:10./JHEP10()061 JHEP 06 (2017) 119 |
1703.05327 |
| 22 | ATLAS Collaboration | Search for nearly mass-degenerate Higgsinos using low-momentum mildly displaced tracks in $ {\mathrm{p}\mathrm{p}} $ collisions at $ \sqrt{s}= $ 13 TeV with the ATLAS detector | PRL 132 (2024) 221801 | 2401.14046 |
| 23 | ATLAS Collaboration | Search for higgsinos in compressed mass spectra using low-momentum tracks in $ {\mathrm{p}\mathrm{p}} $ collisions at $ \sqrt{s}= $ 13 TeV with the ATLAS detector | Submitted to JHEP | 2511.20042 |
| 24 | CMS Collaboration | The CMS experiment at the CERN LHC | JINST 3 (2008) S08004 | |
| 25 | CMS Collaboration | Development of the CMS detector for the CERN LHC \mboxRun 3 | JINST 19 (2024) P05064 | CMS-PRF-21-001 2309.05466 |
| 26 | CMS Collaboration | Performance of the CMS Level-1 trigger in proton-proton collisions at $ \sqrt{s}= $ 13 TeV | JINST 15 (2020) P10017 | CMS-TRG-17-001 2006.10165 |
| 27 | CMS Collaboration | The CMS trigger system | JINST 12 (2017) P01020 | CMS-TRG-12-001 1609.02366 |
| 28 | CMS Collaboration | Performance of the CMS high-level trigger during LHC \mboxRun 2 | JINST 19 (2024) P11021 | CMS-TRG-19-001 2410.17038 |
| 29 | CMS Collaboration | Electron and photon reconstruction and identification with the CMS experiment at the CERN LHC | JINST 16 (2021) P05014 | CMS-EGM-17-001 2012.06888 |
| 30 | CMS Collaboration | Performance of the CMS muon detector and muon reconstruction with proton-proton collisions at $ \sqrt{s}= $ 13 TeV | JINST 13 (2018) P06015 | CMS-MUO-16-001 1804.04528 |
| 31 | CMS Collaboration | Particle-flow reconstruction and global event description with the CMS detector | JINST 12 (2017) P10003 | CMS-PRF-14-001 1706.04965 |
| 32 | CMS Collaboration | Performance of reconstruction and identification of $ \tau $ leptons decaying to hadrons and $ \nu_{\!\tau} $ in $ {\mathrm{p}\mathrm{p}} $ collisions at $ \sqrt{s}= $ 13 TeV | JINST 13 (2018) P10005 | CMS-TAU-16-003 1809.02816 |
| 33 | CMS Collaboration | Jet energy scale and resolution in the CMS experiment in $ {\mathrm{p}\mathrm{p}} $ collisions at 8 TeV | JINST 12 (2017) P02014 | CMS-JME-13-004 1607.03663 |
| 34 | CMS Collaboration | Performance of missing transverse momentum reconstruction in proton-proton collisions at $ \sqrt{s}= $ 13 TeV using the CMS detector | JINST 14 (2019) P07004 | CMS-JME-17-001 1903.06078 |
| 35 | M. Cacciari, G. P. Salam, and G. Soyez | The anti-$ k_{\mathrm{T}} $ jet clustering algorithm | JHEP 04 (2008) 063 | 0802.1189 |
| 36 | M. Cacciari, G. P. Salam, and G. Soyez | FASTJET user manual | EPJC 72 (2012) 1896 | 1111.6097 |
| 37 | J. Alwall et al. | The automated computation of tree-level and next-to-leading order differential cross sections, and their matching to parton shower simulations | JHEP 07 (2014) 079 | 1405.0301 |
| 38 | J. Alwall et al. | Comparative study of various algorithms for the merging of parton showers and matrix elements in hadronic collisions | EPJC 53 (2008) 473 | 0706.2569 |
| 39 | T. Sjöstrand et al. | An introduction to PYTHIA8.2 | Comput. Phys. Commun. 191 (2015) 159 | 1410.3012 |
| 40 | CMS Collaboration | Event generator tunes obtained from underlying event and multiparton scattering measurements | EPJC 76 (2016) 155 | CMS-GEN-14-001 1512.00815 |
| 41 | CMS Collaboration | Extraction and validation of a new set of CMS PYTHIA8 tunes from underlying-event measurements | EPJC 80 (2020) 4 | CMS-GEN-17-001 1903.12179 |
| 42 | NNPDF Collaboration | Parton distributions with QED corrections | NPB 877 (2013) 290 | 1308.0598 |
| 43 | NNPDF Collaboration | Parton distributions from high-precision collider data | EPJC 77 (2017) 663 | 1706.00428 |
| 44 | GEANT4 Collaboration | GEANT 4---a simulation toolkit | NIM A 506 (2003) 250 | |
| 45 | CMS Collaboration , S. Abdullin et al. | The fast simulation of the CMS detector at LHC | in Proc. 18th International Conference on Computing in High Energy and Nuclear Physics (CHEP): Taipei, Taiwan, October 18--22, 2011 J. Phys. Conf. Ser. 331 (2011) 032049 |
|
| 46 | A. Giammanco | The fast simulation of the CMS experiment | in Proc. 20th International Conference on Computing in High Energy and Nuclear Physics (CHEP): Amsterdam, The Netherlands, October 14--18, 2014 J. Phys. Conf. Ser. 513 (2014) 022012 |
|
| 47 | W. Elmetenawee | CMS tracking performance in \mboxRun 2 and early \mboxRun 3 | C in International Workshop on Vertex Detectors (VERTEX): Genova, Italy, October 16--20, 2023 Proc. 3 (2023) 2 |
2312.08017 |
| 48 | CMS Collaboration | Identification of hadronic tau lepton decays using a deep neural network | JINST 17 (2022) P07023 | CMS-TAU-20-001 2201.08458 |
| 49 | CMS Collaboration | Identification of heavy-flavour jets with the CMS detector in $ {\mathrm{p}\mathrm{p}} $ collisions at 13 TeV | JINST 13 (2018) P05011 | CMS-BTV-16-002 1712.07158 |
| 50 | E. Bols et al. | Jet flavour classification using DeepJet | JINST 15 (2020) P12012 | 2008.10519 |
| 51 | A. L. Maas, A. Y. Hannun, and A. Y. Ng | Rectifier nonlinearities improve neural network acoustic models | in the International Conference on Machine Learning (ICML ): Atlanta GA, USA, June 17--19,, 2013 Proc. 3 (2013) 0 |
|
| 52 | M. Wolf et al. | Fast Perfekt: Regression-based refinement of fast simulation | SciPost Phys. Core 8 (2025) 021 | 2410.15992 |
| 53 | Gretton J. et al. | A kernel two-sample test | Mach. Learn. Res. 13 (2012) 723 | |
| 54 | CMS Collaboration | Precision luminosity measurement in proton-proton collisions at $ \sqrt{s}= $ 13 TeV in 2015 and 2016 at CMS | EPJC 81 (2021) 800 | CMS-LUM-17-003 2104.01927 |
| 55 | CMS Collaboration | CMS luminosity measurement for the 2017 data-taking period at $ \sqrt{s}= $ 13 TeV | CMS Physics Analysis Summary, 2018 CMS-PAS-LUM-17-004 |
CMS-PAS-LUM-17-004 |
| 56 | CMS Collaboration | CMS luminosity measurement for the 2018 data-taking period at $ \sqrt{s}= $ 13 TeV | CMS Physics Analysis Summary, 2019 CMS-PAS-LUM-18-002 |
CMS-PAS-LUM-18-002 |
| 57 | CMS Collaboration | Precision luminosity measurement in proton-proton collisions at $ \sqrt{s}= $ 13 TeV with the CMS detector | CMS Physics Analysis Summary, 2025 CMS-PAS-LUM-20-001 |
CMS-PAS-LUM-20-001 |
| 58 | B. Fuks, M. Klasen, D. R. Lamprea, and M. Rothering | Gaugino production in proton-proton collisions at a center-of-mass energy of 8 TeV | JHEP 10 (2012) 081 | 1207.2159 |
| 59 | B. Fuks, M. Klasen, D. R. Lamprea, and M. Rothering | Precision predictions for electroweak superpartner production at hadron colliders with resummino | EPJC 73 (2013) 2480 | 1304.0790 |
| 60 | M. Ibe, Y. Nakayama, and S. Shirai | Precise estimate of charged higgsino/wino decay rate | JHEP 03 (2024) 012 | 2312.08087 |
| 61 | T. Junk | Confidence level computation for combining searches with small statistics | NIM A 434 (1999) 435 | hep-ex/9902006 |
| 62 | A. L. Read | Presentation of search results: The $ \text{CL}_\text{s} $ technique | JPG 28 (2002) 2693 | |
| 63 | CMS Collaboration | HEPData record for this analysis | link | |
|
|
Compact Muon Solenoid LHC, CERN |
|

|

|

|

|

|