

Compact Muon Solenoid
LHC, CERN
| CMS-SUS-23-018 ; CERN-EP-2025-119 | ||
| Search for dark matter production in association with bottom quarks and a lepton pair in proton-proton collisions at $ \sqrt{s}= $ 13 TeV | ||
| CMS Collaboration | ||
| 14 October 2025 | ||
| JHEP 06 (2026) 014 | ||
| Abstract: A search is performed for dark matter produced in association with bottom quarks and a pair of electrons or muons in data collected with the CMS detector at the LHC, corresponding to 138 fb$ ^{-1} $ of integrated luminosity of proton-proton collisions at a center-of-mass energy of 13 TeV. For the first time at the LHC, the associated production of a bottom quark-antiquark pair and a new heavy neutral Higgs boson (H) that subsequently decays into a leptonically decaying Z boson and a pseudoscalar (a) is explored. The latter acts as a dark matter mediator in the context of the two Higgs doublet model plus a pseudoscalar (2HDM+a). Multivariate techniques that target a wide range of mass configurations for the H and a particles are used. The observations are consistent with the expectations from standard model processes. Upper limits at 95% confidence level are set on the product of cross section and branching fraction of the new particles, ranging from 10$^{-2} $ pb for an H mass of 400 GeV to 10$^{-3} $ pb for an H mass of 2000 GeV. Constraints on the parameter space of a benchmark 2HDM+a model are derived and compared with expectations in the context of cosmological predictions. | ||
| Links: e-print arXiv:2510.12396 [hep-ex] (PDF) ; CDS record ; inSPIRE record ; Physics Briefing ; CADI line (restricted) ; | ||
| Figures | |
png pdf |
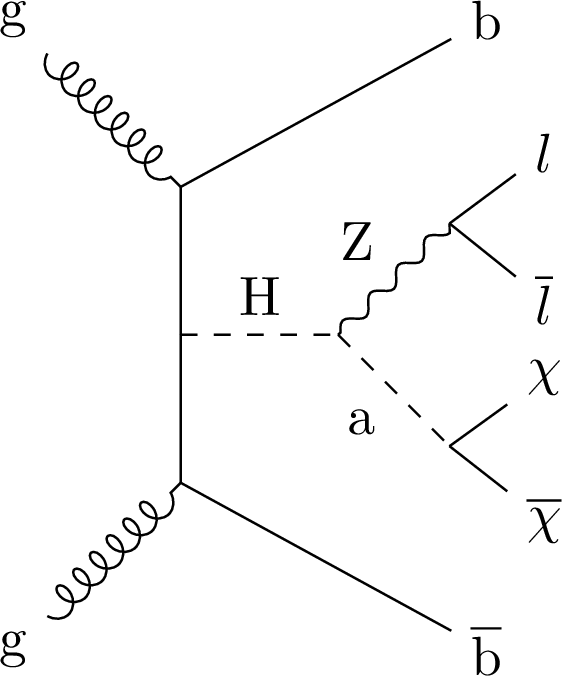
Figure 1:
Example diagram at leading order for the production of a heavy pseudoscalar mediator decaying into dark matter particles, in association with $ \mathrm{Z}(\to \ell\bar{\ell} ) \mathrm{b}\overline{\mathrm{b}} $. |
png pdf |
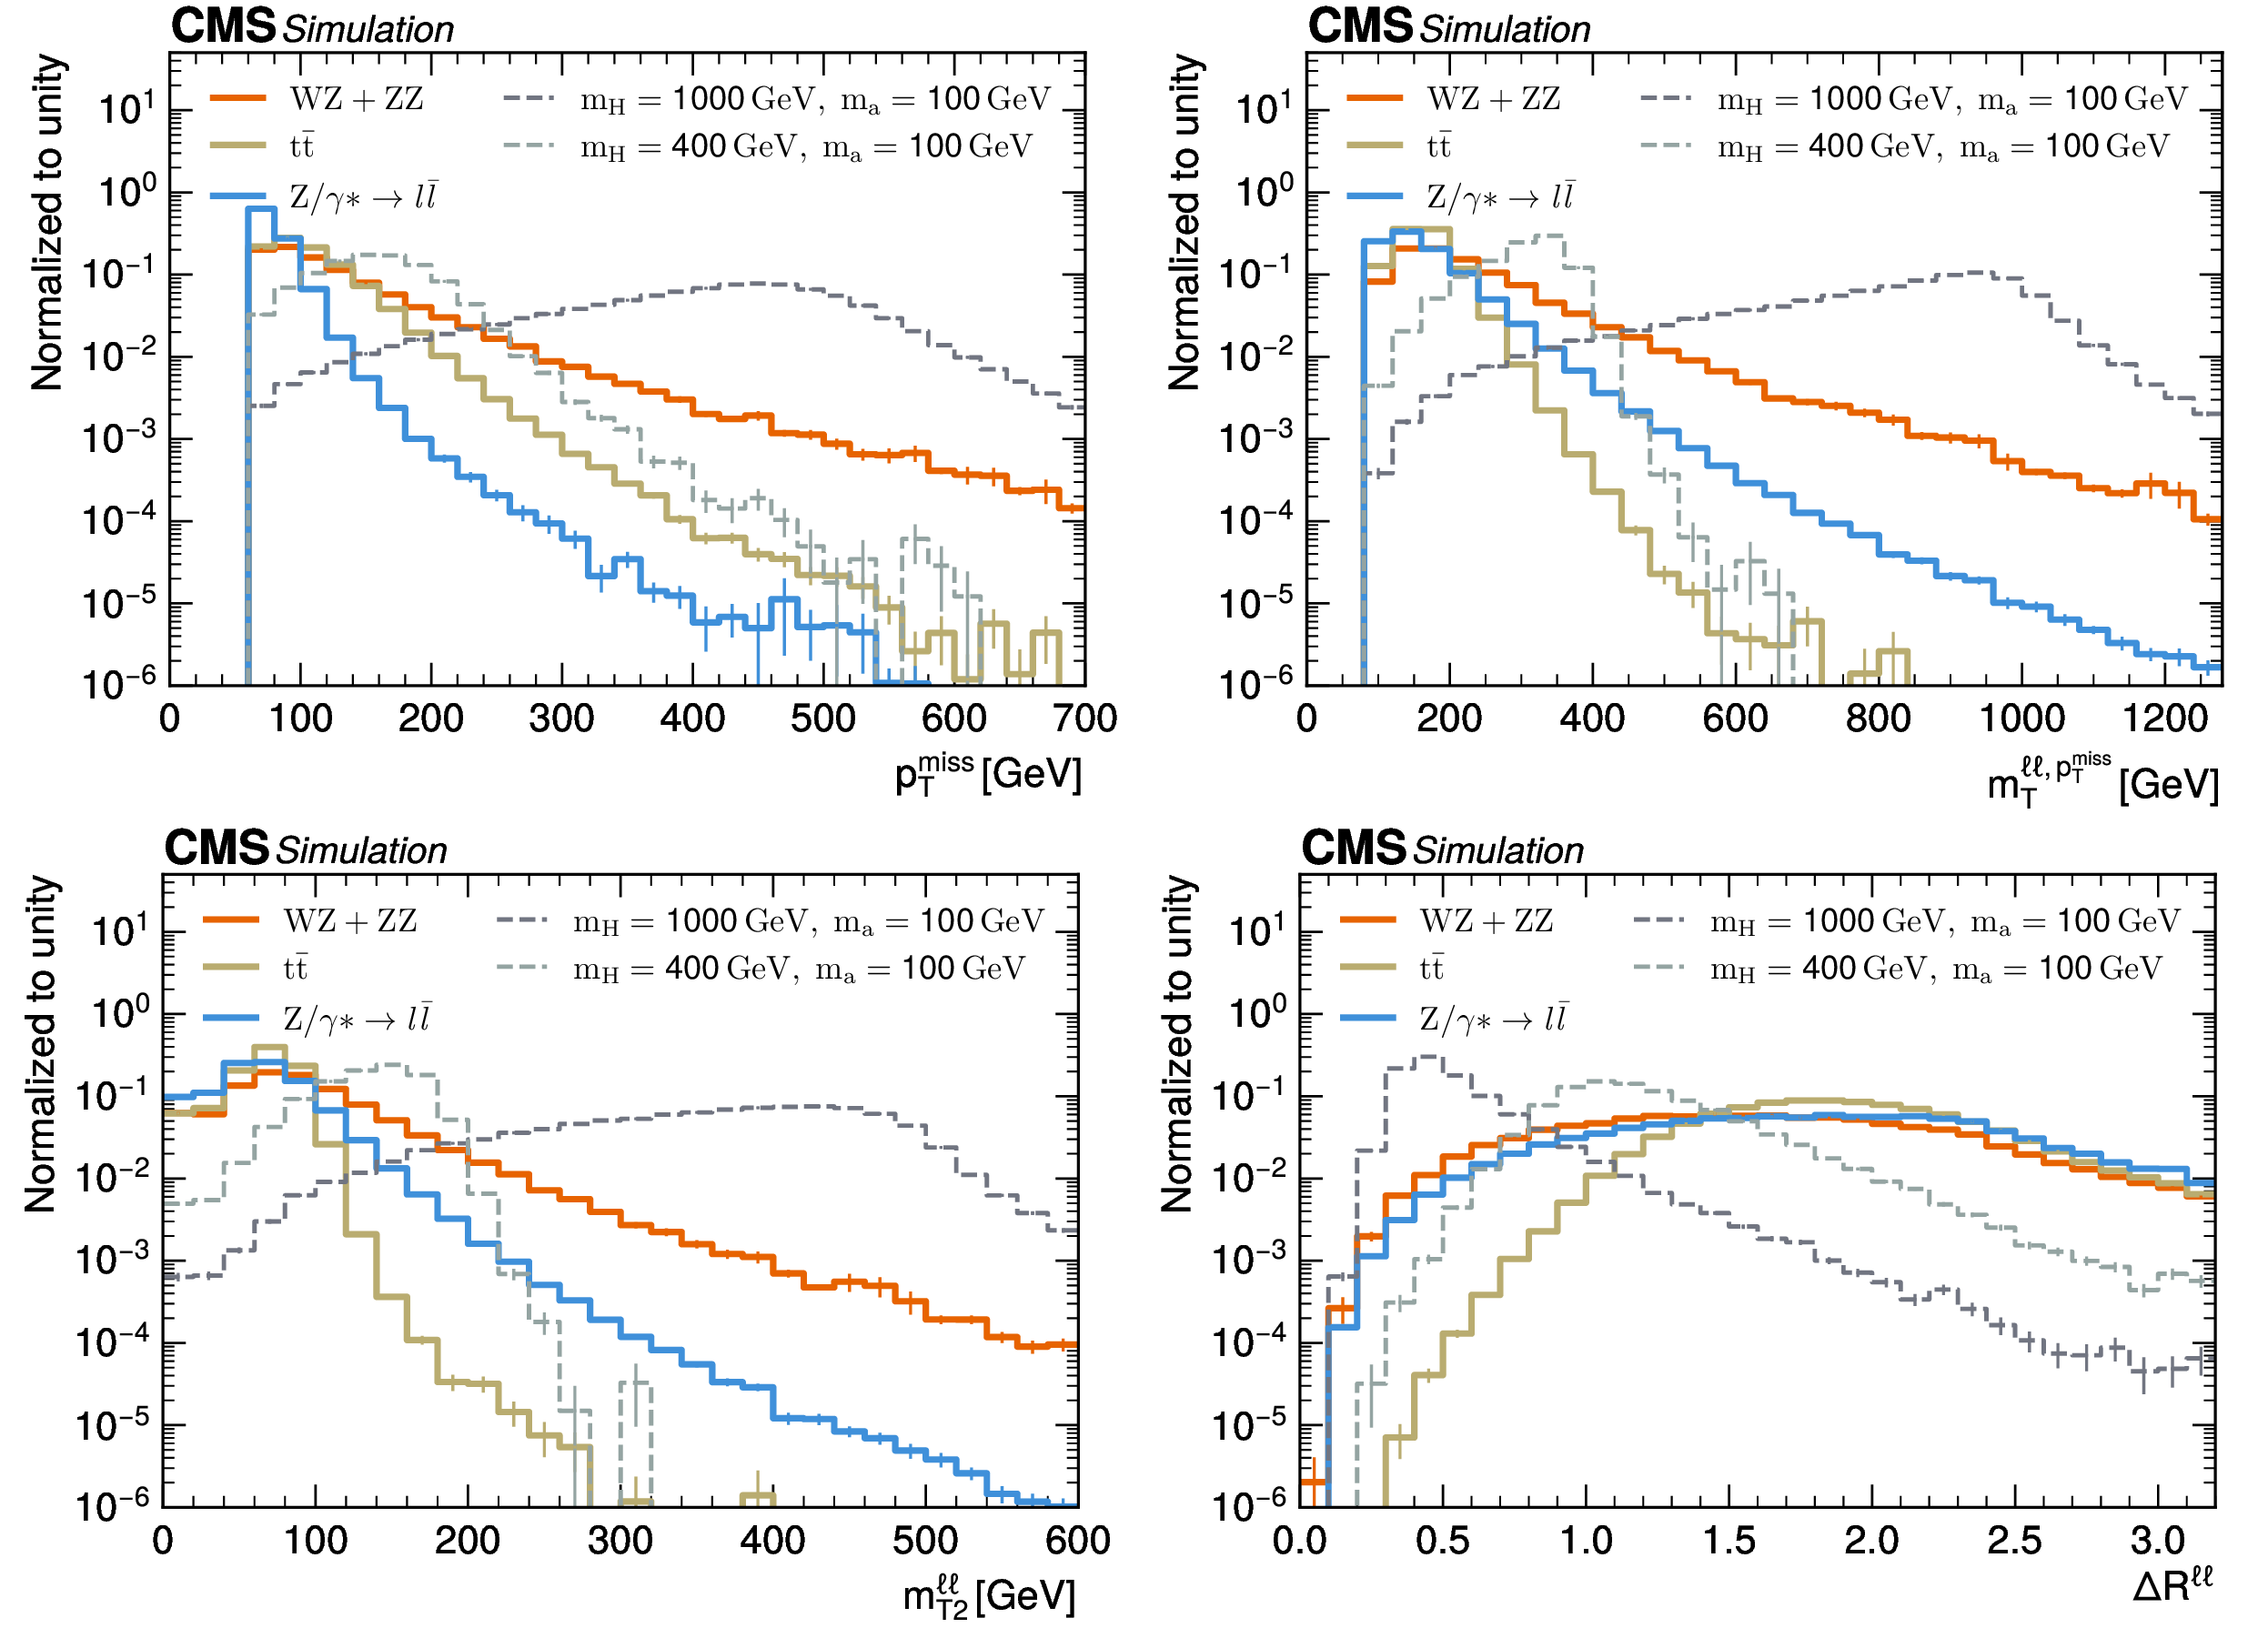
Figure 2:
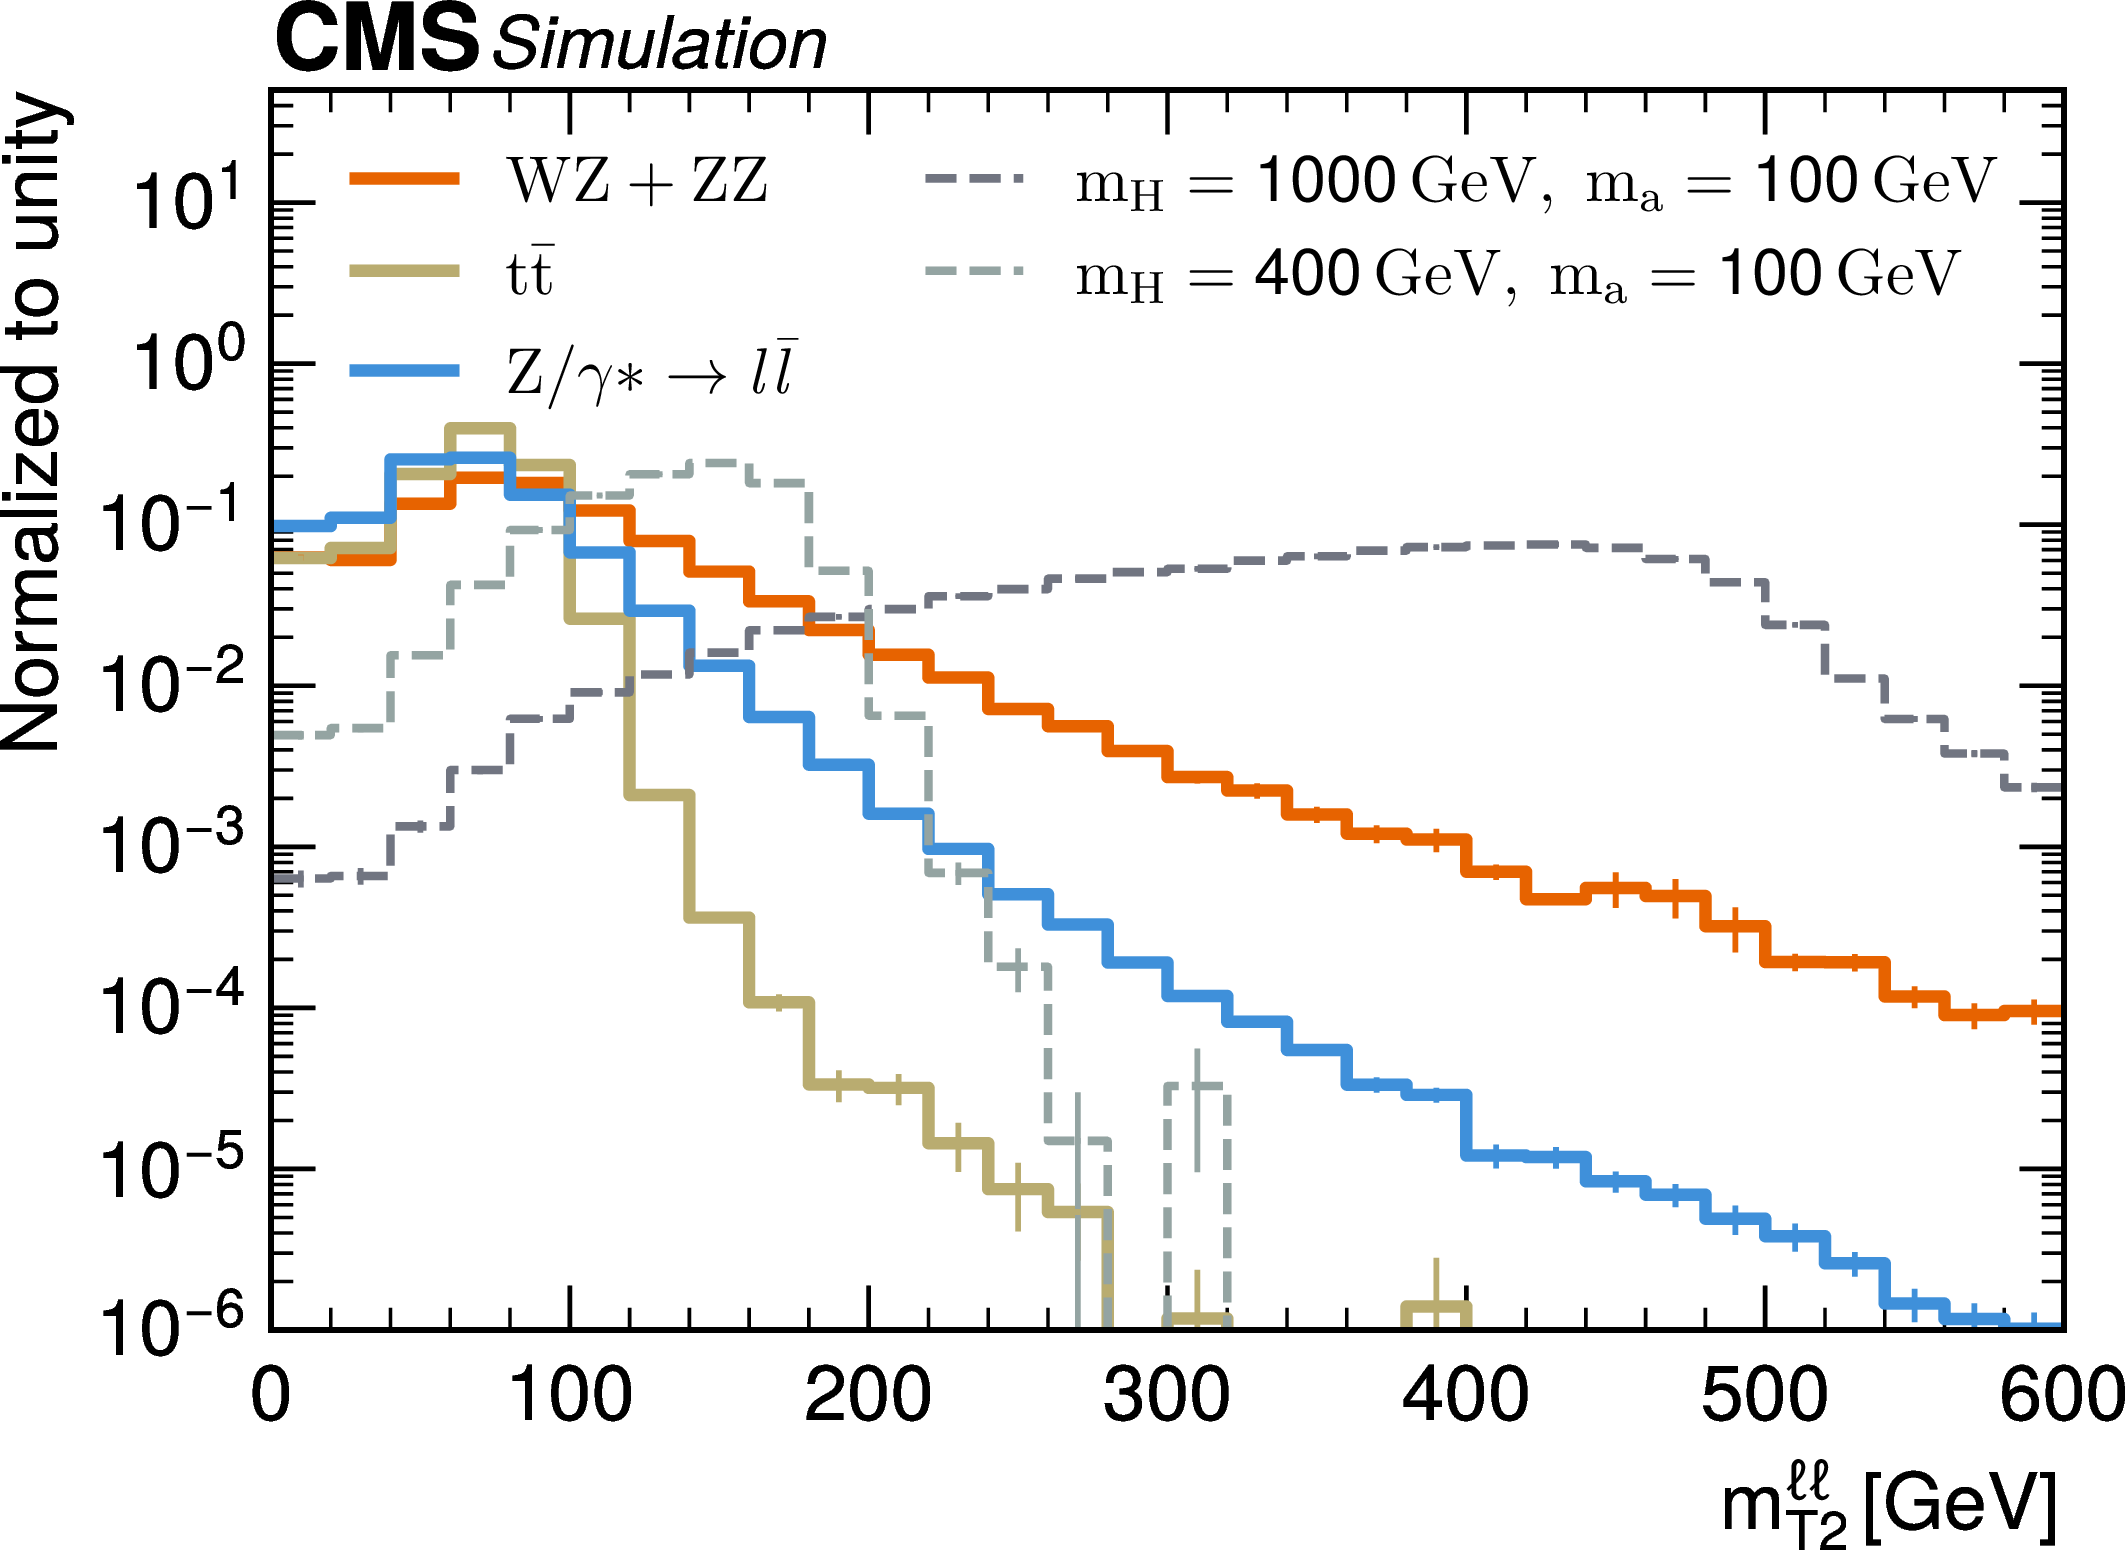
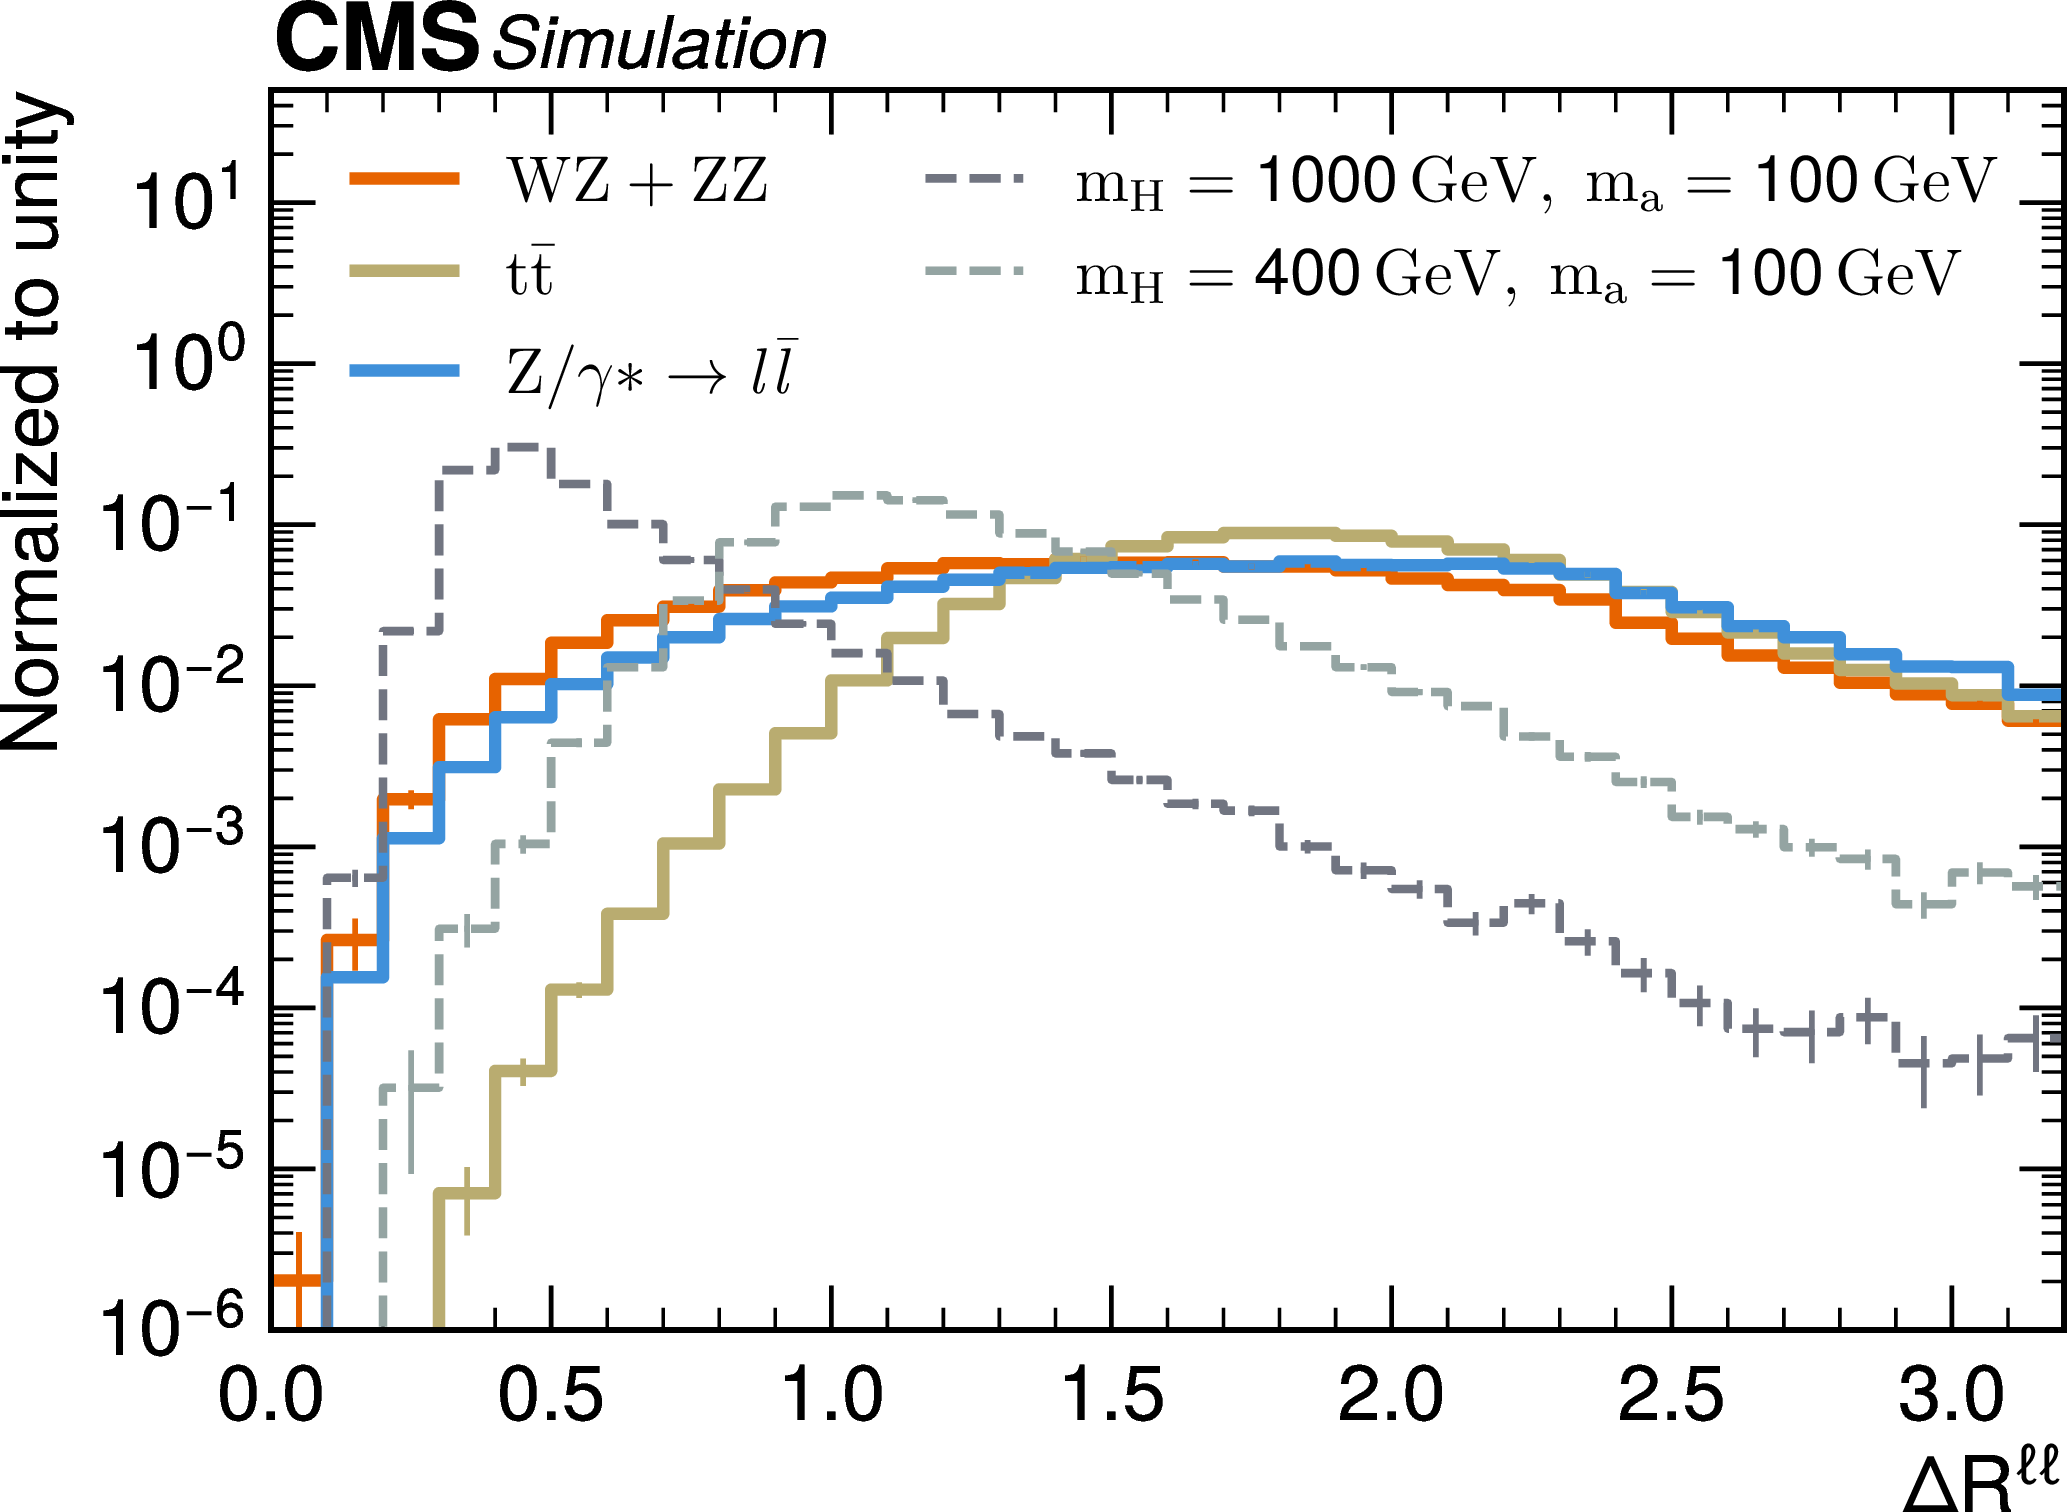
Normalized distributions in $ p_{\mathrm{T}}^\text{miss} $ (upper left), $ m_{\mathrm{T}}^{\mathrm{\ell\ell},p_{\mathrm{T}}^\text{miss}} $ (upper right), $ m_\mathrm{T2}^{\ell\ell} $ (lower left), and $ \Delta R^{\ell\ell} $ (lower right) in the SR for the main background processes (solid lines) and signals with high (dark gray dashed line) and low (light gray dashed line) $ m_\mathrm{H} $ values. The vertical bars at the center of the bins represent the statistical uncertainty in the predictions. |
png pdf |
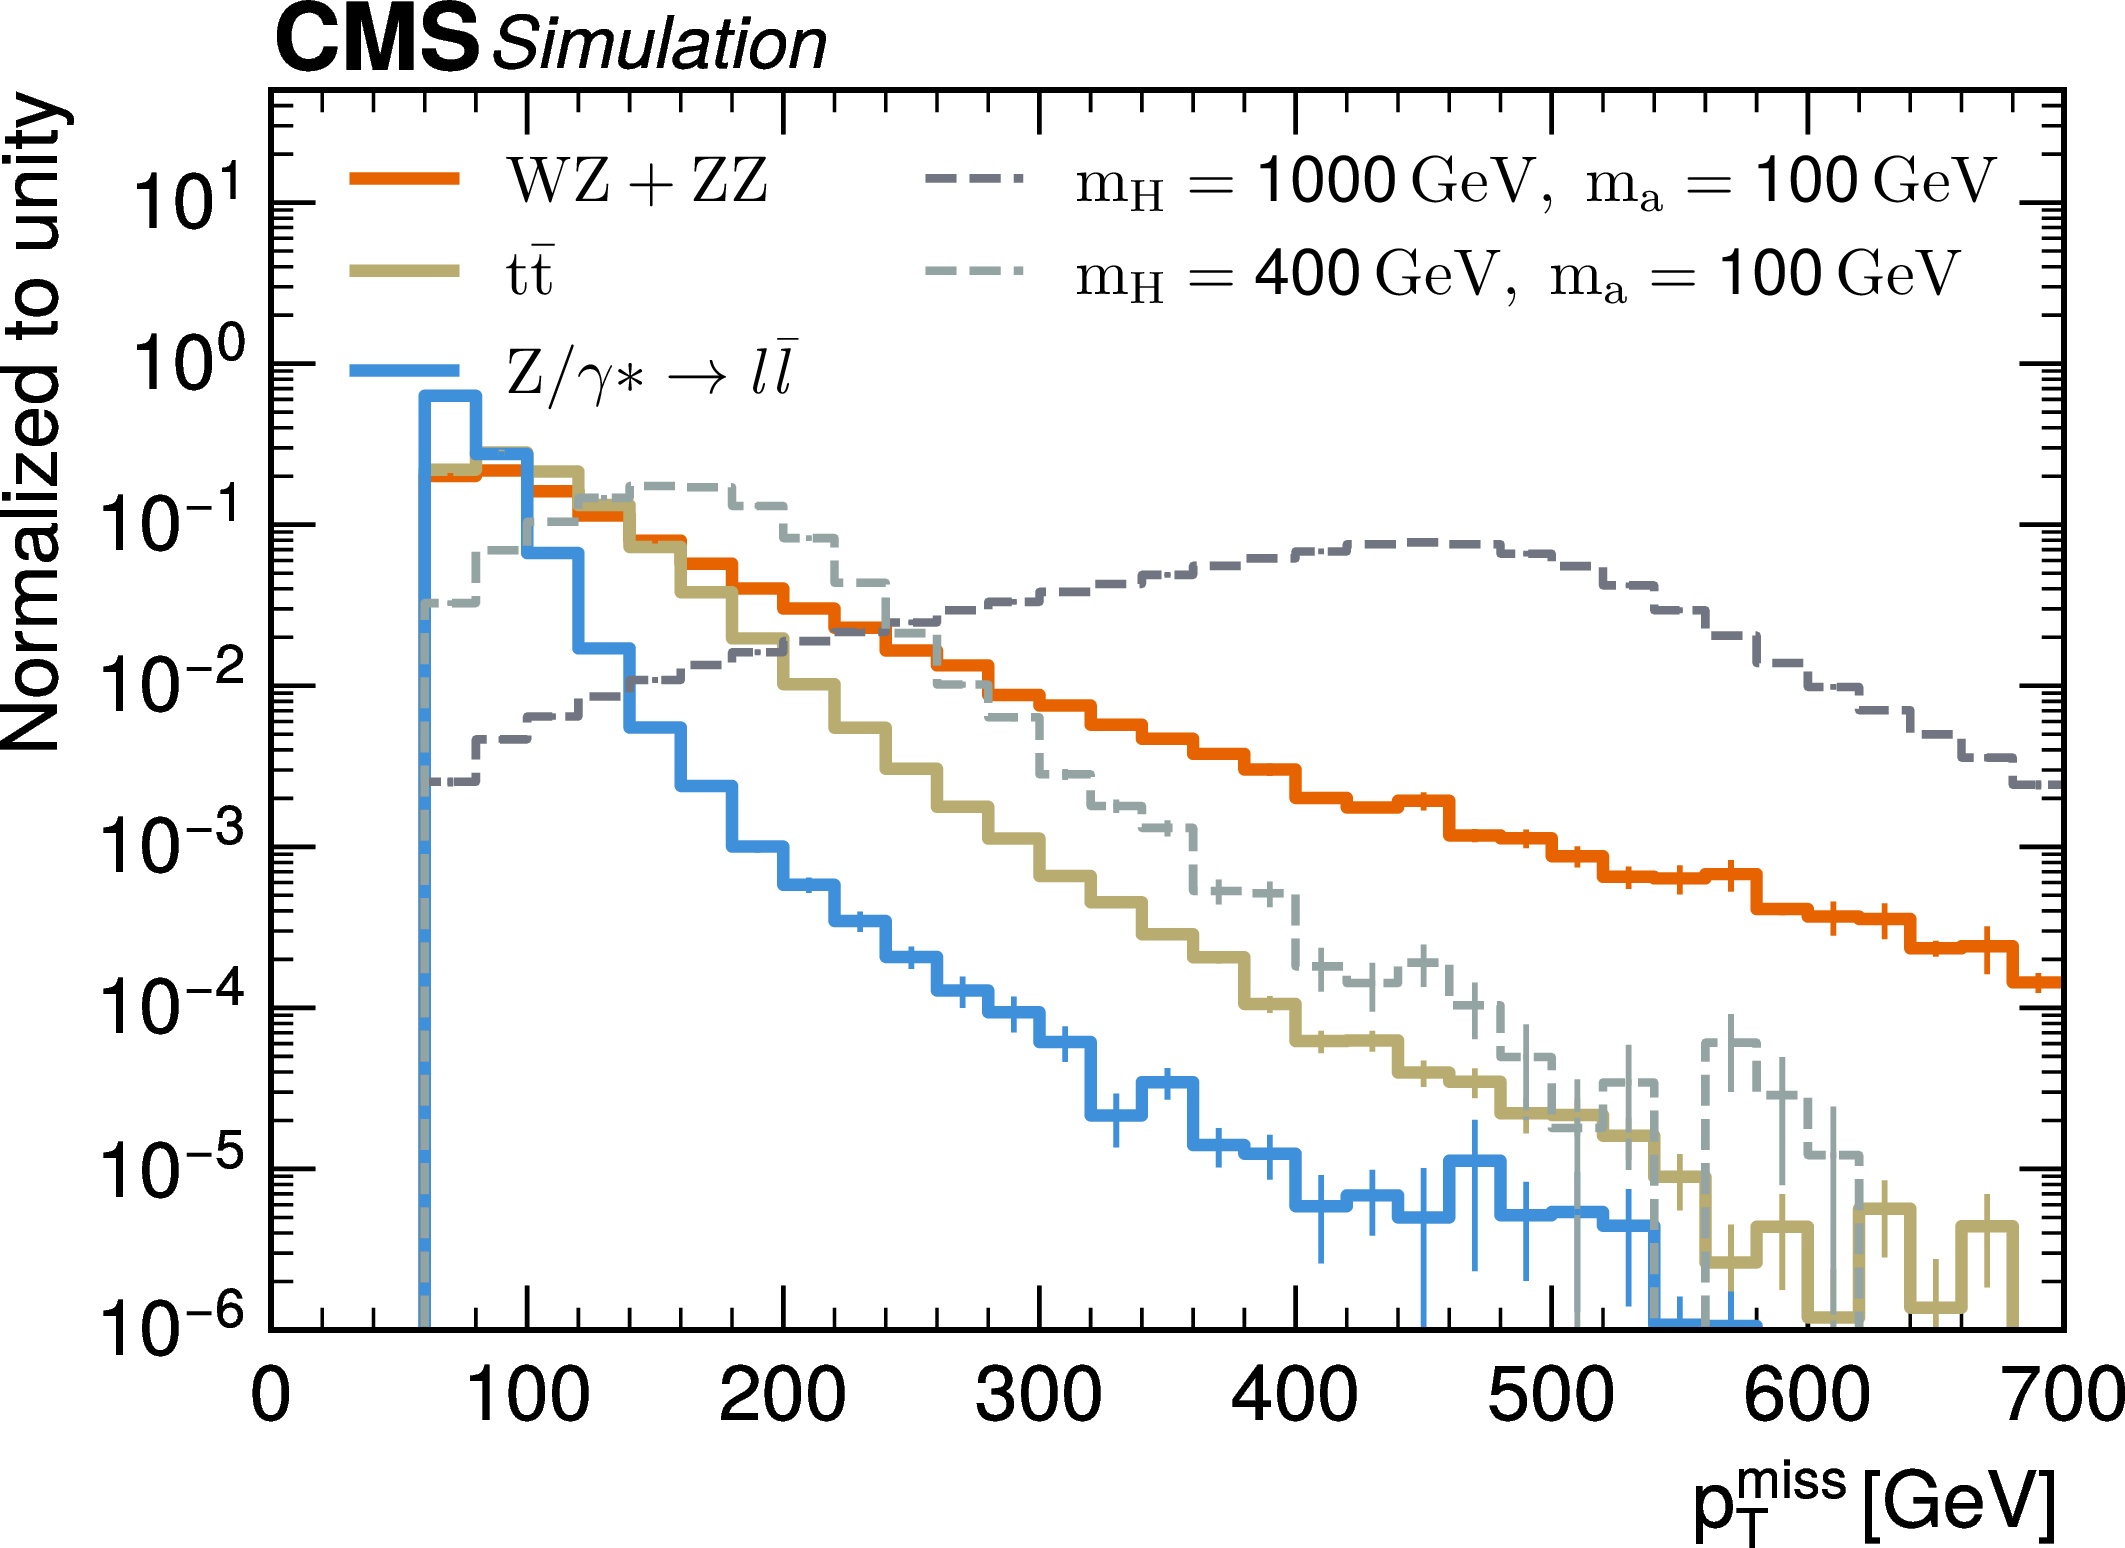
Figure 2-a:
Normalized distributions in $ p_{\mathrm{T}}^\text{miss} $ (upper left), $ m_{\mathrm{T}}^{\mathrm{\ell\ell},p_{\mathrm{T}}^\text{miss}} $ (upper right), $ m_\mathrm{T2}^{\ell\ell} $ (lower left), and $ \Delta R^{\ell\ell} $ (lower right) in the SR for the main background processes (solid lines) and signals with high (dark gray dashed line) and low (light gray dashed line) $ m_\mathrm{H} $ values. The vertical bars at the center of the bins represent the statistical uncertainty in the predictions. |
png pdf |
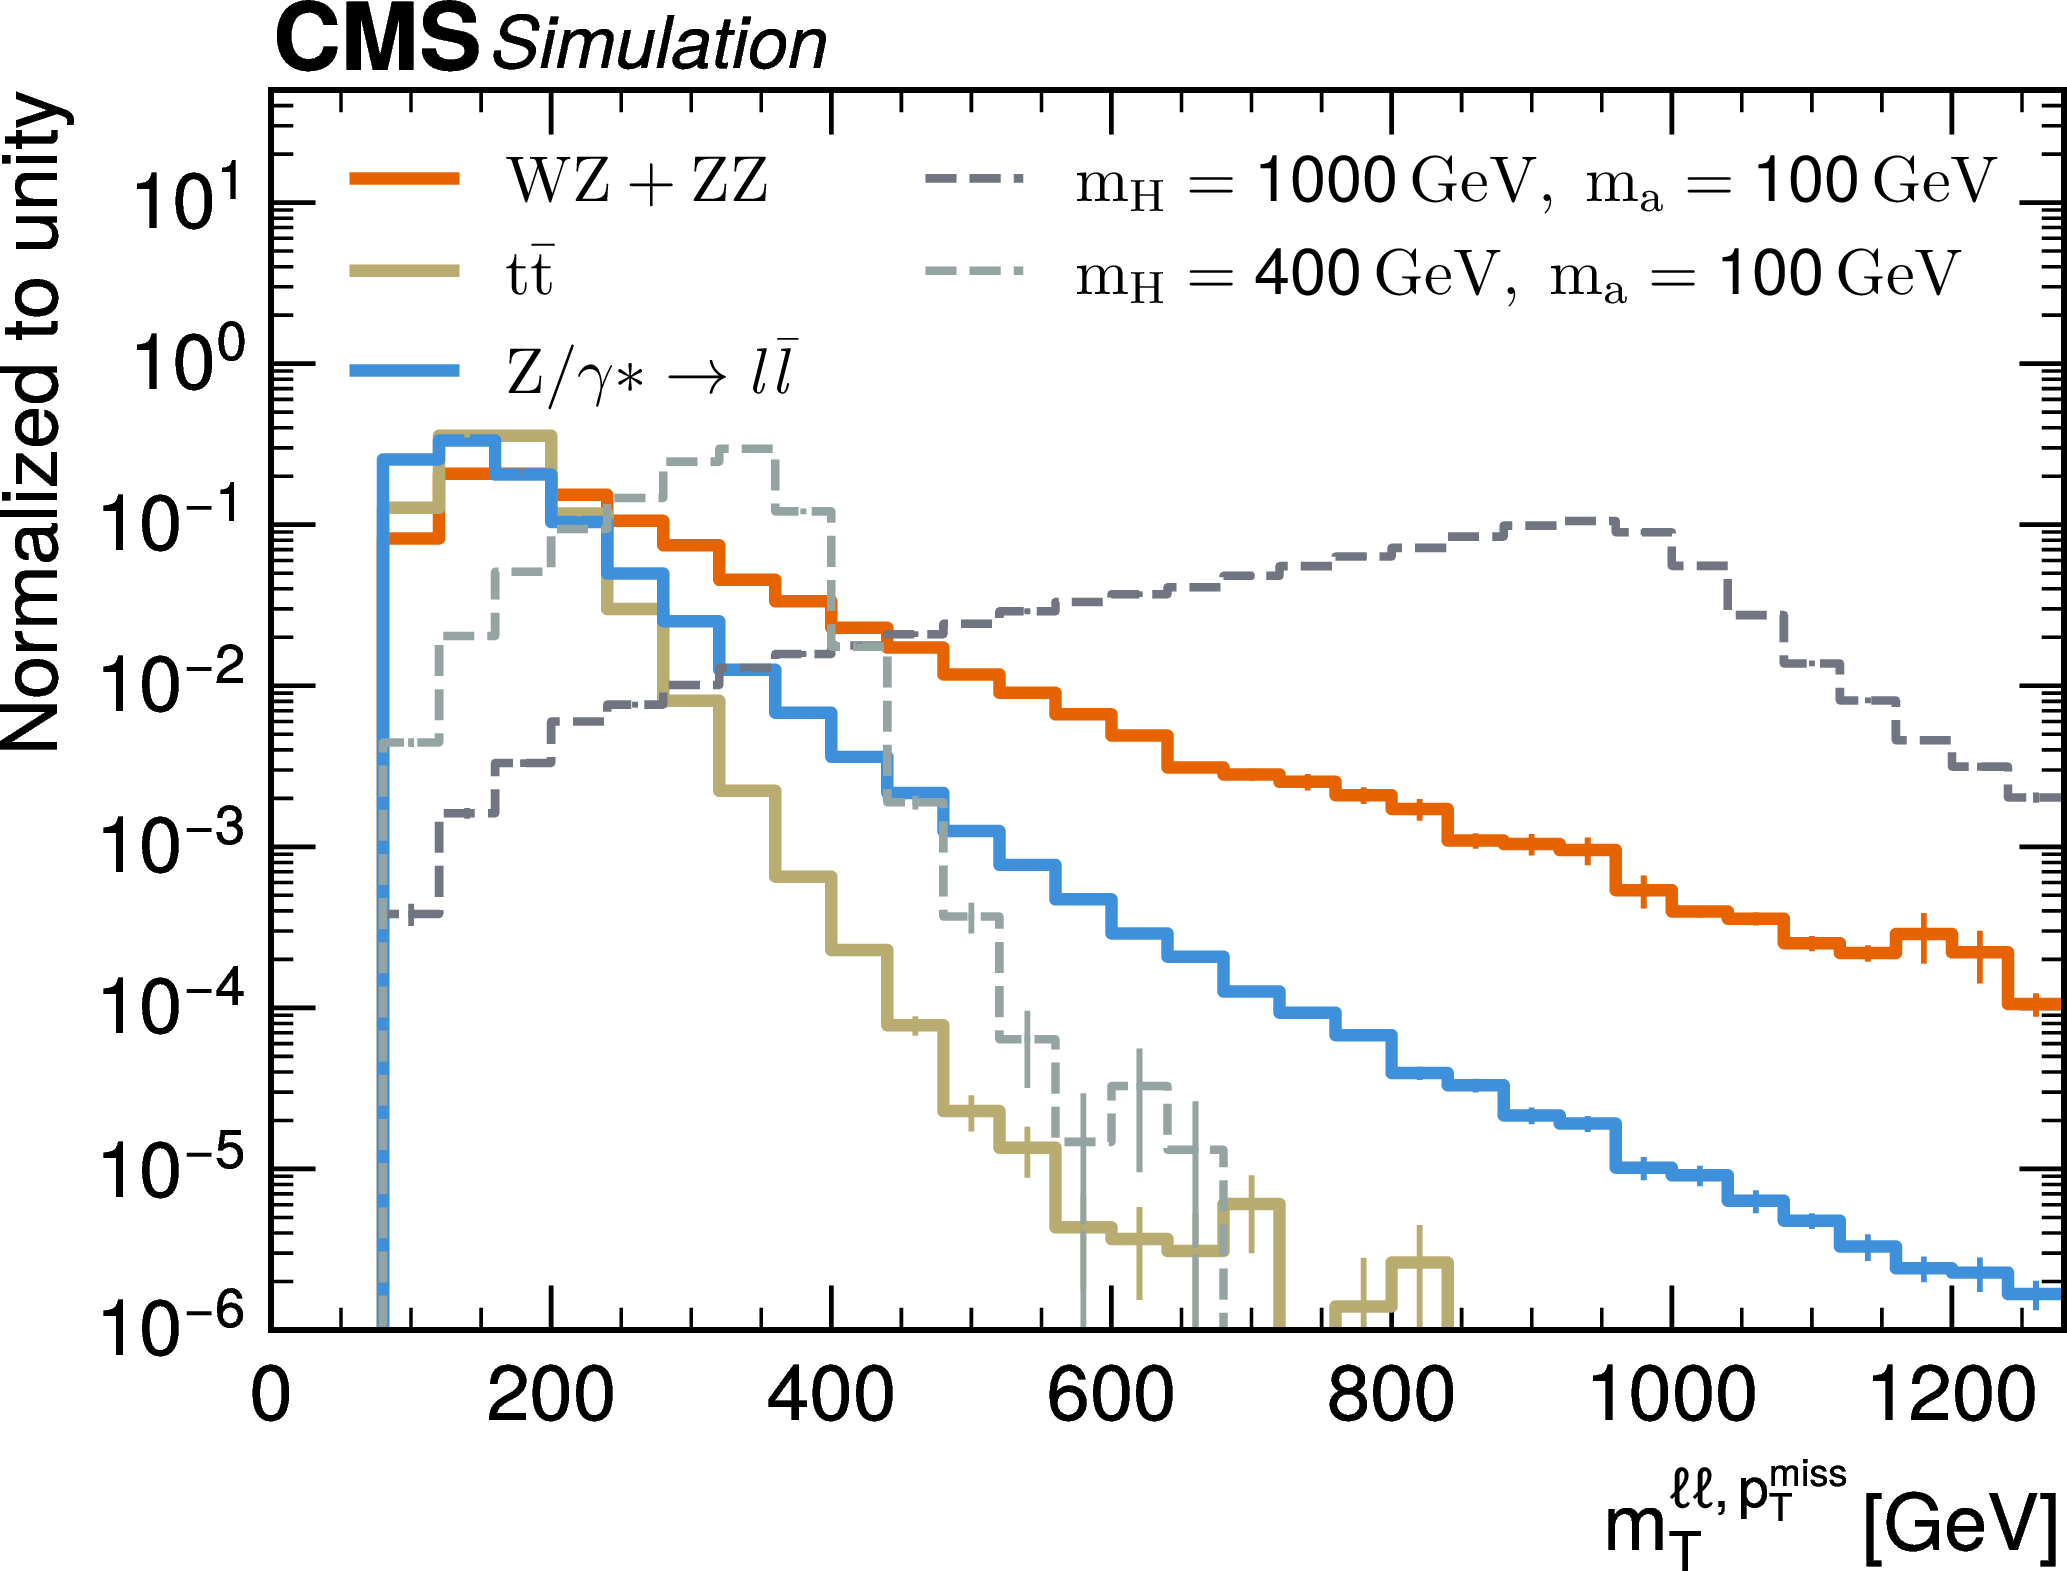
Figure 2-b:
Normalized distributions in $ p_{\mathrm{T}}^\text{miss} $ (upper left), $ m_{\mathrm{T}}^{\mathrm{\ell\ell},p_{\mathrm{T}}^\text{miss}} $ (upper right), $ m_\mathrm{T2}^{\ell\ell} $ (lower left), and $ \Delta R^{\ell\ell} $ (lower right) in the SR for the main background processes (solid lines) and signals with high (dark gray dashed line) and low (light gray dashed line) $ m_\mathrm{H} $ values. The vertical bars at the center of the bins represent the statistical uncertainty in the predictions. |
png pdf |
Figure 2-c:
Normalized distributions in $ p_{\mathrm{T}}^\text{miss} $ (upper left), $ m_{\mathrm{T}}^{\mathrm{\ell\ell},p_{\mathrm{T}}^\text{miss}} $ (upper right), $ m_\mathrm{T2}^{\ell\ell} $ (lower left), and $ \Delta R^{\ell\ell} $ (lower right) in the SR for the main background processes (solid lines) and signals with high (dark gray dashed line) and low (light gray dashed line) $ m_\mathrm{H} $ values. The vertical bars at the center of the bins represent the statistical uncertainty in the predictions. |
png pdf |
Figure 2-d:
Normalized distributions in $ p_{\mathrm{T}}^\text{miss} $ (upper left), $ m_{\mathrm{T}}^{\mathrm{\ell\ell},p_{\mathrm{T}}^\text{miss}} $ (upper right), $ m_\mathrm{T2}^{\ell\ell} $ (lower left), and $ \Delta R^{\ell\ell} $ (lower right) in the SR for the main background processes (solid lines) and signals with high (dark gray dashed line) and low (light gray dashed line) $ m_\mathrm{H} $ values. The vertical bars at the center of the bins represent the statistical uncertainty in the predictions. |
png pdf |
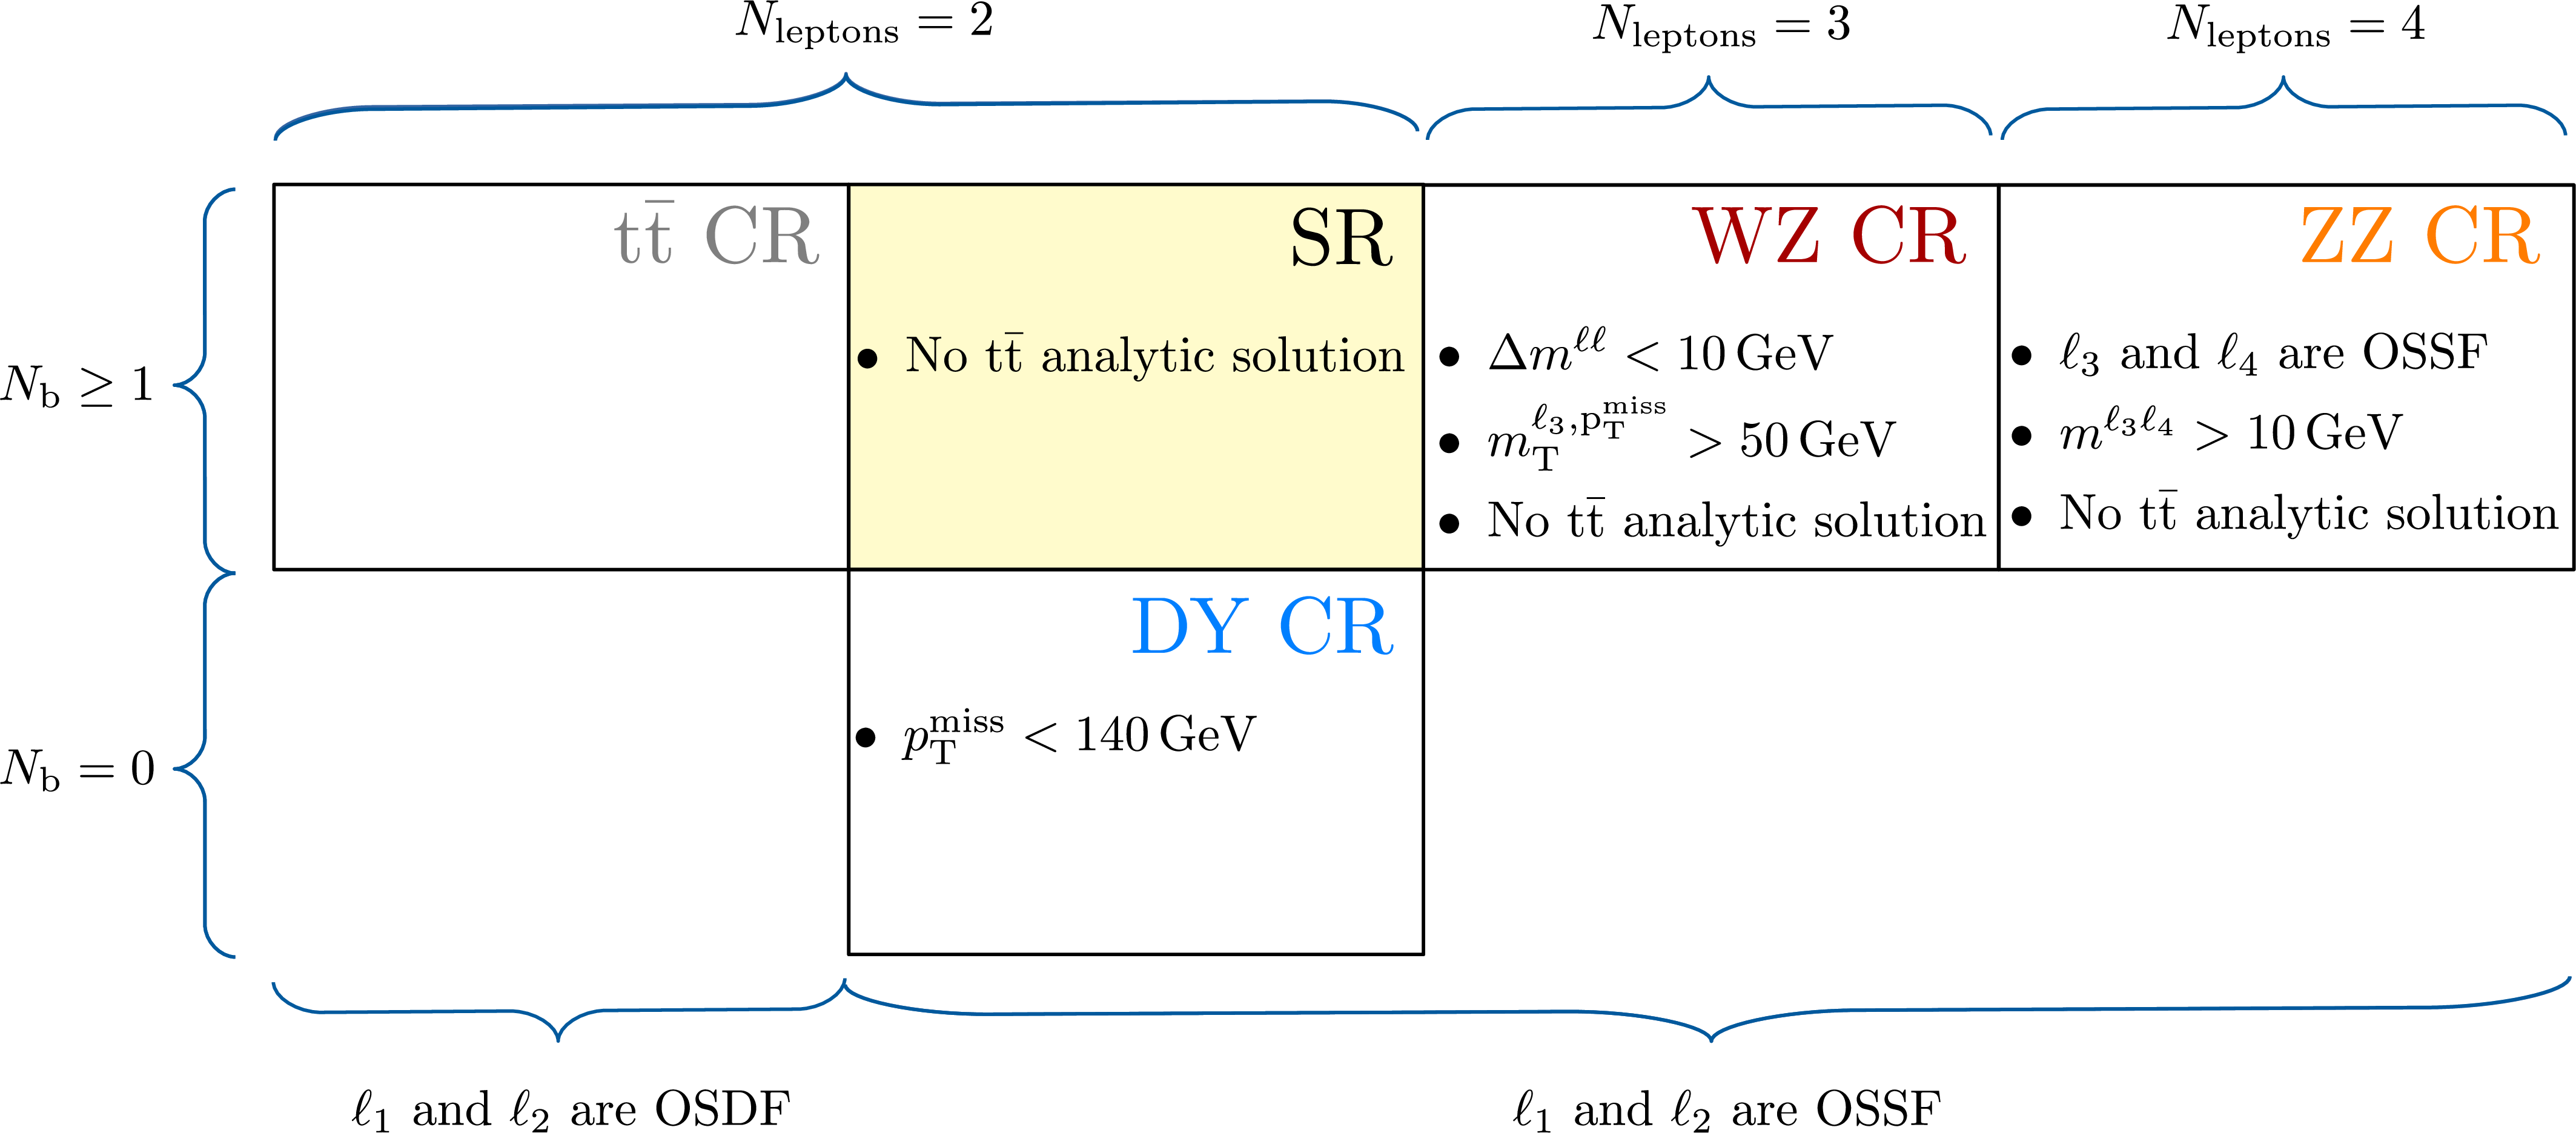
Figure 3:
Illustration of the requirements on the SR and CRs. All requirements are applied on top of the baseline selection. |
png pdf |
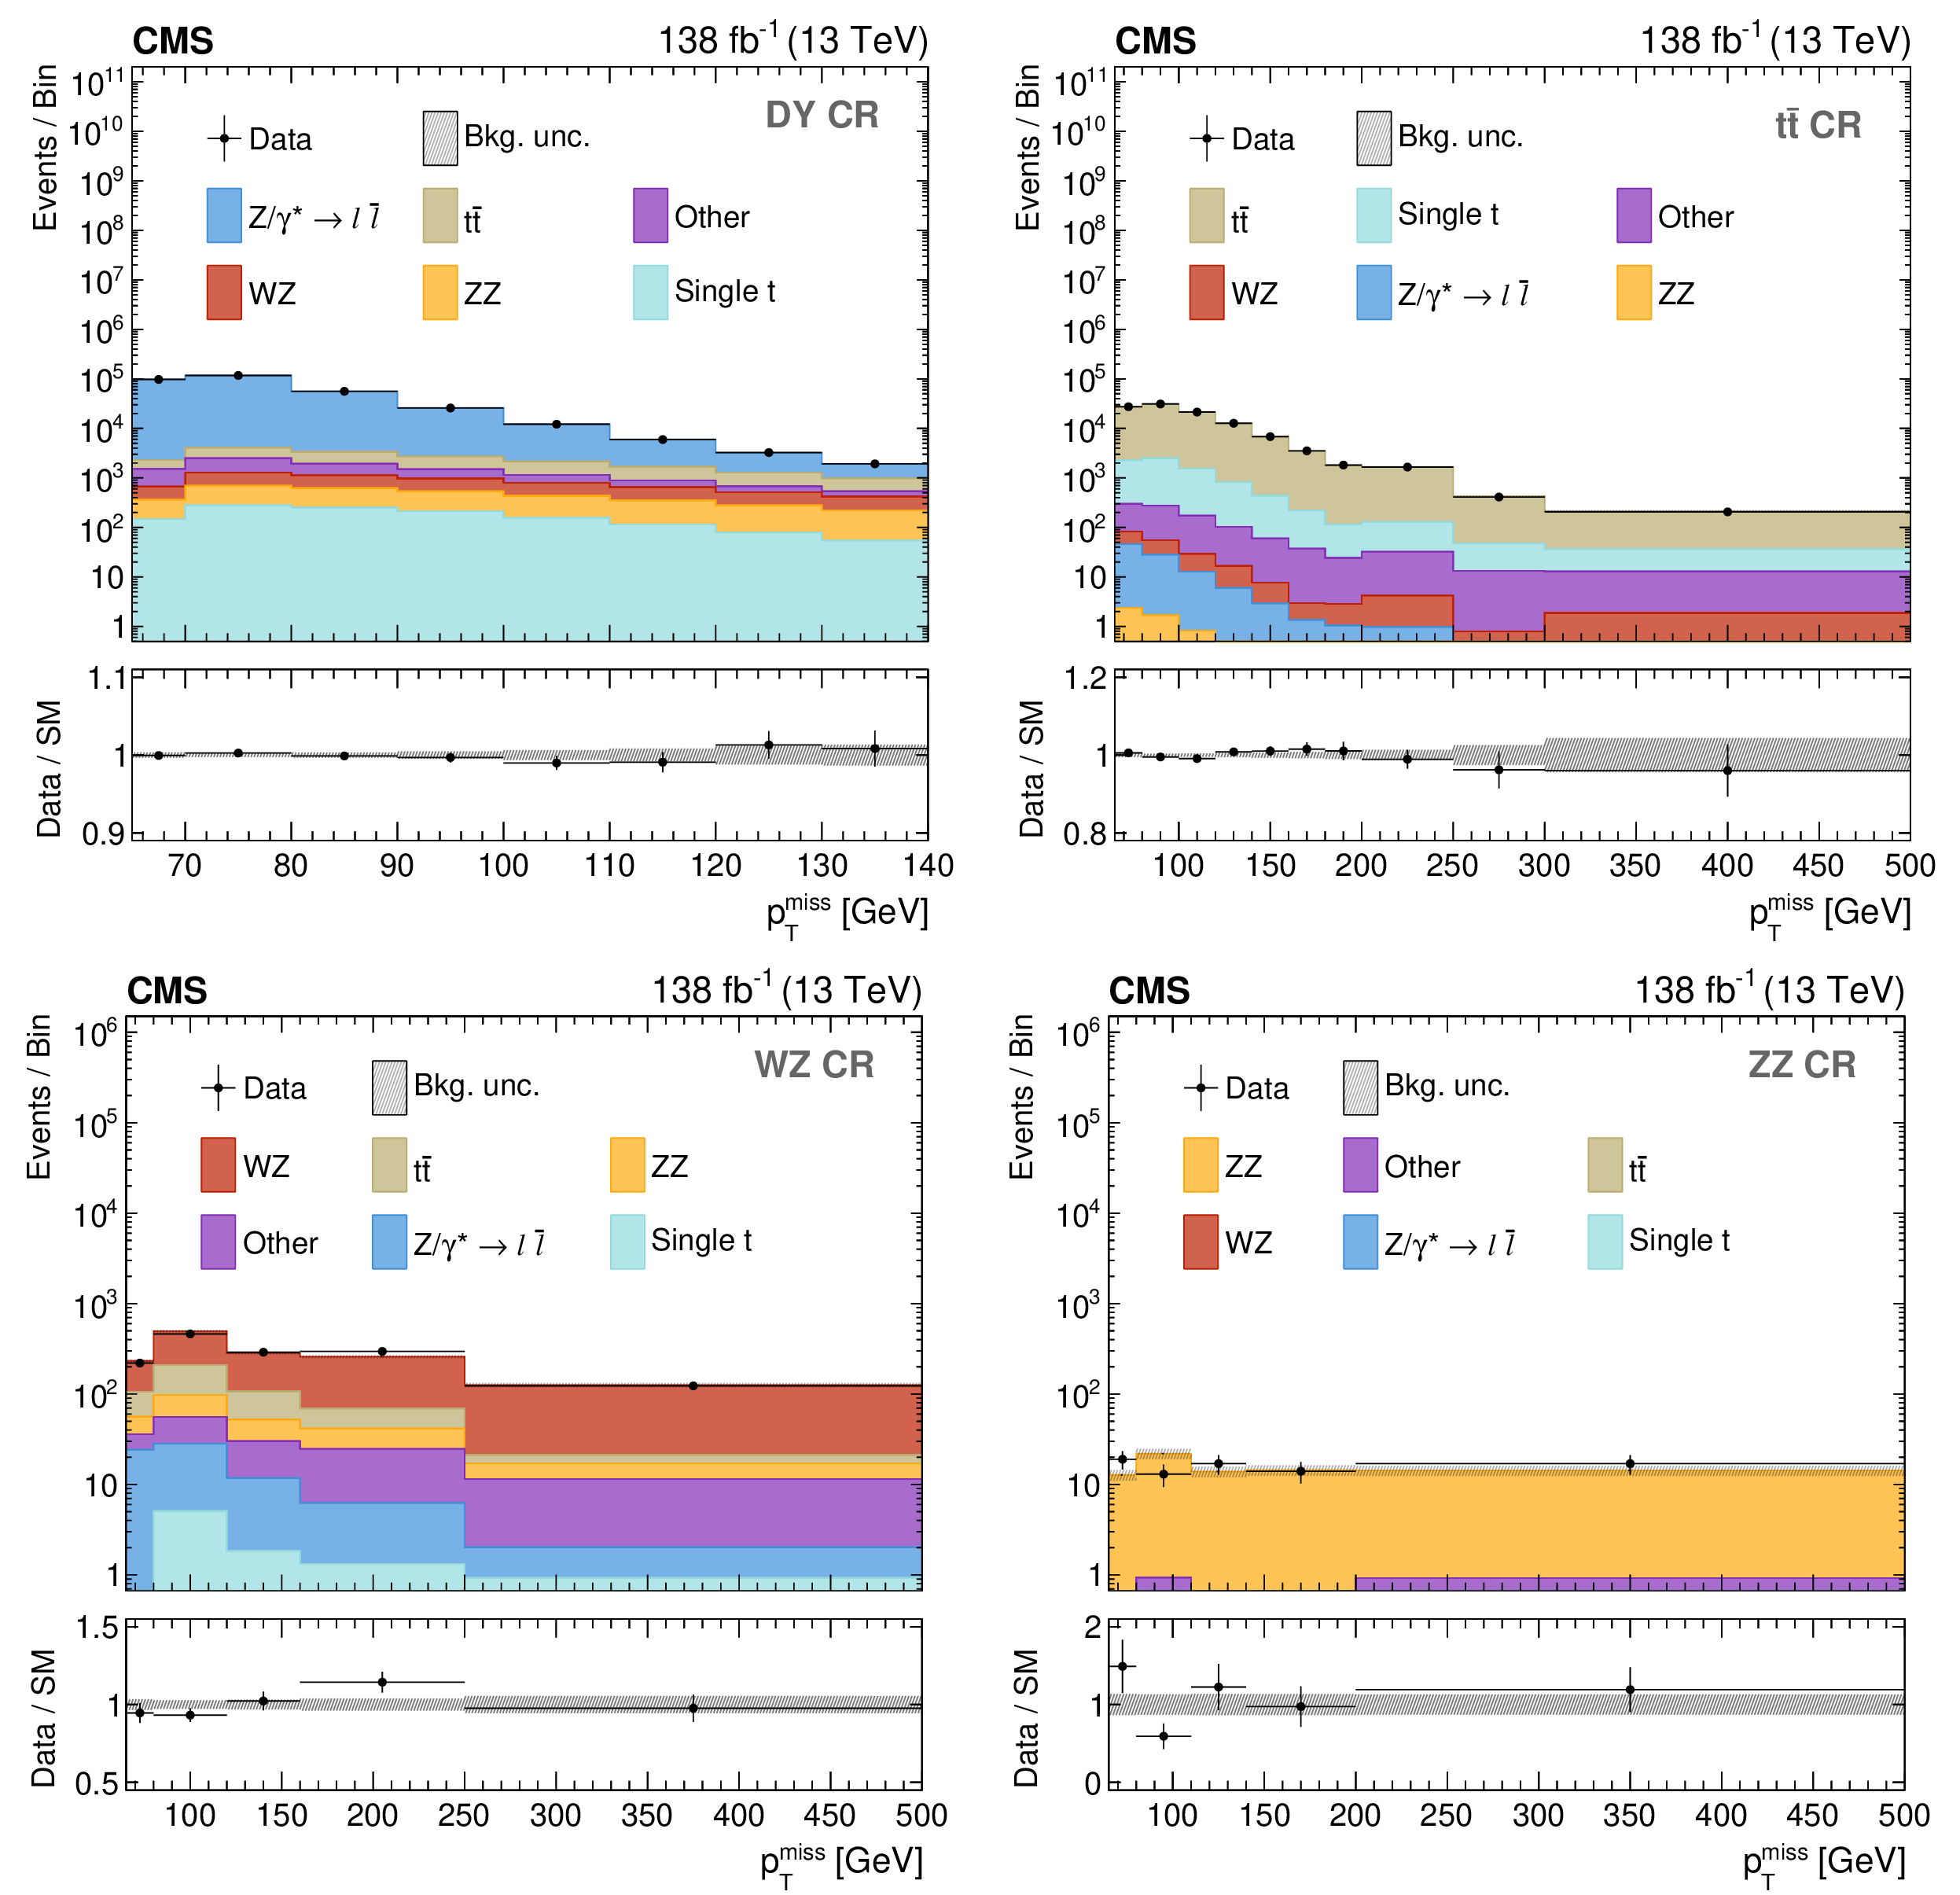
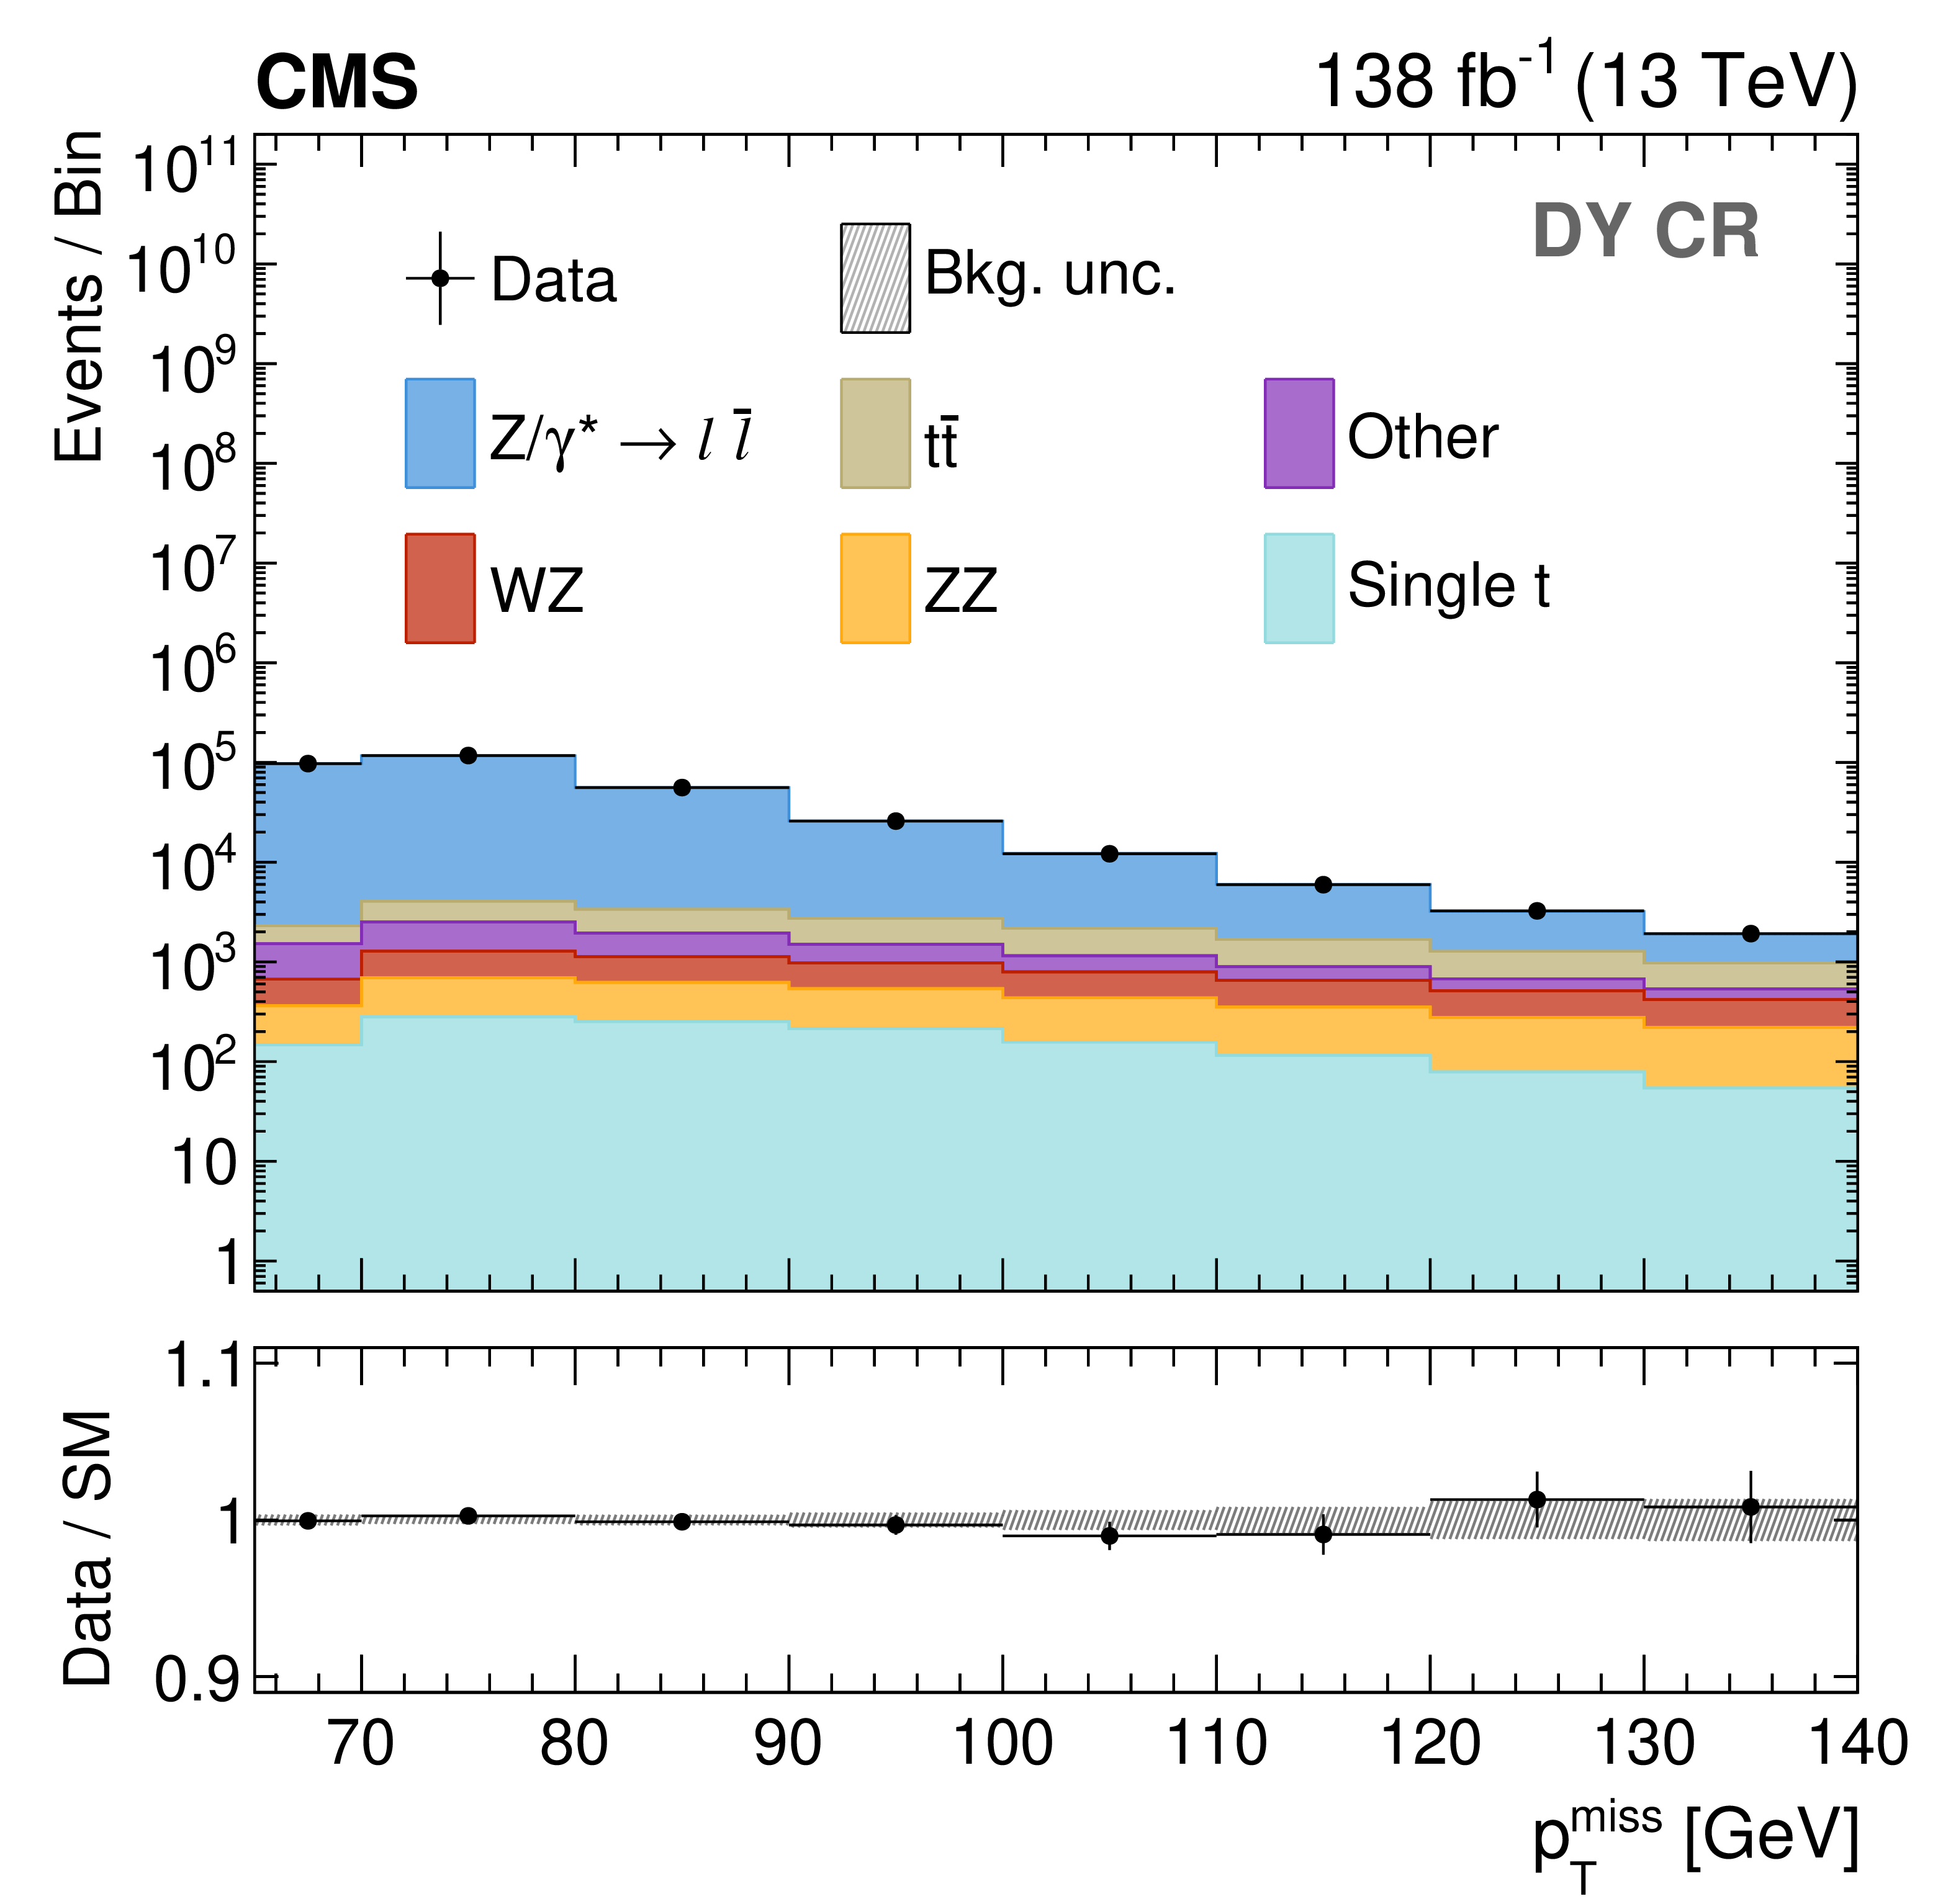
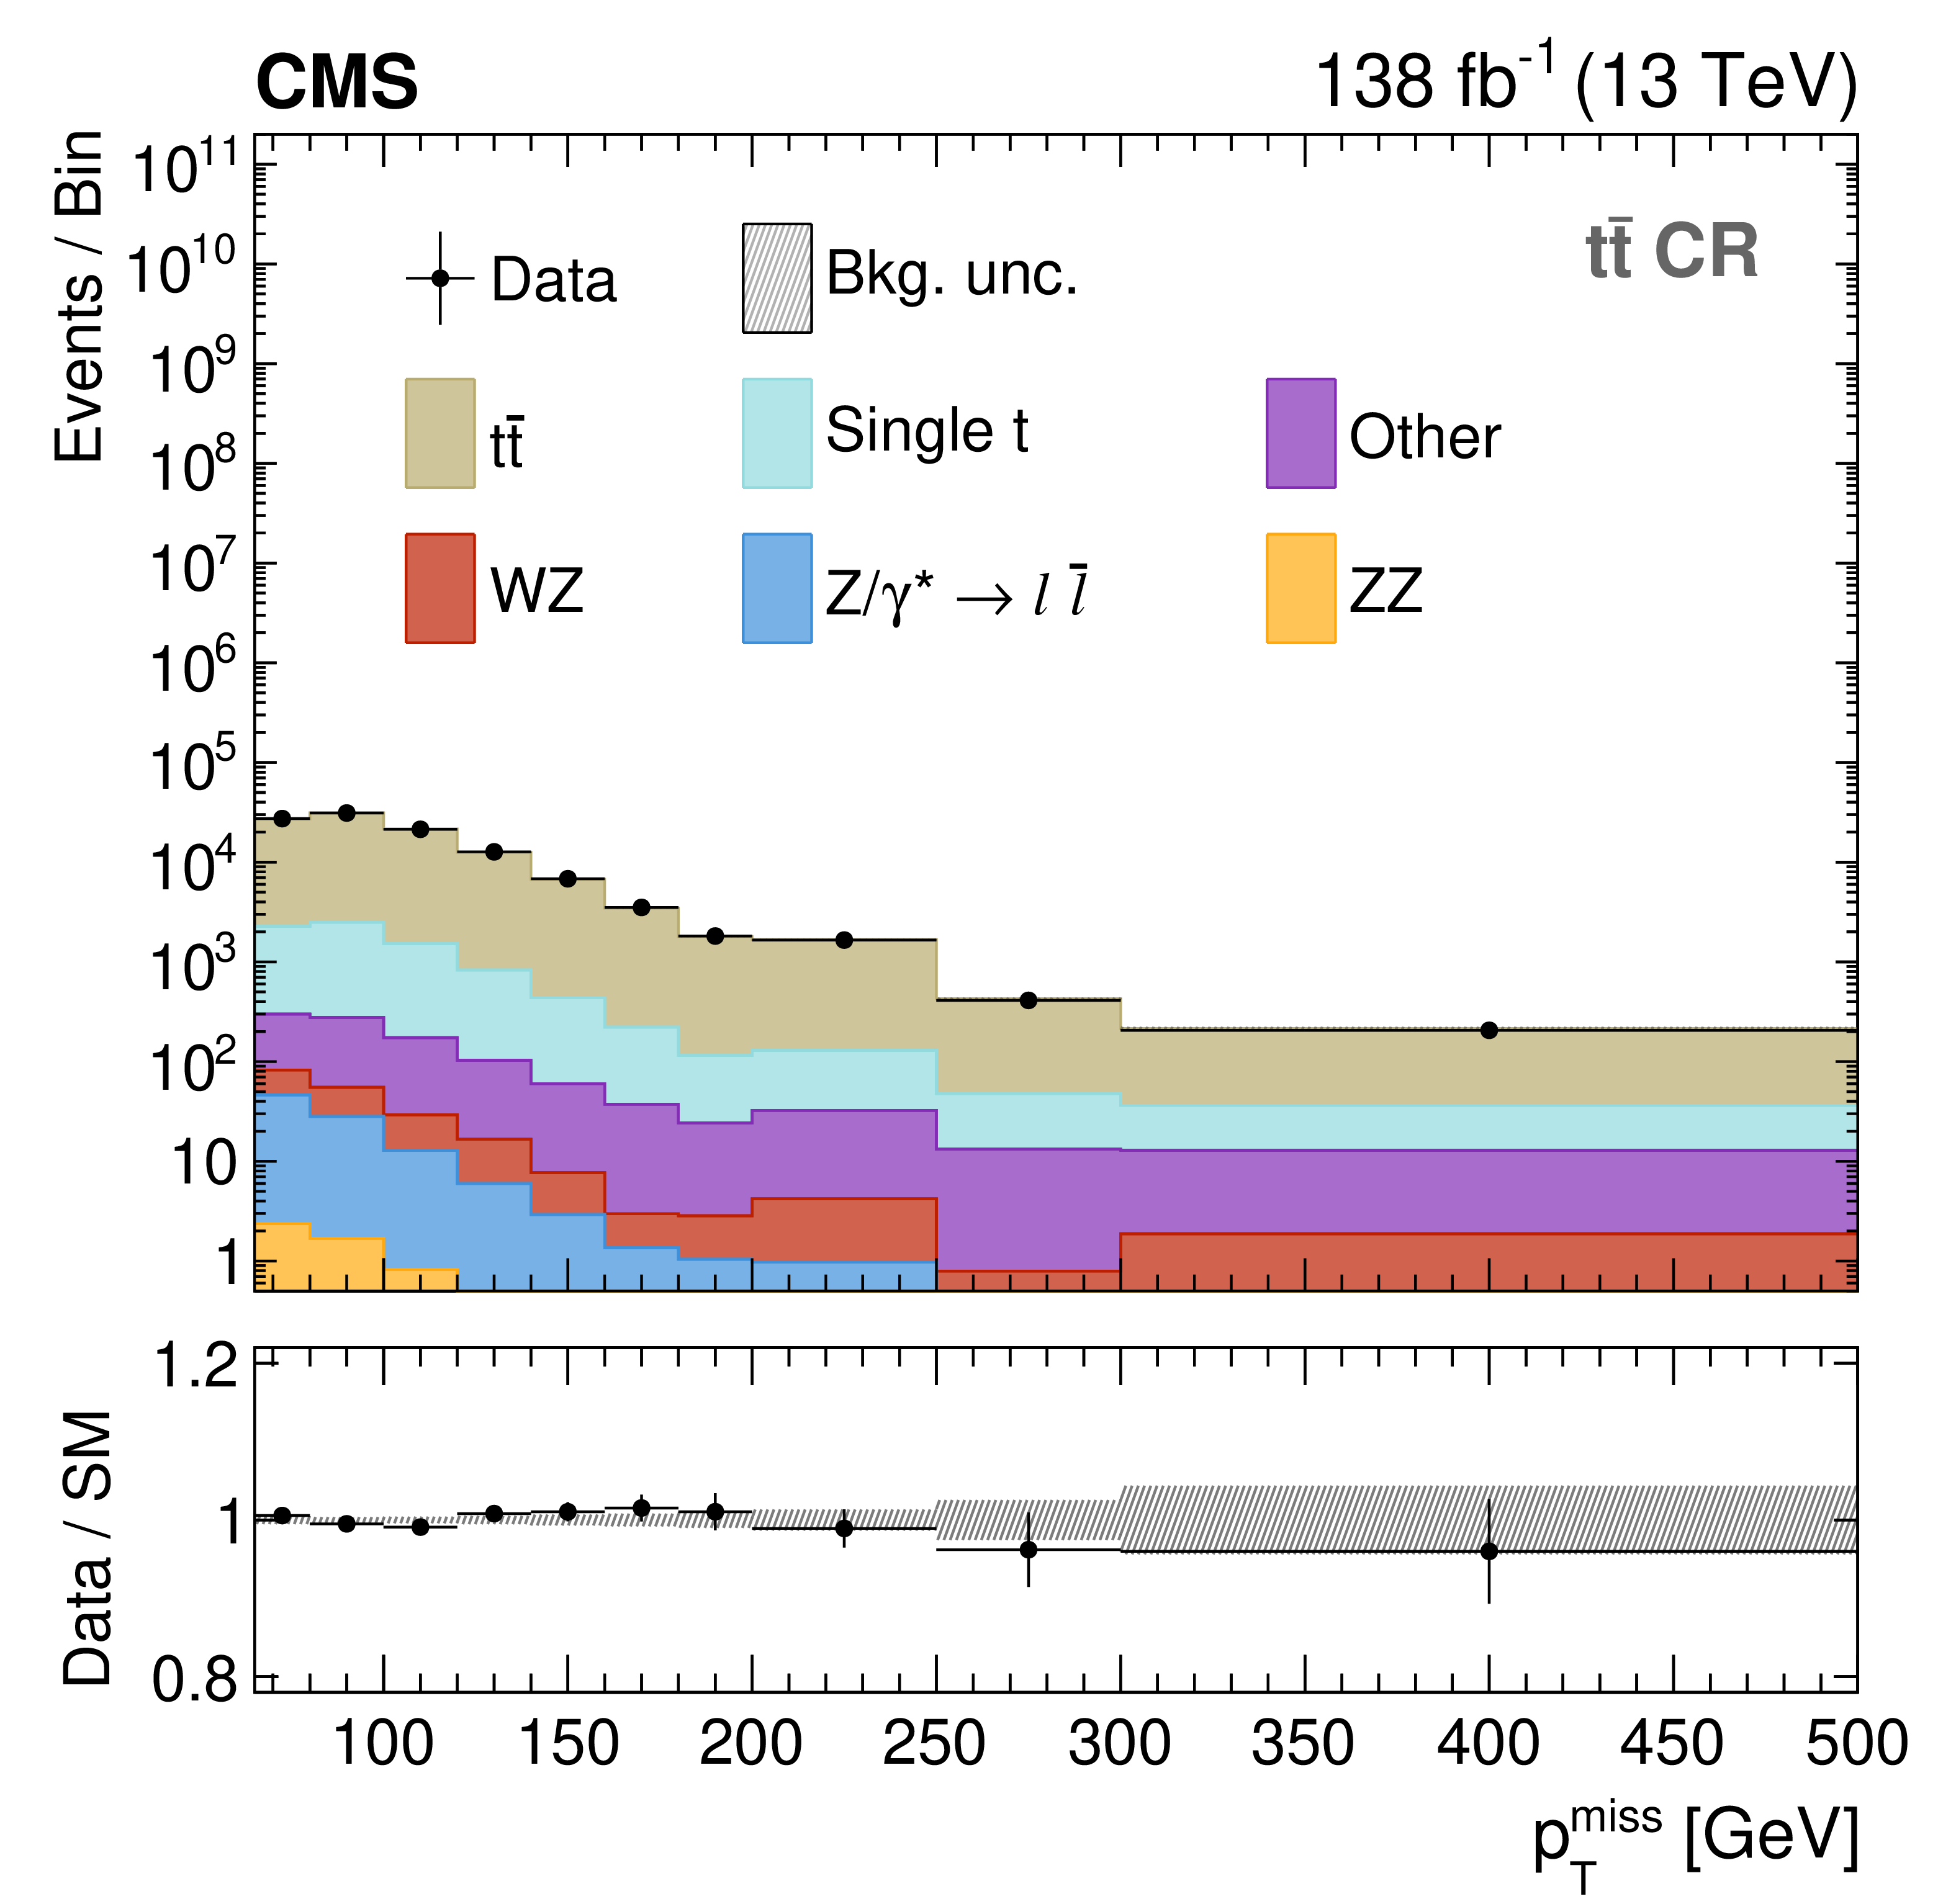
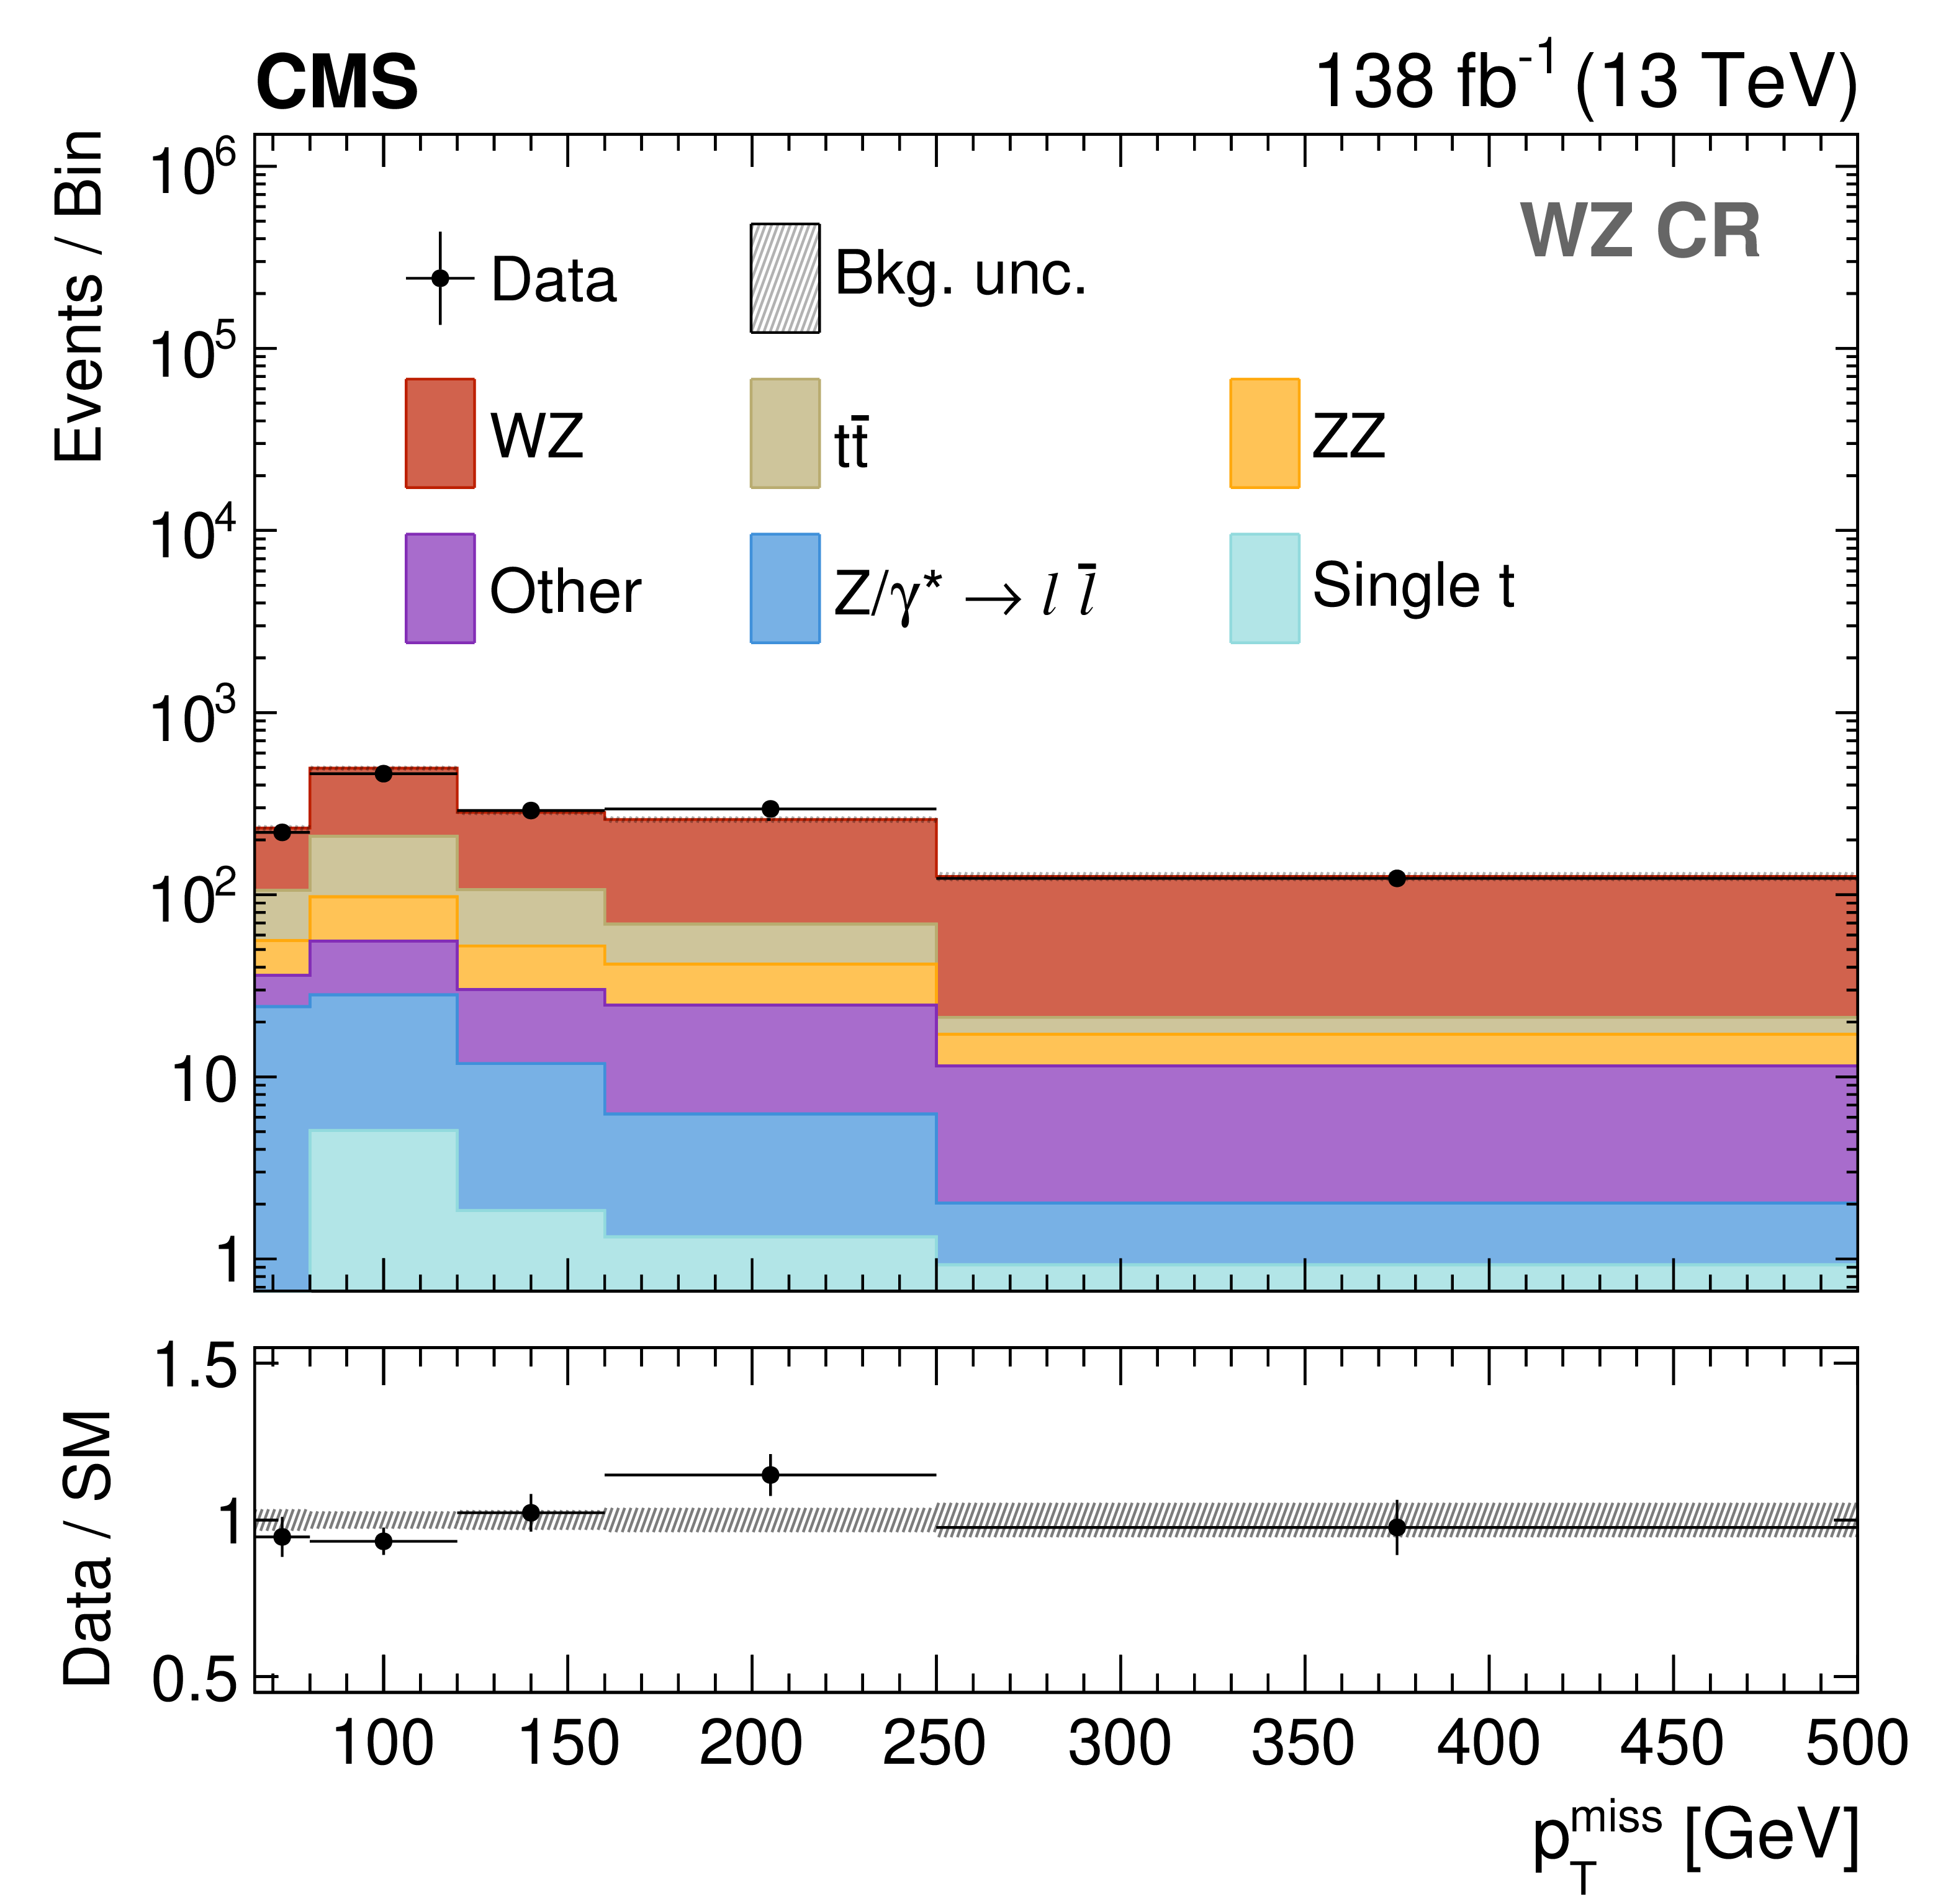
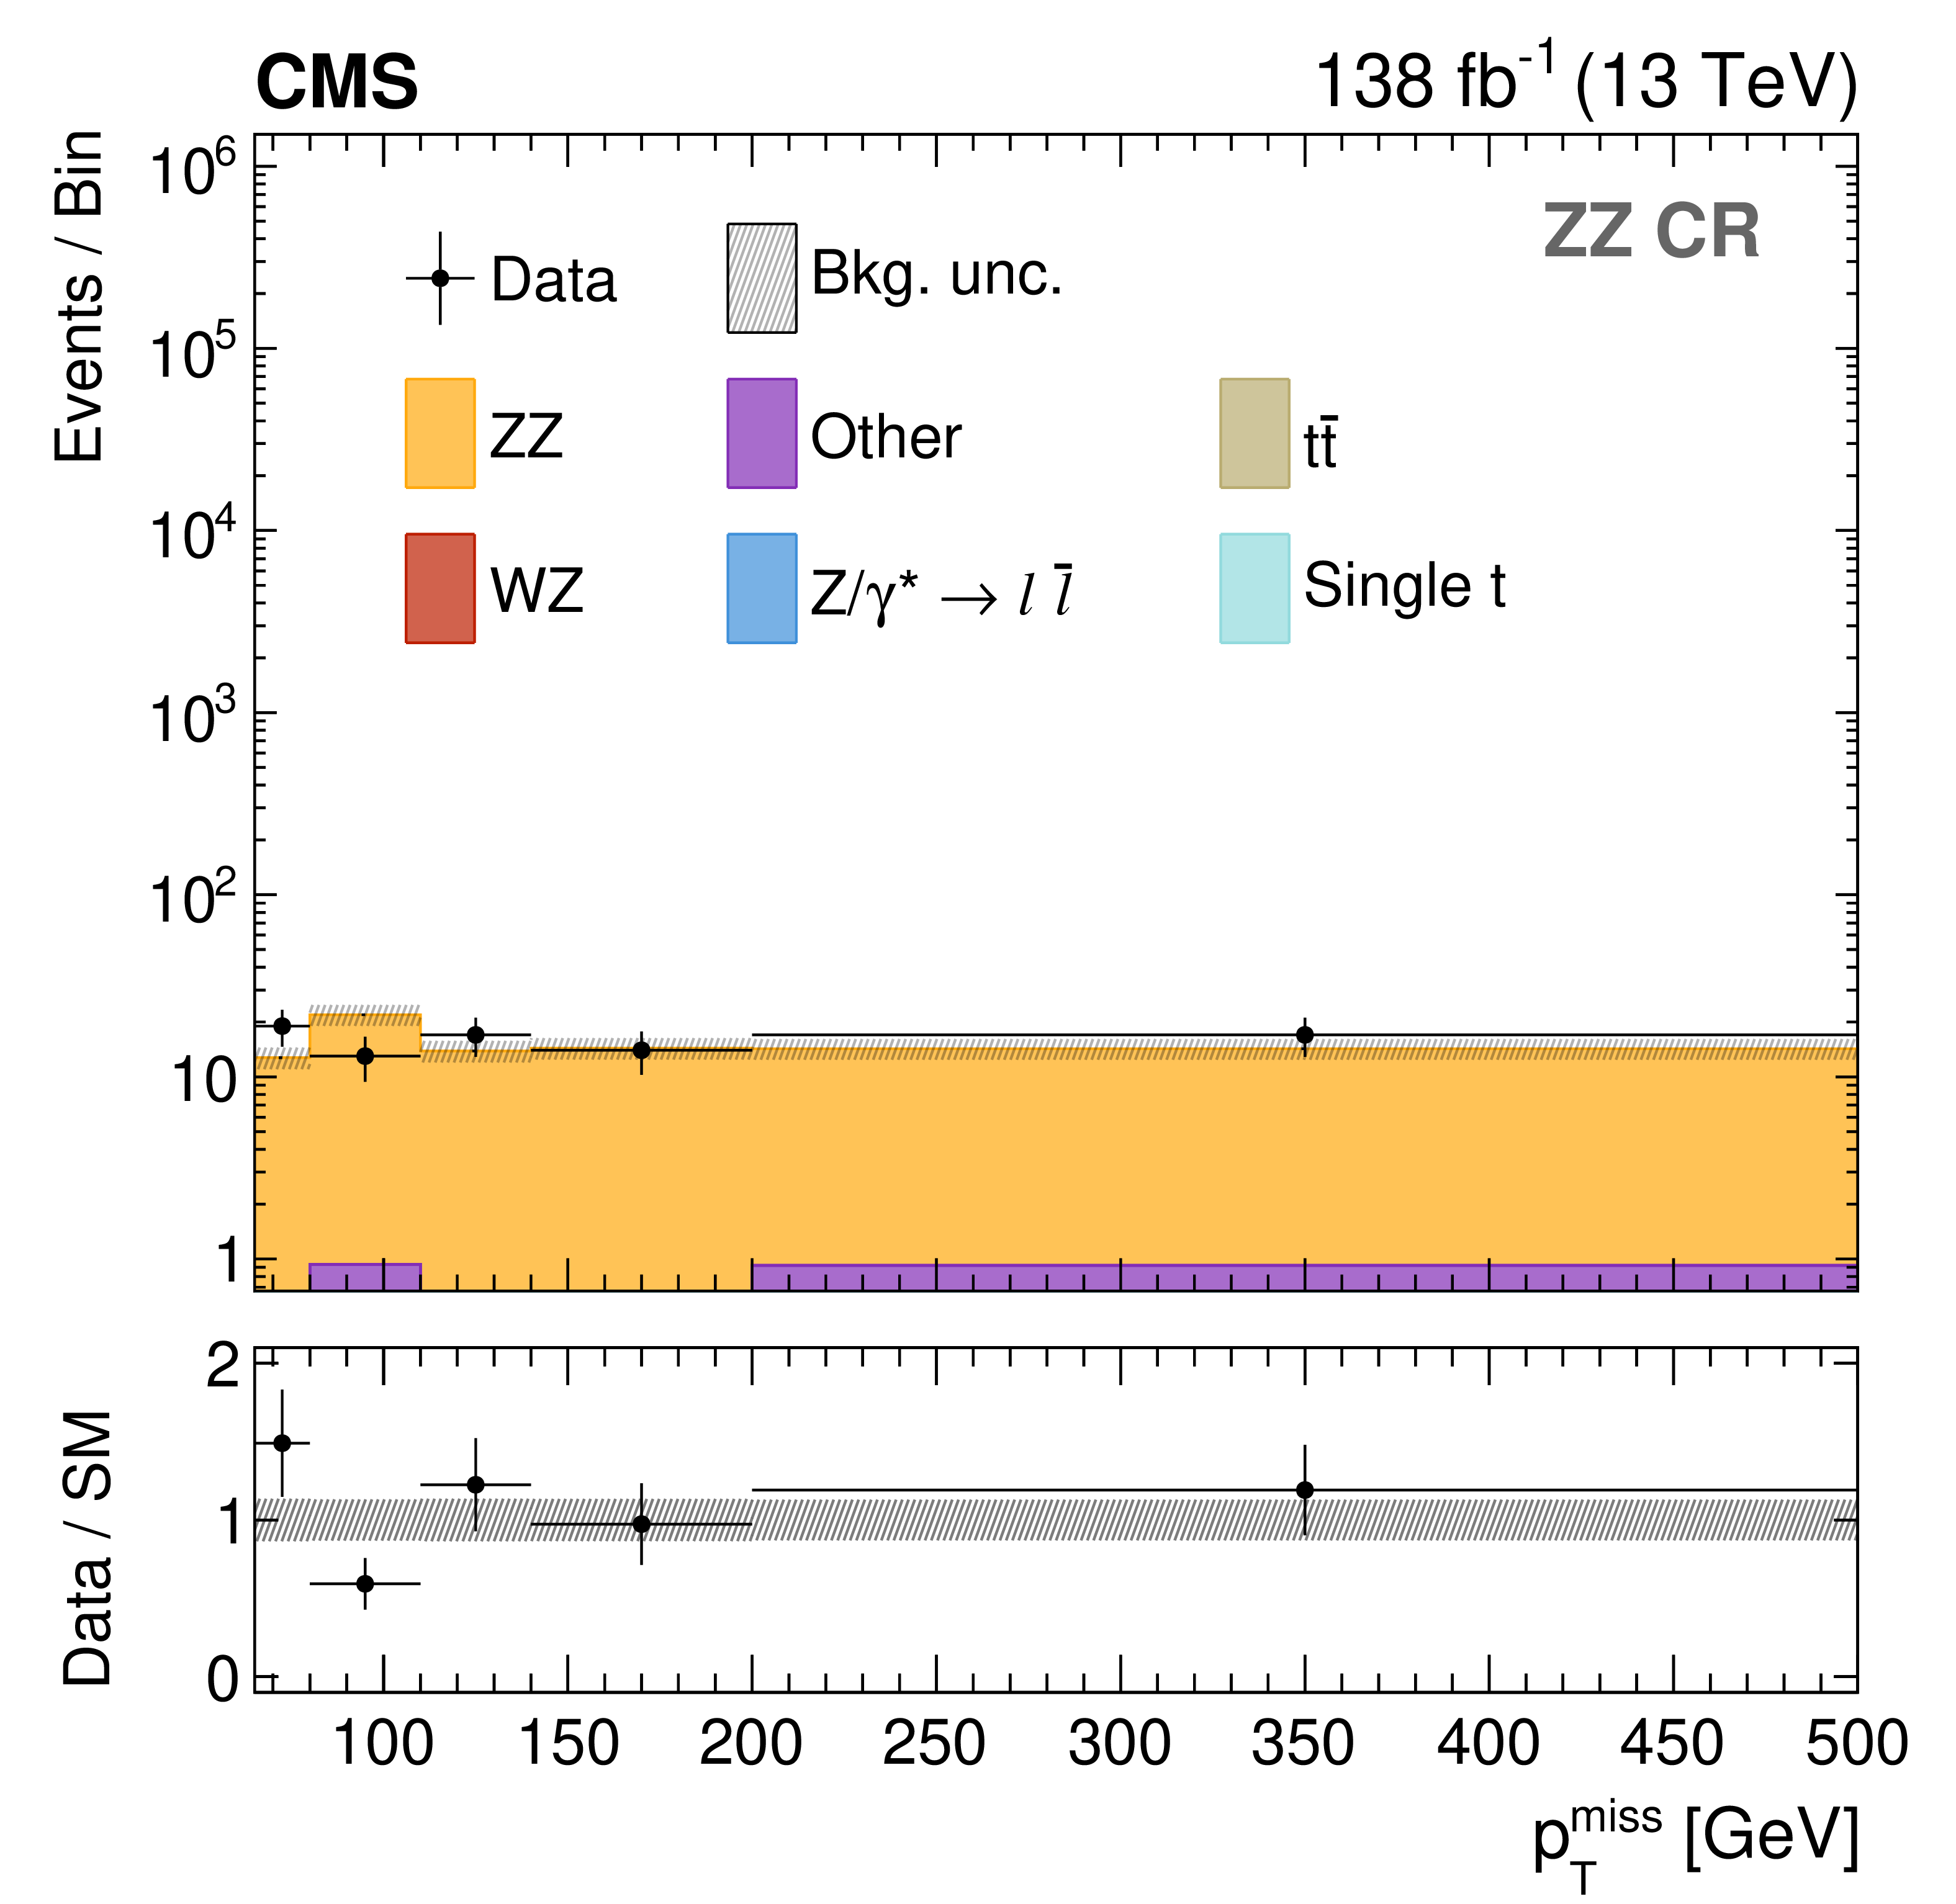
Figure 4:
Distributions in $ p_{\mathrm{T}}^\text{miss} $ for the DY (upper left), $ \mathrm{t} \overline{\mathrm{t}} $ (upper right), WZ (lower left), and ZZ (lower right) CRs. In the WZ and ZZ CRs, $ p_{\mathrm{T}}^\text{miss} $ is obtained by removing the additional leptons from the calculation. The distributions are shown after performing a background-only fit in the $ p_{\mathrm{T}}^\text{miss} $ distributions of all CRs. The last bin includes the overflow, except for the DY CR where $ p_{\mathrm{T}}^\text{miss} < $ 140 GeV. The lower panels show the post-fit values and uncertainties of the ratio between the observed data and the predicted SM backgrounds. The various background processes are represented by filled histograms. The data are shown as black circles, where the vertical bars represent the statistical uncertainty and the horizontal bars indicate the bin width. |
png pdf |
Figure 4-a:
Distributions in $ p_{\mathrm{T}}^\text{miss} $ for the DY (upper left), $ \mathrm{t} \overline{\mathrm{t}} $ (upper right), WZ (lower left), and ZZ (lower right) CRs. In the WZ and ZZ CRs, $ p_{\mathrm{T}}^\text{miss} $ is obtained by removing the additional leptons from the calculation. The distributions are shown after performing a background-only fit in the $ p_{\mathrm{T}}^\text{miss} $ distributions of all CRs. The last bin includes the overflow, except for the DY CR where $ p_{\mathrm{T}}^\text{miss} < $ 140 GeV. The lower panels show the post-fit values and uncertainties of the ratio between the observed data and the predicted SM backgrounds. The various background processes are represented by filled histograms. The data are shown as black circles, where the vertical bars represent the statistical uncertainty and the horizontal bars indicate the bin width. |
png pdf |
Figure 4-b:
Distributions in $ p_{\mathrm{T}}^\text{miss} $ for the DY (upper left), $ \mathrm{t} \overline{\mathrm{t}} $ (upper right), WZ (lower left), and ZZ (lower right) CRs. In the WZ and ZZ CRs, $ p_{\mathrm{T}}^\text{miss} $ is obtained by removing the additional leptons from the calculation. The distributions are shown after performing a background-only fit in the $ p_{\mathrm{T}}^\text{miss} $ distributions of all CRs. The last bin includes the overflow, except for the DY CR where $ p_{\mathrm{T}}^\text{miss} < $ 140 GeV. The lower panels show the post-fit values and uncertainties of the ratio between the observed data and the predicted SM backgrounds. The various background processes are represented by filled histograms. The data are shown as black circles, where the vertical bars represent the statistical uncertainty and the horizontal bars indicate the bin width. |
png pdf |
Figure 4-c:
Distributions in $ p_{\mathrm{T}}^\text{miss} $ for the DY (upper left), $ \mathrm{t} \overline{\mathrm{t}} $ (upper right), WZ (lower left), and ZZ (lower right) CRs. In the WZ and ZZ CRs, $ p_{\mathrm{T}}^\text{miss} $ is obtained by removing the additional leptons from the calculation. The distributions are shown after performing a background-only fit in the $ p_{\mathrm{T}}^\text{miss} $ distributions of all CRs. The last bin includes the overflow, except for the DY CR where $ p_{\mathrm{T}}^\text{miss} < $ 140 GeV. The lower panels show the post-fit values and uncertainties of the ratio between the observed data and the predicted SM backgrounds. The various background processes are represented by filled histograms. The data are shown as black circles, where the vertical bars represent the statistical uncertainty and the horizontal bars indicate the bin width. |
png pdf |
Figure 4-d:
Distributions in $ p_{\mathrm{T}}^\text{miss} $ for the DY (upper left), $ \mathrm{t} \overline{\mathrm{t}} $ (upper right), WZ (lower left), and ZZ (lower right) CRs. In the WZ and ZZ CRs, $ p_{\mathrm{T}}^\text{miss} $ is obtained by removing the additional leptons from the calculation. The distributions are shown after performing a background-only fit in the $ p_{\mathrm{T}}^\text{miss} $ distributions of all CRs. The last bin includes the overflow, except for the DY CR where $ p_{\mathrm{T}}^\text{miss} < $ 140 GeV. The lower panels show the post-fit values and uncertainties of the ratio between the observed data and the predicted SM backgrounds. The various background processes are represented by filled histograms. The data are shown as black circles, where the vertical bars represent the statistical uncertainty and the horizontal bars indicate the bin width. |
png pdf |
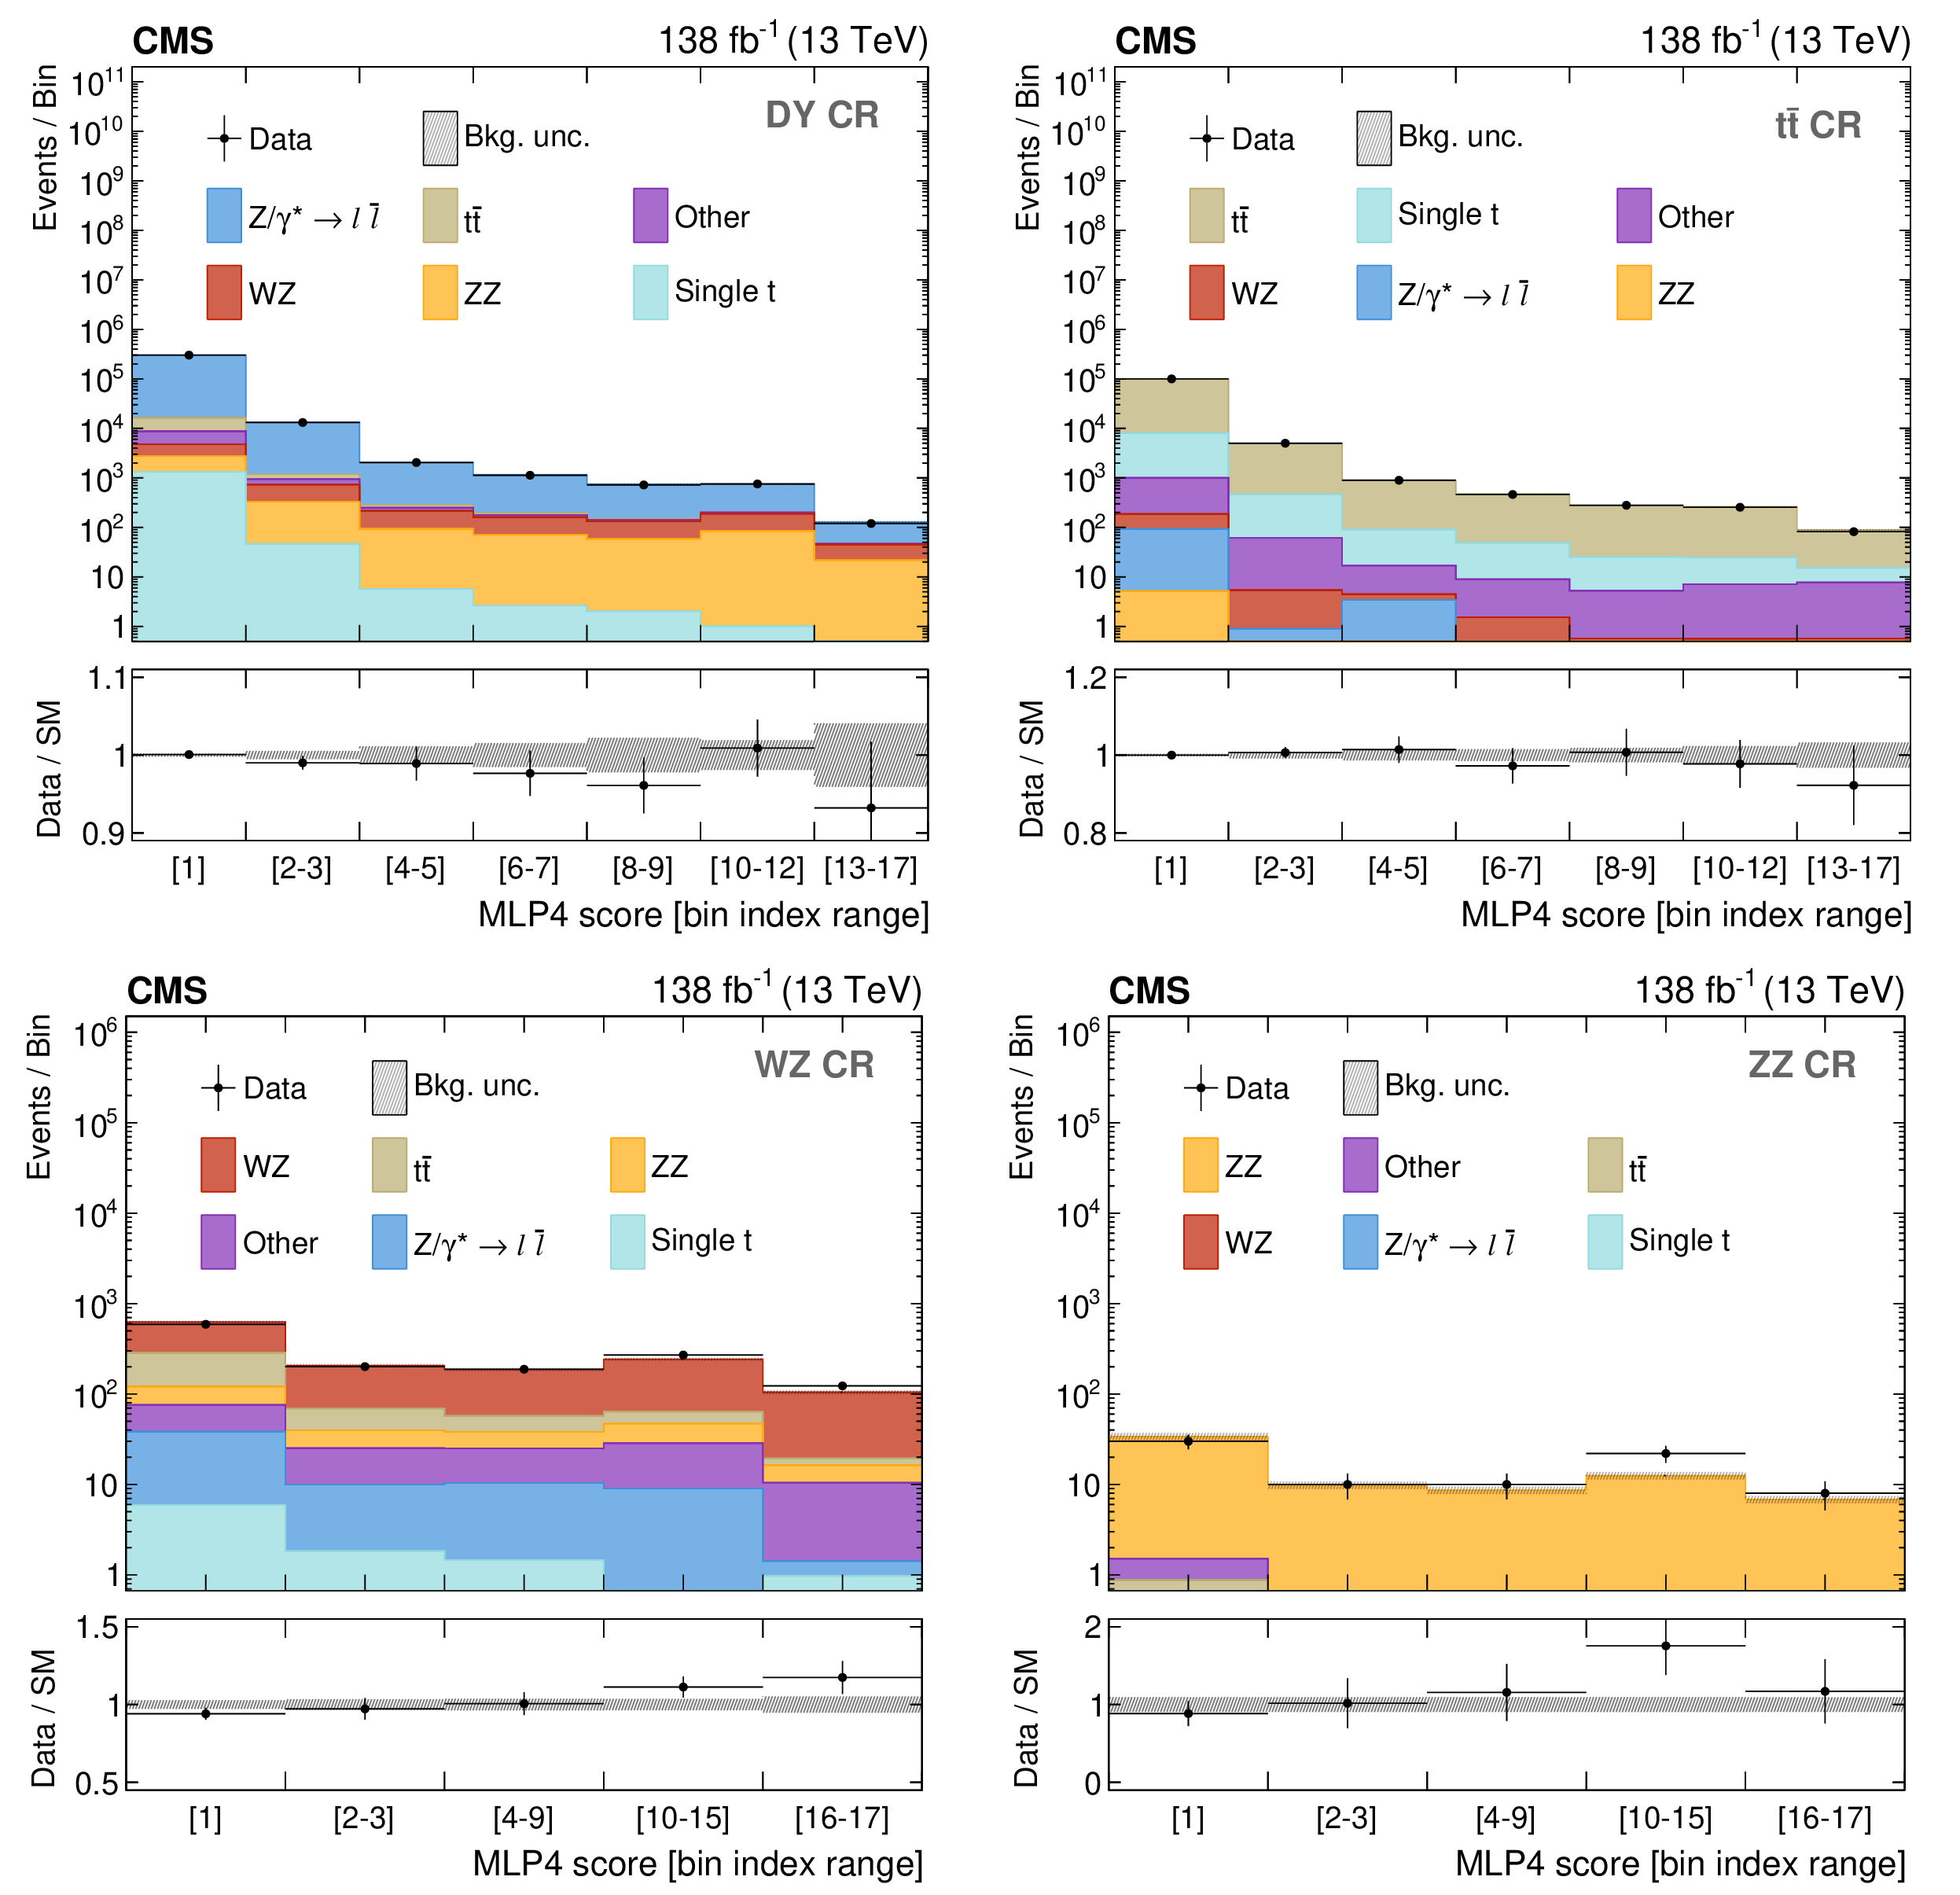
Figure 5:
Distributions in the MLP4 score for the DY (upper left), $ \mathrm{t} \overline{\mathrm{t}} $ (upper right), WZ (lower left), and ZZ (lower right) CRs. The distributions are shown after performing a background-only fit in the MLP4 score distributions of all CRs. The labels on the horizontal axes indicate the MLP4 intervals that define a given bin. The lower panels show the post-fit values and uncertainties of the ratio between the observed data and the predicted SM backgrounds. The various background processes are represented by filled histograms. The data are shown as black dots, where the vertical bars represent the statistical uncertainty and the horizontal bars indicate the bin width. |
png pdf |
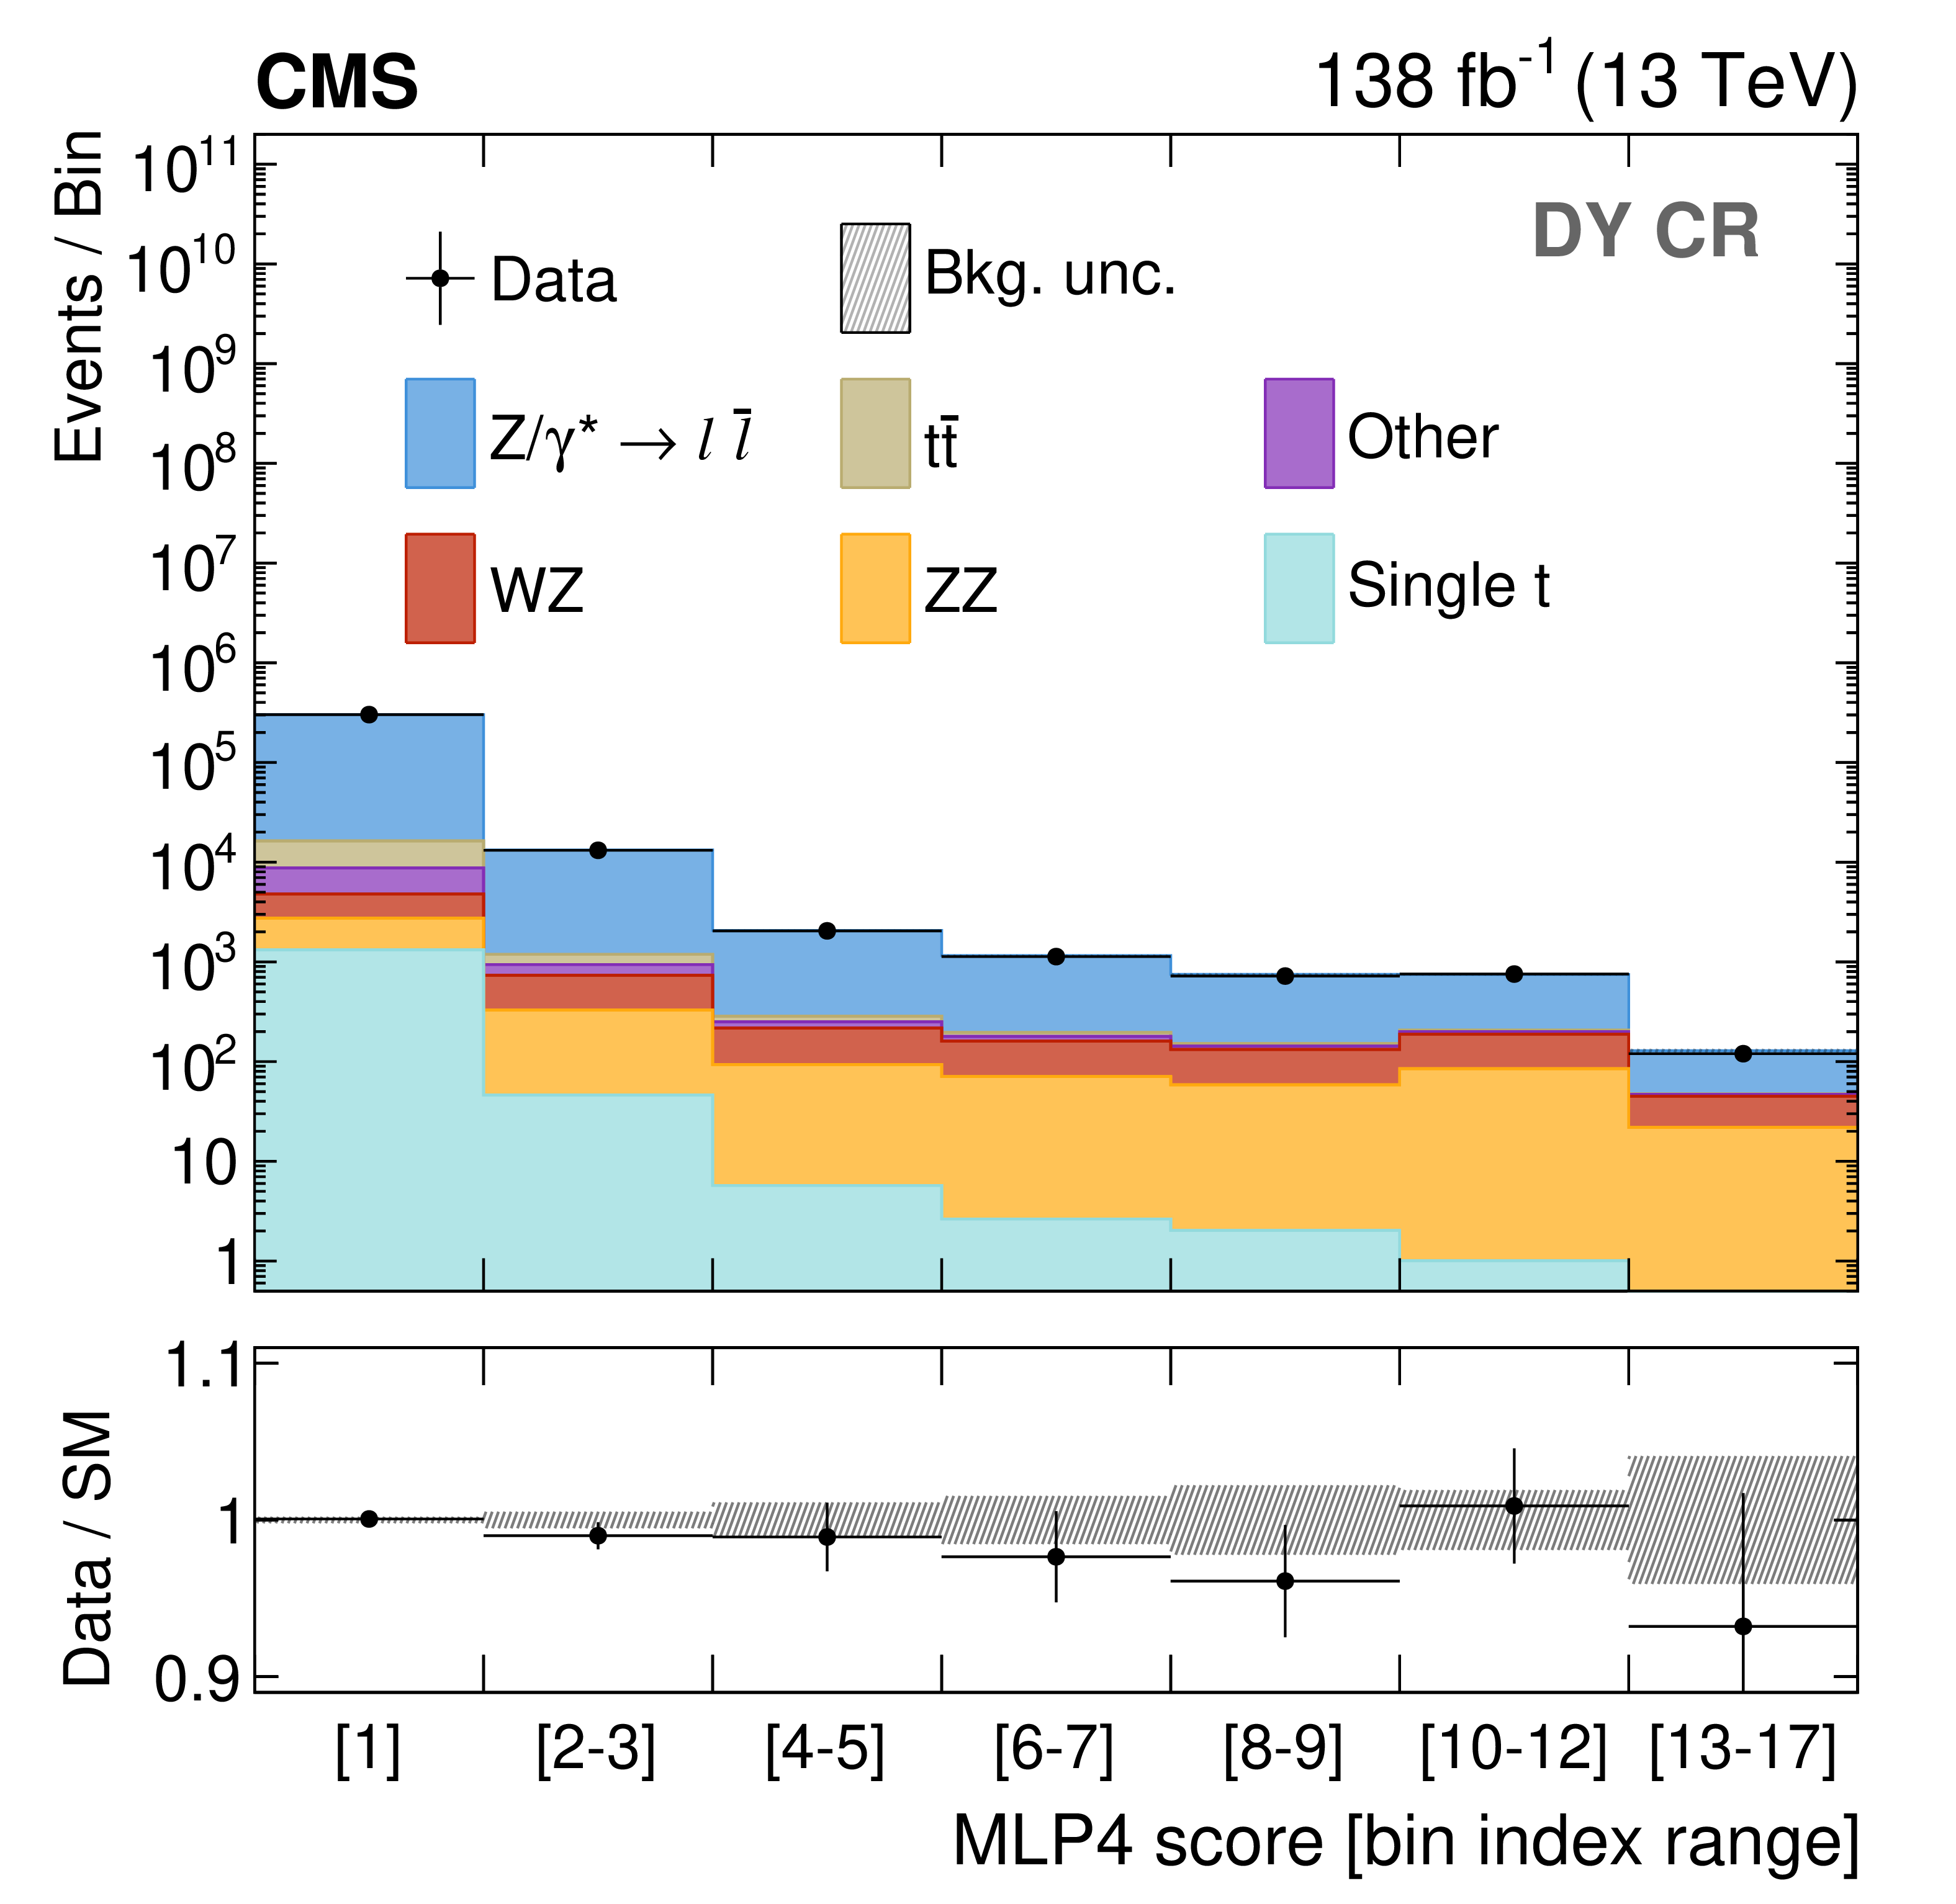
Figure 5-a:
Distributions in the MLP4 score for the DY (upper left), $ \mathrm{t} \overline{\mathrm{t}} $ (upper right), WZ (lower left), and ZZ (lower right) CRs. The distributions are shown after performing a background-only fit in the MLP4 score distributions of all CRs. The labels on the horizontal axes indicate the MLP4 intervals that define a given bin. The lower panels show the post-fit values and uncertainties of the ratio between the observed data and the predicted SM backgrounds. The various background processes are represented by filled histograms. The data are shown as black dots, where the vertical bars represent the statistical uncertainty and the horizontal bars indicate the bin width. |
png pdf |
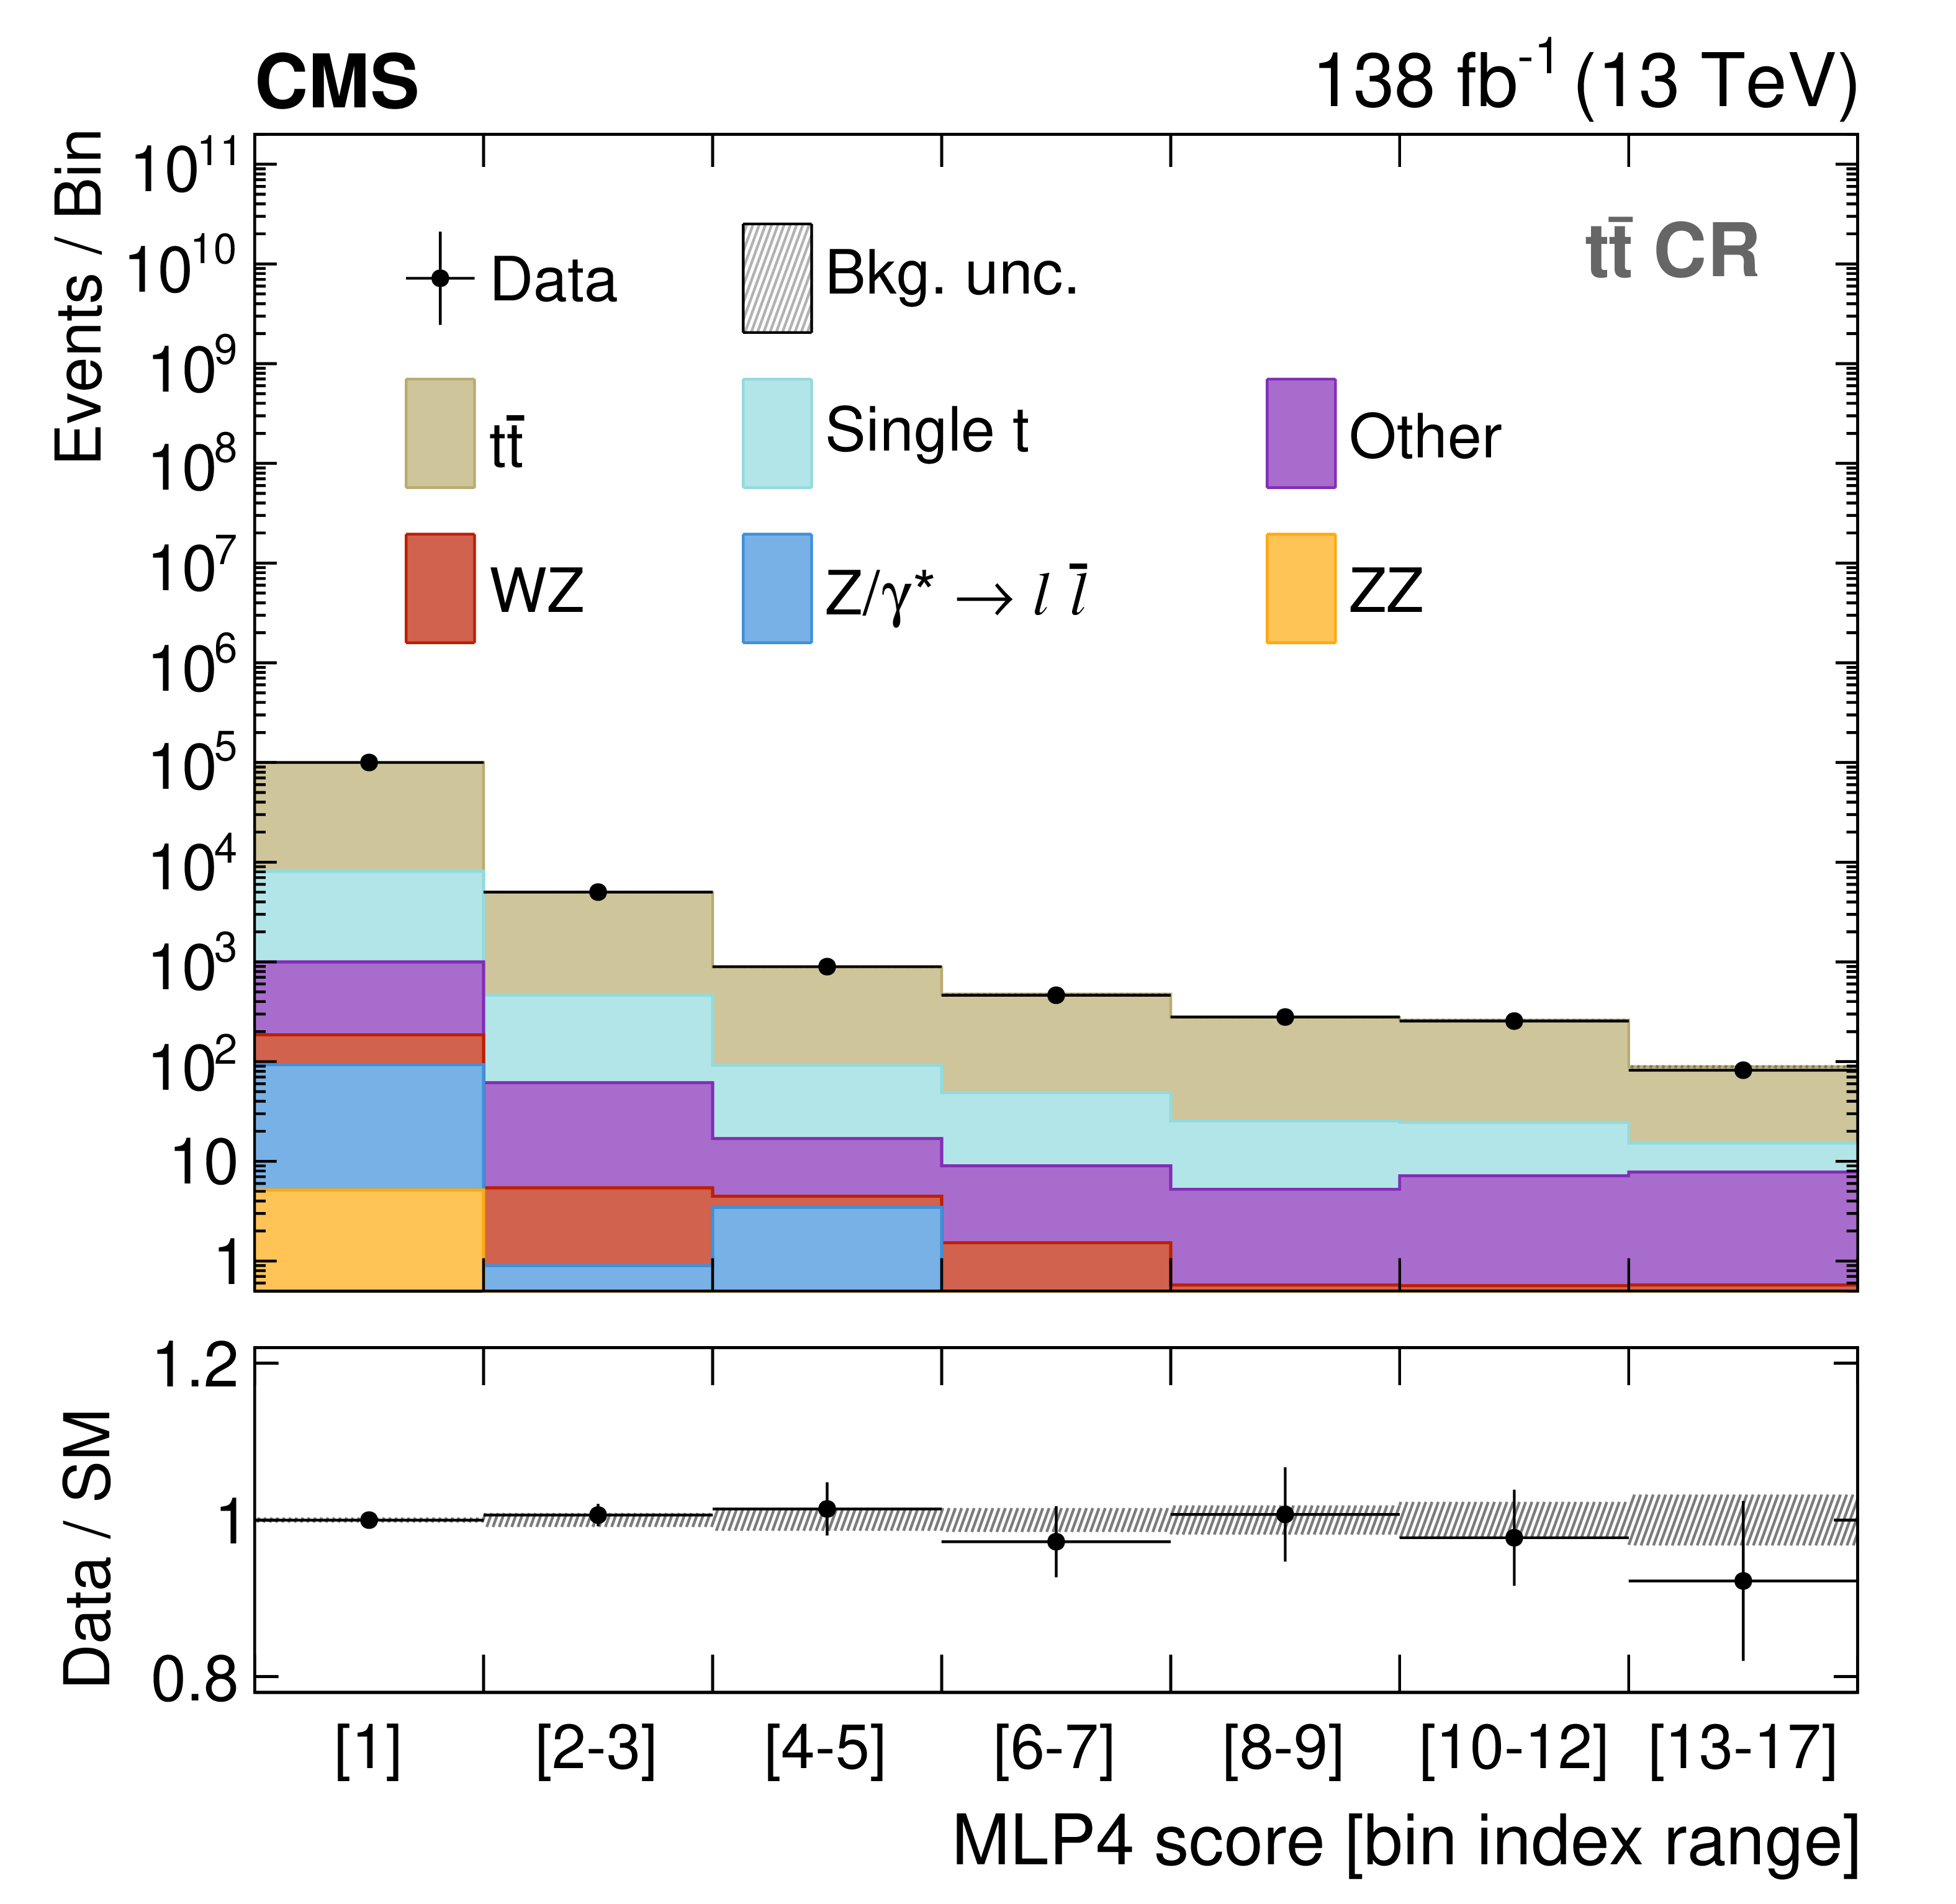
Figure 5-b:
Distributions in the MLP4 score for the DY (upper left), $ \mathrm{t} \overline{\mathrm{t}} $ (upper right), WZ (lower left), and ZZ (lower right) CRs. The distributions are shown after performing a background-only fit in the MLP4 score distributions of all CRs. The labels on the horizontal axes indicate the MLP4 intervals that define a given bin. The lower panels show the post-fit values and uncertainties of the ratio between the observed data and the predicted SM backgrounds. The various background processes are represented by filled histograms. The data are shown as black dots, where the vertical bars represent the statistical uncertainty and the horizontal bars indicate the bin width. |

png pdf |
Figure 5-c:
Distributions in the MLP4 score for the DY (upper left), $ \mathrm{t} \overline{\mathrm{t}} $ (upper right), WZ (lower left), and ZZ (lower right) CRs. The distributions are shown after performing a background-only fit in the MLP4 score distributions of all CRs. The labels on the horizontal axes indicate the MLP4 intervals that define a given bin. The lower panels show the post-fit values and uncertainties of the ratio between the observed data and the predicted SM backgrounds. The various background processes are represented by filled histograms. The data are shown as black dots, where the vertical bars represent the statistical uncertainty and the horizontal bars indicate the bin width. |
png pdf |
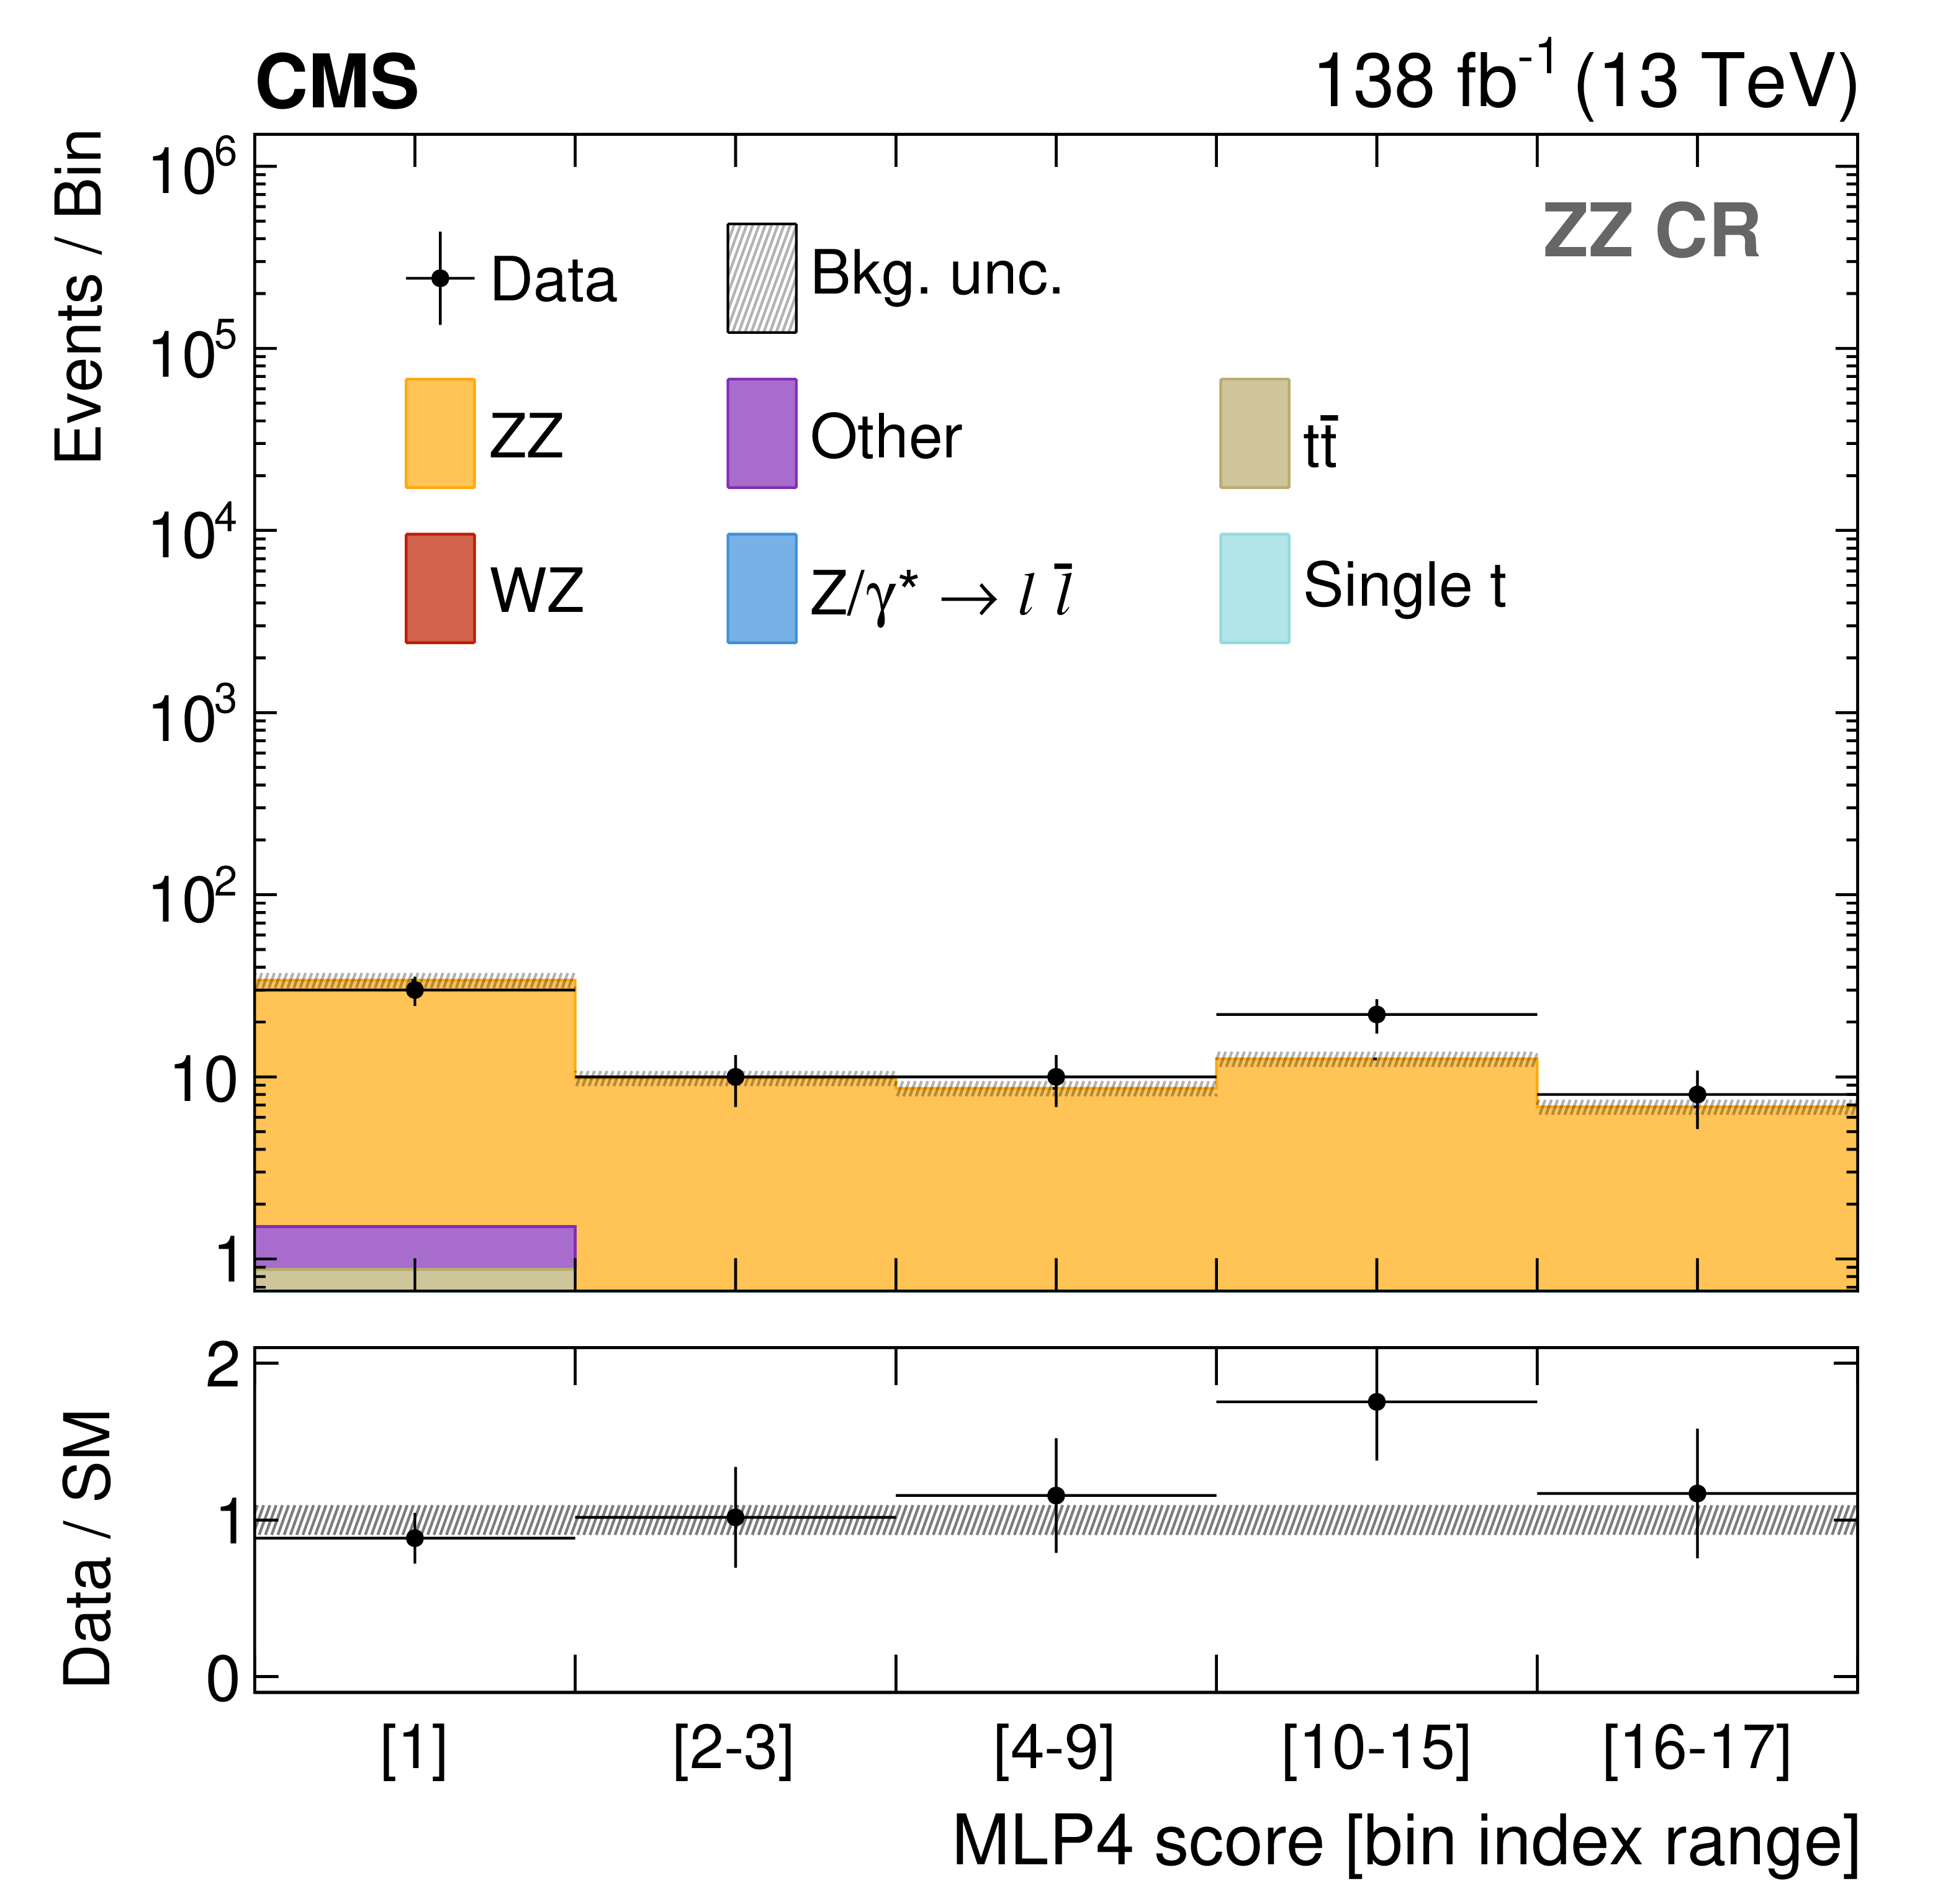
Figure 5-d:
Distributions in the MLP4 score for the DY (upper left), $ \mathrm{t} \overline{\mathrm{t}} $ (upper right), WZ (lower left), and ZZ (lower right) CRs. The distributions are shown after performing a background-only fit in the MLP4 score distributions of all CRs. The labels on the horizontal axes indicate the MLP4 intervals that define a given bin. The lower panels show the post-fit values and uncertainties of the ratio between the observed data and the predicted SM backgrounds. The various background processes are represented by filled histograms. The data are shown as black dots, where the vertical bars represent the statistical uncertainty and the horizontal bars indicate the bin width. |
png pdf |
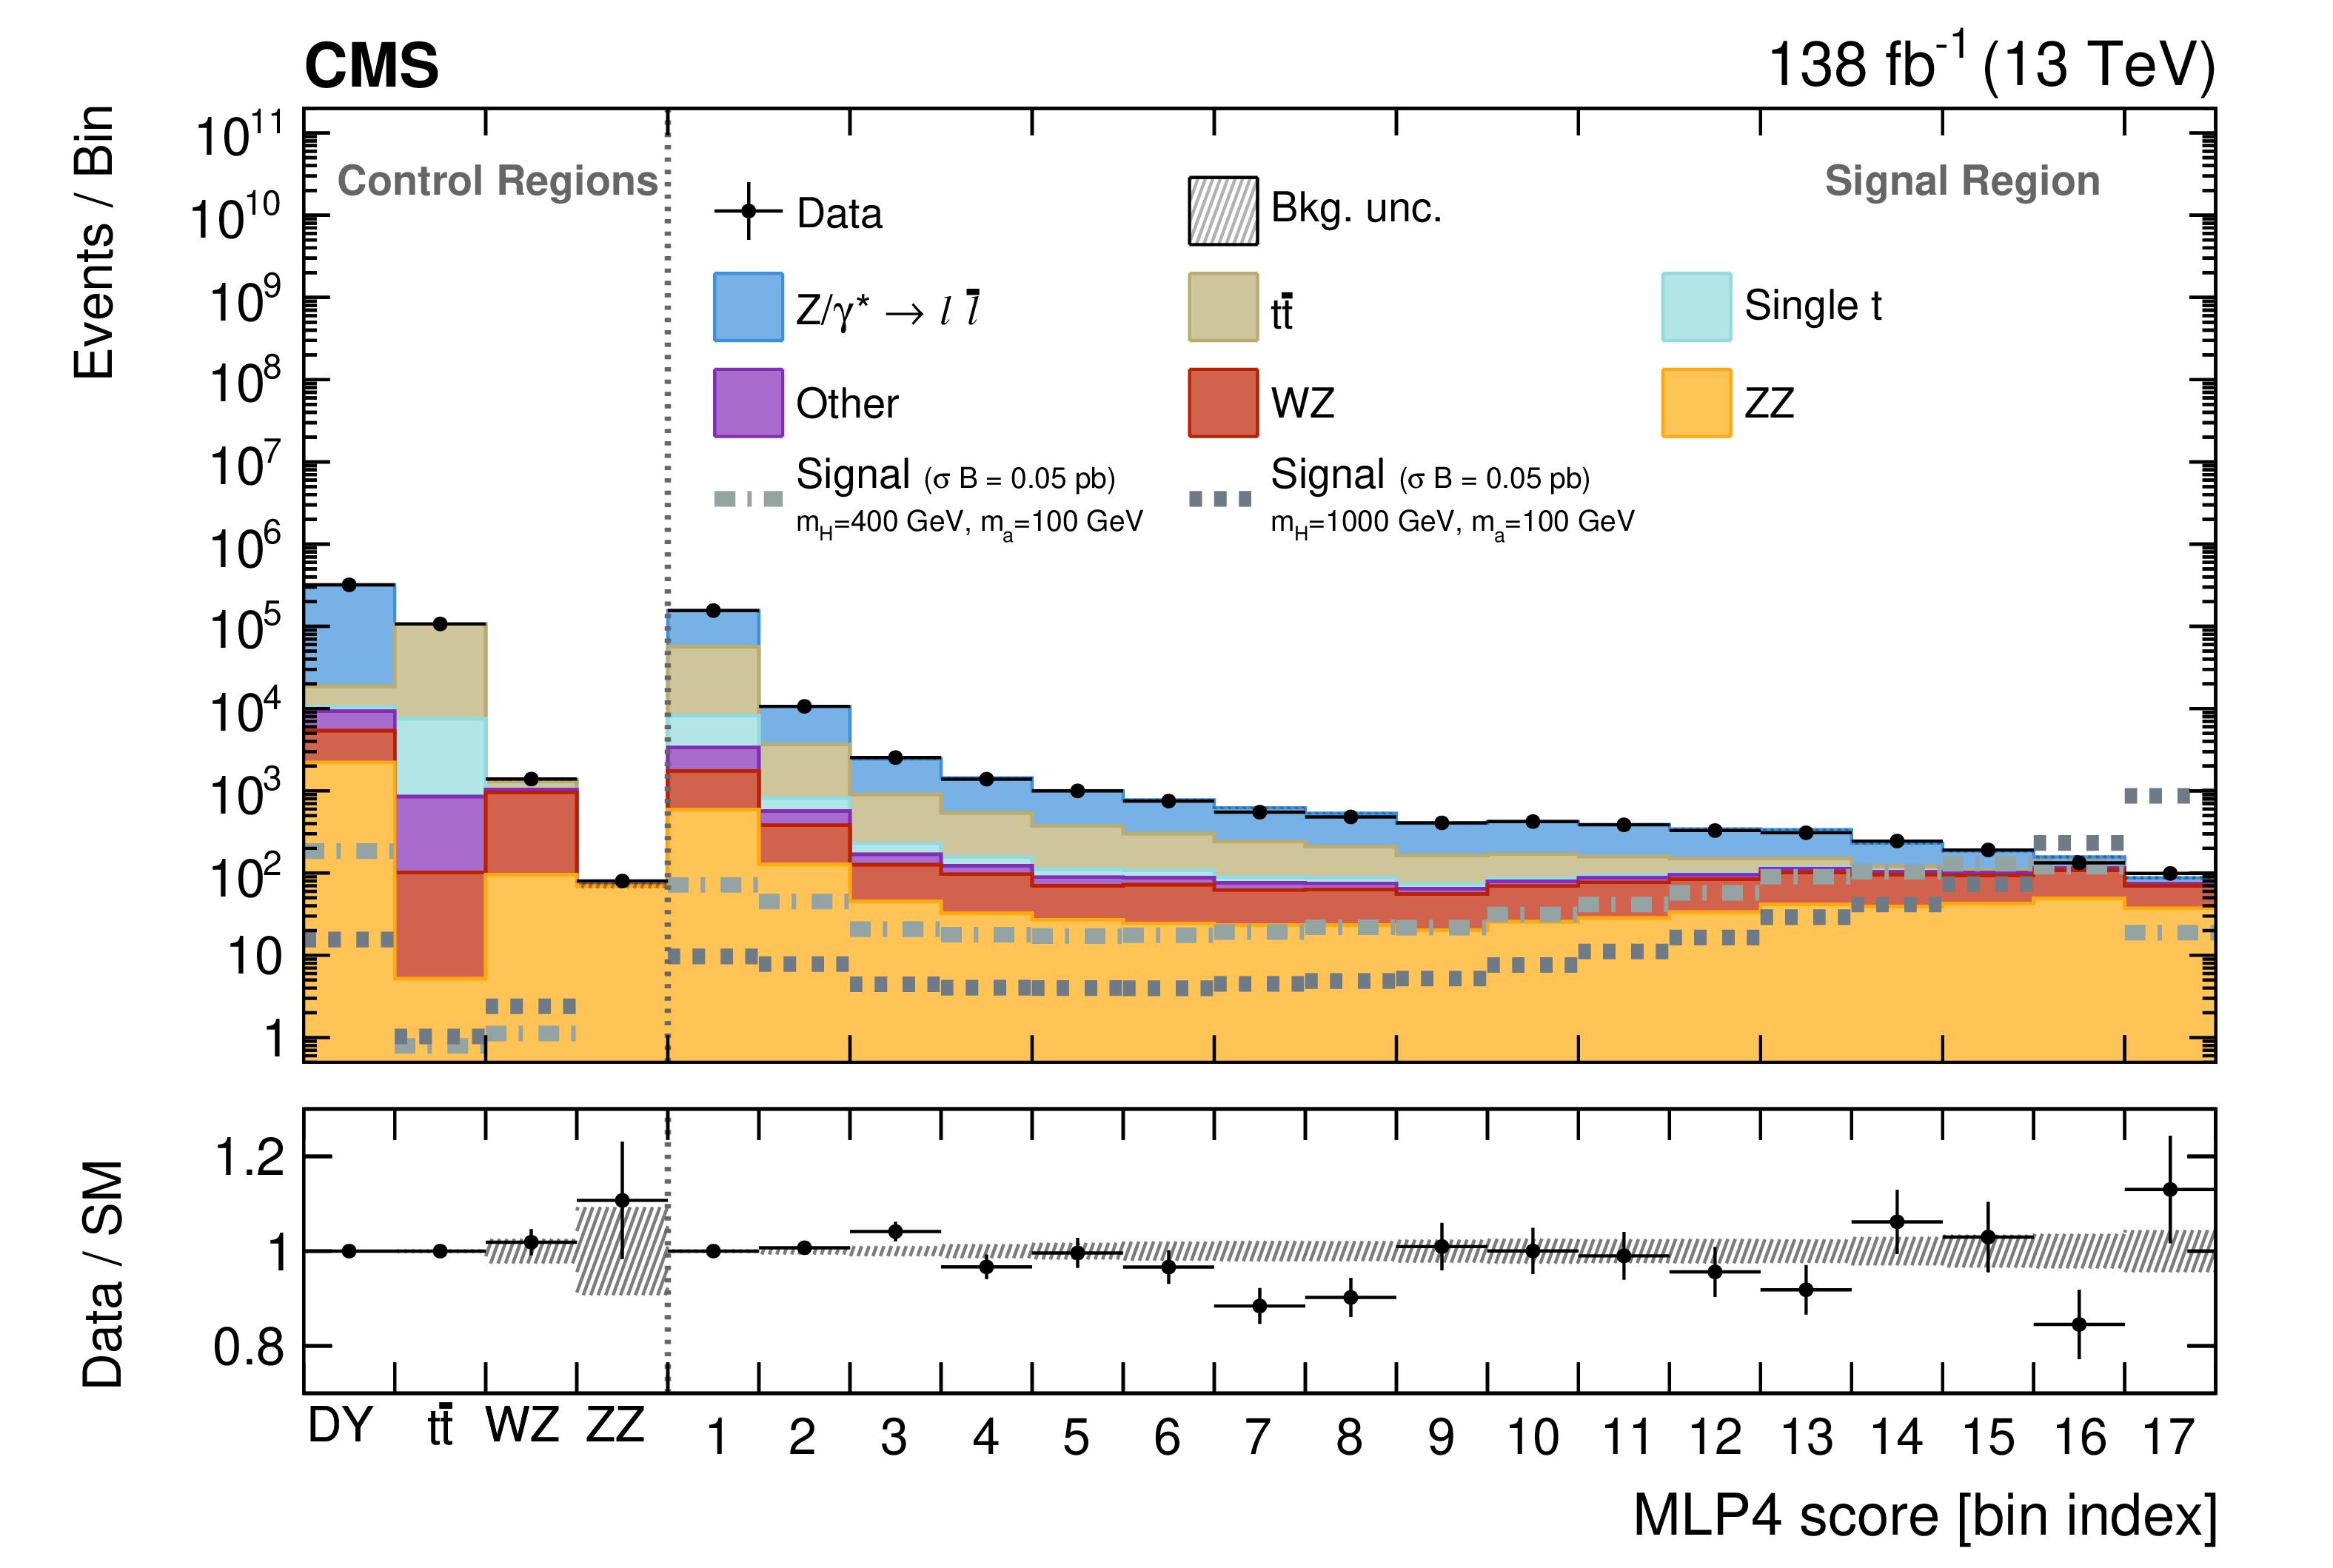
Figure 6:
Main statistical discriminant of the analysis used to extract the signal after having performed a background-only fit to the observed data. The left side of the upper panel, separated by a vertical dotted line from the right side, shows the four CRs used to estimate the normalization of the main background processes entering the SR. The right side shows the full MLP4 score distribution in the SR used to discriminate between signal and background. The various background processes are represented by filled histograms. The data points are shown as black dots, with vertical bars representing the statistical uncertainty and horizontal bars indicating the bin width, while the signal scenarios under consideration are represented with a dashed-dotted line. The benchmark signal cross section is set to 0.05 pb for proper visualization purposes. The figure comprises the full combination of all final states and categories for the full data set. The lower panel shows the post-fit values and uncertainties of the ratio between the observed data and the predicted SM background. |
png pdf |
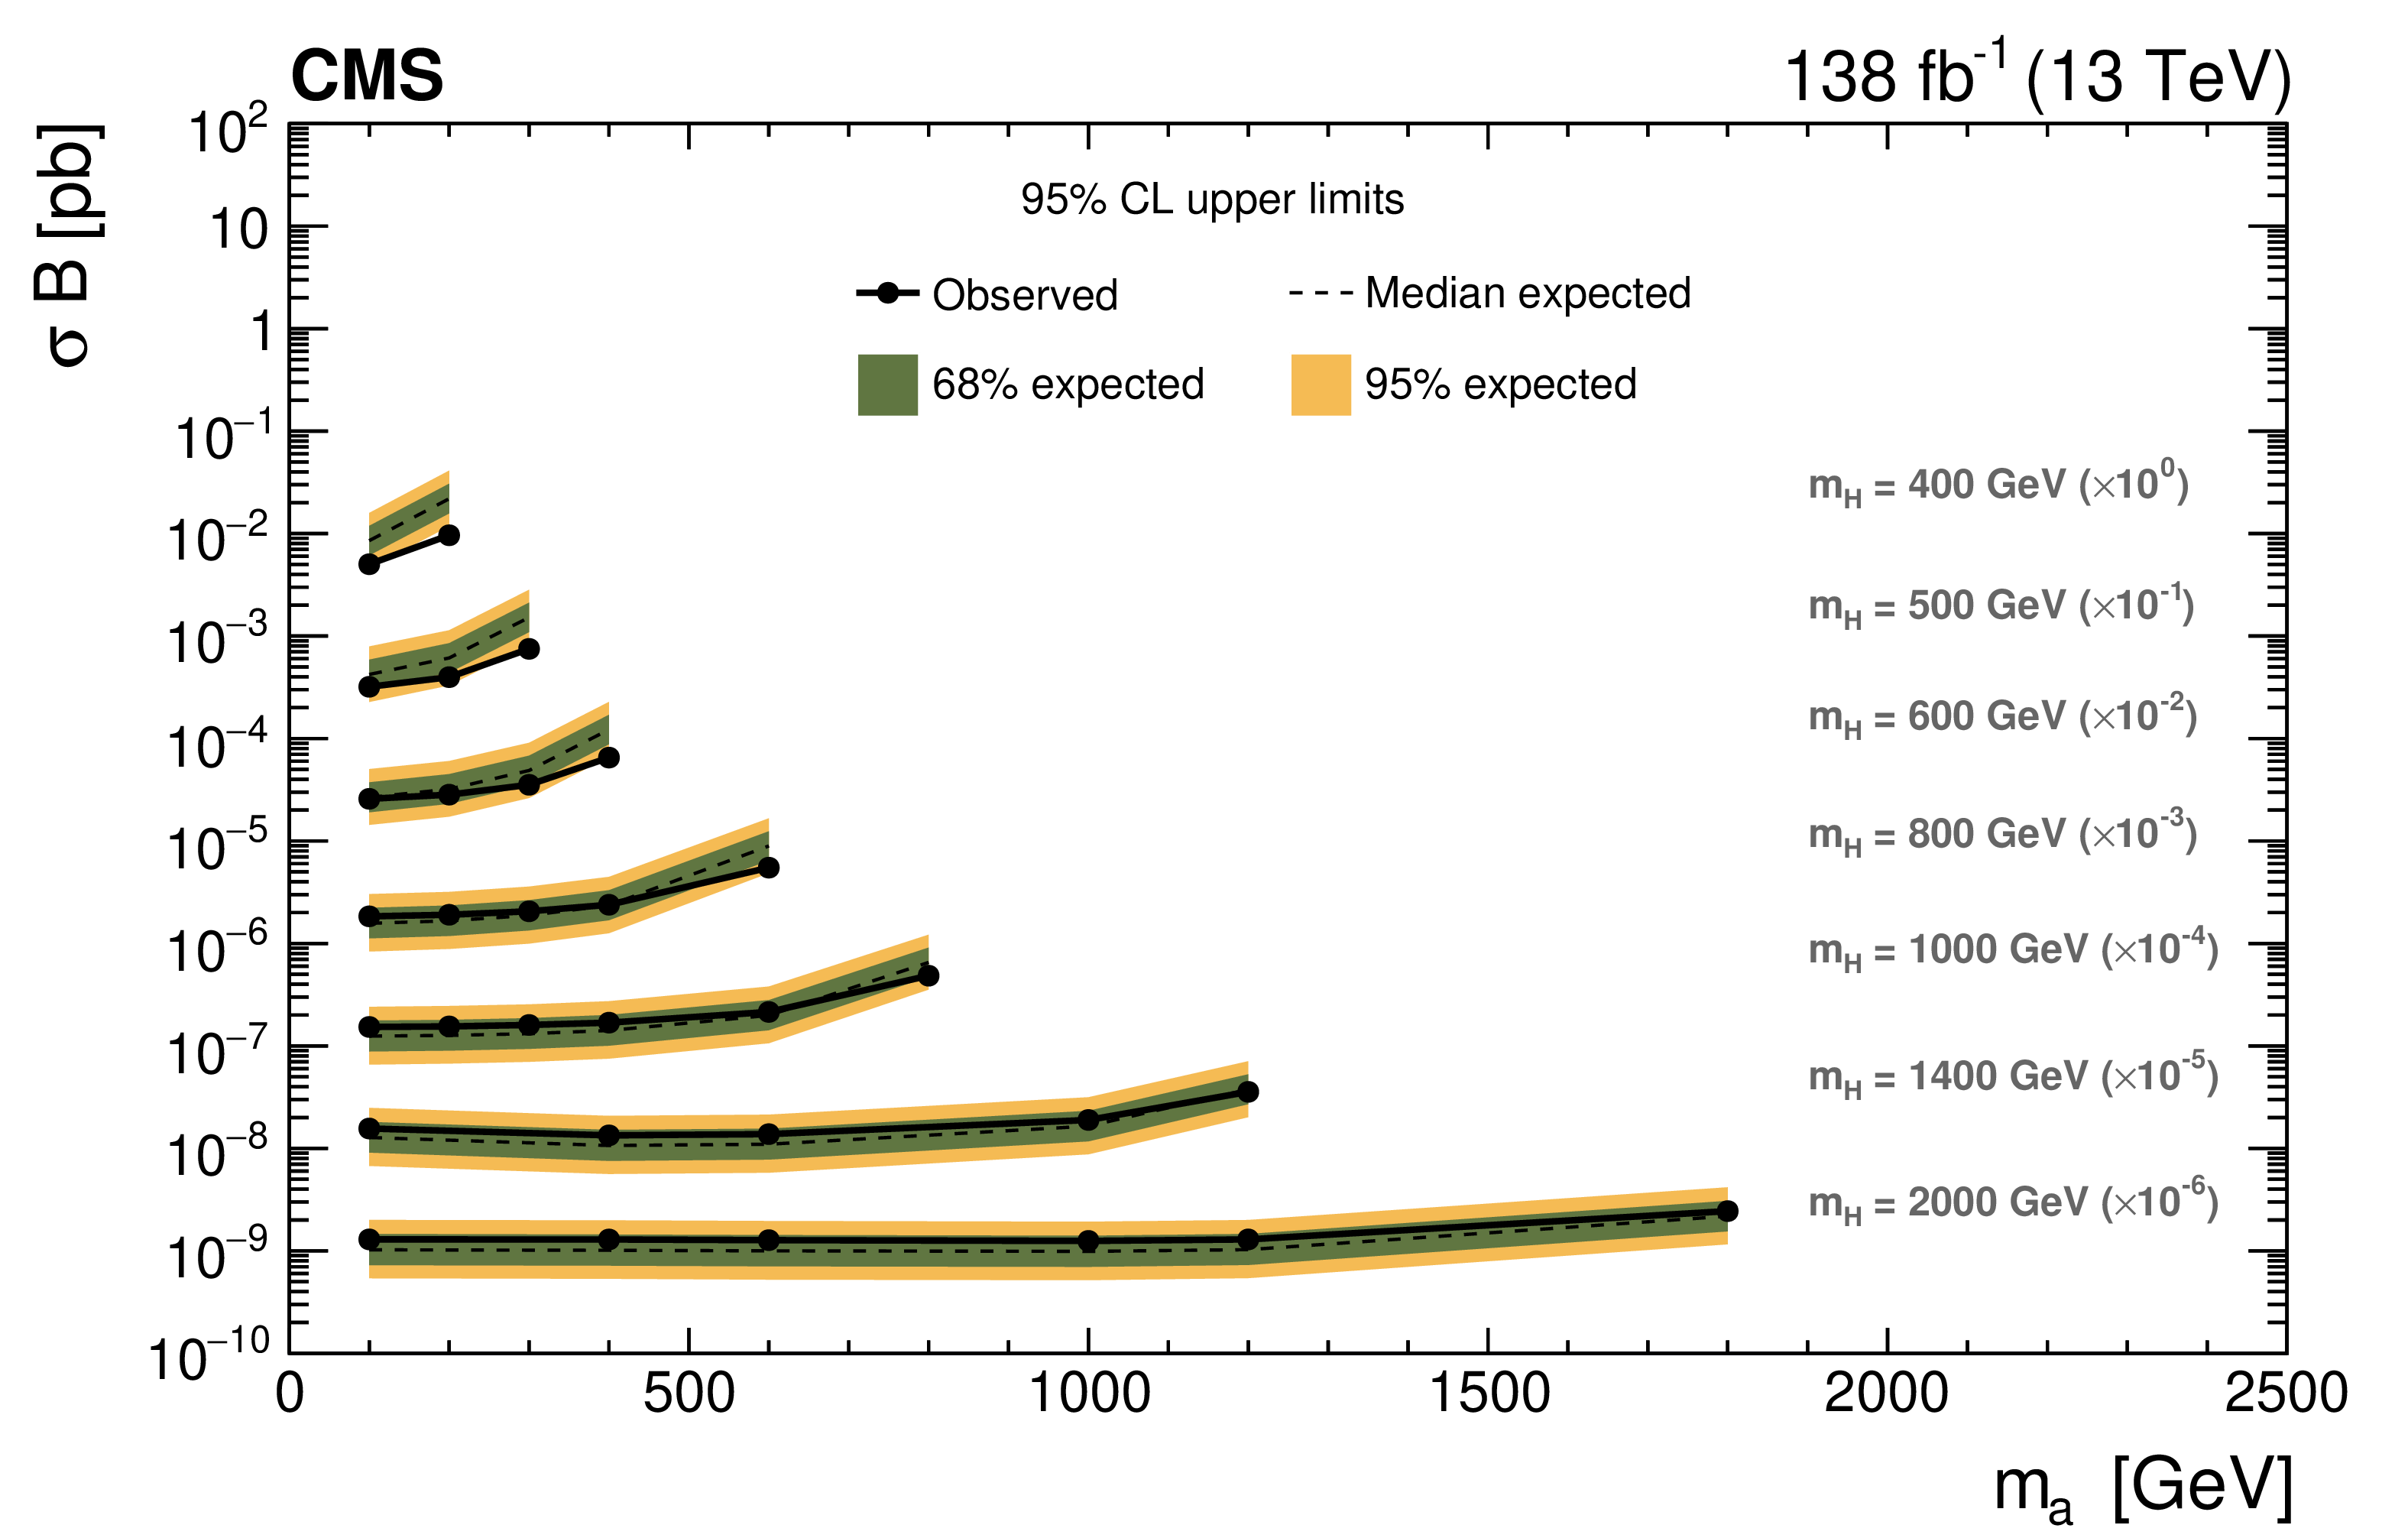
Figure 7:
Observed and expected upper limits at 95% CL on the product of the signal cross section and branching fractions $ \sigma\mathcal{B} $. The dependence of the limits on the pair $ (m_{\mathrm{H}},m_{\mathrm{a}}) $ has been accommodated into various 1D projections for a fixed value of $ m_{\mathrm{H}} $, where the corresponding limits have been scaled by an arbitrary factor ($ \times 10^{-n} $) for visualization purposes. The $ y $ axis contains the obtained cross section upper limit for the various combinations, whereas the $ x $ axis exhibits the dependence on the mass of the pseudoscalar. The solid and dashed lines correspond to the observed and median expected limits, respectively, while the green and yellow bands indicate the regions that contain 68% and 95% of the expected upper limits. |
png pdf |
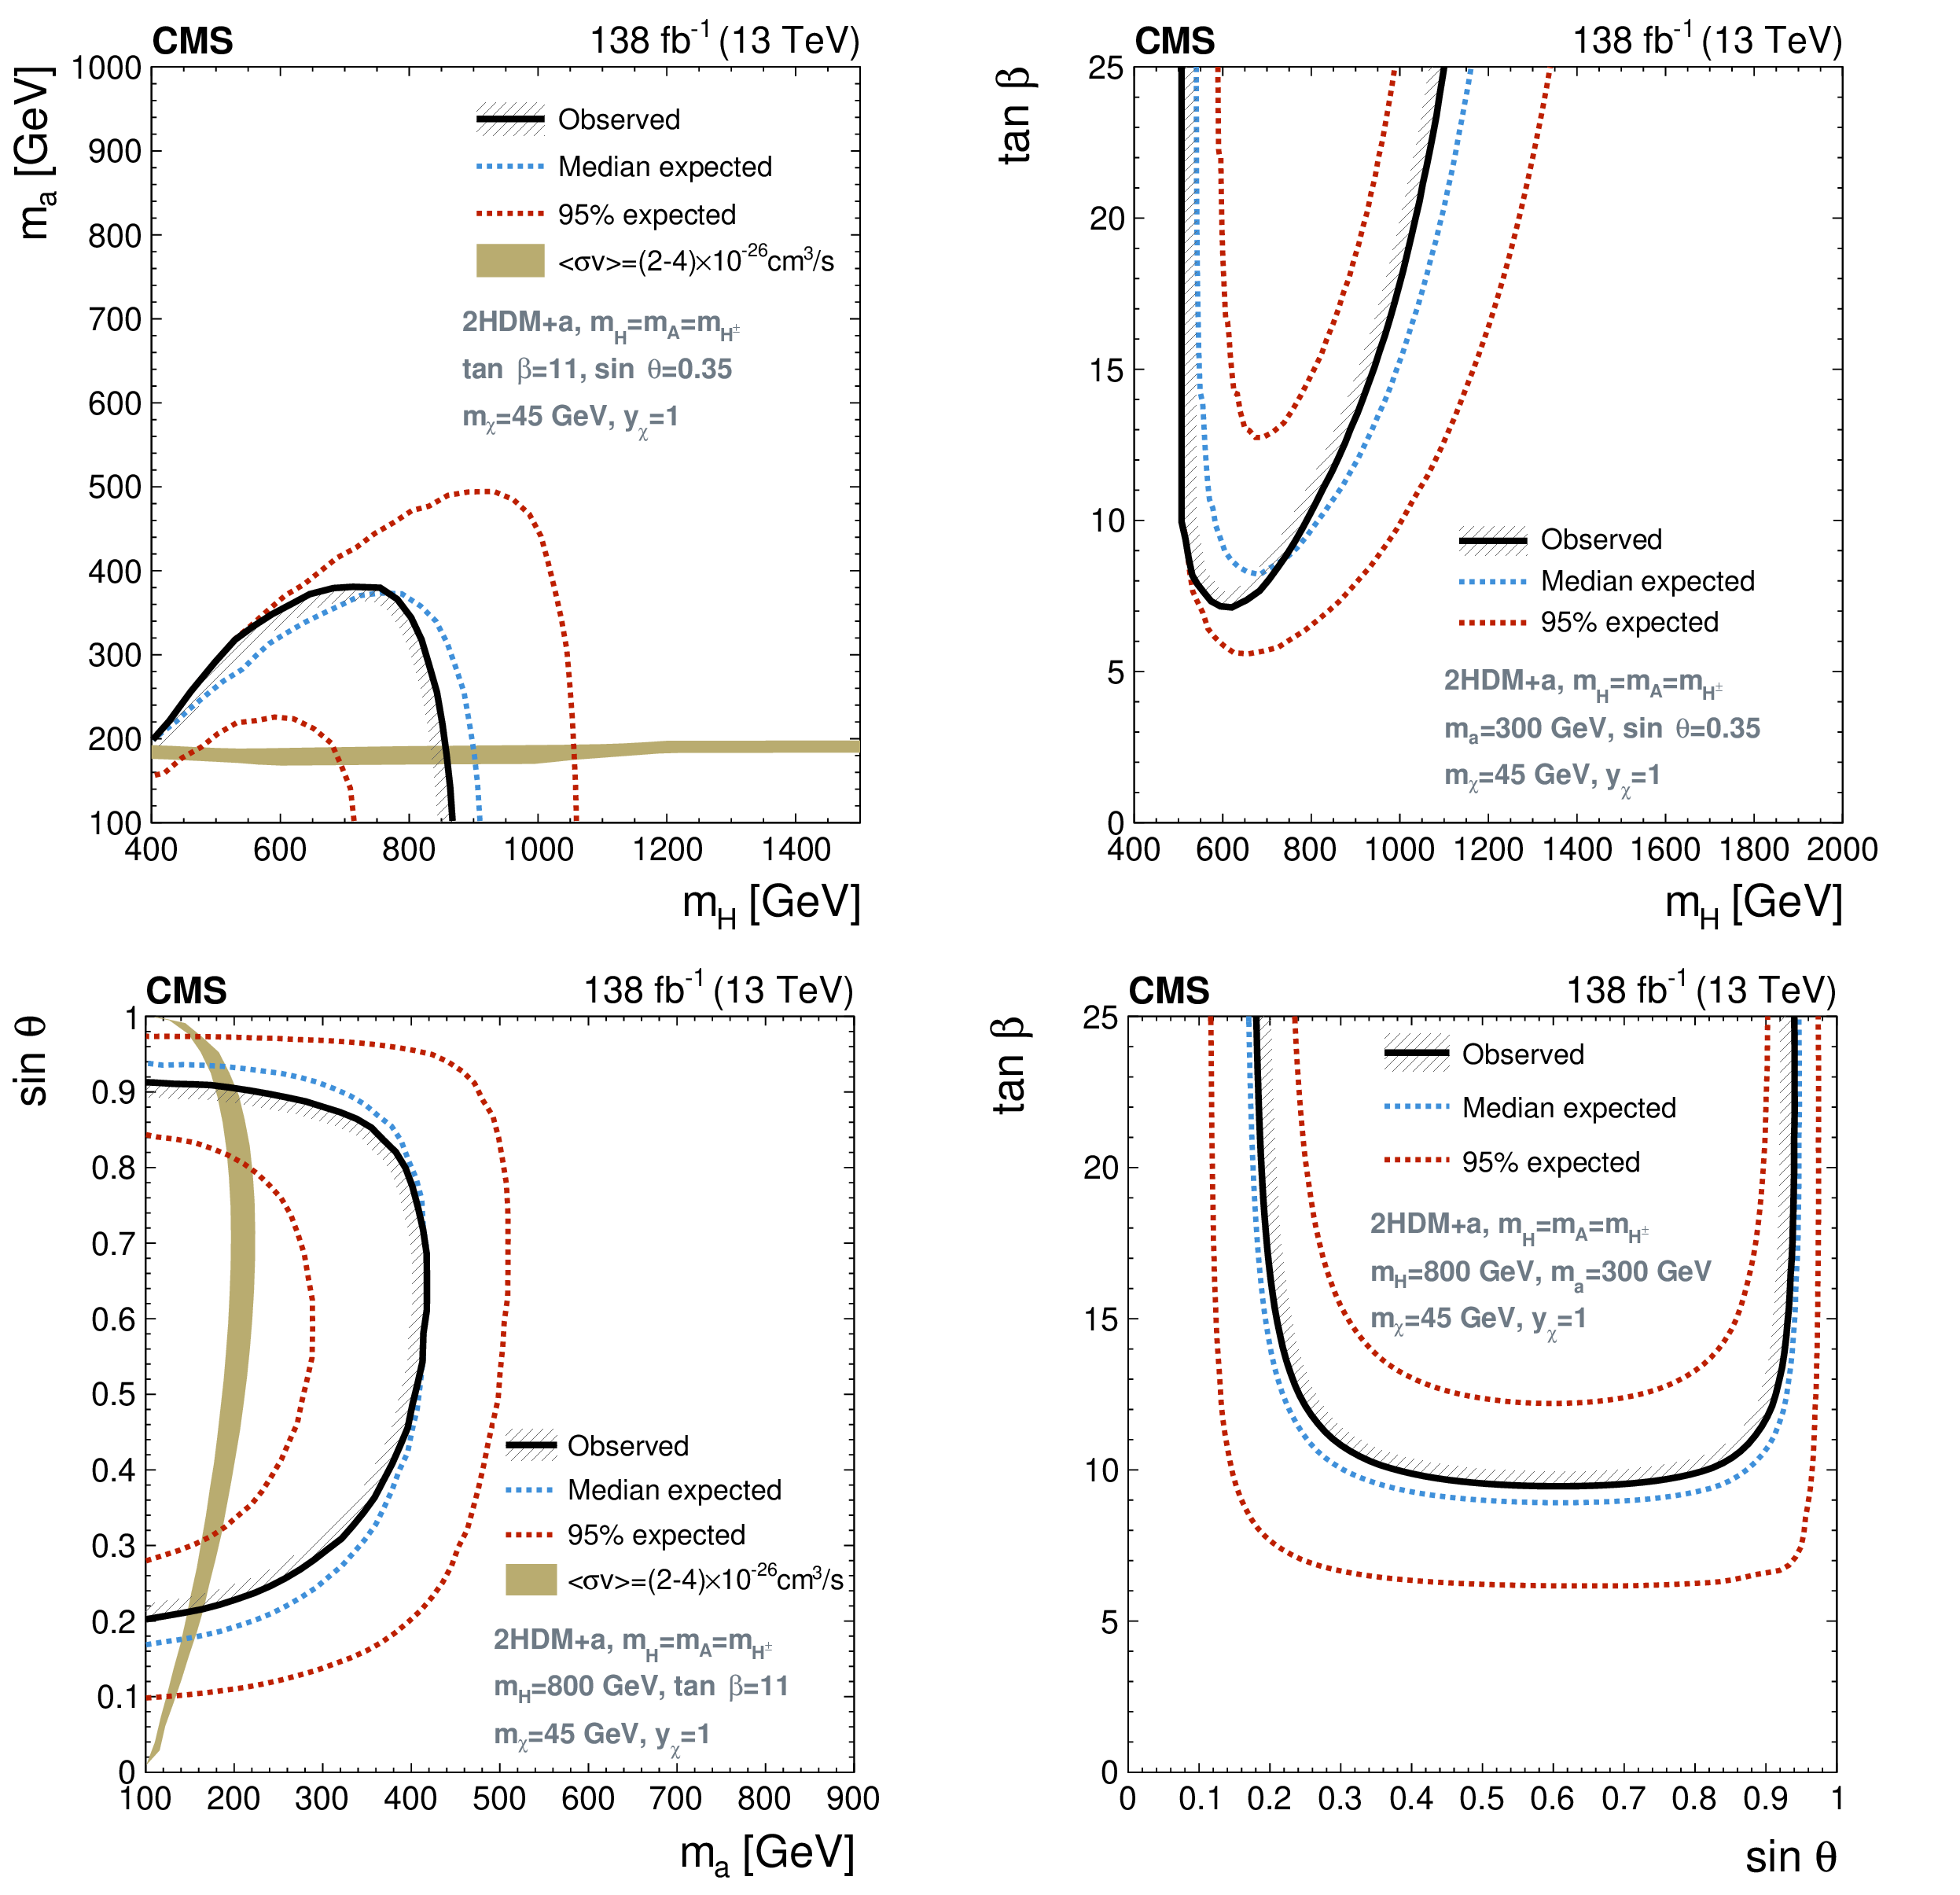
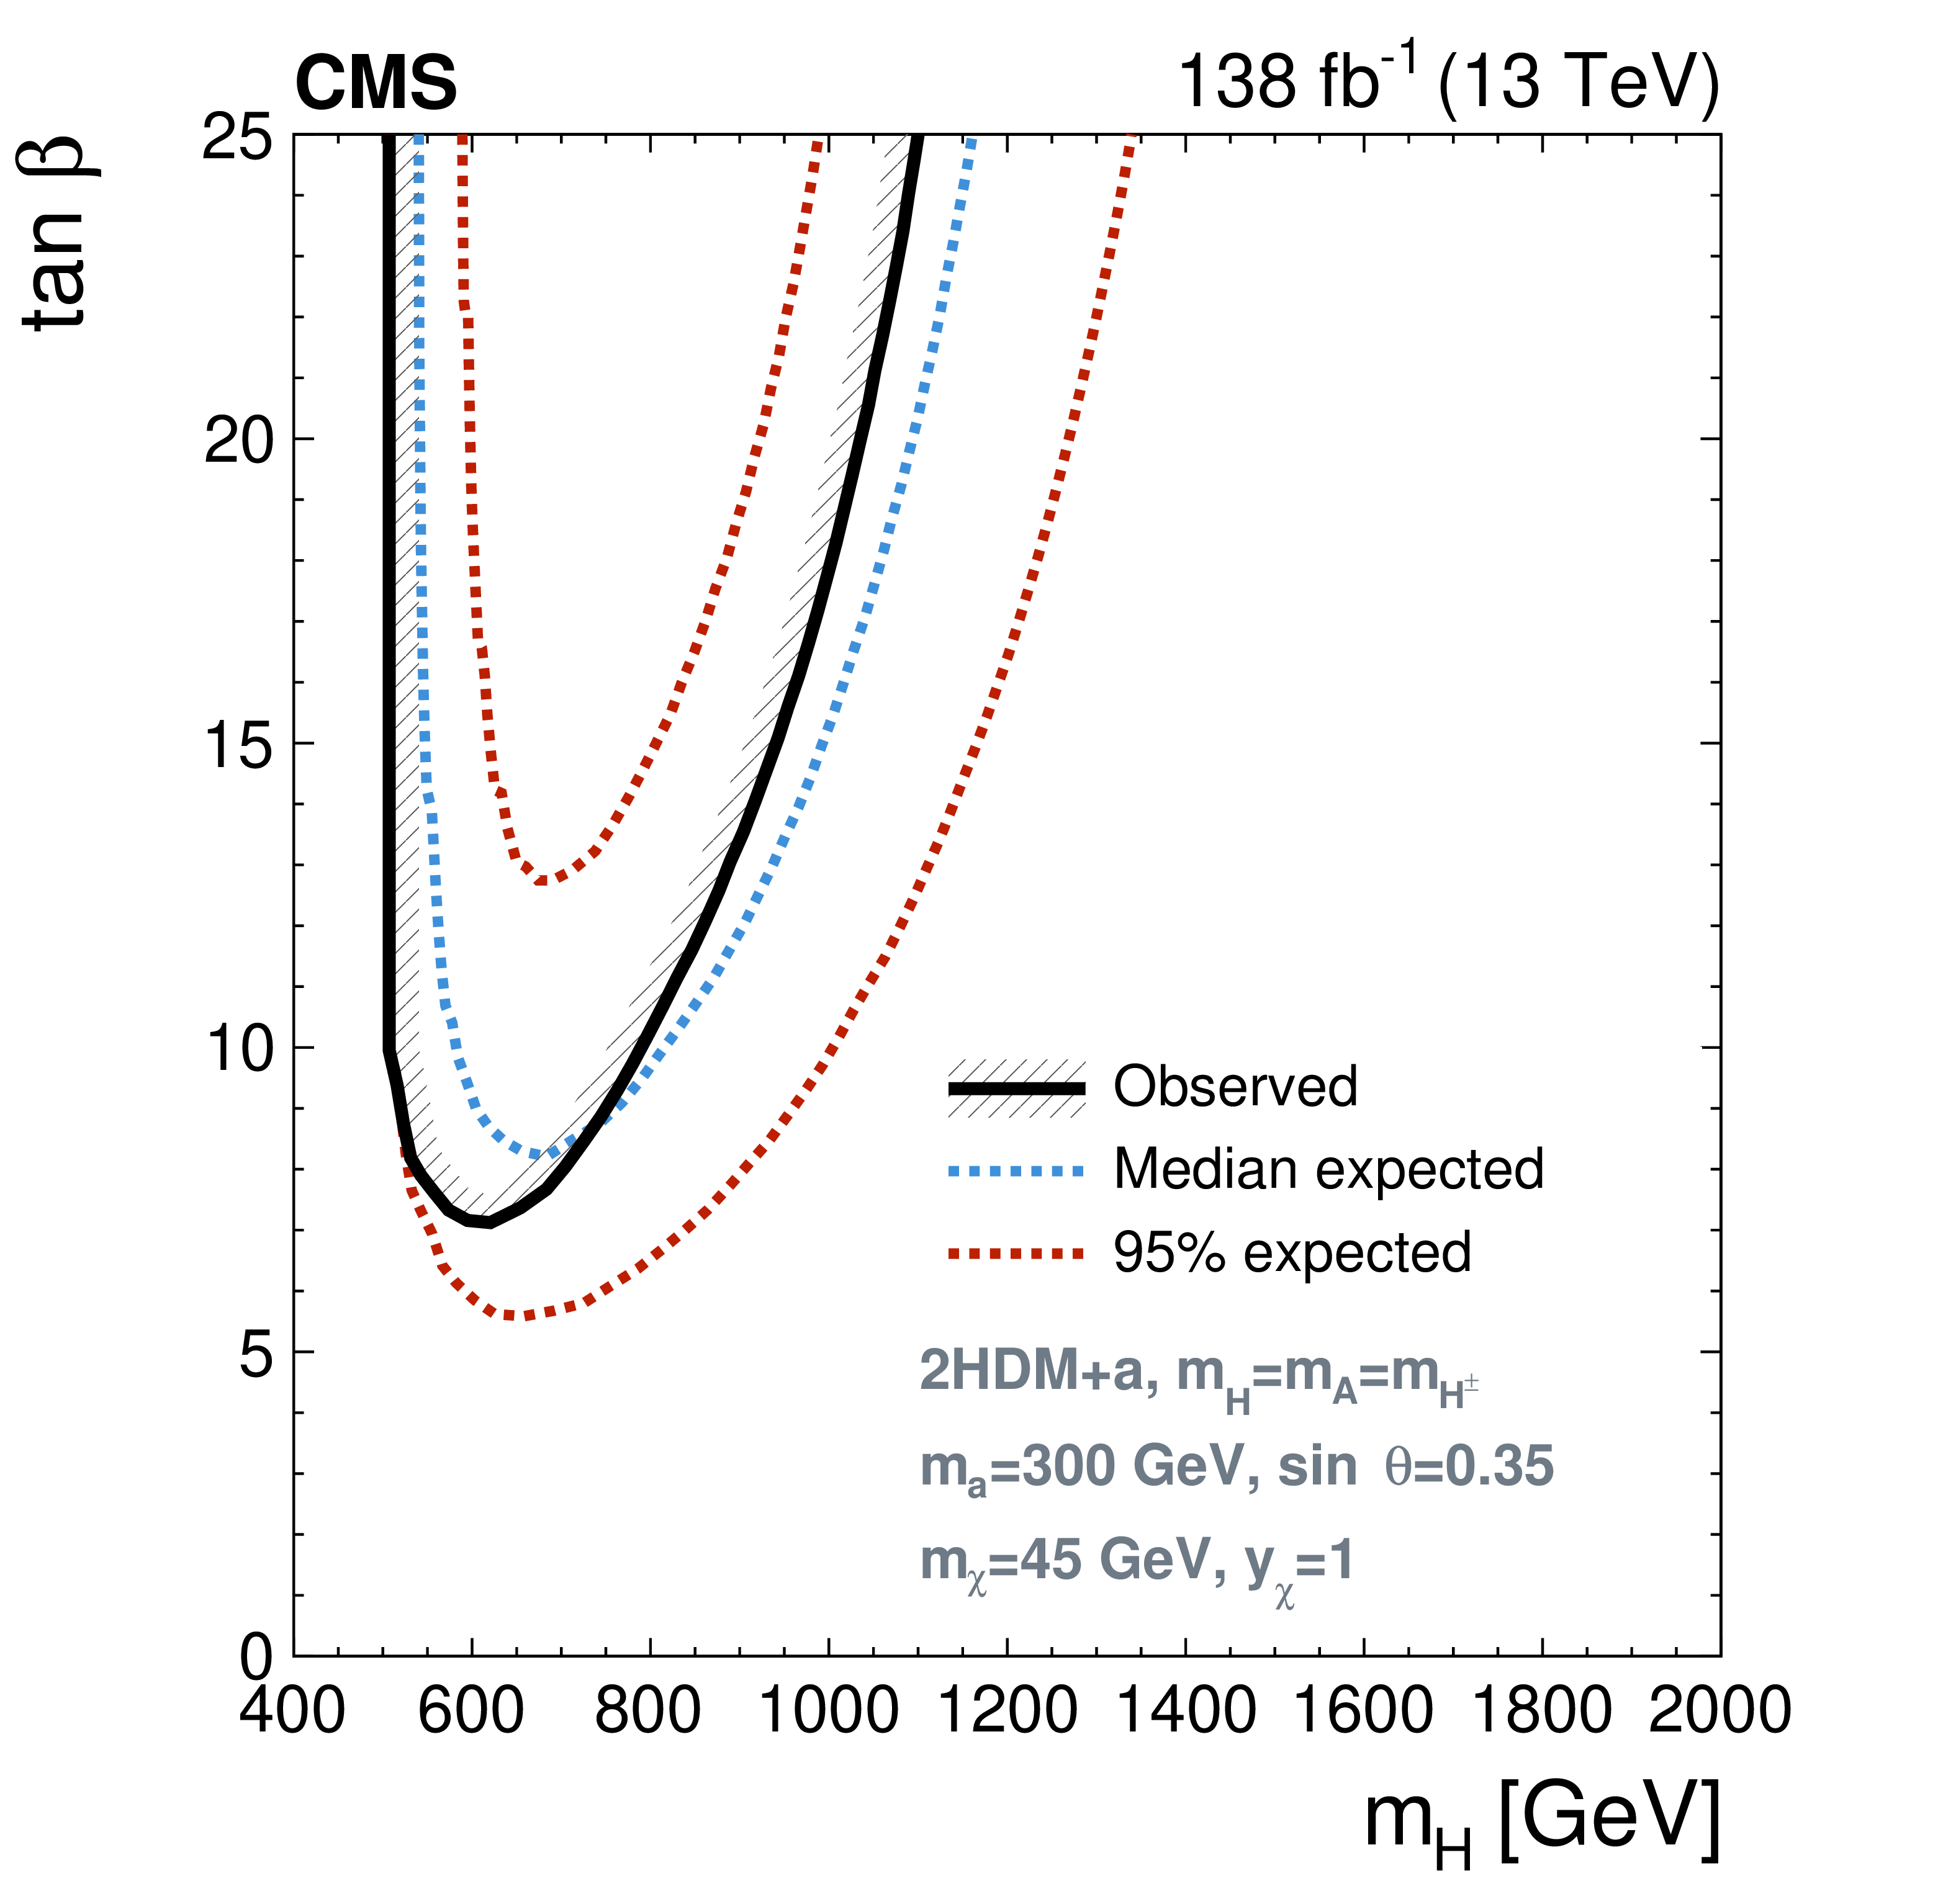
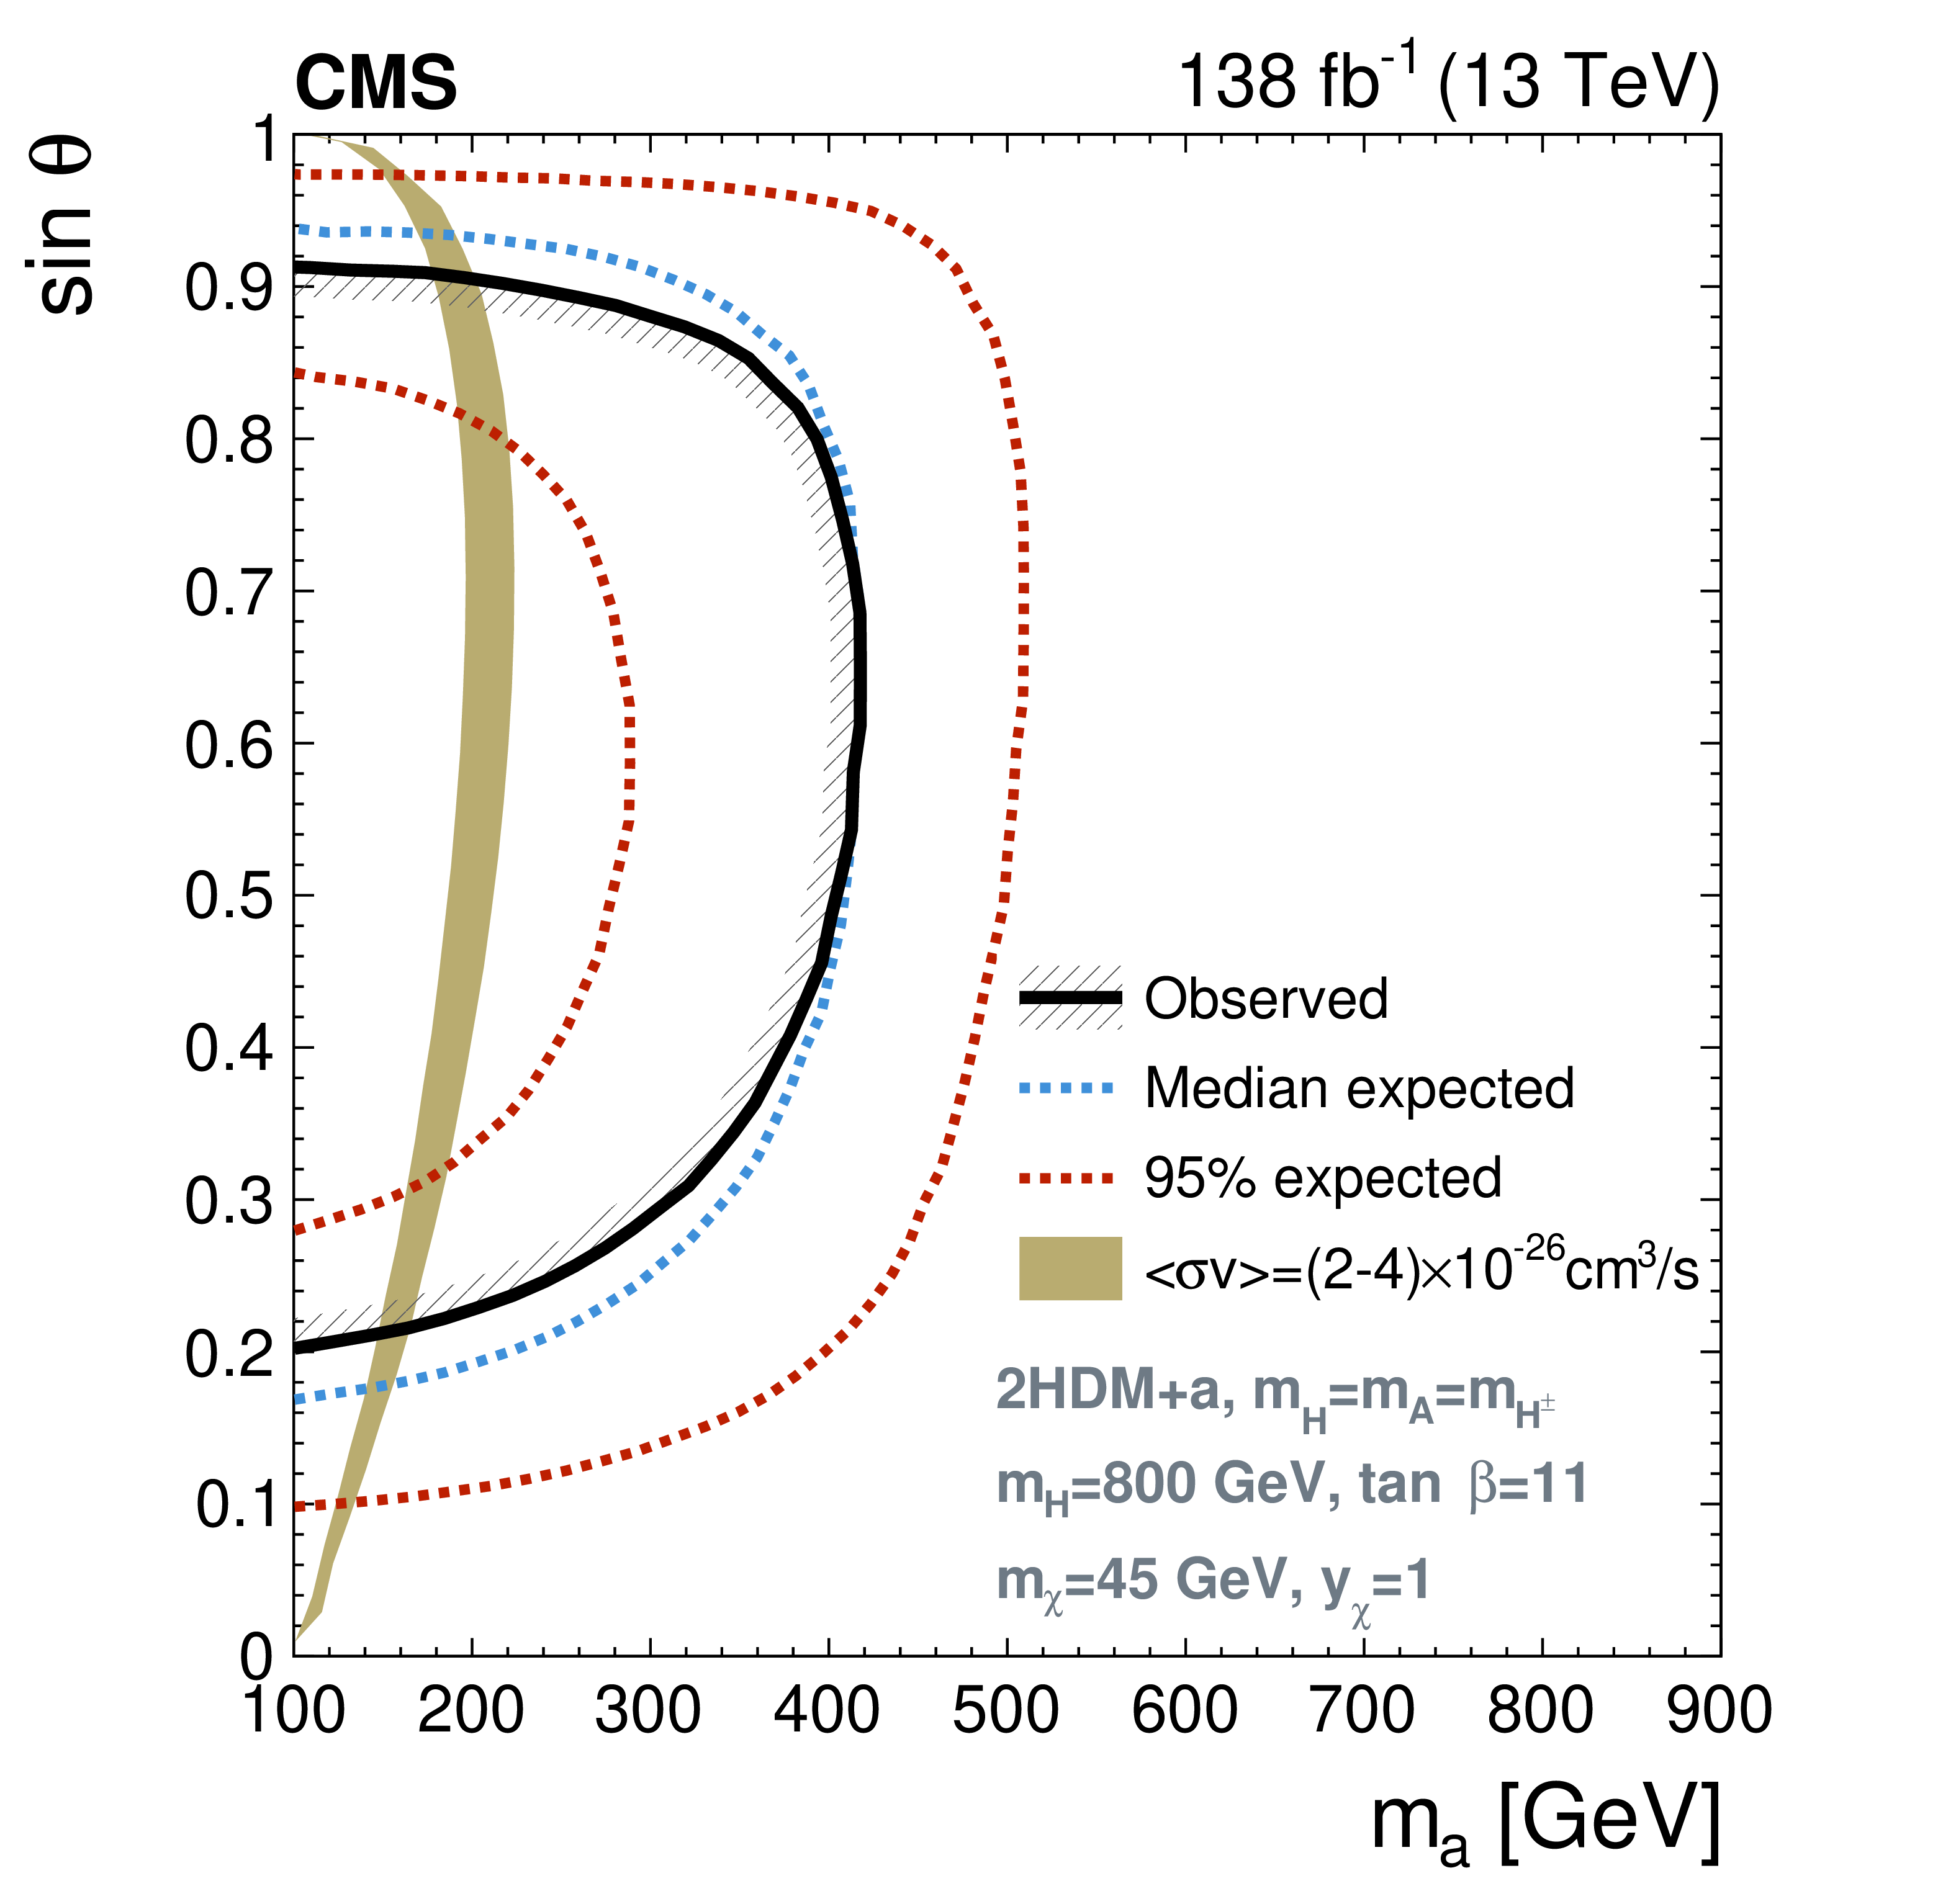
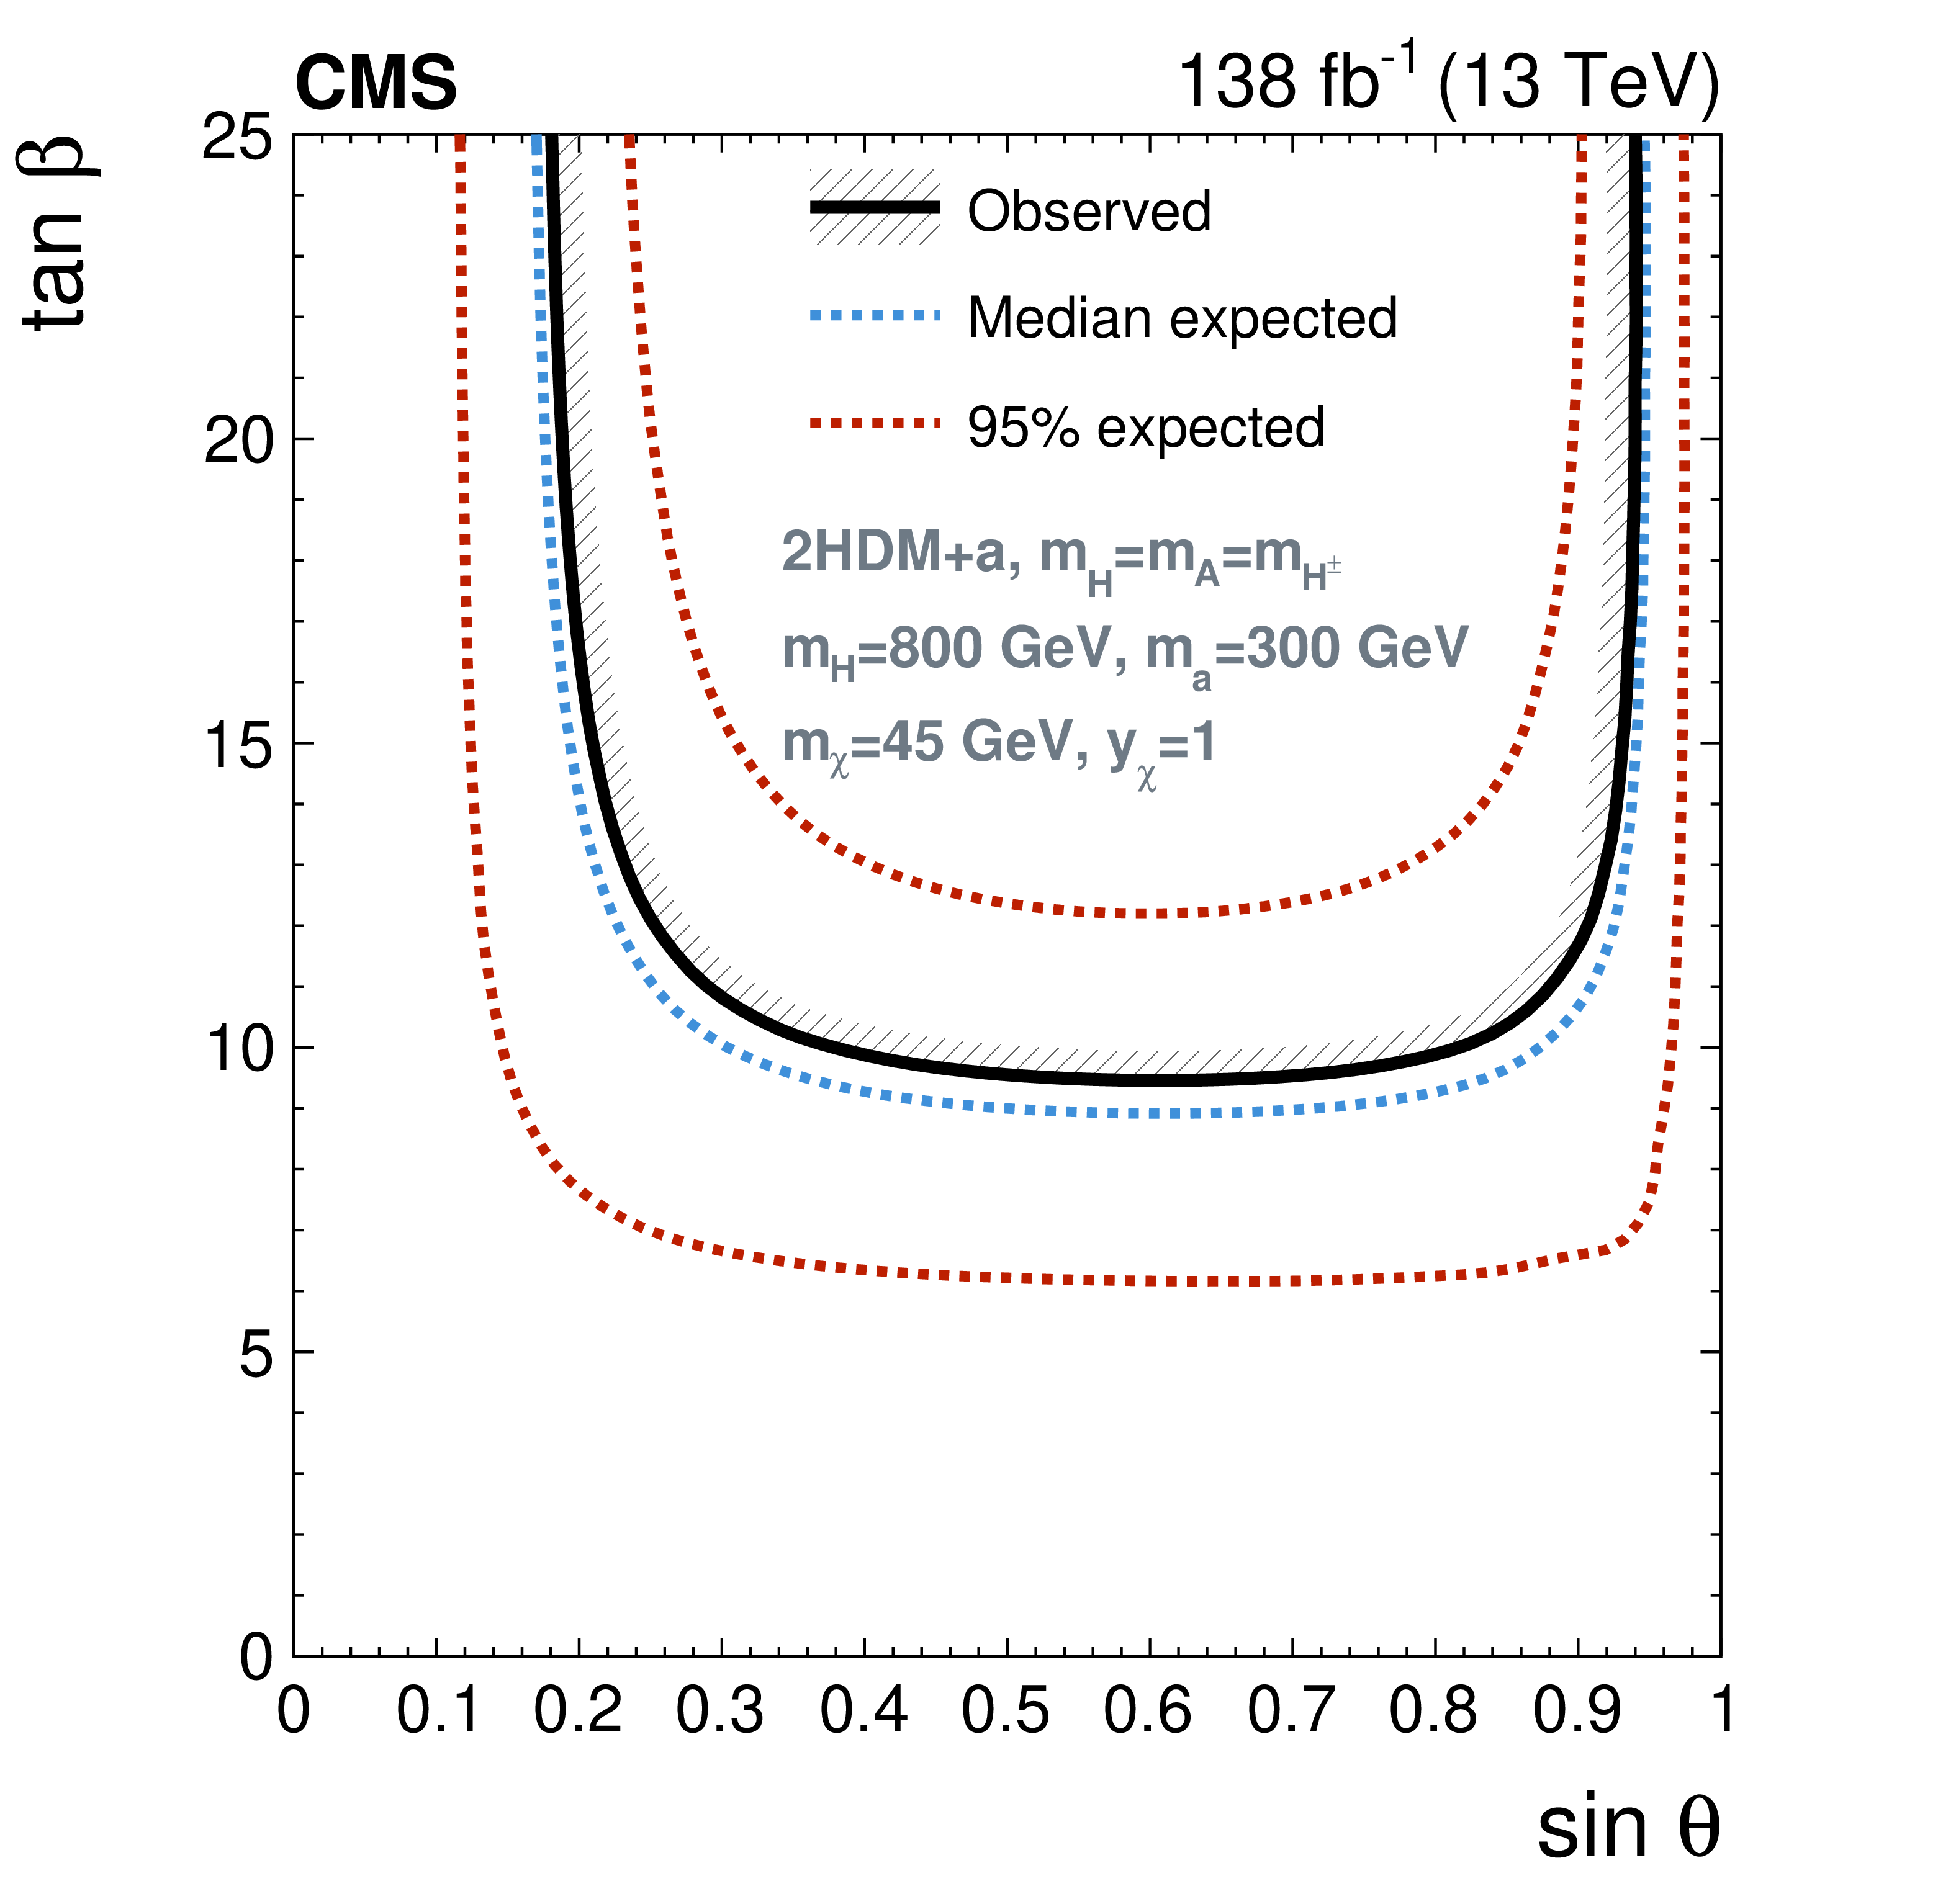
Figure 8:
Excluded regions in the parameter space of the 2HDM+a. The solid lines encompass the observed excluded regions, the dashed blue lines the expected, and the red-dotted lines indicate the regions that contain 95% of the expected exclusion limits. Projections are presented for the ($ m_{\mathrm{H}} $, $ m_{\mathrm{a}} $) plane (upper left), ($ m_{\mathrm{H}} $, $ \tan\beta $) plane (upper right), ($ m_{\mathrm{a}} $, $ \sin\theta $) plane (lower left), and ($ \tan\beta $, $ \sin\theta $) plane (lower right), for fixed values of the parameters in Eq. (1). The olive green band represents the allowed region as estimated from $ \langle \sigma v \rangle = $ (2-4) $ \times $ 10$^{-26}$ cm$^{3}$/s, which covers a range around the central value required by the observed DM relic. The cases where this curve is not visible in the figures correspond to the scenario where the preferable values of $ \tan\beta $ for this range of $ \langle \sigma v \rangle $ fall beyond the threshold ($ \tan\beta > $ 25) depicted in the projections. |
png pdf |
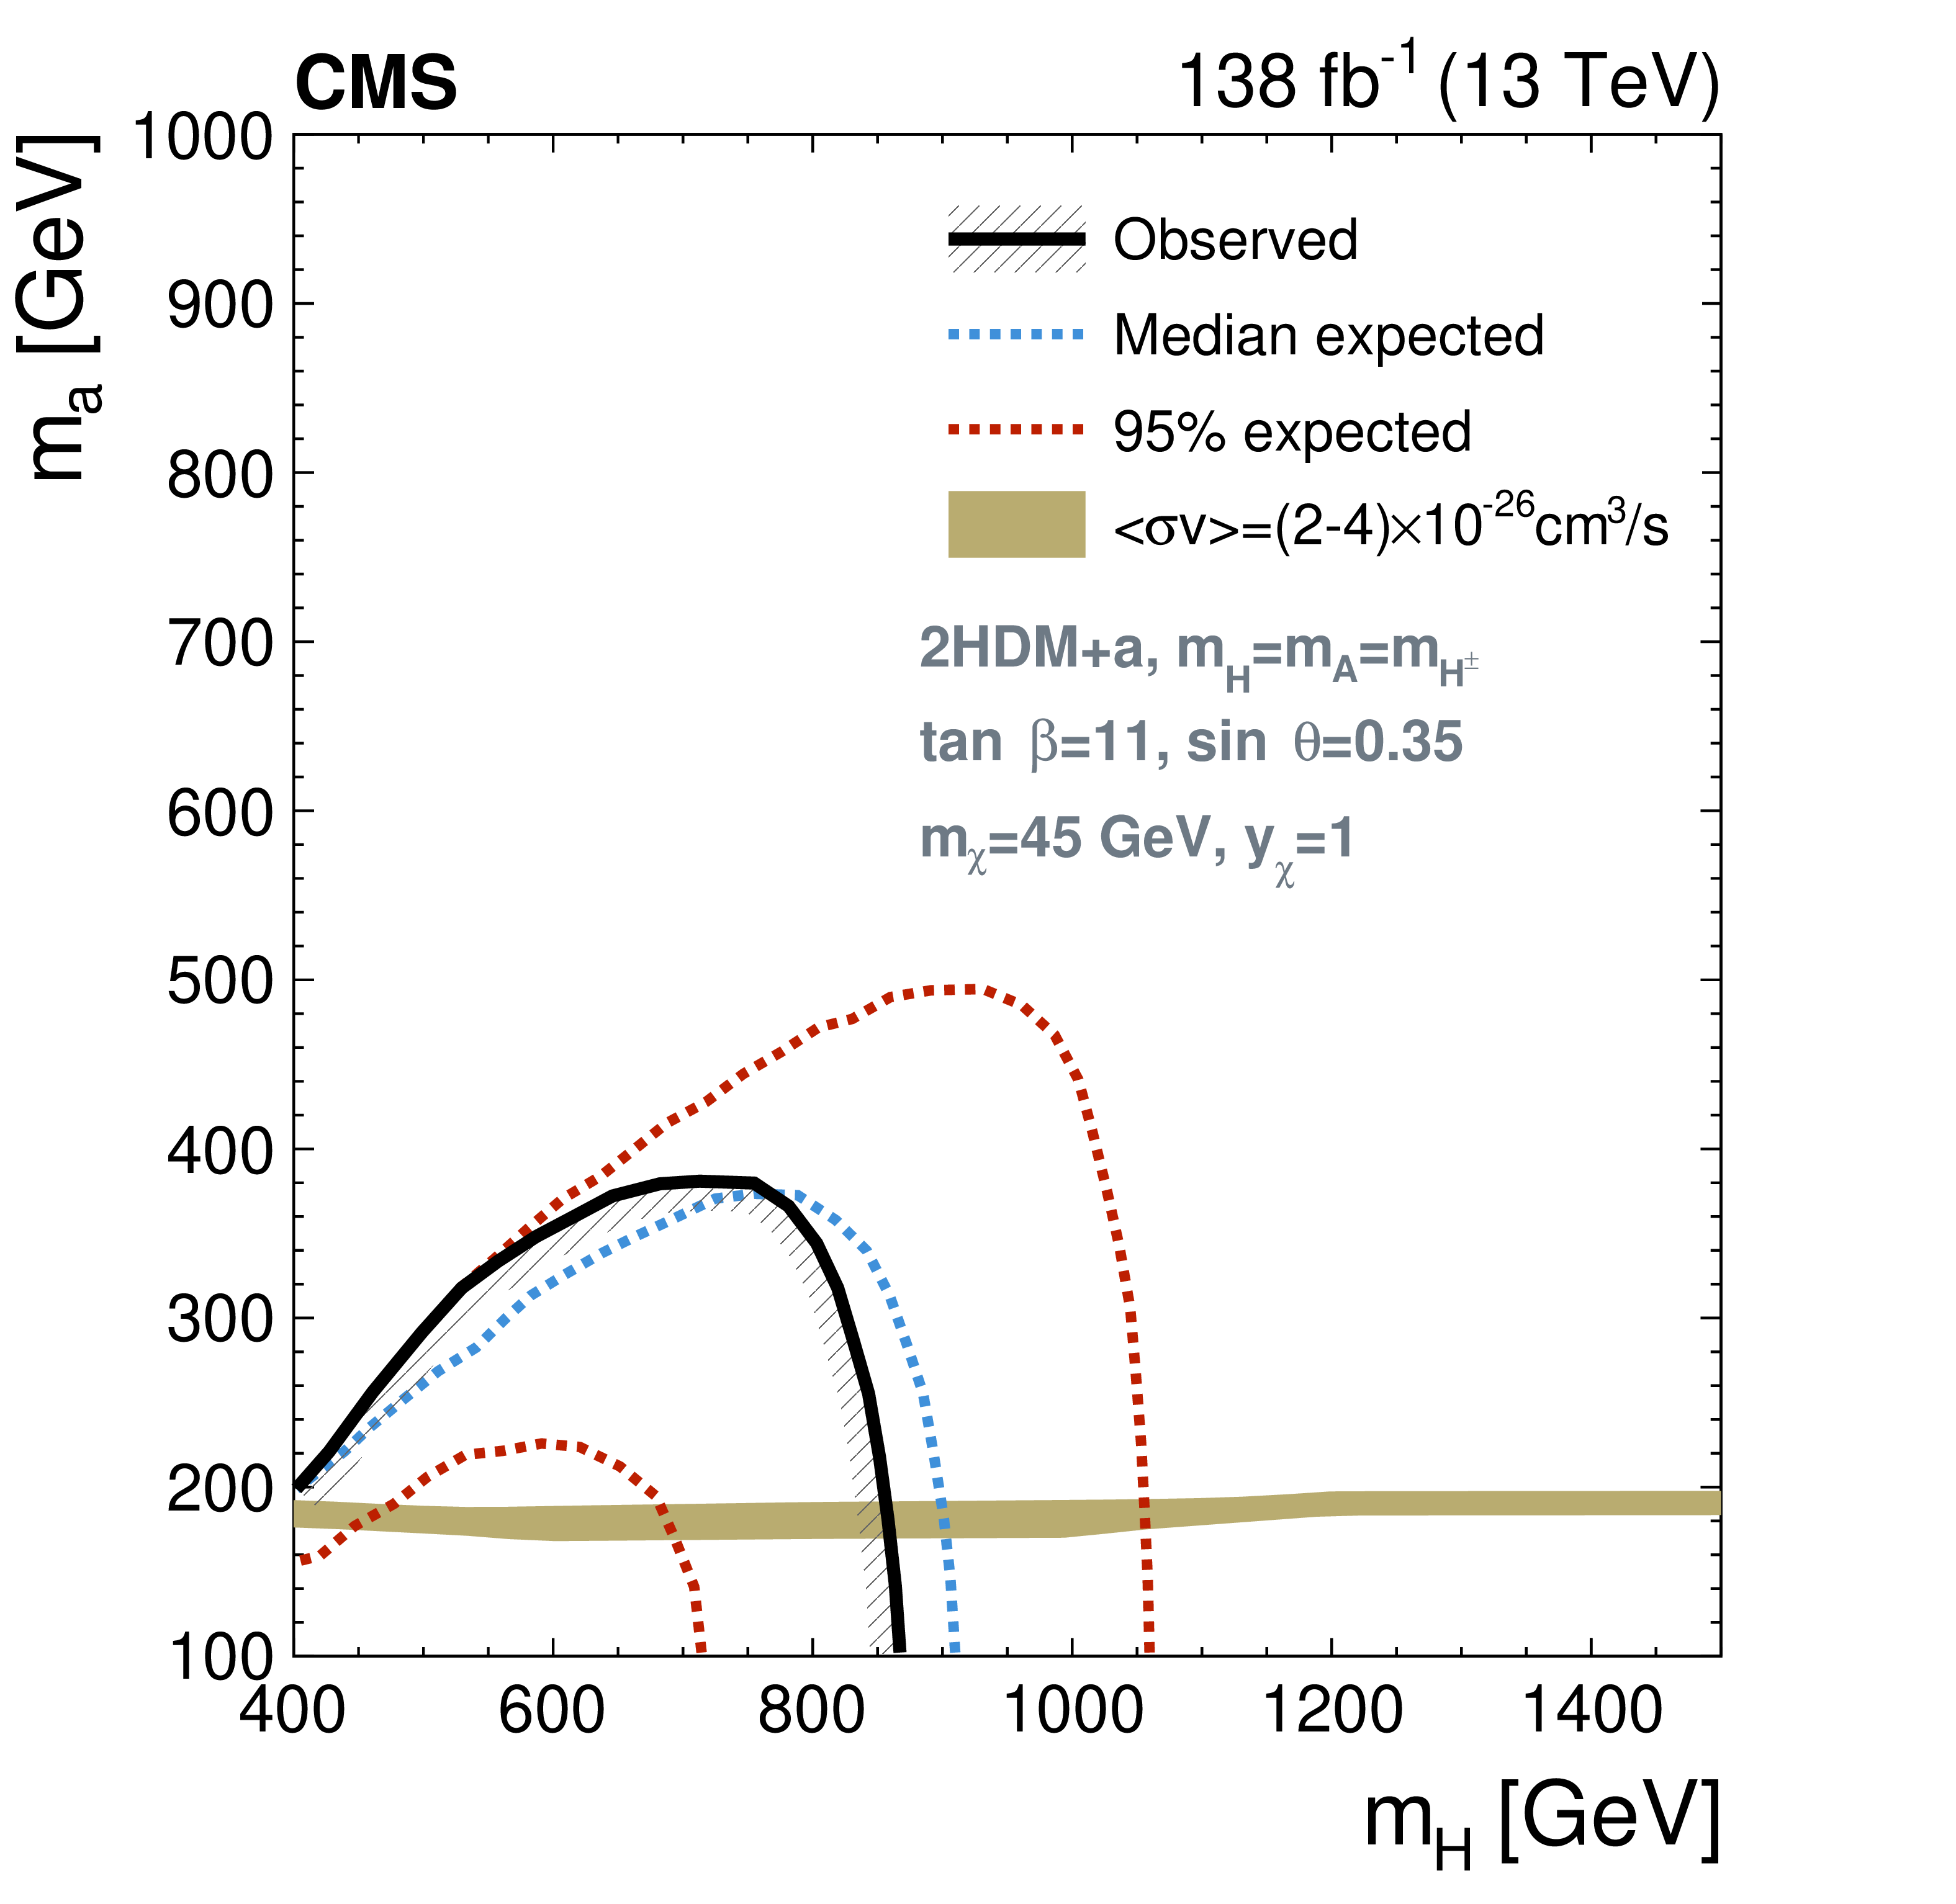
Figure 8-a:
Excluded regions in the parameter space of the 2HDM+a. The solid lines encompass the observed excluded regions, the dashed blue lines the expected, and the red-dotted lines indicate the regions that contain 95% of the expected exclusion limits. Projections are presented for the ($ m_{\mathrm{H}} $, $ m_{\mathrm{a}} $) plane (upper left), ($ m_{\mathrm{H}} $, $ \tan\beta $) plane (upper right), ($ m_{\mathrm{a}} $, $ \sin\theta $) plane (lower left), and ($ \tan\beta $, $ \sin\theta $) plane (lower right), for fixed values of the parameters in Eq. (1). The olive green band represents the allowed region as estimated from $ \langle \sigma v \rangle = $ (2-4) $ \times $ 10$^{-26}$ cm$^{3}$/s, which covers a range around the central value required by the observed DM relic. The cases where this curve is not visible in the figures correspond to the scenario where the preferable values of $ \tan\beta $ for this range of $ \langle \sigma v \rangle $ fall beyond the threshold ($ \tan\beta > $ 25) depicted in the projections. |
png pdf |
Figure 8-b:
Excluded regions in the parameter space of the 2HDM+a. The solid lines encompass the observed excluded regions, the dashed blue lines the expected, and the red-dotted lines indicate the regions that contain 95% of the expected exclusion limits. Projections are presented for the ($ m_{\mathrm{H}} $, $ m_{\mathrm{a}} $) plane (upper left), ($ m_{\mathrm{H}} $, $ \tan\beta $) plane (upper right), ($ m_{\mathrm{a}} $, $ \sin\theta $) plane (lower left), and ($ \tan\beta $, $ \sin\theta $) plane (lower right), for fixed values of the parameters in Eq. (1). The olive green band represents the allowed region as estimated from $ \langle \sigma v \rangle = $ (2-4) $ \times $ 10$^{-26}$ cm$^{3}$/s, which covers a range around the central value required by the observed DM relic. The cases where this curve is not visible in the figures correspond to the scenario where the preferable values of $ \tan\beta $ for this range of $ \langle \sigma v \rangle $ fall beyond the threshold ($ \tan\beta > $ 25) depicted in the projections. |
png pdf |
Figure 8-c:
Excluded regions in the parameter space of the 2HDM+a. The solid lines encompass the observed excluded regions, the dashed blue lines the expected, and the red-dotted lines indicate the regions that contain 95% of the expected exclusion limits. Projections are presented for the ($ m_{\mathrm{H}} $, $ m_{\mathrm{a}} $) plane (upper left), ($ m_{\mathrm{H}} $, $ \tan\beta $) plane (upper right), ($ m_{\mathrm{a}} $, $ \sin\theta $) plane (lower left), and ($ \tan\beta $, $ \sin\theta $) plane (lower right), for fixed values of the parameters in Eq. (1). The olive green band represents the allowed region as estimated from $ \langle \sigma v \rangle = $ (2-4) $ \times $ 10$^{-26}$ cm$^{3}$/s, which covers a range around the central value required by the observed DM relic. The cases where this curve is not visible in the figures correspond to the scenario where the preferable values of $ \tan\beta $ for this range of $ \langle \sigma v \rangle $ fall beyond the threshold ($ \tan\beta > $ 25) depicted in the projections. |
png pdf |
Figure 8-d:
Excluded regions in the parameter space of the 2HDM+a. The solid lines encompass the observed excluded regions, the dashed blue lines the expected, and the red-dotted lines indicate the regions that contain 95% of the expected exclusion limits. Projections are presented for the ($ m_{\mathrm{H}} $, $ m_{\mathrm{a}} $) plane (upper left), ($ m_{\mathrm{H}} $, $ \tan\beta $) plane (upper right), ($ m_{\mathrm{a}} $, $ \sin\theta $) plane (lower left), and ($ \tan\beta $, $ \sin\theta $) plane (lower right), for fixed values of the parameters in Eq. (1). The olive green band represents the allowed region as estimated from $ \langle \sigma v \rangle = $ (2-4) $ \times $ 10$^{-26}$ cm$^{3}$/s, which covers a range around the central value required by the observed DM relic. The cases where this curve is not visible in the figures correspond to the scenario where the preferable values of $ \tan\beta $ for this range of $ \langle \sigma v \rangle $ fall beyond the threshold ($ \tan\beta > $ 25) depicted in the projections. |
| Tables | |
png pdf |
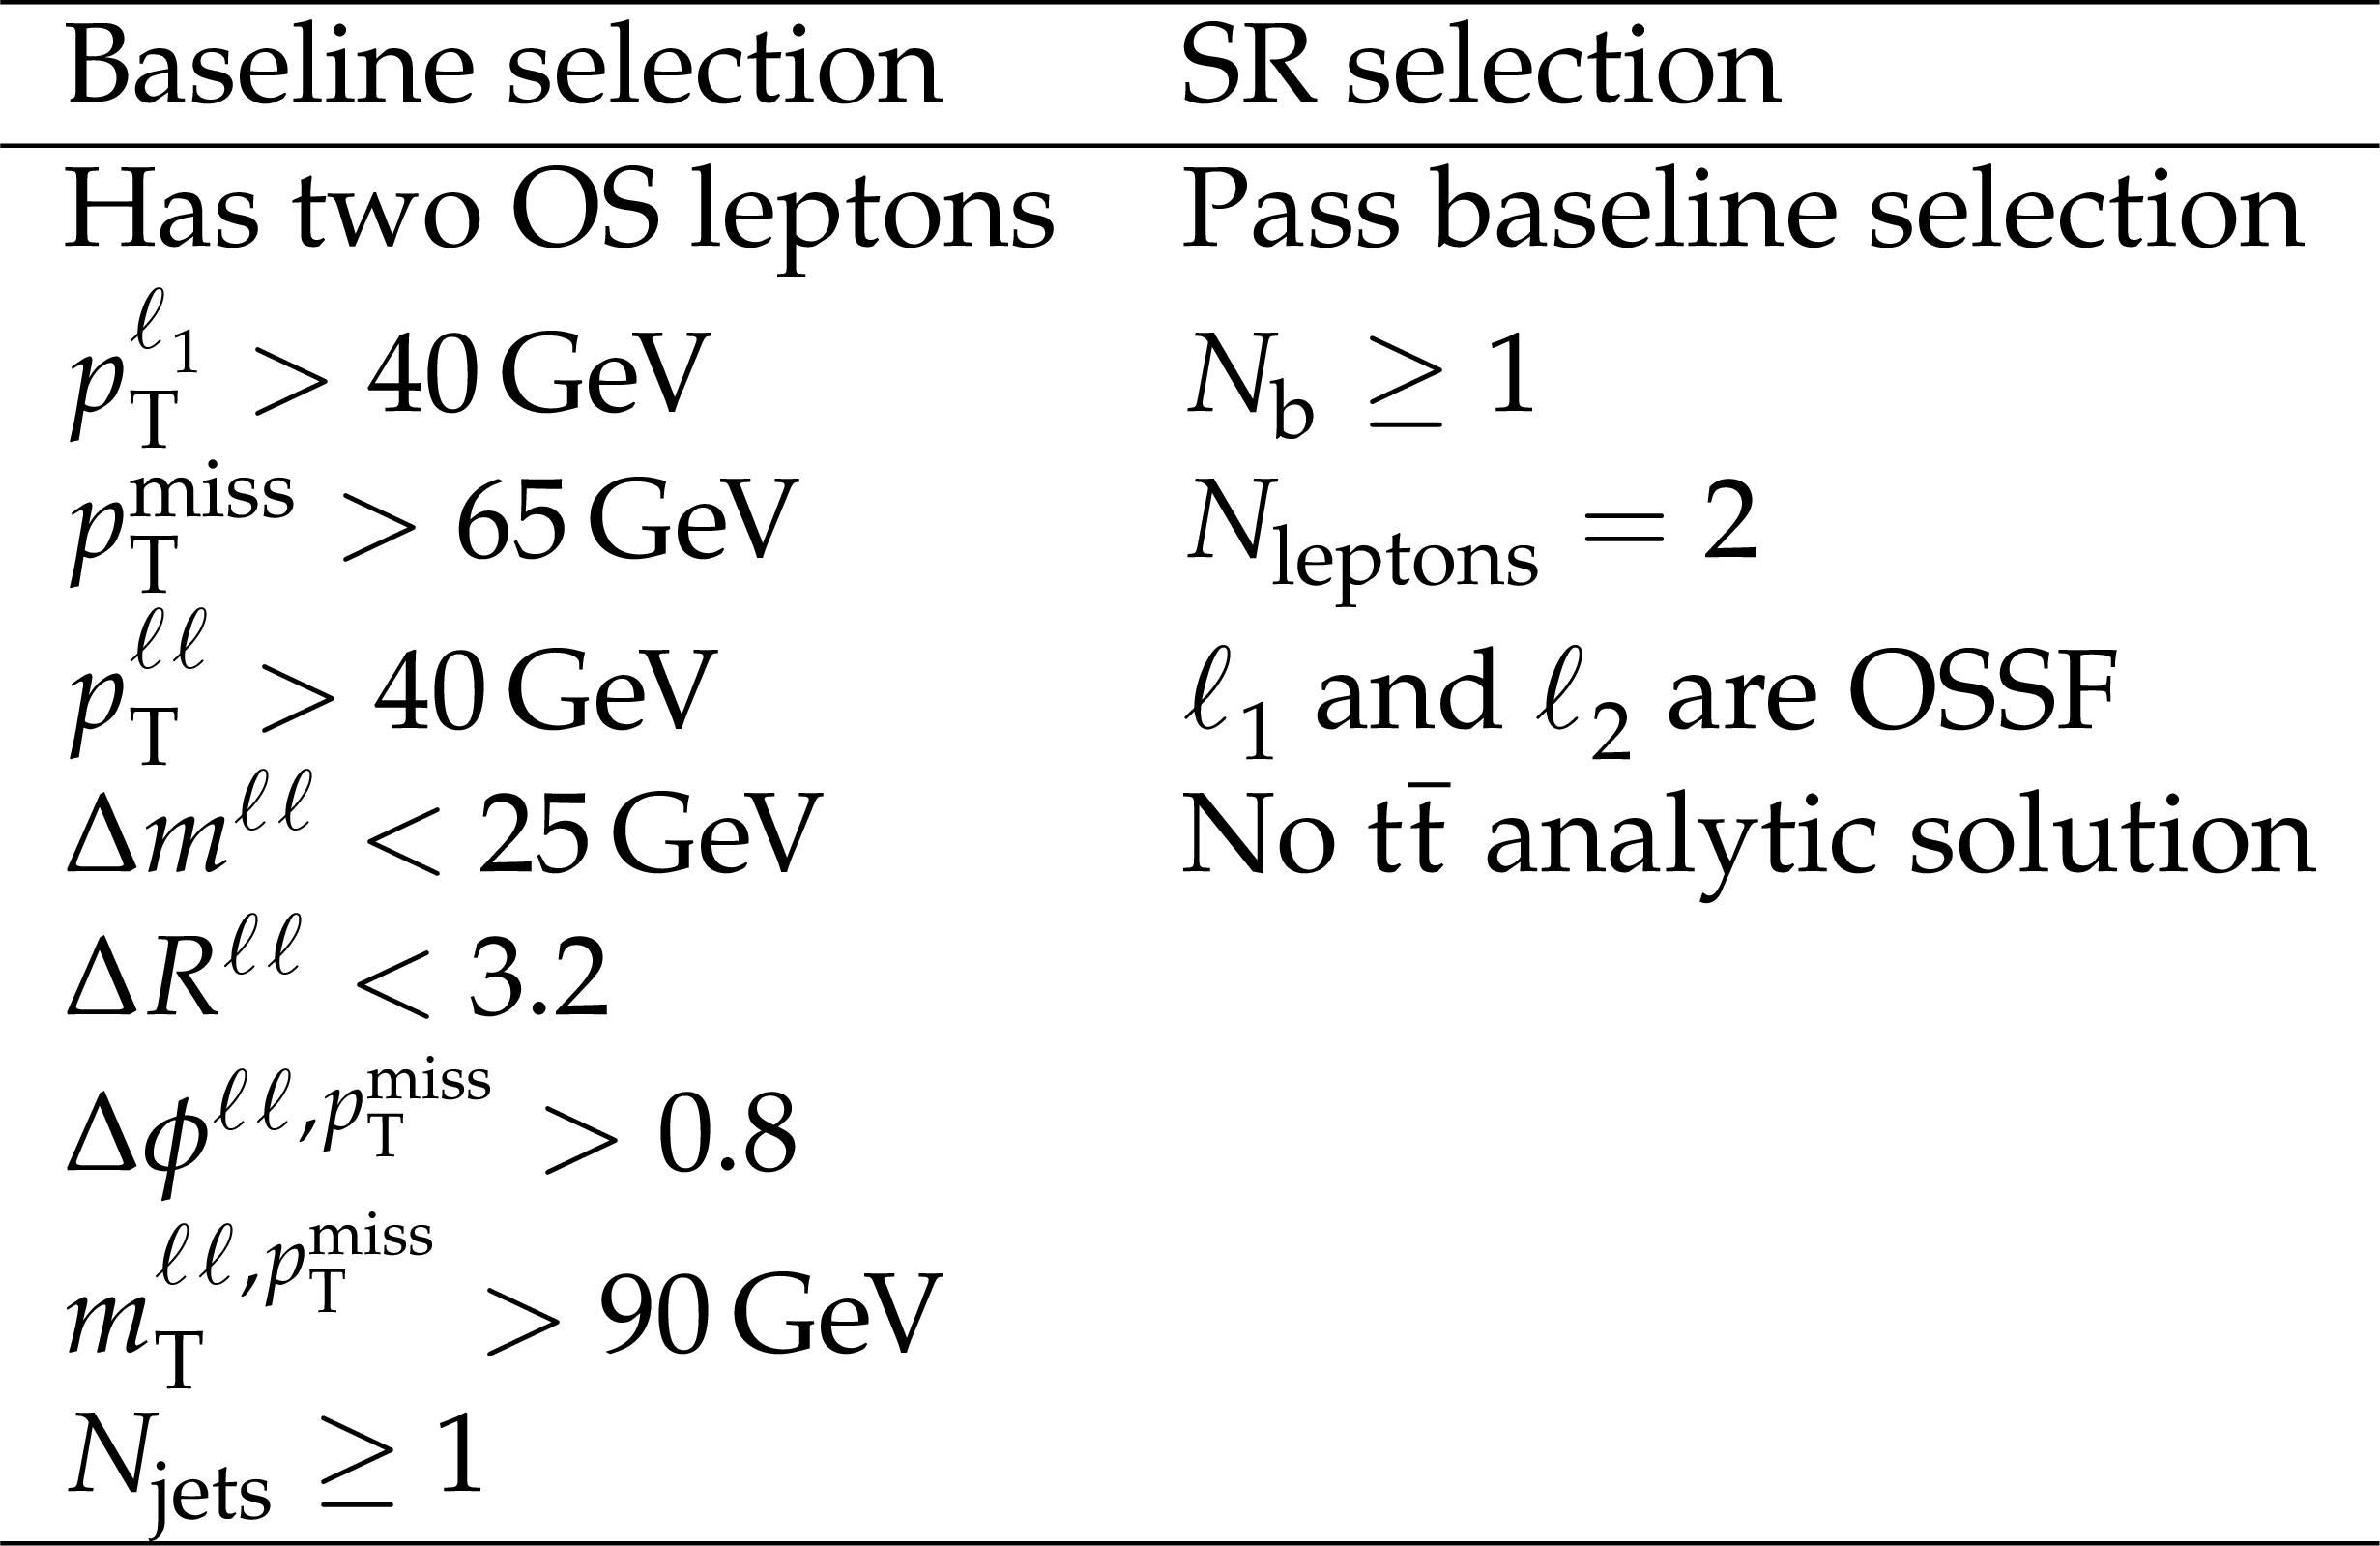
Table 1:
List of requirements used to define the SR, split into a baseline and an SR region selection. |
| Summary |
| The first dedicated search for dark matter (DM) with the CMS experiment has been presented, where the DM particles are produced through the production of a heavy neutral Higgs boson (H) in association with a bottom quark-antiquark ($ \mathrm{b}\overline{\mathrm{b}} $) pair, followed by the decay $ \mathrm{H}\to\mathrm{Z}\mathrm{a} $ with $ \mathrm{a}\to\chi \overline{\chi} $, where a is a pseudoscalar mediator and $ \chi \overline{\chi} $ denote the DM particle and antiparticle. A data set of proton-proton collisions at a center-of-mass energy of 13 TeV, corresponding to an integrated luminosity of 138 fb$ ^{-1} $, is analyzed. This analysis exploits for the first time a signature involving a Z boson decaying into a pair of electrons or muons combined with requirements on the number of b jets and the amount of missing transverse momentum. A discriminator obtained with machine-learning techniques is used to separate the signal from background events. The multivariate classifier is trained to reach a high level of discrimination across a broad range of kinematic variations that arise from the different configurations in which the Z boson and the DM mediator are produced. No signs of DM production via the channel investigated here have been observed. The results are presented in terms of limits on the product of signal cross section and branching fractions for the decays $ \mathrm{H}\to\mathrm{Z}\mathrm{a} $, $ \mathrm{a}\to\chi \overline{\chi} $, and $ \mathrm{Z}\to\ell\bar{\ell} $, where $ l $ denotes a charged lepton. The 95% confidence level upper limits for the production cross section branching fraction of the new particles vary between 10$^{-2} $ and 10$^{-3} $ pb for heavy Higgs masses between 400 and 2000 GeV, respectively. Constraints on the parameter space of a two Higgs doublet model plus a pseudoscalar (2HDM+a) benchmark are derived. Exclusion regions in two-dimensional planes formed from four relevant 2HDM+a parameters are shown. The results are compared with expectations for this model in the context of cosmological predictions, in particular with the constraints arising from the thermally averaged cross section at the time of freeze-out, which are dictated by the observed DM relic abundance. The experimental results exclude a significant region of the parameter space preferred by those predictions for some relevant scenarios of the 2HDM+a model. |
| References | ||||
| 1 | G. Steigman and M. S. Turner | Cosmological constraints on the properties of weakly interacting massive particles | NPB 253 (1985) 375 | |
| 2 | L. Roszkowski, E. M. Sessolo, and S. Trojanowski | WIMP dark matter candidates and searches --- current status and future prospects | Rept. Prog. Phys. 81 (2018) 066201 | 1707.06277 |
| 3 | P. Tunney, J. M. No, and M. Fairbairn | Probing the pseudoscalar portal to dark matter via $ \bar bb\mathrm{Z}(\to\ell\ell)+\hspace{-0.2cm}\not{E}_T $: From the LHC to the galactic center excess | PRD 96 (2017) 095020 | 1705.09670 |
| 4 | G. Bertone, D. Hooper, and J. Silk | Particle dark matter: Evidence, candidates and constraints | Phys. Rept. 405 (2005) 279 | hep-ph/0404175 |
| 5 | CMS Collaboration | Dark sector searches with the CMS experiment | Phys. Rep. 44 (2024) 8 | CMS-EXO-23-005 2405.13778 |
| 6 | A. De Roeck | Dark matter searches at accelerators | NPB 1003 (2024) 116480 | |
| 7 | ATLAS Collaboration | Constraints on simplified dark matter models involving an \textits-channel mediator with the ATLAS detector in pp collisions at $ \sqrt{s} = $ 13 TeV | EPJC 84 (2024) 1102 | 2404.15930 |
| 8 | ATLAS Collaboration | Combination and summary of ATLAS dark matter searches interpreted in a 2HDM with a pseudo-scalar mediator using 139 fb$ ^{-1} $ of $ \sqrt{s} = $ 13 TeV pp collision data | Sci. Bull. 69 (2024) 3005 | 2306.00641 |
| 9 | Fermi-LAT Collaboration | FERMI-LAT observations of high-energy $ \gamma $-ray emission toward the galatic center | Astrophys. J. 819 (2016) 44 | 1511.02938 |
| 10 | MAGIC Collaboration | Limits to dark matter annihilation cross-section from a combined analysis of MAGIC and Fermi-LAT observations of dwarf satellite galaxies | JCAP 02 (2016) 039 | 1601.06590 |
| 11 | D. Hooper and L. Goodenough | Dark matter annihilation in the galactic center as seen by the Fermi gamma ray space telescope | PLB 697 (2011) 412 | 1010.2752 |
| 12 | D. Hooper and T. Linden | Origin of the gamma rays from the galactic center | PRD 84 (2011) 123005 | 1110.0006 |
| 13 | K. N. Abazajian and M. Kaplinghat | Detection of a gamma-ray source in the galactic center consistent with extended emission from dark matter annihilation and concentrated astrophysical emission | PRD 86 (2012) 083511 | 1207.6047 |
| 14 | C. Karwin et al. | Dark matter interpretation of the Fermi-LAT observation toward the galactic center | PRD 95 (2017) 103005 | 1612.05687 |
| 15 | C. Boehm et al. | Extended gamma-ray emission from coy dark matter | JCAP 05 (2014) 009 | 1401.6458 |
| 16 | E. Izaguirre, G. Krnjaic, and B. Shuve | Bottom-up approach to the galactic center excess | PRD 90 (2014) 055002 | 1404.2018 |
| 17 | S. Ipek, D. McKeen, and A. E. Nelson | Renormalizable model for the galactic center gamma-ray excess from dark matter annihilation | PRD 90 (2014) 055021 | 1404.3716 |
| 18 | A. Berlin, D. Hooper, and S. D. McDermott | Simplified dark matter models for the galactic center gamma-ray excess | PRD 89 (2014) 115022 | 1404.0022 |
| 19 | C. Arina, E. Del Nobile, and P. Panci | Dark matter with pseudoscalar-mediated interactions explains the DAMA Signal and the galactic center excess | PRL 114 (2015) 011301 | 1406.5542 |
| 20 | XENON Collaboration | Constraining the spin-dependent WIMP-nucleon cross sections with XENON1T | PRL 122 (2019) 141301 | 1902.03234 |
| 21 | A. Boveia et al. | Recommendations on presenting LHC searches for missing transverse energy signals using simplified $ s $-channel models of dark matter | Phys. Dark Univ. 27 (2020) 100365 | 1603.04156 |
| 22 | A. Berlin, S. Gori, T. Lin, and L.-T. Wang | Pseudoscalar portal dark matter | PRD 92 (2015) 015005 | 1502.06000 |
| 23 | ATLAS Collaboration | Search for new phenomena in events with an energetic jet and missing transverse momentum in pp collisions at $ \sqrt{s}= $ 13 TeV with the ATLAS detector | PRD 103 (2021) 112006 | 2102.10874 |
| 24 | CMS Collaboration | Search for new particles in events with energetic jets and large missing transverse momentum in proton-proton collisions at $ \sqrt{s} = $ 13 TeV | JHEP 11 (2021) 153 | CMS-EXO-20-004 2107.13021 |
| 25 | ATLAS Collaboration | Search for dark matter in association with an energetic photon in pp collisions at $ \sqrt{s} = $ 13 TeV with the ATLAS detector | JHEP 02 (2021) 226 | 2011.05259 |
| 26 | CMS Collaboration | Search for new physics in final states with a single photon and missing transverse momentum in proton-proton collisions at $ \sqrt{s} = $ 13 TeV | JHEP 02 (2019) 074 | CMS-EXO-16-053 1810.00196 |
| 27 | ATLAS Collaboration | Search for associated production of a $ Z $ boson with an invisibly decaying Higgs boson or dark matter candidates at $ \sqrt{s} = $ 13 TeV with the ATLAS detector | PLB 829 (2022) 137066 | 2111.08372 |
| 28 | CMS Collaboration | Search for dark matter produced in association with a leptonically decaying Z boson in proton-proton collisions at $ \sqrt{s} = $ 13 TeV | EPJC 81 (2021) 13 | CMS-EXO-19-003 2008.04735 |
| 29 | ATLAS Collaboration | Search for dark matter produced in association with a standard model Higgs boson decaying into b-quarks using the full run 2 dataset from the ATLAS detector | JHEP 11 (2021) 209 | 2108.13391 |
| 30 | ATLAS Collaboration | Search for dark matter in events with missing transverse momentum and a Higgs boson decaying into two photons in pp collisions at $ \sqrt{s} = $ 13 TeV with the ATLAS detector | JHEP 10 (2021) 013 | 2104.13240 |
| 31 | CMS Collaboration | Search for dark matter particles produced in association with a Higgs boson in proton-proton collisions at $ \sqrt{s} = $ 13 TeV | JHEP 03 (2020) 025 | CMS-EXO-18-011 1908.01713 |
| 32 | CMS Collaboration | Search for dark matter produced in association with a Higgs boson decaying to a pair of bottom quarks in proton-proton collisions at $ \sqrt{s}= $ 13 TeV | EPJC 79 (2019) 280 | CMS-EXO-16-050 1811.06562 |
| 33 | CMS Collaboration | Search for dark matter produced in association with a Higgs boson decaying to $ \gamma\gamma $ or $ \tau^+\tau^- $ at $ \sqrt{s} = $ 13 TeV | JHEP 09 (2018) 046 | CMS-EXO-16-055 1806.04771 |
| 34 | ATLAS Collaboration | Search for dark matter produced in association with a dark Higgs boson decaying into $ \mathrm{W}^{+}\mathrm{W}^{-} $ in the one-lepton final state at $ \sqrt{s} = $ 13 TeV using 139 fb$ ^{-1} $ of pp collisions recorded with the ATLAS detector | JHEP 07 (2023) 116 | 2211.07175 |
| 35 | ATLAS Collaboration | Search for dark matter produced in association with a dark Higgs boson decaying into $ \mathrm{W}^{\pm}\mathrm{W}^{\mp} $ or ZZ in fully hadronic final states from $ \sqrt{s}= $ 13 TeV pp collisions recorded with the ATLAS detector | PRL 126 (2021) 121802 | 2010.06548 |
| 36 | ATLAS Collaboration | Search for dark matter produced in association with a single top quark and an energetic W boson in $ \sqrt{s}= $ 13 TeV pp collisions with the ATLAS detector | EPJC 83 (2023) 603 | 2211.13138 |
| 37 | ATLAS Collaboration | Search for dark matter produced in association with a single top quark in $ \sqrt{s}= $ 13 TeV pp collisions with the ATLAS detector | EPJC 81 (2021) 860 | 2011.09308 |
| 38 | CMS Collaboration | Search for dark matter particles produced in association with a top quark pair at $ \sqrt{s}= $ 13 TeV | PRL 122 (2019) 011803 | CMS-EXO-16-049 1807.06522 |
| 39 | CMS Collaboration | Search for dark matter produced in association with a single top quark or a top quark pair in proton-proton collisions at $ \sqrt{s}= $ 13 TeV | JHEP 03 (2019) 141 | CMS-EXO-18-010 1901.01553 |
| 40 | CMS Collaboration | Measurement of the B$ ^0_\mathrm{S} \to \mu^+\mu^- $ decay properties and search for the B$ ^0 \to \mu^+\mu^- $ decay in proton-proton collisions at $ \sqrt{s} = $ 13 TeV | PLB 842 (2023) 137955 | CMS-BPH-21-006 2212.10311 |
| 41 | ATLAS Collaboration | Study of the rare decays of $ B^0_s $ and $ B^0 $ mesons into muon pairs using data collected during 2015 and 2016 with the ATLAS detector | JHEP 04 (2019) 098 | 1812.03017 |
| 42 | M. Misiak and M. Steinhauser | Weak radiative decays of the B meson and bounds on $ M_{H^\pm } $ in the two-Higgs-doublet model | EPJC 77 (2017) 201 | 1702.04571 |
| 43 | A. Abdesselam et al. | Measurement of the inclusive $ B\to X_{s+d} \gamma $ branching fraction, photon energy spectrum and HQE parameters | Belle Collaboration, in 38th International Conference on High Energy Physics. 8, 2016 | 1608.02344 |
| 44 | H. E. Logan and U. Nierste | $ B_{s,d} \to \ell^+ \ell^- $ in a two Higgs doublet model | NPB 586 (2000) 39 | hep-ph/0004139 |
| 45 | M. Misiak et al. | Updated NNLO QCD predictions for the weak radiative B-meson decays | PRL 114 (2015) 221801 | 1503.01789 |
| 46 | CMS Collaboration | Measurement of the $ {B}_{s}^{0}\rightarrow{\mu}^{\mathbf{+}}{\mu}^{\mathbf{-}} $ branching fraction and search for $ {B}^{0}\rightarrow{\mu}^{\mathbf{+}}{\mu}^{\mathbf{-}} $ with the CMS experiment | PRL 111 (2013) 101804 | CMS-BPH-13-004 1307.5025 |
| 47 | Y. Nomura and J. Thaler | Dark matter through the axion portal | PRD 79 (2009) 075008 | 0810.5397 |
| 48 | D. Goncalves, P. A. N. Machado, and J. M. No | Simplified models for dark matter face their consistent completions | PRD 95 (2017) 055027 | 1611.04593 |
| 49 | J. M. No | Looking through the pseudoscalar portal into dark matter: Novel mono-Higgs and mono-Z signatures at the LHC | PRD 93 (2016) 031701 | 1509.01110 |
| 50 | G. C. Branco et al. | Theory and phenomenology of two-Higgs-doublet models | Phys. Rept. 516 (2012) 1 | 1106.0034 |
| 51 | M. Bauer, U. Haisch, and F. Kahlhoefer | Simplified dark matter models with two Higgs doublets: I. Pseudoscalar mediators | JHEP 05 (2017) 138 | 1701.07427 |
| 52 | LHC Dark Matter Working Group | Next-generation spin-0 dark matter models | Phys. Dark Univ. 27 (2020) 100351 | 1810.09420 |
| 53 | CMS Collaboration | HEPData record for this analysis | link | |
| 54 | CMS Collaboration | The CMS experiment at the CERN LHC | JINST 3 (2008) S08004 | |
| 55 | CMS Collaboration | Performance of the CMS level-1 trigger in proton-proton collisions at $ \sqrt{s} = $ 13 TeV | JINST 15 (2020) P10017 | CMS-TRG-17-001 2006.10165 |
| 56 | CMS Collaboration | The CMS trigger system | JINST 12 (2017) P01020 | CMS-TRG-12-001 1609.02366 |
| 57 | J. Alwall et al. | The automated computation of tree-level and next-to-leading order differential cross sections, and their matching to parton shower simulations | JHEP 07 (2014) 079 | 1405.0301 |
| 58 | R. Frederix and S. Frixione | Merging meets matching in MC@NLO | JHEP 12 (2012) 061 | 1209.6215 |
| 59 | S. Frixione, P. Nason, and C. Oleari | Matching NLO QCD computations with Parton Shower simulations: The POWHEG method | JHEP 11 (2007) 070 | 0709.2092 |
| 60 | S. Alioli, P. Nason, C. Oleari, and E. Re | A general framework for implementing NLO calculations in shower Monte Carlo programs: The POWHEG BOX | JHEP 06 (2010) 043 | 1002.2581 |
| 61 | Y. Li and F. Petriello | Combining QCD and electroweak corrections to dilepton production in FEWZ | PRD 86 (2012) 094034 | 1208.5967 |
| 62 | M. Czakon and A. Mitov | Top++: A program for the calculation of the top-pair cross-section at hadron colliders | Comput. Phys. Commun. 185 (2014) 2930 | 1112.5675 |
| 63 | N. Kidonakis | Two-loop soft anomalous dimensions for single top quark associated production with a $ \mathrm{W}^- $ or $ \mathrm{H}^- $ | PRD 82 (2010) 054018 | 1005.4451 |
| 64 | J. M. Campbell, R. K. Ellis, and C. Williams | Vector boson pair production at the LHC | JHEP 07 (2011) 018 | 1105.0020 |
| 65 | M. Czakon et al. | Top-pair production at the LHC through NNLO QCD and NLO EW | JHEP 10 (2017) 186 | 1705.04105 |
| 66 | M. Grazzini, S. Kallweit, and M. Wiesemann | Fully differential NNLO computations with MATRIX | EPJC 78 (2018) 537 | 1711.06631 |
| 67 | CMS Collaboration | Measurement of the inclusive and differential WZ production cross sections, polarization angles, and triple gauge couplings in pp collisions at $ \sqrt{s} = $ 13 TeV | JHEP 07 (2022) 032 | CMS-SMP-20-014 2110.11231 |
| 68 | NNPDF Collaboration | Parton distributions from high-precision collider data | EPJC 77 (2017) 663 | 1706.00428 |
| 69 | T. Sjostrand et al. | An introduction to pythia 8.2 | Comput. Phys. Commun. 191 (2015) 159 | 1410.3012 |
| 70 | CMS Collaboration | Extraction and validation of a new set of CMS pythia8 tunes from underlying-event measurements | EPJC 80 (2020) 4 | CMS-GEN-17-001 1903.12179 |
| 71 | GEANT4 Collaboration | GEANT4--a simulation toolkit | NIM A 506 (2003) 250 | |
| 72 | CMS Collaboration | Particle-flow reconstruction and global event description with the CMS detector | JINST 12 (2017) P10003 | CMS-PRF-14-001 1706.04965 |
| 73 | CMS Collaboration | Technical proposal for the phase-II upgrade of the CMS detector | technical report, 2015 link |
|
| 74 | CMS Collaboration | Electron and photon reconstruction and identification with the CMS experiment at the CERN LHC | JINST 16 (2021) P05014 | CMS-EGM-17-001 2012.06888 |
| 75 | CMS Collaboration | Performance of the CMS muon detector and muon reconstruction with proton-proton collisions at $ \sqrt{s}= $ 13 TeV | JINST 13 (2018) P06015 | CMS-MUO-16-001 1804.04528 |
| 76 | M. Cacciari, G. P. Salam, and G. Soyez | The anti-$ k_{\mathrm{T}} $ jet clustering algorithm | JHEP 04 (2008) 063 | 0802.1189 |
| 77 | M. Cacciari, G. P. Salam, and G. Soyez | FastJet user manual | EPJC 72 (2012) 1896 | 1111.6097 |
| 78 | M. Cacciari and G. P. Salam | Dispelling the $ N^{3} $ myth for the $ k_{\mathrm{T}} $ jet-finder | PLB 641 (2006) 57 | hep-ph/0512210 |
| 79 | CMS Collaboration | Jet energy scale and resolution in the CMS experiment in pp collisions at 8 TeV | JINST 12 (2017) P02014 | CMS-JME-13-004 1607.03663 |
| 80 | CMS Collaboration | Pileup mitigation at CMS in 13 TeV data | JINST 15 (2020) P09018 | CMS-JME-18-001 2003.00503 |
| 81 | CMS Collaboration | Identification of heavy-flavour jets with the CMS detector in pp collisions at 13 TeV | JINST 13 (2018) P05011 | CMS-BTV-16-002 1712.07158 |
| 82 | CMS Collaboration | Performance of missing transverse momentum reconstruction in proton-proton collisions at $ \sqrt{s} = $ 13 TeV using the CMS detector | JINST 14 (2019) P07004 | CMS-JME-17-001 1903.06078 |
| 83 | Particle data group | Review of particle physics | PRD 110 (2024) 030001 | |
| 84 | C. G. Lester and D. J. Summers | Measuring masses of semi-invisibly decaying particles pair produced at hadron colliders | PLB 463 (1999) 99 | hep-ph/9906349 |
| 85 | L. Sonnenschein | Analytical solution of $ \mathrm{t} \overline{\mathrm{t}} $ dilepton equations | PRD 73 (2006) 054015 | hep-ph/0603011 |
| 86 | A. Paszke et al. | PyTorch: an imperative style, high-performance deep learning library | in NIPS'19: 33rd International Conference on Neural Information, p. 721. Curran Associates Inc., 2019 link |
1912.01703 |
| 87 | C. G. Lester and B. Nachman | Bisection-based asymmetric M$ _{T2} $ computation: A higher precision calculator than existing symmetric methods | JHEP 03 (2015) 100 | 1411.4312 |
| 88 | L. Breiman | Random forests | Mach. Learn. 45 (2001) 5 | |
| 89 | J. Butterworth et al. | PDF4LHC recommendations for LHC run II | JPG 43 (2016) 023001 | 1510.03865 |
| 90 | A. Accardi et al. | A critical appraisal and evaluation of modern PDFs | EPJC 76 (2016) 471 | 1603.08906 |
| 91 | R. Barlow and C. Beeston | Fitting using finite Monte Carlo samples | Comp. Phys. Comm. 77 (1993) 219 | |
| 92 | CMS Collaboration | Measurement of the $ \mathrm{t} \overline{\mathrm{t}} $ production cross section, the top quark mass, and the strong coupling constant using dilepton events in pp collisions at $ \sqrt{s} = $ 13 TeV | EPJC 79 (2019) 368 | CMS-TOP-17-001 1812.10505 |
| 93 | CMS Collaboration | Measurement of the inelastic proton-proton cross section at $ \sqrt{s}= $ 13 TeV | JHEP 07 (2018) 161 | CMS-FSQ-15-005 1802.02613 |
| 94 | CMS Collaboration | Precision luminosity measurement in proton-proton collisions at $ \sqrt{s} = $ 13 TeV in 2015 and 2016 at CMS | EPJC 81 (2021) 800 | CMS-LUM-17-003 2104.01927 |
| 95 | CMS Collaboration | CMS luminosity measurement for the 2017 data-taking period at $ \sqrt{s} = $ 13 TeV | , 2018 CMS-PAS-LUM-17-004 |
CMS-PAS-LUM-17-004 |
| 96 | CMS Collaboration | CMS luminosity measurement for the 2018 data-taking period at $ \sqrt{s} = $ 13 TeV | , 2019 CMS-PAS-LUM-18-002 |
CMS-PAS-LUM-18-002 |
| 97 | CMS Collaboration | The CMS statistical analysis and combination tool: COMBINE | Comput. Softw. Big Sci. 8 (2024) 19 | CMS-CAT-23-001 2404.06614 |
| 98 | A. L. Read | Presentation of search results: the $ \text{CL}_\text{s} $ technique | JPG 28 (2002) 2693 | |
| 99 | G. Cowan, K. Cranmer, E. Gross, and O. Vitells | Asymptotic formulae for likelihood-based tests of new physics | EPJC 71 (2011) 1554 | 1007.1727 |
| 100 | J. Alwall et al. | Computing decay rates for new physics theories with FeynRules and MadGraph 5\_aMC@NLO | Comput. Phys. Commun. 197 (2015) 312 | 1402.1178 |
| 101 | M. Backovic, K. Kong, and M. McCaskey | MadDM v.1.0: Computation of dark matter relic abundance using MadGraph 5 | Phys. Dark Univ. 6 (2014) 18 | 1308.4955 |
| 102 | Planck Collaboration | Planck 2015 results. XIII. Cosmological parameters | Astron. Astrophys. 594 (2016) A13 | 1502.01589 |
| 103 | G. Steigman, B. Dasgupta, and J. F. Beacom | Precise relic WIMP abundance and its impact on searches for dark matter annihilation | PRD 86 (2012) 023506 | 1204.3622 |
|
|
Compact Muon Solenoid LHC, CERN |
|

|

|

|

|

|