

Compact Muon Solenoid
LHC, CERN
 Visit us: CMS Public Website, CMS Physics ;
Contact us: CMS Publications Committee
Visit us: CMS Public Website, CMS Physics ;
Contact us: CMS Publications Committee
| CMS-SMP-25-005 ; CERN-EP-2026-183 | ||
| Measurement of the fragmentation properties of jets containing $ \Upsilon{\textrm{(nS)}} $ mesons in proton-proton collisions at $ \sqrt{s}= $ 13 TeV | ||
| CMS Collaboration | ||
| 28 July 2026 | ||
| Submitted to the Journal of High Energy Physics | ||
| Abstract: A measurement of the fragmentation properties of jets containing $ \Upsilon{\textrm{(nS)}} $ mesons using proton-proton collision data at $ \sqrt{s}= $ 13 TeV, corresponding to an integrated luminosity of 138 fb$ ^{-1} $, is presented. The $ \Upsilon{\textrm{(nS)}} $ mesons associated with jets are reconstructed via their decays producing pairs of oppositely charged muons. The longitudinal and transverse projections of the momenta of the $ \Upsilon{\textrm{(nS)}} $ mesons along the momenta of the corresponding jets are studied. The results are compared with Monte Carlo predictions, including recent developments in the modelling of quarkonia production in parton showers. The description of the data by these Monte Carlo predictions is found to be unsatisfactory, leaving room for improvements in the modelling of such processes. | ||
| Links: e-print arXiv:2607.25653 [hep-ex] (PDF) ; CDS record ; inSPIRE record ; HepData record ; CADI line (restricted) ; | ||
| Figures | |
png pdf |
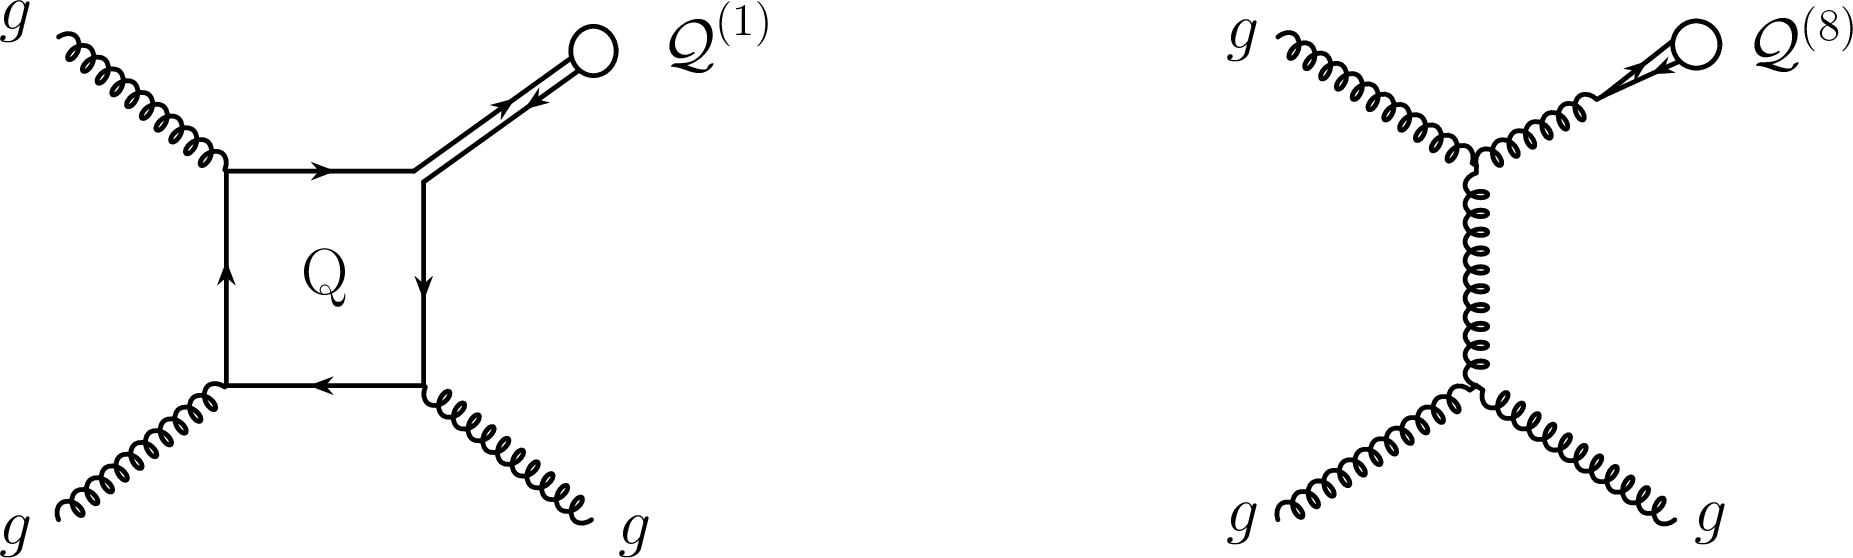
Figure 1:
Example diagrams for the hard production of $ \Upsilon{\textrm{(nS)}} $ mesons in the colour singlet (left) and colour octet mechanisms (right). |
png pdf |
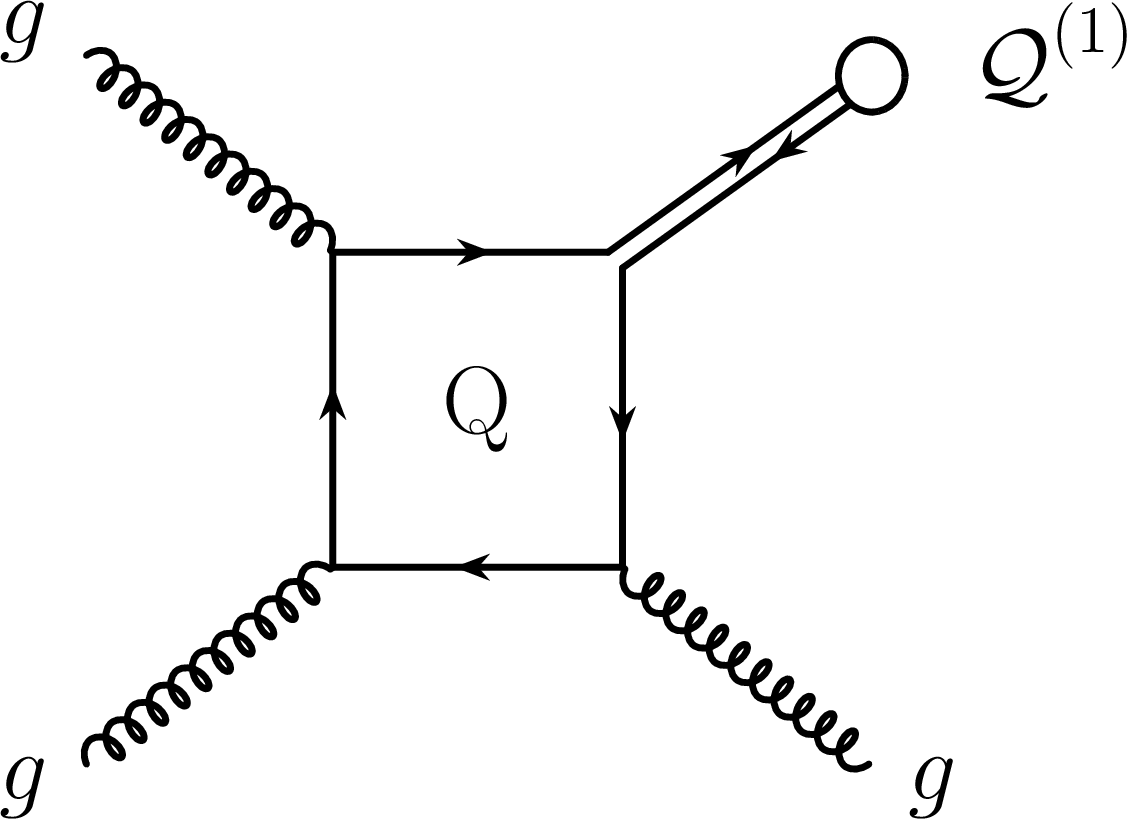
Figure 1-a:
Example diagrams for the hard production of $ \Upsilon{\textrm{(nS)}} $ mesons in the colour singlet (left) and colour octet mechanisms (right). |
png pdf |
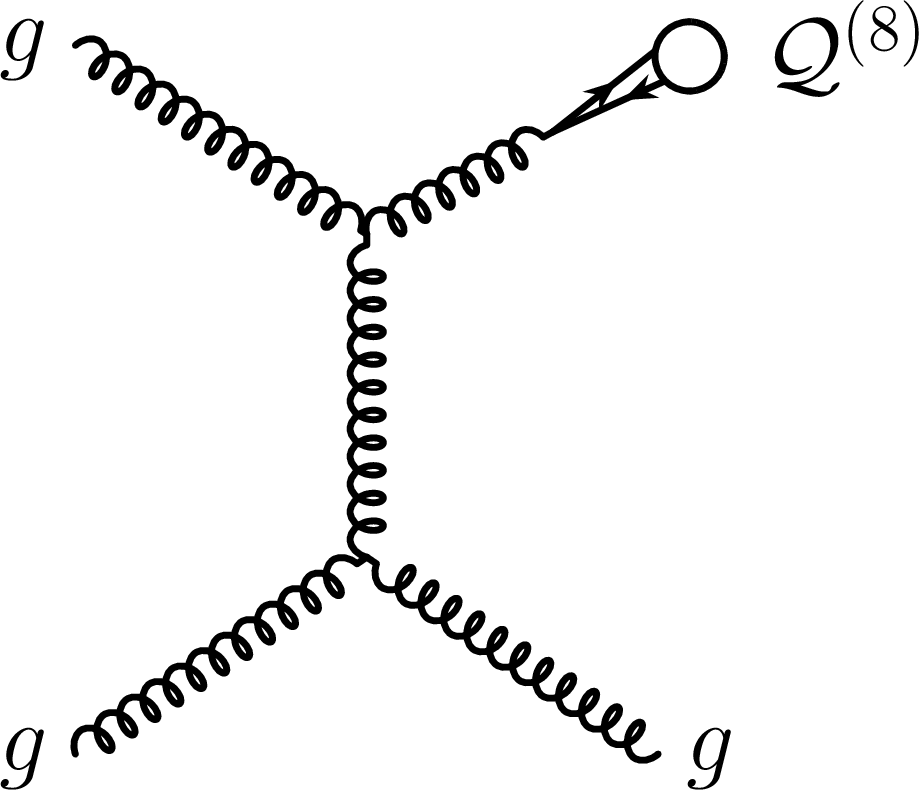
Figure 1-b:
Example diagrams for the hard production of $ \Upsilon{\textrm{(nS)}} $ mesons in the colour singlet (left) and colour octet mechanisms (right). |
png pdf |
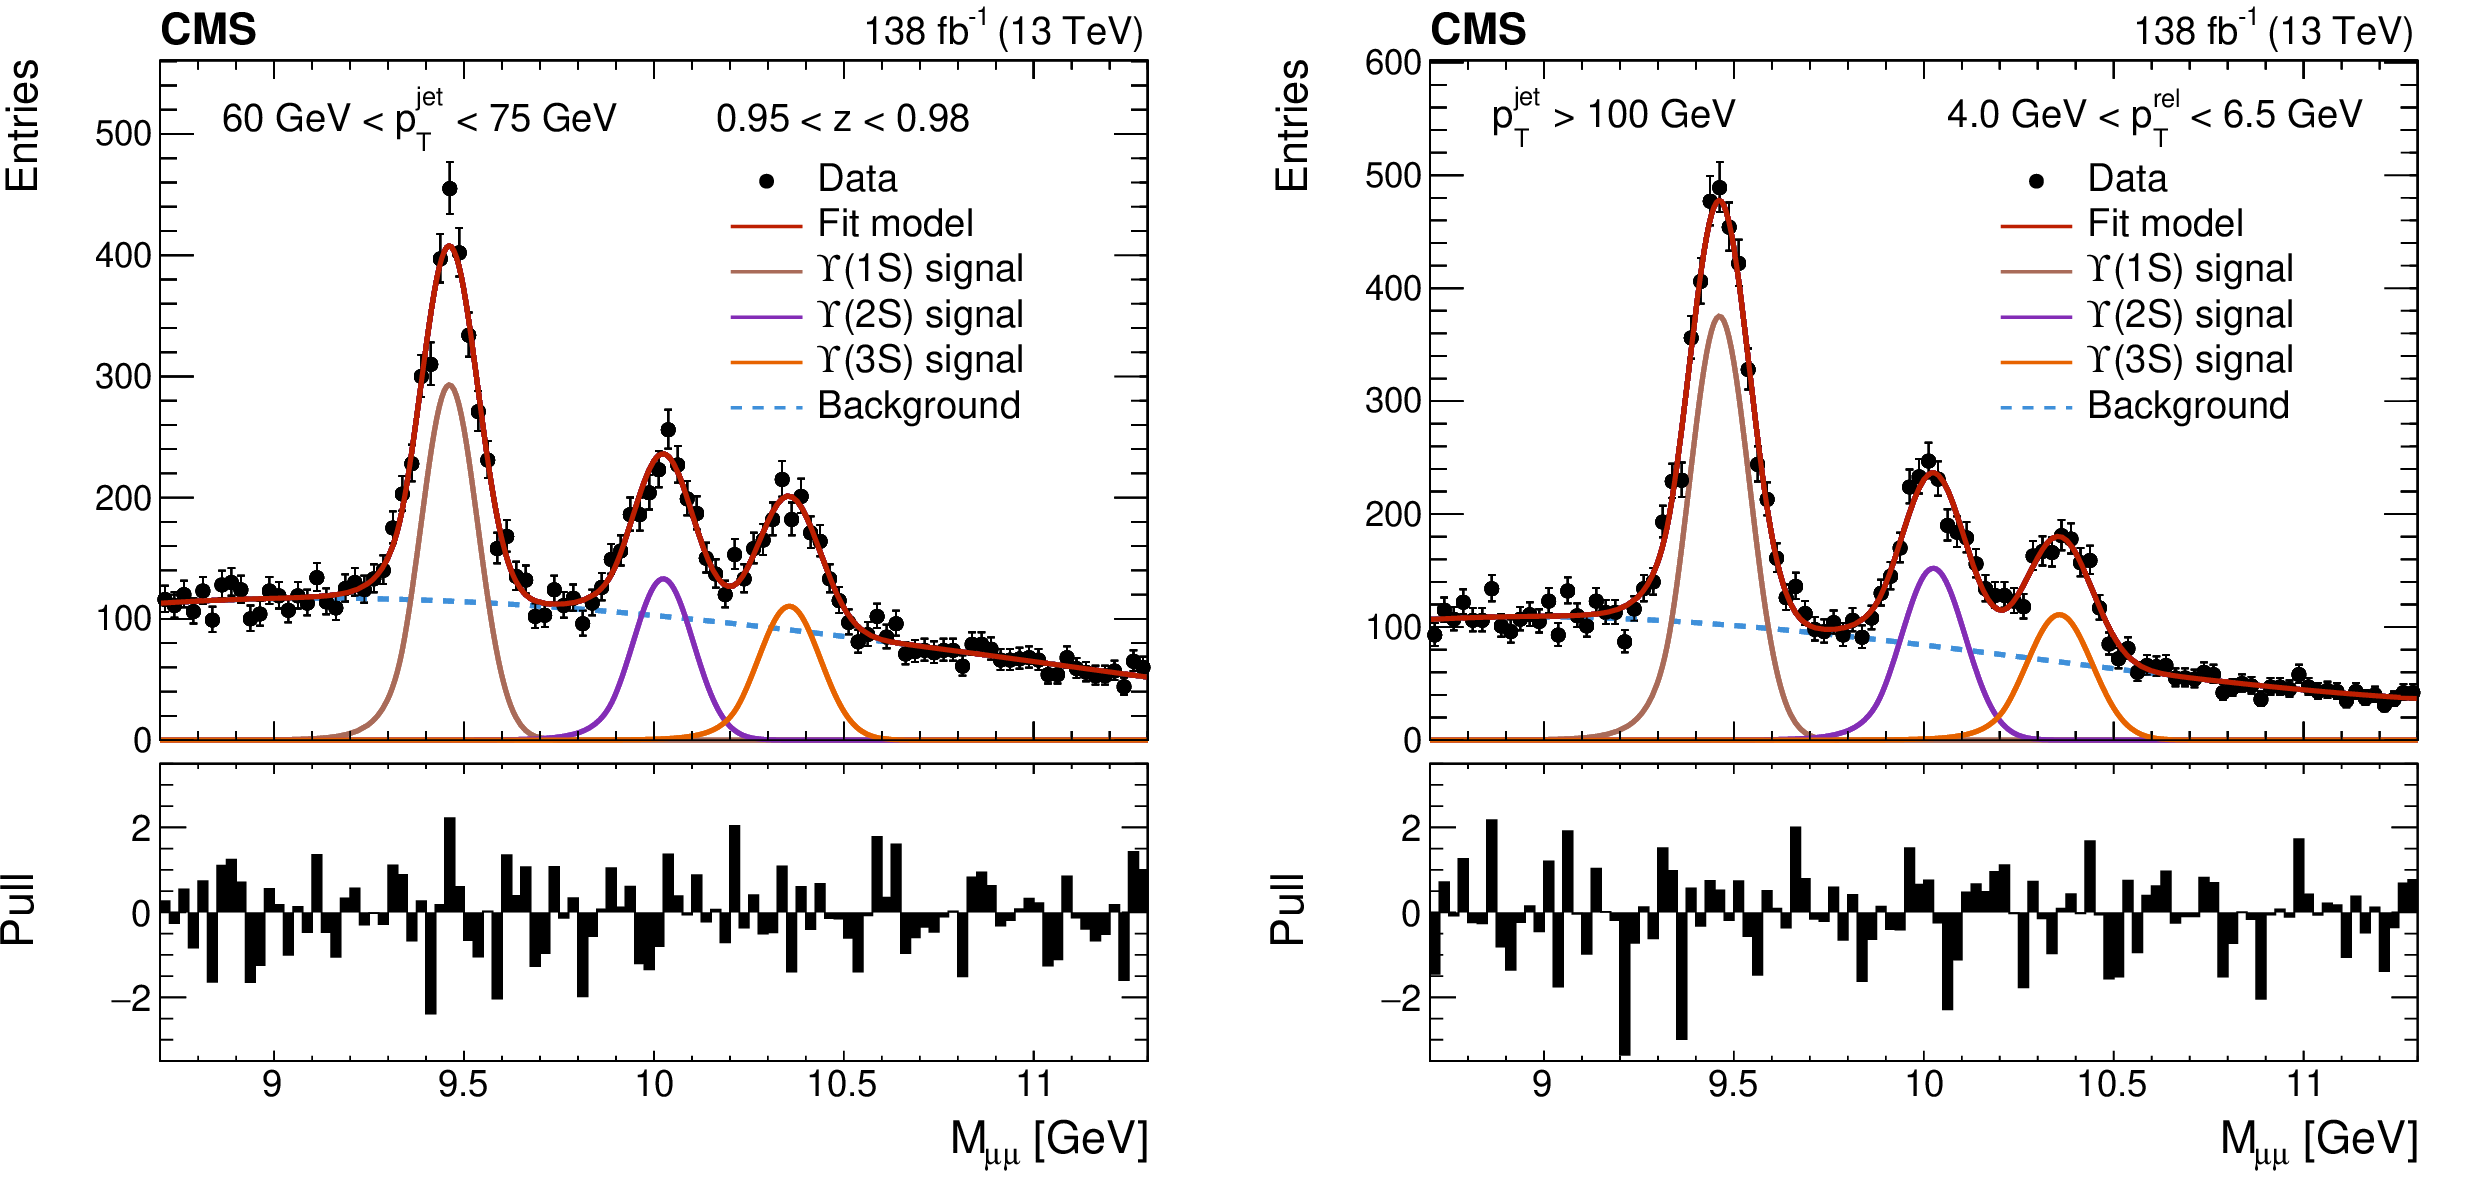
Figure 2:
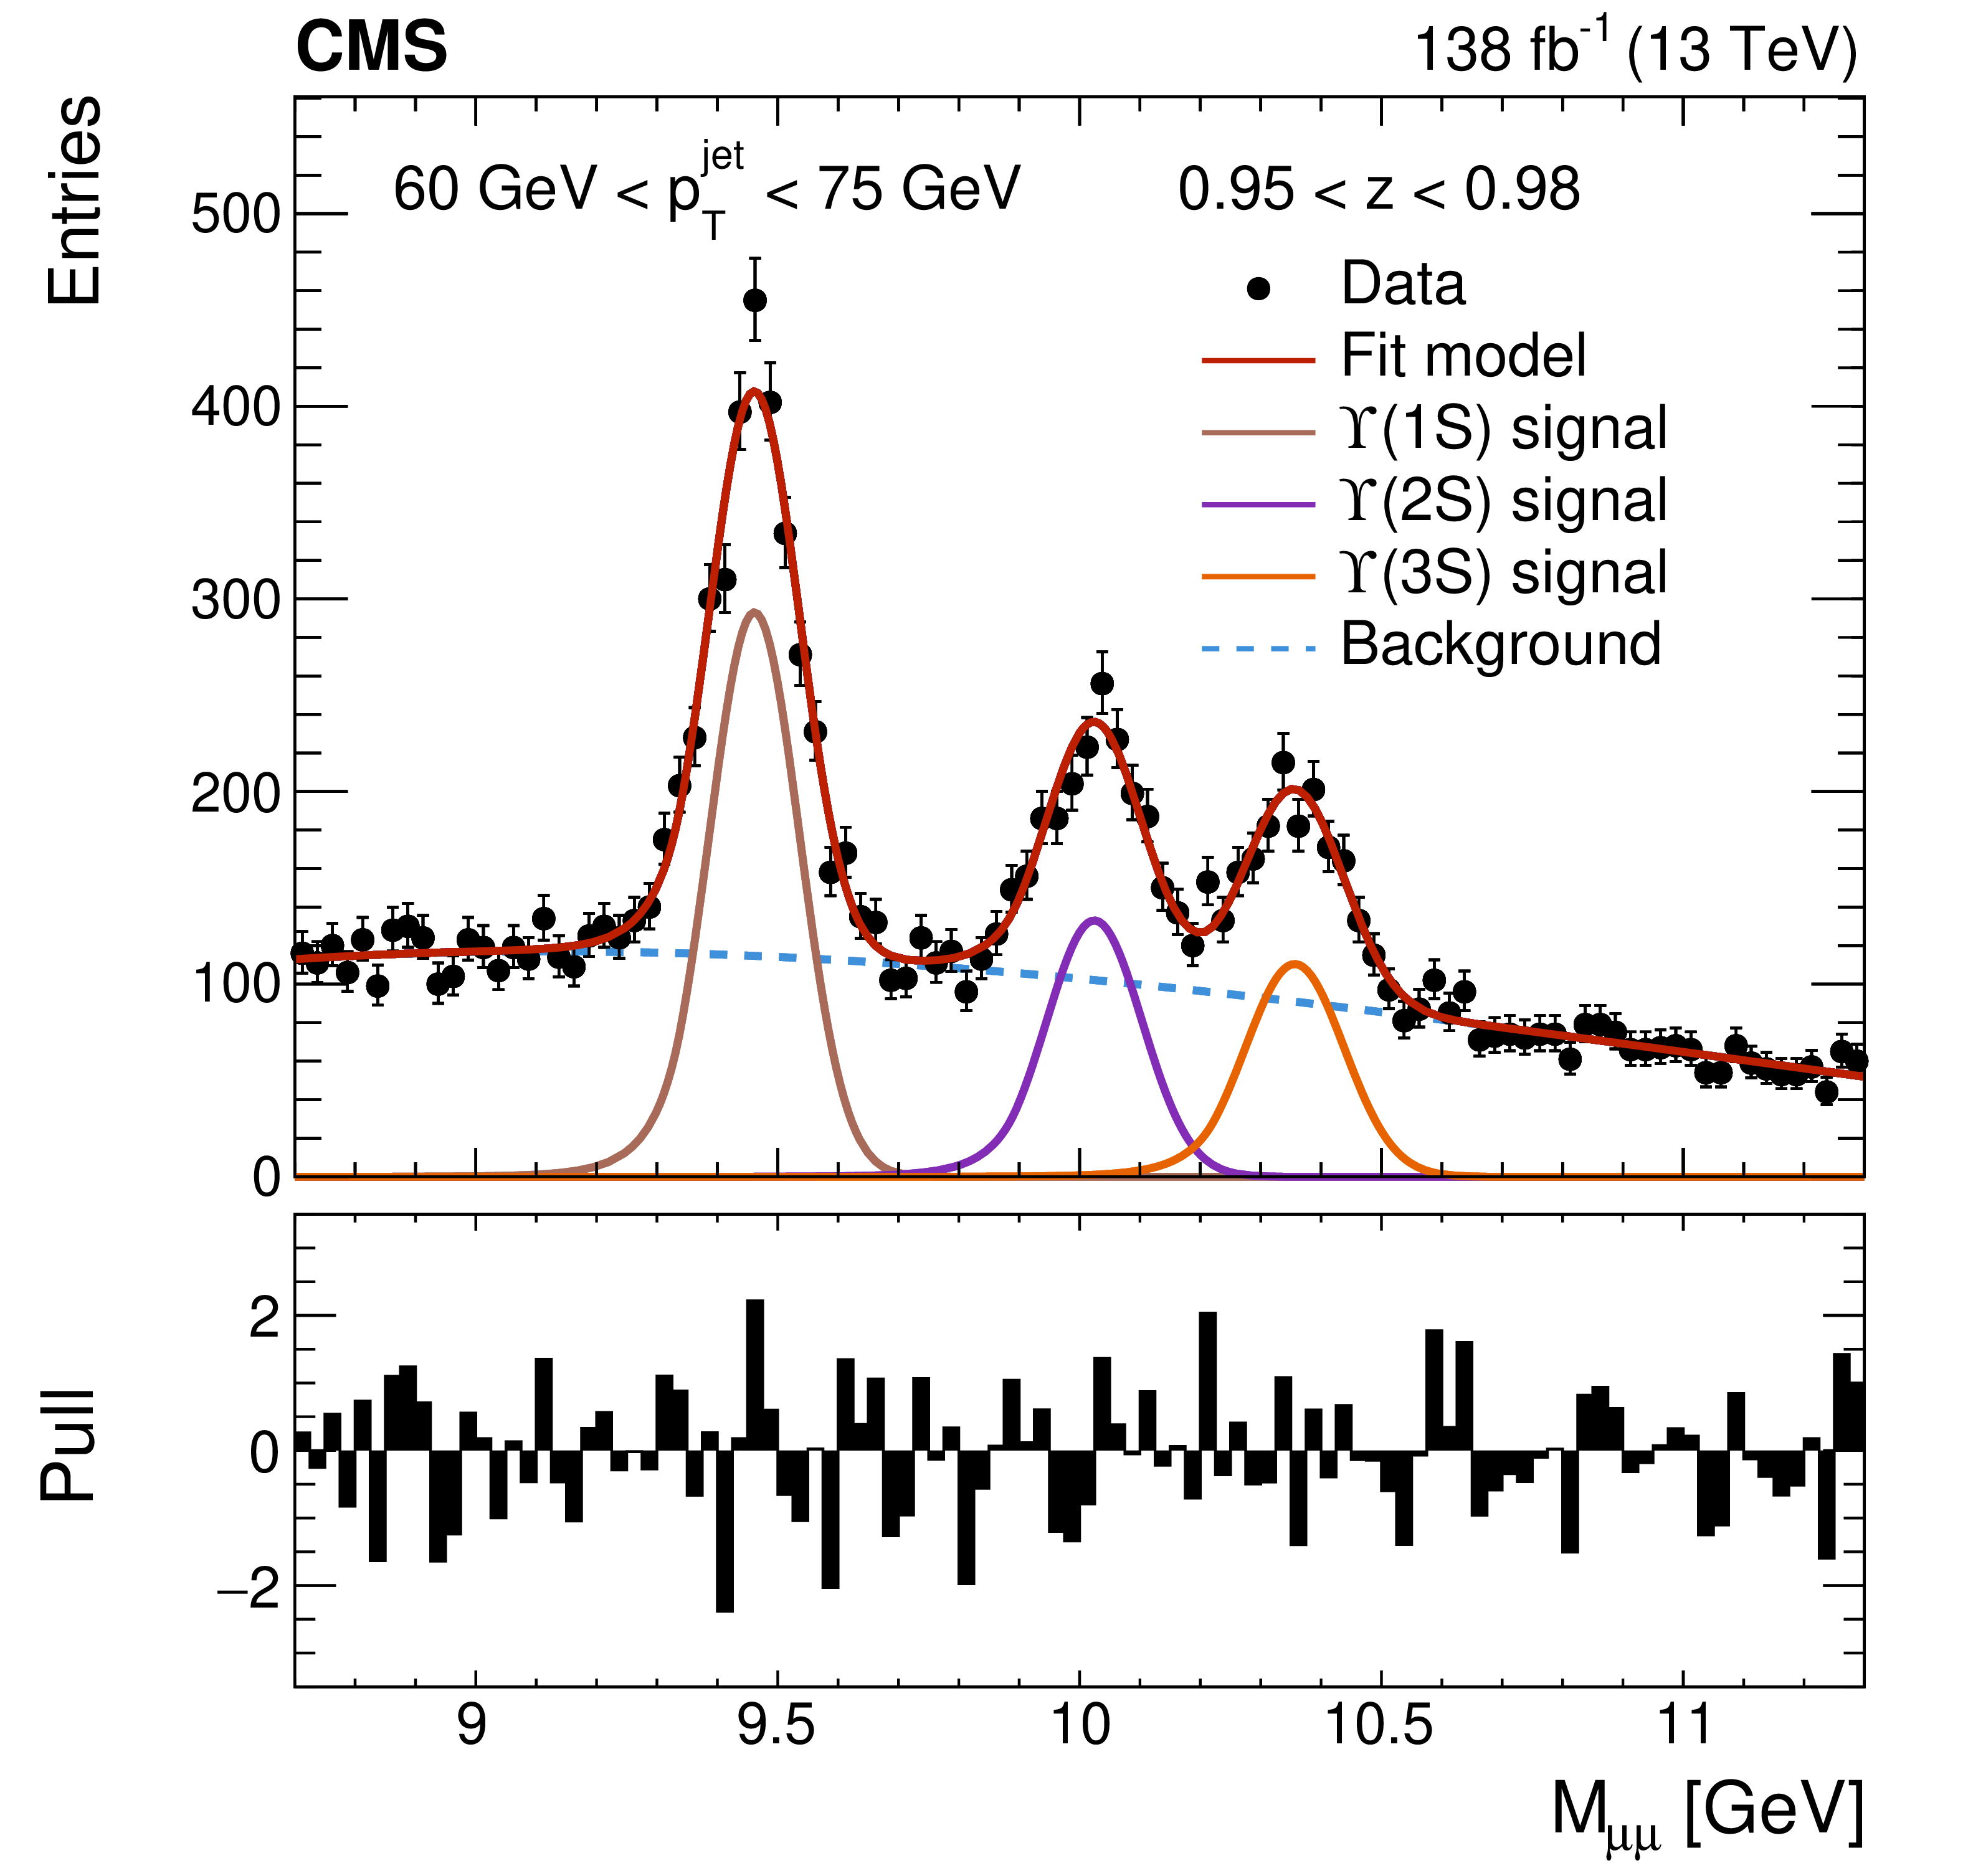
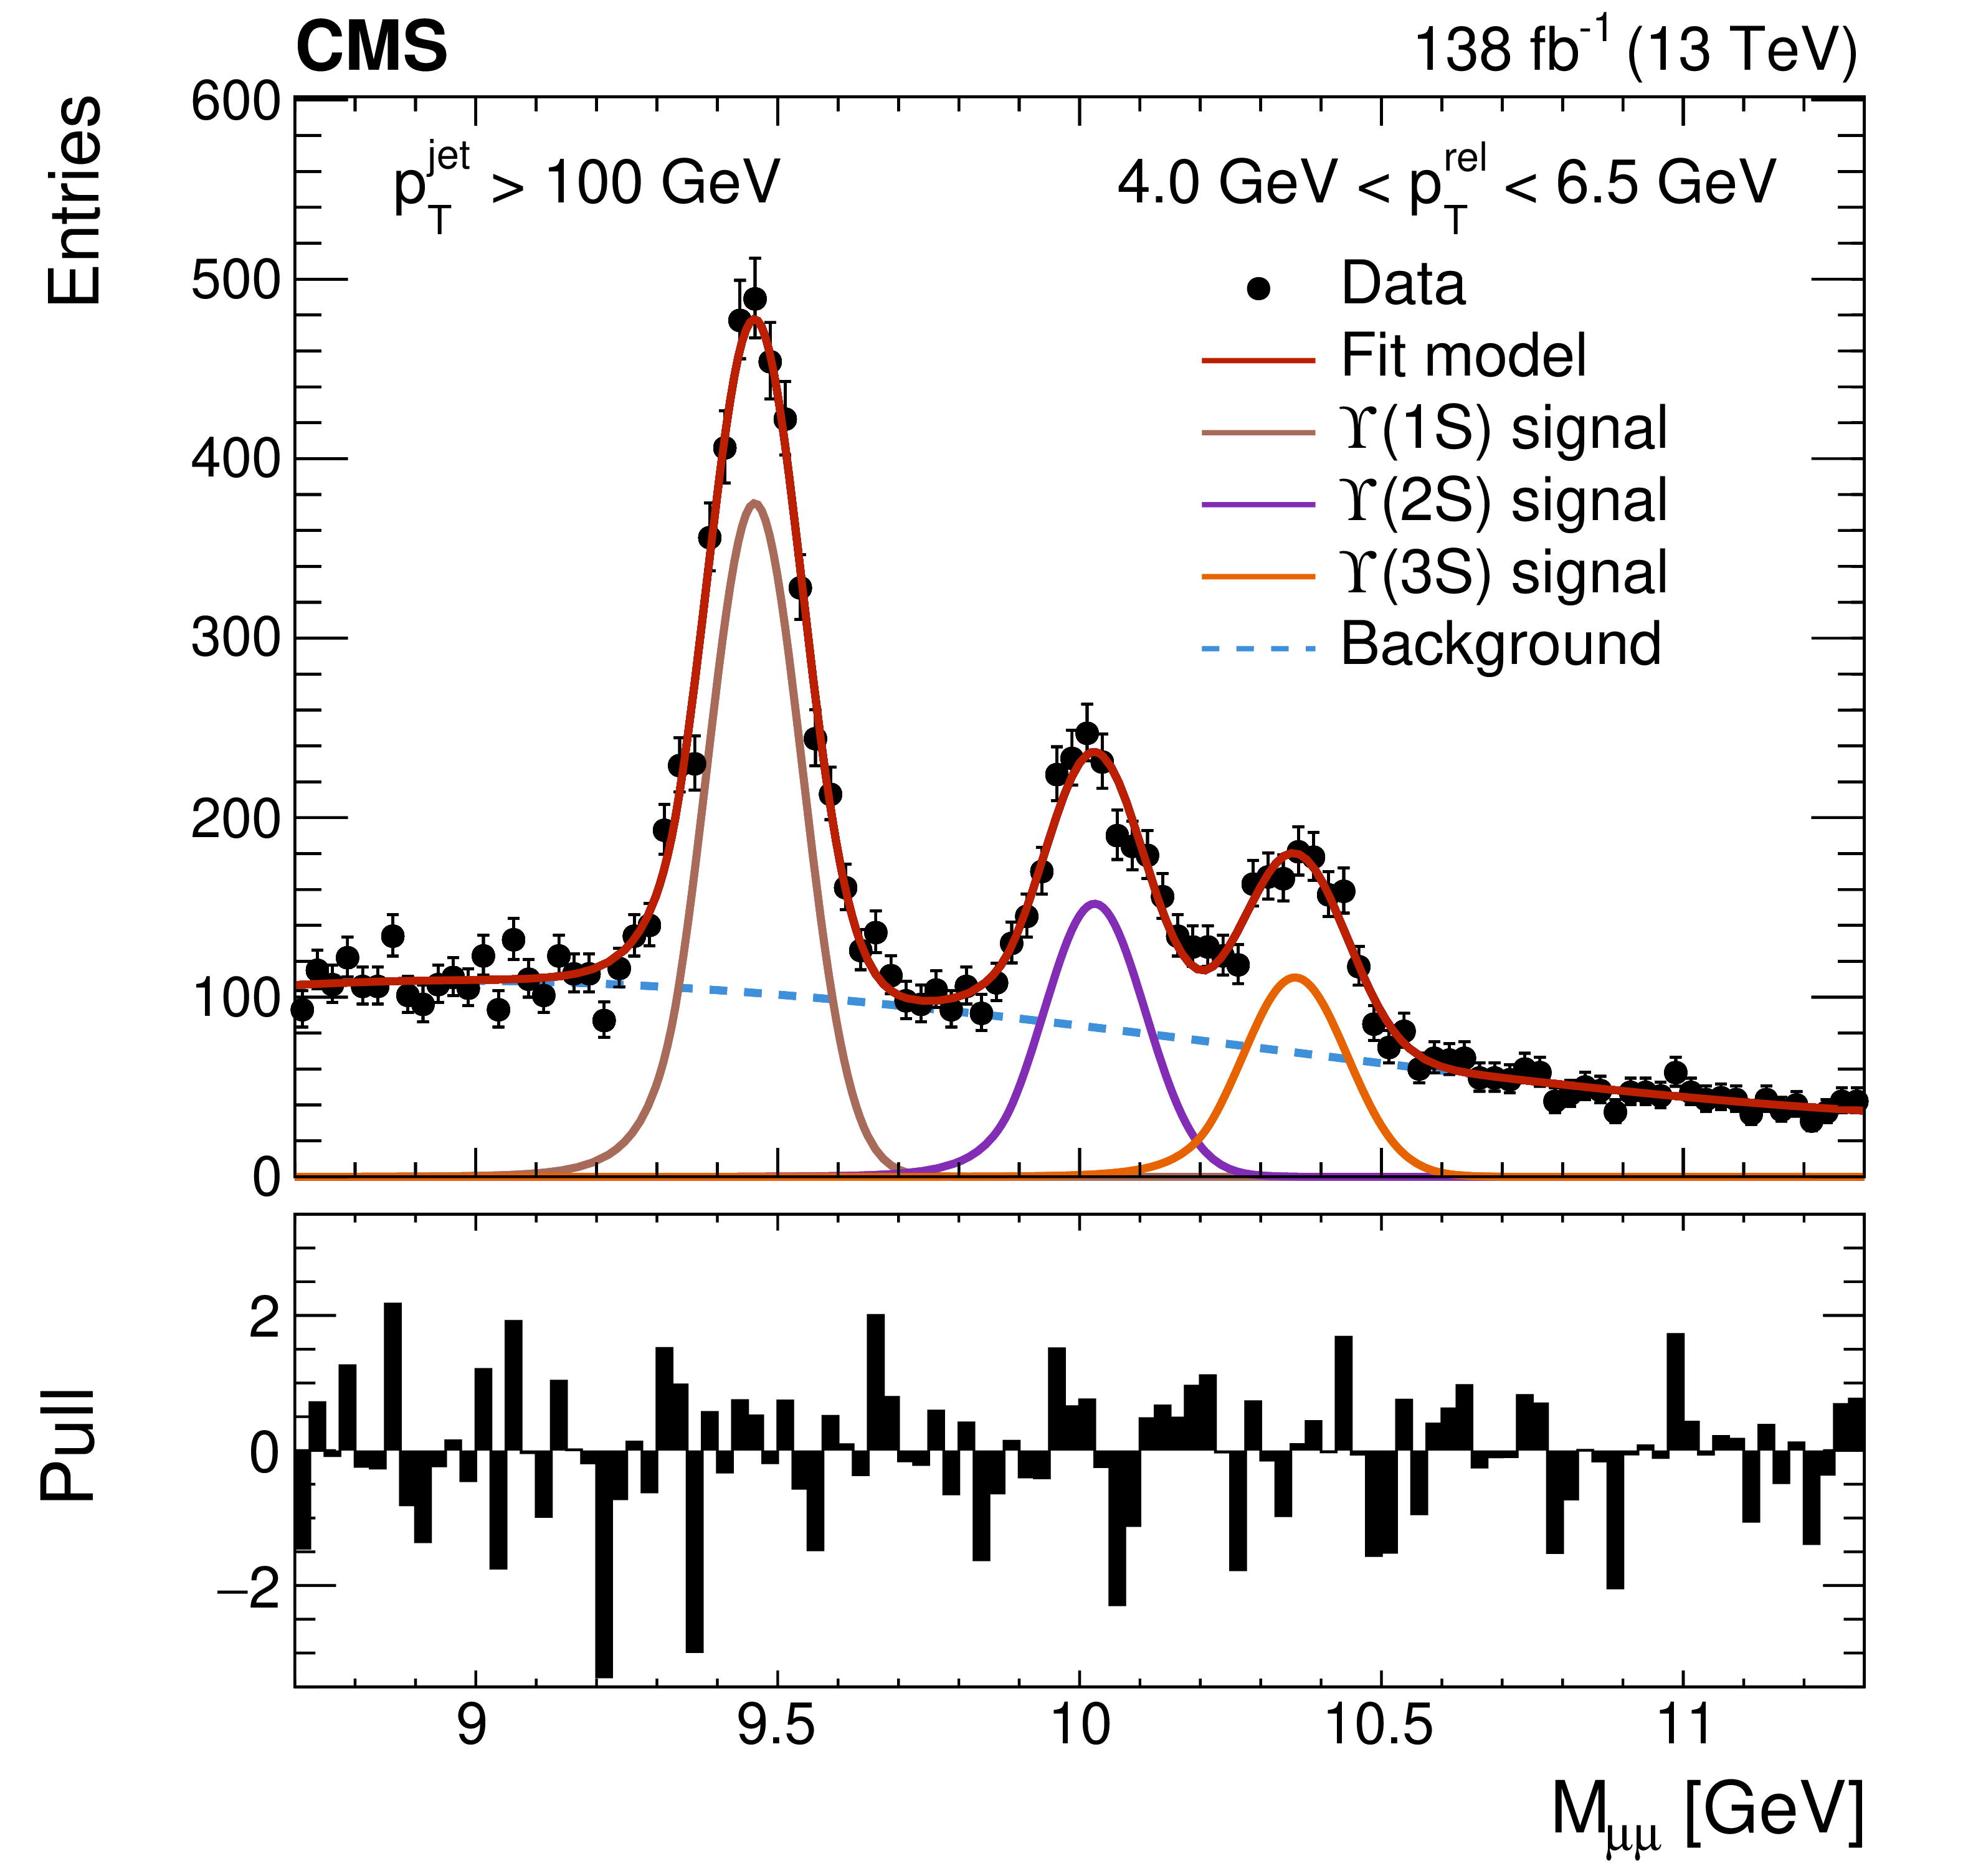
Fits to the invariant mass distributions of $ \Upsilon{\textrm{(nS)}} $ candidates in two representative ranges of the jet $ p_{\mathrm{T}} $ and the fragmentation variables $ z $ (left) and $ p_{\mathrm{T}}^{\text{rel}} $ (right). The fit components, including signal and background functions, are also shown on the upper panels. The vertical error bars represent the statistical uncertainties on the data points. The lower panel shows the difference between the data and the fitted function, divided by the statistical uncertainty of the data. The model shows, in general, a good agreement with the data. |
png pdf |
Figure 2-a:
Fits to the invariant mass distributions of $ \Upsilon{\textrm{(nS)}} $ candidates in two representative ranges of the jet $ p_{\mathrm{T}} $ and the fragmentation variables $ z $ (left) and $ p_{\mathrm{T}}^{\text{rel}} $ (right). The fit components, including signal and background functions, are also shown on the upper panels. The vertical error bars represent the statistical uncertainties on the data points. The lower panel shows the difference between the data and the fitted function, divided by the statistical uncertainty of the data. The model shows, in general, a good agreement with the data. |
png pdf |
Figure 2-b:
Fits to the invariant mass distributions of $ \Upsilon{\textrm{(nS)}} $ candidates in two representative ranges of the jet $ p_{\mathrm{T}} $ and the fragmentation variables $ z $ (left) and $ p_{\mathrm{T}}^{\text{rel}} $ (right). The fit components, including signal and background functions, are also shown on the upper panels. The vertical error bars represent the statistical uncertainties on the data points. The lower panel shows the difference between the data and the fitted function, divided by the statistical uncertainty of the data. The model shows, in general, a good agreement with the data. |
png pdf |
Figure 3:
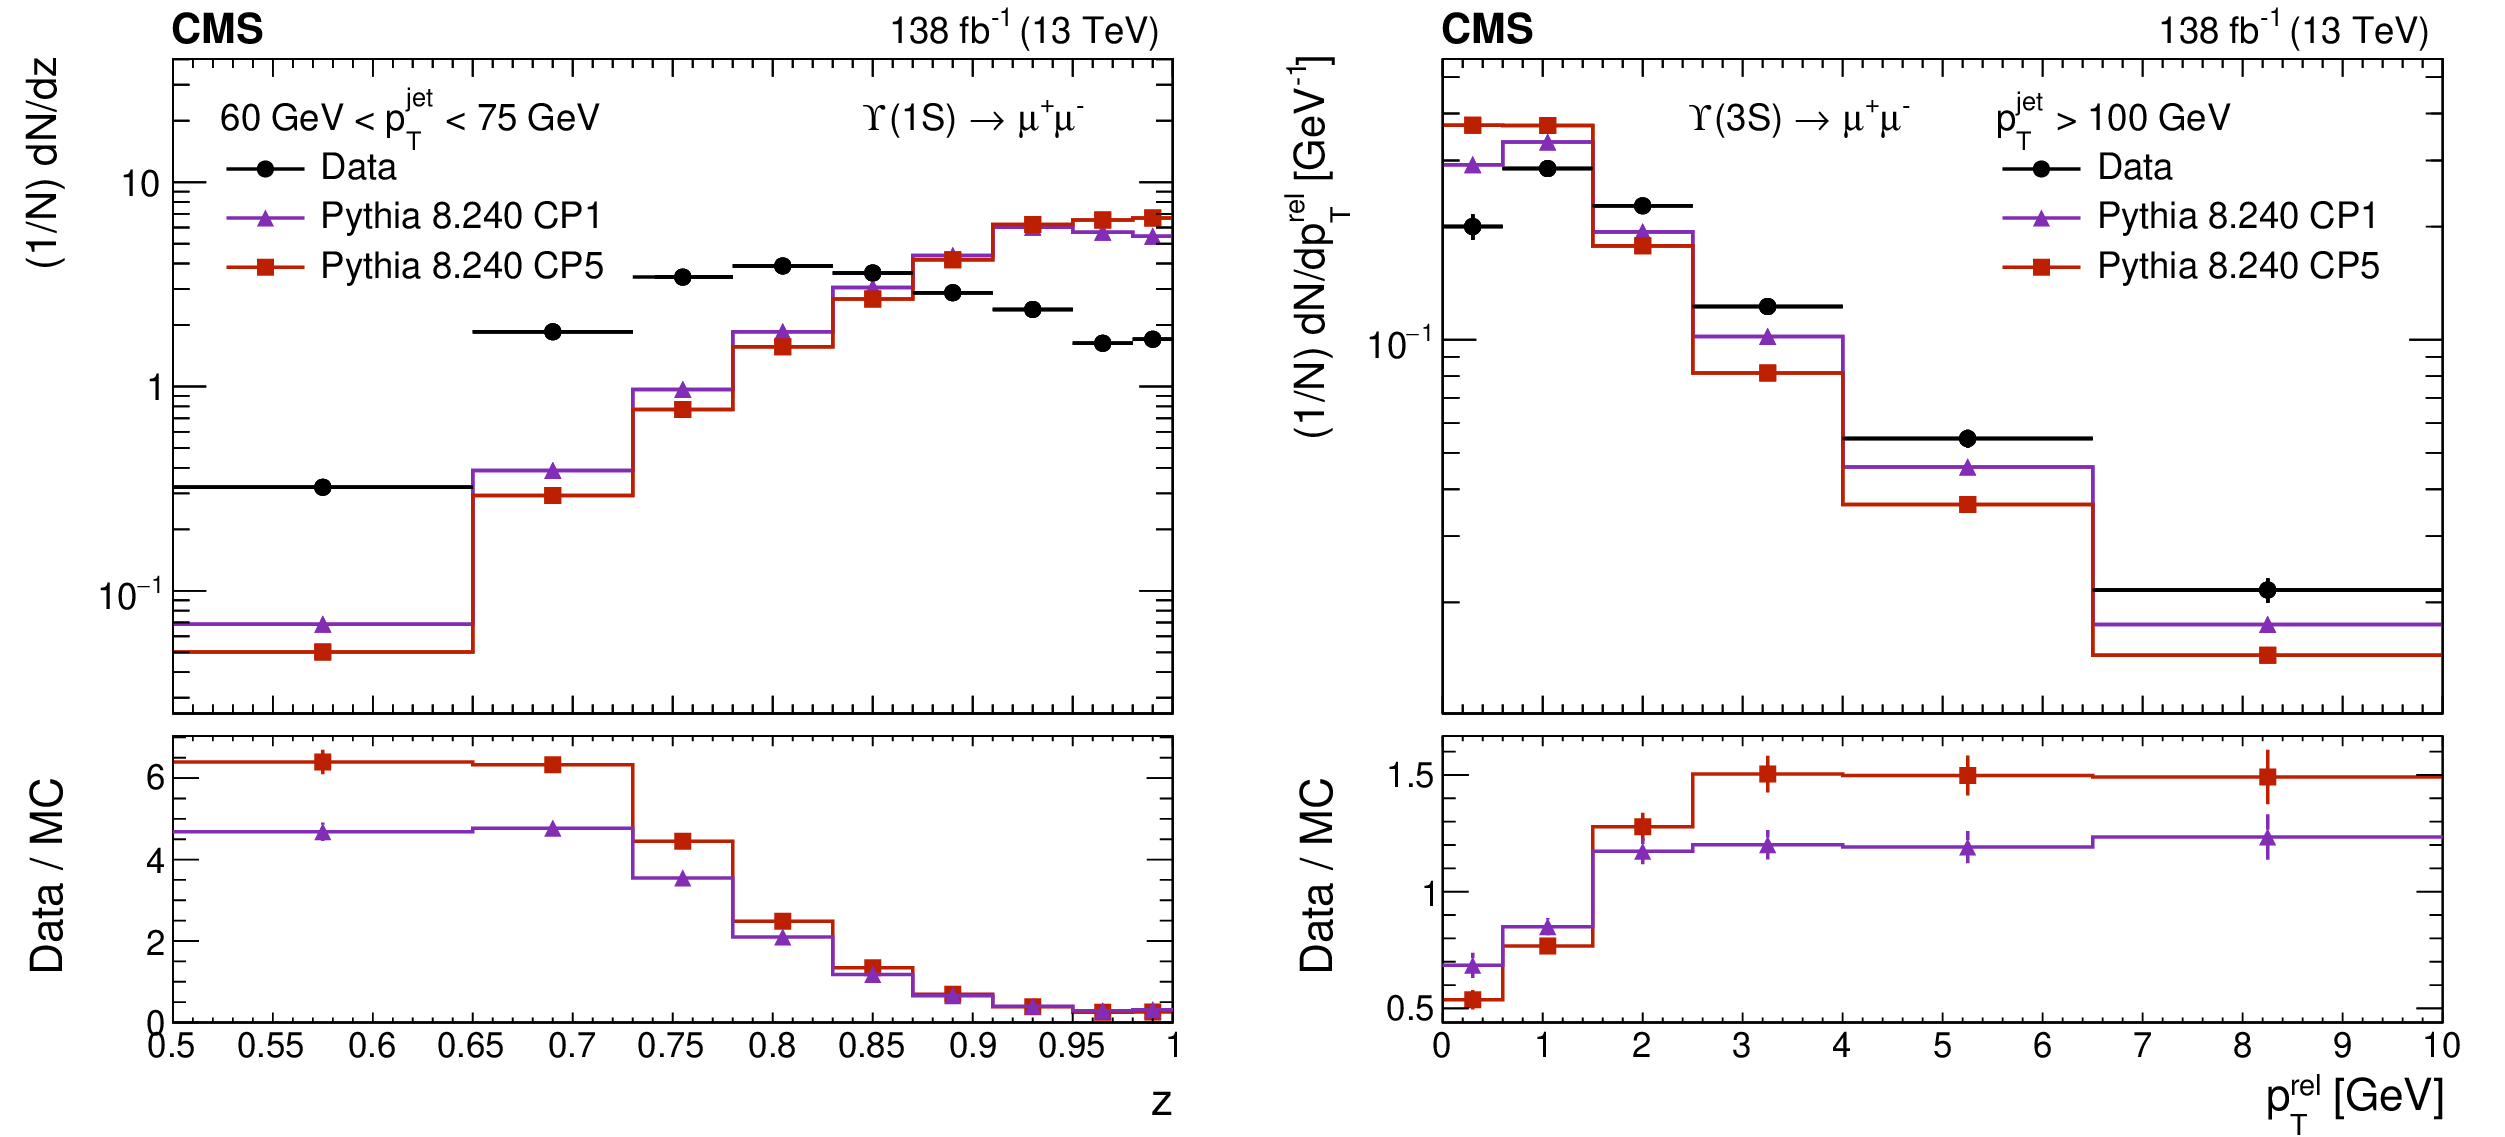
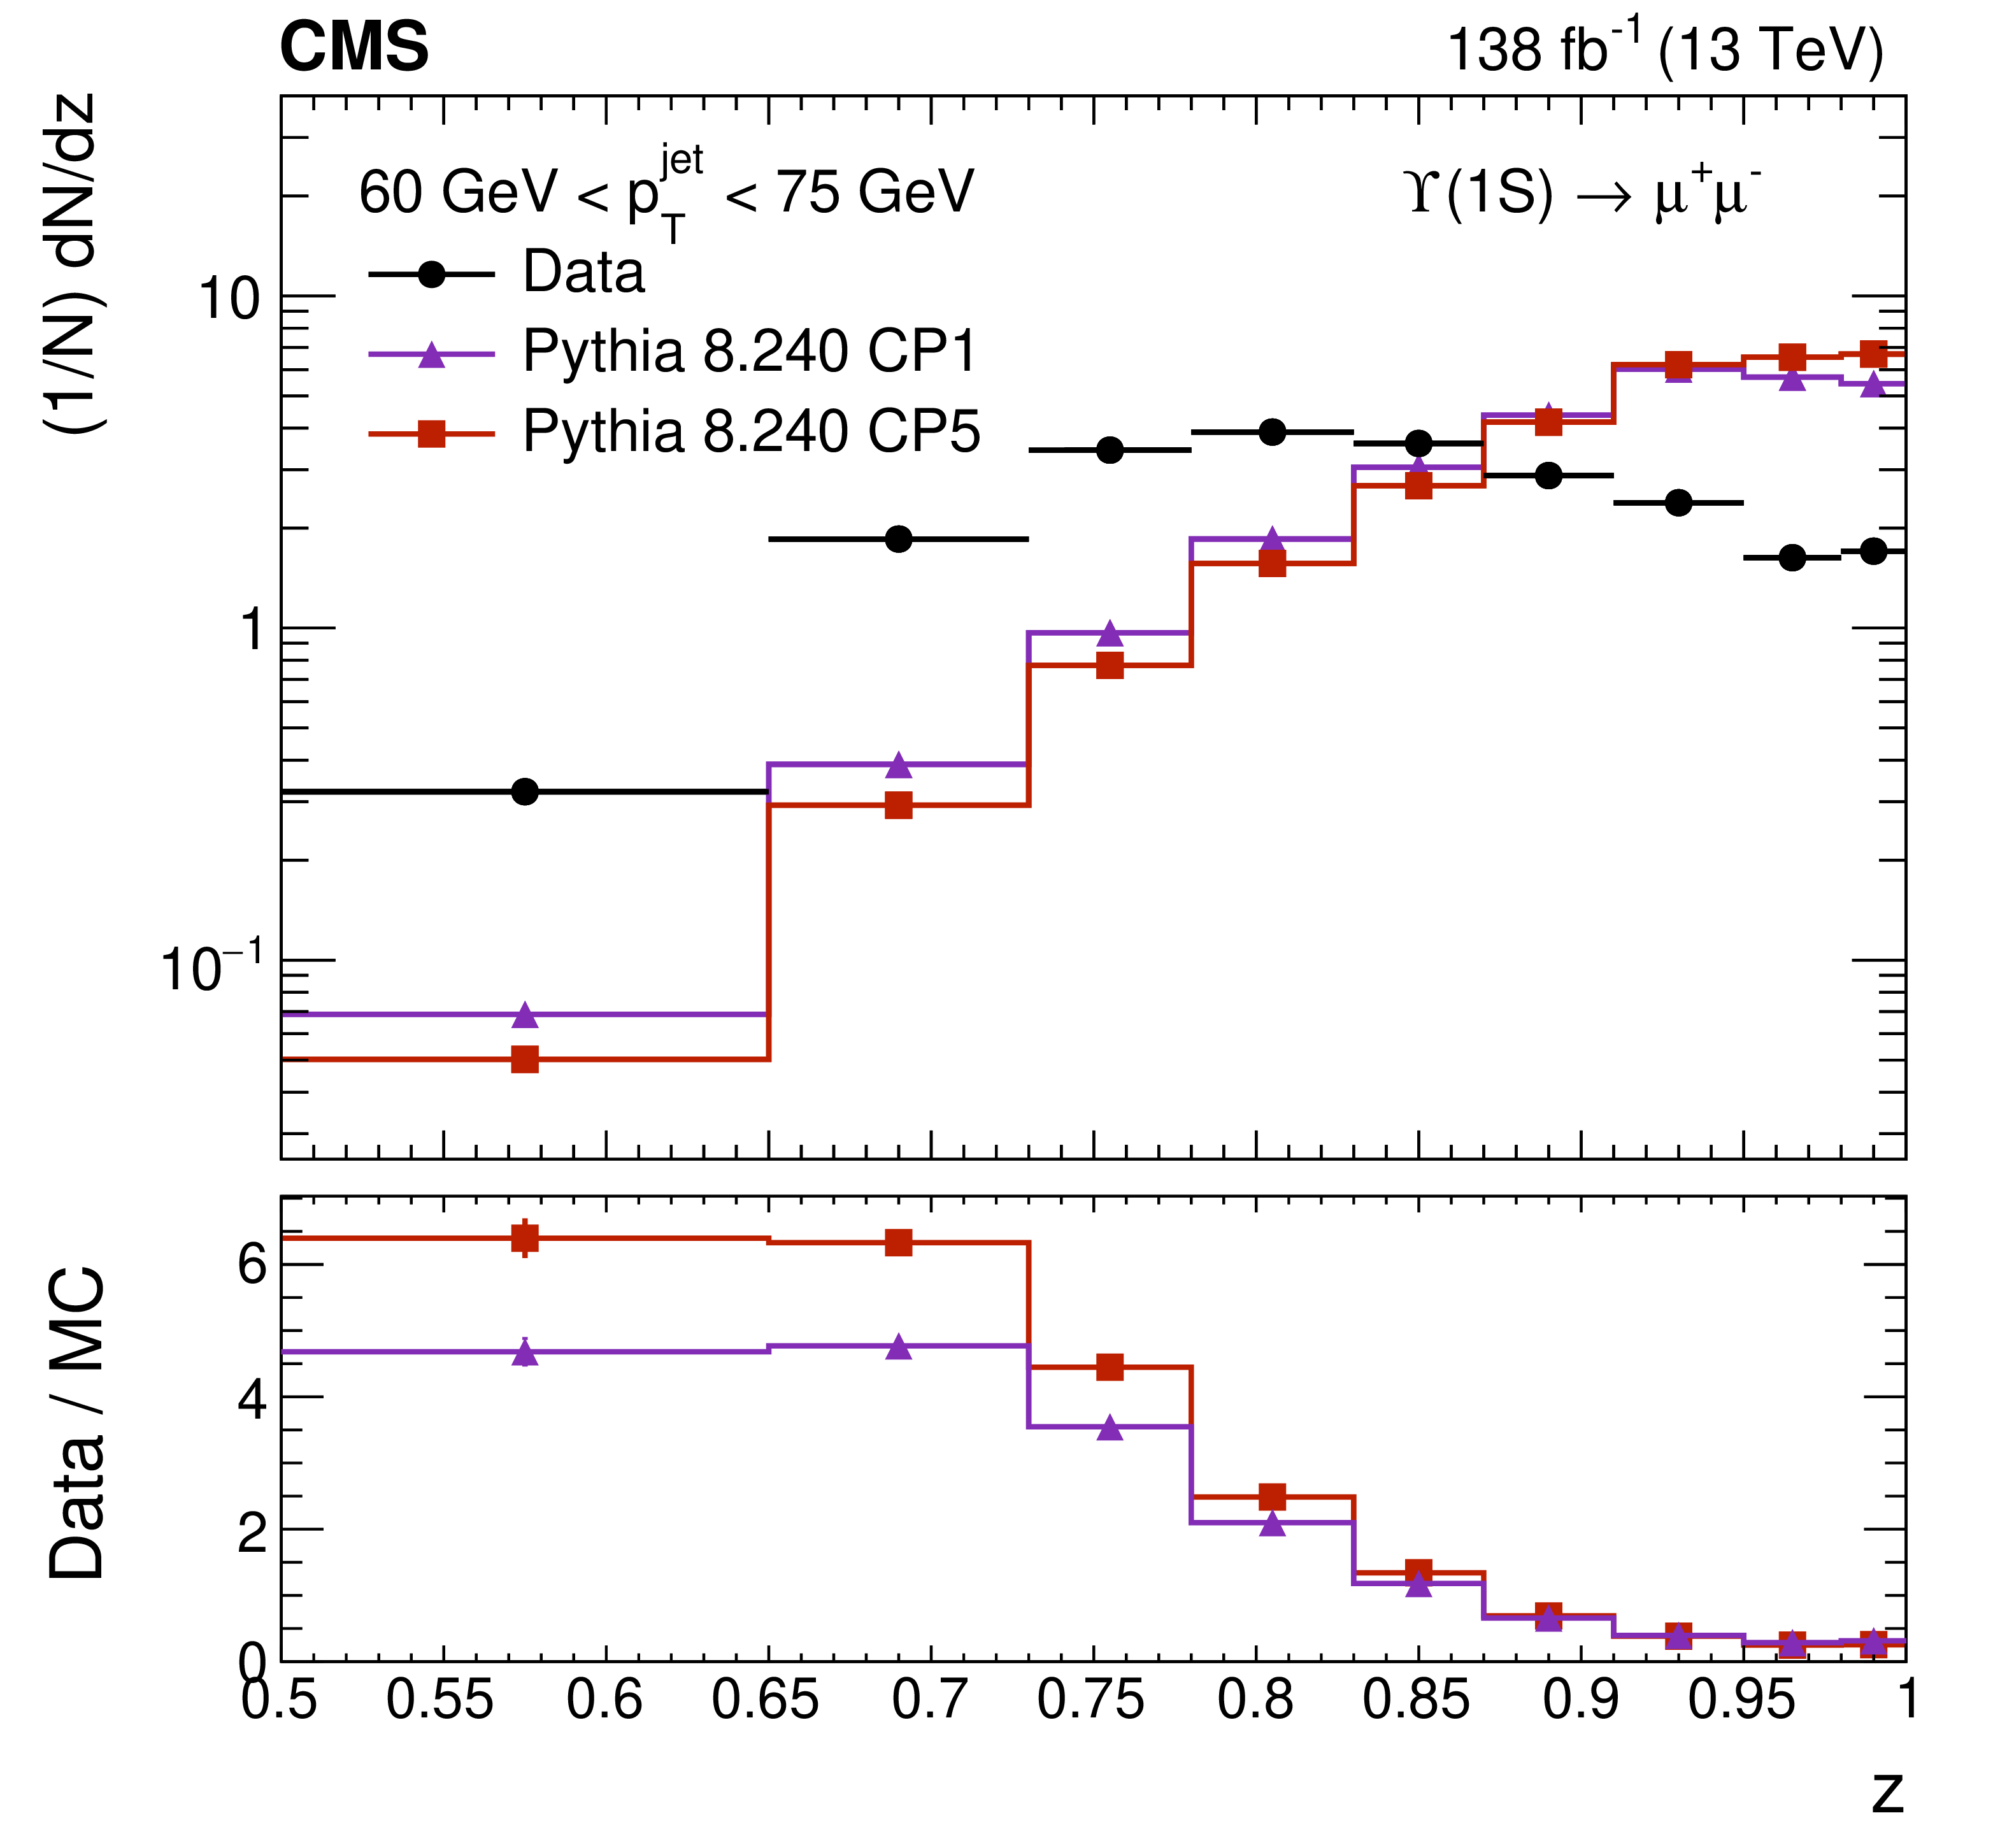
Detector-level longitudinal profile for $ \Upsilon{\textrm{(1S)}} $ mesons (left) and transverse profile for $ \Upsilon{\textrm{(3S)}} $ mesons (right) for two different ranges of the jet transverse momentum. The error bars on the data distributions represent the statistical uncertainties. |
png pdf |
Figure 3-a:
Detector-level longitudinal profile for $ \Upsilon{\textrm{(1S)}} $ mesons (left) and transverse profile for $ \Upsilon{\textrm{(3S)}} $ mesons (right) for two different ranges of the jet transverse momentum. The error bars on the data distributions represent the statistical uncertainties. |
png pdf |
Figure 3-b:
Detector-level longitudinal profile for $ \Upsilon{\textrm{(1S)}} $ mesons (left) and transverse profile for $ \Upsilon{\textrm{(3S)}} $ mesons (right) for two different ranges of the jet transverse momentum. The error bars on the data distributions represent the statistical uncertainties. |
png pdf |
Figure 4:
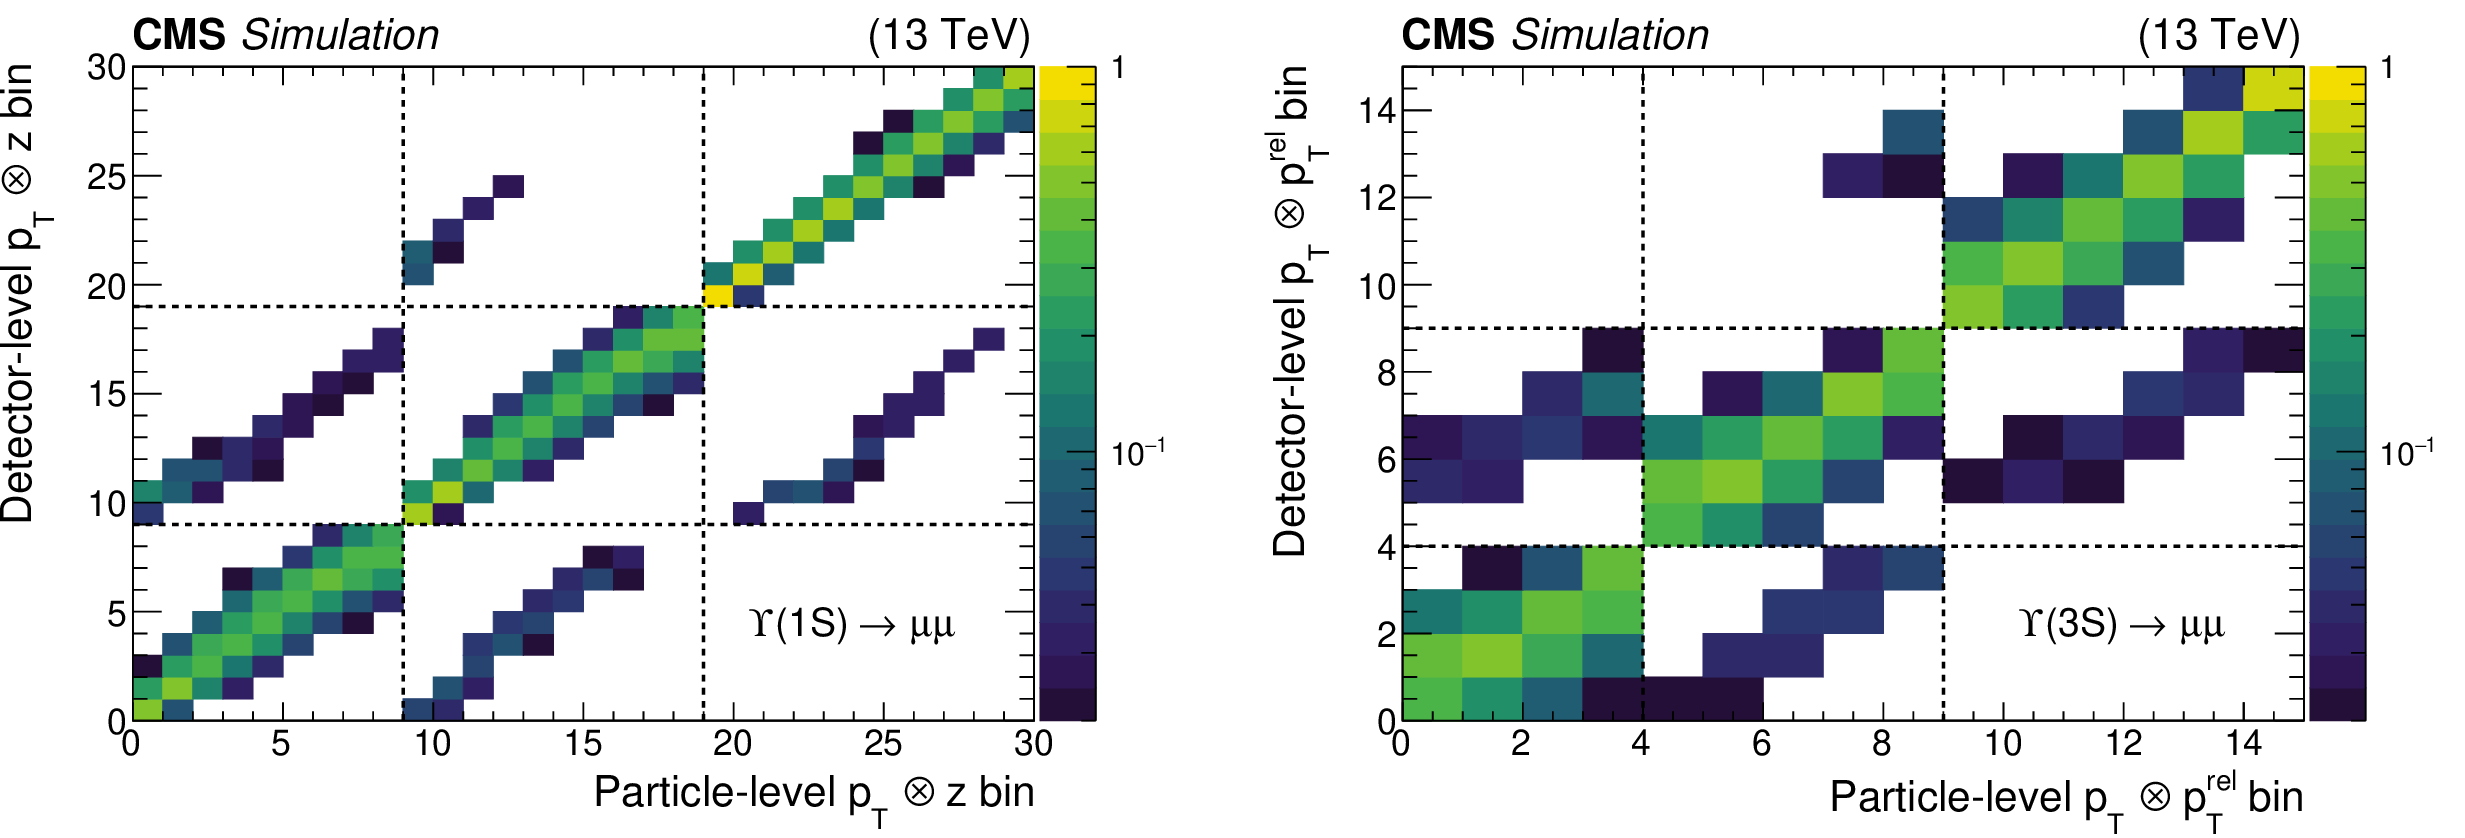
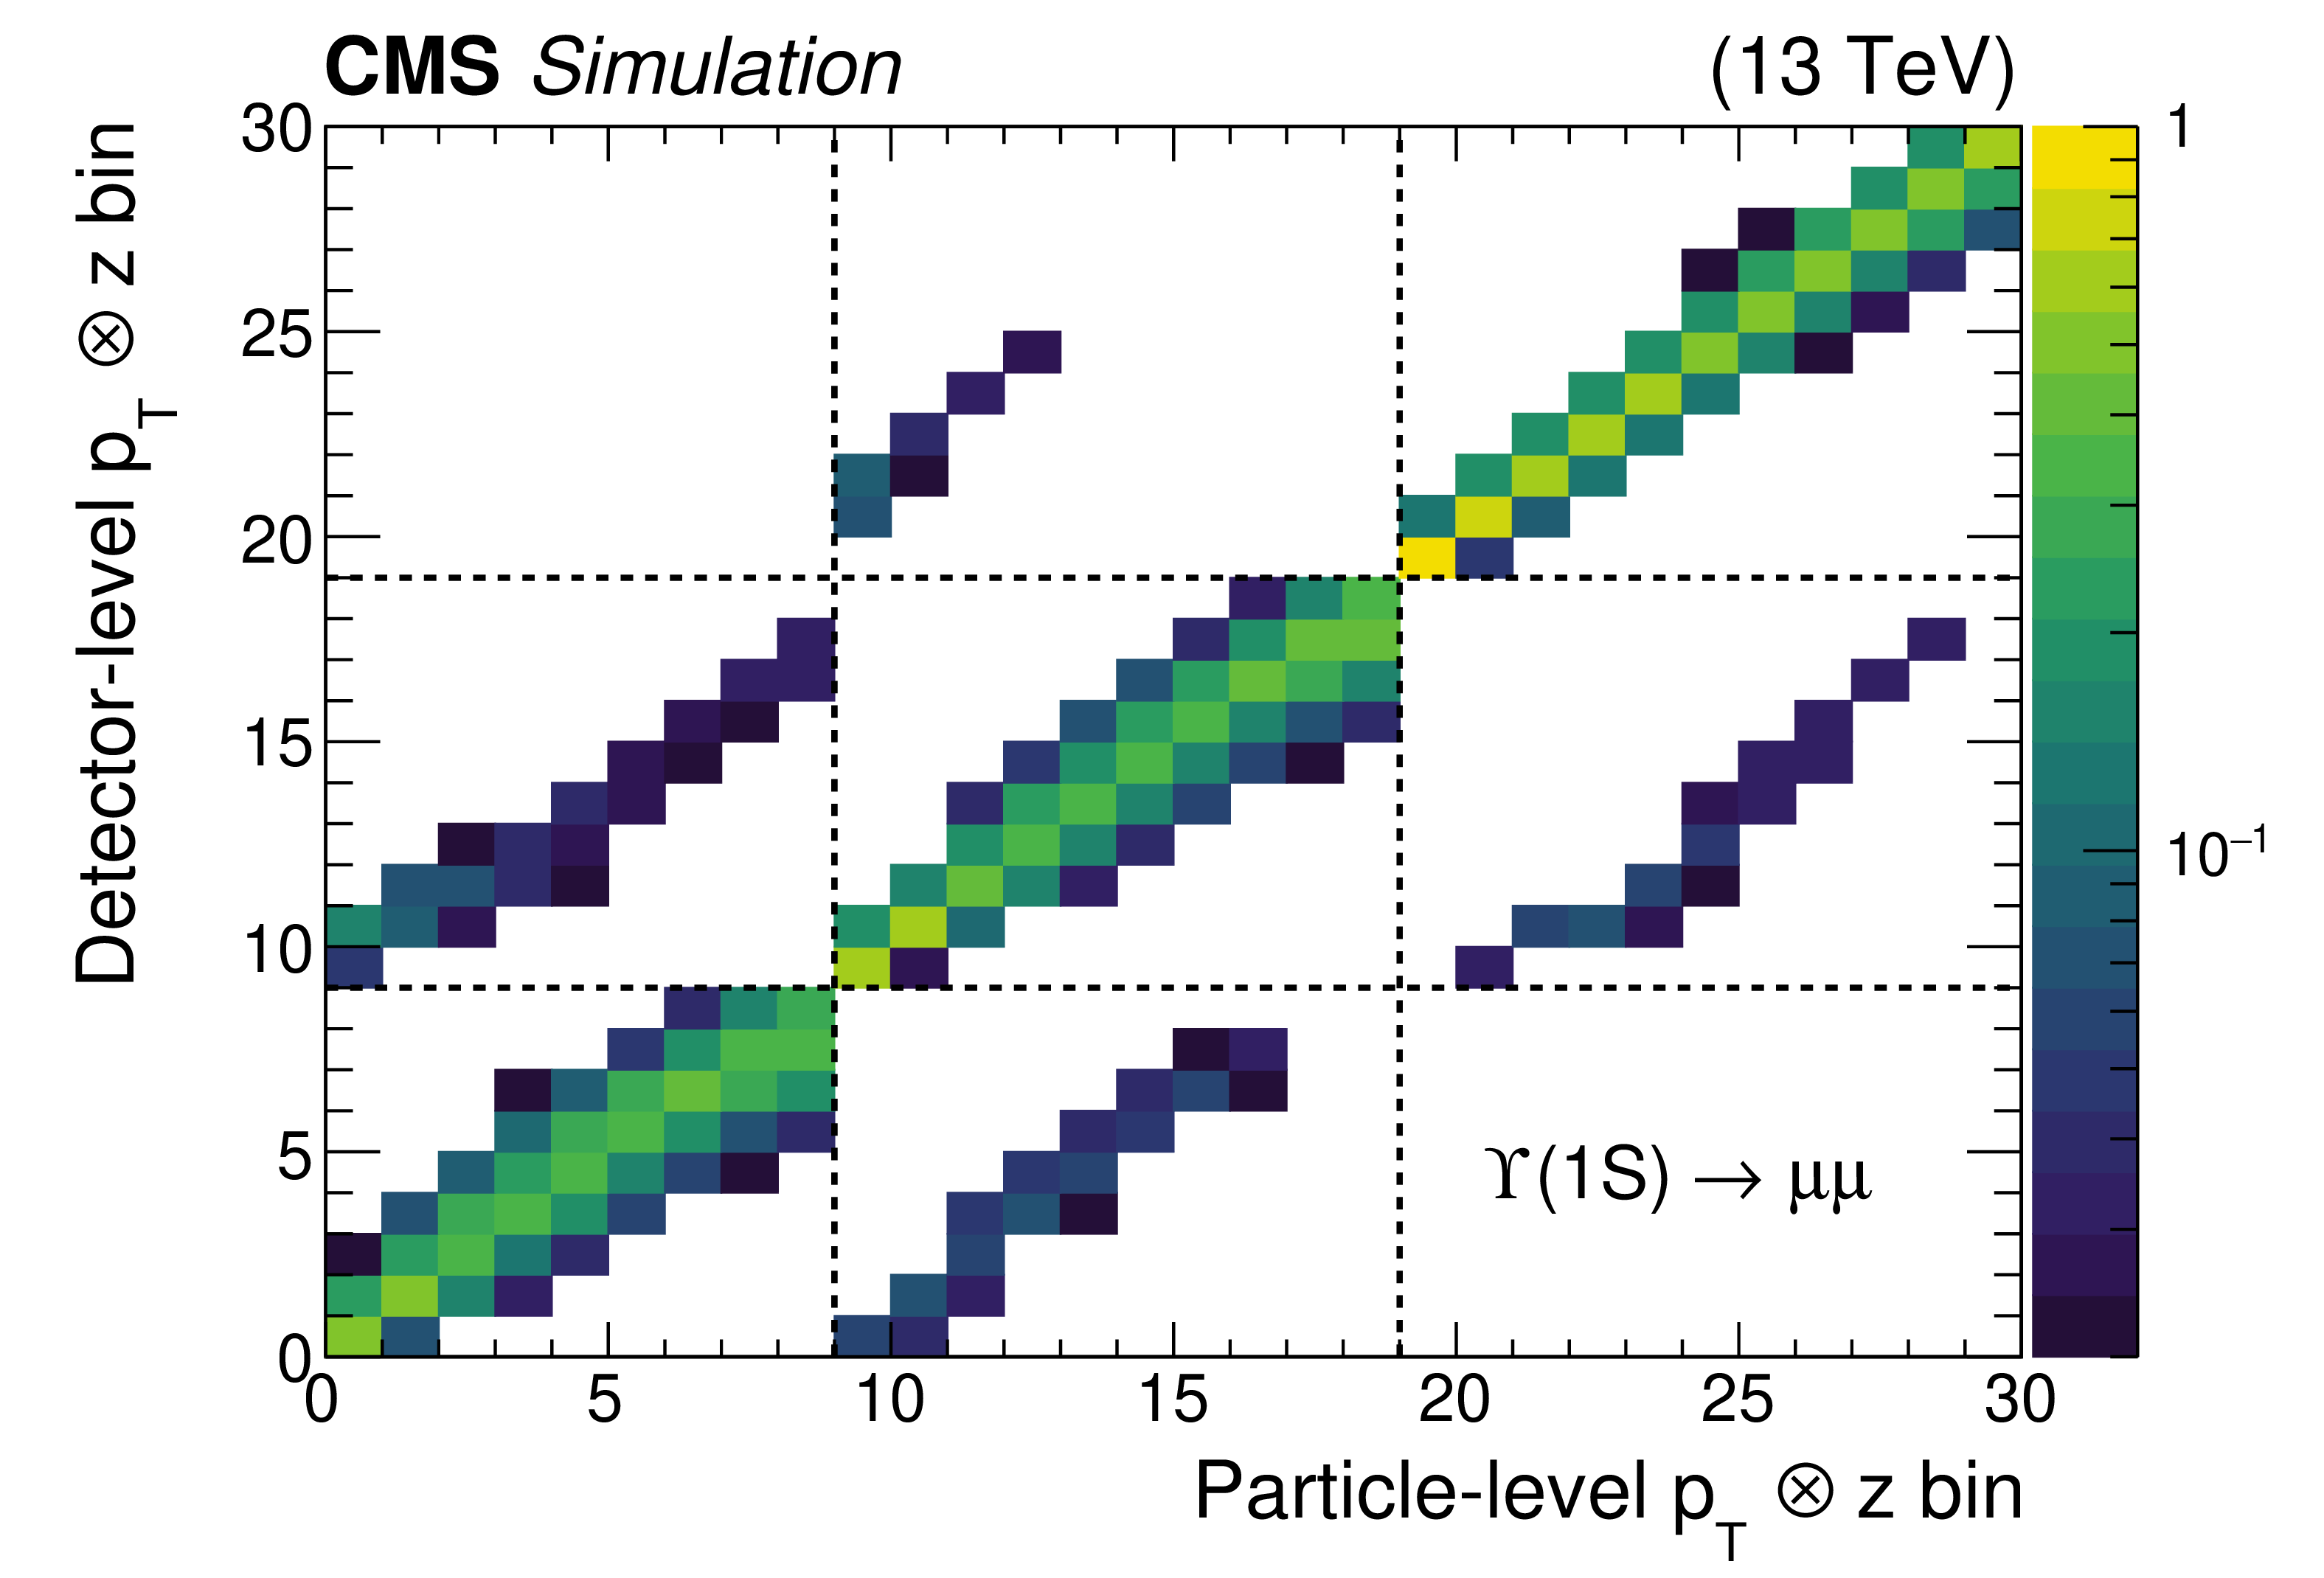
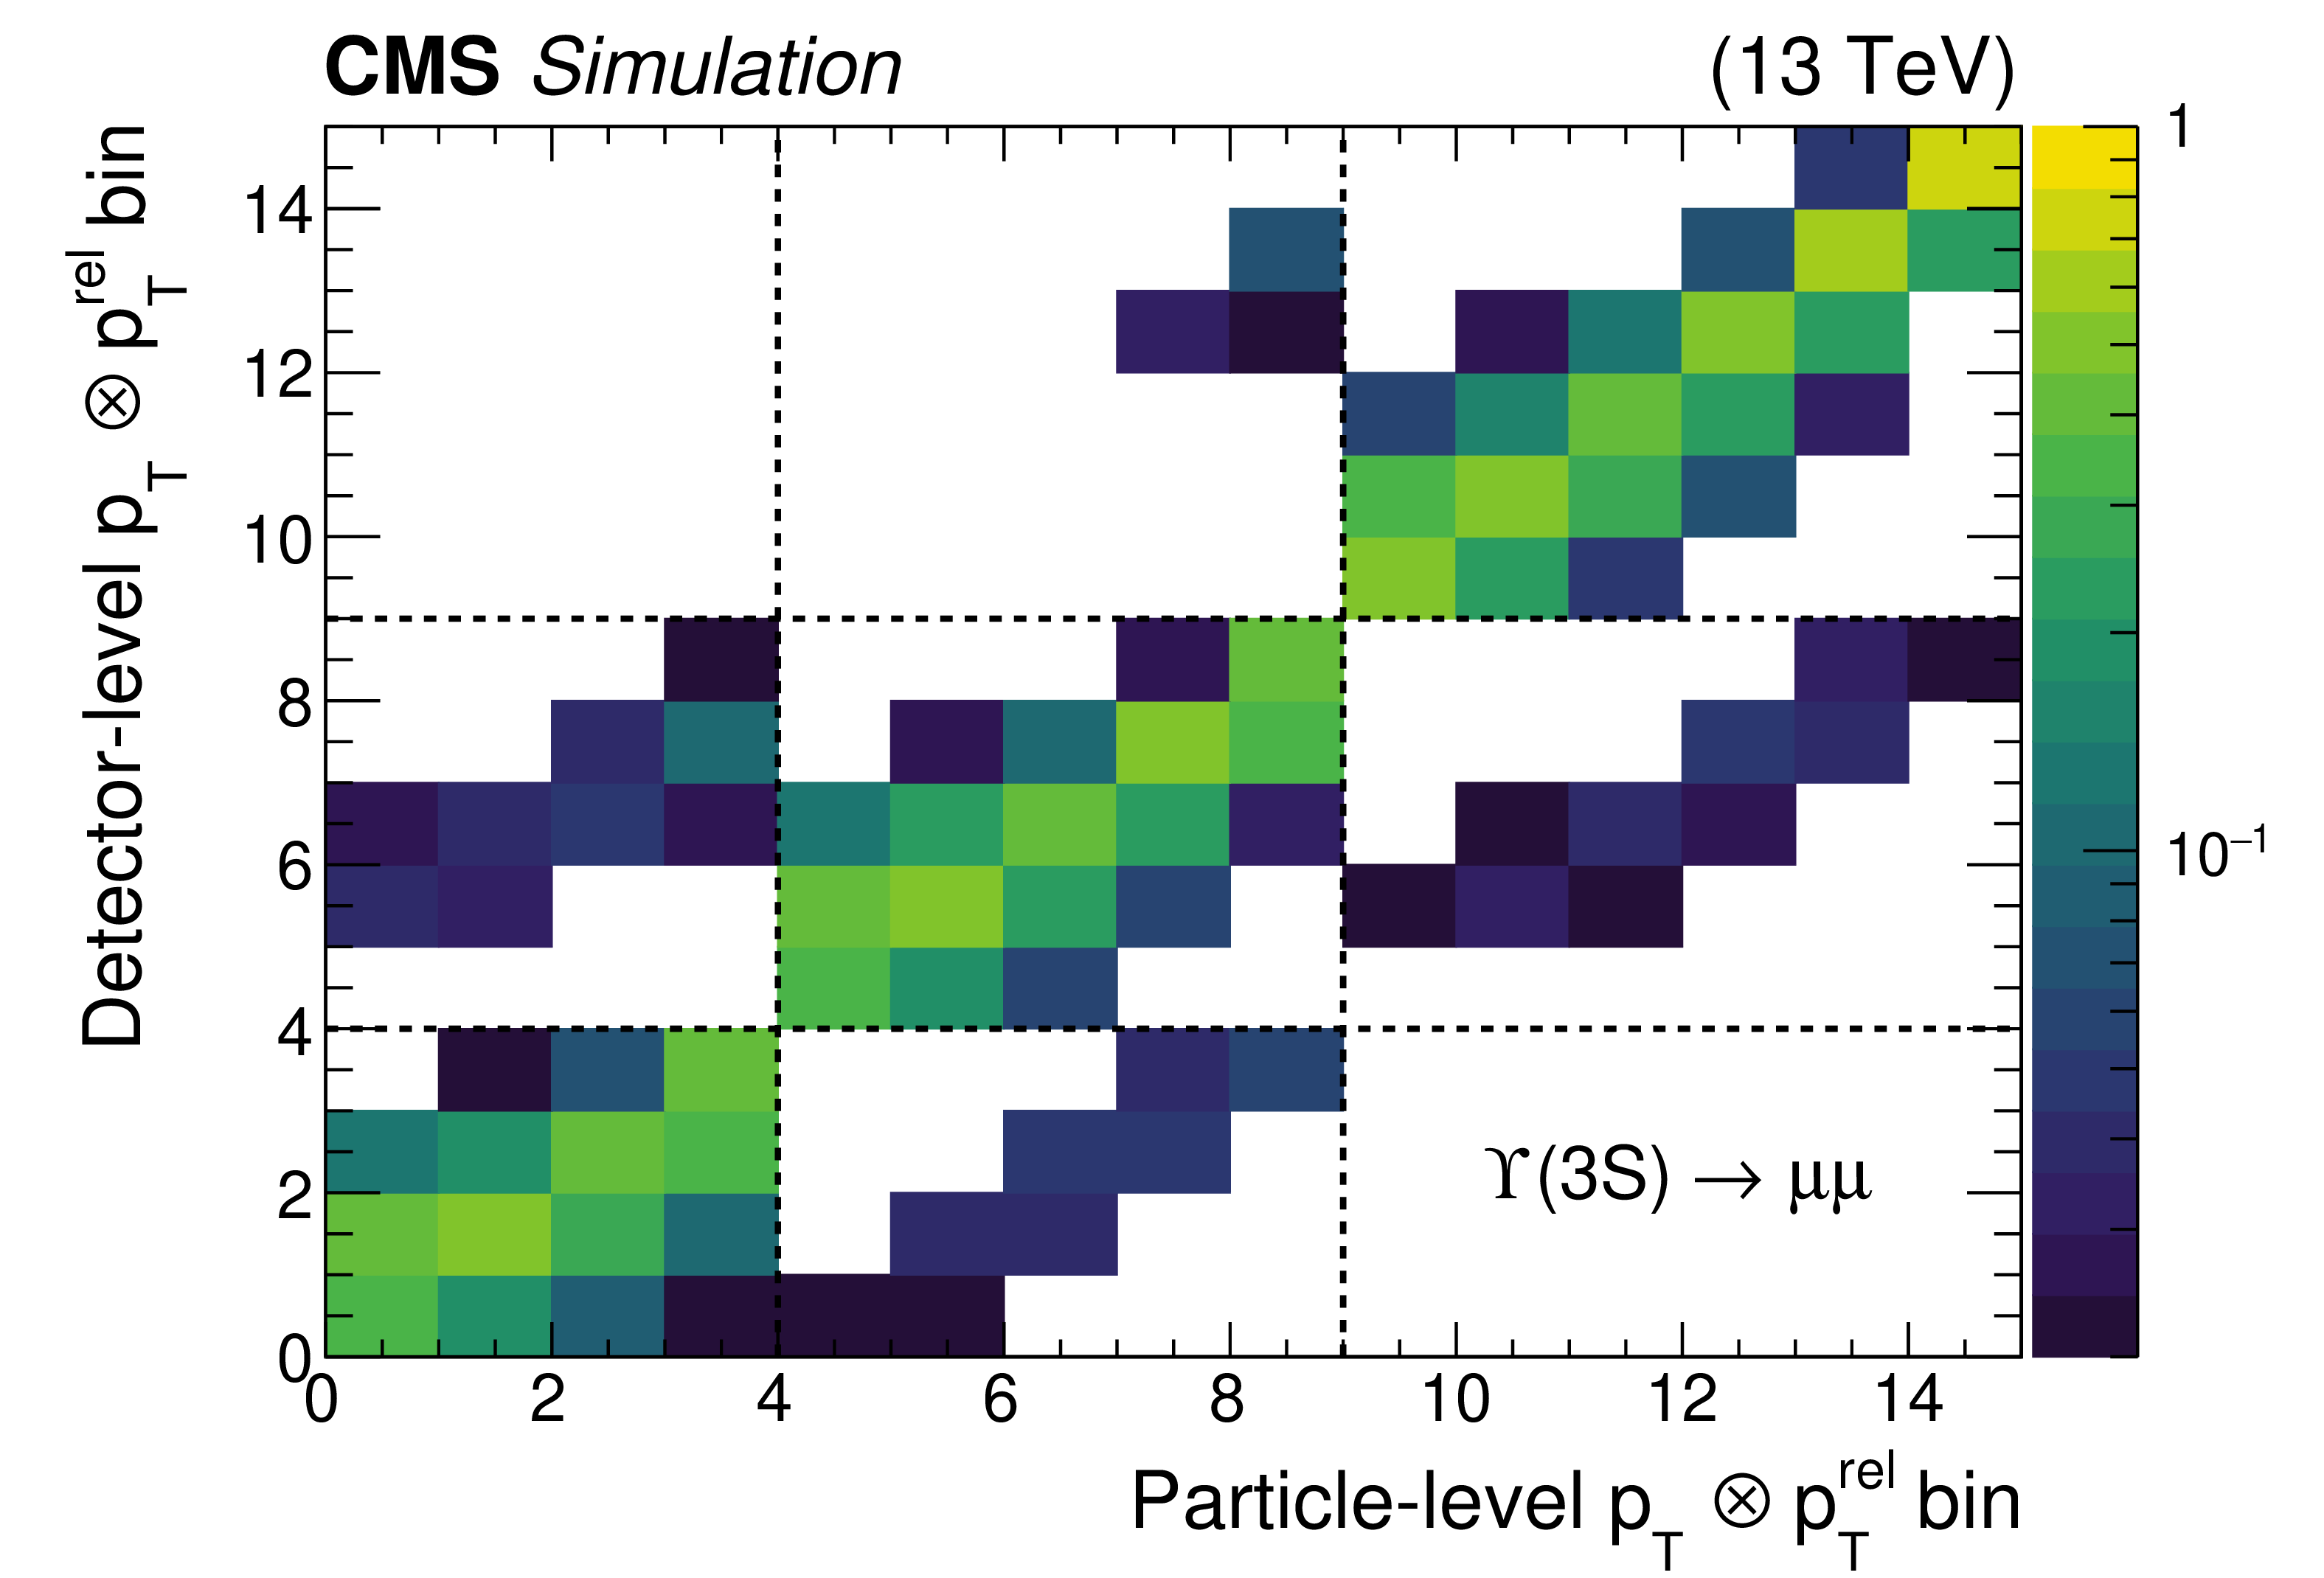
Transfer matrices for the longitudinal profile of jets containing $ \Upsilon{\textrm{(1S)}} $ mesons (left) and for the transverse profile of jets containing $ \Upsilon{\textrm{(3S)}} $ (right). Each transfer matrix parameterizes the migrations among the three bins on the jet $ p_{\mathrm{T}} $ used in the measurement, shown as boxes delimited by dashed lines, as well as among bins on $ z $ or $ p_{\mathrm{T}}^{\text{rel}} $. |
png pdf |
Figure 4-a:
Transfer matrices for the longitudinal profile of jets containing $ \Upsilon{\textrm{(1S)}} $ mesons (left) and for the transverse profile of jets containing $ \Upsilon{\textrm{(3S)}} $ (right). Each transfer matrix parameterizes the migrations among the three bins on the jet $ p_{\mathrm{T}} $ used in the measurement, shown as boxes delimited by dashed lines, as well as among bins on $ z $ or $ p_{\mathrm{T}}^{\text{rel}} $. |
png pdf |
Figure 4-b:
Transfer matrices for the longitudinal profile of jets containing $ \Upsilon{\textrm{(1S)}} $ mesons (left) and for the transverse profile of jets containing $ \Upsilon{\textrm{(3S)}} $ (right). Each transfer matrix parameterizes the migrations among the three bins on the jet $ p_{\mathrm{T}} $ used in the measurement, shown as boxes delimited by dashed lines, as well as among bins on $ z $ or $ p_{\mathrm{T}}^{\text{rel}} $. |
png pdf |
Figure 5:
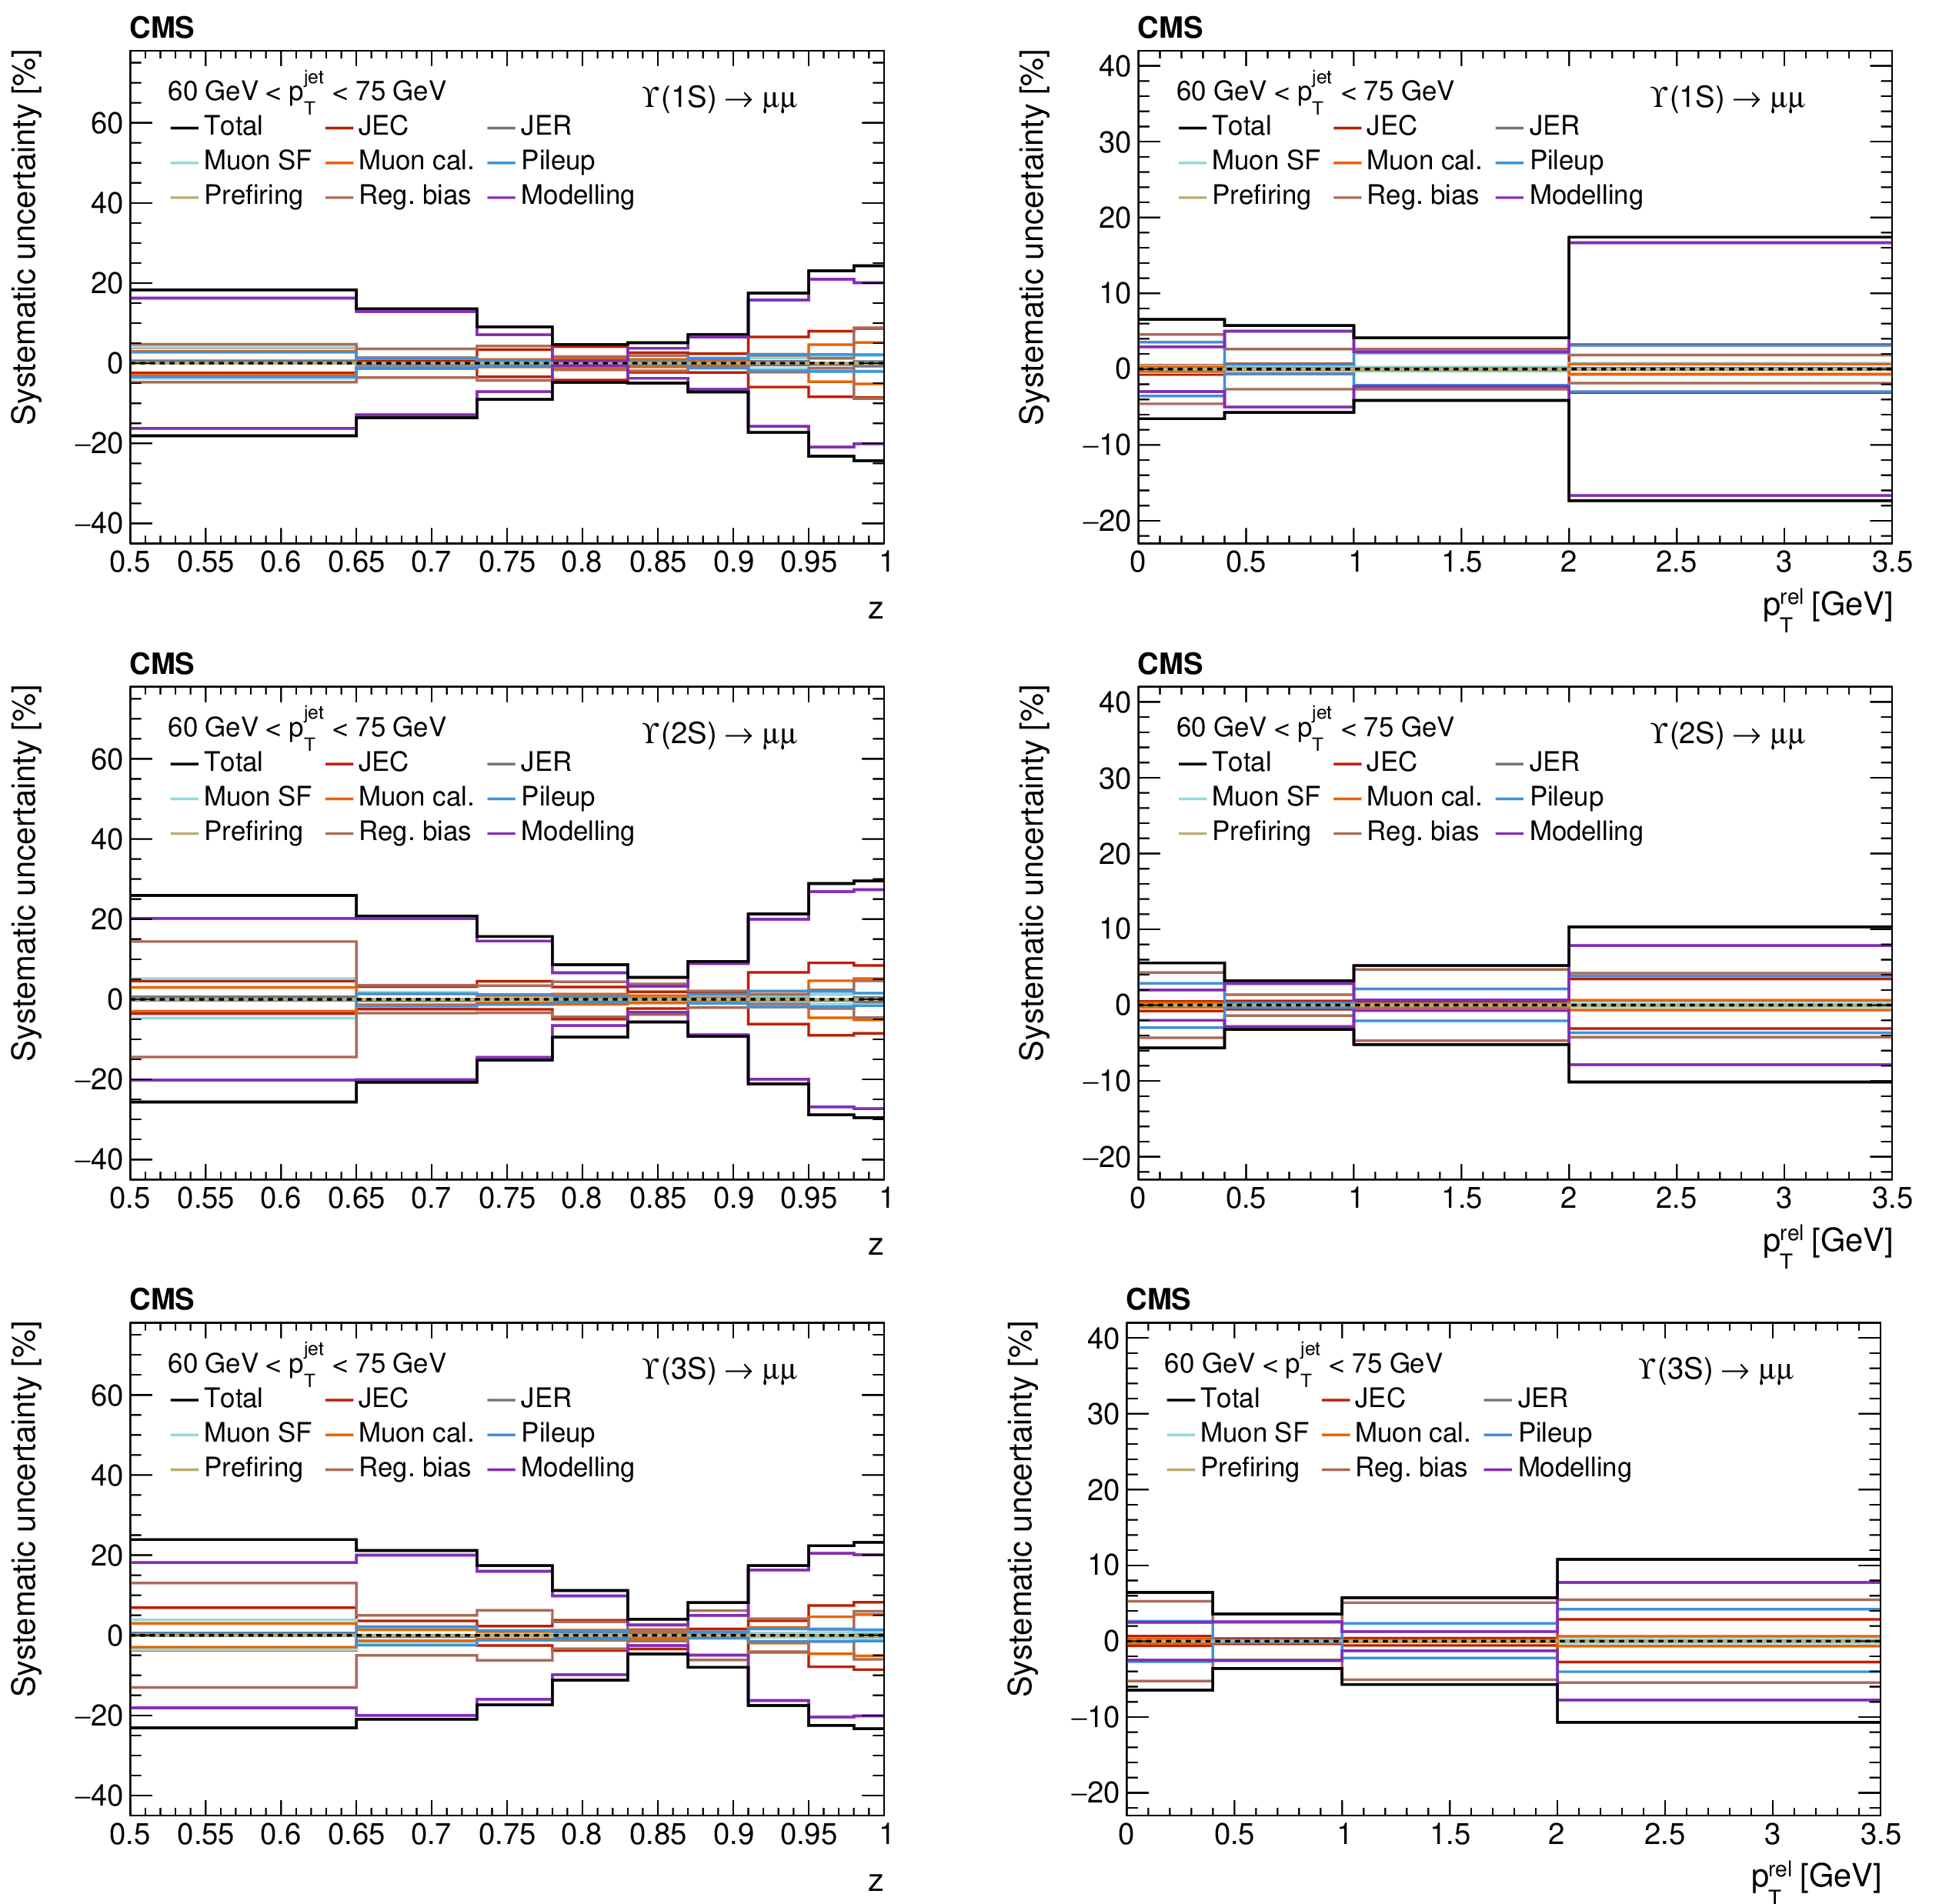
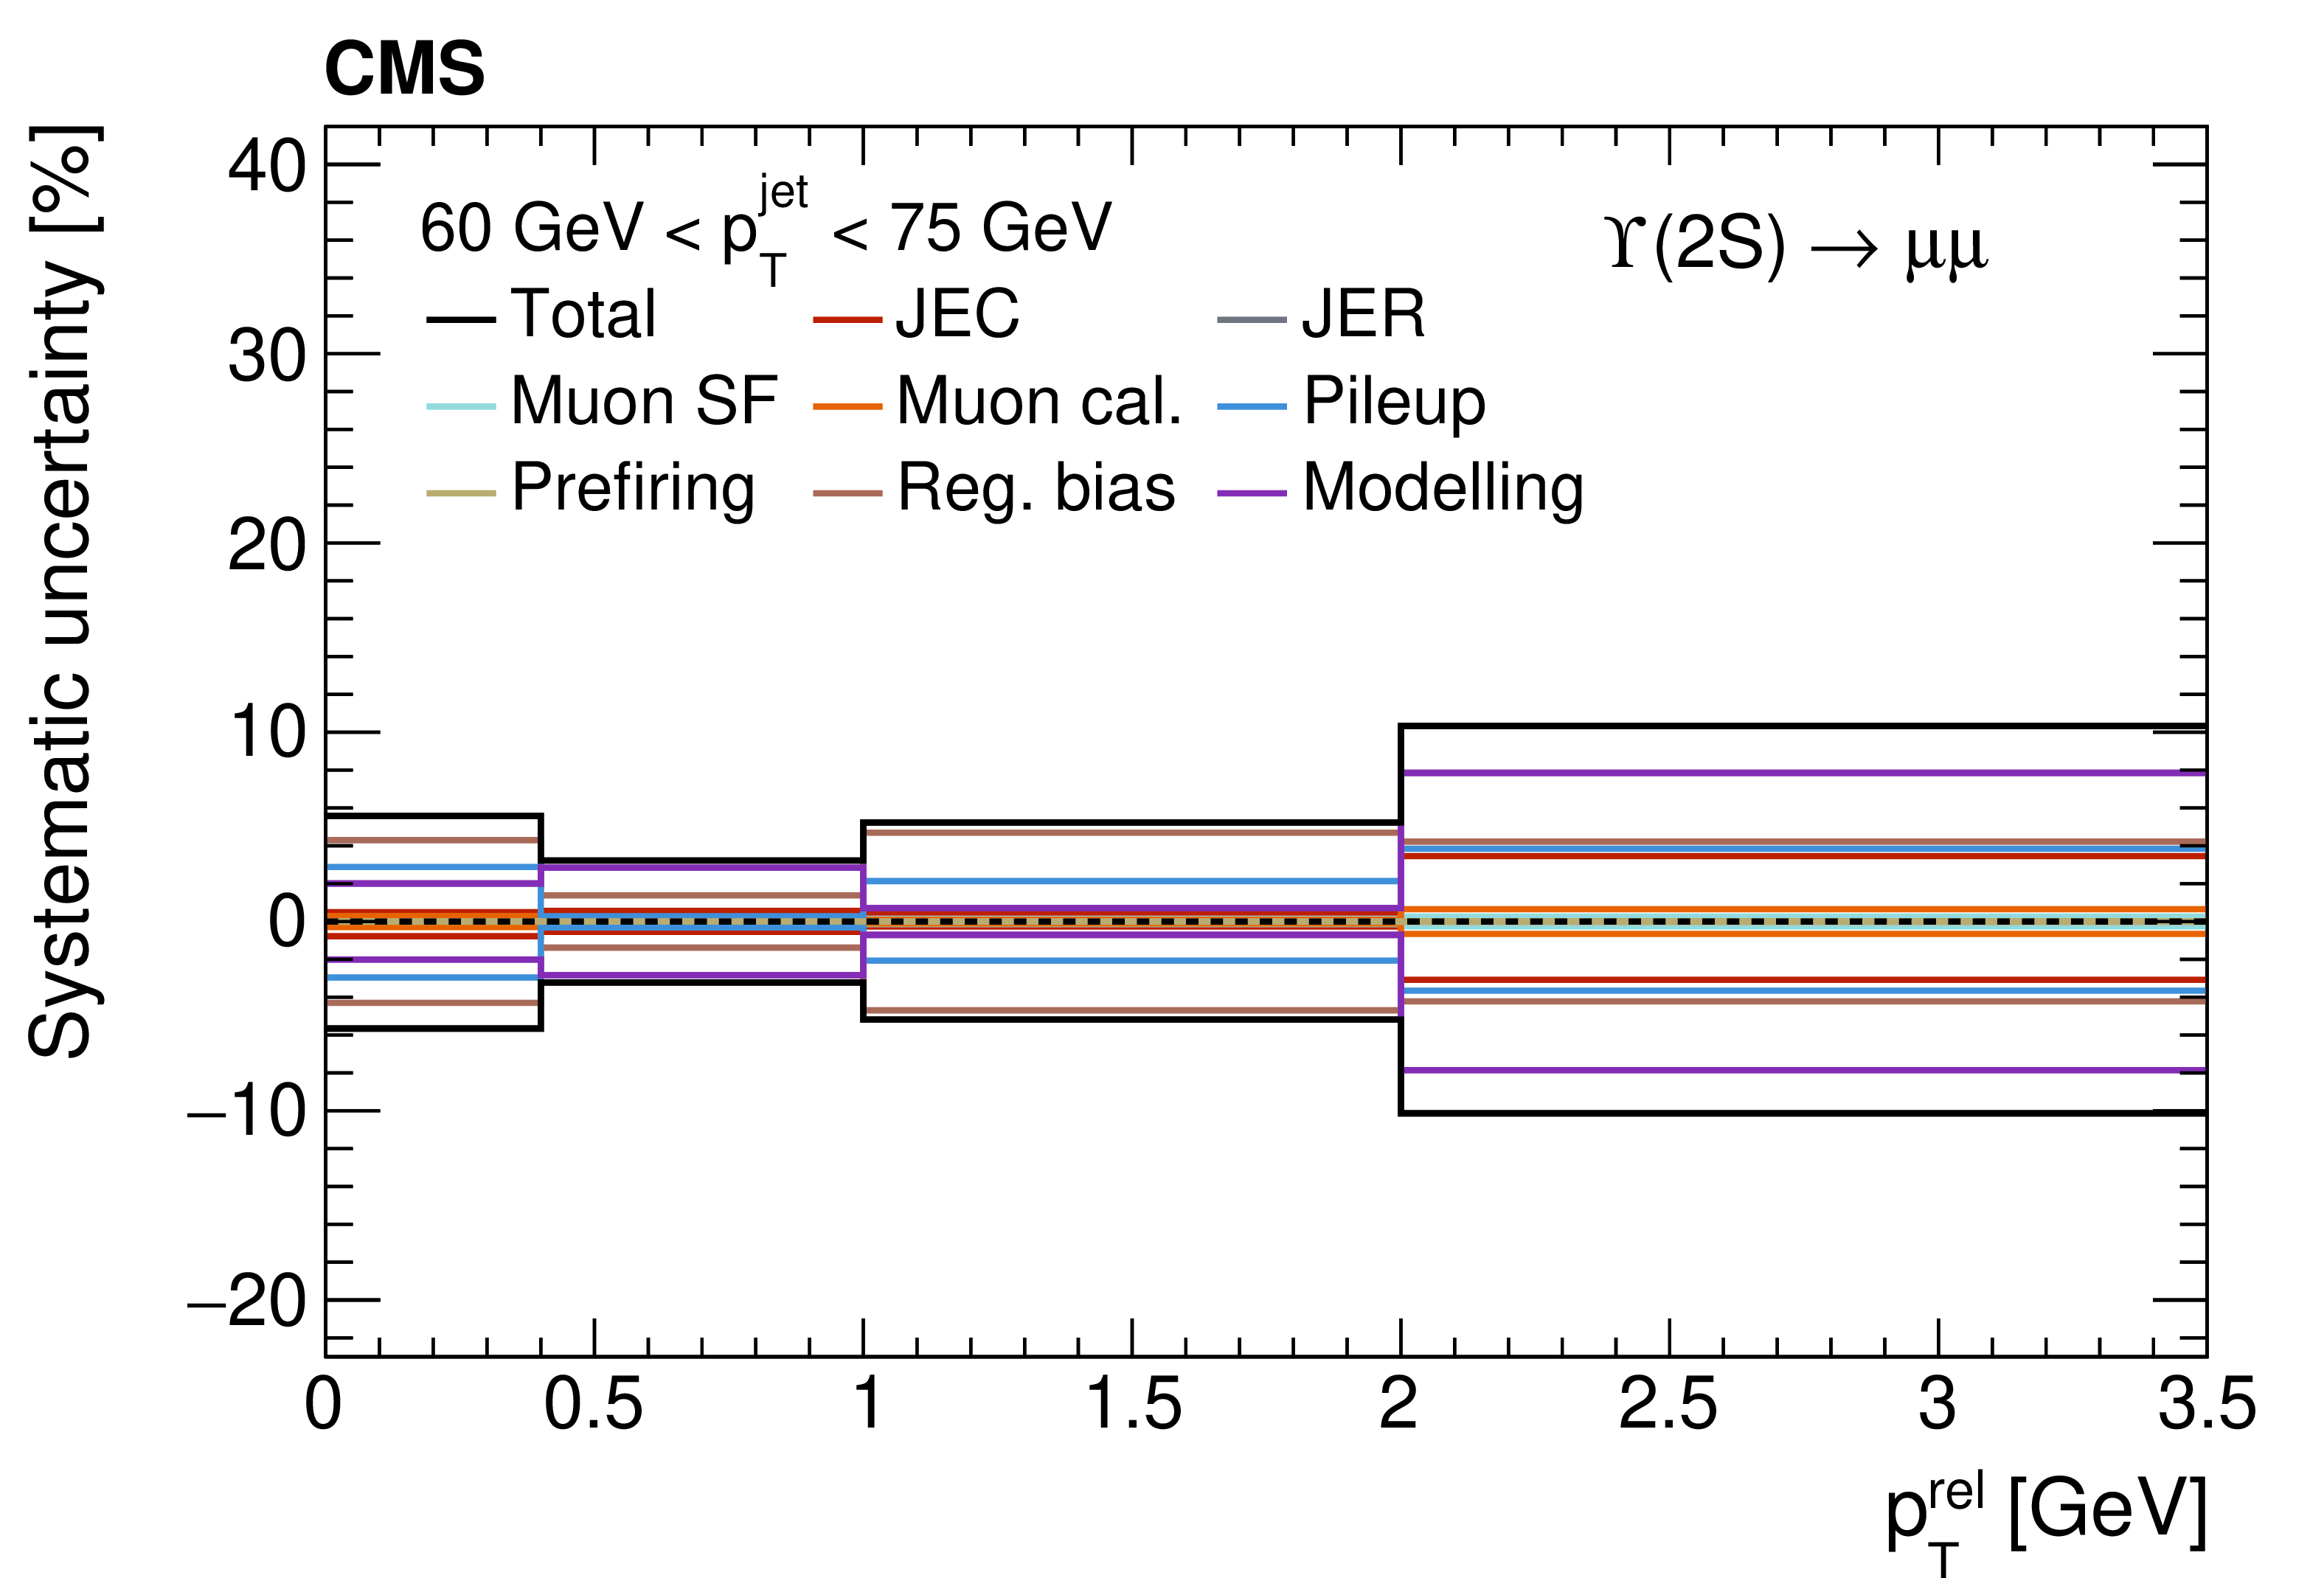
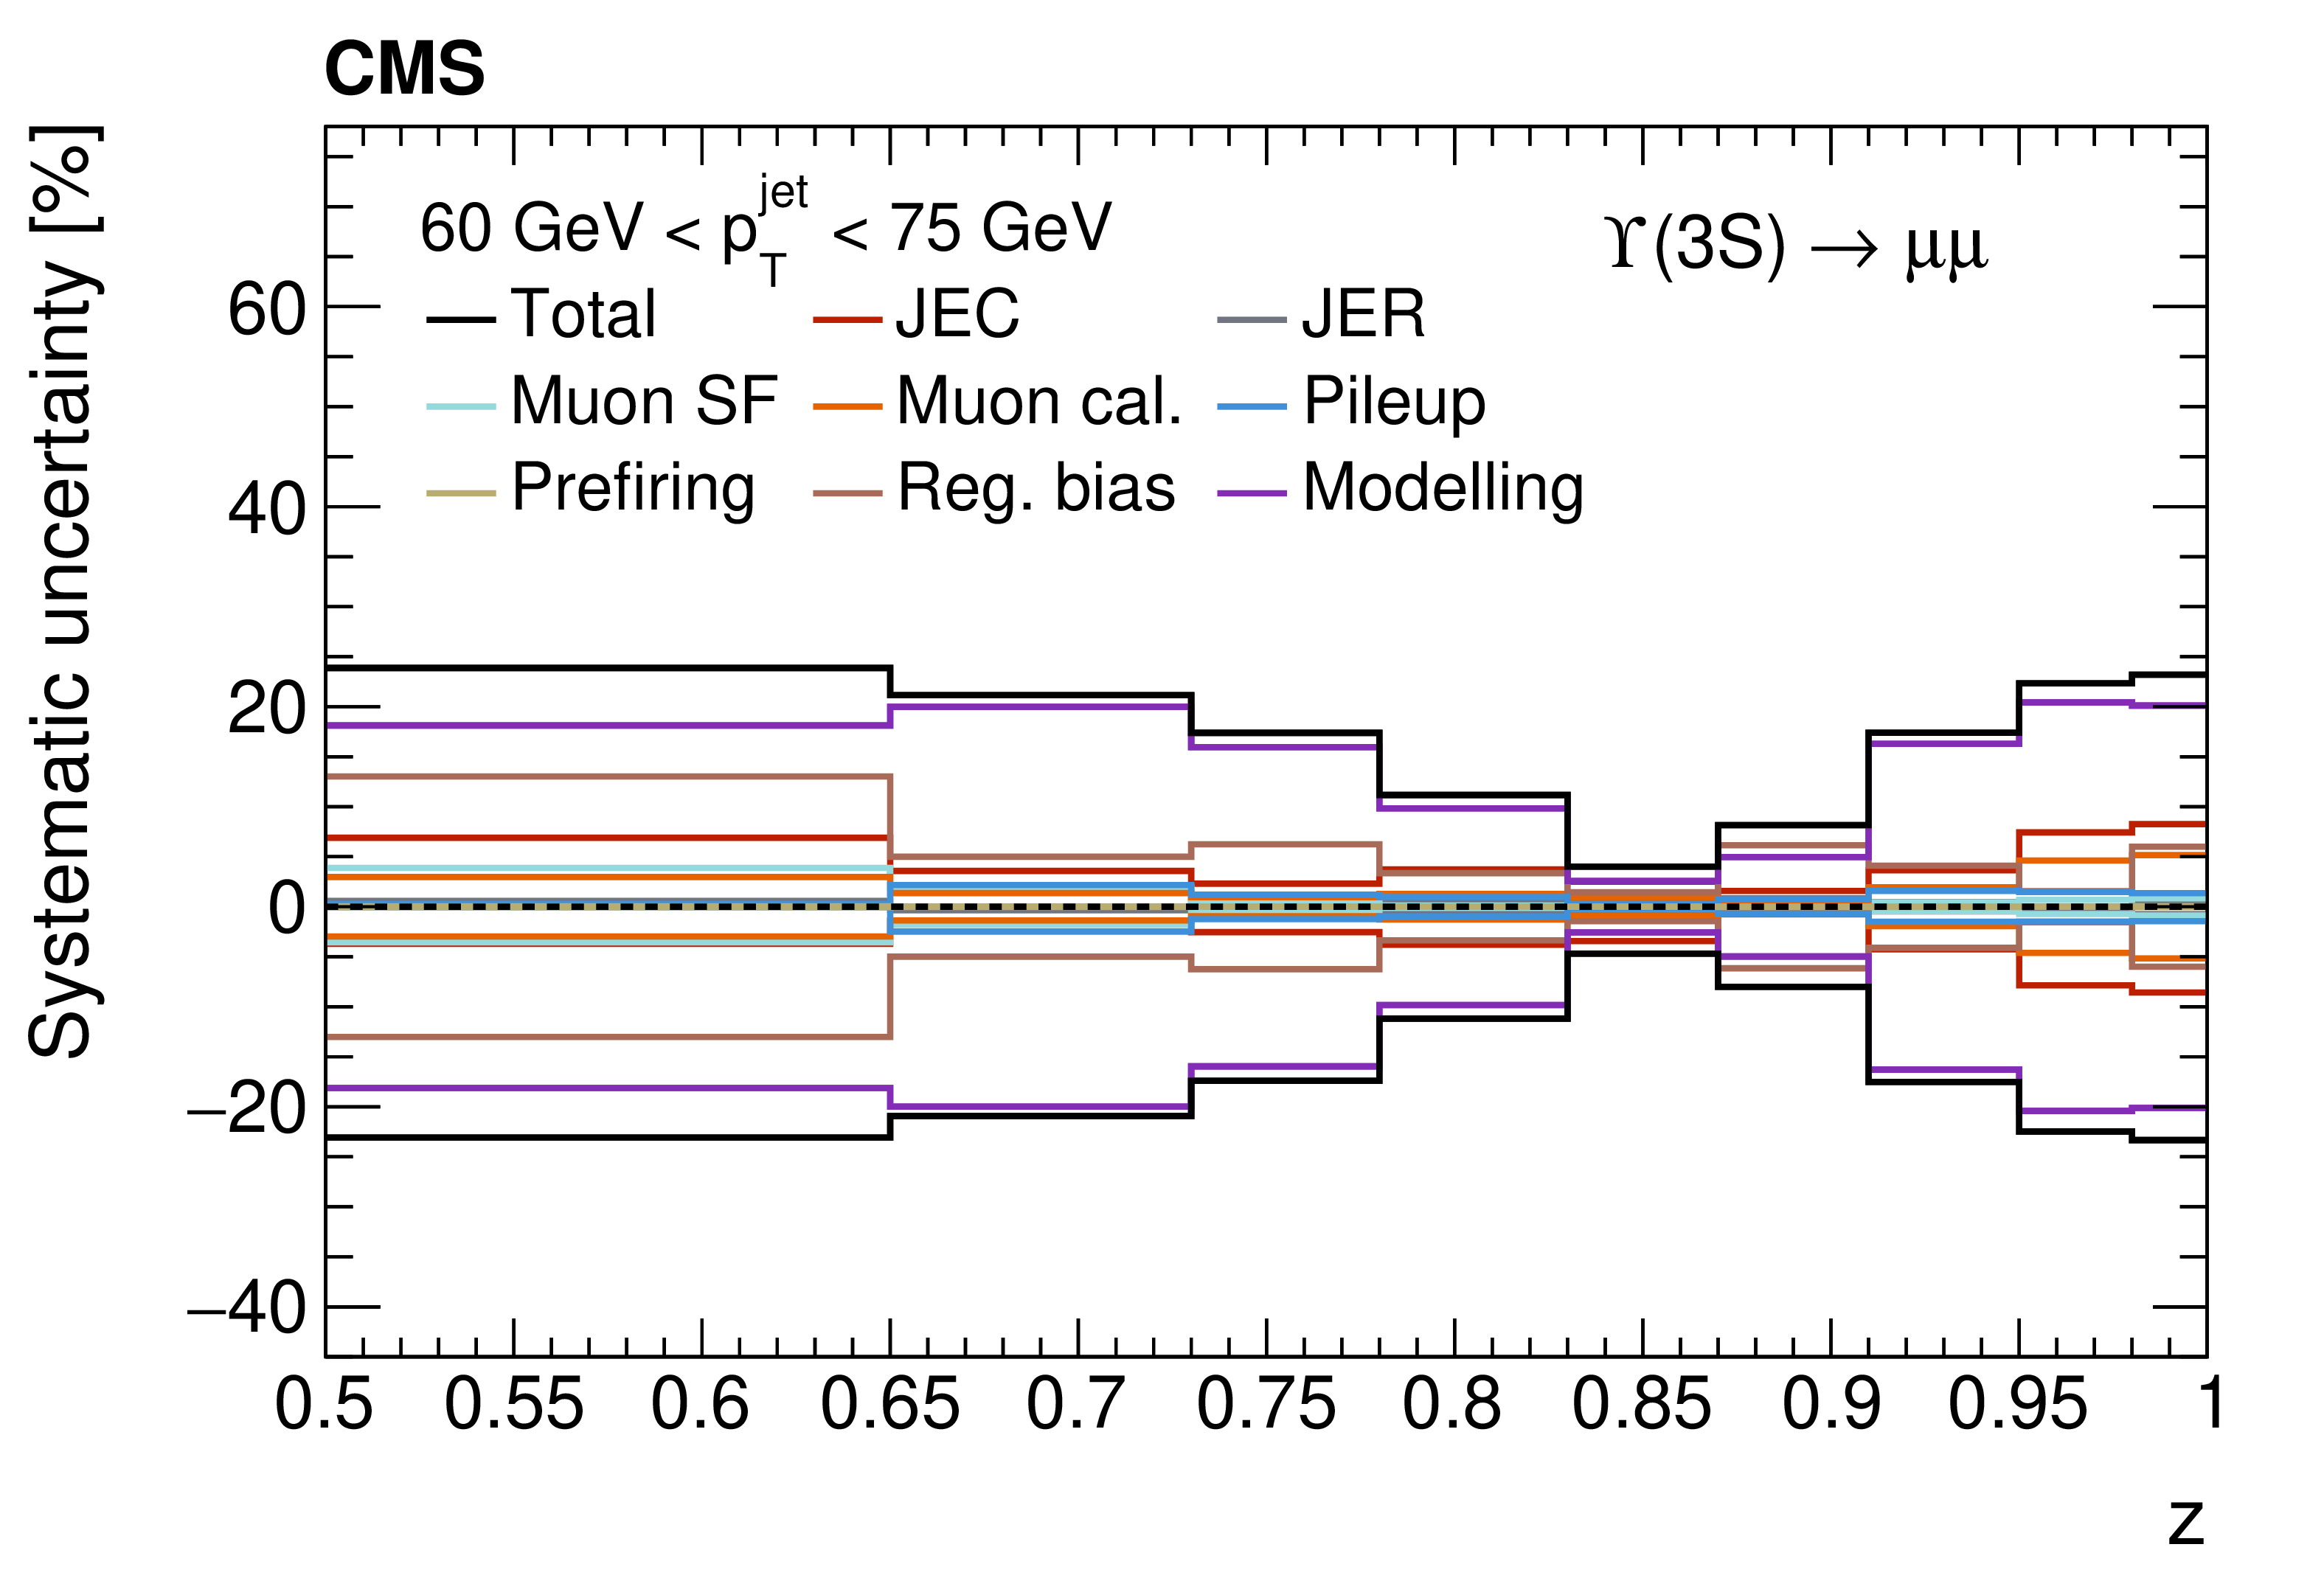
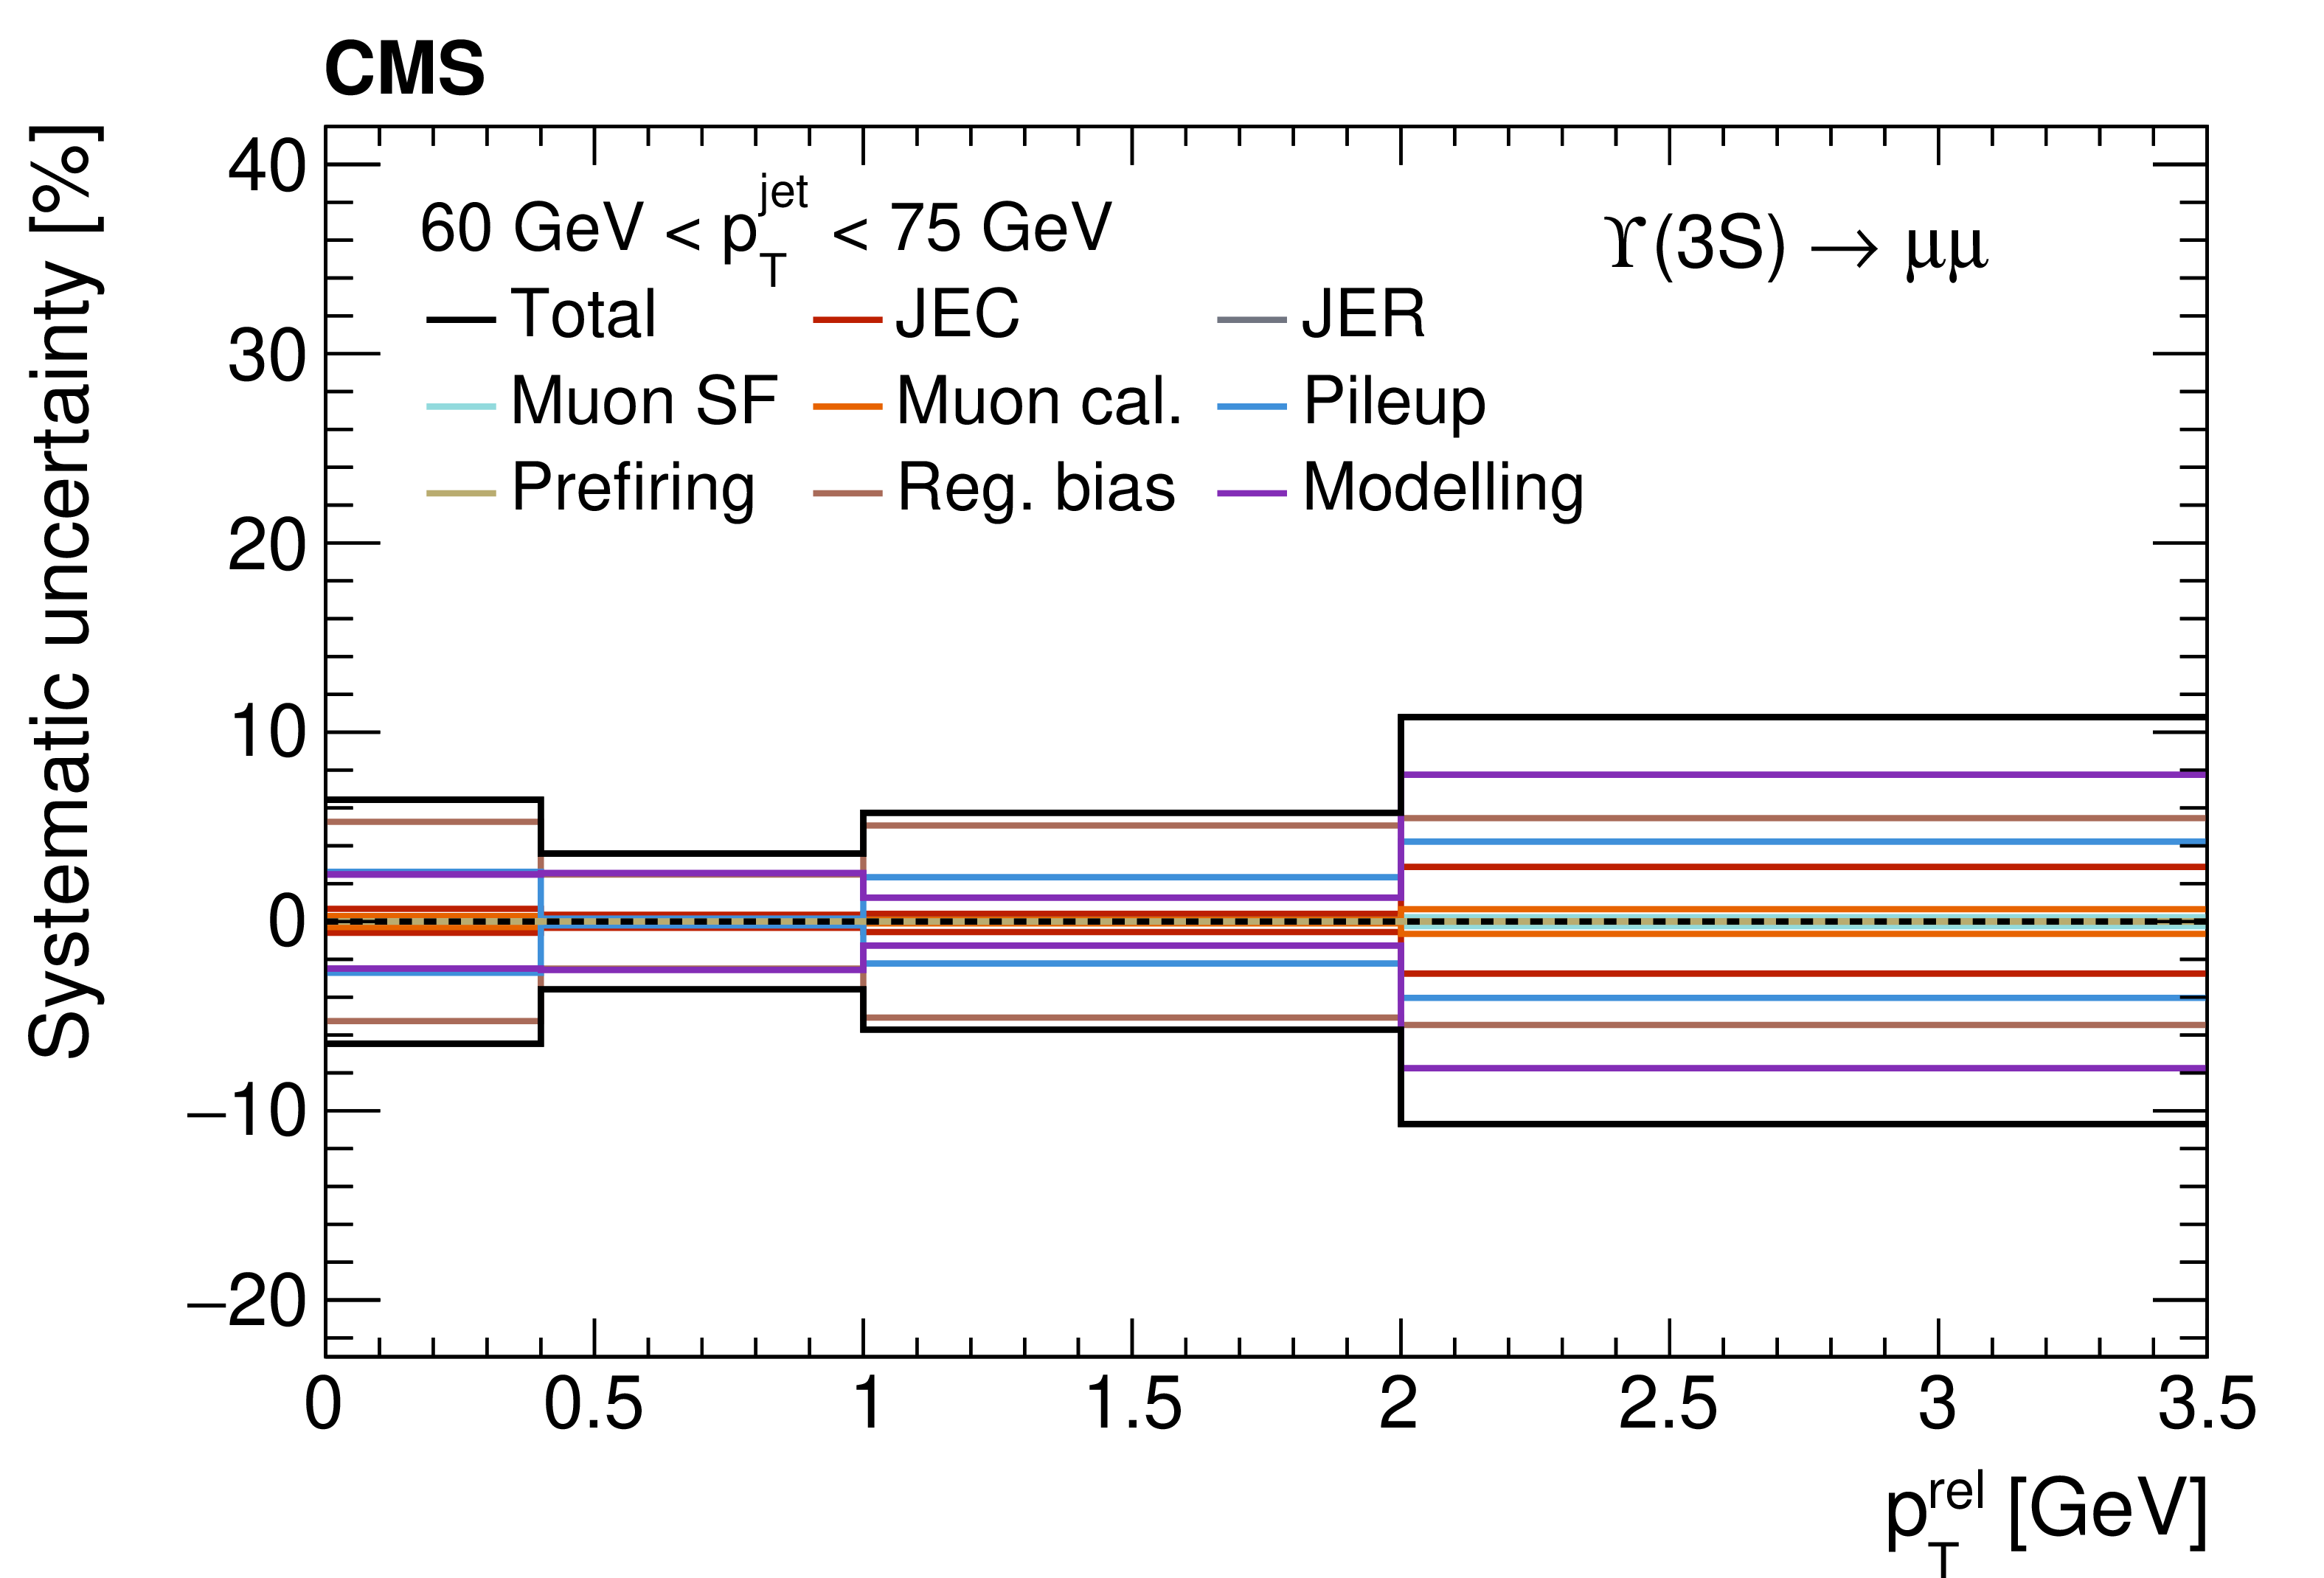
Relative values of the systematic uncertainties discussed in the text, together with the total uncertainty band, for the longitudinal and transverse profiles of $ \Upsilon{\textrm{(1S)}} $ (top), $ \Upsilon{\textrm{(2S)}} $ (middle) and $ \Upsilon{\textrm{(3S)}} $ mesons (bottom) in jets with 60 $ < p_{\mathrm{T}} < $ 75 GeV. |
png pdf |
Figure 5-a:
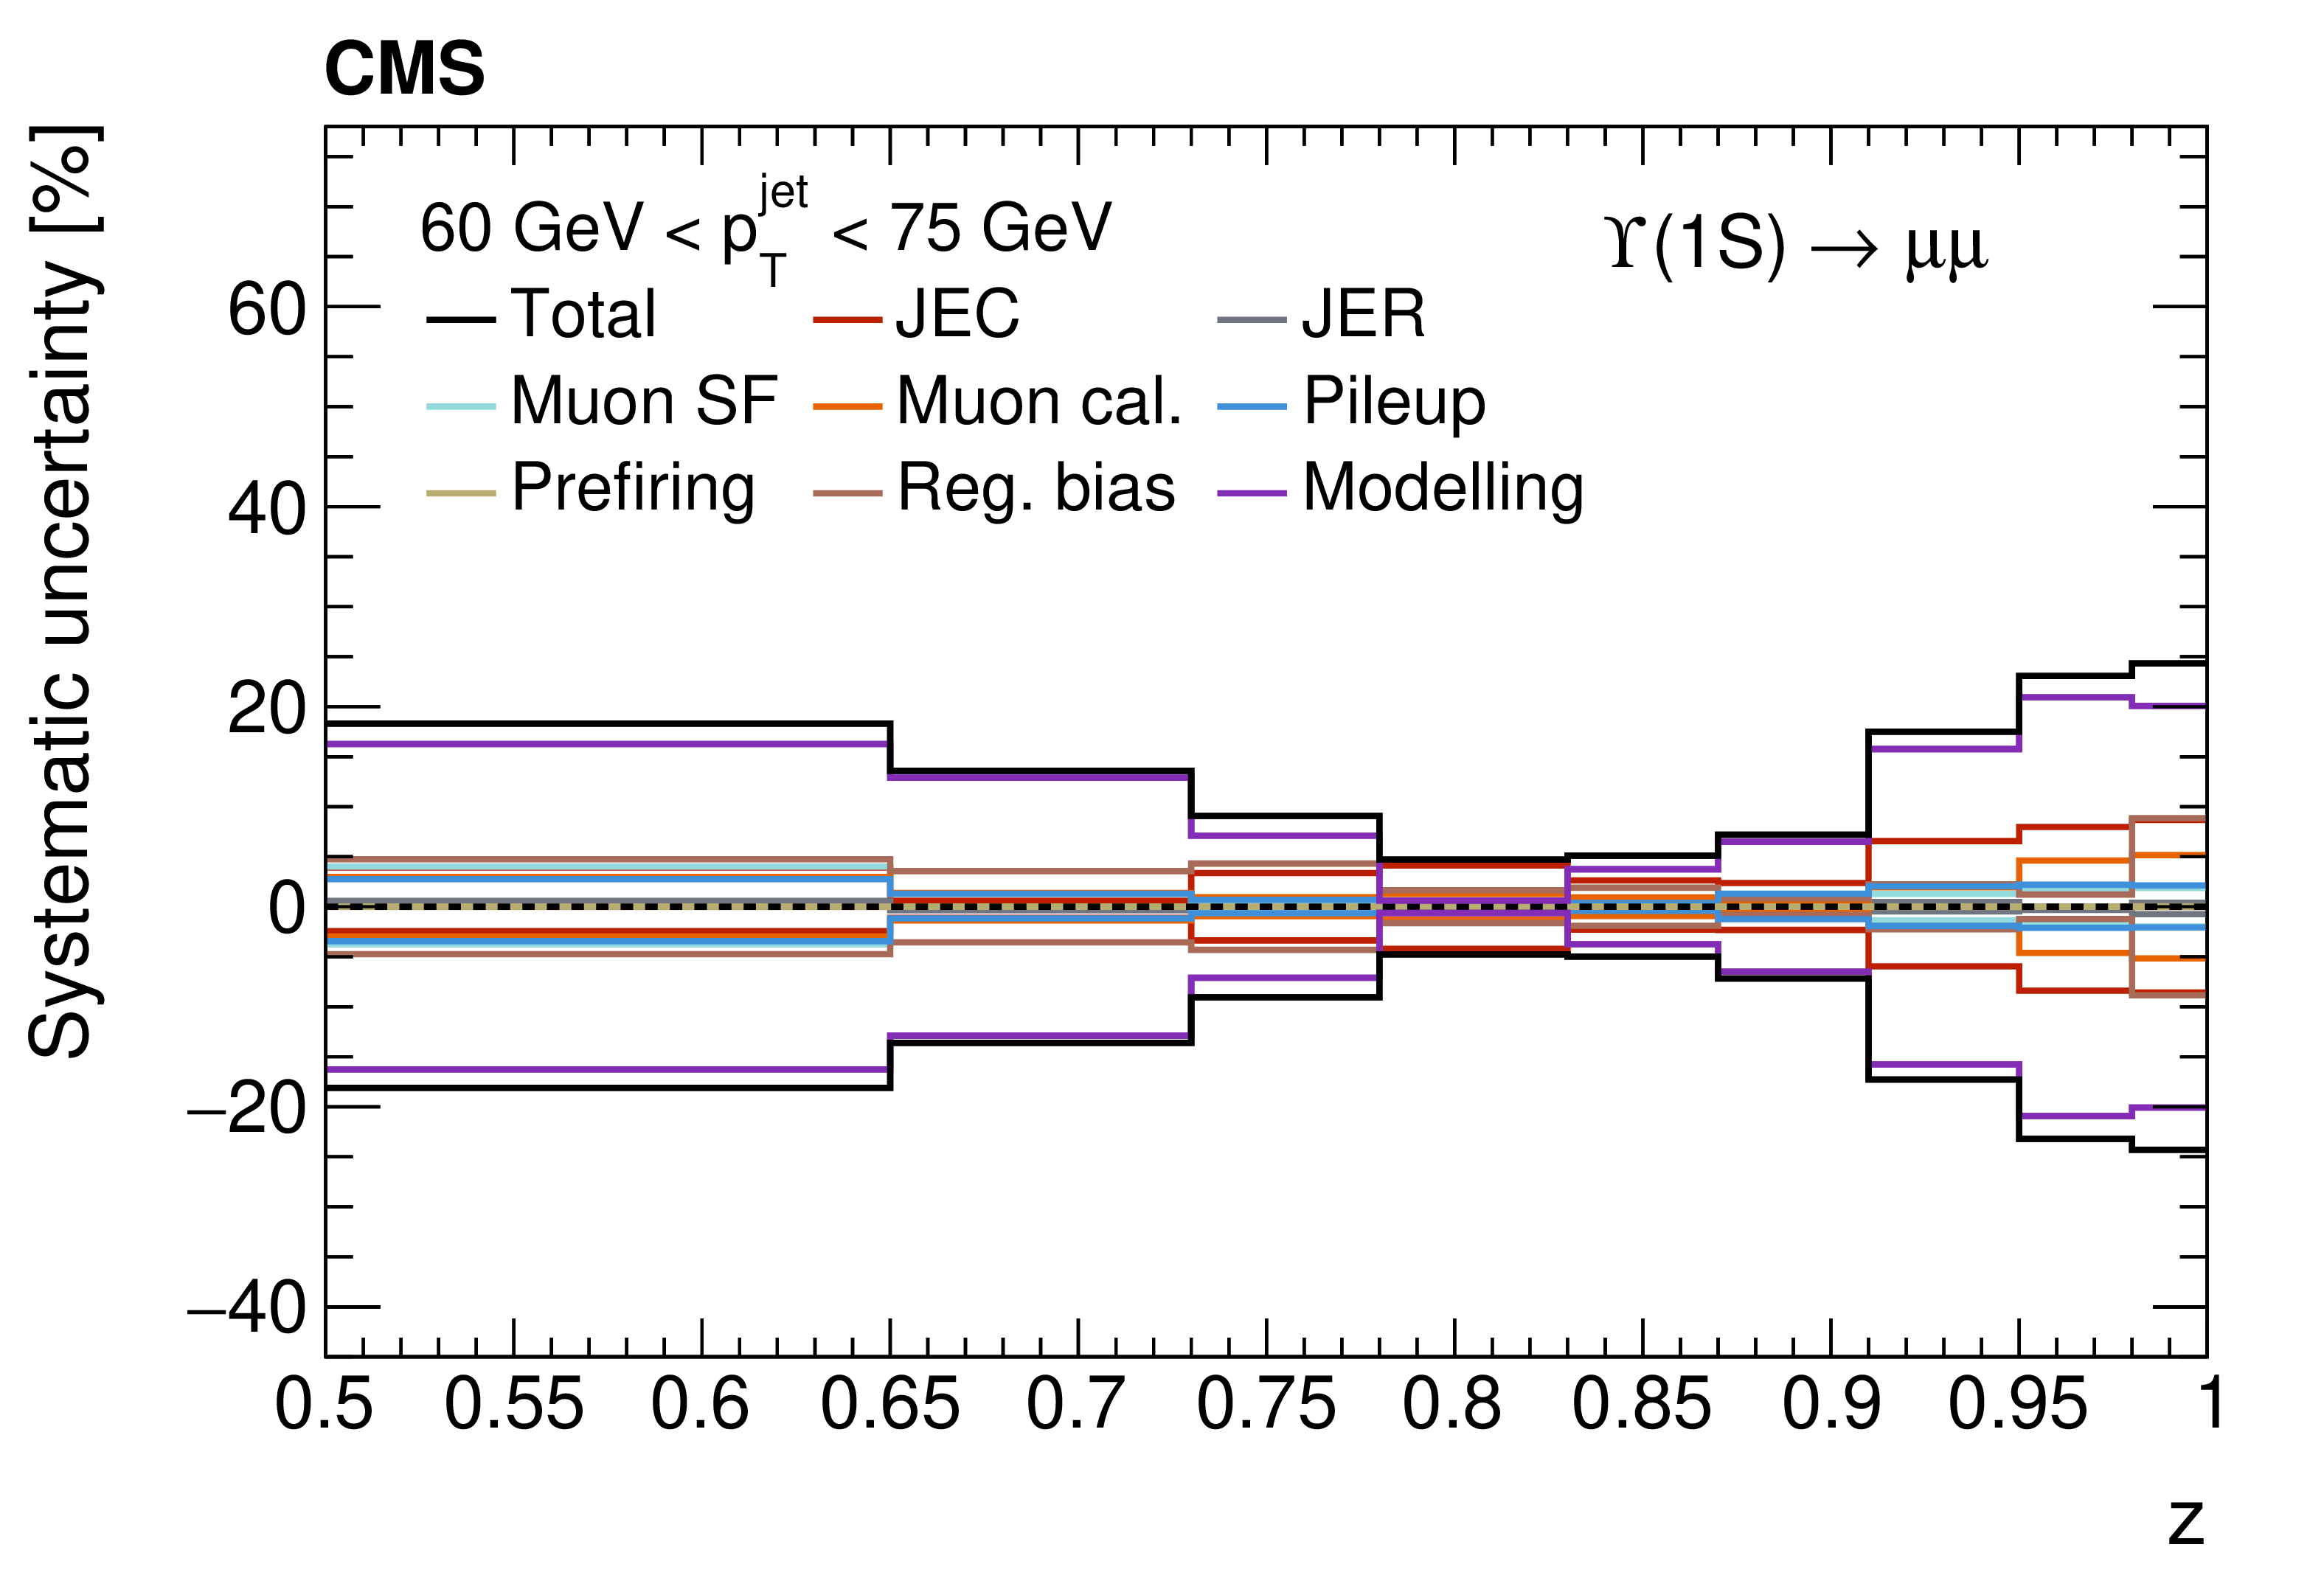
Relative values of the systematic uncertainties discussed in the text, together with the total uncertainty band, for the longitudinal and transverse profiles of $ \Upsilon{\textrm{(1S)}} $ (top), $ \Upsilon{\textrm{(2S)}} $ (middle) and $ \Upsilon{\textrm{(3S)}} $ mesons (bottom) in jets with 60 $ < p_{\mathrm{T}} < $ 75 GeV. |
png pdf |
Figure 5-b:
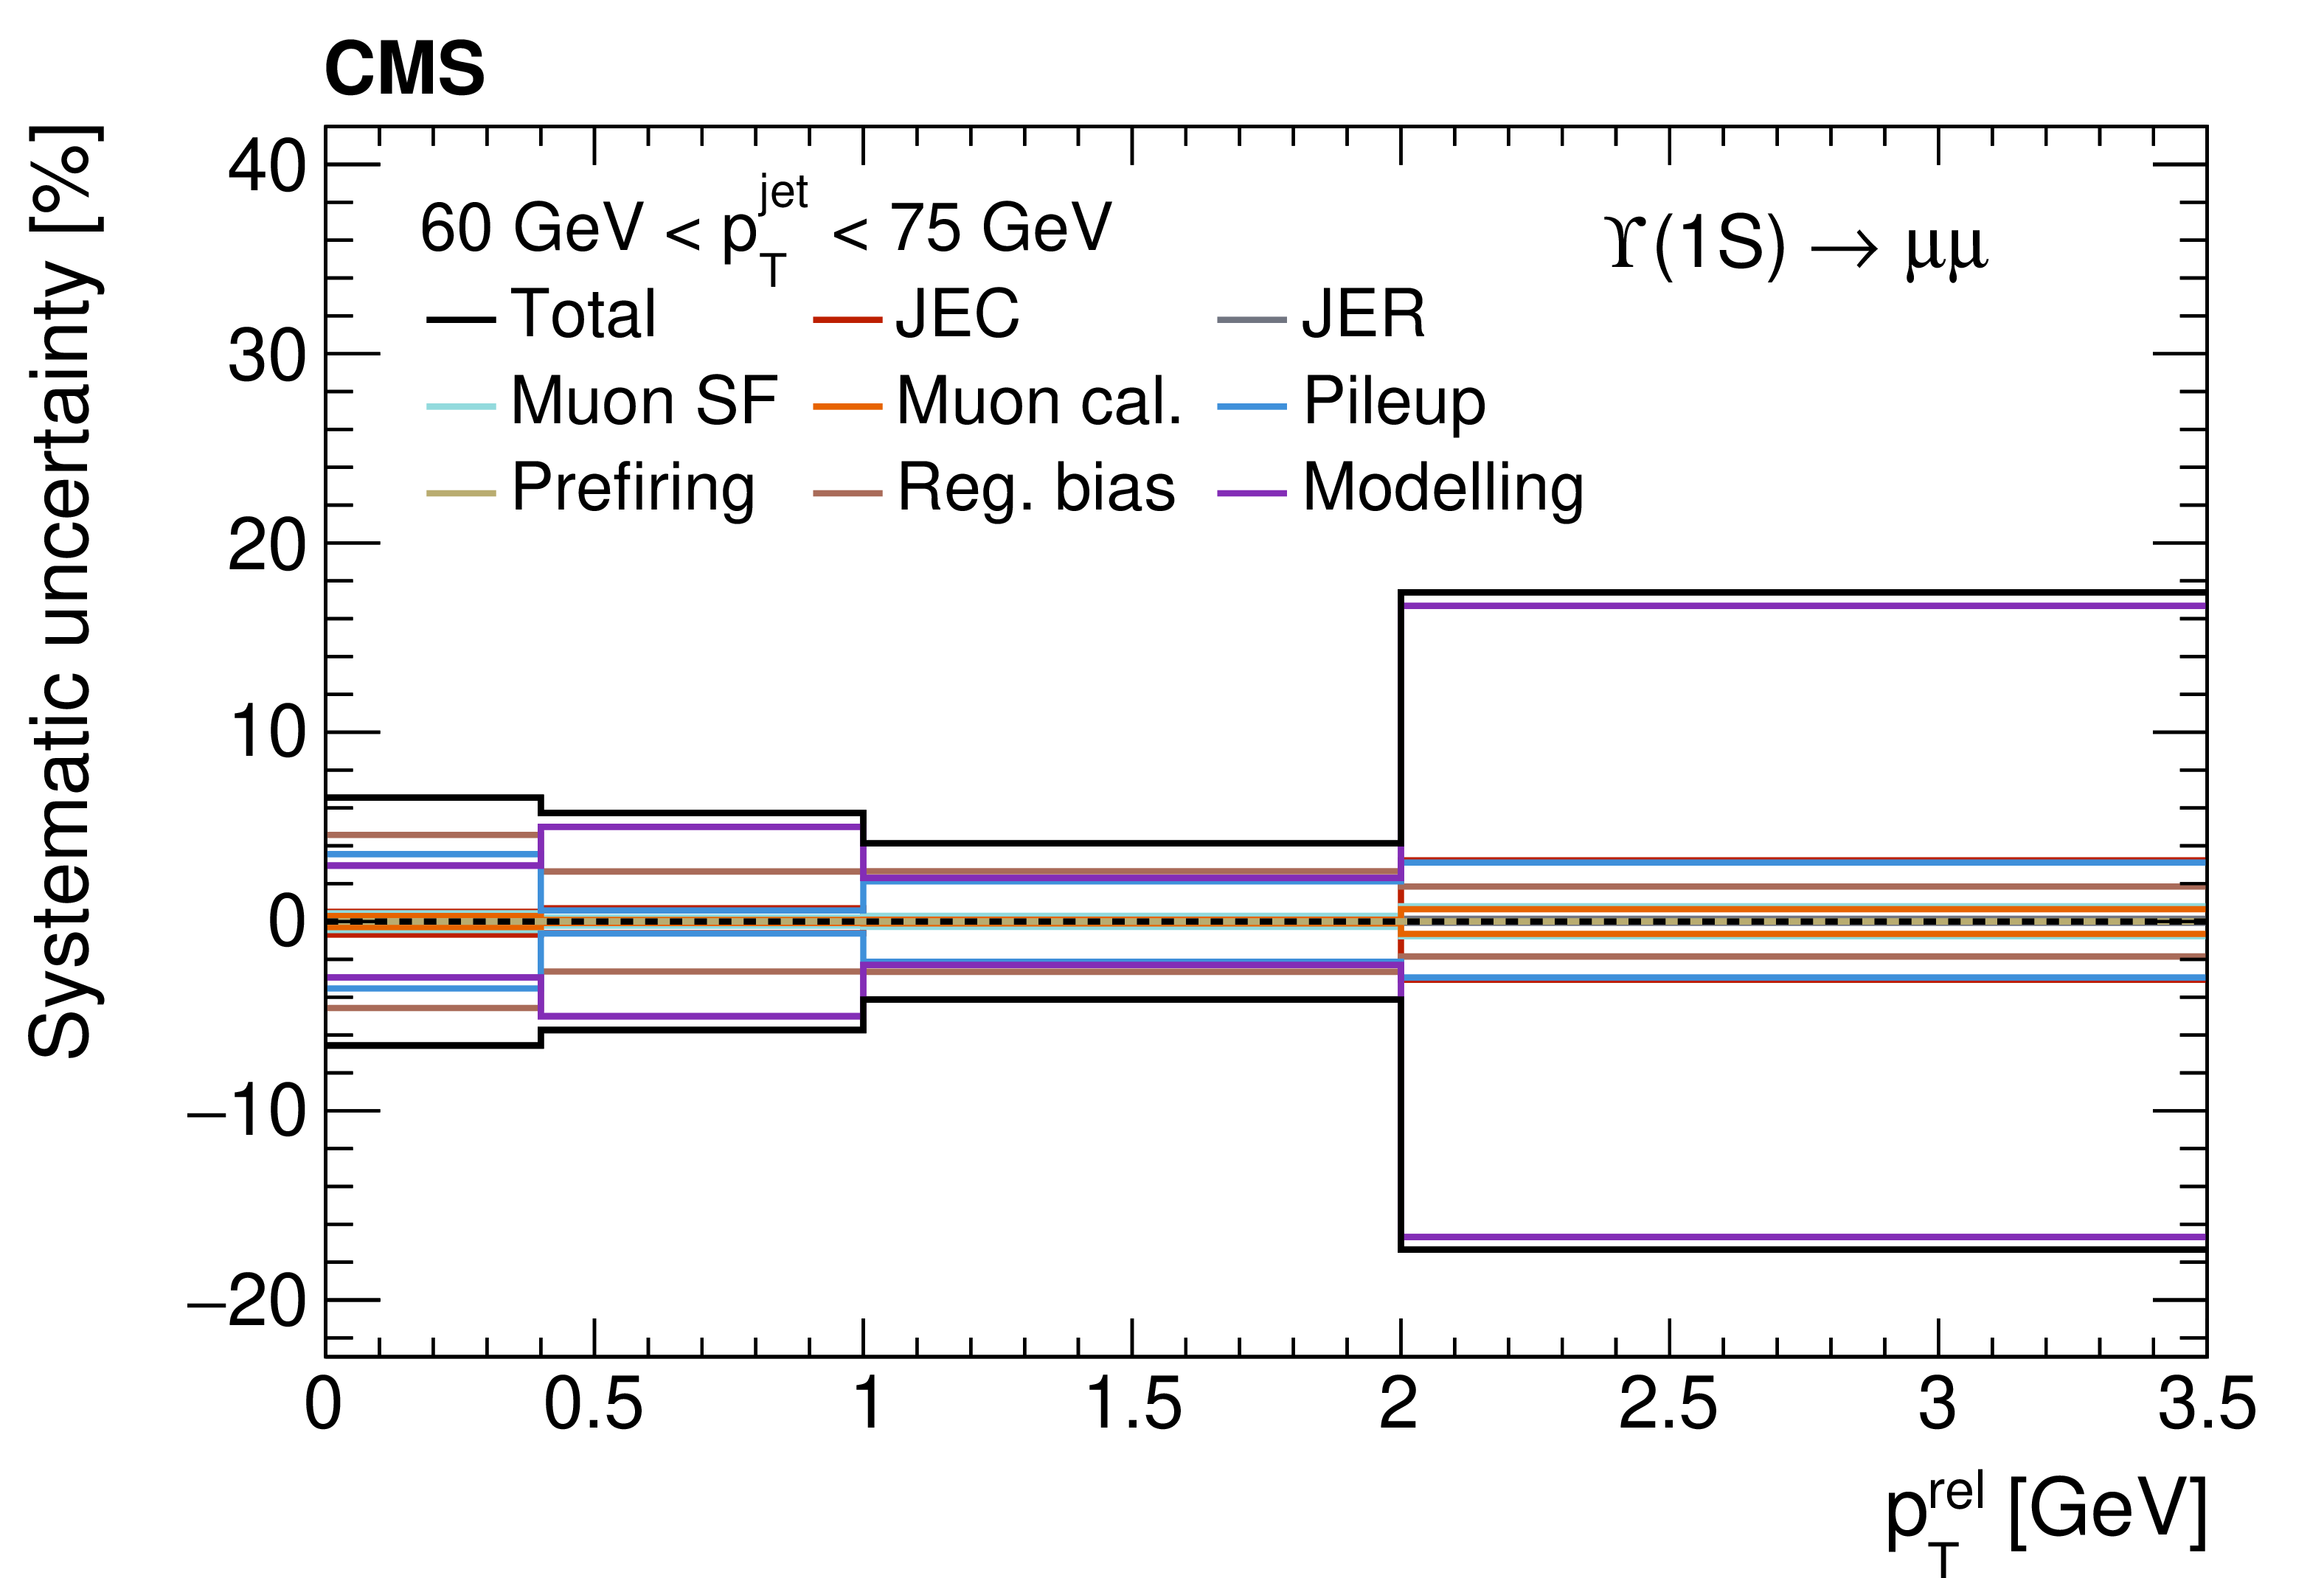
Relative values of the systematic uncertainties discussed in the text, together with the total uncertainty band, for the longitudinal and transverse profiles of $ \Upsilon{\textrm{(1S)}} $ (top), $ \Upsilon{\textrm{(2S)}} $ (middle) and $ \Upsilon{\textrm{(3S)}} $ mesons (bottom) in jets with 60 $ < p_{\mathrm{T}} < $ 75 GeV. |
png pdf |
Figure 5-c:
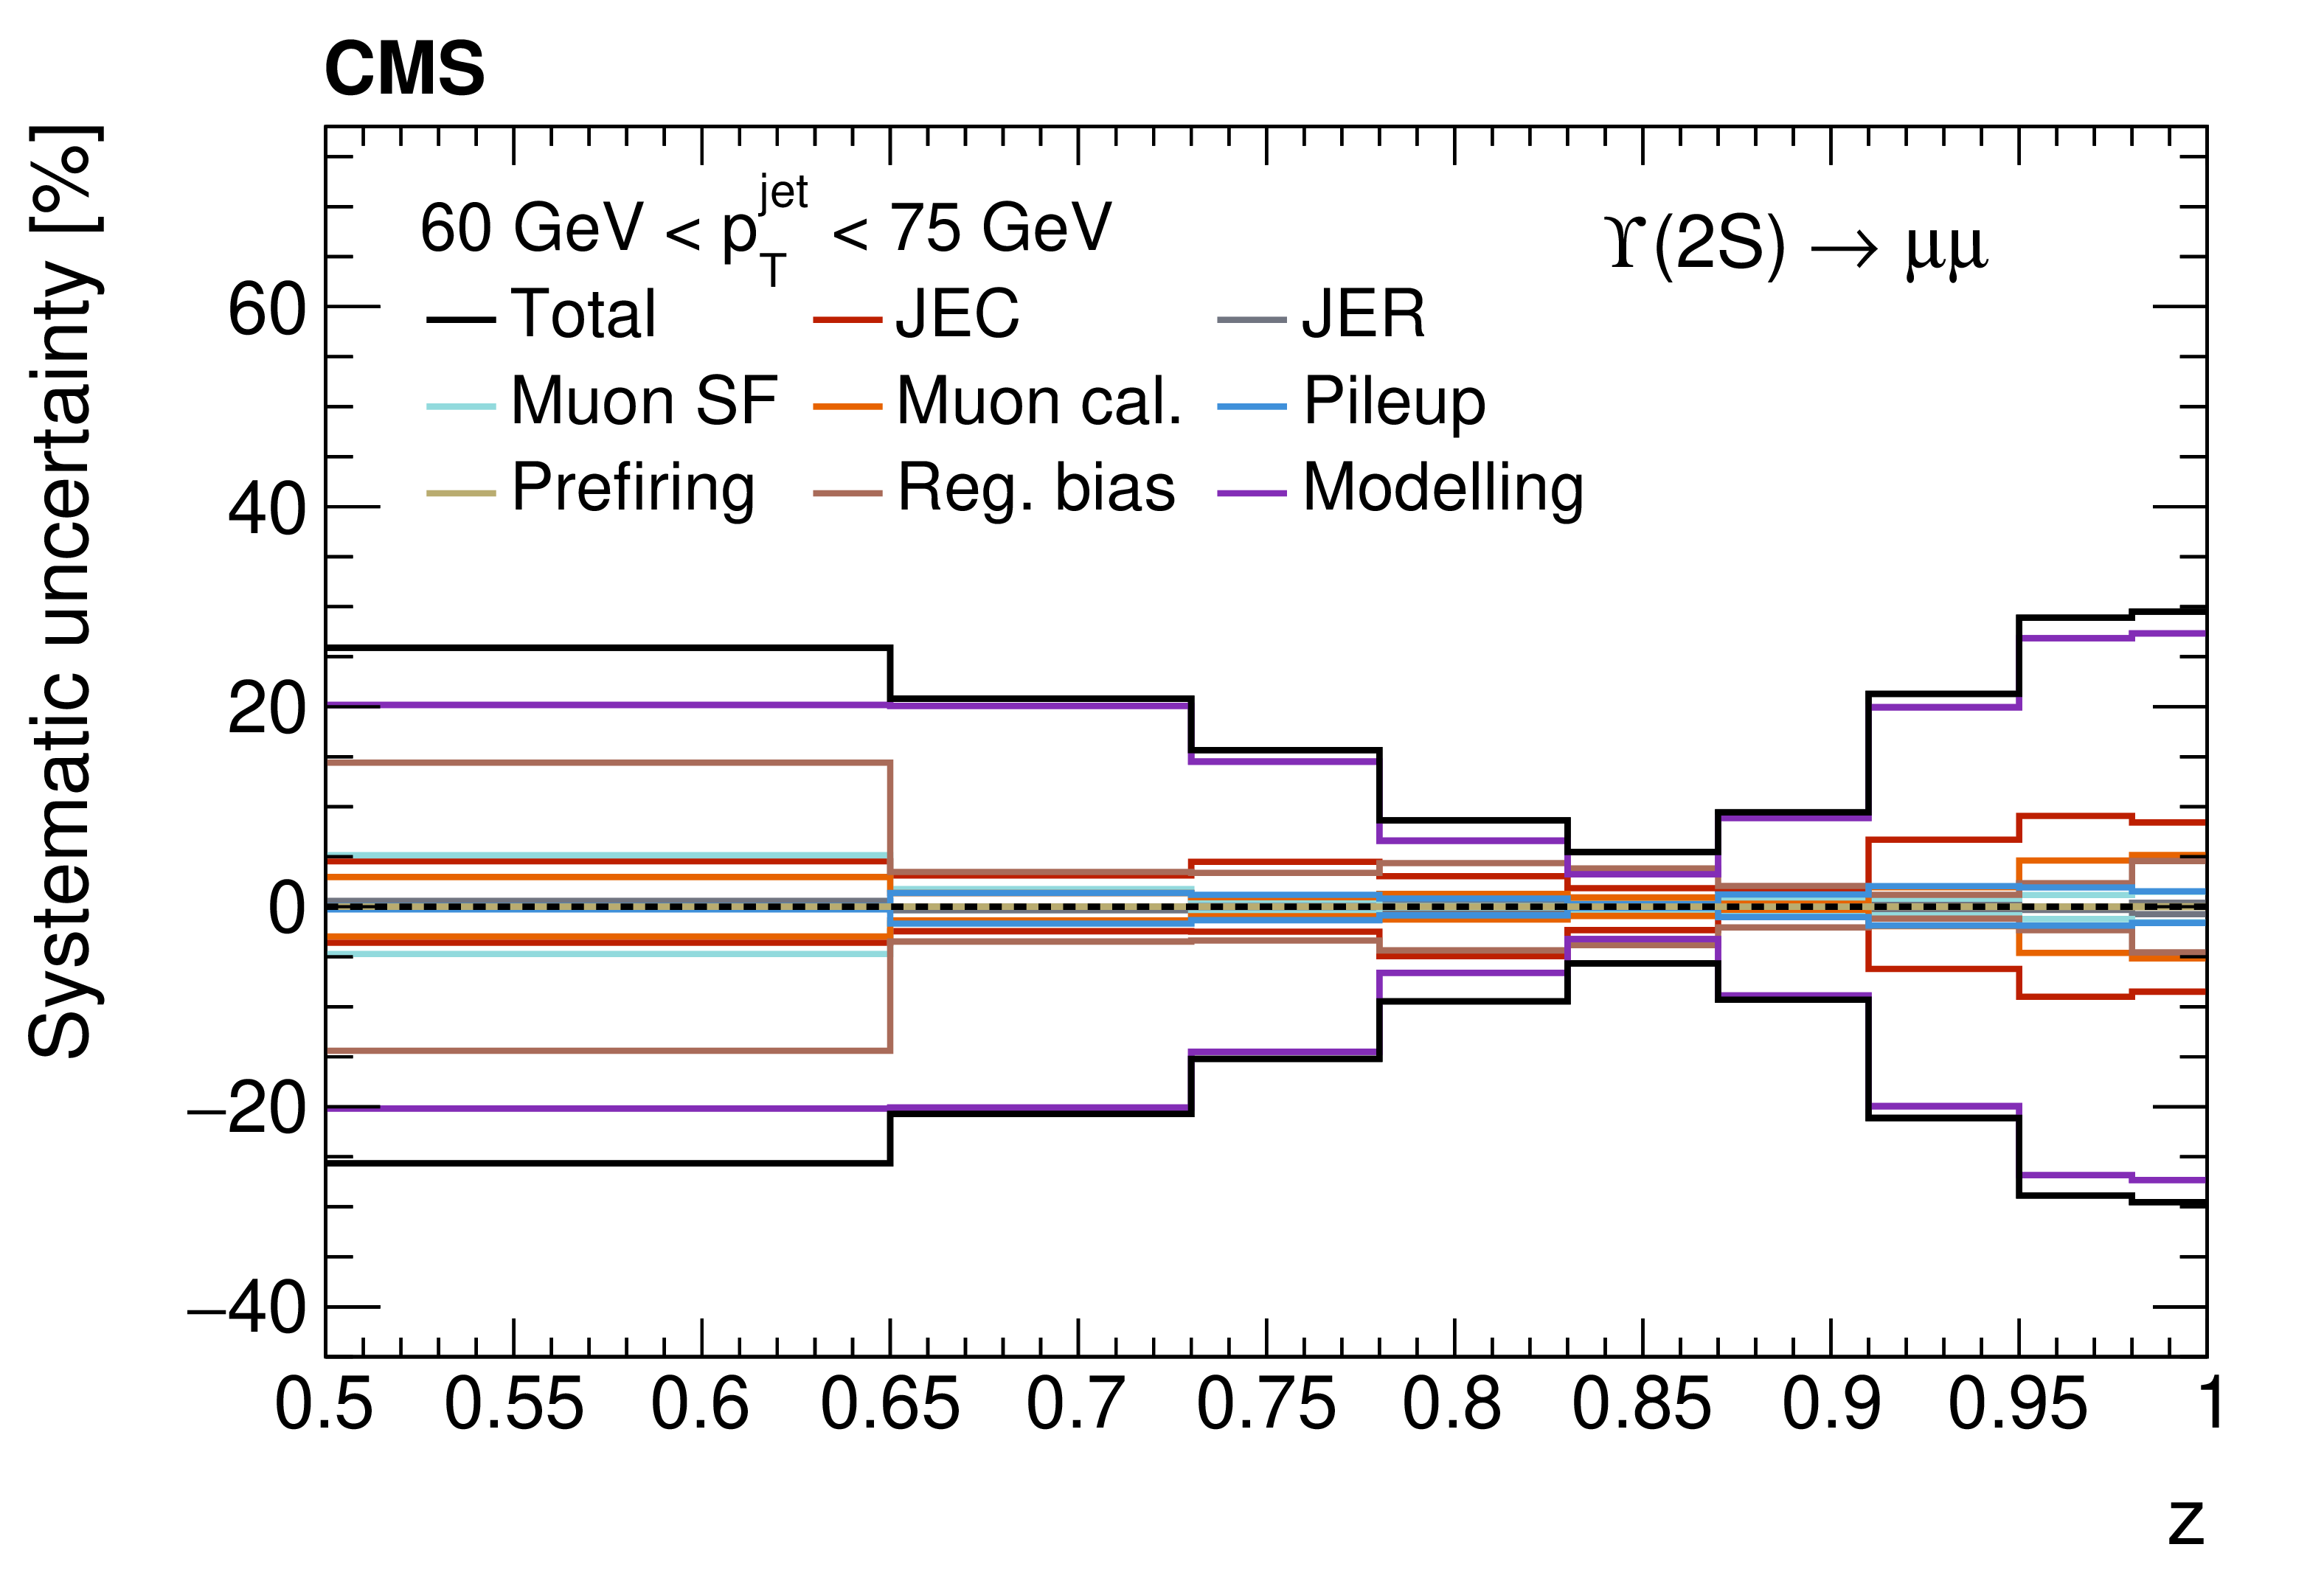
Relative values of the systematic uncertainties discussed in the text, together with the total uncertainty band, for the longitudinal and transverse profiles of $ \Upsilon{\textrm{(1S)}} $ (top), $ \Upsilon{\textrm{(2S)}} $ (middle) and $ \Upsilon{\textrm{(3S)}} $ mesons (bottom) in jets with 60 $ < p_{\mathrm{T}} < $ 75 GeV. |
png pdf |
Figure 5-d:
Relative values of the systematic uncertainties discussed in the text, together with the total uncertainty band, for the longitudinal and transverse profiles of $ \Upsilon{\textrm{(1S)}} $ (top), $ \Upsilon{\textrm{(2S)}} $ (middle) and $ \Upsilon{\textrm{(3S)}} $ mesons (bottom) in jets with 60 $ < p_{\mathrm{T}} < $ 75 GeV. |
png pdf |
Figure 5-e:
Relative values of the systematic uncertainties discussed in the text, together with the total uncertainty band, for the longitudinal and transverse profiles of $ \Upsilon{\textrm{(1S)}} $ (top), $ \Upsilon{\textrm{(2S)}} $ (middle) and $ \Upsilon{\textrm{(3S)}} $ mesons (bottom) in jets with 60 $ < p_{\mathrm{T}} < $ 75 GeV. |
png pdf |
Figure 5-f:
Relative values of the systematic uncertainties discussed in the text, together with the total uncertainty band, for the longitudinal and transverse profiles of $ \Upsilon{\textrm{(1S)}} $ (top), $ \Upsilon{\textrm{(2S)}} $ (middle) and $ \Upsilon{\textrm{(3S)}} $ mesons (bottom) in jets with 60 $ < p_{\mathrm{T}} < $ 75 GeV. |
png pdf |
Figure 6:
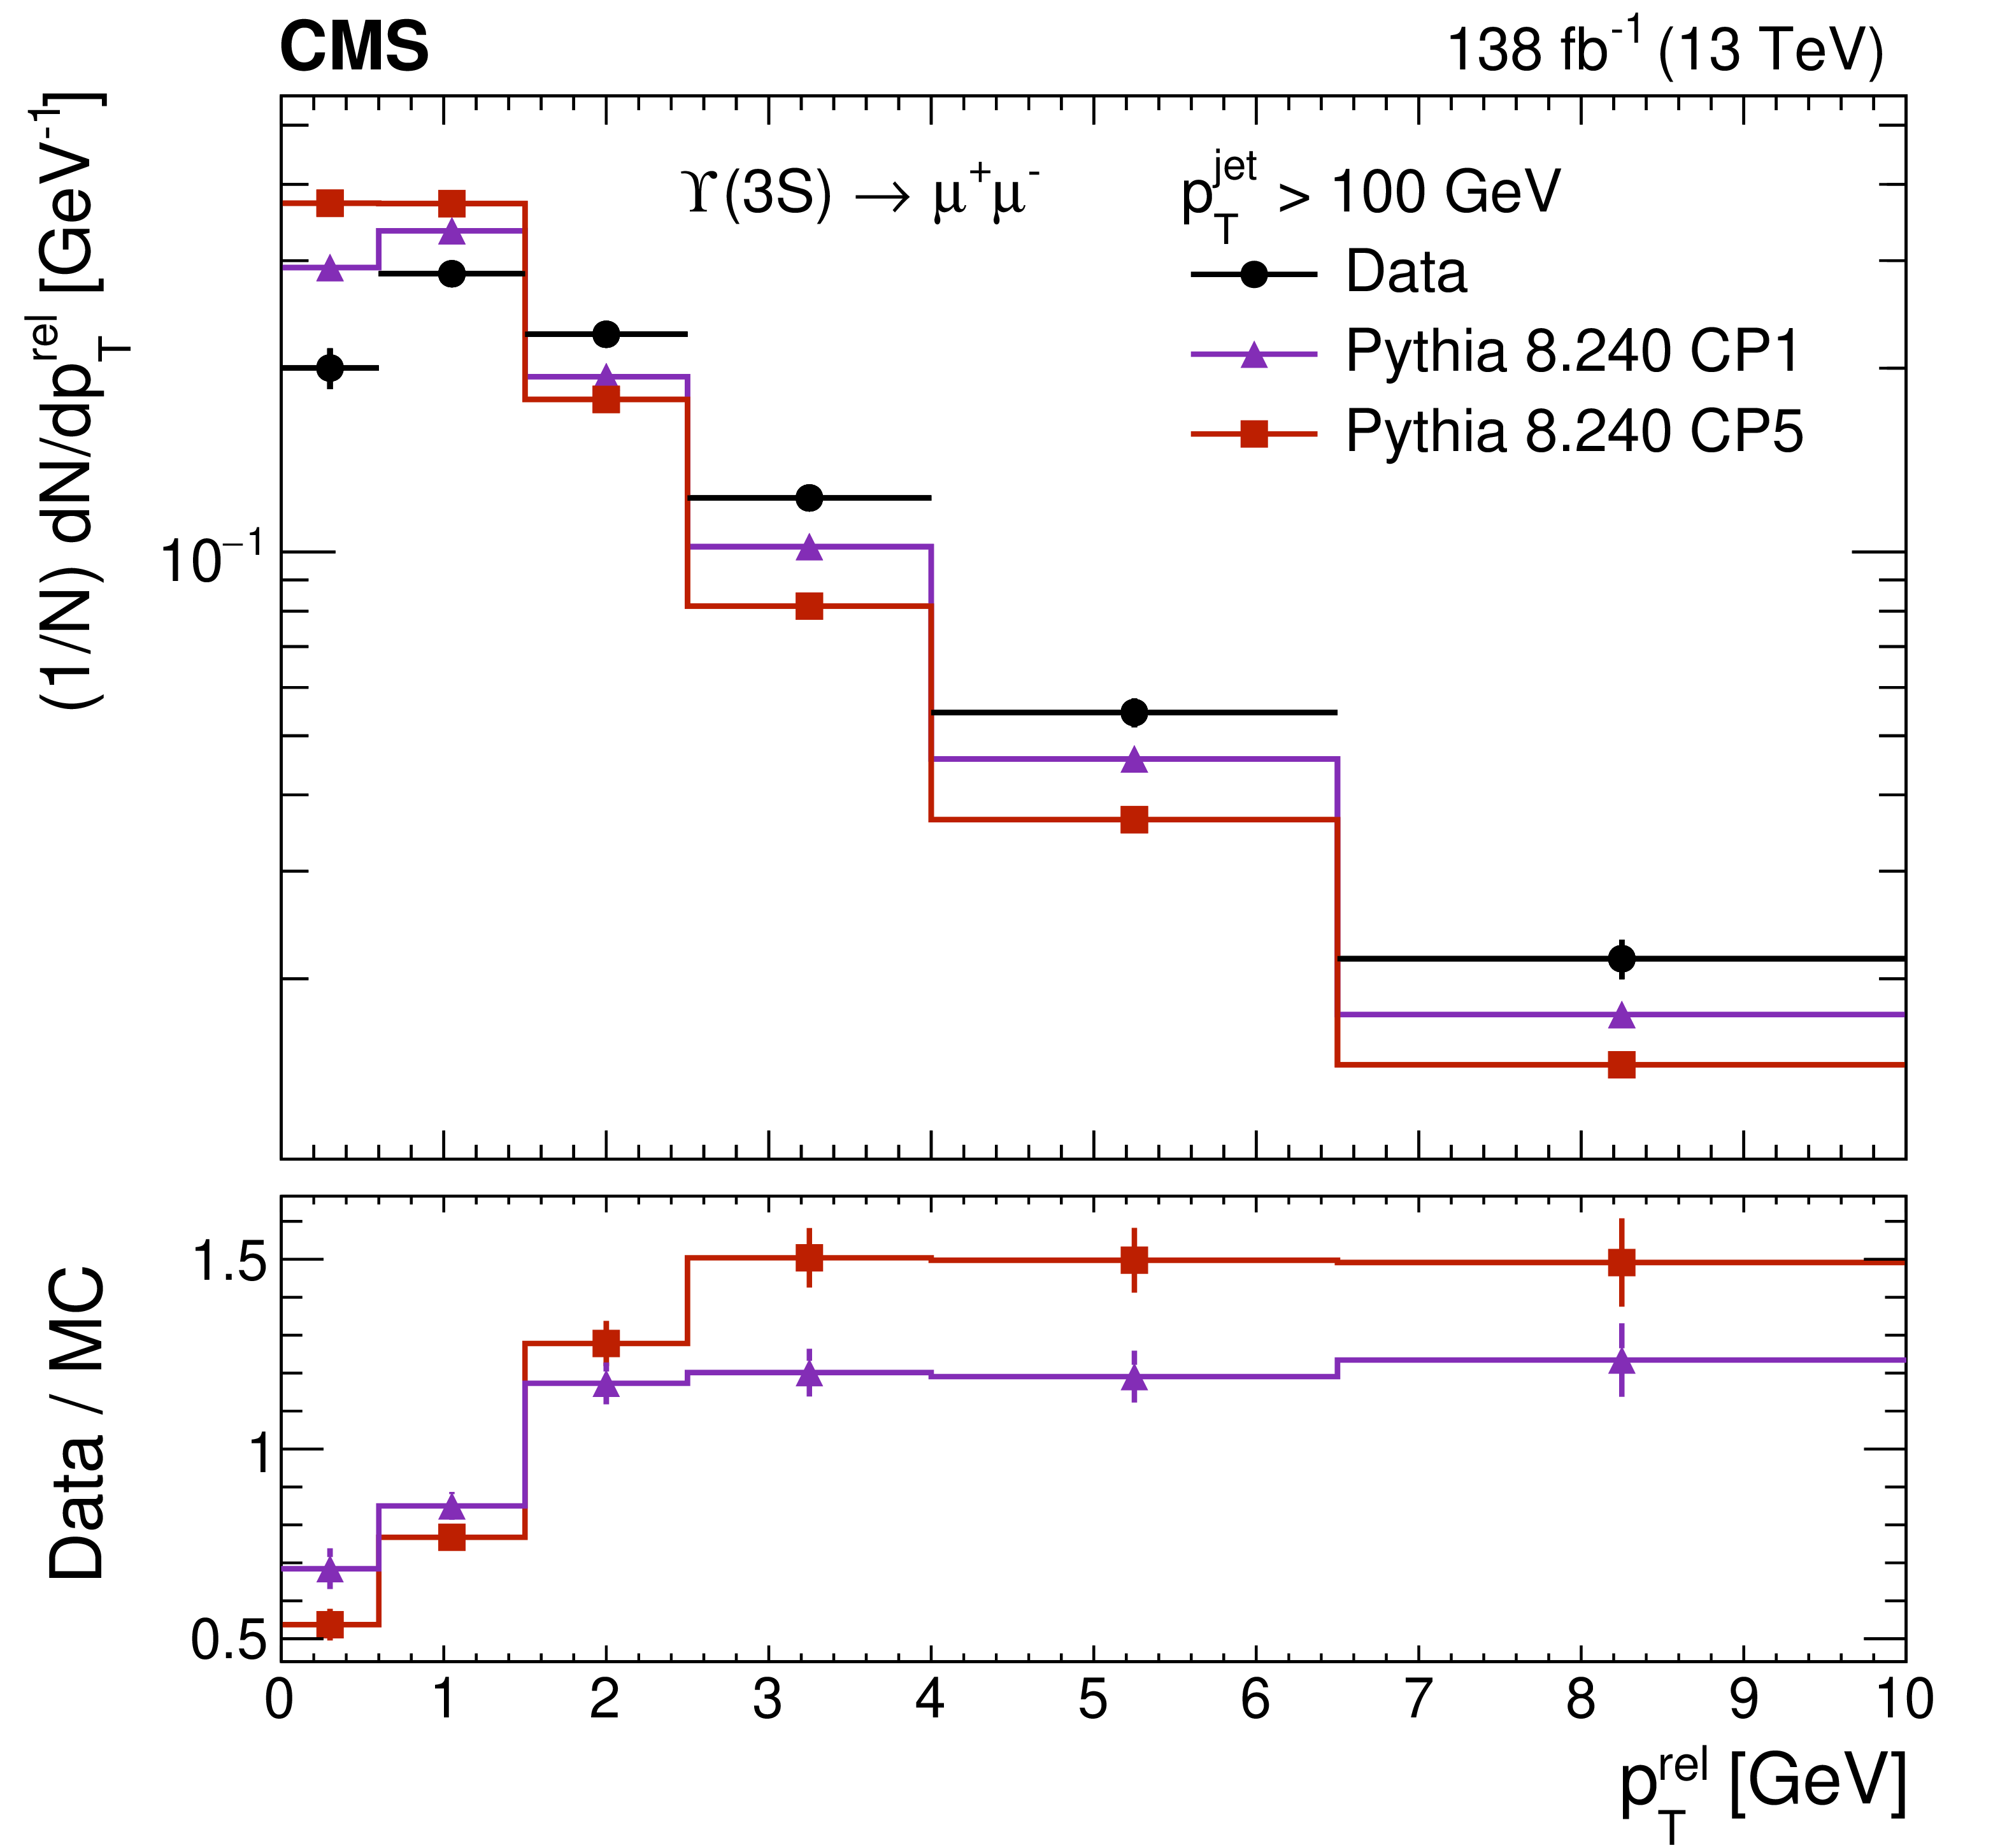
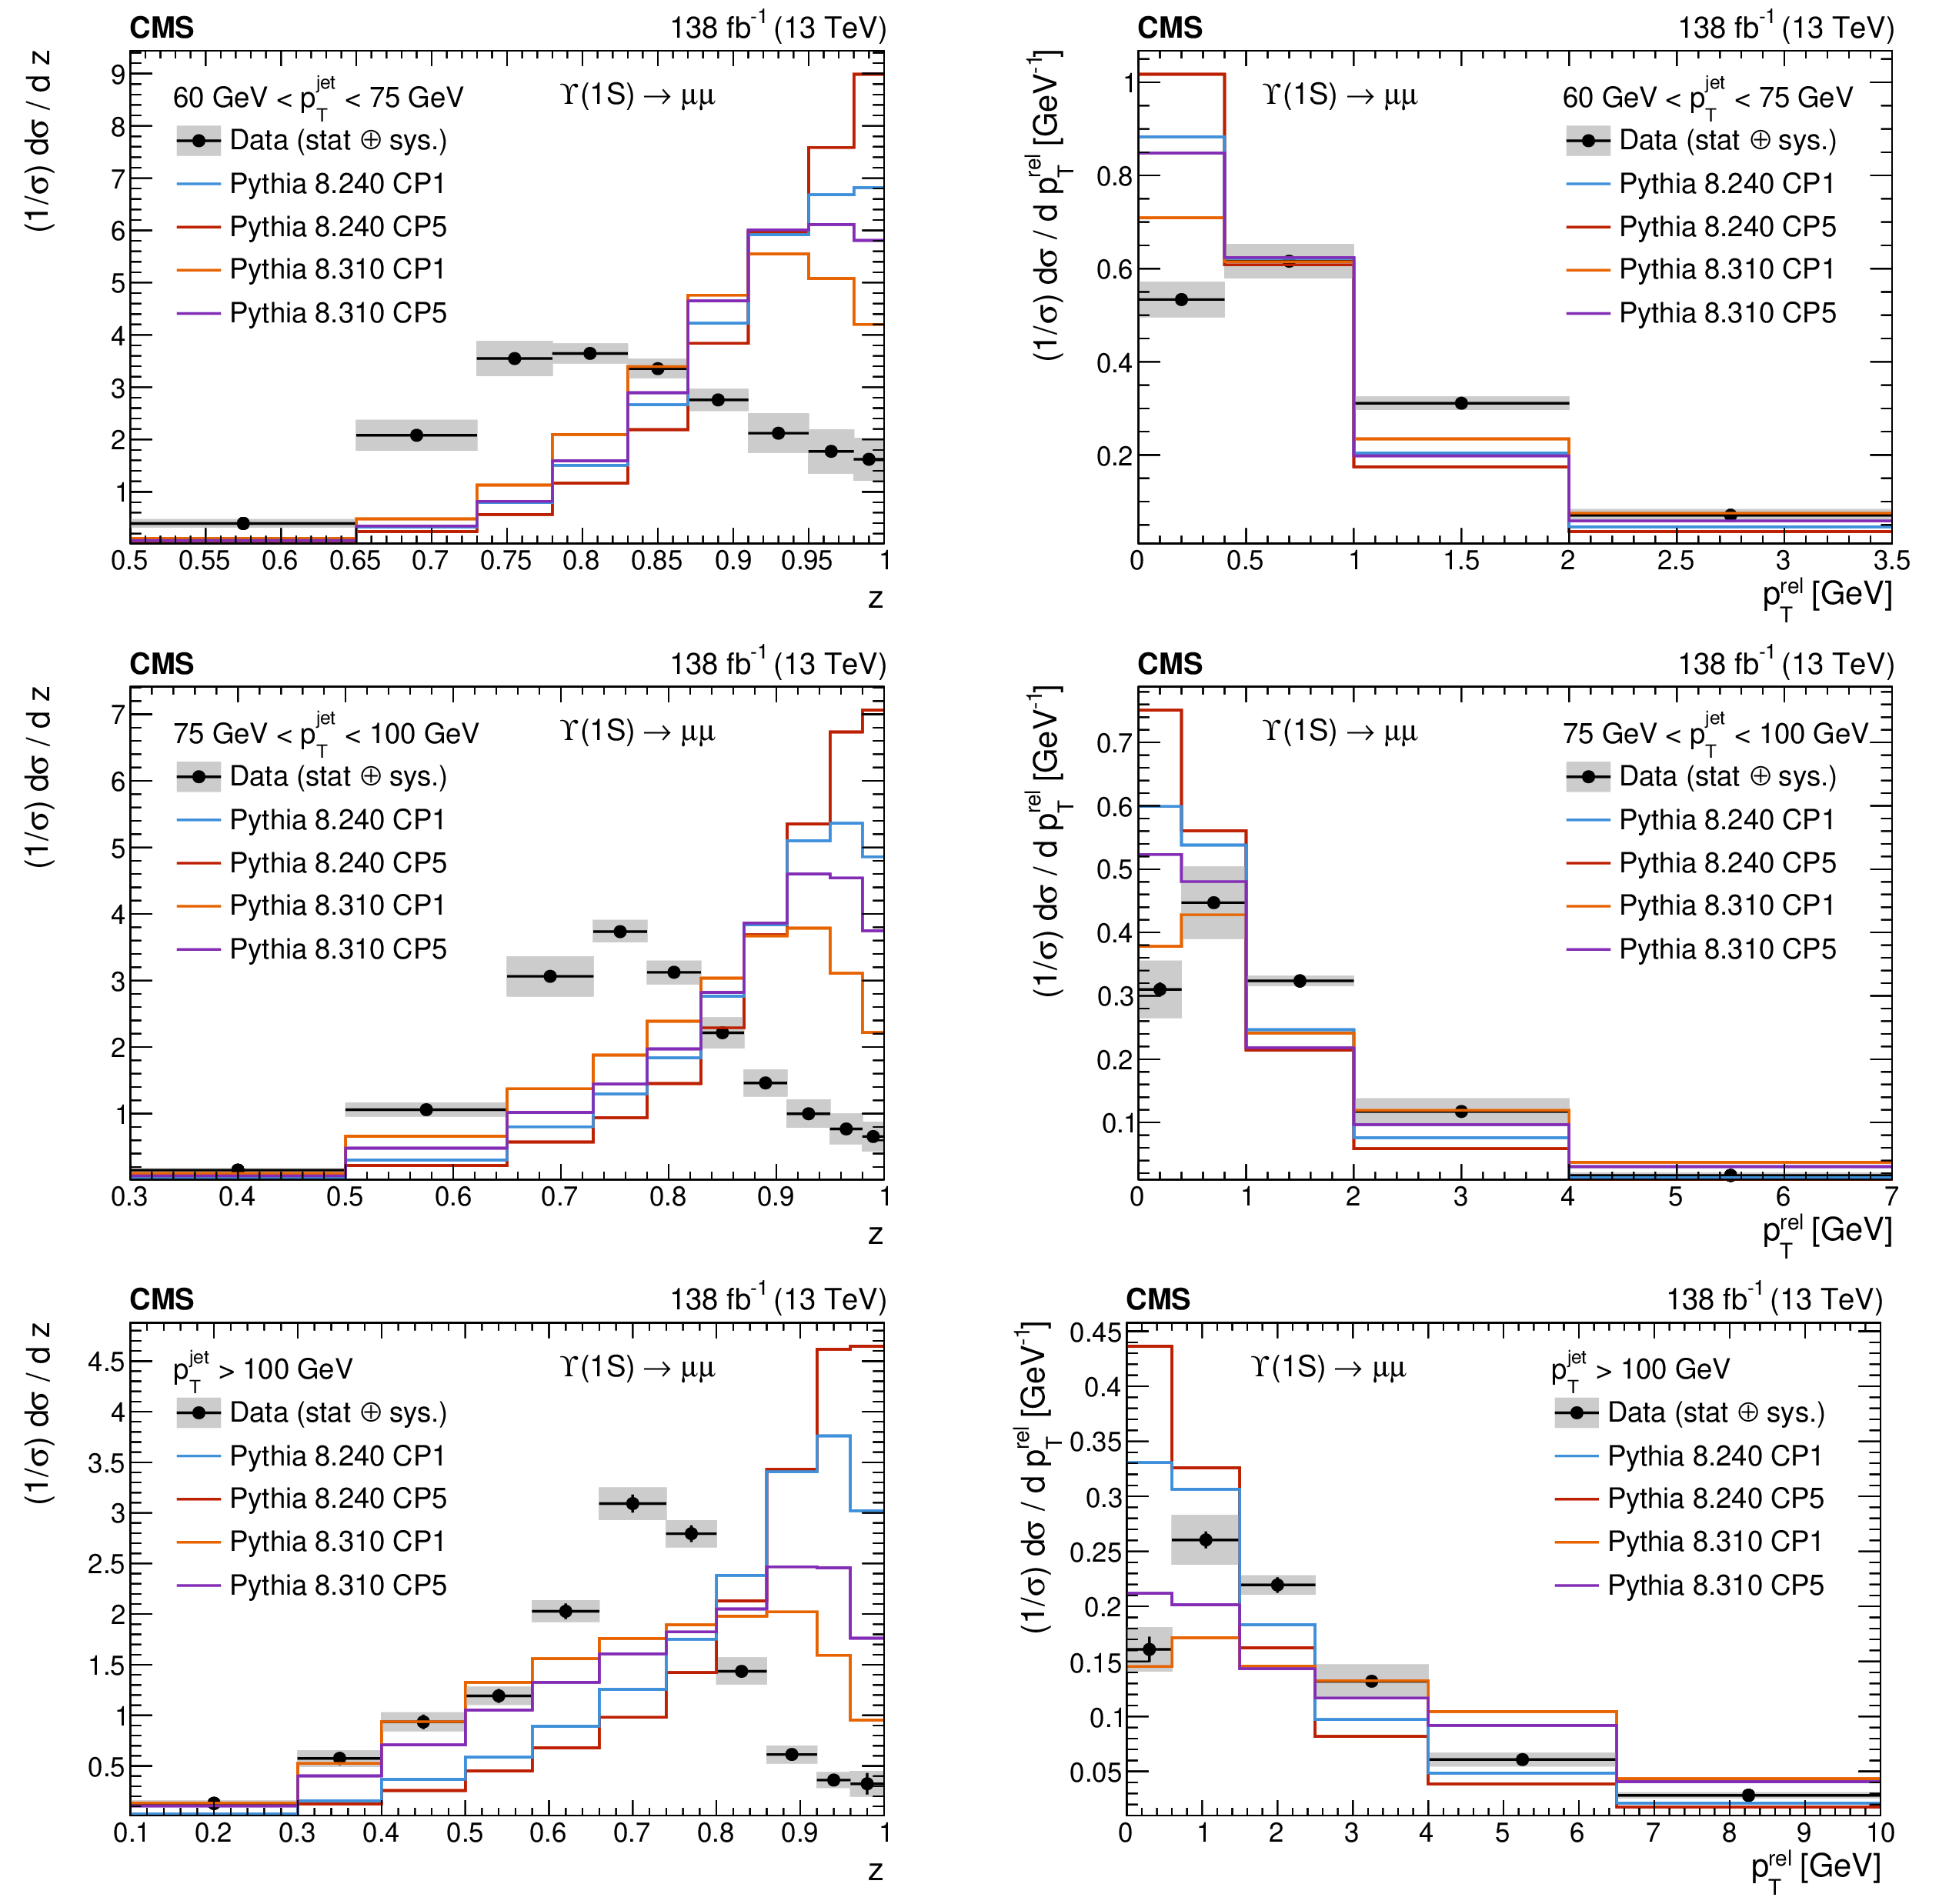
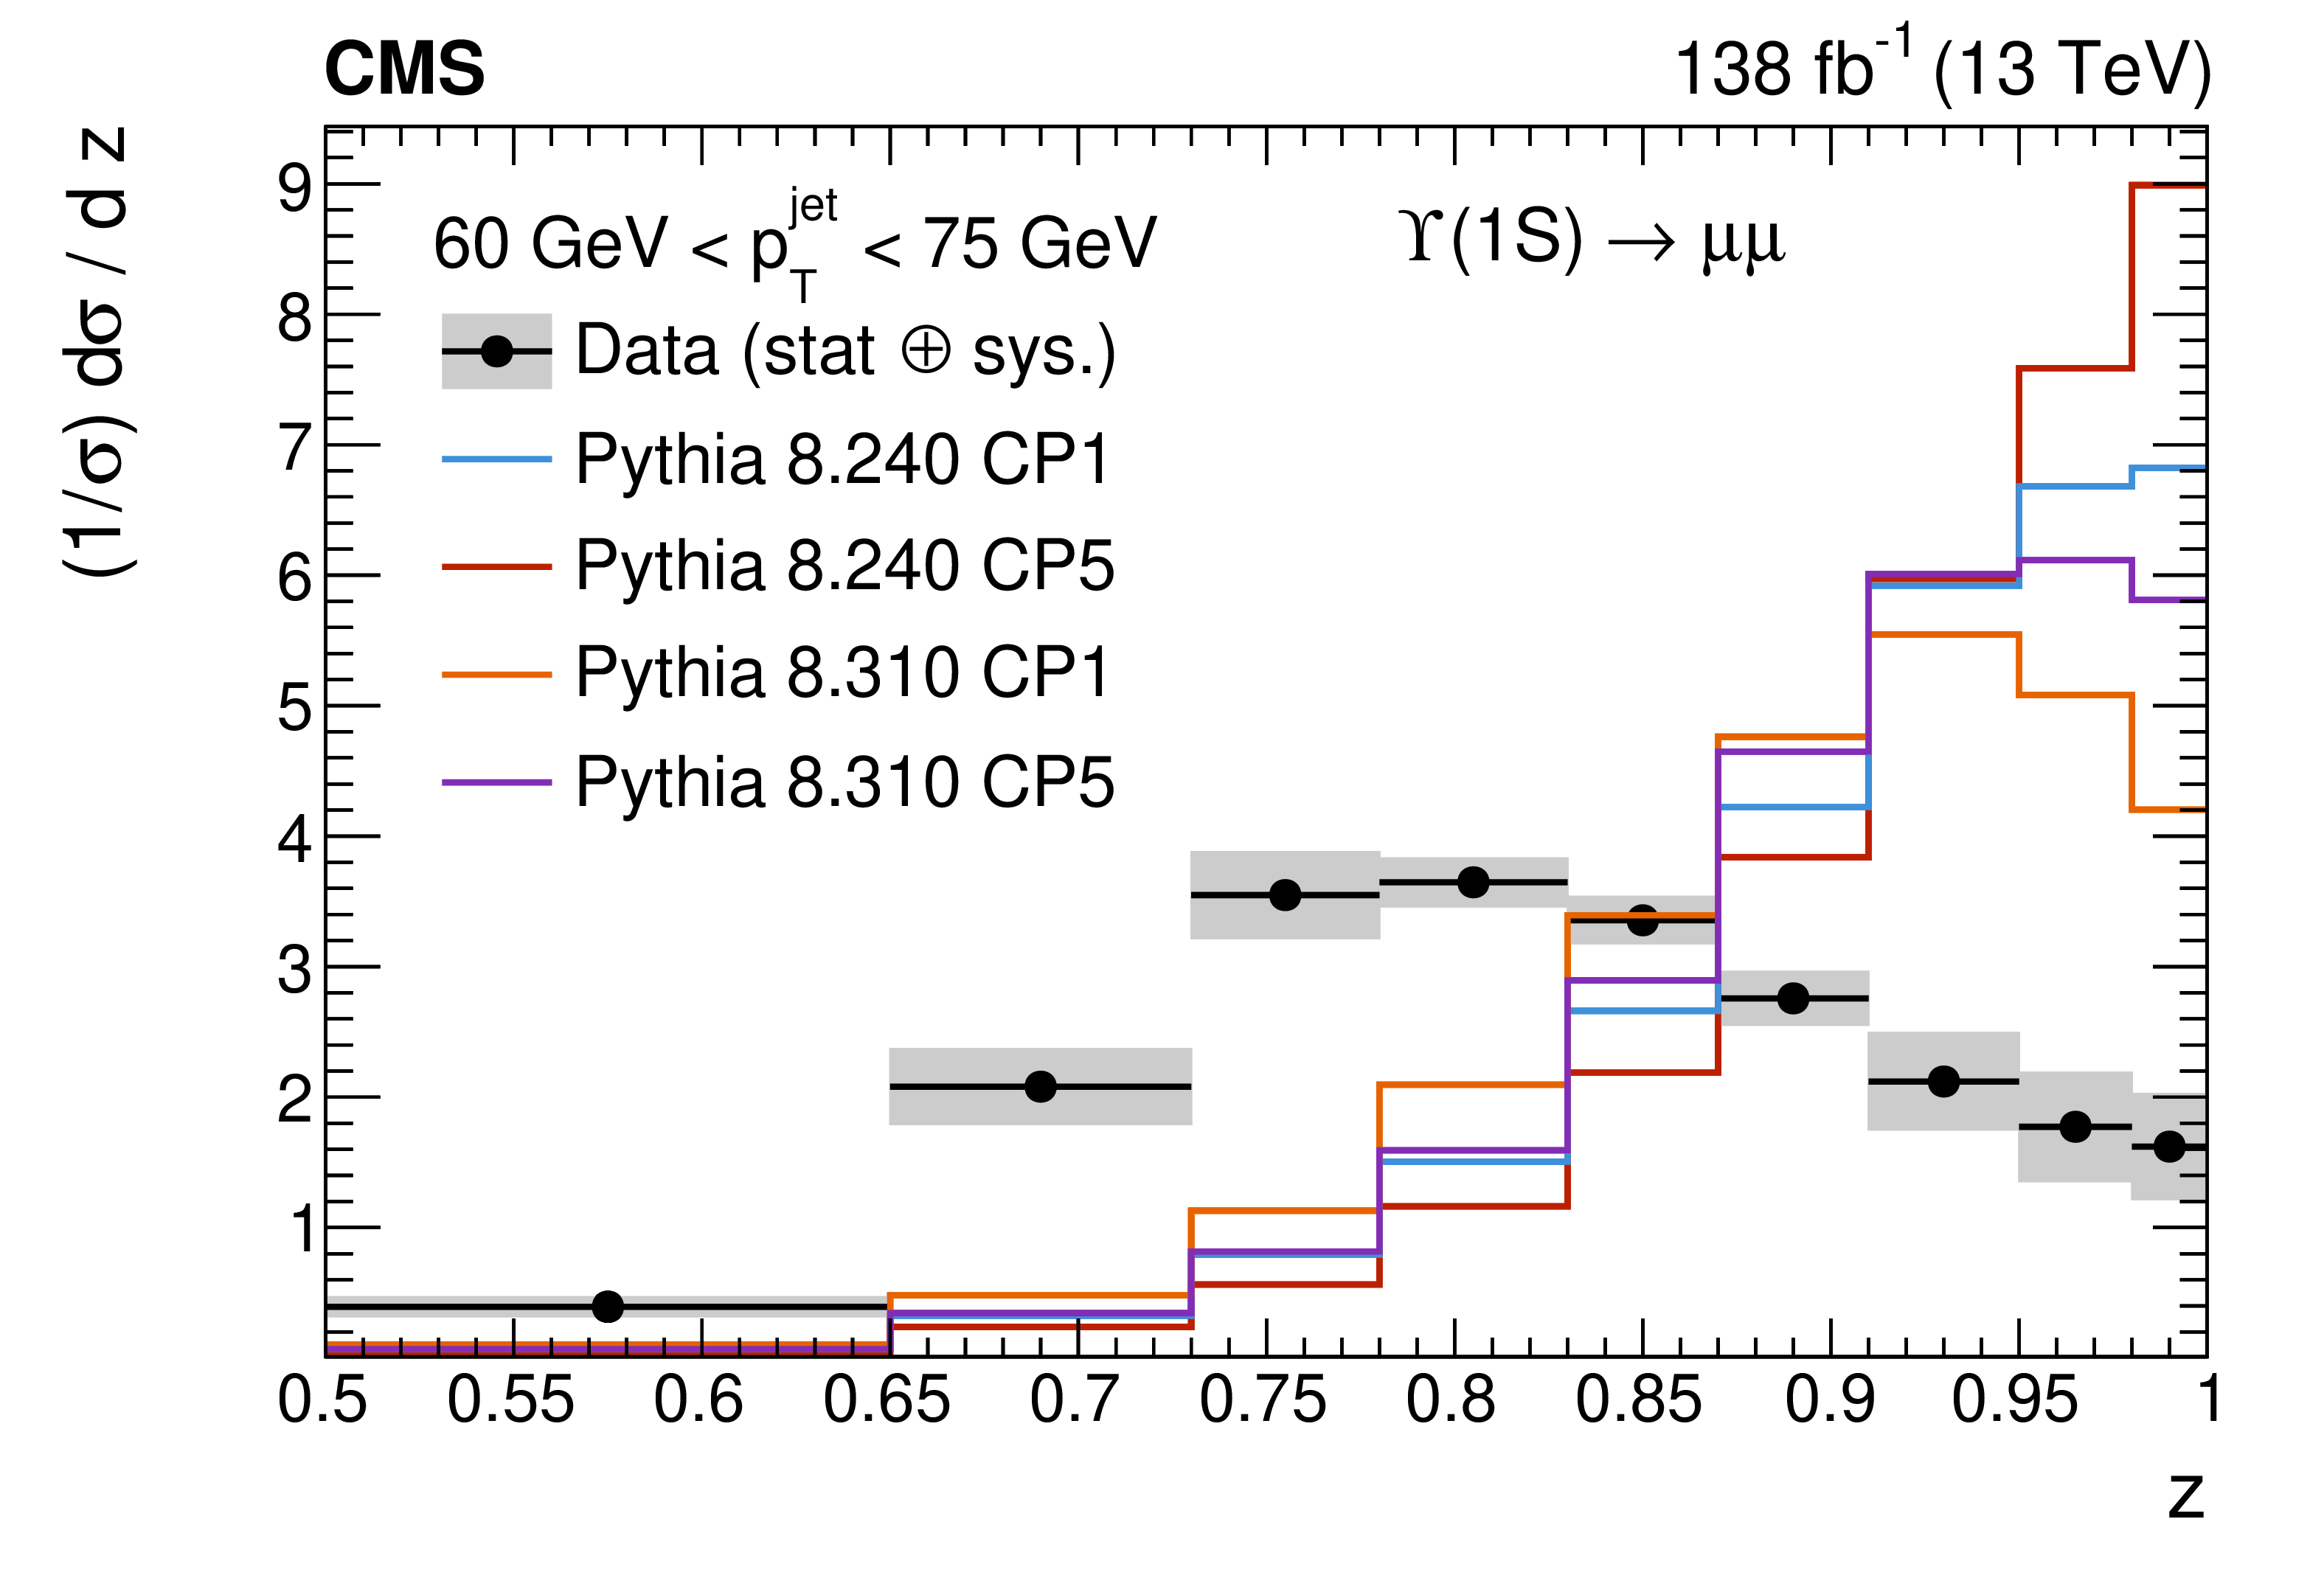
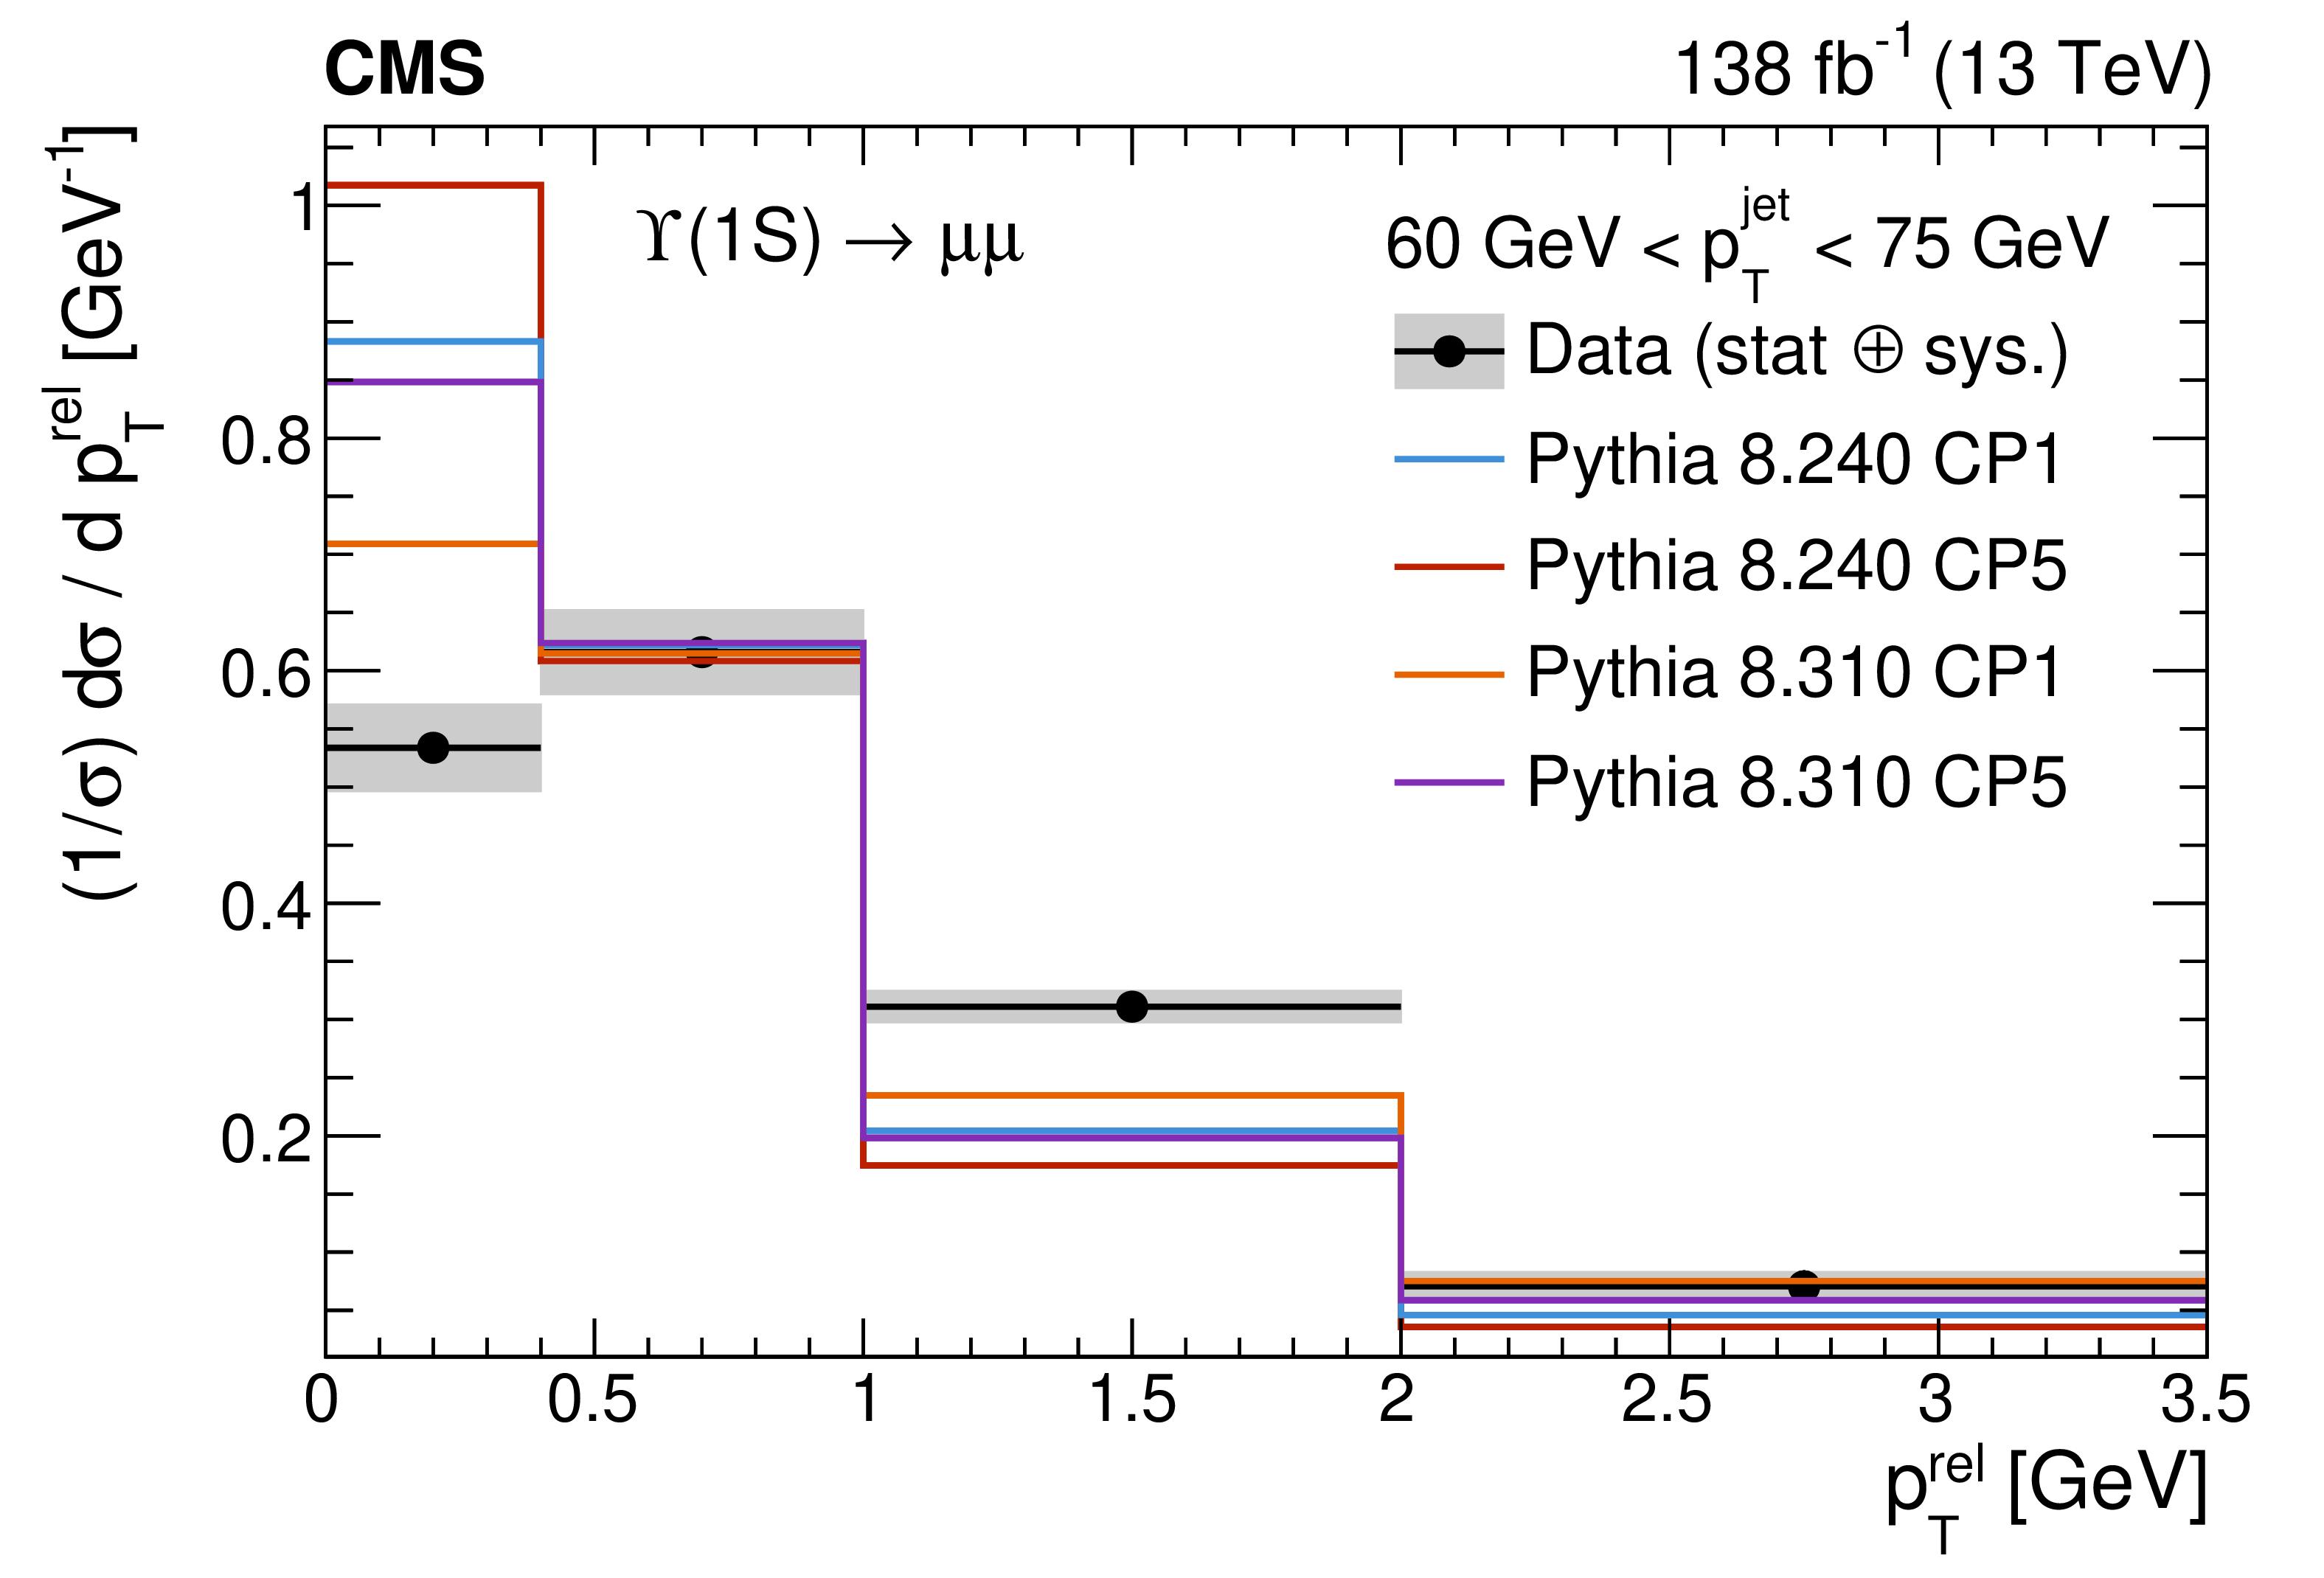
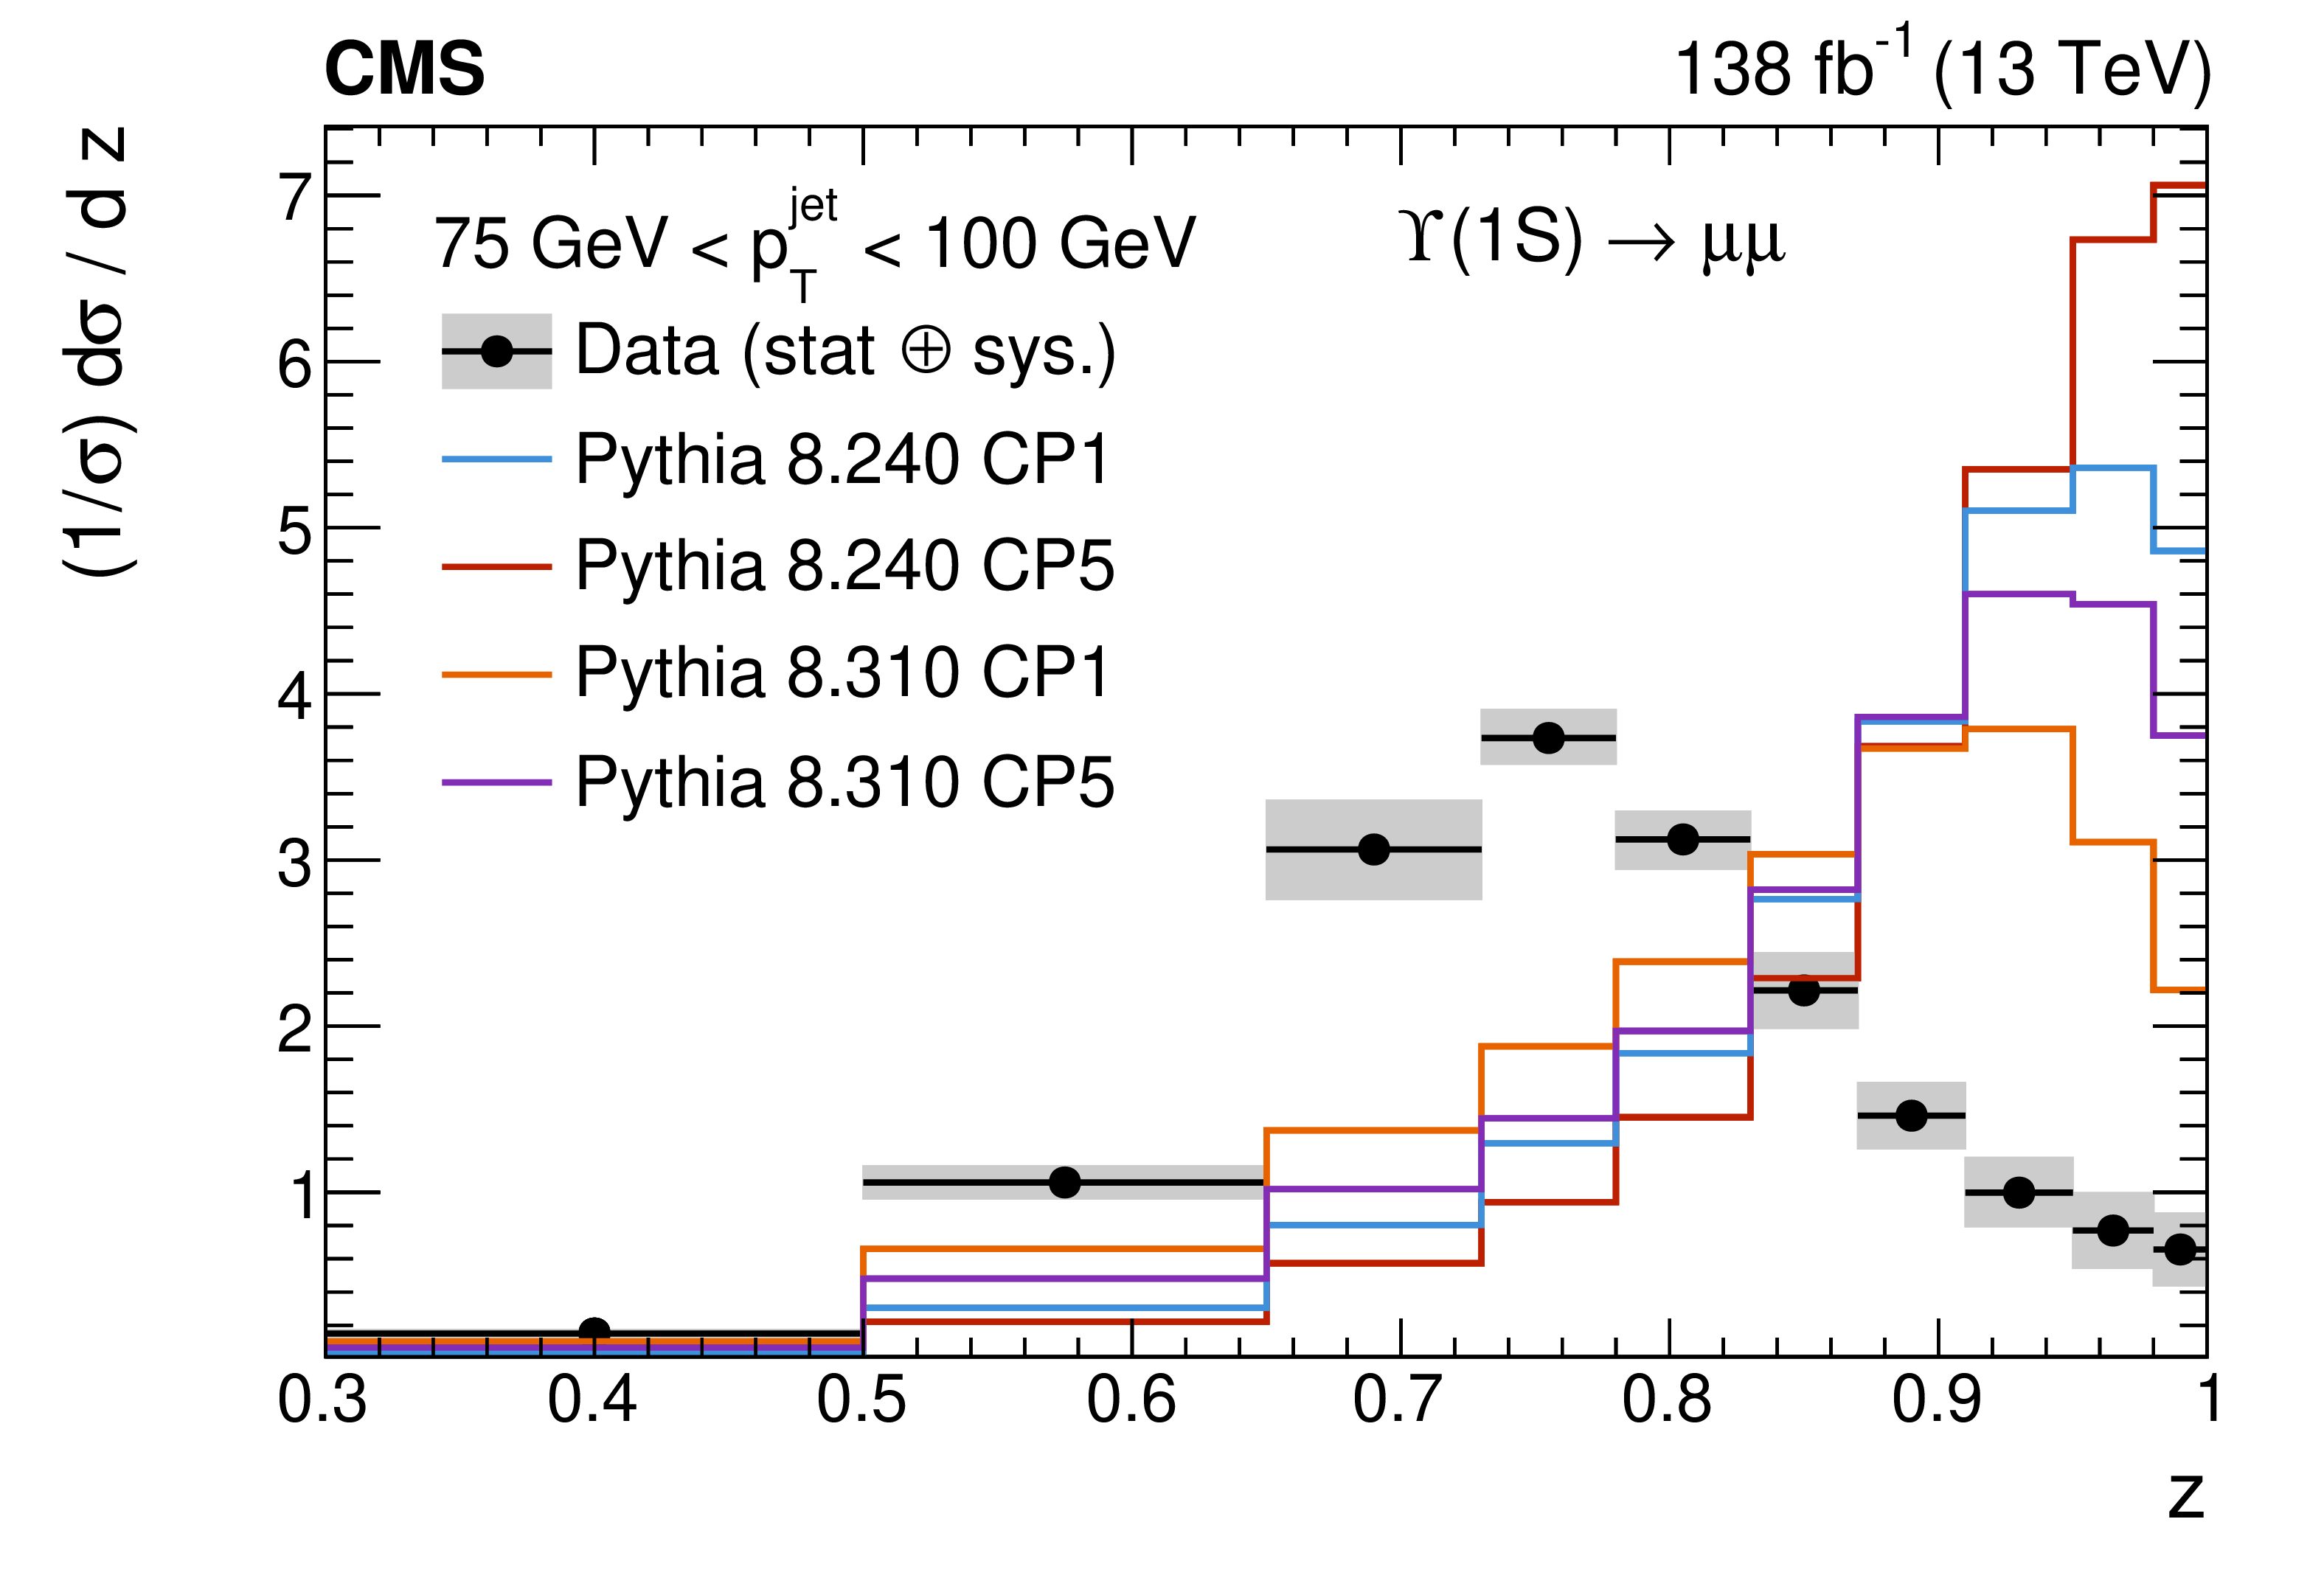
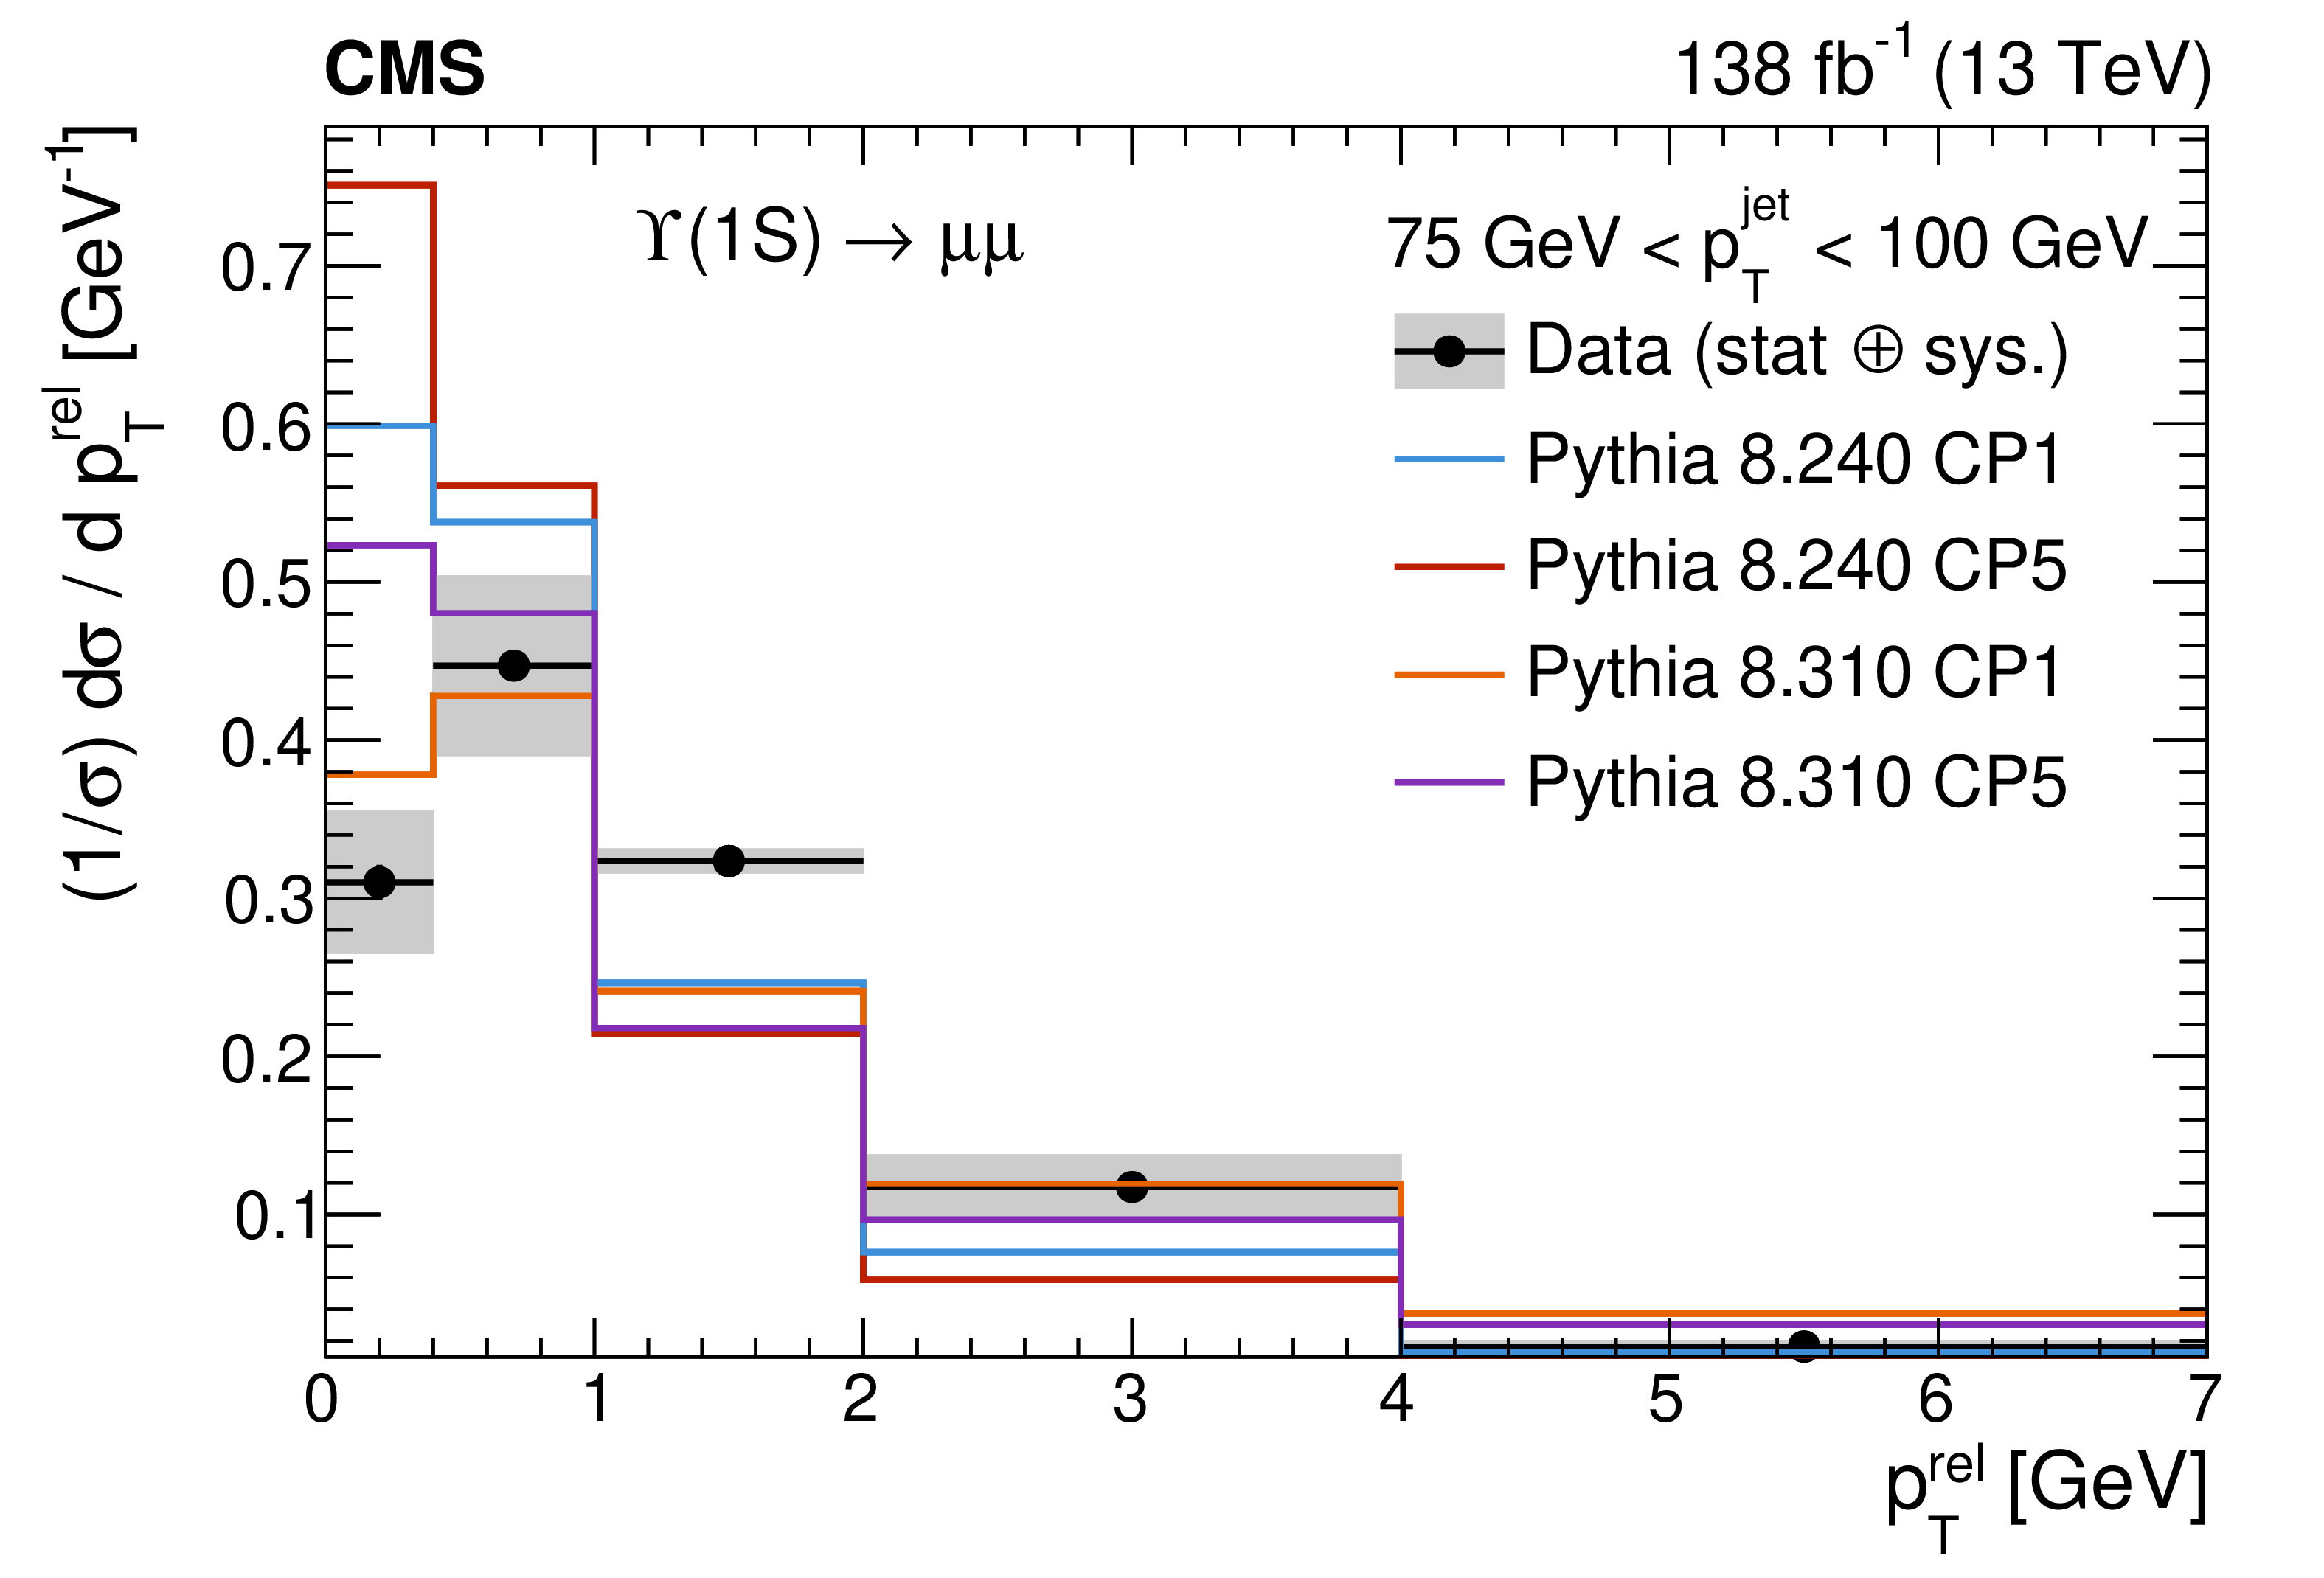
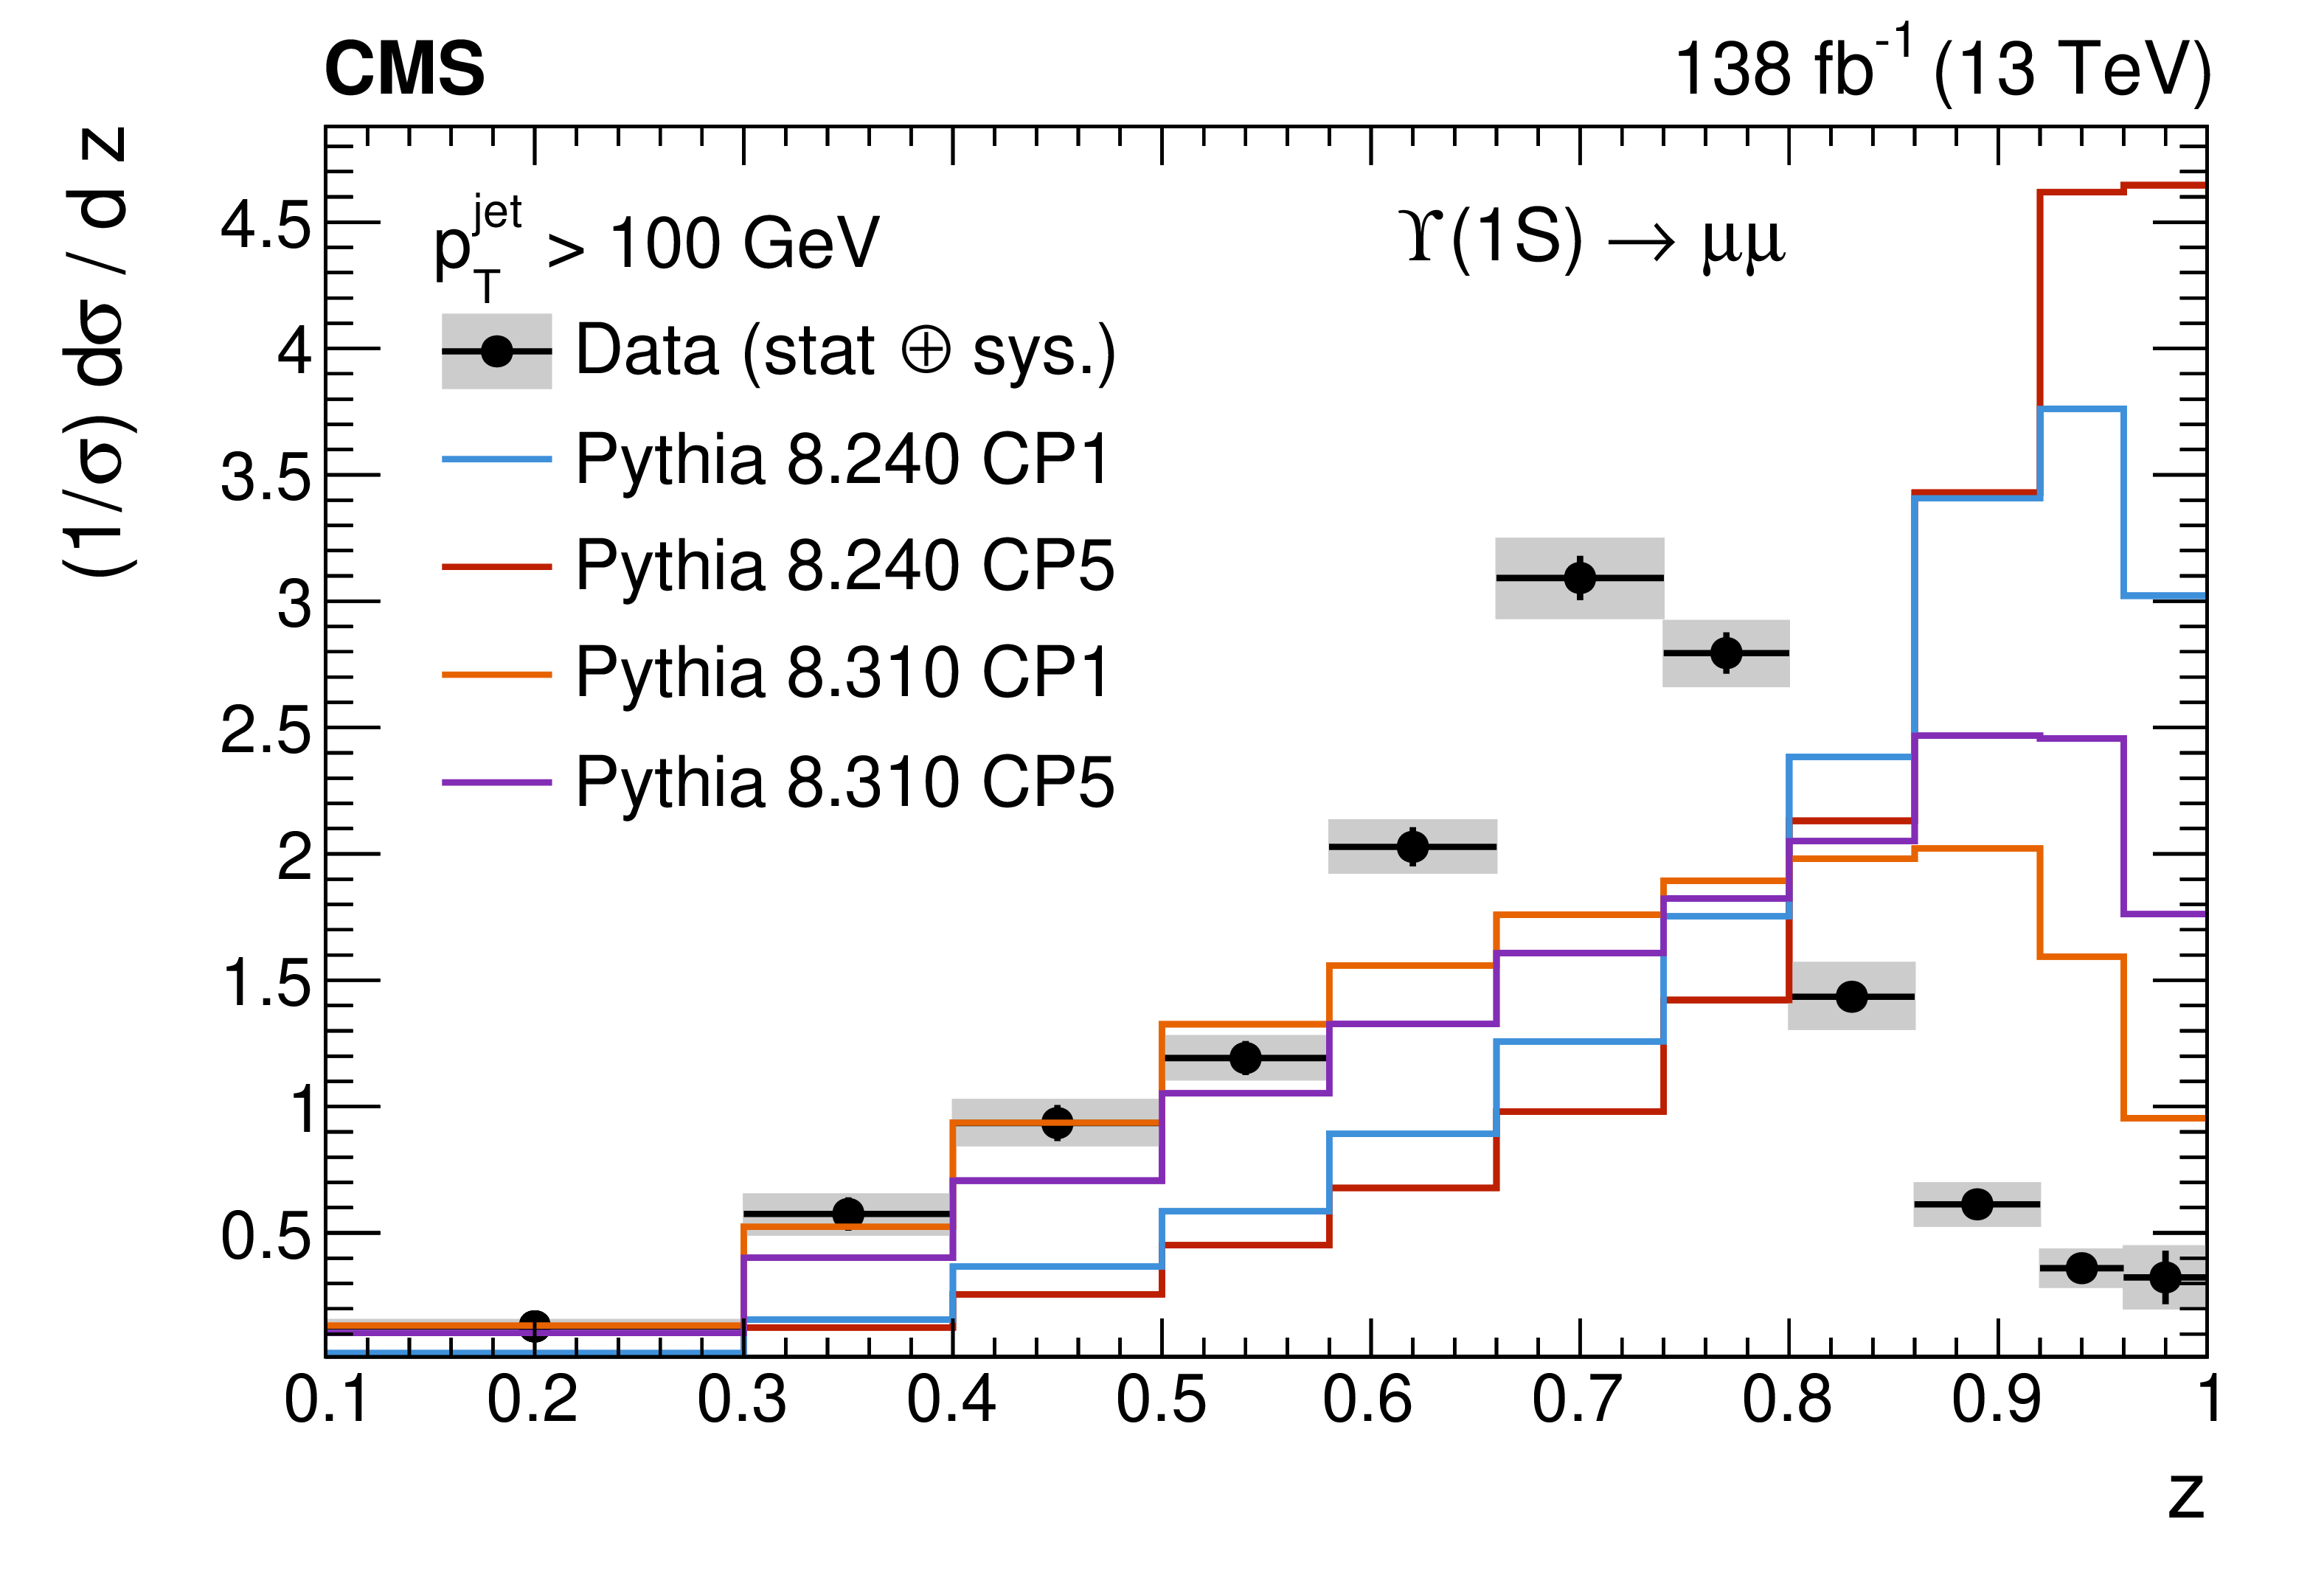
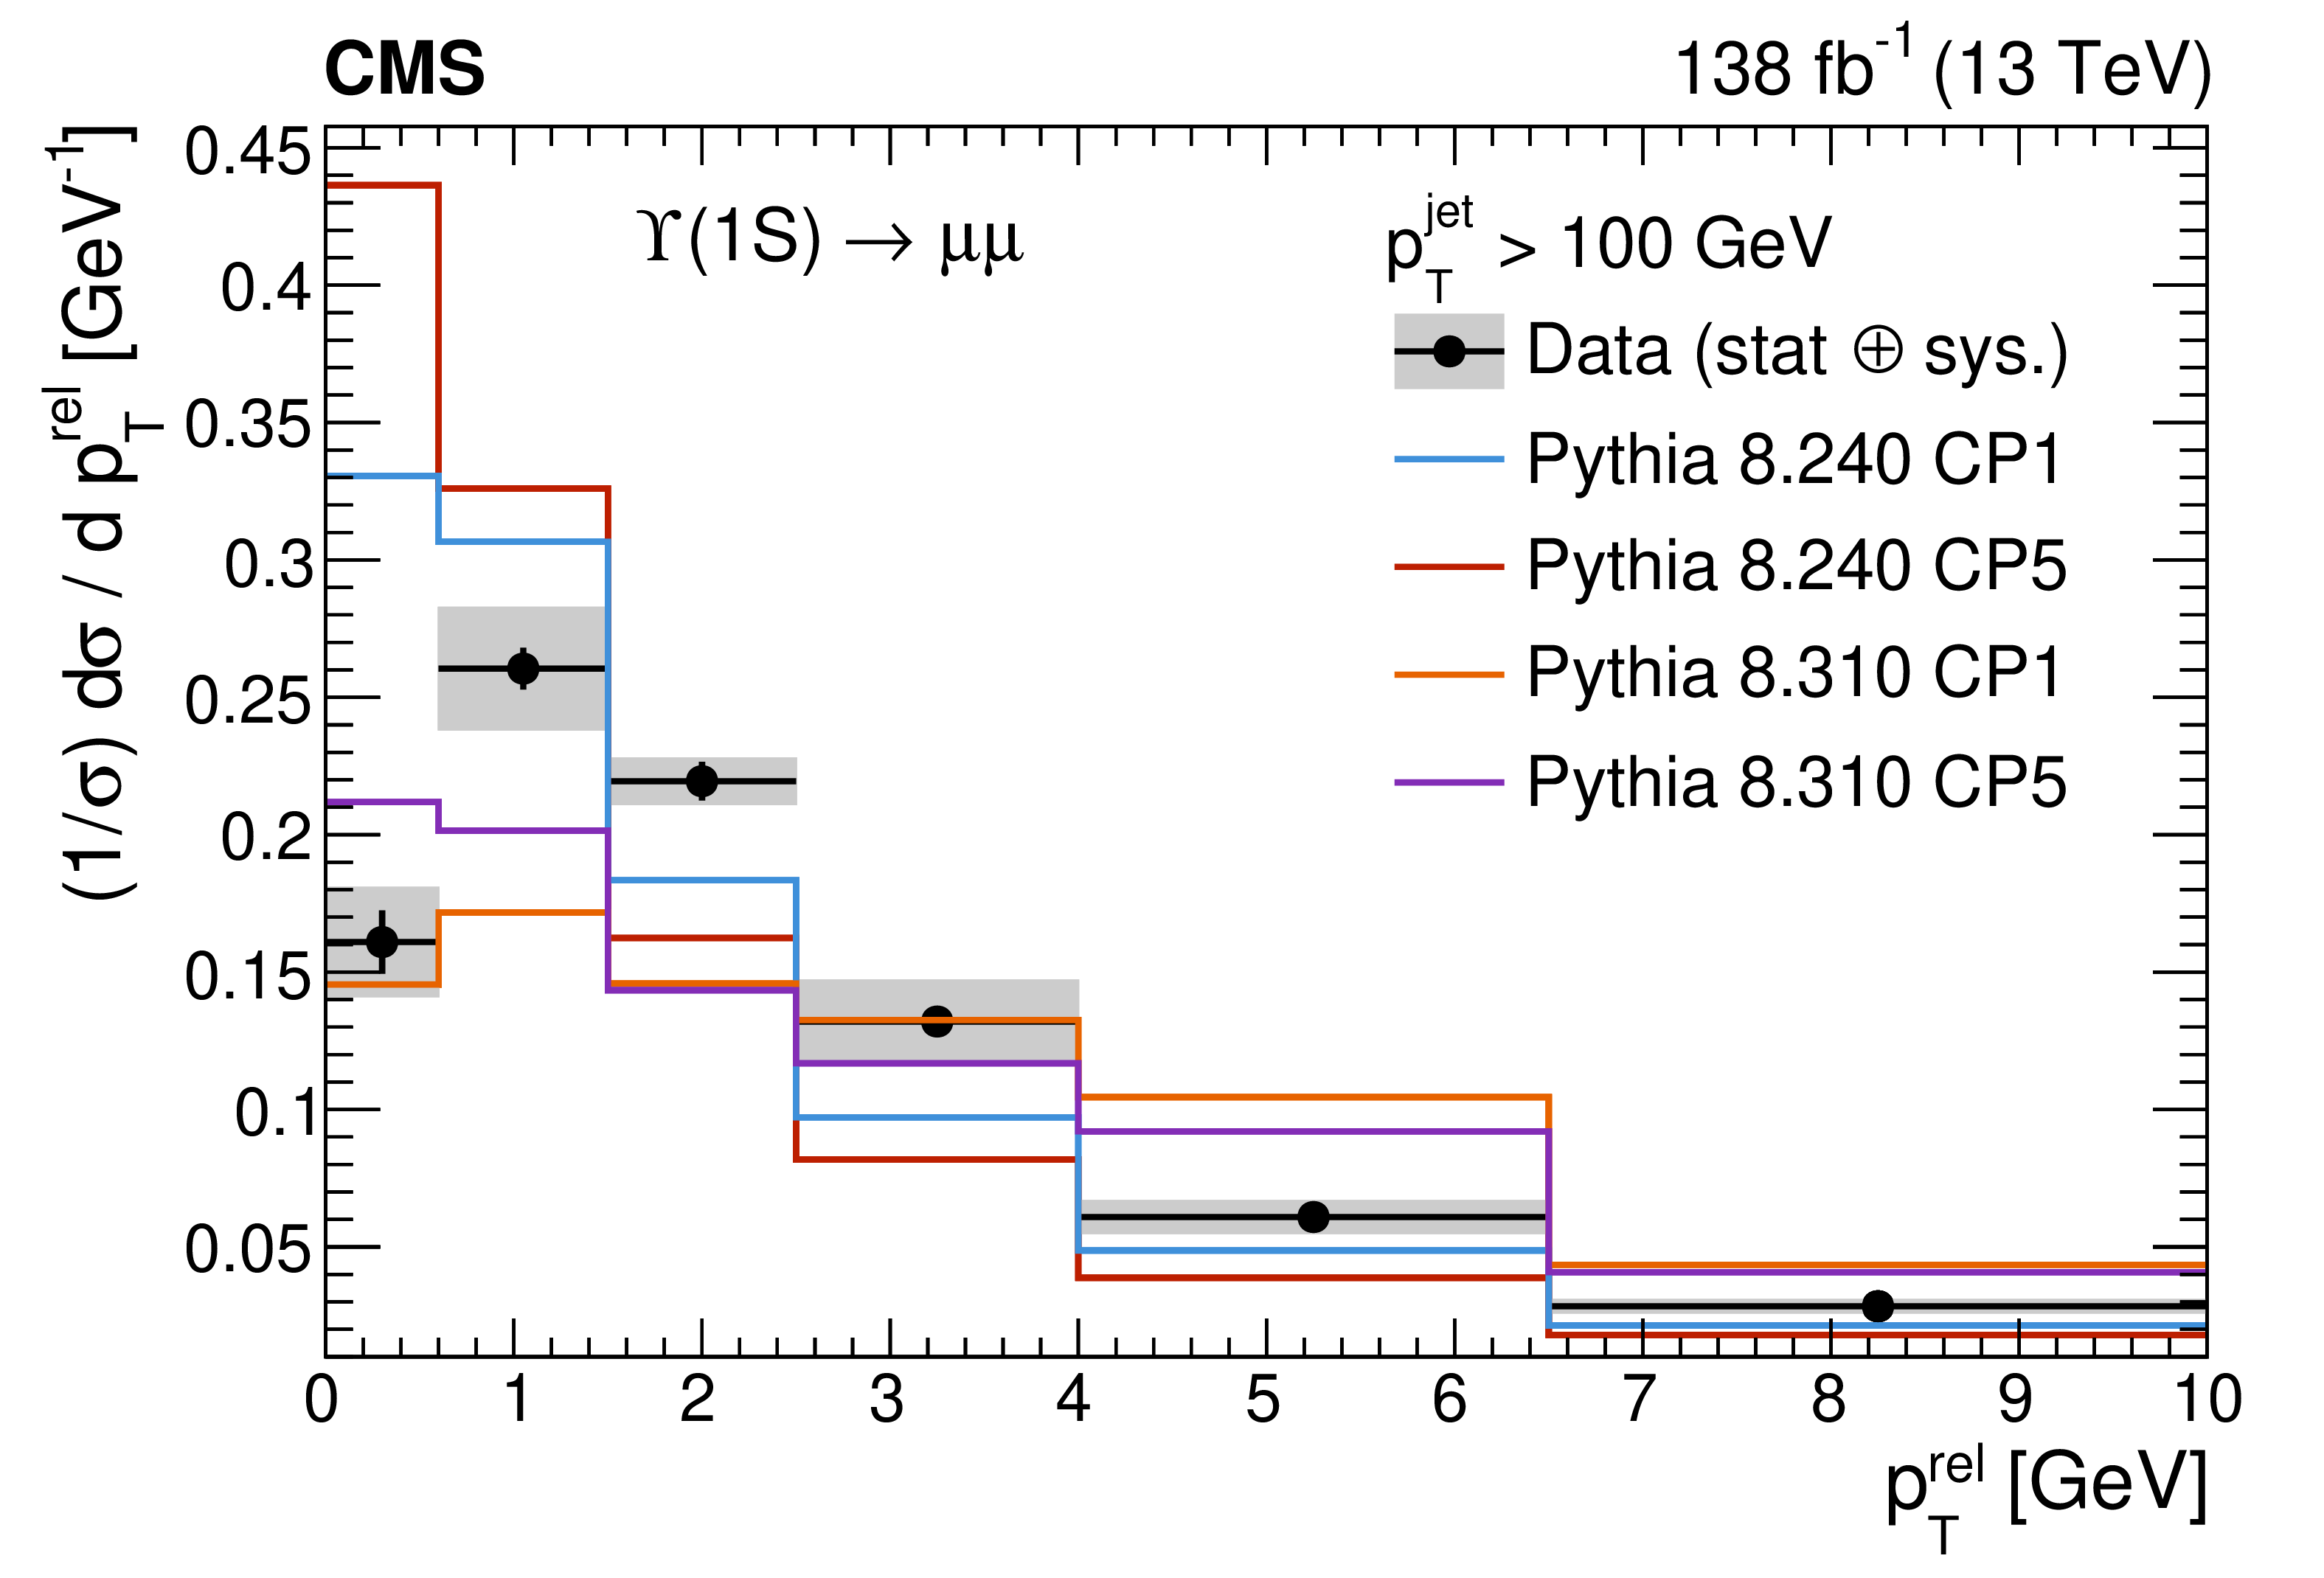
Particle-level results for the longitudinal (left) and transverse profiles (right) of jets containing $ \Upsilon{\textrm{(1S)}} $ mesons in three different $ p_{\mathrm{T}} $ regions. The data (black points) are compared to the expectations of PYTHIA8.240 with the CP1 (blue) and CP5 tunes (red), as well as the PYTHIA8.310 predictions with the CP1 (orange) and CP5 tunes (violet). The vertical error bars represent the statistical uncertainties on the data points, while the grey bands represent the total experimental uncertainties. |
png pdf |
Figure 6-a:
Particle-level results for the longitudinal (left) and transverse profiles (right) of jets containing $ \Upsilon{\textrm{(1S)}} $ mesons in three different $ p_{\mathrm{T}} $ regions. The data (black points) are compared to the expectations of PYTHIA8.240 with the CP1 (blue) and CP5 tunes (red), as well as the PYTHIA8.310 predictions with the CP1 (orange) and CP5 tunes (violet). The vertical error bars represent the statistical uncertainties on the data points, while the grey bands represent the total experimental uncertainties. |
png pdf |
Figure 6-b:
Particle-level results for the longitudinal (left) and transverse profiles (right) of jets containing $ \Upsilon{\textrm{(1S)}} $ mesons in three different $ p_{\mathrm{T}} $ regions. The data (black points) are compared to the expectations of PYTHIA8.240 with the CP1 (blue) and CP5 tunes (red), as well as the PYTHIA8.310 predictions with the CP1 (orange) and CP5 tunes (violet). The vertical error bars represent the statistical uncertainties on the data points, while the grey bands represent the total experimental uncertainties. |
png pdf |
Figure 6-c:
Particle-level results for the longitudinal (left) and transverse profiles (right) of jets containing $ \Upsilon{\textrm{(1S)}} $ mesons in three different $ p_{\mathrm{T}} $ regions. The data (black points) are compared to the expectations of PYTHIA8.240 with the CP1 (blue) and CP5 tunes (red), as well as the PYTHIA8.310 predictions with the CP1 (orange) and CP5 tunes (violet). The vertical error bars represent the statistical uncertainties on the data points, while the grey bands represent the total experimental uncertainties. |
png pdf |
Figure 6-d:
Particle-level results for the longitudinal (left) and transverse profiles (right) of jets containing $ \Upsilon{\textrm{(1S)}} $ mesons in three different $ p_{\mathrm{T}} $ regions. The data (black points) are compared to the expectations of PYTHIA8.240 with the CP1 (blue) and CP5 tunes (red), as well as the PYTHIA8.310 predictions with the CP1 (orange) and CP5 tunes (violet). The vertical error bars represent the statistical uncertainties on the data points, while the grey bands represent the total experimental uncertainties. |
png pdf |
Figure 6-e:
Particle-level results for the longitudinal (left) and transverse profiles (right) of jets containing $ \Upsilon{\textrm{(1S)}} $ mesons in three different $ p_{\mathrm{T}} $ regions. The data (black points) are compared to the expectations of PYTHIA8.240 with the CP1 (blue) and CP5 tunes (red), as well as the PYTHIA8.310 predictions with the CP1 (orange) and CP5 tunes (violet). The vertical error bars represent the statistical uncertainties on the data points, while the grey bands represent the total experimental uncertainties. |
png pdf |
Figure 6-f:
Particle-level results for the longitudinal (left) and transverse profiles (right) of jets containing $ \Upsilon{\textrm{(1S)}} $ mesons in three different $ p_{\mathrm{T}} $ regions. The data (black points) are compared to the expectations of PYTHIA8.240 with the CP1 (blue) and CP5 tunes (red), as well as the PYTHIA8.310 predictions with the CP1 (orange) and CP5 tunes (violet). The vertical error bars represent the statistical uncertainties on the data points, while the grey bands represent the total experimental uncertainties. |
png pdf |
Figure 7:
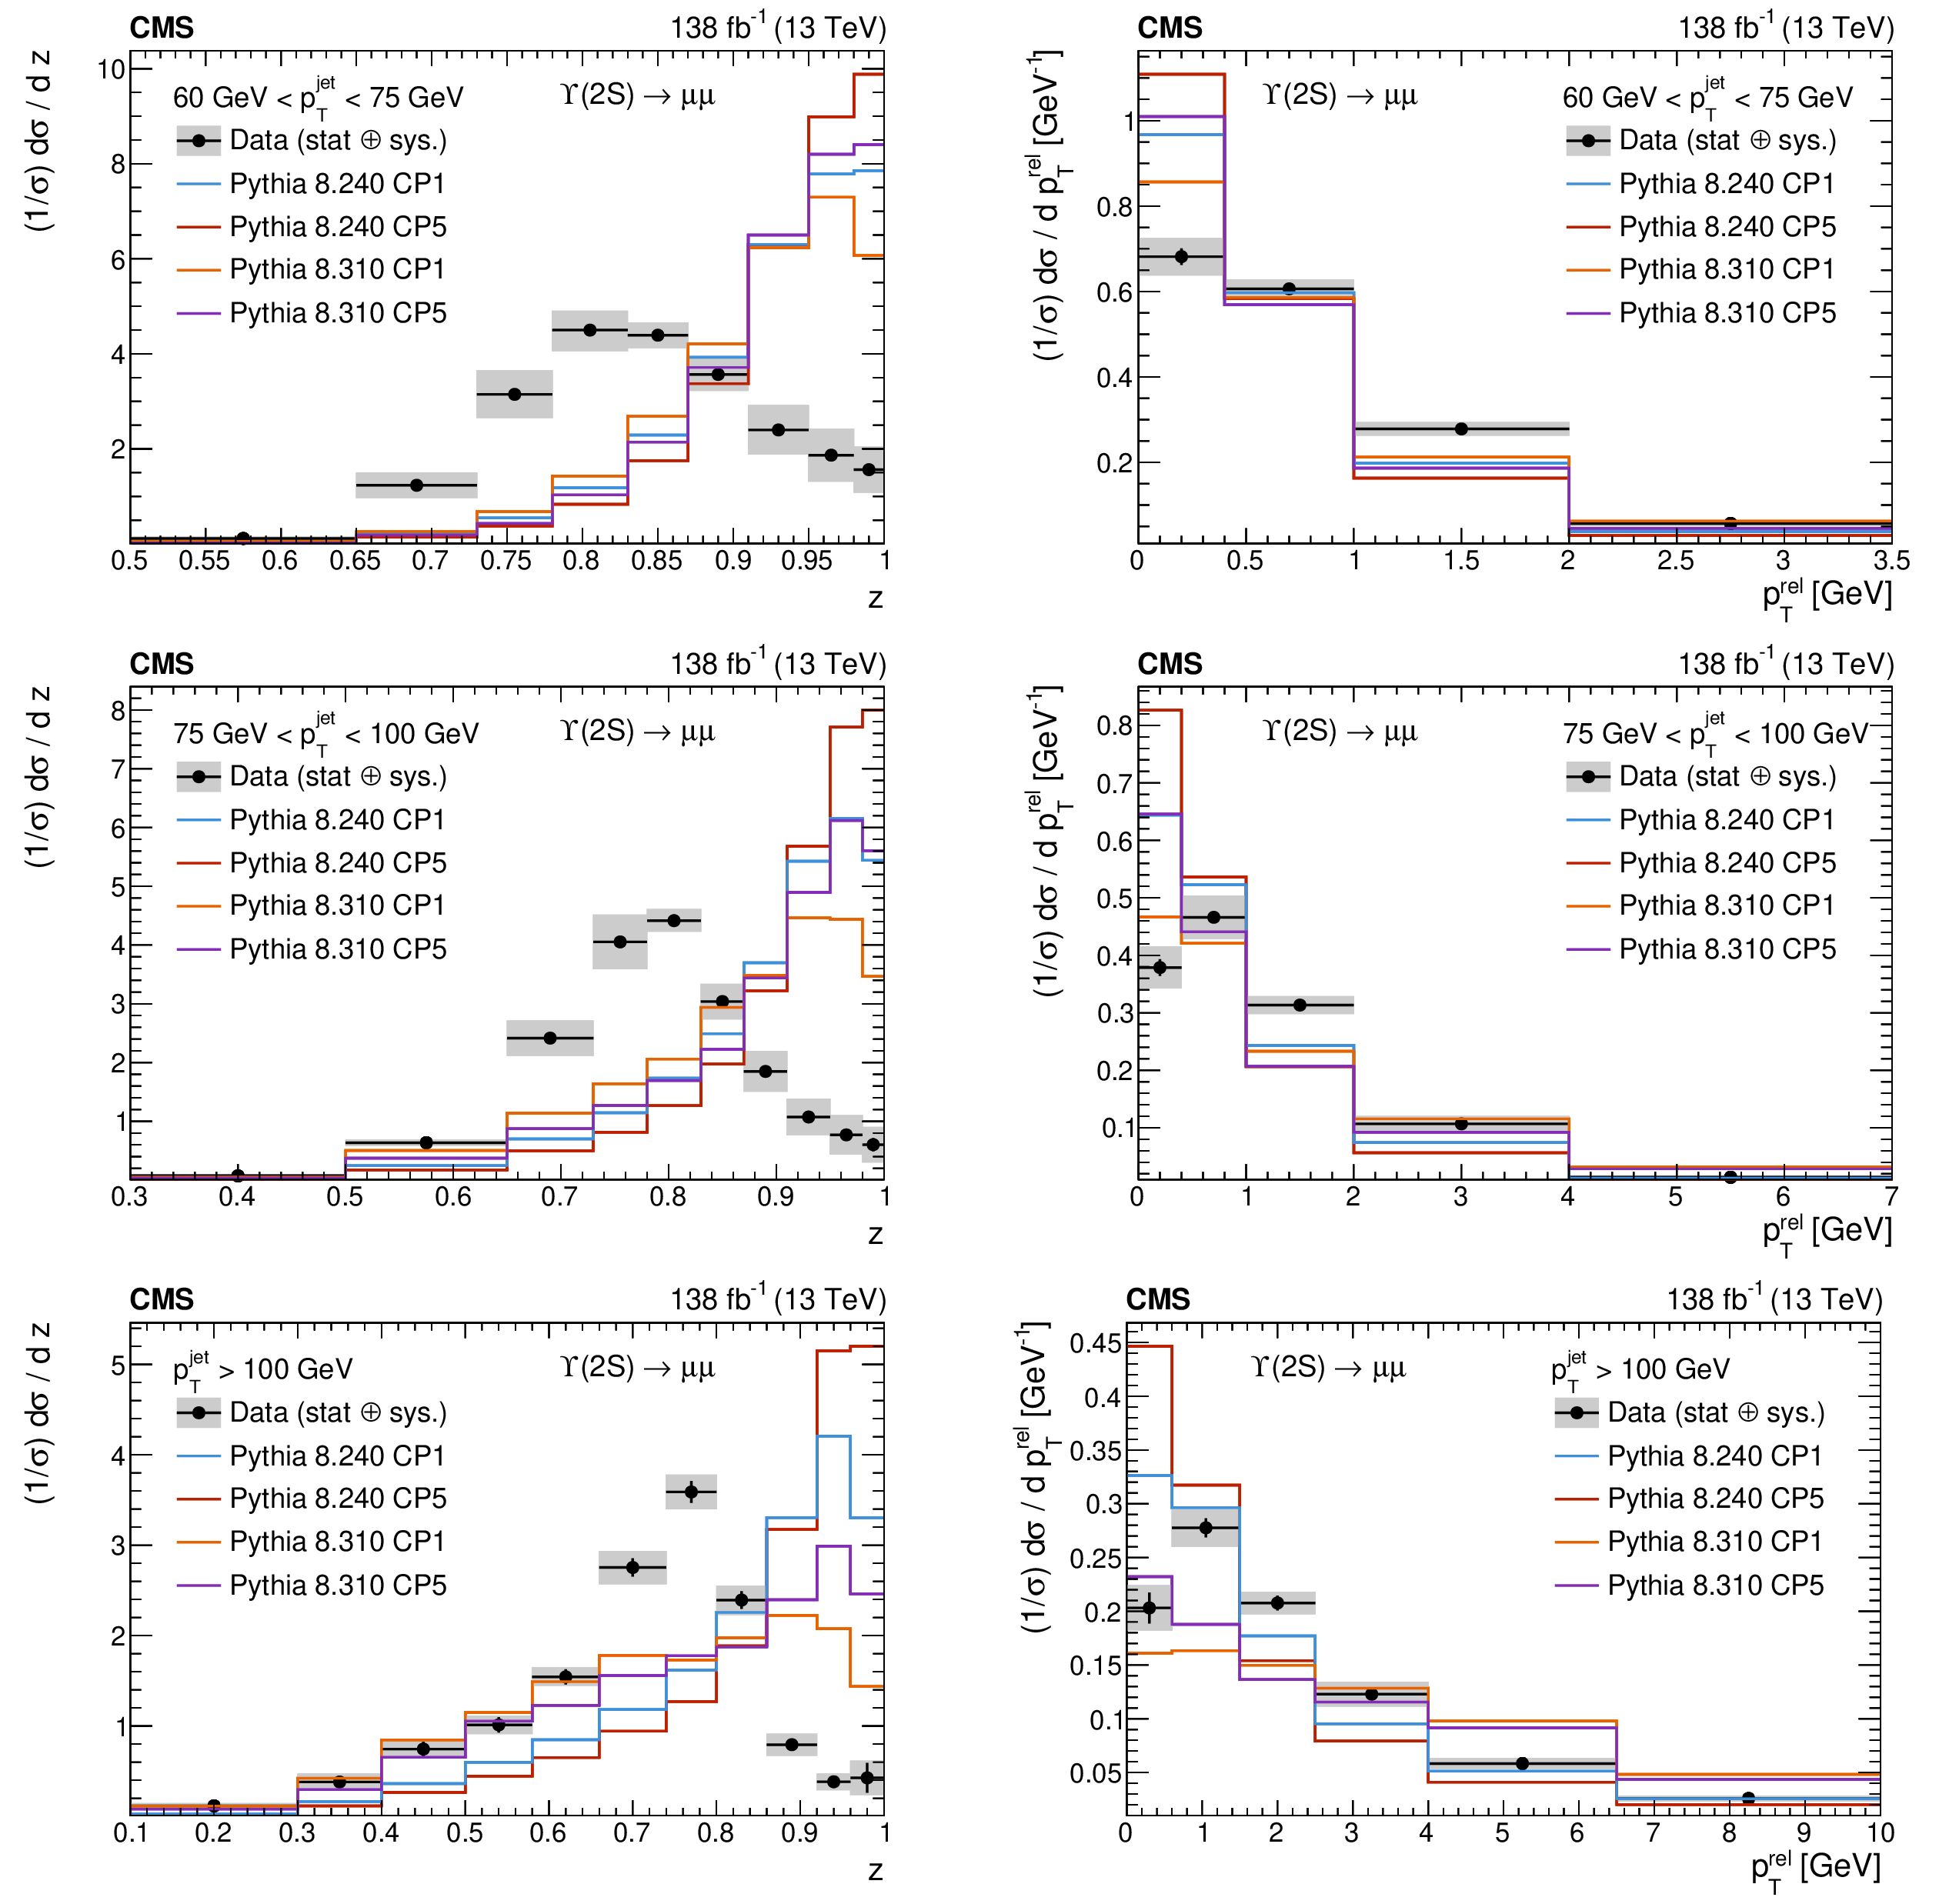
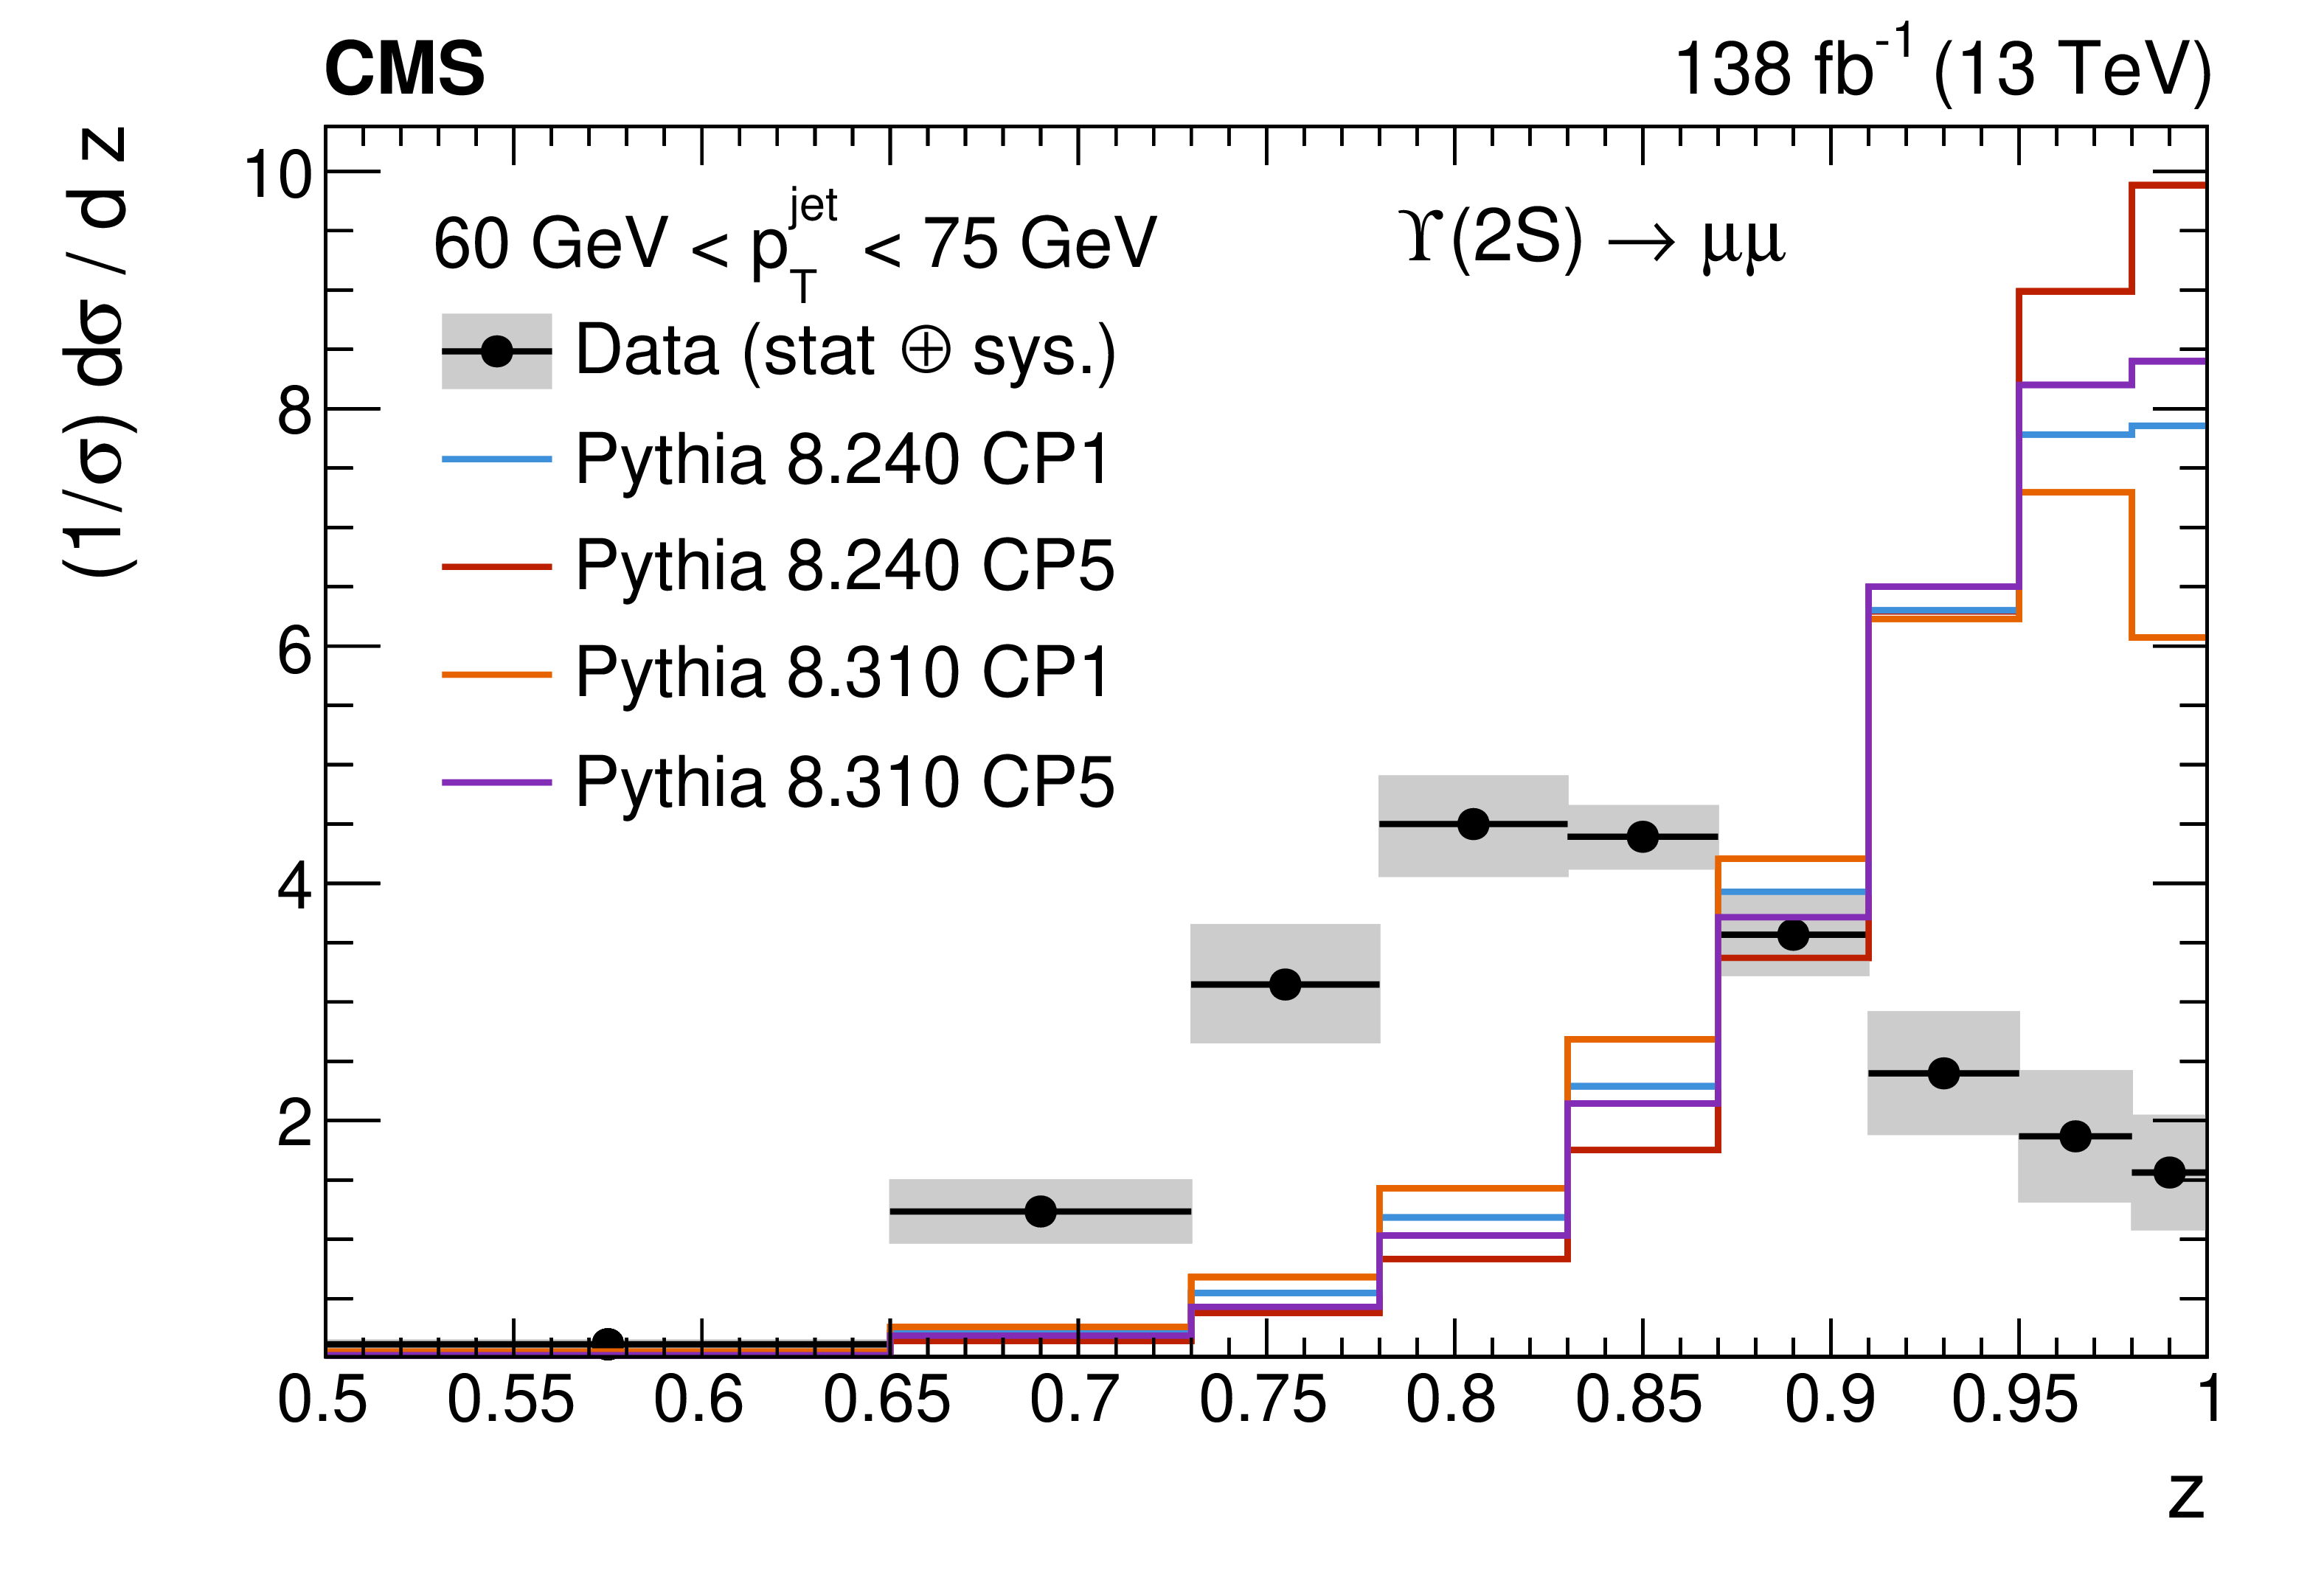
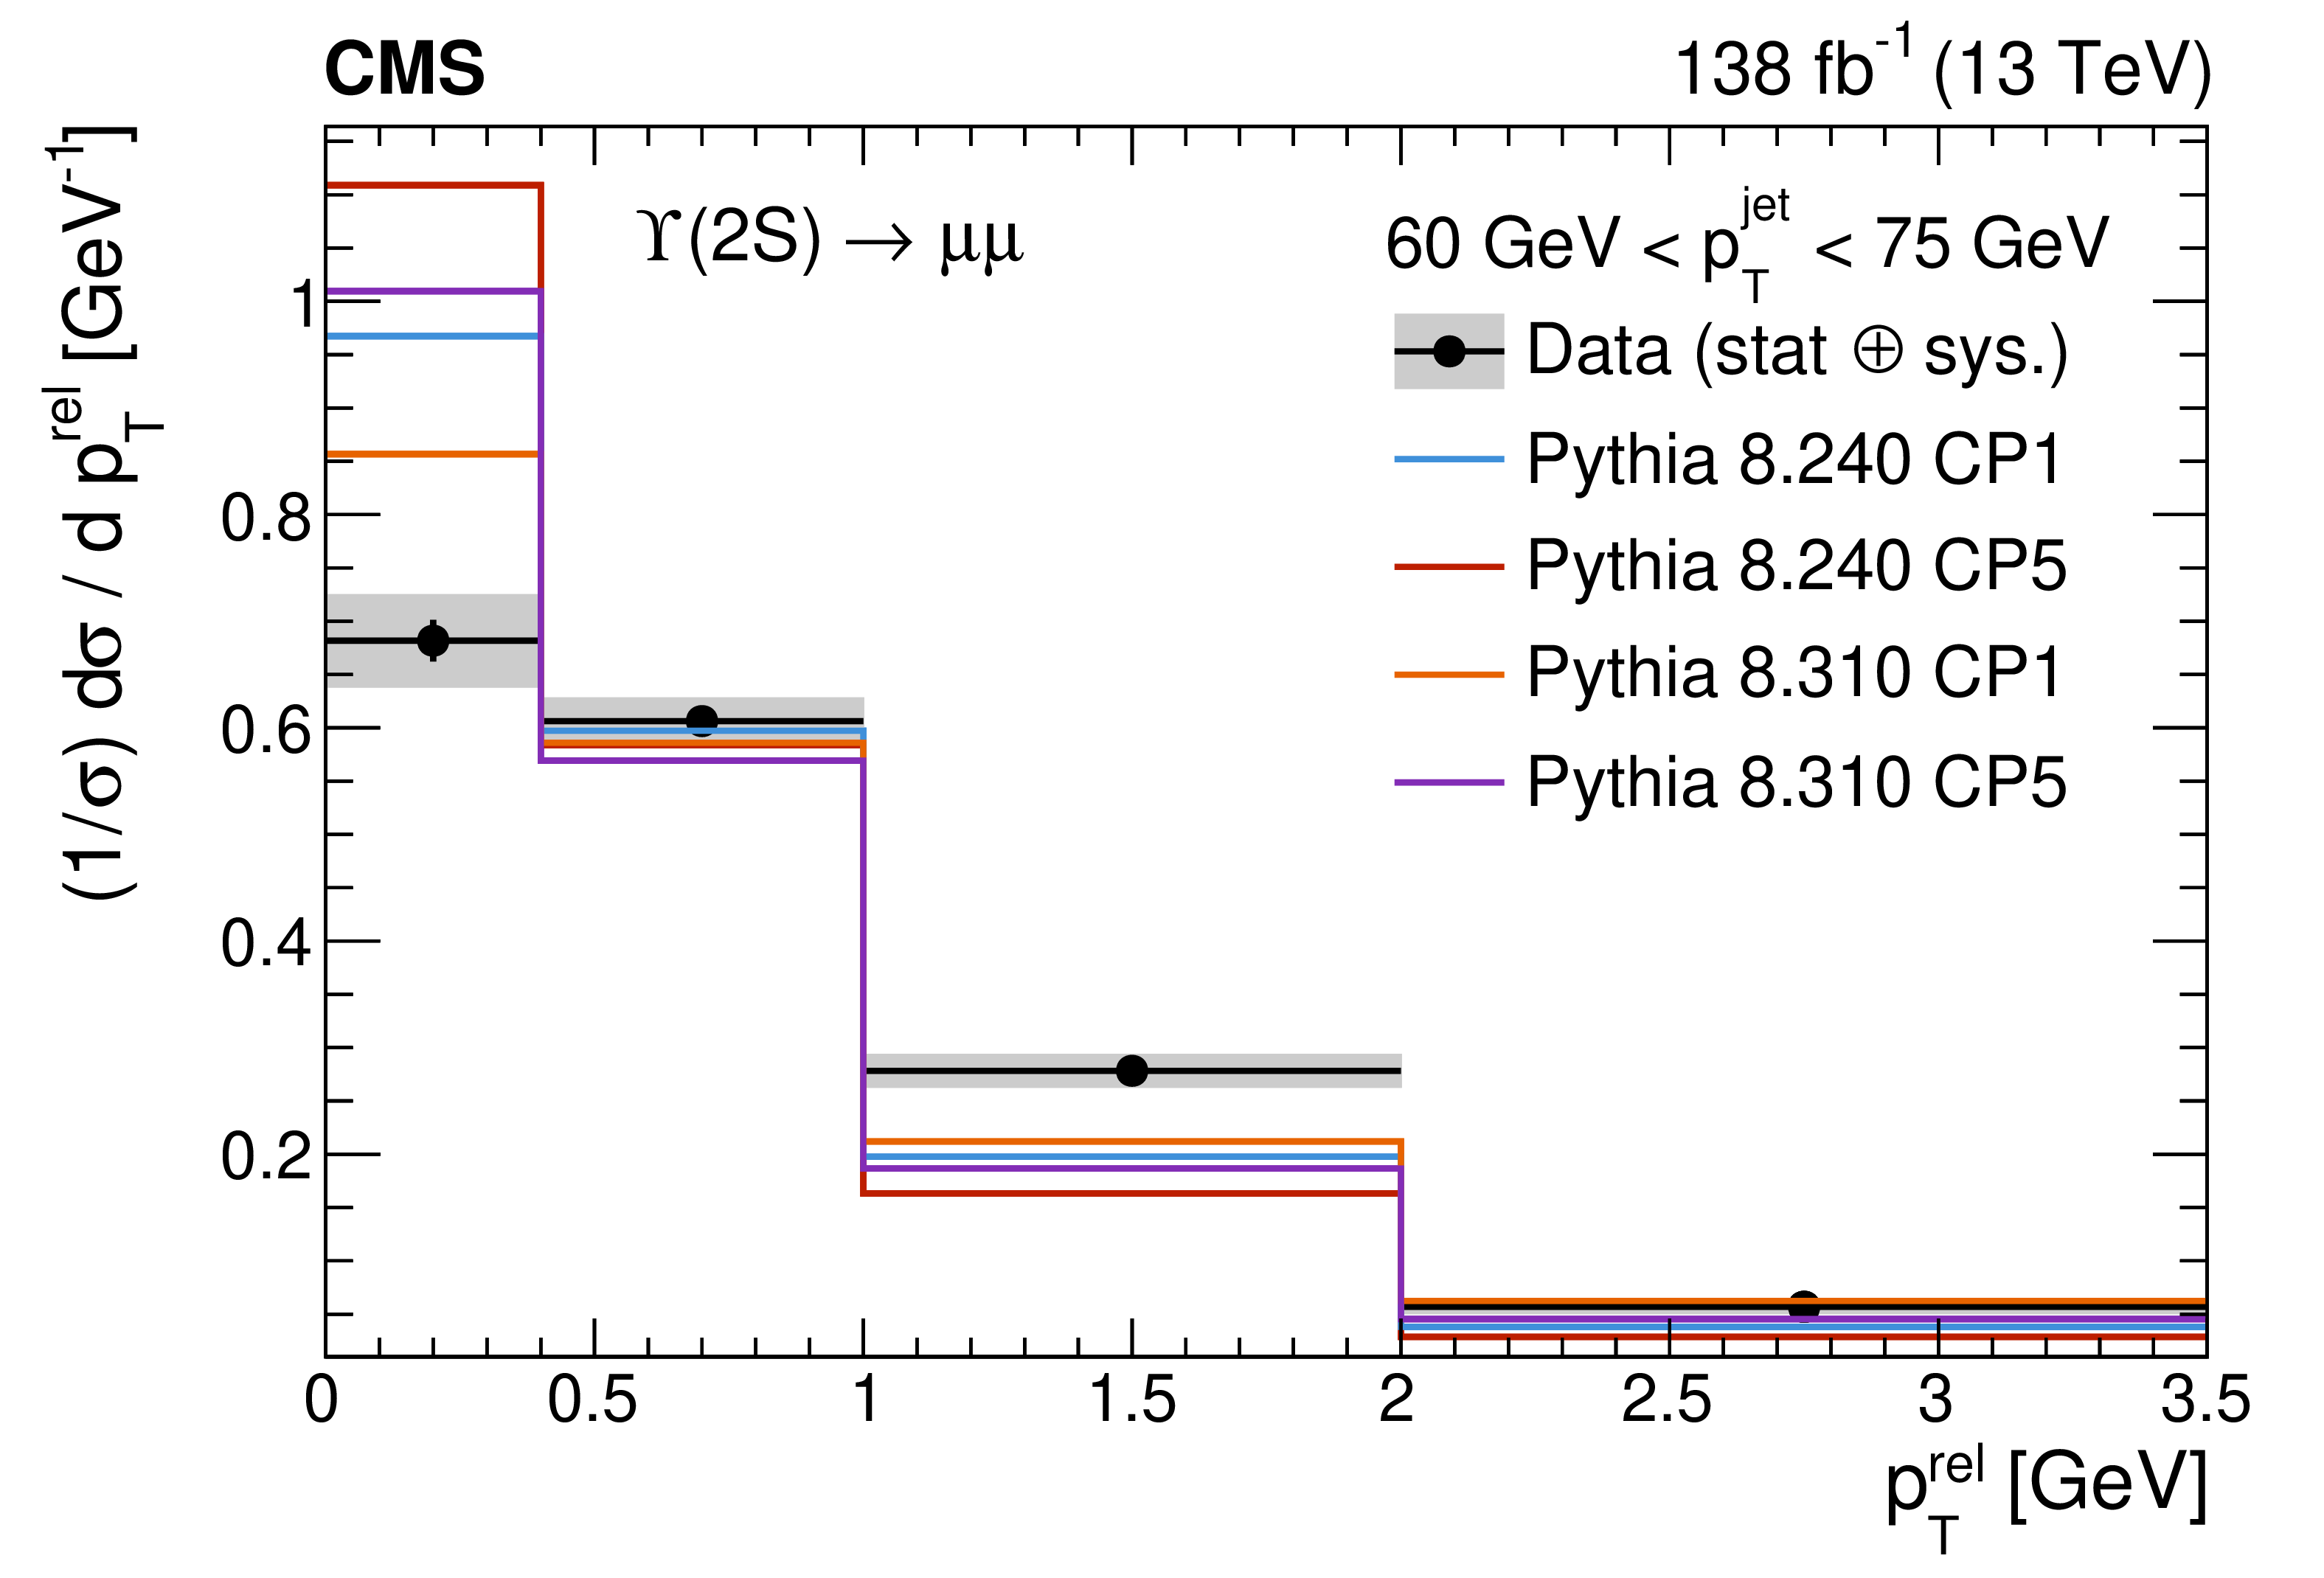
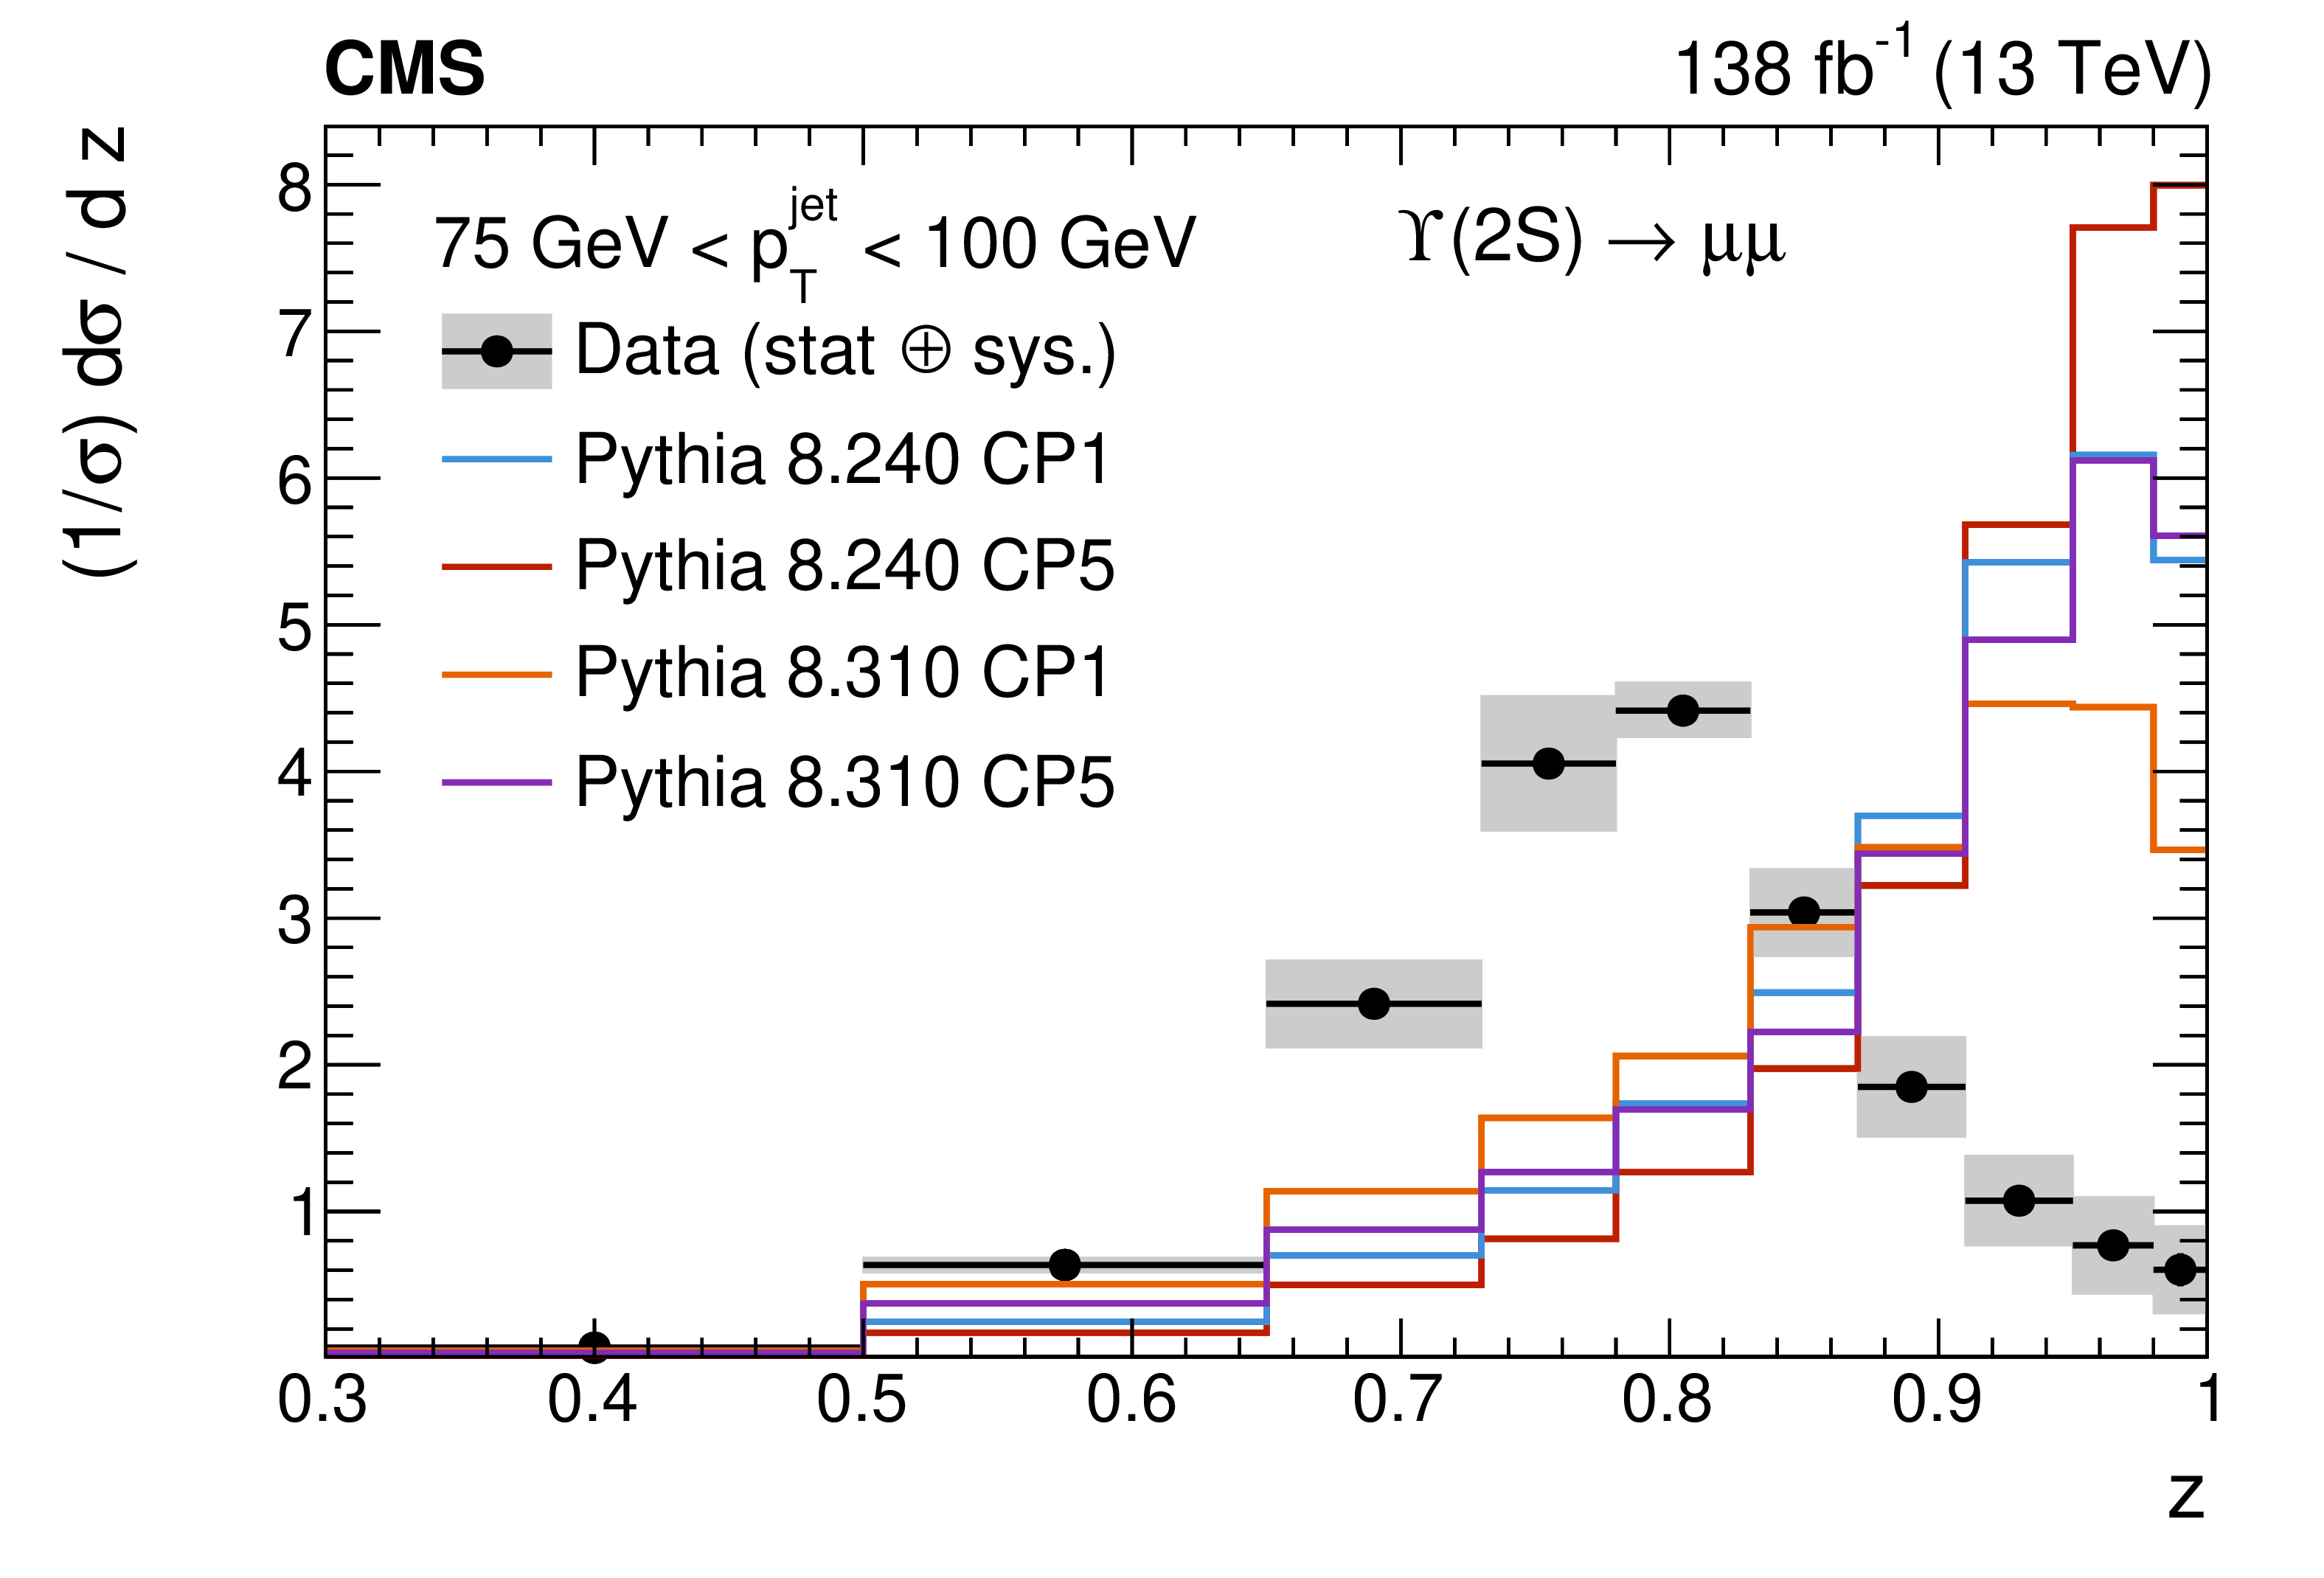
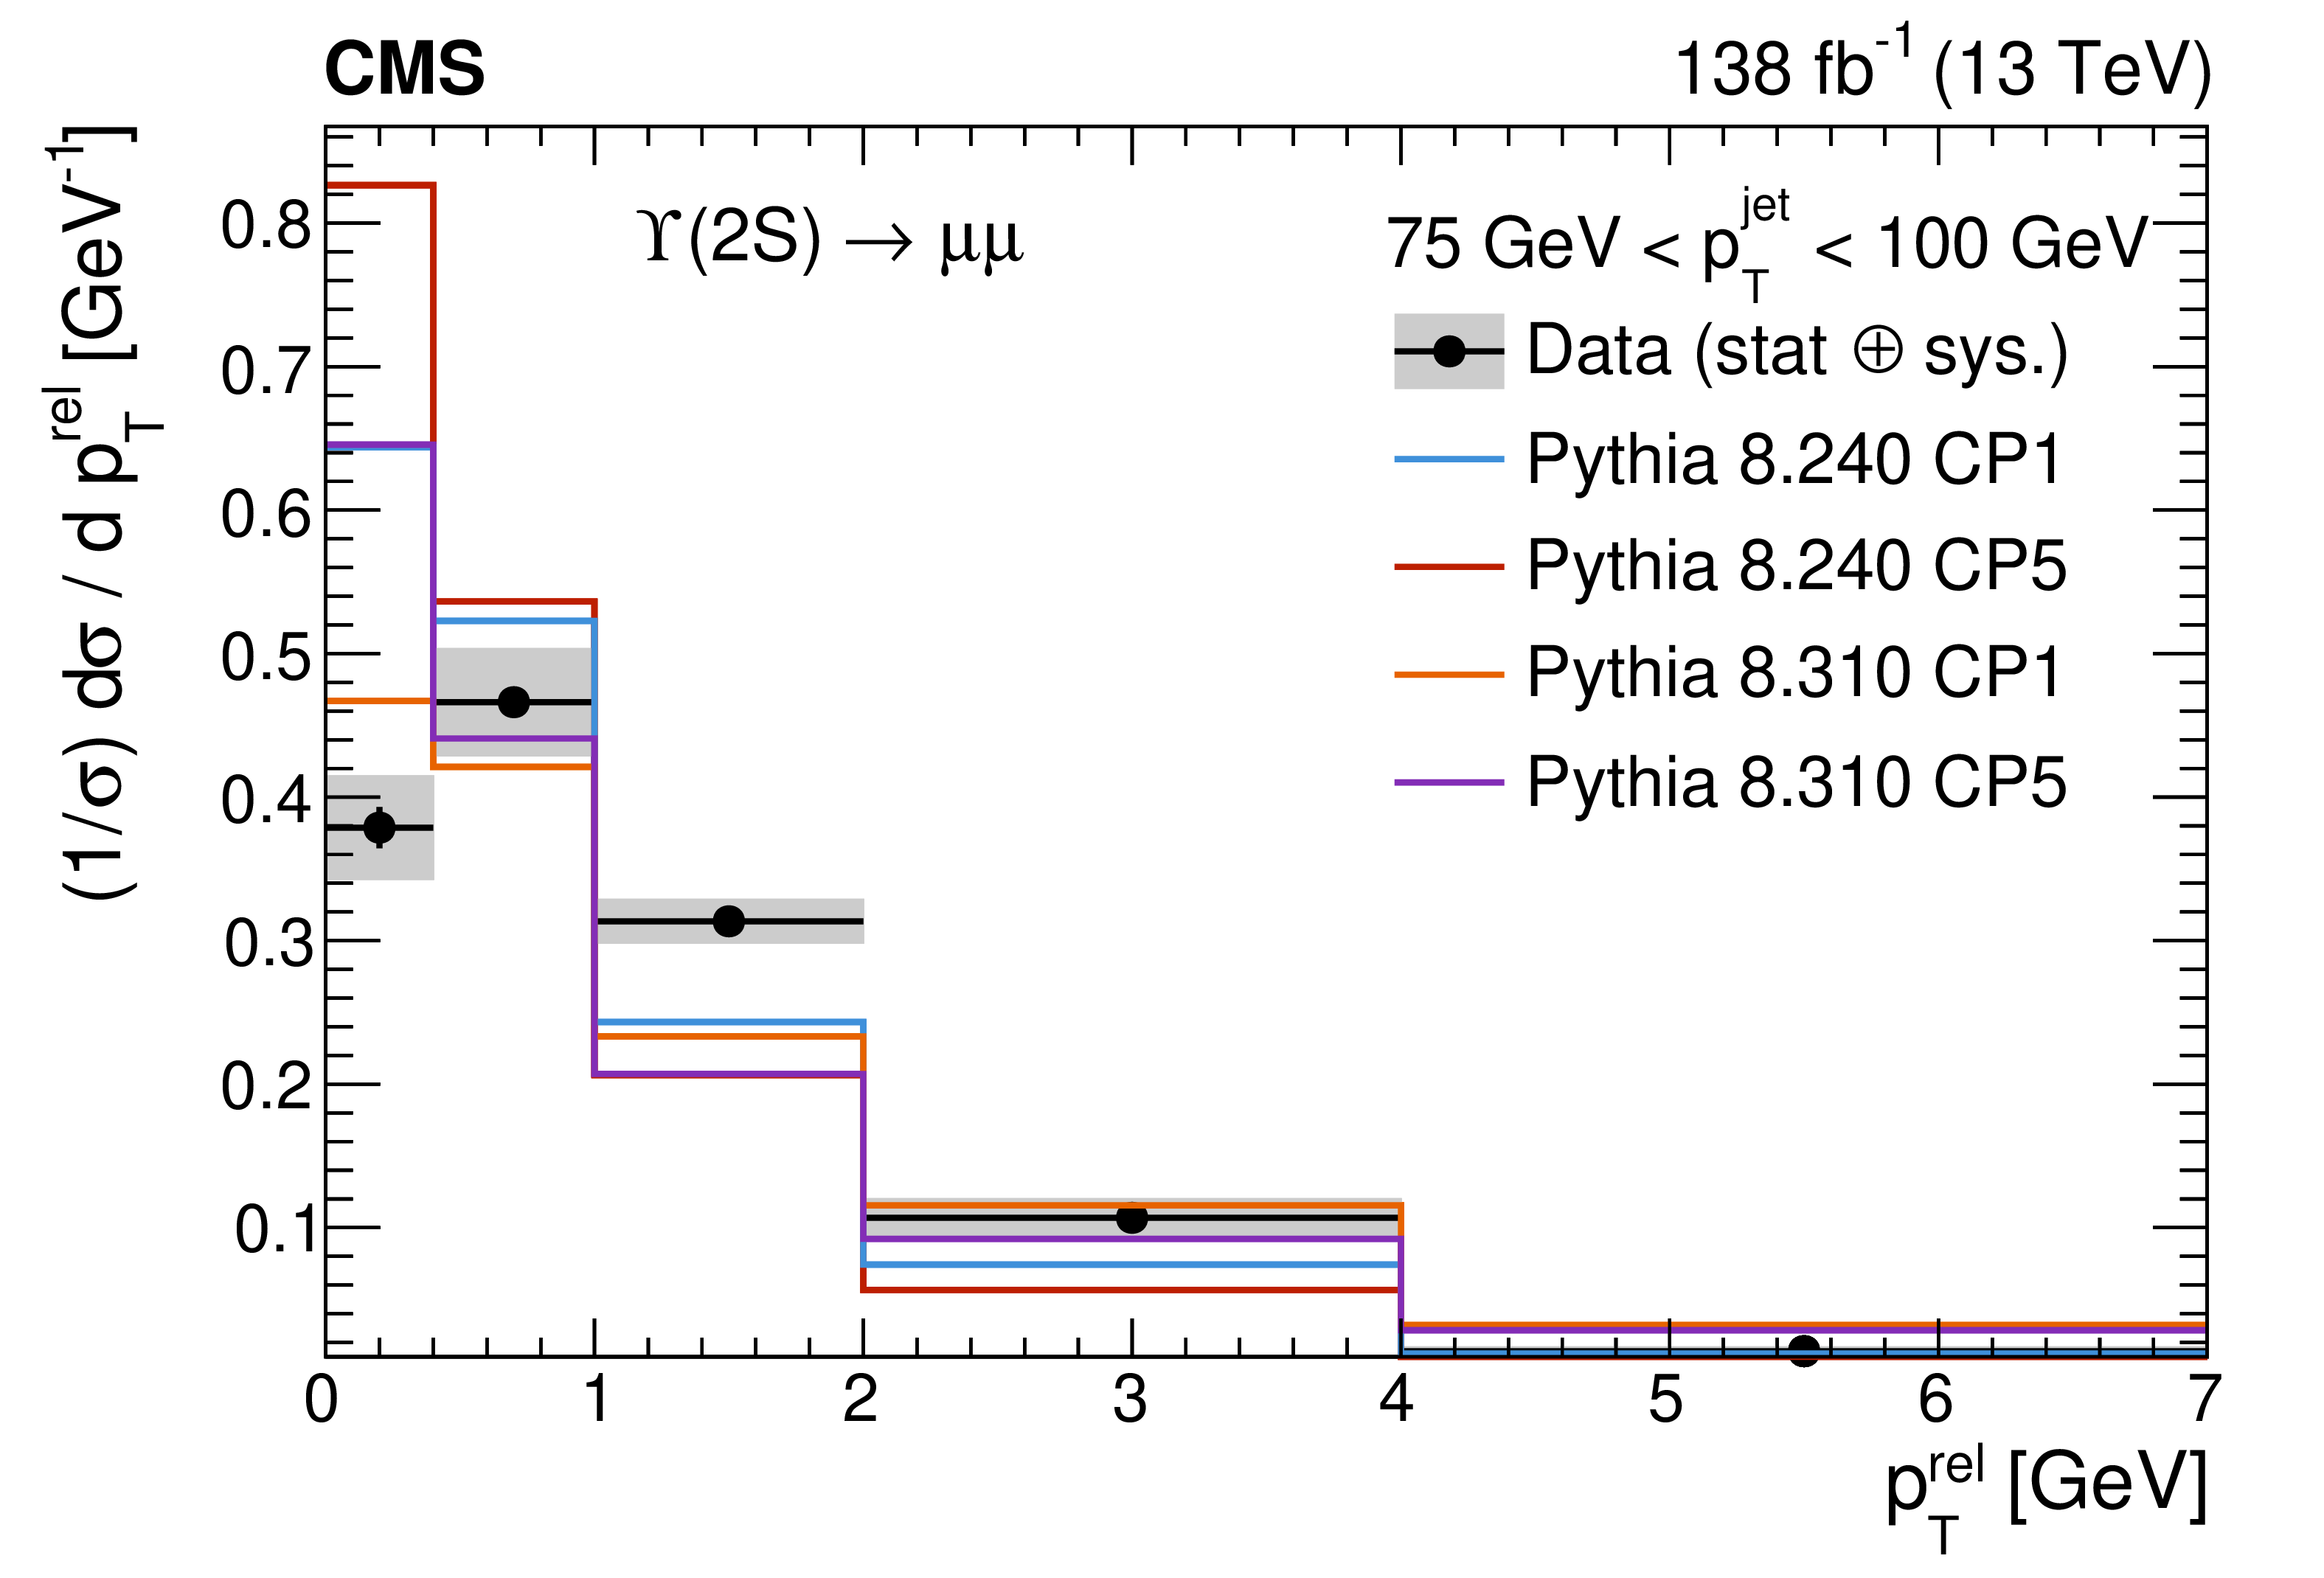
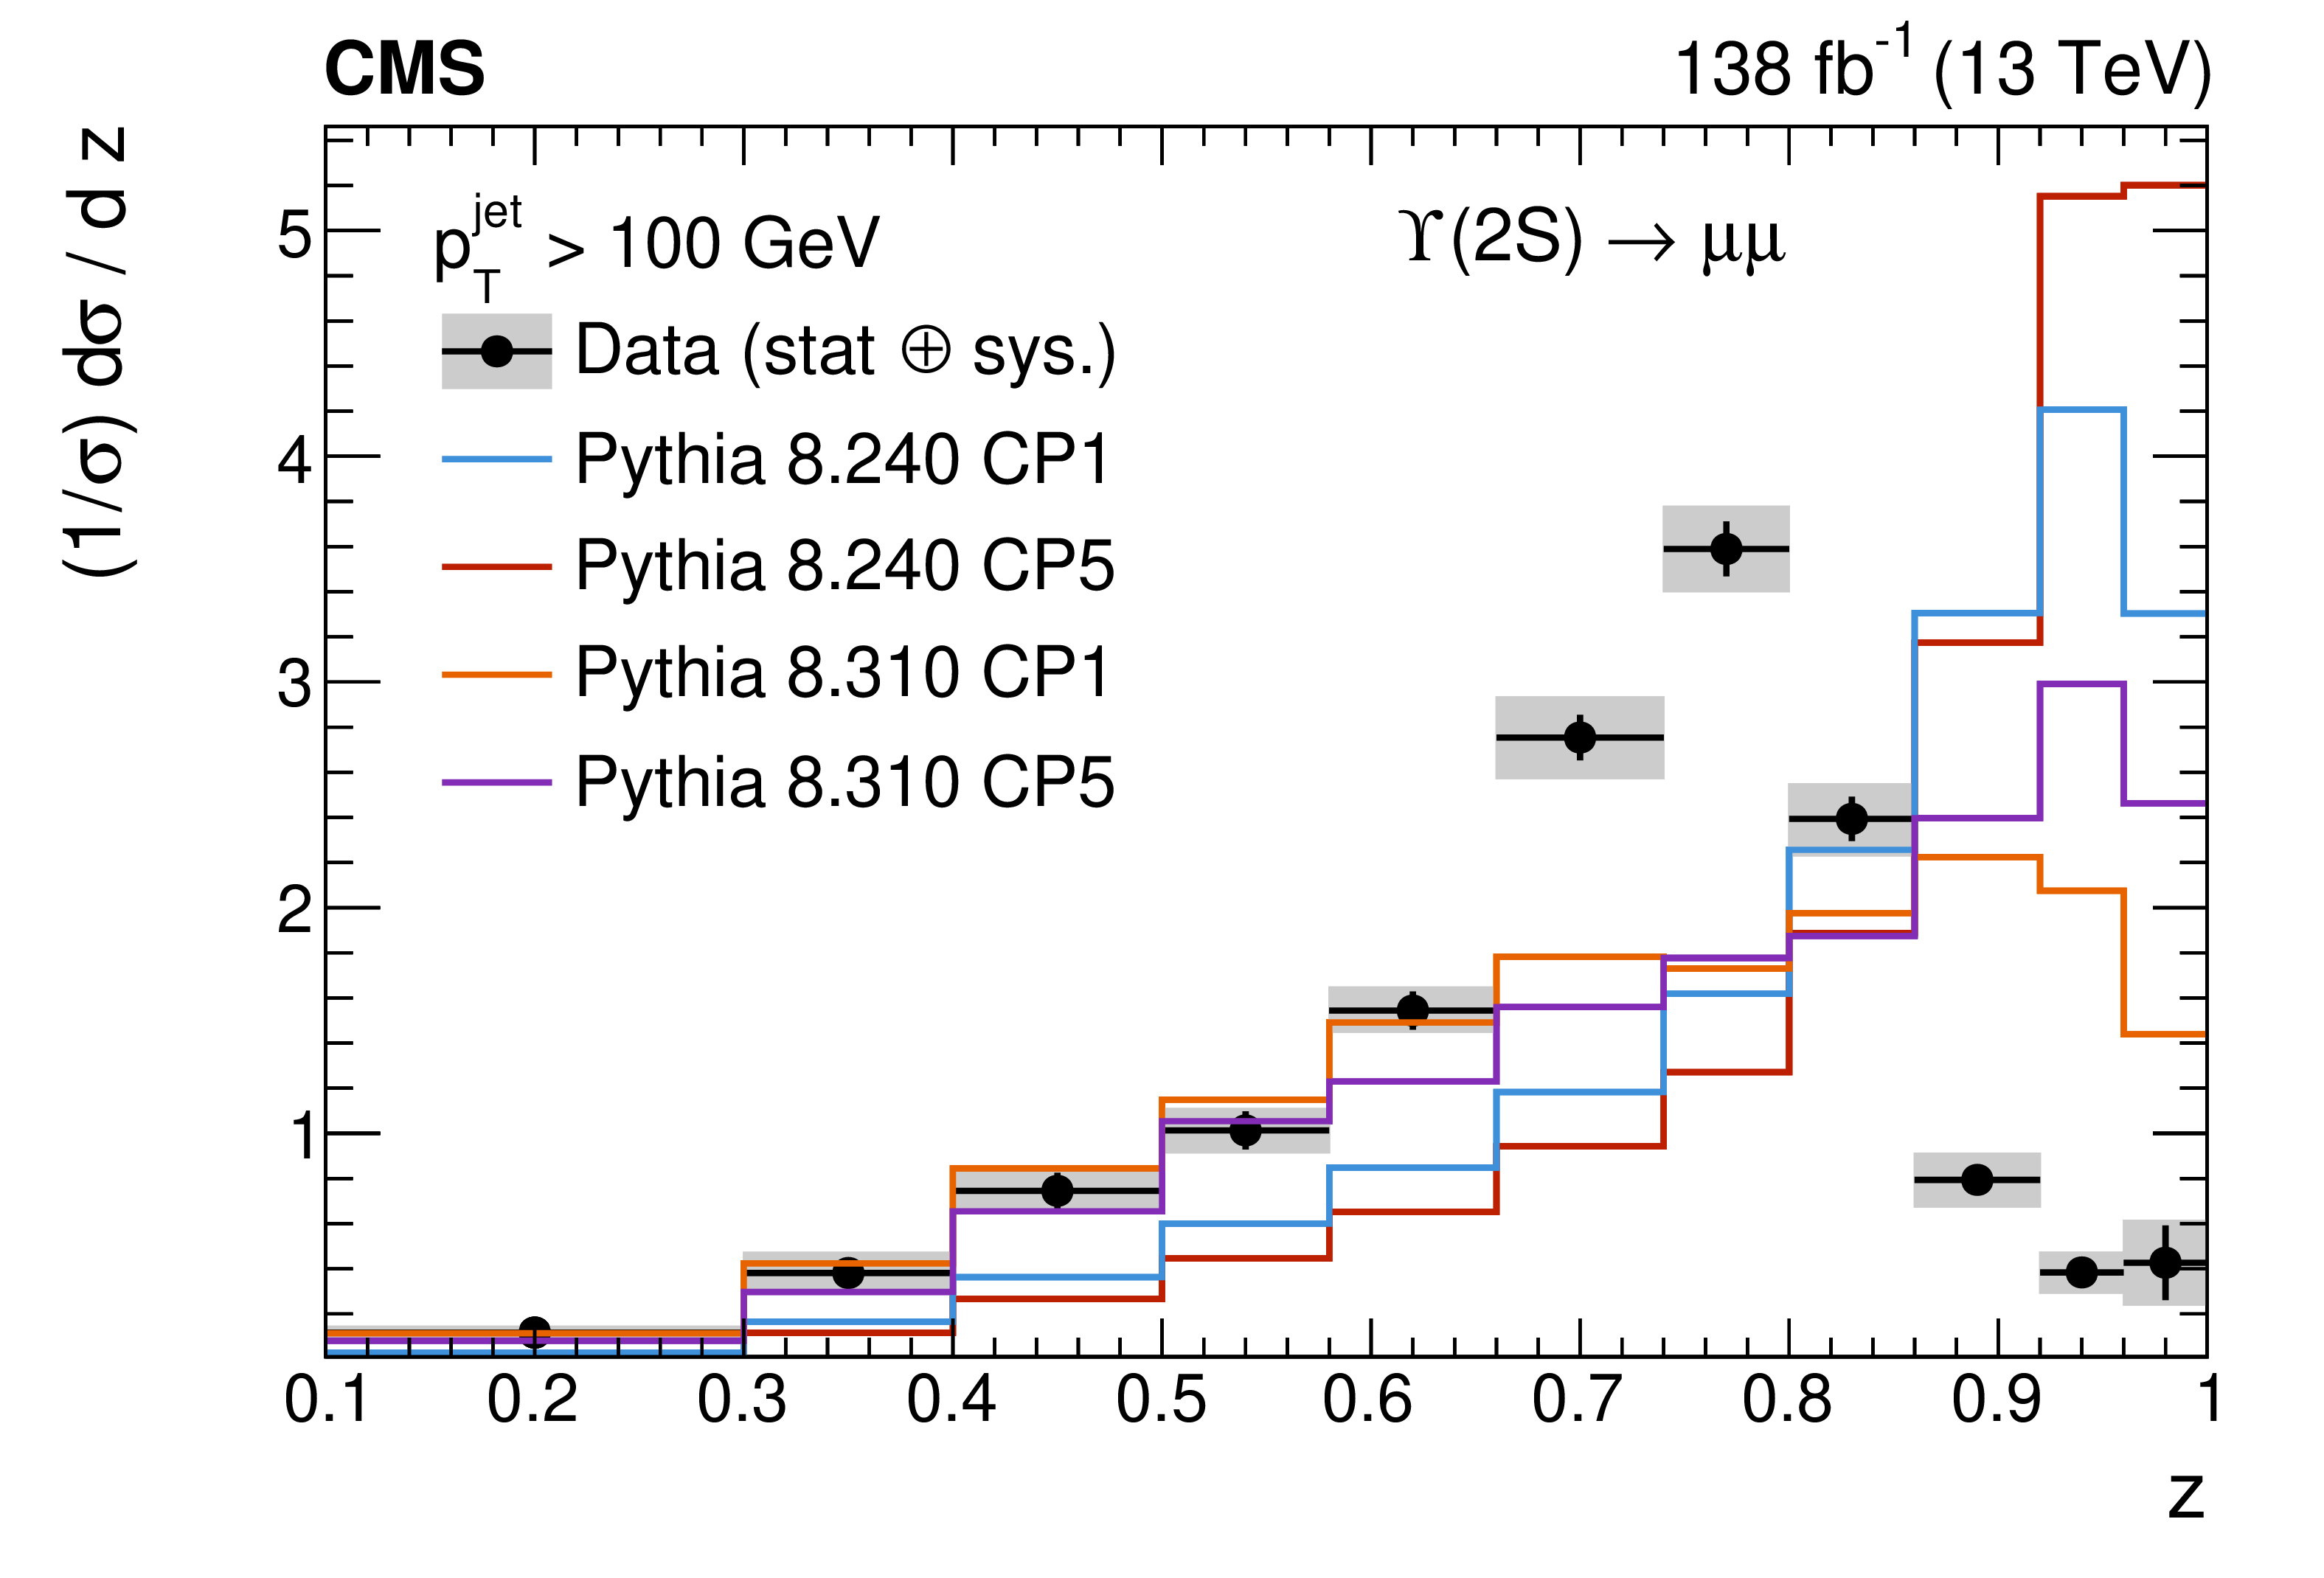
Particle-level results for the longitudinal (left) and transverse profiles (right) of jets containing $ \Upsilon{\textrm{(2S)}} $ mesons in three different $ p_{\mathrm{T}} $ regions. The data (black points) are compared to the expectations of PYTHIA8.240 with the CP1 (blue) and CP5 tunes (red), as well as the PYTHIA8.310 predictions with the CP1 (orange) and CP5 tunes (violet). The vertical error bars represent the statistical uncertainties on the data points, while the grey bands represent the total experimental uncertainties. |
png pdf |
Figure 7-a:
Particle-level results for the longitudinal (left) and transverse profiles (right) of jets containing $ \Upsilon{\textrm{(2S)}} $ mesons in three different $ p_{\mathrm{T}} $ regions. The data (black points) are compared to the expectations of PYTHIA8.240 with the CP1 (blue) and CP5 tunes (red), as well as the PYTHIA8.310 predictions with the CP1 (orange) and CP5 tunes (violet). The vertical error bars represent the statistical uncertainties on the data points, while the grey bands represent the total experimental uncertainties. |
png pdf |
Figure 7-b:
Particle-level results for the longitudinal (left) and transverse profiles (right) of jets containing $ \Upsilon{\textrm{(2S)}} $ mesons in three different $ p_{\mathrm{T}} $ regions. The data (black points) are compared to the expectations of PYTHIA8.240 with the CP1 (blue) and CP5 tunes (red), as well as the PYTHIA8.310 predictions with the CP1 (orange) and CP5 tunes (violet). The vertical error bars represent the statistical uncertainties on the data points, while the grey bands represent the total experimental uncertainties. |
png pdf |
Figure 7-c:
Particle-level results for the longitudinal (left) and transverse profiles (right) of jets containing $ \Upsilon{\textrm{(2S)}} $ mesons in three different $ p_{\mathrm{T}} $ regions. The data (black points) are compared to the expectations of PYTHIA8.240 with the CP1 (blue) and CP5 tunes (red), as well as the PYTHIA8.310 predictions with the CP1 (orange) and CP5 tunes (violet). The vertical error bars represent the statistical uncertainties on the data points, while the grey bands represent the total experimental uncertainties. |
png pdf |
Figure 7-d:
Particle-level results for the longitudinal (left) and transverse profiles (right) of jets containing $ \Upsilon{\textrm{(2S)}} $ mesons in three different $ p_{\mathrm{T}} $ regions. The data (black points) are compared to the expectations of PYTHIA8.240 with the CP1 (blue) and CP5 tunes (red), as well as the PYTHIA8.310 predictions with the CP1 (orange) and CP5 tunes (violet). The vertical error bars represent the statistical uncertainties on the data points, while the grey bands represent the total experimental uncertainties. |
png pdf |
Figure 7-e:
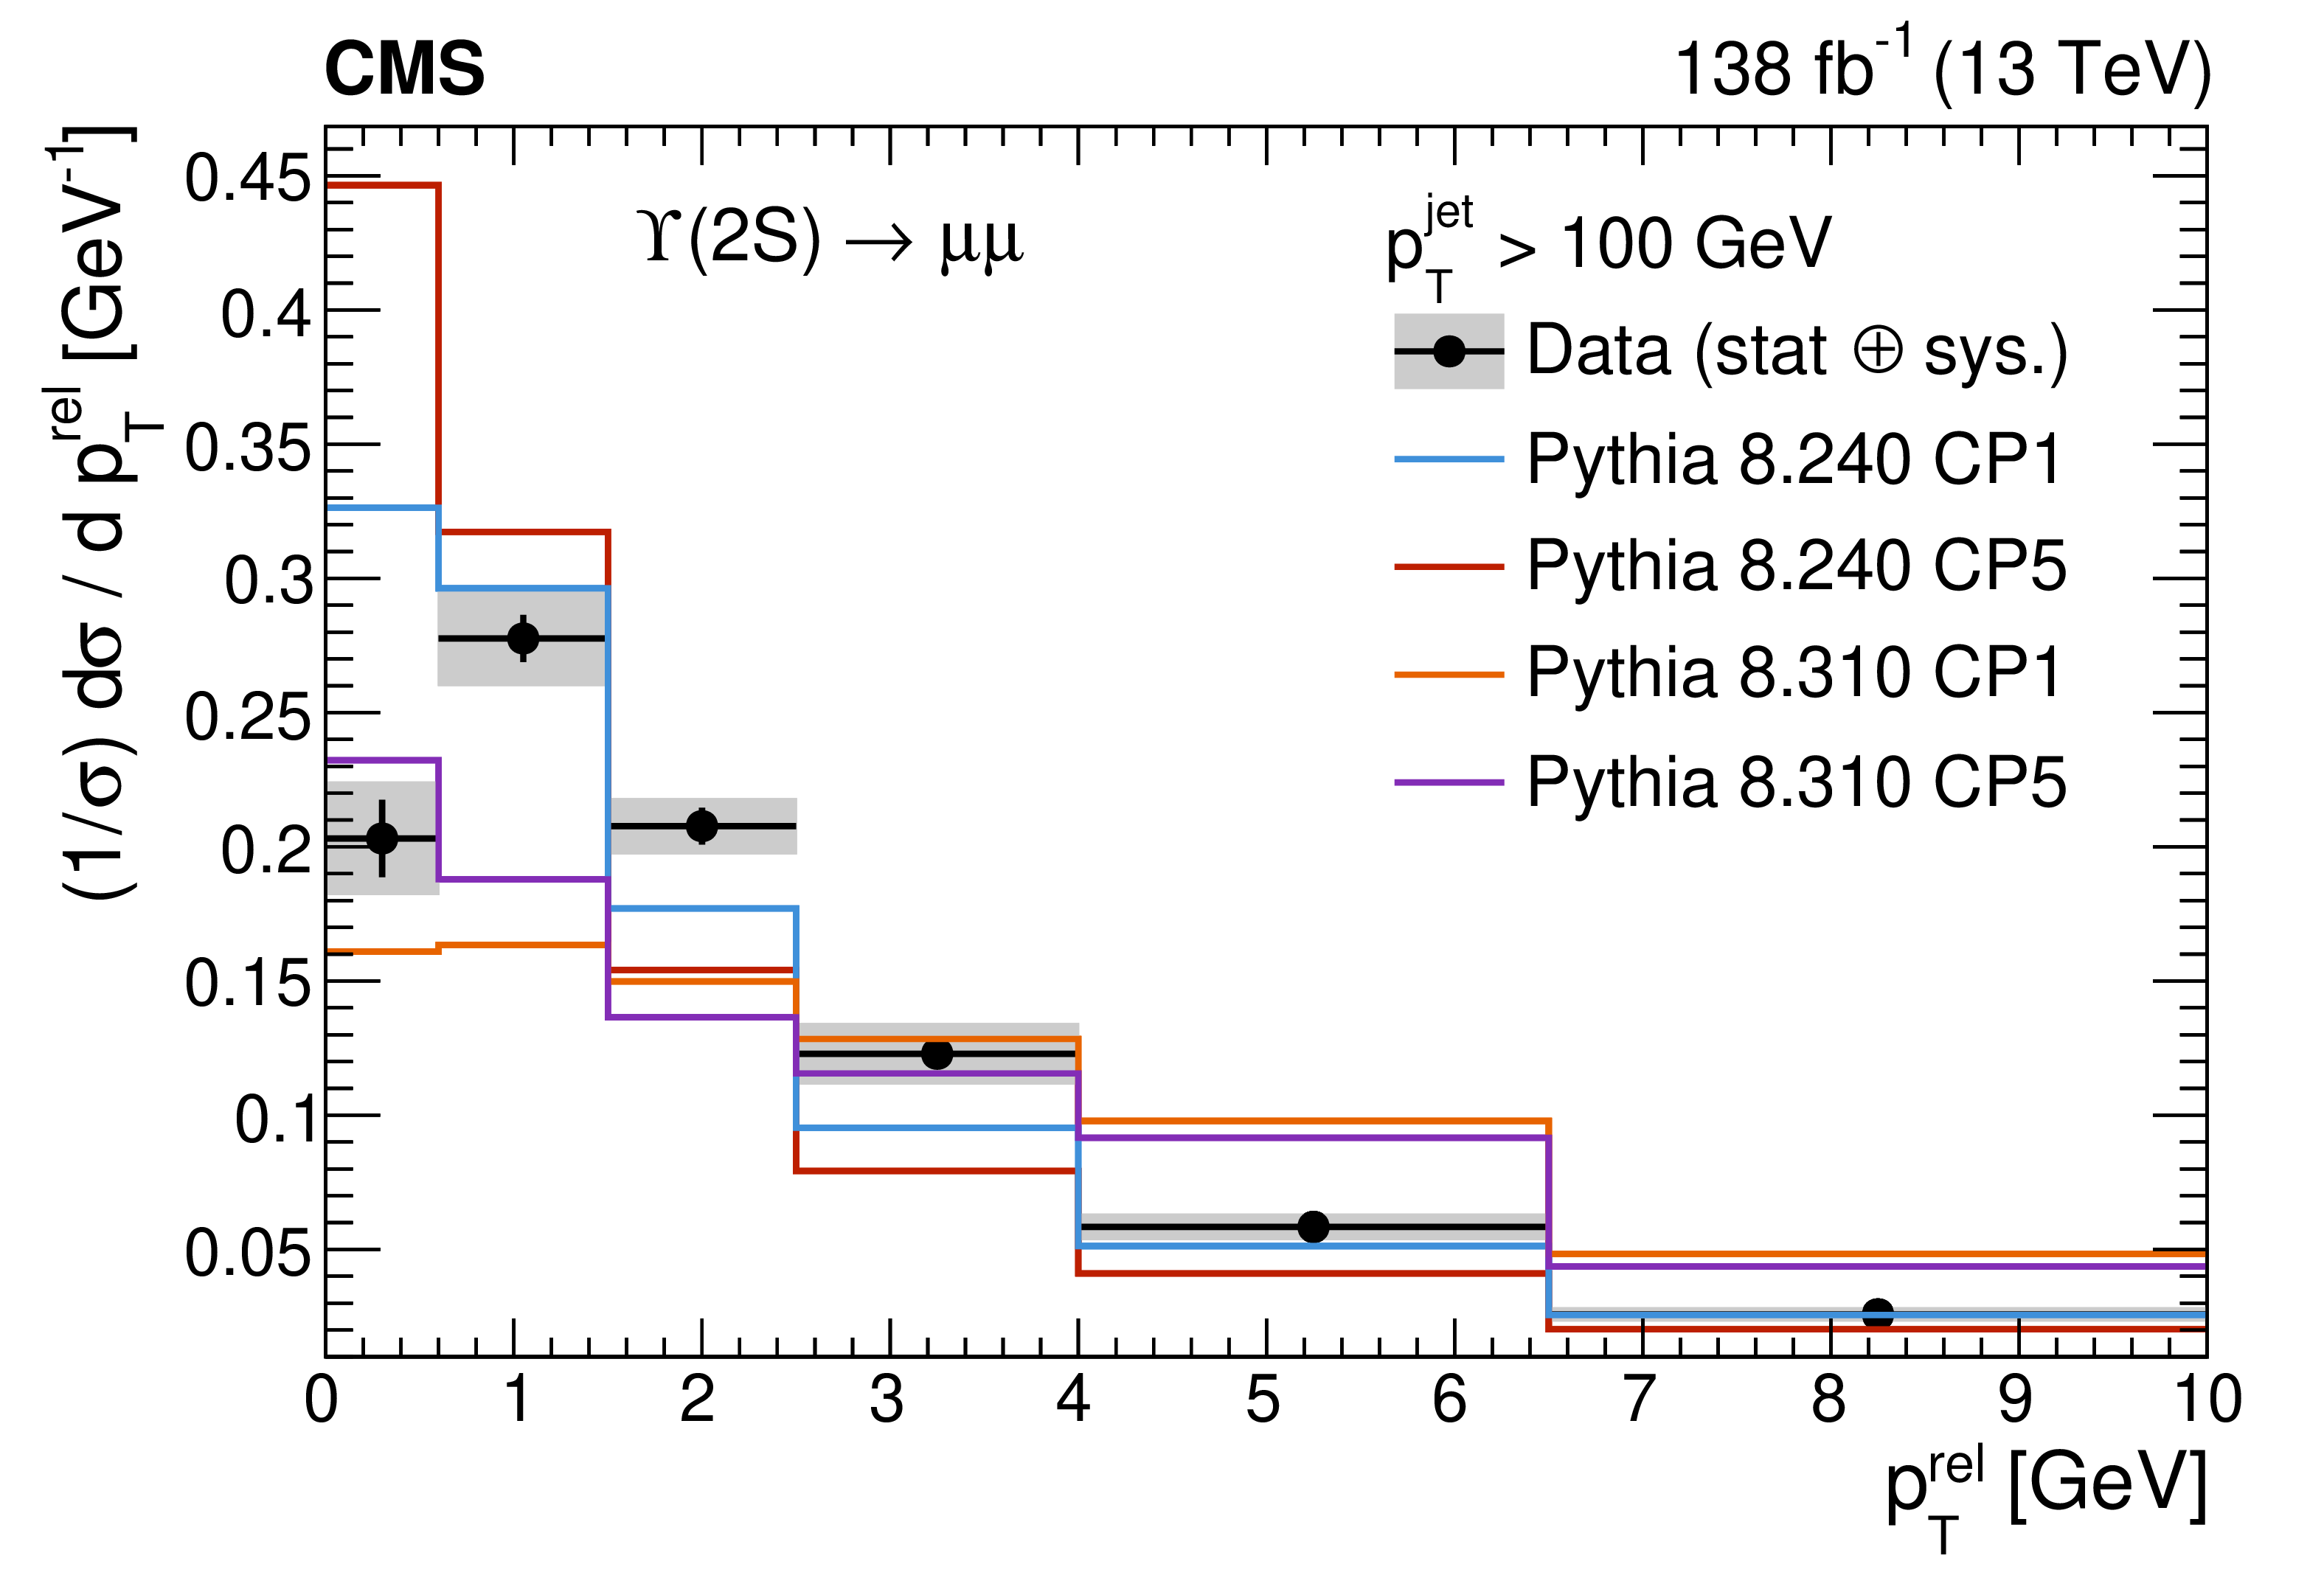
Particle-level results for the longitudinal (left) and transverse profiles (right) of jets containing $ \Upsilon{\textrm{(2S)}} $ mesons in three different $ p_{\mathrm{T}} $ regions. The data (black points) are compared to the expectations of PYTHIA8.240 with the CP1 (blue) and CP5 tunes (red), as well as the PYTHIA8.310 predictions with the CP1 (orange) and CP5 tunes (violet). The vertical error bars represent the statistical uncertainties on the data points, while the grey bands represent the total experimental uncertainties. |
png pdf |
Figure 7-f:
Particle-level results for the longitudinal (left) and transverse profiles (right) of jets containing $ \Upsilon{\textrm{(2S)}} $ mesons in three different $ p_{\mathrm{T}} $ regions. The data (black points) are compared to the expectations of PYTHIA8.240 with the CP1 (blue) and CP5 tunes (red), as well as the PYTHIA8.310 predictions with the CP1 (orange) and CP5 tunes (violet). The vertical error bars represent the statistical uncertainties on the data points, while the grey bands represent the total experimental uncertainties. |
png pdf |
Figure 8:
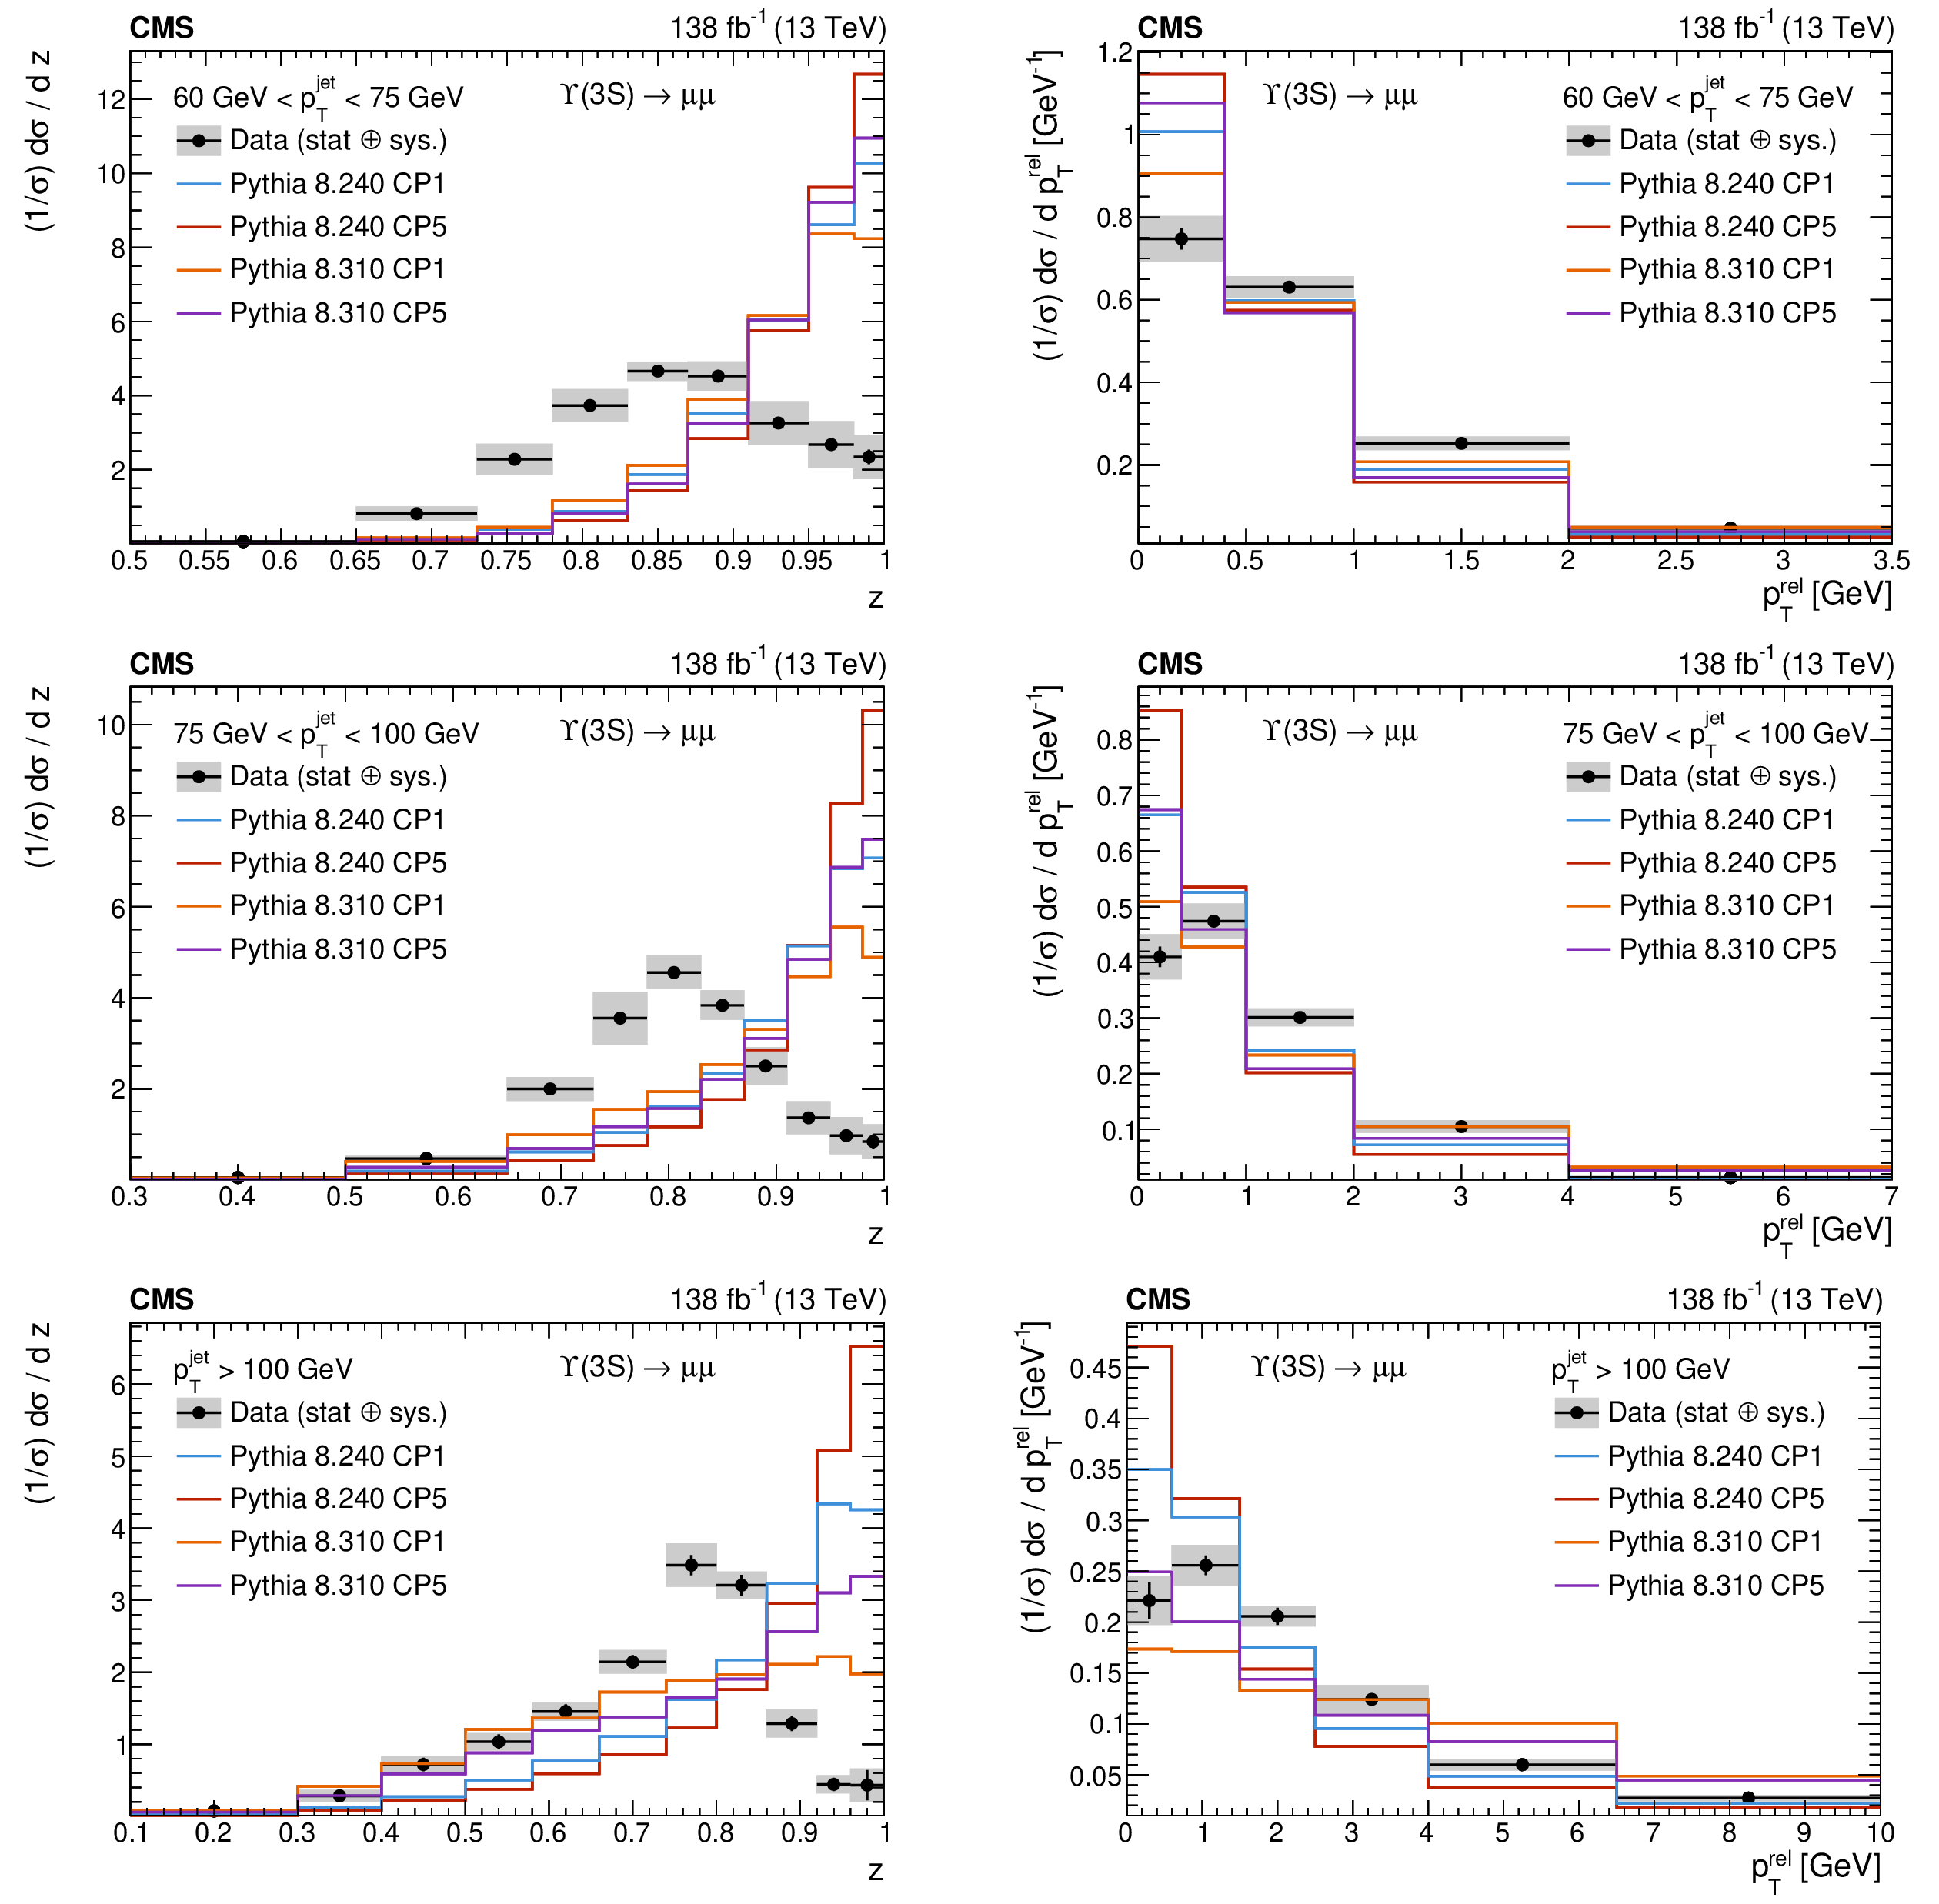
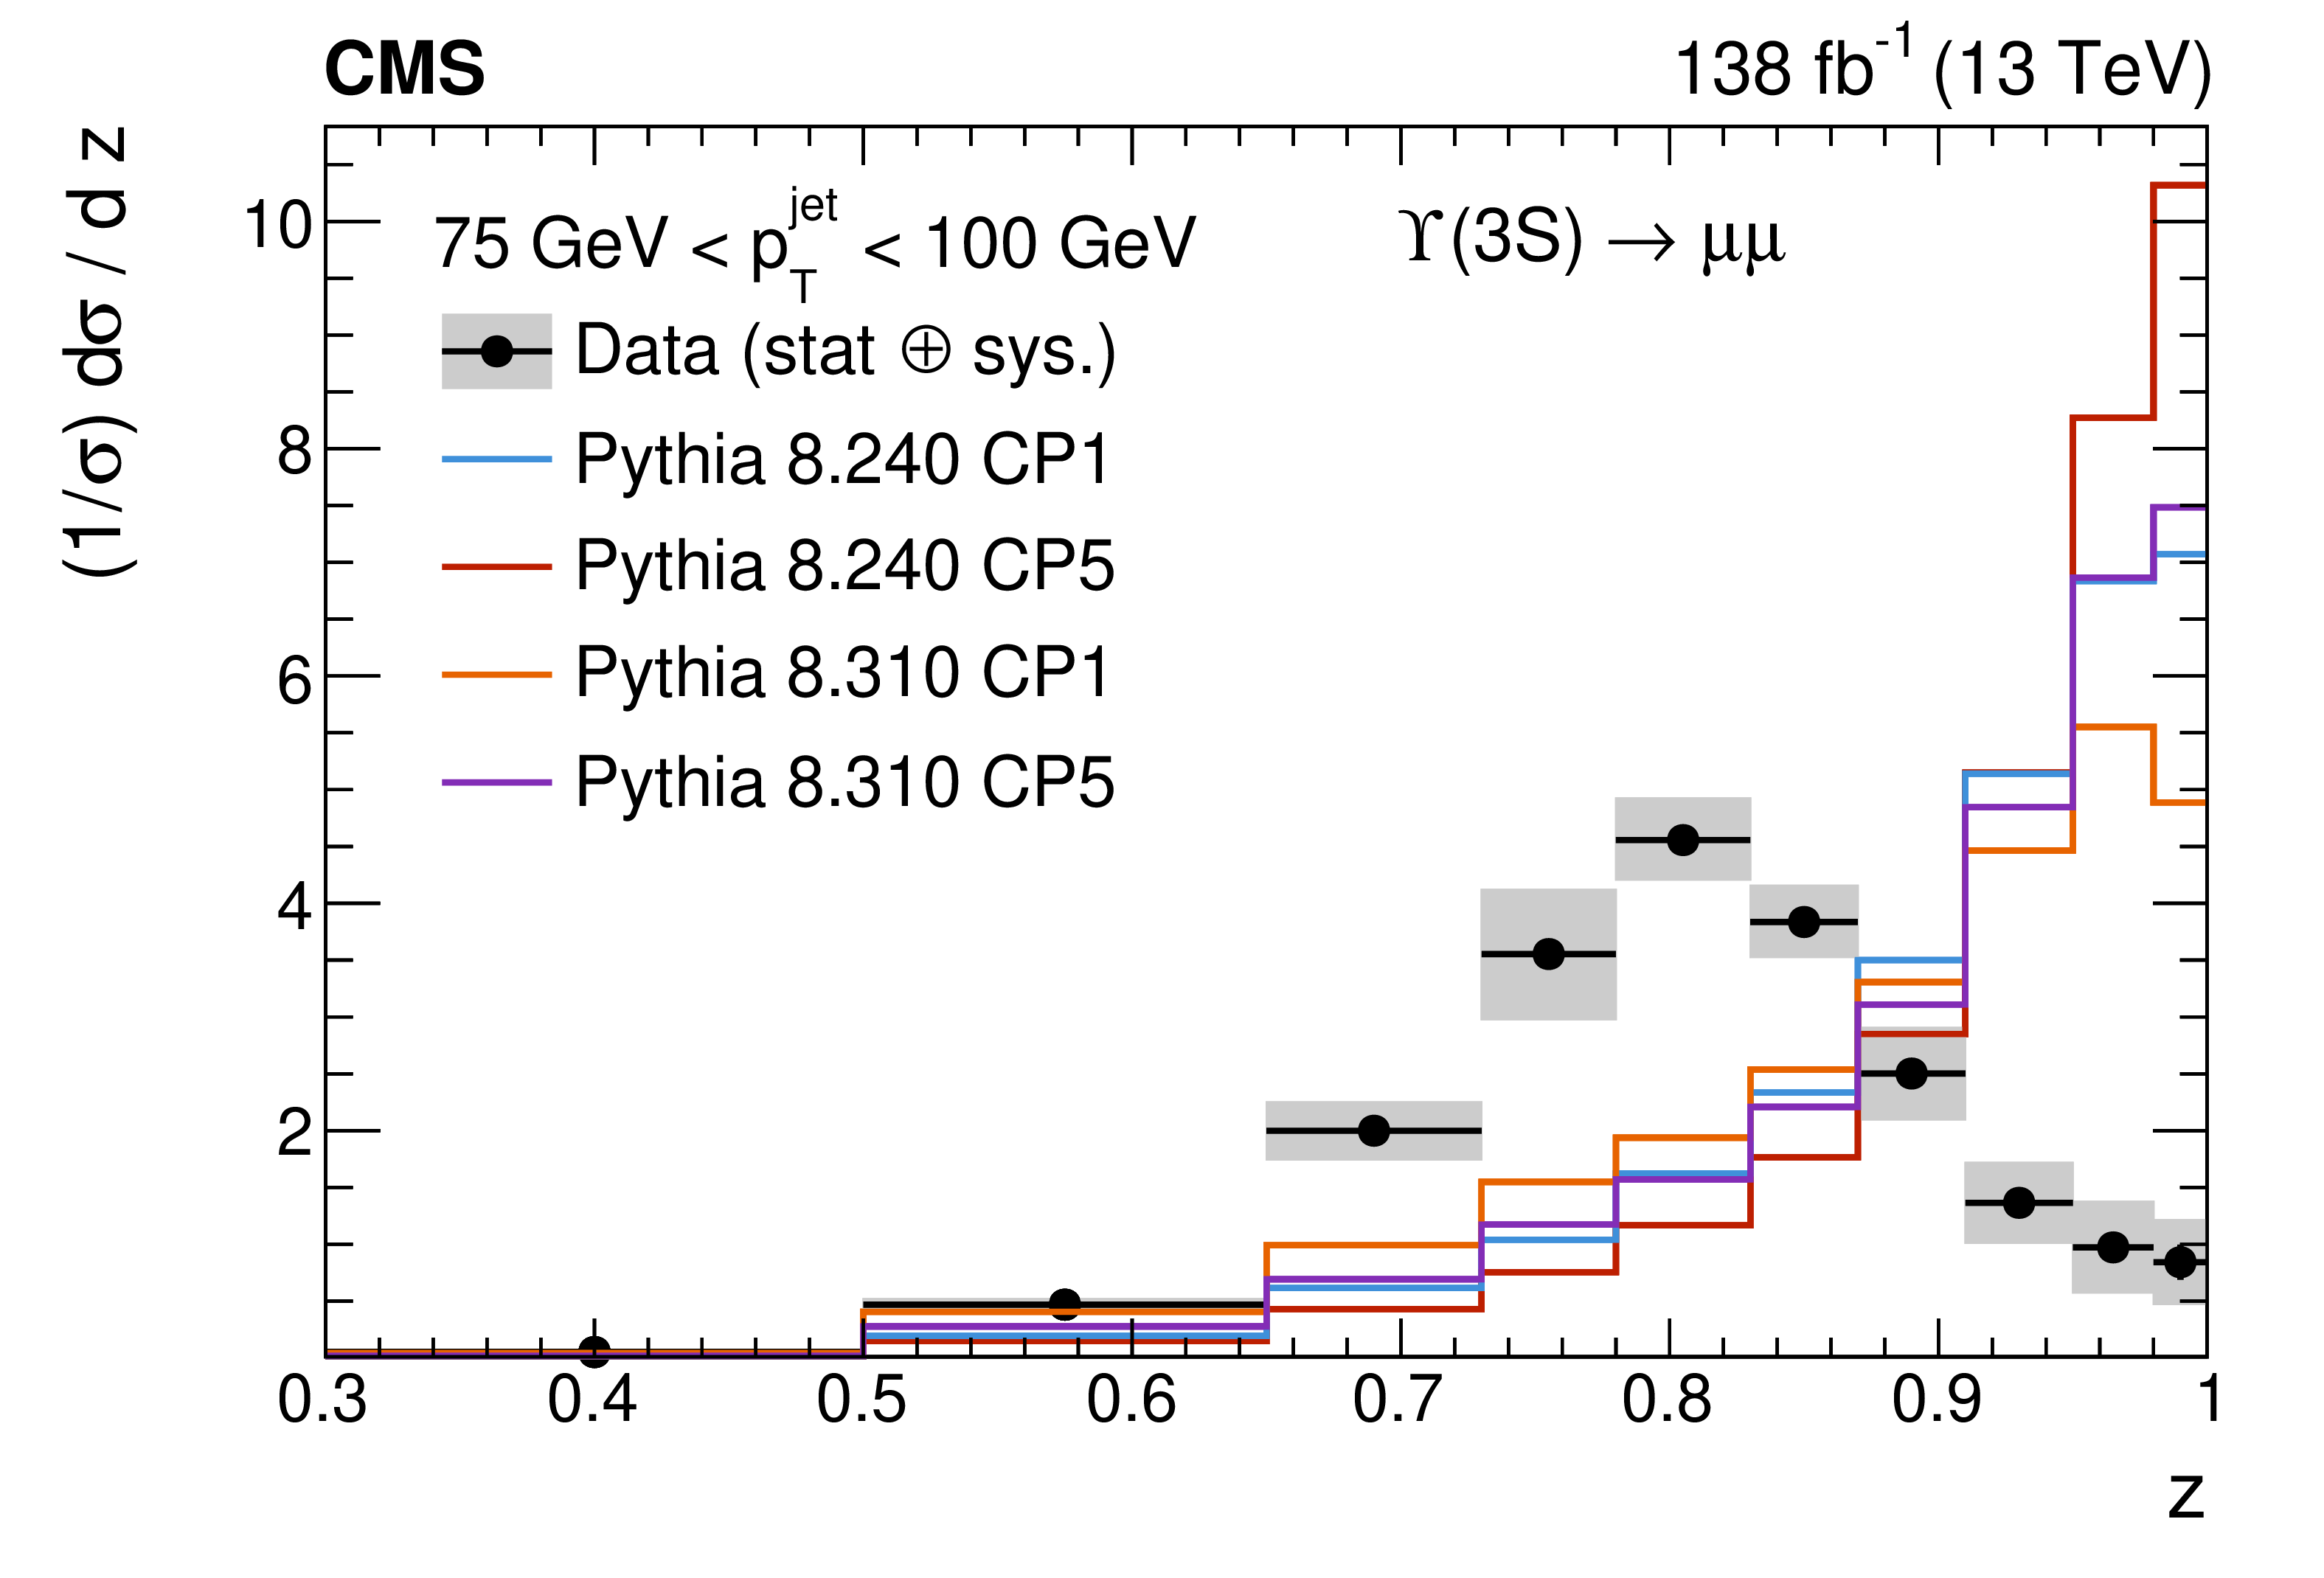
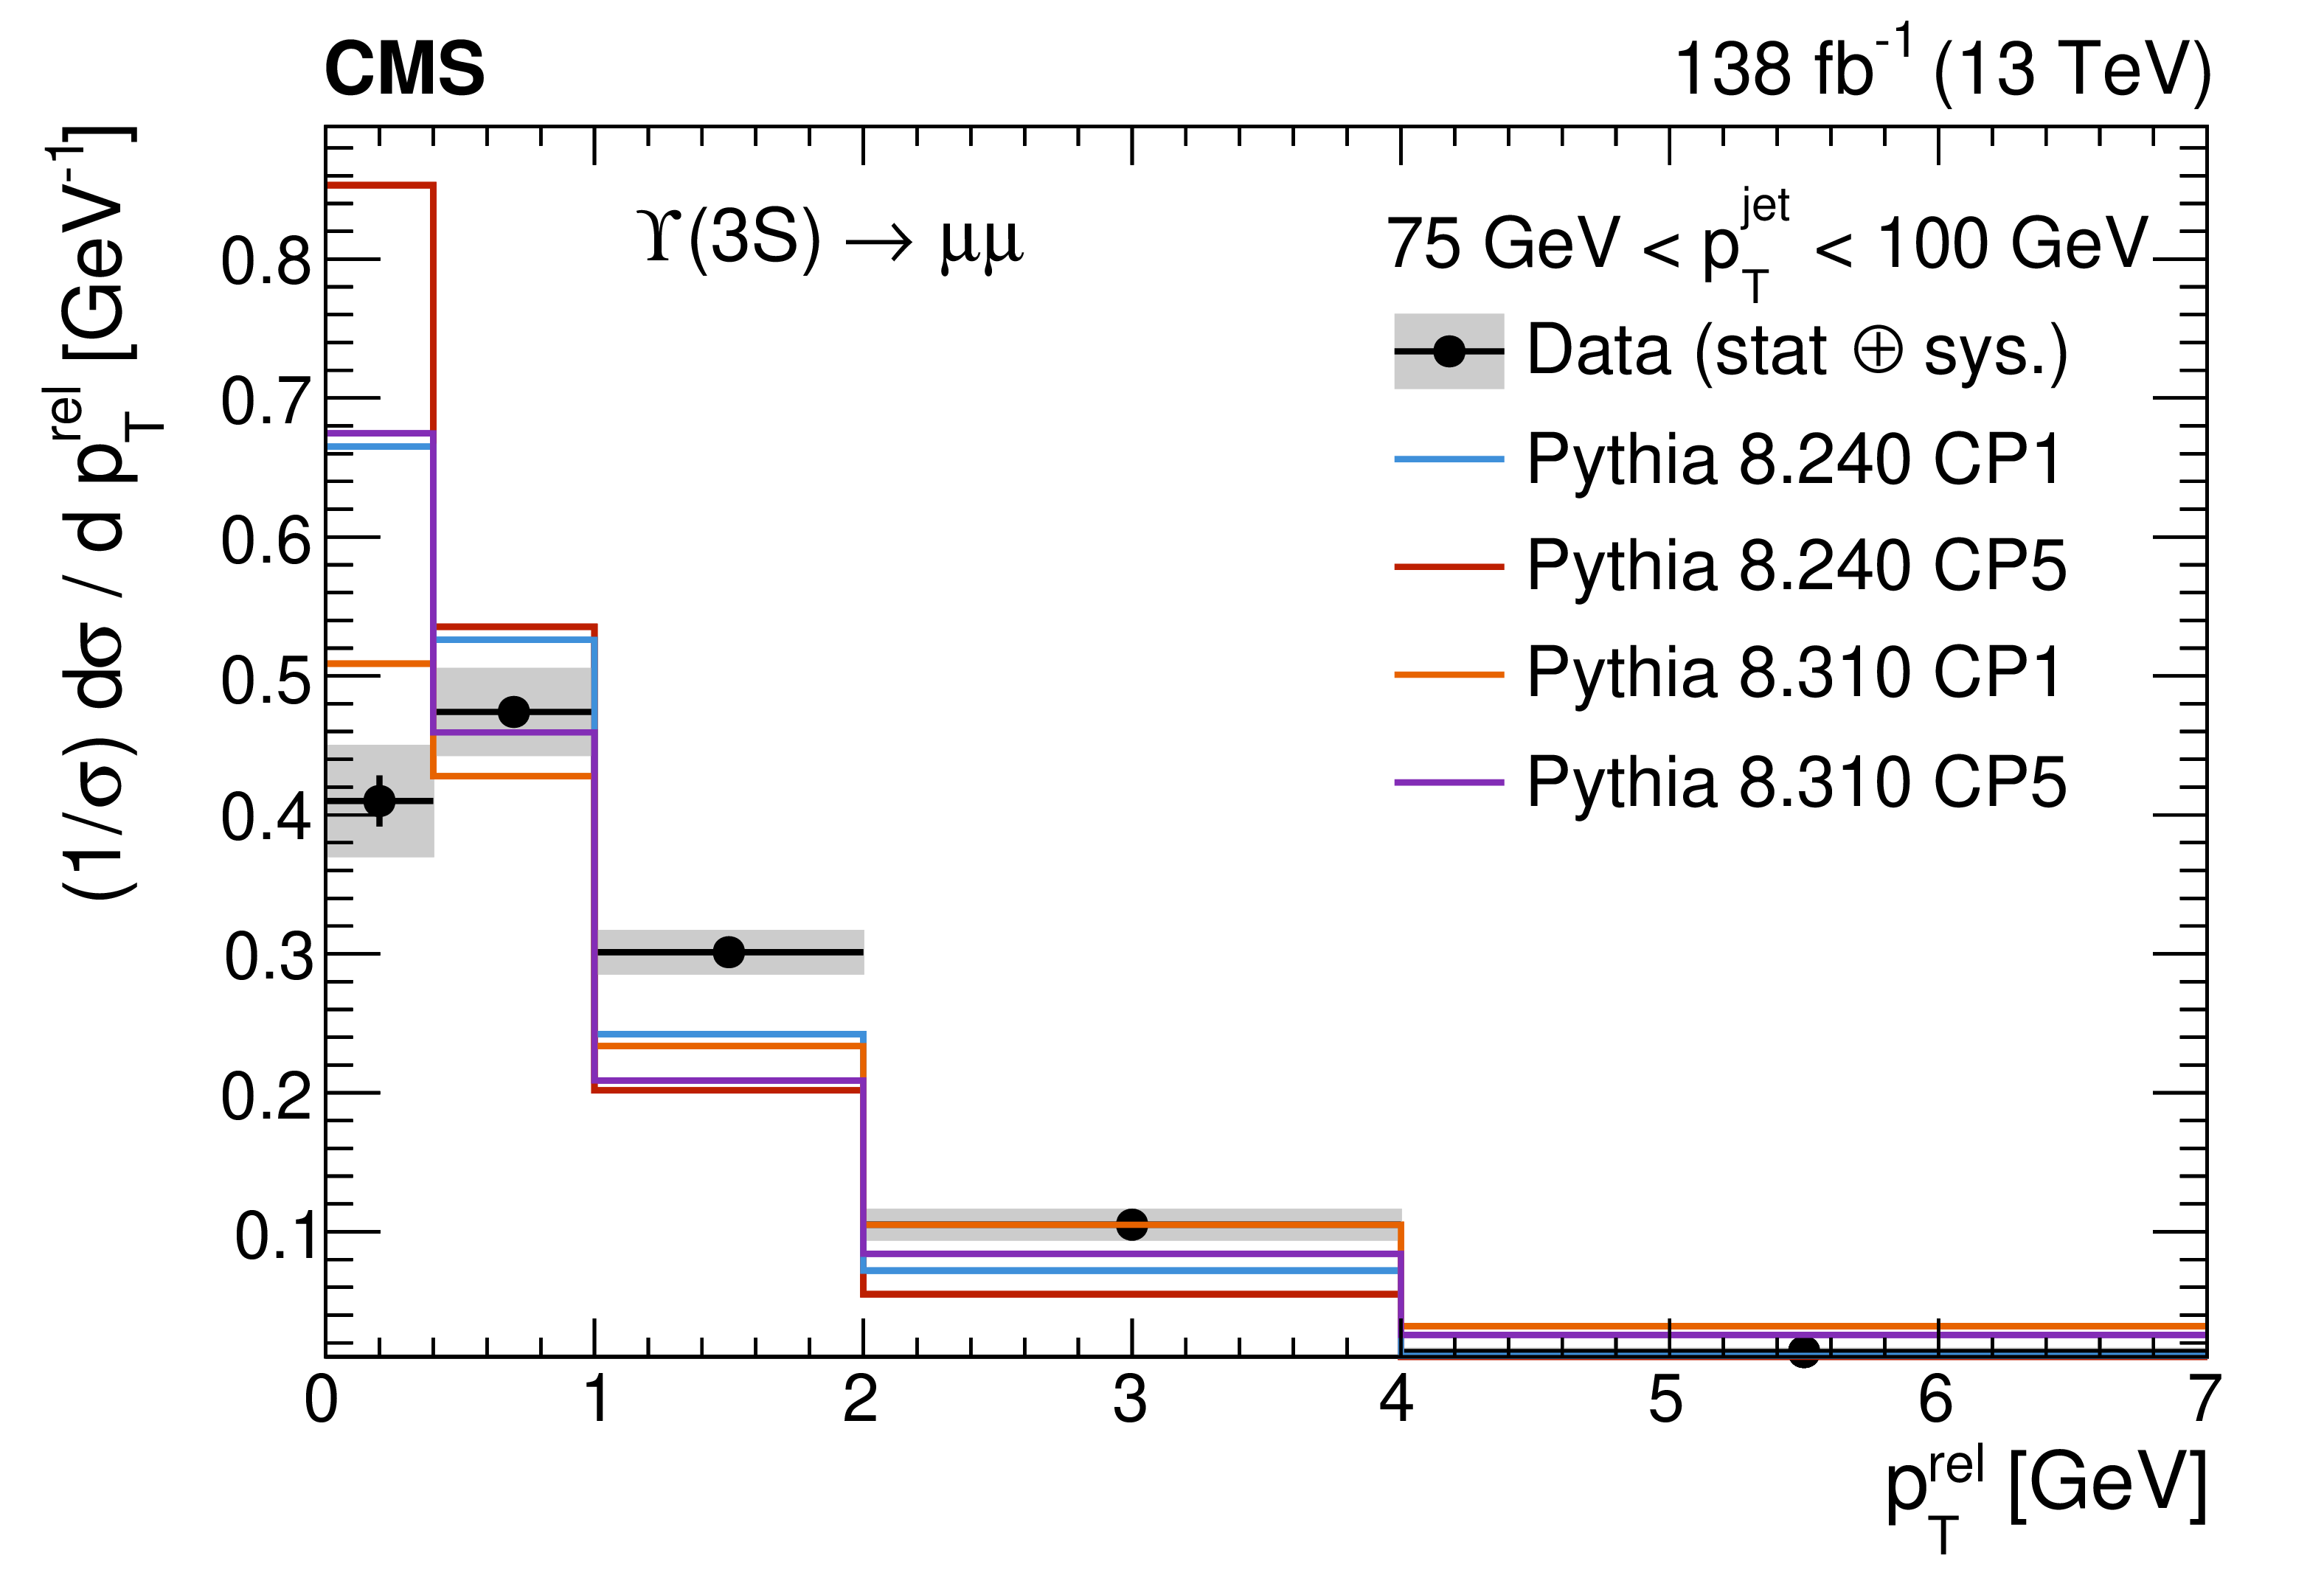
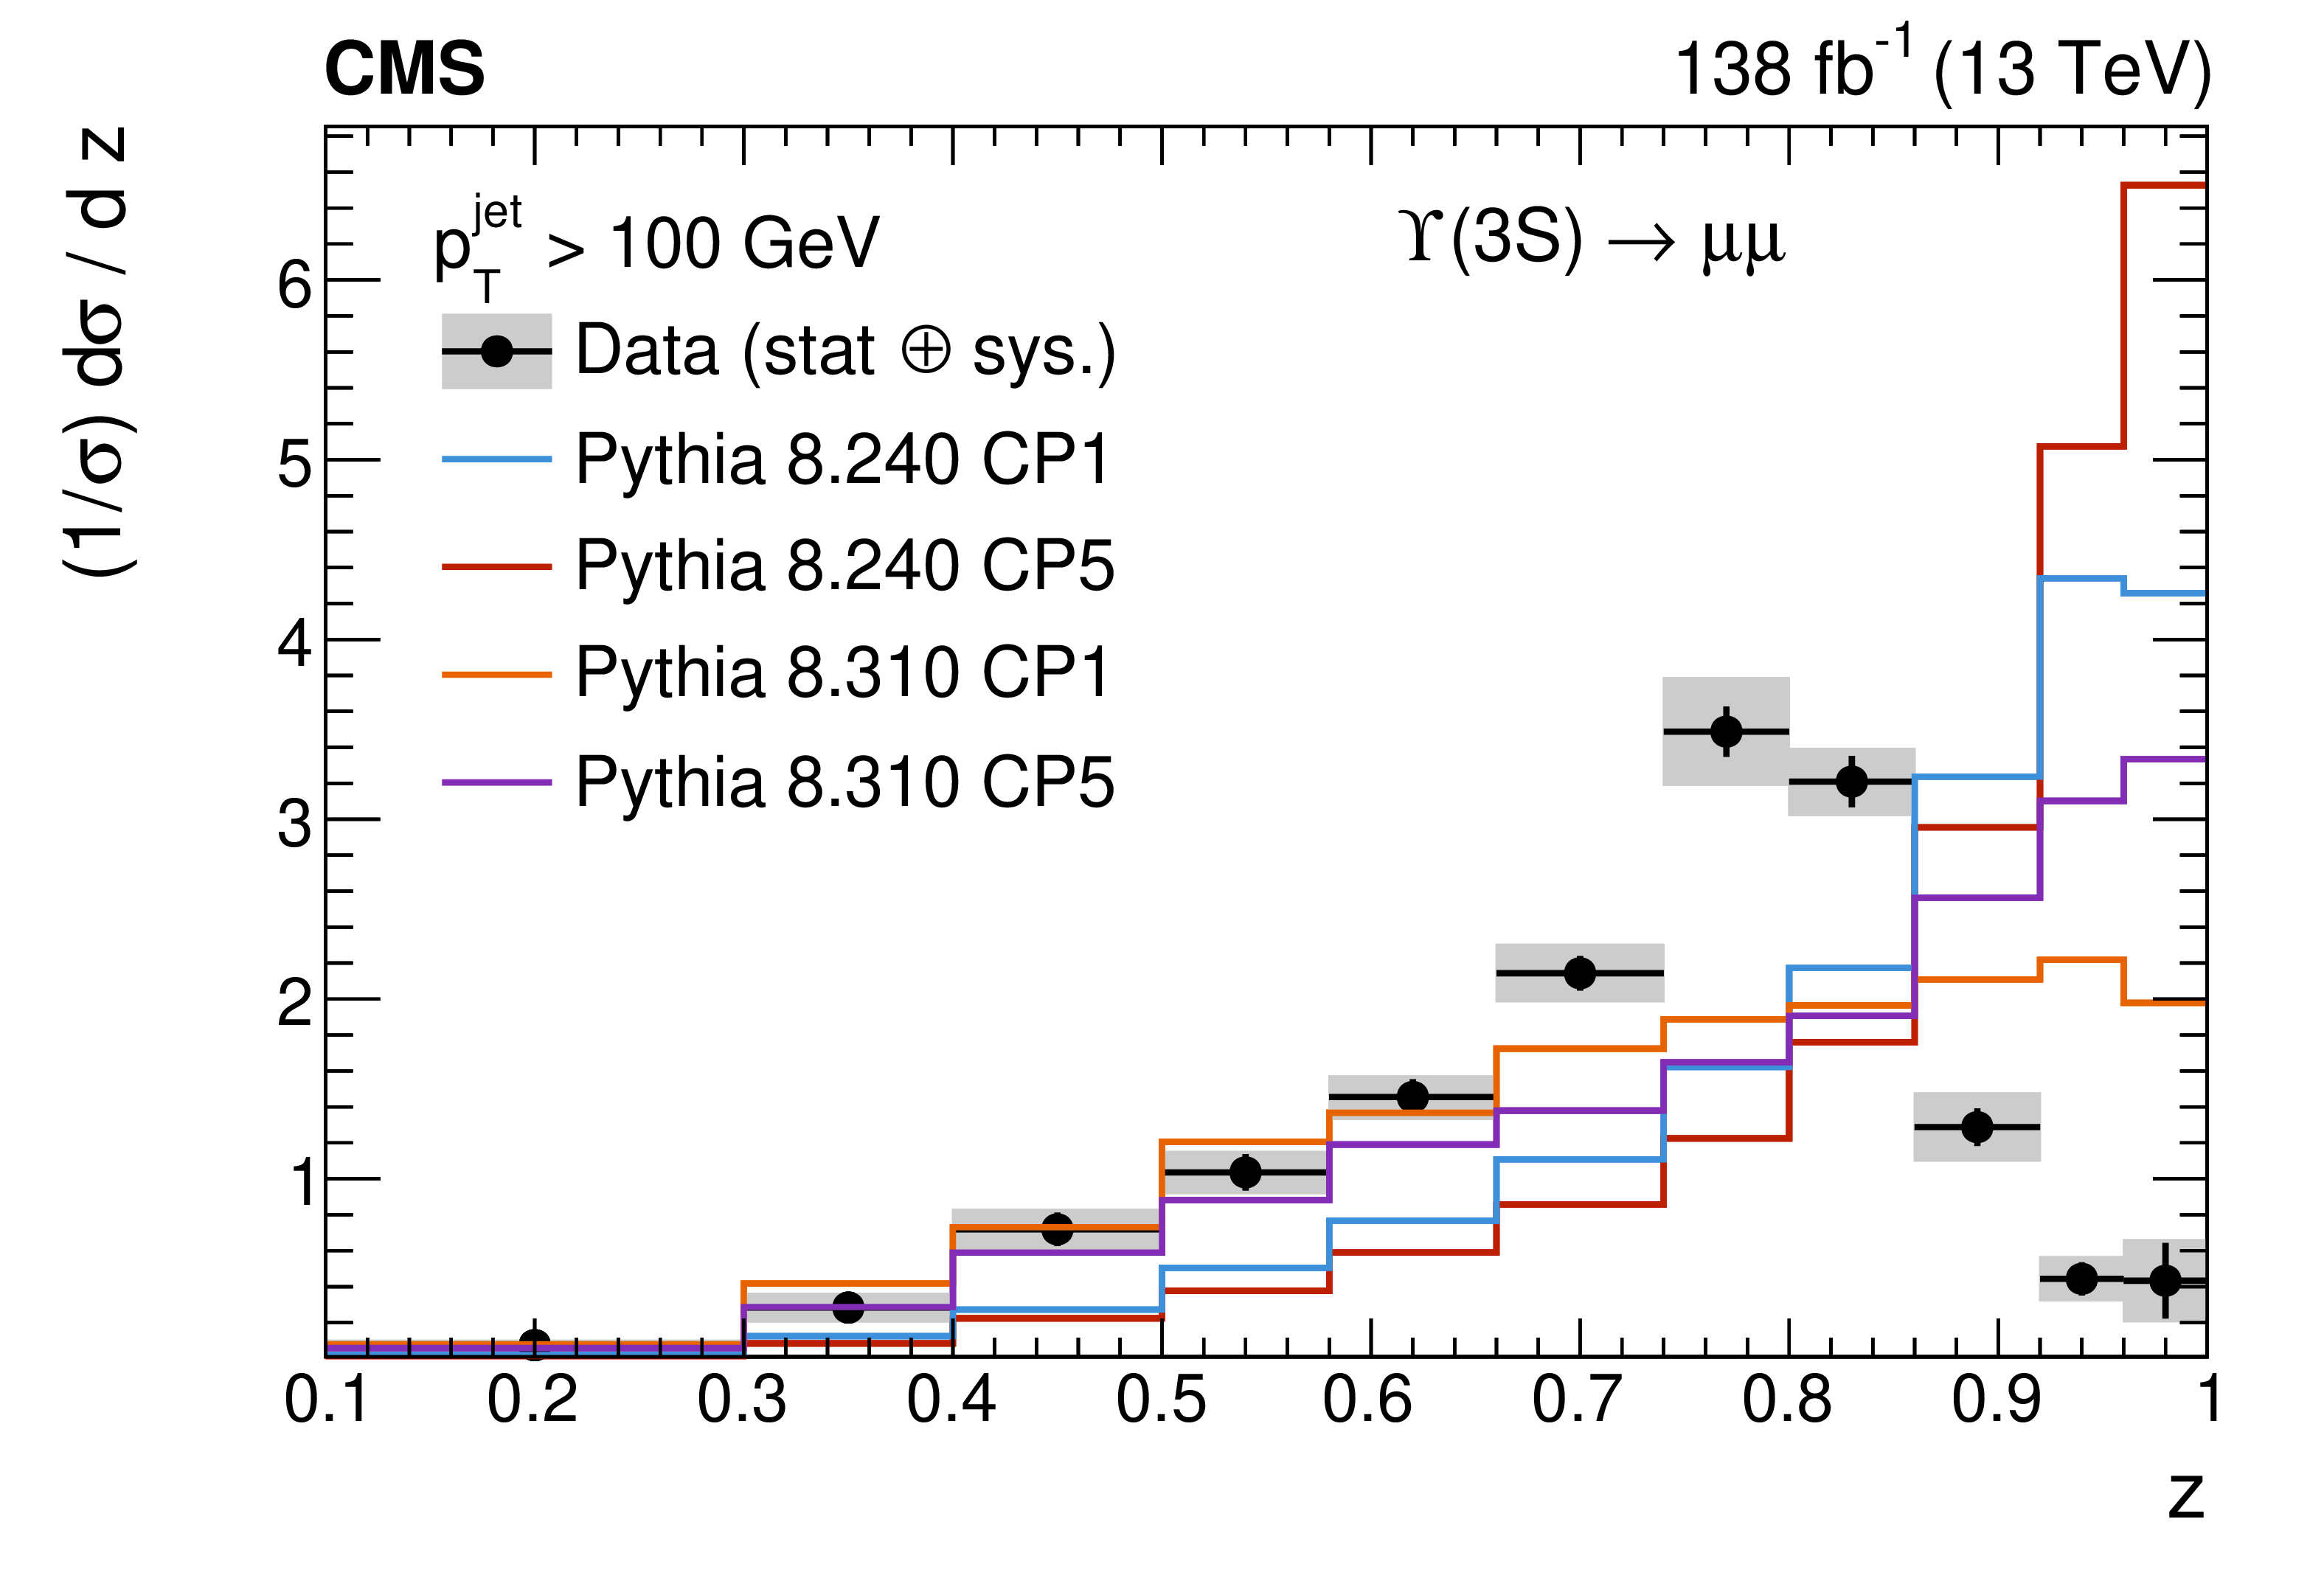
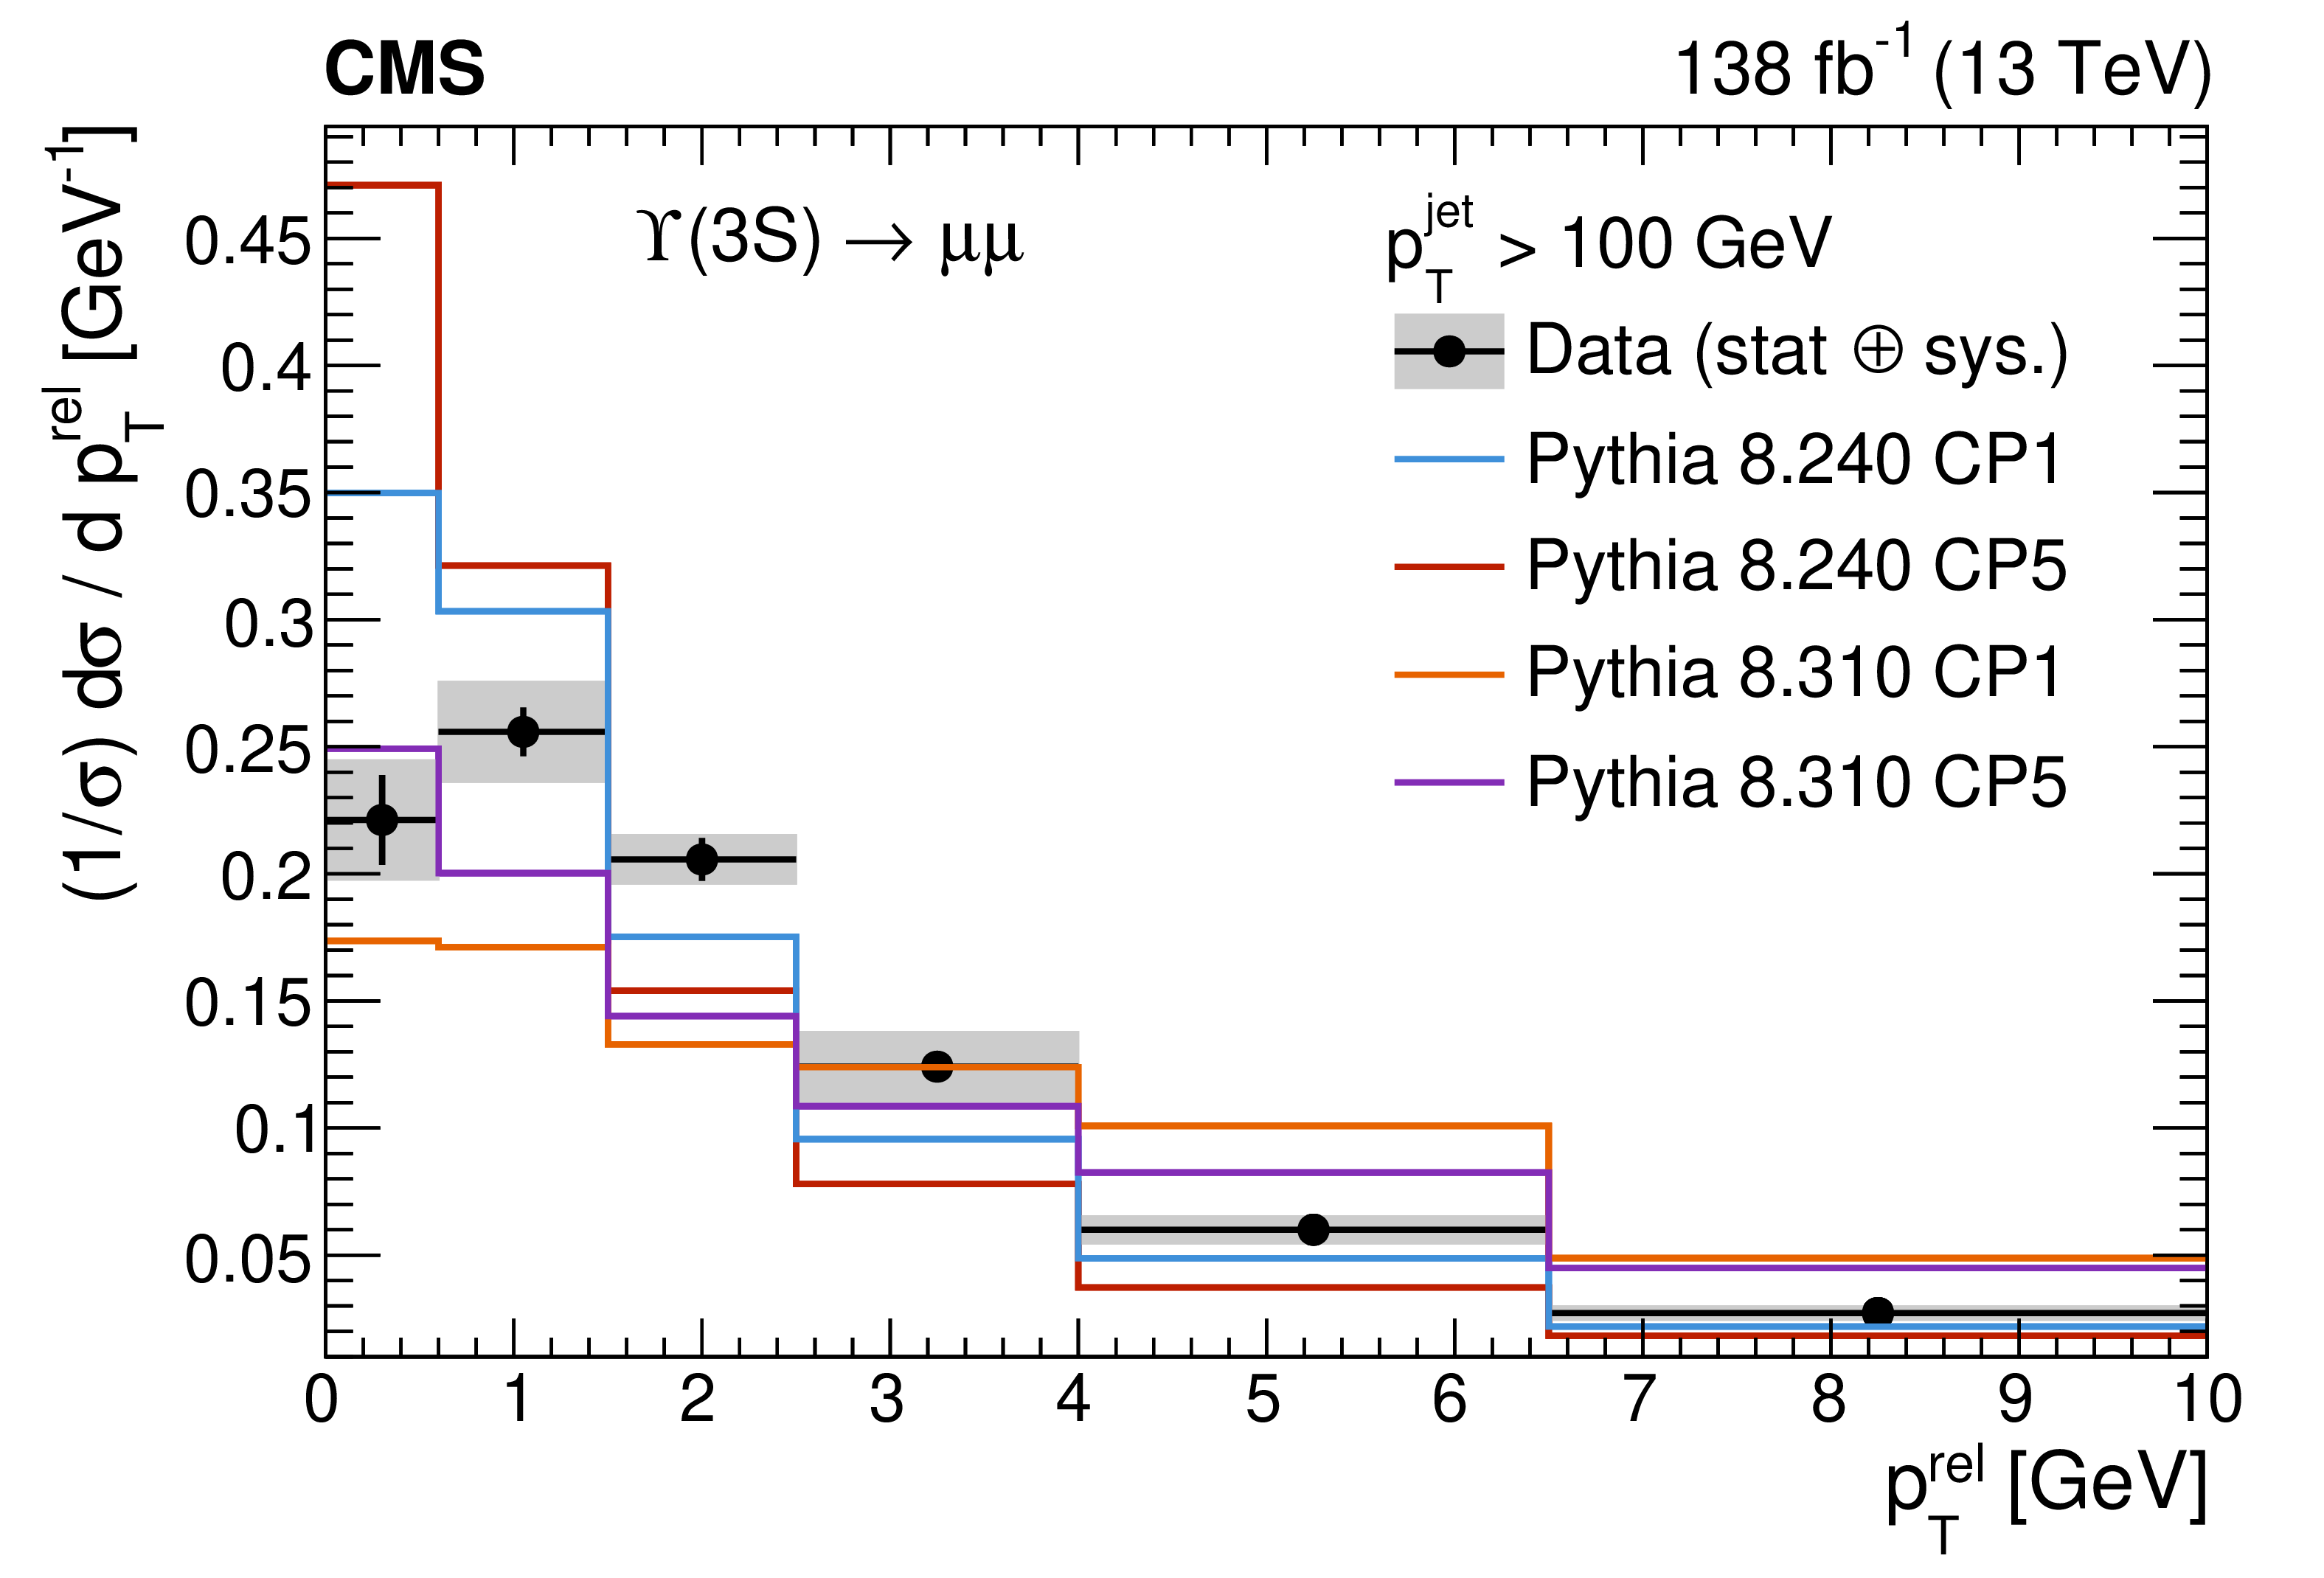
Particle-level results for the longitudinal (left) and transverse profiles (right) of jets containing $ \Upsilon{\textrm{(3S)}} $ mesons in three different $ p_{\mathrm{T}} $ regions. The data (black points) are compared to the expectations of PYTHIA8.240 with the CP1 (blue) and CP5 tunes (red), as well as the PYTHIA8.310 predictions with the CP1 (orange) and CP5 tunes (violet). The vertical error bars represent the statistical uncertainties on the data points, while the grey bands represent the total experimental uncertainties. |
png pdf |
Figure 8-a:
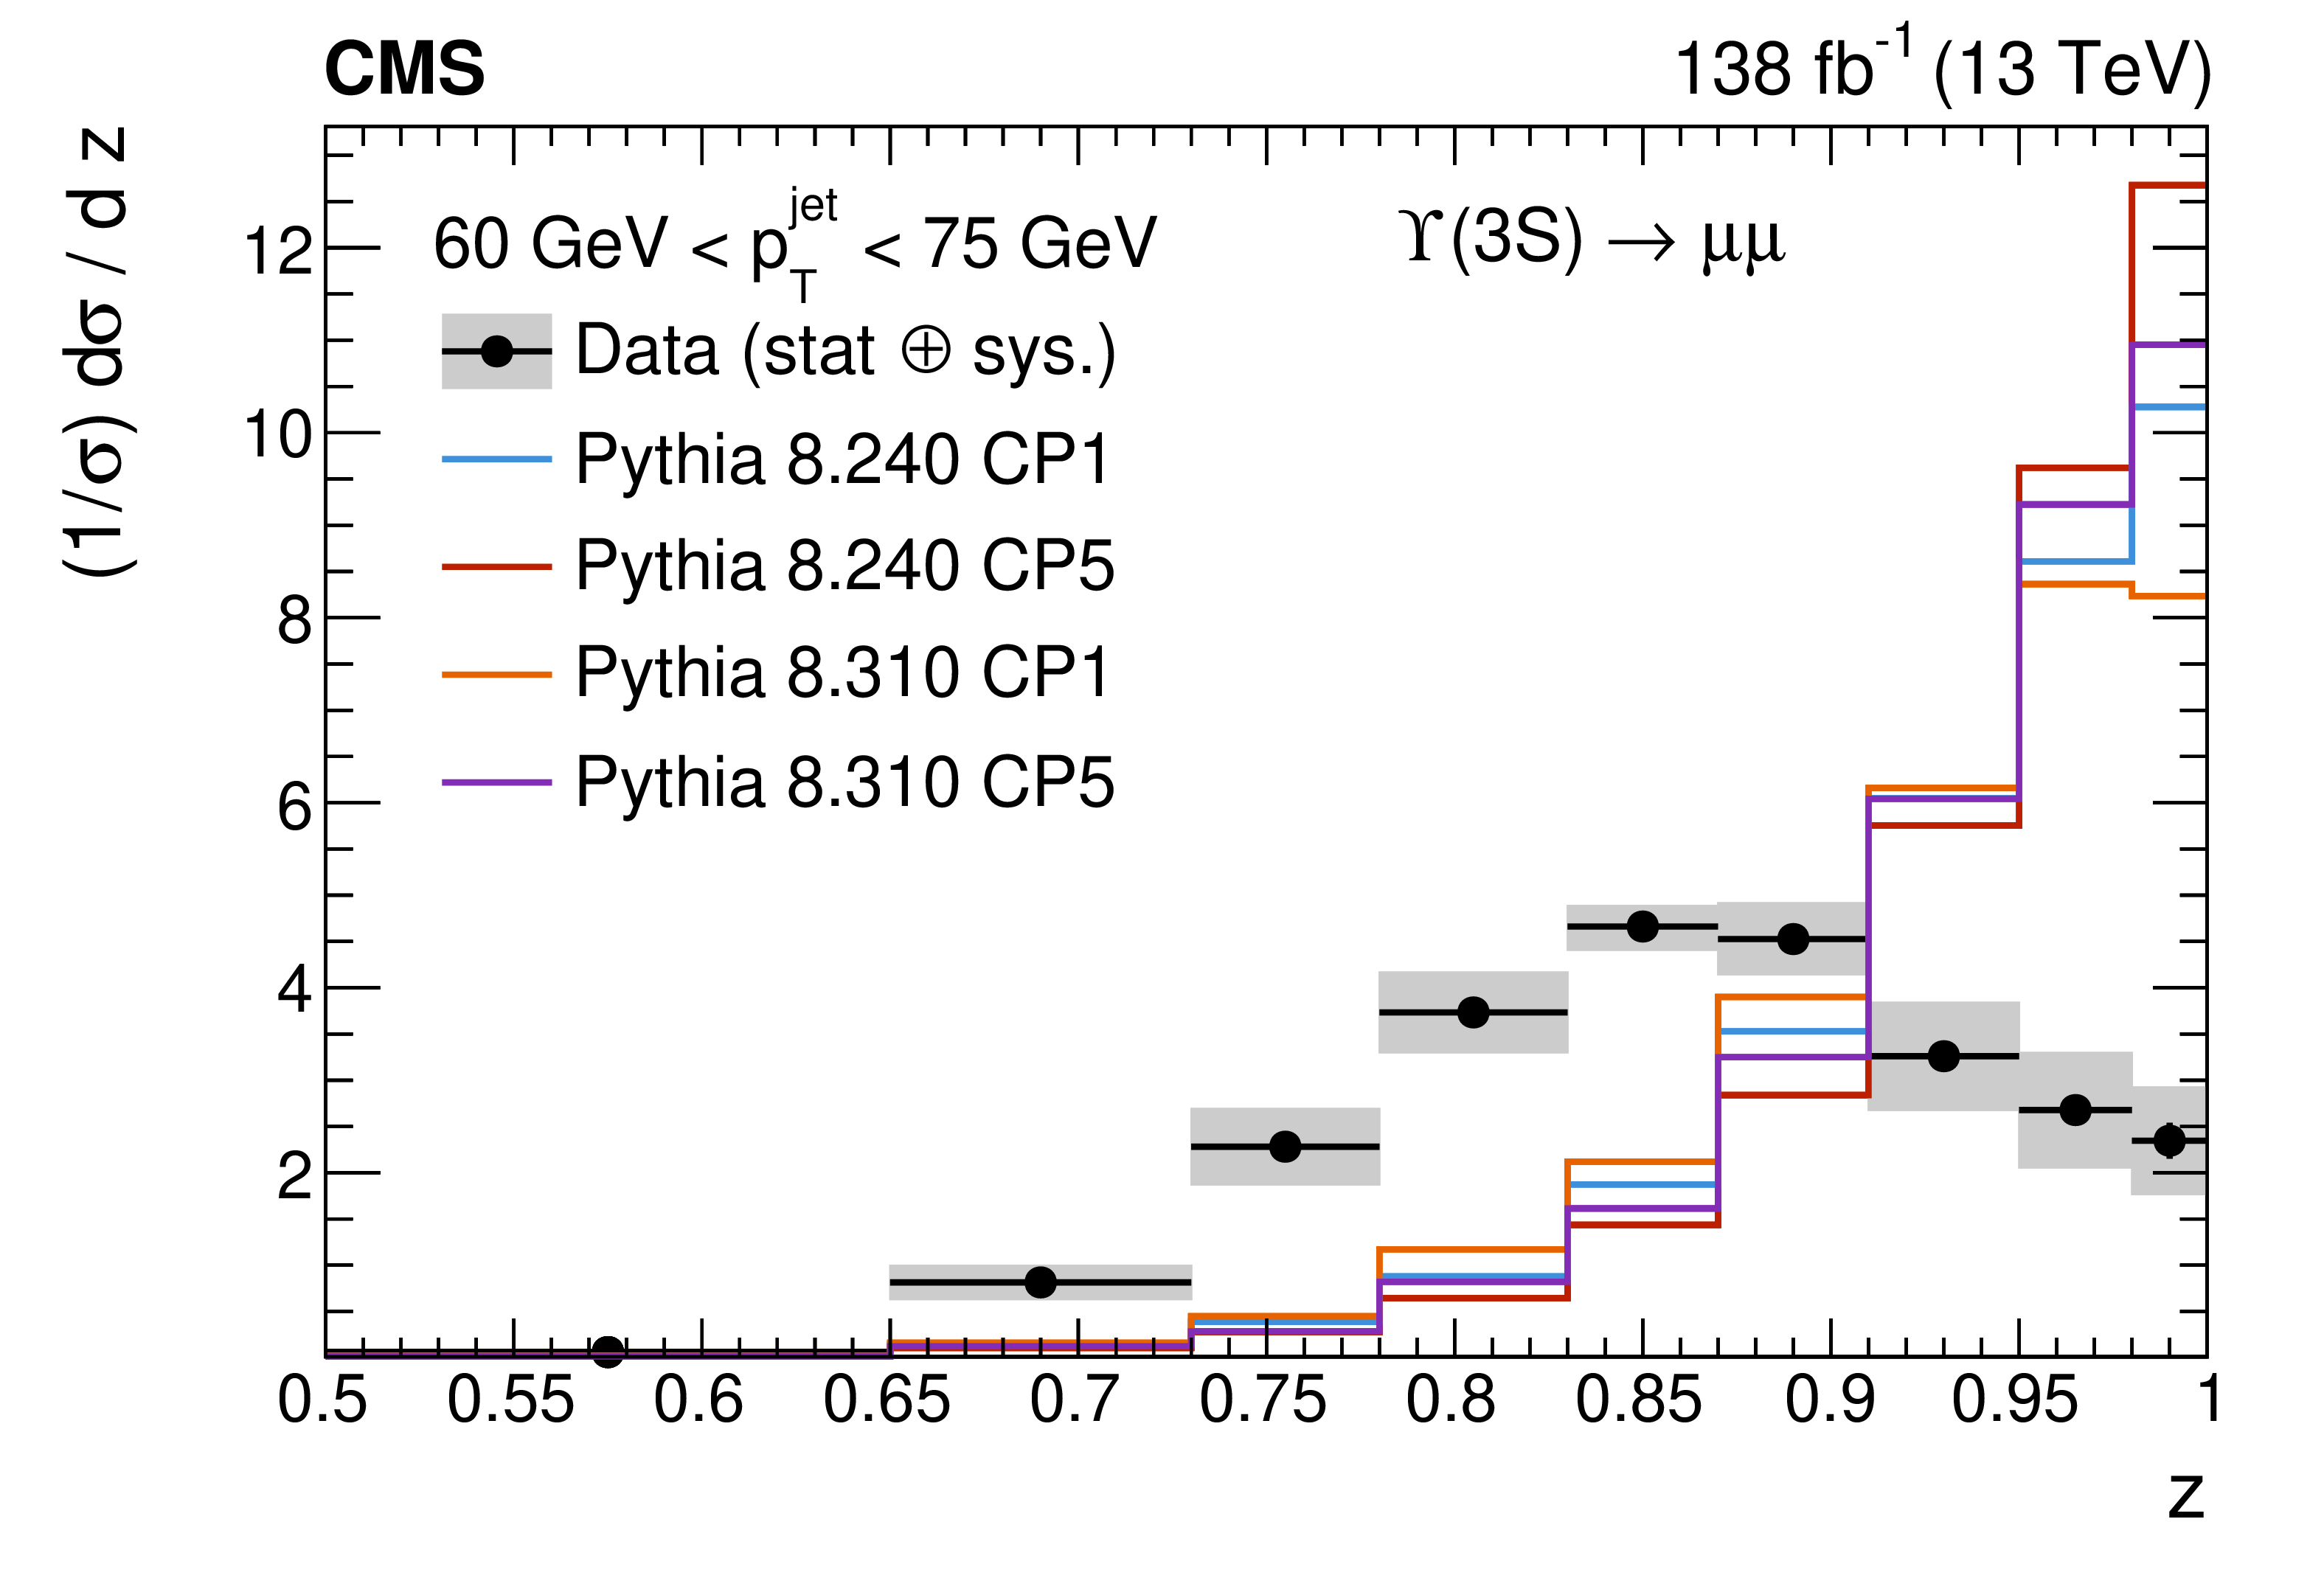
Particle-level results for the longitudinal (left) and transverse profiles (right) of jets containing $ \Upsilon{\textrm{(3S)}} $ mesons in three different $ p_{\mathrm{T}} $ regions. The data (black points) are compared to the expectations of PYTHIA8.240 with the CP1 (blue) and CP5 tunes (red), as well as the PYTHIA8.310 predictions with the CP1 (orange) and CP5 tunes (violet). The vertical error bars represent the statistical uncertainties on the data points, while the grey bands represent the total experimental uncertainties. |
png pdf |
Figure 8-b:
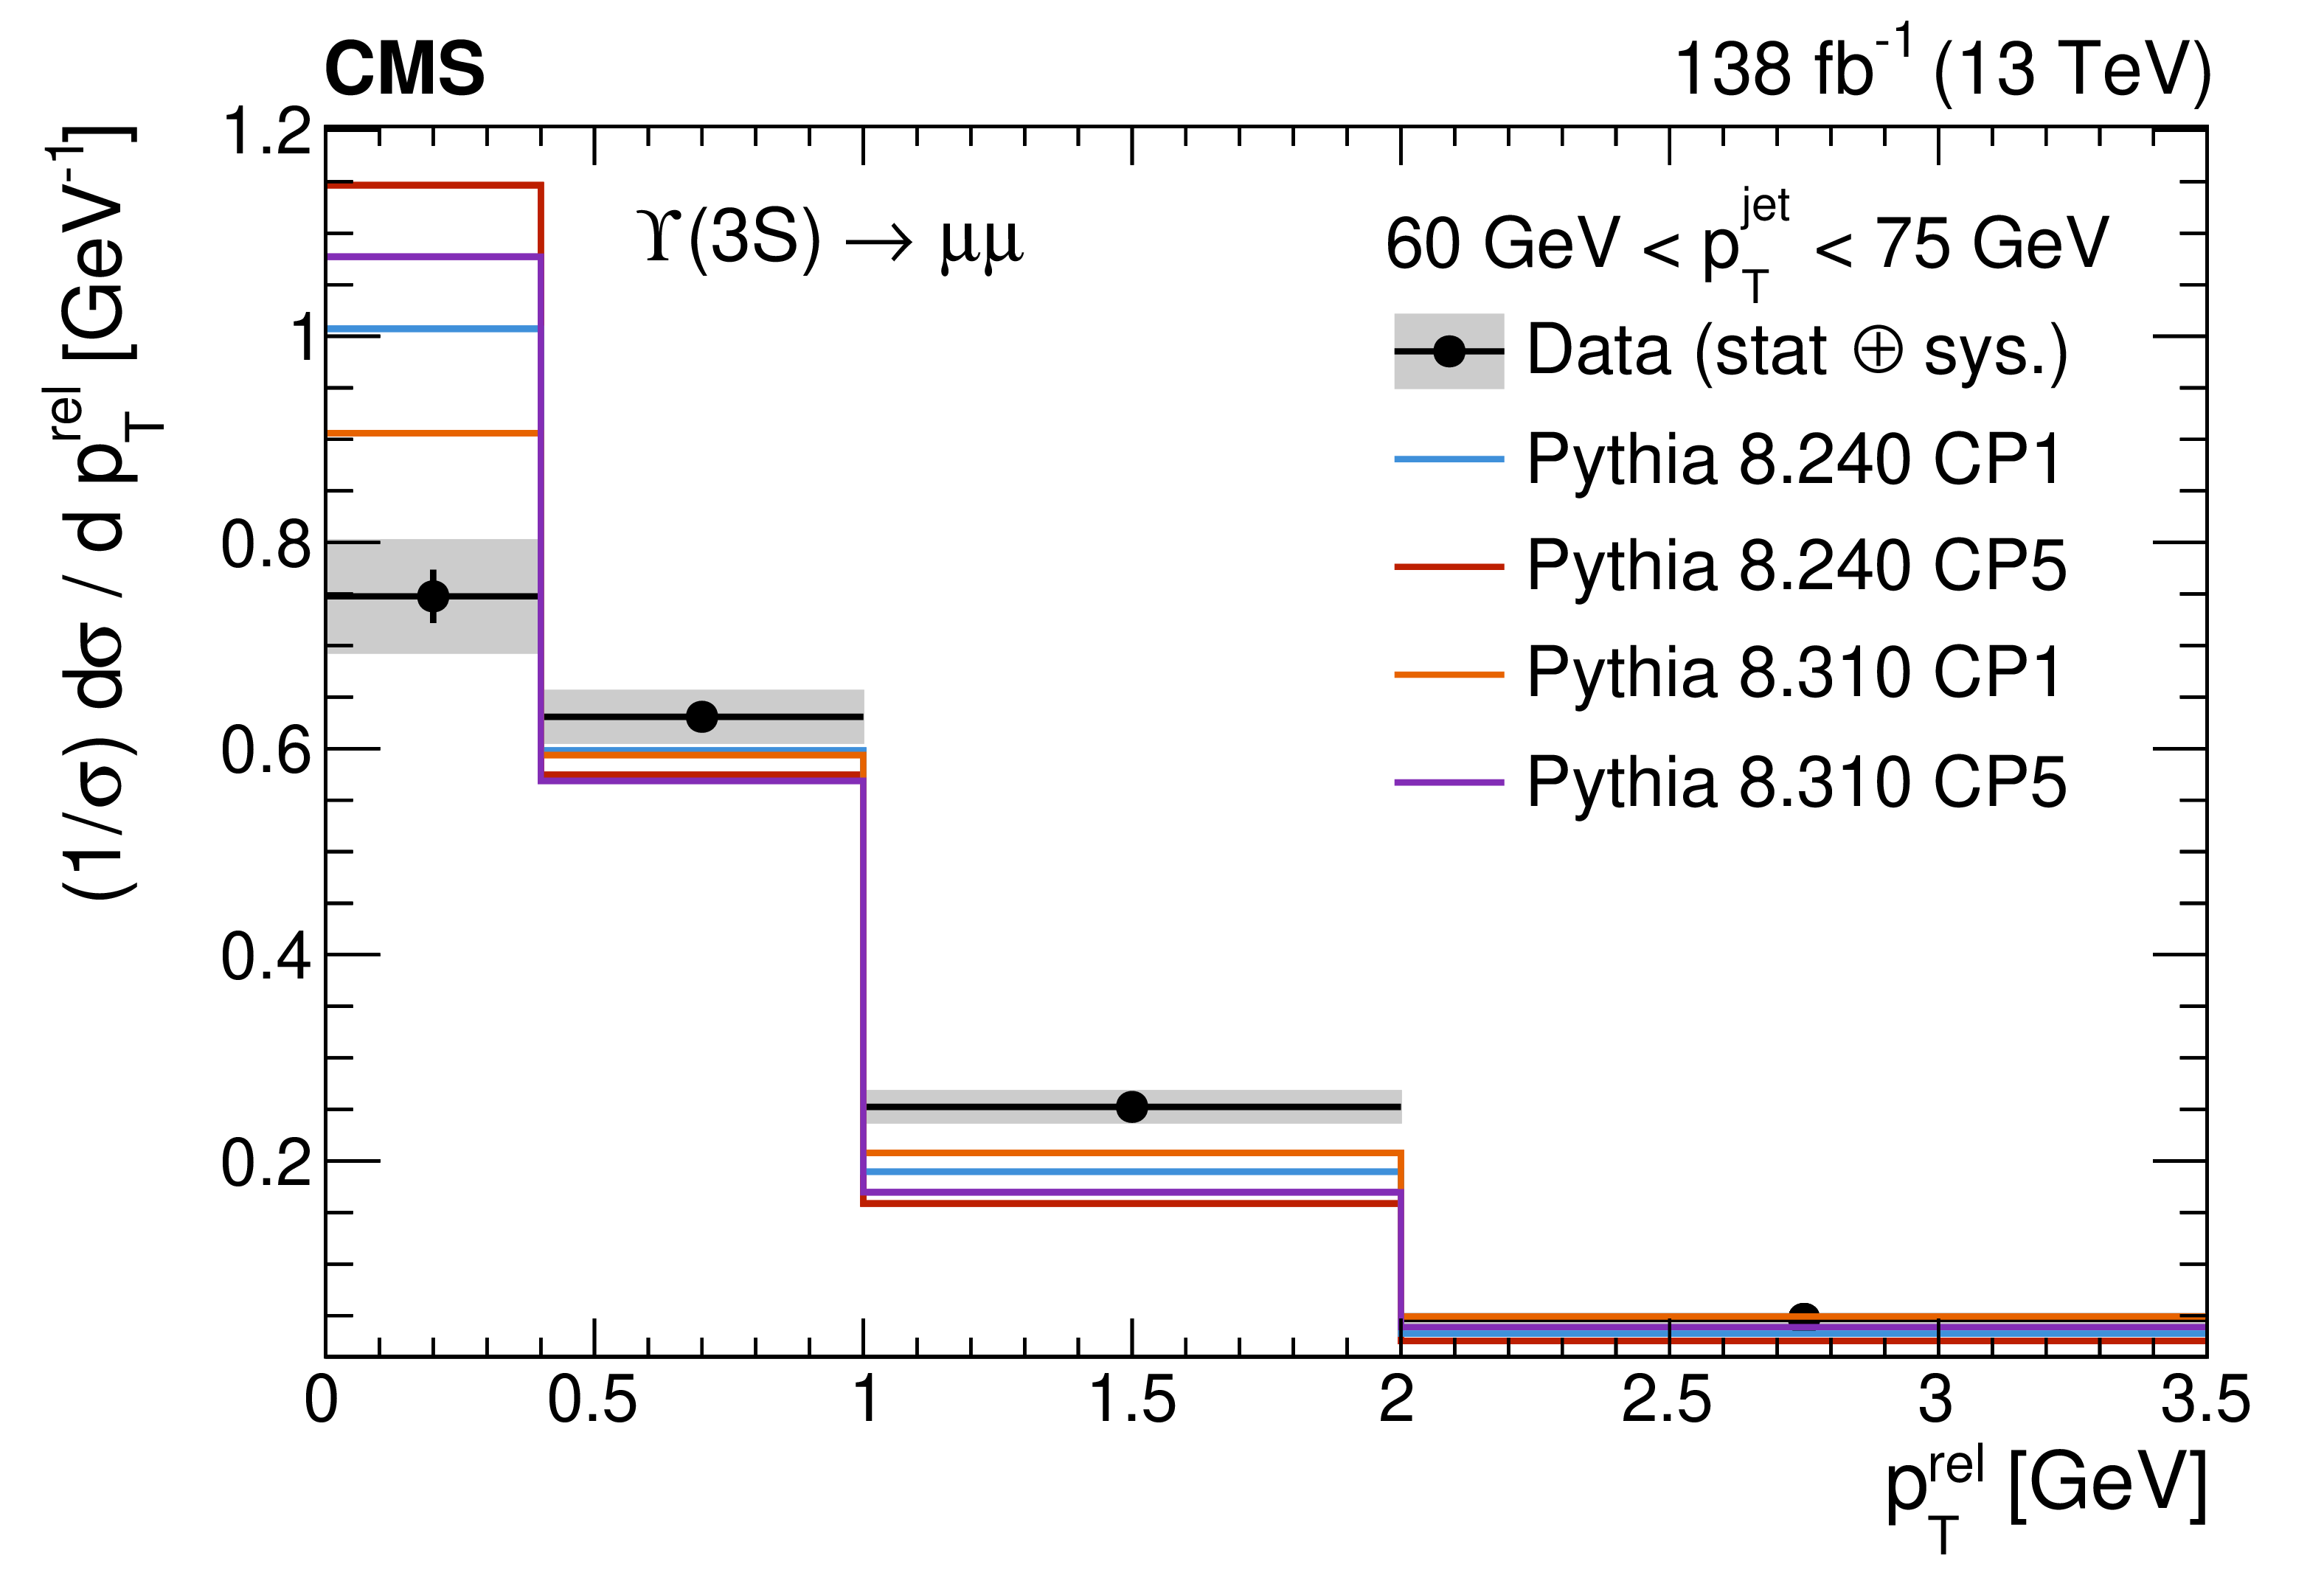
Particle-level results for the longitudinal (left) and transverse profiles (right) of jets containing $ \Upsilon{\textrm{(3S)}} $ mesons in three different $ p_{\mathrm{T}} $ regions. The data (black points) are compared to the expectations of PYTHIA8.240 with the CP1 (blue) and CP5 tunes (red), as well as the PYTHIA8.310 predictions with the CP1 (orange) and CP5 tunes (violet). The vertical error bars represent the statistical uncertainties on the data points, while the grey bands represent the total experimental uncertainties. |
png pdf |
Figure 8-c:
Particle-level results for the longitudinal (left) and transverse profiles (right) of jets containing $ \Upsilon{\textrm{(3S)}} $ mesons in three different $ p_{\mathrm{T}} $ regions. The data (black points) are compared to the expectations of PYTHIA8.240 with the CP1 (blue) and CP5 tunes (red), as well as the PYTHIA8.310 predictions with the CP1 (orange) and CP5 tunes (violet). The vertical error bars represent the statistical uncertainties on the data points, while the grey bands represent the total experimental uncertainties. |
png pdf |
Figure 8-d:
Particle-level results for the longitudinal (left) and transverse profiles (right) of jets containing $ \Upsilon{\textrm{(3S)}} $ mesons in three different $ p_{\mathrm{T}} $ regions. The data (black points) are compared to the expectations of PYTHIA8.240 with the CP1 (blue) and CP5 tunes (red), as well as the PYTHIA8.310 predictions with the CP1 (orange) and CP5 tunes (violet). The vertical error bars represent the statistical uncertainties on the data points, while the grey bands represent the total experimental uncertainties. |
png pdf |
Figure 8-e:
Particle-level results for the longitudinal (left) and transverse profiles (right) of jets containing $ \Upsilon{\textrm{(3S)}} $ mesons in three different $ p_{\mathrm{T}} $ regions. The data (black points) are compared to the expectations of PYTHIA8.240 with the CP1 (blue) and CP5 tunes (red), as well as the PYTHIA8.310 predictions with the CP1 (orange) and CP5 tunes (violet). The vertical error bars represent the statistical uncertainties on the data points, while the grey bands represent the total experimental uncertainties. |
png pdf |
Figure 8-f:
Particle-level results for the longitudinal (left) and transverse profiles (right) of jets containing $ \Upsilon{\textrm{(3S)}} $ mesons in three different $ p_{\mathrm{T}} $ regions. The data (black points) are compared to the expectations of PYTHIA8.240 with the CP1 (blue) and CP5 tunes (red), as well as the PYTHIA8.310 predictions with the CP1 (orange) and CP5 tunes (violet). The vertical error bars represent the statistical uncertainties on the data points, while the grey bands represent the total experimental uncertainties. |
| Summary |
| A measurement of the fragmentation properties of jets containing $ \Upsilon{\textrm{(nS)}} $ quarkonia has been presented for the first time. The measurement is performed using the dimuon decays of the $ \Upsilon $ mesons and the jets containing the dimuon system. The measurements include the longitudinal profile $ z $, the distribution of the fraction of the jet momentum carried by the $ \Upsilon $ meson in the direction of the jet axis, and the transverse profile $ p_{\mathrm{T}}^{\text{rel}} $, the distribution of the momentum of the $ \Upsilon $ meson in the direction perpendicular to the jet axis. The results are compared with the predictions from PYTHIA8.240, in which $ \Upsilon $ mesons are generated directly from the matrix element, as well as with the PYTHIA8.310 predictions, using an alternative approach for the generation of quarkonia from the parton shower. Both PYTHIA versions make use of the CP1 and CP5 tunes. These measurements provide new and stringent tests of non-relativistic QCD (NRQCD). Compared with charmonium, bottomonium production is expected to be more reliably described within the NRQCD framework, because of the larger mass of the b quark, which improves the separation between perturbative and non-perturbative scales. Moreover, the inclusion of the transverse momentum profile of the $ \Upsilon $ meson relative to the jet axis further extends the sensitivity of these measurements to transverse-momentum-dependent aspects of quarkonium production, providing additional constraints on the dynamics of quarkonium formation beyond collinear fragmentation approaches. The results show important discrepancies between the data and the predictions, pointing to $ \Upsilon $ mesons carrying a smaller momentum fraction of the jet than what is predicted in the PYTHIA implementations of NRQCD. These results are consistent in magnitude with previous measurements of jets containing $ \mathrm{J}/\psi $ mesons by the LHCb and CMS Collaborations. While the PYTHIA8.310 improvements tend to go in the correct direction, showing less isolated quarkonia, these results suggest that further theoretical progress is needed to achieve a satisfactory description. Overall, the present measurement is expected to provide additional input to the so-called quarkonium polarization puzzle by constraining the long-distance matrix elements relevant to $ \Upsilon{\textrm{(nS)}} $ production in NRQCD. In particular, the simultaneous sensitivity to the longitudinal and transverse structure of $ \Upsilon{\textrm{(nS)}} $ production in jets may help to disentangle the interplay between colour-singlet and colour-octet production mechanisms in this context, as well as the contributions from higher angular momentum Fock states. |
| References | ||||
| 1 | W. E. Caswell and G. P. Lepage | Effective Lagrangians for bound state problems in QED, QCD, and other field theories | PLB 167 (1986) 437 | |
| 2 | G. T. Bodwin, E. Braaten, and G. P. Lepage | Rigorous QCD analysis of inclusive annihilation and production of heavy quarkonium | PRD 51 (1995) 1125 | hep-ph/9407339 |
| 3 | P. Cho and A. K. Leibovich | Color-octet quarkonia production | PRD 53 (1996) 150 | hep-ph/9505329 |
| 4 | P. Cho and A. K. Leibovich | Color-octet quarkonia production. II | PRD 53 (1996) 6203 | hep-ph/9511315 |
| 5 | CDF Collaboration | $ \mathrm{J}/\psi $ and \PGyP2S production in $ {\mathrm{p}\overline{\mathrm{p}}} $ collisions at $ \sqrt{s}= $ 1.8 TeV | PRL 79 (1997) 572 | |
| 6 | CDF Collaboration | $ \Upsilon $ production in $ {\mathrm{p}\overline{\mathrm{p}}} $ collisions at $ \sqrt{s}= $ 1.8 TeV | PRL 75 (1995) 4358 | |
| 7 | \DZERO Collaboration | $ \mathrm{J}/\psi $ production in $ {\mathrm{p}\overline{\mathrm{p}}} $ collisions at $ \sqrt{s}= $ 1.8 TeV | PLB 370 (1996) 239 | |
| 8 | \DZERO Collaboration | Measurement of inclusive differential cross sections for \PGUP1S production in $ {\mathrm{p}\overline{\mathrm{p}}} $ collisions at $ \sqrt{s}= $ 1.96 TeV | PRL 94 (2005) 232001 | hep-ex/0502030 |
| 9 | CMS Collaboration | Measurement of quarkonium production cross sections in $ {\mathrm{p}\mathrm{p}} $ collisions at $ \sqrt{s}= $ 13 TeV | PLB 780 (2018) 251 | CMS-BPH-15-005 1710.11002 |
| 10 | ATLAS Collaboration | Measurement of the production cross-section of $ \mathrm{J}/\psi $ and \PGyP2S mesons in $ {\mathrm{p}\mathrm{p}} $ collisions at $ \sqrt{s}= $ 13 TeV with the ATLAS detector | EPJC 84 (2024) 169 | 2309.17177 |
| 11 | LHCb Collaboration | Measurement of forward $ \mathrm{J}/\psi $ production cross-sections in $ {\mathrm{p}\mathrm{p}} $ collisions at $ \sqrt{s}= $ 13 TeV | JHEP 10 (2015) 172 | 1509.00771 |
| 12 | ATLAS Collaboration | Measurement of upsilon production in 7 TeV $ {\mathrm{p}\mathrm{p}} $ collisions at ATLAS | PRD 87 (2013) 052004 | 1211.7255 |
| 13 | CMS Collaboration | Measurement of the \PGUP1S, \PGUP2S, and \PGUP3S differential cross sections in $ {\mathrm{p}\mathrm{p}} $ collisions at $ \sqrt{s}= $ 13.6 TeV | Submitted to JHEP, 2026 | CMS-BPH-24-004 2601.20023 |
| 14 | LHCb Collaboration | Measurement of $ \Upsilon $ production in $ {\mathrm{p}\mathrm{p}} $ collisions at $ \sqrt{s}= $ 13 TeV | JHEP 07 (2018) 134 | 1804.09214 |
| 15 | E. Braaten, B. A. Kniehl, and J. Lee | Polarization of prompt $ \mathrm{J}/\psi $ at the Fermilab Tevatron | PRD 62 (2000) 094005 | hep-ph/9911436 |
| 16 | M. Beneke and M. Kr ä mer | Direct $ \mathrm{J}/\psi $ and $ {\psi^\prime} $ polarization and cross sections at the Fermilab Tevatron | PRD 55 (1997) 5269 | hep-ph/9611218 |
| 17 | CDF Collaboration | Polarizations of $ \mathrm{J}/\psi $ and \PGyP2S mesons produced in $ {\mathrm{p}\overline{\mathrm{p}}} $ collisions at $ \sqrt{s}= $ 1.96 TeV | PRL 99 (2007) 132001 | 0704.0638 |
| 18 | \DZERO Collaboration | Measurement of the polarization of the \PGUP1S and \PGUP2S states in $ {\mathrm{p}\overline{\mathrm{p}}} $ collisions at $ \sqrt{s}= $ 1.96 TeV | PRL 101 (2008) 182004 | 0804.2799 |
| 19 | CDF Collaboration | Measurements of the angular distributions of muons from $ \Upsilon $ decays in $ {\mathrm{p}\overline{\mathrm{p}}} $ collisions at $ \sqrt{s}= $ 1.96 TeV | PRL 108 (2012) 151802 | 1112.1591 |
| 20 | CMS Collaboration | Measurement of the prompt $ \mathrm{J}/\psi $ and \PGyP2S polarizations in $ {\mathrm{p}\mathrm{p}} $ collisions at $ \sqrt{s}= $ 7 TeV | PLB 727 (2013) 381 | CMS-BPH-13-003 1307.6070 |
| 21 | CMS Collaboration | Measurement of the polarizations of prompt and non-prompt $ \mathrm{J}/\psi $ and \PGyP2s mesons produced in $ {\mathrm{p}\mathrm{p}} $ collisions at $ \sqrt{s}= $ 13 TeV | PLB 858 (2024) 139044 | CMS-BPH-22-009 2406.14409 |
| 22 | CMS Collaboration | Measurement of the \PGUP1S, \PGUP2S and \PGUP3S polarizations in $ {\mathrm{p}\mathrm{p}} $ collisions at $ \sqrt{s}= $ 7 TeV | PRL 110 (2013) 081802 | CMS-BPH-11-023 1209.2922 |
| 23 | LHCb Collaboration | Measurement of $ \mathrm{J}/\psi $ polarization in $ {\mathrm{p}\mathrm{p}} $ collisions at $ \sqrt{s}= $ 7 TeV | EPJC 73 (2013) 2631 | 1307.6379 |
| 24 | LHCb Collaboration | Measurement of the $ \Upsilon{\textrm{(nS)}} $ polarizations in $ {\mathrm{p}\mathrm{p}} $ collisions at $ \sqrt{s}= $ 7 and 8 TeV | JHEP 12 (2017) 110 | 1709.01301 |
| 25 | B. Mele and P. Nason | The fragmentation function for heavy quarks in QCD | [Corrigendum: \DOI10./j.nuclphysb..05.005], 1991 NPB 361 (1991) 626 |
|
| 26 | M. Cacciari and E. Gardi | Heavy-quark fragmentation | NPB 664 (2003) 299 | hep-ph/0301047 |
| 27 | ATLAS Collaboration | Measurement of $ {\mathrm{D}^{\ast}(2010)^{\pm}} $ meson production in jets from $ {\mathrm{p}\mathrm{p}} $ collisions at $ \sqrt{s}= $ 7 TeV with the ATLAS detector | PRD 85 (2012) 052005 | 1112.4432 |
| 28 | ATLAS Collaboration | Measurement of b-quark fragmentation properties in jets using the decay $ {{\mathrm{B}^{\pm}}\to\mathrm{J}/\psi \mathrm{K^{\pm}}} $ in $ {\mathrm{p}\mathrm{p}} $ collisions at $ \sqrt{s}= $ 13 TeV with the ATLAS detector | JHEP 12 (2021) 131 | 2108.11650 |
| 29 | ALICE Collaboration | Measurement of the production of charm jets tagged with $ \mathrm{D^0} $ mesons in $ {\mathrm{p}\mathrm{p}} $ collisions at $ \sqrt{s}= $ 5.02 and 13 TeV | JHEP 06 (2023) 133 | 2204.10167 |
| 30 | LHCb Collaboration | $ {\mathrm{B}} $-jet fragmentation with $ {{\mathrm{B}^{\pm}}\to\mathrm{J}/\psi \mathrm{K^{\pm}}} $ decays in $ \sqrt{s}= $ 13 TeV $ {\mathrm{p}\mathrm{p}} $ collisions at LHCb | PRD 113 (2026) 112006 | 2603.23663 |
| 31 | M. Baumgart, A. K. Leibovich, T. Mehen, and I. Z. Rothstein | Probing quarkonium production mechanisms with jet substructure | JHEP 11 (2014) 003 | 1406.2295 |
| 32 | Z.-B. Kang et al. | $ \mathrm{J}/\psi $ production and polarization within a jet | PRL 119 (2017) 032001 | 1702.03287 |
| 33 | LHCb Collaboration | Study of $ \mathrm{J}/\psi $ production in jets | PRL 118 (2017) 192001 | 1701.05116 |
| 34 | LHCb Collaboration | Measurements of \PGyP2S and \PGccDoP3872 production within fully reconstructed jets | EPJC 85 (2025) 562 | 2410.18018 |
| 35 | CMS Collaboration | Study of $ \mathrm{J}/\psi $ meson production inside jets in $ {\mathrm{p}\mathrm{p}} $ collisions at $ \sqrt{s}= $ 8 TeV | PLB 804 (2020) 135409 | CMS-BPH-15-003 1910.01686 |
| 36 | CMS Collaboration | Fragmentation of jets containing a prompt $ \mathrm{J}/\psi $ meson in PbPb and $ {\mathrm{p}\mathrm{p}} $ collisions at $ {\sqrt{\smash[b]{s_{_{\mathrm{NN}}}}}= $ 5.02 TeV | PLB 825 (2021) 136842 | CMS-HIN-19-007 2106.13235 |
| 37 | T. Sjöstrand et al. | An introduction to PYTHIA8.2 | Comput. Phys. Commun. 191 (2015) 159 | 1410.3012 |
| 38 | C. Bierlich et al. | A comprehensive guide to the physics and usage of PYTHIA8.3 | SciPost Phys. Codeb. 8 (2022) | 2203.11601 |
| 39 | R. Bain et al. | NRQCD confronts LHCb data on quarkonium production within jets | PRL 119 (2017) 032002 | 1702.05525 |
| 40 | Y. Wang, D. Kang, and H. S. Chung | NRQCD reconfronts LHCb data on quarkonium production within jets | PRD 112 (2025) L071504 | 2507.19022 |
| 41 | N. Cooke, P. Ilten, L. Lönnblad, and S. Mrenna | Non-relativistic quantum chromodynamics in parton showers | EPJC 84 (2024) 432 | 2312.05203 |
| 42 | F. G. Celiberto | On the quarkonium-in-jet collinear fragmentation at moderate-to-large transverse momentum | in Proc. Diffraction and Low-$ x $: Palermo, Italy, September 08--14,.. [-A22], 2025 Acta Phys. Polon. Supp. 18 (2025) 1 |
2412.05661 |
| 43 | F. G. Celiberto and F. Lonigro | Pseudoscalar heavy-quarkonium hadroproduction from nonrelativistic fragmentation at NLL/NLO\textsuperscript+ | PRD 112 (2025) 114040 | 2510.10593 |
| 44 | M. G. Echevarria, Y. Makris, and I. Scimemi | Quarkonium TMD fragmentation functions in NRQCD | JHEP 10 (2020) 164 | 2007.05547 |
| 45 | M. G. Echevarria, S. F. Romera, and I. Scimemi | Gluon TMD fragmentation function into quarkonium | JHEP 12 (2023) 181 | 2308.12356 |
| 46 | M. Copeland et al. | Polarized TMD fragmentation functions for $ \mathrm{J}/\psi $ production | PRD 109 (2024) 054017 | 2308.08605 |
| 47 | E. Chapon et al. | Prospects for quarkonium studies at the high-luminosity LHC | Prog. Part. Nucl. Phys. 122 (2022) 103906 | 2012.14161 |
| 48 | CMS Collaboration | HEPData record for this analysis | link | |
| 49 | CMS Collaboration | The CMS experiment at the CERN LHC | JINST 3 (2008) S08004 | |
| 50 | CMS Collaboration | Development of the CMS detector for the CERN LHC \mboxRun 3 | JINST 19 (2024) P05064 | CMS-PRF-21-001 2309.05466 |
| 51 | CMS Collaboration | Performance of the CMS Level-1 trigger in proton-proton collisions at $ \sqrt{s}= $ 13 TeV | JINST 15 (2020) P10017 | CMS-TRG-17-001 2006.10165 |
| 52 | CMS Collaboration | The CMS trigger system | JINST 12 (2017) P01020 | CMS-TRG-12-001 1609.02366 |
| 53 | CMS Collaboration | Performance of the CMS high-level trigger during LHC \mboxRun 2 | JINST 19 (2024) P11021 | CMS-TRG-19-001 2410.17038 |
| 54 | CMS Collaboration | Electron and photon reconstruction and identification with the CMS experiment at the CERN LHC | JINST 16 (2021) P05014 | CMS-EGM-17-001 2012.06888 |
| 55 | CMS Collaboration | Performance of the CMS muon detector and muon reconstruction with proton-proton collisions at $ \sqrt{s}= $ 13 TeV | JINST 13 (2018) P06015 | CMS-MUO-16-001 1804.04528 |
| 56 | CMS Collaboration | Description and performance of track and primary-vertex reconstruction with the CMS tracker | JINST 9 (2014) P10009 | CMS-TRK-11-001 1405.6569 |
| 57 | CMS Collaboration | Particle-flow reconstruction and global event description with the CMS detector | JINST 12 (2017) P10003 | CMS-PRF-14-001 1706.04965 |
| 58 | M. Cacciari, G. P. Salam, and G. Soyez | The anti-$ k_{\mathrm{T}} $ jet clustering algorithm | JHEP 04 (2008) 063 | 0802.1189 |
| 59 | M. Cacciari, G. P. Salam, and G. Soyez | FASTJET user manual | EPJC 72 (2012) 1896 | 1111.6097 |
| 60 | CMS Collaboration | Pileup mitigation at CMS in 13 TeV data | JINST 15 (2020) P09018 | CMS-JME-18-001 2003.00503 |
| 61 | CMS Collaboration | Jet energy scale and resolution in the CMS experiment in $ {\mathrm{p}\mathrm{p}} $ collisions at 8 TeV | JINST 12 (2017) P02014 | CMS-JME-13-004 1607.03663 |
| 62 | CMS Collaboration | Extraction and validation of a new set of CMS PYTHIA8 tunes from underlying-event measurements | EPJC 80 (2020) 4 | CMS-GEN-17-001 1903.12179 |
| 63 | NNPDF Collaboration | Parton distributions from high-precision collider data | EPJC 77 (2017) 663 | 1706.00428 |
| 64 | R. Baier and R. R \"u ckl | Hadronic collisions: A quarkonium factory | Z. Phys. C 19 (1983) 251 | |
| 65 | R. Gastmans, W. Troost, and T. T. Wu | Production of heavy quarkonia from gluons | NPB 291 (1987) 731 | |
| 66 | D. J. Lange | The EVTGEN particle decay simulation package | NIM A 462 (2001) 152 | |
| 67 | GEANT4 Collaboration | GEANT 4---a simulation toolkit | NIM A 506 (2003) 250 | |
| 68 | A. Bodek et al. | Extracting muon momentum scale corrections for hadron collider experiments | EPJC 72 (2012) 2194 | 1208.3710 |
| 69 | CMS Collaboration | Measurement of the inelastic proton-proton cross section at $ \sqrt{s}= $ 13 TeV | JHEP 07 (2018) 161 | CMS-FSQ-15-005 1802.02613 |
| 70 | CMS Collaboration | Performance of the CMS muon trigger system in proton-proton collisions at $ \sqrt{s}= $ 13 TeV | JINST 16 (2021) P07001 | CMS-MUO-19-001 2102.04790 |
| 71 | E. Braaten and T. C. Yuan | Gluon fragmentation into heavy quarkonium | PRL 71 (1993) 1673 | hep-ph/9303205 |
| 72 | E. Braaten, K. Cheung, and T. C. Yuan | $ \mathrm{Z^0} $ decay into charmonium via charm quark fragmentation | PRD 48 (1993) 4230 | hep-ph/9302307 |
| 73 | E. Braaten and T. C. Yuan | Gluon fragmentation into $ {P} $-wave heavy quarkonium | PRD 50 (1994) 3176 | hep-ph/9403401 |
| 74 | E. Braaten and T. C. Yuan | Gluon fragmentation into spin-triplet $ {S} $-wave quarkonium | PRD 52 (1995) 6627 | hep-ph/9507398 |
| 75 | T. C. Yuan | Perturbative QCD fragmentation functions for production of $ {P} $-wave charm and bottom mesons | PRD 50 (1994) 5664 | hep-ph/9405348 |
| 76 | CMS Collaboration | Precision luminosity measurement in proton-proton collisions at $ \sqrt{s}= $ 13 TeV in 2015 and 2016 at CMS | EPJC 81 (2021) 800 | CMS-LUM-17-003 2104.01927 |
| 77 | CMS Collaboration | CMS luminosity measurement for the 2017 data-taking period at $ \sqrt{s}= $ 13 TeV | CMS Physics Analysis Summary, 2018 CMS-PAS-LUM-17-004 |
CMS-PAS-LUM-17-004 |
| 78 | CMS Collaboration | CMS luminosity measurement for the 2018 data-taking period at $ \sqrt{s}= $ 13 TeV | CMS Physics Analysis Summary, 2019 CMS-PAS-LUM-18-002 |
CMS-PAS-LUM-18-002 |
| 79 | M. J. Oreglia | A study of the reactions $ {\psi^\prime\to\gamma\gamma\psi} $ | PhD thesis, Stanford University, SLAC-R-236, 1980 link |
|
| 80 | J. E. Gaiser | Charmonium spectroscopy from radiative decays of the $ \mathrm{J}/\psi $ and $ {\psi^\prime} $ | PhD thesis, Stanford University, SLAC-0255, 1982 link |
|
| 81 | Particle Data Group , S. Navas et al. | Review of particle physics | PRD 110 (2024) 030001 | |
| 82 | G. D'Agostini | A multidimensional unfolding method based on Bayes' theorem | NIM A 362 (1995) 487 | |
| 83 | T. Adye | Unfolding algorithms and tests using RooUnfold | in orkshop on Statistical Issues Related to Discovery Claims in Search Experiments and Unfolding (PHYSTAT ): Geneva, Switzerland, January 17--20,, 2011 Proc. 2011 (2011) W |
1105.1160 |
| 84 | CMS Collaboration | Measurement of the inclusive W and Z production cross sections in $ {\mathrm{p}\mathrm{p}} $ collisions at $ \sqrt{s}= $ 7 TeV with the CMS experiment | JHEP 10 (2011) 132 | CMS-EWK-10-005 1107.4789 |
|
|
Compact Muon Solenoid LHC, CERN |

|

|

|

|

|

|