

Compact Muon Solenoid
LHC, CERN
| CMS-BPH-22-009 ; CERN-EP-2024-155 | ||
| Measurement of the polarizations of prompt and non-prompt $ \mathrm{J}/\psi $ and $\psi \text{(2S)} $ mesons produced in pp collisions at $ \sqrt{s} = $ 13 TeV | ||
| CMS Collaboration | ||
| 20 June 2024 | ||
| Phys. Lett. B 858 (2024) 139044 | ||
| Abstract: The polarizations of prompt and non-prompt $ \mathrm{J}/\psi $ and $\psi \text{(2S)} $ mesons are measured in proton-proton collisions at $ \sqrt{s} = $ 13 TeV, using data samples collected by the CMS experiment in 2017 and 2018, corresponding to a total integrated luminosity of 103.3 fb$ ^{-1} $. Based on the analysis of the dimuon decay angular distributions in the helicity frame, the polar anisotropy, $ \lambda_\vartheta $, is measured as a function of the transverse momentum, $ p_{\mathrm{T}} $, of the charmonium states, in the 25-120 and 20-100 GeV ranges for the $ \mathrm{J}/\psi $ and $\psi \text{(2S)} $, respectively. The non-prompt polarizations agree with predictions based on the hypothesis that, for $ p_{\mathrm{T}} \gtrsim $ 25 GeV, the non-prompt $ \mathrm{J}/\psi $ and $\psi \text{(2S)} $ are predominantly produced in two-body B meson decays. The prompt results clearly exclude strong transverse polarizations, even for $ p_{\mathrm{T}} $ exceeding 30 times the $ \mathrm{J}/\psi $ mass, where $ \lambda_\vartheta $ tends to an asymptotic value around 0.3. Taken together with previous measurements, by CMS and LHCb at $ \sqrt{s} = $ 7 TeV, the prompt polarizations show a significant variation with $ p_{\mathrm{T}} $, at low $ p_{\mathrm{T}} $. | ||
| Links: e-print arXiv:2406.14409 [hep-ex] (PDF) ; CDS record ; inSPIRE record ; HepData record ; CADI line (restricted) ; | ||
| Figures | |
png pdf |
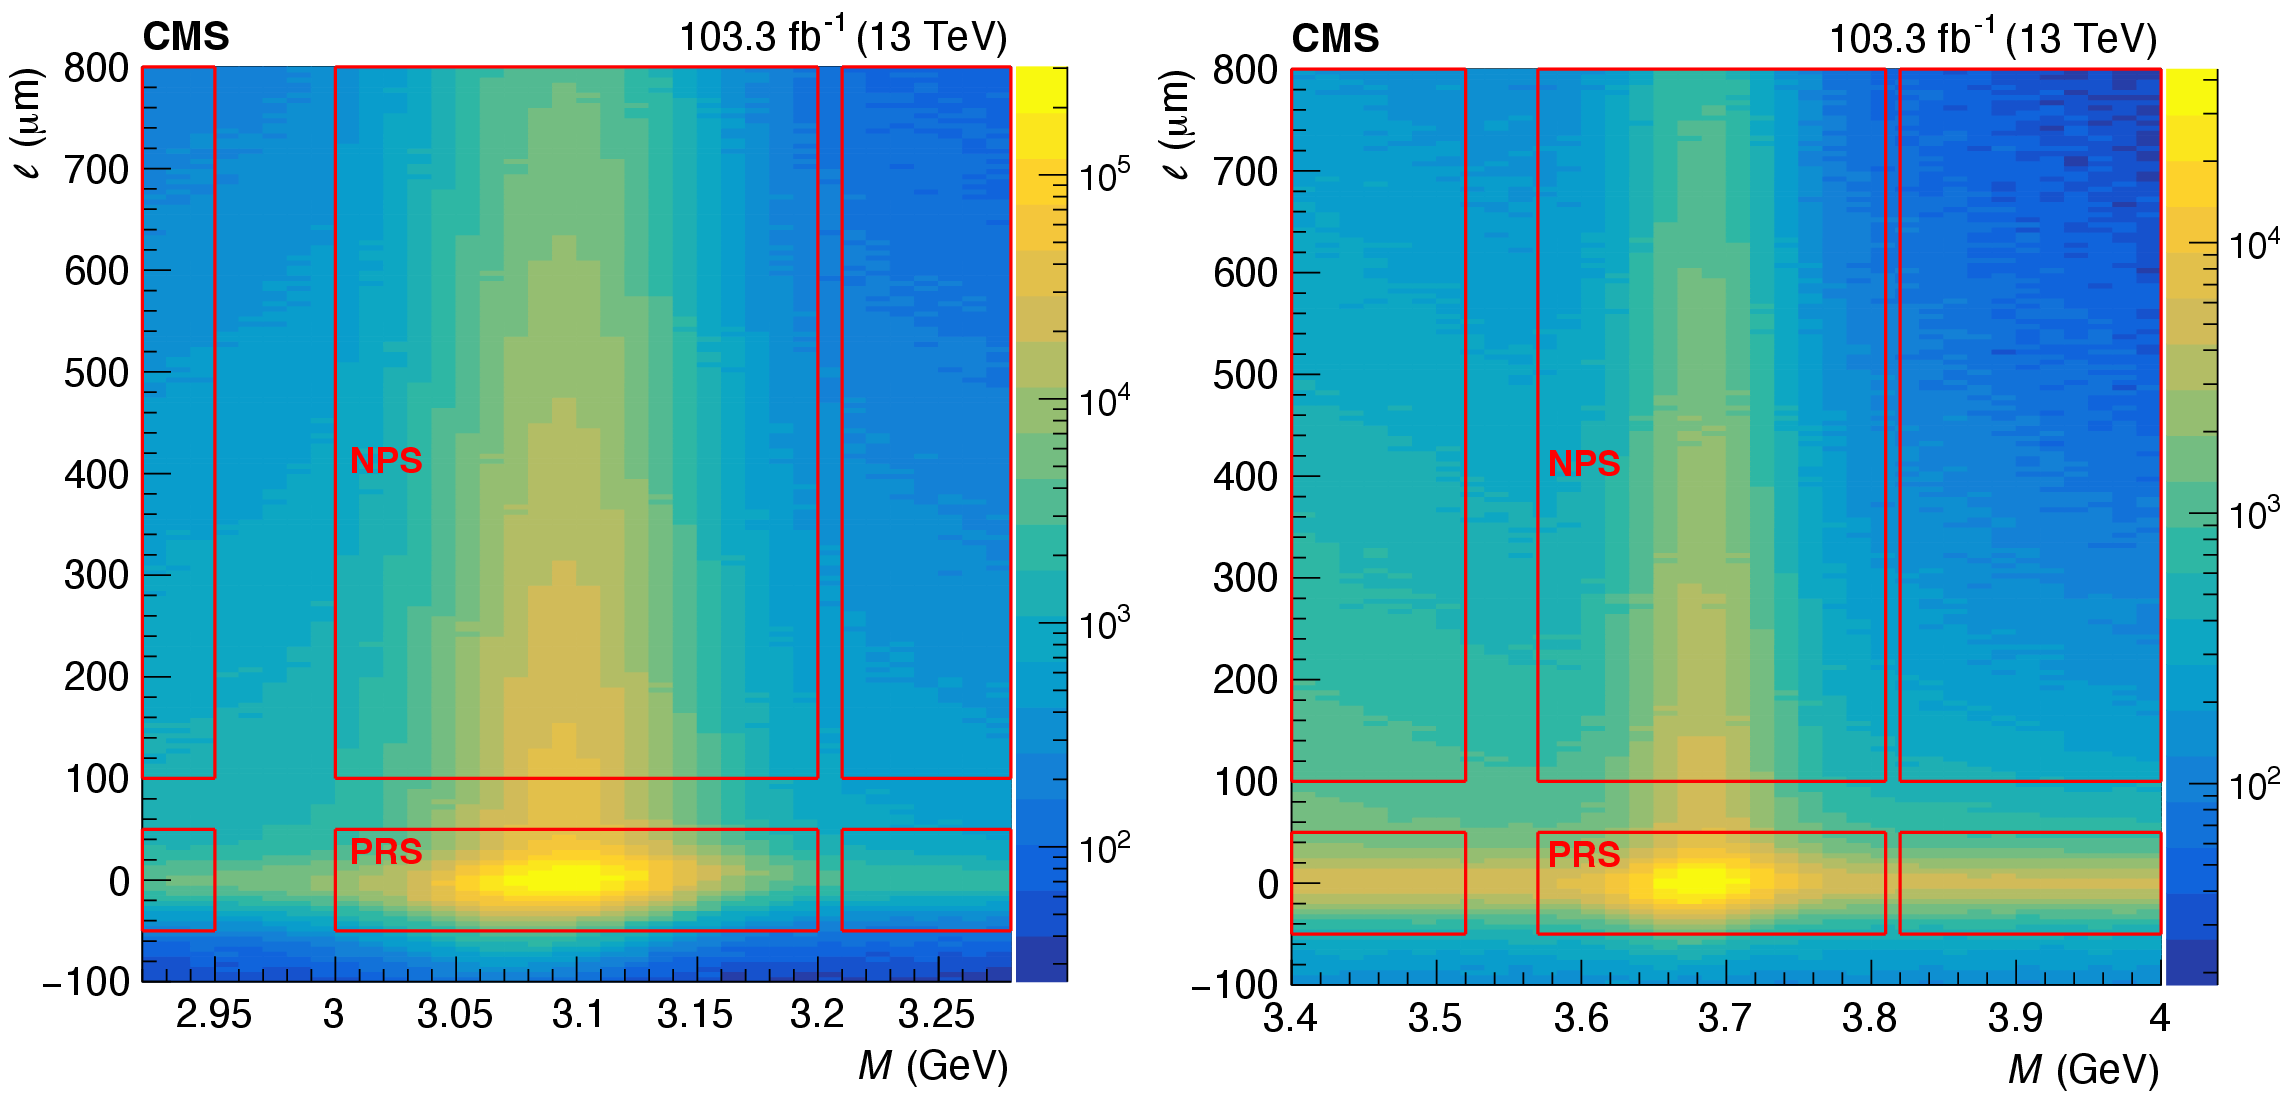
Figure 1:
Measured dimuon decay length vs. mass distributions for the $ \mathrm{J}/\psi $ (left) and $\psi \text{(2S)} $ (right) samples, showing the rectangular regions used in the analysis. The prompt and non-prompt signal regions are labeled PRS and NPS, respectively, while the remaining regions are non-signal (sideband) regions. |
png pdf |
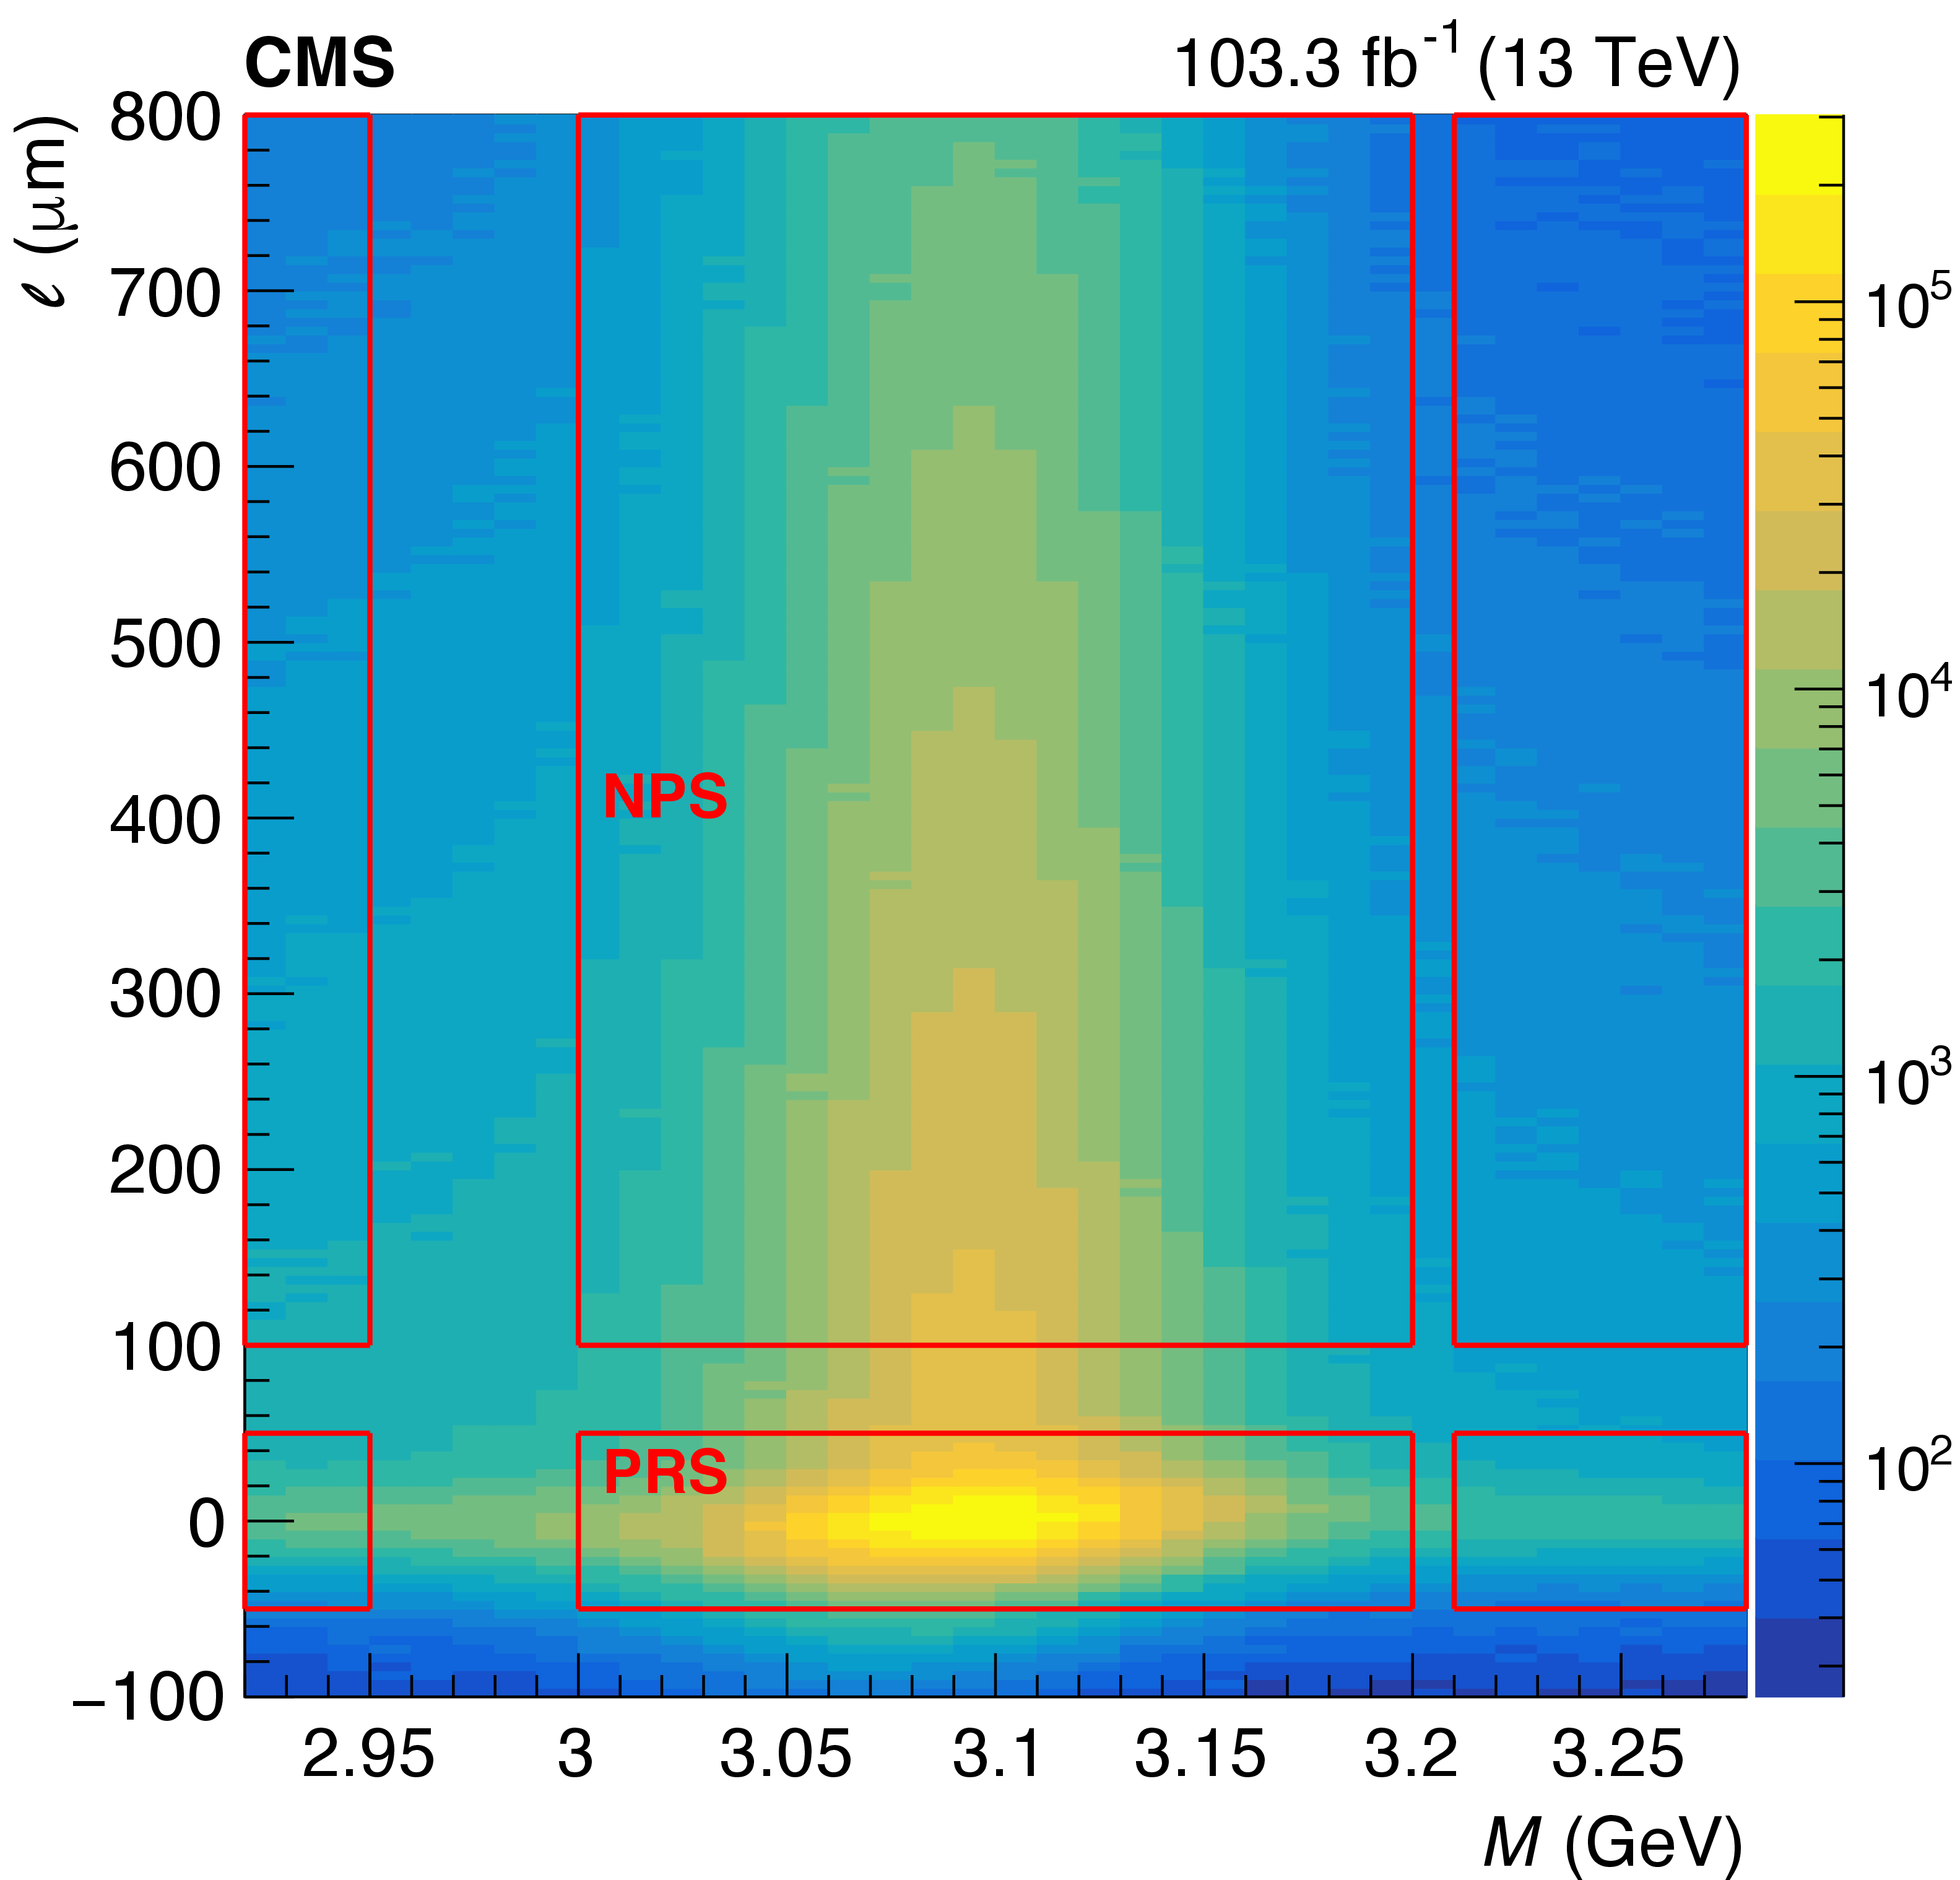
Figure 1-a:
Measured dimuon decay length vs. mass distributions for the $ \mathrm{J}/\psi $ (left) and $\psi \text{(2S)} $ (right) samples, showing the rectangular regions used in the analysis. The prompt and non-prompt signal regions are labeled PRS and NPS, respectively, while the remaining regions are non-signal (sideband) regions. |
png pdf |
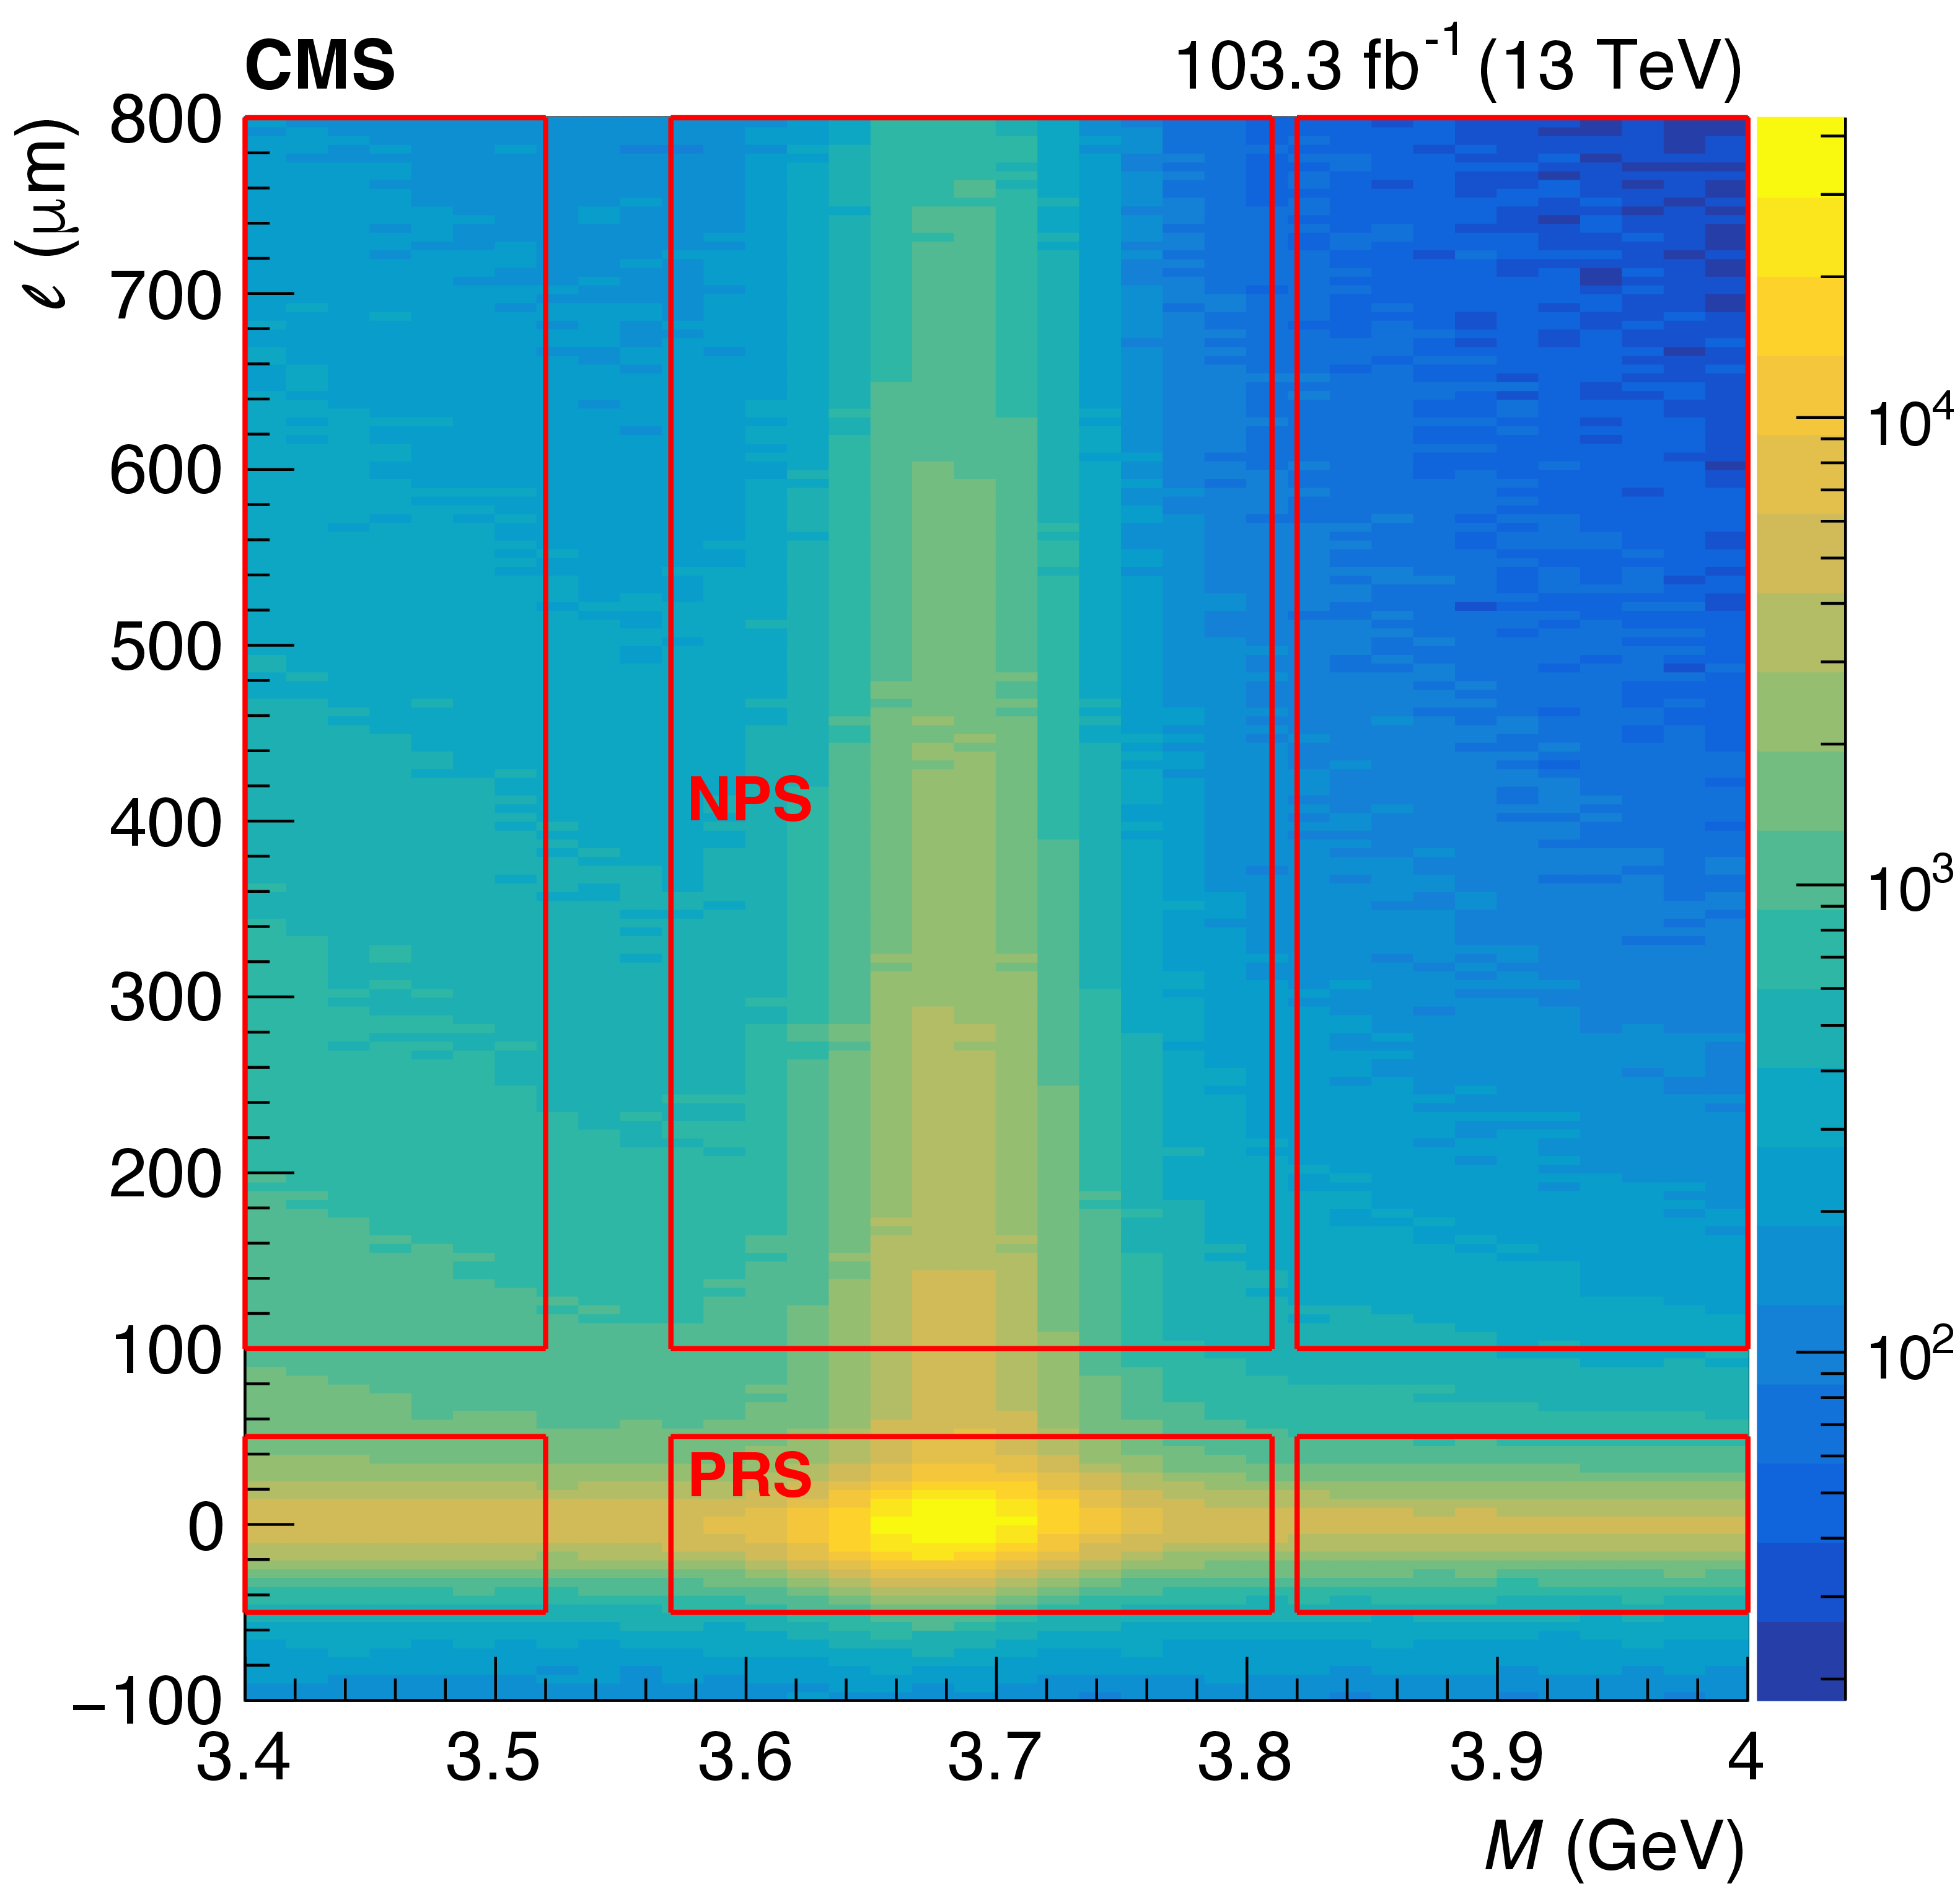
Figure 1-b:
Measured dimuon decay length vs. mass distributions for the $ \mathrm{J}/\psi $ (left) and $\psi \text{(2S)} $ (right) samples, showing the rectangular regions used in the analysis. The prompt and non-prompt signal regions are labeled PRS and NPS, respectively, while the remaining regions are non-signal (sideband) regions. |
png pdf |
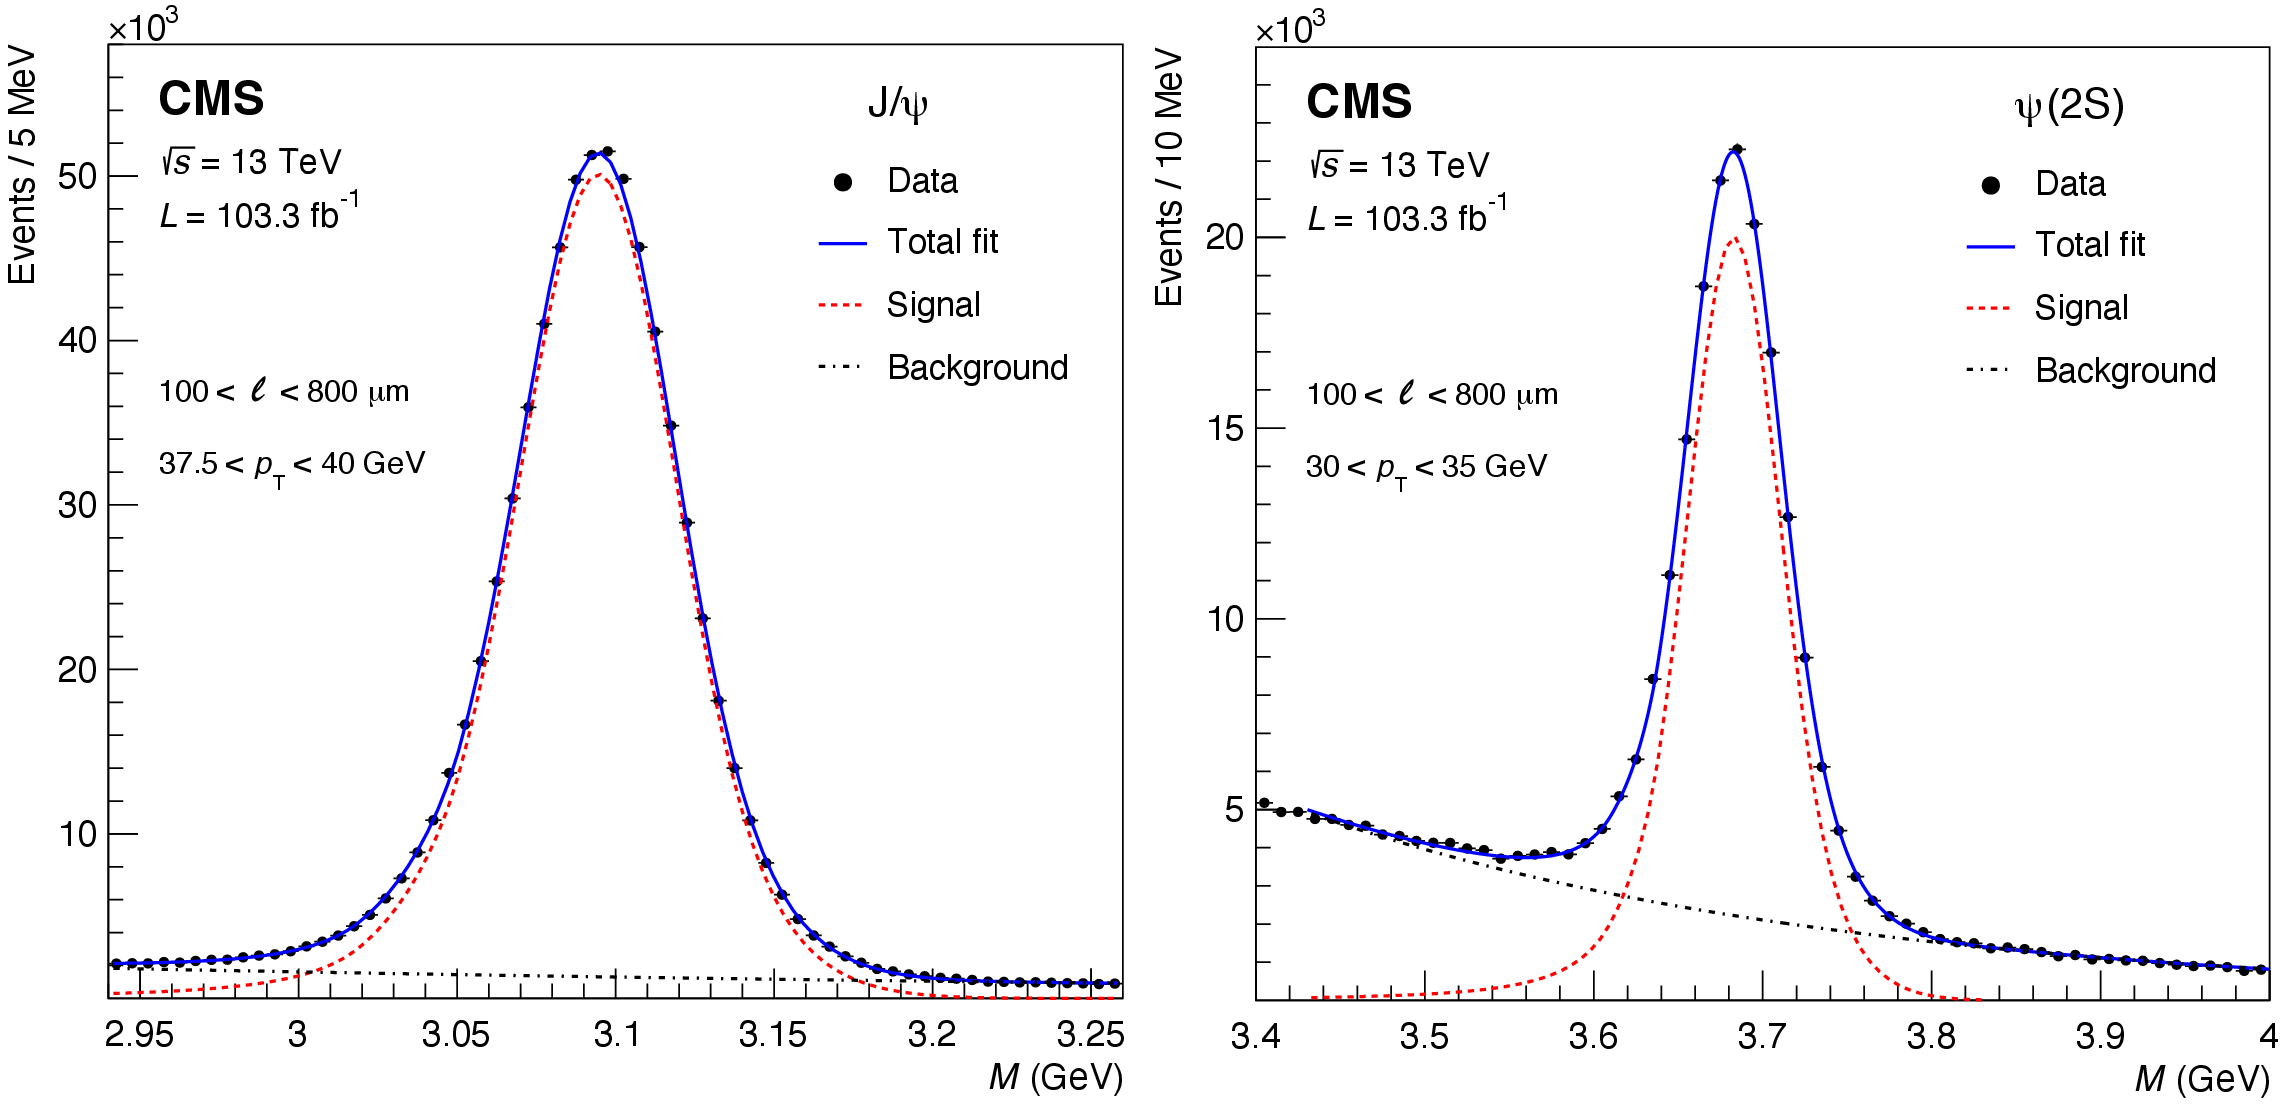
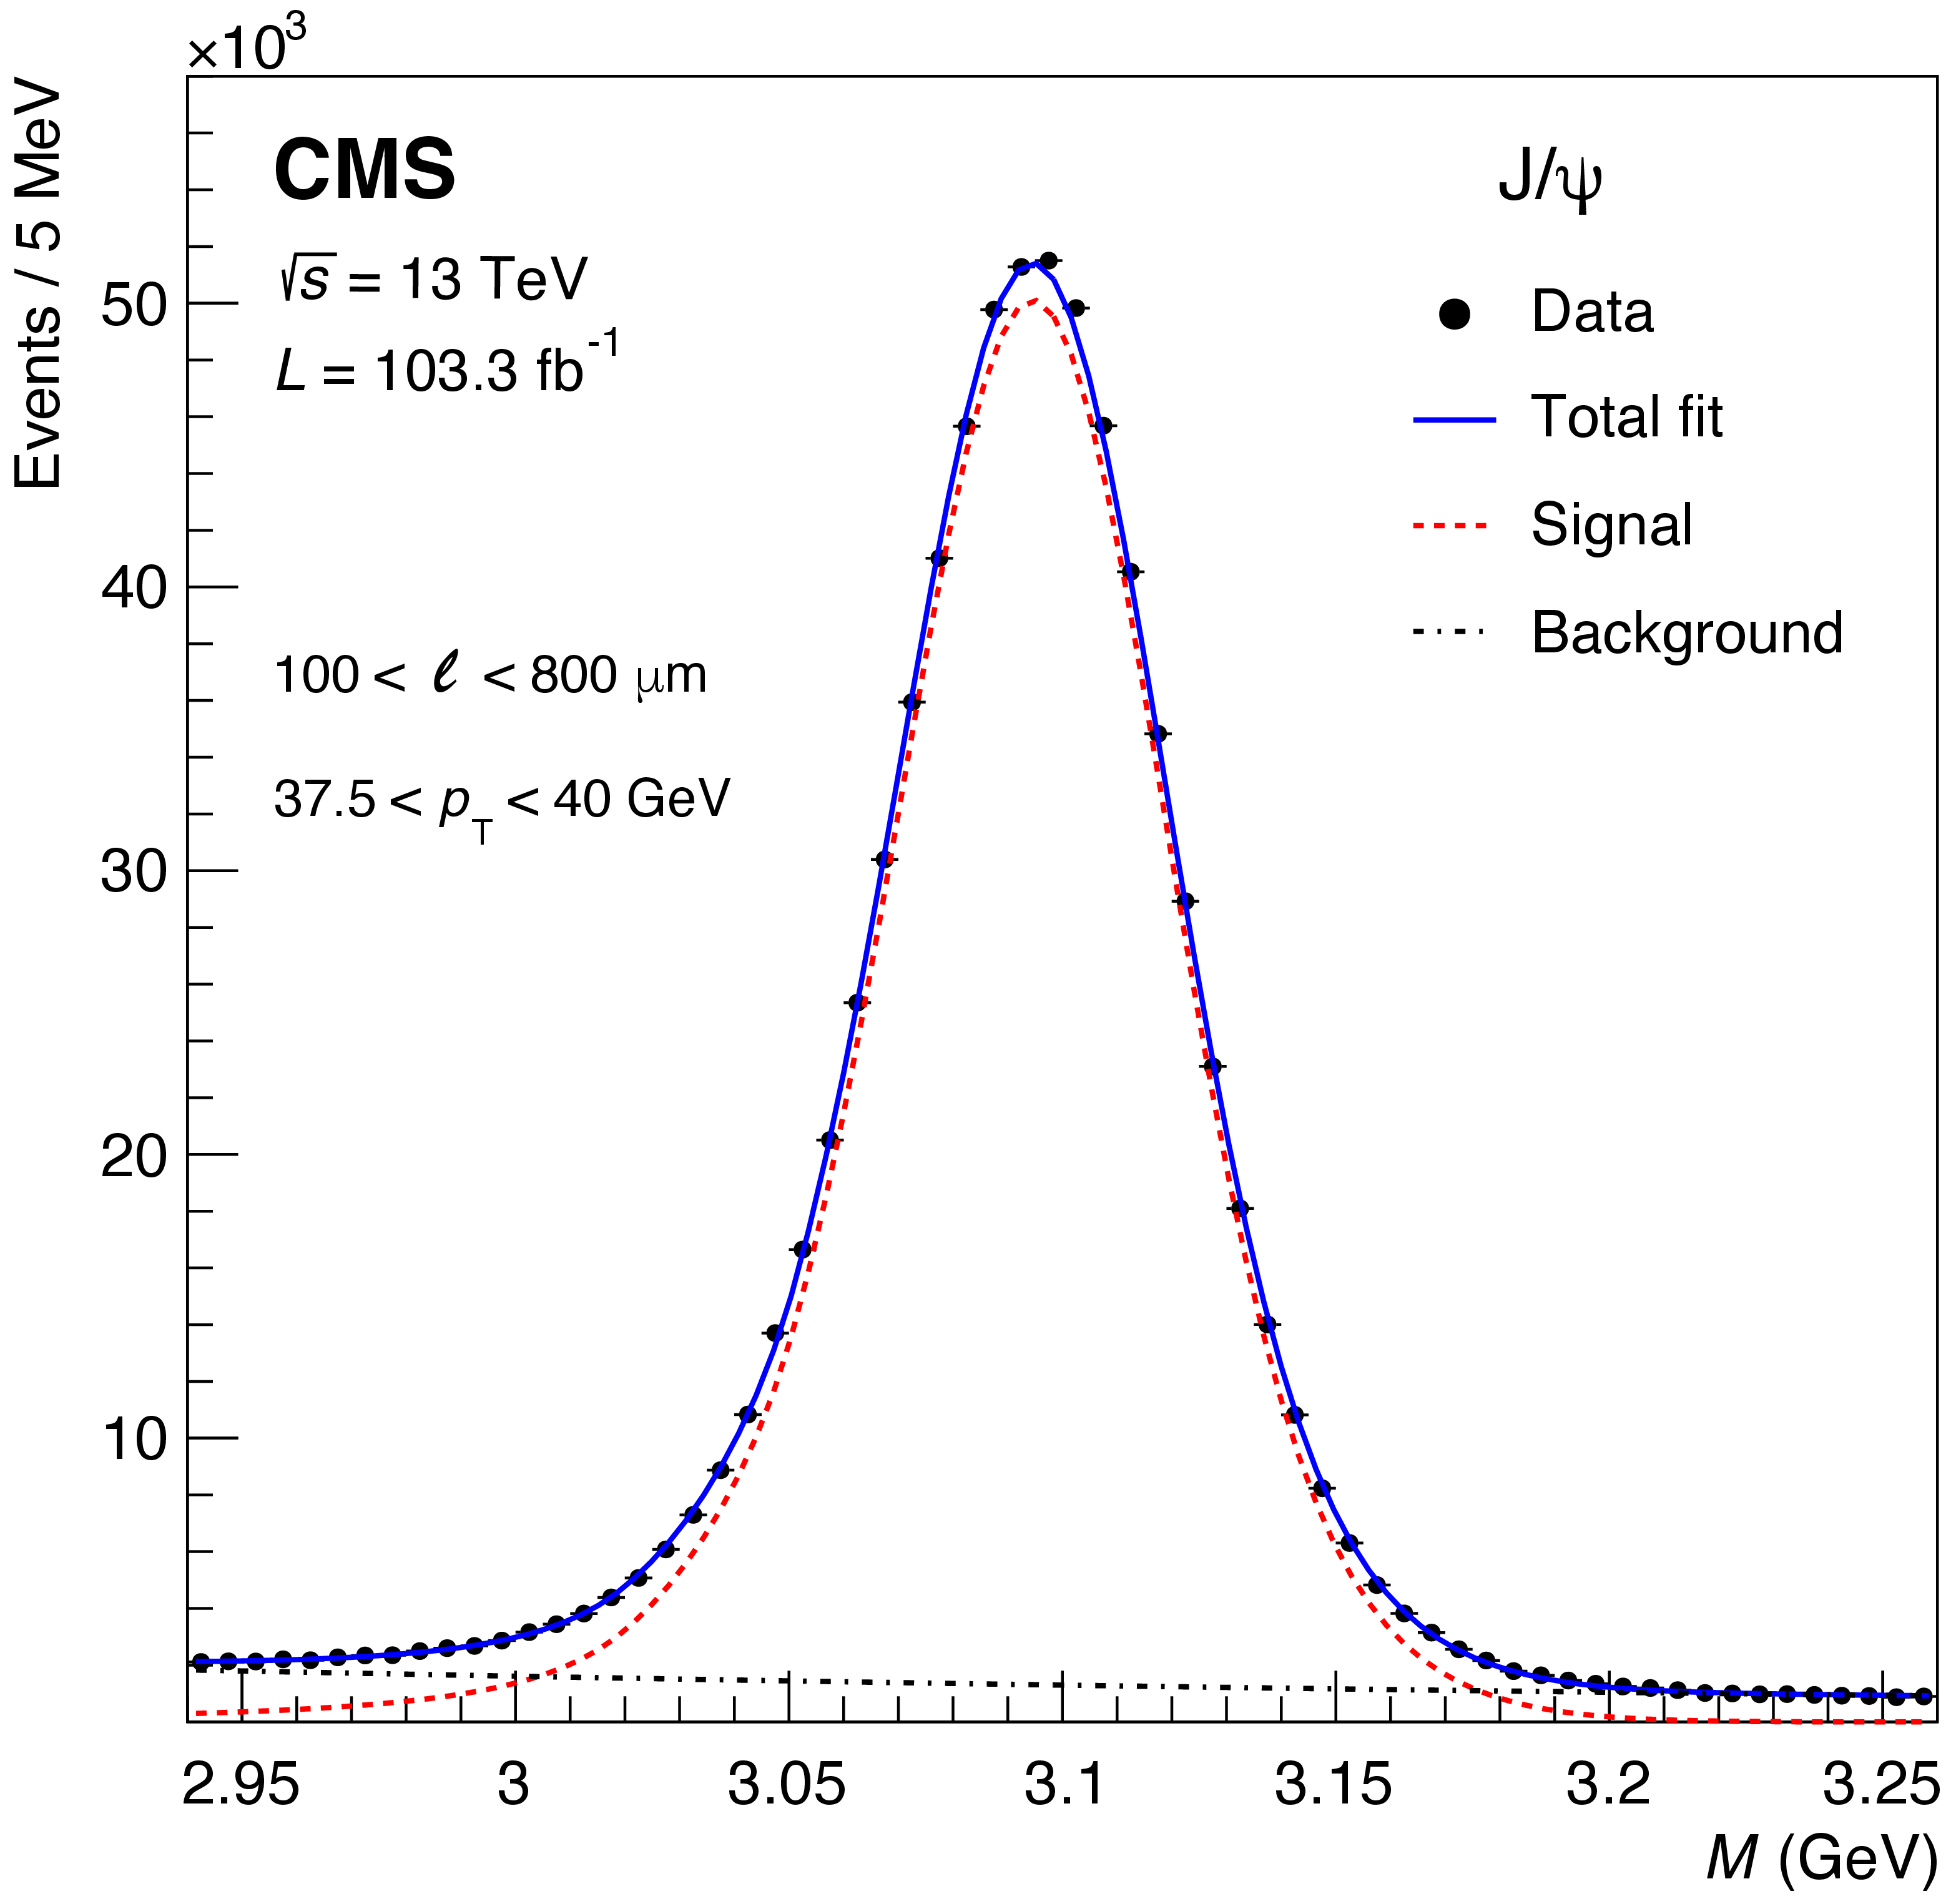
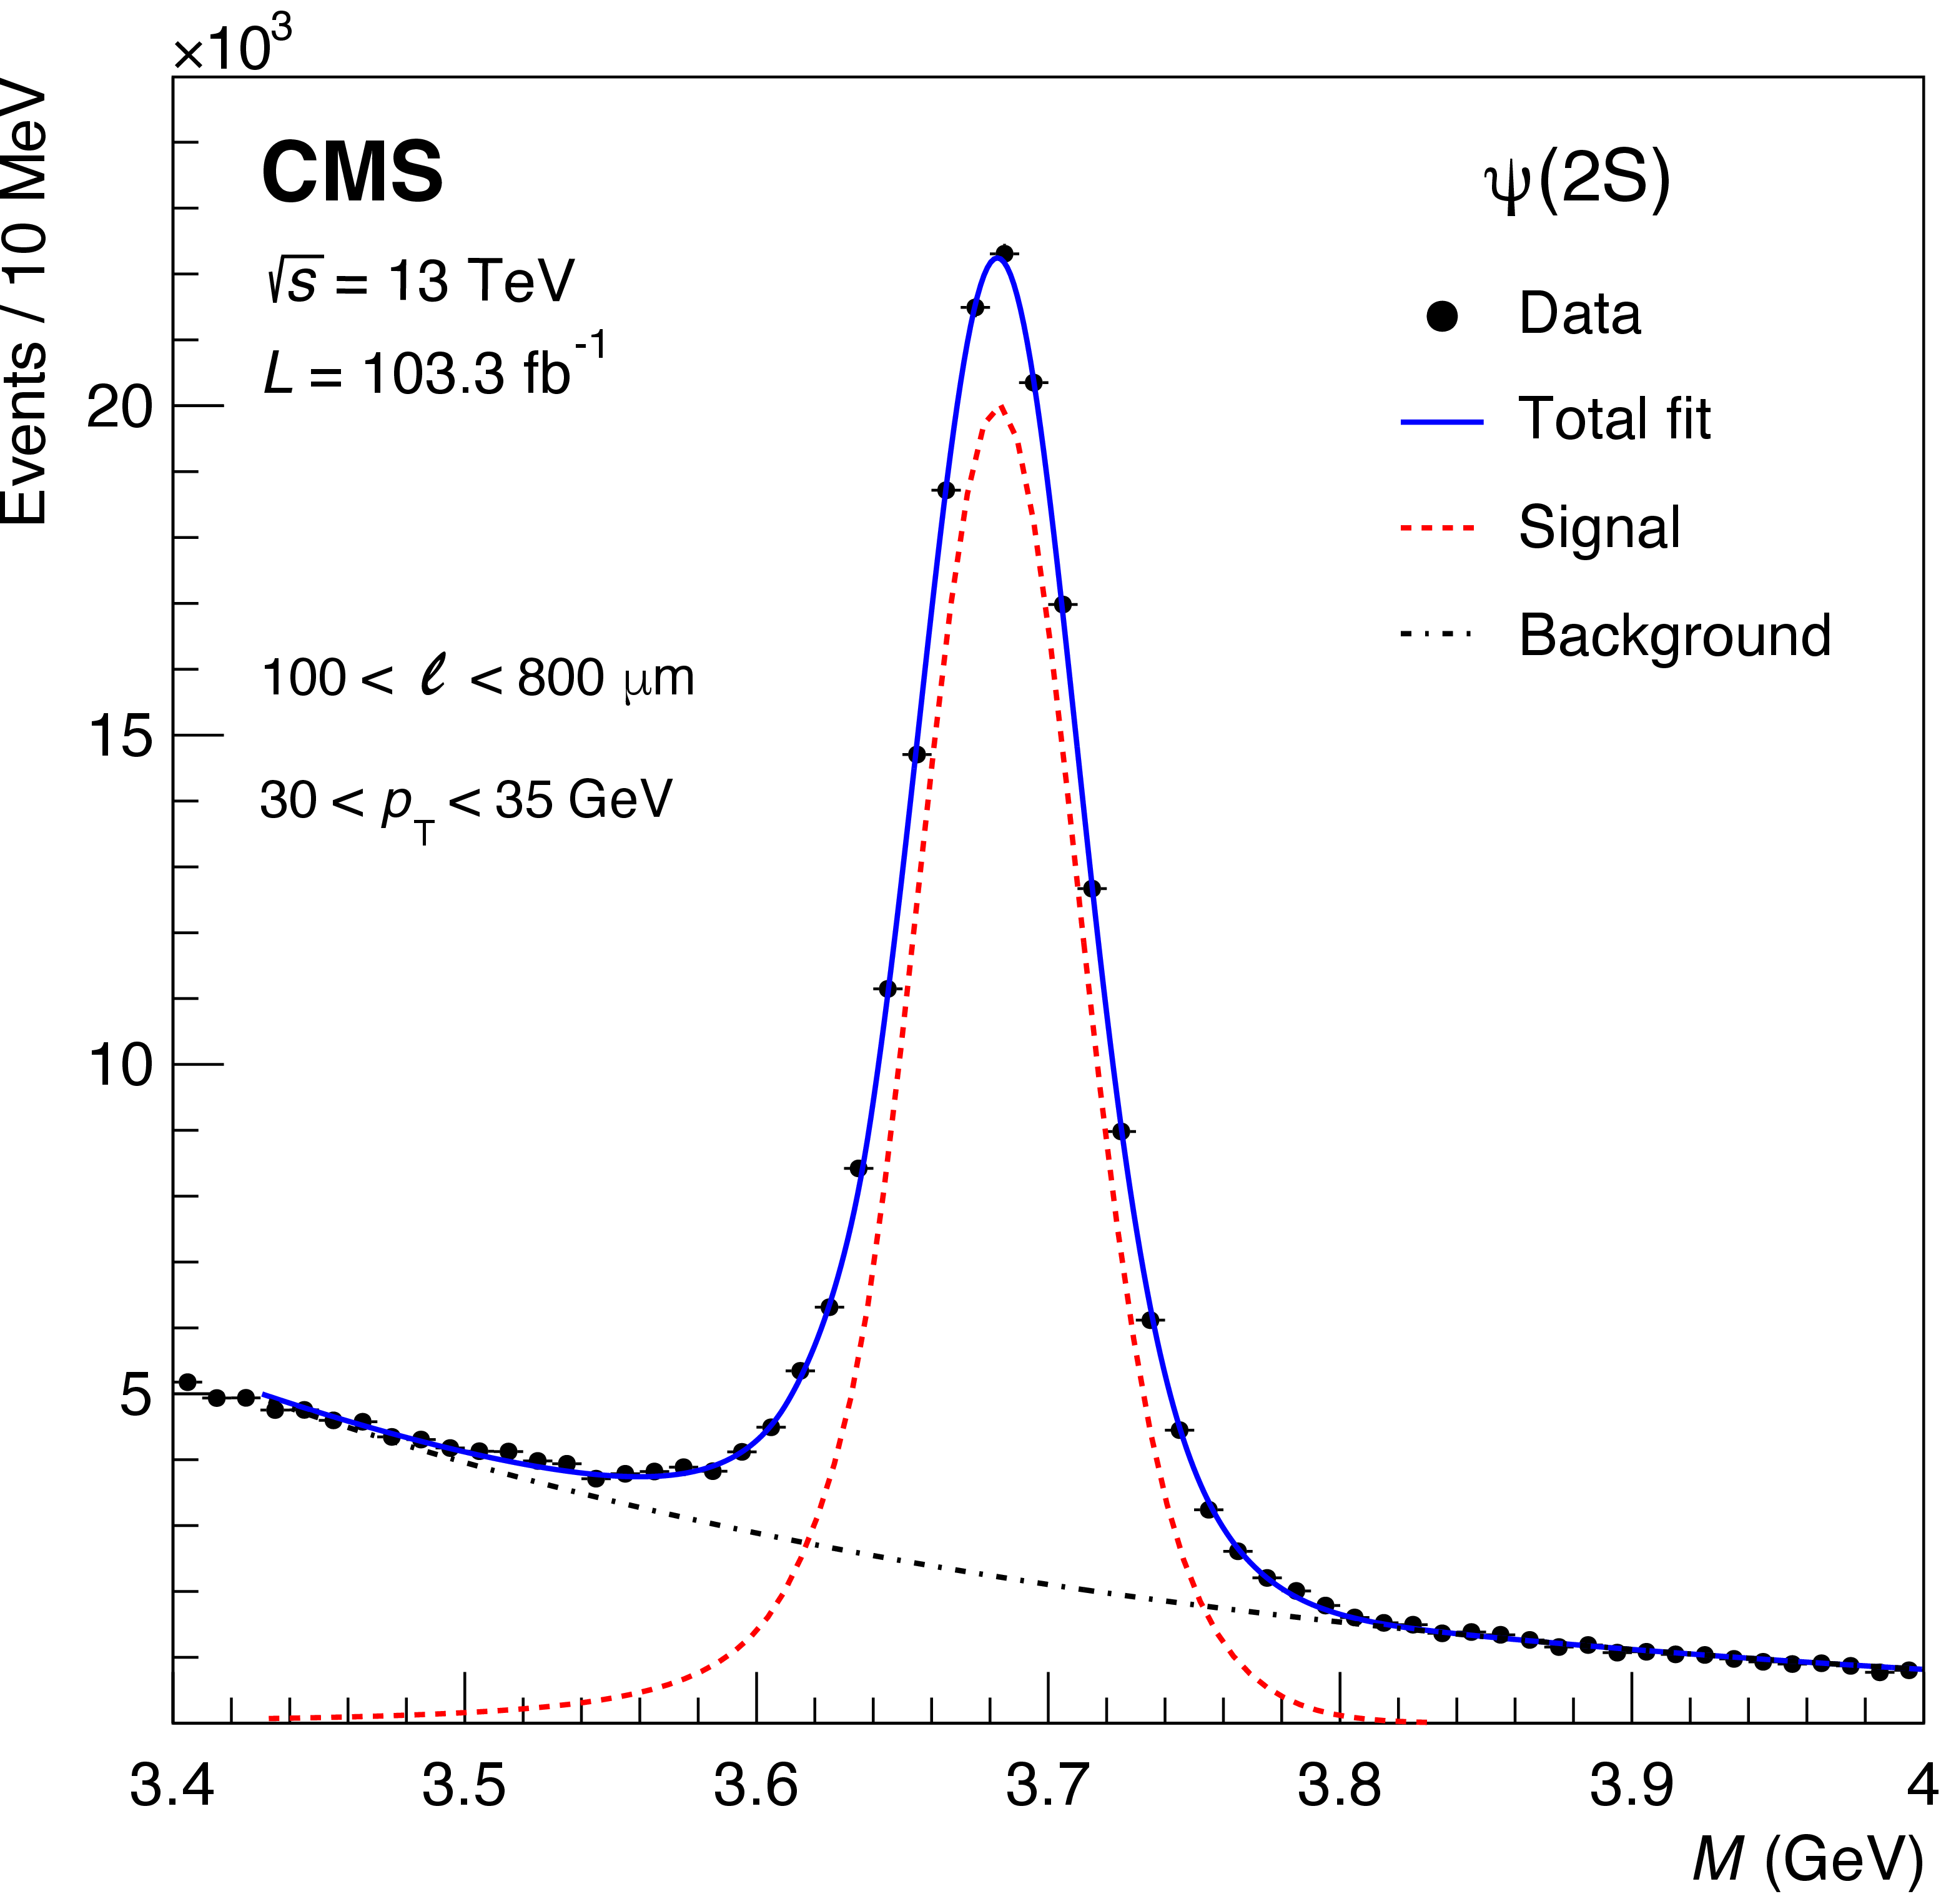
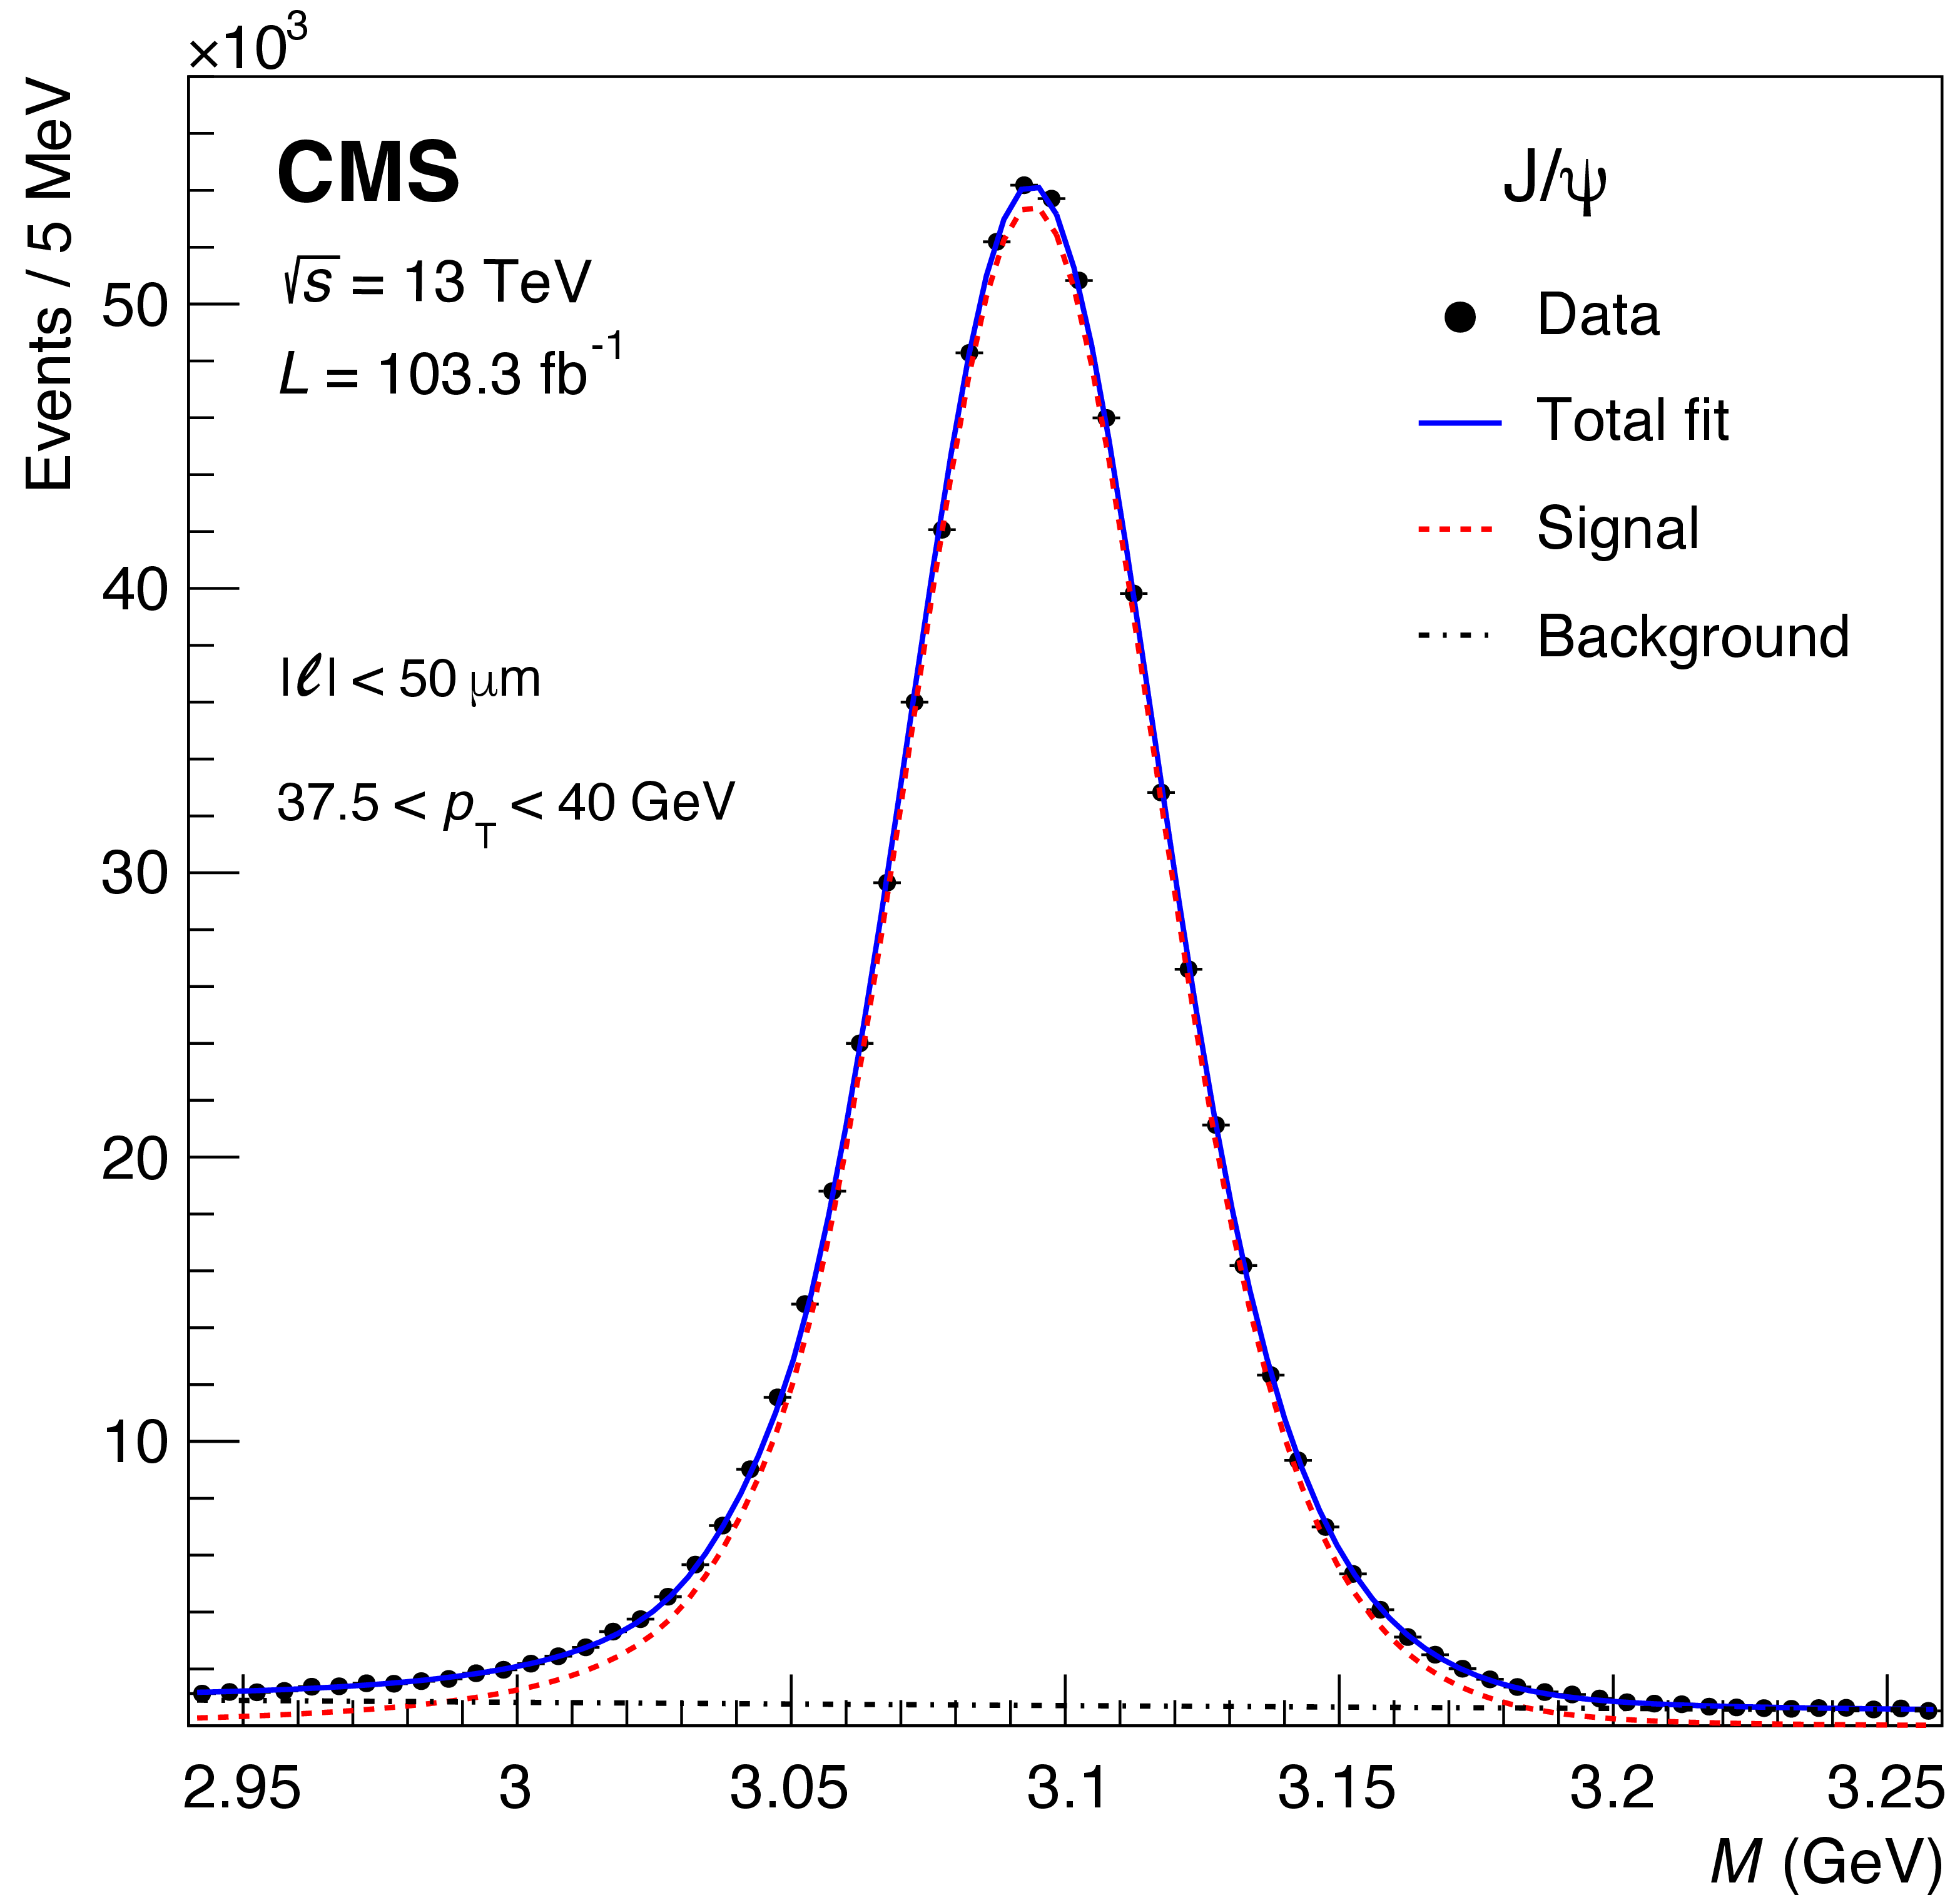
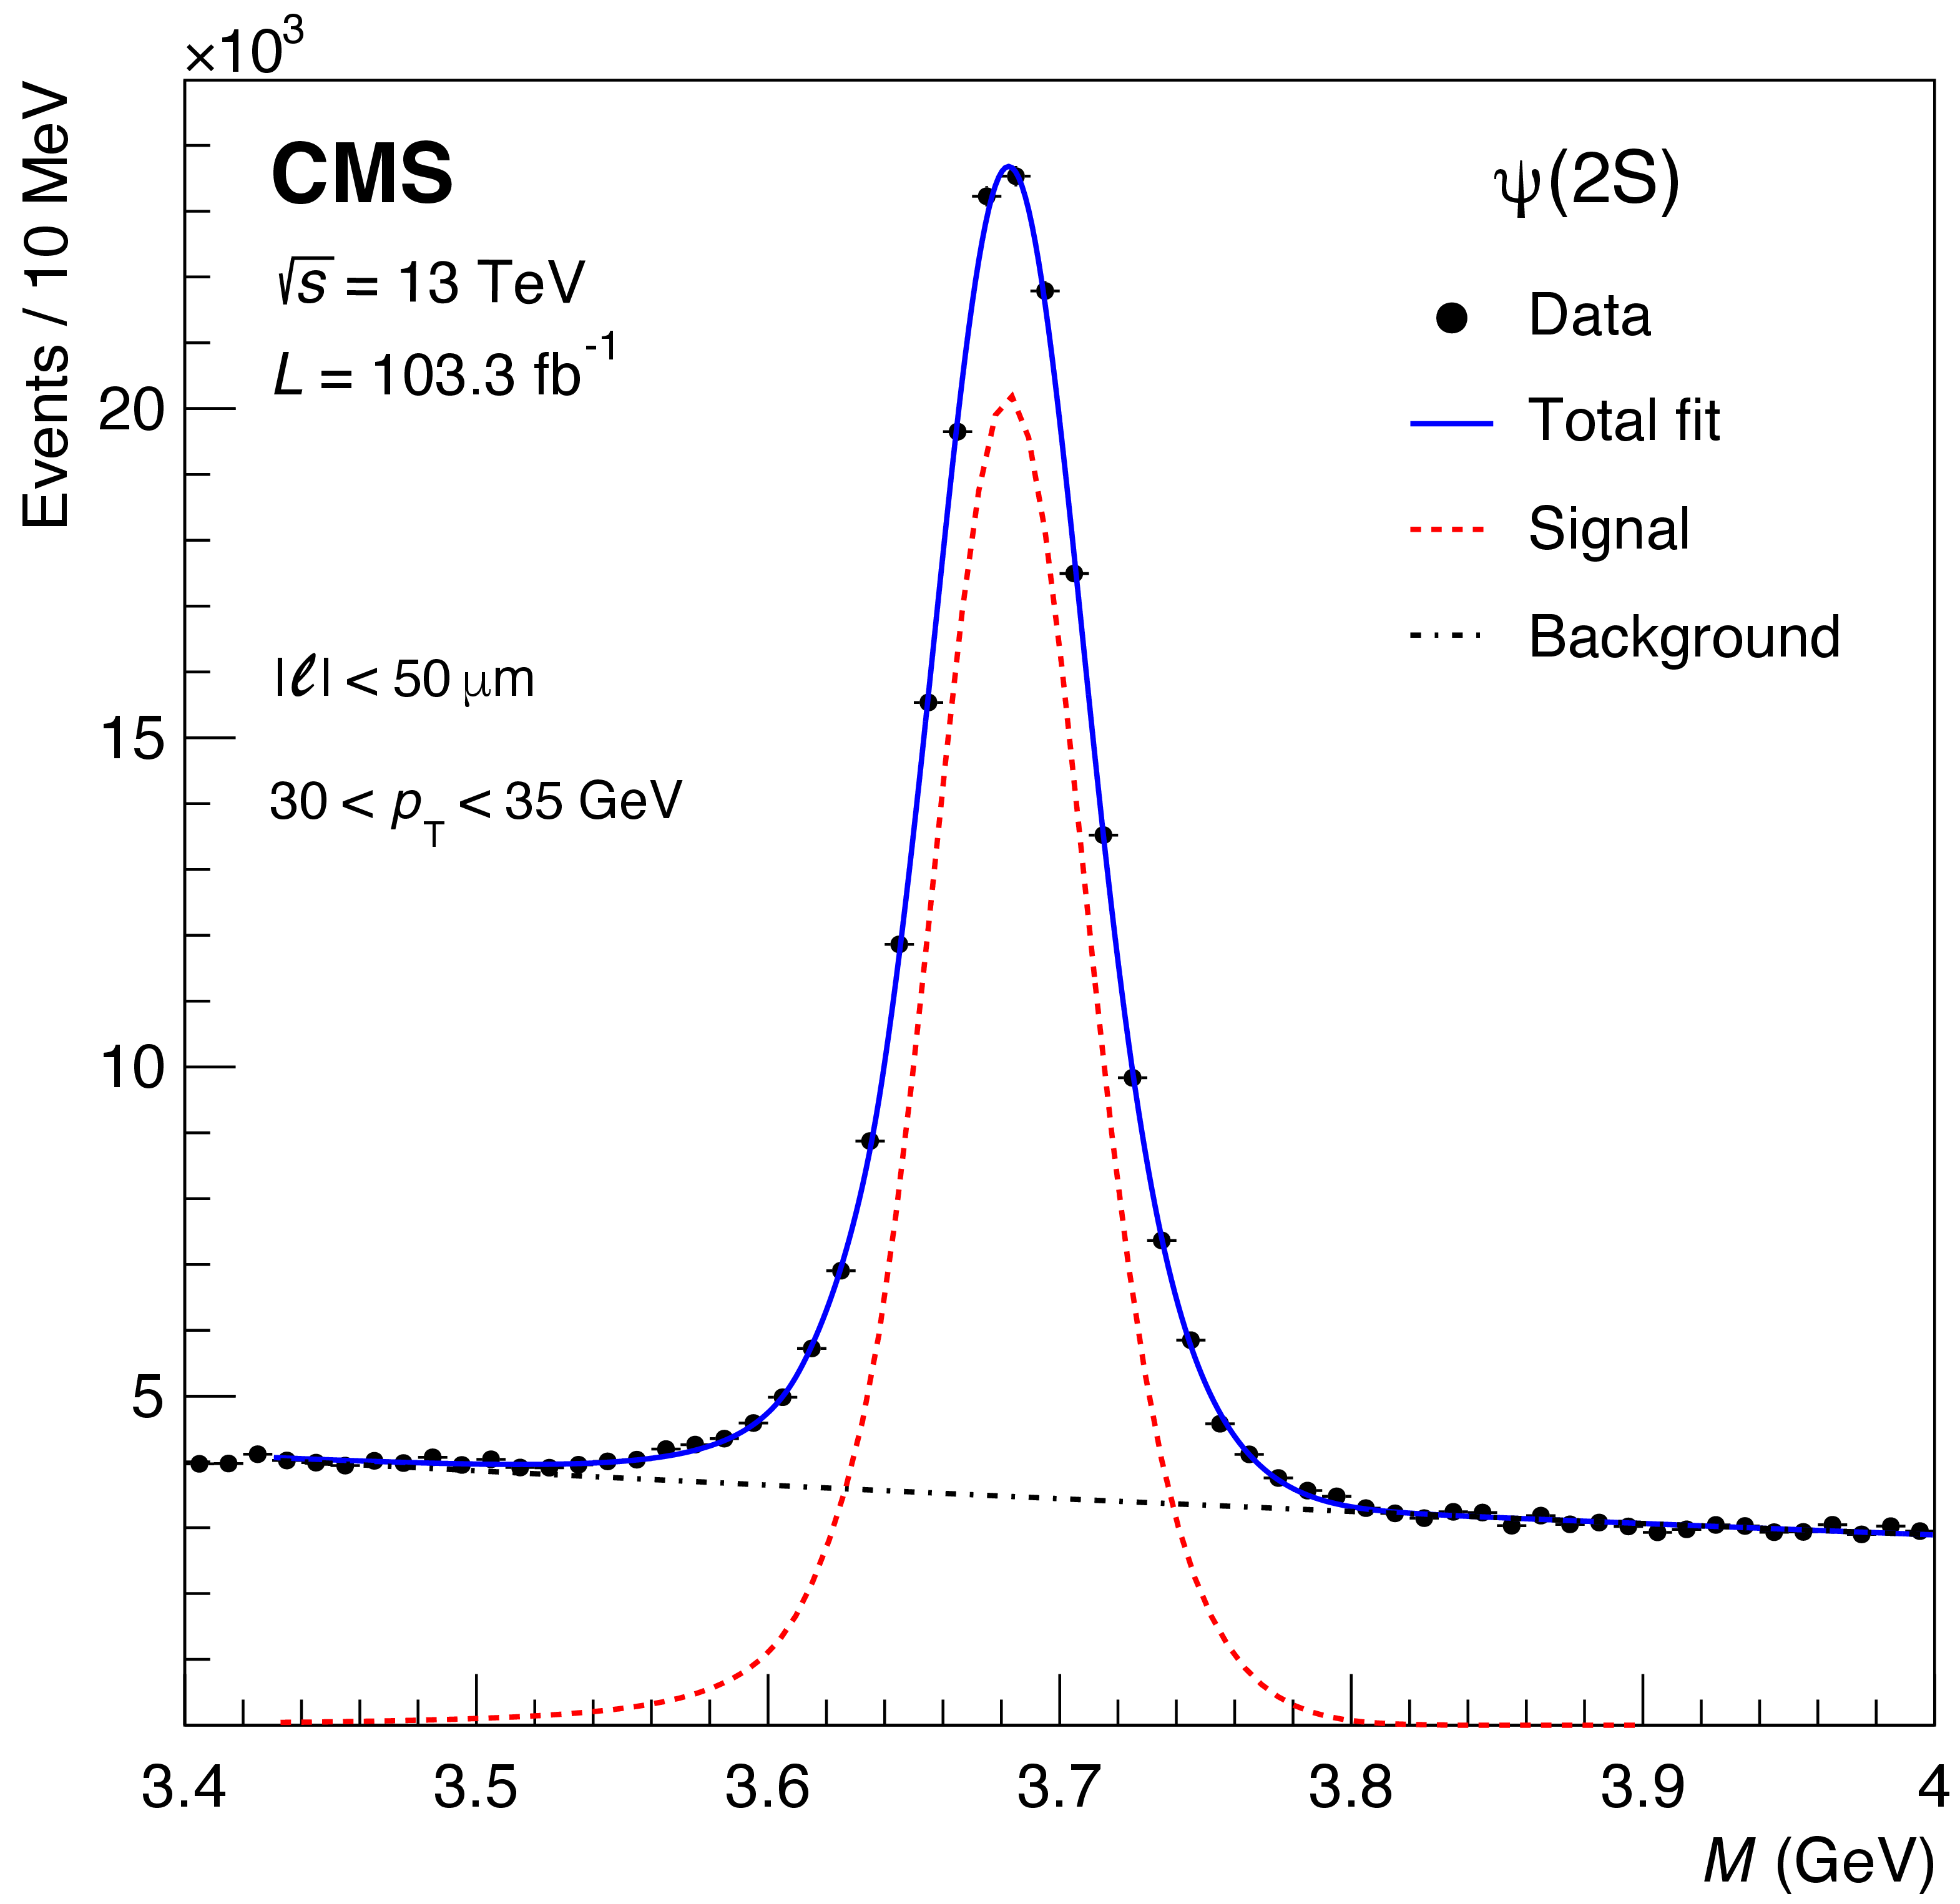
Figure 2:
Dimuon mass distributions measured for the non-prompt $ \mathrm{J}/\psi $ (left) and $\psi \text{(2S)} $ (right) event samples, in the mentioned $ p_{\mathrm{T}} $ bins. The total fit function (blue), the sum of the two CB functions and, only in the $ \mathrm{J}/\psi $ case, the Gaussian function (red), and the background continuum (black) are also shown. |
png pdf |
Figure 2-a:
Dimuon mass distributions measured for the non-prompt $ \mathrm{J}/\psi $ (left) and $\psi \text{(2S)} $ (right) event samples, in the mentioned $ p_{\mathrm{T}} $ bins. The total fit function (blue), the sum of the two CB functions and, only in the $ \mathrm{J}/\psi $ case, the Gaussian function (red), and the background continuum (black) are also shown. |
png pdf |
Figure 2-b:
Dimuon mass distributions measured for the non-prompt $ \mathrm{J}/\psi $ (left) and $\psi \text{(2S)} $ (right) event samples, in the mentioned $ p_{\mathrm{T}} $ bins. The total fit function (blue), the sum of the two CB functions and, only in the $ \mathrm{J}/\psi $ case, the Gaussian function (red), and the background continuum (black) are also shown. |
png pdf |
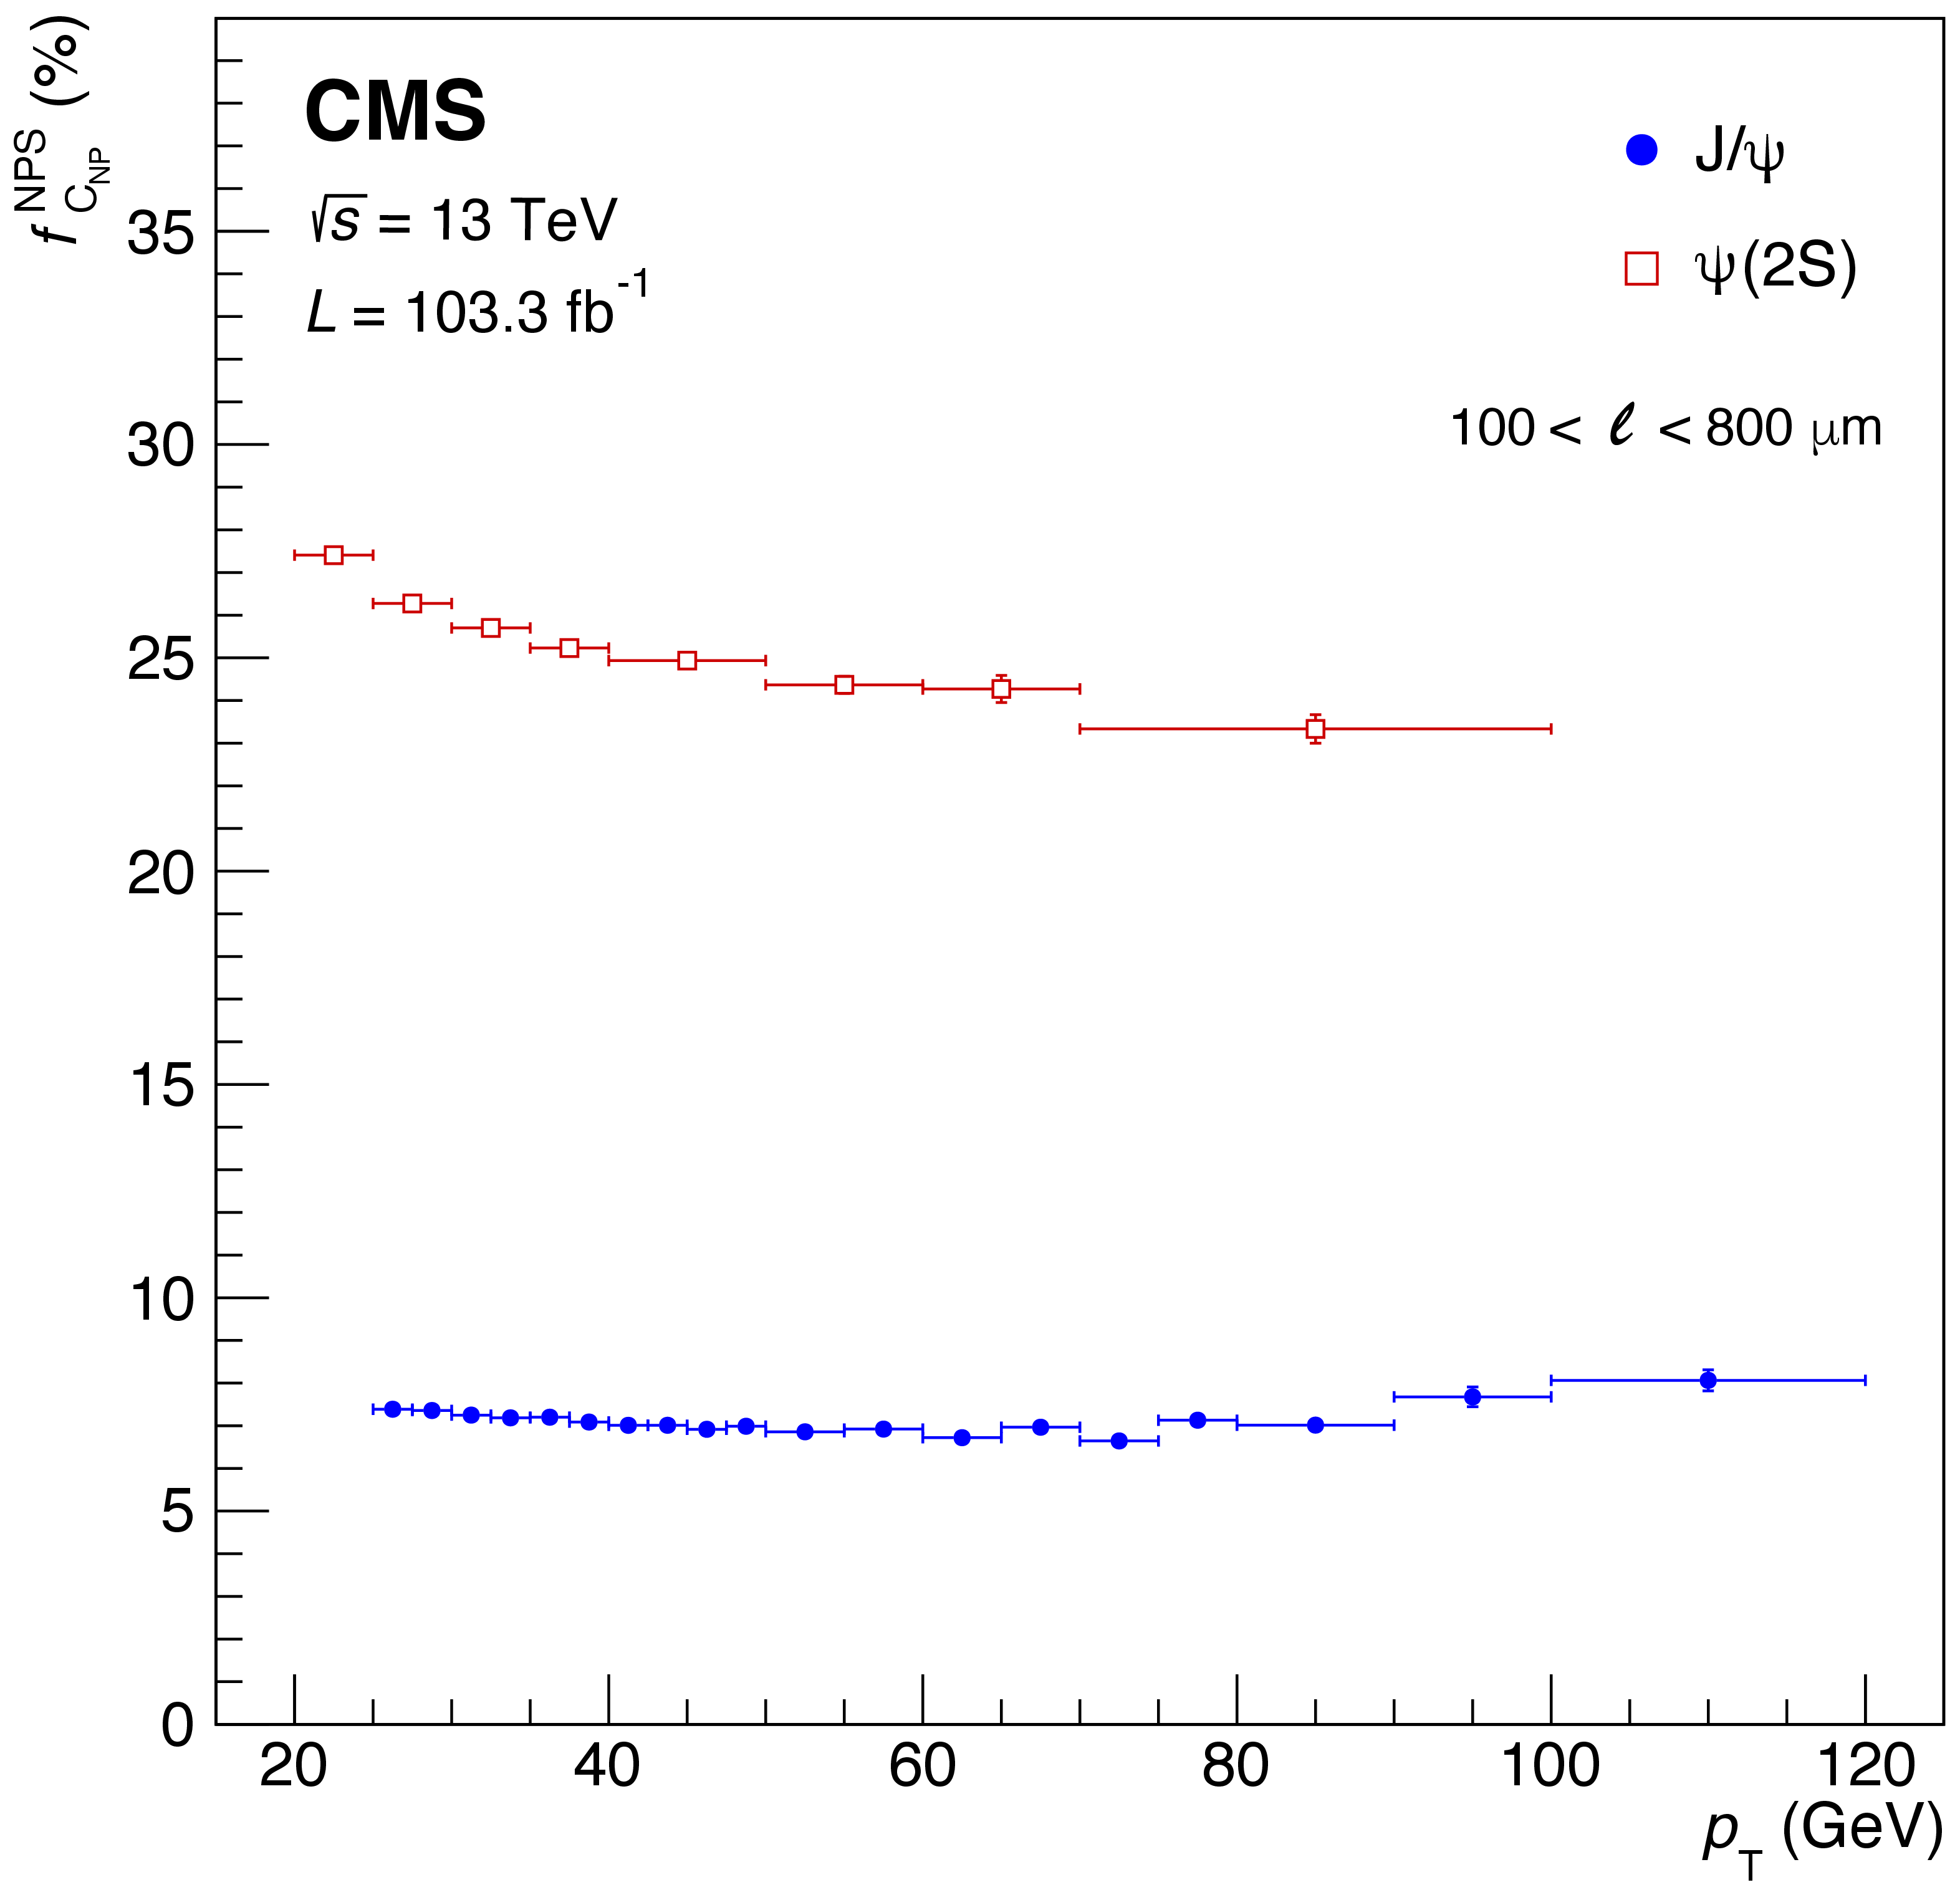
Figure 3:
Fraction of events in the NPS region due to continuum muon pairs, versus $ p_{\mathrm{T}} $, for the non-prompt $ \mathrm{J}/\psi $ and $\psi \text{(2S)} $ events. |
png pdf |
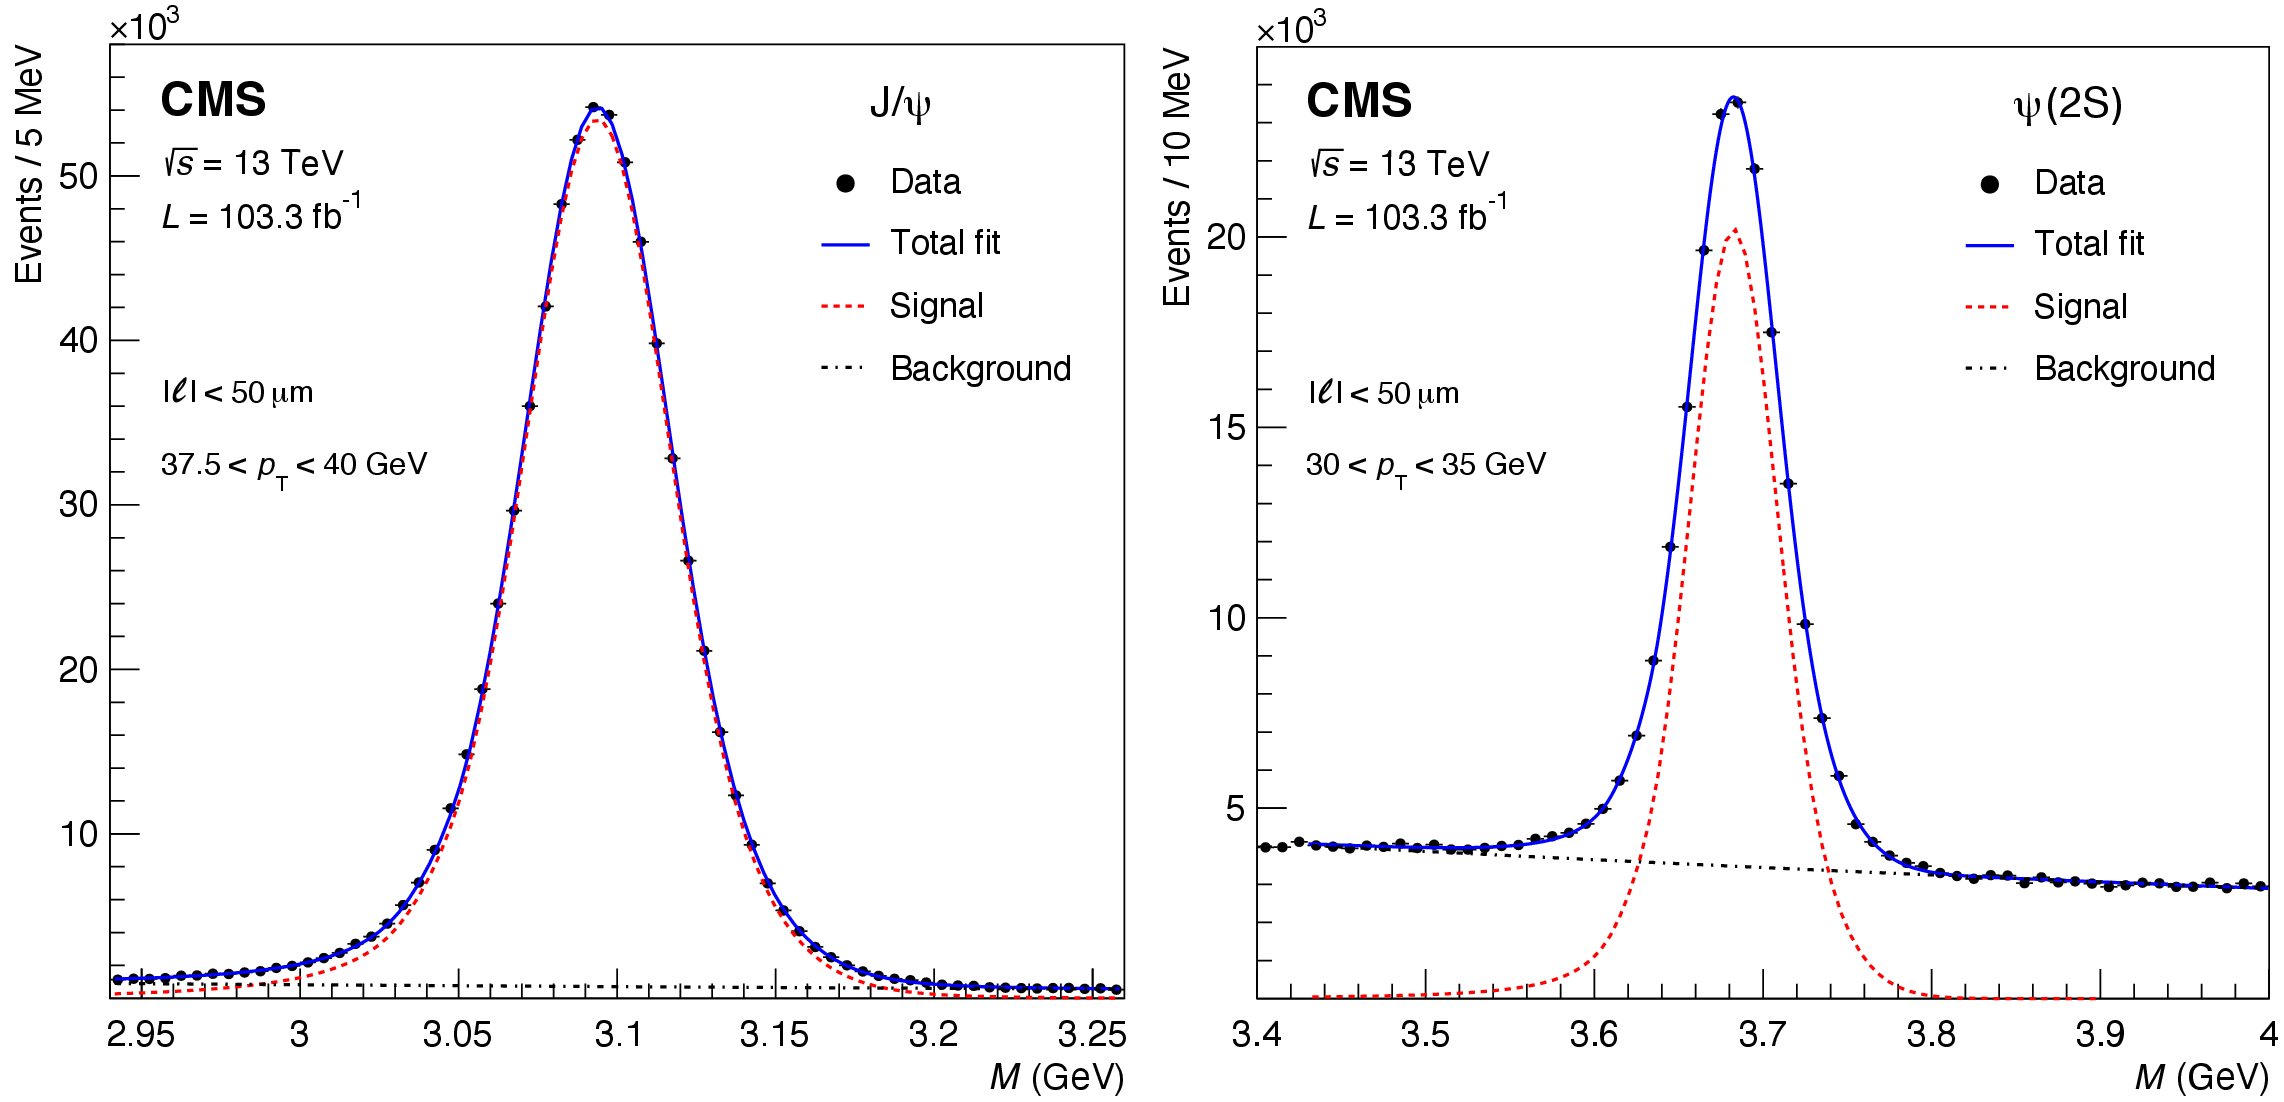
Figure 4:
Dimuon mass distributions measured for the prompt $ \mathrm{J}/\psi $ (left) and $\psi \text{(2S)} $ (right) event samples, in the mentioned $ p_{\mathrm{T}} $ bins. The total fit function (blue), the sum of the two CB functions and (only in the $ \mathrm{J}/\psi $ case) the Gaussian function (red), and the background continuum (black) are also shown. |
png pdf |
Figure 4-a:
Dimuon mass distributions measured for the prompt $ \mathrm{J}/\psi $ (left) and $\psi \text{(2S)} $ (right) event samples, in the mentioned $ p_{\mathrm{T}} $ bins. The total fit function (blue), the sum of the two CB functions and (only in the $ \mathrm{J}/\psi $ case) the Gaussian function (red), and the background continuum (black) are also shown. |
png pdf |
Figure 4-b:
Dimuon mass distributions measured for the prompt $ \mathrm{J}/\psi $ (left) and $\psi \text{(2S)} $ (right) event samples, in the mentioned $ p_{\mathrm{T}} $ bins. The total fit function (blue), the sum of the two CB functions and (only in the $ \mathrm{J}/\psi $ case) the Gaussian function (red), and the background continuum (black) are also shown. |
png pdf |
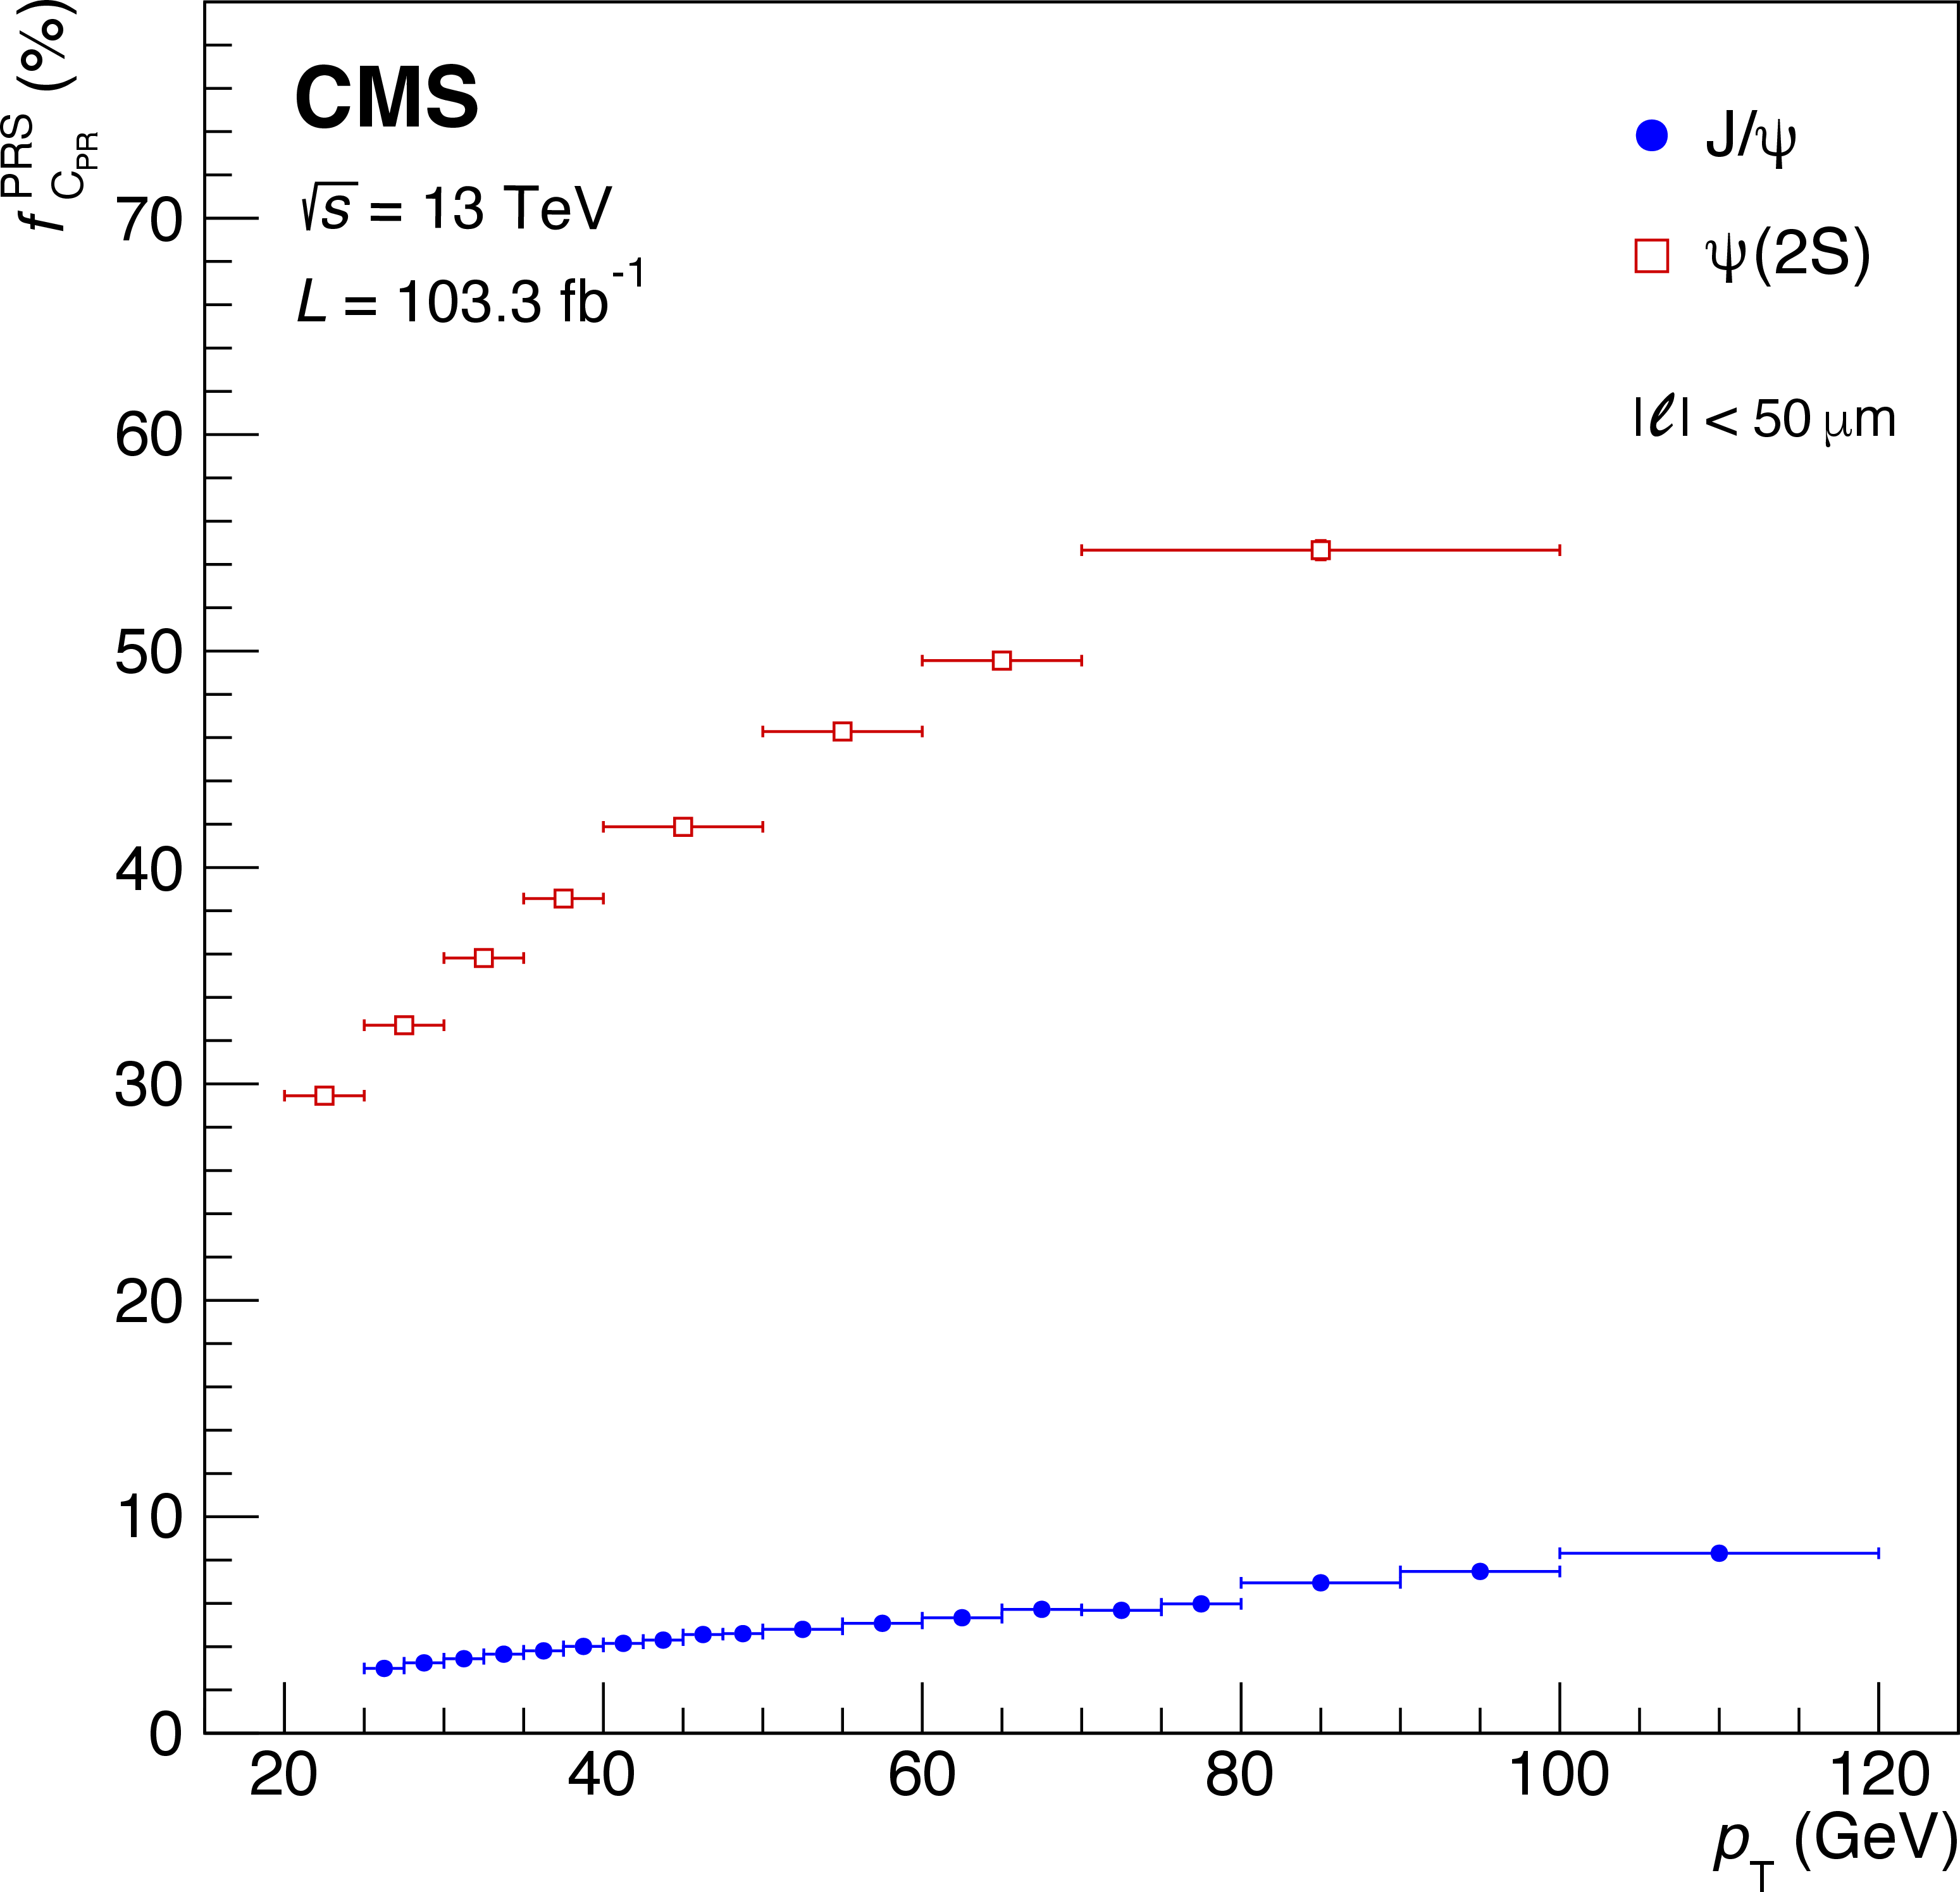
Figure 5:
Fraction of events in the PRS region due to continuum muon pairs, versus $ p_{\mathrm{T}} $, for the prompt $ \mathrm{J}/\psi $ and $\psi \text{(2S)} $ events. |
png pdf |
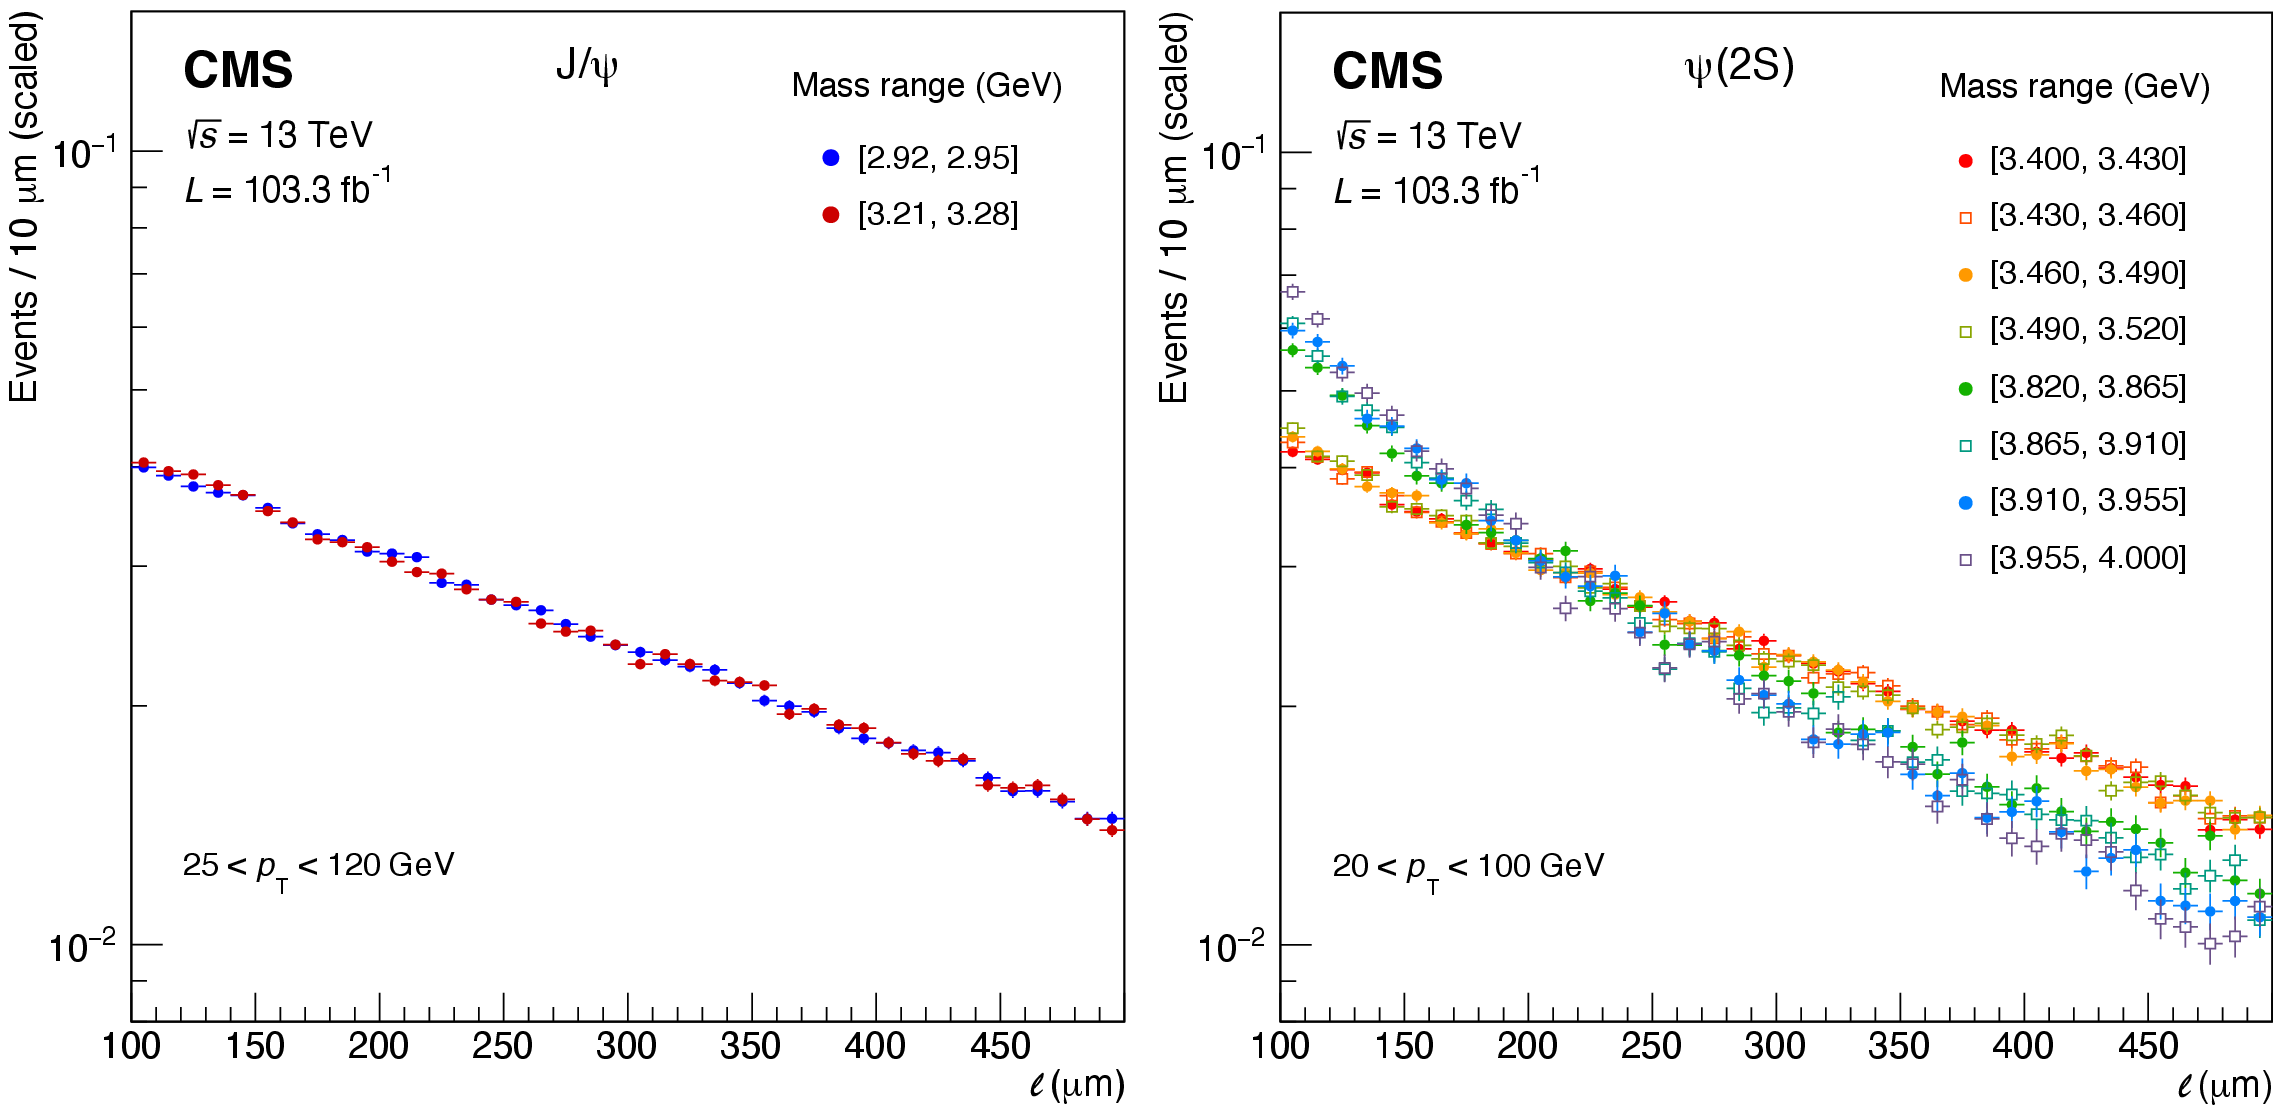
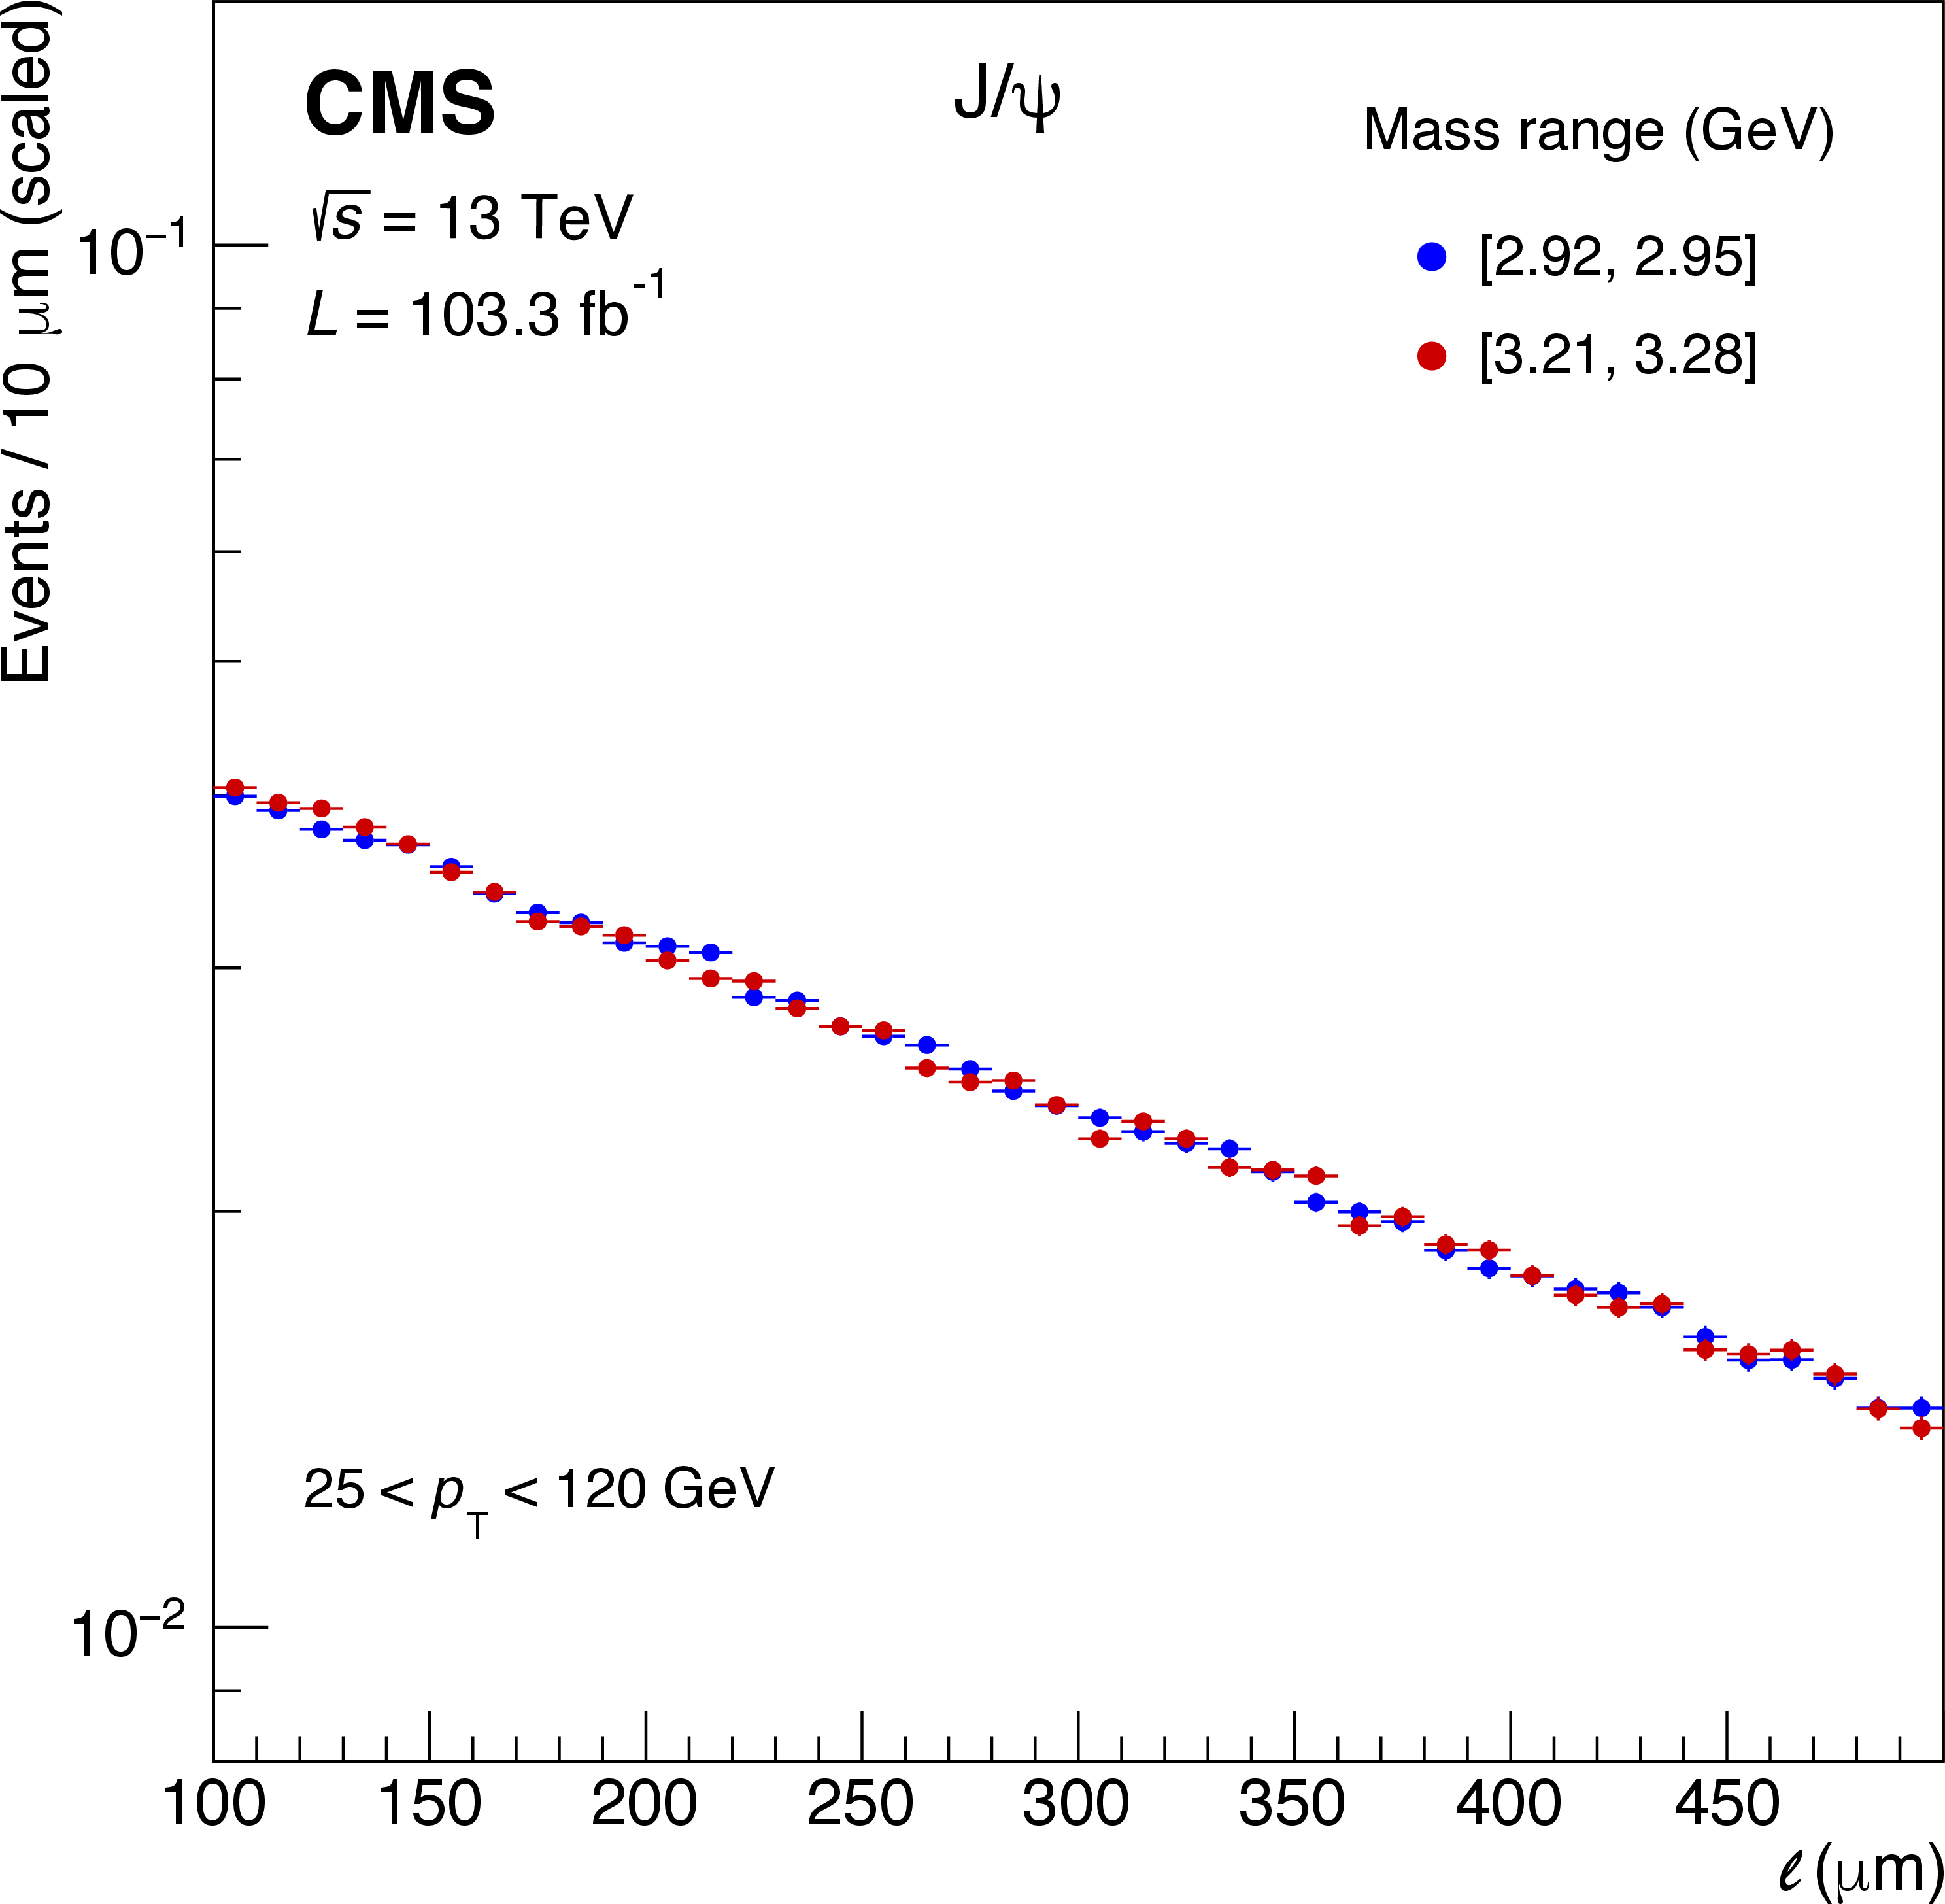
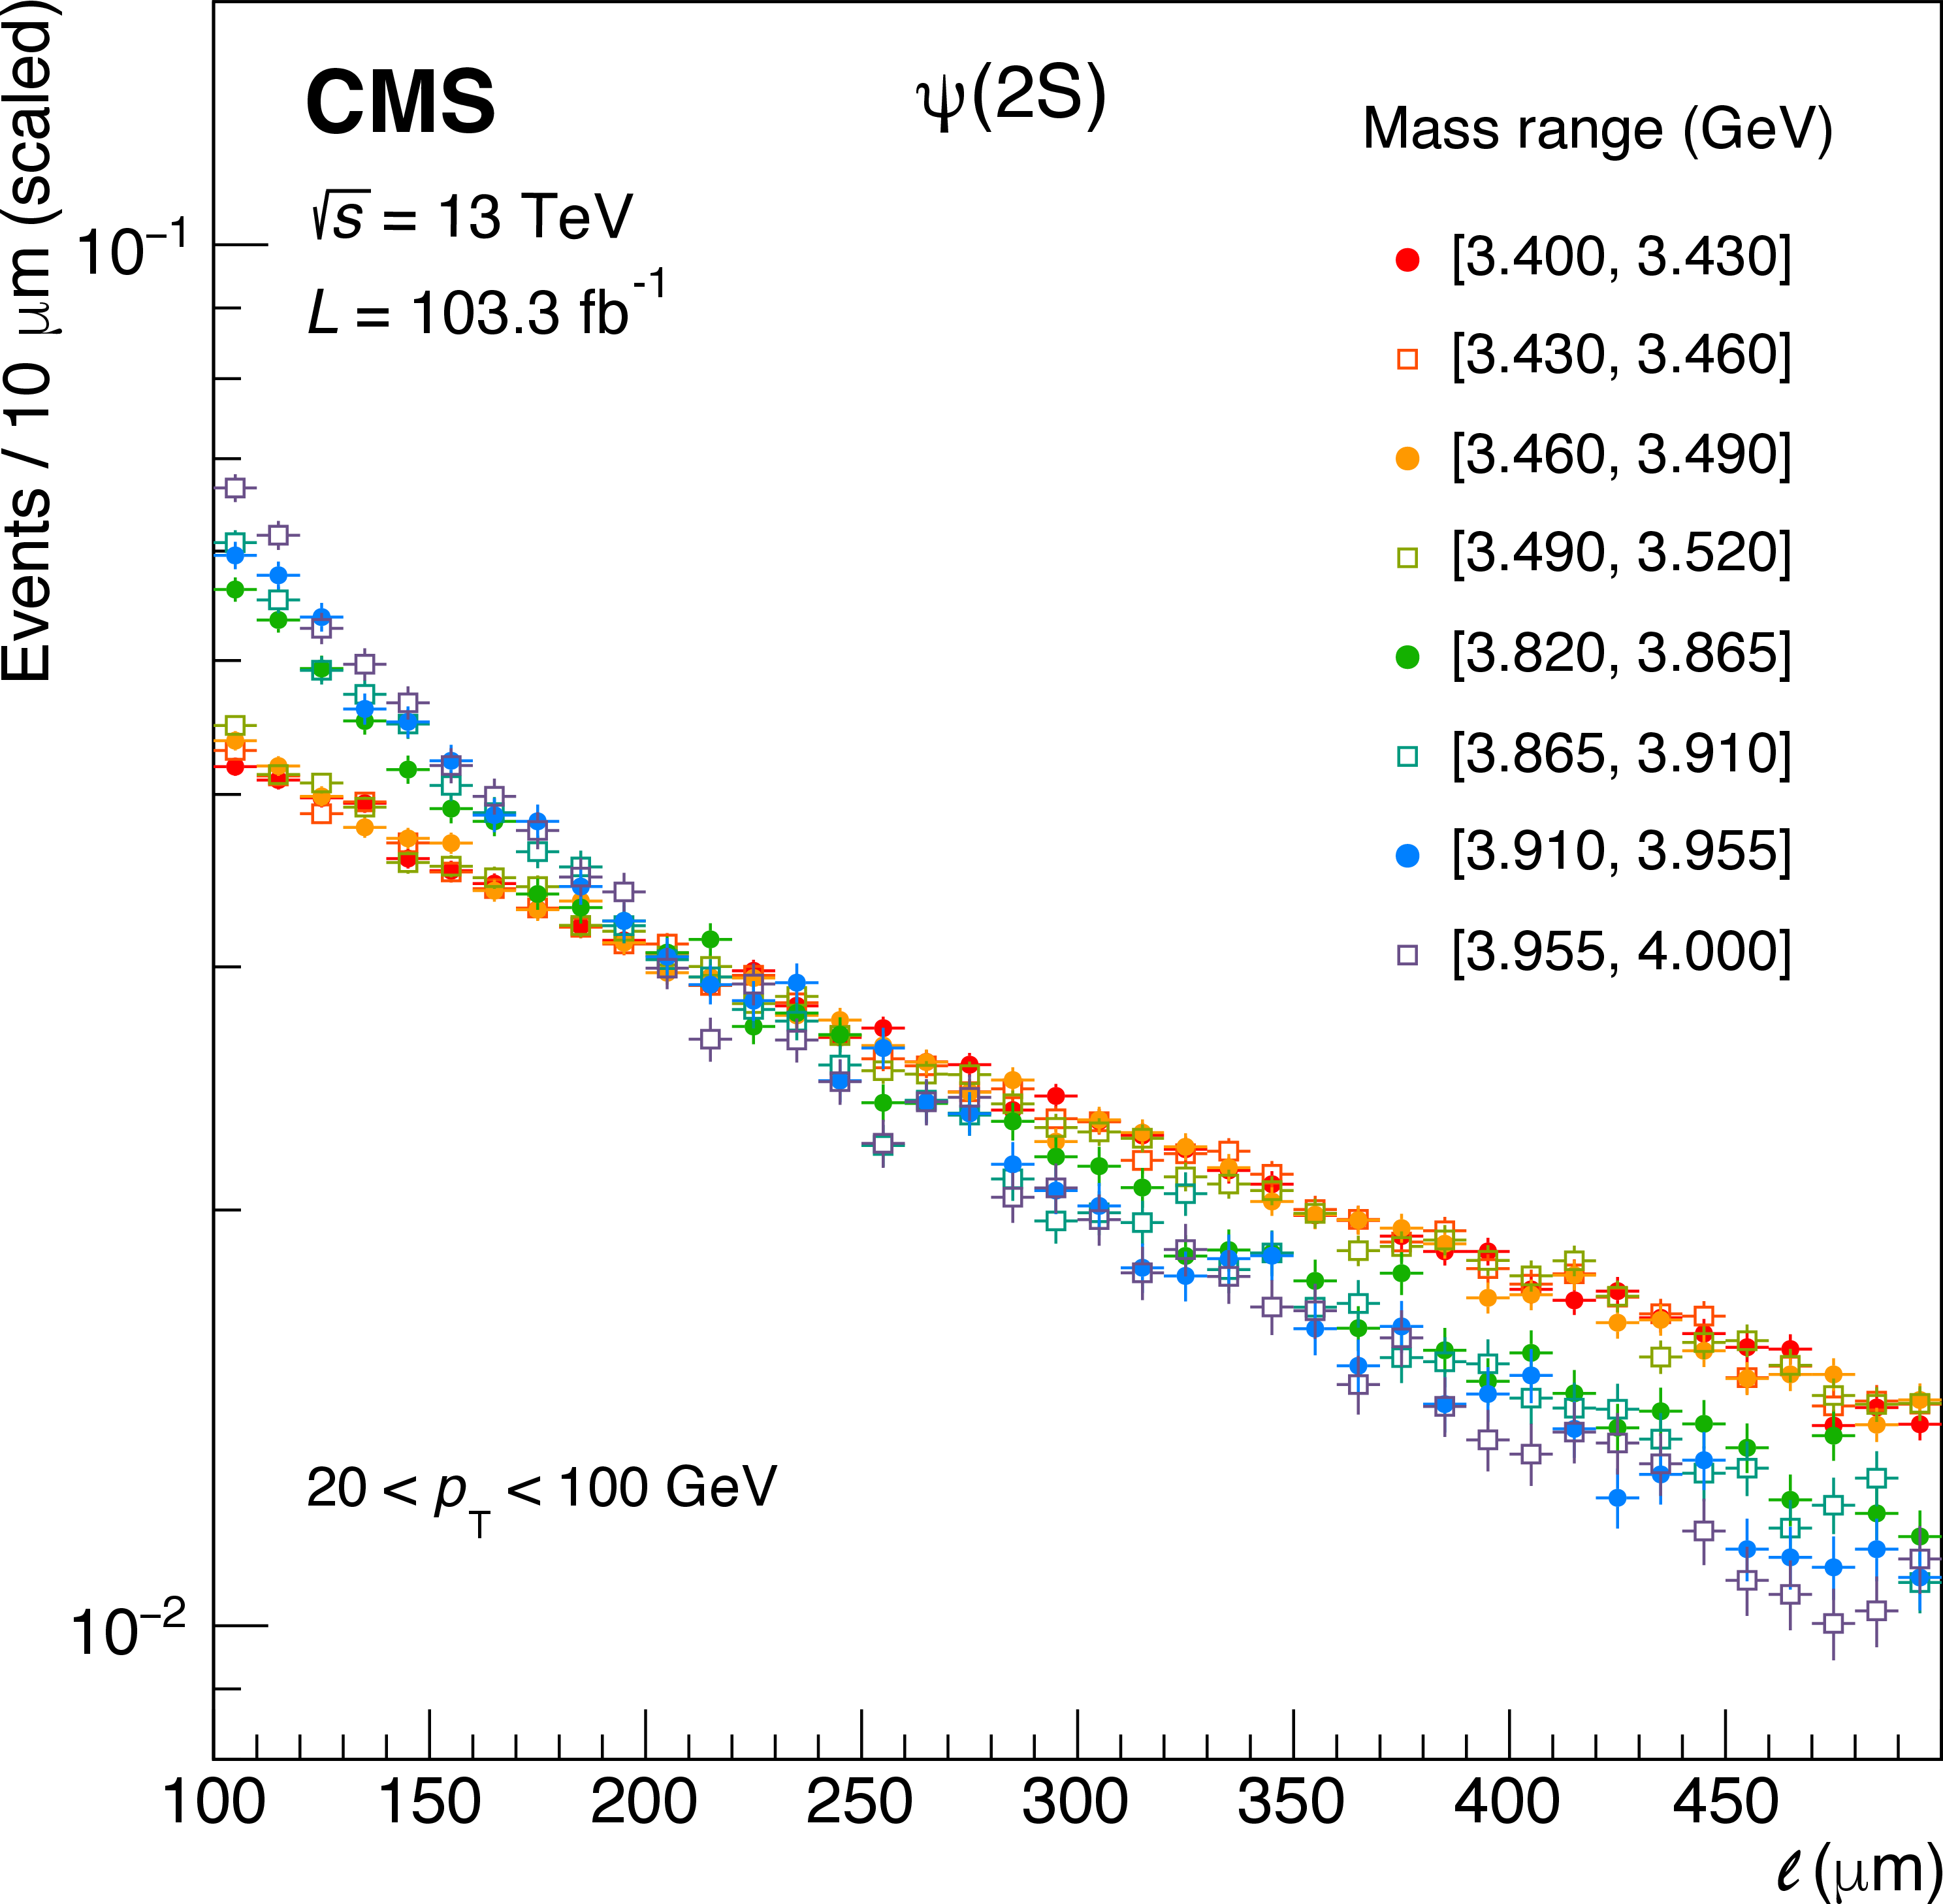
Figure 6:
Dimuon decay length distributions, integrated in $ p_{\mathrm{T}} $, measured for the sideband mass ranges mentioned in the legends, in the $ \mathrm{J}/\psi $ (left) and $\psi \text{(2S)} $ (right) cases. |
png pdf |
Figure 6-a:
Dimuon decay length distributions, integrated in $ p_{\mathrm{T}} $, measured for the sideband mass ranges mentioned in the legends, in the $ \mathrm{J}/\psi $ (left) and $\psi \text{(2S)} $ (right) cases. |
png pdf |
Figure 6-b:
Dimuon decay length distributions, integrated in $ p_{\mathrm{T}} $, measured for the sideband mass ranges mentioned in the legends, in the $ \mathrm{J}/\psi $ (left) and $\psi \text{(2S)} $ (right) cases. |
png pdf |
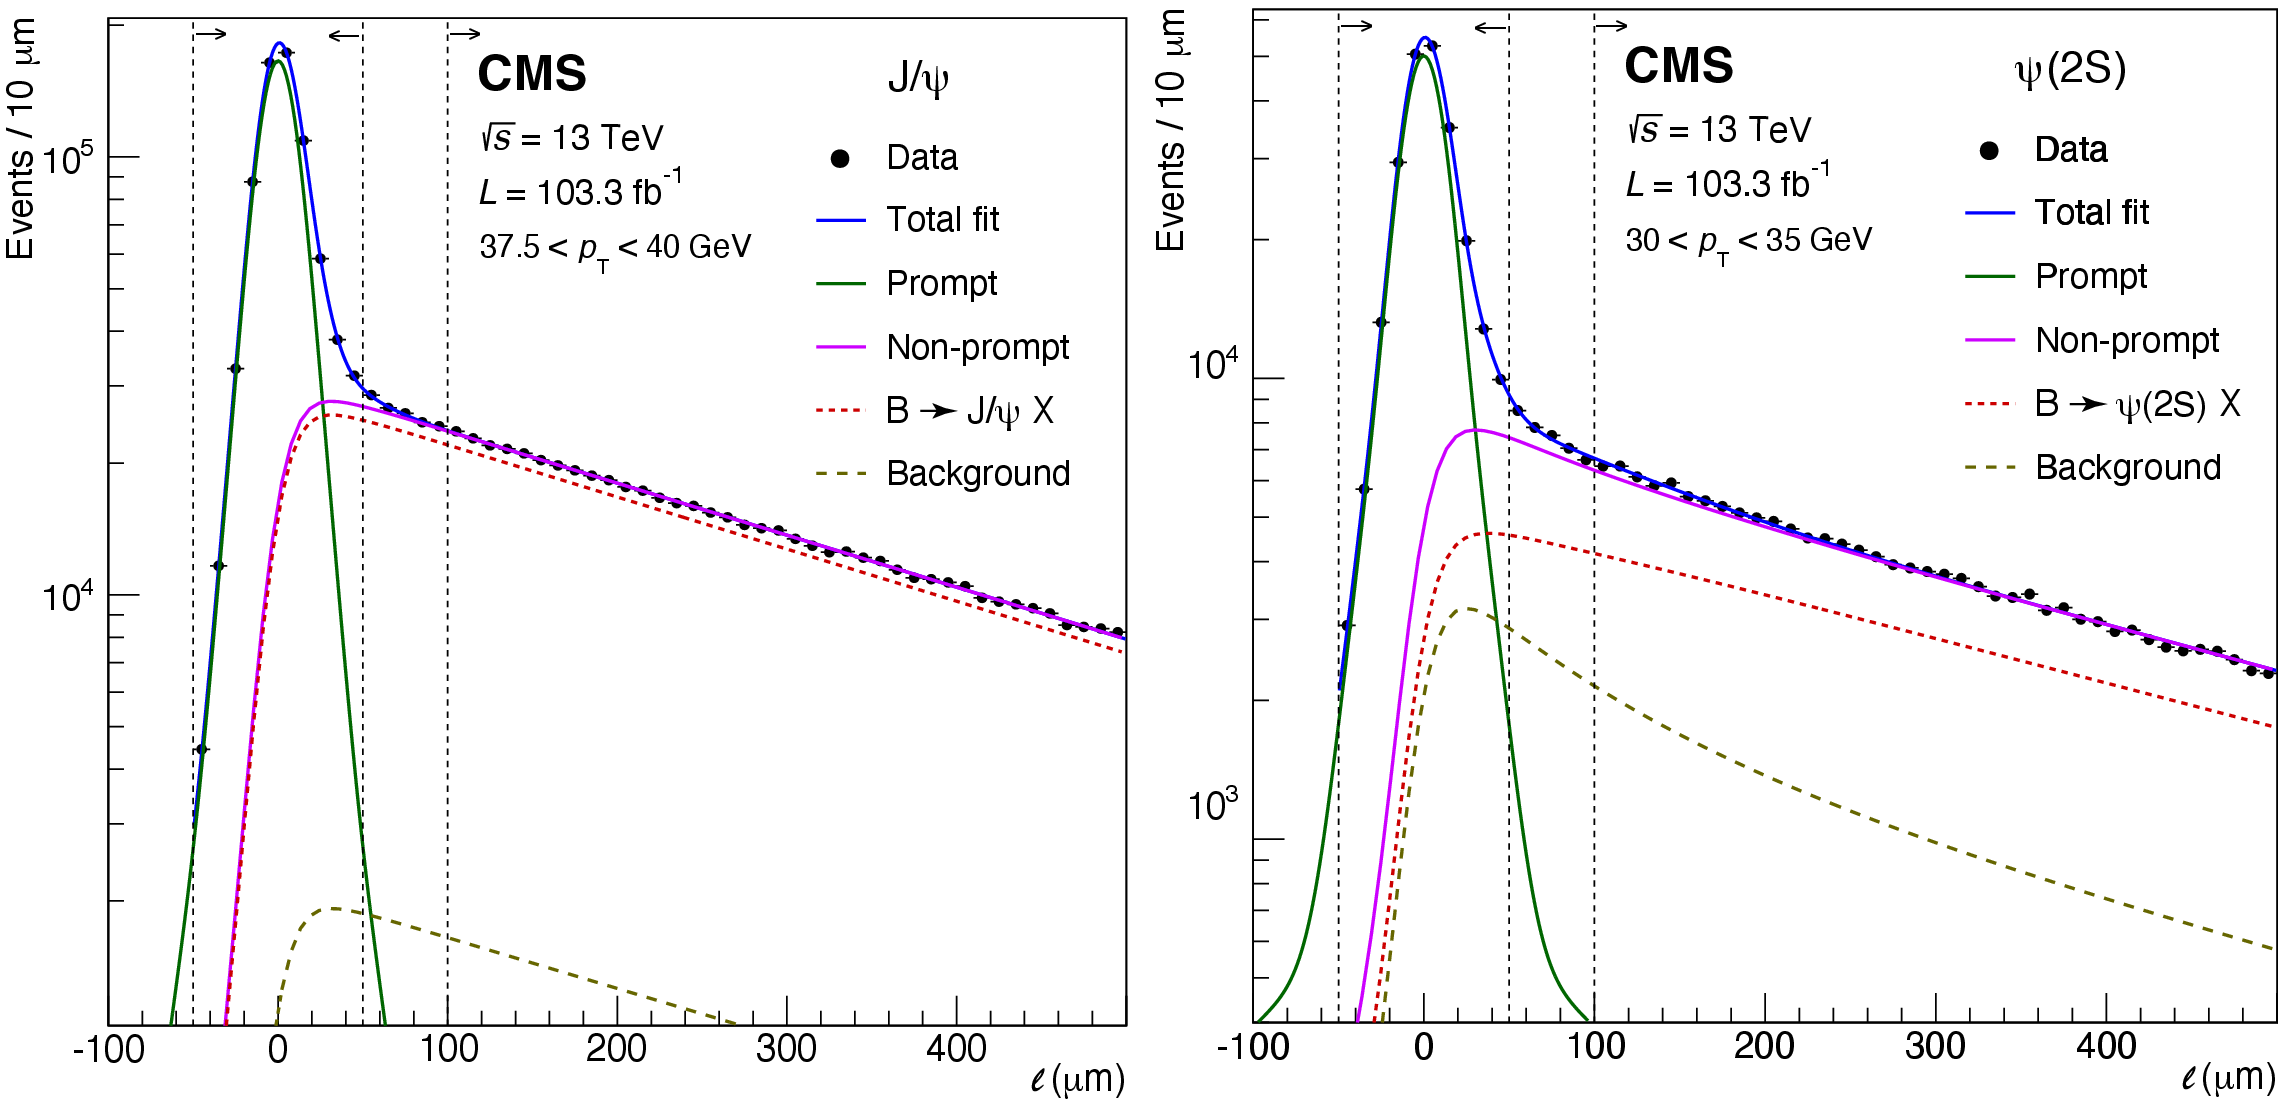
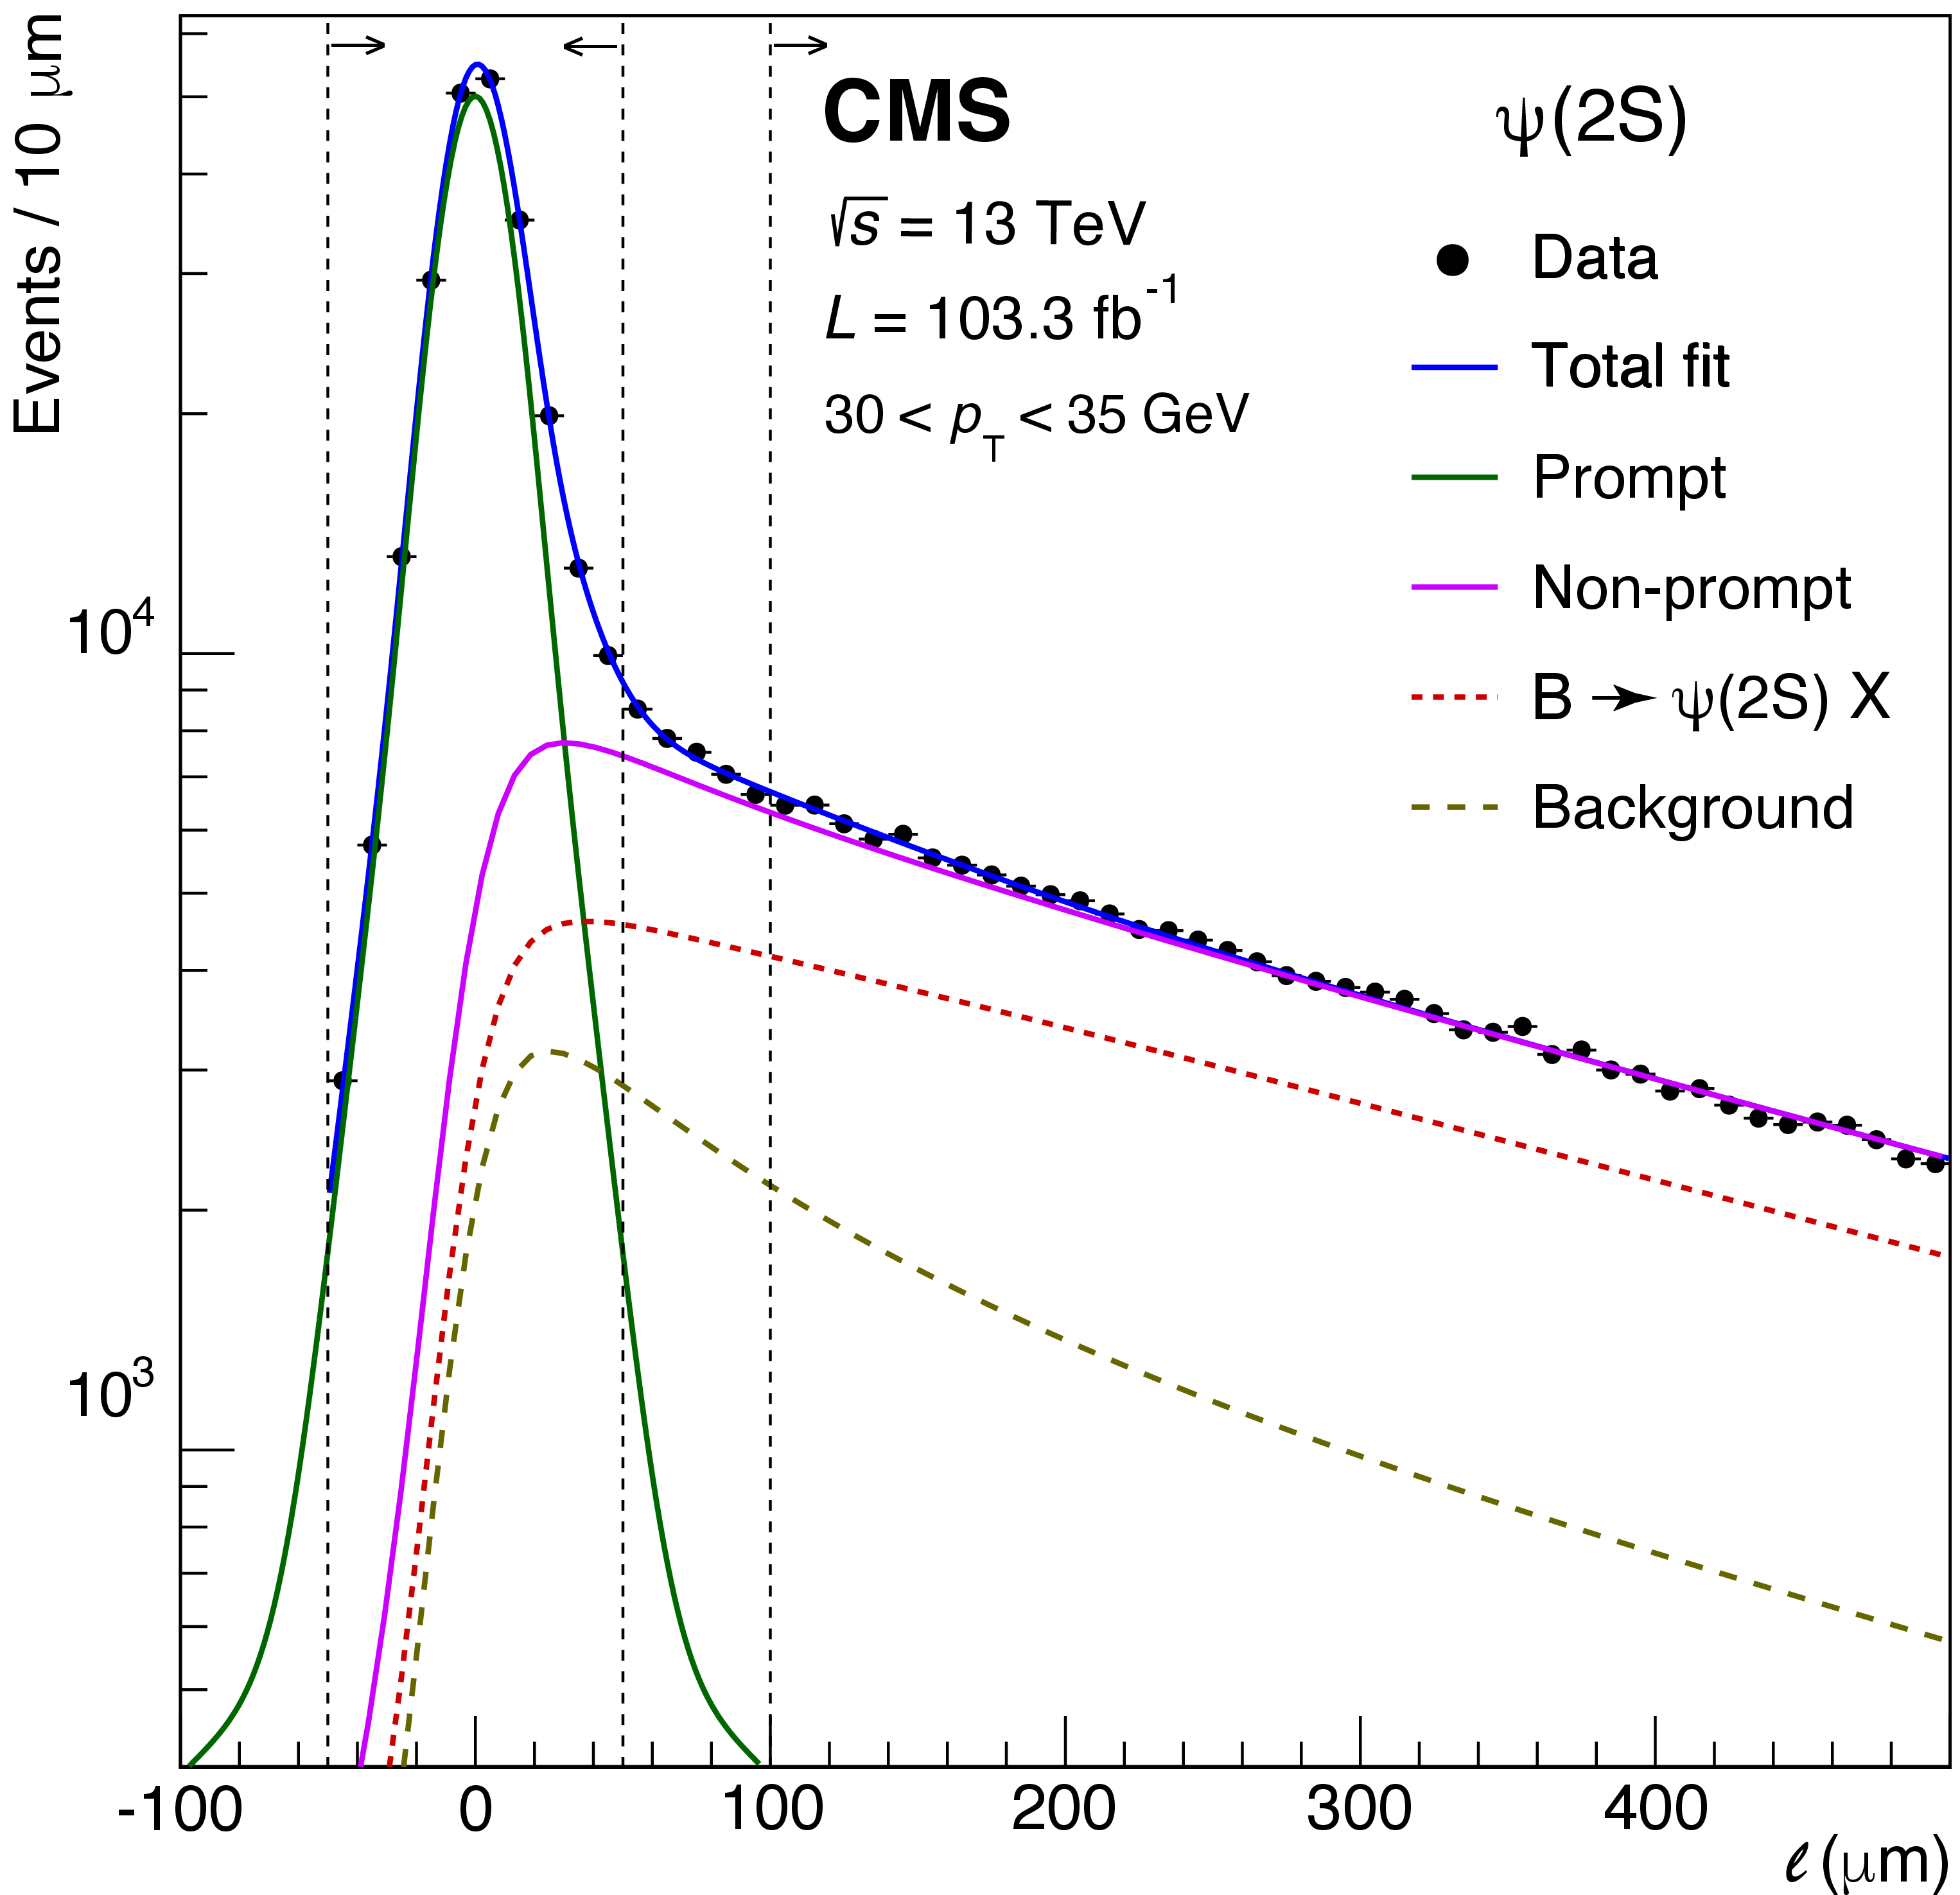
Figure 7:
Dimuon decay length distributions measured for the $ \mathrm{J}/\psi $ (left) and $\psi \text{(2S)} $ (right) cases, in their mass signal windows, in the mentioned $ p_{\mathrm{T}} $ bins. The vertical dashed lines mark the limits of the PR and NP ranges. The total fit function, as well as the individual contributions, are also shown. |
png pdf |
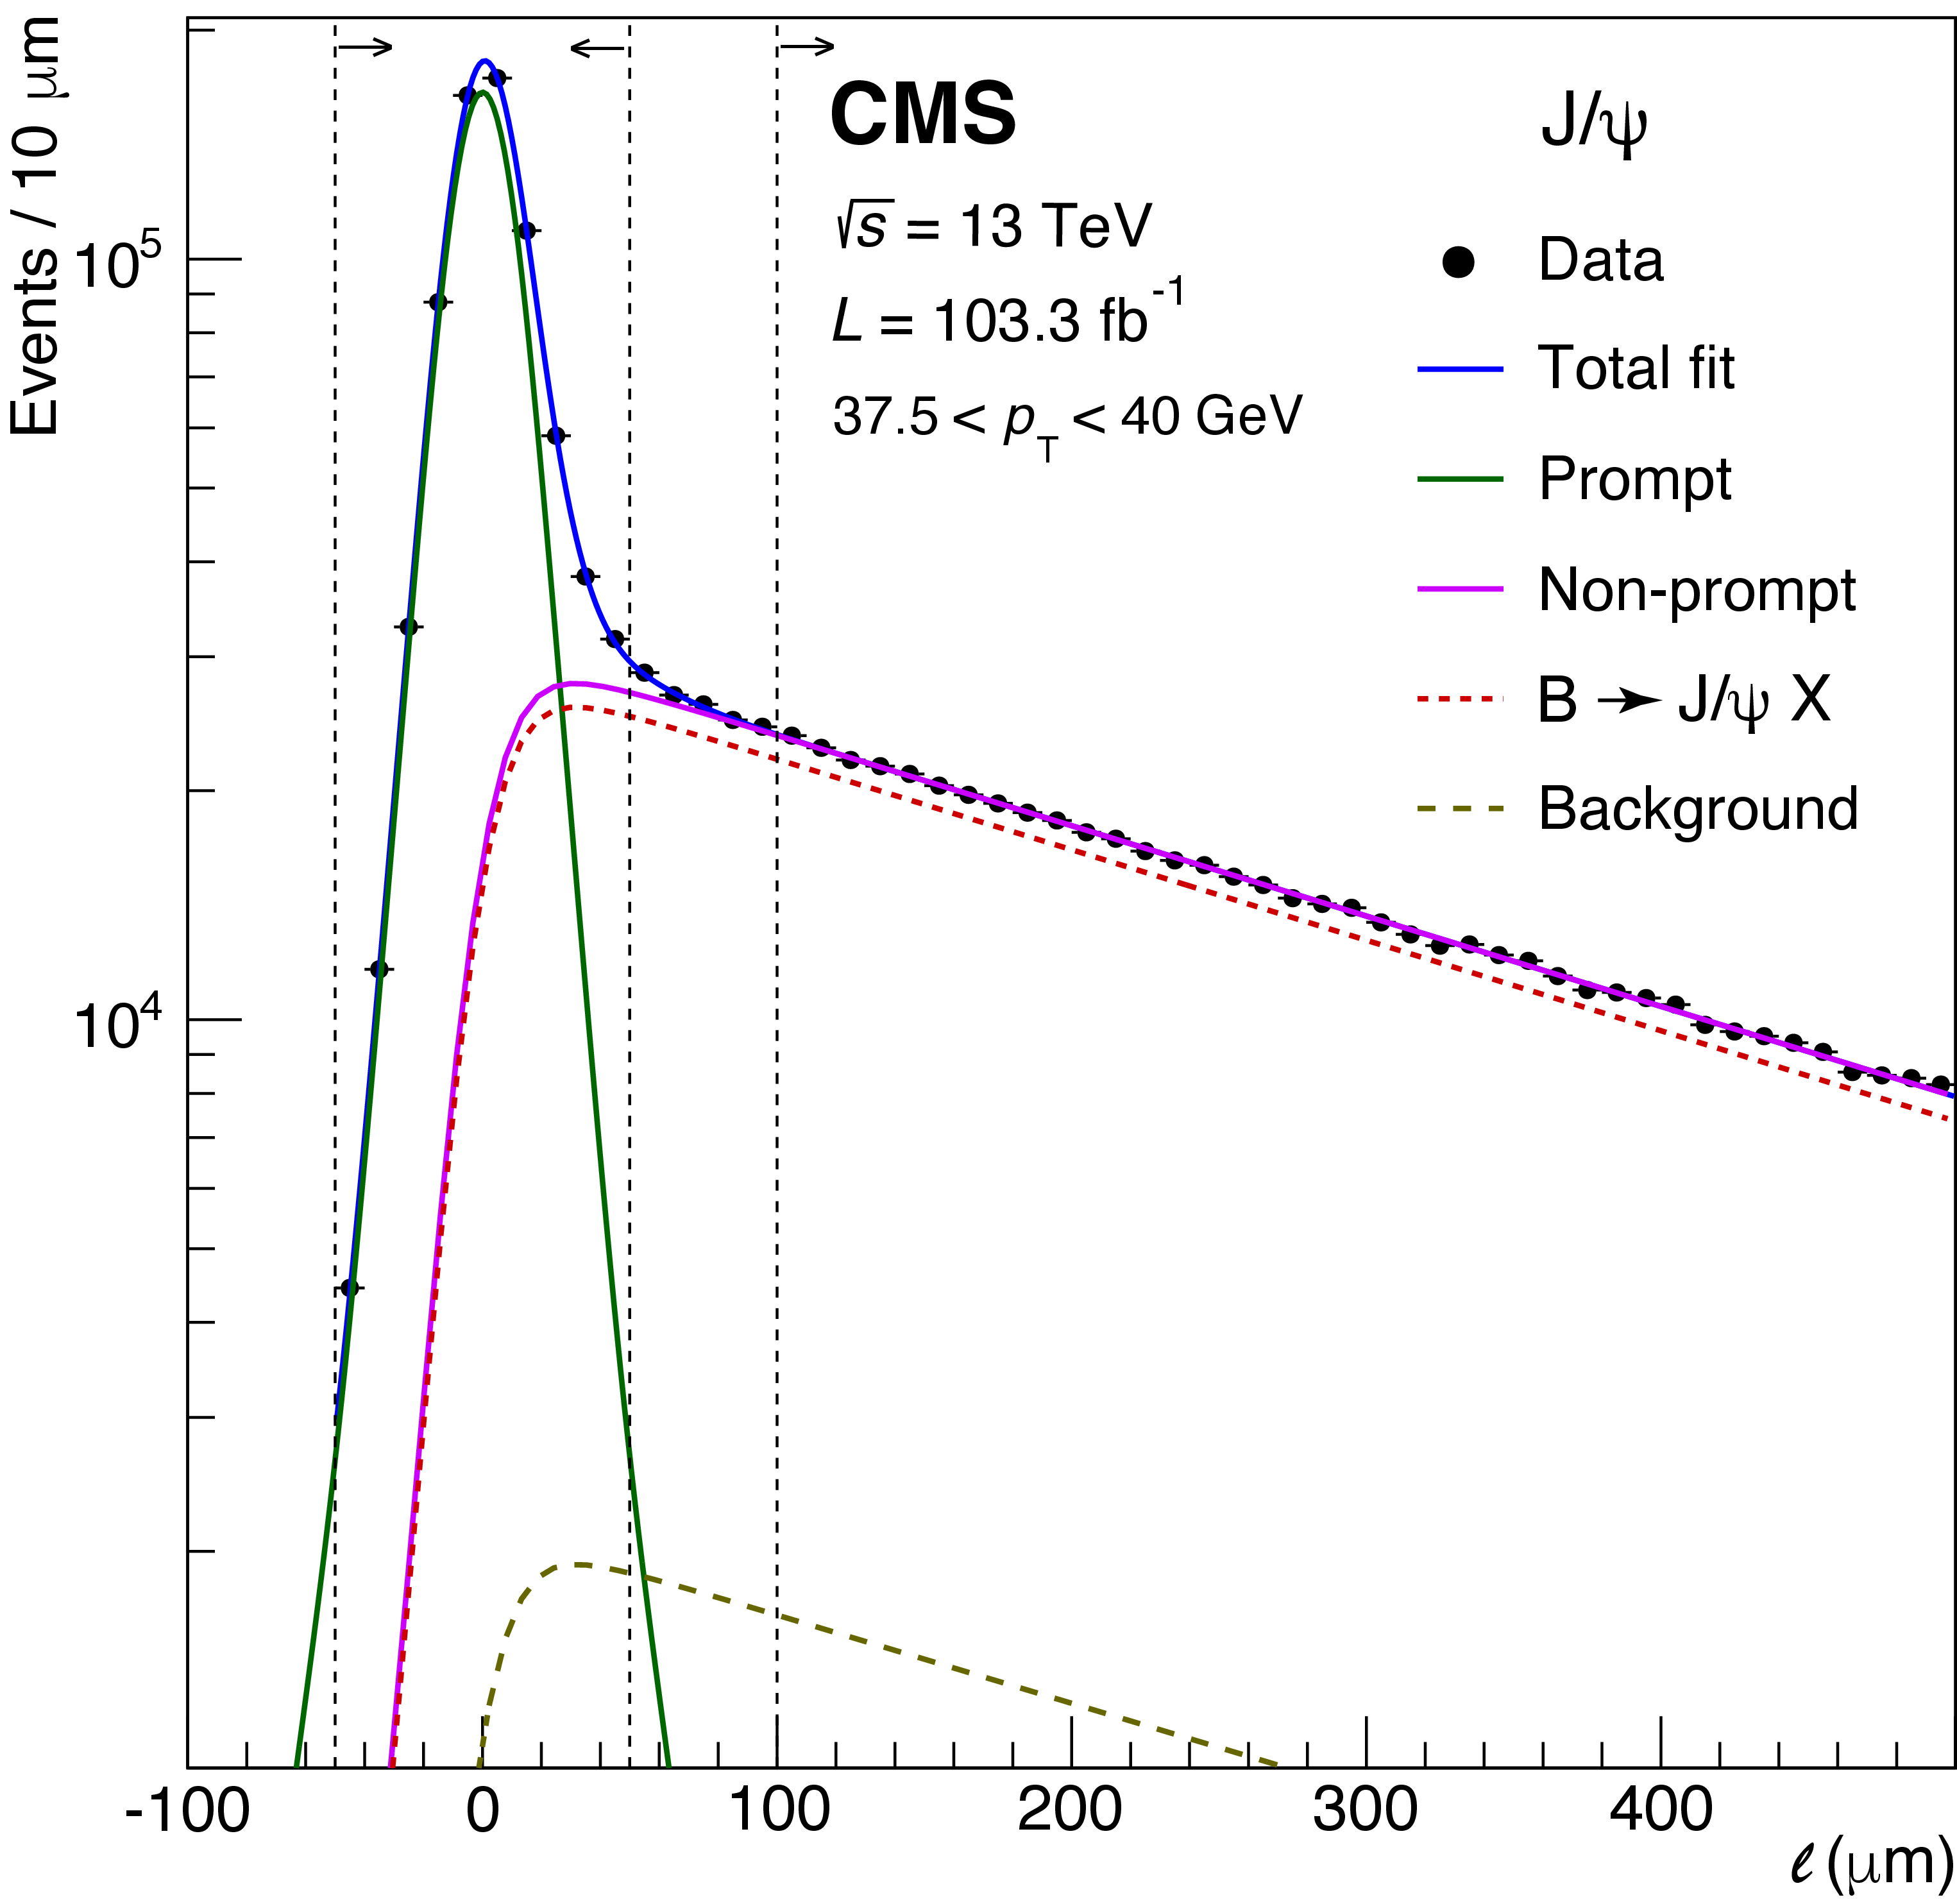
Figure 7-a:
Dimuon decay length distributions measured for the $ \mathrm{J}/\psi $ (left) and $\psi \text{(2S)} $ (right) cases, in their mass signal windows, in the mentioned $ p_{\mathrm{T}} $ bins. The vertical dashed lines mark the limits of the PR and NP ranges. The total fit function, as well as the individual contributions, are also shown. |
png pdf |
Figure 7-b:
Dimuon decay length distributions measured for the $ \mathrm{J}/\psi $ (left) and $\psi \text{(2S)} $ (right) cases, in their mass signal windows, in the mentioned $ p_{\mathrm{T}} $ bins. The vertical dashed lines mark the limits of the PR and NP ranges. The total fit function, as well as the individual contributions, are also shown. |
png pdf |
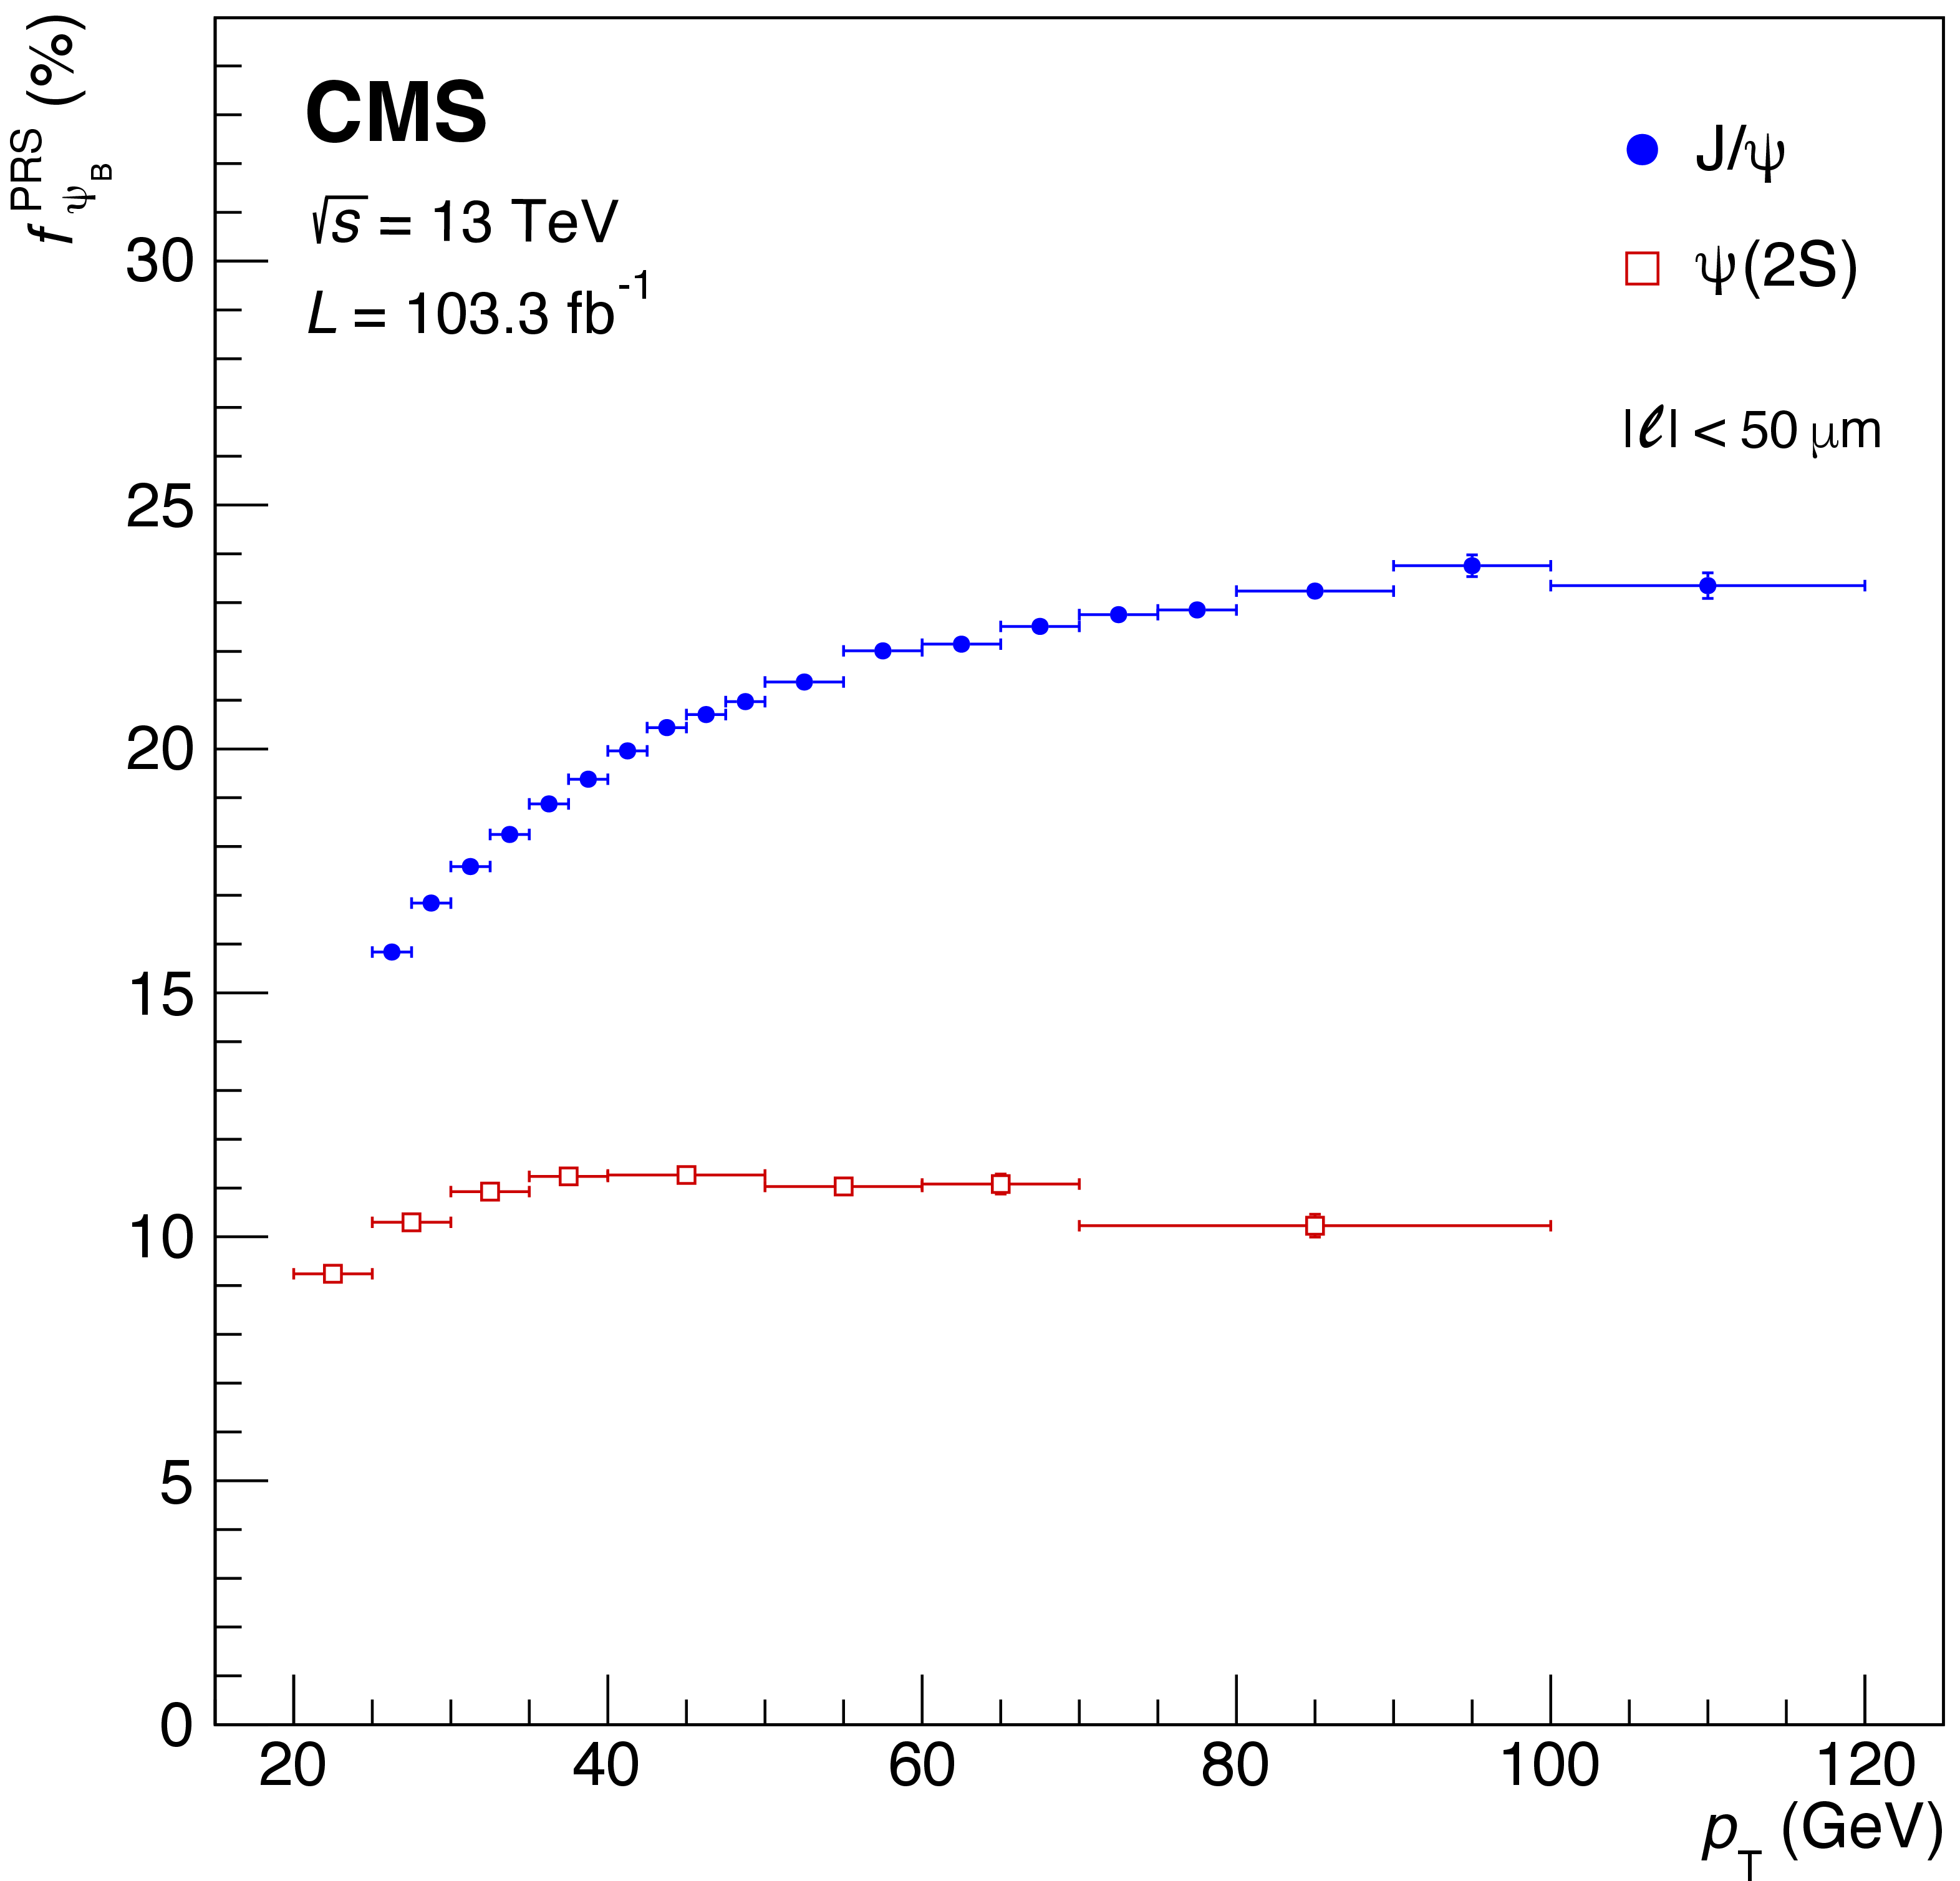
Figure 8:
Variation with $ p_{\mathrm{T}} $ of the fraction of events in the PRS region from non-prompt $ \mathrm{J}/\psi $ and $\psi \text{(2S)} $ mesons. |
png pdf |
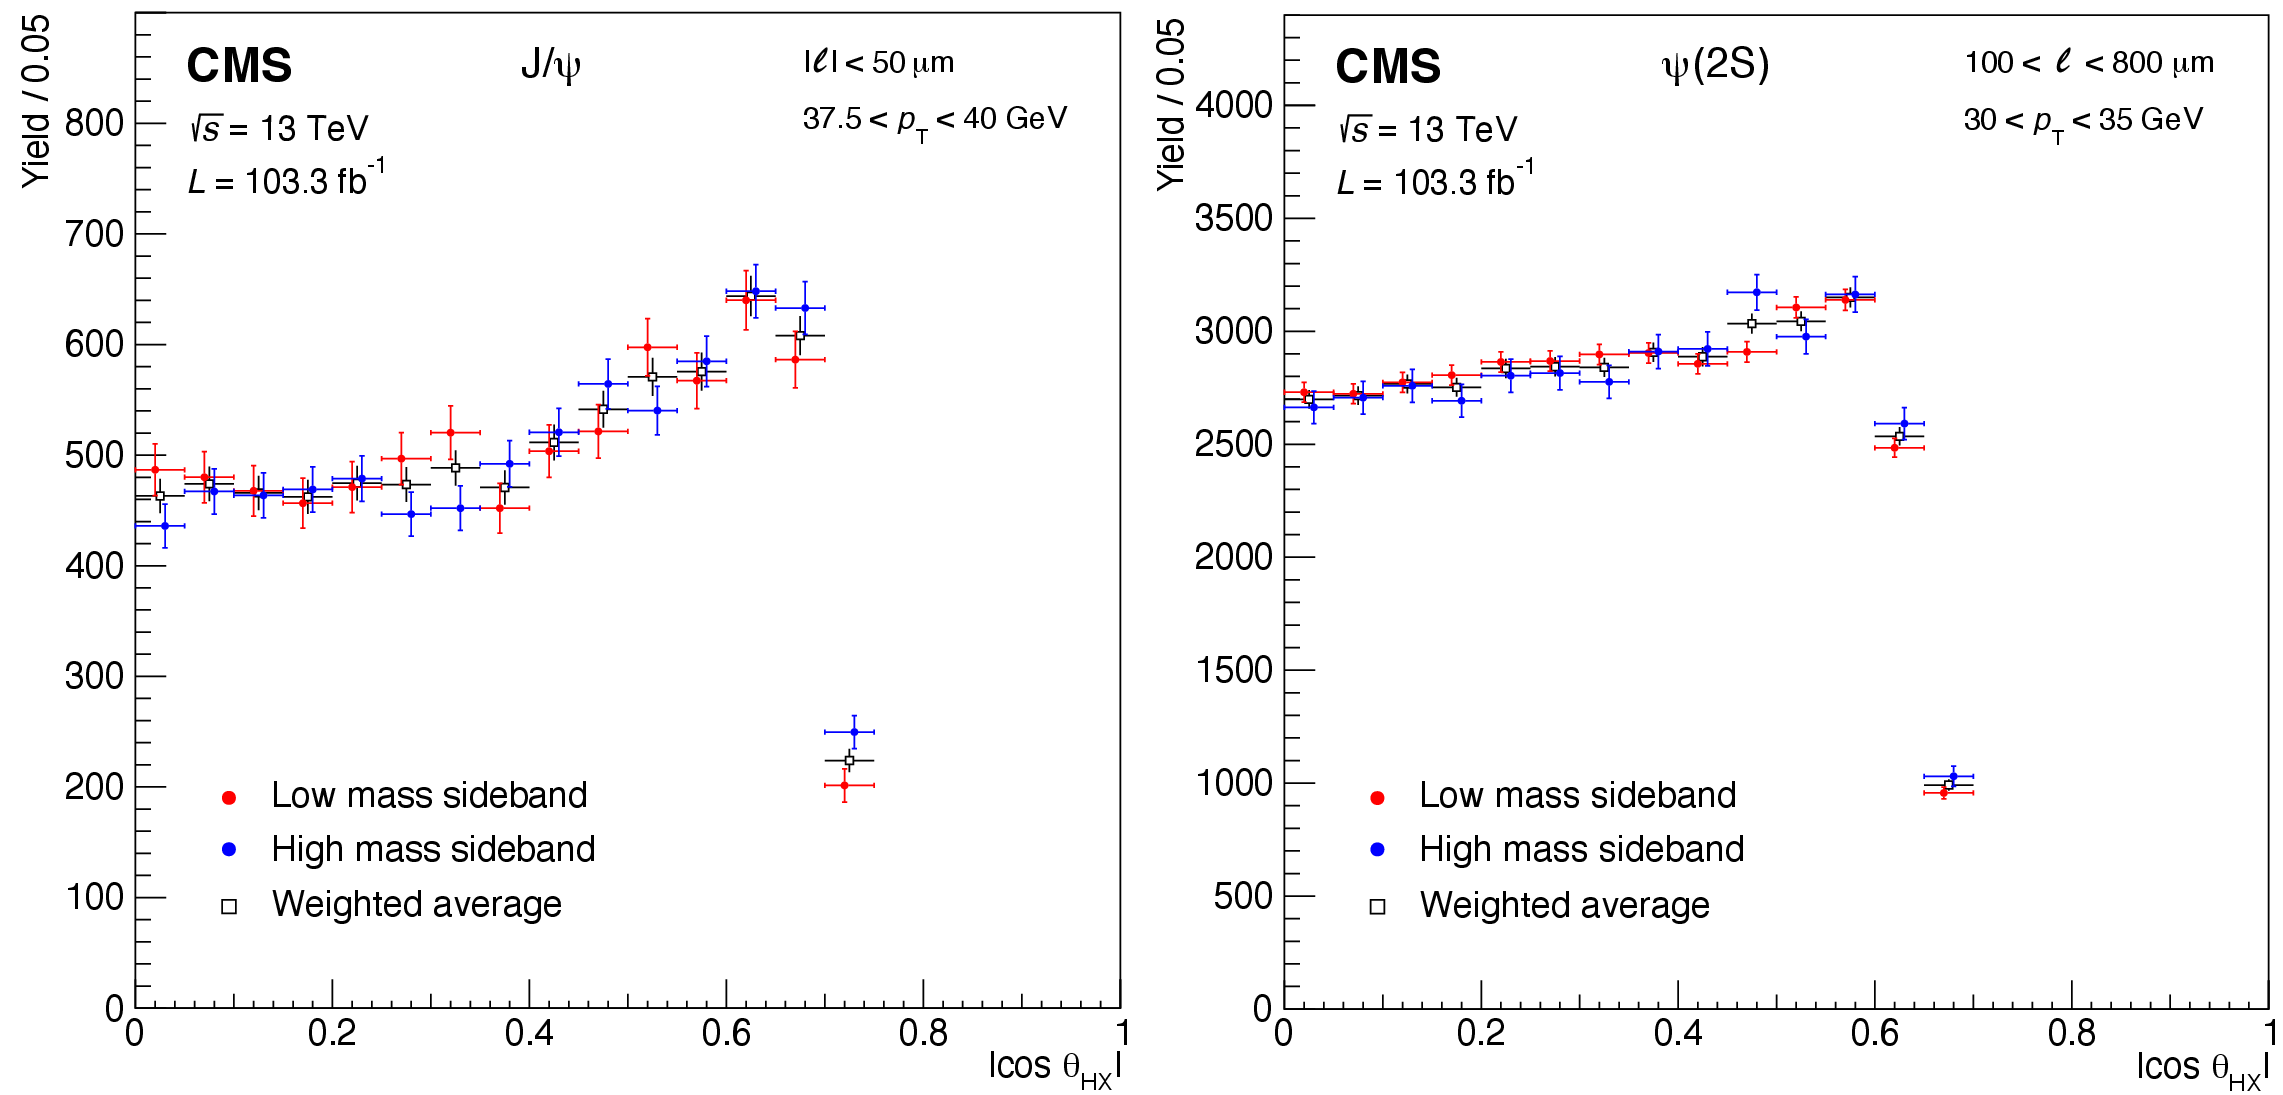
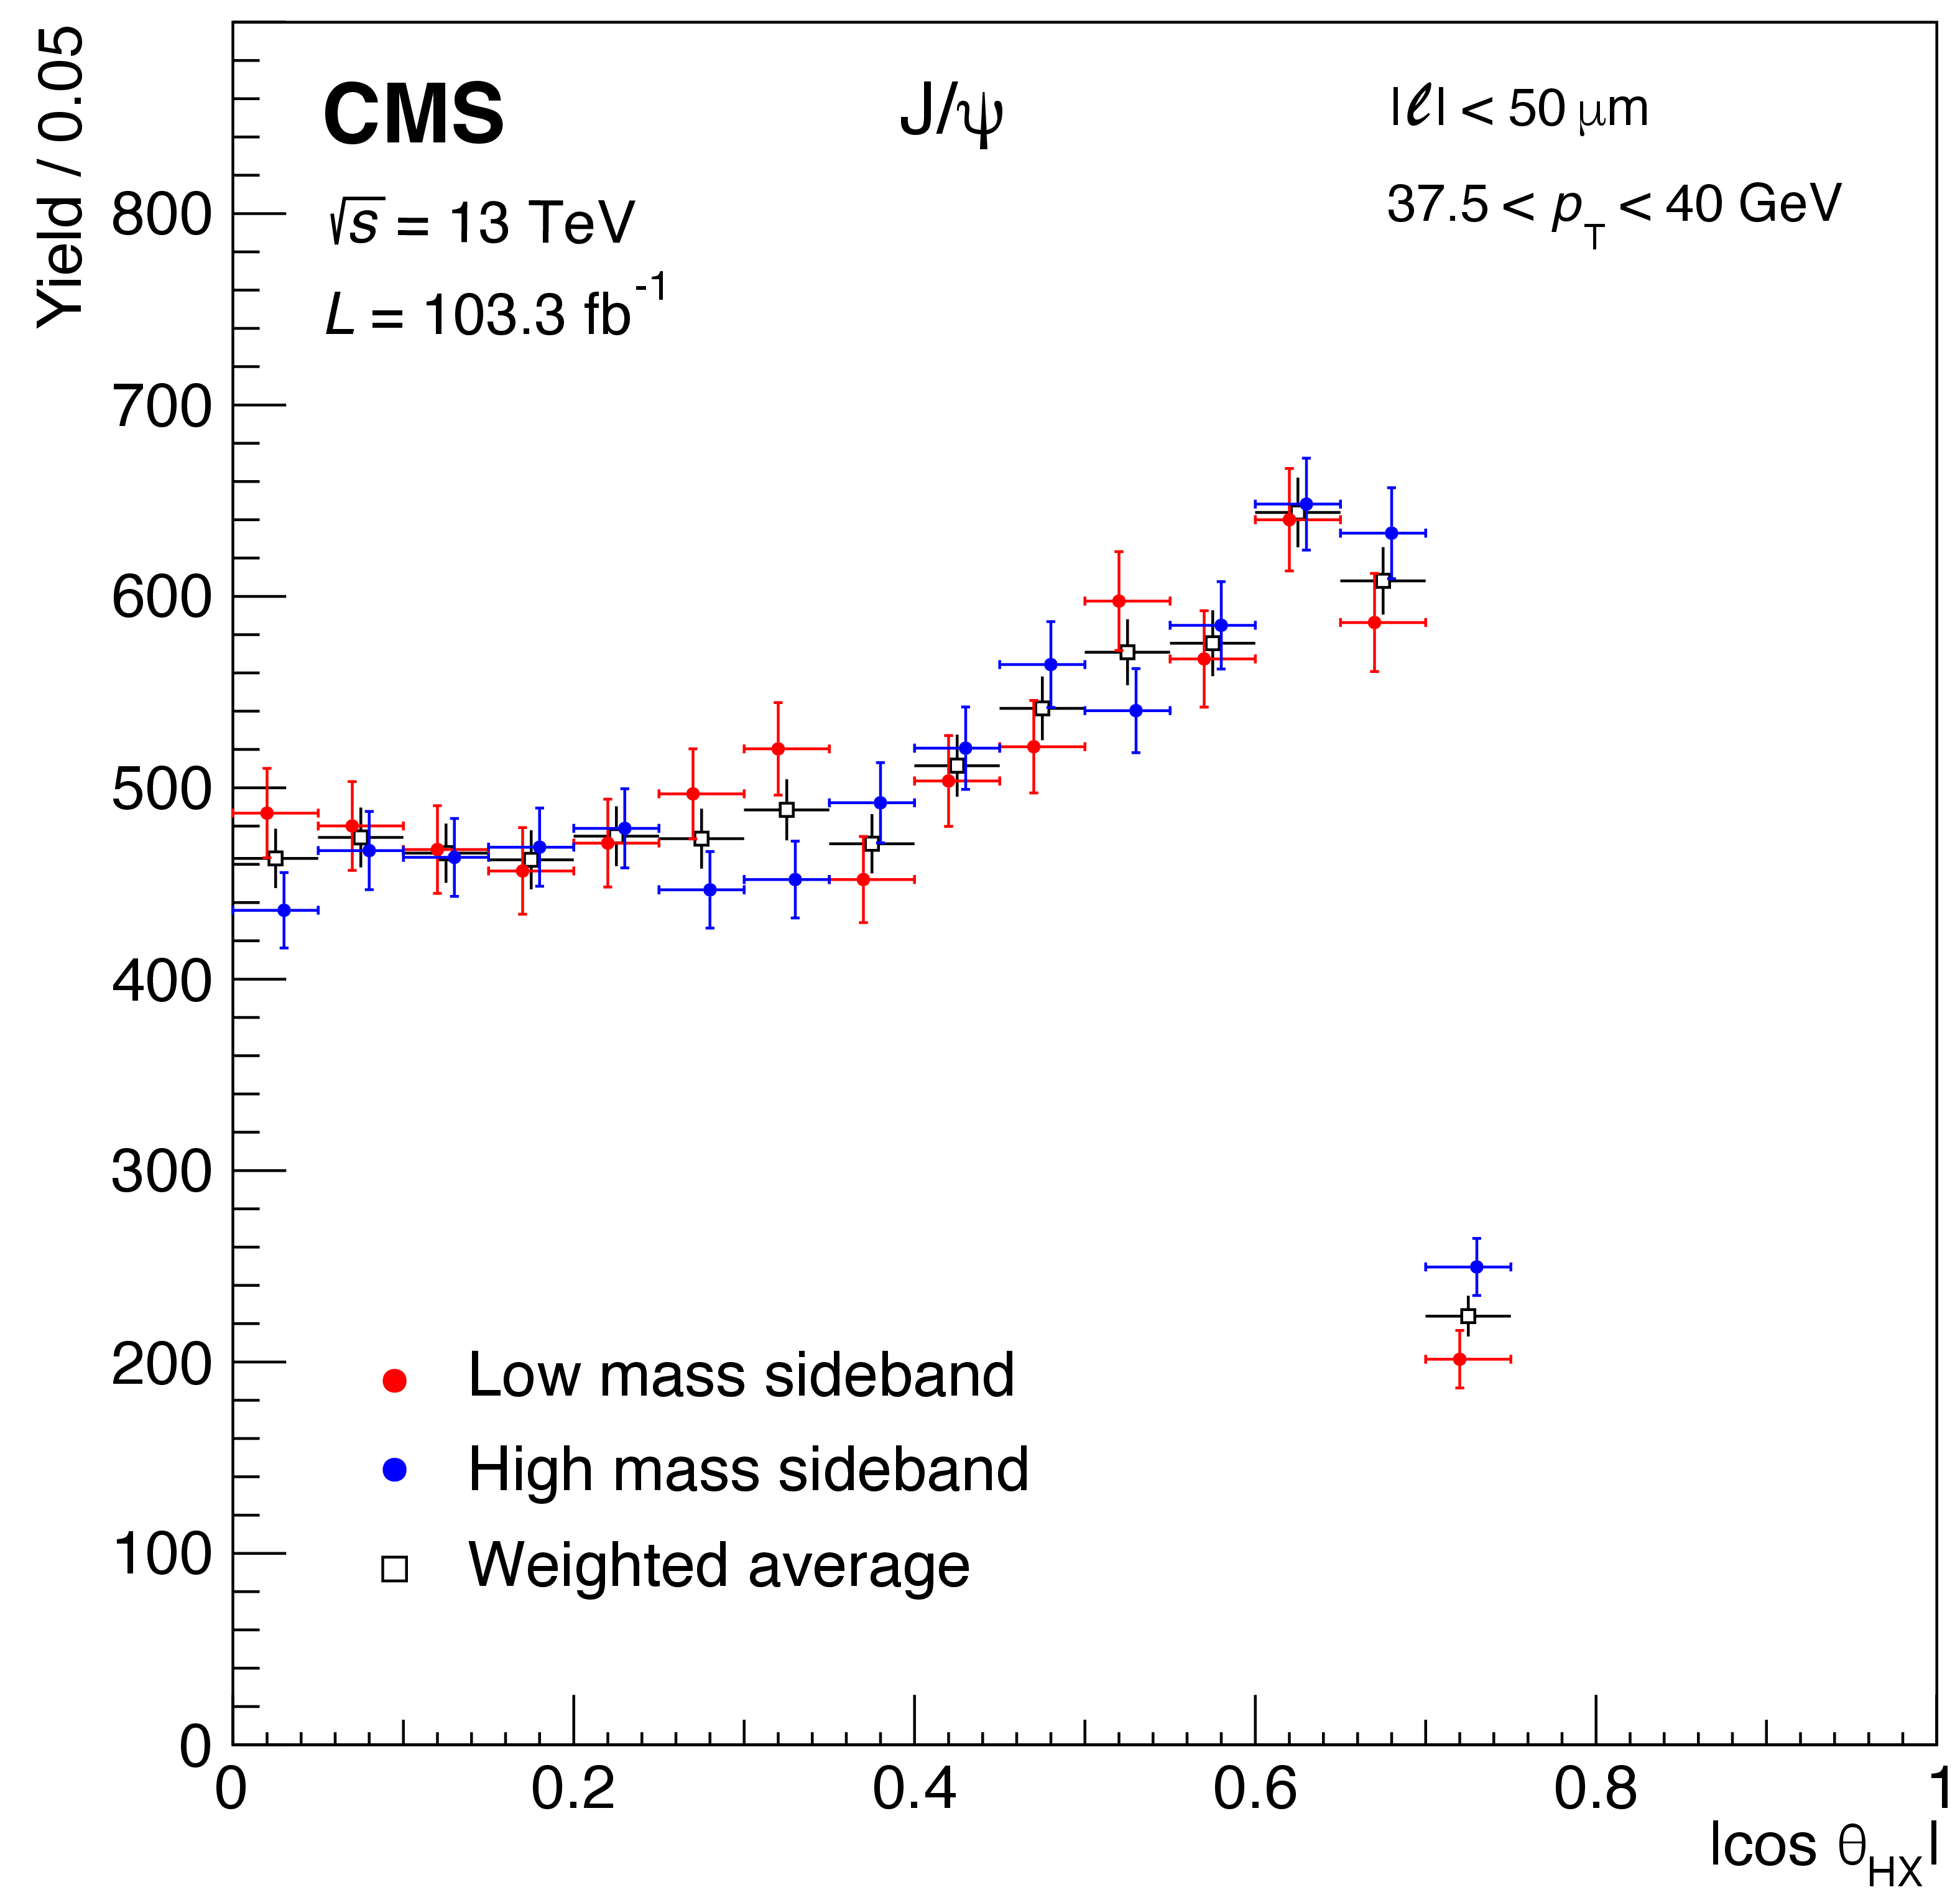
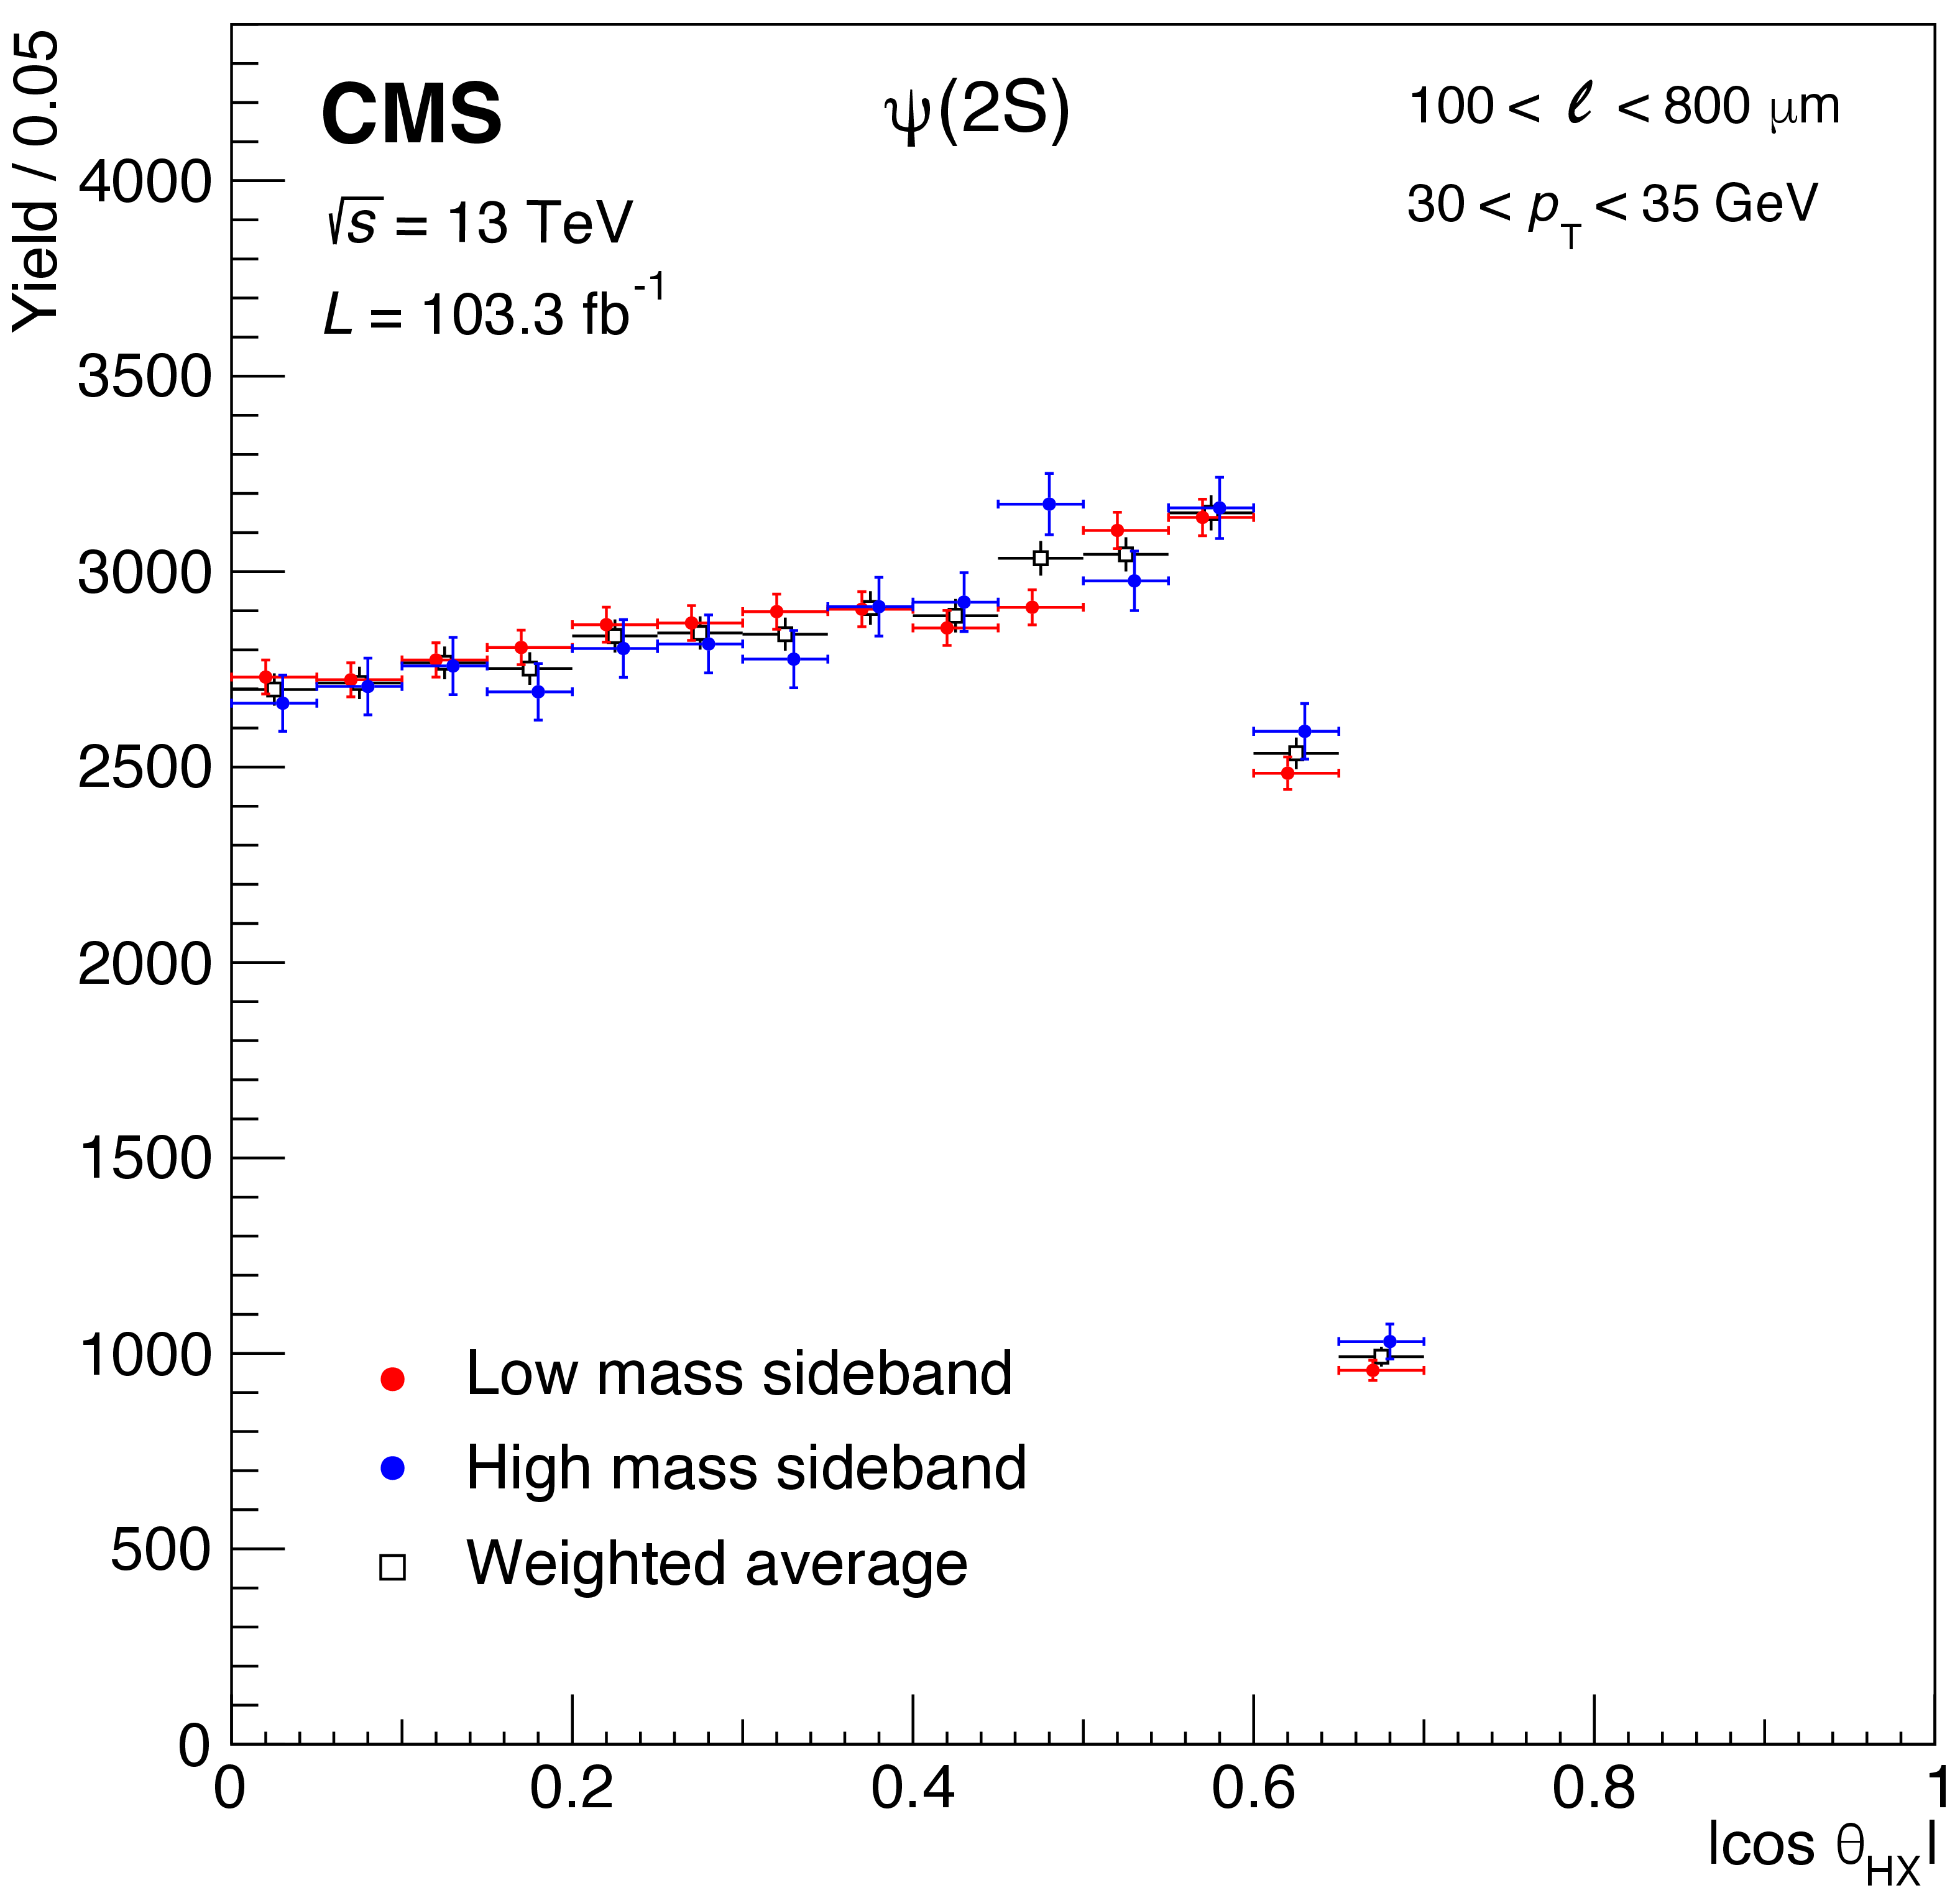
Figure 9:
$ |\cos\vartheta_\mathrm{HX}| $ distributions measured in the mass sidebands (shifted horizontally for better visibility), and their weighted average, for the prompt $ \mathrm{J}/\psi $ (left) and non-prompt $\psi \text{(2S)} $ (right) samples, in the mentioned $ p_{\mathrm{T}} $ bins. |
png pdf |
Figure 9-a:
$ |\cos\vartheta_\mathrm{HX}| $ distributions measured in the mass sidebands (shifted horizontally for better visibility), and their weighted average, for the prompt $ \mathrm{J}/\psi $ (left) and non-prompt $\psi \text{(2S)} $ (right) samples, in the mentioned $ p_{\mathrm{T}} $ bins. |
png pdf |
Figure 9-b:
$ |\cos\vartheta_\mathrm{HX}| $ distributions measured in the mass sidebands (shifted horizontally for better visibility), and their weighted average, for the prompt $ \mathrm{J}/\psi $ (left) and non-prompt $\psi \text{(2S)} $ (right) samples, in the mentioned $ p_{\mathrm{T}} $ bins. |
png pdf |
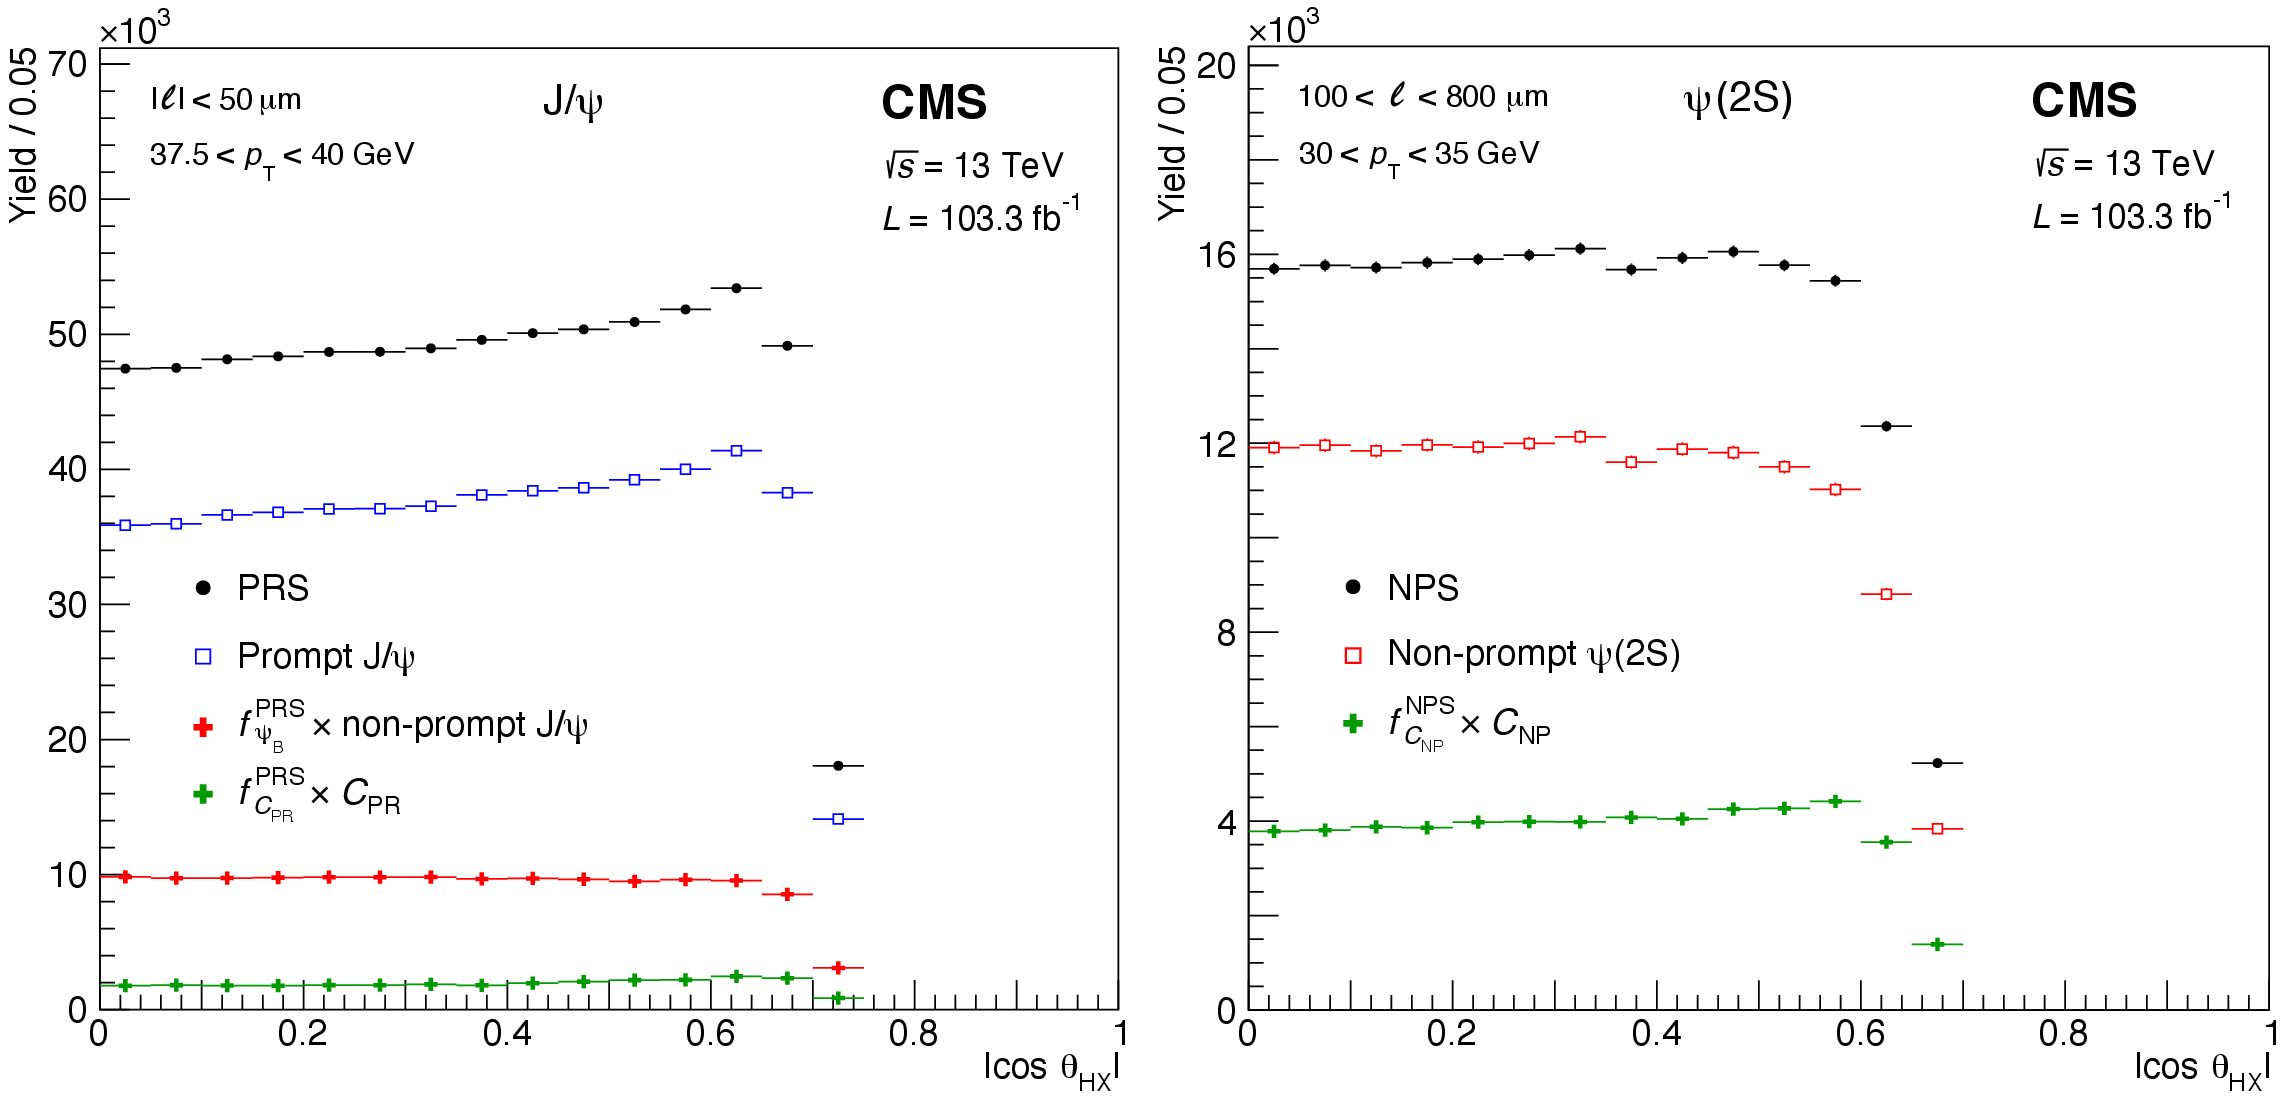
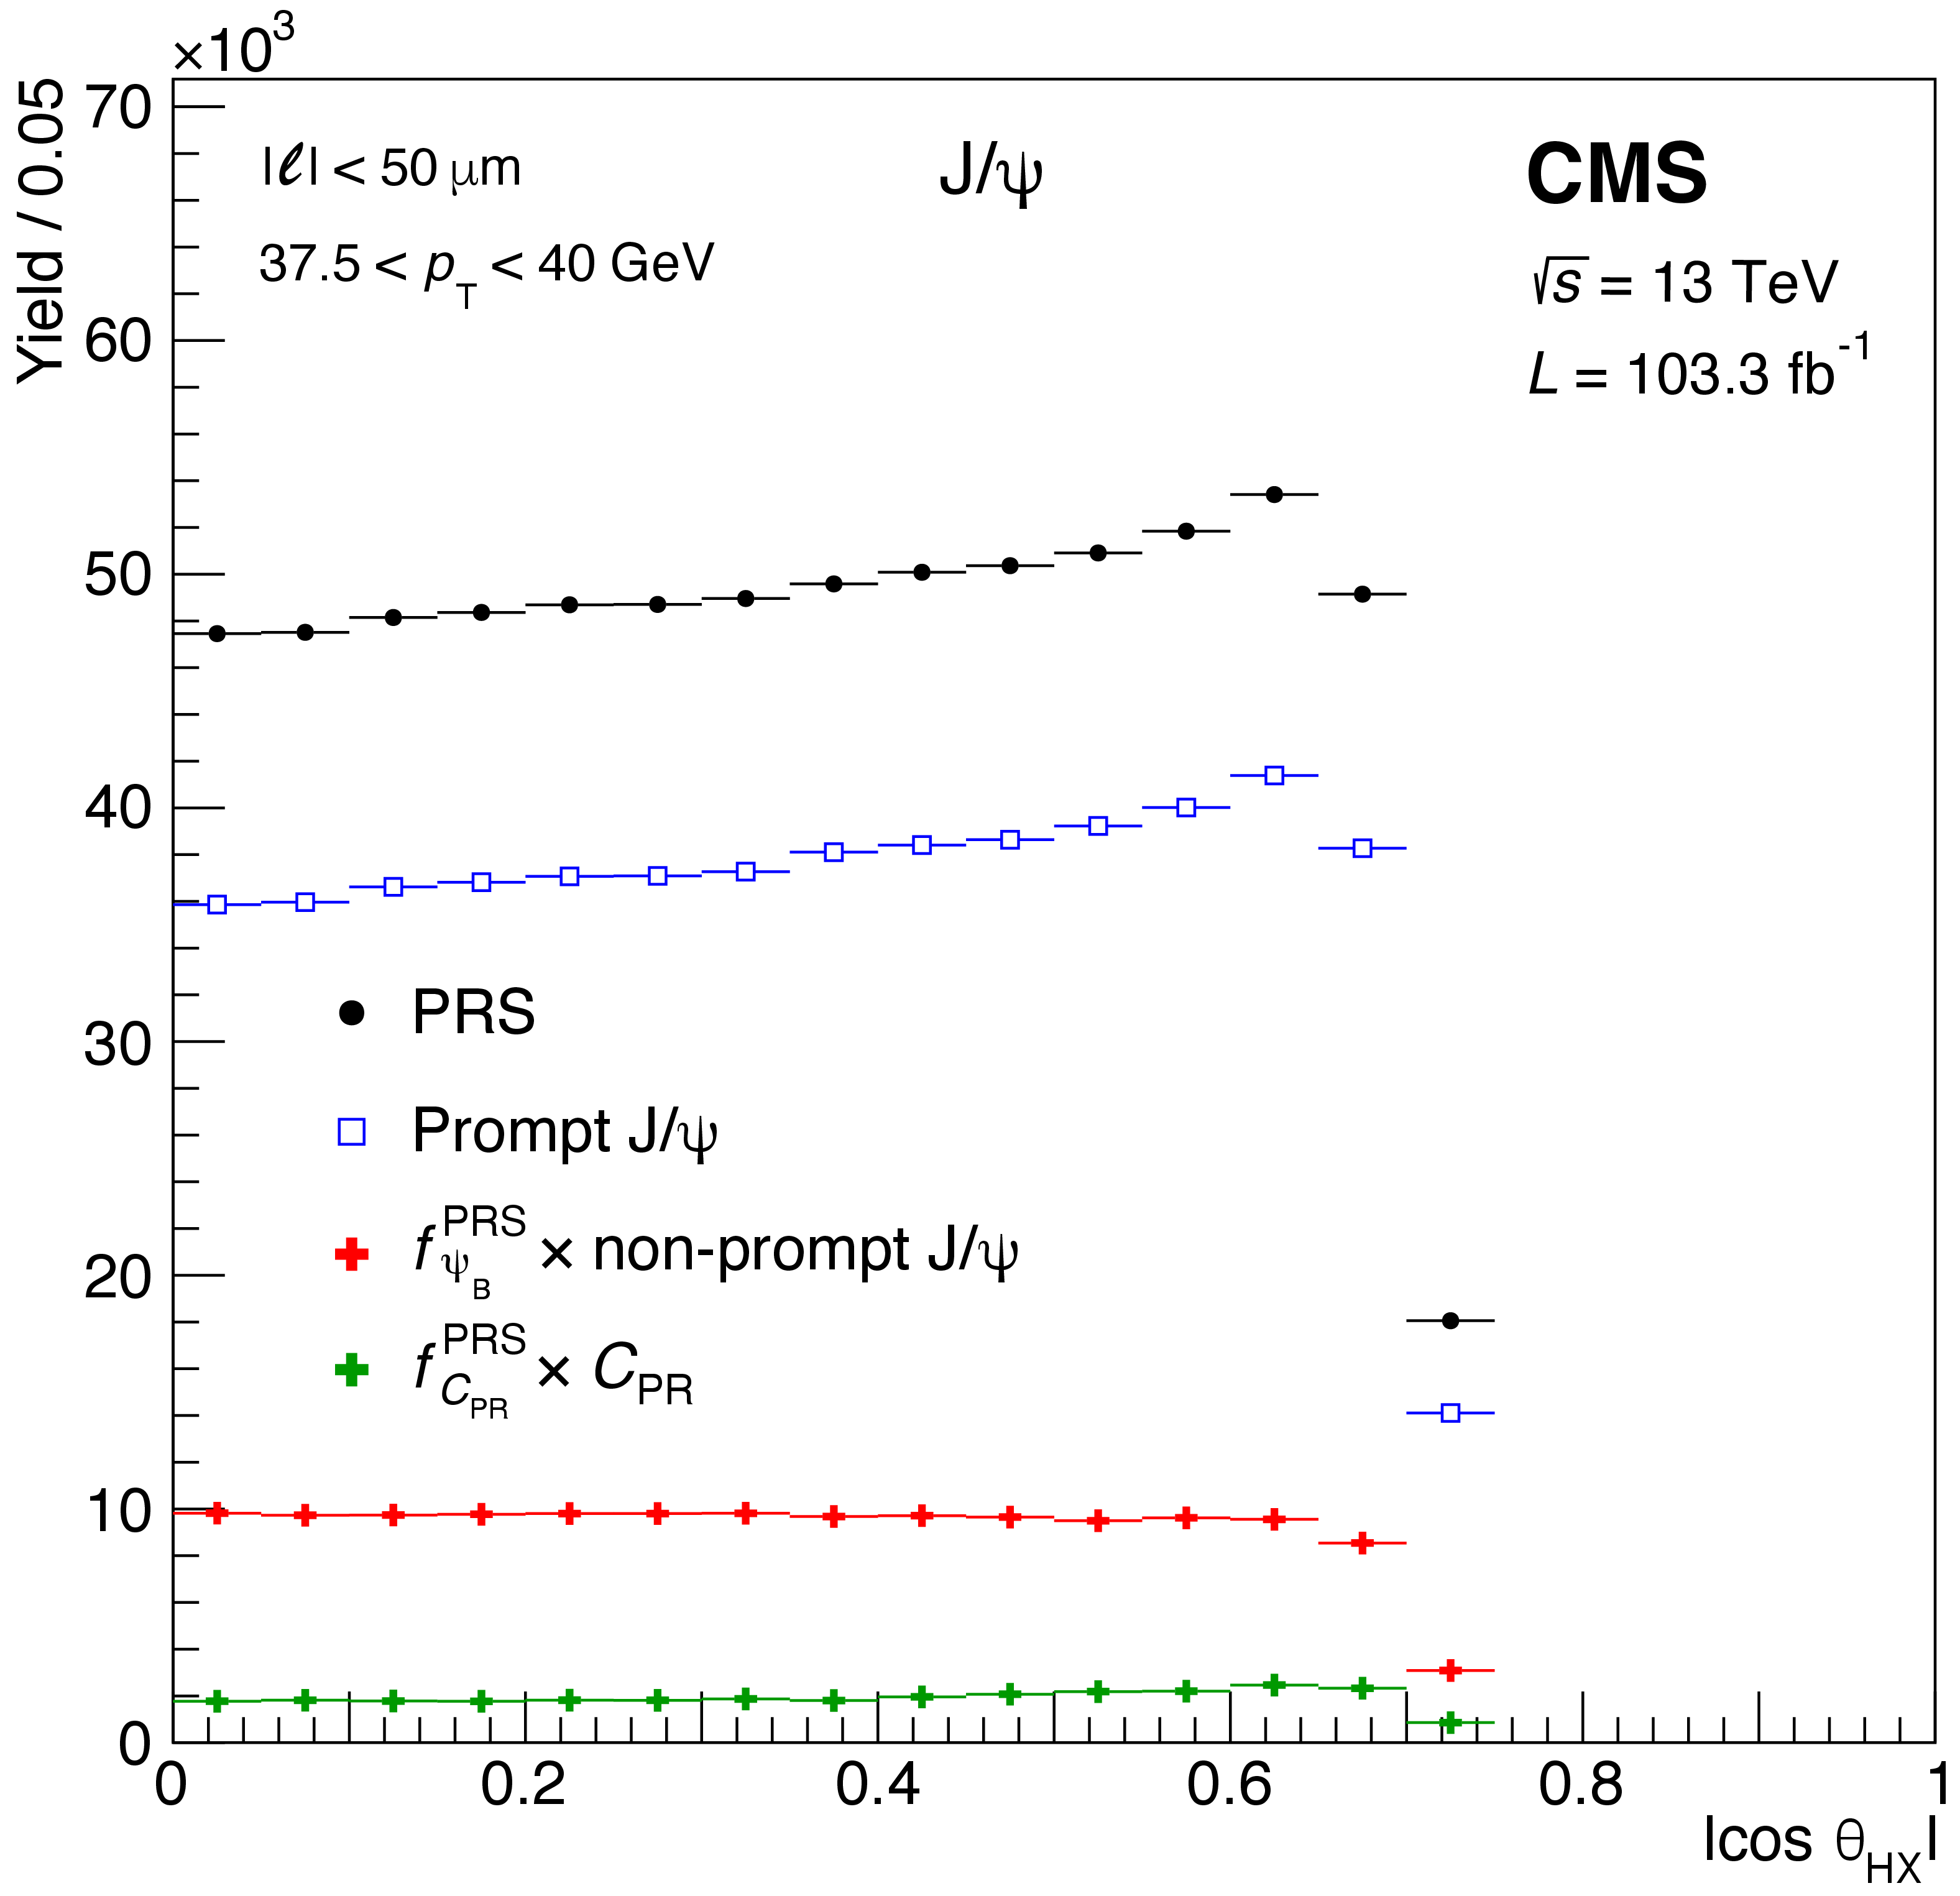
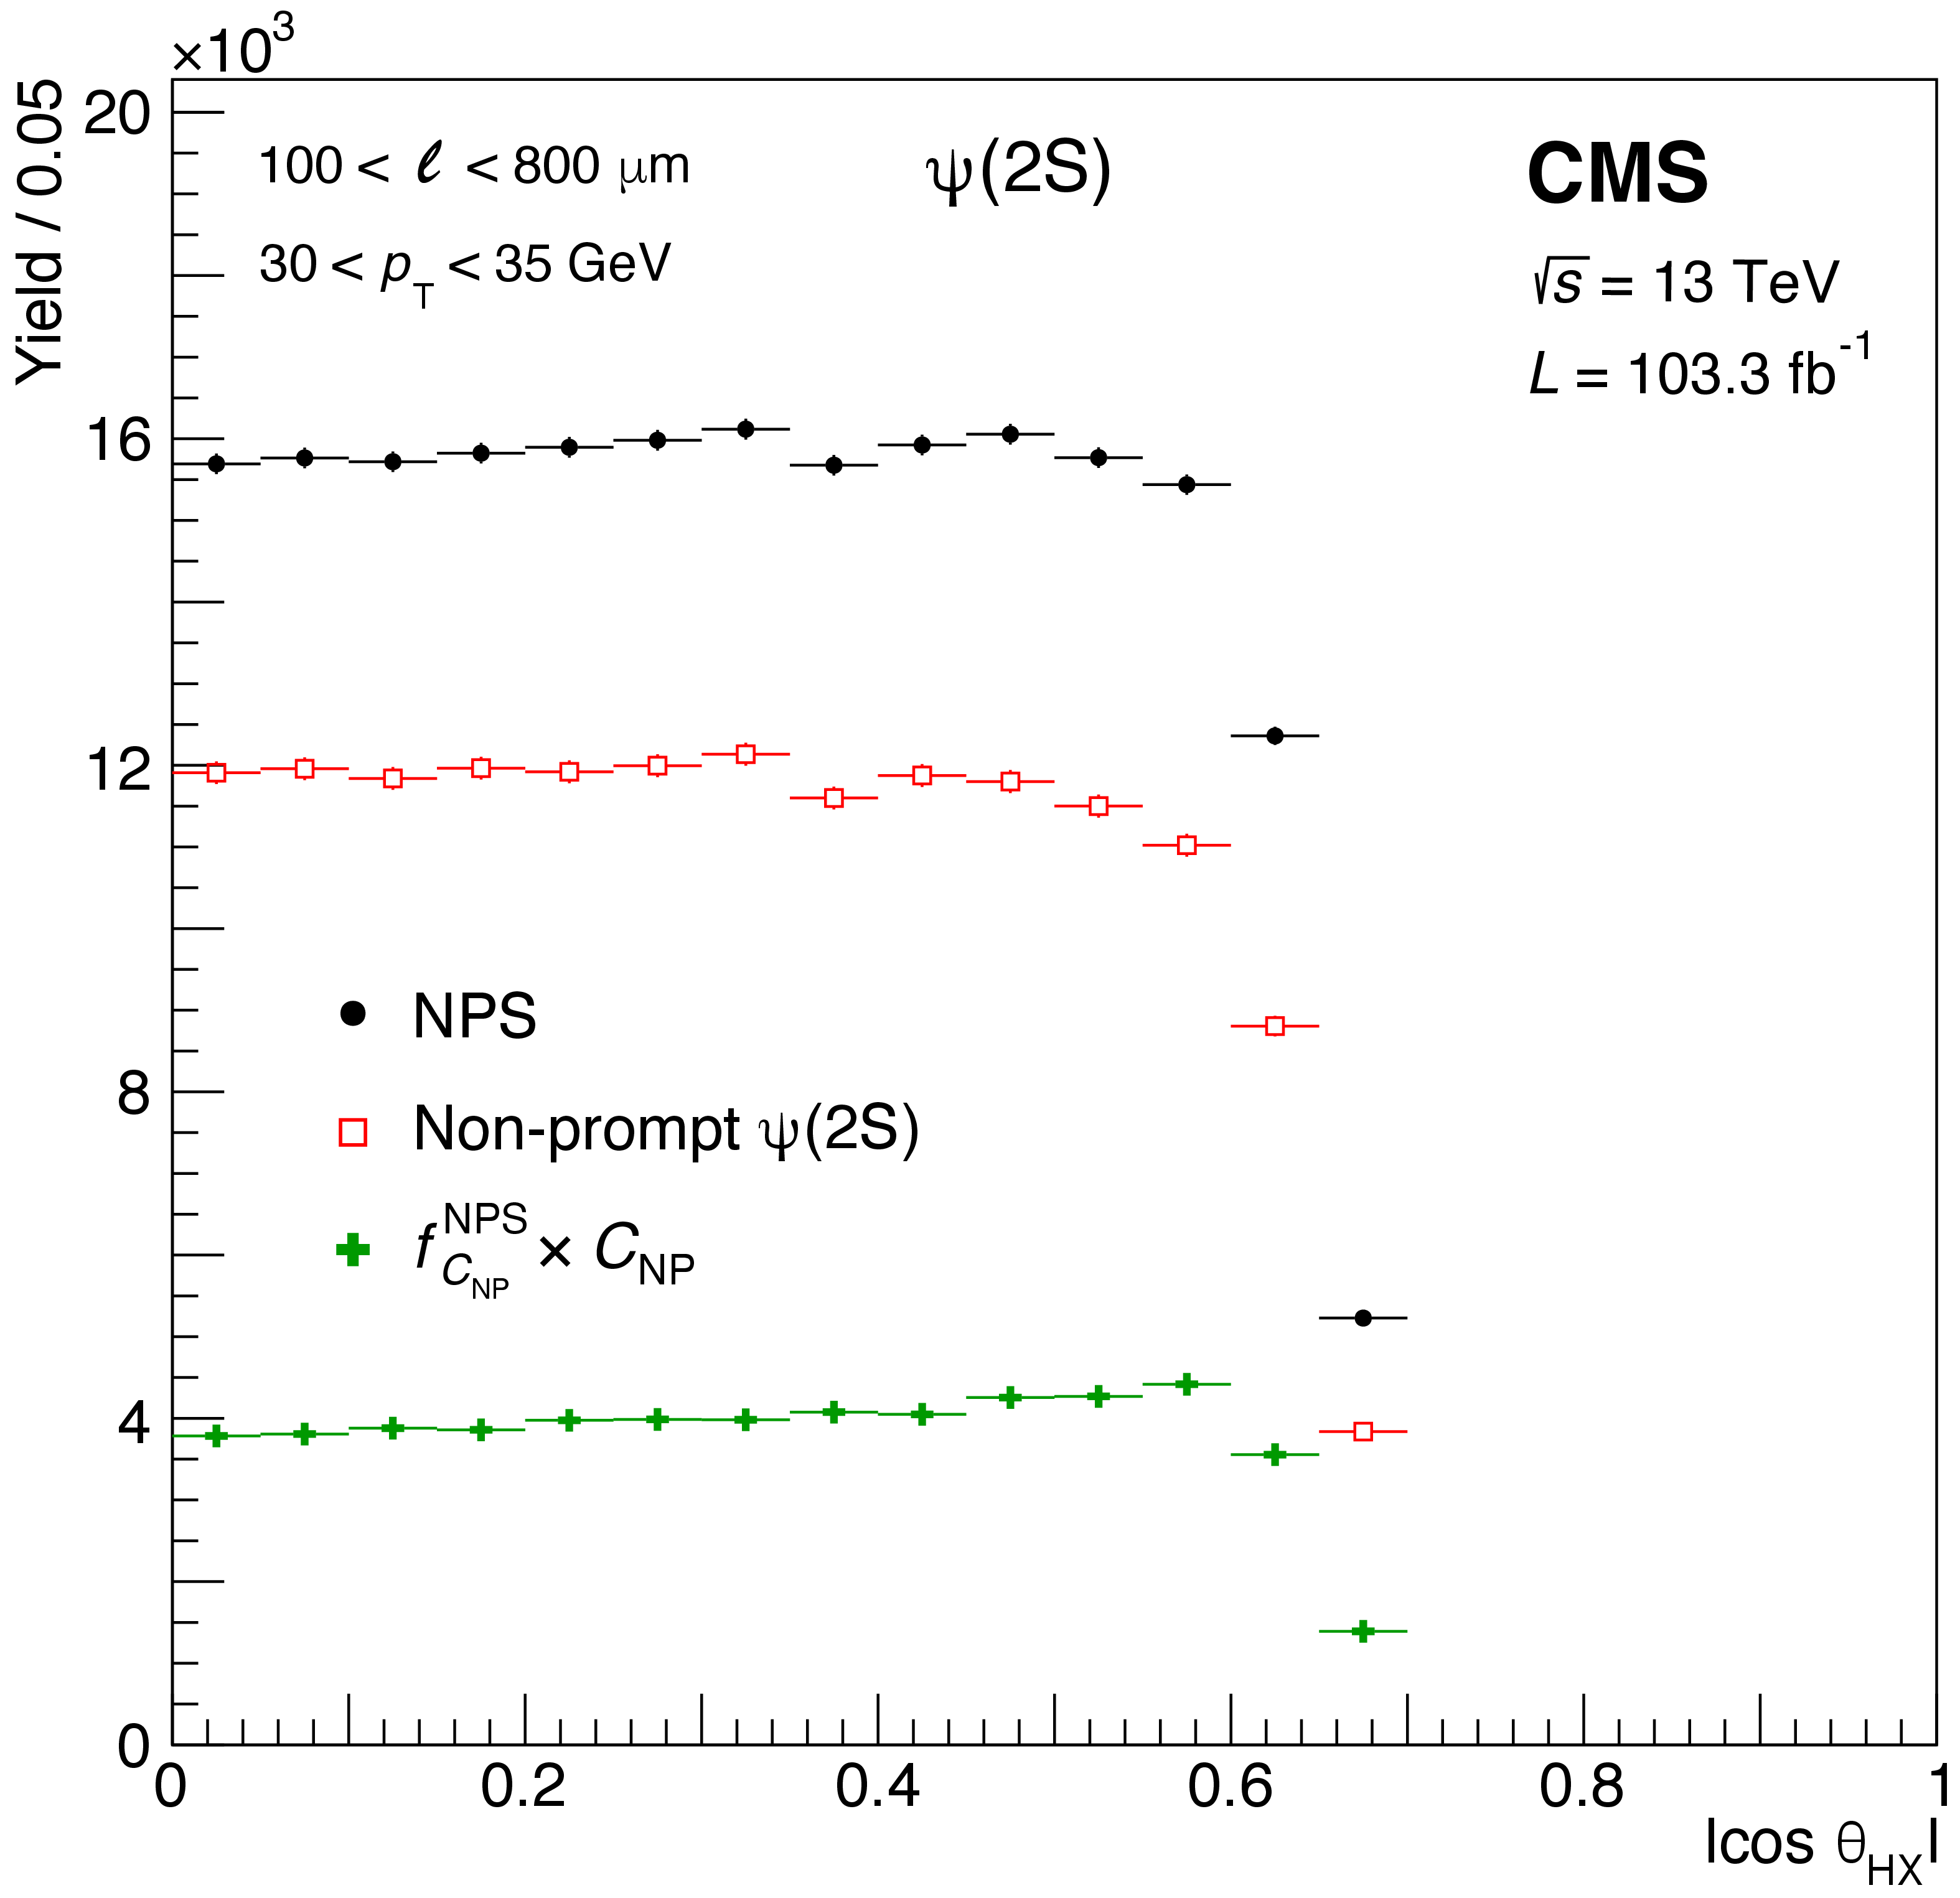
Figure 10:
$ |\cos\vartheta_\mathrm{HX}| $ distributions measured in the PRS $ \mathrm{J}/\psi $ (left) and NPS $\psi \text{(2S)} $ (right) samples, of the terms of Eqs. (4) and (3), respectively, in the mentioned $ p_{\mathrm{T}} $ bins. |
png pdf |
Figure 10-a:
$ |\cos\vartheta_\mathrm{HX}| $ distributions measured in the PRS $ \mathrm{J}/\psi $ (left) and NPS $\psi \text{(2S)} $ (right) samples, of the terms of Eqs. (4) and (3), respectively, in the mentioned $ p_{\mathrm{T}} $ bins. |
png pdf |
Figure 10-b:
$ |\cos\vartheta_\mathrm{HX}| $ distributions measured in the PRS $ \mathrm{J}/\psi $ (left) and NPS $\psi \text{(2S)} $ (right) samples, of the terms of Eqs. (4) and (3), respectively, in the mentioned $ p_{\mathrm{T}} $ bins. |
png pdf |
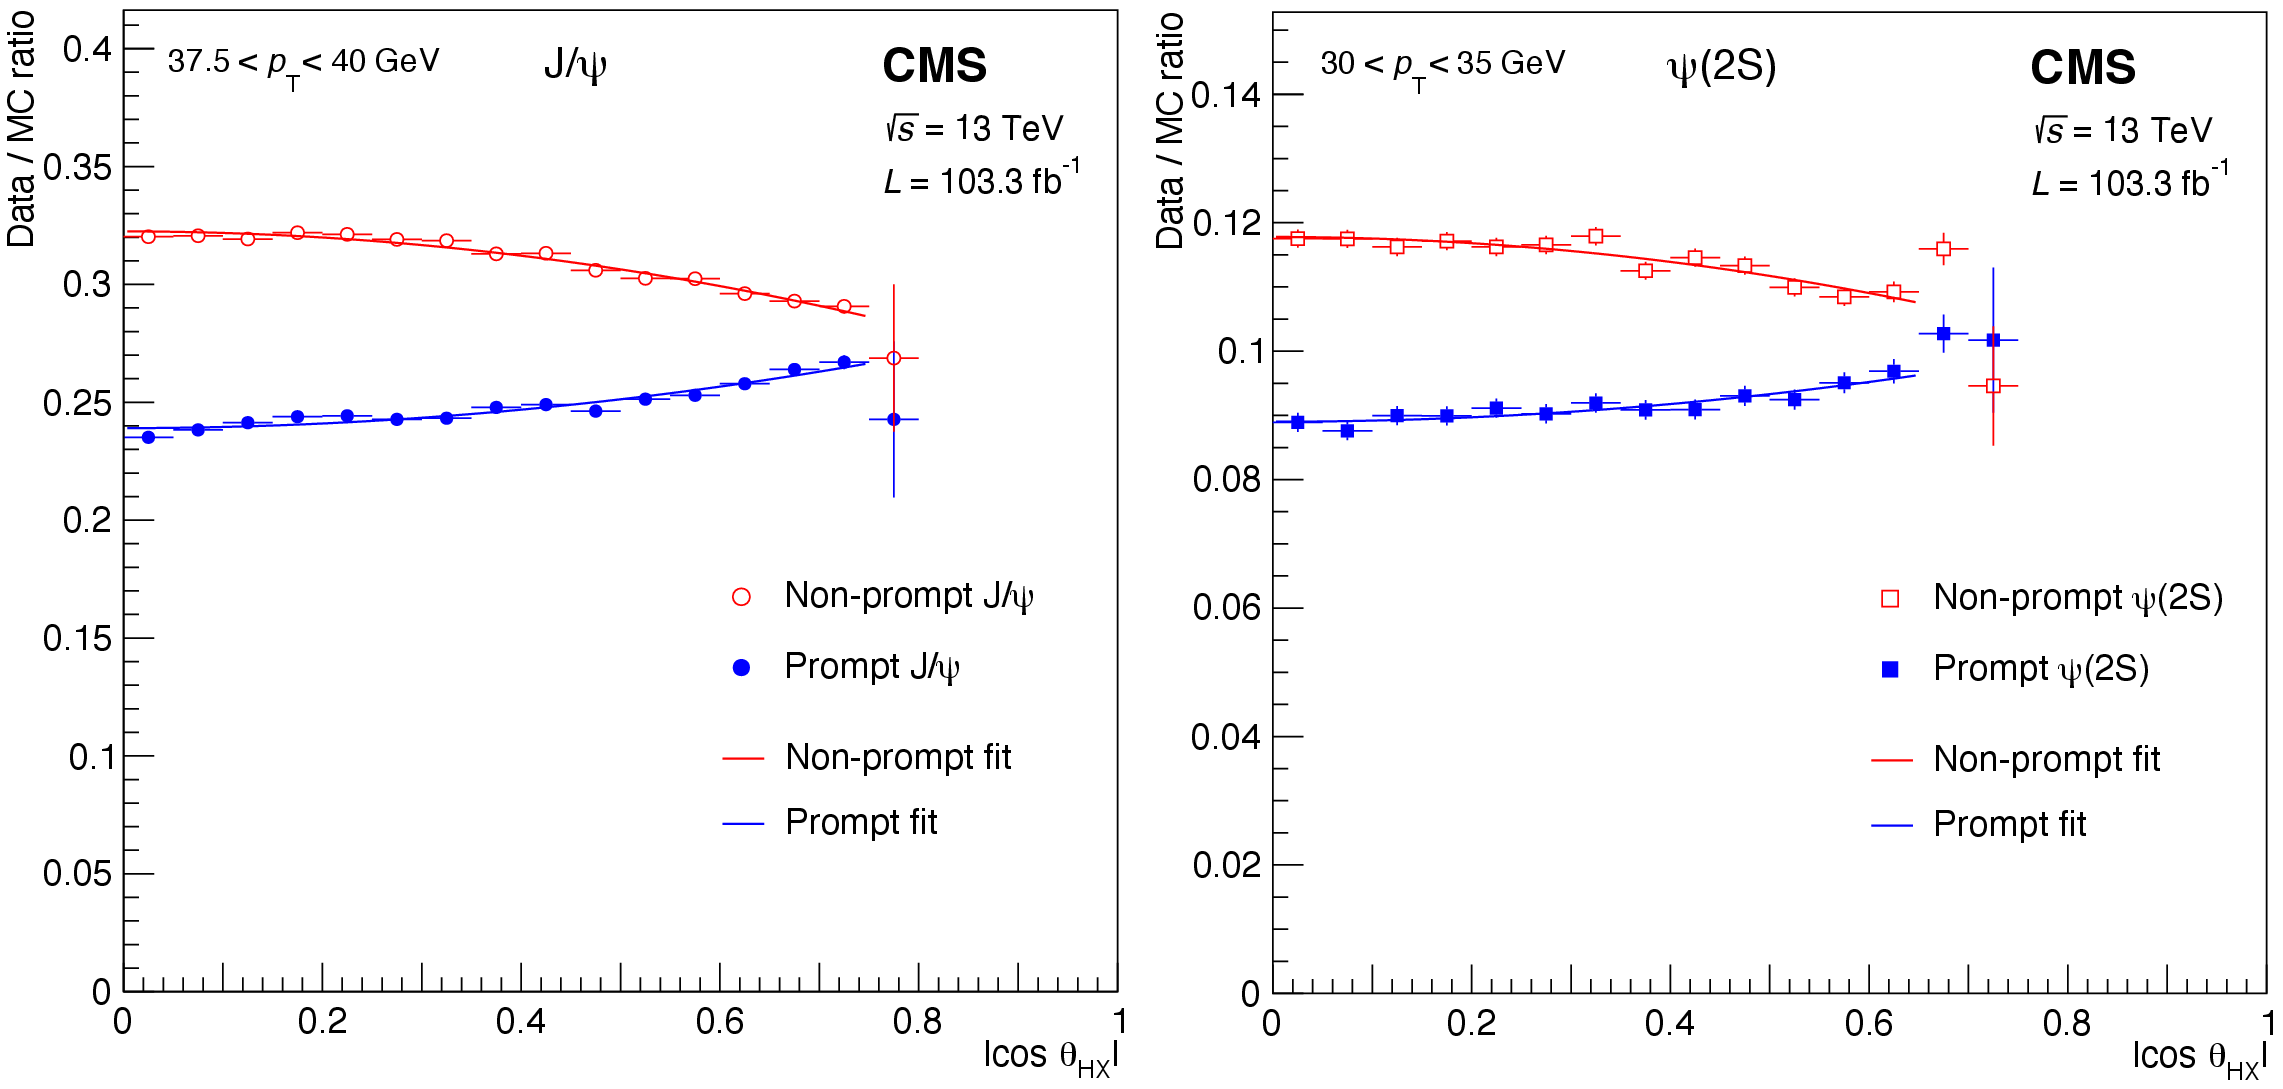
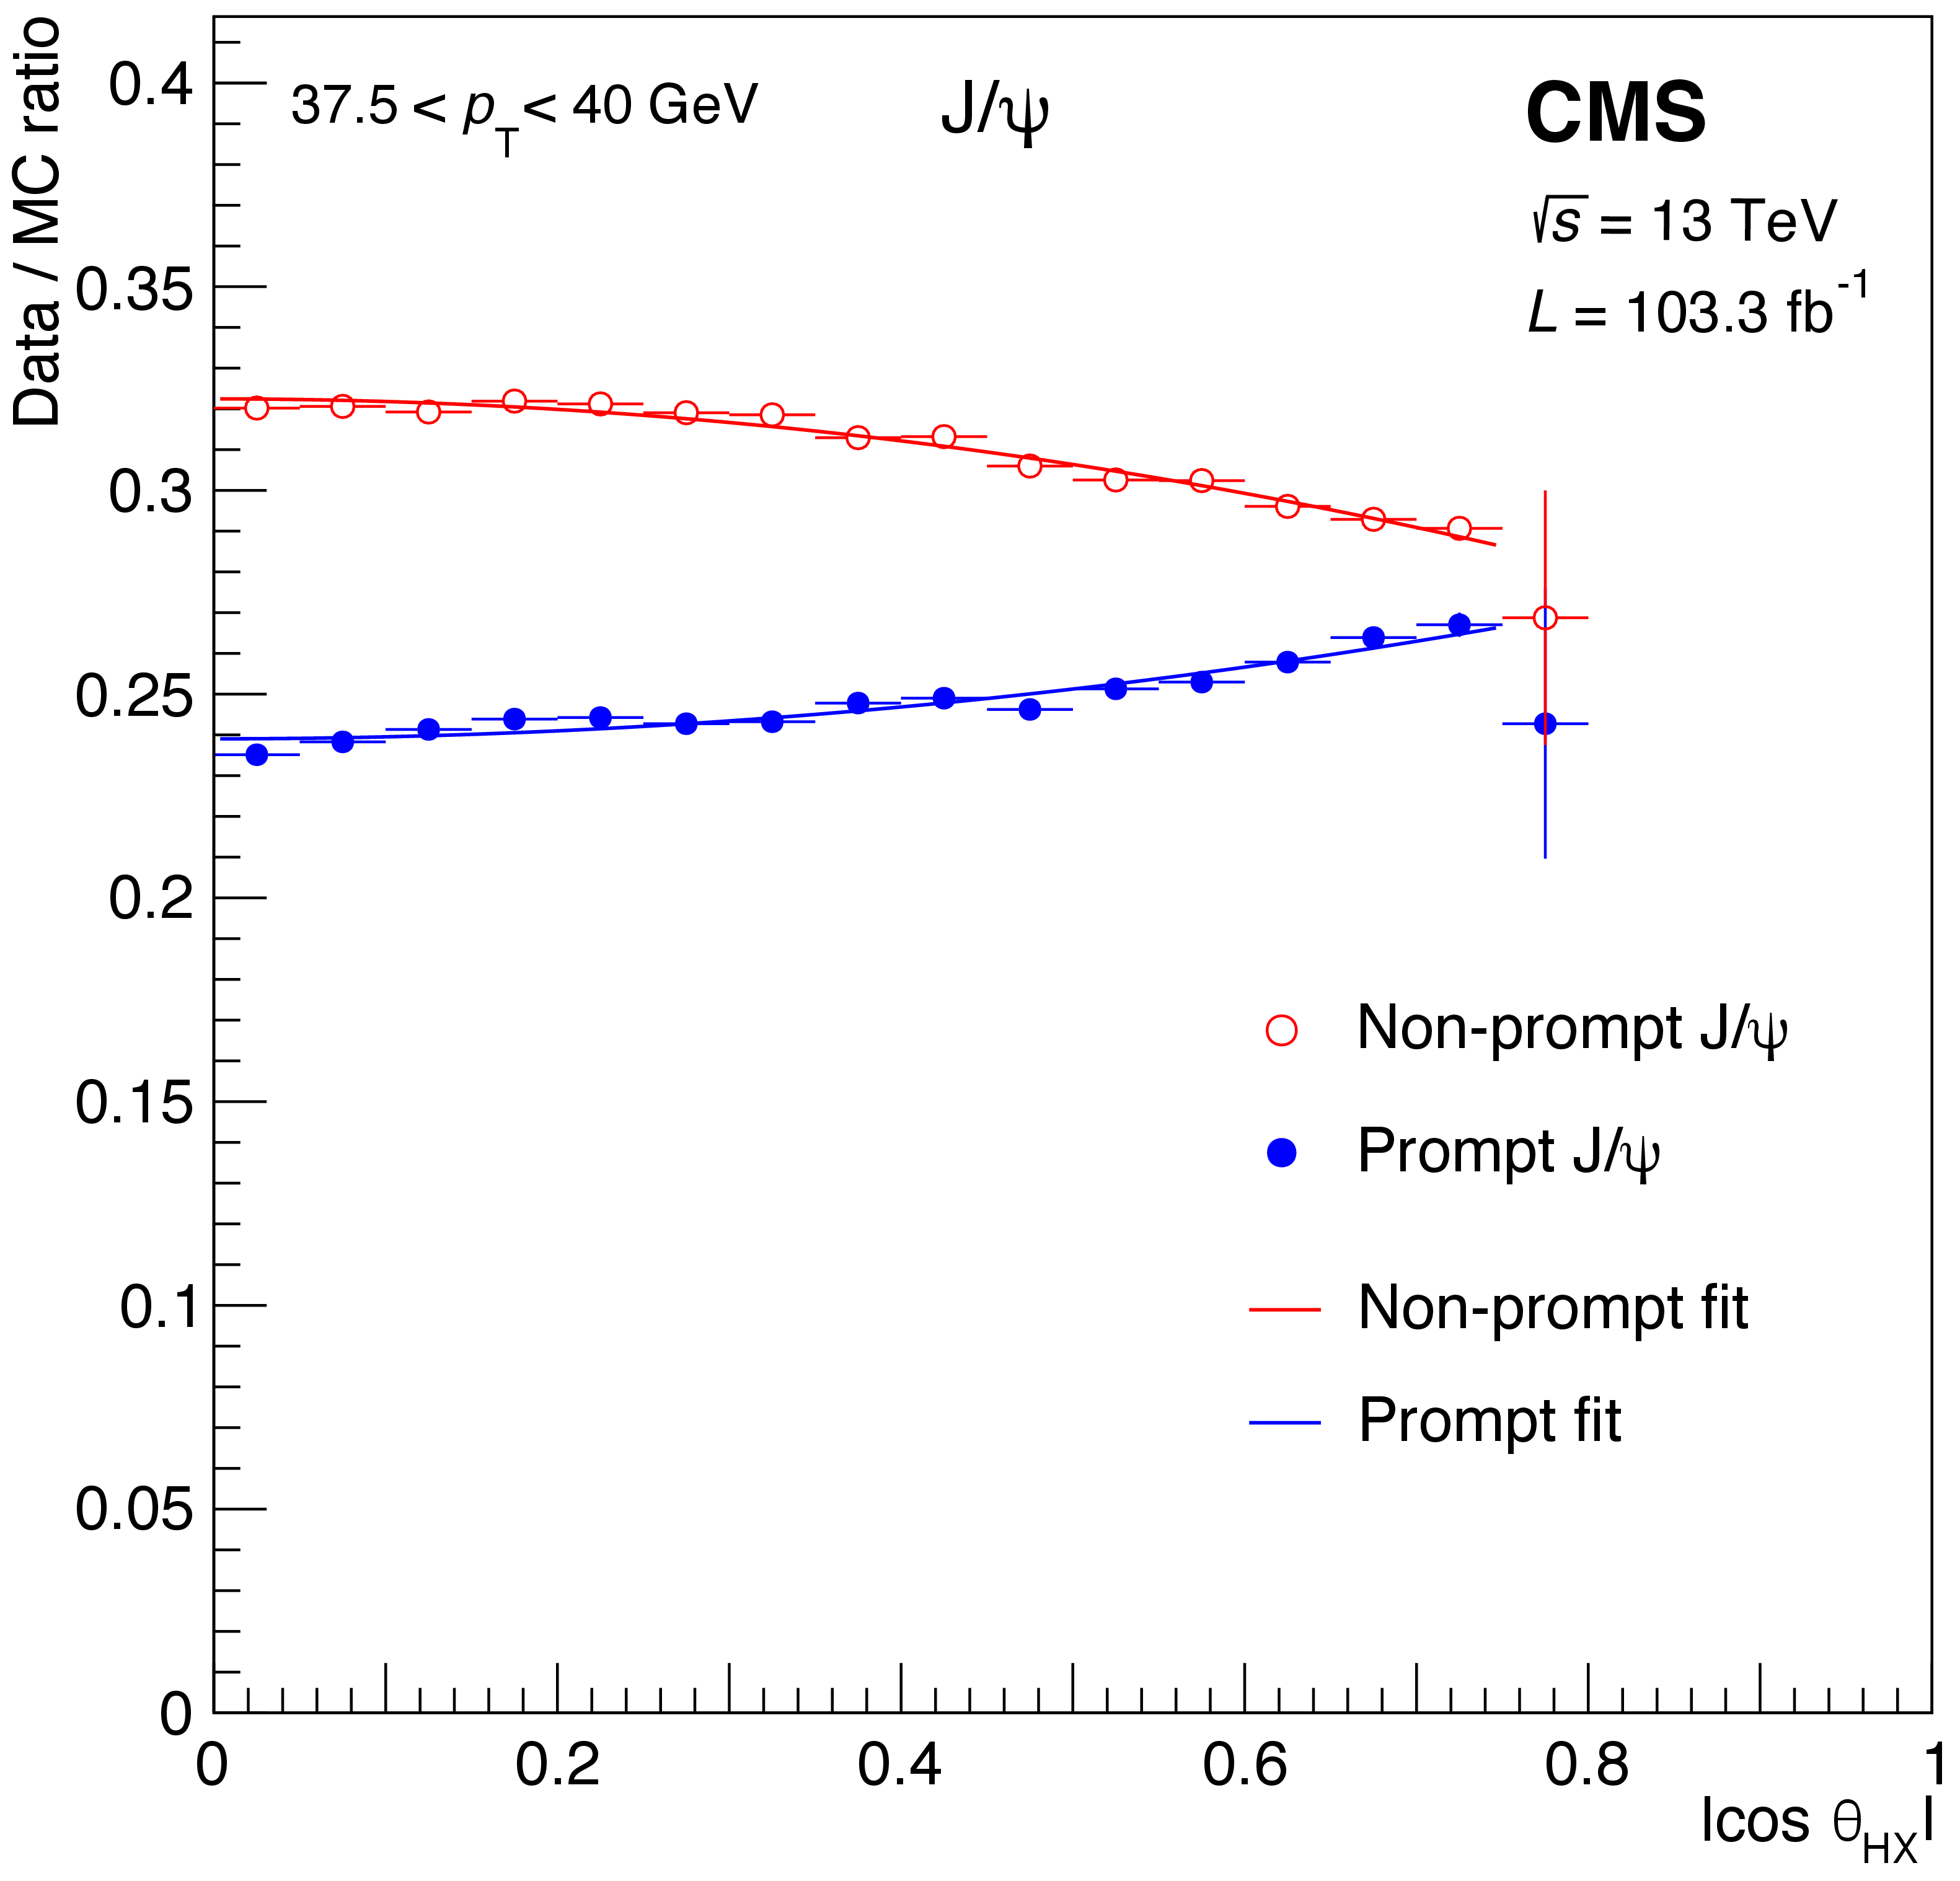
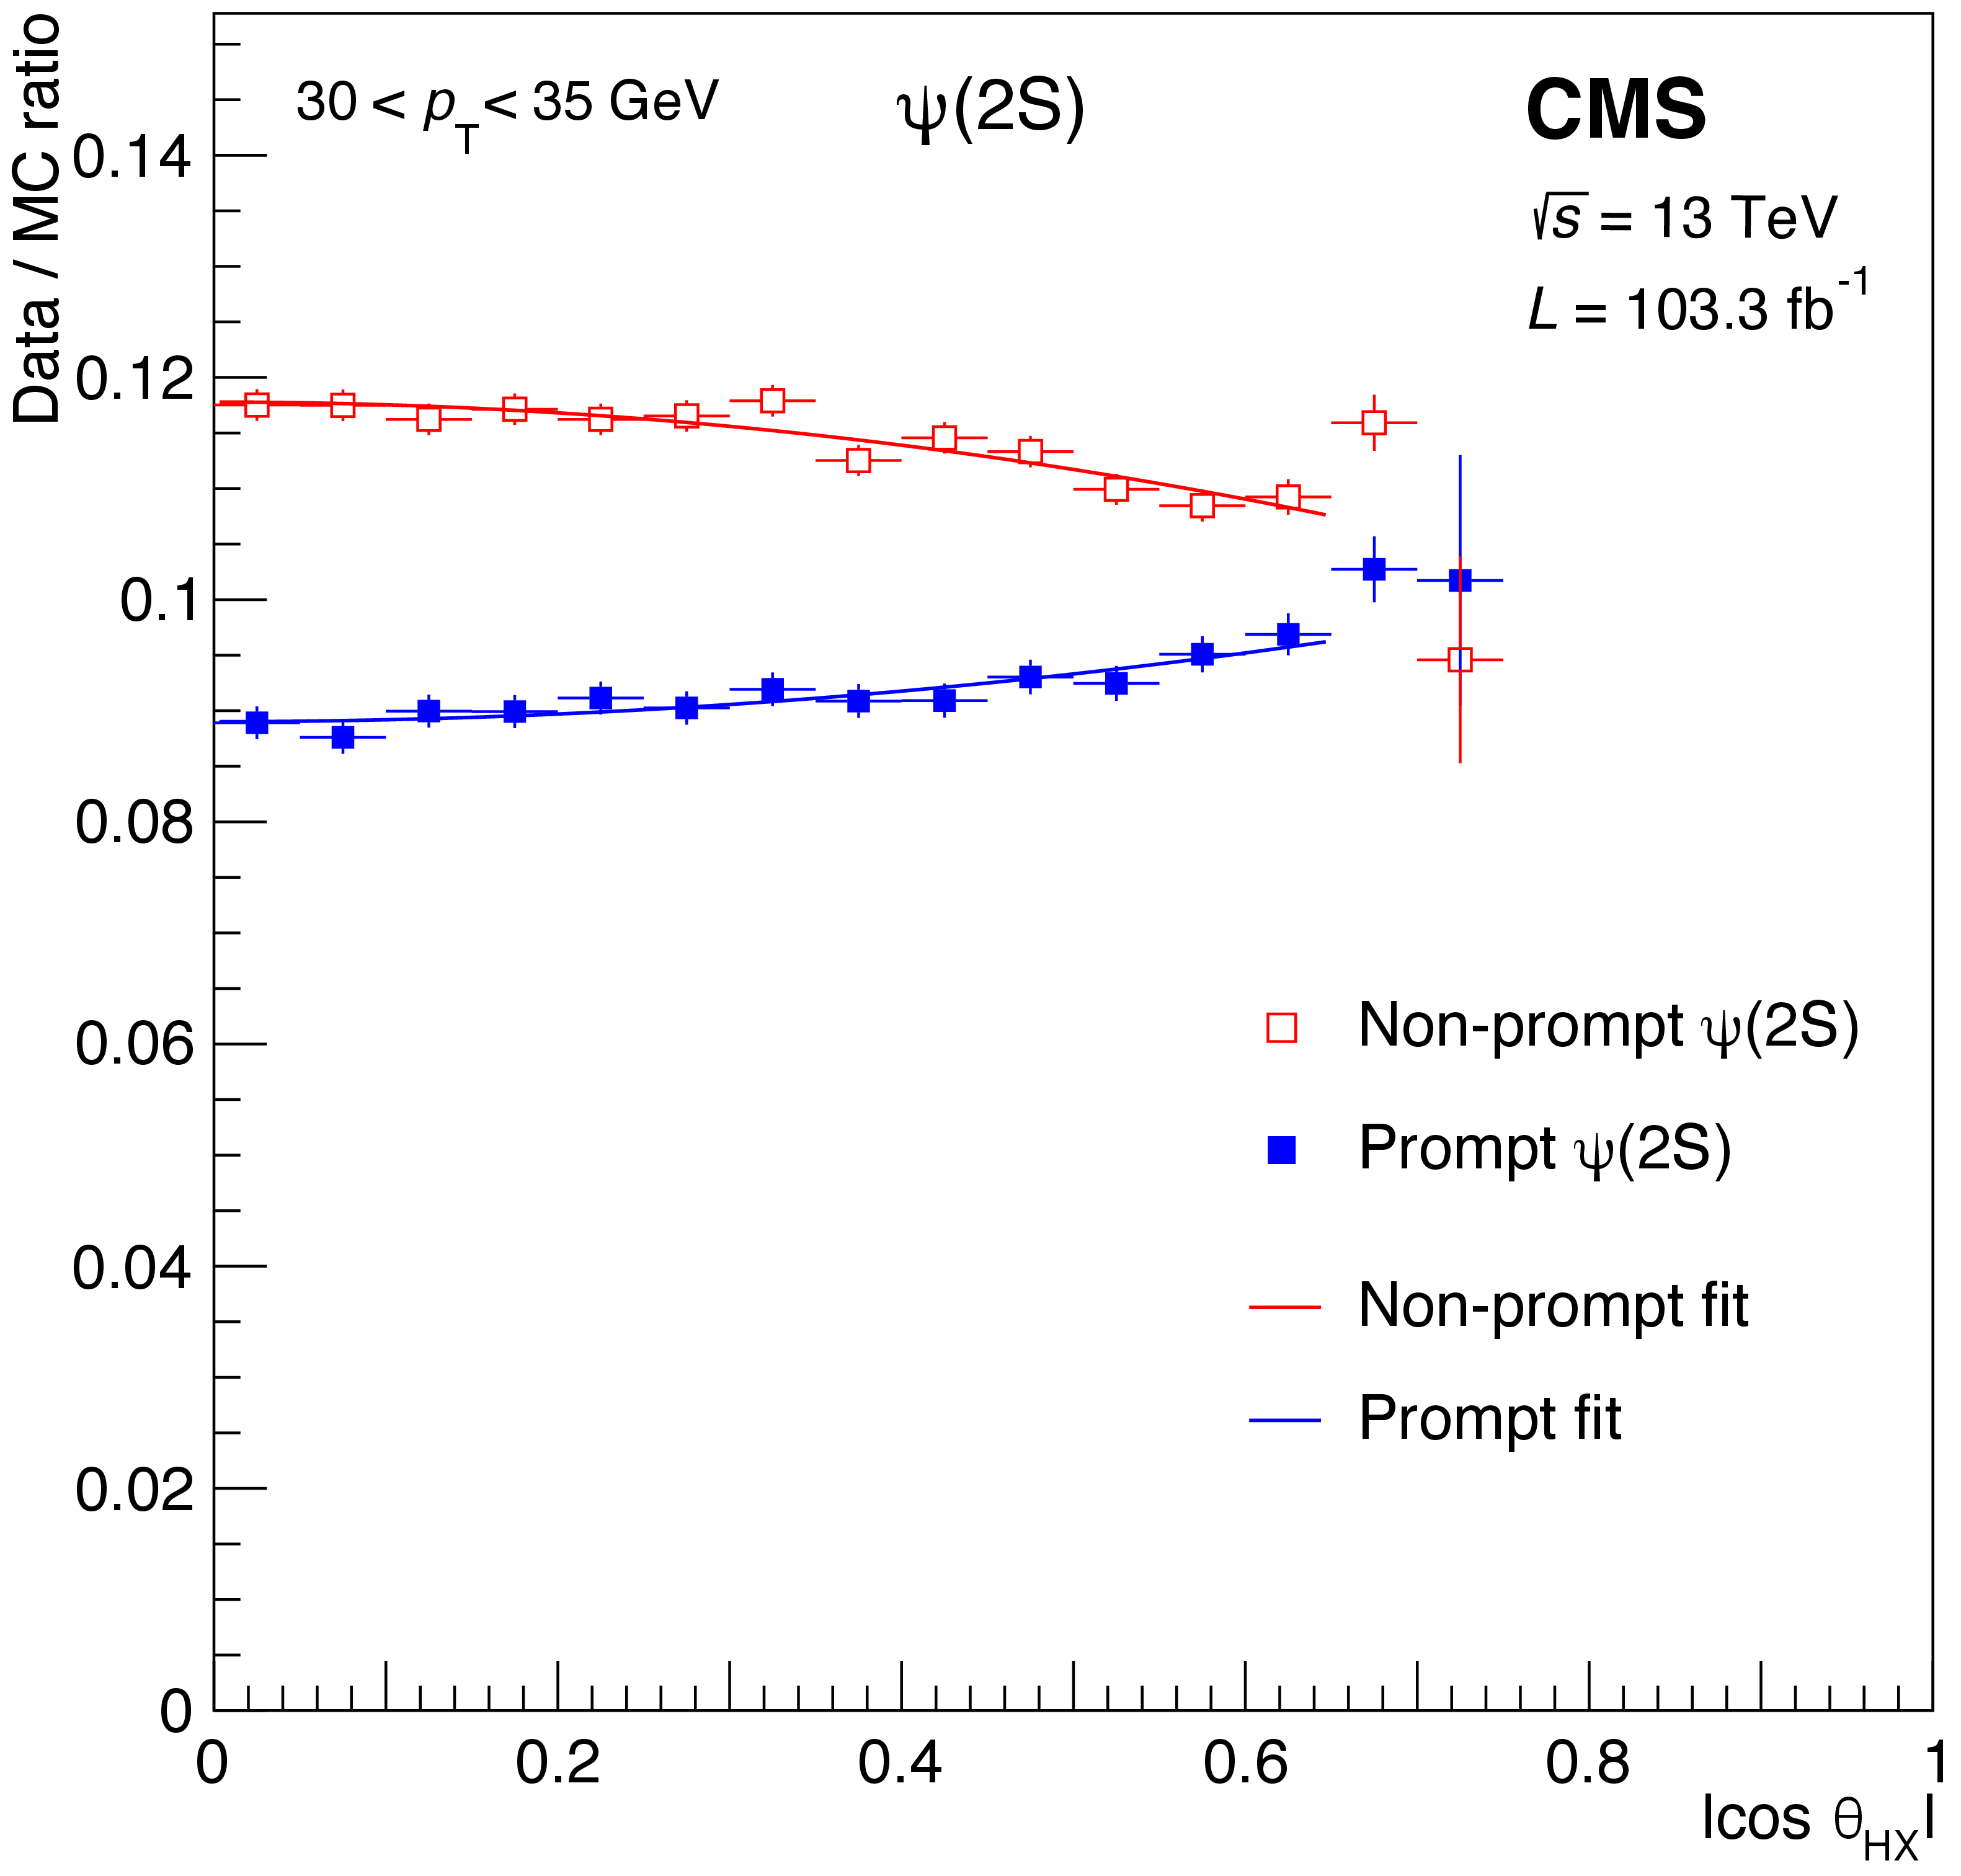
Figure 11:
Ratios between the measured and simulated $ |\cos\vartheta_\mathrm{HX}| $ distributions for the prompt and non-prompt $ \mathrm{J}/\psi $ (left) and $\psi \text{(2S)} $ (right) events, in the $ p_{\mathrm{T}} $ bins mentioned in the legends. The curves represent fits using Eq. (2) and excluding the largest $ |\cos\vartheta_\mathrm{HX}| $ bins. |
png pdf |
Figure 11-a:
Ratios between the measured and simulated $ |\cos\vartheta_\mathrm{HX}| $ distributions for the prompt and non-prompt $ \mathrm{J}/\psi $ (left) and $\psi \text{(2S)} $ (right) events, in the $ p_{\mathrm{T}} $ bins mentioned in the legends. The curves represent fits using Eq. (2) and excluding the largest $ |\cos\vartheta_\mathrm{HX}| $ bins. |
png pdf |
Figure 11-b:
Ratios between the measured and simulated $ |\cos\vartheta_\mathrm{HX}| $ distributions for the prompt and non-prompt $ \mathrm{J}/\psi $ (left) and $\psi \text{(2S)} $ (right) events, in the $ p_{\mathrm{T}} $ bins mentioned in the legends. The curves represent fits using Eq. (2) and excluding the largest $ |\cos\vartheta_\mathrm{HX}| $ bins. |
png pdf |
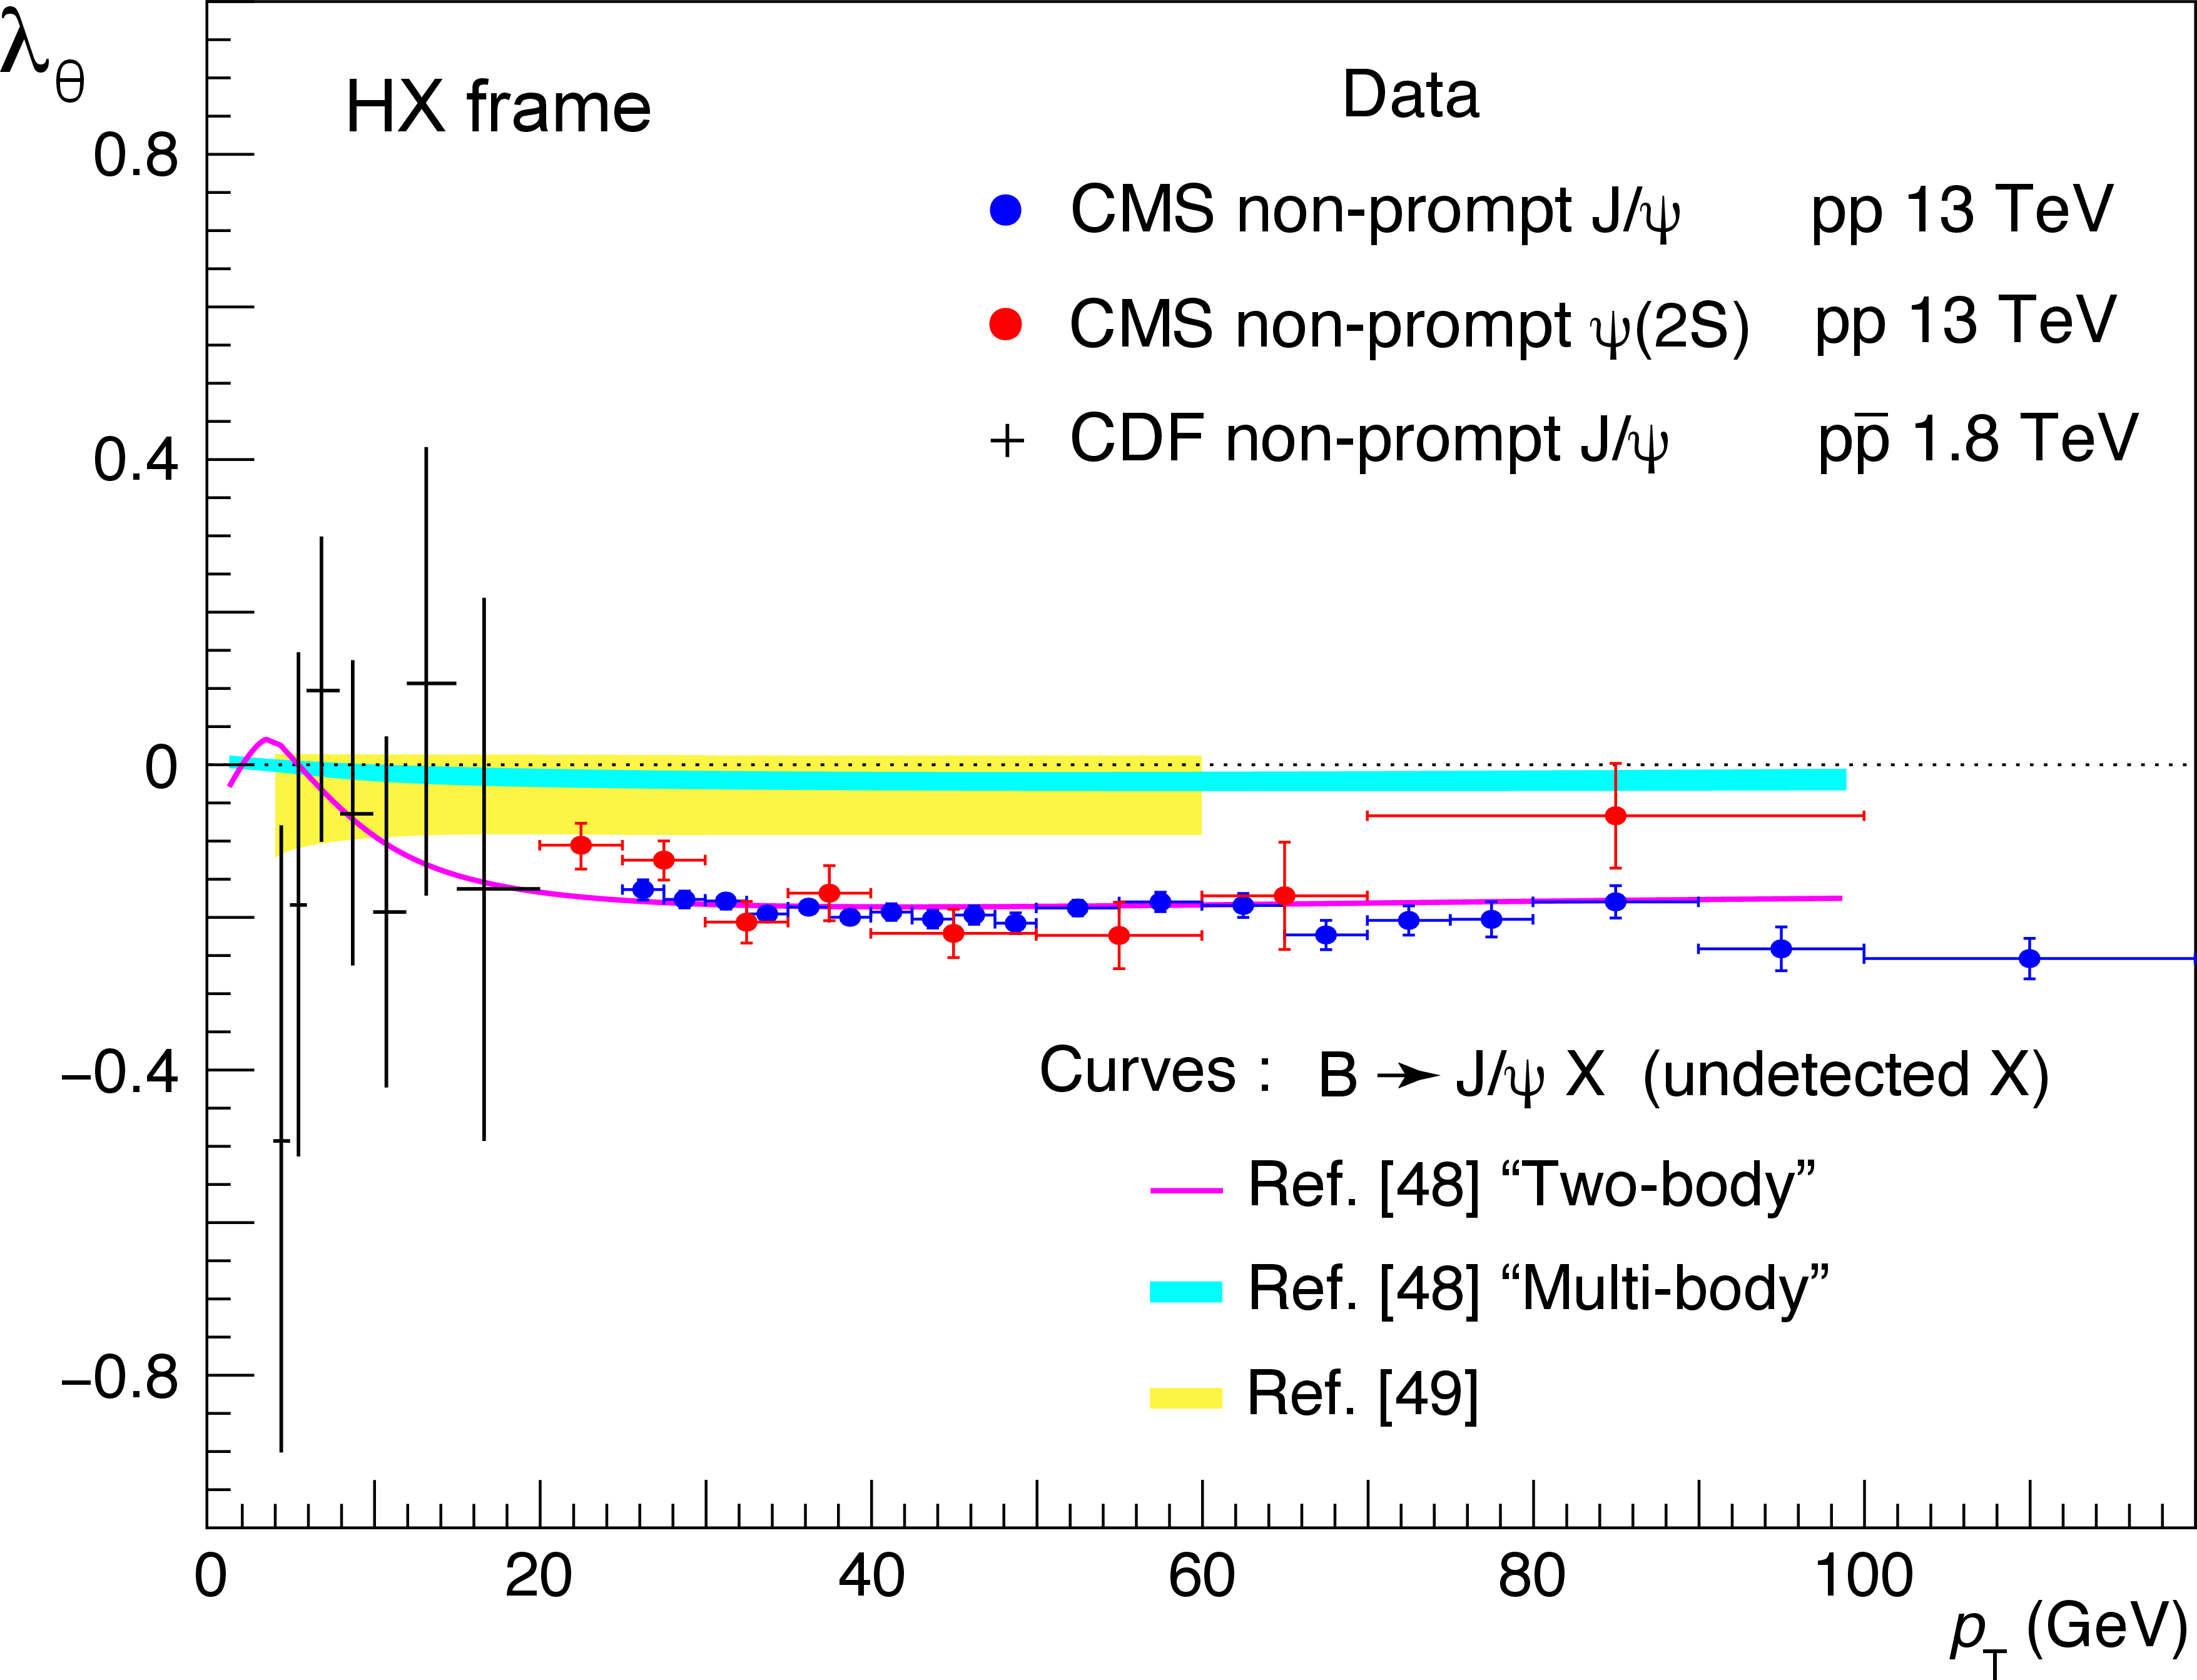
Figure 12:
The $ \lambda_\vartheta $ parameter measured, as a function of $ p_{\mathrm{T}} $, for non-prompt $ \mathrm{J}/\psi $ and $\psi \text{(2S)} $ mesons. The vertical bars represent the total uncertainties. Predicted polarizations of $ \mathrm{J}/\psi $ mesons produced in $ {\mathrm{B}} \to {\mathrm{J}/\psi} \, X $ decays are shown for three calculations [48,49], discussed in the text. The low-$ p_{\mathrm{T}} $ CDF measurement [50] is also shown. |
png pdf |
Figure 13:
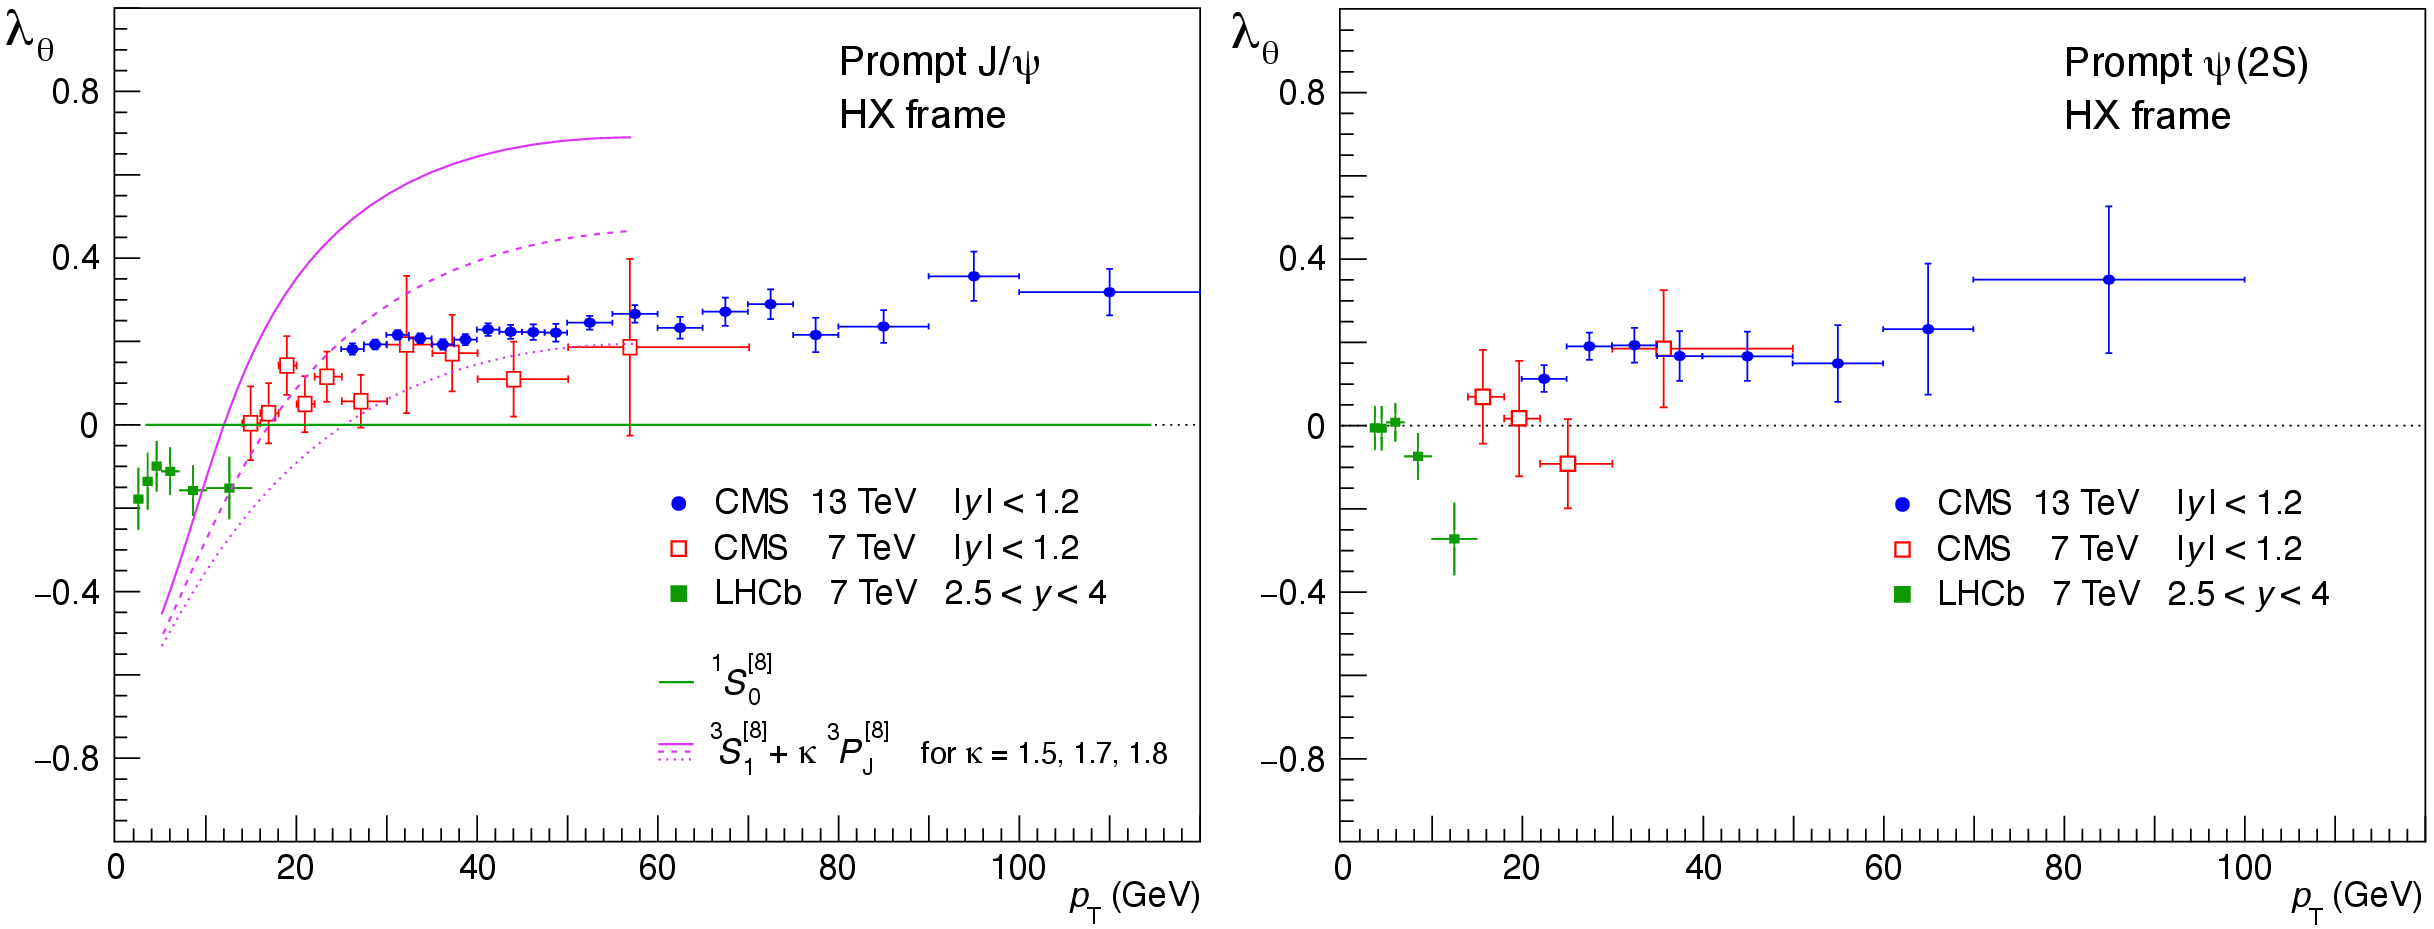
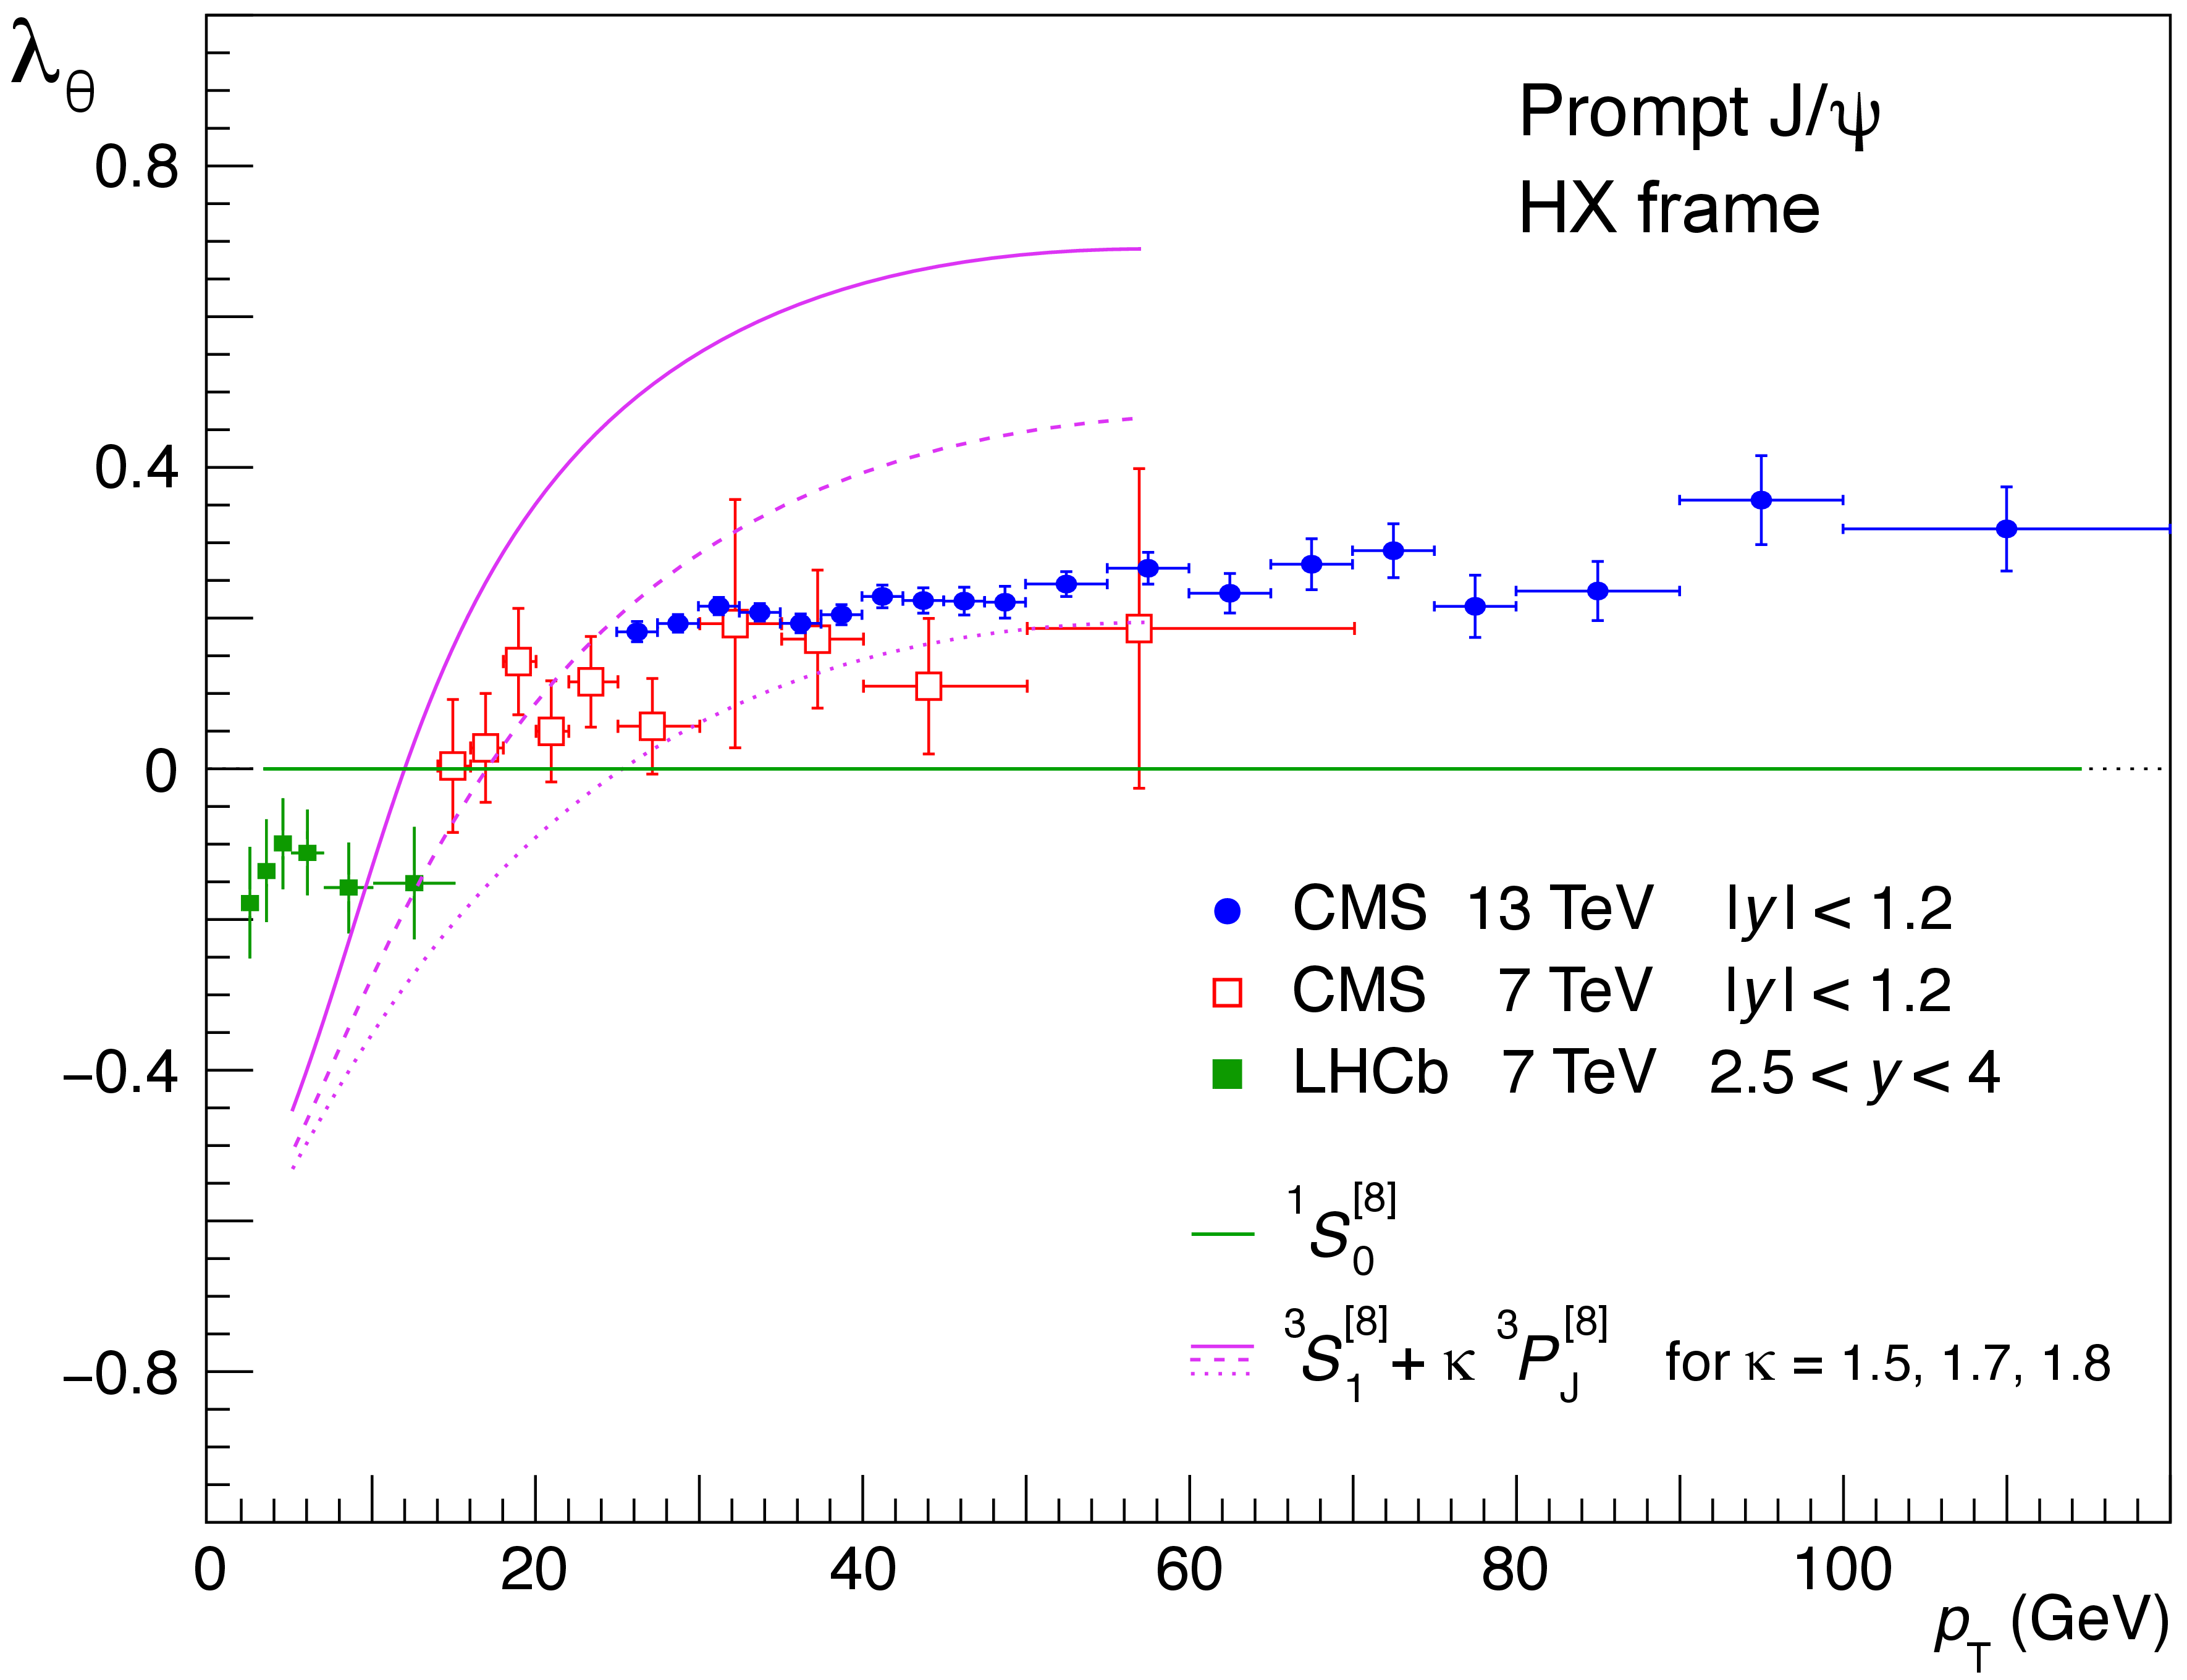
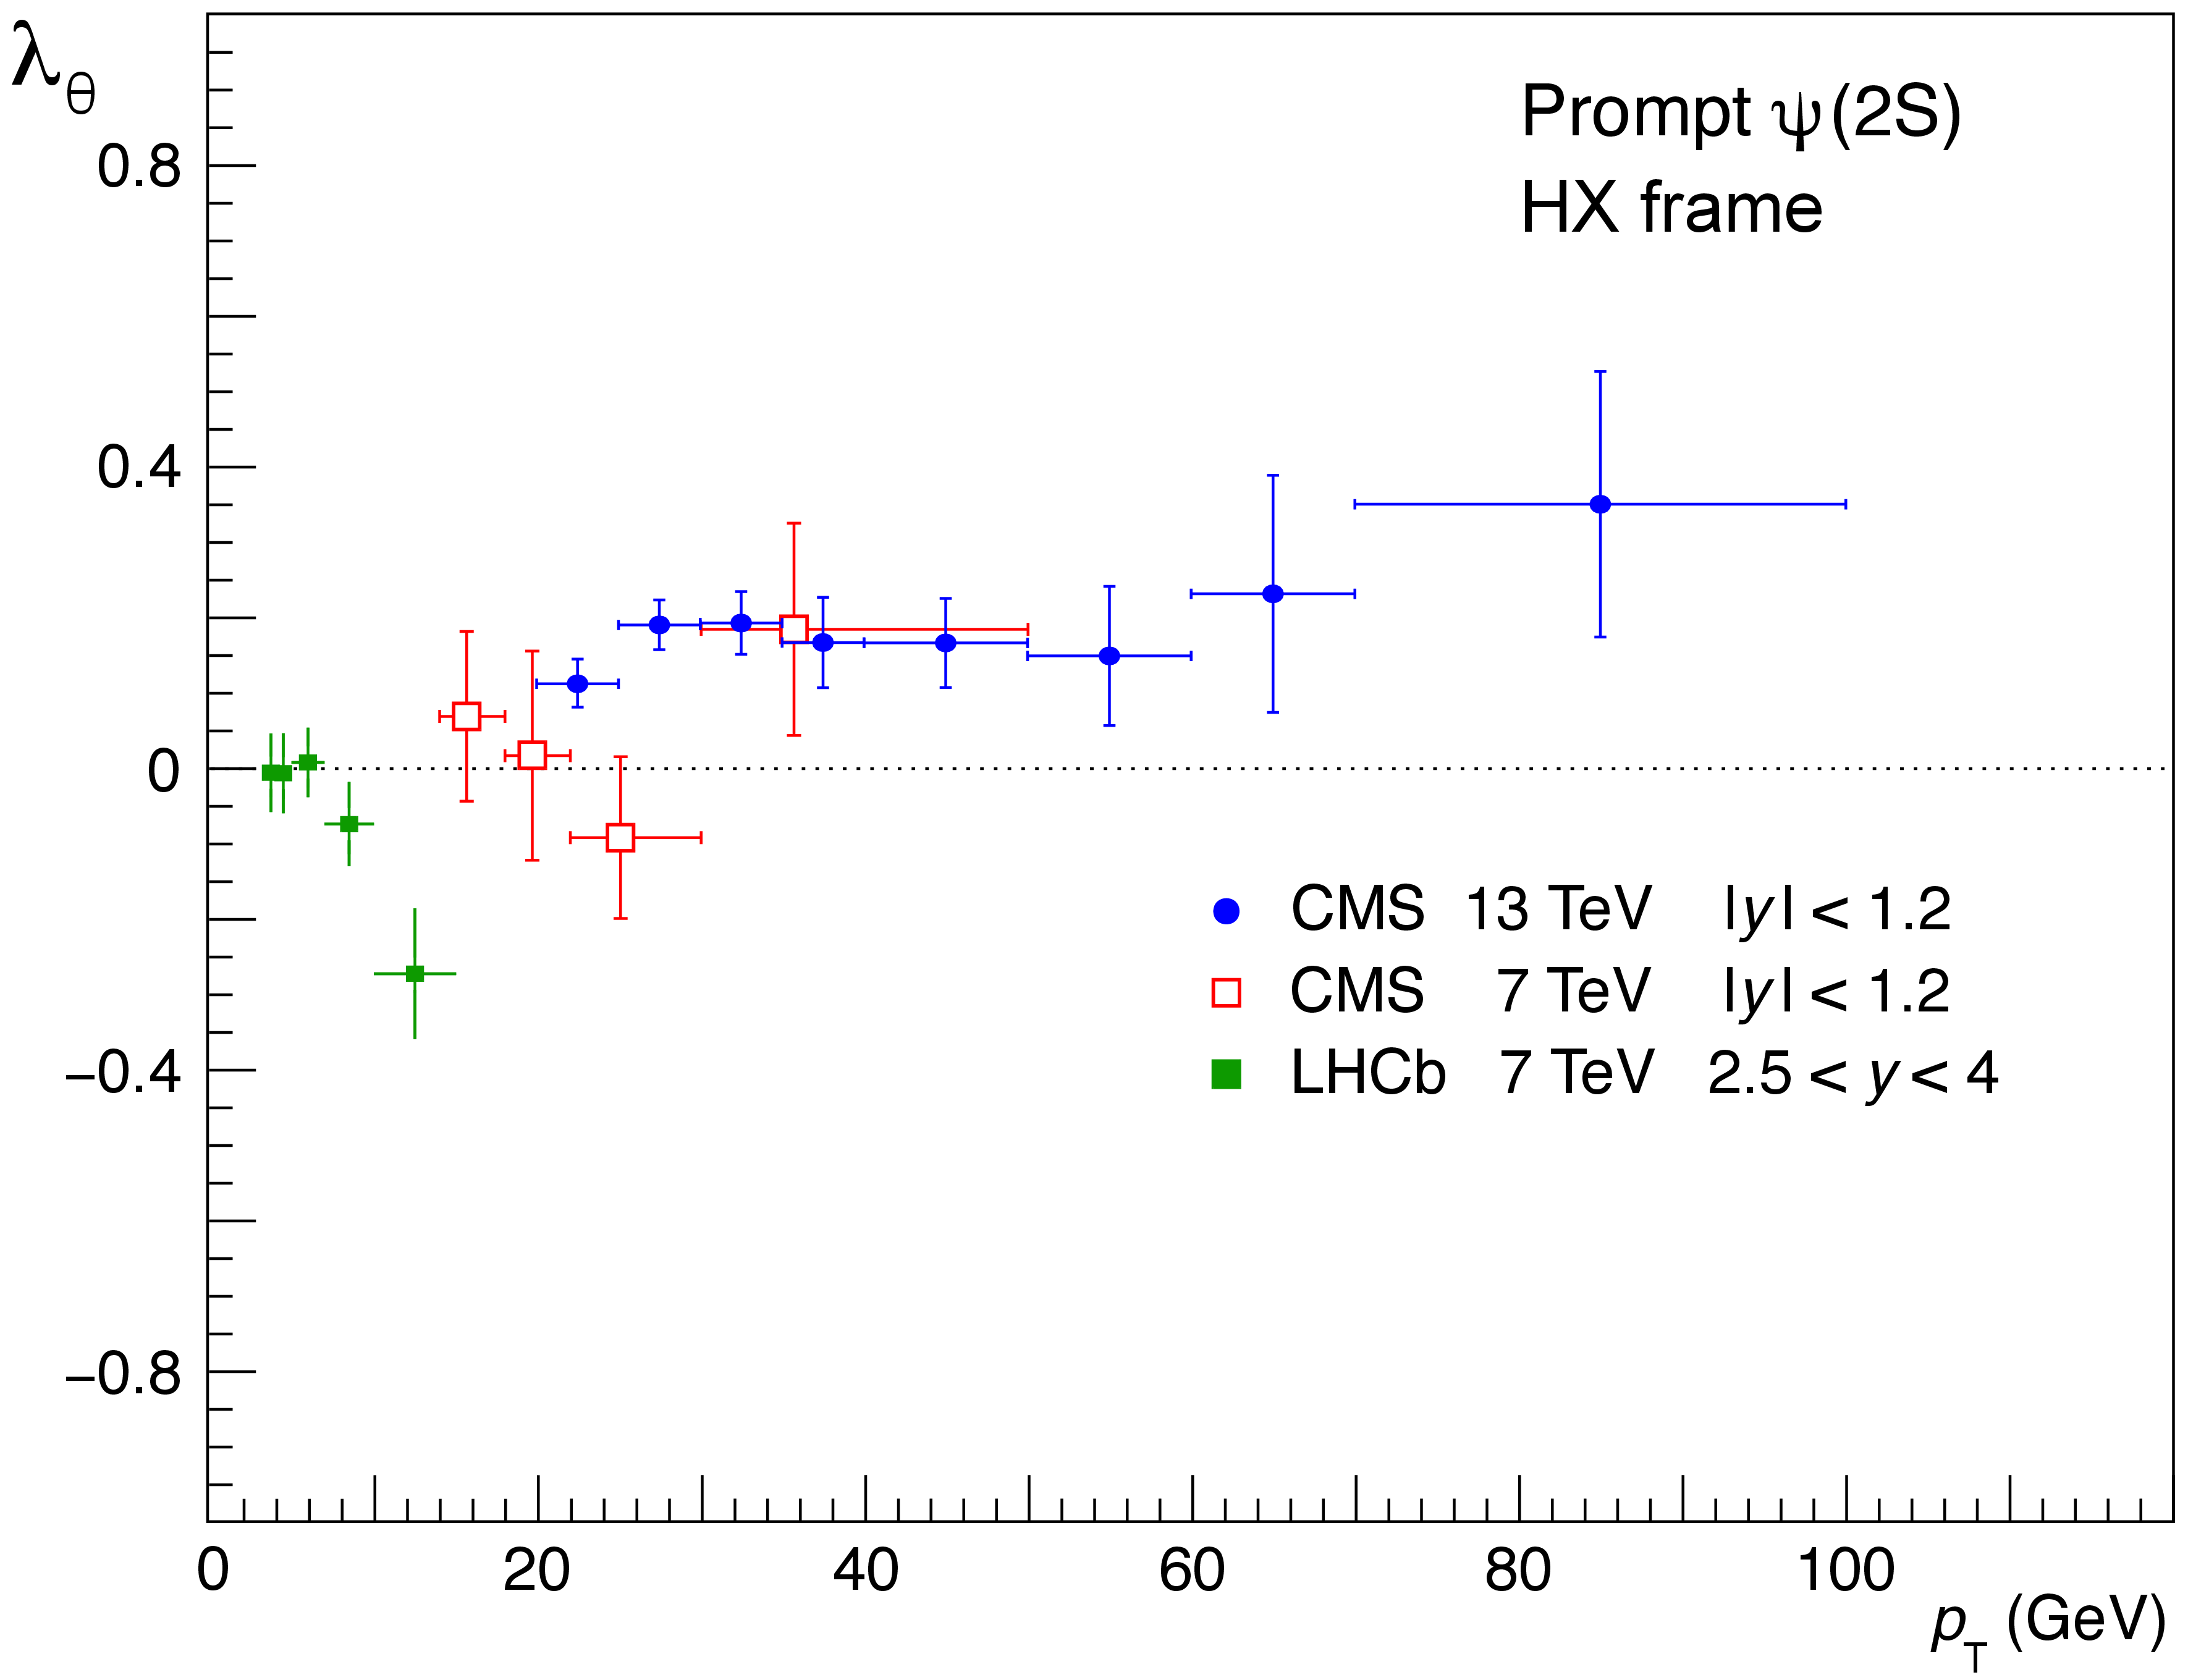
The $ \lambda_\vartheta $ parameter measured, as a function of $ p_{\mathrm{T}} $, for prompt $ \mathrm{J}/\psi $ (left) and $\psi \text{(2S)} $ (right) mesons, in pp collisions at $ \sqrt{s} = $ 13 TeV, compared to measurements made at 7 TeV by CMS [10] and LHCb [11,12]. The vertical bars represent the total uncertainties. The curves on the left panel are described in the text. |
png pdf |
Figure 13-a:
The $ \lambda_\vartheta $ parameter measured, as a function of $ p_{\mathrm{T}} $, for prompt $ \mathrm{J}/\psi $ (left) and $\psi \text{(2S)} $ (right) mesons, in pp collisions at $ \sqrt{s} = $ 13 TeV, compared to measurements made at 7 TeV by CMS [10] and LHCb [11,12]. The vertical bars represent the total uncertainties. The curves on the left panel are described in the text. |
png pdf |
Figure 13-b:
The $ \lambda_\vartheta $ parameter measured, as a function of $ p_{\mathrm{T}} $, for prompt $ \mathrm{J}/\psi $ (left) and $\psi \text{(2S)} $ (right) mesons, in pp collisions at $ \sqrt{s} = $ 13 TeV, compared to measurements made at 7 TeV by CMS [10] and LHCb [11,12]. The vertical bars represent the total uncertainties. The curves on the left panel are described in the text. |
| Tables | |
png pdf |
Table 1:
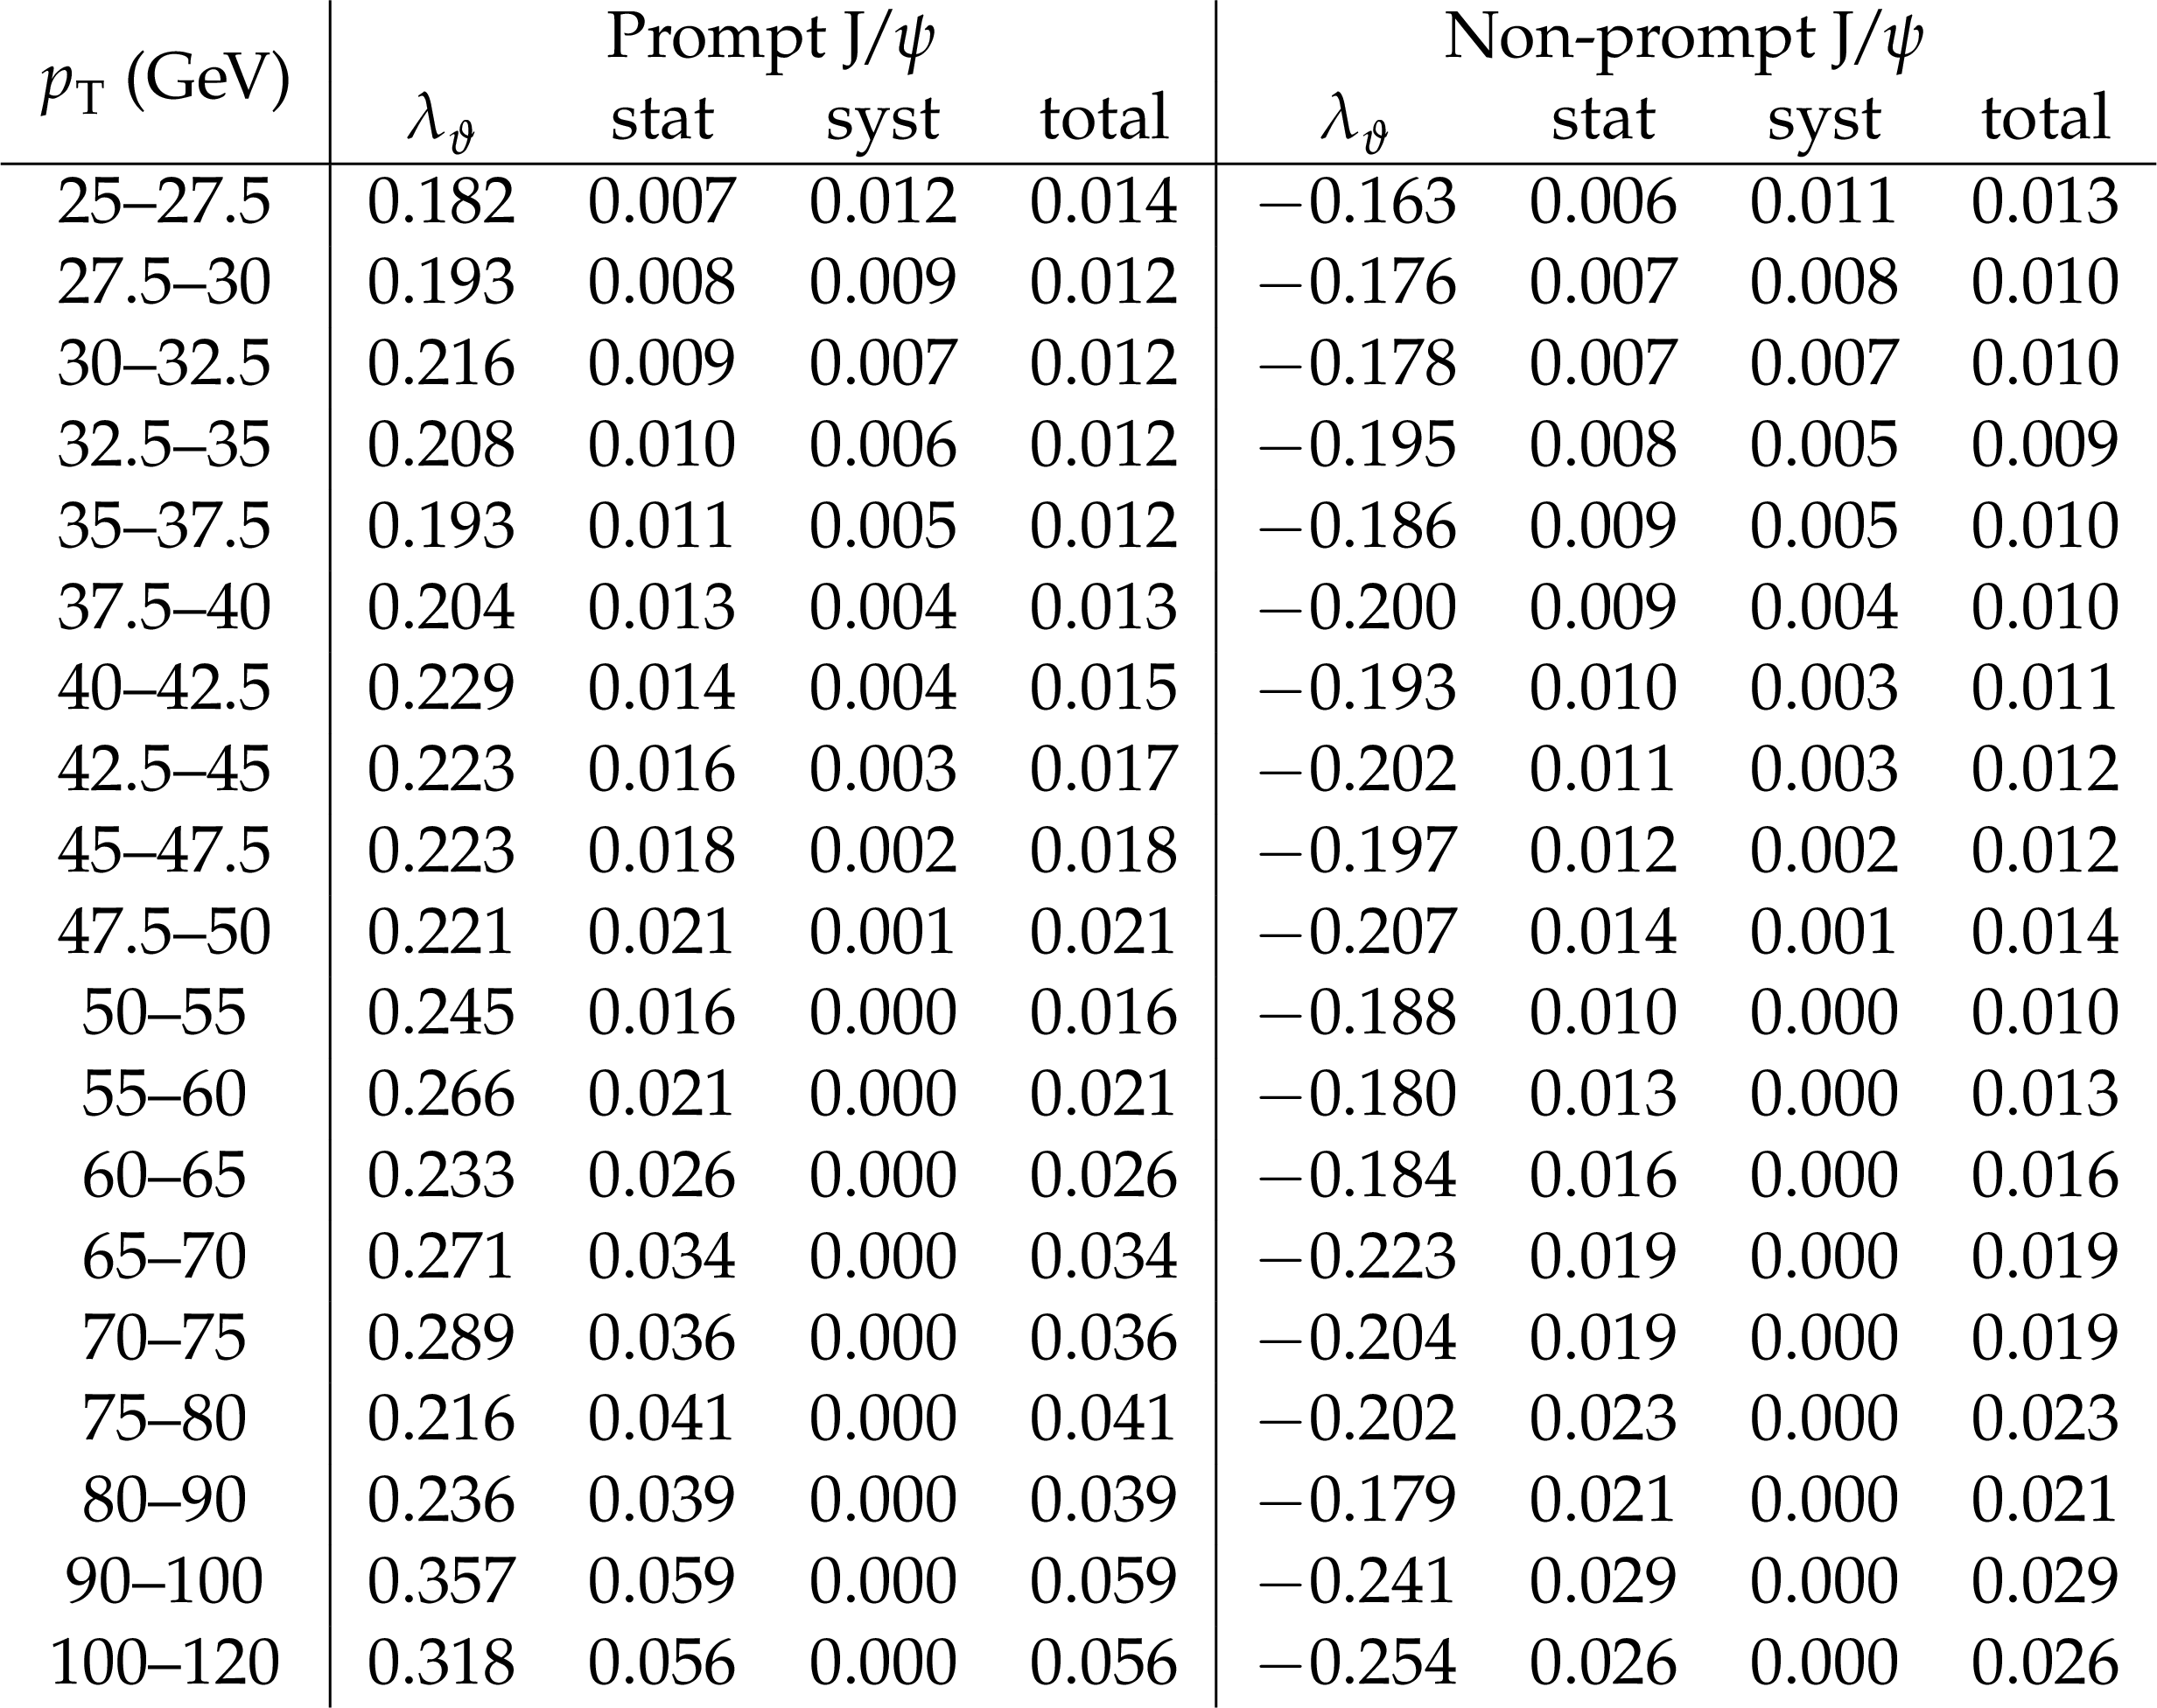
The $ \lambda_\vartheta $ values measured in the HX frame, in bins of $ p_{\mathrm{T}} $, for the prompt and non-prompt $ \mathrm{J}/\psi $ mesons, including the statistical (stat), systematic (syst), and total uncertainties. |
png pdf |
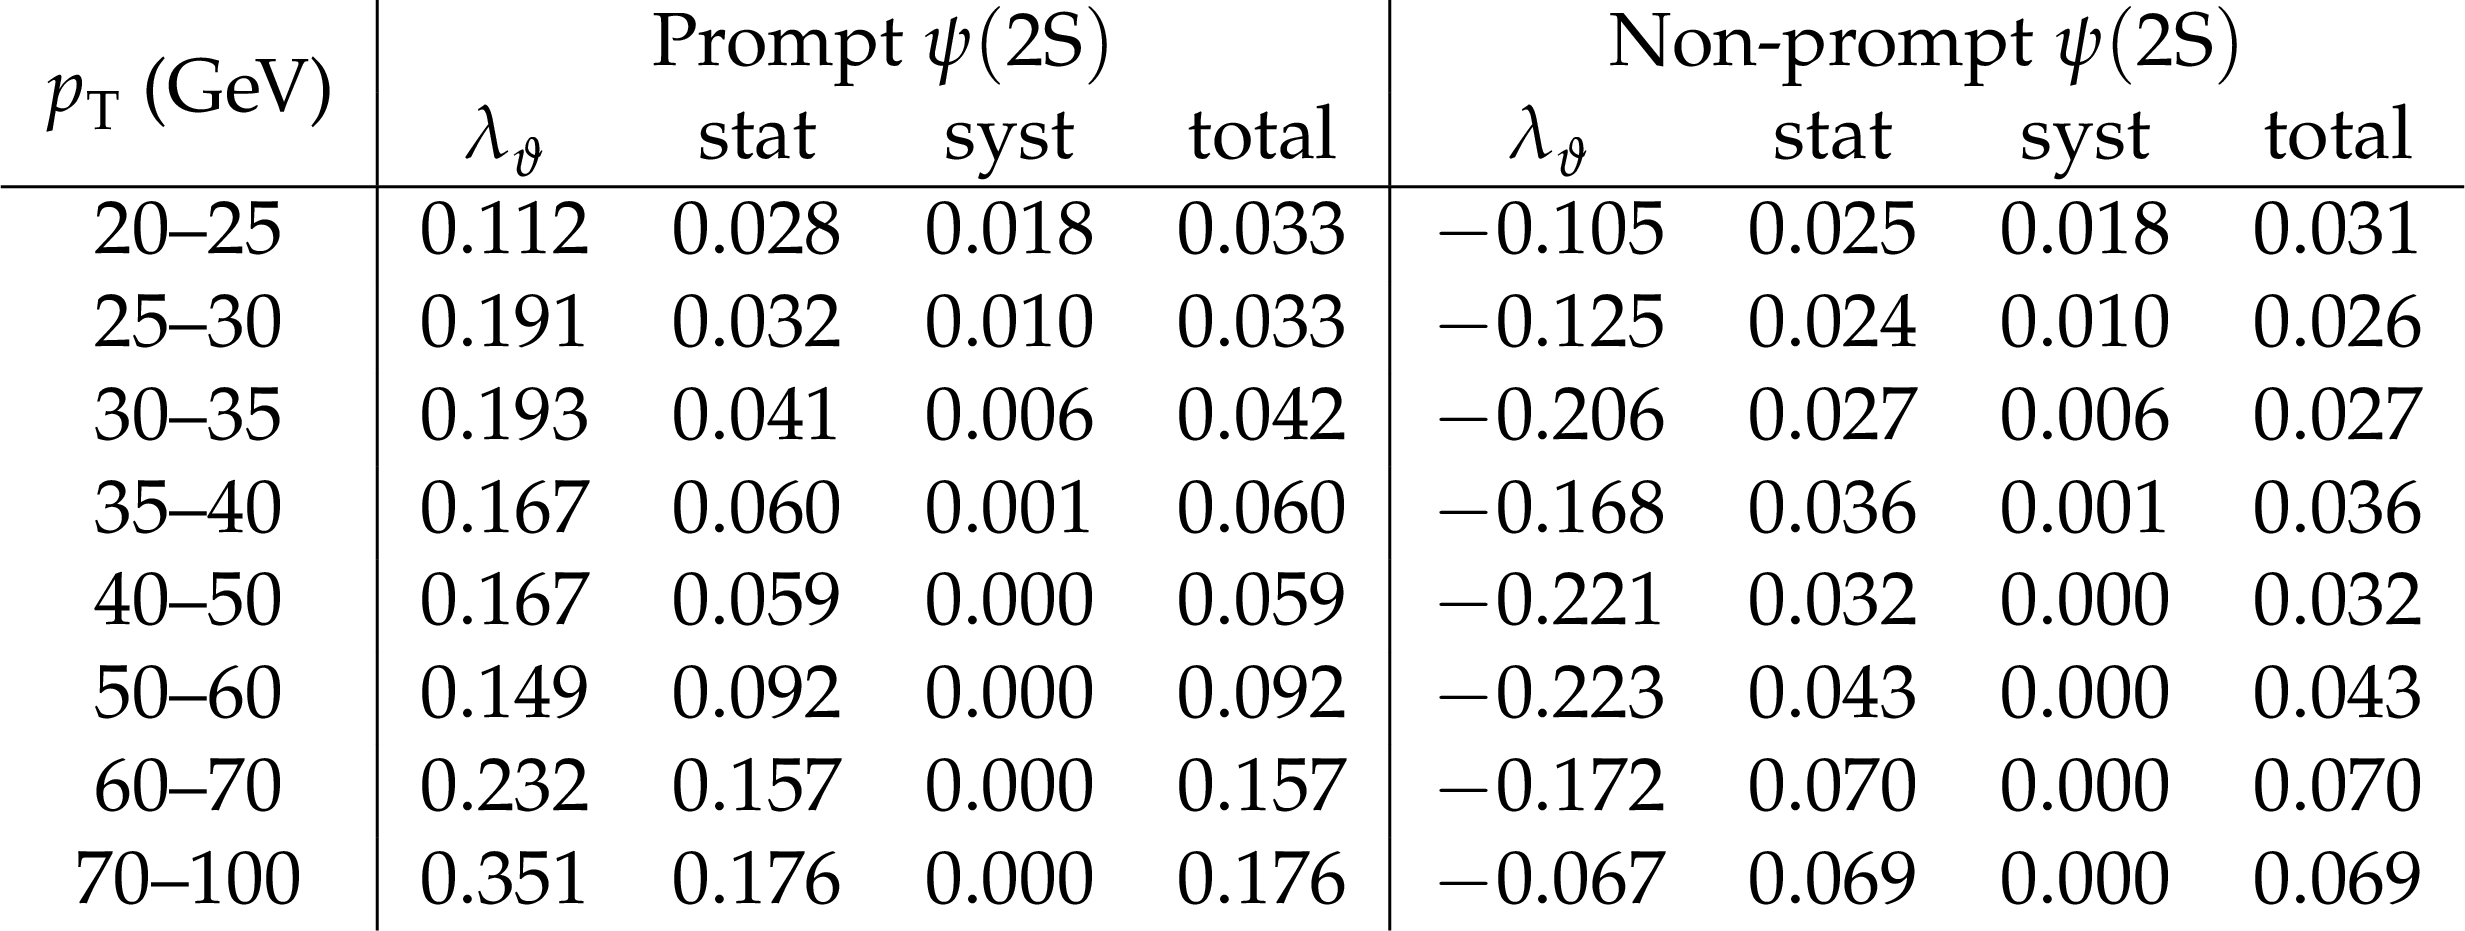
Table 2:
The $ \lambda_\vartheta $ values measured in the HX frame, as a function of $ p_{\mathrm{T}} $, for the prompt and non-prompt $ \psi\mathrm{(2S)} $ mesons, indicating the statistical (stat), systematic (syst), and total uncertainties. |
| Summary |
| The prompt and non-prompt $ \mathrm{J}/\psi $ and $ \psi\mathrm{(2S)}$ $\lambda_\vartheta $ polarization parameters have been measured, in the helicity frame and for the $ |y| < $ 1.25 interval, using a sample of pp collisions at $ \sqrt{s} = $ 13 TeV collected in 2017 and 2018, corresponding to an integrated luminosity of 103.3 fb$ ^{-1} $. The results cover $ p_{\mathrm{T}} $ ranges significantly broader than previous measurements: 25-120 and 20-100 GeV, for the $ \mathrm{J}/\psi $ and $\psi \text{(2S)} $, respectively. The non-prompt $ \mathrm{J}/\psi $ and $\psi \text{(2S)} $ polarization measurements are compatible with each other, regarding the $ p_{\mathrm{T}} $ dependence and the overall magnitude, plateauing at $ \lambda_\vartheta \approx - $0.2 for $ p_{\mathrm{T}} > $ 30 GeV. The measured trends agree with predictions based on the hypothesis that these charmonia are predominantly produced by two-body B meson decays, through colour-singlet processes. Regarding the prompt results, we see no evidence of strong transverse polarizations ($ \lambda_\vartheta $ approaching $ + $1), even at $ p_{\mathrm{T}} $ values exceeding 30 times the $ \mathrm{J}/\psi $ mass. Using NRQCD concepts, there is no evidence that, at very high $ p_{\mathrm{T}} $, the transversely polarized $ ^3 S_1^{[8]} $ and $ ^3 P_J^{[8]} $ octet terms become dominant with respect to the unpolarized $ ^1 S_0^{[8]} $ octet. Taken together with previous CMS and LHCb measurements, covering a lower $ p_{\mathrm{T}} $ domain, we see a significant variation of the prompt polarizations with $ p_{\mathrm{T}} $, at low $ p_{\mathrm{T}} $. These results will significantly constrain phenomenological analyses of charmonium production, so far mostly focused on $ p_{\mathrm{T}} $-differential cross sections. |
| References | ||||
| 1 | Quarkonium Working Group Collaboration, N. Brambilla et al. | Heavy quarkonium physics | CERN Yellow Reports: Monographs, CERN-2005-005, 2005 link |
|
| 2 | N. Brambilla et al. | Heavy quarkonium: progress, puzzles, and opportunities | EPJC 71 (2011) 1534 | 1010.5827 |
| 3 | G. Bodwin, E. Braaten, and P. Lepage | Rigorous QCD analysis of inclusive annihilation and production of heavy quarkonium | PRD 51 (1995) 1125 | hep-ph/9407339 |
| 4 | R. Baier and R. Rückl | Hadronic production of $ \mathrm{J}/\psi $ and $ \Upsilon $: transverse momentum distributions | PLB 102 (1981) 364 | |
| 5 | J.-P. Lansberg | On the mechanisms of heavy-quarkonium hadroproduction | EPJC 61 (2009) 693 | 0811.4005 |
| 6 | V. D. Barger, W.-Y. Keung, and R. J. N. Phillips | On $ \psi $ and $ \Upsilon $ production via gluons | PLB 91 (1980) 253 | |
| 7 | V. D. Barger, W.-Y. Keung, and R. J. N. Phillips | Hadroproduction of $ \psi $ and $ \Upsilon $ | Z. Phys. C 6 (1980) 169 | |
| 8 | CDF Collaboration | $ \mathrm{J}/\psi $ and $ \psi\mathrm{(2S)} $ production in $ \mathrm{p}\overline{\mathrm{p}} $ collisions at $ \sqrt{s} = $ 1.8 TeV | PRL 79 (1997) 572 | |
| 9 | CDF Collaboration | Measurements of angular distributions of muons from $ \Upsilon $ meson decays in $ \mathrm{p}\overline{\mathrm{p}} $ collisions at $ \sqrt{s} = $ 1.96 TeV | PRL 108 (2012) 151802 | 1112.1591 |
| 10 | CMS Collaboration | Measurement of the prompt $ \mathrm{J}/\psi $ and $ \psi\mathrm{(2S)} $ polarizations in pp collisions at $ \sqrt{s} = $ 7 TeV | PLB 727 (2013) 381 | CMS-BPH-13-003 1307.6070 |
| 11 | LHCb Collaboration | Measurement of $ \mathrm{J}/\psi $ polarization in pp collisions at $ \sqrt{s} = $ 7 TeV | EPJC 73 (2013) 2631 | 1307.6379 |
| 12 | LHCb Collaboration | Measurement of $ \psi\mathrm{(2S)} $ polarisation in pp collisions at $ \sqrt{s}= $ 7 TeV | EPJC 74 (2014) 2872 | 1403.1339 |
| 13 | CMS Collaboration | Measurement of the $ \Upsilon $(1S), $ \Upsilon $(2S), and $ \Upsilon $(3S) polarizations in pp collisions at $ \sqrt{s} = $ 7 TeV | PRL 110 (2013) 081802 | CMS-BPH-11-023 1209.2922 |
| 14 | LHCb Collaboration | Measurement of the $ \Upsilon $ polarizations in pp collisions at $ \sqrt{s} = $ 7 and 8 TeV | JHEP 12 (2017) 110 | 1709.01301 |
| 15 | M. Butenschön and B. A. Kniehl | $ \mathrm{J}/\psi $ polarization at Tevatron and LHC: nonrelativistic-QCD factorization at the crossroads | PRL 108 (2012) 172002 | 1201.1872 |
| 16 | K.-T. Chao et al. | $ \mathrm{J}/\psi $ polarization at hadron colliders in nonrelativistic QCD | PRL 108 (2012) 242004 | 1201.2675 |
| 17 | B. Gong, L.-P. Wan, J.-X. Wang, and H.-F. Zhang | Polarization for prompt $ \mathrm{J}/\psi $ and $ \psi\mathrm{(2S)} $ production at the Tevatron and LHC | PRL 110 (2013) 042002 | 1205.6682 |
| 18 | M. Butenschön and B. A. Kniehl | Next-to-leading-order tests of NRQCD factorization with $ \mathrm{J}/\psi $ yield and polarization | Mod. Phys. Lett. A 28 (2013) 1350027 | 1212.2037 |
| 19 | P. Faccioli et al. | Quarkonium production in the LHC era: A polarized perspective | PLB 736 (2014) 98 | 1403.3970 |
| 20 | G. T. Bodwin et al. | Fragmentation contributions to hadroproduction of prompt $ \mathrm{J}/\psi $, $ \chi_{{\mathrm{c}}J} $, and $ \psi\mathrm{(2S)} $ states | PRD 93 (2016) 034041 | 1509.07904 |
| 21 | P. Faccioli et al. | From identical S- and P-wave $ p_{\mathrm{T}} $ spectra to maximally distinct polarizations: probing NRQCD with $ \chi $ states | EPJC 78 (2018) 268 | 1802.01106 |
| 22 | V. Cheung and R. Vogt | Production and polarization of direct $ \mathrm{J}/\psi $ to $ O(\alpha_s^3) $ in the improved color evaporation model in collinear factorization | PRD 104 (2021) 094026 | 2102.09118 |
| 23 | PHENIX Collaboration | Transverse momentum dependence of $ \mathrm{J}/\psi $ polarization at midrapidity in pp collisions at $ \sqrt{s} = $ 200 GeV | PRD 82 (2010) 012001 | 0912.2082 |
| 24 | STAR Collaboration | Measurement of inclusive $ \mathrm{J}/\psi $ polarization in pp collisions at $ \sqrt{s} = $ 200 GeV by the STAR experiment | PRD 102 (2020) 092009 | 2007.04732 |
| 25 | ALICE Collaboration | $ \mathrm{J}/\psi $ polarization in pp collisions at $ \sqrt{s} = $ 7 TeV | PRL 108 (2012) 082001 | 1111.1630 |
| 26 | CMS Collaboration | Constraints on the $ \chi_{{\mathrm{c}}1} $ versus $ \chi_{{\mathrm{c}}2} $ polarizations in proton-proton collisions at $ \sqrt{s} = $ 8 TeV | PRL 124 (2020) 162002 | CMS-BPH-13-001 1912.07706 |
| 27 | P. Faccioli, C. Lourenço, and T. Madlener | From prompt to direct $ \mathrm{J}/\psi $ production: new insights on the $ \chi_{{\mathrm{c}}1} $ and $ \chi_{{\mathrm{c}}2} $ polarizations and feed-down contributions from a global-fit analysis of mid-rapidity LHC data | EPJC 80 (2020) 623 | 2006.15446 |
| 28 | P. Faccioli and C. Lourenço | NRQCD colour-octet expansion vs.\ LHC quarkonium production: signs of a hierarchy puzzle? | EPJC 79 (2019) 457 | 1905.09553 |
| 29 | P. Faccioli, C. Lourenço, J. Seixas, and H. K. Wöhri | Study of $ \psi\mathrm{(2S)} $ and $ \chi_{{\mathrm{c}}} $ decays as feed-down sources of $ \mathrm{J}/\psi $ hadro-production | JHEP 10 (2008) 004 | 0809.2153 |
| 30 | P. Faccioli, C. Lourenço, and J. Seixas | Rotation-invariant relations in vector meson decays into fermion pairs | PRL 105 (2010) 061601 | 1005.2601 |
| 31 | P. Faccioli, C. Lourenço, and J. Seixas | New approach to quarkonium polarization studies | PRD 81 (2010) 111502 | 1005.2855 |
| 32 | P. Faccioli and C. Lourenço | Particle polarization in high energy physics: an introduction and case studies on vector particle production at the LHC | Lecture Notes in Physics. Springer, 2022 link |
|
| 33 | CMS Collaboration | Angular coefficients of Z bosons produced in pp collisions at $ \sqrt{s} = $ 8 TeV and decaying to $ \mu^+ \mu^- $ as a function of transverse momentum and rapidity | PLB 750 (2015) 154 | CMS-SMP-13-010 1504.03512 |
| 34 | ATLAS Collaboration | Measurement of the angular coefficients in Z-boson events using electron and muon pairs from data taken at $ \sqrt{s} = $ 8 TeV with the ATLAS detector | JHEP 08 (2016) 159 | 1606.00689 |
| 35 | E. Braaten, D. Kang, J. Lee, and C. Yu | Optimal spin quantization axes for the polarization of dileptons with large transverse momentum | PRD 79 (2009) 014025 | 0810.4506 |
| 36 | J. C. Collins and D. E. Soper | Angular distribution of dileptons in high-energy hadron collisions | PRD 16 (1977) 2219 | |
| 37 | CMS Collaboration | The CMS experiment at the CERN LHC | JINST 3 (2008) S08004 | |
| 38 | CMS Collaboration | Electron and photon reconstruction and identification with the CMS experiment at the CERN LHC | JINST 16 (2021) P05014 | CMS-EGM-17-001 2012.06888 |
| 39 | CMS Collaboration | Performance of the CMS muon detector and muon reconstruction with proton-proton collisions at $ \sqrt{s} = $ 13 TeV | JINST 13 (2018) P06015 | CMS-MUO-16-001 1804.04528 |
| 40 | CMS Collaboration | Description and performance of track and primary-vertex reconstruction with the CMS tracker | JINST 9 (2014) P10009 | CMS-TRK-11-001 1405.6569 |
| 41 | CMS Collaboration | Performance of the CMS Level-1 trigger in proton-proton collisions at $ \sqrt{s} = $ 13 TeV | JINST 15 (2020) P10017 | CMS-TRG-17-001 2006.10165 |
| 42 | CMS Collaboration | The CMS trigger system | JINST 12 (2017) P01020 | CMS-TRG-12-001 1609.02366 |
| 43 | CMS Collaboration | CMS luminosity measurement for the 2017 data-taking period at $ \sqrt{s} = $ 13 TeV | CMS Physics Analysis Summary, 2018 link |
CMS-PAS-LUM-17-004 |
| 44 | CMS Collaboration | CMS luminosity measurement for the 2018 data-taking period at $ \sqrt{s} = $ 13 TeV | CMS Physics Analysis Summary, 2019 link |
CMS-PAS-LUM-18-002 |
| 45 | CMS Collaboration | Prompt and non-prompt $ \mathrm{J}/\psi $ production in pp collisions at $ \sqrt{s} = $ 7 TeV | EPJC 71 (2011) 1575 | CMS-BPH-10-002 1011.4193 |
| 46 | T. Sjöstrand et al. | An introduction to PYTHIA 8.2 | Comput. Phys. Commun. 191 (2015) 159 | 1410.3012 |
| 47 | N. Davidson, T. Przedzinski, and Z. Was | PHOTOS interface in C++: technical and physics documentation | Comput. Phys. Commun. 199 (2016) 86 | 1011.0937 |
| 48 | GEANT4 Collaboration | GEANT 4---a simulation toolkit | NIM A 506 (2003) 250 | |
| 49 | M. J. Oreglia | A study of the reactions $ \psi^\prime \to \gamma \gamma \psi $ | PhD thesis, Stanford University, 1980 link |
|
| 50 | CMS Collaboration | $ \mathrm{J}/\psi $ and $ \psi\mathrm{(2S)} $ production in pp collisions at $ \sqrt{s} = $ 7 TeV | JHEP 02 (2012) 011 | CMS-BPH-10-014 1111.1557 |
| 51 | CMS Collaboration | Measurement of $ \mathrm{J}/\psi $ and $ \psi\mathrm{(2S)} $ prompt double-differential cross sections in pp collisions at $ \sqrt{s} = $ 7 TeV | PRL 114 (2015) 191802 | CMS-BPH-14-001 1502.04155 |
| 52 | V. Knünz, | Measurement of quarkonium polarization to probe QCD at the LHC | PhD thesis, Vienna, Tech. U., Atominst, 2015 link |
|
| 53 | P. Faccioli, C. Lourenço, J. Seixas, and H. Wöhri | Towards the experimental clarification of quarkonium polarization | EPJC 69 (2010) 657 | 1006.2738 |
| 54 | P. Faccioli and C. Lourenço | On the polarization of the non-prompt contribution to inclusive $ \mathrm{J}/\psi $ production in pp collisions | JHEP 10 (2022) 005 | 2206.14686 |
| 55 | V. Krey and K. R. S. Balaji | Polarized $ \mathrm{J}/\psi $ production from $ {\mathrm{B}} $ mesons at the Fermilab Tevatron | PRD 67 (2003) 054011 | hep-ph/0209135 |
| 56 | CDF Collaboration | Measurement of $ \mathrm{J}/\psi $ and $ \psi\mathrm{(2S)} $ polarization in $ \mathrm{p}\overline{\mathrm{p}} $ collisions at $ \sqrt{s} = $ 1.8 TeV | PRL 85 (2000) 2886 | hep-ex/0004027 |
| 57 | CLEO Collaboration | Inclusive decays of $ {\mathrm{B}} $ mesons to charmonium | PRD 52 (1995) 2661 | |
| 58 | BaBar Collaboration | Study of inclusive production of charmonium mesons in $ {\mathrm{B}} $ decay | PRD 67 (2003) 032002 | hep-ex/0207097 |
| 59 | M. Beneke, F. Maltoni, and I. Z. Rothstein | QCD analysis of inclusive $ {\mathrm{B}} $ decay into charmonium | PRD 59 (1999) 054003 | hep-ph/9808360 |
| 60 | M. Beneke, G. A. Schuler, and S. Wolf | Quarkonium momentum distributions in photoproduction and $ {\mathrm{B}} $ decay | PRD 62 (2000) 034004 | hep-ph/0001062 |
| 61 | S. Fleming, O. F. Hernandez, I. Maksymyk, and H. Nadeau | NRQCD matrix elements in polarization of $ \mathrm{J}/\psi $ produced from b decay | PRD 55 (1997) 4098 | hep-ph/9608413 |
| 62 | H.-S. Shao, Y.-Q. Ma, K. Wang, and K.-T. Chao | Polarizations of $ \chi_{{\mathrm{c}}1} $ and $ \chi_{{\mathrm{c}}2} $ in prompt production at the LHC | PRL 112 (2014) 182003 | 1402.2913 |
| 63 | H.-S. Shao | HELAC-Onia 2.0: an upgraded matrix-element and event generator for heavy quarkonium physics | Comput. Phys. Commun. 198 (2016) 238 | 1507.03435 |
| 64 | CMS Collaboration | HEPData record for this analysis | link | |
|
|
Compact Muon Solenoid LHC, CERN |
|

|

|

|

|

|