

Compact Muon Solenoid
LHC, CERN
| CMS-SMP-24-015 ; CERN-EP-2025-102 | ||
| Measurement of WWZ and ZH production cross sections at $ \sqrt{s}= $ 13 and 13.6 TeV | ||
| CMS Collaboration | ||
| 26 May 2025 | ||
| PRL 135 (2025) 091802 | ||
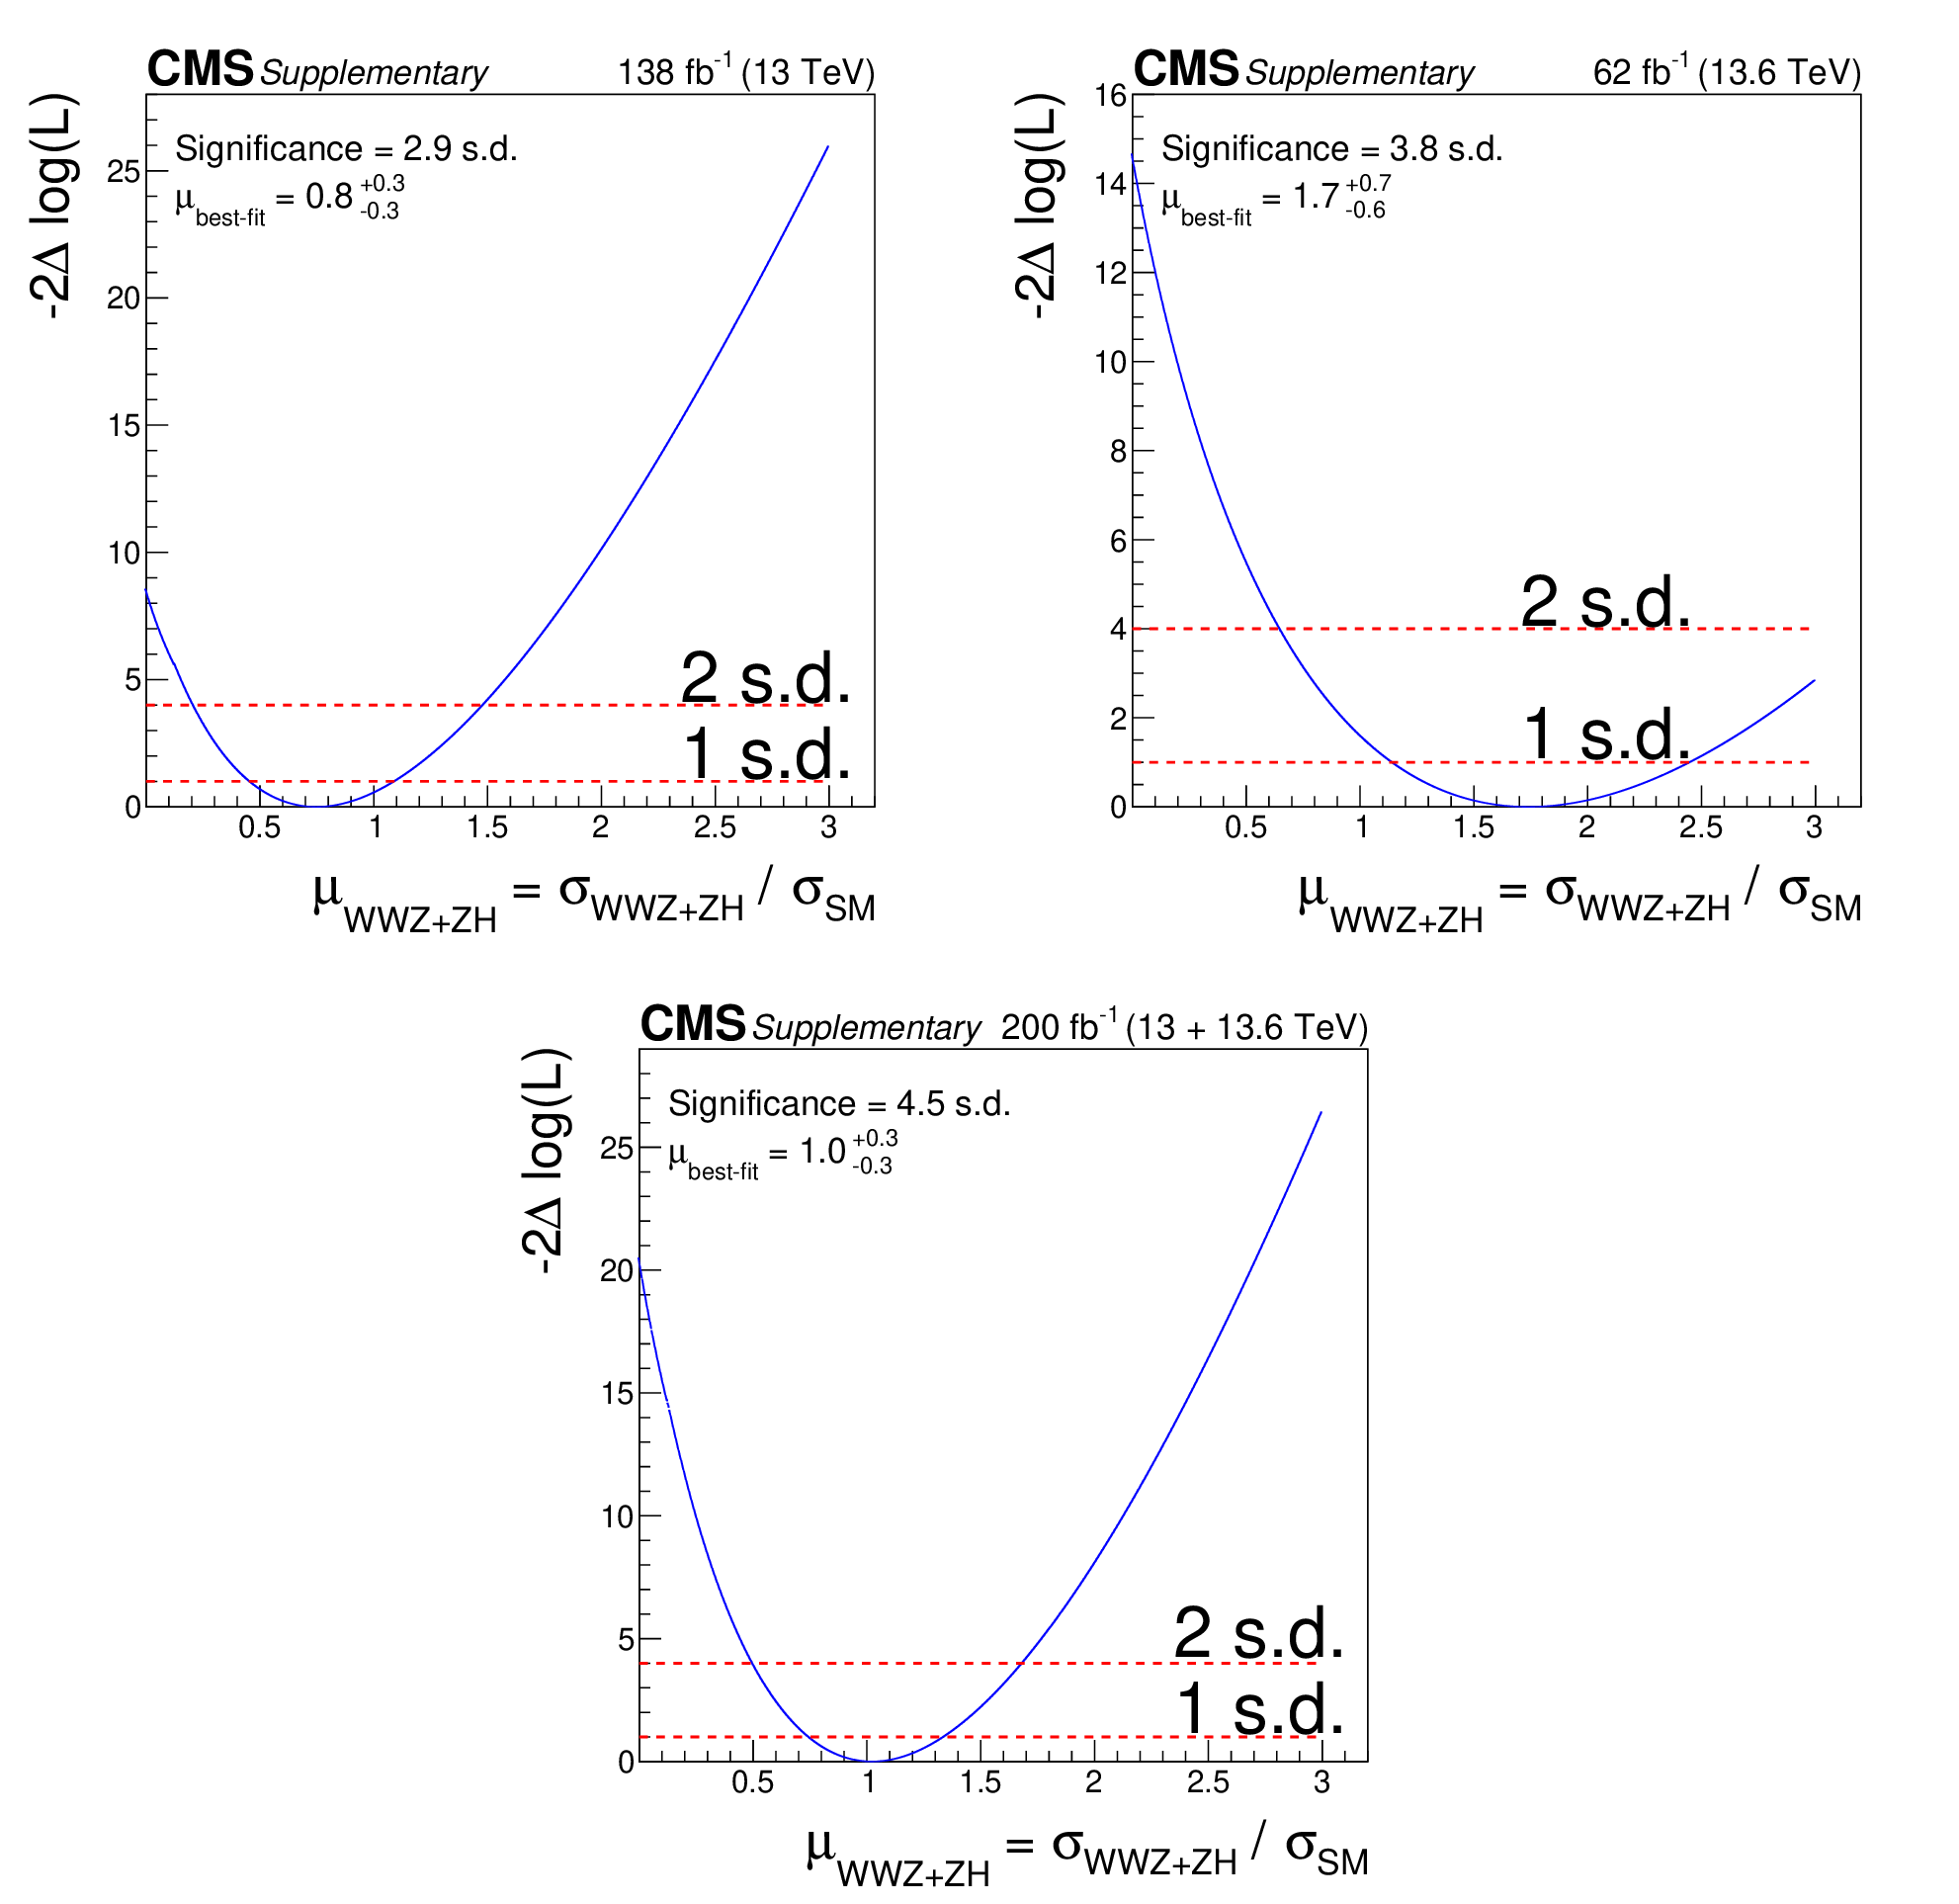
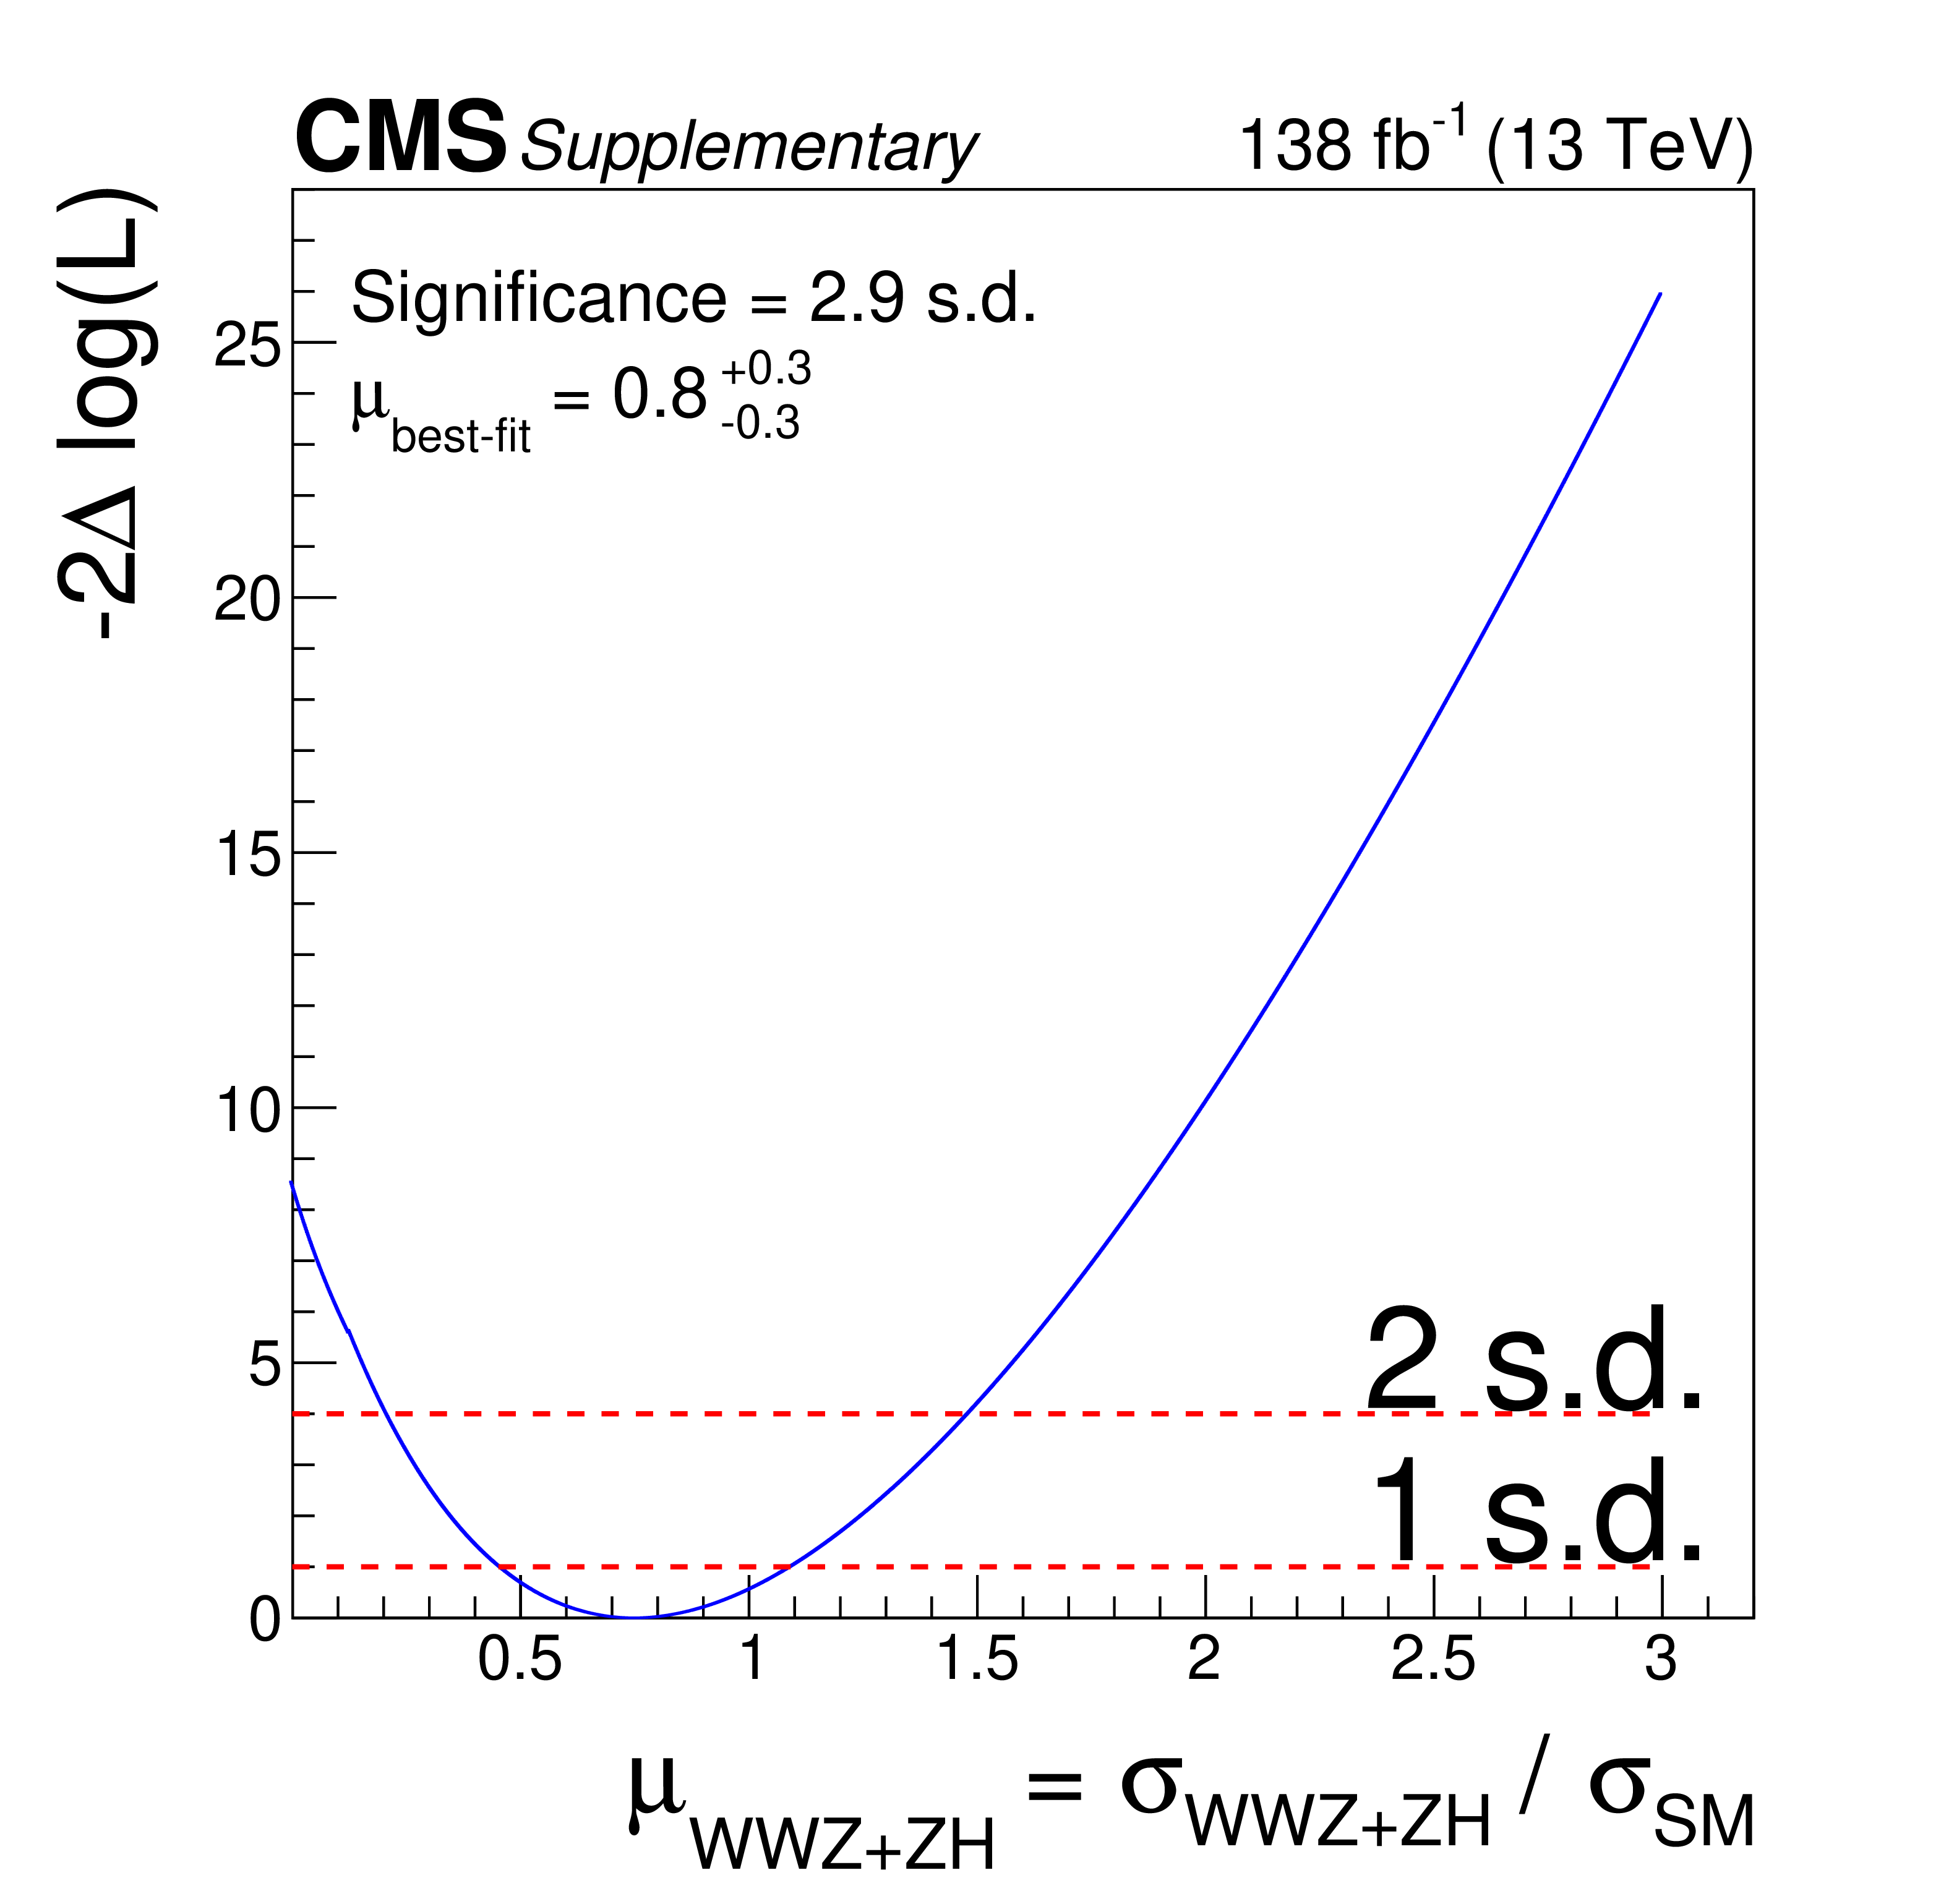
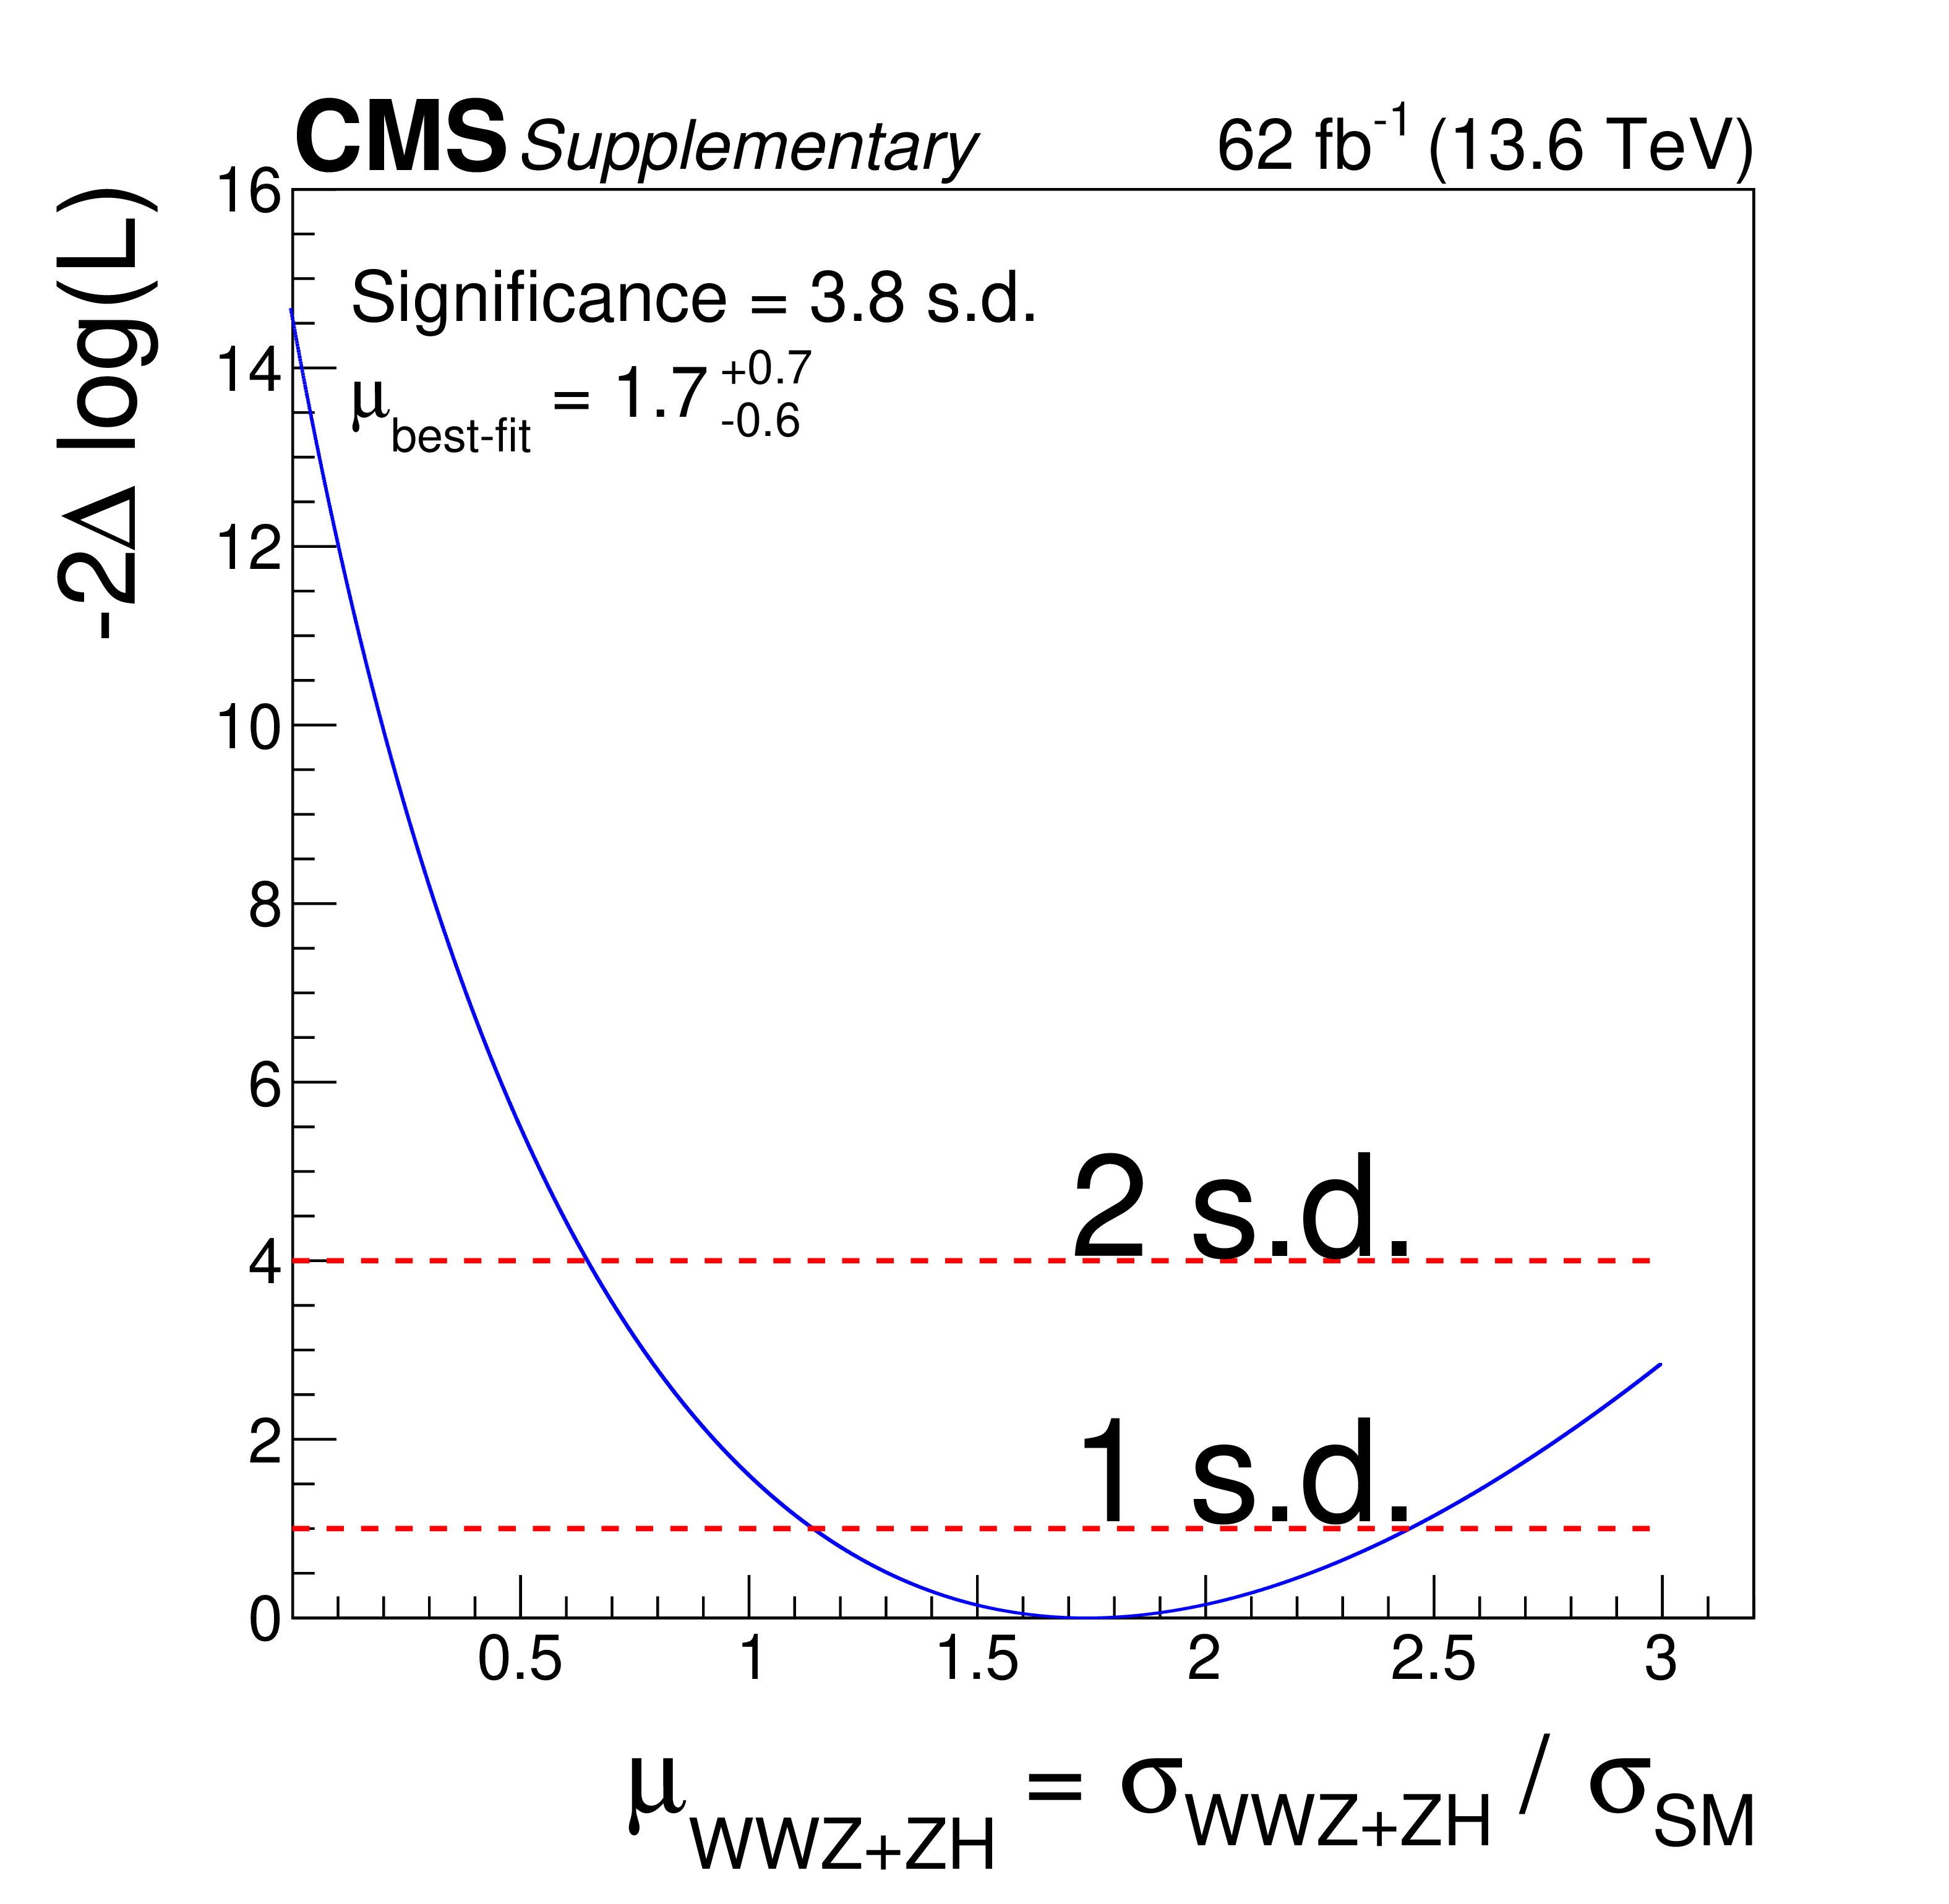
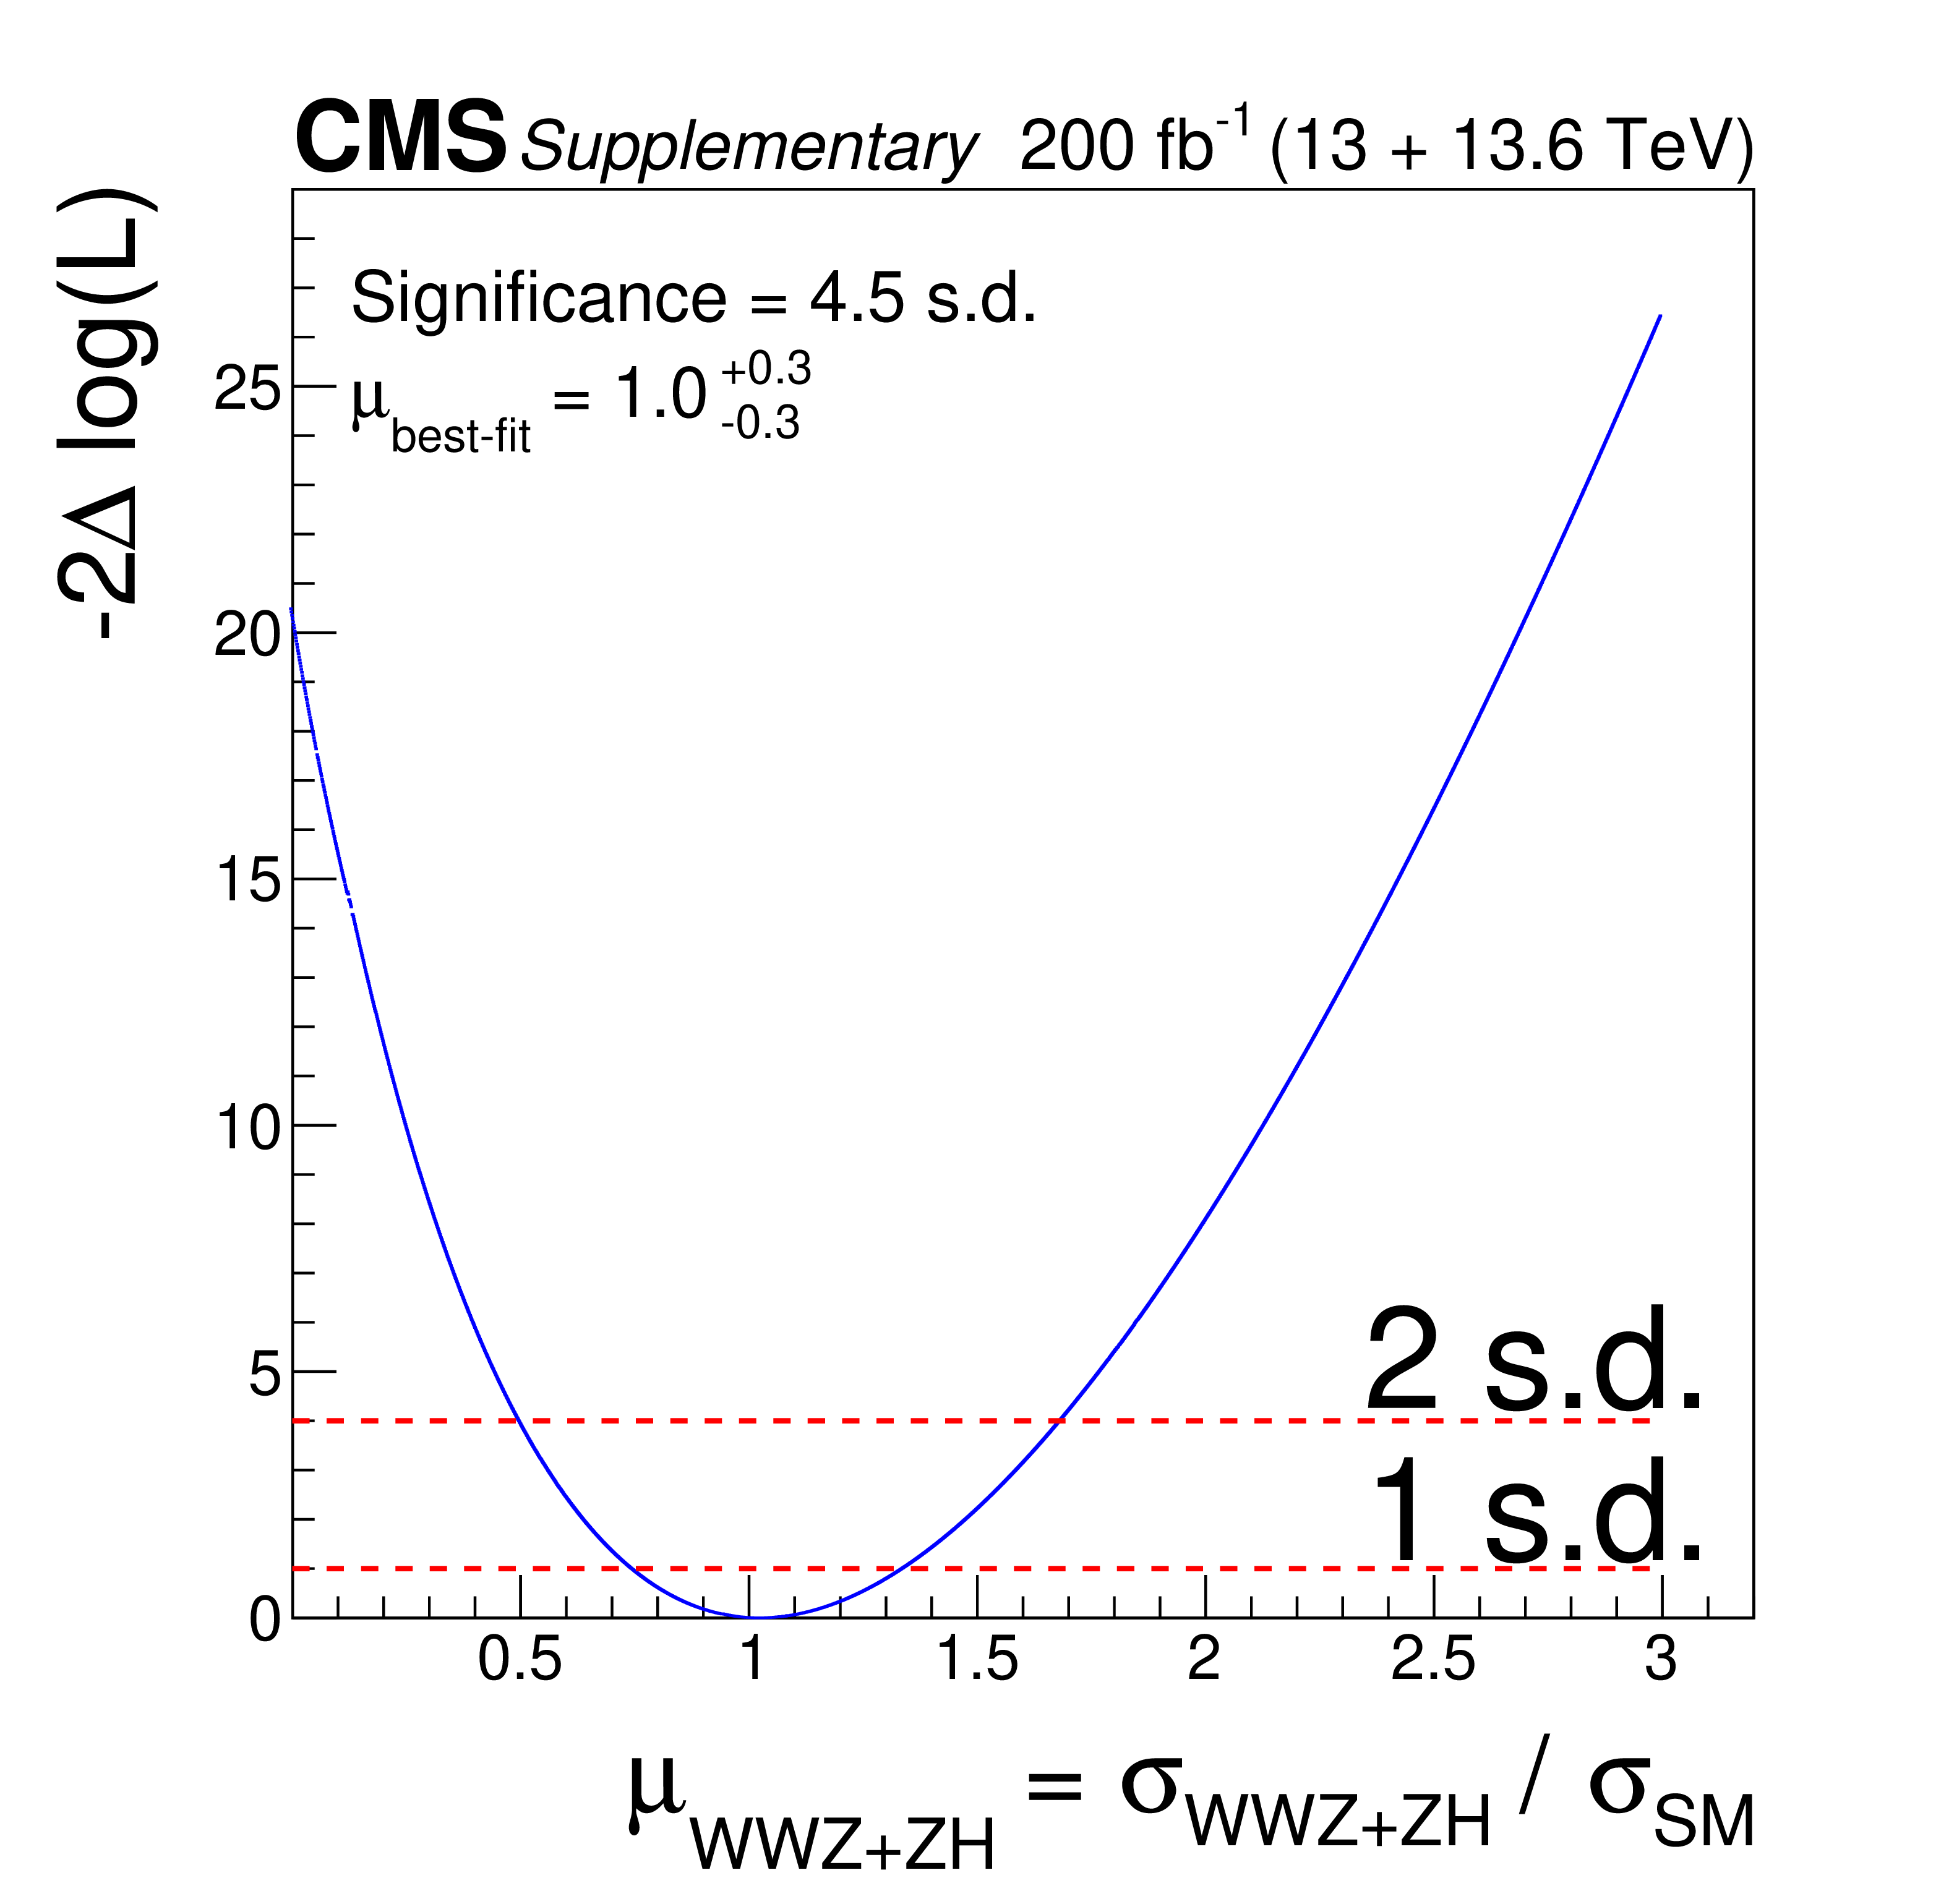
| Abstract: A measurement is presented of the cross section in proton-proton collisions for the production of two W bosons and one Z boson. It is based on data recorded by the CMS experiment at the CERN LHC at center-of-mass energies $ \sqrt{s}= $ 13 and 13.6 TeV, corresponding to an integrated luminosity of 200 fb$ ^{-1} $. Events with four charged leptons (electrons or muons) in the final state are selected. Both nonresonant WWZ production and ZH production, with the Higgs boson decaying into two W bosons, are reported. For the first time, the two processes are measured separately in a simultaneous fit. Combining the two modes, signal strengths relative to the standard model (SM) predictions of 0.75 $ ^{+0.34}_{-0.29} $ and 1.74 $ ^{+0.71}_{-0.60} $ are measured for $ \sqrt{s}= $ 13 and 13.6 TeV, respectively. The observed (expected) significance for the triboson signal is 3.8 (2.5) standard deviations for $ \sqrt{s}= $ 13.6 TeV, thus providing the first evidence for triboson production at this center-of-mass energy. Combining the two modes and the two center-of-mass energies, the inclusive signal strength relative to the SM prediction is measured to be 1.03 $ ^{+0.31}_{-0.28} $, with an observed (expected) significance of 4.5 (5.0) standard deviations. | ||
| Links: e-print arXiv:2505.20483 [hep-ex] (PDF) ; CDS record ; inSPIRE record ; HepData record ; Physics Briefing ; CADI line (restricted) ; | ||
| Figures & Tables | Summary | Additional Figures | References | CMS Publications |
|---|
| Figures | |
png pdf |
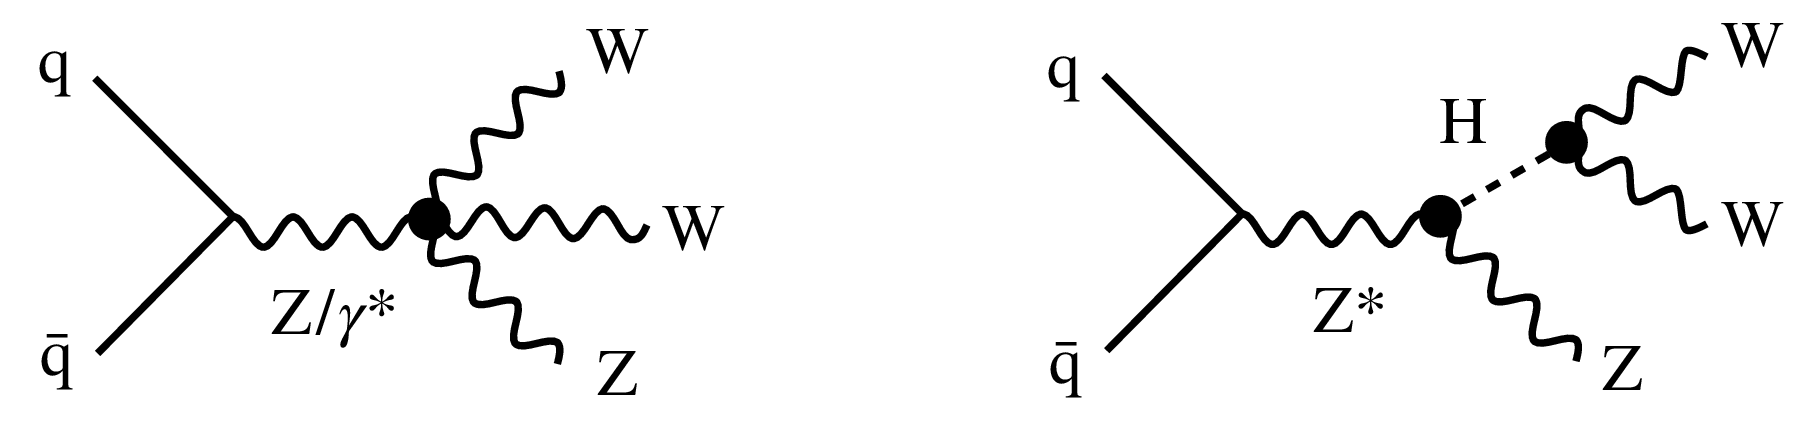
Figure 1:
Example Feynman diagrams for nonresonant $ \mathrm{W}\mathrm{W}\mathrm{Z} $ (left ) and ZH (with $ \mathrm{H}\to\mathrm{W}\mathrm{W} $) production (right ). The quartic gauge coupling is indicated in the left diagram, and the gauge-Higgs couplings are indicated in the right diagram. |
png pdf |
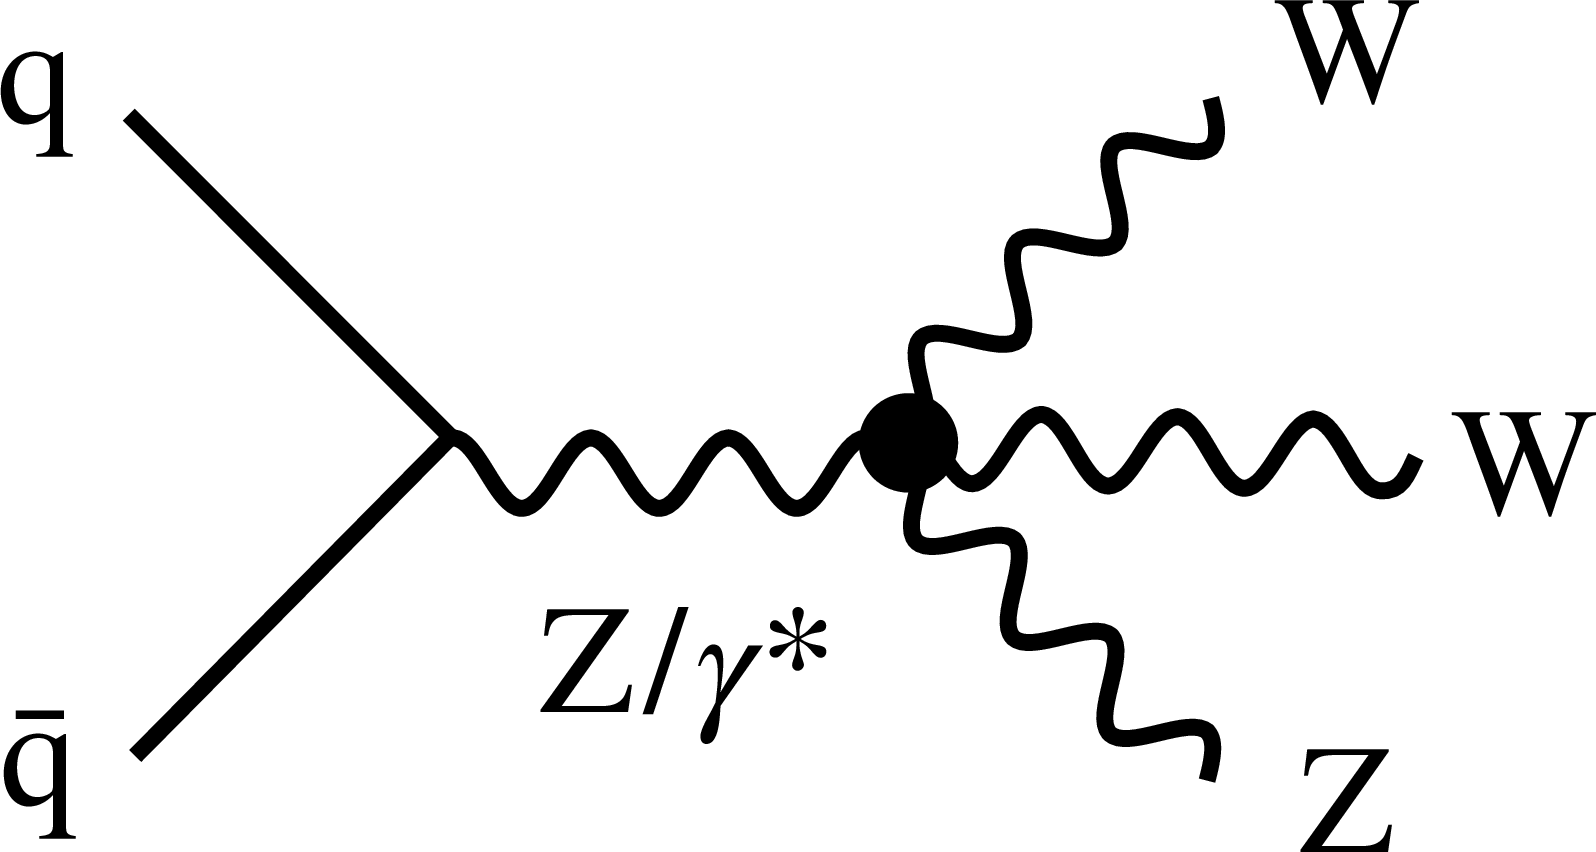
Figure 1-a:
Example Feynman diagrams for nonresonant $ \mathrm{W}\mathrm{W}\mathrm{Z} $ (left ) and ZH (with $ \mathrm{H}\to\mathrm{W}\mathrm{W} $) production (right ). The quartic gauge coupling is indicated in the left diagram, and the gauge-Higgs couplings are indicated in the right diagram. |
png pdf |
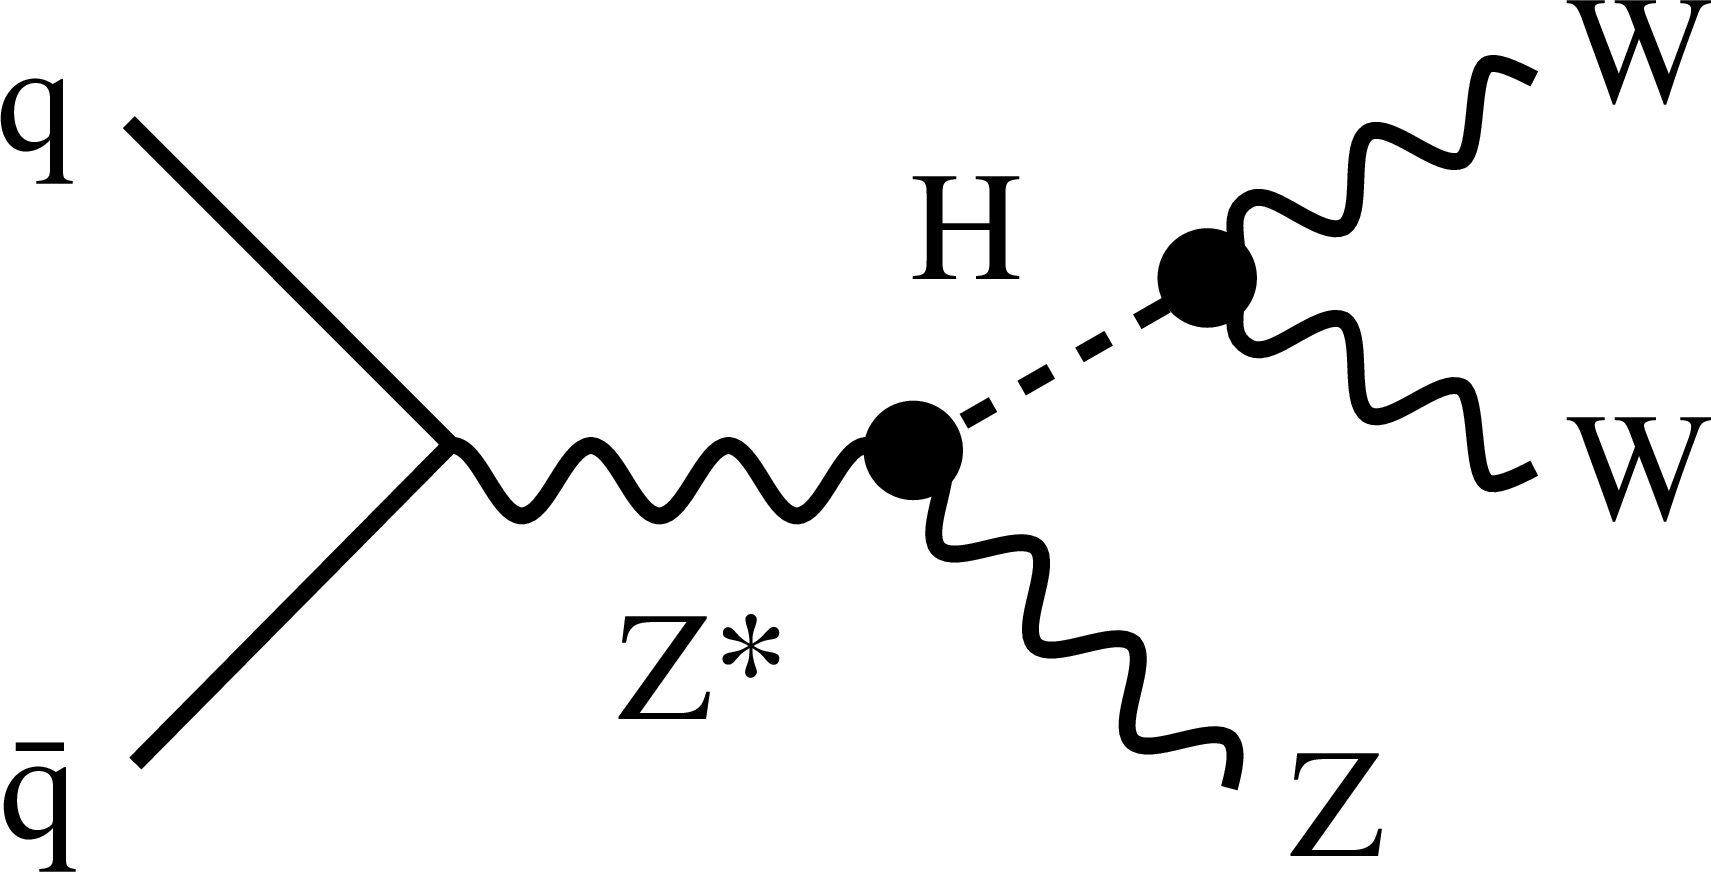
Figure 1-b:
Example Feynman diagrams for nonresonant $ \mathrm{W}\mathrm{W}\mathrm{Z} $ (left ) and ZH (with $ \mathrm{H}\to\mathrm{W}\mathrm{W} $) production (right ). The quartic gauge coupling is indicated in the left diagram, and the gauge-Higgs couplings are indicated in the right diagram. |
png pdf |
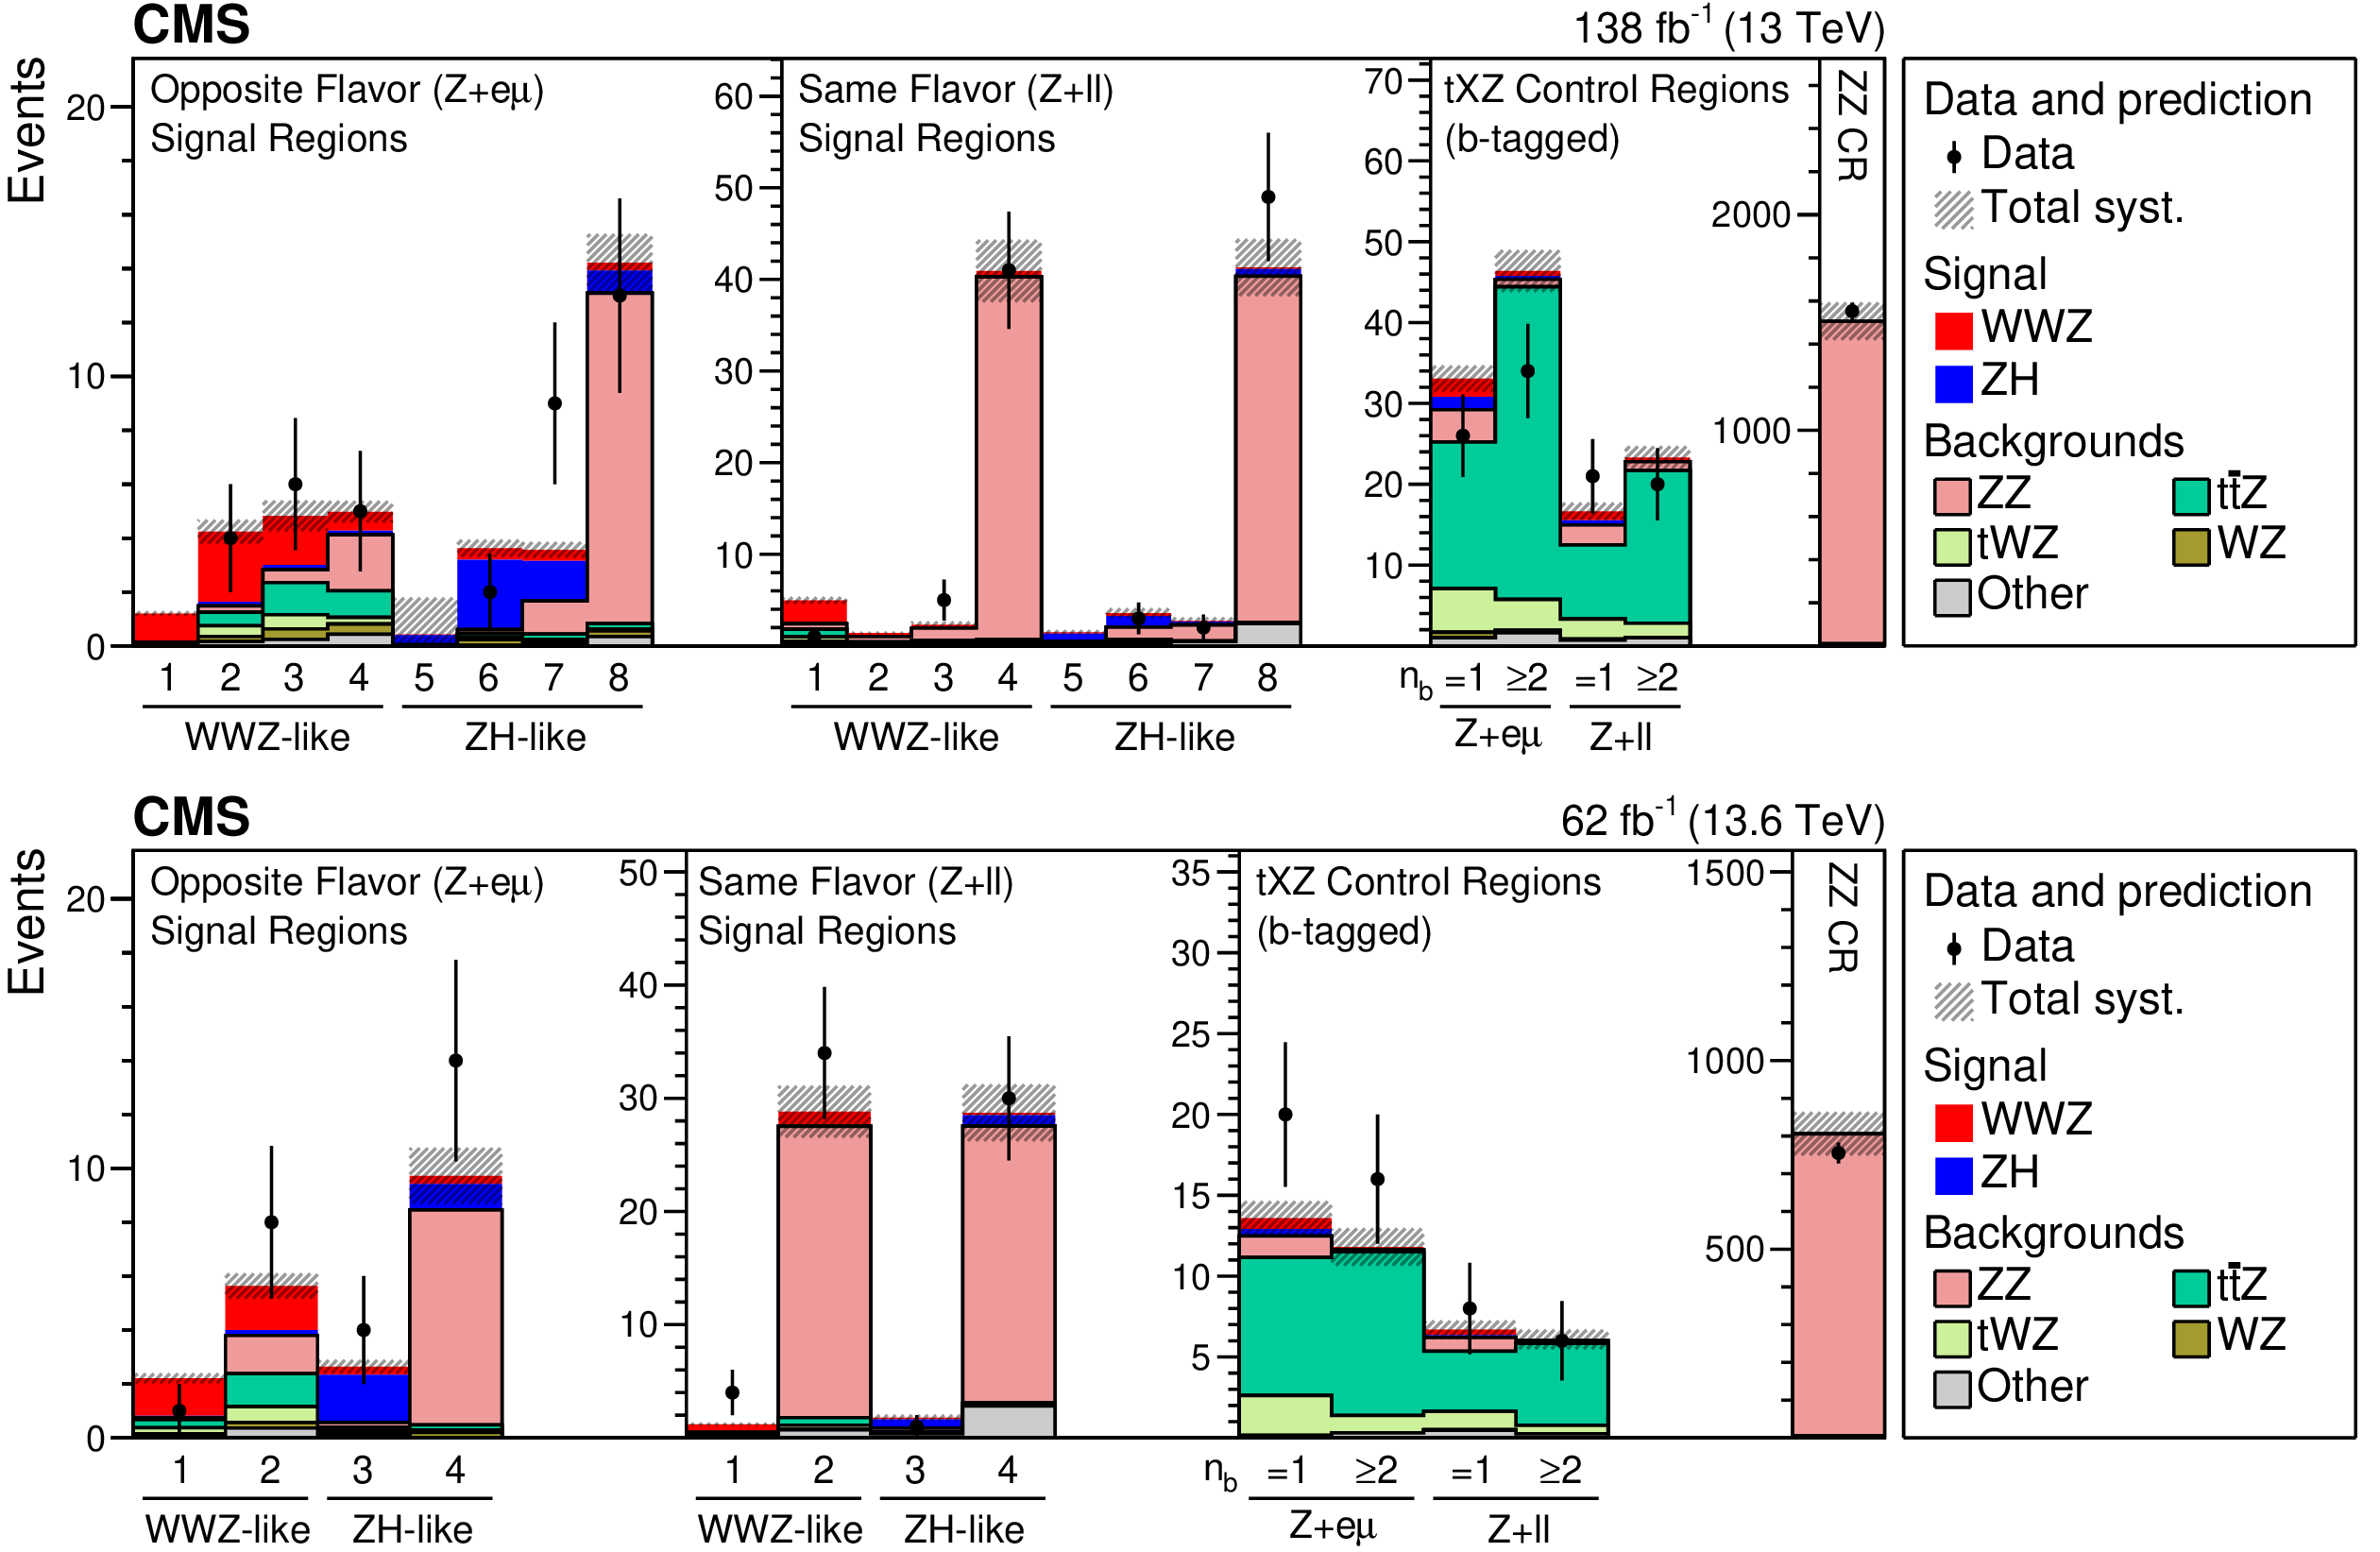
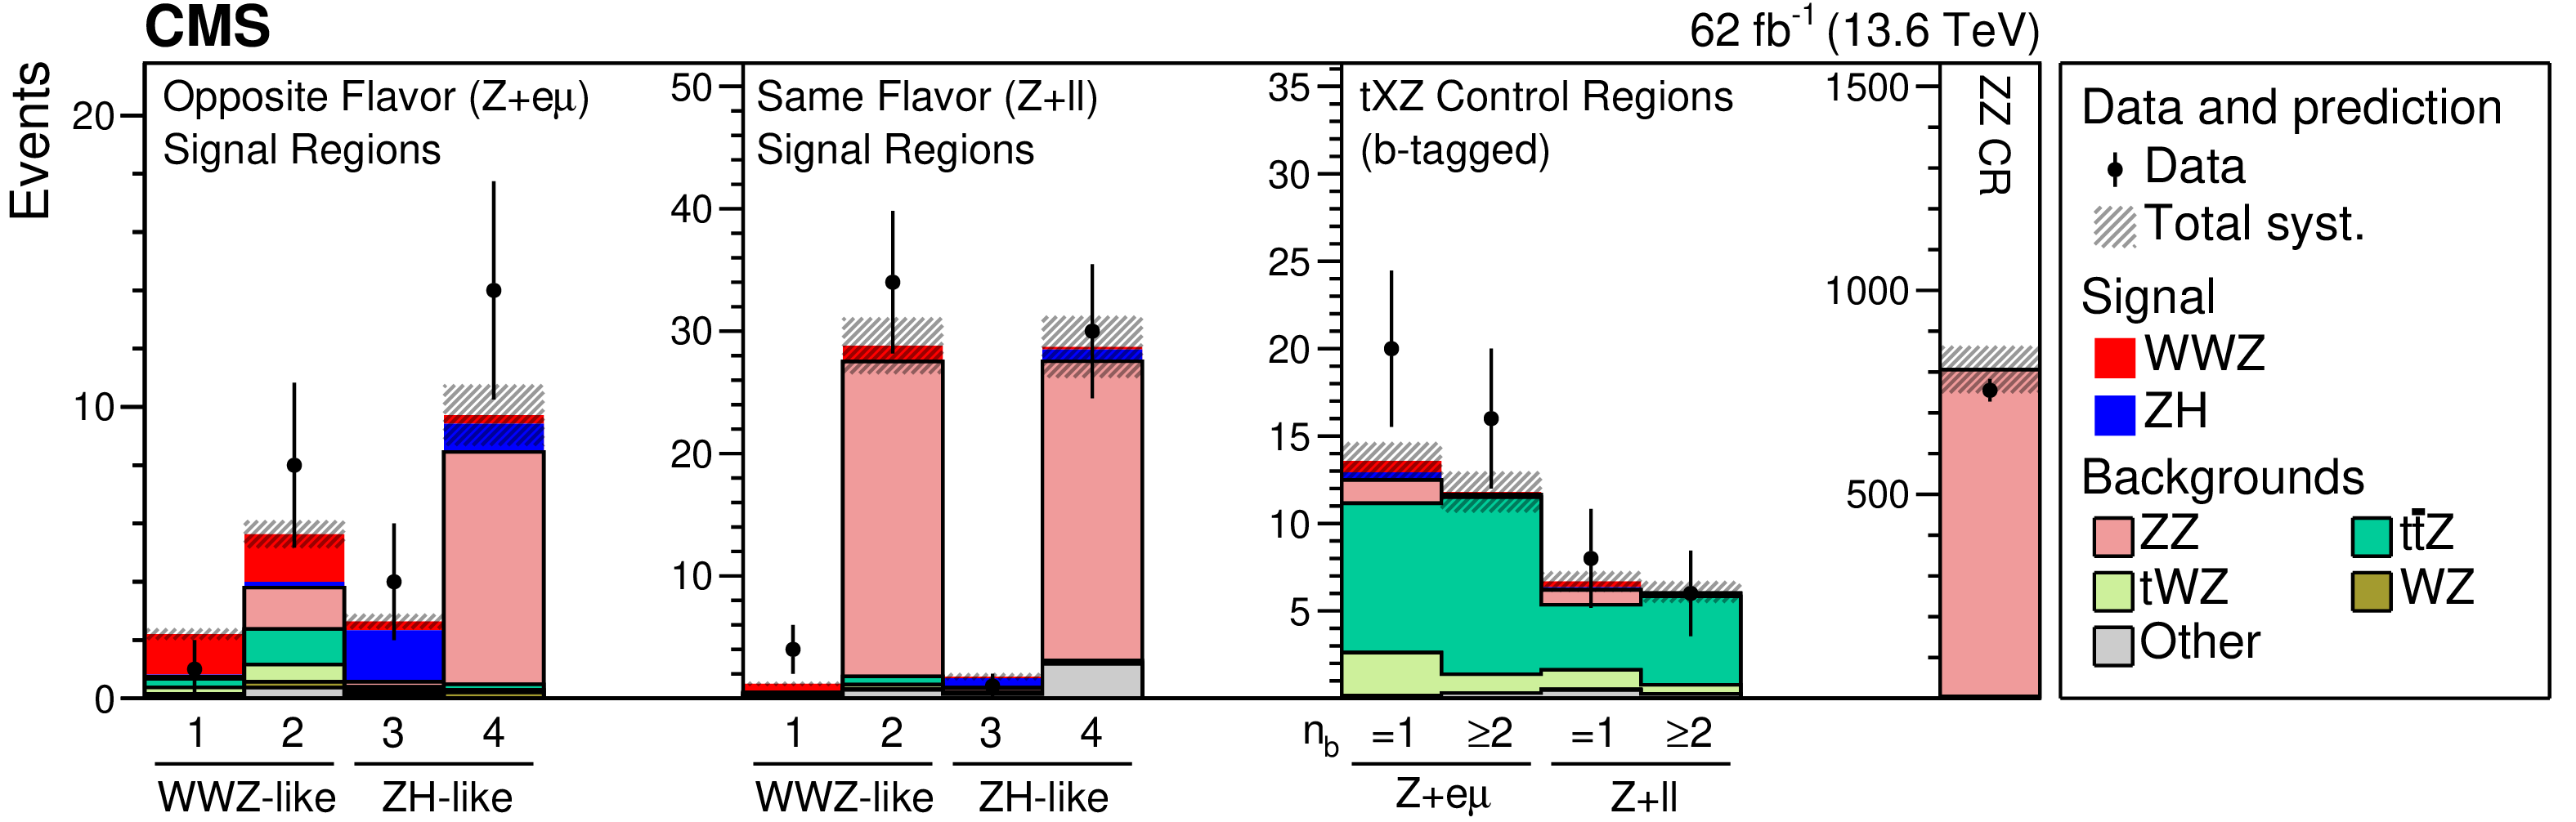
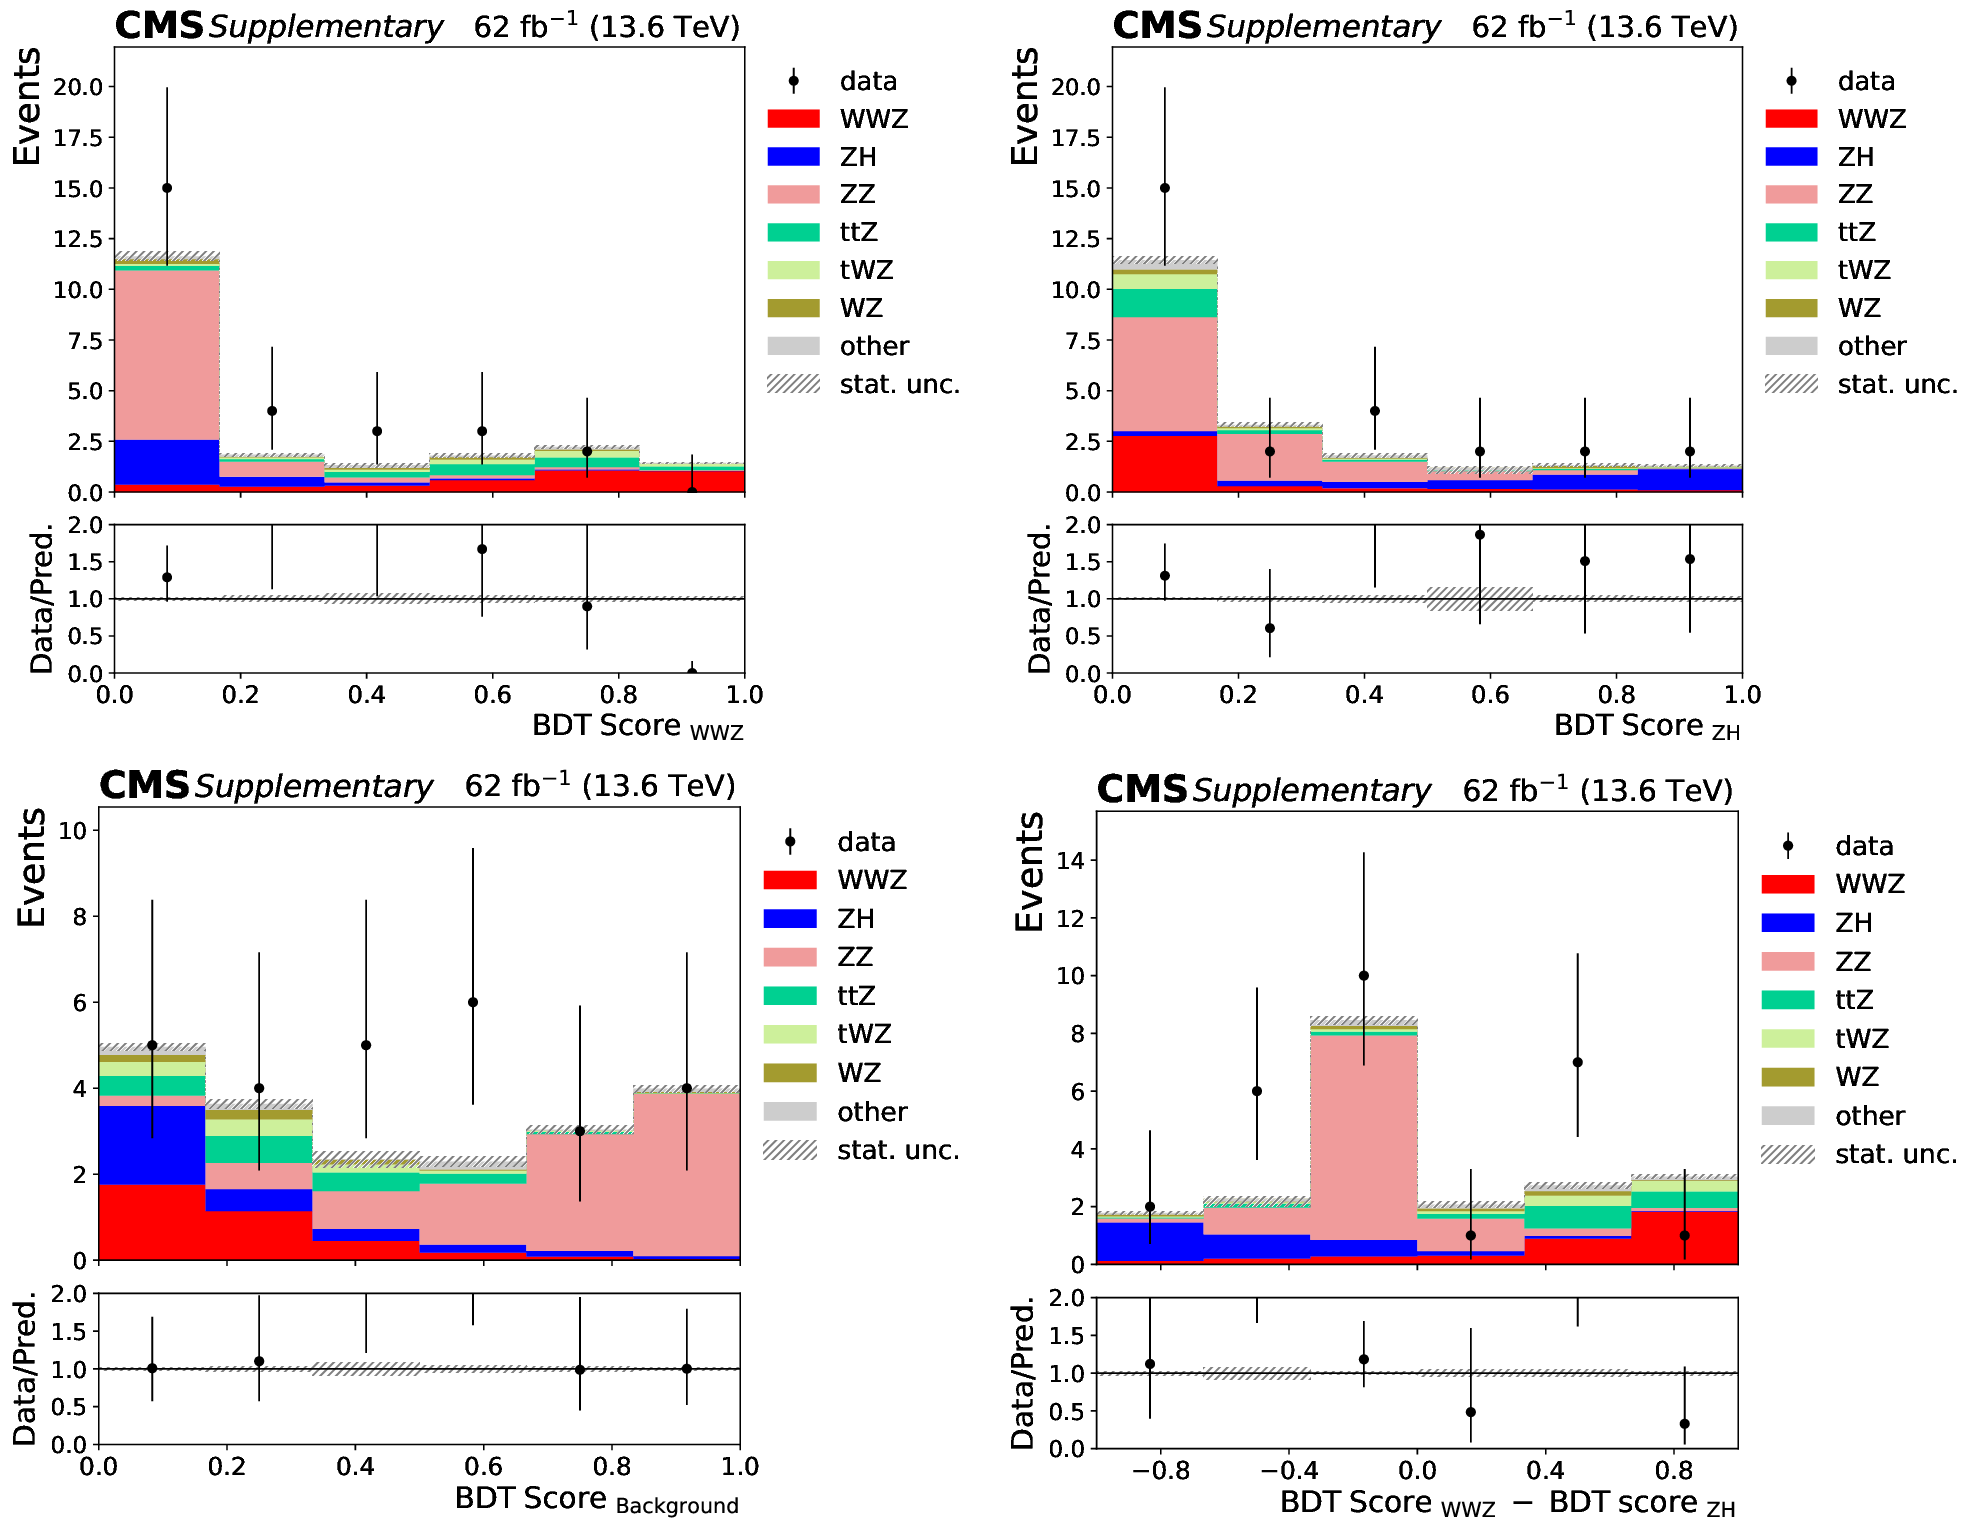
Figure 2:
Comparison of the numbers of observed to SM-predicted events for each of the bins included in the fit for \Run2 (upper row) and \Run3 (lower row). The SM expectations are shown before performing the fit. The horizontal axis legend also indicates ``$ \mathrm{W}\mathrm{W}\mathrm{Z} $-like'' and ``ZH-like'' bins defined based on whether the $ \mathrm{W}\mathrm{W}\mathrm{Z} $ BDT score is higher or lower than the ZH score. The error bars on the data points represent the statistical uncertainties. The shaded bands represent the total contributions of the systematic uncertainties. |

png pdf |
Figure 2-a:
Comparison of the numbers of observed to SM-predicted events for each of the bins included in the fit for \Run2 (upper row) and \Run3 (lower row). The SM expectations are shown before performing the fit. The horizontal axis legend also indicates ``$ \mathrm{W}\mathrm{W}\mathrm{Z} $-like'' and ``ZH-like'' bins defined based on whether the $ \mathrm{W}\mathrm{W}\mathrm{Z} $ BDT score is higher or lower than the ZH score. The error bars on the data points represent the statistical uncertainties. The shaded bands represent the total contributions of the systematic uncertainties. |
png pdf |
Figure 2-b:
Comparison of the numbers of observed to SM-predicted events for each of the bins included in the fit for \Run2 (upper row) and \Run3 (lower row). The SM expectations are shown before performing the fit. The horizontal axis legend also indicates ``$ \mathrm{W}\mathrm{W}\mathrm{Z} $-like'' and ``ZH-like'' bins defined based on whether the $ \mathrm{W}\mathrm{W}\mathrm{Z} $ BDT score is higher or lower than the ZH score. The error bars on the data points represent the statistical uncertainties. The shaded bands represent the total contributions of the systematic uncertainties. |
png pdf |
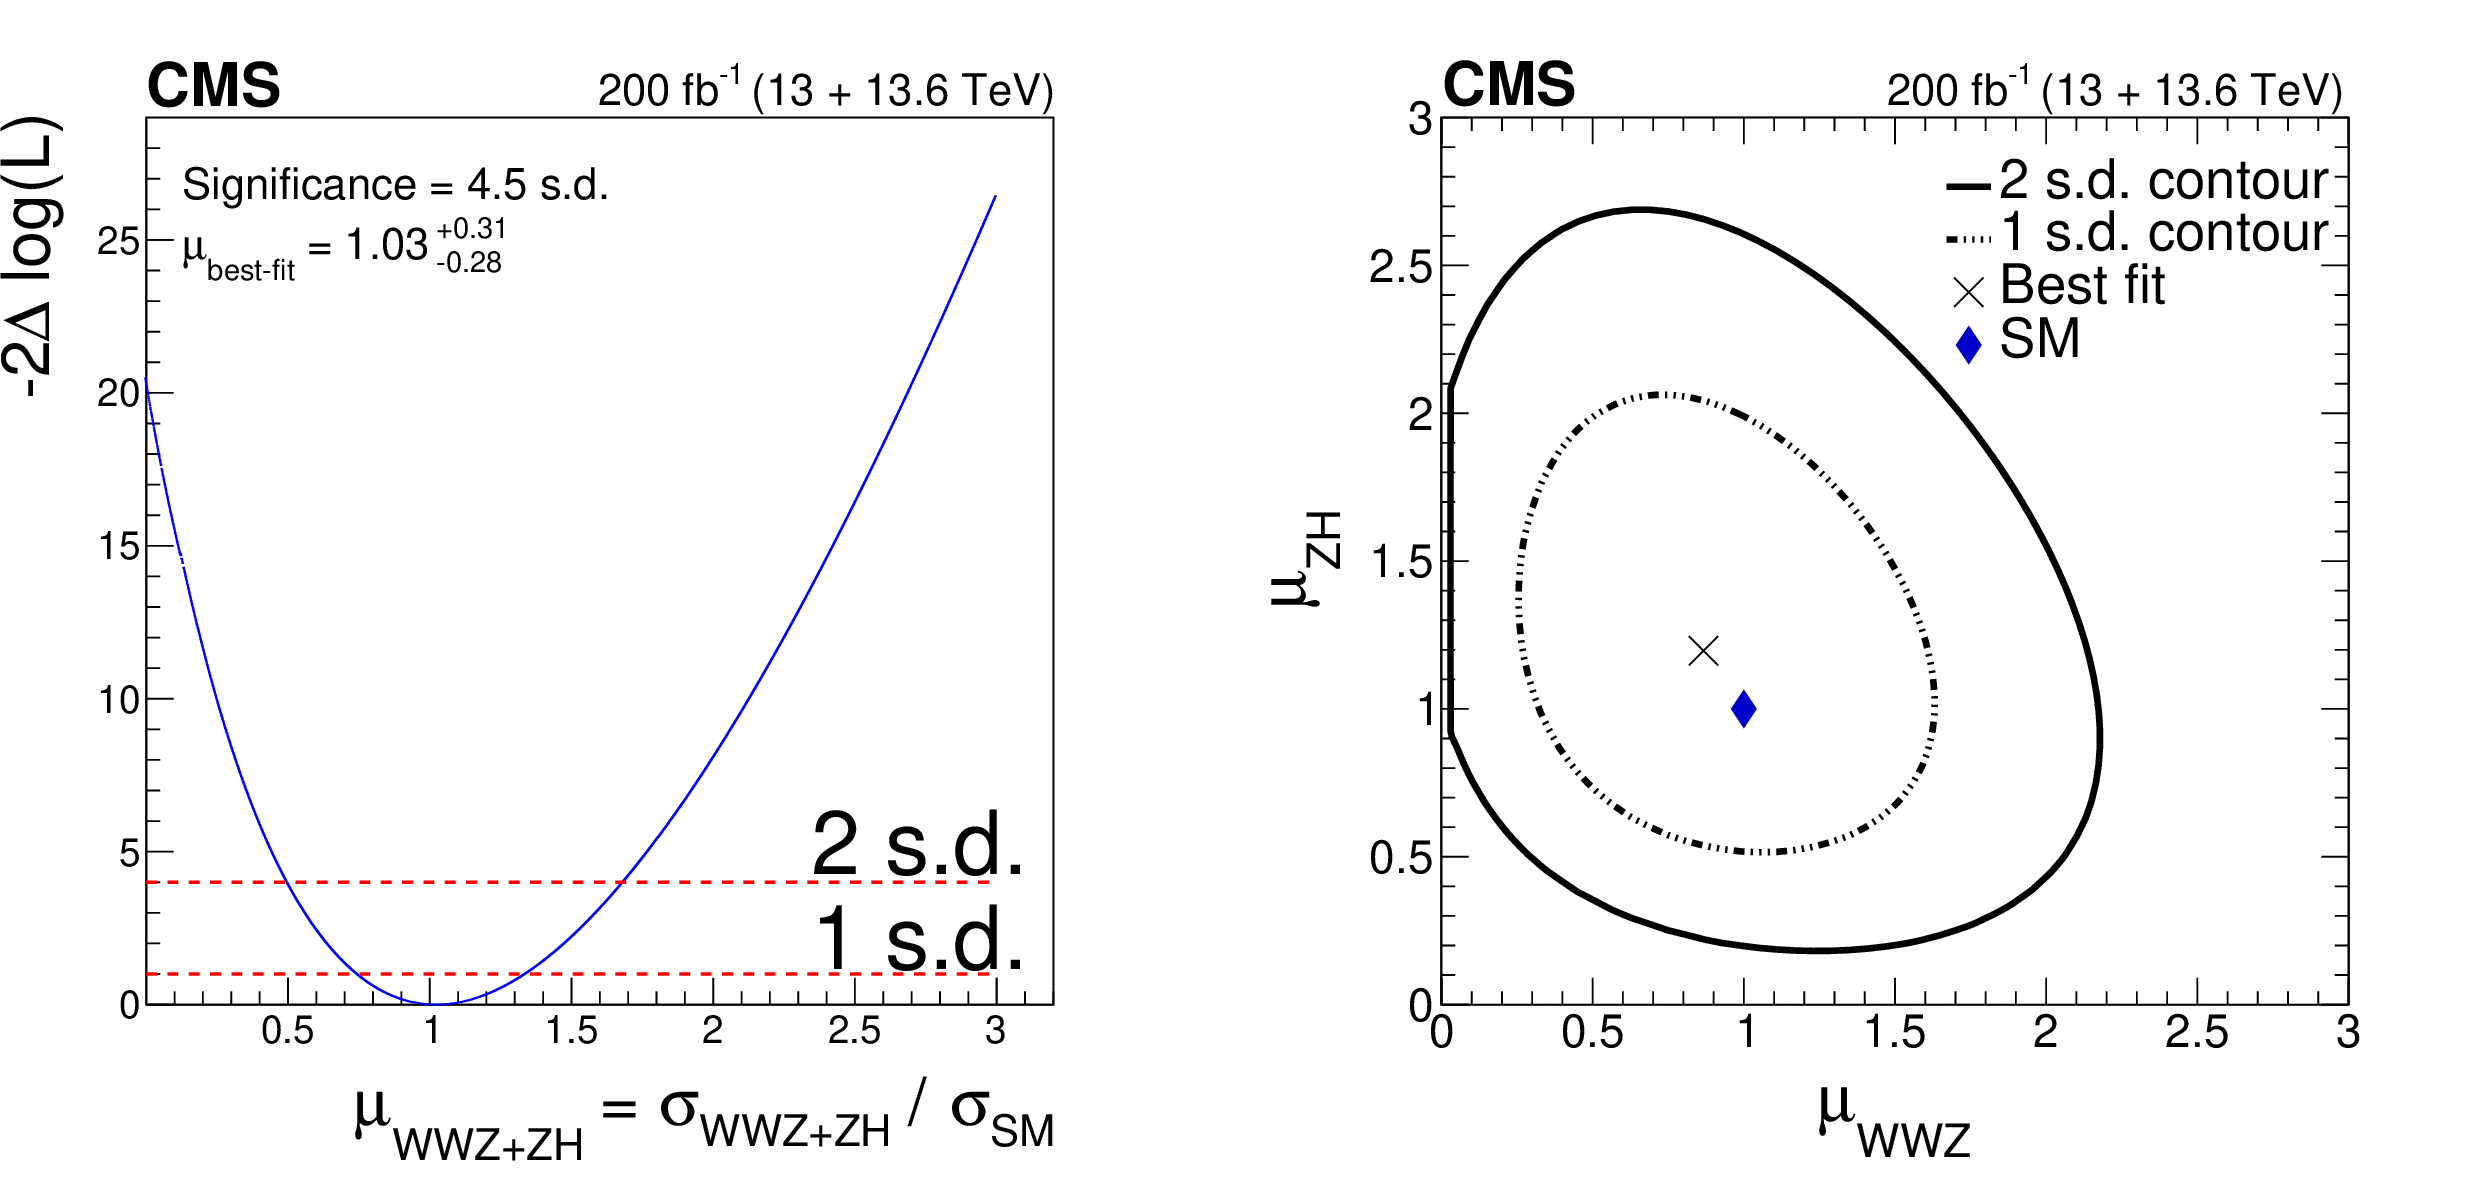
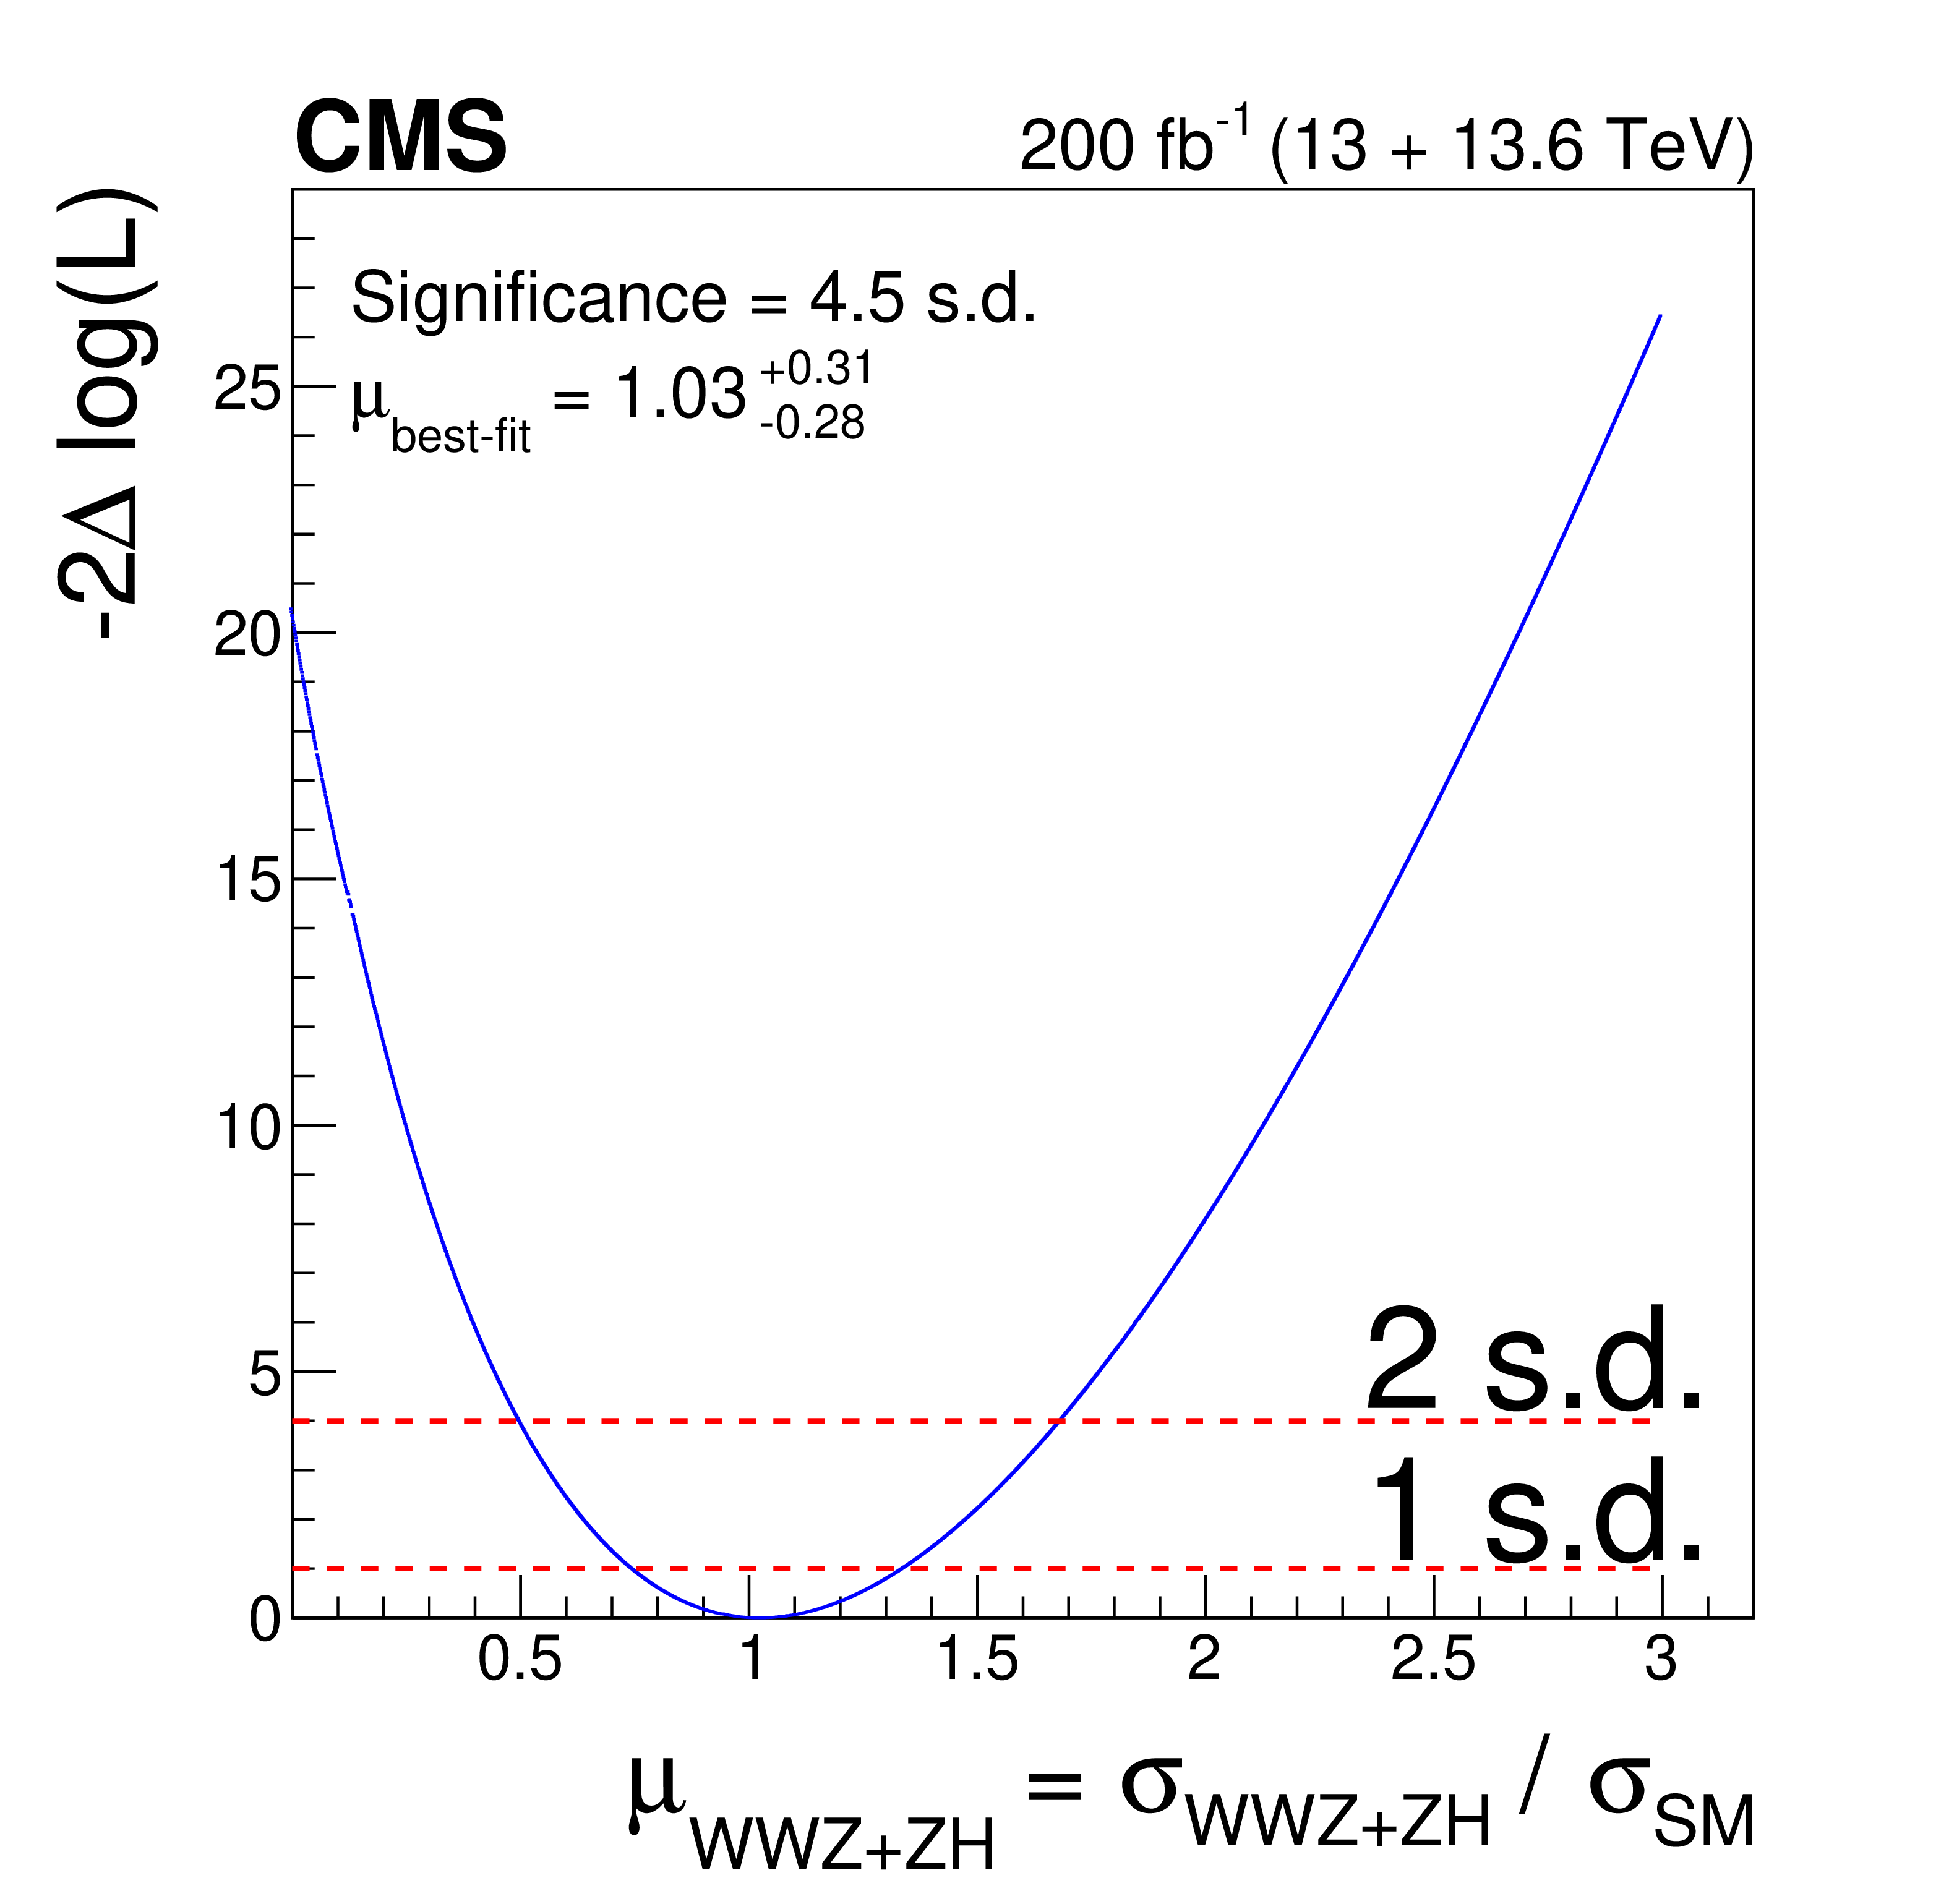
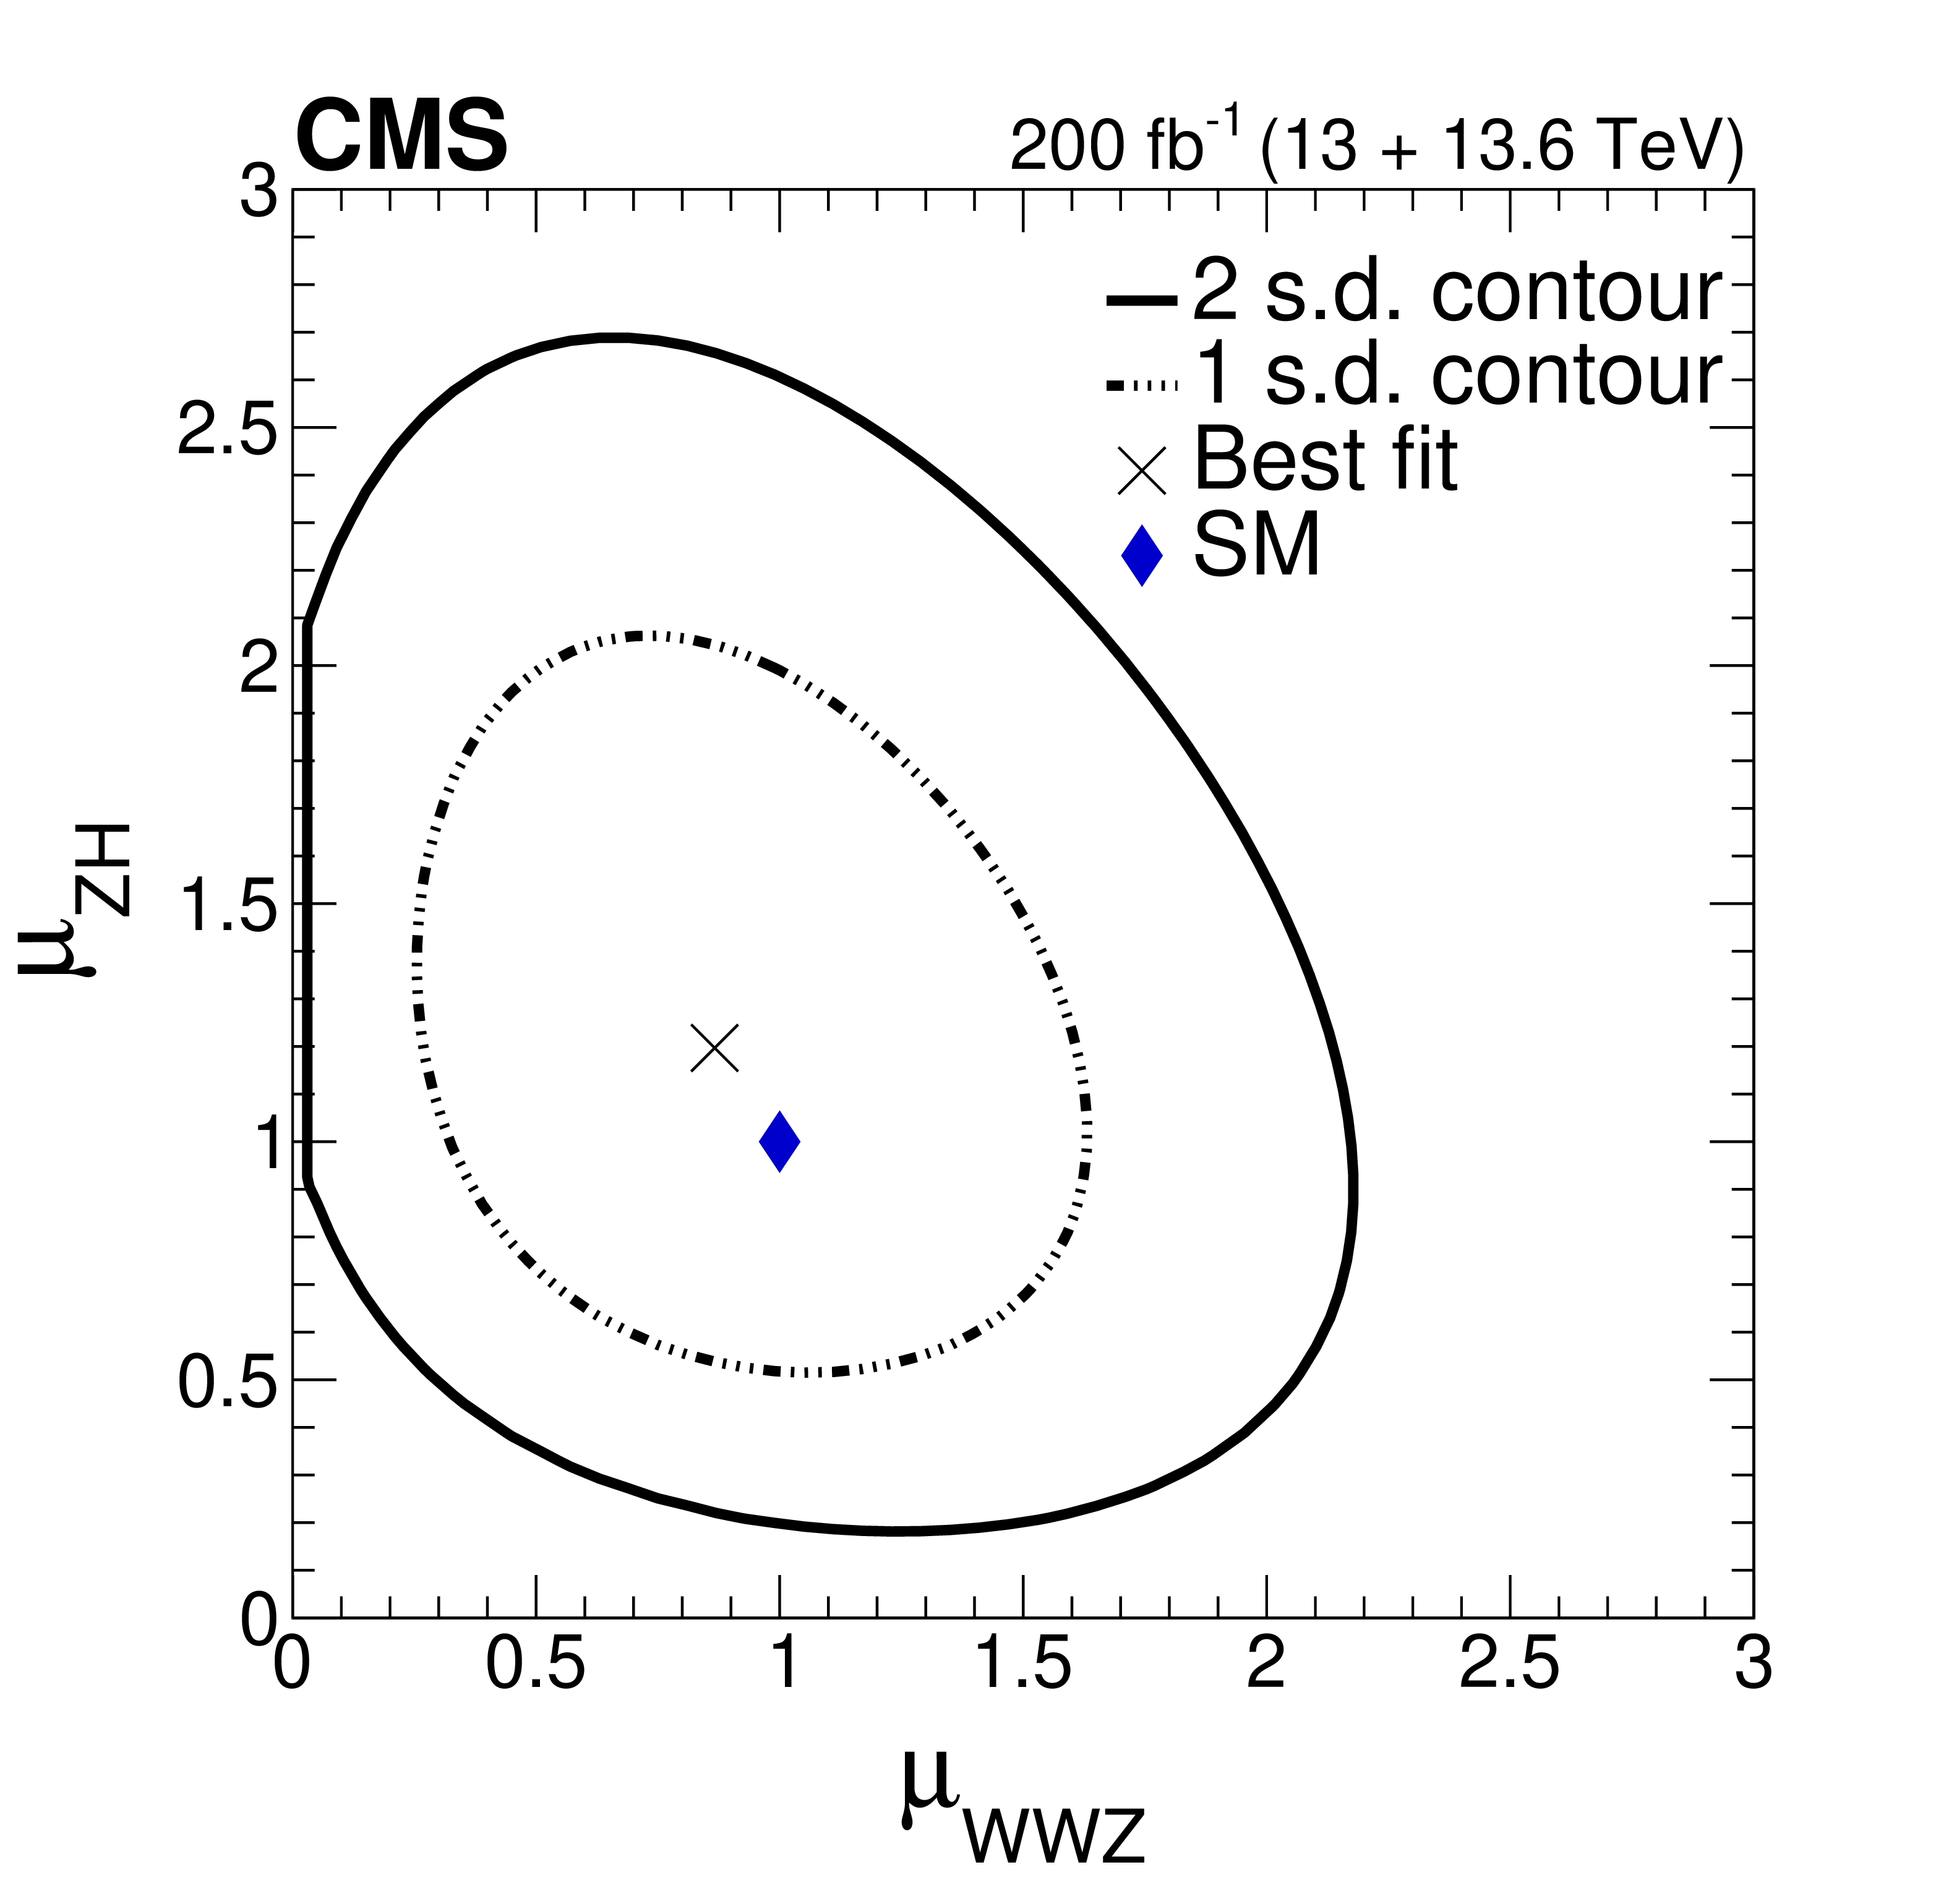
Figure 3:
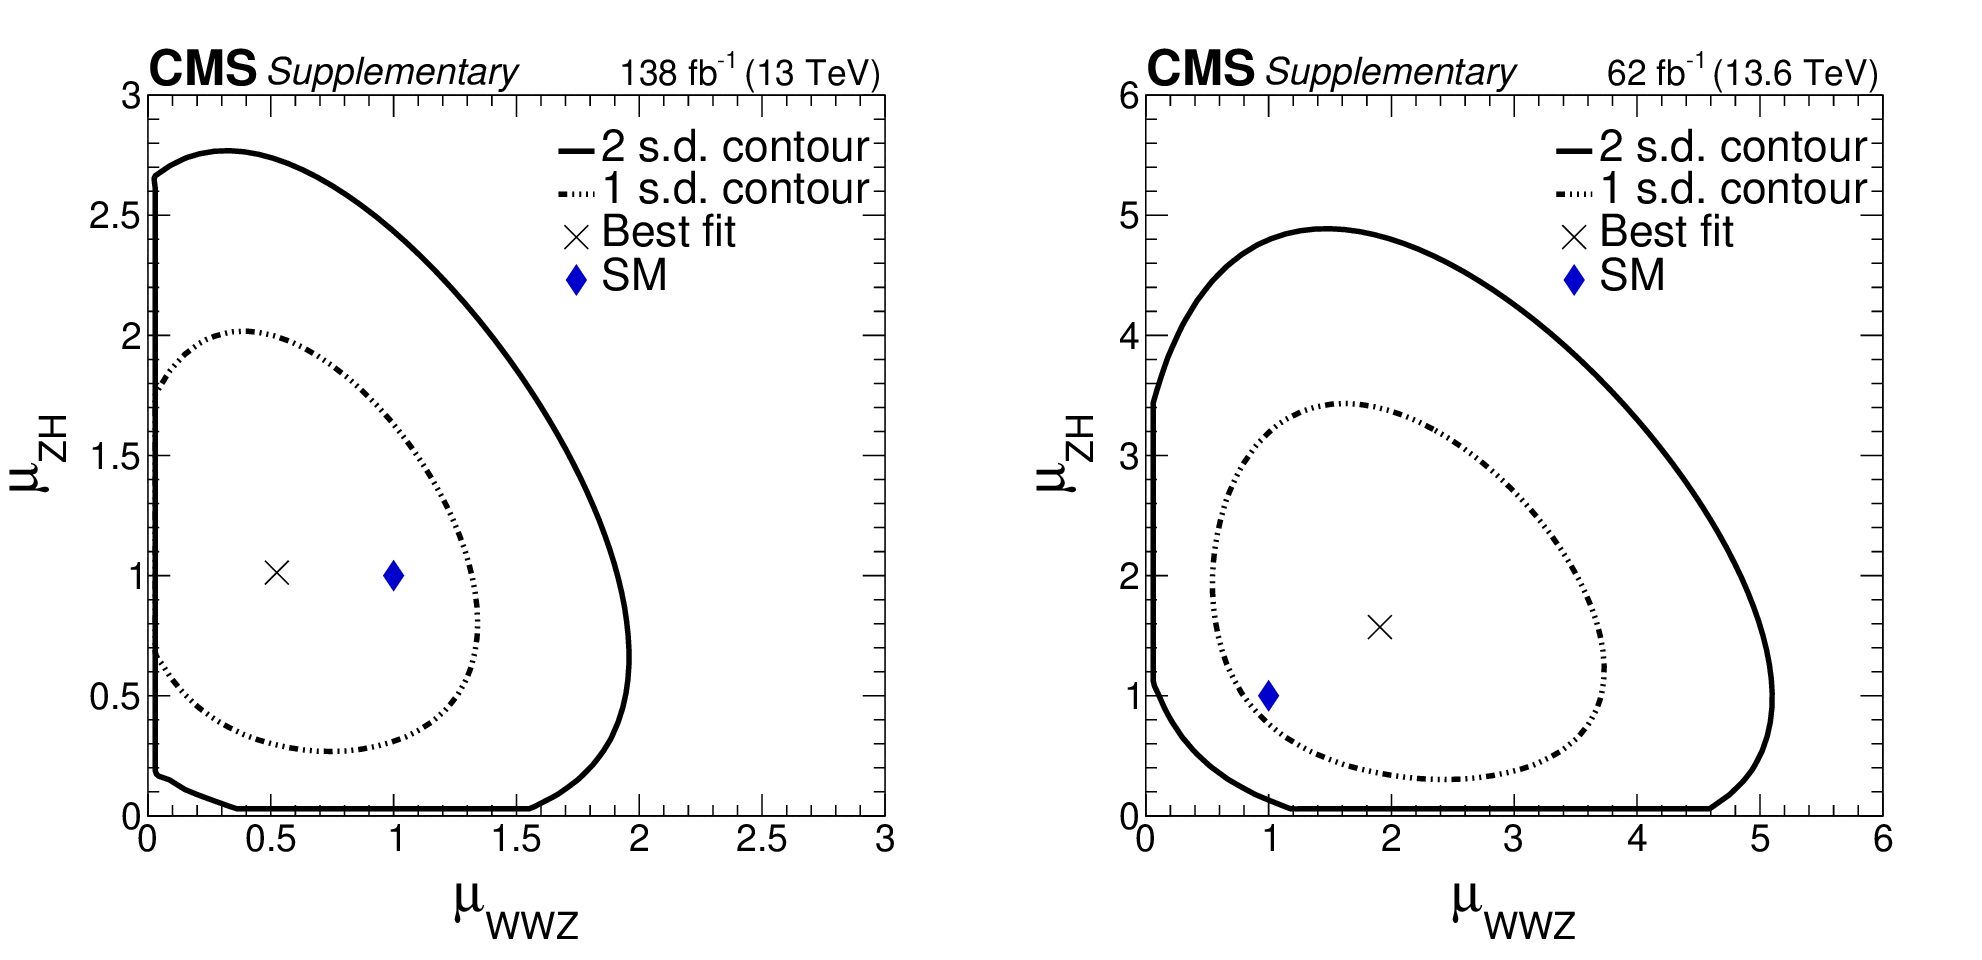
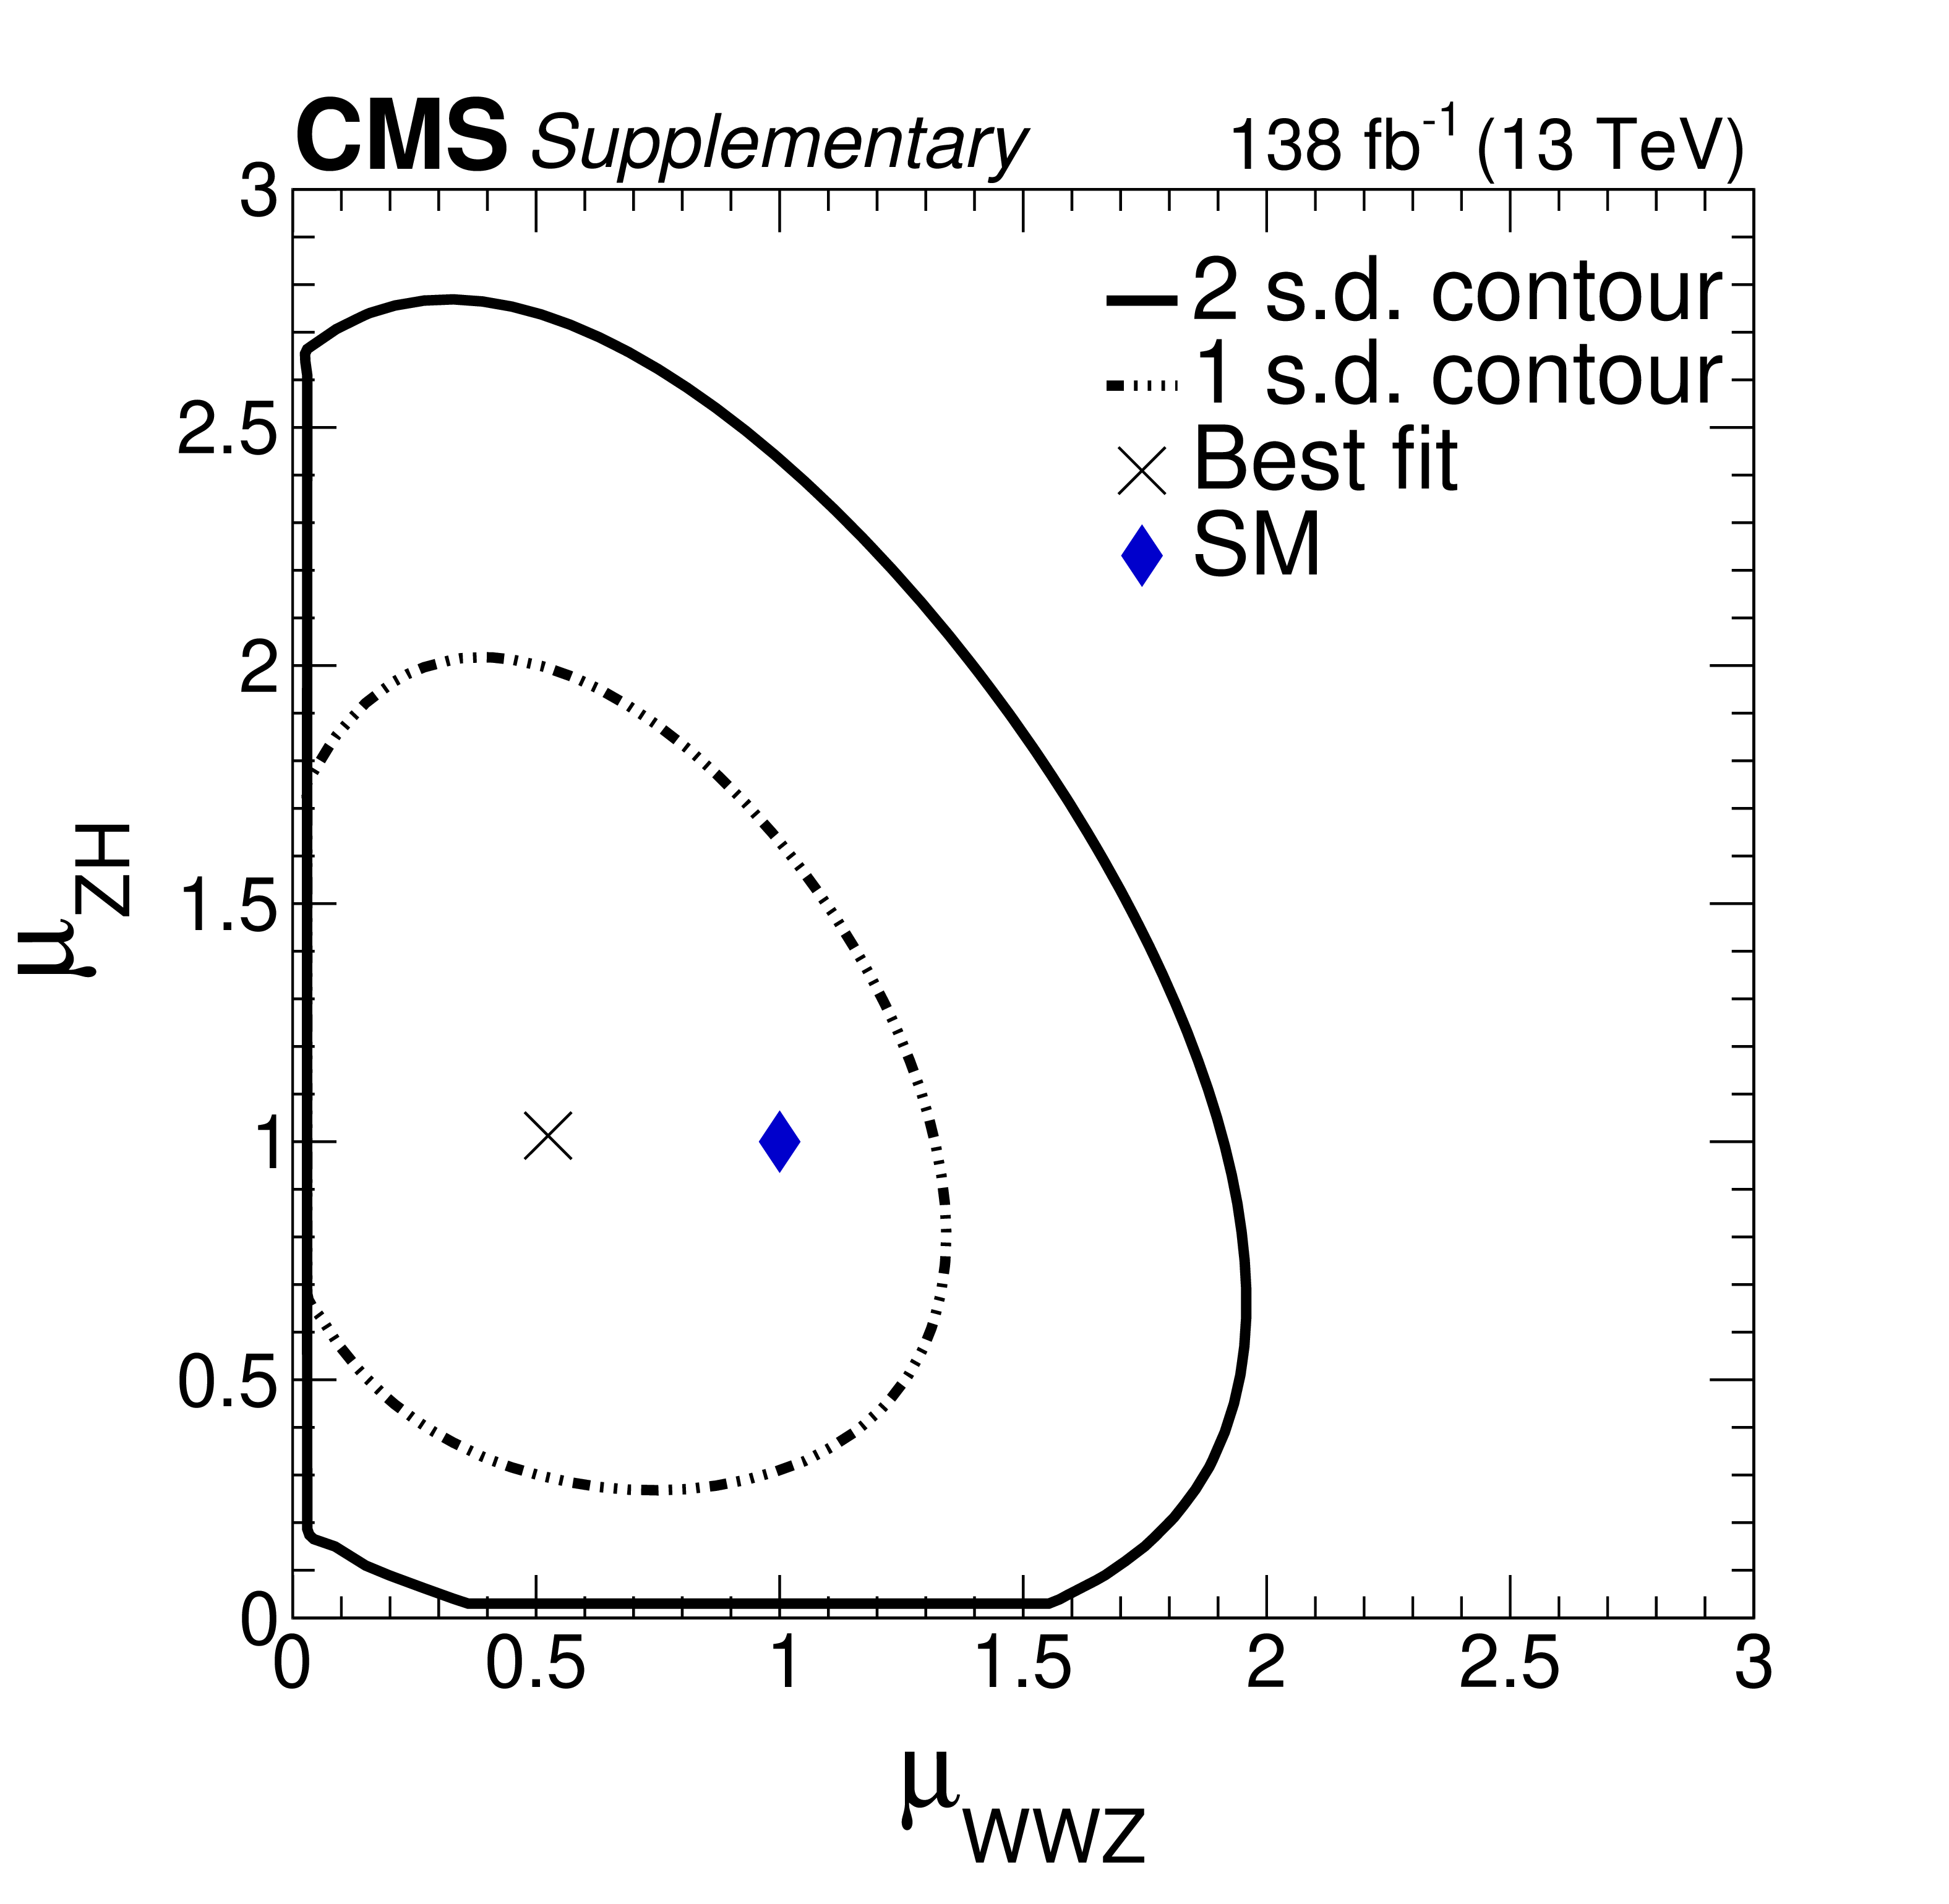
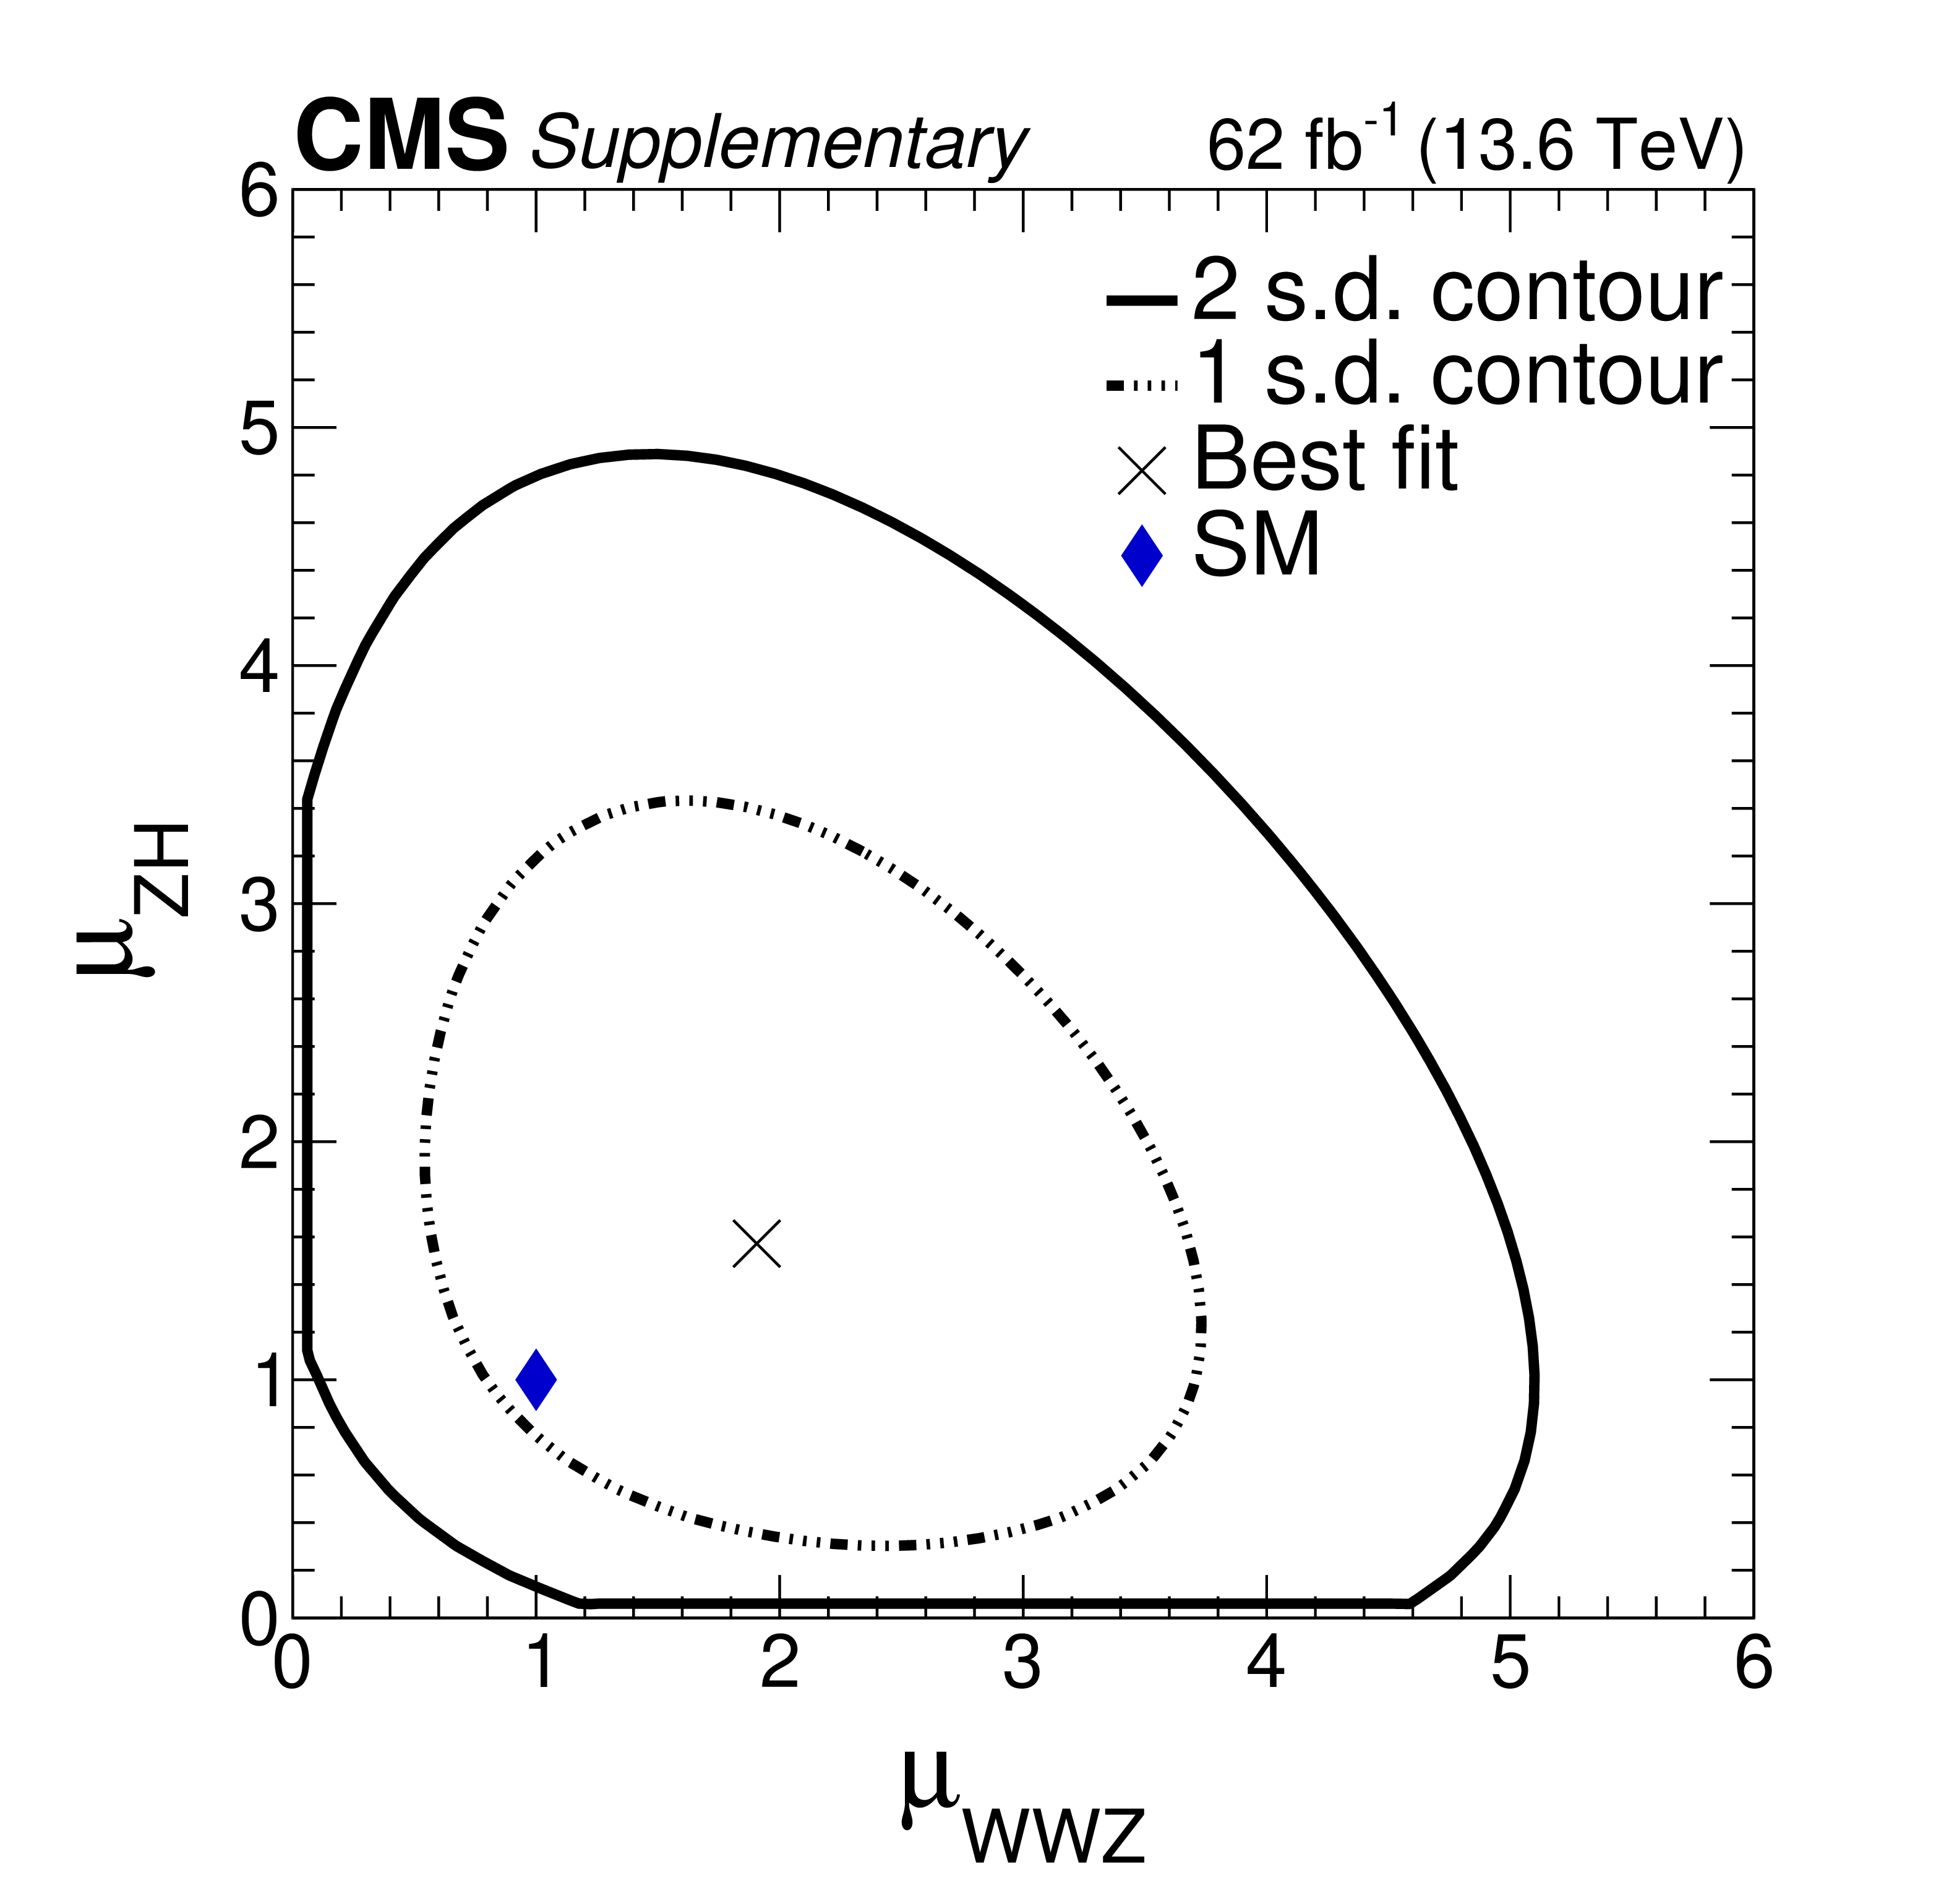
Likelihood scans for the combined \Run2 and \Run3 data sets. left: One-dimensional likelihood scan as a function of the inclusive $ \mathrm{W}\mathrm{W}\mathrm{Z} $ and ZH signal strength parameter ($ \mu_{\mathrm{W}\mathrm{W}\mathrm{Z}{+}\mathrm{Z}\mathrm{H}} $). right: Two-dimensional scan as a function of the individual $ \mathrm{W}\mathrm{W}\mathrm{Z} $ and ZH signal strength parameters. For the two-dimensional scan, the one and two standard deviation (s.d.) contours are indicated by the dotted and solid lines, respectively. The correlation coefficient is-0.23. In the signal strengths reported here, the uncertainty of the predicted cross section is not included. |
png pdf |
Figure 3-a:
Likelihood scans for the combined \Run2 and \Run3 data sets. left: One-dimensional likelihood scan as a function of the inclusive $ \mathrm{W}\mathrm{W}\mathrm{Z} $ and ZH signal strength parameter ($ \mu_{\mathrm{W}\mathrm{W}\mathrm{Z}{+}\mathrm{Z}\mathrm{H}} $). right: Two-dimensional scan as a function of the individual $ \mathrm{W}\mathrm{W}\mathrm{Z} $ and ZH signal strength parameters. For the two-dimensional scan, the one and two standard deviation (s.d.) contours are indicated by the dotted and solid lines, respectively. The correlation coefficient is-0.23. In the signal strengths reported here, the uncertainty of the predicted cross section is not included. |
png pdf |
Figure 3-b:
Likelihood scans for the combined \Run2 and \Run3 data sets. left: One-dimensional likelihood scan as a function of the inclusive $ \mathrm{W}\mathrm{W}\mathrm{Z} $ and ZH signal strength parameter ($ \mu_{\mathrm{W}\mathrm{W}\mathrm{Z}{+}\mathrm{Z}\mathrm{H}} $). right: Two-dimensional scan as a function of the individual $ \mathrm{W}\mathrm{W}\mathrm{Z} $ and ZH signal strength parameters. For the two-dimensional scan, the one and two standard deviation (s.d.) contours are indicated by the dotted and solid lines, respectively. The correlation coefficient is-0.23. In the signal strengths reported here, the uncertainty of the predicted cross section is not included. |

png pdf |
Figure 4:
Measured values of the $ \mathrm{W}\mathrm{W}\mathrm{Z} $, ZH, and inclusive signal strength parameters. Results are shown separately by run period as well as after combining the two data sets. The red error bars on the signal strengths represent the statistical uncertainty, and the black error bars represent the total uncertainty. In the signal strengths reported here, the uncertainty of the cross section prediction is not included. |
| Tables | |
png pdf |
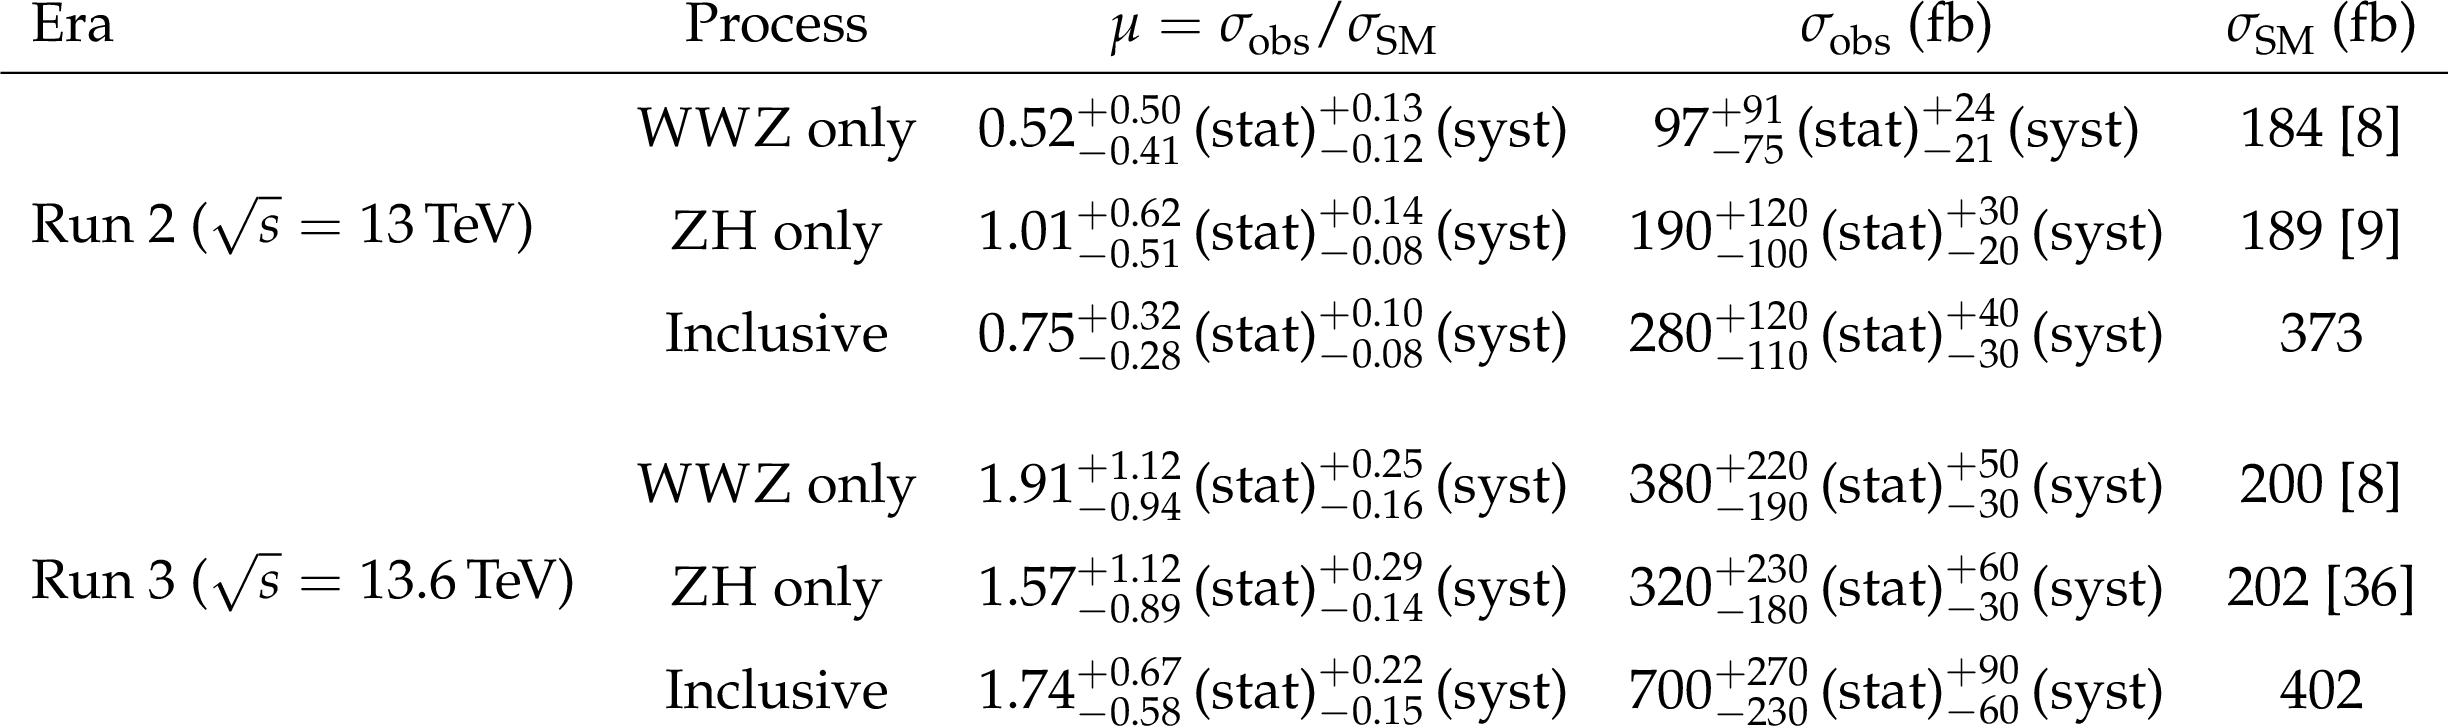
Table 1:
Measured signal strengths and cross sections for the $ \mathrm{W}\mathrm{W}\mathrm{Z} $, ZH (with $ \mathrm{H}\to\mathrm{W}\mathrm{W} $) and inclusive ($ \mathrm{W}\mathrm{W}\mathrm{Z}{+}\mathrm{Z}\mathrm{H} $) processes at $ \sqrt{s}= $ 13 and 13.6 TeV. For the ZH process, the cross section times the $ \mathrm{H}\to\mathrm{W}\mathrm{W} $ branching fraction [49] is reported. The last column shows the SM expectation; the $ \mathrm{W}\mathrm{W}\mathrm{Z} $ cross sections are calculated to NLO precision while the ZH cross sections are calculated at NNLO. In the signal strengths reported here, the uncertainty of the predicted cross section is not included. |
png pdf |
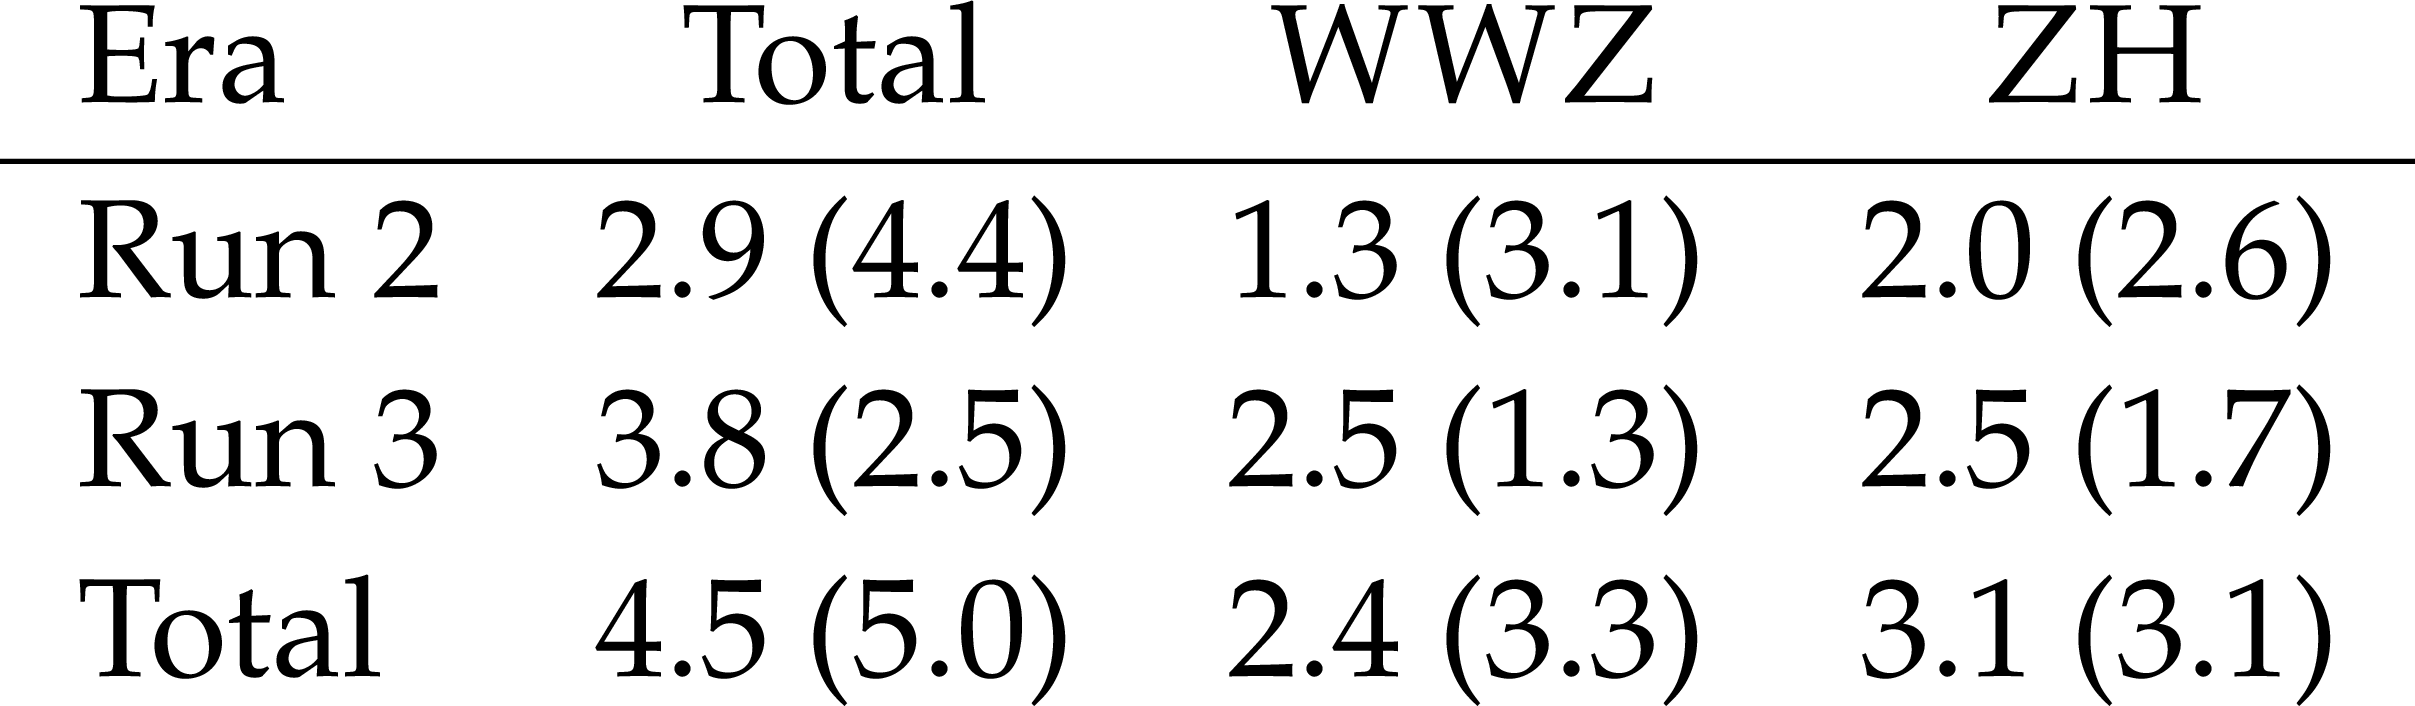
Table 2:
Observed (expected) significance of the signal strength in units of standard deviations. The $ \mathrm{W}\mathrm{W}\mathrm{Z} $-only and ZH-only values are obtained by profiling the other signal process, together with all other nuisances. |
| Summary |
| In summary, in this Letter we have presented a measurement of the $ \mathrm{W}\mathrm{W}\mathrm{Z} $ production cross section in proton-proton collisions in the four charged lepton (e, $ \mu $) final state with a data set corresponding to an integrated luminosity of 200 fb$ ^{-1} $ collected by the CMS Collaboration at center-of-mass energies of 13 and 13.6 TeV. The cross section relative to the standard model prediction is measured to be 1.03 $ ^{+0.31}_{-0.28} $, representing the most precise measurement of this process to date. The result also provides the first evidence for a triboson production process at 13.6 TeV. Additionally, the nonresonant and ZH (with the Higgs boson H decaying to W bosons) contributions are studied simultaneously for the first time. Within the current uncertainties, our results are in agreement with standard model predictions. |
| Additional Figures | |
png pdf |
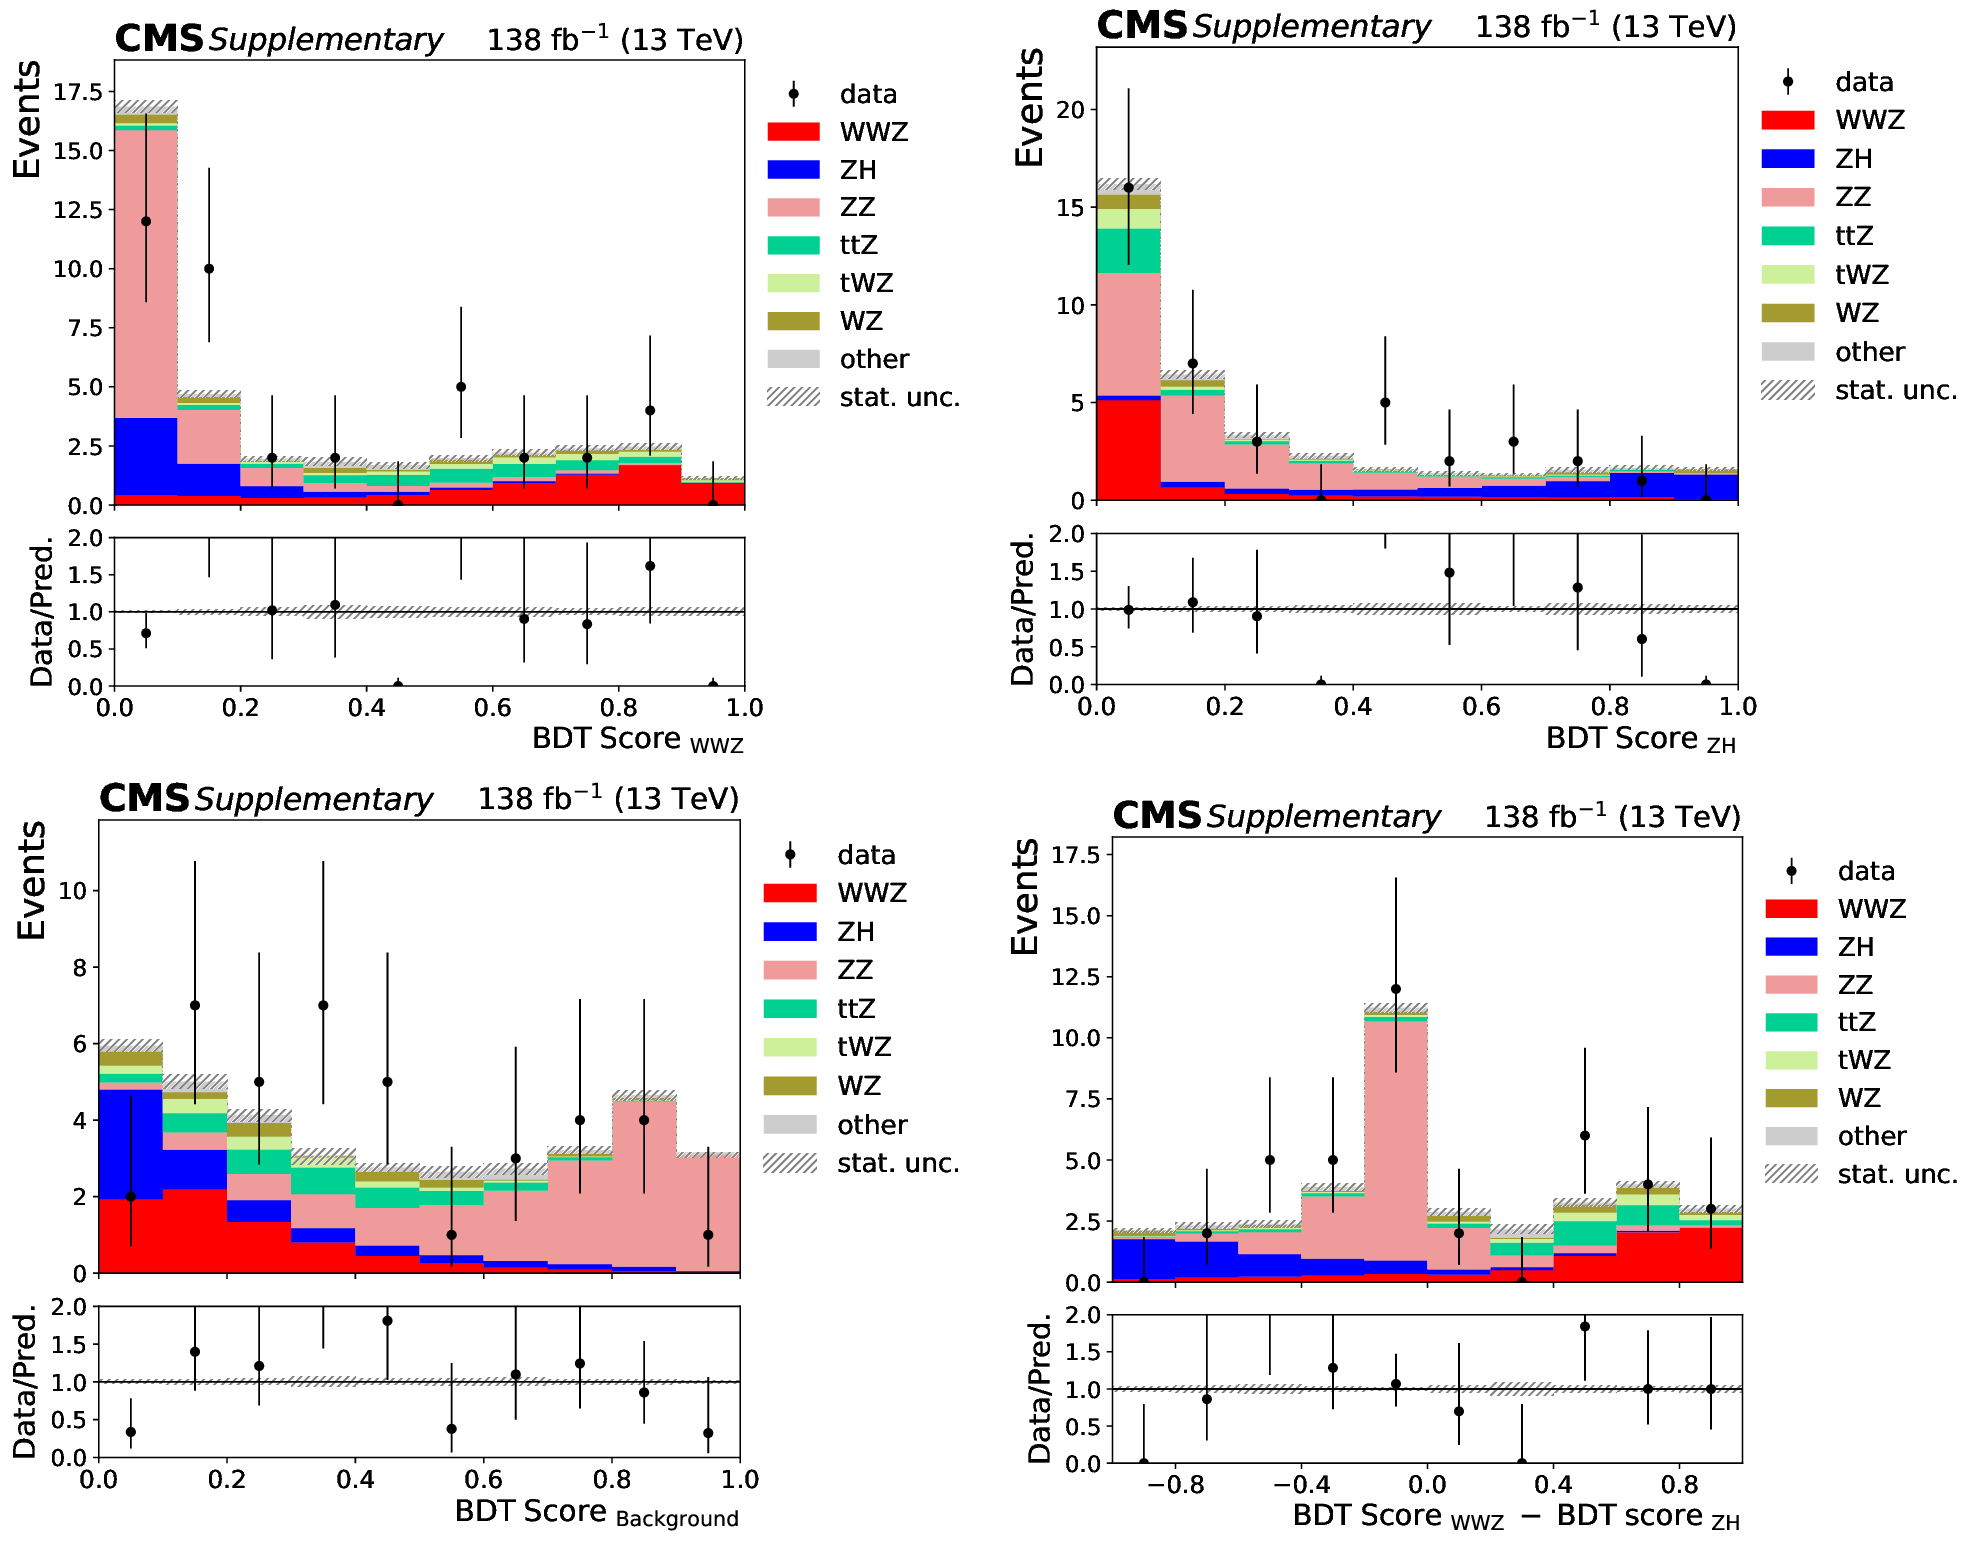
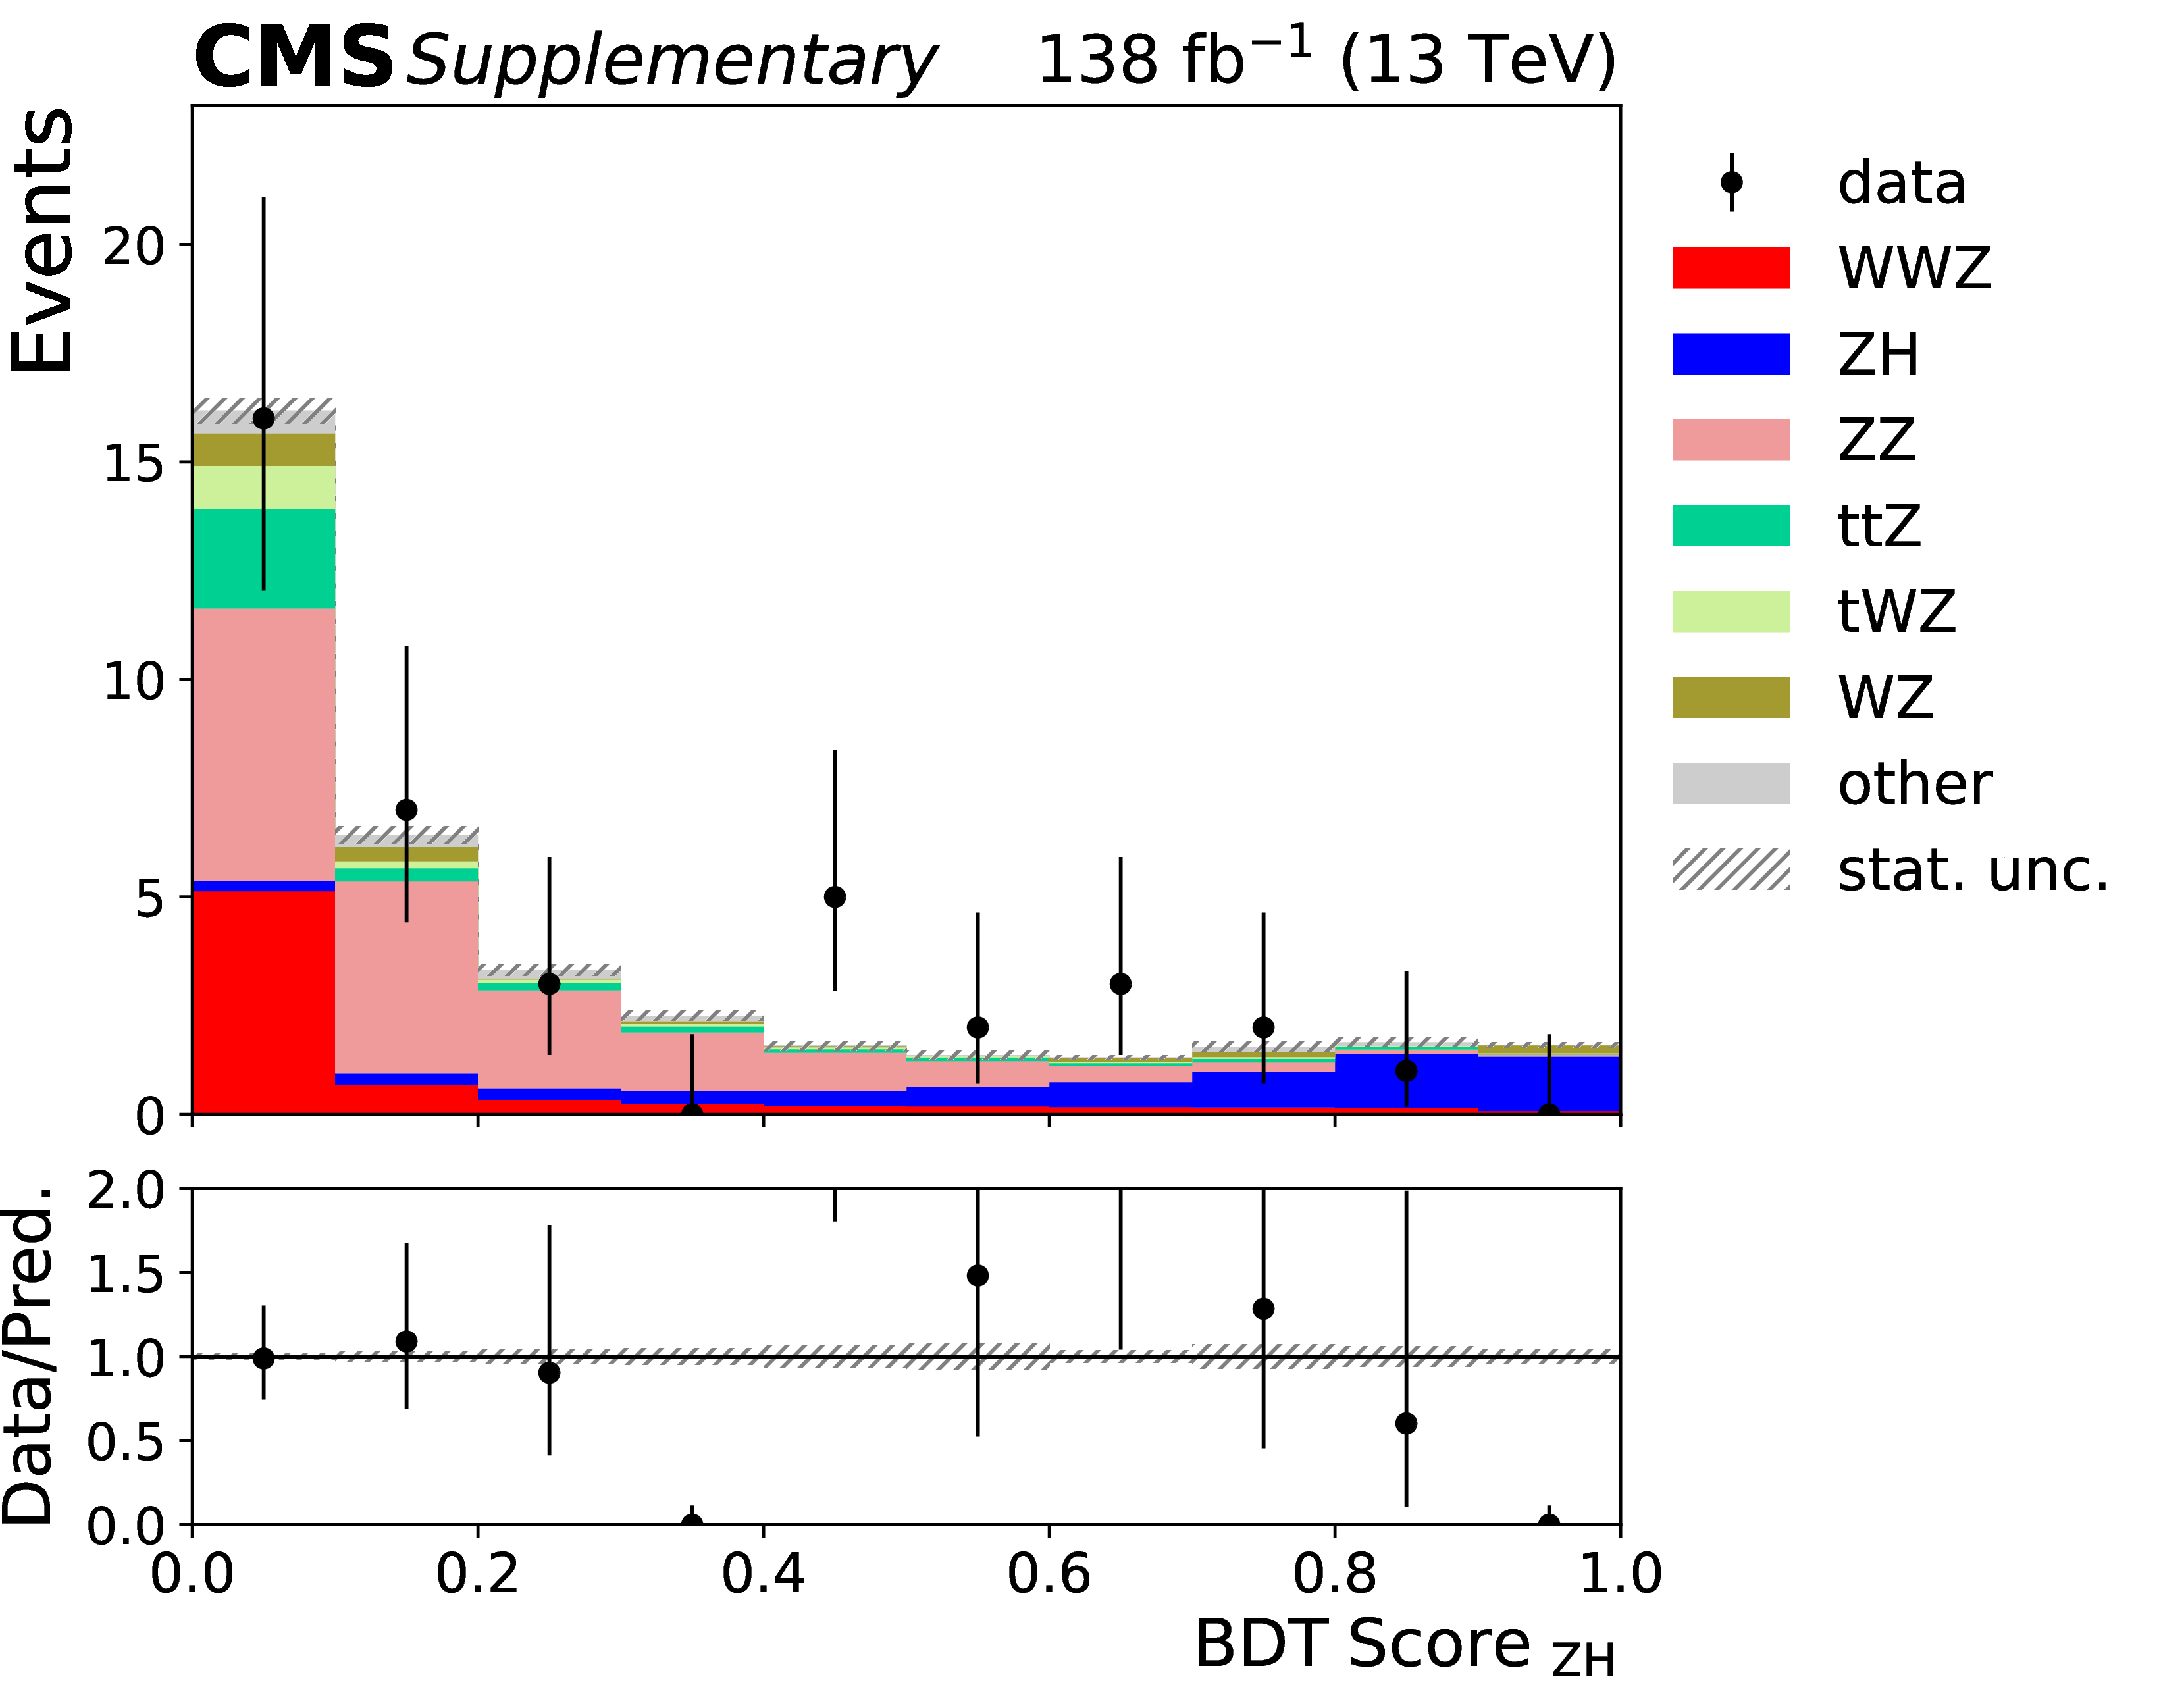
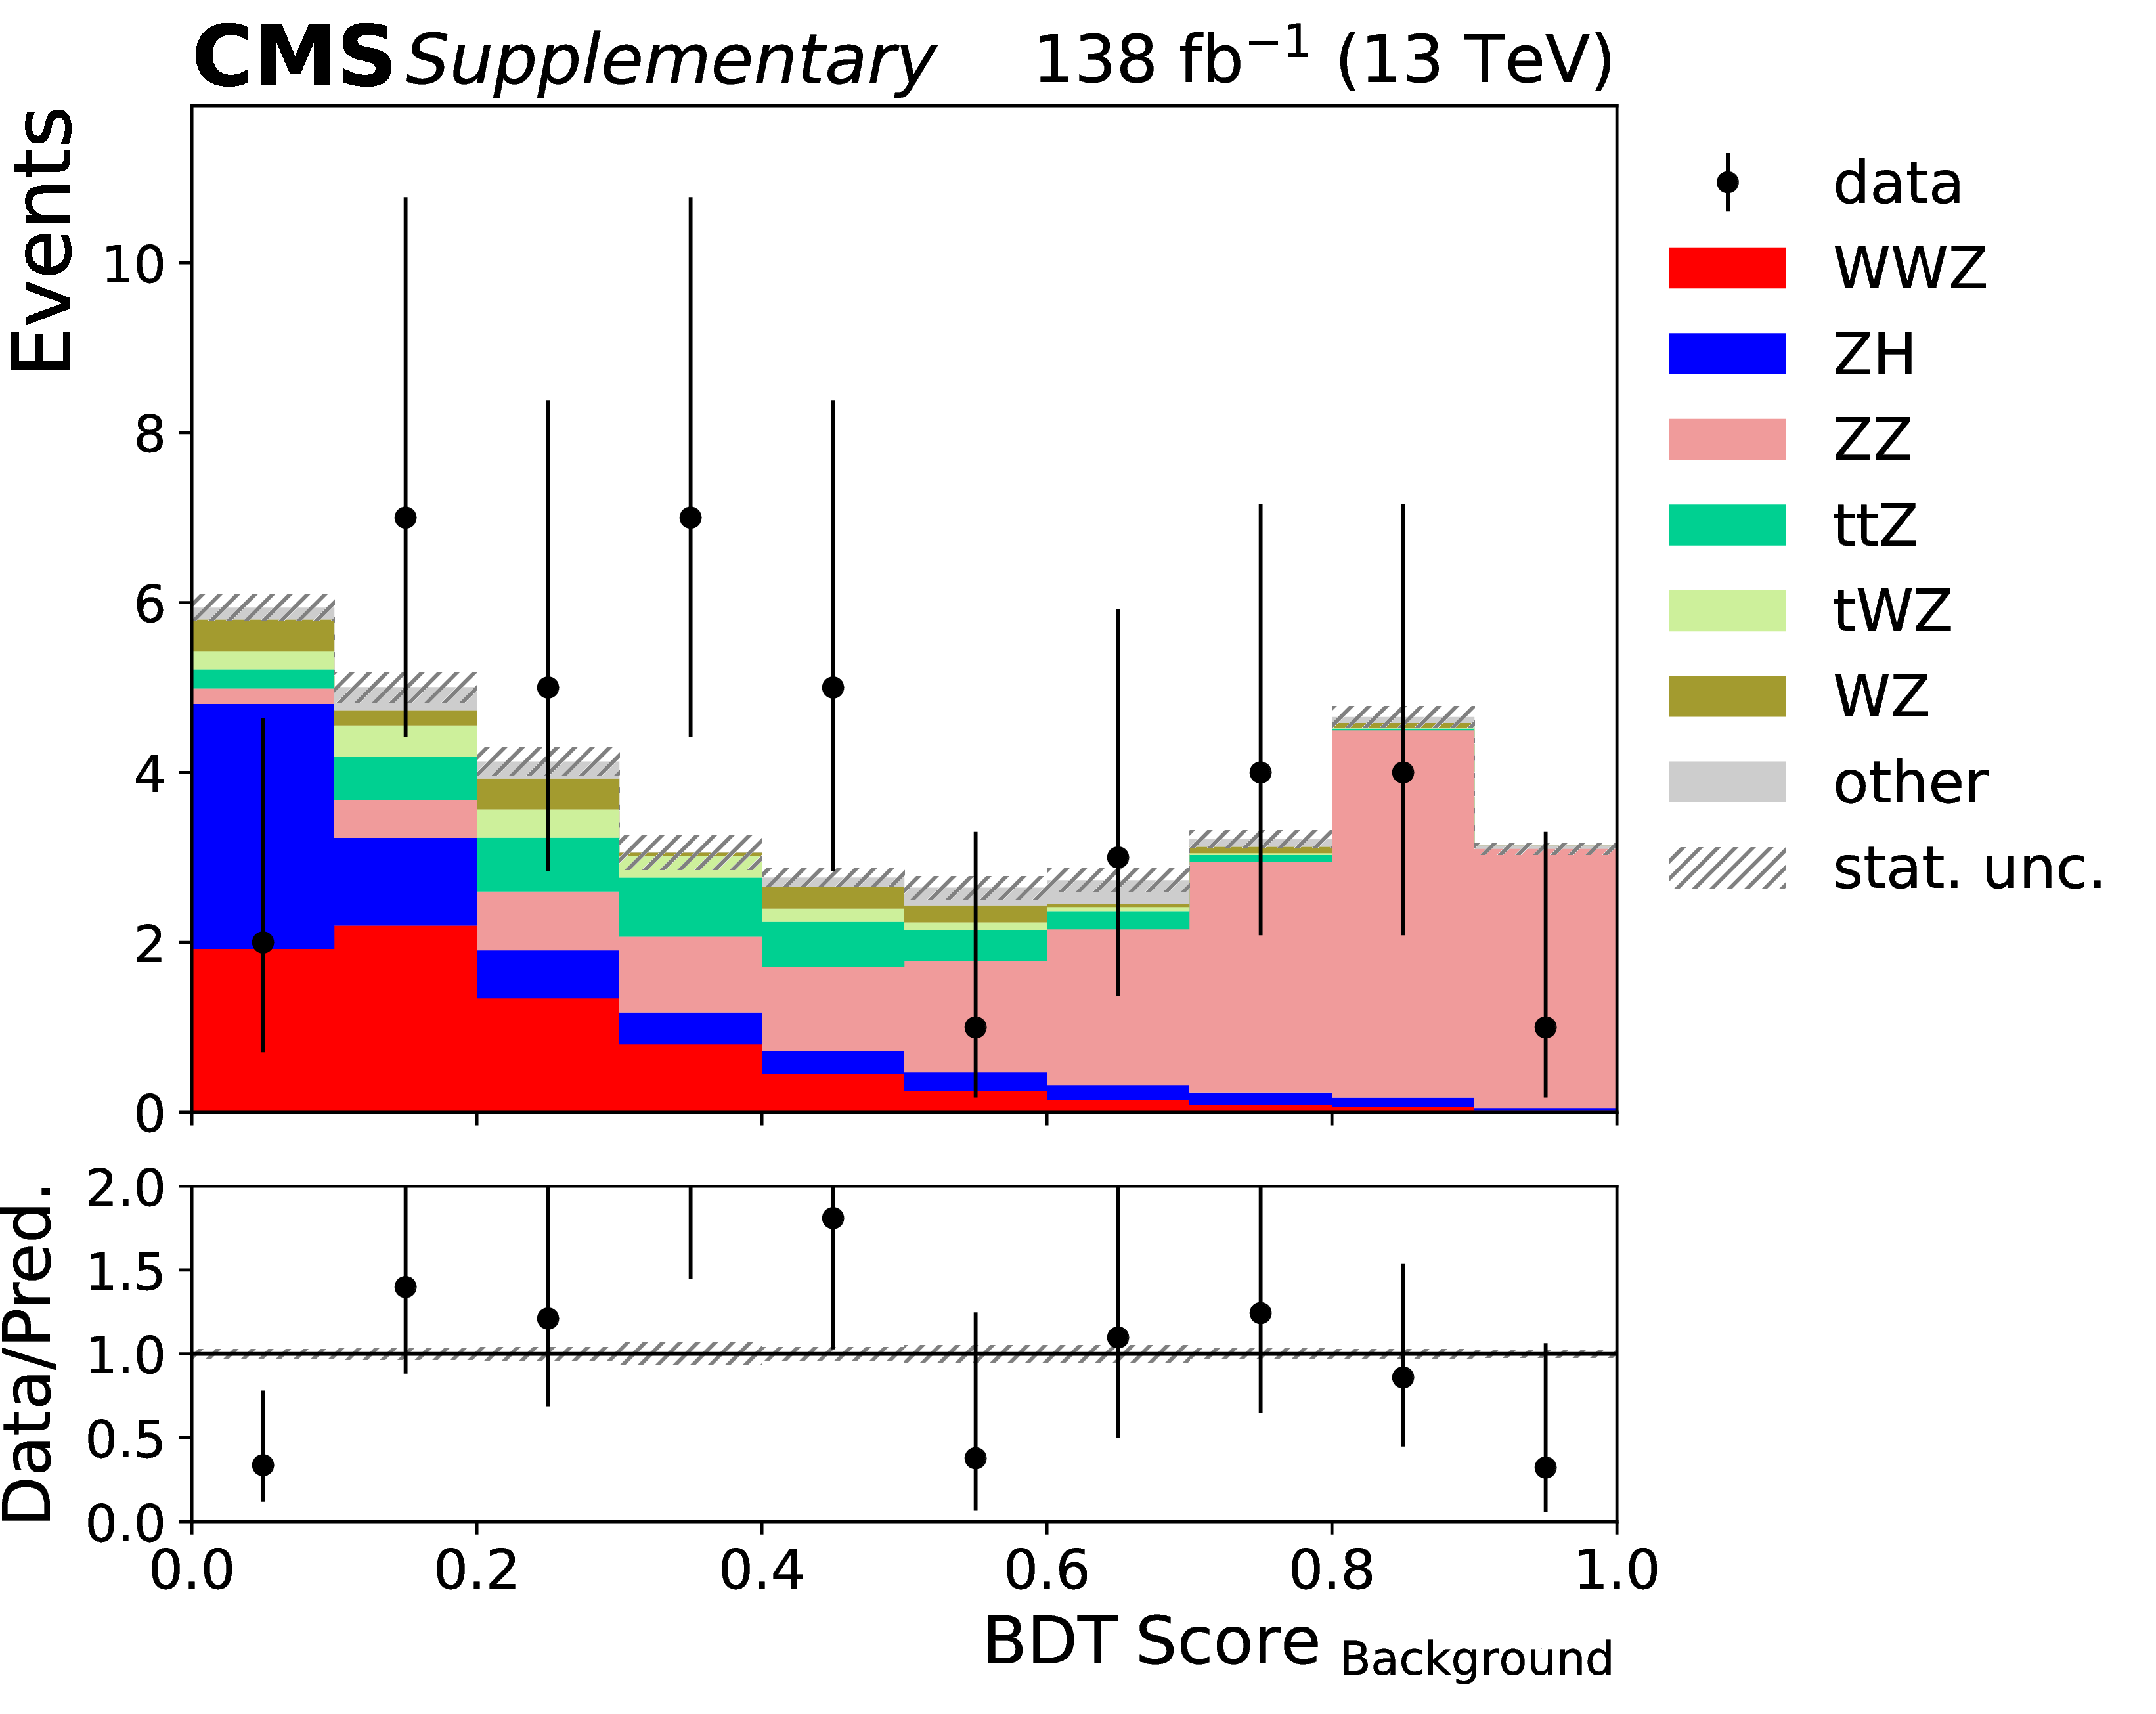
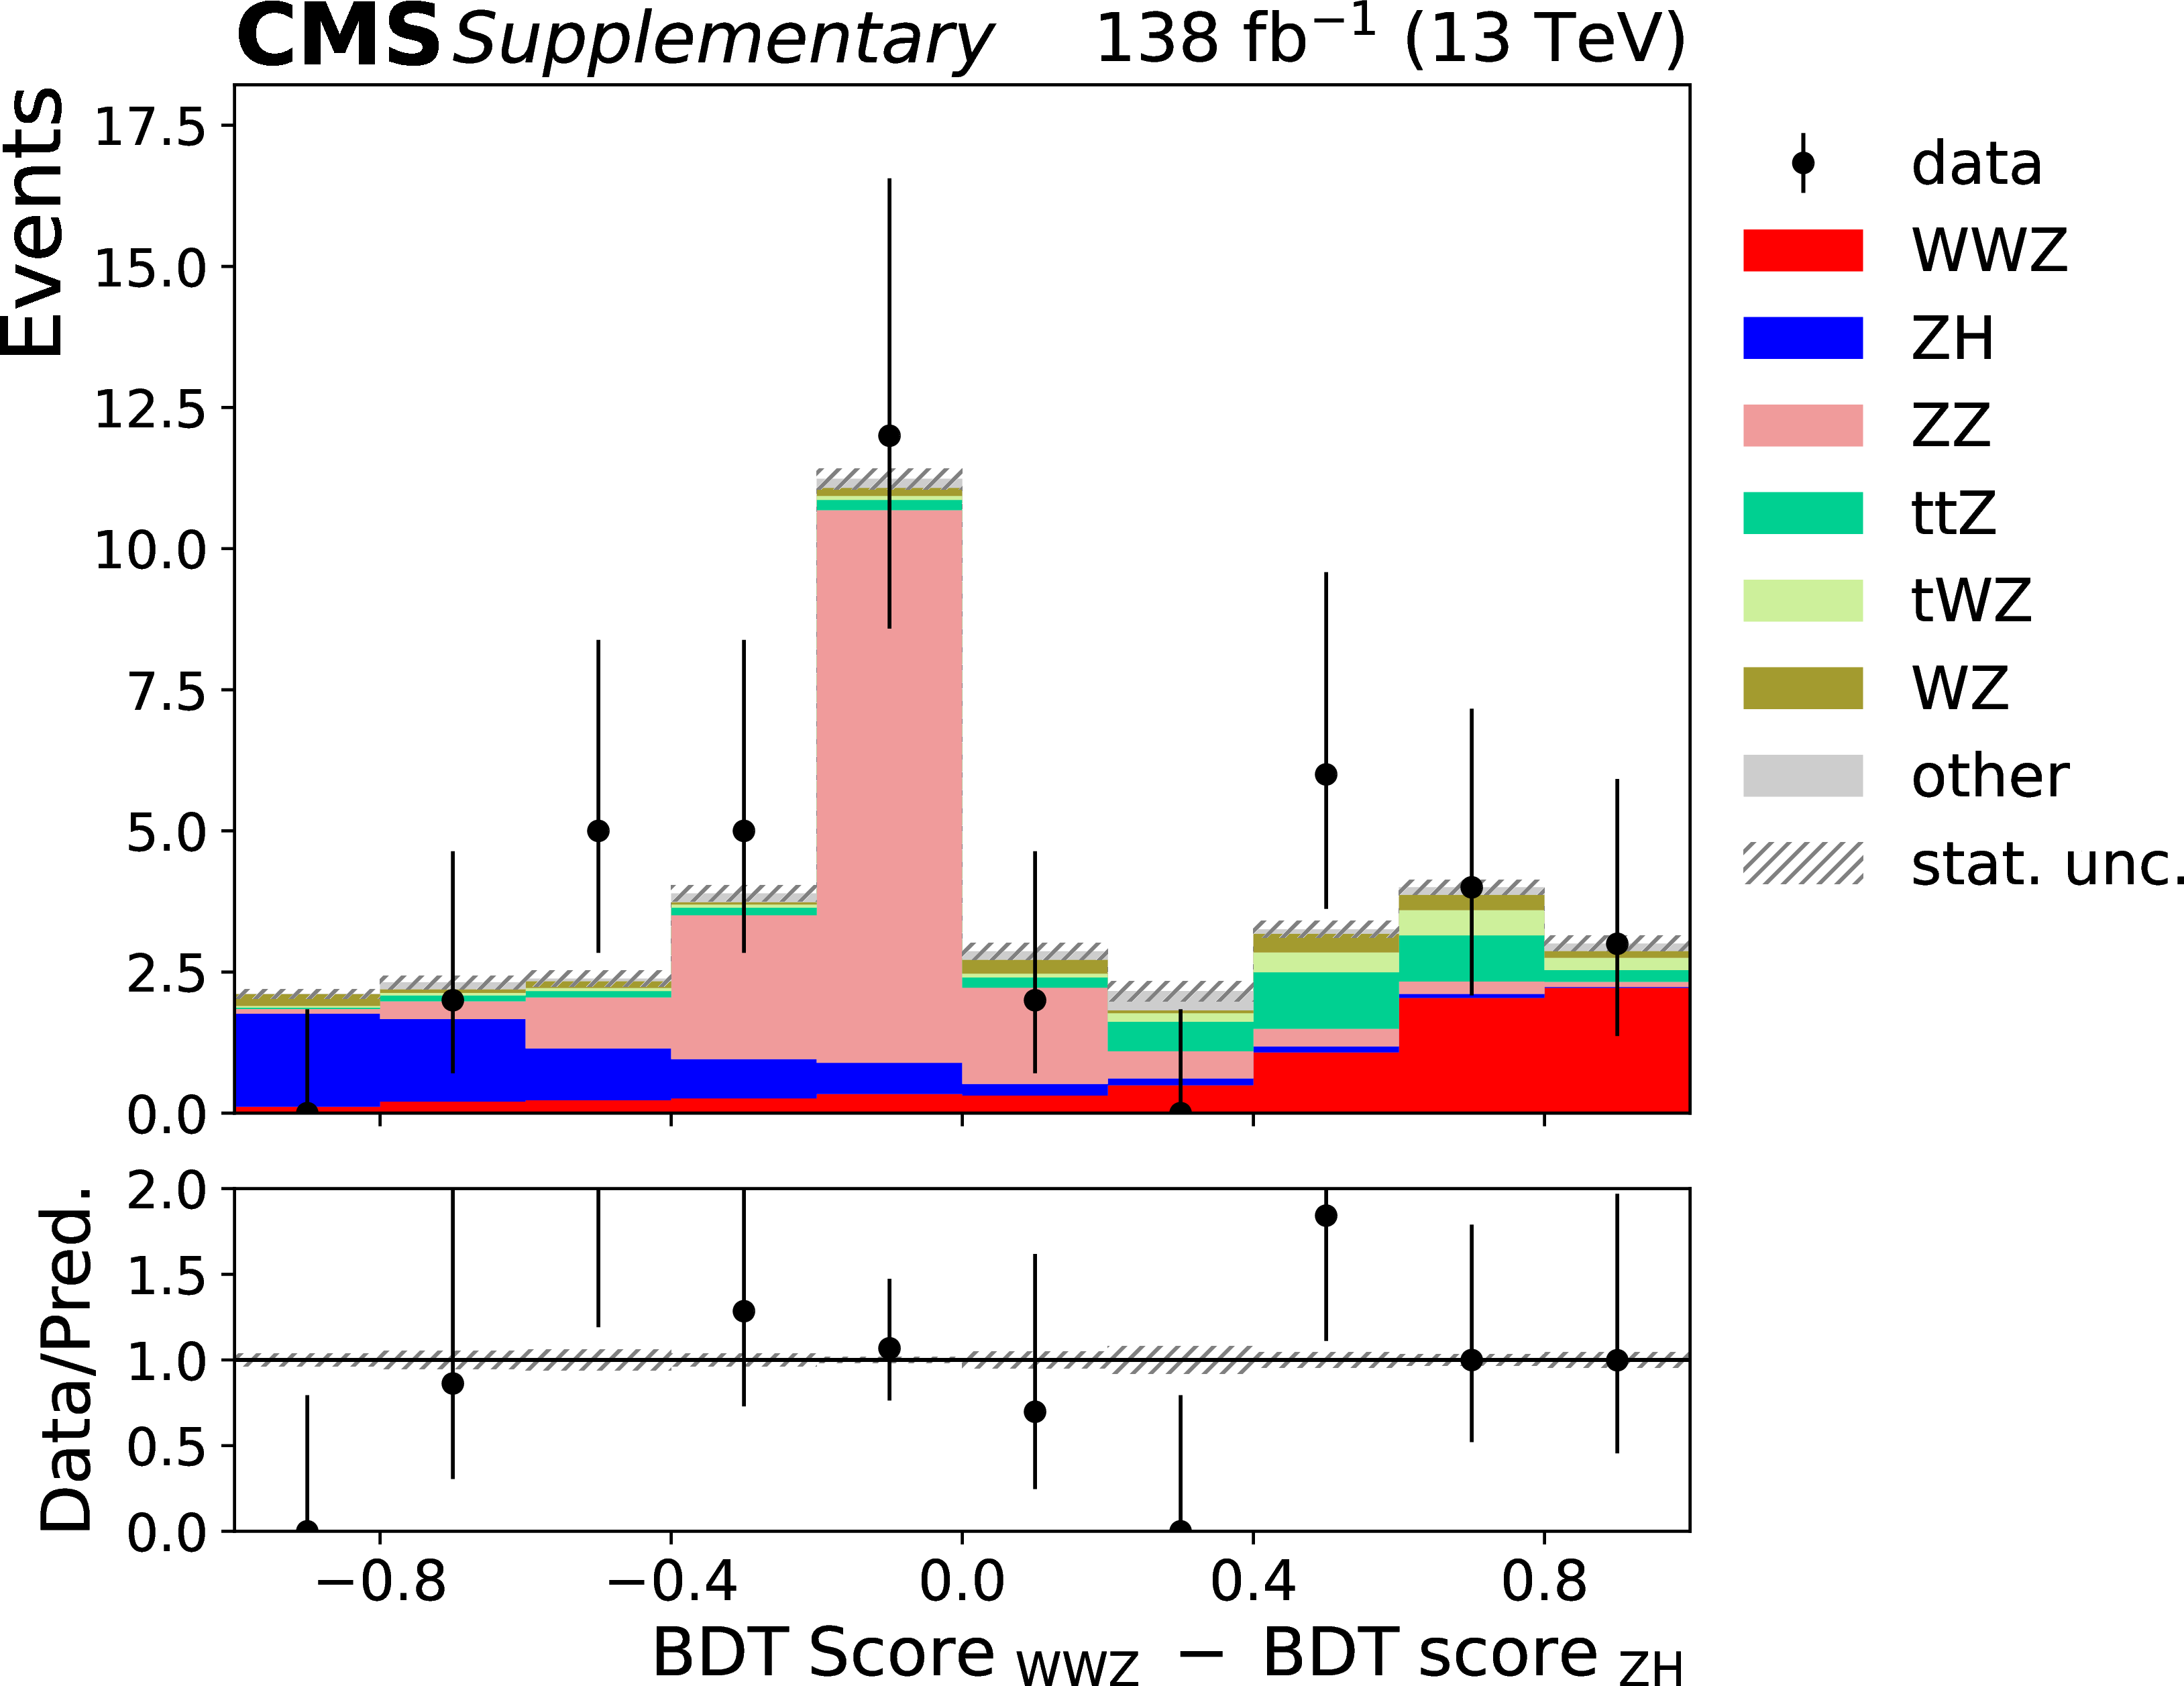
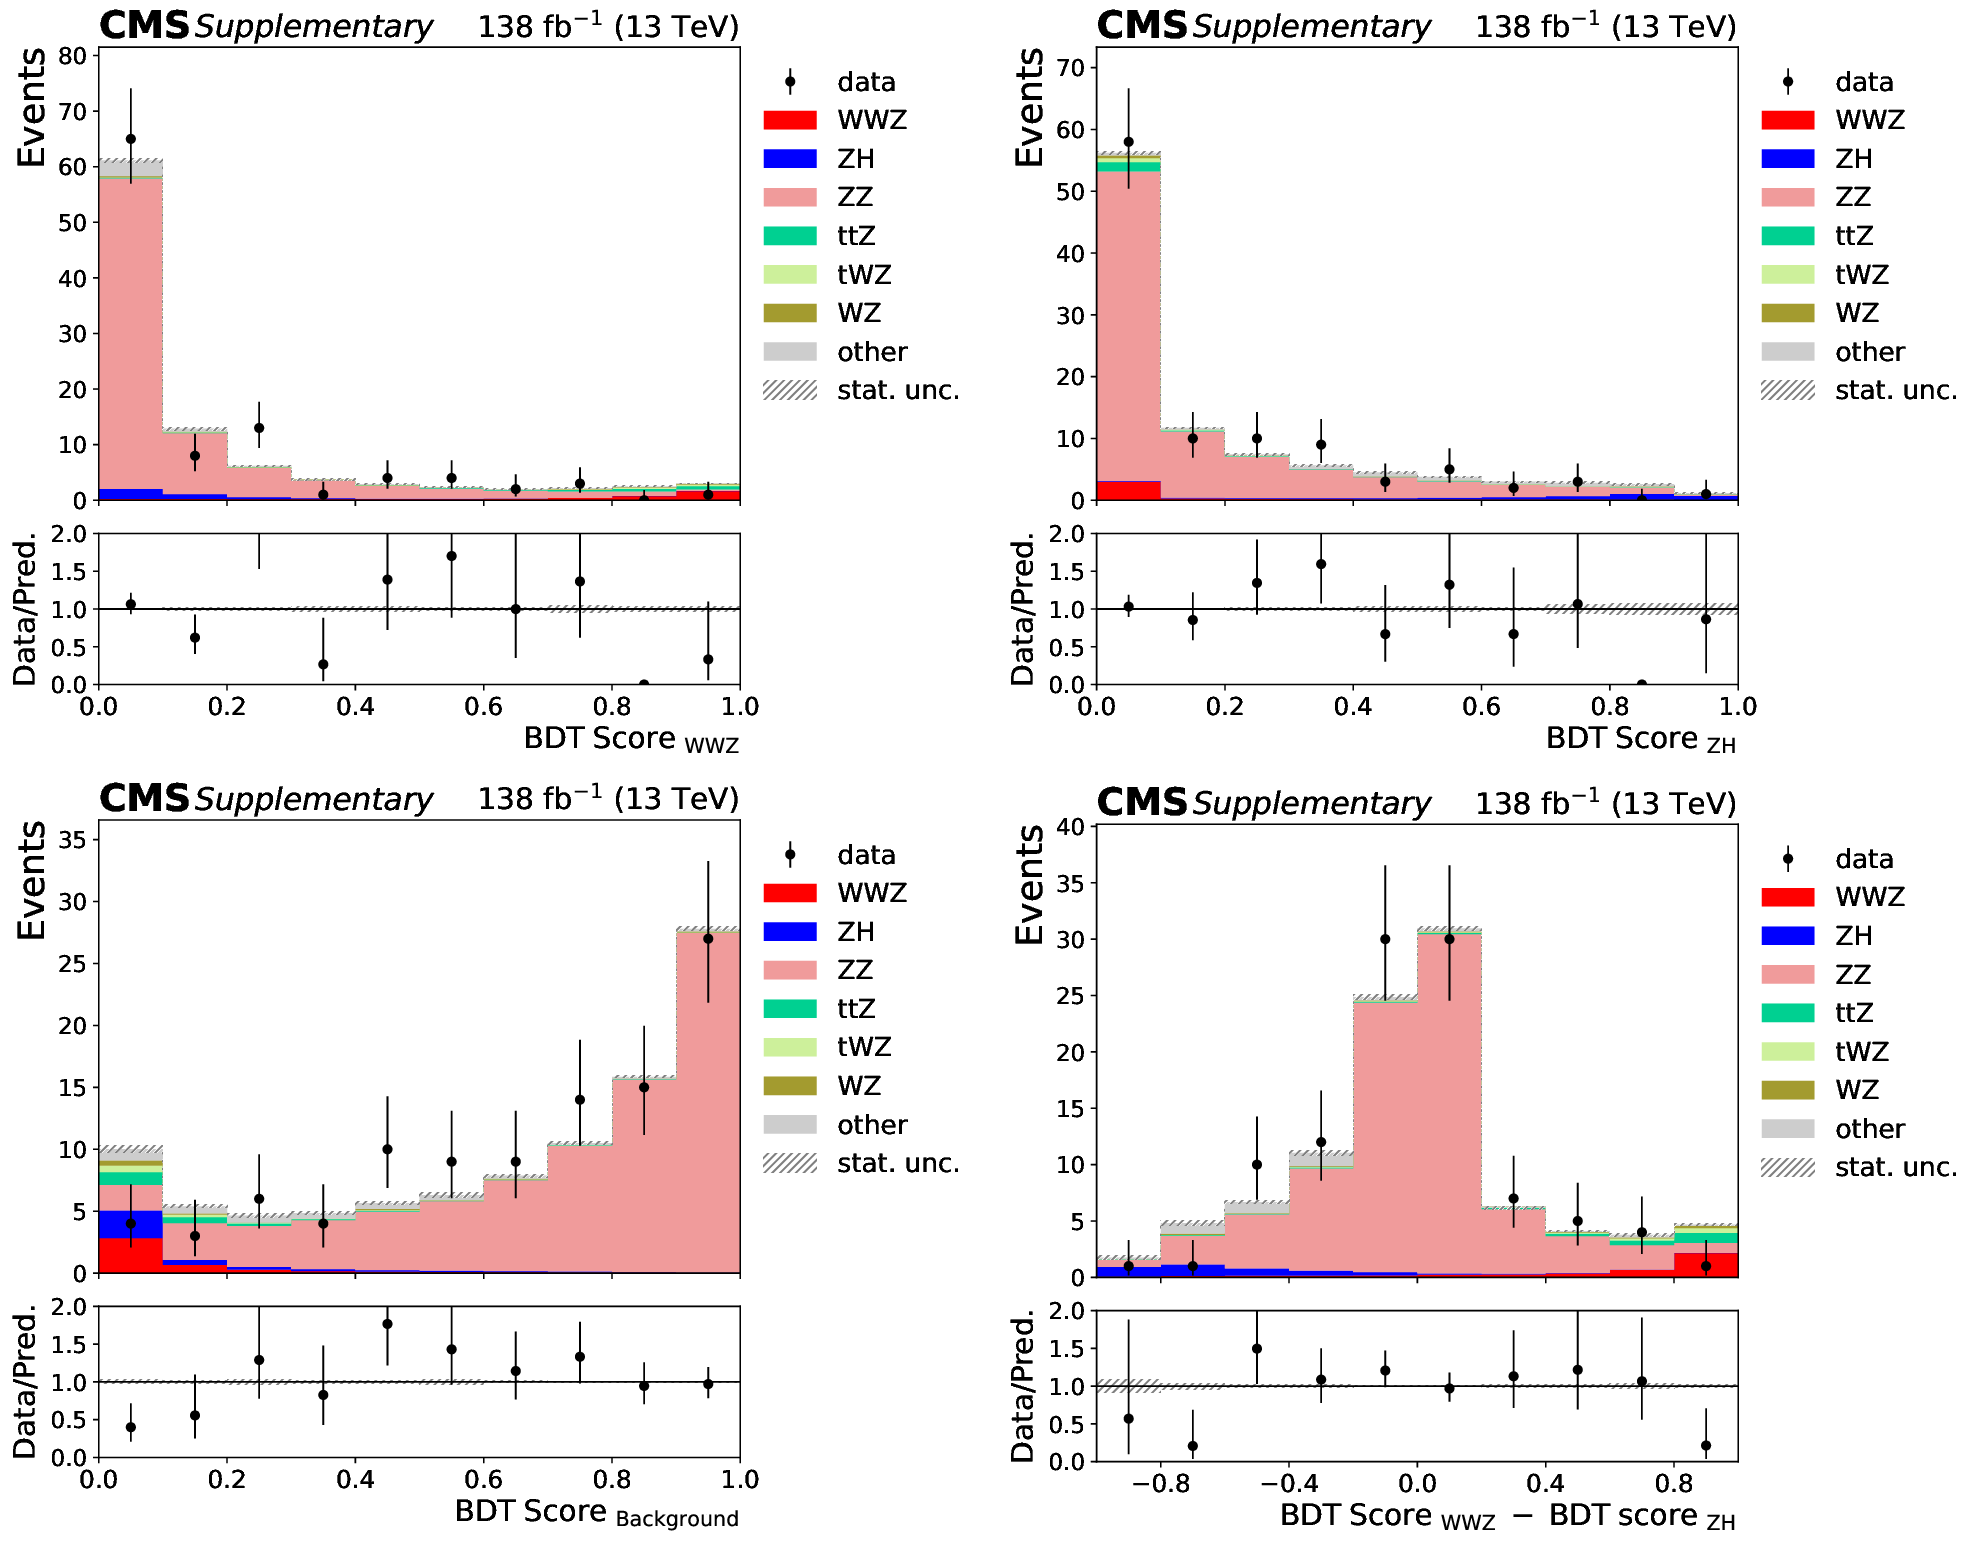
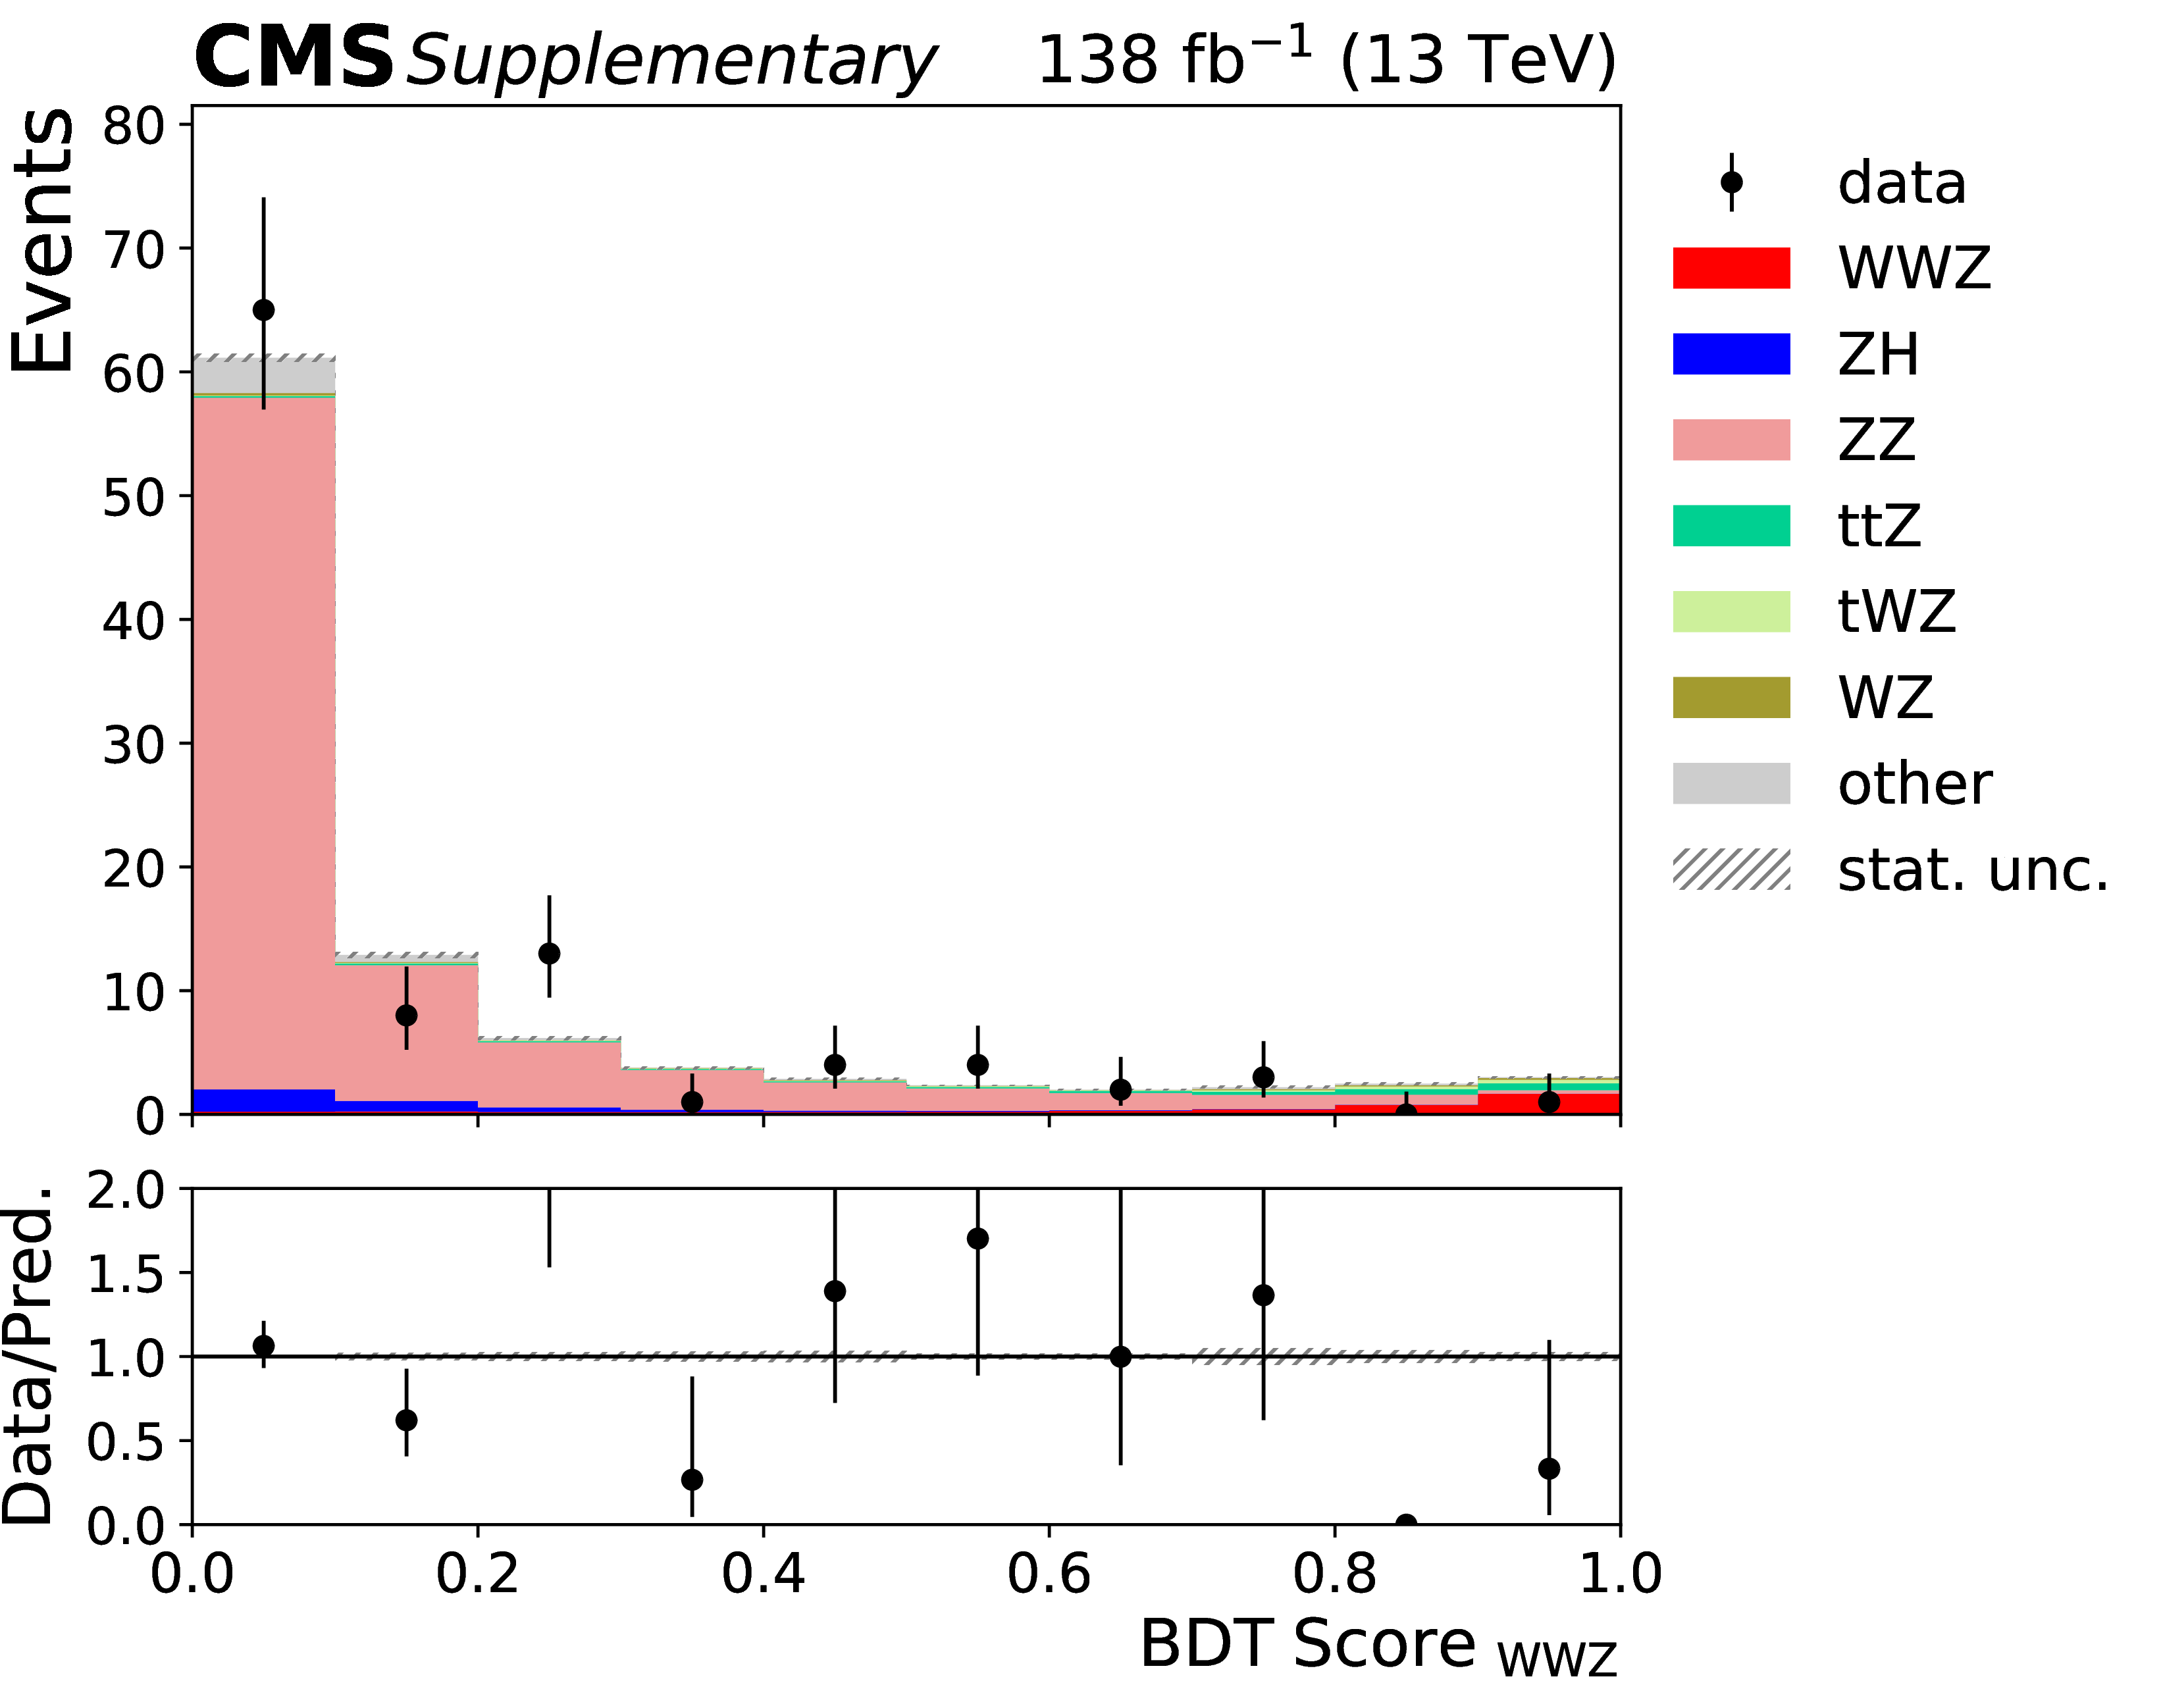
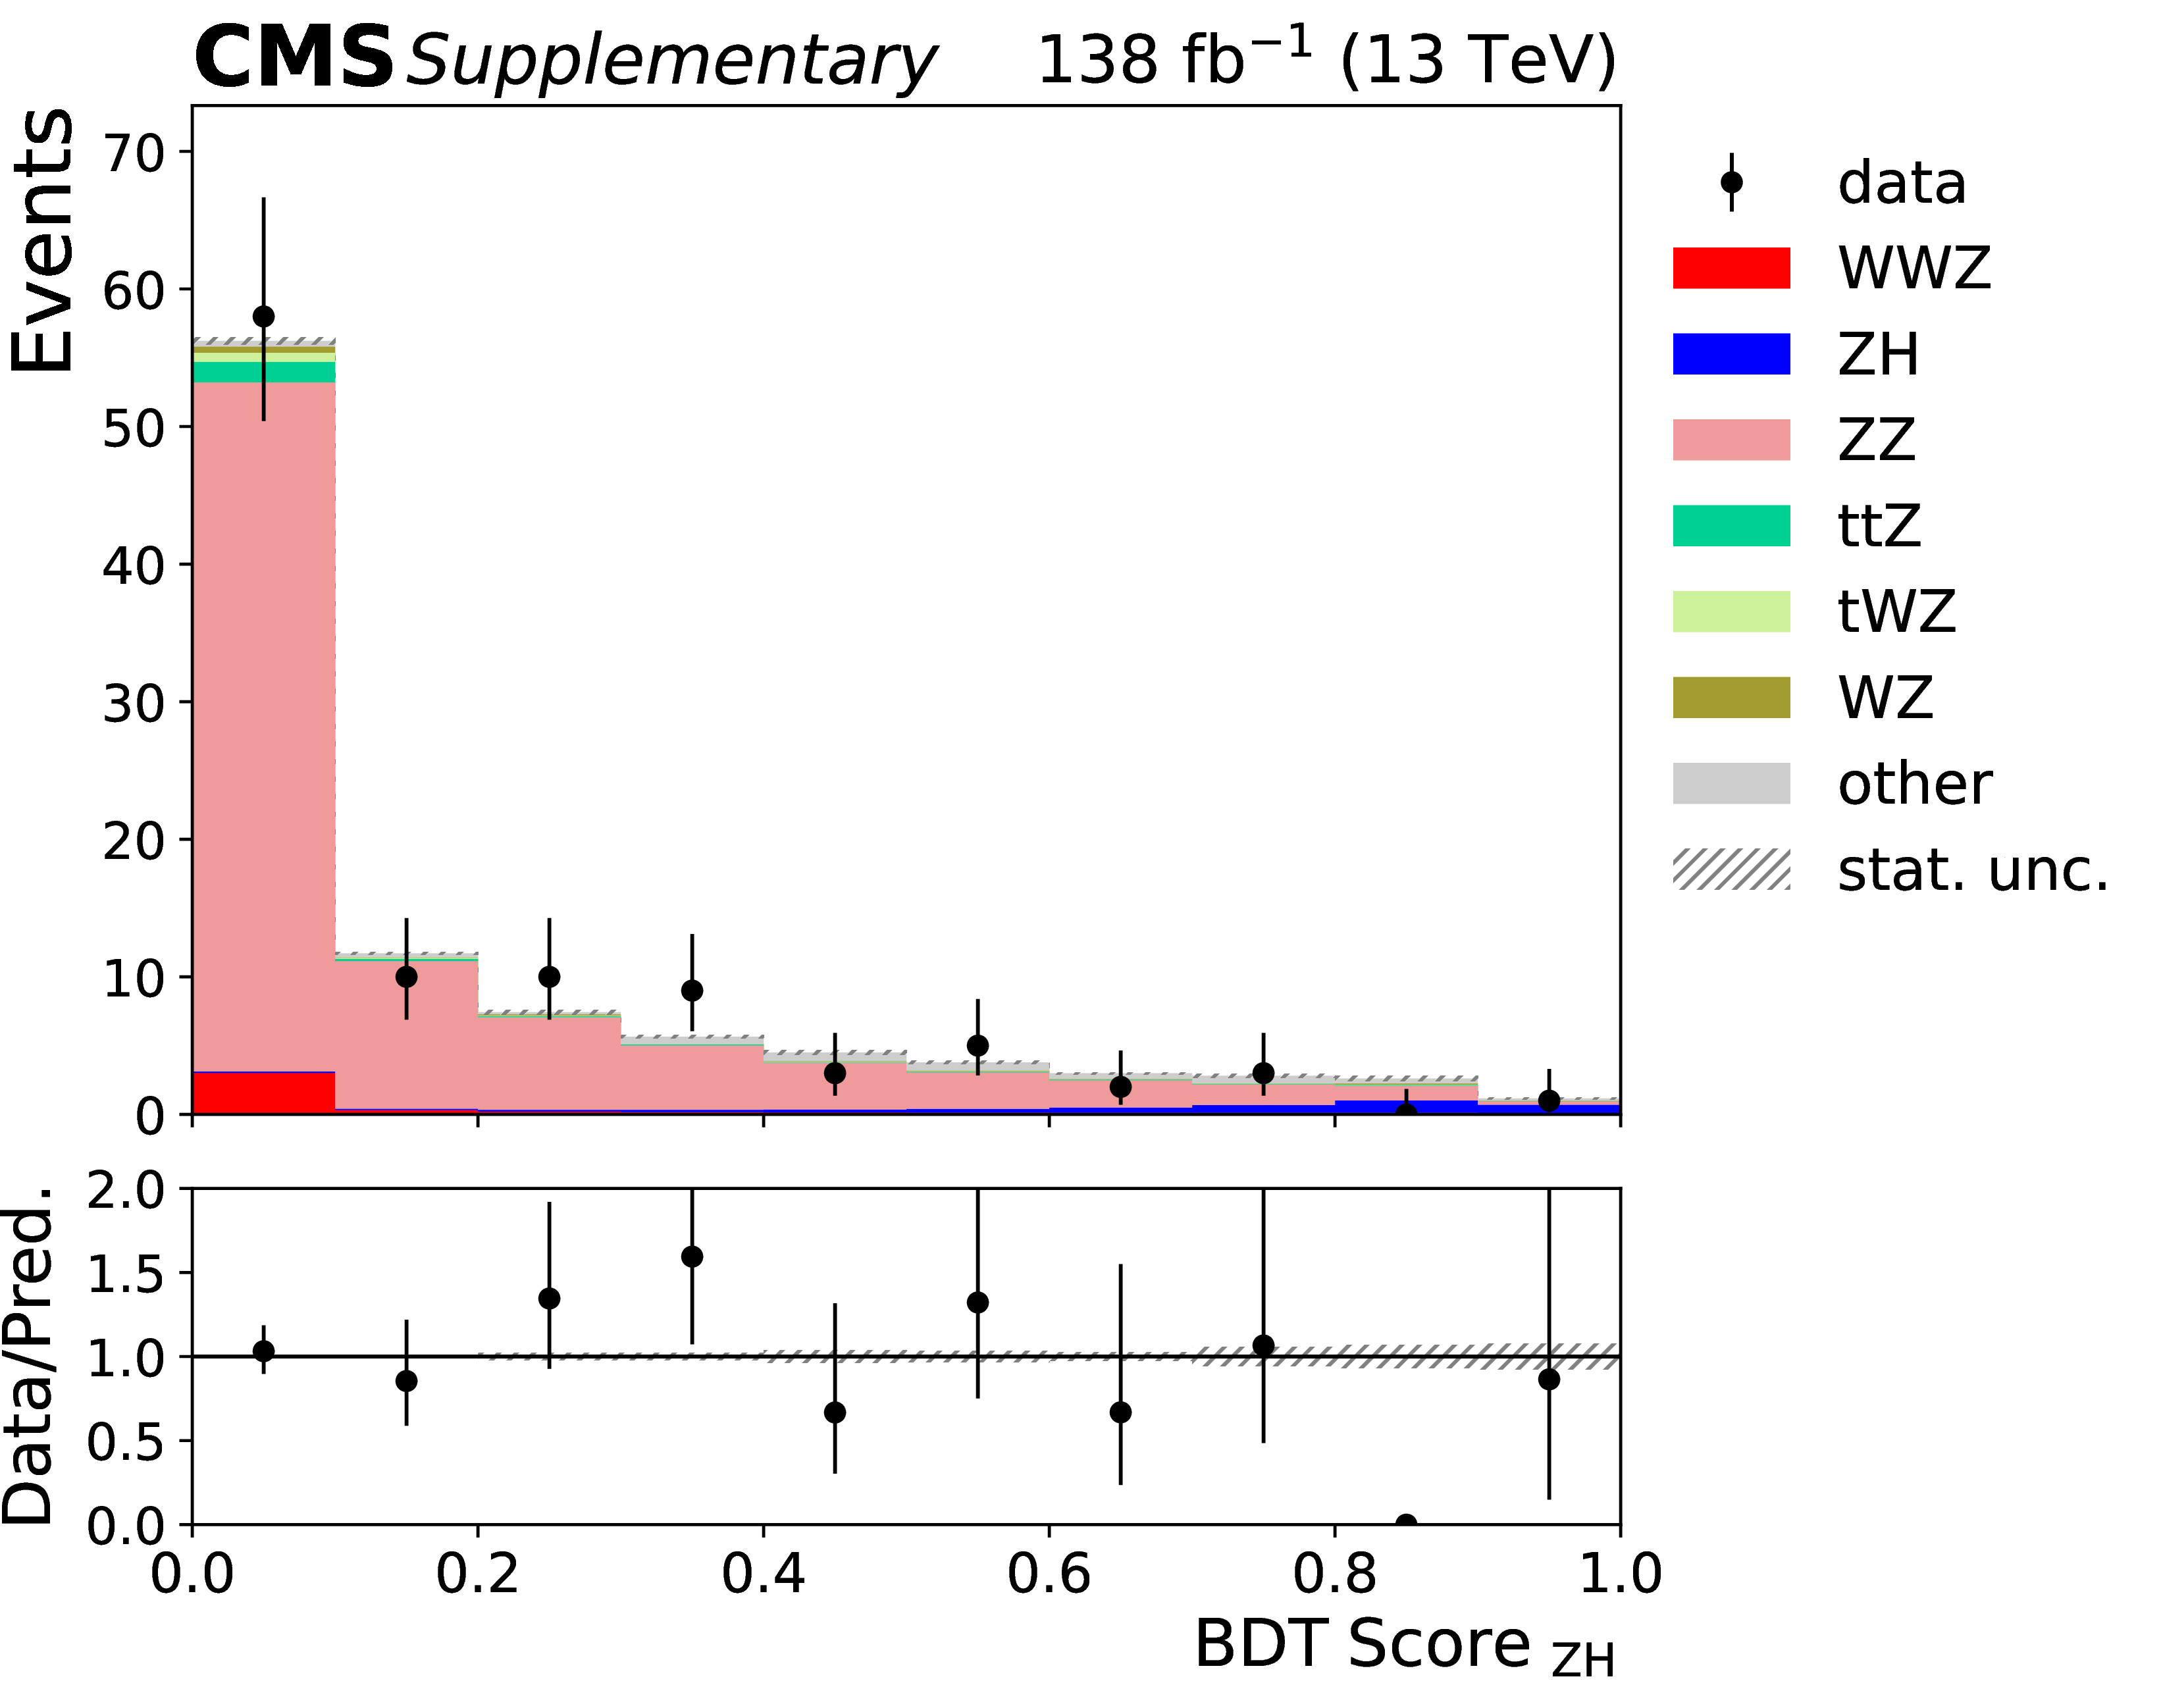
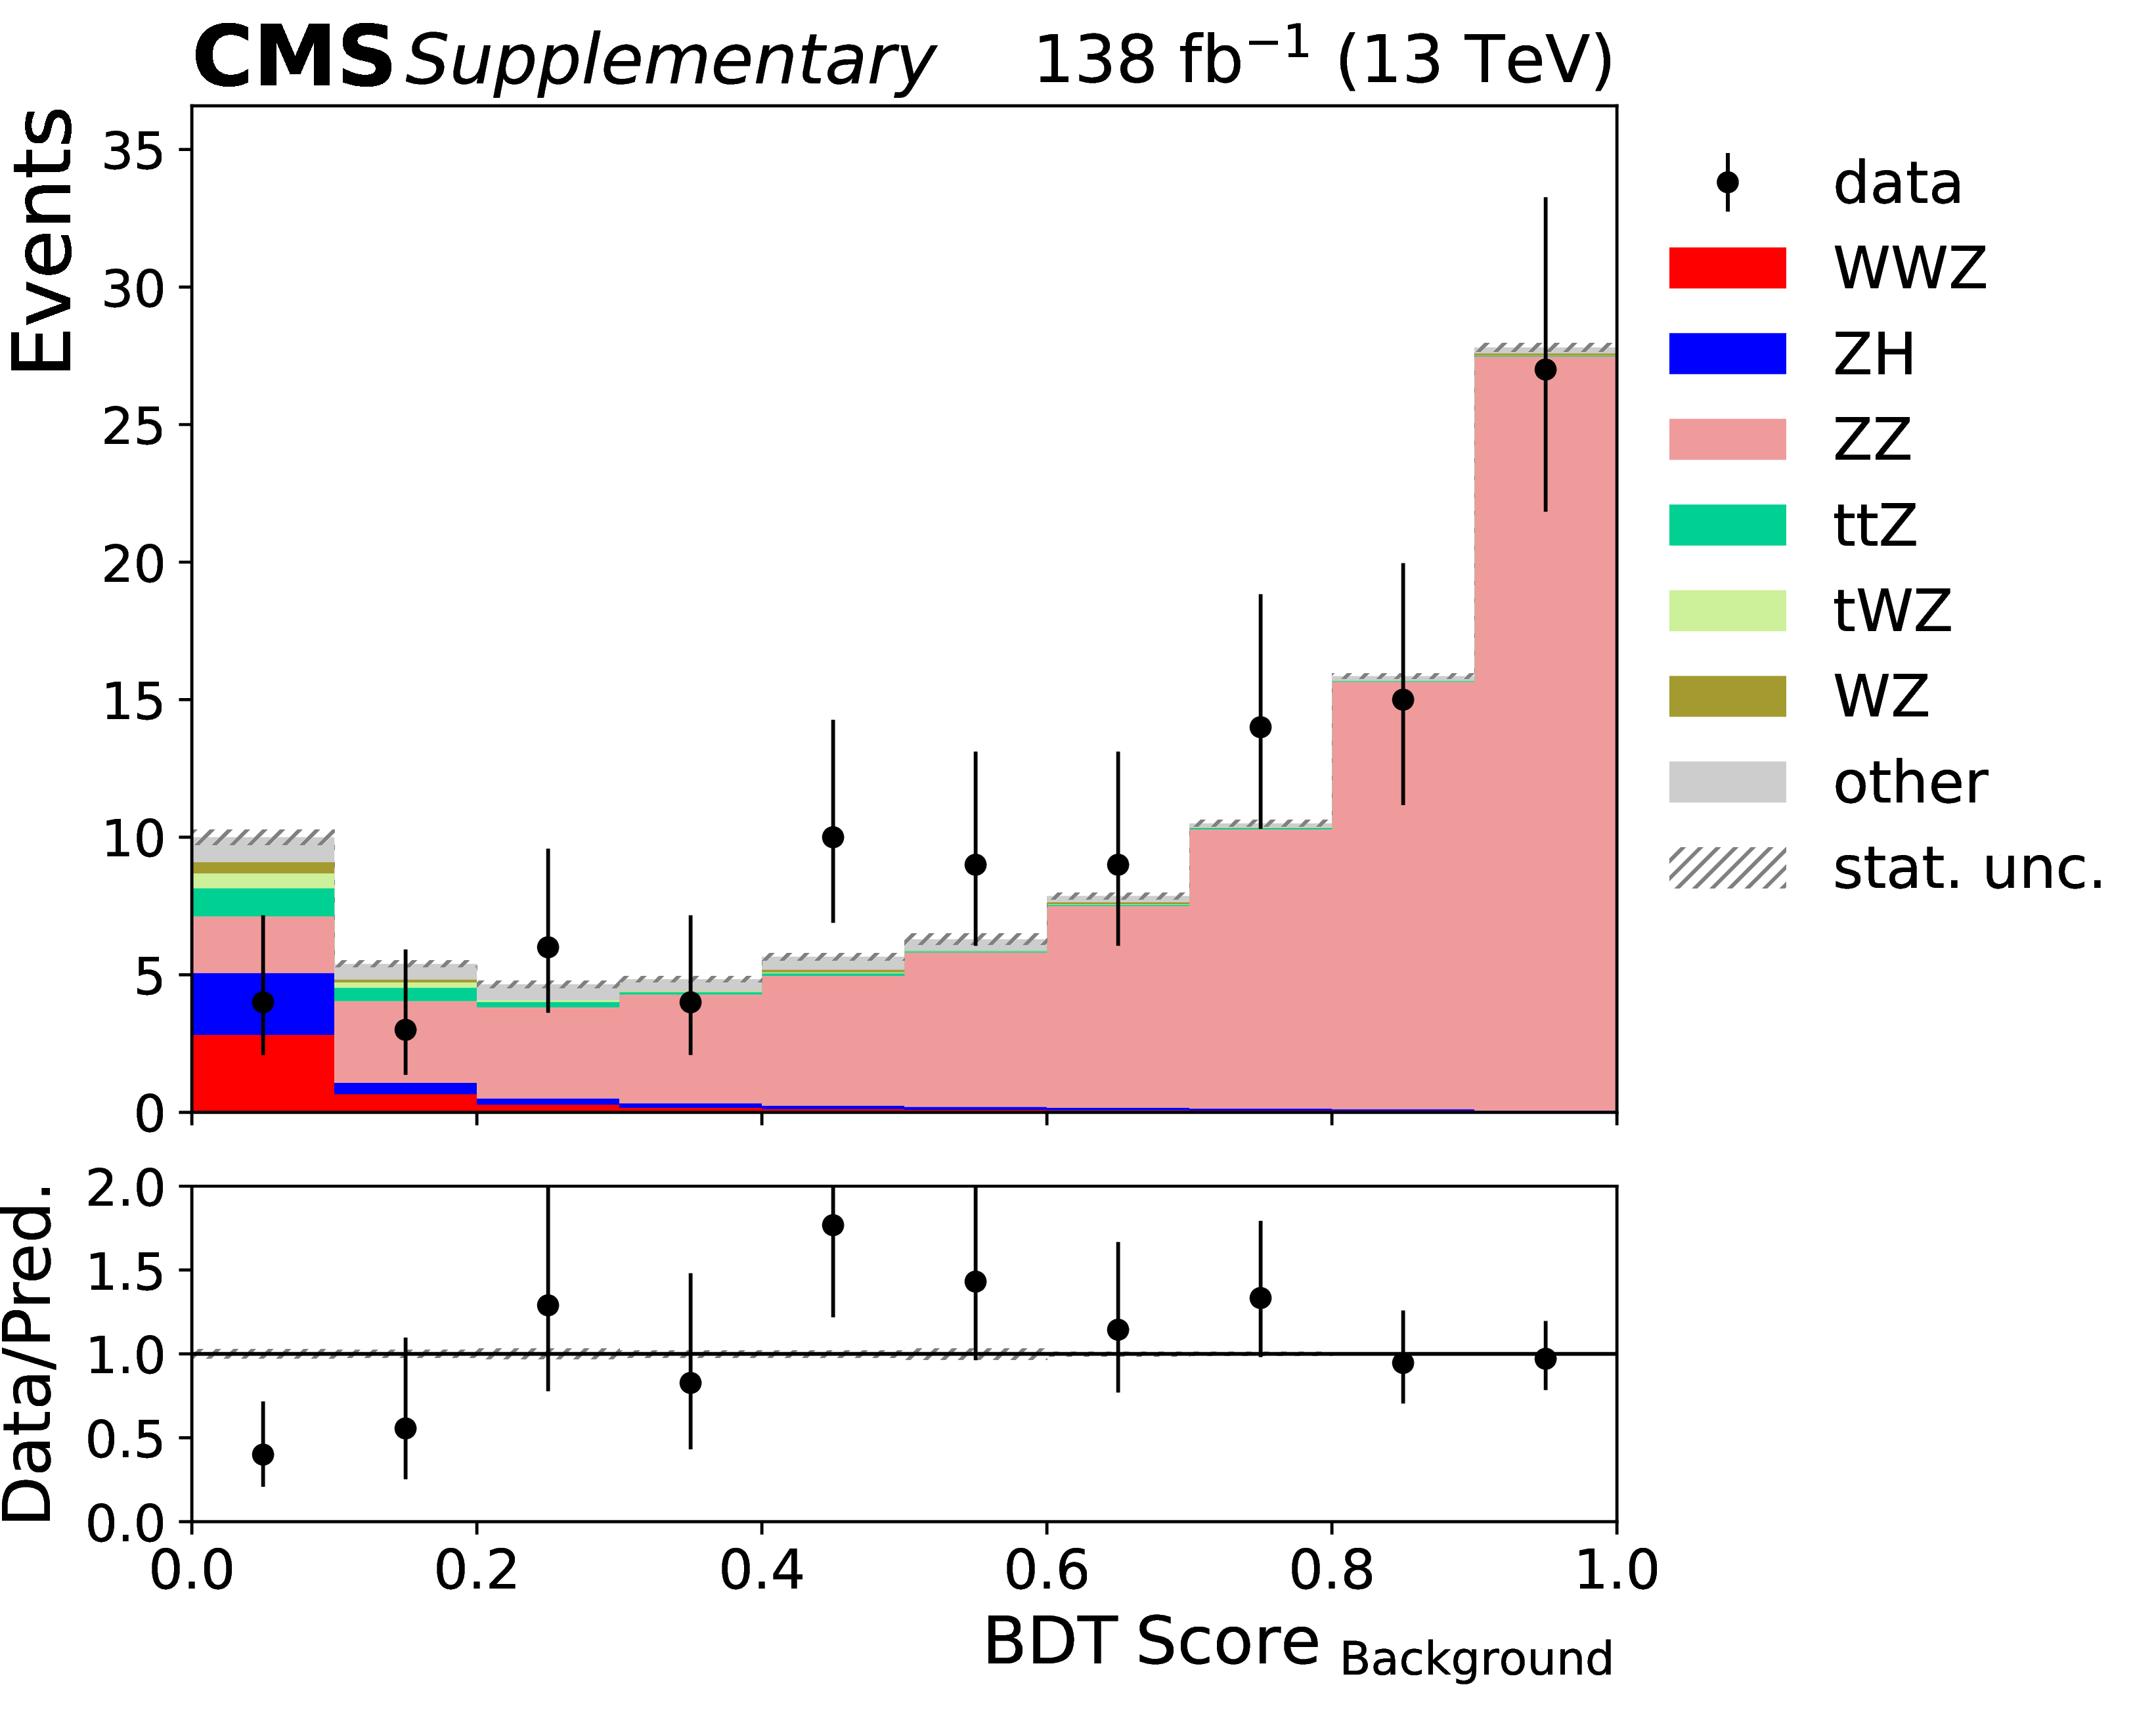
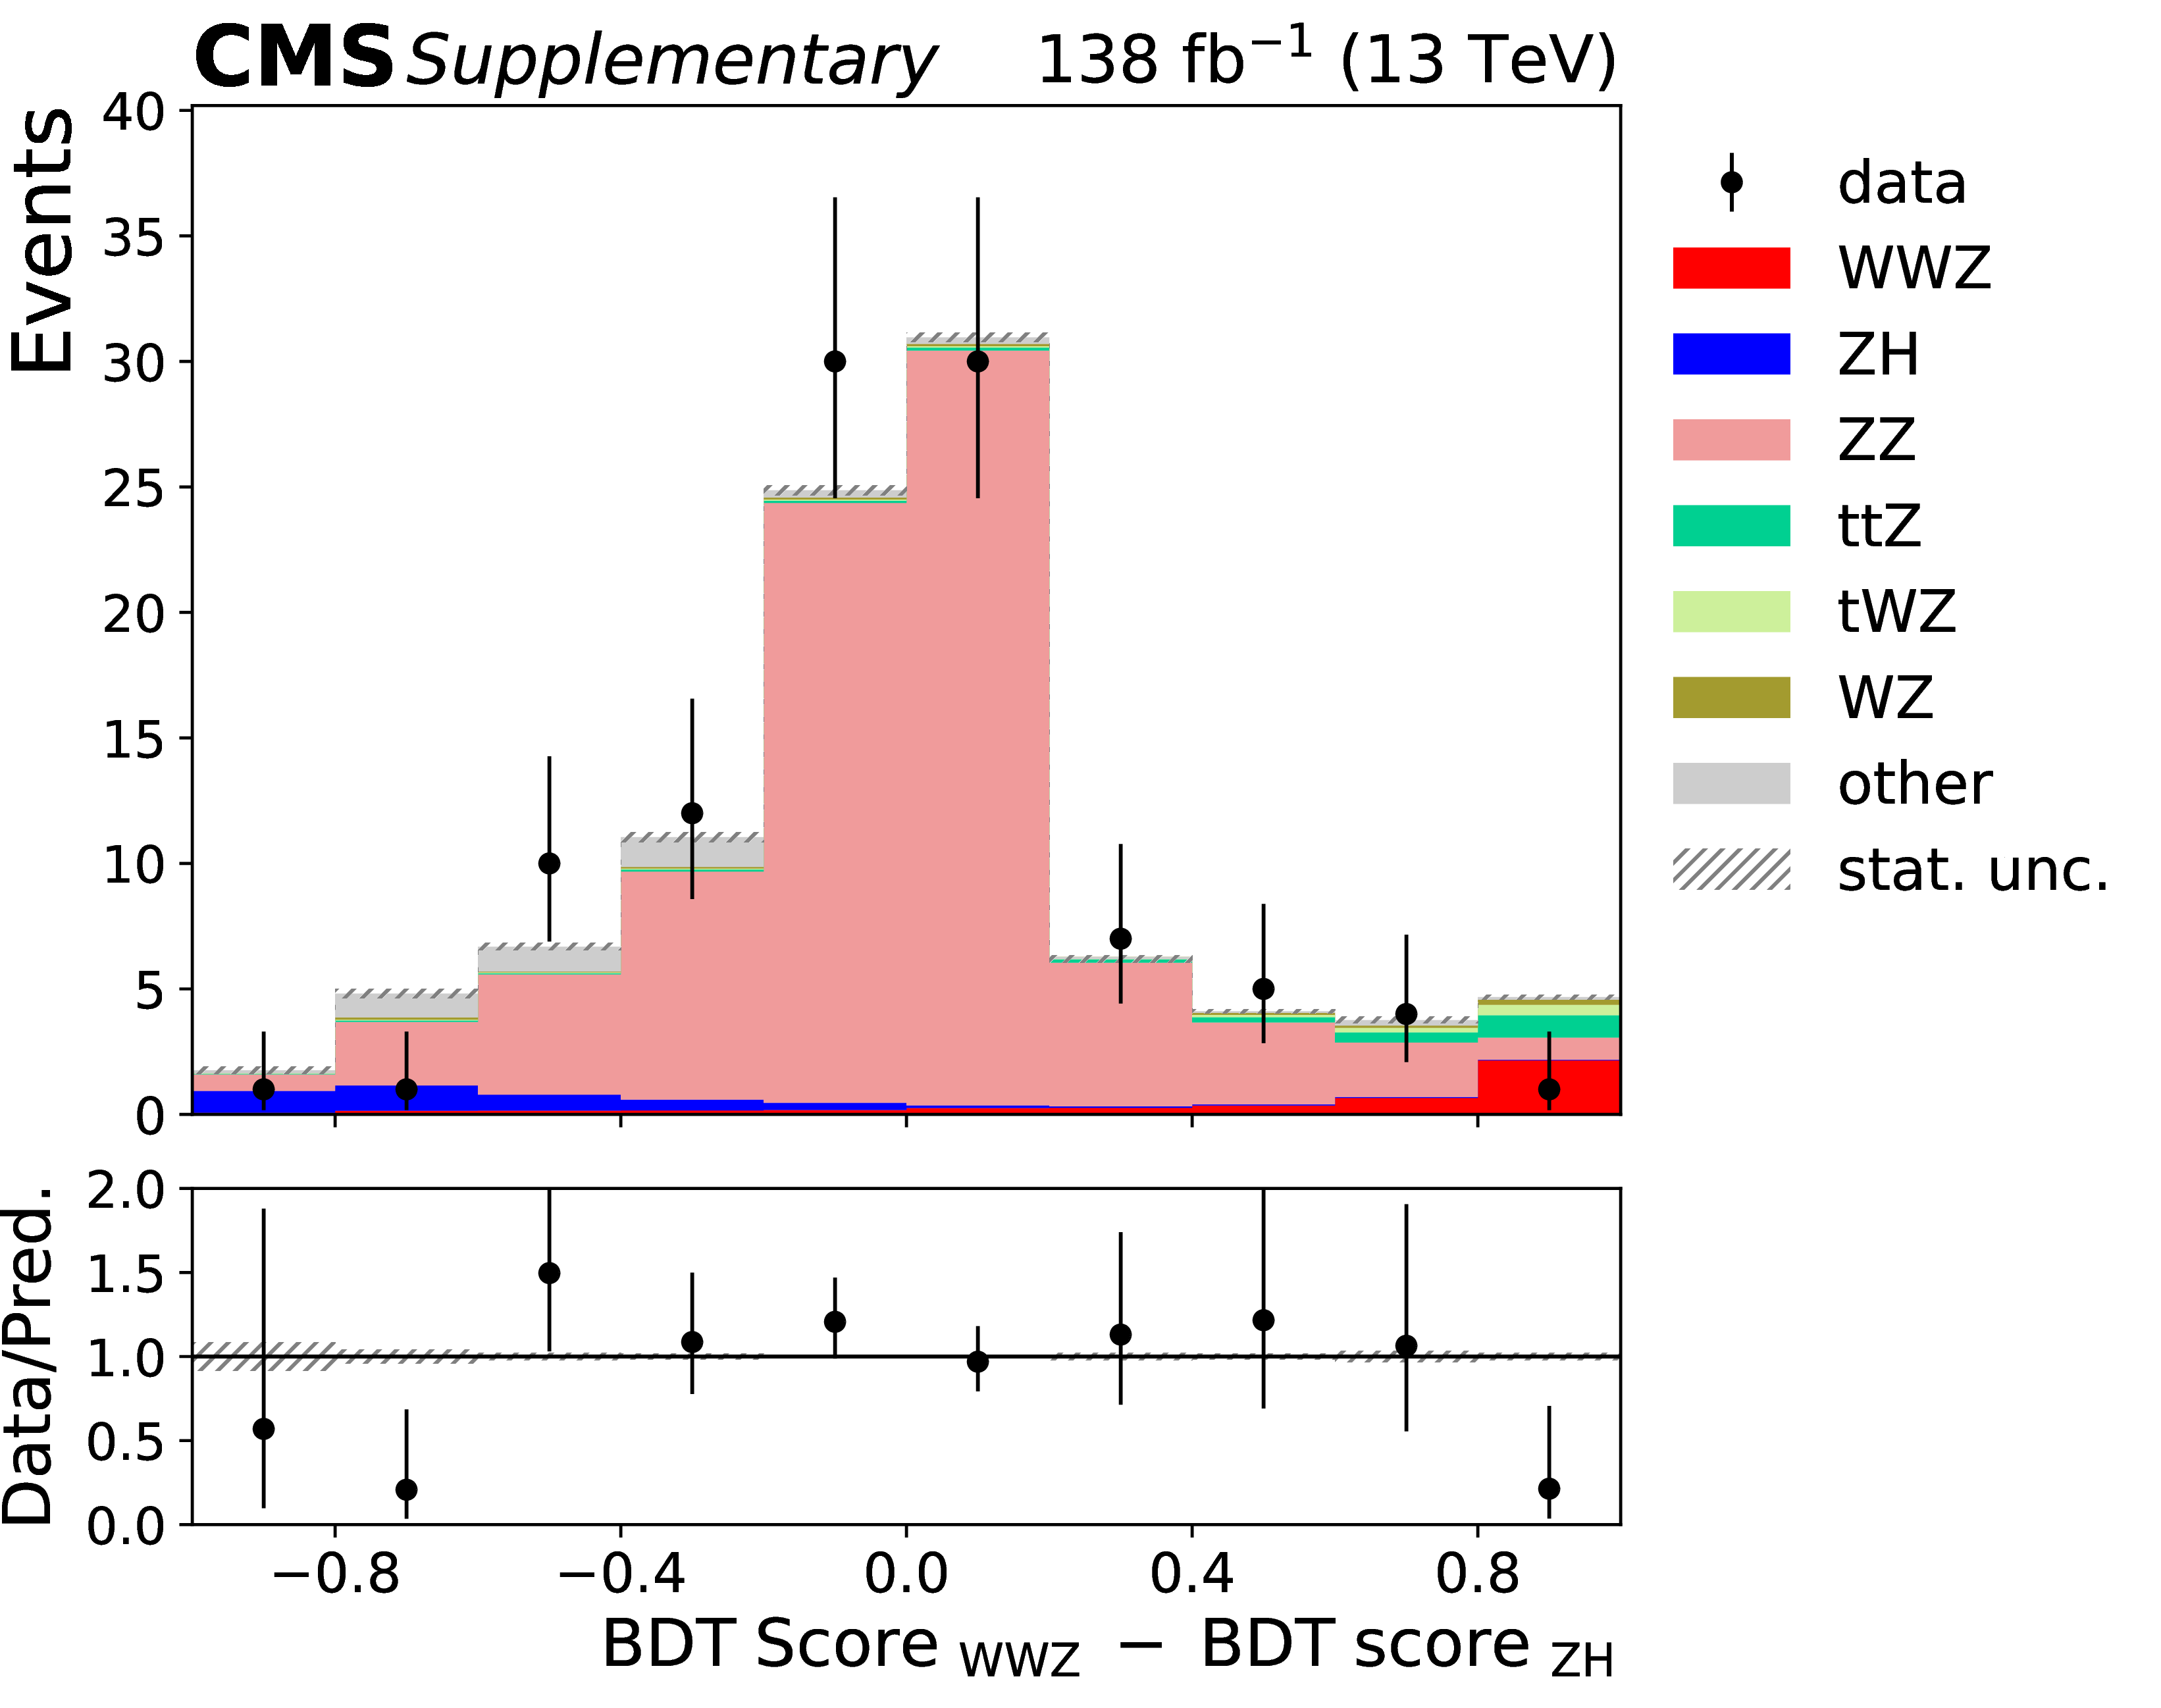
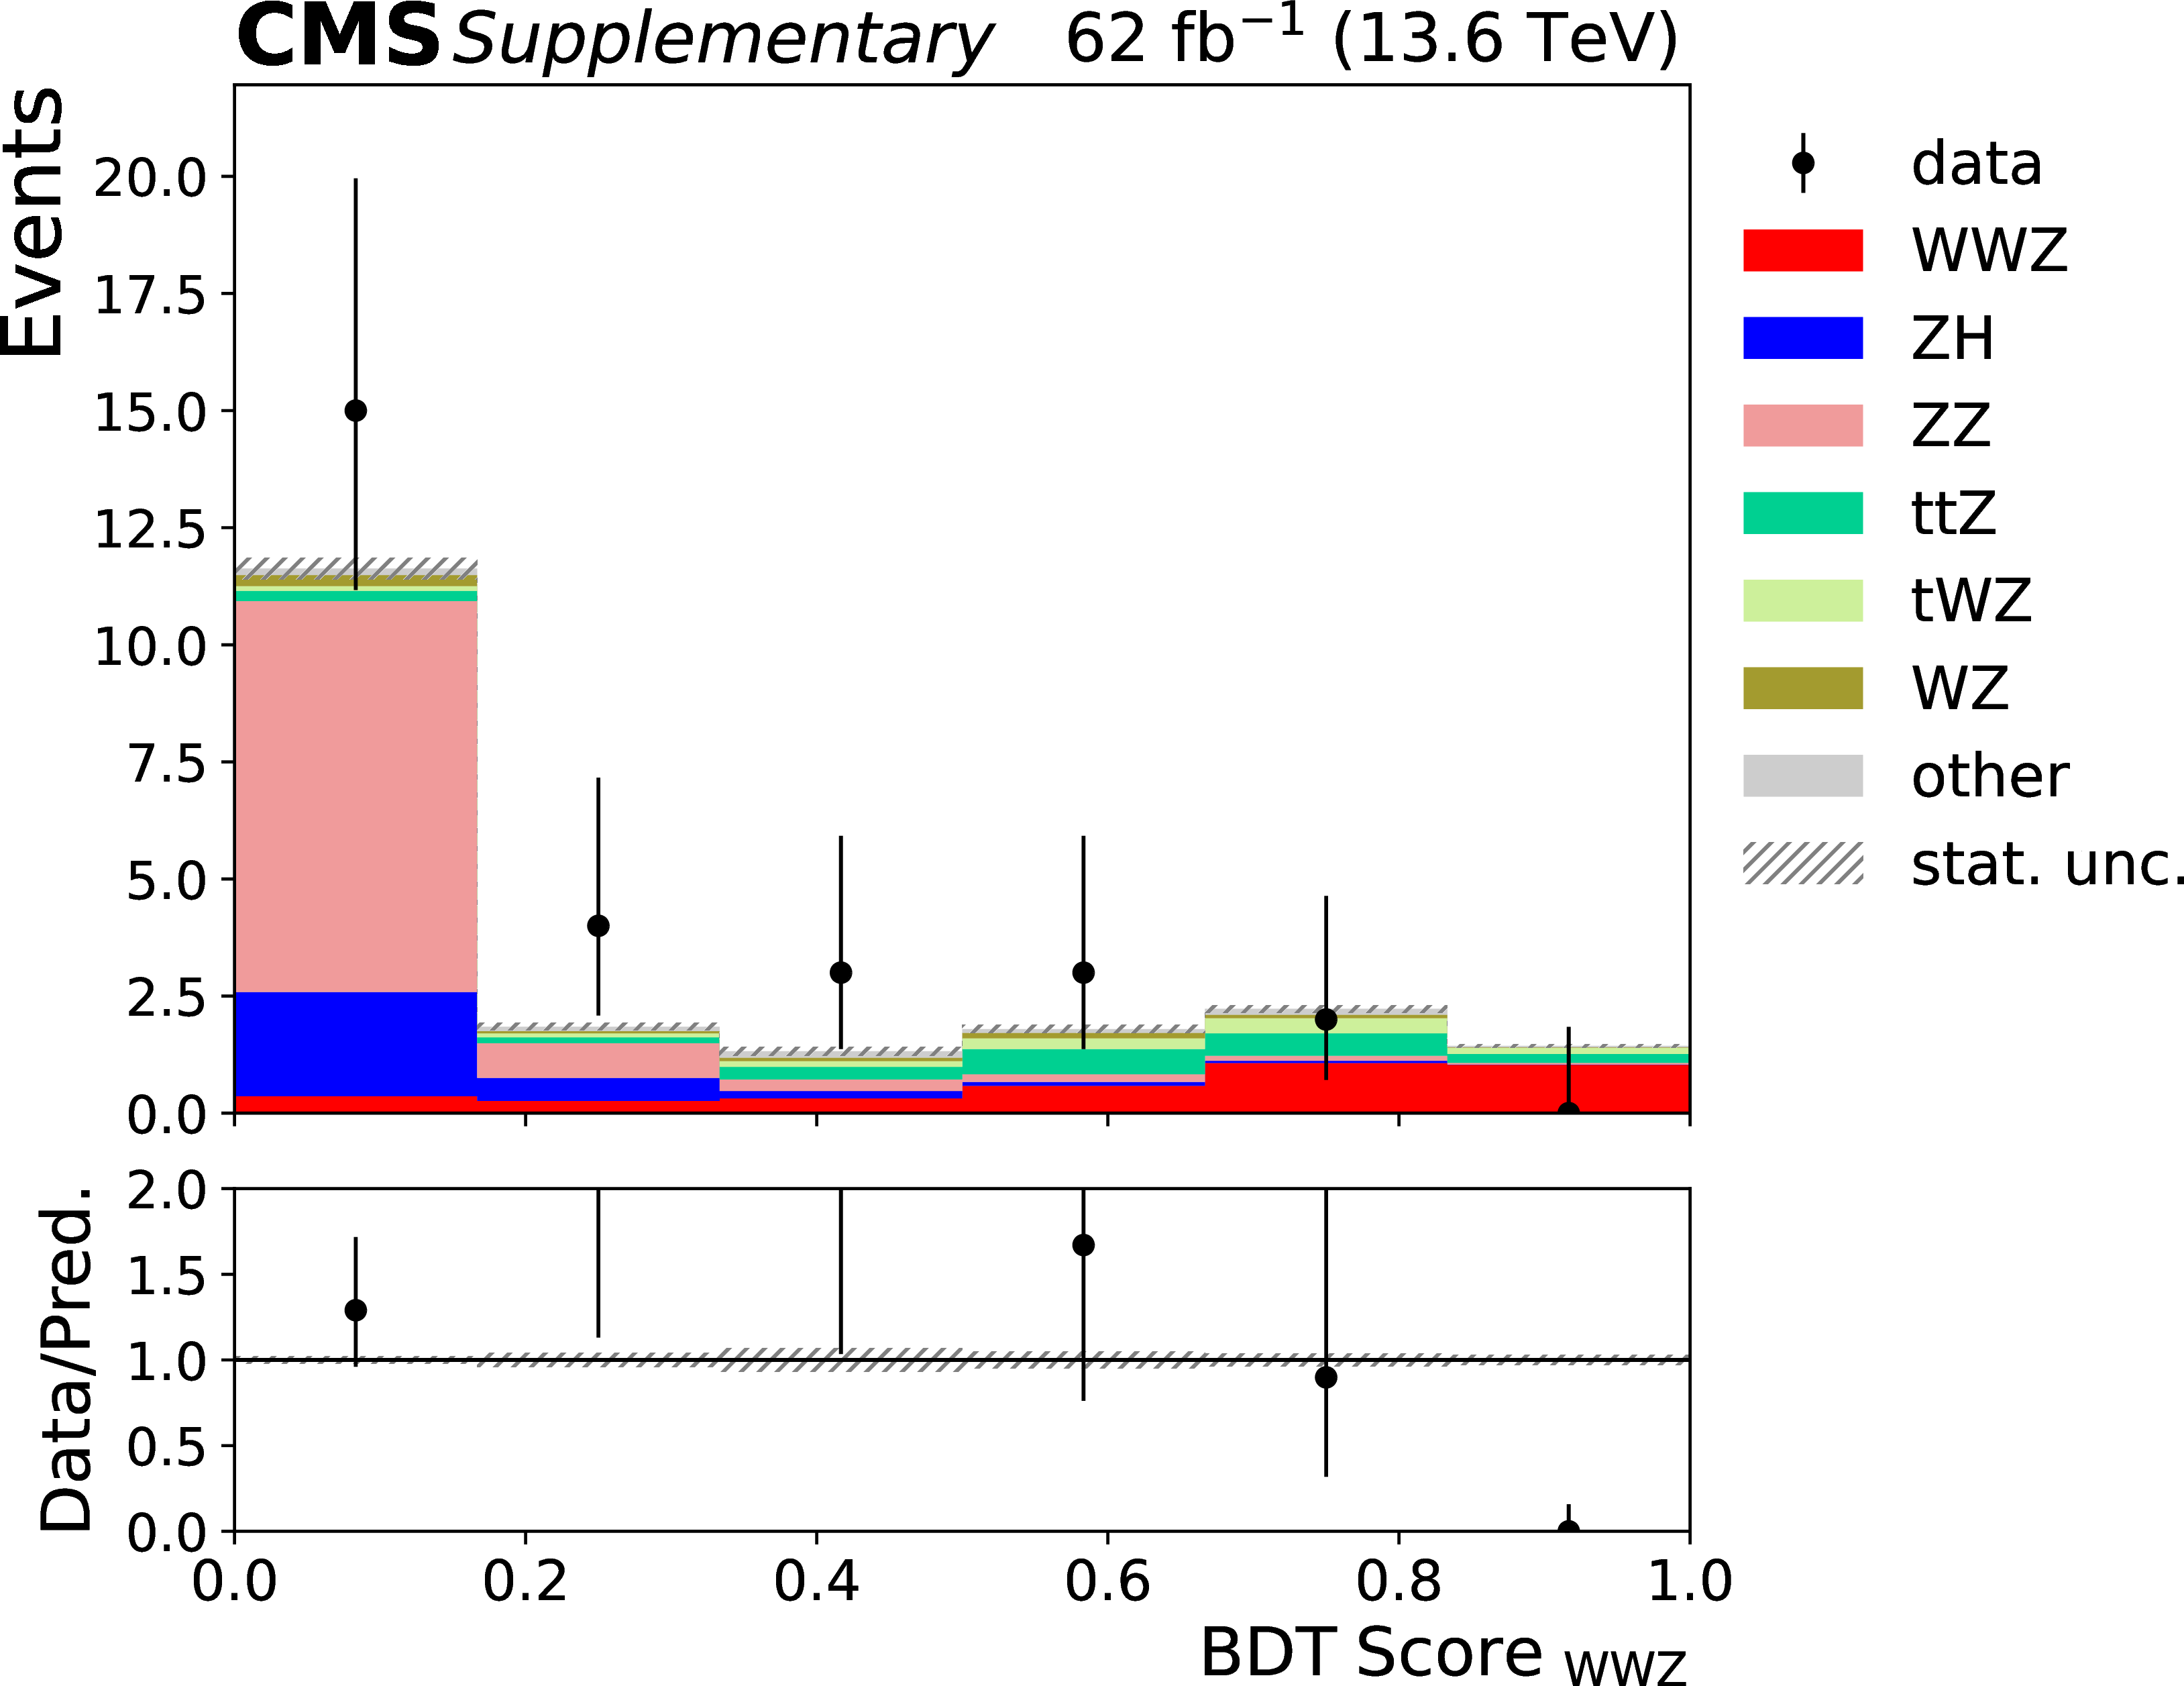
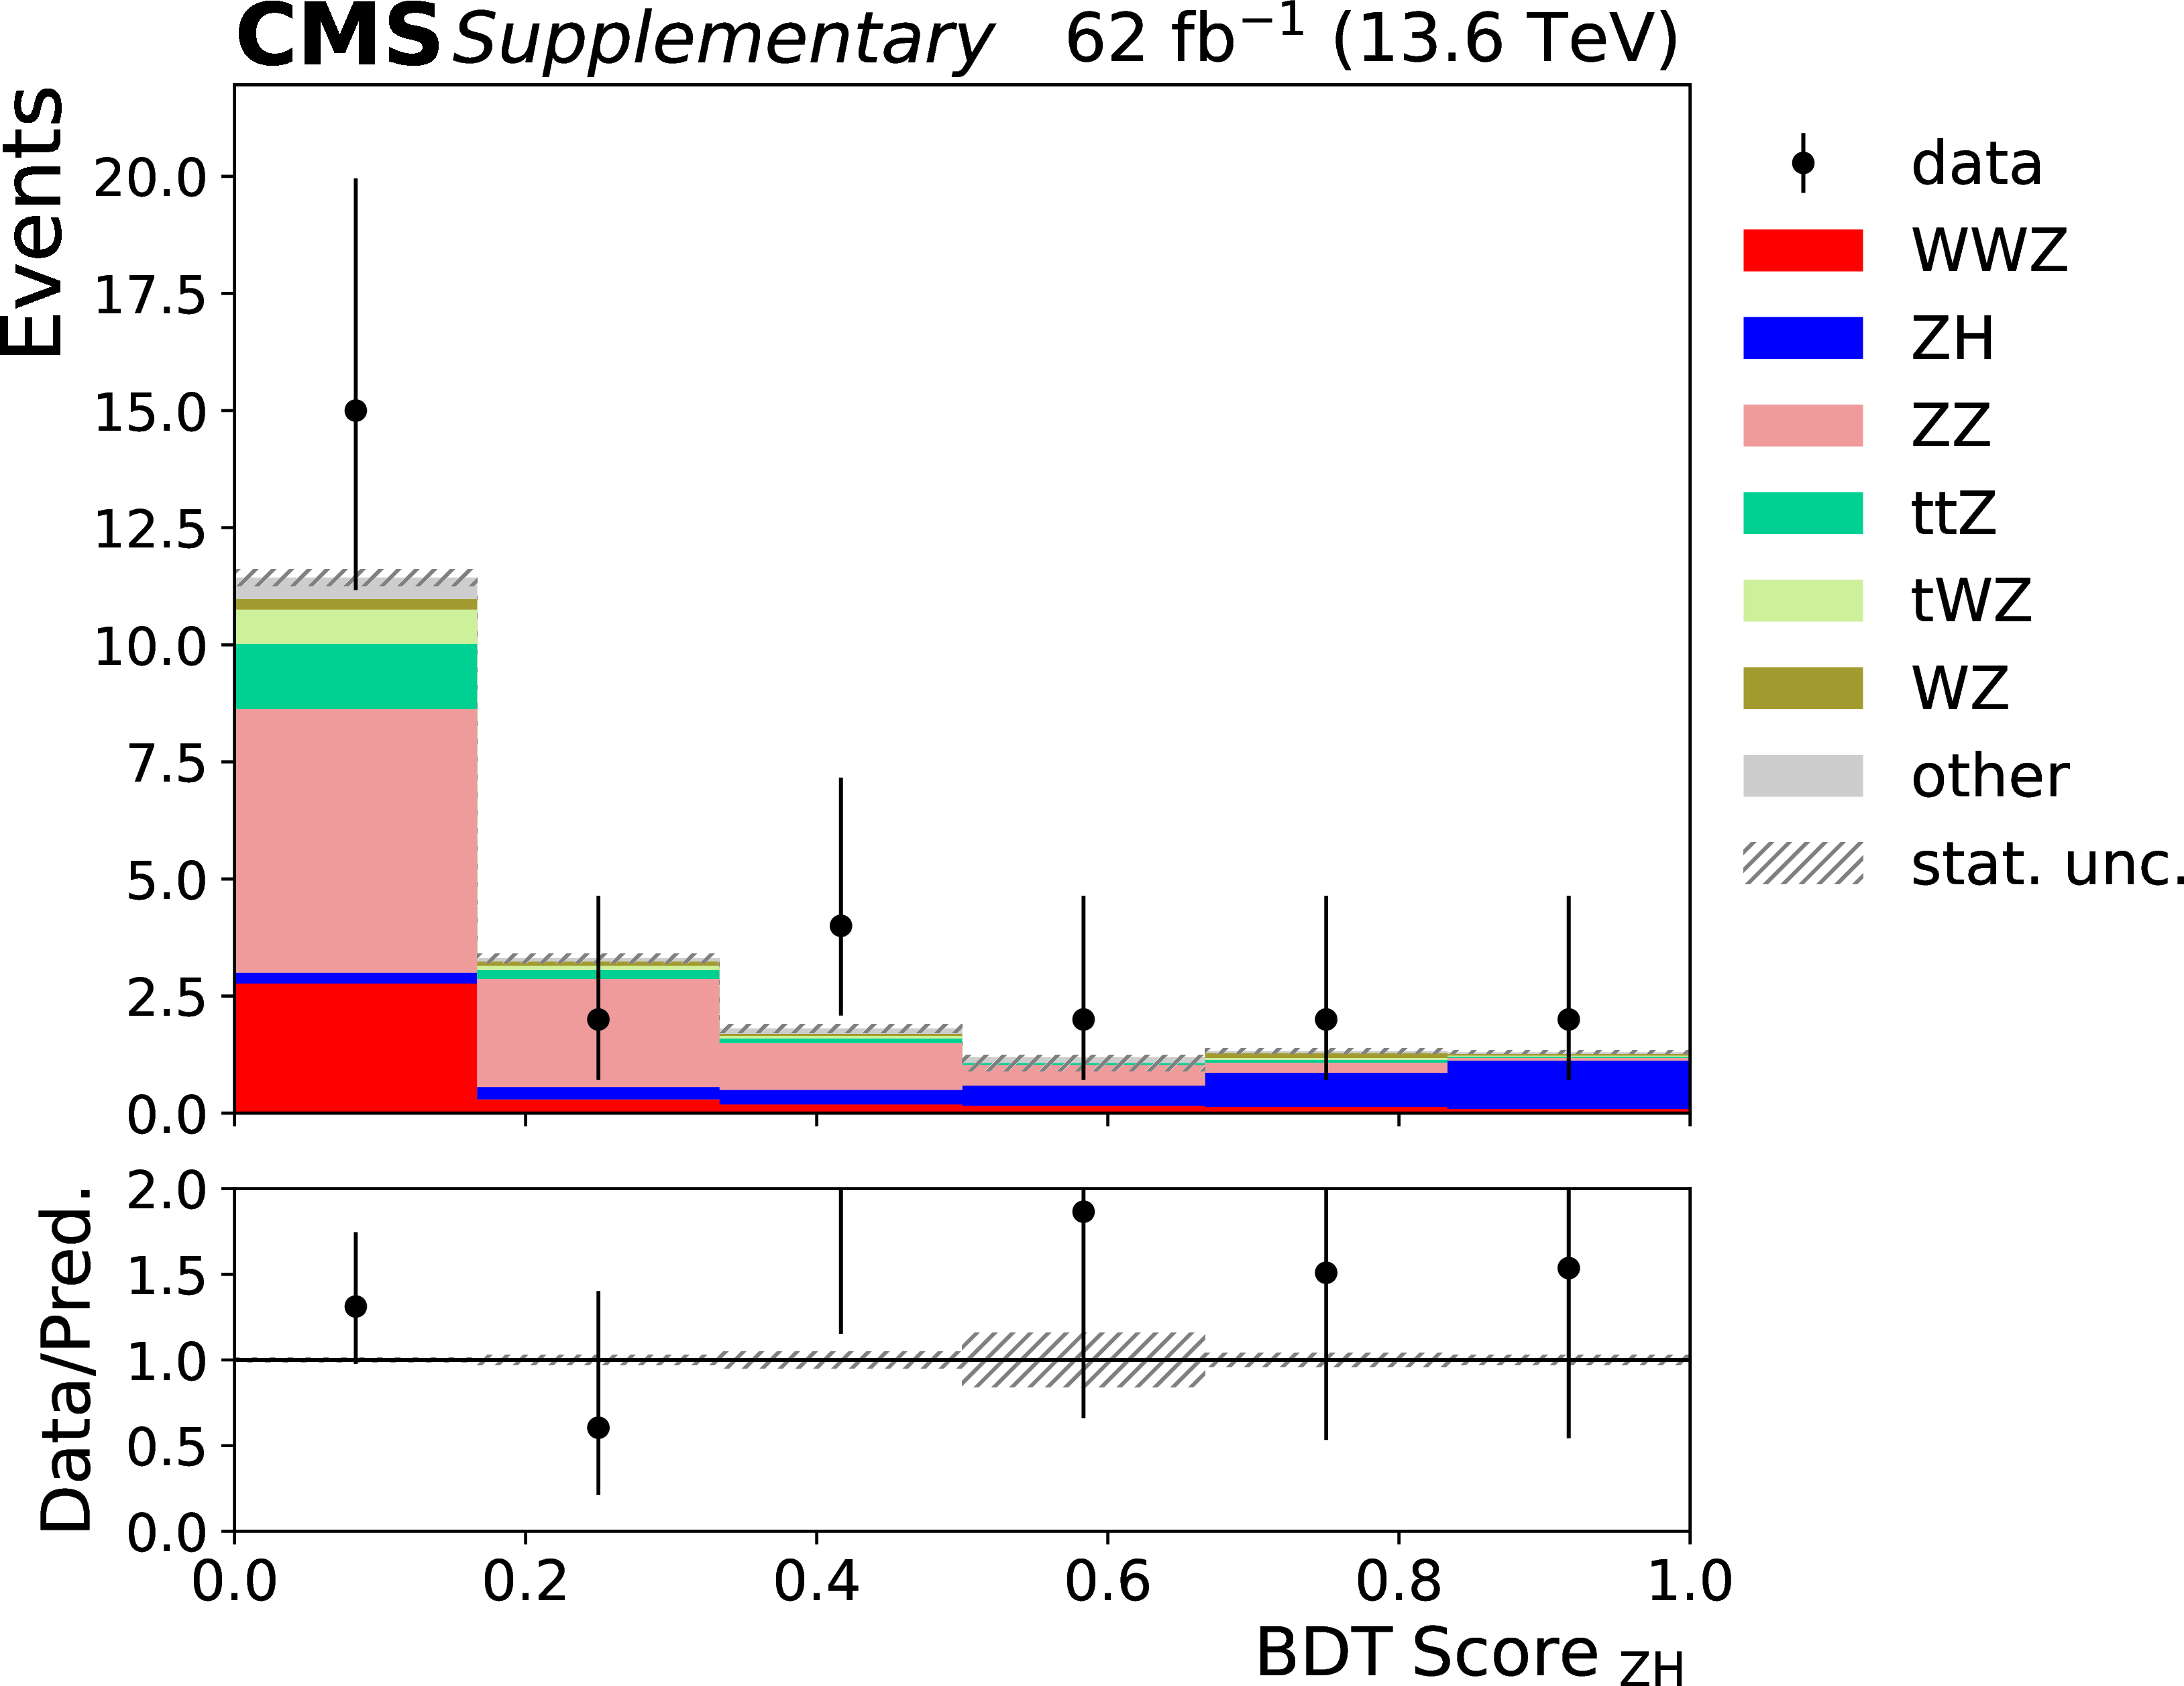
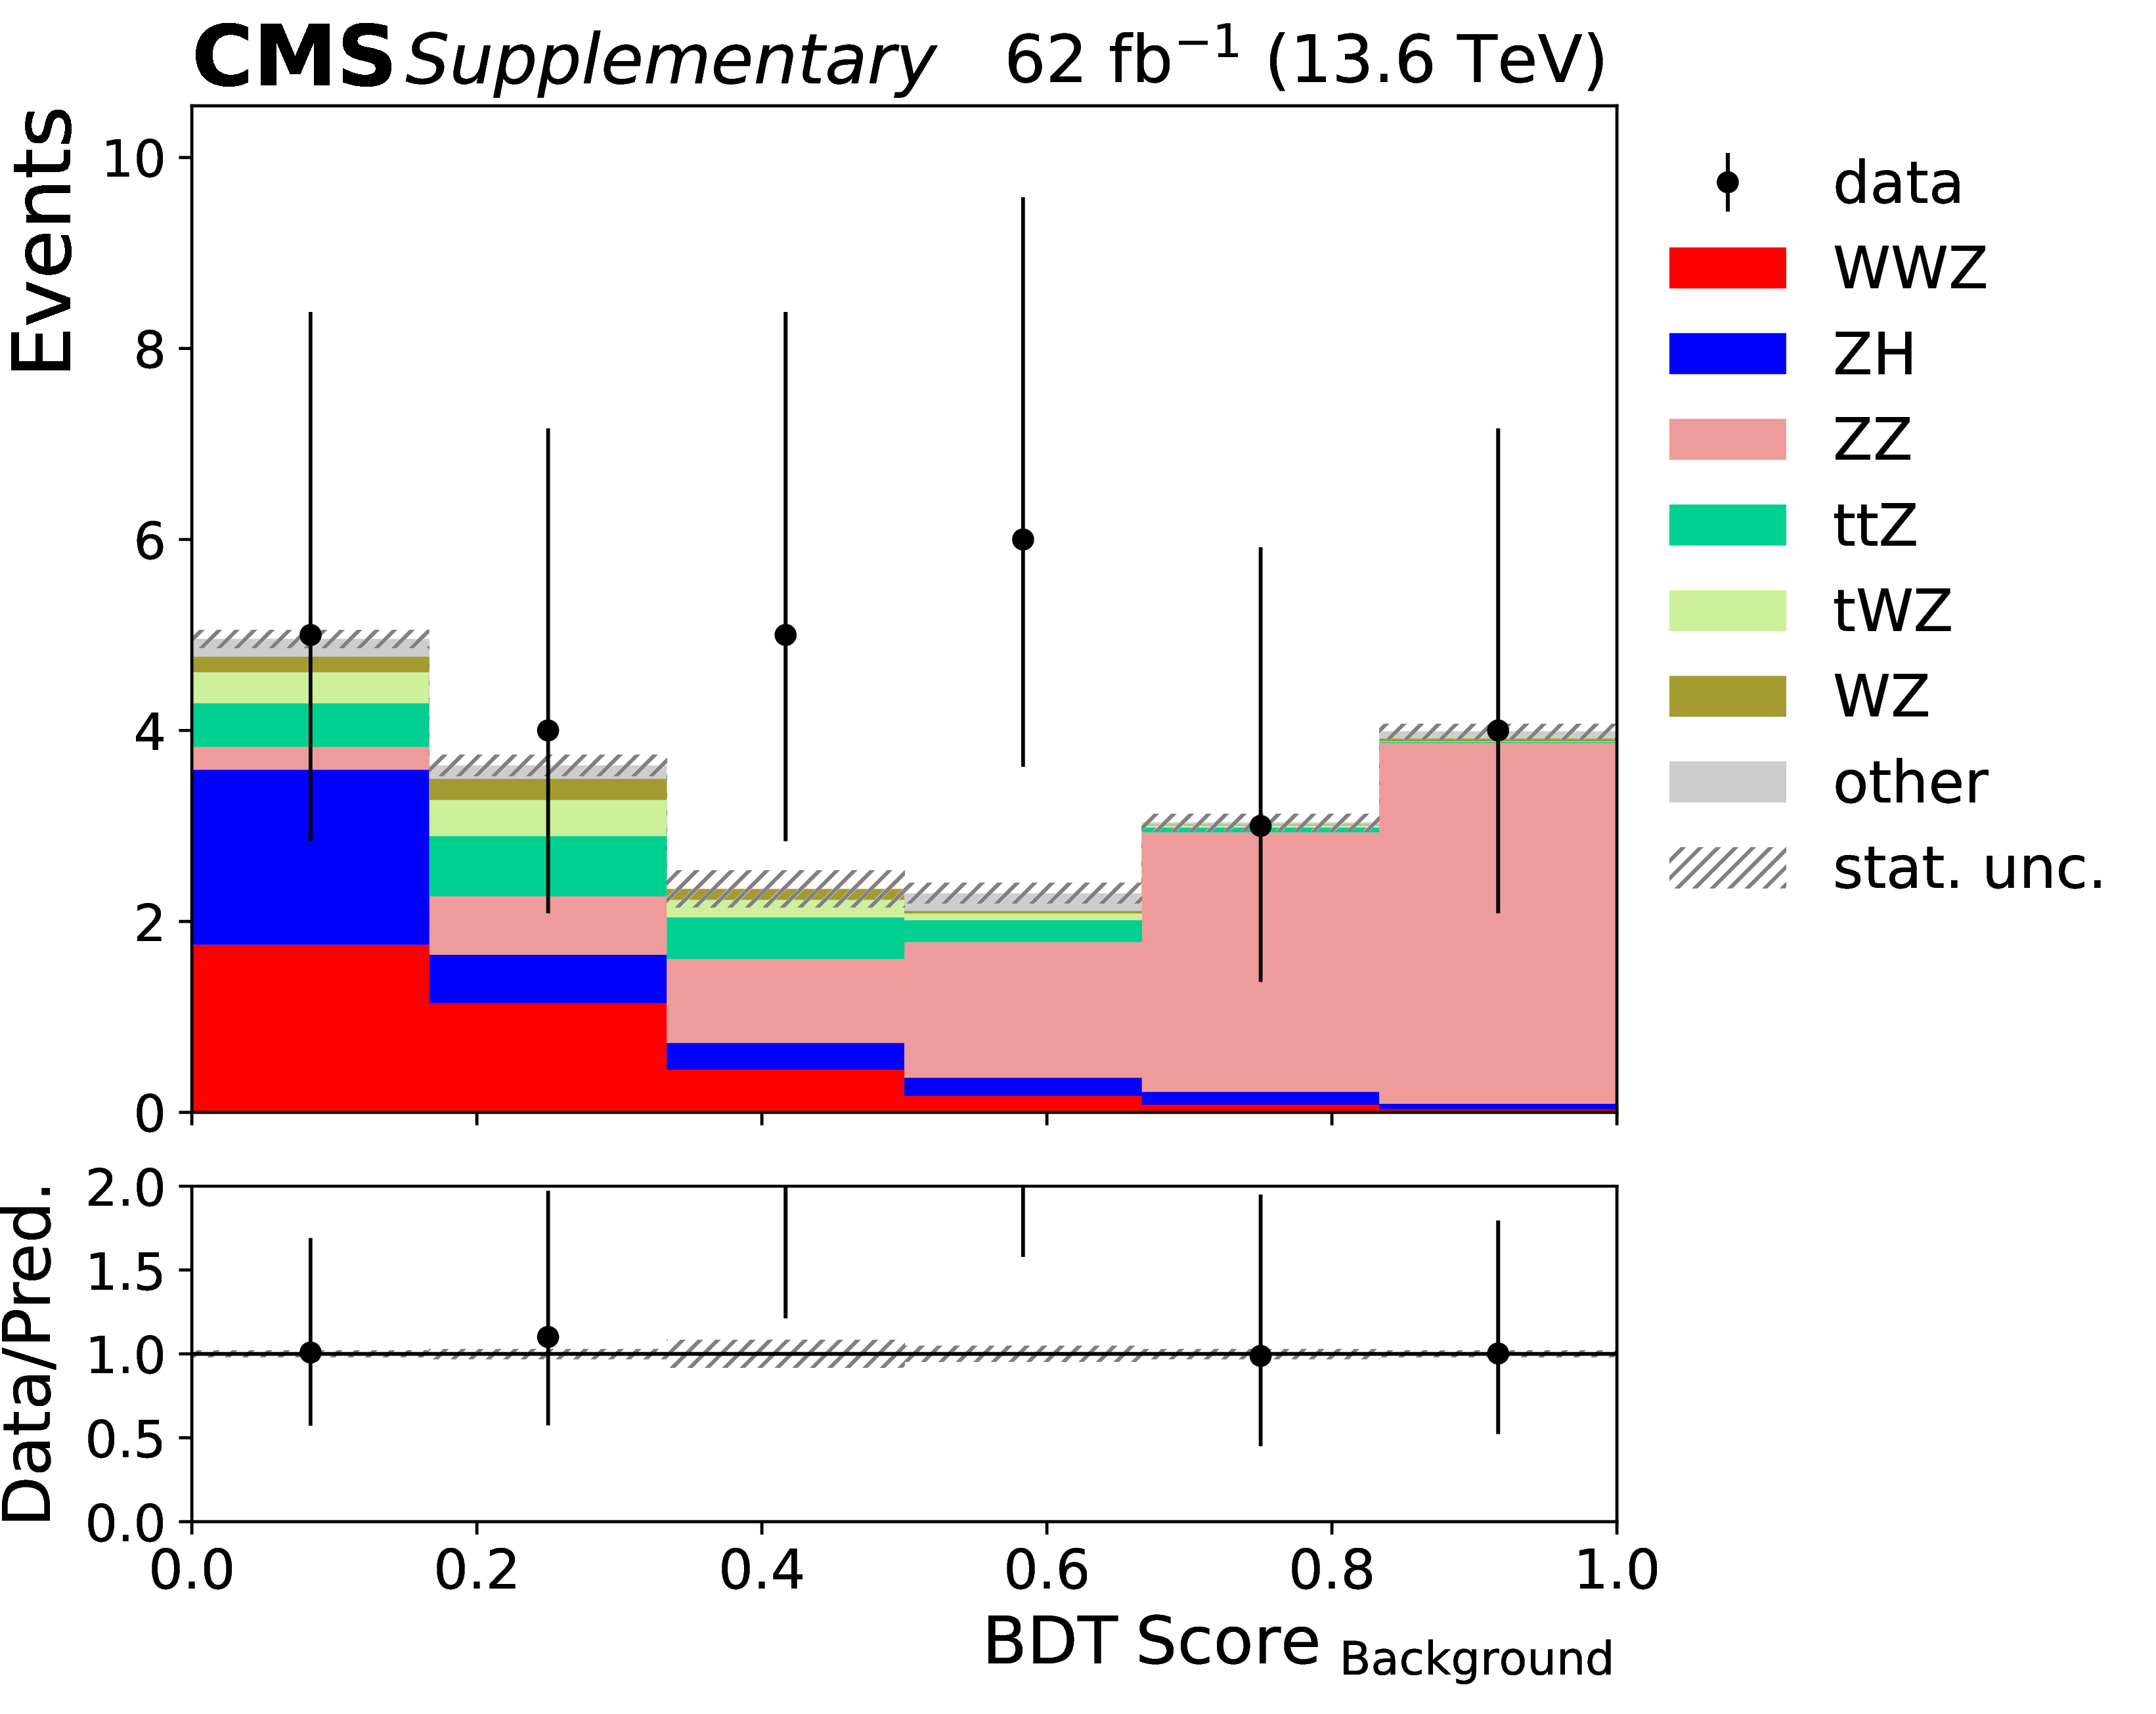
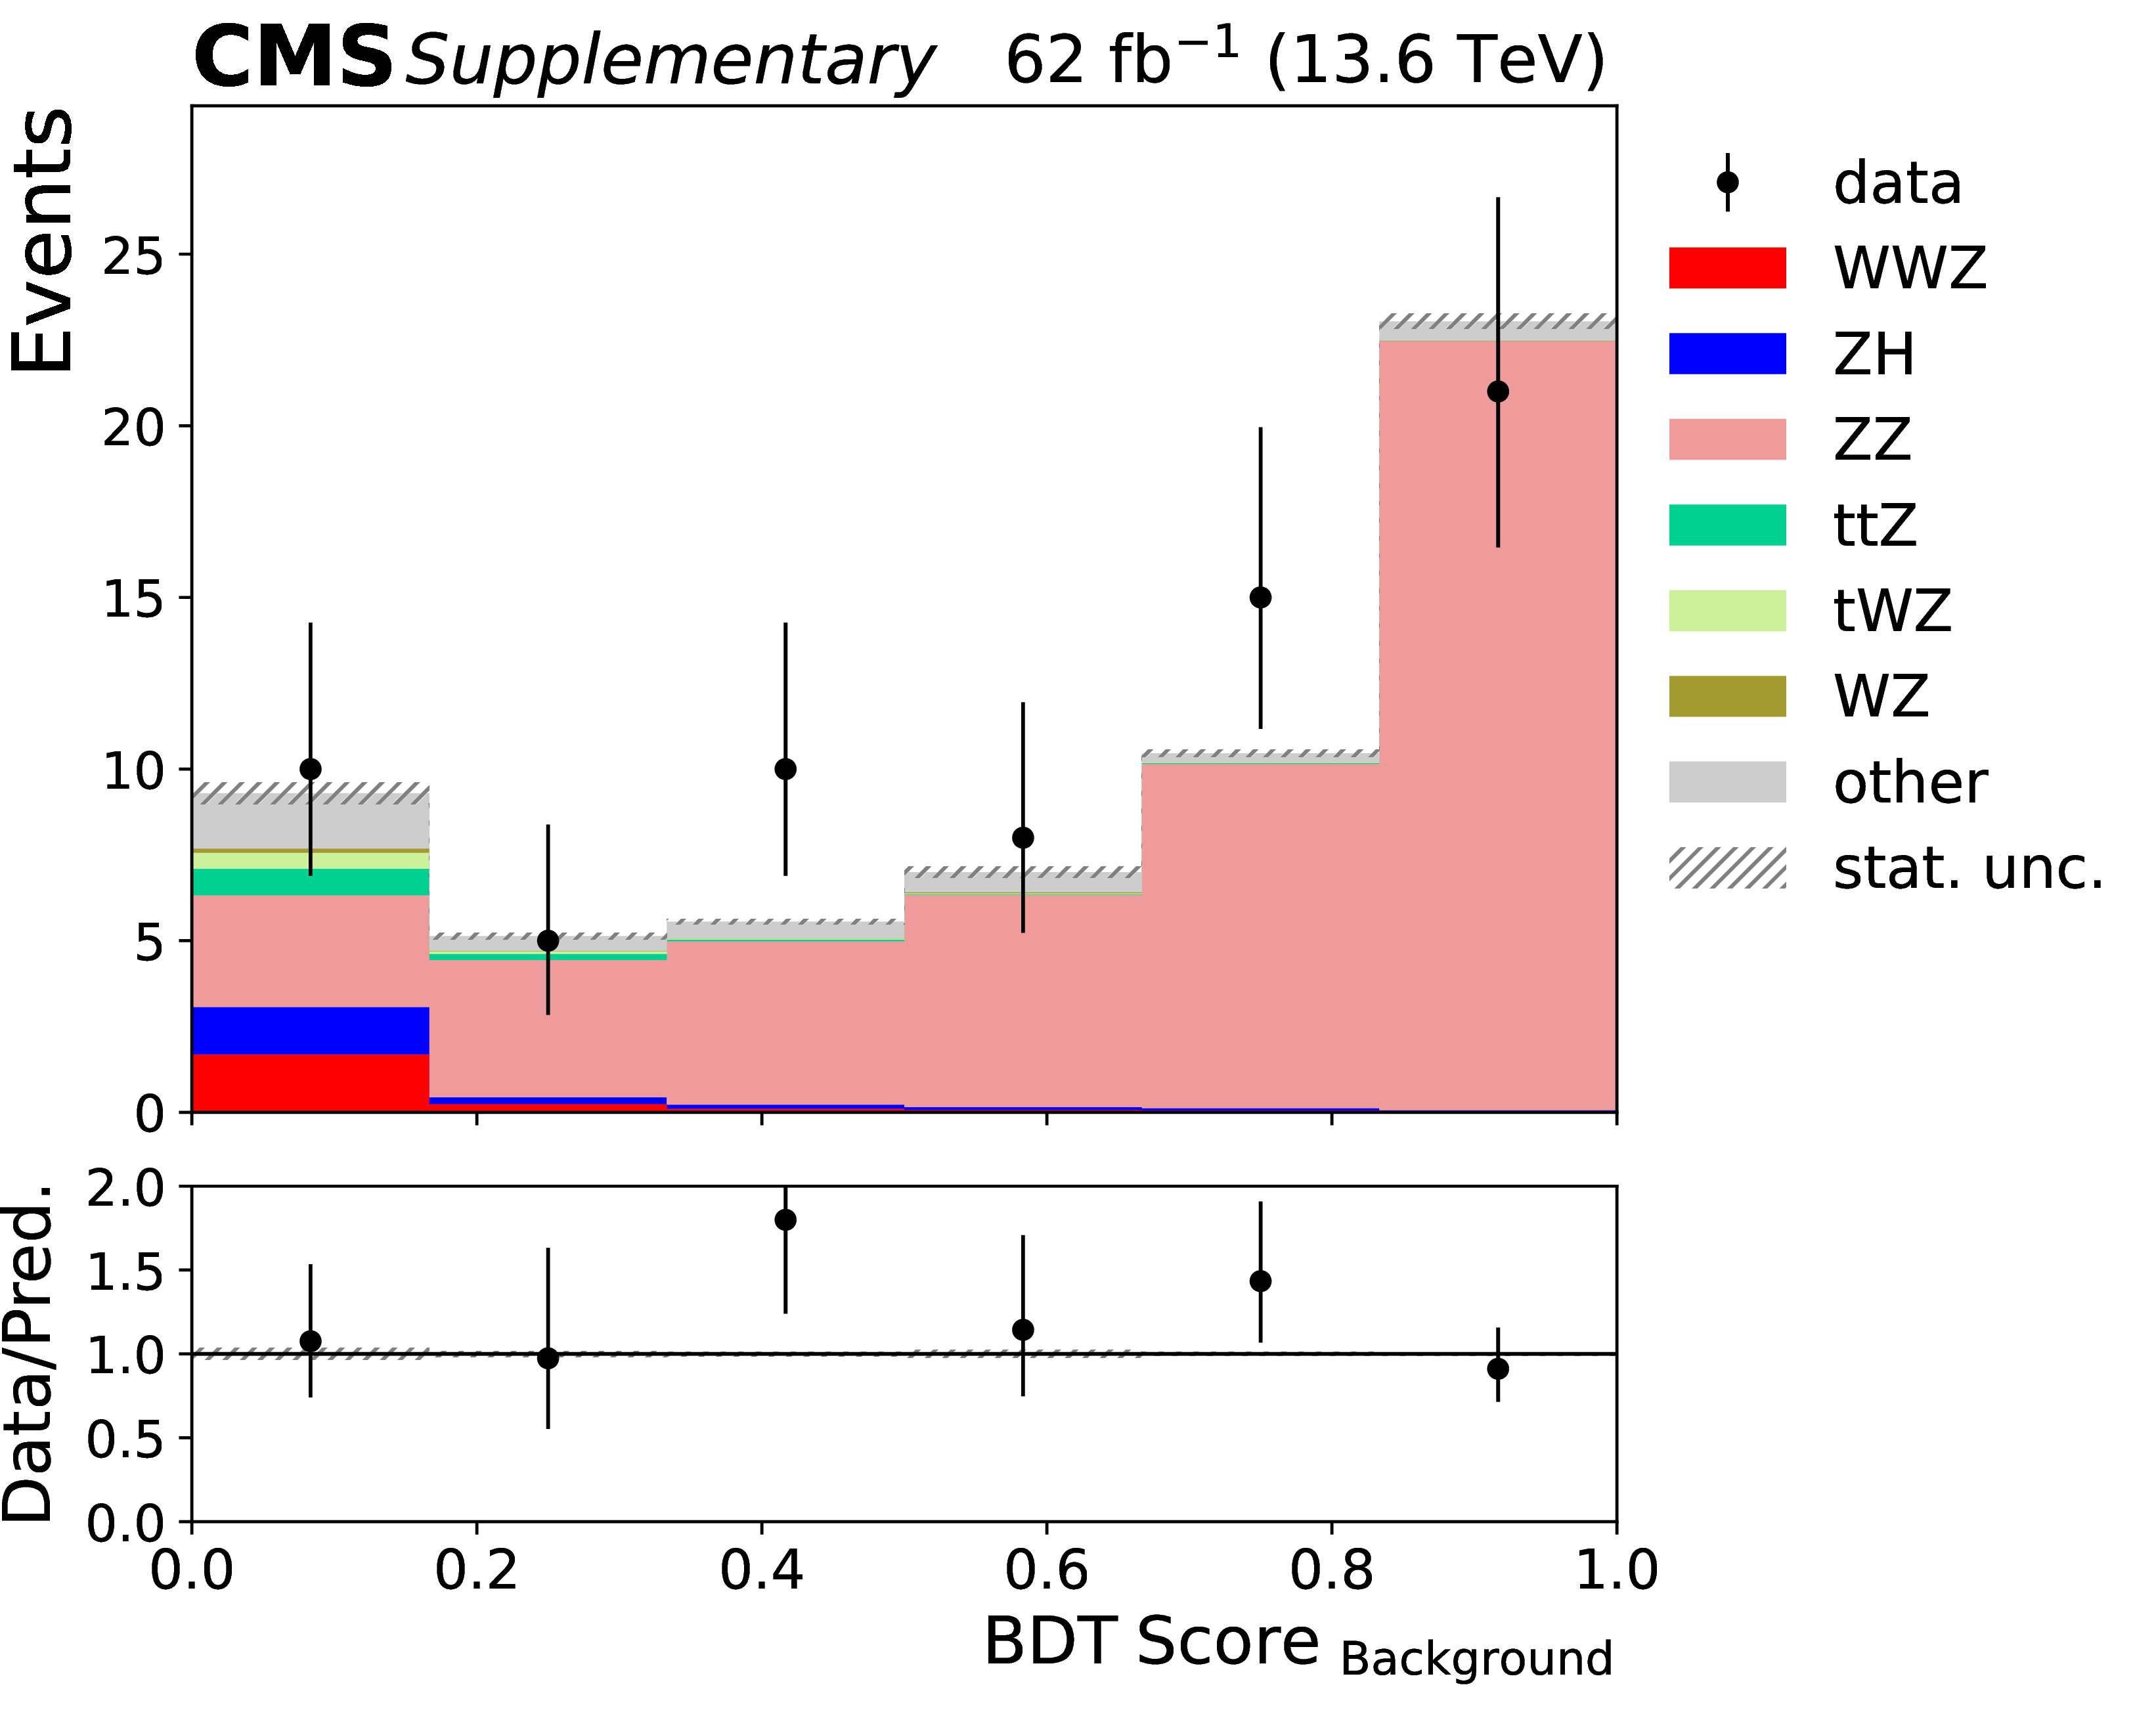
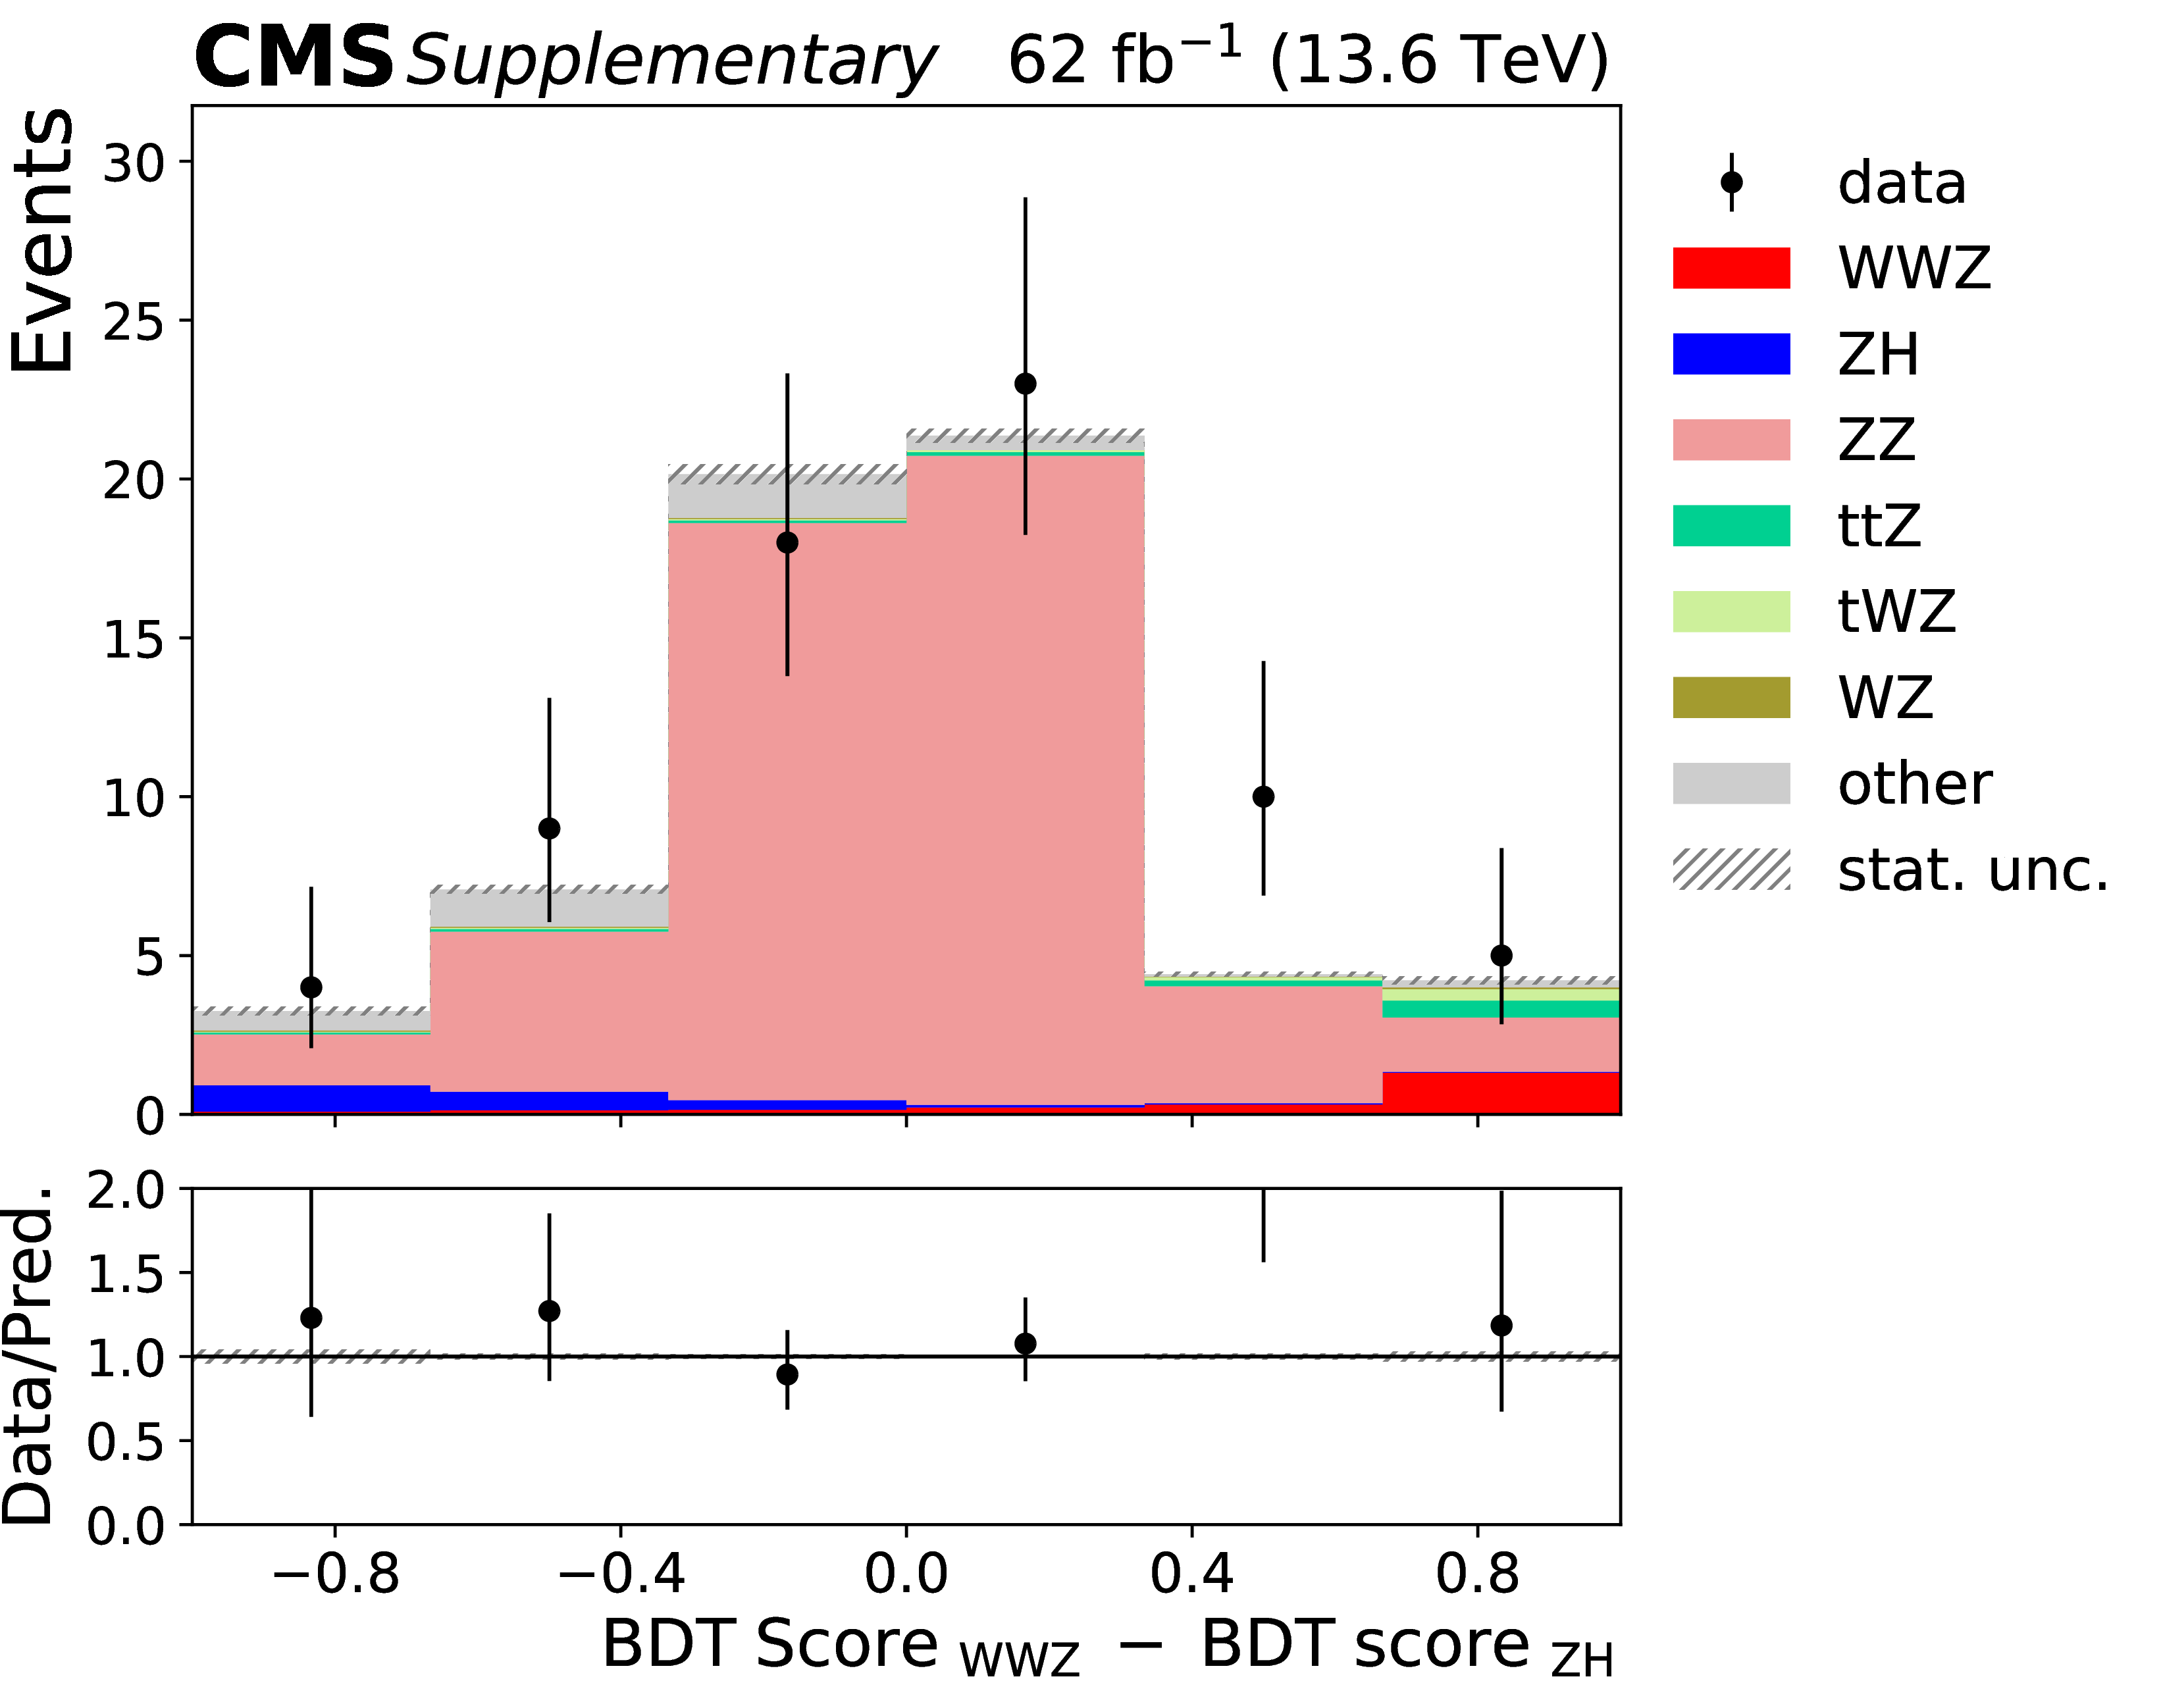
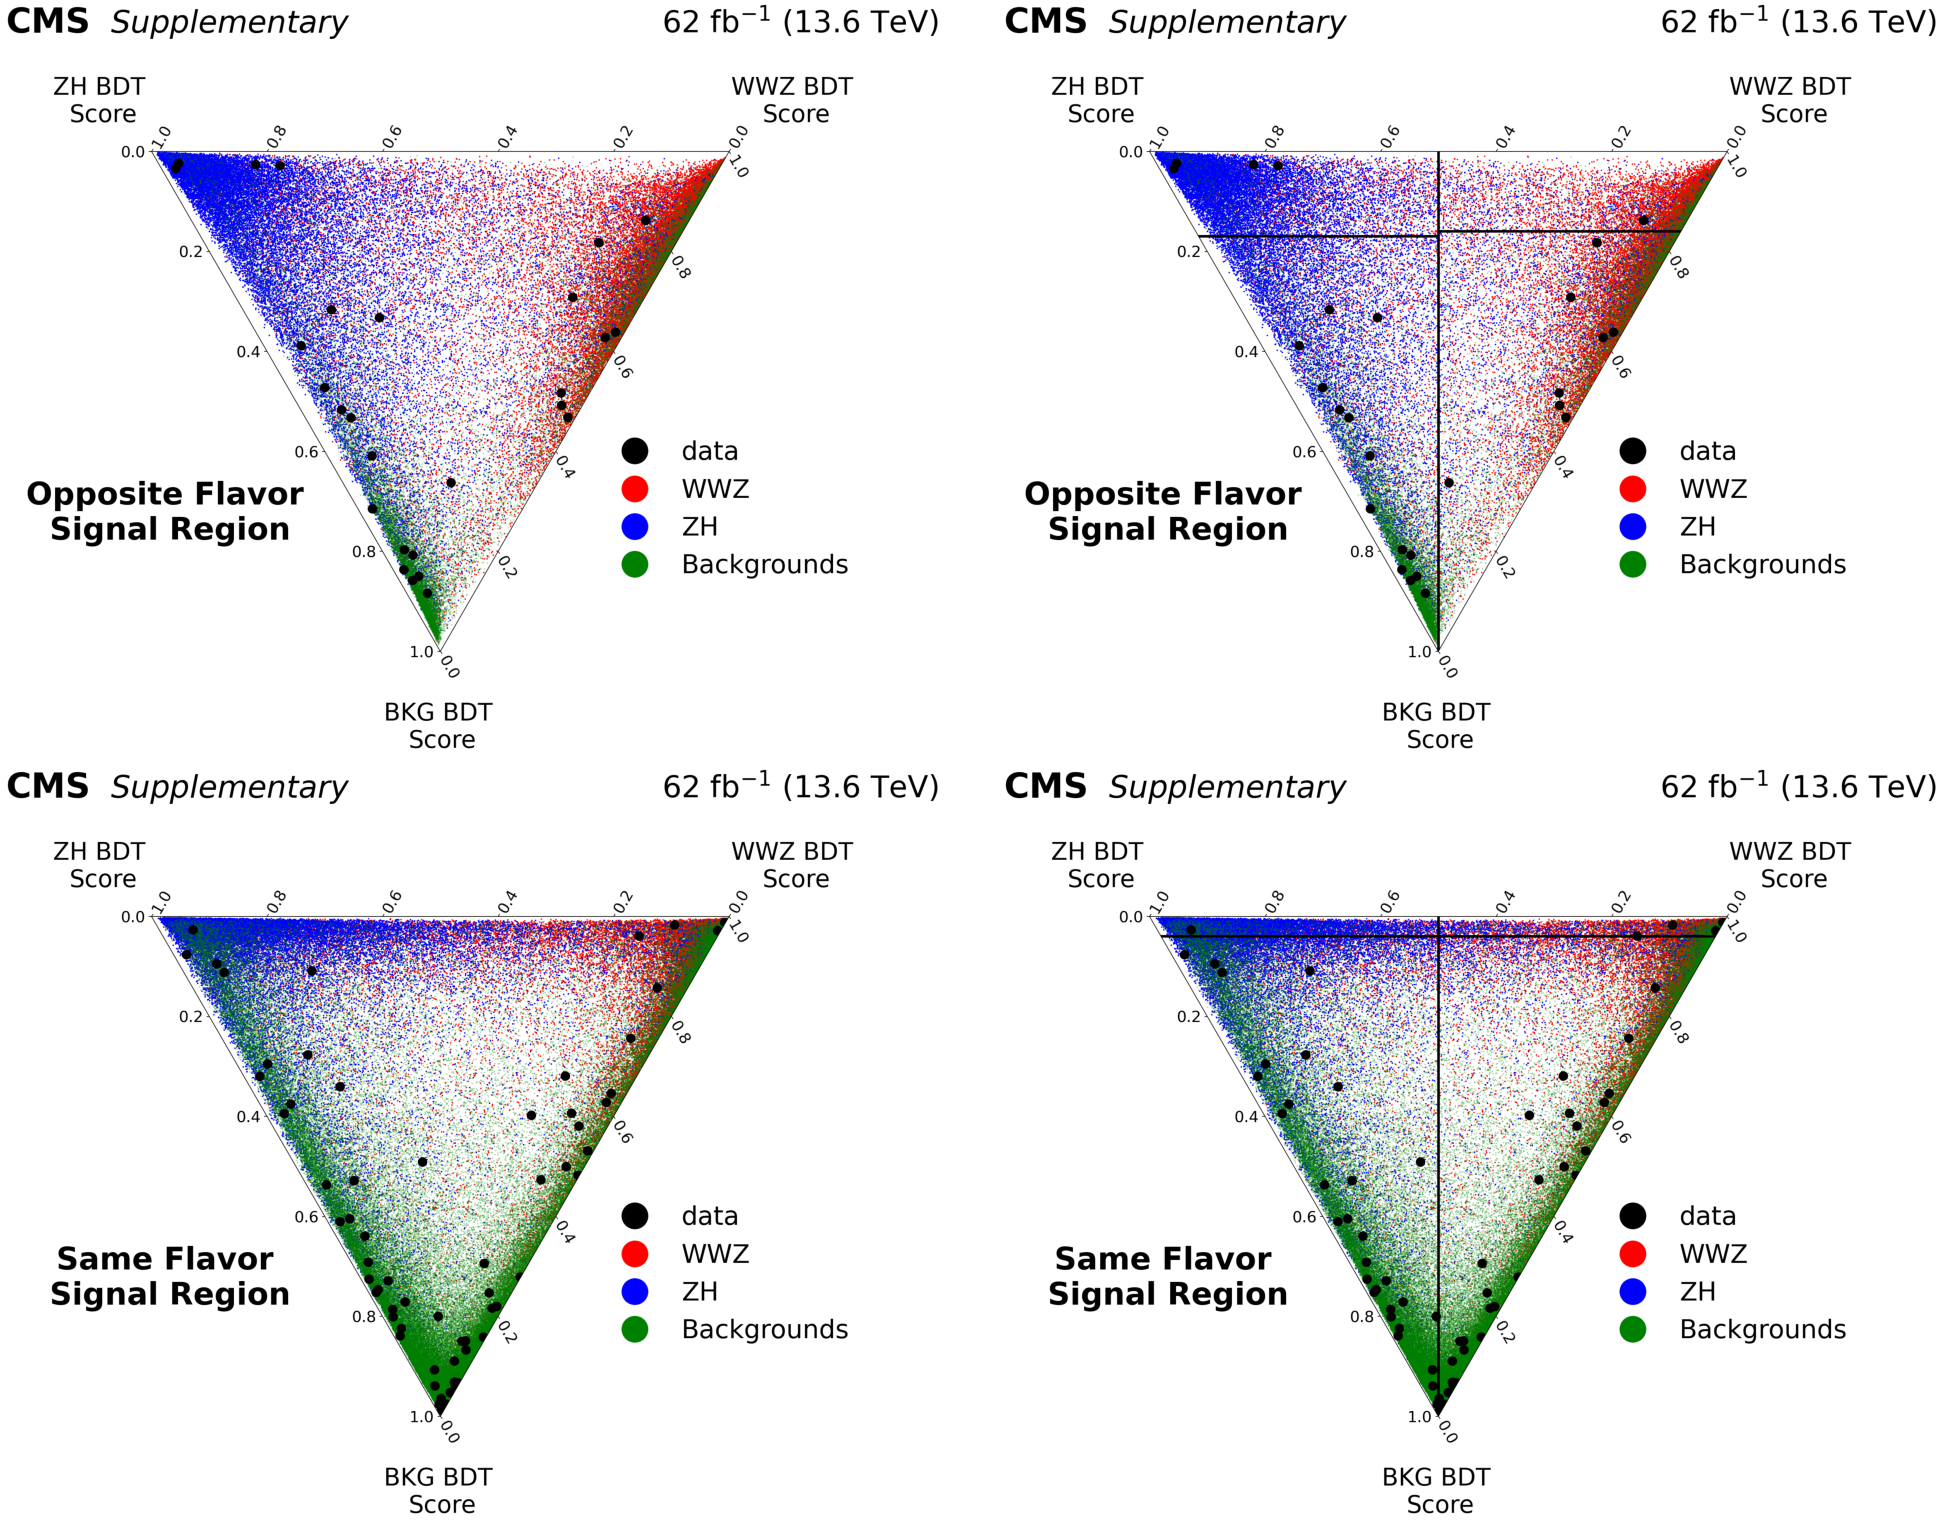
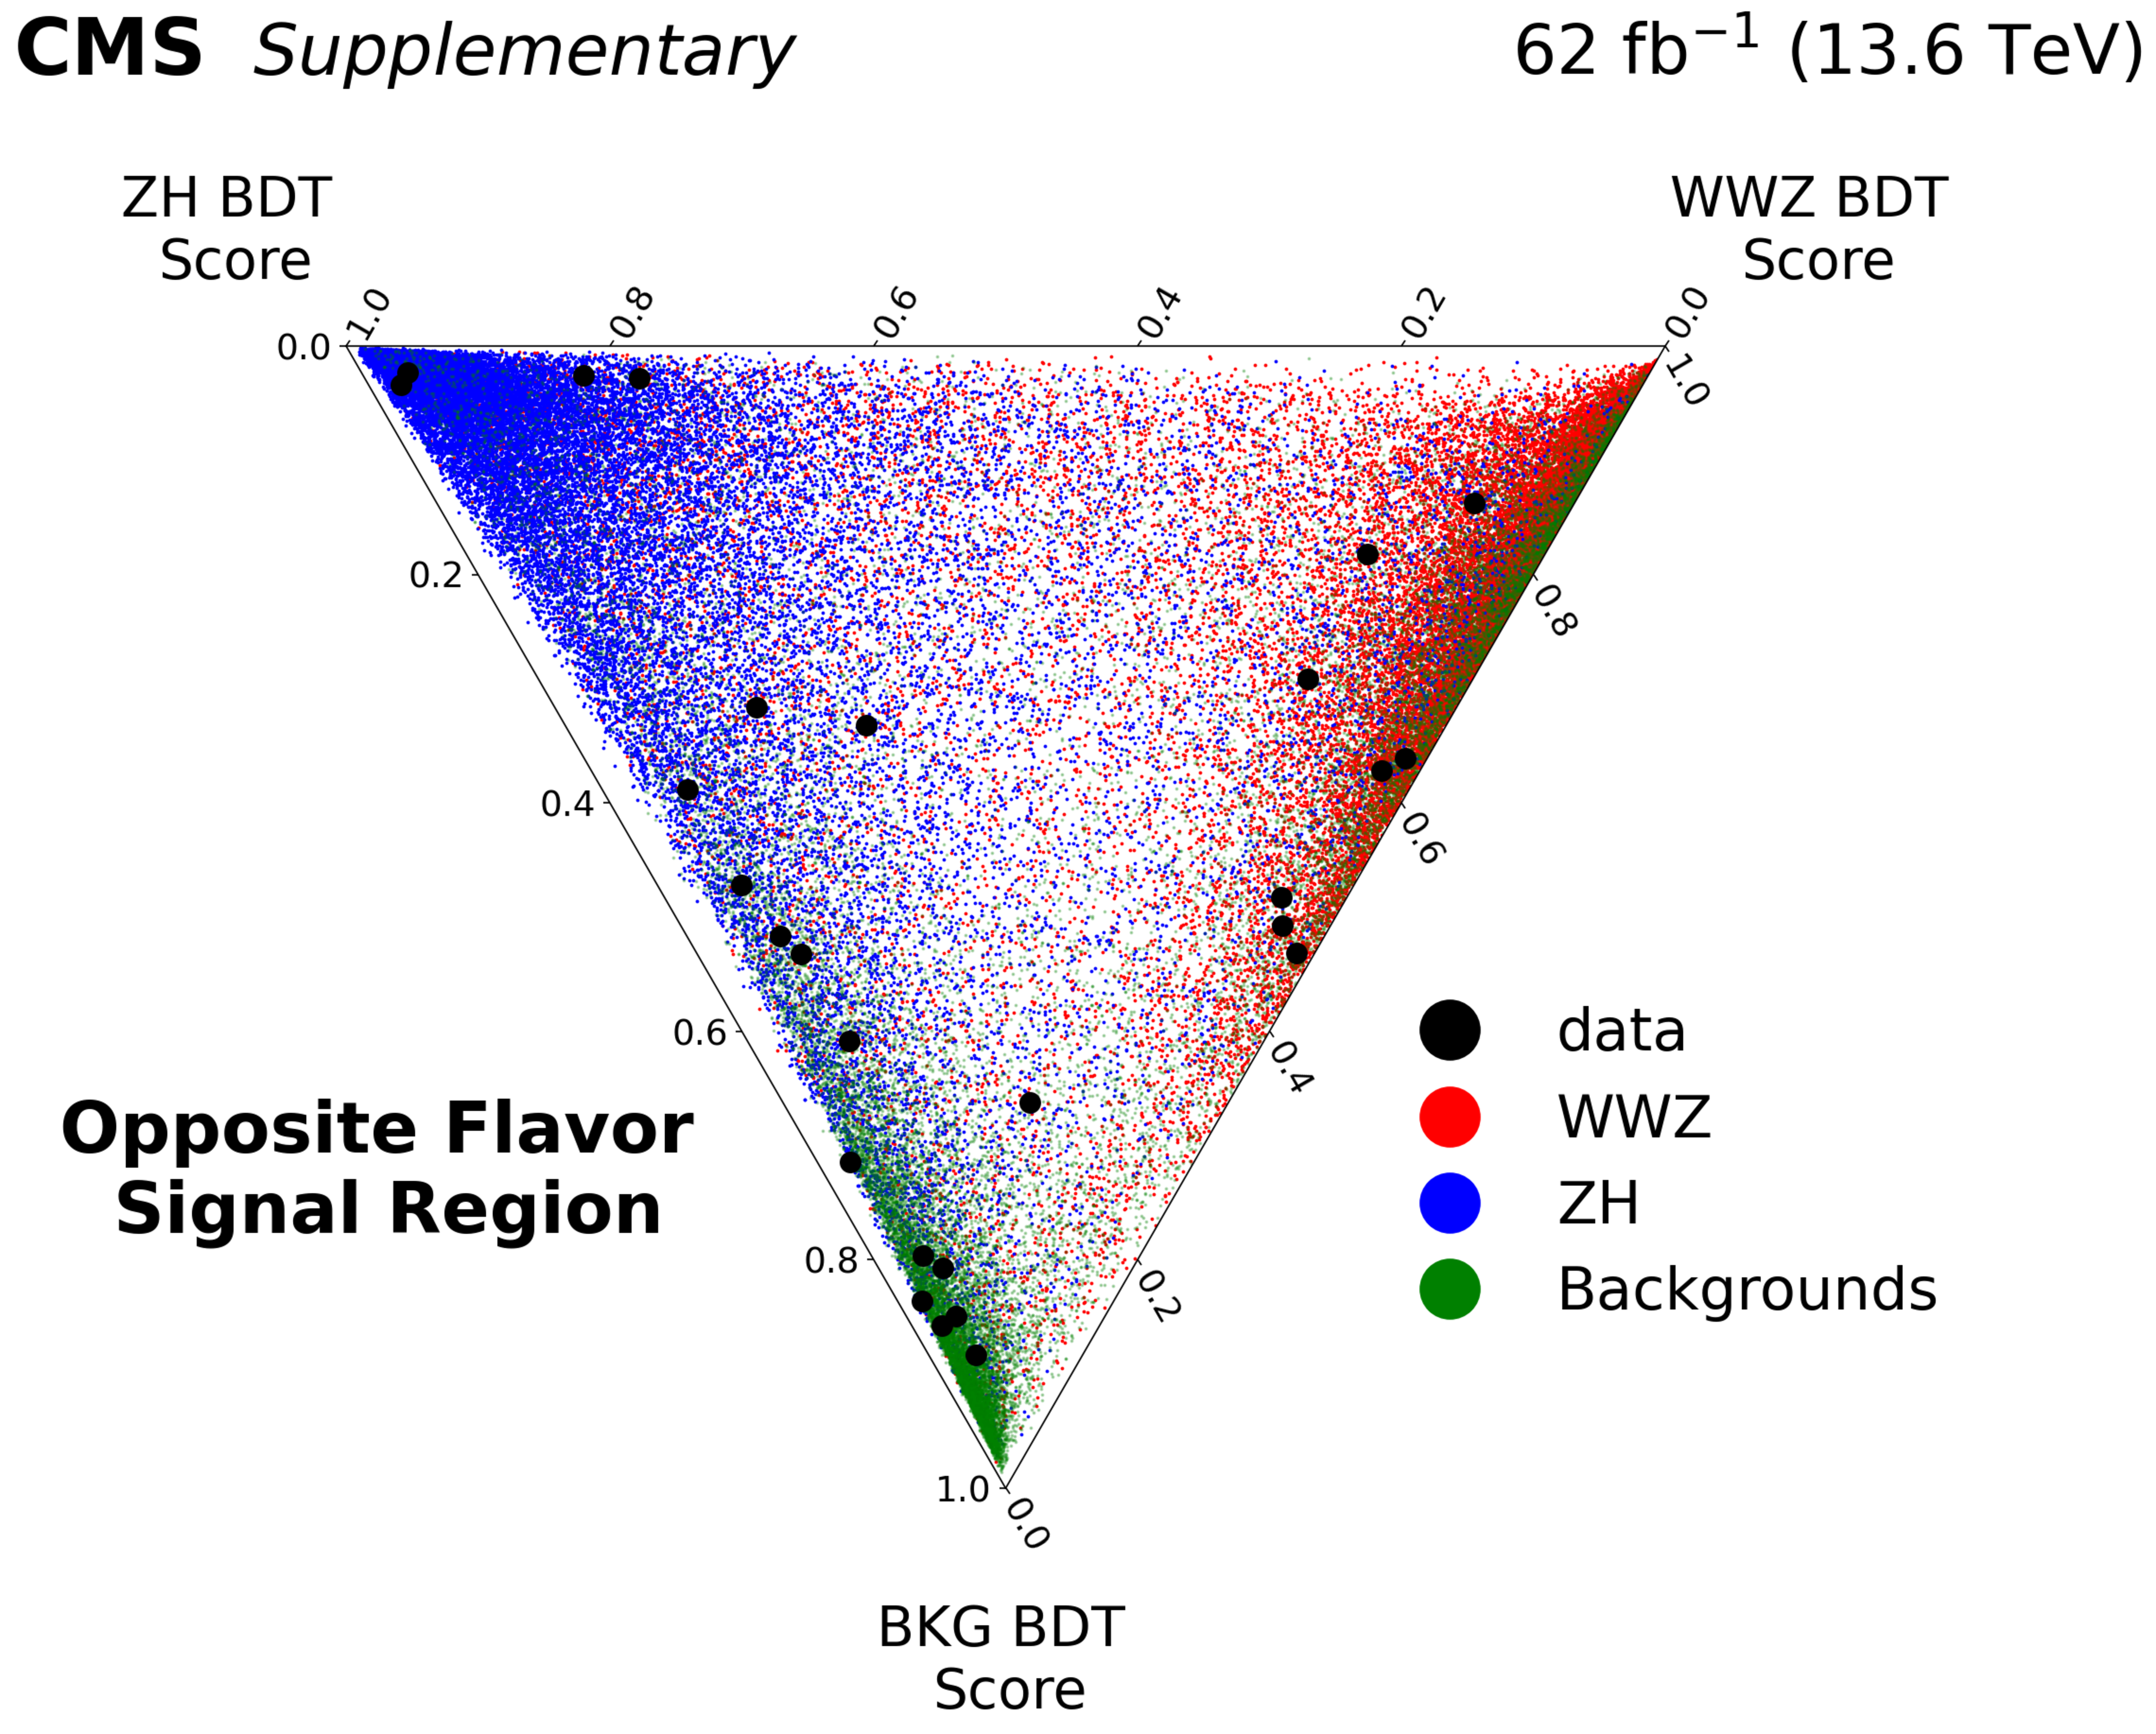
Additional Figure 1:
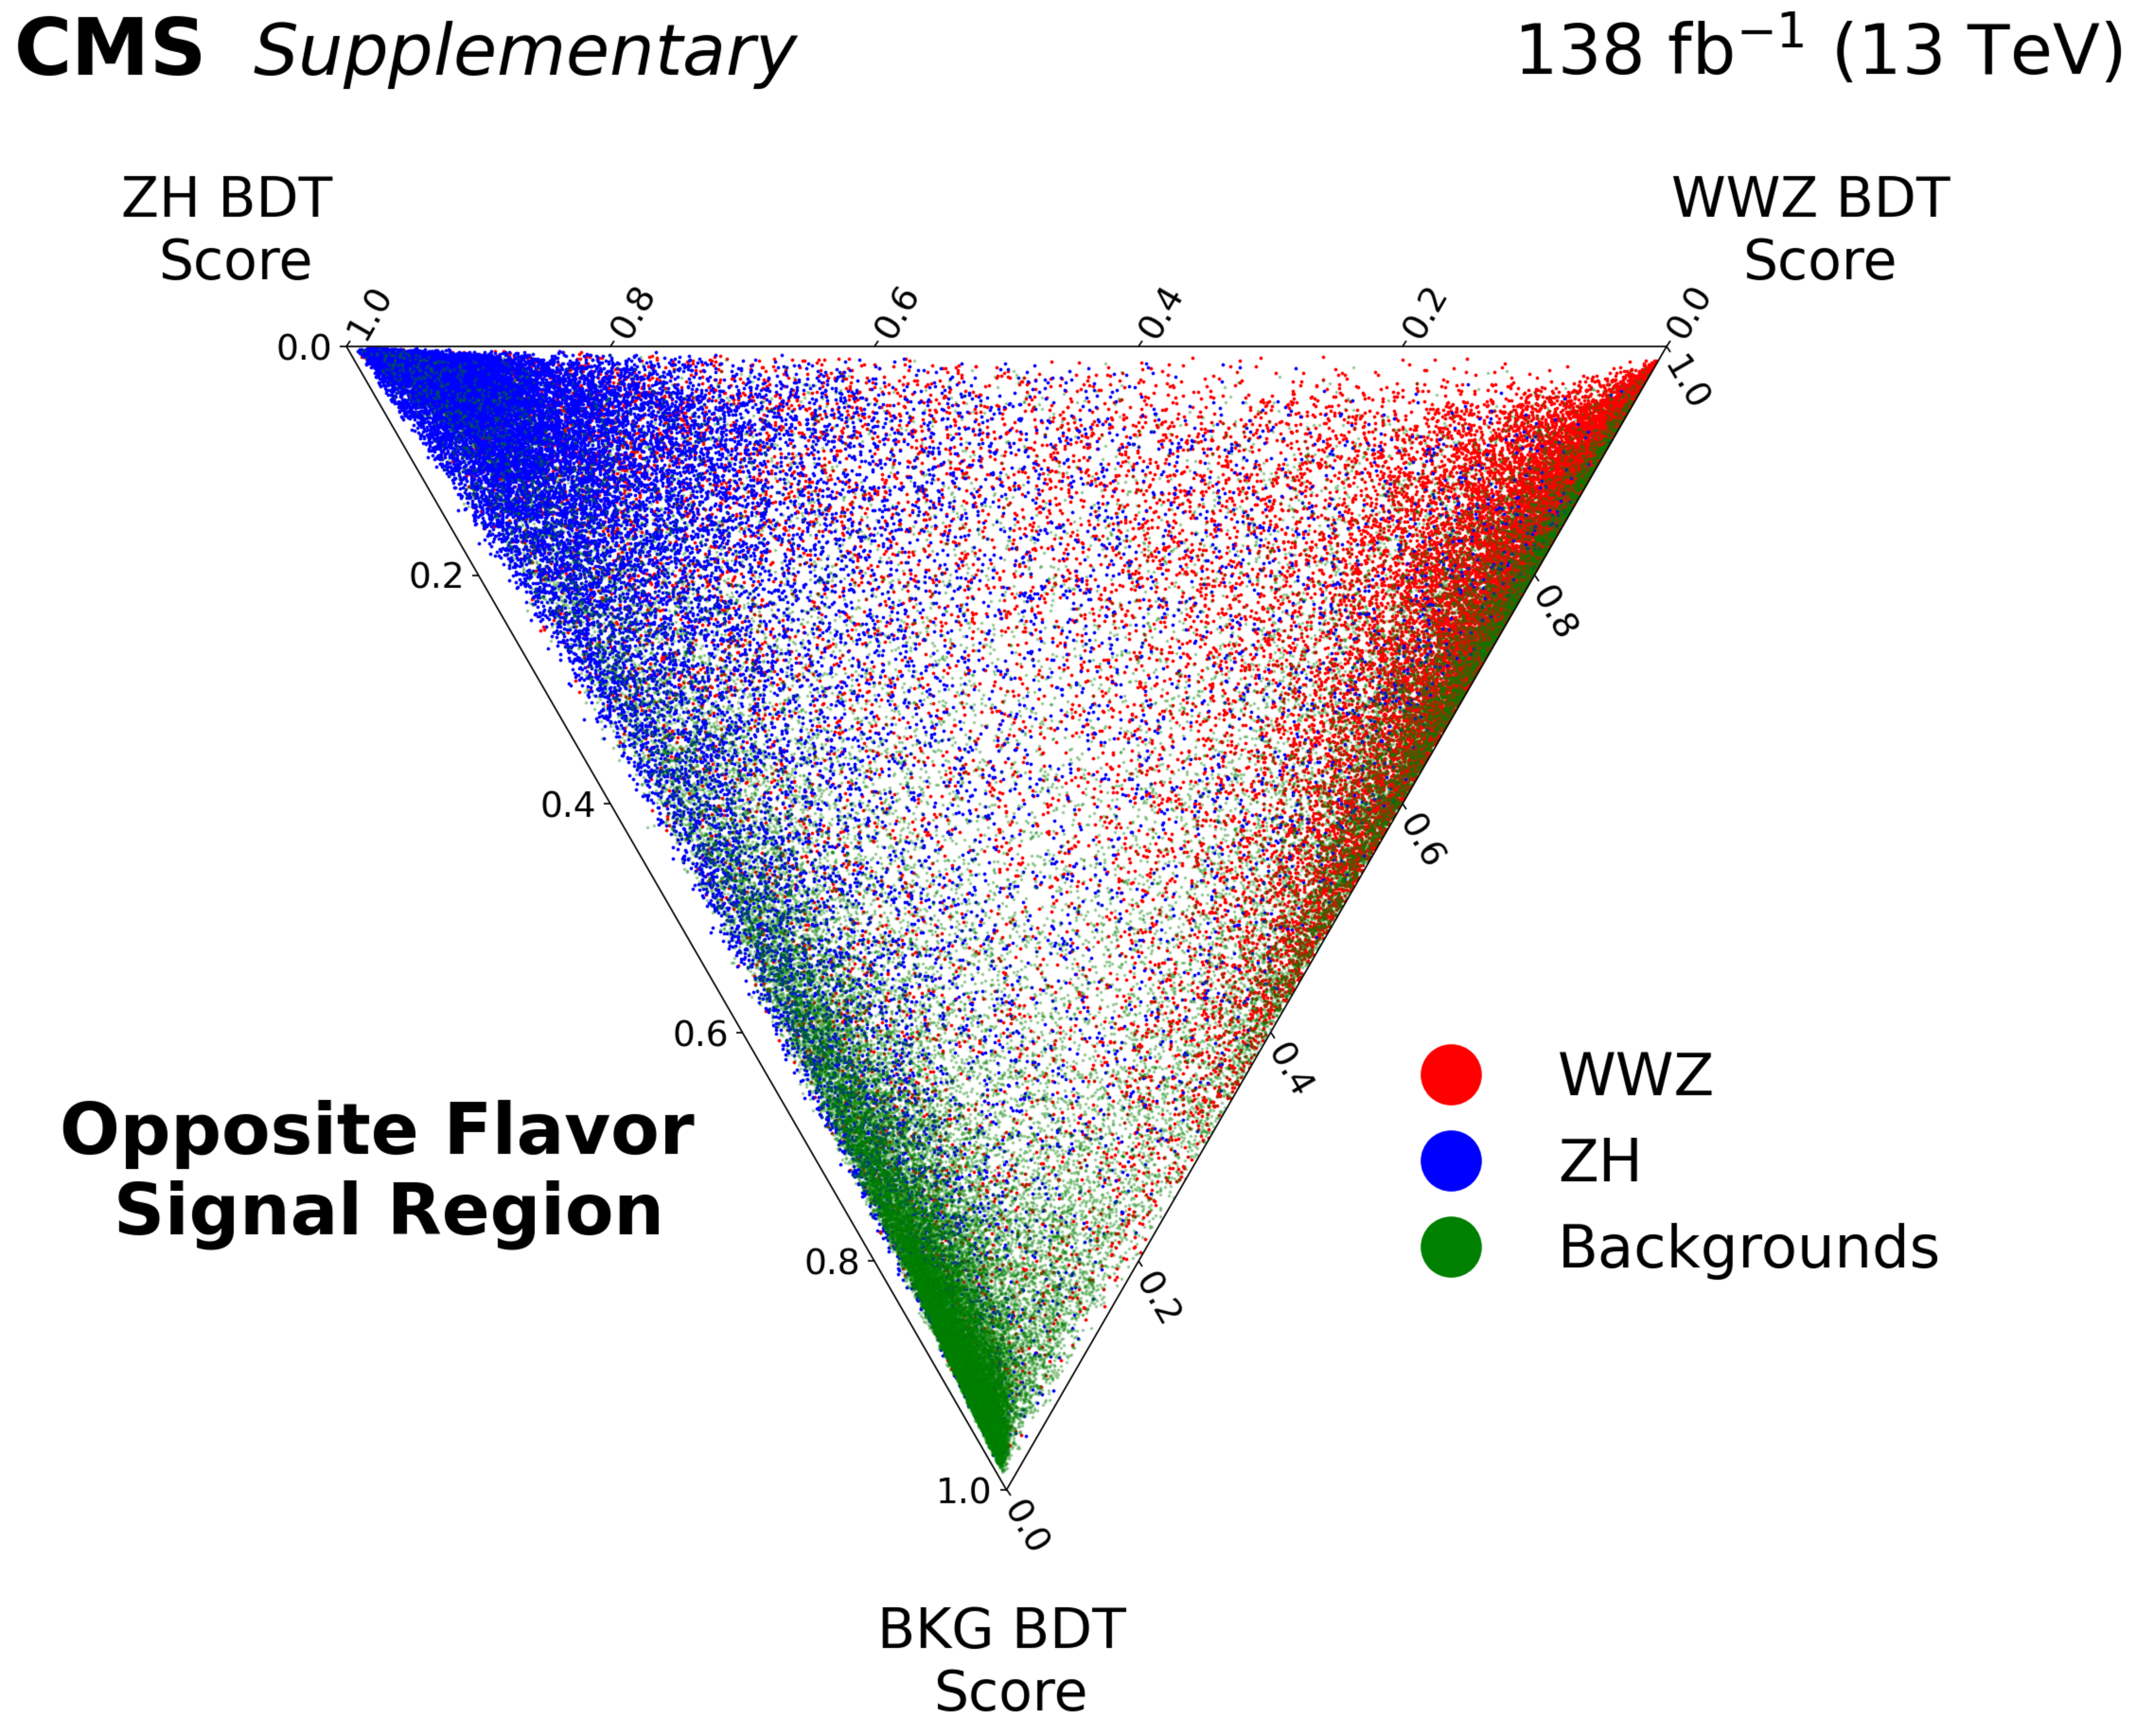
Distributions of BDT scores for the opposite-flavor signal region (for Run 2 data-taking periods). |
png pdf |
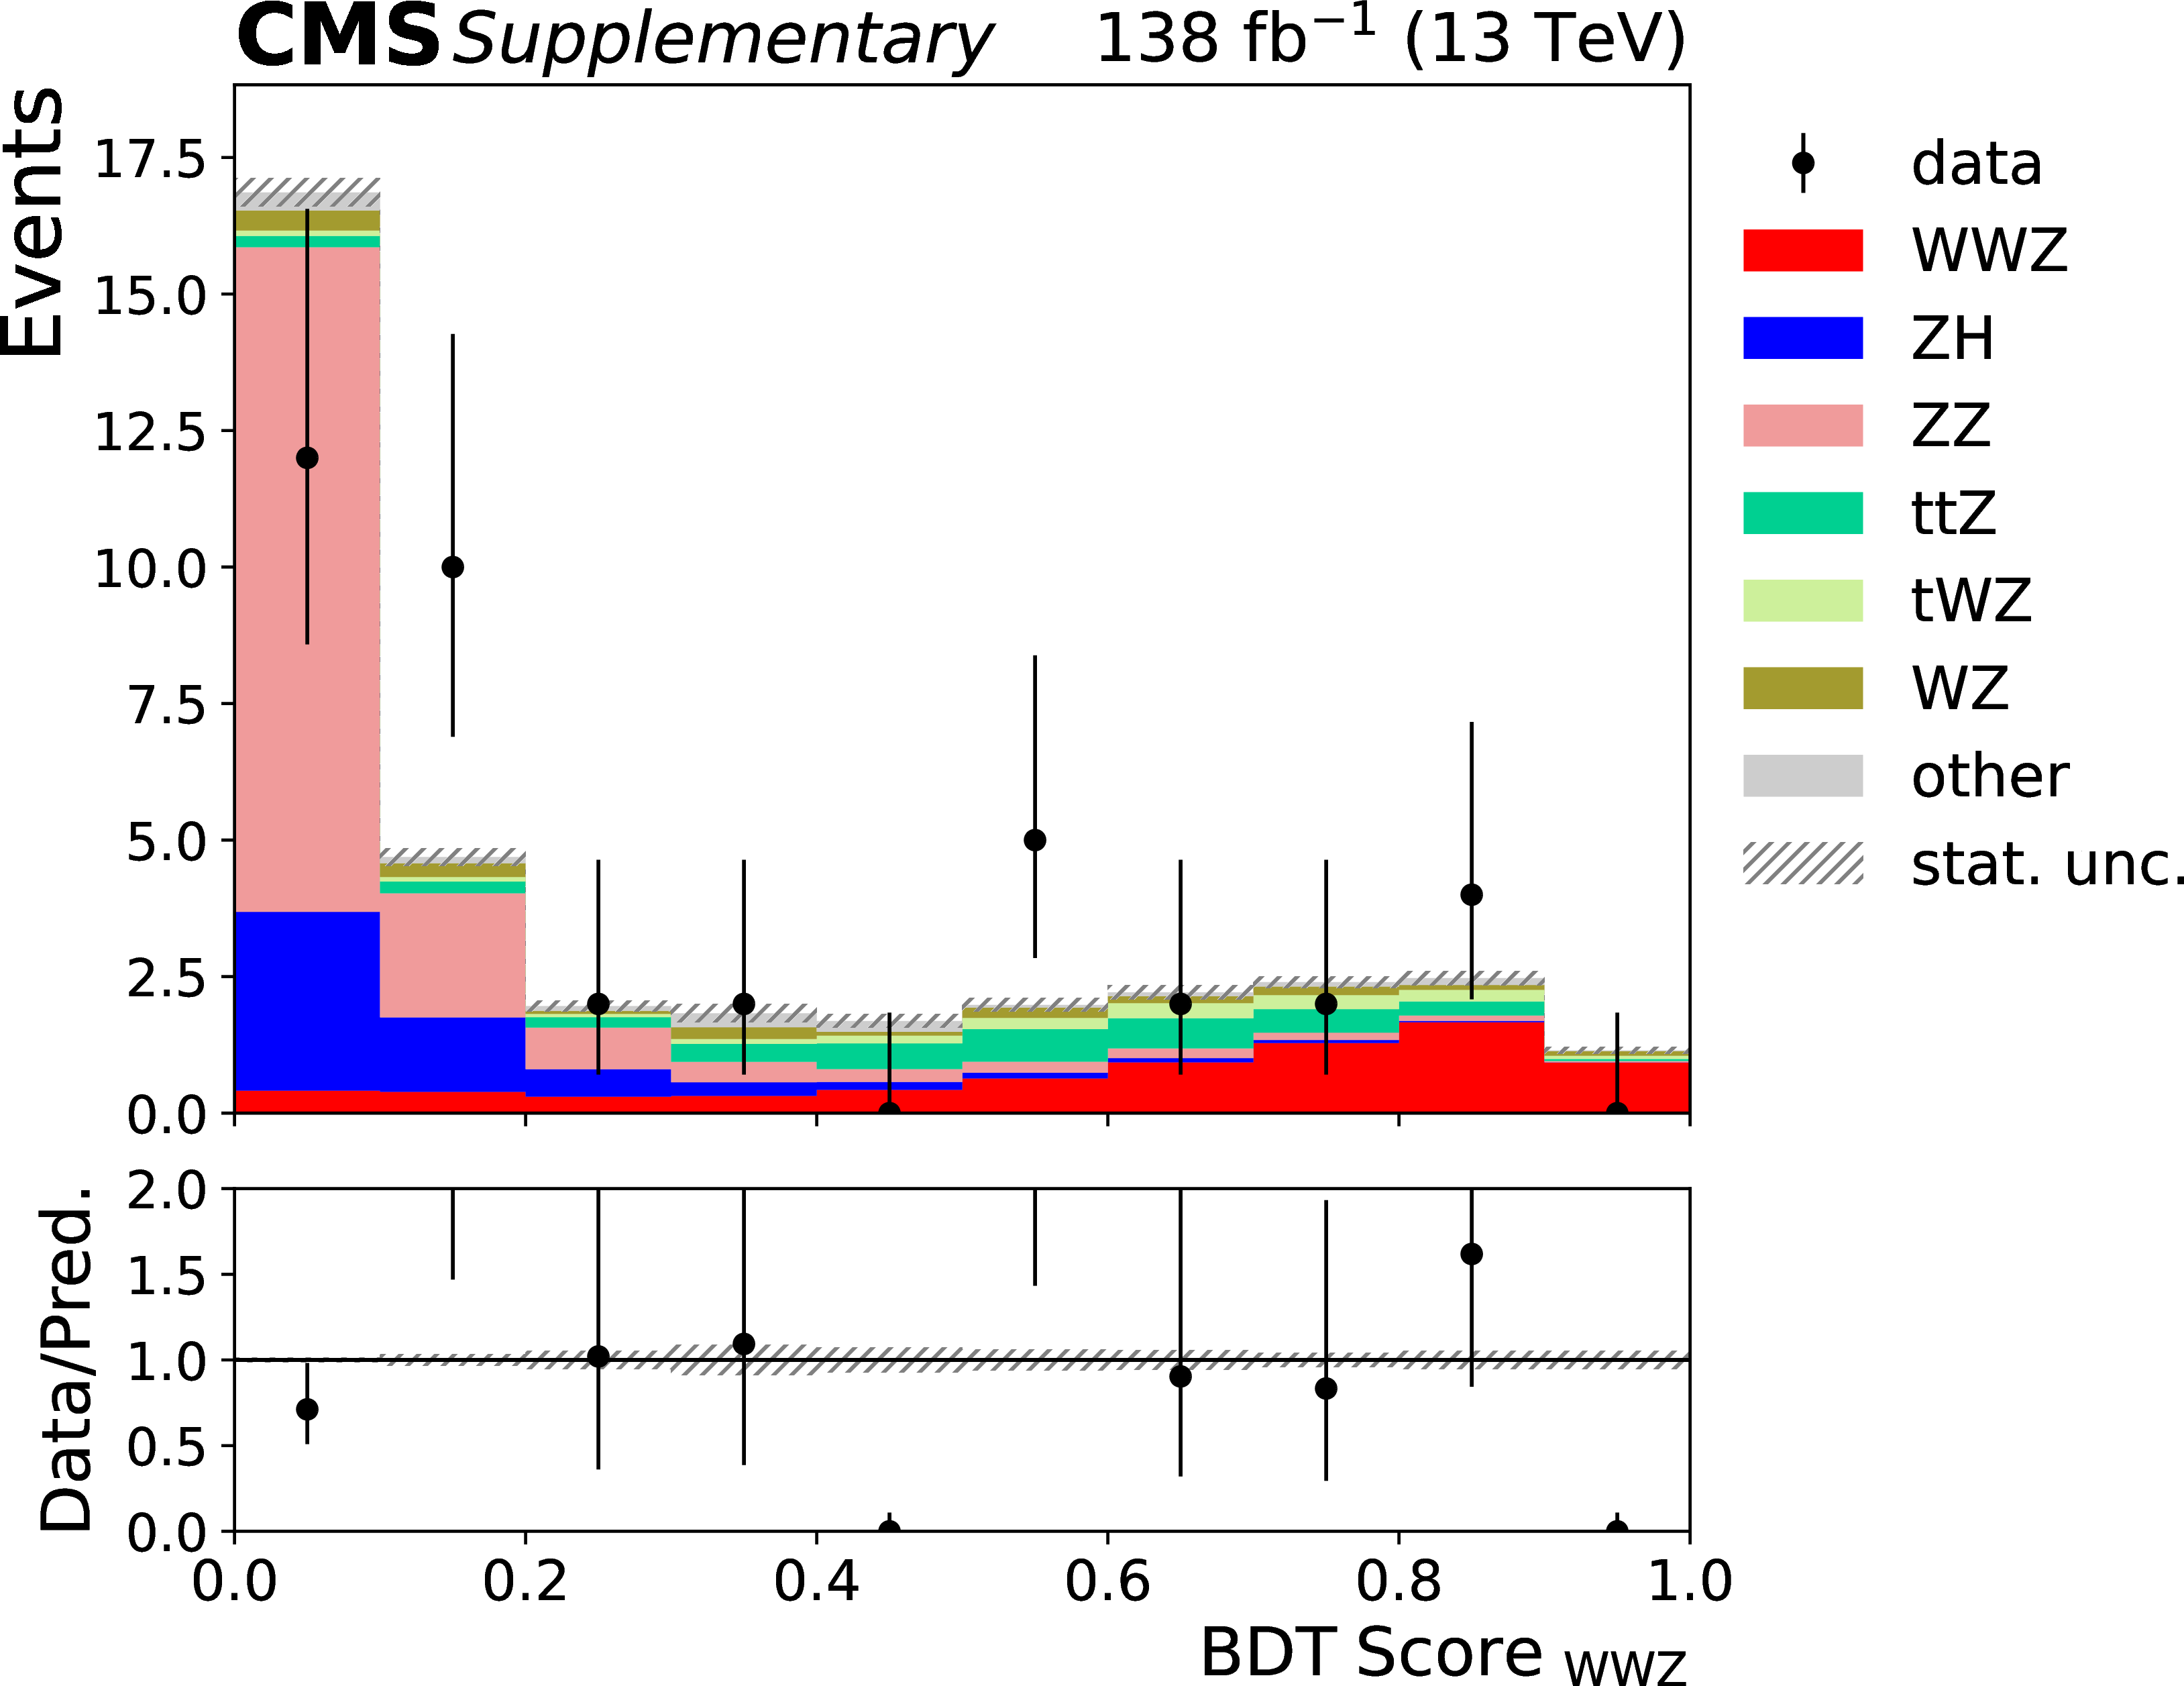
Additional Figure 1-a:
Distributions of BDT scores for the opposite-flavor signal region (for Run 2 data-taking periods). |
png pdf |
Additional Figure 1-b:
Distributions of BDT scores for the opposite-flavor signal region (for Run 2 data-taking periods). |
png pdf |
Additional Figure 1-c:
Distributions of BDT scores for the opposite-flavor signal region (for Run 2 data-taking periods). |
png pdf |
Additional Figure 1-d:
Distributions of BDT scores for the opposite-flavor signal region (for Run 2 data-taking periods). |
png pdf |
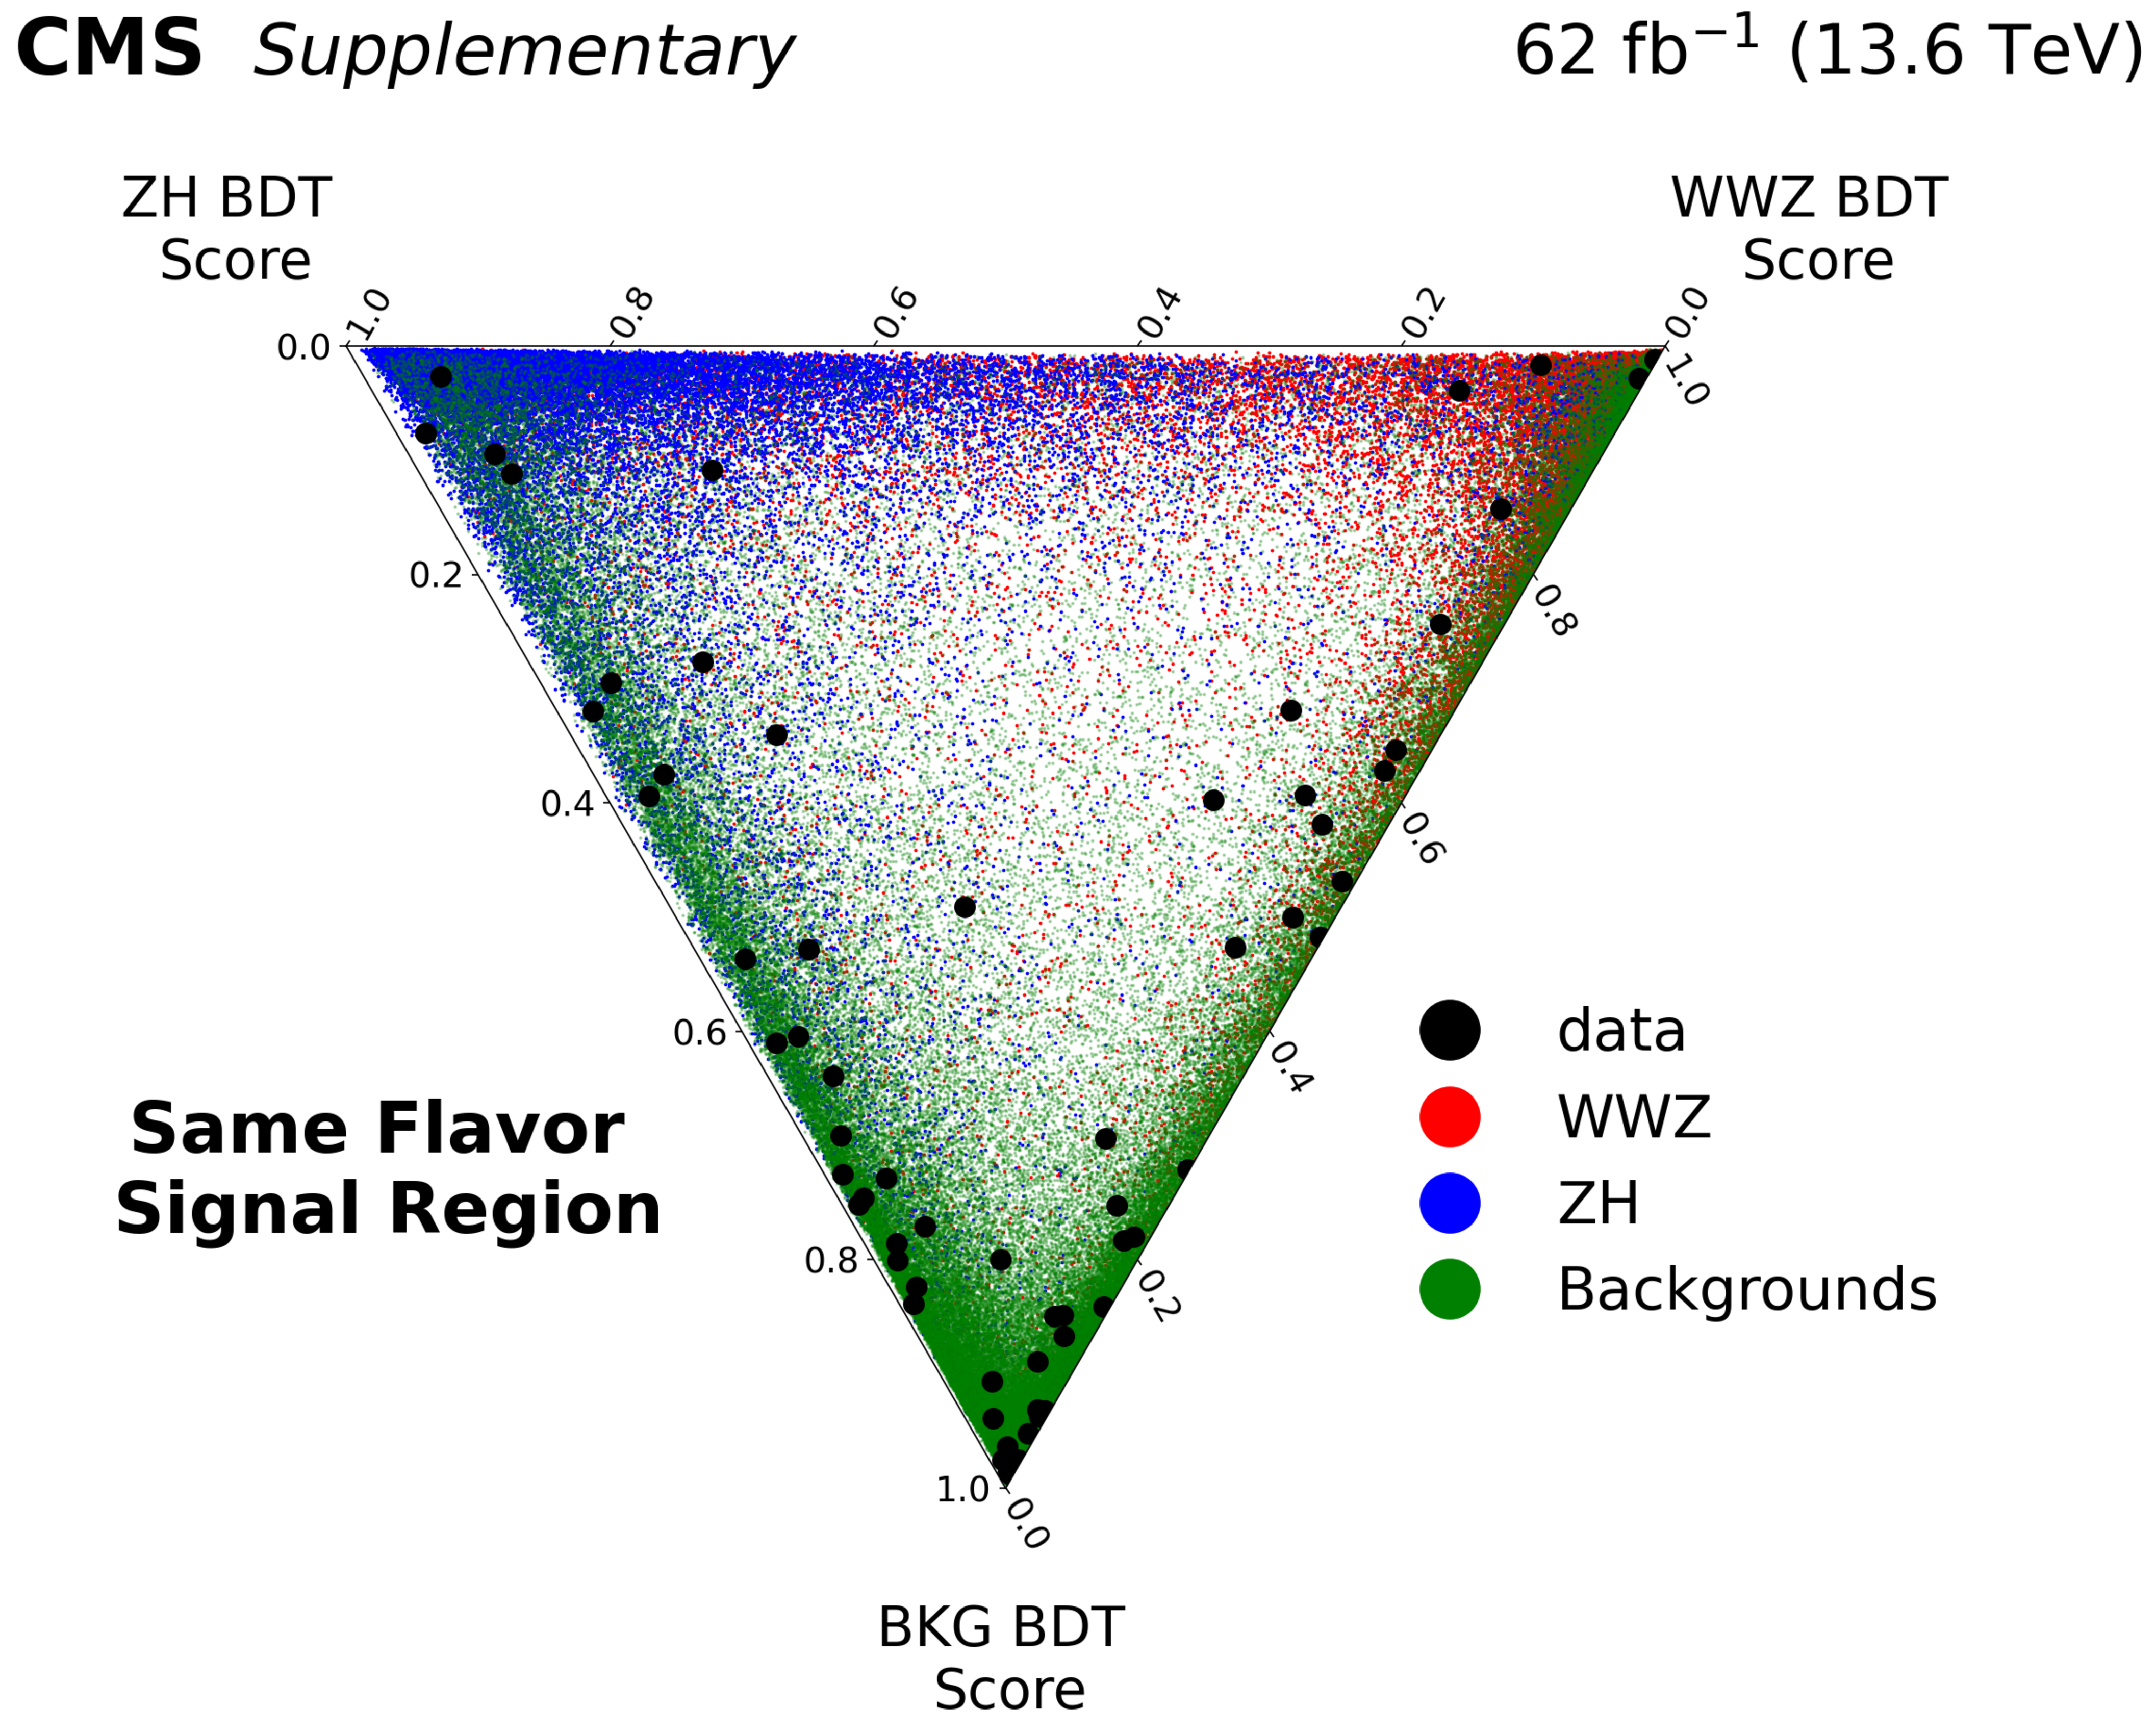
Additional Figure 2:
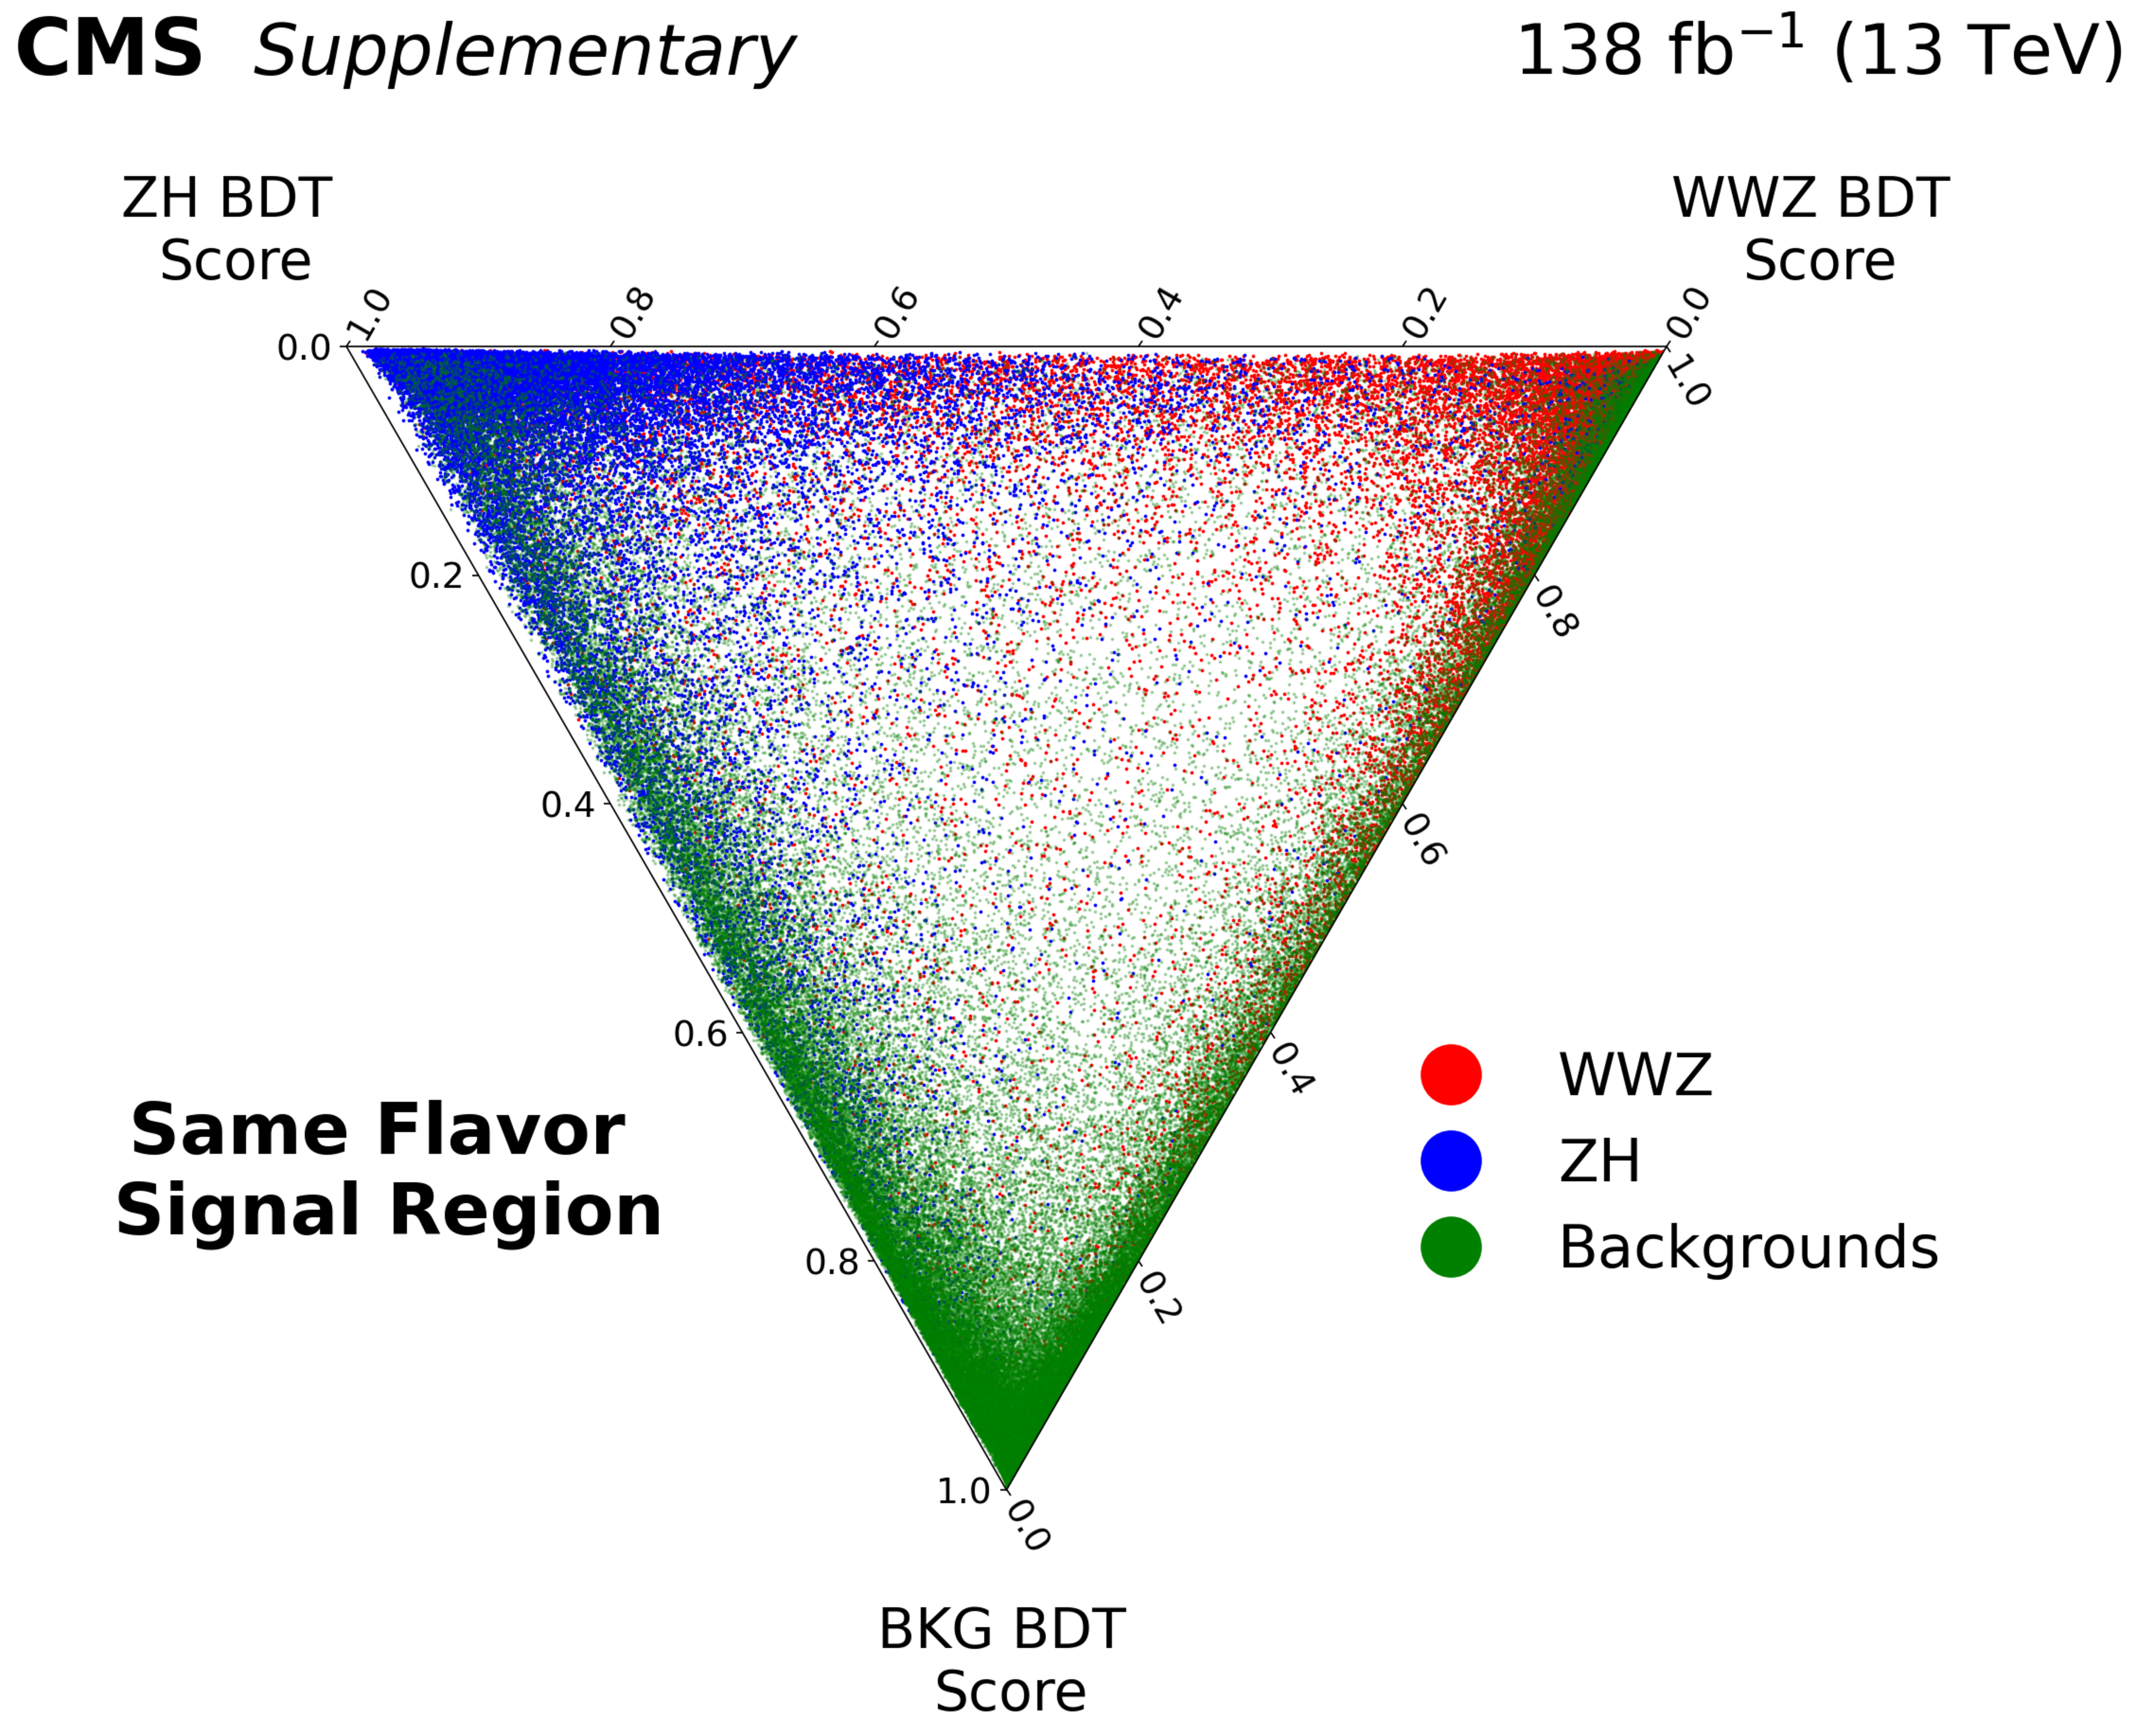
Distributions of BDT scores for the same-flavor signal region (for Run 2 data-taking periods). |
png pdf |
Additional Figure 2-a:
Distributions of BDT scores for the same-flavor signal region (for Run 2 data-taking periods). |
png pdf |
Additional Figure 2-b:
Distributions of BDT scores for the same-flavor signal region (for Run 2 data-taking periods). |
png pdf |
Additional Figure 2-c:
Distributions of BDT scores for the same-flavor signal region (for Run 2 data-taking periods). |
png pdf |
Additional Figure 2-d:
Distributions of BDT scores for the same-flavor signal region (for Run 2 data-taking periods). |
png pdf |
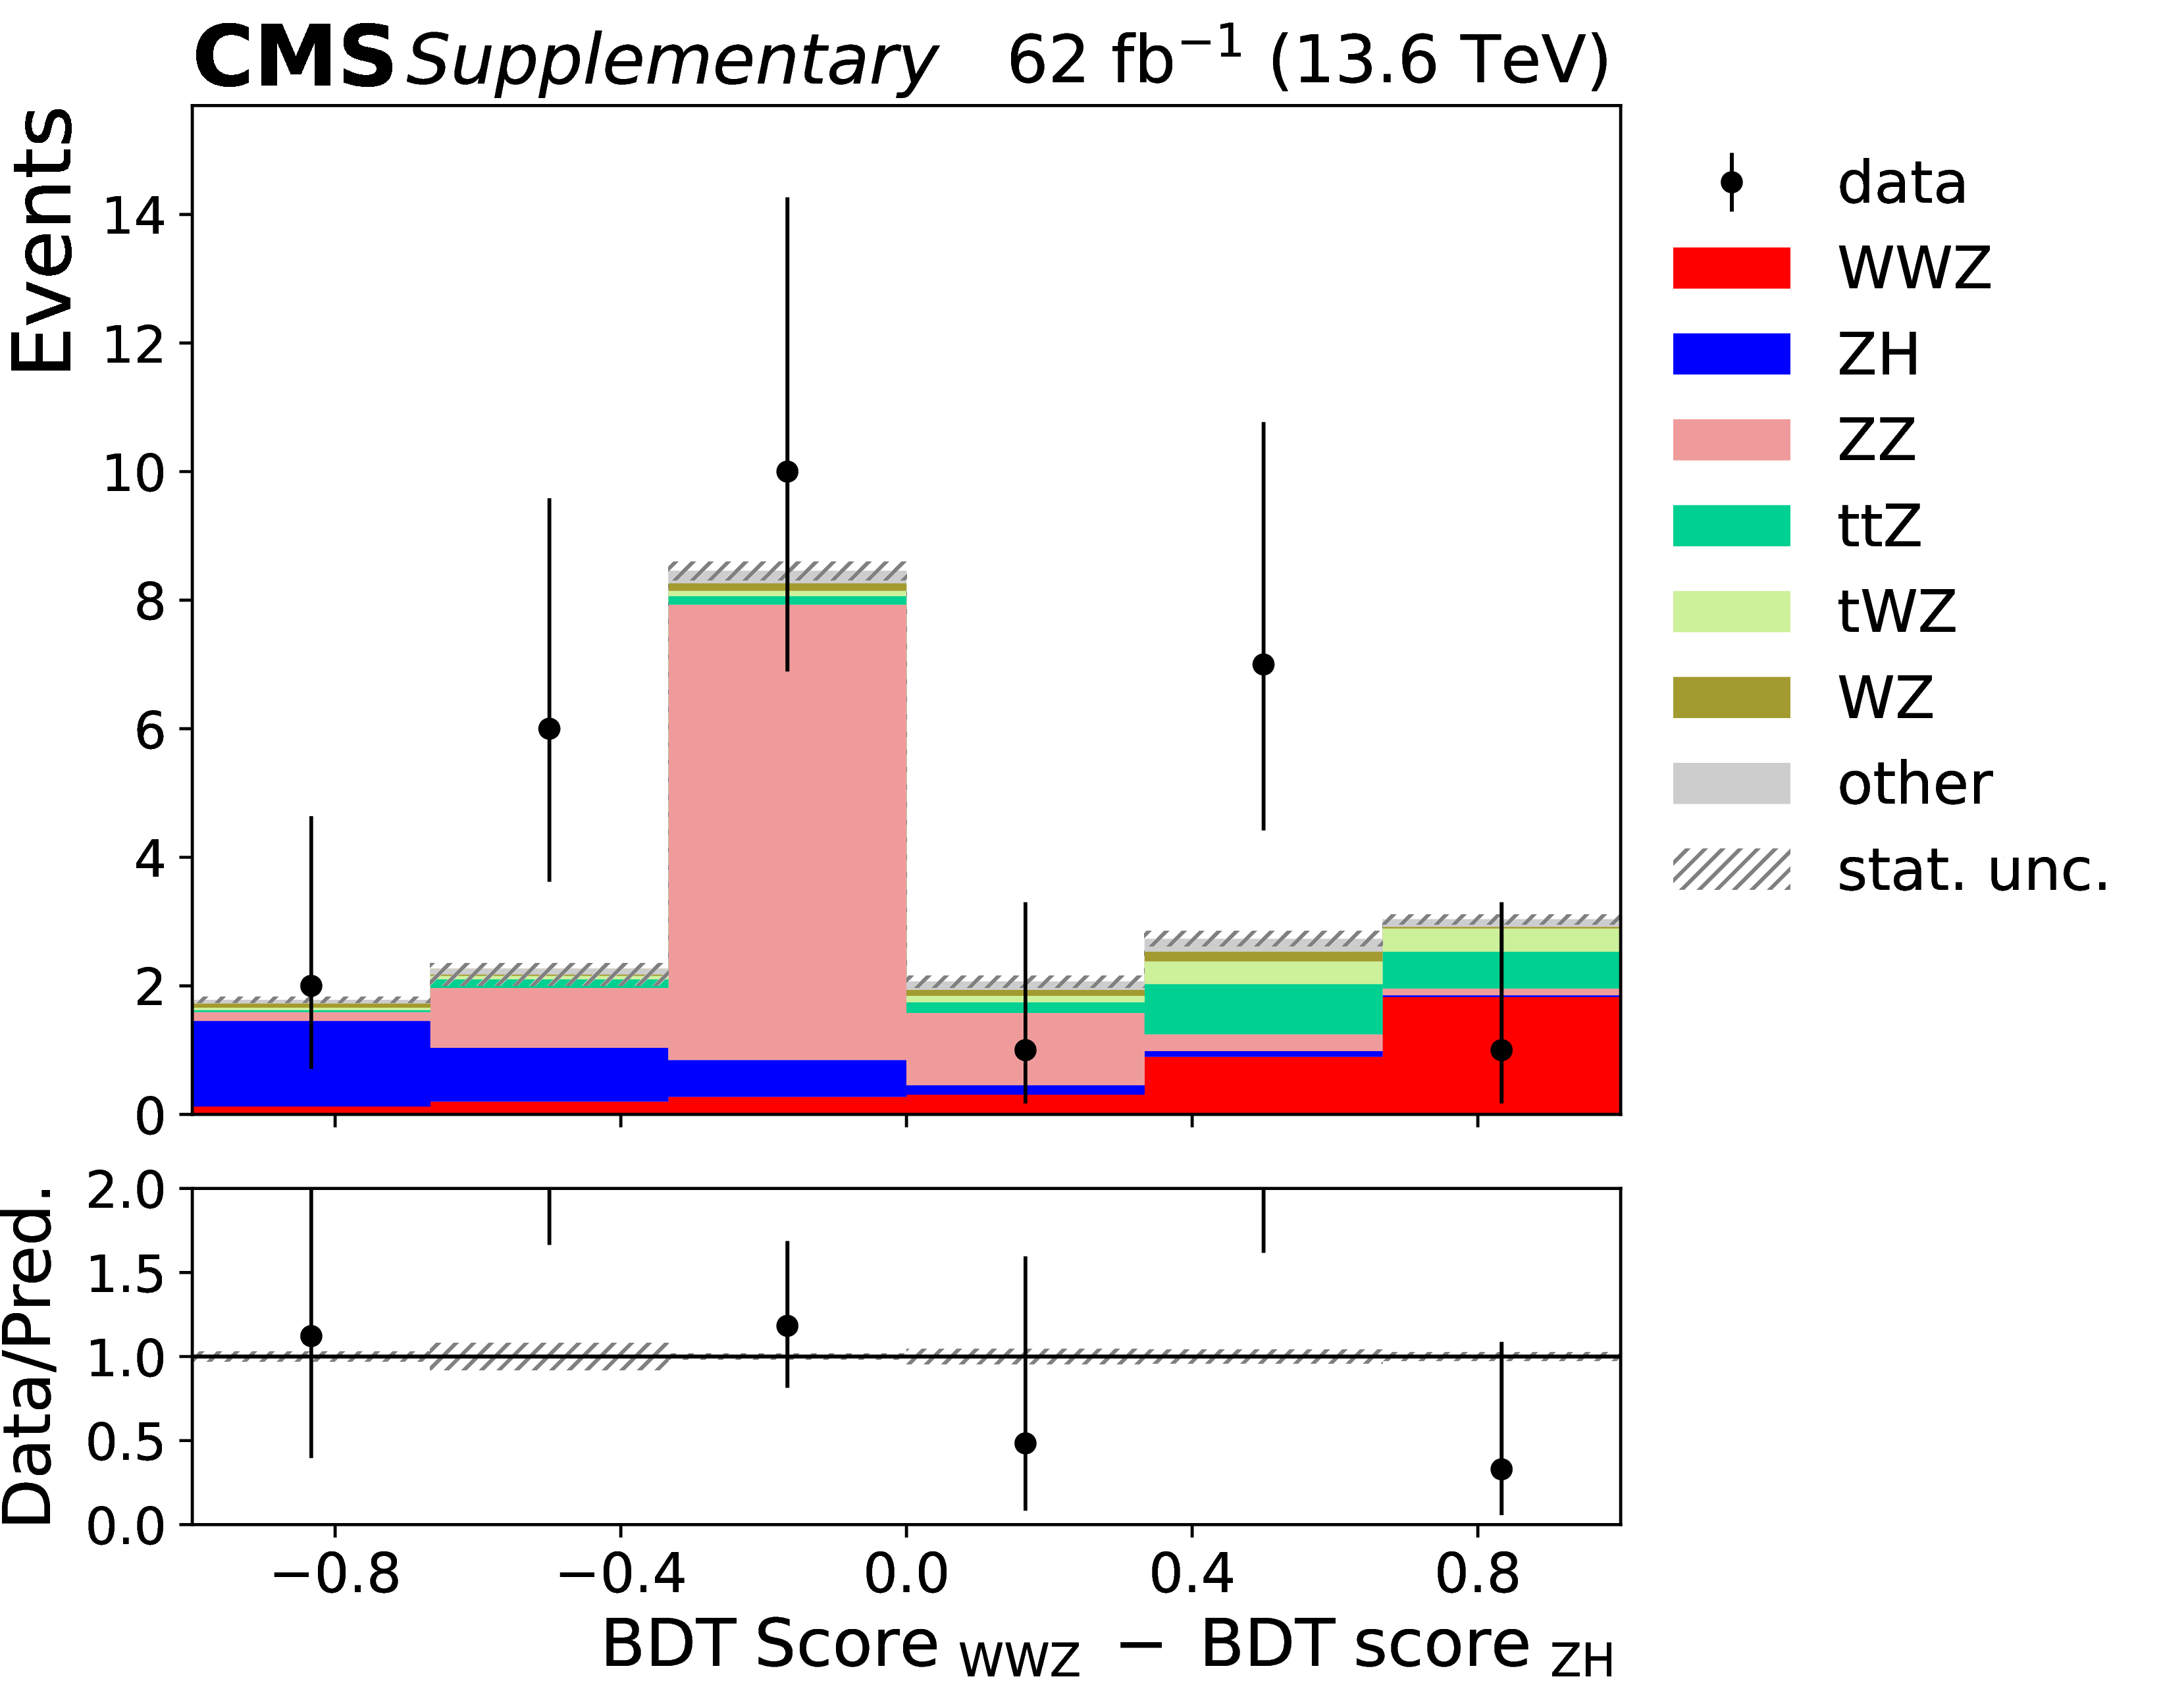
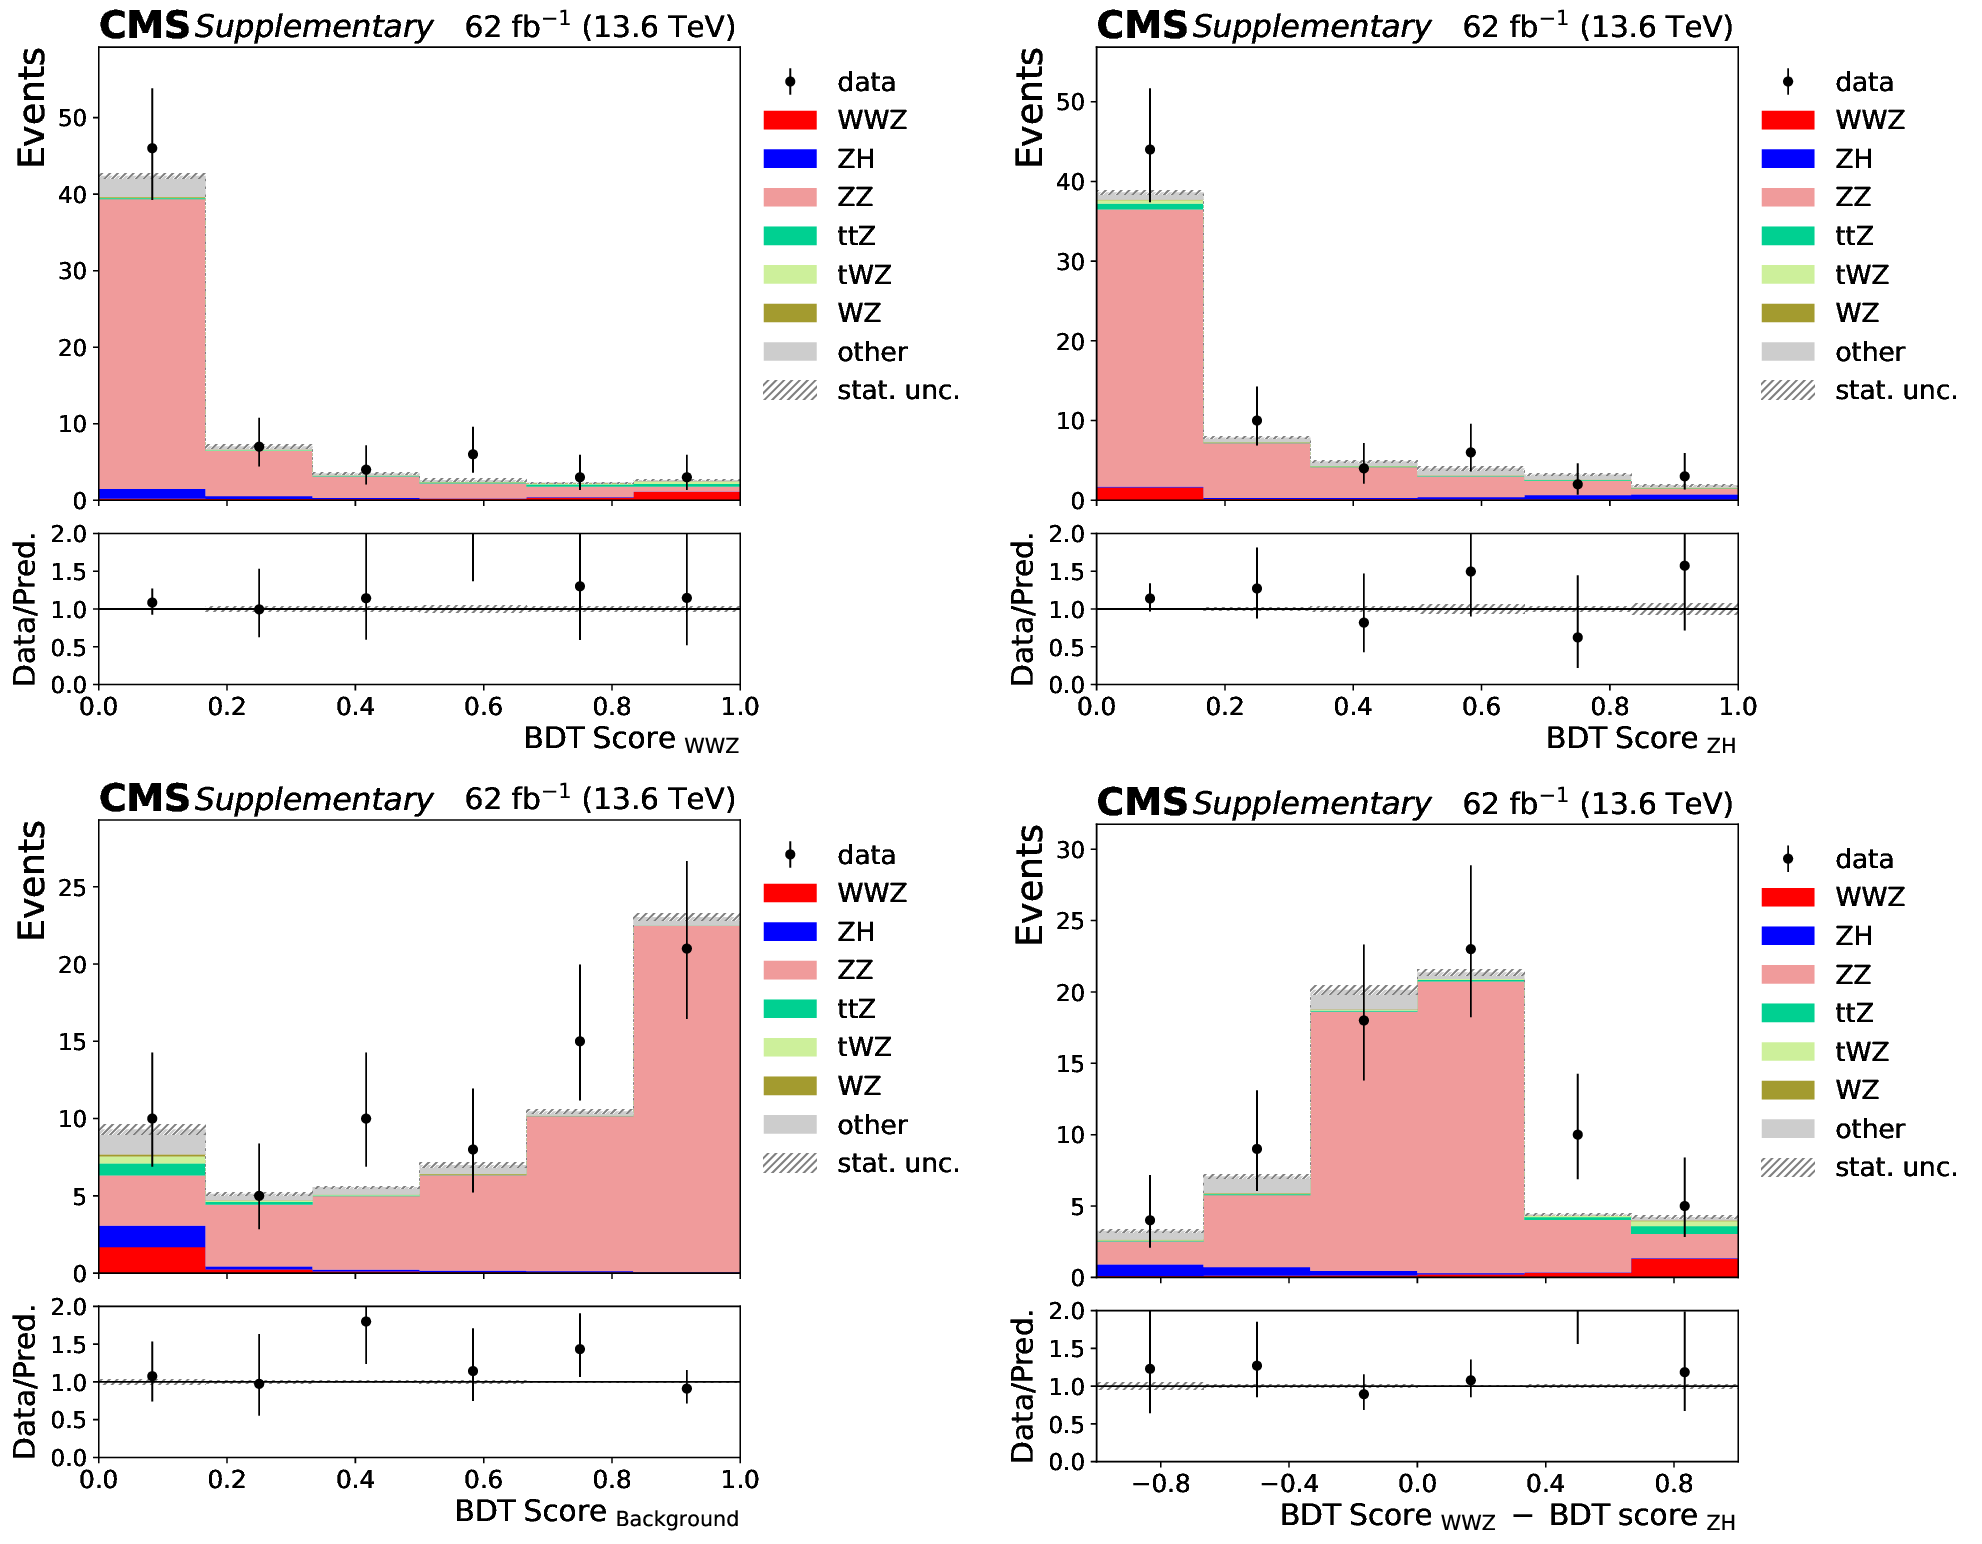
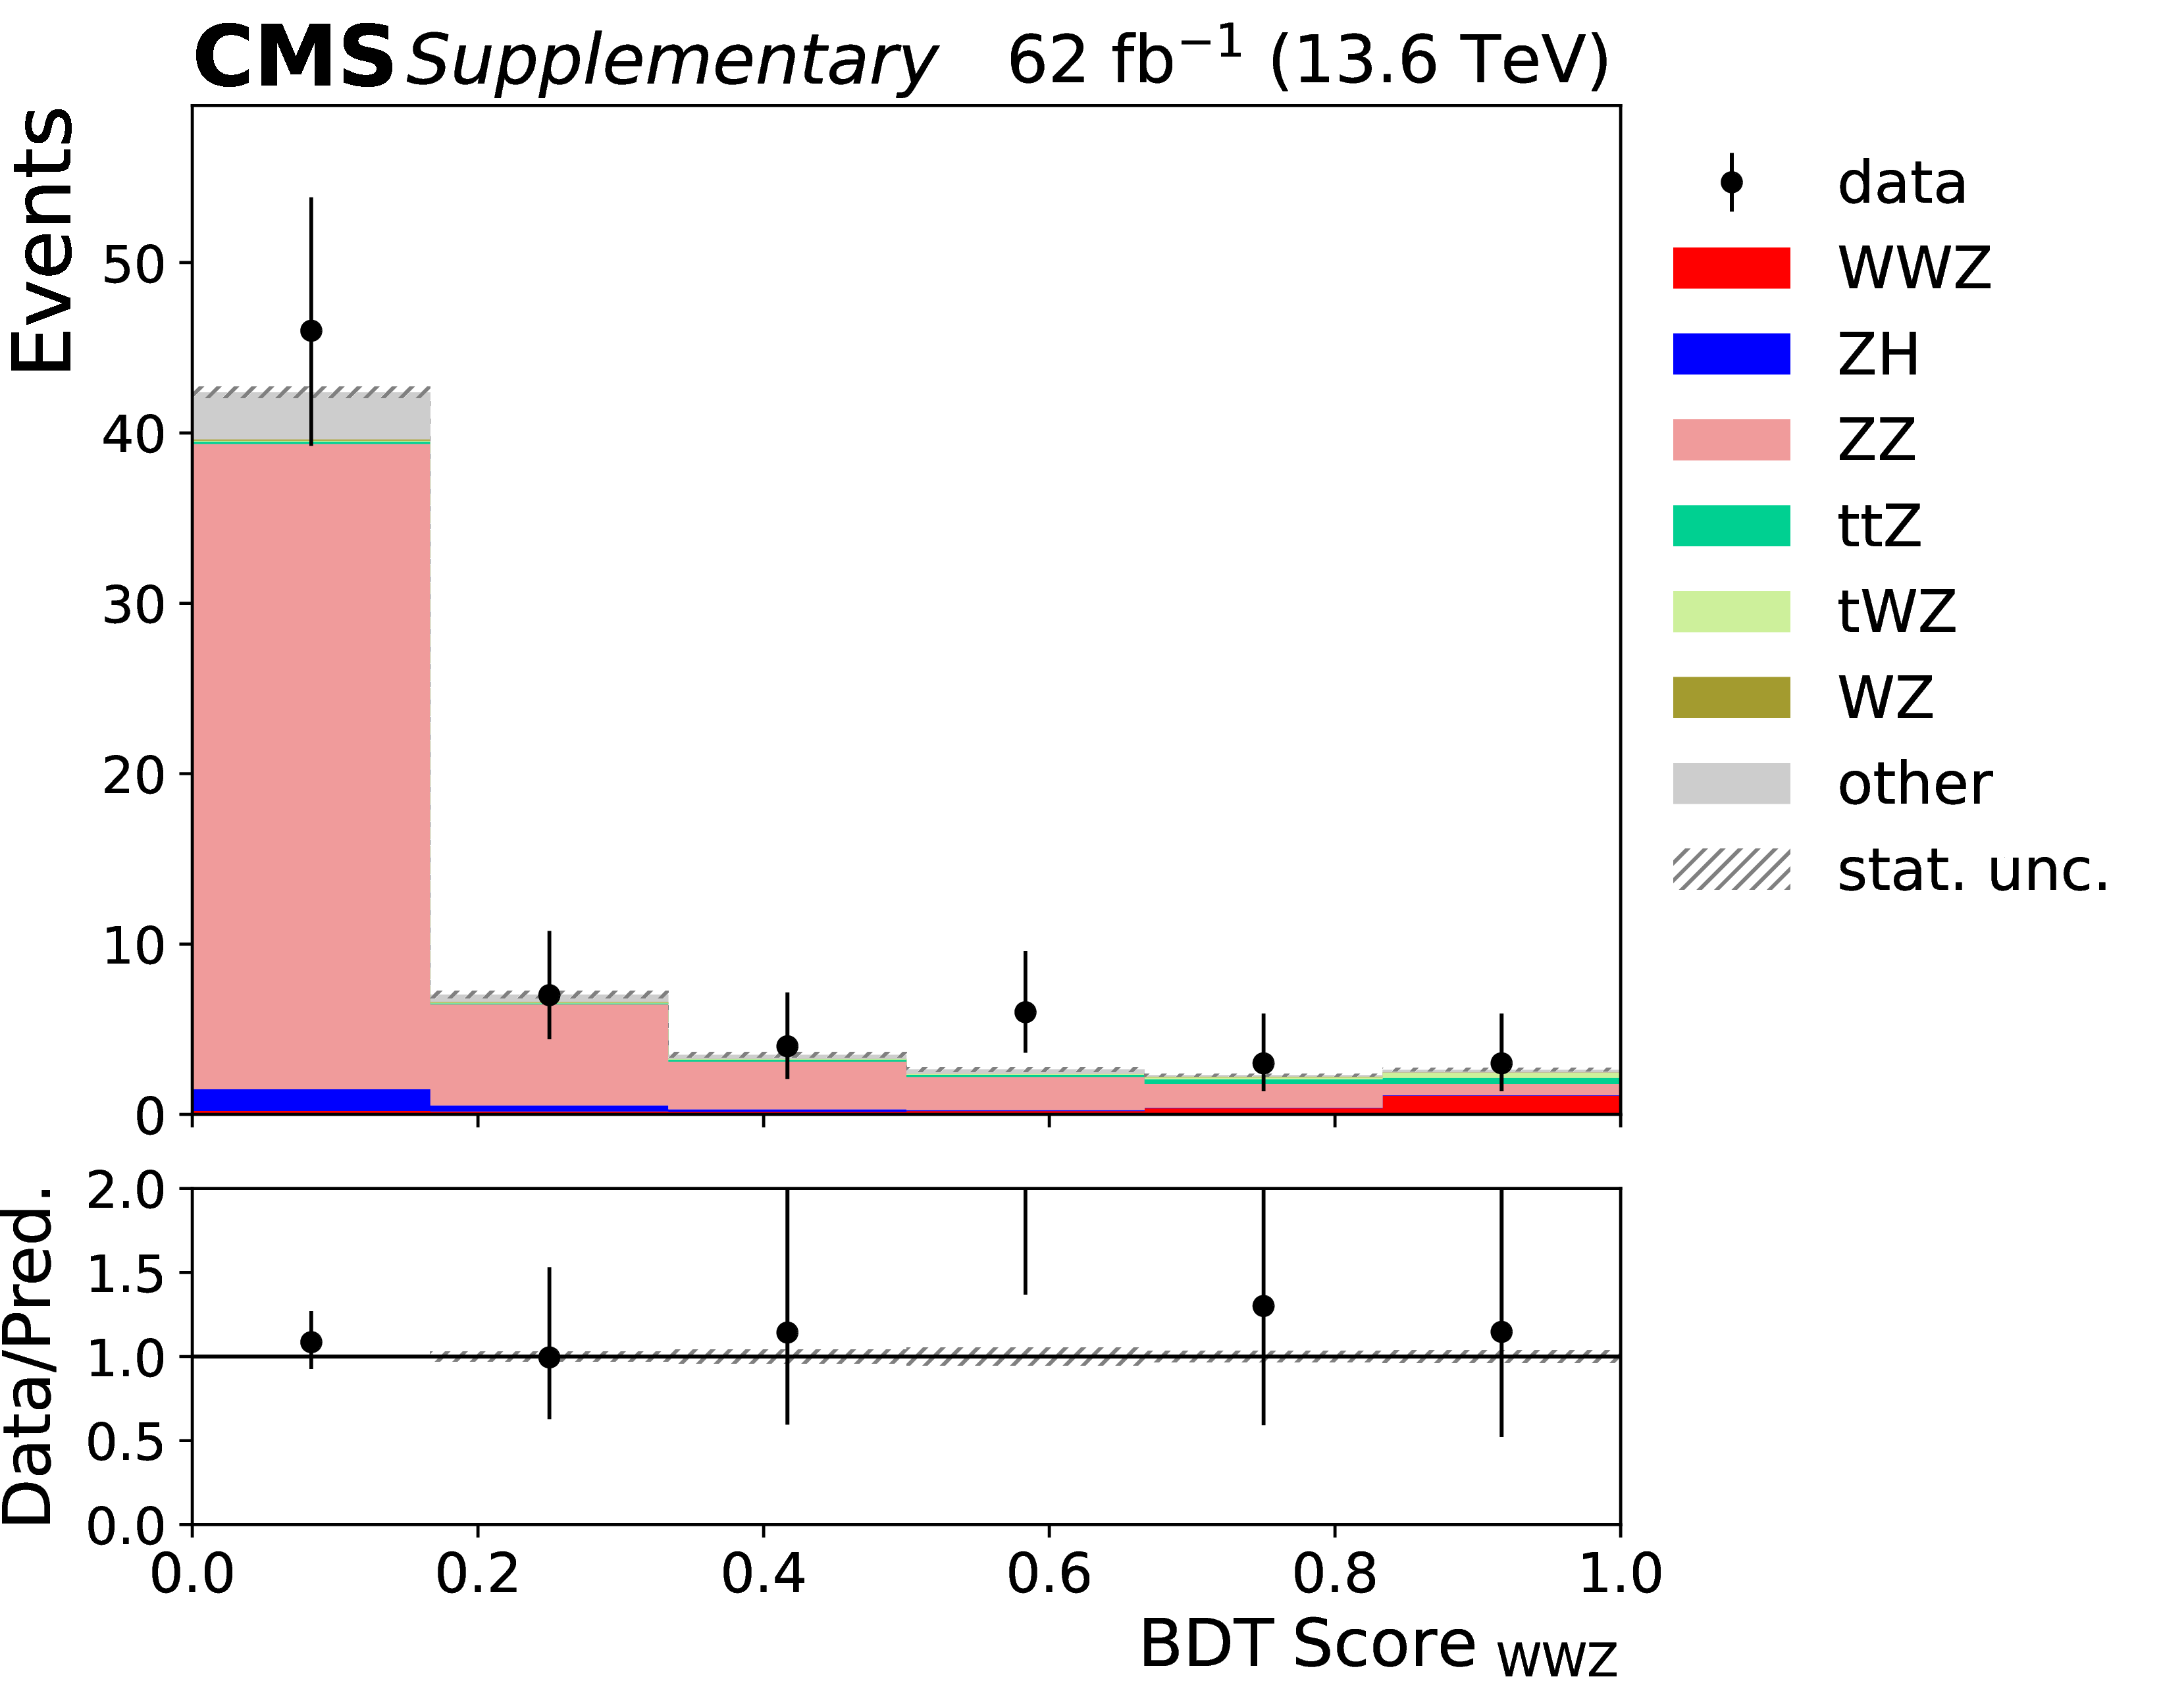
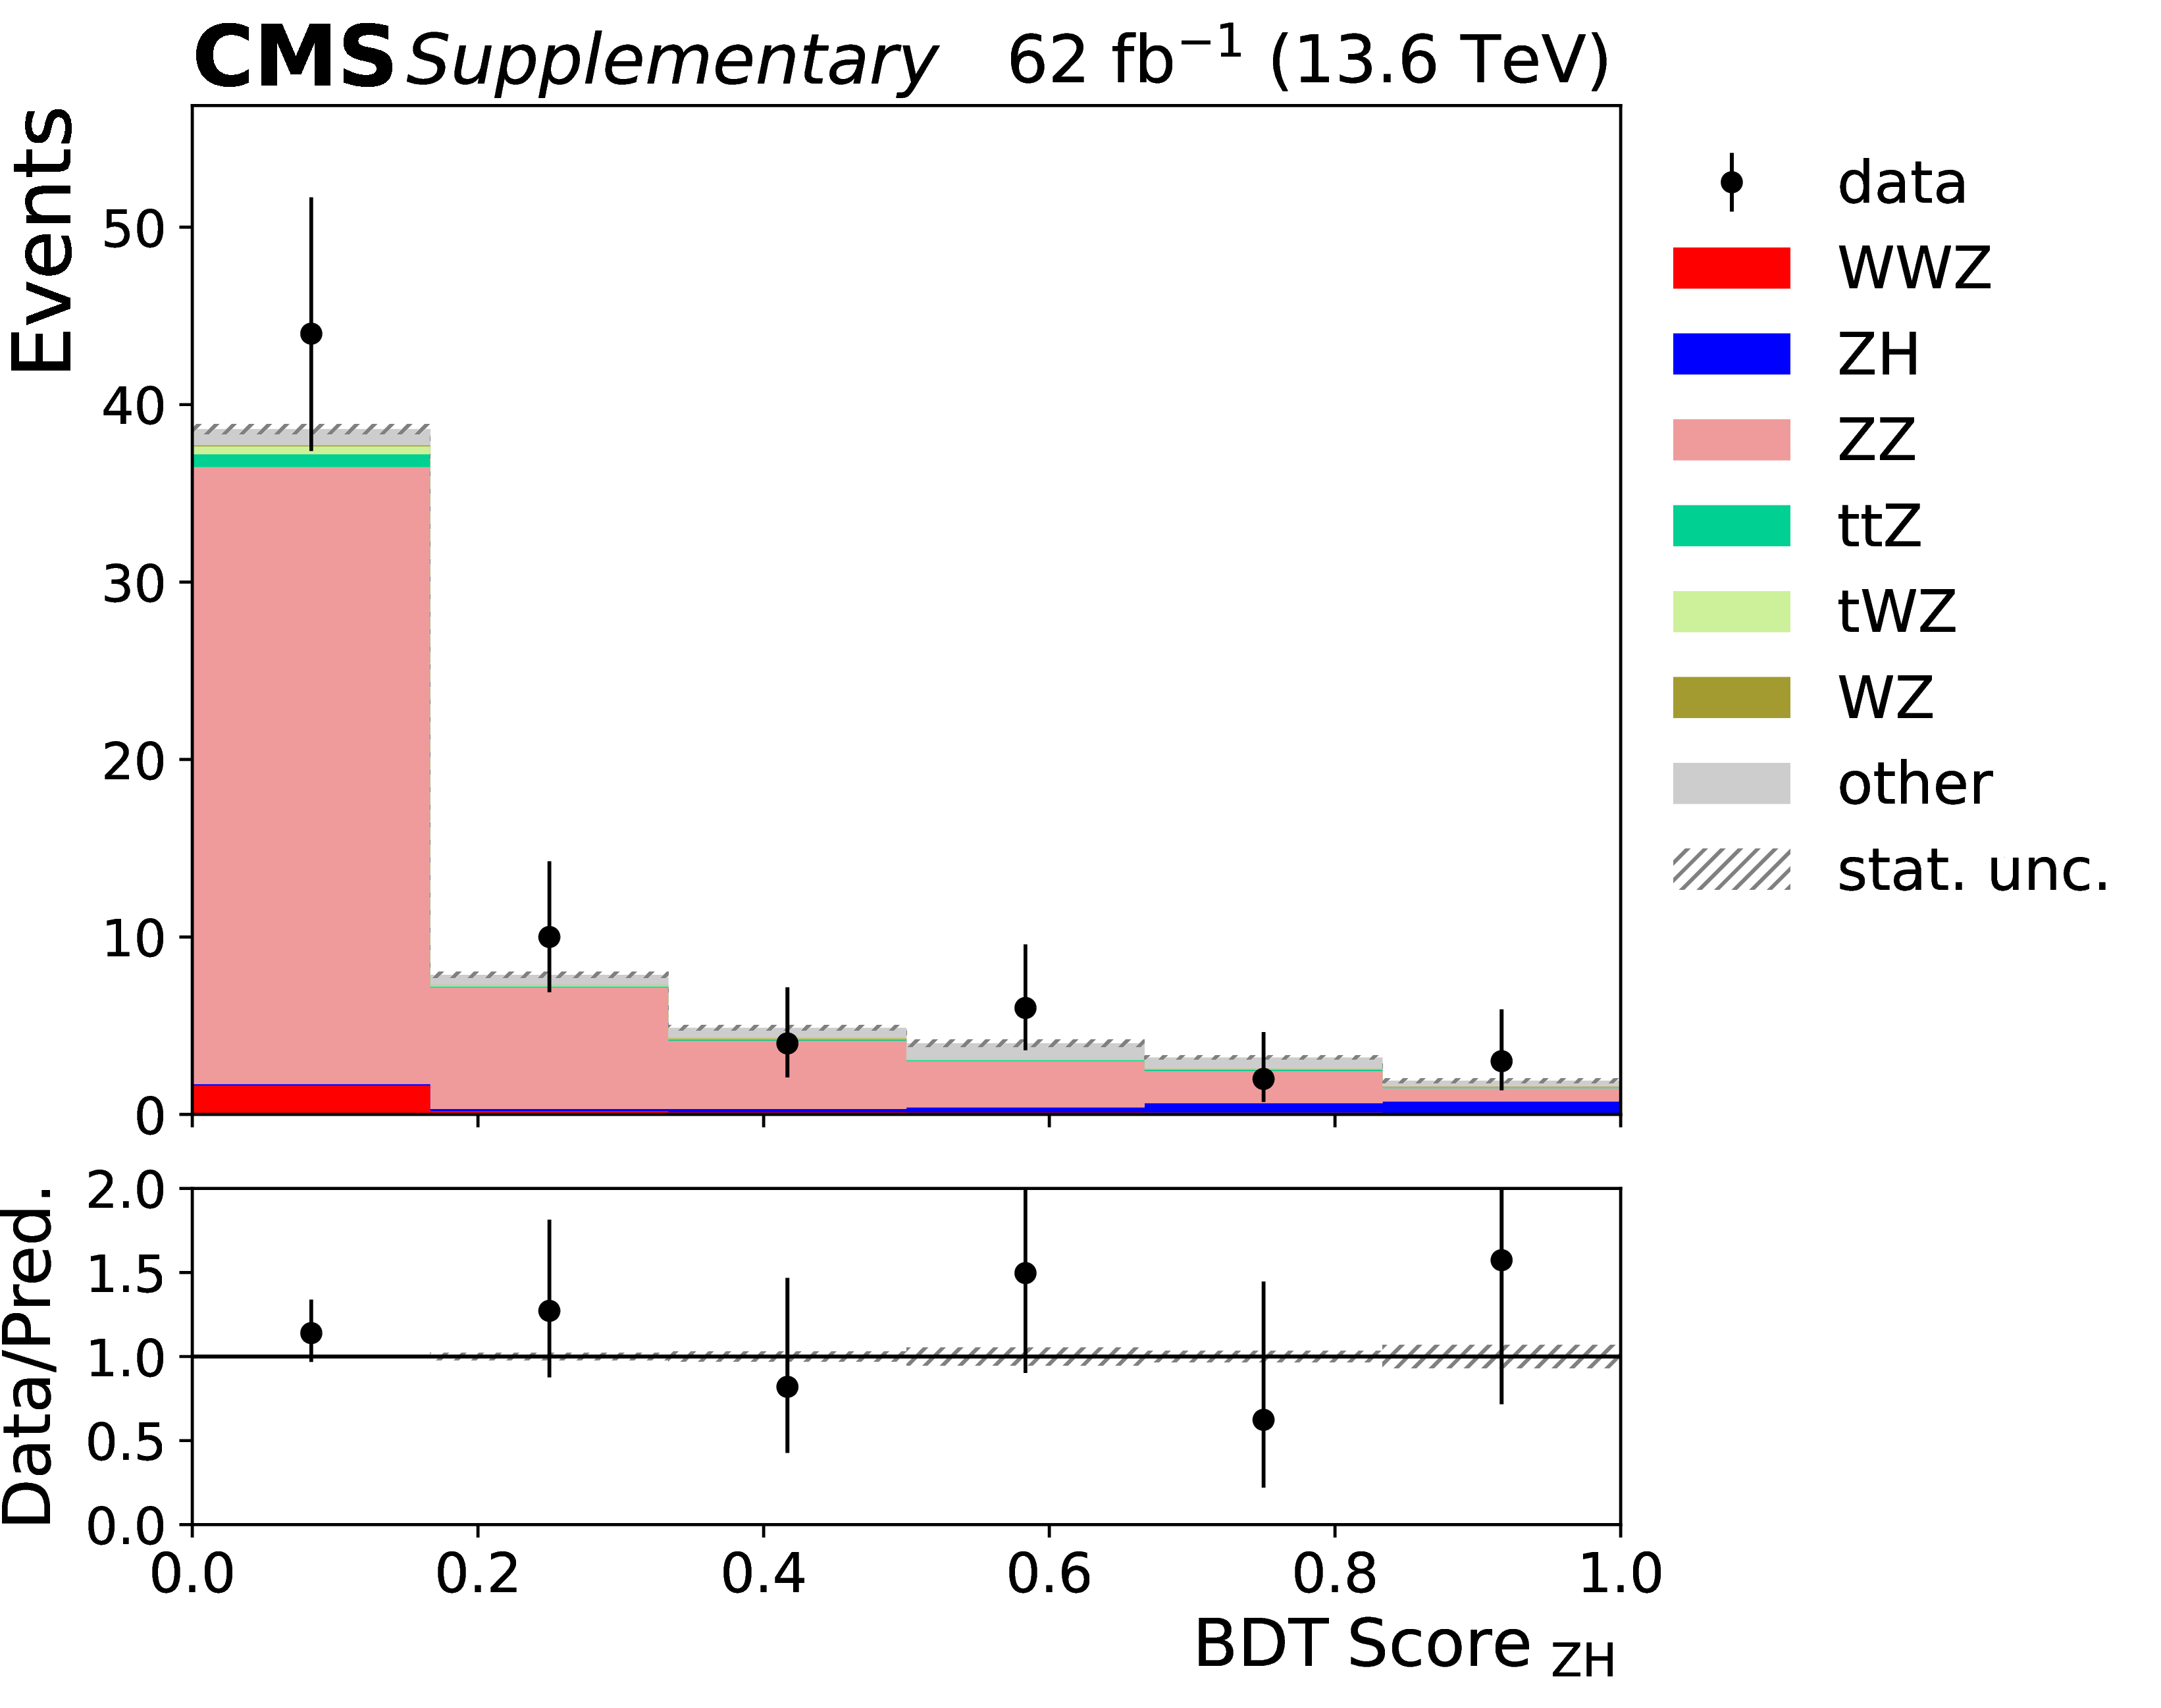
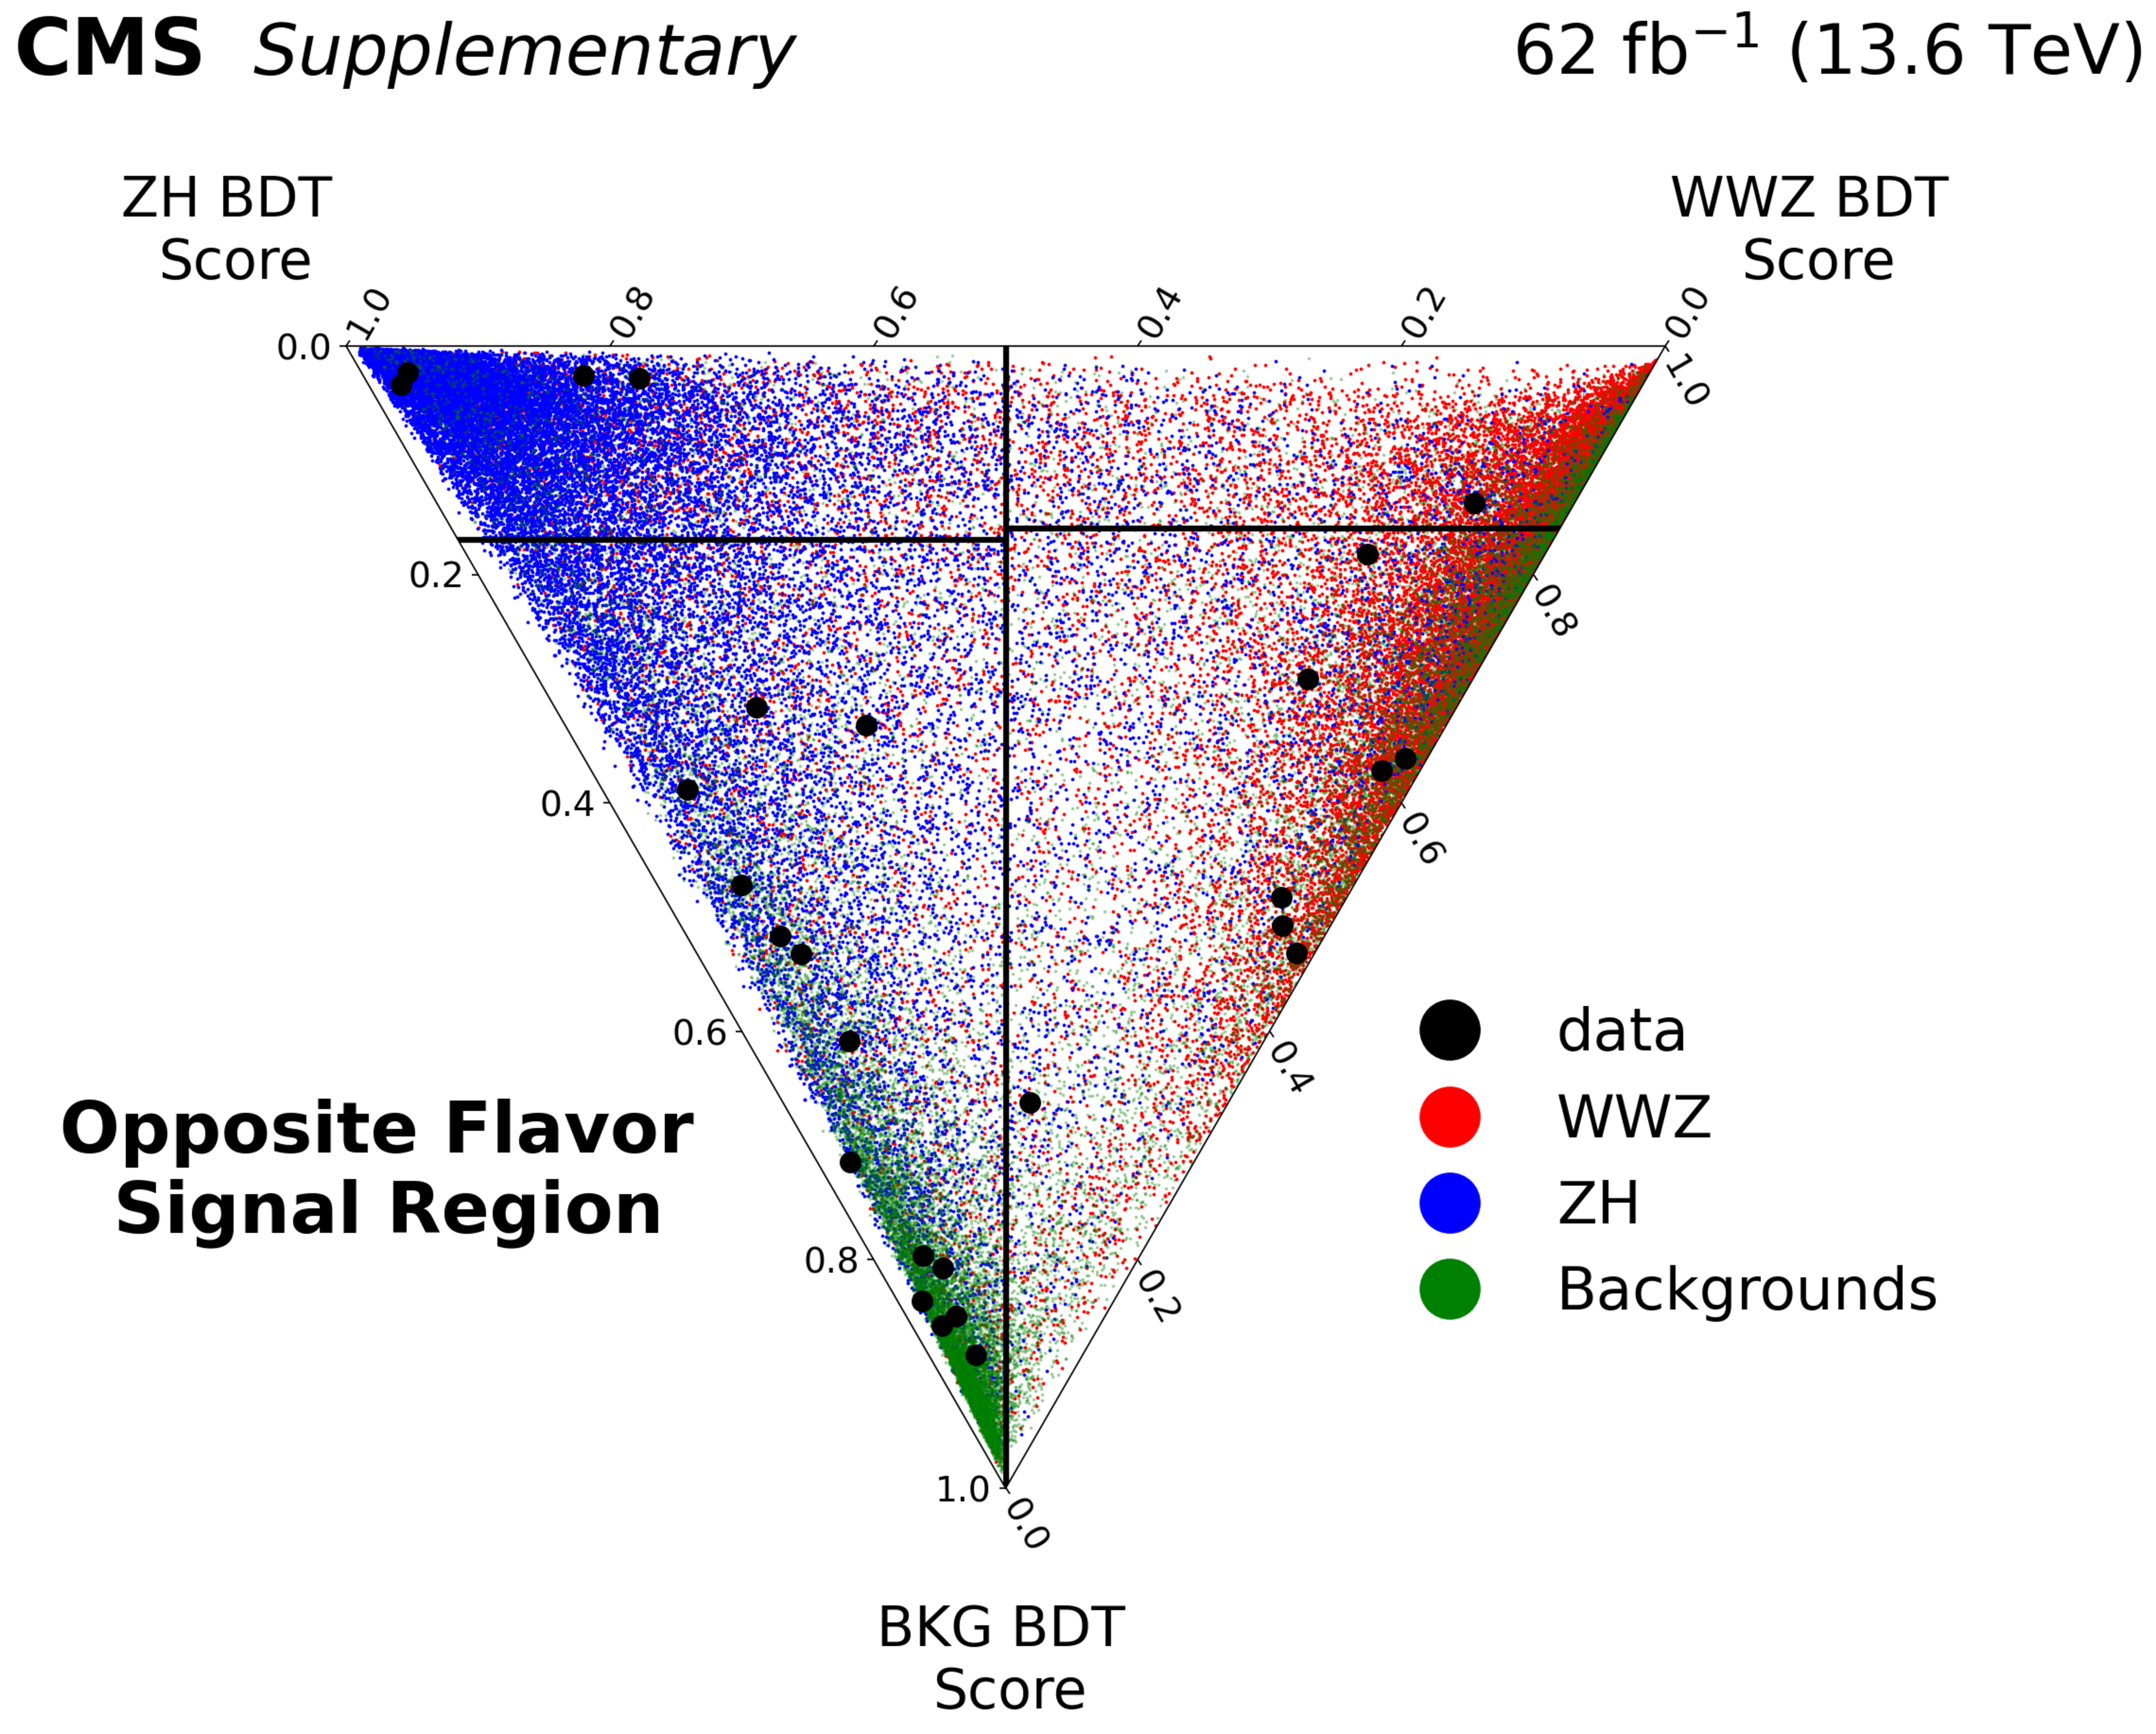
Additional Figure 3:
Distributions of BDT scores for the opposite-flavor signal region (for Run 3 data-taking periods). |
png pdf |
Additional Figure 3-a:
Distributions of BDT scores for the opposite-flavor signal region (for Run 3 data-taking periods). |
png pdf |
Additional Figure 3-b:
Distributions of BDT scores for the opposite-flavor signal region (for Run 3 data-taking periods). |
png pdf |
Additional Figure 3-c:
Distributions of BDT scores for the opposite-flavor signal region (for Run 3 data-taking periods). |
png pdf |
Additional Figure 3-d:
Distributions of BDT scores for the opposite-flavor signal region (for Run 3 data-taking periods). |
png pdf |
Additional Figure 4:
Distributions of BDT scores for the same-flavor signal region (for Run 3 data-taking periods). |
png pdf |
Additional Figure 4-a:
Distributions of BDT scores for the same-flavor signal region (for Run 3 data-taking periods). |
png pdf |
Additional Figure 4-b:
Distributions of BDT scores for the same-flavor signal region (for Run 3 data-taking periods). |
png pdf |
Additional Figure 4-c:
Distributions of BDT scores for the same-flavor signal region (for Run 3 data-taking periods). |
png pdf |
Additional Figure 4-d:
Distributions of BDT scores for the same-flavor signal region (for Run 3 data-taking periods). |
png pdf |
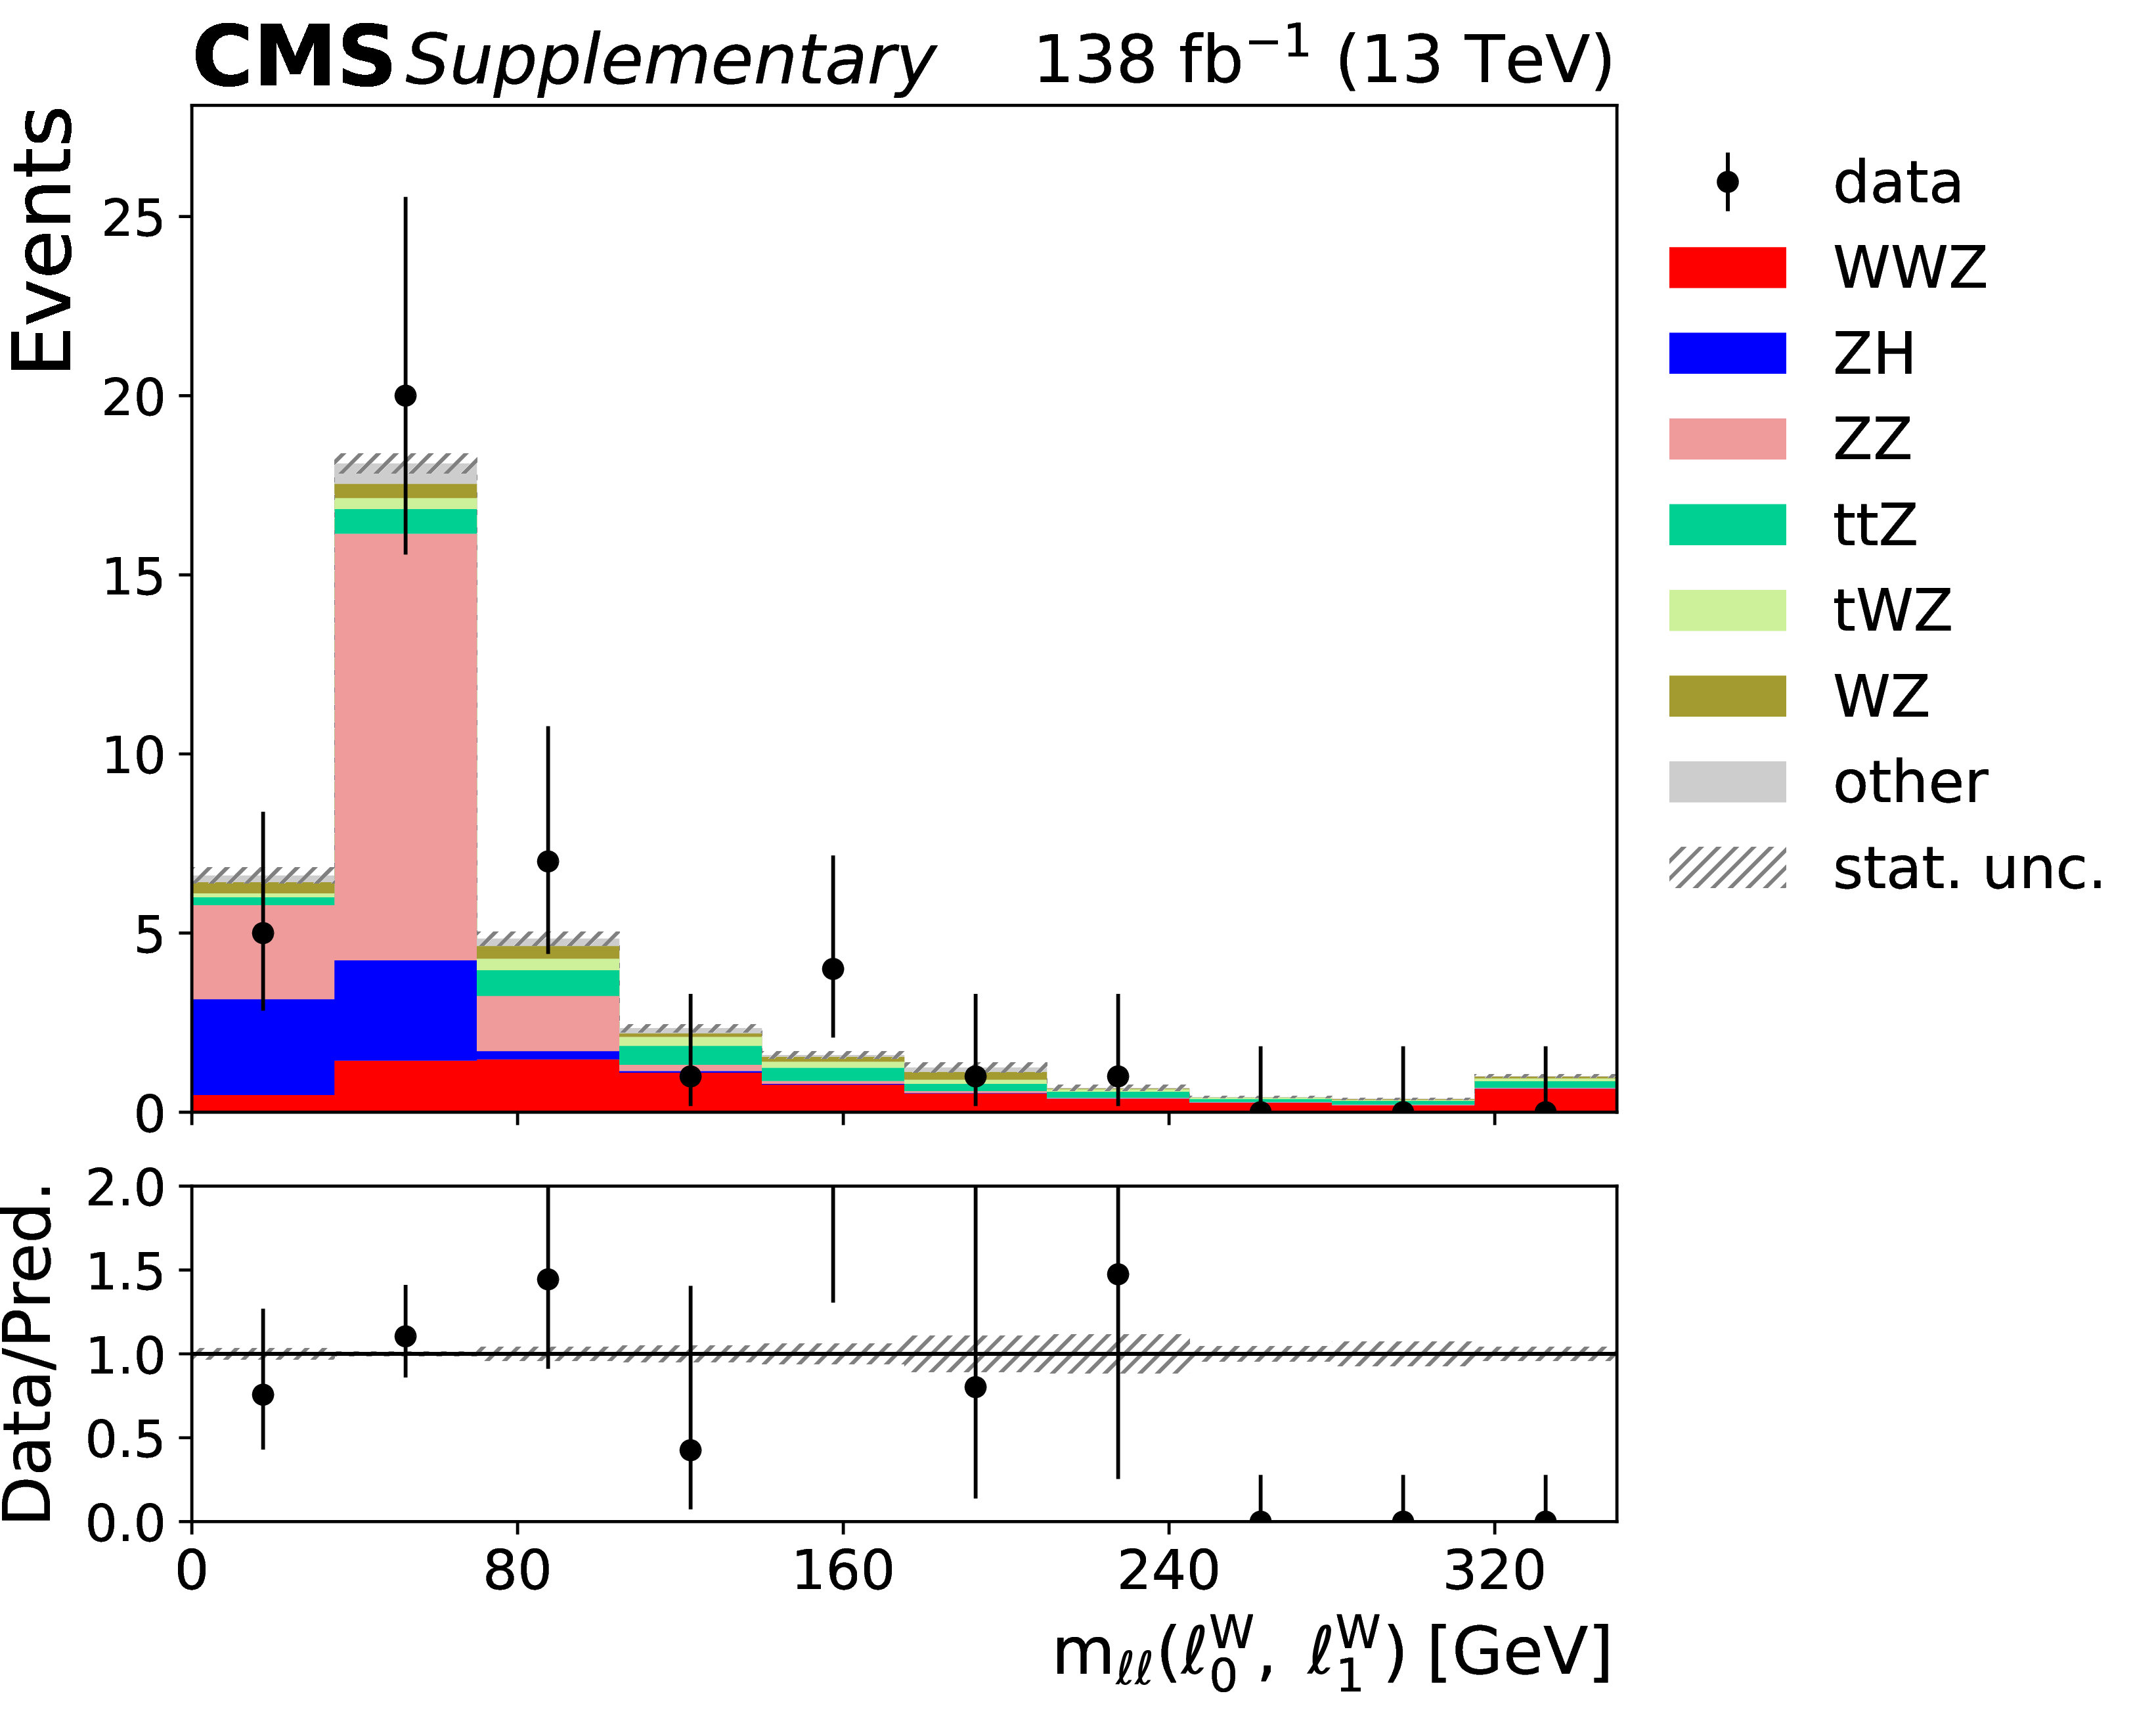
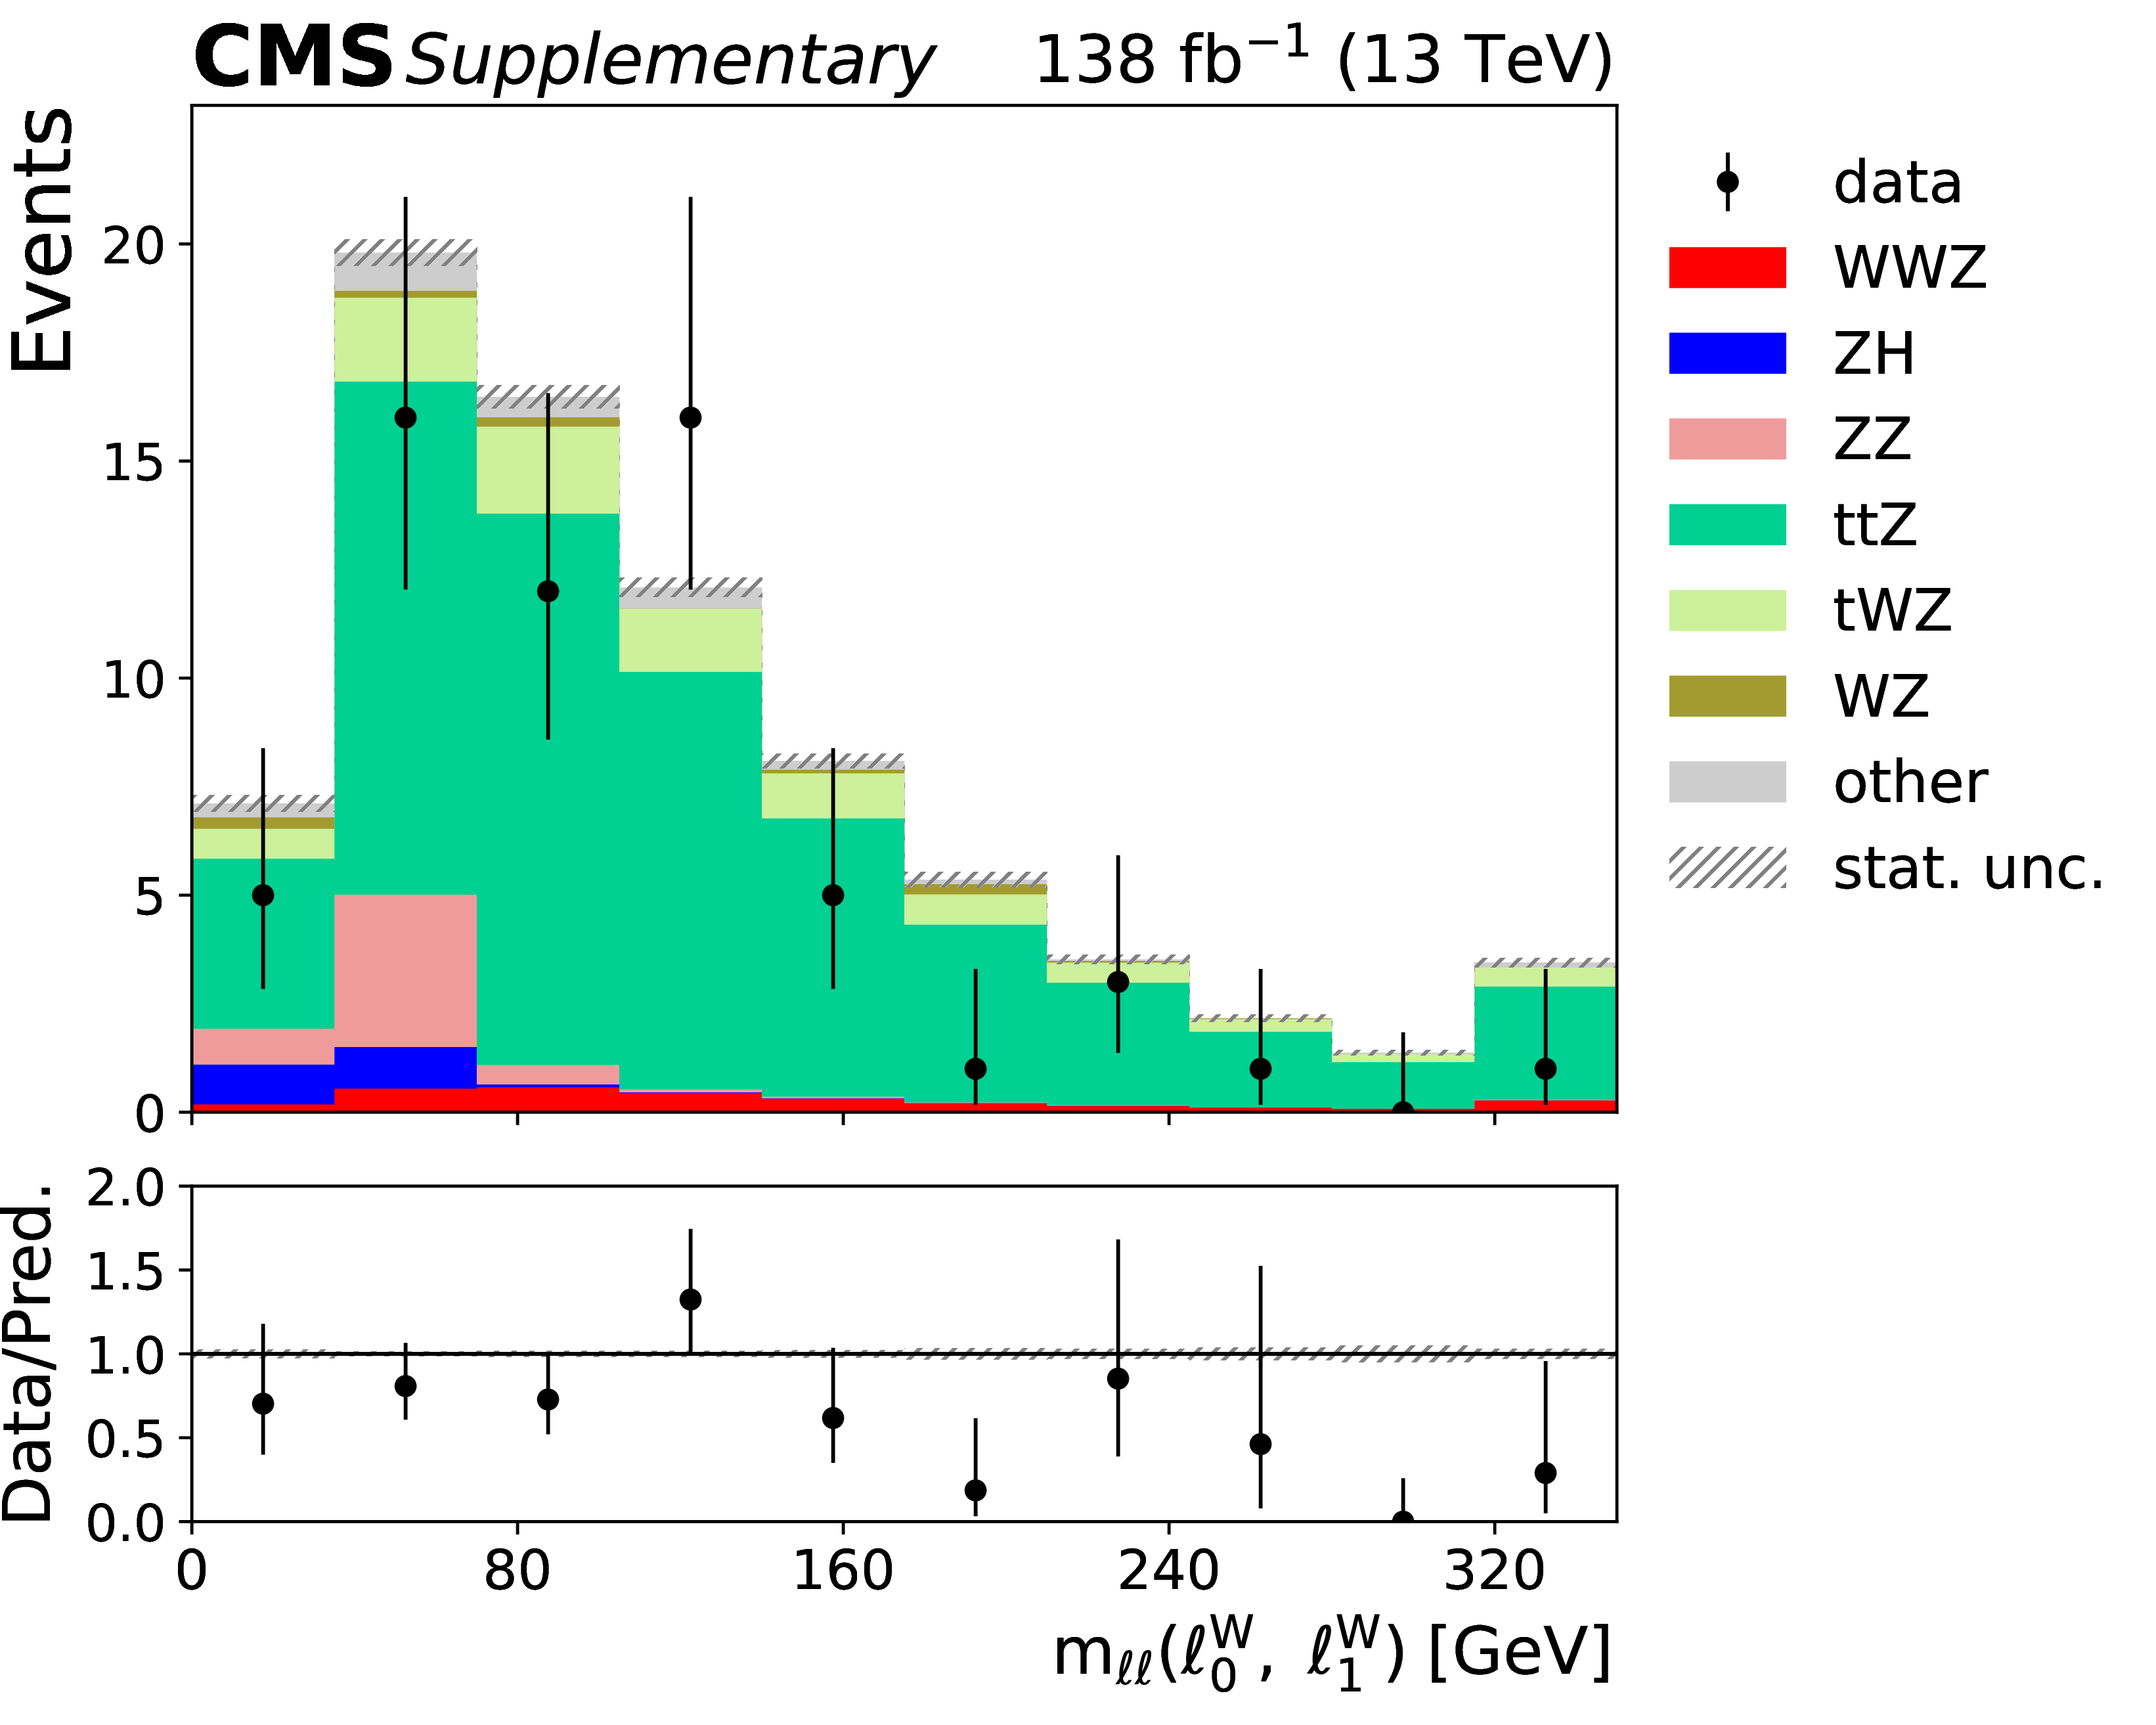
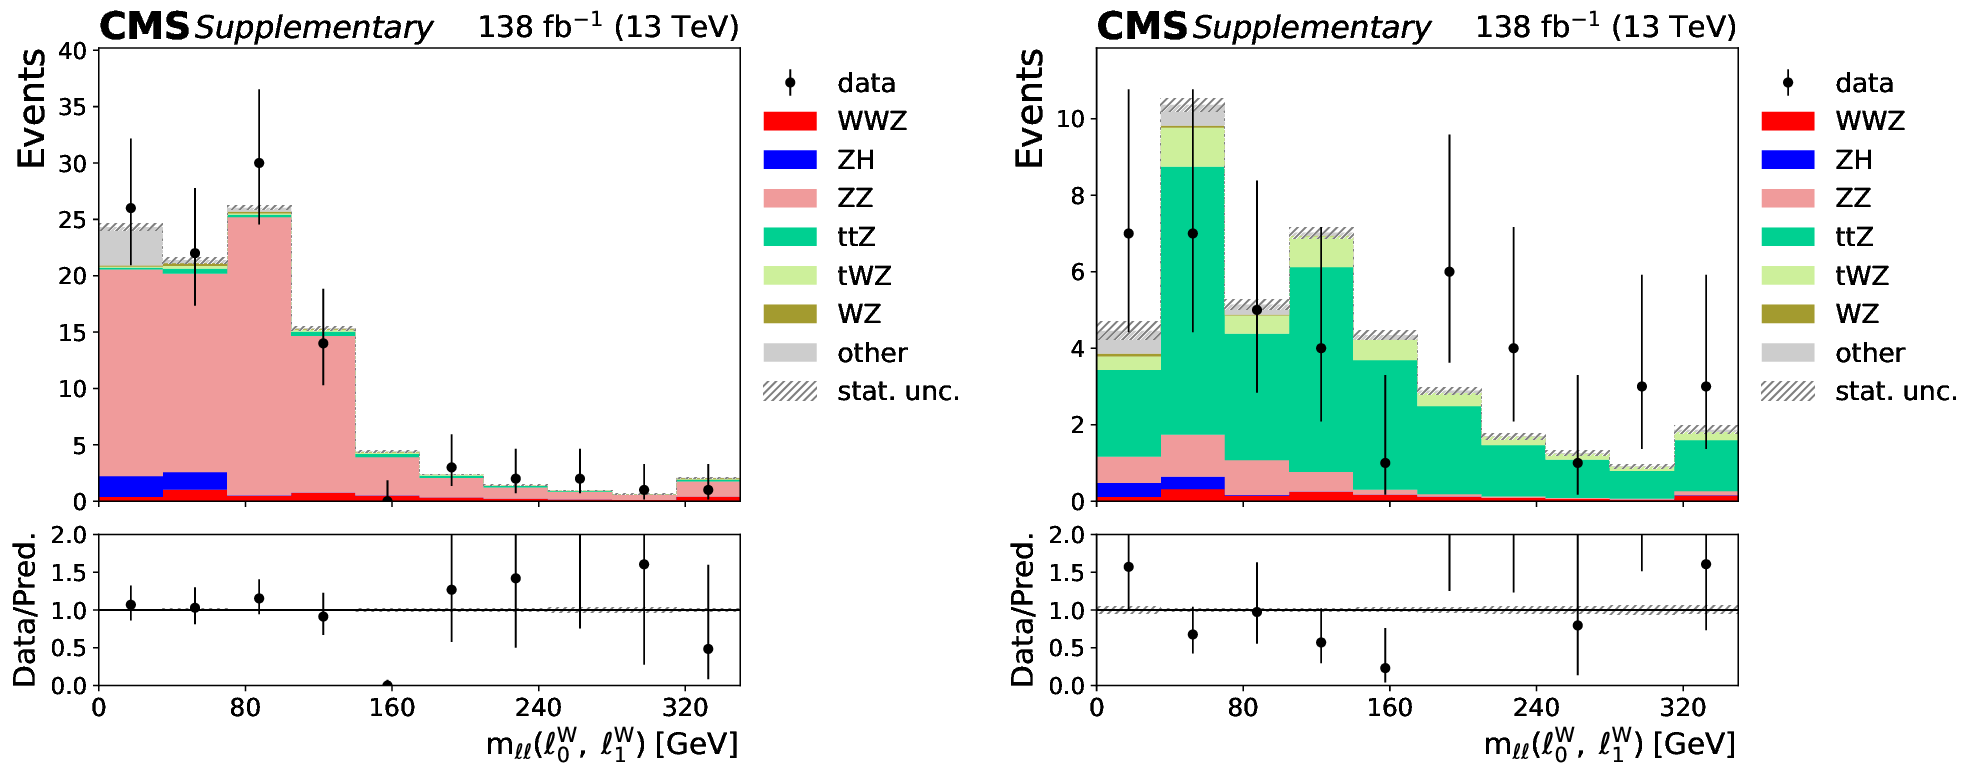
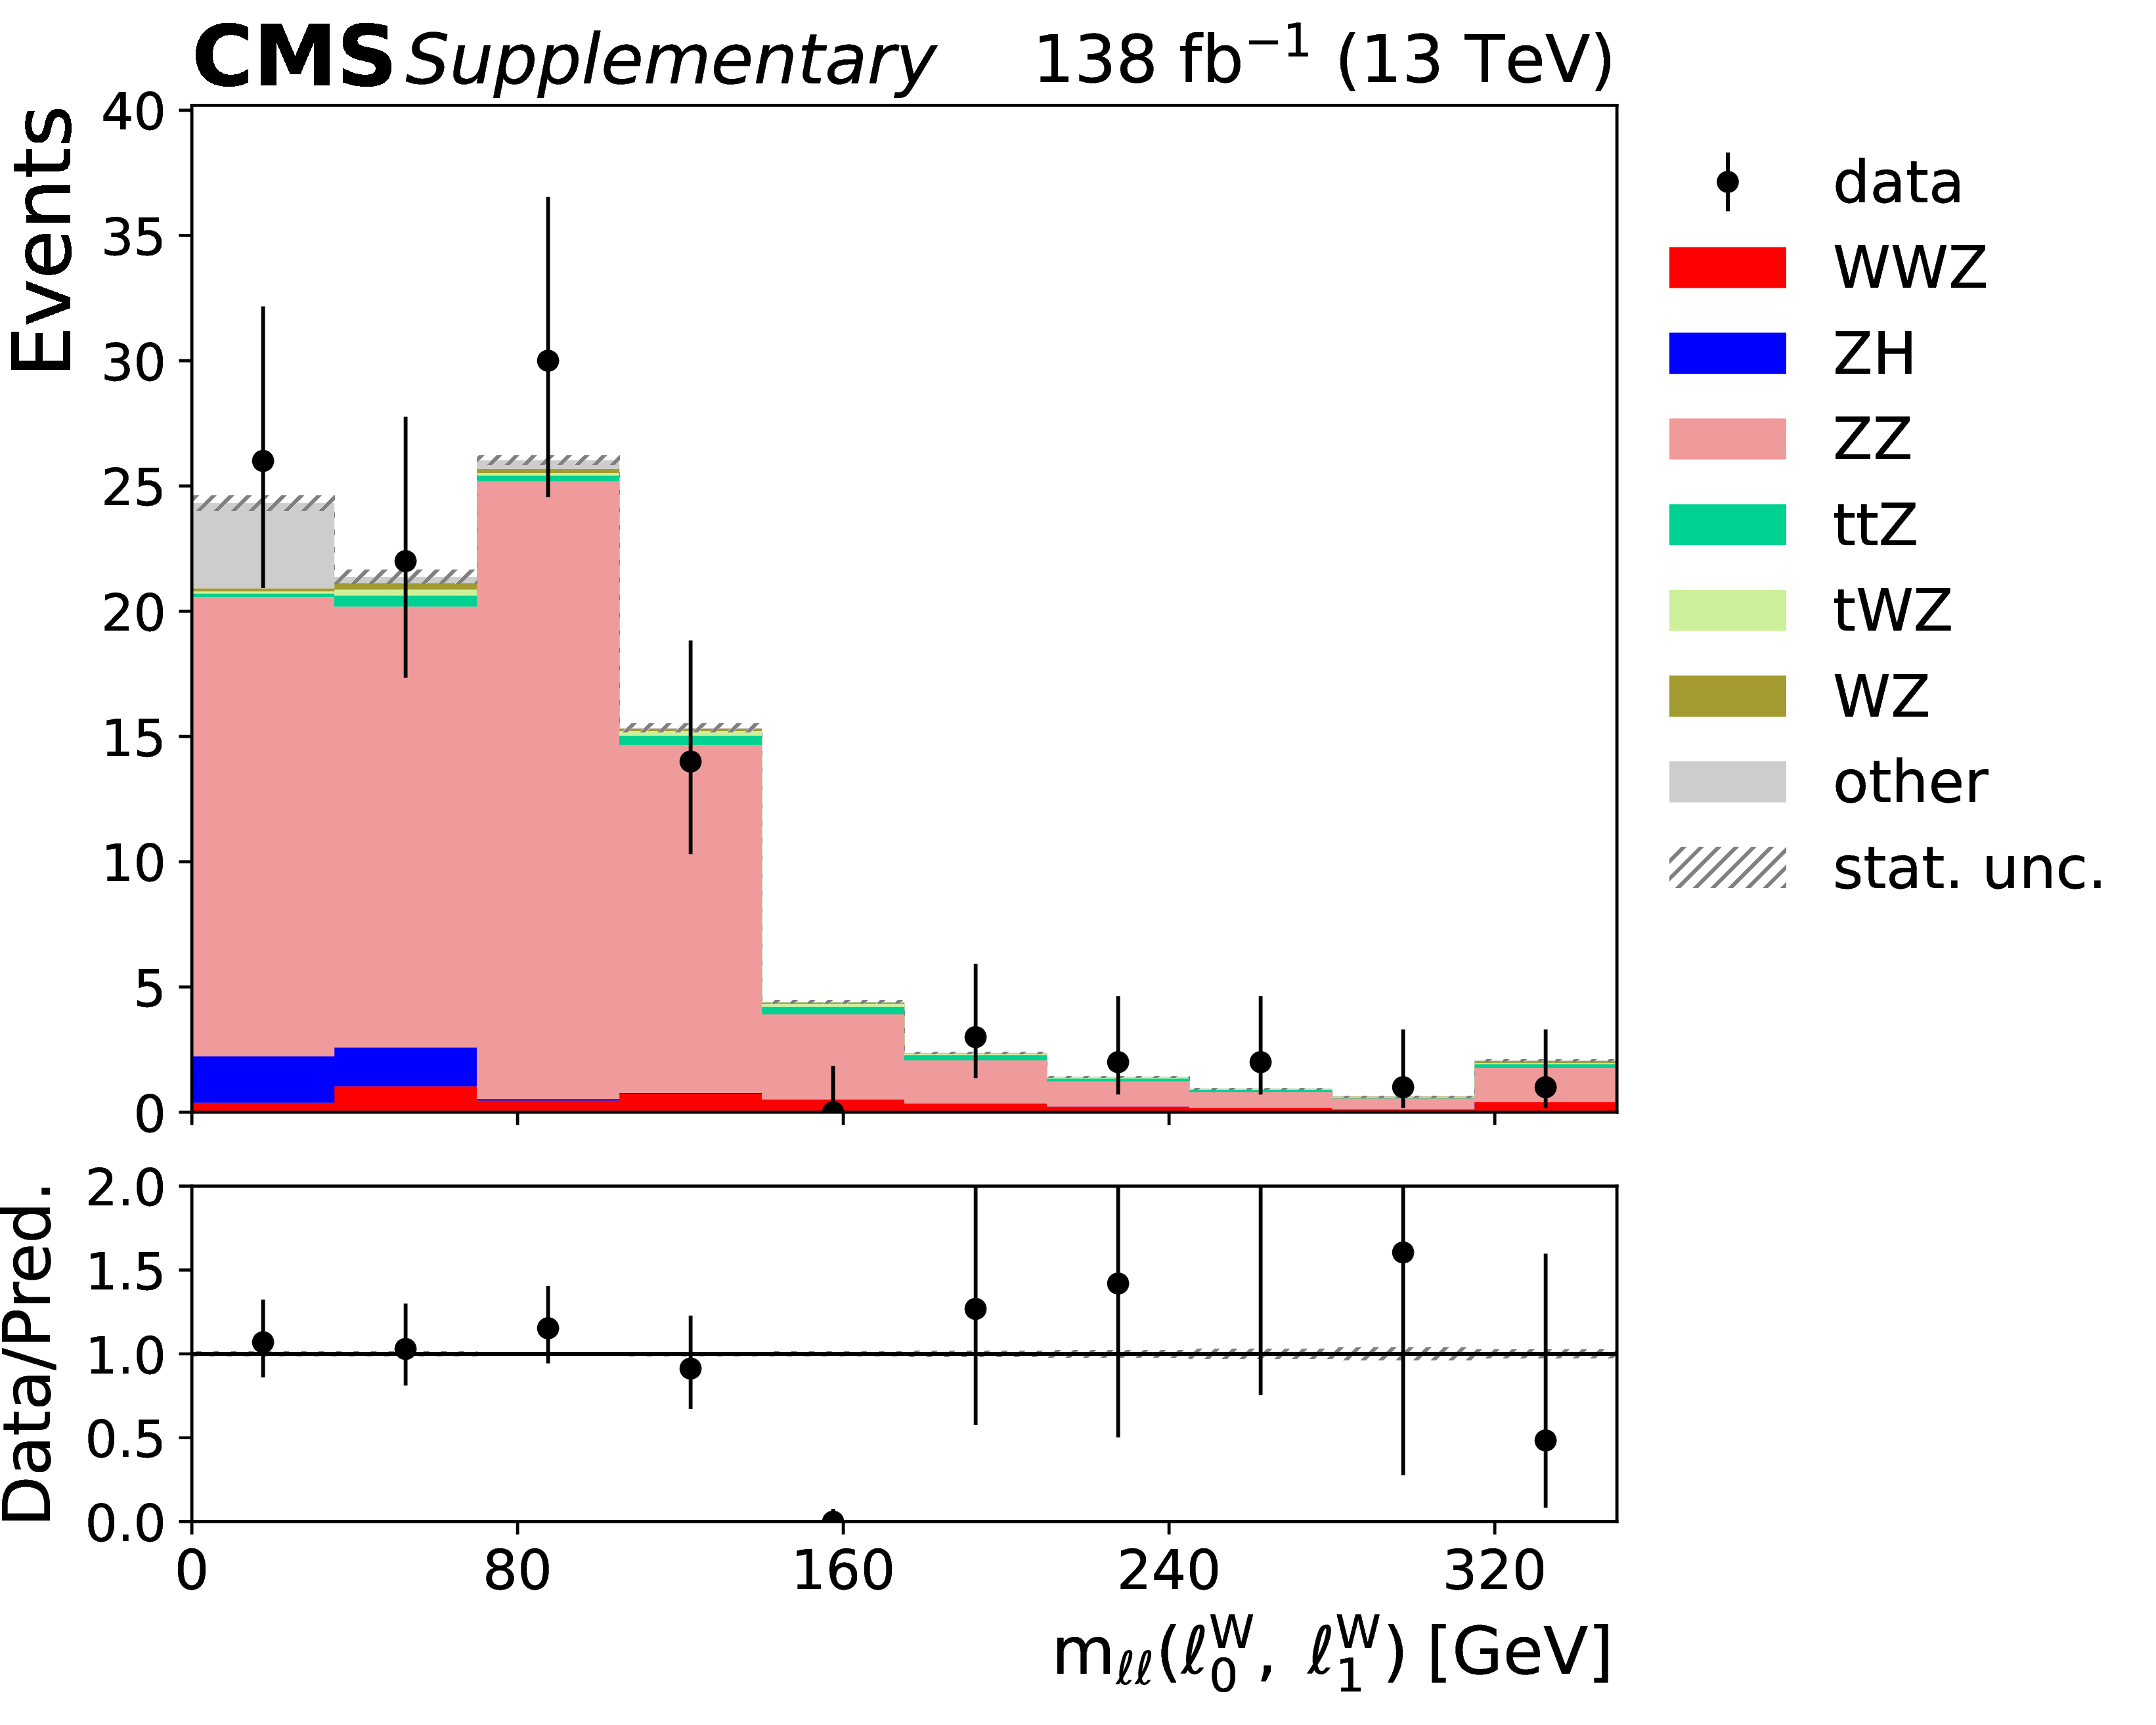
Additional Figure 5:
Example input variable for the BDT trained in the opposite-flavor signal region. This $ \mathrm{m_{\ell\ell}(\ell^W_0, \; \ell^W_1)} $ distribution corresponds to the invariant mass of the two W-boson candidate leptons, and is shown in the opposite-flavor signal region (left) and the opposite-flavor control region (right). |
png pdf |
Additional Figure 5-a:
Example input variable for the BDT trained in the opposite-flavor signal region. This $ \mathrm{m_{\ell\ell}(\ell^W_0, \; \ell^W_1)} $ distribution corresponds to the invariant mass of the two W-boson candidate leptons, and is shown in the opposite-flavor signal region (left) and the opposite-flavor control region (right). |
png pdf |
Additional Figure 5-b:
Example input variable for the BDT trained in the opposite-flavor signal region. This $ \mathrm{m_{\ell\ell}(\ell^W_0, \; \ell^W_1)} $ distribution corresponds to the invariant mass of the two W-boson candidate leptons, and is shown in the opposite-flavor signal region (left) and the opposite-flavor control region (right). |
png pdf |
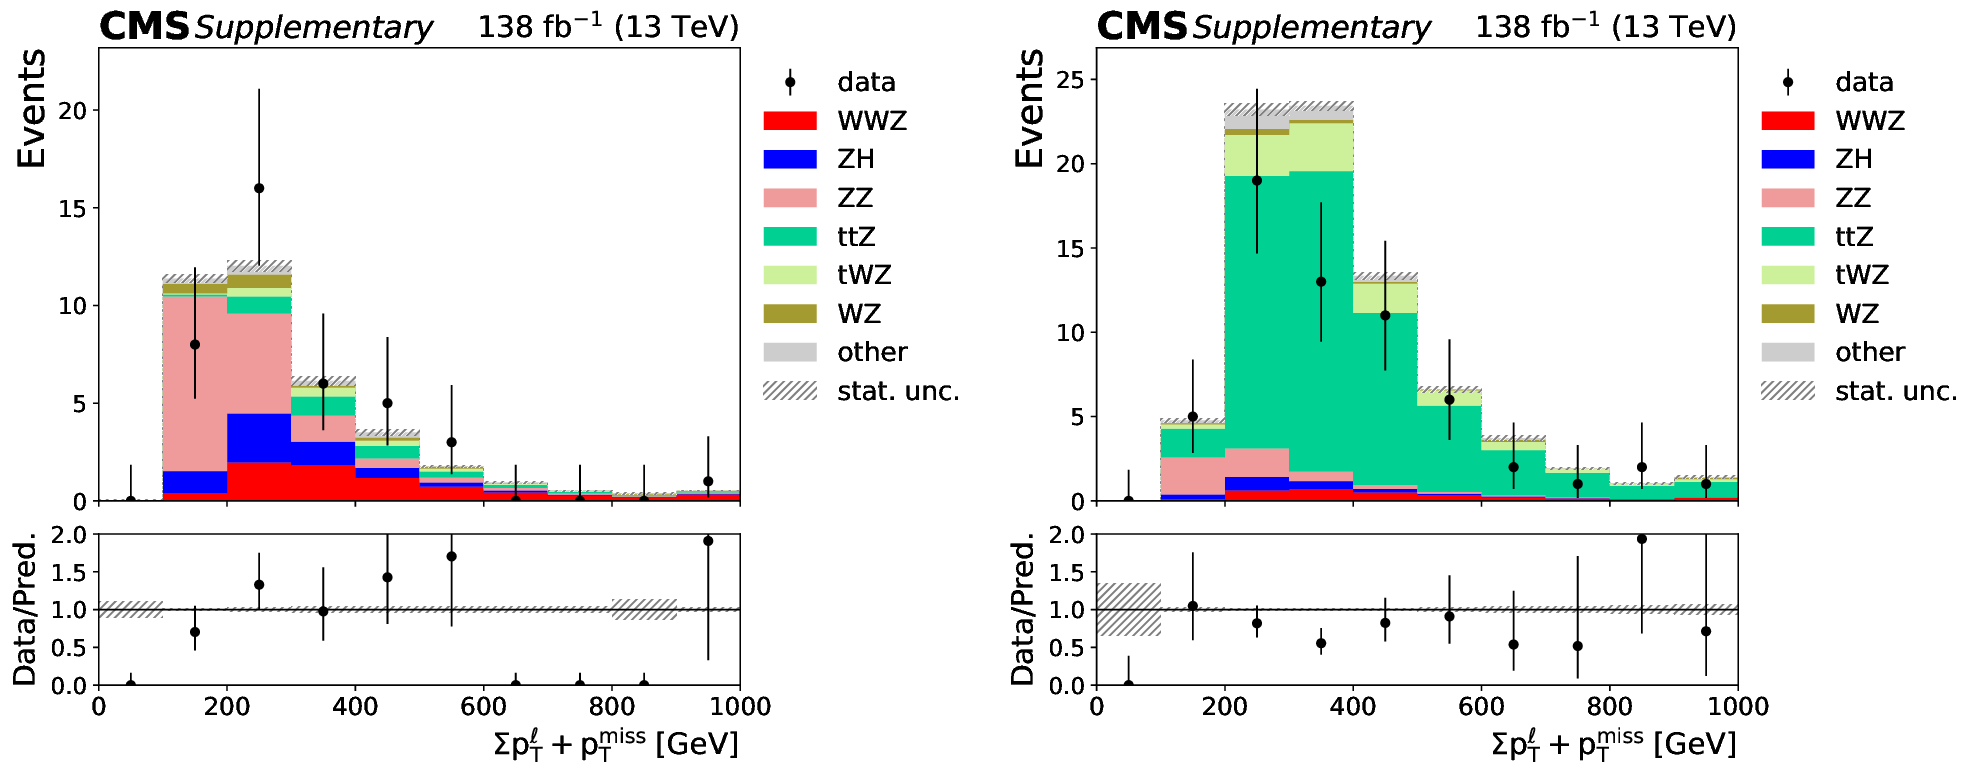
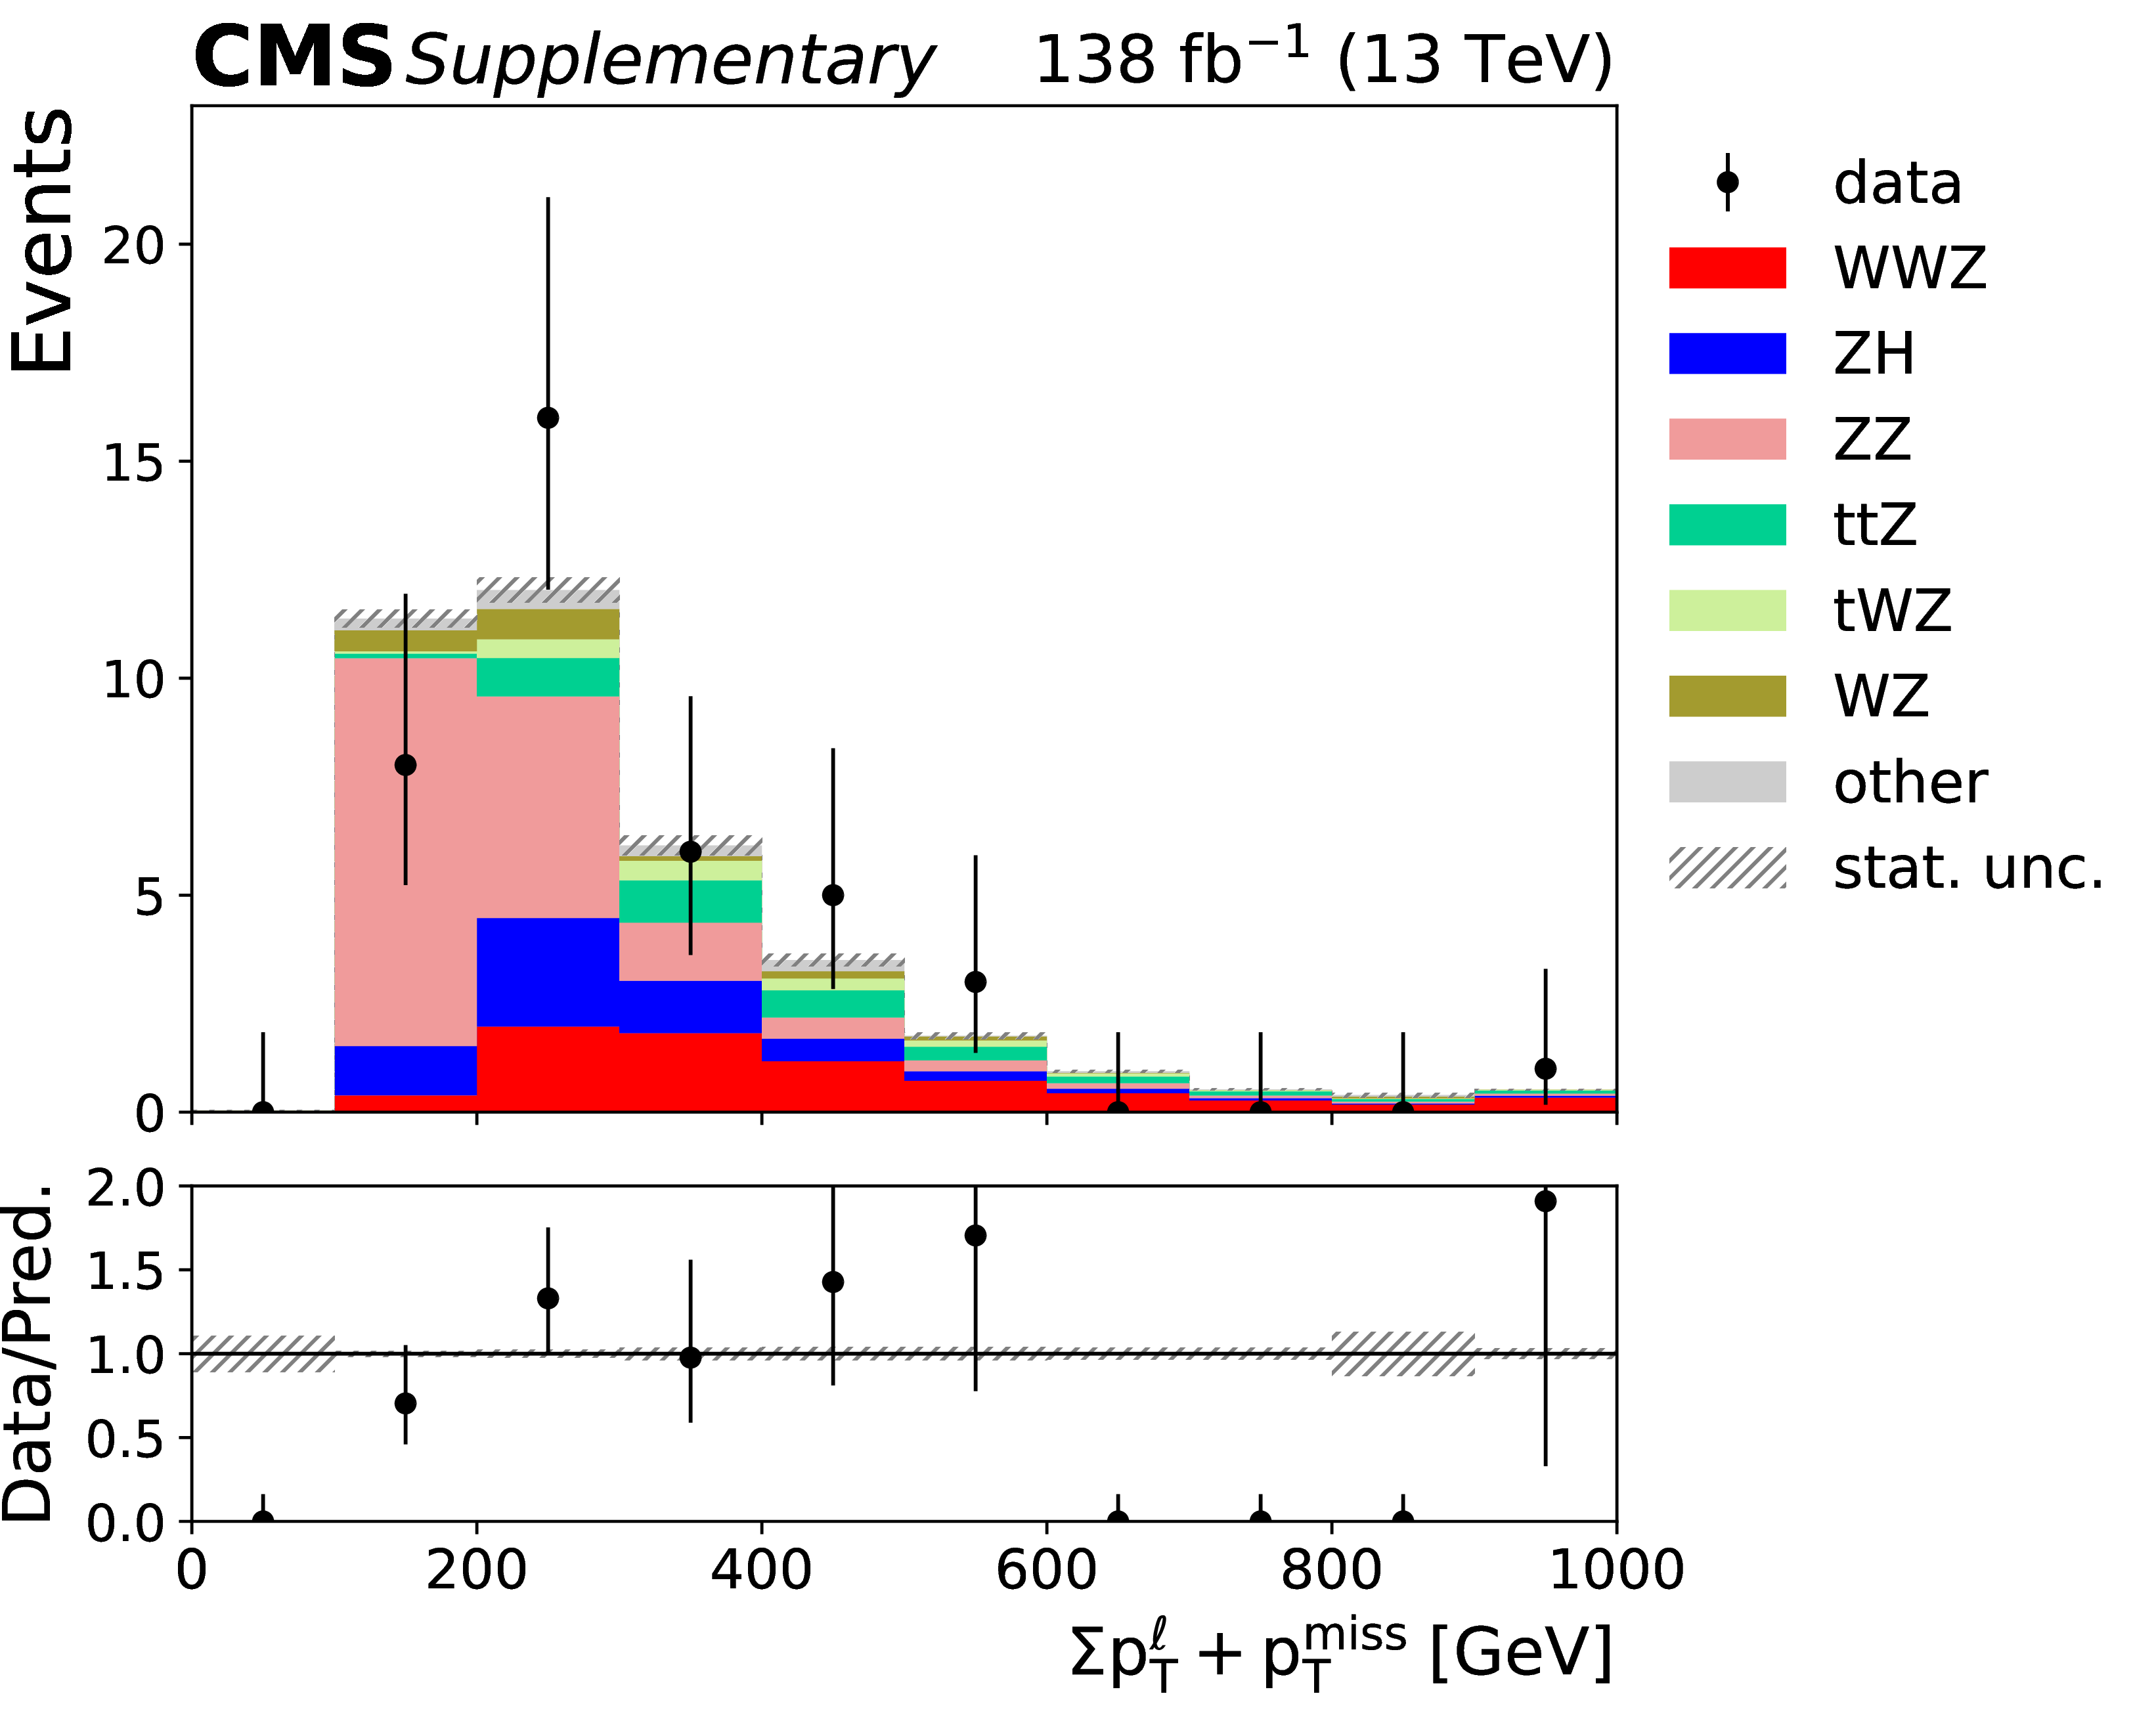
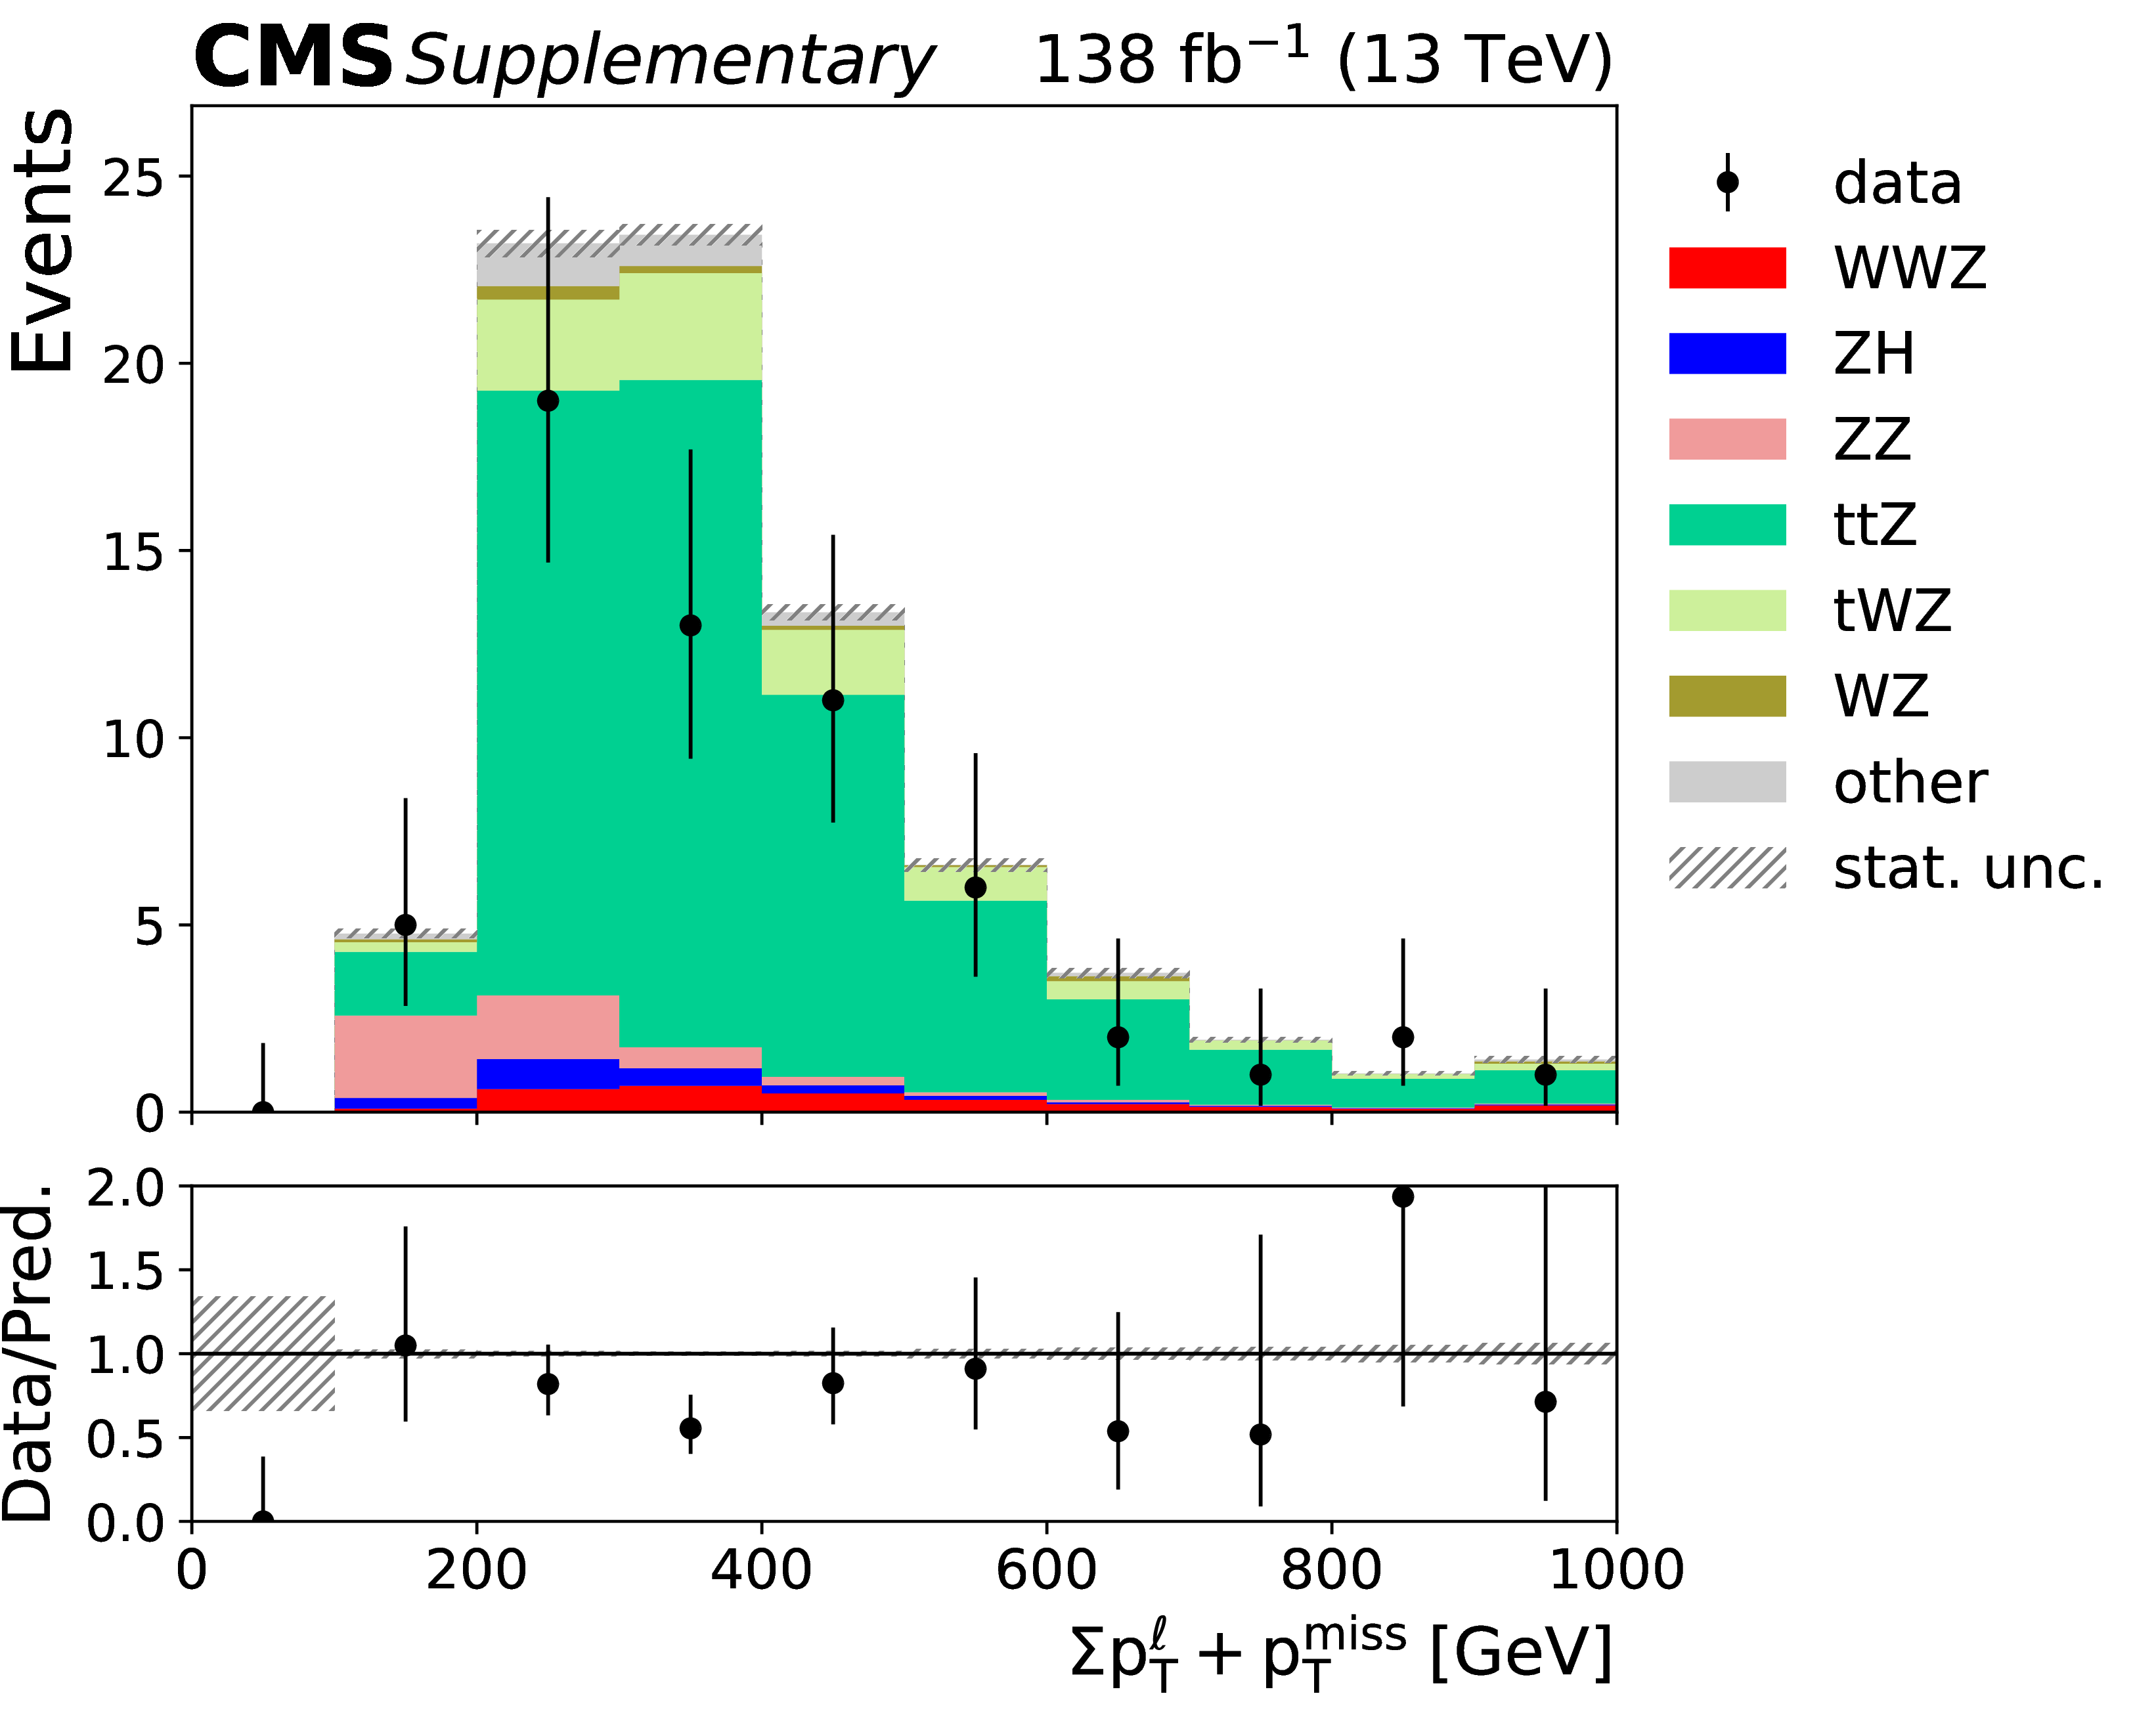
Additional Figure 6:
Example input variable for the BDT trained in the opposite-flavor signal region. This $ \Sigma{\mathrm{p_T^\ell + p_T^{miss}}} $ distribution corresponds to the scalar sum of the transverse momenta of the four leptons in the event with the missing transverse momentum, and is shown in the opposite-flavor signal region (left) and the opposite-flavor control region (right). |
png pdf |
Additional Figure 6-a:
Example input variable for the BDT trained in the opposite-flavor signal region. This $ \Sigma{\mathrm{p_T^\ell + p_T^{miss}}} $ distribution corresponds to the scalar sum of the transverse momenta of the four leptons in the event with the missing transverse momentum, and is shown in the opposite-flavor signal region (left) and the opposite-flavor control region (right). |
png pdf |
Additional Figure 6-b:
Example input variable for the BDT trained in the opposite-flavor signal region. This $ \Sigma{\mathrm{p_T^\ell + p_T^{miss}}} $ distribution corresponds to the scalar sum of the transverse momenta of the four leptons in the event with the missing transverse momentum, and is shown in the opposite-flavor signal region (left) and the opposite-flavor control region (right). |
png pdf |
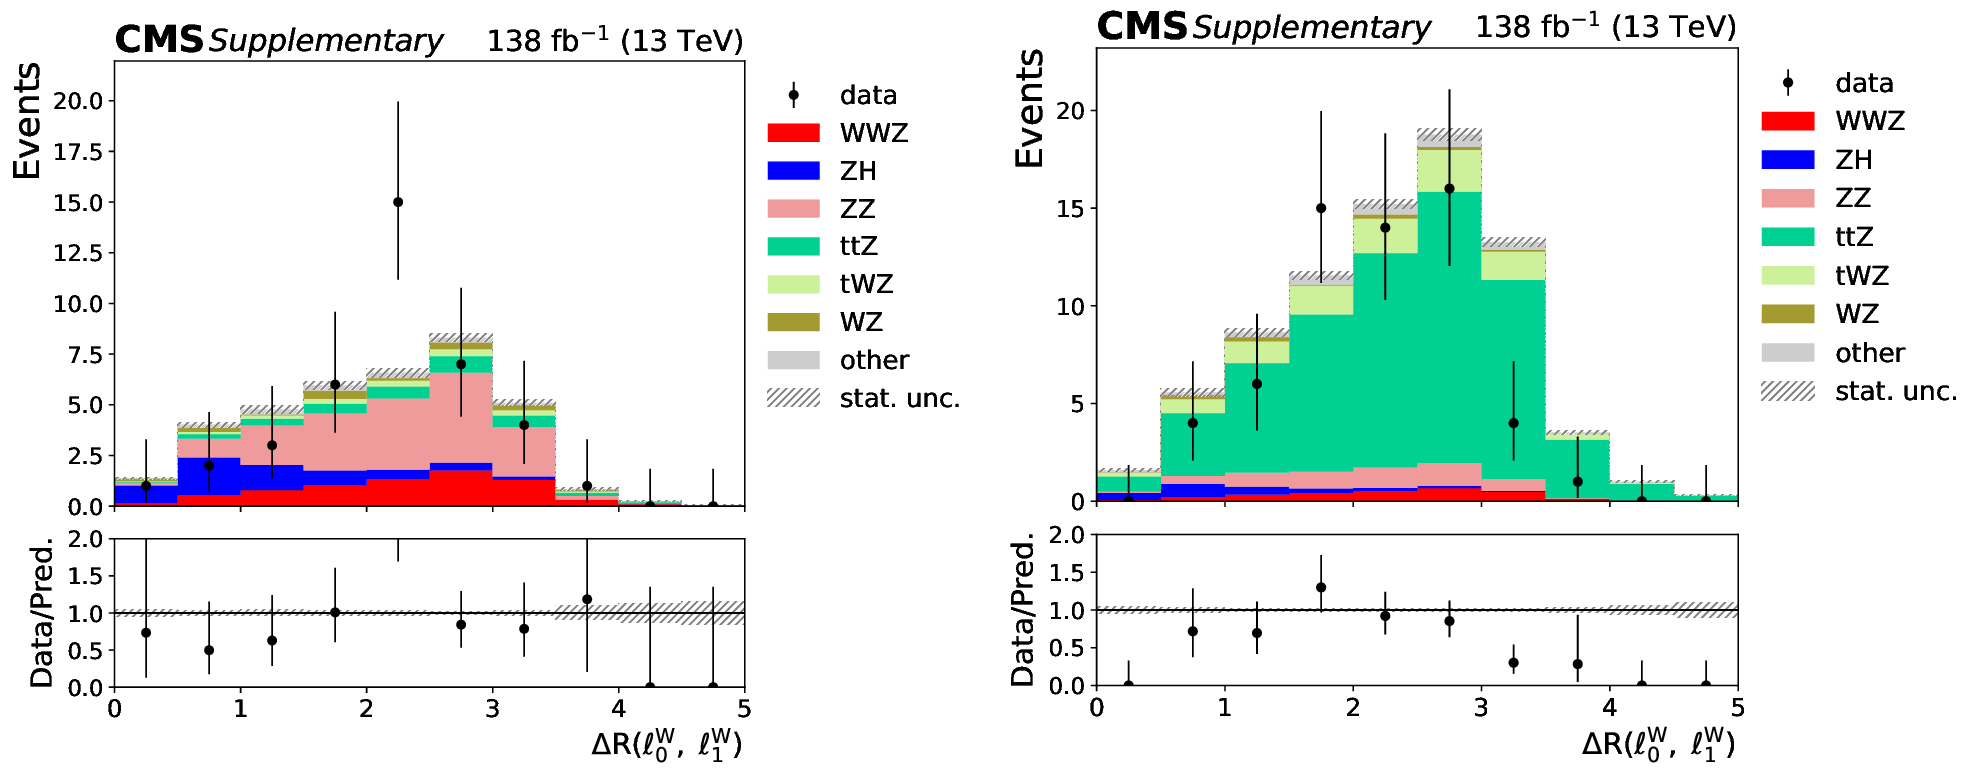
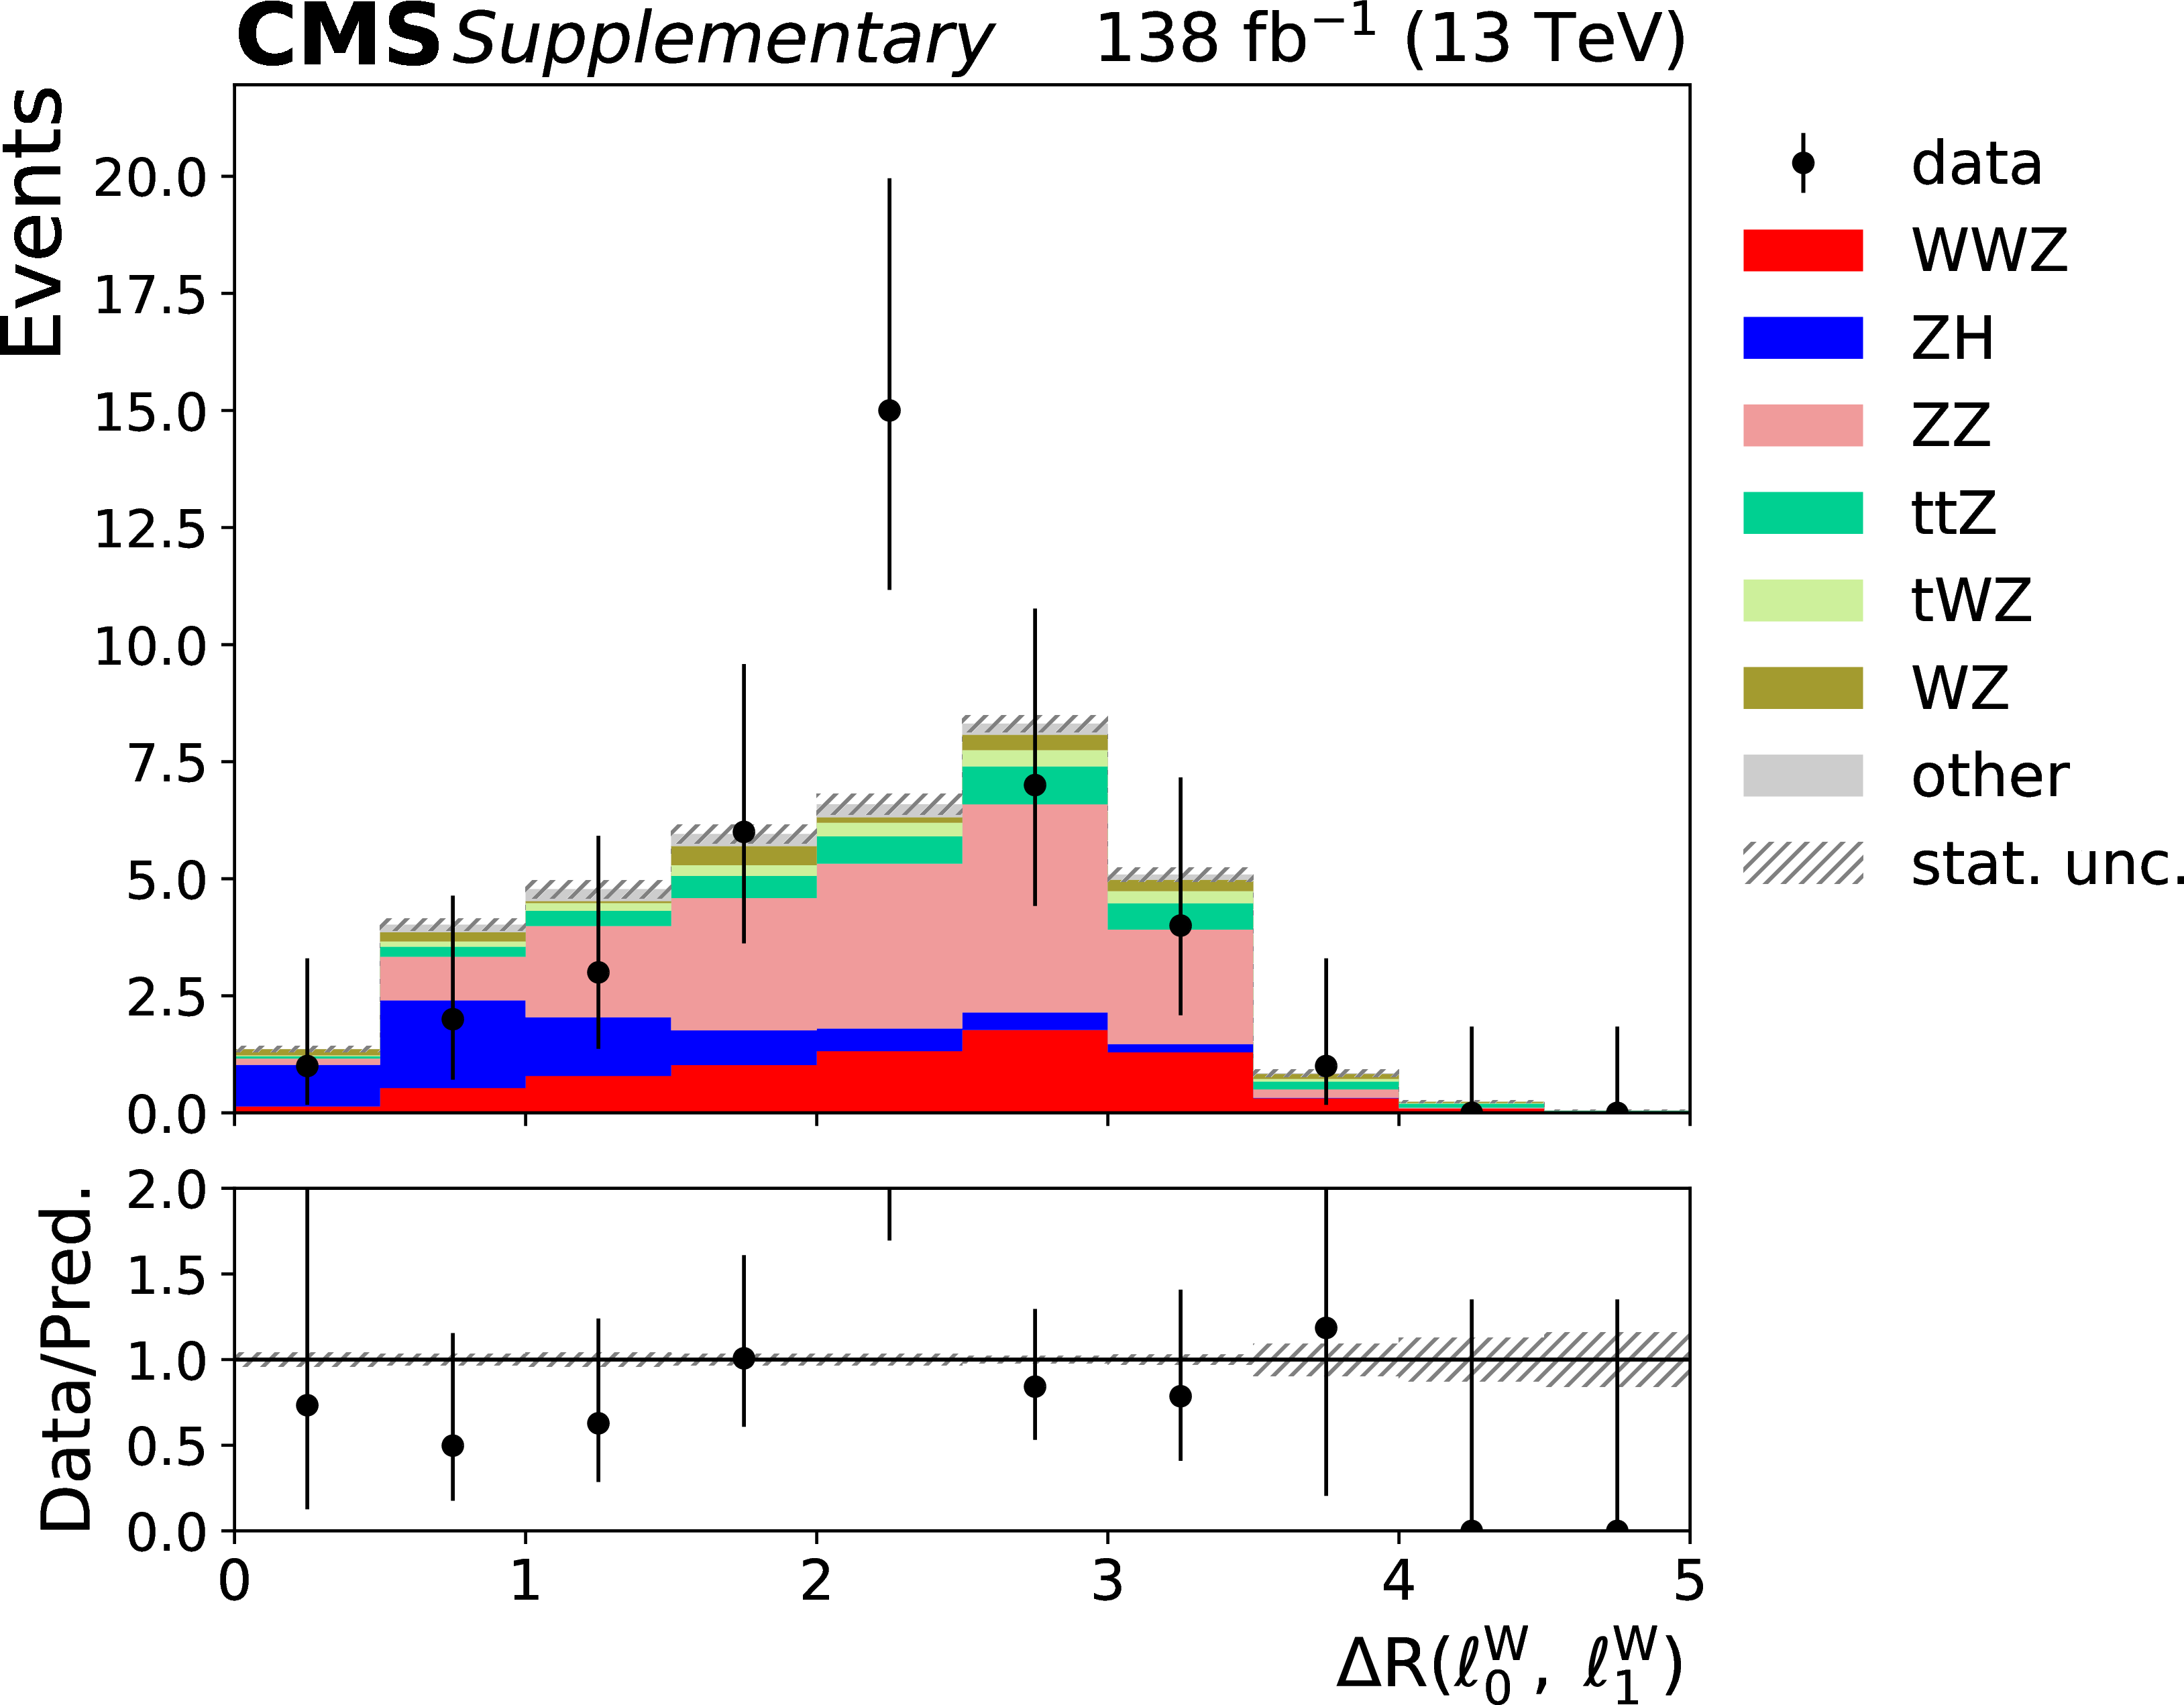
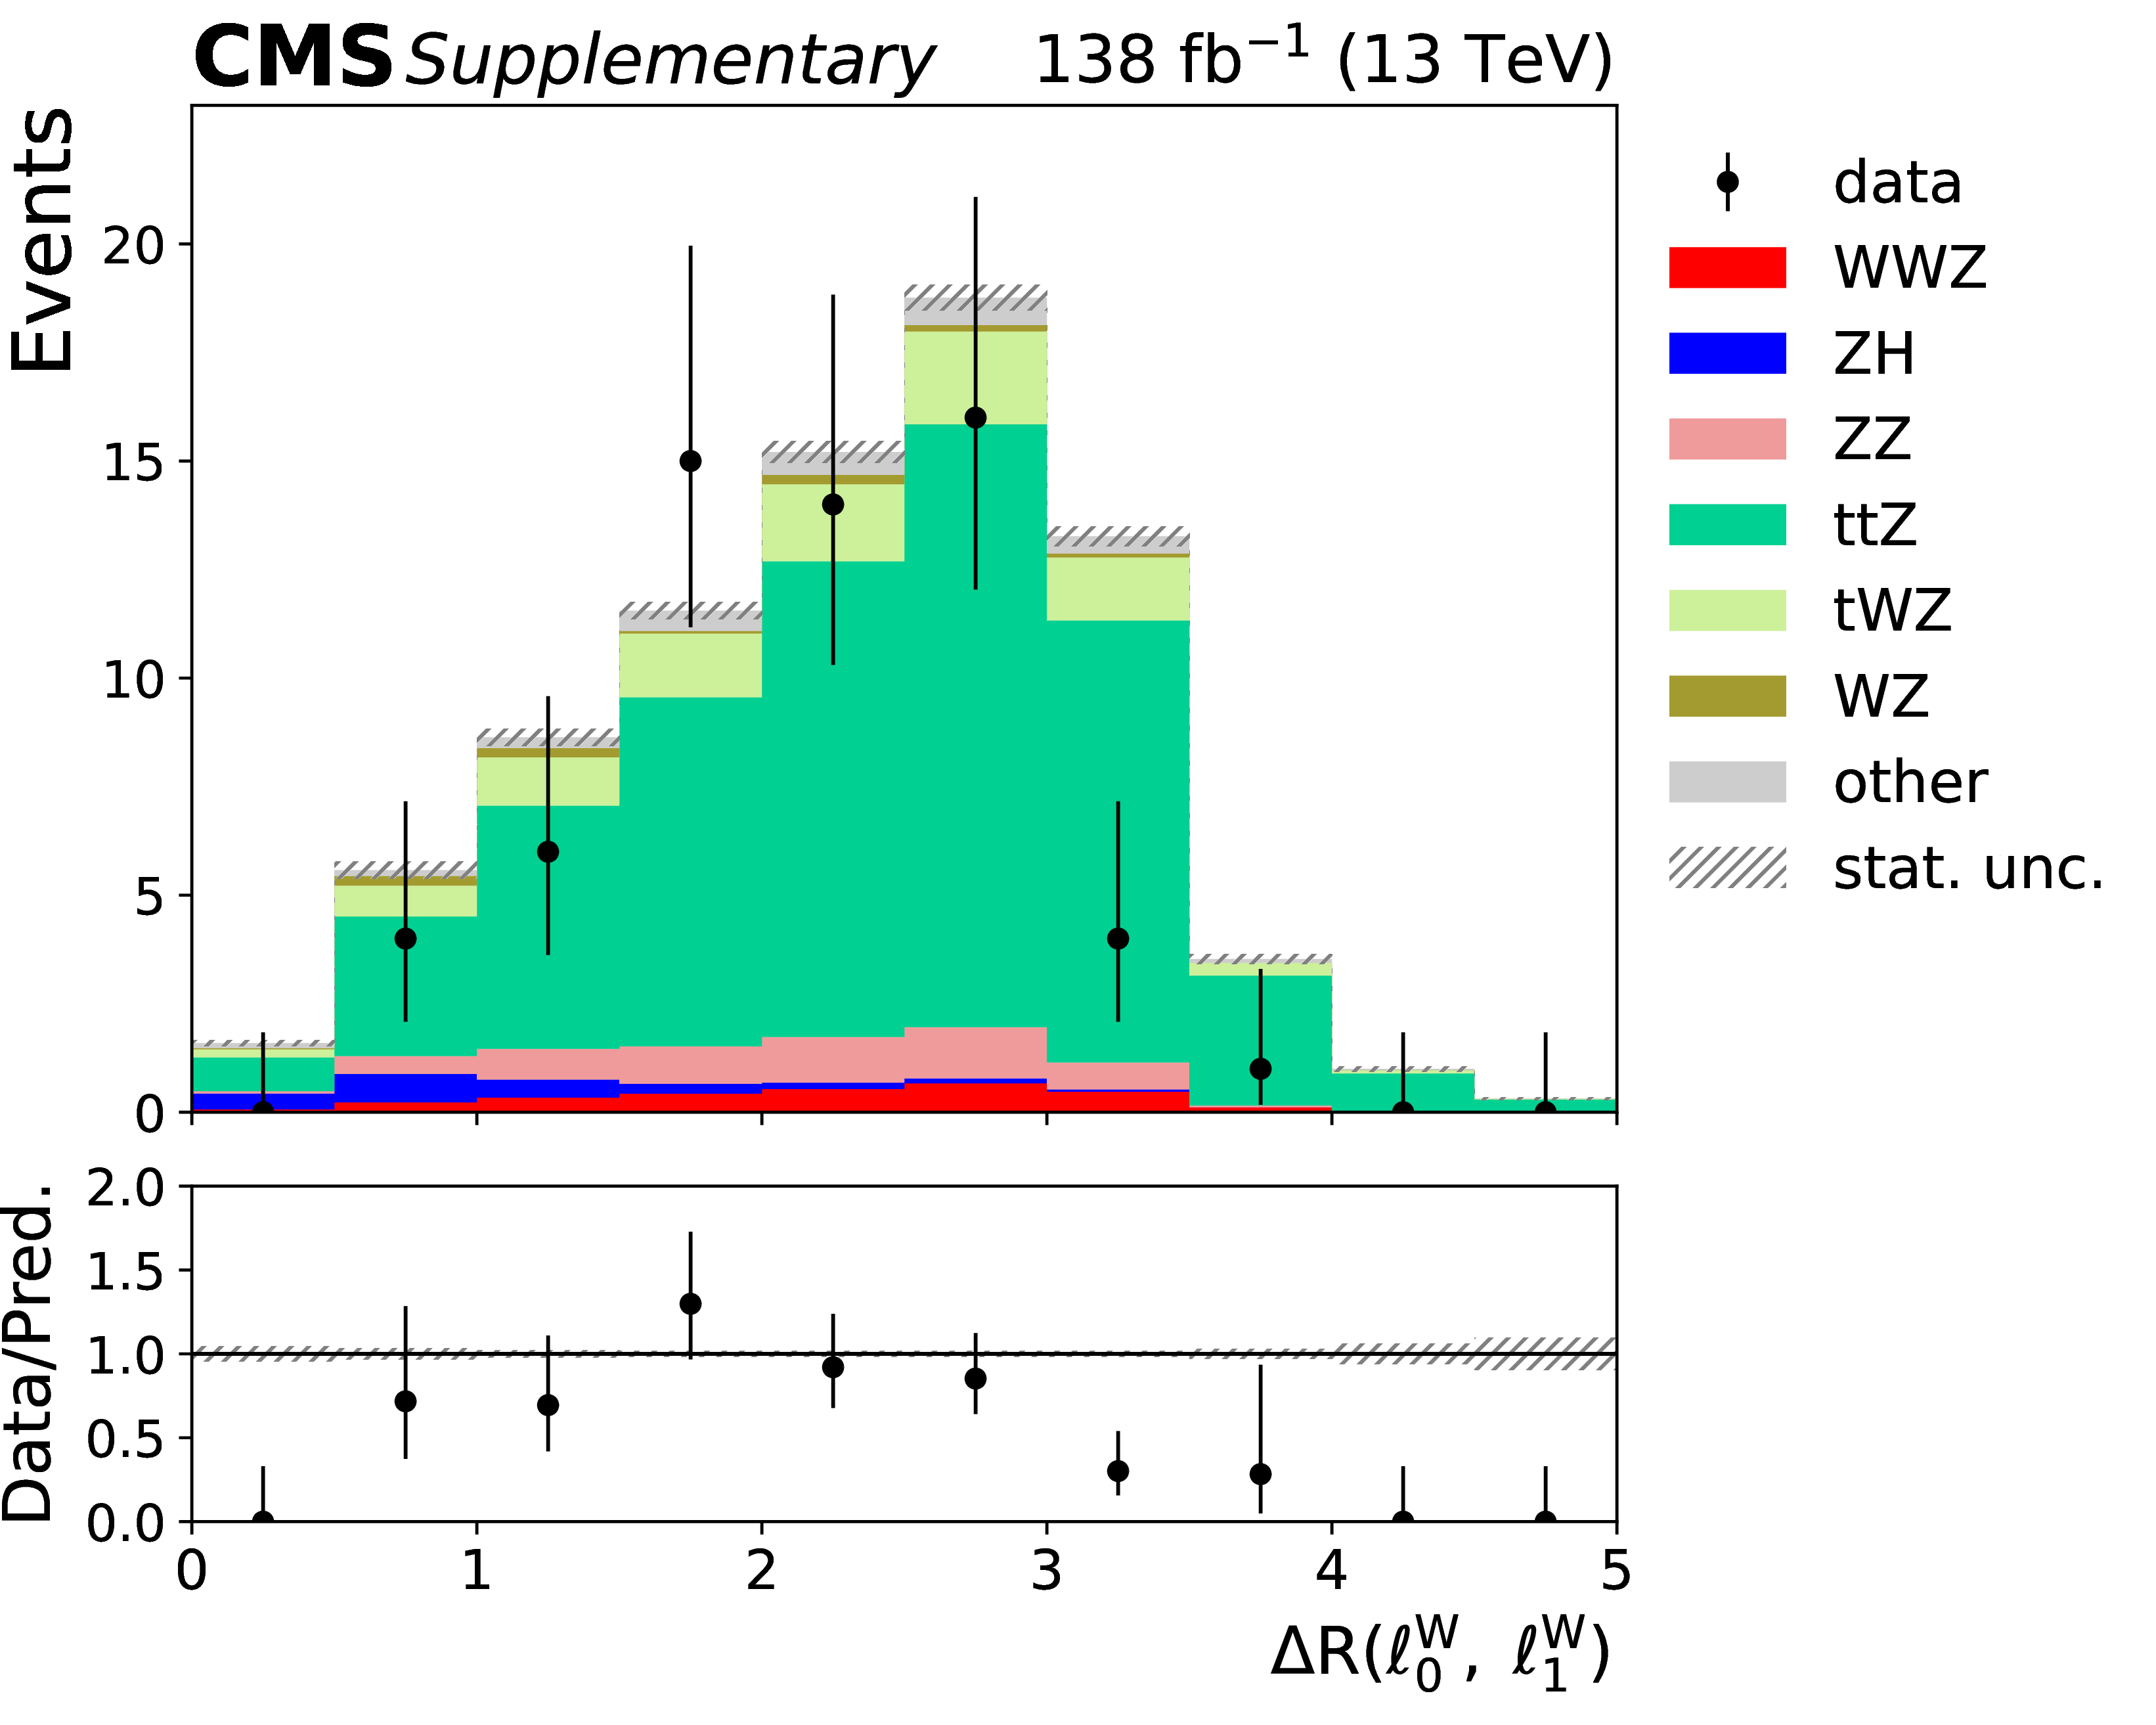
Additional Figure 7:
Example input variable for the BDT trained in the opposite-flavor signal region. This $ \Delta \mathrm{R (\ell^W_0, \; \ell^W_1)} $ distribution corresponds to the $ \Delta $R between the two W-boson candidate leptons, and is shown in the opposite-flavor signal region (left) and the opposite-flavor control region (right). |
png pdf |
Additional Figure 7-a:
Example input variable for the BDT trained in the opposite-flavor signal region. This $ \Delta \mathrm{R (\ell^W_0, \; \ell^W_1)} $ distribution corresponds to the $ \Delta $R between the two W-boson candidate leptons, and is shown in the opposite-flavor signal region (left) and the opposite-flavor control region (right). |
png pdf |
Additional Figure 7-b:
Example input variable for the BDT trained in the opposite-flavor signal region. This $ \Delta \mathrm{R (\ell^W_0, \; \ell^W_1)} $ distribution corresponds to the $ \Delta $R between the two W-boson candidate leptons, and is shown in the opposite-flavor signal region (left) and the opposite-flavor control region (right). |
png pdf |
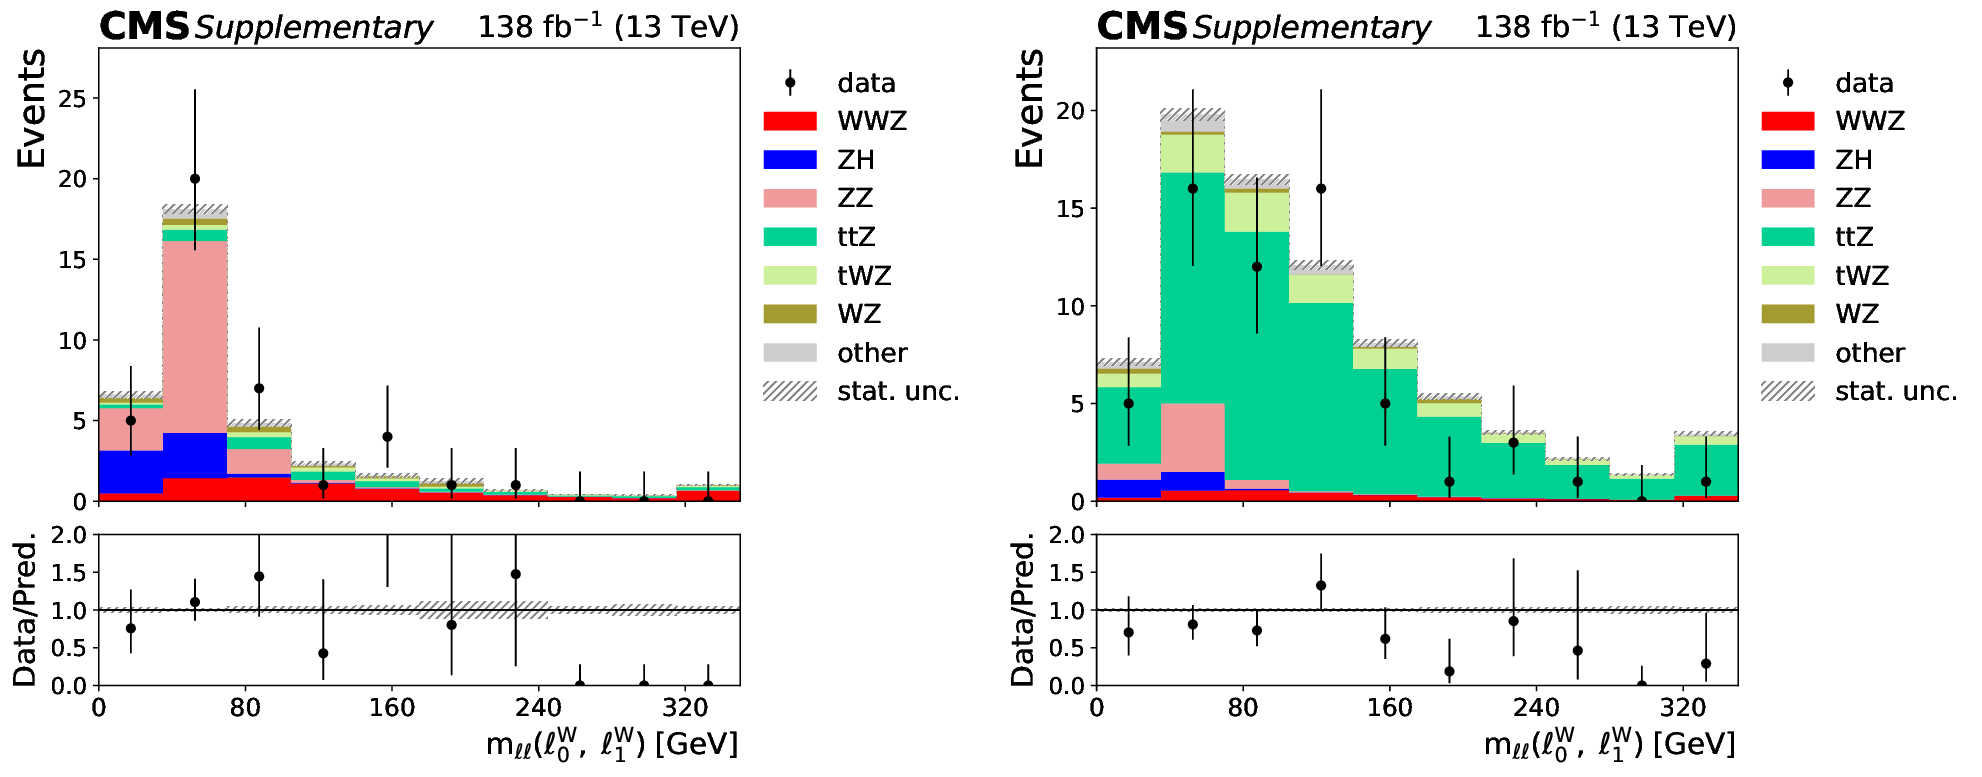
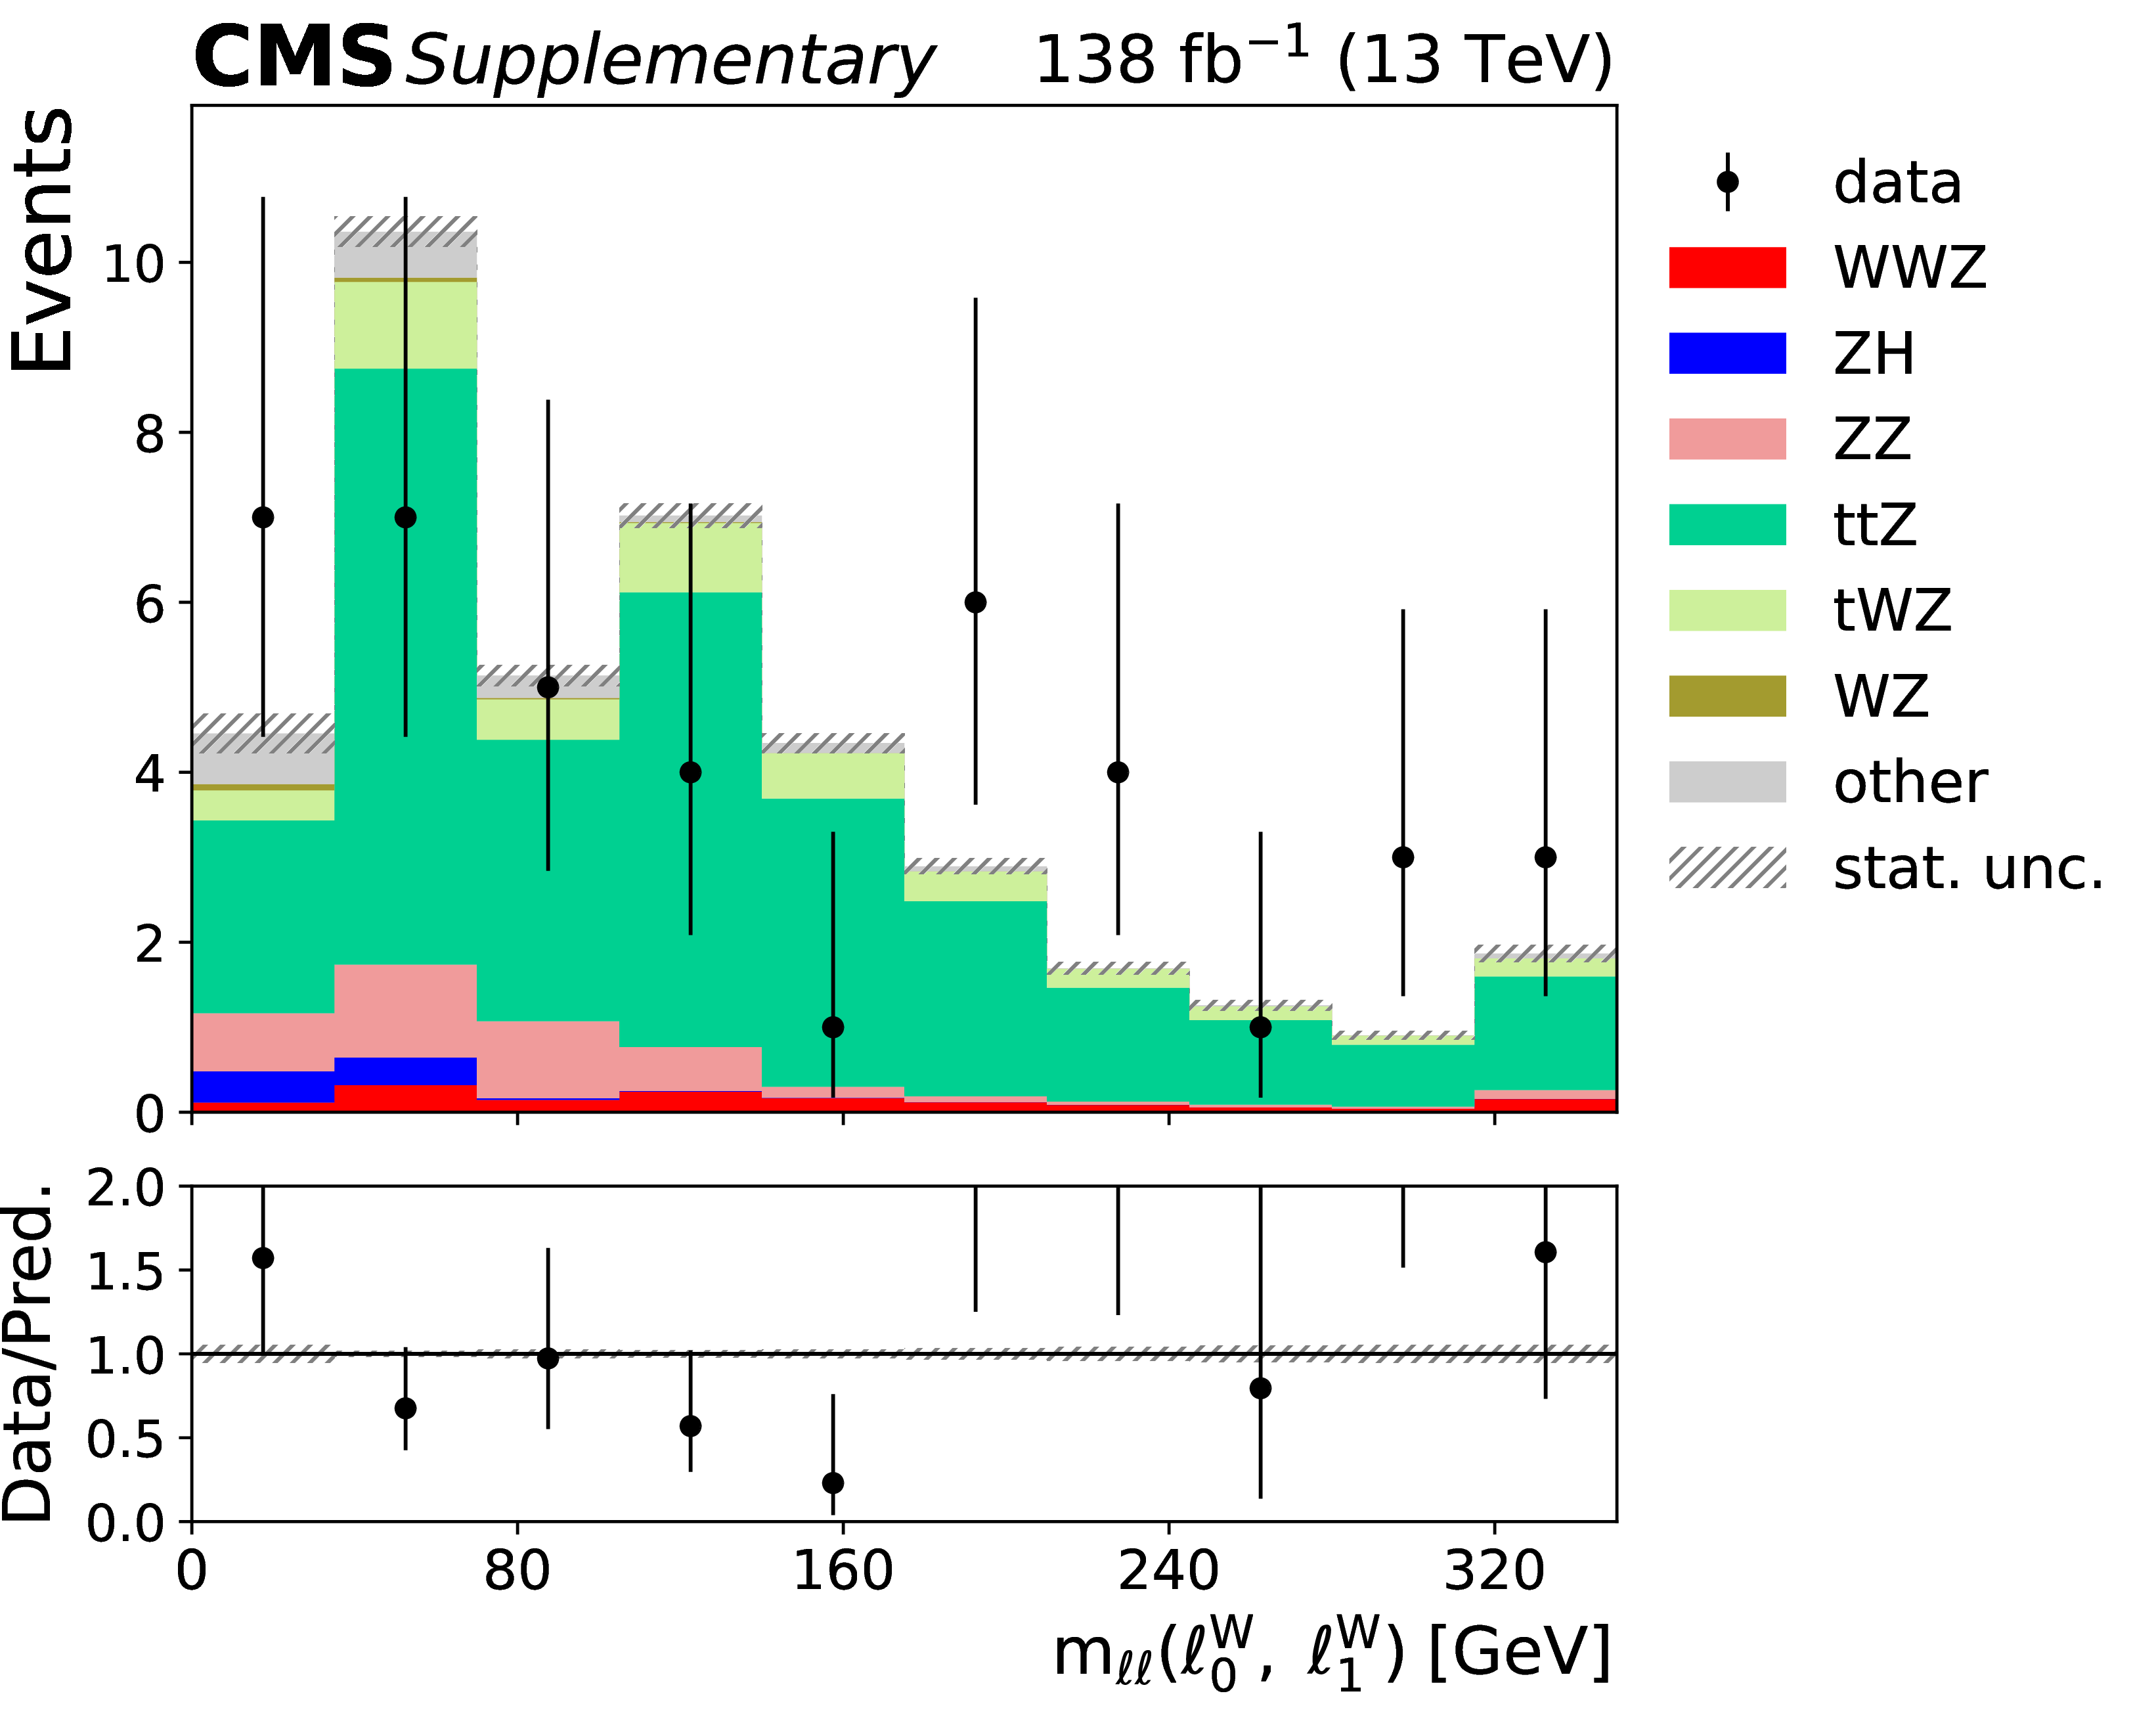
Additional Figure 8:
Example input variable for the BDT trained in the same-flavor signal region. This $ \mathrm{m_{\ell\ell}(\ell^W_0, \; \ell^W_1)} $ distribution corresponds to the invariant mass of the two W-boson candidate leptons, and is shown in the same-flavor signal region (left) and a same-flavor control region (right). |
png pdf |
Additional Figure 8-a:
Example input variable for the BDT trained in the same-flavor signal region. This $ \mathrm{m_{\ell\ell}(\ell^W_0, \; \ell^W_1)} $ distribution corresponds to the invariant mass of the two W-boson candidate leptons, and is shown in the same-flavor signal region (left) and a same-flavor control region (right). |
png pdf |
Additional Figure 8-b:
Example input variable for the BDT trained in the same-flavor signal region. This $ \mathrm{m_{\ell\ell}(\ell^W_0, \; \ell^W_1)} $ distribution corresponds to the invariant mass of the two W-boson candidate leptons, and is shown in the same-flavor signal region (left) and a same-flavor control region (right). |
png pdf |
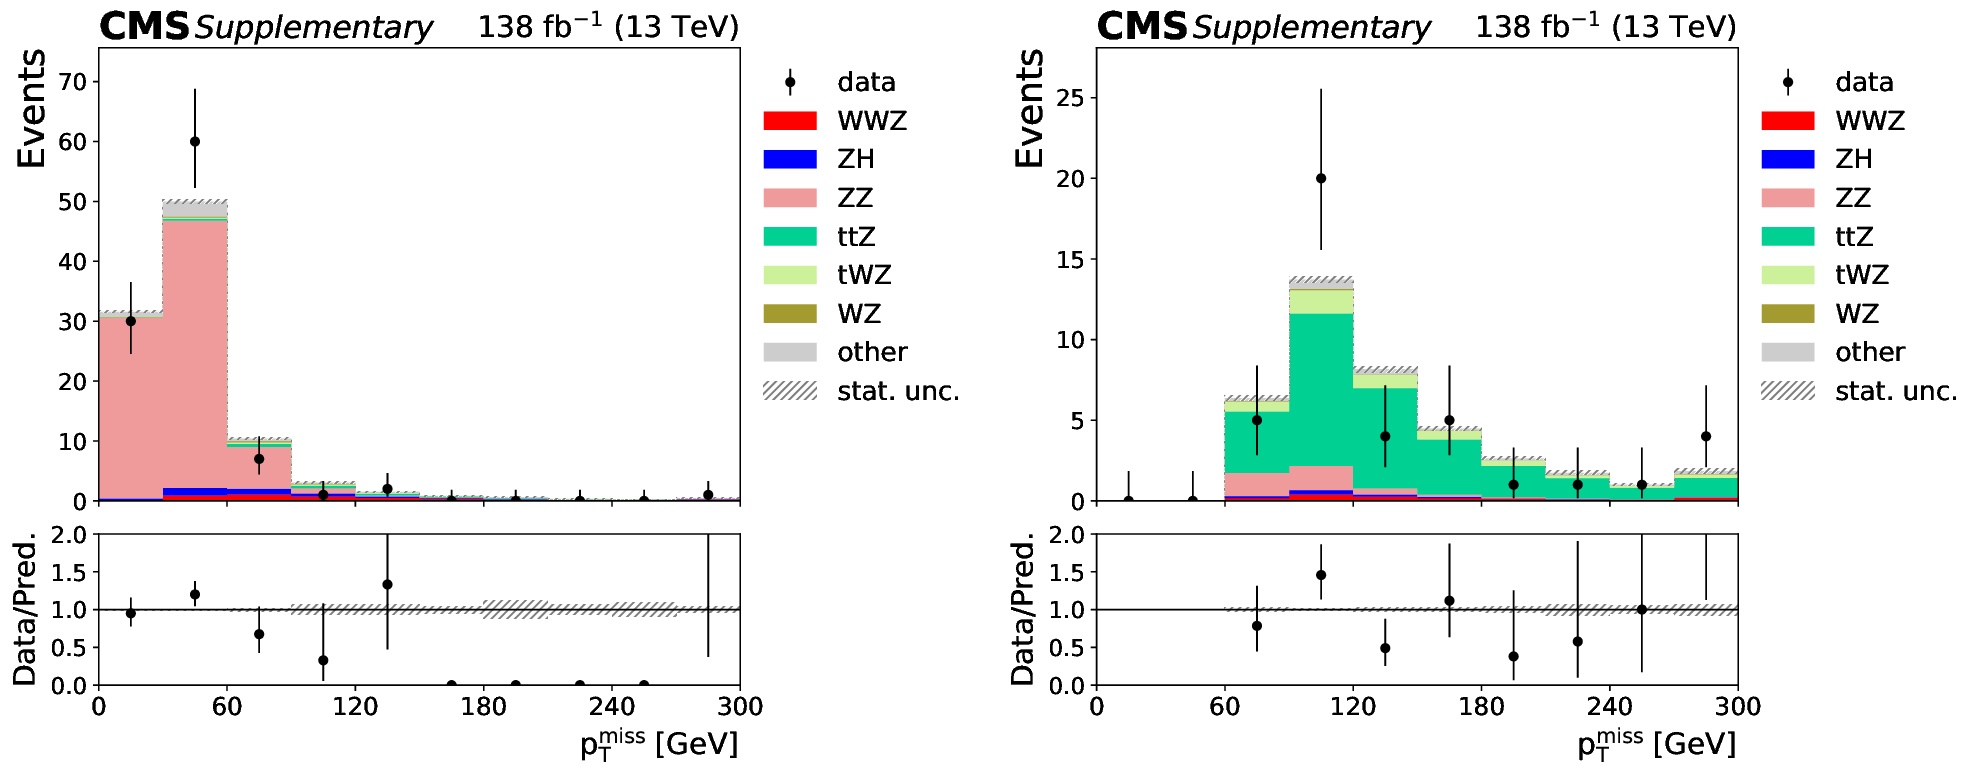
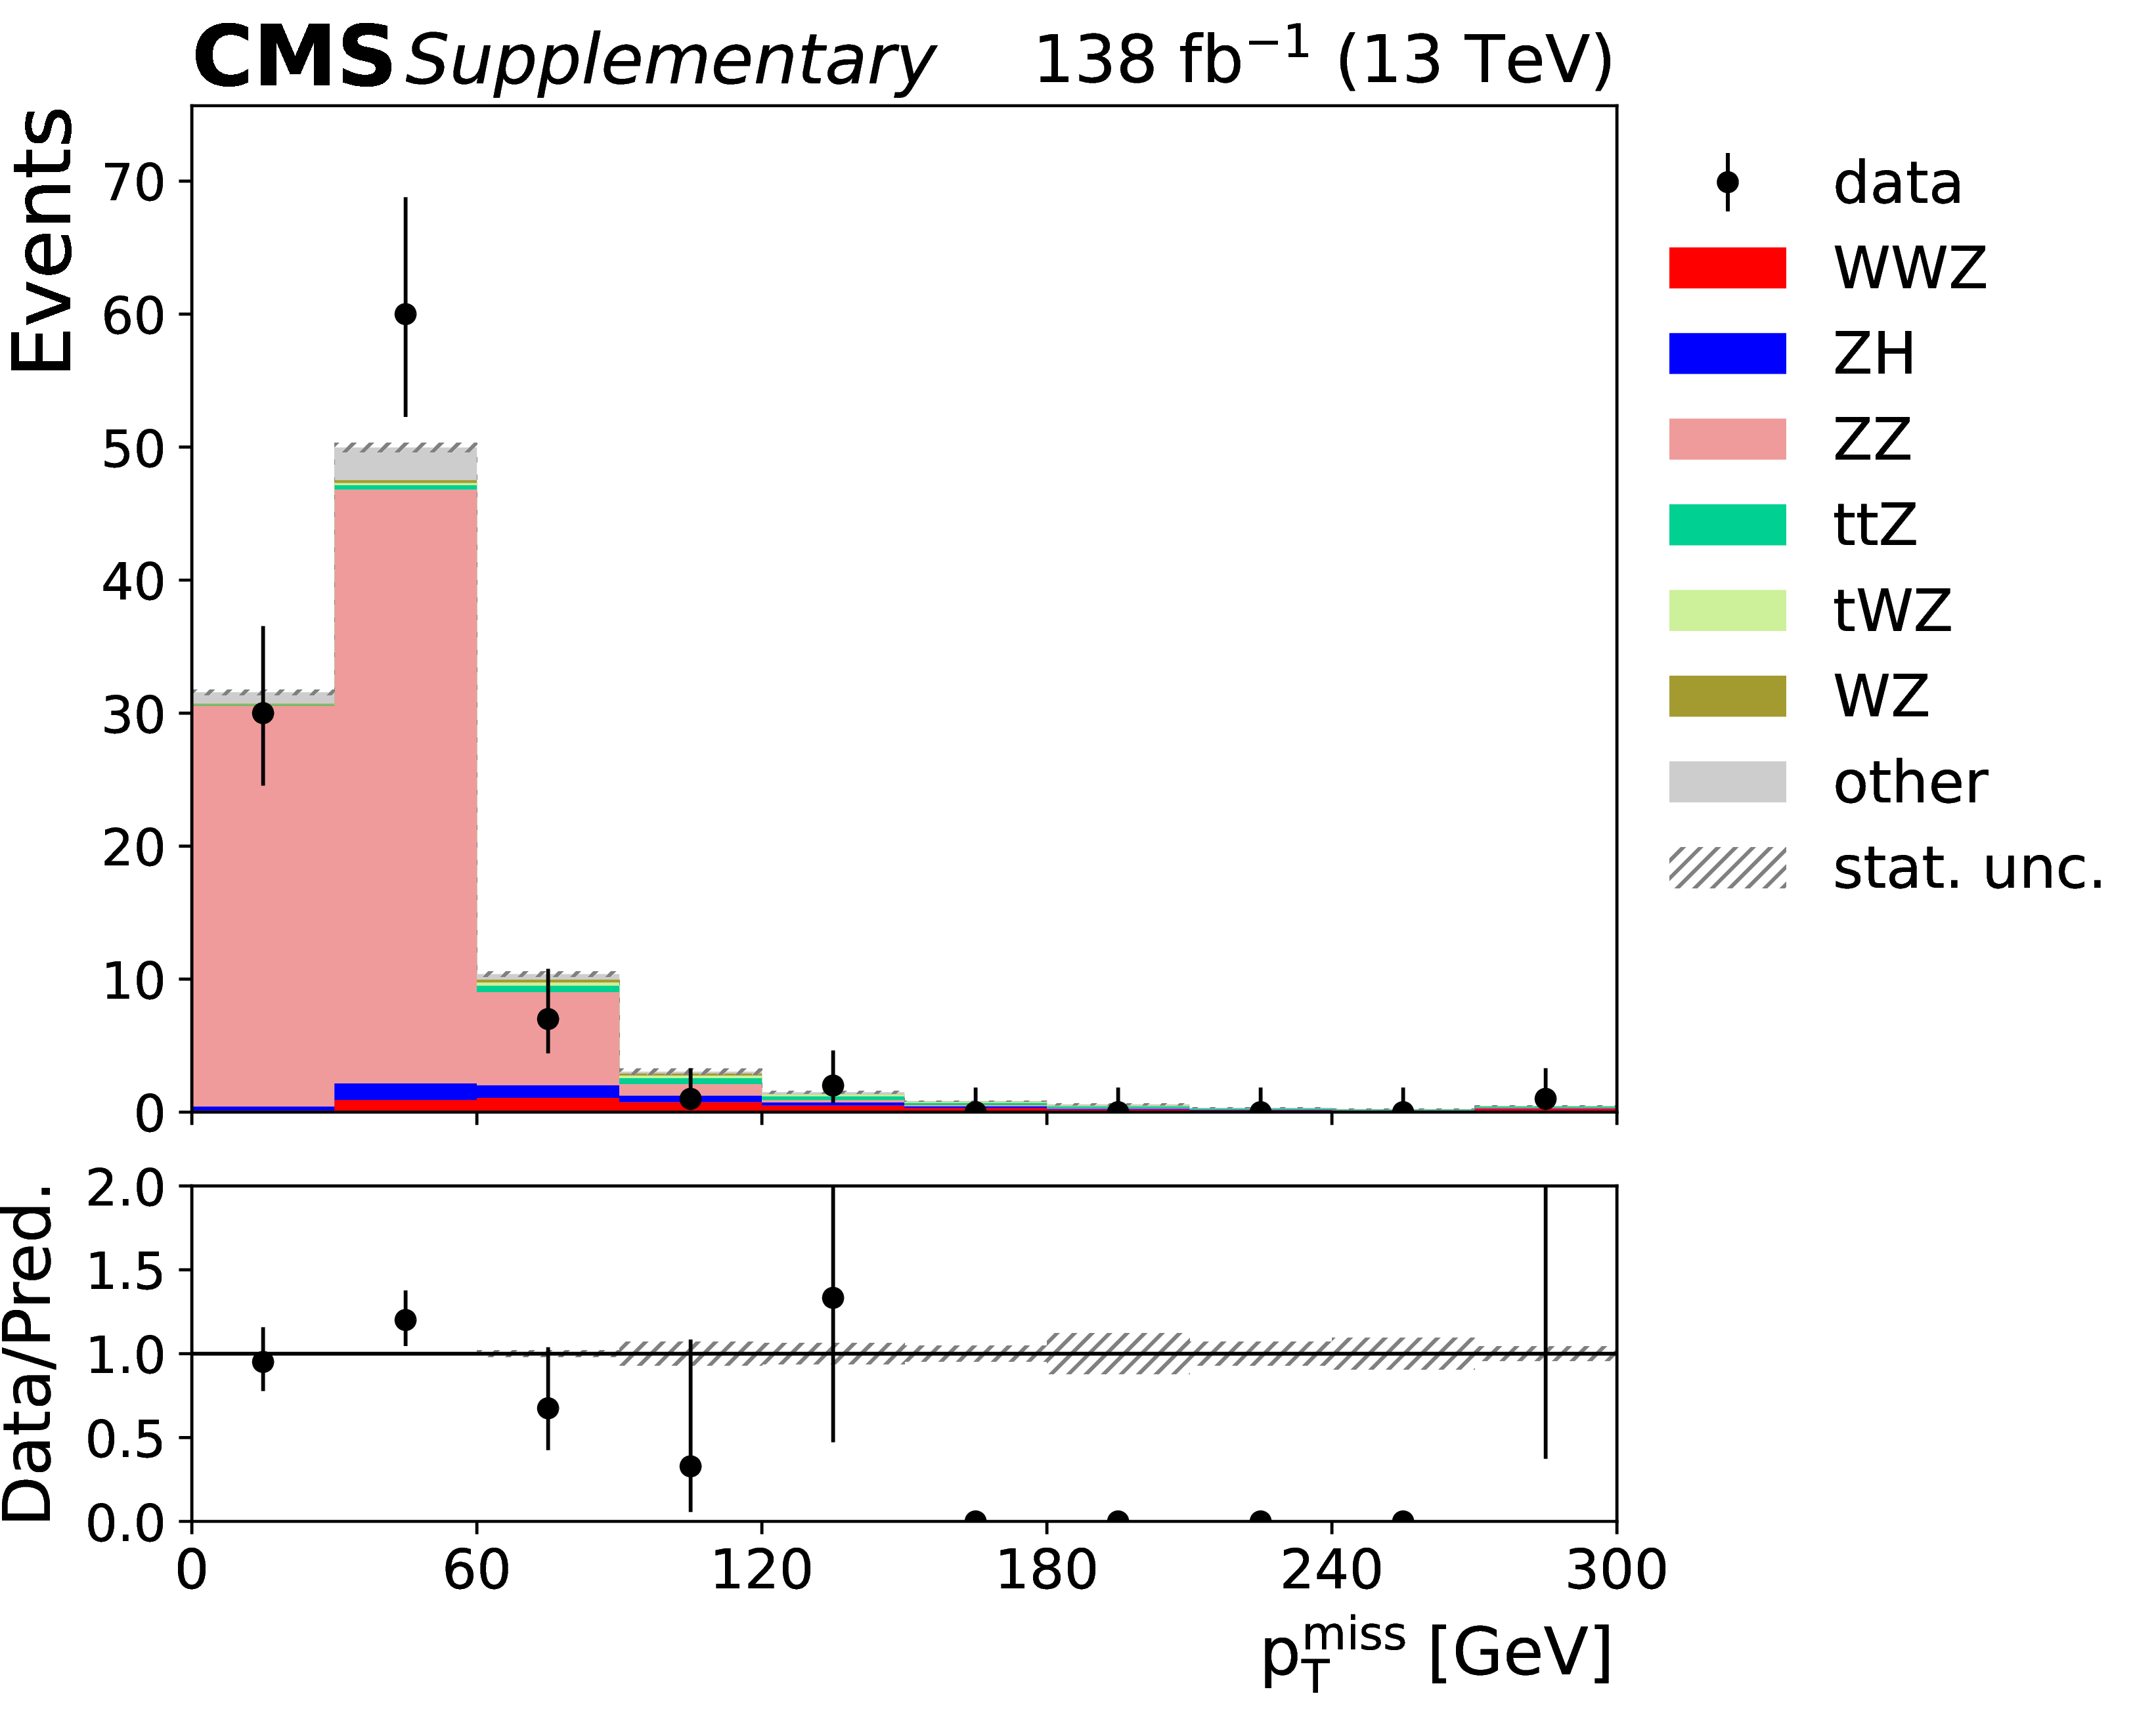
Additional Figure 9:
Example input variable for the BDT trained in the same-flavor signal region. This $ p_{T}^{miss} $ distribution corresponds to the missing transverse momentum, and is shown in the same-flavor signal region (left), and a same-flavor control region (right). |
png pdf |
Additional Figure 9-a:
Example input variable for the BDT trained in the same-flavor signal region. This $ p_{T}^{miss} $ distribution corresponds to the missing transverse momentum, and is shown in the same-flavor signal region (left), and a same-flavor control region (right). |
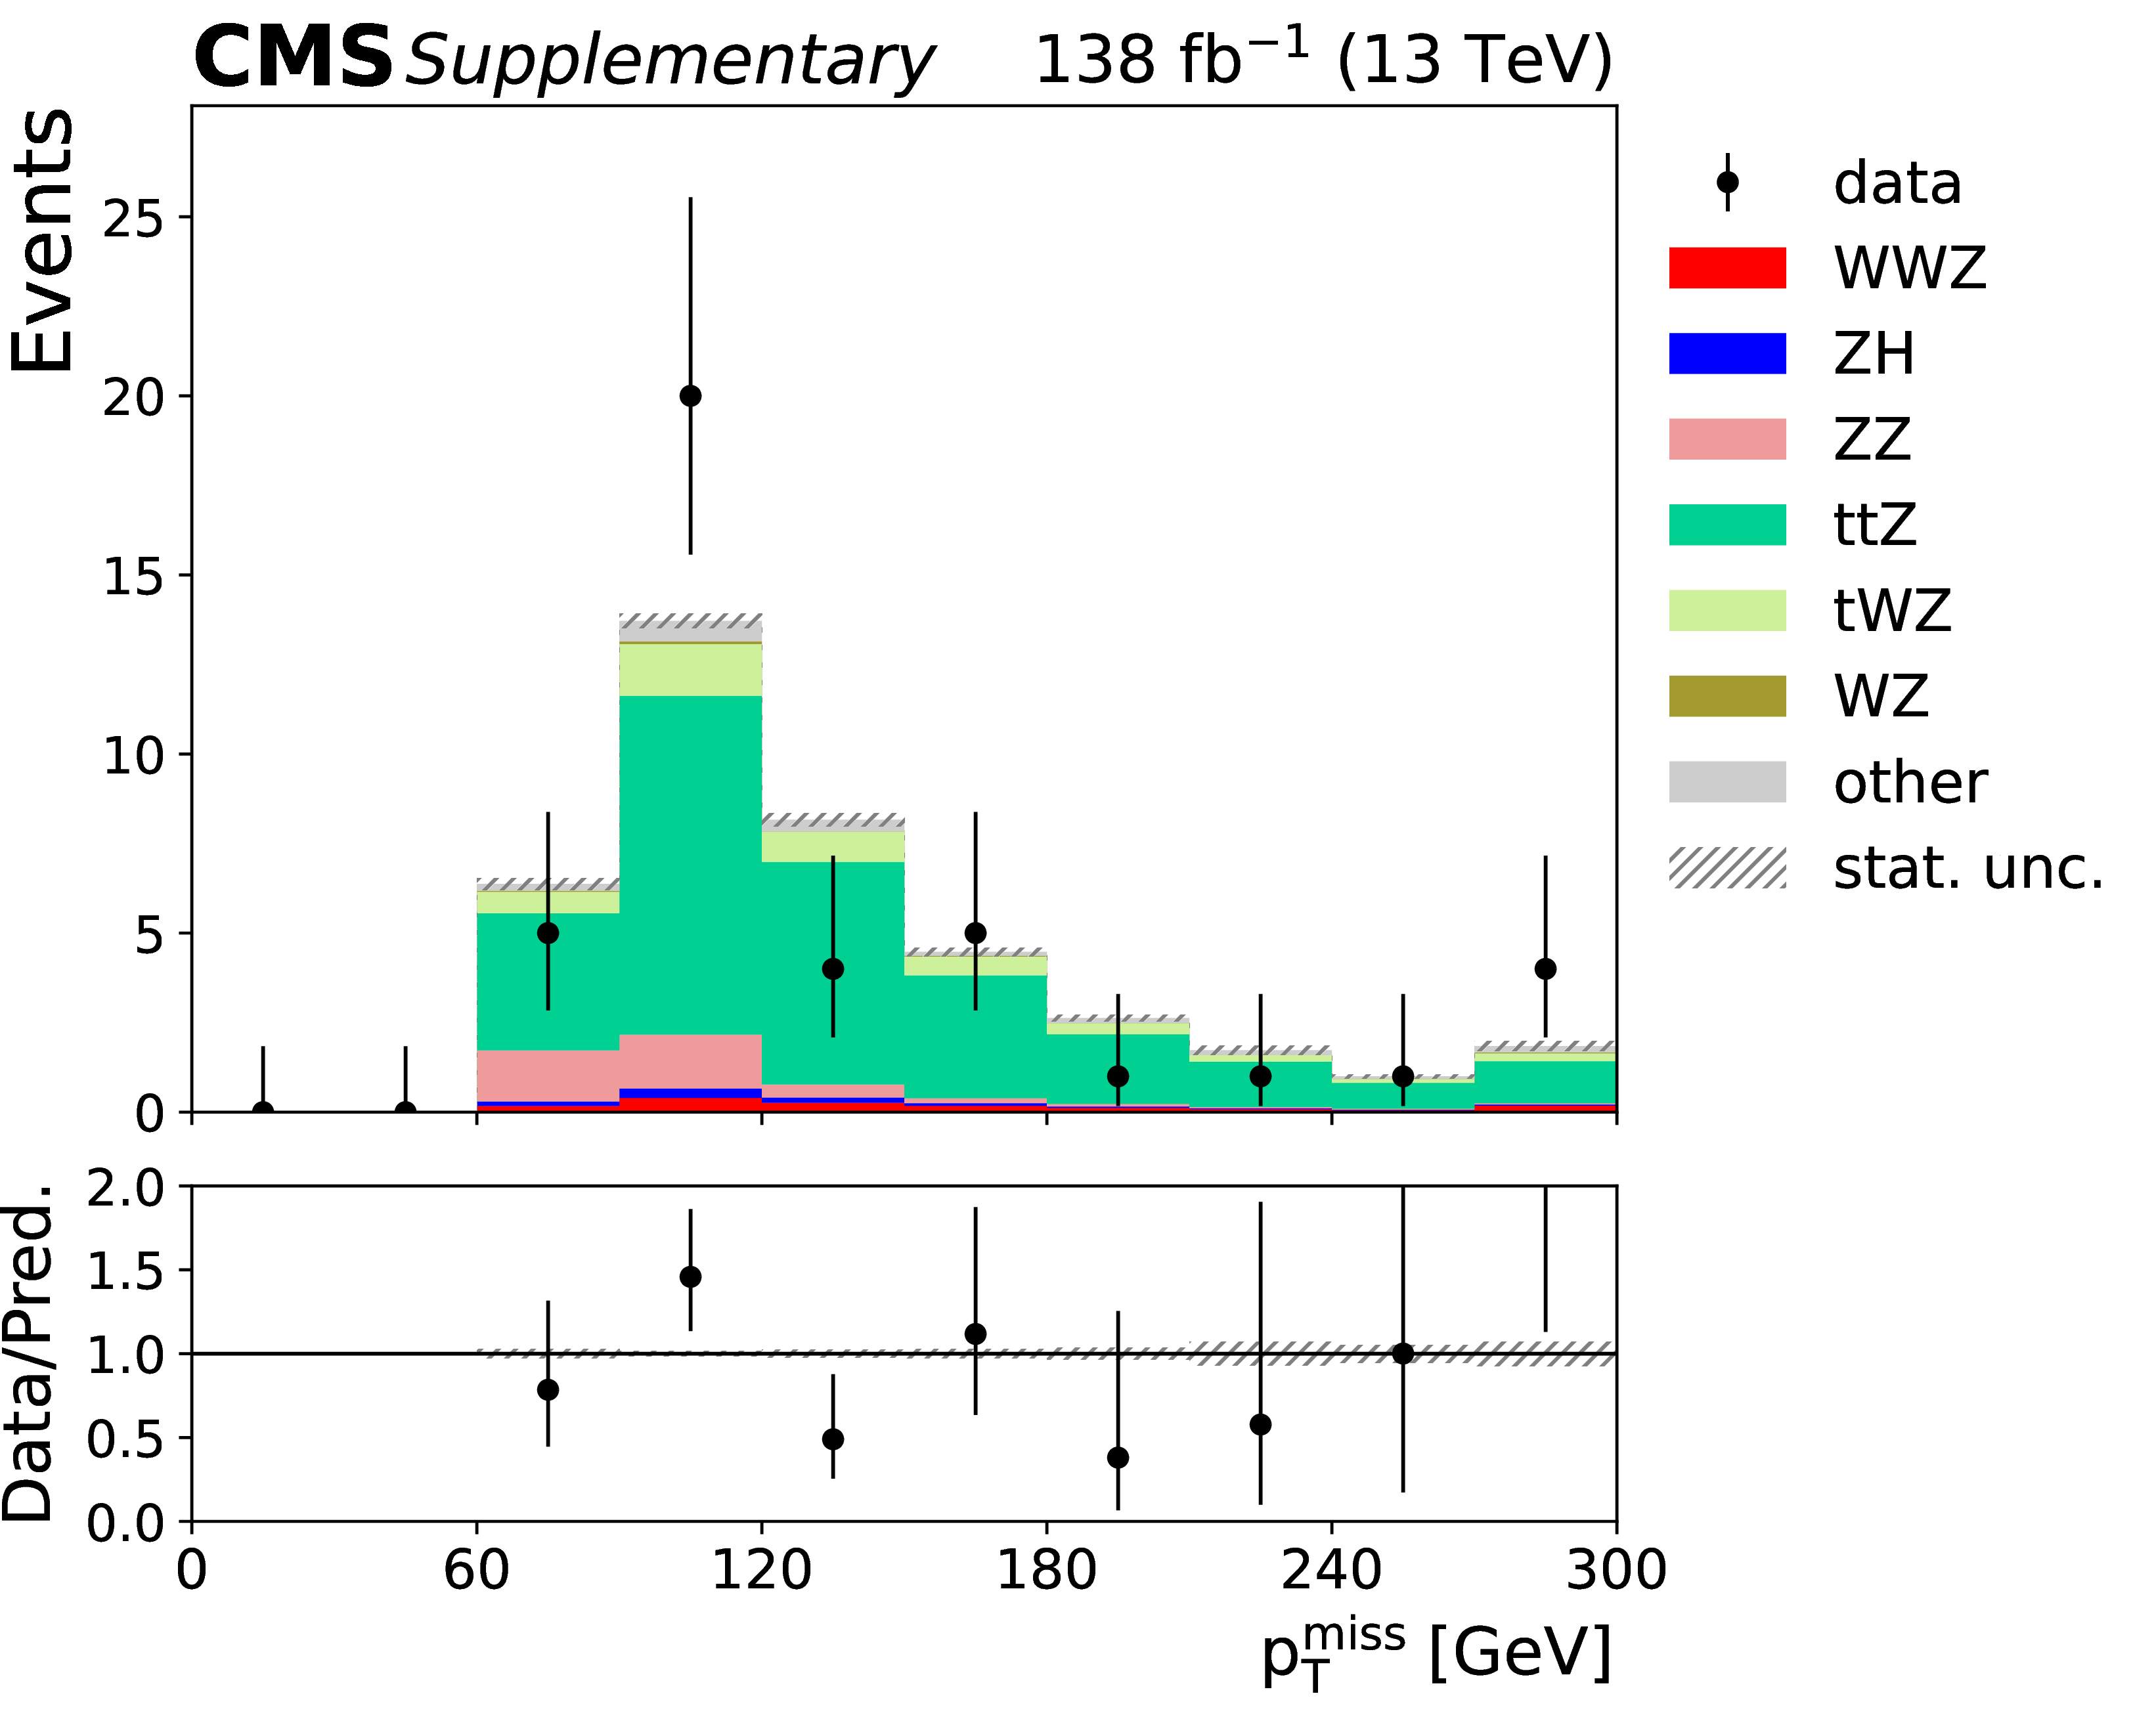
png pdf |
Additional Figure 9-b:
Example input variable for the BDT trained in the same-flavor signal region. This $ p_{T}^{miss} $ distribution corresponds to the missing transverse momentum, and is shown in the same-flavor signal region (left), and a same-flavor control region (right). |
png pdf |
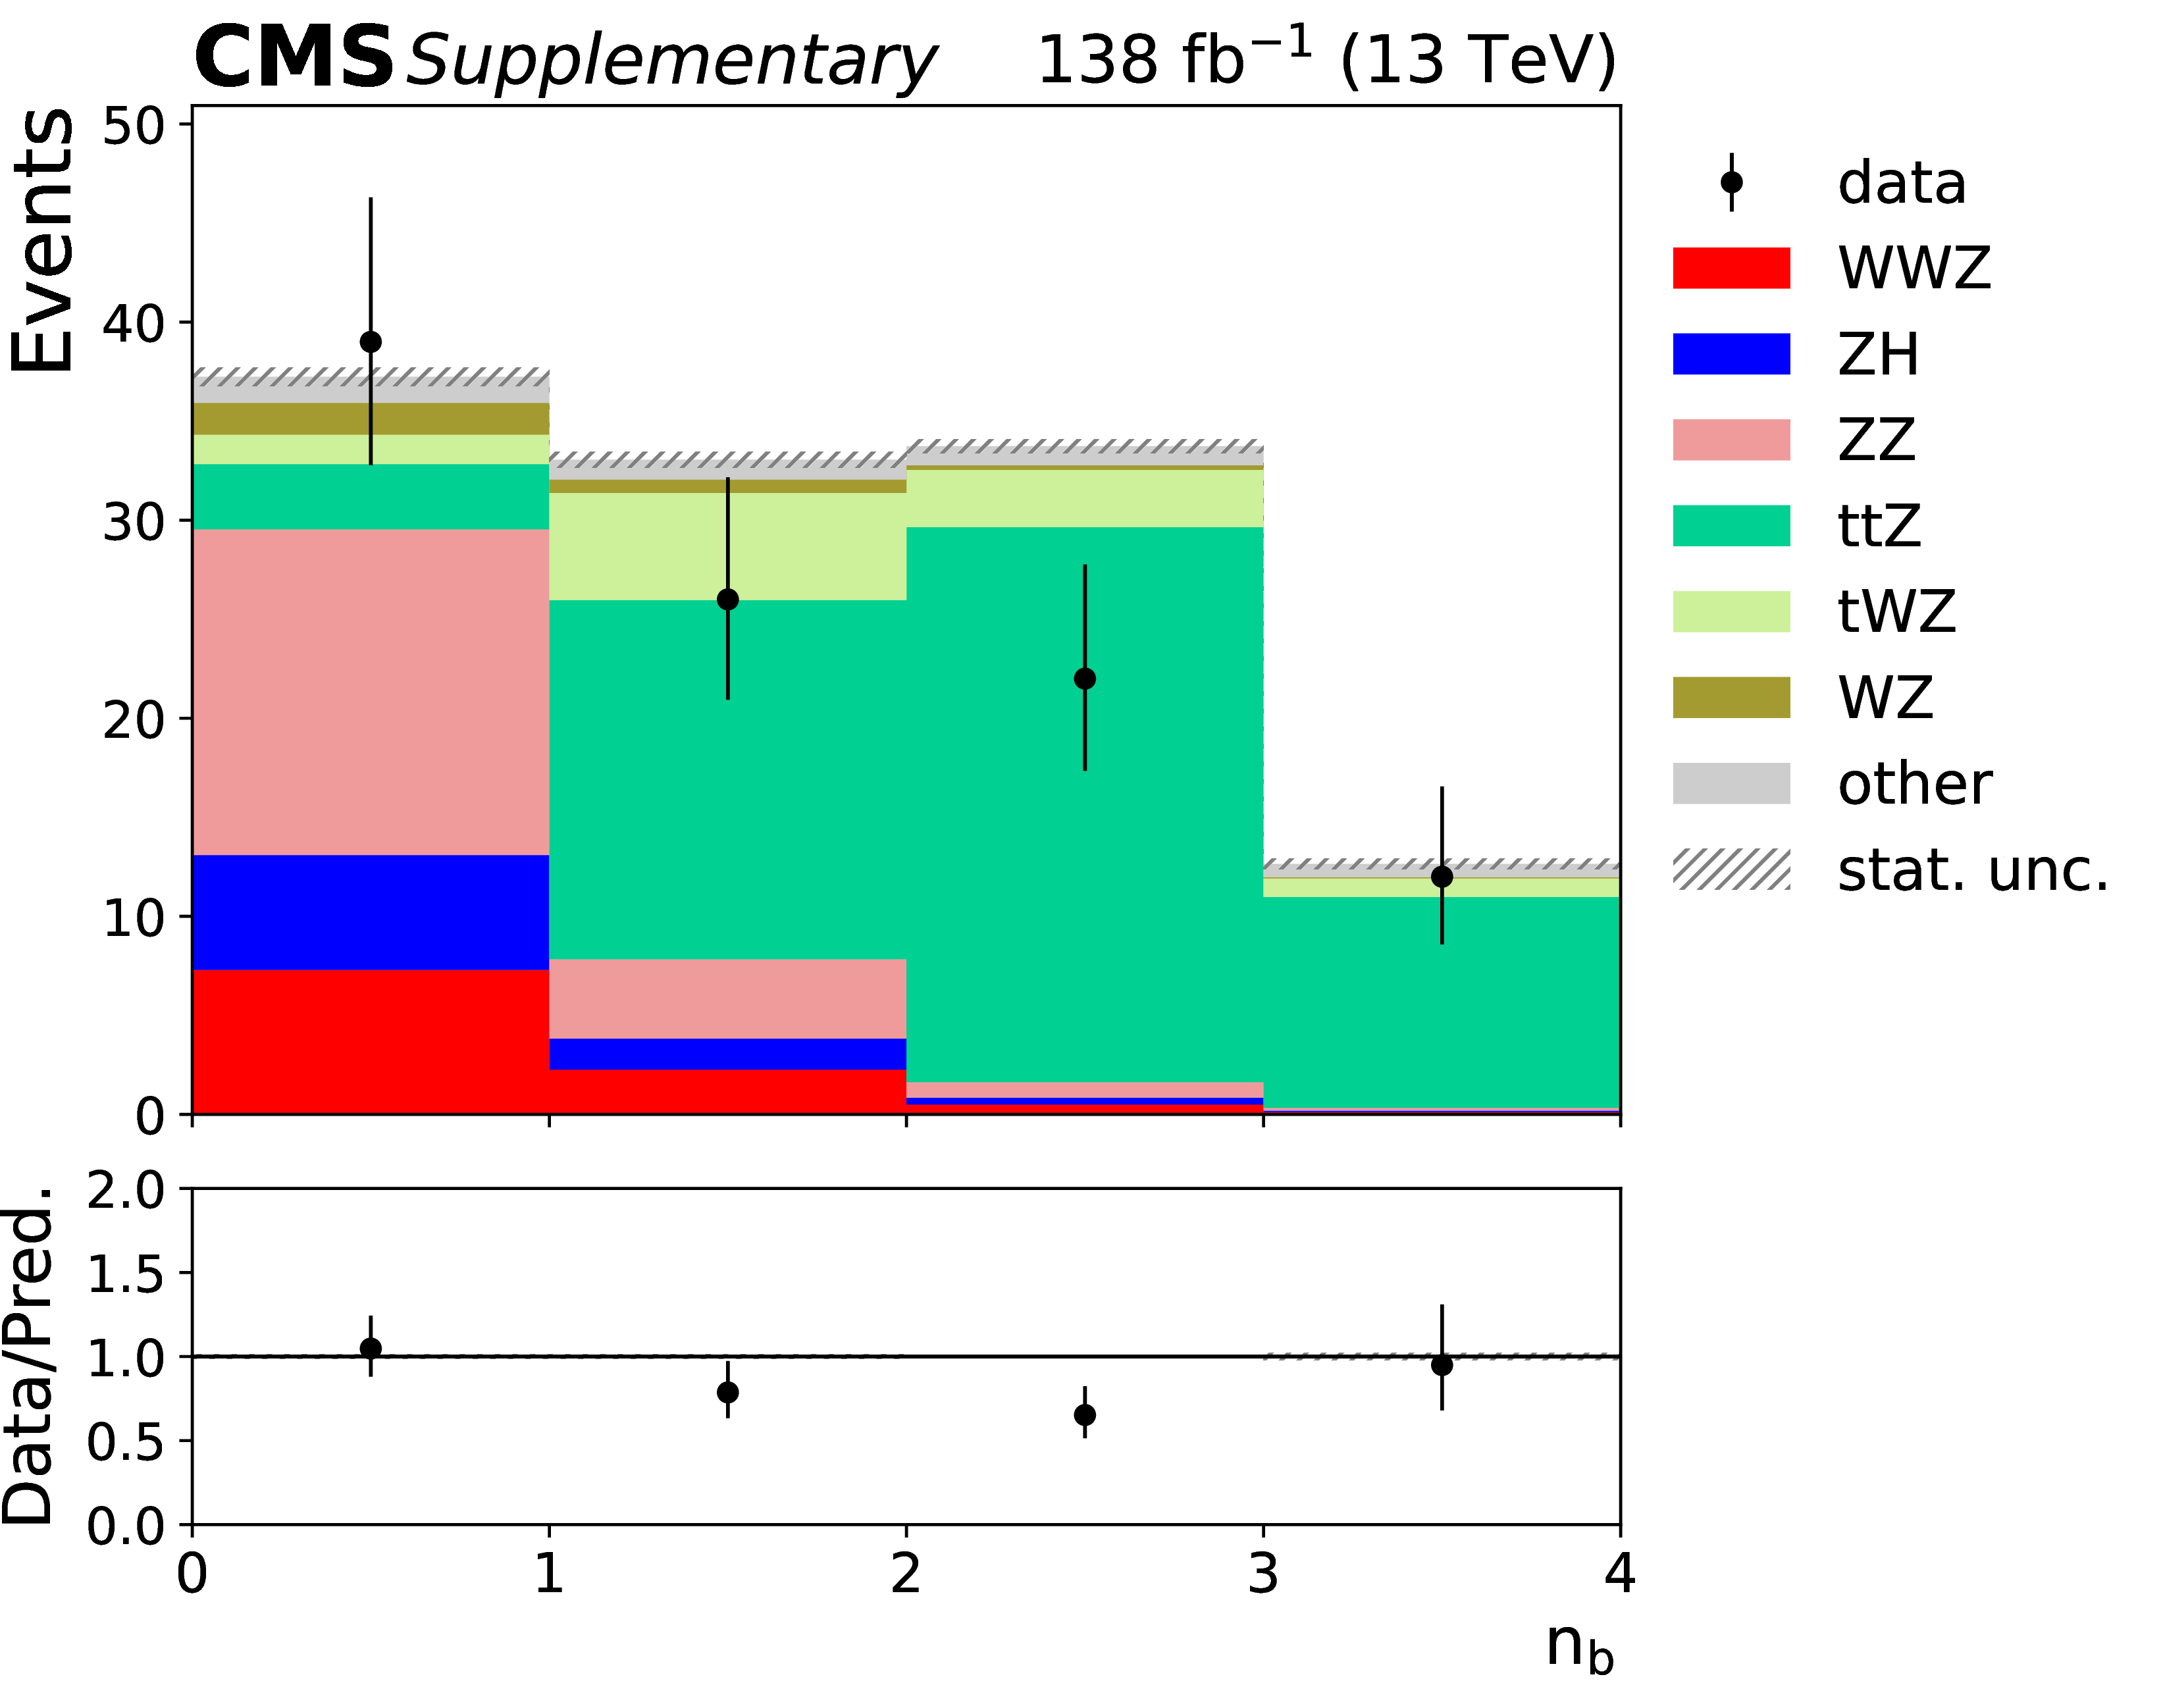
Additional Figure 10:
The b-tagged jet multiplicity in the opposite-flavor preselection region. The events with zero b-tagged jets fall into the opposite-flavor signal region, while the events with one ore more b-tagged jets fall into the opposite-flavor control region. |
png pdf |
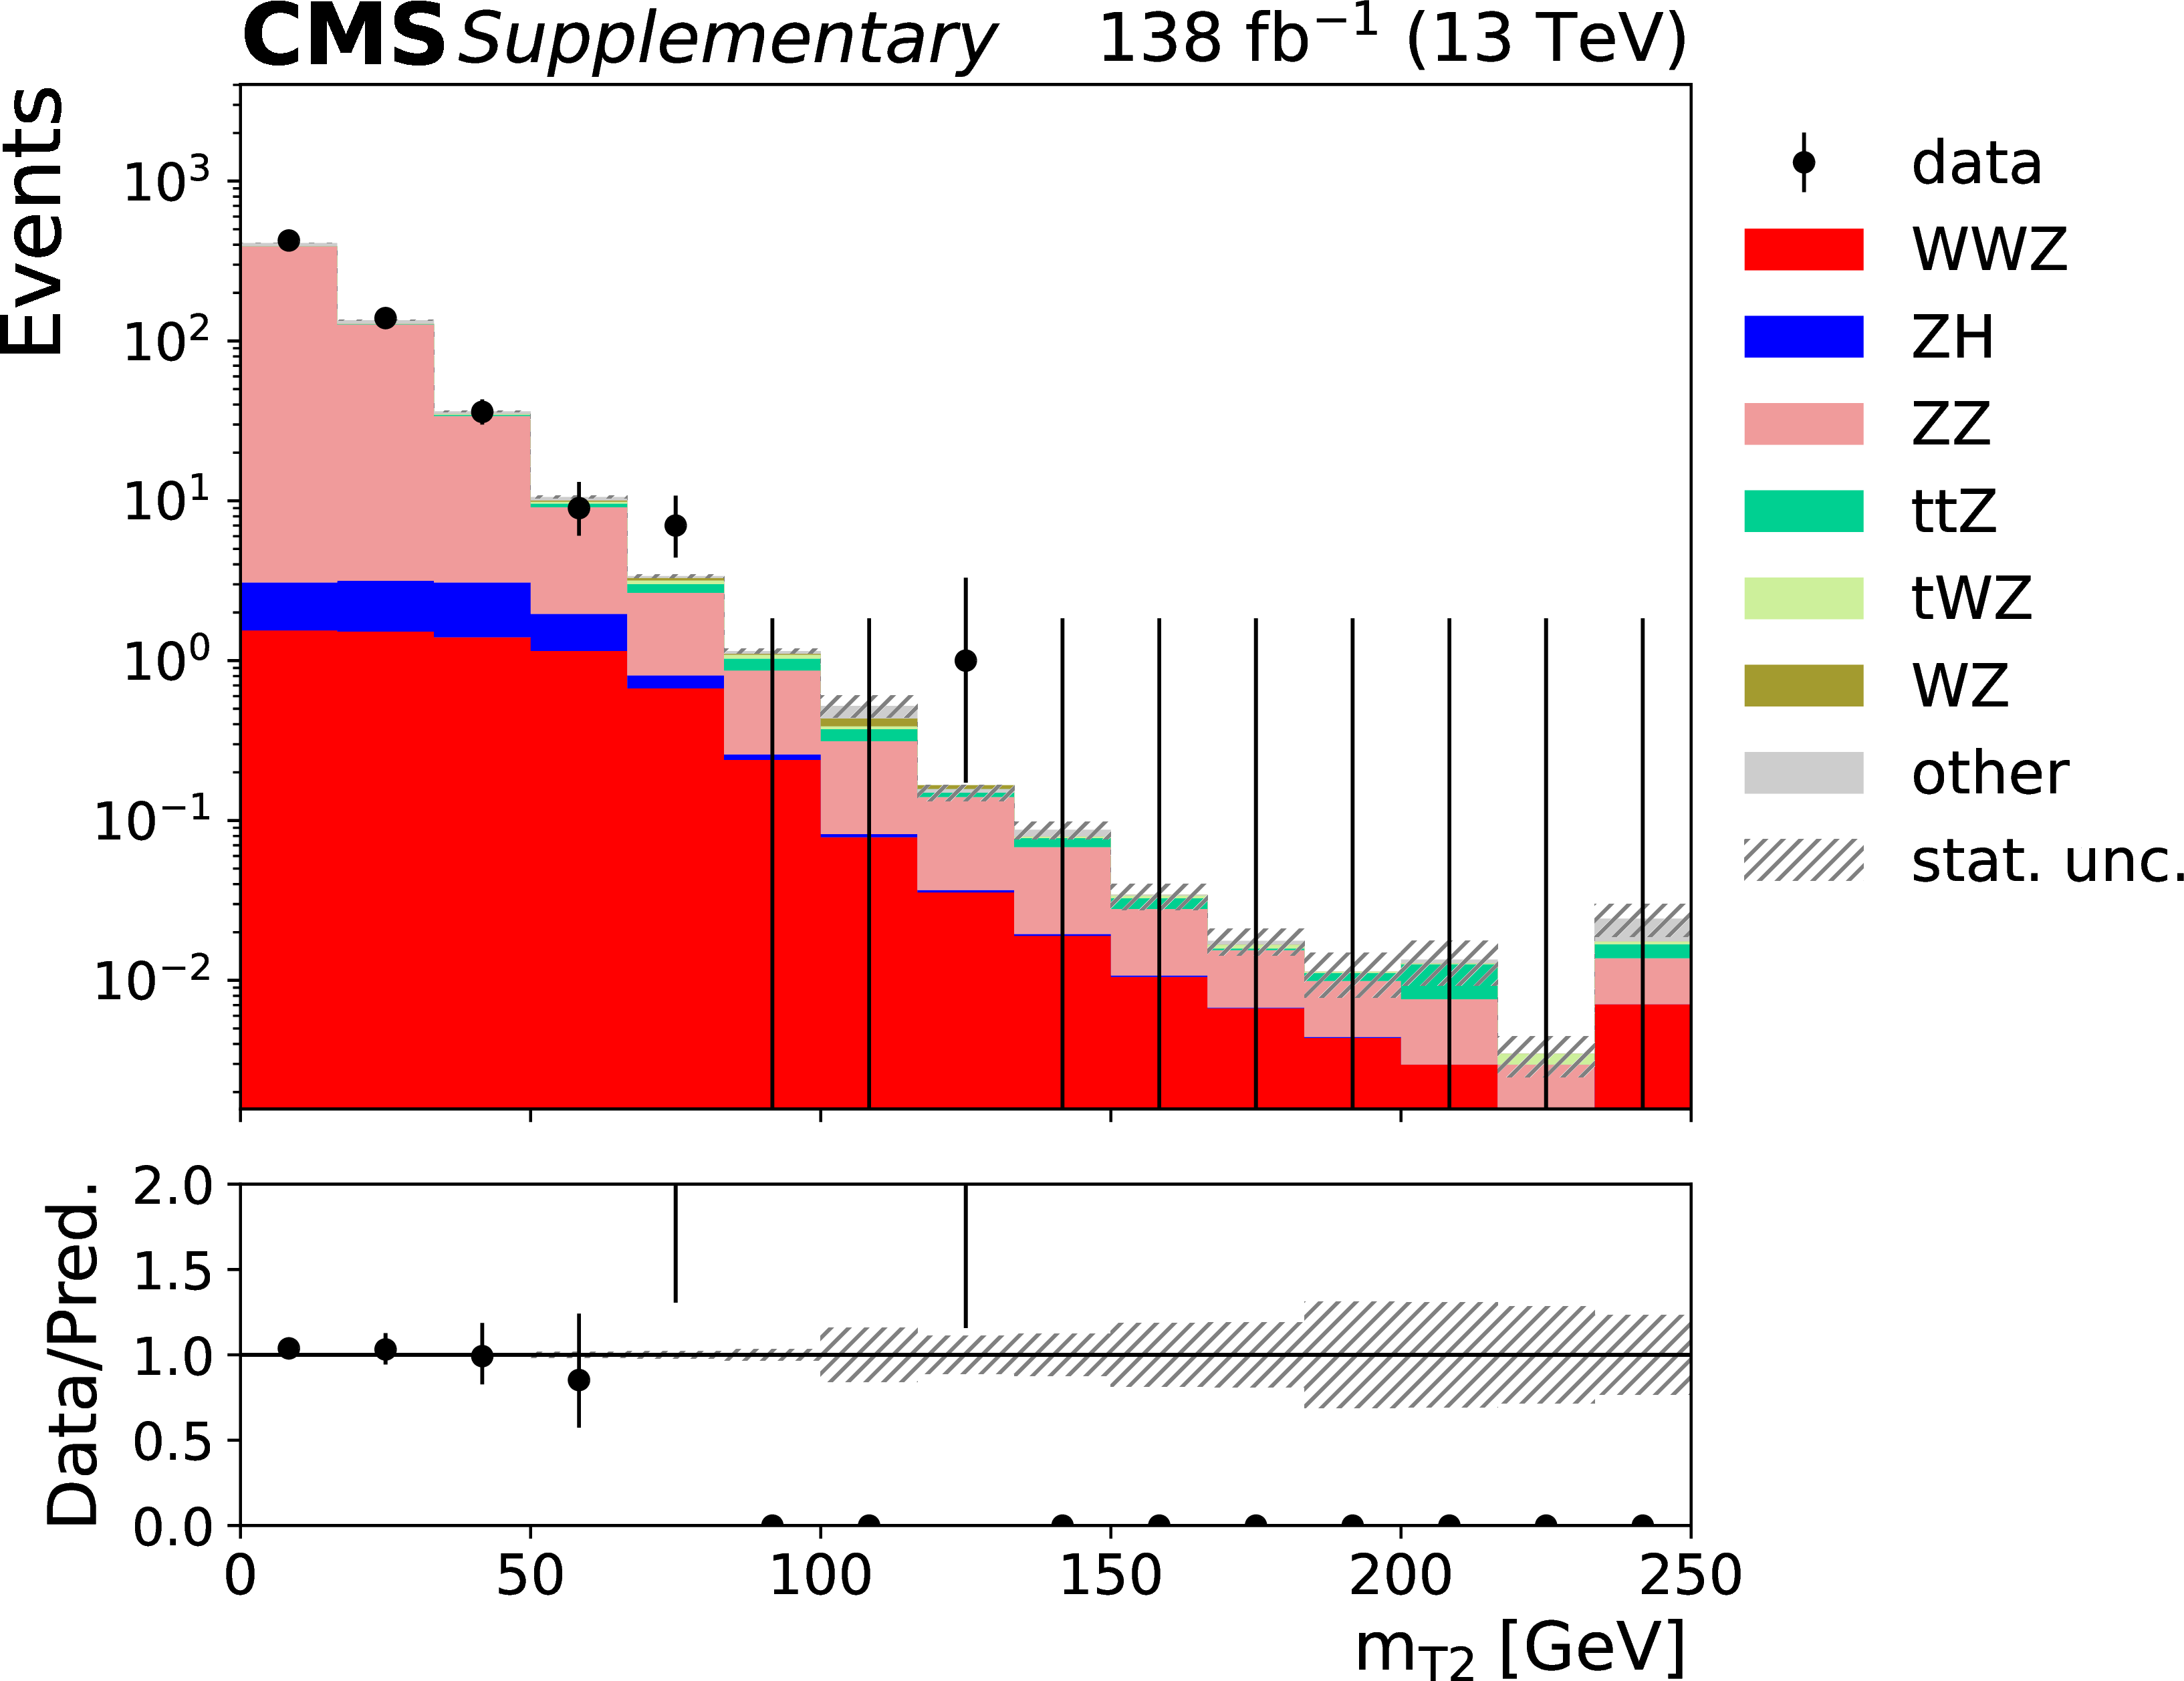
Additional Figure 11:
The $ m_{T2} $ distribution in the same-flavor signal pre-selection region. The events an $ m_{T2} $ value greater than 25 GeV constitute the same-flavor signal region. |
png pdf |
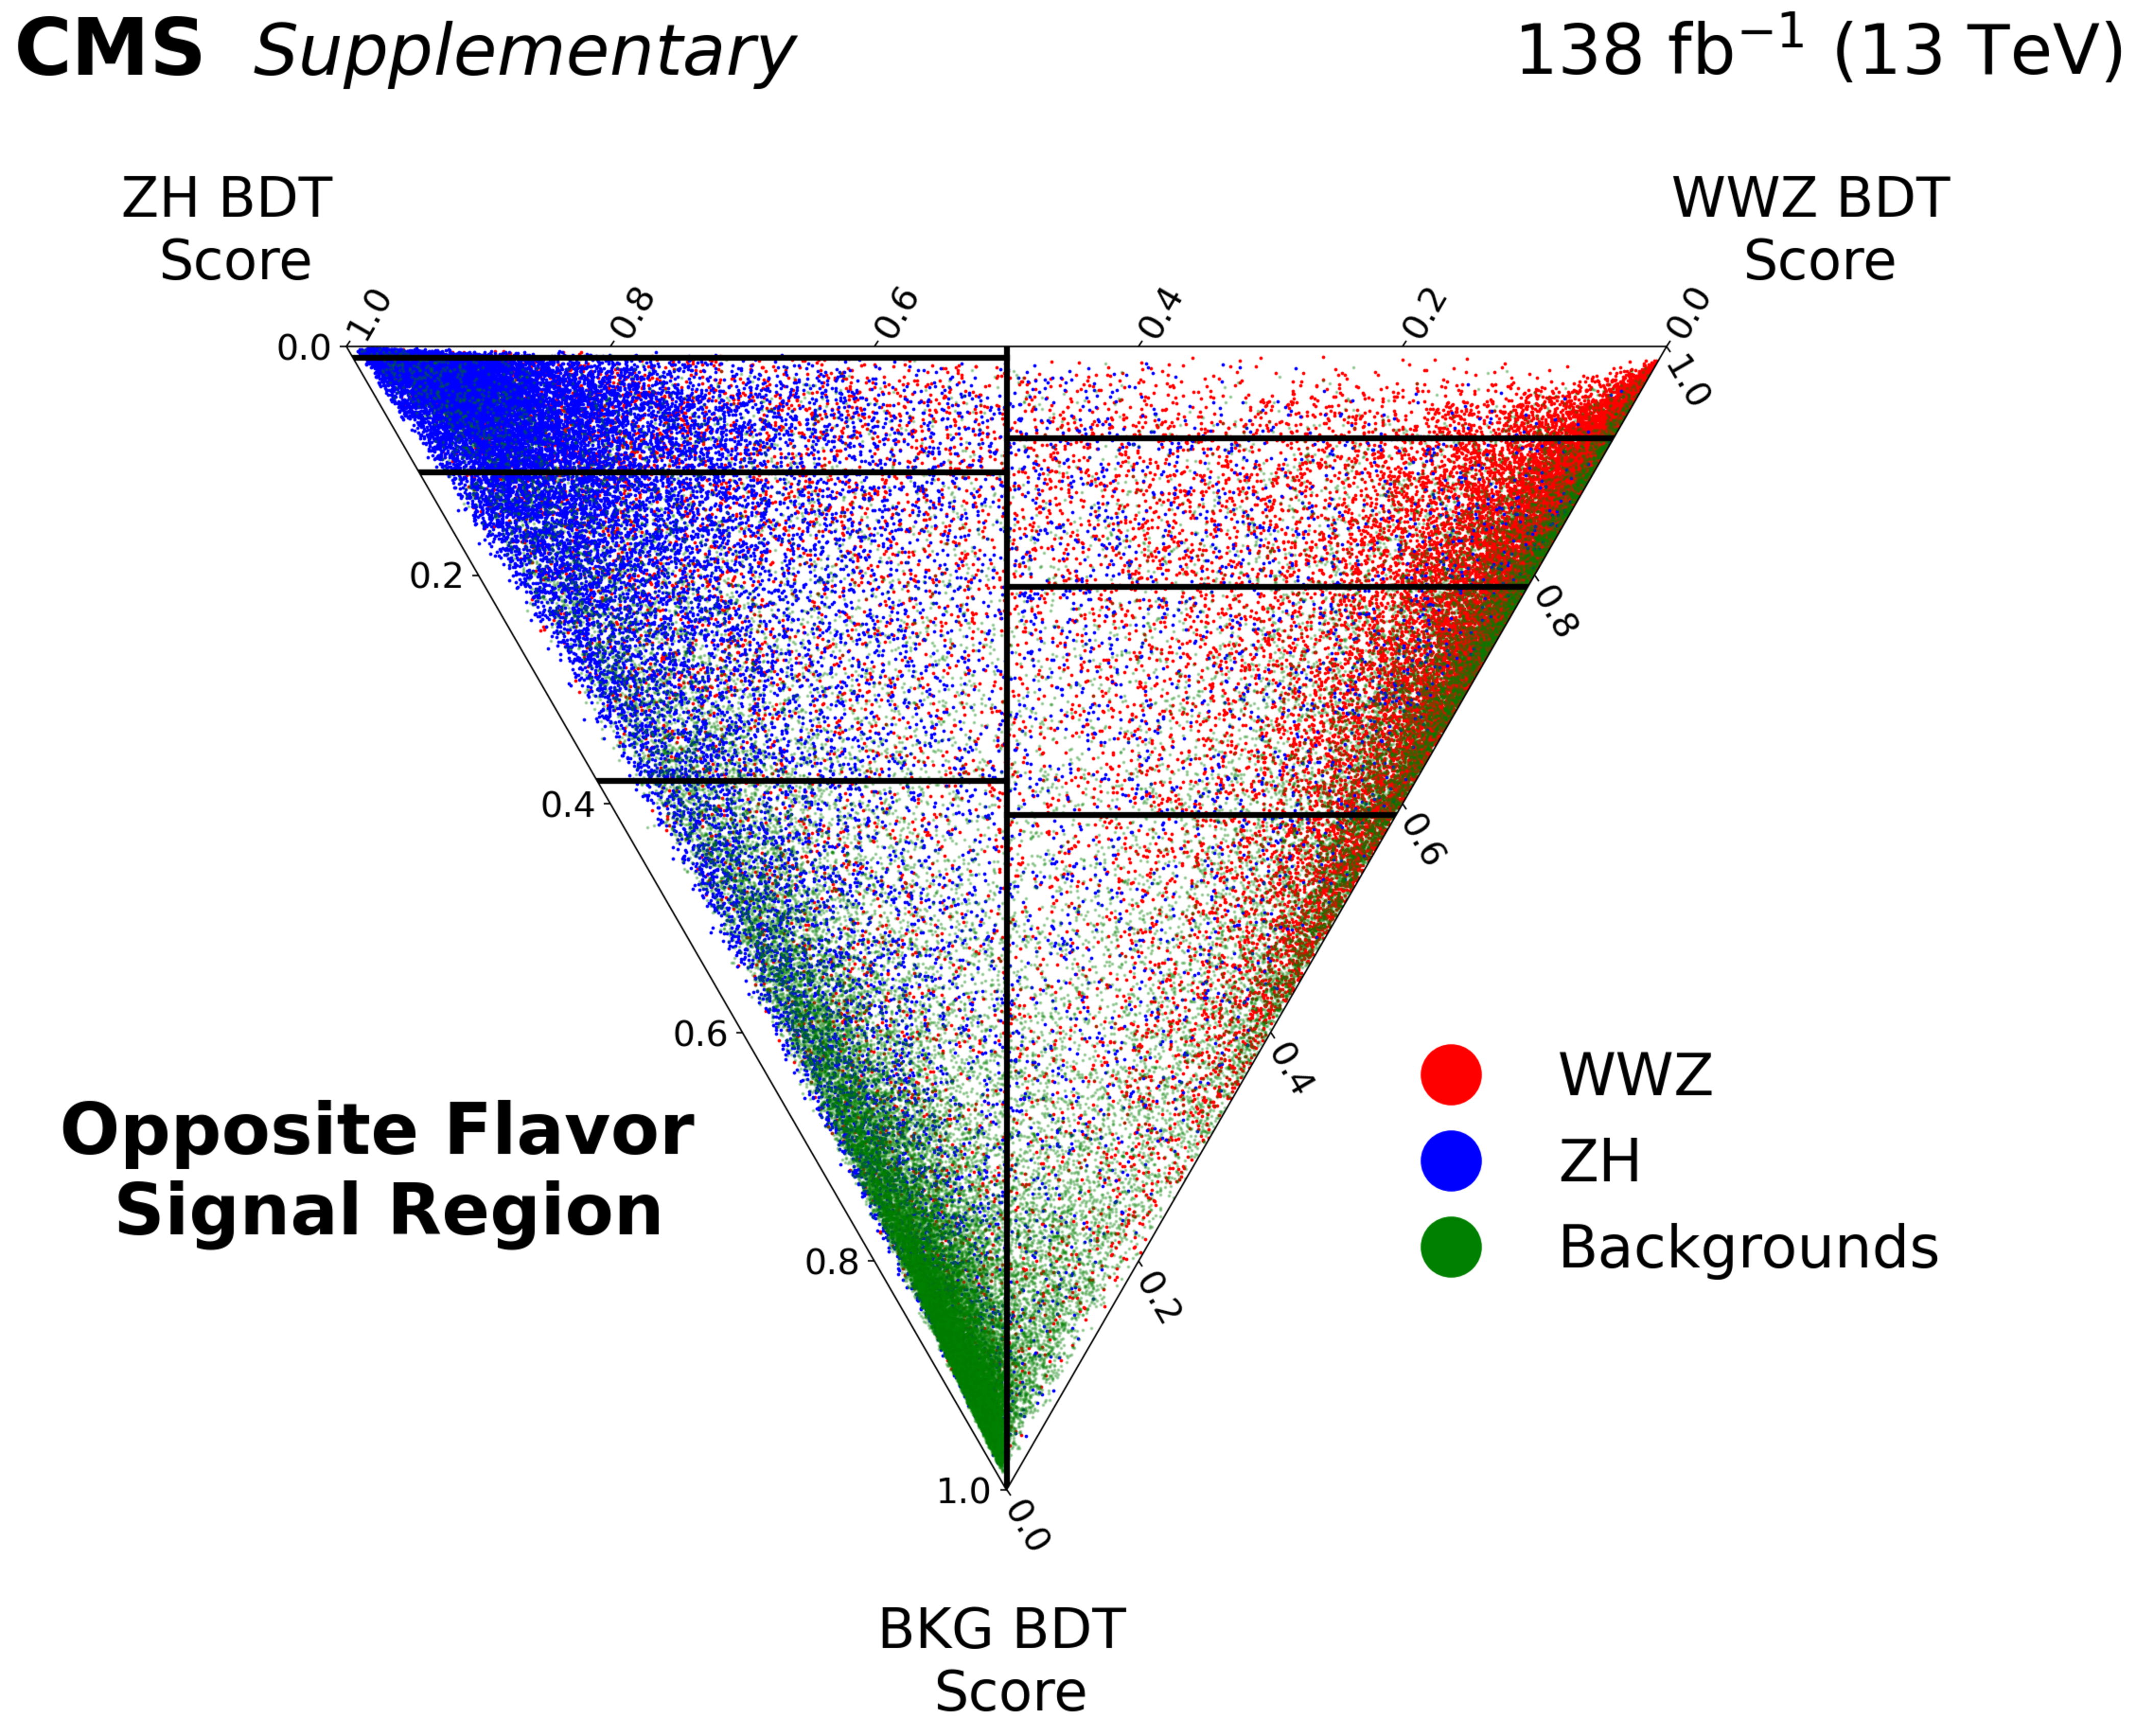
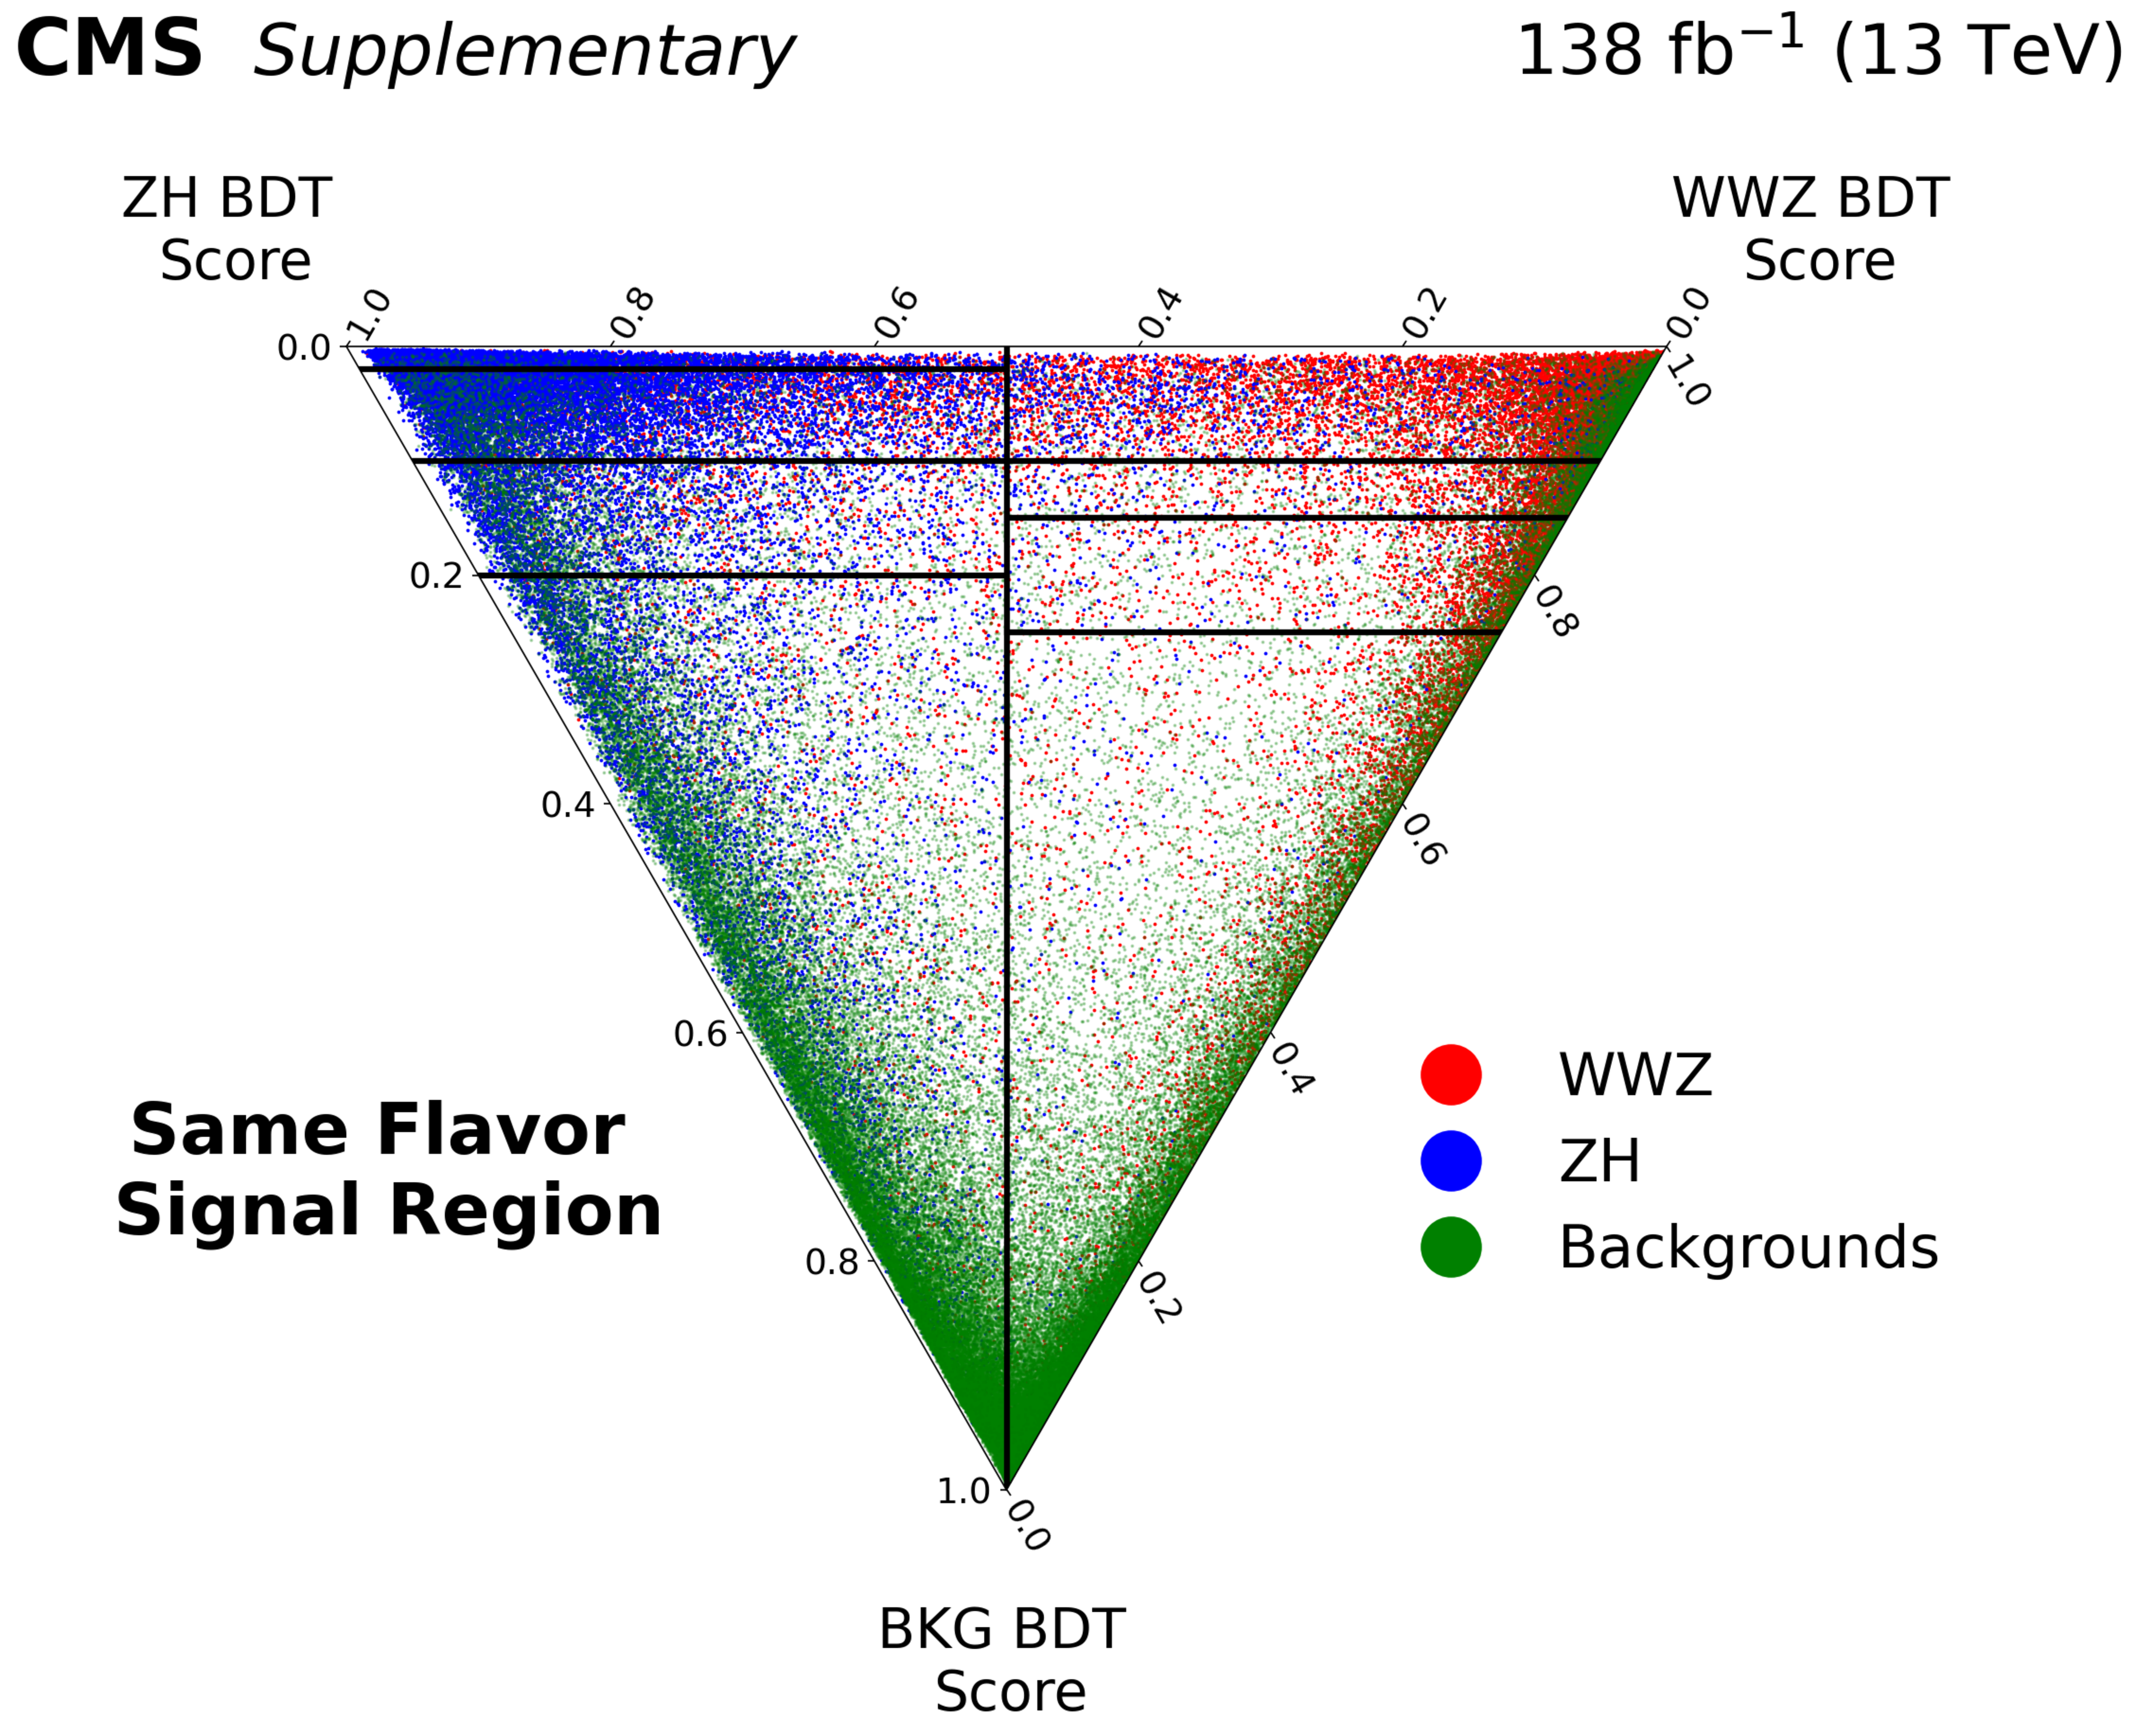
Additional Figure 12:
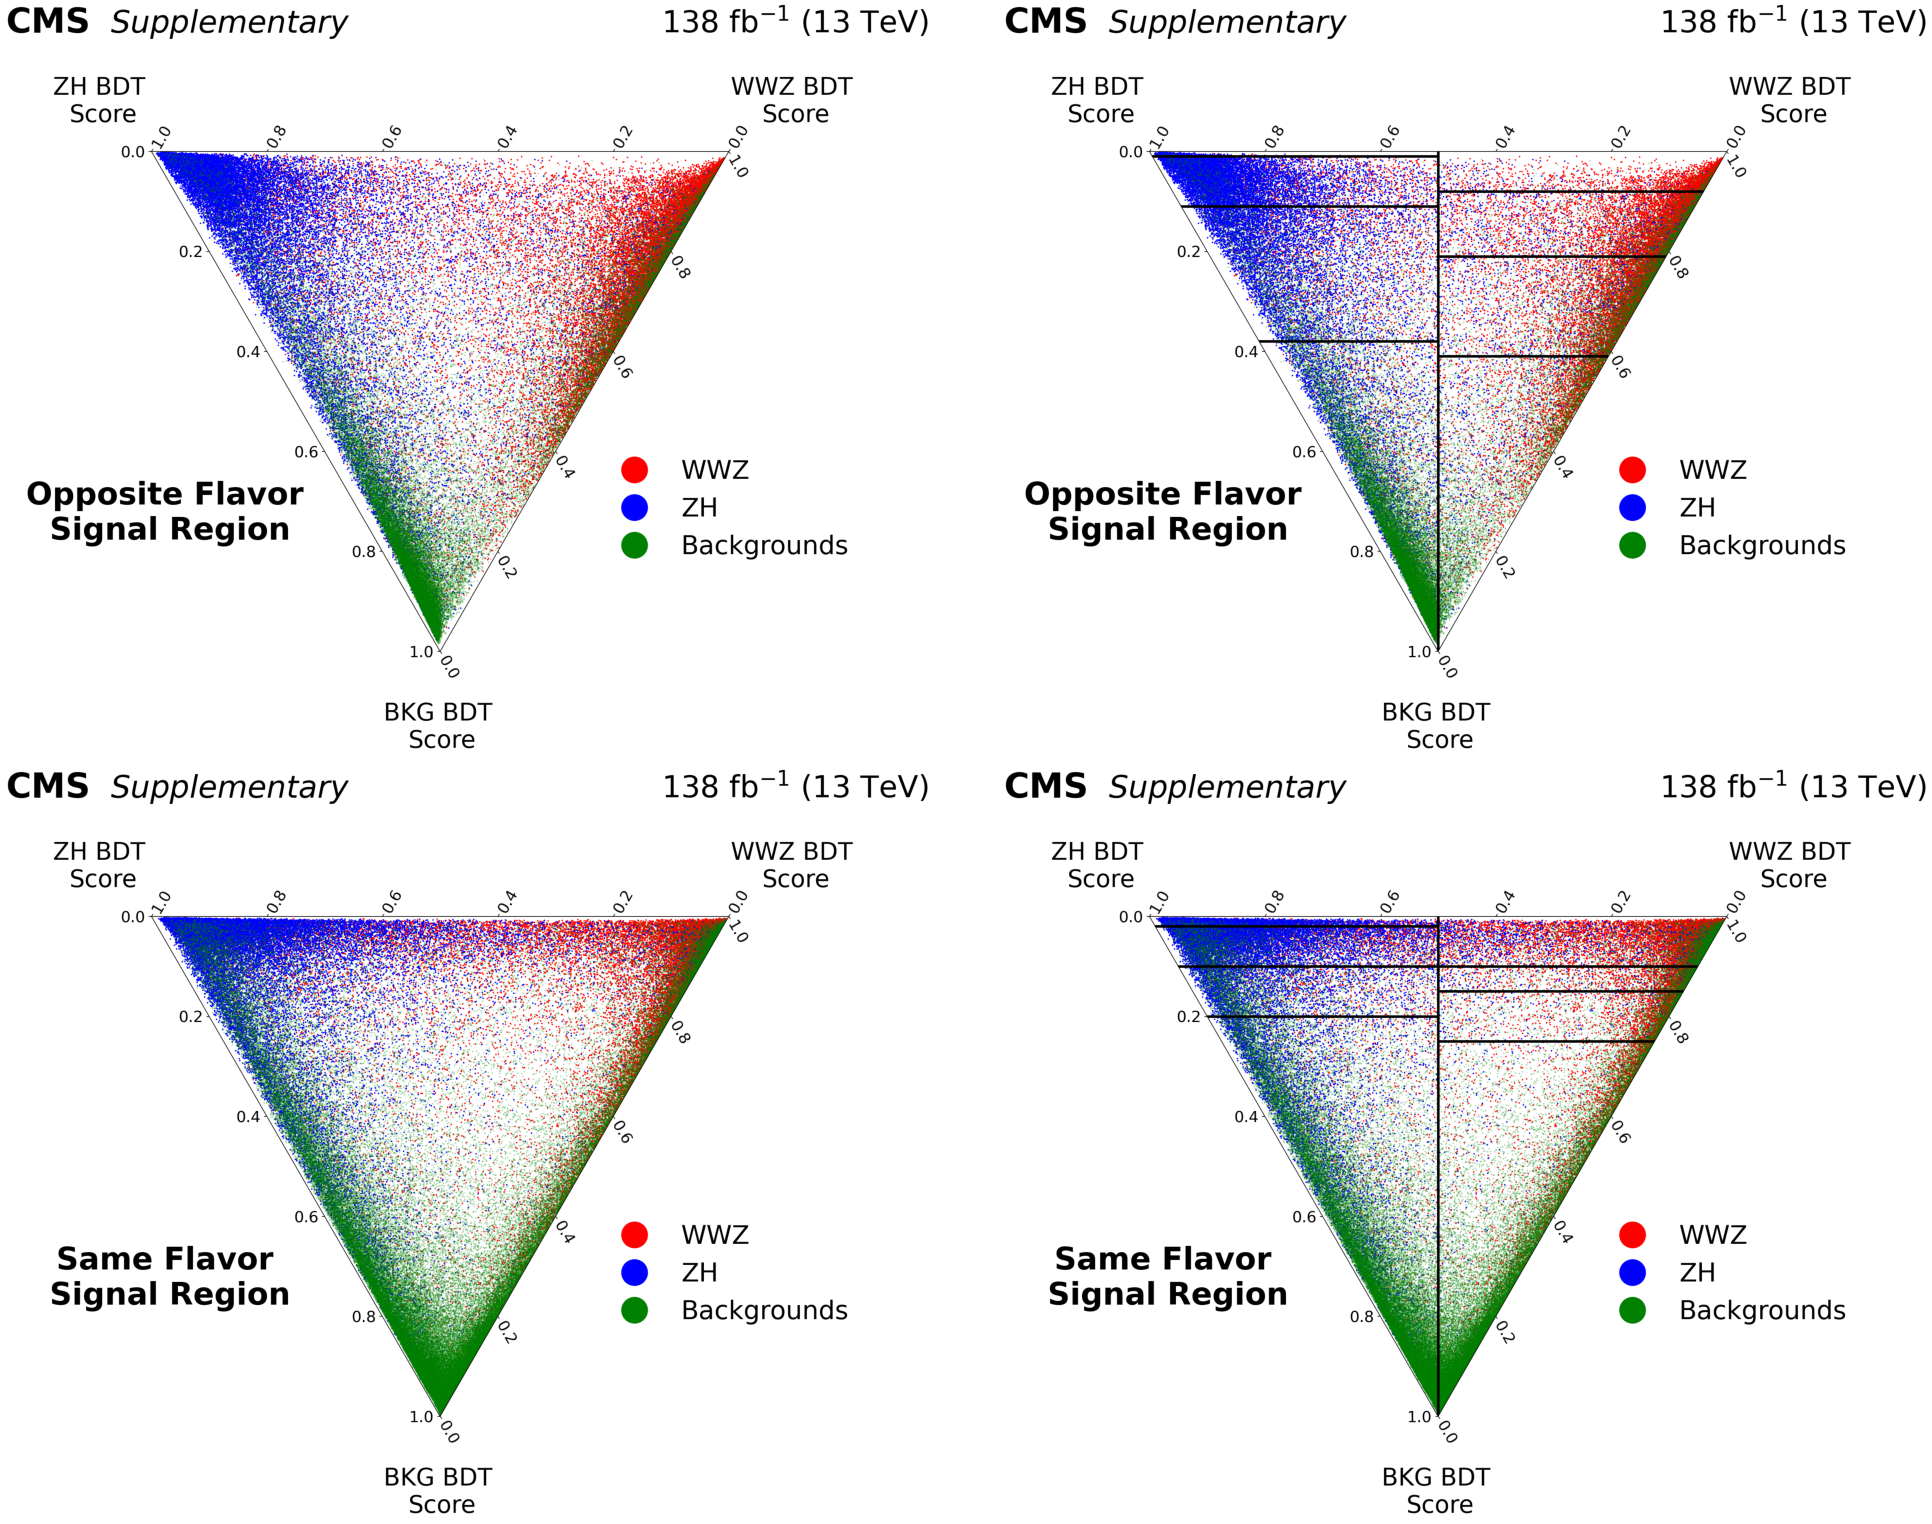
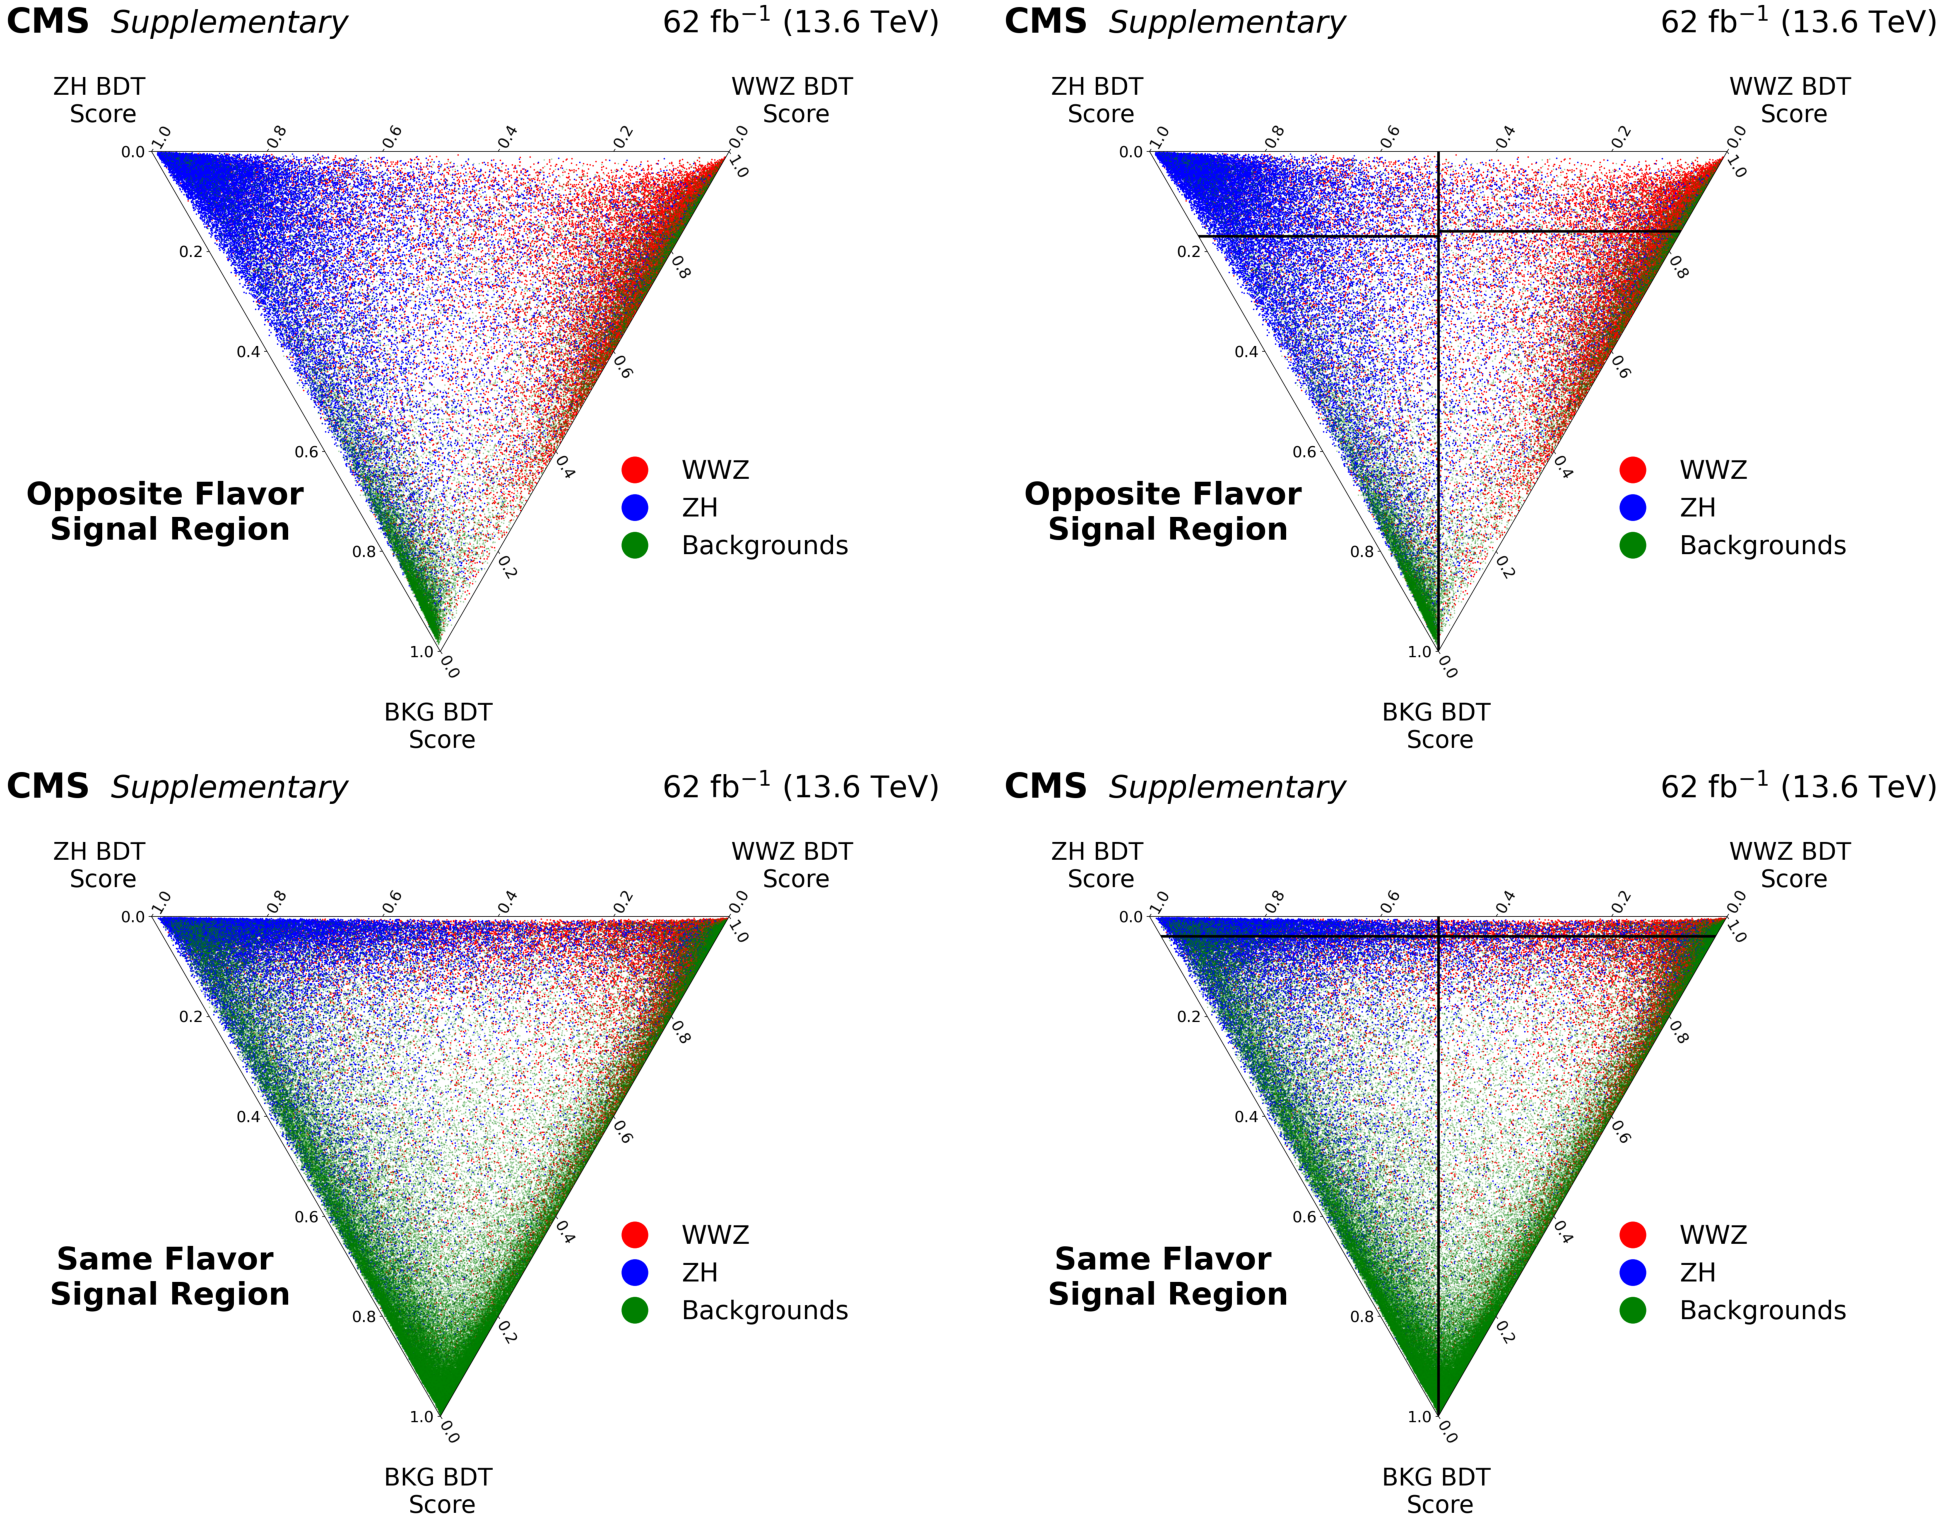
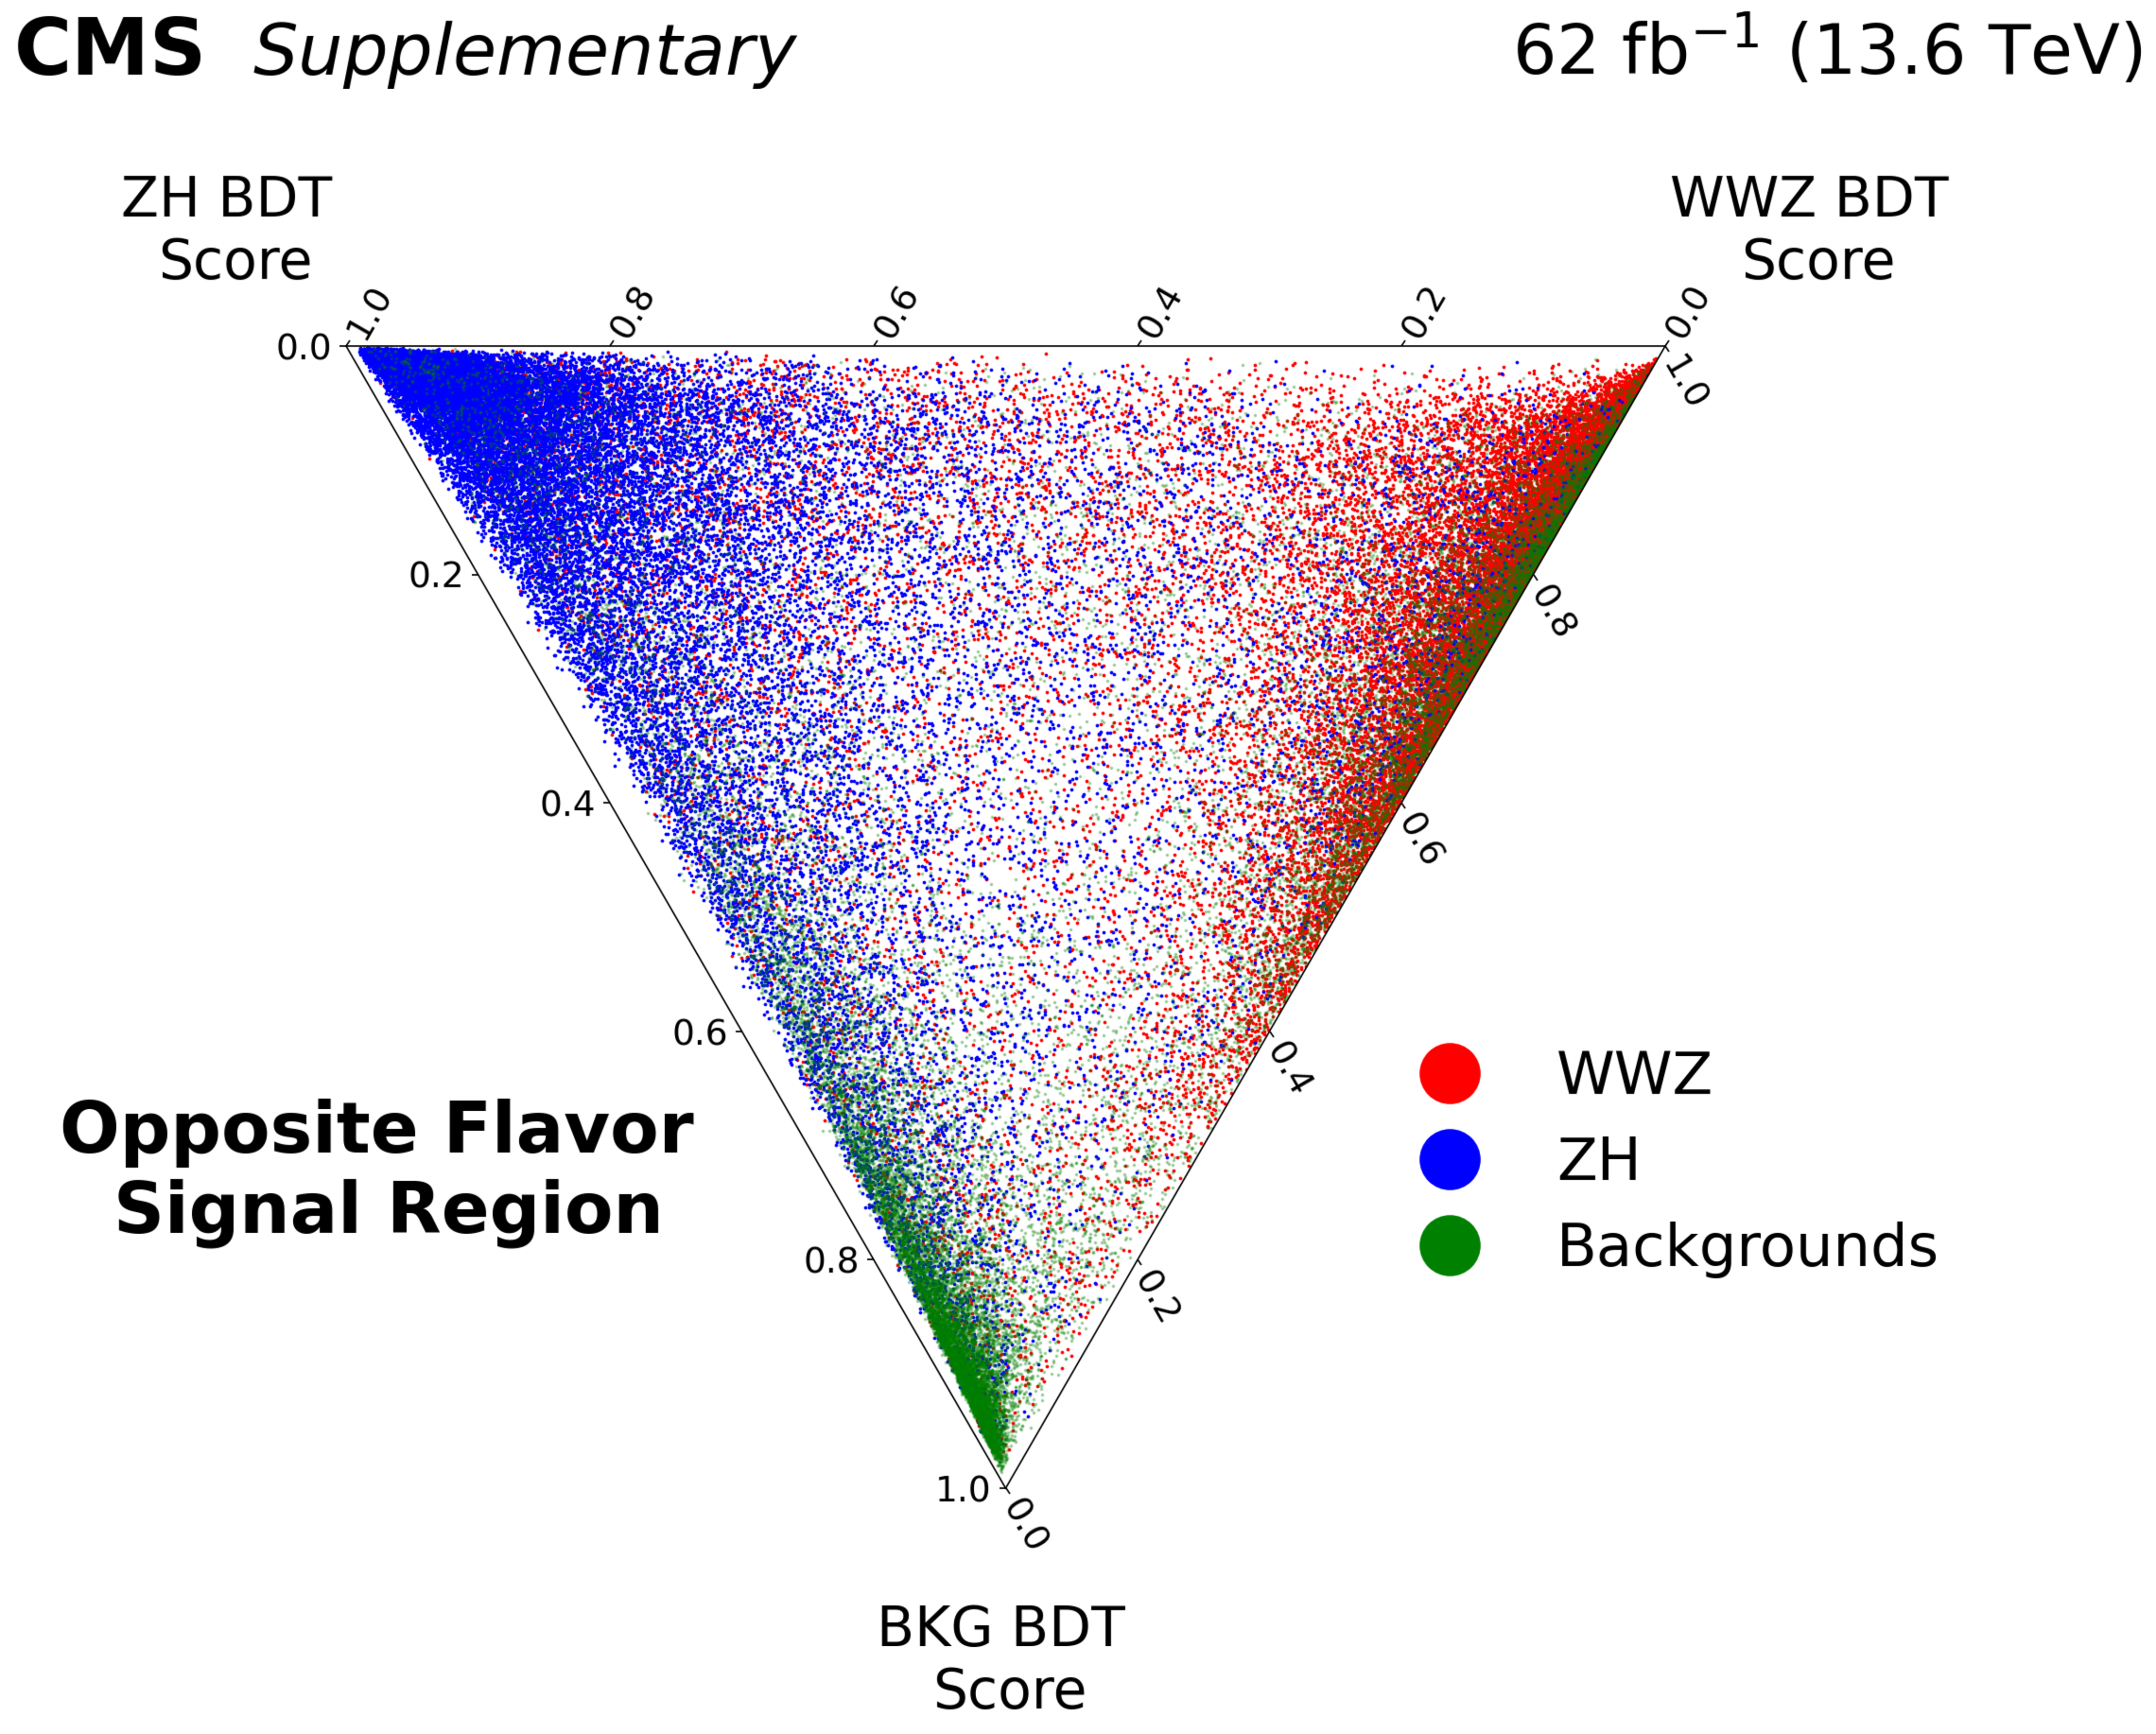
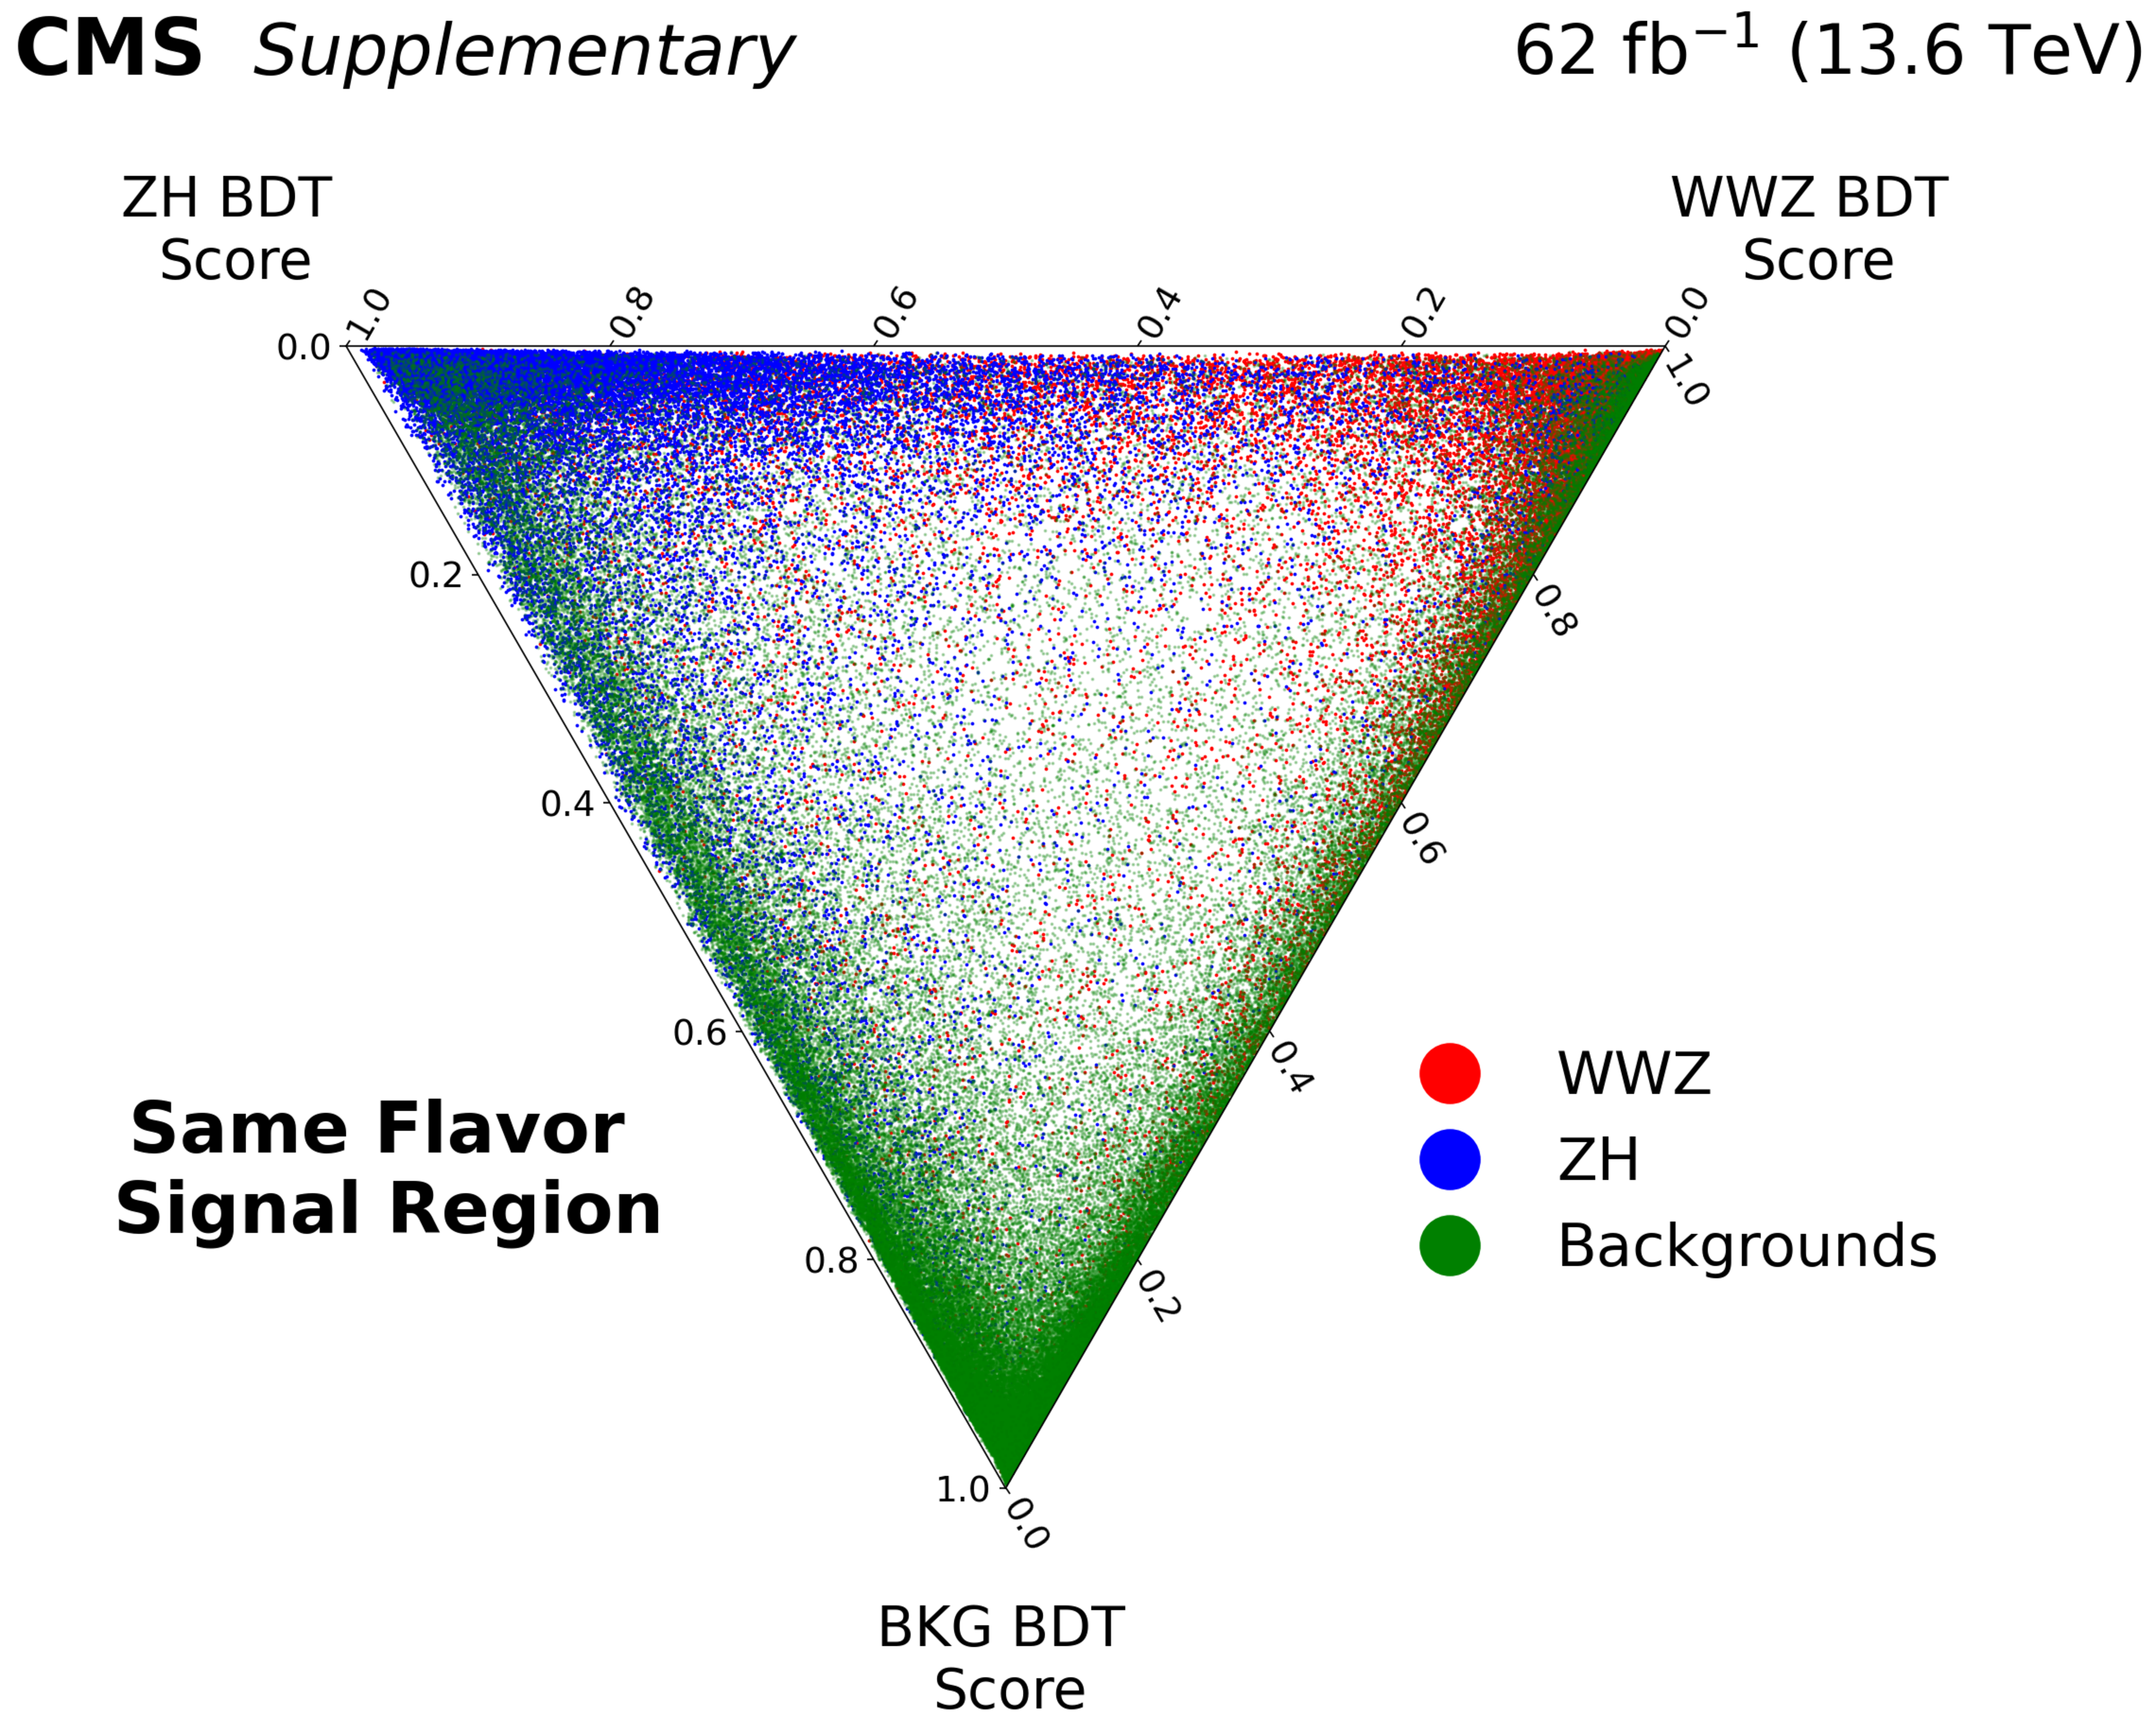
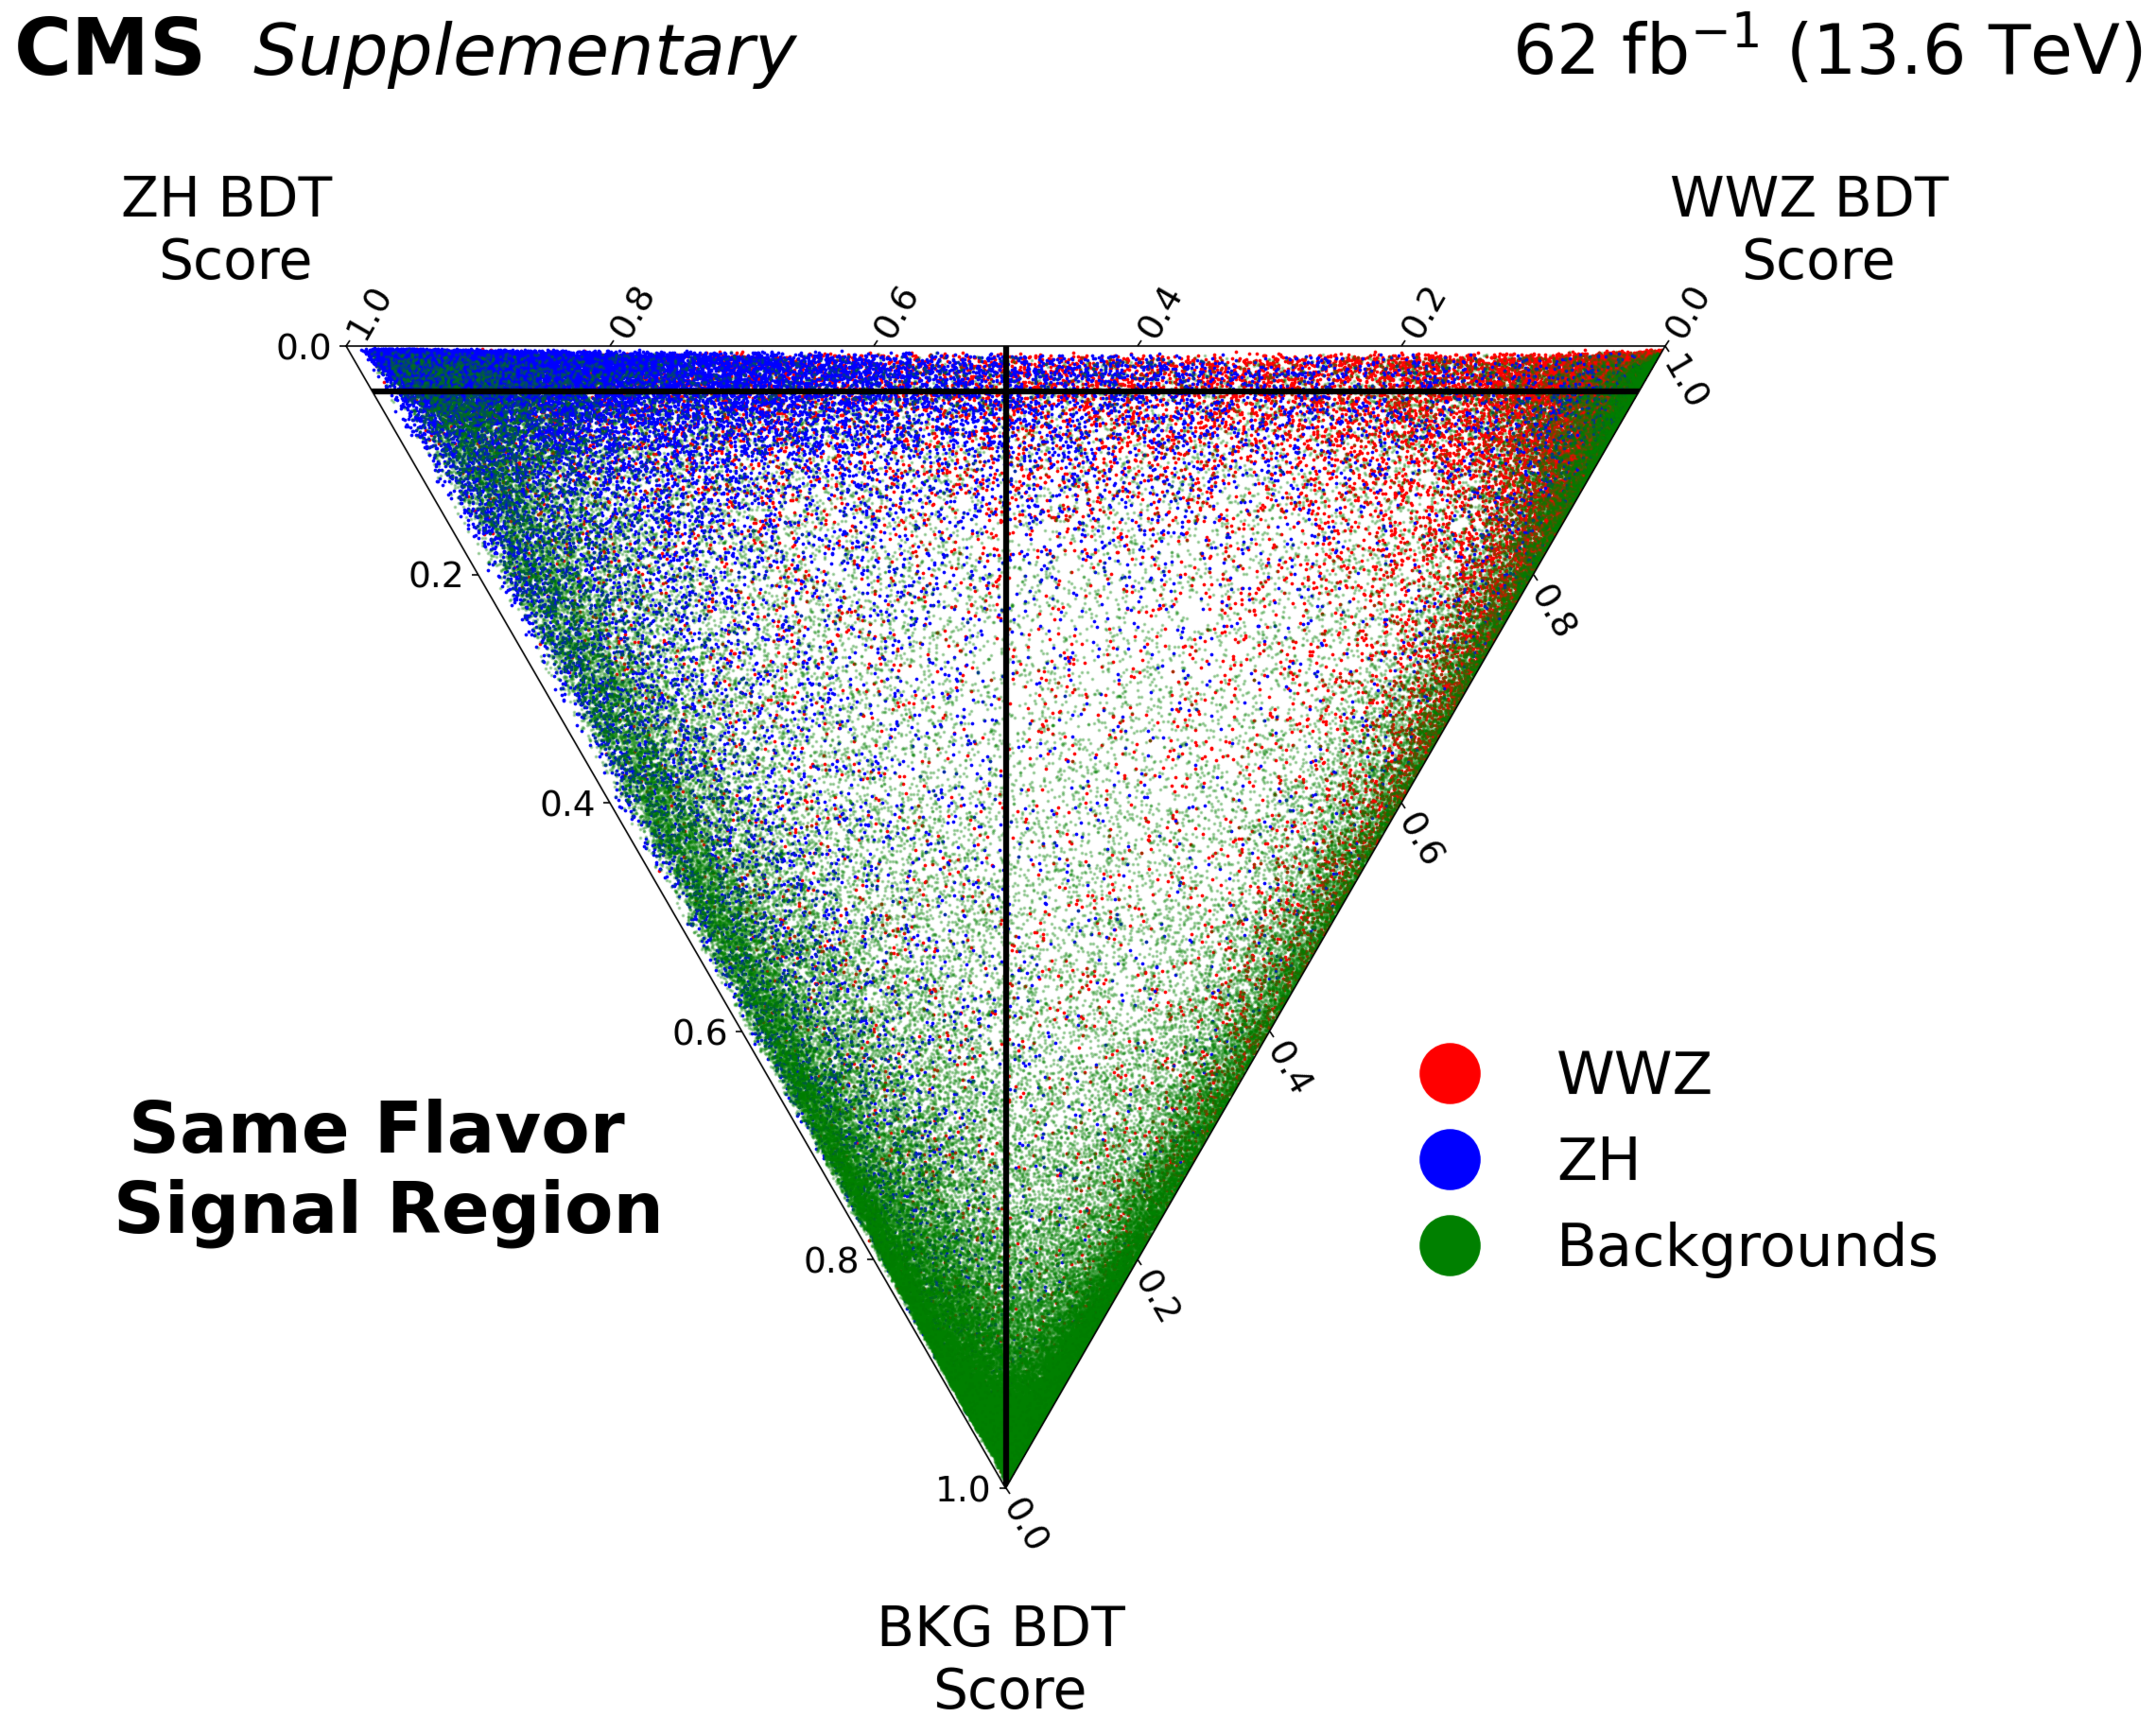
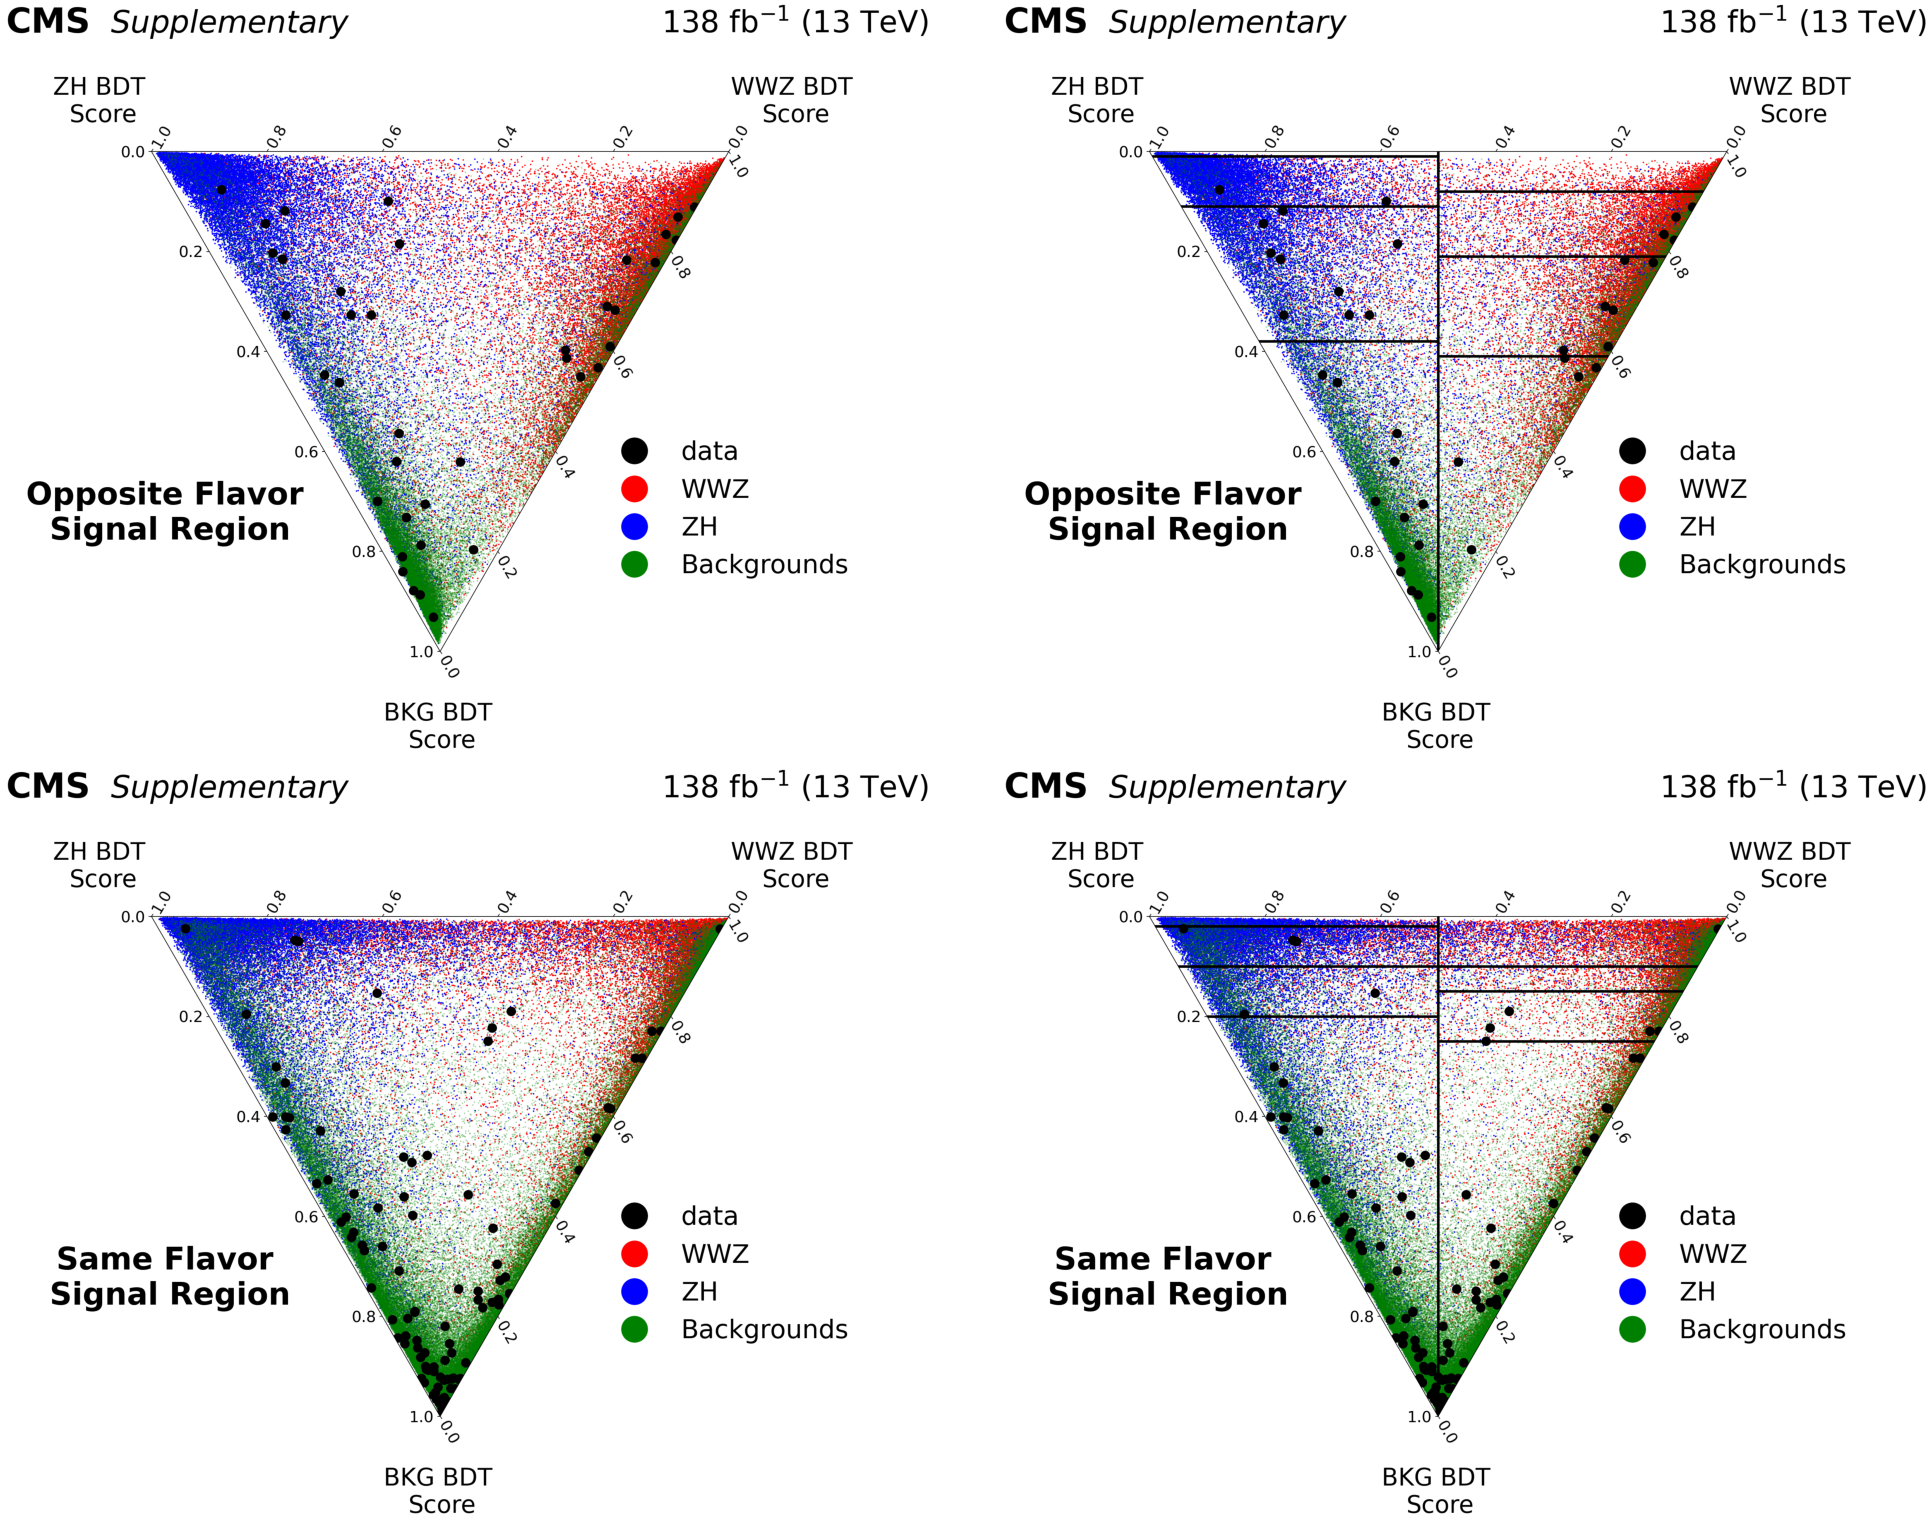
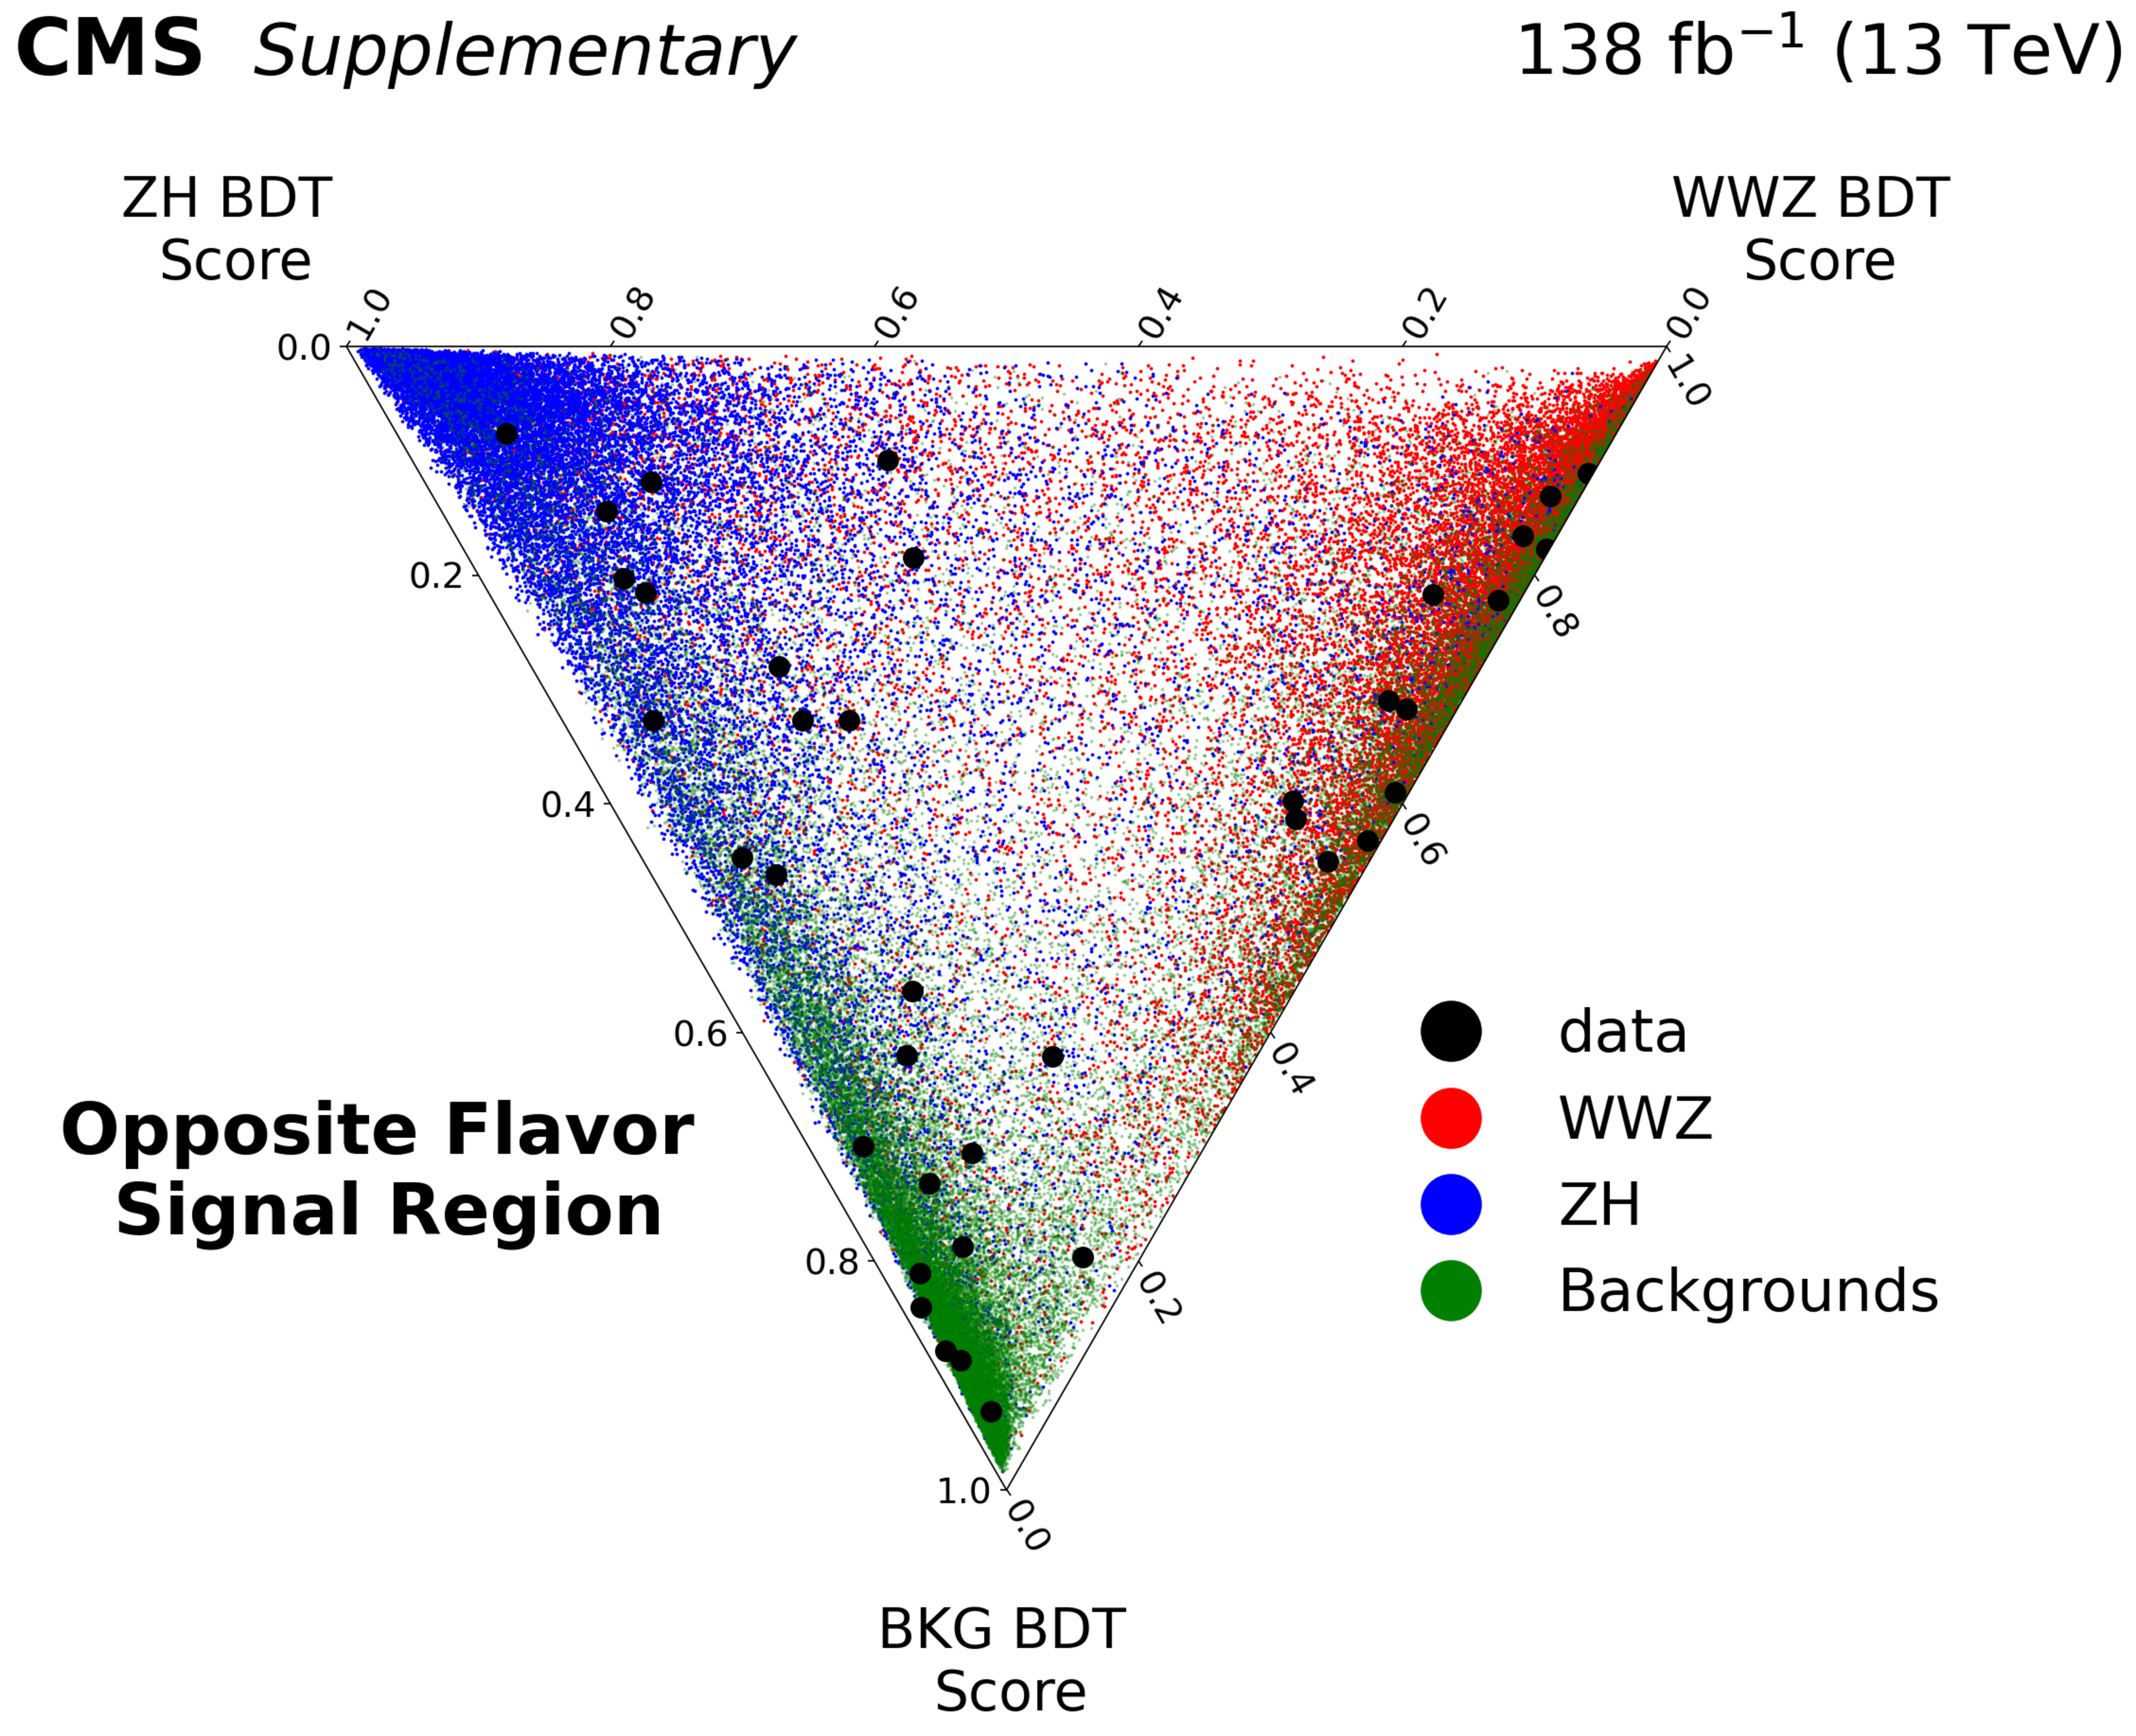
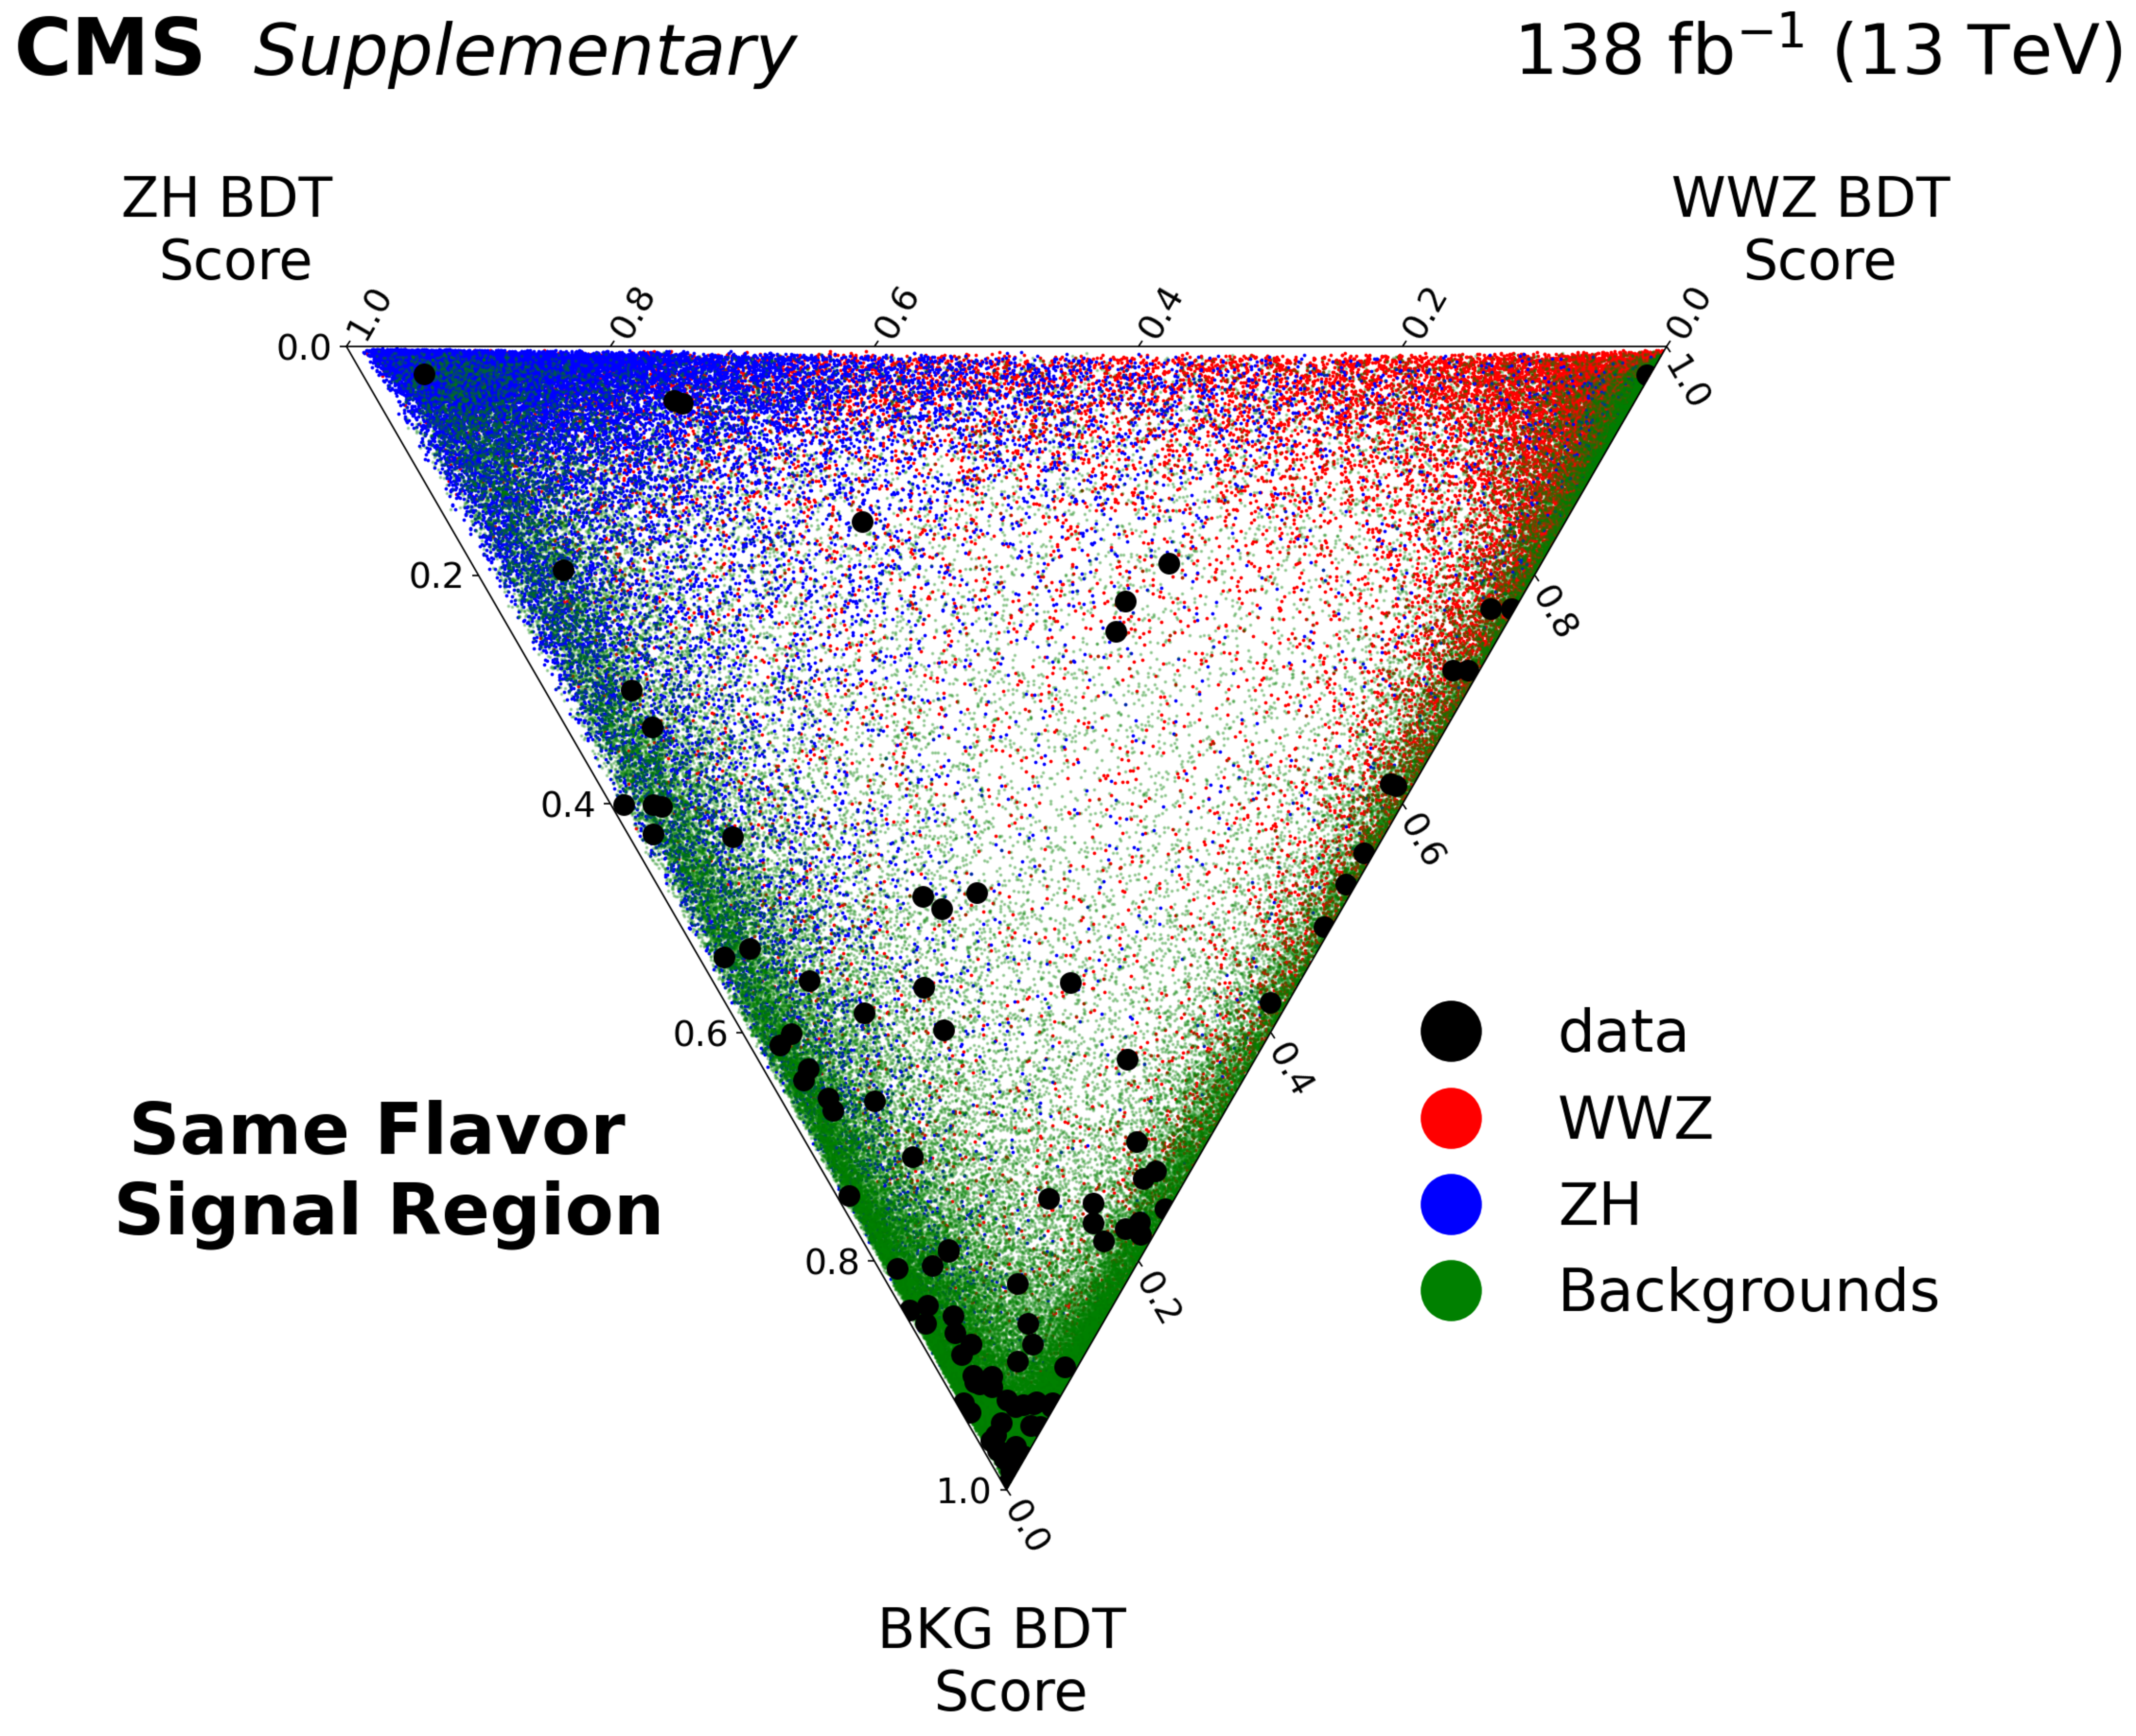
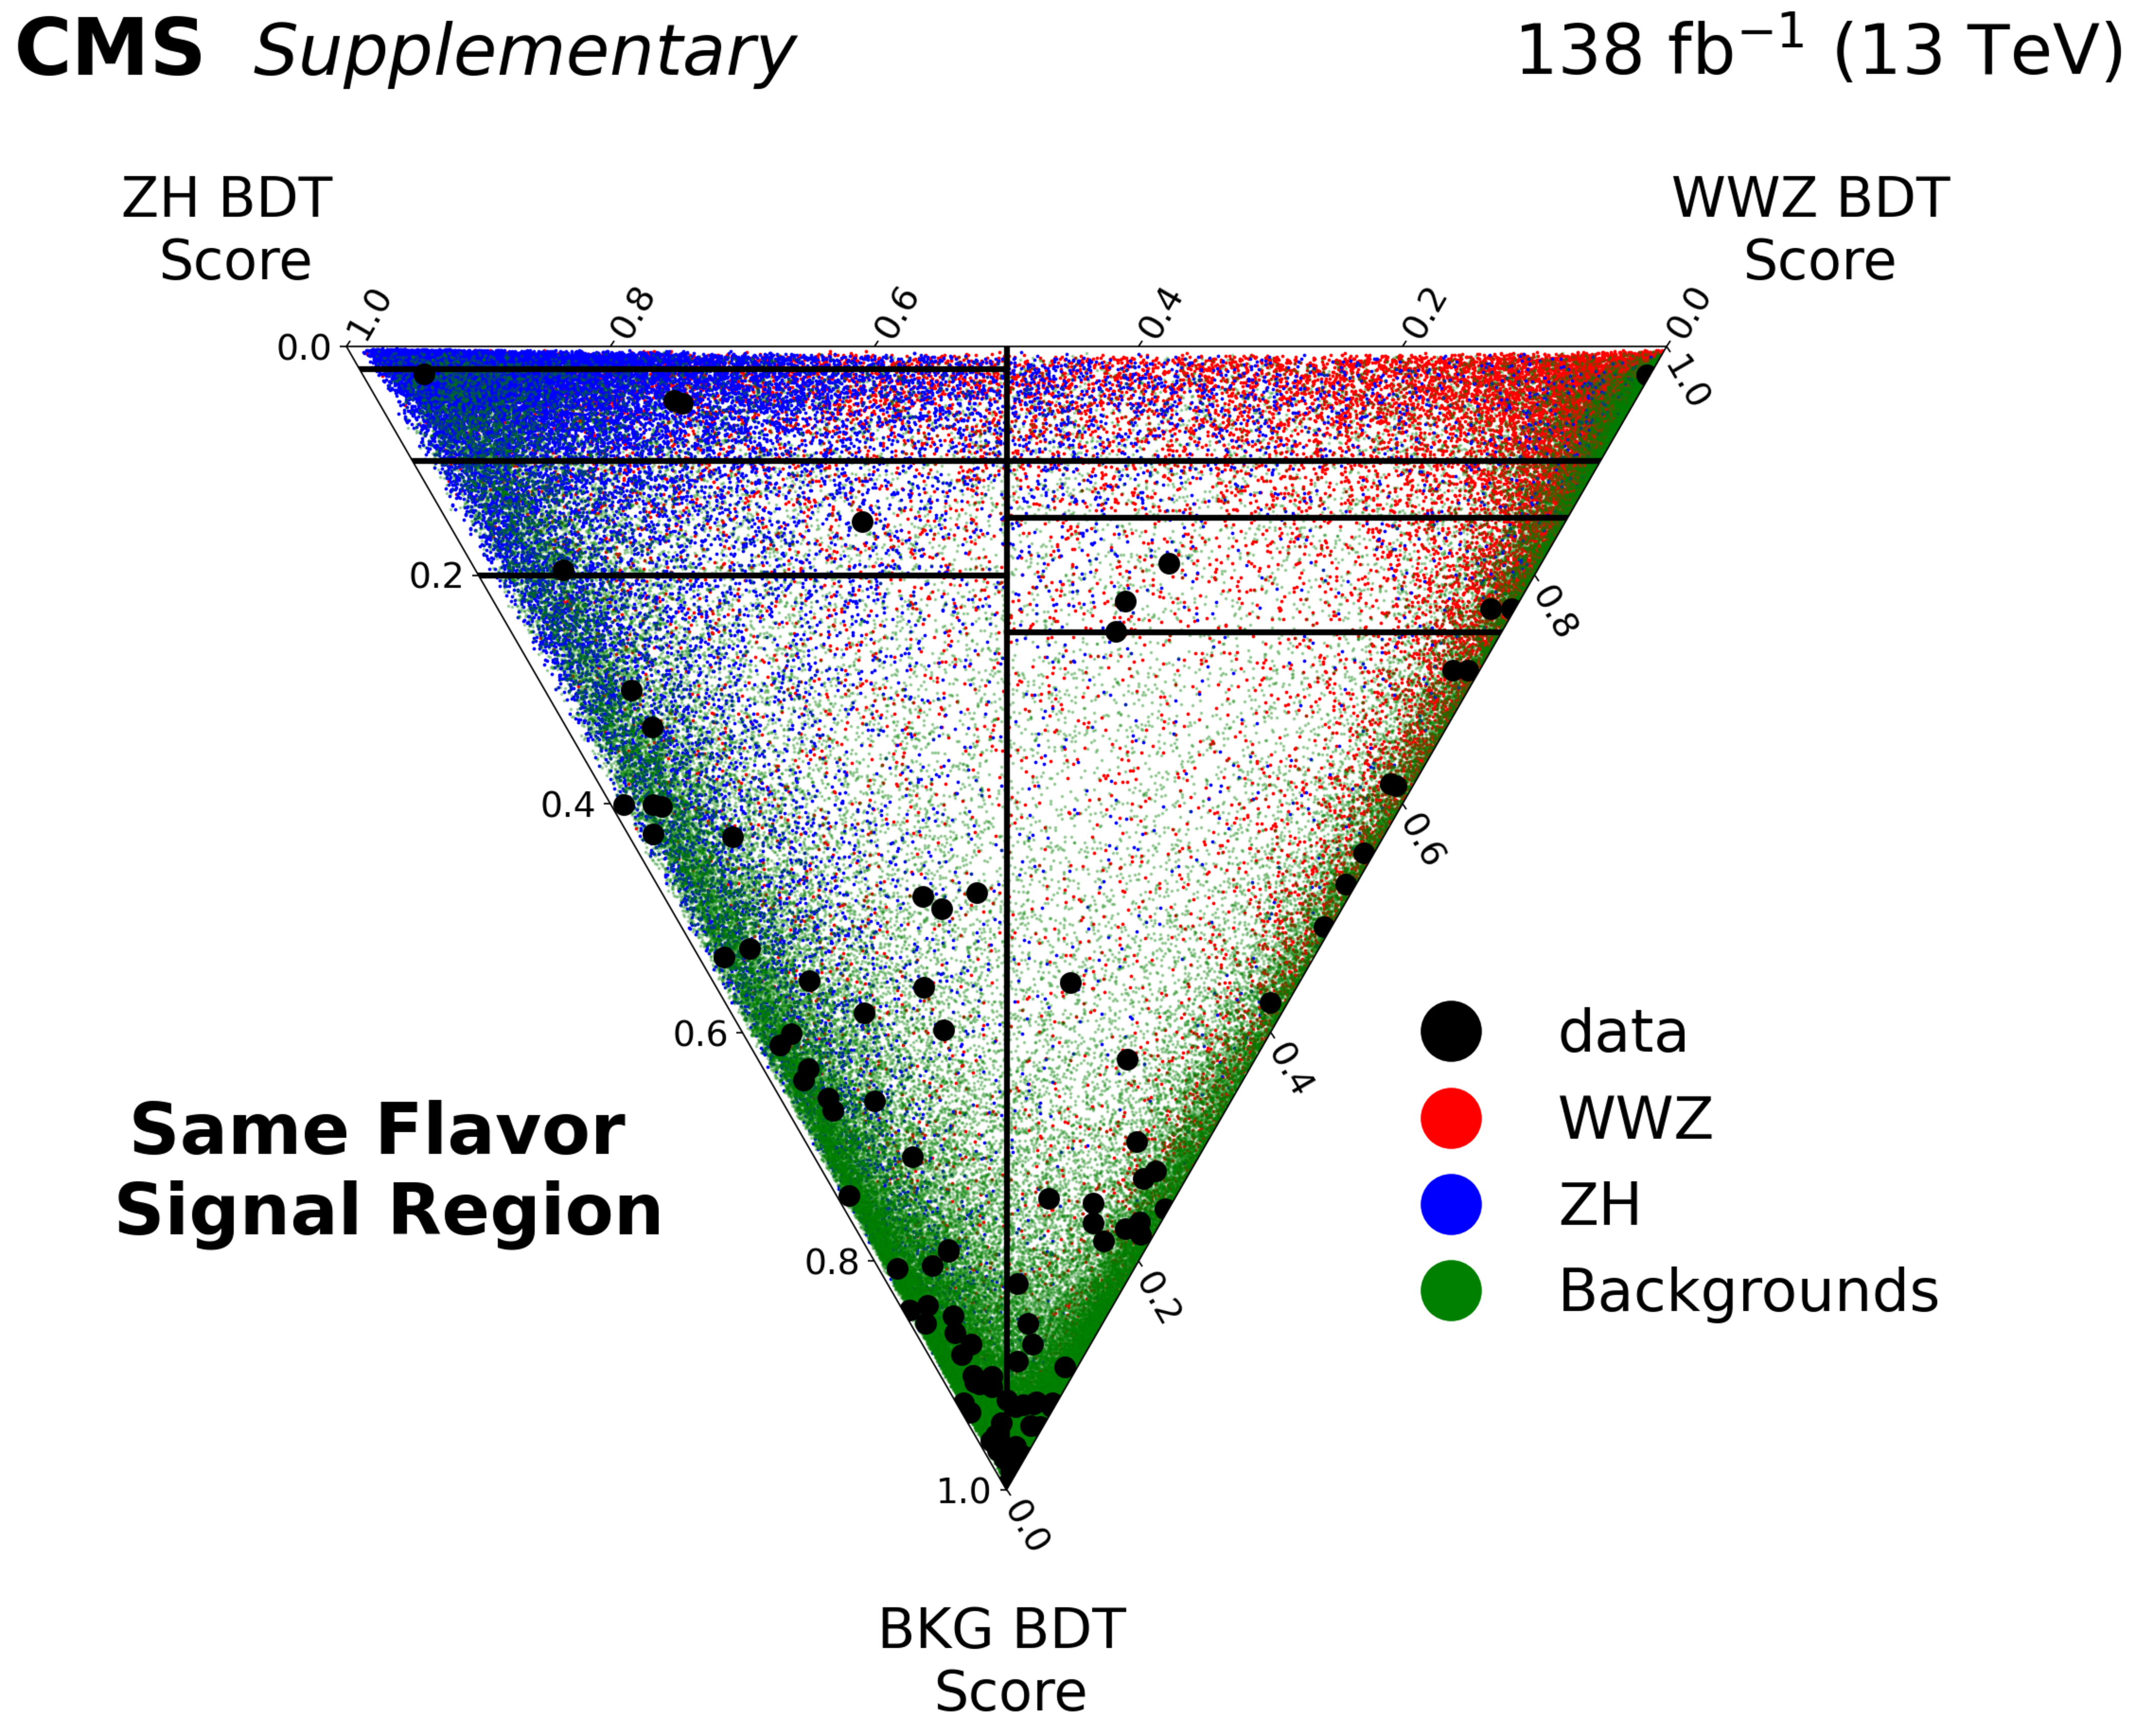
Distribution of simulated events in the three BDT scores in the Run 2 opposite-flavor channel (top) and same-flavor channel (bottom). The signal region boundaries are shown on the right-hand side. |
png pdf |
Additional Figure 12-a:
Distribution of simulated events in the three BDT scores in the Run 2 opposite-flavor channel (top) and same-flavor channel (bottom). The signal region boundaries are shown on the right-hand side. |
png pdf |
Additional Figure 12-b:
Distribution of simulated events in the three BDT scores in the Run 2 opposite-flavor channel (top) and same-flavor channel (bottom). The signal region boundaries are shown on the right-hand side. |
png pdf |
Additional Figure 12-c:
Distribution of simulated events in the three BDT scores in the Run 2 opposite-flavor channel (top) and same-flavor channel (bottom). The signal region boundaries are shown on the right-hand side. |
png pdf |
Additional Figure 12-d:
Distribution of simulated events in the three BDT scores in the Run 2 opposite-flavor channel (top) and same-flavor channel (bottom). The signal region boundaries are shown on the right-hand side. |
png pdf |
Additional Figure 13:
Distribution of simulated events in the three BDT scores in the Run 3 opposite-flavor channel (top) and same-flavor channel (bottom). The signal region boundaries are shown on the right-hand side. |
png pdf |
Additional Figure 13-a:
Distribution of simulated events in the three BDT scores in the Run 3 opposite-flavor channel (top) and same-flavor channel (bottom). The signal region boundaries are shown on the right-hand side. |

png pdf |
Additional Figure 13-b:
Distribution of simulated events in the three BDT scores in the Run 3 opposite-flavor channel (top) and same-flavor channel (bottom). The signal region boundaries are shown on the right-hand side. |
png pdf |
Additional Figure 13-c:
Distribution of simulated events in the three BDT scores in the Run 3 opposite-flavor channel (top) and same-flavor channel (bottom). The signal region boundaries are shown on the right-hand side. |
png pdf |
Additional Figure 13-d:
Distribution of simulated events in the three BDT scores in the Run 3 opposite-flavor channel (top) and same-flavor channel (bottom). The signal region boundaries are shown on the right-hand side. |
png pdf |
Additional Figure 14:
Distribution of simulated events and data in the three BDT scores in the Run 2 opposite-flavor channel (top) and same-flavor channel (bottom). The signal region boundaries are shown on the right-hand side. |
png pdf |
Additional Figure 14-a:
Distribution of simulated events and data in the three BDT scores in the Run 2 opposite-flavor channel (top) and same-flavor channel (bottom). The signal region boundaries are shown on the right-hand side. |

png pdf |
Additional Figure 14-b:
Distribution of simulated events and data in the three BDT scores in the Run 2 opposite-flavor channel (top) and same-flavor channel (bottom). The signal region boundaries are shown on the right-hand side. |
png pdf |
Additional Figure 14-c:
Distribution of simulated events and data in the three BDT scores in the Run 2 opposite-flavor channel (top) and same-flavor channel (bottom). The signal region boundaries are shown on the right-hand side. |
png pdf |
Additional Figure 14-d:
Distribution of simulated events and data in the three BDT scores in the Run 2 opposite-flavor channel (top) and same-flavor channel (bottom). The signal region boundaries are shown on the right-hand side. |
png pdf |
Additional Figure 15:
Distribution of simulated events in the three BDT scores in the Run 3 opposite-flavor channel (top) and same-flavor channel (bottom). The signal region boundaries are shown on the right-hand side. |
png pdf |
Additional Figure 15-a:
Distribution of simulated events in the three BDT scores in the Run 3 opposite-flavor channel (top) and same-flavor channel (bottom). The signal region boundaries are shown on the right-hand side. |
png pdf |
Additional Figure 15-b:
Distribution of simulated events in the three BDT scores in the Run 3 opposite-flavor channel (top) and same-flavor channel (bottom). The signal region boundaries are shown on the right-hand side. |
png pdf |
Additional Figure 15-c:
Distribution of simulated events in the three BDT scores in the Run 3 opposite-flavor channel (top) and same-flavor channel (bottom). The signal region boundaries are shown on the right-hand side. |

png pdf |
Additional Figure 15-d:
Distribution of simulated events in the three BDT scores in the Run 3 opposite-flavor channel (top) and same-flavor channel (bottom). The signal region boundaries are shown on the right-hand side. |
png pdf |
Additional Figure 16:
Two-dimensional likelihood scan over the signal strengths of th WWZ and ZH contributions for Run 2 data (left), Run 3 data (right). |
png pdf |
Additional Figure 16-a:
Two-dimensional likelihood scan over the signal strengths of th WWZ and ZH contributions for Run 2 data (left), Run 3 data (right). |
png pdf |
Additional Figure 16-b:
Two-dimensional likelihood scan over the signal strengths of th WWZ and ZH contributions for Run 2 data (left), Run 3 data (right). |
png pdf |
Additional Figure 17:
One-dimensional likelihood scan over the signal strength (taking both WWZ and ZH contributions as signal) for Run 2 data, Run 3 data, and Run 2 and Run 3 data together. |
png pdf |
Additional Figure 17-a:
One-dimensional likelihood scan over the signal strength (taking both WWZ and ZH contributions as signal) for Run 2 data, Run 3 data, and Run 2 and Run 3 data together. |
png pdf |
Additional Figure 17-b:
One-dimensional likelihood scan over the signal strength (taking both WWZ and ZH contributions as signal) for Run 2 data, Run 3 data, and Run 2 and Run 3 data together. |
png pdf |
Additional Figure 17-c:
One-dimensional likelihood scan over the signal strength (taking both WWZ and ZH contributions as signal) for Run 2 data, Run 3 data, and Run 2 and Run 3 data together. |
| References | ||||
| 1 | CMS Collaboration | The CMS experiment at the CERN LHC | JINST 3 (2008) S08004 | |
| 2 | CMS Collaboration | Development of the CMS detector for the CERN LHC Run 3 | JINST 19 (2024) P05064 | CMS-PRF-21-001 2309.05466 |
| 3 | CMS Collaboration | Observation of the production of three massive gauge bosons at $ \sqrt{s}= $ 13 TeV | PRL 125 (2020) 151802 | CMS-SMP-19-014 2006.11191 |
| 4 | ATLAS Collaboration | The ATLAS experiment at the CERN Large Hadron Collider | JINST 3 (2008) S08003 | |
| 5 | ATLAS Collaboration | Observation of $ {\mathrm{V}\mathrm{V}\mathrm{Z}} $ production at $ \sqrt{s}= $ 13 TeV with the ATLAS detector | Submitted to Phys. Lett. B, 2024 | 2412.15123 |
| 6 | CMS Collaboration | A portrait of the Higgs boson by the CMS experiment ten years after the discovery | Nature 607 (2022) 60 | CMS-HIG-22-001 2207.00043 |
| 7 | ATLAS Collaboration | A detailed map of Higgs boson interactions by the ATLAS experiment ten years after the discovery | Nature 607 (2022) 52 | 2207.00092 |
| 8 | J. Alwall et al. | The automated computation of tree-level and next-to-leading order differential cross sections, and their matching to parton shower simulations | JHEP 07 (2014) 079 | 1405.0301 |
| 9 | LHC Higgs Cross Section Working Group , D. de Florian et al. | Handbook of LHC Higgs cross sections: 4. Deciphering the nature of the Higgs sector | CERN Report CERN-2017-002-M, 2016 link |
1610.07922 |
| 10 | CMS Collaboration | Performance of the CMS Level-1 trigger in proton-proton collisions at $ \sqrt{s}= $ 13 TeV | JINST 15 (2020) P10017 | CMS-TRG-17-001 2006.10165 |
| 11 | CMS Collaboration | The CMS trigger system | JINST 12 (2017) P01020 | CMS-TRG-12-001 1609.02366 |
| 12 | CMS Collaboration | Electron and photon reconstruction and identification with the CMS experiment at the CERN LHC | JINST 16 (2021) P05014 | CMS-EGM-17-001 2012.06888 |
| 13 | CMS Collaboration | Performance of the CMS muon detector and muon reconstruction with proton-proton collisions at $ \sqrt{s}= $ 13 TeV | JINST 13 (2018) P06015 | CMS-MUO-16-001 1804.04528 |
| 14 | CMS Collaboration | Description and performance of track and primary-vertex reconstruction with the CMS tracker | JINST 9 (2014) P10009 | CMS-TRK-11-001 1405.6569 |
| 15 | CMS Collaboration | Particle-flow reconstruction and global event description with the CMS detector | JINST 12 (2017) P10003 | CMS-PRF-14-001 1706.04965 |
| 16 | CMS Collaboration | Performance of reconstruction and identification of $ \tau $ leptons decaying to hadrons and $ \nu_{\!\tau} $ in $ {\mathrm{p}\mathrm{p}} $ collisions at $ \sqrt{s}= $ 13 TeV | JINST 13 (2018) P10005 | CMS-TAU-16-003 1809.02816 |
| 17 | CMS Collaboration | Jet energy scale and resolution in the CMS experiment in $ {\mathrm{p}\mathrm{p}} $ collisions at 8 TeV | JINST 12 (2017) P02014 | CMS-JME-13-004 1607.03663 |
| 18 | CMS Collaboration | Performance of missing transverse momentum reconstruction in proton-proton collisions at $ \sqrt{s}= $ 13 TeV using the CMS detector | JINST 14 (2019) P07004 | CMS-JME-17-001 1903.06078 |
| 19 | M. Cacciari, G. P. Salam, and G. Soyez | The anti-$ k_{\mathrm{T}} $ jet clustering algorithm | JHEP 04 (2008) 063 | 0802.1189 |
| 20 | M. Cacciari, G. P. Salam, and G. Soyez | FASTJET user manual | EPJC 72 (2012) 1896 | 1111.6097 |
| 21 | CMS Collaboration | Pileup mitigation at CMS in 13 TeV data | JINST 15 (2020) P09018 | CMS-JME-18-001 2003.00503 |
| 22 | D. Bertolini, P. Harris, M. Low, and N. Tran | Pileup per particle identification | JHEP 10 (2014) 059 | 1407.6013 |
| 23 | R. Frederix and S. Frixione | Merging meets matching in MC@NLO | JHEP 12 (2012) 061 | 1209.6215 |
| 24 | J. Alwall et al. | Comparative study of various algorithms for the merging of parton showers and matrix elements in hadronic collisions | EPJC 53 (2008) 473 | 0706.2569 |
| 25 | P. Nason | A new method for combining NLO QCD with shower Monte Carlo algorithms | JHEP 11 (2004) 040 | hep-ph/0409146 |
| 26 | S. Frixione, P. Nason, and C. Oleari | Matching NLO QCD computations with parton shower simulations: the POWHEG method | JHEP 11 (2007) 070 | 0709.2092 |
| 27 | S. Alioli, P. Nason, C. Oleari, and E. Re | A general framework for implementing NLO calculations in shower Monte Carlo programs: the POWHEG \textscbox | JHEP 06 (2010) 043 | 1002.2581 |
| 28 | T. Melia, P. Nason, R. Röntsch, and G. Zanderighi | $ {\mathrm{W^+}\mathrm{W^-}} $, $ {\mathrm{W}\mathrm{Z}} $ and $ {\mathrm{Z}\mathrm{Z}} $ production in the POWHEG \textscbox | JHEP 11 (2011) 078 | 1107.5051 |
| 29 | S. Frixione, G. Ridolfi, and P. Nason | A positive-weight next-to-leading-order Monte Carlo for heavy flavour hadroproduction | JHEP 09 (2007) 126 | 0707.3088 |
| 30 | J. M. Campbell and R. K. Ellis | Update on vector boson pair production at hadron colliders | PRD 60 (1999) 113006 | hep-ph/9905386 |
| 31 | NNPDF Collaboration | Parton distributions for the LHC run II | JHEP 04 (2015) 040 | 1410.8849 |
| 32 | T. Sjöstrand et al. | An introduction to PYTHIA8.2 | Comput. Phys. Commun. 191 (2015) 159 | 1410.3012 |
| 33 | C. Bierlich et al. | A comprehensive guide to the physics and usage of PYTHIA8.3 | SciPost Phys. Codeb. 8 (2022) | 2203.11601 |
| 34 | CMS Collaboration | Extraction and validation of a new set of CMS PYTHIA8 tunes from underlying-event measurements | EPJC 80 (2020) 4 | CMS-GEN-17-001 1903.12179 |
| 35 | GEANT4 Collaboration | GEANT 4---a simulation toolkit | NIM A 506 (2003) 250 | |
| 36 | A. Karlberg et al. | Ad interim recommendations for the Higgs boson production cross sections at $ \sqrt{s}= $ 13.6 TeV | LHC Higgs Working Group Public Note LHCHWG-2024-001, 2024 | 2402.09955 |
| 37 | Particle Data Group , S. Navas et al. | Review of particle physics | PRD 110 (2024) 030001 | |
| 38 | CMS Collaboration | Identification of heavy-flavour jets with the CMS detector in $ {\mathrm{p}\mathrm{p}} $ collisions at 13 TeV | JINST 13 (2018) P05011 | CMS-BTV-16-002 1712.07158 |
| 39 | E. Bols et al. | Jet flavour classification using DeepJet | JINST 15 (2020) P12012 | 2008.10519 |
| 40 | CMS Collaboration | Performance of the DeepJet b tagging algorithm using 41.9 fb$ ^{-1} $ of data from proton-proton collisions at 13 TeV with Phase 1 CMS detector | CMS Detector Performance Note CMS-DP-2018-058, 2018 CDS |
|
| 41 | C. G. Lester and D. J. Summers | Measuring masses of semi-invisibly decaying particles pair produced at hadron colliders | PLB 463 (1999) 99 | hep-ph/9906349 |
| 42 | A. Barr, C. Lester, and P. Stephens | A variable for measuring masses at hadron colliders when missing energy is expected; $ m_{\mathrm{T2}} $: the truth behind the glamour | JPG 29 (2003) 2343 | hep-ph/0304226 |
| 43 | H. Voss, A. Höcker, J. Stelzer, and F. Tegenfeldt | TMVA, the toolkit for multivariate data analysis with ROOT | in Proc. 11th International Workshop on Advanced Computing and Analysis Techniques in Physics Research (ACAT ), Amsterdam, The Netherlands, 2017 PoS (ACAT) 040 |
physics/0703039 |
| 44 | CMS Collaboration | The CMS statistical analysis and combination tool: \textsccombine | Comput. Softw. Big Sci. 8 (2024) 19 | CMS-CAT-23-001 2404.06614 |
| 45 | CMS Collaboration | Precision luminosity measurement in proton-proton collisions at $ \sqrt{s}= $ 13 TeV in 2015 and 2016 at CMS | EPJC 81 (2021) 800 | CMS-LUM-17-003 2104.01927 |
| 46 | CMS Collaboration | CMS luminosity measurement for the 2017 data-taking period at $ \sqrt{s}= $ 13 TeV | CMS Physics Analysis Summary, 2018 CMS-PAS-LUM-17-004 |
CMS-PAS-LUM-17-004 |
| 47 | CMS Collaboration | CMS luminosity measurement for the 2018 data-taking period at $ \sqrt{s}= $ 13 TeV | CMS Physics Analysis Summary, 2019 CMS-PAS-LUM-18-002 |
CMS-PAS-LUM-18-002 |
| 48 | CMS Collaboration | Luminosity measurement in proton-proton collisions at 13.6 TeV in 2022 at CMS | CMS Physics Analysis Summary, 2024 CMS-PAS-LUM-22-001 |
CMS-PAS-LUM-22-001 |
| 49 | LHC Higgs Cross Section Working Group , S. Heinemeyer et al. | Handbook of LHC Higgs cross sections: 3. Higgs properties | CERN Report CERN-2013-004, 2013 link |
1307.1347 |
| 50 | CMS Collaboration | HEPData record for this analysis | link | |
|
|
Compact Muon Solenoid LHC, CERN |
|

|

|

|

|

|