

Compact Muon Solenoid
LHC, CERN
| CMS-SMP-24-009 ; CERN-EP-2024-314 | ||
| Measurement of the W boson decay branching fraction ratio $ \mathcal{B}(\mathrm{ W \to c q })/\mathcal{B}(\mathrm{{W}\to q \bar{q}{}^{'}}) $ in proton-proton collisions at $ \sqrt{s} = $ 13 TeV | ||
| CMS Collaboration | ||
| 20 December 2024 | ||
| PLB 868 (2025) 139754 | ||
| Abstract: The most precise measurement to date of the W boson hadronic decay branching fraction ratio $ R_\mathrm{c}^{\mathrm{W}}=\mathcal{B}(\mathrm{ W \to c q })/\mathcal{B}(\mathrm{{W}\to q \bar{q}{}^{'}}) $ is presented. The measurement is based on a sample of proton-proton collision data from the CERN LHC collected by the CMS experiment at a center-of-mass energy of 13 TeV in 2016-2018 with an integrated luminosity of 138 fb$^{-1}$. The large cross section of top quark-antiquark production at the LHC offers a sizable high-purity sample of W bosons suitable for this measurement. Events with one charged lepton (electron or muon) and at least four jets, two tagged as bottom quark jets, are analyzed. Charm jets are tagged using the presence of a muon inside the jet. The result, $ R_\mathrm{c}^{\mathrm{W}}= $ 0.489 $ \pm $ 0.020, is consistent with the standard model prediction and is twice as precise as the current world-average value. | ||
| Links: e-print arXiv:2412.16296 [hep-ex] (PDF) ; CDS record ; inSPIRE record ; CADI line (restricted) ; | ||
| Figures | |

png pdf |
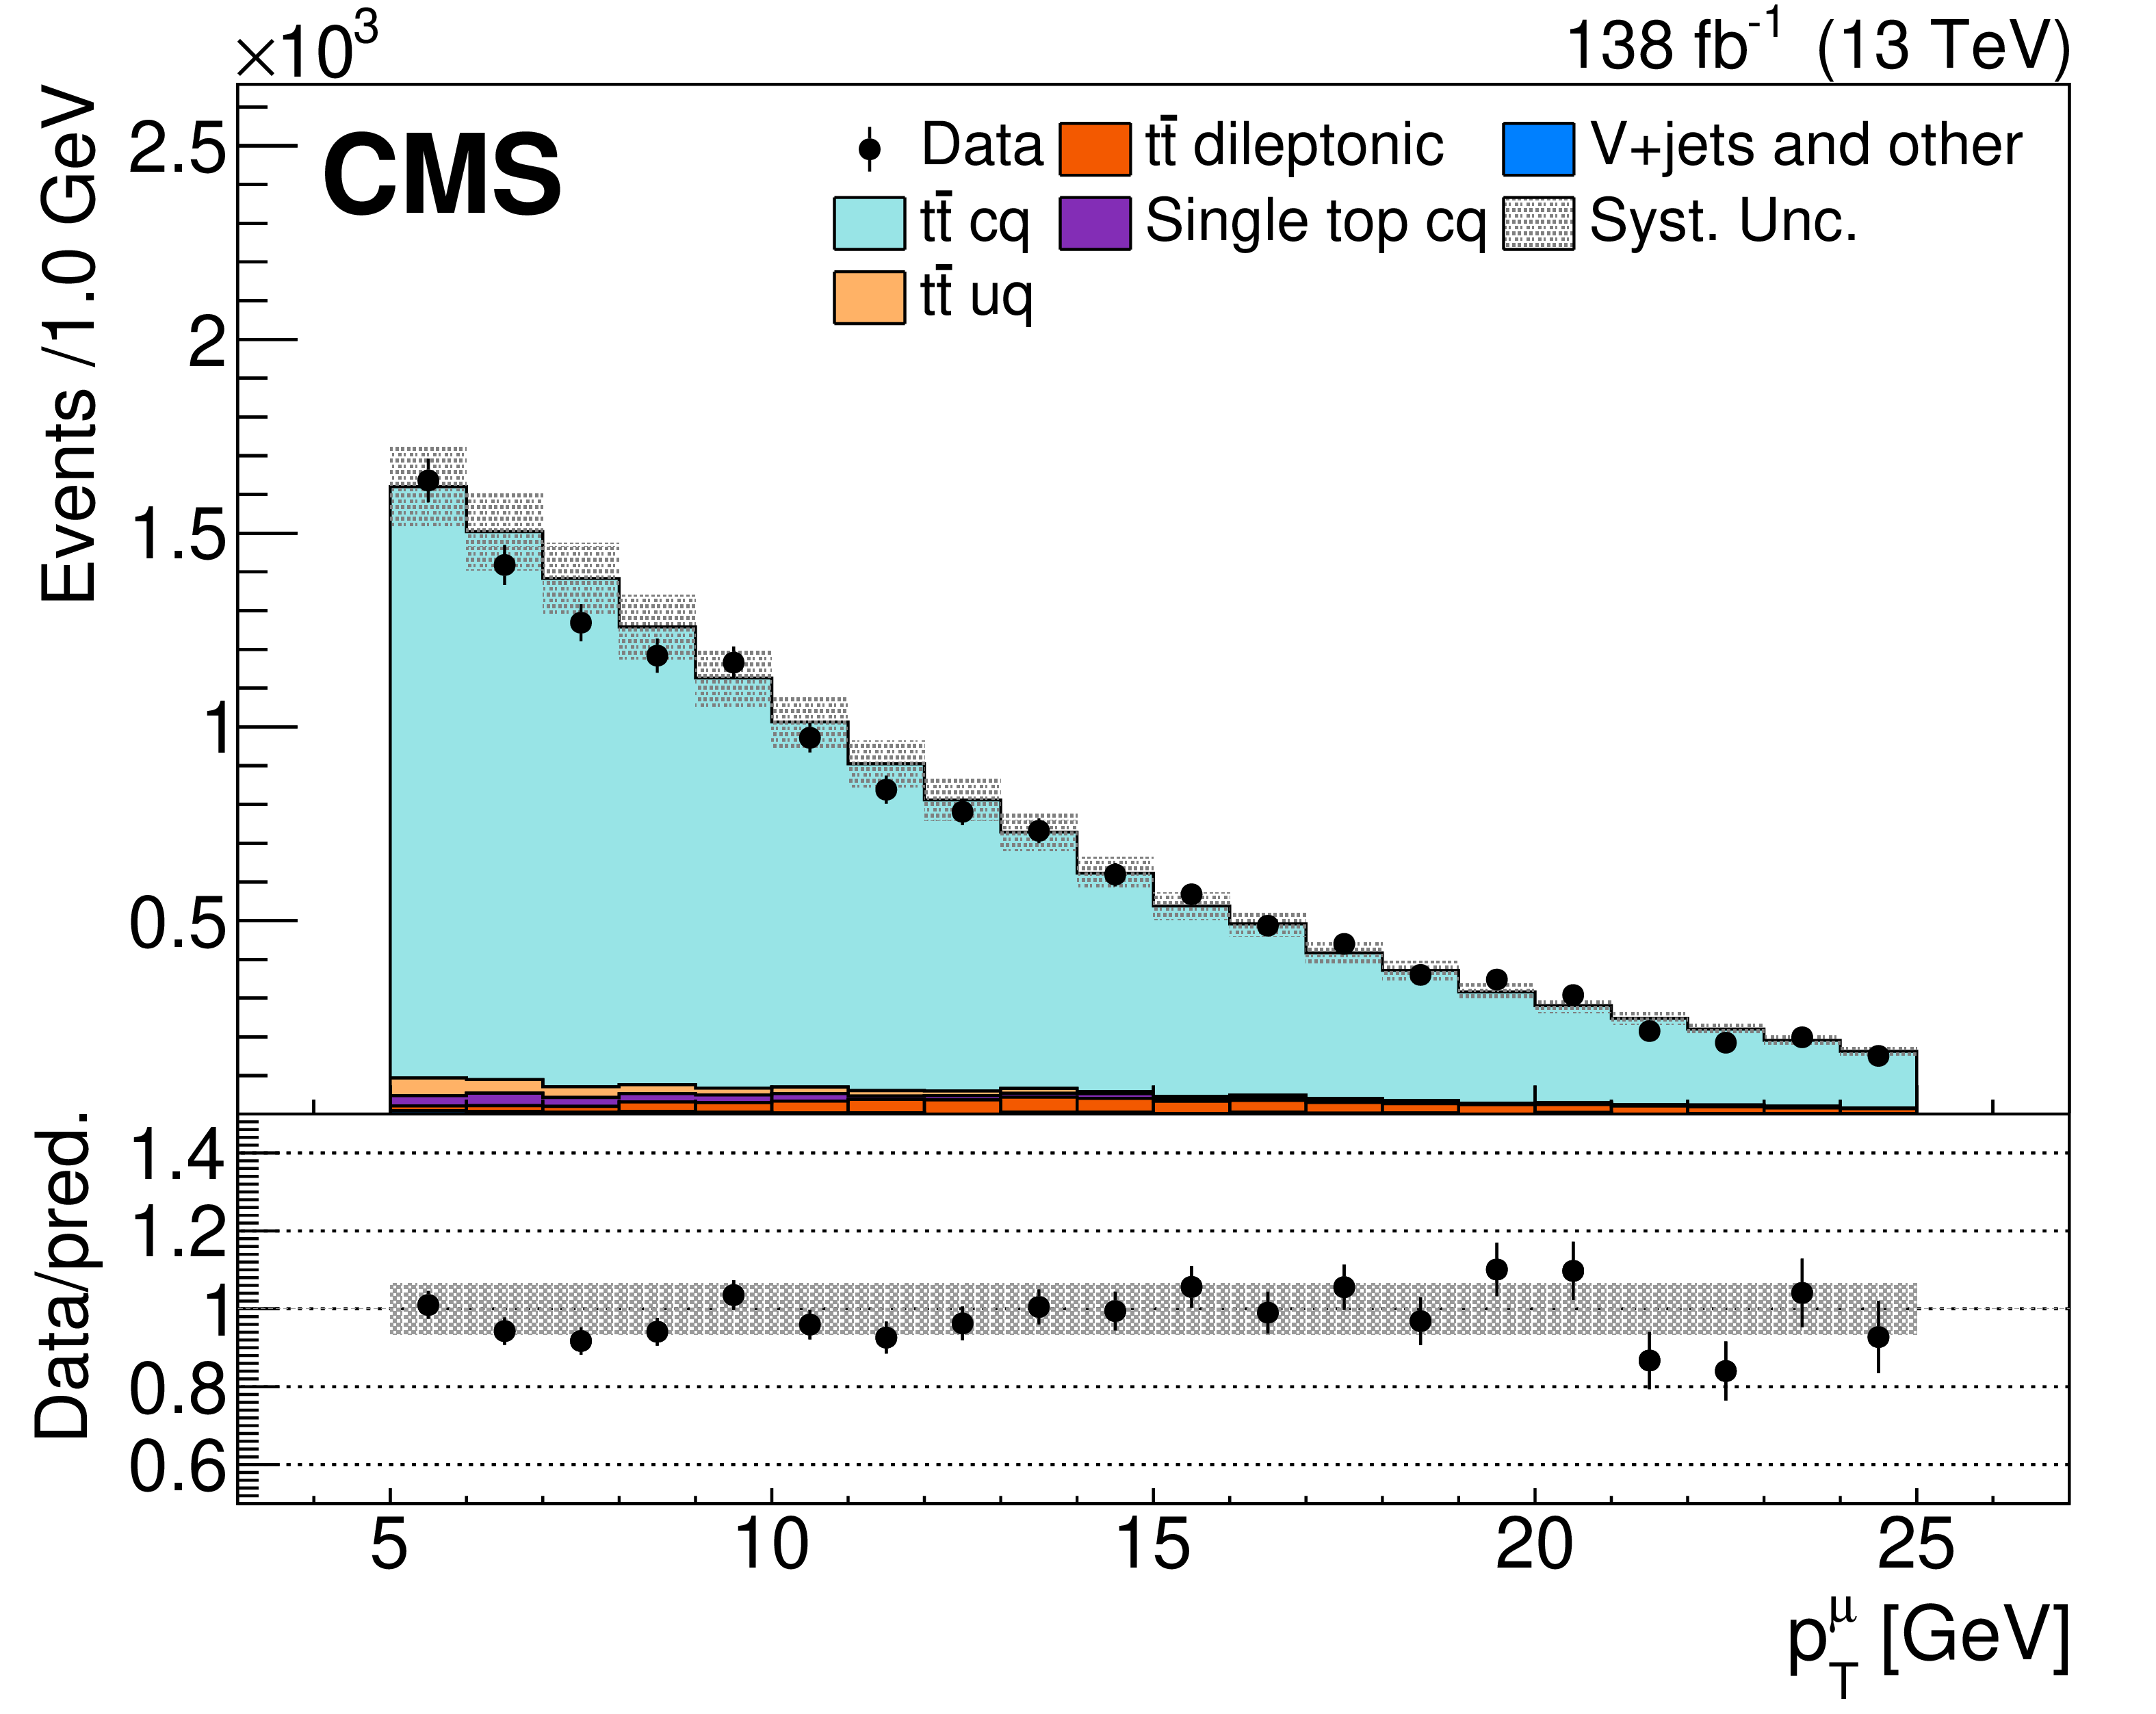
Figure 1:
Kinematic distributions of the muon inside the c-tagged jets: transverse momentum $ p_{\mathrm{T}}^{\mu} $ (upper left), pseudorapidity $ \eta^{\mu} $ (upper right), isolation $ I^{\mu} $ (lower left), and $ p_{\mathrm{T}}^{\mu}/p_{\mathrm{T}}^{\text{jet}} $ (lower right). Histograms show OS-SS yields for both data and simulations. Events with a prompt electron or muon are considered. The data are displayed as points with statistical error bars. The gray band in the predictions represents the systematic uncertainties. The ratios of data to the expected yields are given at the bottom of each panel, together with the statistical and systematic uncertainties. |
png pdf |
Figure 1-a:
Kinematic distributions of the muon inside the c-tagged jets: transverse momentum $ p_{\mathrm{T}}^{\mu} $ (upper left), pseudorapidity $ \eta^{\mu} $ (upper right), isolation $ I^{\mu} $ (lower left), and $ p_{\mathrm{T}}^{\mu}/p_{\mathrm{T}}^{\text{jet}} $ (lower right). Histograms show OS-SS yields for both data and simulations. Events with a prompt electron or muon are considered. The data are displayed as points with statistical error bars. The gray band in the predictions represents the systematic uncertainties. The ratios of data to the expected yields are given at the bottom of each panel, together with the statistical and systematic uncertainties. |
png pdf |
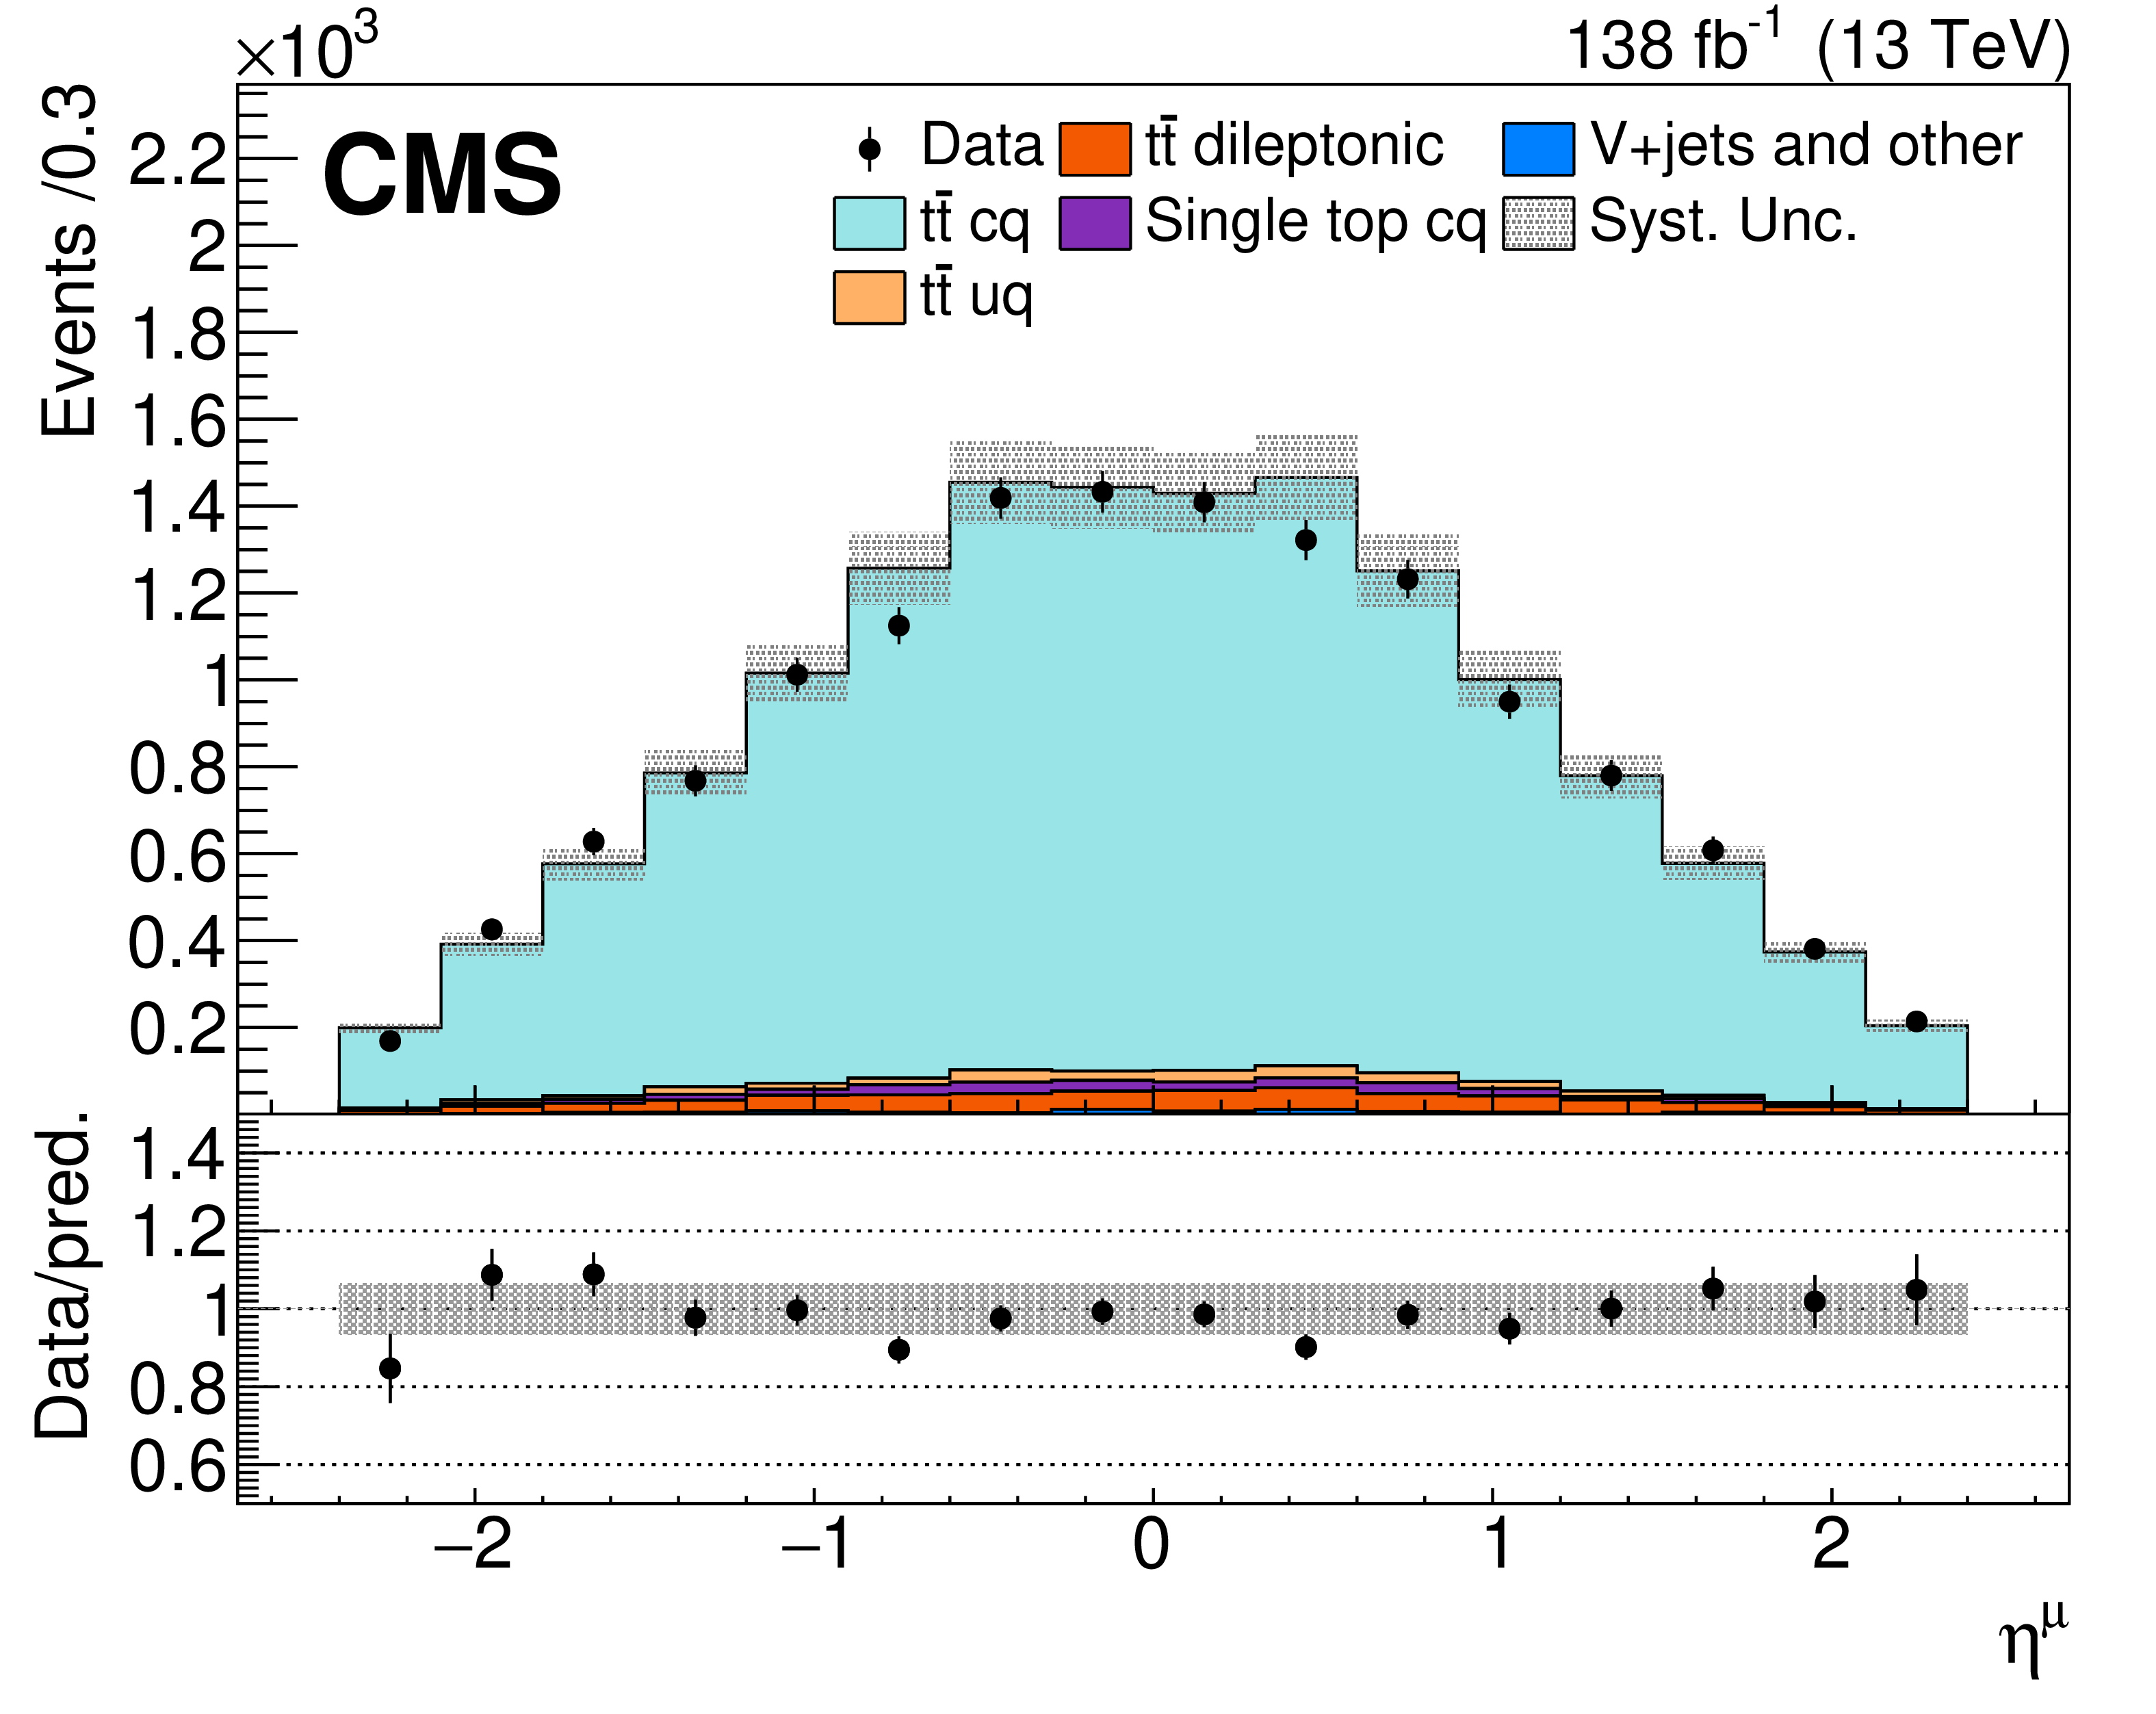
Figure 1-b:
Kinematic distributions of the muon inside the c-tagged jets: transverse momentum $ p_{\mathrm{T}}^{\mu} $ (upper left), pseudorapidity $ \eta^{\mu} $ (upper right), isolation $ I^{\mu} $ (lower left), and $ p_{\mathrm{T}}^{\mu}/p_{\mathrm{T}}^{\text{jet}} $ (lower right). Histograms show OS-SS yields for both data and simulations. Events with a prompt electron or muon are considered. The data are displayed as points with statistical error bars. The gray band in the predictions represents the systematic uncertainties. The ratios of data to the expected yields are given at the bottom of each panel, together with the statistical and systematic uncertainties. |
png pdf |
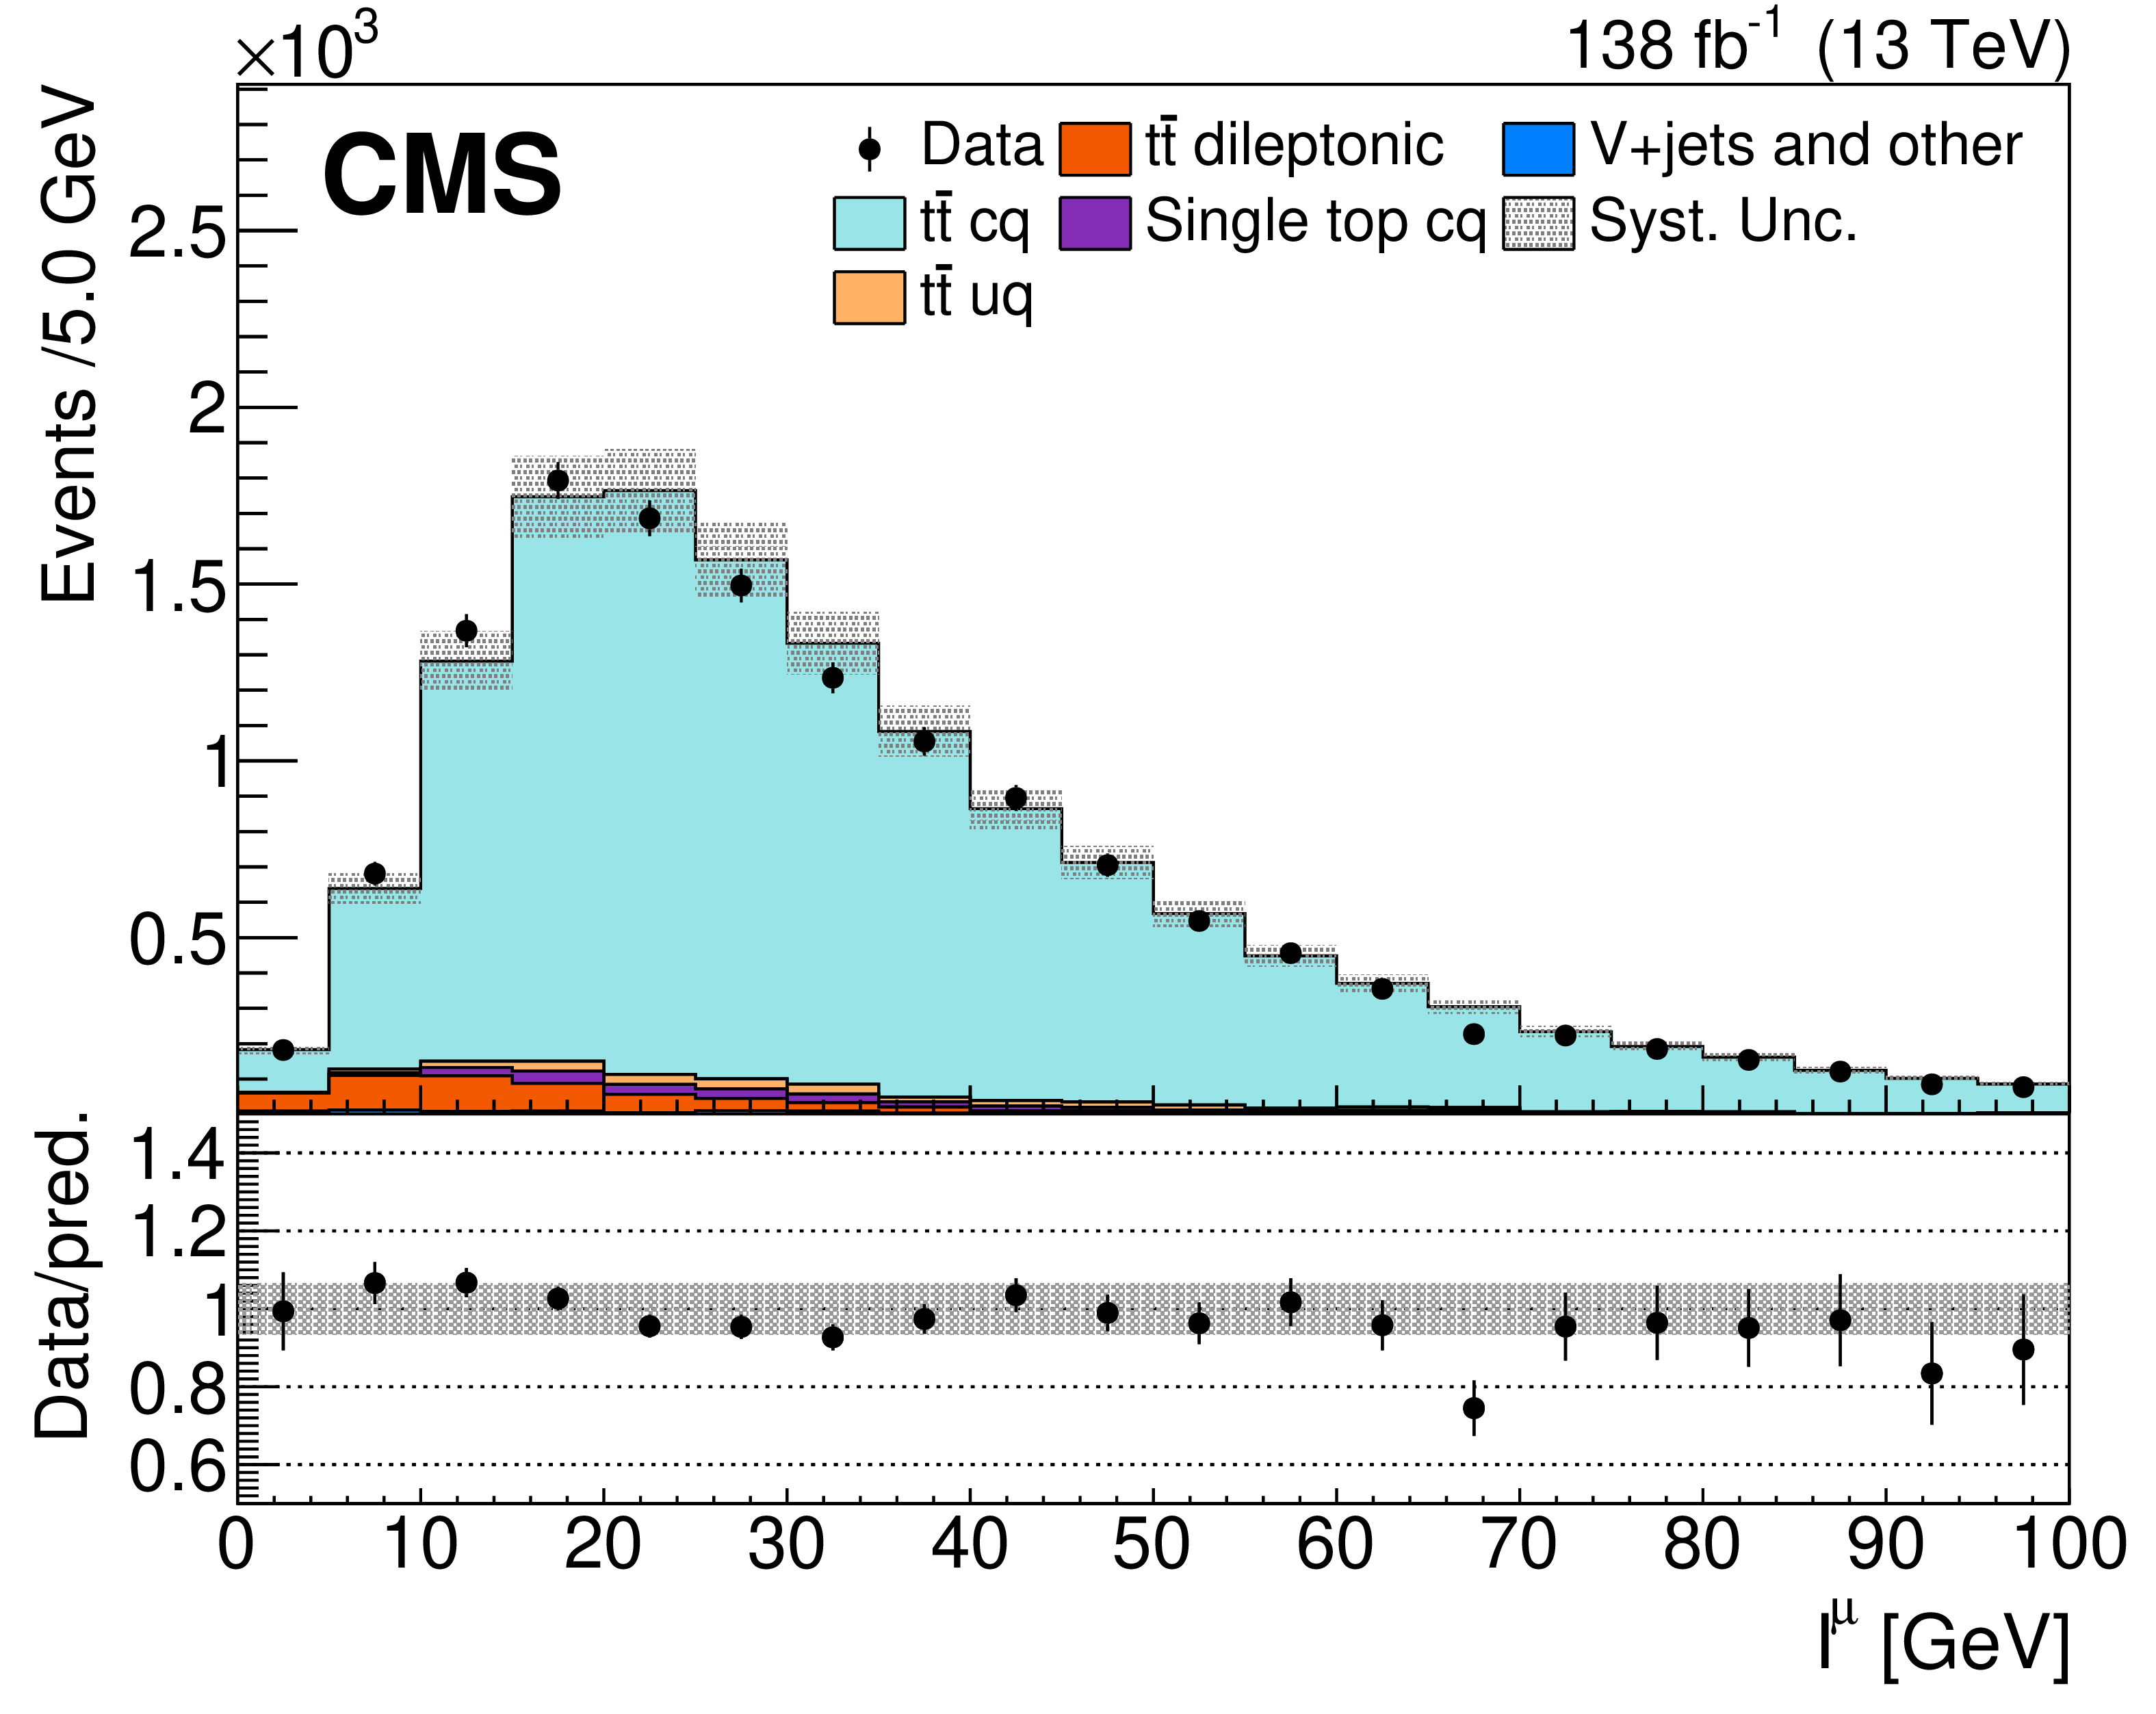
Figure 1-c:
Kinematic distributions of the muon inside the c-tagged jets: transverse momentum $ p_{\mathrm{T}}^{\mu} $ (upper left), pseudorapidity $ \eta^{\mu} $ (upper right), isolation $ I^{\mu} $ (lower left), and $ p_{\mathrm{T}}^{\mu}/p_{\mathrm{T}}^{\text{jet}} $ (lower right). Histograms show OS-SS yields for both data and simulations. Events with a prompt electron or muon are considered. The data are displayed as points with statistical error bars. The gray band in the predictions represents the systematic uncertainties. The ratios of data to the expected yields are given at the bottom of each panel, together with the statistical and systematic uncertainties. |
png pdf |
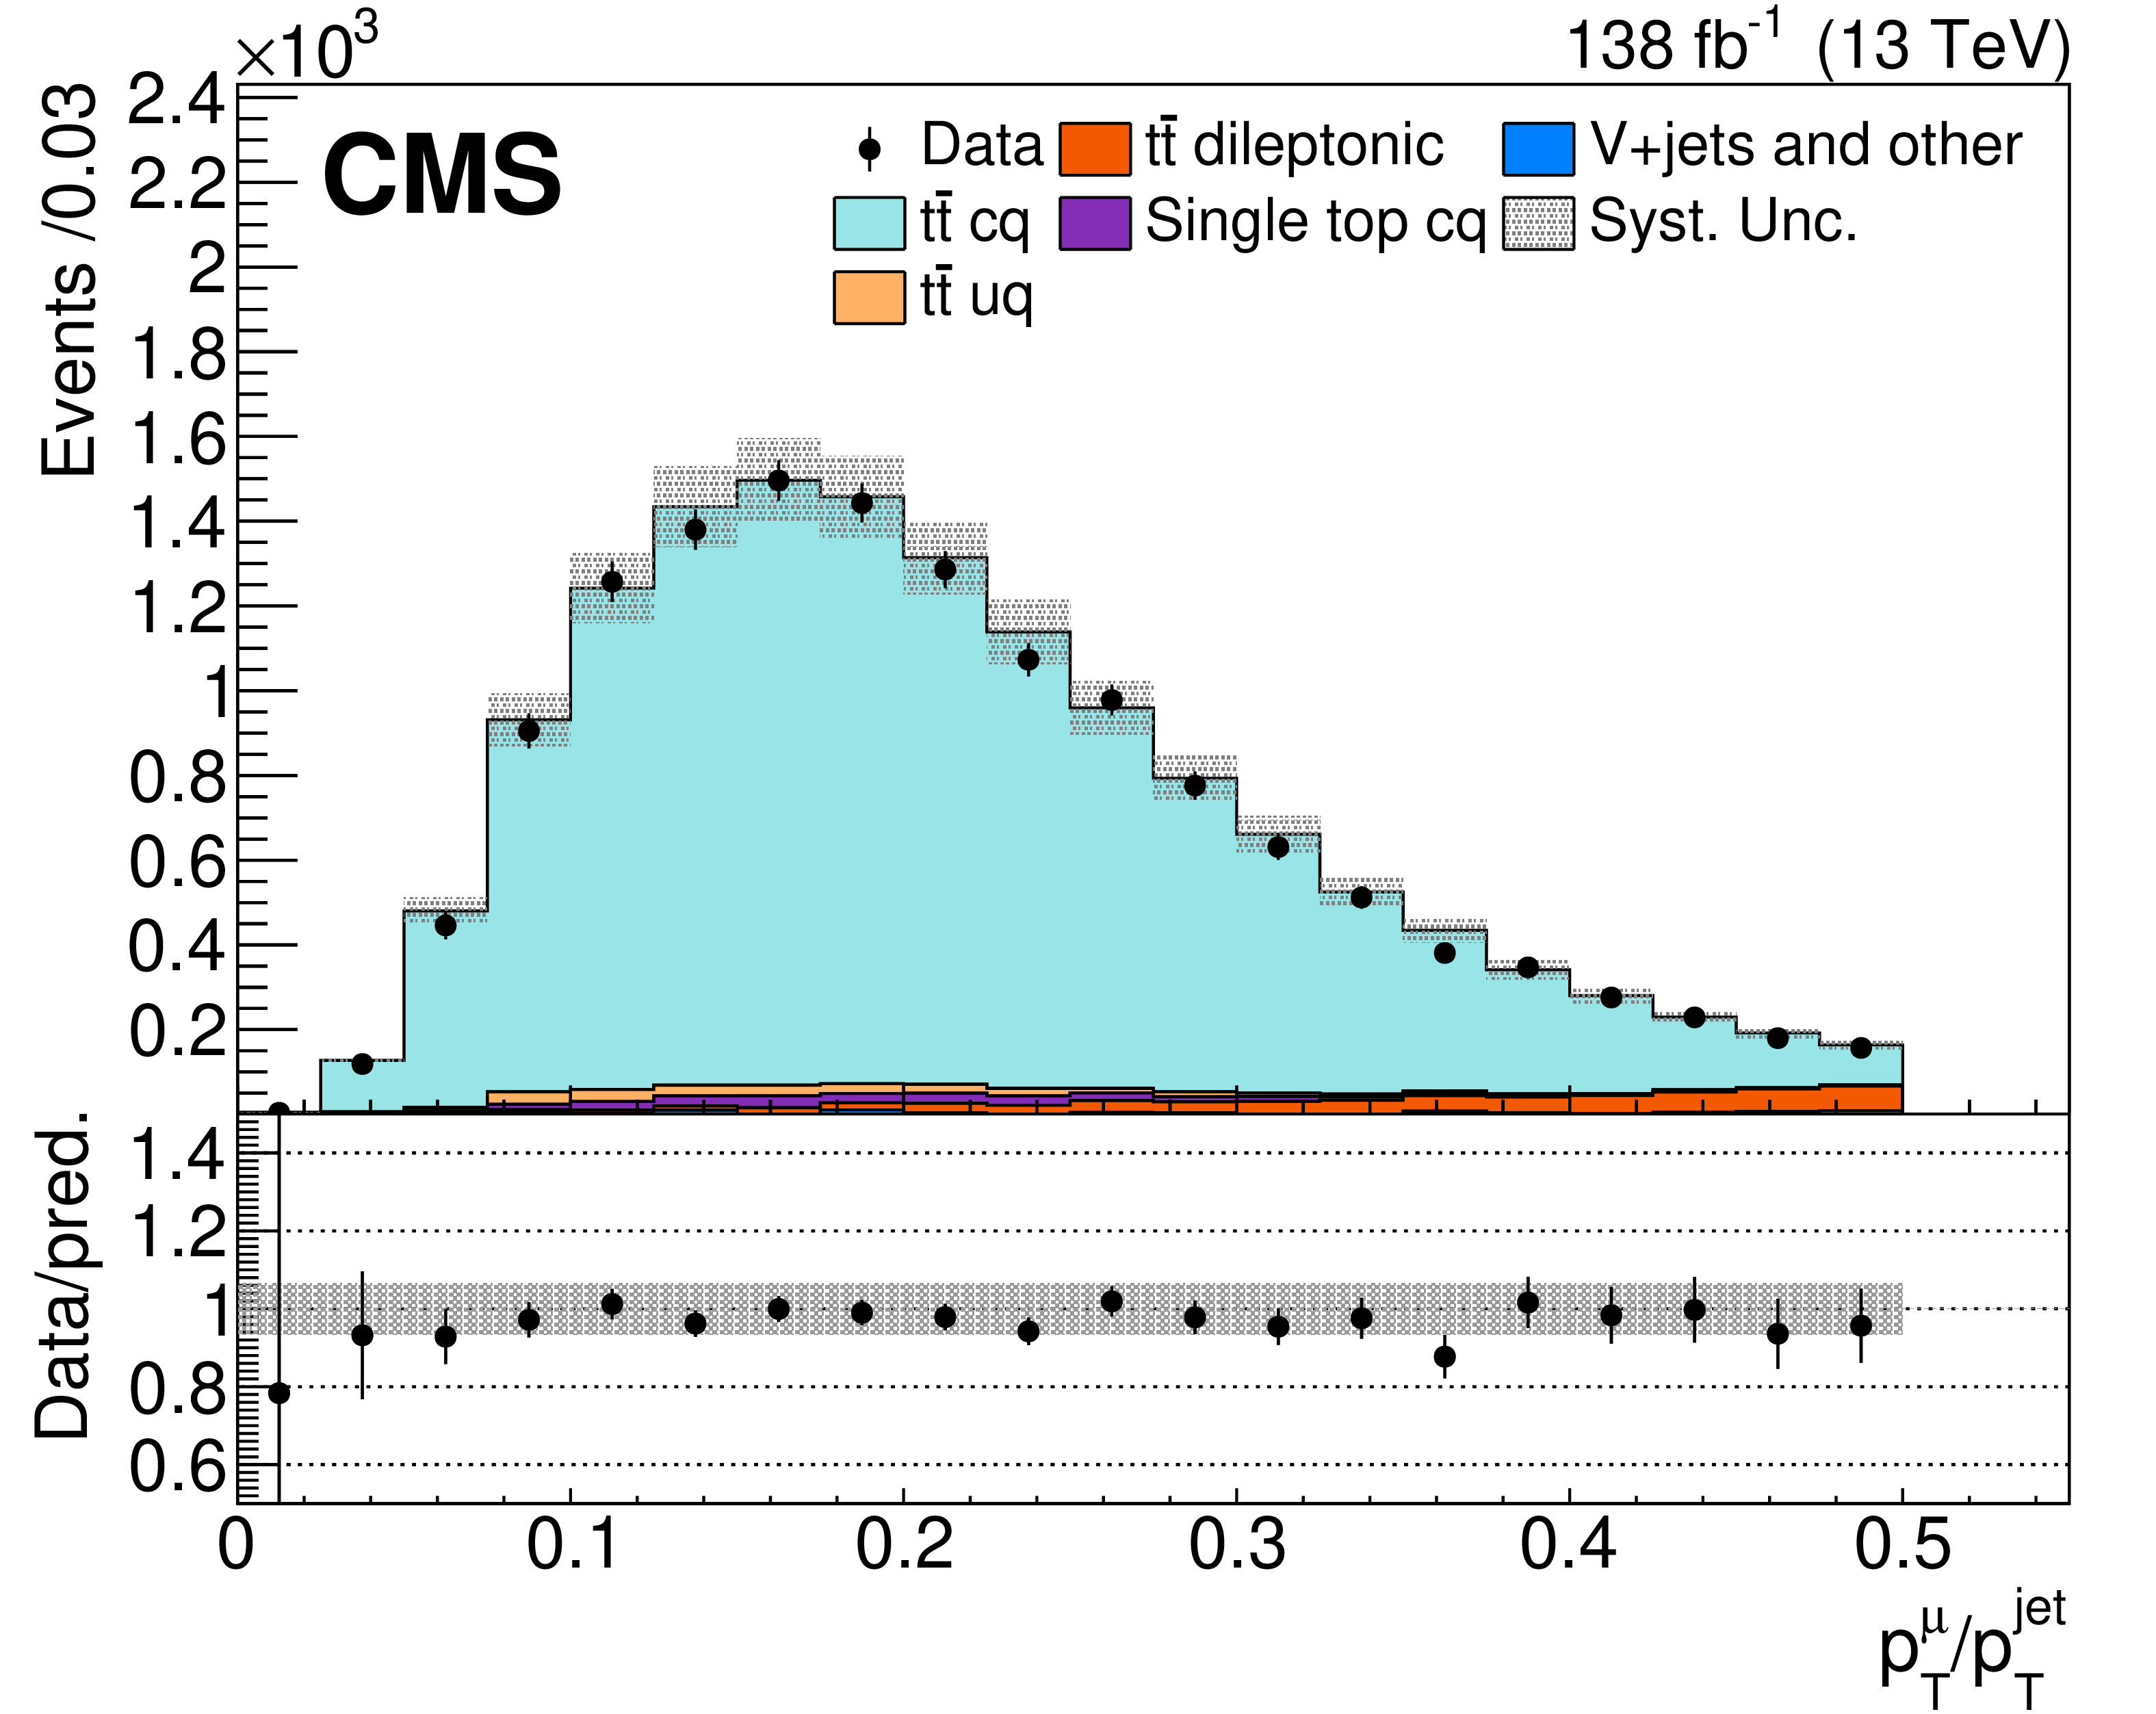
Figure 1-d:
Kinematic distributions of the muon inside the c-tagged jets: transverse momentum $ p_{\mathrm{T}}^{\mu} $ (upper left), pseudorapidity $ \eta^{\mu} $ (upper right), isolation $ I^{\mu} $ (lower left), and $ p_{\mathrm{T}}^{\mu}/p_{\mathrm{T}}^{\text{jet}} $ (lower right). Histograms show OS-SS yields for both data and simulations. Events with a prompt electron or muon are considered. The data are displayed as points with statistical error bars. The gray band in the predictions represents the systematic uncertainties. The ratios of data to the expected yields are given at the bottom of each panel, together with the statistical and systematic uncertainties. |
png pdf |
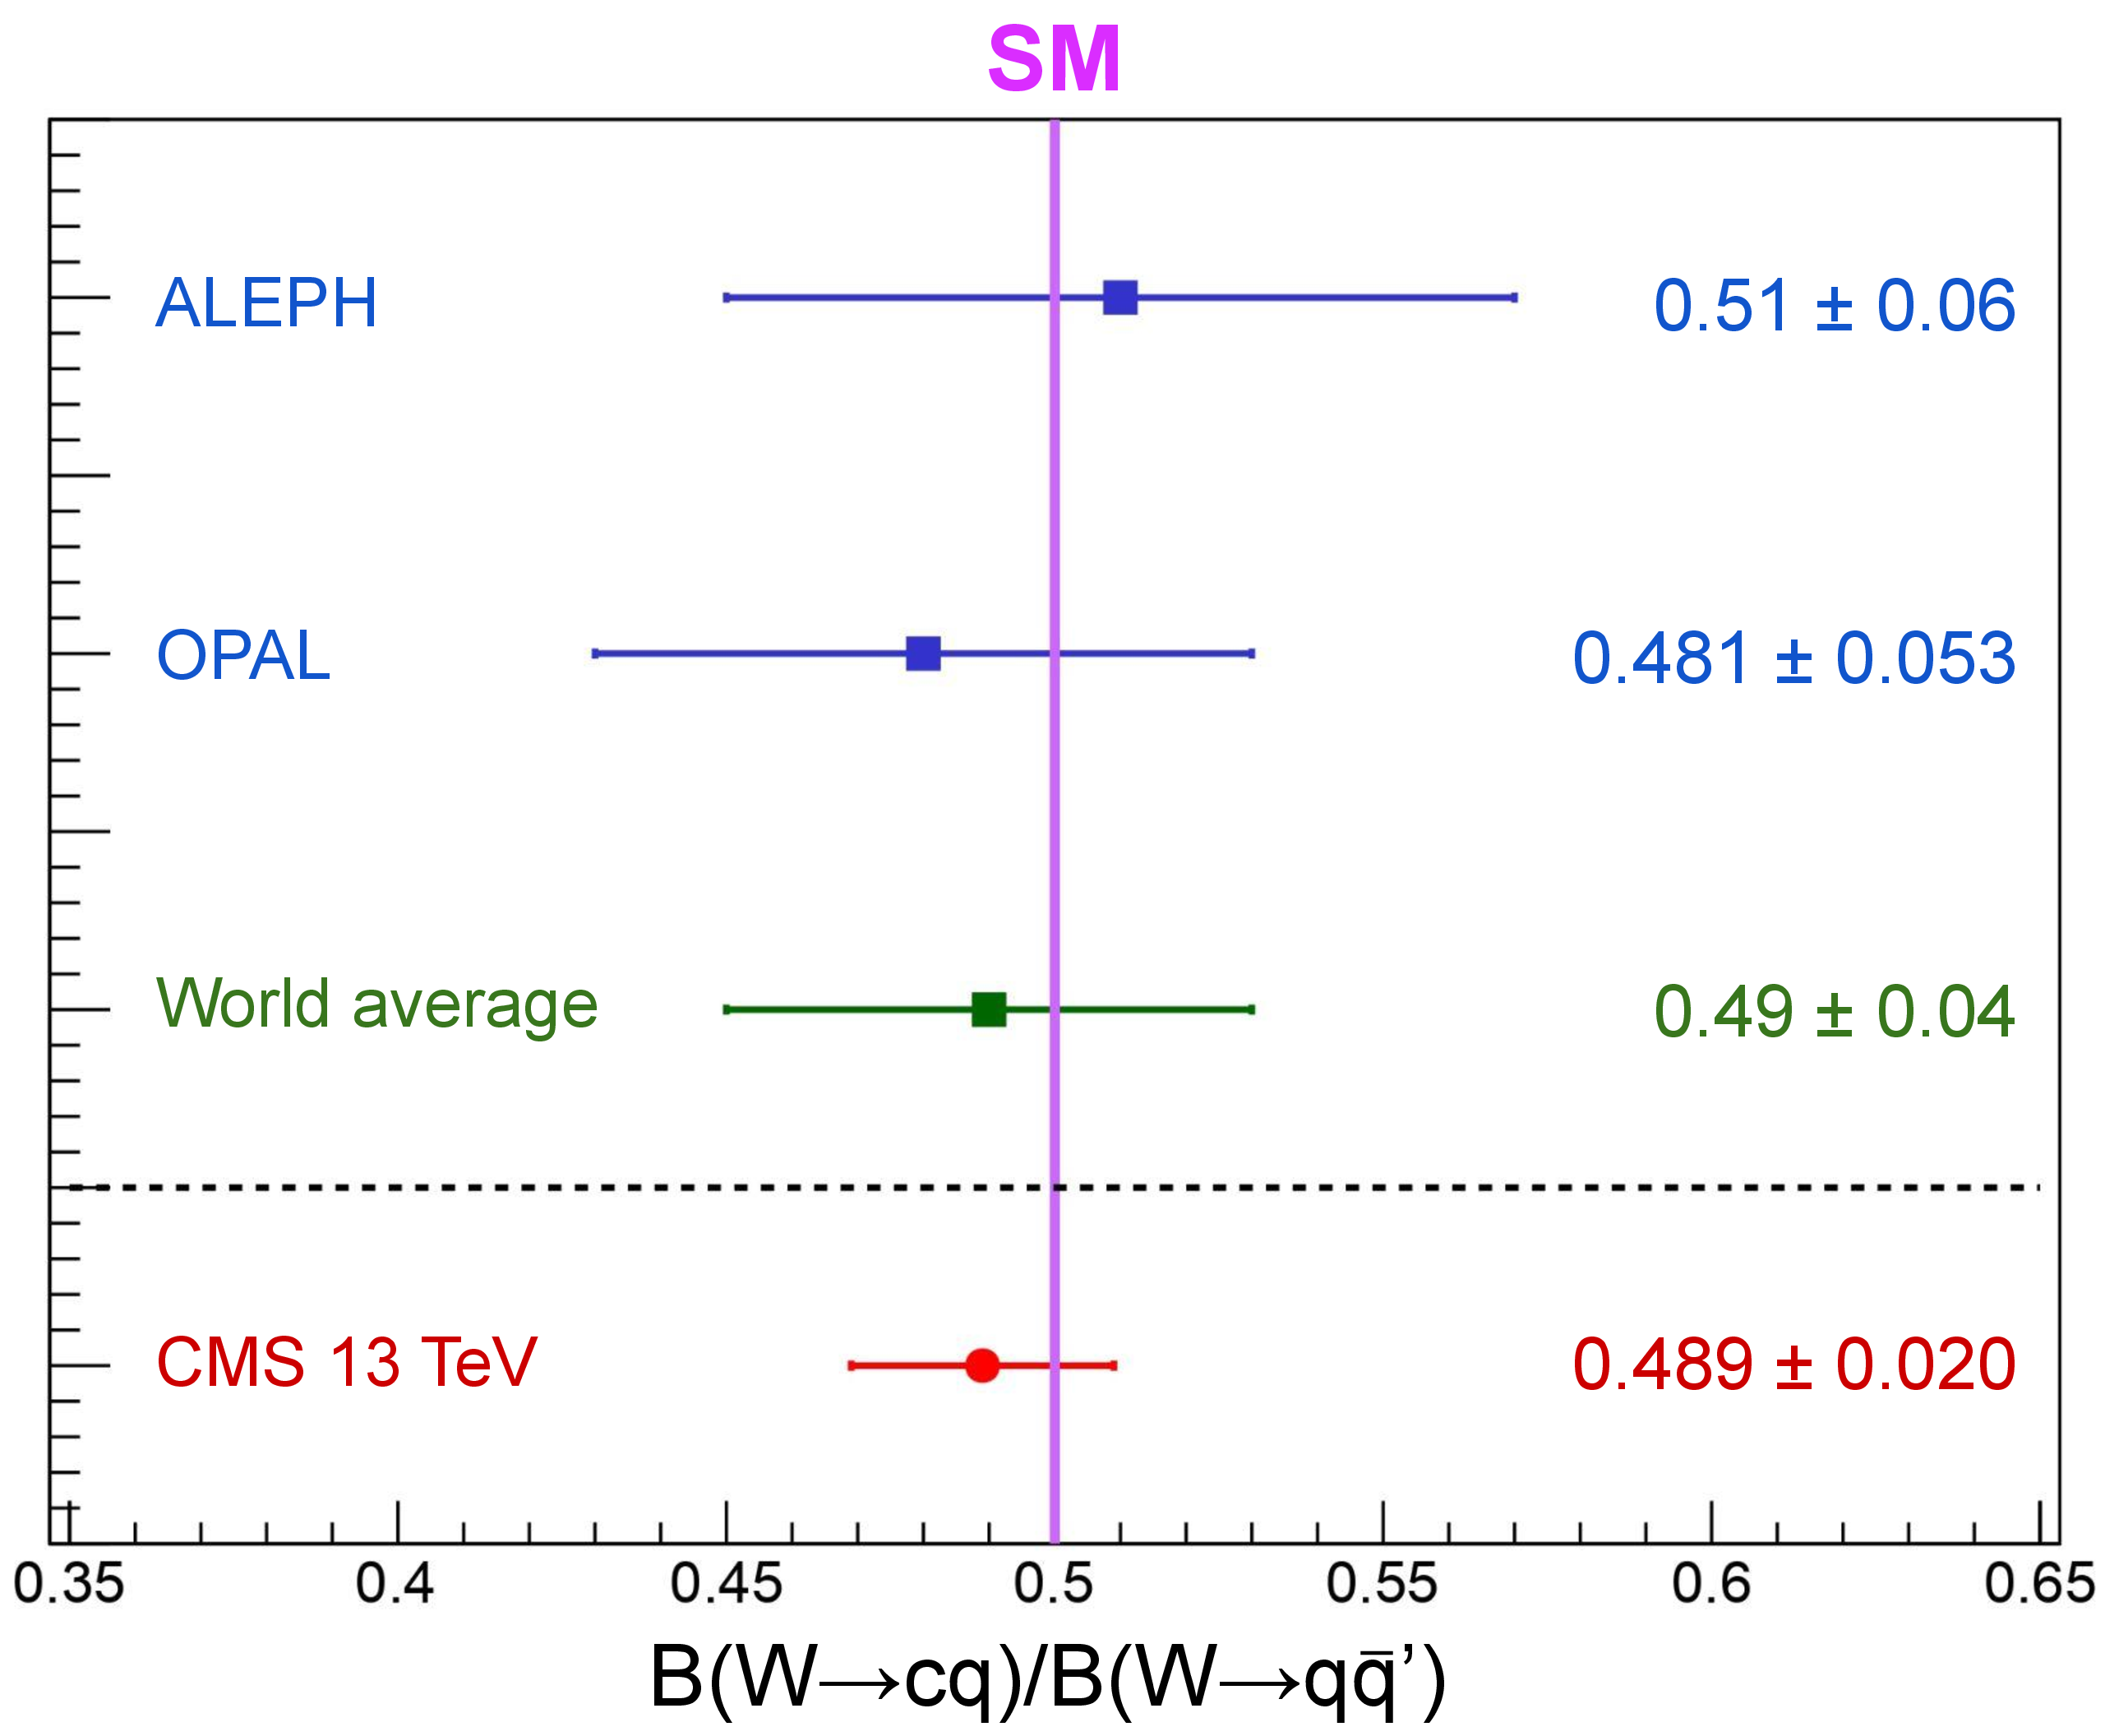
Figure 2:
Comparison of the measured value of $ R_\mathrm{c}^{\mathrm{W}} $ with previous LEP2 measurements [2,3], and the world-average value [1]. Horizontal bars represent the total uncertainty of the measurements. |
png pdf |
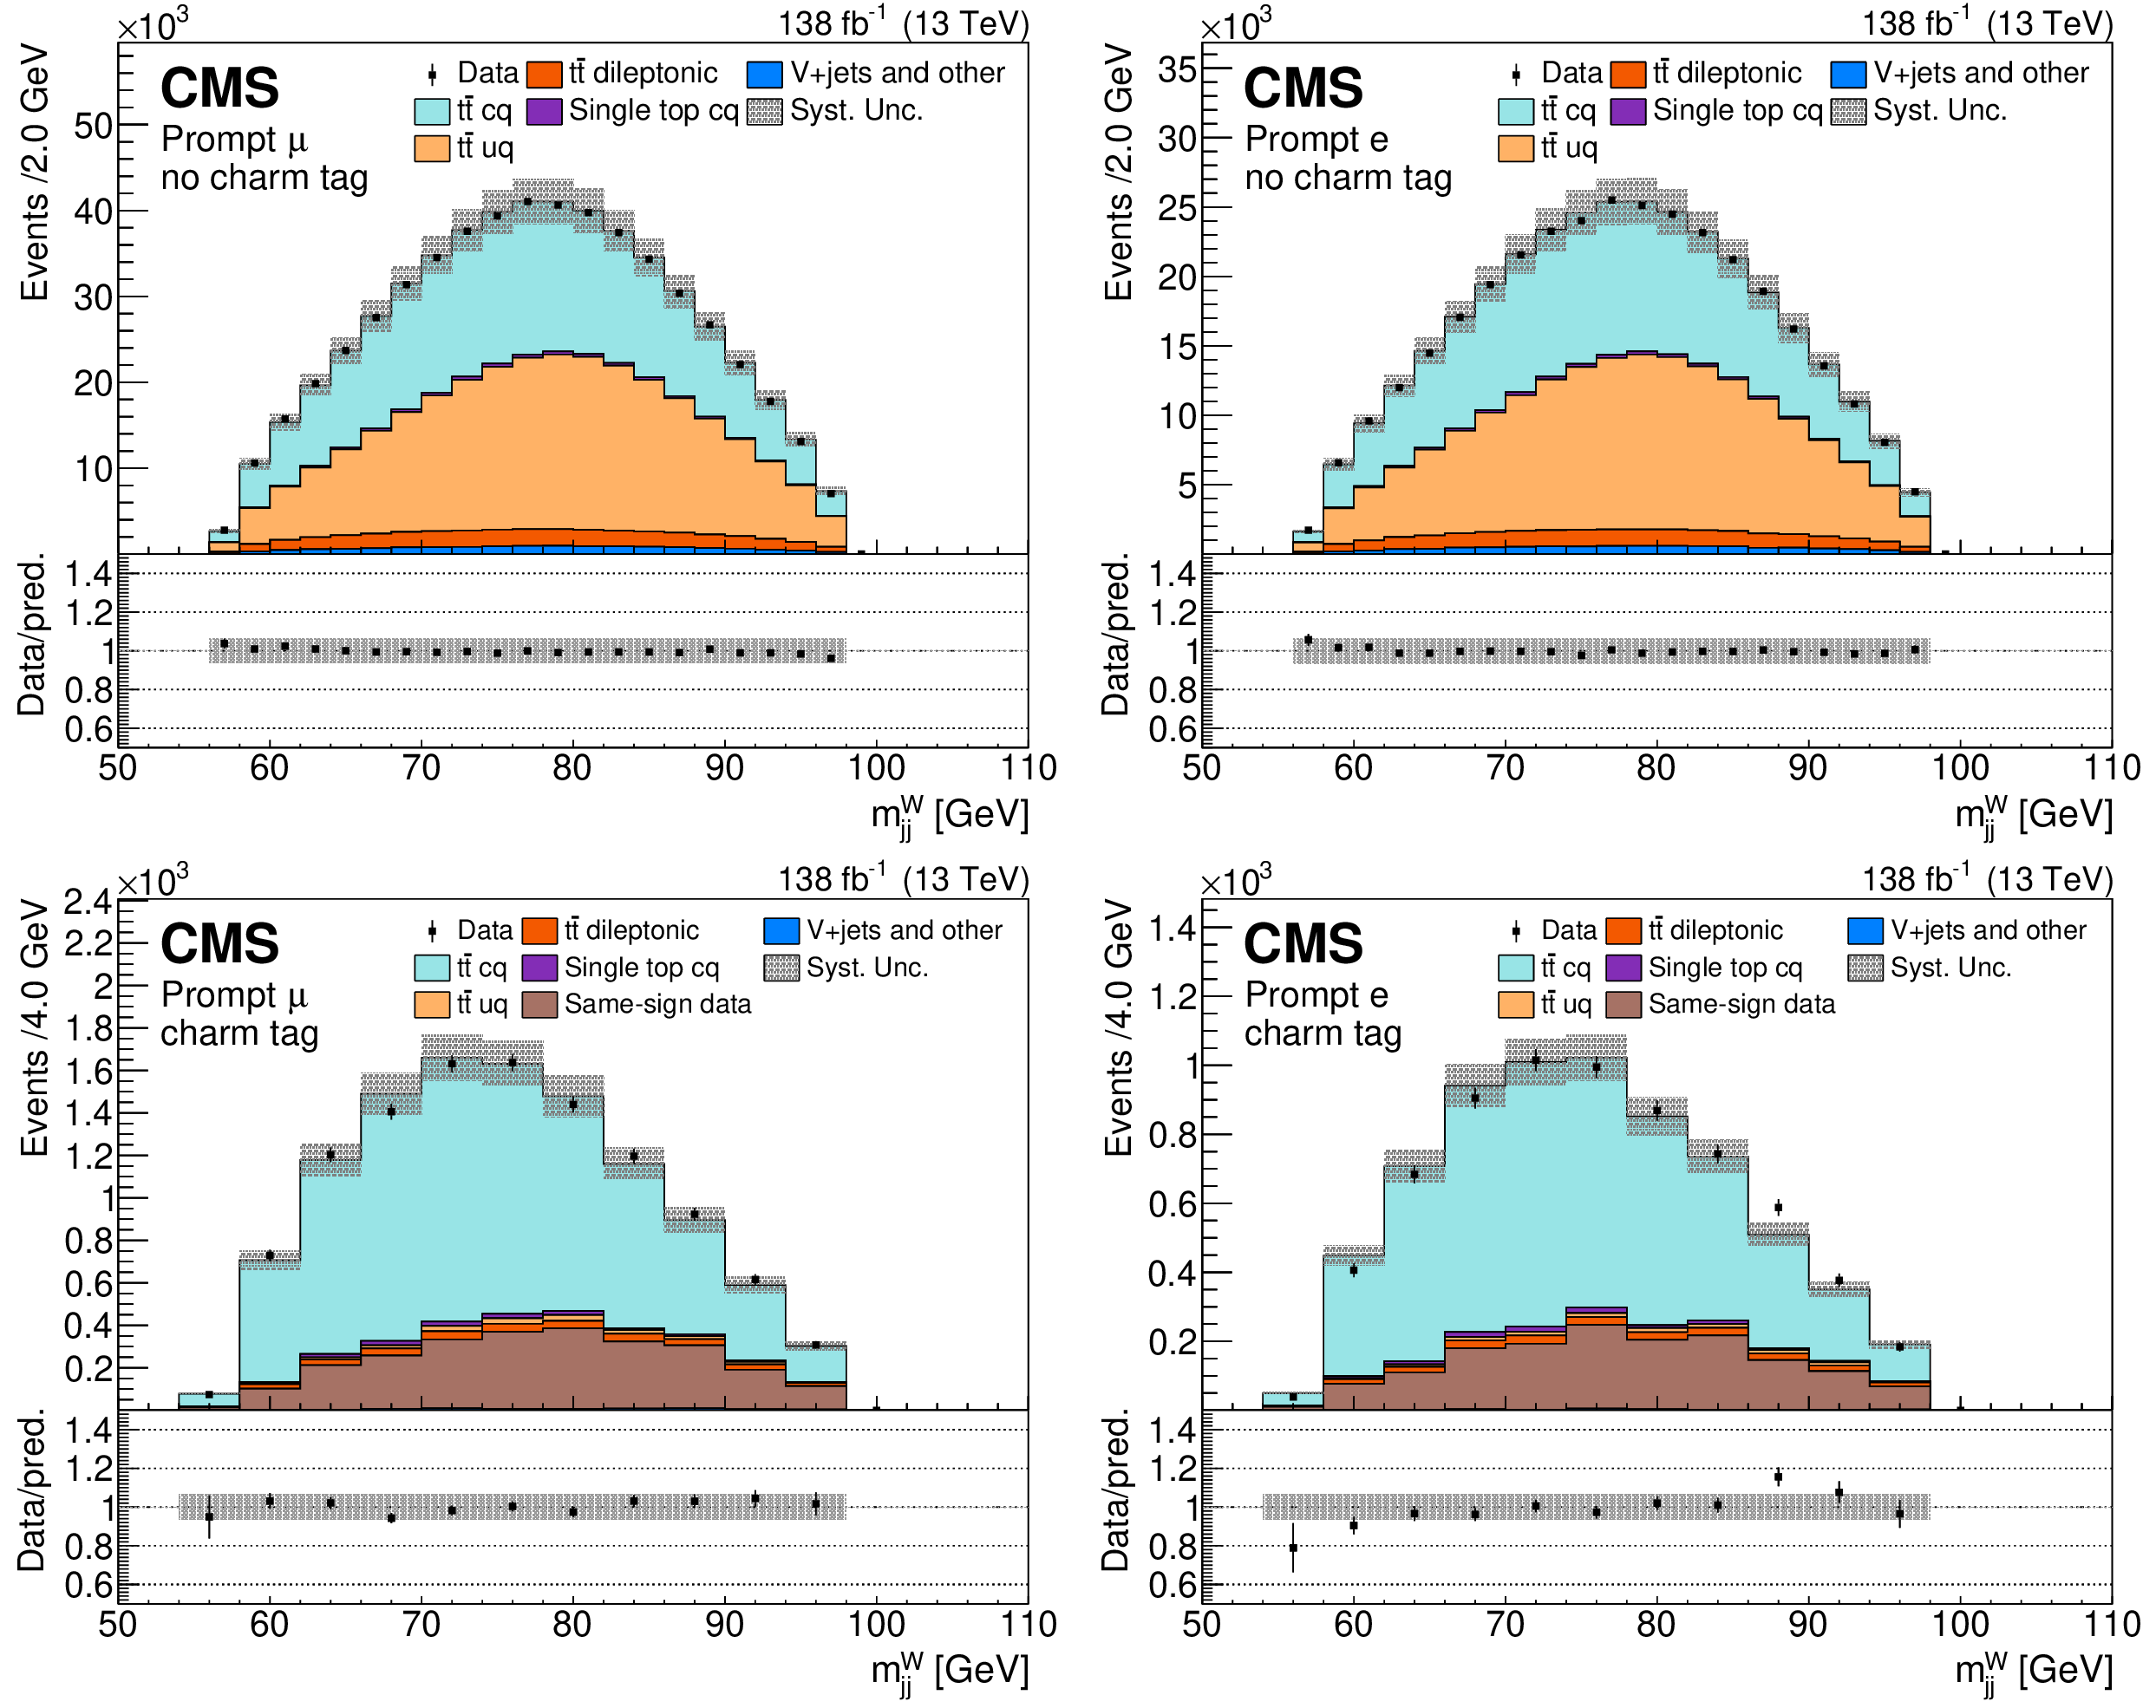
Figure 3:
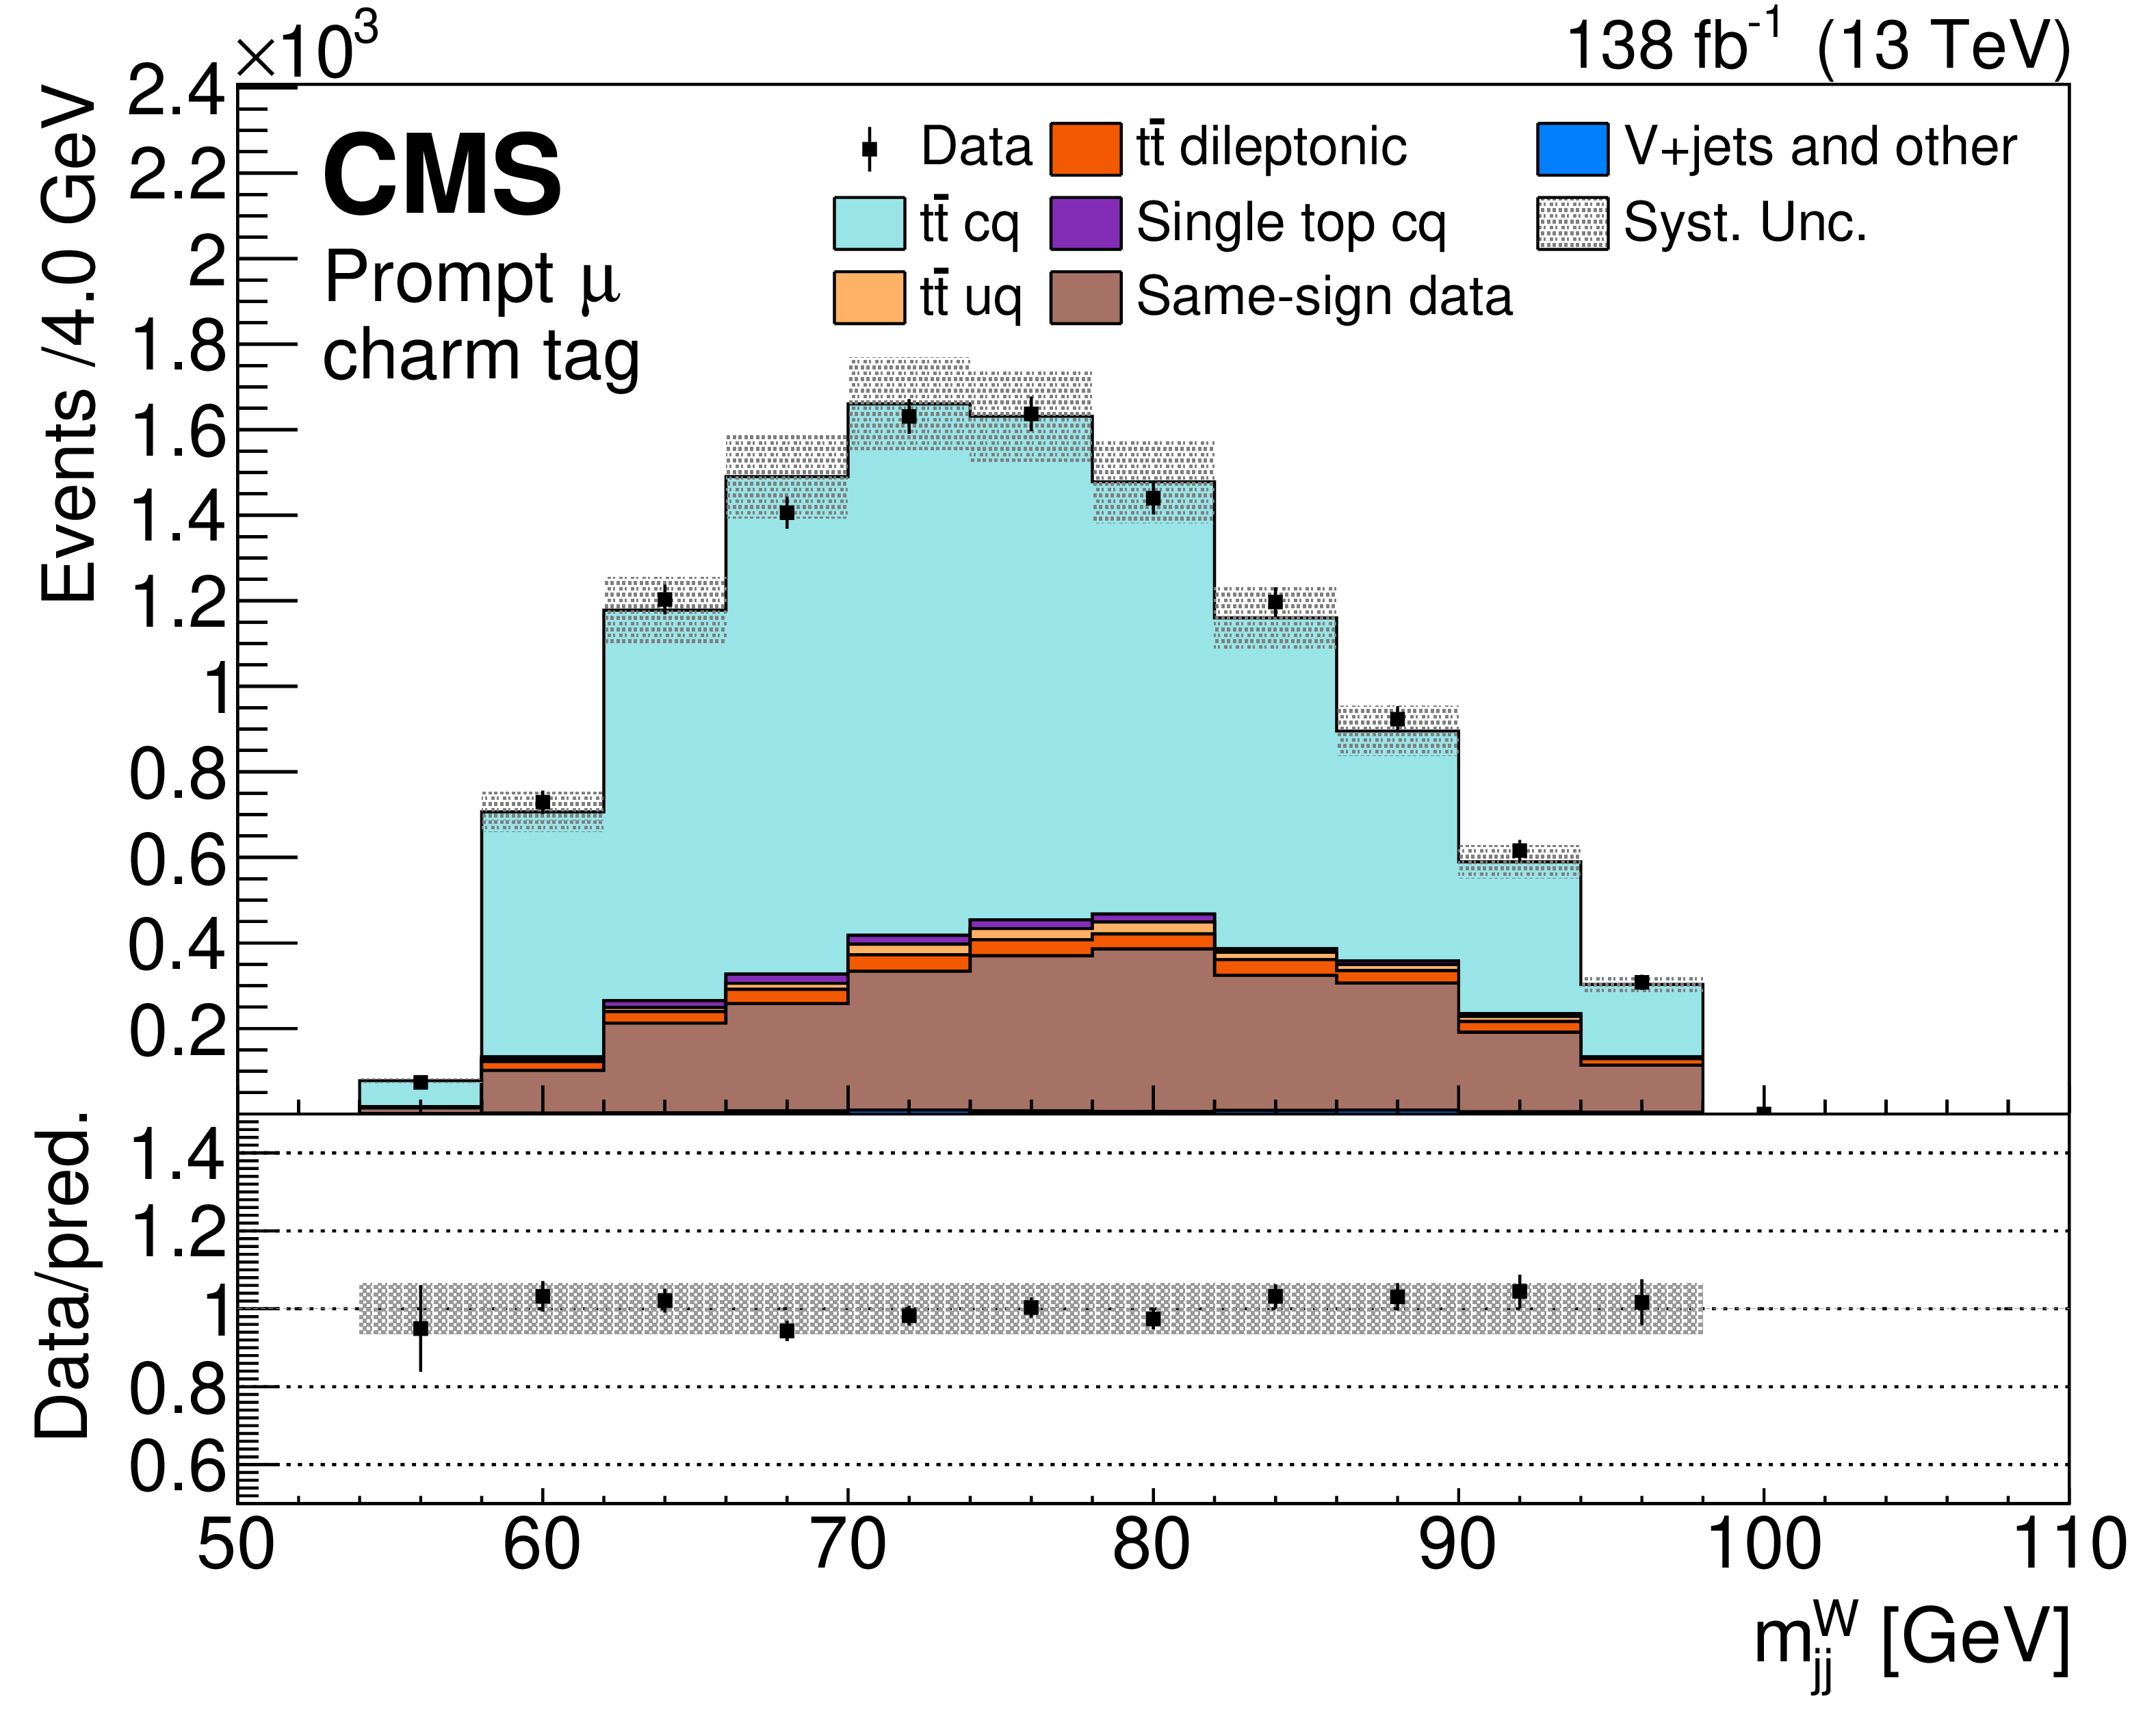
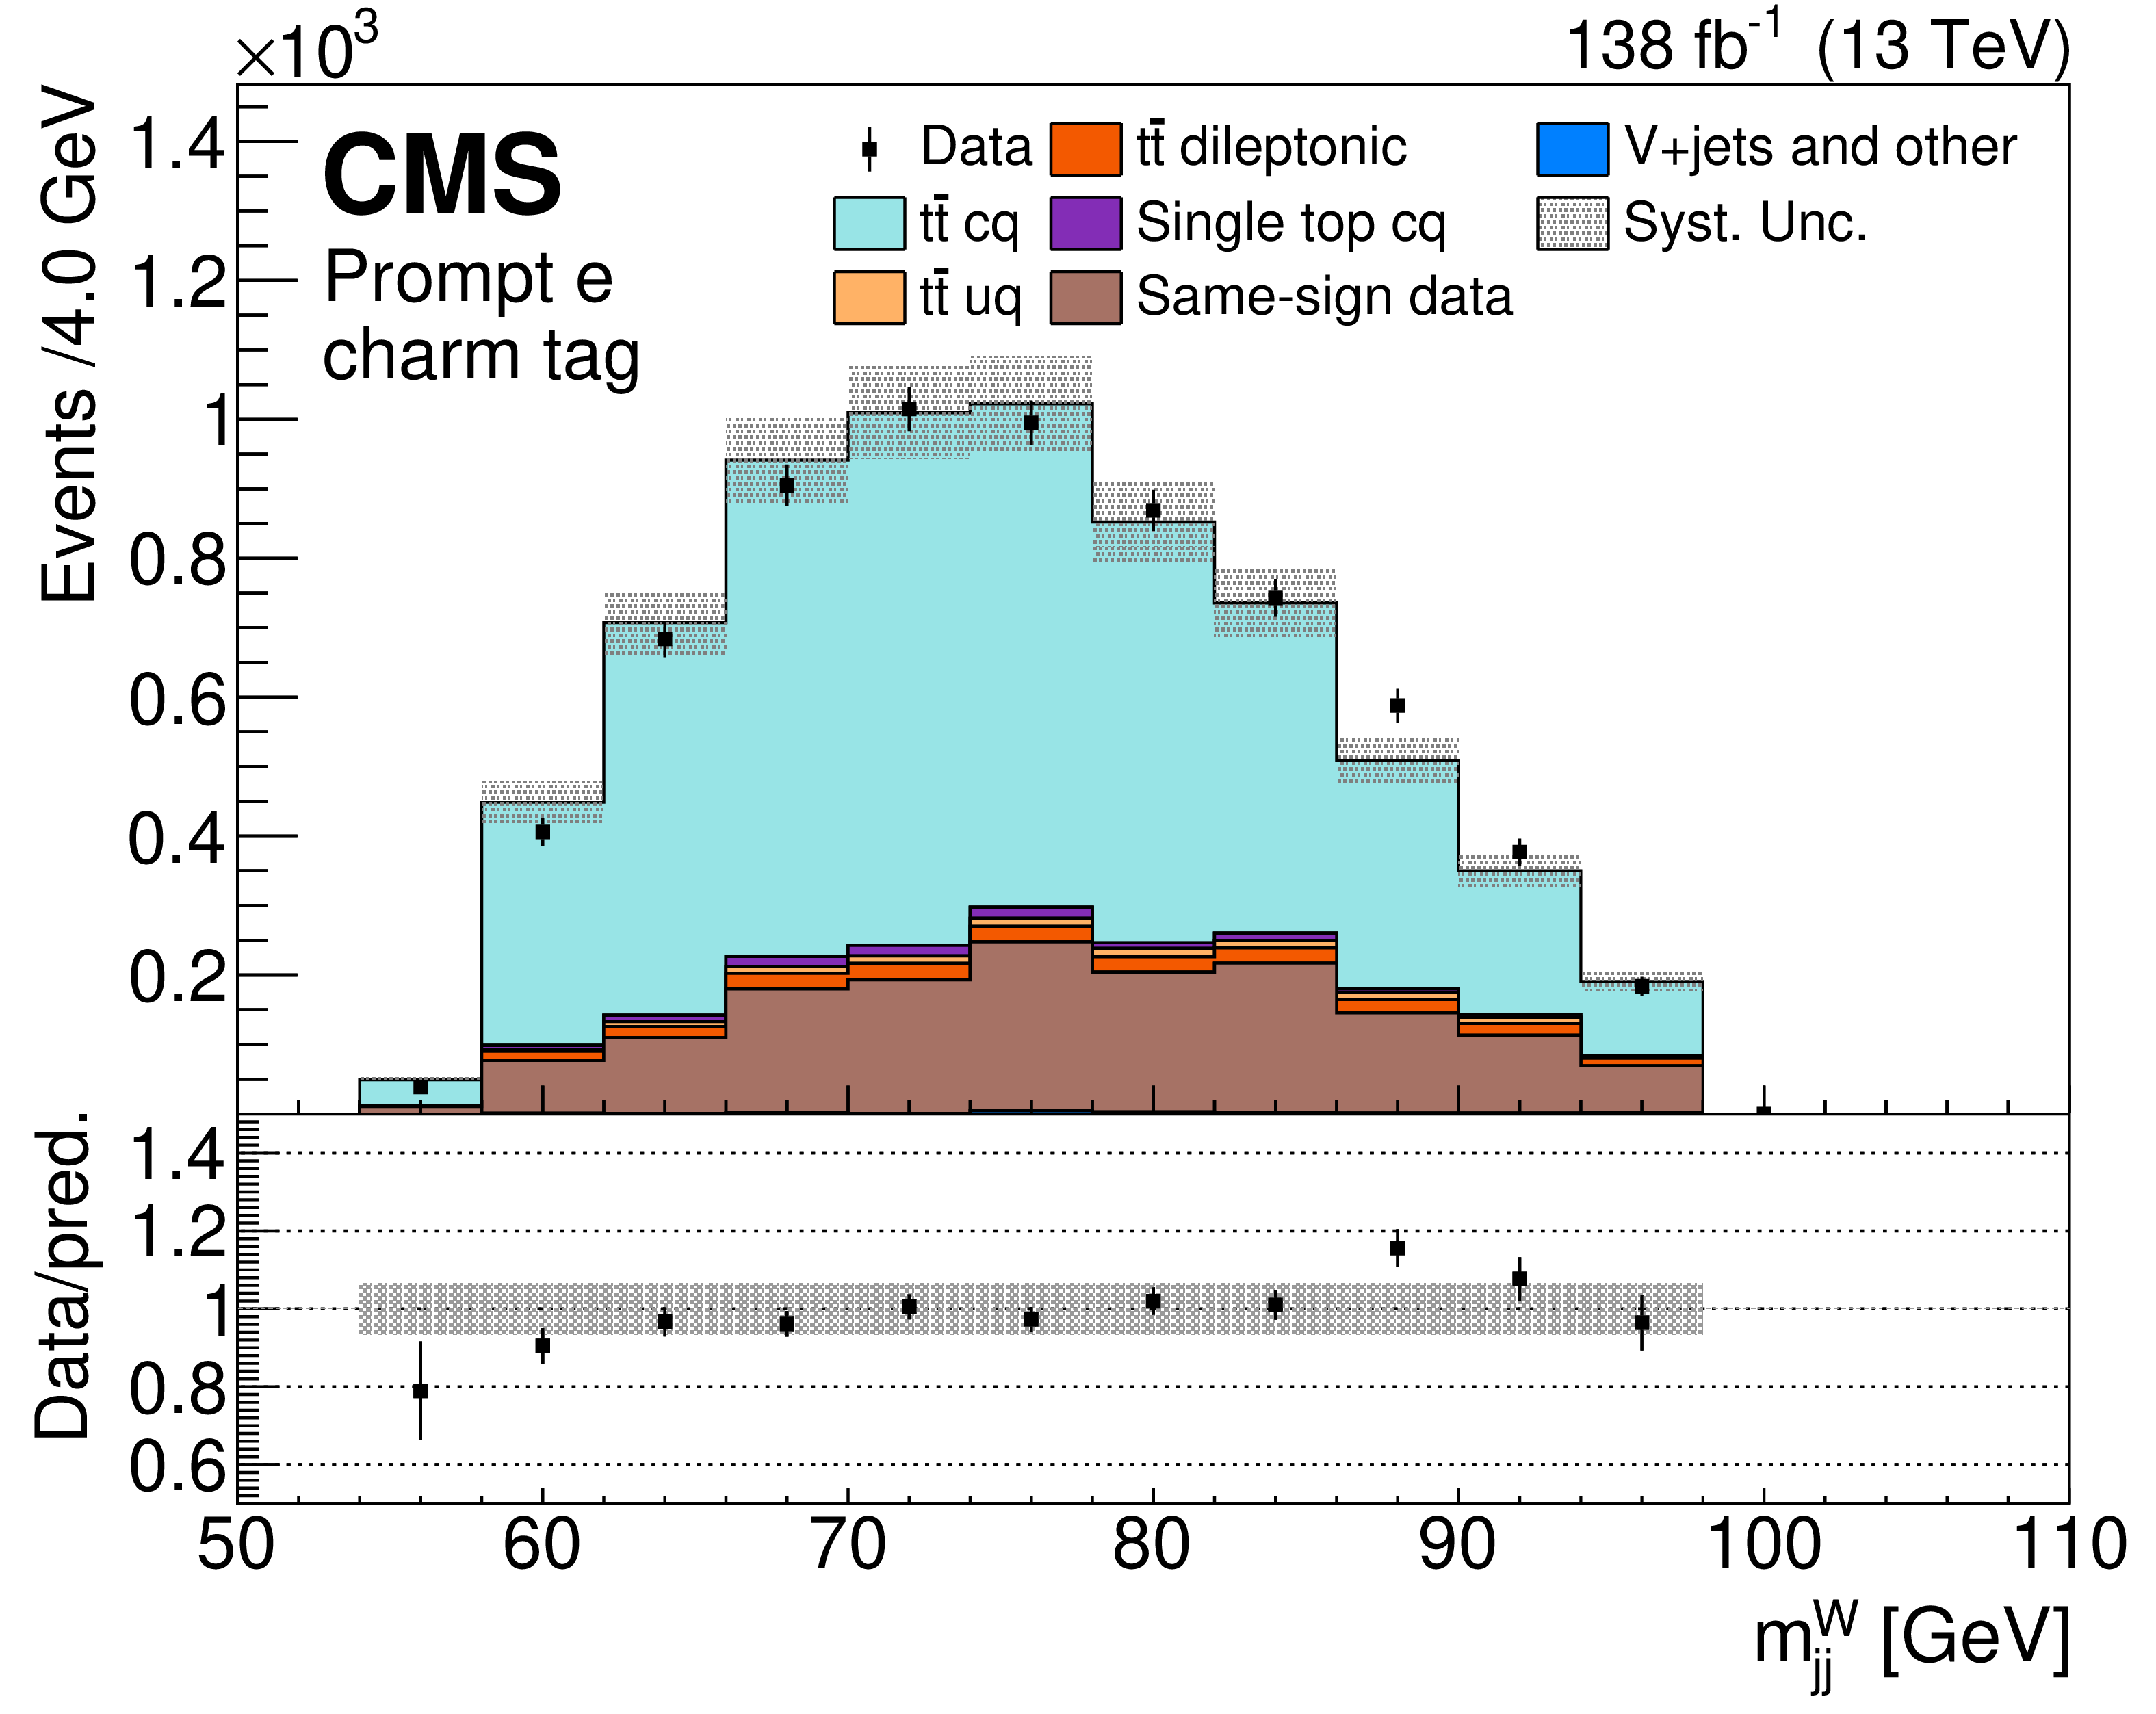
Invariant mass of the two jets associated with the W boson, for the four event categories entering the fit: prompt muon and no charm tag (upper left), prompt electron and no charm tag (upper right), prompt muon and charm tag (lower left), prompt electron and charm tag (lower right). The measured data correspond to OS events, whereas the predictions from the simulations are OS-SS subtracted yields on top of the background prediction using the SS data. The data are displayed as points with statistical error bars. The gray band in the predictions represents the pre-fit systematic uncertainties. The ratios of data to the expected yields are given at the bottom of each panel together with the statistical and systematic uncertainties. |
png pdf |
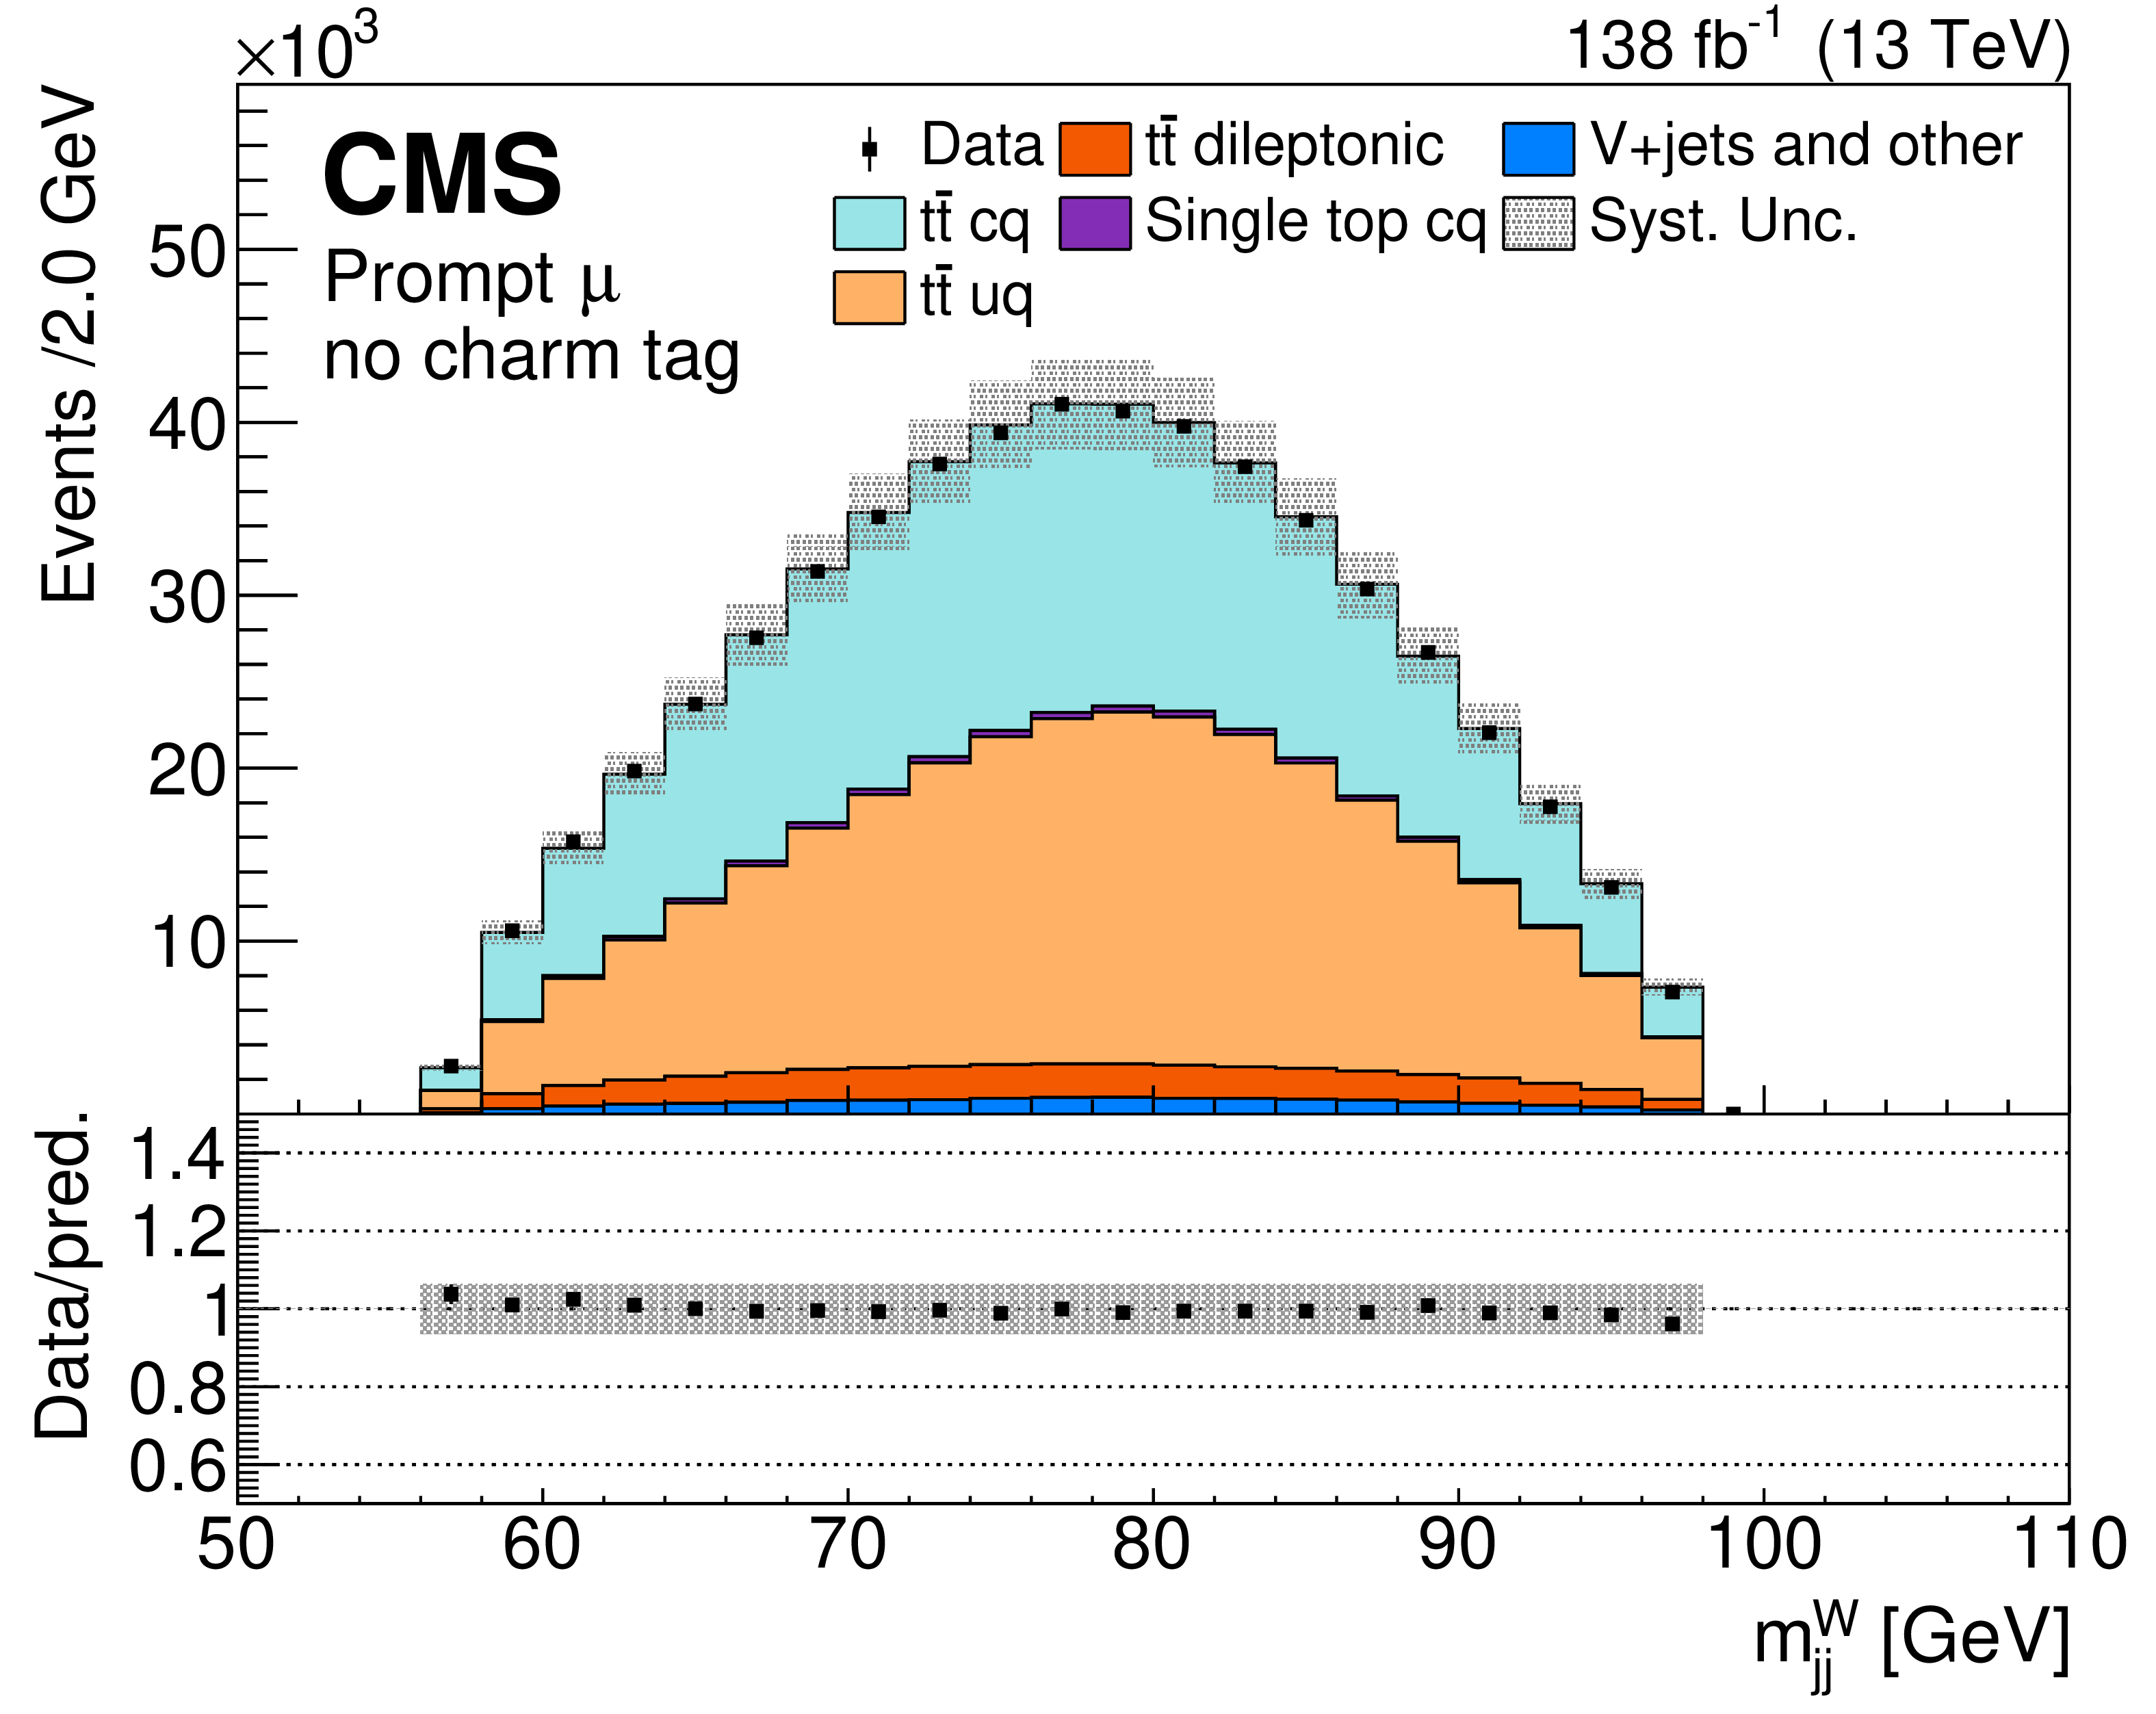
Figure 3-a:
Invariant mass of the two jets associated with the W boson, for the four event categories entering the fit: prompt muon and no charm tag (upper left), prompt electron and no charm tag (upper right), prompt muon and charm tag (lower left), prompt electron and charm tag (lower right). The measured data correspond to OS events, whereas the predictions from the simulations are OS-SS subtracted yields on top of the background prediction using the SS data. The data are displayed as points with statistical error bars. The gray band in the predictions represents the pre-fit systematic uncertainties. The ratios of data to the expected yields are given at the bottom of each panel together with the statistical and systematic uncertainties. |
png pdf |
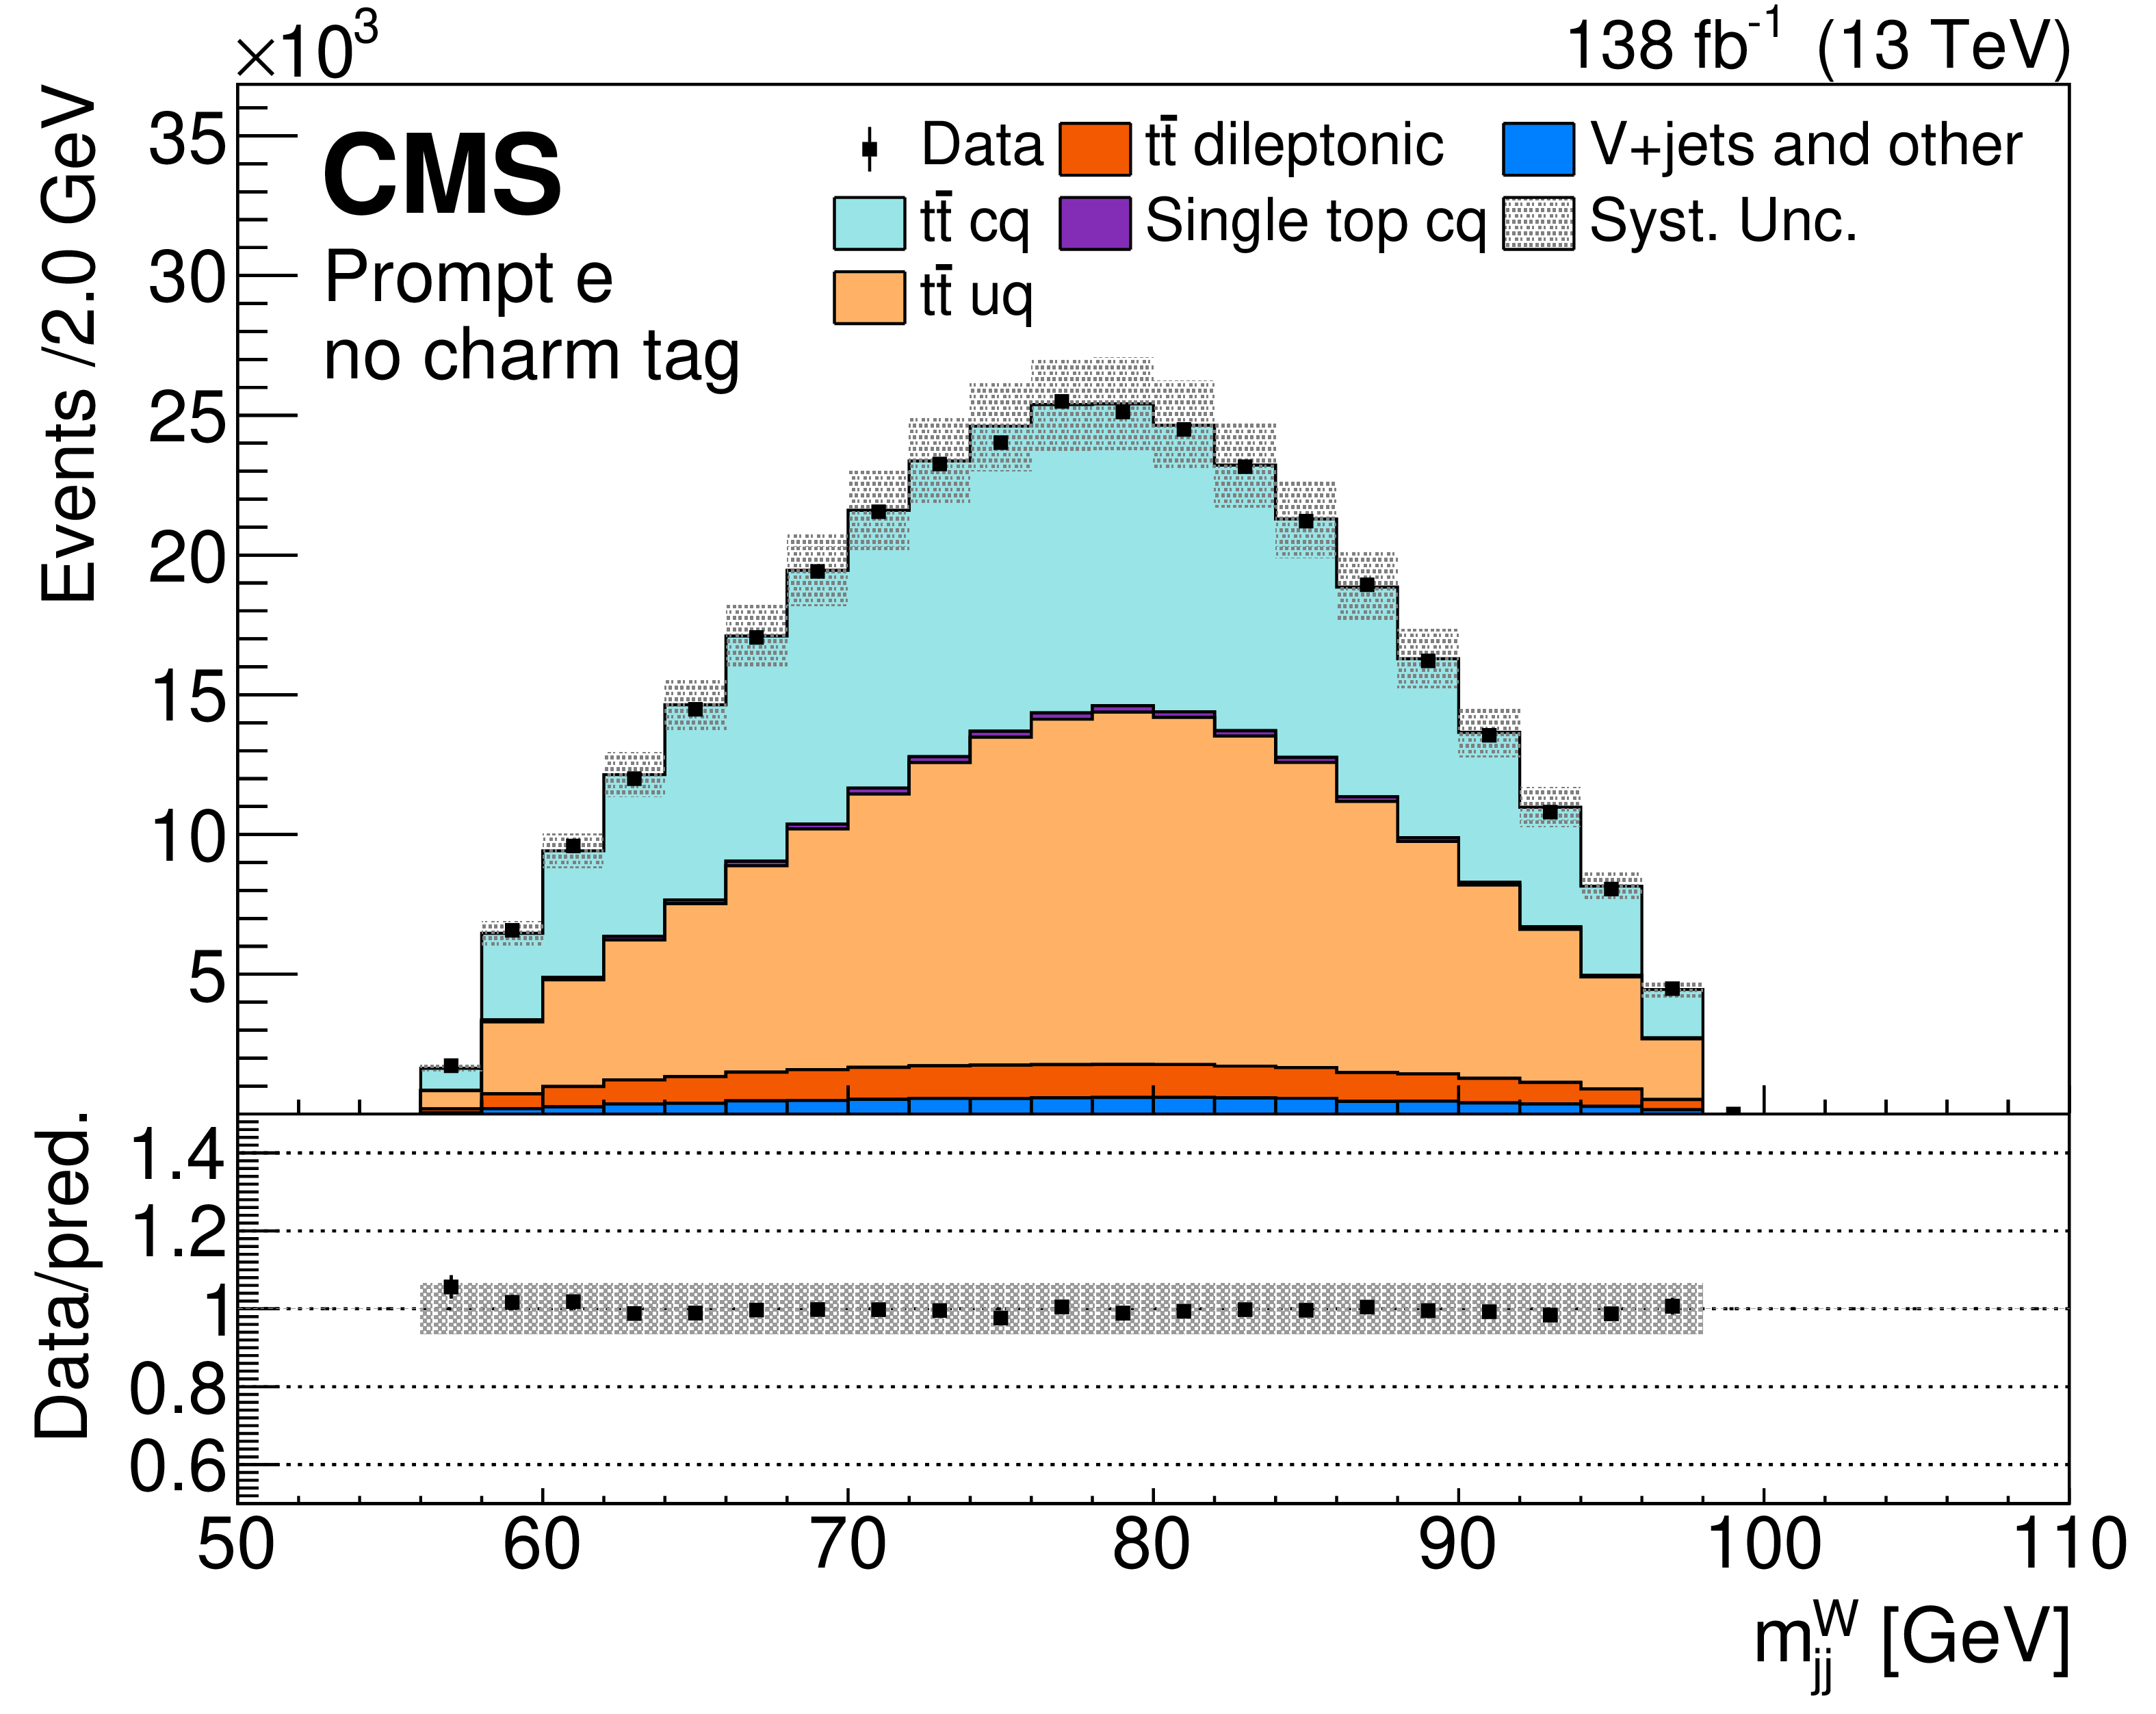
Figure 3-b:
Invariant mass of the two jets associated with the W boson, for the four event categories entering the fit: prompt muon and no charm tag (upper left), prompt electron and no charm tag (upper right), prompt muon and charm tag (lower left), prompt electron and charm tag (lower right). The measured data correspond to OS events, whereas the predictions from the simulations are OS-SS subtracted yields on top of the background prediction using the SS data. The data are displayed as points with statistical error bars. The gray band in the predictions represents the pre-fit systematic uncertainties. The ratios of data to the expected yields are given at the bottom of each panel together with the statistical and systematic uncertainties. |
png pdf |
Figure 3-c:
Invariant mass of the two jets associated with the W boson, for the four event categories entering the fit: prompt muon and no charm tag (upper left), prompt electron and no charm tag (upper right), prompt muon and charm tag (lower left), prompt electron and charm tag (lower right). The measured data correspond to OS events, whereas the predictions from the simulations are OS-SS subtracted yields on top of the background prediction using the SS data. The data are displayed as points with statistical error bars. The gray band in the predictions represents the pre-fit systematic uncertainties. The ratios of data to the expected yields are given at the bottom of each panel together with the statistical and systematic uncertainties. |
png pdf |
Figure 3-d:
Invariant mass of the two jets associated with the W boson, for the four event categories entering the fit: prompt muon and no charm tag (upper left), prompt electron and no charm tag (upper right), prompt muon and charm tag (lower left), prompt electron and charm tag (lower right). The measured data correspond to OS events, whereas the predictions from the simulations are OS-SS subtracted yields on top of the background prediction using the SS data. The data are displayed as points with statistical error bars. The gray band in the predictions represents the pre-fit systematic uncertainties. The ratios of data to the expected yields are given at the bottom of each panel together with the statistical and systematic uncertainties. |
png pdf |
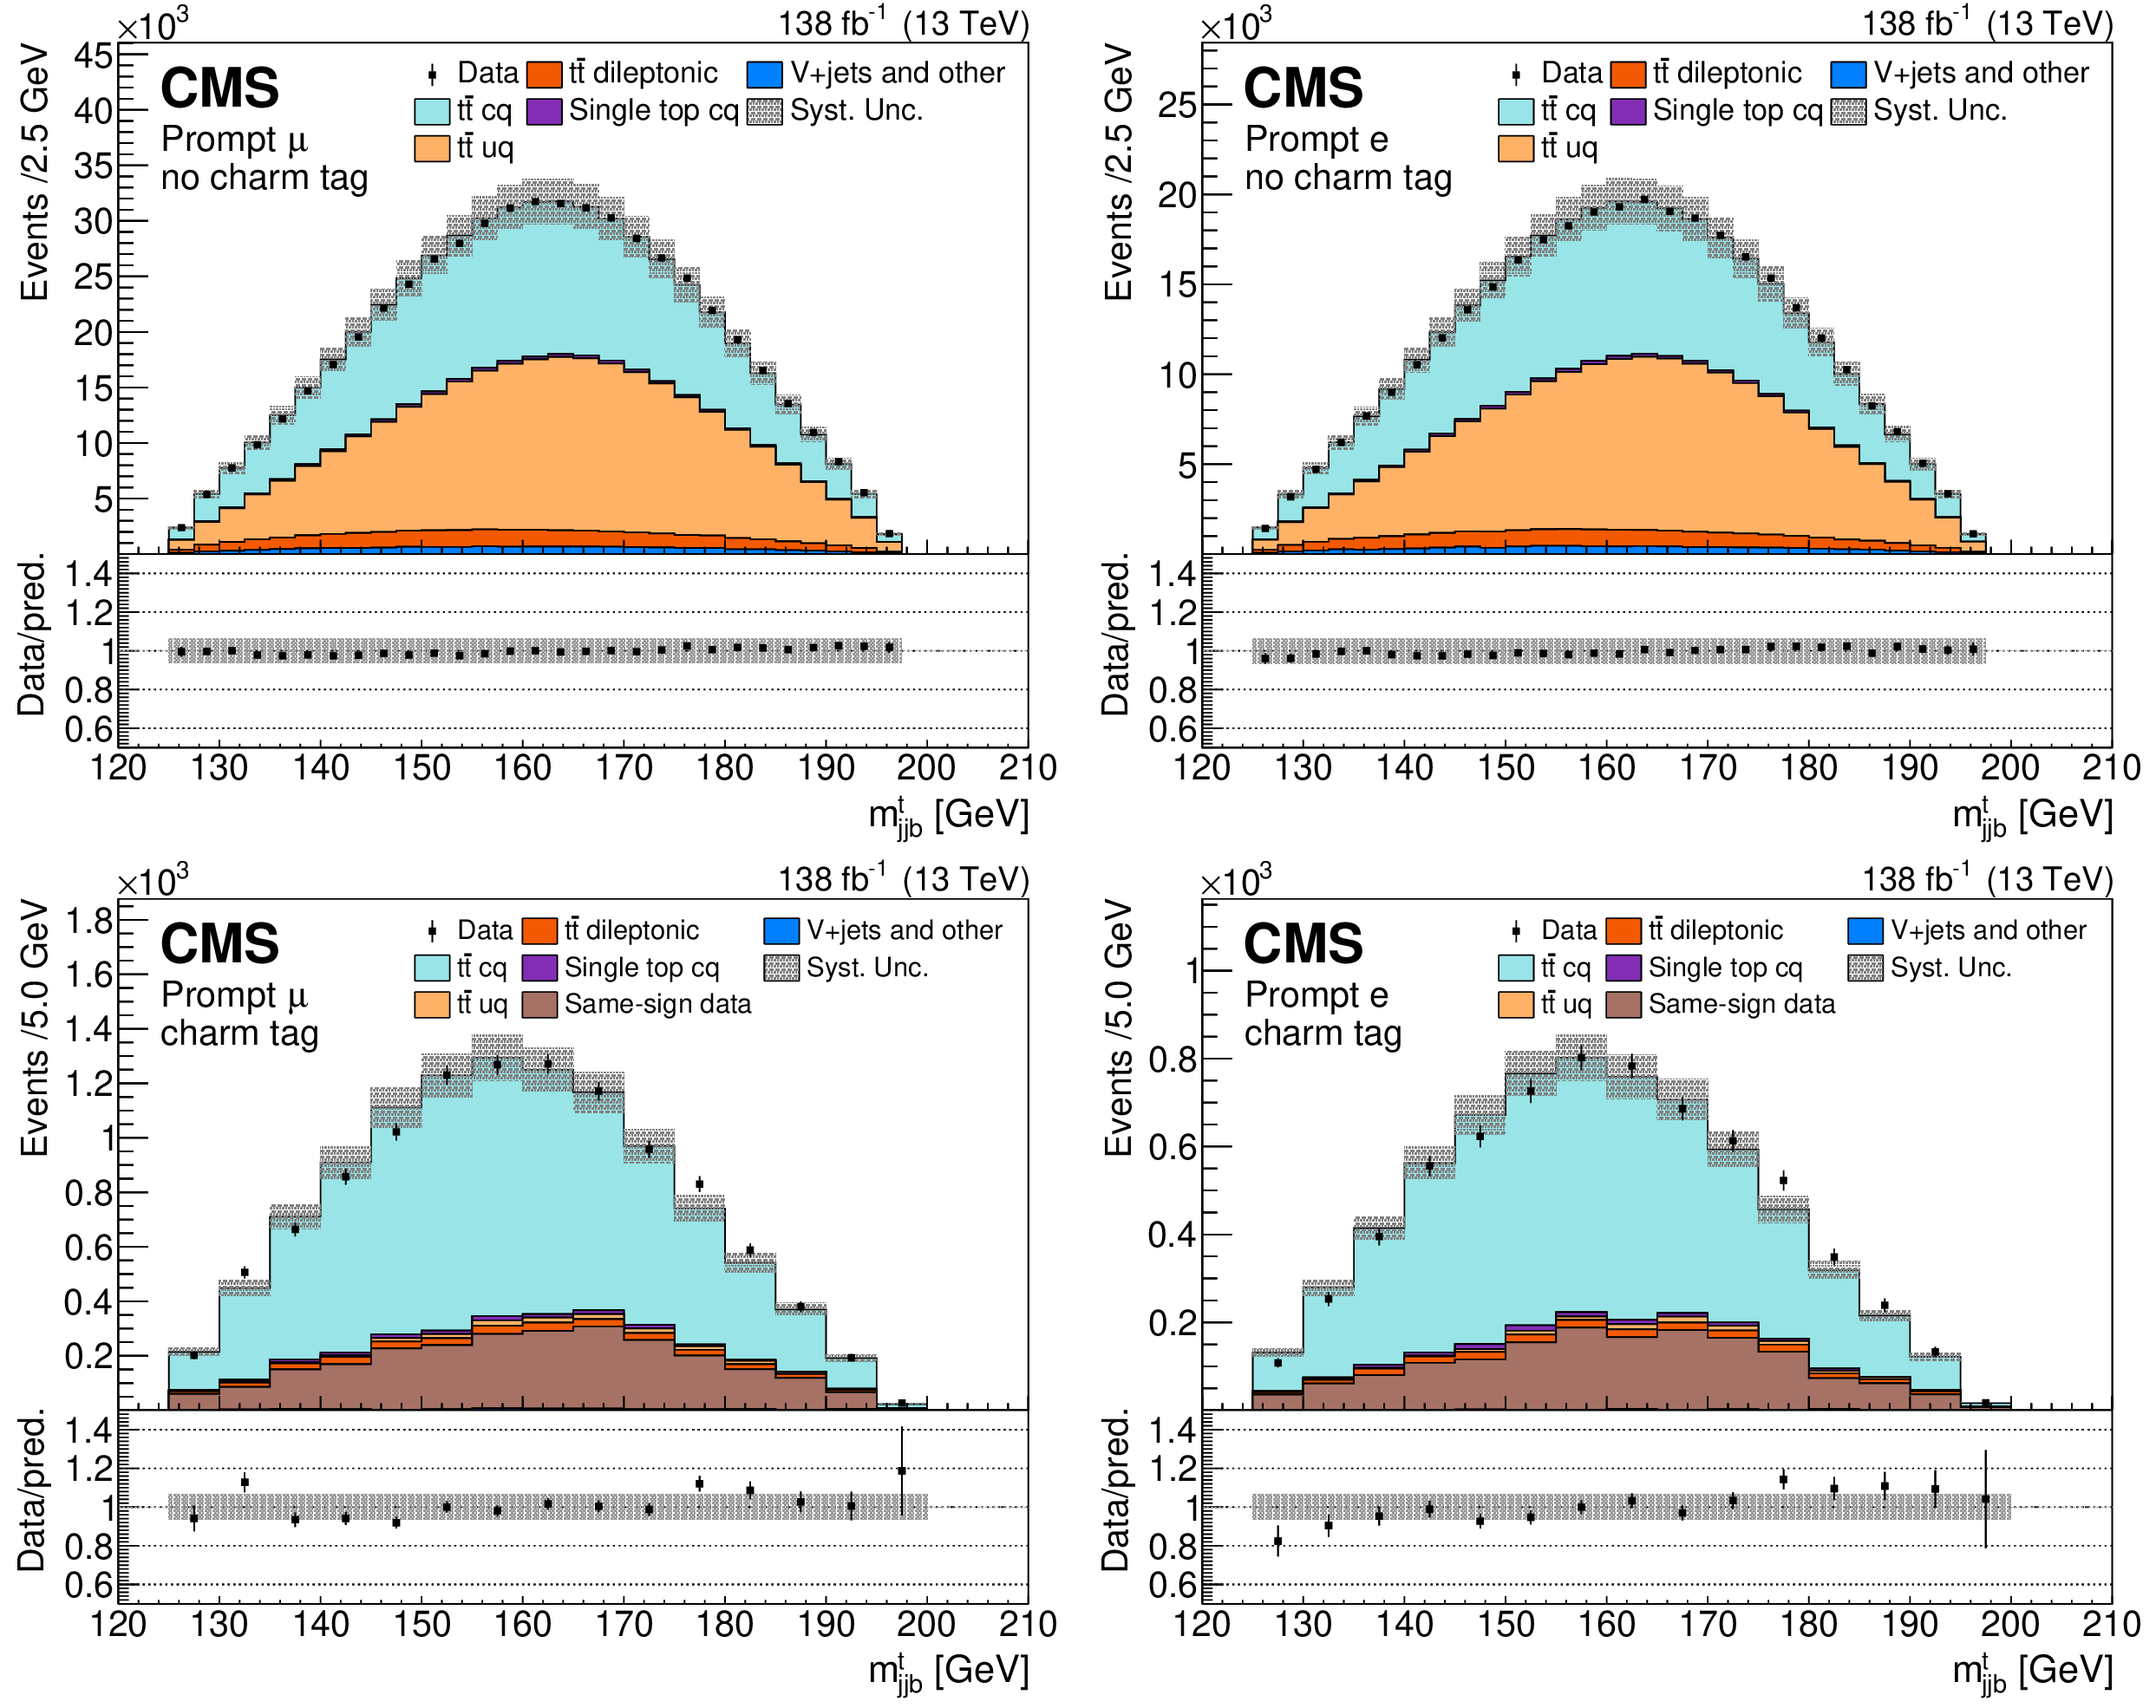
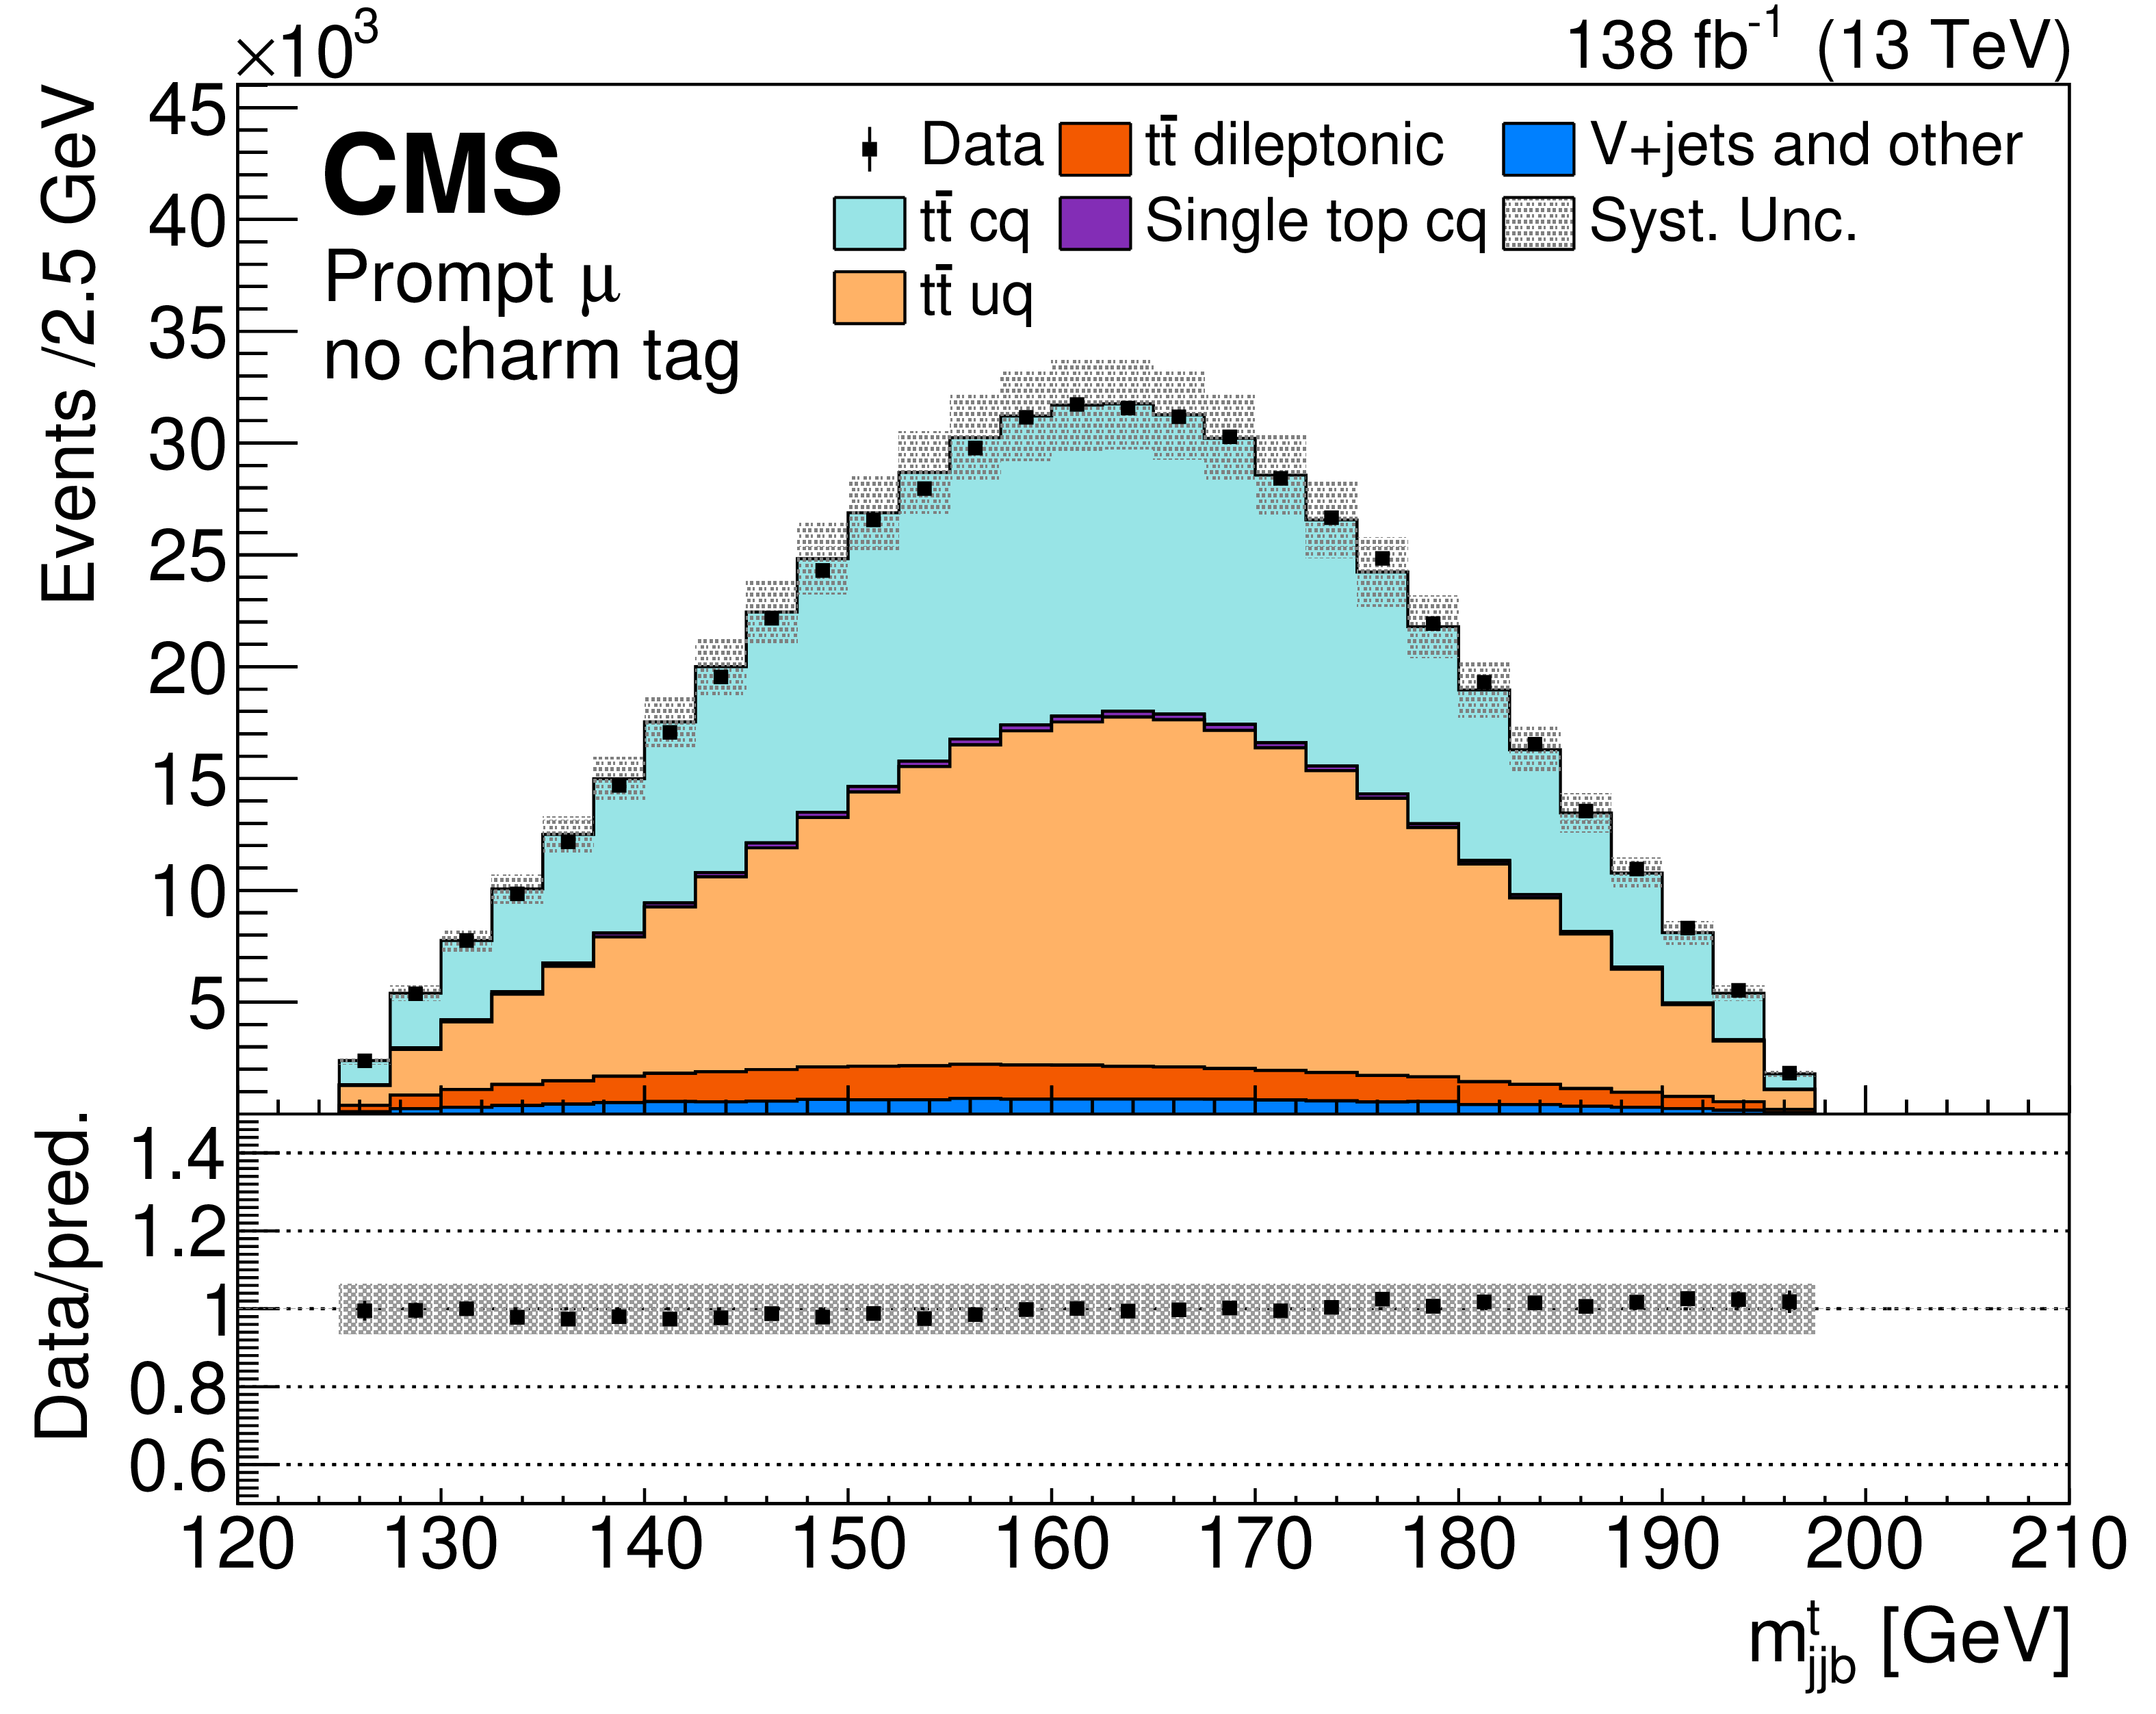
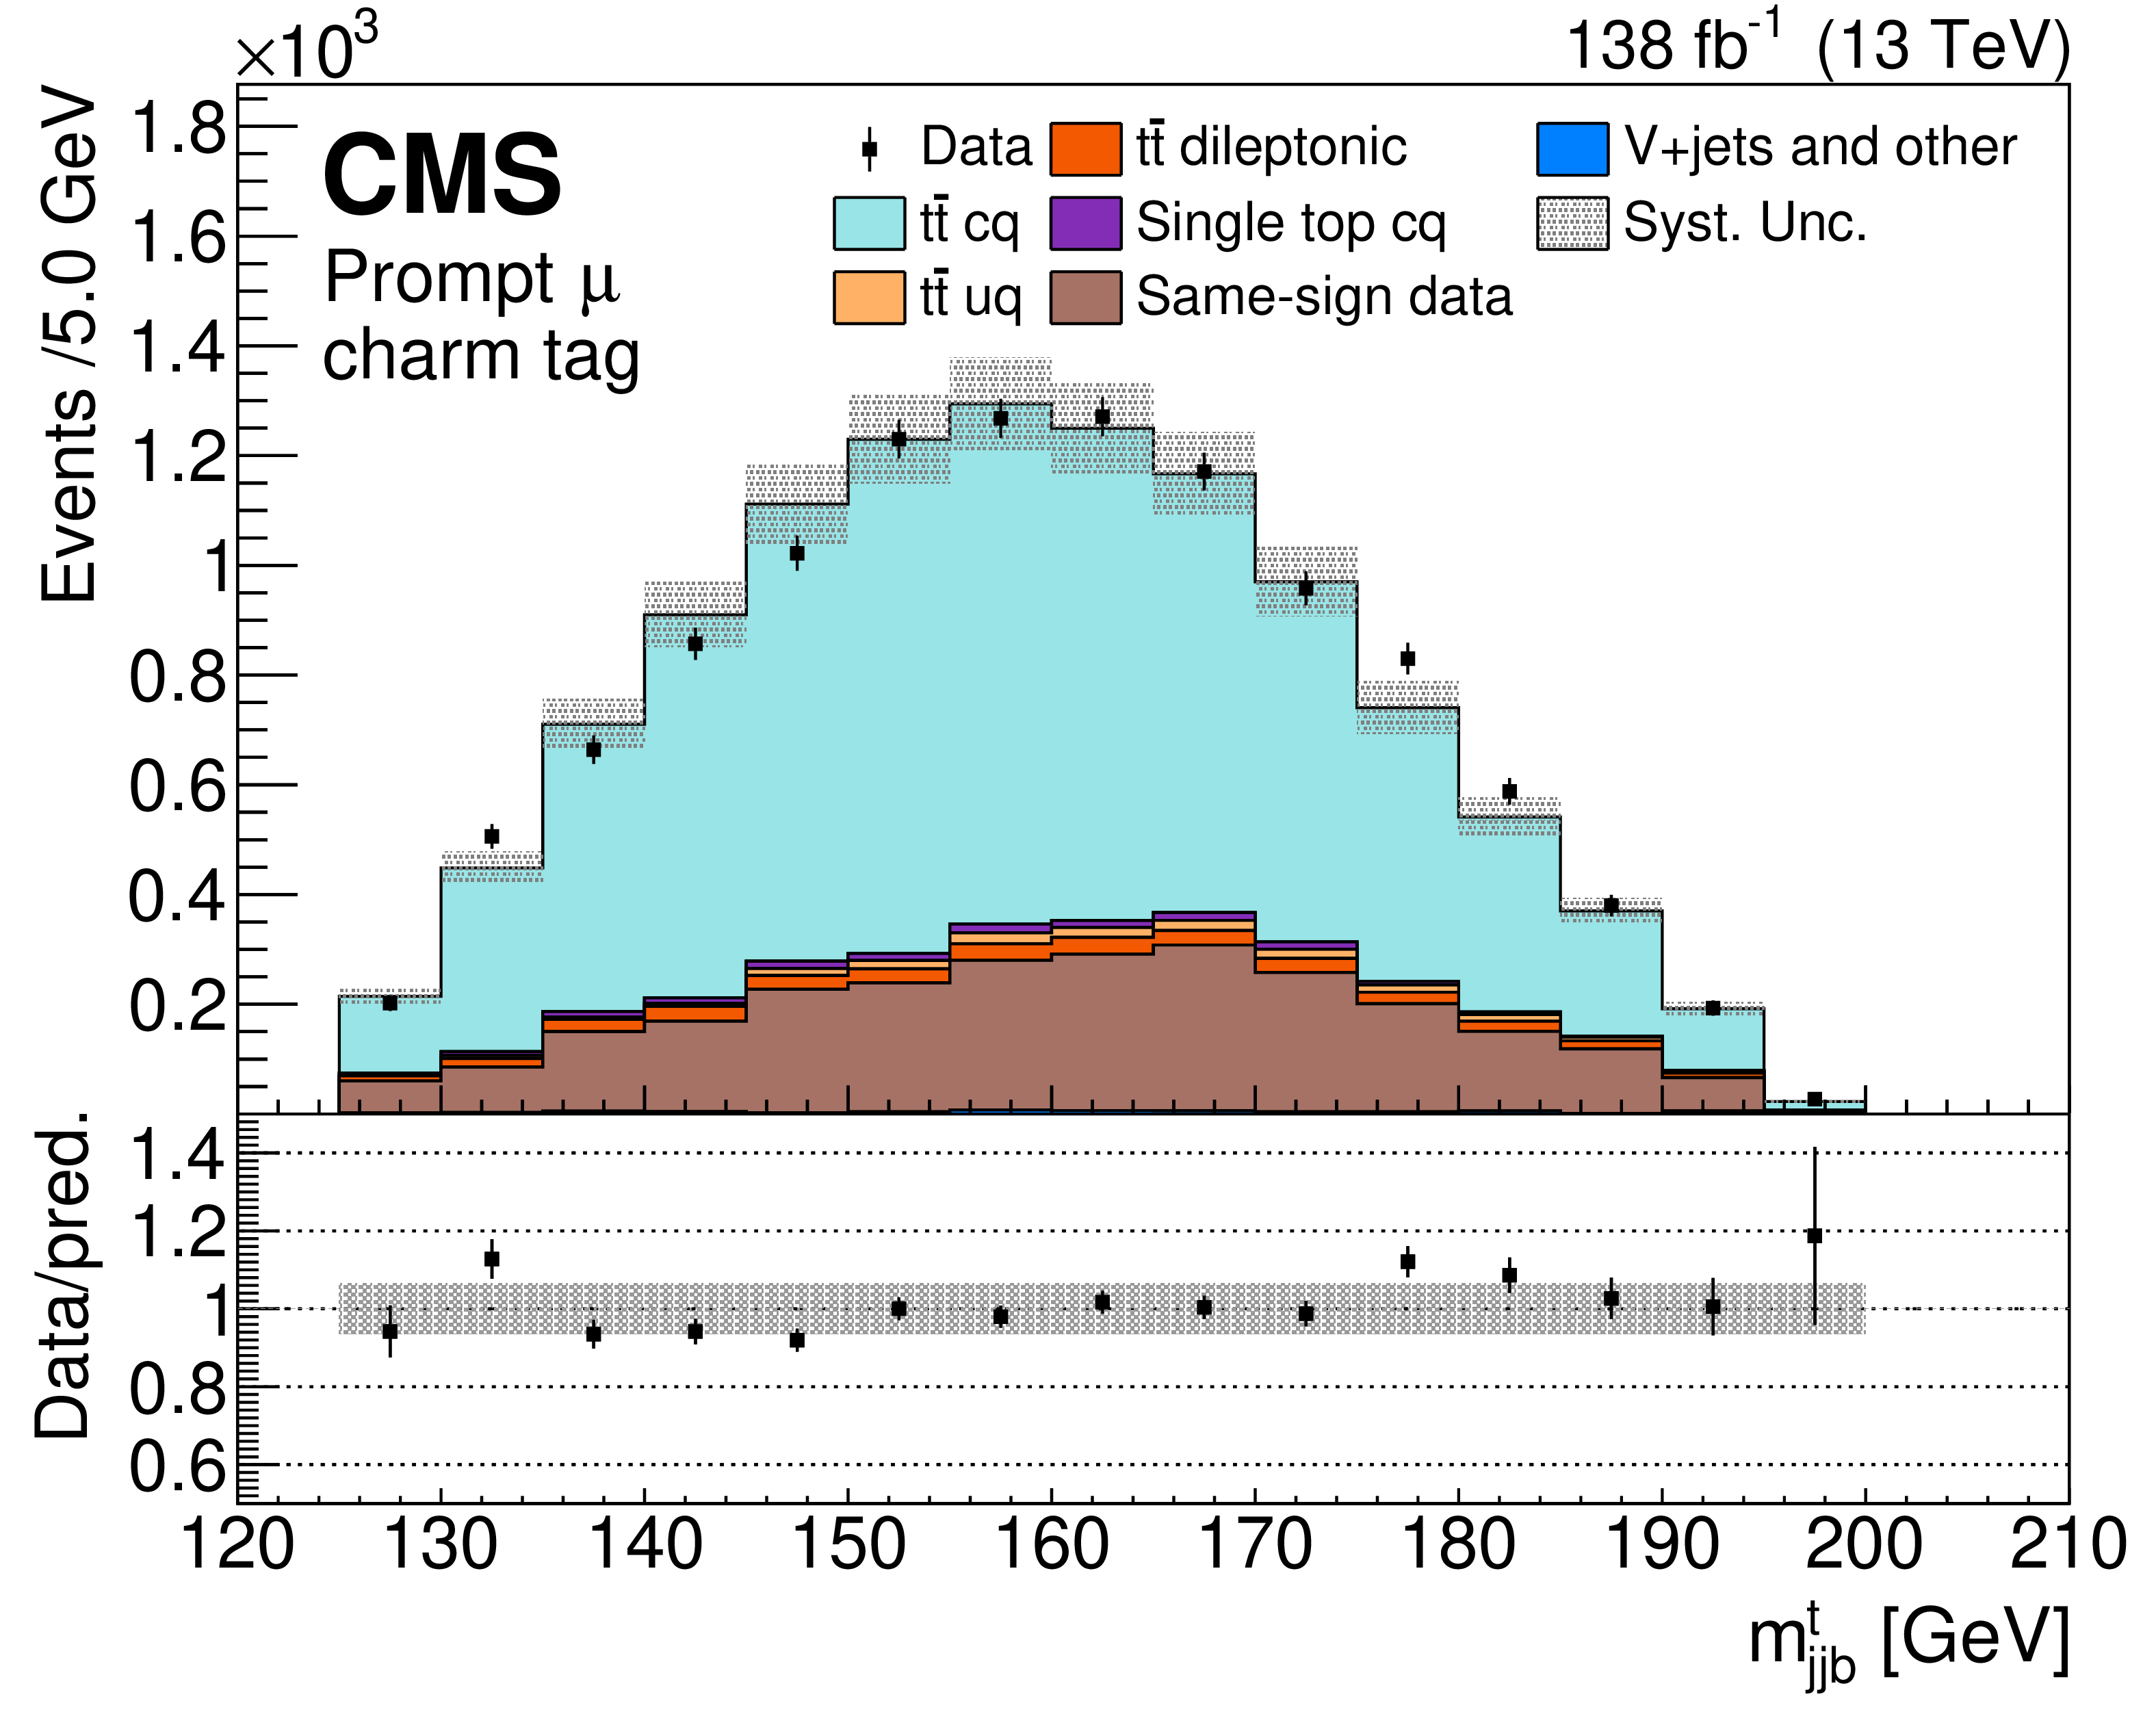
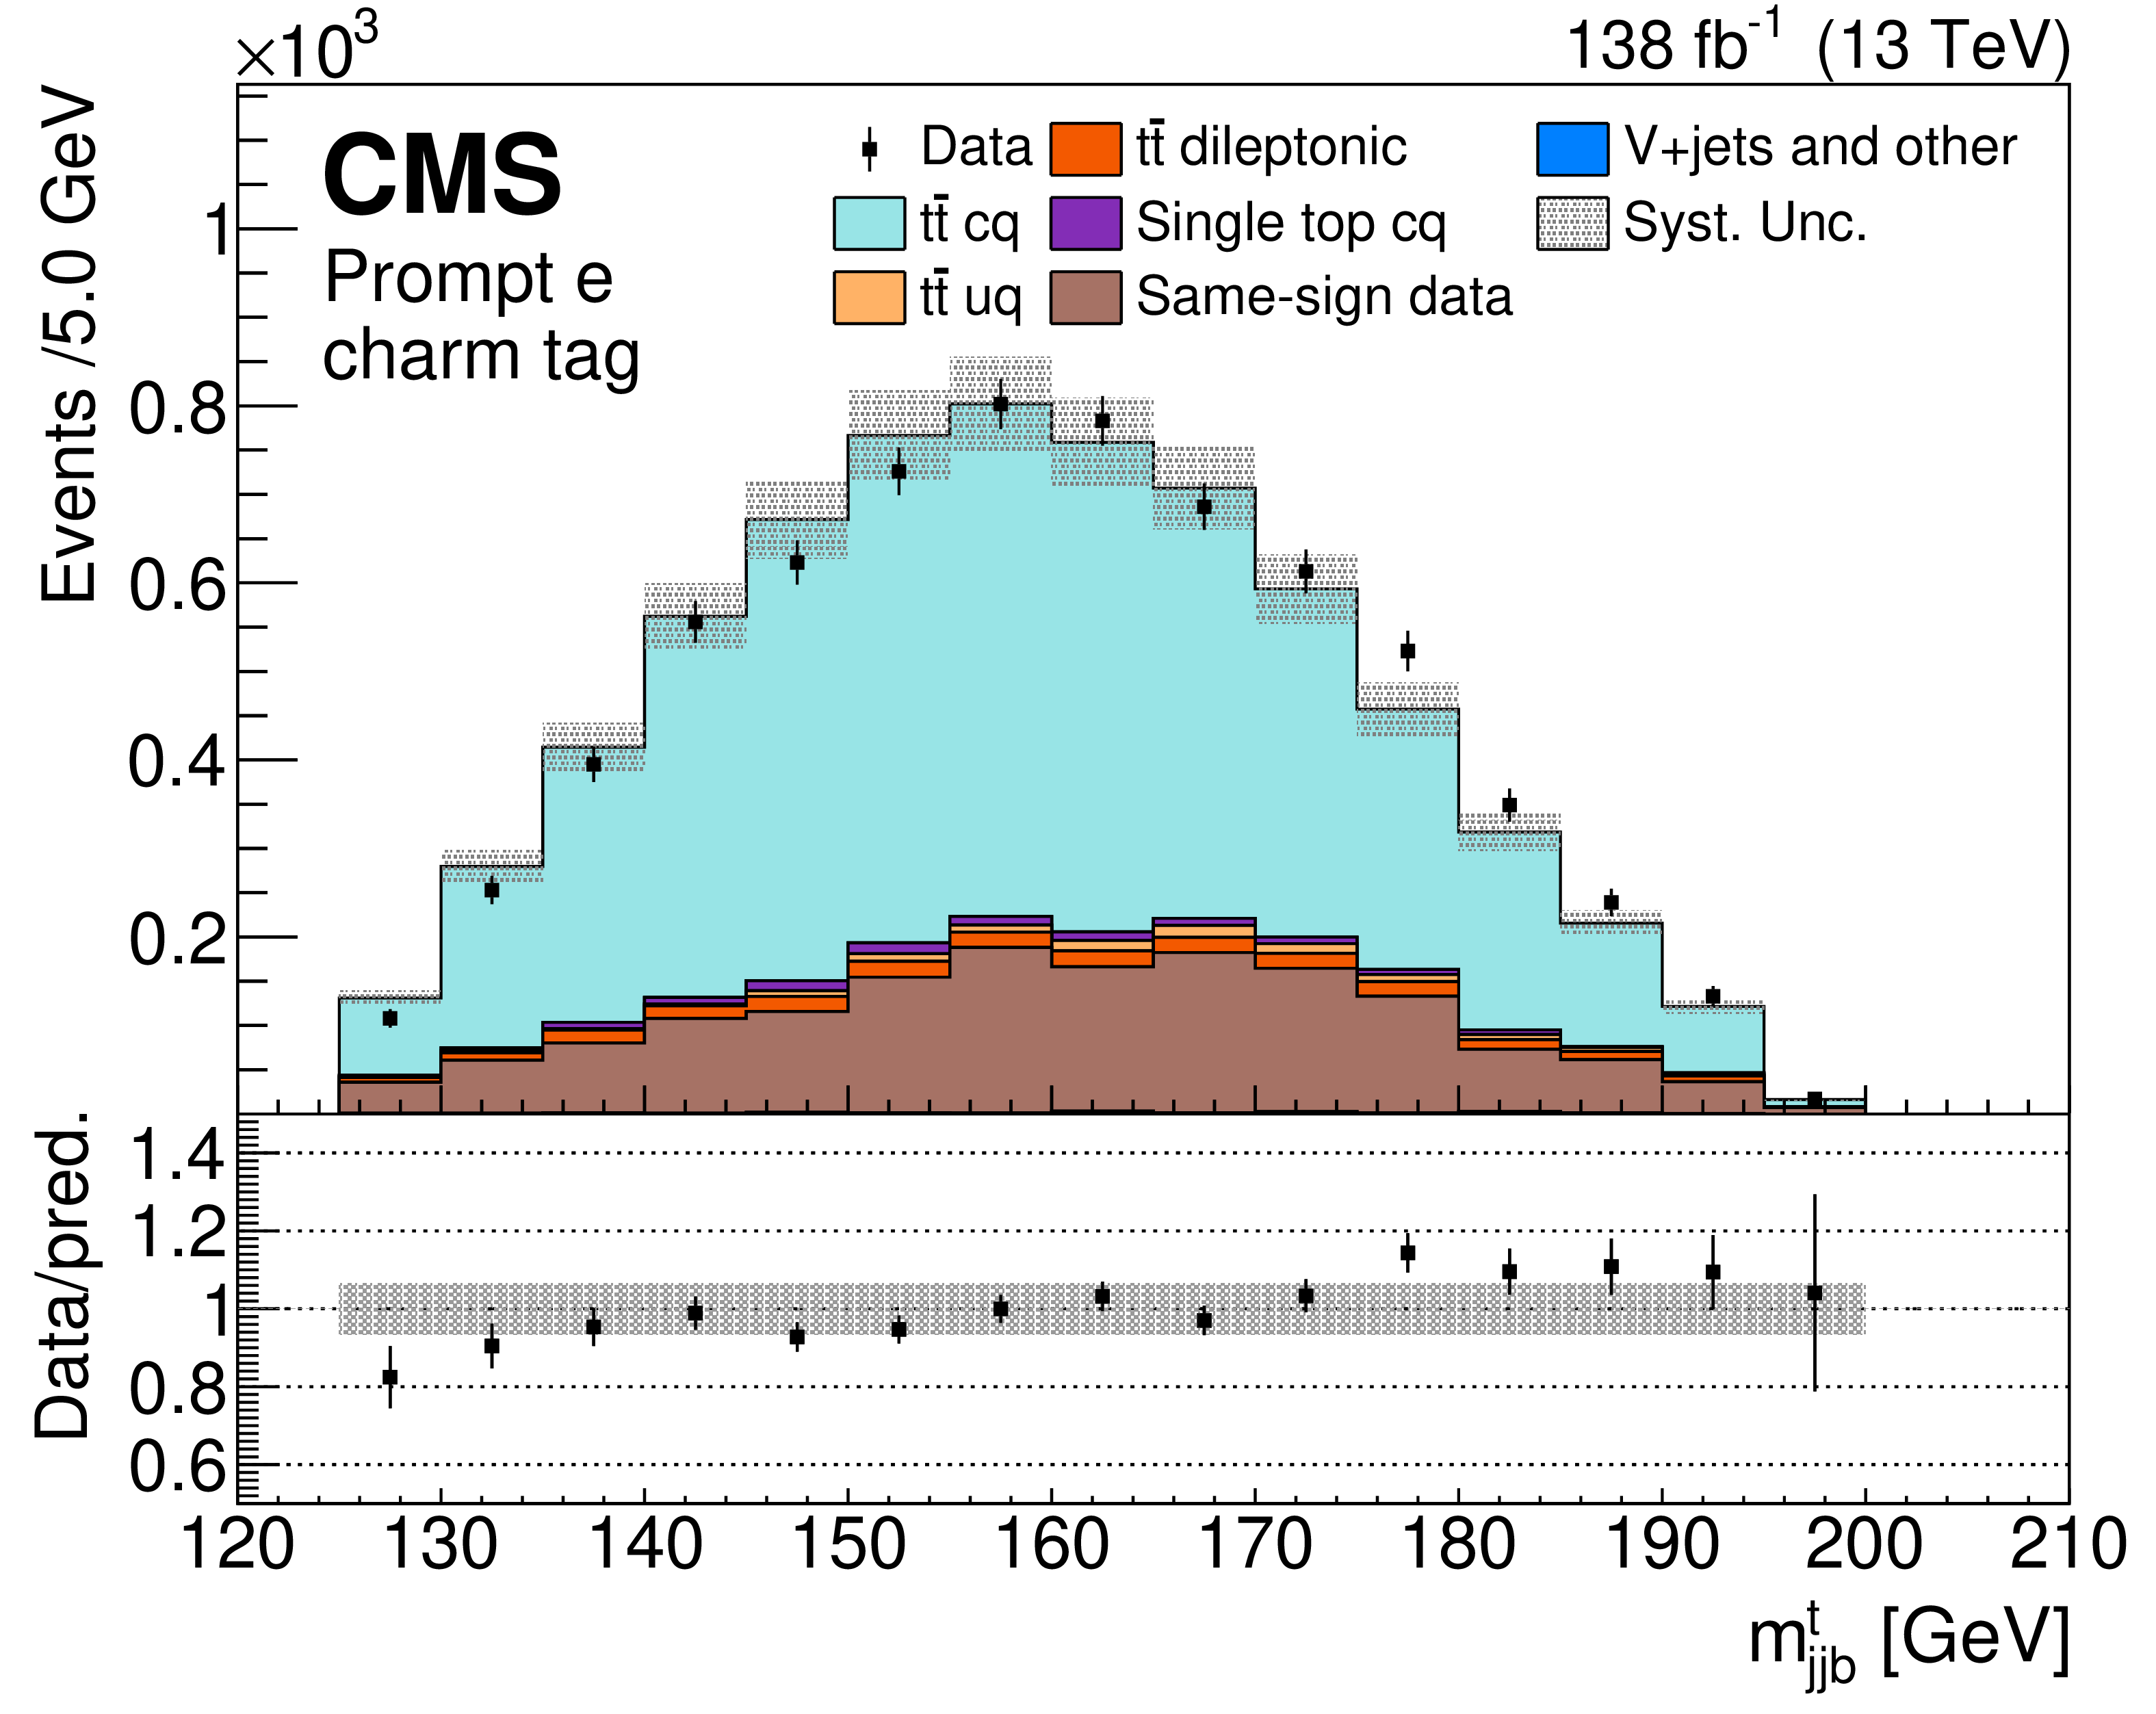
Figure 4:
Invariant mass of the three jets associated with the top quark, for the four event categories entering the fit: prompt muon and no charm tag (upper left), prompt electron and no charm tag (upper right), prompt muon and charm tag (lower left), prompt electron and charm tag (lower right). The measured data correspond to OS events, whereas the predictions from the simulations are OS-SS subtracted yields on top of the background prediction using the SS data. The data are displayed as points with statistical error bars. The gray band in the predictions represents the pre-fit systematic uncertainties. The ratios of data to the expected yields are given at the bottom of each panel together with the statistical and systematic uncertainties. |
png pdf |
Figure 4-a:
Invariant mass of the three jets associated with the top quark, for the four event categories entering the fit: prompt muon and no charm tag (upper left), prompt electron and no charm tag (upper right), prompt muon and charm tag (lower left), prompt electron and charm tag (lower right). The measured data correspond to OS events, whereas the predictions from the simulations are OS-SS subtracted yields on top of the background prediction using the SS data. The data are displayed as points with statistical error bars. The gray band in the predictions represents the pre-fit systematic uncertainties. The ratios of data to the expected yields are given at the bottom of each panel together with the statistical and systematic uncertainties. |

png pdf |
Figure 4-b:
Invariant mass of the three jets associated with the top quark, for the four event categories entering the fit: prompt muon and no charm tag (upper left), prompt electron and no charm tag (upper right), prompt muon and charm tag (lower left), prompt electron and charm tag (lower right). The measured data correspond to OS events, whereas the predictions from the simulations are OS-SS subtracted yields on top of the background prediction using the SS data. The data are displayed as points with statistical error bars. The gray band in the predictions represents the pre-fit systematic uncertainties. The ratios of data to the expected yields are given at the bottom of each panel together with the statistical and systematic uncertainties. |
png pdf |
Figure 4-c:
Invariant mass of the three jets associated with the top quark, for the four event categories entering the fit: prompt muon and no charm tag (upper left), prompt electron and no charm tag (upper right), prompt muon and charm tag (lower left), prompt electron and charm tag (lower right). The measured data correspond to OS events, whereas the predictions from the simulations are OS-SS subtracted yields on top of the background prediction using the SS data. The data are displayed as points with statistical error bars. The gray band in the predictions represents the pre-fit systematic uncertainties. The ratios of data to the expected yields are given at the bottom of each panel together with the statistical and systematic uncertainties. |
png pdf |
Figure 4-d:
Invariant mass of the three jets associated with the top quark, for the four event categories entering the fit: prompt muon and no charm tag (upper left), prompt electron and no charm tag (upper right), prompt muon and charm tag (lower left), prompt electron and charm tag (lower right). The measured data correspond to OS events, whereas the predictions from the simulations are OS-SS subtracted yields on top of the background prediction using the SS data. The data are displayed as points with statistical error bars. The gray band in the predictions represents the pre-fit systematic uncertainties. The ratios of data to the expected yields are given at the bottom of each panel together with the statistical and systematic uncertainties. |
| Tables | |

png pdf |
Table 1:
Summary of the main systematic uncertainties affecting the $ R_\mathrm{c}^{\mathrm{W}} $ measurement. The quoted numbers are the percentage change in the predicted yields of the samples with no charm and with a charm tag, and the last column reflects the impacts in percentage of the measured $ R_\mathrm{c}^{\mathrm{W}} $ value from each uncertainty source. The total systematic uncertainty, calculated from the various sources of uncertainty and their correlations, is given in the last row. |
png pdf |
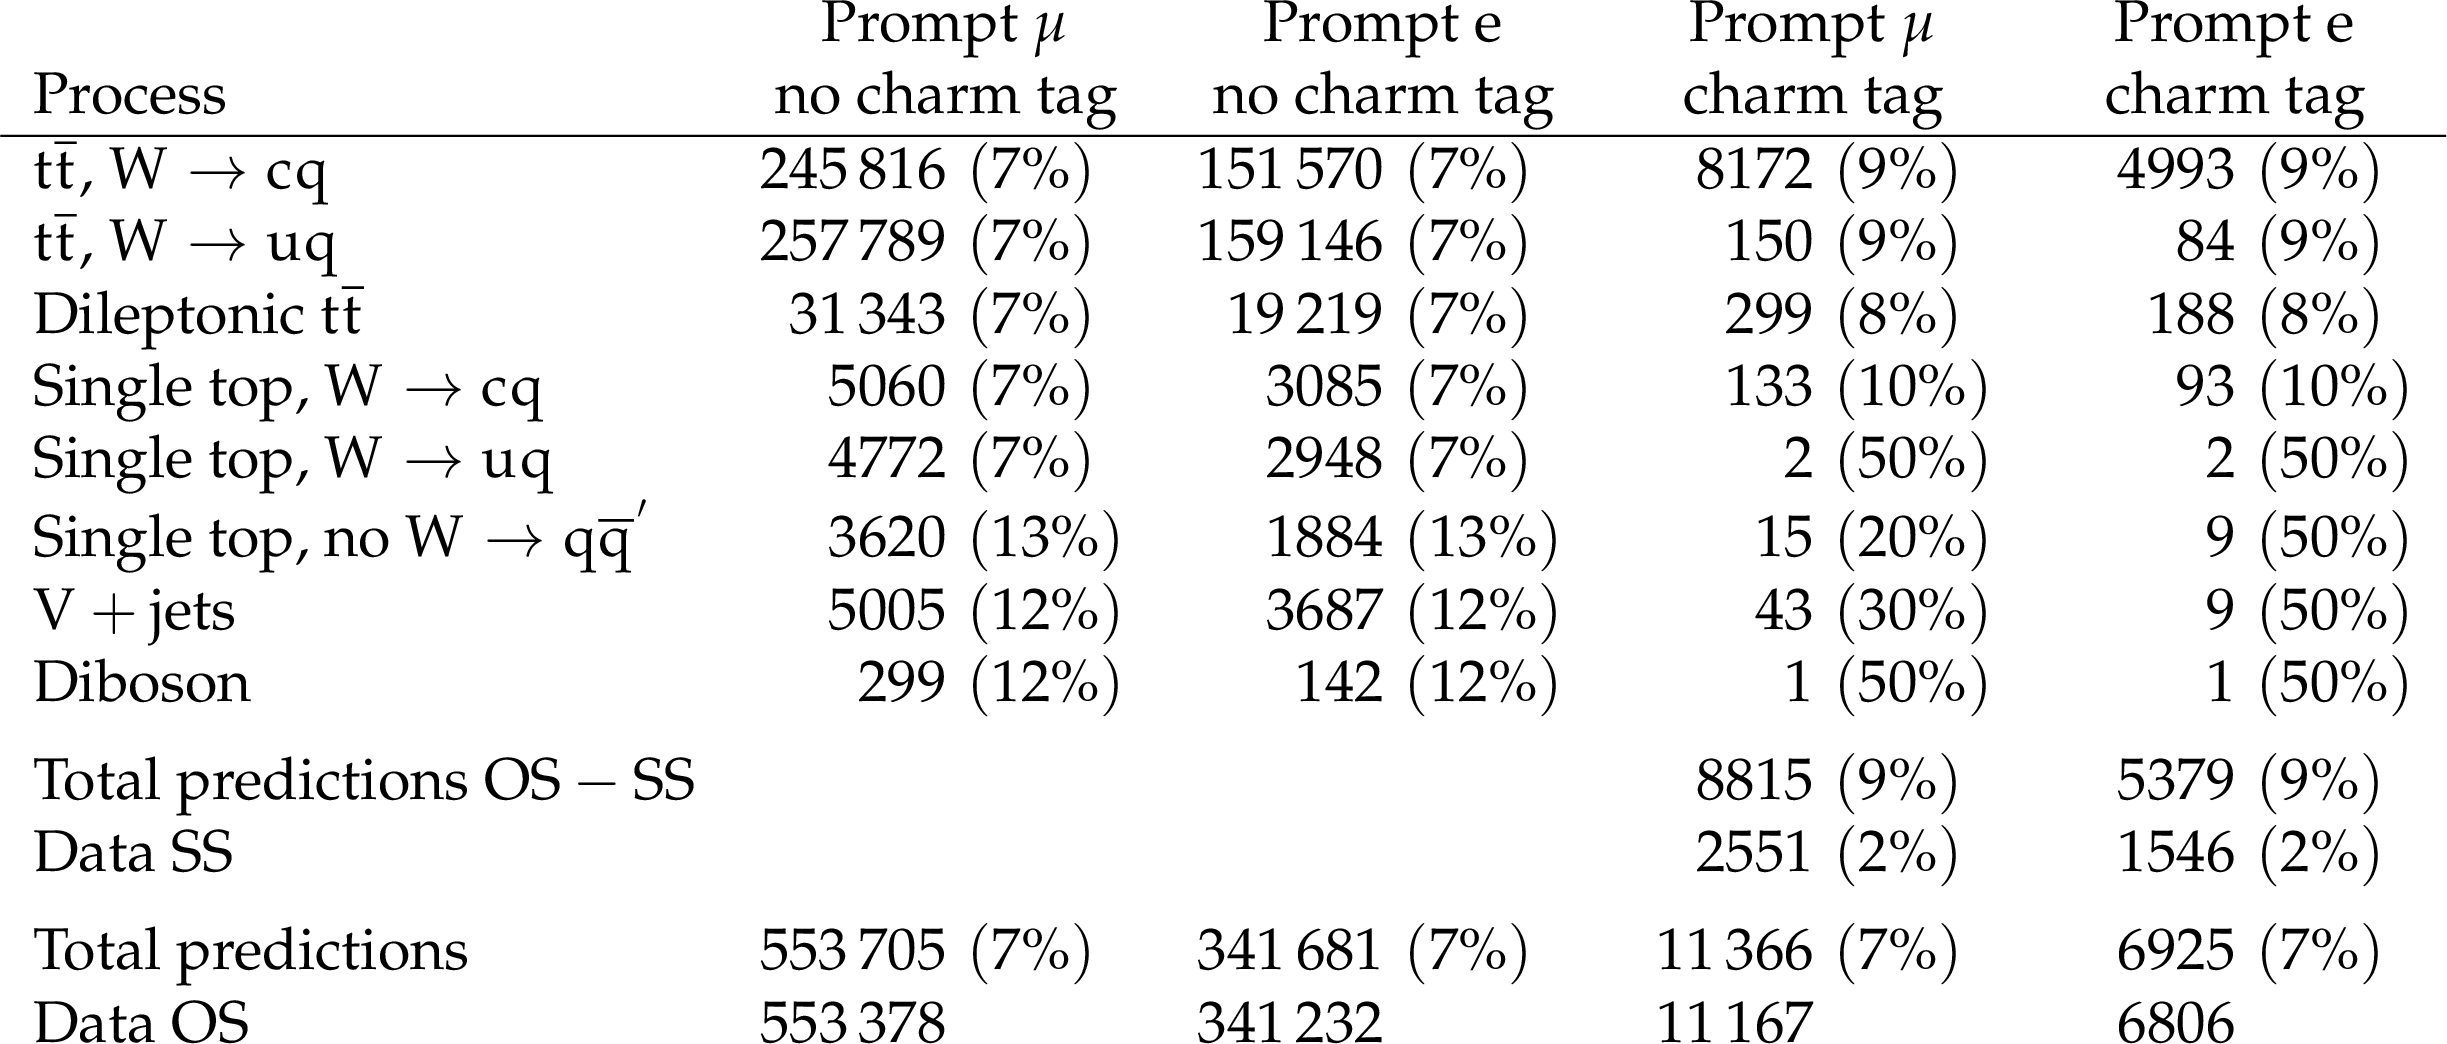
Table 2:
Observed and predicted event yields input to the fit for the four categories. Predictions are separated by process. For the two categories with charm tag, the yields predicted by the simulations correspond to OS-SS subtracted events, the SS contamination is estimated with data, and the number of observed events in data corresponds to OS events. The relative uncertainties shown in parenthesis for the predictions are based on the statistical uncertainties of the MC samples and the systematic uncertainties and their correlations discussed in Section 5. Correlated systematic effects dominate the uncertainties. |
| Summary |
| The most precise measurement to date of the W boson hadronic decay branching fraction ratio $ R_\mathrm{c}^{\mathrm{W}} $ = $ \mathcal{B}(\mathrm{ W \to c q })/\mathcal{B}(\mathrm{{W}\to q \bar{q}{}^{'}}) $ is reported. The measurement is based on a data sample collected by the CMS experiment at a center-of-mass energy of 13 TeV in 2016-2018 at the CERN LHC with an integrated luminosity of 138 fb$ ^{-1} $. The large cross section of top quark-antiquark production at the LHC offers a sizable high-purity sample of W bosons suitable for this measurement. Events with one prompt charged lepton (electron or muon) and at least four jets, two of them tagged as bottom quark jets, are analyzed. Charm jets are tagged using the presence of a muon inside the jet. This charm tagging method enables the selection of a sample of charm jets with a low level of background that is precisely determined from data. The measured $ R_\mathrm{c}^{\mathrm{W}} $ value is 0.489 $ \pm $ 0.020, in good agreement with the standard model prediction. The relative precision of the measurement of 4%, limited by the systematic uncertainty in the charm tagging efficiency, is improved by a factor of two compared with the current world-average value. From the $ R_\mathrm{c}^{\mathrm{W}} $ measurement, the sum of squared elements in the second row of the Cabibbo-Kobayashi-Maskawa (CKM) matrix, 0.970 $ \pm $ 0.041, and the CKM matrix element $ |V_{\mathrm{c}\mathrm{s}}|= $ 0.959 $ \pm $ 0.021 are derived. These results provide a consistency test of the CKM unitarity and a measurement of $ |V_{\mathrm{c}\mathrm{s}}| $ from hadronic W boson decays. |
| References | ||||
| 1 | N. Cabibbo | Unitary symmetry and leptonic decays | PRL 10 (1963) 531 | |
| 2 | M. Kobayashi and T. Maskawa | CP violation in the renormalizable theory of weak interaction | Prog. Theor. Phys. 49 (1973) 652 | |
| 3 | Particle Data Group, S. Navas et al. | Review of particle physics | PRD 110 (2024) 030001 | |
| 4 | ALEPH Collaboration | A direct measurement of $ |V_{\mathrm{c}\mathrm{s}}| $ in hadronic W decays using a charm tag | PLB 465 (1999) 349 | |
| 5 | OPAL Collaboration | A measurement of the rate of charm production in W decays | PLB 490 (2000) 71 | hep-ex/0009020 |
| 6 | CMS Collaboration | Measurement of associated Z + charm production in proton-proton collisions at $ \sqrt{s} = $ 8 TeV | EPJC 78 (2018) 287 | CMS-SMP-15-009 1711.02143 |
| 7 | CMS Collaboration | Measurement of associated W + charm production in pp collisions at $ \sqrt{s} = $ 7 TeV | JHEP 02 (2014) 013 | CMS-SMP-12-002 1310.1138 |
| 8 | CMS Collaboration | Measurements of the production of a W boson in association with a charm quark in proton-proton collisions at $ \sqrt{s}= $ 8 TeV | EPJC 82 (2022) 1094 | CMS-SMP-18-013 2112.00895 |
| 9 | CMS Collaboration | Measurements of the production cross section for a W boson in association with a charm quark in proton-proton collisions at $ \sqrt{s}= $ 13 TeV | EPJC 84 (2024) 27 | 2308.02285 |
| 10 | CMS Collaboration | The CMS experiment at the CERN LHC | JINST 3 (2008) S08004 | |
| 11 | CMS Collaboration | Performance of the CMS Level-1 trigger in proton-proton collisions at $ \sqrt{s} = $ 13 TeV | JINST 15 (2020) P10017 | CMS-TRG-17-001 2006.10165 |
| 12 | CMS Collaboration | The CMS trigger system | JINST 12 (2017) P01020 | CMS-TRG-12-001 1609.02366 |
| 13 | CMS Collaboration | Particle-flow reconstruction and global event description with the CMS detector | JINST 12 (2017) P10003 | CMS-PRF-14-001 1706.04965 |
| 14 | CMS Collaboration | Electron and photon reconstruction and identification with the CMS experiment at the CERN LHC | JINST 16 (2021) P05014 | CMS-EGM-17-001 2012.06888 |
| 15 | CMS Collaboration | Performance of the CMS muon detector and muon reconstruction with proton-proton collisions at $ \sqrt{s}= $ 13 TeV | JINST 13 (2018) P06015 | CMS-MUO-16-001 1804.04528 |
| 16 | CMS Collaboration | Technical proposal for the phase-II upgrade of the Compact Muon Solenoid | CMS Technical Proposal, CERN-LHCC-2015-010, CMS-TDR-15-02 CDS |
|
| 17 | M. Cacciari, G. P. Salam, and G. Soyez | The anti-$ k_{\mathrm{T}} $ jet clustering algorithm | JHEP 04 (2008) 063 | 0802.1189 |
| 18 | M. Cacciari, G. P. Salam, and G. Soyez | FastJet user manual | EPJC 72 (2012) 1896 | 1111.6097 |
| 19 | CMS Collaboration | Pileup mitigation at CMS in 13 TeV data | JINST 15 (2020) P09018 | CMS-JME-18-001 2003.00503 |
| 20 | CMS Collaboration | Jet energy scale and resolution in the CMS experiment in pp collisions at 8 TeV | JINST 12 (2017) P02014 | CMS-JME-13-004 1607.03663 |
| 21 | CMS Collaboration | Performance of missing transverse momentum reconstruction in proton-proton collisions at $ \sqrt{s} = $ 13 TeV using the CMS detector | JINST 14 (2019) P07004 | CMS-JME-17-001 1903.06078 |
| 22 | CMS Collaboration | Measurement of the inclusive W and Z production cross sections in pp collisions at $ \sqrt{s}= $ 7 TeV | JHEP 10 (2011) 132 | CMS-EWK-10-005 1107.4789 |
| 23 | P. Nason | A new method for combining NLO QCD with shower Monte Carlo algorithms | JHEP 11 (2004) 40 | hep-ph/0409146 |
| 24 | S. Frixione, P. Nason, and C. Oleari | Matching NLO QCD computations with parton shower simulations: the POWHEG method | JHEP 11 (2007) 70 | 0709.2092 |
| 25 | S. Alioli, P. Nason, C. Oleari, and E. Re | A general framework for implementing NLO calculations in shower Monte Carlo programs: the POWHEG BOX | JHEP 06 (2010) 043 | 1002.2581 |
| 26 | J. Alwall et al. | The automated computation of tree-level and next-to-leading order differential cross sections, and their matching to parton shower simulations | JHEP 07 (2014) 079 | 1405.0301 |
| 27 | T. Sjöstrand et al. | An Introduction to PYTHIA 8.2 | Comput. Phys. Commun. 191 (2015) 159 | 1410.3012 |
| 28 | NNPDF Collaboration | Parton distributions from high-precision collider data | EPJC 77 (2017) 663 | 1706.00428 |
| 29 | CMS Collaboration | Extraction and validation of a new set of CMS Pythia8 tunes from underlying-event measurements | EPJC 80 (2020) 4 | CMS-GEN-17-001 1903.12179 |
| 30 | GEANT4 Collaboration | GEANT 4--a simulation toolkit | NIM A 506 (2003) 250 | |
| 31 | CMS Collaboration | Identification of heavy-flavour jets with the CMS detector in pp collisions at 13 TeV | JINST 13 (2018) P05011 | CMS-BTV-16-002 1712.07158 |
| 32 | E. Bols et al. | Jet flavour classification using DeepJet | JINST 15 (2020) P12012 | 2008.10519 |
| 33 | M. Lisovyi, A. Verbytskyi, and O. Zenaiev | Combined analysis of charm-quark fragmentation-fraction measurements | EPJC 76 (2016) 397 | 1509.01061 |
| 34 | CMS Collaboration | Performance of the DeepJet b tagging algorithm using 41.9 fb$^{-1}$ of data from proton-proton collisions at 13 TeV with Phase 1 CMS detector | CMS Detector Performance Summary CMS-DP-2018-058, 2018 CDS |
|
| 35 | CMS Collaboration | Measurement of the inelastic proton-proton cross section at $ \sqrt{s}= $ 13 TeV | JHEP 07 (2018) 161 | CMS-FSQ-15-005 1802.02613 |
| 36 | CMS Collaboration | Precision luminosity measurement in proton-proton collisions at $ \sqrt{s} = $ 13 TeV in 2015 and 2016 at CMS | EPJC 81 (2021) 800 | CMS-LUM-17-003 2104.01927 |
| 37 | CMS Collaboration | CMS luminosity measurement for the 2017 data-taking period at $ \sqrt{s} = $ 13 TeV | CMS Physics Analysis Summary CMS-PAS-LUM-17-004 |
CMS-PAS-LUM-17-004 |
| 38 | CMS Collaboration | CMS luminosity measurement for the 2018 data-taking period at $ \sqrt{s} = $ 13 TeV | CMS Physics Analysis Summary CMS-PAS-LUM-18-002 |
CMS-PAS-LUM-18-002 |
| 39 | M. Czakon and A. Mitov | Top++: A program for the calculation of the top-pair cross-section at hadron colliders | Comput. Phys. Commun. 185 (2014) 2930 | 1112.5675 |
| 40 | J. Campbell, T. Neumann, and Z. Sullivan | Single-top-quark production in the $ t $-channel at NNLO | JHEP 02 (2021) 040 | 2012.01574 |
| 41 | N. Kidonakis and N. Yamanaka | Higher-order corrections for $ tW $ production at high-energy hadron colliders | JHEP 05 (2021) 278 | 2102.11300 |
| 42 | CMS Collaboration | Measurement of the inclusive cross sections for W and Z boson production in proton-proton collisions at $ \sqrt{s} = $ 5.02 and 13 TeV | Submitted to JHEP, 2024 | CMS-SMP-20-004 2408.03744 |
| 43 | CMS Collaboration | $ {W}^{+}{W}^{-} $ boson pair production in proton-proton collisions at $ \sqrt{s} = $ 13 TeV | PRD 102 (2020) 092001 | CMS-SMP-18-004 2009.00119 |
| 44 | CMS Collaboration | Measurements of $ {\mathrm{p}} {\mathrm{p}} \rightarrow {\mathrm{Z}} {\mathrm{Z}} $ production cross sections and constraints on anomalous triple gauge couplings at $ \sqrt{s} = $ 13 TeV | EPJC 81 (2021) 200 | CMS-SMP-19-001 2009.01186 |
| 45 | CMS Collaboration | Measurement of the inclusive and differential WZ production cross sections, polarization angles, and triple gauge couplings in pp collisions at $ \sqrt{s} = $ 13 TeV | JHEP 07 (2022) 32 | CMS-SMP-20-014 2110.11231 |
| 46 | CMS Collaboration Collaboration | Measurement of differential cross sections for top quark pair production using the $ \text{lepton}+\text{jets} $ final state in proton-proton collisions at 13 tev | (May, ) 09, , \hrefhttp://www.arXiv.org/abs/1610.04191v2\textttarXiv:1610.04191v2, 2017 PRD 9 (2017) 5 |
|
| 47 | DELPHI Collaboration | A measurement of D meson production in $ {Z}^{0} $ hadronic decays | Z. Phys. C 59 (1993) 533 | |
| 48 | OPAL Collaboration | A measurement of the production of $ {D}^{*\pm} $ mesons on the $ {Z}^{0} $ resonance | Z. Phys. C 67 (1995) 27 | |
| 49 | ALEPH Collaboration | Study of charm production in Z decays | EPJC 16 (2000) 597 | hep-ex/9909032 |
| 50 | CMS Collaboration | The CMS statistical analysis and combination tool: Combine | Comput. Softw. Big Sci. 8 (2024) 19 | CMS-CAT-23-001 2404.06614 |
| 51 | CMS Collaboration | Precision measurement of the W boson decay branching fractions in proton-proton collisions at $ \sqrt{s} = $ 13 TeV | PRD 105 (2022) 072008 | CMS-SMP-18-011 2201.07861 |
|
|
Compact Muon Solenoid LHC, CERN |
|

|

|

|

|

|