

Compact Muon Solenoid
LHC, CERN
| CMS-SMP-20-004 ; CERN-EP-2024-134 | ||
| Measurement of the inclusive cross sections for W and Z boson production in proton-proton collisions at $ \sqrt{s}= $ 5.02 and 13 TeV | ||
| CMS Collaboration | ||
| 7 August 2024 | ||
| JHEP 04 (2025) 162 | ||
| Abstract: Measurements of fiducial and total inclusive cross sections for W and Z boson production are presented in proton-proton collisions at $ \sqrt{s}= $ 5.02 and 13 TeV. Electron and muon decay modes ($ \ell=\mathrm{e} $ or $ \mu $) are studied in the data collected with the CMS detector in 2017, in dedicated runs with reduced instantaneous luminosity. The data sets correspond to integrated luminosities of 298 $ \pm $ 6 pb$^{-1}$ at 5.02 TeV and 206 $ \pm $ 5 pb$^{-1}$ at 13 TeV. Measured values of the products of the total inclusive cross sections and the branching fractions at 5.02 TeV are $ \sigma(\mathrm{p}\mathrm{p} \to \mathrm{W} + \mathrm{X})\mathcal{B}(\mathrm{W} \to \ell\nu) = $ 7300 $ \pm $ 10 (stat) $ \pm $ 60 (syst) $ \pm $ 140 (lumi) pb, and $ \sigma(\mathrm{p}\mathrm{p} \to \mathrm{Z} + \mathrm{X})\mathcal{B}(\mathrm{Z}\to\ell^+\ell^-) = $ 669 $ \pm $ 2 (stat) $ \pm $ 6 (syst) $ \pm $ 13 (lumi) pb for the dilepton invariant mass in the range of 60-120 GeV. The corresponding results at 13 TeV are 20480 $ \pm $ 10 (stat) $ \pm $ 170 (syst) $ \pm $ 470 (lumi) pb and 1952 $ \pm $ 4 (stat) $ \pm $ 18 (syst) $ \pm $ 45 (lumi) pb. The measured values agree with cross section calculations at next-to-next-to-leading-order in perturbative quantum chromodynamics. Fiducial and total inclusive cross sections, ratios of cross sections of W$^{+}$ and W$^{-}$ production as well as inclusive W and Z boson production, and ratios of these measurements at 5.02 and 13 TeV are reported. | ||
| Links: e-print arXiv:2408.03744 [hep-ex] (PDF) ; CDS record ; inSPIRE record ; HepData record ; CADI line (restricted) ; | ||
| Figures | |
png pdf |
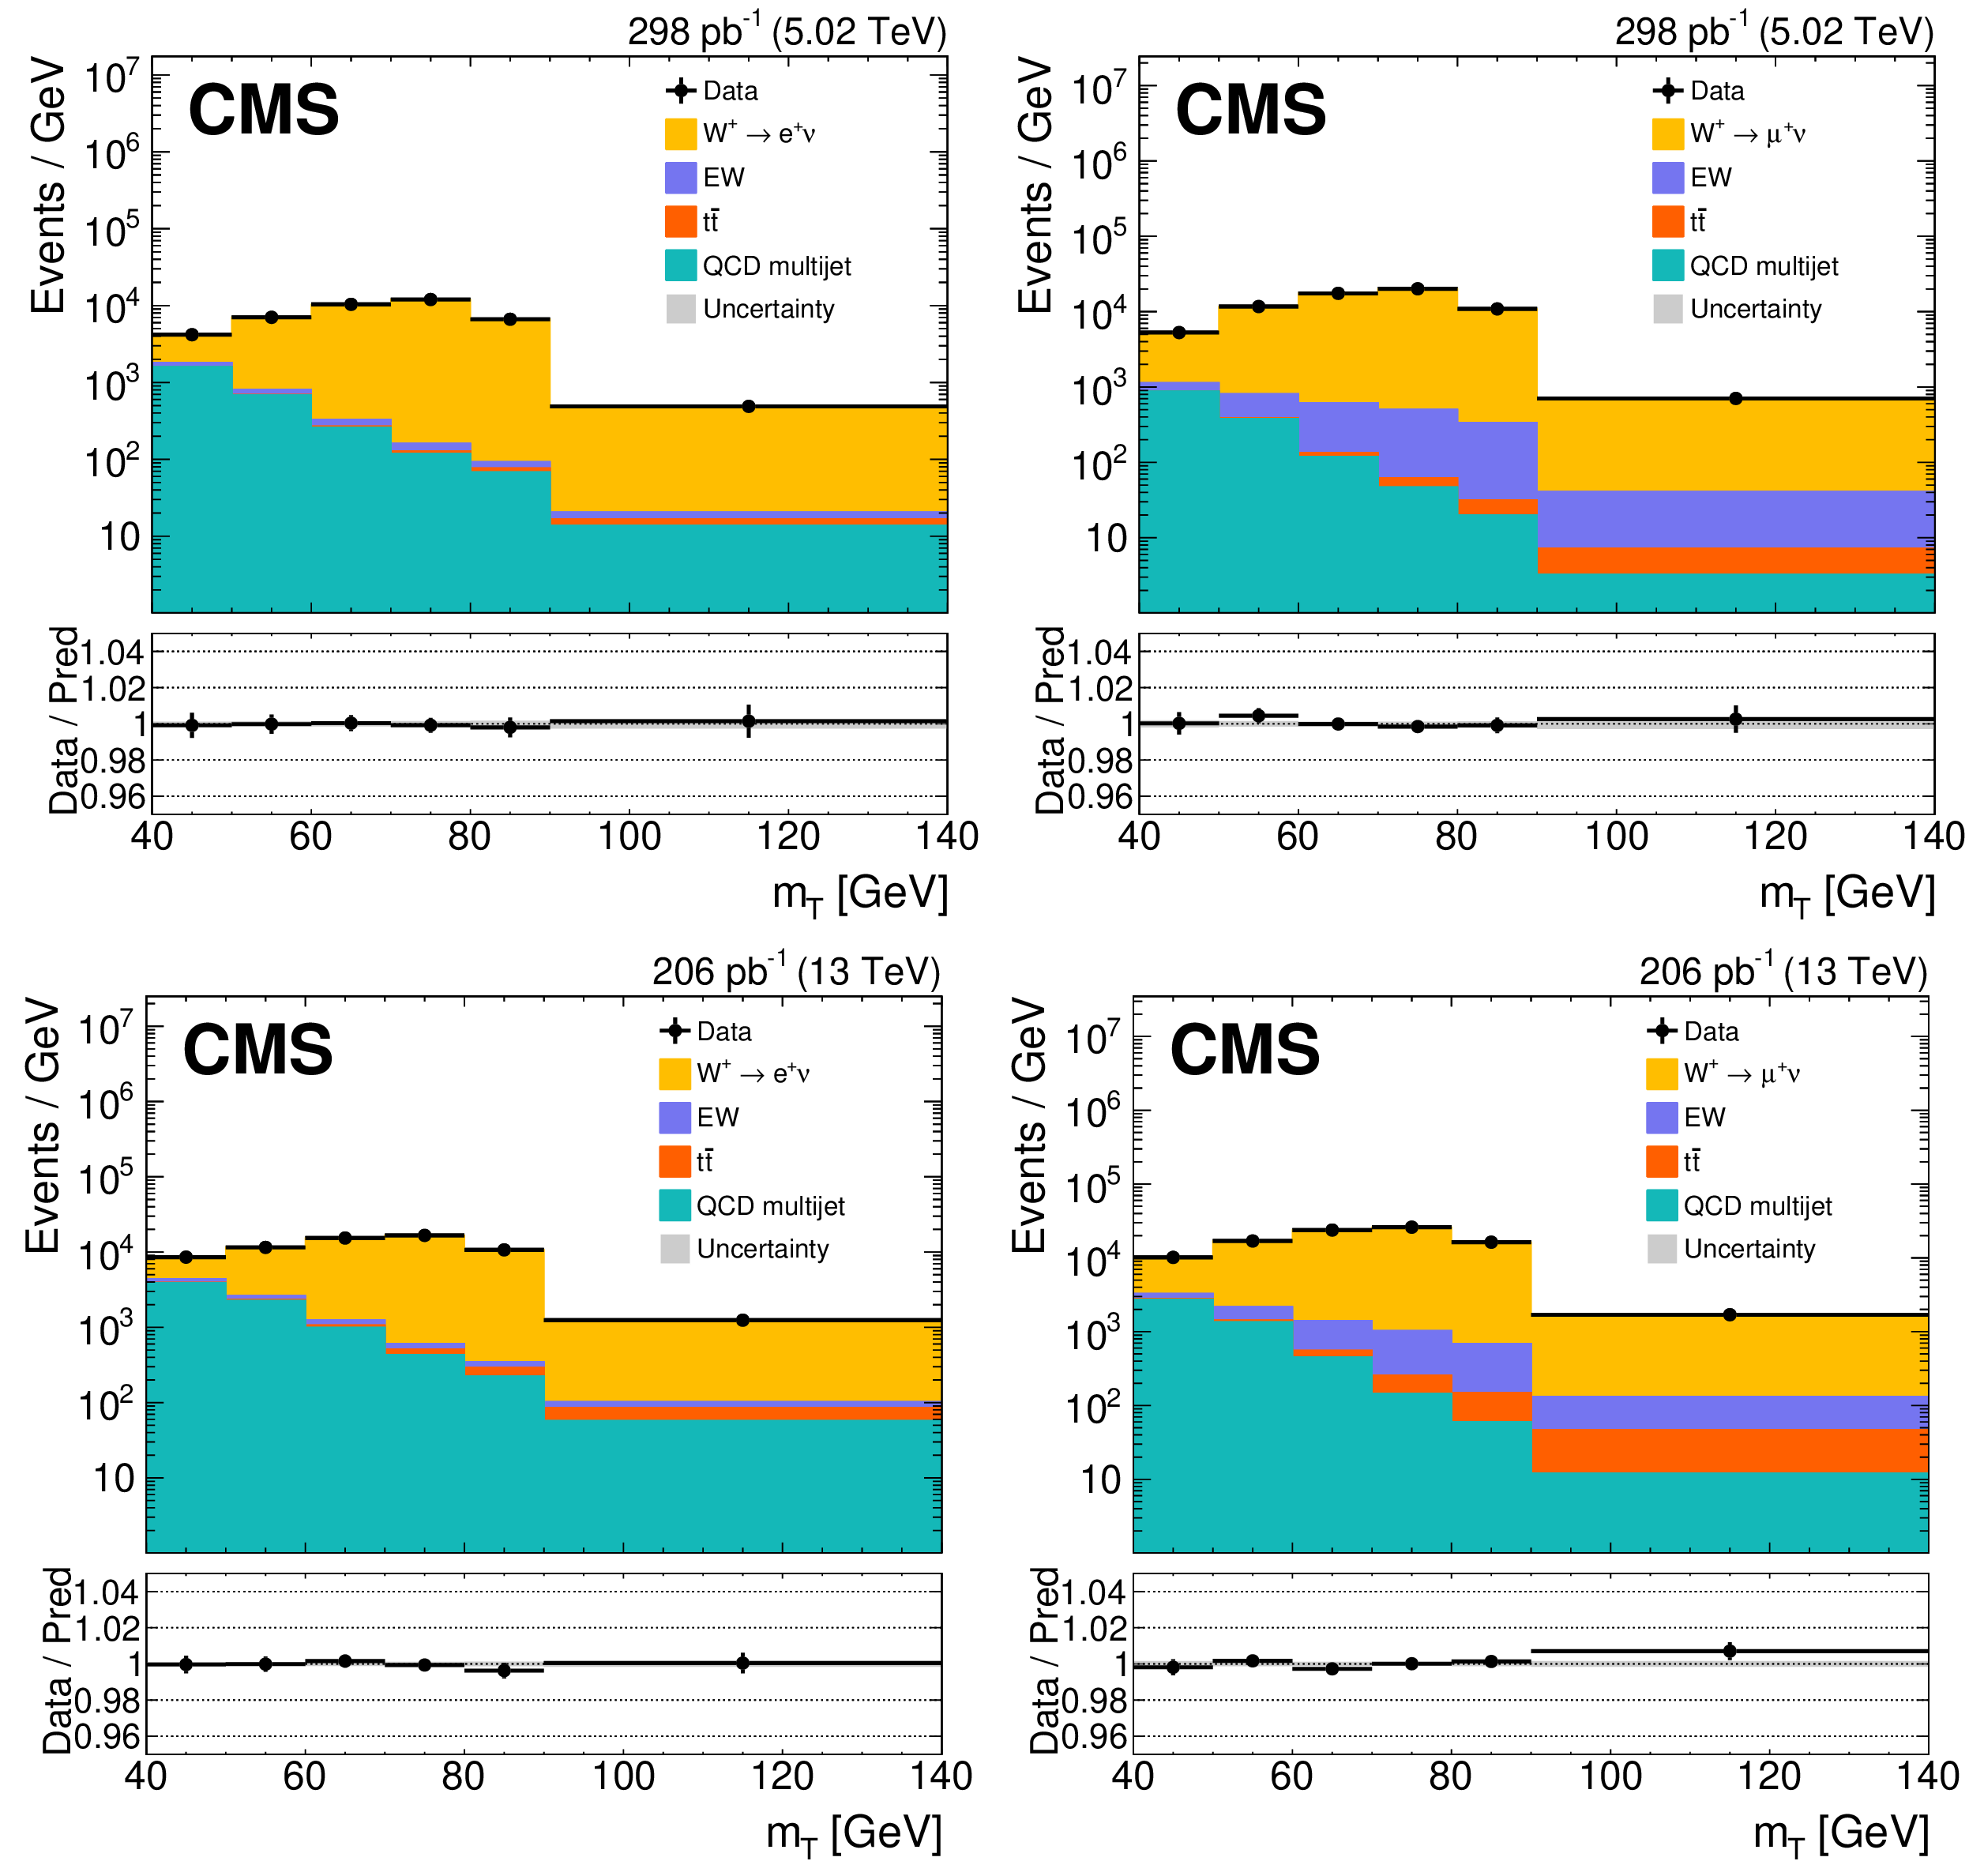
Figure 1:
Distributions of $ m_{\mathrm{T}} $ in the W$^{+}$ signal selection for electron (left) and muon (right) final states for the pp collisions at $ \sqrt{s}= $ 5.02 TeV (upper) and 13 TeV (lower) after the maximum likelihood fit. The vertical bars on the observed data represent corresponding statistical uncertainties. The EW backgrounds include the contributions from DY, $ \mathrm{W}\to\tau\nu $, and diboson processes. The lower panel in each plot shows the ratio of the number of observed events to that of the total signal and background predictions. The gray band represents the uncertainty in the total prediction after the fit. |

png pdf |
Figure 1-a:
Distributions of $ m_{\mathrm{T}} $ in the W$^{+}$ signal selection for electron (left) and muon (right) final states for the pp collisions at $ \sqrt{s}= $ 5.02 TeV (upper) and 13 TeV (lower) after the maximum likelihood fit. The vertical bars on the observed data represent corresponding statistical uncertainties. The EW backgrounds include the contributions from DY, $ \mathrm{W}\to\tau\nu $, and diboson processes. The lower panel in each plot shows the ratio of the number of observed events to that of the total signal and background predictions. The gray band represents the uncertainty in the total prediction after the fit. |
png pdf |
Figure 1-b:
Distributions of $ m_{\mathrm{T}} $ in the W$^{+}$ signal selection for electron (left) and muon (right) final states for the pp collisions at $ \sqrt{s}= $ 5.02 TeV (upper) and 13 TeV (lower) after the maximum likelihood fit. The vertical bars on the observed data represent corresponding statistical uncertainties. The EW backgrounds include the contributions from DY, $ \mathrm{W}\to\tau\nu $, and diboson processes. The lower panel in each plot shows the ratio of the number of observed events to that of the total signal and background predictions. The gray band represents the uncertainty in the total prediction after the fit. |
png pdf |
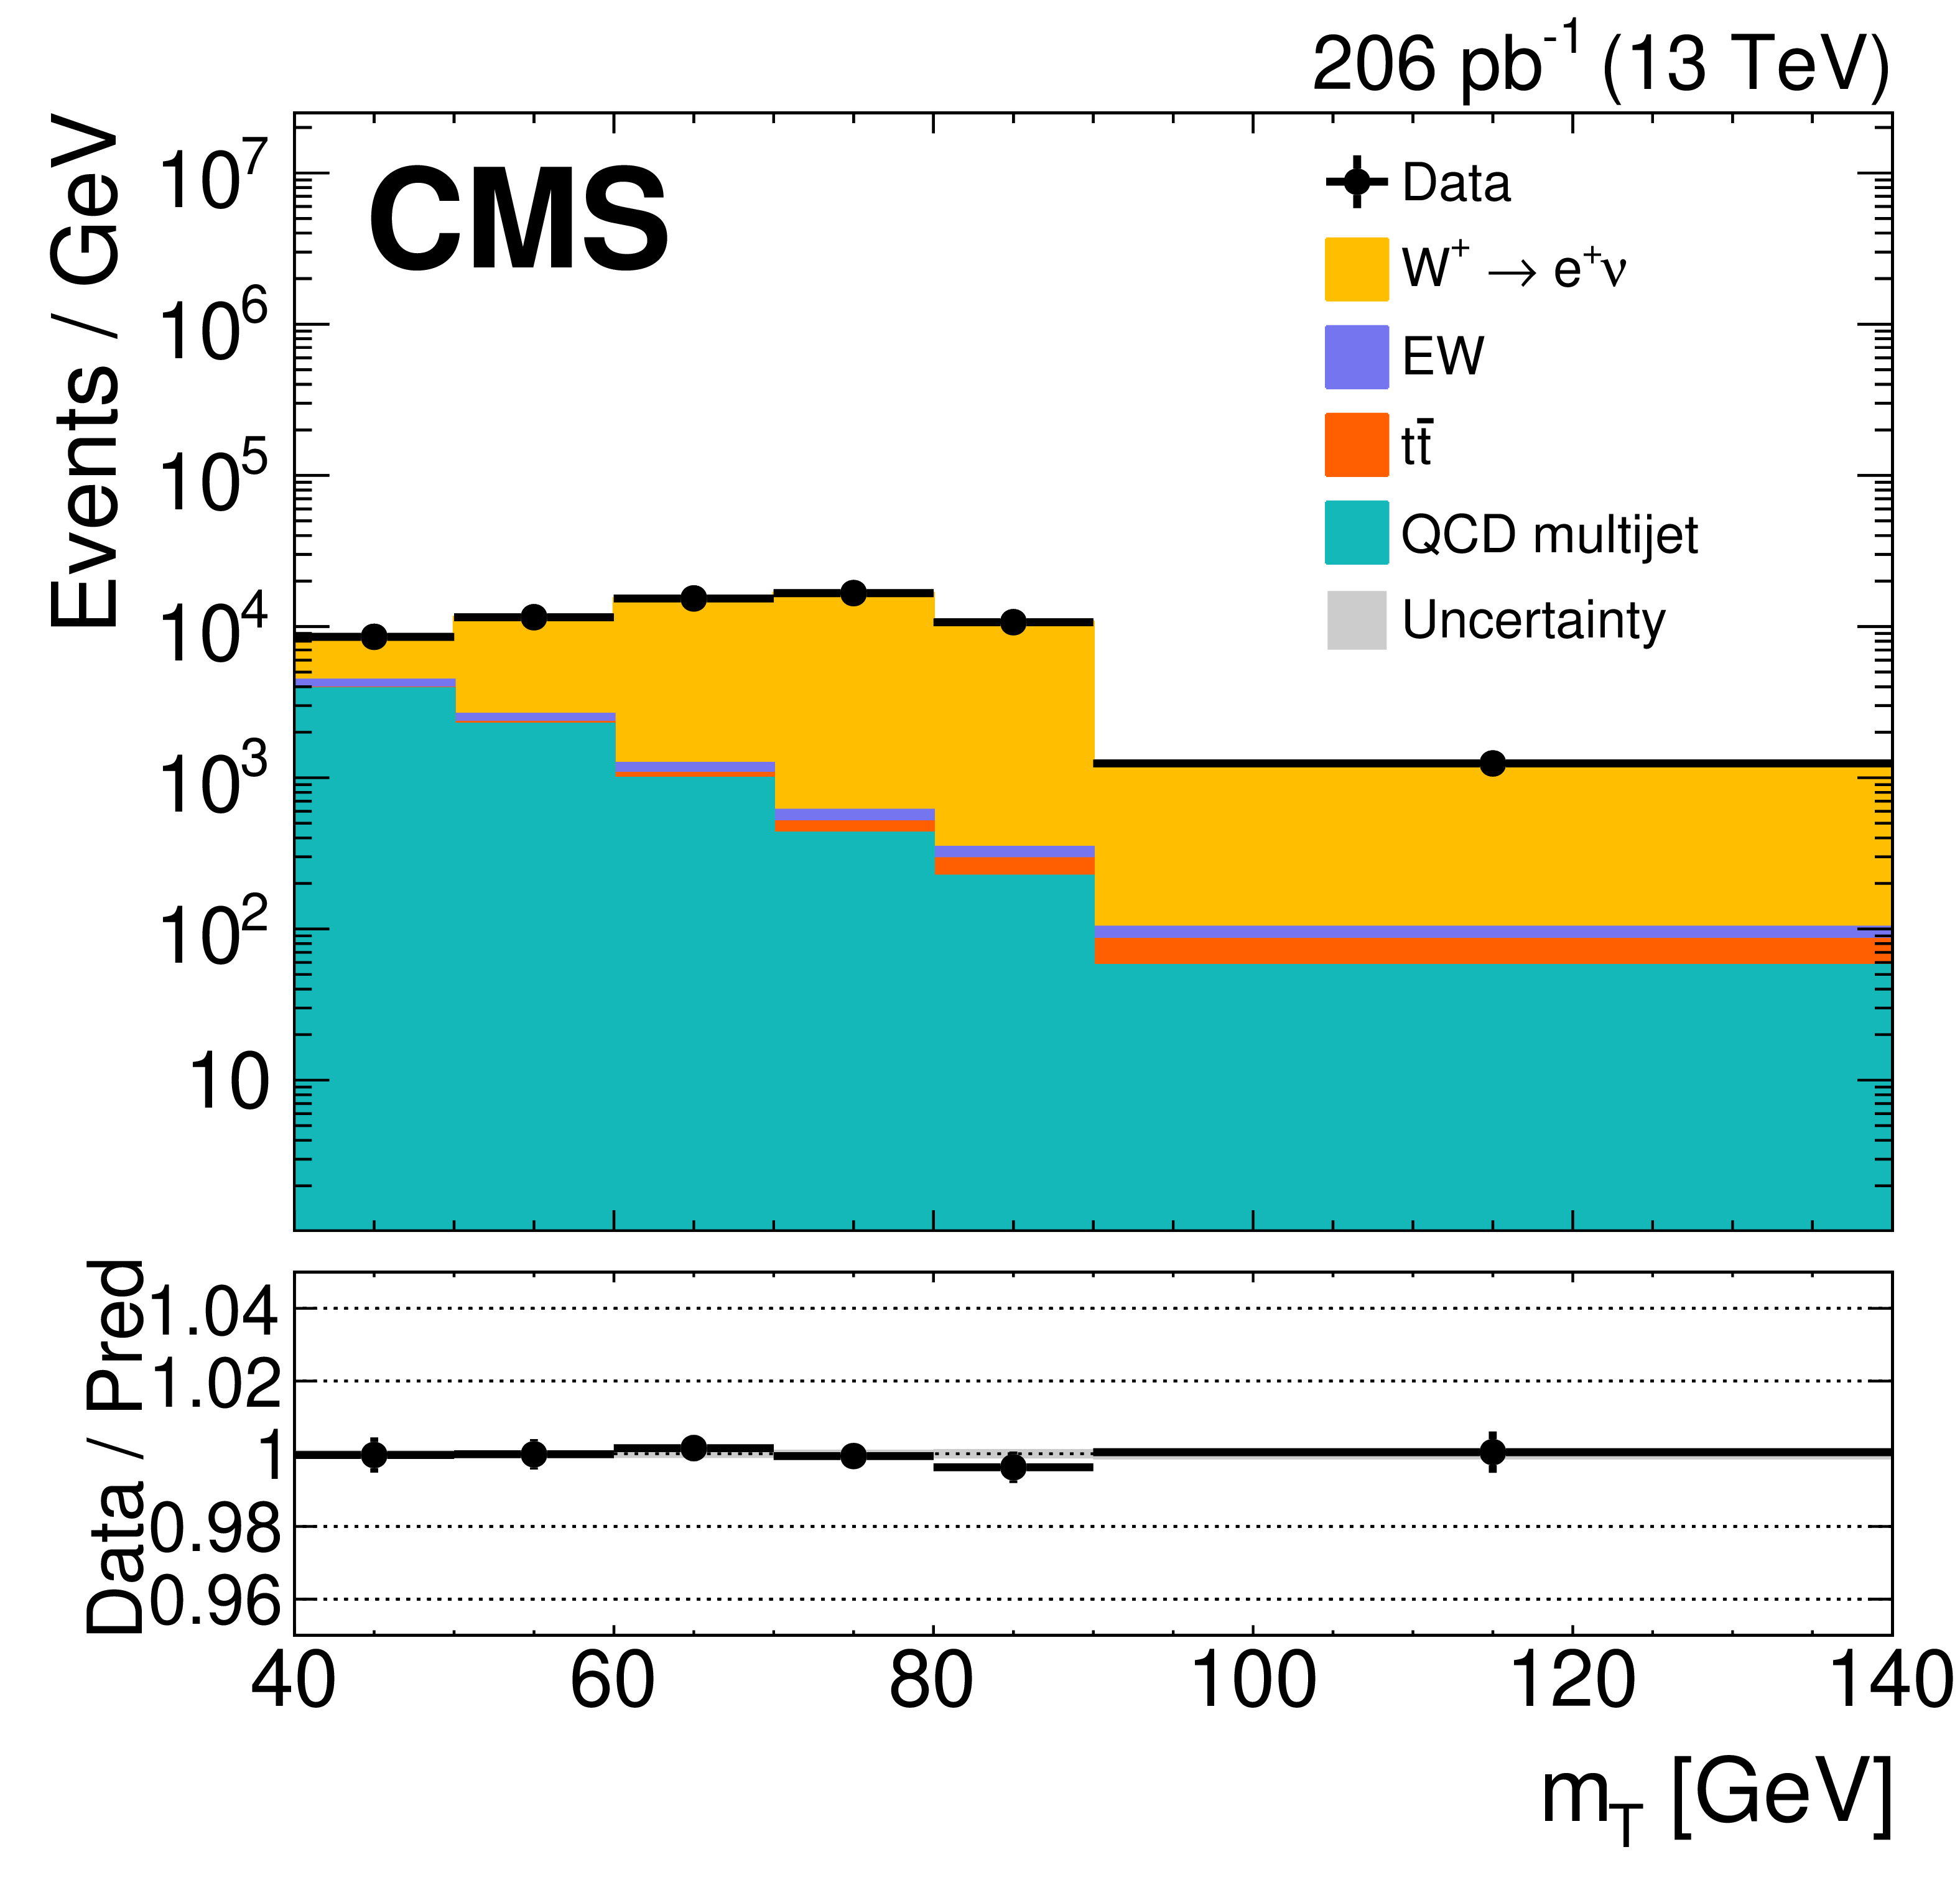
Figure 1-c:
Distributions of $ m_{\mathrm{T}} $ in the W$^{+}$ signal selection for electron (left) and muon (right) final states for the pp collisions at $ \sqrt{s}= $ 5.02 TeV (upper) and 13 TeV (lower) after the maximum likelihood fit. The vertical bars on the observed data represent corresponding statistical uncertainties. The EW backgrounds include the contributions from DY, $ \mathrm{W}\to\tau\nu $, and diboson processes. The lower panel in each plot shows the ratio of the number of observed events to that of the total signal and background predictions. The gray band represents the uncertainty in the total prediction after the fit. |

png pdf |
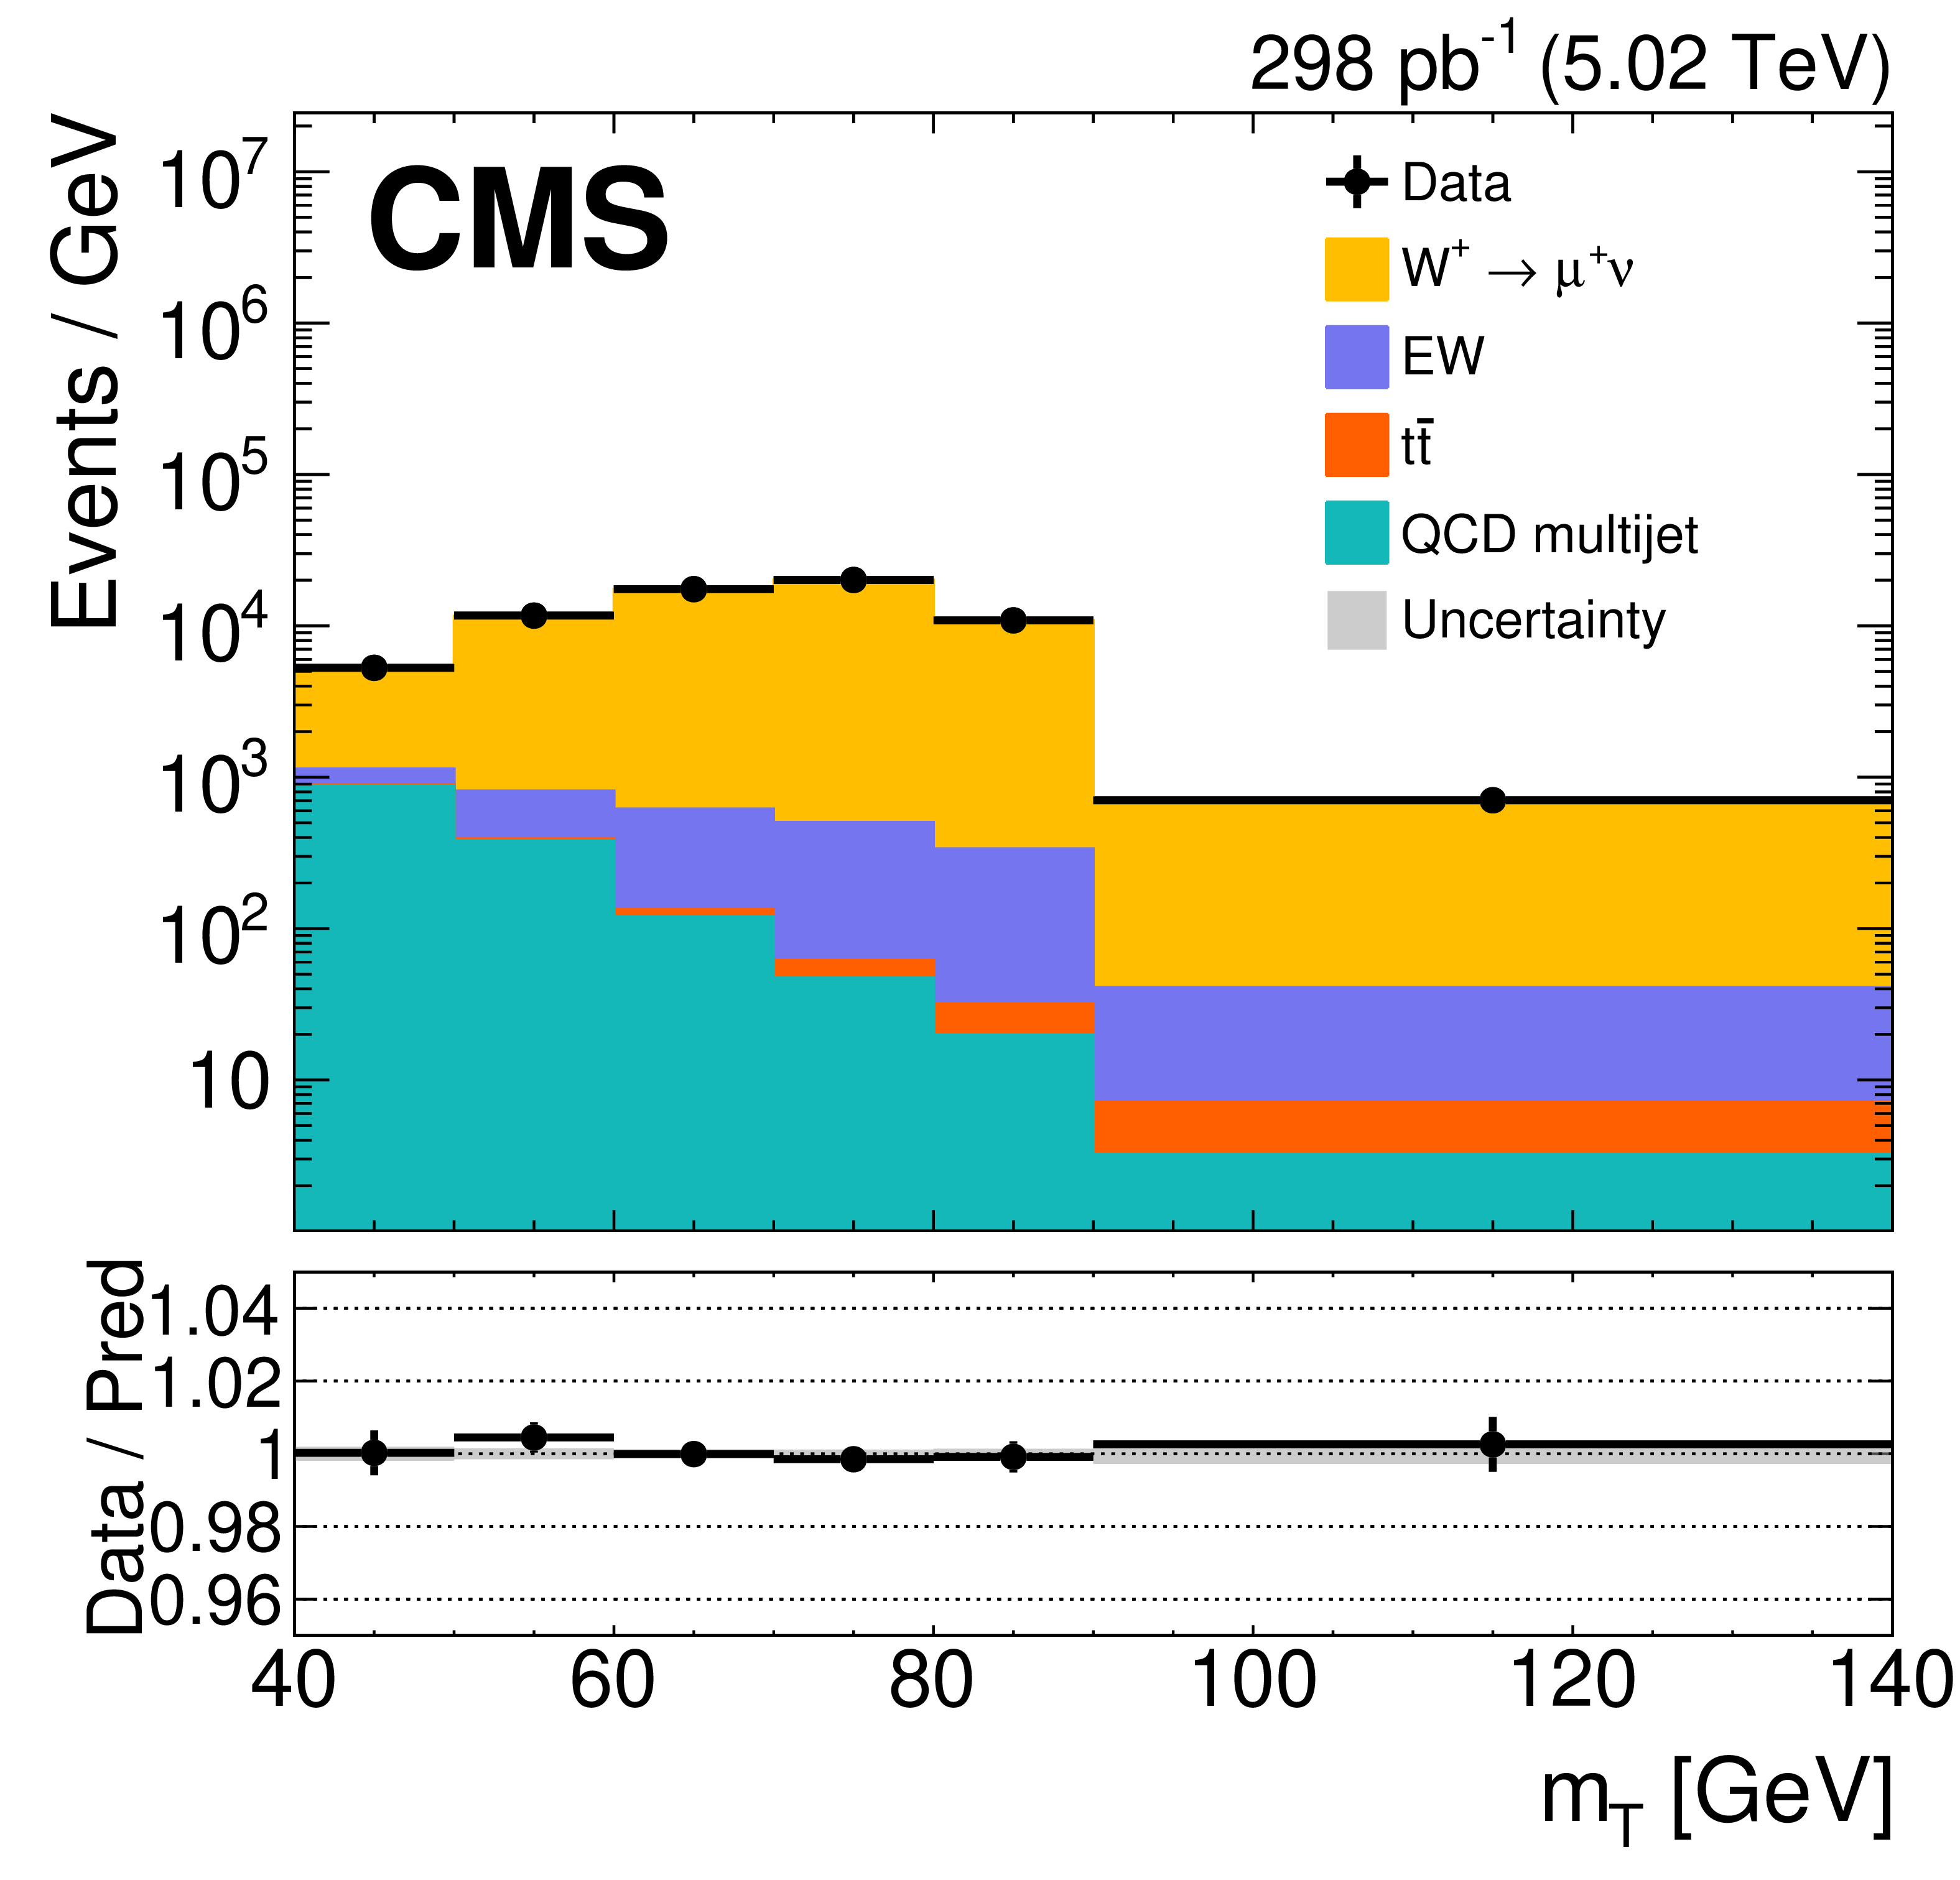
Figure 1-d:
Distributions of $ m_{\mathrm{T}} $ in the W$^{+}$ signal selection for electron (left) and muon (right) final states for the pp collisions at $ \sqrt{s}= $ 5.02 TeV (upper) and 13 TeV (lower) after the maximum likelihood fit. The vertical bars on the observed data represent corresponding statistical uncertainties. The EW backgrounds include the contributions from DY, $ \mathrm{W}\to\tau\nu $, and diboson processes. The lower panel in each plot shows the ratio of the number of observed events to that of the total signal and background predictions. The gray band represents the uncertainty in the total prediction after the fit. |
png pdf |
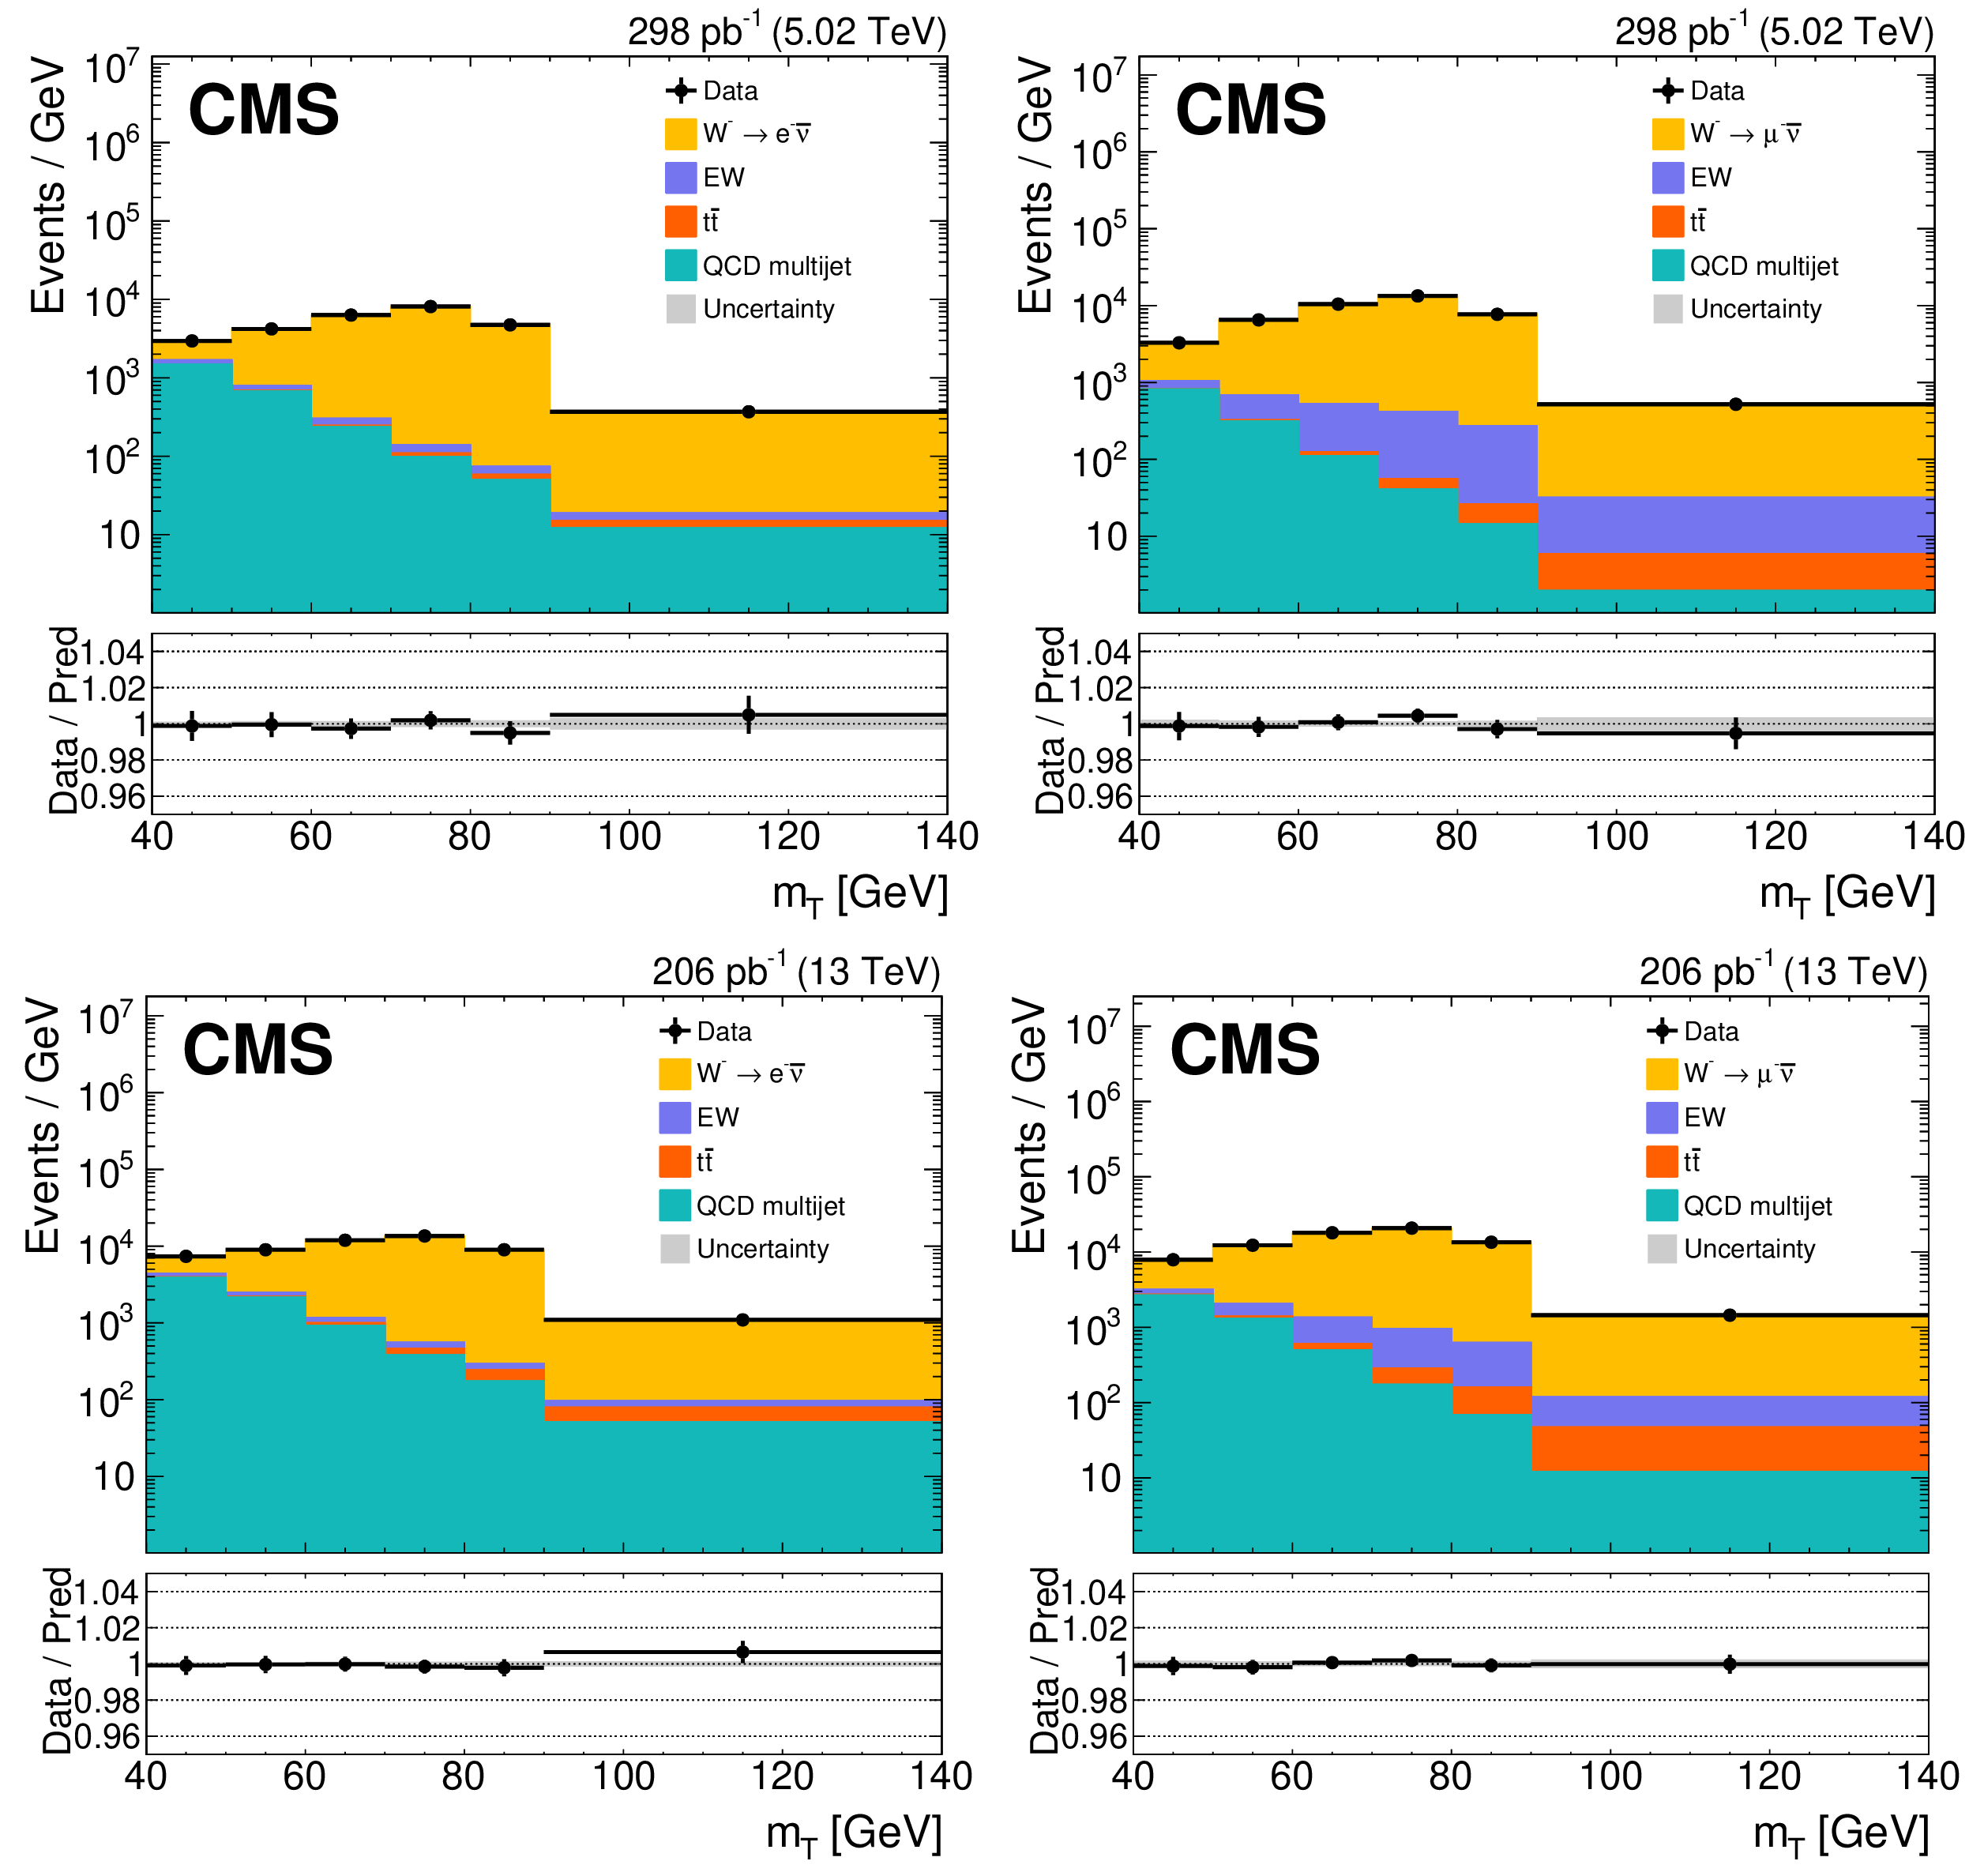
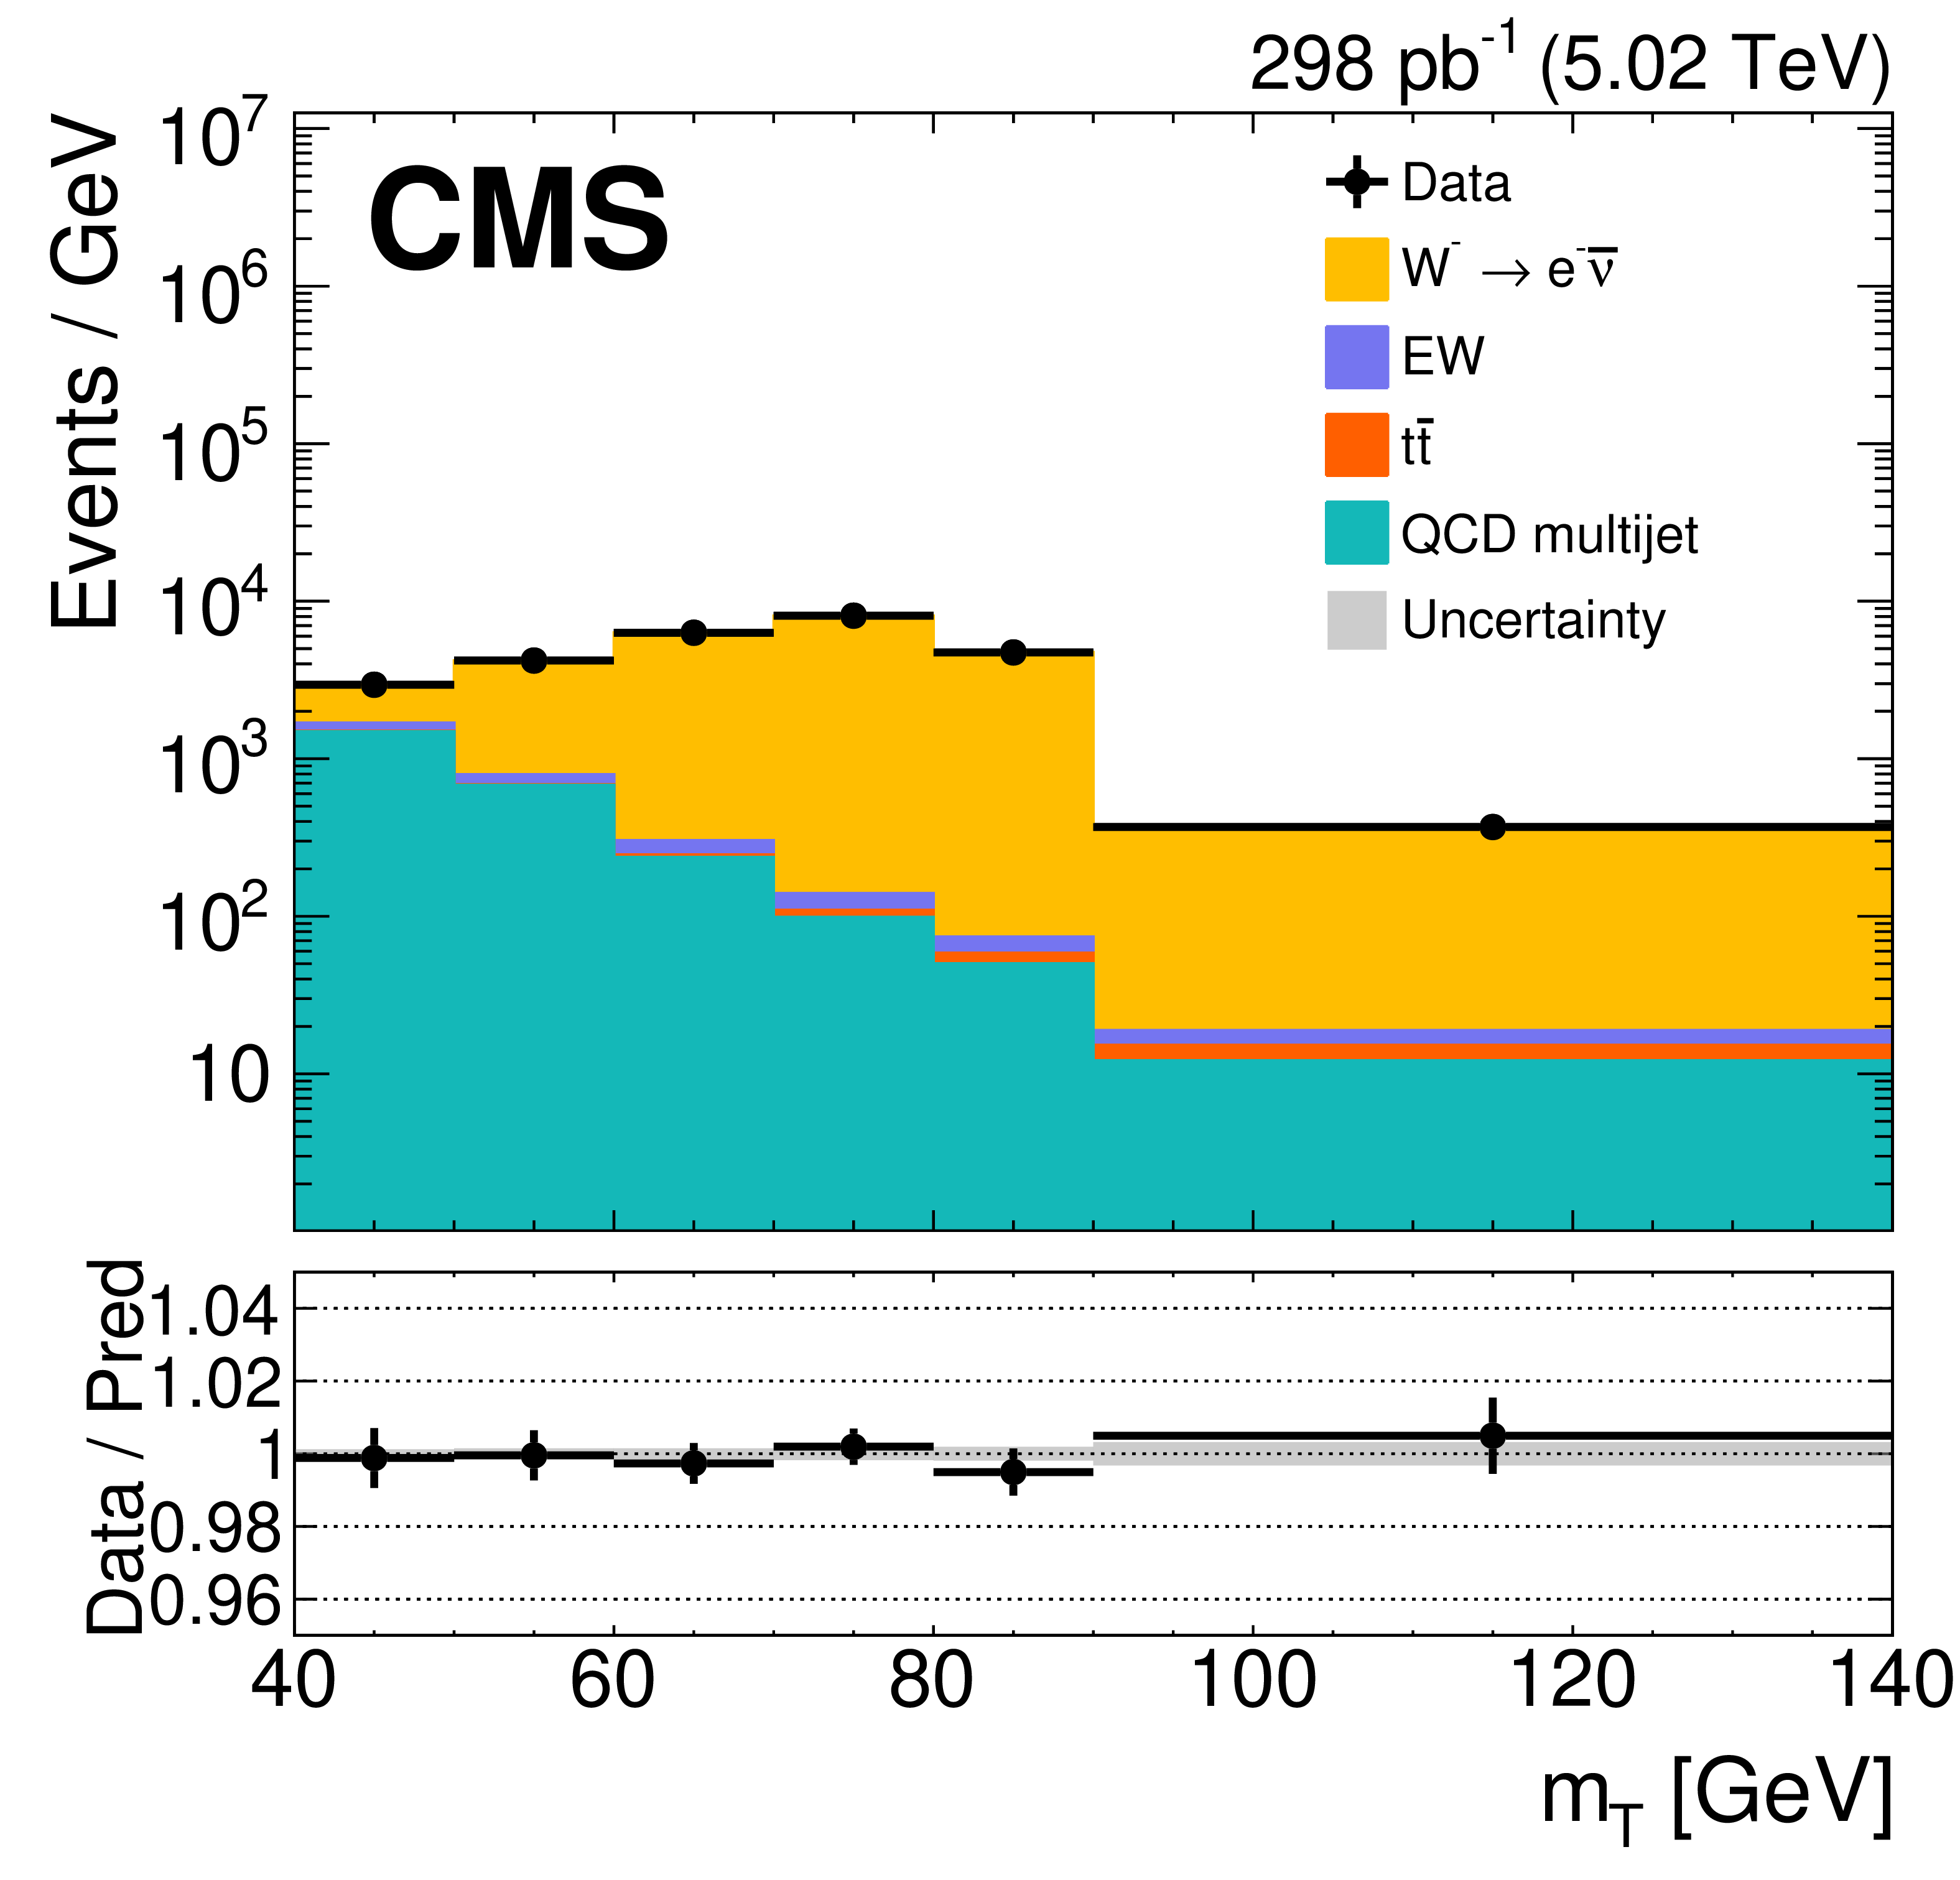
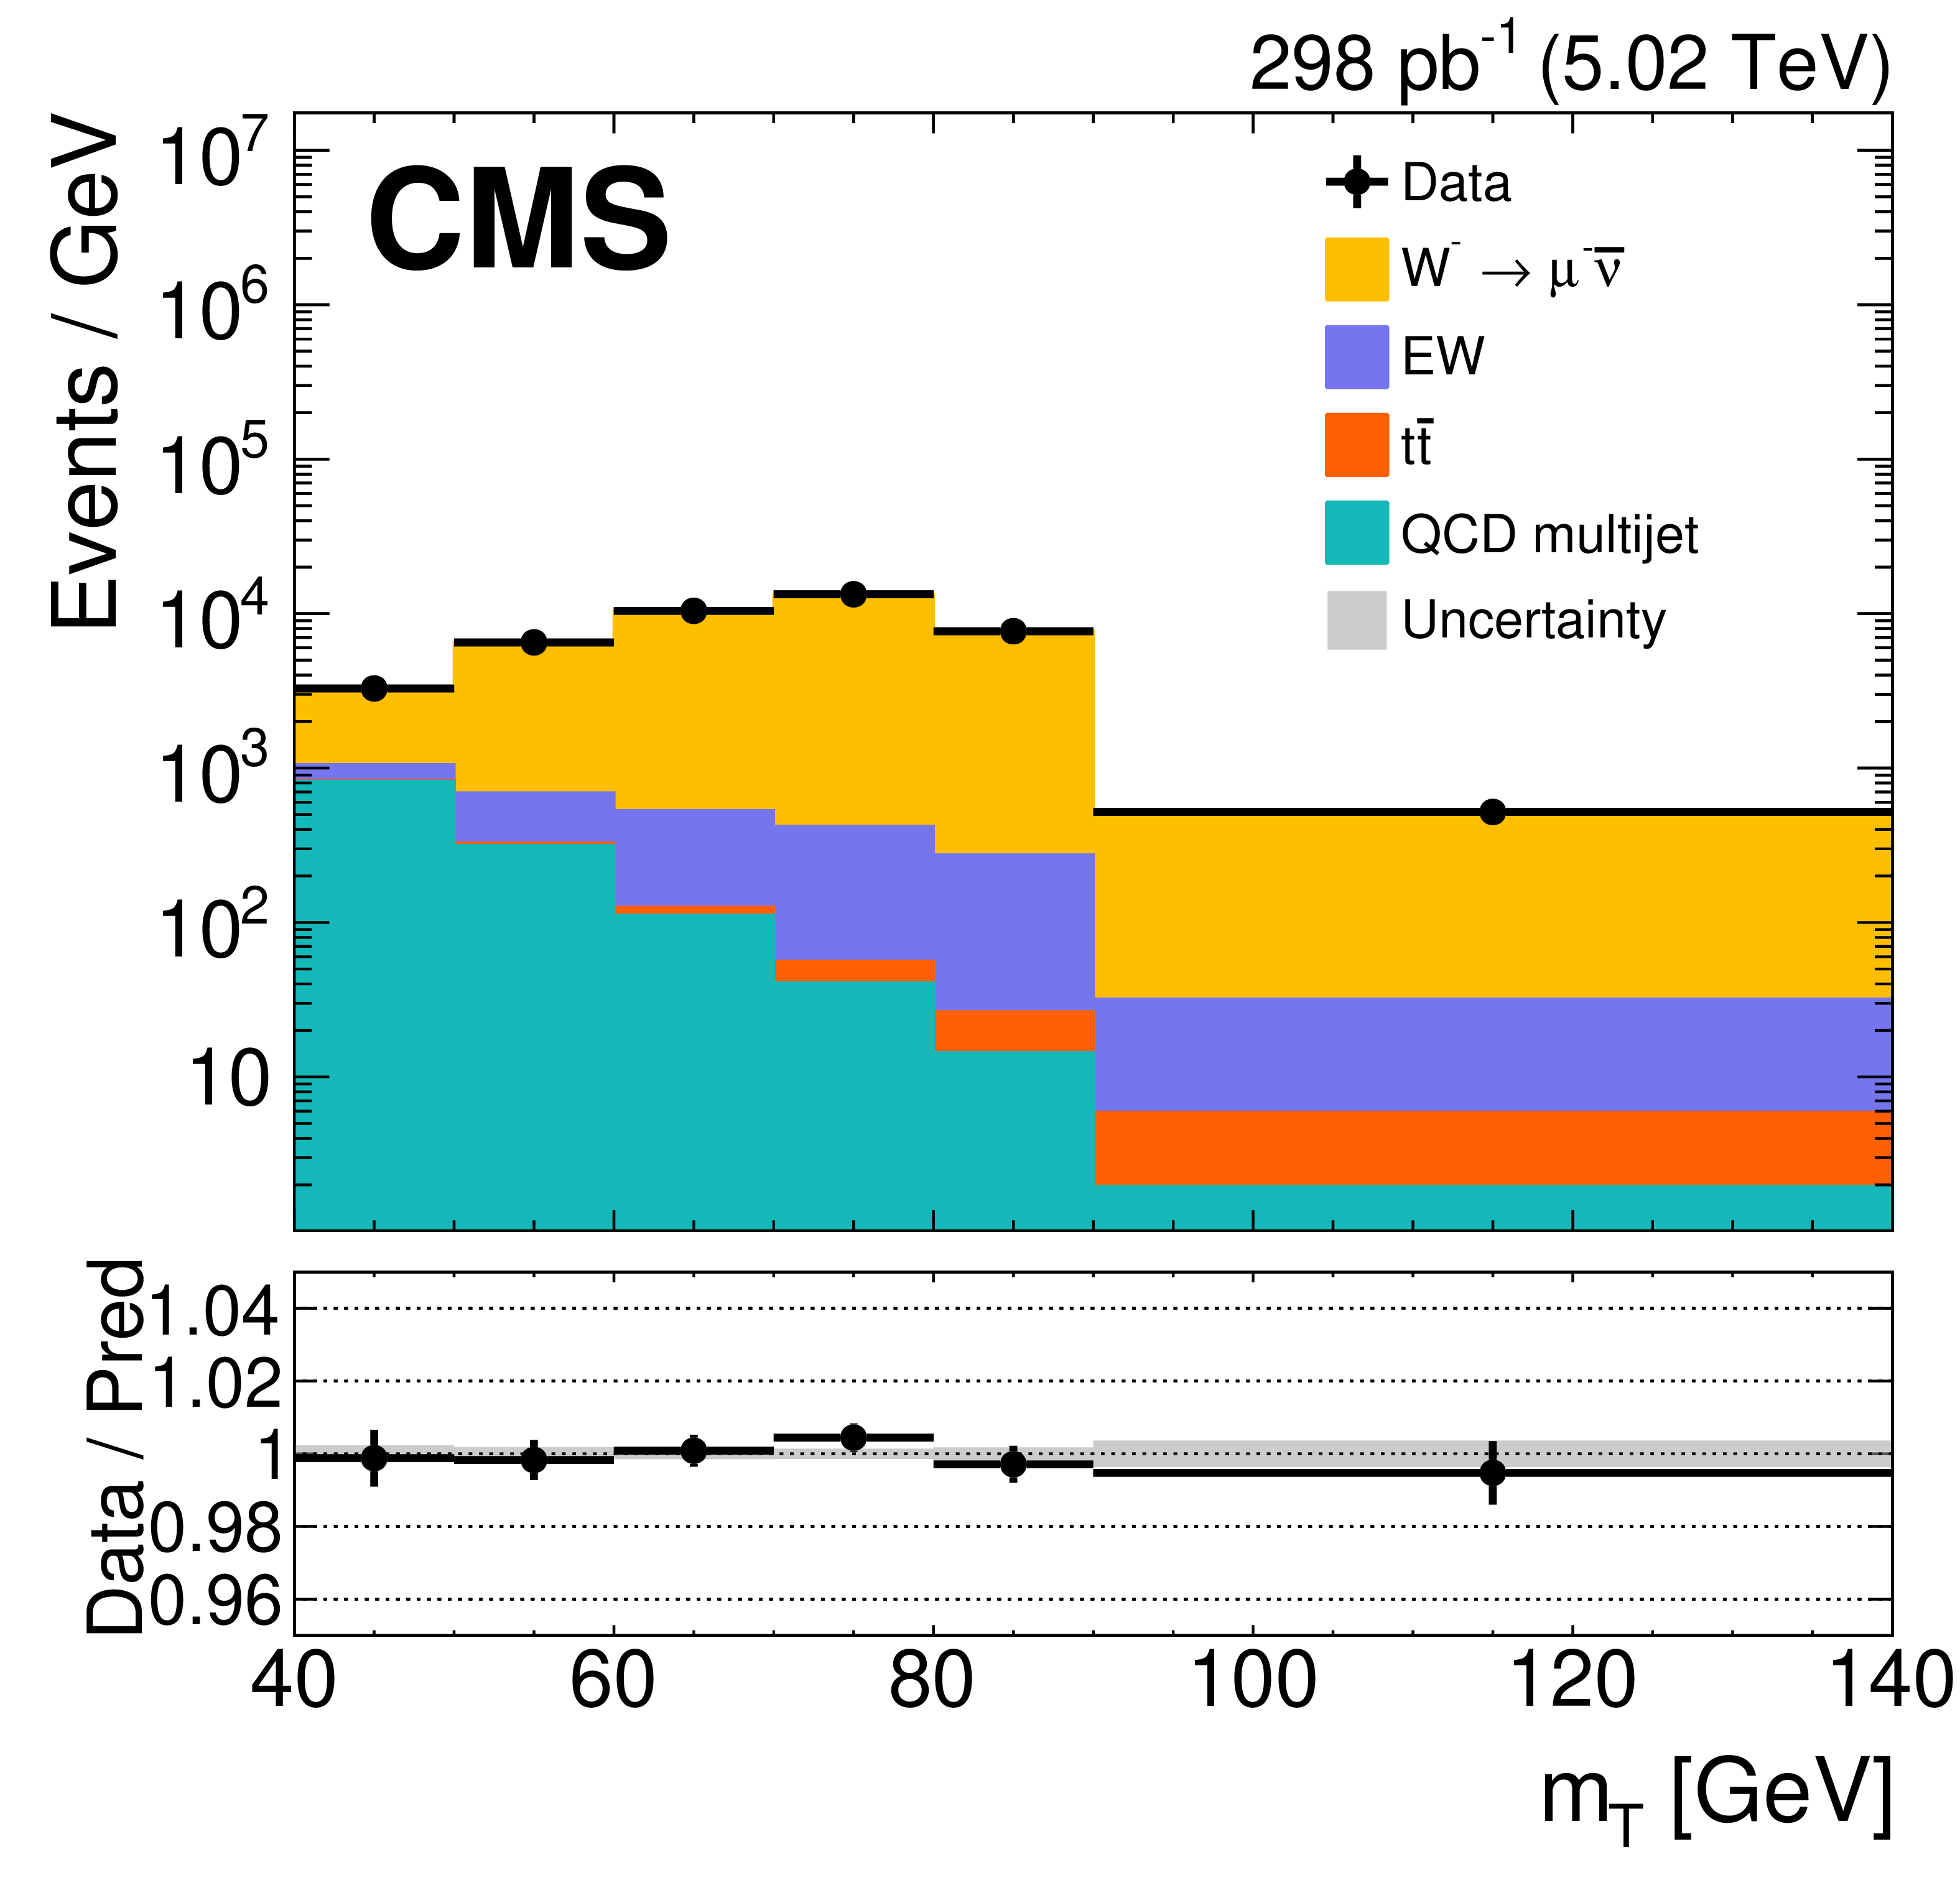
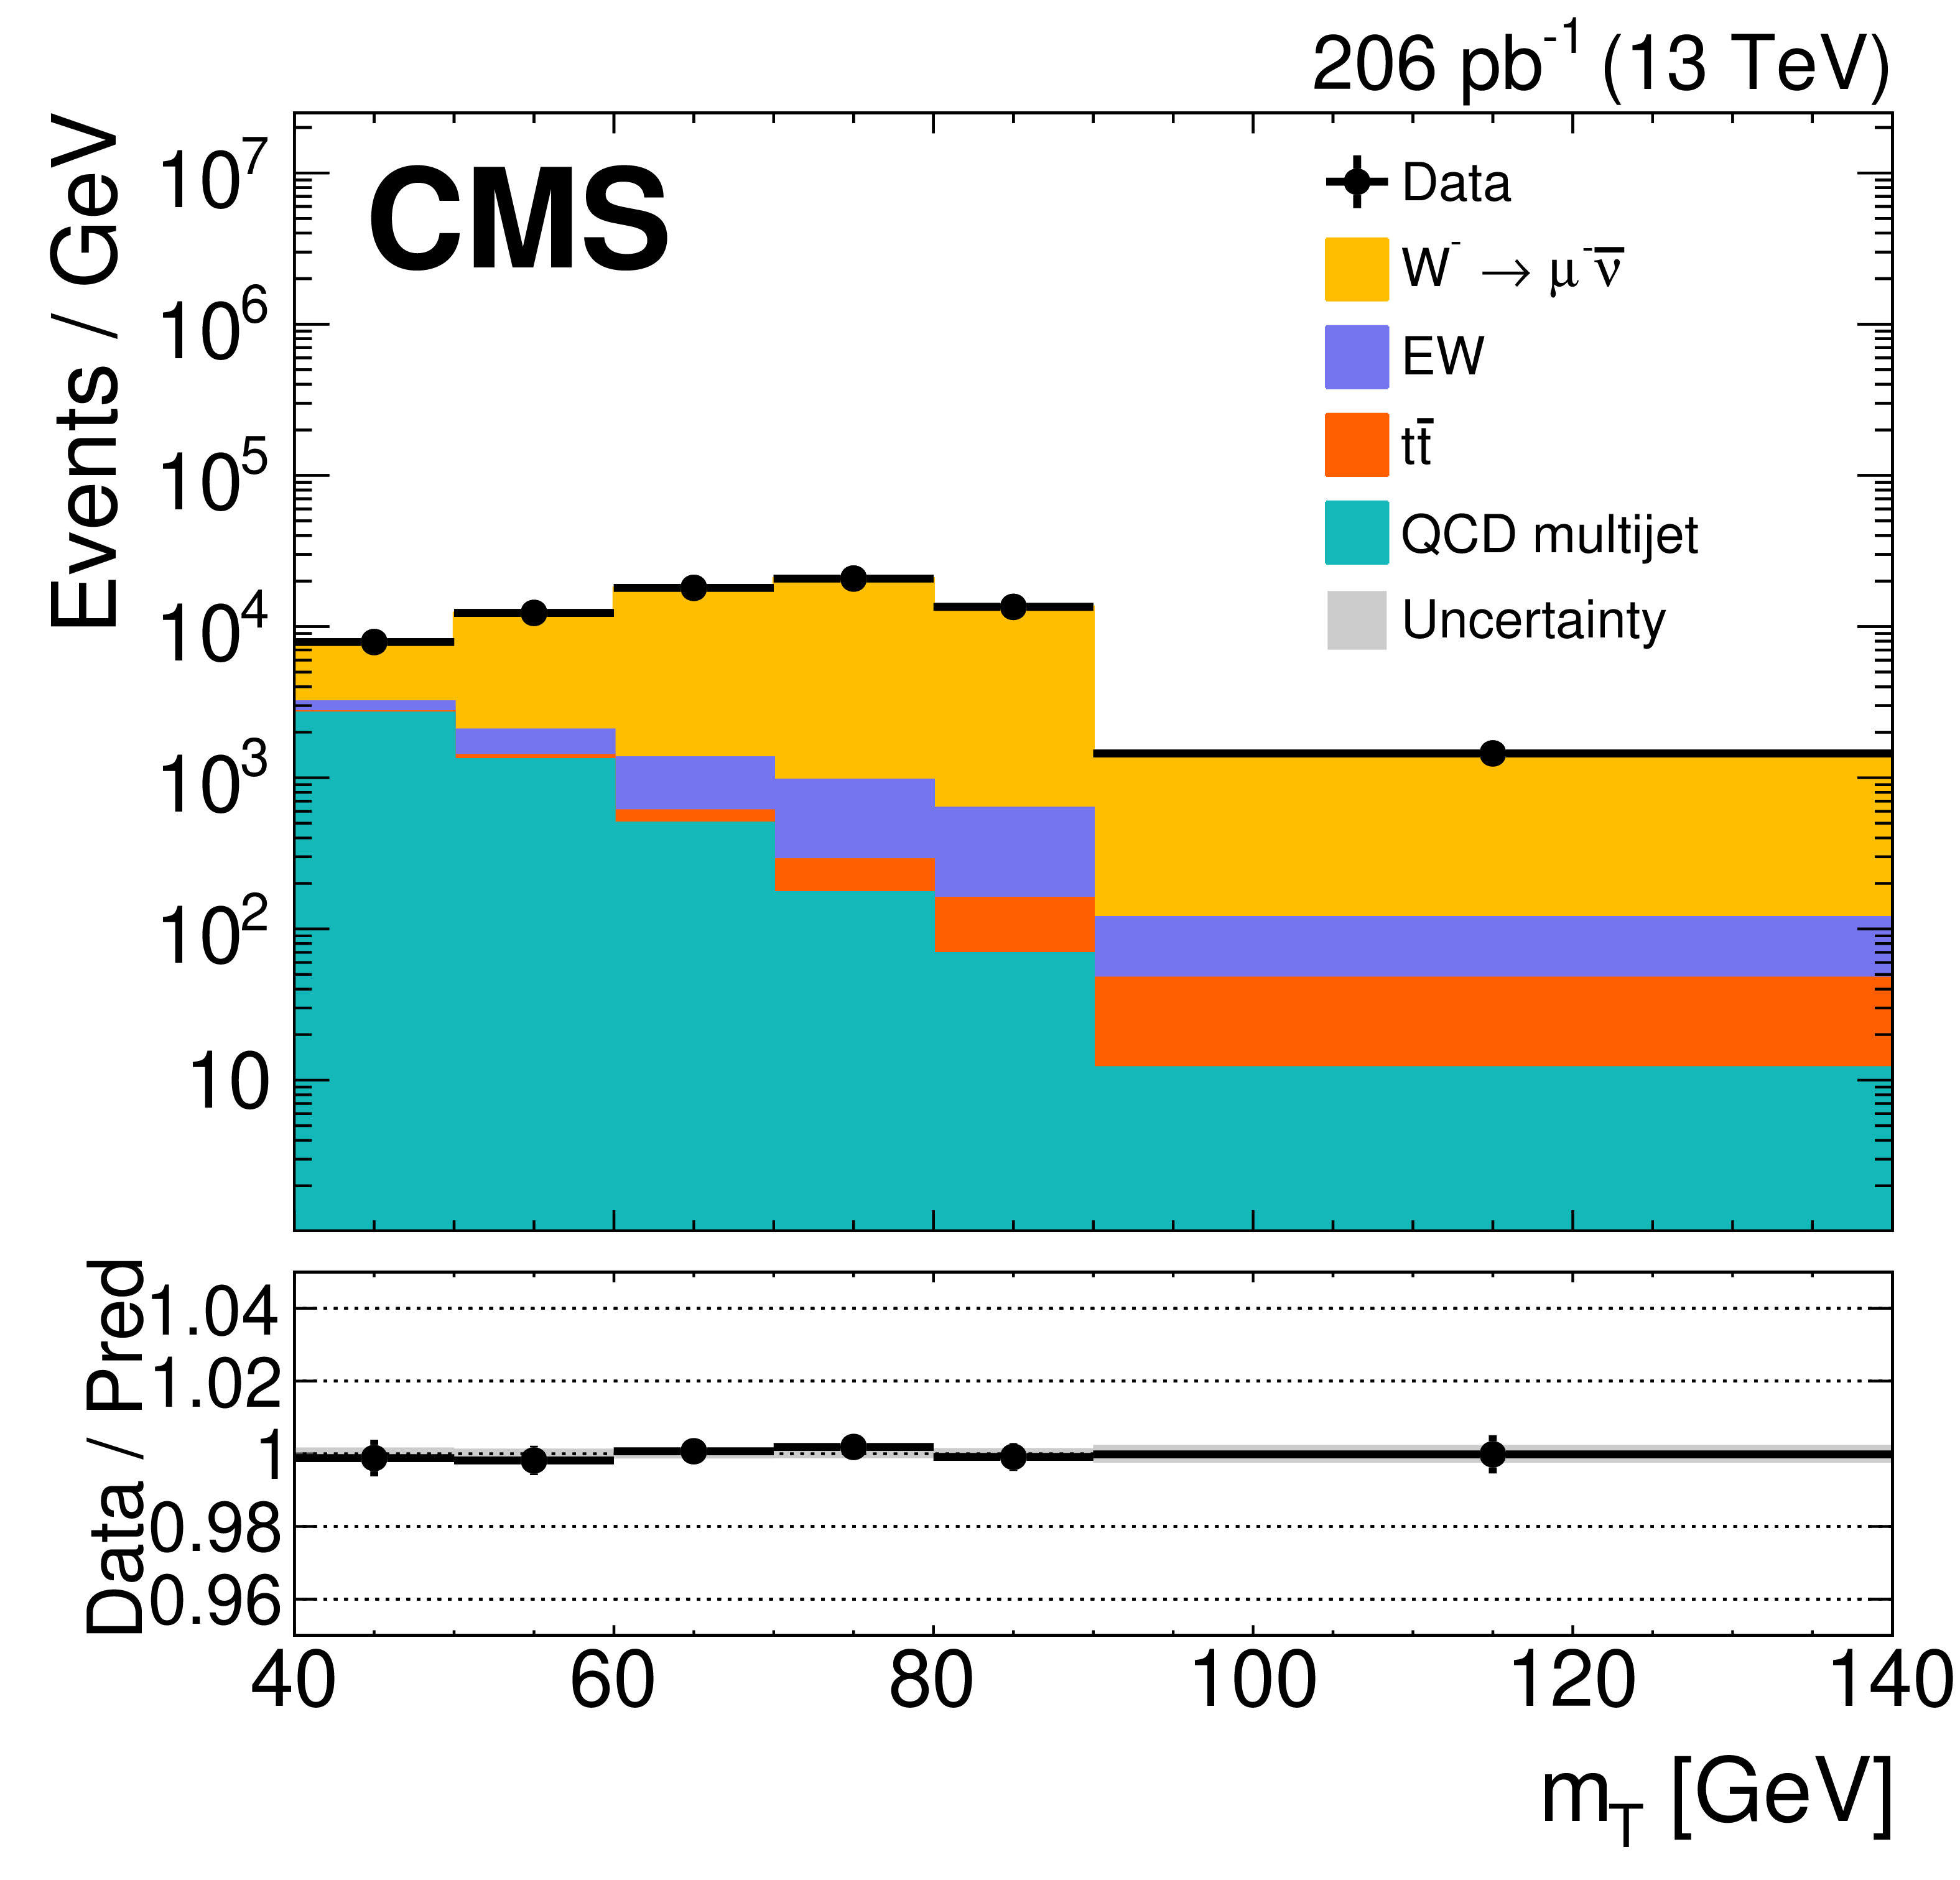
Figure 2:
Distributions of $ m_{\mathrm{T}} $ in the W$^{-}$ signal selection for electron (left) and muon (right) final states for the pp collisions at $ \sqrt{s}= $ 5.02 TeV (upper) and 13 TeV (lower) after the maximum likelihood fit. The EW backgrounds include the contributions from DY, $ \mathrm{W}\to\tau\nu $, and diboson processes. Notations are as in Fig. 1. |
png pdf |
Figure 2-a:
Distributions of $ m_{\mathrm{T}} $ in the W$^{-}$ signal selection for electron (left) and muon (right) final states for the pp collisions at $ \sqrt{s}= $ 5.02 TeV (upper) and 13 TeV (lower) after the maximum likelihood fit. The EW backgrounds include the contributions from DY, $ \mathrm{W}\to\tau\nu $, and diboson processes. Notations are as in Fig. 1. |
png pdf |
Figure 2-b:
Distributions of $ m_{\mathrm{T}} $ in the W$^{-}$ signal selection for electron (left) and muon (right) final states for the pp collisions at $ \sqrt{s}= $ 5.02 TeV (upper) and 13 TeV (lower) after the maximum likelihood fit. The EW backgrounds include the contributions from DY, $ \mathrm{W}\to\tau\nu $, and diboson processes. Notations are as in Fig. 1. |

png pdf |
Figure 2-c:
Distributions of $ m_{\mathrm{T}} $ in the W$^{-}$ signal selection for electron (left) and muon (right) final states for the pp collisions at $ \sqrt{s}= $ 5.02 TeV (upper) and 13 TeV (lower) after the maximum likelihood fit. The EW backgrounds include the contributions from DY, $ \mathrm{W}\to\tau\nu $, and diboson processes. Notations are as in Fig. 1. |
png pdf |
Figure 2-d:
Distributions of $ m_{\mathrm{T}} $ in the W$^{-}$ signal selection for electron (left) and muon (right) final states for the pp collisions at $ \sqrt{s}= $ 5.02 TeV (upper) and 13 TeV (lower) after the maximum likelihood fit. The EW backgrounds include the contributions from DY, $ \mathrm{W}\to\tau\nu $, and diboson processes. Notations are as in Fig. 1. |
png pdf |
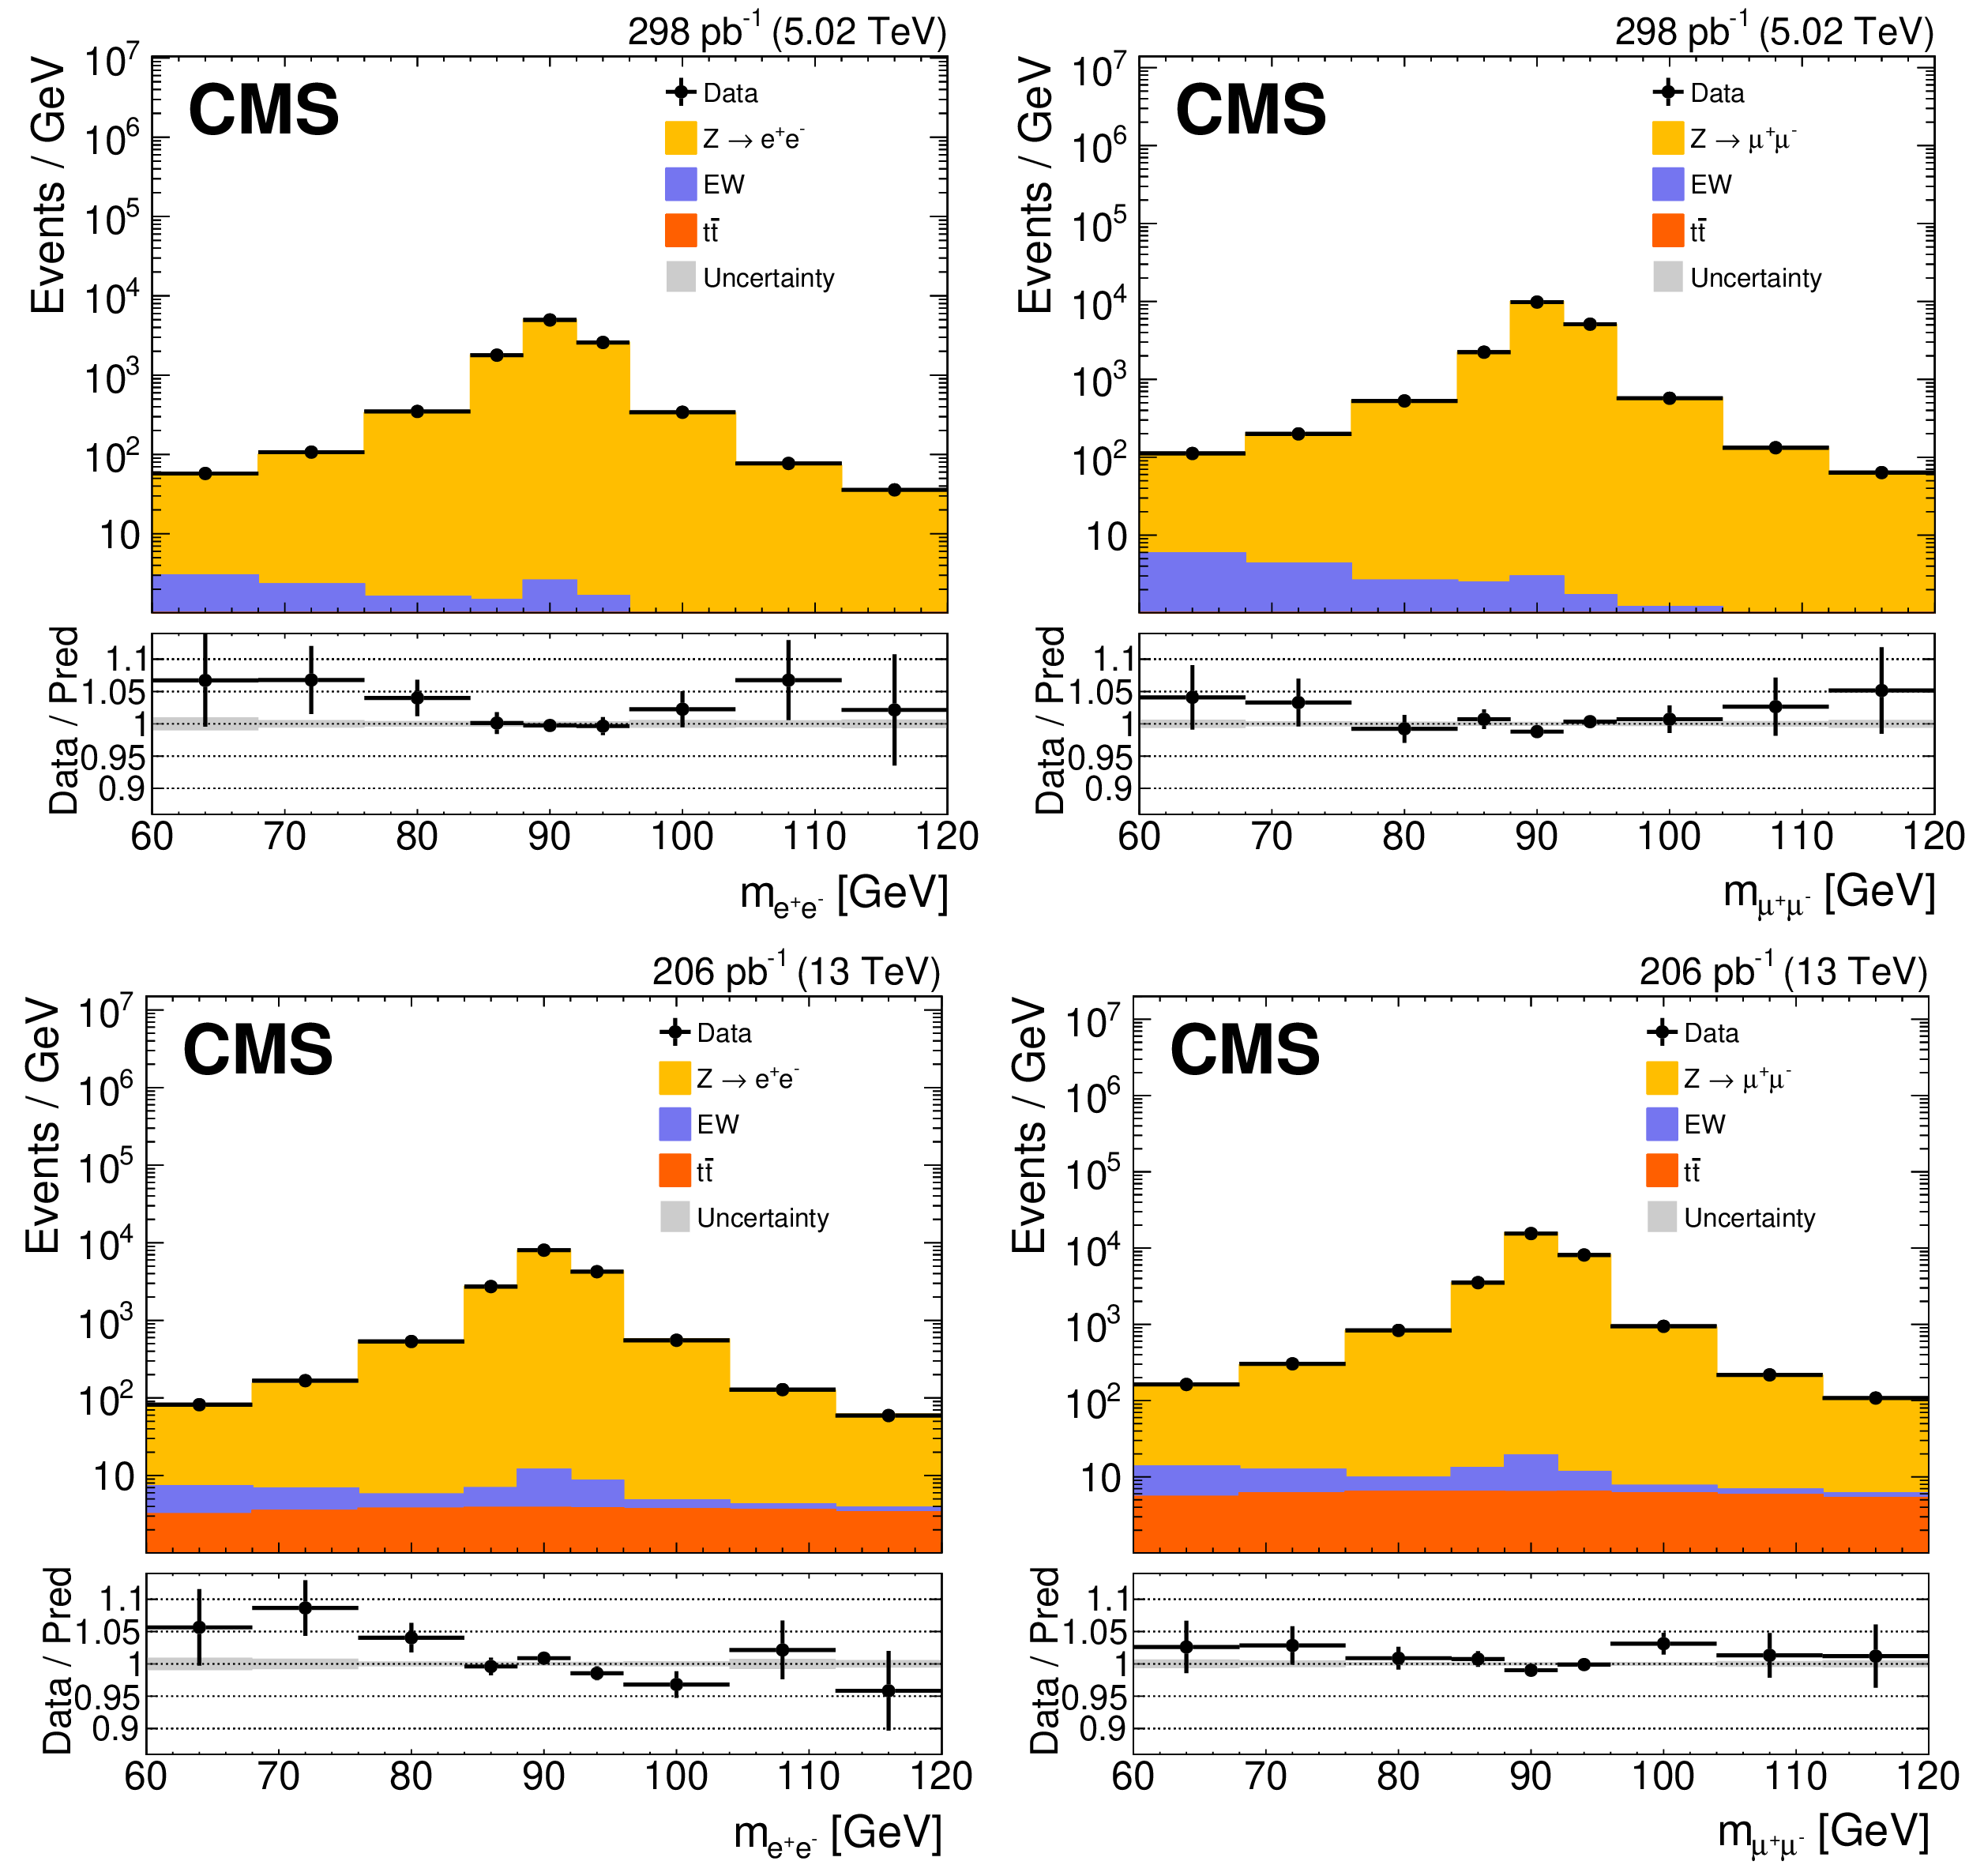
Figure 3:
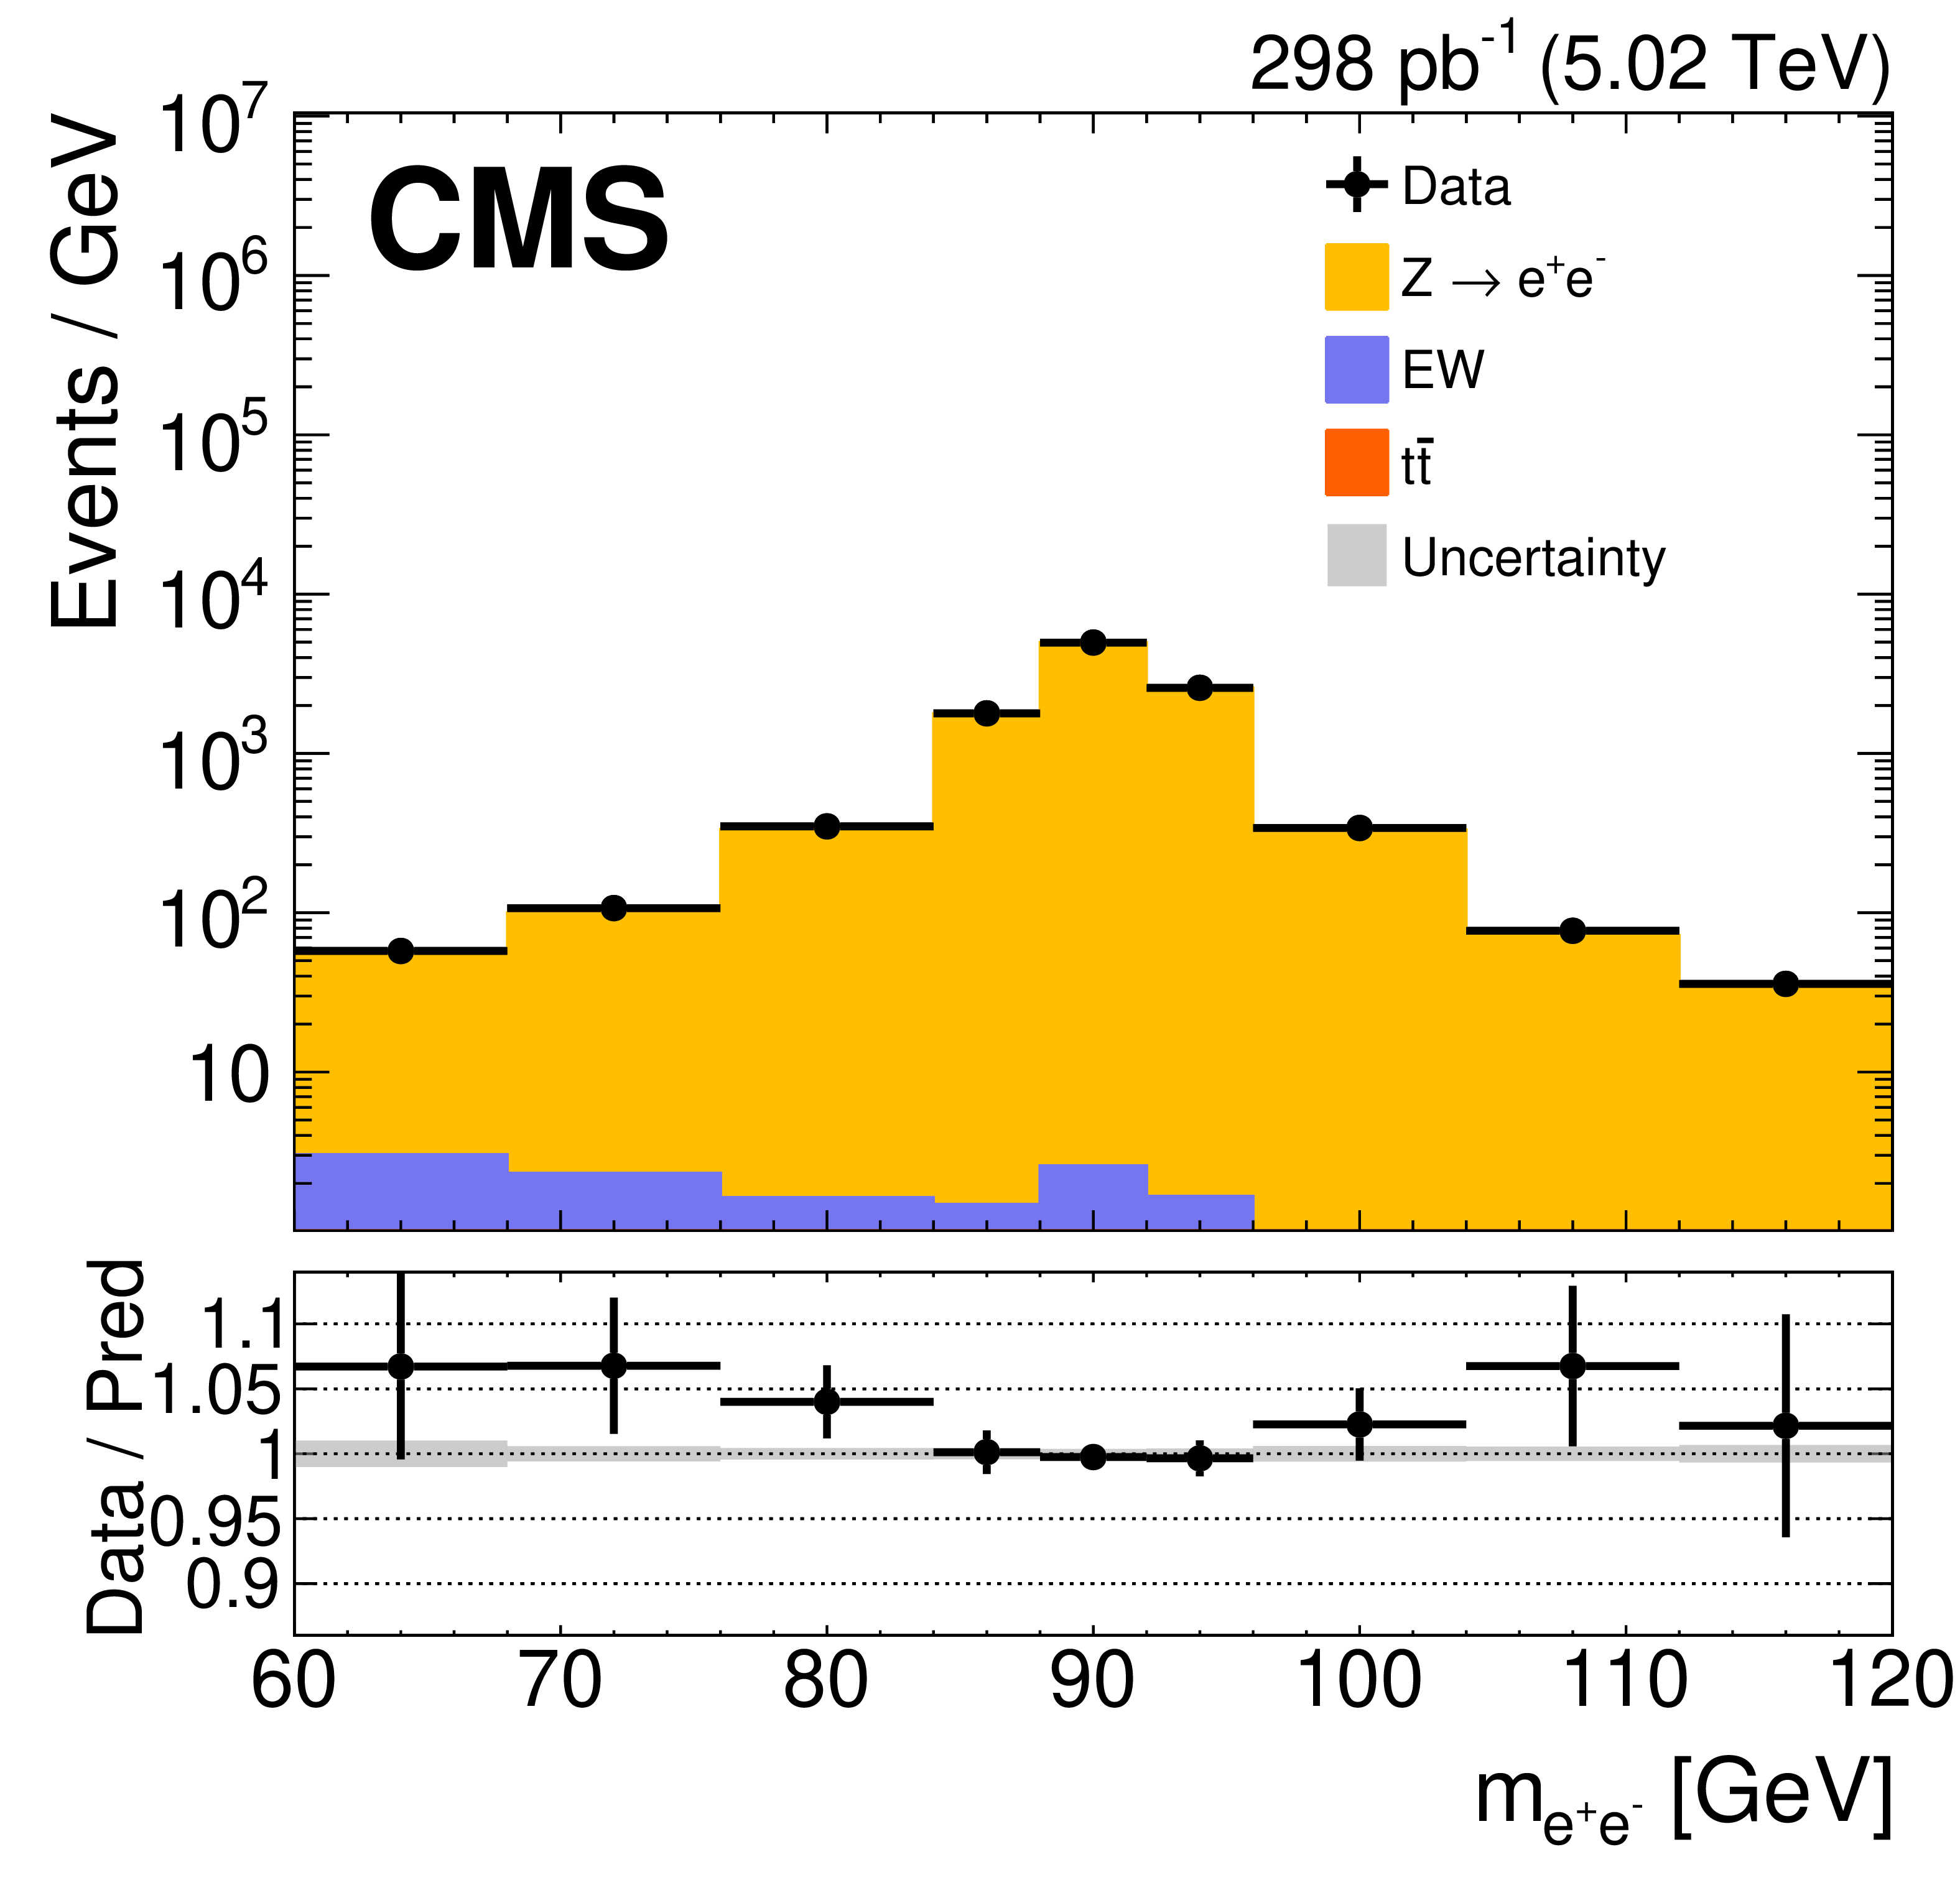
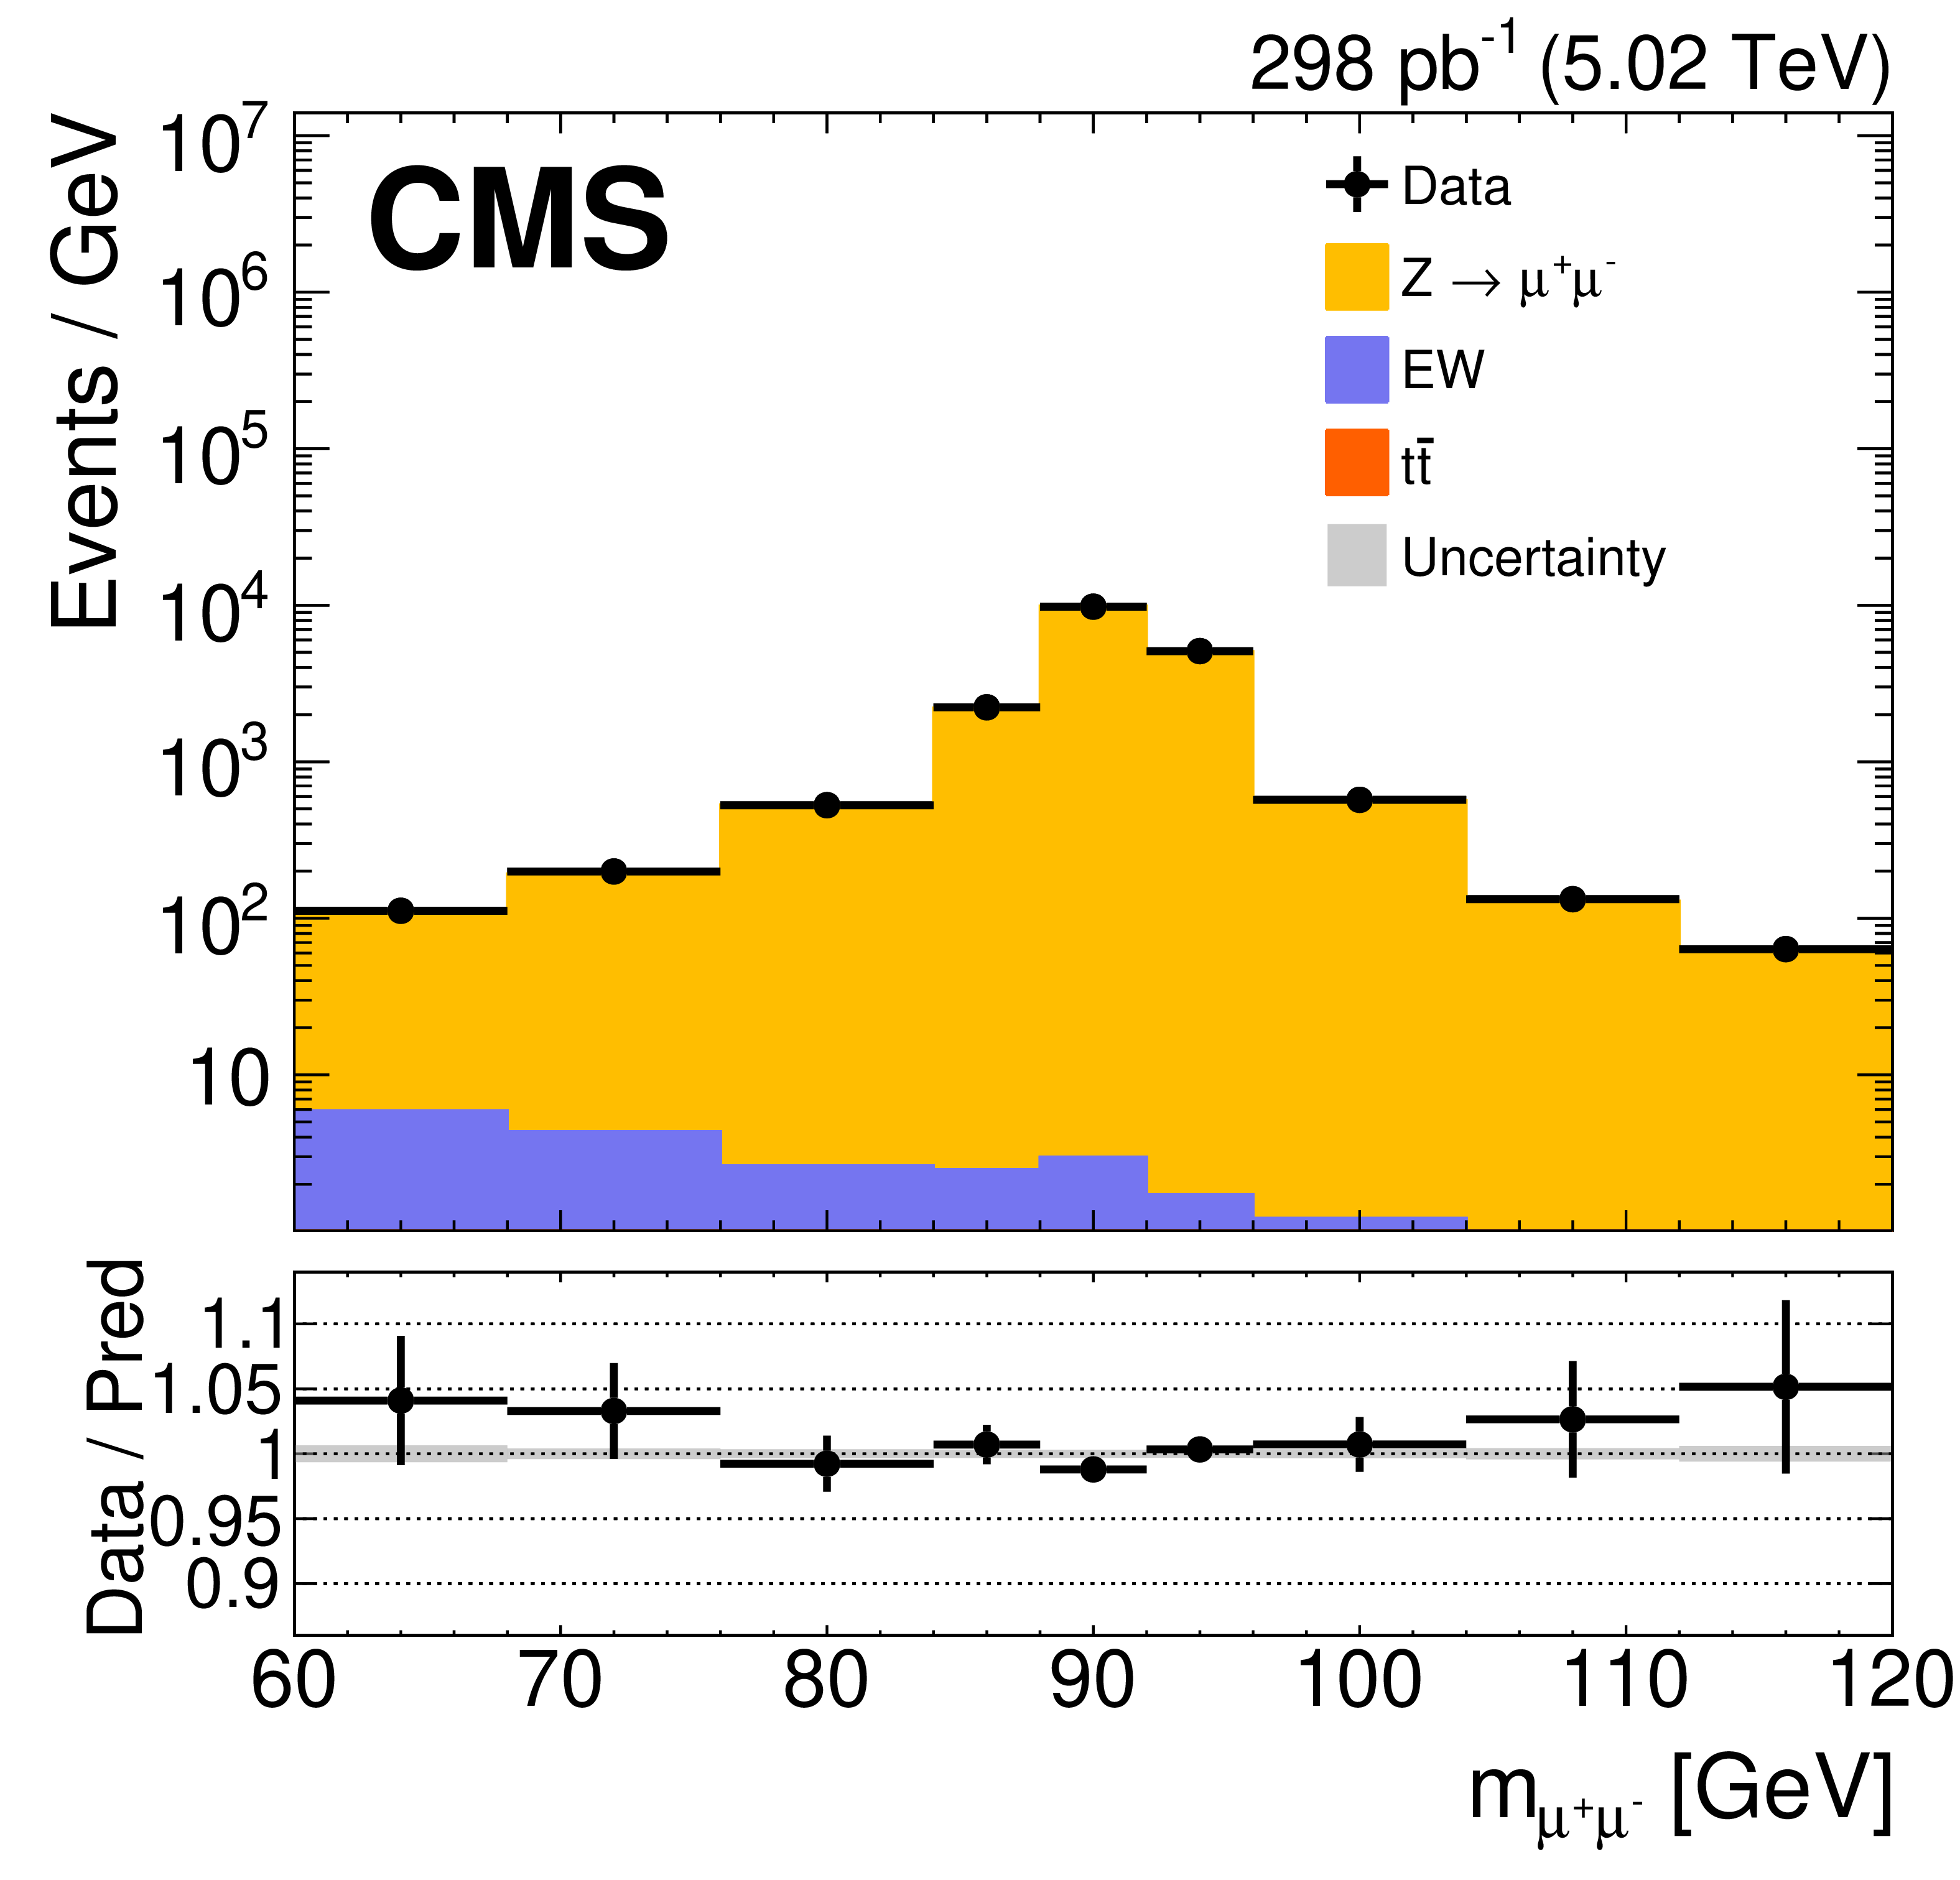
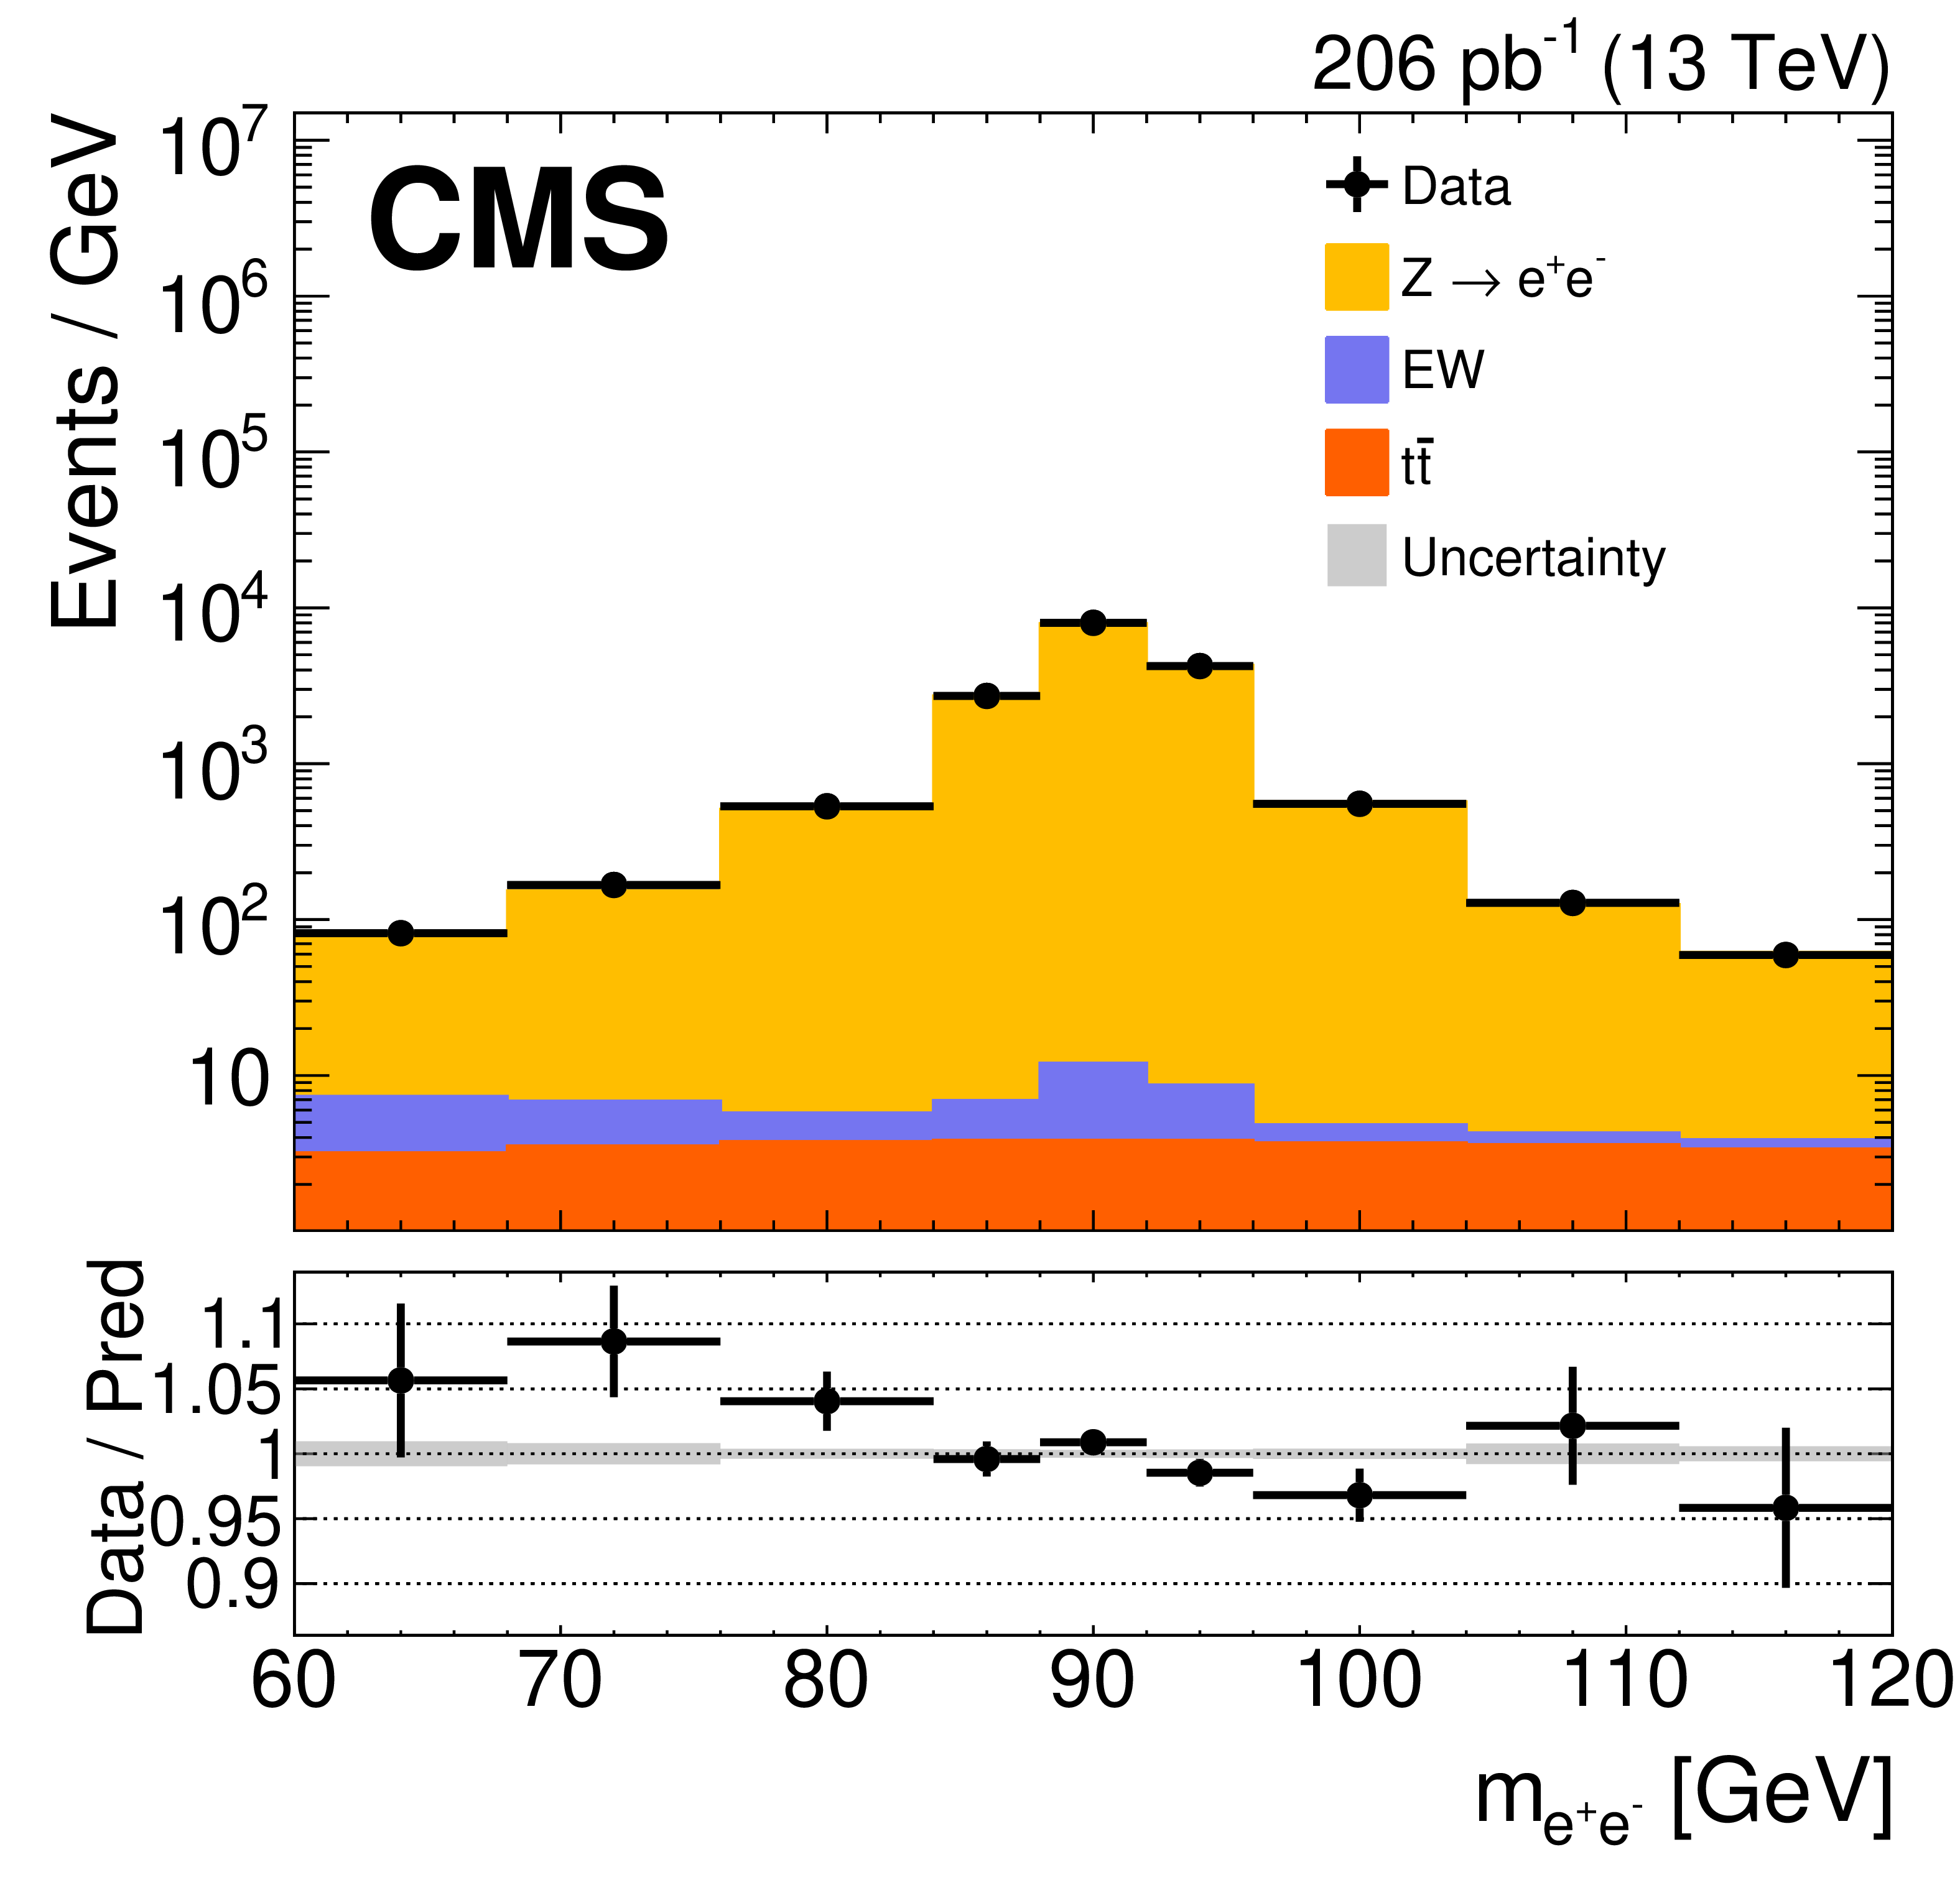
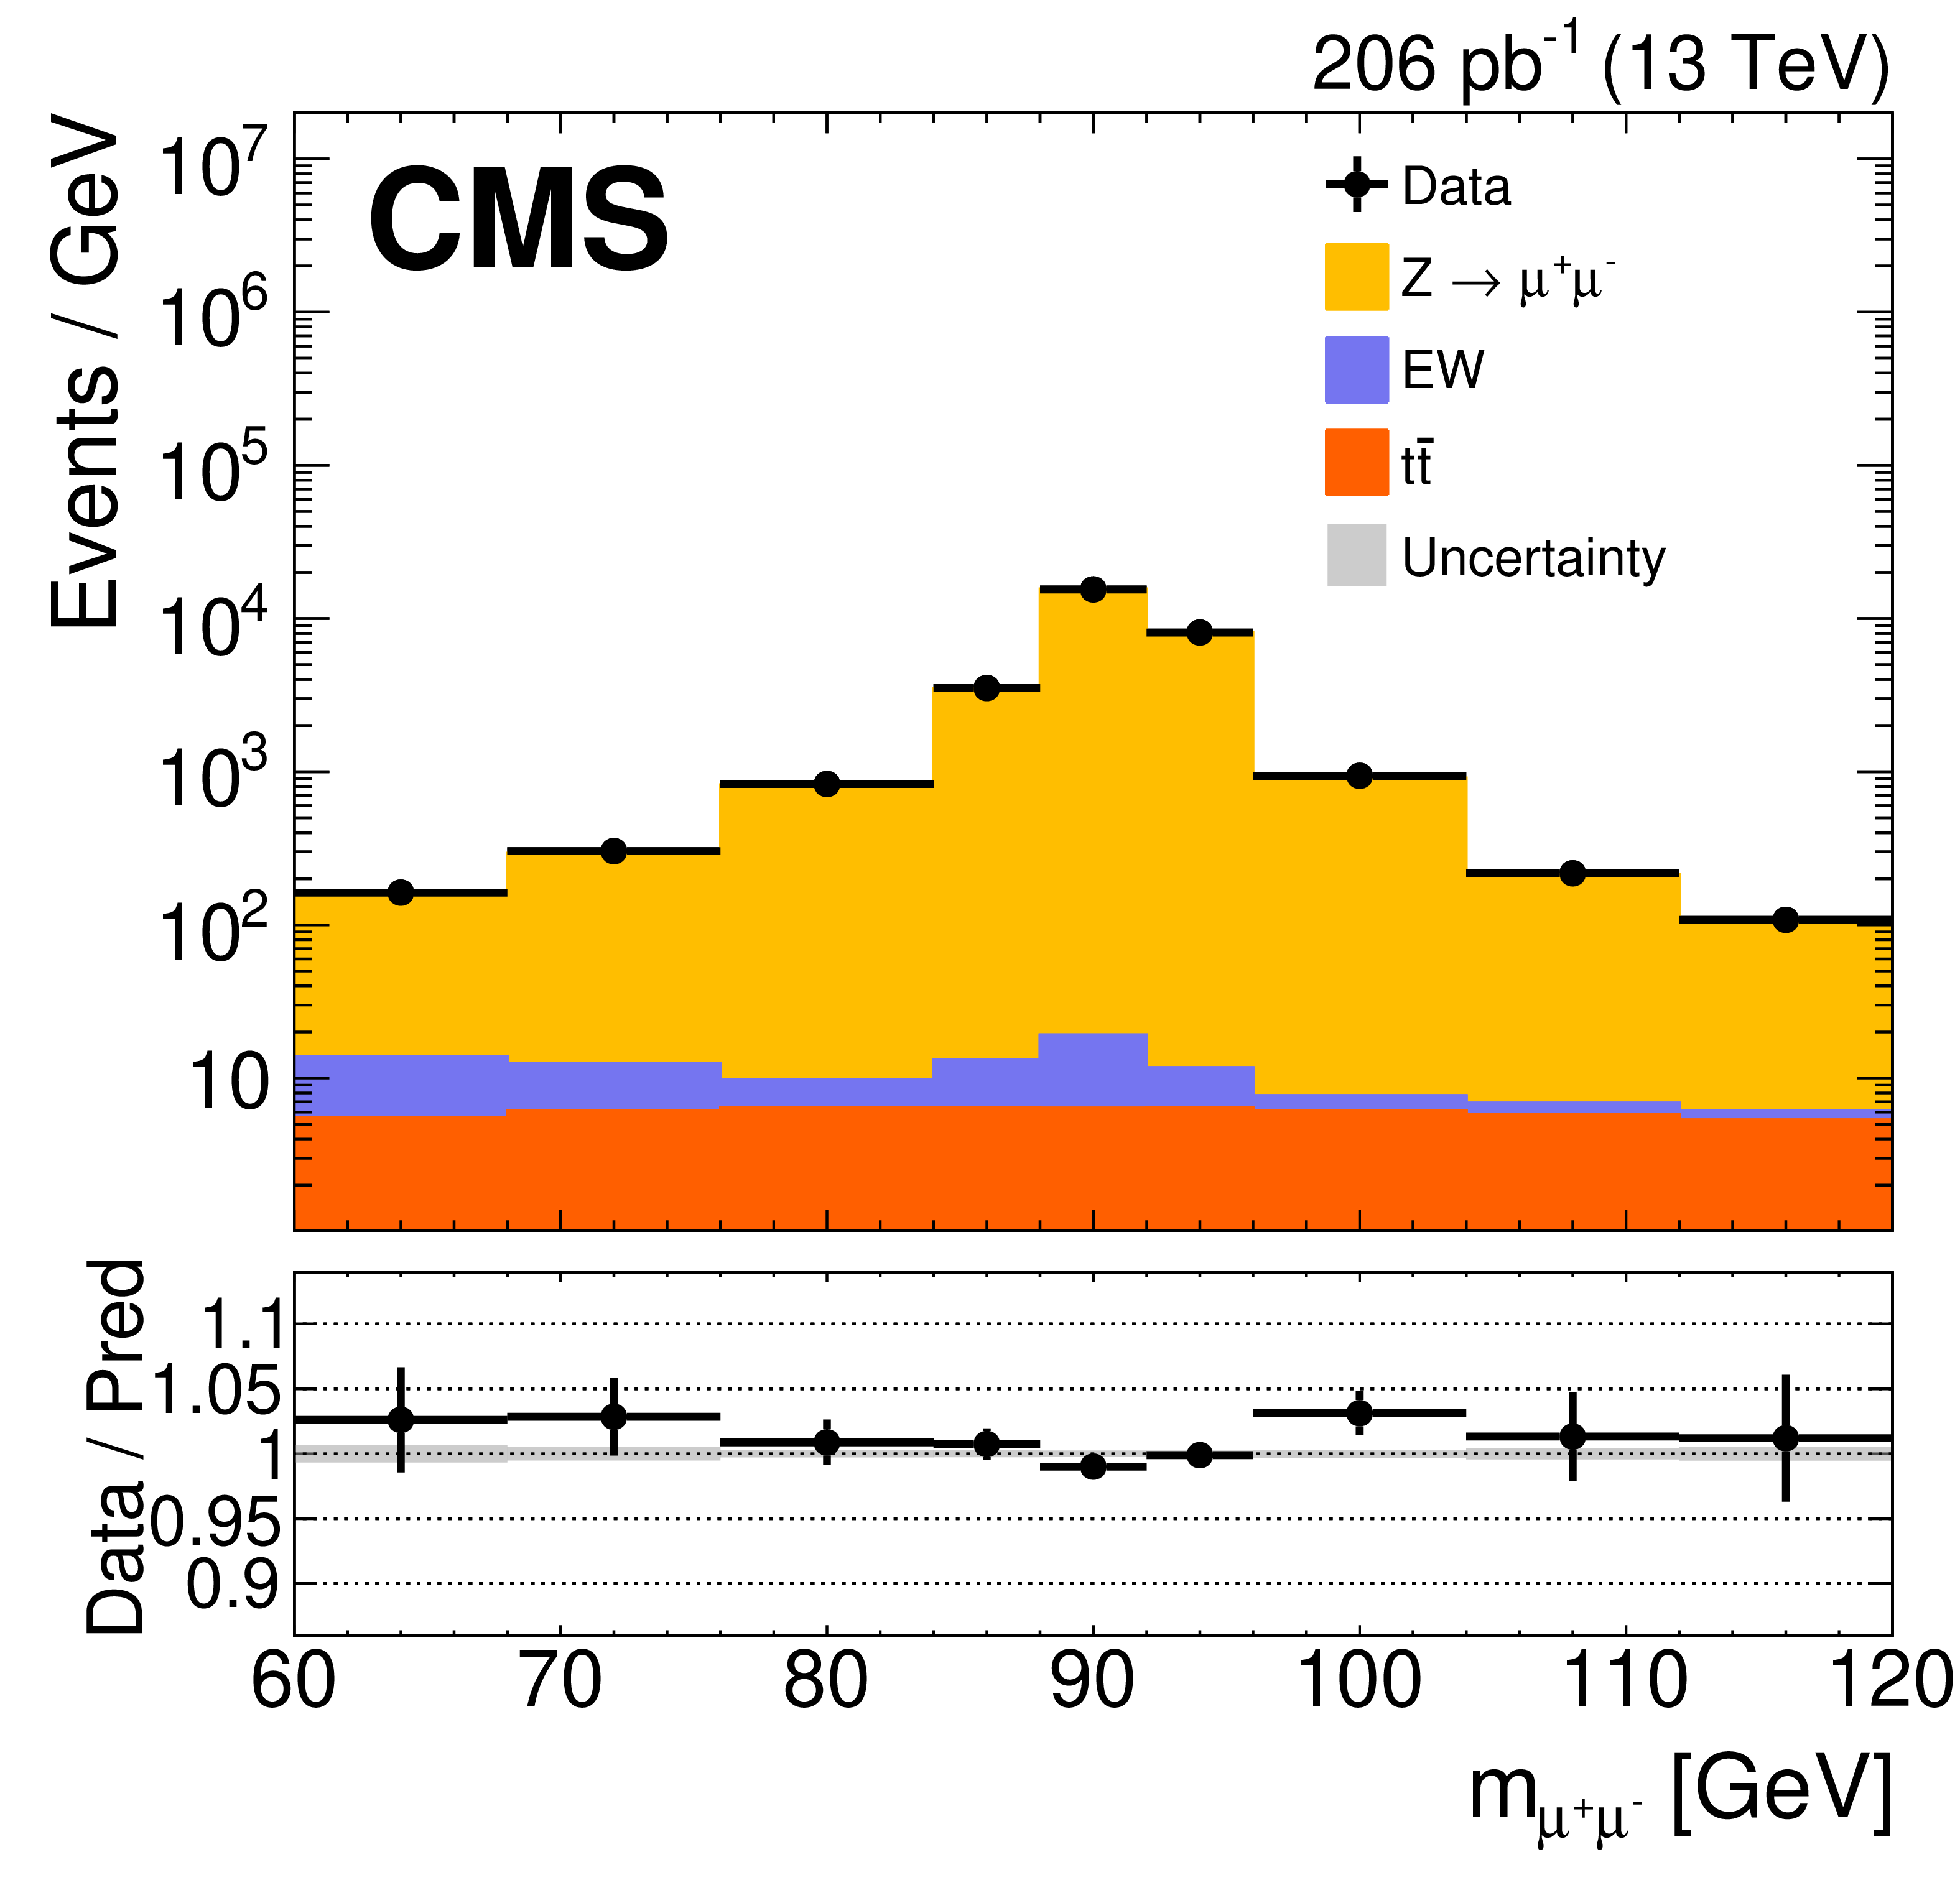
Distributions of $ m_{\mathrm{e}^+\mathrm{e}^-} $ (left) and $ m_{\mu^{+}\mu^{-}} $ (right) for the pp collisions at $ \sqrt{s}= $ 5.02 TeV (upper) and 13 TeV (lower), after the maximum likelihood fit. The EW backgrounds include the contributions from diboson processes. Notations are as in Fig. 1. |
png pdf |
Figure 3-a:
Distributions of $ m_{\mathrm{e}^+\mathrm{e}^-} $ (left) and $ m_{\mu^{+}\mu^{-}} $ (right) for the pp collisions at $ \sqrt{s}= $ 5.02 TeV (upper) and 13 TeV (lower), after the maximum likelihood fit. The EW backgrounds include the contributions from diboson processes. Notations are as in Fig. 1. |
png pdf |
Figure 3-b:
Distributions of $ m_{\mathrm{e}^+\mathrm{e}^-} $ (left) and $ m_{\mu^{+}\mu^{-}} $ (right) for the pp collisions at $ \sqrt{s}= $ 5.02 TeV (upper) and 13 TeV (lower), after the maximum likelihood fit. The EW backgrounds include the contributions from diboson processes. Notations are as in Fig. 1. |
png pdf |
Figure 3-c:
Distributions of $ m_{\mathrm{e}^+\mathrm{e}^-} $ (left) and $ m_{\mu^{+}\mu^{-}} $ (right) for the pp collisions at $ \sqrt{s}= $ 5.02 TeV (upper) and 13 TeV (lower), after the maximum likelihood fit. The EW backgrounds include the contributions from diboson processes. Notations are as in Fig. 1. |
png pdf |
Figure 3-d:
Distributions of $ m_{\mathrm{e}^+\mathrm{e}^-} $ (left) and $ m_{\mu^{+}\mu^{-}} $ (right) for the pp collisions at $ \sqrt{s}= $ 5.02 TeV (upper) and 13 TeV (lower), after the maximum likelihood fit. The EW backgrounds include the contributions from diboson processes. Notations are as in Fig. 1. |

png pdf |
Figure 4:
Comparisons of the fiducial inclusive cross sections and cross section ratios between measurements and the theoretical calculations from DYTURBO with different PDF sets at 5.02 TeV. The gray band represents the total uncertainty of each measurement. The uncertainties in the theoretical predictions include the statistical uncertainty, and the PDF, $ \alpha_\mathrm{S} $, and renormalization and factorization scale uncertainties. The measured values and theoretical predictions (DYTURBO with NNPDF 3.1 as the example) are also shown in the right part of the plot. |
png pdf |
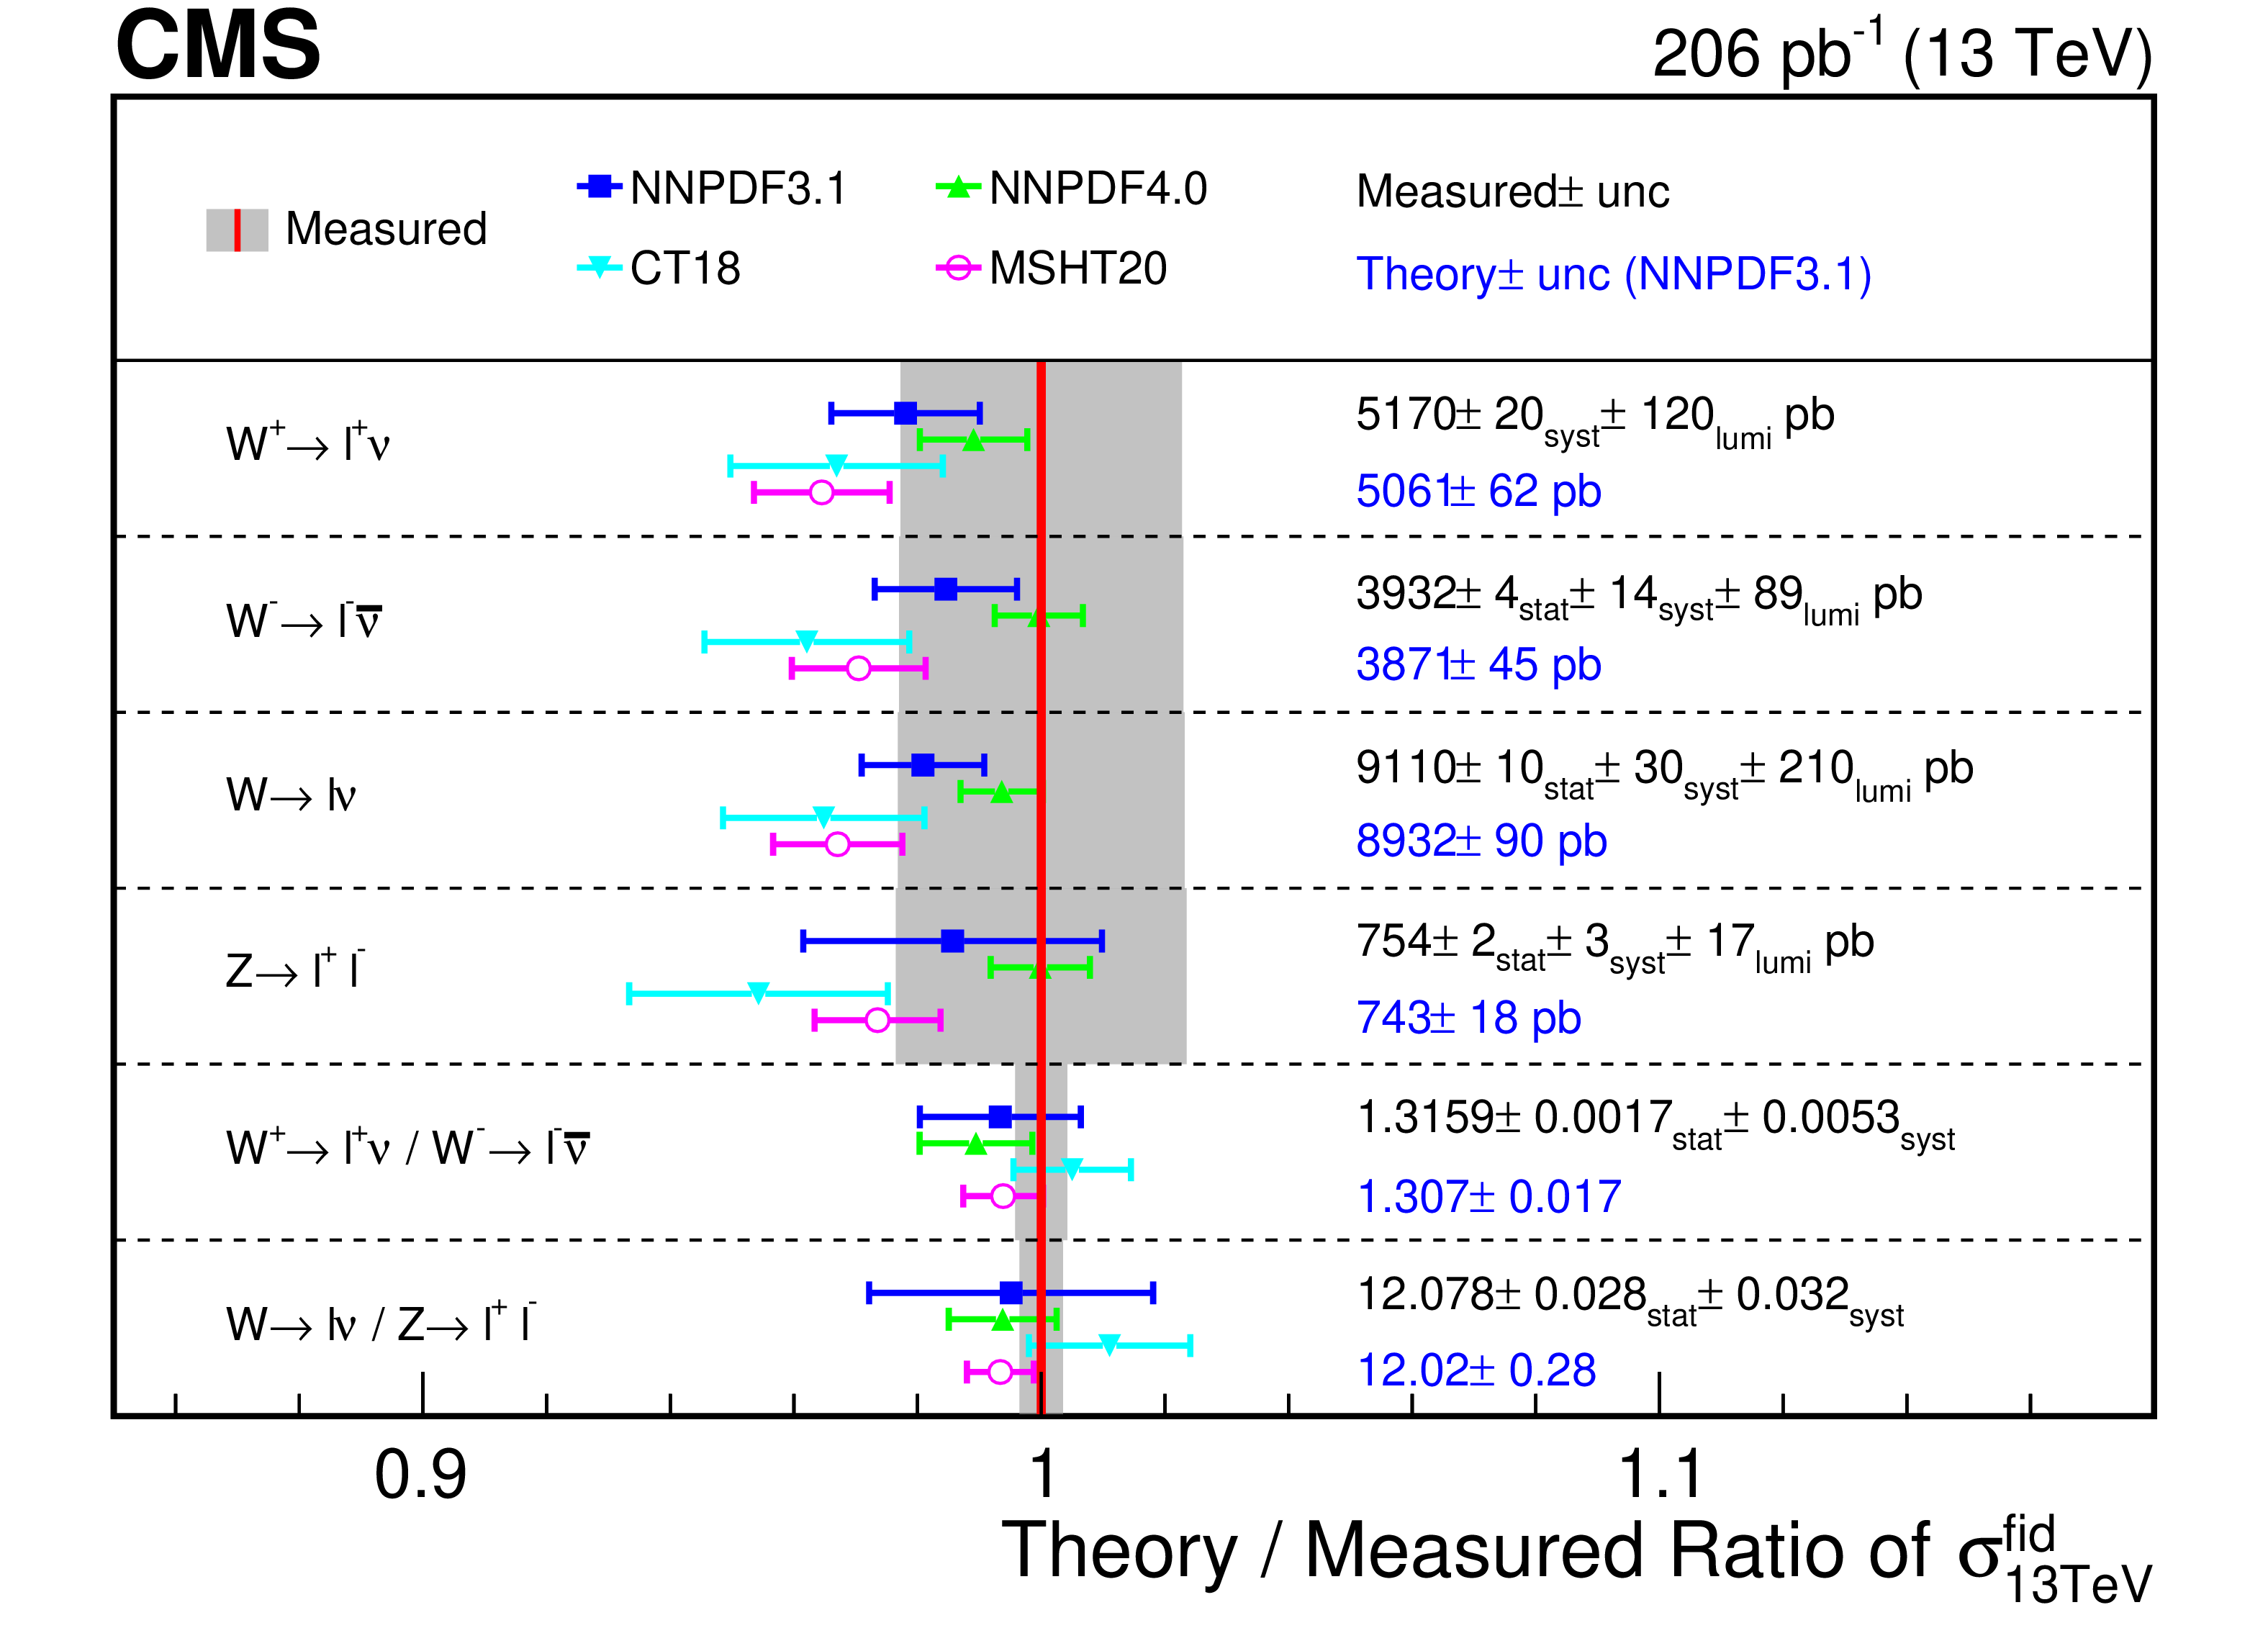
Figure 5:
Comparisons of the fiducial inclusive cross sections and cross section ratios between measurements and the theoretical calculations from DYTURBO with different PDF sets at 13 TeV. The gray band represents the total uncertainty of each measurement. The uncertainties in the theoretical predictions include the statistical uncertainty, and the PDF, $ \alpha_\mathrm{S} $, and renormalization and factorization scale uncertainties. The measured values and theoretical predictions (DYTURBO with NNPDF 3.1 as the example) are also shown in the right part of the plot. The statistical uncertainty for $ \mathrm{W^+}\to \ell^{+}\nu $ is negligible compared with the other uncertainties, therefore not included in this plot. |
png pdf |
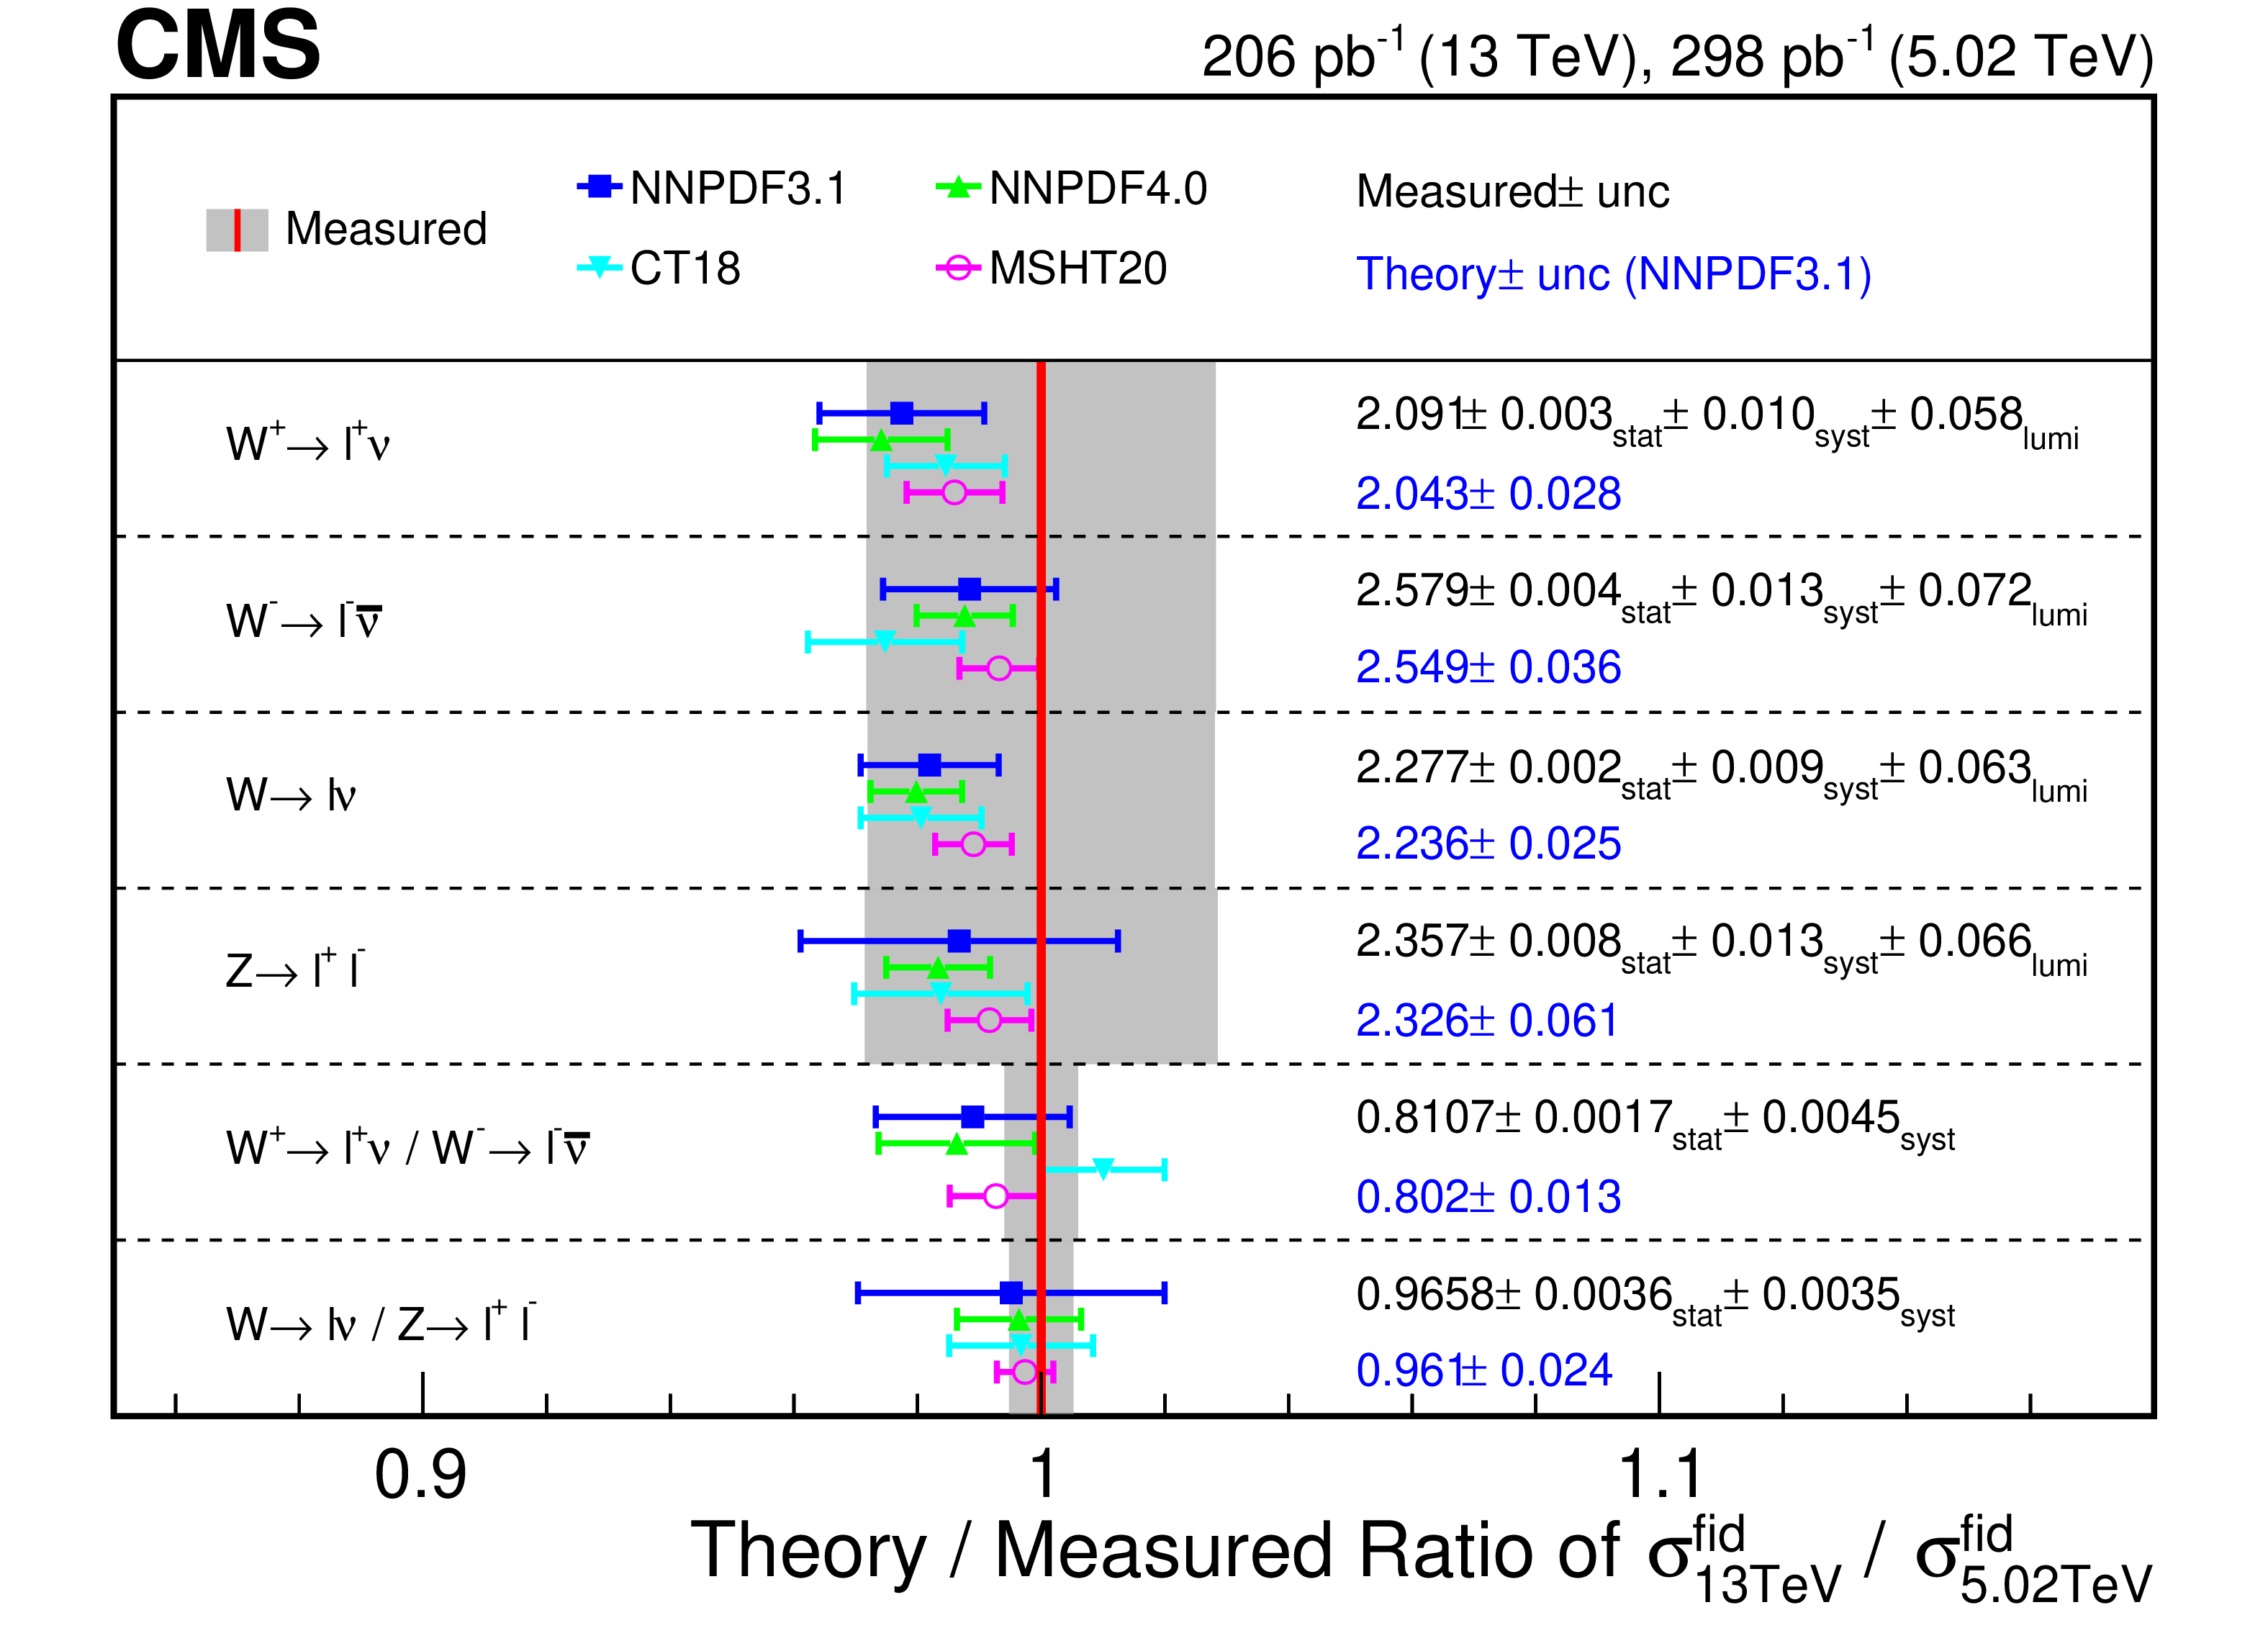
Figure 6:
Comparisons of the fiducial inclusive cross section ratios and double ratios between 13 and 5.02 TeV, between measurements and the theoretical calculations from DYTURBO with different PDF sets. The gray band represents the total uncertainty of each measurement. The uncertainties in the theoretical predictions include the statistical uncertainty, and the PDF, $ \alpha_\mathrm{S} $, and renormalization and factorization scale uncertainties. The measured values and theoretical predictions (DYTURBO with NNPDF 3.1 as the example) are also shown in the right part of the plot. |
png pdf |
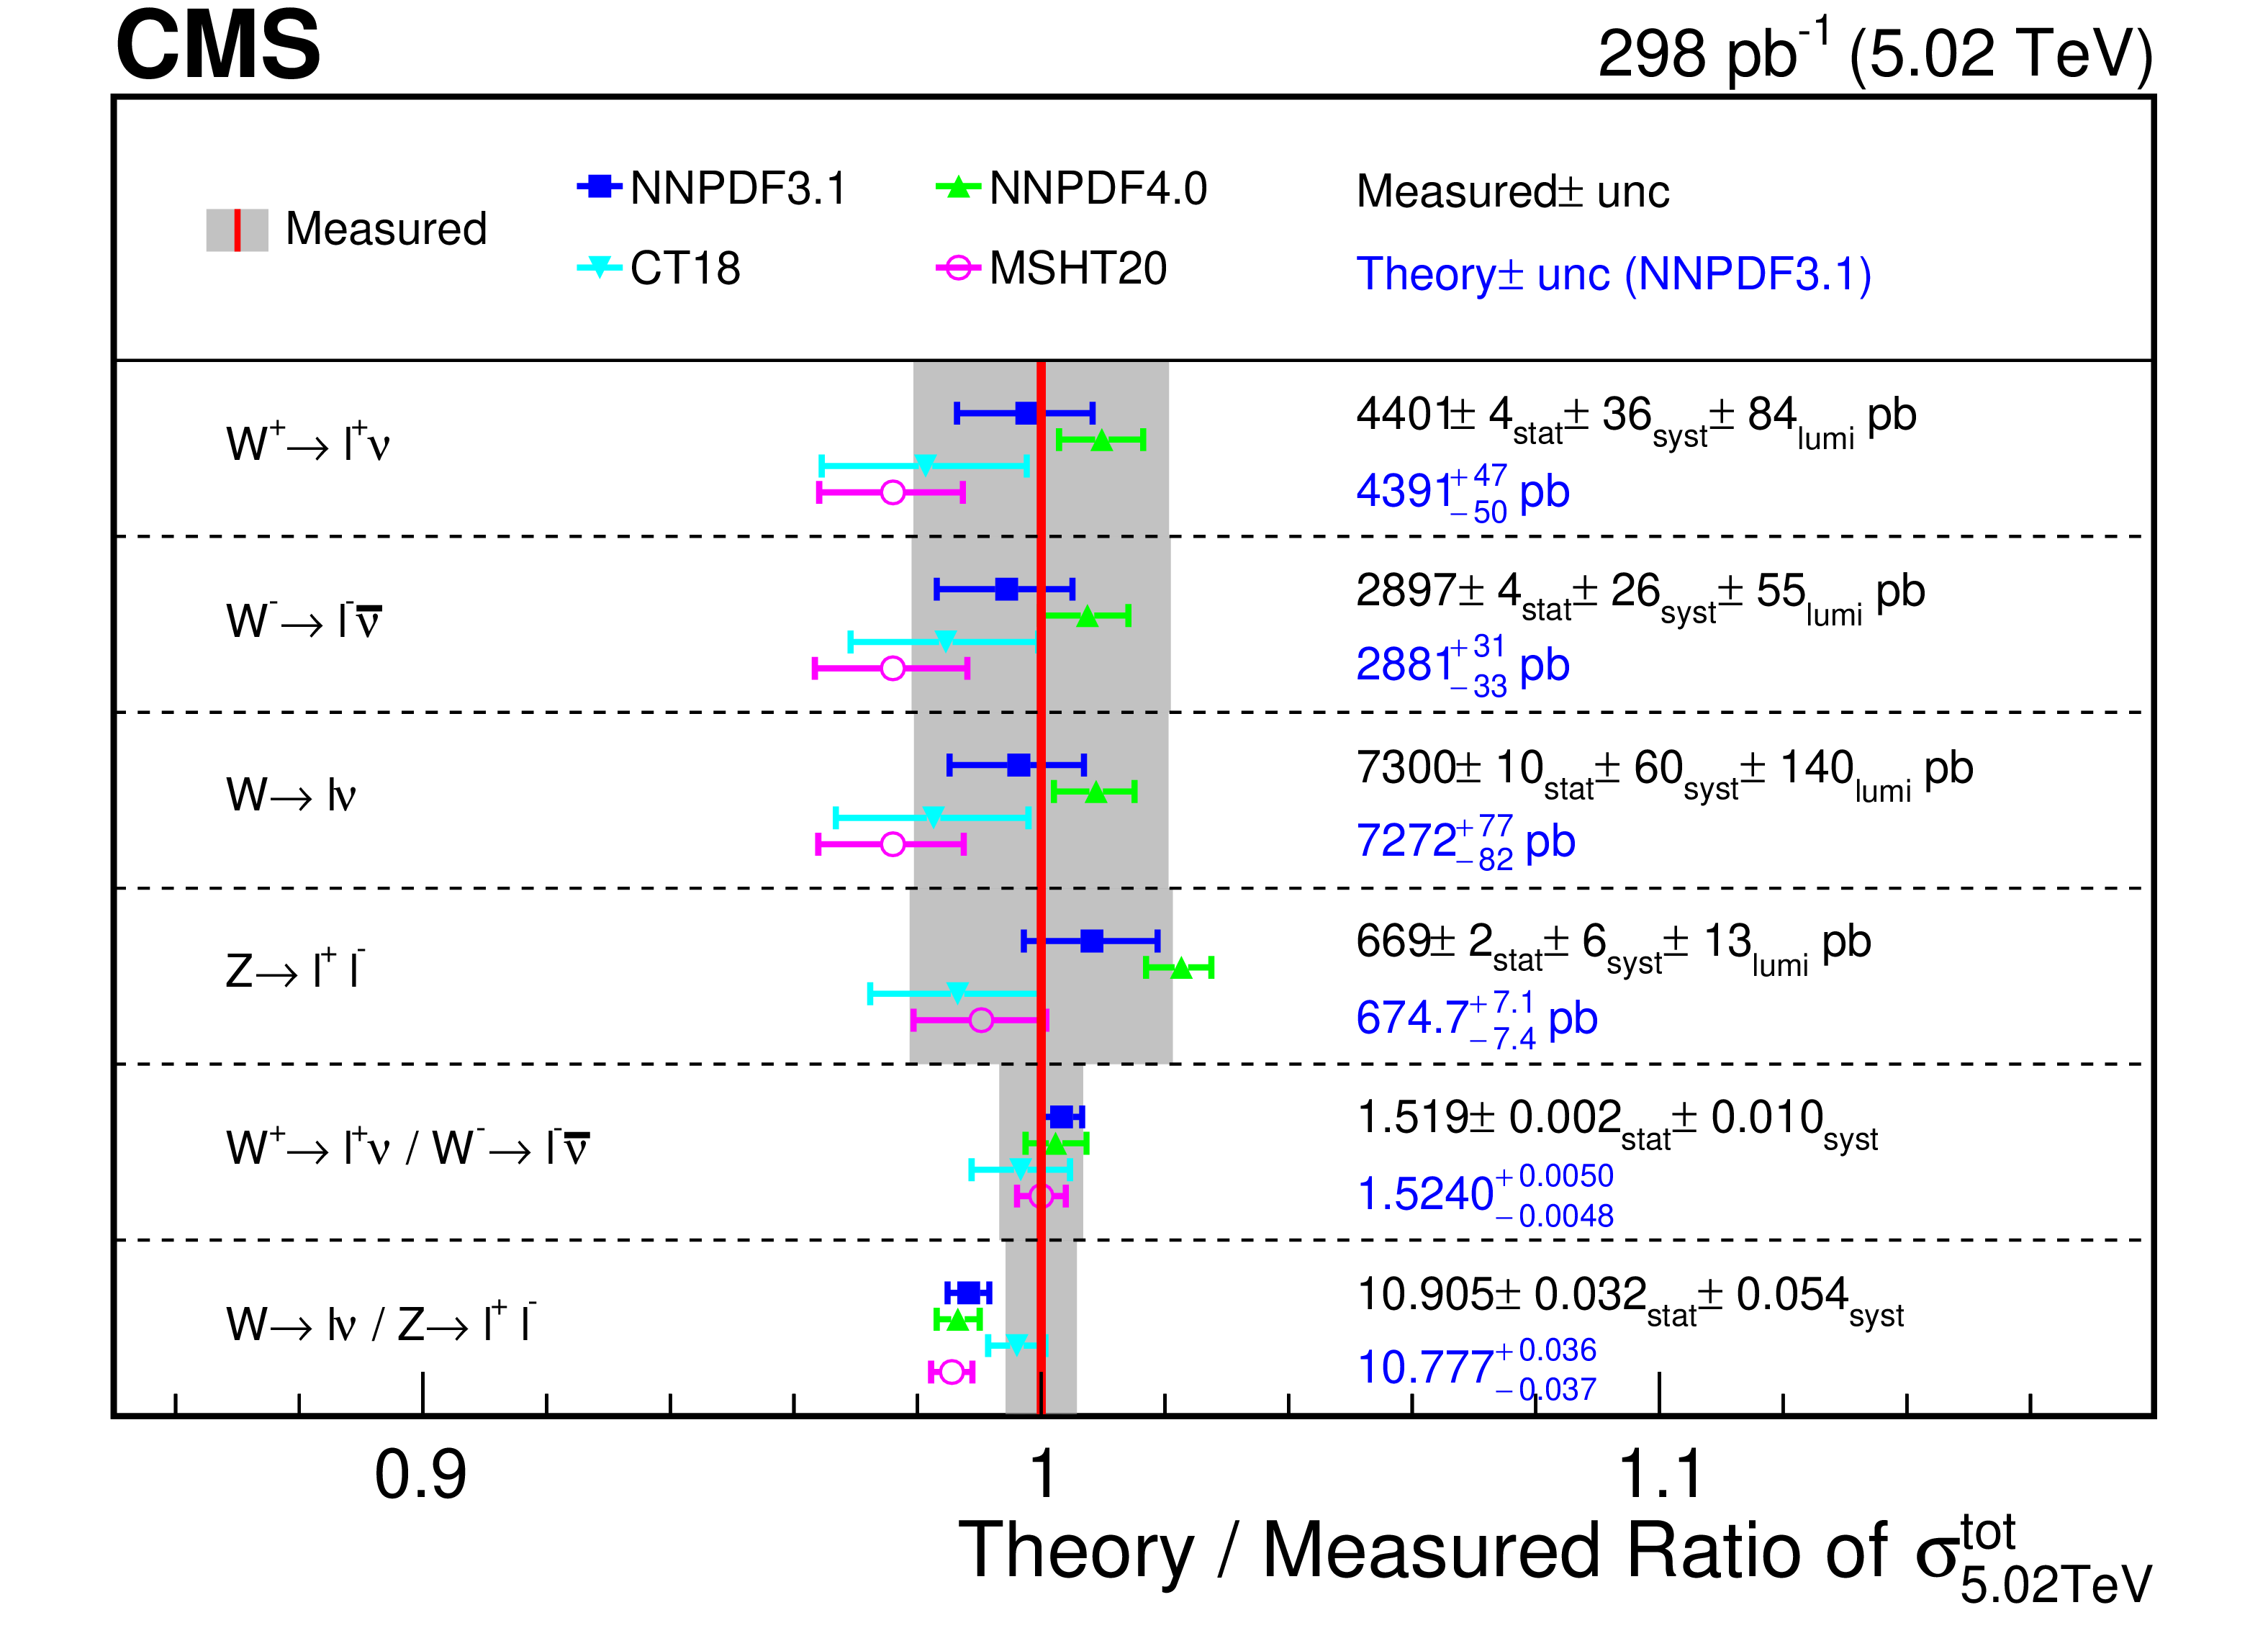
Figure 7:
Comparisons of the total inclusive cross sections and cross section ratios between measurements and the theoretical calculations from DYTURBO with different PDF sets at 5.02 TeV. The gray band represents the total uncertainty of each measurement. The uncertainties in the theoretical predictions include the statistical uncertainty, and the PDF, $ \alpha_\mathrm{S} $, and renormalization and factorization scale uncertainties. The measured values and theoretical predictions (DYTURBO with NNPDF 3.1 as the example) are also shown in the right part of the plot. |
png pdf |
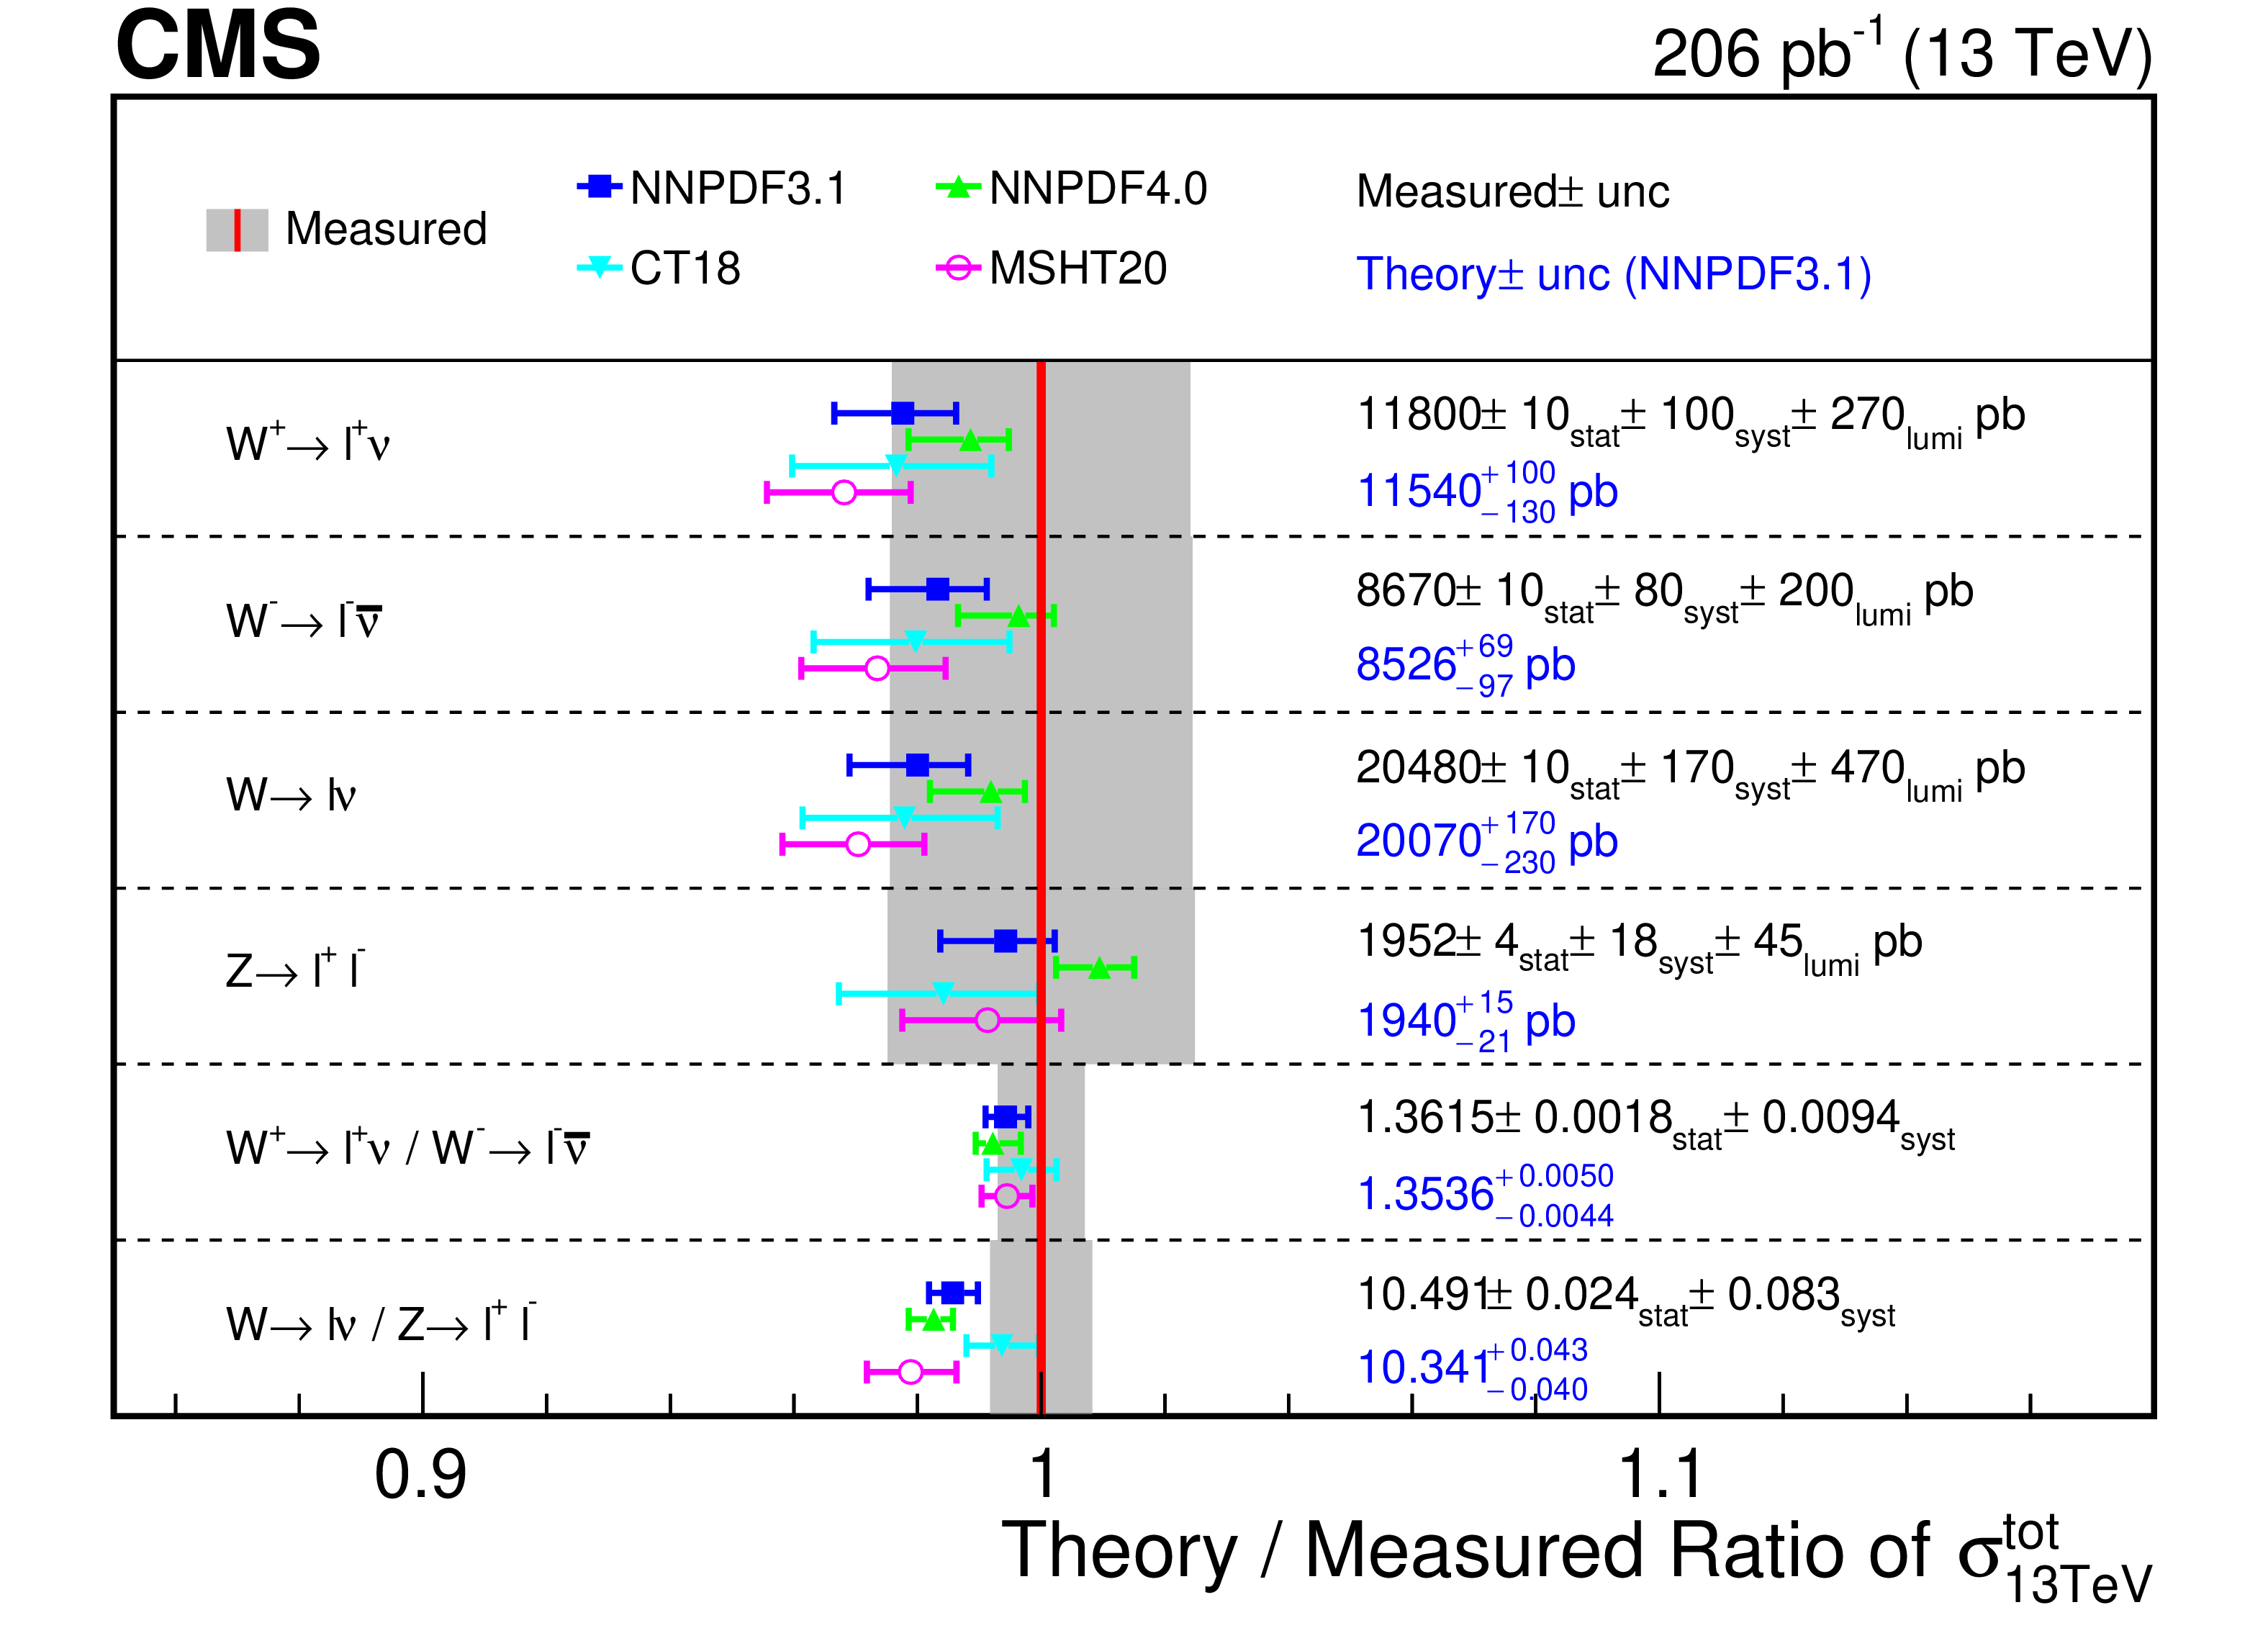
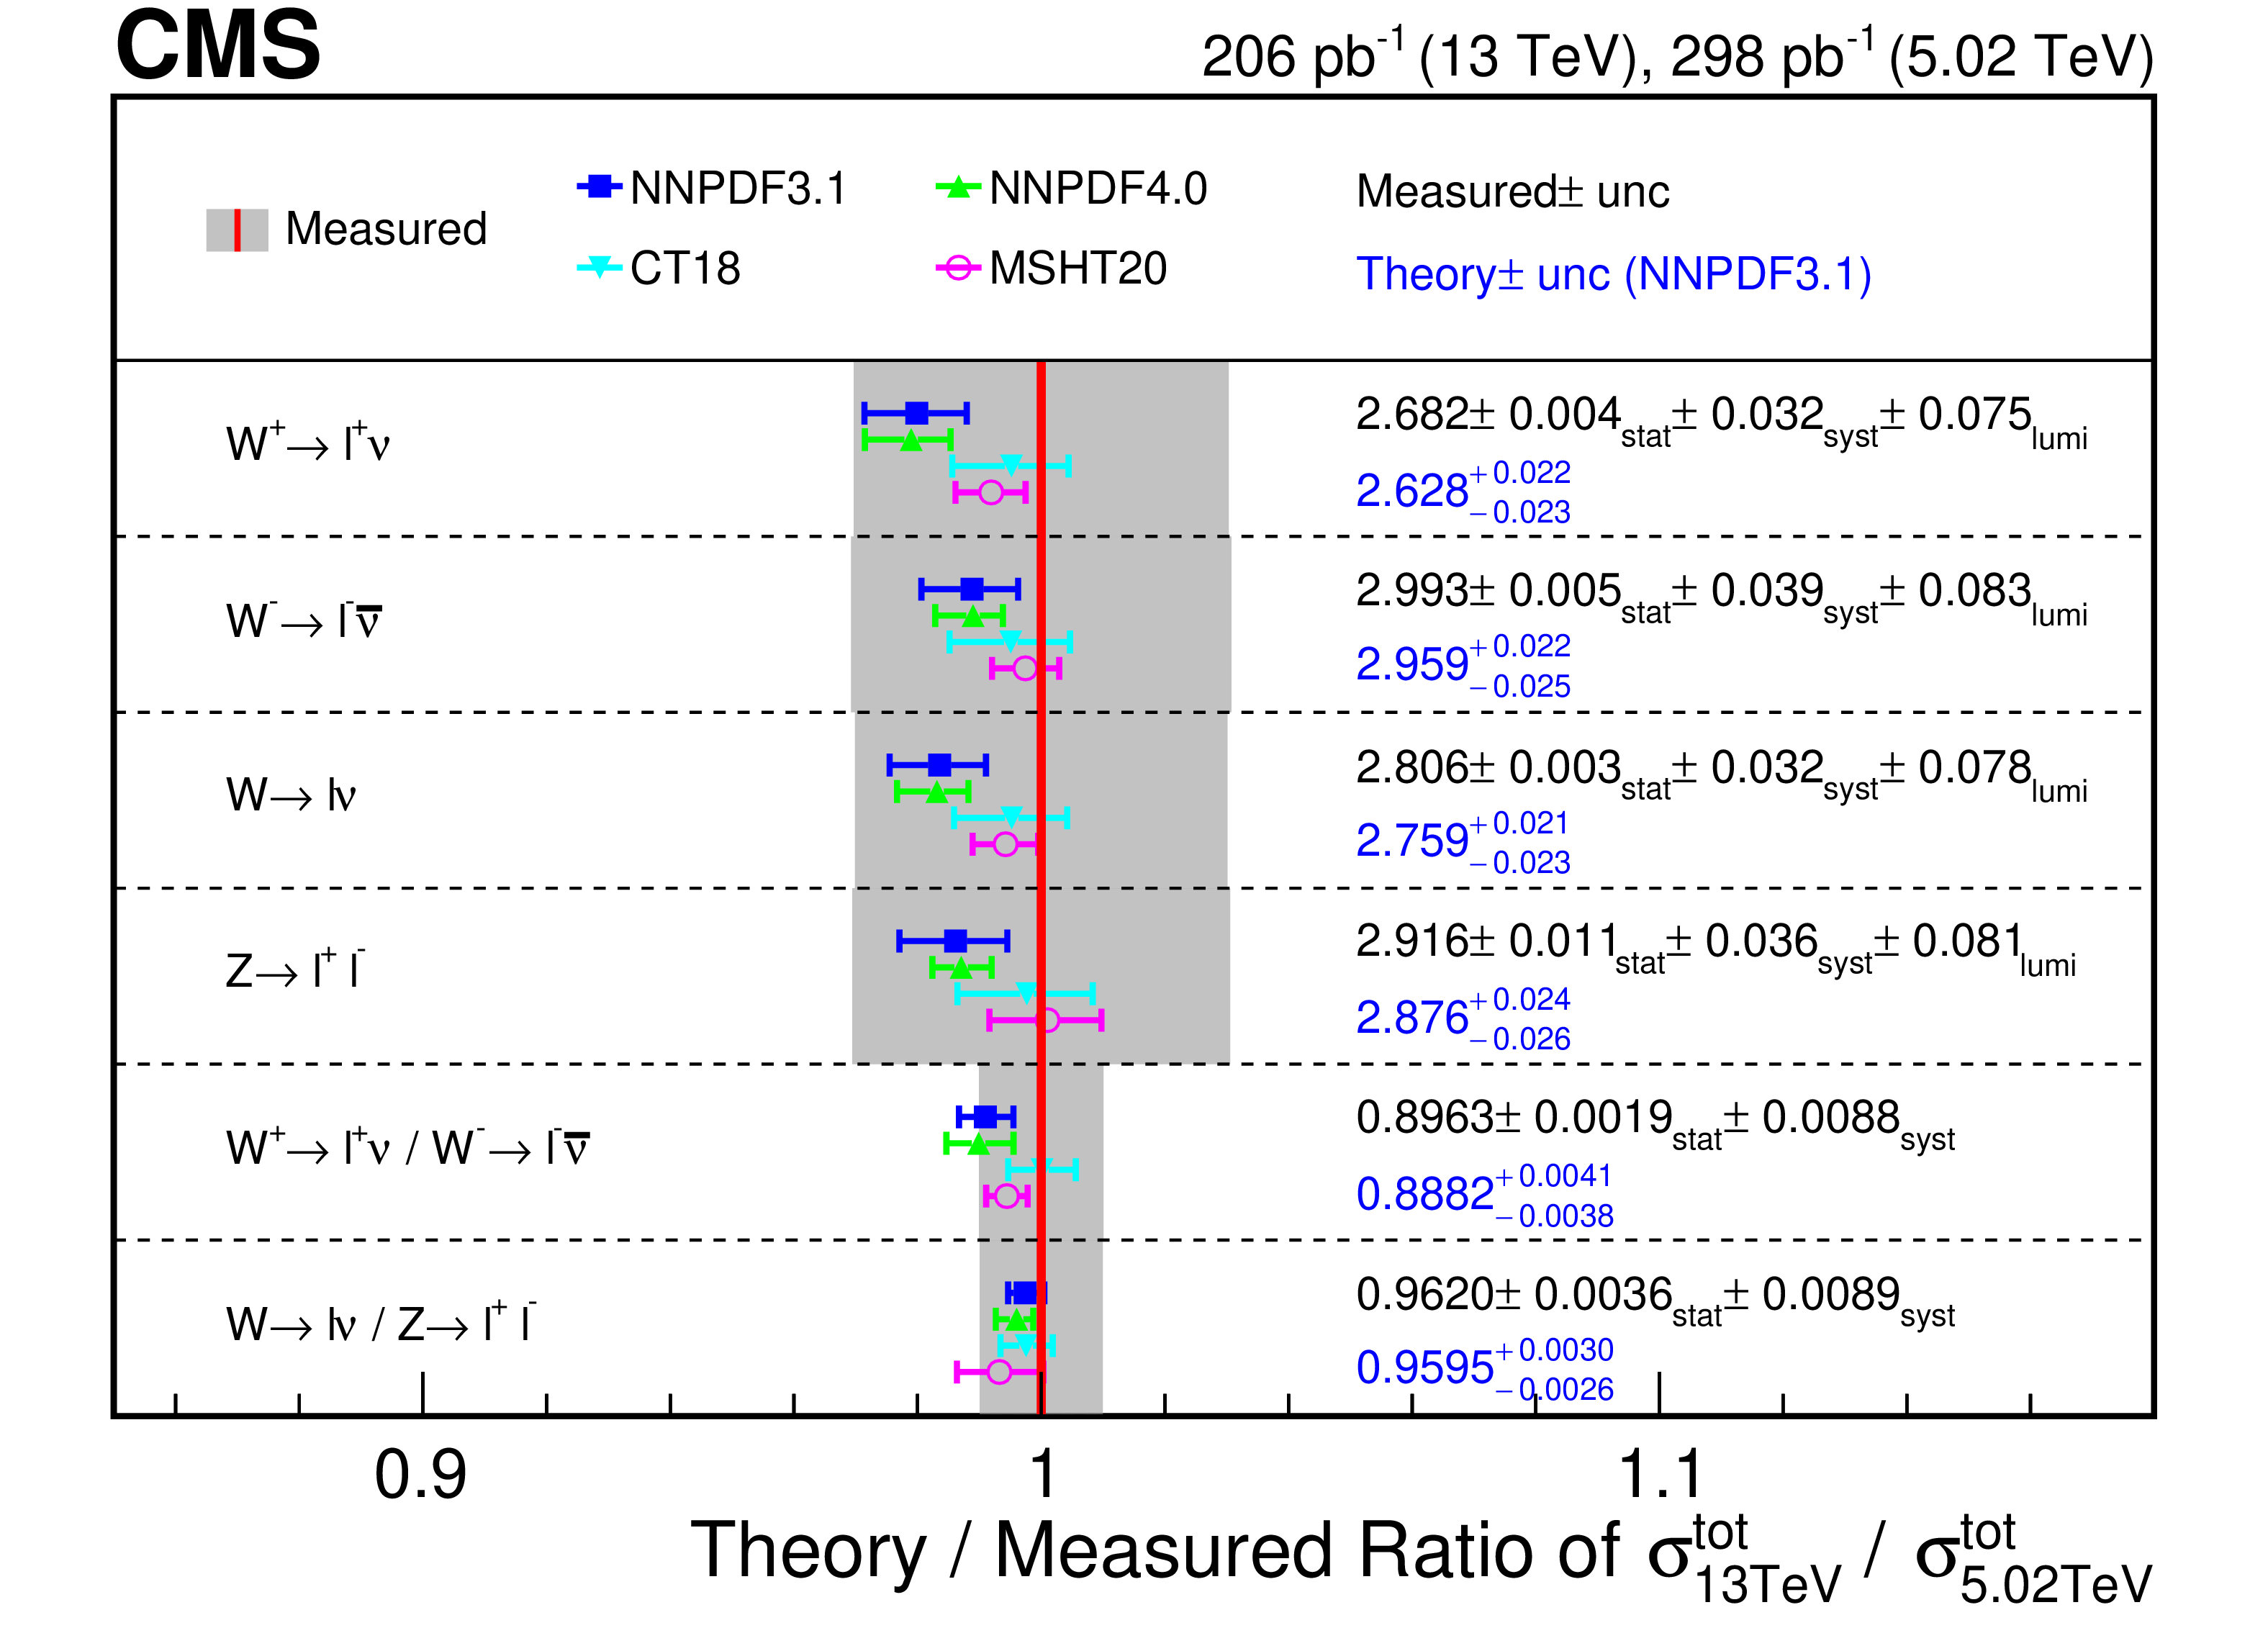
Figure 8:
Comparisons of the total inclusive cross sections and cross section ratios between measurements and the theoretical calculations from DYTURBO with different PDF sets at 13 TeV. The gray band represents the total uncertainty of each measurement. The uncertainties in the theoretical predictions include the statistical uncertainty, and the PDF, $ \alpha_\mathrm{S} $, and renormalization and factorization scale uncertainties. The measured values and theoretical predictions (DYTURBO with NNPDF 3.1 as the example) are also shown in the right part of the plot. |
png pdf |
Figure 9:
Comparisons of the total inclusive cross section ratios and double ratios between 13 and 5.02 TeV, between measurements and the theoretical calculations from DYTURBO with different PDF sets. The gray band represents the total uncertainty of each measurement. The uncertainties in the theoretical predictions include the statistical uncertainty, and the PDF, $ \alpha_\mathrm{S} $, and renormalization and factorization scale uncertainties. The measured values and theoretical predictions (DYTURBO with NNPDF 3.1 as the example) are also shown in the right part of the plot. |
png pdf |
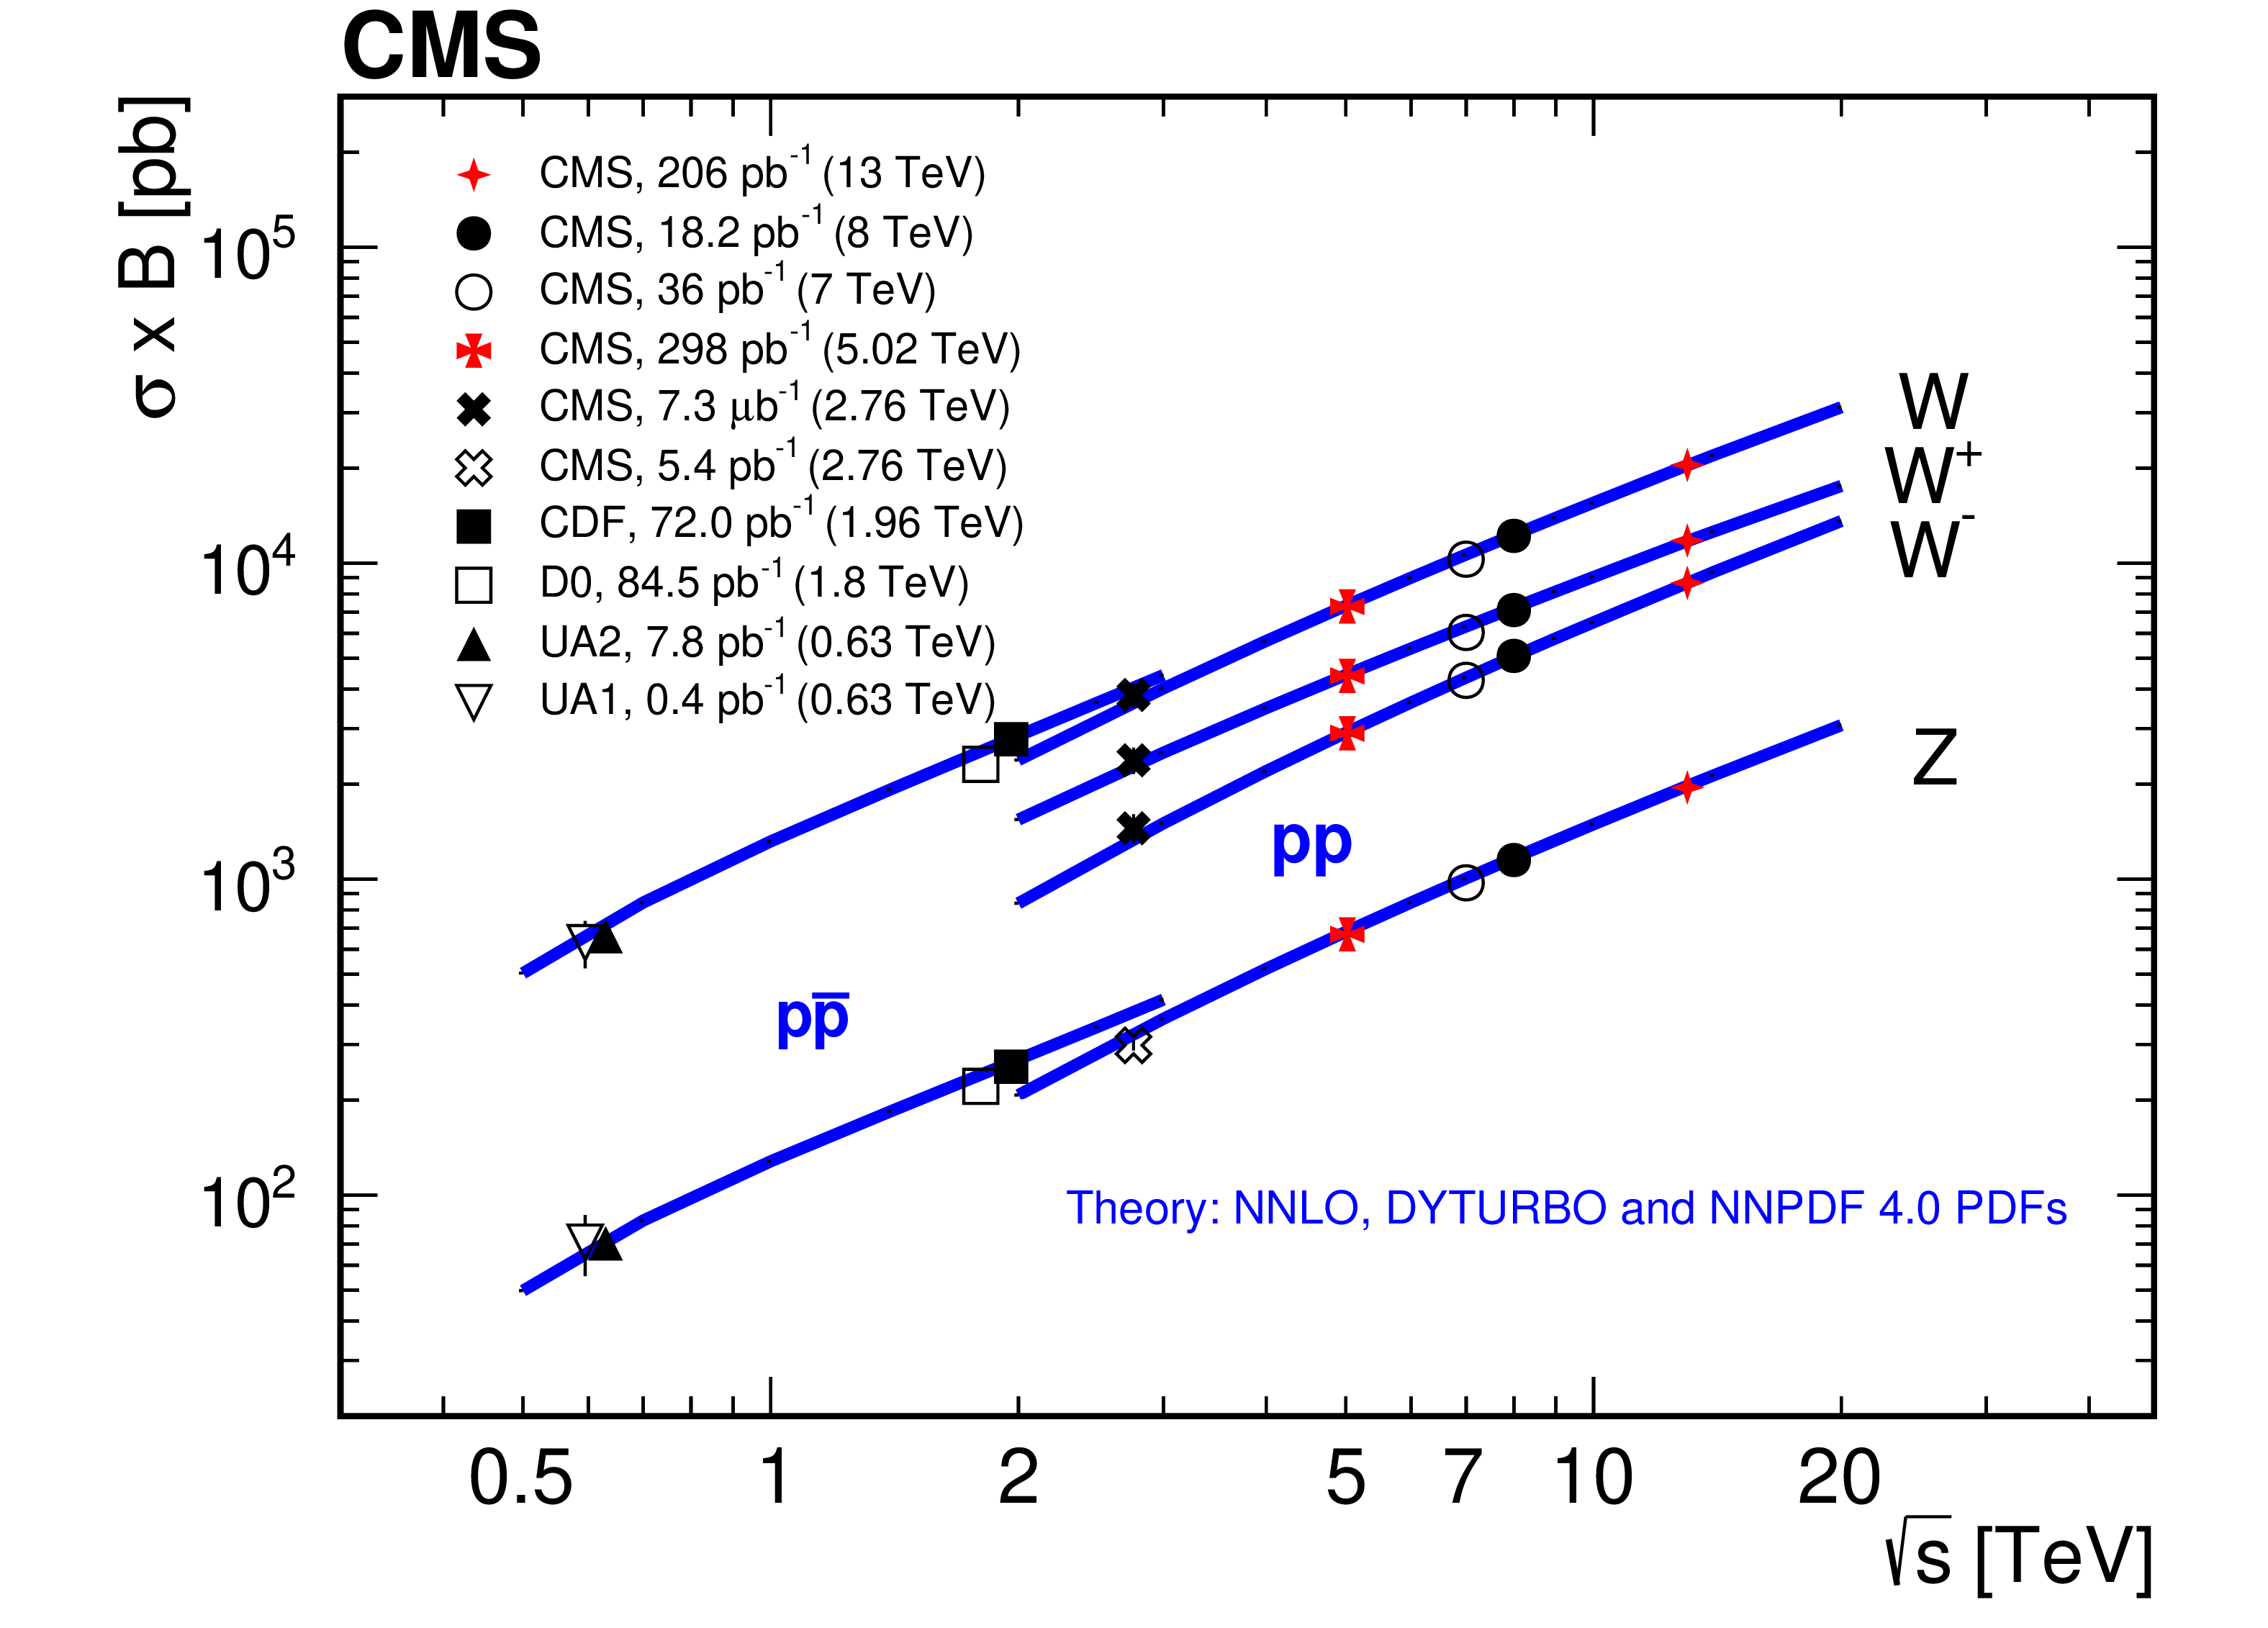
Figure 10:
Summary of the measurements of the total inclusive cross sections for W$^{+}$, W$^{-}$, W, and Z boson production times branching fractions versus center-of-mass energy from CMS and experiments at lower-energy colliders. The vertical error bar represents the total uncertainty of each measurement. |
| Tables | |
png pdf |
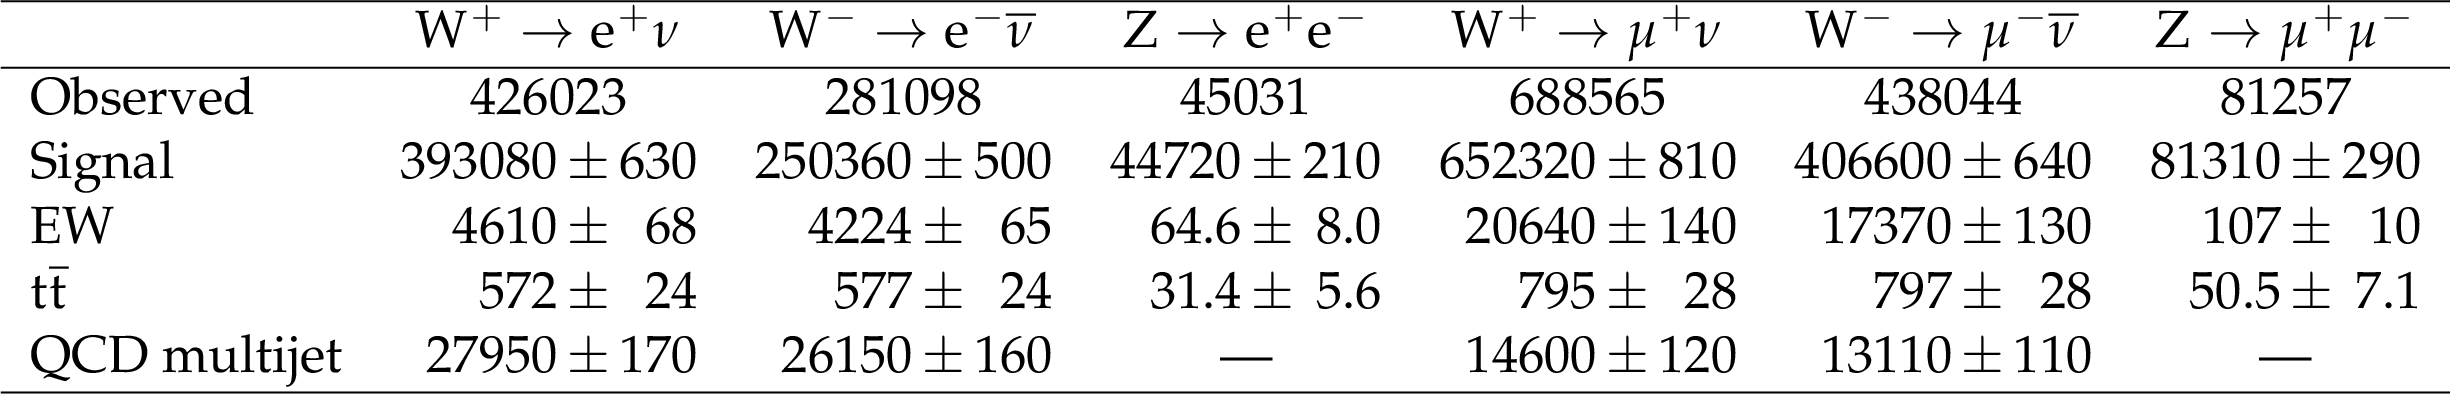
Table 1:
Event yields, after the maximum likelihood fit, in the W$^{+}$, W$^{-}$, and Z boson signal regions for electron and muon final states at 5.02 TeV. |
png pdf |
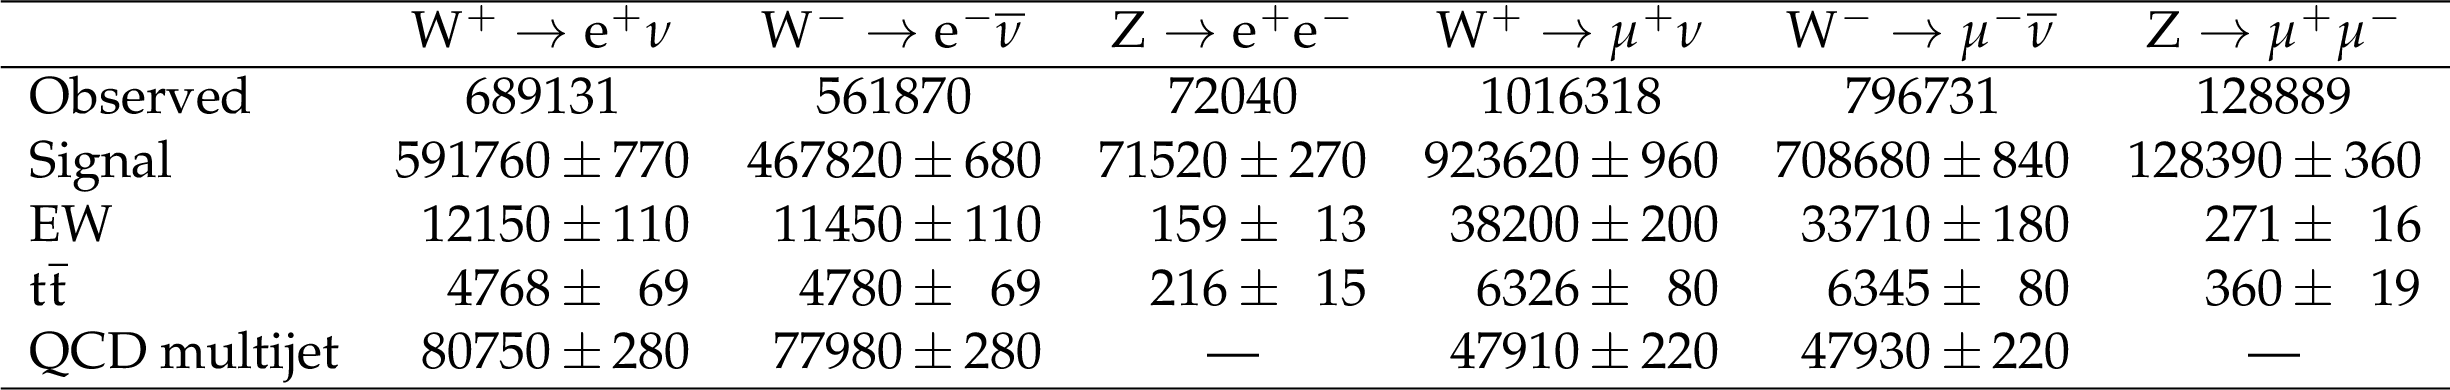
Table 2:
Event yields, after the maximum likelihood fit, in the W$^{+}$, W$^{-}$, and Z boson signal regions for electron and muon final states at 13 TeV. |
png pdf |
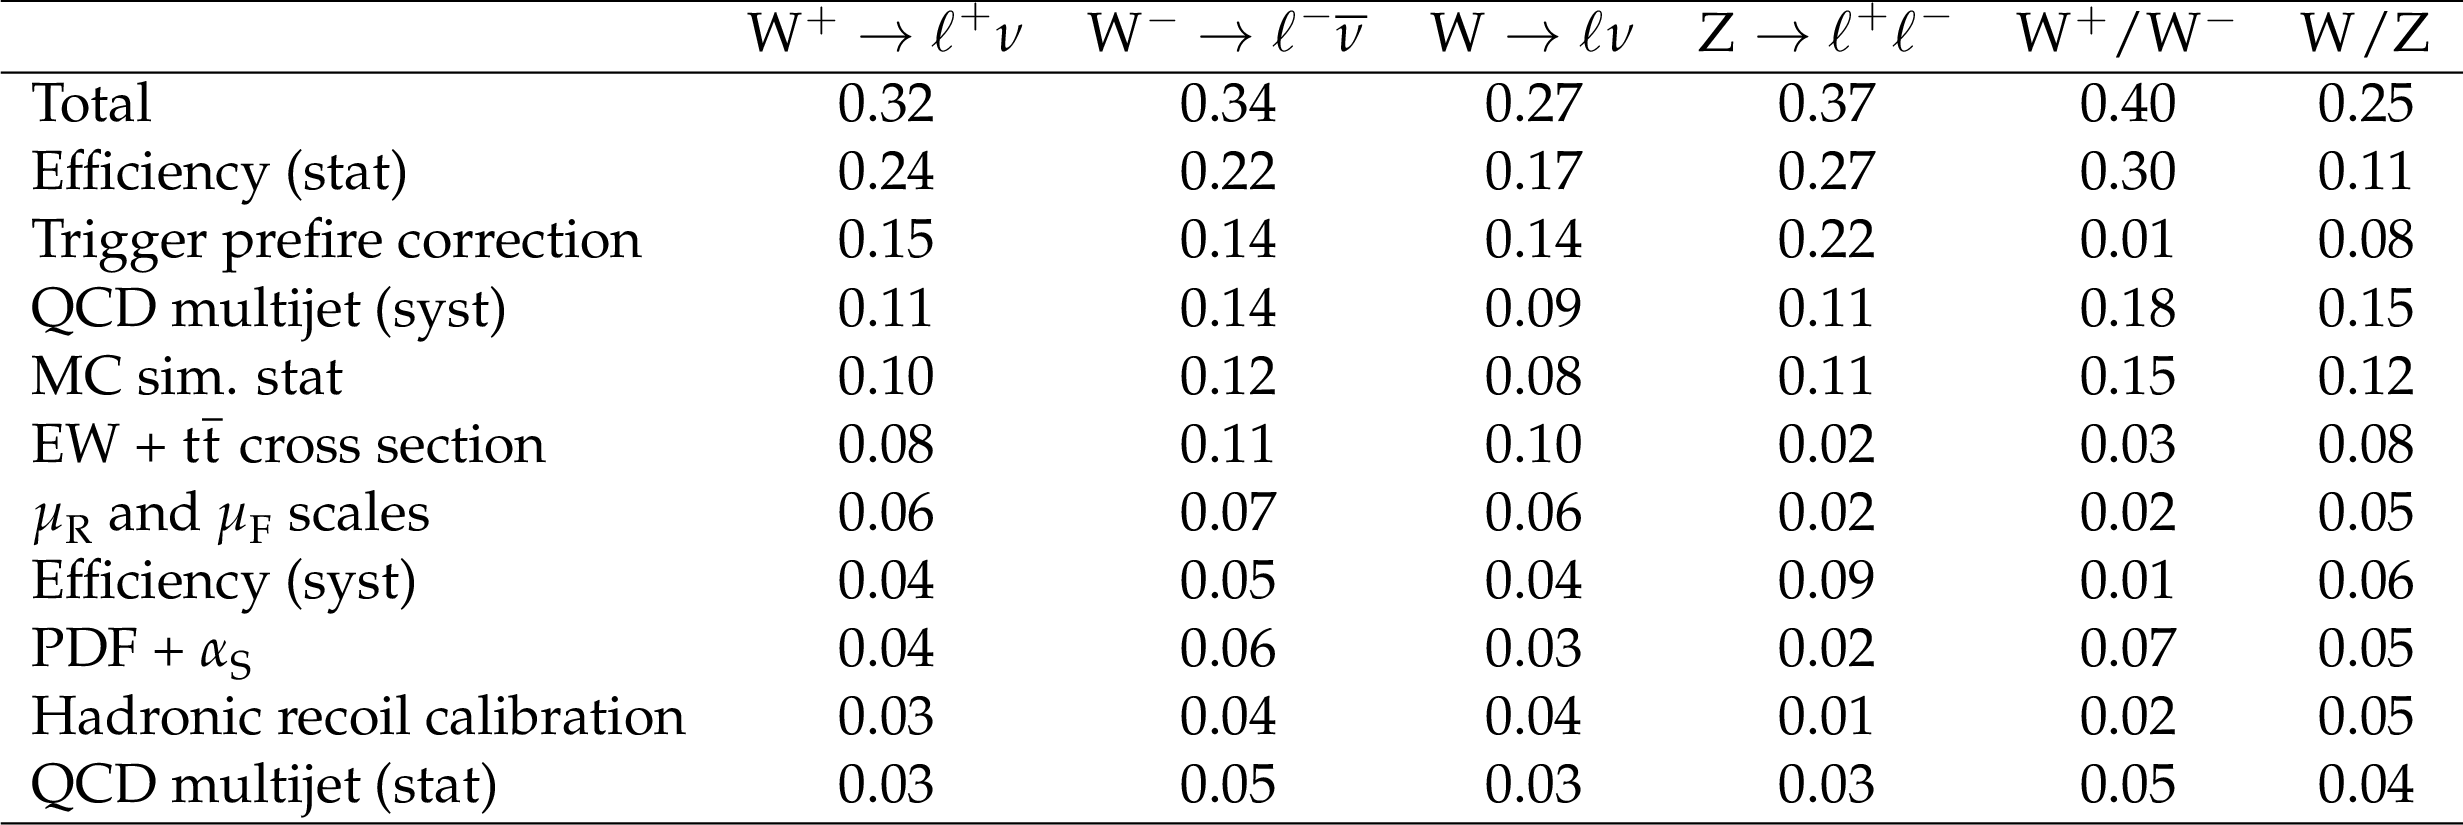
Table 3:
Systematic uncertainties, in percent, for the fiducial inclusive cross sections at 5.02 TeV. The 1.9% integrated luminosity uncertainty, which affects the W and Z boson production cross sections, is not included in the table. |
png pdf |
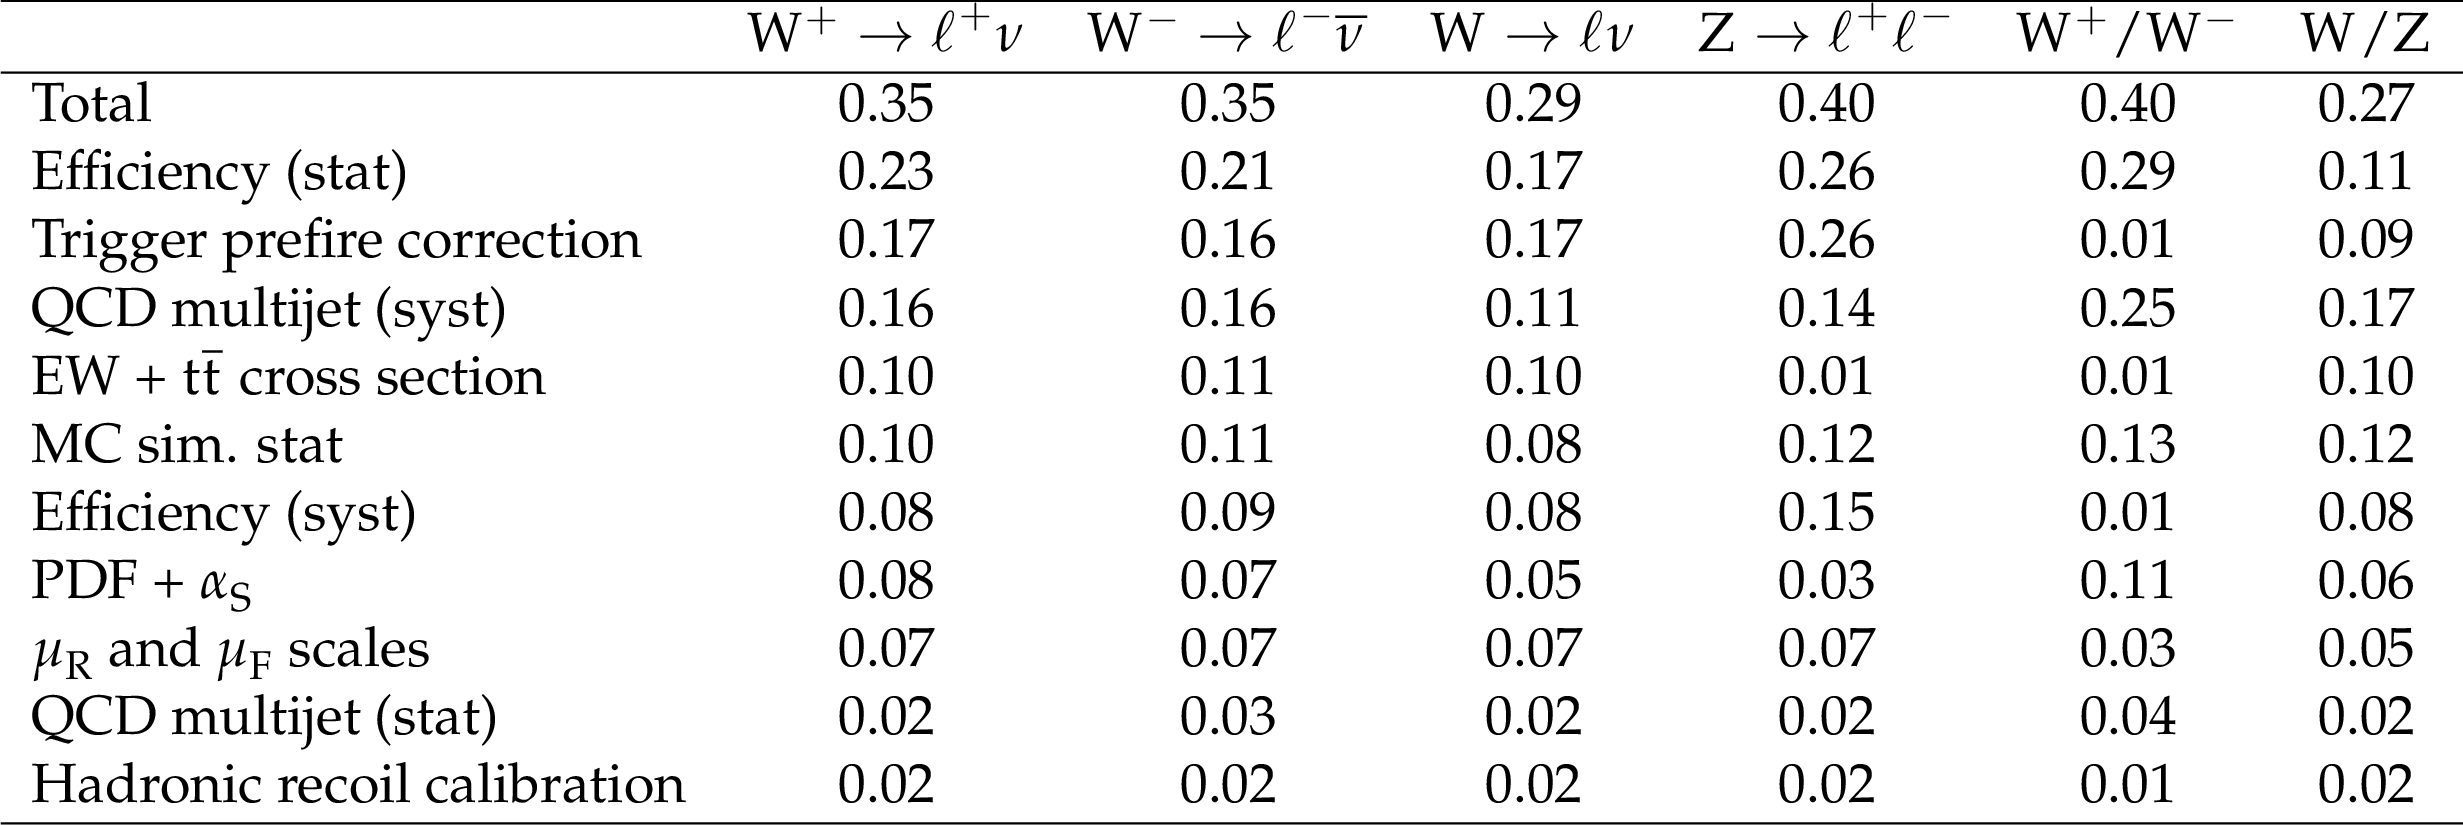
Table 4:
Systematic uncertainties, in percent, for the fiducial inclusive cross sections at 13 TeV. The 2.3% integrated luminosity uncertainty, which affects the W and Z boson production cross sections, is not included in the table. |
png pdf |
Table 5:
Systematic uncertainties, in percent, for the fiducial inclusive cross section ratios between 13 and 5.02 TeV. The 2.8% integrated luminosity uncertainty, which affects the W and Z boson production cross section ratios, is not included in the table. |
png pdf |
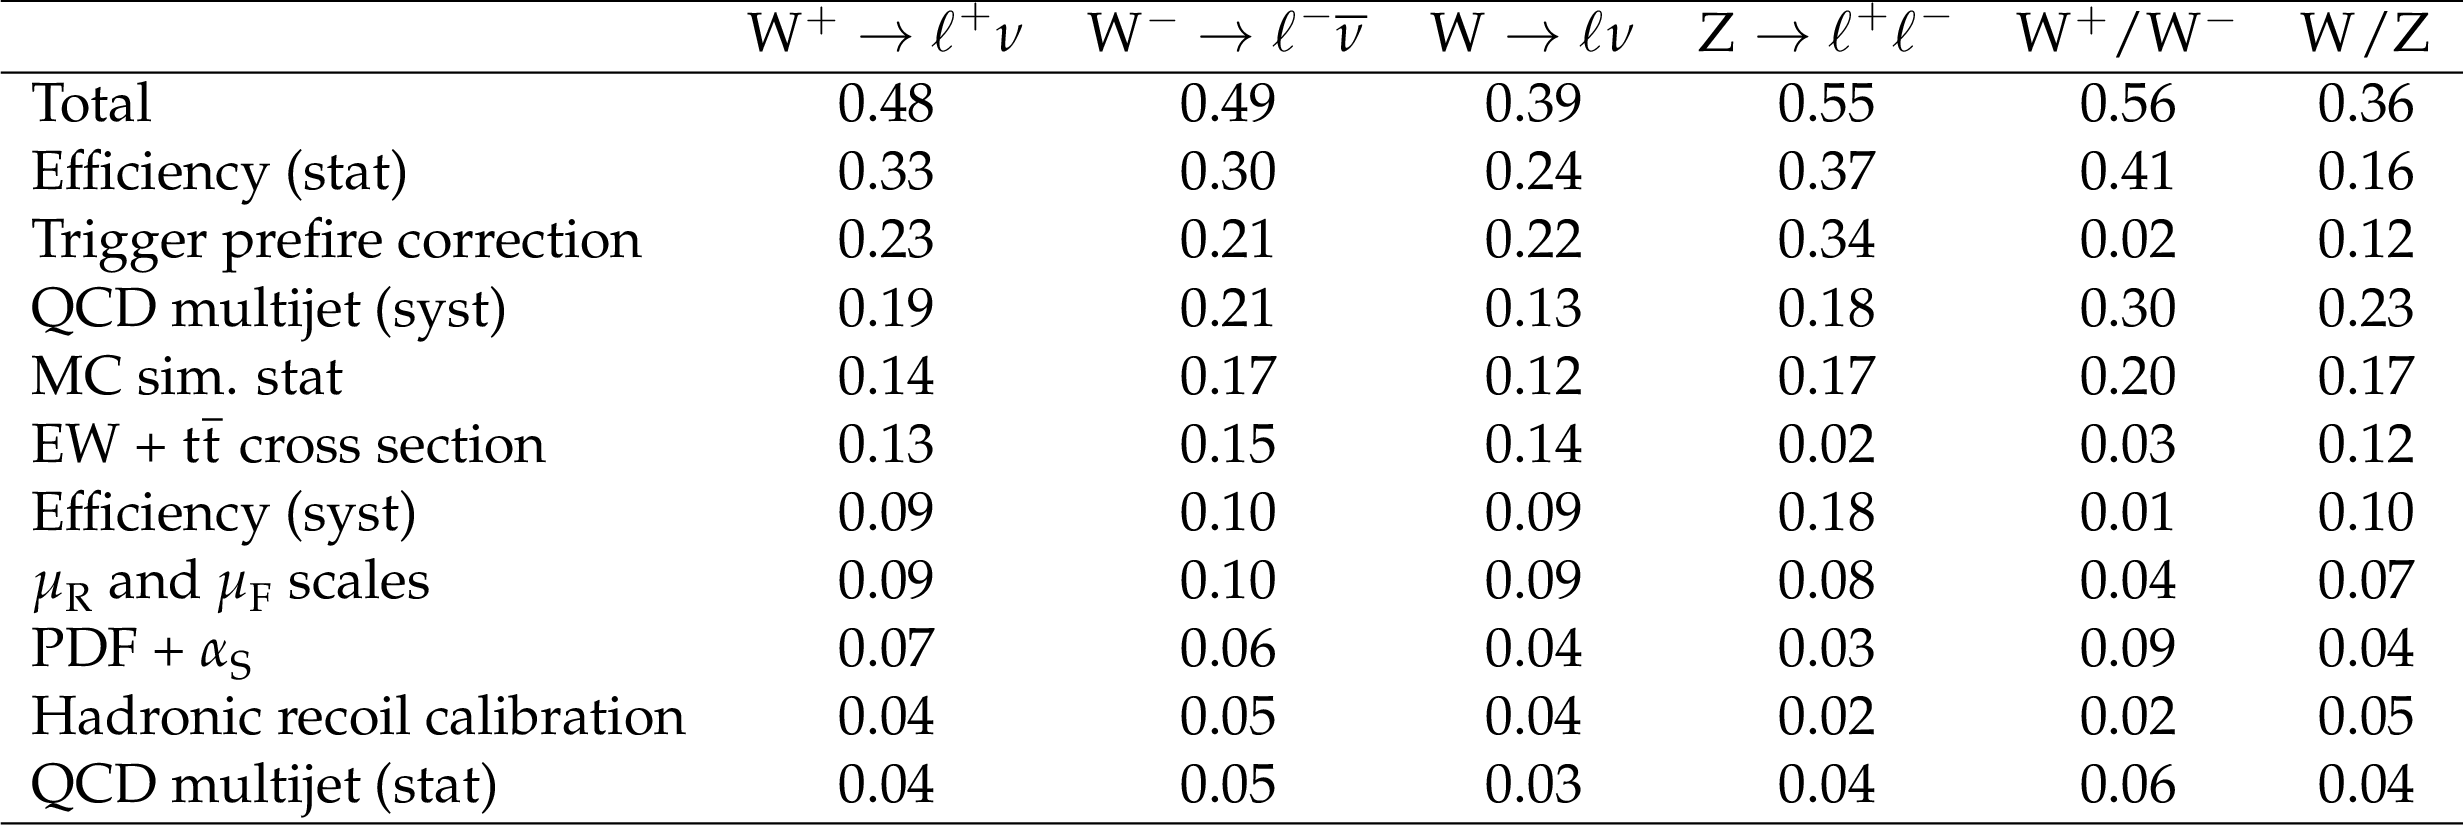
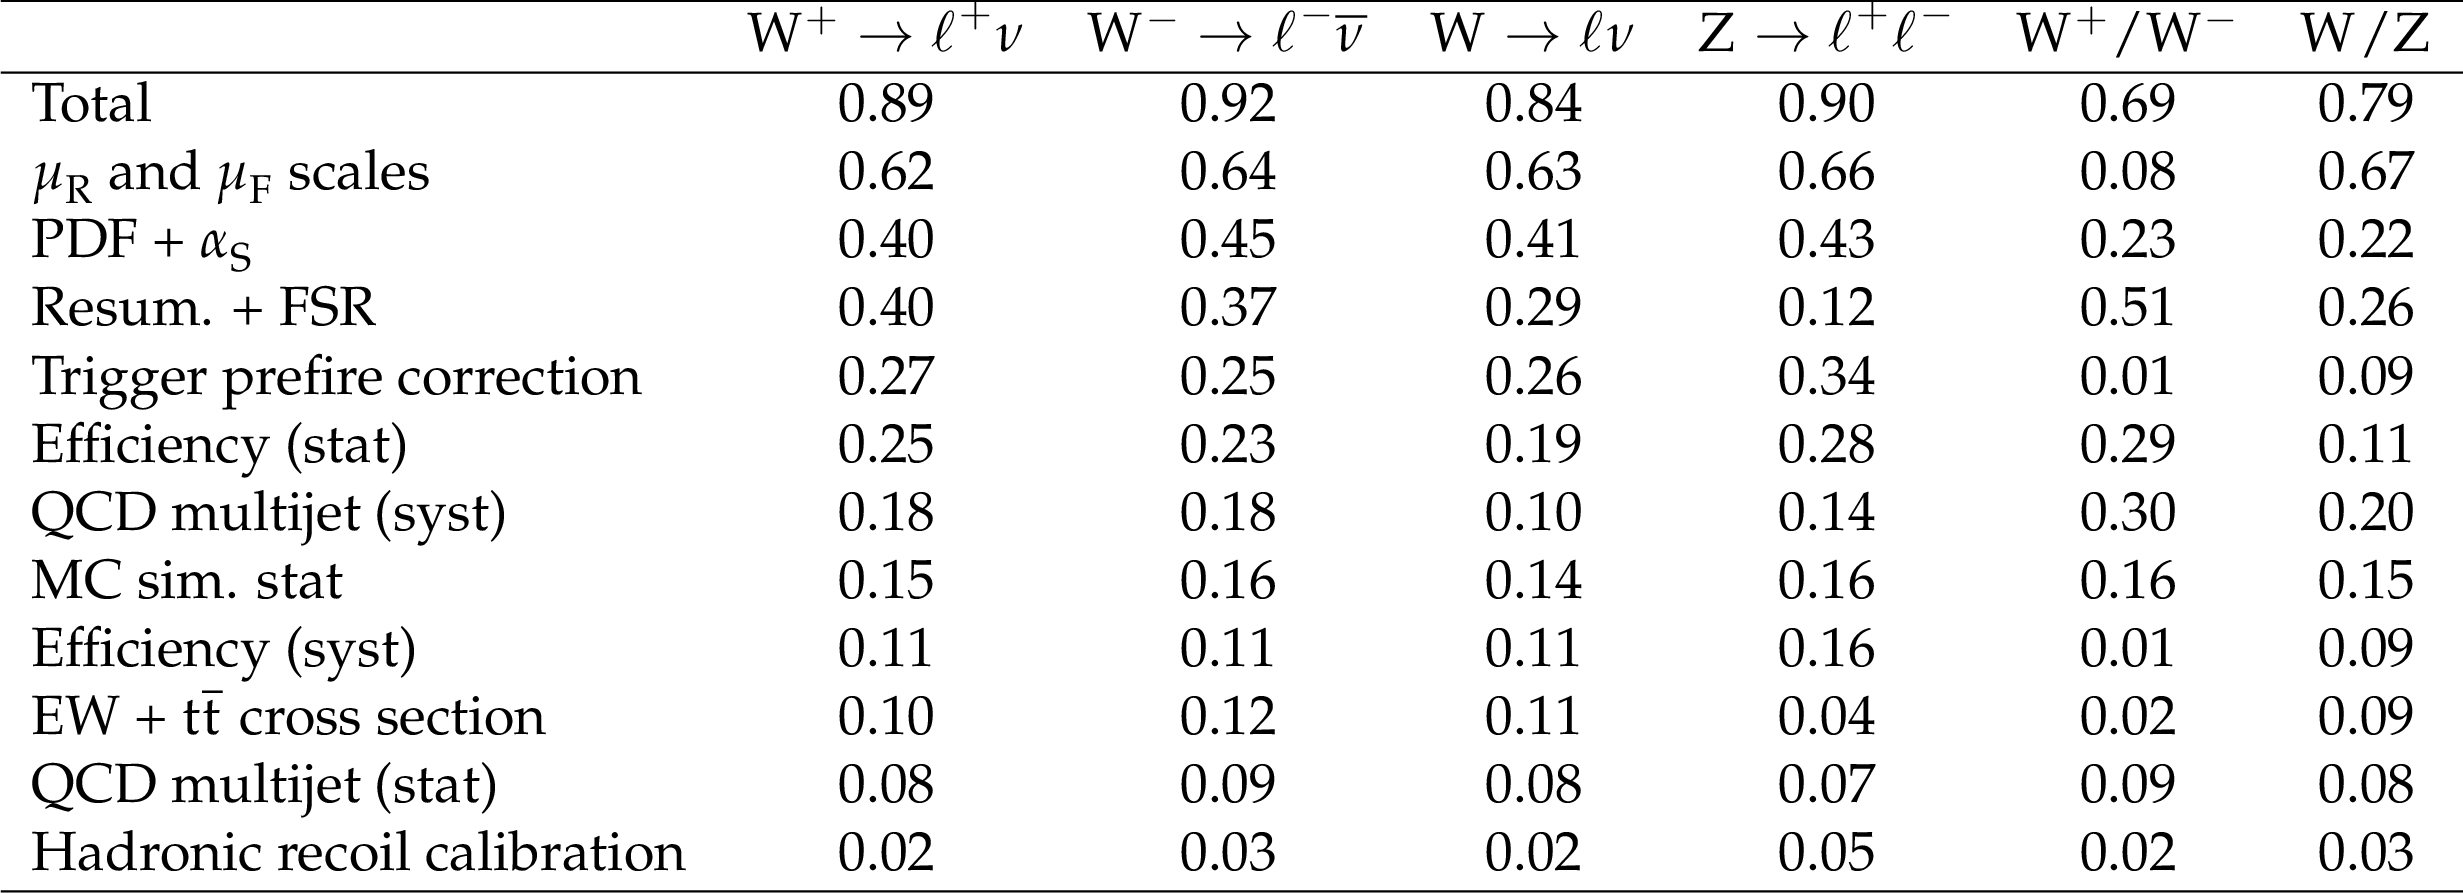
Table 6:
Systematic uncertainties, in percent, for the total inclusive cross sections at 5.02 TeV. The 1.9% integrated luminosity uncertainty, which affects the W and Z boson production cross sections, is not included in the table. |
png pdf |
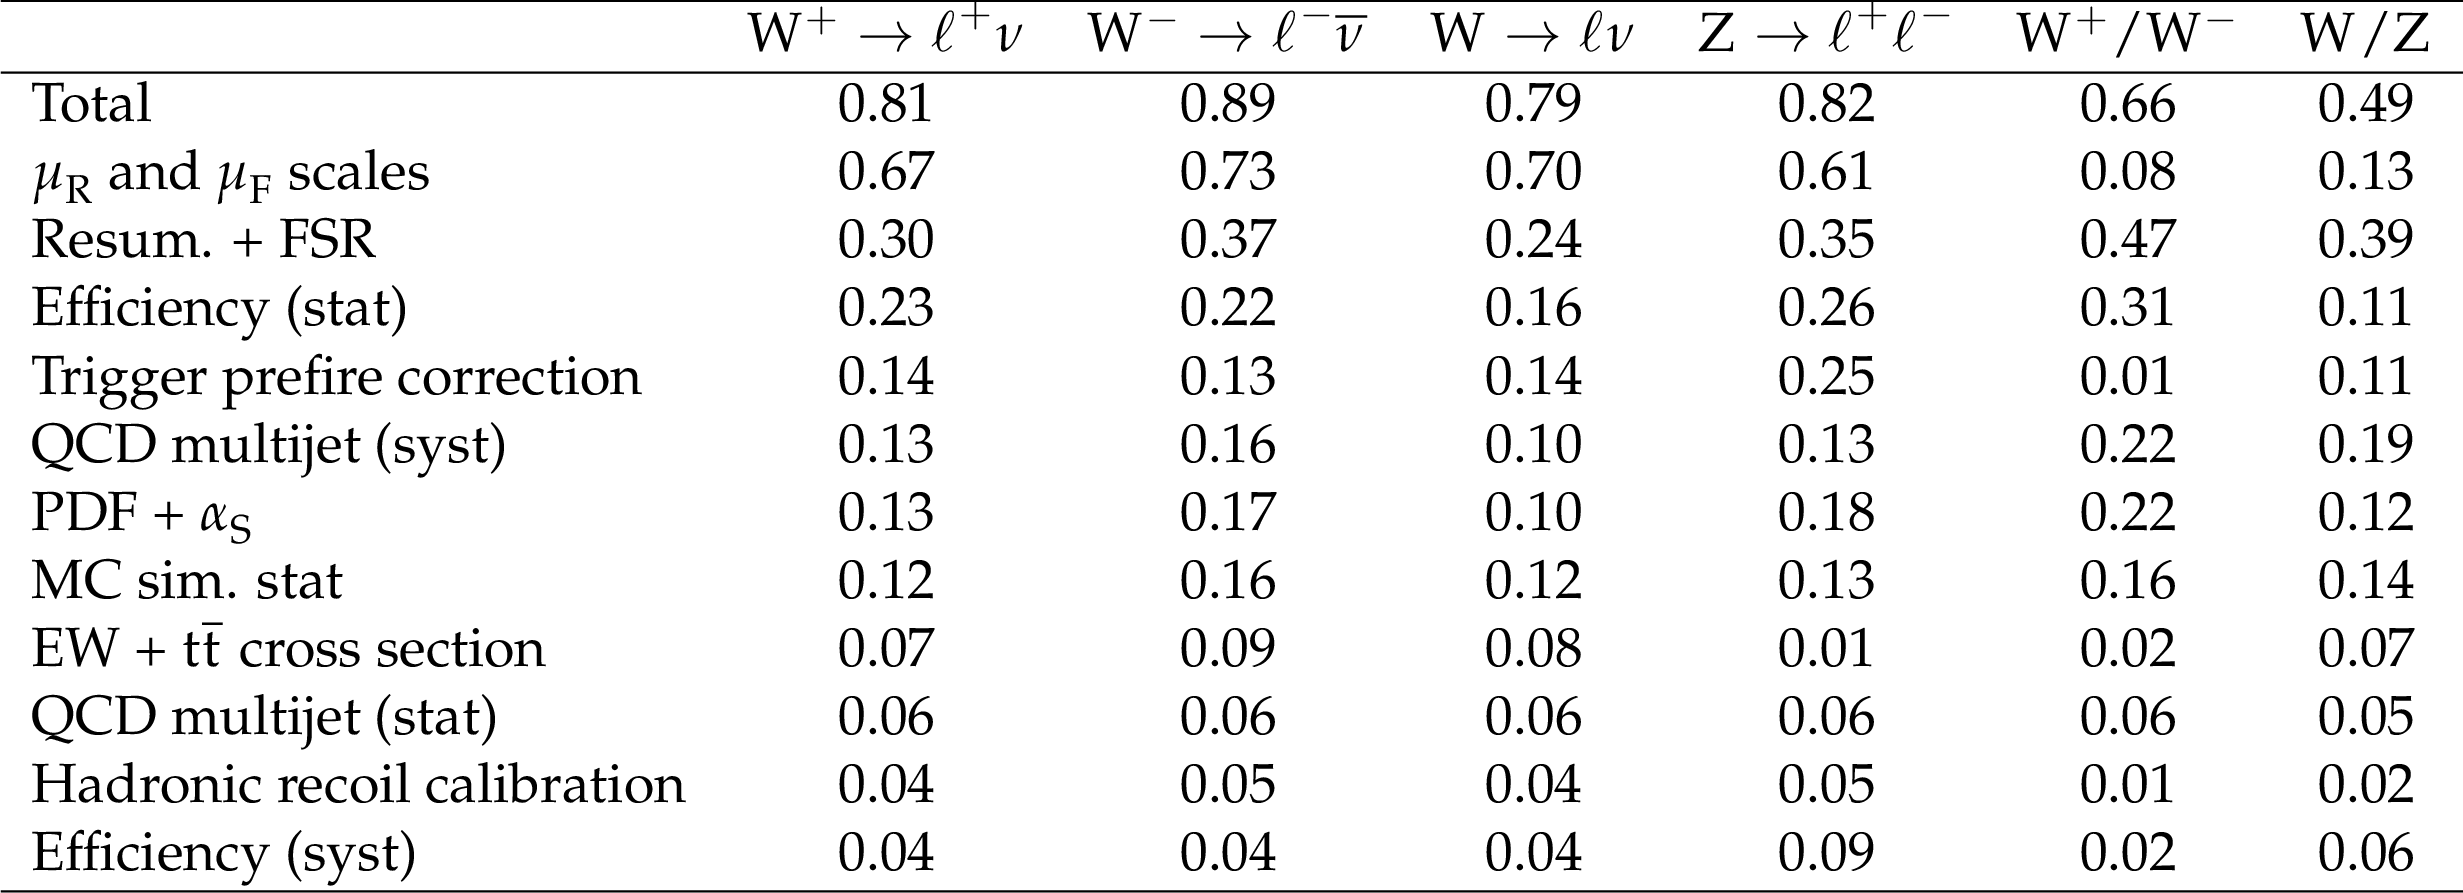
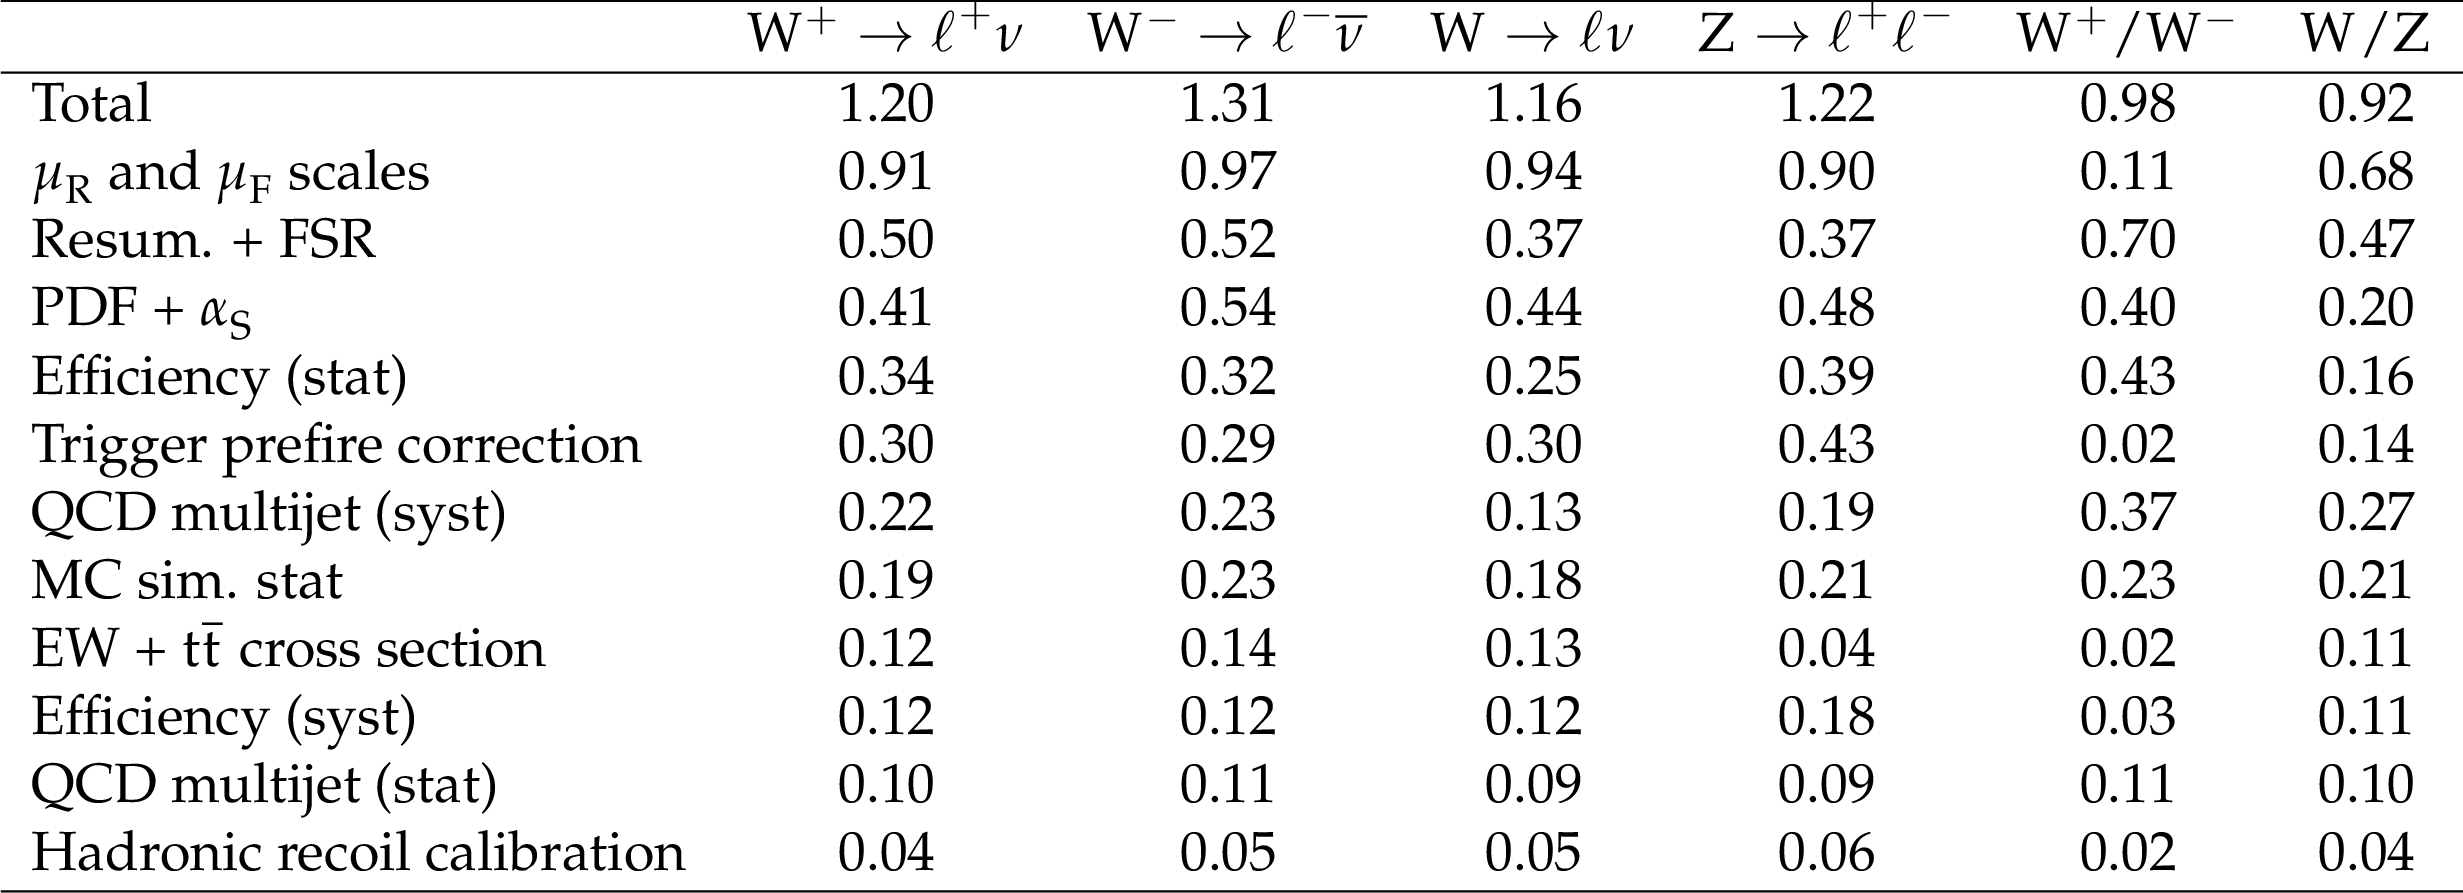
Table 7:
Systematic uncertainties, in percent, for the total inclusive cross sections at 13 TeV. The 2.3% integrated luminosity uncertainty, which affects the W and Z boson production cross sections, is not included in the table. |
png pdf |
Table 8:
Systematic uncertainties, in percent, for the total inclusive cross section ratios between 13 and 5.02 TeV. The 2.8% integrated luminosity uncertainty, which affects the W and Z boson production cross section ratios, is not included in the table. |
png pdf |
Table 9:
Comparison of the theoretical calculations and the measured fiducial inclusive cross sections and ratios at 5.02 TeV. The unit for cross sections is always pb. The uncertainties in the theoretical predictions include the statistical uncertainty, and the PDF, $ \alpha_\mathrm{S} $, and renormalization and factorization scale uncertainties. |

png pdf |
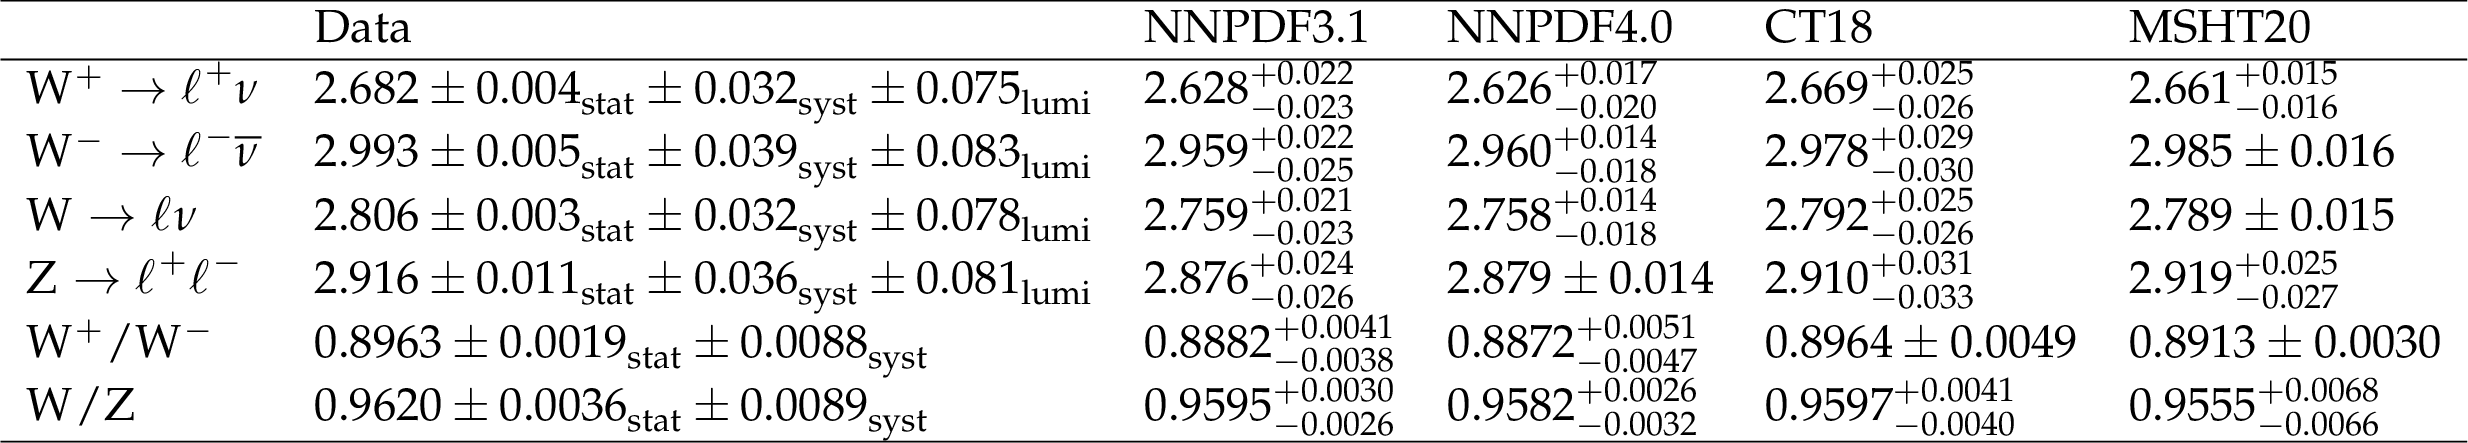
Table 10:
Comparison of the theoretical calculations and the measured fiducial inclusive cross sections and ratios at 13 TeV. The unit for cross sections is always pb. The uncertainties in the theoretical predictions include the statistical uncertainty, and the PDF, $ \alpha_\mathrm{S} $, and renormalization and factorization scale uncertainties. The statistical uncertainty for $ \mathrm{W^+}\to \ell^{+}\nu $ is negligible compared with the other uncertainties. |

png pdf |
Table 11:
Comparison of the theoretical calculations and the measured fiducial inclusive cross section ratios between 13 and 5.02 TeV. The uncertainties in the theoretical predictions include the statistical uncertainty, and the PDF, $ \alpha_\mathrm{S} $, and renormalization and factorization scale uncertainties. |
png pdf |
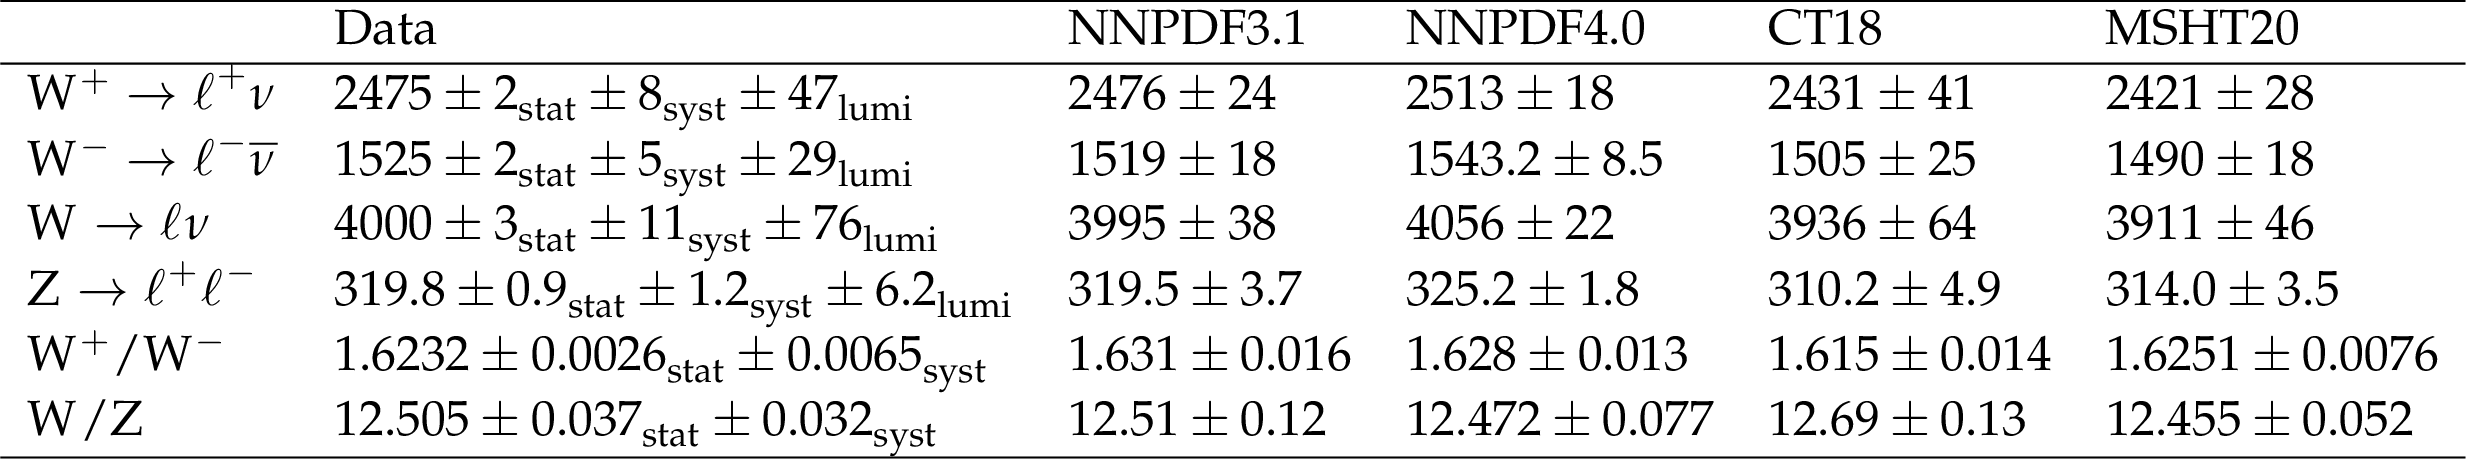
Table 12:
Comparison of the theoretical calculations and the measured total inclusive cross sections and ratios at 5.02 TeV. The unit for cross sections is always pb. The uncertainties in the theoretical predictions include the statistical uncertainty, and the PDF, $ \alpha_\mathrm{S} $, and renormalization and factorization scale uncertainties. |

png pdf |
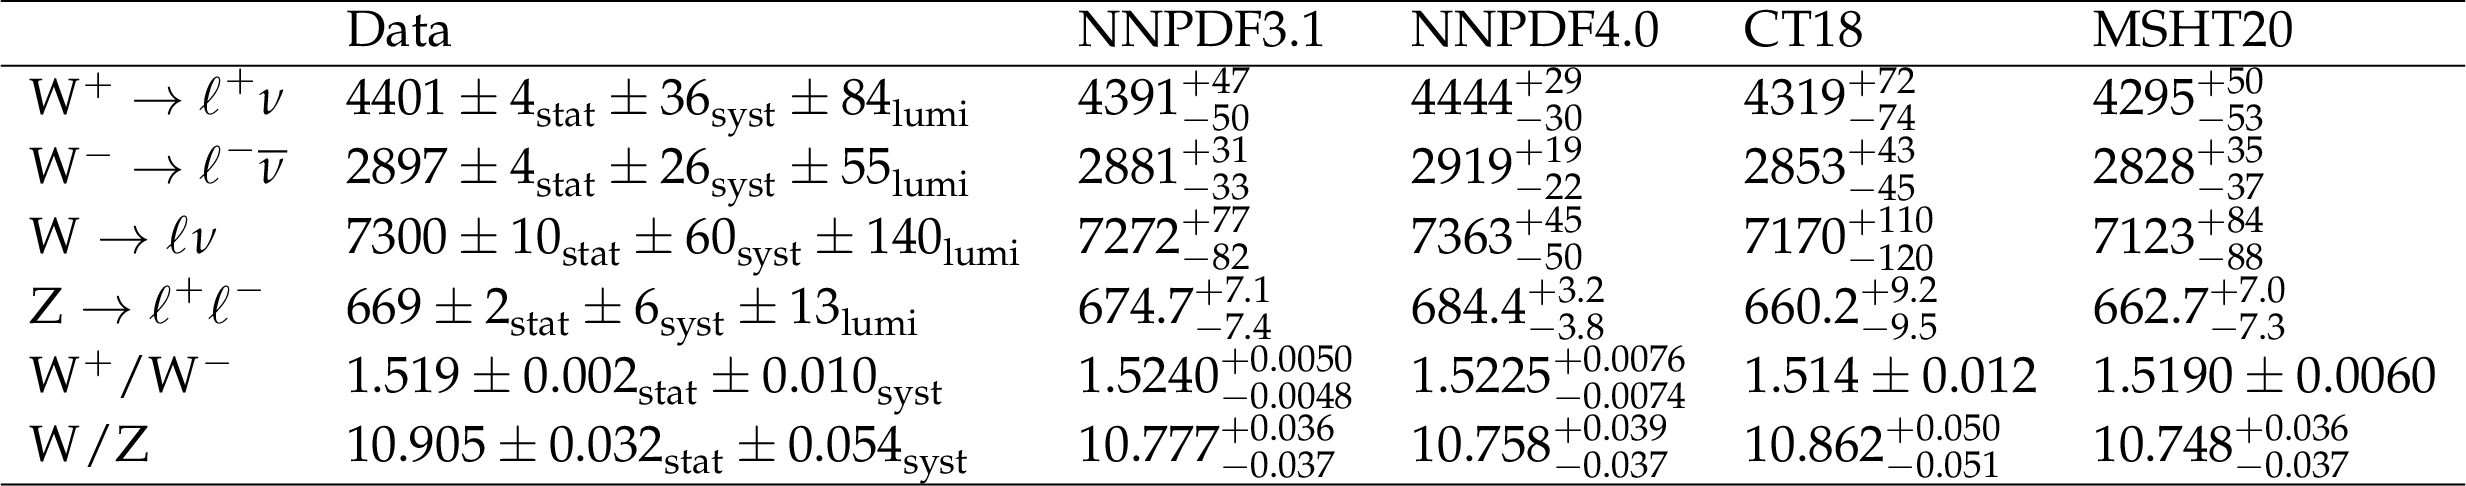
Table 13:
Comparison of the theoretical calculations and the measured total inclusive cross sections and ratios at 13 TeV. The unit for cross sections is always pb. The uncertainties in the theoretical predictions include the statistical uncertainty, and the PDF, $ \alpha_\mathrm{S} $, and renormalization and factorization scale uncertainties. |
png pdf |
Table 14:
Comparison of the theoretical calculations and the measured total inclusive cross section ratios and double ratios between 13 and 5.02 TeV. The uncertainties in the theoretical predictions include the statistical uncertainty, and the PDF, $ \alpha_\mathrm{S} $, and renormalization and factorization scale uncertainties. |
| Summary |
| Fiducial and total inclusive cross sections for W and Z boson production measured in proton-proton collisions at 5.02 TeV and 13 TeV are presented. Electron and muon decay modes are studied in the data collected with the CMS detector in 2017, in dedicated runs with reduced instantaneous luminosity. The data sets correspond to integrated luminosities of 298 $ \pm $ 6 pb$^{-1}$ at 5.02 TeV and 206 $ \pm $ 5 pb$^{-1}$ at 13 TeV. Measured values of the products of the total inclusive cross sections and the branching fractions are $ \sigma(\mathrm{p}\mathrm{p} \to \mathrm{W} + \mathrm{X})\mathcal{B}(\mathrm{W} \to \ell\nu ) = $ 7300 $ \pm $ 10 (stat) $ \pm $ 60 (syst) $ \pm $ 140 (lumi) pb, and $ \sigma(\mathrm{p}\mathrm{p} \to \mathrm{Z} + \mathrm{X})\mathcal{B}(\mathrm{Z} \to \ell^+\ell^-) = $ 669 $ \pm $ 2 (stat) $ \pm $ 6 (syst) $ \pm $ 13 (lumi) pb for the dilepton invariant mass in the range of 60-120 GeV at 5.02 TeV, and correspondingly 20480 $ \pm $ 10 (stat) $ \pm $ 170 (syst) $ \pm $ 470 (lumi) pb and 1952 $ \pm $ 4 (stat) $ \pm $ 18 (syst) $ \pm $ 45 (lumi) pb at 13 TeV. The measured values agree with cross section calculations at next-to-next-to-leading-order in perturbative quantum chromodynamics. Fiducial and total inclusive cross sections, ratios of cross sections of W$^{+}$ to W$^{-}$, W to Z, and 13 TeV to 5.02 TeV measurements are reported. The fiducial inclusive cross sections for W and Z boson productions at 5.02 TeV achieve a precision of less than 2%, which is the most precisely measured cross sections from the CMS experiment. |
| References | ||||
| 1 | J. Butterworth et al. | PDF4LHC recommendations for LHC Run II | JPG 43 (2016) 023001 | 1510.03865 |
| 2 | S. Bailey et al. | Parton distributions from LHC, HERA, Tevatron and fixed target data: MSHT20 PDFs | EPJC 81 (2021) 341 | 2012.04684 |
| 3 | T.-J. Hou et al. | Progress in the CTEQ-TEA NNLO global QCD analysis | 1908.11394 | |
| 4 | NNPDF Collaboration | Parton distributions from high-precision collider data | EPJC 77 (2017) 663 | 1706.00428 |
| 5 | K. Melnikov and F. Petriello | Electroweak gauge boson production at hadron colliders through $ \mathcal{O}(\alpha_{\mathrm{s}}^2) $ | PRD 74 (2006) 114017 | hep-ph/0609070 |
| 6 | S. Catani et al. | Vector boson production at hadron colliders: a fully exclusive QCD calculation at NNLO | PRL 103 (2009) 082001 | 0903.2120 |
| 7 | J. Baglio, C. Duhr, B. Mistlberger, and R. Szafron | Inclusive production cross sections at N$ ^{3} $LO | JHEP 12 (2022) 066 | 2209.06138 |
| 8 | C. Anastasiou, L. Dixon, K. Melnikov, and F. Petriello | High precision QCD at hadron colliders: Electroweak gauge boson rapidity distributions at NNLO | PRD 69 (2004) 094008 | hep-ph/0312266 |
| 9 | S. Dittmaier, A. Huss, and C. Schwinn | Mixed QCD-electroweak $ \mathcal{O}(\alpha_s\alpha) $ corrections to Drell-Yan processes in the resonance region: pole approximation and non-factorizable corrections | NPB 885 (2014) 318 | 1403.3216 |
| 10 | J. M. Lindert et al. | Precise predictions for V+jets dark matter backgrounds | EPJC 77 (2017) 829 | 1705.04664 |
| 11 | CMS Collaboration | The CMS experiment at the CERN LHC | JINST 3 (2008) S08004 | |
| 12 | CMS Collaboration | Study of Z production in PbPb and pp collisions at $ \sqrt{s_{\mathrm{NN}}}= $ 2.76 TeV in the dimuon and dielectron decay channels | JHEP 03 (2015) 022 | CMS-HIN-13-004 1410.4825 |
| 13 | CMS Collaboration | Study of W boson production in PbPb and pp collisions at $ \sqrt{s_{\mathrm{NN}}}= $ 2.76 TeV | PLB 715 (2012) 66 | CMS-HIN-11-008 1205.6334 |
| 14 | ATLAS Collaboration | Measurement of $ \mathrm{W}^{\pm} $-boson and Z-boson production cross-sections in pp collisions at $ \sqrt{s}= $ 2.76 TeV with the ATLAS detector | EPJC 79 (2019) 901 | 1907.03567 |
| 15 | ATLAS Collaboration | Measurements of W and Z boson production in pp collisions at $ \sqrt{s}= $ 5.02 TeV with the ATLAS detector | EPJC 79 (2019) 128 | 1810.08424 |
| 16 | ATLAS Collaboration | Precision measurement and interpretation of inclusive $ \mathrm{W}^+ $, $ \mathrm{W}^- $ and $ \mathrm{Z}/\gamma ^* $ production cross sections with the ATLAS detector | EPJC 77 (2017) 367 | 1612.03016 |
| 17 | CMS Collaboration | Measurement of the inclusive W and Z production cross sections in pp collisions at $ \sqrt{s}= $ 7 TeV | JHEP 10 (2011) 132 | CMS-EWK-10-005 1107.4789 |
| 18 | LHCb Collaboration | Measurement of the forward W boson cross-section in pp collisions at $ \sqrt{s} = $ 7 TeV | JHEP 12 (2014) 079 | 1408.4354 |
| 19 | LHCb Collaboration | Measurement of the cross-section for $ \mathrm{Z} \to e^+e^- $ production in pp collisions at $ \sqrt{s}= $ 7 TeV | JHEP 02 (2013) 106 | 1212.4620 |
| 20 | LHCb Collaboration | Measurement of the forward Z boson production cross-section in pp collisions at $ \sqrt{s}= $ 7 TeV | JHEP 08 (2015) 039 | 1505.07024 |
| 21 | LHCb Collaboration | Measurement of forward $ \mathrm{W}\to e\nu $ production in pp collisions at $ \sqrt{s}= $ 8 TeV | JHEP 10 (2016) 030 | 1608.01484 |
| 22 | LHCb Collaboration | Measurement of the forward Z boson production cross-section in pp collisions at $ \sqrt{s} = $ 13 TeV | JHEP 09 (2016) 136 | 1607.06495 |
| 23 | LHCb Collaboration | Measurement of forward W and Z boson production in pp collisions at $ \sqrt{s}= $ 8 TeV | JHEP 01 (2016) 155 | 1511.08039 |
| 24 | CMS Collaboration | Measurement of inclusive W and Z boson production cross sections in pp collisions at $ \sqrt{s} = $ 8 TeV | PRL 112 (2014) 191802 | CMS-SMP-12-011 1402.0923 |
| 25 | ATLAS Collaboration | Measurement of $ \mathrm{W}^{\pm} $ and Z-boson production cross sections in pp collisions at $ \sqrt{s}= $ 13 TeV with the ATLAS detector | PLB 759 (2016) 601 | 1603.09222 |
| 26 | CMS Collaboration | Measurements of differential Z boson production cross sections in proton-proton collisions at $ \sqrt{s} = $ 13 TeV | JHEP 12 (2019) 061 | CMS-SMP-17-010 1909.04133 |
| 27 | CMS Collaboration | Measurements of the W boson rapidity, helicity, double-differential cross sections, and charge asymmetry in pp collisions at $ \sqrt {s} = $ 13 TeV | PRD 102 (2020) 092012 | CMS-SMP-18-012 2008.04174 |
| 28 | ATLAS Collaboration | Precise measurements of $ W $- and $ Z $-boson transverse momentum spectra with the ATLAS detector using $ pp $ collisions at $ \sqrt{s} = $ 5.02 TeV and 13 TeV | Submitted to Eur. Phys. J. C, 2024 | 2404.06204 |
| 29 | ATLAS Collaboration | Measurement of vector boson production cross sections and their ratios using pp collisions at $\sqrt{s} =$ 13.6 TeV with the ATLAS detector | PLB 854 (2024) 138725 | 2403.12902 |
| 30 | CMS Collaboration | HEPData record for this analysis | link | |
| 31 | CMS Collaboration | Performance of the CMS Level-1 trigger in proton-proton collisions at $ \sqrt{s} = $ 13 TeV | JINST 15 (2020) P10017 | CMS-TRG-17-001 2006.10165 |
| 32 | CMS Collaboration | The CMS trigger system | JINST 12 (2017) P01020 | CMS-TRG-12-001 1609.02366 |
| 33 | J. Alwall et al. | The automated computation of tree-level and next-to-leading order differential cross sections, and their matching to parton shower simulations | JHEP 07 (2014) 079 | 1405.0301 |
| 34 | P. Nason | A new method for combining NLO QCD with shower Monte Carlo algorithms | JHEP 11 (2004) 040 | hep-ph/0409146 |
| 35 | S. Frixione, P. Nason, and C. Oleari | Matching NLO QCD computations with parton shower simulations: the POWHEG method | JHEP 11 (2007) 070 | 0709.2092 |
| 36 | S. Alioli, P. Nason, C. Oleari, and E. Re | NLO vector-boson production matched with shower in POWHEG | JHEP 07 (2008) 060 | 0805.4802 |
| 37 | S. Alioli, P. Nason, C. Oleari, and E. Re | A general framework for implementing NLO calculations in shower Monte Carlo programs: the POWHEG BOX | JHEP 06 (2010) 043 | 1002.2581 |
| 38 | M. Chiesa, C. Oleari, and E. Re | NLO QCD+NLO EW corrections to diboson production matched to parton shower | EPJC 80 (2020) 849 | 2005.12146 |
| 39 | S. Frixione, P. Nason, and G. Ridolfi | The POWHEG-hvq manual version 1.0 | 0707.3081 | |
| 40 | T. Sjöstrand et al. | An introduction to PYTHIA 8.2 | Comput. Phys. Commun. 191 (2015) 159 | 1410.3012 |
| 41 | P. Skands, S. Carrazza, and J. Rojo | Tuning PYTHIA 8.1: the Monash 2013 tune | EPJC 74 (2014) 3024 | 1404.5630 |
| 42 | CMS Collaboration | Extraction and validation of a new set of CMS PYTHIA 8 tunes from underlying-event measurements | EPJC 80 (2020) 4 | CMS-GEN-17-001 1903.12179 |
| 43 | GEANT4 Collaboration | GEANT 4---a simulation toolkit | NIM A 506 (2003) 250 | |
| 44 | CMS Collaboration | Particle-flow reconstruction and global event description with the CMS detector | JINST 12 (2017) P10003 | CMS-PRF-14-001 1706.04965 |
| 45 | CMS Collaboration | Technical proposal for the Phase-II upgrade of the Compact Muon Solenoid | CMS Technical Proposal CERN-LHCC-2015-010, CMS-TDR-15-02, 2015 CDS |
|
| 46 | M. Cacciari, G. P. Salam, and G. Soyez | The anti-$ k_{\mathrm{T}} $ jet clustering algorithm | JHEP 04 (2008) 063 | 0802.1189 |
| 47 | M. Cacciari, G. P. Salam, and G. Soyez | FastJet user manual | EPJC 72 (2012) 1896 | 1111.6097 |
| 48 | CMS Collaboration | Performance of missing transverse momentum reconstruction in proton-proton collisions at $ \sqrt{s} = $ 13 TeV using the CMS detector | JINST 14 (2019) P07004 | CMS-JME-17-001 1903.06078 |
| 49 | CMS Collaboration | Electron and photon reconstruction and identification with the CMS experiment at the CERN LHC | JINST 16 (2021) P05014 | CMS-EGM-17-001 2012.06888 |
| 50 | CMS Collaboration | ECAL 2016 refined calibration and Run 2 summary plots | CMS Detector Performance Note CMS-DP-2020-021, 2020 CDS |
|
| 51 | CMS Collaboration | Performance of the CMS muon detector and muon reconstruction with proton-proton collisions at $ \sqrt{s}= $ 13 TeV | JINST 13 (2018) P06015 | CMS-MUO-16-001 1804.04528 |
| 52 | CMS Collaboration | Pileup mitigation at CMS in 13 TeV data | JINST 15 (2020) P09018 | CMS-JME-18-001 2003.00503 |
| 53 | A. Bodek et al. | Extracting muon momentum scale corrections for hadron collider experiments | EPJC 72 (2012) 2194 | 1208.3710 |
| 54 | CMS Collaboration | Performance of the CMS electromagnetic calorimeter in pp collisions at $ \sqrt{s} = $ 13 TeV | CMS-EGM-18-002 2403.15518 |
|
| 55 | T.-J. Hou et al. | New CTEQ global analysis of quantum chromodynamics with high-precision data from the LHC | PRD 103 (2021) 014013 | 1912.10053 |
| 56 | CMS Collaboration | The CMS statistical analysis and combination tool: Combine | Submitted to Comput. Softw. Big Sci, 2024 | CMS-CAT-23-001 2404.06614 |
| 57 | CMS Collaboration | CMS luminosity measurement for the 2017 data-taking period at $ \sqrt{s} = $ 13 TeV | CMS Physics Analysis Summary, 2017 CMS-PAS-LUM-17-004 |
CMS-PAS-LUM-17-004 |
| 58 | CMS Collaboration | Luminosity measurement in proton-proton collisions at 5.02 TeV in 2017 at CMS | CMS Physics Analysis Summary, 2021 link |
CMS-PAS-LUM-19-001 |
| 59 | P. Golonka and Z. Was | PHOTOS Monte Carlo: A precision tool for QED corrections in Z and W decays | EPJC 45 (2006) 97 | hep-ph/0506026 |
| 60 | R. Barlow and C. Beeston | Fitting using finite Monte Carlo samples | Comput. Phys. Comm. 77 (1993) 219 | |
| 61 | J. C. Collins, D. E. Soper, and G. Sterman | Transverse momentum distribution in Drell-Yan pair and W and Z boson production | NPB 250 (1985) 199 | |
| 62 | T. Gleisberg et al. | Event generation with SHERPA 1.1 | JHEP 02 (2009) 007 | 0811.4622 |
| 63 | M. Bähr et al. | Herwig++ physics and manual | EPJC 58 (2008) 639 | 0803.0883 |
| 64 | S. Frixione and B. R. Webber | Matching NLO QCD computations and parton shower simulations | JHEP 06 (2002) 029 | hep-ph/0204244 |
| 65 | C. Balázs, J.-W. Qiu, and C. P. Yuan | Effects of QCD resummation on distributions of leptons from the decay of electroweak vector bosons | PLB 355 (1995) 548 | hep-ph/9505203 |
| 66 | S. Catani, D. de Florian, G. Ferrera, and M. Grazzini | Vector boson production at hadron colliders: transverse-momentum resummation and leptonic decay | JHEP 12 (2015) 047 | 1507.06937 |
| 67 | S. Camarda et al. | DYTurbo: Fast predictions for Drell-Yan processes | EPJC 80 (2020) 251 | 1910.07049 |
| 68 | S. Camarda, L. Cieri, and G. Ferrera | Drell-Yan lepton-pair production: $ \mathrm{q}_\mathrm{T} $ resummation at N$ ^3 $LL accuracy and fiducial cross sections at N$ ^3 $LO | PRD 104 (2021) L111503 | 2103.04974 |
| 69 | S. Camarda, L. Cieri, and G. Ferrera | Fiducial perturbative power corrections within the $ \mathrm{q}_\mathrm{T} $ subtraction formalism | EPJC 82 (2022) 575 | 2111.14509 |
| 70 | S. Camarda, L. Cieri, and G. Ferrera | Drell-Yan lepton-pair production: $ \mathrm{q}_\mathrm{T} $ resummation at approximate N$ ^4 $LL+N$ ^4 $LO accuracy | 2303.12781 | |
| 71 | NNPDF Collaboration | The path to proton structure at 1\% accuracy | EPJC 82 (2022) 428 | 2109.02653 |
| 72 | G. P. Lepage | A New Algorithm for Adaptive Multidimensional Integration | J. Comput. Phys. 27 (1978) 192 | |
| 73 | UA1 Collaboration | Intermediate vector boson cross sections at the CERN super proton synchrotron collider and the number of neutrino types | PLB 198 (1987) 271 | |
| 74 | UA2 Collaboration | Measurement of W and Z production cross sections at the CERN $ \mathrm{\bar{p}p} $ collider | Z. Phys. C 47 (1990) 11 | |
| 75 | D0 Collaboration | Extraction of the width of the W boson from measurements of $ \sigma(p\bar{p} \to W + X) \times B(W \to e \nu) $ and $ \sigma(p\bar{p} \to Z + X) \times B(Z \to e e) $ and their ratio | PRD 61 (2000) 072001 | hep-ex/9906025 |
| 76 | CDF Collaboration | First measurements of inclusive $ W $ and $ Z $ cross sections from Run II of the Tevatron collider | PRL 94 (2005) 091803 | hep-ex/0406078 |
|
|
Compact Muon Solenoid LHC, CERN |
|

|

|

|

|

|