

Compact Muon Solenoid
LHC, CERN
| CMS-SMP-15-009 ; CERN-EP-2017-257 | ||
| Measurement of associated Z+charm production in proton-proton collisions at $\sqrt{s} = $ 8 TeV | ||
| CMS Collaboration | ||
| 6 November 2017 | ||
| Eur. Phys. J. C 78 (2018) 287 | ||
| Abstract: A study of the associated production of a Z boson and a charm quark jet (Z+c), and a comparison to production with a b quark jet (Z+b), in pp collisions at a centre-of-mass energy of 8 TeV are presented. The analysis uses a data sample corresponding to an integrated luminosity of 19.7 fb$^{-1}$, collected with the CMS detector at the CERN LHC. The Z boson candidates are identified through their decays into pairs of electrons or muons. Jets originating from heavy flavour quarks are identified using semileptonic decays of c or b flavoured hadrons and hadronic decays of charm hadrons. The measurements are performed in the kinematic region with two leptons with $p_{\rm T}^{\ell} > $ 20 GeV, ${|\eta^{\ell}|} < $ 2.1, 71 $ < m_{\ell\ell} < $ 111 GeV, and heavy flavour jets with $p_{\rm T}^{{\rm jet}} > $ 25 GeV and ${|\eta^{{\rm jet}}|} < $ 2.5. The Z+c production cross section is measured to be $\sigma({\mathrm{p}}{\mathrm{p}} \rightarrow \mathrm{Z} + \mathrm{c} + \mathrm{X}) {\cal B}(\mathrm{Z} \rightarrow \ell^+\ell^-) = $ 8.8 $\pm$ 0.5 (stat) $\pm$ 0.6 (syst) pb. The ratio of the Z+c and Z+b production cross sections is measured to be $\mathrm{(Z+c)/(Z+b)} = $ 2.0 $\pm$ 0.2 (stat) $\pm$ 0.2 (syst). The Z+c production cross section and the cross section ratio are also measured as a function of the transverse momentum of the Z boson and of the heavy flavour jet. The measurements are compared with theoretical predictions. | ||
| Links: e-print arXiv:1711.02143 [hep-ex] (PDF) ; CDS record ; inSPIRE record ; HepData record ; CADI line (restricted) ; | ||
| Figures | |
png pdf |
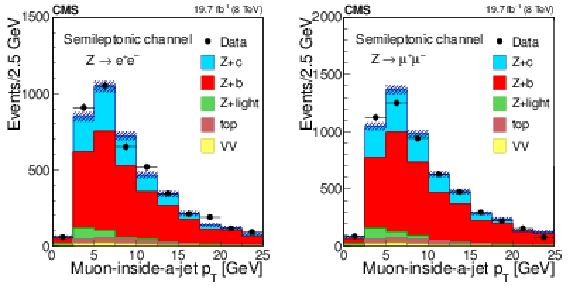
Figure 1:
Transverse momentum distribution of the selected muon-inside-a-jet for events with an identified muon among the jet constituents, in the dielectron (left) and dimuon (right) channels. The contributions from all processes are estimated with the simulated samples. Vertical bars on data points represent the statistical uncertainty in the data. The hatched areas represent the statistical uncertainty in the MC simulation. |
png pdf |
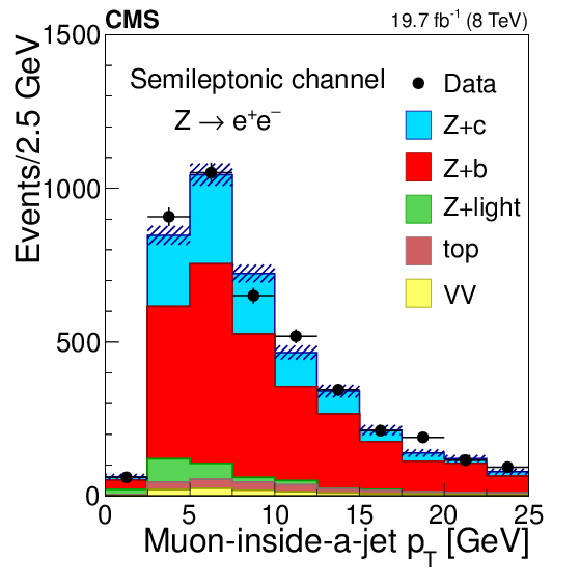
Figure 1-a:
Transverse momentum distribution of the selected muon-inside-a-jet for events with an identified muon among the jet constituents, in the dielectron channel. The contributions from all processes are estimated with the simulated samples. Vertical bars on data points represent the statistical uncertainty in the data. The hatched areas represent the statistical uncertainty in the MC simulation. |
png pdf |
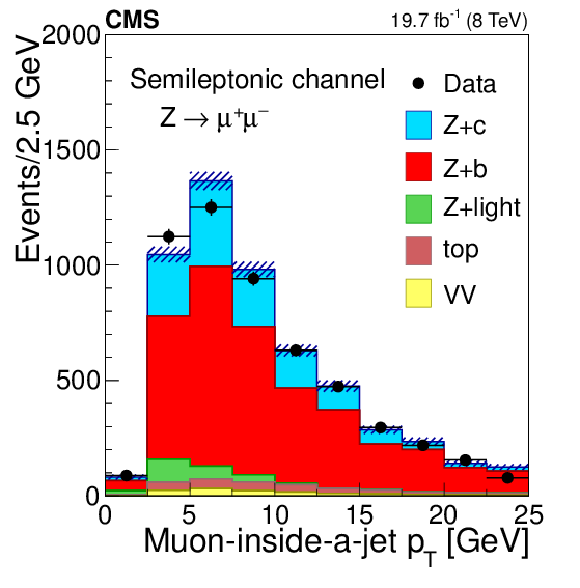
Figure 1-b:
Transverse momentum distribution of the selected muon-inside-a-jet for events with an identified muon among the jet constituents, in the dimuon channel. The contributions from all processes are estimated with the simulated samples. Vertical bars on data points represent the statistical uncertainty in the data. The hatched areas represent the statistical uncertainty in the MC simulation. |
png pdf |
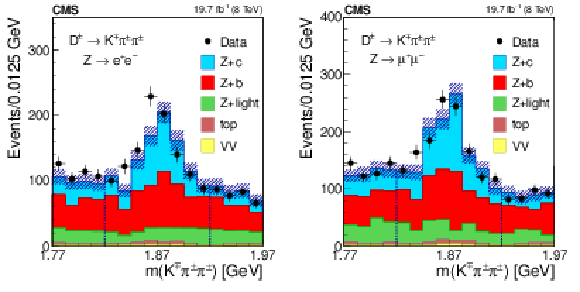
Figure 2:
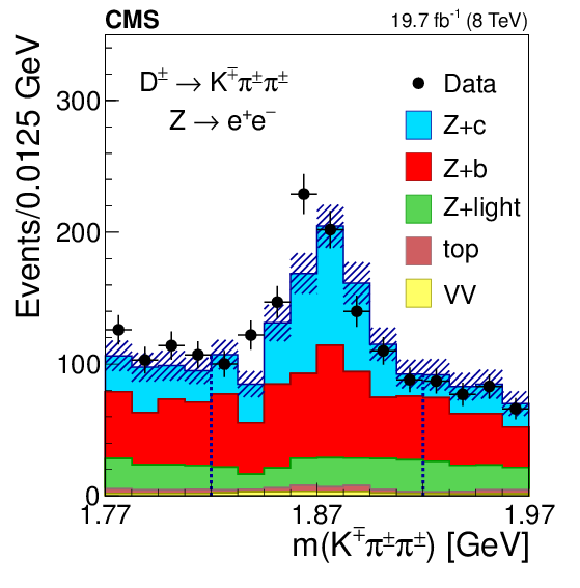
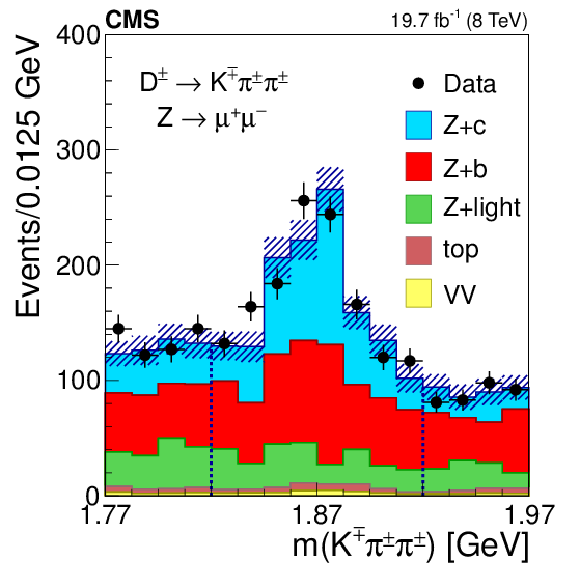
The invariant mass distribution of three-prong secondary vertices for events selected in the D mode, in the dielectron (left) and dimuon (right) channels. The mass assigned to each of the three tracks is explained in the text. The contributions from all processes are estimated with the simulated samples. The two dashed, vertical lines indicate the mass range of the signal region. Vertical bars on data points represent the statistical uncertainty in the data. The hatched areas represent the statistical uncertainty in the MC simulation. |
png pdf |
Figure 2-a:
The invariant mass distribution of three-prong secondary vertices for events selected in the D mode, in the dielectron channel. The mass assigned to each of the three tracks is explained in the text. The contributions from all processes are estimated with the simulated samples. The two dashed, vertical lines indicate the mass range of the signal region. Vertical bars on data points represent the statistical uncertainty in the data. The hatched areas represent the statistical uncertainty in the MC simulation. |
png pdf |
Figure 2-b:
The invariant mass distribution of three-prong secondary vertices for events selected in the D mode, in the dimuon channel. The mass assigned to each of the three tracks is explained in the text. The contributions from all processes are estimated with the simulated samples. The two dashed, vertical lines indicate the mass range of the signal region. Vertical bars on data points represent the statistical uncertainty in the data. The hatched areas represent the statistical uncertainty in the MC simulation. |
png pdf |
Figure 3:
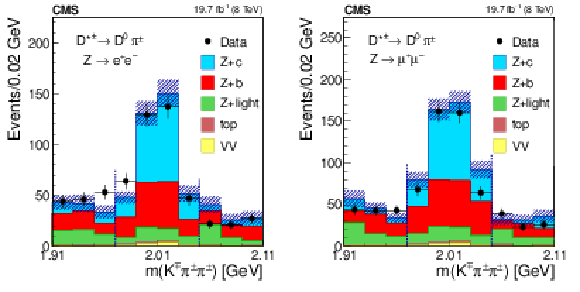
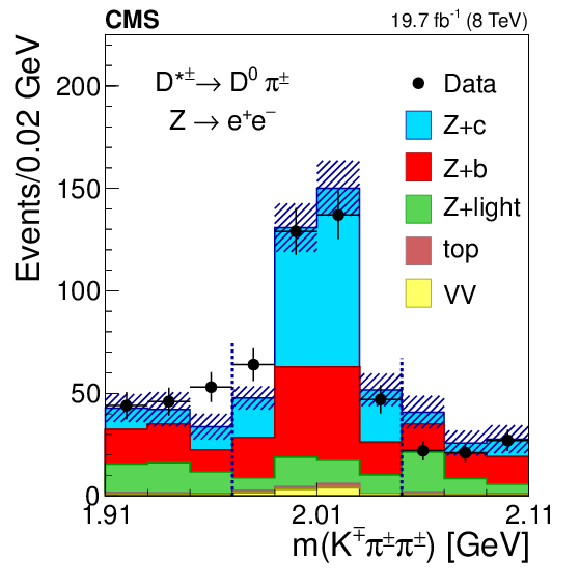
The invariant mass distribution of the three-track system composed of a two-prong secondary vertex and a primary particle for events selected in the $ {{{\mathrm{D}^{\ast}(2010)^{\pm}}}}$ mode, in the dielectron (left) and dimuon (right) channels. The mass assigned to each of the three tracks is explained in the text. The contributions from all processes are estimated with the simulated samples. The two dashed, vertical lines mark the mass range of the signal region. Vertical bars on data points represent the statistical uncertainty in the data. The hatched areas represent the statistical uncertainty in the MC simulation. |
png pdf |
Figure 3-a:
The invariant mass distribution of the three-track system composed of a two-prong secondary vertex and a primary particle for events selected in the $ {{{\mathrm{D}^{\ast}(2010)^{\pm}}}}$ mode, in the dielectron channel. The mass assigned to each of the three tracks is explained in the text. The contributions from all processes are estimated with the simulated samples. The two dashed, vertical lines mark the mass range of the signal region. Vertical bars on data points represent the statistical uncertainty in the data. The hatched areas represent the statistical uncertainty in the MC simulation. |

png pdf |
Figure 3-b:
The invariant mass distribution of the three-track system composed of a two-prong secondary vertex and a primary particle for events selected in the $ {{{\mathrm{D}^{\ast}(2010)^{\pm}}}}$ mode, in the dimuon channel. The mass assigned to each of the three tracks is explained in the text. The contributions from all processes are estimated with the simulated samples. The two dashed, vertical lines mark the mass range of the signal region. Vertical bars on data points represent the statistical uncertainty in the data. The hatched areas represent the statistical uncertainty in the MC simulation. |
png pdf |
Figure 4:
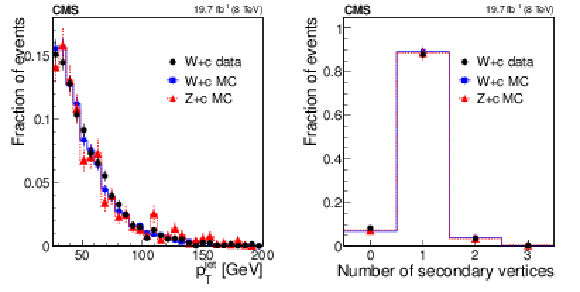
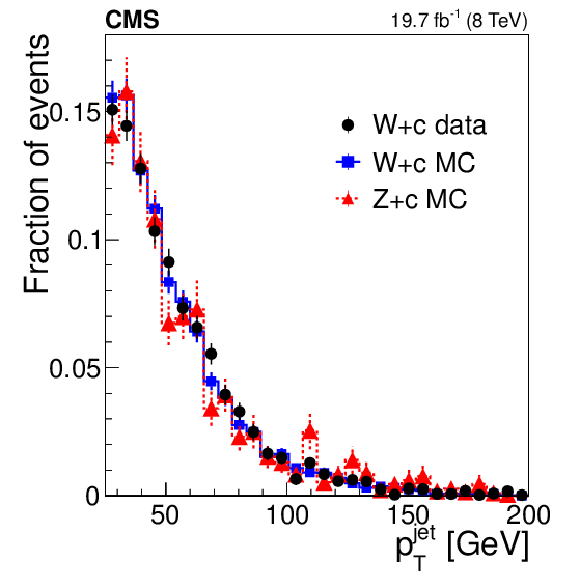
Transverse momentum distribution of the c-tagged jet (left) and number of reconstructed secondary vertices (right), normalized to unity, in simulated W+c and Z+c samples and in W+c data events. The W+c distributions are presented after the OS-SS subtraction. Vertical bars represent the statistical uncertainties. |
png pdf |
Figure 4-a:
Transverse momentum distribution of the c-tagged jet, normalized to unity, in simulated W+c and Z+c samples and in W+c data events. The W+c distributions are presented after the OS-SS subtraction. Vertical bars represent the statistical uncertainties. |

png pdf |
Figure 4-b:
Number of reconstructed secondary vertices, normalized to unity, in simulated W+c and Z+c samples and in W+c data events. The W+c distributions are presented after the OS-SS subtraction. Vertical bars represent the statistical uncertainties. |

png pdf |
Figure 5:
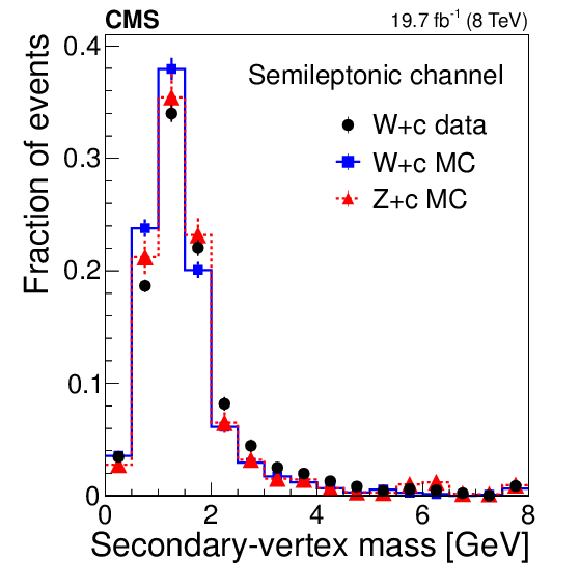
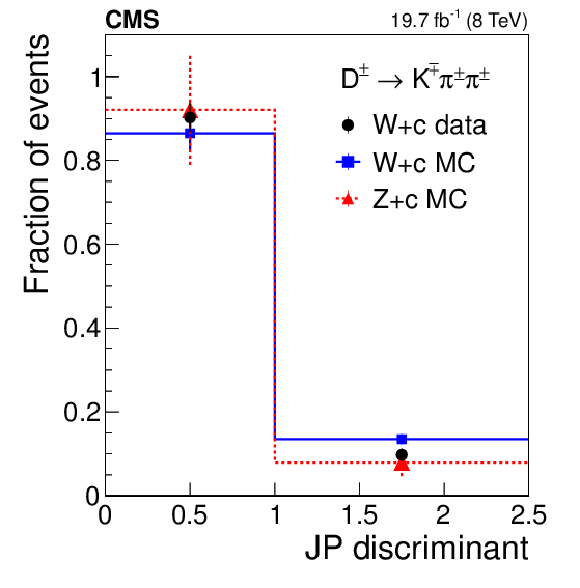
Distributions of the corrected secondary-vertex mass (left plot) and JP discriminant (D and $ {{{\mathrm{D}^{\ast}(2010)^{\pm}}}}$ modes in the middle and right plots), normalized to unity, in simulated W+c and Z+c samples, and in W+c data events. The W+c distributions are presented after the OS-SS subtraction. Events with $M_{\rm vertex}^{\rm corr} > $ 8 GeV are included in the last bin of the corrected secondary-vertex mass distribution. Vertical bars represent the statistical uncertainties. |
png pdf |
Figure 5-a:
Distribution of the JP discriminant for the $ {{{\mathrm{D}^{\ast}(2010)^{\pm}}}}$ mode, normalized to unity, in simulated W+c and Z+c samples, and in W+c data events. The W+c distributions are presented after the OS-SS subtraction. Events with $M_{\rm vertex}^{\rm corr} > $ 8 GeV are included in the last bin of the corrected secondary-vertex mass distribution. Vertical bars represent the statistical uncertainties. |
png pdf |
Figure 5-b:
Distributions of the corrected secondary-vertex mass (left plot) and JP discriminant (D and $ {{{\mathrm{D}^{\ast}(2010)^{\pm}}}}$ modes in the middle and right plots), normalized to unity, in simulated W+c and Z+c samples, and in W+c data events. The W+c distributions are presented after the OS-SS subtraction. Events with $M_{\rm vertex}^{\rm corr} > $ 8 GeV are included in the last bin of the corrected secondary-vertex mass distribution. Vertical bars represent the statistical uncertainties. |

png pdf |
Figure 5-c:
Distributions of the corrected secondary-vertex mass (left plot) and JP discriminant (D and $ {{{\mathrm{D}^{\ast}(2010)^{\pm}}}}$ modes in the middle and right plots), normalized to unity, in simulated W+c and Z+c samples, and in W+c data events. The W+c distributions are presented after the OS-SS subtraction. Events with $M_{\rm vertex}^{\rm corr} > $ 8 GeV are included in the last bin of the corrected secondary-vertex mass distribution. Vertical bars represent the statistical uncertainties. |
png pdf |
Figure 6:
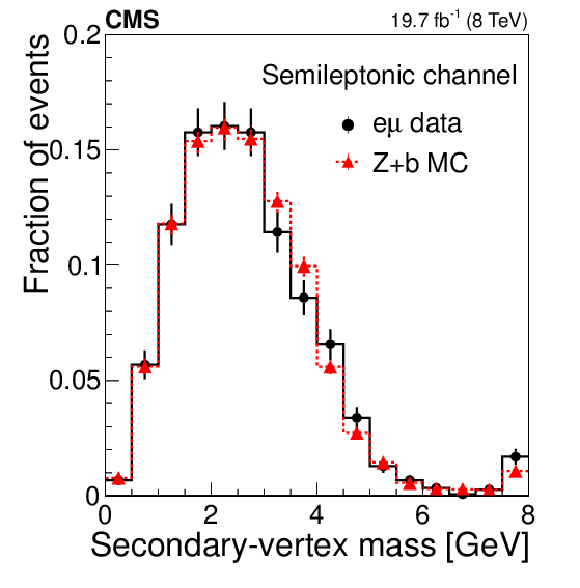
Distribution of the corrected secondary-vertex mass normalized to unity from simulated Z+b and $\mathrm{e} \mu $-${\mathrm{t} {}\mathrm{\bar{t}}} $ data (described in the text) events. Vertical bars represent the statistical uncertainties. The last bin of the distribution includes events with $M_{\rm vertex}^{\rm corr} > $ 8 GeV. |
png pdf |
Figure 7:
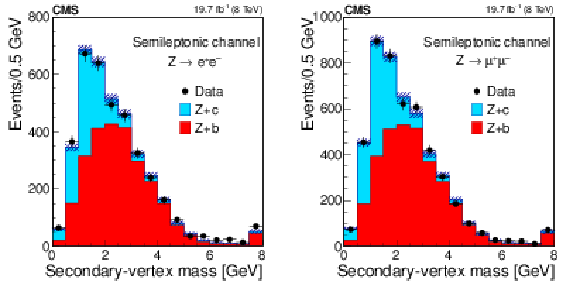
Corrected secondary-vertex mass distributions, after background subtraction, in the dielectron (left) and dimuon (right) channels for events selected in the semileptonic mode. Events with $M_{\rm vertex}^{\rm corr} > $ 8 GeV are included in the last bin of the distribution. The shape of the Z+c and Z+b contributions is estimated as explained in the text. Their normalization is adjusted to the result of the signal extraction fit. Vertical bars on data points represent the statistical uncertainty in the data. The hatched areas represent the sum in quadrature of the statistical uncertainties of the templates describing the two contributions (Z+c from W+c data events and Z+b from simulation). |

png pdf |
Figure 7-a:
Corrected secondary-vertex mass distributions, after background subtraction, in the dielectron channel for events selected in the semileptonic mode. Events with $M_{\rm vertex}^{\rm corr} > $ 8 GeV are included in the last bin of the distribution. The shape of the Z+c and Z+b contributions is estimated as explained in the text. Their normalization is adjusted to the result of the signal extraction fit. Vertical bars on data points represent the statistical uncertainty in the data. The hatched areas represent the sum in quadrature of the statistical uncertainties of the templates describing the two contributions (Z+c from W+c data events and Z+b from simulation). |
png pdf |
Figure 7-b:
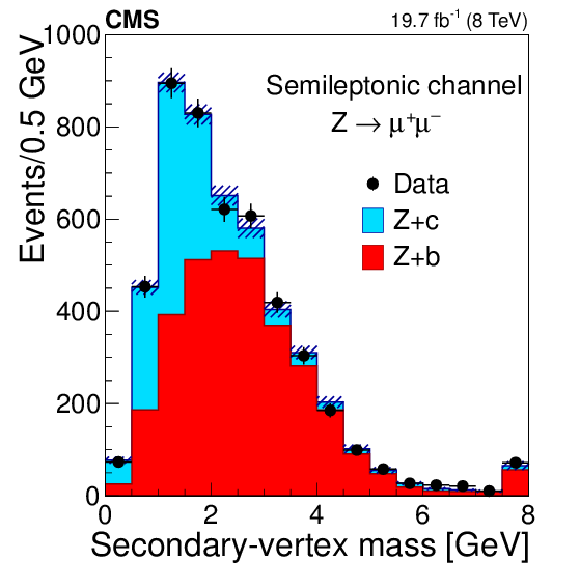
Corrected secondary-vertex mass distributions, after background subtraction, in the dimuon channel for events selected in the semileptonic mode. Events with $M_{\rm vertex}^{\rm corr} > $ 8 GeV are included in the last bin of the distribution. The shape of the Z+c and Z+b contributions is estimated as explained in the text. Their normalization is adjusted to the result of the signal extraction fit. Vertical bars on data points represent the statistical uncertainty in the data. The hatched areas represent the sum in quadrature of the statistical uncertainties of the templates describing the two contributions (Z+c from W+c data events and Z+b from simulation). |
png pdf |
Figure 8:
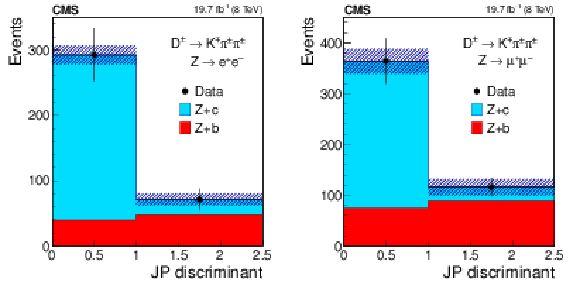
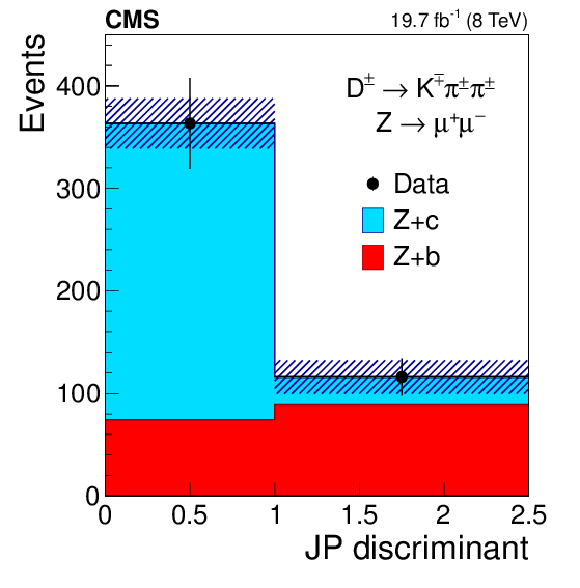
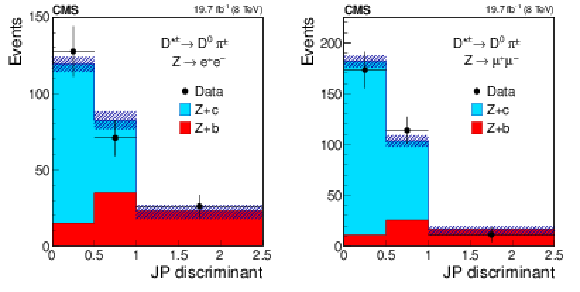
Background-subtracted distributions of the JP discriminant in the dielectron (left) and dimuon (right) channels for Z+jets events with a $ \mathrm{D}^{\pm} \to \mathrm{K} ^\mp \pi ^\pm \pi ^\pm $ candidate. The shape of the Z+c and Z+b contributions is estimated as explained in the text. Their normalization is adjusted to the result of the signal extraction fit. Vertical bars on data points represent the statistical uncertainty in the data. The hatched areas represent the sum in quadrature of the statistical uncertainties of the templates describing the two contributions (Z+c from W+c data events and Z+b from simulation). |

png pdf |
Figure 8-a:
Background-subtracted distributions of the JP discriminant in the dielectron channel for Z+jets events with a $ \mathrm{D}^{\pm} \to \mathrm{K} ^\mp \pi ^\pm \pi ^\pm $ candidate. The shape of the Z+c and Z+b contributions is estimated as explained in the text. Their normalization is adjusted to the result of the signal extraction fit. Vertical bars on data points represent the statistical uncertainty in the data. The hatched areas represent the sum in quadrature of the statistical uncertainties of the templates describing the two contributions (Z+c from W+c data events and Z+b from simulation). |
png pdf |
Figure 8-b:
Background-subtracted distributions of the JP discriminant in the dimuon channel for Z+jets events with a $ \mathrm{D}^{\pm} \to \mathrm{K} ^\mp \pi ^\pm \pi ^\pm $ candidate. The shape of the Z+c and Z+b contributions is estimated as explained in the text. Their normalization is adjusted to the result of the signal extraction fit. Vertical bars on data points represent the statistical uncertainty in the data. The hatched areas represent the sum in quadrature of the statistical uncertainties of the templates describing the two contributions (Z+c from W+c data events and Z+b from simulation). |
png pdf |
Figure 9:
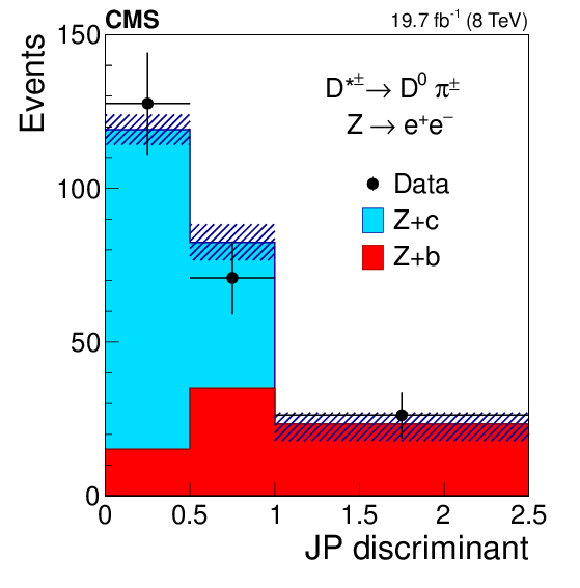
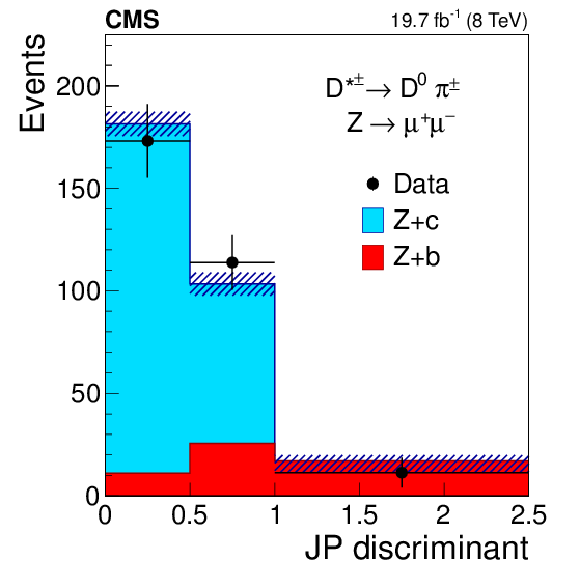
Background-subtracted distributions of the JP discriminant in the dielectron (left) and dimuon (right) channels for Z+jets events with a $ {{{\mathrm{D}^{\ast}(2010)^{\pm}}}}\to {{{\mathrm{D^0}}}}\pi ^\pm \to \mathrm{K} ^\mp \pi ^\pm \pi ^\pm $ candidate. The shape of the Z+c and Z+b contributions is estimated as explained in the text. Their normalization is adjusted to the result of the signal extraction fit. Vertical bars on data points represent the statistical uncertainty in the data. The hatched areas represent the sum in quadrature of the statistical uncertainties of the templates describing the two contributions (Z+c from W+c data events and Z+b from simulation). |
png pdf |
Figure 9-a:
Background-subtracted distributions of the JP discriminant in the dielectron channel for Z+jets events with a $ {{{\mathrm{D}^{\ast}(2010)^{\pm}}}}\to {{{\mathrm{D^0}}}}\pi ^\pm \to \mathrm{K} ^\mp \pi ^\pm \pi ^\pm $ candidate. The shape of the Z+c and Z+b contributions is estimated as explained in the text. Their normalization is adjusted to the result of the signal extraction fit. Vertical bars on data points represent the statistical uncertainty in the data. The hatched areas represent the sum in quadrature of the statistical uncertainties of the templates describing the two contributions (Z+c from W+c data events and Z+b from simulation). |
png pdf |
Figure 9-b:
Background-subtracted distributions of the JP discriminant in the dimuon channel for Z+jets events with a $ {{{\mathrm{D}^{\ast}(2010)^{\pm}}}}\to {{{\mathrm{D^0}}}}\pi ^\pm \to \mathrm{K} ^\mp \pi ^\pm \pi ^\pm $ candidate. The shape of the Z+c and Z+b contributions is estimated as explained in the text. Their normalization is adjusted to the result of the signal extraction fit. Vertical bars on data points represent the statistical uncertainty in the data. The hatched areas represent the sum in quadrature of the statistical uncertainties of the templates describing the two contributions (Z+c from W+c data events and Z+b from simulation). |
png pdf |
Figure 10:
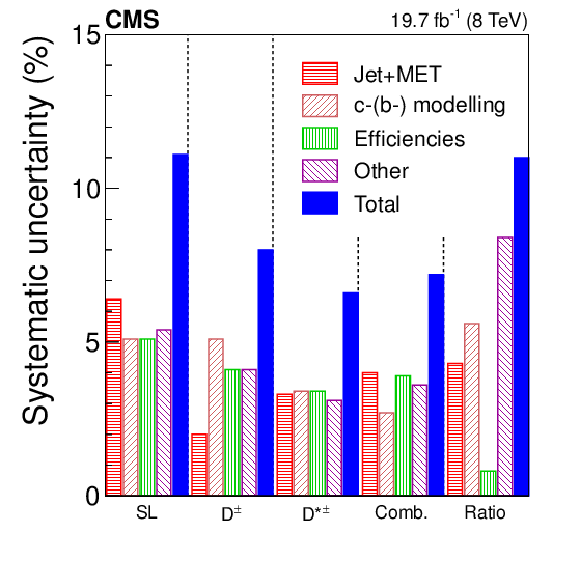
Contributions to the systematic uncertainty in the measured Z+c cross section and in the (Z+c)/(Z+b) cross section ratio. The first three blocks in the graph show the uncertainties in the Z+c cross section in the three decay modes, semileptonic (SL), D, and $ {{{\mathrm{D}^{\ast}(2010)^{\pm}}}}$, calculated from the combination of the dimuon and dielectron Z boson decay channels. The fourth block shows the systematic uncertainties in the combined (Comb.) Z+c cross section. The last block presents the systematic uncertainty in the (Z+c)/(Z+b) cross section ratio measured in the semileptonic mode. For every block, the height of the hatched bars indicates the contribution from the different sources of systematic uncertainty. The last, solid bar shows their sum in quadrature. |
png pdf |
Figure 11:
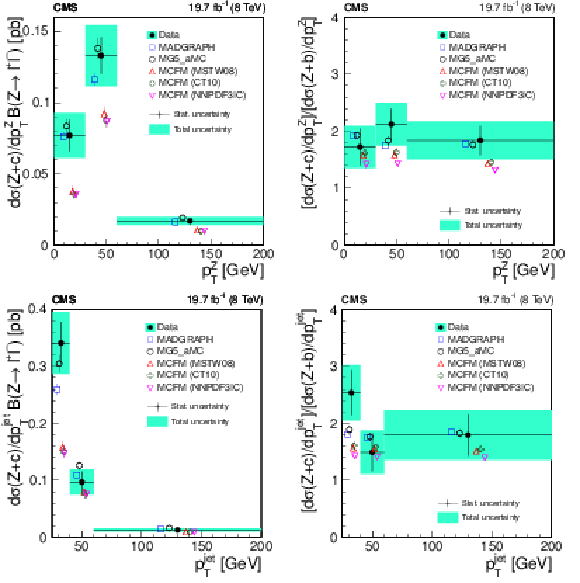
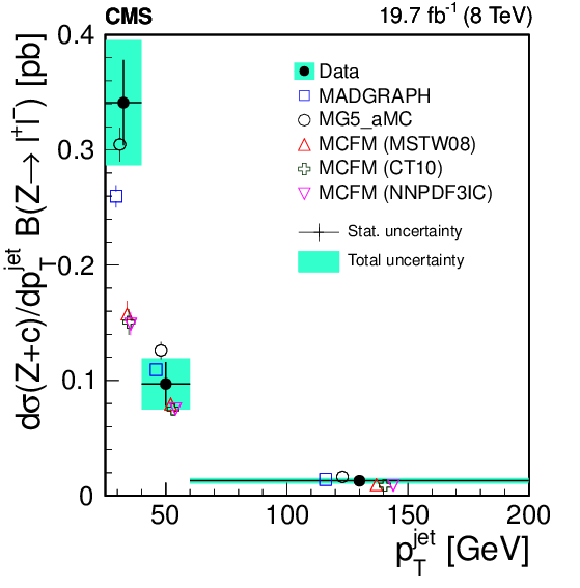
Differential Z+c cross section and (Z+c)/(Z+b) cross section ratio as a function of the transverse momentum of the Z boson (top) and the transverse momentum of the jet (bottom). The combination of the results in the dielectron and dimuon channels is presented. The Z+c differential cross section is shown on the left and the (Z+c)/(Z+b) cross section ratio is on the right. Statistical uncertainties in the data are shown as crosses. The solid rectangles indicate the total (statistical and systematic) experimental uncertainty. Statistical and systematic uncertainties in the theoretical predictions are shown added in quadrature. Symbols showing the theoretical expectations are slightly displaced from the bin centre in the horizontal axis for better visibility of the predictions. |
png pdf |
Figure 11-a:
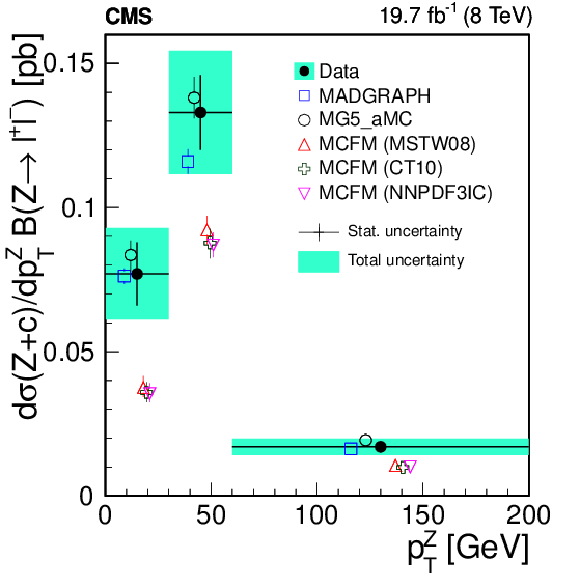
Differential Z+c cross section as a function of the transverse momentum of the Z boson. The combination of the results in the dielectron and dimuon channels is presented. The Z+c differential cross section is shown on the left and the (Z+c)/(Z+b) cross section ratio is on the right. Statistical uncertainties in the data are shown as crosses. The solid rectangles indicate the total (statistical and systematic) experimental uncertainty. Statistical and systematic uncertainties in the theoretical predictions are shown added in quadrature. Symbols showing the theoretical expectations are slightly displaced from the bin centre in the horizontal axis for better visibility of the predictions. |
png pdf |
Figure 11-b:
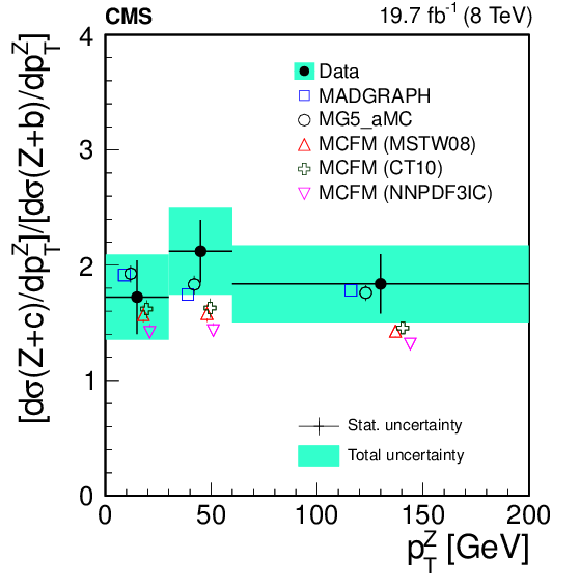
(Z+c)/(Z+b) cross section ratio as a function of the transverse momentum of the jet. The combination of the results in the dielectron and dimuon channels is presented. The Z+c differential cross section is shown on the left and the (Z+c)/(Z+b) cross section ratio is on the right. Statistical uncertainties in the data are shown as crosses. The solid rectangles indicate the total (statistical and systematic) experimental uncertainty. Statistical and systematic uncertainties in the theoretical predictions are shown added in quadrature. Symbols showing the theoretical expectations are slightly displaced from the bin centre in the horizontal axis for better visibility of the predictions. |
png pdf |
Figure 11-c:
Differential Z+c cross section as a function of the transverse momentum of the Z boson. The combination of the results in the dielectron and dimuon channels is presented. The Z+c differential cross section is shown on the left and the (Z+c)/(Z+b) cross section ratio is on the right. Statistical uncertainties in the data are shown as crosses. The solid rectangles indicate the total (statistical and systematic) experimental uncertainty. Statistical and systematic uncertainties in the theoretical predictions are shown added in quadrature. Symbols showing the theoretical expectations are slightly displaced from the bin centre in the horizontal axis for better visibility of the predictions. |

png pdf |
Figure 11-d:
(Z+c)/(Z+b) cross section ratio as a function of the transverse momentum of the jet. The combination of the results in the dielectron and dimuon channels is presented. The Z+c differential cross section is shown on the left and the (Z+c)/(Z+b) cross section ratio is on the right. Statistical uncertainties in the data are shown as crosses. The solid rectangles indicate the total (statistical and systematic) experimental uncertainty. Statistical and systematic uncertainties in the theoretical predictions are shown added in quadrature. Symbols showing the theoretical expectations are slightly displaced from the bin centre in the horizontal axis for better visibility of the predictions. |
| Tables | |

png pdf |
Table 1:
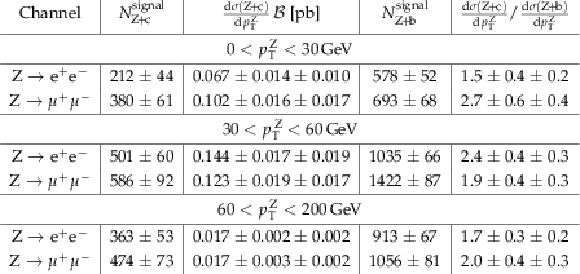
Cross section $ {\sigma (\mathrm{Z+c})}{\cal B}$ and cross section ratio $ {\sigma (\mathrm{Z+c})}/ {\sigma (\mathrm{Z+b})}$ in the three categories of this analysis and in the two Z boson decay channels. The $N^{\rm signal}_{\mathrm{Z+c}}$ and $N^{\rm signal}_{\mathrm{Z+b}}$ are the yields of Z+c and Z+b events, respectively, extracted from the fit to the corrected secondary-vertex mass (semileptonic mode) or JP discriminant (D and $ {{{\mathrm{D}^{\ast}(2010)^{\pm}}}}$ modes) distributions. The factors ${\cal C}$ that correct the selection inefficiencies are also given. They include the relevant branching fraction for the corresponding channel. All uncertainties quoted in the table are statistical, except for those of the measured cross sections and cross section ratios where the first uncertainty is statistical and the second is the estimated systematic uncertainty from the sources discussed in the text. |
png pdf |
Table 2:
Differential cross section $ {{\mathrm {d}}\sigma (\mathrm{Z+c})/ {\mathrm {d}}{{{p_{\mathrm {T}}} ^{ \mathrm {Z}}}}}{\mathcal B}$ and cross section ratio $({{\mathrm {d}}\sigma (\mathrm{Z+c})/ {\mathrm {d}}{{{p_{\mathrm {T}}} ^{ \mathrm {Z}}}}})/({{\mathrm {d}}\sigma (\mathrm{Z+b})/ {\mathrm {d}}{{{p_{\mathrm {T}}} ^{ \mathrm {Z}}}}})$ in the semileptonic mode and in the two Z boson decay channels. The $N^{\rm signal}_{\mathrm{Z+c}}$ and $N^{\rm signal}_{\mathrm{Z+b}}$ are the yields of Z+c and Z+b events, respectively, extracted from the fit. All uncertainties quoted in the table are statistical, except for those of the measured cross sections and cross section ratios, where the first uncertainty is statistical and the second is the estimated systematic uncertainty from the sources discussed in the text. |
png pdf |
Table 3:
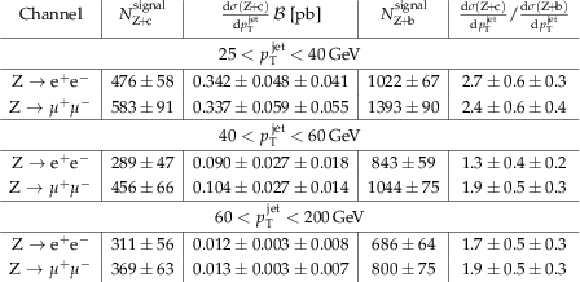
Differential cross section $ {{\mathrm {d}}\sigma (\mathrm{Z+c})/ {\mathrm {d}}{{p_{\mathrm {T}}} ^{jet}}}{\mathcal B}$ and cross section ratio $({{\mathrm {d}}\sigma (\mathrm{Z+c})/ {\mathrm {d}}{{p_{\mathrm {T}}} ^{jet}}})/({{\mathrm {d}}\sigma (\mathrm{Z+b})/ {\mathrm {d}}{{p_{\mathrm {T}}} ^{jet}}})$ in the semileptonic mode and in the two Z boson decay channels. The $N^{\rm signal}_{\mathrm{Z+c}}$ and $N^{\rm signal}_{\mathrm{Z+b}}$ are the yields of Z+c and Z+b events, respectively, extracted from the fit. All uncertainties quoted in the table are statistical, except for those of the measured cross sections and cross section ratios, where the first uncertainty is statistical and the second is the estimated systematic uncertainty from the sources discussed in the text. |
png pdf |
Table 4:
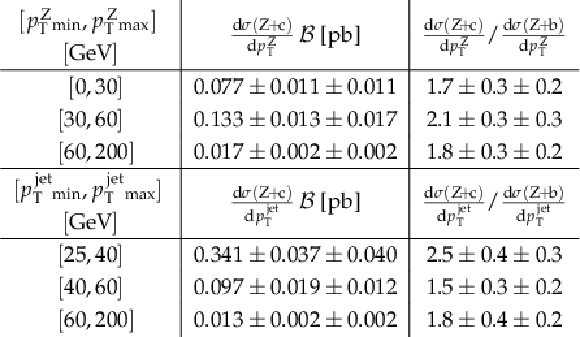
Differential Z+c cross section and (Z+c)/(Z+b) cross section ratio. The first column presents the $ {p_{\mathrm {T}}} $ range for each bin. Column 2 presents the cross section and column 3 the ratio. The differential measurements as a function of the transverse momentum of the Z boson (jet with heavy flavour content) are given in the upper (lower) part of the table. The first uncertainty is statistical and the second is the systematic uncertainty arising from the sources discussed in the text. |
| Summary |
|
The associated production of a Z boson with at least one charm quark jet in proton-proton collisions at a centre-of-mass energy of 8 TeV was studied with a data sample corresponding to an integrated luminosity of 19.7 $\pm$ 0.5 fb$^{-1}$. It was compared to the production of a Z boson with at least one b quark jet. Selection of event candidates relies on the identification of semileptonic decays of c or B hadrons with a muon in the final state and through the reconstruction of exclusive decay channels of D and D* mesons. The Z boson is identified through its decay into an $\mathrm{e}^+\mathrm{e}^-$ or $\mu^+\mu^-$ pair. The cross section for the production of a Z boson associated with at least one c quark jet is measured. The measurement is performed in the kinematic region with two leptons with transverse momentum ${p_{\mathrm{T}}}^{\ell} > $ 20 GeV, pseudorapidity $|\eta^{\ell}| < $ 2.1, dilepton invariant mass 71 $ < m_{\ell\ell} < $ 111 GeV and a jet with ${p_{\mathrm{T}}}^{\text{jet}} > $ 25 GeV, $ | {\eta^{\text{jet}}} | < $ 2.5, separated from the leptons of the Z boson candidate by a distance $\Delta R ({\text{jet}},\ell) > $ 0.5. The Z+c production cross sections measured in all the analysis categories are fully consistent, and the combined value is $\sigma(\mathrm{pp \to Z+c + X} ) {\mathcal B}(\mathrm{Z} \rightarrow \ell^+\ell^-) = $ 8.8 $\pm$ 0.5 (stat) $\pm$ 0.6 (syst) pb. This is the first measurement at the LHC of Z+c production in the central pseudorapidity region. The cross section ratio for the production of a Z boson and at least one c and at least one b quark jet is measured in the same kinematic region and is $\sigma(\mathrm{pp \to Z+c + X} )/\sigma(\mathrm{pp \to Z+b + X} ) = $ 2.0 $\pm$ 0.2 (stat) $\pm$ 0.2 (syst). The size of the sample selected in the semileptonic channel allows for the first differential measurements of the Z+c cross section at the LHC. The Z+c cross section and $(Z+c)/(Z+b)$ cross section ratio are measured as a function of the transverse momentum of the Z boson and of the heavy flavour jet. The measurements are in agreement with the leading order predictions from MadGraph and next-to-leading-order predictions from MadGraph5+MCatNLO. Predictions from the MCFM program are lower than the measured Z+c cross section and $(Z+c)/(Z+b)$ cross section ratio, both inclusively and differentially. This difference can be explained by the absence of parton shower development and nonperturbative effects in the MCFM calculation. Measurements in the highest ${p_{\mathrm{T}}}^{\mathrm{Z}}$ (${p_{\mathrm{T}}}^{\text{jet}}$) region analyzed, 60 $ < {p_{\mathrm{T}}}^{\mathrm{Z}} ({p_{\mathrm{T}}}^{\text{jet}}) < $ 200 GeV, would be sensitive to the existence of an intrinsic charm component inside the proton if this IC component were large enough to induce a significant enhancement in the Z+c production cross section. However, our measurements of the Z+c cross section and $(Z+c)/(Z+b)$ cross section ratio are consistent with predictions using PDF sets with no IC component. |
| References | ||||
| 1 | ATLAS Collaboration | Search for pair-produced third-generation squarks decaying via charm quarks or in compressed supersymmetric scenarios in pp collisions at $ \sqrt{s} = $ 8 TeV with the ATLAS detector | PRD 90 (2014) 052008 | 1407.0608 |
| 2 | ATLAS Collaboration | Search for scalar charm quark pair production in pp collisions at $ \sqrt{s} = $ 8 TeV with the ATLAS detector | PRL 114 (2015) 161801 | 1501.01325 |
| 3 | CMS Collaboration | Searches for third-generation squark production in fully hadronic final states in proton-proton collisions at $ \sqrt{s} = $ 8 TeV | JHEP 06 (2015) 116 | CMS-SUS-14-001 1503.08037 |
| 4 | CMS Collaboration | Search for the standard model Higgs boson decaying to bottom quarks in pp collisions at $ \sqrt{s} = $ 7 TeV | PLB 710 (2012) 284 | CMS-HIG-11-031 1202.4195 |
| 5 | CMS Collaboration | Search for the standard model Higgs boson produced in association with a W or a Z boson and decaying to bottom quarks | PRD 89 (2014) 012003 | CMS-HIG-13-012 1310.3687 |
| 6 | ATLAS Collaboration | Search for the Standard Model Higgs boson produced in association with a vector boson and decaying to a b-quark pair with the ATLAS detector | PLB 718 (2012) 369 | 1207.0210 |
| 7 | ATLAS Collaboration | Search for the $ \mathrm{b \overline{b}} $ decay of the Standard Model Higgs boson in associated (W/Z)H production with the ATLAS detector | JHEP 01 (2015) 069 | 1409.6212 |
| 8 | C. Delaunay, T. Golling, G. Perez, and Y. Soreq | Enhanced Higgs boson coupling to charm pairs | PRD 89 (2014) 033014 | 1310.7029 |
| 9 | S. J. Brodsky et al. | A review of the intrinsic heavy quark content of the nucleon | Adv. High Energy Phys. 2015 (2015) 231547 | 1504.06287 |
| 10 | P.-H. Beauchemin, V. A. Bednyakov, G. I. Lykasov, and \relax Yu. \relax Yu. Stepanenko | Search for intrinsic charm in vector boson production accompanied by heavy-flavor jets | PRD 92 (2015) 034014 | 1410.2616 |
| 11 | G. Bailas and V. P. Goncalves | Phenomenological implications of the intrinsic charm in the Z boson production at the LHC | EPJC 76 (2016) 105 | 1512.06007 |
| 12 | A. V. Lipatov, G. I. Lykasov, \relax Yu. \relax Yu. Stepanenko, and V. A. Bednyakov | Probing proton intrinsic charm in photon or Z boson production accompanied by heavy jets at the LHC | PRD 94 (2016) 053011 | 1606.04882 |
| 13 | T. Boettcher, P. Ilten, and M. Williams | Direct probe of the intrinsic charm content of the proton | PRD 93 (2016) 074008 | 1512.06666 |
| 14 | D0 Collaboration | Measurement of associated production of Z bosons with charm quark jets in $ {\mathrm p}\overline{\mathrm p} $ collisions at $ \sqrt{s} = $ 1.96 TeV | PRL 112 (2014) 042001 | 1308.4384 |
| 15 | CDF Collaboration | Measurement of vector boson plus $ {\mathrm{D}}^{*}(2010)^{+} $ meson production in $ \mathrm{\overline{p} p} $ collisions at $ \sqrt{s} = $ 1.96 TeV | PRD 93 (2016) 052012 | 1508.06980 |
| 16 | LHCb Collaboration | Observation of associated production of a Z boson with a D meson in the forward region | JHEP 04 (2014) 091 | 1401.3245 |
| 17 | CMS Collaboration | Measurements of the associated production of a Z boson and b jets in pp collisions at $ \sqrt{s} = $ 8 TeV | Accepted by EPJC | CMS-SMP-14-010 1611.06507 |
| 18 | CMS Collaboration | Description and performance of track and primary-vertex reconstruction with the CMS tracker | JINST 9 (2014) P10009 | CMS-TRK-11-001 1405.6569 |
| 19 | CMS Collaboration | Performance of electron reconstruction and selection with the CMS detector in proton-proton collisions at $ \sqrt{s} = $ 8 TeV | JINST 10 (2015) P06005 | CMS-EGM-13-001 1502.02701 |
| 20 | CMS Collaboration | Performance of CMS muon reconstruction in pp collision events at $ \sqrt{s} = $ 7 TeV | JINST 7 (2012) P10002 | CMS-MUO-10-004 1206.4071 |
| 21 | CMS Collaboration | The CMS trigger system | JINST 12 (2017) P01020 | CMS-TRG-12-001 1609.02366 |
| 22 | CMS Collaboration | The CMS experiment at the CERN LHC | JINST 3 (2008) S08004 | CMS-00-001 |
| 23 | J. Alwall et al. | MadGraph 5: going beyond | JHEP 06 (2011) 128 | 1106.0522 |
| 24 | T. Sjostrand, S. Mrenna, and P. Z. Skands | PYTHIA 6.4 physics and manual | JHEP 05 (2006) 026 | hep-ph/0603175 |
| 25 | J. Alwall et al. | Comparative study of various algorithms for the merging of parton showers and matrix elements in hadronic collisions | EPJC 53 (2008) 473 | 0706.2569 |
| 26 | J. Alwall, S. de Visscher, and F. Maltoni | QCD radiation in the production of heavy colored particles at the LHC | JHEP 02 (2009) 017 | 0810.5350 |
| 27 | J. Pumplin et al. | New generation of parton distributions with uncertainties from global QCD analysis | JHEP 07 (2002) 012 | hep-ph/0201195 |
| 28 | J. M. Campbell, R. K. Ellis, P. Nason, and E. Re | Top-pair production and decay at NLO matched with parton showers | JHEP 04 (2015) 114 | 1412.1828 |
| 29 | P. Nason | A new method for combining NLO QCD with shower Monte Carlo algorithms | JHEP 11 (2004) 040 | hep-ph/0409146 |
| 30 | S. Frixione, P. Nason, and C. Oleari | Matching NLO QCD computations with parton shower simulations: the POWHEG method | JHEP 11 (2007) 070 | 0709.2092 |
| 31 | S. Alioli, P. Nason, C. Oleari, and E. Re | A general framework for implementing NLO calculations in shower Monte Carlo programs: the POWHEG BOX | JHEP 06 (2010) 043 | 1002.2581 |
| 32 | J. Gao et al. | CT10 next-to-next-to-leading order global analysis of QCD | PRD 89 (2014) 033009 | 1302.6246 |
| 33 | CMS Collaboration | Study of the underlying event at forward rapidity in pp collisions at $ \sqrt{s}= $ 0.9 , 2.76, and 7 TeV | JHEP 04 (2013) 072 | CMS-FWD-11-003 1302.2394 |
| 34 | GEANT4 Collaboration | GEANT4---a simulation toolkit | NIMA 506 (2003) 250 | |
| 35 | Y. Li and F. Petriello | Combining QCD and electroweak corrections to dilepton production in the framework of the FEWZ simulation code | PRD 86 (2012) 094034 | 1208.5967 |
| 36 | A. D. Martin, W. J. Stirling, R. S. Thorne, and G. Watt | Parton distributions for the LHC | EPJC 63 (2009) 189 | 0901.0002 |
| 37 | J. M. Campbell and R. Ellis | MCFM for the Tevatron and the LHC | NPB - Proc. Suppl. 205 (2010) 10 | 1007.3492 |
| 38 | M. Czakon, P. Fiedler, and A. Mitov | Total top-quark pair-production cross-section at hadron colliders through $ {\cal O}(\alpha_{\rm S}^4) $ | PRL 110 (2013) 252004 | 1303.6254 |
| 39 | CMS Collaboration | Measurement of the inclusive W and Z production cross sections in pp collisions at $ \sqrt{s} = $ 7 TeV with the CMS experiment | JHEP 10 (2011) 132 | CMS-EWK-10-005 1107.4789 |
| 40 | CMS Collaboration | Particle-flow reconstruction and global event description with the CMS detector | JINST 12 (2017) P10003 | CMS-PRF-14-001 1706.04965 |
| 41 | M. Cacciari, G. P. Salam, and G. Soyez | The anti-$ k_t $ jet clustering algorithm | JHEP 04 (2008) 063 | 0802.1189 |
| 42 | CMS Collaboration | Determination of jet energy calibration and transverse momentum resolution in CMS | JINST 6 (2011) P11002 | CMS-JME-10-011 1107.4277 |
| 43 | CMS Collaboration | Jet energy scale and resolution in the CMS experiment in pp collisions at 8 TeV | JINST 12 (2017) P02014 | CMS-JME-13-004 1607.03663 |
| 44 | CMS Collaboration | MET performance in 8 TeV data | CMS-PAS-JME-12-002 | CMS-PAS-JME-12-002 |
| 45 | M. Cacciari and G. P. Salam | Pileup subtraction using jet areas | PLB 659 (2008) 119 | 0707.1378 |
| 46 | CMS Collaboration | Measurements of differential production cross sections for a Z boson in association with jets in pp collisions at $ \sqrt{s} = $ 8 TeV | JHEP 04 (2017) 022 | CMS-SMP-14-013 1611.03844 |
| 47 | CMS Collaboration | Identification of b-quark jets with the CMS experiment | JINST 8 (2013) P04013 | CMS-BTV-12-001 1211.4462 |
| 48 | CMS Collaboration | Measurement of $ \mathrm{B \overline{B}} $ angular correlations based on secondary vertex reconstruction at $ \sqrt{s} = $ 7 TeV | JHEP 03 (2011) 136 | CMS-BPH-10-010 1102.3194 |
| 49 | CMS Collaboration | Measurement of the cross section and angular correlations for associated production of a Z boson with b hadrons in pp collisions at $ \sqrt{s} = $ 7 TeV | JHEP 12 (2013) 039 | CMS-EWK-11-015 1310.1349 |
| 50 | W. Waltenberger, R. Fruhwirth, and P. Vanlaer | Adaptive vertex fitting | JPG 34 (2007) N343 | |
| 51 | Particle Data Group, C. Patrignani et al. | Review of particle physics | CPC 40 (2016) 100001 | |
| 52 | L. Gladilin | Fragmentation fractions of c and b quarks into charmed hadrons at LEP | EPJC 75 (2015) 19 | 1404.3888 |
| 53 | OPAL Collaboration | Measurement of $ {\rm f}({\rm c}\to {\rm D}^{*+}X) $, $ {\rm f}({\rm b}\to {\rm D}^{*+}X) $ and $ \Gamma({\rm c\bar c})/\Gamma({\rm had}) $ using $ {\rm D}^{*\pm} $ mesons | EPJC 1 (1998) 439 | hep-ex/9708021 |
| 54 | ALEPH Collaboration | Study of charm production in Z decays | EPJC 16 (2000) 597 | hep-ex/9909032 |
| 55 | DELPHI Collaboration | Determination of $ P({\rm c}\to {\rm D}^{*+}) $ and $ \mathcal{B}({\rm c}\to\ell^+) $ at LEP 1 | EPJC 12 (2000) 209 | |
| 56 | R. Fruhwirth, R. Kubinec, W. Mitaroff, and M. Regler | Vertex reconstruction and track bundling at the LEP collider using robust algorithms | Comp. Phys. Comm. 96 (1996) 189 | |
| 57 | CMS Collaboration | Measurement of associated W+charm production in pp collisions at $ \sqrt{s} = $ 7 TeV | JHEP 02 (2014) 013 | CMS-SMP-12-002 1310.1138 |
| 58 | CMS Collaboration | Performance of b tagging at $ \sqrt{s} = $ 8 TeV in multijet, $ \mathrm{t\bar{t}} $ and boosted topology events | CMS-PAS-BTV-13-001 | CMS-PAS-BTV-13-001 |
| 59 | LHCb Collaboration | Identification of beauty and charm quark jets at LHCb | JINST 10 (2015) P06013 | 1504.07670 |
| 60 | ALEPH Collaboration | A measurement of the gluon splitting rate into $ \mathrm{c\overline c} $ pairs in hadronic Z decays | PLB 561 (2003) 213 | hep-ex/0302003 |
| 61 | ALEPH Collaboration | A measurement of the gluon splitting rate into $ \mathrm{b \overline{b}} $ pairs in hadronic Z decays | PLB 434 (1998) 437 | |
| 62 | CMS Collaboration | CMS luminosity based on pixel cluster counting -- Summer 2013 update | CMS-PAS-LUM-13-001 | CMS-PAS-LUM-13-001 |
| 63 | J. Alwall et al. | The automated computation of tree-level and next-to-leading order differential cross sections, and their matching to parton shower simulations | JHEP 07 (2014) 079 | 1405.0301 |
| 64 | T. Sjostrand, S. Mrenna, and P. Z. Skands | A brief introduction to PYTHIA 8.1 | CPC 178 (2008) 852 | 0710.3820 |
| 65 | CMS Collaboration | Event generator tunes obtained from underlying event and multiparton scattering measurements | EPJC 76 (2016) 155 | CMS-GEN-14-001 1512.00815 |
| 66 | R. Frederix and S. Frixione | Merging meets matching in MC@NLO | JHEP 12 (2012) 061 | 1209.6215 |
| 67 | NNPDF Collaboration | Parton distributions for the LHC Run II | JHEP 04 (2015) 040 | 1410.8849 |
| 68 | R. Frederix et al. | Four-lepton production at hadron colliders: aMC@NLO predictions with theoretical uncertainties | JHEP 02 (2012) 099 | 1110.4738 |
| 69 | J. M. Campbell, R. K. Ellis, F. Maltoni, and S. Willenbrock | Associated production of a Z boson and a single heavy-quark jet | PRD 69 (2004) 074021 | hep-ph/0312024 |
| 70 | A. Buckley et al. | LHAPDF6: parton density access in the LHC precision era | EPJC 75 (2015) 132 | 1412.7420 |
| 71 | J. M. Campbell, R. K. Ellis, F. Maltoni, and S. Willenbrock | Higgs-boson production in association with a single bottom quark | PRD 67 (2003) 095002 | hep-ph/0204093 |
| 72 | NNPDF Collaboration | A determination of the charm content of the proton | EPJC 76 (2016) 647 | 1605.06515 |
| 73 | European Muon Collaboration | Production of charmed particles in 250 GeV $\mu$-iron interactions | NPB 213 (1983) 31 | |
| 74 | S. Dulat et al. | Intrinsic charm parton distribution functions from CTEQ-TEA global analysis | PRD 89 (2014) 073004 | 1309.0025 |
| 75 | T.-J. Hou et al. | Heavy flavors on CT14 | PoS DIS2015 (2015)166 | |

|
Compact Muon Solenoid LHC, CERN |

|

|

|

|

|

|