

Compact Muon Solenoid
LHC, CERN
| CMS-HIG-21-005 ; CERN-EP-2024-043 | ||
| Search for Higgs boson pair production in the $ \mathrm{b}\overline{\mathrm{b}}\mathrm{W^+}\mathrm{W^-} $ decay mode in proton-proton collisions at $ \sqrt{s}= $ 13 TeV | ||
| CMS Collaboration | ||
| 14 March 2024 | ||
| JHEP 07 (2024) 293 | ||
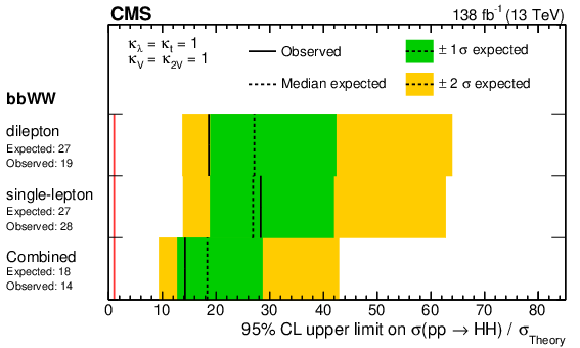
| Abstract: A search for Higgs boson pair (HH) production with one Higgs boson decaying to two bottom quarks and the other to two W bosons are presented. The search is done using proton-proton collisions data at a centre-of-mass energy of 13 TeV, corresponding to an integrated luminosity of 138 fb$ ^{-1} $ recorded by the CMS detector at the LHC from 2016 to 2018. The final states considered include at least one leptonically decaying W boson. No evidence for the presence of a signal is observed and corresponding upper limits on the HH production cross section are derived. The limit on the inclusive cross section of the nonresonant HH production, assuming that the distributions of kinematic observables are as expected in the standard model (SM), is observed (expected) to be 14 (18) times the value predicted by the SM, at 95% confidence level. The limits on the cross section are also presented as functions of various Higgs boson coupling modifiers, and anomalous Higgs boson coupling scenarios. In addition, limits are set on the resonant HH production via spin-0 and spin-2 resonances within the mass range 250-900 GeV. | ||
| Links: e-print arXiv:2403.09430 [hep-ex] (PDF) ; CDS record ; inSPIRE record ; HepData record ; CADI line (restricted) ; | ||
| Figures | |
png pdf |
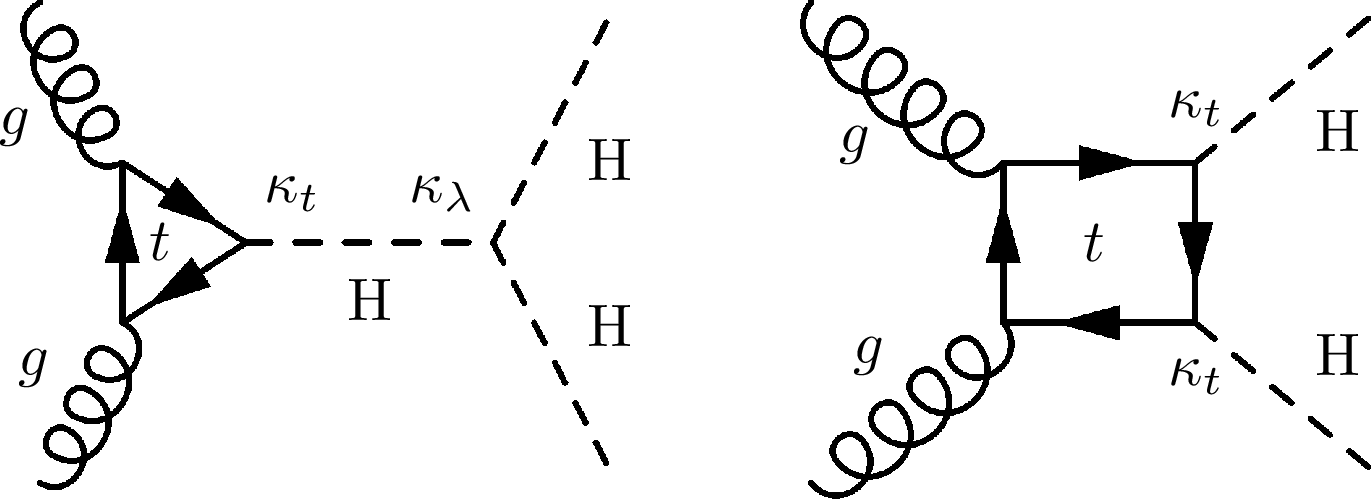
Figure 1:
Leading-order Feynman diagrams of nonresonant Higgs boson pair production via gluon fusion in the standard model. |
png pdf |
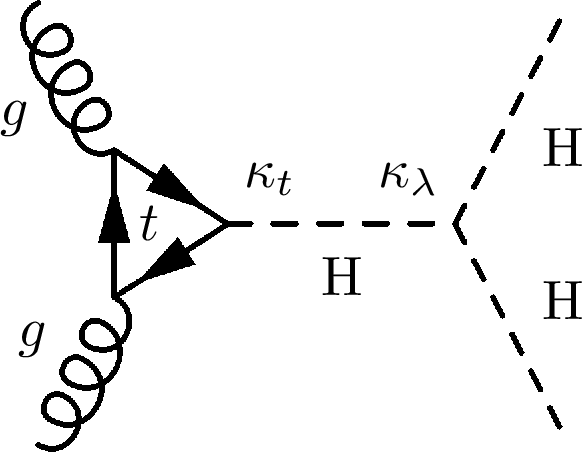
Figure 1-a:
Leading-order Feynman diagrams of nonresonant Higgs boson pair production via gluon fusion in the standard model. |

png pdf |
Figure 1-b:
Leading-order Feynman diagrams of nonresonant Higgs boson pair production via gluon fusion in the standard model. |

png pdf |
Figure 2:
Leading-order Feynman diagrams of Higgs boson pair nonresonant production via vector boson fusion in the standard model. |
png pdf |
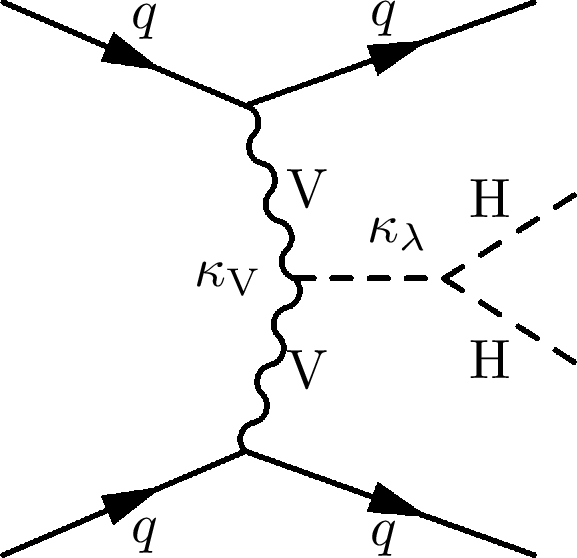
Figure 2-a:
Leading-order Feynman diagrams of Higgs boson pair nonresonant production via vector boson fusion in the standard model. |
png pdf |
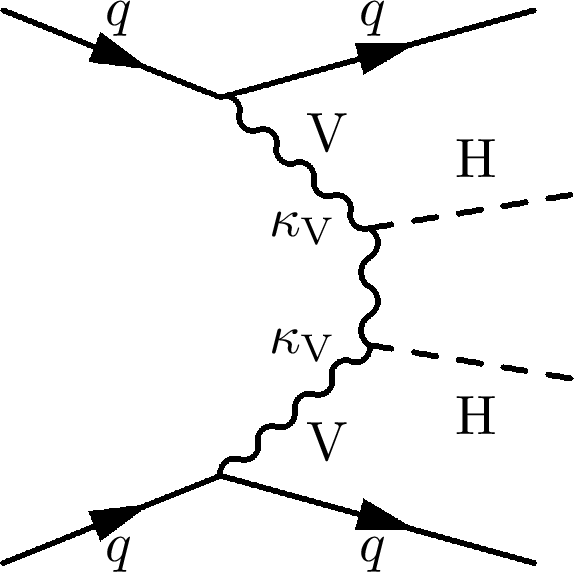
Figure 2-b:
Leading-order Feynman diagrams of Higgs boson pair nonresonant production via vector boson fusion in the standard model. |

png pdf |
Figure 2-c:
Leading-order Feynman diagrams of Higgs boson pair nonresonant production via vector boson fusion in the standard model. |

png pdf |
Figure 3:
Leading-order Feynman diagrams of nonresonant Higgs boson pair production via gluon fusion with anomalous Higgs boson couplings. |
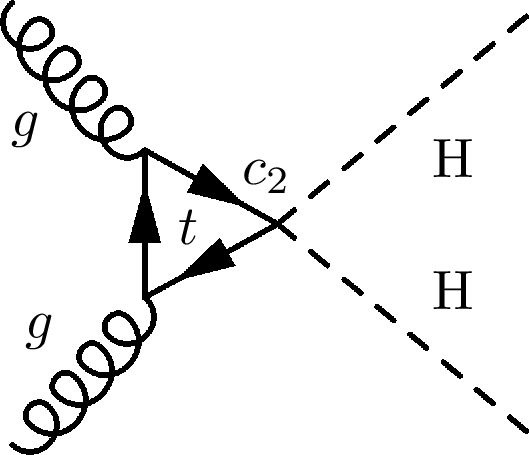
png pdf |
Figure 3-a:
Leading-order Feynman diagrams of nonresonant Higgs boson pair production via gluon fusion with anomalous Higgs boson couplings. |
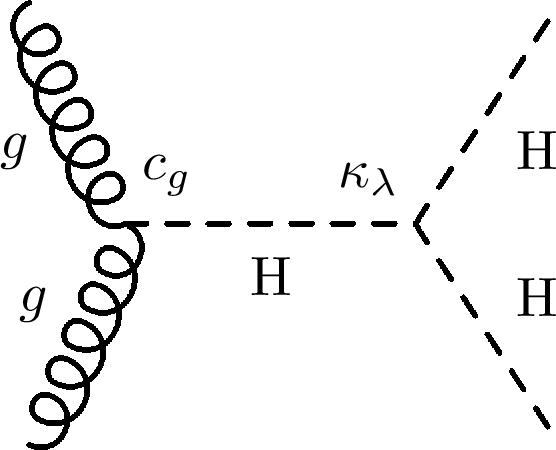
png pdf |
Figure 3-b:
Leading-order Feynman diagrams of nonresonant Higgs boson pair production via gluon fusion with anomalous Higgs boson couplings. |
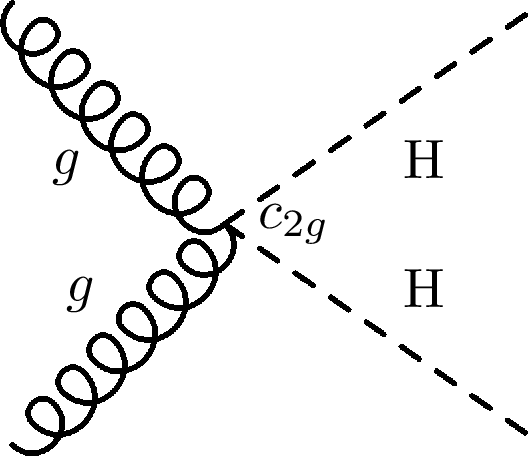
png pdf |
Figure 3-c:
Leading-order Feynman diagrams of nonresonant Higgs boson pair production via gluon fusion with anomalous Higgs boson couplings. |

png pdf |
Figure 4:
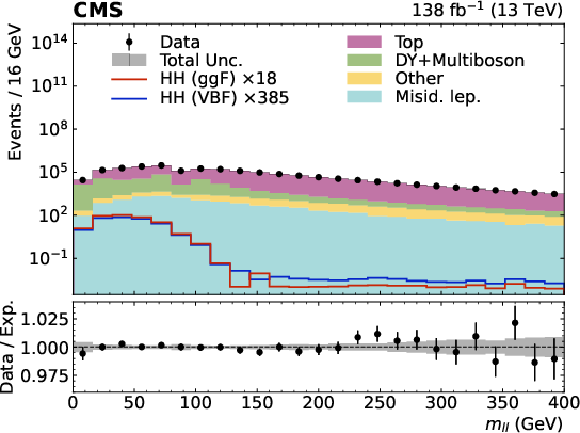
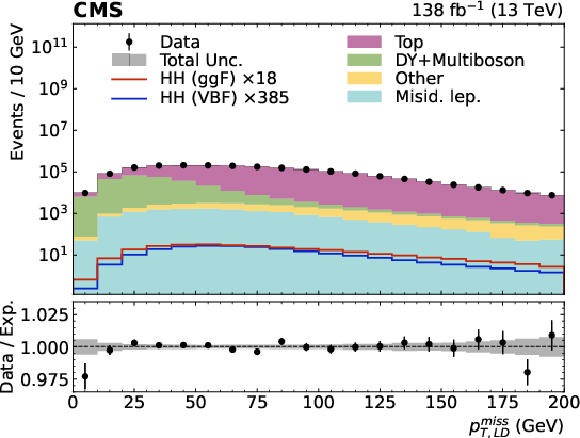
The distributions of some of the discriminants included in the DNN training for the single-lepton channel (upper) and the dilepton channel (lower). The distributions are shown after performing a maximum likelihood fit on the data for the variable pictured, using the same set of nuisance parameters (Section 8) as in the likelihood fit used to extract signal. The variables are from upper left to lower right: the $ H_{\mathrm{T}} $ variable, defined as the scalar sum of all selected jets $ p_{\mathrm{T}} $; the invariant mass of the two b-tagged jets; the invariant mass of the two leptons; the $ p_{\mathrm{T,LD}}^{\text{miss}} $, as defined in Section 4.5. |
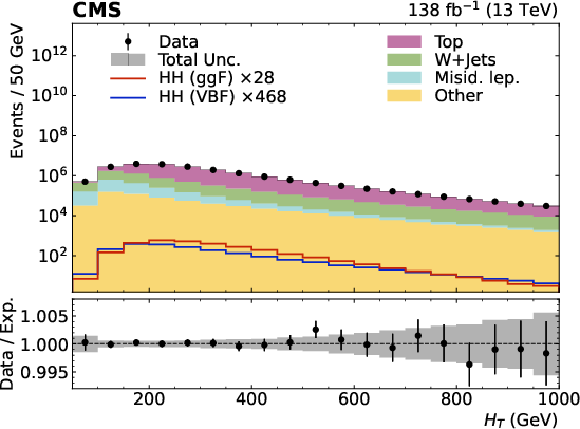
png pdf |
Figure 4-a:
The distributions of some of the discriminants included in the DNN training for the single-lepton channel (upper) and the dilepton channel (lower). The distributions are shown after performing a maximum likelihood fit on the data for the variable pictured, using the same set of nuisance parameters (Section 8) as in the likelihood fit used to extract signal. The variables are from upper left to lower right: the $ H_{\mathrm{T}} $ variable, defined as the scalar sum of all selected jets $ p_{\mathrm{T}} $; the invariant mass of the two b-tagged jets; the invariant mass of the two leptons; the $ p_{\mathrm{T,LD}}^{\text{miss}} $, as defined in Section 4.5. |

png pdf |
Figure 4-b:
The distributions of some of the discriminants included in the DNN training for the single-lepton channel (upper) and the dilepton channel (lower). The distributions are shown after performing a maximum likelihood fit on the data for the variable pictured, using the same set of nuisance parameters (Section 8) as in the likelihood fit used to extract signal. The variables are from upper left to lower right: the $ H_{\mathrm{T}} $ variable, defined as the scalar sum of all selected jets $ p_{\mathrm{T}} $; the invariant mass of the two b-tagged jets; the invariant mass of the two leptons; the $ p_{\mathrm{T,LD}}^{\text{miss}} $, as defined in Section 4.5. |
png pdf |
Figure 4-c:
The distributions of some of the discriminants included in the DNN training for the single-lepton channel (upper) and the dilepton channel (lower). The distributions are shown after performing a maximum likelihood fit on the data for the variable pictured, using the same set of nuisance parameters (Section 8) as in the likelihood fit used to extract signal. The variables are from upper left to lower right: the $ H_{\mathrm{T}} $ variable, defined as the scalar sum of all selected jets $ p_{\mathrm{T}} $; the invariant mass of the two b-tagged jets; the invariant mass of the two leptons; the $ p_{\mathrm{T,LD}}^{\text{miss}} $, as defined in Section 4.5. |
png pdf |
Figure 4-d:
The distributions of some of the discriminants included in the DNN training for the single-lepton channel (upper) and the dilepton channel (lower). The distributions are shown after performing a maximum likelihood fit on the data for the variable pictured, using the same set of nuisance parameters (Section 8) as in the likelihood fit used to extract signal. The variables are from upper left to lower right: the $ H_{\mathrm{T}} $ variable, defined as the scalar sum of all selected jets $ p_{\mathrm{T}} $; the invariant mass of the two b-tagged jets; the invariant mass of the two leptons; the $ p_{\mathrm{T,LD}}^{\text{miss}} $, as defined in Section 4.5. |
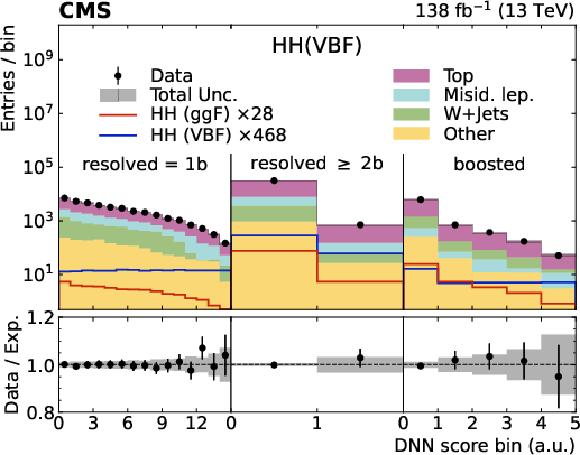
png pdf |
Figure 5:
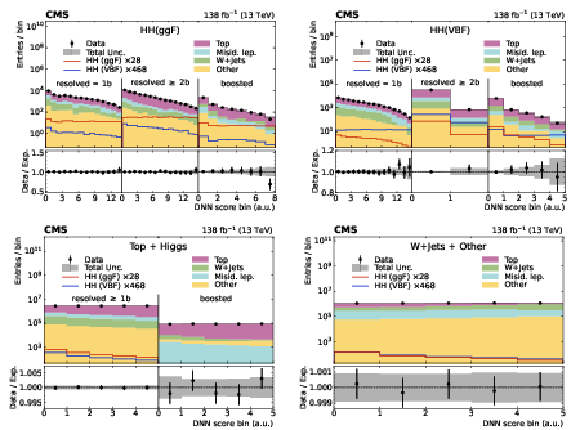
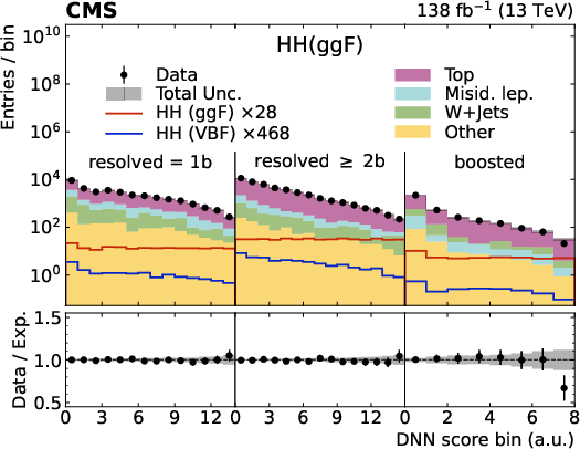
The distributions of the DNN discriminants of the nonresonant search for each event category for the single-lepton channel, after performing a maximum likelihood fit to the same distributions in data. The DNN discriminant for the HH (ggF) category is shown on the upper left, HH (VBF) on the upper right, Top+Higgs on the lower left and W$+$jets + Other on the lower right. The event categories are summarised in Table 1. The signal shown is scaled to the expected upper limit on cross section. |
png pdf |
Figure 5-a:
The distributions of the DNN discriminants of the nonresonant search for each event category for the single-lepton channel, after performing a maximum likelihood fit to the same distributions in data. The DNN discriminant for the HH (ggF) category is shown on the upper left, HH (VBF) on the upper right, Top+Higgs on the lower left and W$+$jets + Other on the lower right. The event categories are summarised in Table 1. The signal shown is scaled to the expected upper limit on cross section. |
png pdf |
Figure 5-b:
The distributions of the DNN discriminants of the nonresonant search for each event category for the single-lepton channel, after performing a maximum likelihood fit to the same distributions in data. The DNN discriminant for the HH (ggF) category is shown on the upper left, HH (VBF) on the upper right, Top+Higgs on the lower left and W$+$jets + Other on the lower right. The event categories are summarised in Table 1. The signal shown is scaled to the expected upper limit on cross section. |

png pdf |
Figure 5-c:
The distributions of the DNN discriminants of the nonresonant search for each event category for the single-lepton channel, after performing a maximum likelihood fit to the same distributions in data. The DNN discriminant for the HH (ggF) category is shown on the upper left, HH (VBF) on the upper right, Top+Higgs on the lower left and W$+$jets + Other on the lower right. The event categories are summarised in Table 1. The signal shown is scaled to the expected upper limit on cross section. |
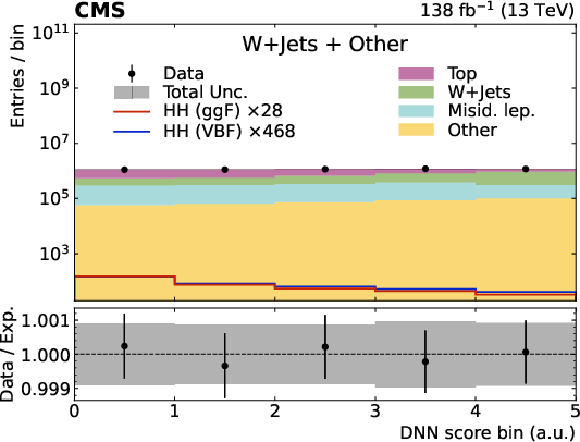
png pdf |
Figure 5-d:
The distributions of the DNN discriminants of the nonresonant search for each event category for the single-lepton channel, after performing a maximum likelihood fit to the same distributions in data. The DNN discriminant for the HH (ggF) category is shown on the upper left, HH (VBF) on the upper right, Top+Higgs on the lower left and W$+$jets + Other on the lower right. The event categories are summarised in Table 1. The signal shown is scaled to the expected upper limit on cross section. |
png pdf |
Figure 6:
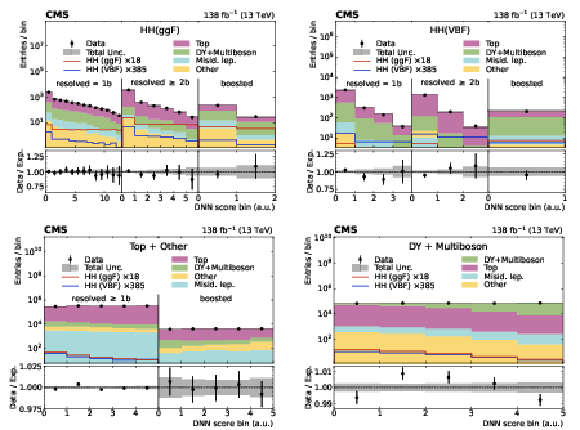
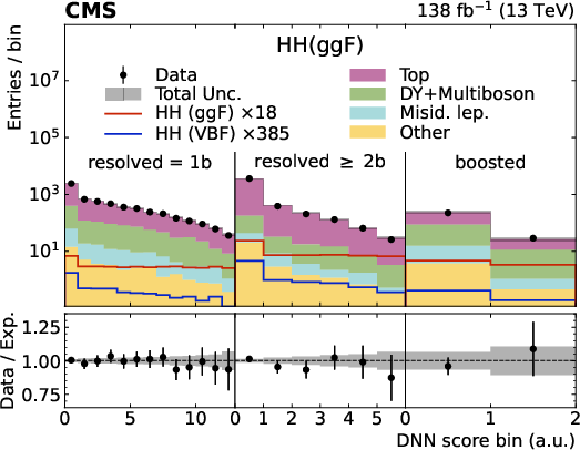
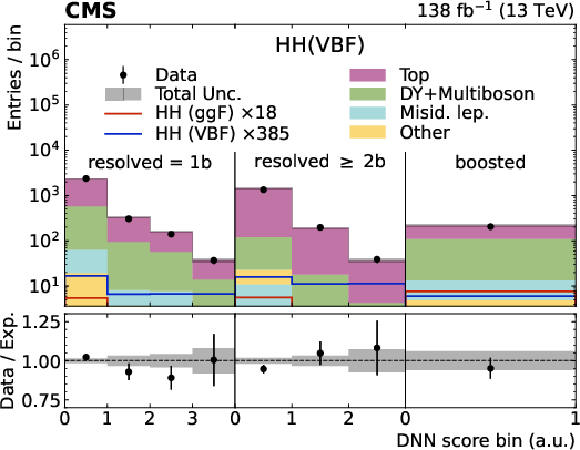
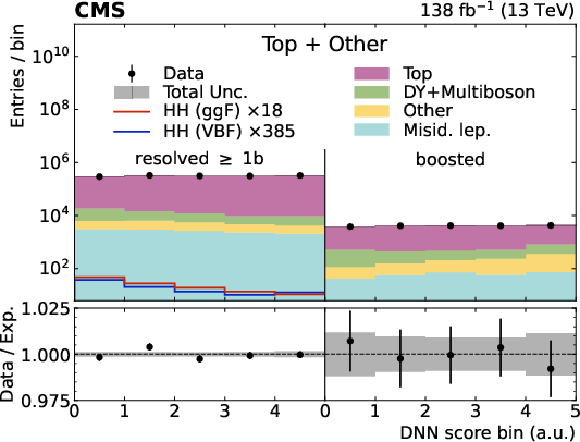
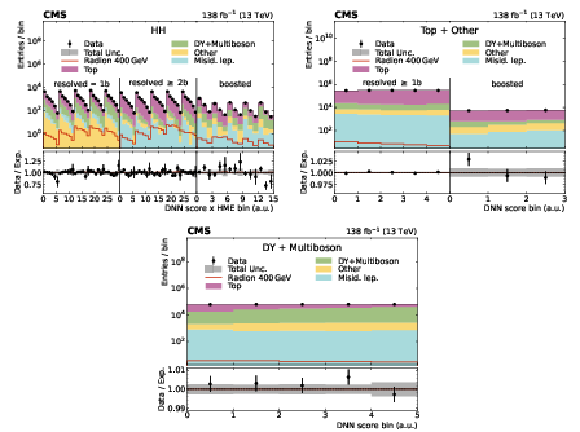
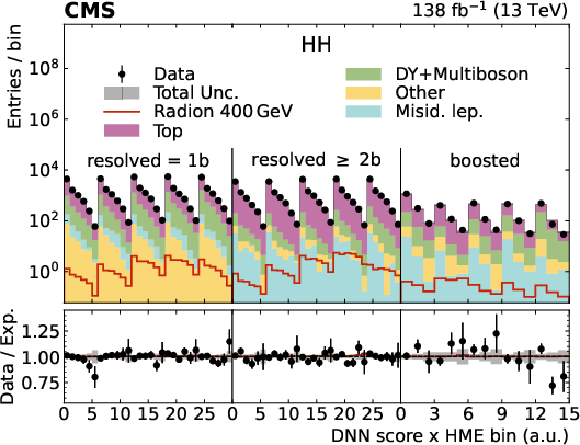
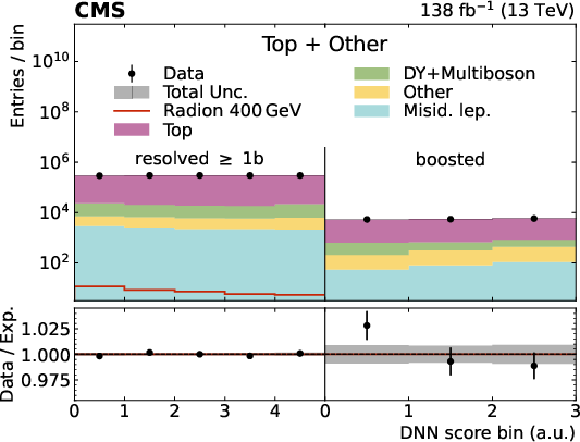
The distributions of the DNN discriminants of the nonresonant search for each event category for the dilepton channel, after performing a maximum likelihood fit to the same distributions in data. The DNN discriminant for the HH (ggF) category is shown on the upper left, HH (VBF) on the upper right, Top+Other on the lower left and DY+Multiboson on the lower right. The event categories are summarised in Table 2. The signal shown is scaled to the expected upper limit on cross section. |
png pdf |
Figure 6-a:
The distributions of the DNN discriminants of the nonresonant search for each event category for the dilepton channel, after performing a maximum likelihood fit to the same distributions in data. The DNN discriminant for the HH (ggF) category is shown on the upper left, HH (VBF) on the upper right, Top+Other on the lower left and DY+Multiboson on the lower right. The event categories are summarised in Table 2. The signal shown is scaled to the expected upper limit on cross section. |
png pdf |
Figure 6-b:
The distributions of the DNN discriminants of the nonresonant search for each event category for the dilepton channel, after performing a maximum likelihood fit to the same distributions in data. The DNN discriminant for the HH (ggF) category is shown on the upper left, HH (VBF) on the upper right, Top+Other on the lower left and DY+Multiboson on the lower right. The event categories are summarised in Table 2. The signal shown is scaled to the expected upper limit on cross section. |
png pdf |
Figure 6-c:
The distributions of the DNN discriminants of the nonresonant search for each event category for the dilepton channel, after performing a maximum likelihood fit to the same distributions in data. The DNN discriminant for the HH (ggF) category is shown on the upper left, HH (VBF) on the upper right, Top+Other on the lower left and DY+Multiboson on the lower right. The event categories are summarised in Table 2. The signal shown is scaled to the expected upper limit on cross section. |

png pdf |
Figure 6-d:
The distributions of the DNN discriminants of the nonresonant search for each event category for the dilepton channel, after performing a maximum likelihood fit to the same distributions in data. The DNN discriminant for the HH (ggF) category is shown on the upper left, HH (VBF) on the upper right, Top+Other on the lower left and DY+Multiboson on the lower right. The event categories are summarised in Table 2. The signal shown is scaled to the expected upper limit on cross section. |
png pdf |
Figure 7:
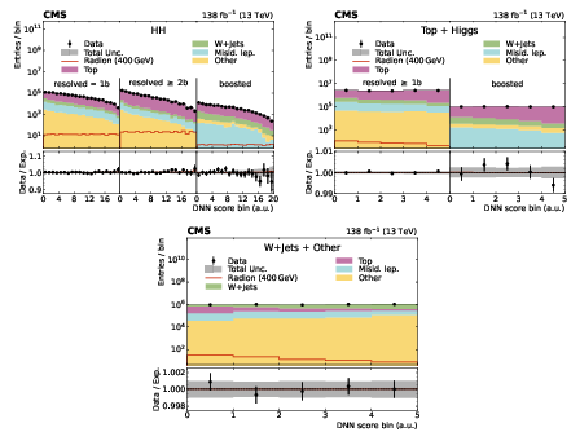
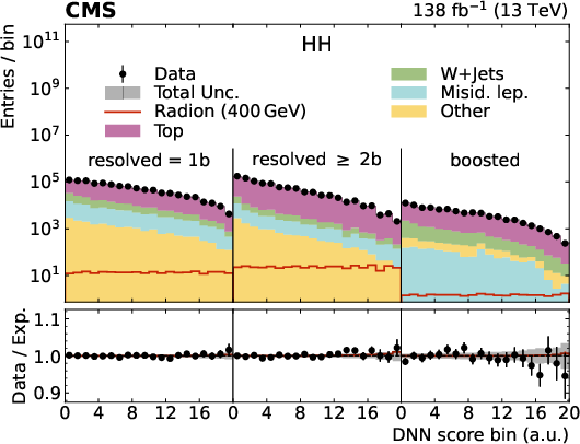
The distributions of the DNN discriminants of the resonant search for each event category for the single-lepton channel, after performing a maximum likelihood fit to the same distributions in data. The DNN shown corresponds to a scalar resonance with mass 400 GeV. The DNN discriminant for the HH (ggF) category is shown on the upper left, Top+Higgs on the upper right and W$+$jets + Other on the lower. The event categories are summarised in Table 1. The signal shown is scaled to a cross section of 1 pb. |
png pdf |
Figure 7-a:
The distributions of the DNN discriminants of the resonant search for each event category for the single-lepton channel, after performing a maximum likelihood fit to the same distributions in data. The DNN shown corresponds to a scalar resonance with mass 400 GeV. The DNN discriminant for the HH (ggF) category is shown on the upper left, Top+Higgs on the upper right and W$+$jets + Other on the lower. The event categories are summarised in Table 1. The signal shown is scaled to a cross section of 1 pb. |
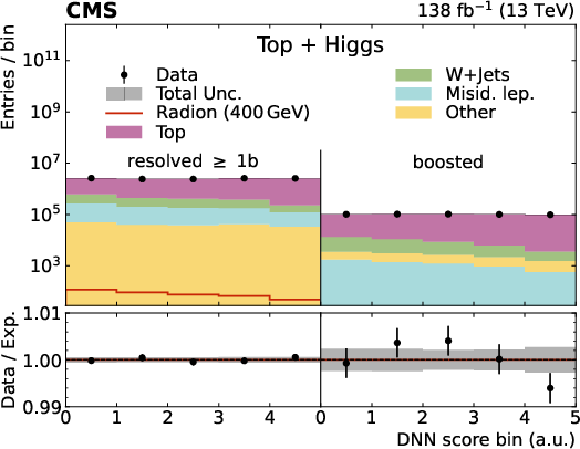
png pdf |
Figure 7-b:
The distributions of the DNN discriminants of the resonant search for each event category for the single-lepton channel, after performing a maximum likelihood fit to the same distributions in data. The DNN shown corresponds to a scalar resonance with mass 400 GeV. The DNN discriminant for the HH (ggF) category is shown on the upper left, Top+Higgs on the upper right and W$+$jets + Other on the lower. The event categories are summarised in Table 1. The signal shown is scaled to a cross section of 1 pb. |
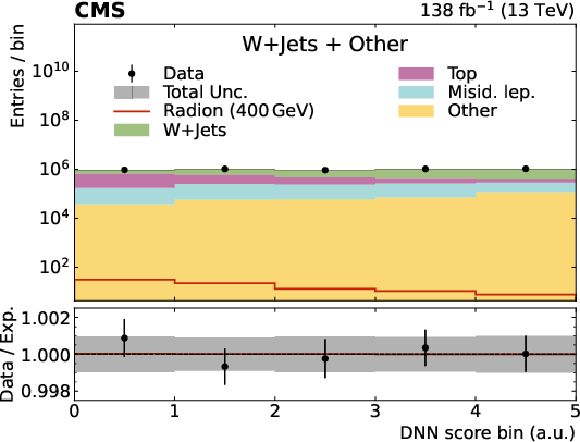
png pdf |
Figure 7-c:
The distributions of the DNN discriminants of the resonant search for each event category for the single-lepton channel, after performing a maximum likelihood fit to the same distributions in data. The DNN shown corresponds to a scalar resonance with mass 400 GeV. The DNN discriminant for the HH (ggF) category is shown on the upper left, Top+Higgs on the upper right and W$+$jets + Other on the lower. The event categories are summarised in Table 1. The signal shown is scaled to a cross section of 1 pb. |
png pdf |
Figure 8:
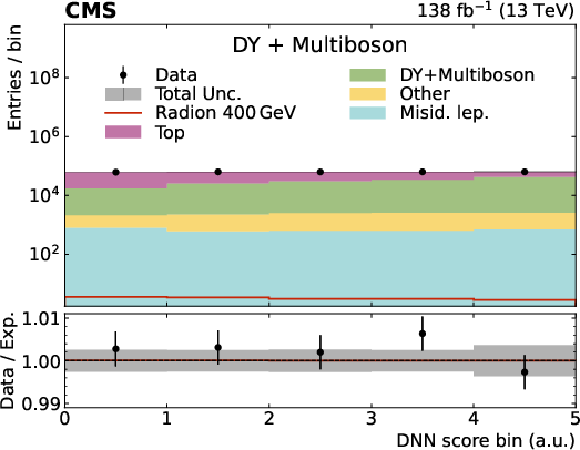
The distributions of the DNN discriminants of the resonant search for each event category for the dilepton channel, after performing a maximum likelihood fit to the same distributions in data. The DNN shown corresponds to a scalar resonance with mass 400 GeV. The DNN discriminant for the HH (ggF) category is shown on the upper left, Top+Other upper right and DY+Multiboson on the lower. The event categories are summarised in Table 2. The signal shown is scaled to a cross section of 1 pb. |
png pdf |
Figure 8-a:
The distributions of the DNN discriminants of the resonant search for each event category for the dilepton channel, after performing a maximum likelihood fit to the same distributions in data. The DNN shown corresponds to a scalar resonance with mass 400 GeV. The DNN discriminant for the HH (ggF) category is shown on the upper left, Top+Other upper right and DY+Multiboson on the lower. The event categories are summarised in Table 2. The signal shown is scaled to a cross section of 1 pb. |
png pdf |
Figure 8-b:
The distributions of the DNN discriminants of the resonant search for each event category for the dilepton channel, after performing a maximum likelihood fit to the same distributions in data. The DNN shown corresponds to a scalar resonance with mass 400 GeV. The DNN discriminant for the HH (ggF) category is shown on the upper left, Top+Other upper right and DY+Multiboson on the lower. The event categories are summarised in Table 2. The signal shown is scaled to a cross section of 1 pb. |
png pdf |
Figure 8-c:
The distributions of the DNN discriminants of the resonant search for each event category for the dilepton channel, after performing a maximum likelihood fit to the same distributions in data. The DNN shown corresponds to a scalar resonance with mass 400 GeV. The DNN discriminant for the HH (ggF) category is shown on the upper left, Top+Other upper right and DY+Multiboson on the lower. The event categories are summarised in Table 2. The signal shown is scaled to a cross section of 1 pb. |
png pdf |
Figure 9:
Observed and expected 95% CL upper limits on the inclusive nonresonant HH production cross section obtained for both single-lepton and dilepton channels, and from their combination. The green and yellow bands show the 1 and 2 standard deviations from the expectation. |

png pdf |
Figure 10:
Observed and expected 95% CL upper limits on the nonresonant HH production via vector boson fusion cross section obtained for both single-lepton and dilepton channels, and from their combination. The green and yellow bands show the 1 and 2 standard deviations from the expectation. |
png pdf |
Figure 11:
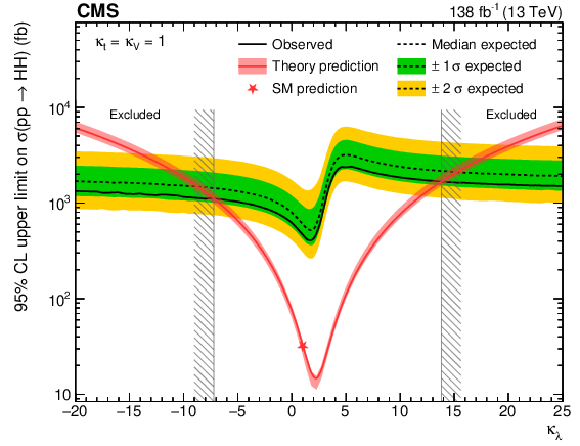
Observed and expected 95% CL upper limits on the nonresonant HH production cross section as a function of the Higgs boson self-coupling strength modifier $ \kappa_{\lambda}$. The green and yellow bands show the 1 and 2 standard deviations from the expectation. All Higgs boson couplings other than $ \lambda $ are assumed to have the values predicted by the SM. Overlaid in red is the curve representing the predicted HH production cross section. |
png pdf |
Figure 12:
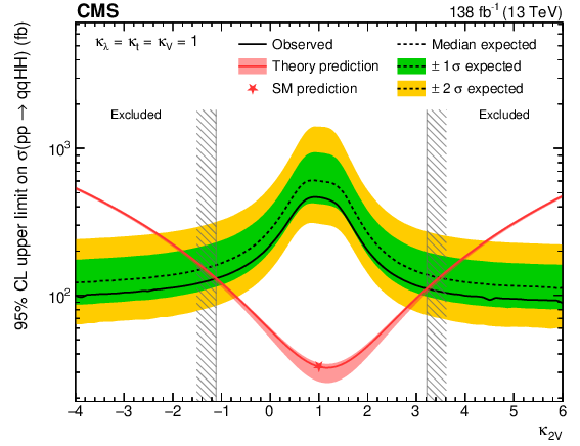
Observed and expected 95% CL upper limits on the nonresonant HH production via VBF cross section as a function of the effective coupling $ \kappa_{2\mathrm{V}} $. The green and yellow bands show the 1 and 2 standard deviations from the expectation. The ggF contribution in this case is set to the SM expectation. All other Higgs boson couplings are assumed to have the values predicted by the SM. Overlaid in red is the curve representing the predicted HH production cross section. |

png pdf |
Figure 13:
Observed and expected 95% CL exclusion limits on the nonresonant HH production cross section as a function of the effective couplings $ \kappa_{\lambda}$ and $ \kappa_{2\mathrm{V}} $. The blue area is excluded by the observation. The confidence intervals around the expected median exclusion contour are shown as dark and light-grey areas corresponding to 1 and 2 standard deviations respectively. The red diamond shows the SM expectation while the fine dashed lines show the theoretical cross section contours. The ggF contribution in this case is set to the SM expectation. All other Higgs boson couplings are assumed to have the values predicted by the SM. |
png pdf |
Figure 14:
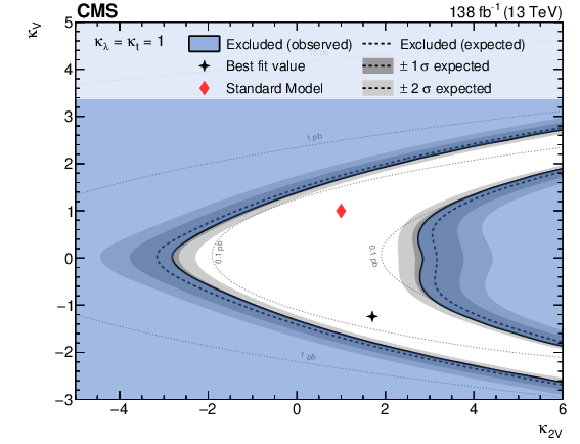
Observed and expected 95% CL exclusion limits on the nonresonant HH production via VBF cross section as a function of the effective couplings $ \kappa_{\mathrm{V}} $ and $ \kappa_{2\mathrm{V}} $. The blue area is excluded by the observation. The confidence intervals around the expected median exclusion contour are shown as dark and light-grey areas corresponding to 1 and 2 standard deviations respectively. The red diamond shows the SM expectation while the fine dashed lines show the theoretical cross section contours. The ggF contribution in this case is set to the SM expectation. All other Higgs boson couplings are assumed to have the values predicted by the SM. |
png pdf |
Figure 15:
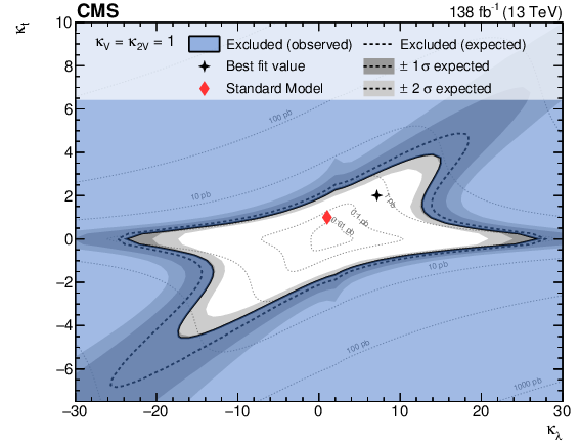
Observed and expected 95% CL exclusion limits on the nonresonant HH production cross section as a function of the effective couplings $ \kappa_{\lambda}$ and $\kappa_{\mathrm{t}}$. The blue area is excluded by the observation. The confidence intervals around the expected median exclusion contour are shown as dark and light-grey areas corresponding to 1 and 2 standard deviations respectively. The red diamond shows the SM expectation while the fine dashed lines show the theoretical cross section contours. All other Higgs boson couplings are assumed to have the values predicted by the SM. |
png pdf |
Figure 16:
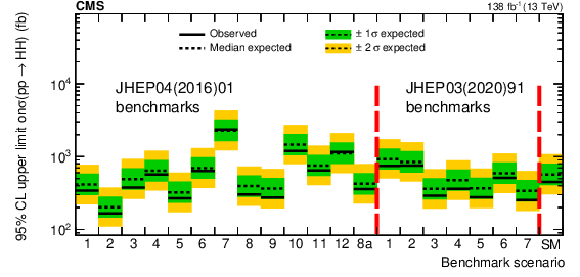
Observed and expected 95% CL upper limits on the nonresonant HH production cross section for two different benchmark scenarios ``JHEP04(2016)01'' and ``JHEP03(2020)91'' from Refs. [89,90]. The green and yellow bands show the 1 and 2 standard deviations from the expectation. |
png pdf |
Figure 17:
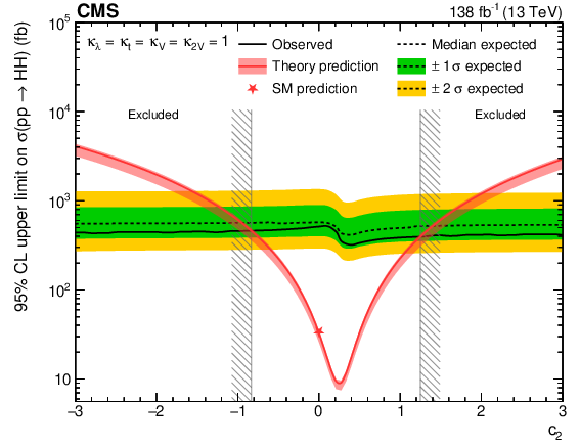
Observed and expected 95% CL upper limits on the nonresonant HH production cross section as a function of the effective coupling $ c_{2} $. The green and yellow bands show the 1 and 2 standard deviations from the expectation. All other Higgs boson couplings are assumed to have the values predicted in the SM. Overlaid in red (upper) is the curve representing the predicted HH production cross section. |
png pdf |
Figure 18:
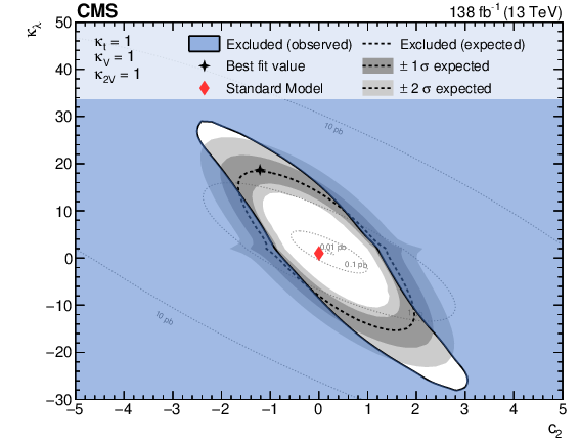
Observed and expected 95% CL exclusion limits on the nonresonant HH production cross section as a function of the effective couplings $ \kappa_{\lambda}$ and $ c_{2} $. The blue area is excluded by the observation. The confidence intervals around the expected median exclusion contour are shown as dark and light-grey areas corresponding to 1 and 2 standard deviations respectively. The red diamond shows the SM expectation while the fine dashed lines show the theoretical cross section contours. All other Higgs boson couplings are assumed to have the values predicted in the SM. |

png pdf |
Figure 19:
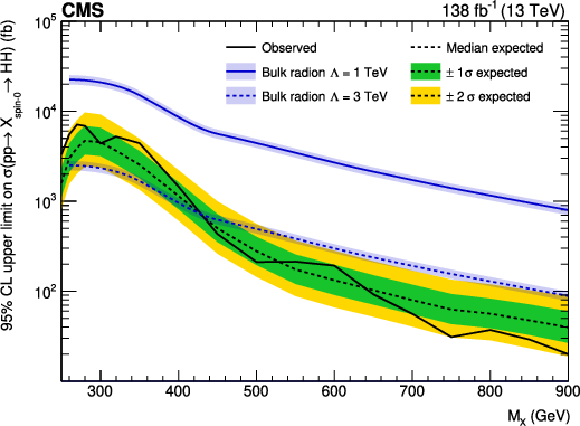
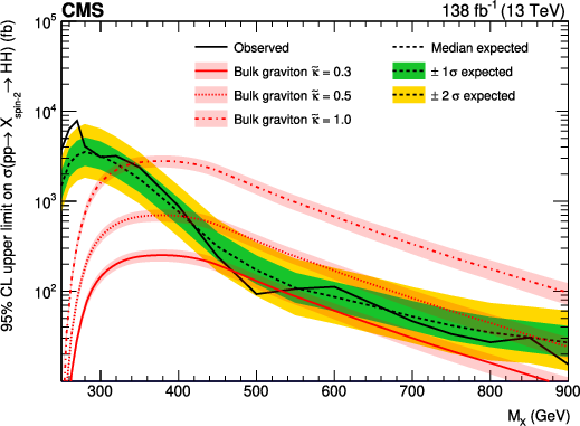
Observed and expected 95% CL upper limits on the production of new particles X of spin-0 (upper) and spin-2 (lower) and mass $ m_{\mathrm{X}} $ in the range 250 $ \leq m_{\mathrm{X}} \leq $ 900 GeV, which decay to Higgs boson pairs. The green and yellow bands show the 1 and 2 standard deviations from the expectation. Theory predictions in benchmark scenarios for bulk radion (upper) and bulk graviton (lower) models are overlaid. |
png pdf |
Figure 19-a:
Observed and expected 95% CL upper limits on the production of new particles X of spin-0 (upper) and spin-2 (lower) and mass $ m_{\mathrm{X}} $ in the range 250 $ \leq m_{\mathrm{X}} \leq $ 900 GeV, which decay to Higgs boson pairs. The green and yellow bands show the 1 and 2 standard deviations from the expectation. Theory predictions in benchmark scenarios for bulk radion (upper) and bulk graviton (lower) models are overlaid. |
png pdf |
Figure 19-b:
Observed and expected 95% CL upper limits on the production of new particles X of spin-0 (upper) and spin-2 (lower) and mass $ m_{\mathrm{X}} $ in the range 250 $ \leq m_{\mathrm{X}} \leq $ 900 GeV, which decay to Higgs boson pairs. The green and yellow bands show the 1 and 2 standard deviations from the expectation. Theory predictions in benchmark scenarios for bulk radion (upper) and bulk graviton (lower) models are overlaid. |
| Tables | |

png pdf |
Table 1:
Summary of the categories of events according to the DNN-based multiclassification and $ \mathrm{H}\to \mathrm{b}\overline{\mathrm{b}} $ topology for the single-lepton channel. The VBF category is considered only in the nonresonant search. |

png pdf |
Table 2:
Summary of the categories of events according to the DNN-based multiclassification and $ \mathrm{H}\to \mathrm{b}\overline{\mathrm{b}} $ topology for the dilepton channel. The VBF category is considered only in the nonresonant search. |
| Summary |
| In this paper, a search for Higgs boson pair production (HH) in the $ {\mathrm{H}\mathrm{H}}\to\mathrm{b}\overline{\mathrm{b}}\mathrm{W^+}\mathrm{W^-} $ decay channel is presented. The nonresonant and the resonant production mechanisms are studied. No significant deviation from the standard model (SM) background is found. Upper limits are set on the HH production cross section.The cross section for the inclusive nonresonant $ {\mathrm{H}\mathrm{H}}\to\mathrm{b}\overline{\mathrm{b}}\mathrm{W^+}\mathrm{W^-} $ production is excluded up to a minimum of 14 times the value predicted by the SM at 95% confidence level. Compared to previous results on the same process by the CMS Collaboration, this search represents a significant improvement with a gain in sensitivity by up to a factor of five. The vector boson fusion production is excluded up to 277 times the value predicted by the SM at 95% confidence level.The limits on the cross sections are also shown as a function of various Higgs boson coupling modifiers and anomalous Higgs boson couplings. The Higgs boson trilinear coupling $ \lambda_{\mathrm{HHH}} $ is constrained between-7.2 and 13.8 times the value expected in the SM. The coupling modifier for the quartic interaction between two Higgs bosons and two W or Z bosons, $ \kappa_{2\mathrm{V}} $, is constrained between-1.1 and 3.2. The coupling between two top quarks and two Higgs bosons, which is predicted to be zero in the SM, is constrained between-0.8 and 1.3. The exclusion contours are drawn as a function of the Higgs boson coupling modifiers.The HH production via a heavy resonance is studied in the mass range from 250 to 900 GeV. Spin-0 and spin-2 scenarios for the resonance are tested and compared to the common theoretical benchmarks of a heavy CP-even scalar radion and a graviton. The limits on the resonance production cross section in the spin-0 (2) scenario vary between 5540 (6368) and 20 (15) fb corresponding to the 250 and 900 GeV mass points, respectively. These limits are comparable to those set by the $ \gamma\gamma\mathrm{b}\overline{\mathrm{b}} $ resonant HH search. |
| References | ||||
| 1 | ATLAS Collaboration | Observation of a new particle in the search for the Standard Model Higgs boson with the ATLAS detector at the LHC | PLB 716 (2012) 1 | 1207.7214 |
| 2 | CMS Collaboration | Observation of a new boson at a mass of 125 GeV with the CMS experiment at the LHC | PLB 716 (2012) 30 | CMS-HIG-12-028 1207.7235 |
| 3 | CMS Collaboration | Observation of a new boson with mass near 125 GeV in pp collisions at $ \sqrt{s}= $ 7 and 8 TeV | JHEP 06 (2013) 081 | CMS-HIG-12-036 1303.4571 |
| 4 | ATLAS Collaboration | A detailed map of Higgs boson interactions by the ATLAS experiment ten years after the discovery | Nature 607 (2022) 52 | 2207.00092 |
| 5 | CMS Collaboration | A portrait of the Higgs boson by the CMS experiment ten years after the discovery | Nature 607 (2022) 60 | CMS-HIG-22-001 2207.00043 |
| 6 | CMS Collaboration | Combined measurements of Higgs boson couplings in proton--proton collisions at $ \sqrt{s}= $ 13 TeV | EPJC 79 (2019) 421 | CMS-HIG-17-031 1809.10733 |
| 7 | ATLAS Collaboration | Combined measurements of Higgs boson production and decay using up to 80 fb$ ^{-1} $ of proton-proton collision data at $ \sqrt{s}= $ 13 TeV collected with the ATLAS experiment | PRD 101 (2020) 012002 | 1909.02845 |
| 8 | S. Borowka et al. | Higgs boson pair production in gluon fusion at next-to-leading order with full top-quark mass dependence | PRL 117 (2016) 012001 | 1604.06447 |
| 9 | J. Baglio et al. | Gluon fusion into Higgs pairs at NLO QCD and the top mass scheme | EPJC 79 (2019) 459 | 1811.05692 |
| 10 | J. Baglio et al. | $ gg\to HH $: Combined uncertainties | PRD 103 (2021) 056002 | 2008.11626 |
| 11 | J. Alison et al. | Higgs boson potential at colliders: Status and perspectives | Rev. Phys. 5 (2020) 100045 | 1910.00012 |
| 12 | F. A. Dreyer and A. Karlberg | Vector-boson fusion Higgs pair production at N$ ^3 $LO | PRD 98 (2018) 114016 | 1811.07906 |
| 13 | LHC Higgs Cross Section Working Group | Handbook of LHC Higgs cross sections: 3. Higgs properties | CERN Yellow Rep. Monogr. 4 (2013) | 1307.1347 |
| 14 | K. Cheung | Phenomenology of radion in Randall-Sundrum scenario | PRD 63 (2001) 056007 | hep-ph/0009232 |
| 15 | G. C. Branco et al. | Theory and phenomenology of two-Higgs-doublet models | Phys. Rep. 516 (2012) 1 | 1106.0034 |
| 16 | L. Randall and R. Sundrum | A Large mass hierarchy from a small extra dimension | PRL 83 (1999) 3370 | hep-ph/9905221 |
| 17 | W. D. Goldberger and M. B. Wise | Modulus stabilization with bulk fields | PRL 83 (1999) 4922 | hep-ph/9907447 |
| 18 | CMS Collaboration | The CMS experiment at the CERN LHC | JINST 3 (2008) S08004 | |
| 19 | CMS Collaboration | Precision luminosity measurement in proton-proton collisions at $ \sqrt{s} = $ 13 TeV in 2015 and 2016 at CMS | EPJC 81 (2021) 800 | CMS-LUM-17-003 2104.01927 |
| 20 | CMS Collaboration | CMS luminosity measurement for the 2017 data-taking period at $ \sqrt{s} = $ 13 TeV | CMS Physics Analysis Summary, 2018 link |
CMS-PAS-LUM-17-004 |
| 21 | CMS Collaboration | CMS luminosity measurement for the 2018 data-taking period at $ \sqrt{s} = $ 13 TeV | CMS Physics Analysis Summary, 2019 link |
CMS-PAS-LUM-18-002 |
| 22 | ATLAS Collaboration | Constraints on the Higgs boson self-coupling from single- and double-Higgs production with the ATLAS detector using pp collisions at $ \sqrt{s}= $ 13 TeV | PLB 843 (2023) 137745 | 2211.01216 |
| 23 | ATLAS Collaboration | Search for non-resonant Higgs boson pair production in the $ \mathrm{b}\mathrm{b}\ell\ell\nu\nu $ final state with the ATLAS detector in pp collisions at $ \sqrt{s} = $ 13 TeV | PLB 801 (2020) 135145 | 1908.06765 |
| 24 | CMS Collaboration | Search for resonant and non-resonant Higgs boson pair production in the $ \mathrm{b}\overline{\mathrm{b}}\ell\nu\ell\nu $ final state in proton-proton collisions at $ \sqrt{s} = $ 13 TeV | JHEP 01 (2018) 054 | CMS-HIG-17-006 1708.04188 |
| 25 | E. Bols et al. | Jet flavour classification using DeepJet | JINST 15 (2020) P12012 | 2008.10519 |
| 26 | CMS Collaboration | HEPData record for this analysis | link | |
| 27 | CMS Collaboration | Performance of the CMS Level-1 trigger in proton-proton collisions at $ \sqrt{s} = $ 13 TeV | JINST 15 (2020) P10017 | CMS-TRG-17-001 2006.10165 |
| 28 | CMS Collaboration | The CMS trigger system | JINST 12 (2017) P01020 | CMS-TRG-12-001 1609.02366 |
| 29 | T. Sjöstrand et al. | An introduction to PYTHIA 8.2 | Comput. Phys. Commun. 191 (2015) 159 | 1410.3012 |
| 30 | CMS Collaboration | Event generator tunes obtained from underlying event and multiparton scattering measurements | EPJC 76 (2016) 155 | CMS-GEN-14-001 1512.00815 |
| 31 | CMS Collaboration | Extraction and validation of a new set of CMS PYTHIA8 tunes from underlying-event measurements | EPJC 80 (2020) 4 | CMS-GEN-17-001 1903.12179 |
| 32 | NNPDF Collaboration | Parton distributions with QED corrections | NPB 877 (2013) 290 | 1308.0598 |
| 33 | NNPDF Collaboration | Parton distributions for the LHC Run II | JHEP 04 (2015) 040 | 1410.8849 |
| 34 | NNPDF Collaboration | Parton distributions from high-precision collider data | EPJC 77 (2017) 663 | 1706.00428 |
| 35 | J. Alwall et al. | The automated computation of tree-level and next-to-leading order differential cross sections, and their matching to parton shower simulations | JHEP 07 (2014) 079 | 1405.0301 |
| 36 | J. Alwall et al. | Comparative study of various algorithms for the merging of parton showers and matrix elements in hadronic collisions | EPJC 53 (2007) 473 | 0706.2569 |
| 37 | R. Frederix and S. Frixione | Merging meets matching in MC@NLO | JHEP 12 (2012) 061 | 1209.6215 |
| 38 | P. Nason | A new method for combining NLO QCD with shower Monte Carlo algorithms | JHEP 11 (2004) 040 | hep-ph/0409146 |
| 39 | S. Frixione, P. Nason, and C. Oleari | Matching NLO QCD computations with parton shower simulations: the POWHEG method | JHEP 11 (2007) 070 | 0709.2092 |
| 40 | S. Alioli, P. Nason, C. Oleari, and E. Re | A general framework for implementing NLO calculations in shower Monte Carlo programs: the POWHEG BOX | JHEP 06 (2010) 043 | 1002.2581 |
| 41 | GEANT4 Collaboration | GEANT 4---a simulation toolkit | NIM A 506 (2003) 250 | |
| 42 | G. Heinrich et al. | Probing the trilinear higgs boson coupling in di-Higgs production at NLO QCD including parton shower effects | JHEP 06 (2019) 066 | 1903.08137 |
| 43 | M. Grazzini et al. | Higgs boson pair production at NNLO with top quark mass effects | JHEP 05 (2018) 059 | 1803.02463 |
| 44 | K. Ehat ä ht and C. Veelken | Stitching Monte Carlo samples | EPJC 82 (2022) 484 | 2106.04360 |
| 45 | K. Melnikov and F. Petriello | Electroweak gauge boson production at hadron colliders through O($ \alpha_{s}^{2} $) | PRD 74 (2006) 114017 | hep-ph/0609070 |
| 46 | M. Czakon and A. Mitov | Top++: A program for the calculation of the top-pair cross section at hadron colliders | Comput. Phys. Commun. 185 (2014) 2930 | 1112.5675 |
| 47 | CMS Collaboration | Measurement of differential cross sections for Z boson production in association with jets in proton-proton collisions at $ \sqrt{s} = $ 13 TeV | EPJC 78 (2018) 965 | CMS-SMP-16-015 1804.05252 |
| 48 | CMS Collaboration | Particle-flow reconstruction and global event description with the CMS detector | JINST 12 (2017) P10003 | CMS-PRF-14-001 1706.04965 |
| 49 | CMS Collaboration | Technical proposal for the Phase-II upgrade of the Compact Muon Solenoid | CMS Technical Proposal CERN-LHCC-2015-010, CMS-TDR-15-02, 2015 CDS |
|
| 50 | M. Cacciari, G. P. Salam, and G. Soyez | The anti-$ k_{\mathrm{T}} $ jet clustering algorithm | JHEP 04 (2008) 063 | 0802.1189 |
| 51 | M. Cacciari, G. P. Salam, and G. Soyez | FastJet user manual | EPJC 72 (2012) 1896 | 1111.6097 |
| 52 | CMS Collaboration | Jet energy scale and resolution measurement with Run 2 legacy data collected by CMS at 13 TeV | CMS Detector Performance Note CERN-CMS-DP-2021-033, 2021 CDS |
|
| 53 | CMS Collaboration | Jet energy scale and resolution in the CMS experiment in pp collisions at 8 TeV | JINST 12 (2017) P02014 | CMS-JME-13-004 1607.03663 |
| 54 | CMS Collaboration | Pileup mitigation at CMS in 13 TeV data | JINST 15 (2020) P09018 | CMS-JME-18-001 2003.00503 |
| 55 | CMS Collaboration | Performance of the DeepJet b tagging algorithm using 41.9 fb$ ^{-1} $ of data from proton-proton collisions at 13 TeV with Phase 1 CMS detector | CMS Detector Performance Note CMS-DP-2018-058, 2018 CDS |
|
| 56 | CMS Collaboration | A Deep Neural Network for Simultaneous Estimation of b Jet Energy and Resolution | Comput. Softw. Big Sci. 4 (2020) 10 | CMS-HIG-18-027 1912.06046 |
| 57 | D. Bertolini, P. Harris, M. Low, and N. Tran | Pileup per particle identification | JHEP 10 (2014) 059 | 1407.6013 |
| 58 | CMS Collaboration | Identification of heavy-flavour jets with the CMS detector in pp collisions at 13 TeV | JINST 13 (2018) P05011 | CMS-BTV-16-002 1712.07158 |
| 59 | M. Dasgupta, A. Fregoso, S. Marzani, and G. P. Salam | Towards an understanding of jet substructure | JHEP 09 (2013) 029 | 1307.0007 |
| 60 | J. M. Butterworth, A. R. Davison, M. Rubin, and G. P. Salam | Jet substructure as a new Higgs search channel at the LHC | PRL 100 (2008) 242001 | 0802.2470 |
| 61 | J. Thaler and K. Van Tilburg | Identifying boosted objects with N-subjettiness | JHEP 03 (2011) 015 | 1011.2268 |
| 62 | CMS Collaboration | Performance of electron reconstruction and selection with the CMS detector in proton-proton collisions at $ \sqrt{s}= $ 8 TeV | JINST 10 (2015) P06005 | CMS-EGM-13-001 1502.02701 |
| 63 | CMS Collaboration | Electron and photon reconstruction and identification with the CMS experiment at the CERN LHC | JINST 16 (2021) P05014 | CMS-EGM-17-001 2012.06888 |
| 64 | A. Hoecker et al. | TMVA --- toolkit for multivariate data analysis | PoS ACAT 04 (2007) 0 | physics/0703039 |
| 65 | CMS Collaboration | Performance of CMS muon reconstruction in pp collision events at $ \sqrt{s}= $ 7 TeV | JINST 7 (2012) P10002 | CMS-MUO-10-004 1206.4071 |
| 66 | CMS Collaboration | Performance of the CMS muon detector and muon reconstruction with proton-proton collisions at $ \sqrt{s}= $ 13 TeV | JINST 13 (2018) P06015 | CMS-MUO-16-001 1804.04528 |
| 67 | M. Cacciari, G. P. Salam, and G. Soyez | The catchment area of jets | JHEP 04 (2008) 005 | 0802.1188 |
| 68 | M. Cacciari and G. P. Salam | Pileup subtraction using jet areas | PLB 659 (2008) 119 | 0707.1378 |
| 69 | CMS Collaboration | Measurement of the Higgs boson production rate in association with top quarks in final states with electrons, muons, and hadronically decaying tau leptons at $ \sqrt{s}= $ 13 TeV | EPJC 81 (2021) 378 | CMS-HIG-19-008 2011.03652 |
| 70 | CMS Collaboration | Performance of missing transverse momentum reconstruction in proton-proton collisions at $ \sqrt{s} = $ 13 TeV using the CMS detector | JINST 14 (2019) P07004 | CMS-JME-17-001 1903.06078 |
| 71 | PDG Group | Review of Particle Physics | PTEP 2022 (2022) 083C01 | |
| 72 | CMS Collaboration | Identification of hadronic tau lepton decays using a deep neural network | JINST 17 (2022) P07023 | CMS-TAU-20-001 2201.08458 |
| 73 | CMS Collaboration | Search for nonresonant Higgs boson pair production in final state with two bottom quarks and two tau leptons in proton-proton collisions at $ \sqrt{s}= $ 13 TeV | PLB 842 (2023) 137531 | CMS-HIG-20-010 2206.09401 |
| 74 | ATLAS and CMS Collaborations, and LHC Higgs Combination Group | Procedure for the LHC Higgs boson search combination in Summer 2011 | Technical Report CMS-NOTE-2011-005, ATL-PHYS-PUB-2011-11, 2011 | |
| 75 | A. L. Read | Presentation of search results: the $ \text{CL}_\text{s} $ technique | JPG 28 (2002) 2693 | |
| 76 | T. Junk | Confidence level computation for combining searches with small statistics | NIM A 434 (1999) 435 | hep-ex/9902006 |
| 77 | P. Baldi et al. | Parameterized neural networks for high-energy physics | EPJC 76 (2016) 235 | 1601.07913 |
| 78 | M. Erdmann, E. Geiser, Y. Rath, and M. Rieger | Lorentz Boost Networks: Autonomous physics-inspired feature engineering | JINST 14 (2019) P06006 | 1812.09722 |
| 79 | T. Huang et al. | Resonant di-Higgs boson production in the $ \mathrm{b}\overline{\mathrm{b}}\mathrm{W}\mathrm{W} $ channel: Probing the electroweak phase transition at the LHC | PRD 96 (2017) 035007 | 1701.04442 |
| 80 | CMS Collaboration | Evidence for associated production of a Higgs boson with a top quark pair in final states with electrons, muons, and hadronically decaying $ \tau $ leptons at $ \sqrt{s}= $ 13 TeV | JHEP 08 (2018) 066 | CMS-HIG-17-018 1803.05485 |
| 81 | L.-S. Ling et al. | NNLO QCD corrections to Higgs pair production via vector boson fusion at hadron colliders | PRD 89 (2014) 073001 | 1401.7754 |
| 82 | F. A. Dreyer and A. Karlberg | Fully differential vector-boson fusion Higgs pair production at next-to-next-to-leading order | PRD 99 (2019) 074028 | 1811.07918 |
| 83 | B. Cabouat and T. Sjöstrand | Some dipole shower studies | EPJC 78 (2018) 226 | |
| 84 | D. de Florian, I. Fabre, and J. Mazzitelli | Higgs boson pair production at NNLO in QCD including dimension 6 operators | JHEP 10 (2017) 215 | 1704.05700 |
| 85 | LHC Higgs Cross Section Working Group | Handbook of LHC Higgs Cross Sections: 4. Deciphering the nature of the Higgs sector | CERN Yellow Rep. Monogr. 2 (2017) | 1610.07922 |
| 86 | CMS Collaboration | Measurement of the inelastic proton-proton cross section at $ \sqrt{s}= $ 13 TeV | JHEP 07 (2018) 161 | CMS-FSQ-15-005 1802.02613 |
| 87 | G. Cowan, K. Cranmer, E. Gross, and O. Vitells | Asymptotic formulae for likelihood-based tests of new physics | EPJC 71 (2011) 1554 | 1007.1727 |
| 88 | CMS Collaboration | Search for nonresonant Higgs boson pair production in final states with two bottom quarks and two photons in proton-proton collisions at $ \sqrt{s}= $ 13 TeV | JHEP 03 (2021) 257 | CMS-HIG-19-018 2011.12373 |
| 89 | A. Carvalho et al. | Higgs pair production: choosing benchmarks with cluster analysis | JHEP 04 (2016) 1 | 1507.02245 |
| 90 | M. Capozi and G. Heinrich | Exploring anomalous couplings in Higgs boson pair production through shape analysis | JHEP 03 (2020) 091 | 1908.08923 |
| 91 | CMS Collaboration | Search for a new resonance decaying into two spin-0 bosons in a final state with two photons and two bottom quarks in proton-proton collisions at $ \sqrt{s} = $ 13 TeV | Submitted to JHEP, 2023 | CMS-HIG-21-011 2310.01643 |
| 92 | A. Carvalho | Gravity particles from warped extra dimensions, predictions for LHC | 1404.0102 | |
| 93 | M. Gouzevitch et al. | Scale-invariant resonance tagging in multijet events and new physics in Higgs pair production | JHEP 07 (2013) 148 | 1303.6636 |

|
Compact Muon Solenoid LHC, CERN |

|

|

|

|

|

|