

Compact Muon Solenoid
LHC, CERN
 Visit us: CMS Public Website, CMS Physics ;
Contact us: CMS Publications Committee
Visit us: CMS Public Website, CMS Physics ;
Contact us: CMS Publications Committee
| CMS-EXO-24-039 ; CERN-EP-2026-185 | ||
| Search for resonant and nonresonant production of pairs of dijet resonances with b jets in the final state in proton-proton collisions at $ \sqrt{s} = $ 13 TeV | ||
| CMS Collaboration | ||
| 18 September 2026 | ||
| Submitted to the Journal of High Energy Physics | ||
| Abstract: A search is presented for pair-produced dijet resonances of identical mass, each decaying into a bottom (b) quark and a light-flavor quark. The search uses a data sample corresponding to an integrated luminosity of 138 fb$^{-1}$ collected with the CMS detector in proton-proton collisions at $ \sqrt{s}= $ 13 TeV. Results are presented separately for nonresonant production and for the case where the four-jet production proceeds via an intermediate resonant state. Upper limits are reported on the production of four-jet and dijet resonances with b jets in the final state. This is the first LHC search for resonant production of pairs of fully resolved dijet resonances with b jets in the final state, in which all resonances considered correspond to non-standard-model states. For nonresonant production, the most significant excess occurs at an average dijet mass of 1.0 TeV, with a local significance of 2.1 standard deviations. Additionally, the results exclude pair production of top squarks with masses between 0.5 and 0.8 TeV, extending previous searches for $ R $-parity-violating decays to strange and b quarks. In the search for resonant production, the most significant excess occurs at a four-jet resonance mass of 3.1 TeV and a dijet resonance mass of 1.3 TeV, with a local significance of 2.6 standard deviations. The results are also used to set limits at 95% confidence level on the diquark-to-diquarks model and exclude the heavier diquark masses between 2 and 7 TeV. | ||
| Links: e-print arXiv:2609.21850 [hep-ex] (PDF) ; CDS record ; inSPIRE record ; HepData record ; CADI line (restricted) ; | ||
| Figures | |
png pdf |
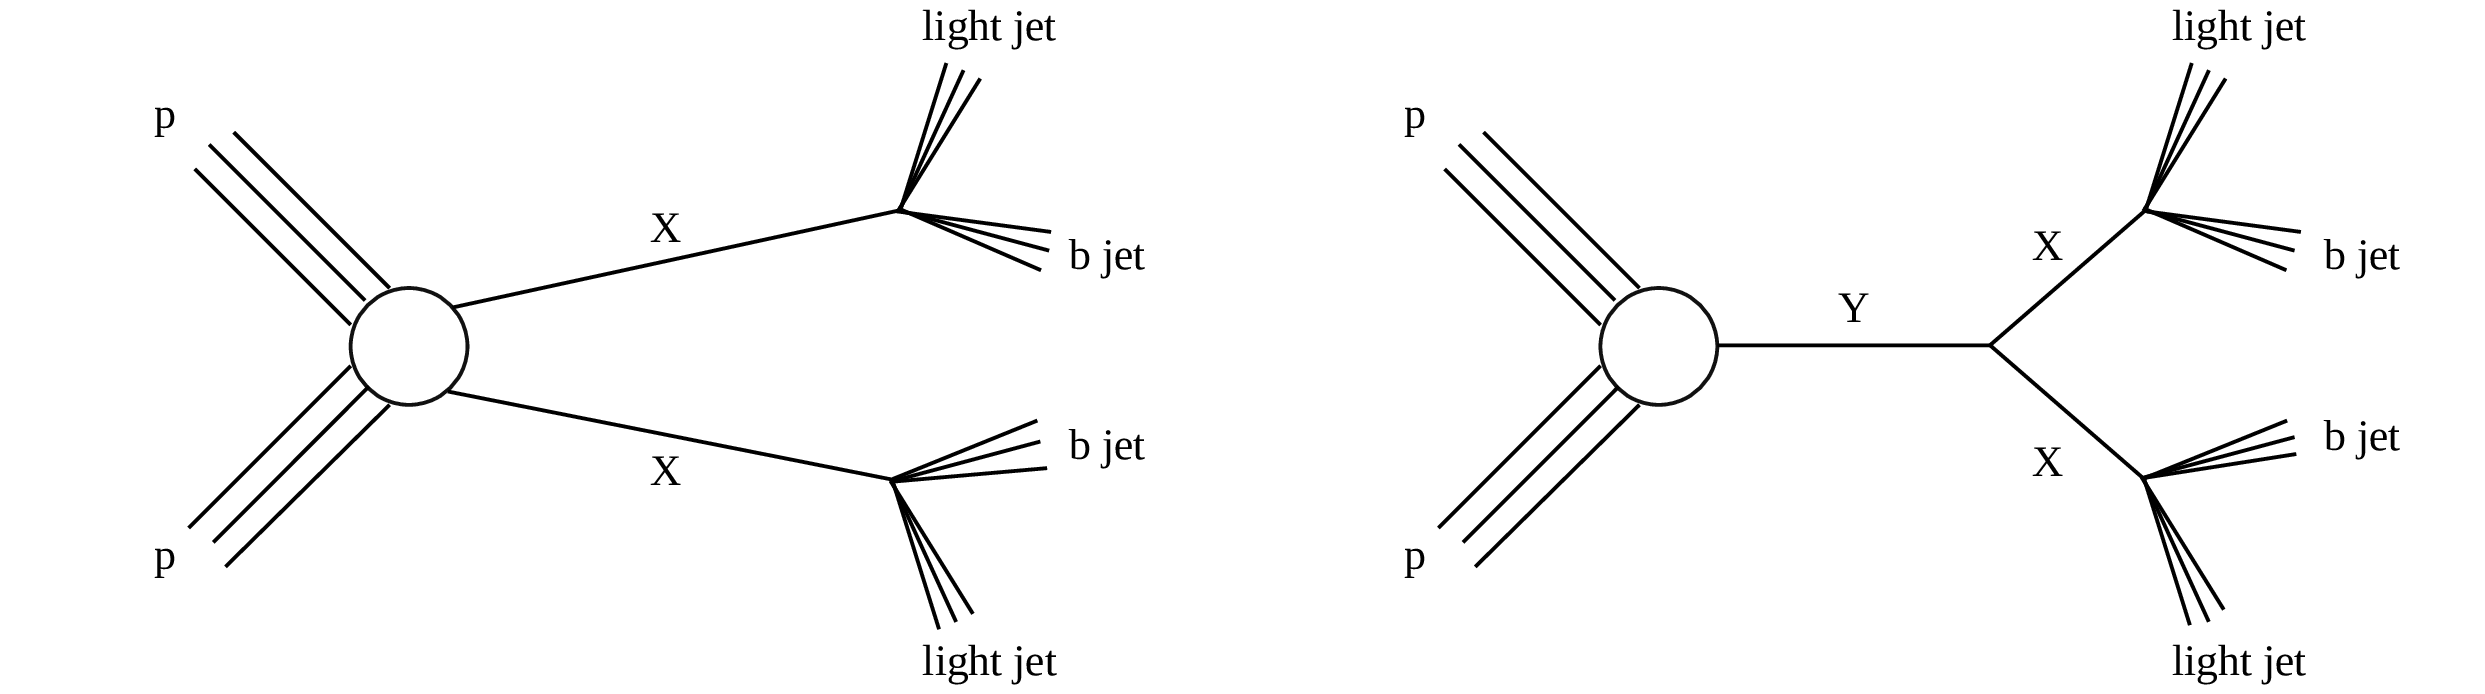
Figure 1:
(Left) Nonresonant production of pairs of dijet resonances, $ \mathrm{X} $. (Right) Resonant production of pairs of dijet resonances, $ \mathrm{X} $, via a massive resonance, Y. In both scenarios, each dijet resonance, $ \mathrm{X} $, produces a b jet and a light-flavor jet. |
png pdf |
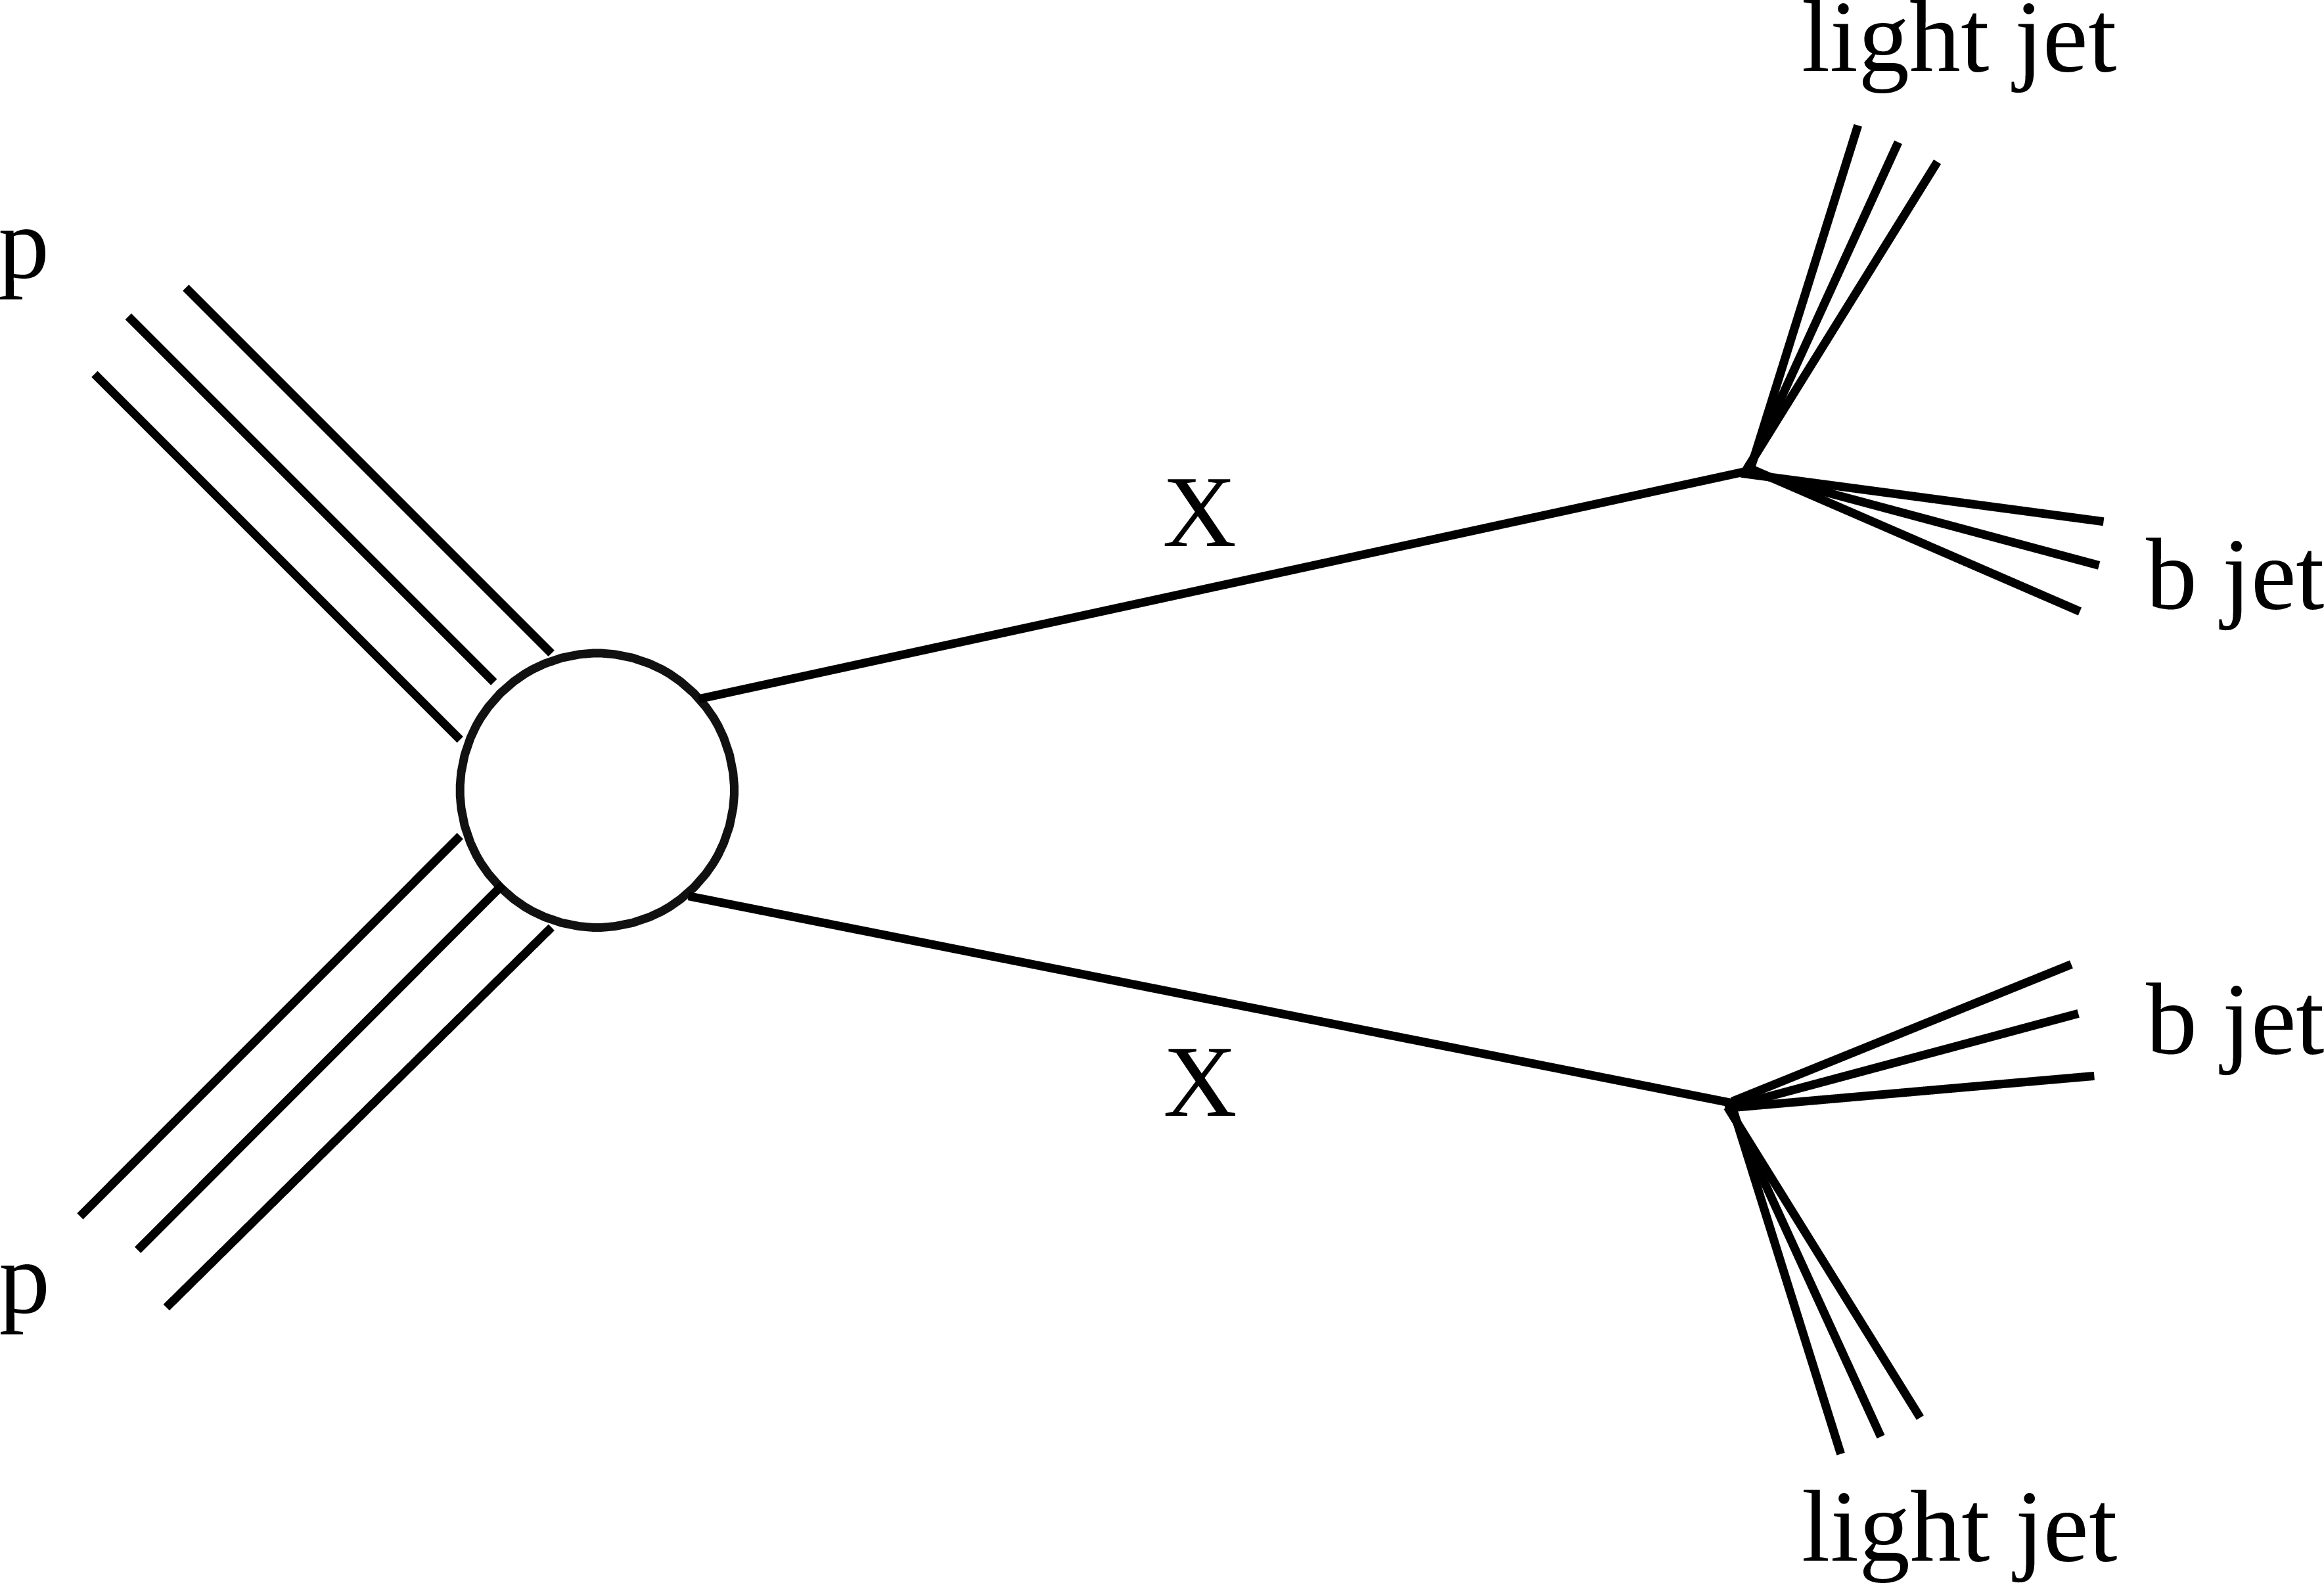
Figure 1-a:
(Left) Nonresonant production of pairs of dijet resonances, $ \mathrm{X} $. (Right) Resonant production of pairs of dijet resonances, $ \mathrm{X} $, via a massive resonance, Y. In both scenarios, each dijet resonance, $ \mathrm{X} $, produces a b jet and a light-flavor jet. |
png pdf |
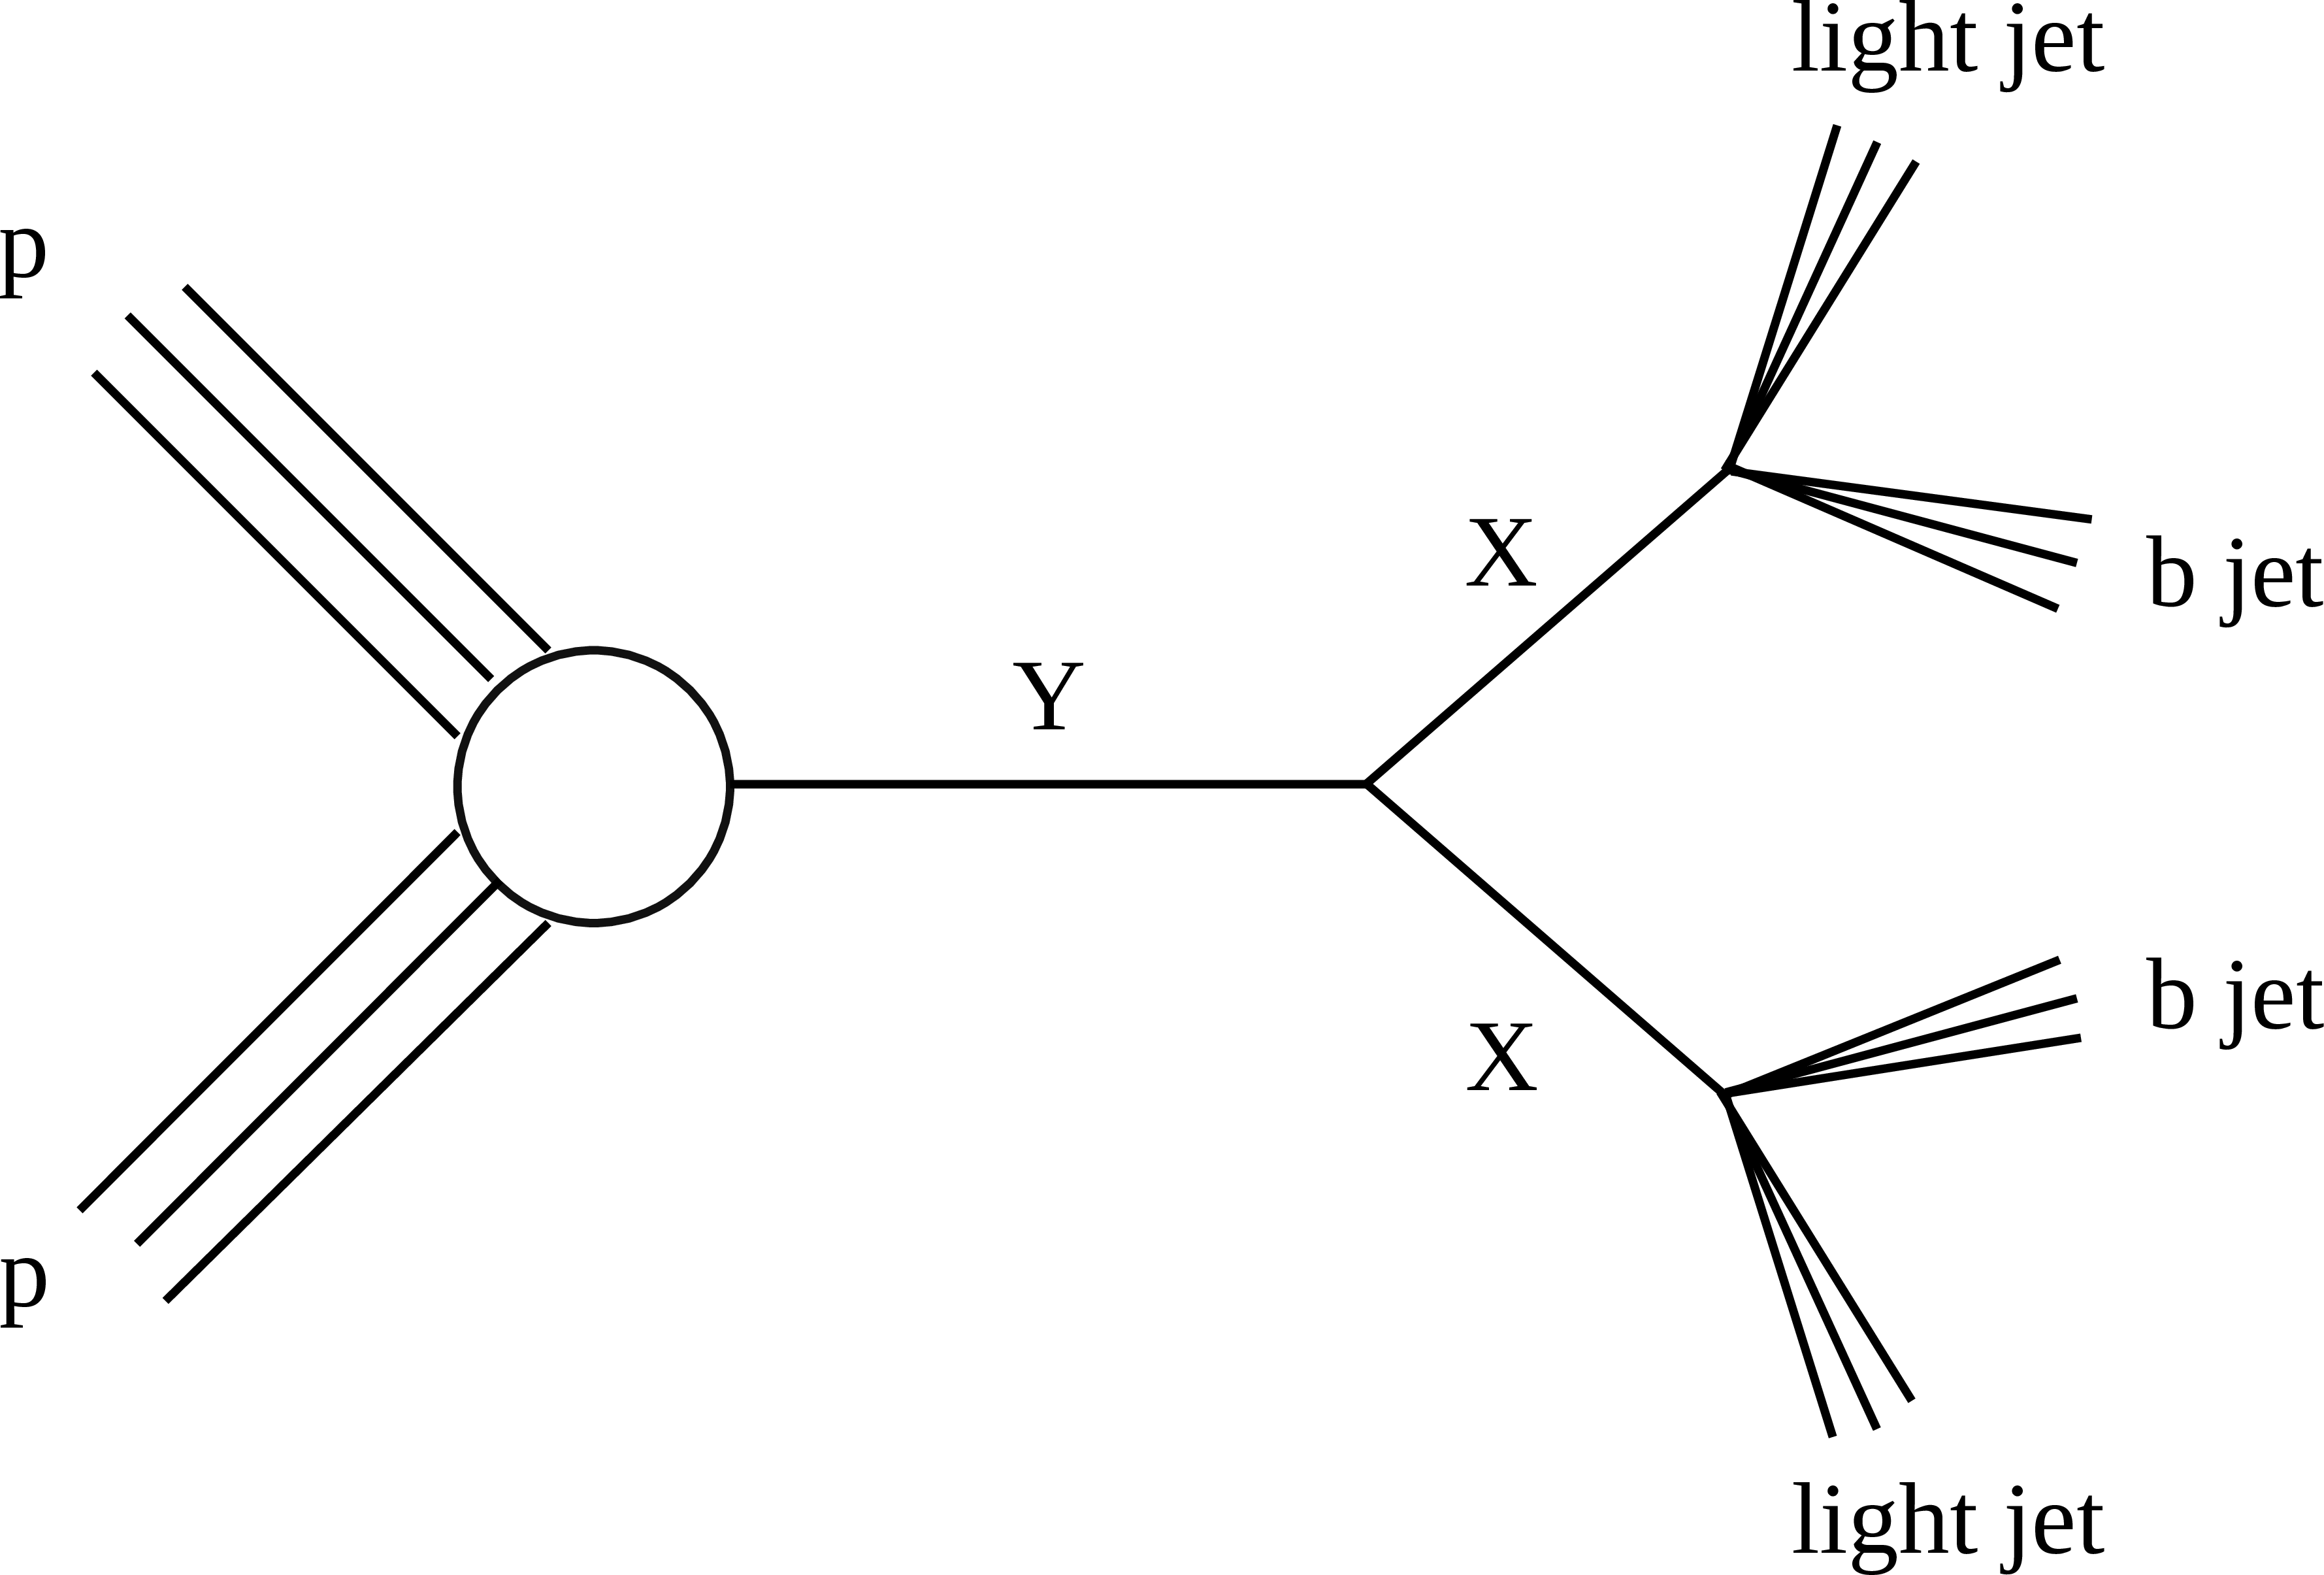
Figure 1-b:
(Left) Nonresonant production of pairs of dijet resonances, $ \mathrm{X} $. (Right) Resonant production of pairs of dijet resonances, $ \mathrm{X} $, via a massive resonance, Y. In both scenarios, each dijet resonance, $ \mathrm{X} $, produces a b jet and a light-flavor jet. |
png pdf |
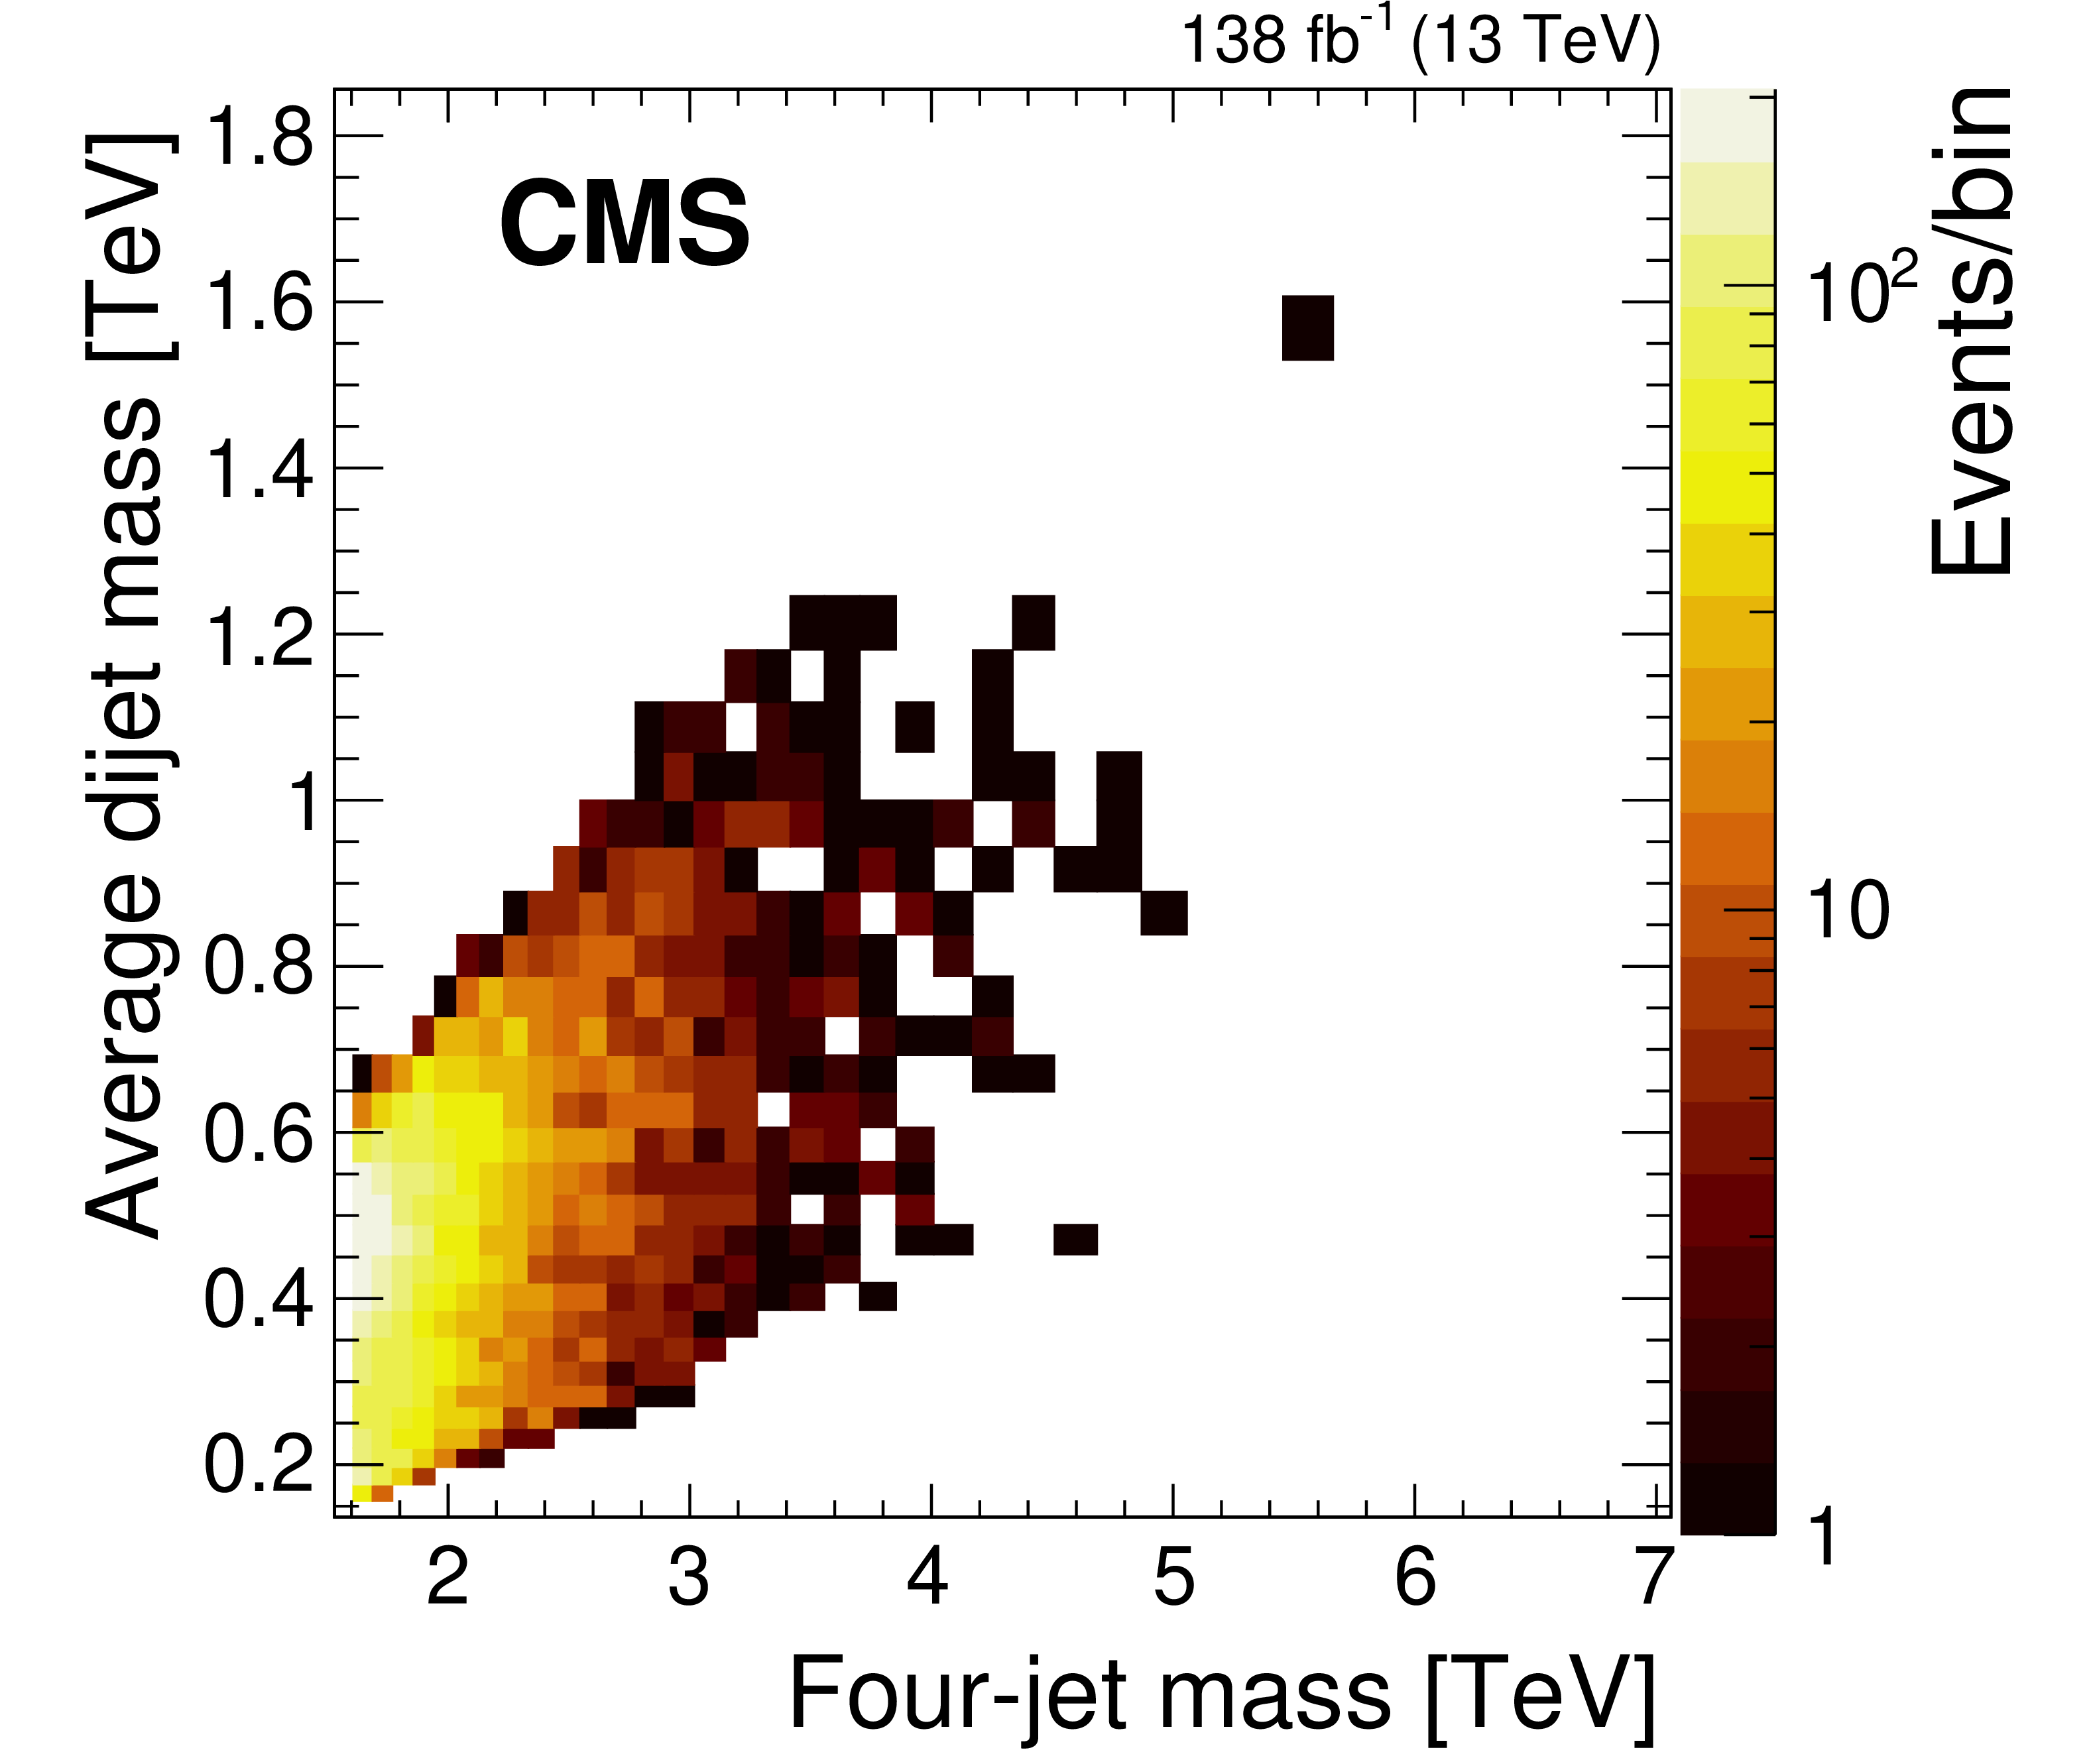
Figure 2:
Number of events observed (color scale) within bins of the invariant mass of the four jets and the average dijet mass. |
png pdf |
Figure 3:
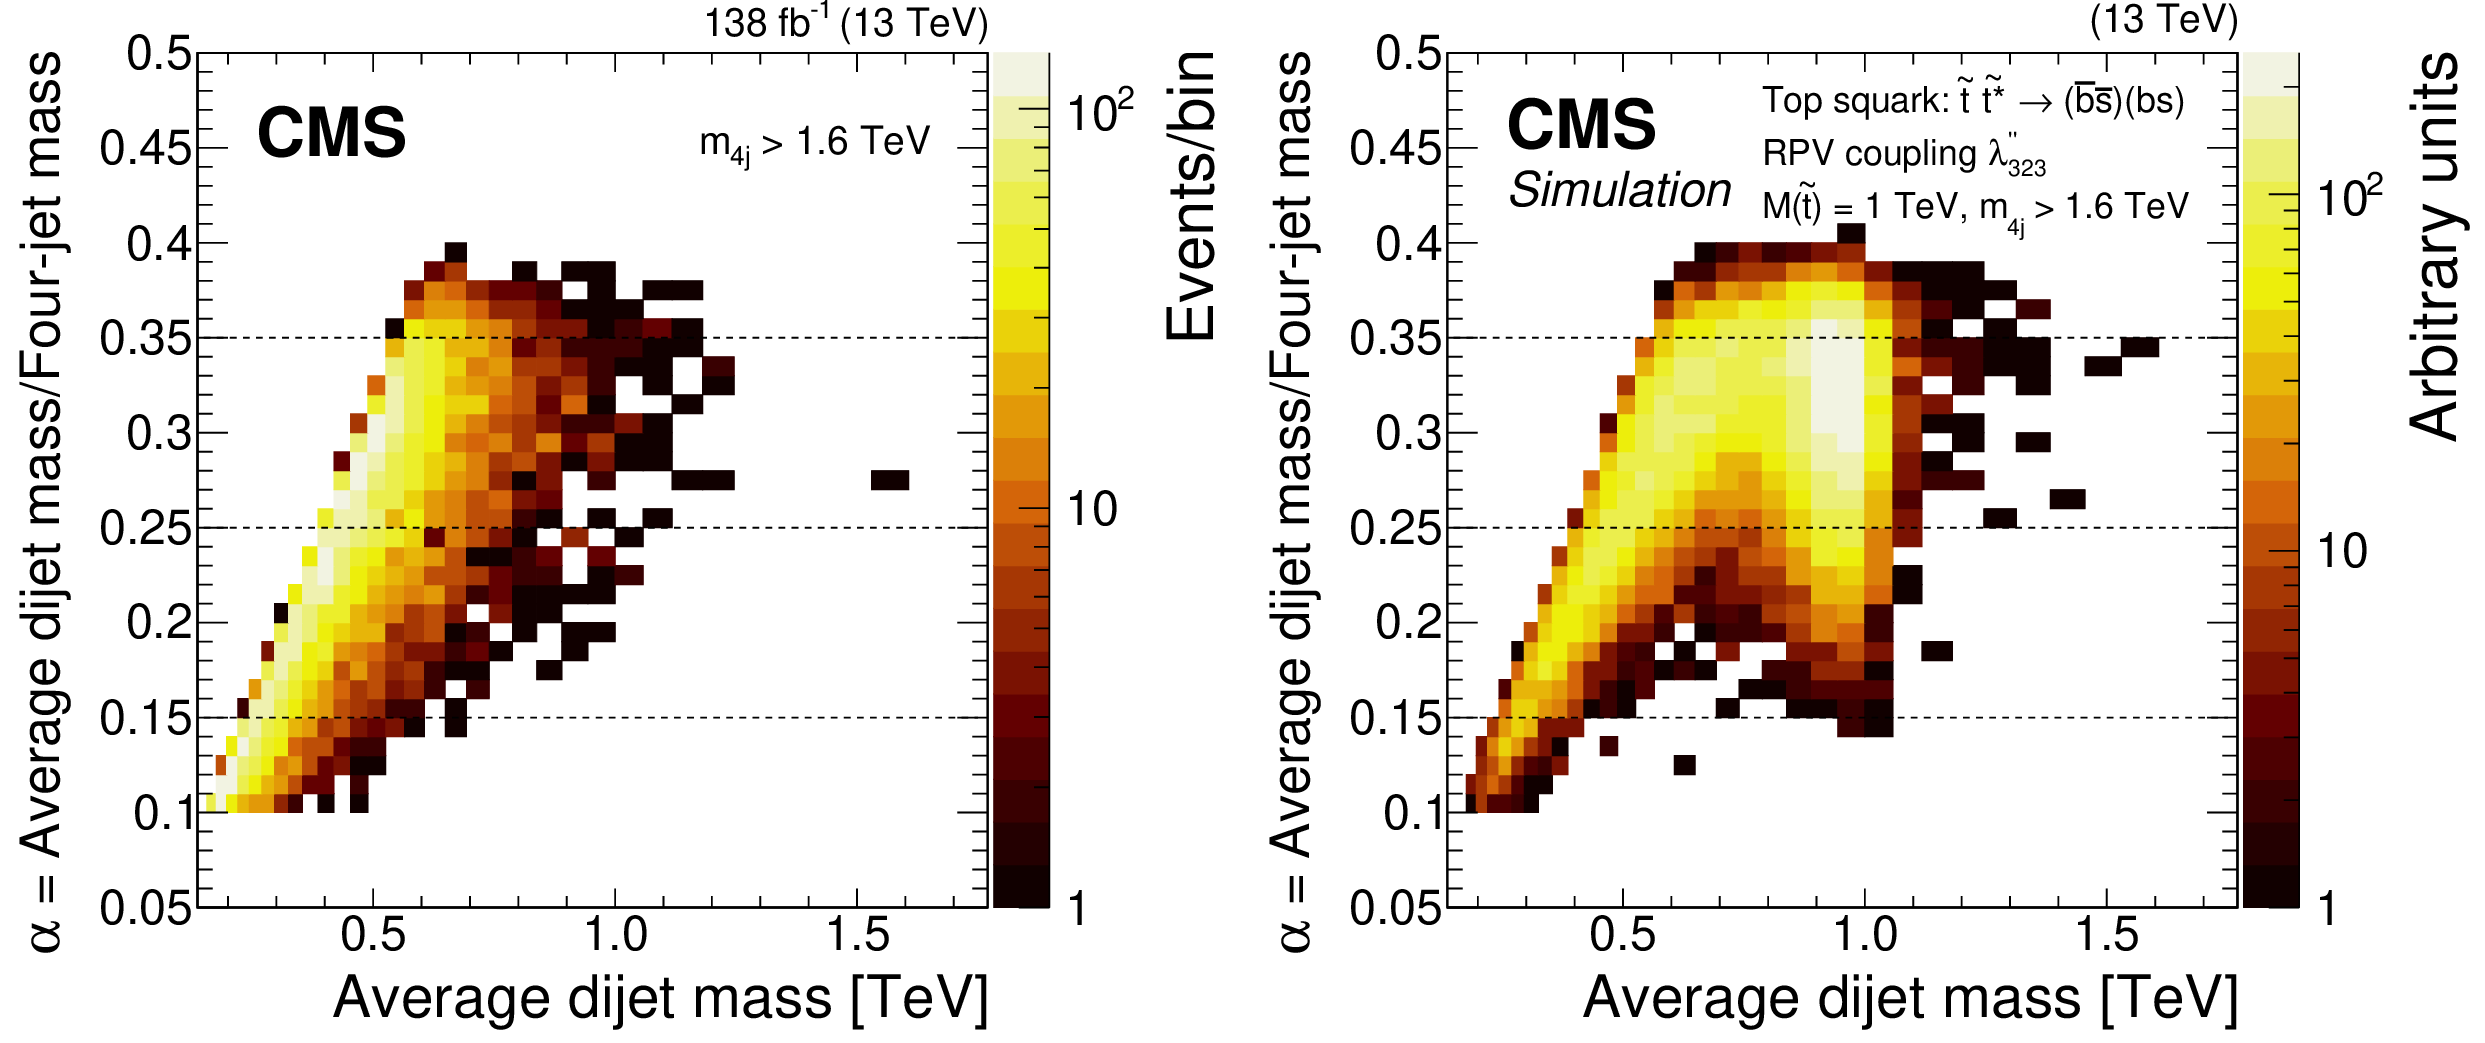
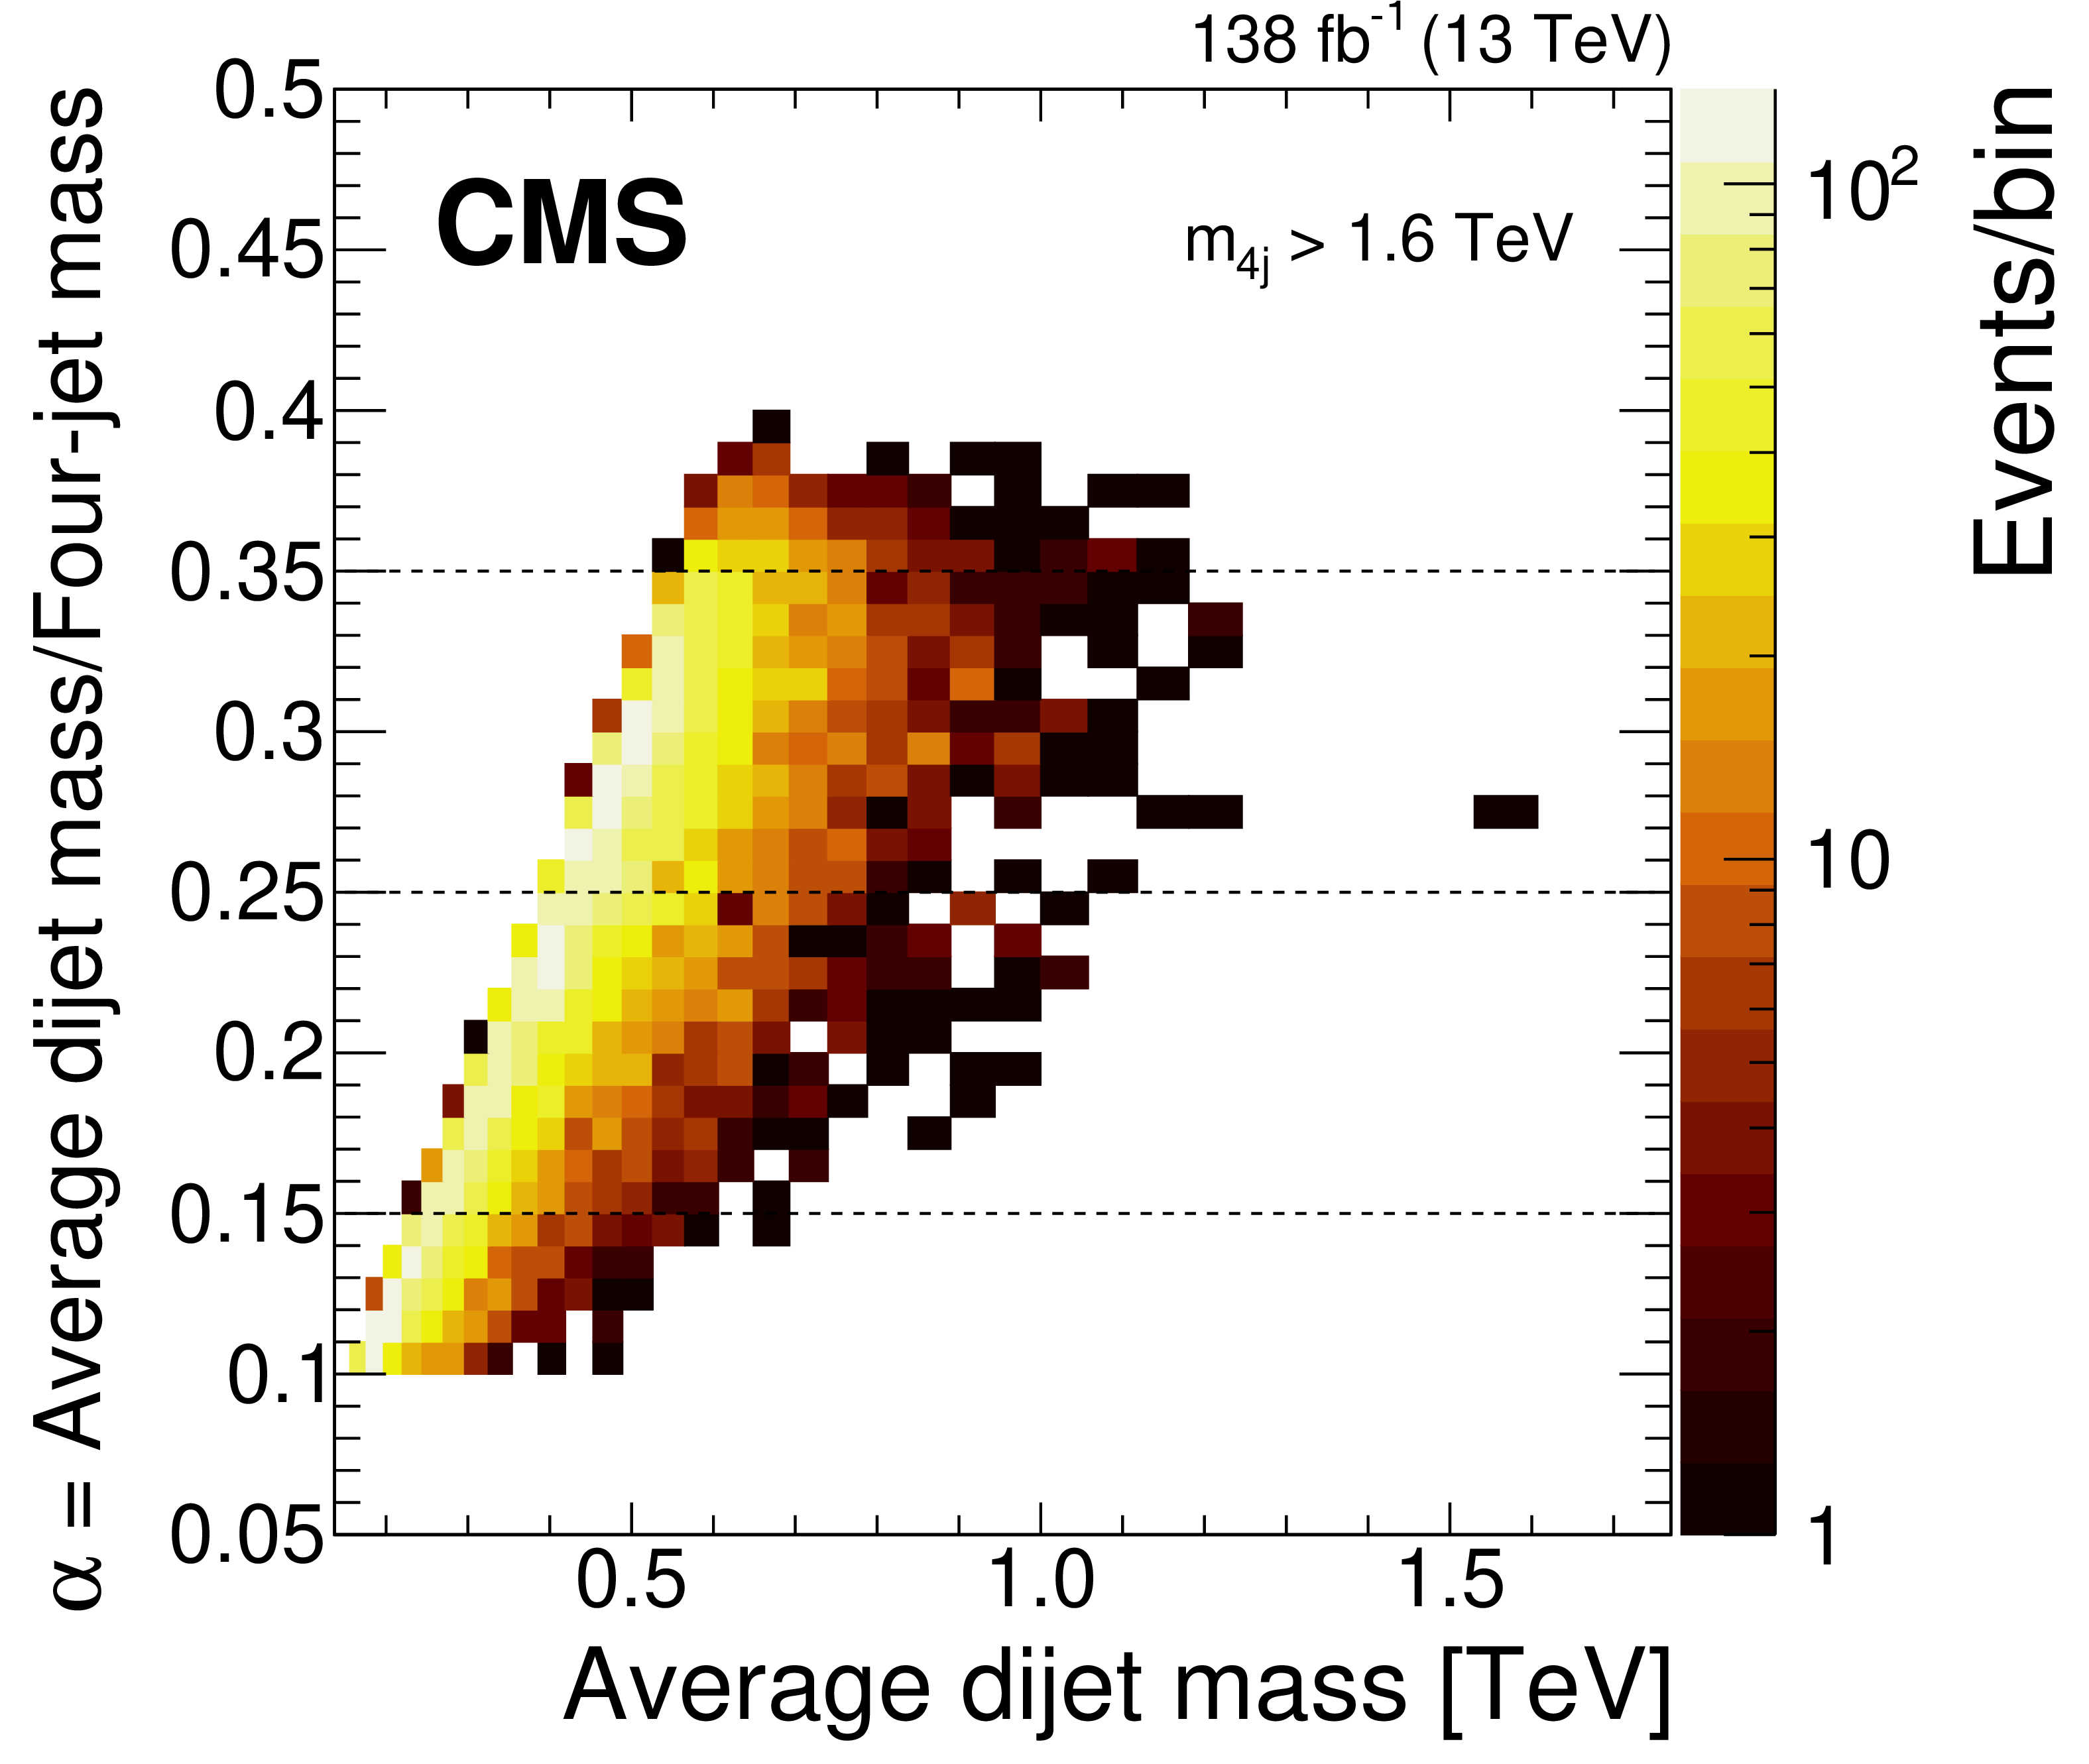
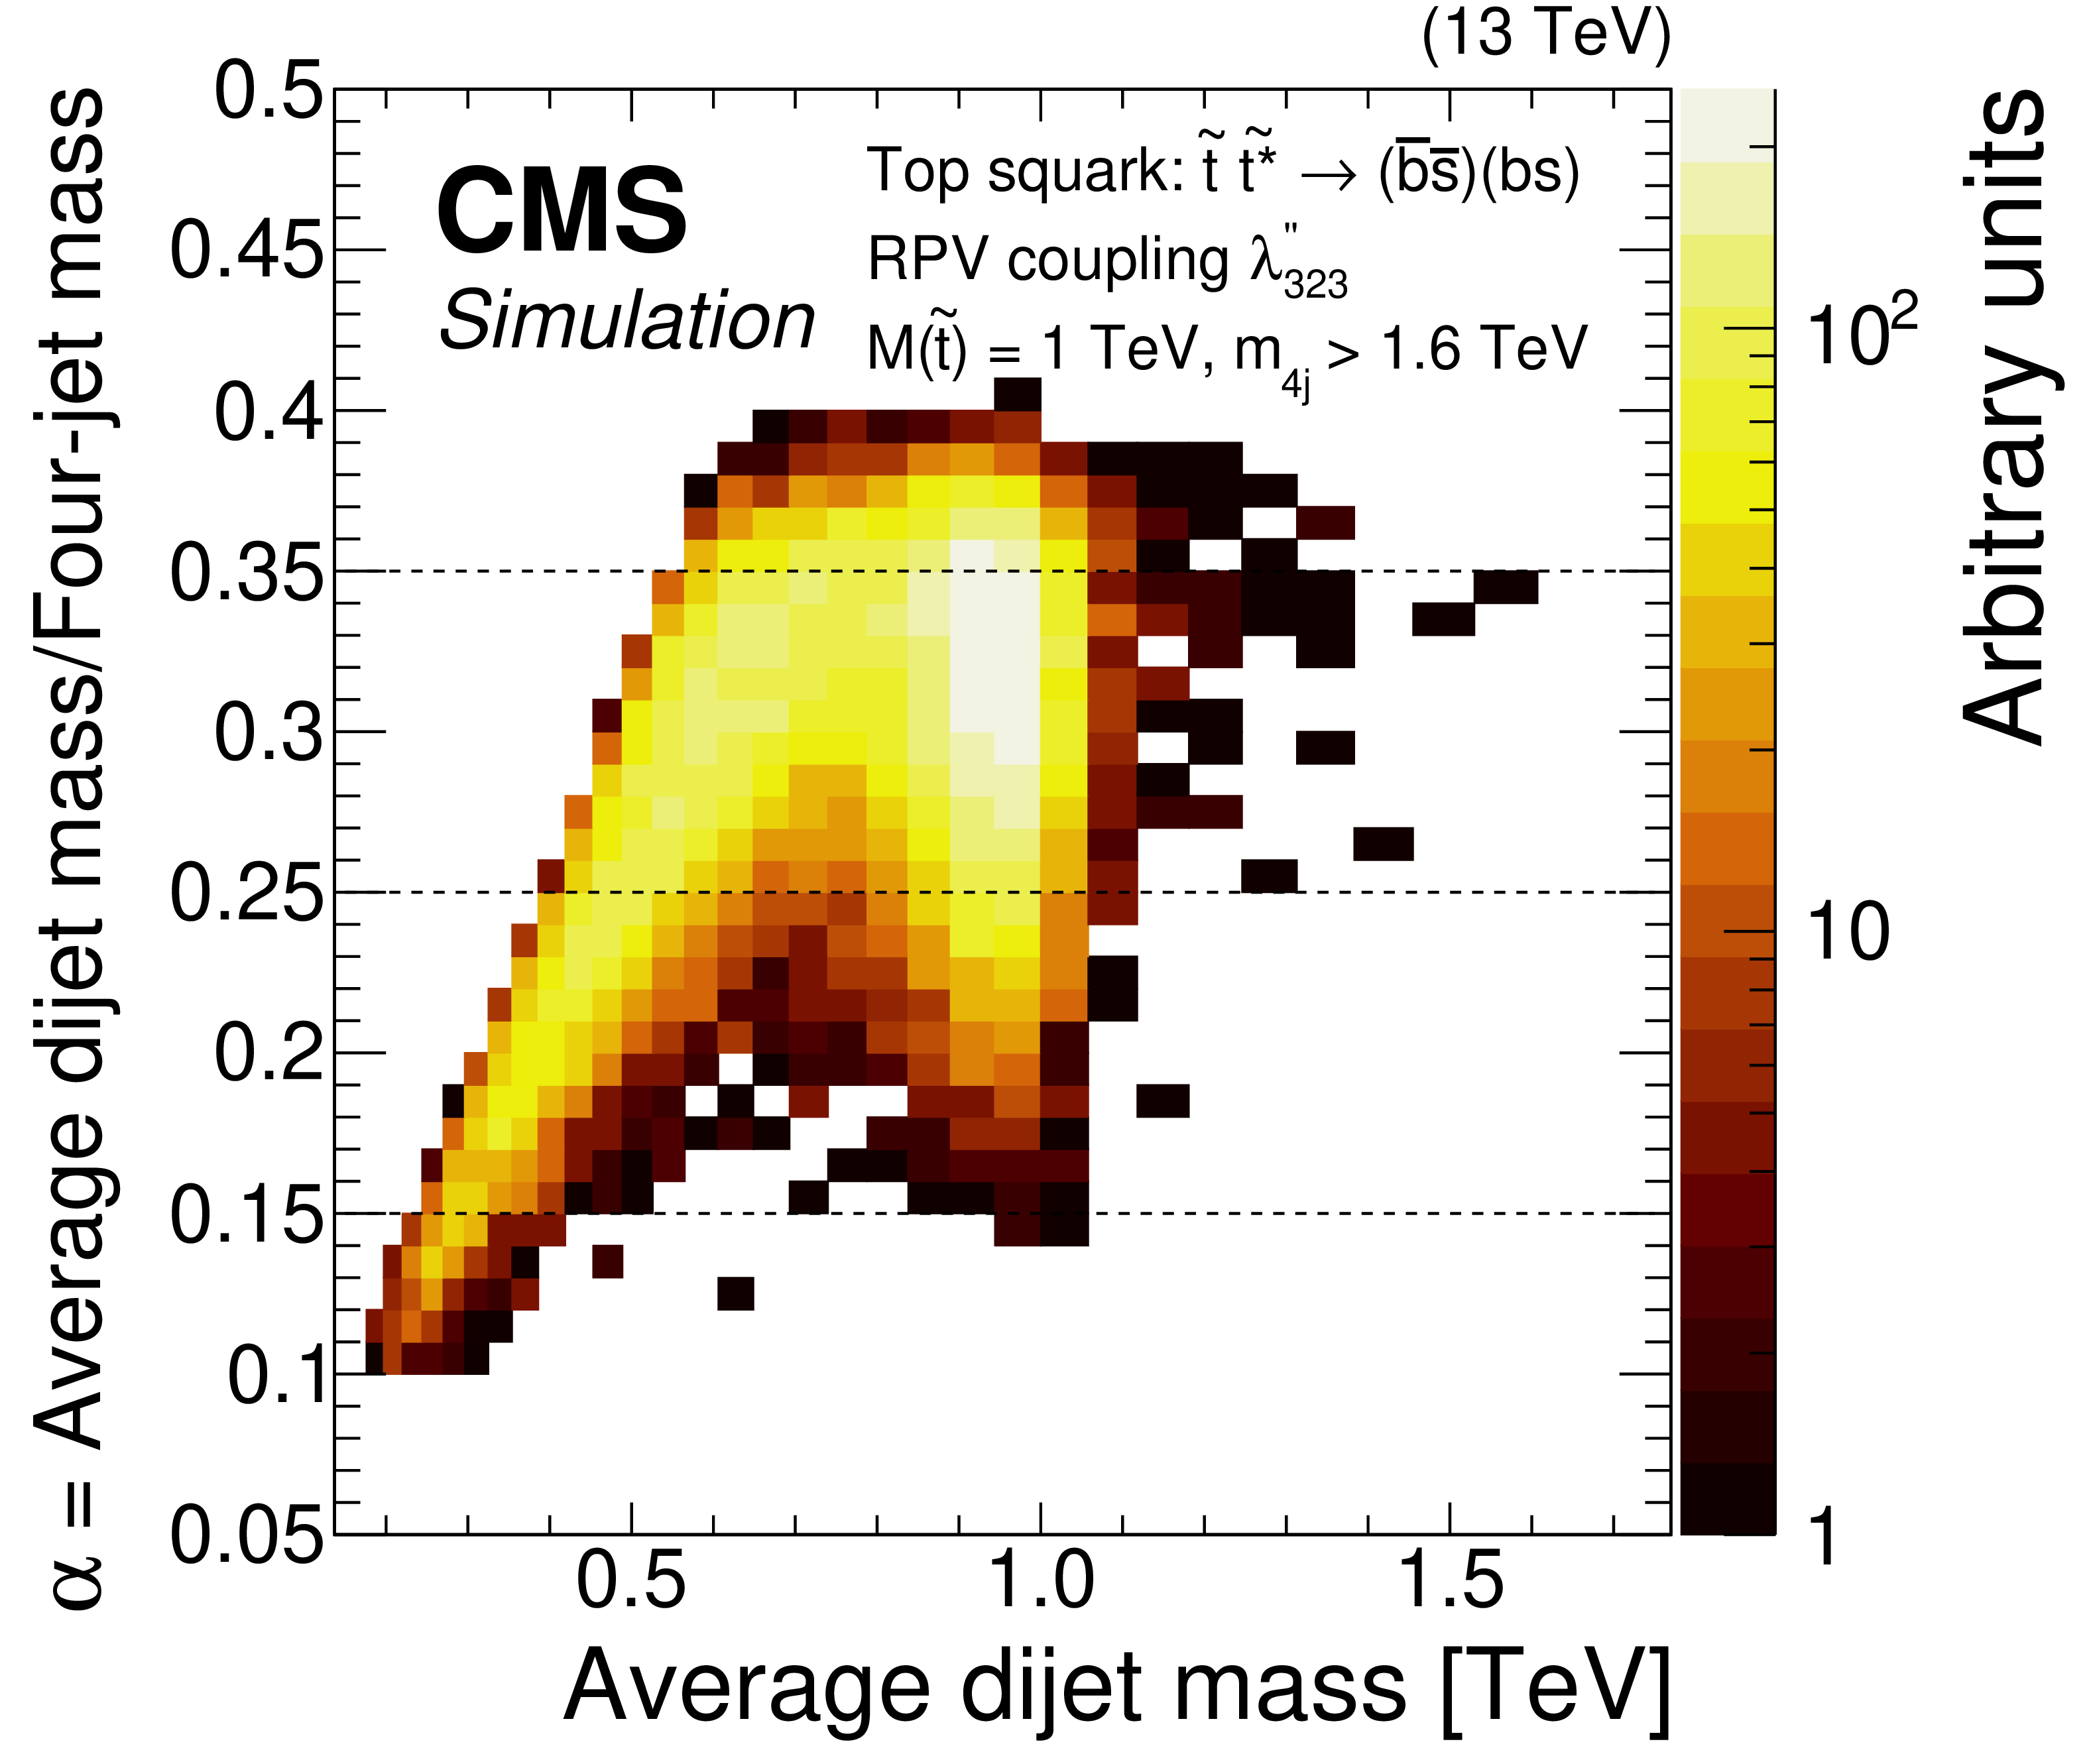
(Left) Number of events observed (color scale) within bins of the average dijet mass and the ratio $ \alpha $. (Right) Number of events predicted in the same bins by a simulation of the production and RPV decay of a pair of top squarks with a mass of 1 TeV. The distribution of the simulated signal events arises from the performance of the jet pairing algorithm, and is explained in Section 6. The dashed lines indicate the lower edges of the three $ \alpha $ bins in which the analysis is conducted. |
png pdf |
Figure 3-a:
(Left) Number of events observed (color scale) within bins of the average dijet mass and the ratio $ \alpha $. (Right) Number of events predicted in the same bins by a simulation of the production and RPV decay of a pair of top squarks with a mass of 1 TeV. The distribution of the simulated signal events arises from the performance of the jet pairing algorithm, and is explained in Section 6. The dashed lines indicate the lower edges of the three $ \alpha $ bins in which the analysis is conducted. |
png pdf |
Figure 3-b:
(Left) Number of events observed (color scale) within bins of the average dijet mass and the ratio $ \alpha $. (Right) Number of events predicted in the same bins by a simulation of the production and RPV decay of a pair of top squarks with a mass of 1 TeV. The distribution of the simulated signal events arises from the performance of the jet pairing algorithm, and is explained in Section 6. The dashed lines indicate the lower edges of the three $ \alpha $ bins in which the analysis is conducted. |
png pdf |
Figure 4:
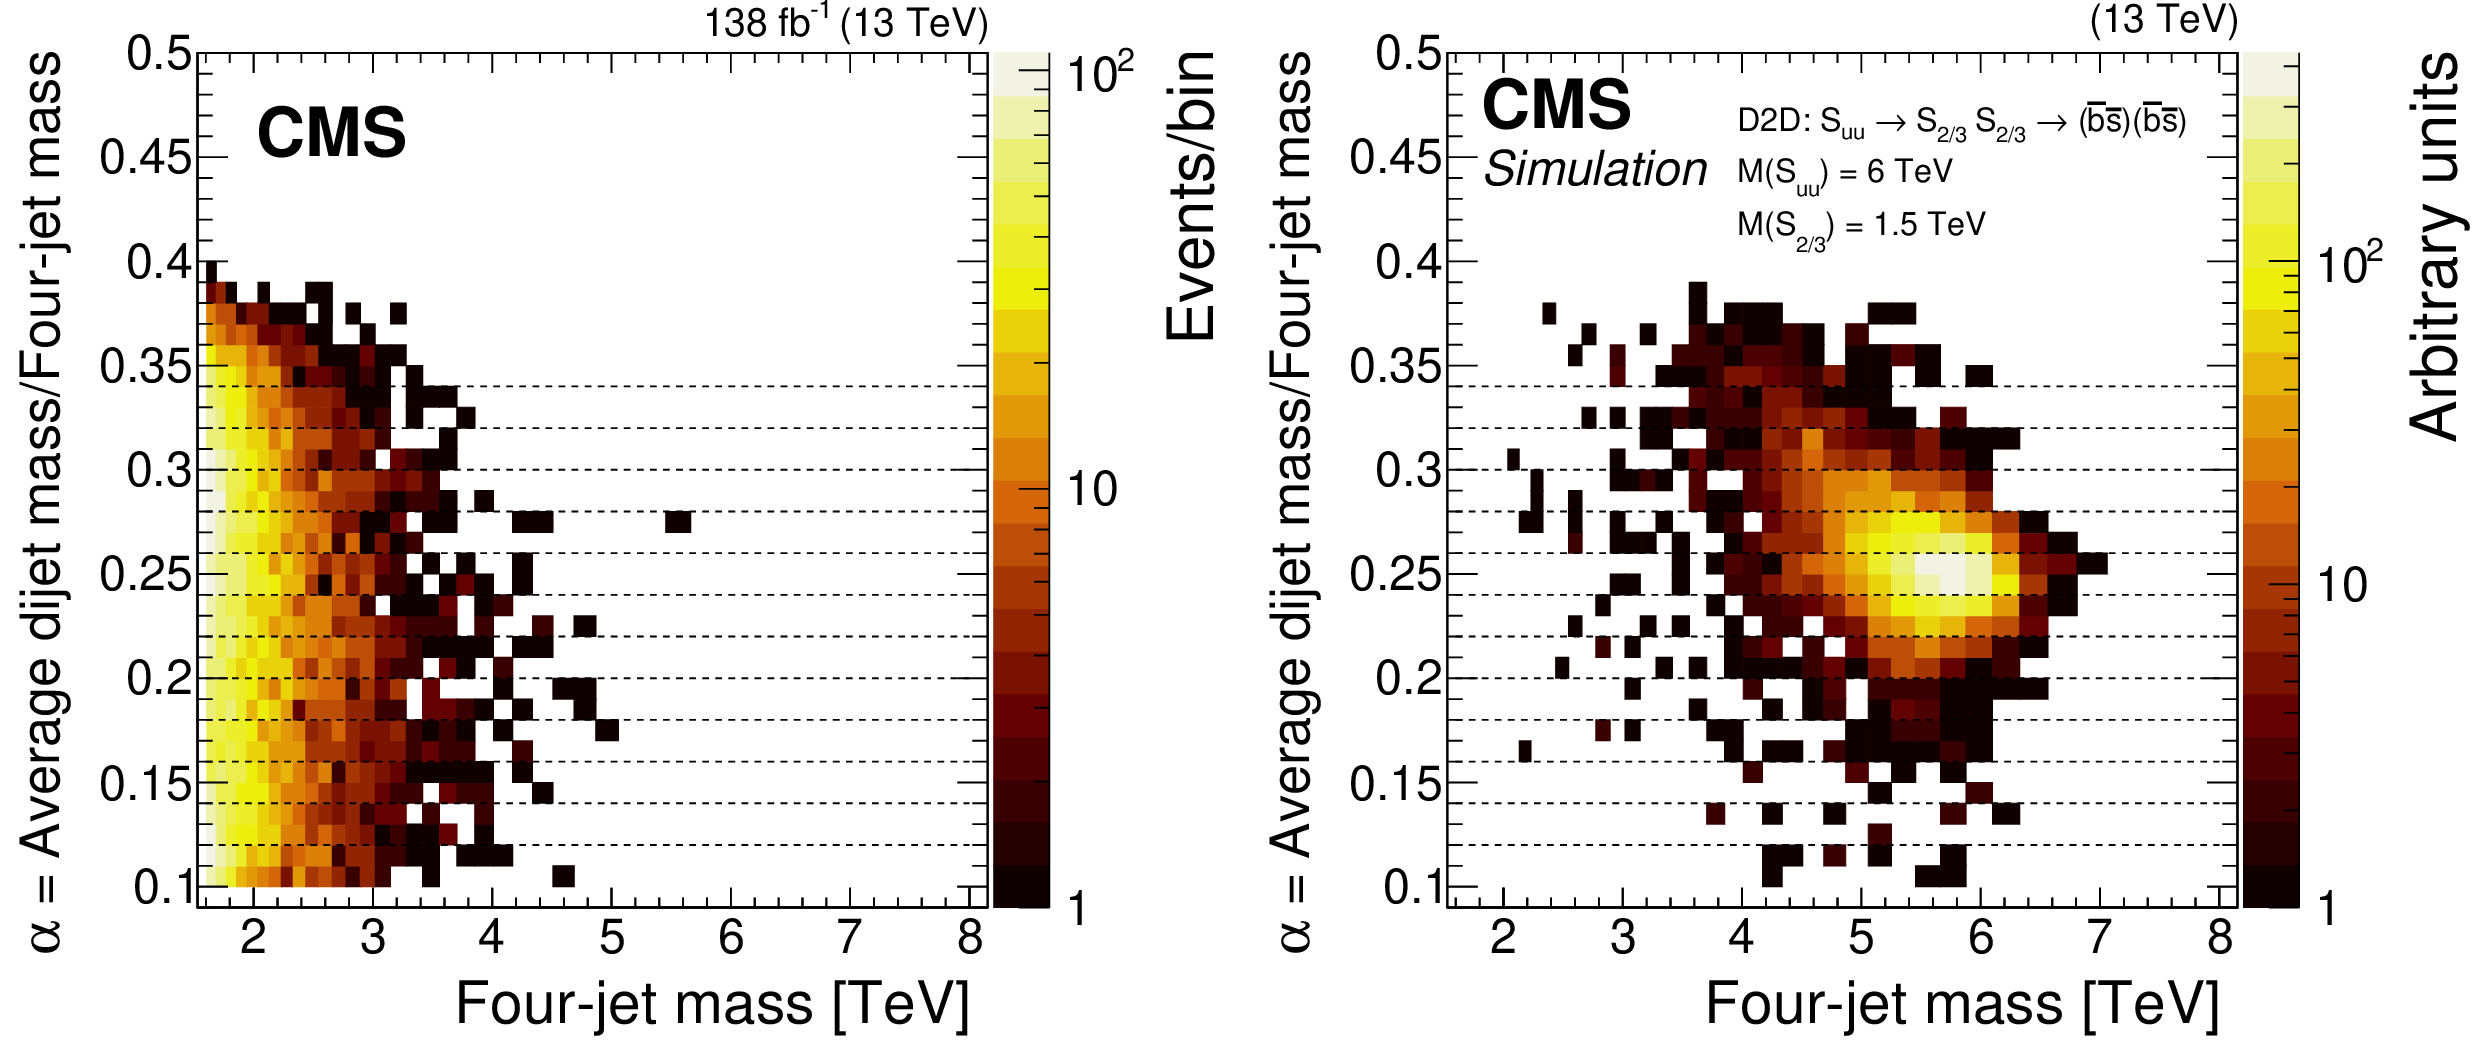
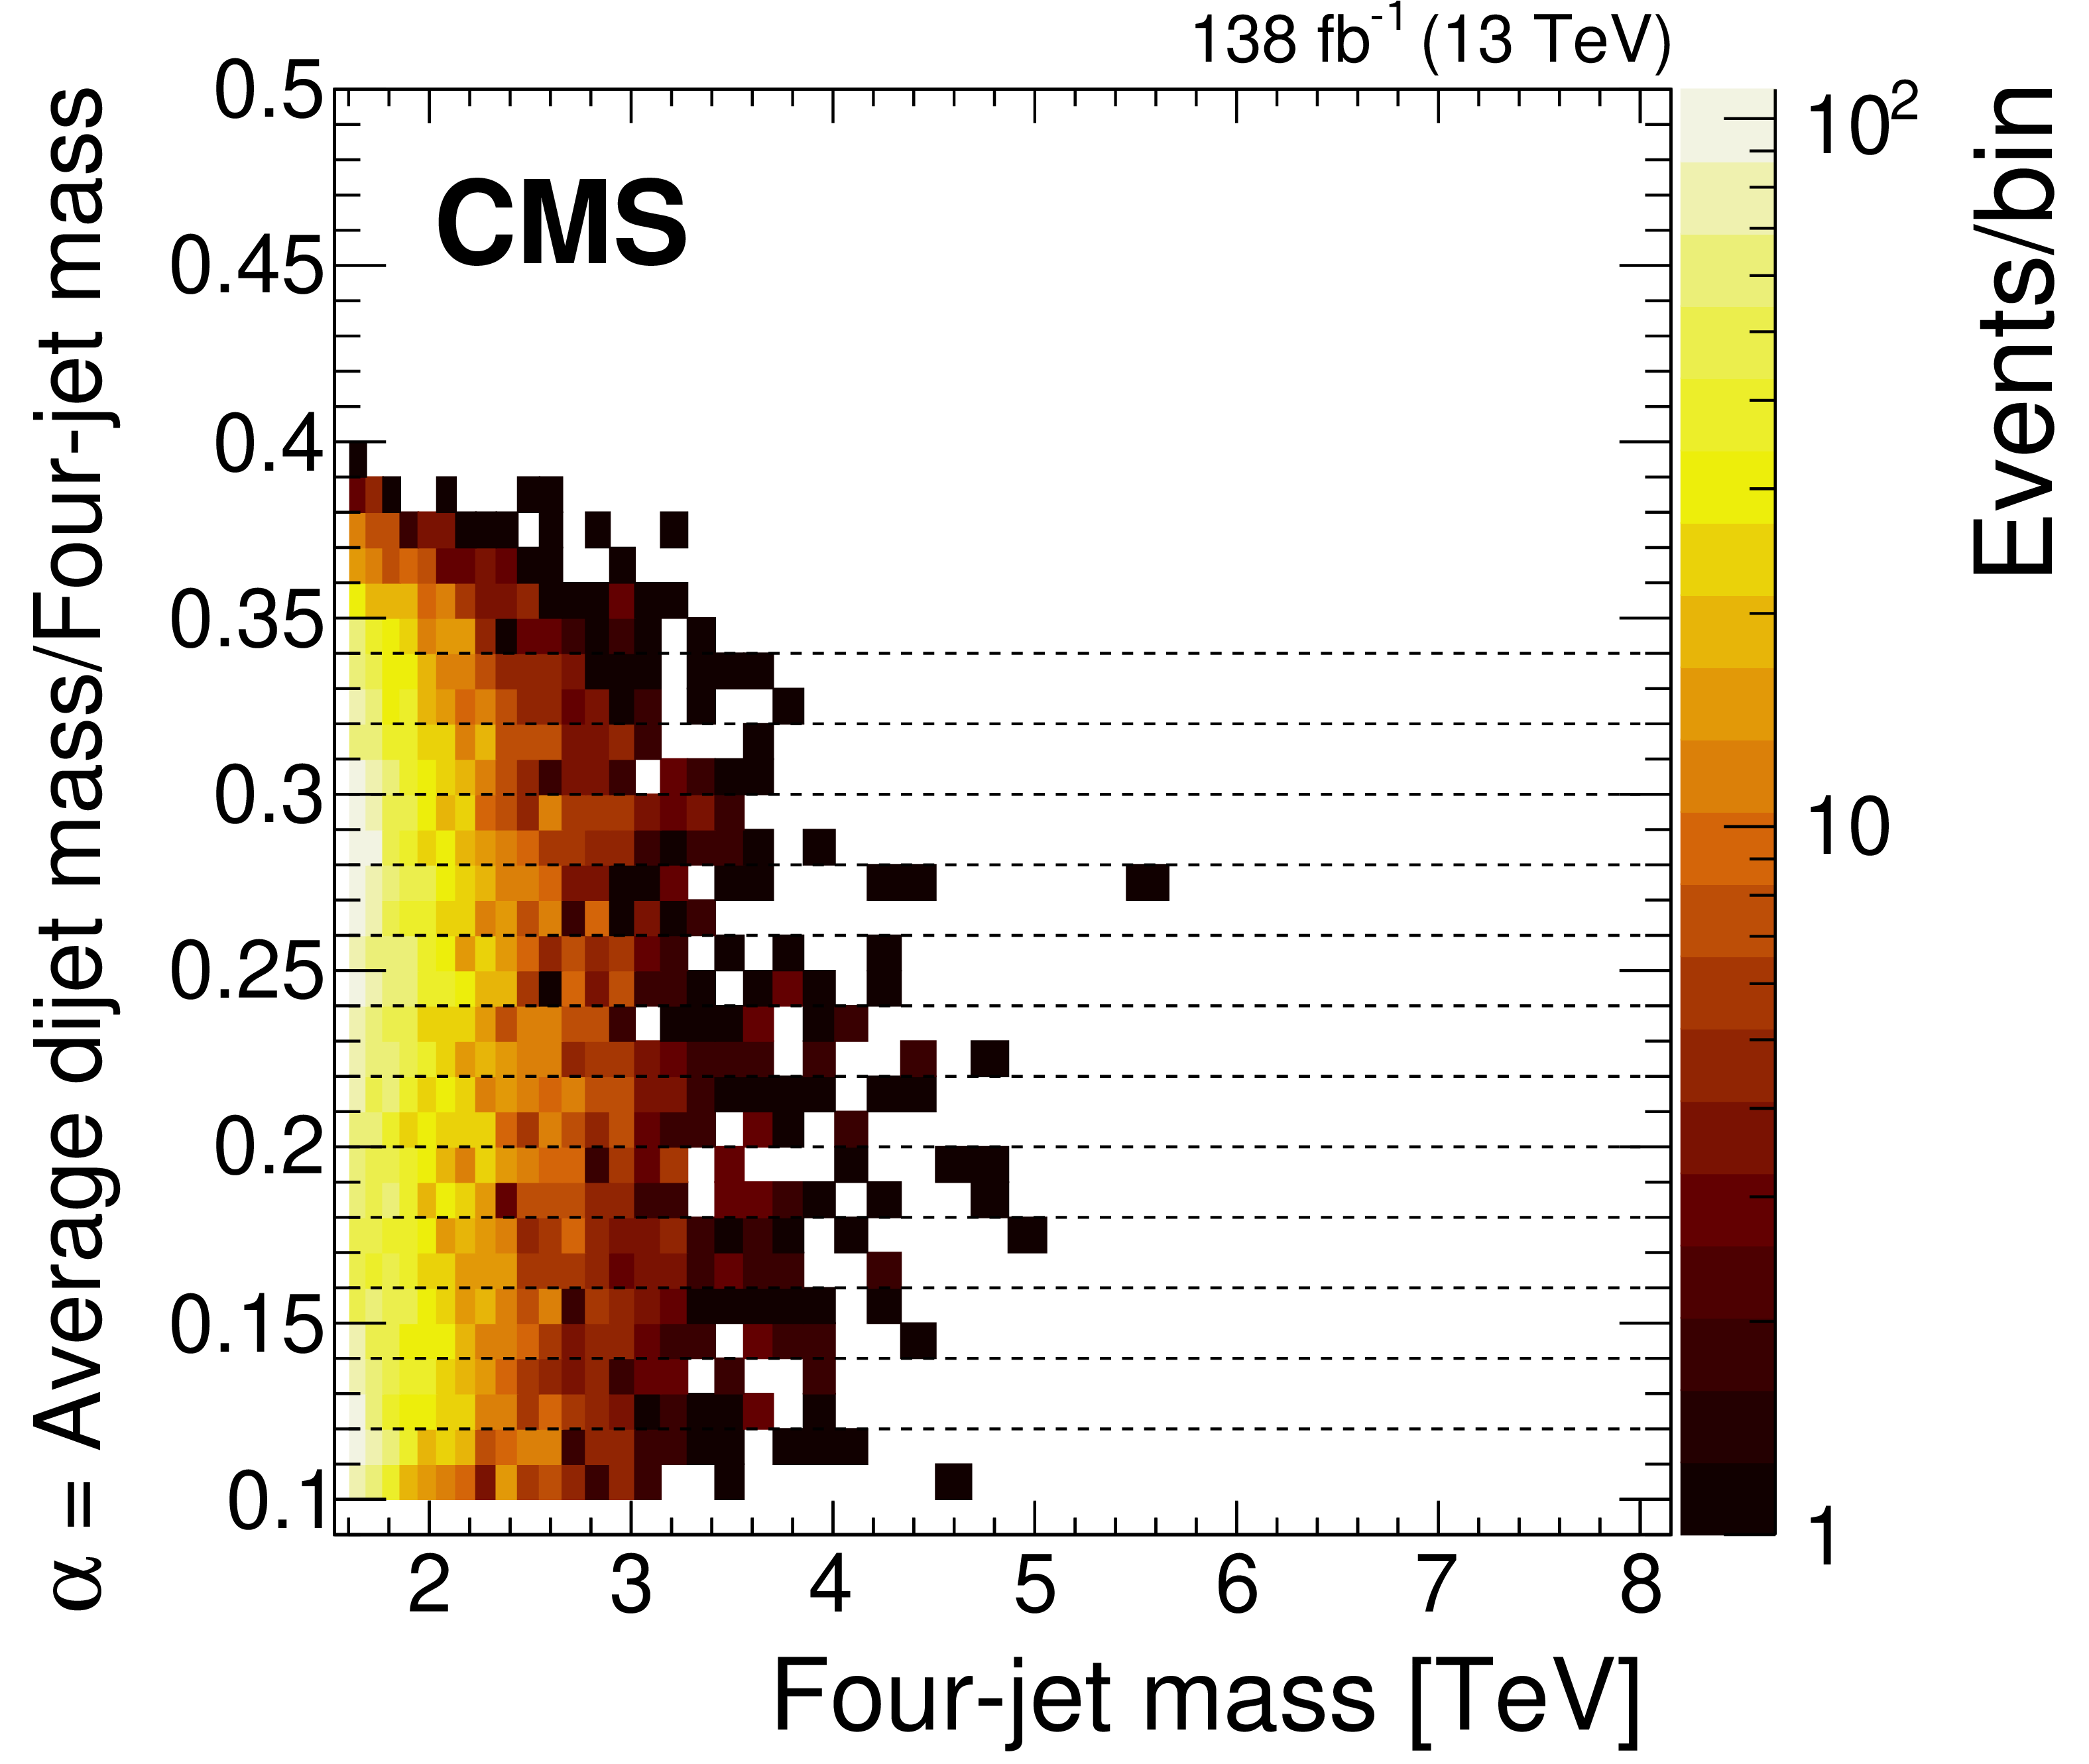
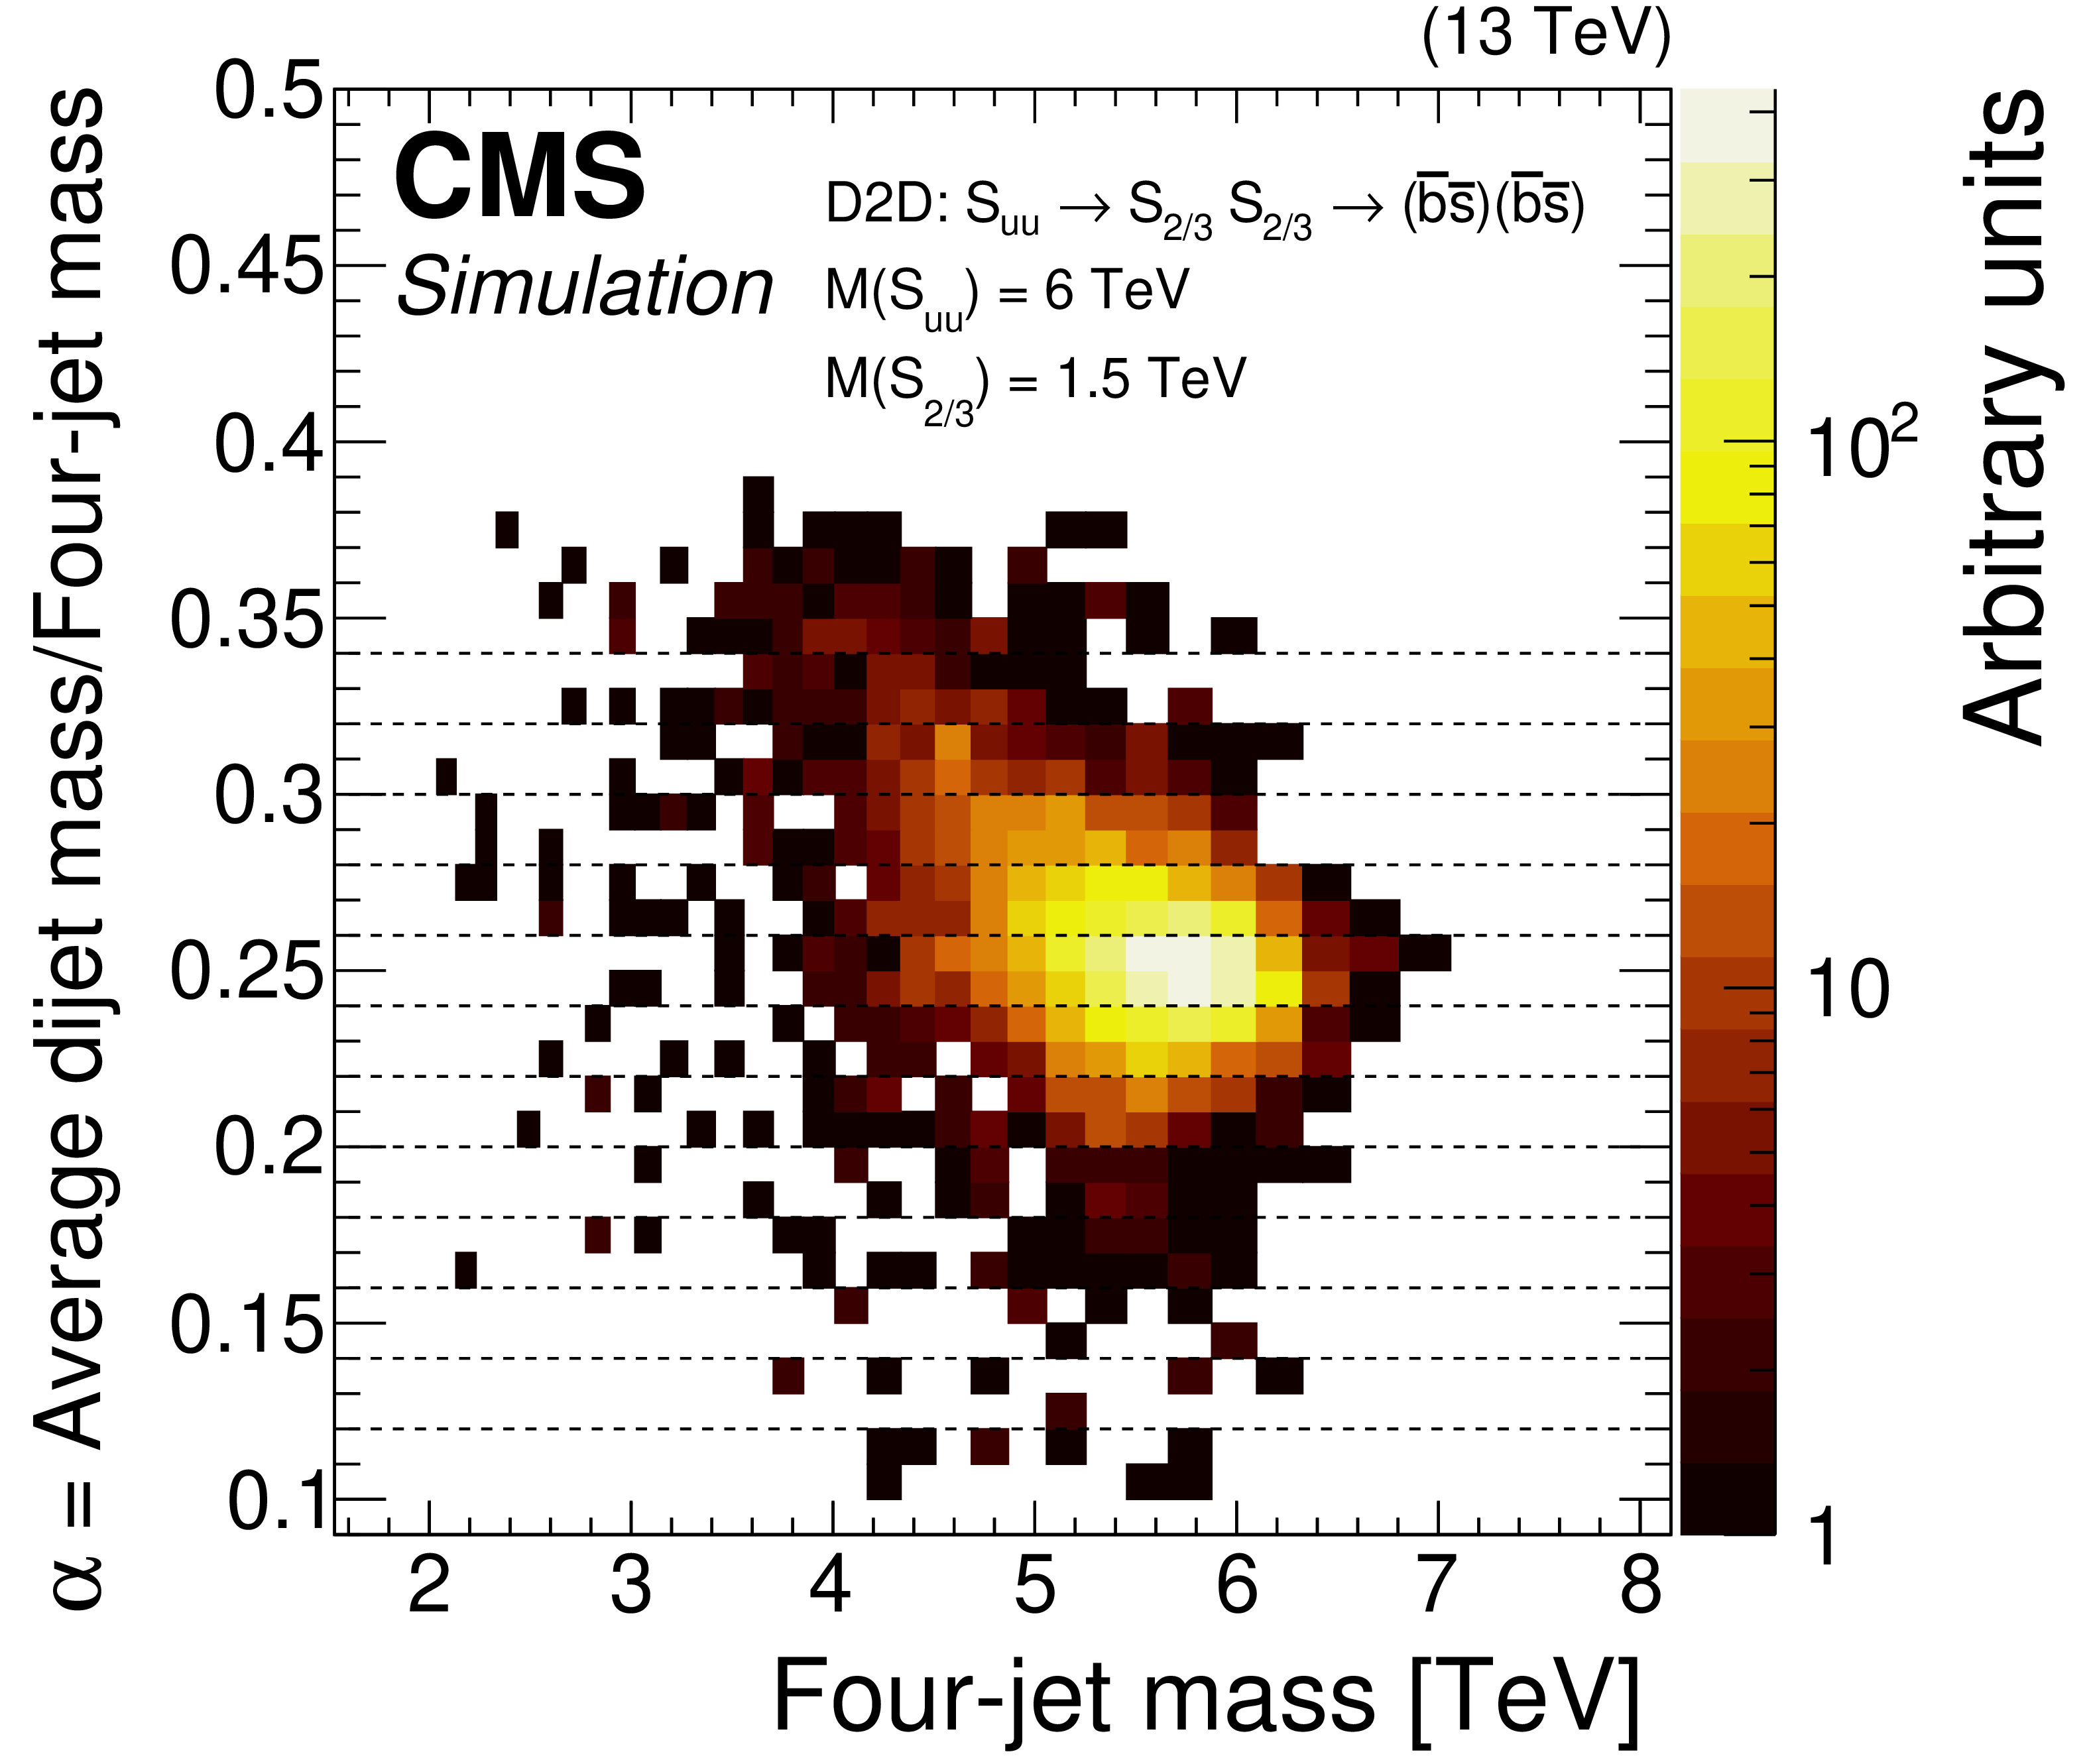
(Left) Number of events observed (color scale) within bins of the four-jet mass and the ratio $ \alpha $. (Right) Number of events predicted in the same bins by a simulation of a diquark with a mass of 6 TeV, decaying to a pair of color-triplet scalar diquarks, each with a mass of 1.5 TeV. The dashed lines indicate the lower edges of the twelve $ \alpha $ bins in which the analysis is conducted. |
png pdf |
Figure 4-a:
(Left) Number of events observed (color scale) within bins of the four-jet mass and the ratio $ \alpha $. (Right) Number of events predicted in the same bins by a simulation of a diquark with a mass of 6 TeV, decaying to a pair of color-triplet scalar diquarks, each with a mass of 1.5 TeV. The dashed lines indicate the lower edges of the twelve $ \alpha $ bins in which the analysis is conducted. |
png pdf |
Figure 4-b:
(Left) Number of events observed (color scale) within bins of the four-jet mass and the ratio $ \alpha $. (Right) Number of events predicted in the same bins by a simulation of a diquark with a mass of 6 TeV, decaying to a pair of color-triplet scalar diquarks, each with a mass of 1.5 TeV. The dashed lines indicate the lower edges of the twelve $ \alpha $ bins in which the analysis is conducted. |
png pdf |
Figure 5:
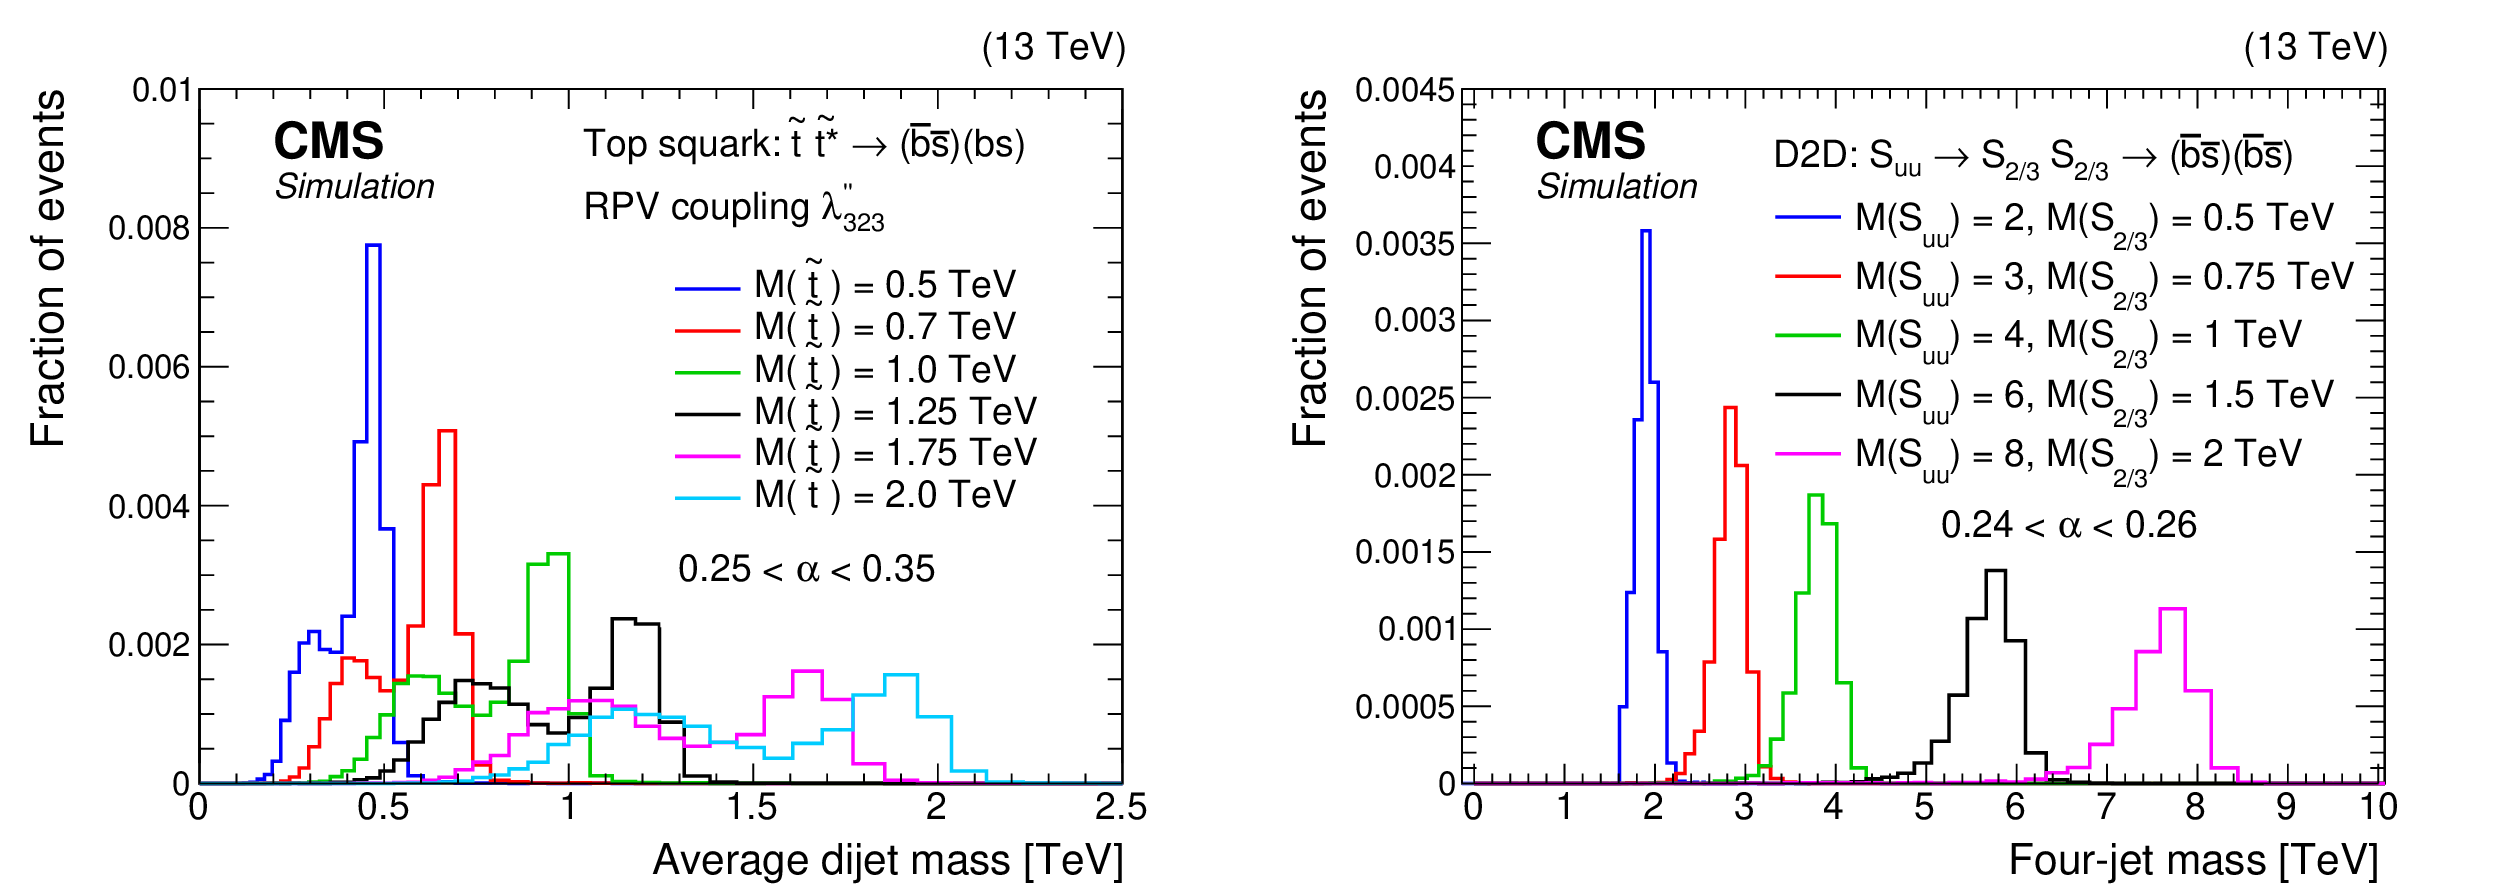
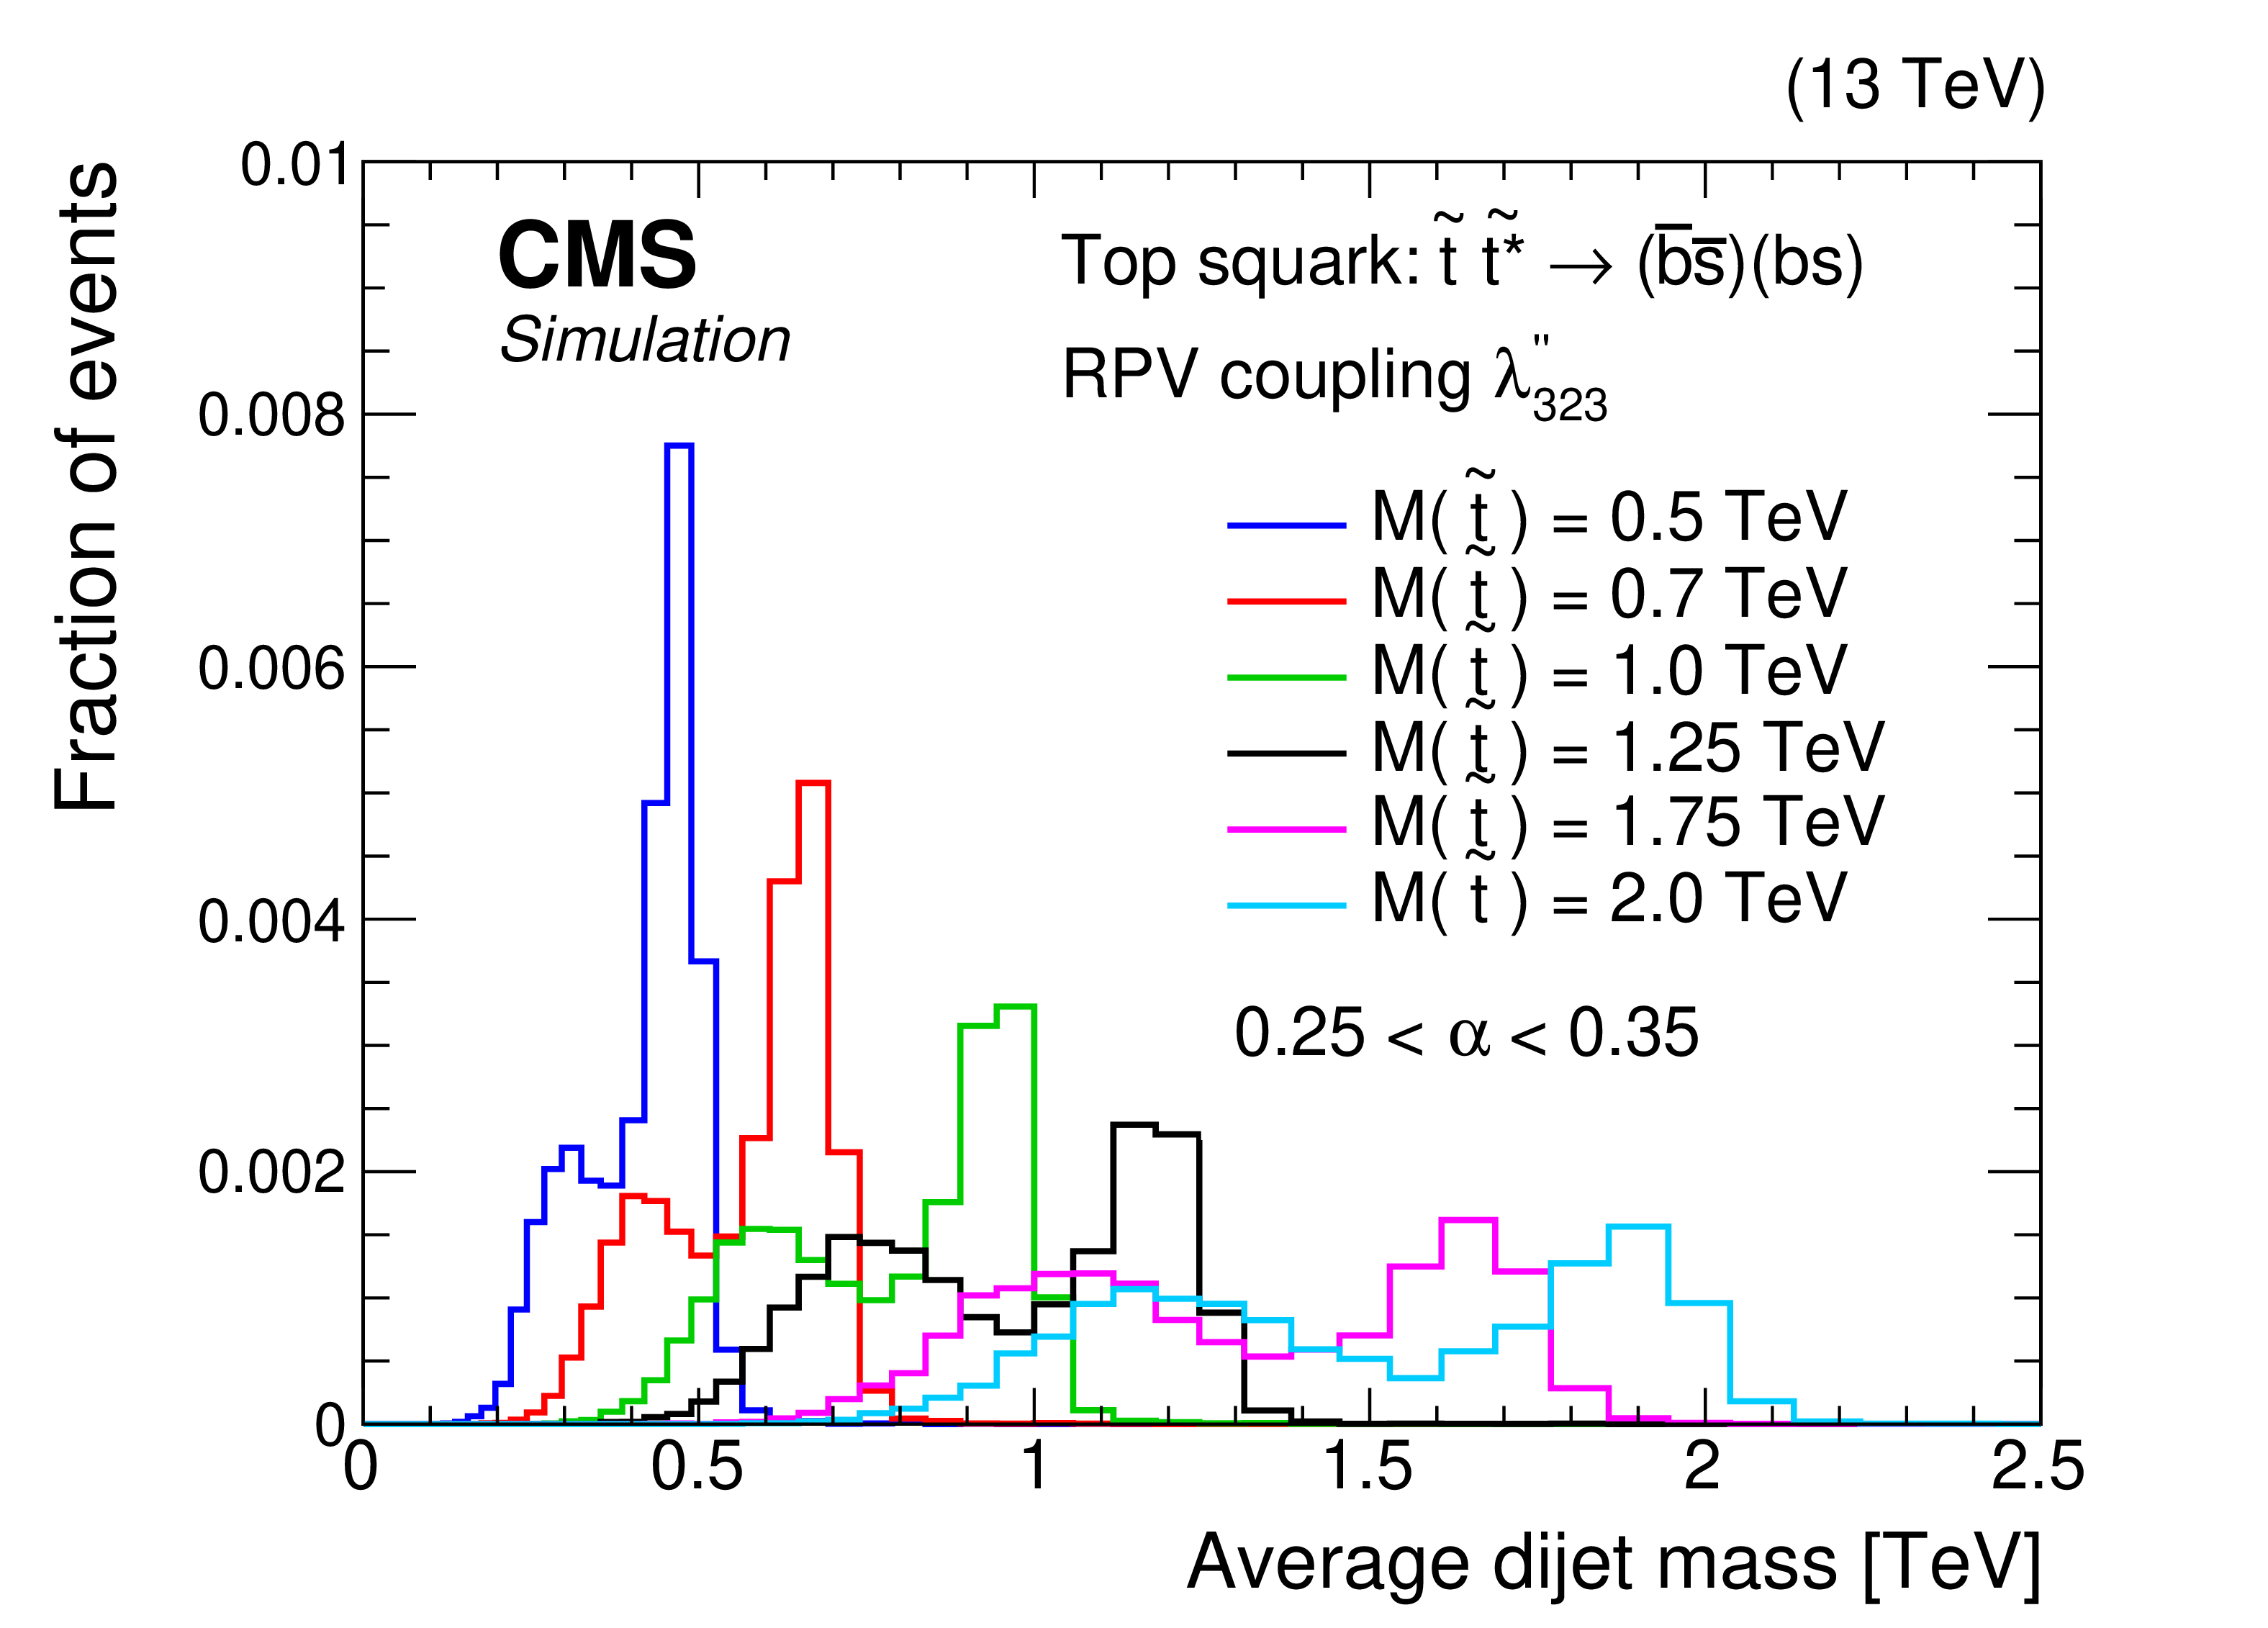
(Left) The average dijet mass distributions for different $ R $-parity-violating top squark signal masses, with the kinematic and b tagging selections applied. (Right) The four-jet mass distributions for different signal S$ \mathrm{u} \mathrm{u} $ diquark masses with $ \alpha_{\text{true}} = $ 0.25, with the kinematic and b tagging selections applied. Shapes are shown for the $ \alpha $ bins with the largest yield for each search, and have been normalized to have a unit area. |
png pdf |
Figure 5-a:
(Left) The average dijet mass distributions for different $ R $-parity-violating top squark signal masses, with the kinematic and b tagging selections applied. (Right) The four-jet mass distributions for different signal S$ \mathrm{u} \mathrm{u} $ diquark masses with $ \alpha_{\text{true}} = $ 0.25, with the kinematic and b tagging selections applied. Shapes are shown for the $ \alpha $ bins with the largest yield for each search, and have been normalized to have a unit area. |
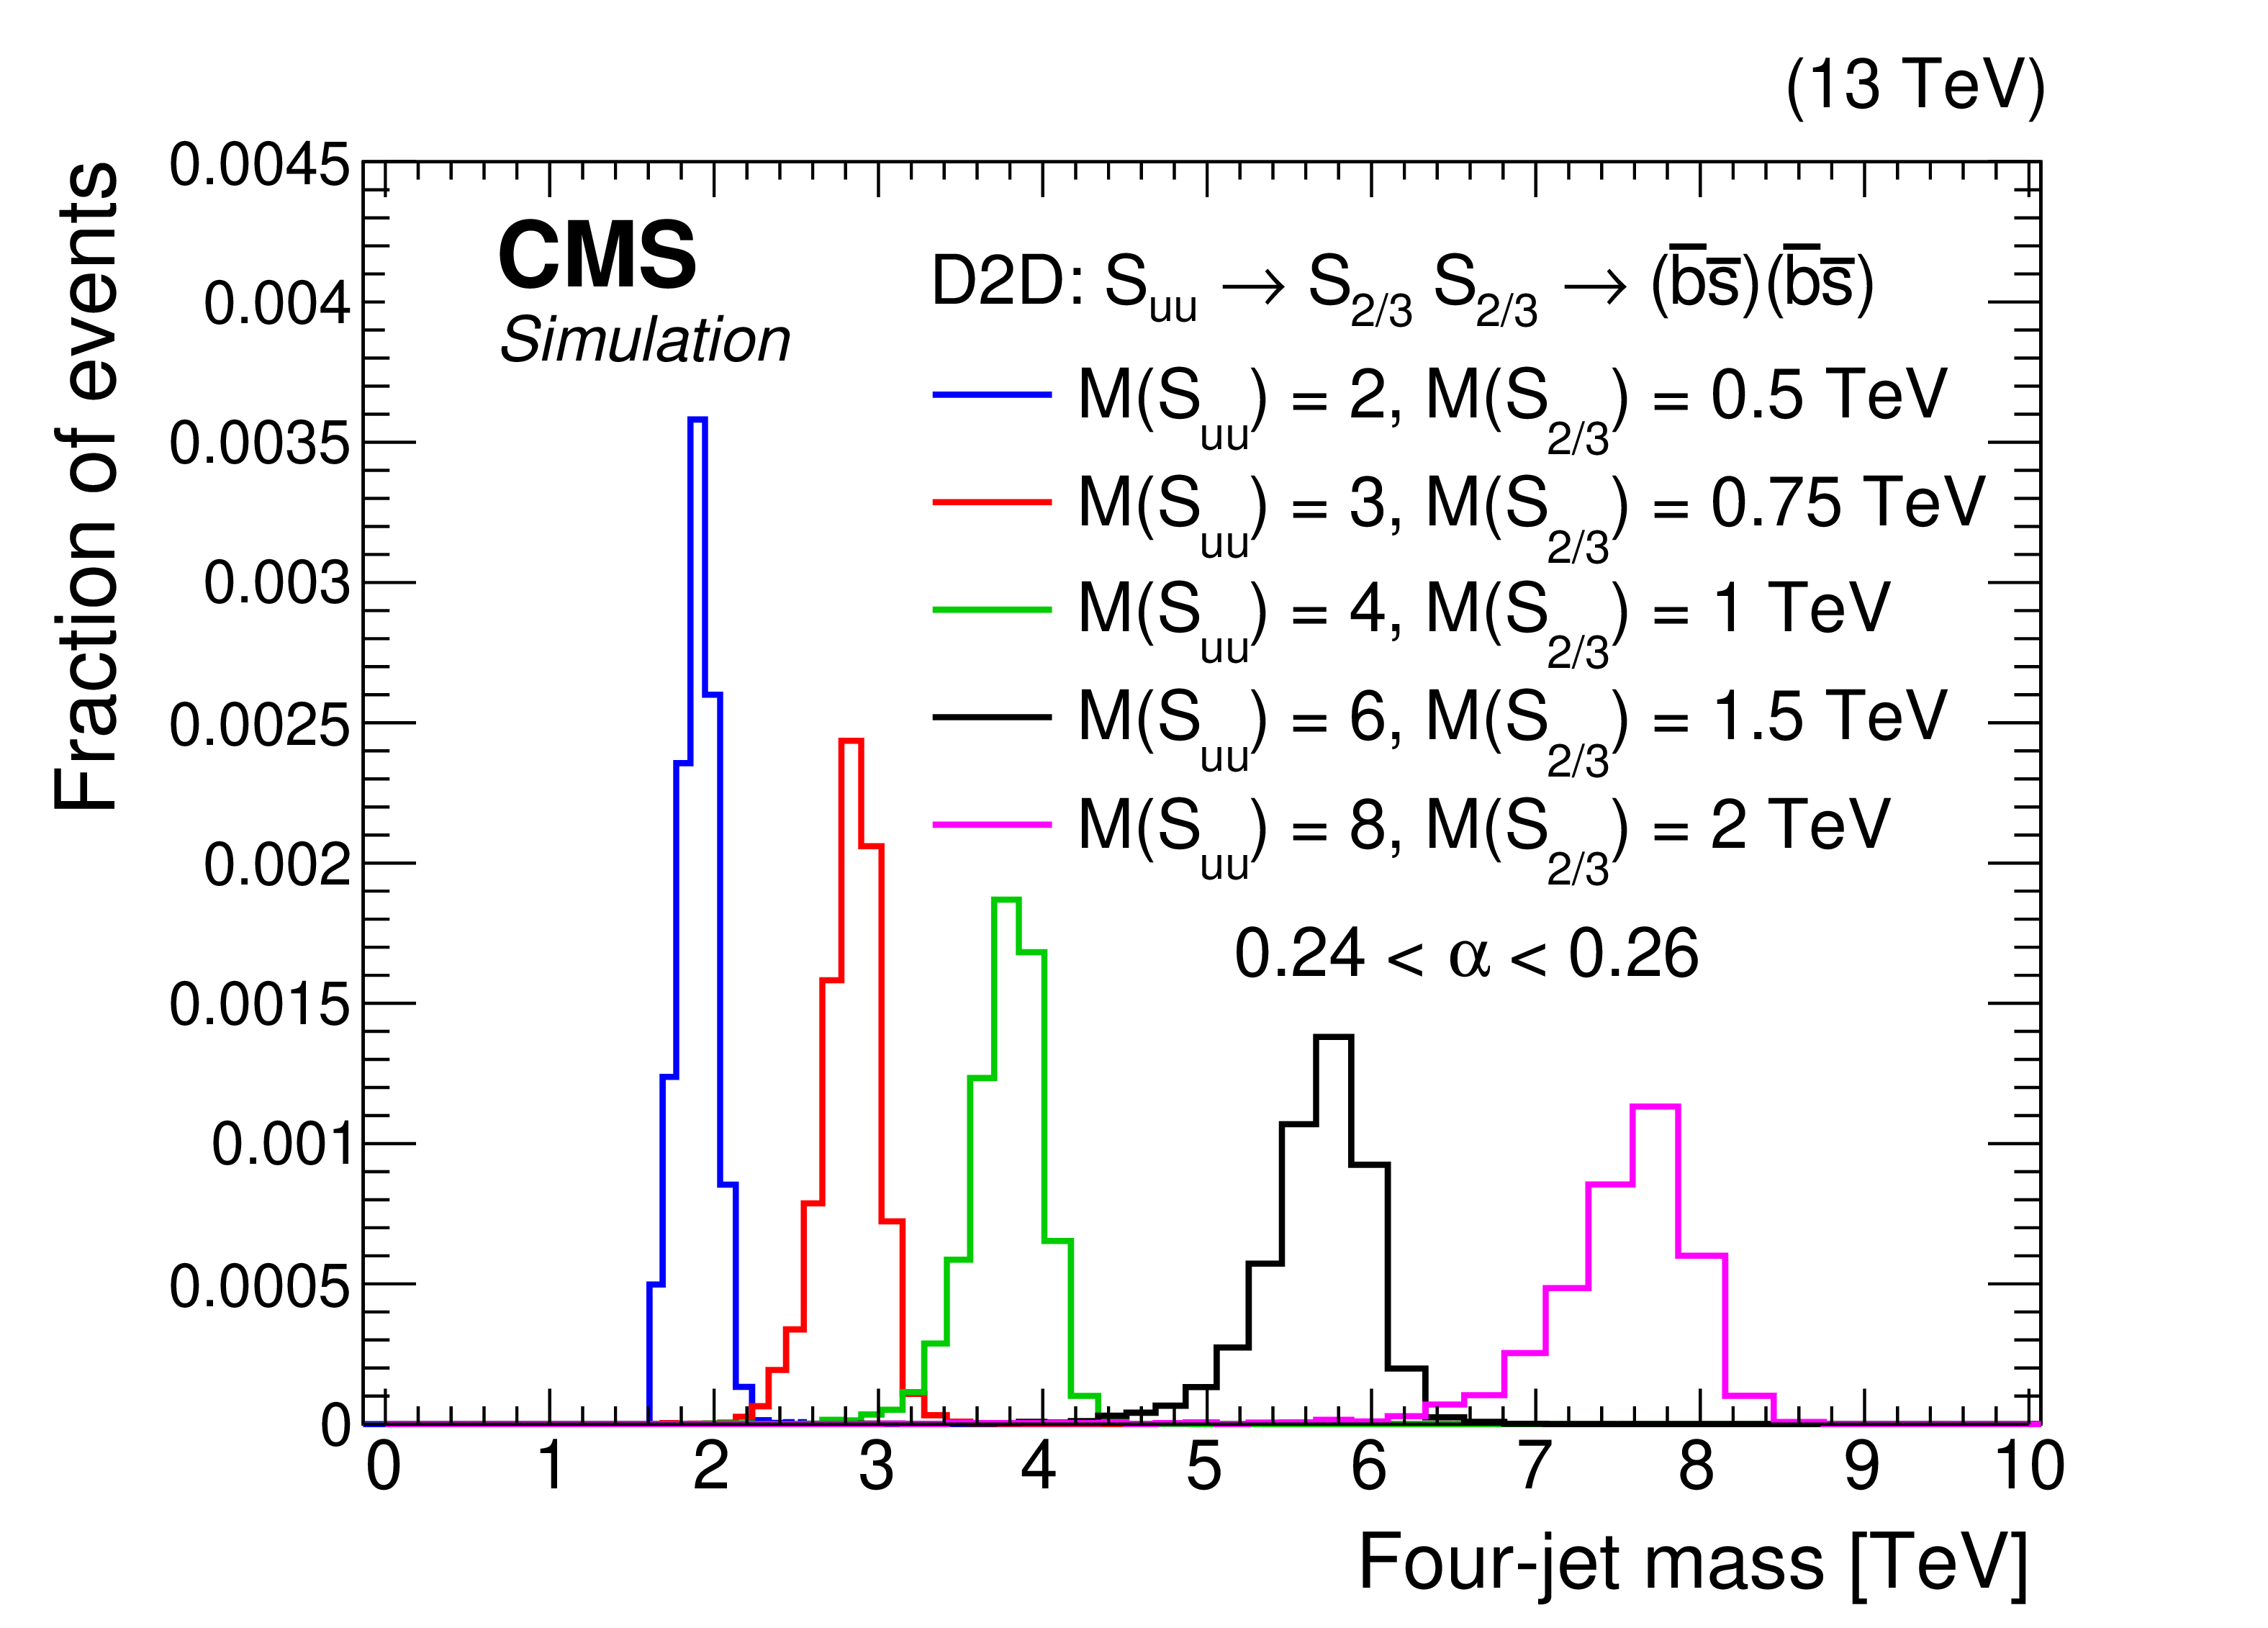
png pdf |
Figure 5-b:
(Left) The average dijet mass distributions for different $ R $-parity-violating top squark signal masses, with the kinematic and b tagging selections applied. (Right) The four-jet mass distributions for different signal S$ \mathrm{u} \mathrm{u} $ diquark masses with $ \alpha_{\text{true}} = $ 0.25, with the kinematic and b tagging selections applied. Shapes are shown for the $ \alpha $ bins with the largest yield for each search, and have been normalized to have a unit area. |
png pdf |
Figure 6:
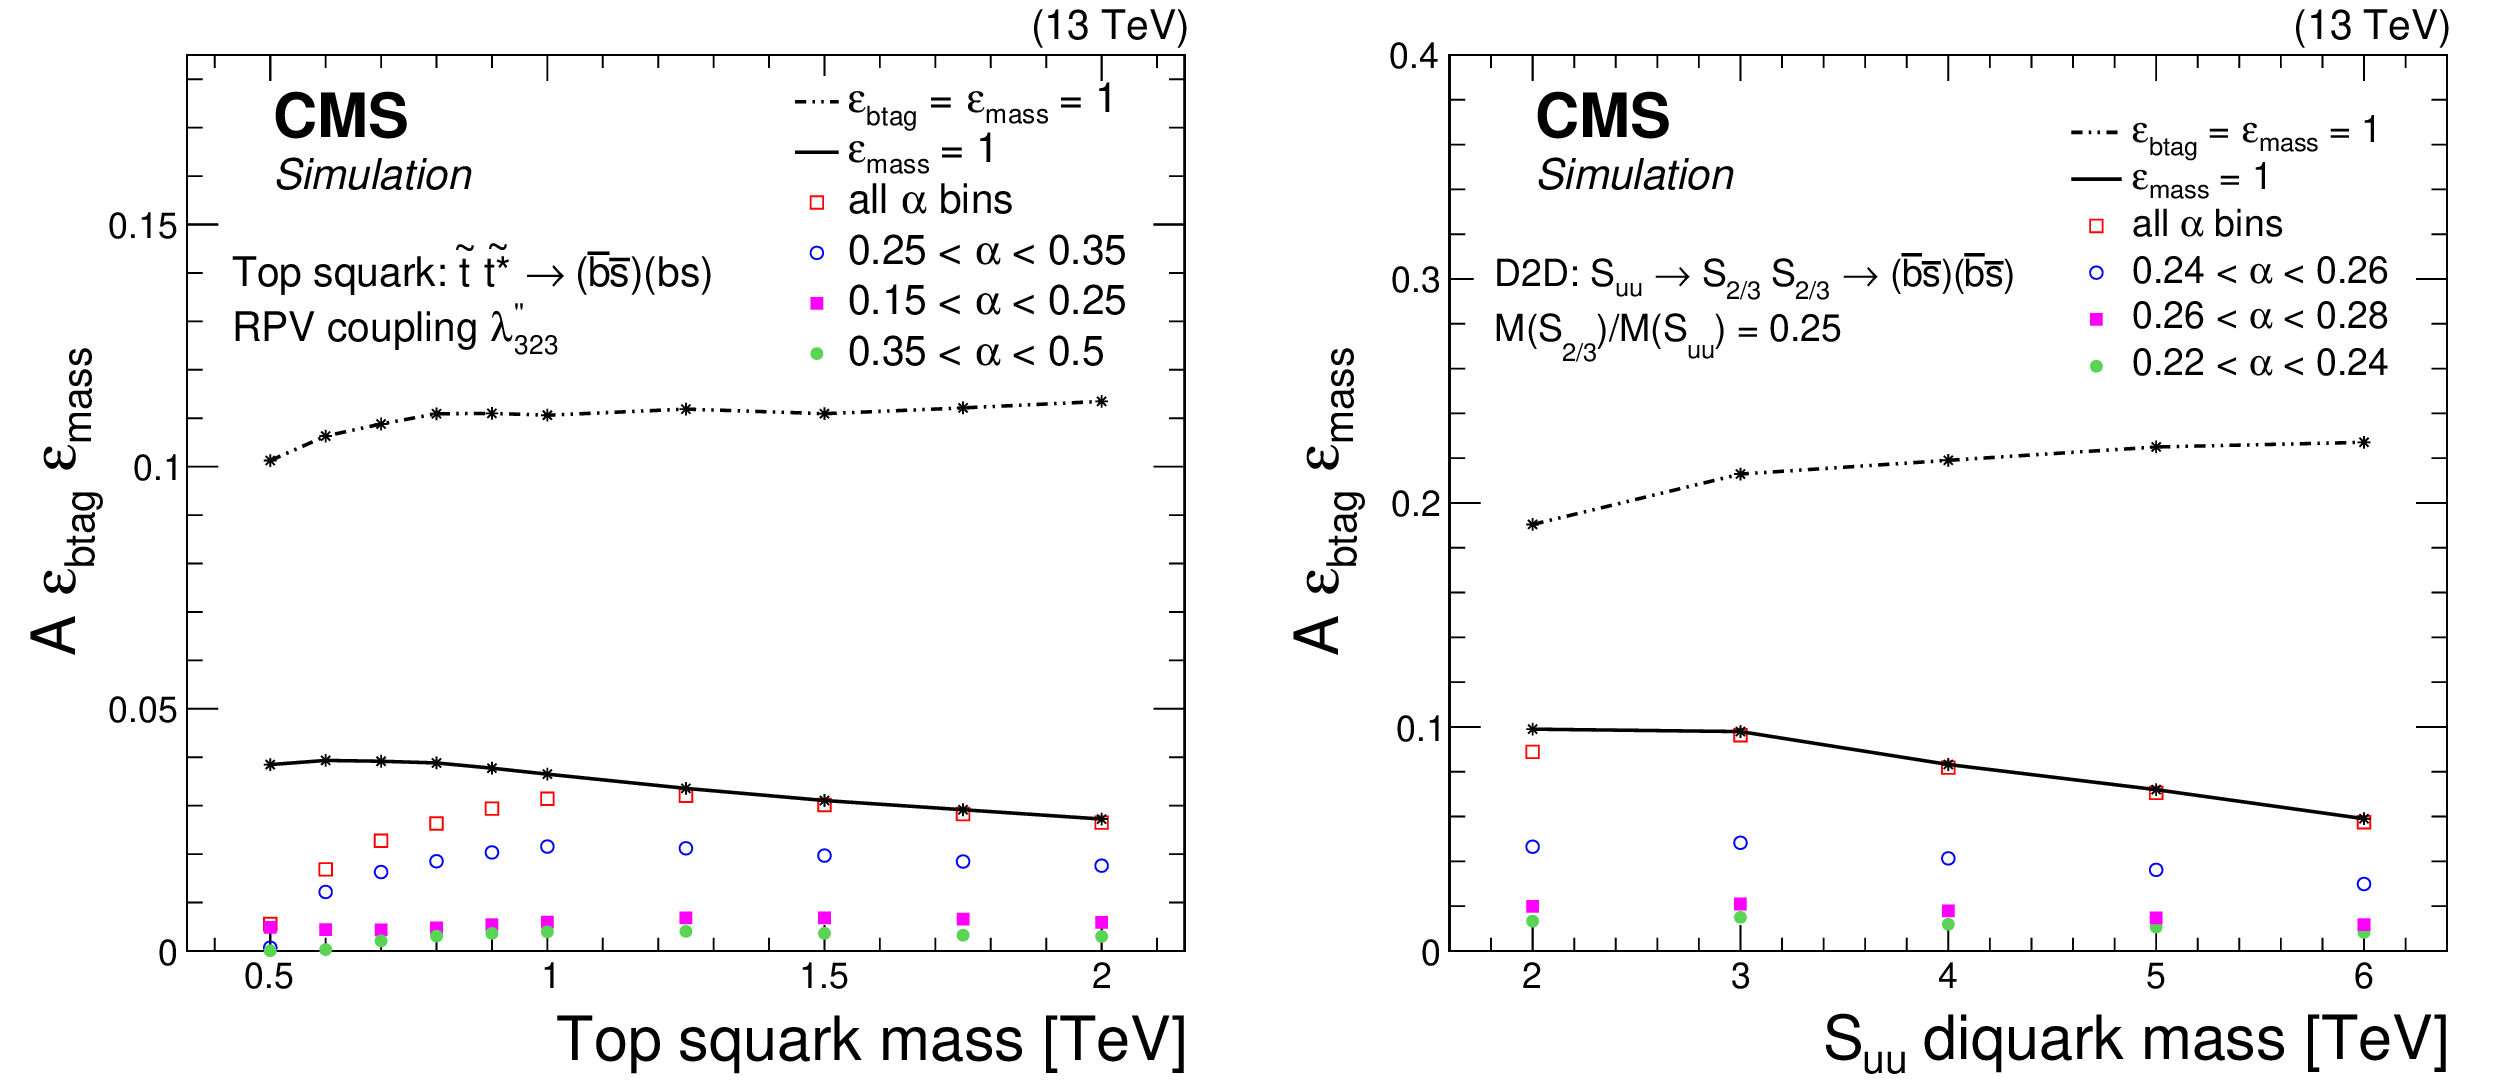
The products of acceptance and efficiency for a nonresonant signal vs. the top squark mass (left), and a resonant signal vs. the diquark mass (right) inclusively, i.e.,, for all $ \alpha $ values, and for the three $ \alpha $ bins that contain the majority ($ > $85%) of the signal. The case where the efficiency of the mass selection is unity is shown as a solid line, and the case where both the mass selection and b tagging efficiencies are unity is shown as a dashed black line. |
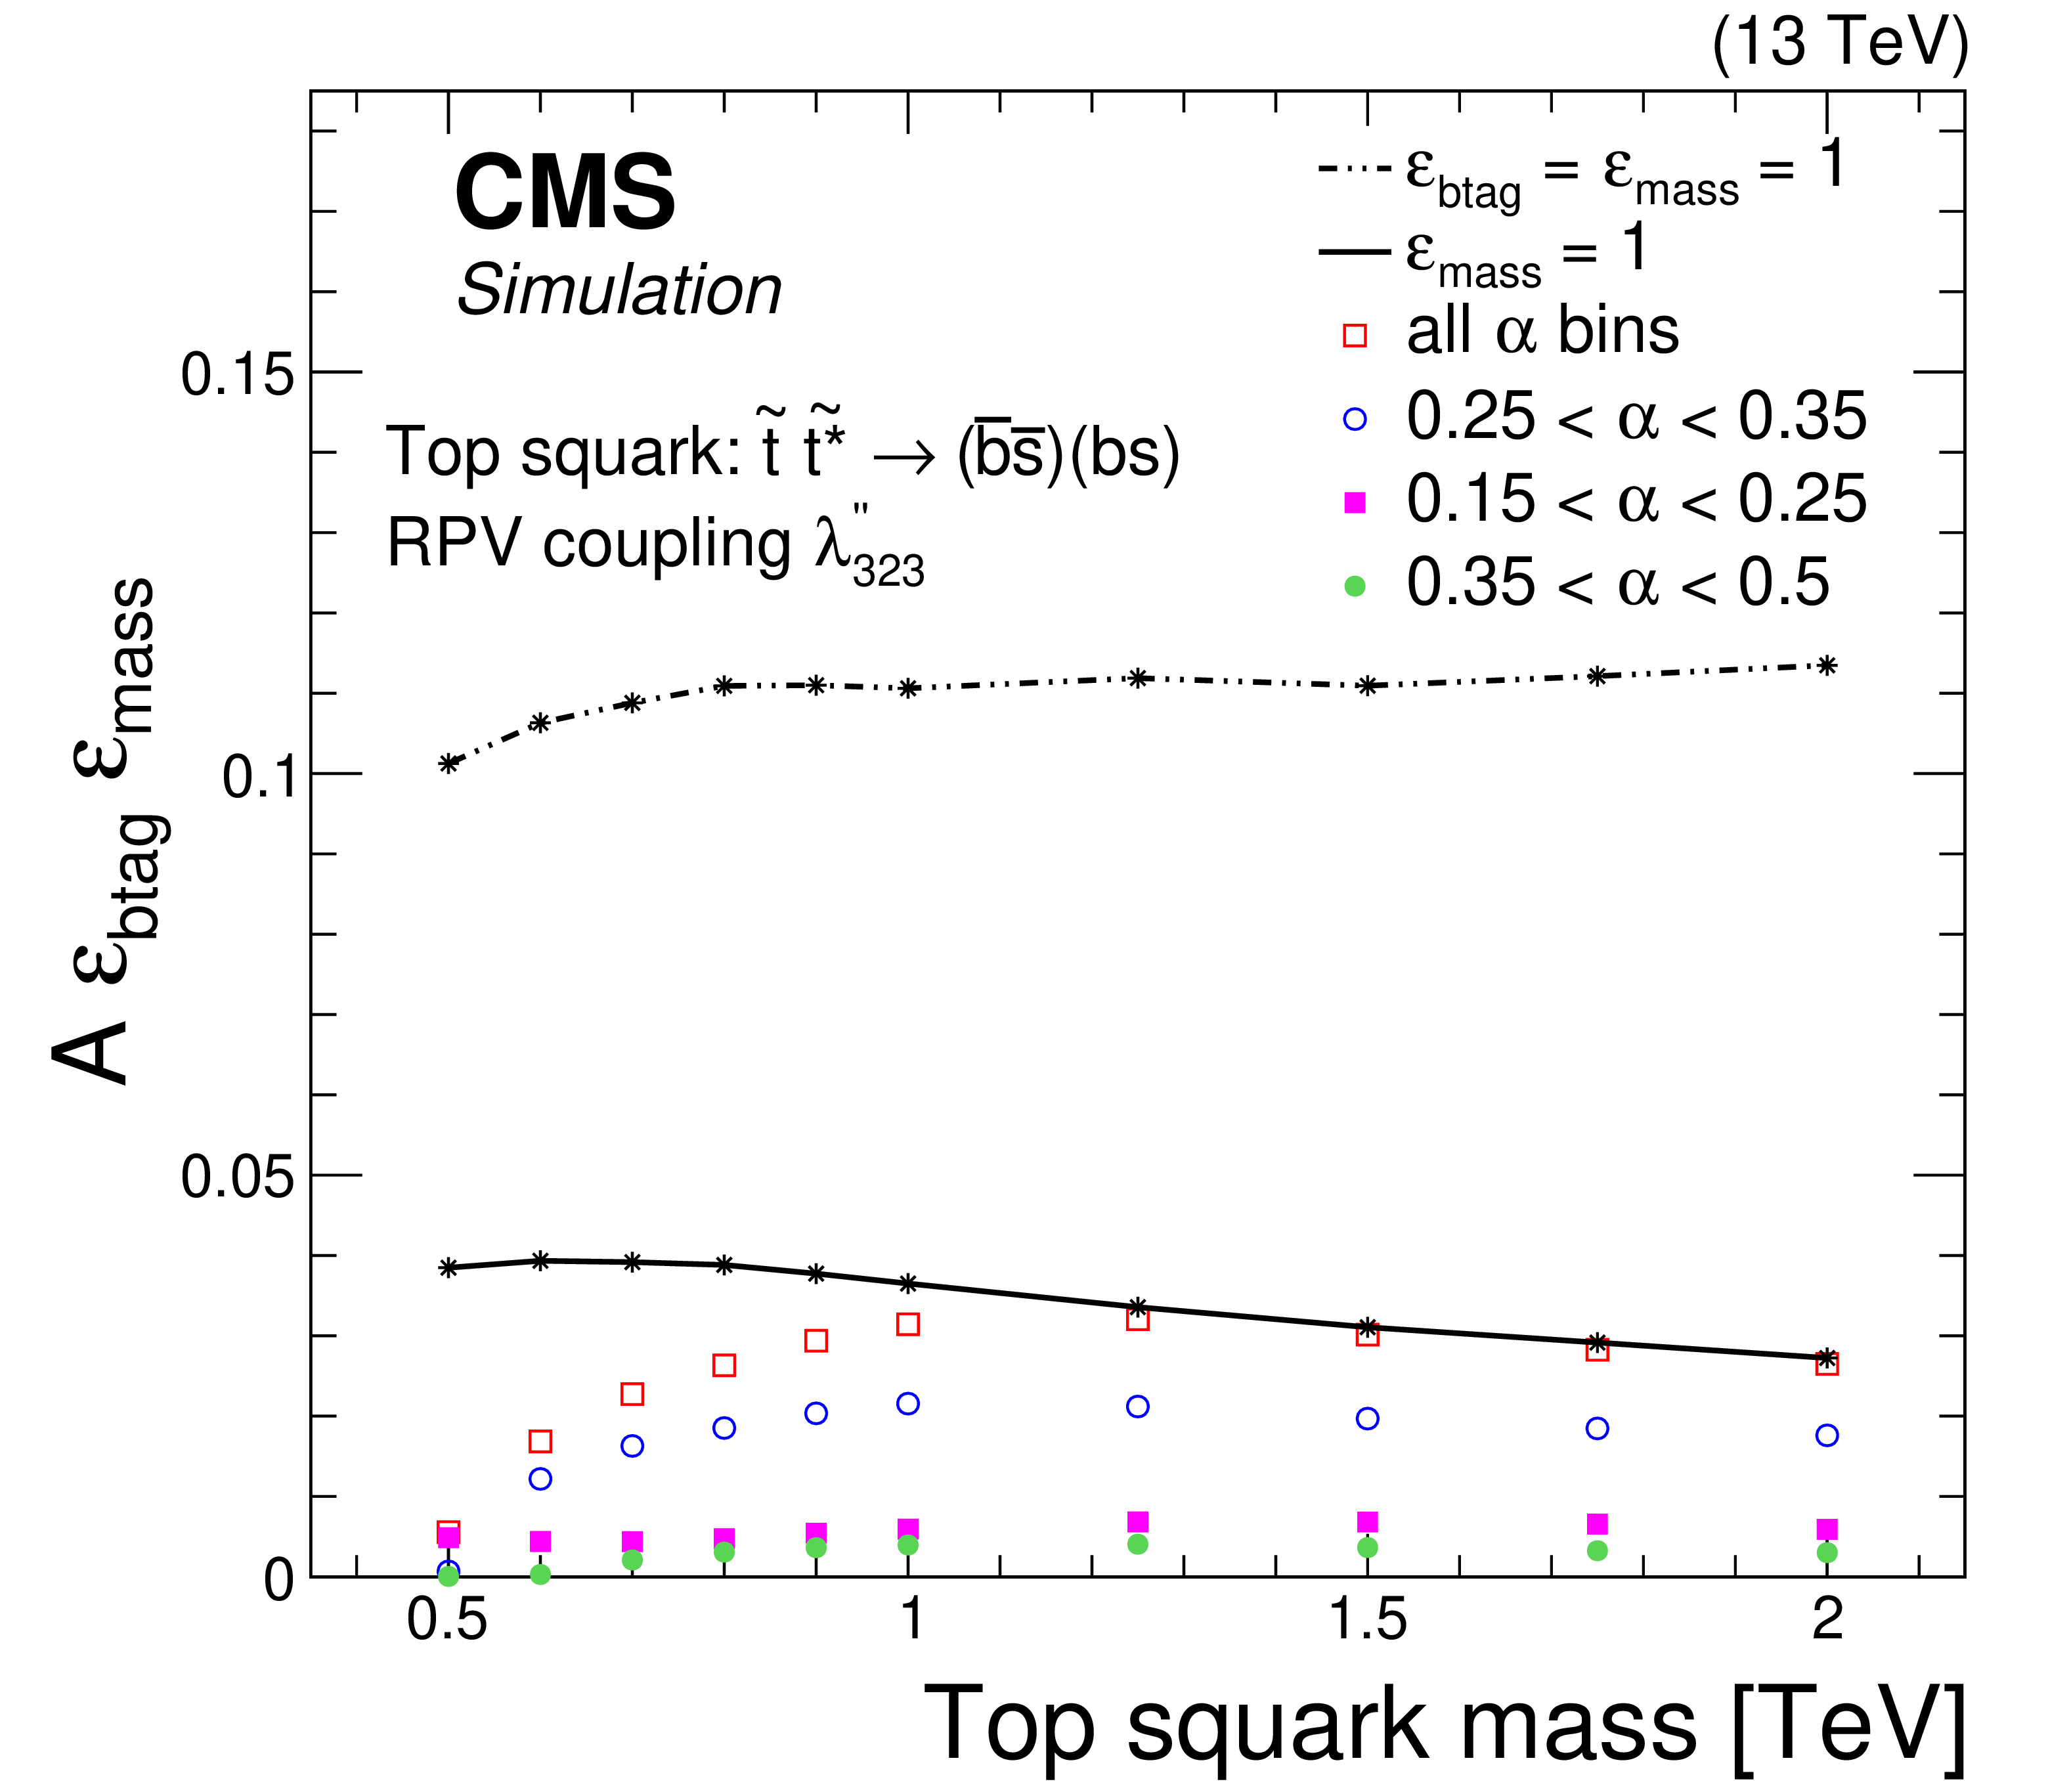
png pdf |
Figure 6-a:
The products of acceptance and efficiency for a nonresonant signal vs. the top squark mass (left), and a resonant signal vs. the diquark mass (right) inclusively, i.e.,, for all $ \alpha $ values, and for the three $ \alpha $ bins that contain the majority ($ > $85%) of the signal. The case where the efficiency of the mass selection is unity is shown as a solid line, and the case where both the mass selection and b tagging efficiencies are unity is shown as a dashed black line. |
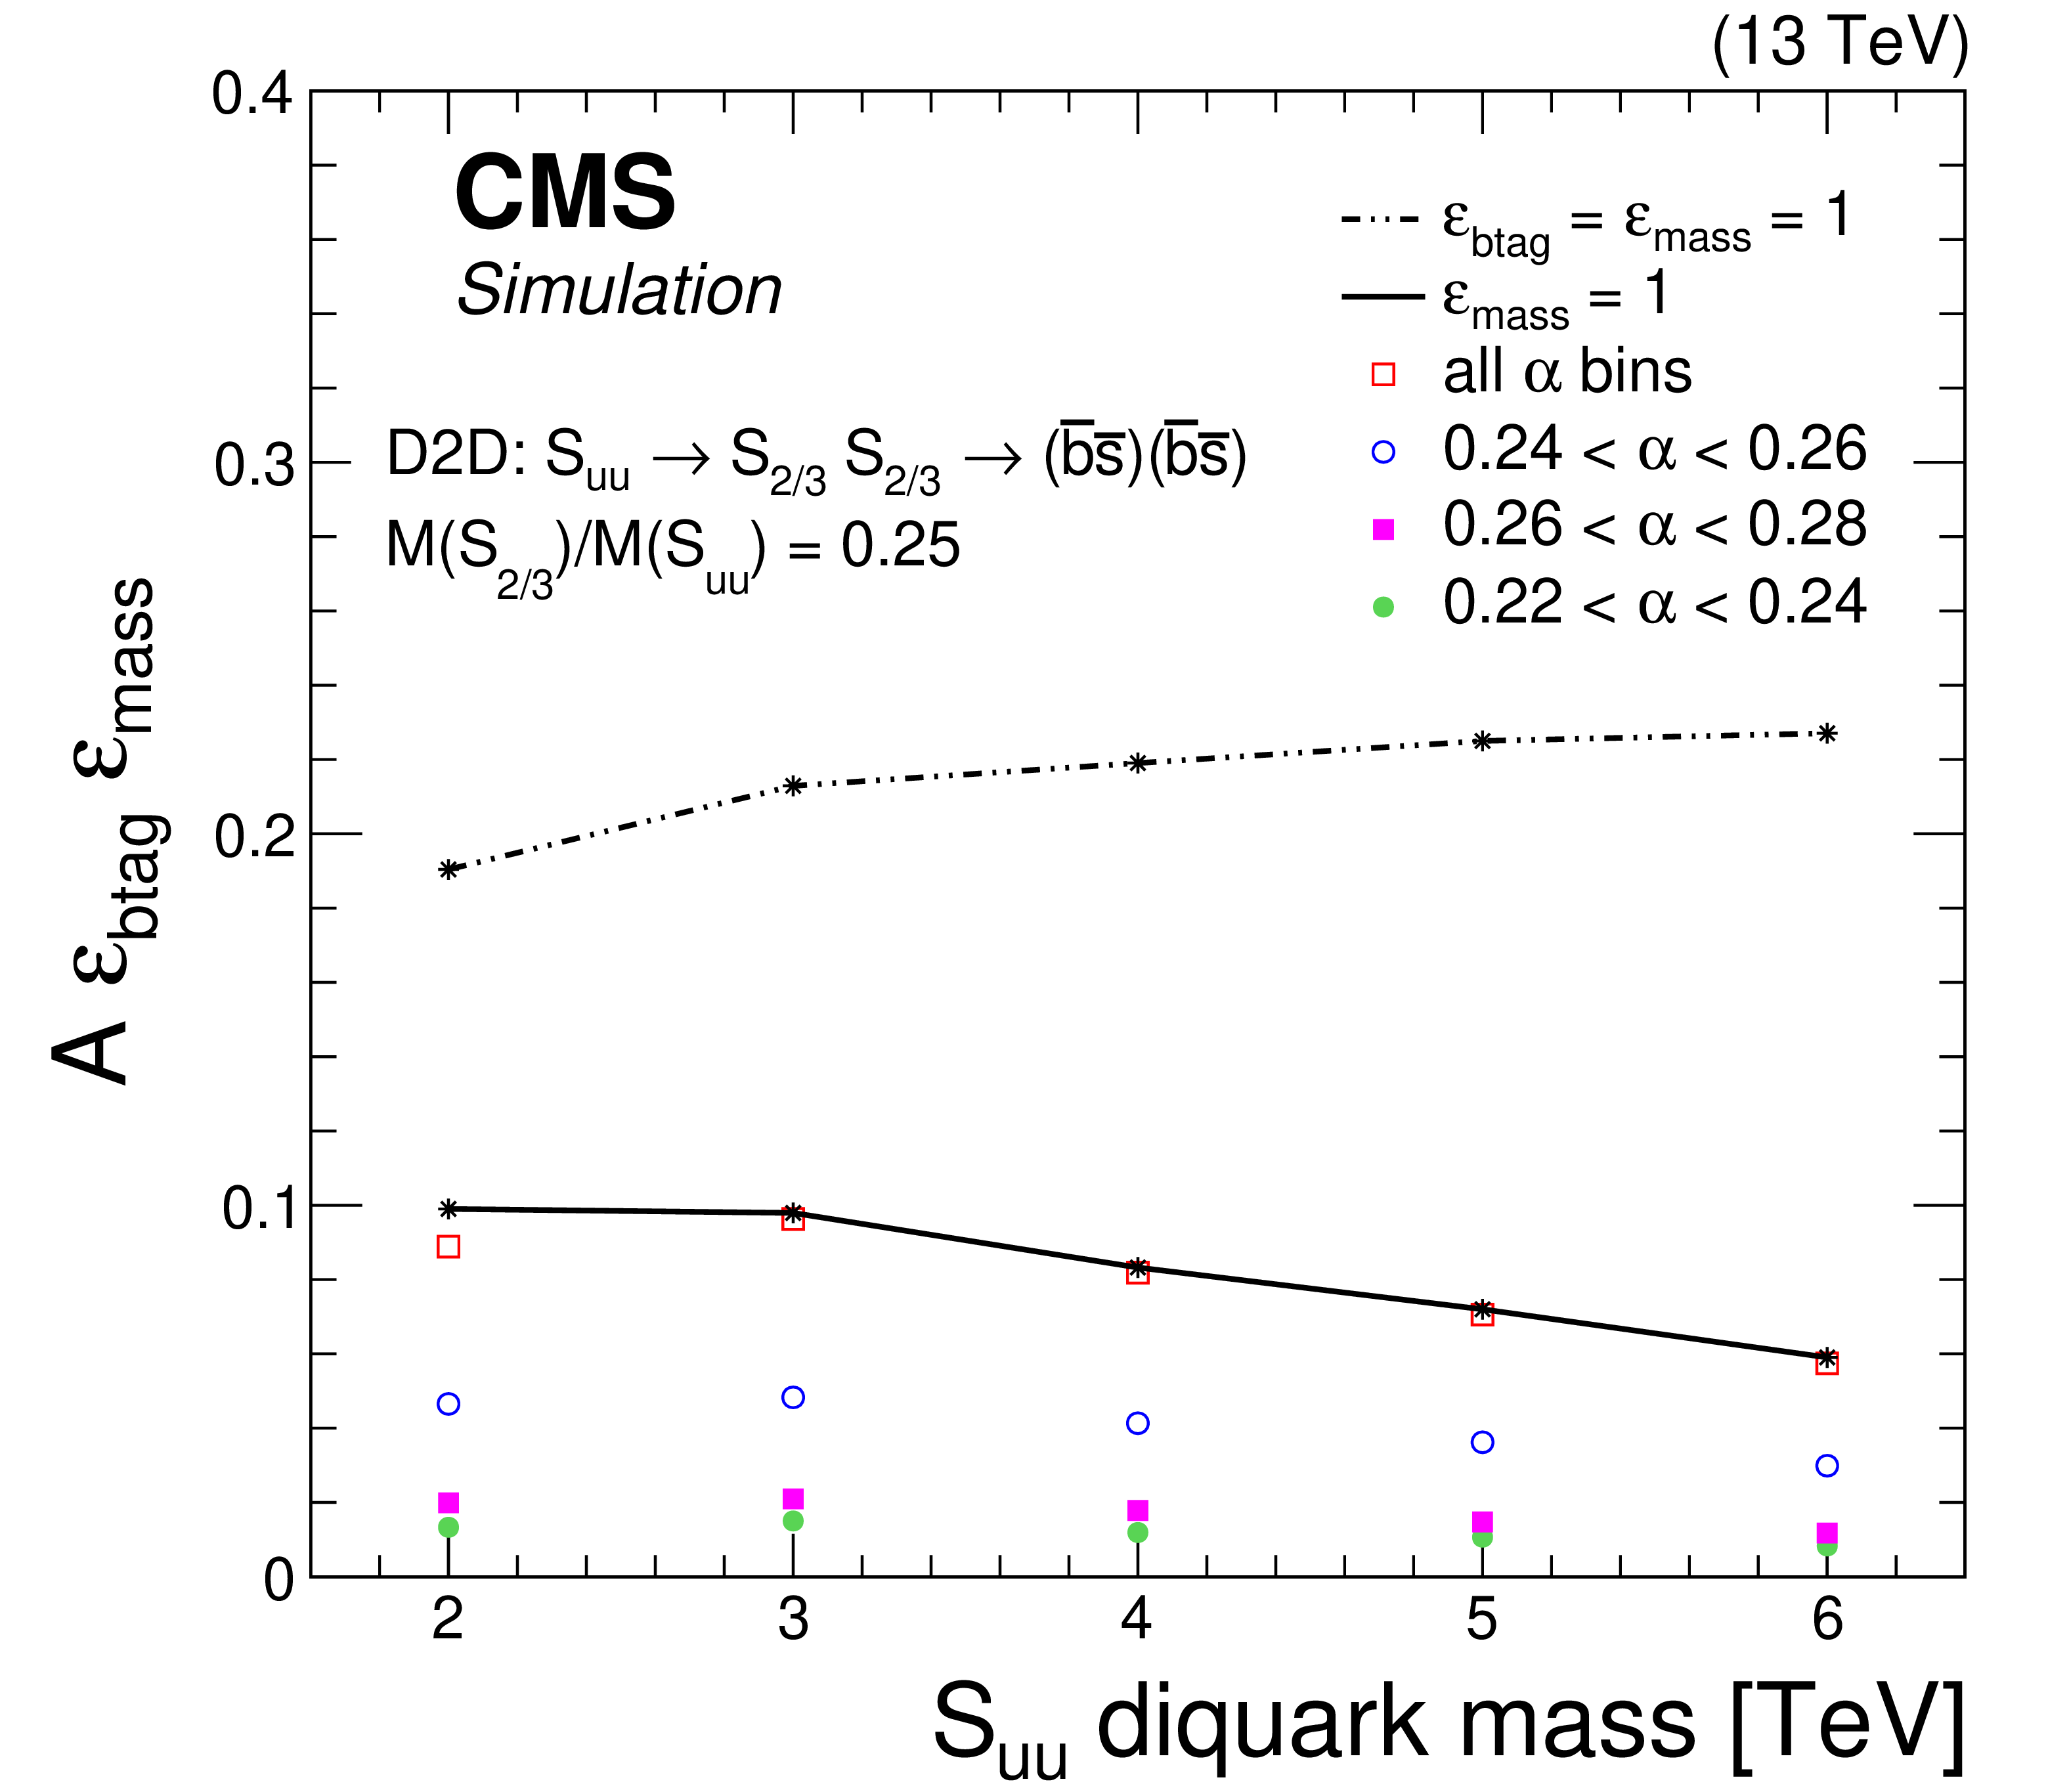
png pdf |
Figure 6-b:
The products of acceptance and efficiency for a nonresonant signal vs. the top squark mass (left), and a resonant signal vs. the diquark mass (right) inclusively, i.e.,, for all $ \alpha $ values, and for the three $ \alpha $ bins that contain the majority ($ > $85%) of the signal. The case where the efficiency of the mass selection is unity is shown as a solid line, and the case where both the mass selection and b tagging efficiencies are unity is shown as a dashed black line. |
png pdf |
Figure 7:
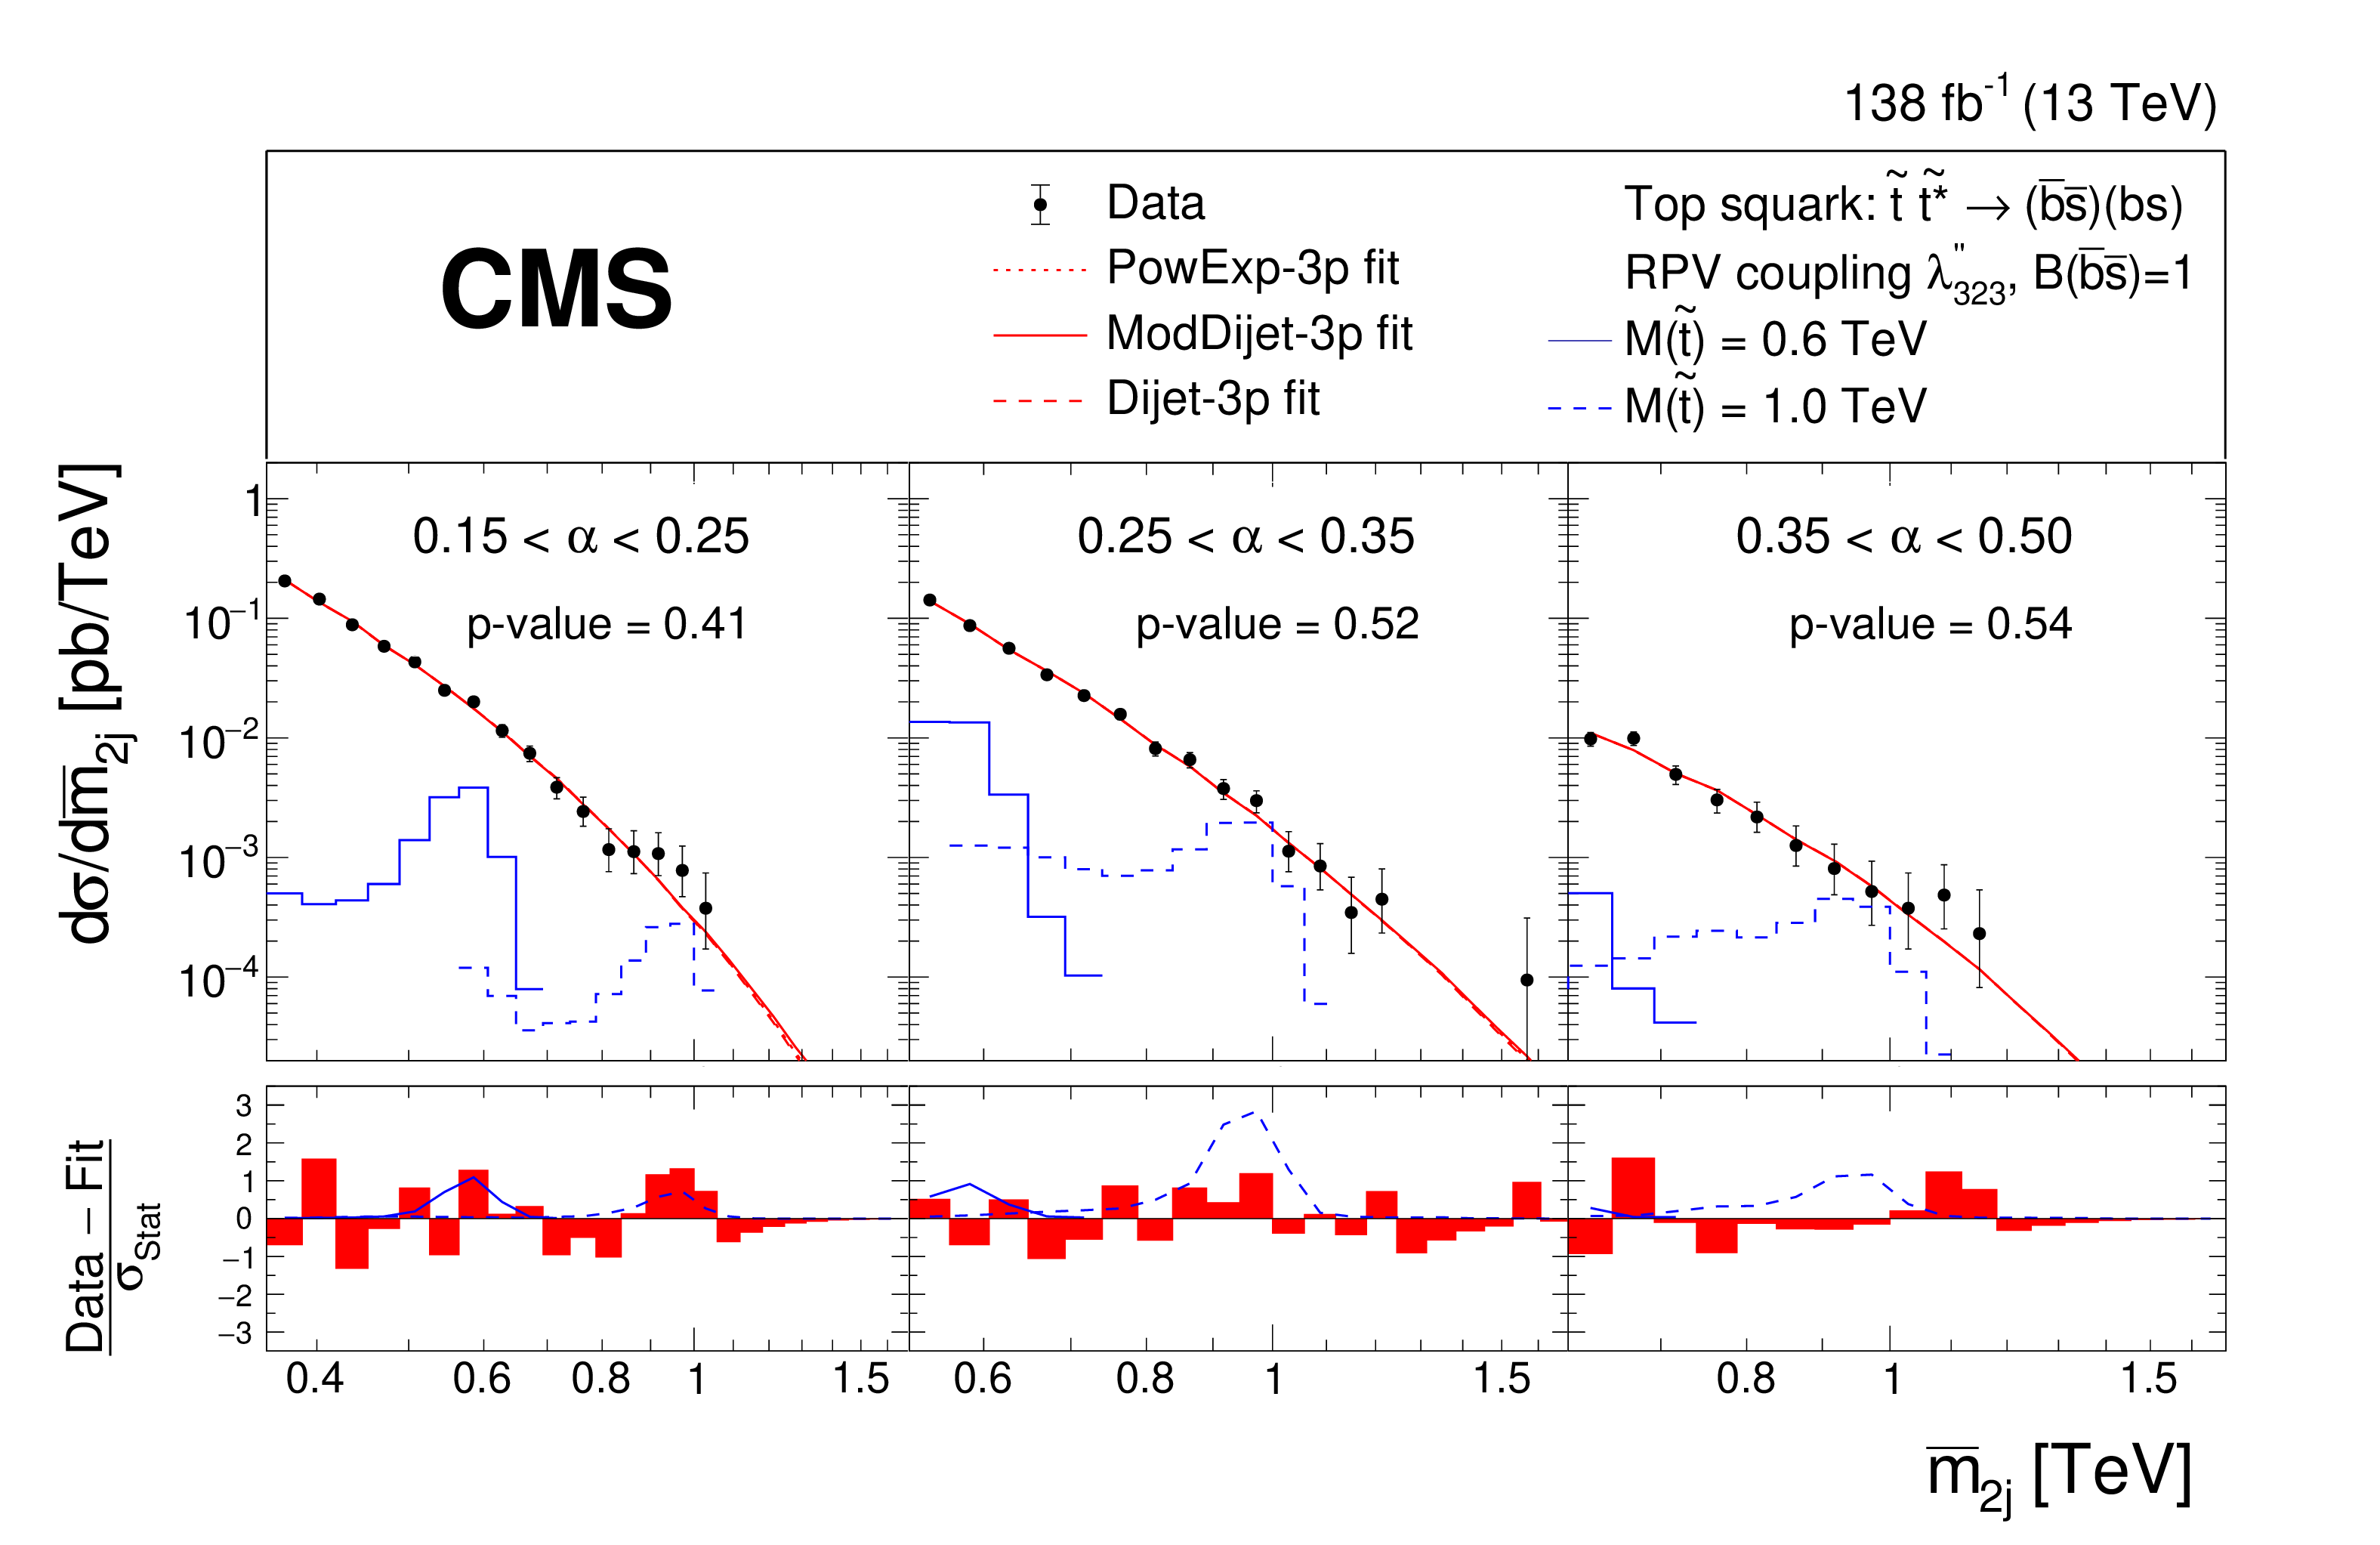
(Upper panel) The measured $ \overline{m}_{2{j} } $ distributions (points) and background fits (red curves) in each slice of $ \alpha $, in the nonresonant search. We note that the three background fits lie nearly on top of one another. (Lower panel) The residual difference between data and the Dijet-3p function, divided by the statistical uncertainty of data ($ \sigma_{\text{Stat}} $). In both panels, examples of predicted top squark pair production signals are shown, with cross sections equal to the observed upper limits at 95% confidence level, for top squark masses of 0.6 TeV (blue solid line) and 1.0 TeV (blue dashed line). We quote the $ p $-value for each fit of the Dijet-3p function to the average dijet mass distribution in data, evaluated from pseudo-experiments. |
png pdf |
Figure 8:
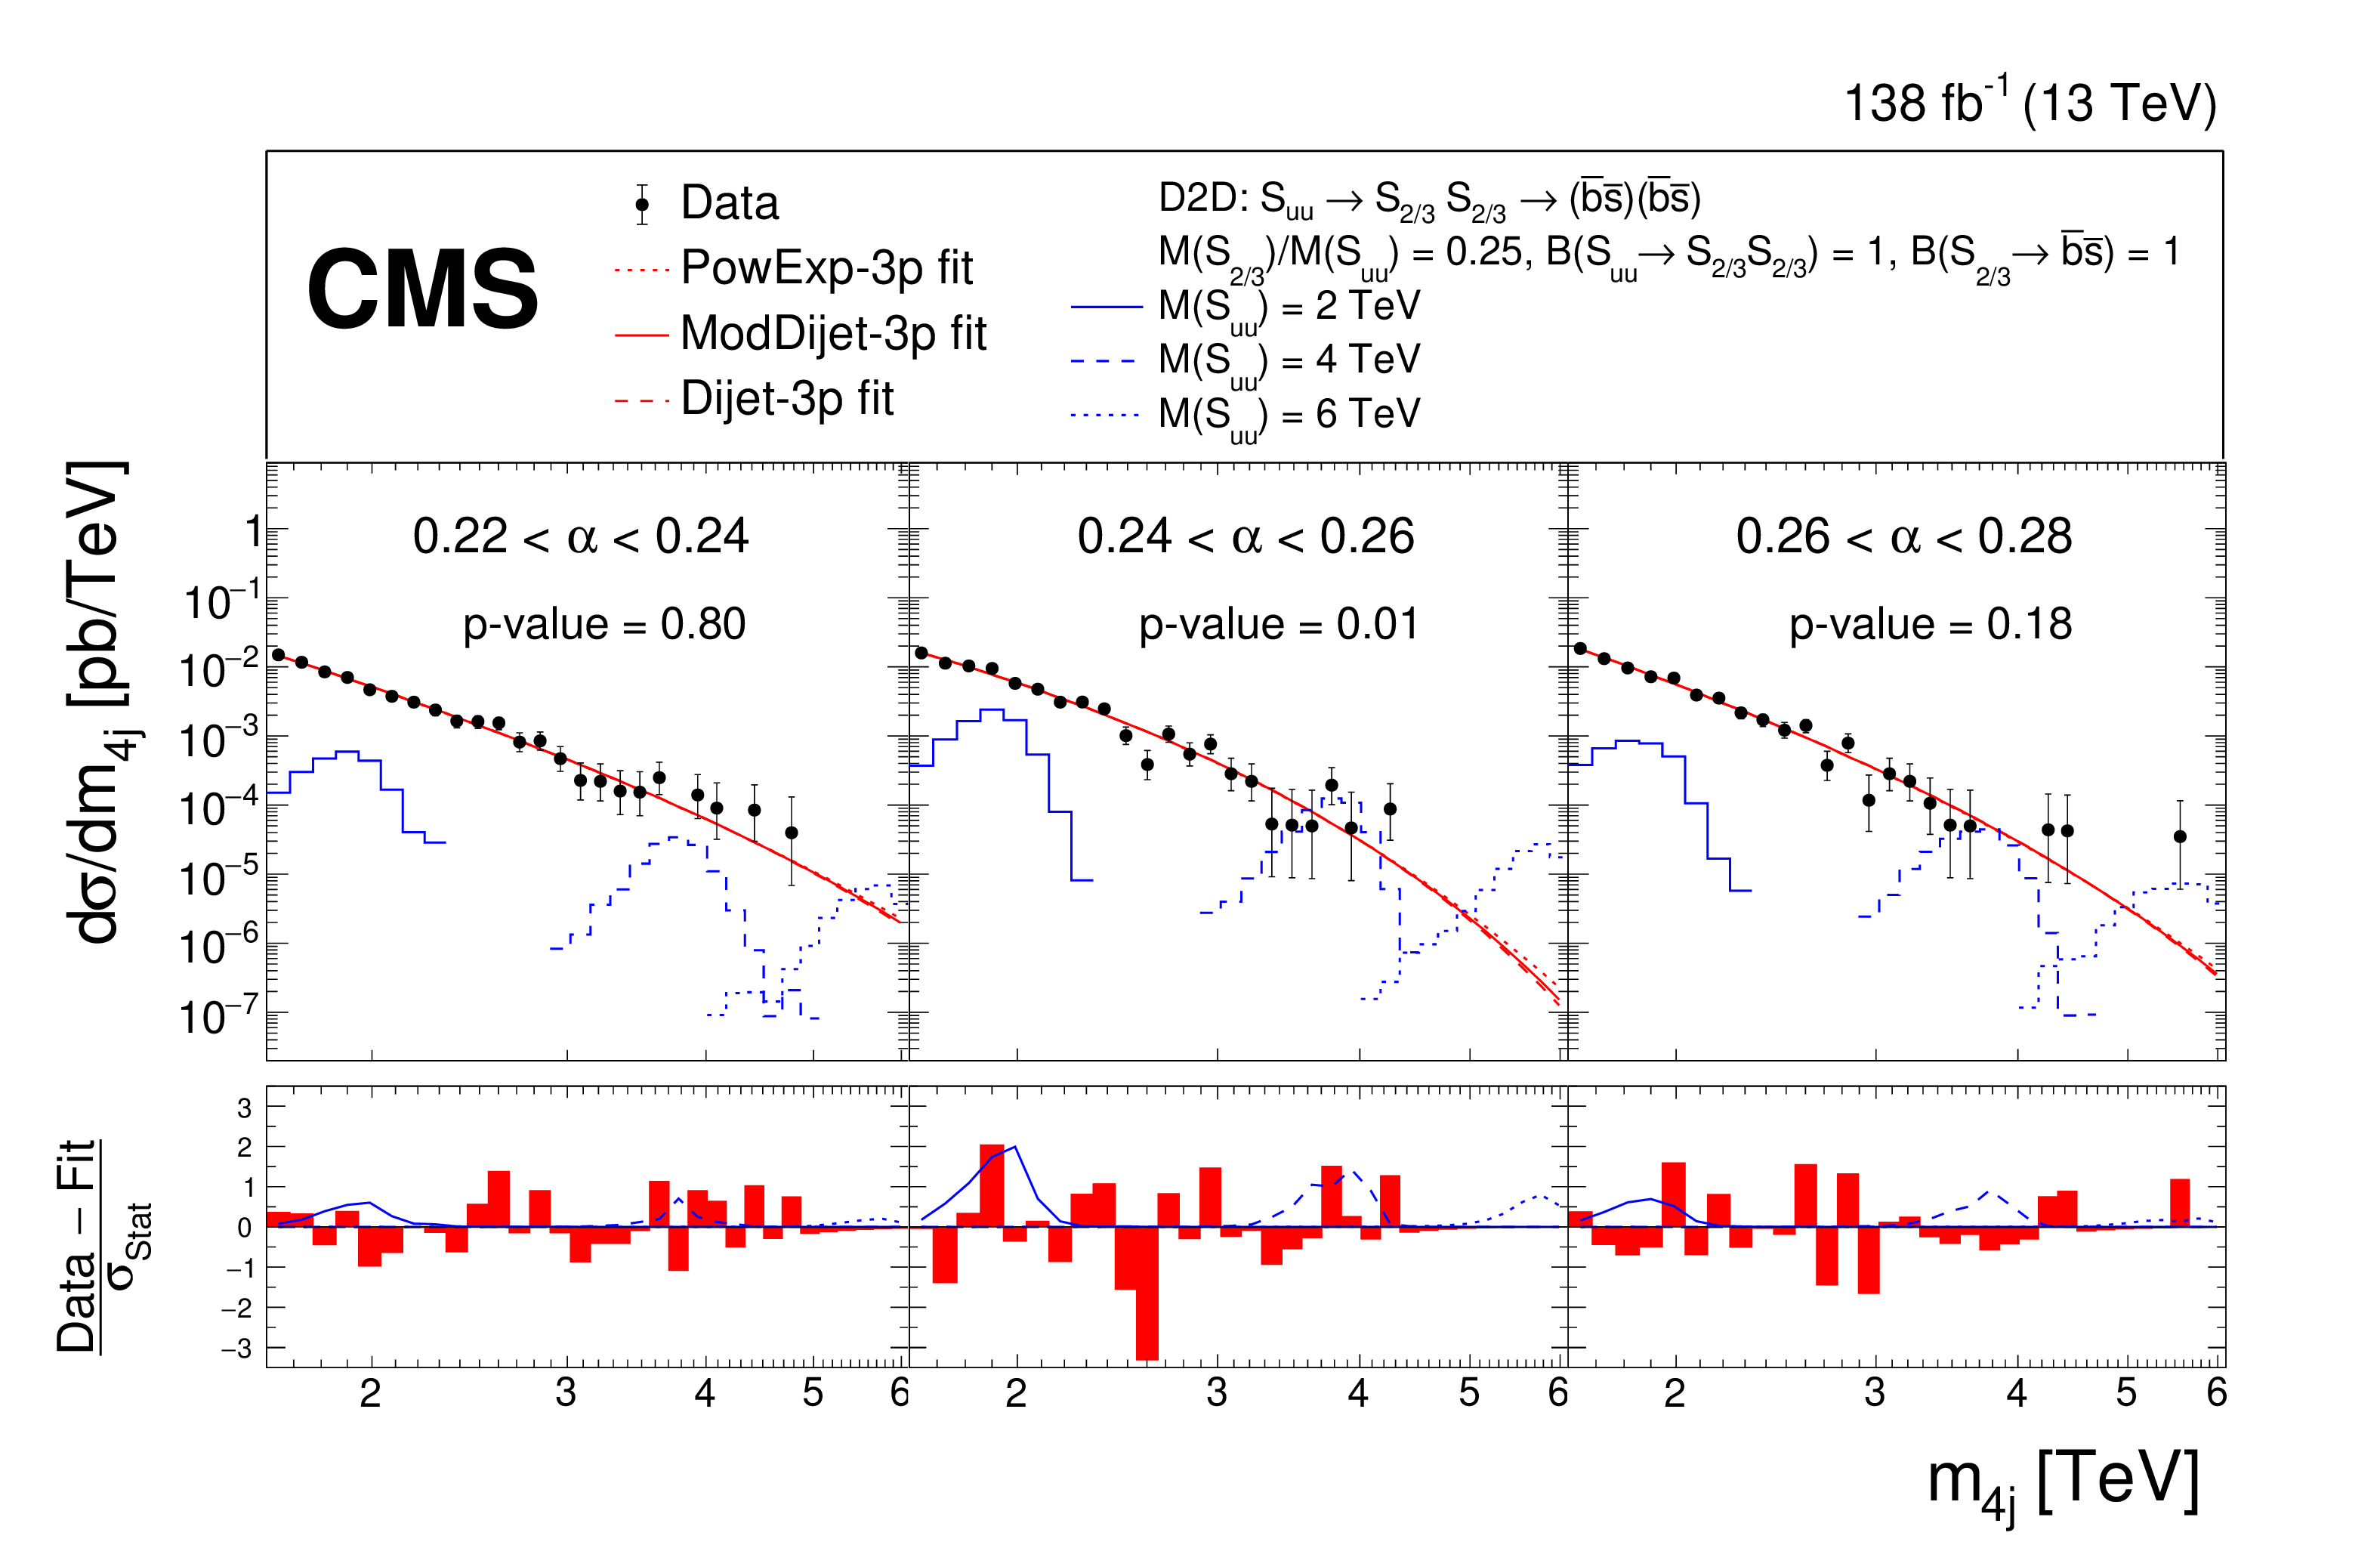
(Upper panel) The measured $ m_{\mathrm{4j}} $ distributions (points) and background fits (red curves) in three out of the twelve slices of $ \alpha $ in the resonant search. We note that the three background fits lie nearly on top of one another. (Lower panel) The residual difference between data and the Dijet-3p function, divided by the statistical uncertainty of data ($ \sigma_{\text{Stat}} $). In both panels, examples of predicted D2D signals are shown, with cross sections equal to the observed upper limits at 95% confidence level, for S$ \mathrm{u} \mathrm{u} $ diquark masses of 2 TeV (blue solid line), 4 TeV (blue dashed line), and 6 TeV (blue dotted line), and for $ M({{S}{2/3}} )/M({S}{\mathrm{u}\mathrm{u}} ) = $ 0.25. We quote the $ p $-value for each fit of the Dijet-3p function to the four-jet mass distribution in data, evaluated from pseudo-experiments. |
png pdf |
Figure 9:
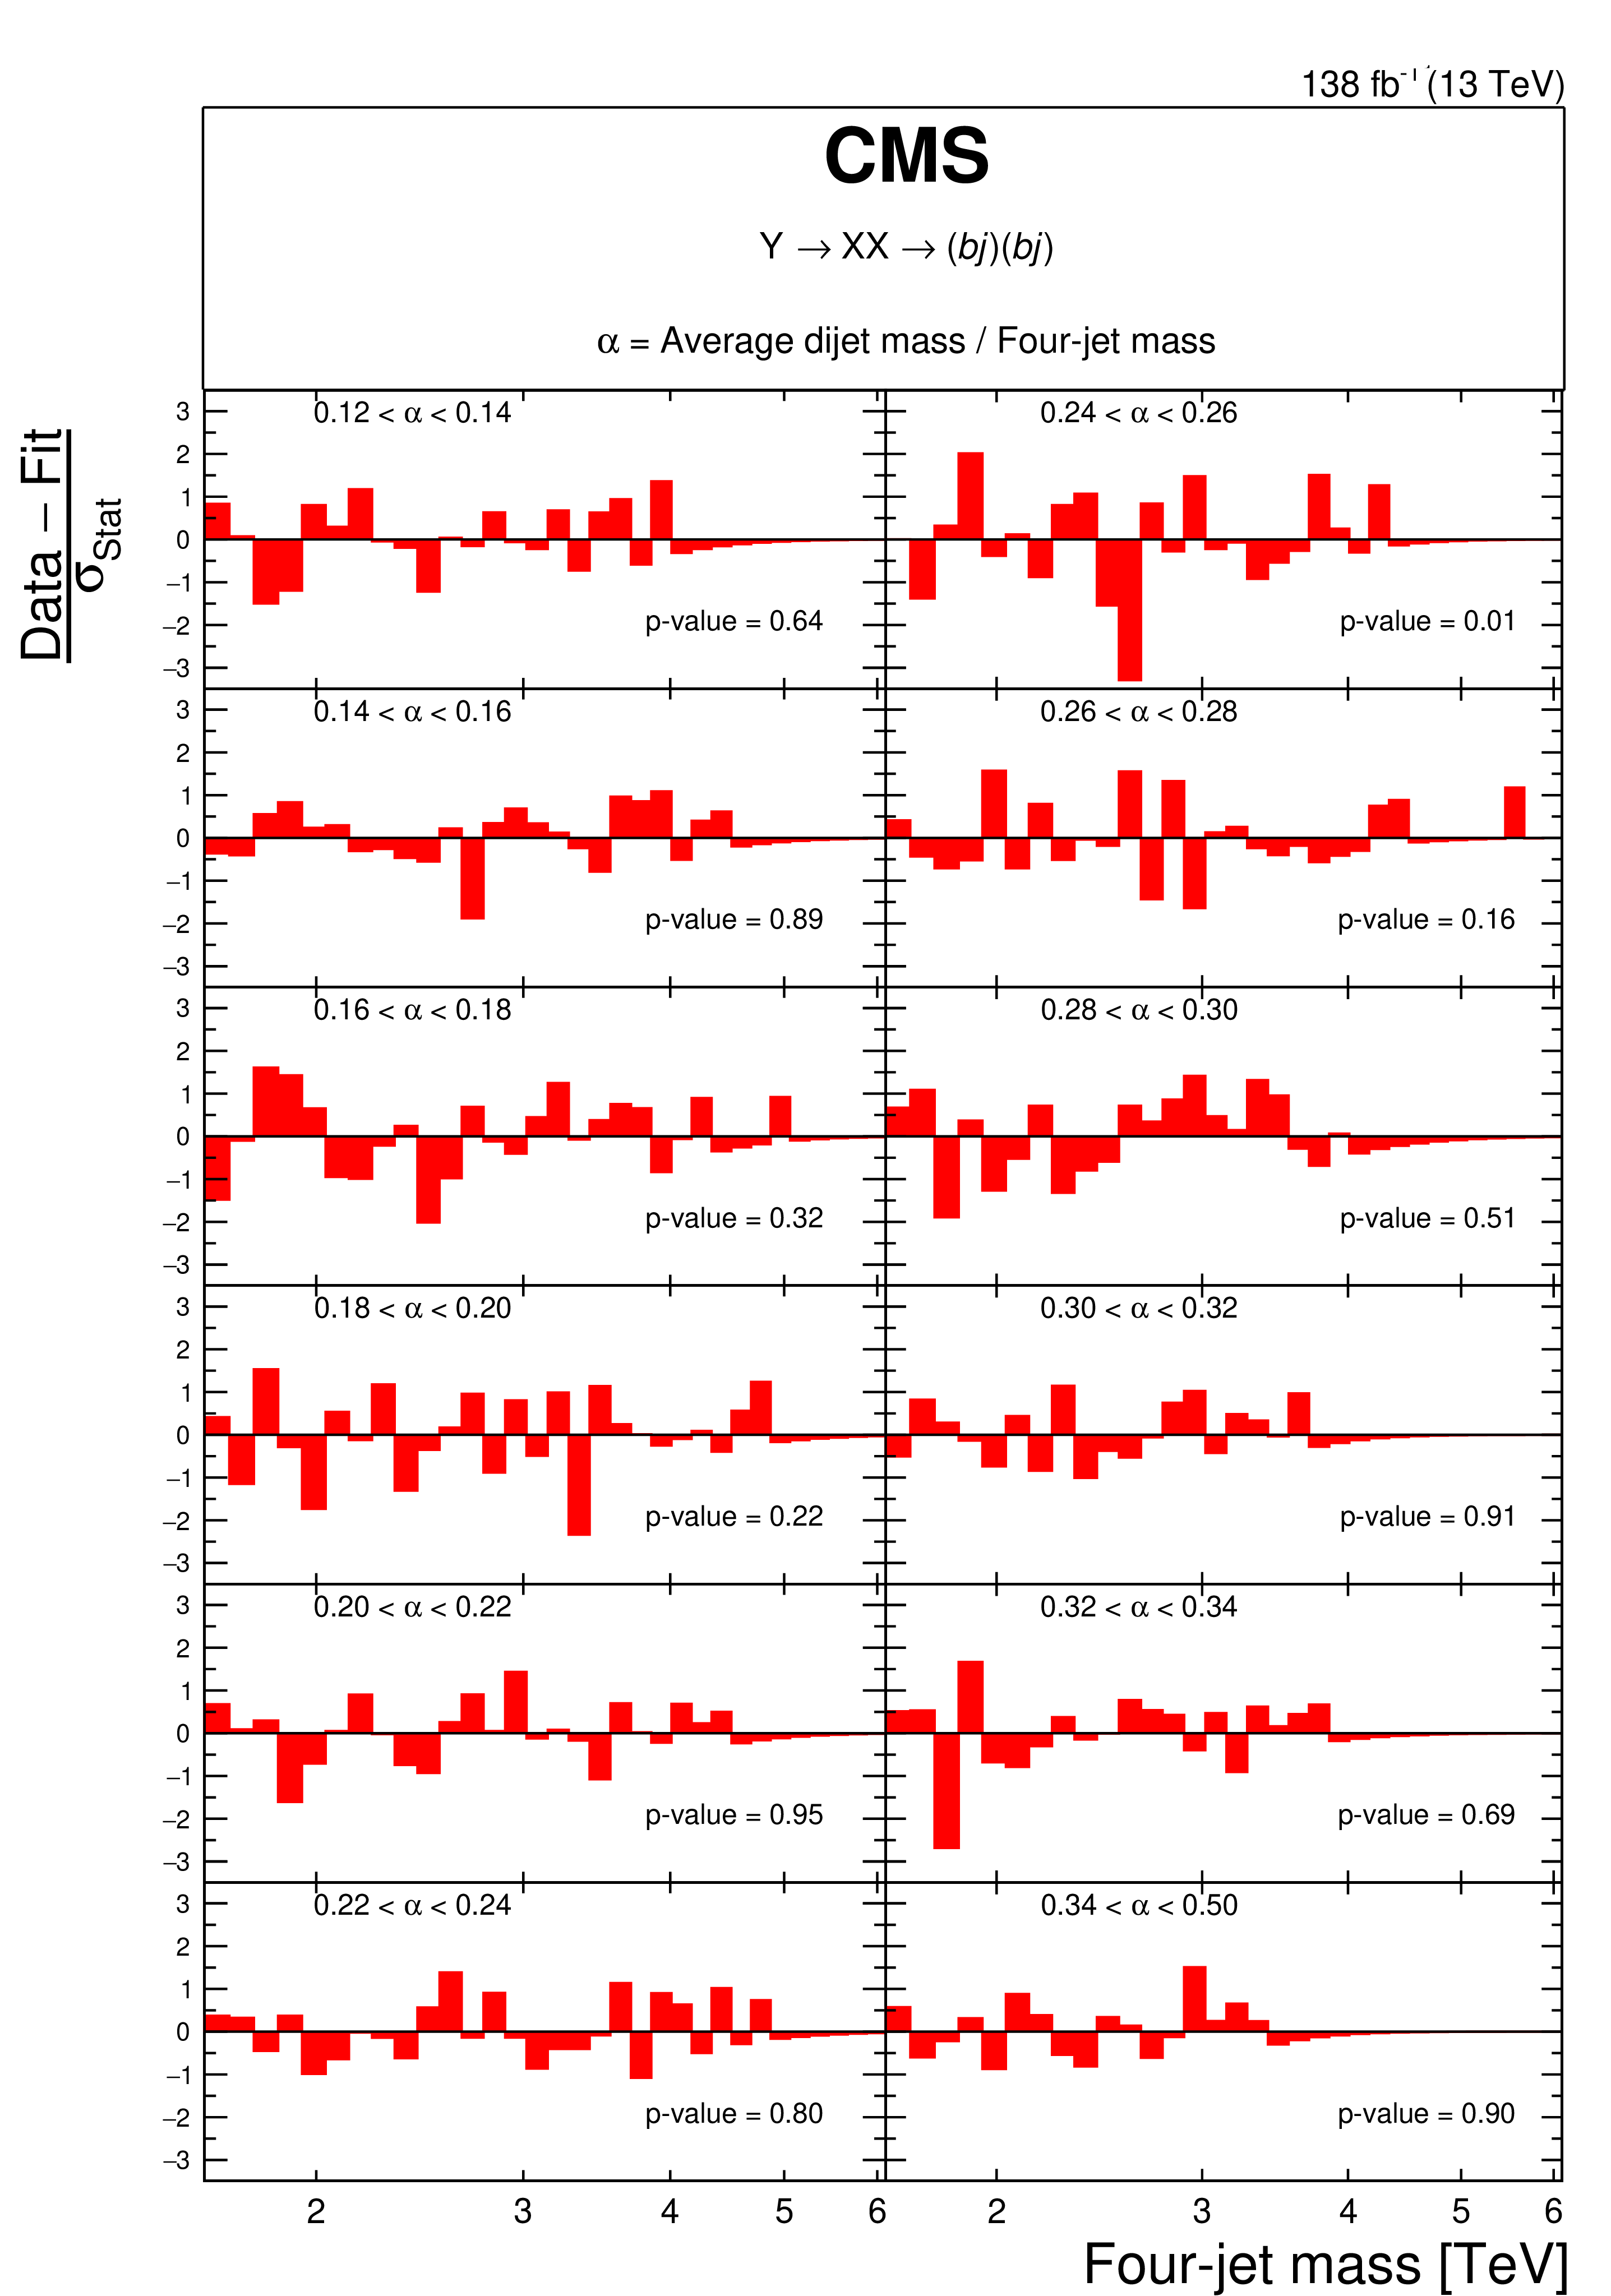
The residual difference between data and the Dijet-3p function, divided by the statistical uncertainty of data ($ \sigma_{\text{stat}} $), in all twelve $ \alpha $ slices used in the resonant search. We quote the $ p $-value for each fit of the Dijet-3p function to the four-jet mass distribution in data, evaluated from pseudo-experiments. The distributions and fits for the 0.22 $ < \alpha < $ 0.24, 0.24 $ < \alpha < $ 0.26, and 0.26 $ < \alpha < $ 0.28 bins are shown in Fig. 8. |
png pdf |
Figure 10:
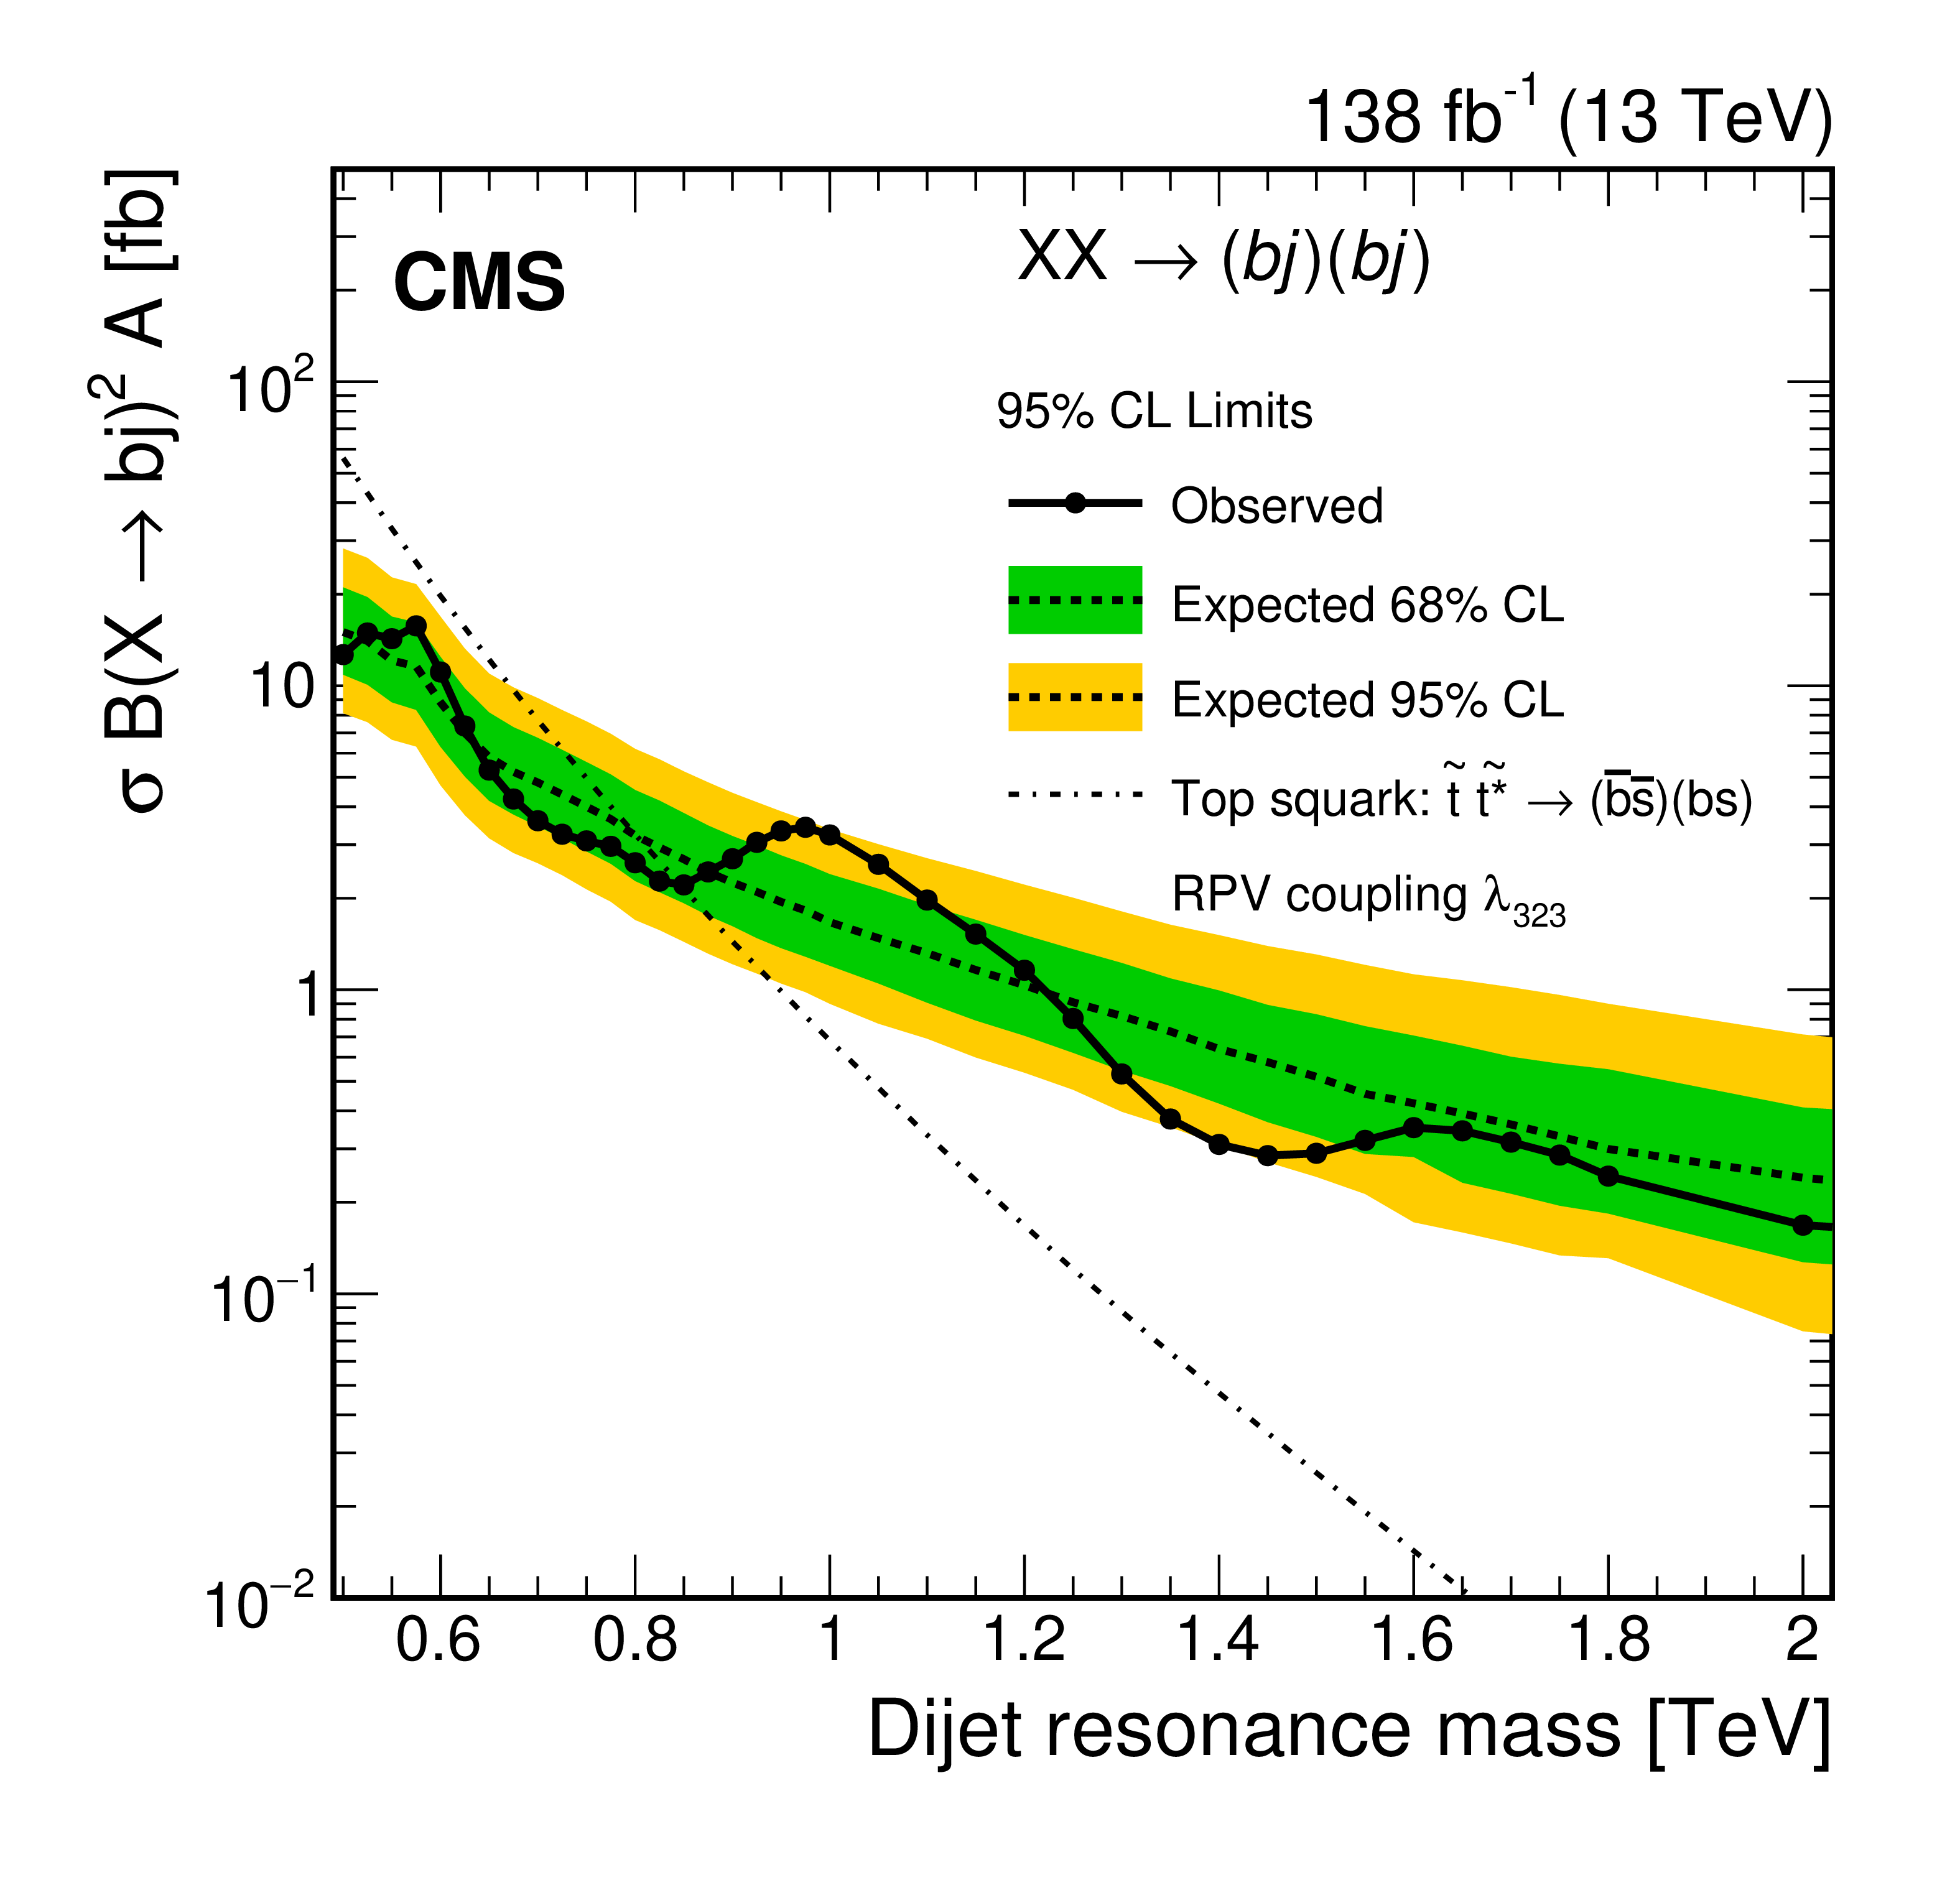
The observed 95% CL upper limits (black line with points) on the product of the cross section, branching fraction, and acceptance in the nonresonant search for $ \mathrm{X} \mathrm{X} \to (\mathrm{b} {j} )(\mathrm{b} {j} ) $. The expected limits (dashed line) and their variations at the 68% and 95% CL (shaded bands) are also shown. Limits are compared to the predicted cross section of the RPV model [63,64] (dot-dashed line), assuming $ \mathcal{B}(\tilde{\mathrm{t}} \to \overline{\mathrm{b}}\overline{\mathrm{s}}) = $ 1. |
png pdf |
Figure 11:
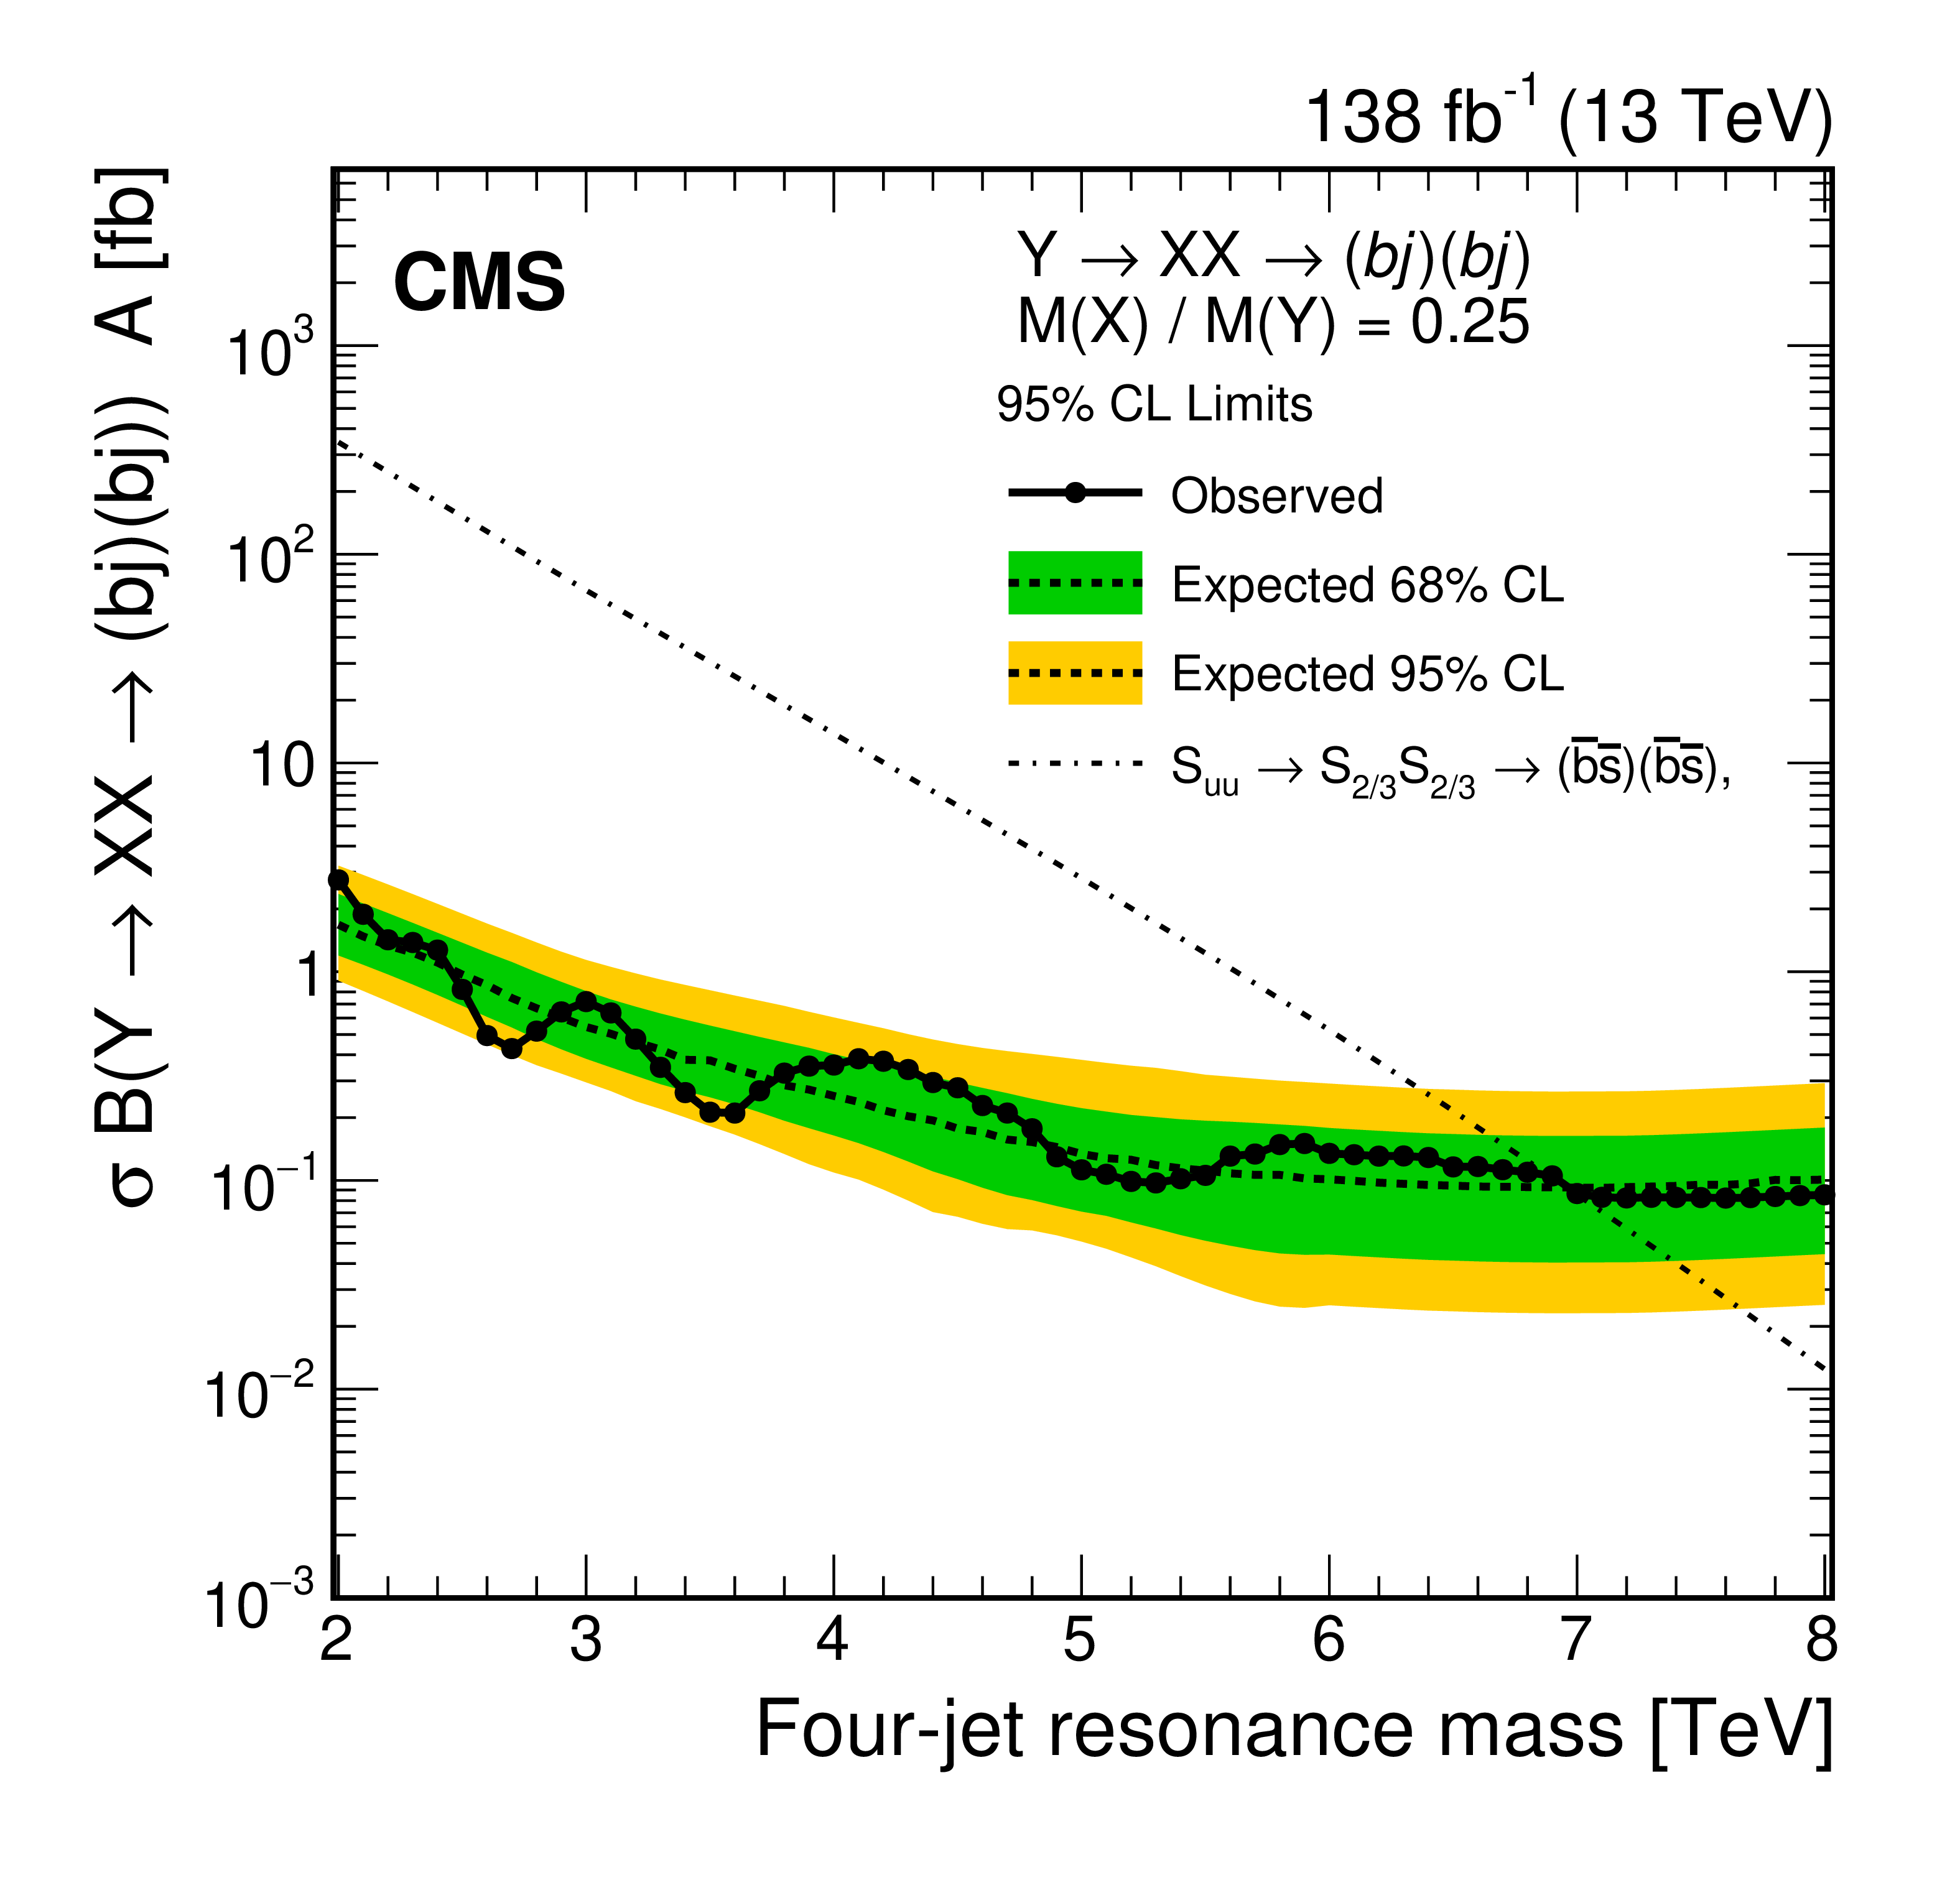
The observed 95% CL upper limits (black line with points) on the product of the cross section, branching fraction, and acceptance in the resonant search for $ {Y} \to \mathrm{X} \mathrm{X} \to (\mathrm{b} {j} )(\mathrm{b} {j} ) $ with $ \alpha_{\text{true}} = M(\mathrm{X})/M({Y} ) = $ 0.25. The expected limits (dashed line) and their variations at the 68% and 95% CL (shaded bands) are also shown. Limits are compared to the predicted cross section of the D2D diquark model [20] (dot-dashed line) for $ M({{S}{2/3}} )/M({S}{\mathrm{u}\mathrm{u}} ) = $ 0.25 and $ \mathcal{B}({S}{\mathrm{u}\mathrm{u}} \to {{S}{2/3}} {{S}{2/3}} \to (\overline{\mathrm{b}}\overline{\mathrm{s}})(\overline{\mathrm{b}}\overline{\mathrm{s}})) = $ 1. |
png pdf |
Figure 12:
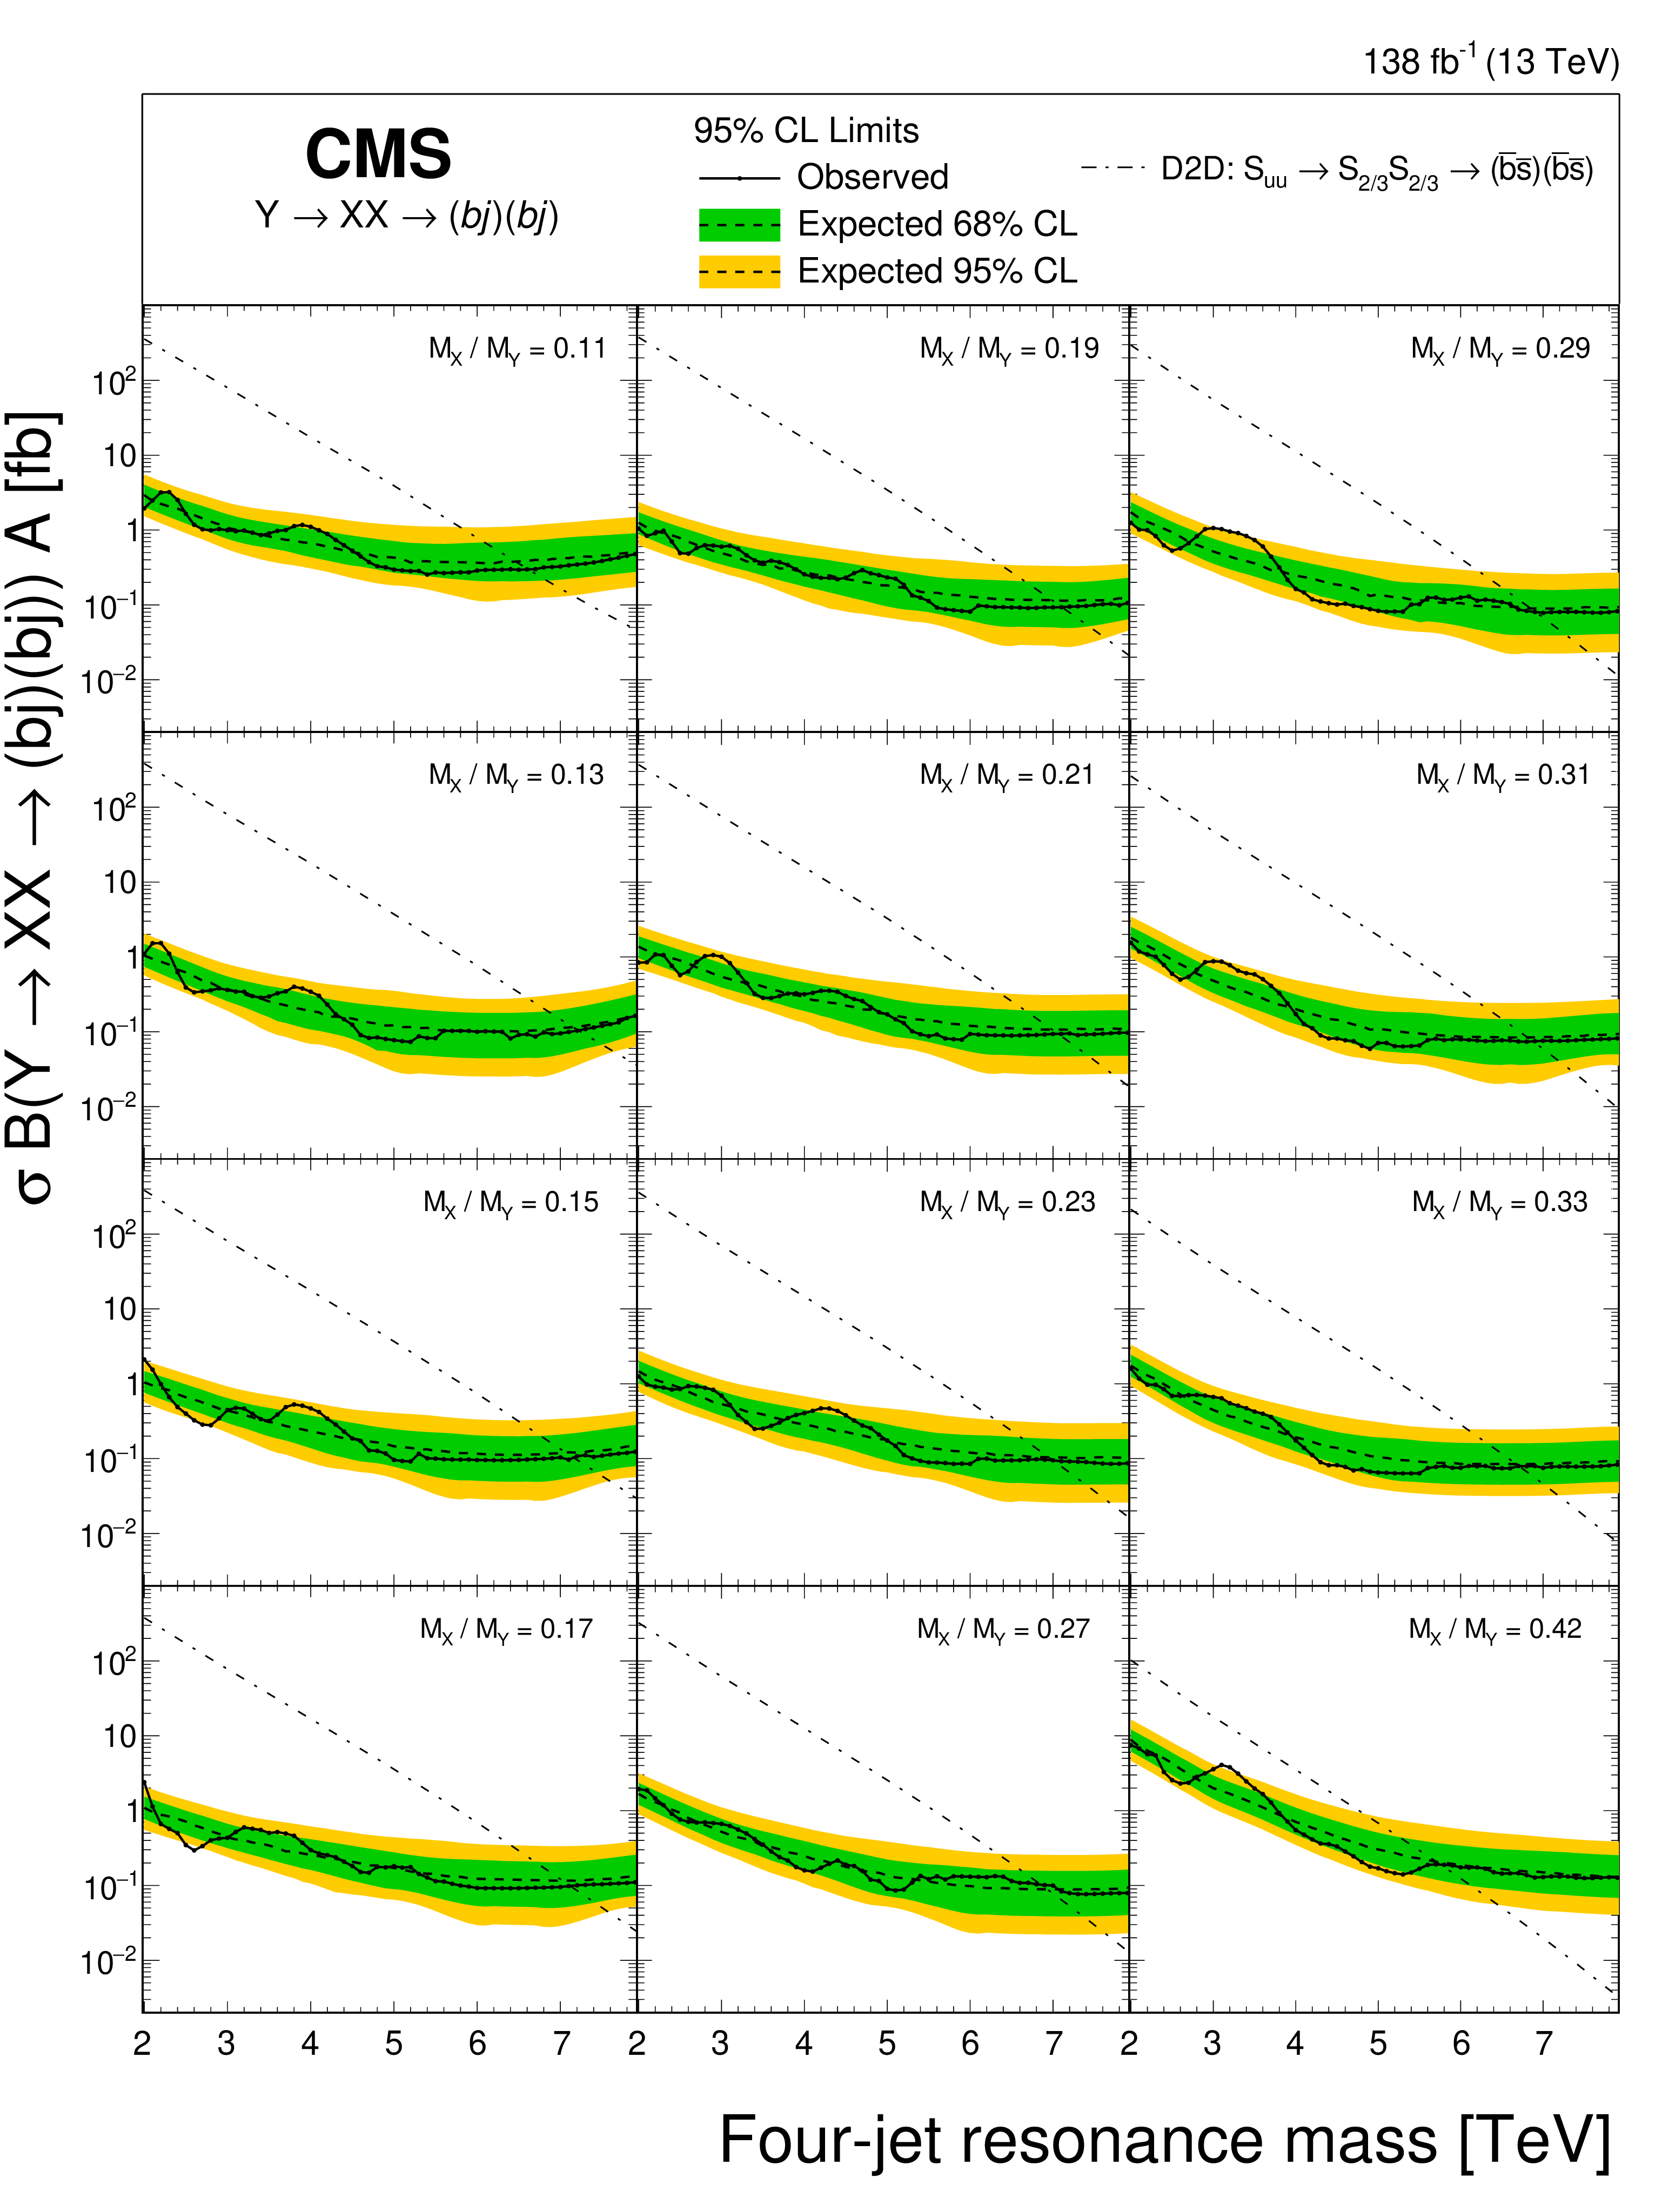
The observed 95% CL upper limits (black line with points) on the product of the cross section, branching fraction, and acceptance in the resonant search for $ {Y} \to \mathrm{X} \mathrm{X} \to (\mathrm{b} {j} )(\mathrm{b} {j} ) $ for the other twelve values of $ \alpha_{\text{true}} = M(\mathrm{X})/M({Y} ) $. The expected limits (dashed line) and their variations at the 68% and 95% CL (shaded bands) are also shown. Limits are compared to the predicted cross section of the D2D diquark model [20] (dot-dashed line) for the respective $ \alpha_{\text{true}} $ values, assuming $ \mathcal{B}({S}{\mathrm{u}\mathrm{u}} \to {{S}{2/3}} {{S}{2/3}} \to (\overline{\mathrm{b}}\overline{\mathrm{s}})(\overline{\mathrm{b}}\overline{\mathrm{s}})) = $ 1. |
png pdf |
Figure 13:
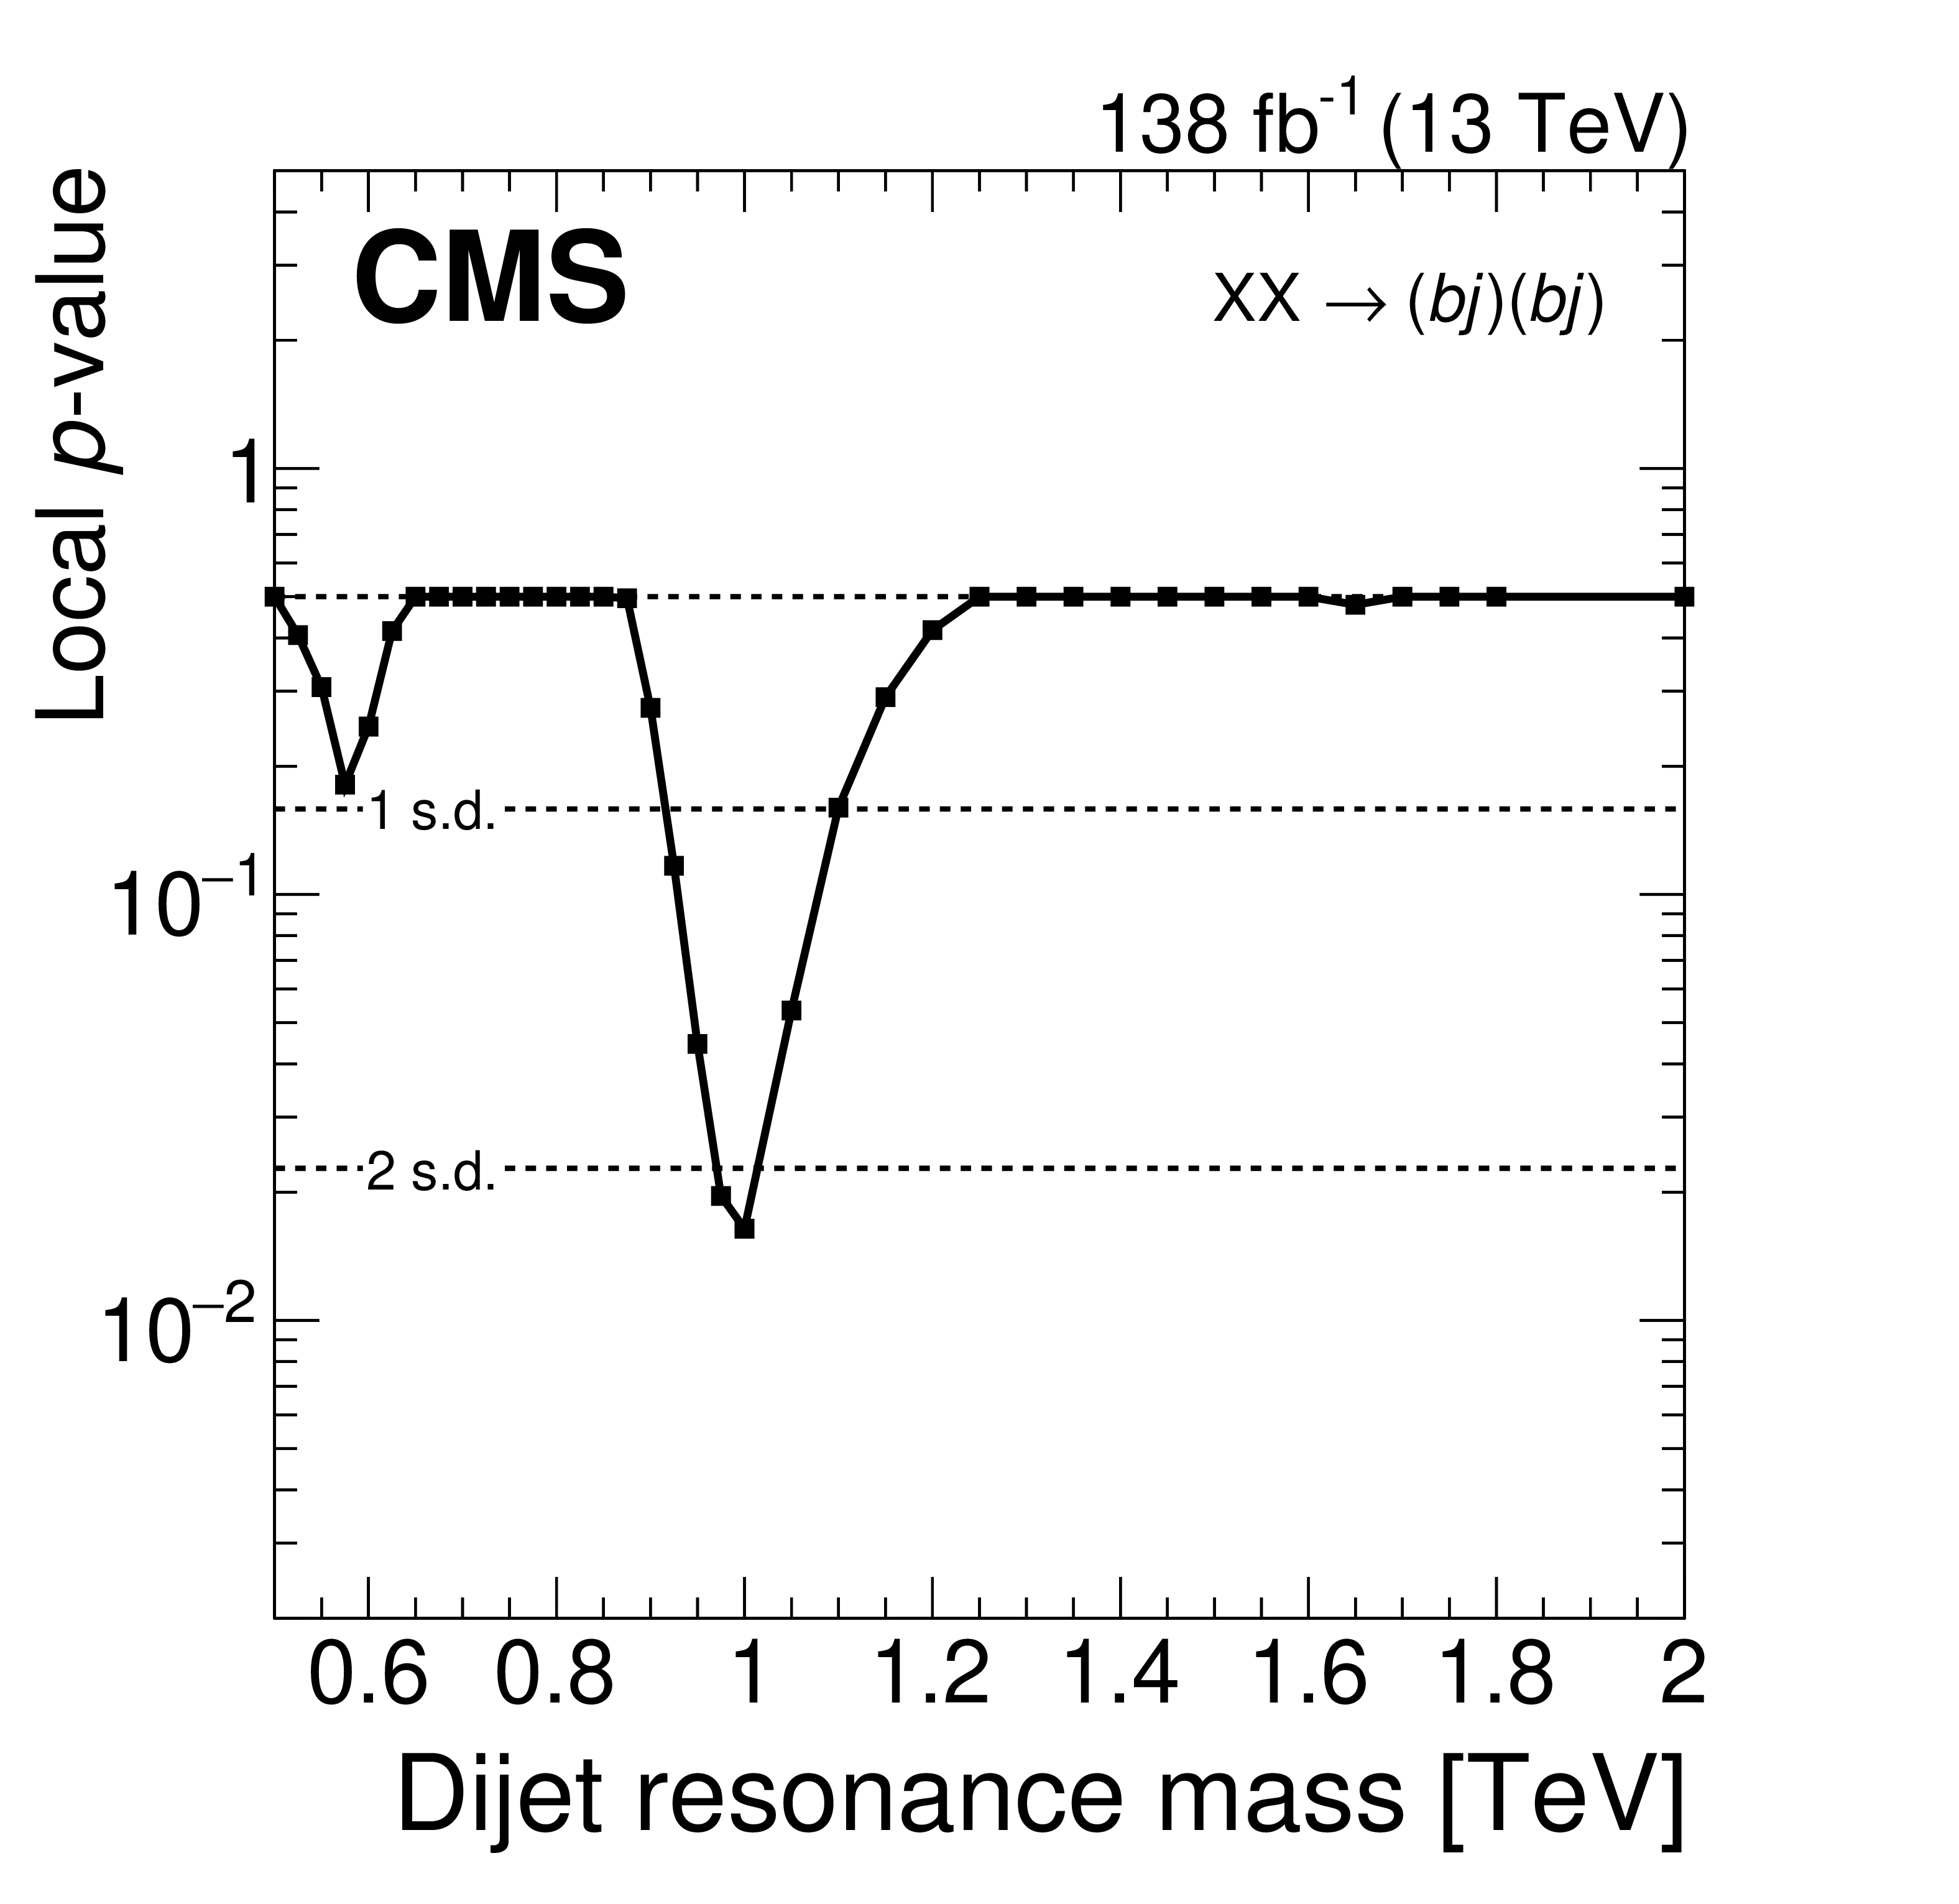
The observed local $ p $-value for a signal across all $ \alpha $ bins for the nonresonant search $ \mathrm{X} \mathrm{X} \to (\mathrm{b} {j} )(\mathrm{b} {j} ) $. Dashed lines indicate the corresponding levels of local significance, expressed in standard deviations (s.d.). |
png pdf |
Figure 14:
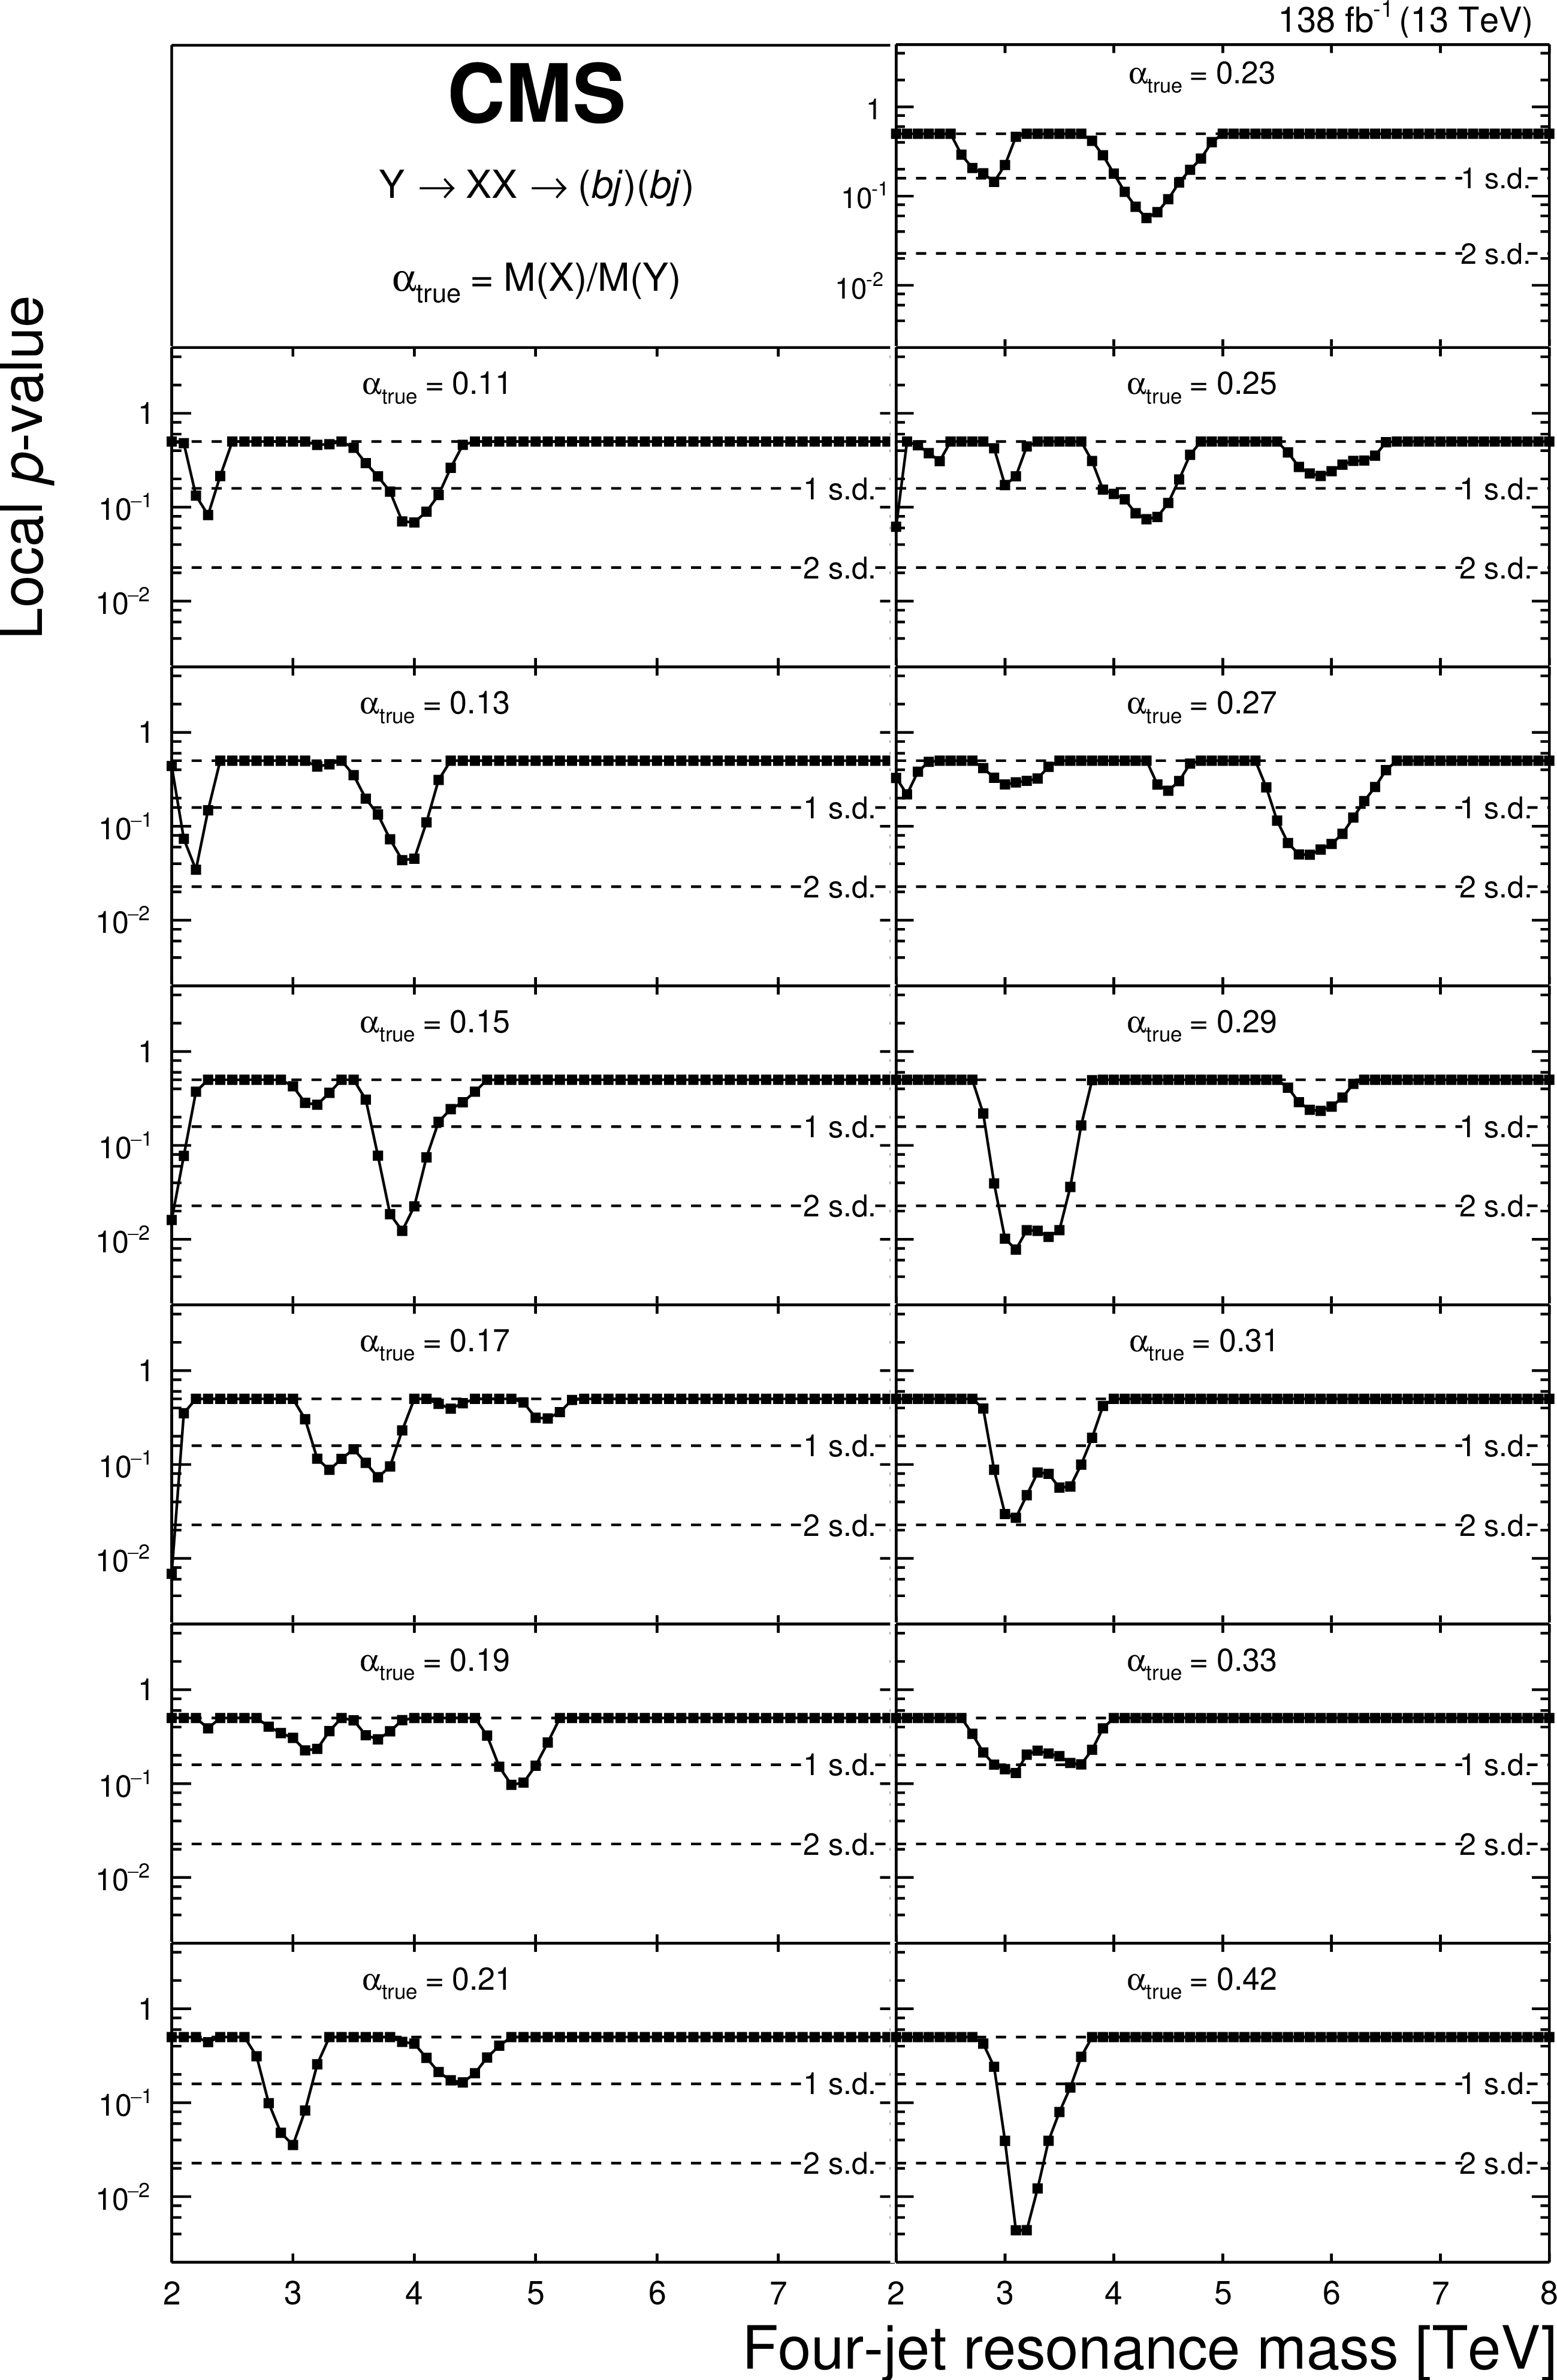
The observed local $ p $-values for a signal across all $ \alpha $ bins for the resonant search $ {Y} \to \mathrm{X} \mathrm{X} \to (\mathrm{b} {j} )(\mathrm{b} {j} ) $ for 13 values of $ \alpha_{\text{true}} = M(\mathrm{X})/M({Y} ) $. Dashed lines denote the corresponding levels of local significance, expressed in standard deviations (s.d.). |
png pdf |
Figure 15:
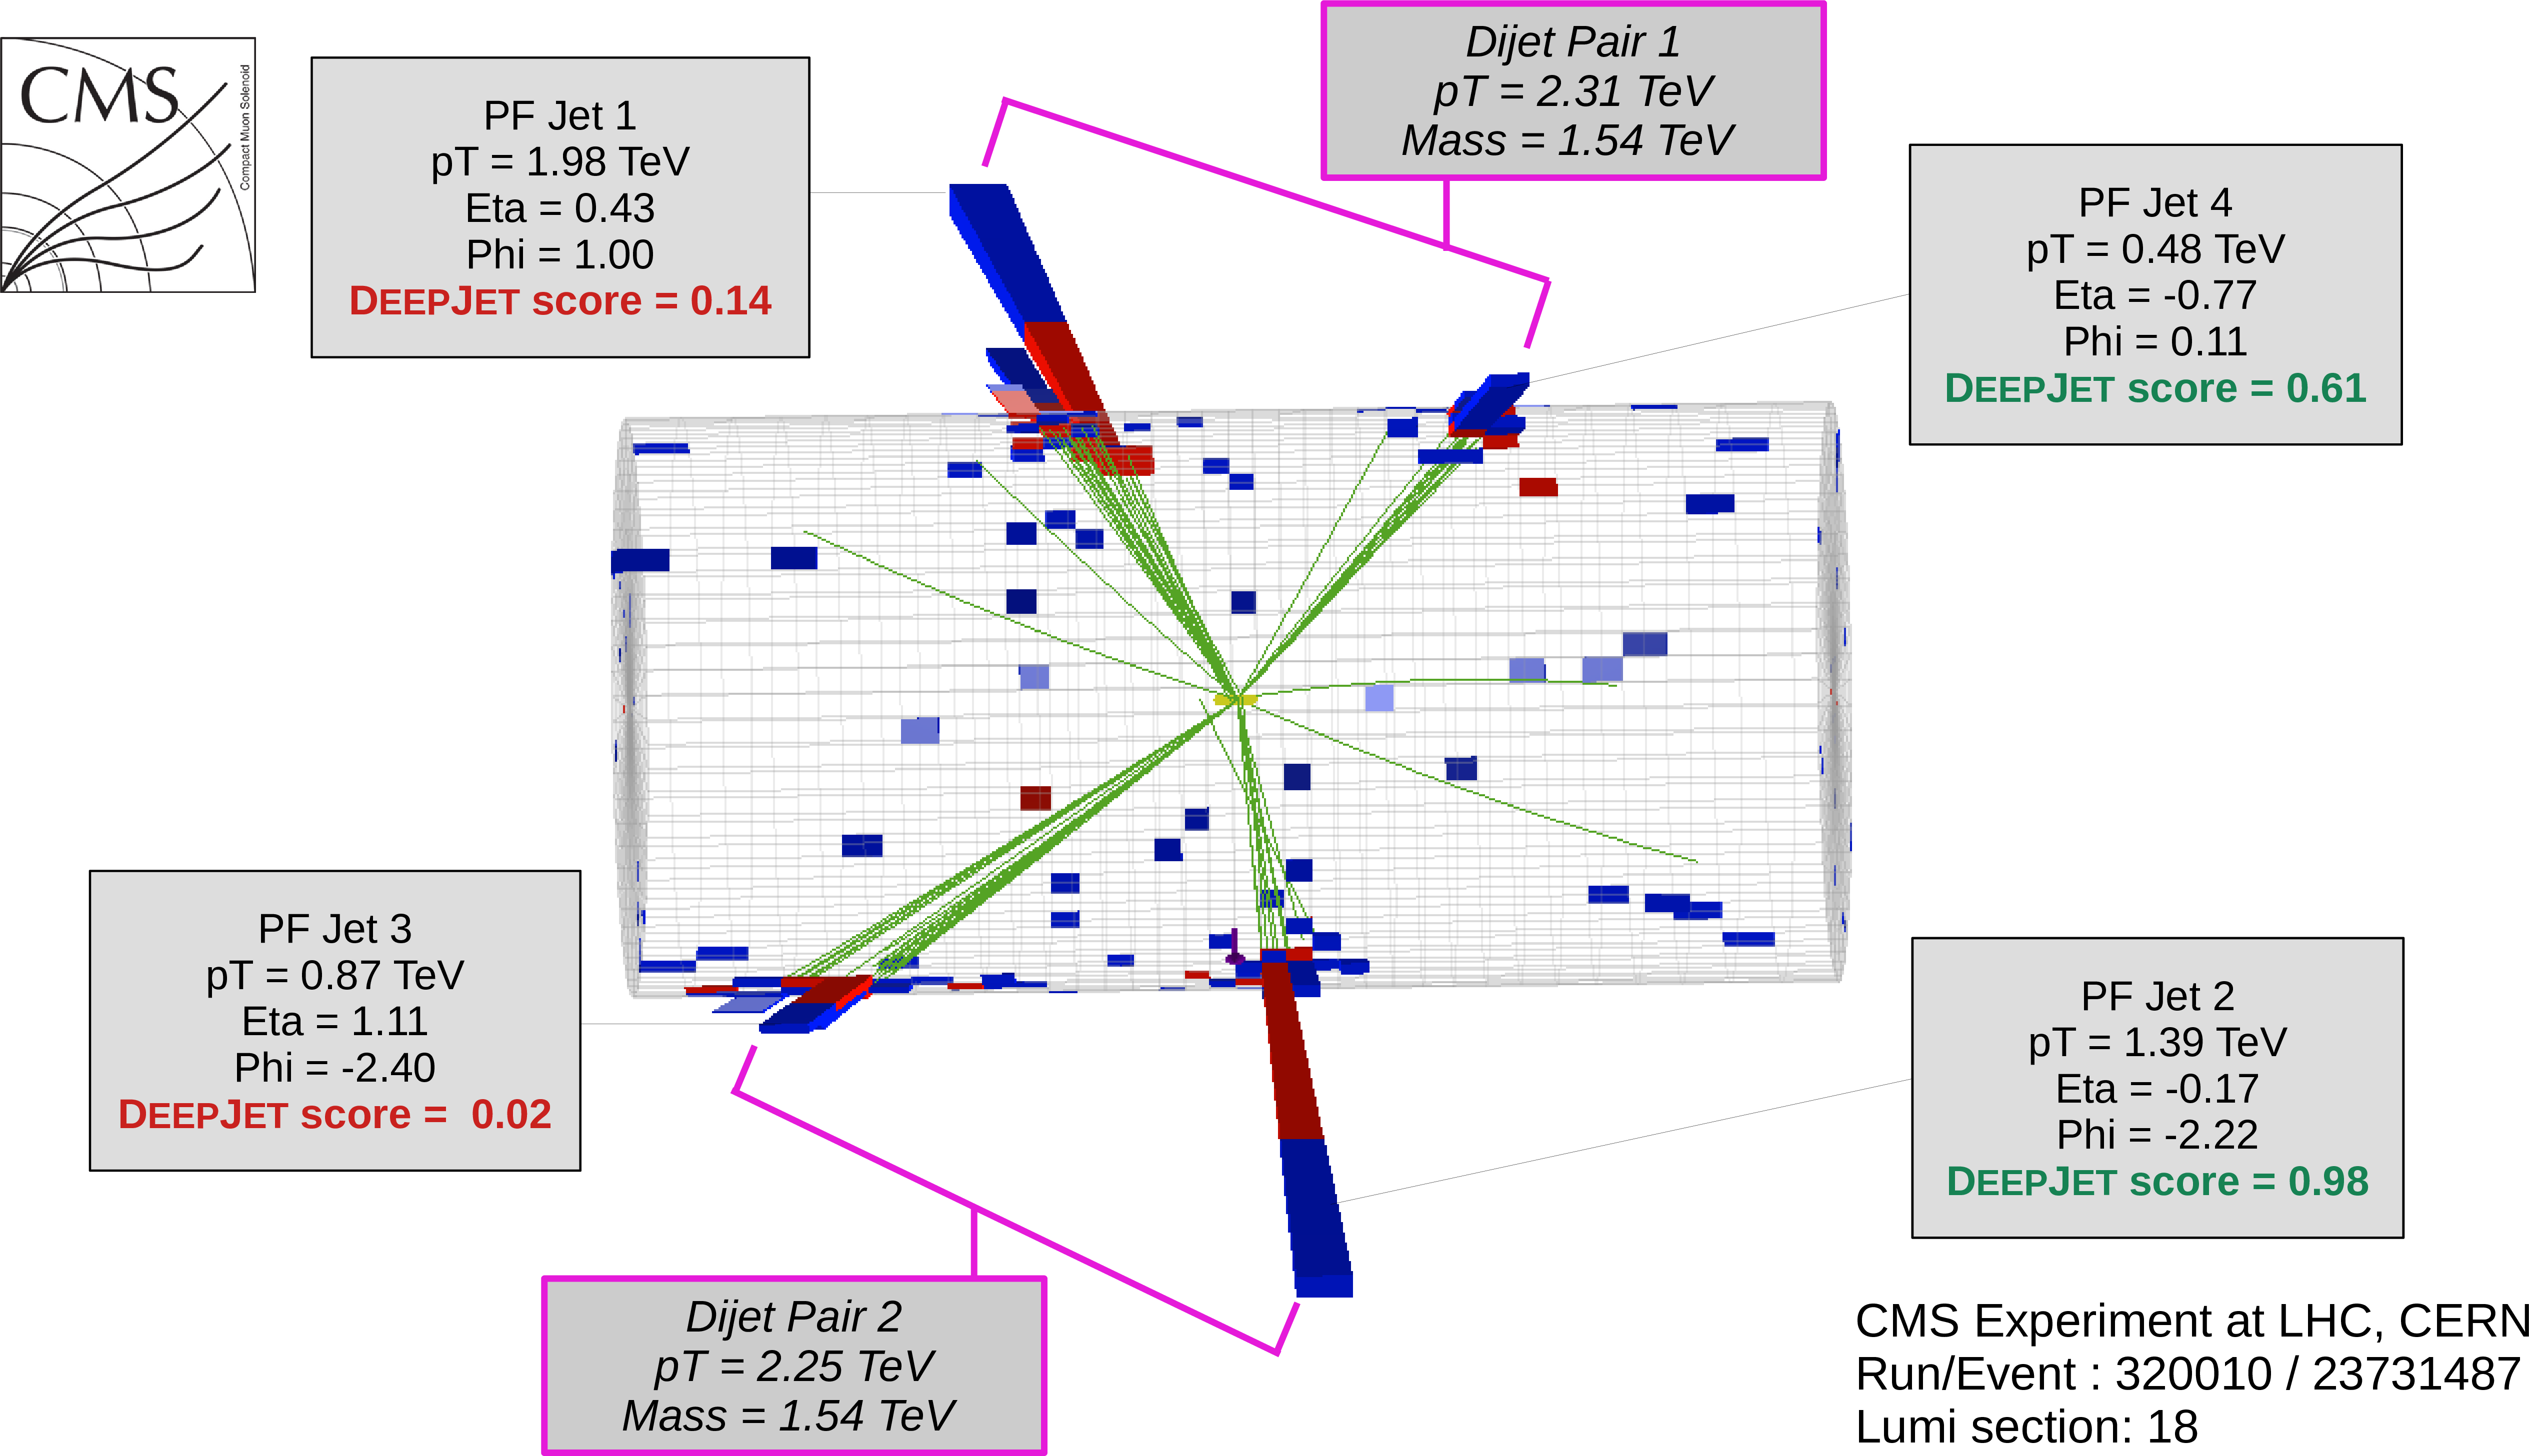
Three-dimensional display of the event with the highest $ m_{\mathrm{4j}} = $ 5.5 TeV and highest $ \overline{m}_{2{j} } = $ 1.5 TeV. The display shows the energy deposited in the electromagnetic (red) and hadron (blue) calorimeters, and the reconstructed tracks of charged particles (green). The two b jets in the event have passing b tagging scores, shown in green, and the two other jets in the event have failing b tagging scores, shown in red, using the 2018 `medium' working point threshold of 0.2770. The grouping of the four observed jets into two dijet pairs (purple box) is discussed in the text. |
| Summary |
| A search for nonresonant and resonant production of pairs of dijet resonances, with a bottom (b) jet within each dijet, has been performed. Data from proton-proton collisions at $ \sqrt{s}= $ 13 TeV are used in this search, collected by the CMS experiment at the LHC, corresponding to an integrated luminosity of 138 fb$^{-1}$. The analysis is conducted across steeply falling dijet ($ \overline{m}_{2{j} } $) and four-jet ($ m_{\mathrm{4j}} $) mass distributions, binned in $ \alpha = \overline{m}_{2{j} }/m_{\mathrm{4j}} $. The mass distributions are fitted with a sum of empirical background functions and the simulated shapes of resonance signals, to search for a mass bump indicative of a heavy resonance. We observe no significant evidence for new resonances. Upper limits at 95% confidence level (CL) are provided for the production cross section multiplied by the branching fraction and acceptance, for models predicting pair-produced resonances decaying to pairs of quarks. These are the first LHC limits on resonant production of pairs of dijet resonances decaying to b jets, in which all resonances considered are beyond the standard model. For nonresonant production, the limits are presented as functions of the mass of the spin-0 dijet resonance, in the range 0.5 to 2.0 TeV. For resonant production, the limits are given for values of four-jet resonance mass between 2 and 8 TeV. Limits from the nonresonant search are compared to a model [18,19] of $ R $-parity-violating supersymmetry, with pair-produced top squarks decaying to bottom and strange quarks. Top squarks with masses between 0.5 and 0.8 TeV are excluded at 95% CL. This significantly extends the mass limit on these top squark decays, which was previously about 0.5 TeV [16]. The largest excess observed in the nonresonant search occurs for a dijet resonance mass of 1.0 TeV and has a local significance of 2.1 standard deviations. Limits from the resonant search are compared to a recent model [20] of massive intermediate scalar diquarks (S$ \mathrm{u} \mathrm{u} $ ) decaying to pairs of final state diquarks ({S2/3} ), and exclude the S$ \mathrm{u} \mathrm{u} $ for masses between 2 and 7 TeV, for nearly all values of the {S2/3} mass considered. We note that these are the first limits on this model of S$ \mathrm{u} \mathrm{u} $ decays. The most significant excess seen in the resonant search occurs at an S$ \mathrm{u} \mathrm{u} $ mass of 3.1 TeV and an {S2/3} mass of 1.3 TeV, and has a local significance of 2.6 standard deviations. |
| References | ||||
| 1 | C. T. Hill | Topcolor: Top quark condensation in a gauge extension of the standard model | PLB 266 (1991) 419 | |
| 2 | L. Randall and R. Sundrum | A large mass hierarchy from a small extra dimension | PRL 83 (1999) 3370 | hep-ph/9905221 |
| 3 | G. D. Kribs, E. Poppitz, and N. Weiner | Flavor in supersymmetry with an extended $ R $ symmetry | PRD 78 (2008) 055010 | 0712.2039 |
| 4 | C. Kilic, T. Okui, and R. Sundrum | Colored resonances at the Tevatron: Phenomenology and discovery potential in multijets | JHEP 07 (2008) 038 | 0802.2568 |
| 5 | B. A. Dobrescu, R. M. Harris, and J. Isaacson | Ultraheavy resonances at the LHC: beyond the QCD background | 1810.09429 | |
| 6 | I. Duminica et al. | Ultraheavy diquark decaying into vectorlike quarks at the LHC | PRD 111 (2025) 115025 | 2503.17031 |
| 7 | ATLAS Collaboration | Search for new phenomena in dijet mass and angular distributions from pp collisions at $ \sqrt{s}= $ 13 TeV with the ATLAS detector | PLB 754 (2016) 302 | 1512.01530 |
| 8 | CMS Collaboration | Search for narrow resonances decaying to dijets in proton-proton collisions at $ \sqrt{s} = $ 13 TeV | PRL 116 (2016) 071801 | CMS-EXO-15-001 1512.01224 |
| 9 | CMS Collaboration | Search for dijet resonances in proton-proton collisions at $ \sqrt{s} = $ 13 TeV and constraints on dark matter and other models | PLB 769 (2017) 520 | CMS-EXO-16-032 1611.03568 |
| 10 | ATLAS Collaboration | Search for new phenomena in dijet events using 37 fb$ ^{-1} $ of $ pp $ collision data collected at $ \sqrt{s}= $13 TeV with the ATLAS detector | PRD 96 (2017) 052004 | 1703.09127 |
| 11 | CMS Collaboration | Search for narrow and broad dijet resonances in proton-proton collisions at $ \sqrt{s}= $ 13 TeV and constraints on dark matter mediators and other new particles | JHEP 08 (2018) 130 | CMS-EXO-16-056 1806.00843 |
| 12 | ATLAS Collaboration | Search for new resonances in mass distributions of jet pairs using 139 fb$ ^{-1} $ of $ pp $ collisions at $ \sqrt{s}= $ 13 TeV with the ATLAS detector | JHEP 03 (2020) 145 | 1910.08447 |
| 13 | CMS Collaboration | Search for high mass dijet resonances with a new background prediction method in proton-proton collisions at $ \sqrt{s} = $ 13 TeV | JHEP 05 (2020) 033 | CMS-EXO-19-012 1911.03947 |
| 14 | CMS Collaboration | Search for resonant and nonresonant production of pairs of dijet resonances in proton-proton collisions at $ \sqrt{s}= $ 13 TeV | JHEP 07 (2023) 161 | CMS-EXO-21-010 2206.09997 |
| 15 | ATLAS Collaboration | Pursuit of paired dijet resonances in the Run 2 dataset with ATLAS | PRD 108 (2023) 112005 | 2307.14944 |
| 16 | CMS Collaboration | Search for pair-produced resonances decaying to quark pairs in proton-proton collisions at $ \sqrt{s}= $ 13 TeV | PRD 98 (2018) 112014 | CMS-EXO-17-021 1808.03124 |
| 17 | ATLAS Collaboration | A search for pair-produced resonances in four-jet final states at $ \sqrt{s}= $ 13 TeV with the ATLAS detector | EPJC 78 (2018) 250 | 1710.07171 |
| 18 | J. A. Evans and Y. Kats | LHC coverage of RPV MSSM with light stops | JHEP 04 (2013) 028 | 1209.0764 |
| 19 | R. Barbier et al. | $ R $-parity-violating supersymmetry | Phys. Rept. 420 (2005) 1 | hep-ph/0406039 |
| 20 | B. A. Dobrescu | LHC probes of the 10 TeV scale | 1912.13155 | |
| 21 | CMSnoop | none | \hrefHEPData record for this analysis, 2026 link |
|
| 22 | CMS Collaboration | The CMS experiment at the CERN LHC | JINST 3 (2008) S08004 | |
| 23 | CMS Collaboration | Development of the CMS detector for the CERN LHC Run 3 | JINST 19 (2024) P05064 | CMS-PRF-21-001 2309.05466 |
| 24 | CMS Collaboration | Performance of the CMS Level-1 trigger in proton-proton collisions at $ \sqrt{s} = $ 13 TeV | JINST 15 (2020) P10017 | CMS-TRG-17-001 2006.10165 |
| 25 | CMS Collaboration | The CMS trigger system | JINST 12 (2017) P01020 | CMS-TRG-12-001 1609.02366 |
| 26 | CMS Collaboration | Performance of the CMS high-level trigger during LHC Run 2 | JINST 19 (2024) P11021 | CMS-TRG-19-001 2410.17038 |
| 27 | CMS Collaboration | Electron and photon reconstruction and identification with the CMS experiment at the CERN LHC | JINST 16 (2021) P05014 | CMS-EGM-17-001 2012.06888 |
| 28 | CMS Collaboration | Performance of the CMS muon detector and muon reconstruction with proton-proton collisions at $ \sqrt{s}= $ 13 TeV | JINST 13 (2018) P06015 | CMS-MUO-16-001 1804.04528 |
| 29 | CMS Collaboration | Description and performance of track and primary-vertex reconstruction with the CMS tracker | JINST 9 (2014) P10009 | CMS-TRK-11-001 1405.6569 |
| 30 | CMS Collaboration | Particle-flow reconstruction and global event description with the CMS detector | JINST 12 (2017) P10003 | CMS-PRF-14-001 1706.04965 |
| 31 | CMS Collaboration | Performance of reconstruction and identification of $ \tau $ leptons decaying to hadrons and $ \nu_\tau $ in pp collisions at $ \sqrt{s}= $ 13 TeV | JINST 13 (2018) P10005 | CMS-TAU-16-003 1809.02816 |
| 32 | CMS Collaboration | Jet energy scale and resolution in the CMS experiment in pp collisions at 8 TeV | JINST 12 (2017) P02014 | CMS-JME-13-004 1607.03663 |
| 33 | CMS Collaboration | Performance of missing transverse momentum reconstruction in proton-proton collisions at $ \sqrt{s} = $ 13 TeV using the CMS detector | JINST 14 (2019) P07004 | CMS-JME-17-001 1903.06078 |
| 34 | P. Skands, S. Carrazza, and J. Rojo | Tuning PYTHIA 8.1: the Monash 2013 tune | EPJC 74 (2014) 3024 | 1404.5630 |
| 35 | CMS Collaboration | Event generator tunes obtained from underlying event and multiparton scattering measurements | EPJC 76 (2016) 155 | CMS-GEN-14-001 1512.00815 |
| 36 | NNPDF Collaboration | Parton distributions with LHC data | NPB 867 (2013) 244 | 1207.1303 |
| 37 | J. Alwall et al. | The automated computation of tree-level and next-to-leading order differential cross sections, and their matching to parton shower simulations | JHEP 07 (2014) 079 | 1405.0301 |
| 38 | P. Artoisenet, R. Frederix, O. Mattelaer, and R. Rietkerk | Automatic spin-entangled decays of heavy resonances in Monte Carlo simulations | JHEP 03 (2013) 015 | 1212.3460 |
| 39 | J. Alwall et al. | Comparative study of various algorithms for the merging of parton showers and matrix elements in hadronic collisions | EPJC 53 (2008) 473 | 0706.2569 |
| 40 | T. Sjöstrand et al. | An introduction to PYTHIA 8.2 | Comput. Phys. Commun. 191 (2015) 159 | 1410.3012 |
| 41 | CMS Collaboration | Extraction and validation of a new set of CMS PYTHIA8 tunes from underlying-event measurements | EPJC 80 (2020) 4 | CMS-GEN-17-001 1903.12179 |
| 42 | NNPDF Collaboration | Parton distributions for the LHC Run II | JHEP 04 (2015) 040 | 1410.8849 |
| 43 | GEANT4 Collaboration | GEANT 4---a simulation toolkit | NIM A 506 (2003) 250 | |
| 44 | M. Cacciari, G. P. Salam, and G. Soyez | The anti-$ k_t $ jet clustering algorithm | JHEP 04 (2008) 063 | 0802.1189 |
| 45 | M. Cacciari, G. P. Salam, and G. Soyez | FastJet user manual | EPJC 72 (2012) 1896 | 1111.6097 |
| 46 | CMS Collaboration | Technical proposal for the Phase-II upgrade of the Compact Muon Solenoid | CMS Technical Proposal CERN-LHCC-2015-010, CMS-TDR-15-02, 2015 CDS |
|
| 47 | CMS Collaboration | Pileup mitigation at CMS in 13 TeV data | JINST 15 (2020) P09018 | CMS-JME-18-001 2003.00503 |
| 48 | CMS Collaboration | Jet algorithms performance in 13 TeV data | CMS Physics Analysis Summary, 2017 CMS-PAS-JME-16-003 |
CMS-PAS-JME-16-003 |
| 49 | CMS Collaboration | Identification of heavy-flavour jets with the CMS detector in pp collisions at 13 TeV | JINST 13 (2018) P05011 | CMS-BTV-16-002 1712.07158 |
| 50 | E. Bols et al. | Jet flavour classification using DeepJet | JINST 15 (2020) P12012 | 2008.10519 |
| 51 | CMS Collaboration | Performance summary of AK4 jet b tagging with data from proton-proton collisions at 13 TeV with the CMS detector | CMS Detector Performance Summary CMS-DP-2023-005, 2023 CDS |
|
| 52 | P. D. Dauncey, M. Kenzie, N. Wardle, and G. J. Davies | Handling uncertainties in background shapes: the discrete profiling method | JINST 10 (2015) P04015 | 1408.6865 |
| 53 | E. Gross and O. Vitells | Trial factors for the look elsewhere effect in high energy physics | EPJC 70 (2010) 525 | 1005.1891 |
| 54 | R. A. Fisher | On the interpretation of $ \chi^{2} $ from contingency tables, and the calculation of P | J. R. Stat. Soc. 85 (1922) 87 | |
| 55 | CMS Collaboration | Precision luminosity measurement in proton-proton collisions at $ \sqrt{s} = $ 13 TeV in 2015 and 2016 at CMS | EPJC 81 (2021) 800 | CMS-LUM-17-003 2104.01927 |
| 56 | CMS Collaboration | CMS luminosity measurement for the 2017 data-taking period at $ \sqrt{s} = $ 13 TeV | CMS Physics Analysis Summary, 2018 link |
CMS-PAS-LUM-17-004 |
| 57 | CMS Collaboration | CMS luminosity measurement for the 2018 data-taking period at $ \sqrt{s} = $ 13 TeV | CMS Physics Analysis Summary, 2019 link |
CMS-PAS-LUM-18-002 |
| 58 | T. Junk | Confidence level computation for combining searches with small statistics | NIM A 434 (1999) 435 | hep-ex/9902006 |
| 59 | A. L. Read | Presentation of search results: the $ \text{CL}_\text{s} $ technique | JPG 28 (2002) 2693 | |
| 60 | G. Cowan, K. Cranmer, E. Gross, and O. Vitells | Asymptotic formulae for likelihood-based tests of new physics | EPJC 71 (2011) 1554 | 1007.1727 |
| 61 | ATLAS and CMS Collaborations, and LHC Higgs Combination Group | Procedure for the LHC Higgs boson search combination in Summer 2011 | Technical Report CMS-NOTE-2011-005, ATL-PHYS-PUB-2011-11, 2011 | |
| 62 | CMS Collaboration | The CMS statistical analysis and combination tool: Combine | Comput. Softw. Big Sci. 8 (2024) 19 | CMS-CAT-23-001 2404.06614 |
| 63 | C. Borschensky et al. | Squark and gluino production cross sections in pp collisions at 13, 14, 33 and 100 TeV | EPJC 74 (2014) 3174 | 1407.5066 |
| 64 | W. Beenakker et al. | NLO+NLL squark and gluino production cross-sections with threshold-improved parton distributions | EPJC 76 (2016) 53 | 1510.00375 |
|
|
Compact Muon Solenoid LHC, CERN |

|

|

|

|

|

|