

Compact Muon Solenoid
LHC, CERN
 Visit us: CMS Public Website, CMS Physics ;
Contact us: CMS Publications Committee
Visit us: CMS Public Website, CMS Physics ;
Contact us: CMS Publications Committee
| CMS-EXO-24-001 ; CERN-EP-2026-169 | ||
| Search for dark matter in a signature with a four-prong large-radius jet in proton-proton collisions at $ \sqrt{s}= $ 13 TeV | ||
| CMS Collaboration | ||
| 10 July 2026 | ||
| Accepted for publication in the Journal of High Energy Physics | ||
| Abstract: A search for a pair of nonprompt dark matter (DM) candidates produced in association with an initial-state radiation jet, in a signature containing a four-prong large-radius jet, is presented. The signal model contains a heavy vector or axial-vector mediator, which produces long-lived dark-sector particles that decay to a stable DM particle and a light boson, which decays to quarks. The analysis is based on data collected in the years 2016--2018 with the CMS detector at the LHC in proton-proton collisions at $ \sqrt{s}= $ 13 TeV, corresponding to an integrated luminosity of 138 fb$ ^{-1} $. Signal candidates feature large-radius jets, which are identified using a jet substructure tagger based on a graph neural network. The large-radius jet aims to reconstruct the decay of light DM mediators into four quarks, which are produced in association with two stable DM particles. The standard model background contributions are estimated from data using dedicated control regions. The missing transverse momentum spectrum is probed for a potential signal over the expected background. No significant excess over the standard model expectation is observed. Upper limits at 95% confidence level are set on the signal strength as functions of either the mediator mass or the relevant coupling. This is the first search for a pair of nonprompt DM candidates in the Lorentz-boosted topology, characterized by a large-radius jet and large missing transverse momentum. | ||
| Links: e-print arXiv:2607.11016 [hep-ex] (PDF) ; CDS record ; inSPIRE record ; HepData record ; CADI line (restricted) ; | ||
| Figures | |
png pdf |
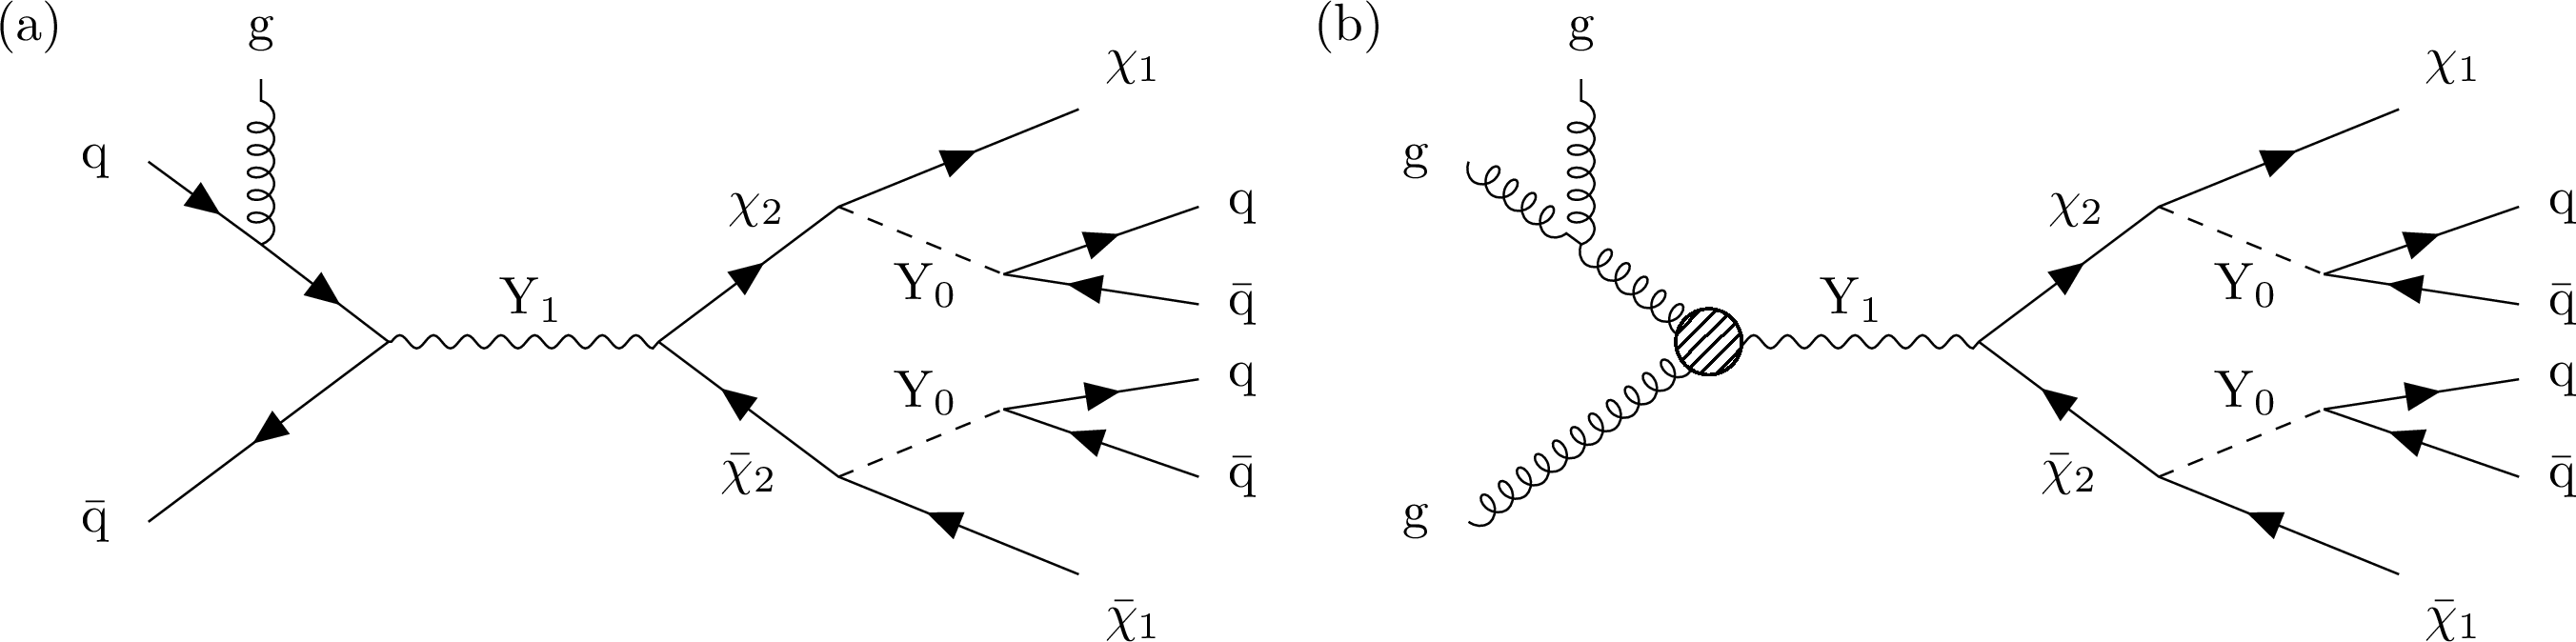
Figure 1:
Representative Feynman diagrams of the signal process. The mediator Y1 is produced via quark-antiquark annihilation (left) or gluon-gluon fusion (right) in association with a jet from initial-state radiation. A hatched circle represents an effective $ \mathrm{Y}_1 \mathrm{g} \mathrm{g} $ coupling. |
png pdf |
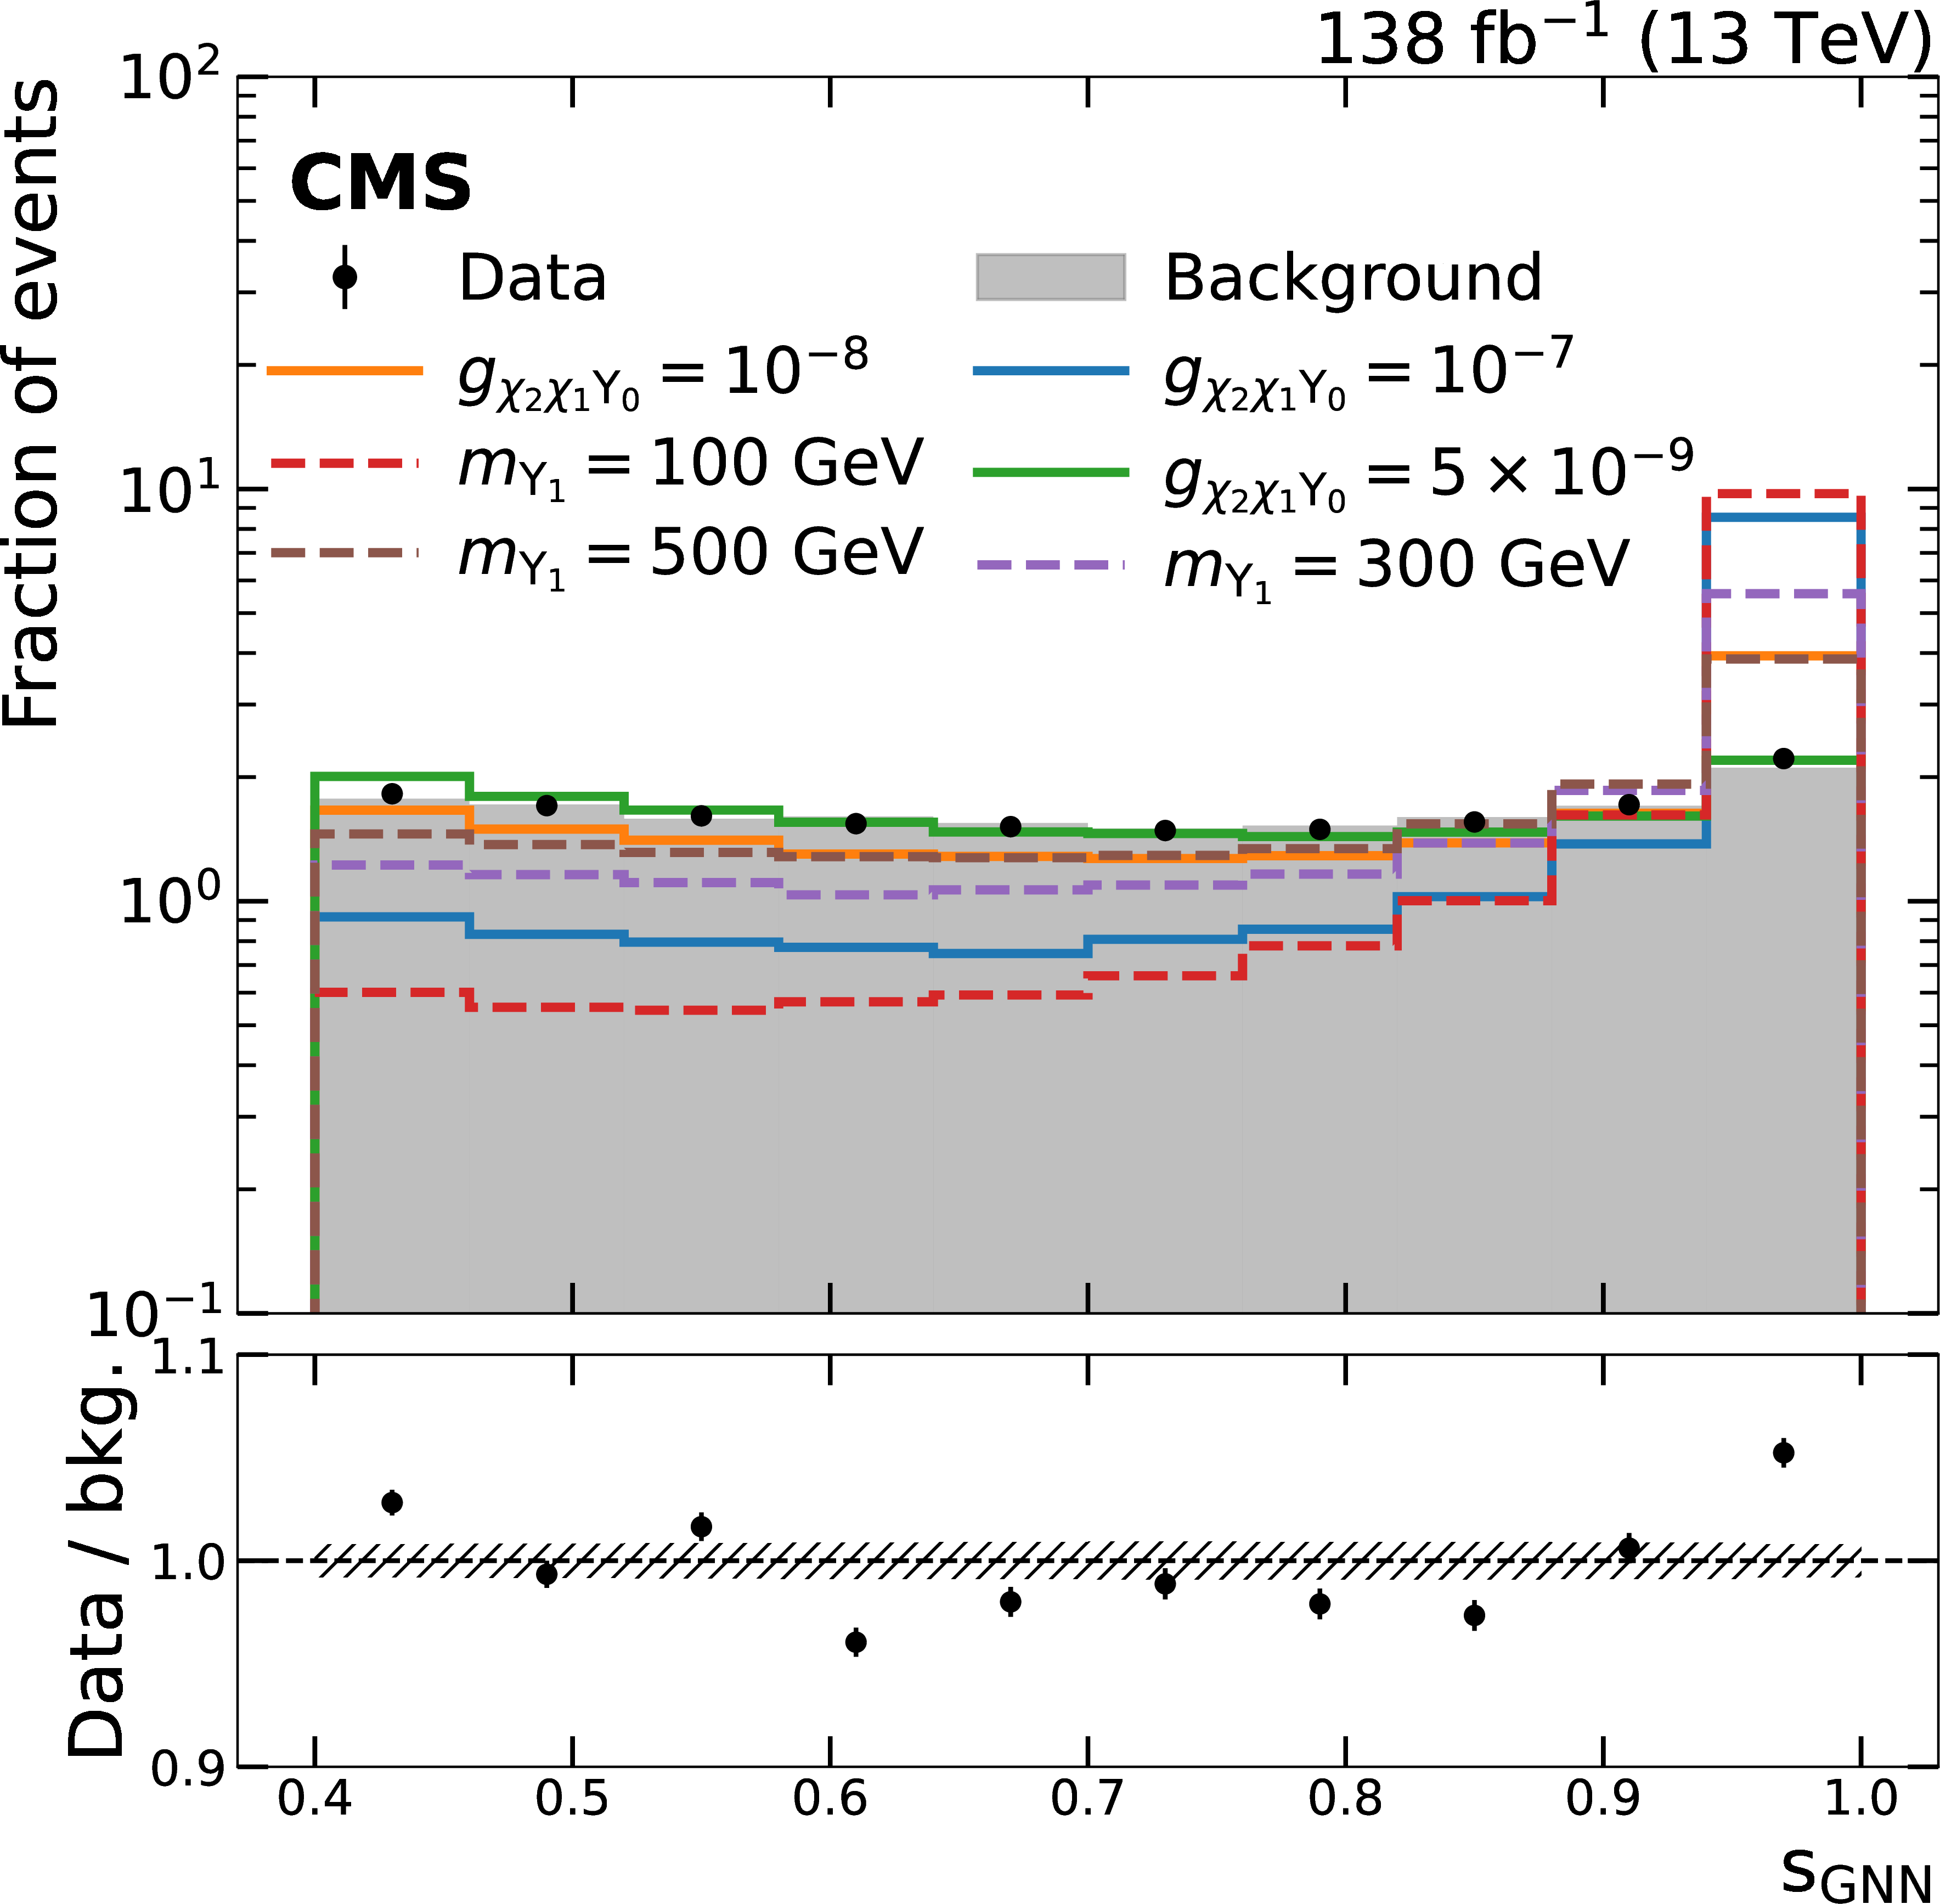
Figure 2:
Distribution of $ s_{\text{GNN}} $ in the SR before imposing any requirement on $ s_{\text{GNN}} $ for the range of values considered in this analysis. The data are shown as black markers with vertical bars indicating the statistical uncertainty. Signal processes are shown as solid lines, while the total background, corresponding to the sum of all considered background contributions estimated from simulation, is represented by the filled histogram. The lower panel shows the ratio of the data and the total background prediction, and the hatched area represents the total uncertainty in the background. The different signal points shown in the figure are listed in Table 1. All distributions are normalized to unity. |
png pdf |
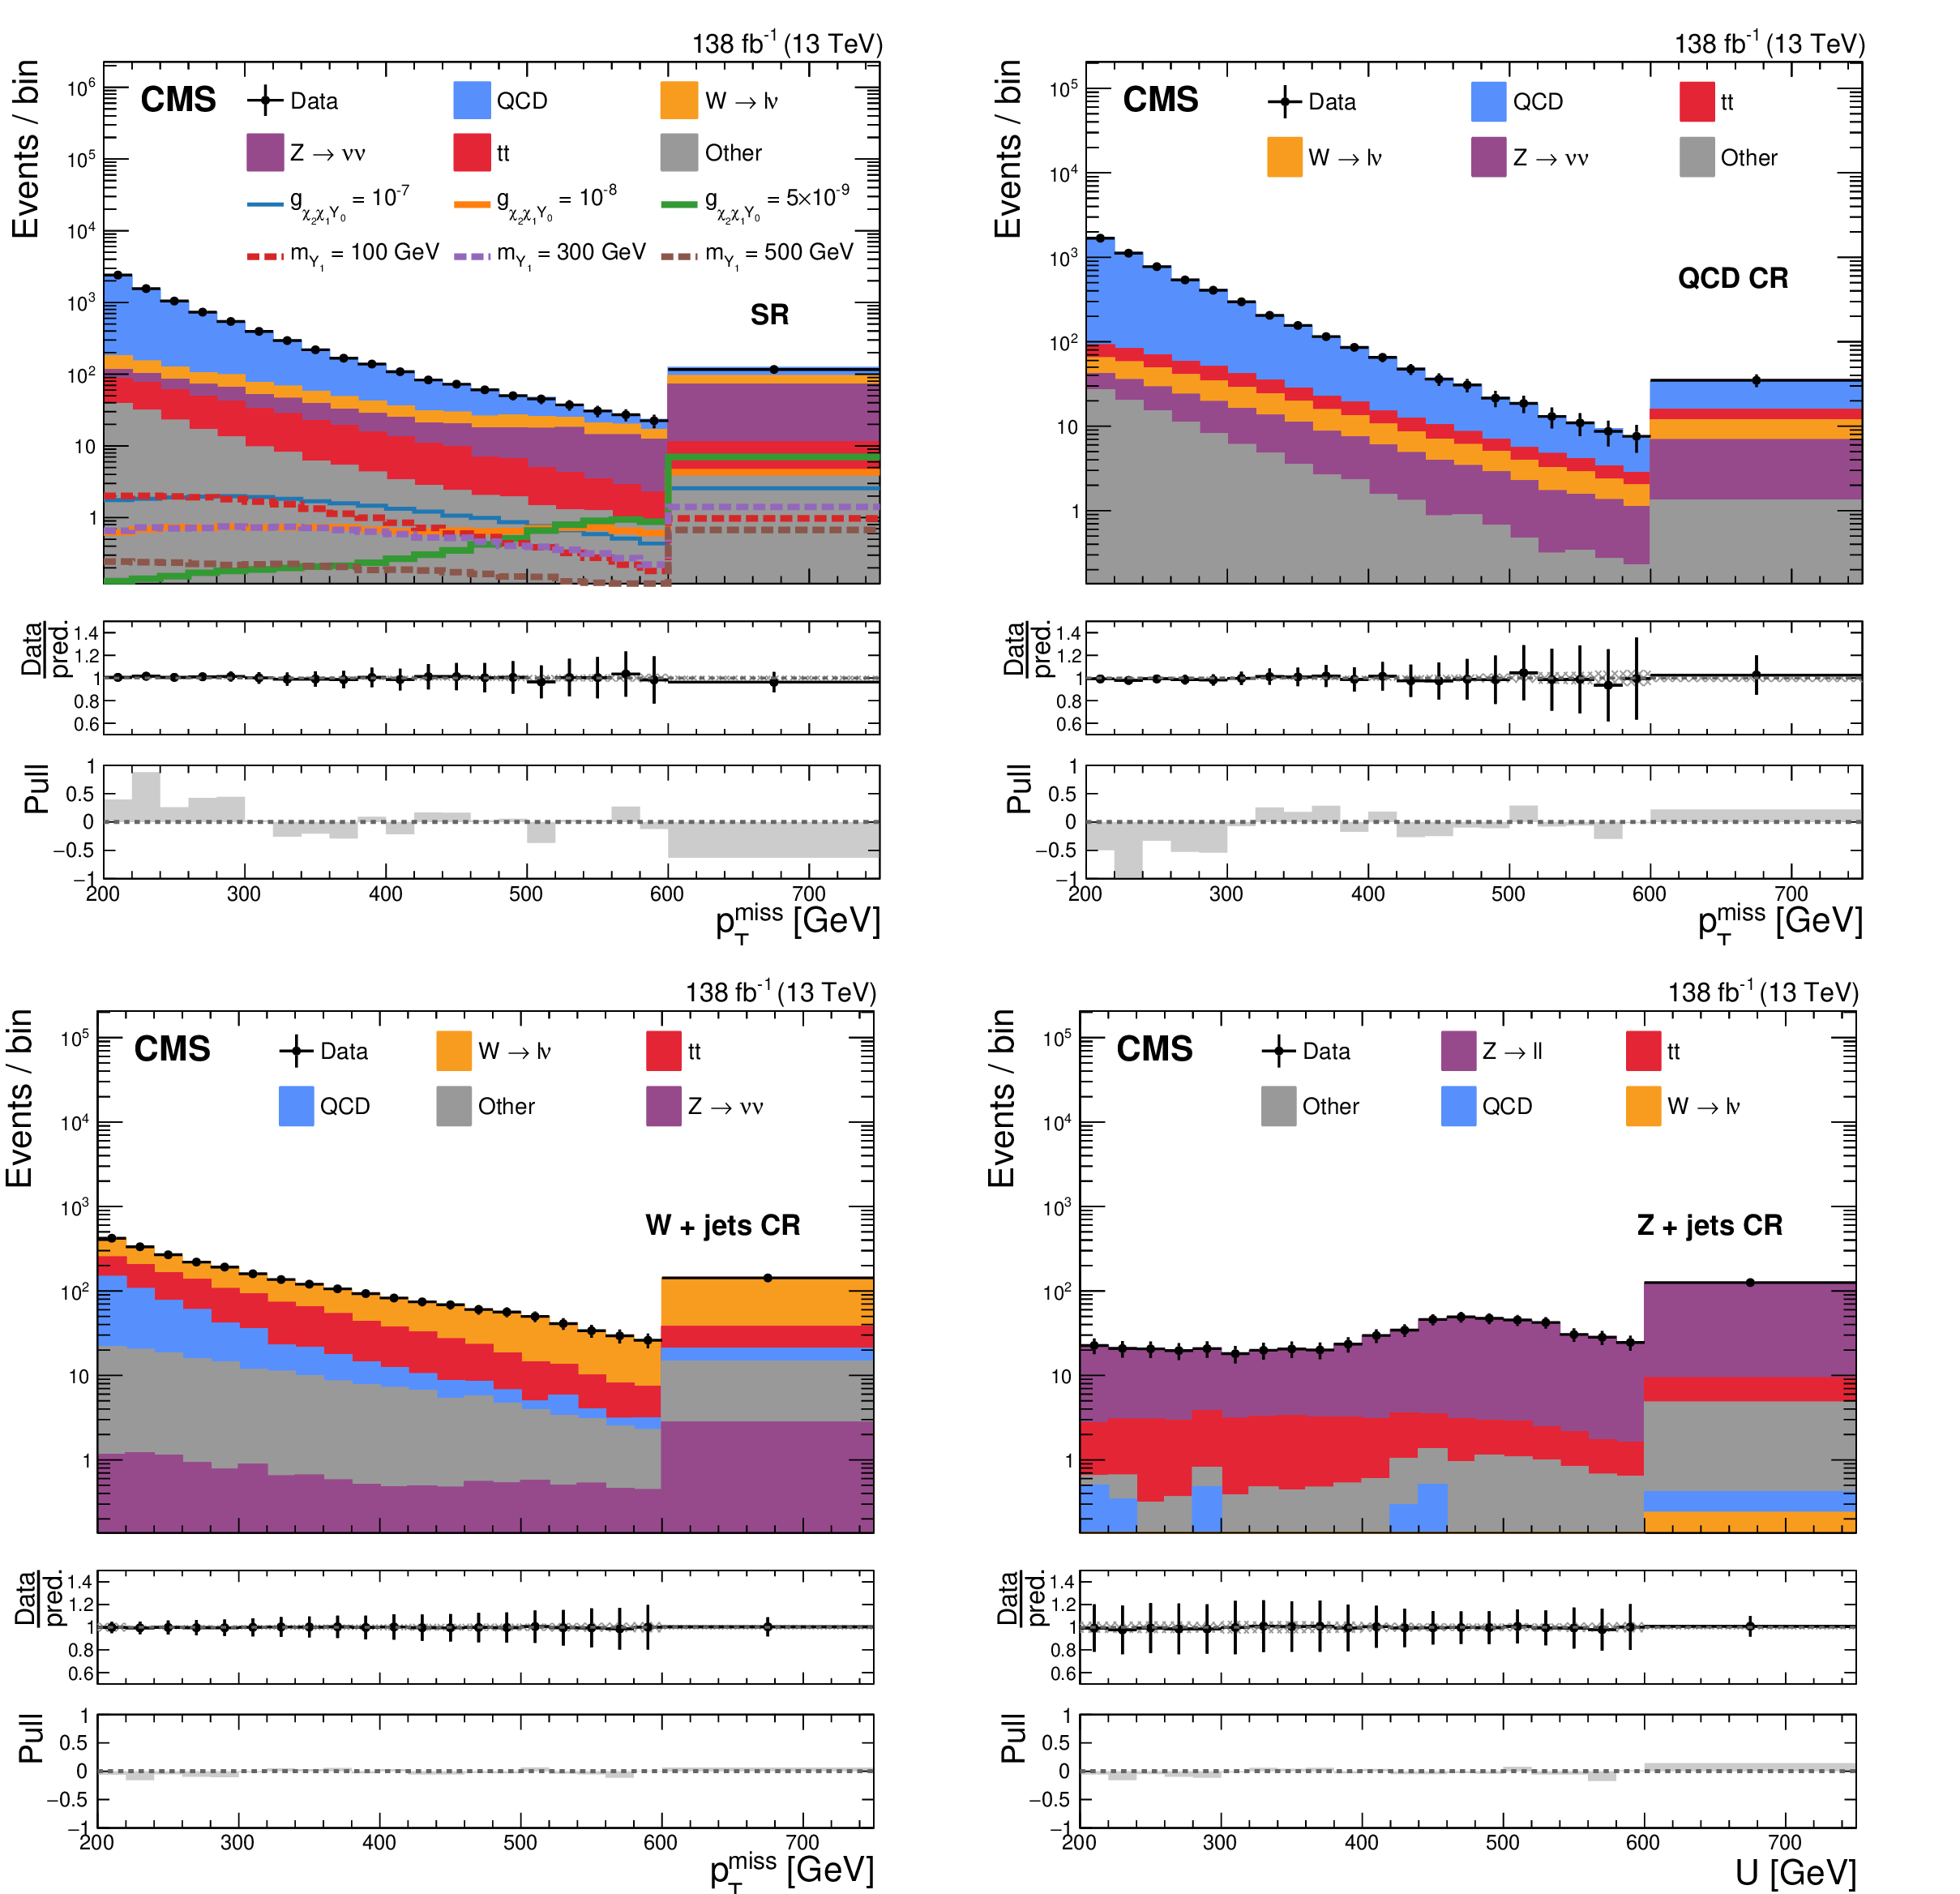
Figure 3:
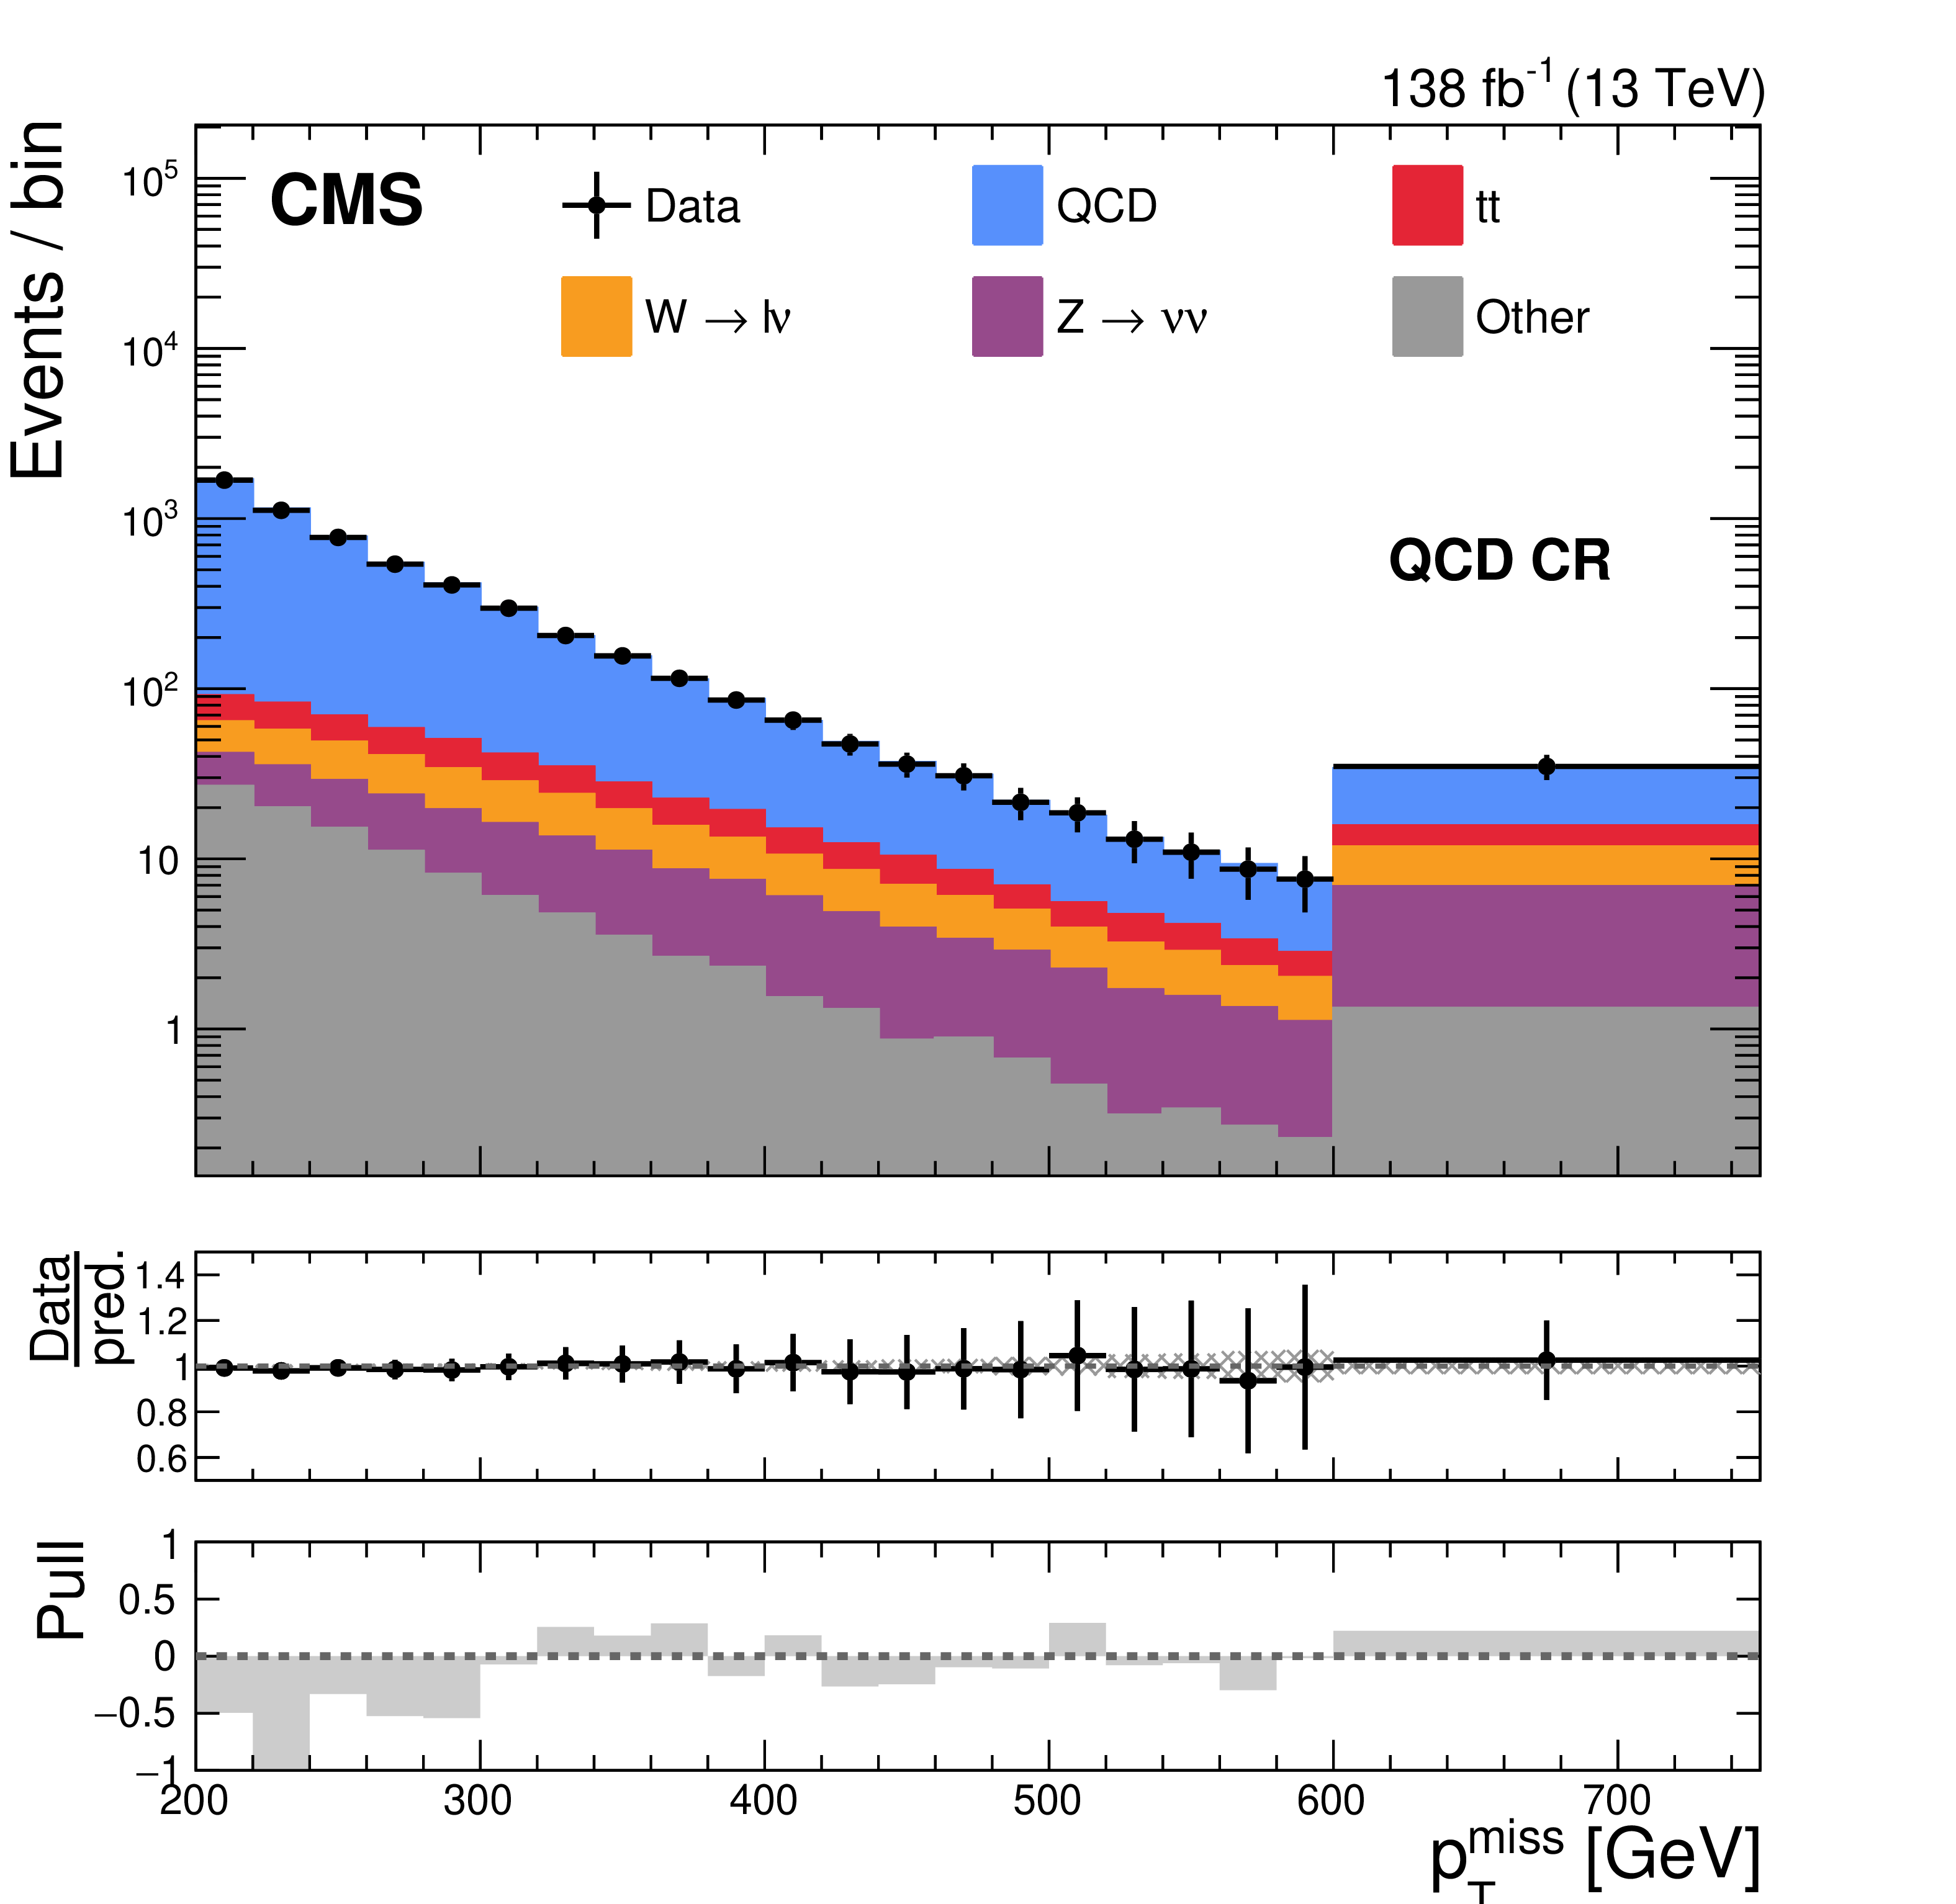
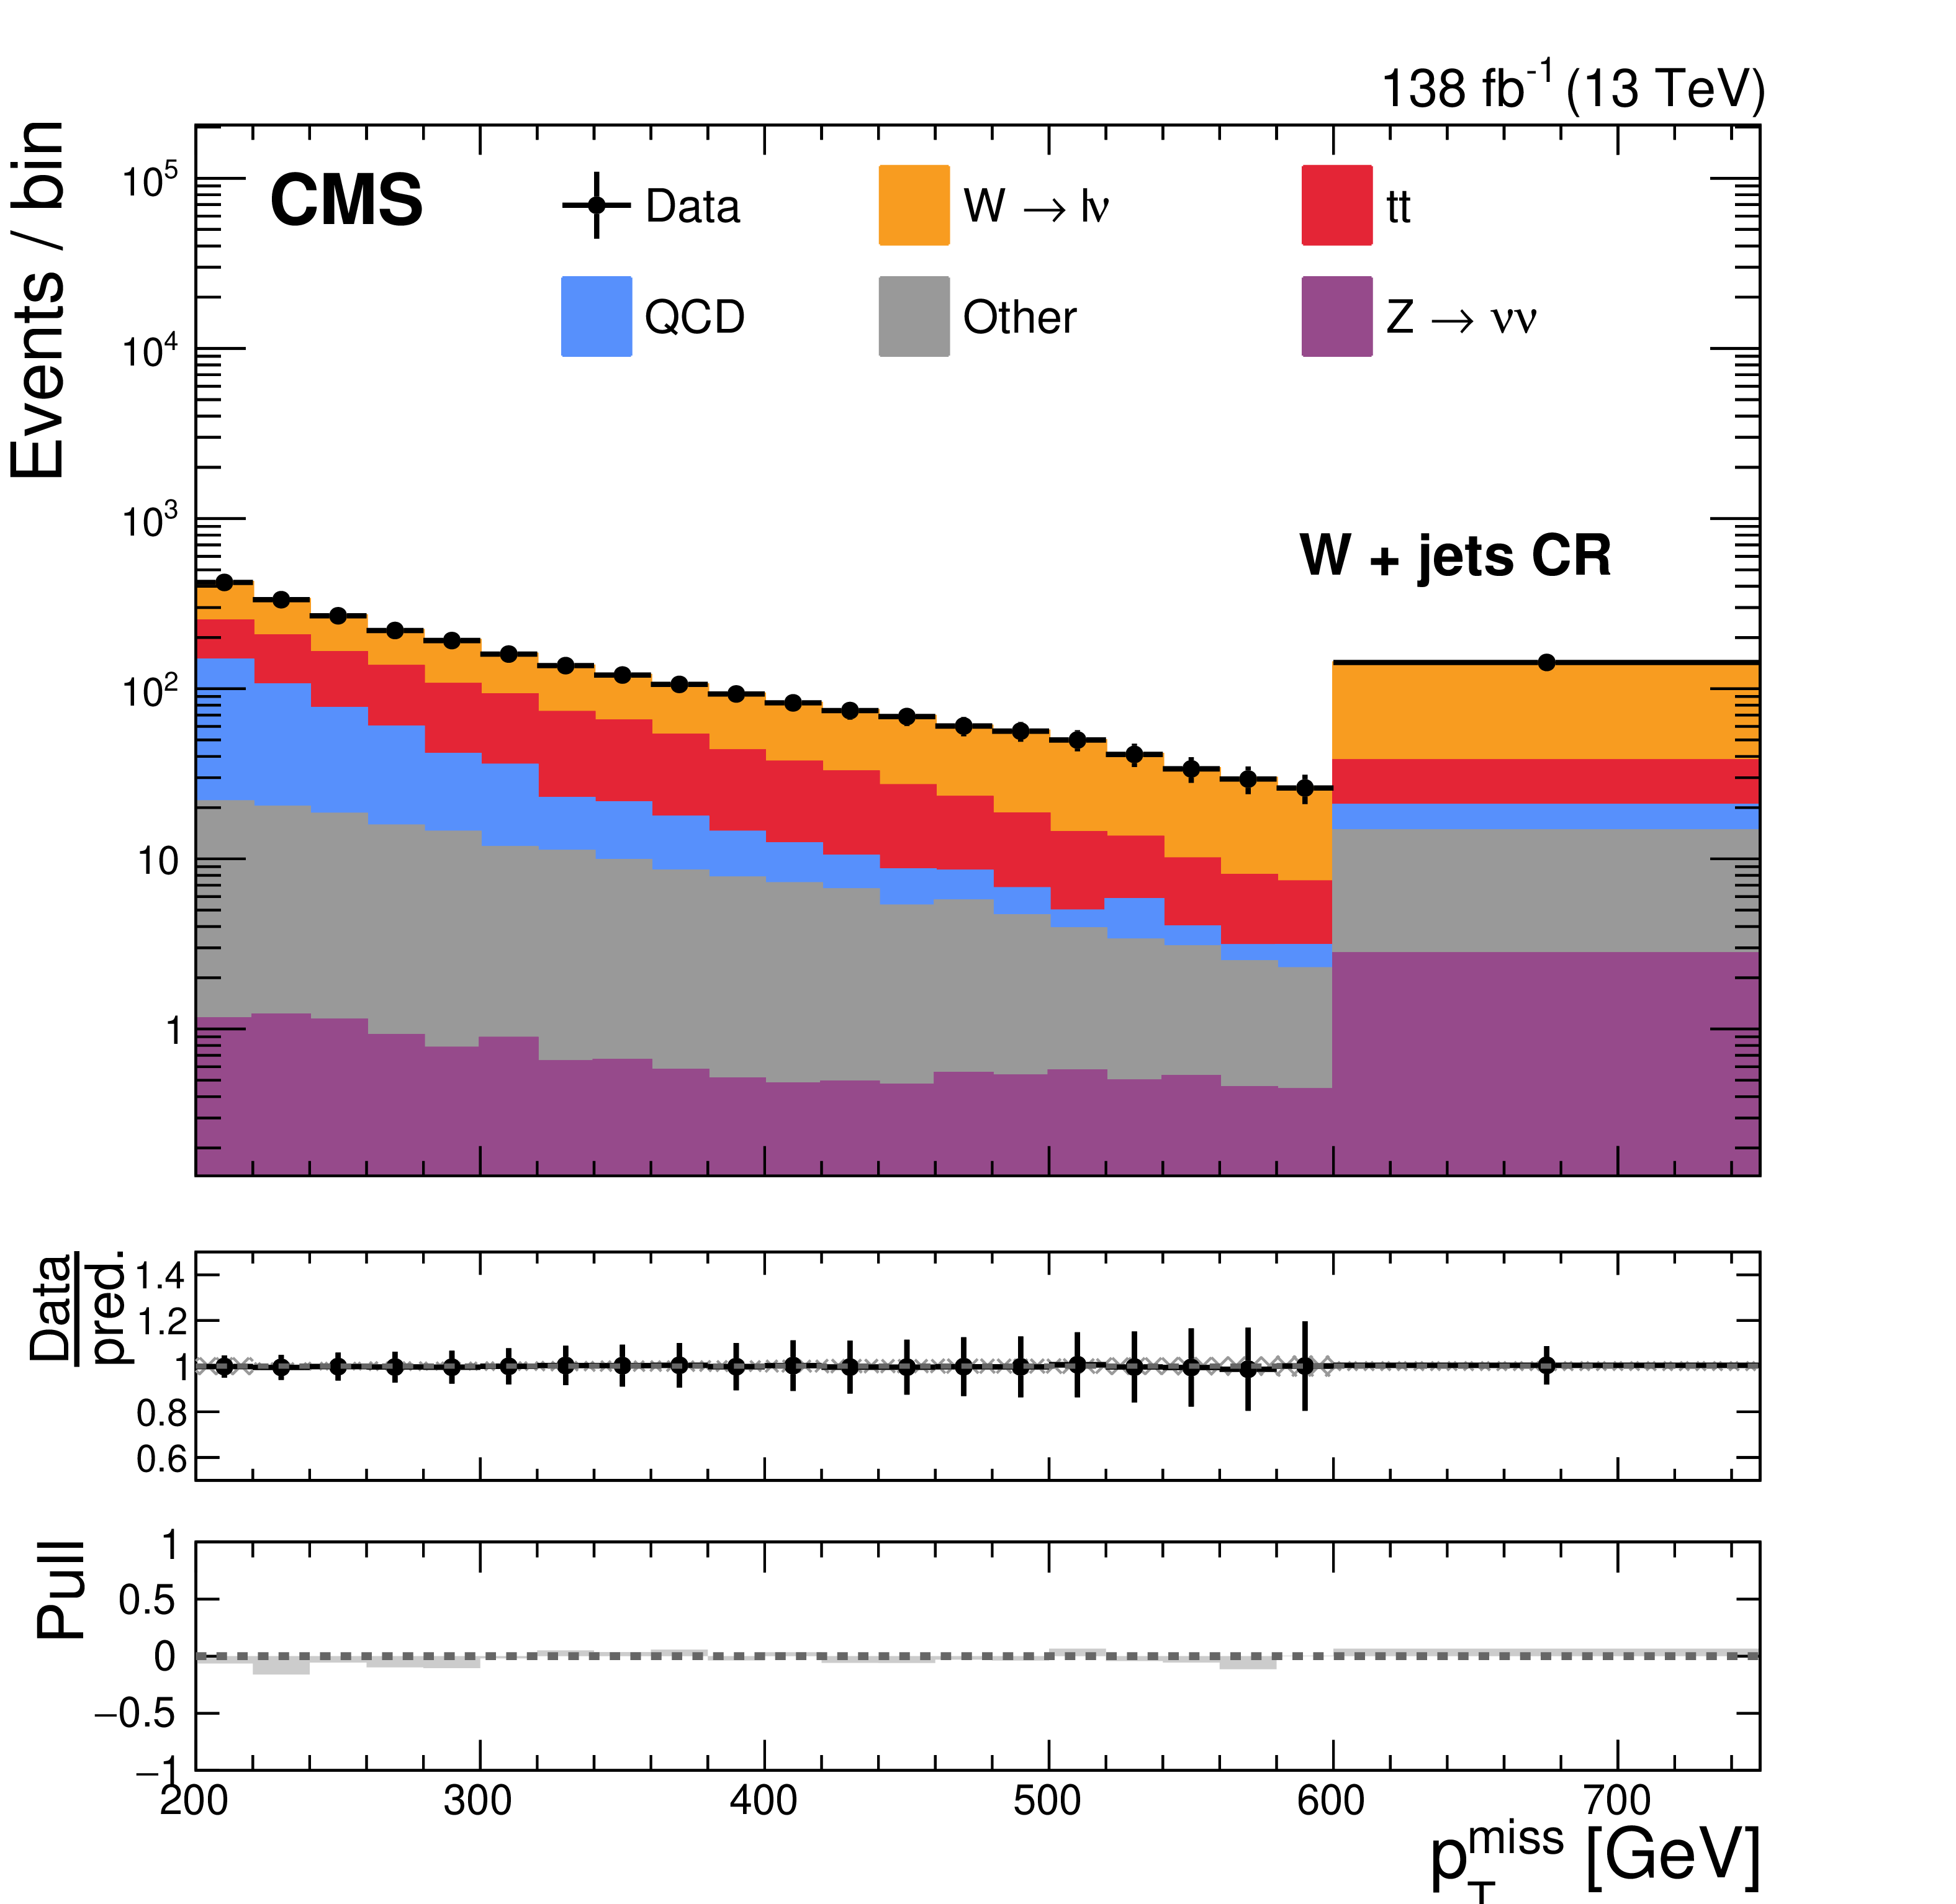
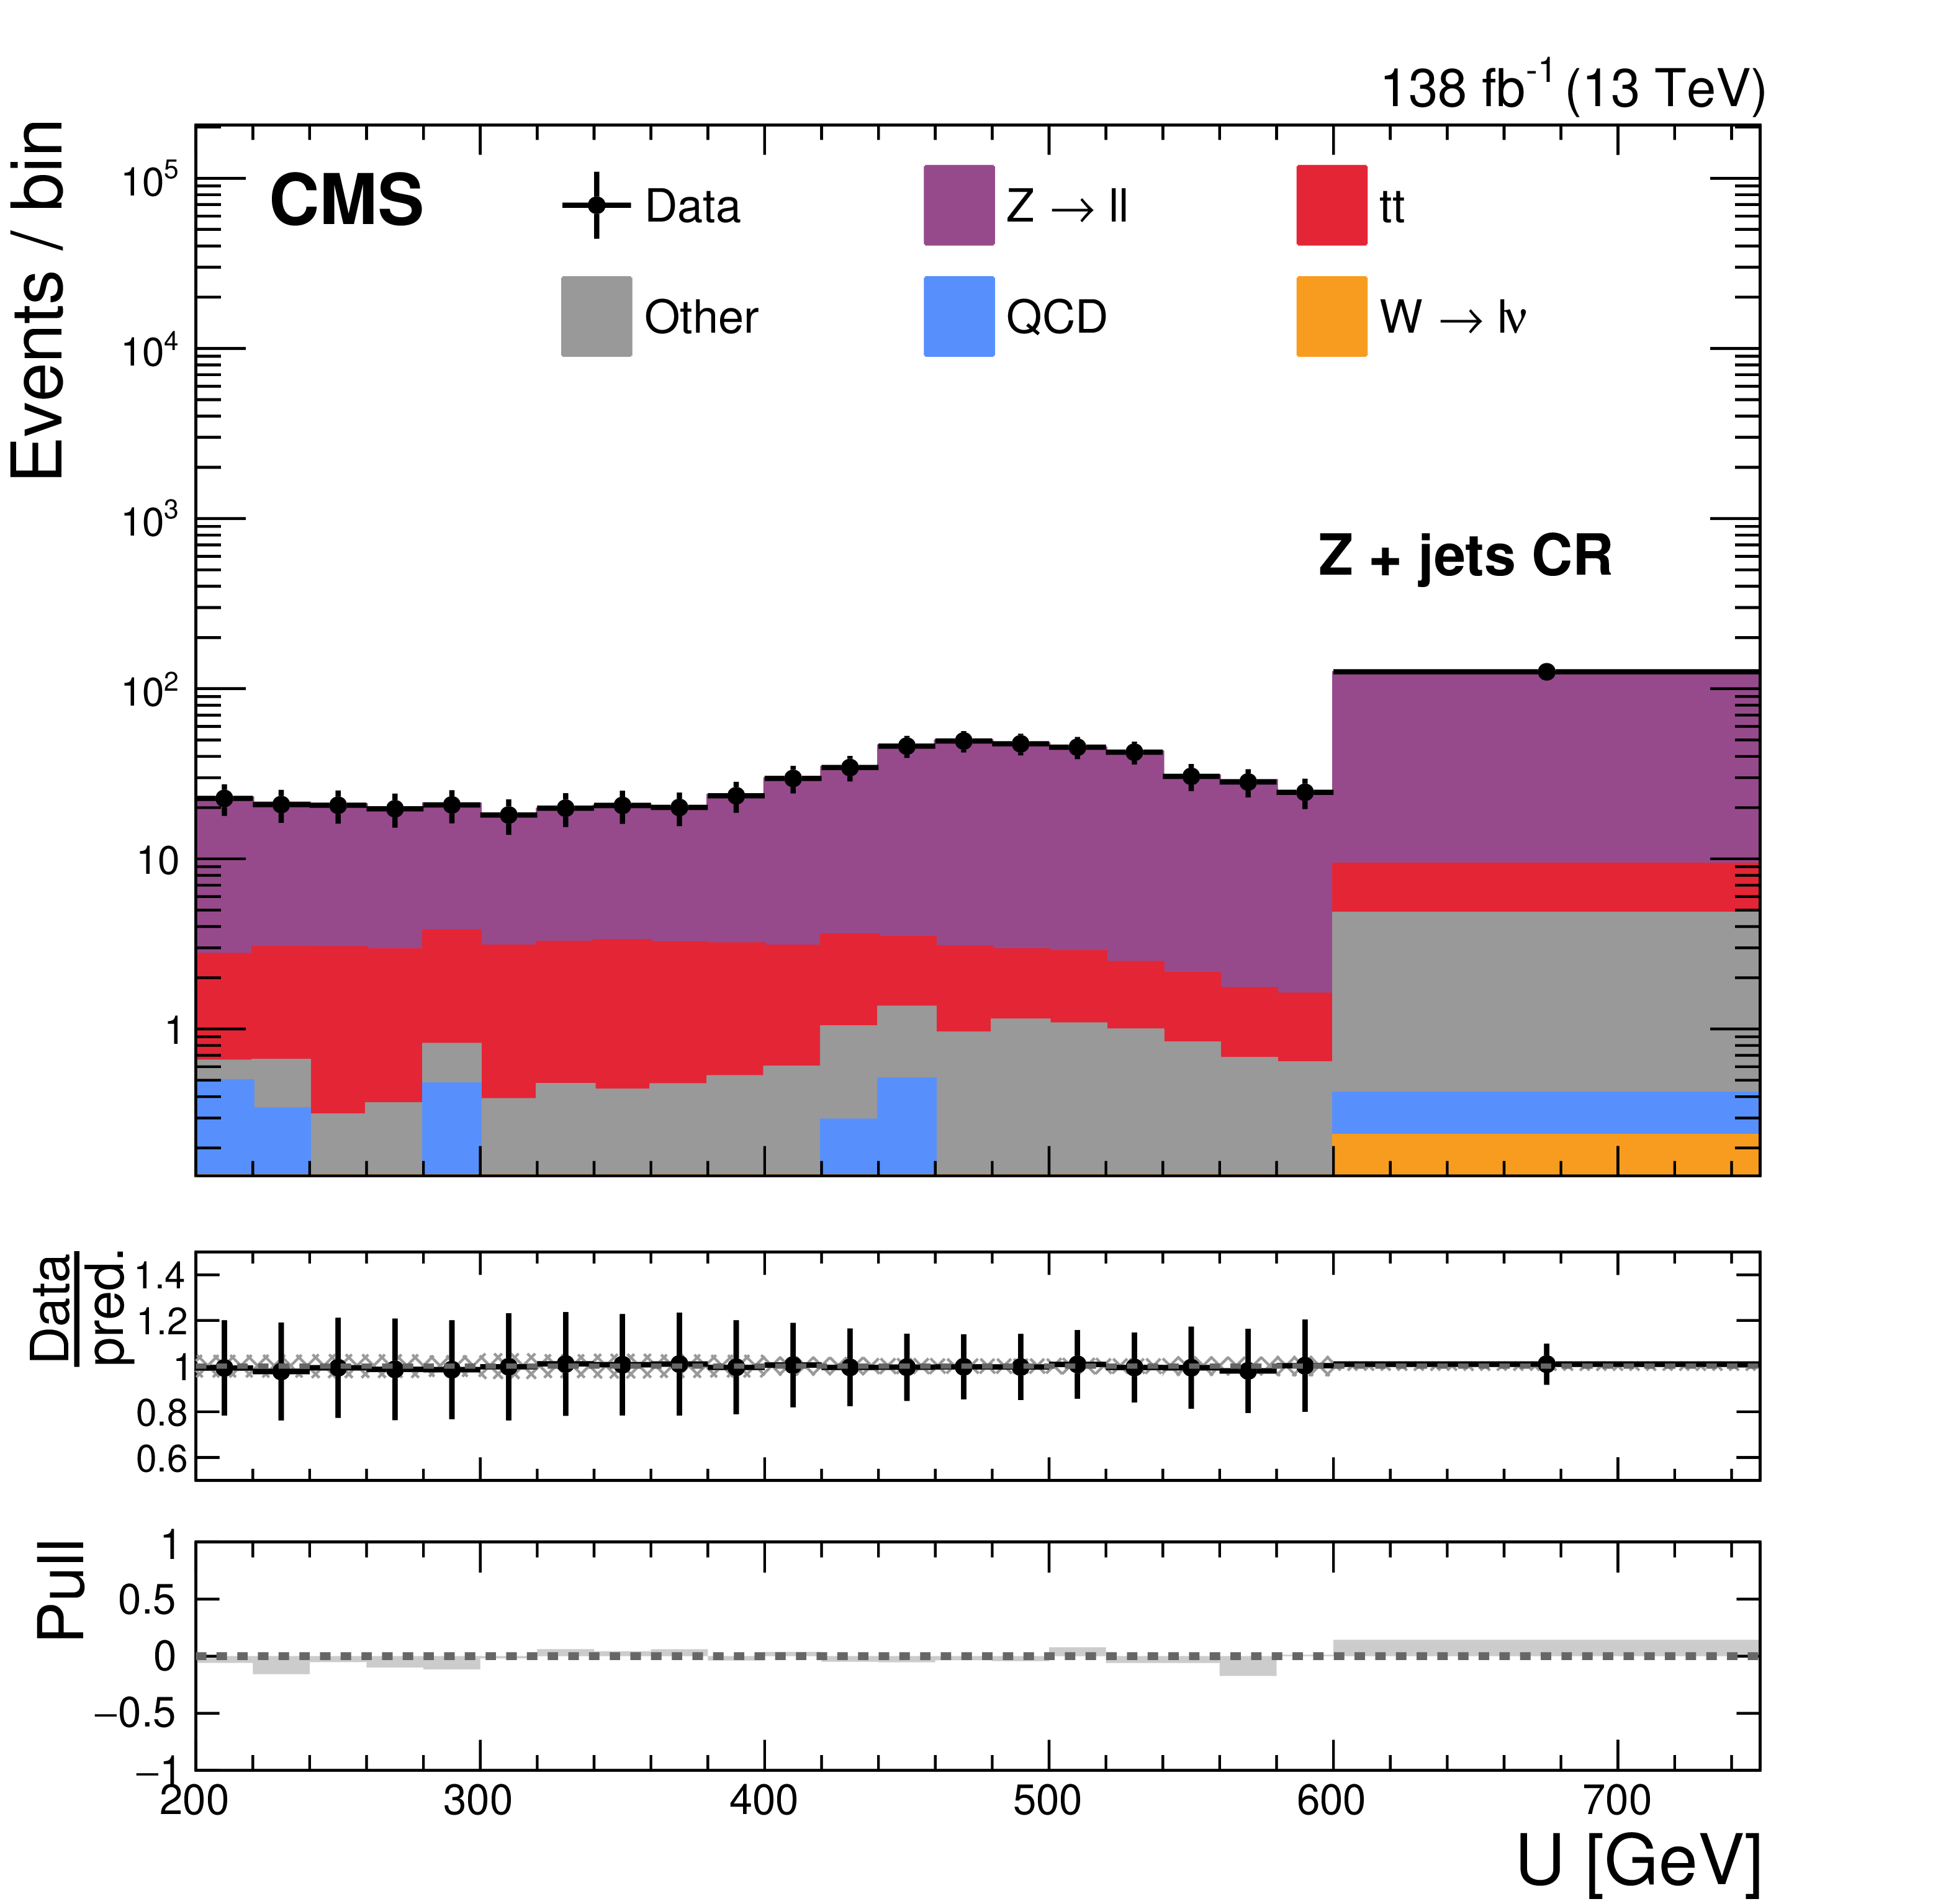
Postfit $ p_{\mathrm{T}}^\text{miss} $ distributions in the SR (upper left), QCD CR (upper right), $ \mathrm{W}+\text{jets} $ CR (lower left), and postfit distribution of the magnitude of the hadronic recoil in the $ \mathrm{Z}+\text{jets} $ CR (lower right). The data are shown as black markers with vertical bars indicating the statistical uncertainty. The SM expectation is shown as stacked histograms. In the SR, the prefit expected signal contributions are displayed as dashed lines for different signal parameter settings (different colors). In the middle panels, the ratio of the data to the postfit SM prediction is shown, with the total uncertainty in the latter represented as a hatched area. In the lower panels, the difference between data and SM expectation divided by the uncertainty in that difference (pull) is reported. The last bin includes the overflow events. |
png pdf |
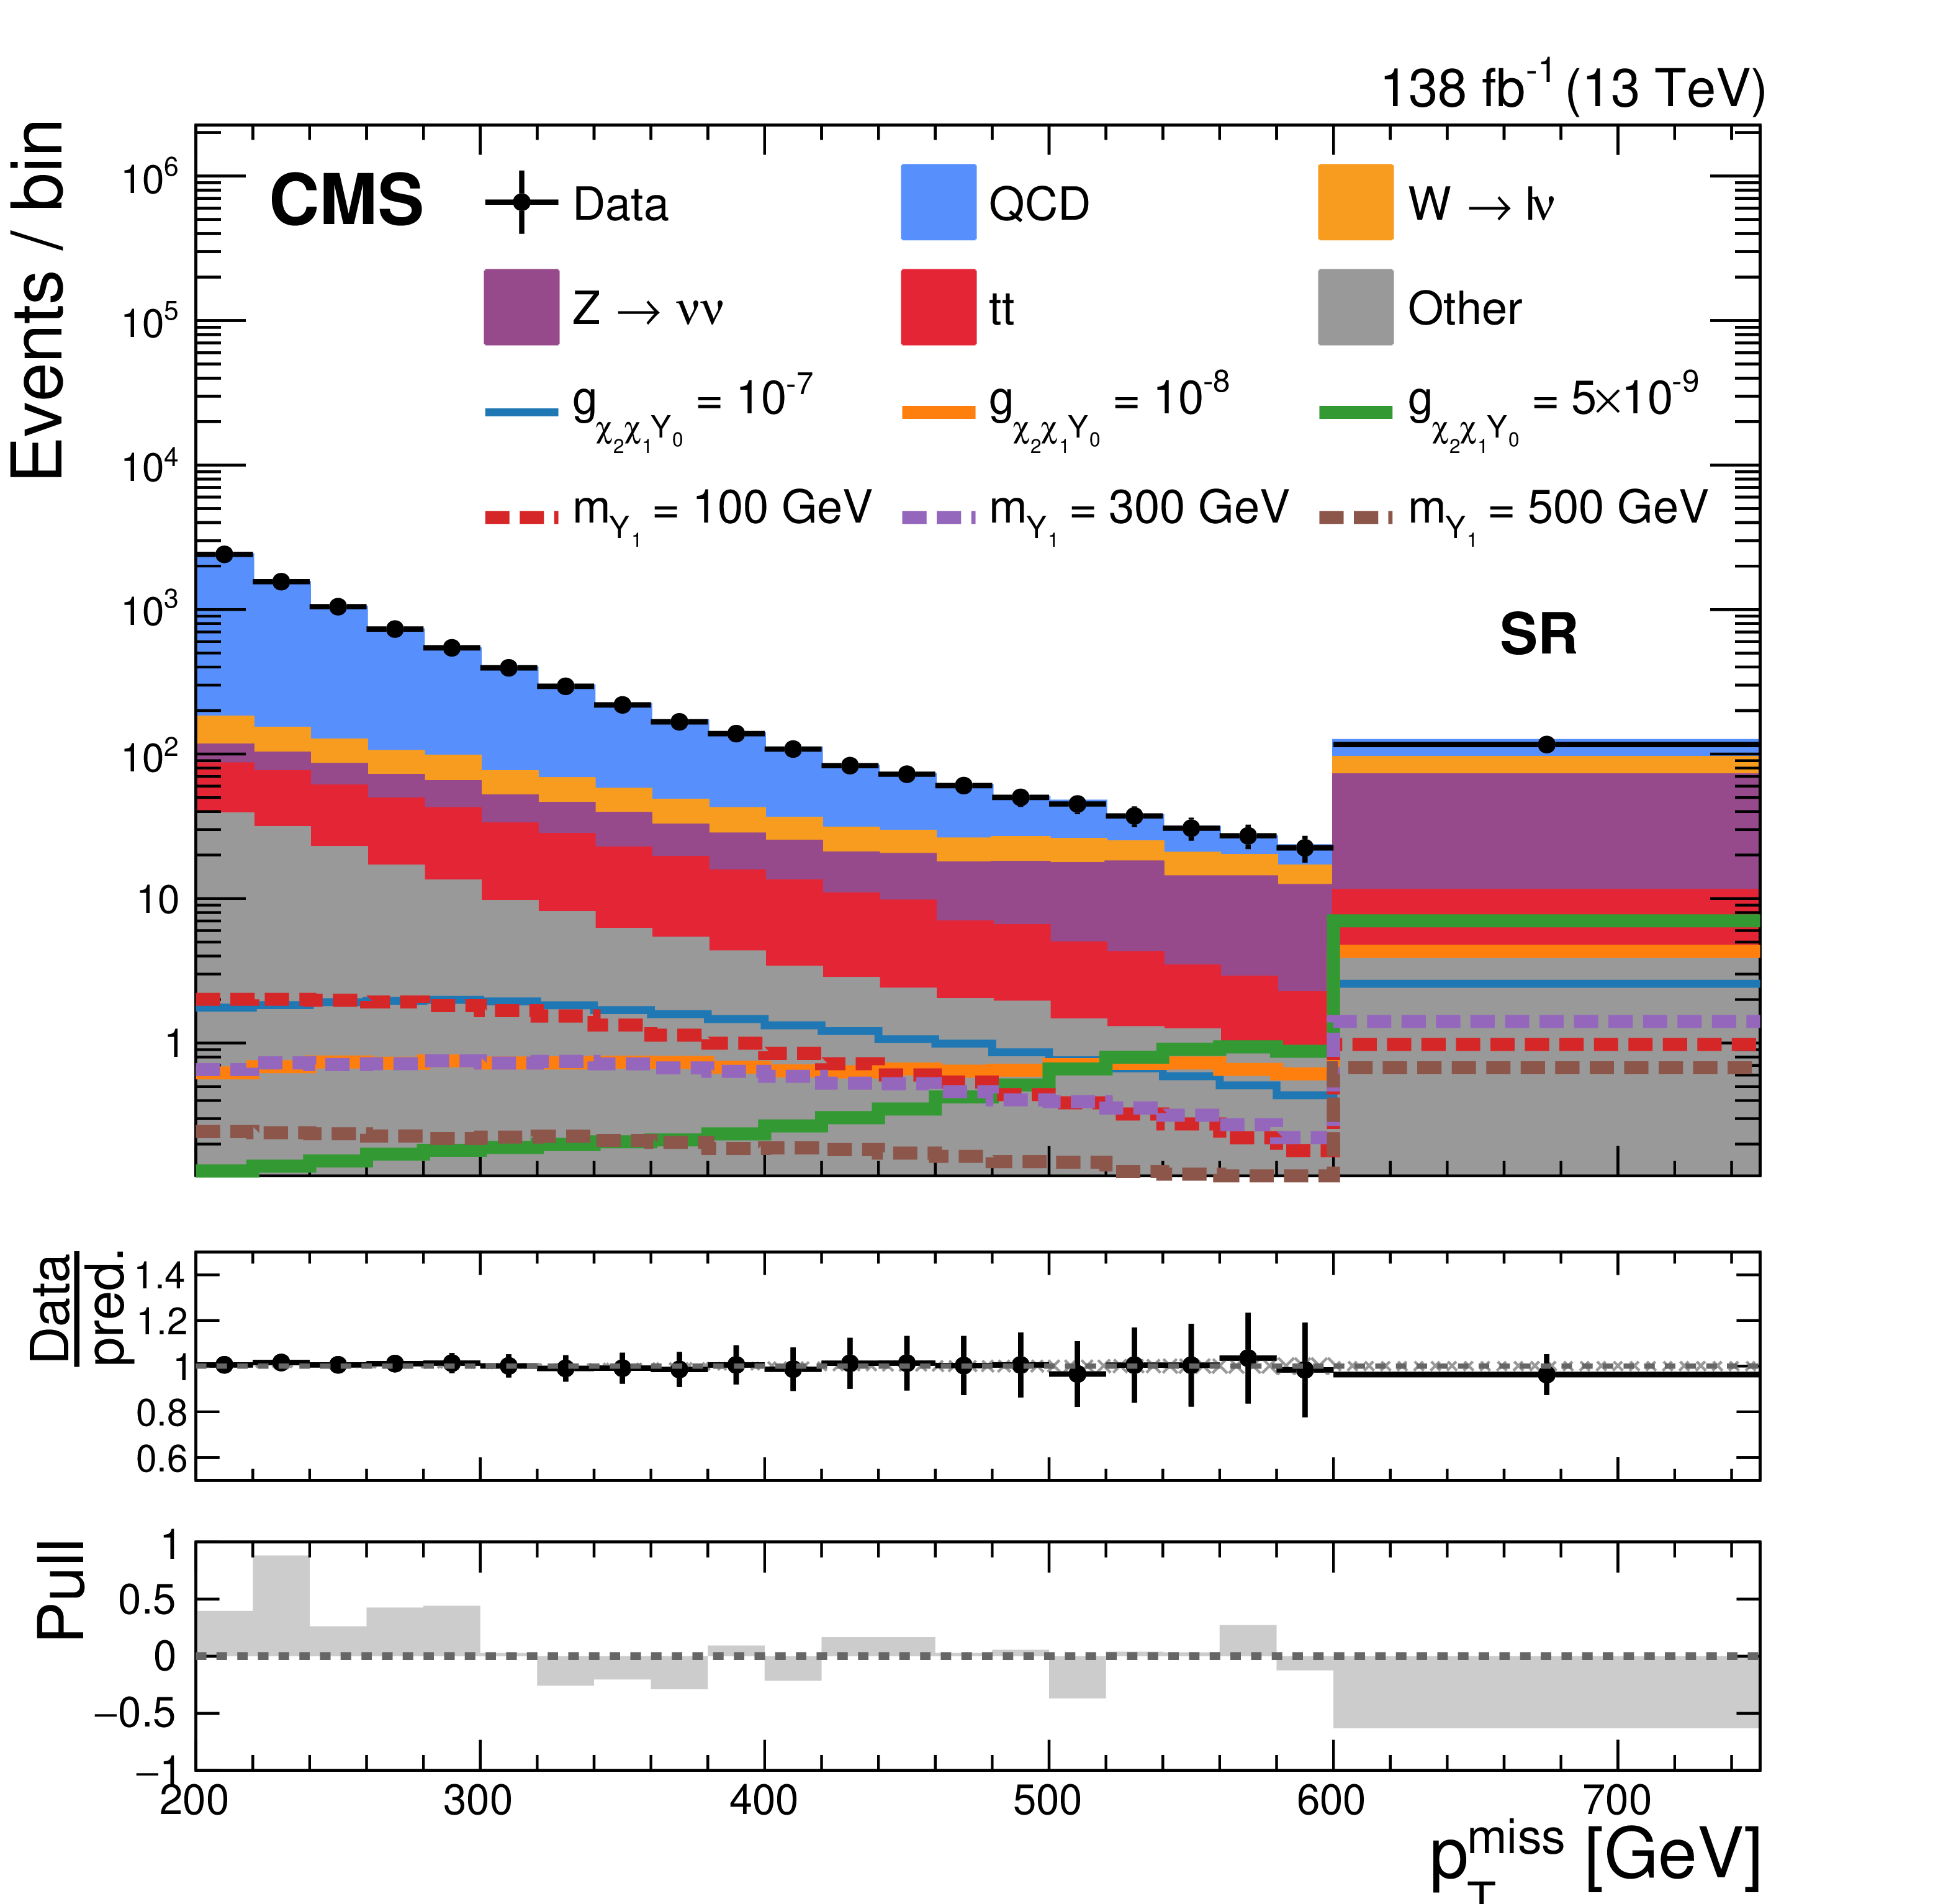
Figure 3-a:
Postfit $ p_{\mathrm{T}}^\text{miss} $ distributions in the SR (upper left), QCD CR (upper right), $ \mathrm{W}+\text{jets} $ CR (lower left), and postfit distribution of the magnitude of the hadronic recoil in the $ \mathrm{Z}+\text{jets} $ CR (lower right). The data are shown as black markers with vertical bars indicating the statistical uncertainty. The SM expectation is shown as stacked histograms. In the SR, the prefit expected signal contributions are displayed as dashed lines for different signal parameter settings (different colors). In the middle panels, the ratio of the data to the postfit SM prediction is shown, with the total uncertainty in the latter represented as a hatched area. In the lower panels, the difference between data and SM expectation divided by the uncertainty in that difference (pull) is reported. The last bin includes the overflow events. |
png pdf |
Figure 3-b:
Postfit $ p_{\mathrm{T}}^\text{miss} $ distributions in the SR (upper left), QCD CR (upper right), $ \mathrm{W}+\text{jets} $ CR (lower left), and postfit distribution of the magnitude of the hadronic recoil in the $ \mathrm{Z}+\text{jets} $ CR (lower right). The data are shown as black markers with vertical bars indicating the statistical uncertainty. The SM expectation is shown as stacked histograms. In the SR, the prefit expected signal contributions are displayed as dashed lines for different signal parameter settings (different colors). In the middle panels, the ratio of the data to the postfit SM prediction is shown, with the total uncertainty in the latter represented as a hatched area. In the lower panels, the difference between data and SM expectation divided by the uncertainty in that difference (pull) is reported. The last bin includes the overflow events. |
png pdf |
Figure 3-c:
Postfit $ p_{\mathrm{T}}^\text{miss} $ distributions in the SR (upper left), QCD CR (upper right), $ \mathrm{W}+\text{jets} $ CR (lower left), and postfit distribution of the magnitude of the hadronic recoil in the $ \mathrm{Z}+\text{jets} $ CR (lower right). The data are shown as black markers with vertical bars indicating the statistical uncertainty. The SM expectation is shown as stacked histograms. In the SR, the prefit expected signal contributions are displayed as dashed lines for different signal parameter settings (different colors). In the middle panels, the ratio of the data to the postfit SM prediction is shown, with the total uncertainty in the latter represented as a hatched area. In the lower panels, the difference between data and SM expectation divided by the uncertainty in that difference (pull) is reported. The last bin includes the overflow events. |
png pdf |
Figure 3-d:
Postfit $ p_{\mathrm{T}}^\text{miss} $ distributions in the SR (upper left), QCD CR (upper right), $ \mathrm{W}+\text{jets} $ CR (lower left), and postfit distribution of the magnitude of the hadronic recoil in the $ \mathrm{Z}+\text{jets} $ CR (lower right). The data are shown as black markers with vertical bars indicating the statistical uncertainty. The SM expectation is shown as stacked histograms. In the SR, the prefit expected signal contributions are displayed as dashed lines for different signal parameter settings (different colors). In the middle panels, the ratio of the data to the postfit SM prediction is shown, with the total uncertainty in the latter represented as a hatched area. In the lower panels, the difference between data and SM expectation divided by the uncertainty in that difference (pull) is reported. The last bin includes the overflow events. |
png pdf |
Figure 4:
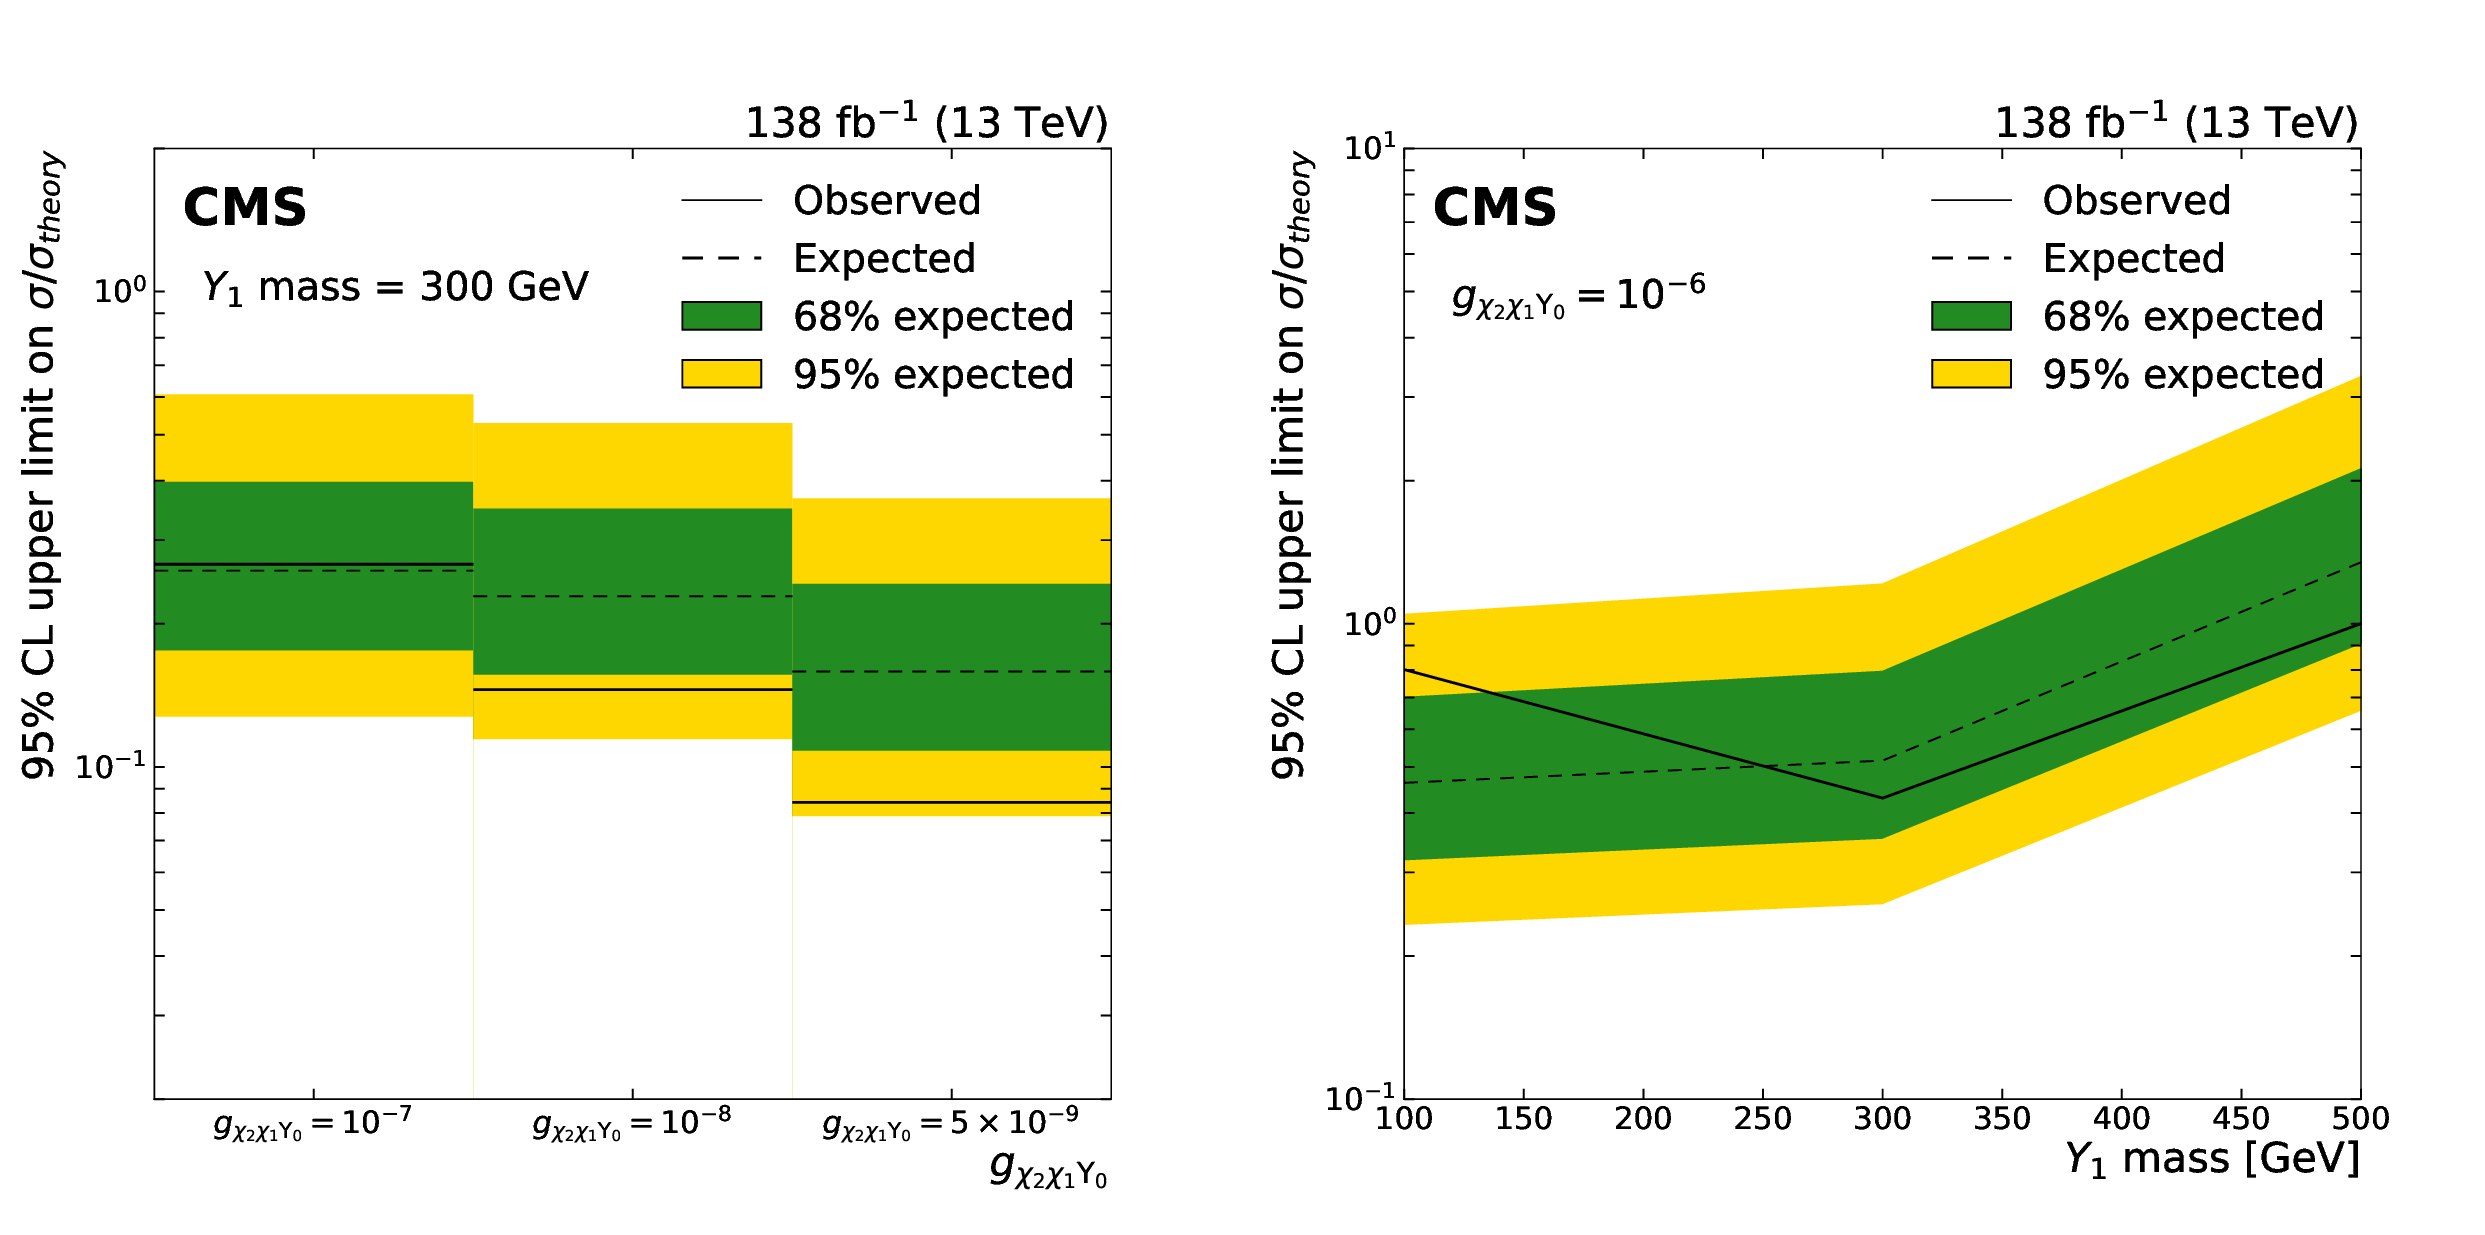
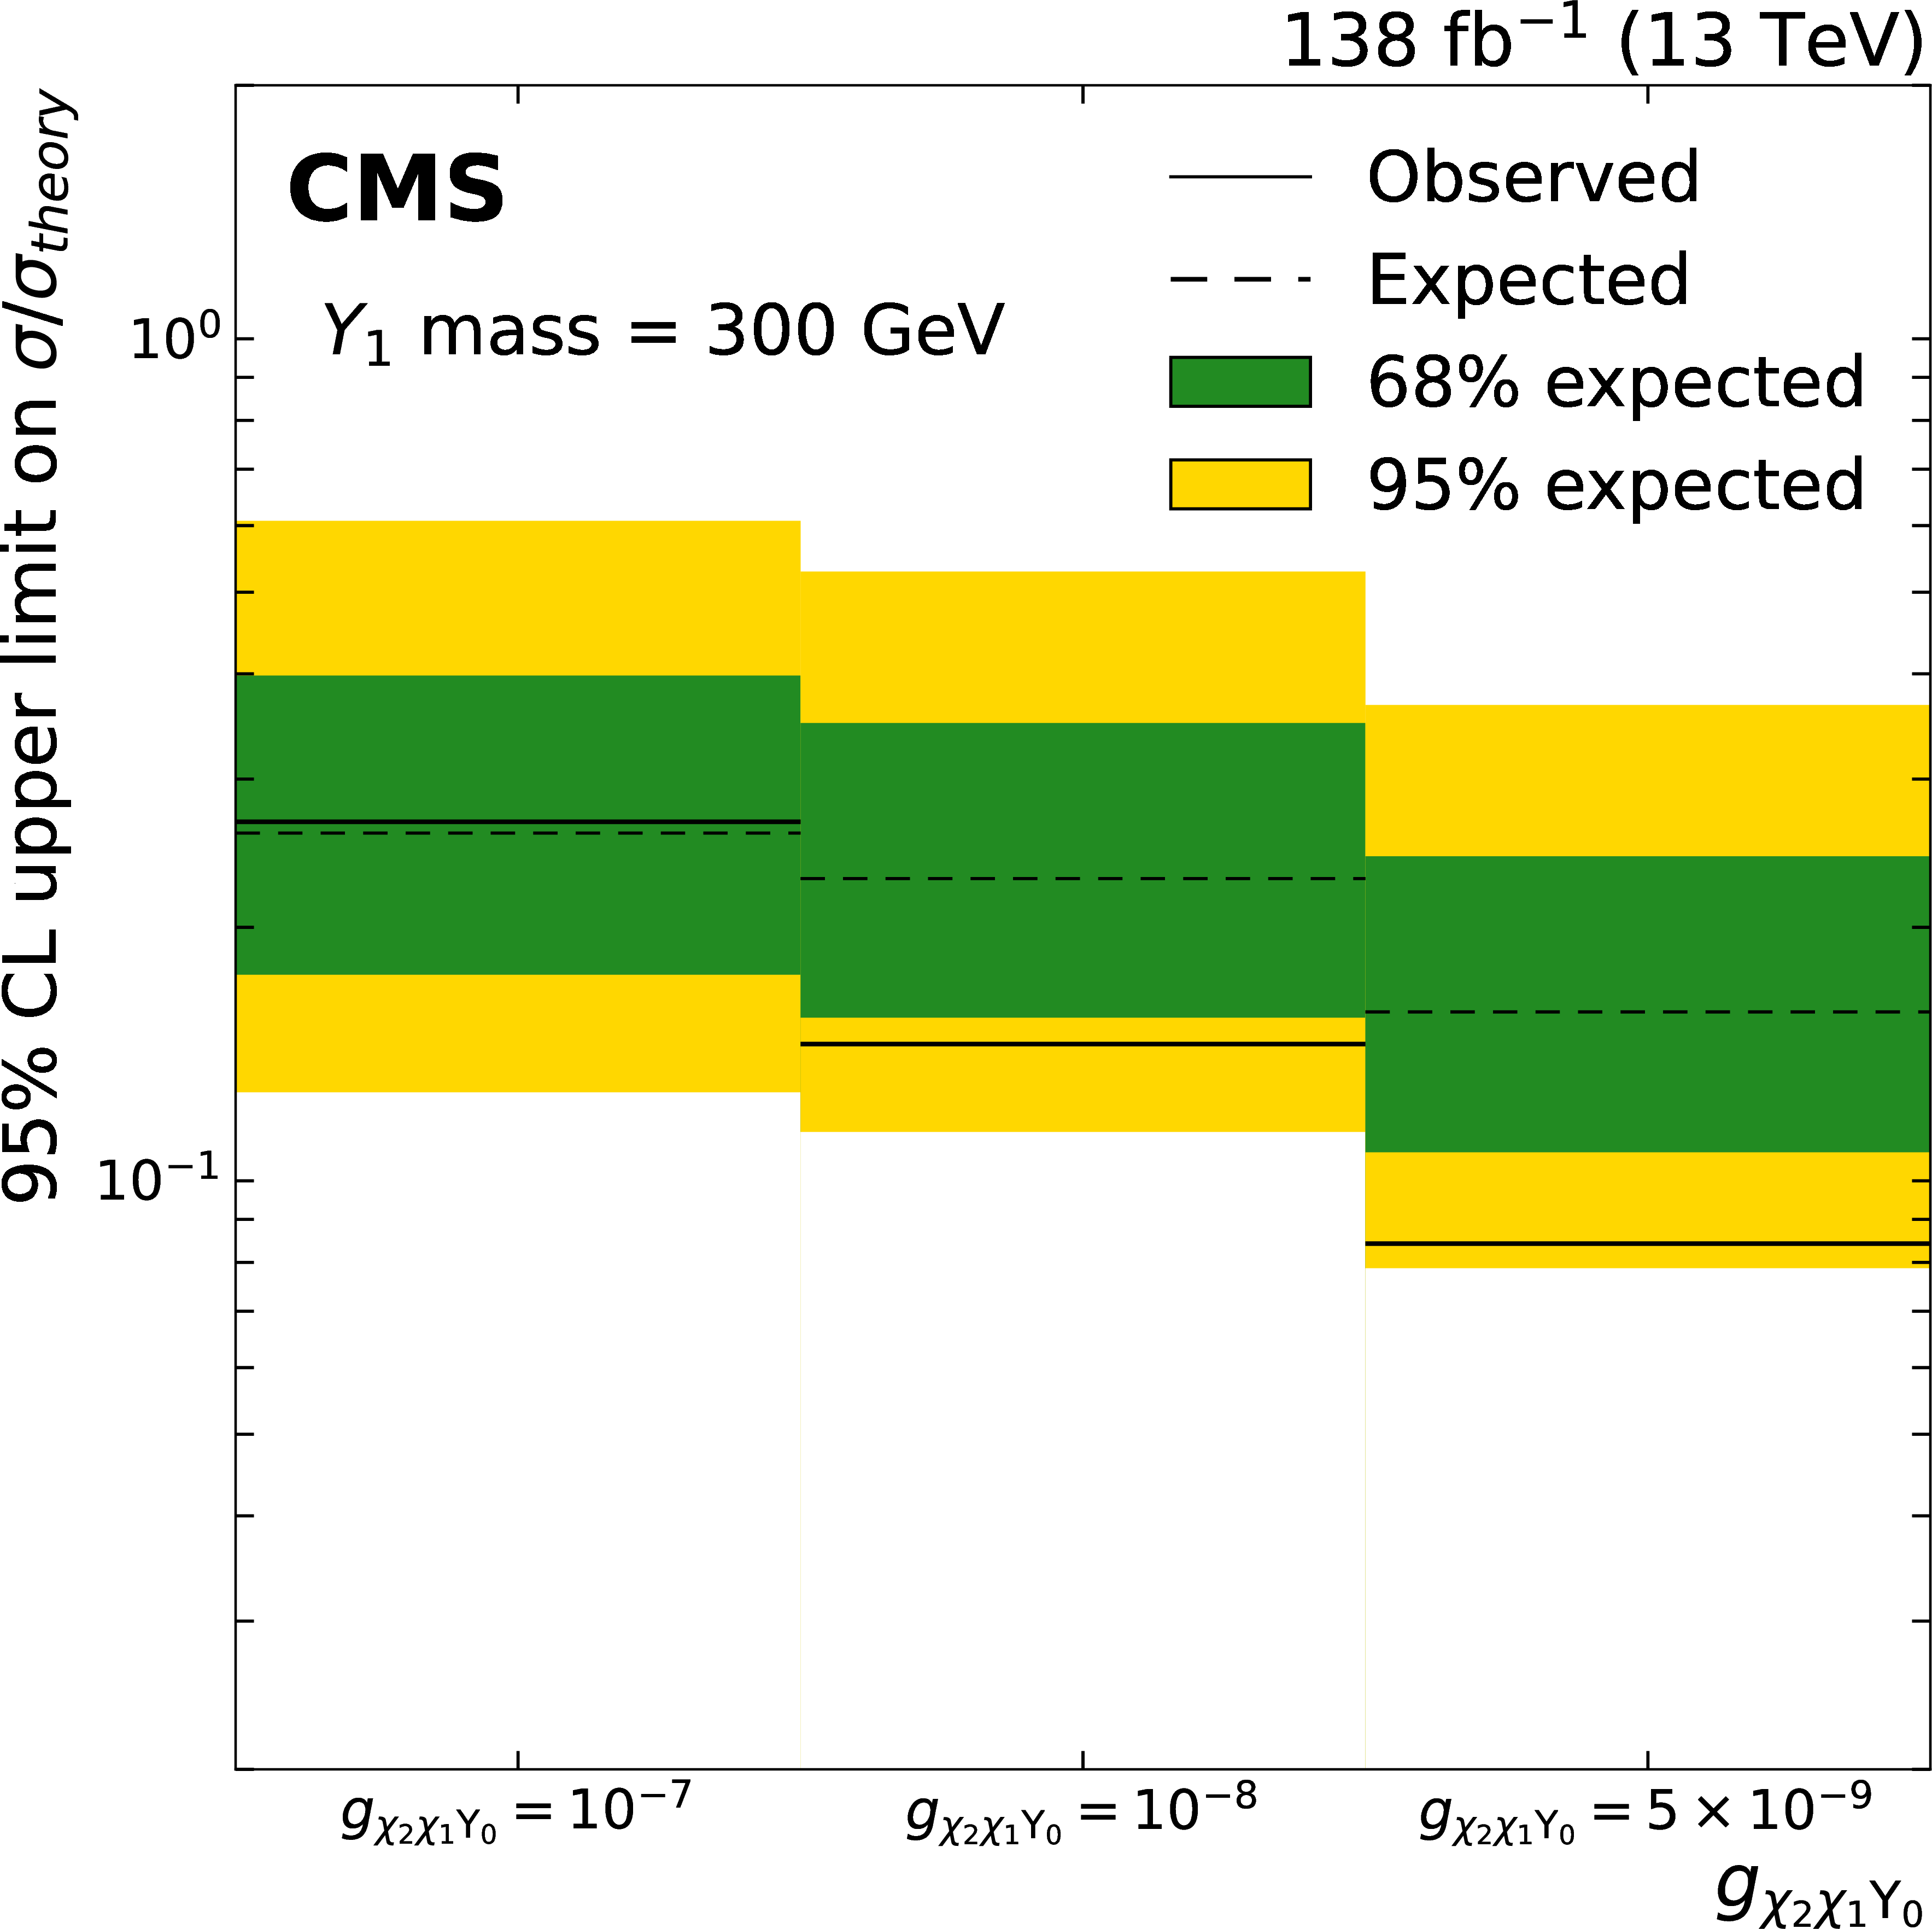
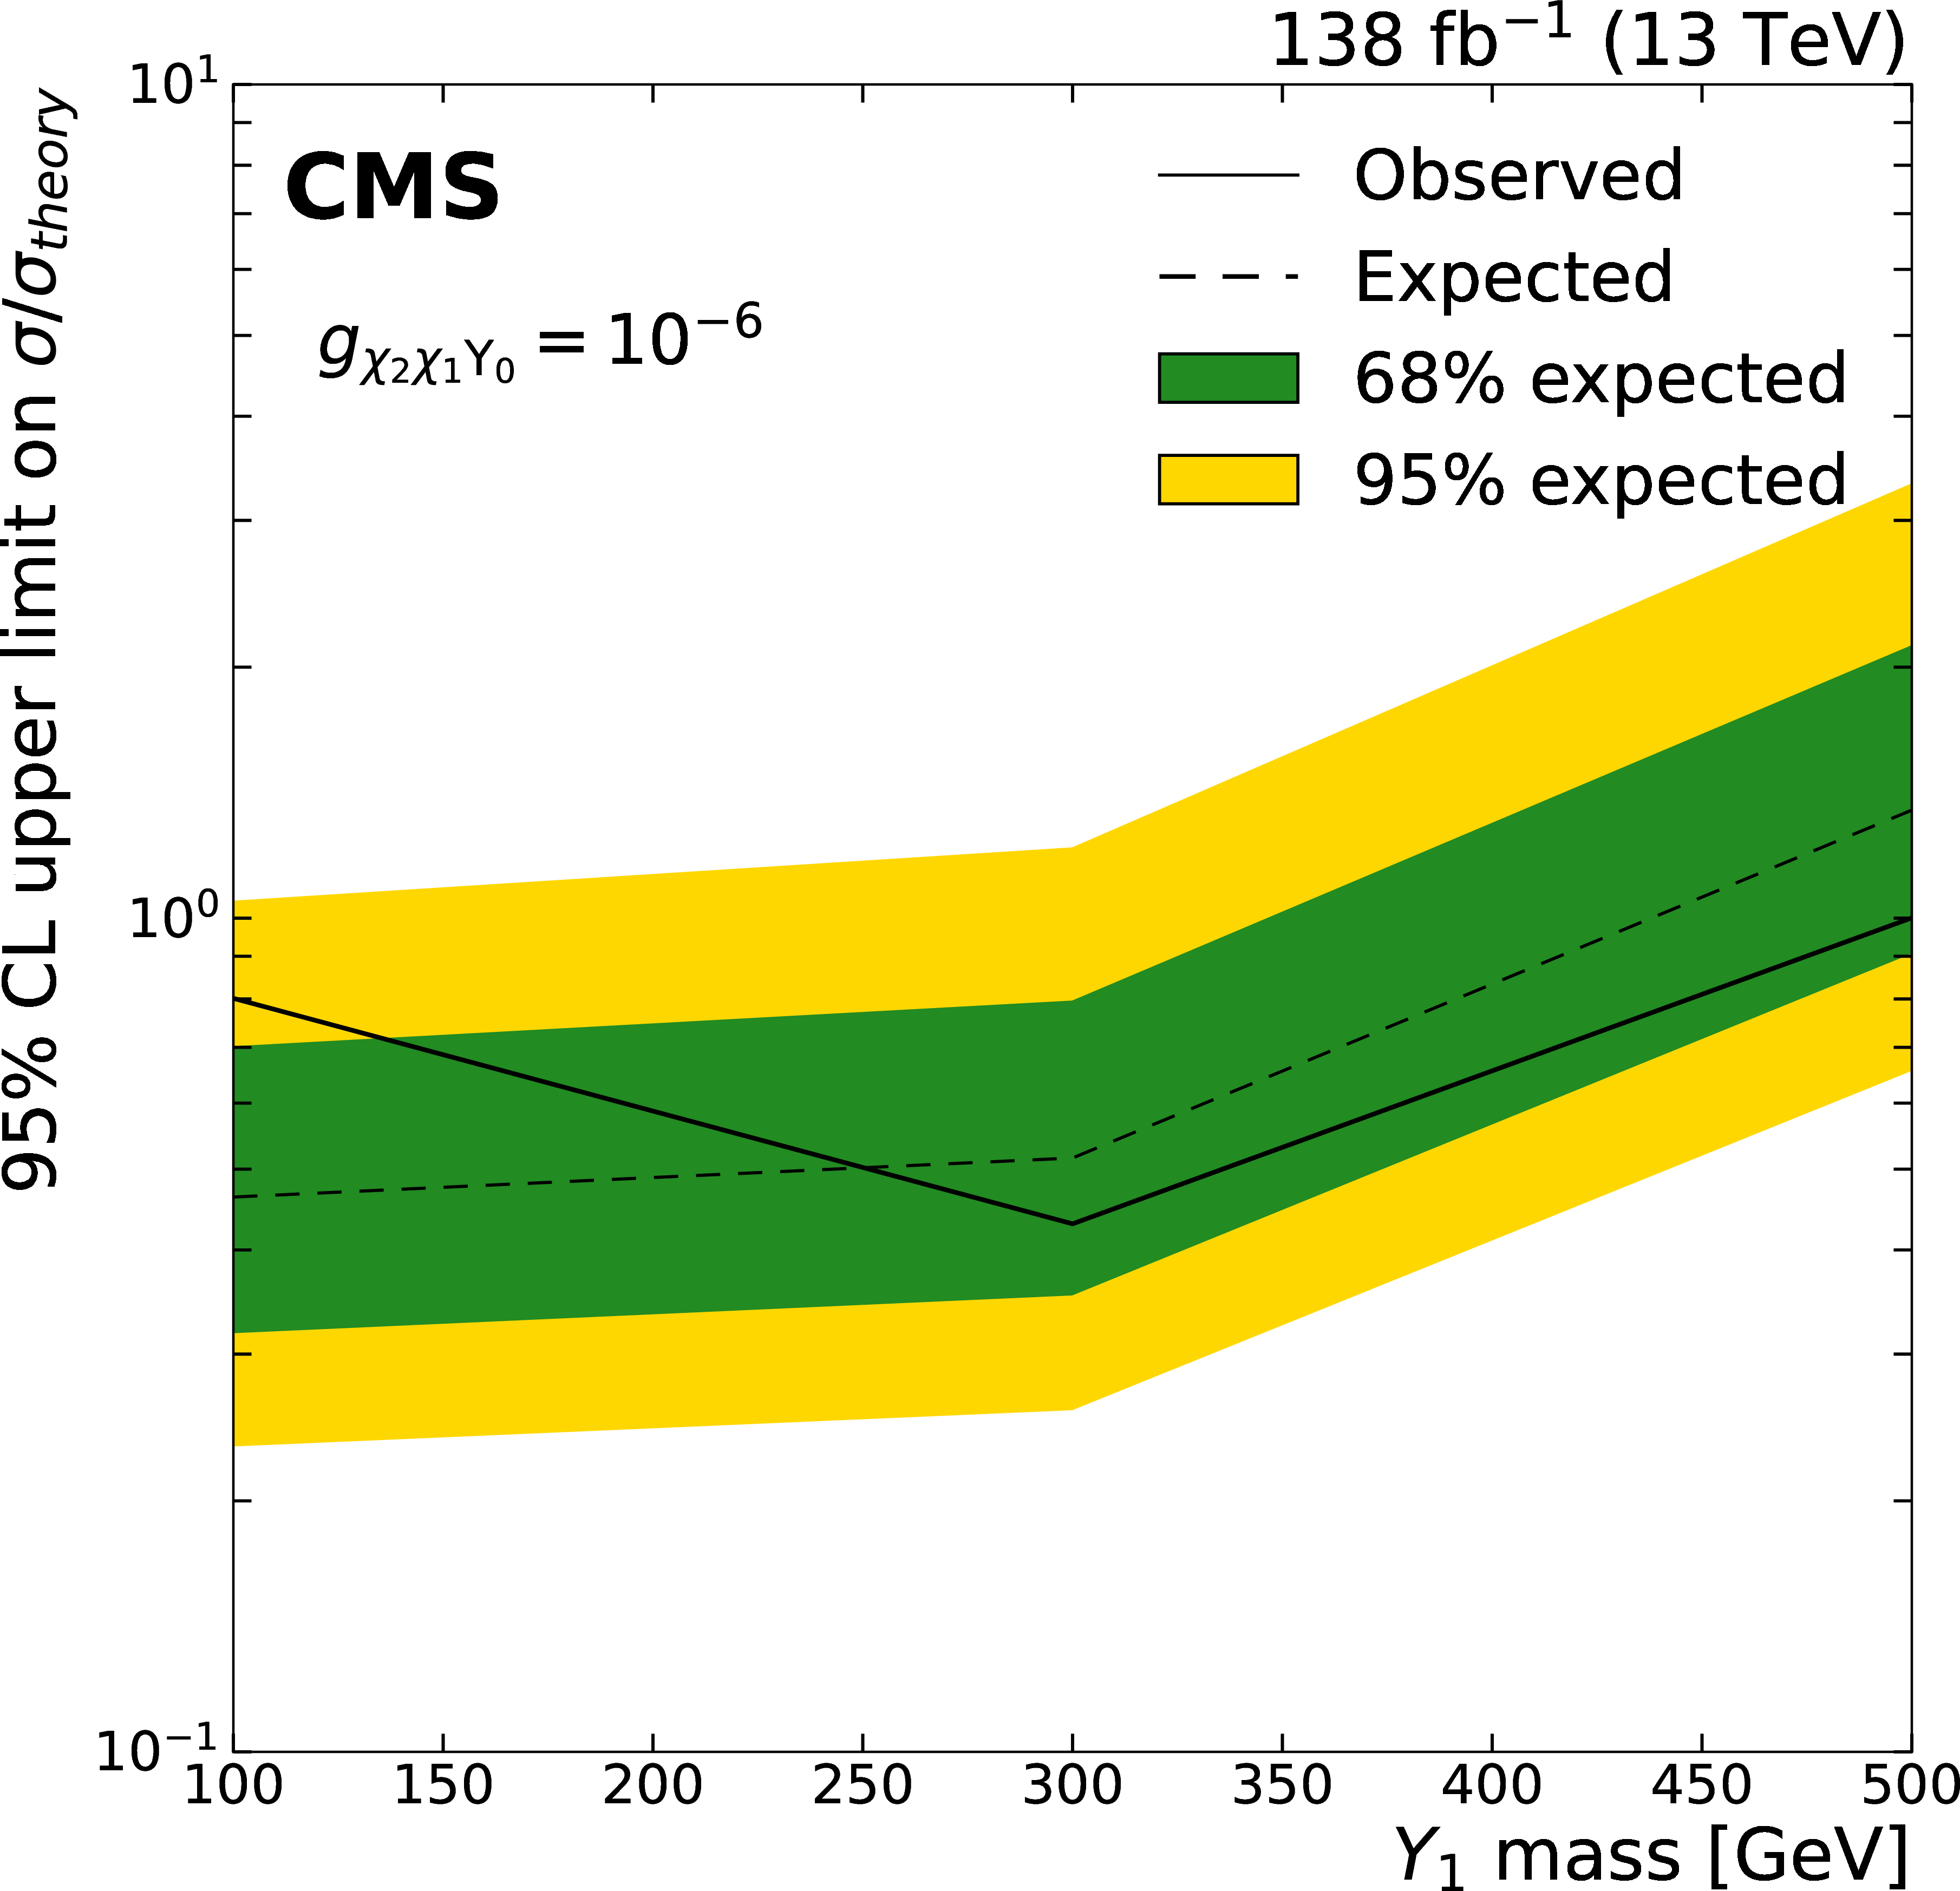
Upper limits at 95% CL on the signal strength for different scenarios of the coupling $ g_{{\chi}{2} {\chi}{1} {Y}{0} } $ (left) and varying Y1 masses (right). The observed (expected) limits are shown as a solid (dashed) black line and the inner (green) band and the outer (yellow) band indicate the regions containing 68% and 95%, respectively, of the distribution of limits expected under the background-only hypothesis. The $ \sigma_{\text{theory}} $ values for the signal are reported in Table 1. |
png pdf |
Figure 4-a:
Upper limits at 95% CL on the signal strength for different scenarios of the coupling $ g_{{\chi}{2} {\chi}{1} {Y}{0} } $ (left) and varying Y1 masses (right). The observed (expected) limits are shown as a solid (dashed) black line and the inner (green) band and the outer (yellow) band indicate the regions containing 68% and 95%, respectively, of the distribution of limits expected under the background-only hypothesis. The $ \sigma_{\text{theory}} $ values for the signal are reported in Table 1. |
png pdf |
Figure 4-b:
Upper limits at 95% CL on the signal strength for different scenarios of the coupling $ g_{{\chi}{2} {\chi}{1} {Y}{0} } $ (left) and varying Y1 masses (right). The observed (expected) limits are shown as a solid (dashed) black line and the inner (green) band and the outer (yellow) band indicate the regions containing 68% and 95%, respectively, of the distribution of limits expected under the background-only hypothesis. The $ \sigma_{\text{theory}} $ values for the signal are reported in Table 1. |
| Tables | |
png pdf |
Table 1:
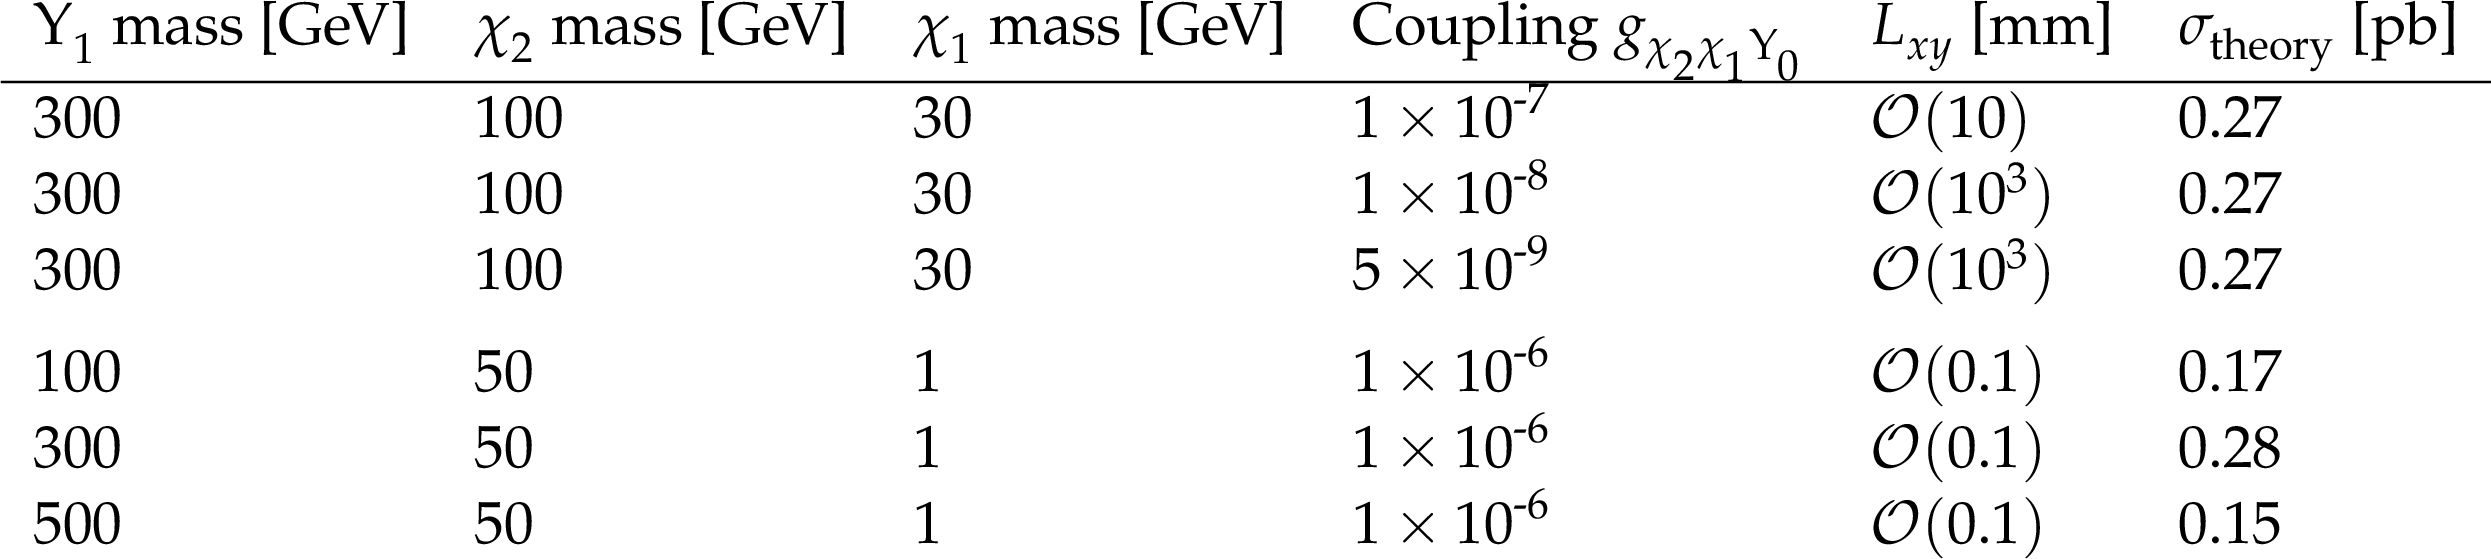
Combinations of particle masses and the $ g_{{\chi}{2} {\chi}{1} {Y}{0} } $ probed in this search. The configurations in the upper block vary the coupling $ g_{{\chi}{2} {\chi}{1} {Y}{0} } $ for fixed masses of the new particles, whereas the configurations in the lower block vary the Y1 boson mass for otherwise constant parameters. For all benchmark scenarios, the Y0 scalar mediator mass is fixed to $ m_{{Y}{0} }= $ 1 GeV. The quoted displacement $ L_{xy} $ corresponds to a characteristic transverse decay length. The theoretical cross sections for the benchmark scenarios are listed in the last column. |

png pdf |
Table 2:
Tagger efficiency scale factors and absolute reconstruction efficiency derived for the representative signal parameters. |
png pdf |
Table 3:
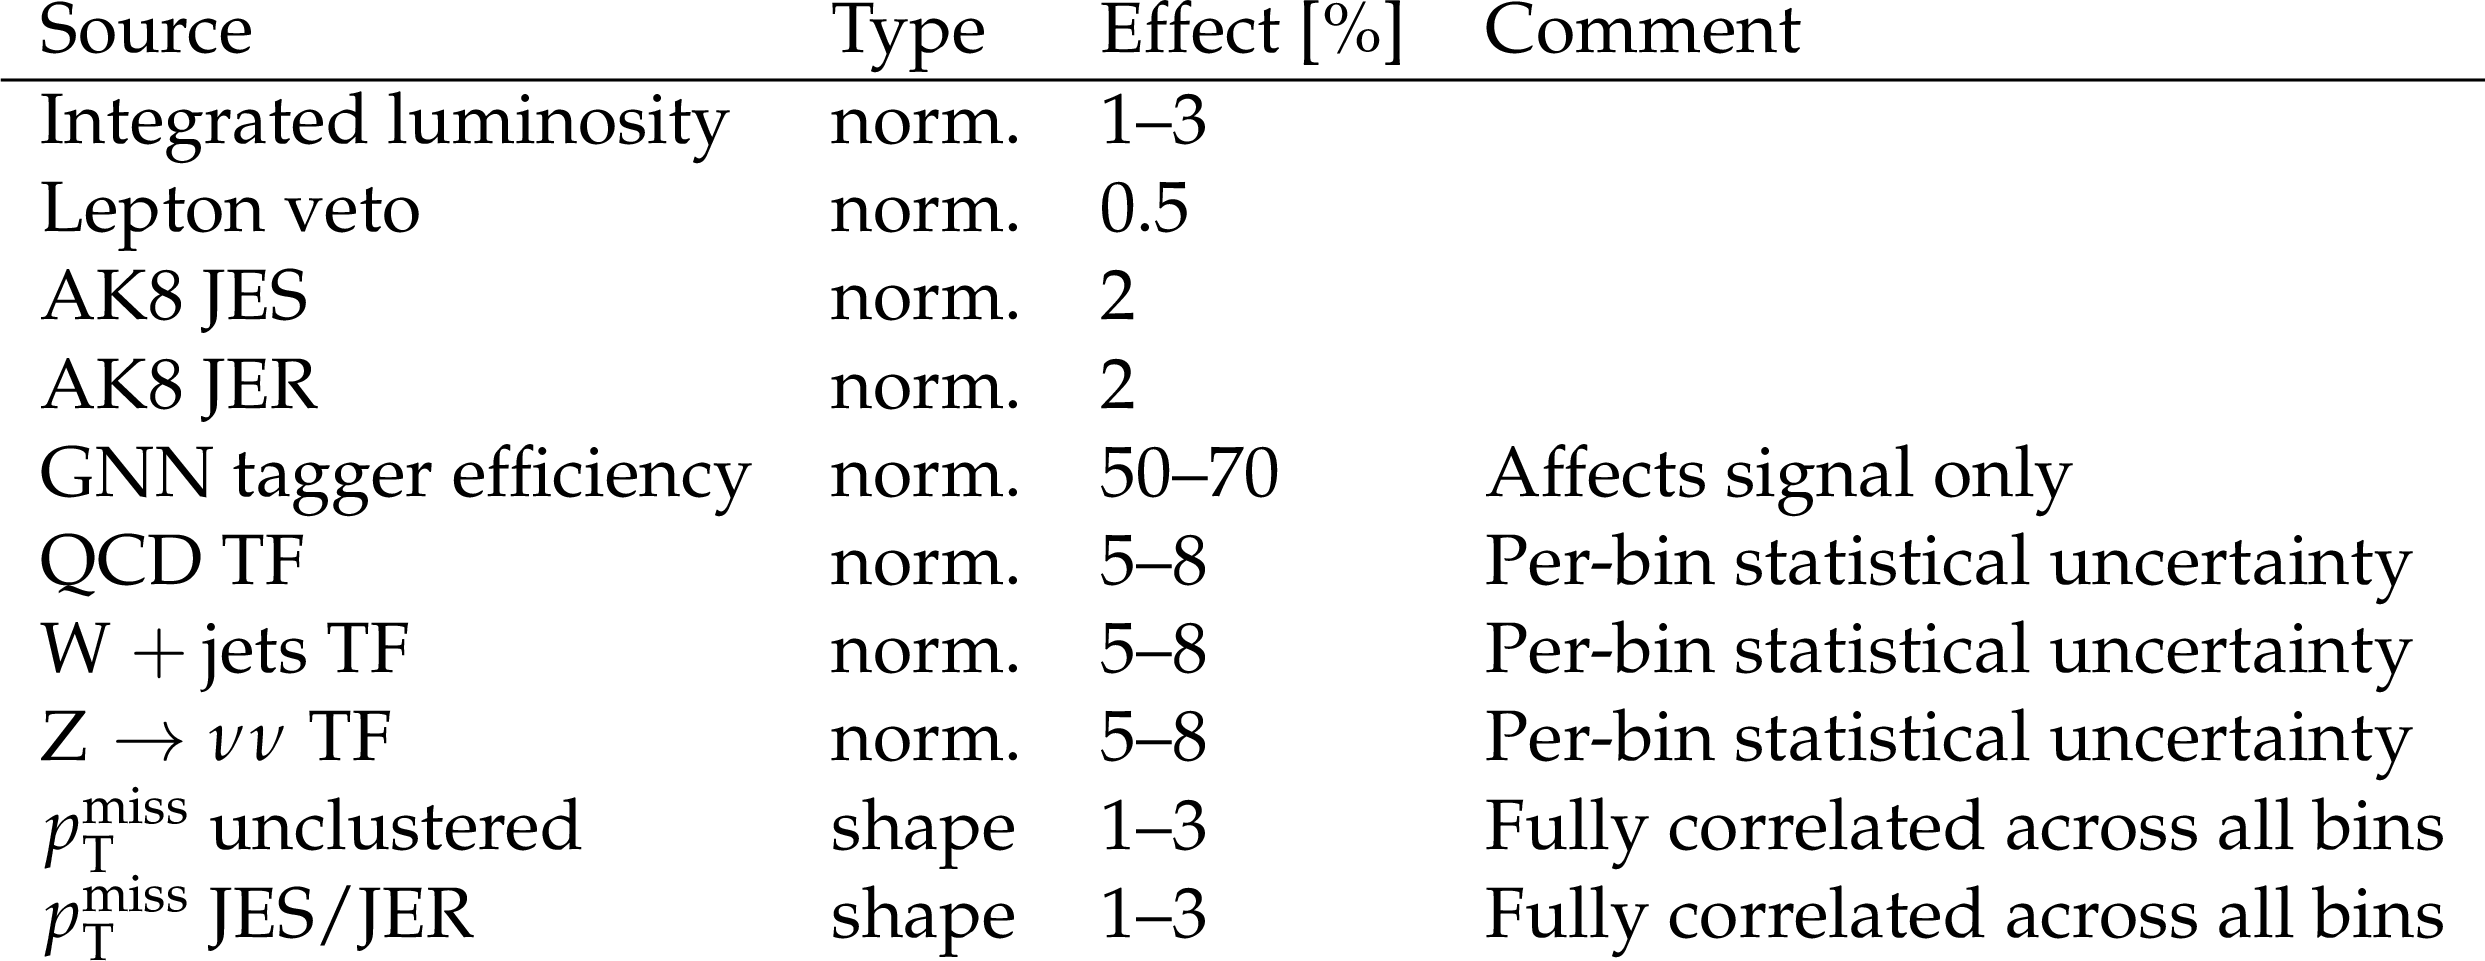
Summary of the systematic uncertainties considered in this analysis. The second column details whether the uncertainty affects the shape or the normalization (norm.) of the fitted distribution. Uncertainty in the third column reports the effect of a given uncertainty on the normalization of the affected processes. |
| Summary |
| The first search for a pair of nonprompt dark matter candidates in the Lorentz-boosted topology, characterized by a large-radius jet and large missing transverse momentum, has been presented. The analysis uses data collected in proton-proton collisions at $ \sqrt{s}= $ 13 TeV, corresponding to an integrated luminosity of 138 fb$^{-1}$. Signal candidates are selected by requiring the presence of a large-radius jet that is identified as signal-like using a tagger based on a graph neural network that exploits jet substructure and secondary vertex information. The dominant standard model backgrounds from quantum chromodynamics multijet production, $ \mathrm{Z}(\to\nu\nu)+\text{jets} $, and $ \mathrm{W}+\text{jets} $ processes are estimated from data using dedicated control regions. The missing transverse momentum spectrum is analyzed to search for a potential signal above the expected background. No significant excess over the standard model expectation is observed. Upper limits at 95% confidence level are set on the signal strength as functions of either the mediator mass or the coupling strength of the $ {\chi}{2} {\chi}{1} {Y}{0} $ vertex. |
| References | ||||
| 1 | D. Abercrombie et al. | Dark matter benchmark models for early LHC Run-2 searches: Report of the ATLAS/CMS dark matter forum | Phys. Dark Univ. 27 (2020) 100371 | 1507.00966 |
| 2 | O. Buchmueller et al. | Simplified models for displaced dark matter signatures | JHEP 09 (2017) 076 | 1704.06515 |
| 3 | CMS Collaboration | HEPData record for this analysis | link | |
| 4 | CMS Collaboration | The CMS experiment at the CERN LHC | JINST 3 (2008) S08004 | |
| 5 | CMS Collaboration | Development of the CMS detector for the CERN LHC Run 3 | JINST 19 (2024) P05064 | CMS-PRF-21-001 2309.05466 |
| 6 | CMS Collaboration | Performance of the CMS Level-1 trigger in proton-proton collisions at $ \sqrt{s} = $ 13 TeV | JINST 15 (2020) P10017 | CMS-TRG-17-001 2006.10165 |
| 7 | CMS Collaboration | The CMS trigger system | JINST 12 (2017) P01020 | CMS-TRG-12-001 1609.02366 |
| 8 | CMS Collaboration | Performance of the CMS high-level trigger during LHC Run 2 | JINST 19 (2024) P11021 | CMS-TRG-19-001 2410.17038 |
| 9 | CMS Collaboration | Electron and photon reconstruction and identification with the CMS experiment at the CERN LHC | JINST 16 (2021) P05014 | CMS-EGM-17-001 2012.06888 |
| 10 | CMS Collaboration | Performance of the CMS muon detector and muon reconstruction with proton-proton collisions at $ \sqrt{s}= $ 13 TeV | JINST 13 (2018) P06015 | CMS-MUO-16-001 1804.04528 |
| 11 | CMS Collaboration | Description and performance of track and primary-vertex reconstruction with the CMS tracker | JINST 9 (2014) P10009 | CMS-TRK-11-001 1405.6569 |
| 12 | GEANT4 Collaboration | GEANT 4---a simulation toolkit | NIM A 506 (2003) 250 | |
| 13 | J. Alwall et al. | The automated computation of tree-level and next-to-leading order differential cross sections, and their matching to parton shower simulations | JHEP 07 (2014) 079 | 1405.0301 |
| 14 | P. Nason | A new method for combining NLO QCD with shower Monte Carlo algorithms | JHEP 11 (2004) 040 | hep-ph/0409146 |
| 15 | S. Frixione, P. Nason, and G. Ridolfi | A positive-weight next-to-leading-order Monte Carlo for heavy flavour hadroproduction | JHEP 09 (2007) 126 | 0707.3088 |
| 16 | S. Frixione, P. Nason, and C. Oleari | Matching NLO QCD computations with parton shower simulations: the POWHEG method | JHEP 11 (2007) 070 | 0709.2092 |
| 17 | S. Alioli, P. Nason, C. Oleari, and E. Re | NLO single-top production matched with shower in POWHEG: s- and t-channel contributions | JHEP 09 (2009) 111 | 0907.4076 |
| 18 | S. Alioli, P. Nason, C. Oleari, and E. Re | A general framework for implementing NLO calculations in shower Monte Carlo programs: the POWHEG BOX | JHEP 06 (2010) 043 | 1002.2581 |
| 19 | J. M. Campbell, R. K. Ellis, P. Nason, and E. Re | Top-pair production and decay at NLO matched with parton showers | JHEP 04 (2015) 114 | 1412.1828 |
| 20 | P. Artoisenet, R. Frederix, O. Mattelaer, and R. Rietkerk | Automatic spin-entangled decays of heavy resonances in Monte Carlo simulations | JHEP 03 (2013) 015 | 1212.3460 |
| 21 | CMS Collaboration | Extraction and validation of a new set of CMS PYTHIA8 tunes from underlying-event measurements | EPJC 80 (2020) 4 | CMS-GEN-17-001 1903.12179 |
| 22 | NNPDF Collaboration | Parton distributions from high-precision collider data | EPJC 77 (2017) 663 | 1706.00428 |
| 23 | CMS Collaboration | Particle-flow reconstruction and global event description with the CMS detector | JINST 12 (2017) P10003 | CMS-PRF-14-001 1706.04965 |
| 24 | M. Cacciari, G. P. Salam, and G. Soyez | The anti-$ k_{\mathrm{T}} $ jet clustering algorithm | JHEP 04 (2008) 063 | 0802.1189 |
| 25 | M. Cacciari, G. P. Salam, and G. Soyez | FastJet user manual | EPJC 72 (2012) 1896 | 1111.6097 |
| 26 | D. Bertolini, P. Harris, M. Low, and N. Tran | Pileup per particle identification | JHEP 10 (2014) 059 | 1407.6013 |
| 27 | CMS Collaboration | Pileup mitigation at CMS in 13 TeV data | JINST 15 (2020) P09018 | CMS-JME-18-001 2003.00503 |
| 28 | CMS Collaboration | Jet energy scale and resolution in the CMS experiment in pp collisions at 8 TeV | JINST 12 (2017) P02014 | CMS-JME-13-004 1607.03663 |
| 29 | CMS Collaboration | Performance of missing transverse momentum reconstruction in proton-proton collisions at $ \sqrt{s} = $ 13 TeV using the CMS detector | JINST 14 (2019) P07004 | CMS-JME-17-001 1903.06078 |
| 30 | D. Krohn, J. Thaler, and L.-T. Wang | Jet trimming | JHEP 02 (2010) 084 | 0912.1342 |
| 31 | CMS Collaboration | Jet algorithms performance in 13 TeV data | CMS Physics Analysis Summary, 2017 CMS-PAS-JME-16-003 |
CMS-PAS-JME-16-003 |
| 32 | E. A. Moreno et al. | Interaction networks for the identification of boosted H$ {\rightarrow}b\overline{b} $ decays | PRD 102 (2020) 012010 | 1909.12285 |
| 33 | H. Qu and L. Gouskos | Jet tagging via particle clouds | PRD 101 (2020) 056019 | 1902.08570 |
| 34 | CMS Collaboration | Identification of hadronic tau lepton decays using a deep neural network | JINST 17 (2022) P07023 | CMS-TAU-20-001 2201.08458 |
| 35 | CMS Collaboration | Precision luminosity measurement in proton-proton collisions at $ \sqrt{s} = $ 13 TeV in 2015 and 2016 at CMS | EPJC 81 (2021) 800 | CMS-LUM-17-003 2104.01927 |
| 36 | CMS Collaboration | CMS luminosity measurement for the 2017 data-taking period at $ \sqrt{s} = $ 13 TeV | CMS Physics Analysis Summary, 2018 link |
CMS-PAS-LUM-17-004 |
| 37 | CMS Collaboration | CMS luminosity measurement for the 2018 data-taking period at $ \sqrt{s} = $ 13 TeV | CMS Physics Analysis Summary, 2019 link |
CMS-PAS-LUM-18-002 |
| 38 | CMS Collaboration | A method for correcting the substructure of multiprong jets using the Lund jet plane | JHEP 11 (2025) 038 | CMS-JME-23-001 2507.07775 |
| 39 | T. Junk | Confidence level computation for combining searches with small statistics | NIM A 434 (1999) 435 | hep-ex/9902006 |
| 40 | A. L. Read | Presentation of search results: the CLs technique | JPG 28 (2002) 2693 | |
| 41 | G. Cowan, K. Cranmer, E. Gross, and O. Vitells | Asymptotic formulae for likelihood-based tests of new physics | [Erratum: 10.1140/epjc/s2-013-2501-z] EPJC 71 (2011) 1554 |
1007.1727 |
| 42 | CMS Collaboration | The CMS statistical analysis and combination tool: Combine | Comput. Softw. Big Sci. 8 (2024) 19 | CMS-CAT-23-001 2404.06614 |
|
|
Compact Muon Solenoid LHC, CERN |

|

|

|

|

|

|