

Compact Muon Solenoid
LHC, CERN
| CMS-B2G-22-004 ; CERN-EP-2026-021 | ||
| Search for the single production of vector-like quarks decaying into a W boson and a b quark using single-lepton final states in proton-proton collisions at $ \sqrt{s} = $ 13 TeV | ||
| CMS Collaboration | ||
| 19 April 2026 | ||
| Submitted to Physics Letters B | ||
| Abstract: A search is performed for the single production of a heavy vector-like quark (VLQ), decaying into a W boson and a b quark. The analysis uses proton-proton collision data collected by the CMS experiment at the CERN LHC at a center-of-mass energy of 13 TeV and corresponding to an integrated luminosity of 138 fb$ ^{-1} $. The search targets events with leptonic W boson decays. The event signature consists of one electron or muon, large transverse momentum imbalance, at least one jet consistent with coming from the fragmentation of a b quark and having large transverse momentum, and at least one jet in the forward region of the detector. No significant excess over the standard model prediction is observed. Upper limits are set at the 95% confidence level on the production cross section of a VLQ and its coupling $ \kappa_\mathrm{W} $ to the standard model sector. For a VLQ decaying exclusively into $ \mathrm{W}\mathrm{b} $, the upper limit on $ \kappa_\mathrm{W} $ depends on the VLQ mass and reaches values as low as 0.086 for masses around 1.4 TeV. For $ \kappa_\mathrm{W} = $ 0.2 the lower limit on the VLQ mass is 2.4 TeV. These are the most stringent limits to date on the single production of VLQs decaying into $ \mathrm{W}\mathrm{b} $. | ||
| Links: e-print arXiv:2604.17564 [hep-ex] (PDF) ; CDS record ; inSPIRE record ; HepData record ; CADI line (restricted) ; | ||
| Figures | |
png pdf |
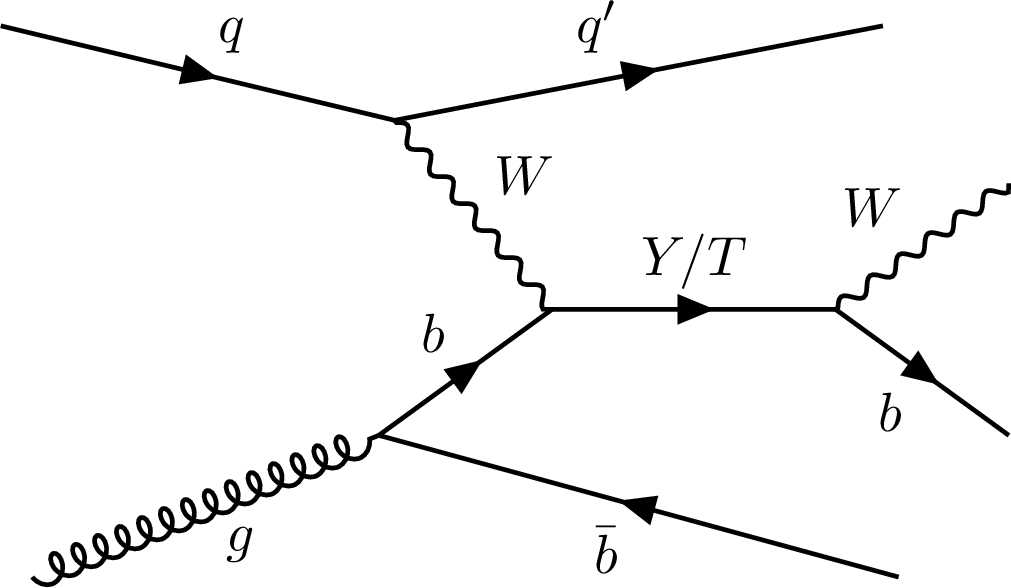
Figure 1:
Leading-order Feynman diagram for singly produced Y or T quarks. |
png pdf |
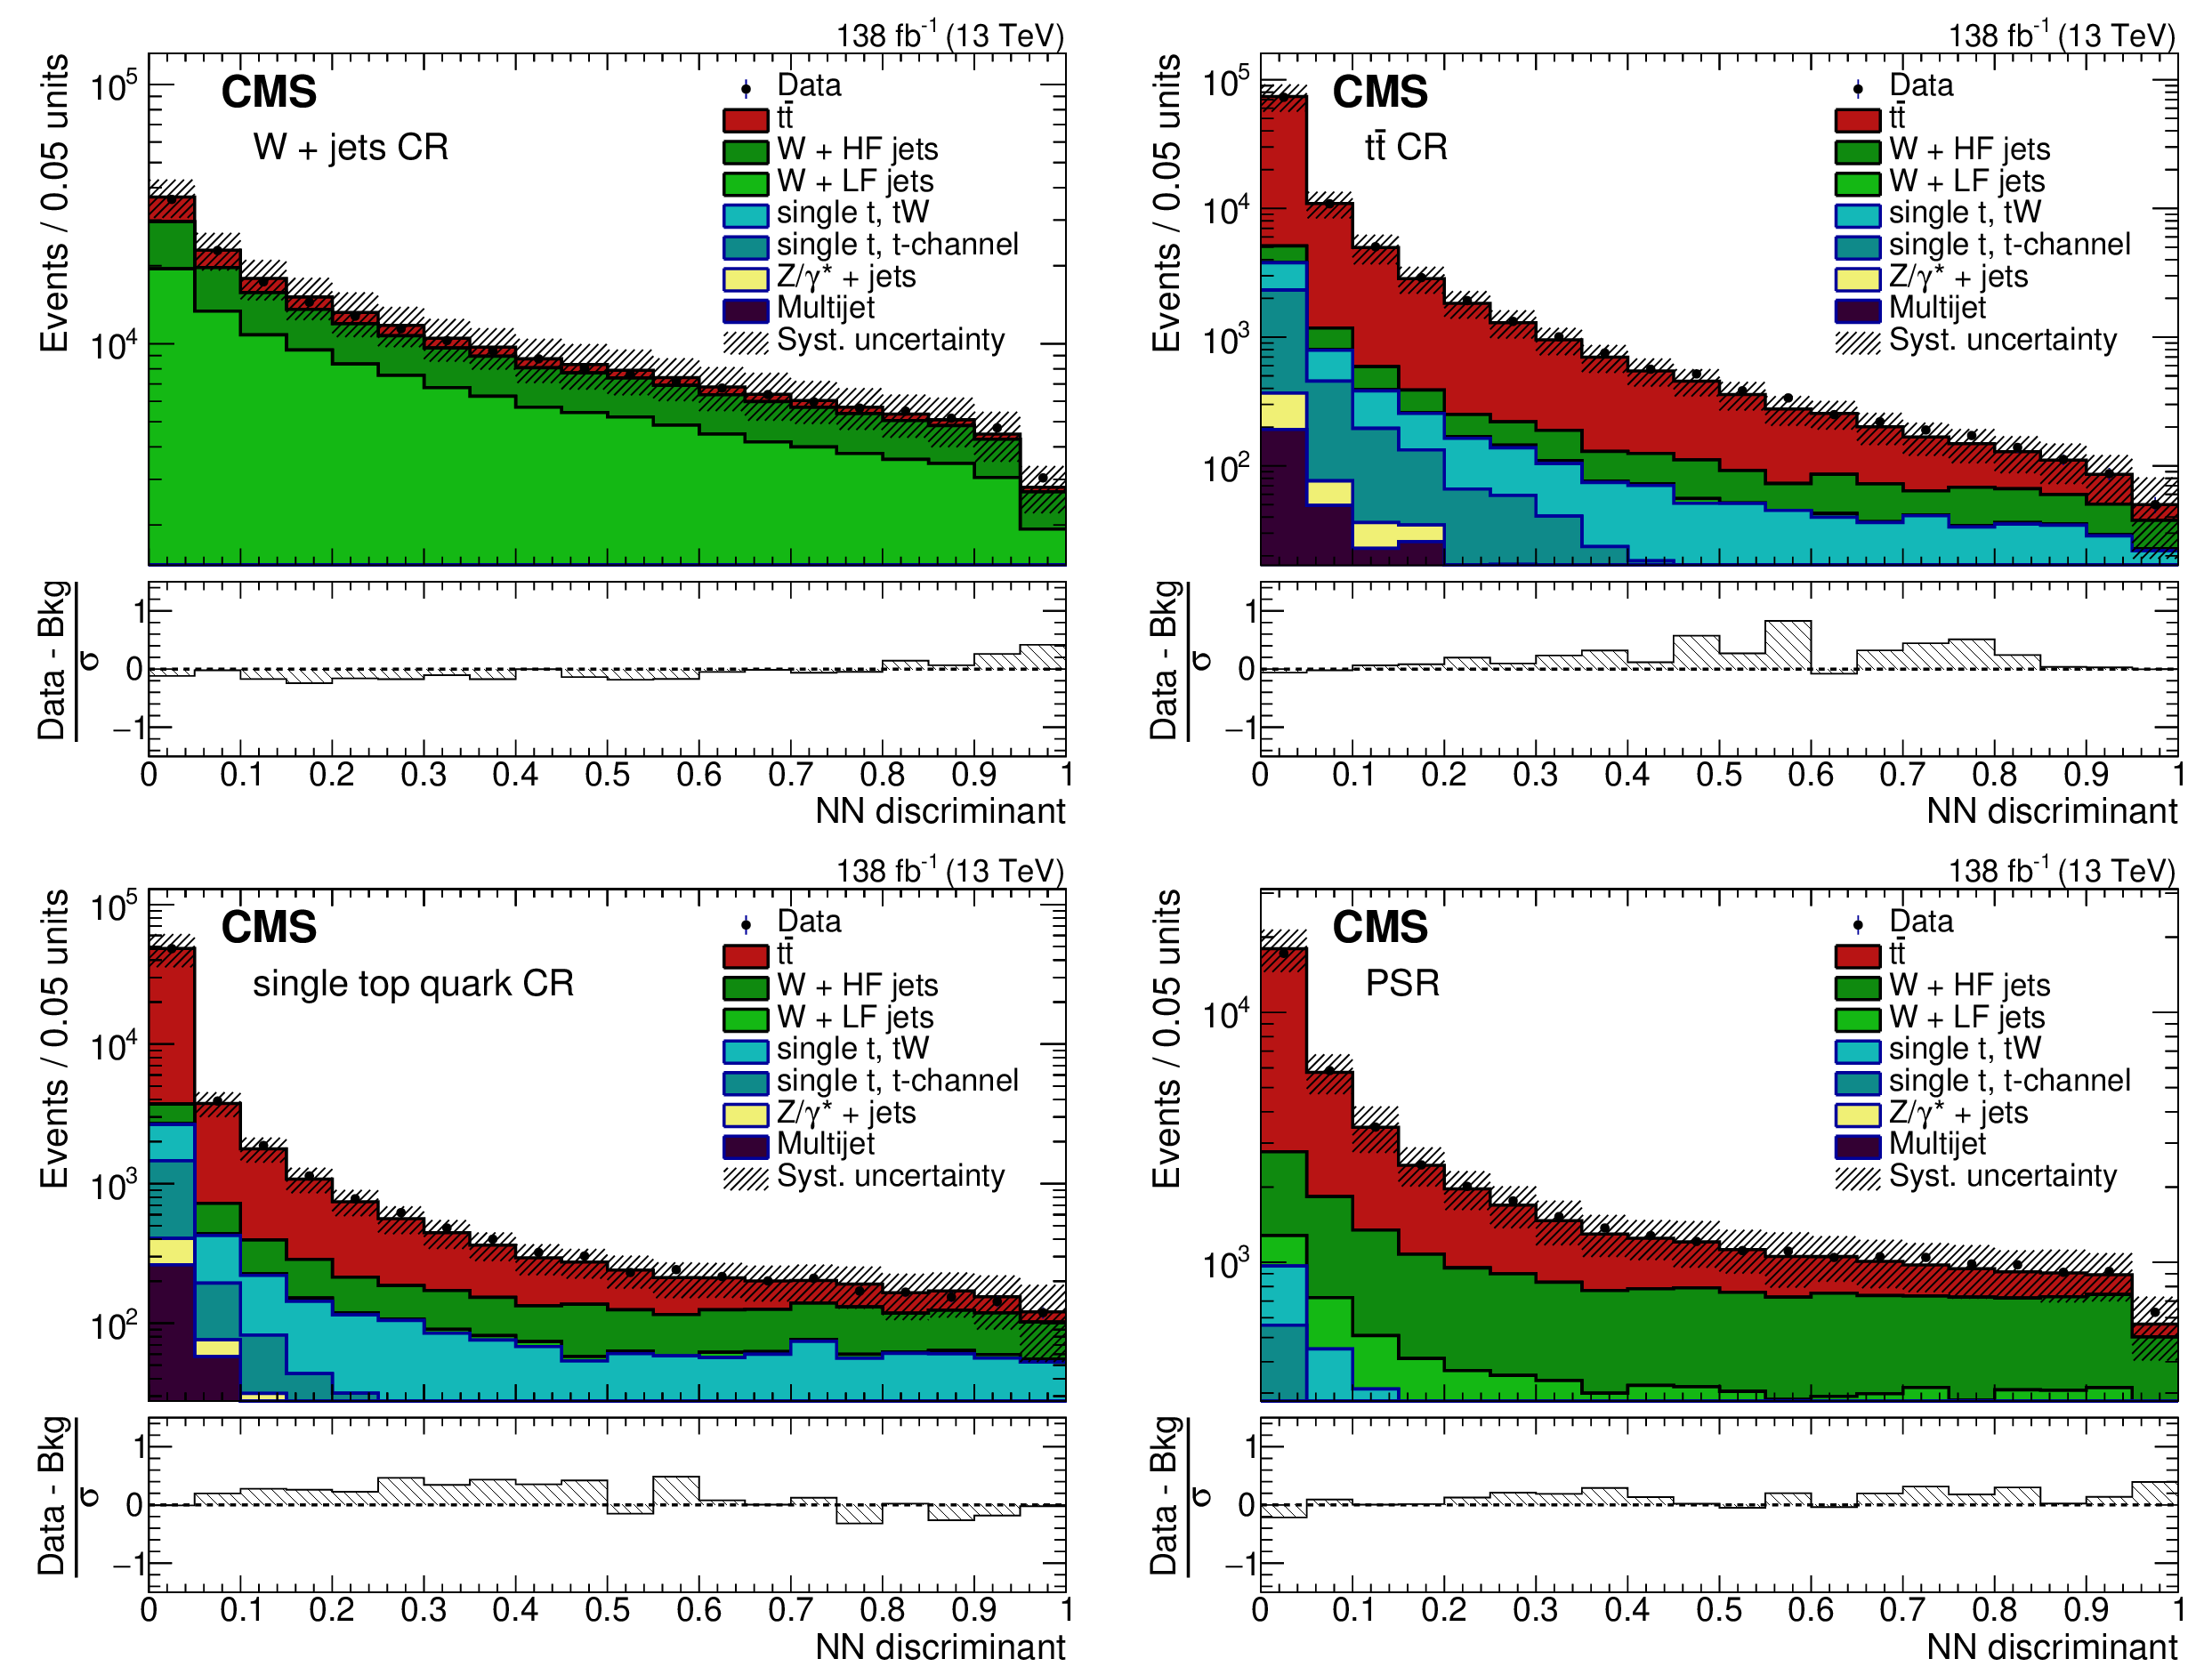
Figure 2:
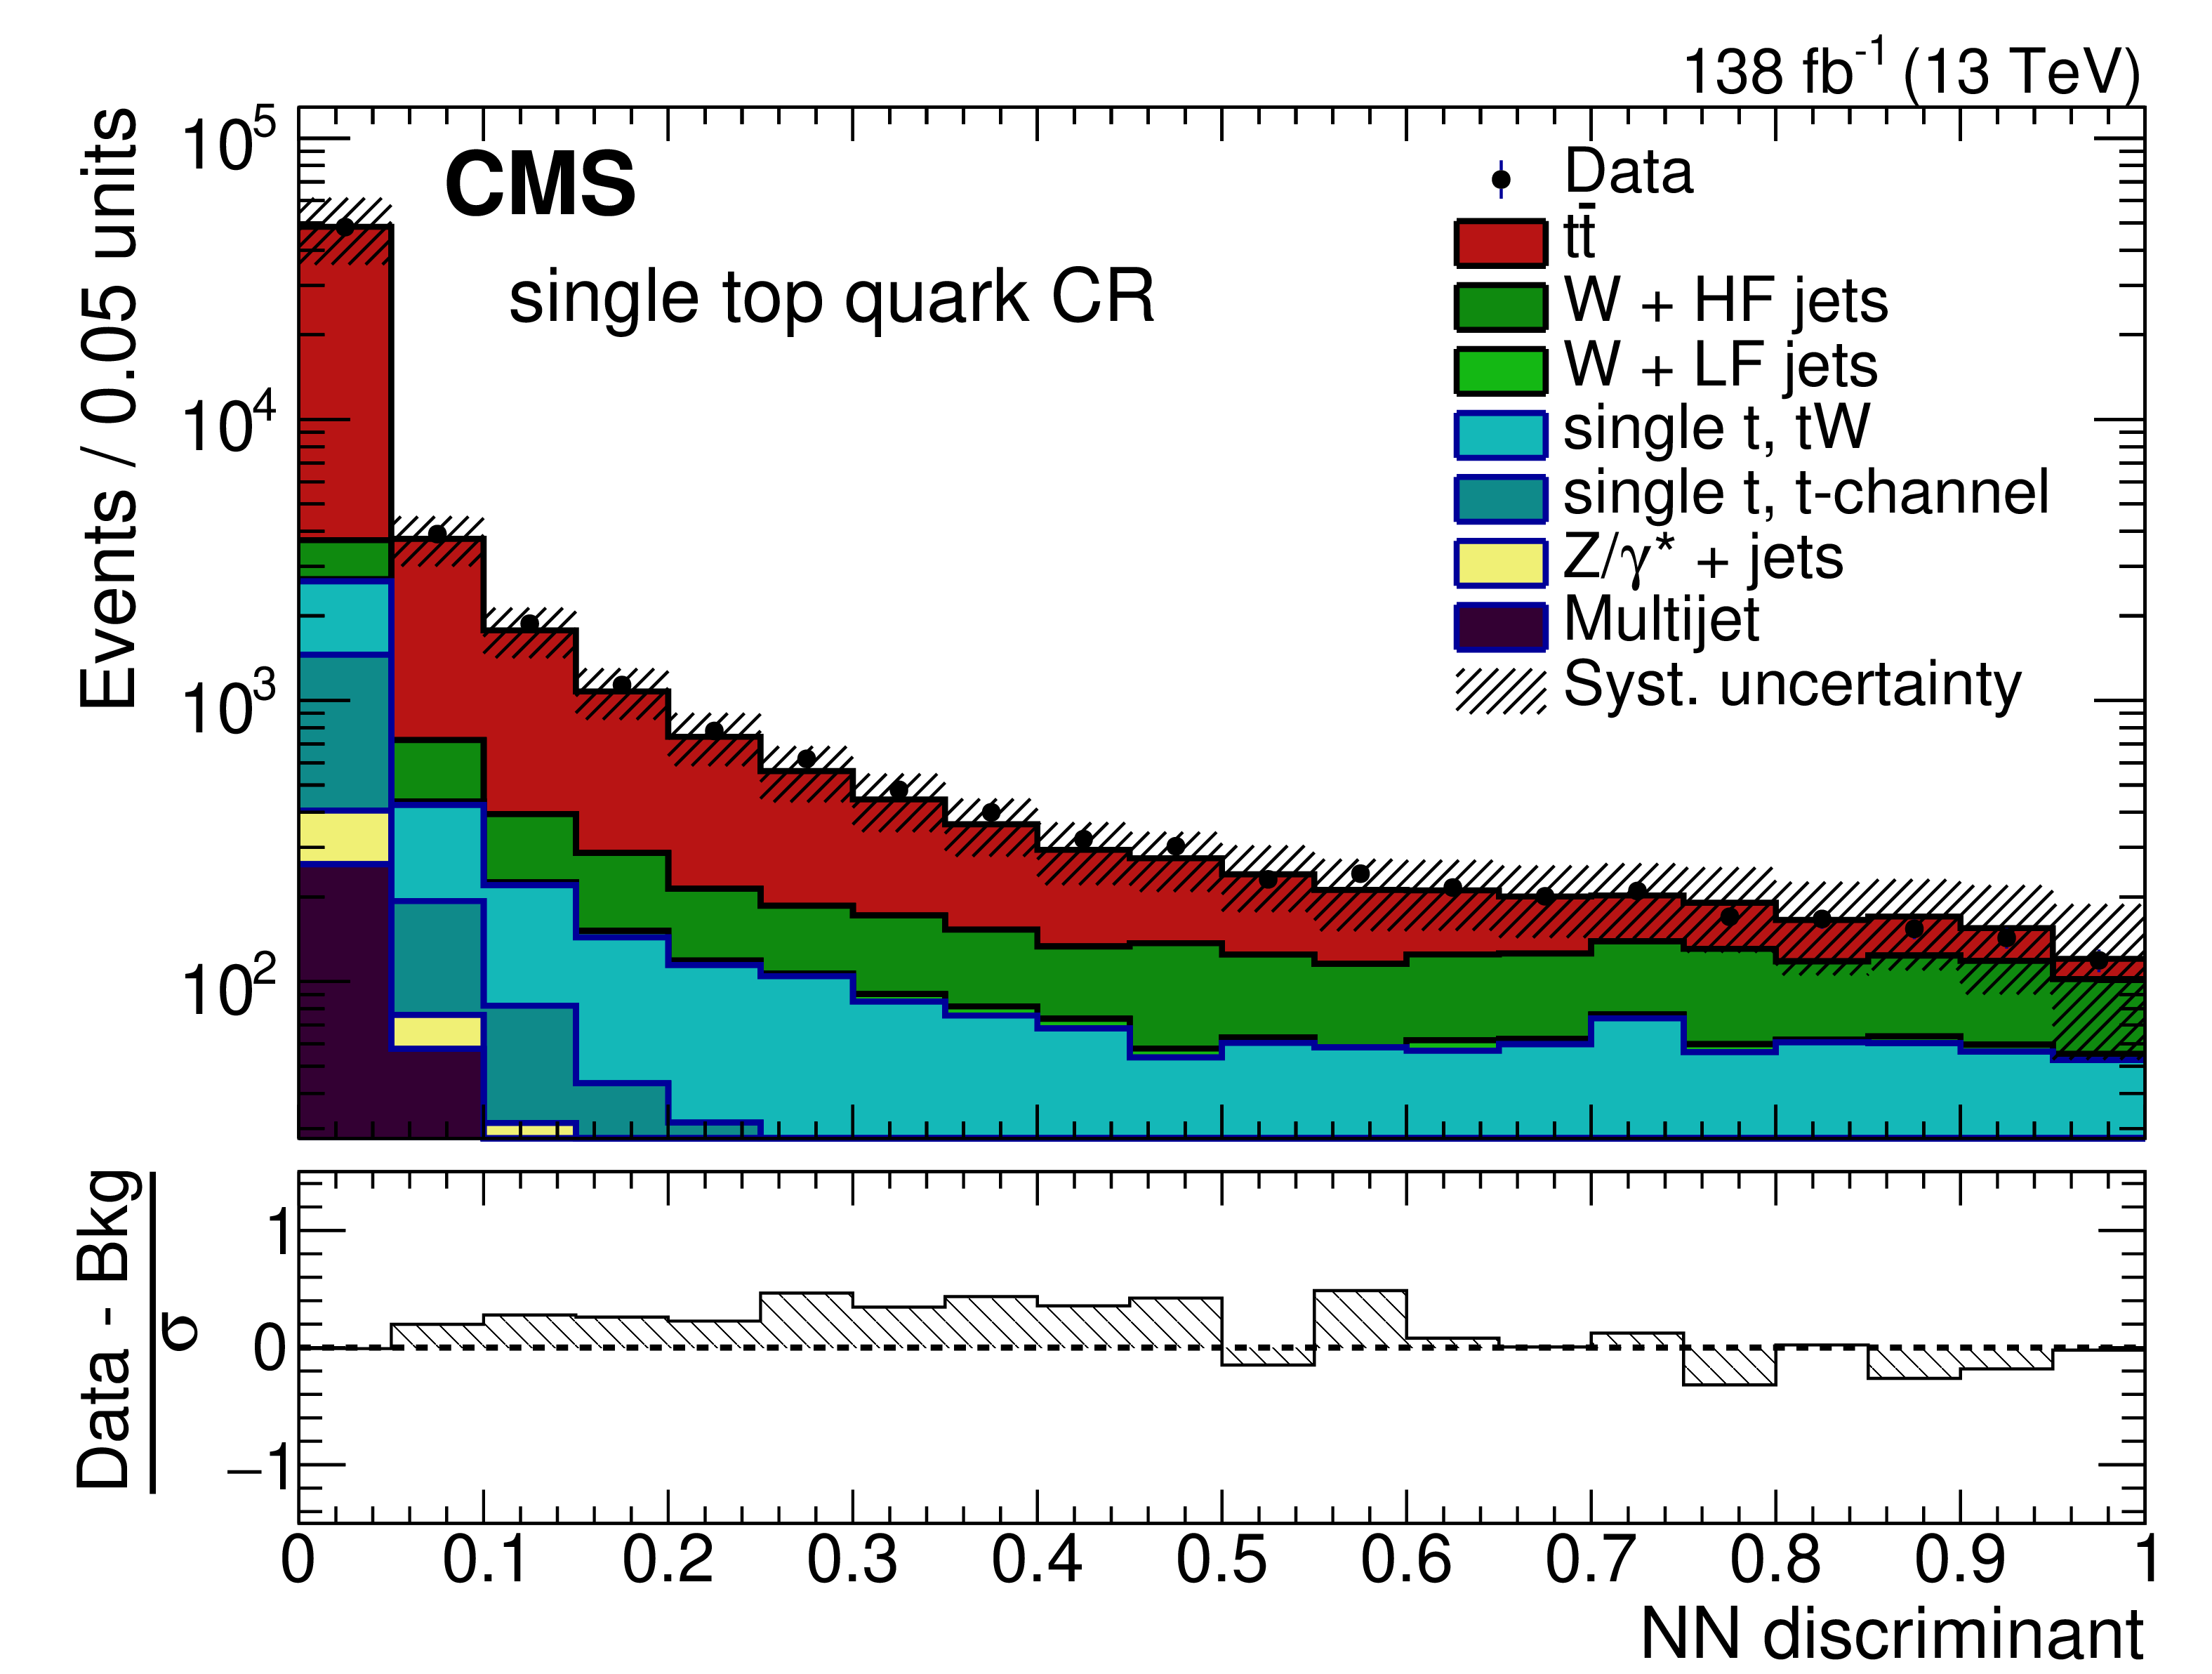
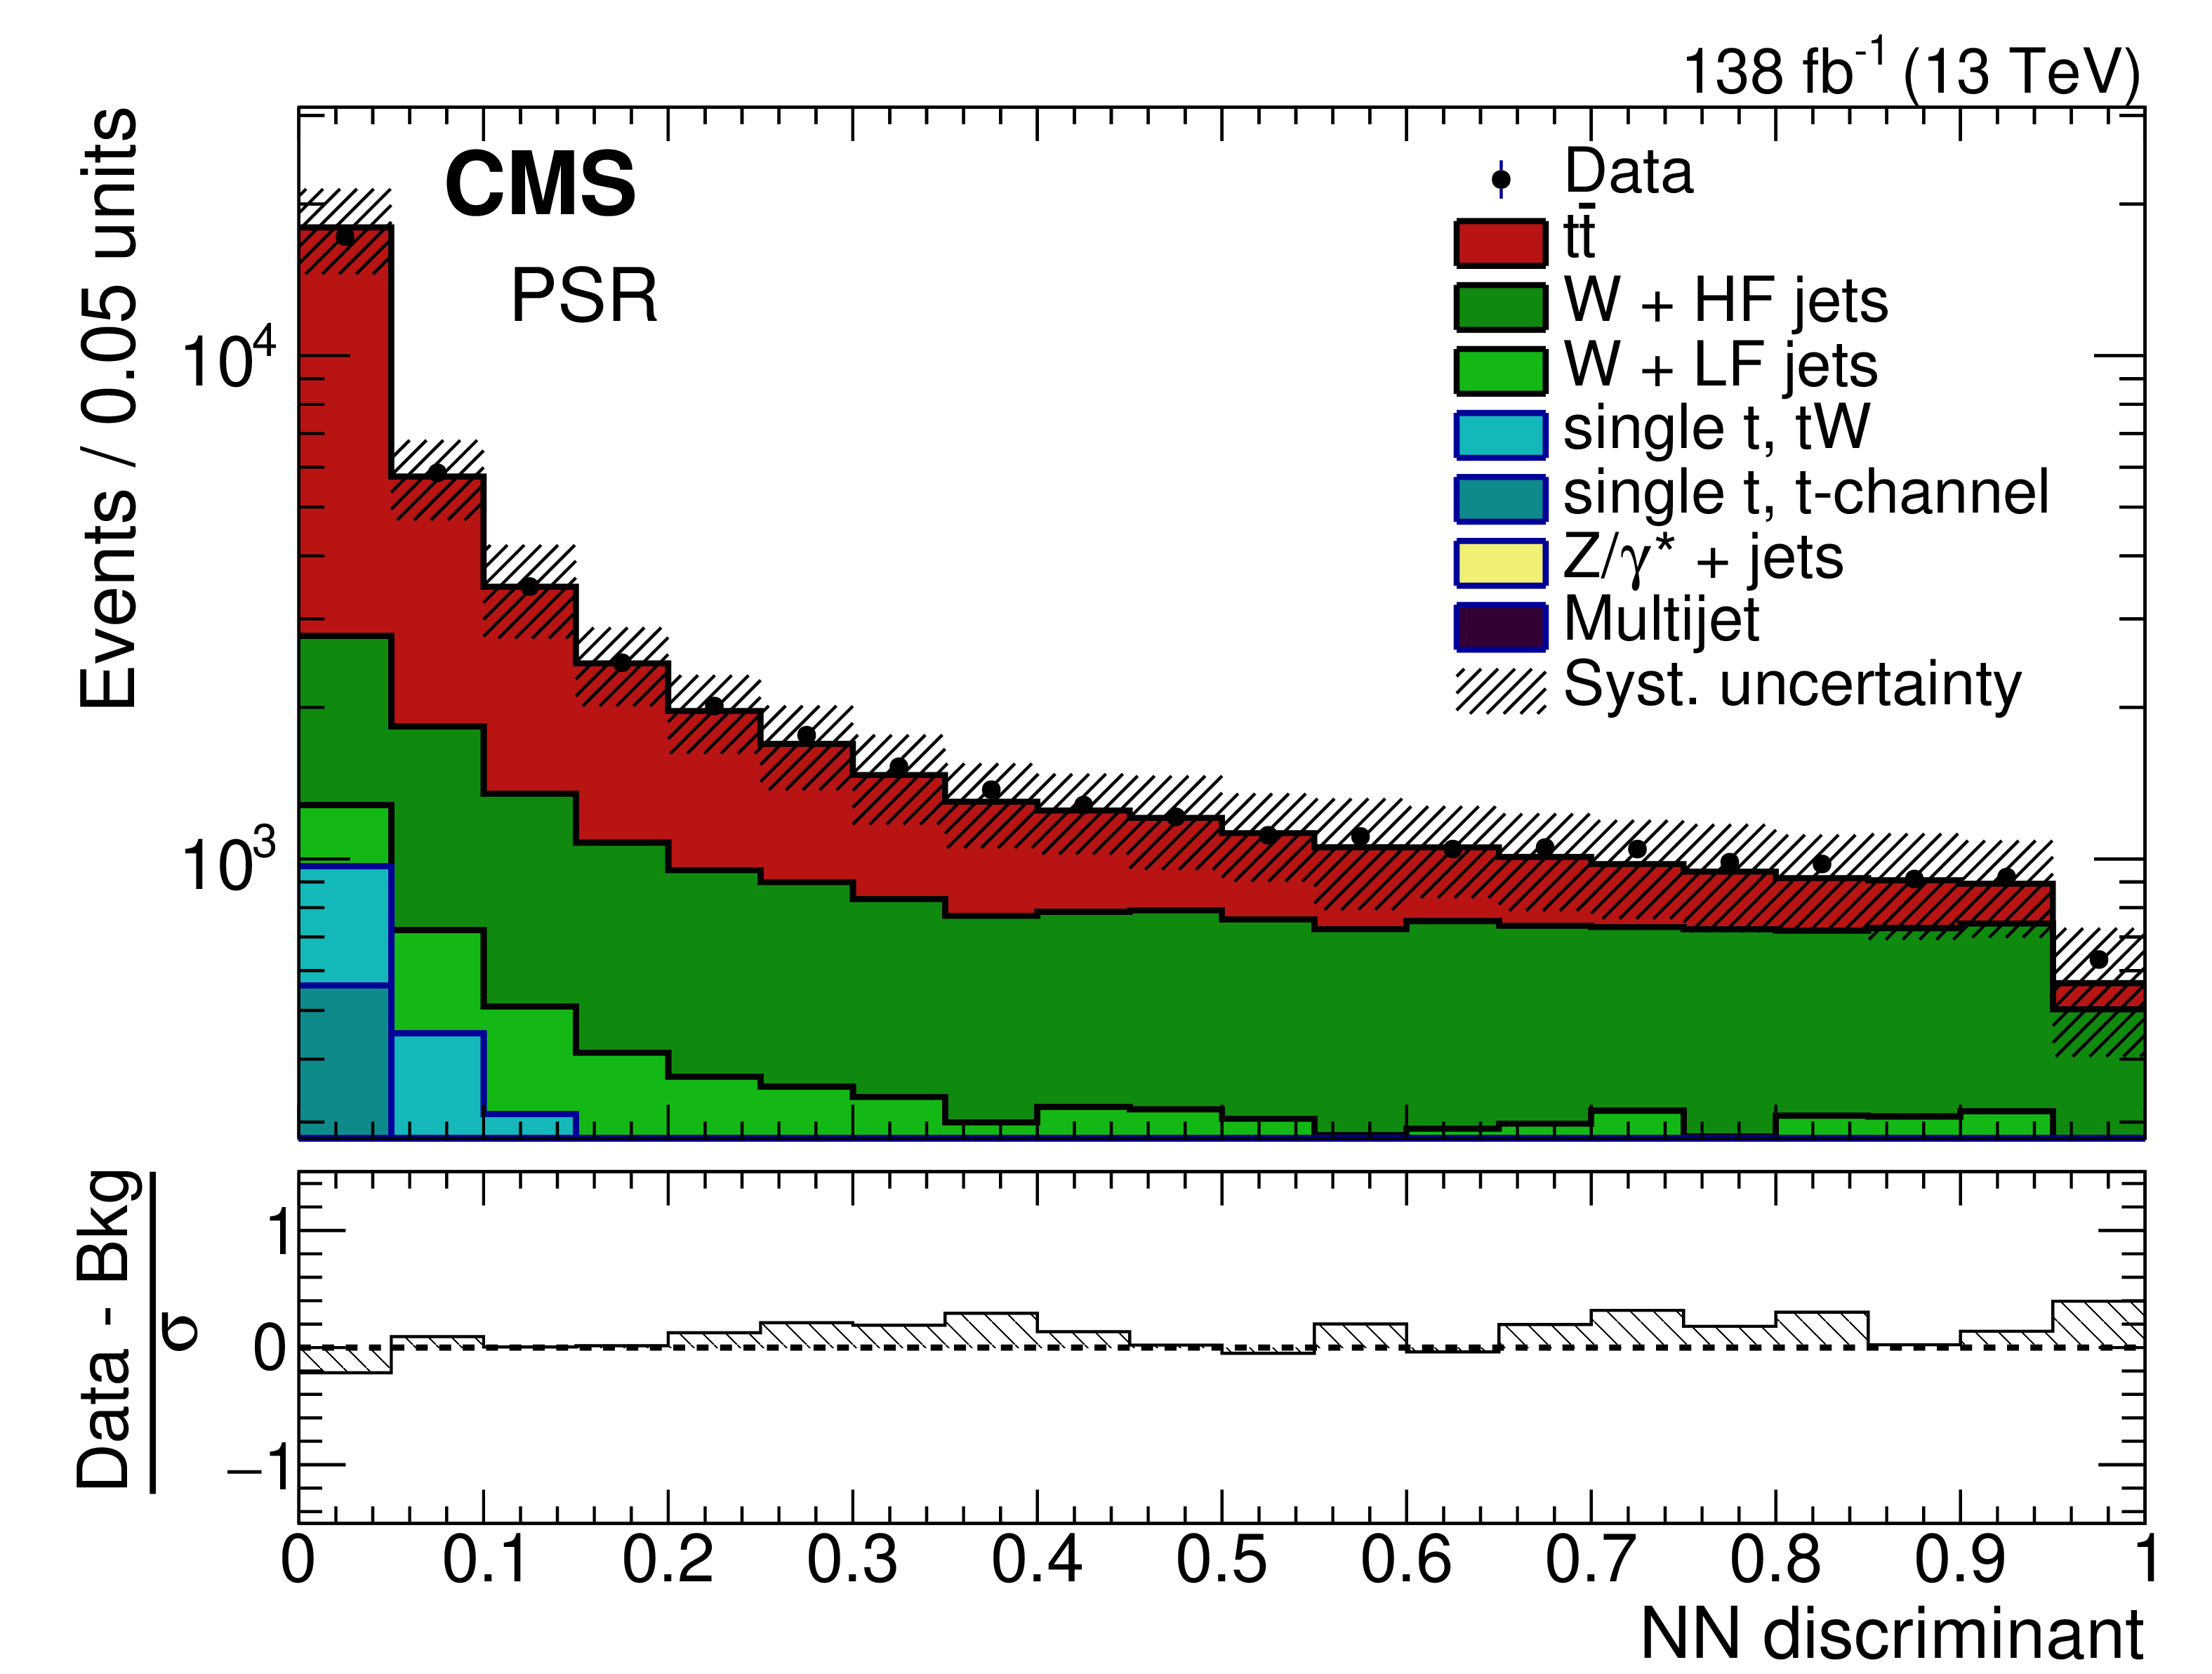
Distributions of the NN discriminant in the W + $\text{jets}$ (upper left), $ \mathrm{t} \overline{\mathrm{t}} $ (upper right), single top quark (lower left) CRs, and in the PSR (lower right). The data are shown as points and the simulations as colored histograms. The vertical bars on the data points represent the statistical uncertainty and the cross-hatched areas give the systematic uncertainty. The ``HF" and ``LF" labels refer to heavy- and light-flavor quarks, respectively. The lower panels show the differences between the data and the total simulated background predictions, divided by the total uncertainty $ \sigma $. |
png pdf |
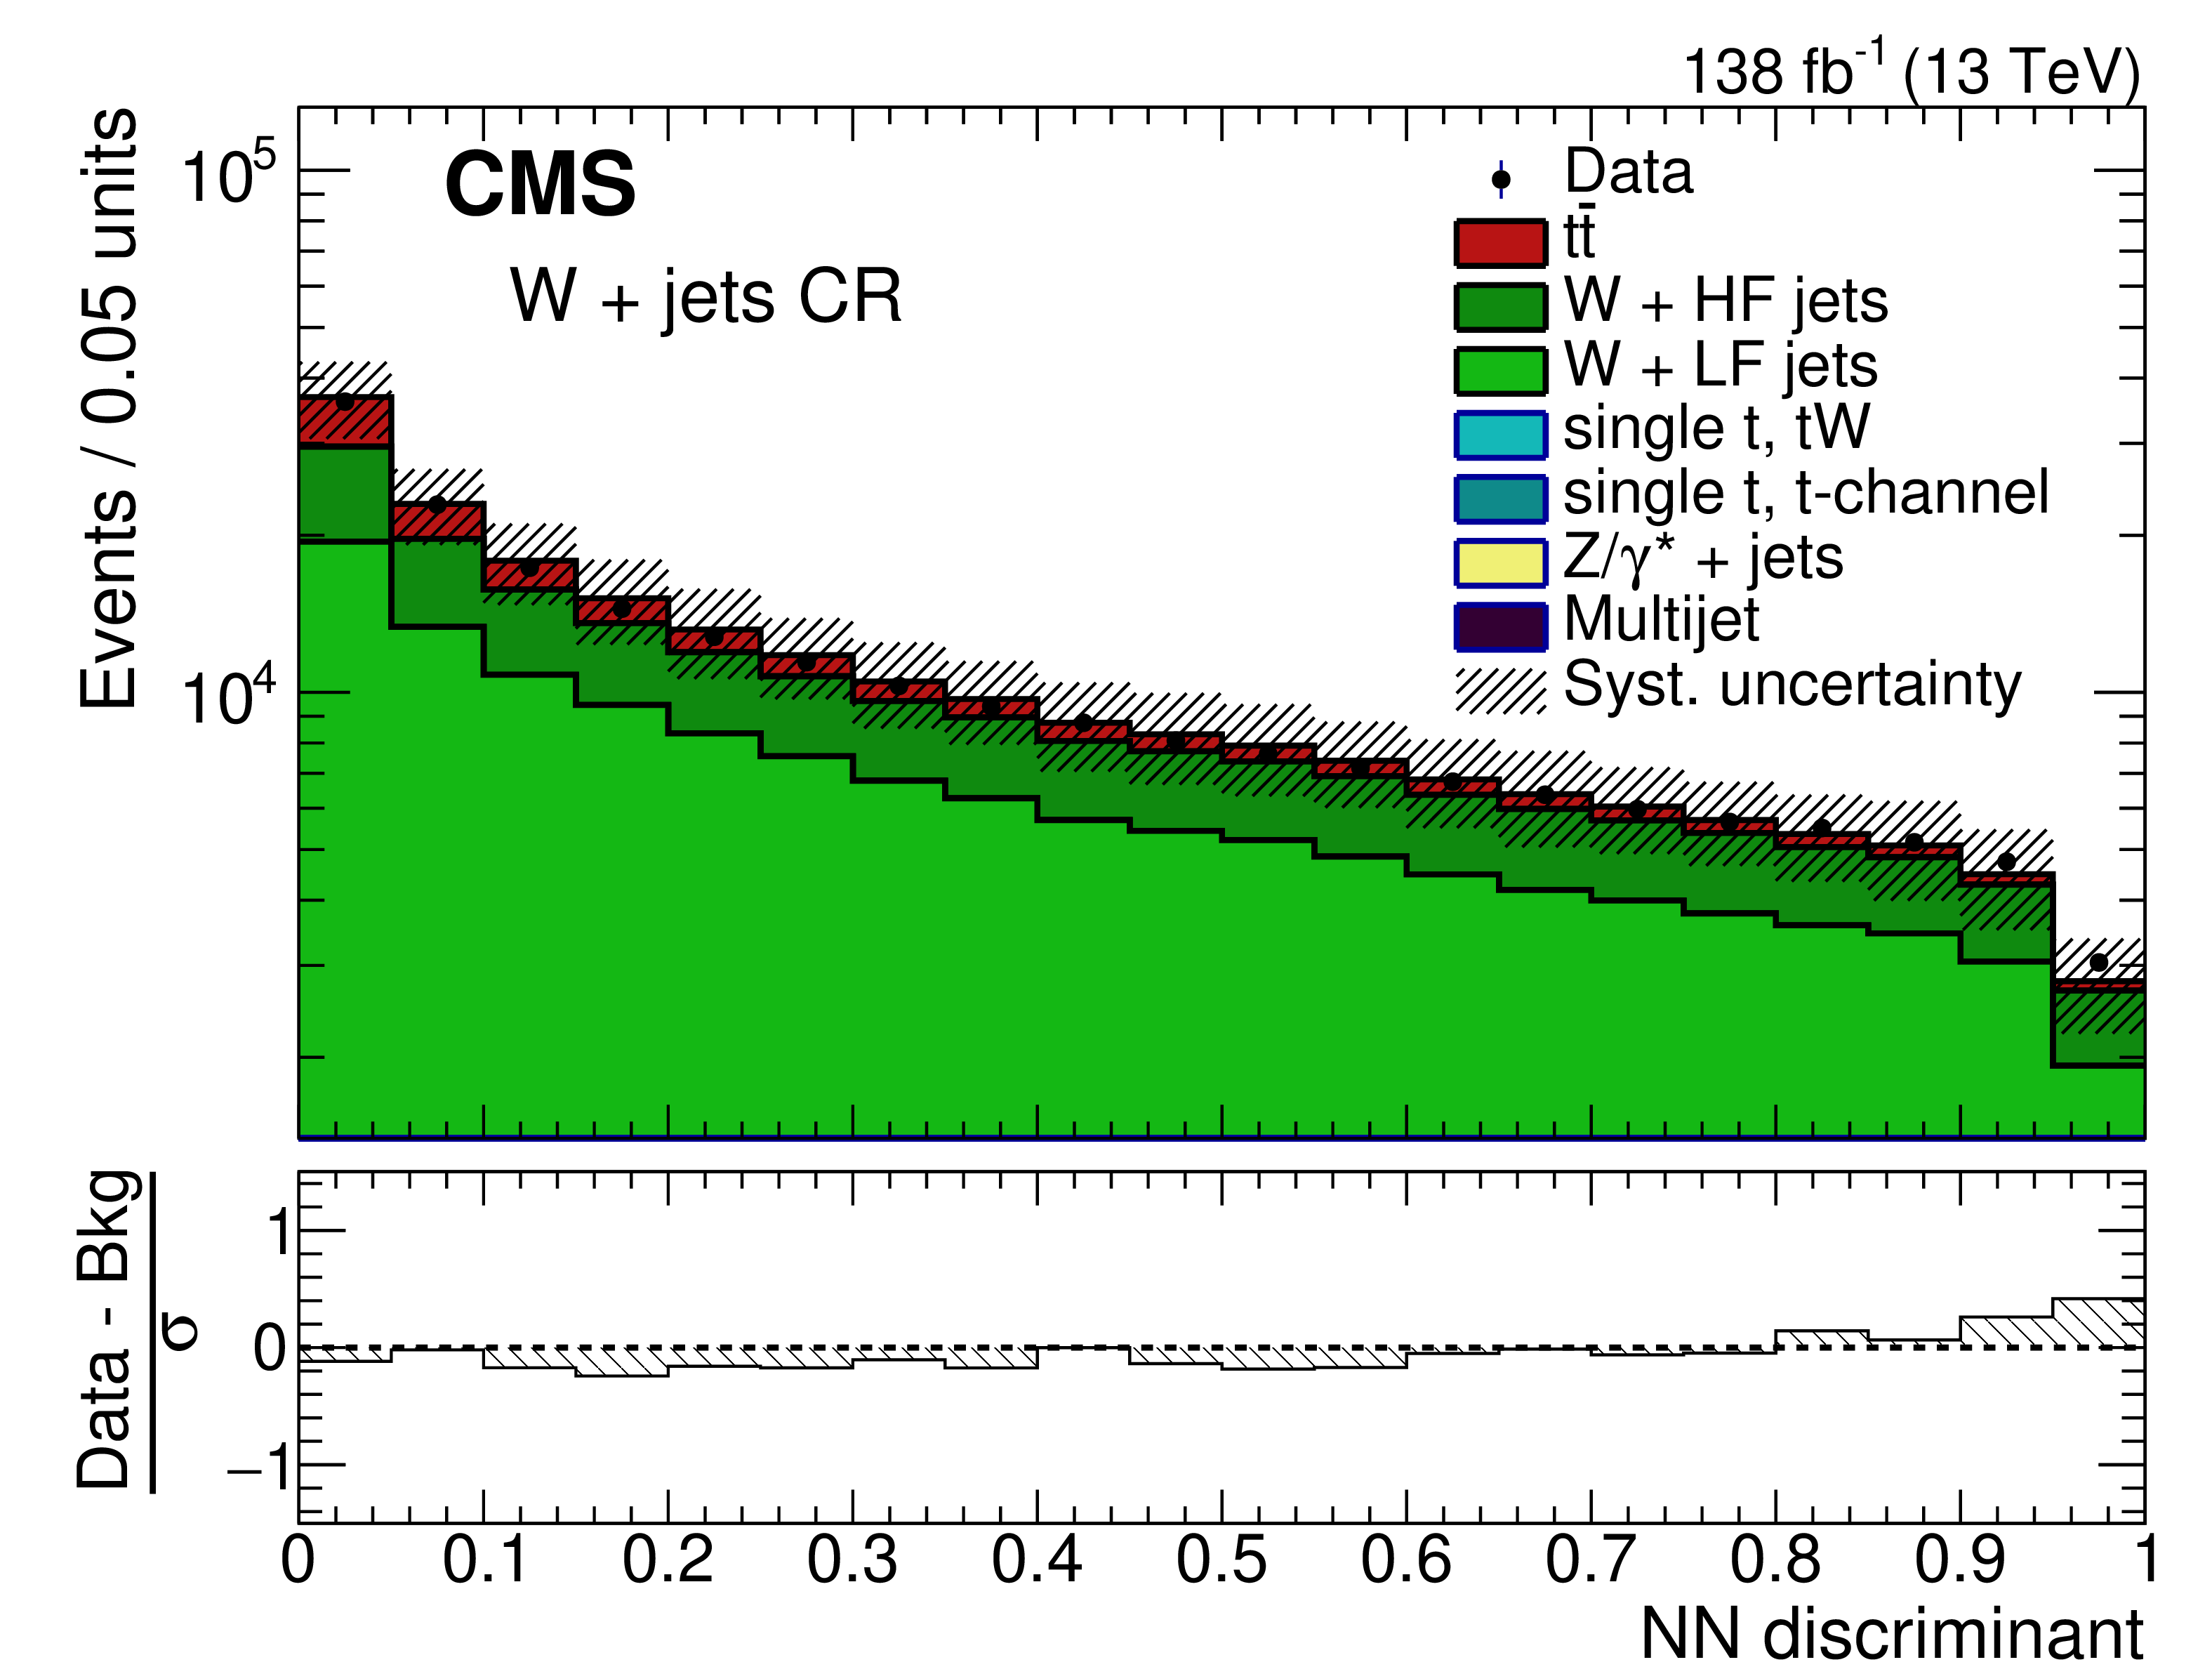
Figure 2-a:
Distributions of the NN discriminant in the W + $\text{jets}$ (upper left), $ \mathrm{t} \overline{\mathrm{t}} $ (upper right), single top quark (lower left) CRs, and in the PSR (lower right). The data are shown as points and the simulations as colored histograms. The vertical bars on the data points represent the statistical uncertainty and the cross-hatched areas give the systematic uncertainty. The ``HF" and ``LF" labels refer to heavy- and light-flavor quarks, respectively. The lower panels show the differences between the data and the total simulated background predictions, divided by the total uncertainty $ \sigma $. |
png pdf |
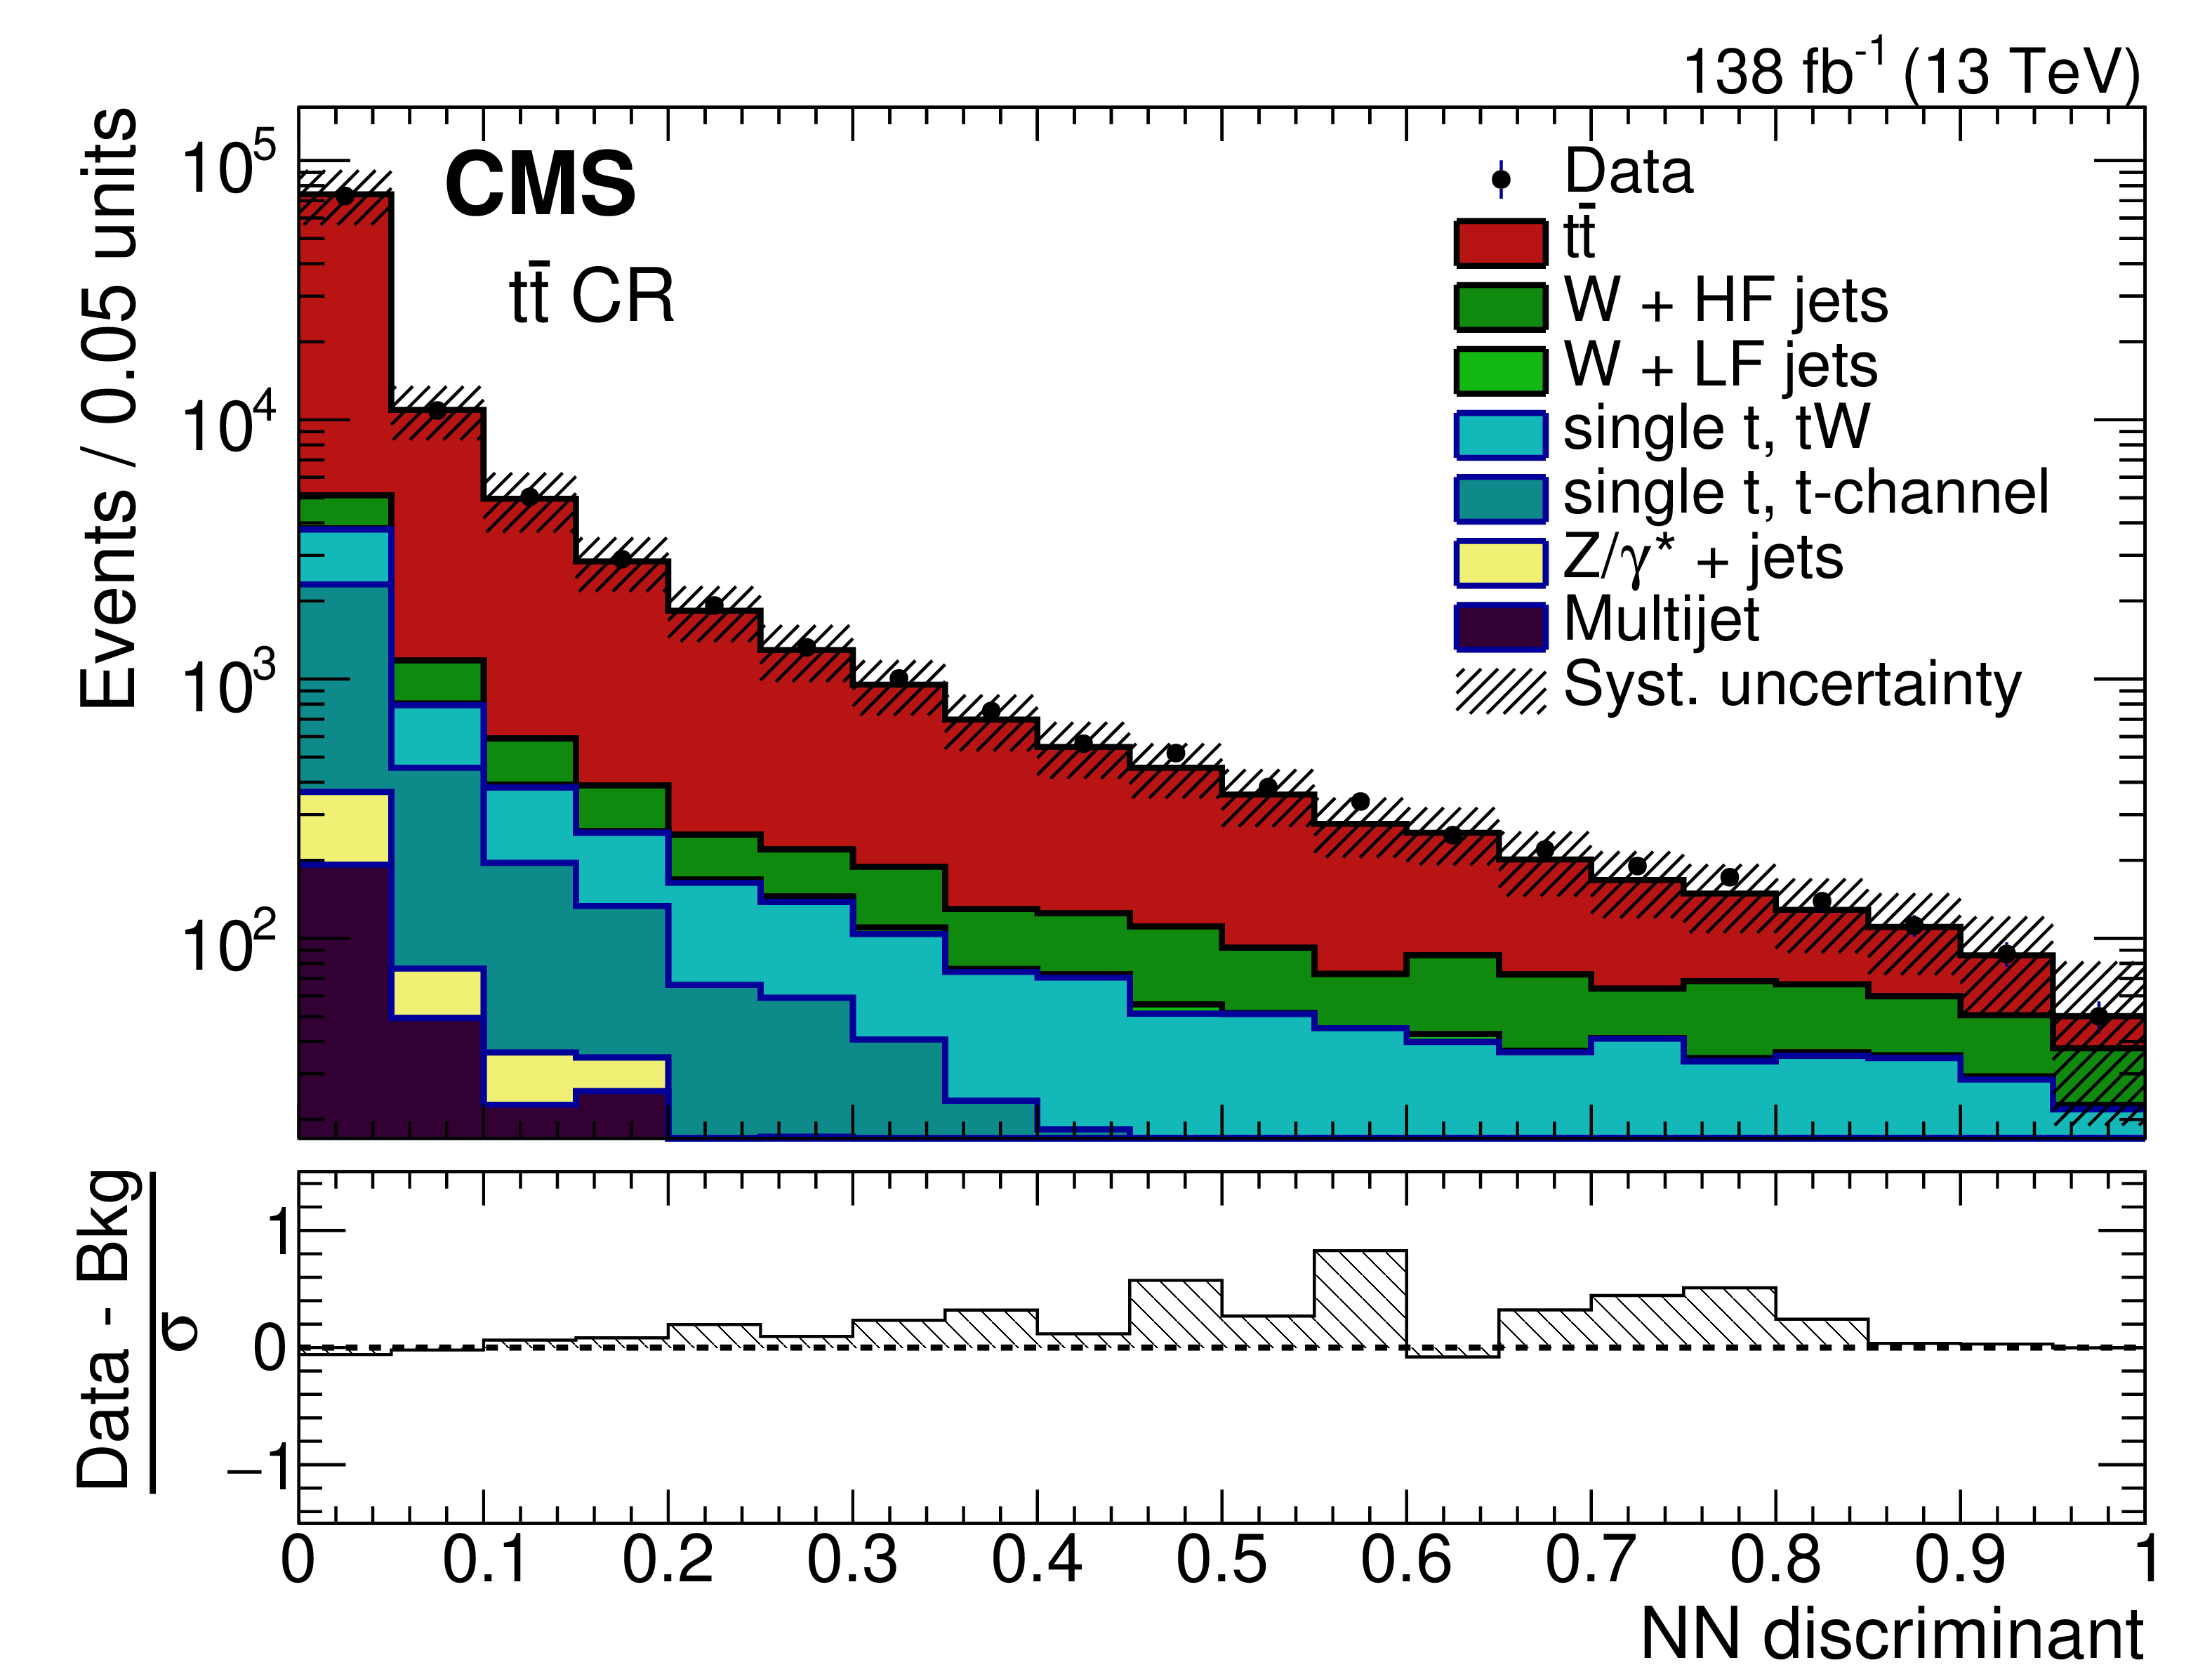
Figure 2-b:
Distributions of the NN discriminant in the W + $\text{jets}$ (upper left), $ \mathrm{t} \overline{\mathrm{t}} $ (upper right), single top quark (lower left) CRs, and in the PSR (lower right). The data are shown as points and the simulations as colored histograms. The vertical bars on the data points represent the statistical uncertainty and the cross-hatched areas give the systematic uncertainty. The ``HF" and ``LF" labels refer to heavy- and light-flavor quarks, respectively. The lower panels show the differences between the data and the total simulated background predictions, divided by the total uncertainty $ \sigma $. |
png pdf |
Figure 2-c:
Distributions of the NN discriminant in the W + $\text{jets}$ (upper left), $ \mathrm{t} \overline{\mathrm{t}} $ (upper right), single top quark (lower left) CRs, and in the PSR (lower right). The data are shown as points and the simulations as colored histograms. The vertical bars on the data points represent the statistical uncertainty and the cross-hatched areas give the systematic uncertainty. The ``HF" and ``LF" labels refer to heavy- and light-flavor quarks, respectively. The lower panels show the differences between the data and the total simulated background predictions, divided by the total uncertainty $ \sigma $. |
png pdf |
Figure 2-d:
Distributions of the NN discriminant in the W + $\text{jets}$ (upper left), $ \mathrm{t} \overline{\mathrm{t}} $ (upper right), single top quark (lower left) CRs, and in the PSR (lower right). The data are shown as points and the simulations as colored histograms. The vertical bars on the data points represent the statistical uncertainty and the cross-hatched areas give the systematic uncertainty. The ``HF" and ``LF" labels refer to heavy- and light-flavor quarks, respectively. The lower panels show the differences between the data and the total simulated background predictions, divided by the total uncertainty $ \sigma $. |
png pdf |
Figure 3:
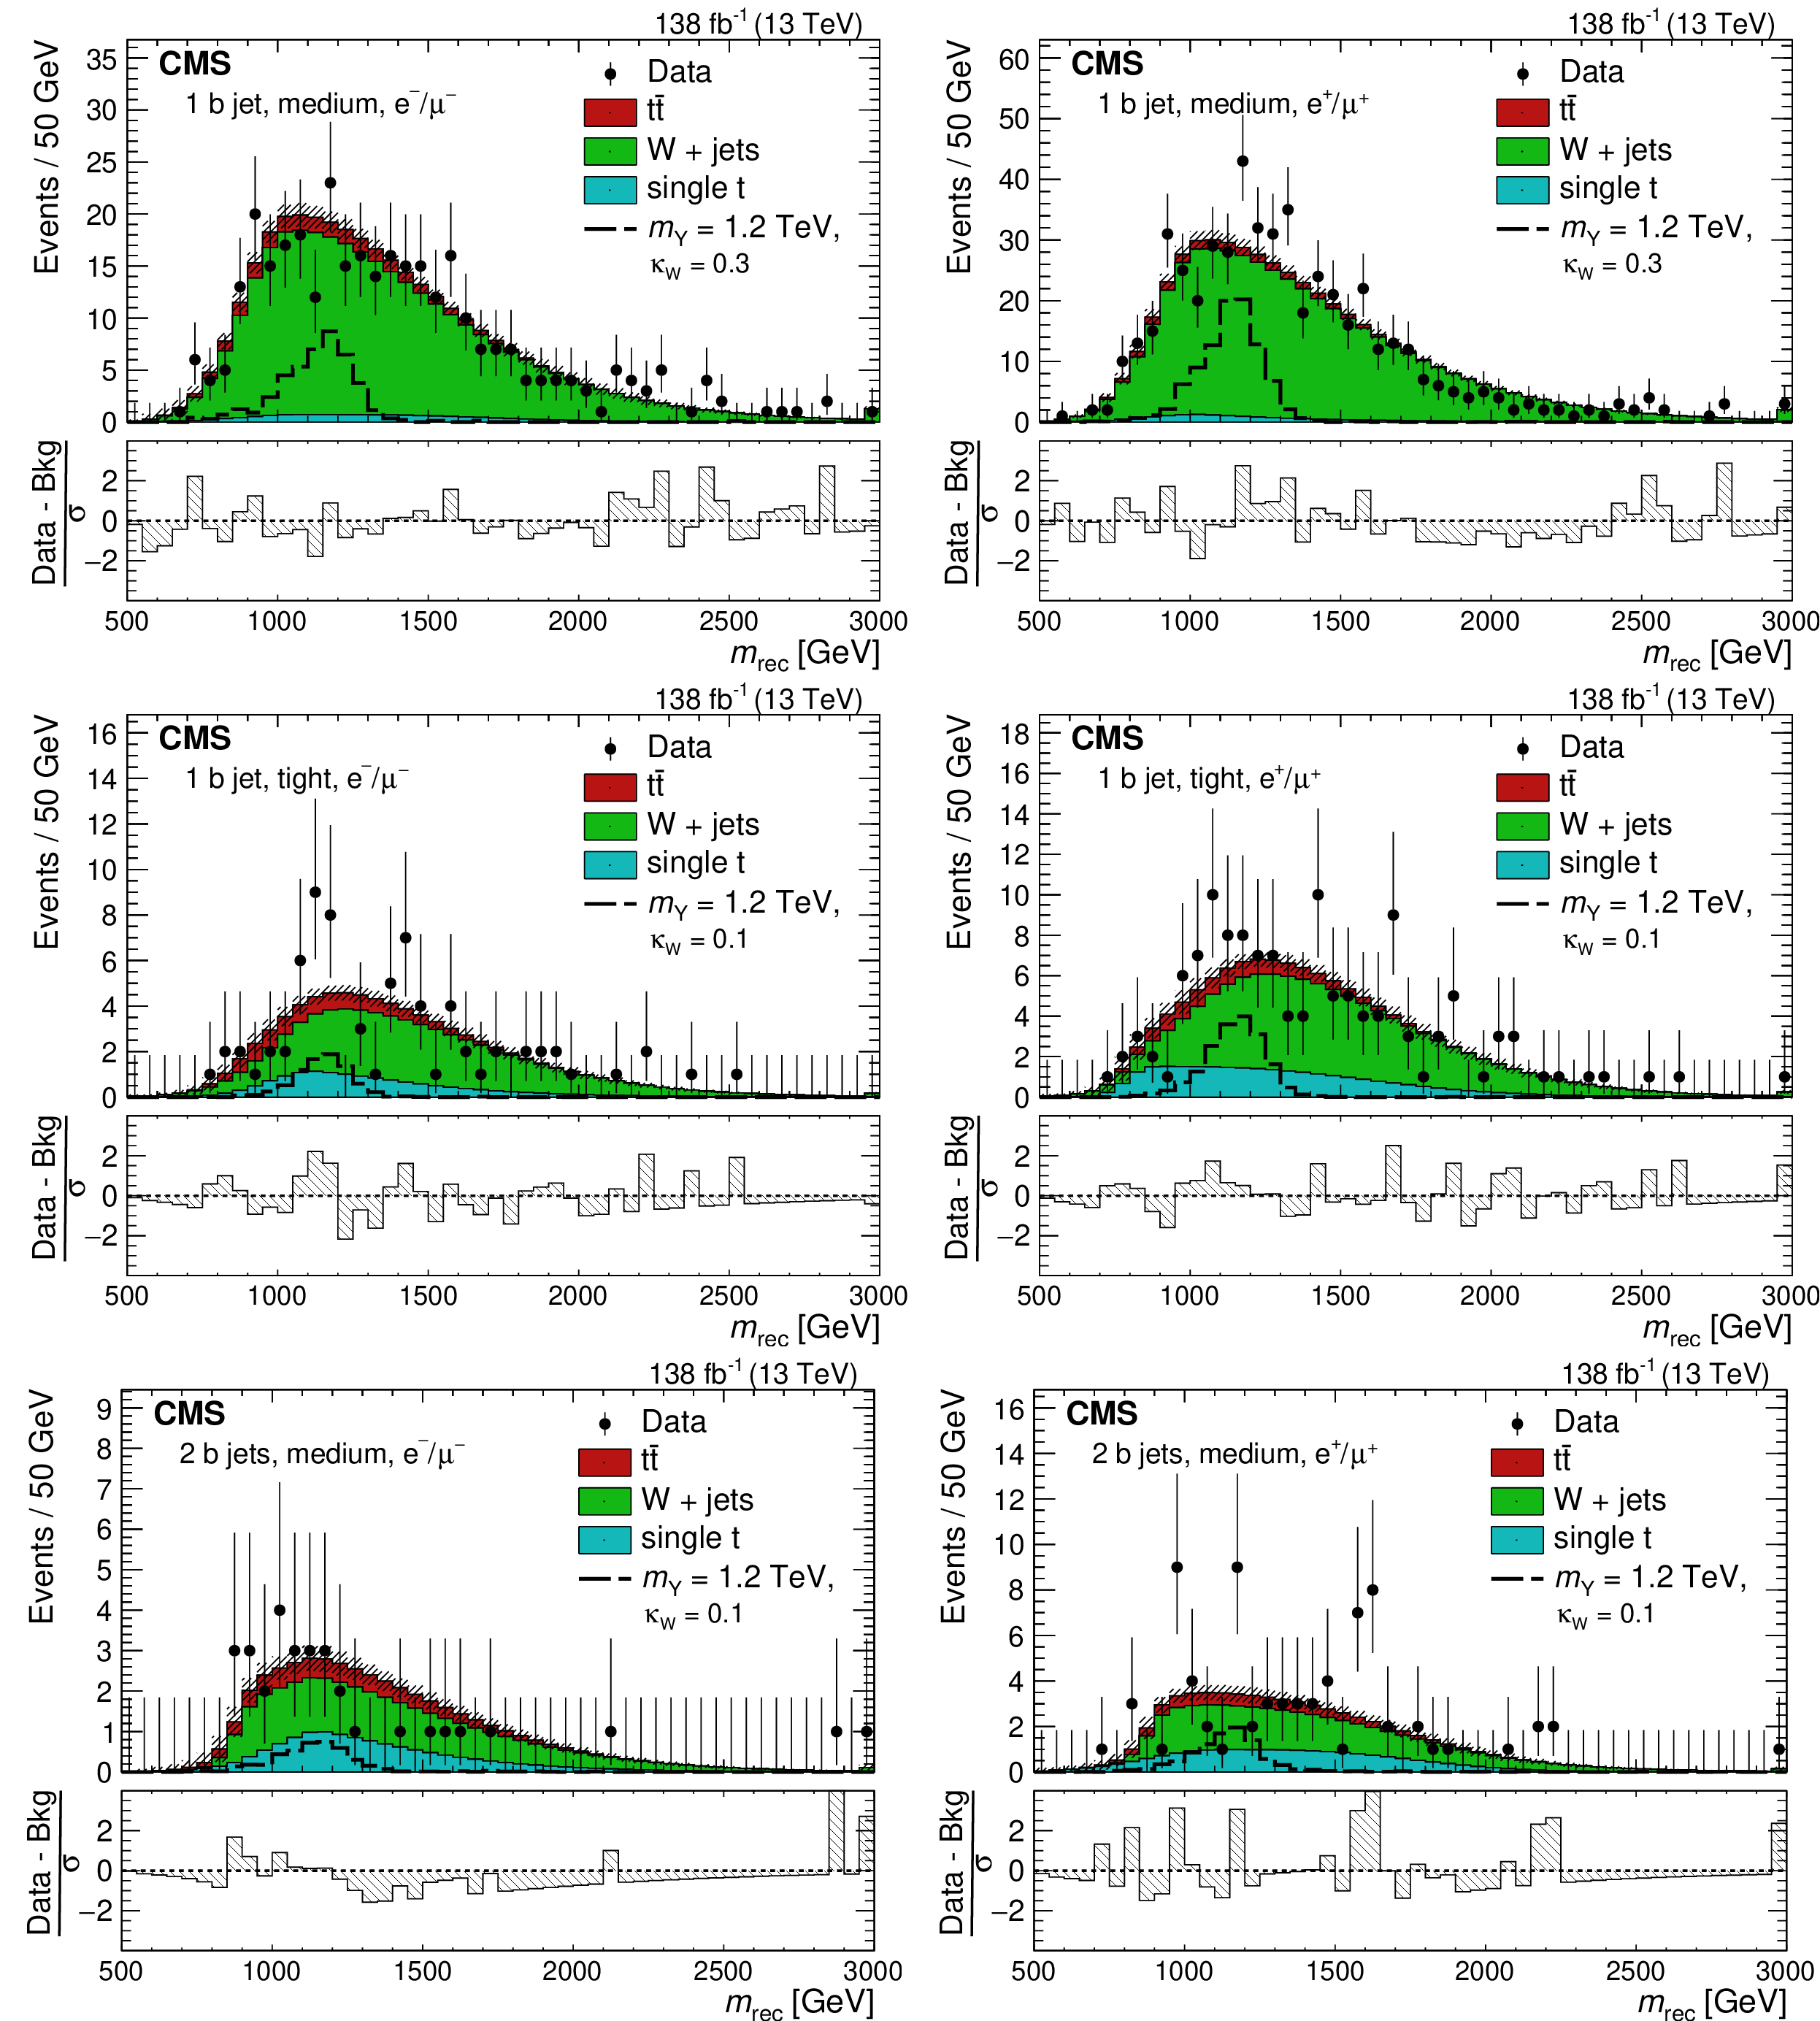
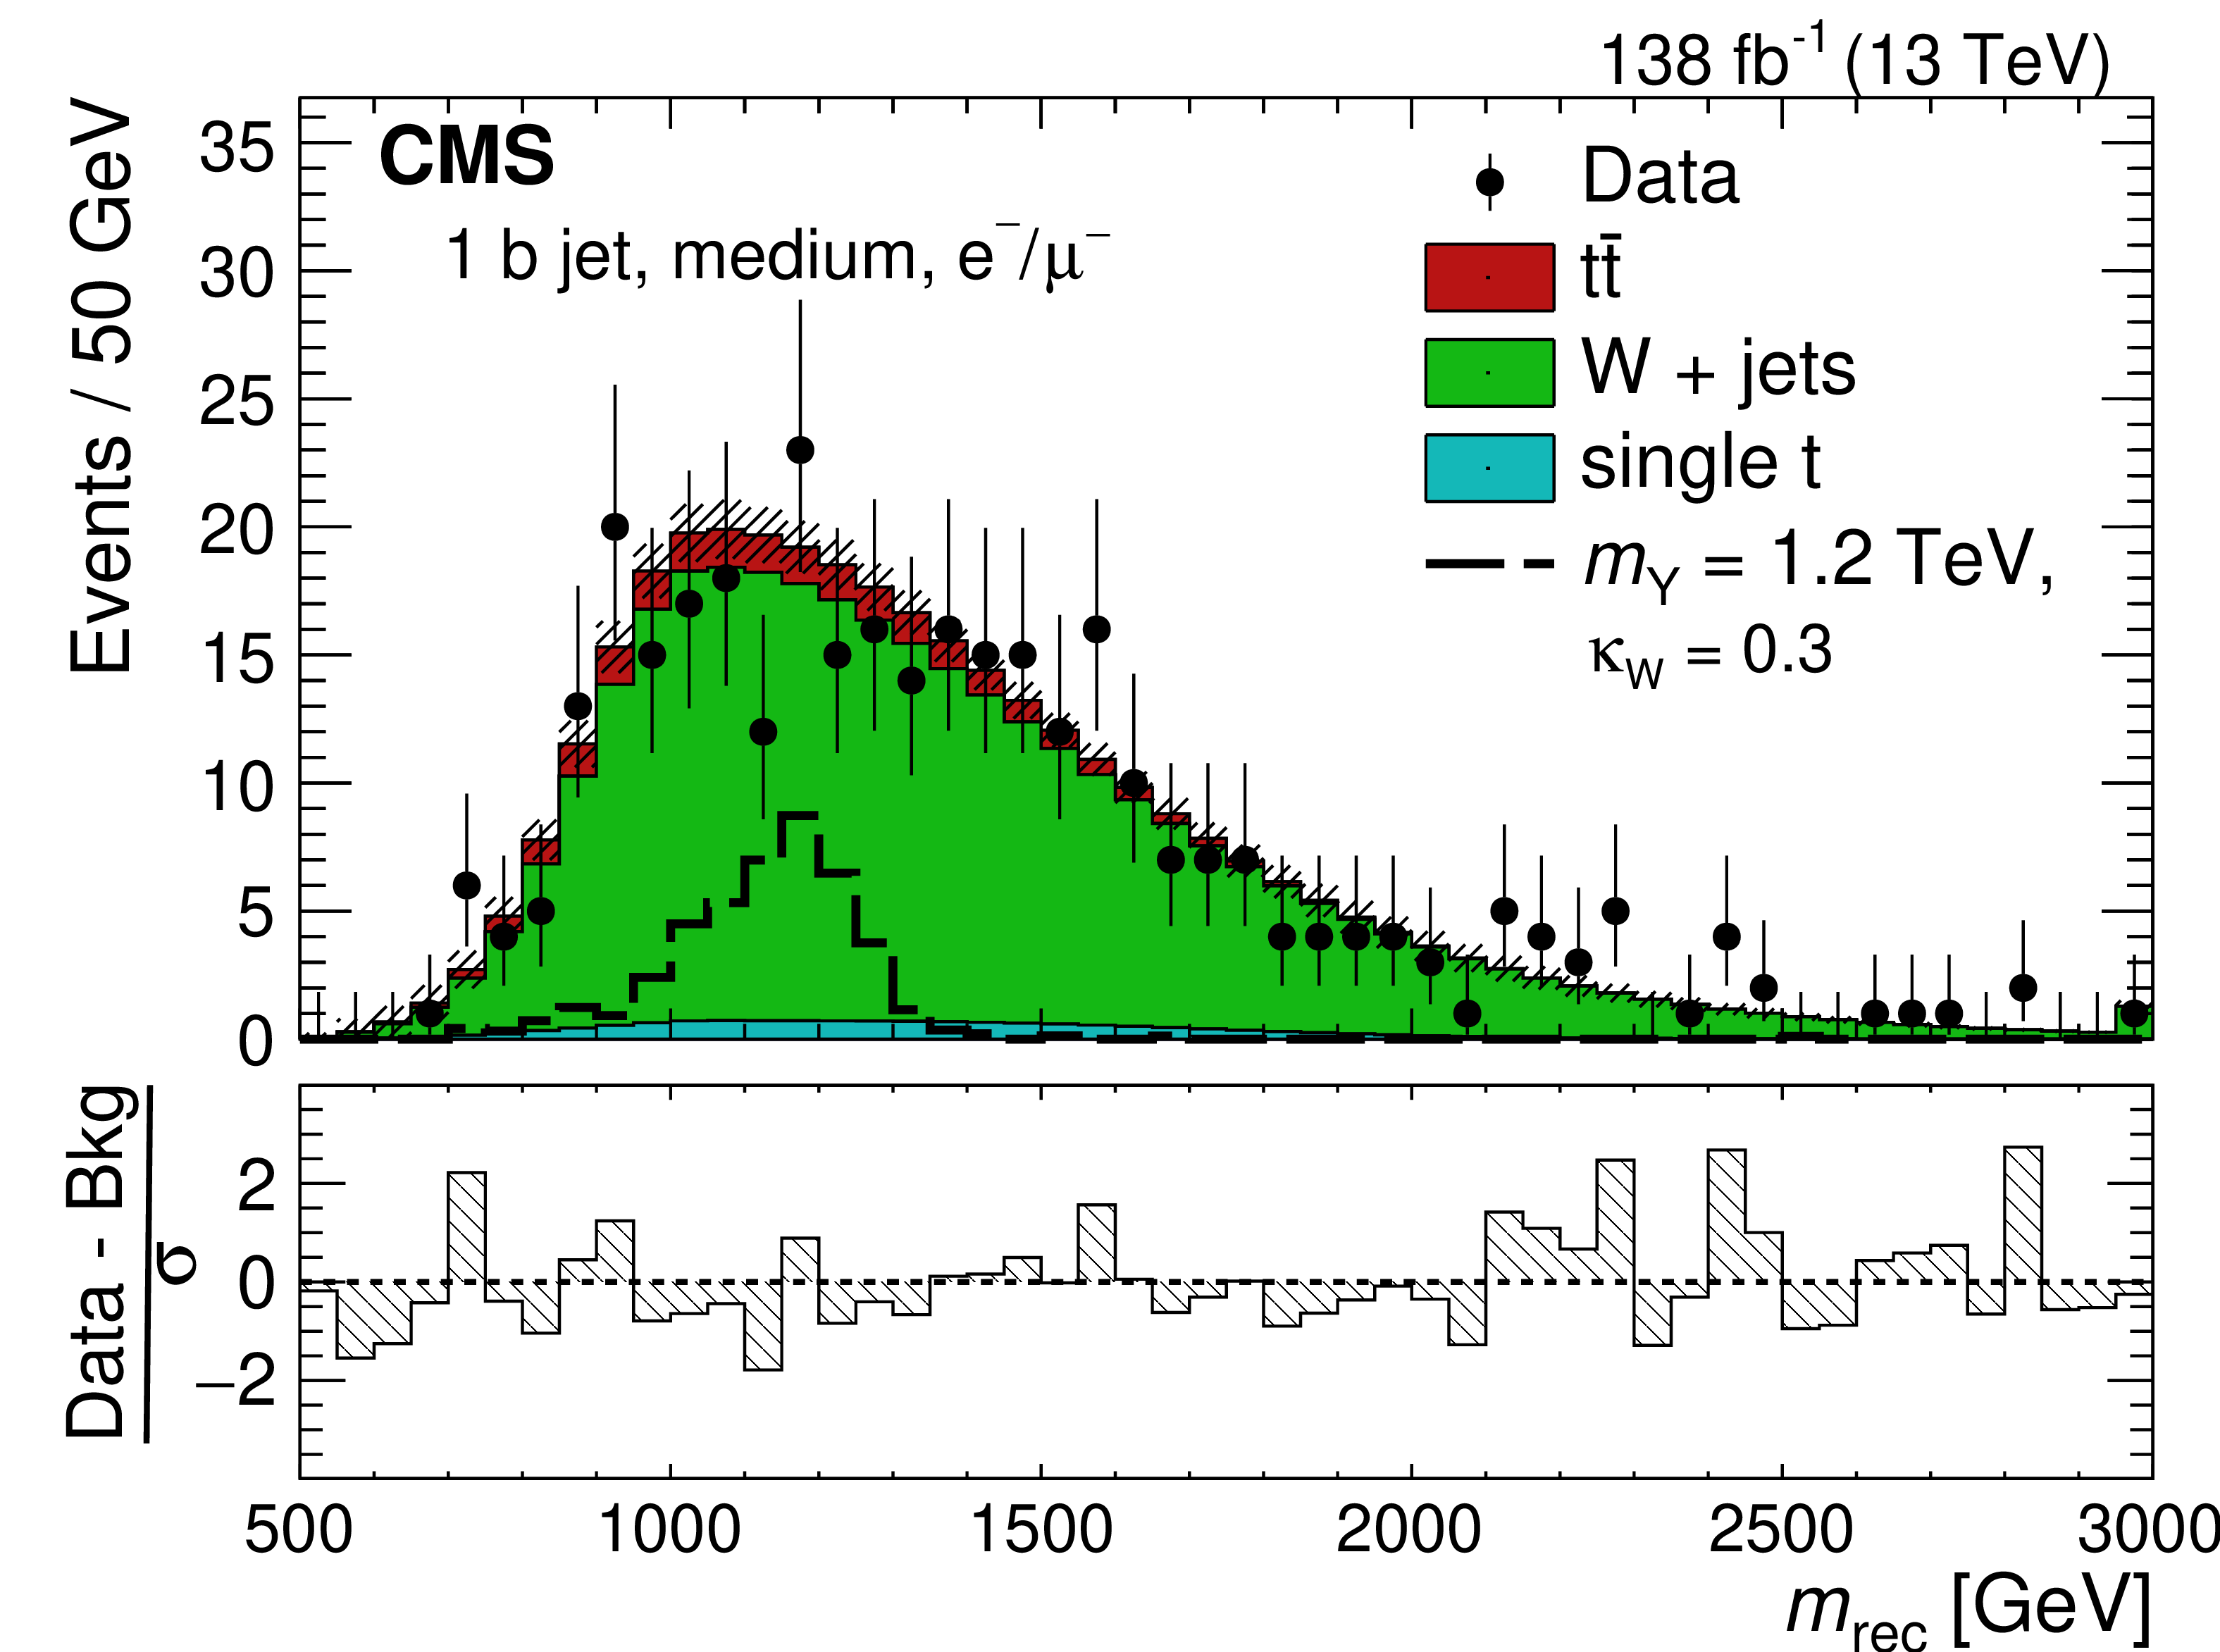
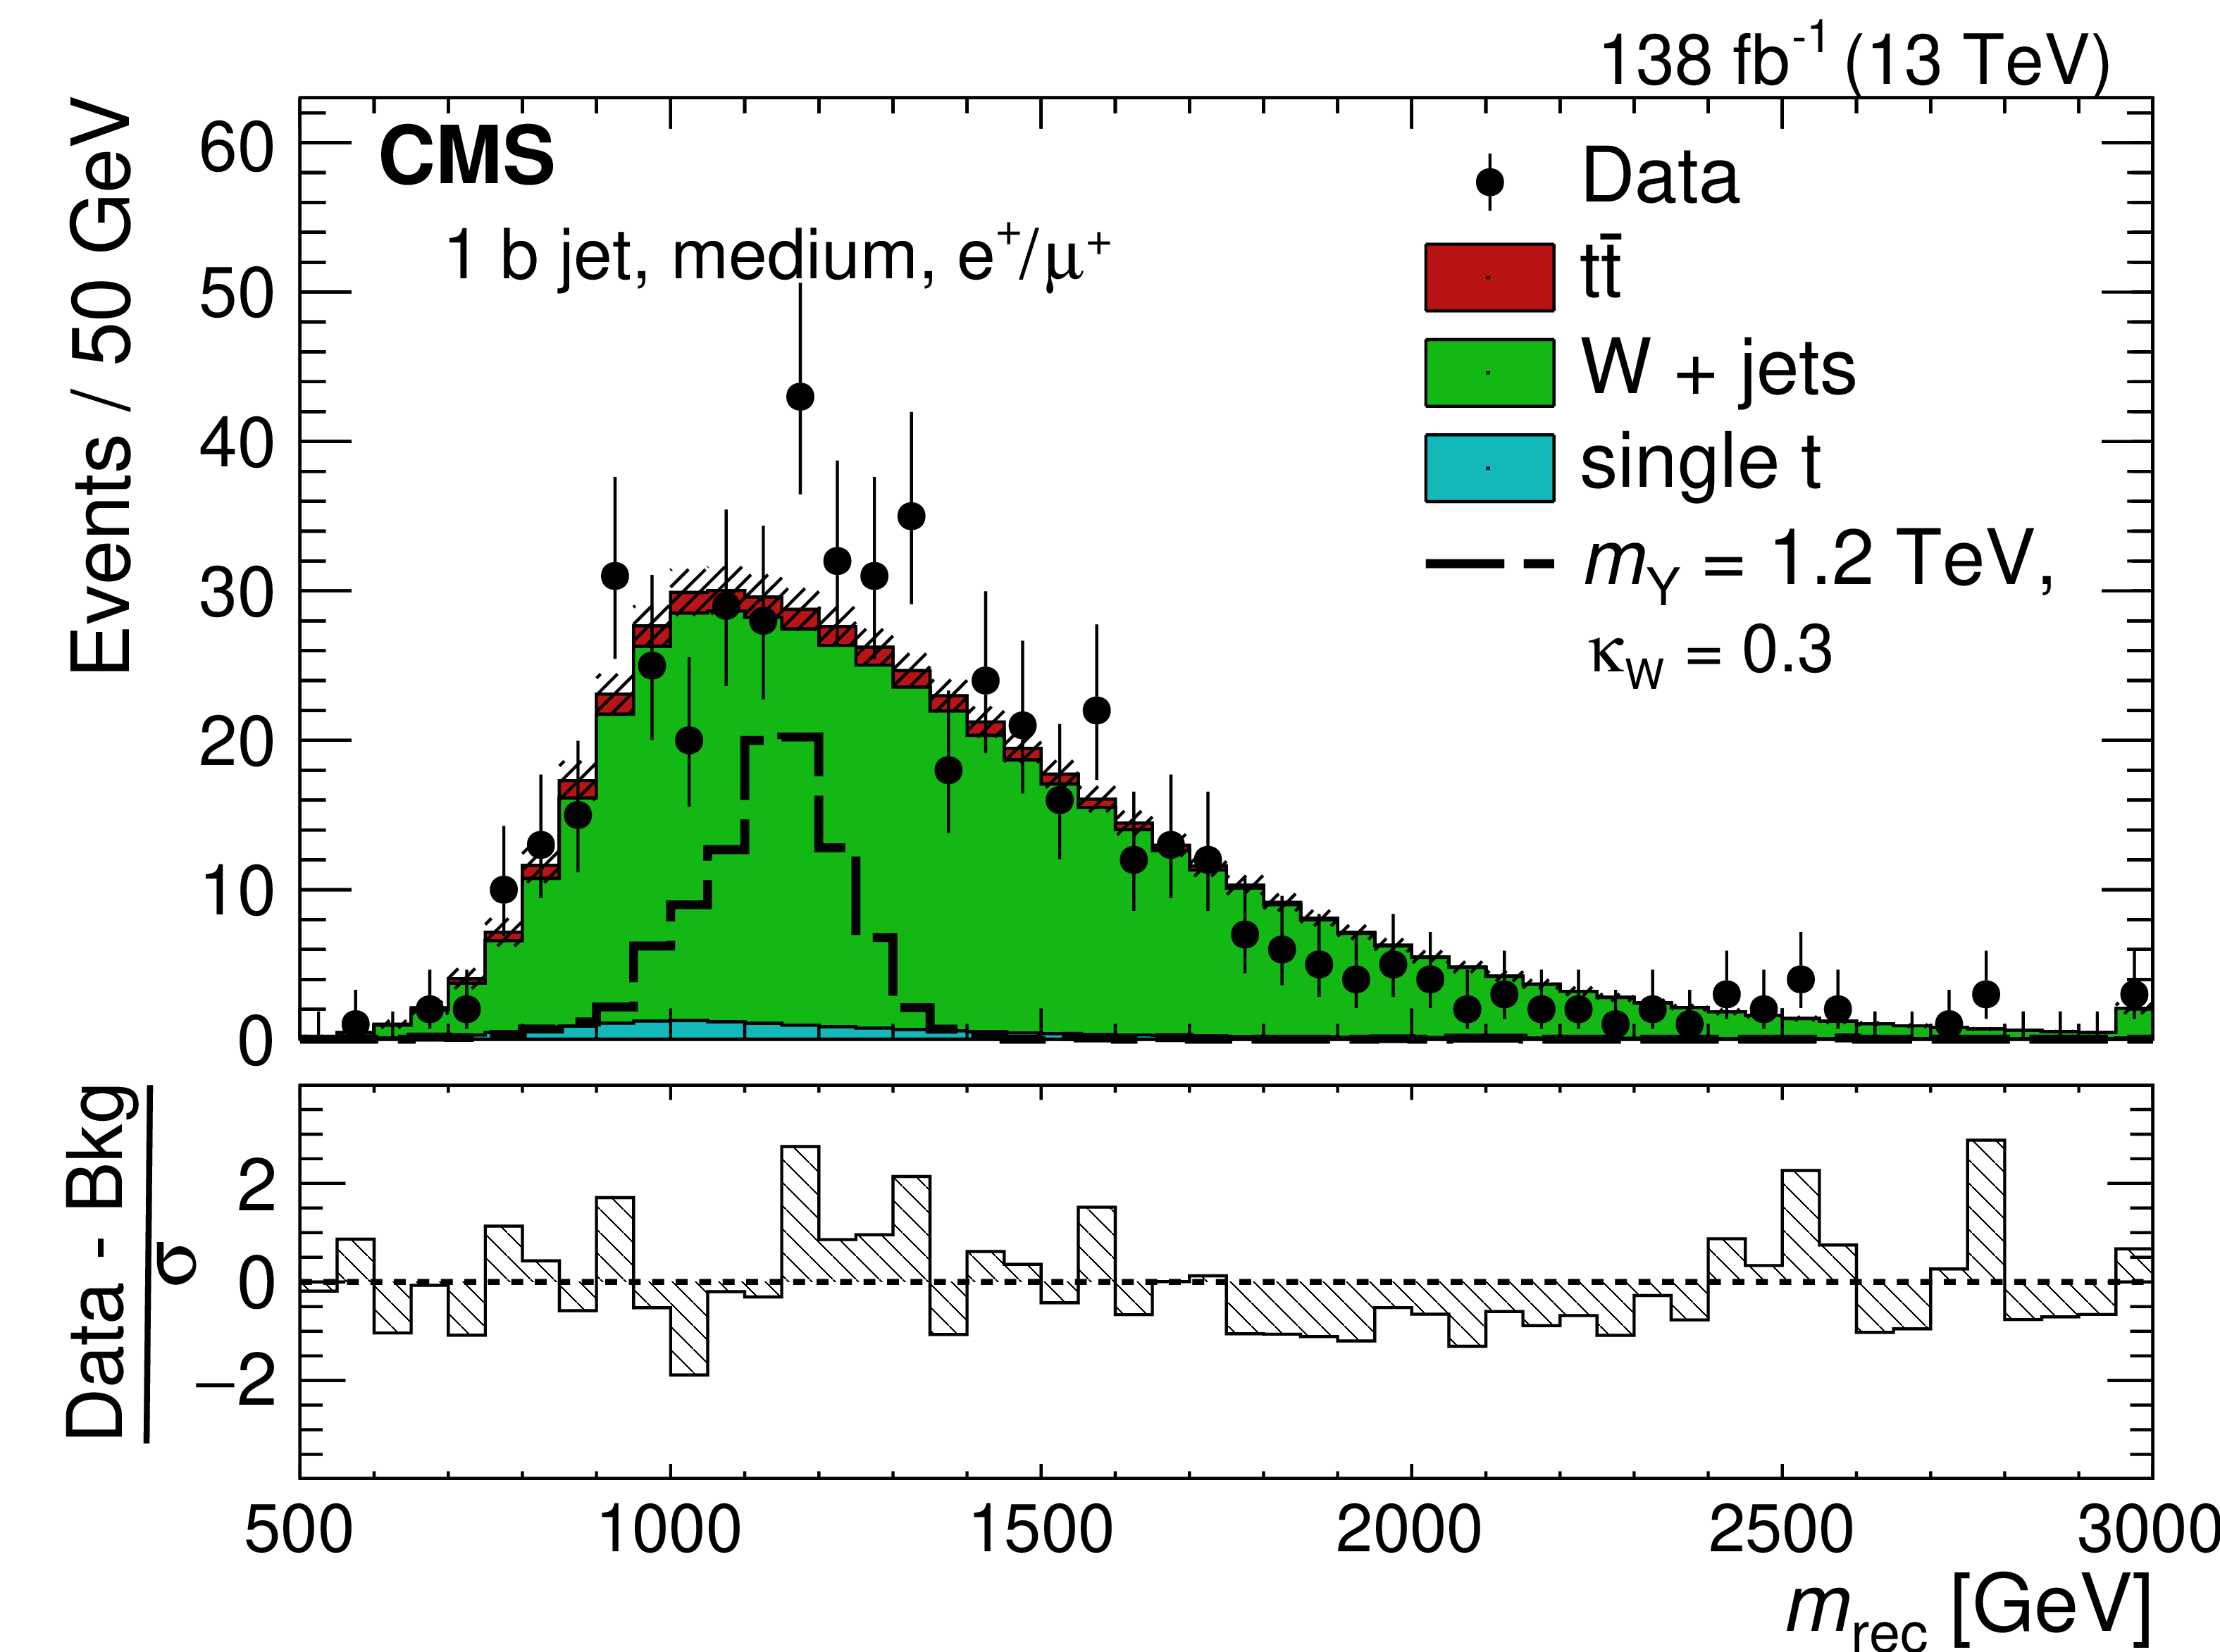
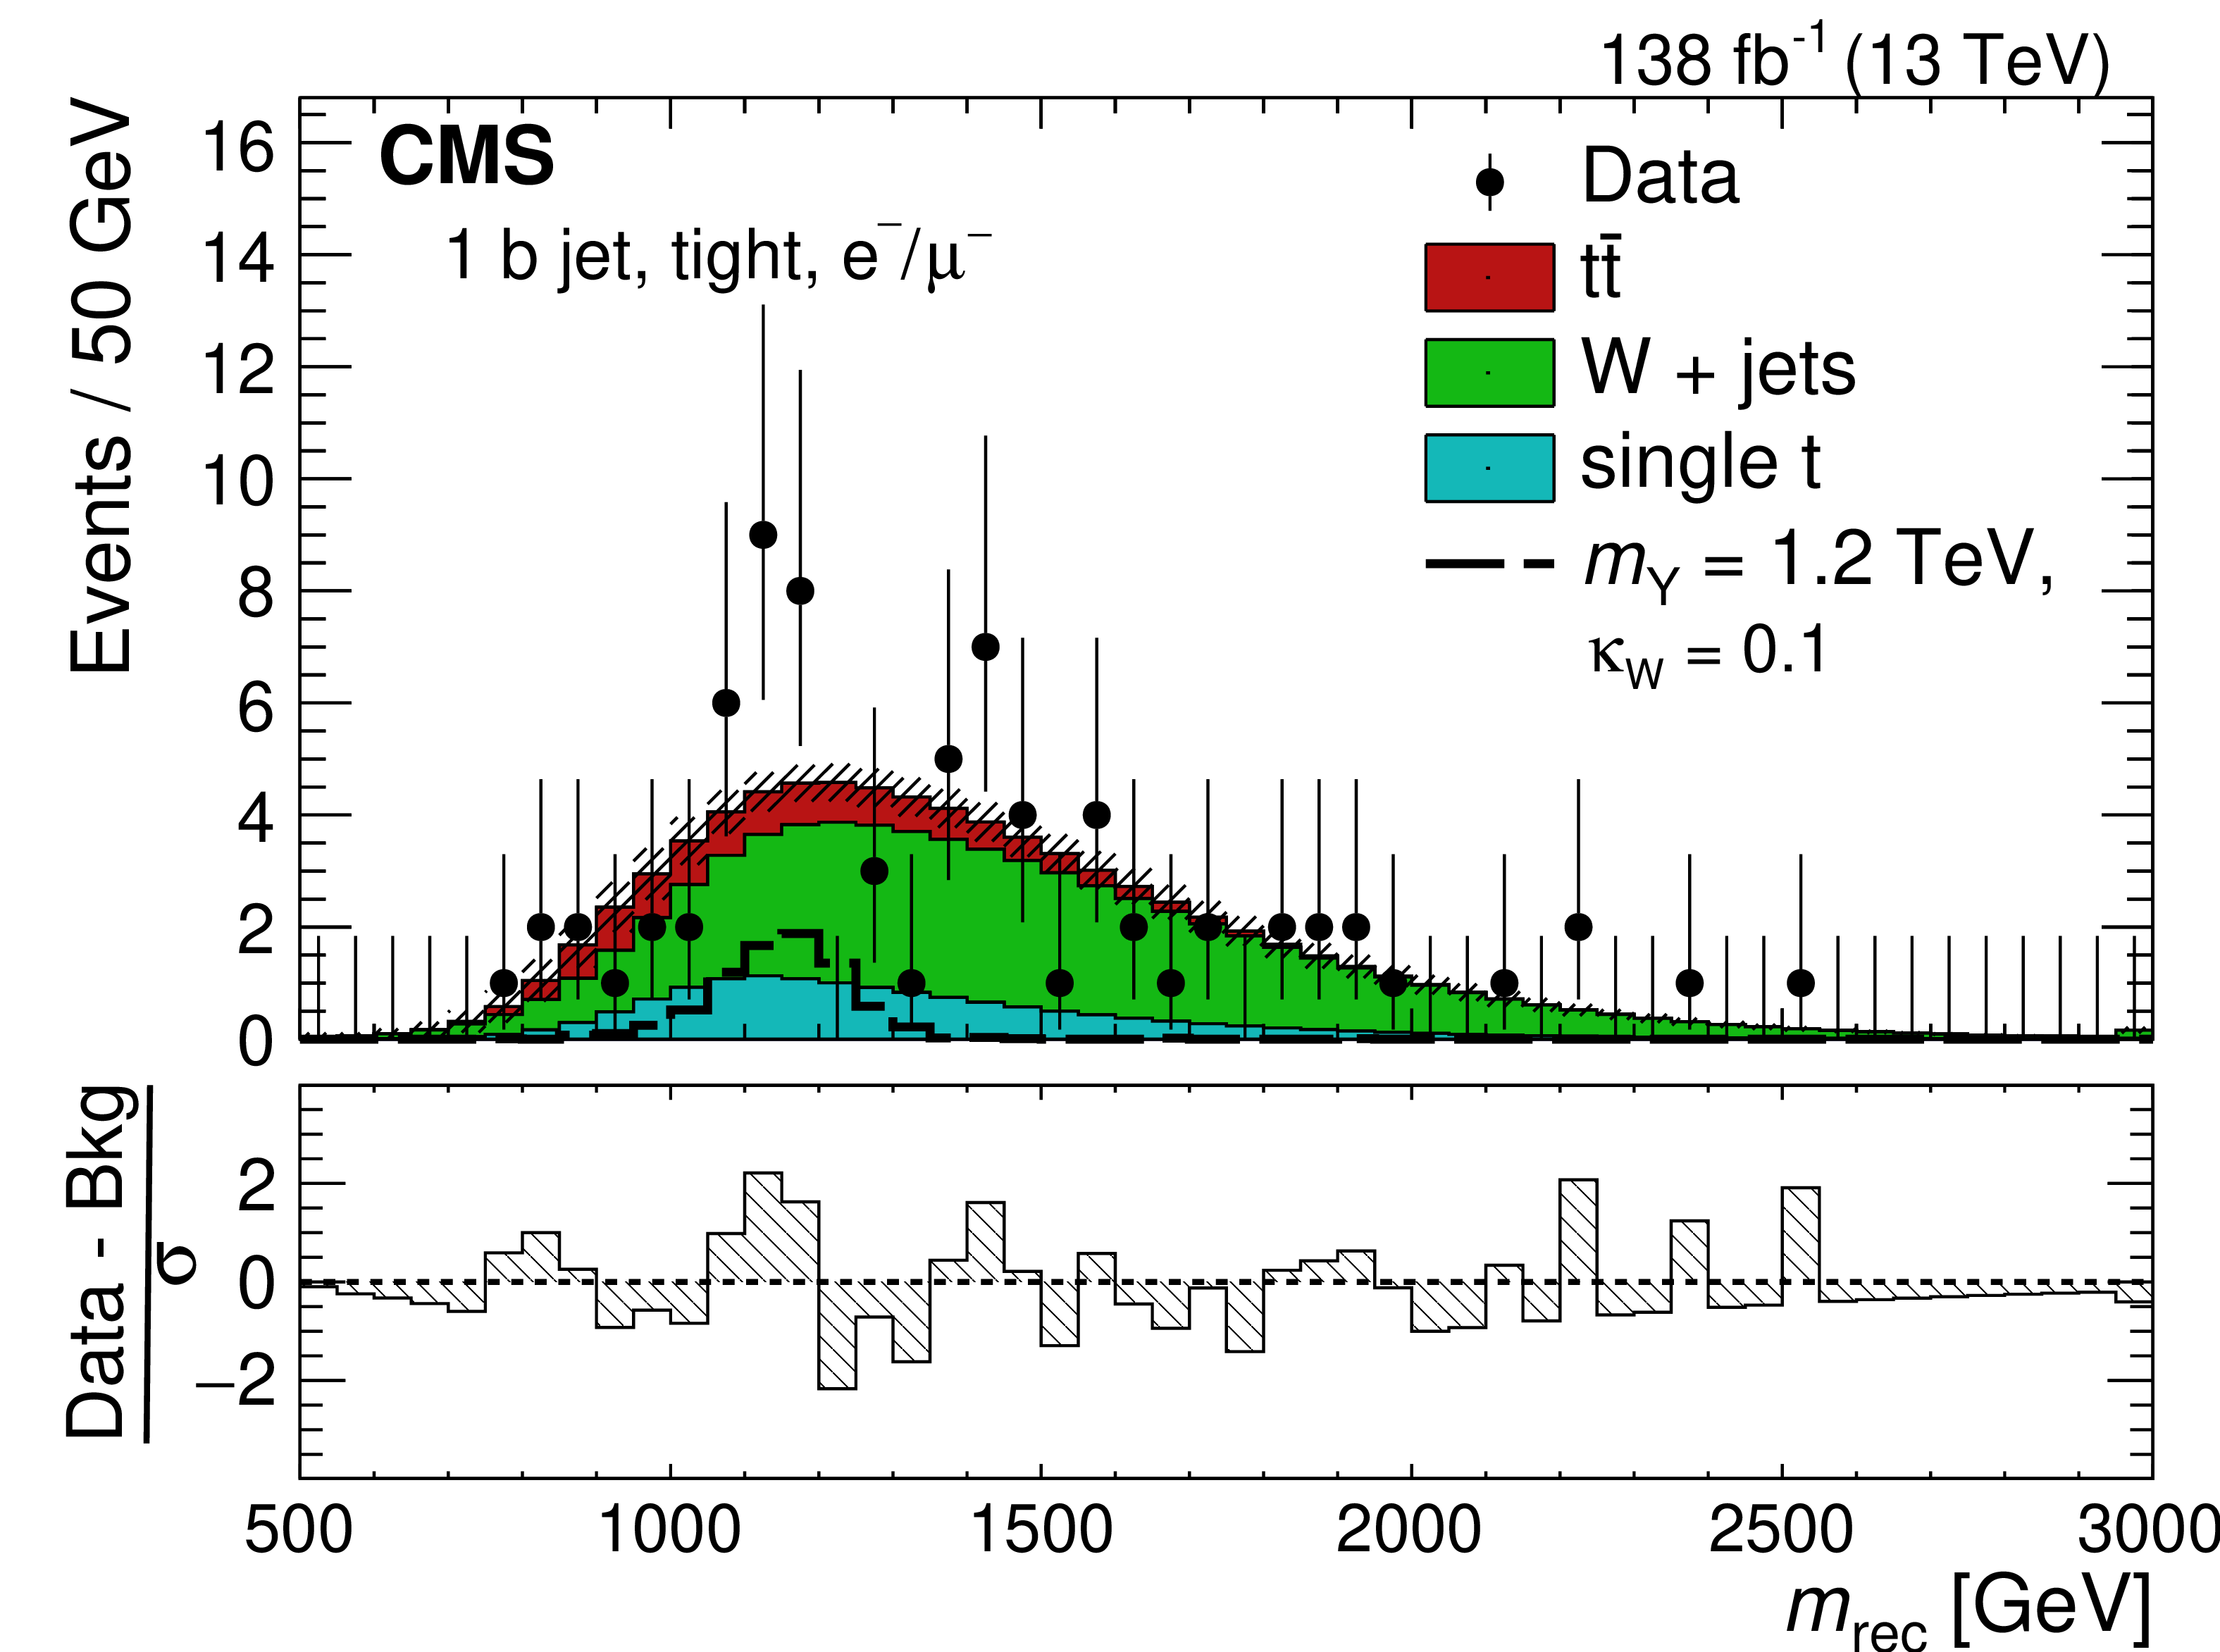
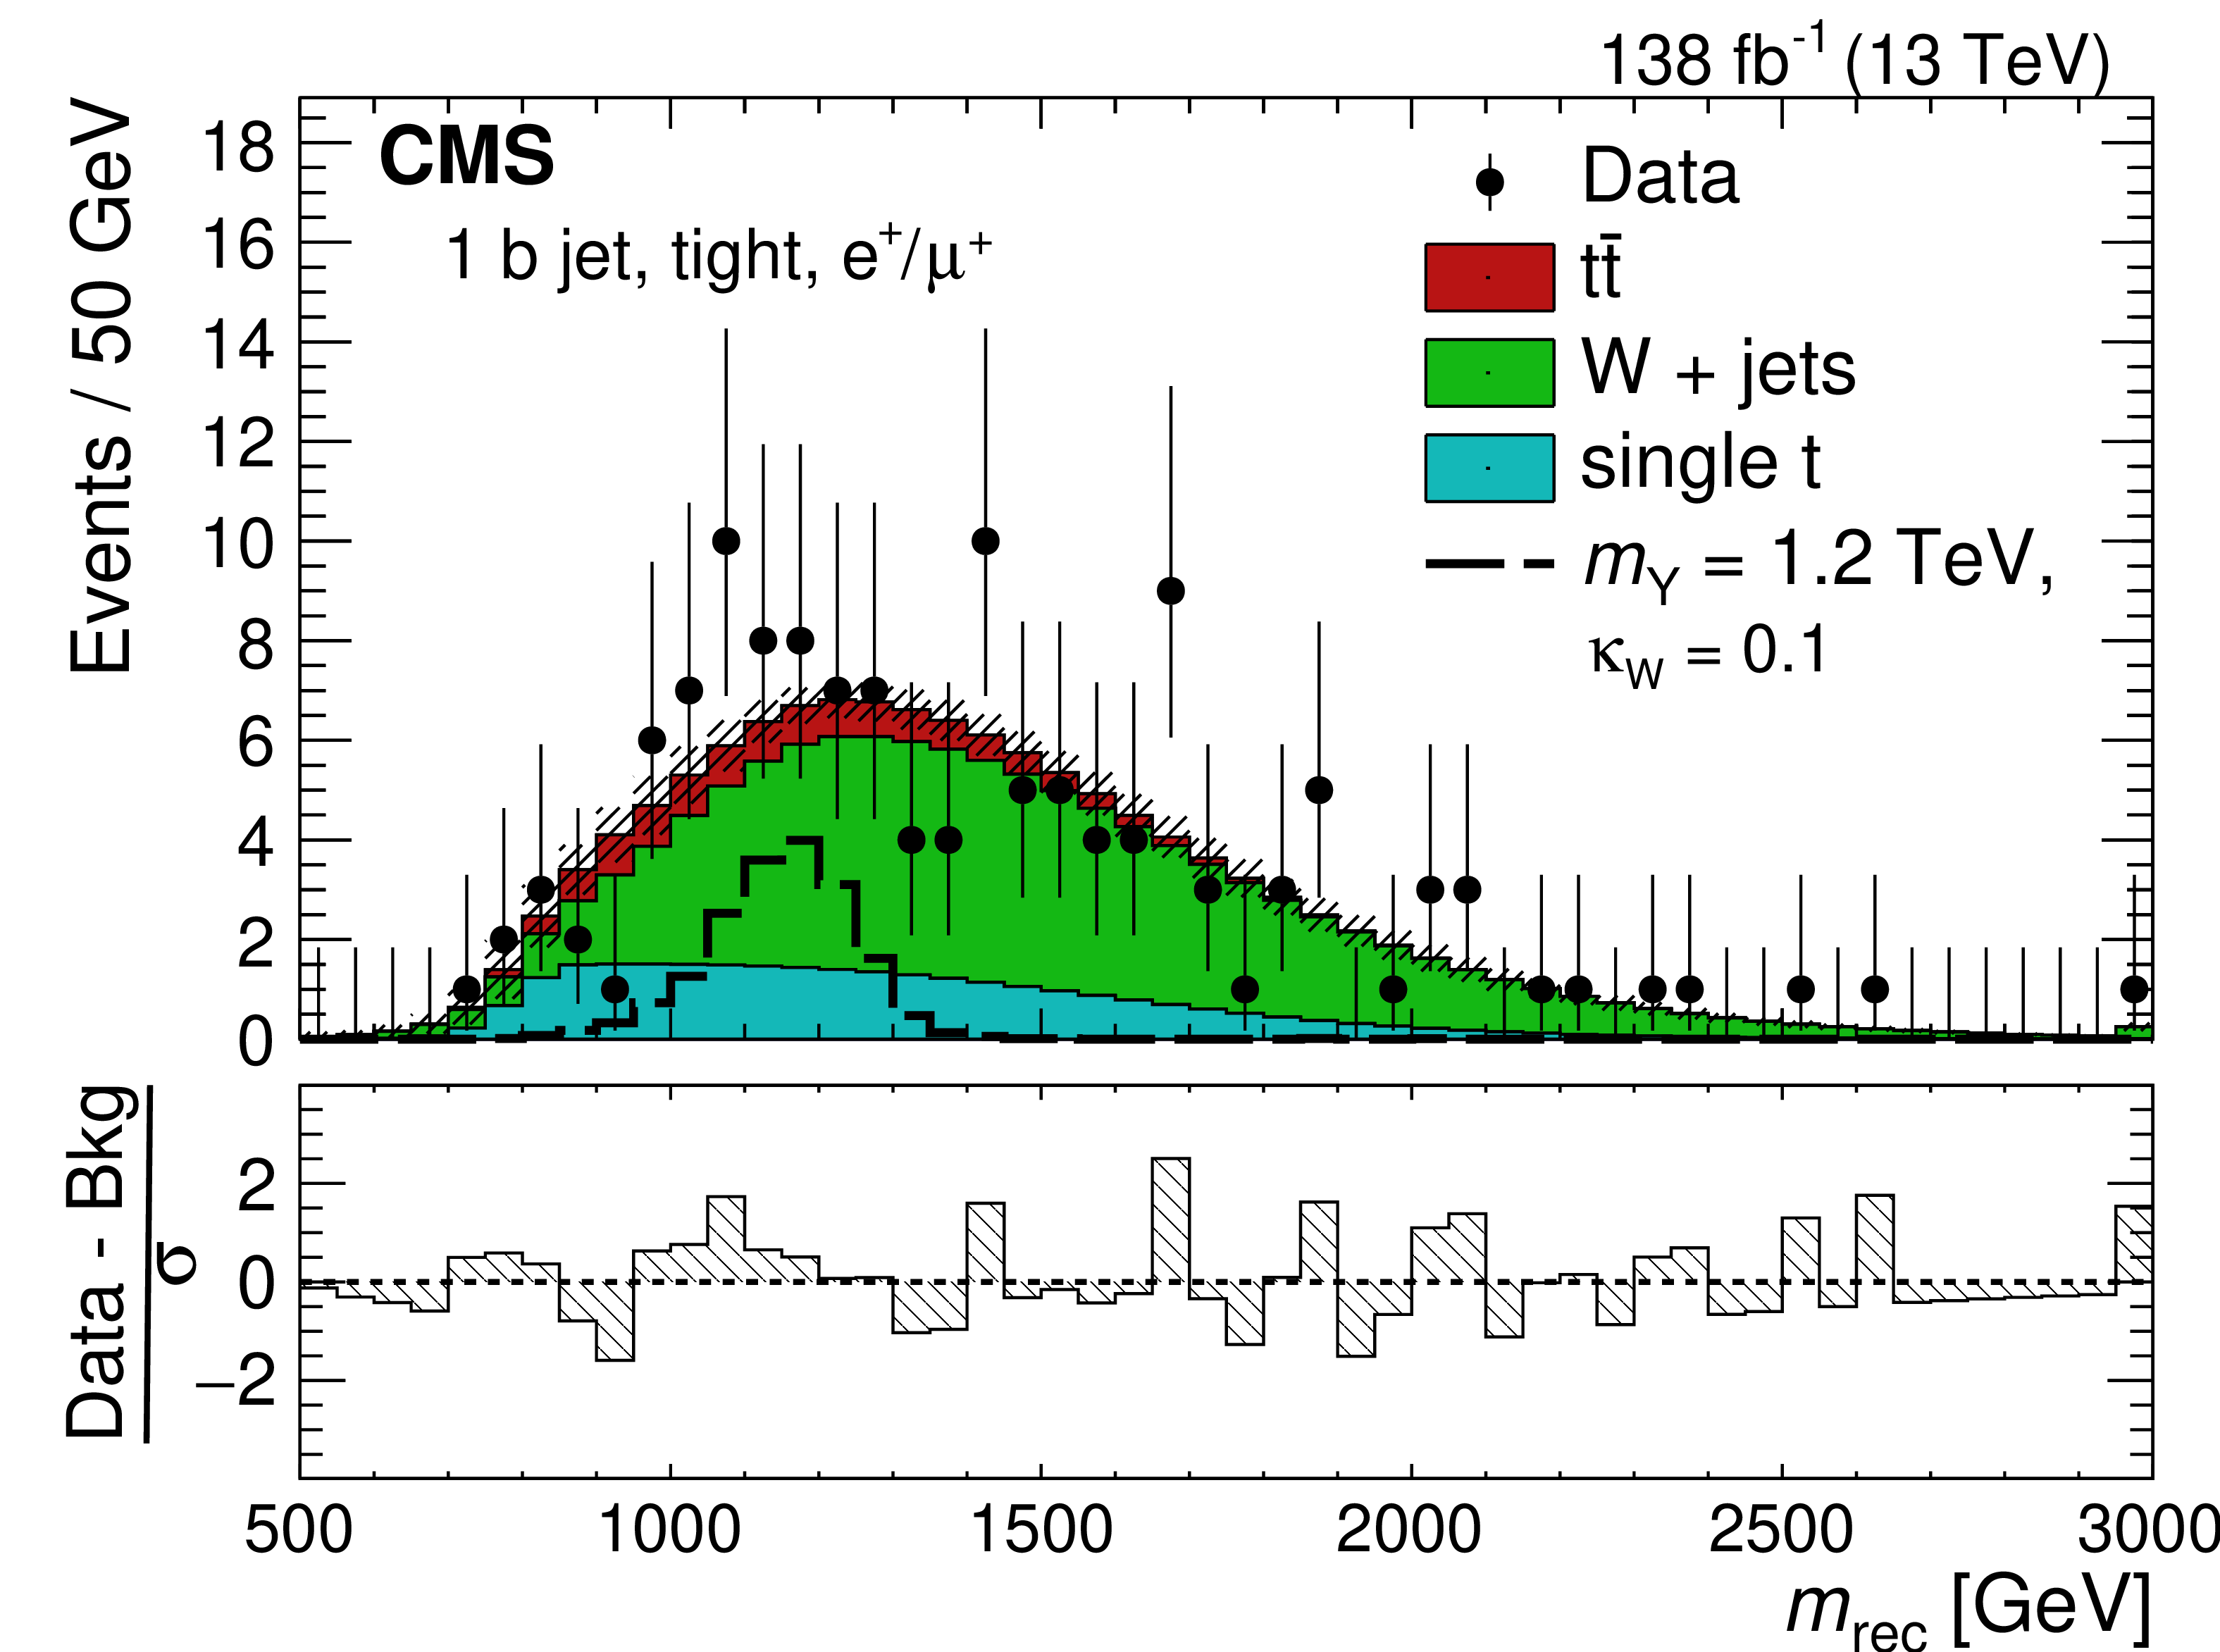
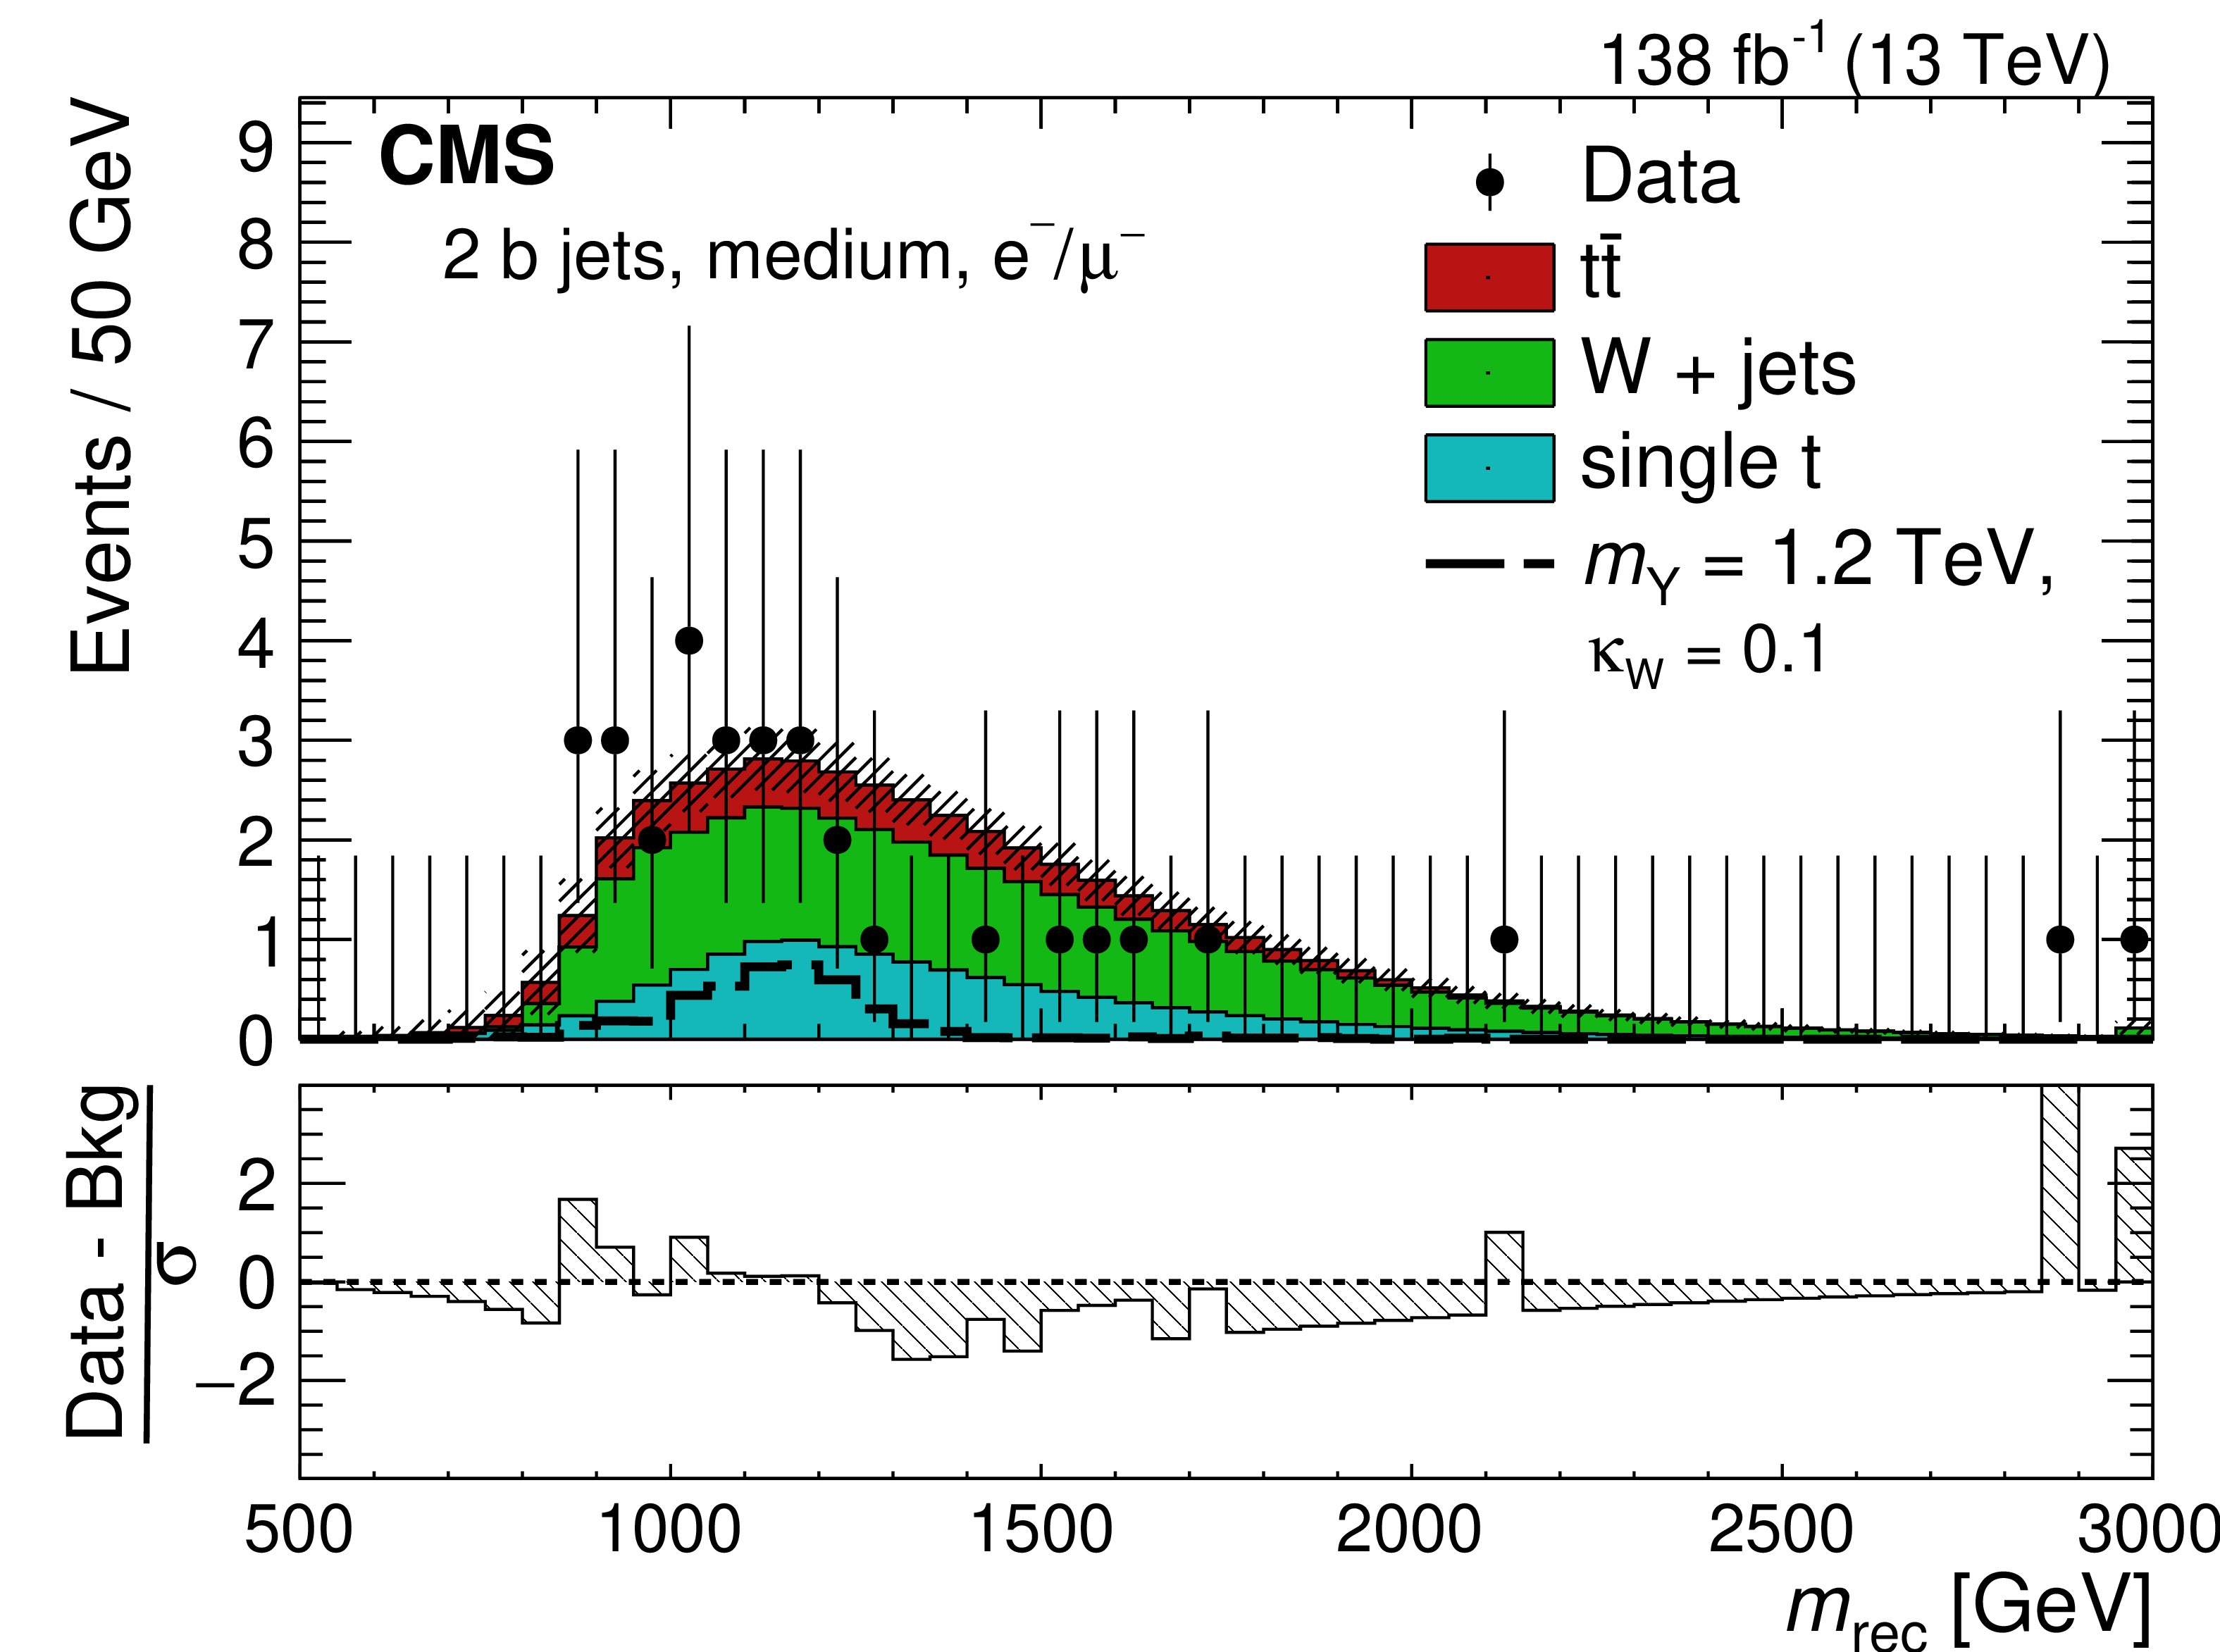
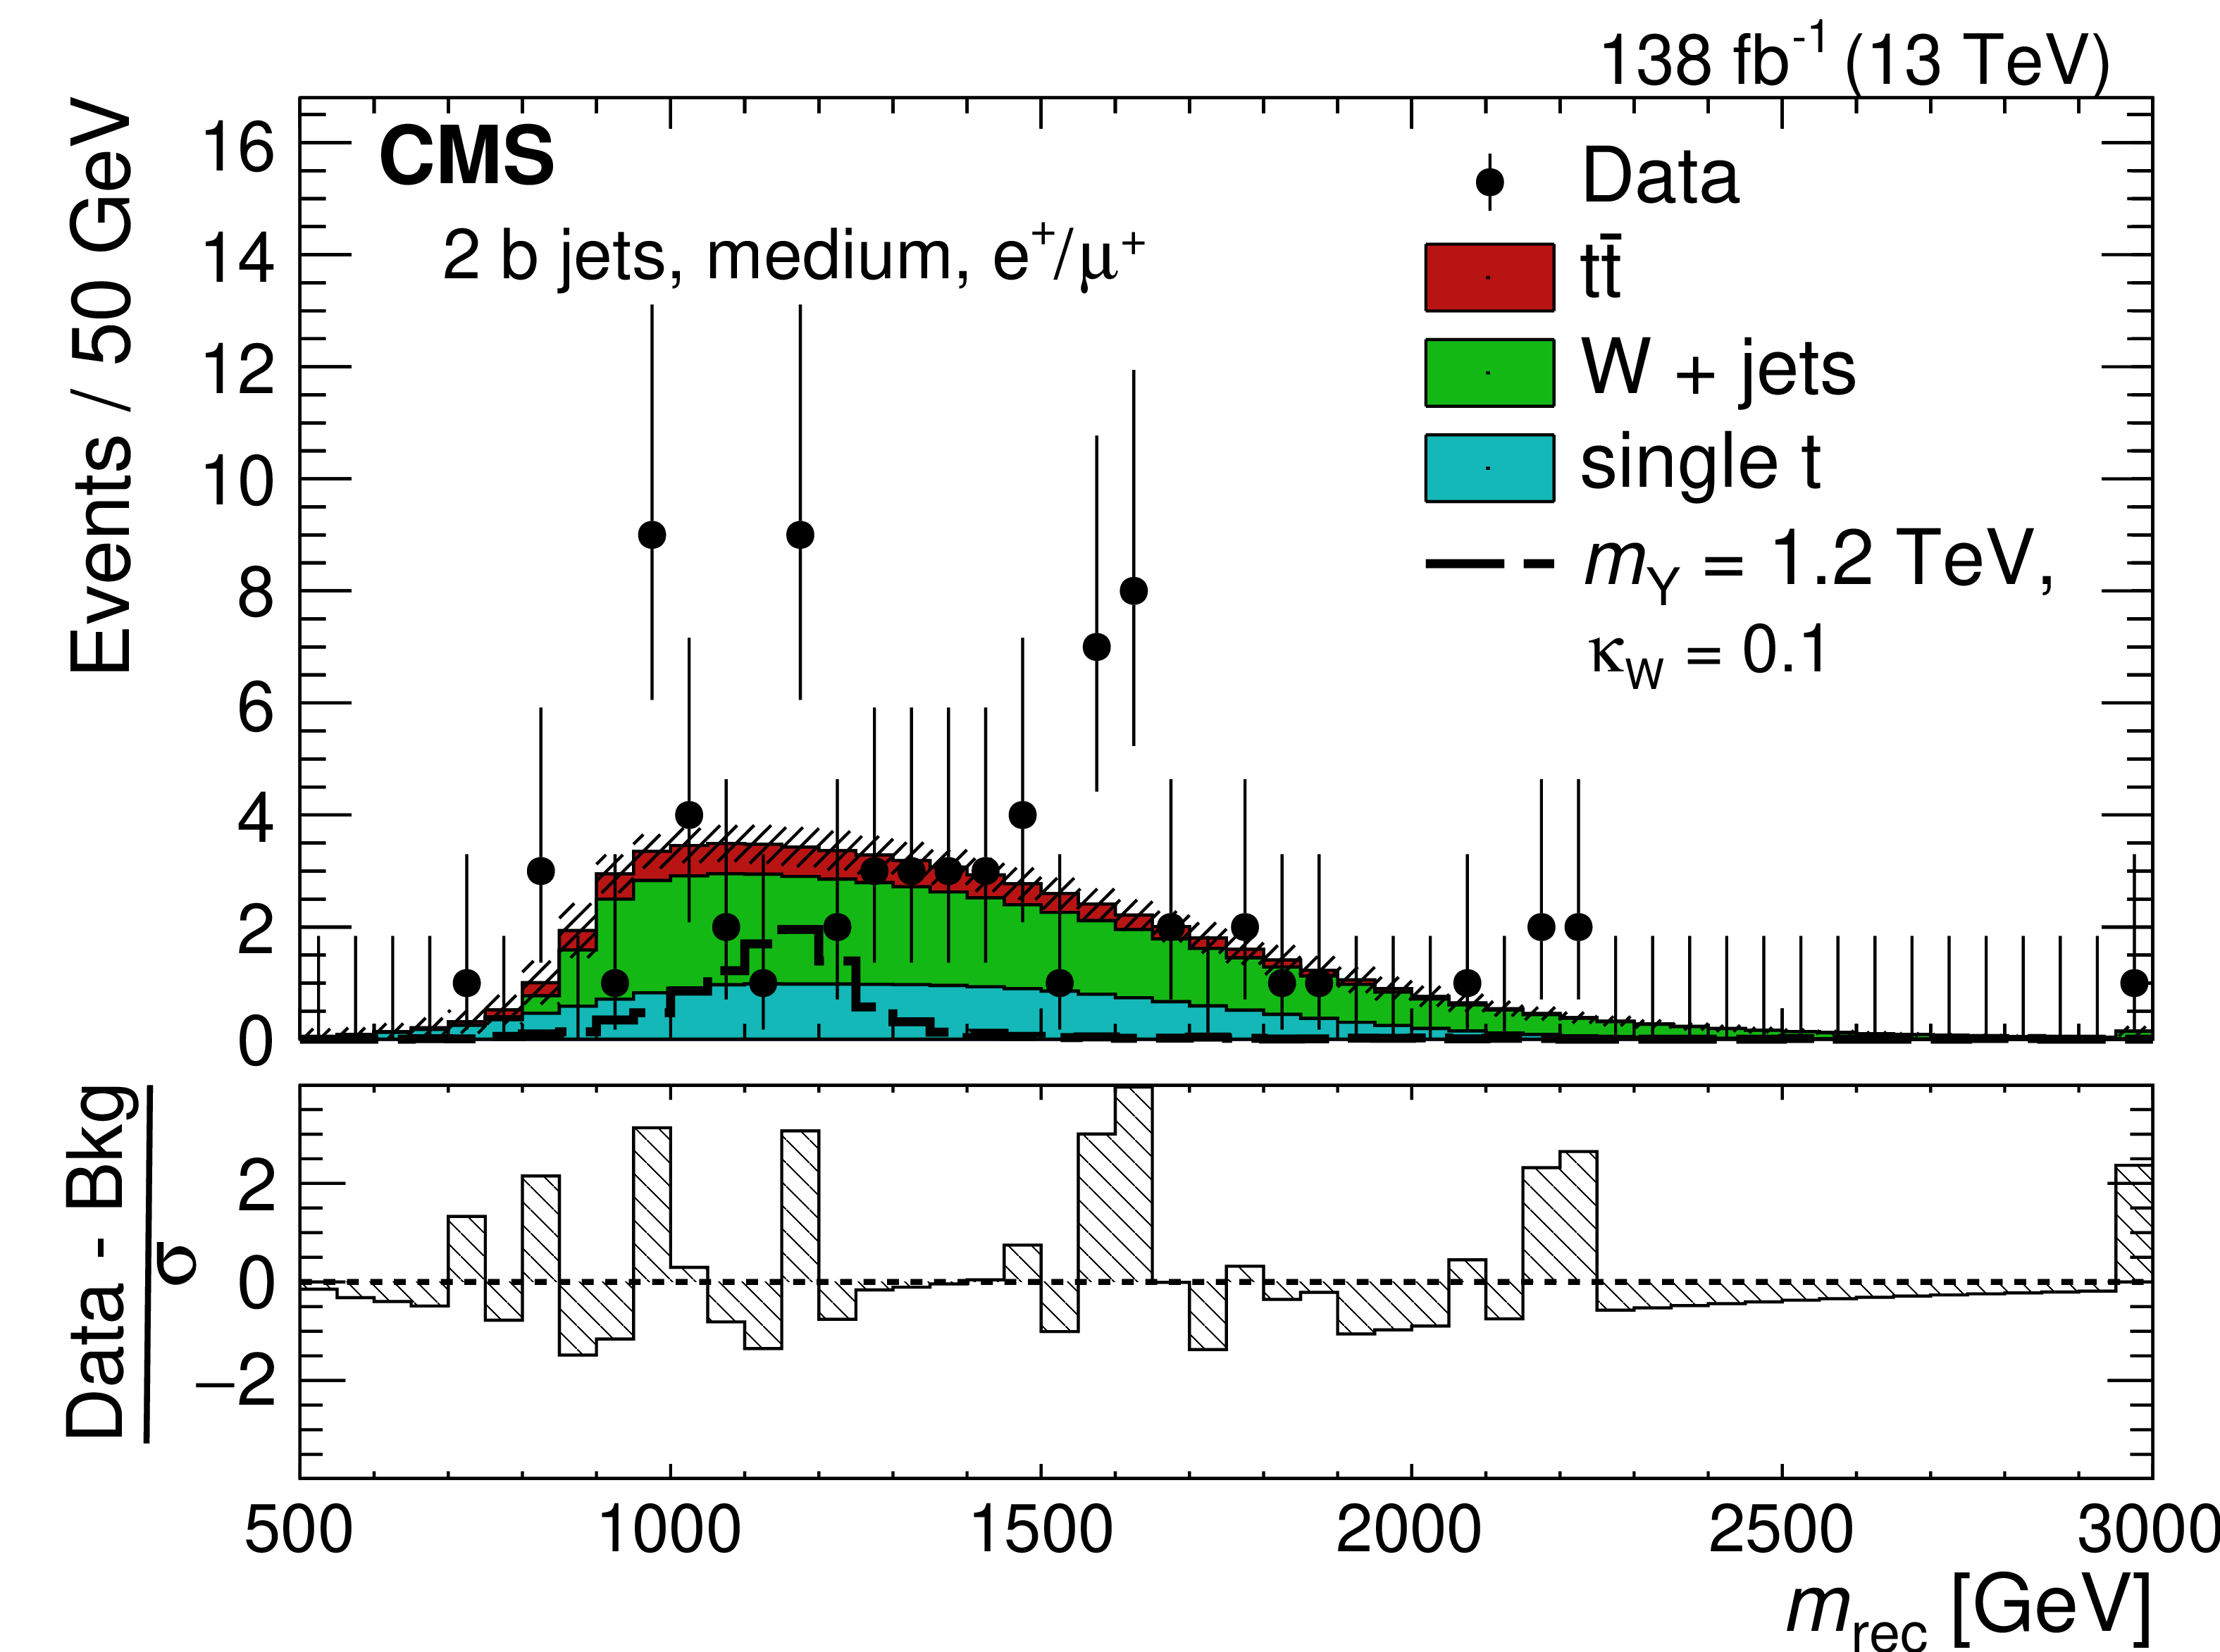
The $ m_{\text{rec}} $ distributions for each of the six event categories described in the legends showing the data (points), the simulated SM backgrounds (colored histograms), and the signal predictions for Y quark production (black dashed histogram) for a Y quark mass of 1.2 TeV. The coupling parameter $ \kappa_\mathrm{W} $ is set to 0.3 in the ``1 b jet, medium'' channels, and $ \kappa_\mathrm{W} = $ 0.1 for the others. The vertical bars on the data points represent the statistical uncertainty in the data. The hatched area in the upper panels represents the post-fit systematic uncertainties. The lower panels show the pulls as hatched bars, defined as the difference between the data and the fitted SM background predictions divided by the total uncertainty $ \sigma $. |
png pdf |
Figure 3-a:
The $ m_{\text{rec}} $ distributions for each of the six event categories described in the legends showing the data (points), the simulated SM backgrounds (colored histograms), and the signal predictions for Y quark production (black dashed histogram) for a Y quark mass of 1.2 TeV. The coupling parameter $ \kappa_\mathrm{W} $ is set to 0.3 in the ``1 b jet, medium'' channels, and $ \kappa_\mathrm{W} = $ 0.1 for the others. The vertical bars on the data points represent the statistical uncertainty in the data. The hatched area in the upper panels represents the post-fit systematic uncertainties. The lower panels show the pulls as hatched bars, defined as the difference between the data and the fitted SM background predictions divided by the total uncertainty $ \sigma $. |
png pdf |
Figure 3-b:
The $ m_{\text{rec}} $ distributions for each of the six event categories described in the legends showing the data (points), the simulated SM backgrounds (colored histograms), and the signal predictions for Y quark production (black dashed histogram) for a Y quark mass of 1.2 TeV. The coupling parameter $ \kappa_\mathrm{W} $ is set to 0.3 in the ``1 b jet, medium'' channels, and $ \kappa_\mathrm{W} = $ 0.1 for the others. The vertical bars on the data points represent the statistical uncertainty in the data. The hatched area in the upper panels represents the post-fit systematic uncertainties. The lower panels show the pulls as hatched bars, defined as the difference between the data and the fitted SM background predictions divided by the total uncertainty $ \sigma $. |
png pdf |
Figure 3-c:
The $ m_{\text{rec}} $ distributions for each of the six event categories described in the legends showing the data (points), the simulated SM backgrounds (colored histograms), and the signal predictions for Y quark production (black dashed histogram) for a Y quark mass of 1.2 TeV. The coupling parameter $ \kappa_\mathrm{W} $ is set to 0.3 in the ``1 b jet, medium'' channels, and $ \kappa_\mathrm{W} = $ 0.1 for the others. The vertical bars on the data points represent the statistical uncertainty in the data. The hatched area in the upper panels represents the post-fit systematic uncertainties. The lower panels show the pulls as hatched bars, defined as the difference between the data and the fitted SM background predictions divided by the total uncertainty $ \sigma $. |
png pdf |
Figure 3-d:
The $ m_{\text{rec}} $ distributions for each of the six event categories described in the legends showing the data (points), the simulated SM backgrounds (colored histograms), and the signal predictions for Y quark production (black dashed histogram) for a Y quark mass of 1.2 TeV. The coupling parameter $ \kappa_\mathrm{W} $ is set to 0.3 in the ``1 b jet, medium'' channels, and $ \kappa_\mathrm{W} = $ 0.1 for the others. The vertical bars on the data points represent the statistical uncertainty in the data. The hatched area in the upper panels represents the post-fit systematic uncertainties. The lower panels show the pulls as hatched bars, defined as the difference between the data and the fitted SM background predictions divided by the total uncertainty $ \sigma $. |
png pdf |
Figure 3-e:
The $ m_{\text{rec}} $ distributions for each of the six event categories described in the legends showing the data (points), the simulated SM backgrounds (colored histograms), and the signal predictions for Y quark production (black dashed histogram) for a Y quark mass of 1.2 TeV. The coupling parameter $ \kappa_\mathrm{W} $ is set to 0.3 in the ``1 b jet, medium'' channels, and $ \kappa_\mathrm{W} = $ 0.1 for the others. The vertical bars on the data points represent the statistical uncertainty in the data. The hatched area in the upper panels represents the post-fit systematic uncertainties. The lower panels show the pulls as hatched bars, defined as the difference between the data and the fitted SM background predictions divided by the total uncertainty $ \sigma $. |
png pdf |
Figure 3-f:
The $ m_{\text{rec}} $ distributions for each of the six event categories described in the legends showing the data (points), the simulated SM backgrounds (colored histograms), and the signal predictions for Y quark production (black dashed histogram) for a Y quark mass of 1.2 TeV. The coupling parameter $ \kappa_\mathrm{W} $ is set to 0.3 in the ``1 b jet, medium'' channels, and $ \kappa_\mathrm{W} = $ 0.1 for the others. The vertical bars on the data points represent the statistical uncertainty in the data. The hatched area in the upper panels represents the post-fit systematic uncertainties. The lower panels show the pulls as hatched bars, defined as the difference between the data and the fitted SM background predictions divided by the total uncertainty $ \sigma $. |
png pdf |
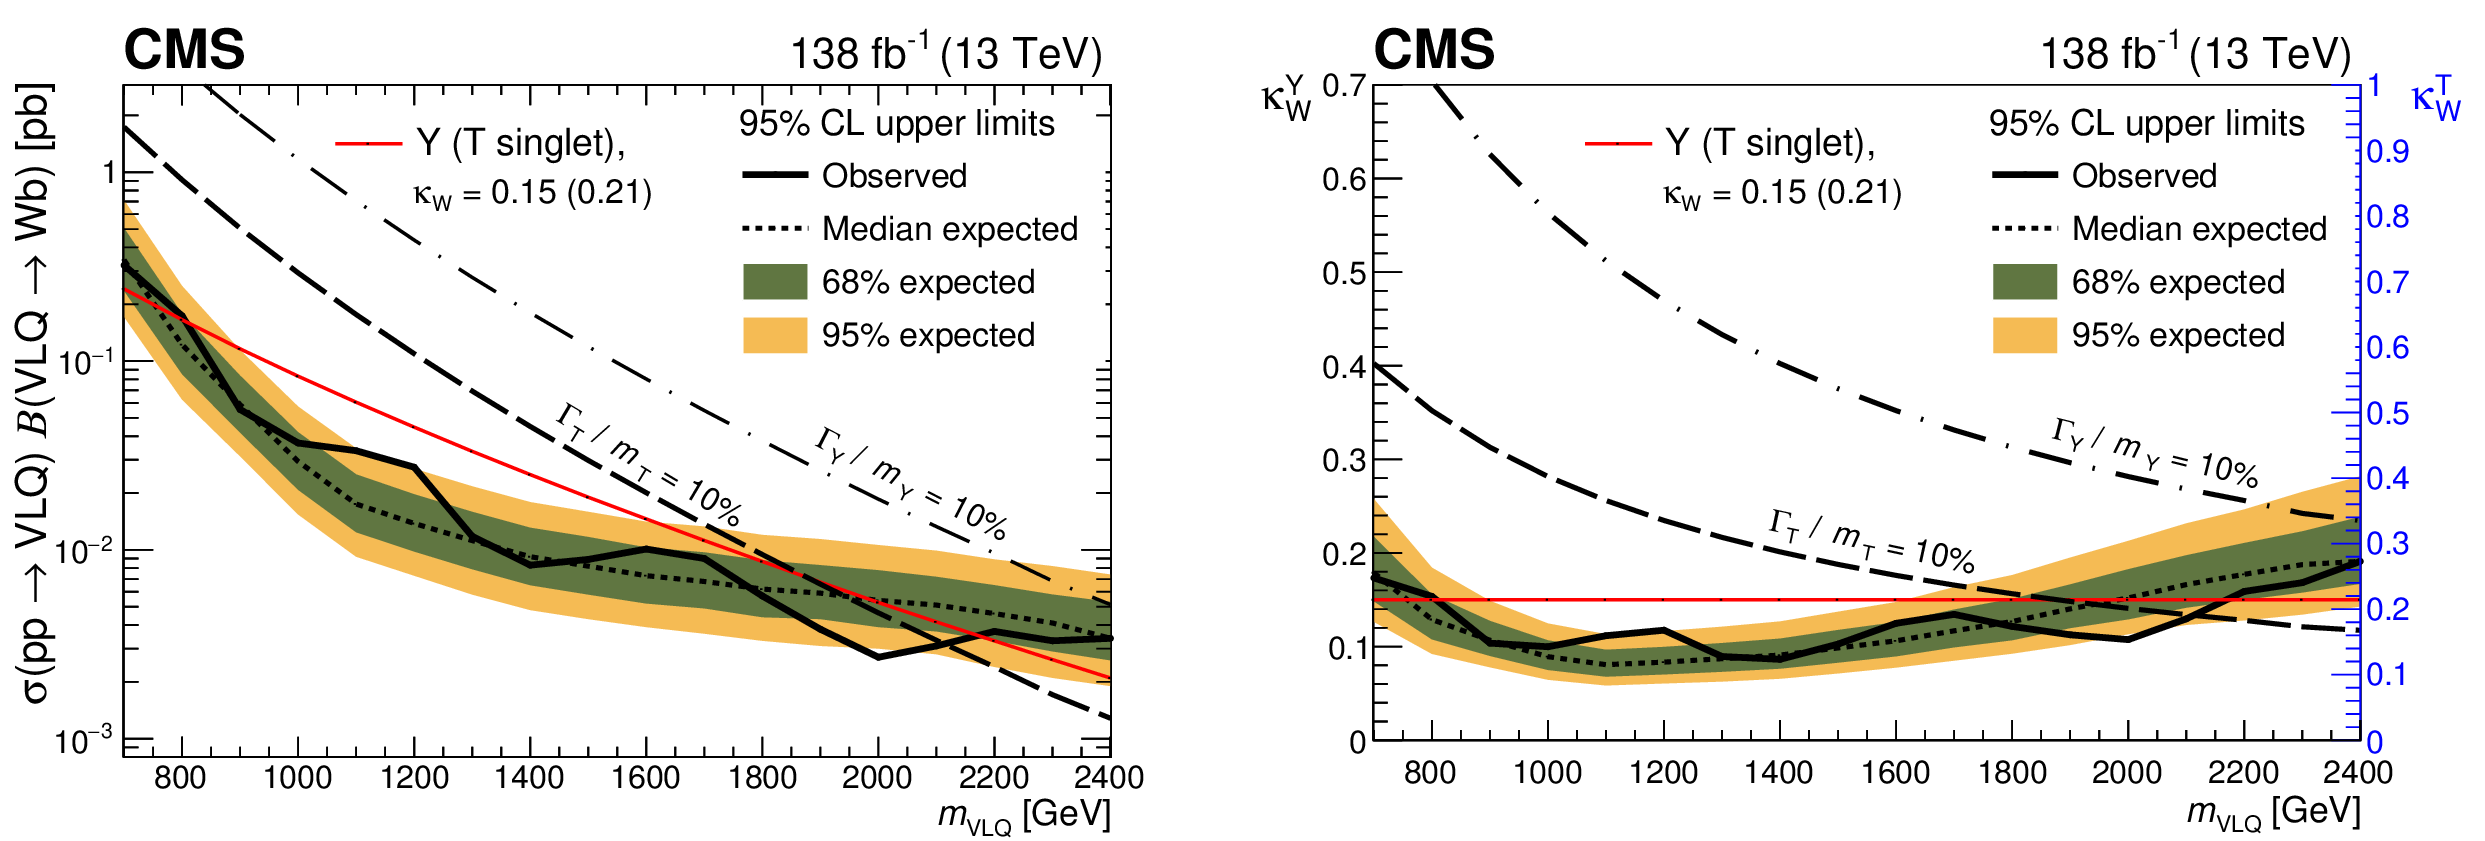
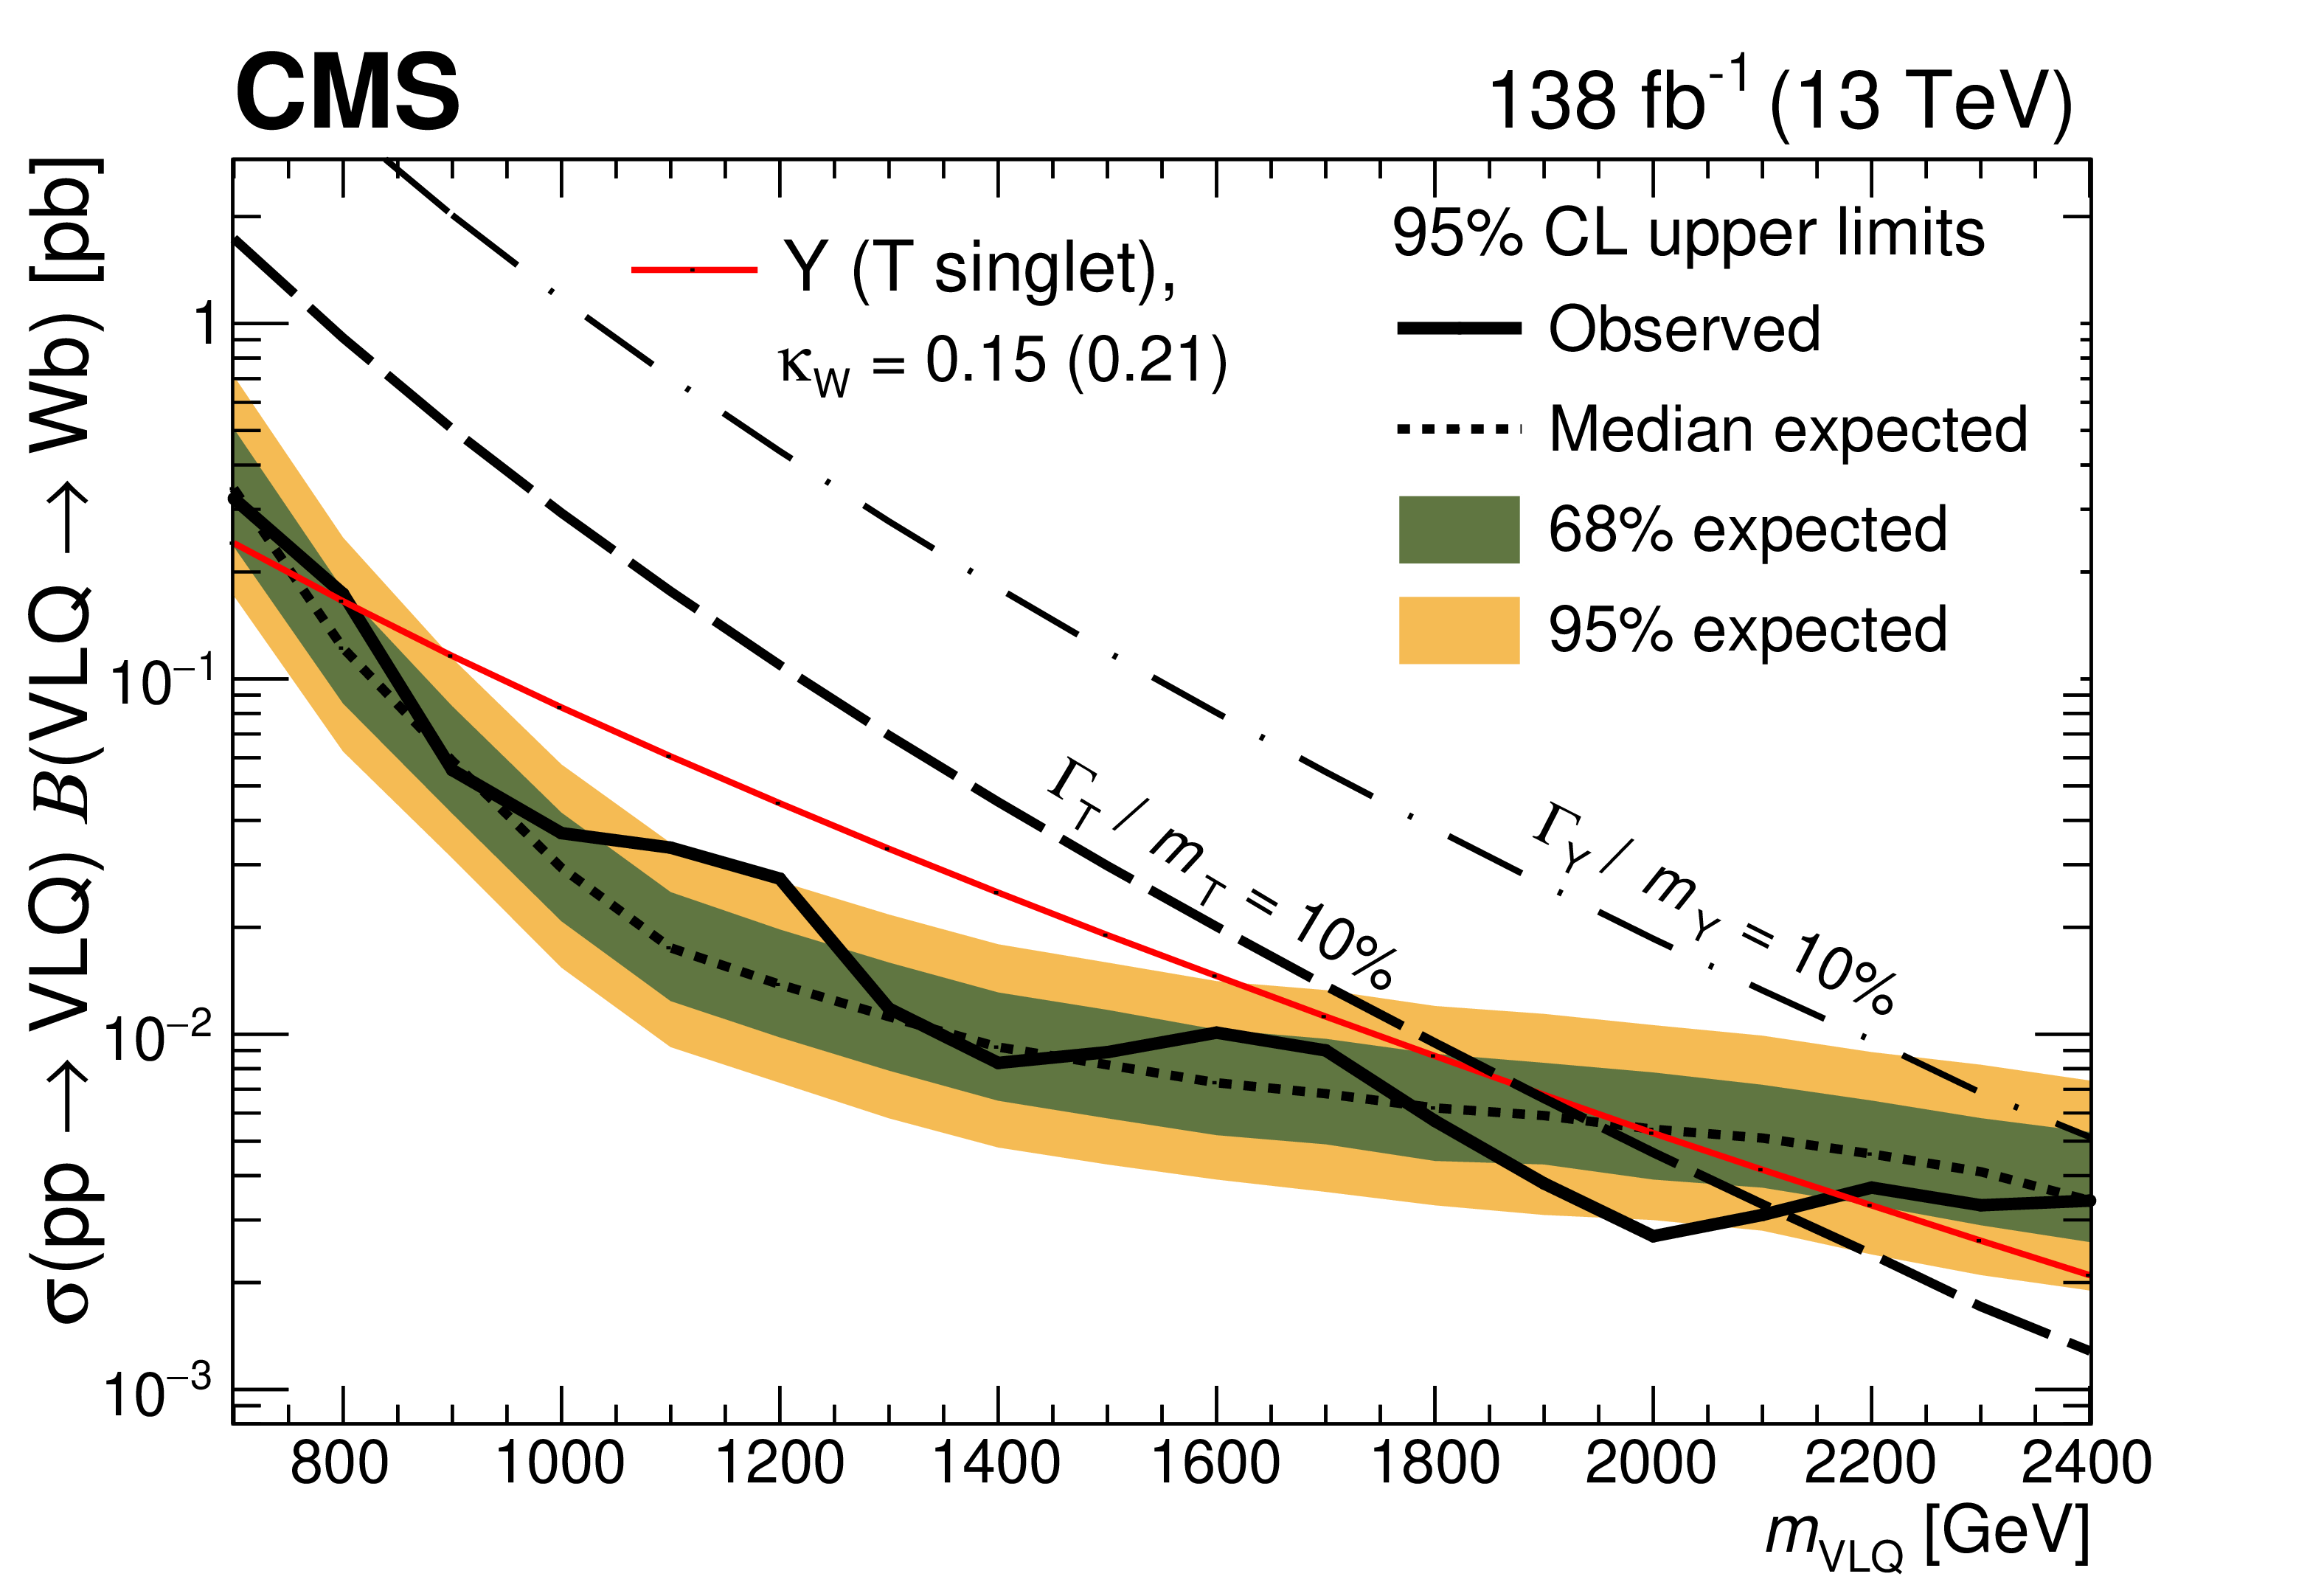
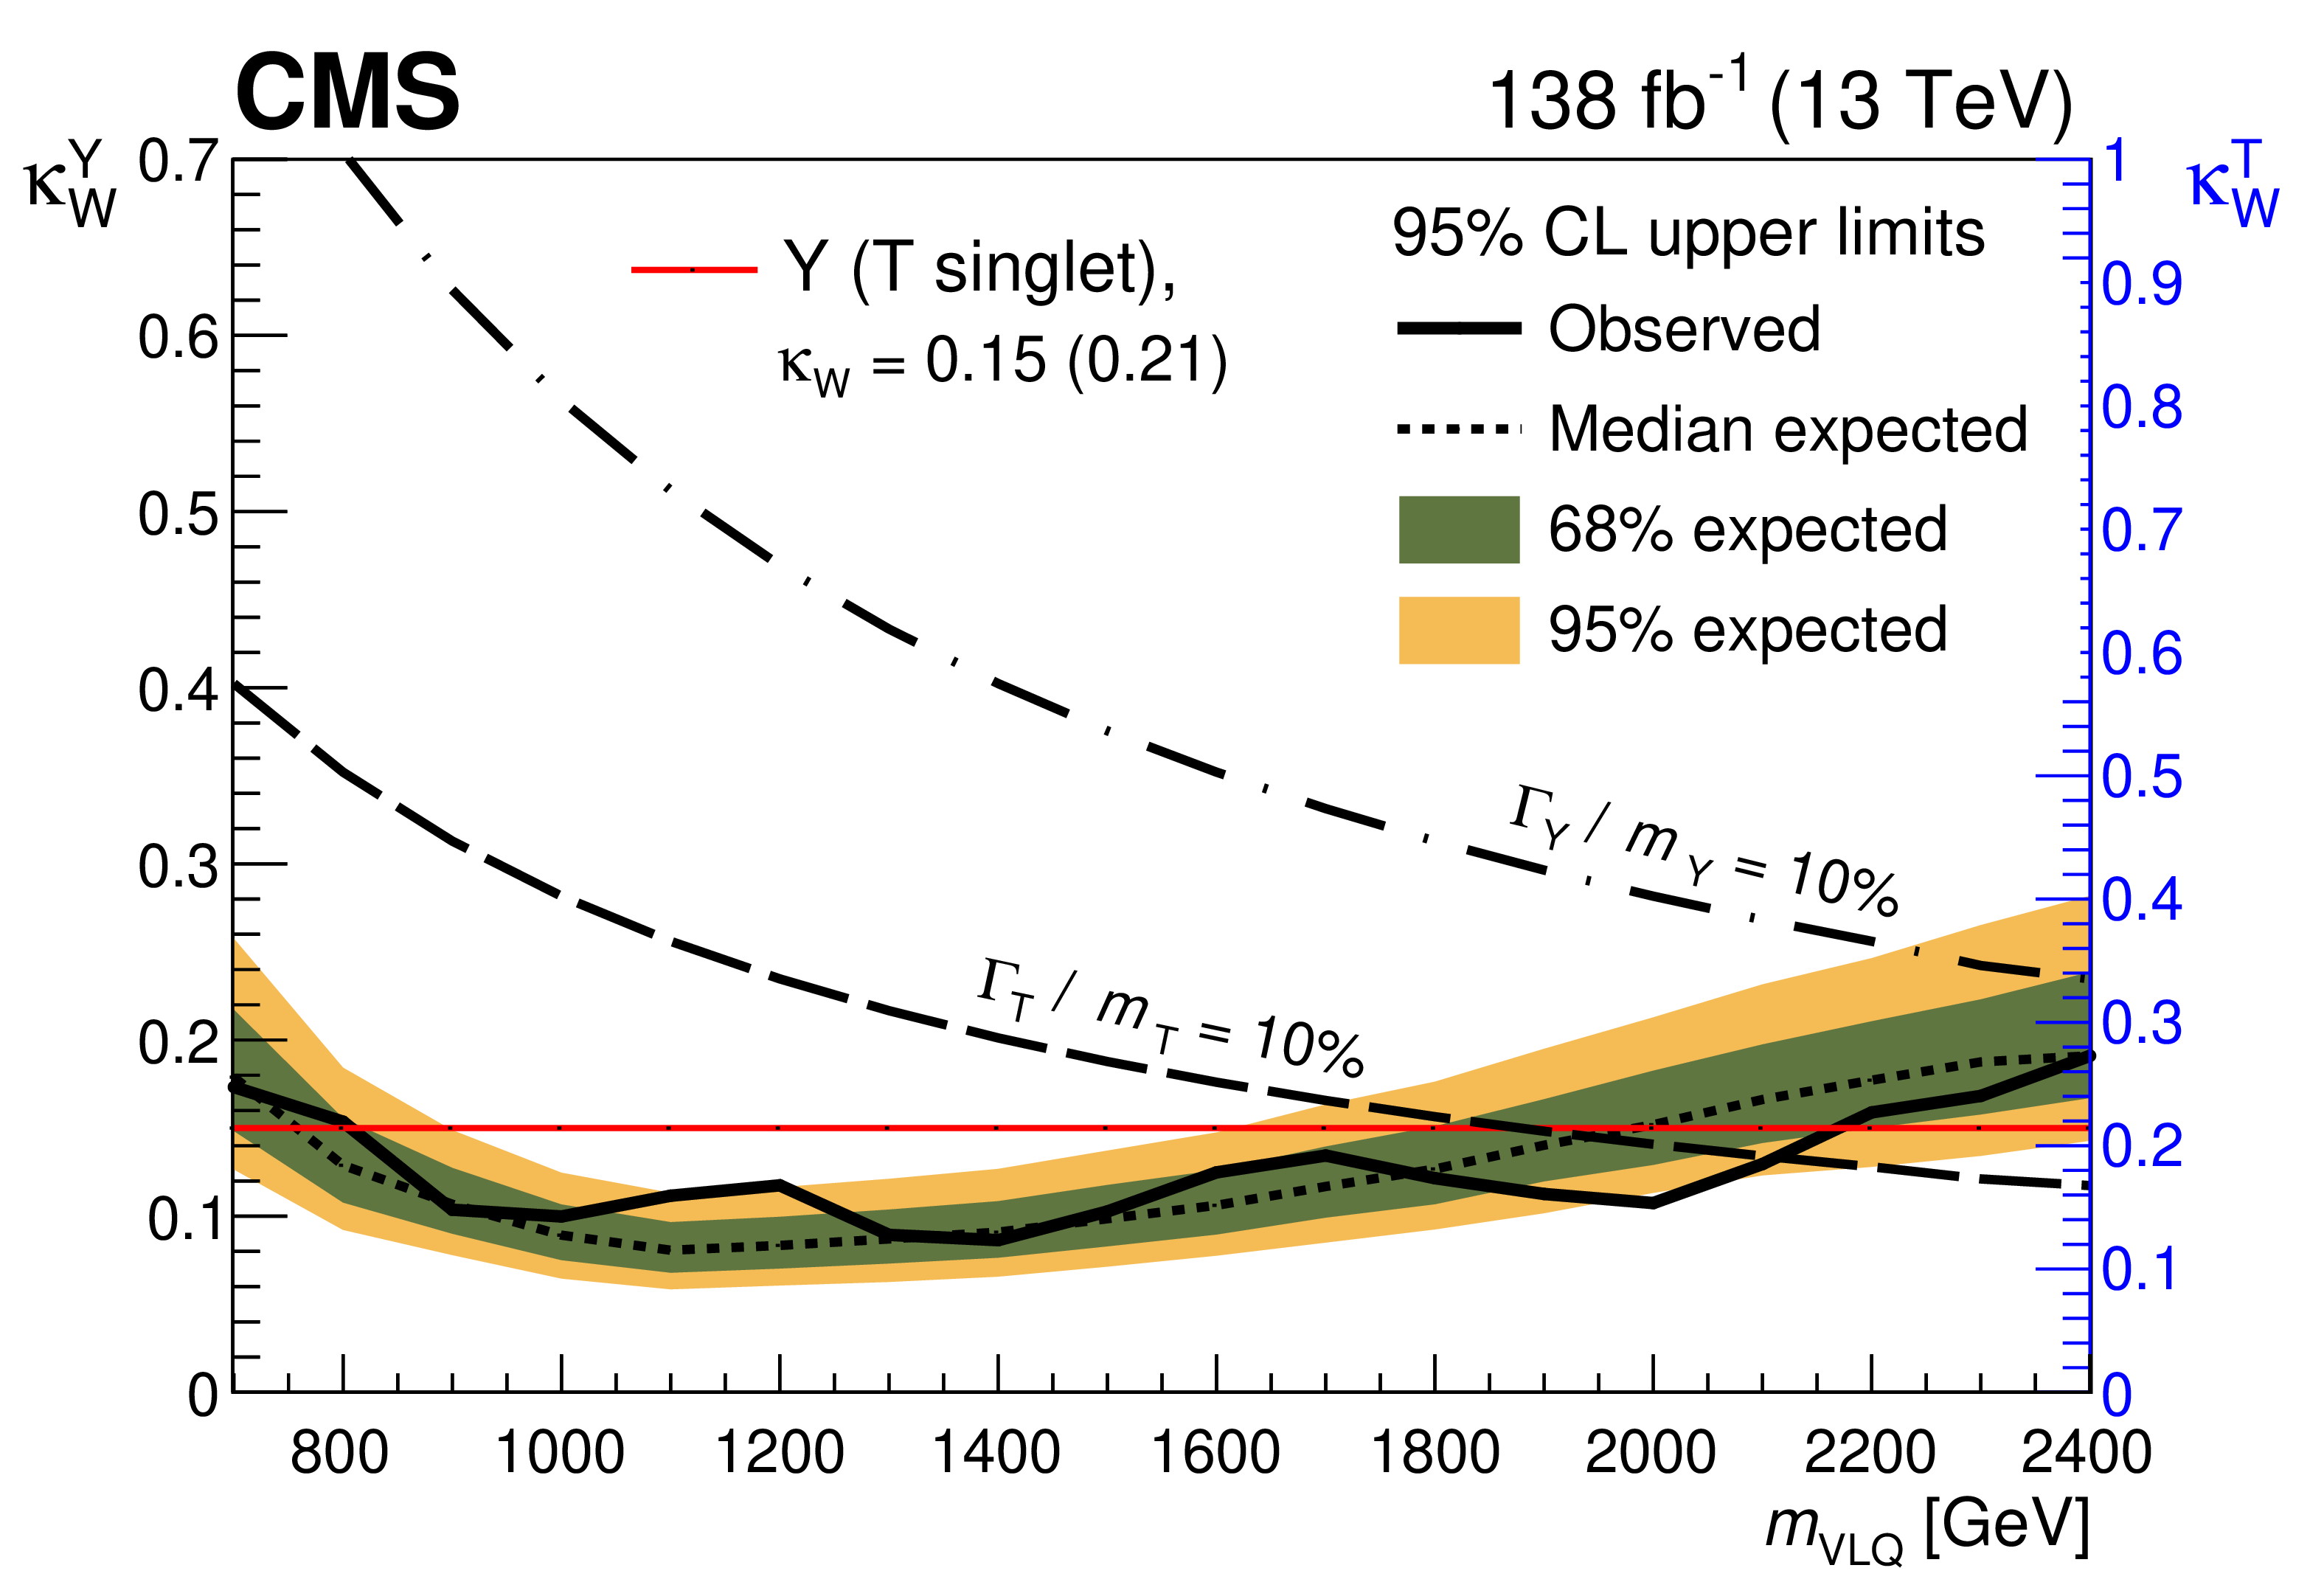
Figure 4:
The 95% CL upper limits on the VLQ single-production cross section (upper) and on the coupling parameter $ \kappa_\mathrm{W} $ (lower) as a function of $ m_{\text{VLQ}} $. The solid black curve gives the observed upper limit, while the dotted black curve shows the expected upper limit, with the green and yellow bands representing the $ \pm $1 and $ \pm $2 standard deviation uncertainties in the expected limit, respectively. The solid red curve in the upper plot displays the theoretical prediction for the Y and T quark single-production cross section assuming exclusive decay to $ \mathrm{W}\mathrm{b} $ and $ \kappa_\mathrm{W} = $ 0.15, while the solid red curve in the lower plot shows the prediction for $ \kappa_\mathrm{W}^{Y} $ under the same assumptions. These two curves also correspond to the predictions for the T singlet, with $ \mathcal{B}(\mathrm{W}\mathrm{b}) = 50% $ and $ \kappa_\mathrm{W} = $ 0.21. In this case, the scale for the prediction of $ \kappa_\mathrm{W}^{T} $ is given by the right vertical axis in the lower plot. The black dashed and dot-dashed curves show the expected cross sections corresponding to a fixed VLQ width to mass ratio $ \Gamma/m = 10% $ for the T singlet and Y quarks, respectively. Below these curves, the VLQ natural width is smaller than the experimental invariant mass resolution, and the narrow-width approximation assumed in the analysis is justified. |
png pdf |
Figure 4-a:
The 95% CL upper limits on the VLQ single-production cross section (upper) and on the coupling parameter $ \kappa_\mathrm{W} $ (lower) as a function of $ m_{\text{VLQ}} $. The solid black curve gives the observed upper limit, while the dotted black curve shows the expected upper limit, with the green and yellow bands representing the $ \pm $1 and $ \pm $2 standard deviation uncertainties in the expected limit, respectively. The solid red curve in the upper plot displays the theoretical prediction for the Y and T quark single-production cross section assuming exclusive decay to $ \mathrm{W}\mathrm{b} $ and $ \kappa_\mathrm{W} = $ 0.15, while the solid red curve in the lower plot shows the prediction for $ \kappa_\mathrm{W}^{Y} $ under the same assumptions. These two curves also correspond to the predictions for the T singlet, with $ \mathcal{B}(\mathrm{W}\mathrm{b}) = 50% $ and $ \kappa_\mathrm{W} = $ 0.21. In this case, the scale for the prediction of $ \kappa_\mathrm{W}^{T} $ is given by the right vertical axis in the lower plot. The black dashed and dot-dashed curves show the expected cross sections corresponding to a fixed VLQ width to mass ratio $ \Gamma/m = 10% $ for the T singlet and Y quarks, respectively. Below these curves, the VLQ natural width is smaller than the experimental invariant mass resolution, and the narrow-width approximation assumed in the analysis is justified. |
png pdf |
Figure 4-b:
The 95% CL upper limits on the VLQ single-production cross section (upper) and on the coupling parameter $ \kappa_\mathrm{W} $ (lower) as a function of $ m_{\text{VLQ}} $. The solid black curve gives the observed upper limit, while the dotted black curve shows the expected upper limit, with the green and yellow bands representing the $ \pm $1 and $ \pm $2 standard deviation uncertainties in the expected limit, respectively. The solid red curve in the upper plot displays the theoretical prediction for the Y and T quark single-production cross section assuming exclusive decay to $ \mathrm{W}\mathrm{b} $ and $ \kappa_\mathrm{W} = $ 0.15, while the solid red curve in the lower plot shows the prediction for $ \kappa_\mathrm{W}^{Y} $ under the same assumptions. These two curves also correspond to the predictions for the T singlet, with $ \mathcal{B}(\mathrm{W}\mathrm{b}) = 50% $ and $ \kappa_\mathrm{W} = $ 0.21. In this case, the scale for the prediction of $ \kappa_\mathrm{W}^{T} $ is given by the right vertical axis in the lower plot. The black dashed and dot-dashed curves show the expected cross sections corresponding to a fixed VLQ width to mass ratio $ \Gamma/m = 10% $ for the T singlet and Y quarks, respectively. Below these curves, the VLQ natural width is smaller than the experimental invariant mass resolution, and the narrow-width approximation assumed in the analysis is justified. |
| Tables | |
png pdf |
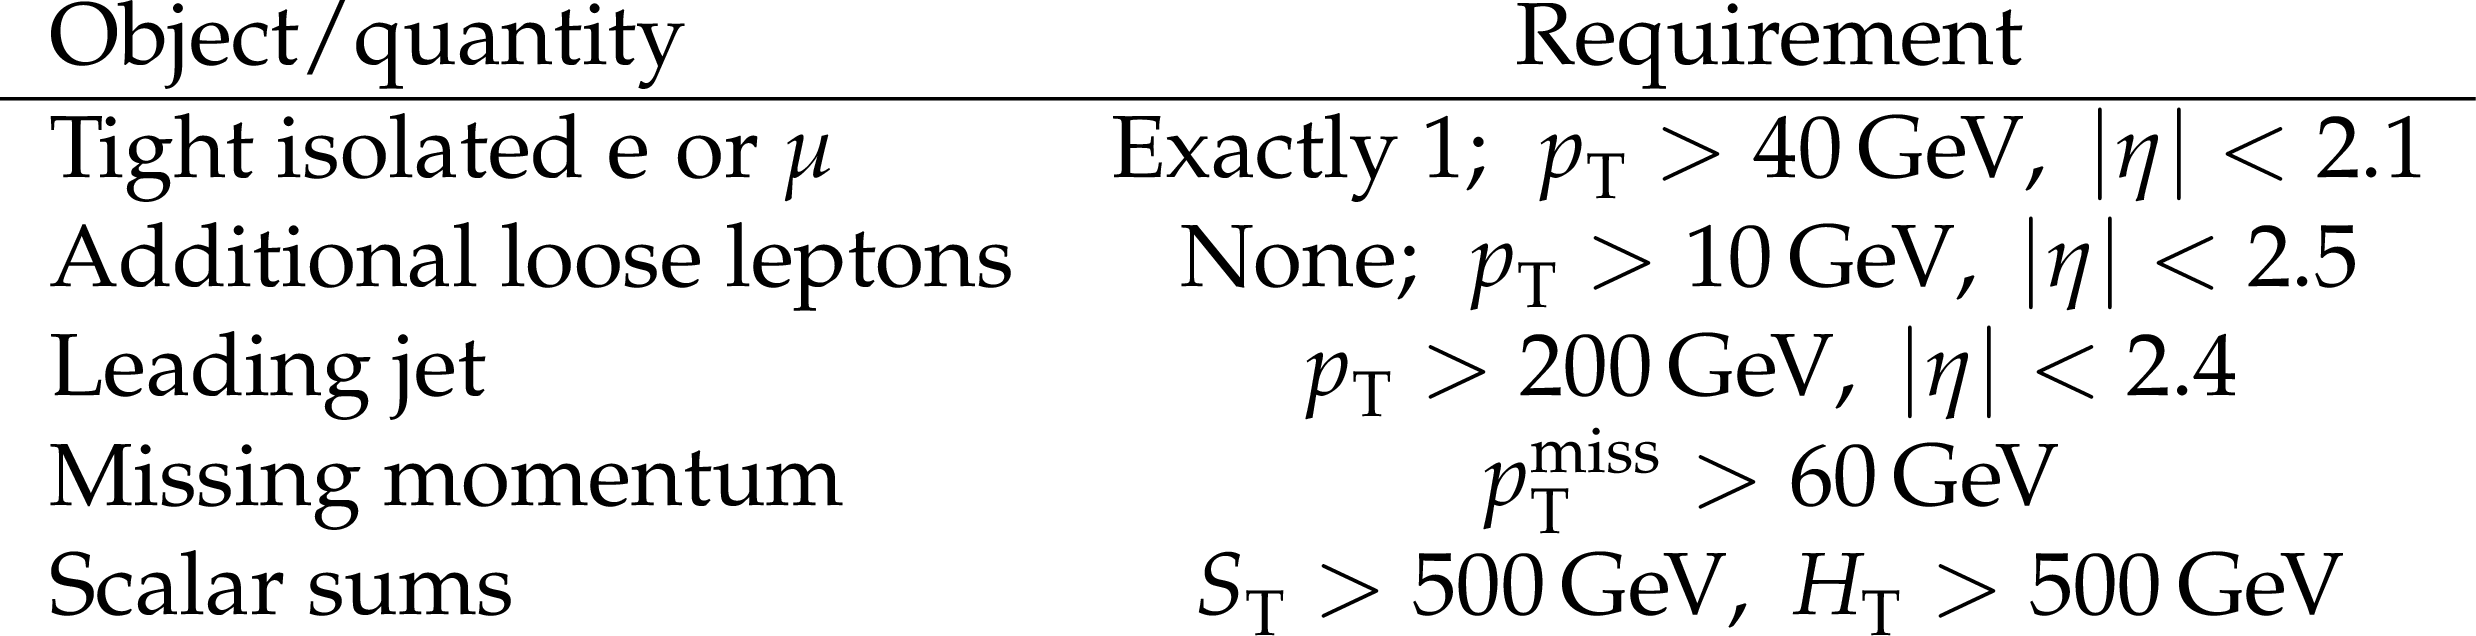
Table 1:
Event selection criteria used for NN training. |
png pdf |
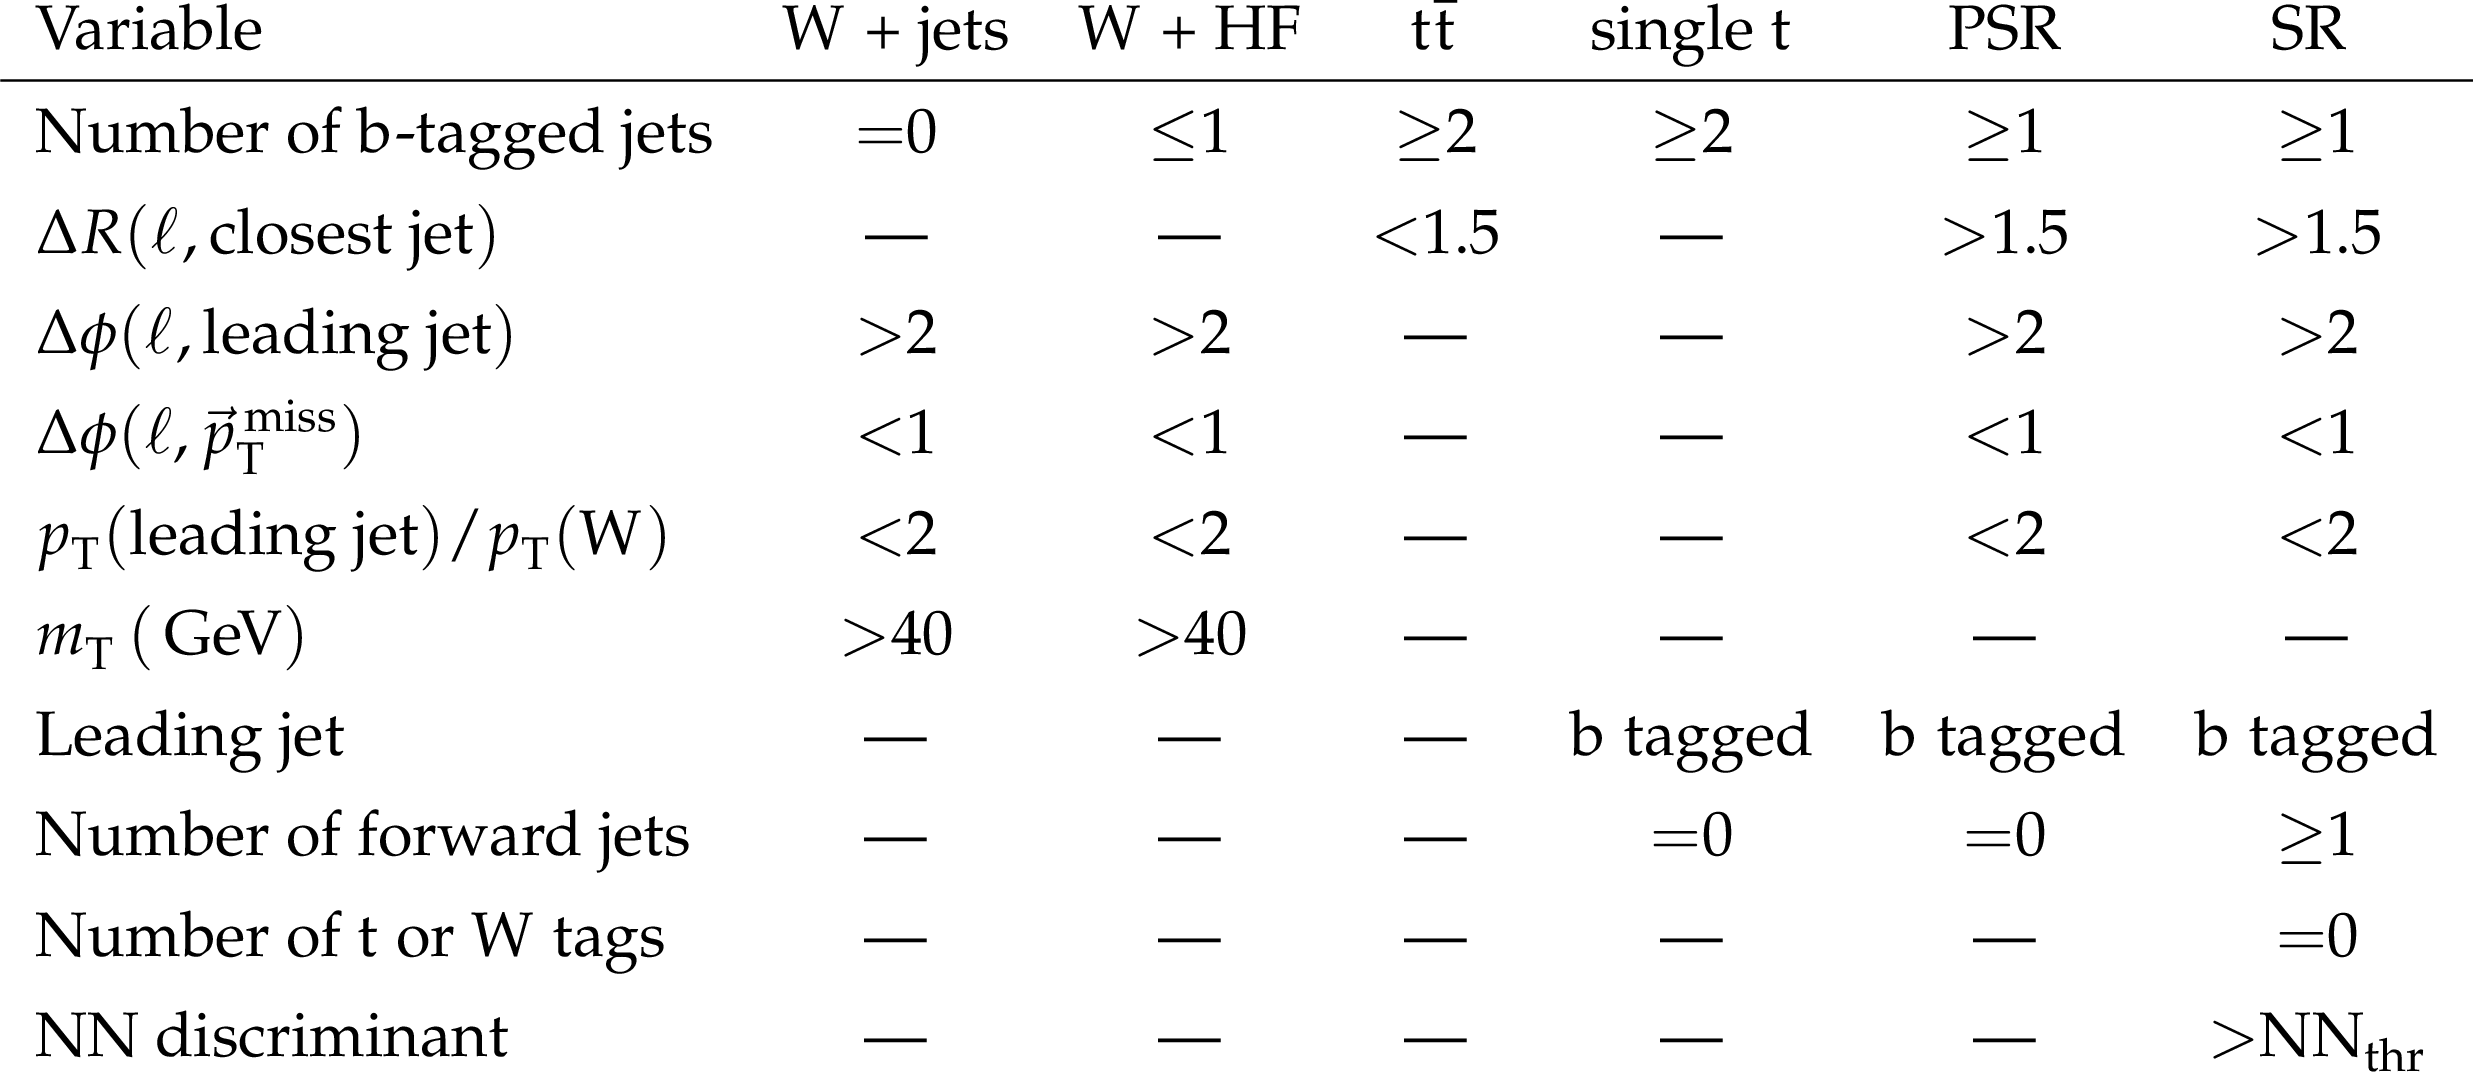
Table 2:
Summary of the event selection requirements defining the four CRs, PSR, and SR. The NN threshold value $ \mathrm{NN}_{\text{thr}} $ for the SR is optimized separately for each category, as described in Section 5. |
| Summary |
| Results have been presented from a search for the single production of the vector-like quarks T and Y, with electric charges of $ +2/ $ 3 and $ -4/ $ 3, respectively, and decaying into a W boson and a b quark. The results are based on data collected by the CMS experiment at the CERN LHC from proton-proton collisions at $ \sqrt{s} = $ 13 TeV, corresponding to an integrated luminosity of 138 fb$ ^{-1} $. The search is performed using events with large transverse momentum imbalance, exactly one charged lepton, at least one jet identified as coming from the fragmentation of a b quark (b tagged), and at least one jet in the forward region of the detector. The invariant mass $ m_{\text{rec}} $ of the vector-like quark is reconstructed with the recursive jigsaw technique using the four-momenta of the charged lepton and the highest momentum b-tagged jet, combined with the missing transverse momentum. A profile likelihood fit to the observed $ m_{\text{rec}} $ spectrum is performed simultaneously in six different event categories based on the number of b-tagged jets in the event and the sign of the lepton charge. No evidence for an excess above the expected standard model background due to the production of a VLQ is observed. No evidence of an excess due to new physics above the expected background is observed. Upper limits at 95% confidence level are set on the cross sections for the single production of vector-like quarks and on their coupling $ \kappa_\mathrm{W} $ to the standard model sector in the mass range from 0.70 to 2.40 TeV. Assuming $ \mathcal{B} (Y/T \to \mathrm{W}\mathrm{b}) = $ 100%, the 95% confidence level upper limit on $ \kappa_\mathrm{W} $ depends on the VLQ mass and reaches values as low as 0.086 at VLQ masses around 1.4 TeV. For $ \kappa_\mathrm{W} $ values of 0.2 and 0.15, the Y vector-like quark is excluded in the mass range 0.7 to 2.4 and 0.82 to 2.15 TeV, respectively. For T quarks with $ \mathcal{B} (T \to \mathrm{W}\mathrm{b}) = $ 50%, the upper limits on the production cross section are twice as large, and the T vector-like quark is excluded over the mass range 0.8 to 2 TeV for $ \kappa_\mathrm{W} = $ 0.2. These results represent the most stringent limits to date on the single production of vector-like Y and T quarks decaying into a W boson and a b quark. |
| References | ||||
| 1 | A. Arhrib et al. | Phenomenology of 2HDM with vectorlike quarks | PRD 97 (2018) 095015 | 1607.08517 |
| 2 | K. Agashe, R. Contino, and A. Pomarol | The minimal composite Higgs model | NPB 719 (2005) 165 | hep-ph/0412089 |
| 3 | O. Matsedonskyi, G. Panico, and A. Wulzer | Light top partners for a light composite Higgs | JHEP 01 (2013) 164 | 1204.6333 |
| 4 | L. Randall and R. Sundrum | Large mass hierarchy from a small extra dimension | PRL 83 (1999) 3370 | hep-ph/9905221 |
| 5 | I. Antoniadis | A possible new dimension at a few TeV | PLB 246 (1990) 377 | |
| 6 | S. Martin | Extra vectorlike matter and the lightest Higgs scalar boson mass in low-energy supersymmetry | PRD 81 (2010) 035004 | 0910.2732 |
| 7 | S. Gopalakrishna and A. Velusam | Higgs vacuum stability with vectorlike fermions | PRD 99 (2019) 115020 | 1812.11303 |
| 8 | A. Arsenault, K. Y. Cingiloglu, and M. Frank | Vacuum stability in the Standard Model with vectorlike fermions | PRD 107 (2023) 036018 | 2207.10332 |
| 9 | D. Egana-Ugrinovic | The minimal fermionic model of electroweak baryogenesis | JHEP 12 (2017) 064 | 1707.02306 |
| 10 | R. Dermisek | Unification of gauge couplings in the standard model with extra vectorlike families | PRD 87 (2013) 055008 | 1212.3035 |
| 11 | J. A. Aguilar-Saavedra, R. Benbrik, S. Heinemeyer, and M. Perez-Victoria | Handbook of vectorlike quarks: mixing and single production | PRD 88 (2013) 094010 | 1306.0572 |
| 12 | G.~Cacciapaglia et al. | Interplay of vectorlike top partner multiplets in a realistic mixing set-up | KEK report KEK-TH-1729, LYCEN-2014-09, 2015 link |
1502.00370 |
| 13 | CMS Collaboration | Review of searches for vector-like quarks, vector-like leptons, and heavy neutral leptons in proton-proton collisions at $ \sqrt{s} = $ 13 TeV at the CMS experiment | Phys. Rept. 1115 (2025) 570 | CMS-EXO-23-006 2405.17605 |
| 14 | ATLAS Collaboration | Combination of the Searches for Pair-Produced Vectorlike Partners of the Third-Generation Quarks at $ \sqrt{s} = $ 13 TeV with the ATLAS Detector | PRL 121 (2018) 211801 | 1808.02343 |
| 15 | ATLAS Collaboration | Search for pair production of heavy vectorlike quarks decaying into hadronic final states in pp collisions at $ \sqrt{s} = $ 13 TeV with the ATLAS detector | PRD 98 (2018) 092005 | 1808.01771 |
| 16 | ATLAS Collaboration | Combination of searches for singly produced vectorlike top quarks in pp collisions at $ \sqrt{s} = $ 13 TeV with the ATLAS detector | PRD 111 (2025) 012012 | 2408.08789 |
| 17 | M. Buchkremer, A. Cacciapaglia, A. Deandrea, and L. Panizzi | Model-independent framework for searches of top partners | NPB 876 (2013) 376 | 1305.4172 |
| 18 | M. Chanowitz and M. Caillard | The TeV physics of strongly interacting W's and Z's | NPB 261 (1985) 379 | |
| 19 | J. Haller et al. | Update of the global electroweak fit and constraints on two-Higgs-doublet models | EPJC 78 (2018) 675 | 1803.01853 |
| 20 | J. Haller et al. | Status of the global electroweak fit with Gfitter in the light of new precision measurements | in International Conference on High Energy Physics (ICHEP), 2022 Proceedings of the 4 (2022) 1 |
2211.07665 |
| 21 | CMS Collaboration | Search for single production of vector-like quarks decaying into a b quark and a W boson in proton-proton collisions at $ \sqrt{s} = $ 13 TeV | PLB 772 (2017) 634 | 1701.08328 |
| 22 | ATLAS Collaboration | Search for single production of vector-like quarks decaying into Wb in pp collisions at $ \sqrt{s} = $ 13 TeV with the ATLAS detector | JHEP 05 (2019) 164 | 1812.07343 |
| 23 | ATLAS Collaboration | Search for single-production of vector-like quarks decaying into Wb in the fully hadronic final state in pp collisions at $ \sqrt{s} = $ 13 TeV with the ATLAS detector | JHEP 02 (2025) 075 | |
| 24 | ATLAS Collaboration | Search for single production of vector-like quarks decaying into W($ \ell\nu $)b in pp collisions at $ \sqrt{s} = $ 13 TeV with the ATLAS detector | JHEP 12 (2025) 012 | 2506.15515 |
| 25 | CMS Collaboration | The CMS experiment at the CERN LHC | JINST 3 (2008) S08004 | |
| 26 | CMS Collaboration | Development of the CMS detector for the CERN LHC Run 3 | JINST 19 (2024) P05064 | CMS-PRF-21-001 2309.05466 |
| 27 | CMS Collaboration | Performance of the CMS Level-1 trigger in proton-proton collisions at $ \sqrt{s} = $ 13 TeV | JINST 15 (2020) P10017 | CMS-TRG-17-001 2006.10165 |
| 28 | CMS Collaboration | The CMS trigger system | JINST 12 (2017) P01020 | CMS-TRG-12-001 1609.02366 |
| 29 | CMS Collaboration | Performance of the CMS high-level trigger during LHC Run 2 | JINST 19 (2024) P11021 | CMS-TRG-19-001 2410.17038 |
| 30 | CMS Collaboration | Particle-flow reconstruction and global event description with the CMS detector | JINST 12 (2017) P10003 | CMS-PRF-14-001 1706.04965 |
| 31 | CMS Collaboration | Technical proposal for the Phase-II upgrade of the Compact Muon Solenoid | CMS Technical Proposal CERN-LHCC-2015-010, CMS-TDR-15-02, 2015 CDS |
|
| 32 | CMS Collaboration | Electron and photon reconstruction and identification with the CMS experiment at the CERN LHC | JINST 16 (2021) P05014 | CMS-EGM-17-001 2012.06888 |
| 33 | CMS Collaboration | ECAL 2016 refined calibration and Run2 summary plots | CMS Detector Performance Summary CMS-DP-2020-021, 2020 CDS |
|
| 34 | CMS Collaboration | Performance of the CMS muon detector and muon reconstruction with proton-proton collisions at $ \sqrt{s}= $ 13 TeV | JINST 13 (2018) P06015 | CMS-MUO-16-001 1804.04528 |
| 35 | M. Cacciari, G. P. Salam, and G. Soyez | Fastjet user manual | EPJC 72 (2012) 1896 | 1111.6097 |
| 36 | M. Cacciari, G. P. Salam, and G. Soyez | The anti-$ k_{\mathrm{T}} $ jet clustering algorithm | JHEP 04 (2008) 063 | 0802.1189 |
| 37 | M. Cacciari, G. P. Salam, and G. Soyez | The catchment area of jets | JHEP 04 (2008) 005 | 0802.1188 |
| 38 | CMS Collaboration | Jet energy scale and resolution in the CMS experiment in pp collisions at 8 TeV | JINST 12 (2017) P02014 | CMS-JME-13-004 1607.03663 |
| 39 | E. Bols et al. | Jet flavour classification using DeepJet | JINST 15 (2020) P12012 | 2008.10519 |
| 40 | CMS Collaboration | Identification of heavy-flavour jets with the CMS detector in pp collisions at 13 TeV | JINST 13 (2018) P05011 | CMS-BTV-16-002 1712.07158 |
| 41 | CMS Collaboration | Identification of heavy, energetic, hadronically decaying particles using machine-learning techniques | JINST 15 (2020) P06005 | CMS-JME-18-002 2004.08262 |
| 42 | CMS Collaboration | Performance of missing transverse momentum reconstruction in proton-proton collisions at $ \sqrt{s} = $ 13 TeV using the CMS detector | JINST 14 (2019) P07004 | CMS-JME-17-001 1903.06078 |
| 43 | NNPDF Collaboration | Parton distributions for the LHC Run II | JHEP 04 (2015) 040 | 1410.8849 |
| 44 | CMS Collaboration | Parton distributions from high-precision collider data | EPJC 77 (2017) 663 | 1706.00428 |
| 45 | J. Alwall et al. | The automated computation of tree-level and next-to-leading order differential cross sections, and their matching to parton shower simulations | JHEP 07 (2014) 079 | 1405.0301 |
| 46 | P. Artoisenet, R. Frederix, O. Mattelaer, and R. Rietkerk | Automatic spin-entangled decays of heavy resonances in Monte Carlo simulations | JHEP 03 (2013) 015 | 1212.3460 |
| 47 | A. Carvalho et al. | Single production of vectorlike quarks with large width at the Large Hadron Collider | PRD 98 (2018) 015029 | 1805.06402 |
| 48 | S. Frixione, P. Nason, and C. Oleari | Matching NLO QCD computations with parton shower simulations: the POWHEG method | JHEP 11 (2007) 070 | 0709.2092 |
| 49 | P. Nason | A new method for combining NLO QCD with shower Monte Carlo algorithms | JHEP 11 (2004) 040 | hep-ph/0409146 |
| 50 | S. Alioli, P. Nason, C. Oleari, and E. Re | A general framework for implementing NLO calculations in shower Monte Carlo programs: the POWHEG BOX | JHEP 06 (2010) 043 | 1002.2581 |
| 51 | C. Bierlich et al. | A comprehensive guide to the physics and usage of PYTHIA 8.3 | SciPost Phys. Codeb. 2022 (2022) 8 | 2203.11601 |
| 52 | R. Frederix and S. Frixione | Merging meets matching in MC@NLO | JHEP 12 (2012) 061 | 1209.6215 |
| 53 | J. Alwall et al. | Comparative study of various algorithms for the merging of parton showers and matrix elements in hadronic collisions | EPJC 53 (2008) 473 | 0706.2569 |
| 54 | CMS Collaboration | Event generator tunes obtained from underlying event and multiparton scattering measurements | EPJC 76 (2016) 155 | CMS-GEN-14-001 1512.00815 |
| 55 | J. Lindert et al. | Precise predictions for V+jets dark matter backgrounds | EPJC 77 (2017) 829 | 1705.04664 |
| 56 | M. Czakon and A. Mitov | Top++: A program for the calculation of the top-pair cross-section at hadron colliders | Comput. Phys. Commun. 185 (2014) 2930 | 1112.5675 |
| 57 | A. Kulesza et al. | Associated production of a top quark pair with a heavy electroweak gauge boson at NLO+NNLL accuracy | EPJC 79 (2019) 249 | 1812.08622 |
| 58 | J. M. Campbell and R. K. Ellis | MCFM for the Tevatron and the LHC | Nucl. Phys. B Proc. Suppl. 10 (2010) 205 | 1007.3492 |
| 59 | J. Campbell, T. Neumann, and Z. Sullivan | Single-top-quark production in the $ t $-channel at NNLO | JHEP 02 (2021) 040 | 2012.01574 |
| 60 | N. Kidonakis and N. Yamanaka | Higher-order corrections for tW production at high-energy hadron colliders | JHEP 05 (2021) 278 | 2102.11300 |
| 61 | GEANT4 Collaboration | GEANT 4 --- a simulation toolkit | NIM A 506 (2003) 250 | |
| 62 | D. Kingma and J. Ba | Adam: a method for stochastic optimization | in Proceedings of the 3rd International Conference for Learning Representations. 201 (1900) 4 |
1412.6980 |
| 63 | P. Jackson and C. Rogan | Recursive jigsaw reconstruction: HEP event analysis in the presence of kinematic and combinatoric ambiguities | PRD 96 (2017) 112007 | 1705.10733 |
| 64 | F. Massey Jr. | The Kolmogorov--Smirnov test for goodness of fit | J. Am. Stat. Assoc. 46 (1951) 68 | |
| 65 | R. A. Fisher | On the interpretation of $ \chi^2 $ from contingency tables, and the calculation of p | J. Roy. Stat. Soc. 85 (1922) 87 | |
| 66 | CMS Collaboration | Precision luminosity measurement in proton-proton collisions at $ \sqrt{s} = $ 13 TeV in 2015 and 2016 at CMS | EPJC 81 (2021) 800 | CMS-LUM-17-003 2104.01927 |
| 67 | CMS Collaboration | CMS luminosity measurement for the 2017 data-taking period at $ \sqrt{s} = $ 13 TeV | CMS Physics Analysis Summary | CMS-PAS-LUM-17-004 |
| 68 | CMS Collaboration | CMS luminosity measurement for the 2018 data-taking period at $ \sqrt{s} = $ 13 TeV | CMS Physics Analysis Summary | CMS-PAS-LUM-18-002 |
| 69 | CMS Collaboration | Measurement of differential $ \mathrm{t} \overline{\mathrm{t}} $ production cross sections in the full kinematic range using $ \mathrm{lepton}+\text{jets} $ events from proton-proton collisions at $ \sqrt{s} = $ 13 TeV | PRD 104 (2021) 092013 | CMS-TOP-20-001 2108.02803 |
| 70 | CMS Collaboration | Observation of tW production in the single-lepton channel in pp collisions at $ \sqrt{s} = $ 13 TeV | JHEP 11 (2021) 111 | CMS-TOP-20-002 2109.01706 |
| 71 | CMS Collaboration | Measurement of the inclusive cross sections for W and Z boson production in proton-proton collisions at $ \sqrt{s} = $ 5.02 and 13 TeV | JHEP 04 (2025) 162 | CMS-SMP-20-004 2408.03744 |
| 72 | CMS Collaboration | Measurement of the production cross section of a W boson in association with two b jets in pp collisions at $ \sqrt{s} = $ 8 TeV | EPJC 77 (2017) 92 | |
| 73 | CMS Collaboration | Measurement of the production cross section for a W boson in association with a charm quark in proton-proton collisions at $ \sqrt{s} = $ 13 TeV | EPJC 84 (2024) 27 | CMS-SMP-21-005 2308.02285 |
| 74 | J. Butterworth et al. | PDF4LHC recommendations for LHC Run II | JPG 43 (2016) 02 | 1510.03865 |
| 75 | CMS Collaboration | Measurement of the inelastic proton-proton cross section at $ \sqrt{s}= $ 13 TeV | JHEP 07 (2018) 161 | CMS-FSQ-15-005 1802.02613 |
| 76 | F. E. James | Statistical methods in experimental physics | World Scientific, Singapore, 2nd edition, ISBN 978-981-270-527-3, 2006 link |
|
| 77 | R. D. Cousins | Lectures on statistics in theory: Prelude to statistics in practice | 1807.05996 | |
| 78 | E. Gross and O. Vitells | Trial factors for the look elsewhere effect in high energy physics | EPJC 70 (2010) 525 | |
| 79 | CMS Collaboration | The CMS statistical analysis and combination tool: Combine | Comput. Softw. Big. Sci 8 (2024) 19 | CMS-CAT-23-001 2404.06614 |
| 80 | A. L. Read | Presentation of search results: The CL$ _{\text{s}} $ technique | JPG 28 (2002) 2693 | |
| 81 | T. Junk | Confidence level computation for combining searches with small statistics | NIM A 434 (1999) 435 | hep-ex/9902006 |
| 82 | G. Cowan, K. Cranmer, E. Gross, and O. Vitells | Asymptotic formulae for likelihood-based tests of new physics | EPJC 71 (2011) 1554 | 1007.1727 |
| 83 | CMS Collaboration | HEPData record for this analysis | link | |
|
|
Compact Muon Solenoid LHC, CERN |
|

|

|

|

|

|