

Compact Muon Solenoid
LHC, CERN
| CMS-PAS-SUS-23-017 | ||
| Search for dark matter recoiling from a low-multiplicity jet in proton-proton collisions at $ \sqrt{s}= $ 13 TeV | ||
| CMS Collaboration | ||
| 31 March 2025 | ||
| Abstract: A search for dark matter particles, using events containing an imbalance in transverse momentum and one energetic low-multiplicity jet, is performed using data collected in proton-proton collisions with the CMS detector at a center-of-mass energy of 13 TeV. The analysis is based on a data set corresponding to an integrated luminosity of 138 fb$ ^{-1} $ collected from 2016-2018. This is the first search using the low-multiplicity jet signature at the LHC and supervised machine learning and data augmentation techniques are used to enhance signal sensitivity. No excess of events over the standard model background expectation is observed. Upper limits on the dark matter production cross sections in simplified models with vector and axial vector mediators are set at the 95% confidence level (CL). Mediator masses of up to $ \approx $ 4250 GeV are excluded at 95% CL for dark matter mass of $ \approx $ 100 GeV and mediator masses of up to $ \approx $ 3500 GeV are excluded at 95% CL for dark matter mass of $ \approx $ 550 GeV. | ||
| Links: CDS record (PDF) ; Physics Briefing ; CADI line (restricted) ; | ||
| Figures | |
png pdf |
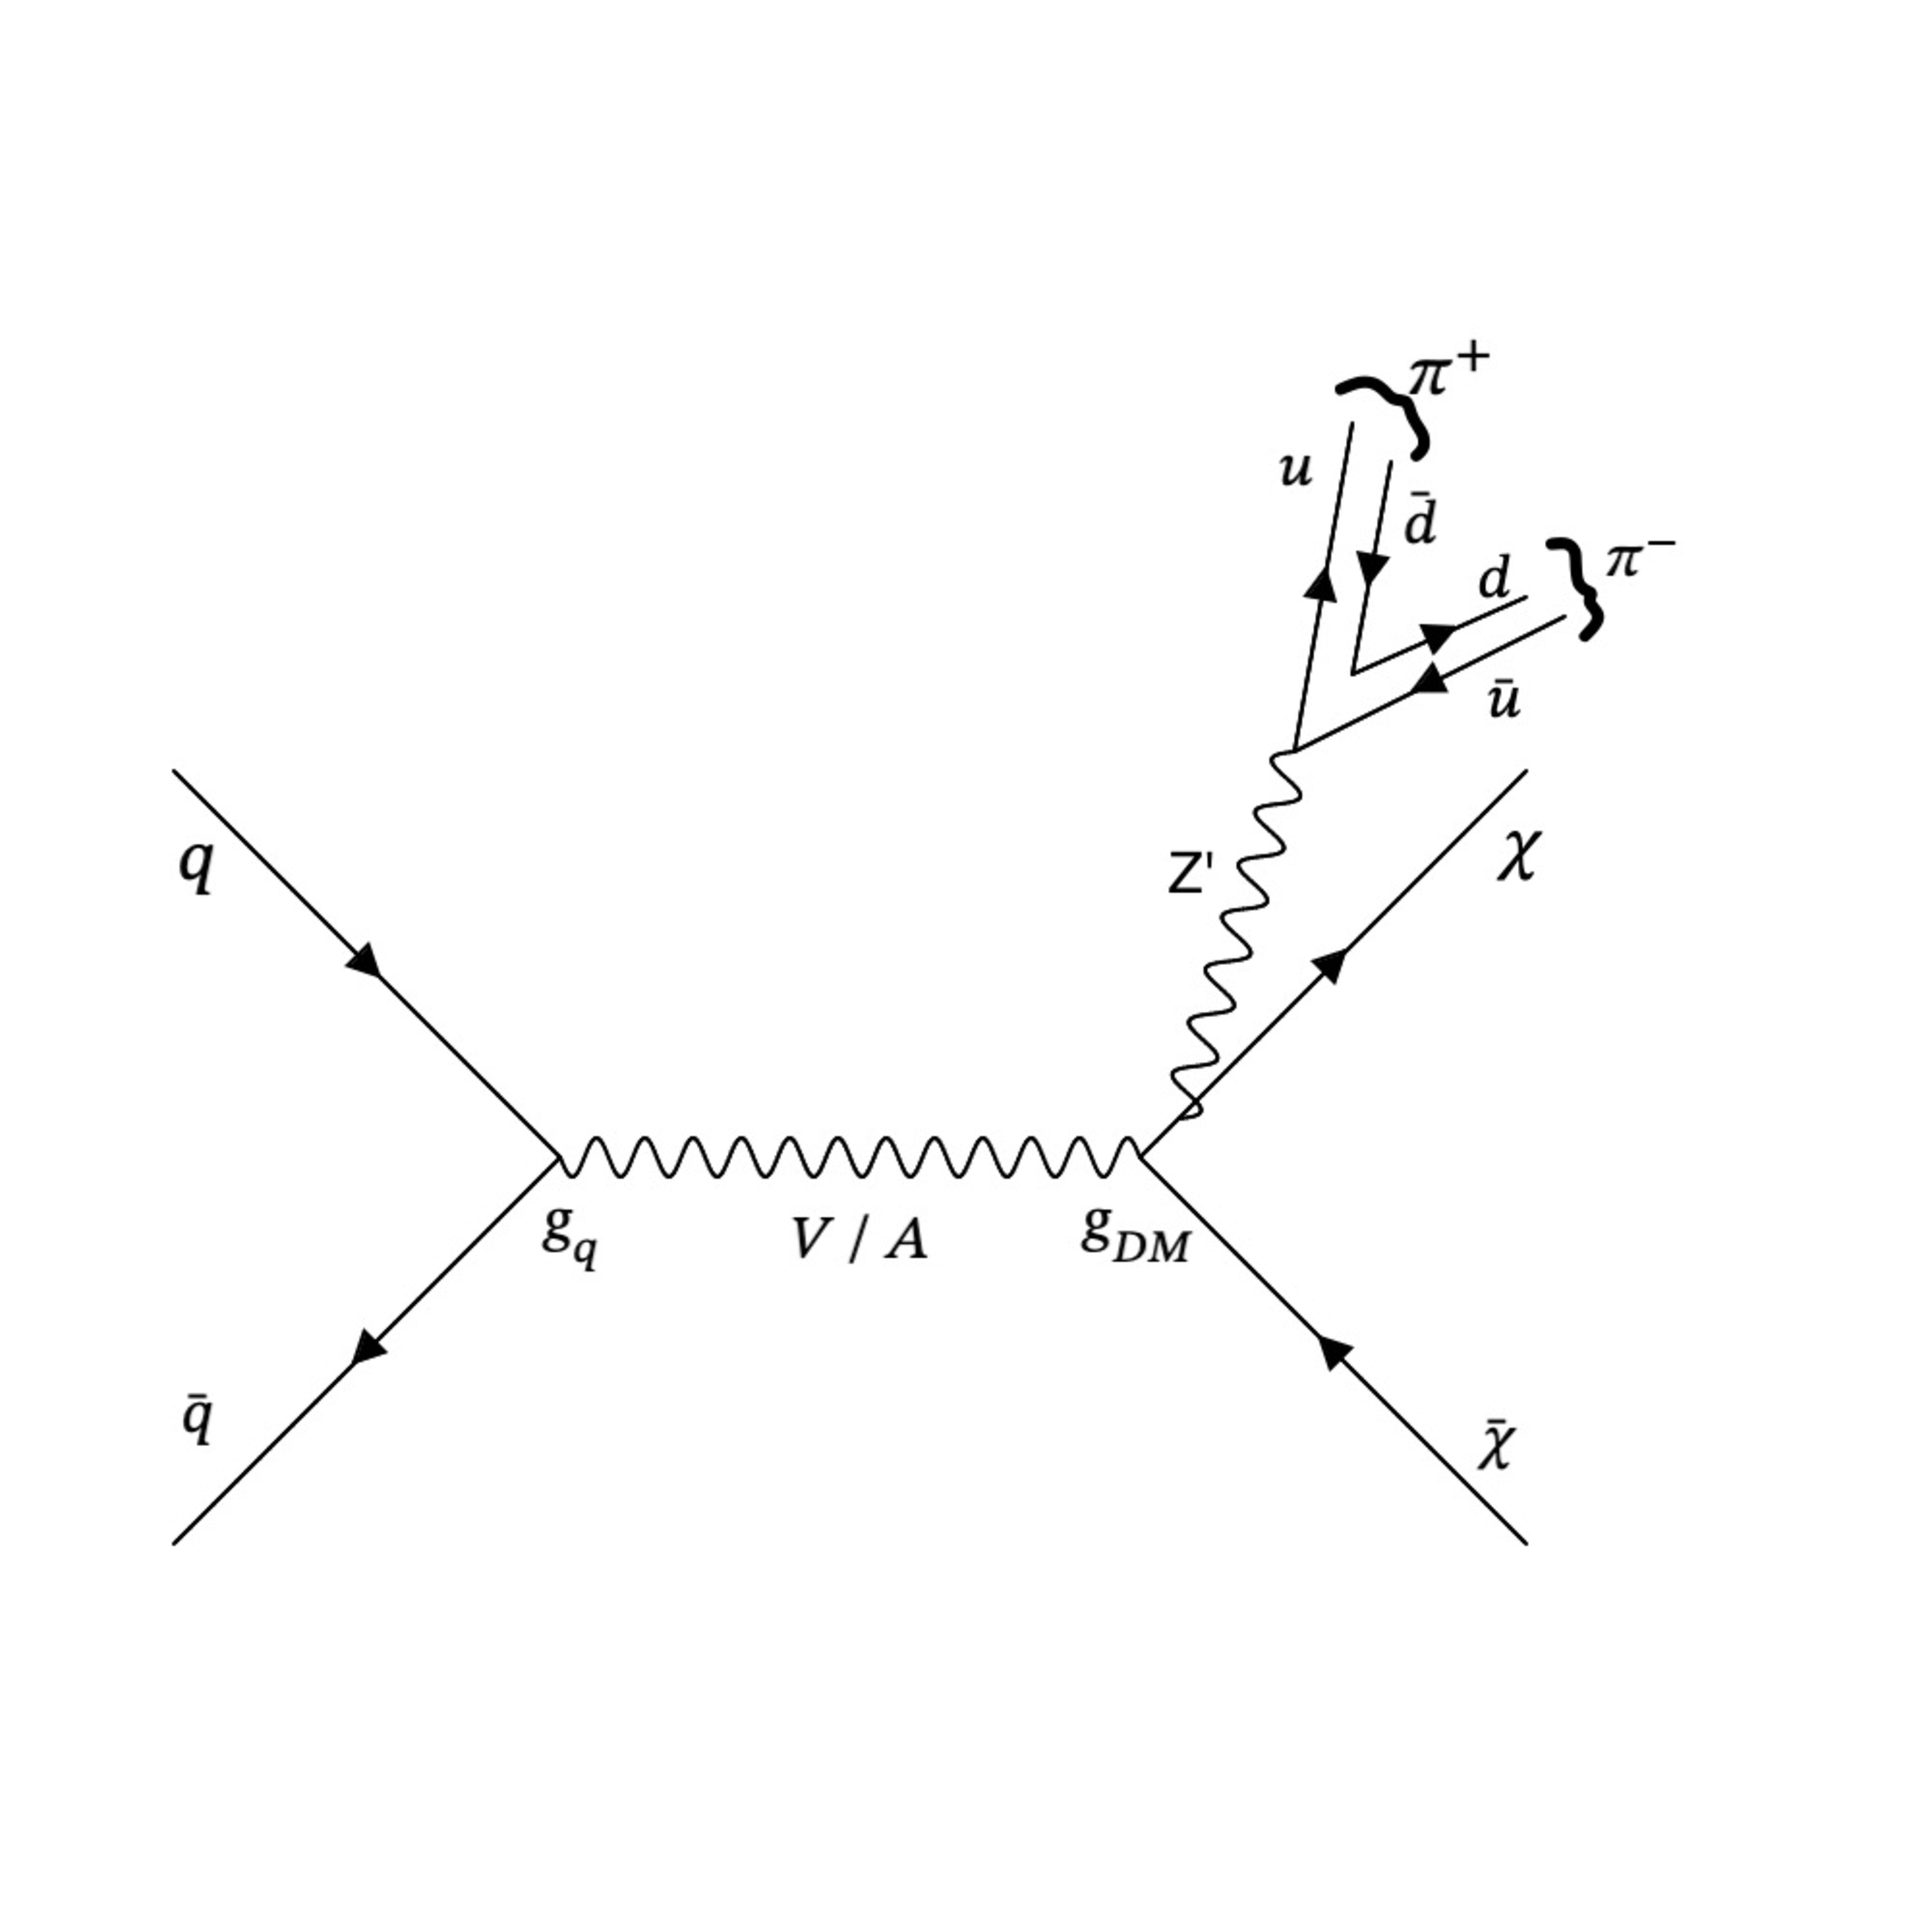
Figure 1:
Representative Leading Order Feynman Diagram of the signal process. |
png pdf |
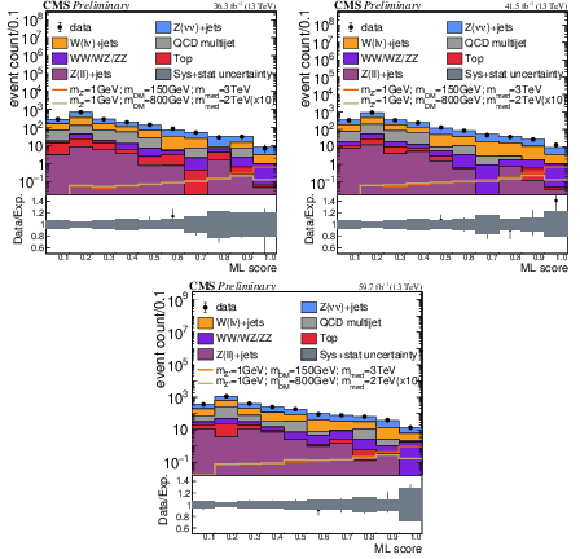
Figure 2:
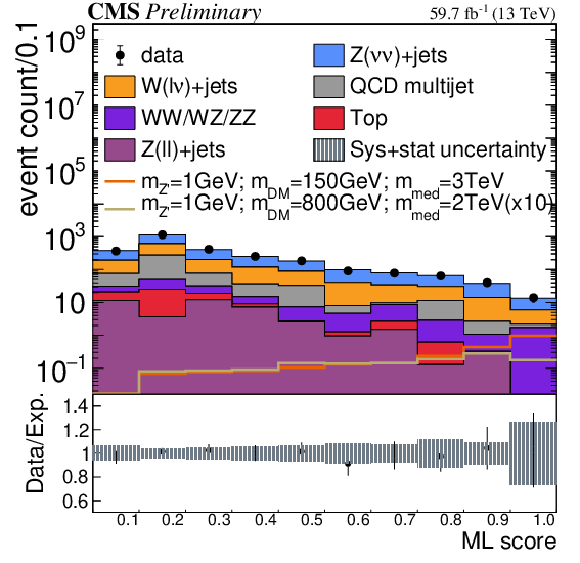
The post-fit distributions of the ML output for the 3 years of data analyzed, 2016 on the top-left, 2017 on the top-right and 2018 at the bottom. In the legend, 'Sys' stands for systematic uncertainties and 'stat' for the statistical uncertainties. The bottom panels of each plot show the ratio between data and background prediction, with the gray band representing the total (Sys+stat) postfit uncertainty. |
png pdf |
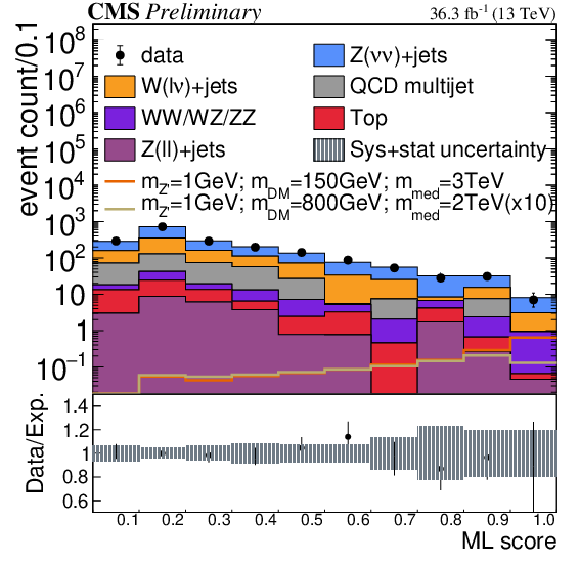
Figure 2-a:
The post-fit distributions of the ML output for the 3 years of data analyzed, 2016 on the top-left, 2017 on the top-right and 2018 at the bottom. In the legend, 'Sys' stands for systematic uncertainties and 'stat' for the statistical uncertainties. The bottom panels of each plot show the ratio between data and background prediction, with the gray band representing the total (Sys+stat) postfit uncertainty. |
png pdf |
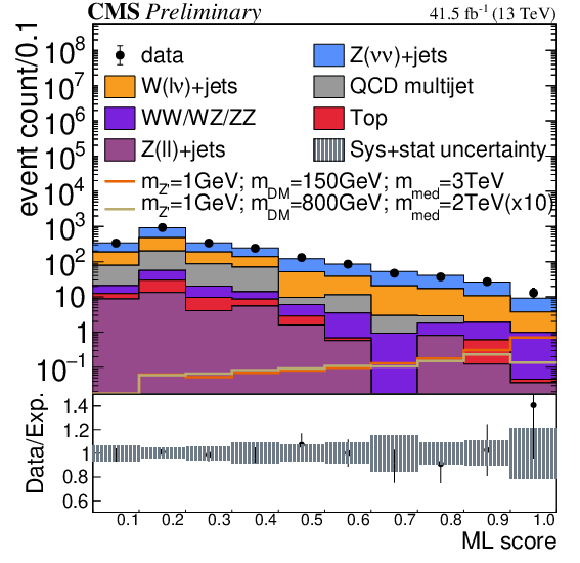
Figure 2-b:
The post-fit distributions of the ML output for the 3 years of data analyzed, 2016 on the top-left, 2017 on the top-right and 2018 at the bottom. In the legend, 'Sys' stands for systematic uncertainties and 'stat' for the statistical uncertainties. The bottom panels of each plot show the ratio between data and background prediction, with the gray band representing the total (Sys+stat) postfit uncertainty. |
png pdf |
Figure 2-c:
The post-fit distributions of the ML output for the 3 years of data analyzed, 2016 on the top-left, 2017 on the top-right and 2018 at the bottom. In the legend, 'Sys' stands for systematic uncertainties and 'stat' for the statistical uncertainties. The bottom panels of each plot show the ratio between data and background prediction, with the gray band representing the total (Sys+stat) postfit uncertainty. |
png pdf |
Figure 3:
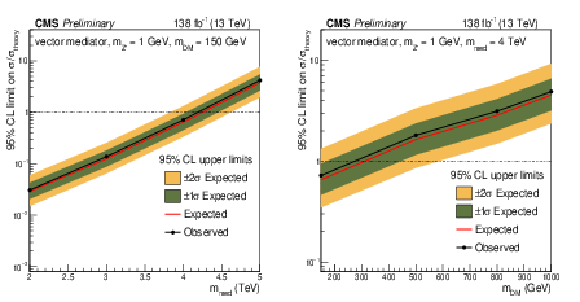
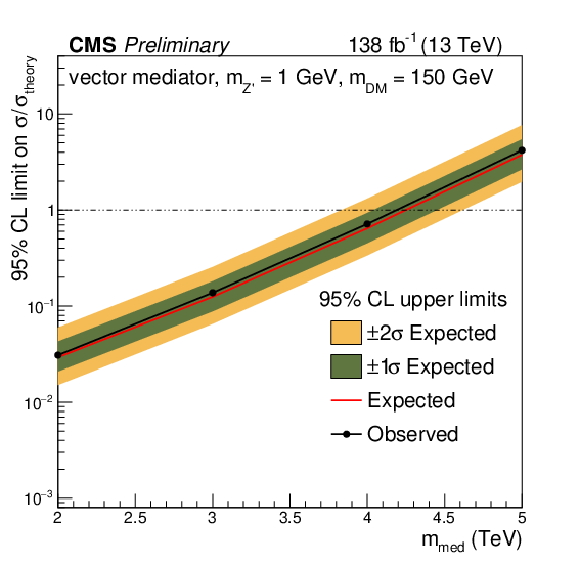
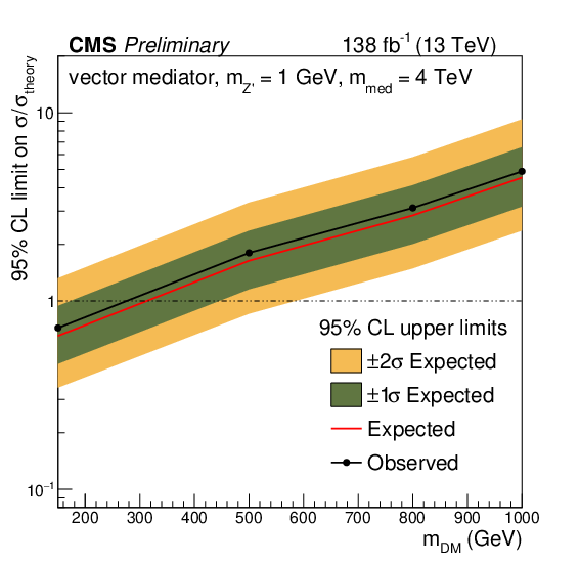
95% CL upper limits on $ \mu = \frac{\sigma}{\sigma_{theory}} $ for the vector mediator, $ m_{Z^{\prime}}= $ 1 GeV. Left plot shows upper limits for $ m_{DM}= $ 150 GeV for a range of mediator mass and right side plot shows upper limits for $ m_{med}= $ 4000 GeV for a range of DM mass. A linear interpolation is performed in between available points. The inner (green) band and the outer (yellow) band indicate the regions containing 68% and 95%, respectively, of the distribution of limits expected under the background-only hypothesis. |
png pdf |
Figure 3-a:
95% CL upper limits on $ \mu = \frac{\sigma}{\sigma_{theory}} $ for the vector mediator, $ m_{Z^{\prime}}= $ 1 GeV. Left plot shows upper limits for $ m_{DM}= $ 150 GeV for a range of mediator mass and right side plot shows upper limits for $ m_{med}= $ 4000 GeV for a range of DM mass. A linear interpolation is performed in between available points. The inner (green) band and the outer (yellow) band indicate the regions containing 68% and 95%, respectively, of the distribution of limits expected under the background-only hypothesis. |
png pdf |
Figure 3-b:
95% CL upper limits on $ \mu = \frac{\sigma}{\sigma_{theory}} $ for the vector mediator, $ m_{Z^{\prime}}= $ 1 GeV. Left plot shows upper limits for $ m_{DM}= $ 150 GeV for a range of mediator mass and right side plot shows upper limits for $ m_{med}= $ 4000 GeV for a range of DM mass. A linear interpolation is performed in between available points. The inner (green) band and the outer (yellow) band indicate the regions containing 68% and 95%, respectively, of the distribution of limits expected under the background-only hypothesis. |
png pdf |
Figure 4:
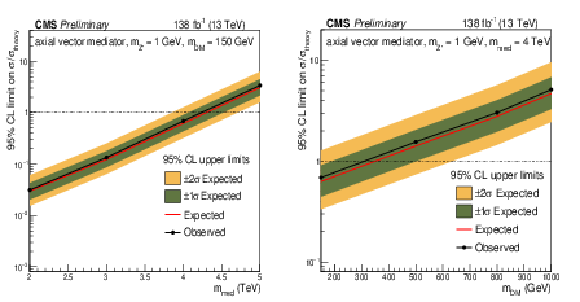
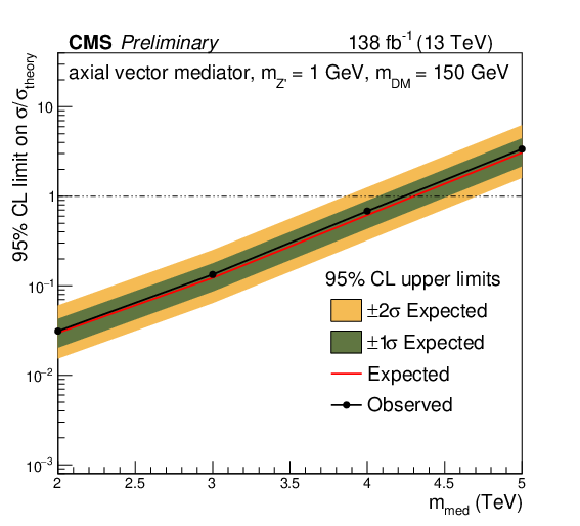
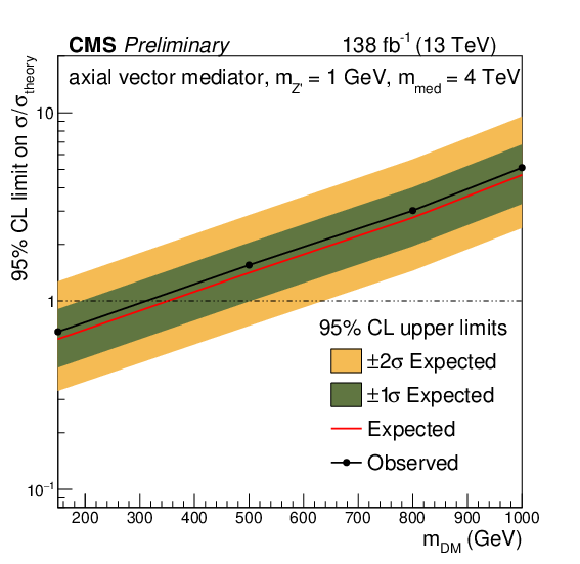
95% CL upper limits on $ \mu = \frac{\sigma}{\sigma_{theory}} $ for the axial vector mediator, $ m_{Z^{\prime}}= $ 1 GeV. Left plot shows upper limits for $ m_{DM}= $ 150 GeV for a range of mediator mass and right side plot shows upper limits for $ m_{med}= $ 4000 GeV for a range of DM mass. A linear interpolation is performed in between available points. The inner (green) band and the outer (yellow) band indicate the regions containing 68% and 95%, respectively, of the distribution of limits expected under the background-only hypothesis. |
png pdf |
Figure 4-a:
95% CL upper limits on $ \mu = \frac{\sigma}{\sigma_{theory}} $ for the axial vector mediator, $ m_{Z^{\prime}}= $ 1 GeV. Left plot shows upper limits for $ m_{DM}= $ 150 GeV for a range of mediator mass and right side plot shows upper limits for $ m_{med}= $ 4000 GeV for a range of DM mass. A linear interpolation is performed in between available points. The inner (green) band and the outer (yellow) band indicate the regions containing 68% and 95%, respectively, of the distribution of limits expected under the background-only hypothesis. |
png pdf |
Figure 4-b:
95% CL upper limits on $ \mu = \frac{\sigma}{\sigma_{theory}} $ for the axial vector mediator, $ m_{Z^{\prime}}= $ 1 GeV. Left plot shows upper limits for $ m_{DM}= $ 150 GeV for a range of mediator mass and right side plot shows upper limits for $ m_{med}= $ 4000 GeV for a range of DM mass. A linear interpolation is performed in between available points. The inner (green) band and the outer (yellow) band indicate the regions containing 68% and 95%, respectively, of the distribution of limits expected under the background-only hypothesis. |
png pdf |
Figure 5:
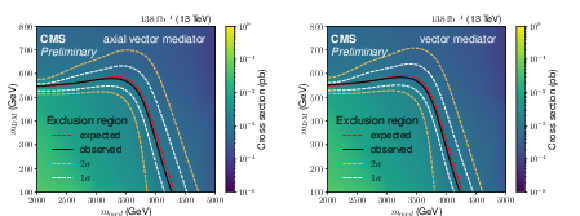
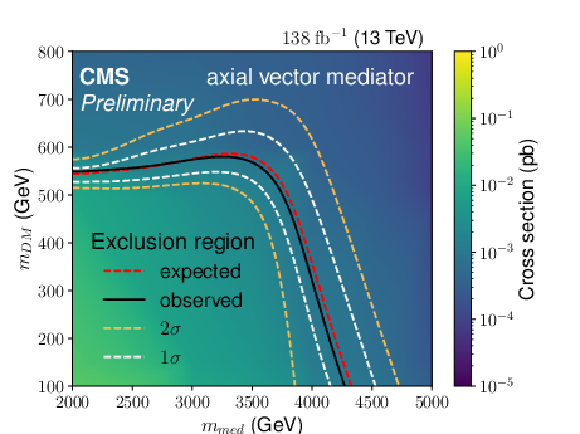
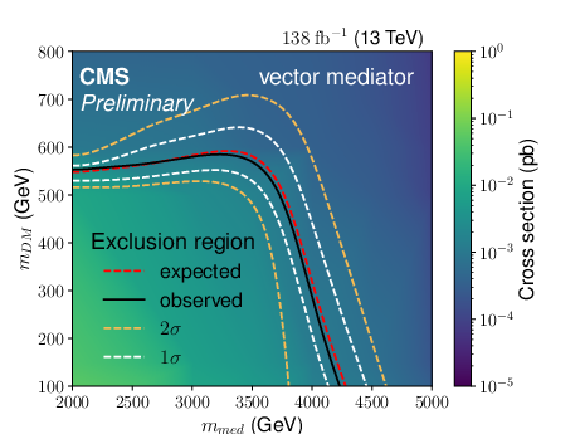
Expected and observed exclusion region in the $ m_{DM}-m_{med} $ plane for the axial vector mediator (left) and vector mediator (right), for $ m_{Z^{\prime}}= $ 1 GeV. The color scale represents the theoretical cross section of the signal process. |
png pdf |
Figure 5-a:
Expected and observed exclusion region in the $ m_{DM}-m_{med} $ plane for the axial vector mediator (left) and vector mediator (right), for $ m_{Z^{\prime}}= $ 1 GeV. The color scale represents the theoretical cross section of the signal process. |
png pdf |
Figure 5-b:
Expected and observed exclusion region in the $ m_{DM}-m_{med} $ plane for the axial vector mediator (left) and vector mediator (right), for $ m_{Z^{\prime}}= $ 1 GeV. The color scale represents the theoretical cross section of the signal process. |
| Tables | |
png pdf |
Table 1:
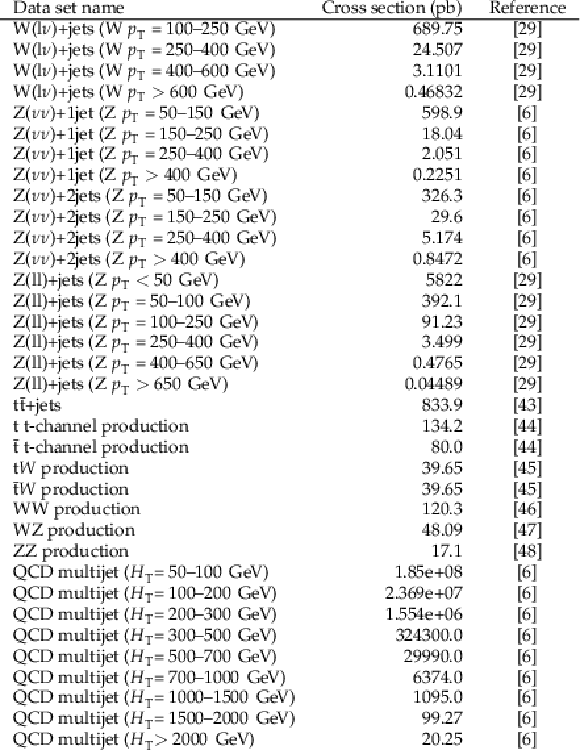
Simulated datasets for the backgrounds, their normalization cross sections along with the references. $ H_\mathrm{T} $ is the hadronic transverse momentum. |
png pdf |
Table 2:
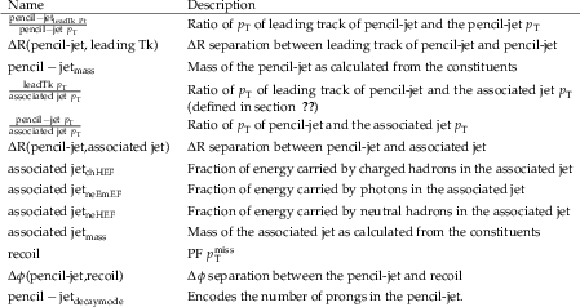
ML model input features |
png pdf |
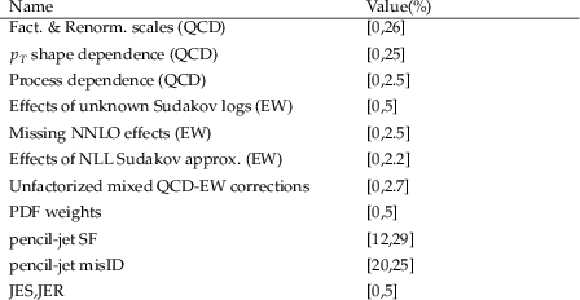
Table 3:
Major uncertainties. All these uncertainties affect the shape of the input variables. The value column represents the effect of each uncertainty as a percentage of the event yield. Most of these uncertainties are correlated amongst processes and eras, except for pencil jet scale factors and misidentification, which are decorrelated across decay modes and eras. In addition, the misidentification uncertainties are correlated across non-QCD processes. QCD (EW) next to the name implies the uncertainty is related to higher order QCD (electroweak) effects. |
| Summary |
| A novel search for DM particles is presented, using 138 fb$ ^{-1} $ of data recorded by the CMS detector in proton-proton collisions at a center-of-mass energy of 13 TeV. The final state consists of a large transverse momentum imbalance and an energetic low-multiplicity jet, marking the first time such a signal is being probed at the LHC. Supervised machine learning methods and data augmentation techniques are used to increase the sensitivity to the signal. No significant deviation from the standard model predictions is observed. Upper limits on the DM production cross section are set at the 95% confidence level, excluding mediator masses up to $ \approx $ 4250 GeV for a DM mass of $ \approx $ 100 GeV and up to $ \approx $ 3500 GeV for a DM mass of $ \approx $ 550 GeV for both the vector and axial vector mediator scenarios. |
| References | ||||
| 1 | J. L. Feng | Dark matter candidates from particle physics and methods of detection | Ann. Rev. Astron. Astrophys. 48 (2010) 495 | 1003.0904 |
| 2 | T. A. Porter, R. P. Johnson, and P. W. Graham | Dark matter searches with astroparticle data | Ann. Rev. Astron. Astrophys. 49 (2011) 155 | 1104.2836 |
| 3 | D. Clowe, A. Gonzalez, and M. Markevitch | Weak lensing mass reconstruction of the interacting cluster 1e0657-558: Direct evidence for the existence of dark matter | Astrophys. J. 604 (2004) 596 | astro-ph/0312273 |
| 4 | Planck Collaboration | Planck 2015 results. xiii. cosmological parameters | Astron. Astrophys. 594 (2016) A13 | 1502.01589 |
| 5 | Y. Bai, J. Bourbeau, and T. Lin | Dark matter searches with a mono-Z' jet | JHEP, 2015 | 1504.01395 |
| 6 | CMS Collaboration | Search for new particles in events with energetic jets and large missing transverse momentum in proton-proton collisions at $ \sqrt{s} $ = 13 TeV | JHEP 11 (2021) 153 | CMS-EXO-20-004 2107.13021 |
| 7 | CMS Collaboration | Performance of reconstruction and identification of $ \tau $ leptons decaying to hadrons and $ \nu_\tau $ in pp collisions at $ \sqrt{s}= $ 13 TeV | JINST 13 (2018) P10005 | CMS-TAU-16-003 1809.02816 |
| 8 | CMS Collaboration | Description and performance of track and primary-vertex reconstruction with the CMS tracker | JINST 9 (2014) P10009 | CMS-TRK-11-001 1405.6569 |
| 9 | CMS Collaboration | The CMS phase-1 pixel detector upgrade | JINST 16 (2021) P02027 | 2012.14304 |
| 10 | CMS Collaboration | Track impact parameter resolution for the full pseudo rapidity coverage in the 2017 dataset with the CMS phase-1 pixel detector | CMS Detector Performance Summary CMS-DP-2020-049, 2020 CDS |
|
| 11 | CMS Collaboration | 2017 tracking performance plots | CMS Detector Performance Summary CMS-DP-2017-015, 2017 CDS |
|
| 12 | CMS Collaboration | Electron and photon reconstruction and identification with the CMS experiment at the CERN LHC | JINST 16 (2021) P05014 | CMS-EGM-17-001 2012.06888 |
| 13 | CMS Collaboration | ECAL 2016 refined calibration and Run2 summary plots | CMS Detector Performance Summary CMS-DP-2020-021, 2020 CDS |
|
| 14 | CMS Collaboration | Performance of the CMS Level-1 trigger in proton-proton collisions at $ \sqrt{s} = $ 13\,TeV | JINST 15 (2020) P10017 | CMS-TRG-17-001 2006.10165 |
| 15 | CMS Collaboration | The CMS trigger system | JINST 12 (2017) P01020 | CMS-TRG-12-001 1609.02366 |
| 16 | CMS Collaboration | Performance of the CMS high-level trigger during LHC Run 2 | JINST 19 (2024) P11021 | CMS-TRG-19-001 2410.17038 |
| 17 | CMS Collaboration | The CMS experiment at the CERN LHC | JINST 3 (2008) S08004 | |
| 18 | M. Cacciari, G. P. Salam, and G. Soyez | The anti-$ k_t $ jet clustering algorithm | JHEP 04 (2008) 063 | 0802.1189 |
| 19 | M. Cacciari, G. P. Salam, and G. Soyez | FastJet user manual | EPJC 72 (2012) 1896 | 1111.6097 |
| 20 | CMS Collaboration | Particle-flow reconstruction and global event description with the CMS detector | JINST 12 (2017) P10003 | CMS-PRF-14-001 1706.04965 |
| 21 | CMS Collaboration | Jet energy scale and resolution in the CMS experiment in pp collisions at 8 TeV | JINST 12 (2017) P02014 | CMS-JME-13-004 1607.03663 |
| 22 | CMS Collaboration | Jet algorithms performance in 13 TeV data | CMS Physics Analysis Summary, 2017 CMS-PAS-JME-16-003 |
CMS-PAS-JME-16-003 |
| 23 | CMS Collaboration | Identification of hadronic tau lepton decays using a deep neural network | JINST 17 (2022) P07023 | CMS-TAU-20-001 2201.08458 |
| 24 | CMS Collaboration | Electron and photon reconstruction and identification with the CMS experiment at the cern lhc | JINST 16 (2021) P05014 | CMS-EGM-17-001 2012.06888 |
| 25 | CMS Collaboration | Performance of the CMS muon detector and muon reconstruction with proton-proton collisions at $ \sqrt{s}= $ 13 tev | JINST 13 (2018) P06015 | CMS-MUO-16-001 1804.04528 |
| 26 | CMS Collaboration | Identification of heavy-flavour jets with the CMS detector in pp collisions at 13 tev | JINST 13 (2018) P05011 | CMS-BTV-16-002 1712.07158 |
| 27 | CMS Collaboration | Performance of missing transverse momentum reconstruction in proton-proton collisions at $ \sqrt{s} = $ 13\,TeV using the CMS detector | JINST 14 (2019) P07004 | CMS-JME-17-001 1903.06078 |
| 28 | D. Abercrombie et al. | Dark matter benchmark models for early LHC run-2 searches: Report of the ATLAS/CMS dark matter forum | Phys. Dark Univ. 27 (2020) 100371 | 1507.00966 |
| 29 | J. Alwall et al. | The automated computation of tree-level and next-to-leading order differential cross sections, and their matching to parton shower simulations | JHEP 07 (2014) 079 | 1405.0301 |
| 30 | S. Frixione, P. Nason, and C. Oleari | Matching NLO QCD computations with parton shower simulations: the POWHEG method | JHEP, 2007 | 0709.2092 |
| 31 | P. Nason | A New method for combining NLO QCD with shower Monte Carlo algorithms | JHEP 11 (2004) 040 | hep-ph/0409146 |
| 32 | S. Alioli, P. Nason, C. Oleari, and E. Re | A general framework for implementing NLO calculations in shower monte carlo programs: the POWHEG BOX | JHEP, 2010 | |
| 33 | S. Alioli et al. | Jet pair production in POWHEG | JHEP, 2011 | |
| 34 | T. Sjöstrand et al. | An introduction to PYTHIA 8.2 | Computer Physics Communications, 2015 | 1410.3012 |
| 35 | CMS Collaboration | Extraction and validation of a new set of CMS PYTHIA8 tunes from underlying-event measurements | JINST, 2019 | CMS-GEN-17-001 1903.12179 |
| 36 | M. L. Mangano, M. Moretti, F. Piccinini, and M. Treccani | Matching matrix elements and shower evolution for top-quark production in hadronic collisions | JHEP 01 (2007) 013 | hep-ph/0611129 |
| 37 | R. Frederix and S. Frixione | Merging meets matching in MC@NLO | JHEP 12 (2012) 061 | 1209.6215 |
| 38 | NNPDF Collaboration | Parton distributions from high-precision collider data | EPJC, 2017 | 1706.00428 |
| 39 | GEANT4 Collaboration | GEANT4: A Simulation toolkit | NIM A 506 (2003) 250 | |
| 40 | CMS Collaboration | Precision luminosity measurement in proton-proton collisions at $ \sqrt{s} = $ 13 TeV in 2015 and 2016 at CMS | EPJC 81 (2021) 800 | CMS-LUM-17-003 2104.01927 |
| 41 | CMS Collaboration | CMS luminosity measurement for the 2017 data-taking period at $ \sqrt{s} = $ 13 TeV | CMS Physics Analysis Summary, 2018 CMS-PAS-LUM-17-004 |
CMS-PAS-LUM-17-004 |
| 42 | CMS Collaboration | CMS luminosity measurement for the 2018 data-taking period at $ \sqrt{s} = $ 13 TeV | CMS Physics Analysis Summary, 2019 CMS-PAS-LUM-18-002 |
CMS-PAS-LUM-18-002 |
| 43 | M. Czakon and A. Mitov | Top++: A Program for the Calculation of the Top-Pair Cross-Section at Hadron Colliders | Comput. Phys. Commun. 185 (2014) 2930 | 1112.5675 |
| 44 | J. Campbell, T. Neumann, and Z. Sullivan | Single-top-quark production in the $ t $-channel at NNLO | JHEP 02 (2021) 040 | 2012.01574 |
| 45 | N. Kidonakis and N. Yamanaka | Higher-order corrections for $ tW $ production at high-energy hadron colliders | JHEP 05 (2021) 278 | 2102.11300 |
| 46 | CMS Collaboration | Measurement of the WW cross section pp collisions at $ \sqrt{s}= $13 TeV | CMS Physics Analysis Summary, 2016 | CMS-PAS-SMP-16-006 |
| 47 | CMS Collaboration | Measurements of the pp → WZ inclusive and differential production cross sections and constraints on charged anomalous triple gauge couplings at $ \sqrt{s} $ = 13 tev | JHEP, 2019 | CMS-SMP-18-002 1901.03428 |
| 48 | CMS Collaboration | Measurements of $ {\mathrm{p} } {\mathrm{p}} \rightarrow {\mathrm{Z}} {\mathrm{Z}} $ production cross sections and constraints on anomalous triple gauge couplings at $ \sqrt{s} = 13\,\text {TeV} $ | EPJC, 2021 | CMS-SMP-19-001 2009.01186 |
| 49 | M. Abadi et al. | TensorFlow: Large-scale machine learning on heterogeneous systems | link | |
| 50 | T. Chen and C. Guestrin | XGBoost: A scalable tree boosting system | link | |
| 51 | CMS Collaboration | Performance of the CMS electromagnetic calorimeter in pp collisions at $ \sqrt{s} = $ 13 tev | JINST, 2024 | CMS-EGM-18-002 2403.15518 |
| 52 | J. M. Lindert et al. | Precise predictions for $ V+ $ jets dark matter backgrounds | 1705.04664 | |
| 53 | PDF4LHC Working Group Collaboration | The PDF4LHC21 combination of global PDF fits for the LHC Run III | JPG 49 (2022) 080501 | 2203.05506 |
| 54 | R. Barlow | Event classification using weighting methods | Journal of Computational Physics, 1987 | |
| 55 | A. Hayrapetyan et al. | The CMS statistical analysis and combination tool: COMBINE | Computing and Software for Big Science, 2024 | 2404.06614 |
| 56 | A. L. Read | Presentation of search results: The CL$ _{\text{s}} $ technique | JPG 28 (2002) 2693 | |
| 57 | T. Junk | Confidence level computation for combining searches with small statistics | NIM A 434 (1999) 435 | hep-ex/9902006 |
| 58 | G. Cowan, K. Cranmer, E. Gross, and O. Vitells | Asymptotic formulae for likelihood-based tests of new physics | EPJC 71 (2011) 1554 | 1007.1727 |

|
Compact Muon Solenoid LHC, CERN |

|

|

|

|

|

|