

Compact Muon Solenoid
LHC, CERN
| CMS-PAS-HIG-25-010 | ||
| Search for the rare Higgs boson decay $ \mathrm{H}\to\mathrm{Z}\gamma $ in proton-proton collisions at $ \sqrt{s}= $ 13 and 13.6 TeV | ||
| CMS Collaboration | ||
| 2026-04-07 | ||
| Abstract: A search is presented for the rare Higgs boson decay $ \mathrm{H}\to\mathrm{Z}\gamma $, where $ \mathrm{Z}\to \ell^{+}\ell^{-} $ and $ \ell^{\pm} = \mathrm{e}^{\pm} $ or $ \mu^{\pm} $. The search is performed using a sample of proton-proton (pp) collision data at the center-of-mass energies of 13 and 13.6 TeV, recorded by the CMS experiment at the LHC and corresponding to a total integrated luminosity of 200 $ \mathrm{fb}^{-1} $. The analysis design separately considers and optimizes sensitivity to Higgs boson production via gluon-gluon fusion, vector-boson fusion, and associated-production processes. The signal is extracted from a combined fit to the invariant mass distributions of the $ \ell^+\ell^-\gamma $ system in the various production channels and event categories. The observed (expected) signal strength $ \mu $, defined as the ratio of the measured value of $ \sigma(\mathrm{p}\mathrm{p}\to\mathrm{H})B(\mathrm{H}\to\mathrm{Z}\gamma) $ to the corresponding value predicted in the standard model, is found to be $ \mu = $ 1.10 $ ^{+0.52}_{-0.61} $ (1.00 $^{+0.49}_{-0.46}$) for a Higgs boson mass of $ m_{\mathrm{H}} = $ 125.38 GeV. The signal has an observed (expected) significance of 1.9 (2.3) standard deviations. | ||
| Links: CDS record (PDF) ; Physics Briefing ; CADI line (restricted) ; | ||
| Figures & Tables | Summary | Additional Figures | References | CMS Publications |
|---|
| Figures | |
png pdf |
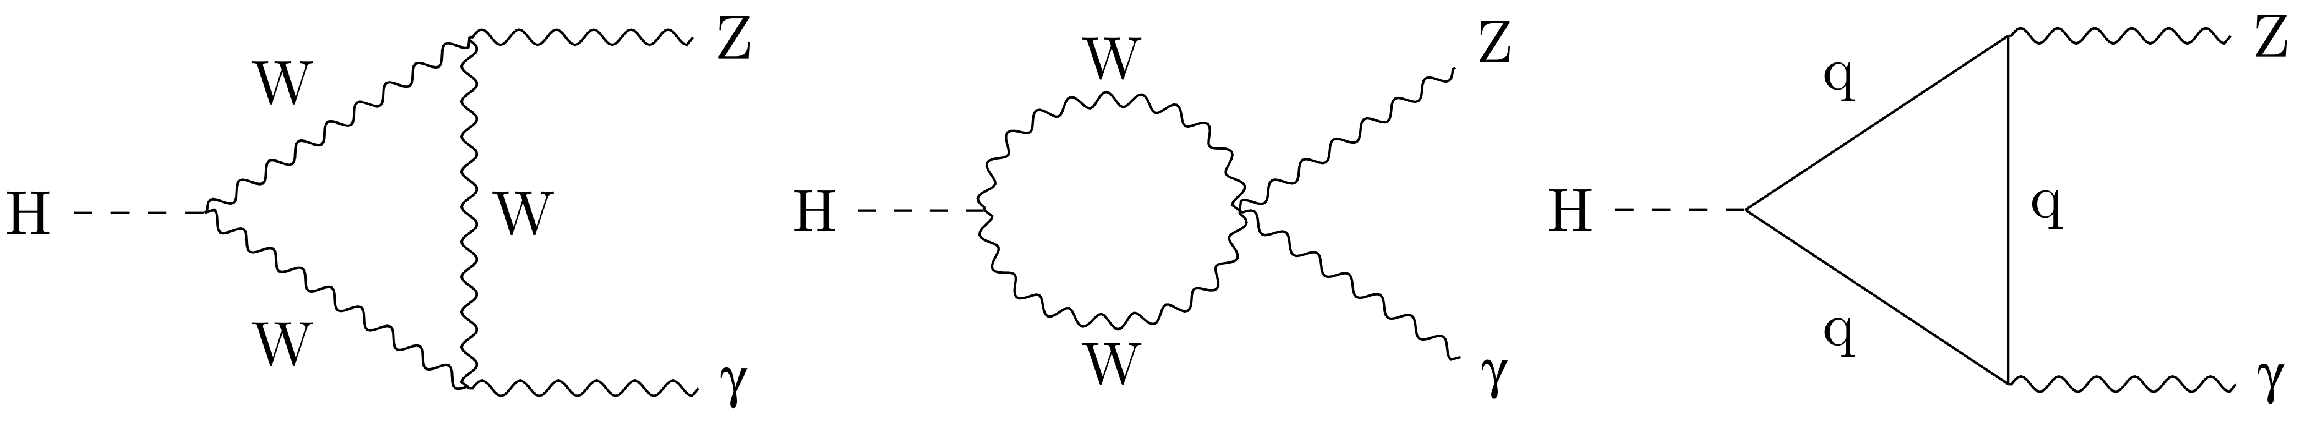
Figure 1:
Feynman diagrams for $ \mathrm{H} \to \mathrm{Z} \gamma $ in the SM. In these loop-induced processes, the amplitudes associated with W bosons in the intermediate state dominate over those with quarks. |
png pdf |
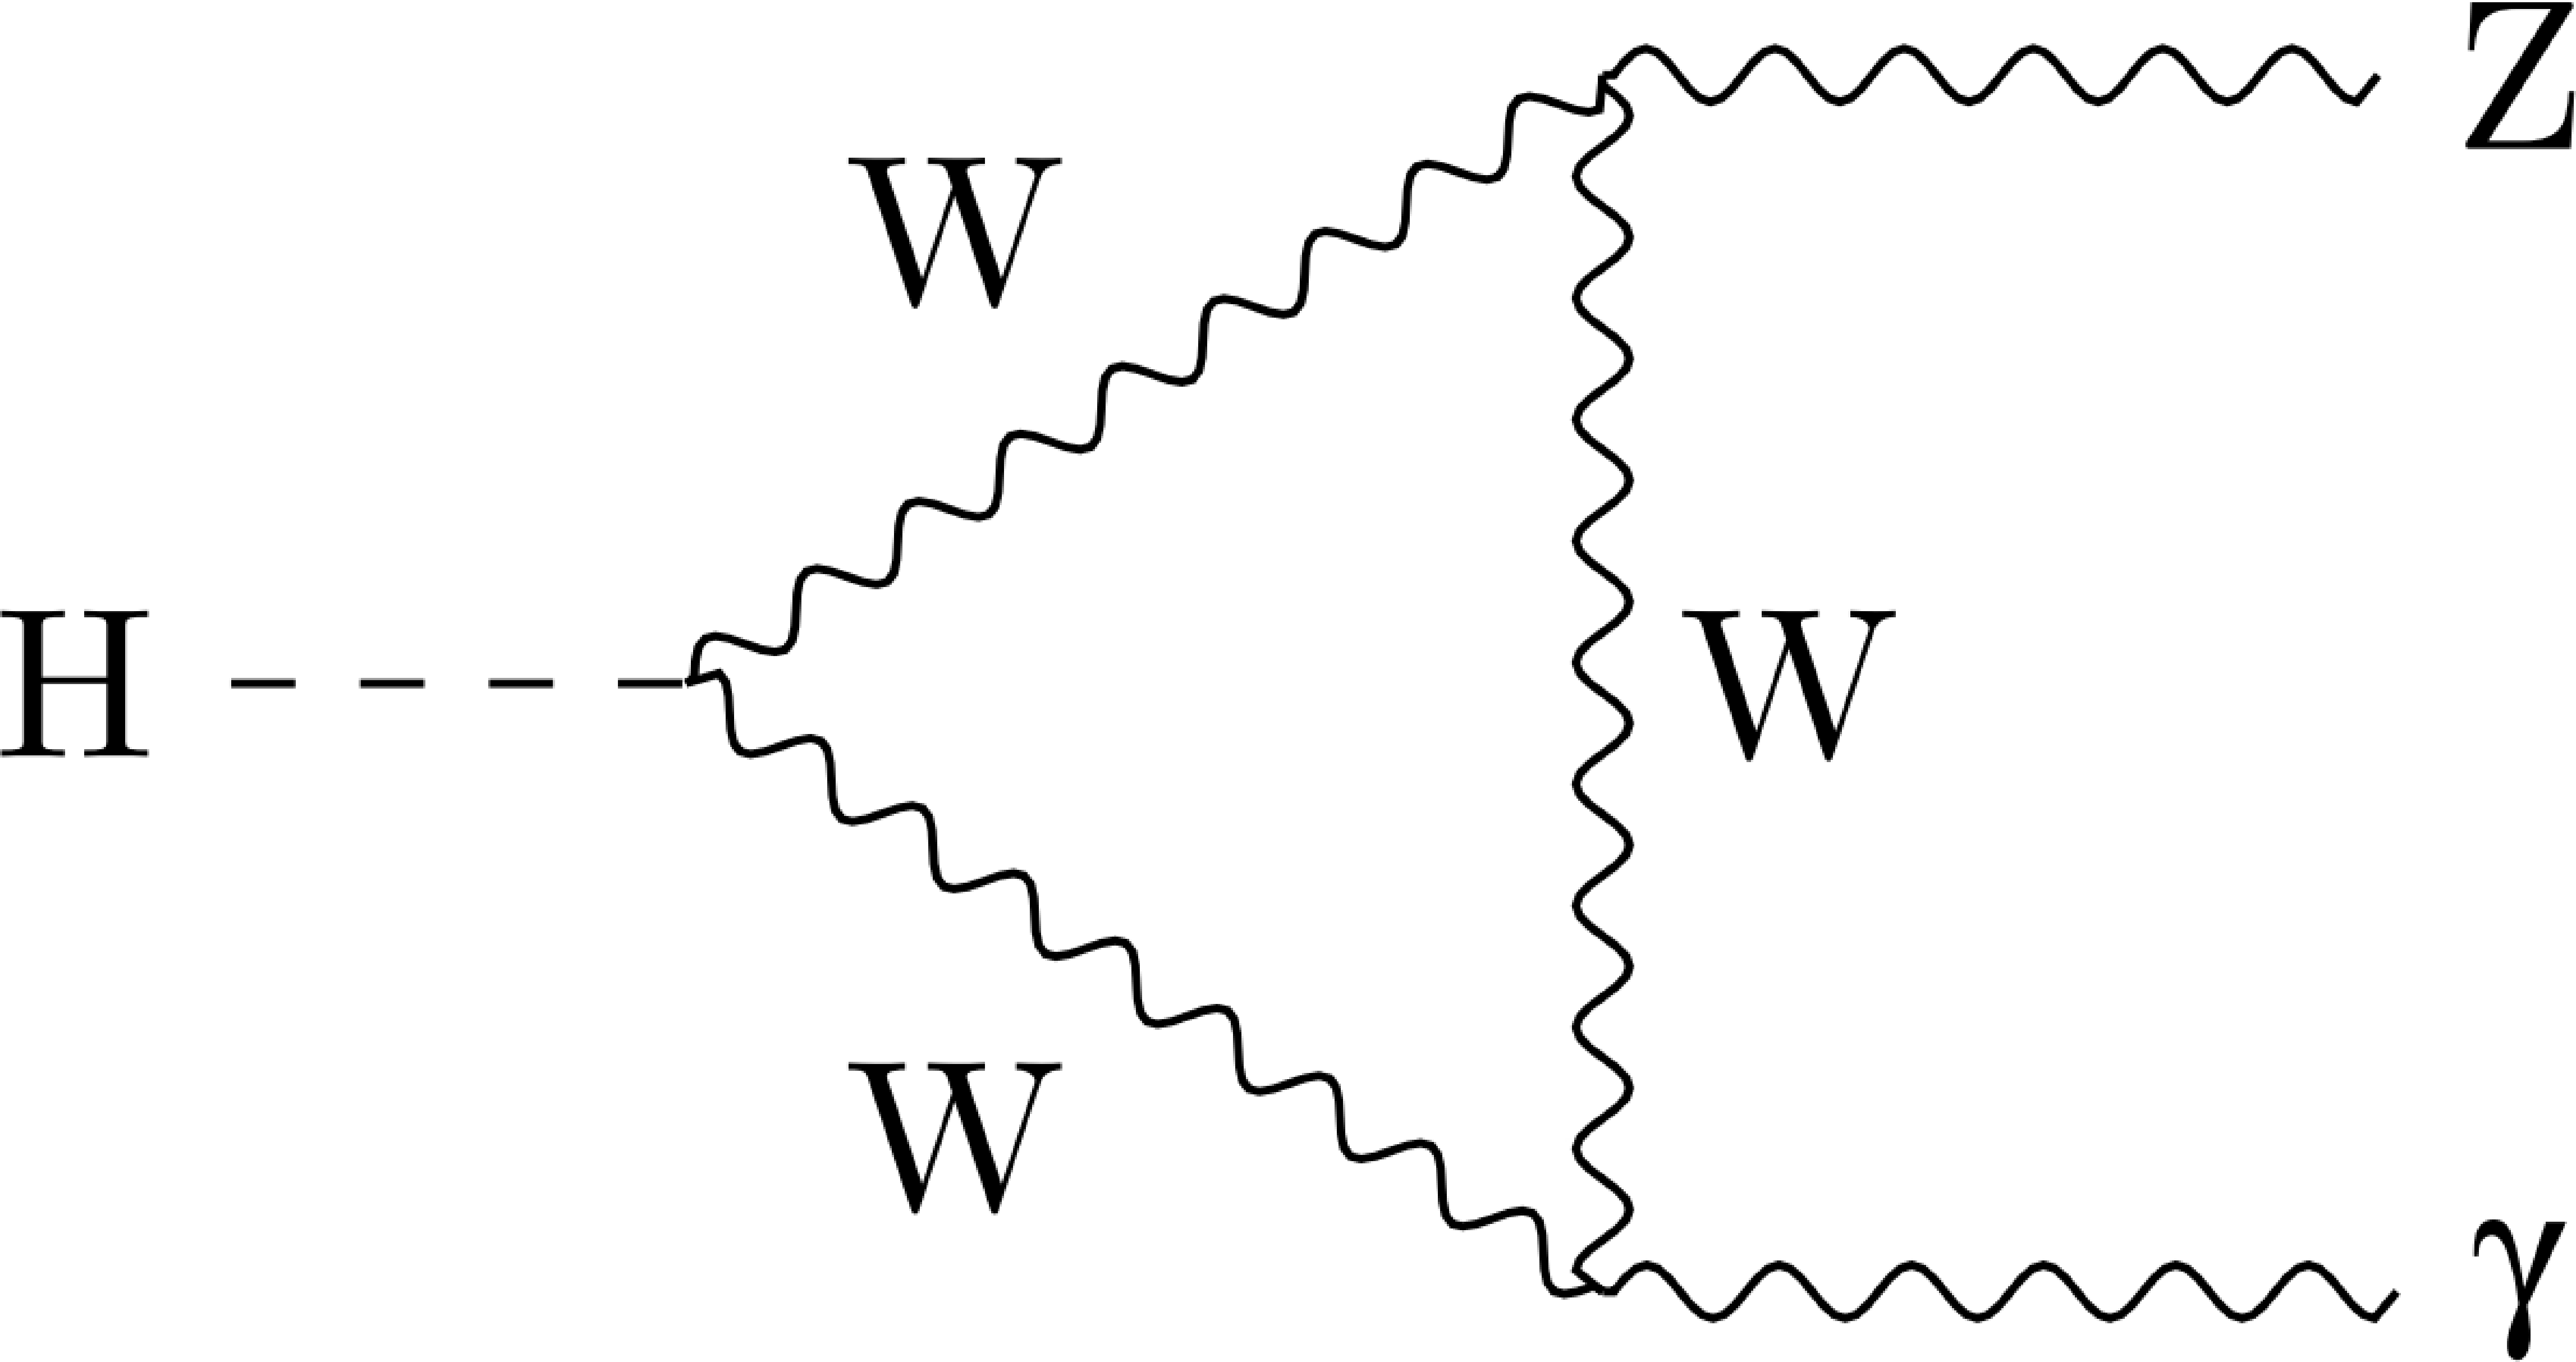
Figure 1-a:
Feynman diagrams for $ \mathrm{H} \to \mathrm{Z} \gamma $ in the SM. In these loop-induced processes, the amplitudes associated with W bosons in the intermediate state dominate over those with quarks. |
png pdf |
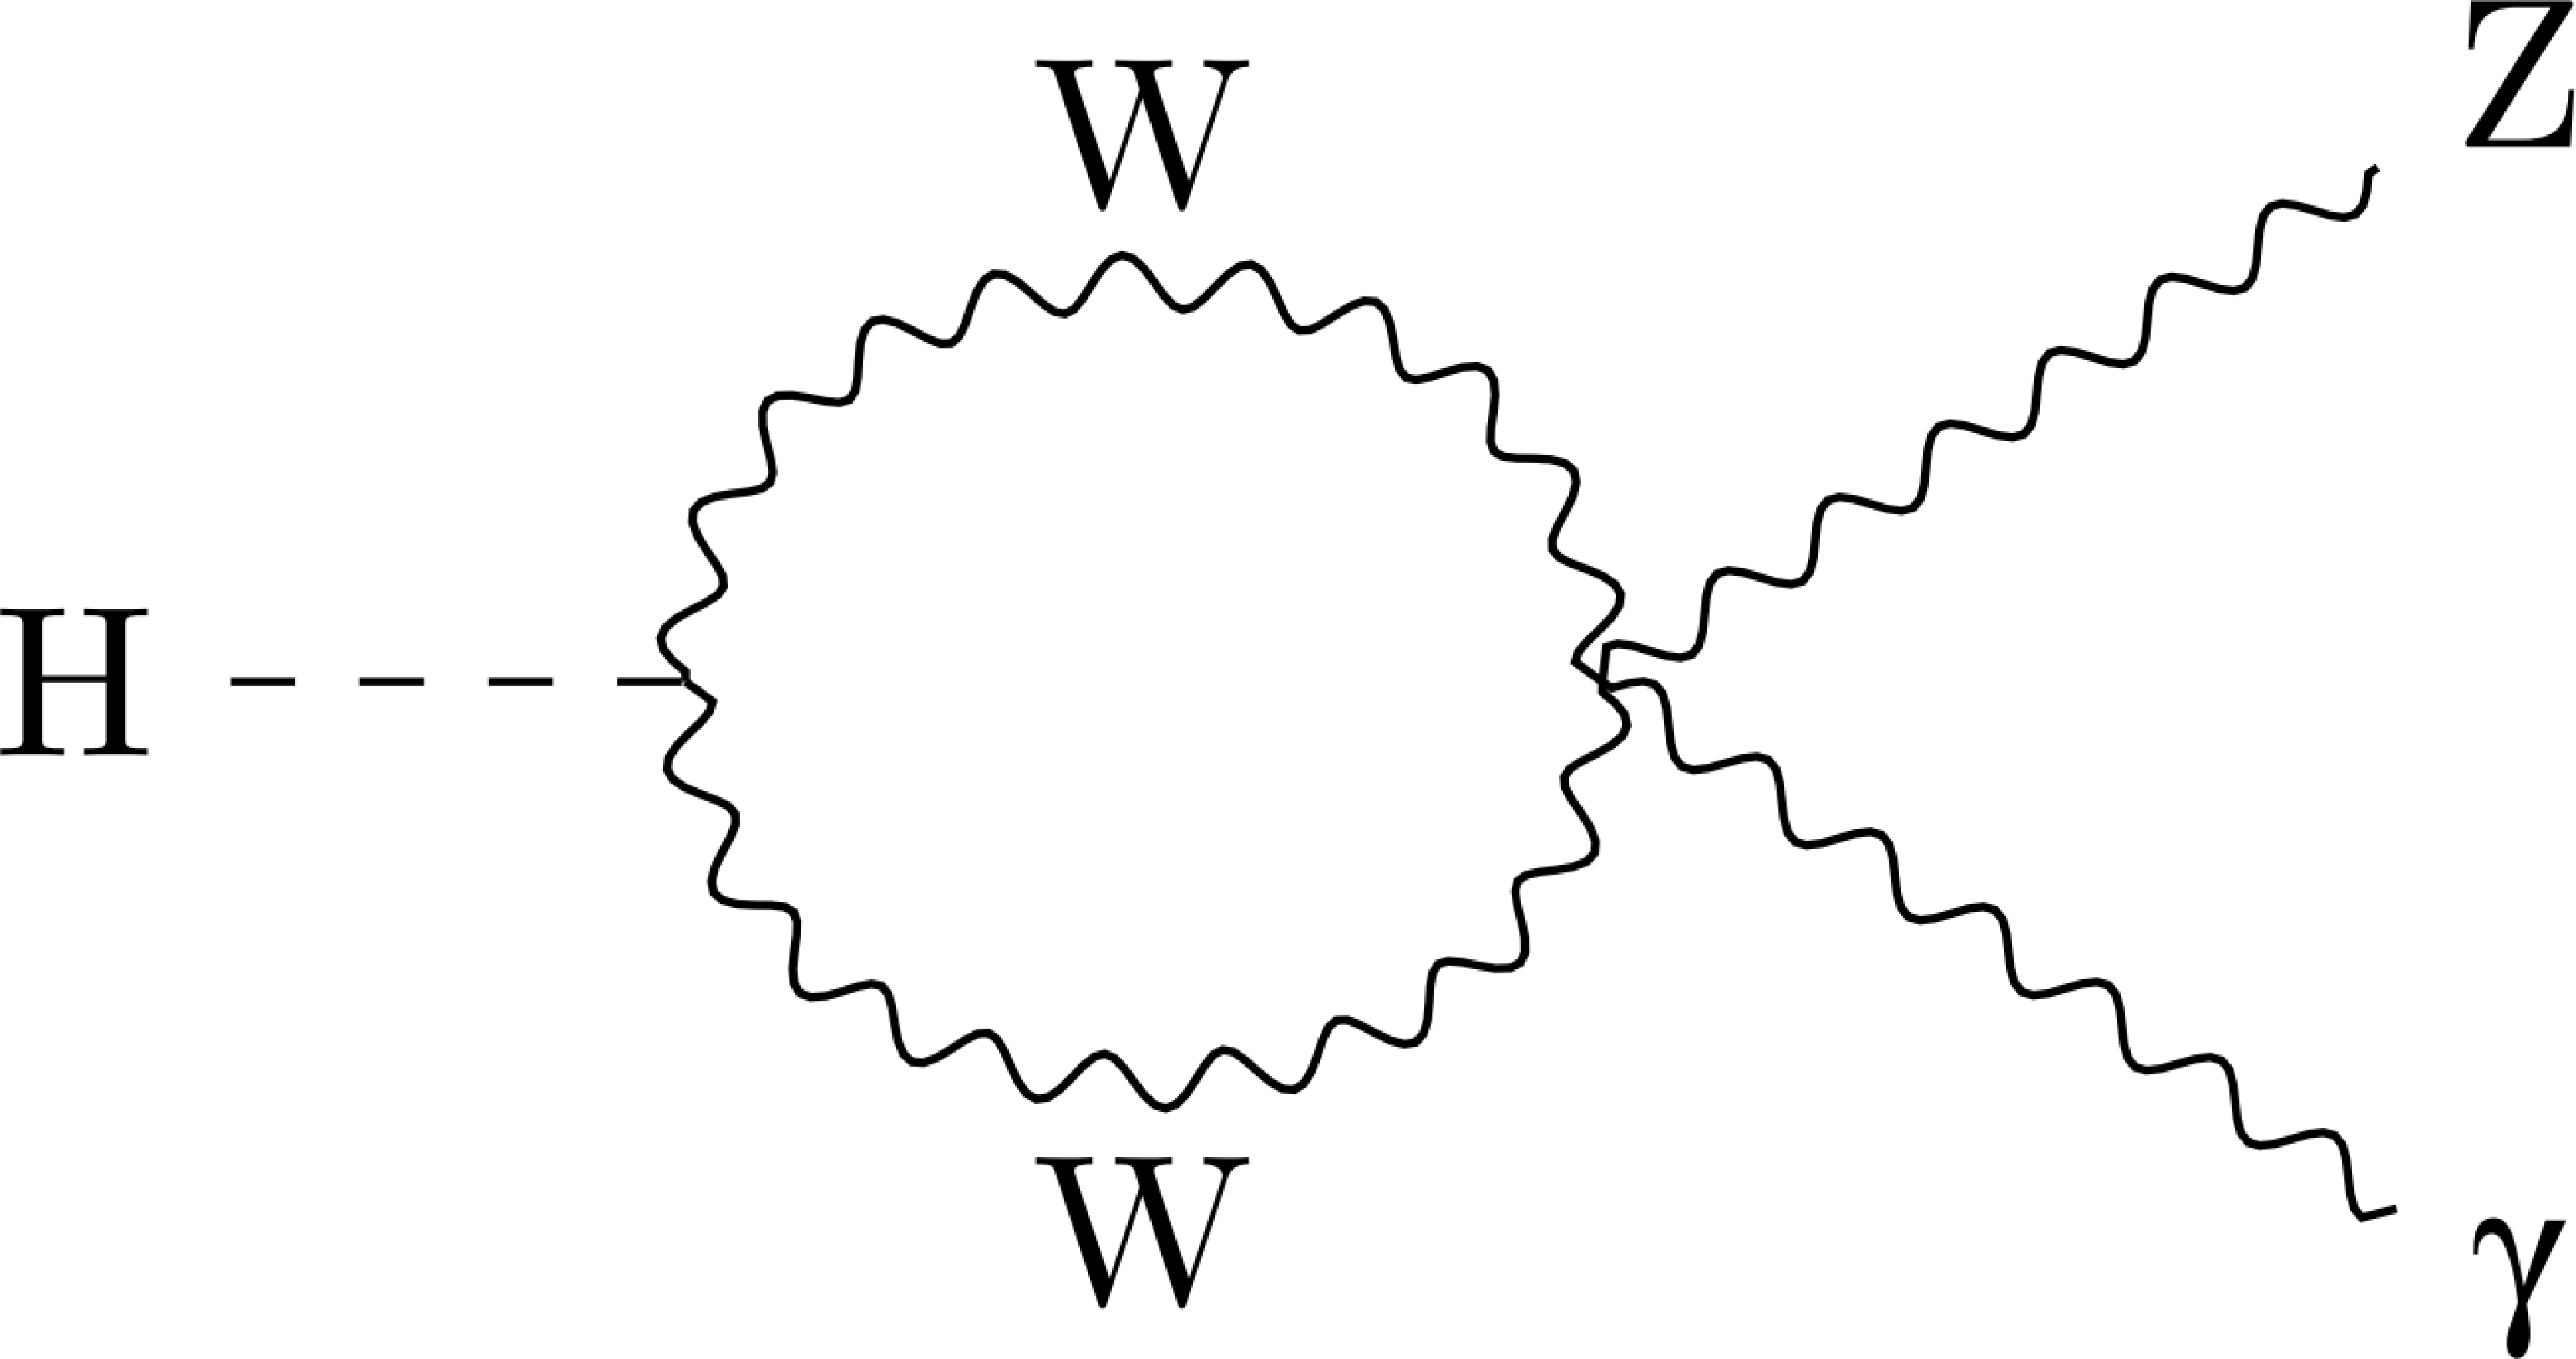
Figure 1-b:
Feynman diagrams for $ \mathrm{H} \to \mathrm{Z} \gamma $ in the SM. In these loop-induced processes, the amplitudes associated with W bosons in the intermediate state dominate over those with quarks. |
png pdf |
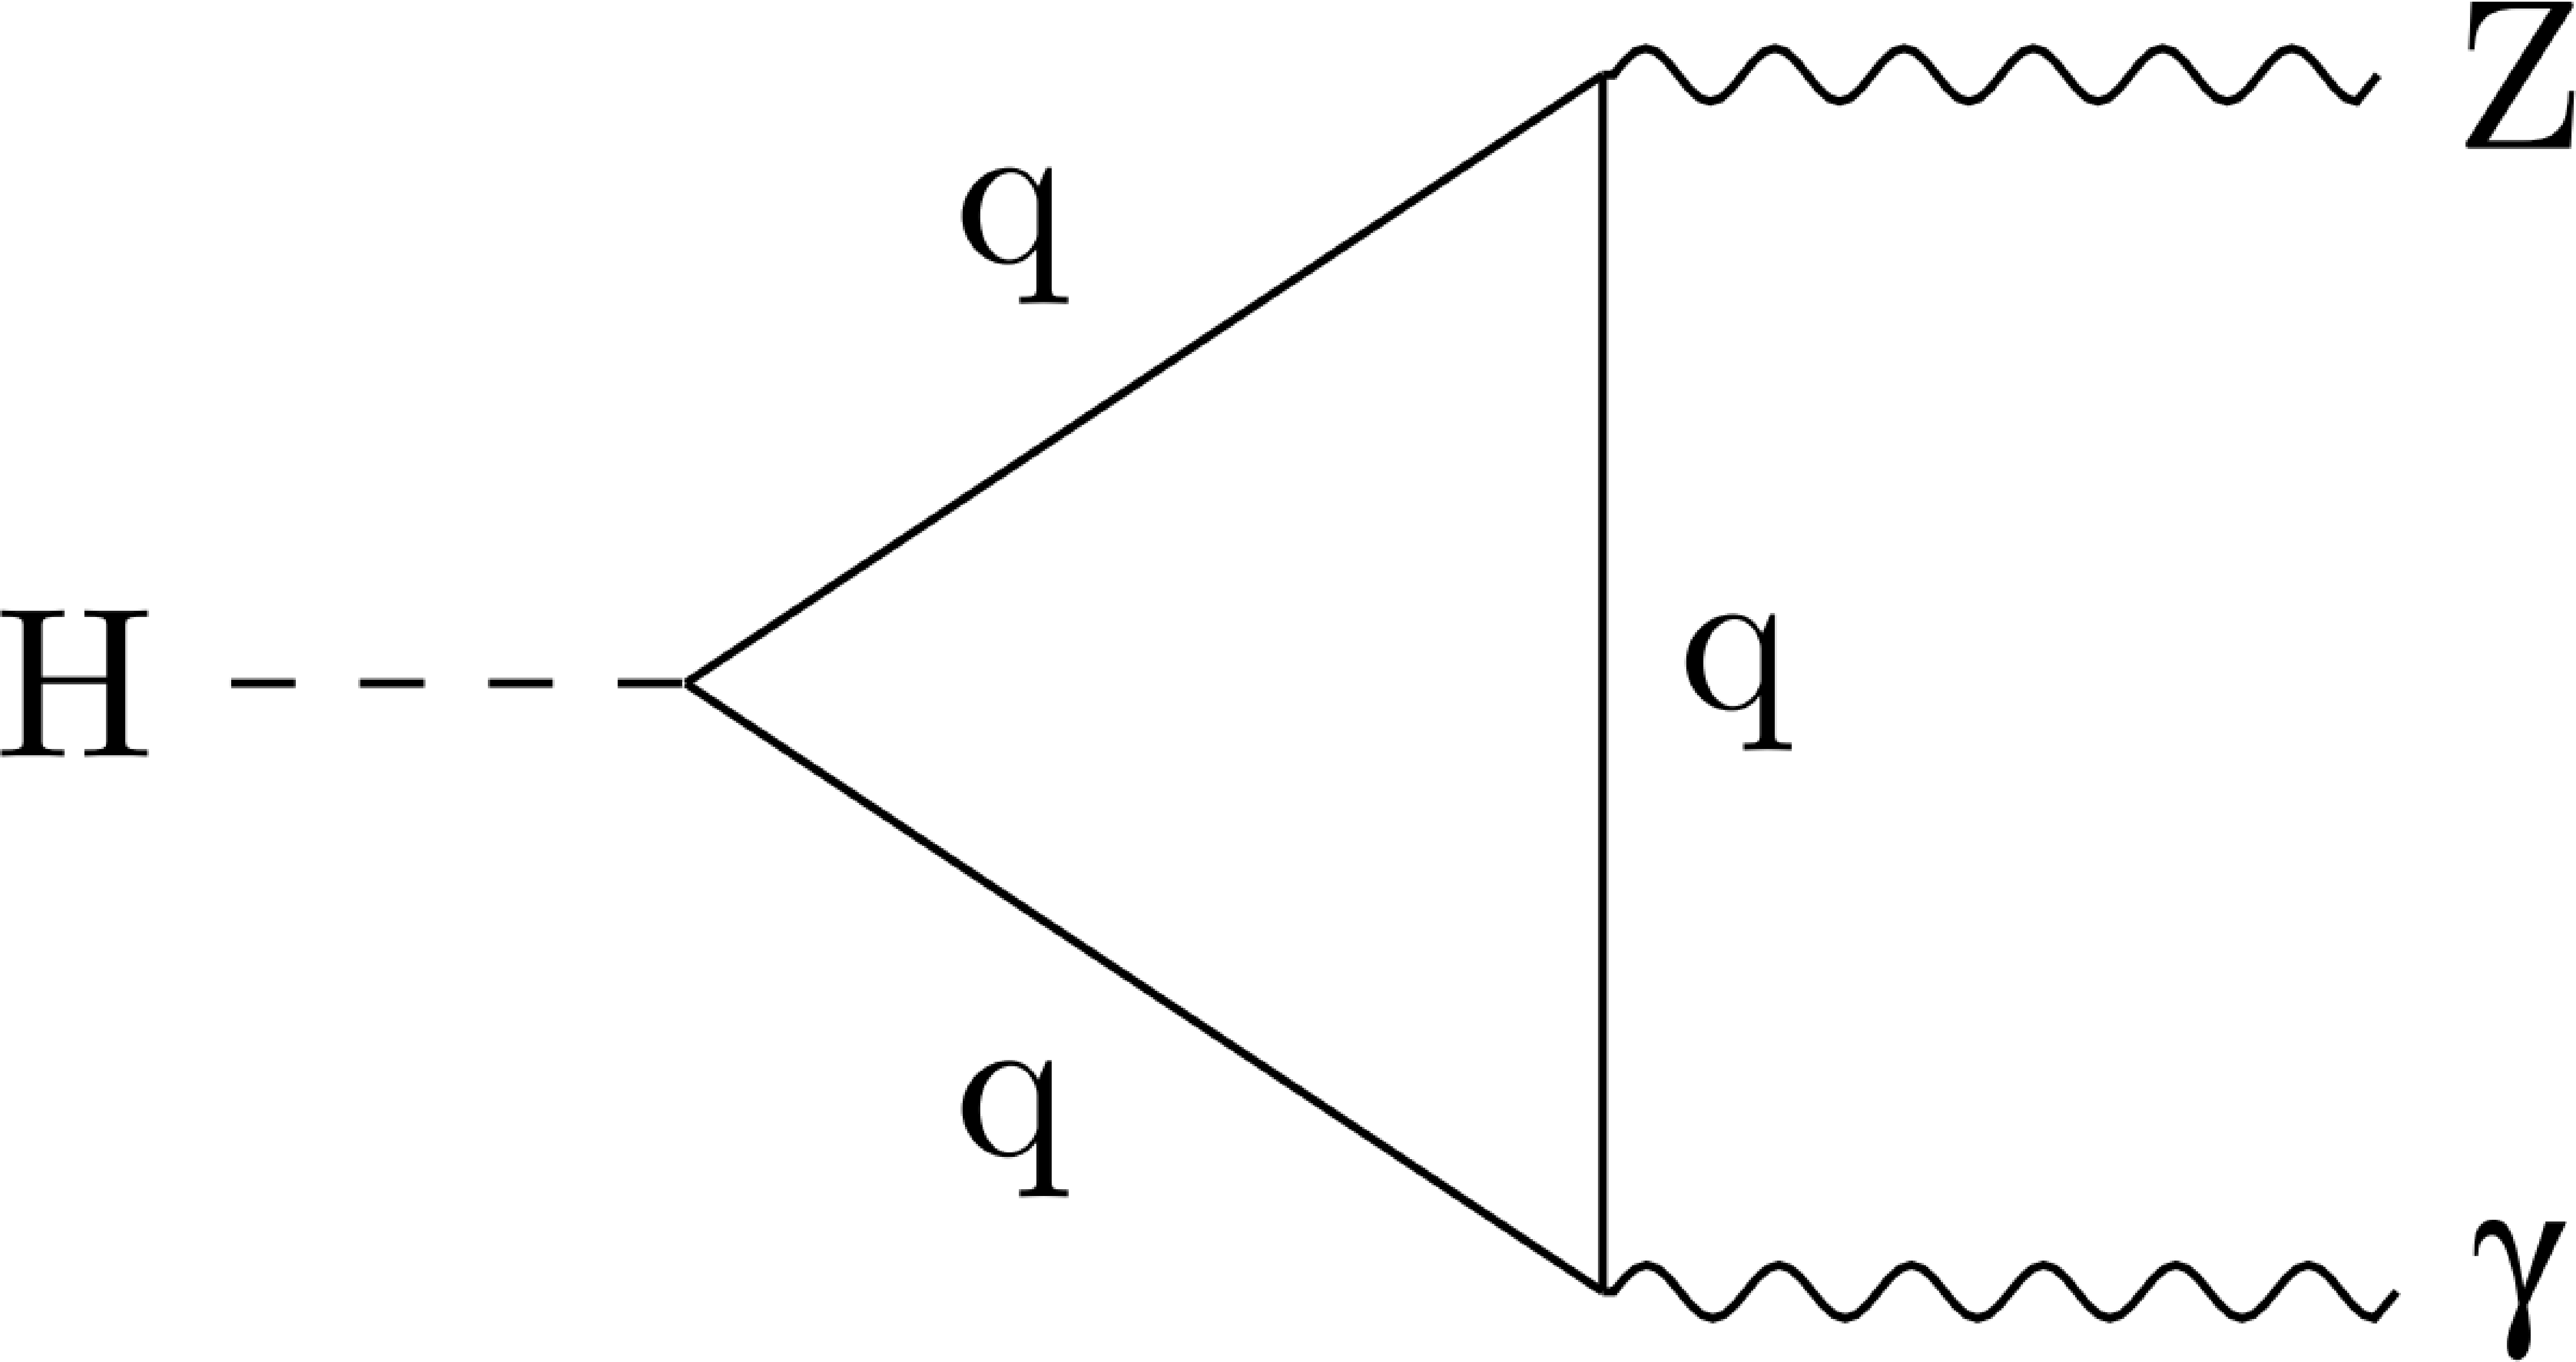
Figure 1-c:
Feynman diagrams for $ \mathrm{H} \to \mathrm{Z} \gamma $ in the SM. In these loop-induced processes, the amplitudes associated with W bosons in the intermediate state dominate over those with quarks. |
png pdf |
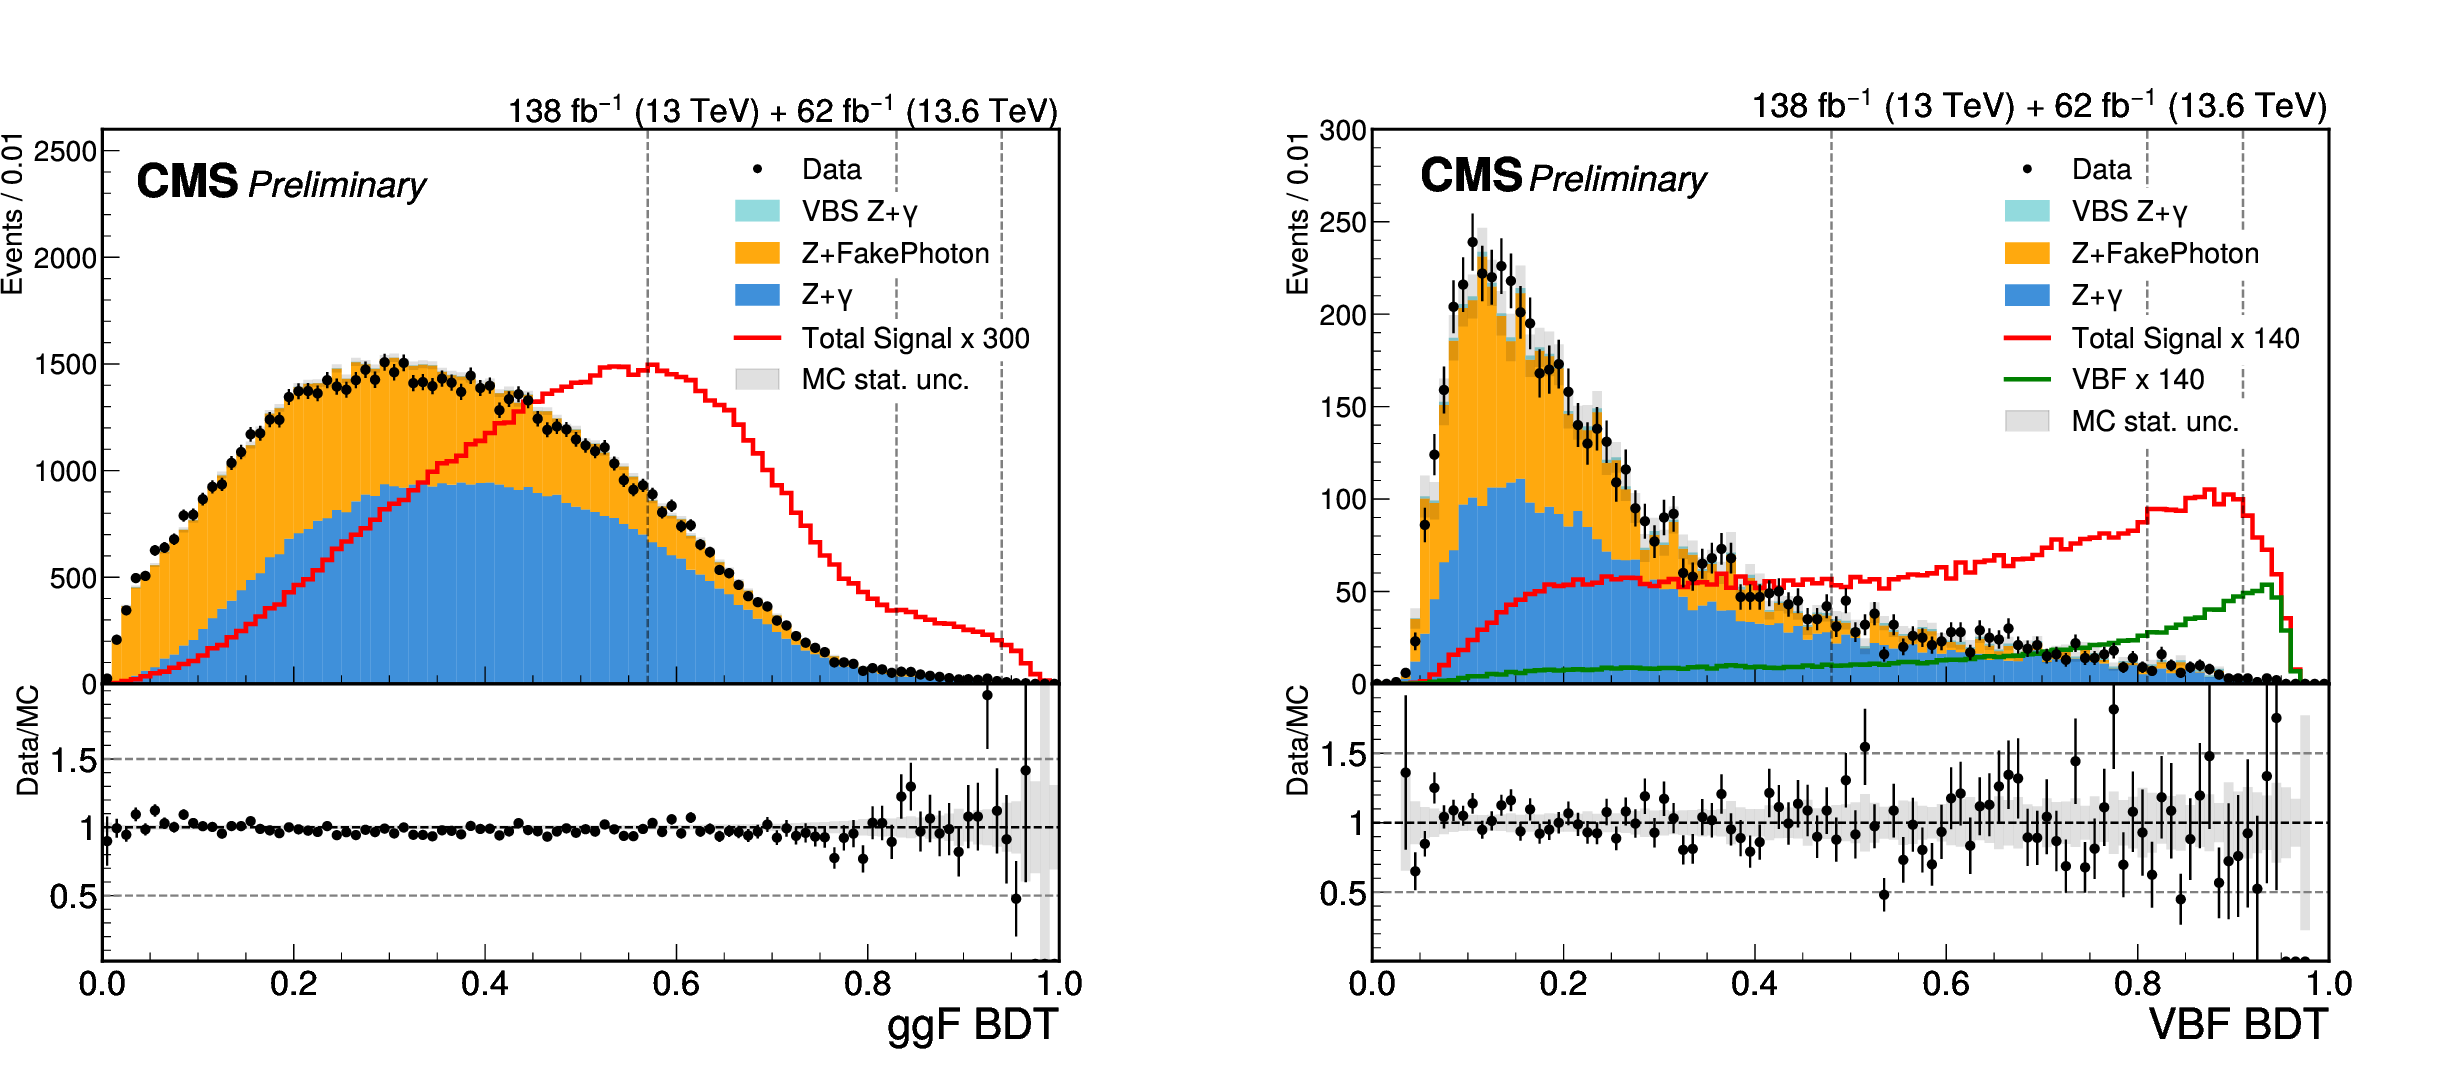
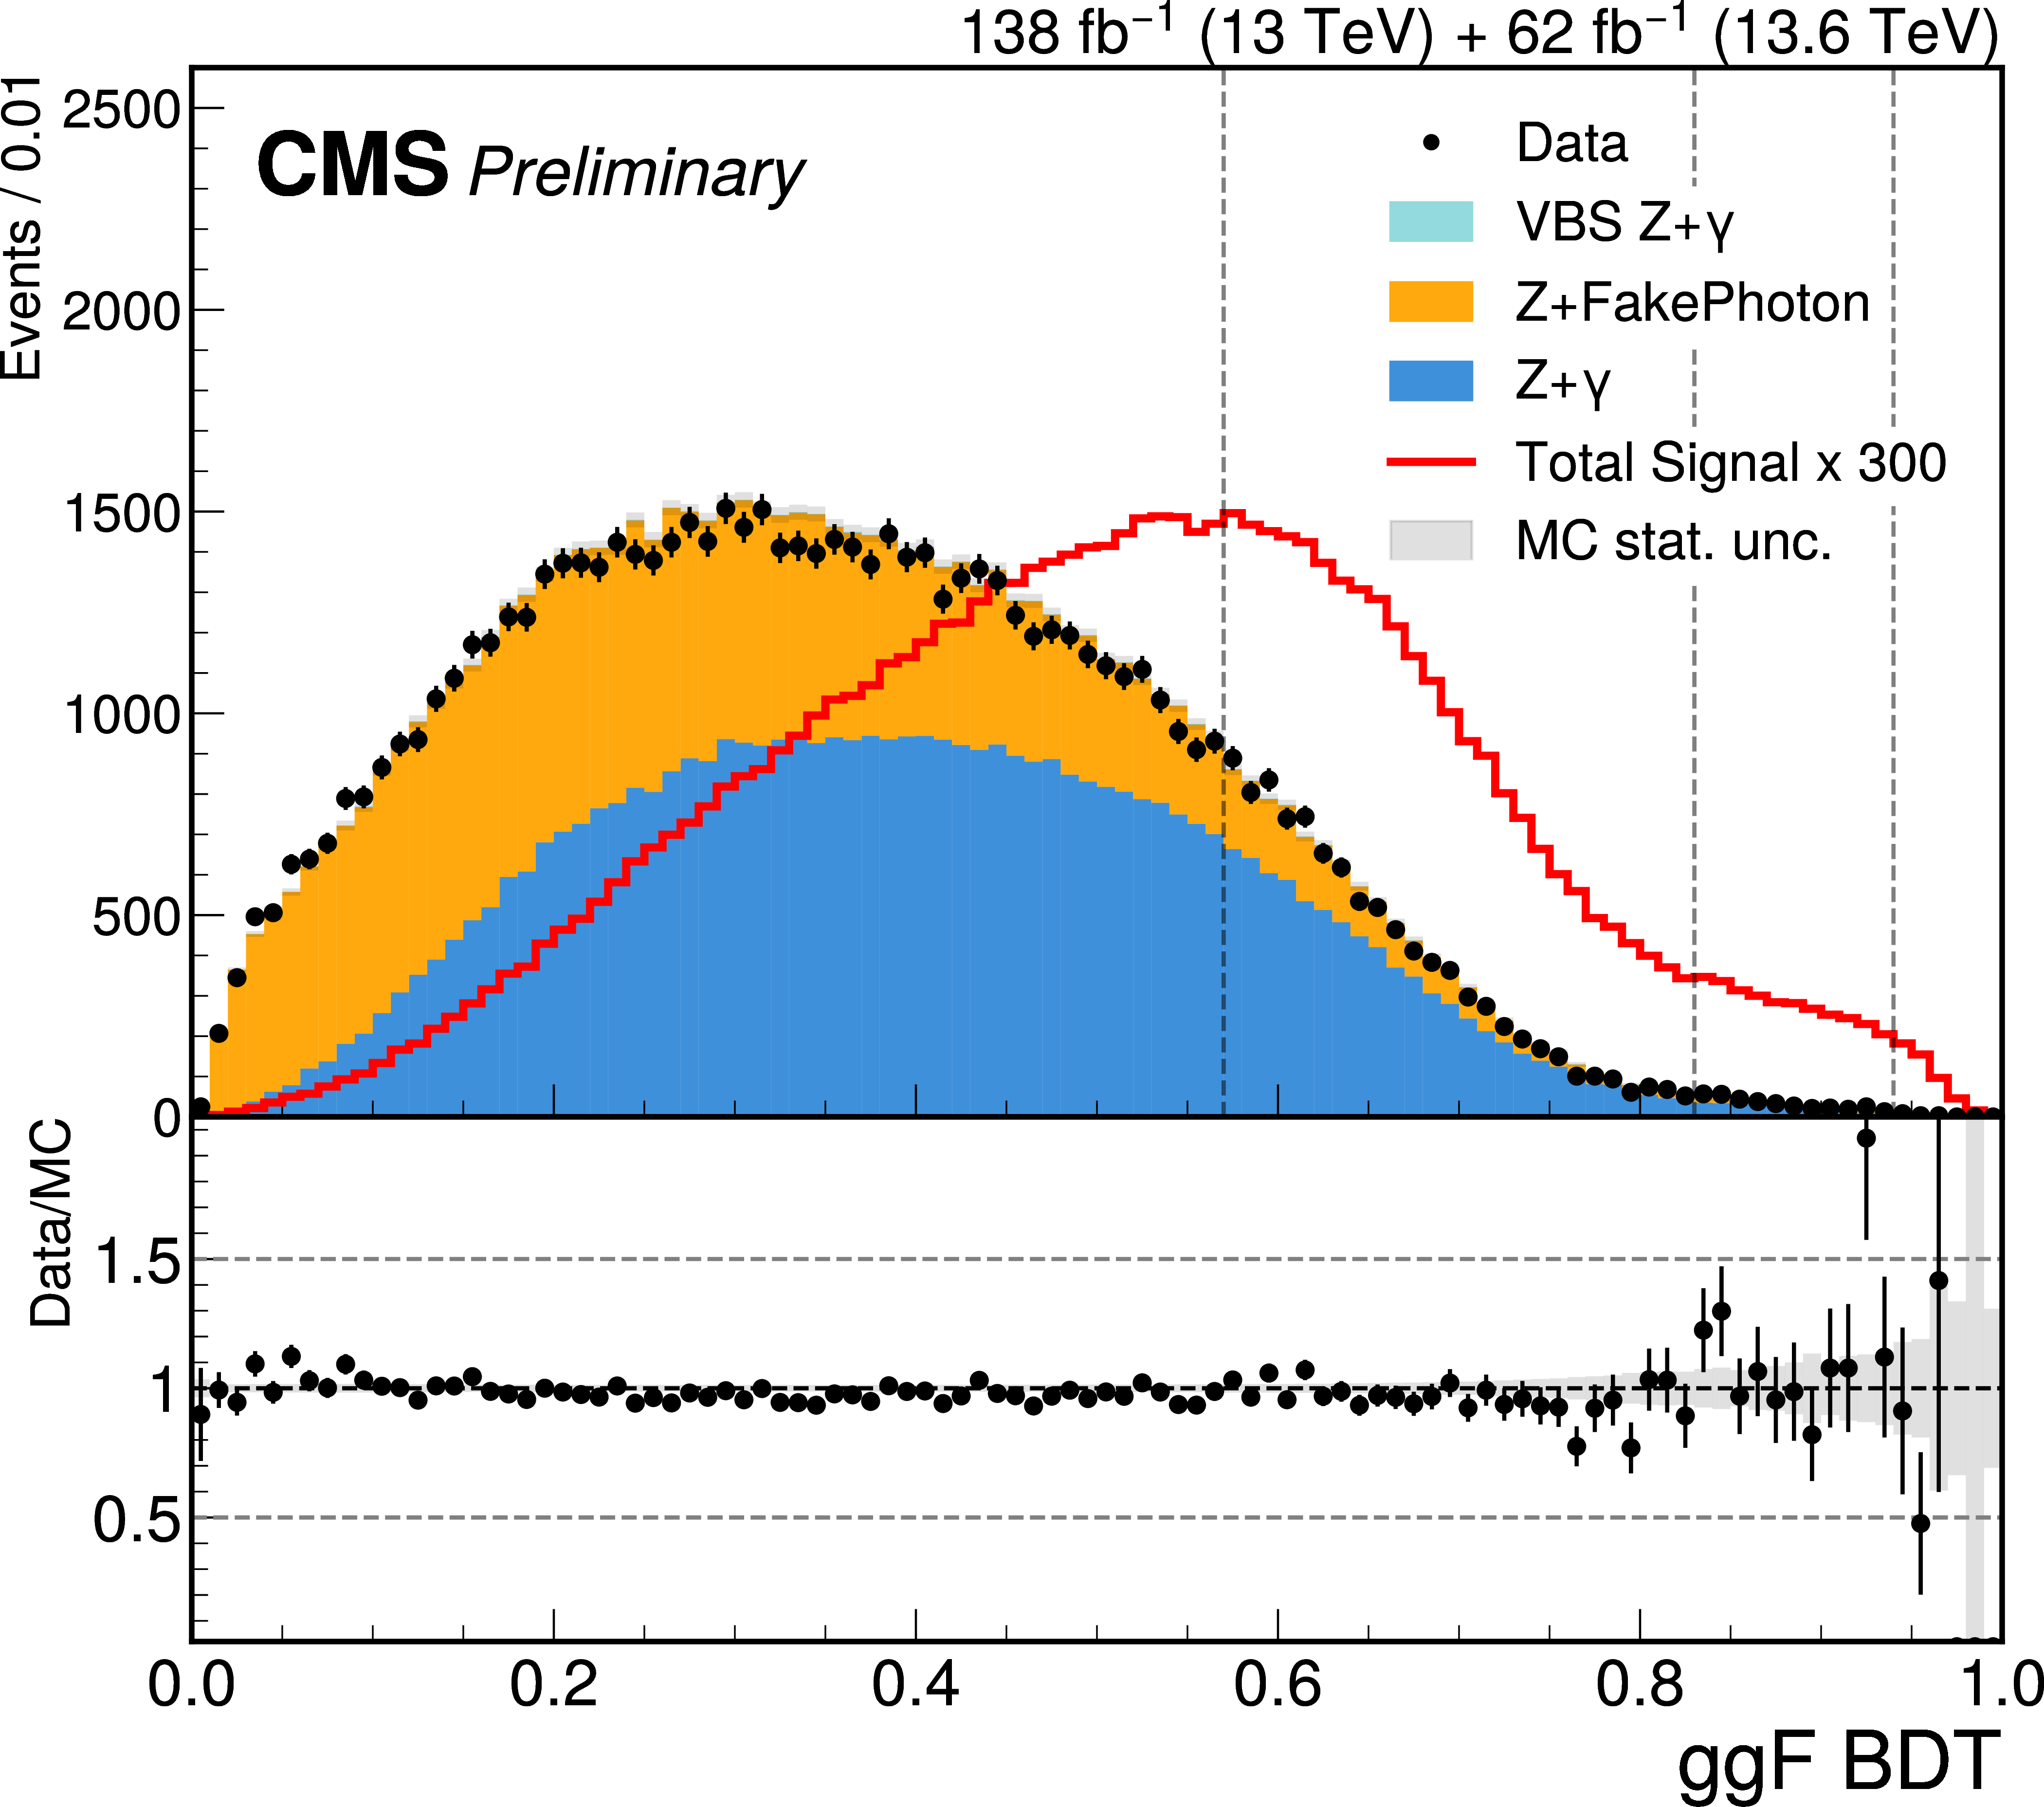
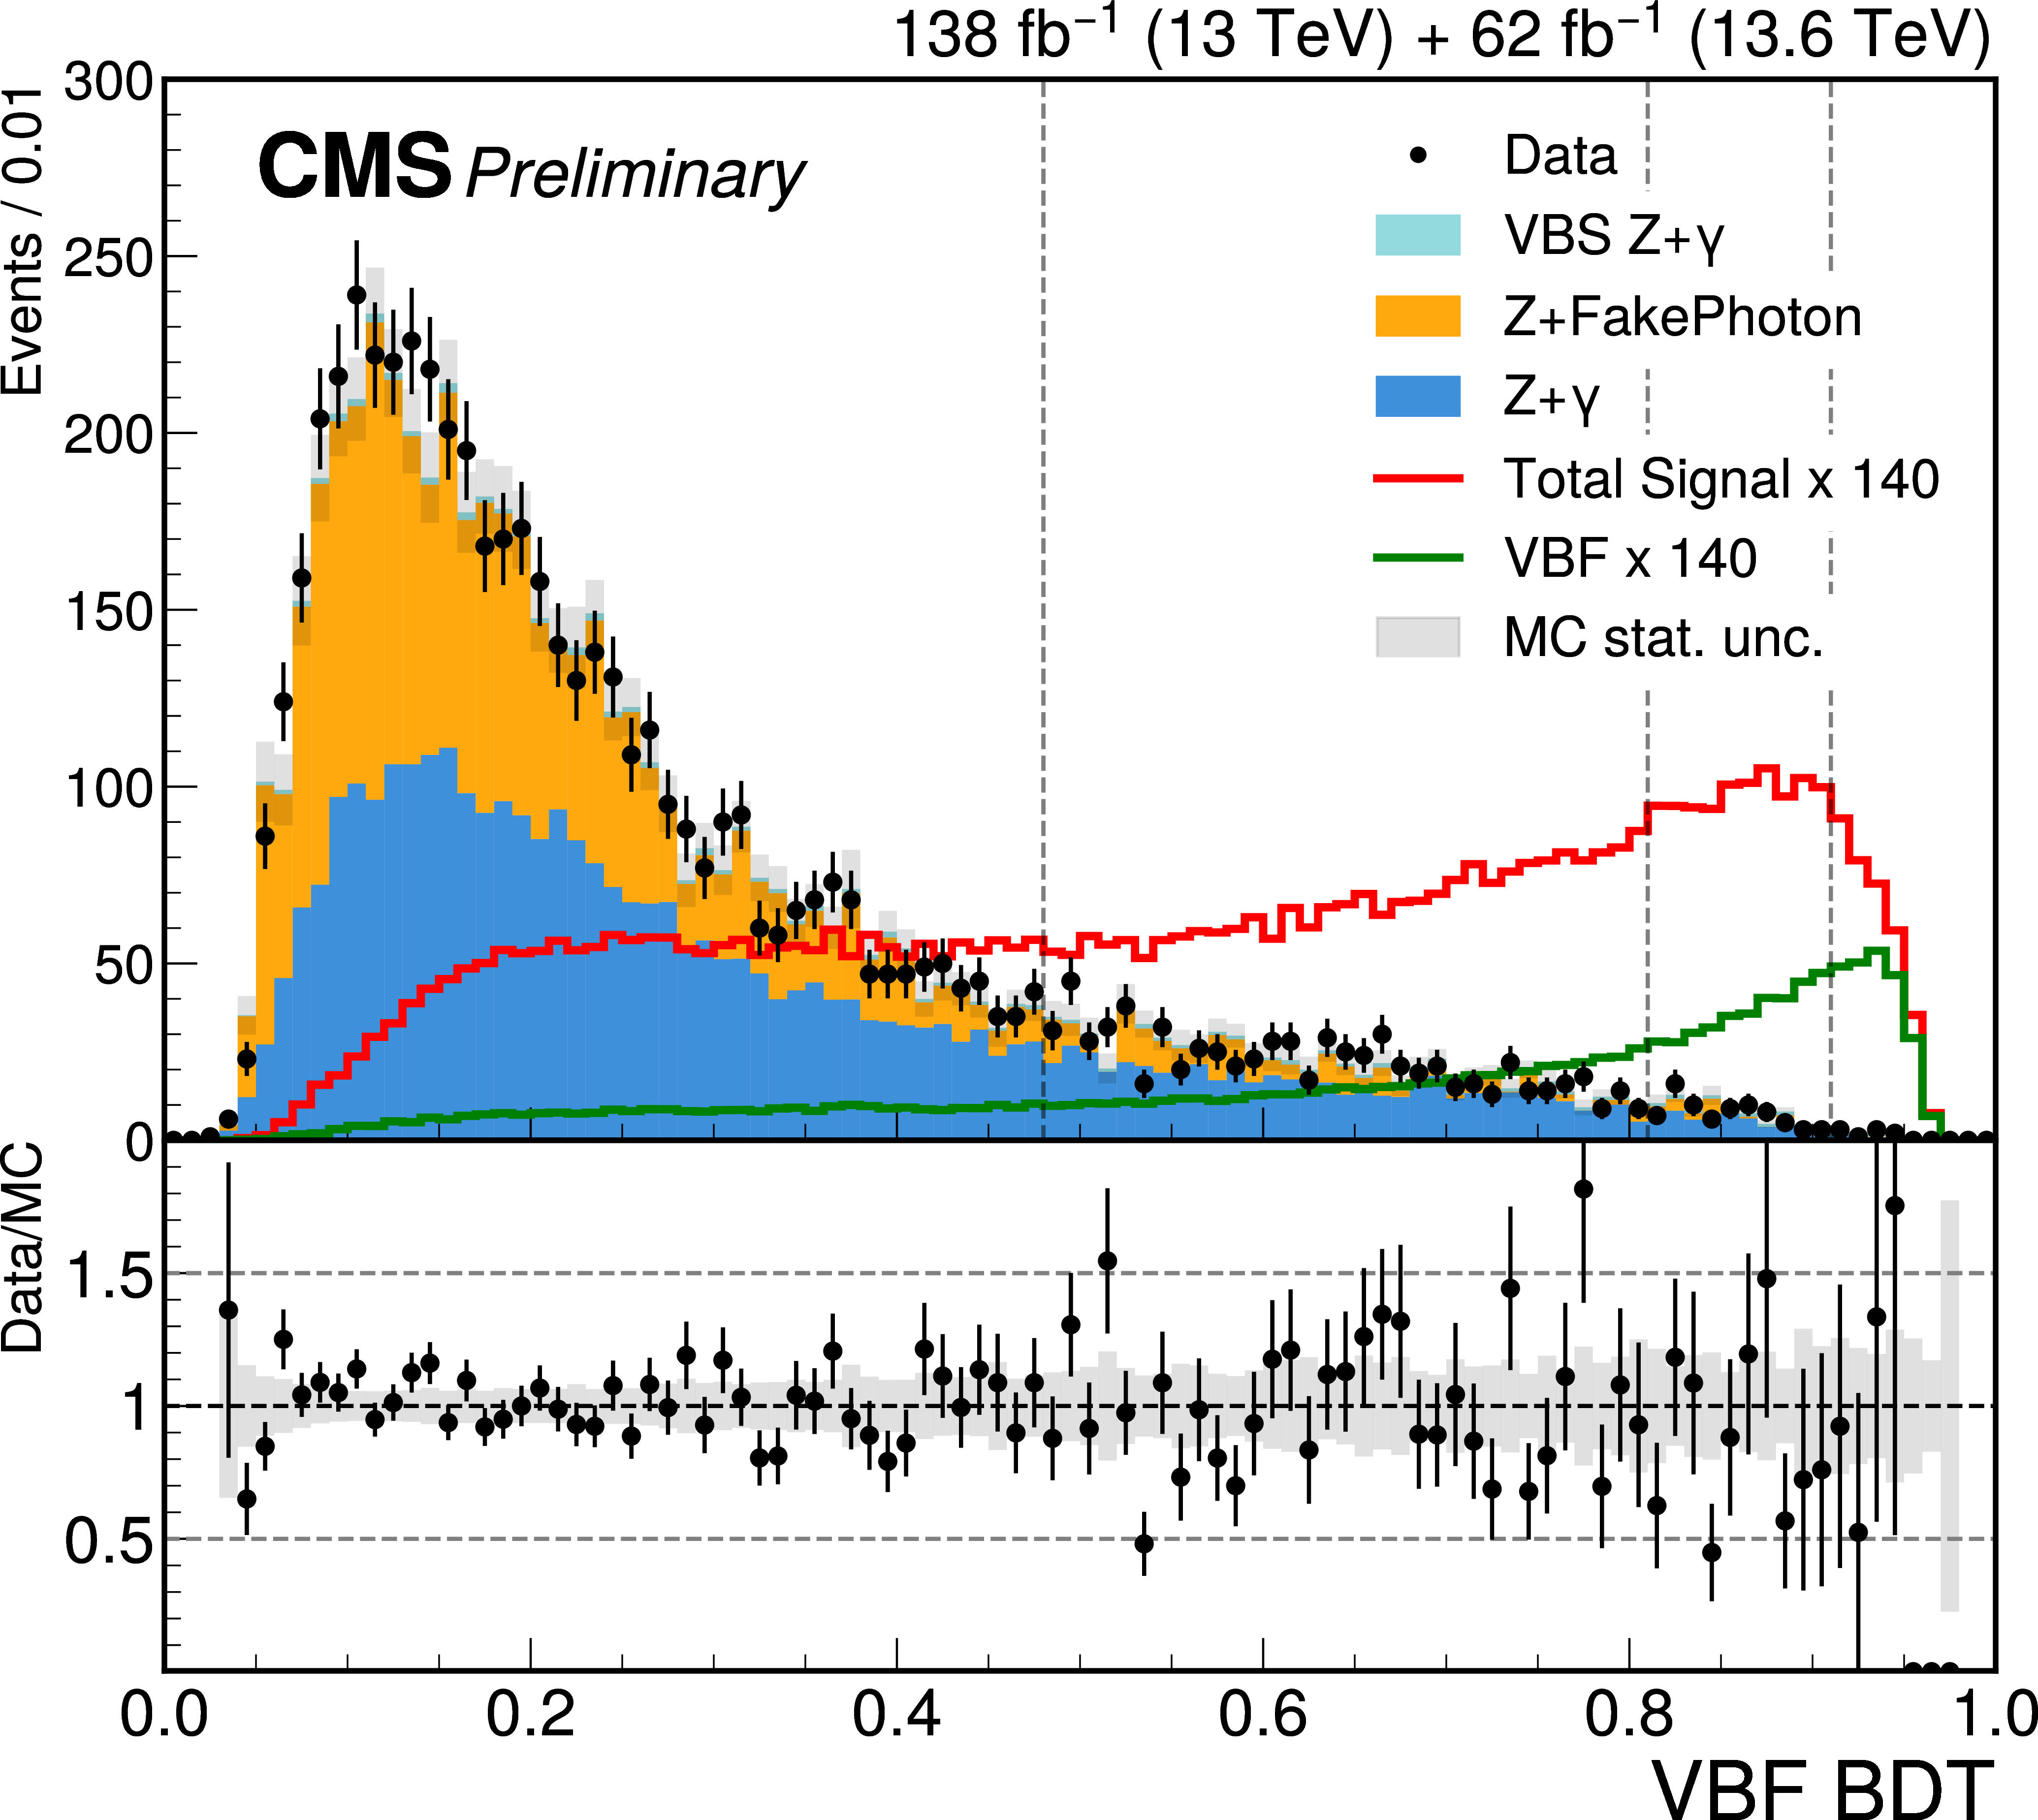
Figure 2:
Distributions of the BDT scores in ggF (left) and VBF (right) primary event category for data (points with error bars), the simulated signal (colored lines), and simulated background samples (filled histograms) in the $ m_{\ell \ell \gamma}$ $\mathrm{H} $ mass region (120--130 GeV). The background MC samples are normalized to match data yields in the $ m_{\ell \ell \gamma}$ $\mathrm{H}$-mass sideband regions. The signal simulated event yields are scaled by a factor of 300 on the left plot, and 140 on the right plot for visibility. The optimized BDT score bin boundaries are shown as dashed lines. They are [0,0.57,0.83,0.94,1] for ggF and [0,0.48,0.81,0.91,1] for VBF. |
png pdf |
Figure 2-a:
Distributions of the BDT scores in ggF (left) and VBF (right) primary event category for data (points with error bars), the simulated signal (colored lines), and simulated background samples (filled histograms) in the $ m_{\ell \ell \gamma}$ $\mathrm{H} $ mass region (120--130 GeV). The background MC samples are normalized to match data yields in the $ m_{\ell \ell \gamma}$ $\mathrm{H}$-mass sideband regions. The signal simulated event yields are scaled by a factor of 300 on the left plot, and 140 on the right plot for visibility. The optimized BDT score bin boundaries are shown as dashed lines. They are [0,0.57,0.83,0.94,1] for ggF and [0,0.48,0.81,0.91,1] for VBF. |
png pdf |
Figure 2-b:
Distributions of the BDT scores in ggF (left) and VBF (right) primary event category for data (points with error bars), the simulated signal (colored lines), and simulated background samples (filled histograms) in the $ m_{\ell \ell \gamma}$ $\mathrm{H} $ mass region (120--130 GeV). The background MC samples are normalized to match data yields in the $ m_{\ell \ell \gamma}$ $\mathrm{H}$-mass sideband regions. The signal simulated event yields are scaled by a factor of 300 on the left plot, and 140 on the right plot for visibility. The optimized BDT score bin boundaries are shown as dashed lines. They are [0,0.57,0.83,0.94,1] for ggF and [0,0.48,0.81,0.91,1] for VBF. |
png pdf |
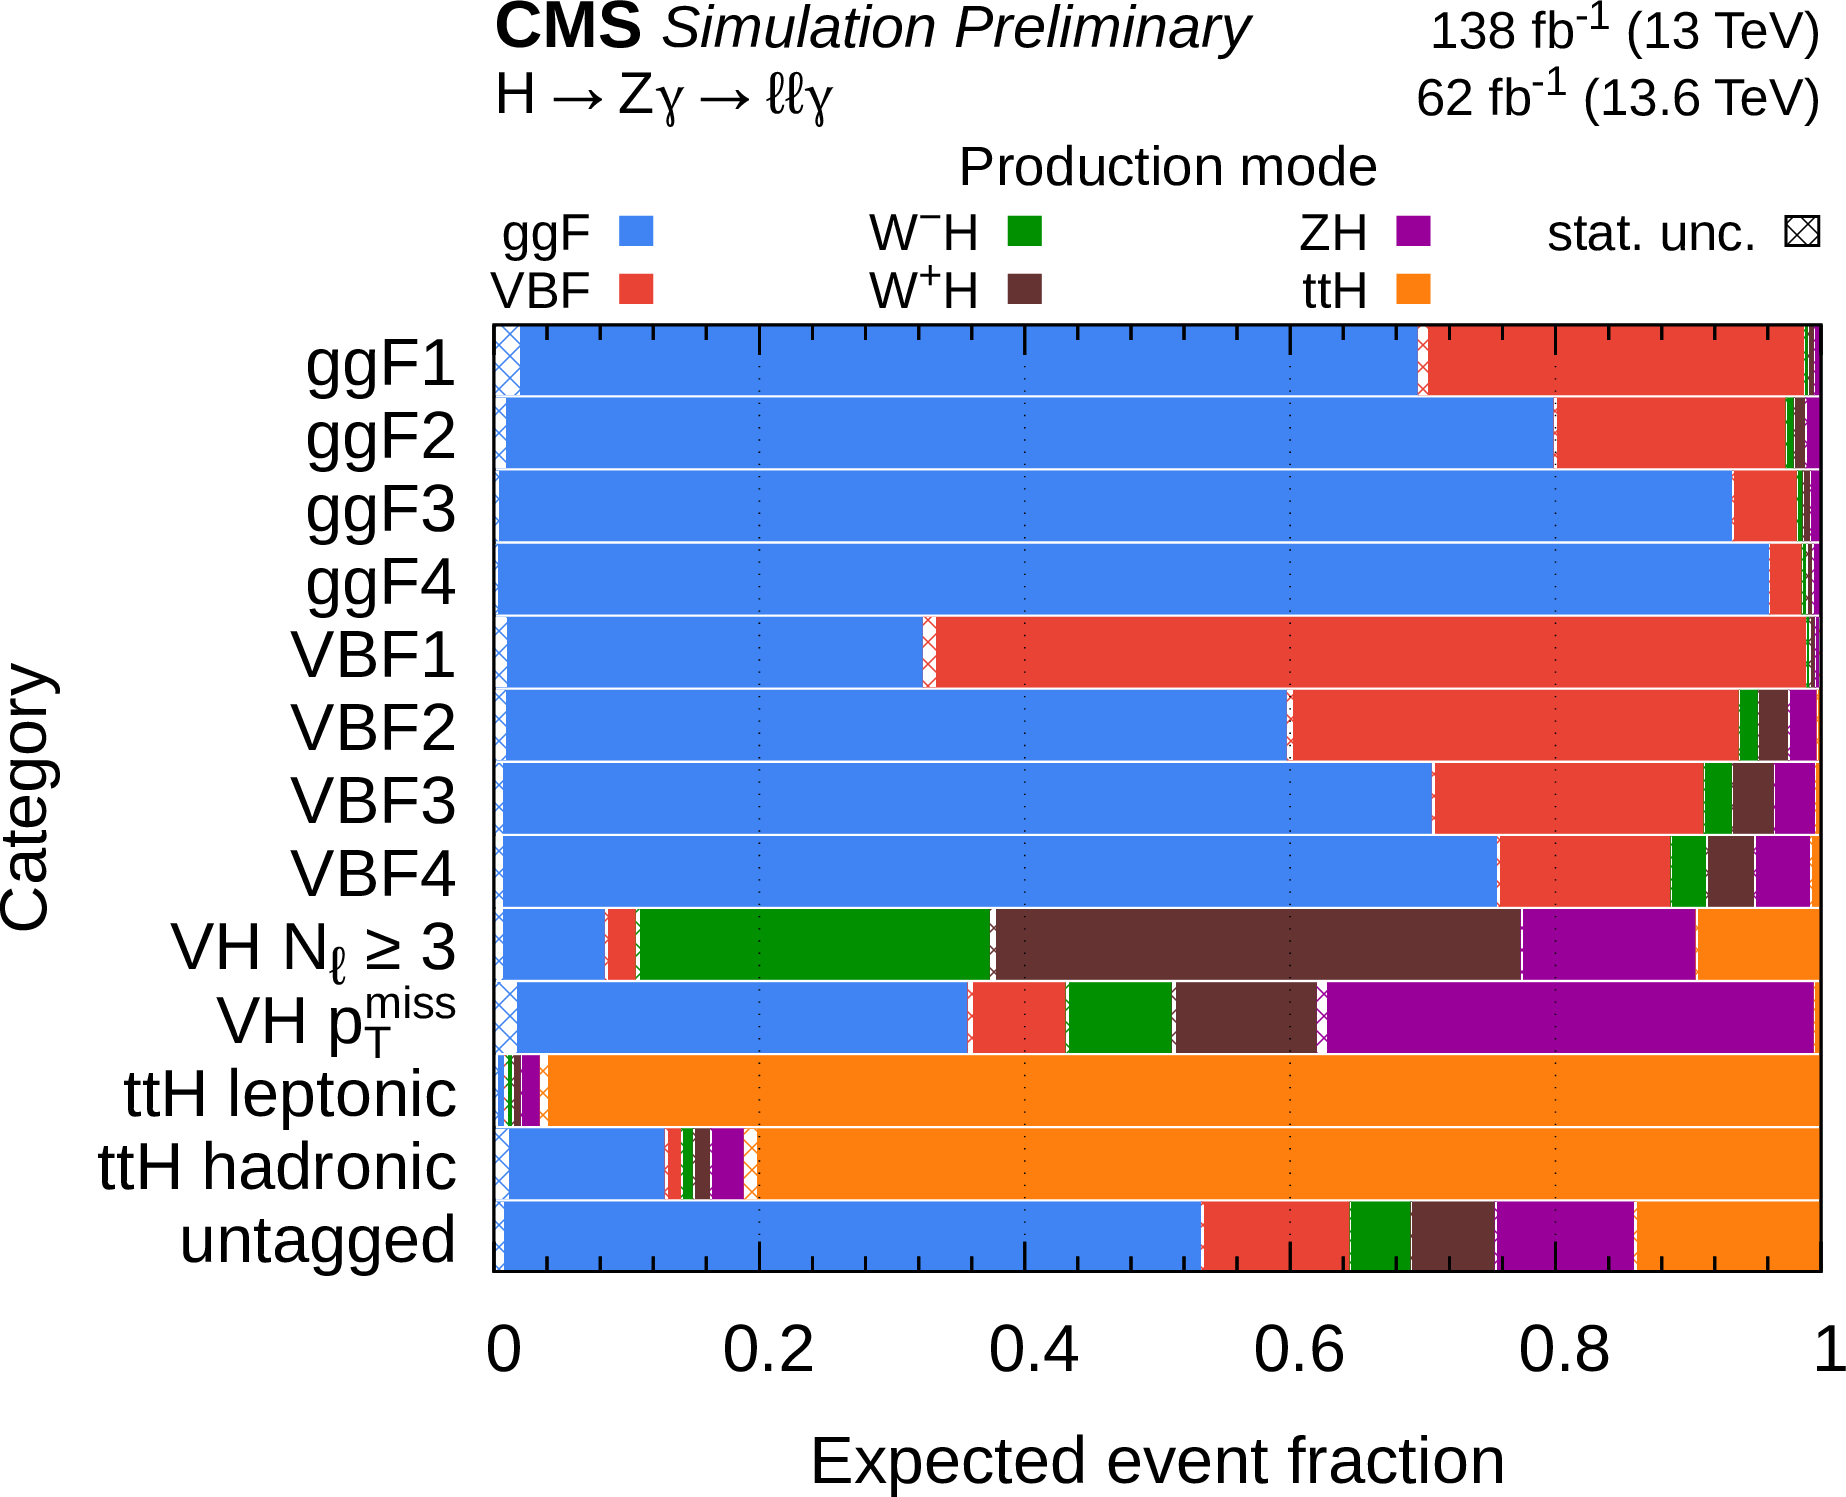
Figure 3:
Expected fraction of signal events arising from different Higgs boson production mechanisms, as a function of event category and based on simulated event samples. |
png pdf |
Figure 4:
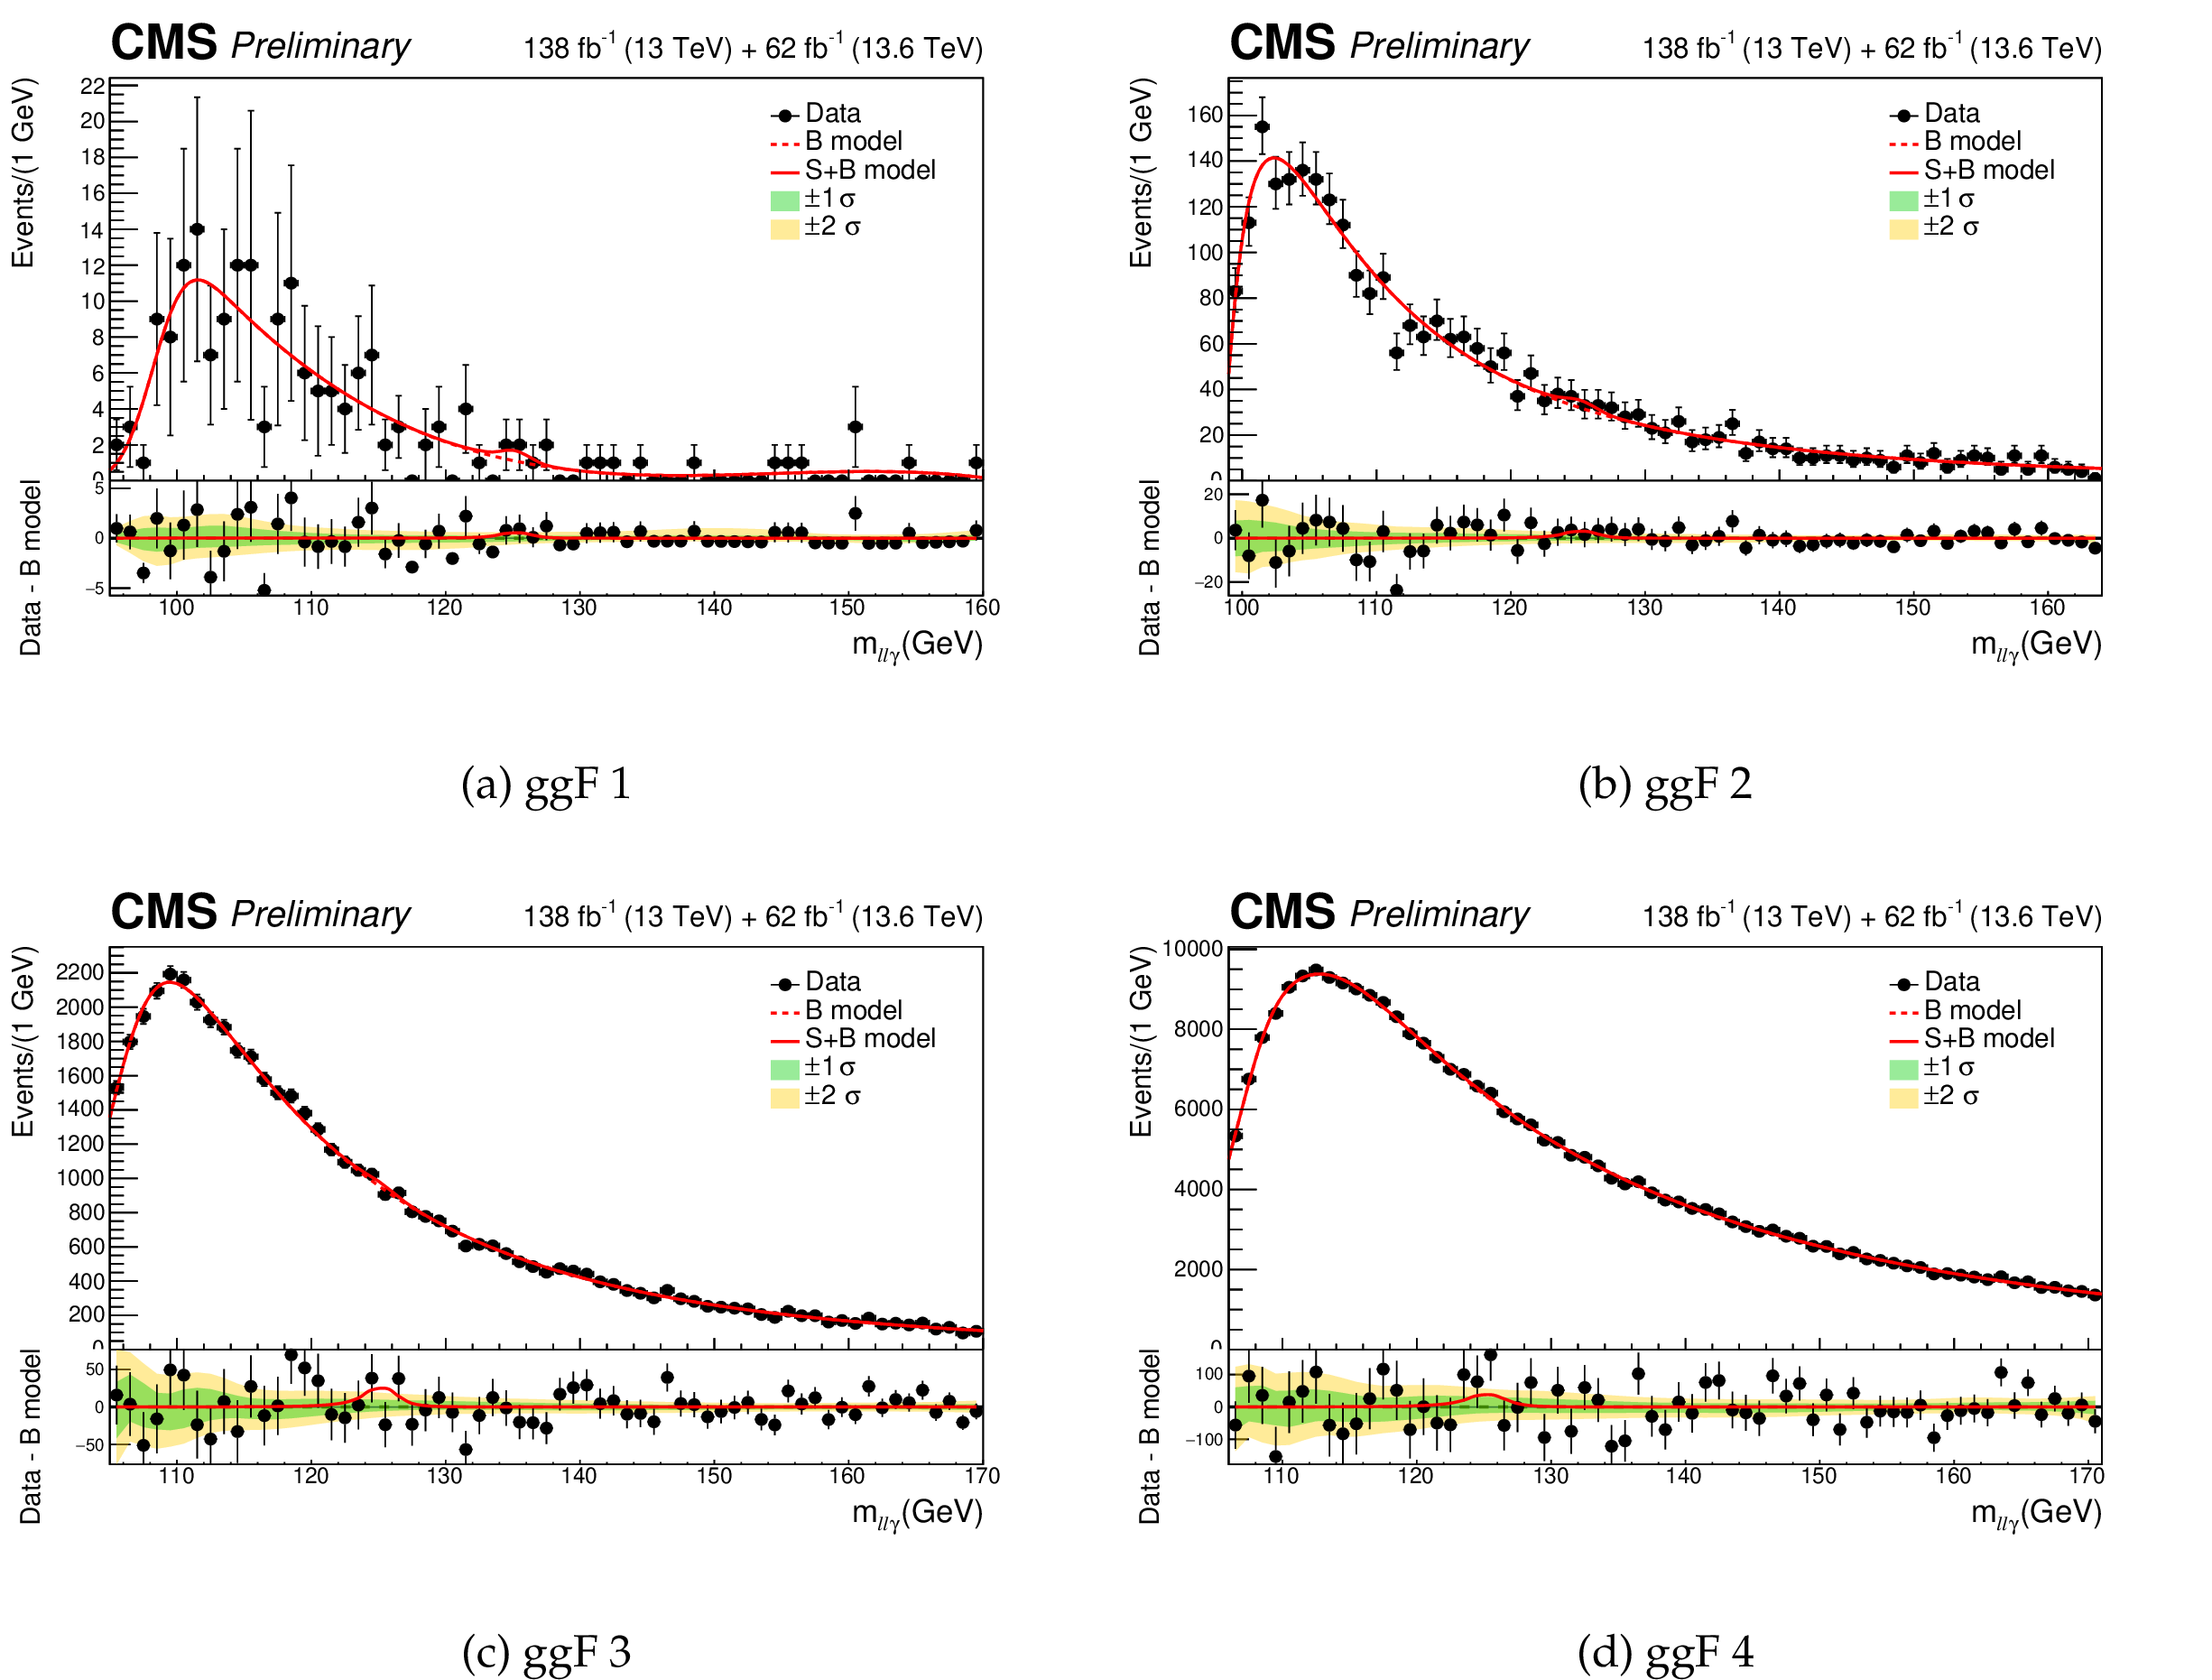
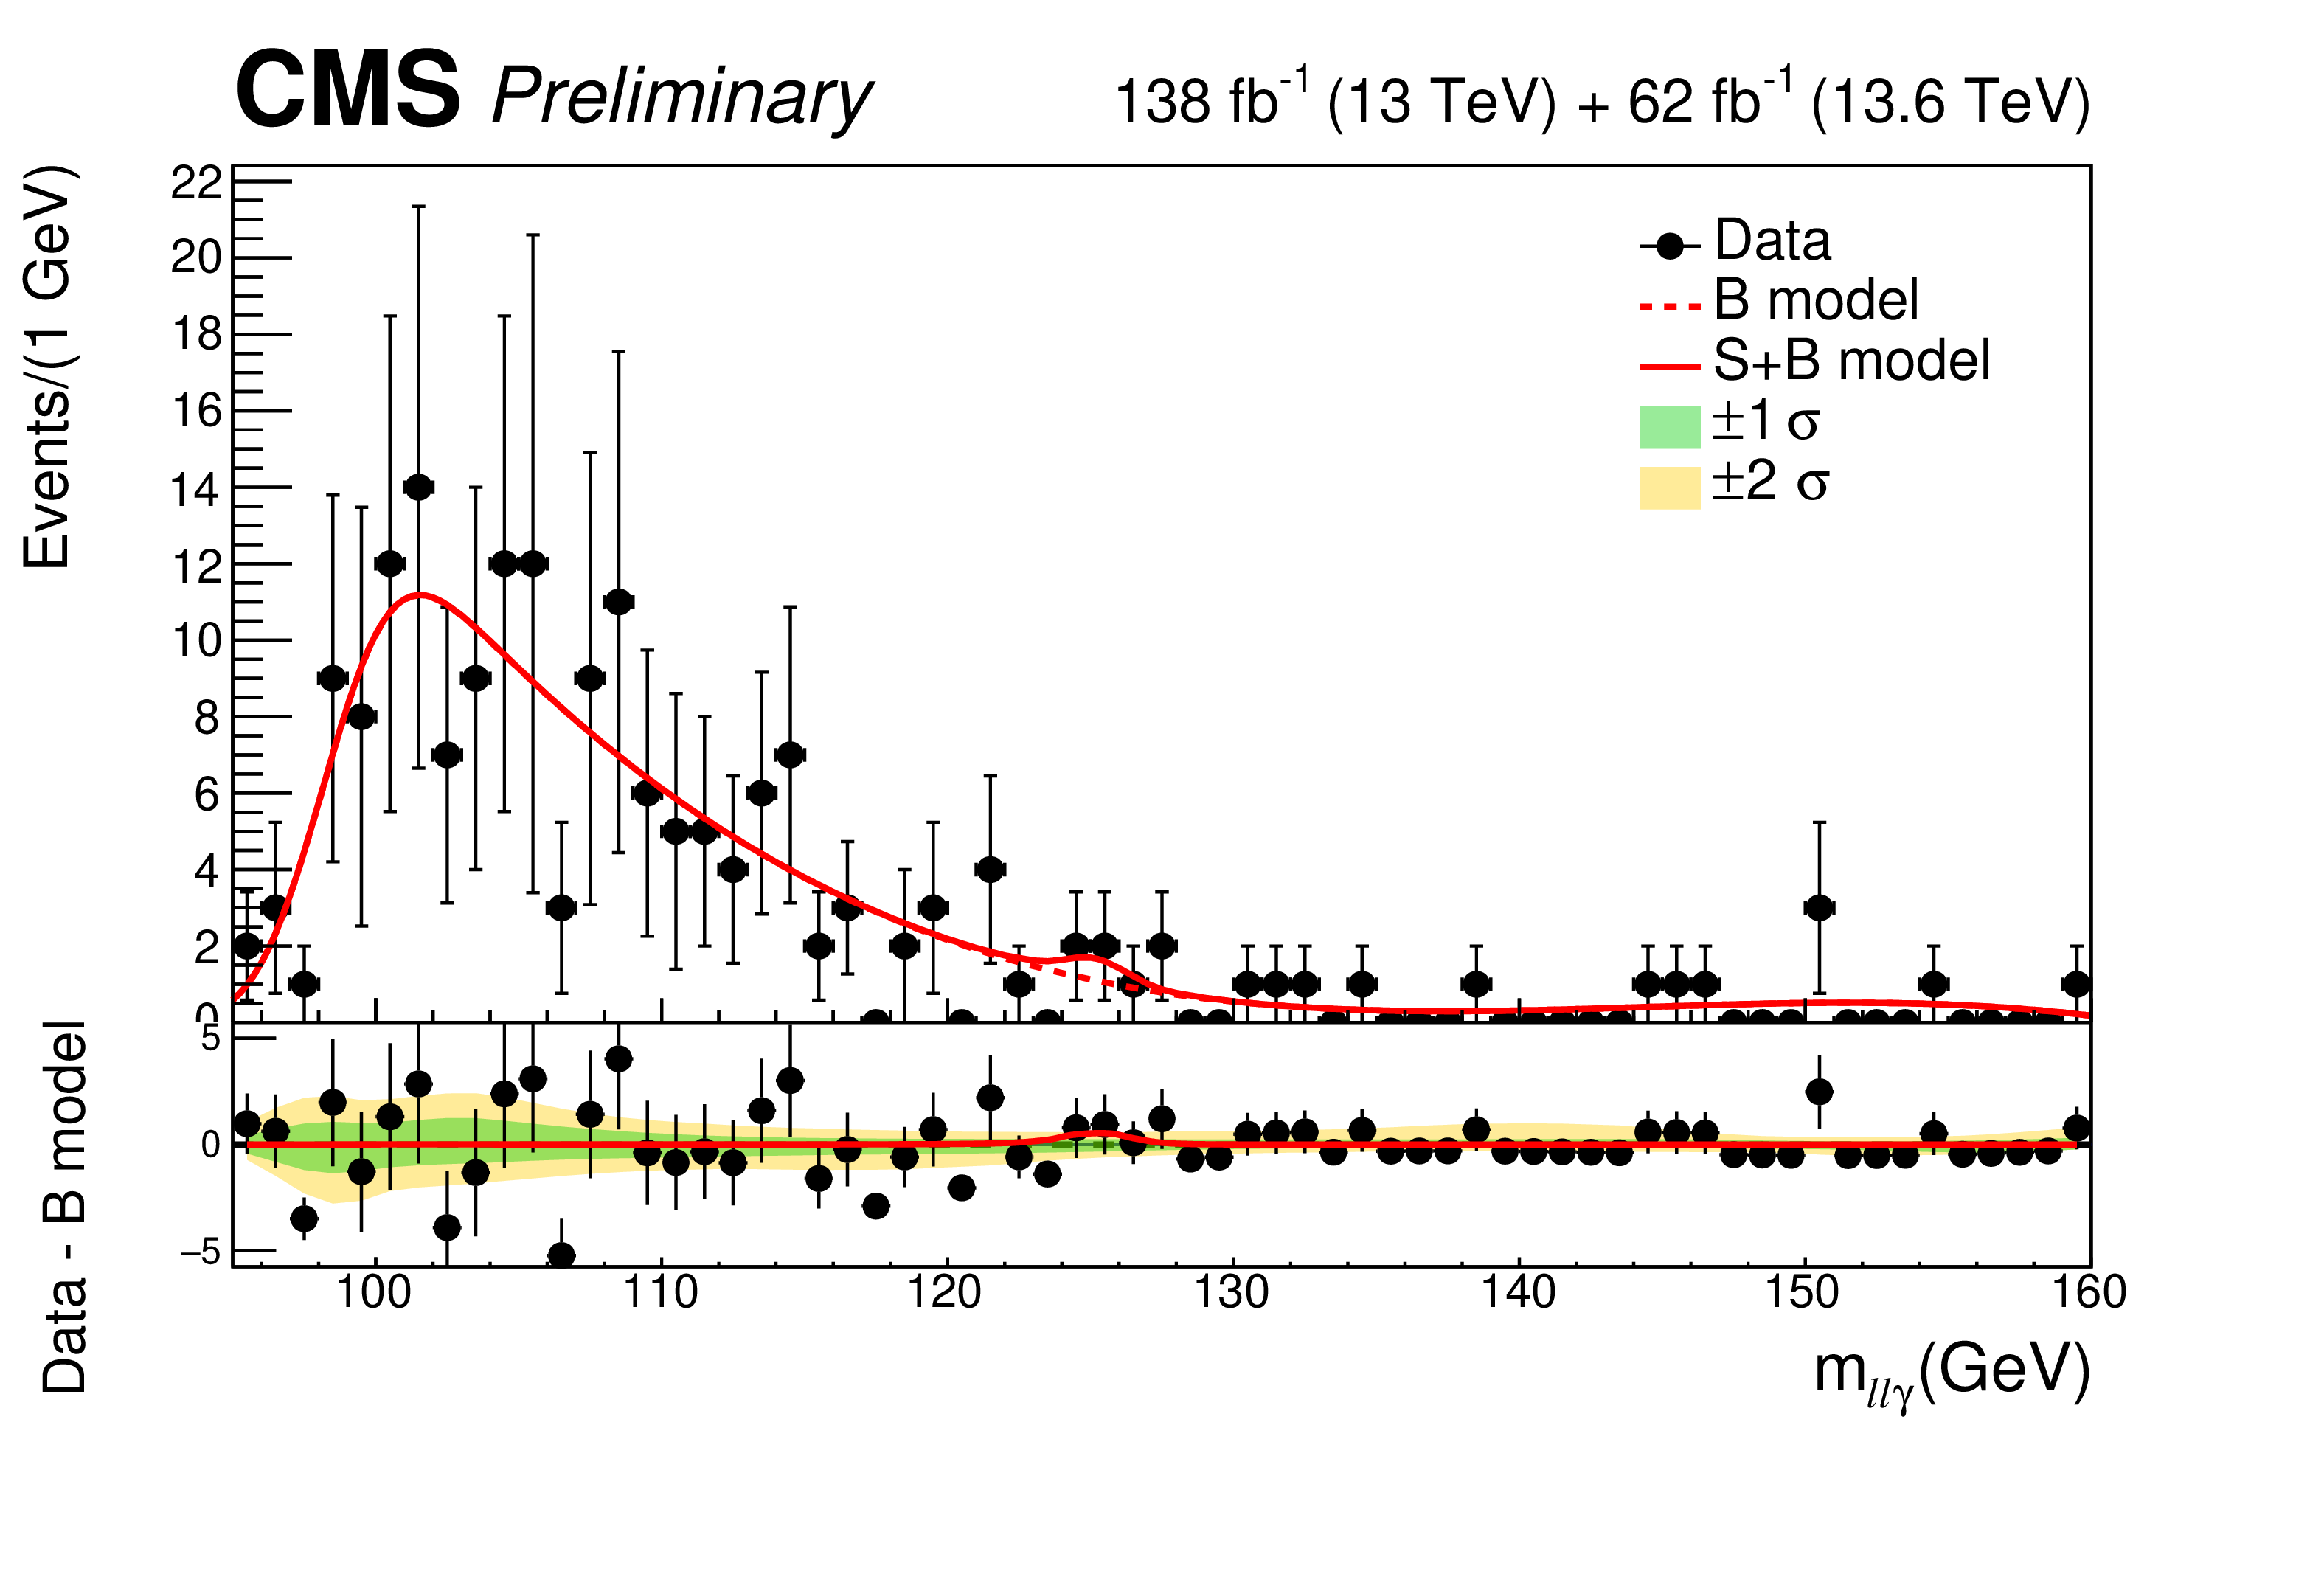
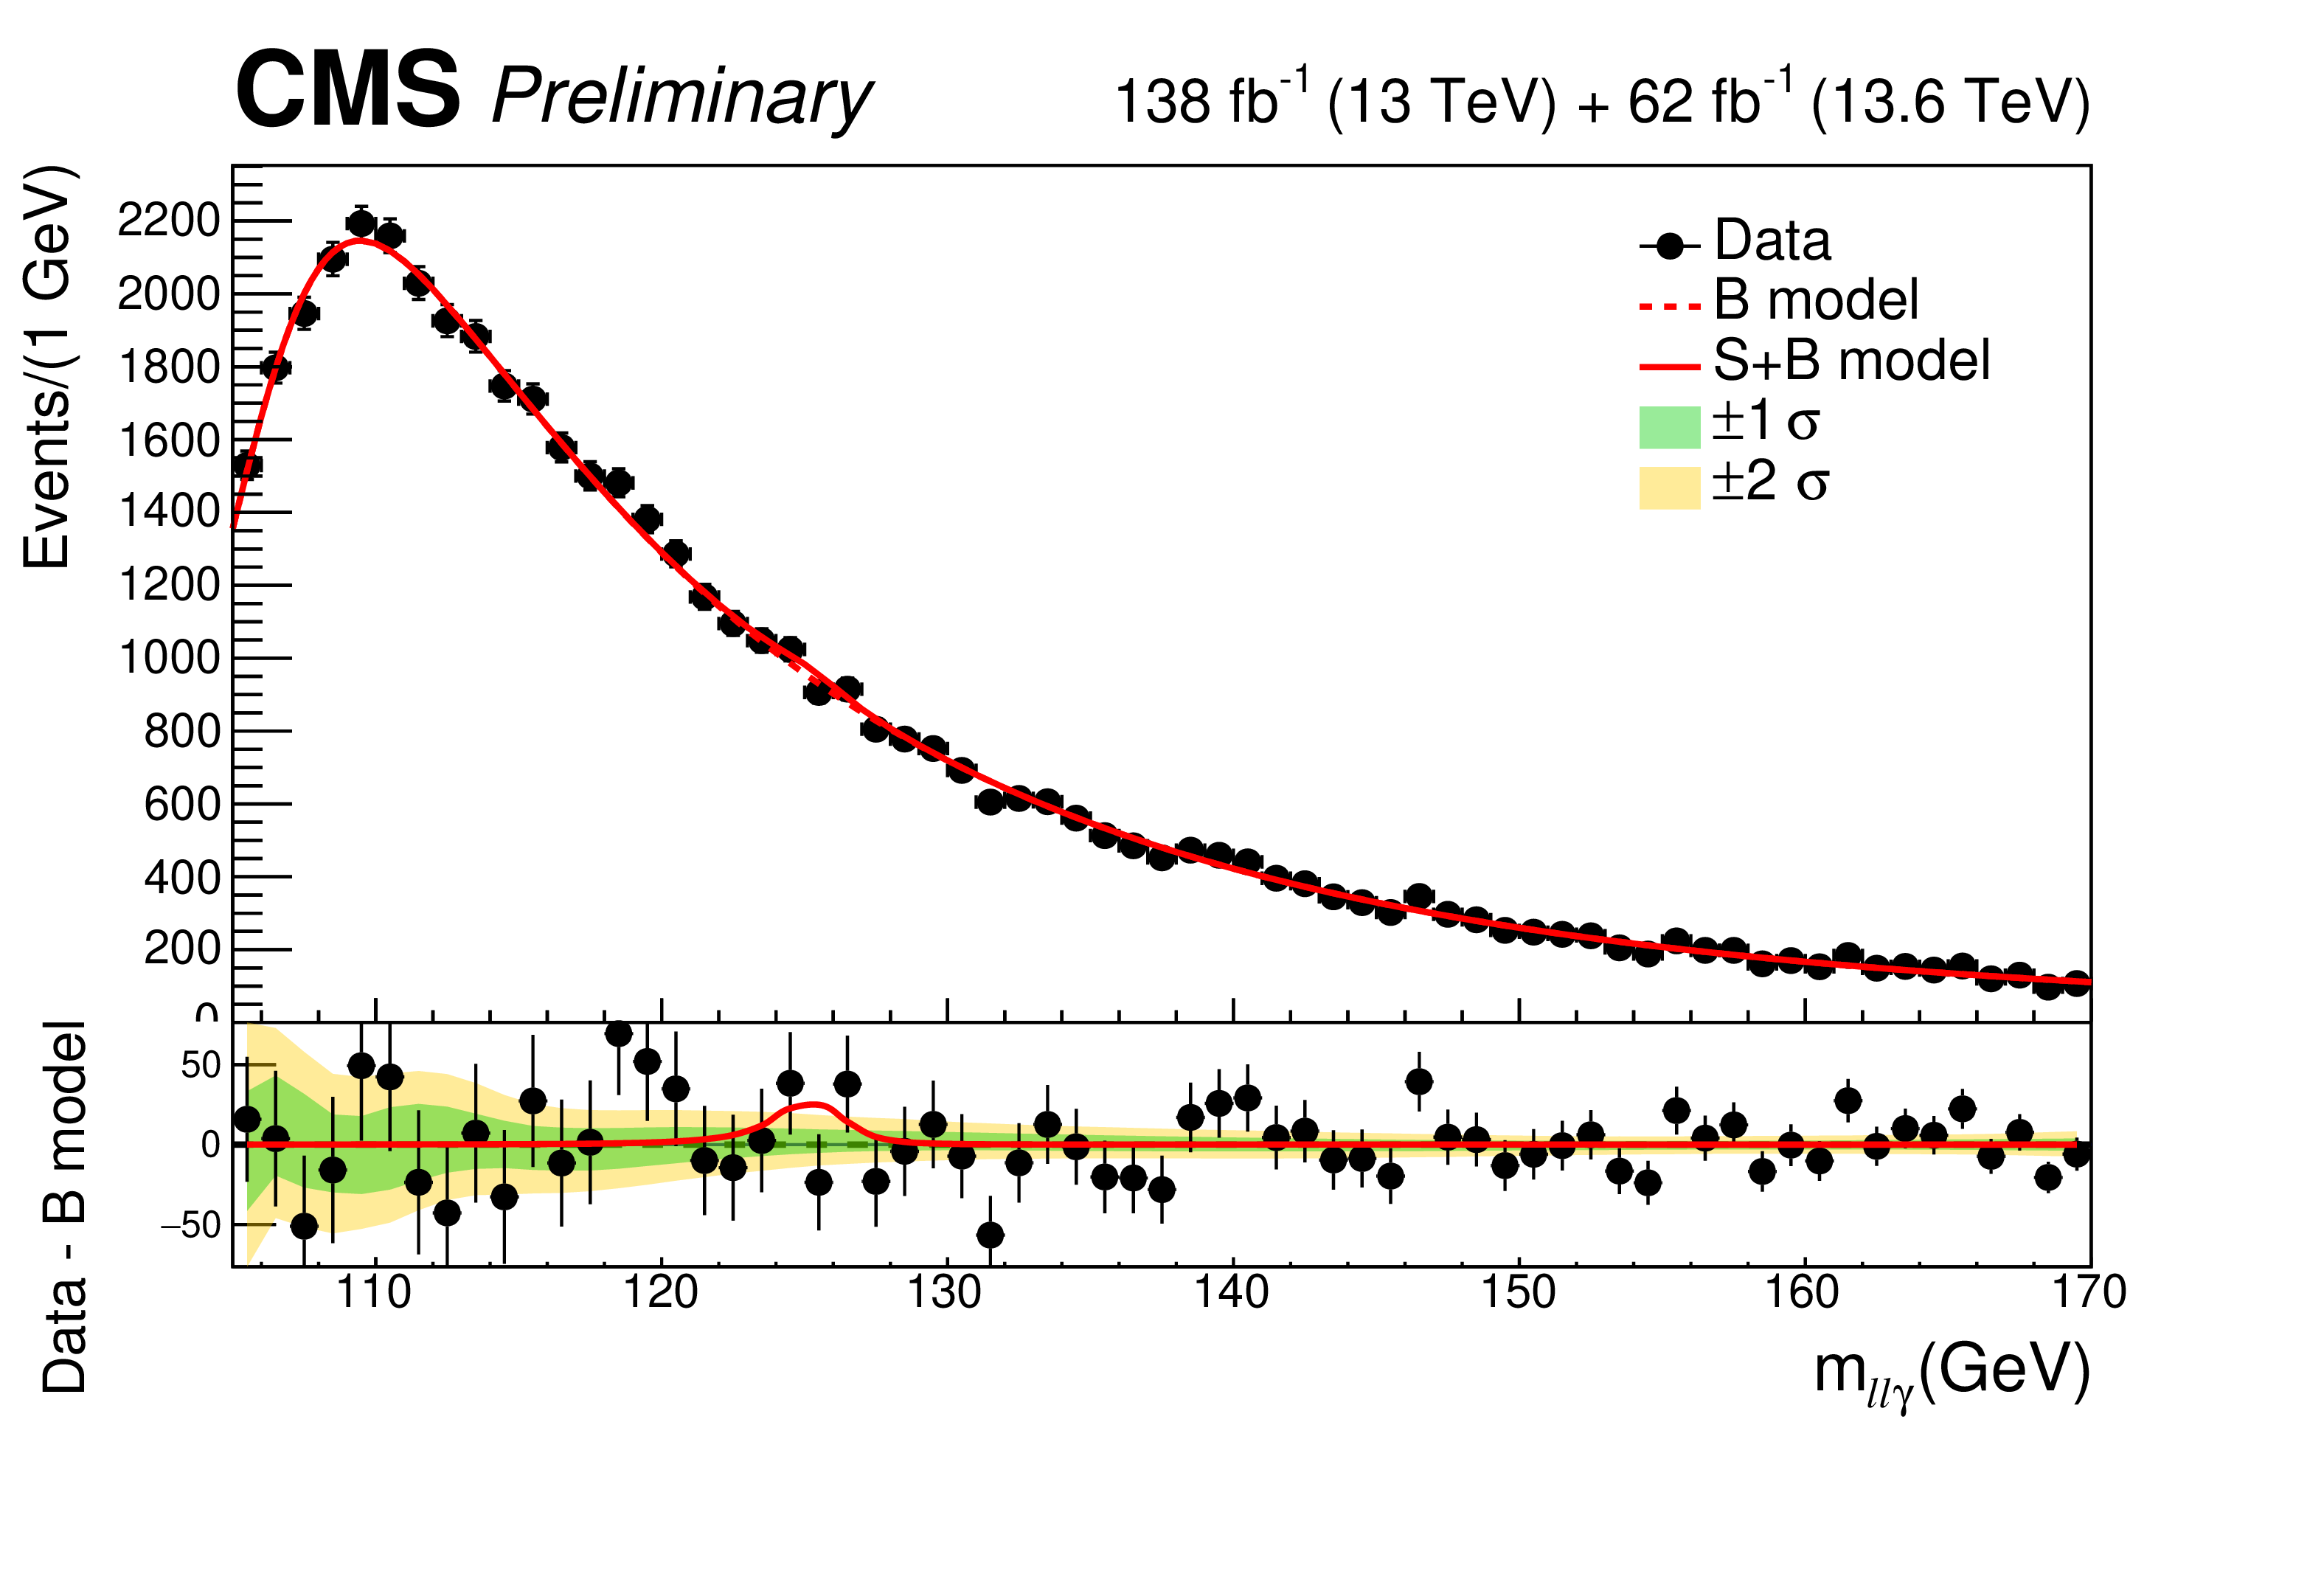
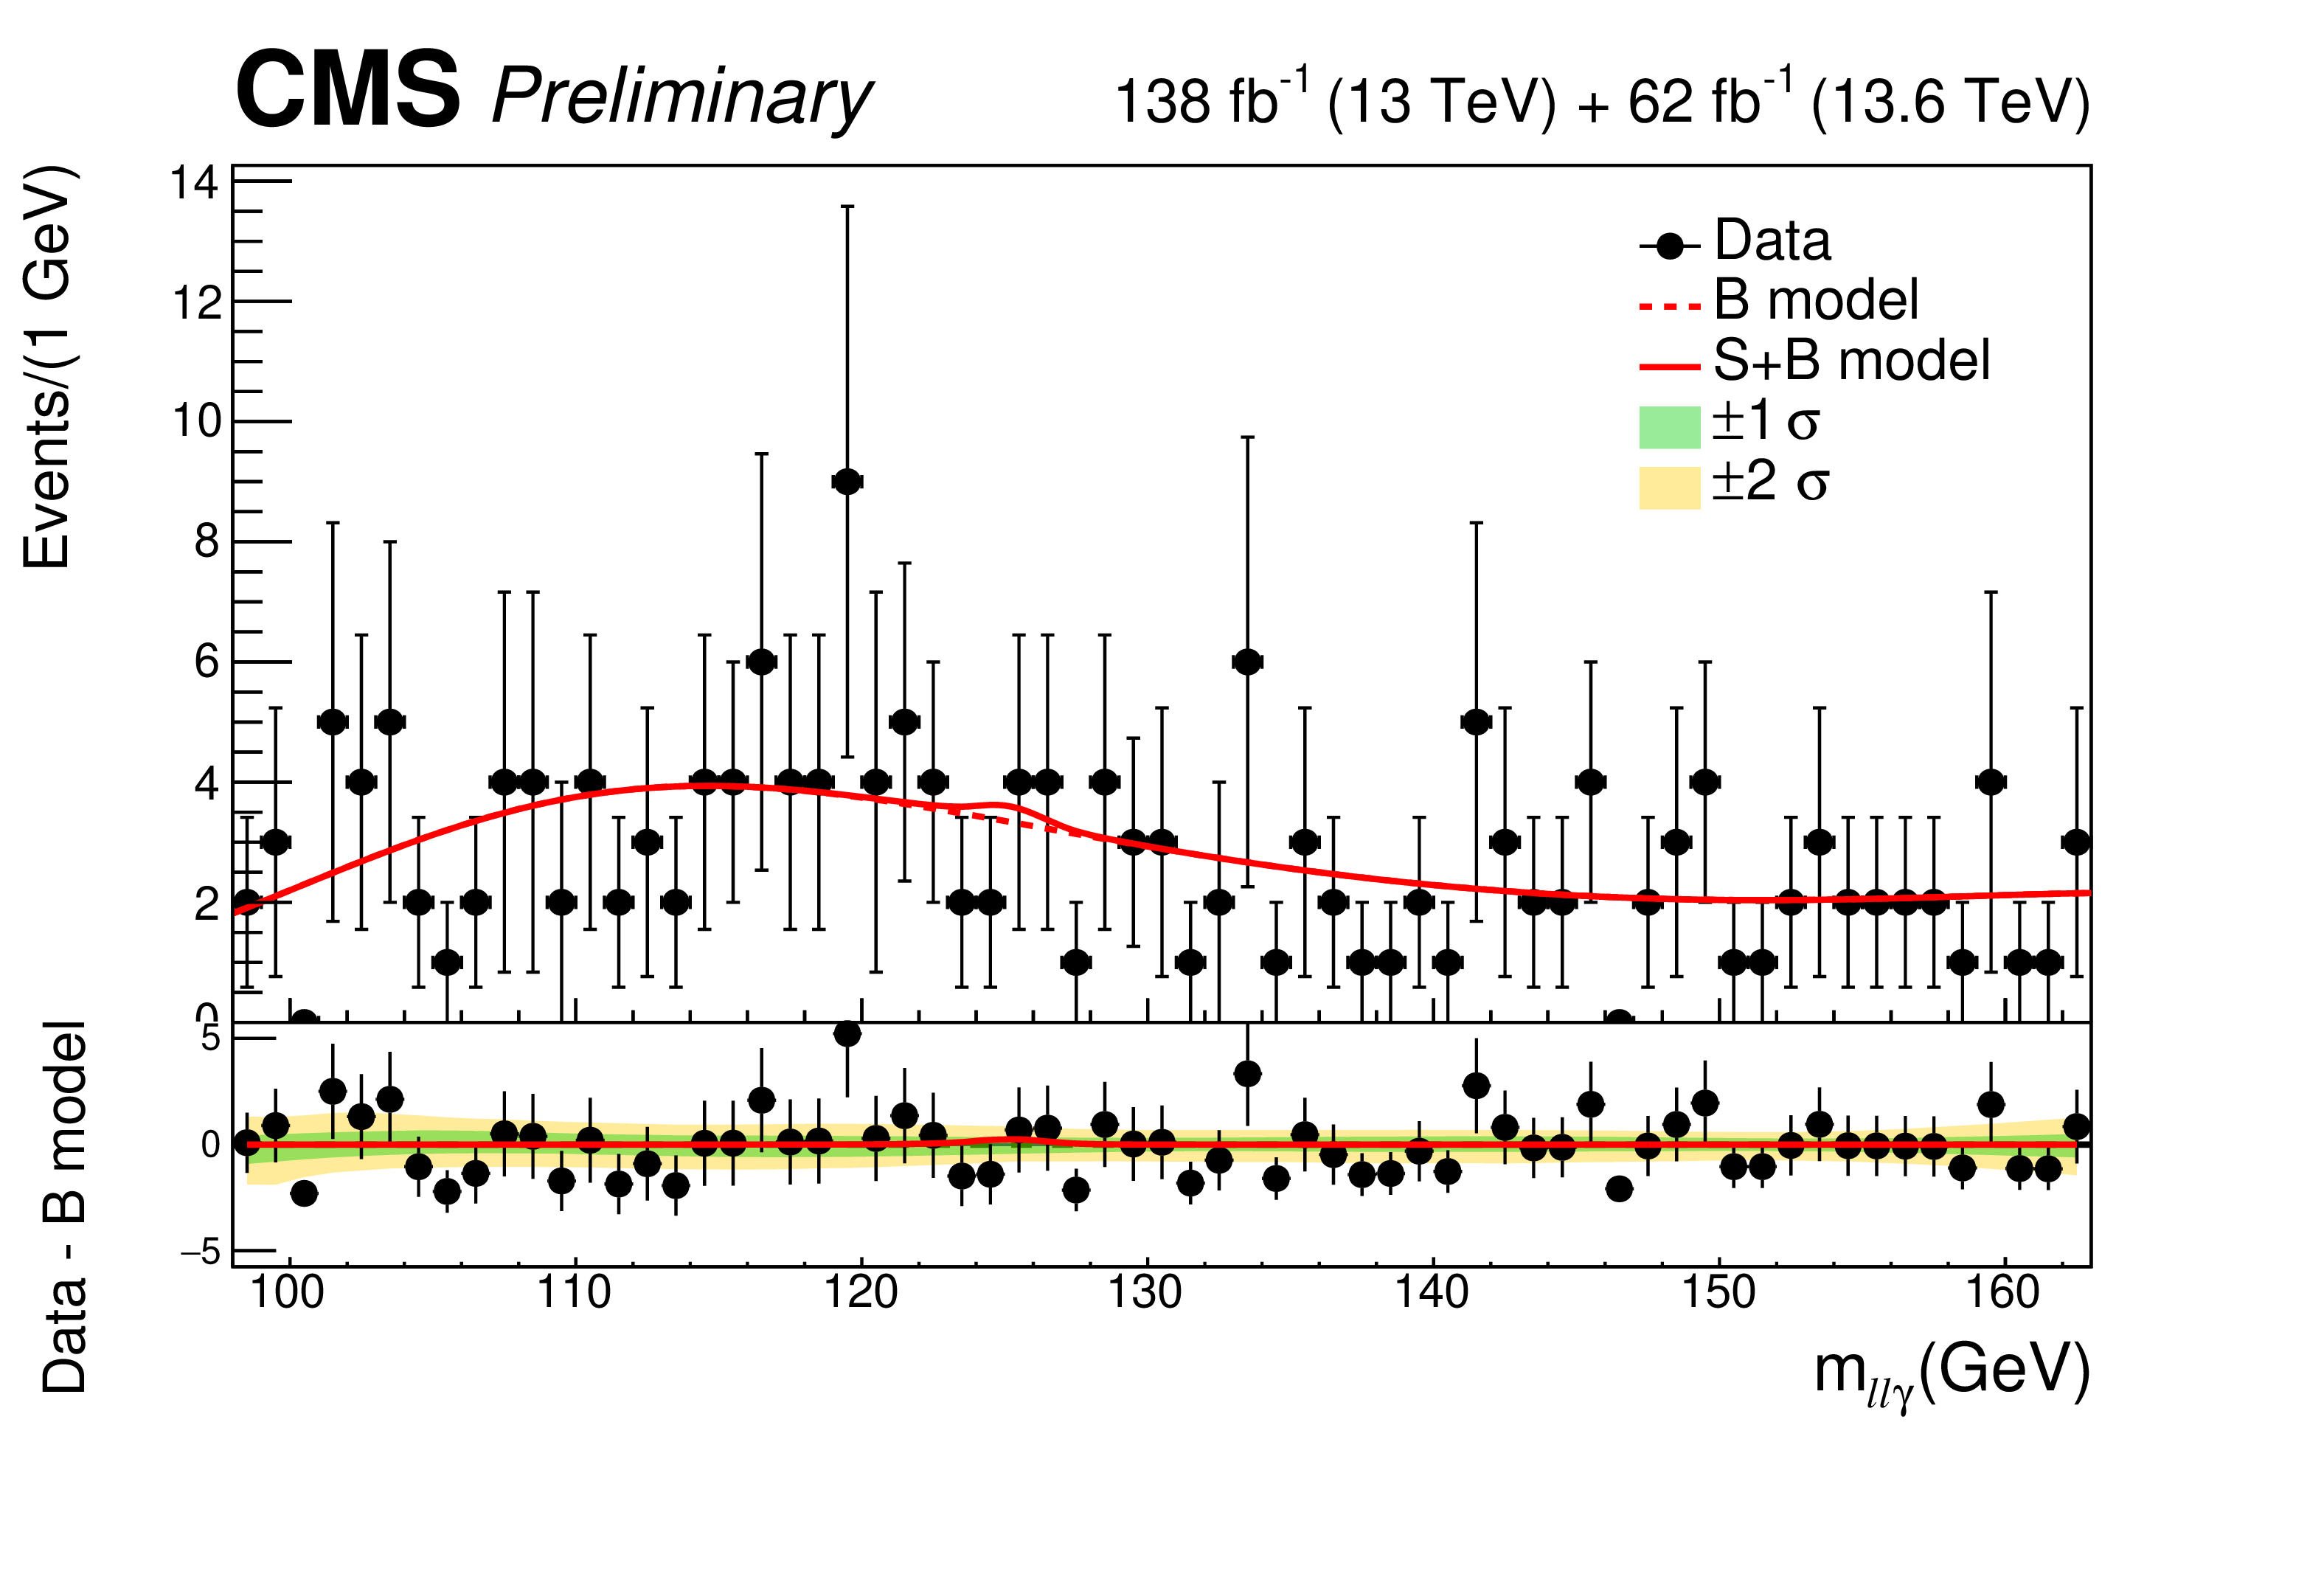
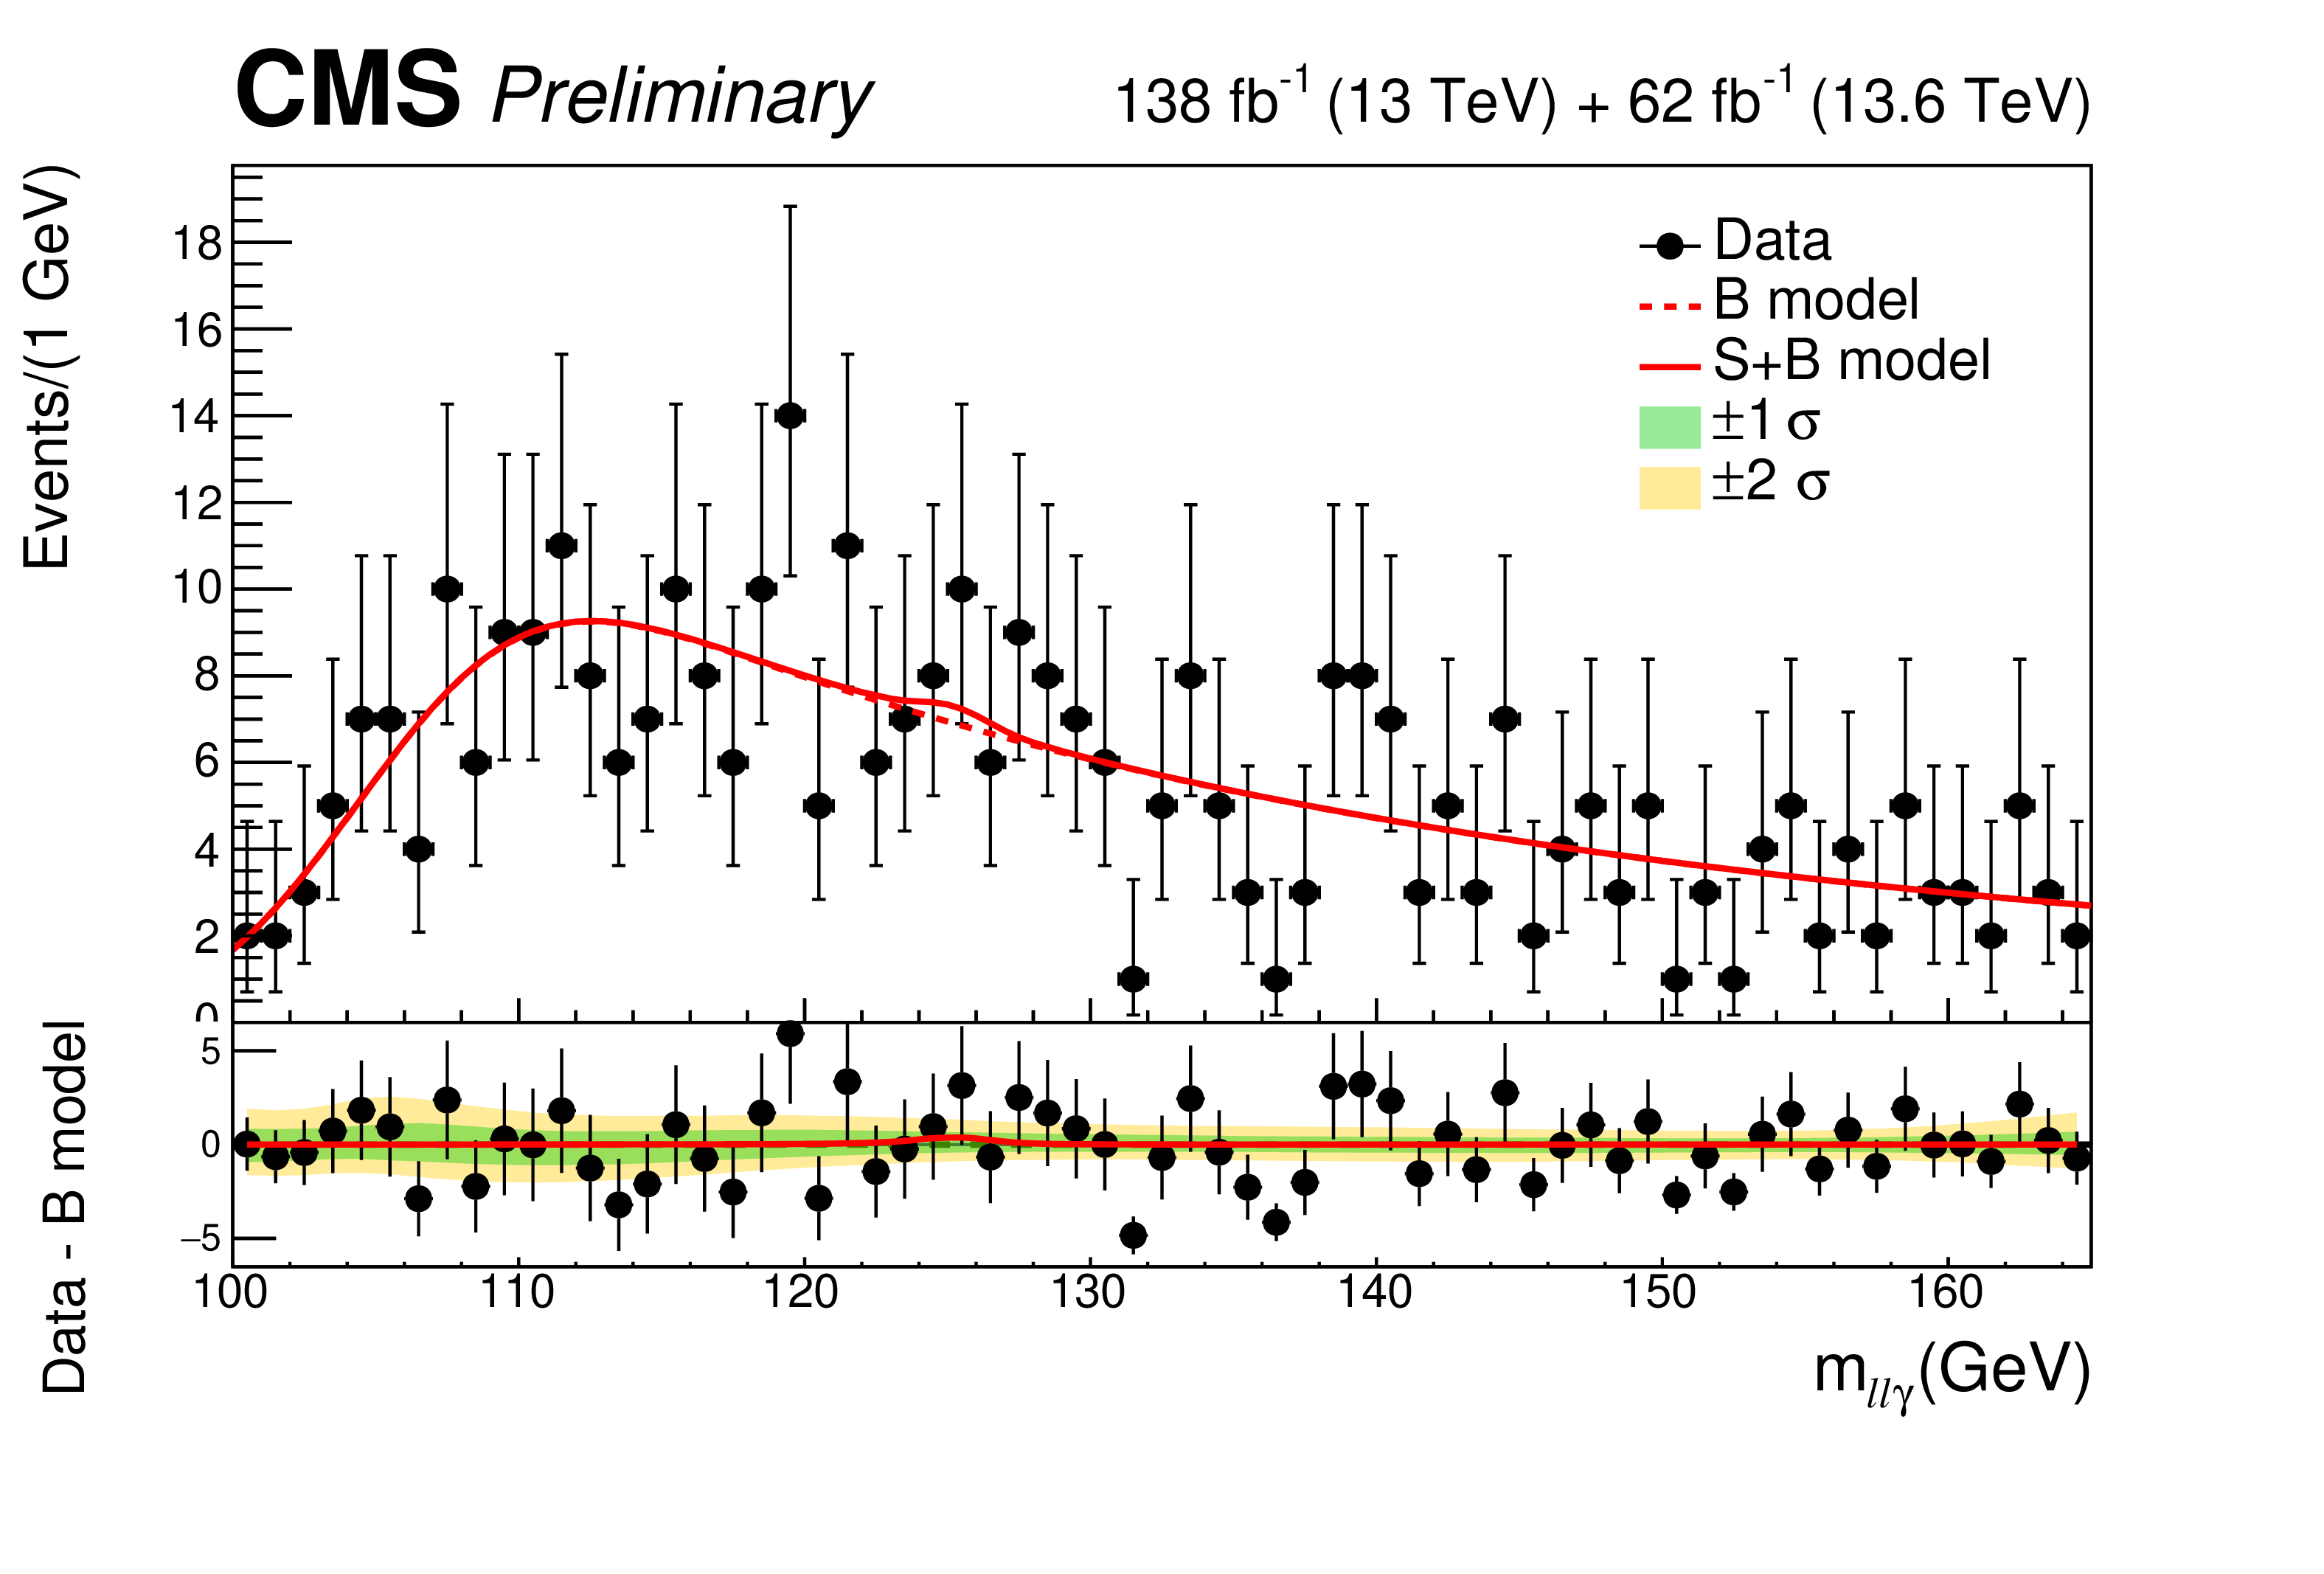
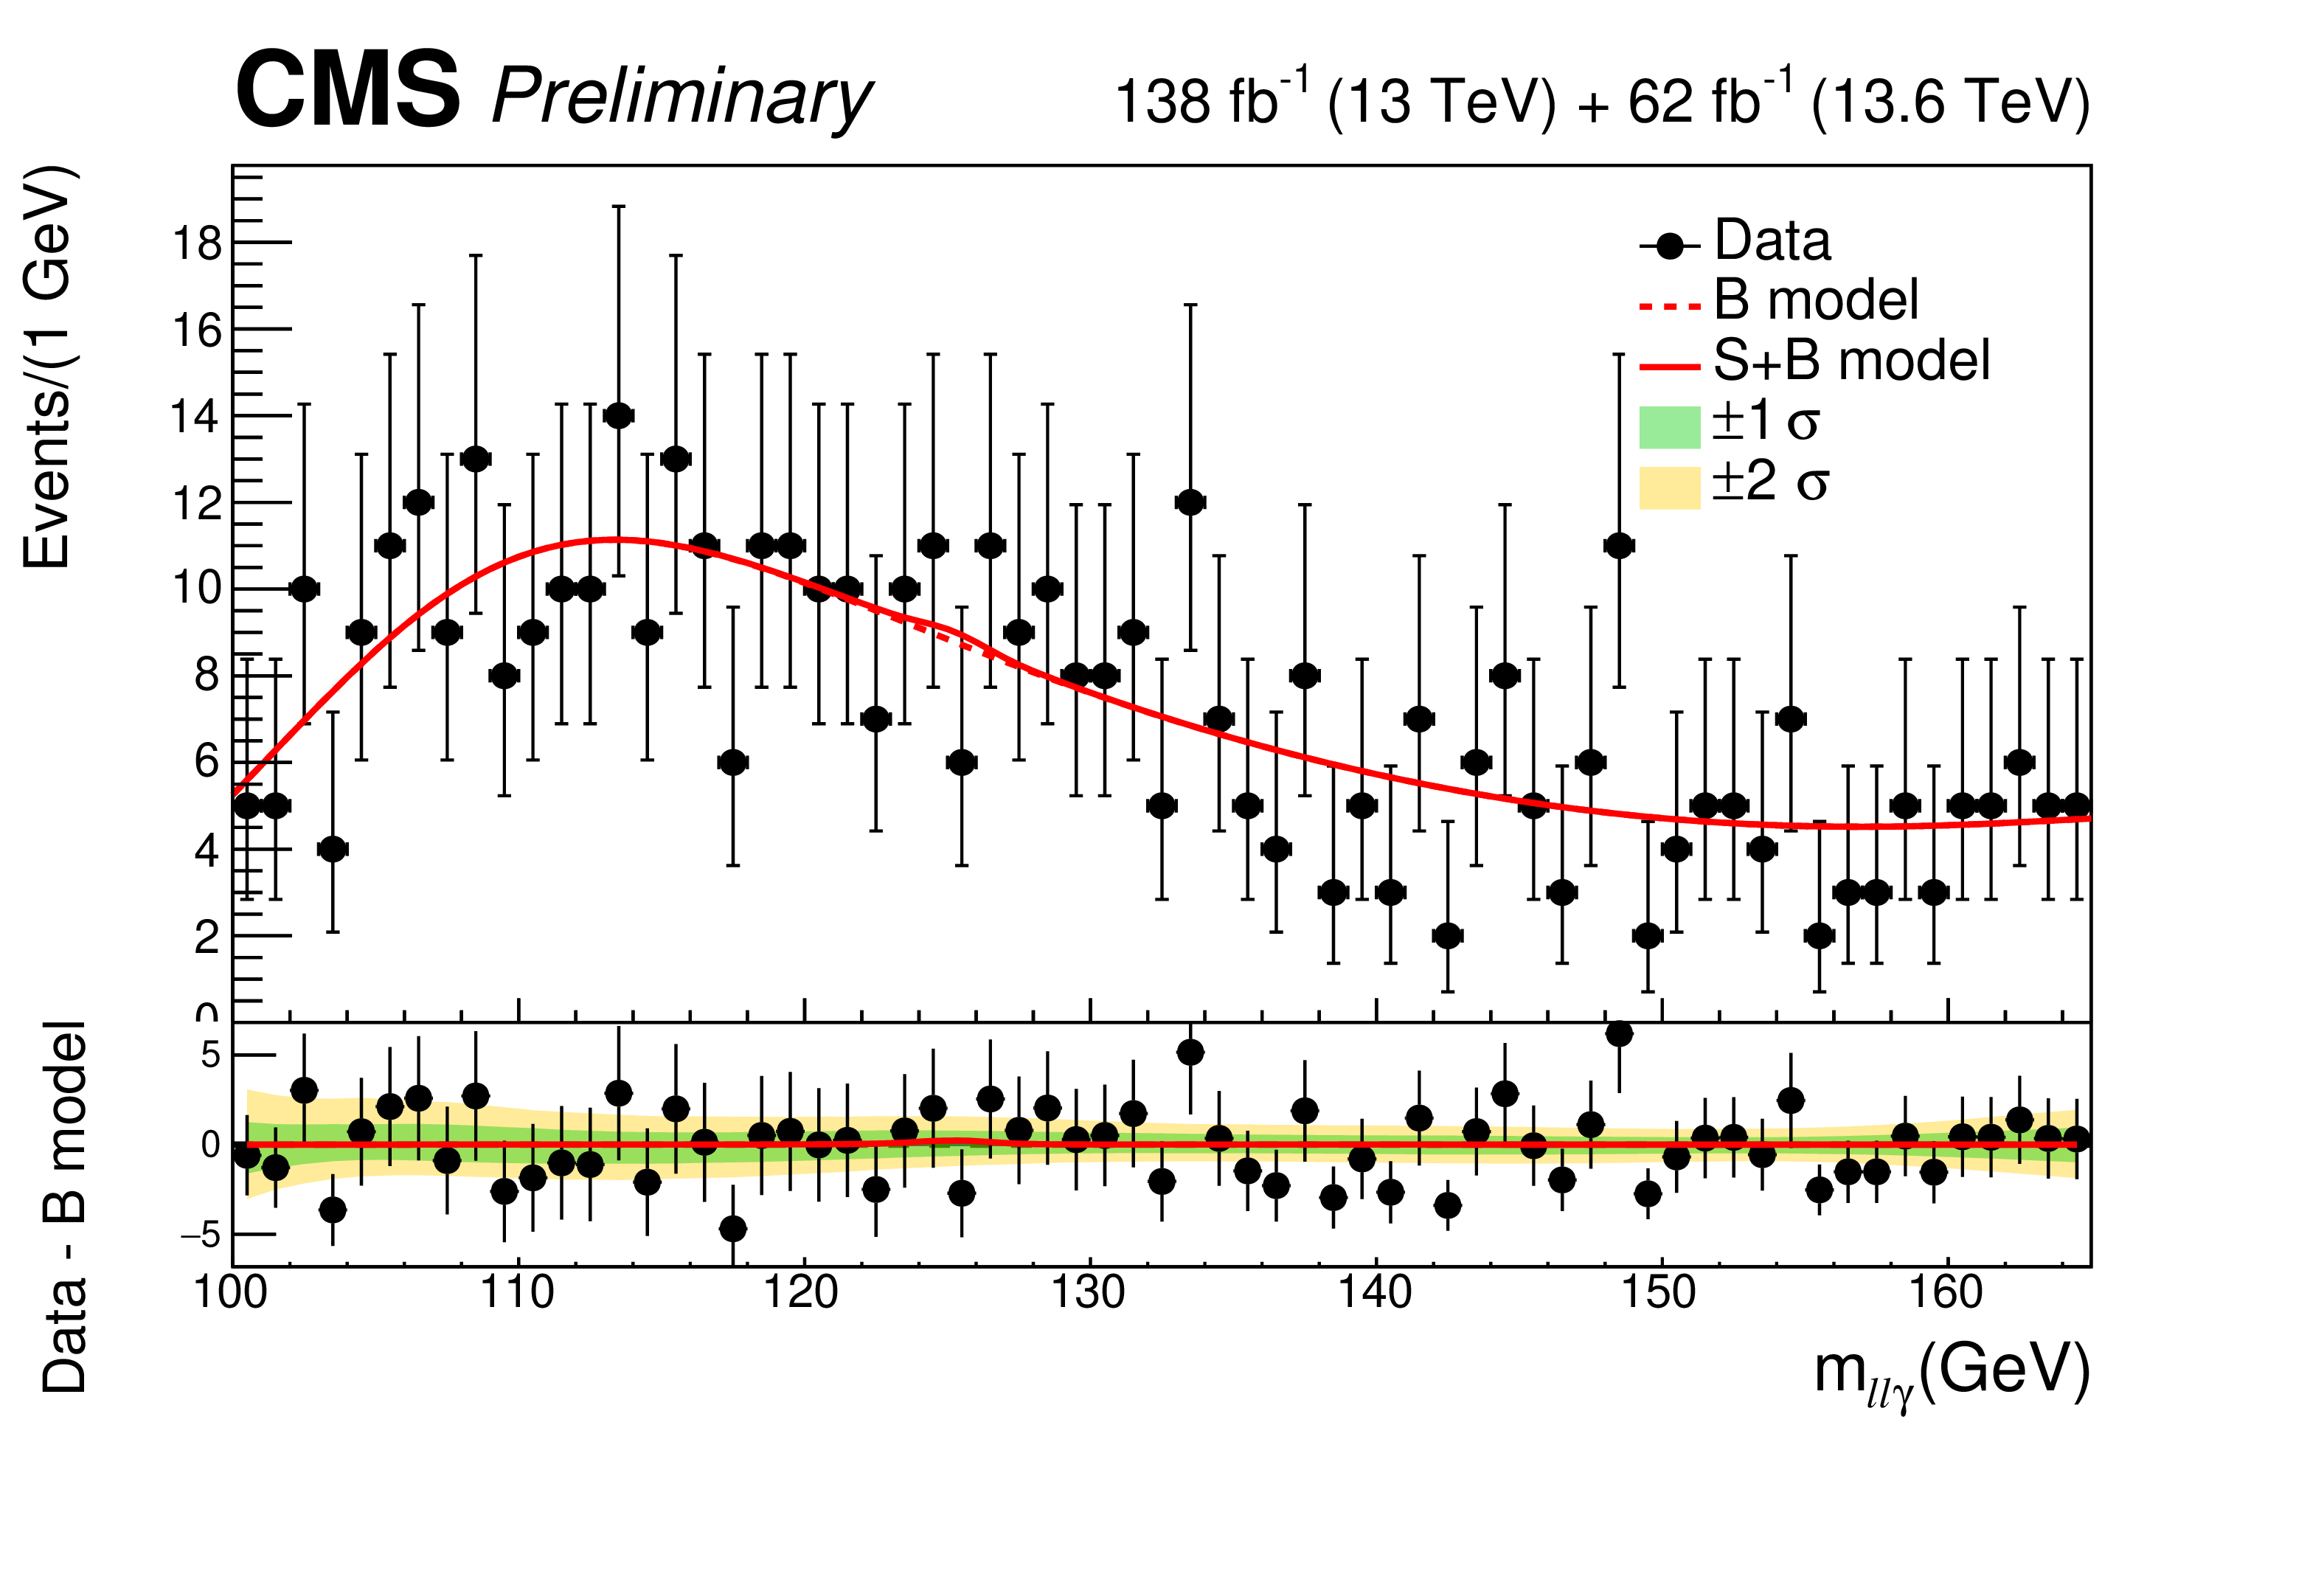
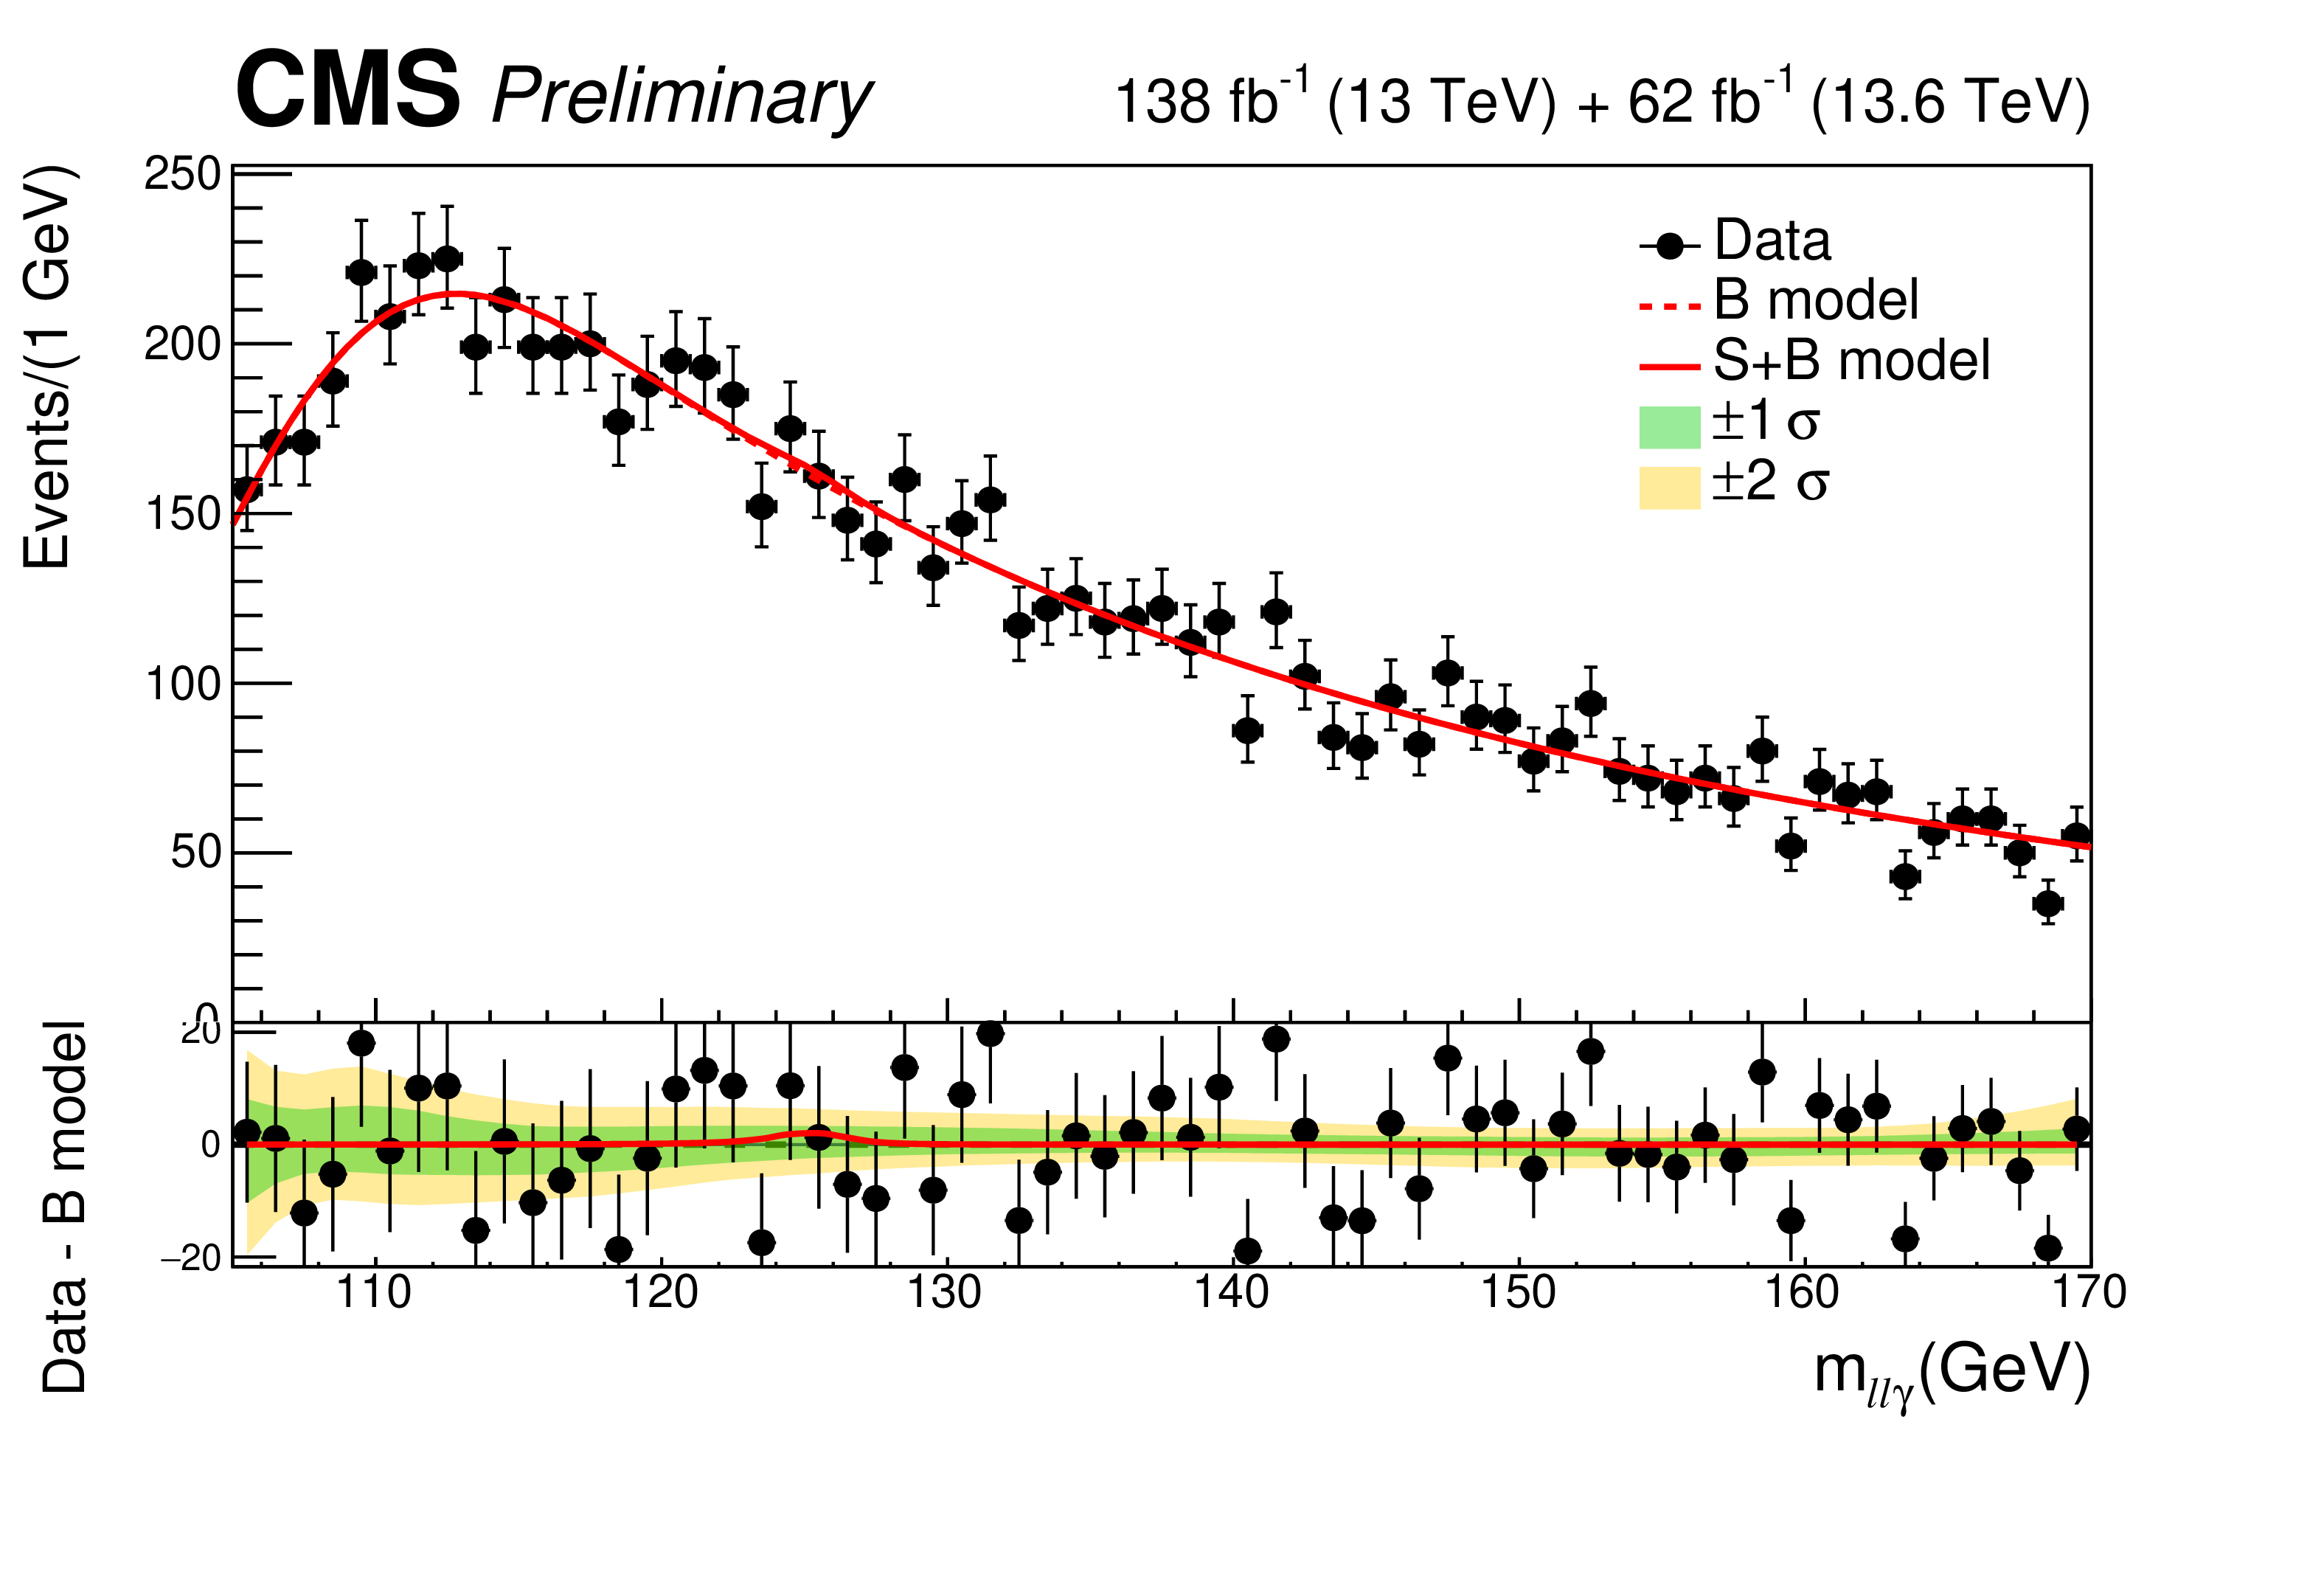
Distributions of $ m_{\ell \ell \gamma} $ in each of the ggF categories with the results of the simultaneous fit to all categories superimposed. |
png pdf |
Figure 4-a:
Distributions of $ m_{\ell \ell \gamma} $ in each of the ggF categories with the results of the simultaneous fit to all categories superimposed. |
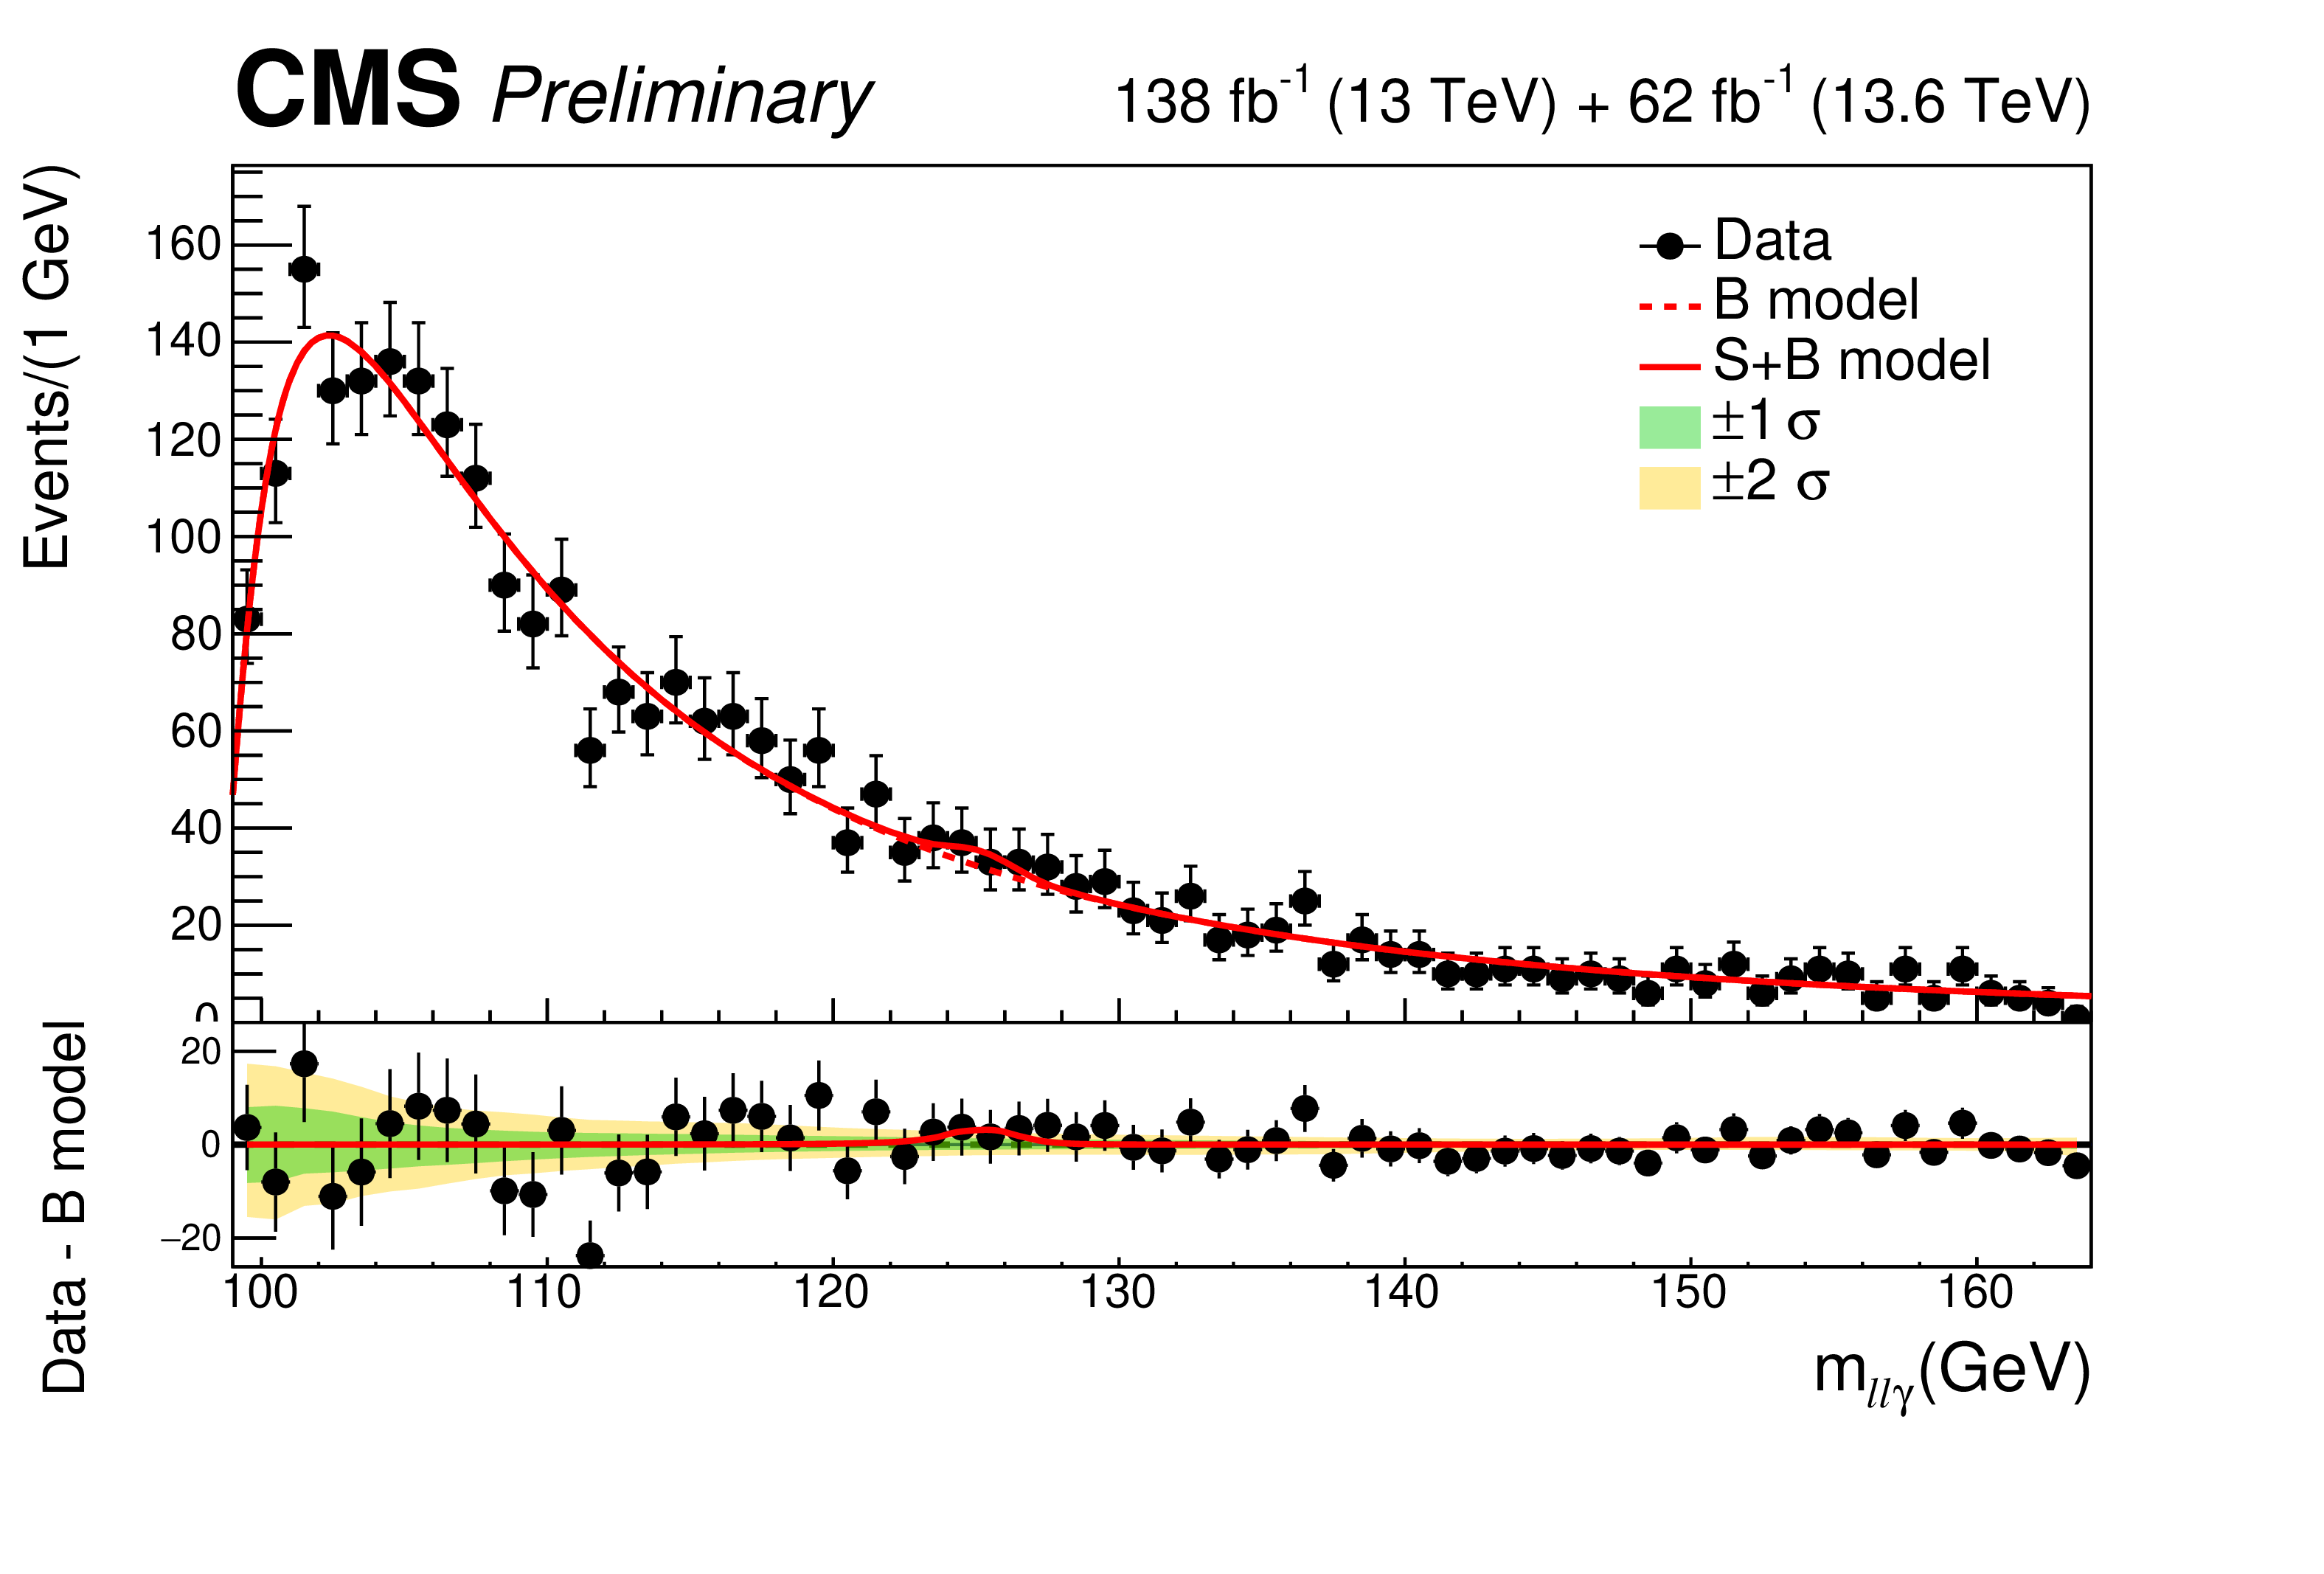
png pdf |
Figure 4-b:
Distributions of $ m_{\ell \ell \gamma} $ in each of the ggF categories with the results of the simultaneous fit to all categories superimposed. |
png pdf |
Figure 4-c:
Distributions of $ m_{\ell \ell \gamma} $ in each of the ggF categories with the results of the simultaneous fit to all categories superimposed. |
png pdf |
Figure 4-d:
Distributions of $ m_{\ell \ell \gamma} $ in each of the ggF categories with the results of the simultaneous fit to all categories superimposed. |
png pdf |
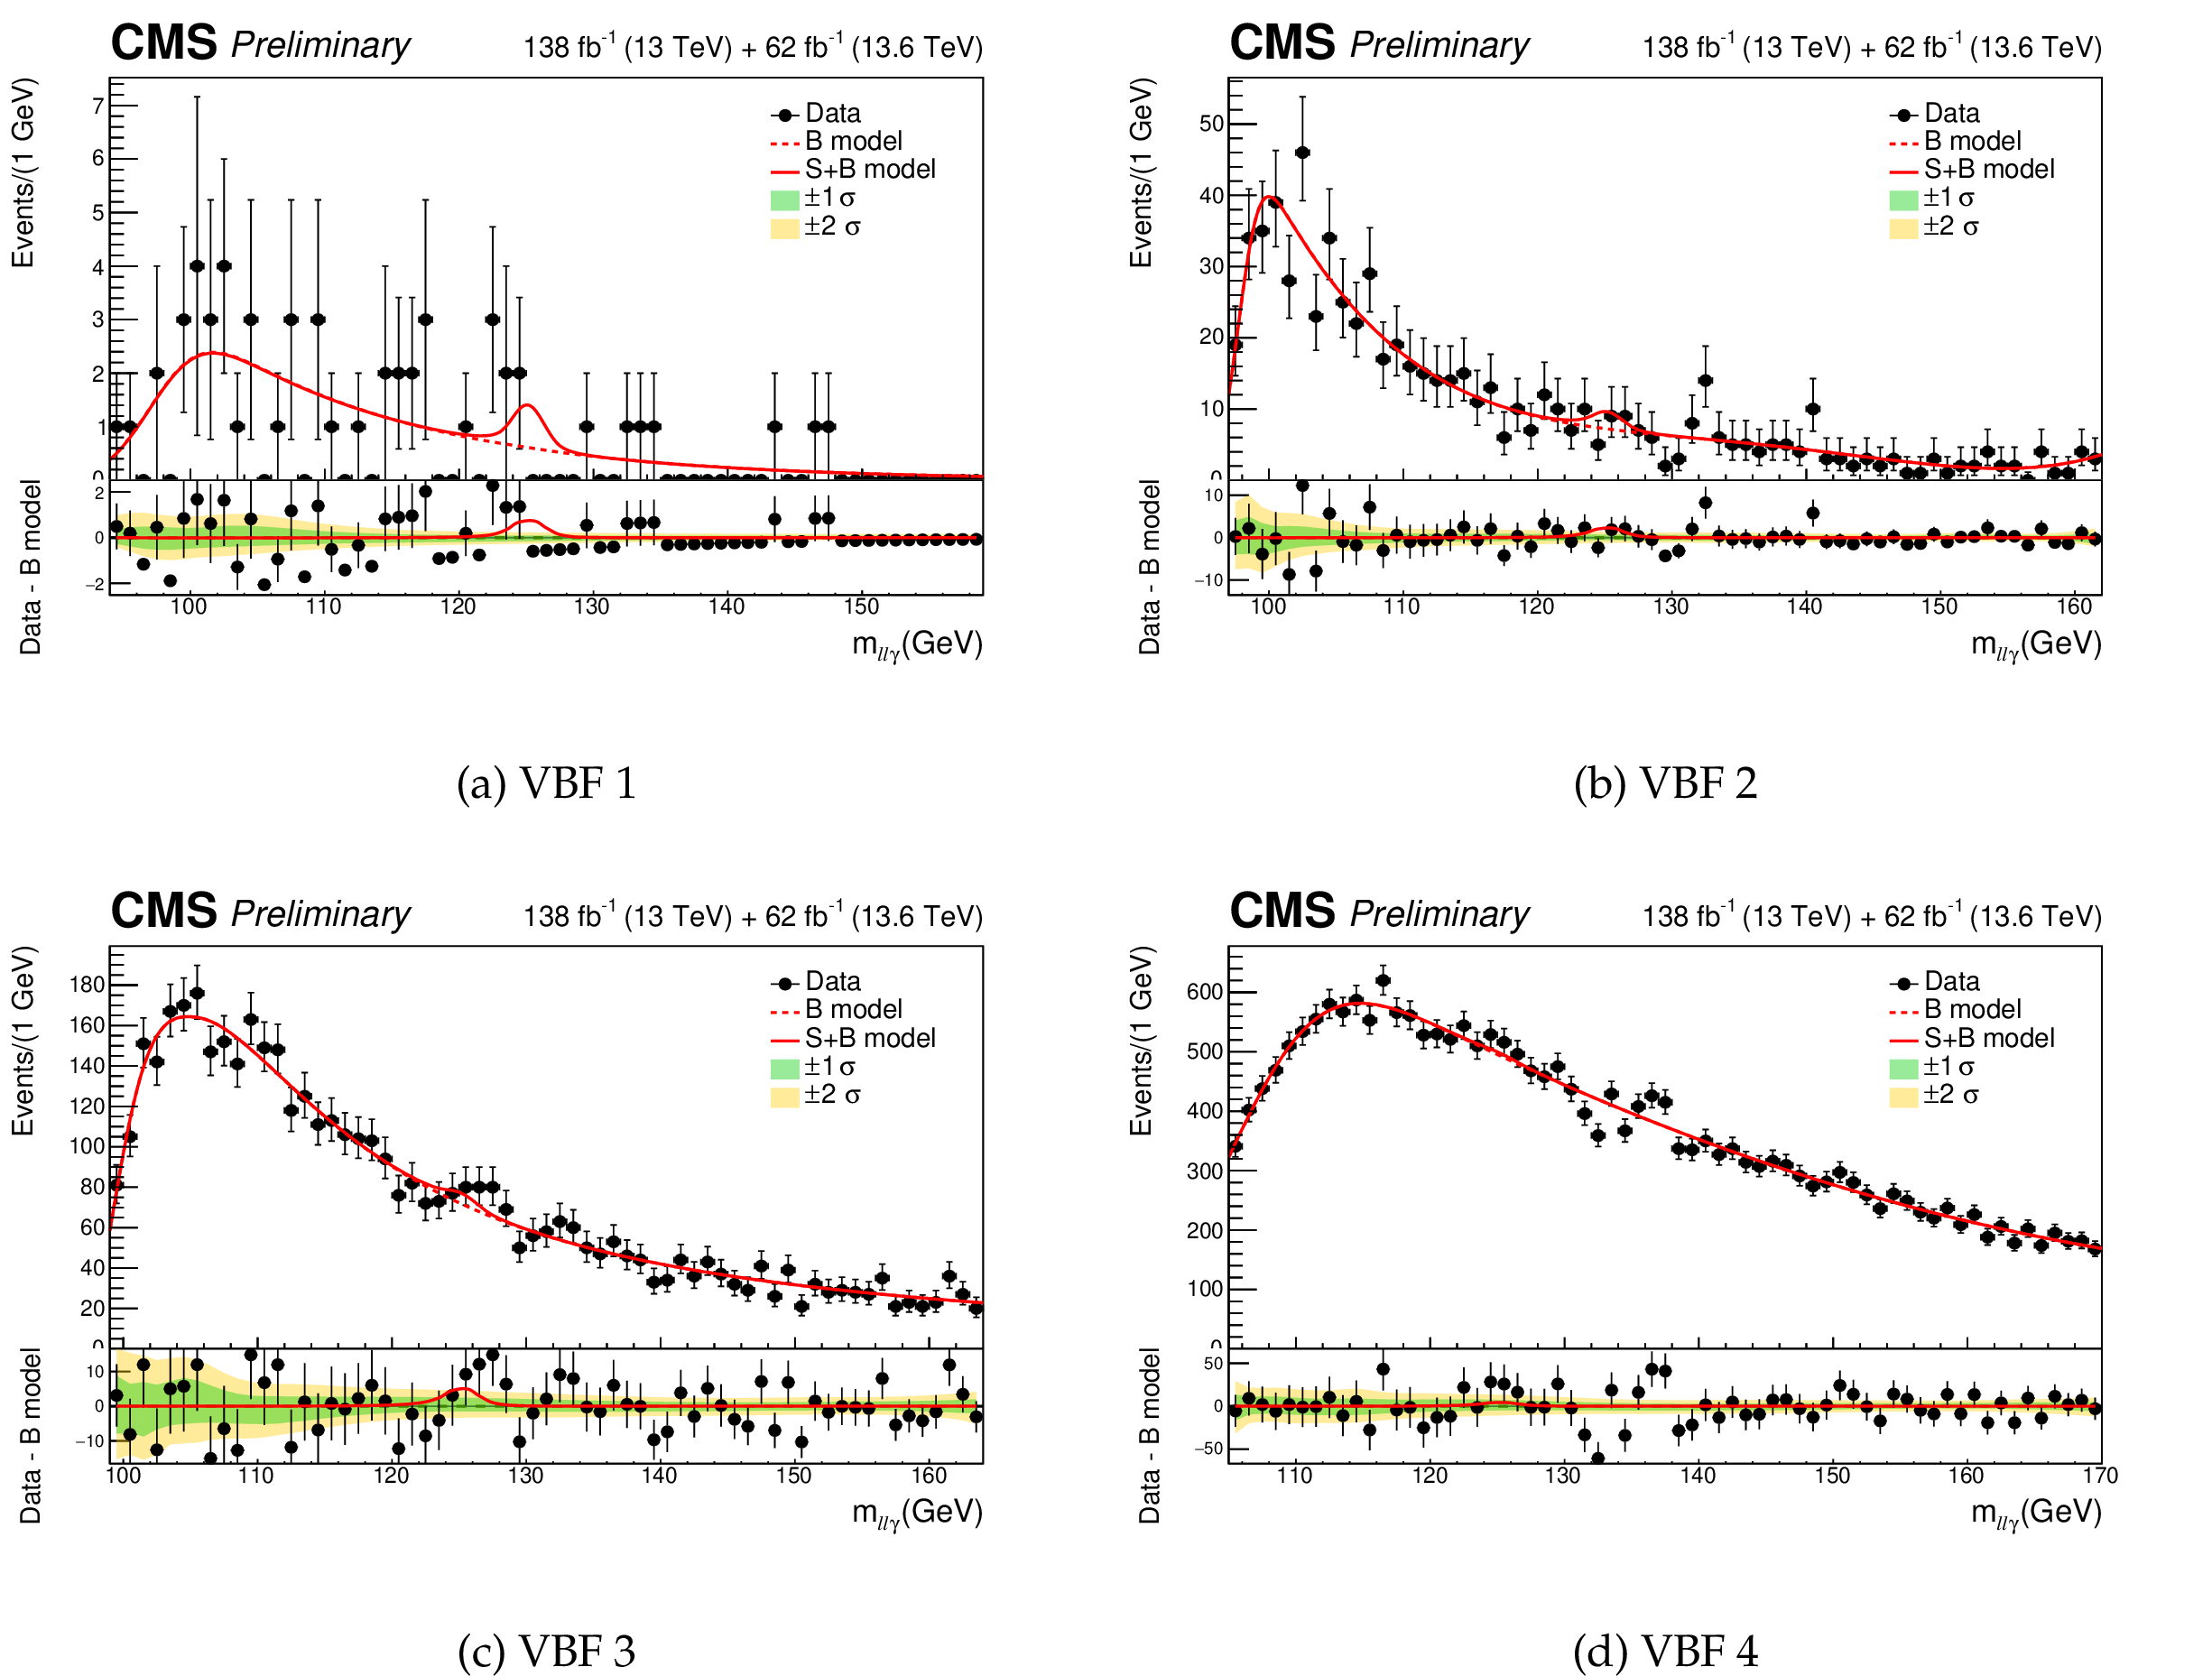
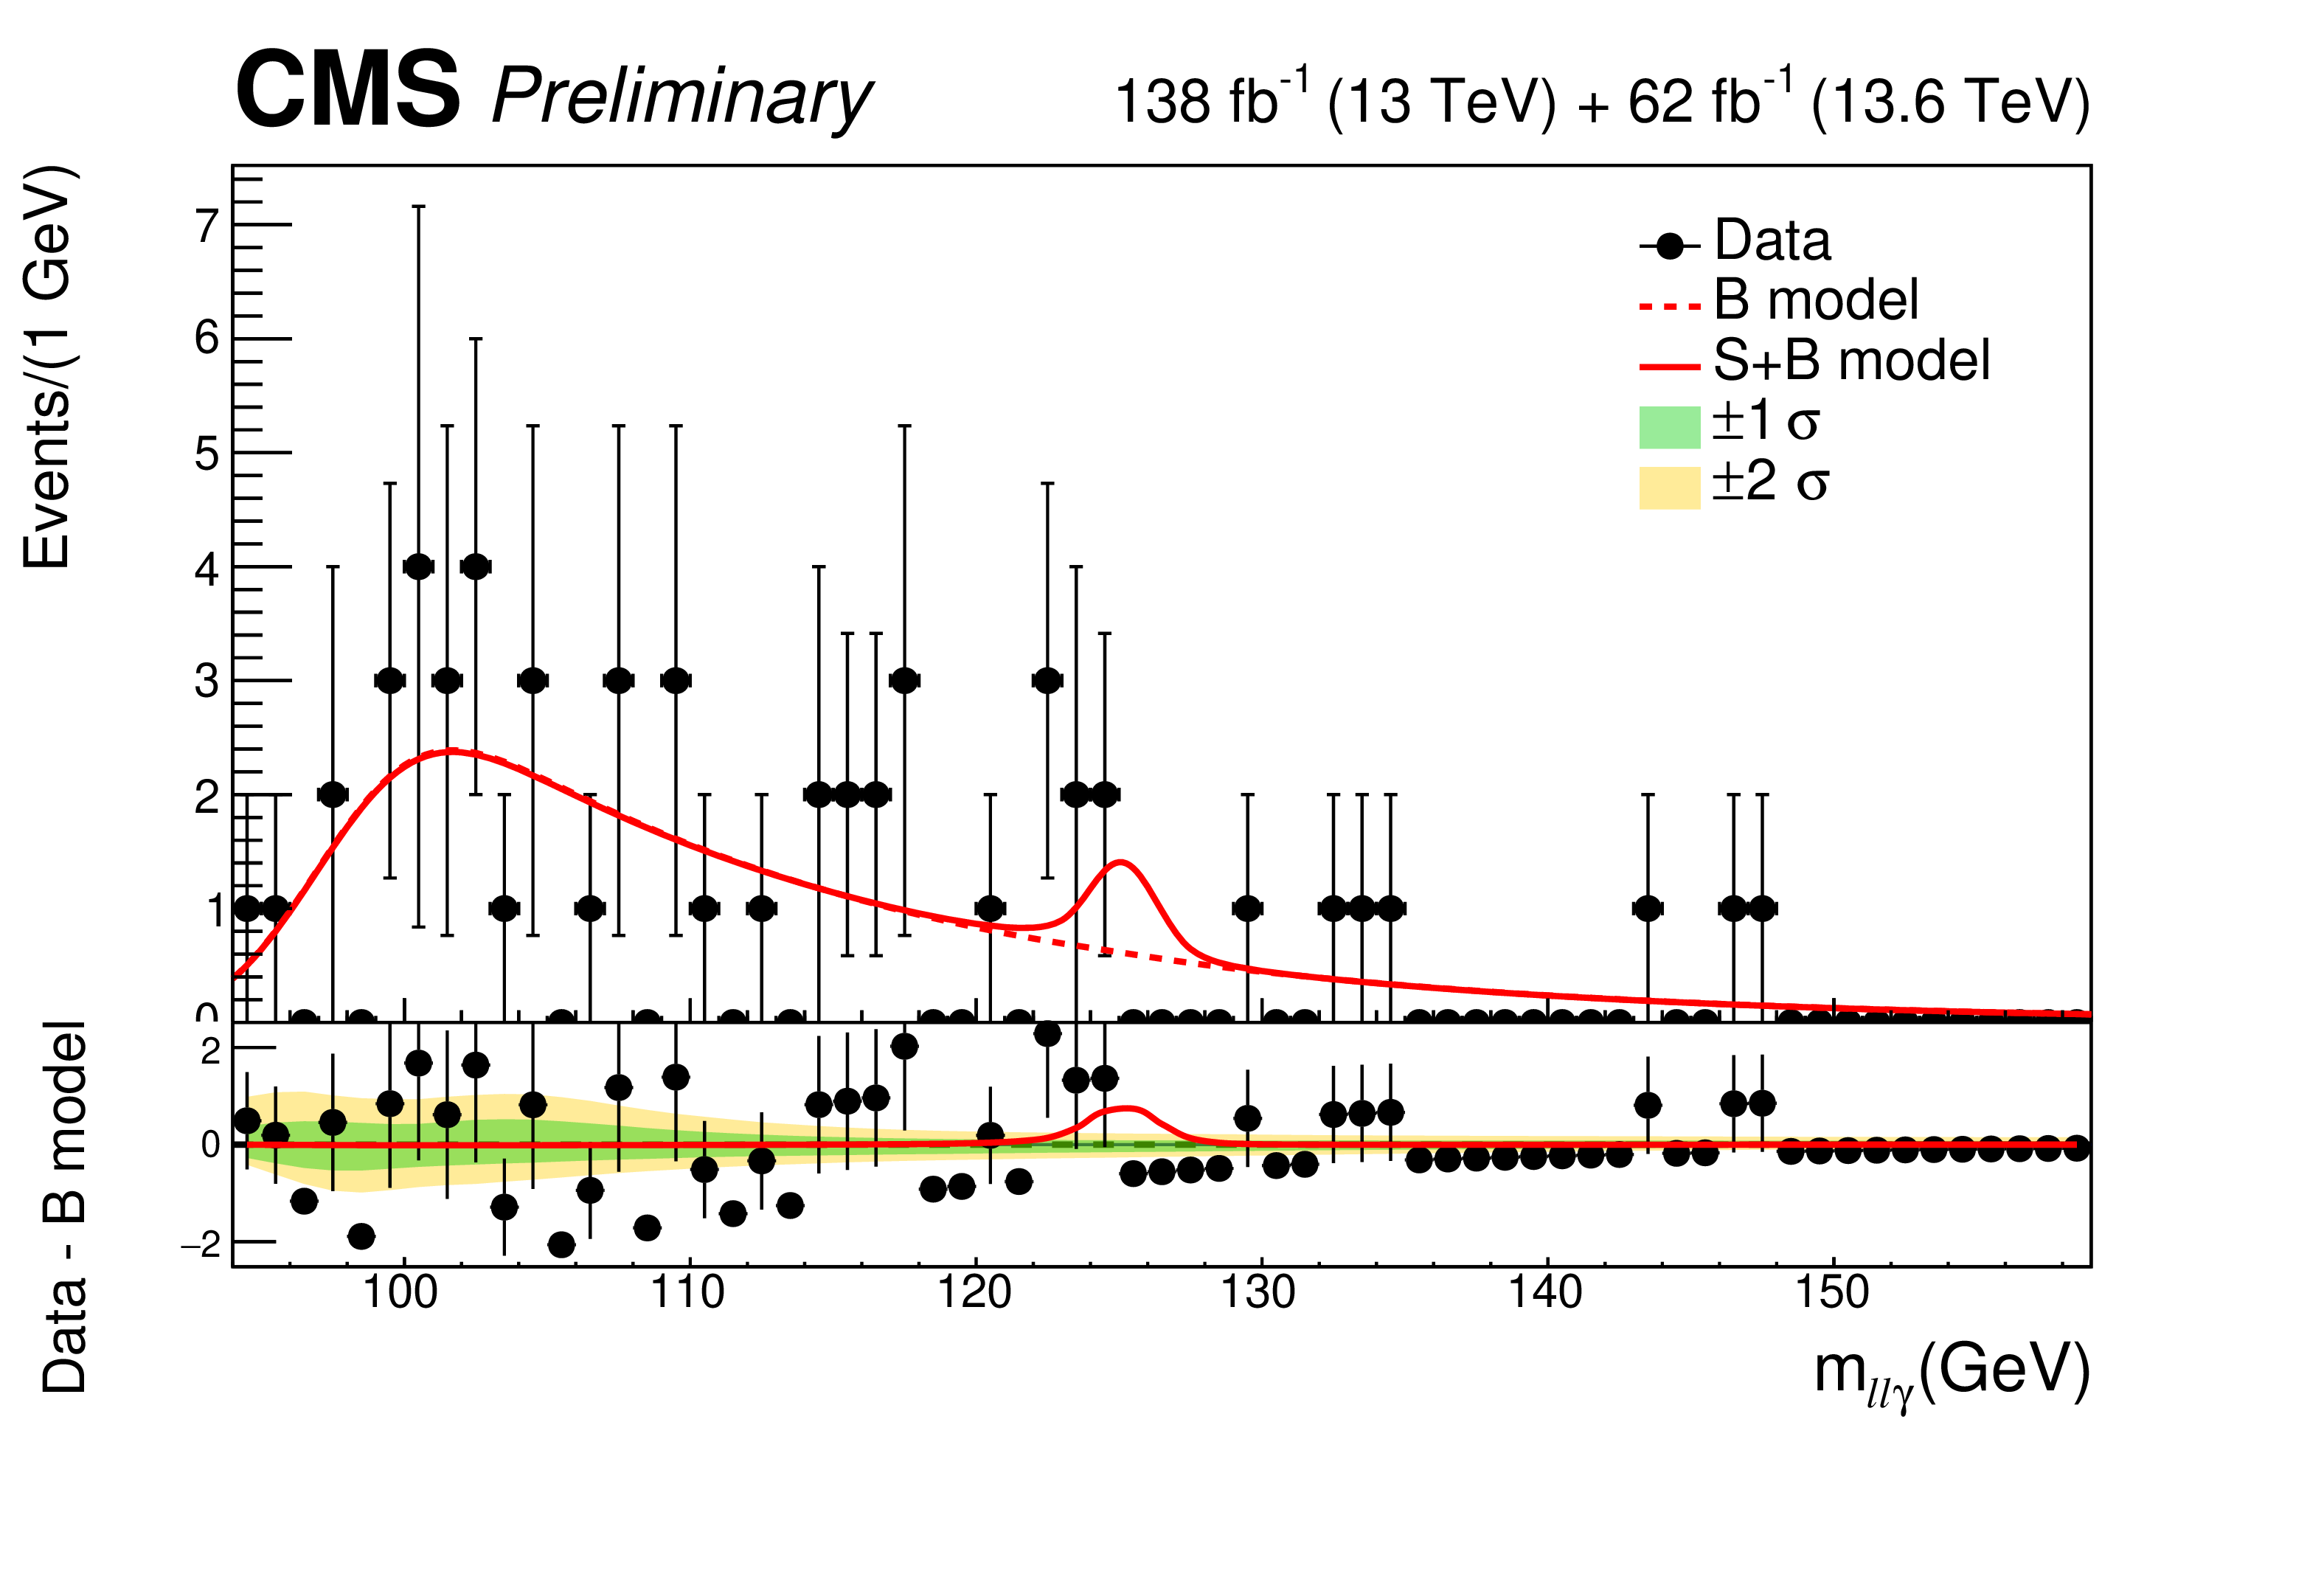
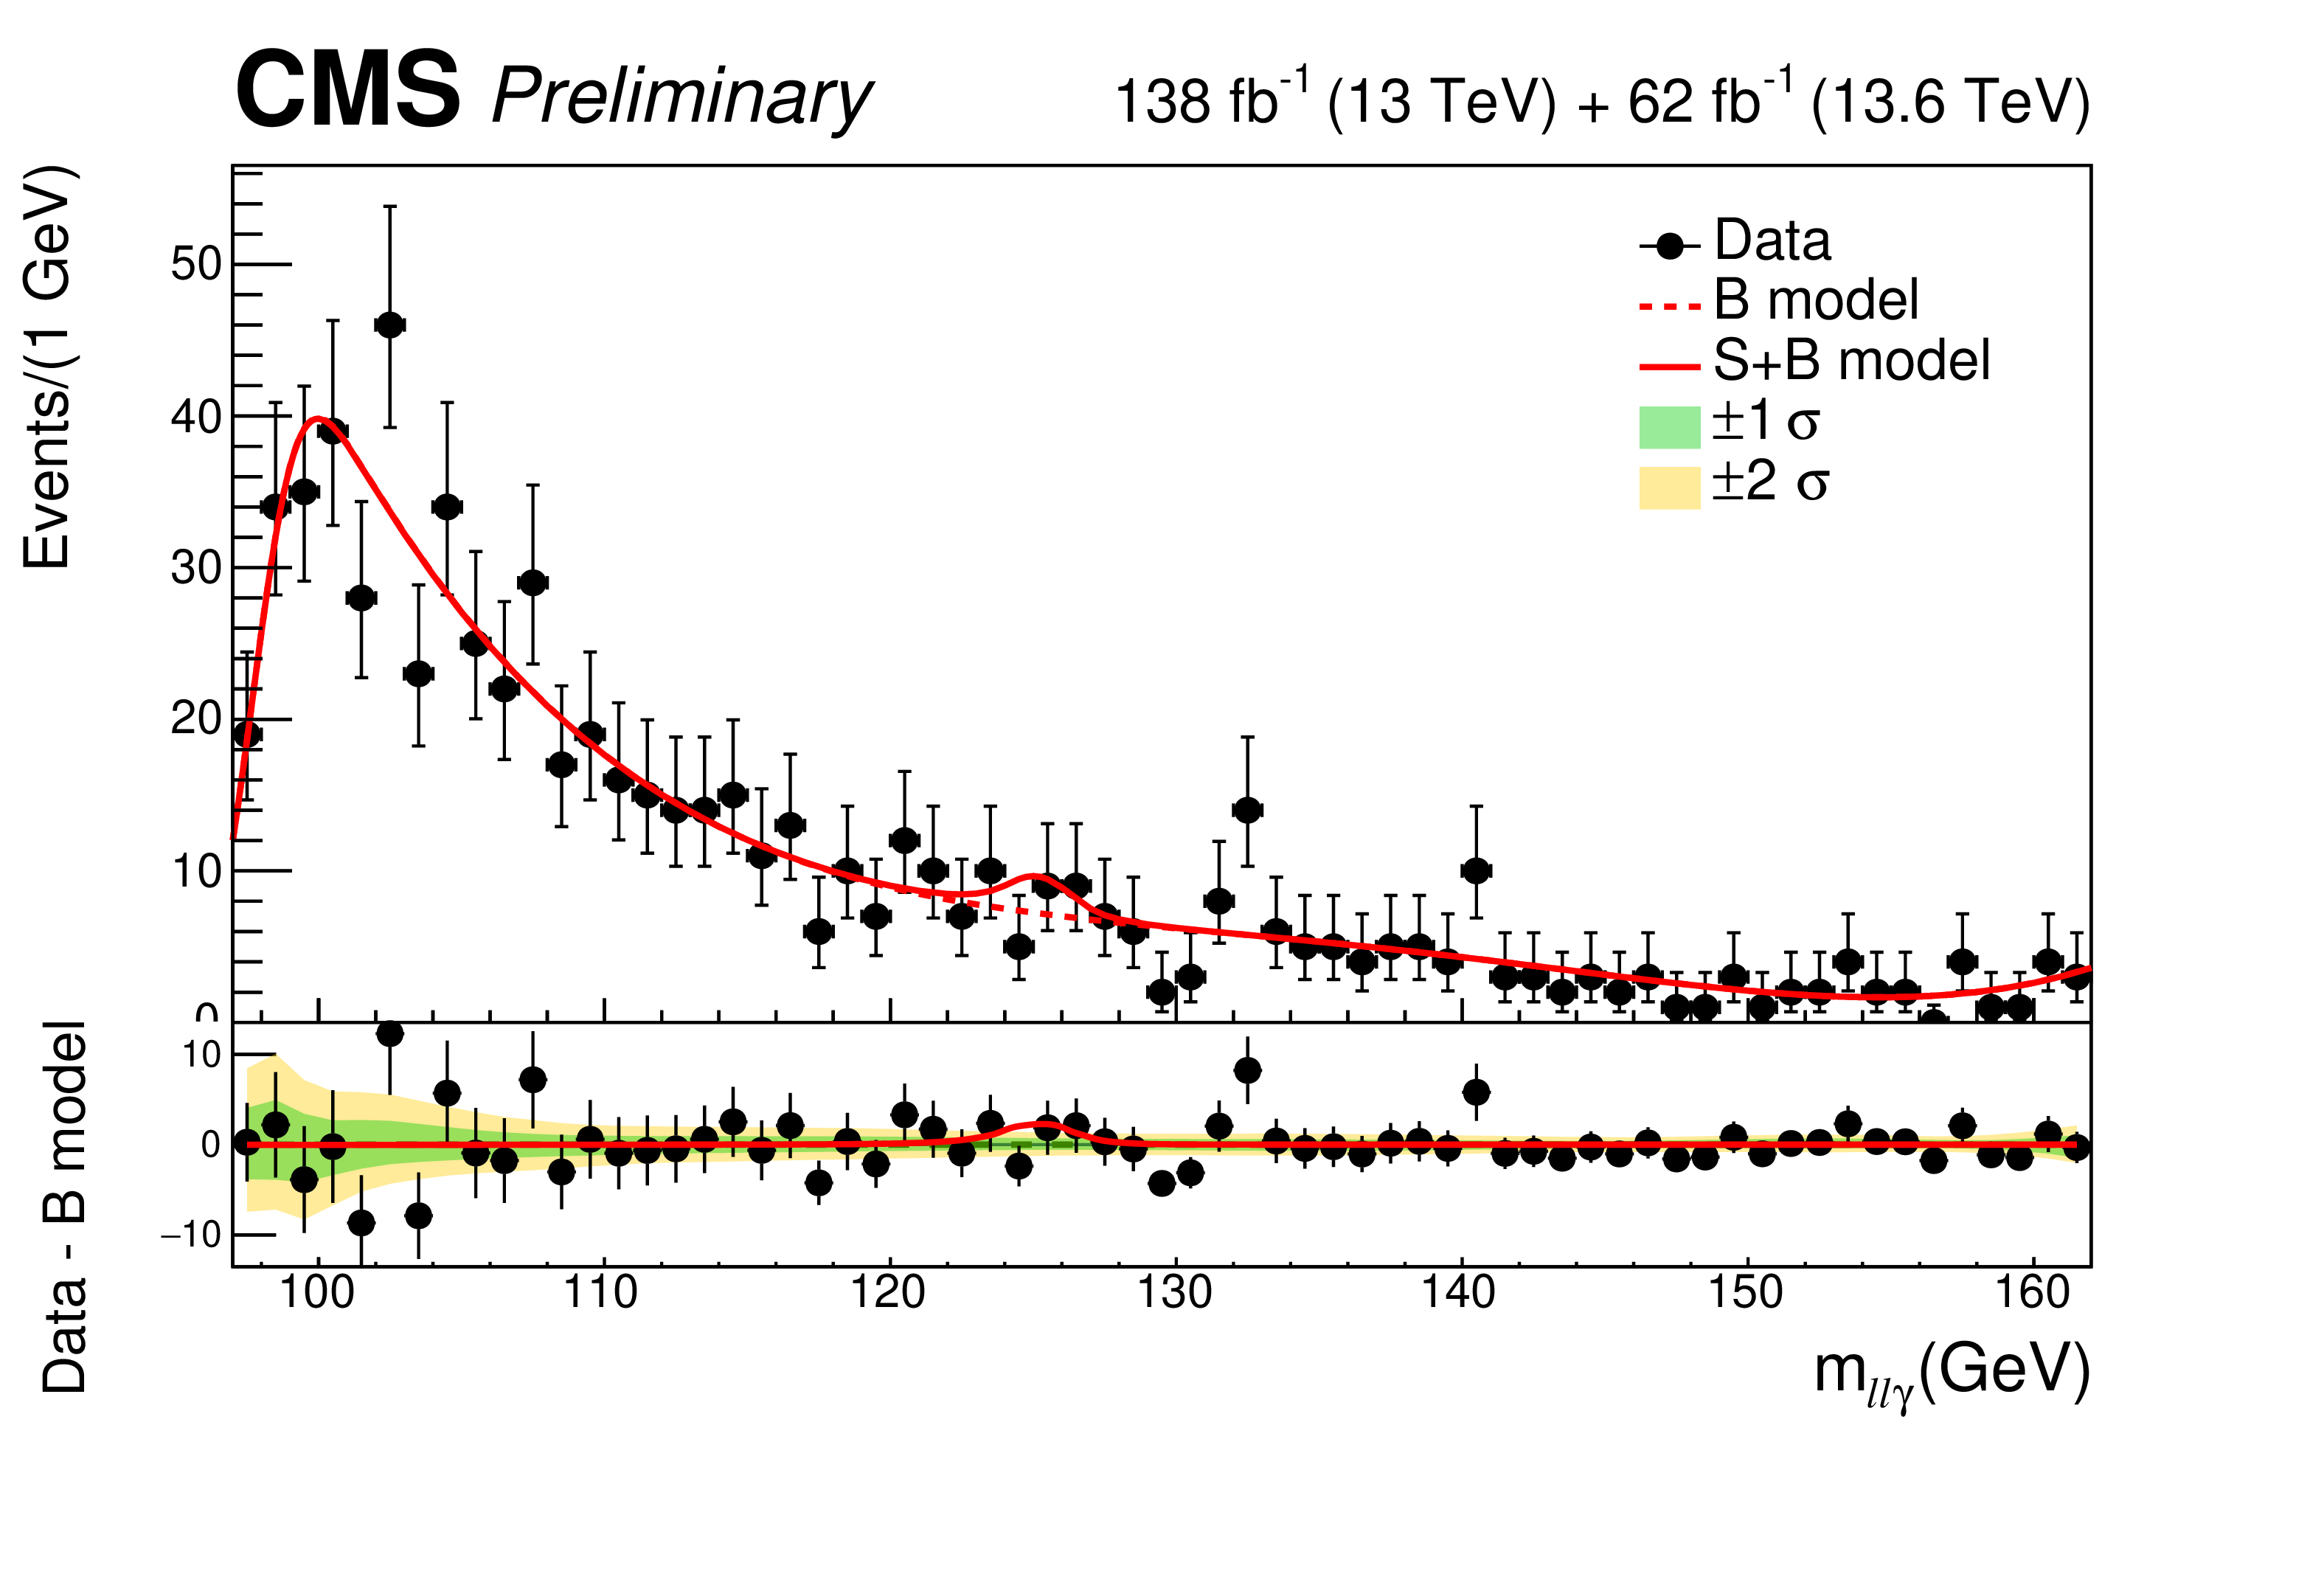
Figure 5:
Distributions of $ m_{\ell \ell \gamma} $ in each of the VBF categories with the results of the simultaneous fit to all categories superimposed. |
png pdf |
Figure 5-a:
Distributions of $ m_{\ell \ell \gamma} $ in each of the VBF categories with the results of the simultaneous fit to all categories superimposed. |
png pdf |
Figure 5-b:
Distributions of $ m_{\ell \ell \gamma} $ in each of the VBF categories with the results of the simultaneous fit to all categories superimposed. |
png pdf |
Figure 5-c:
Distributions of $ m_{\ell \ell \gamma} $ in each of the VBF categories with the results of the simultaneous fit to all categories superimposed. |
png pdf |
Figure 5-d:
Distributions of $ m_{\ell \ell \gamma} $ in each of the VBF categories with the results of the simultaneous fit to all categories superimposed. |
png pdf |
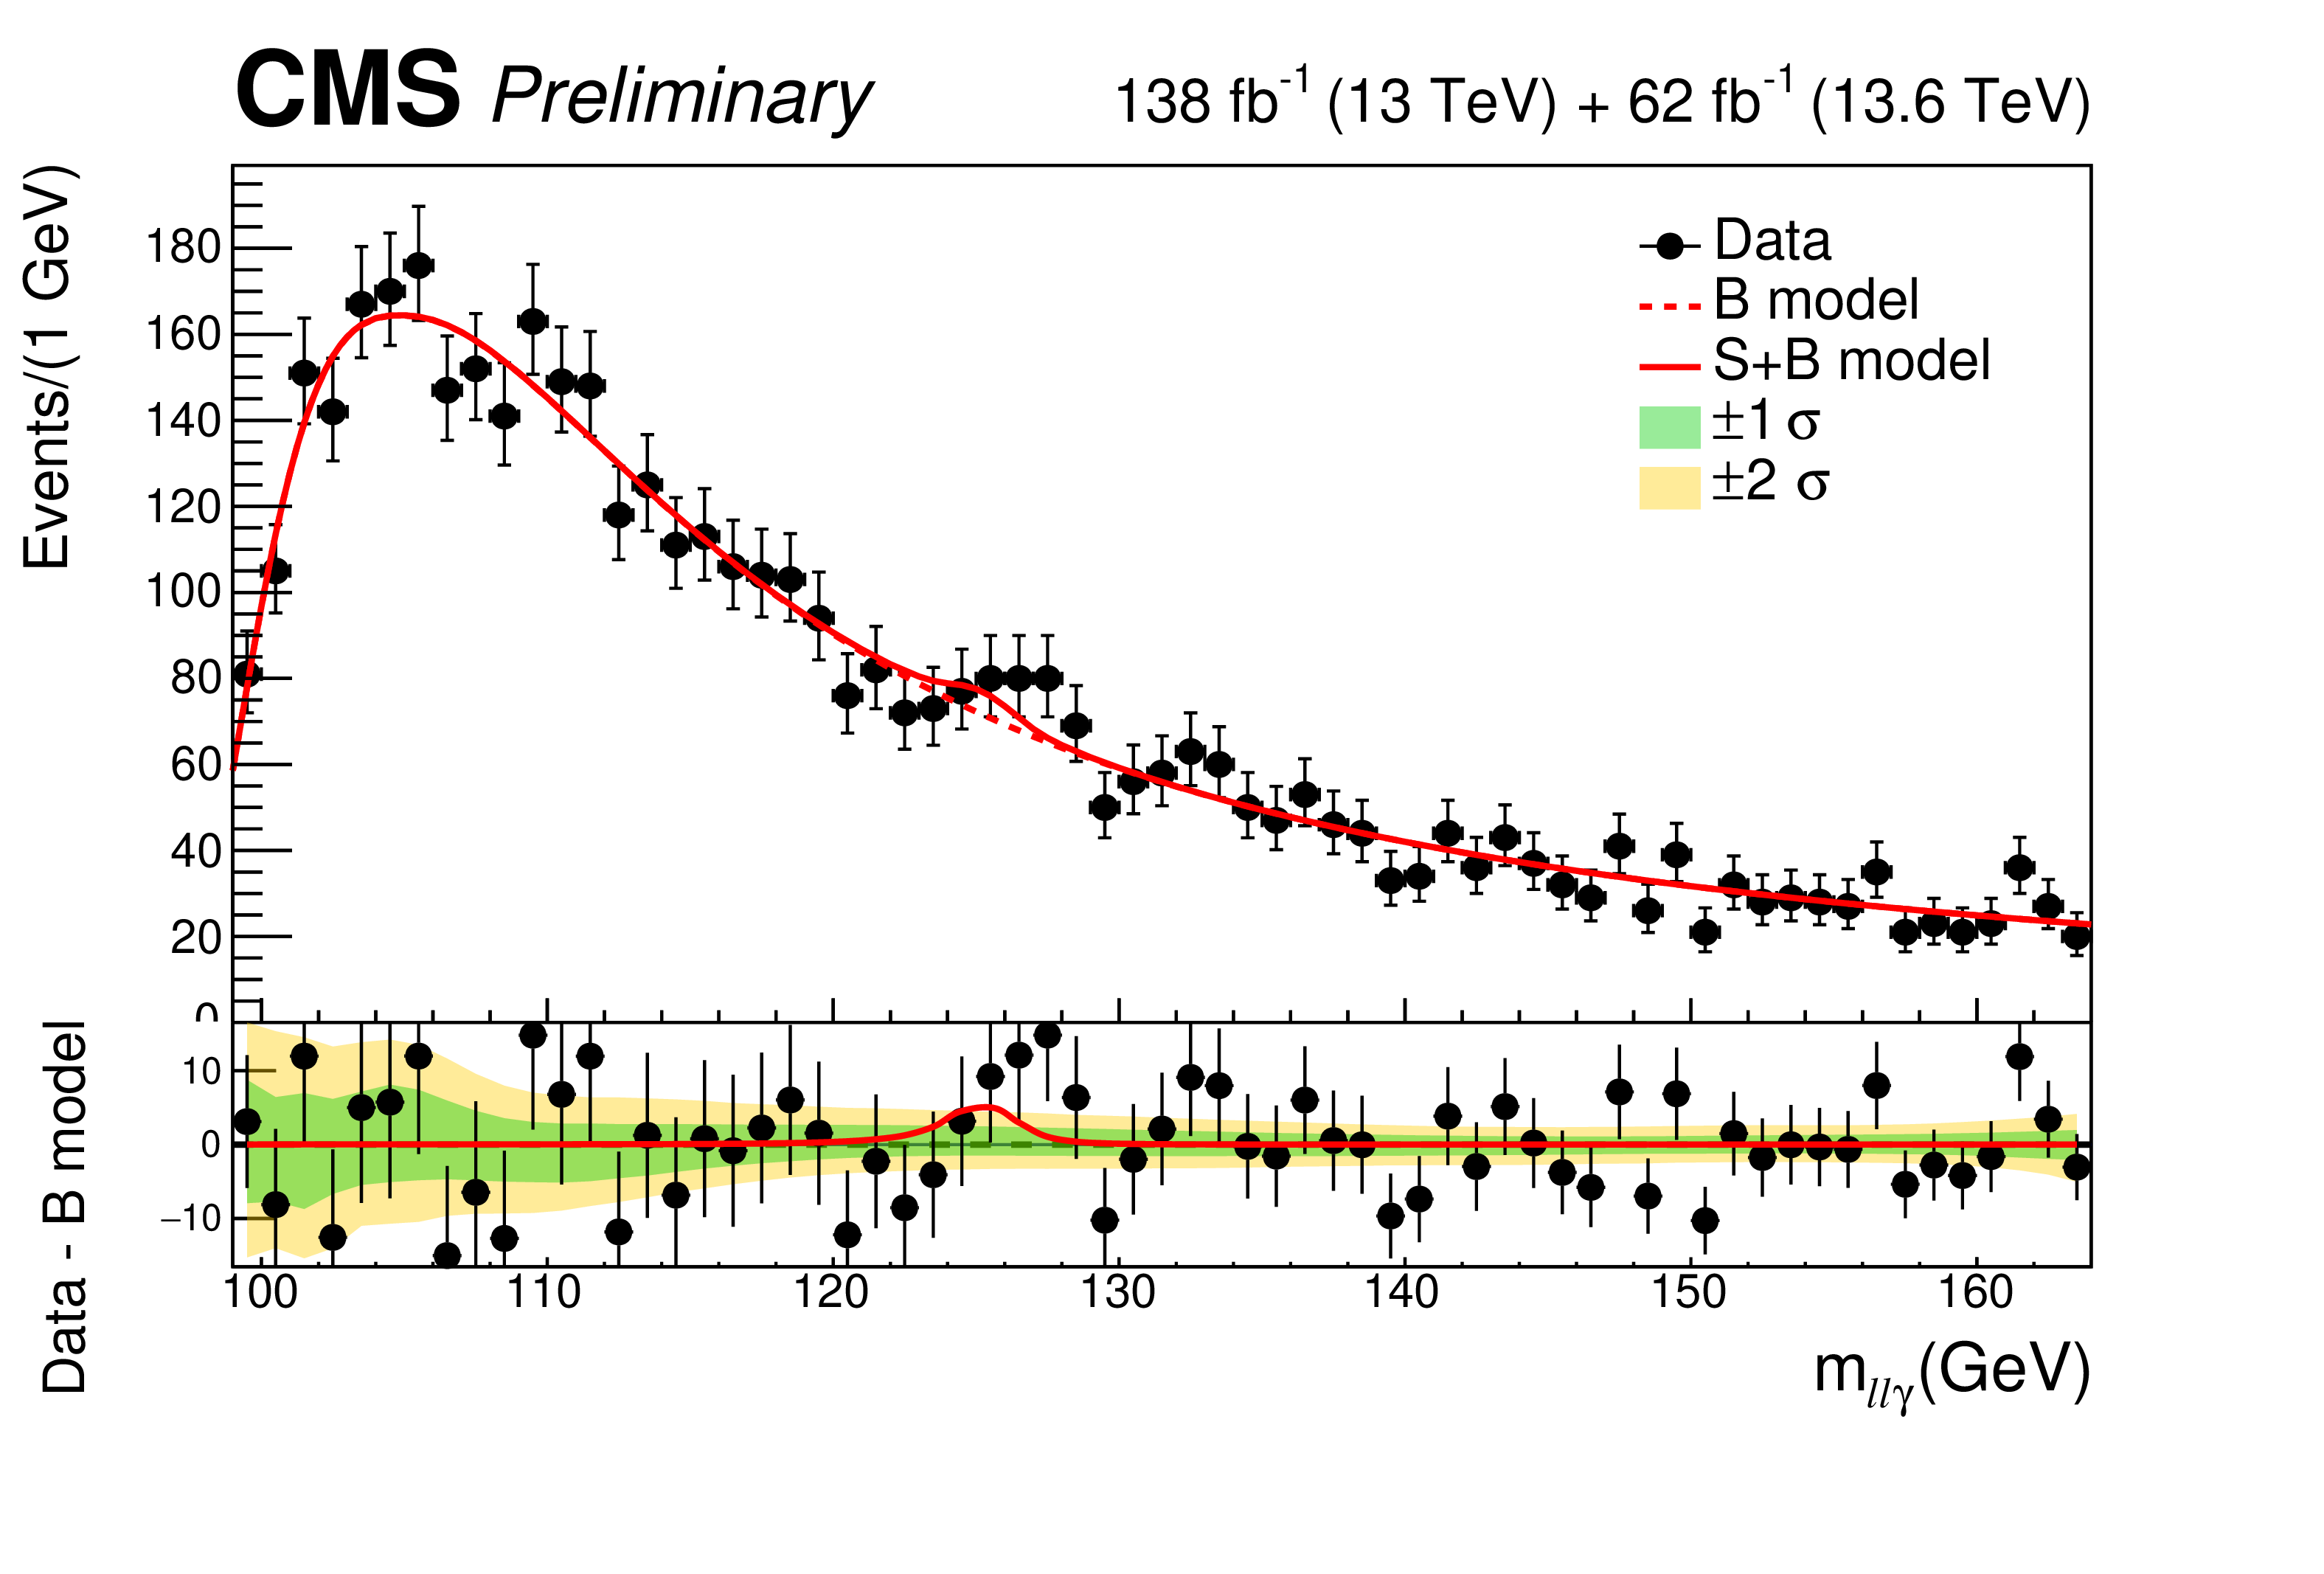
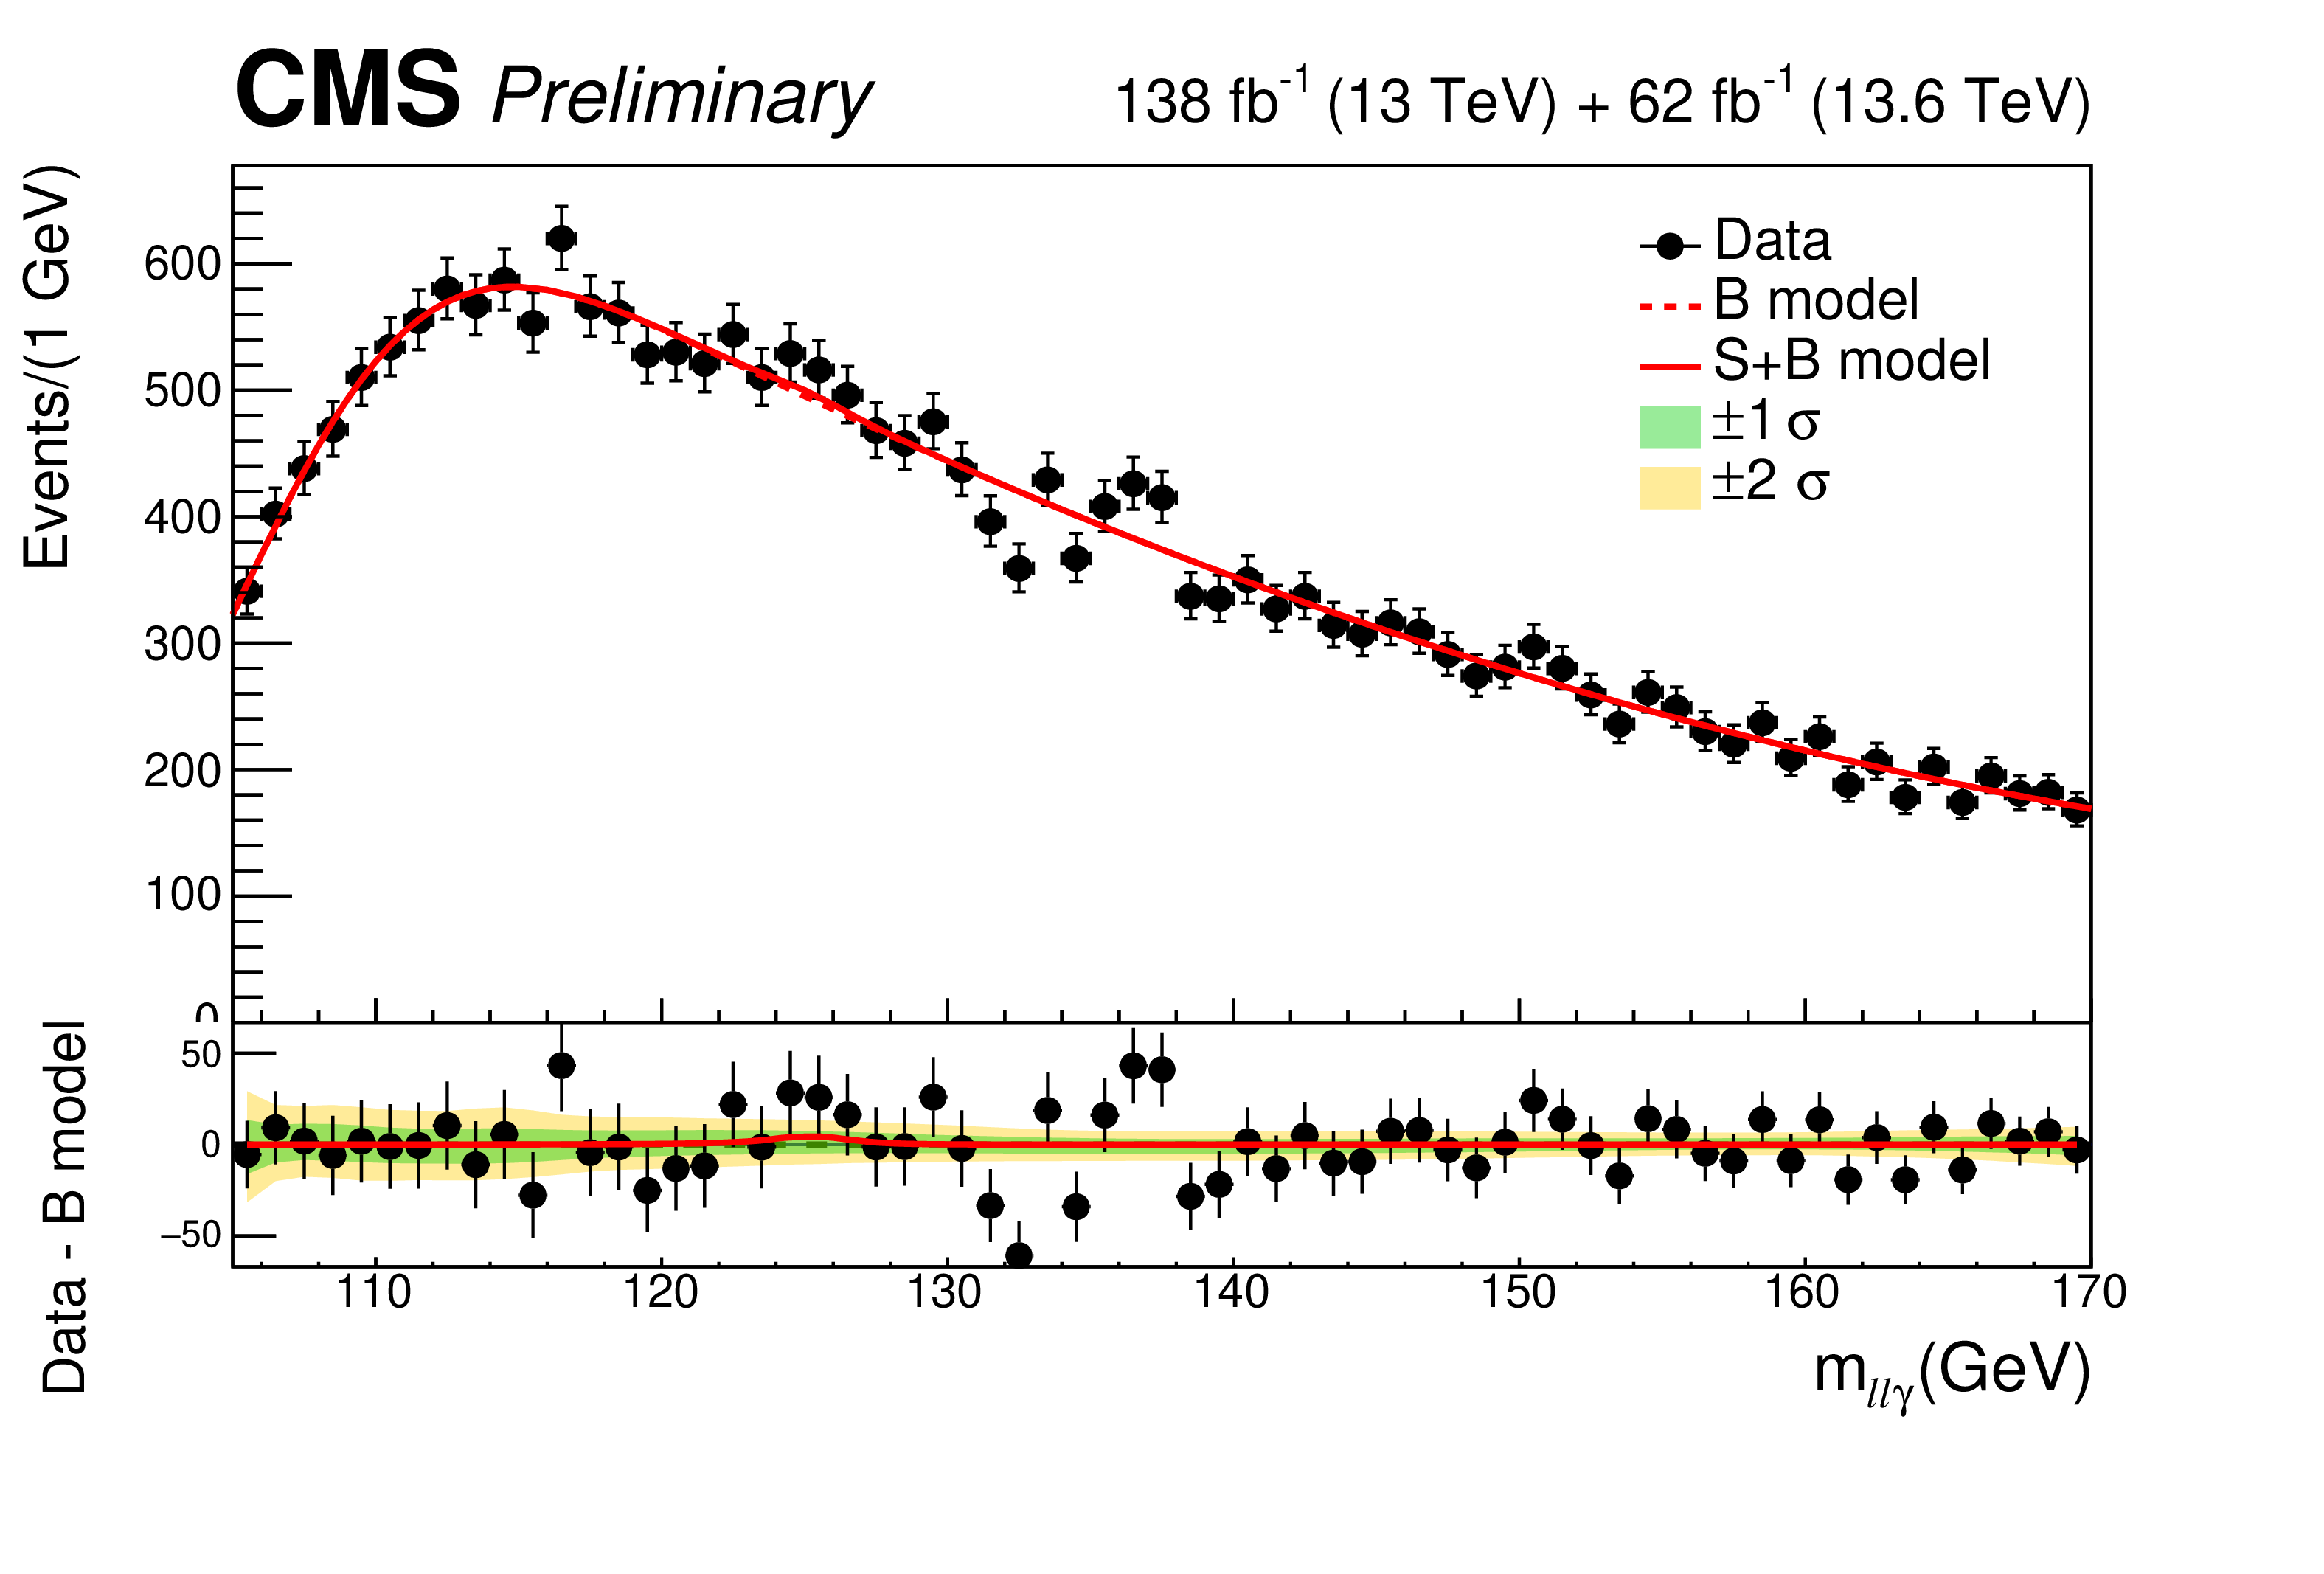
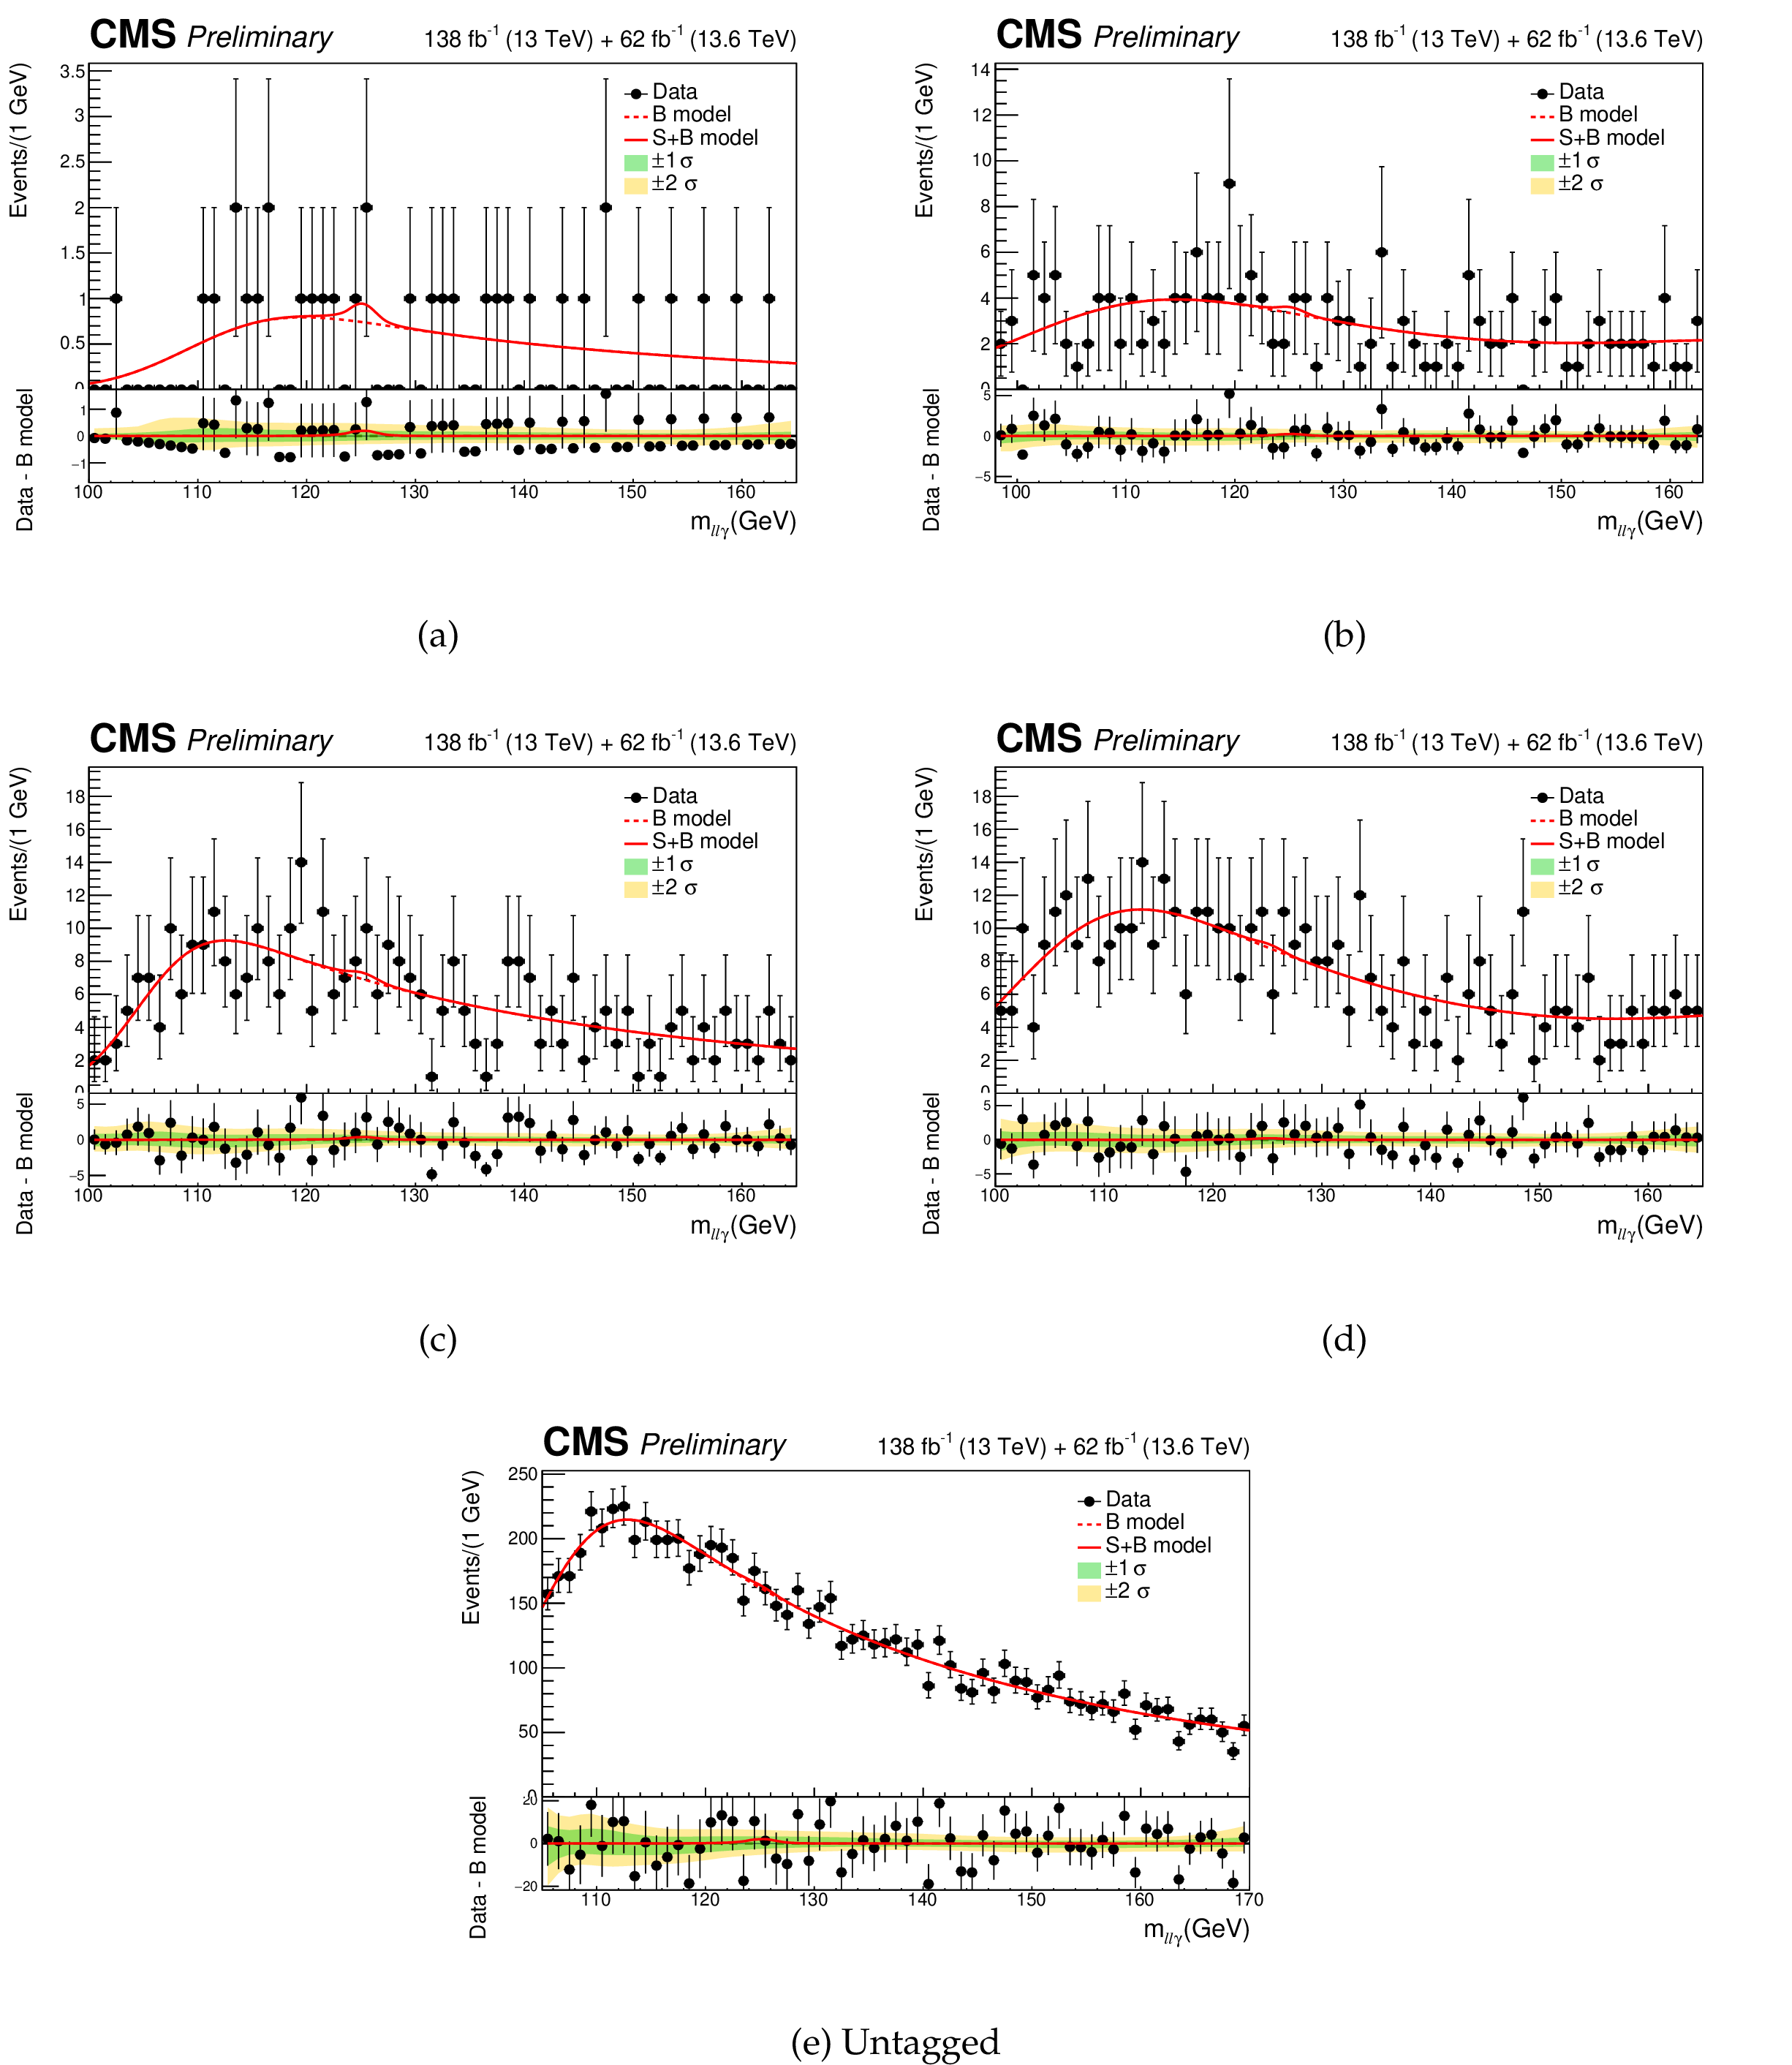
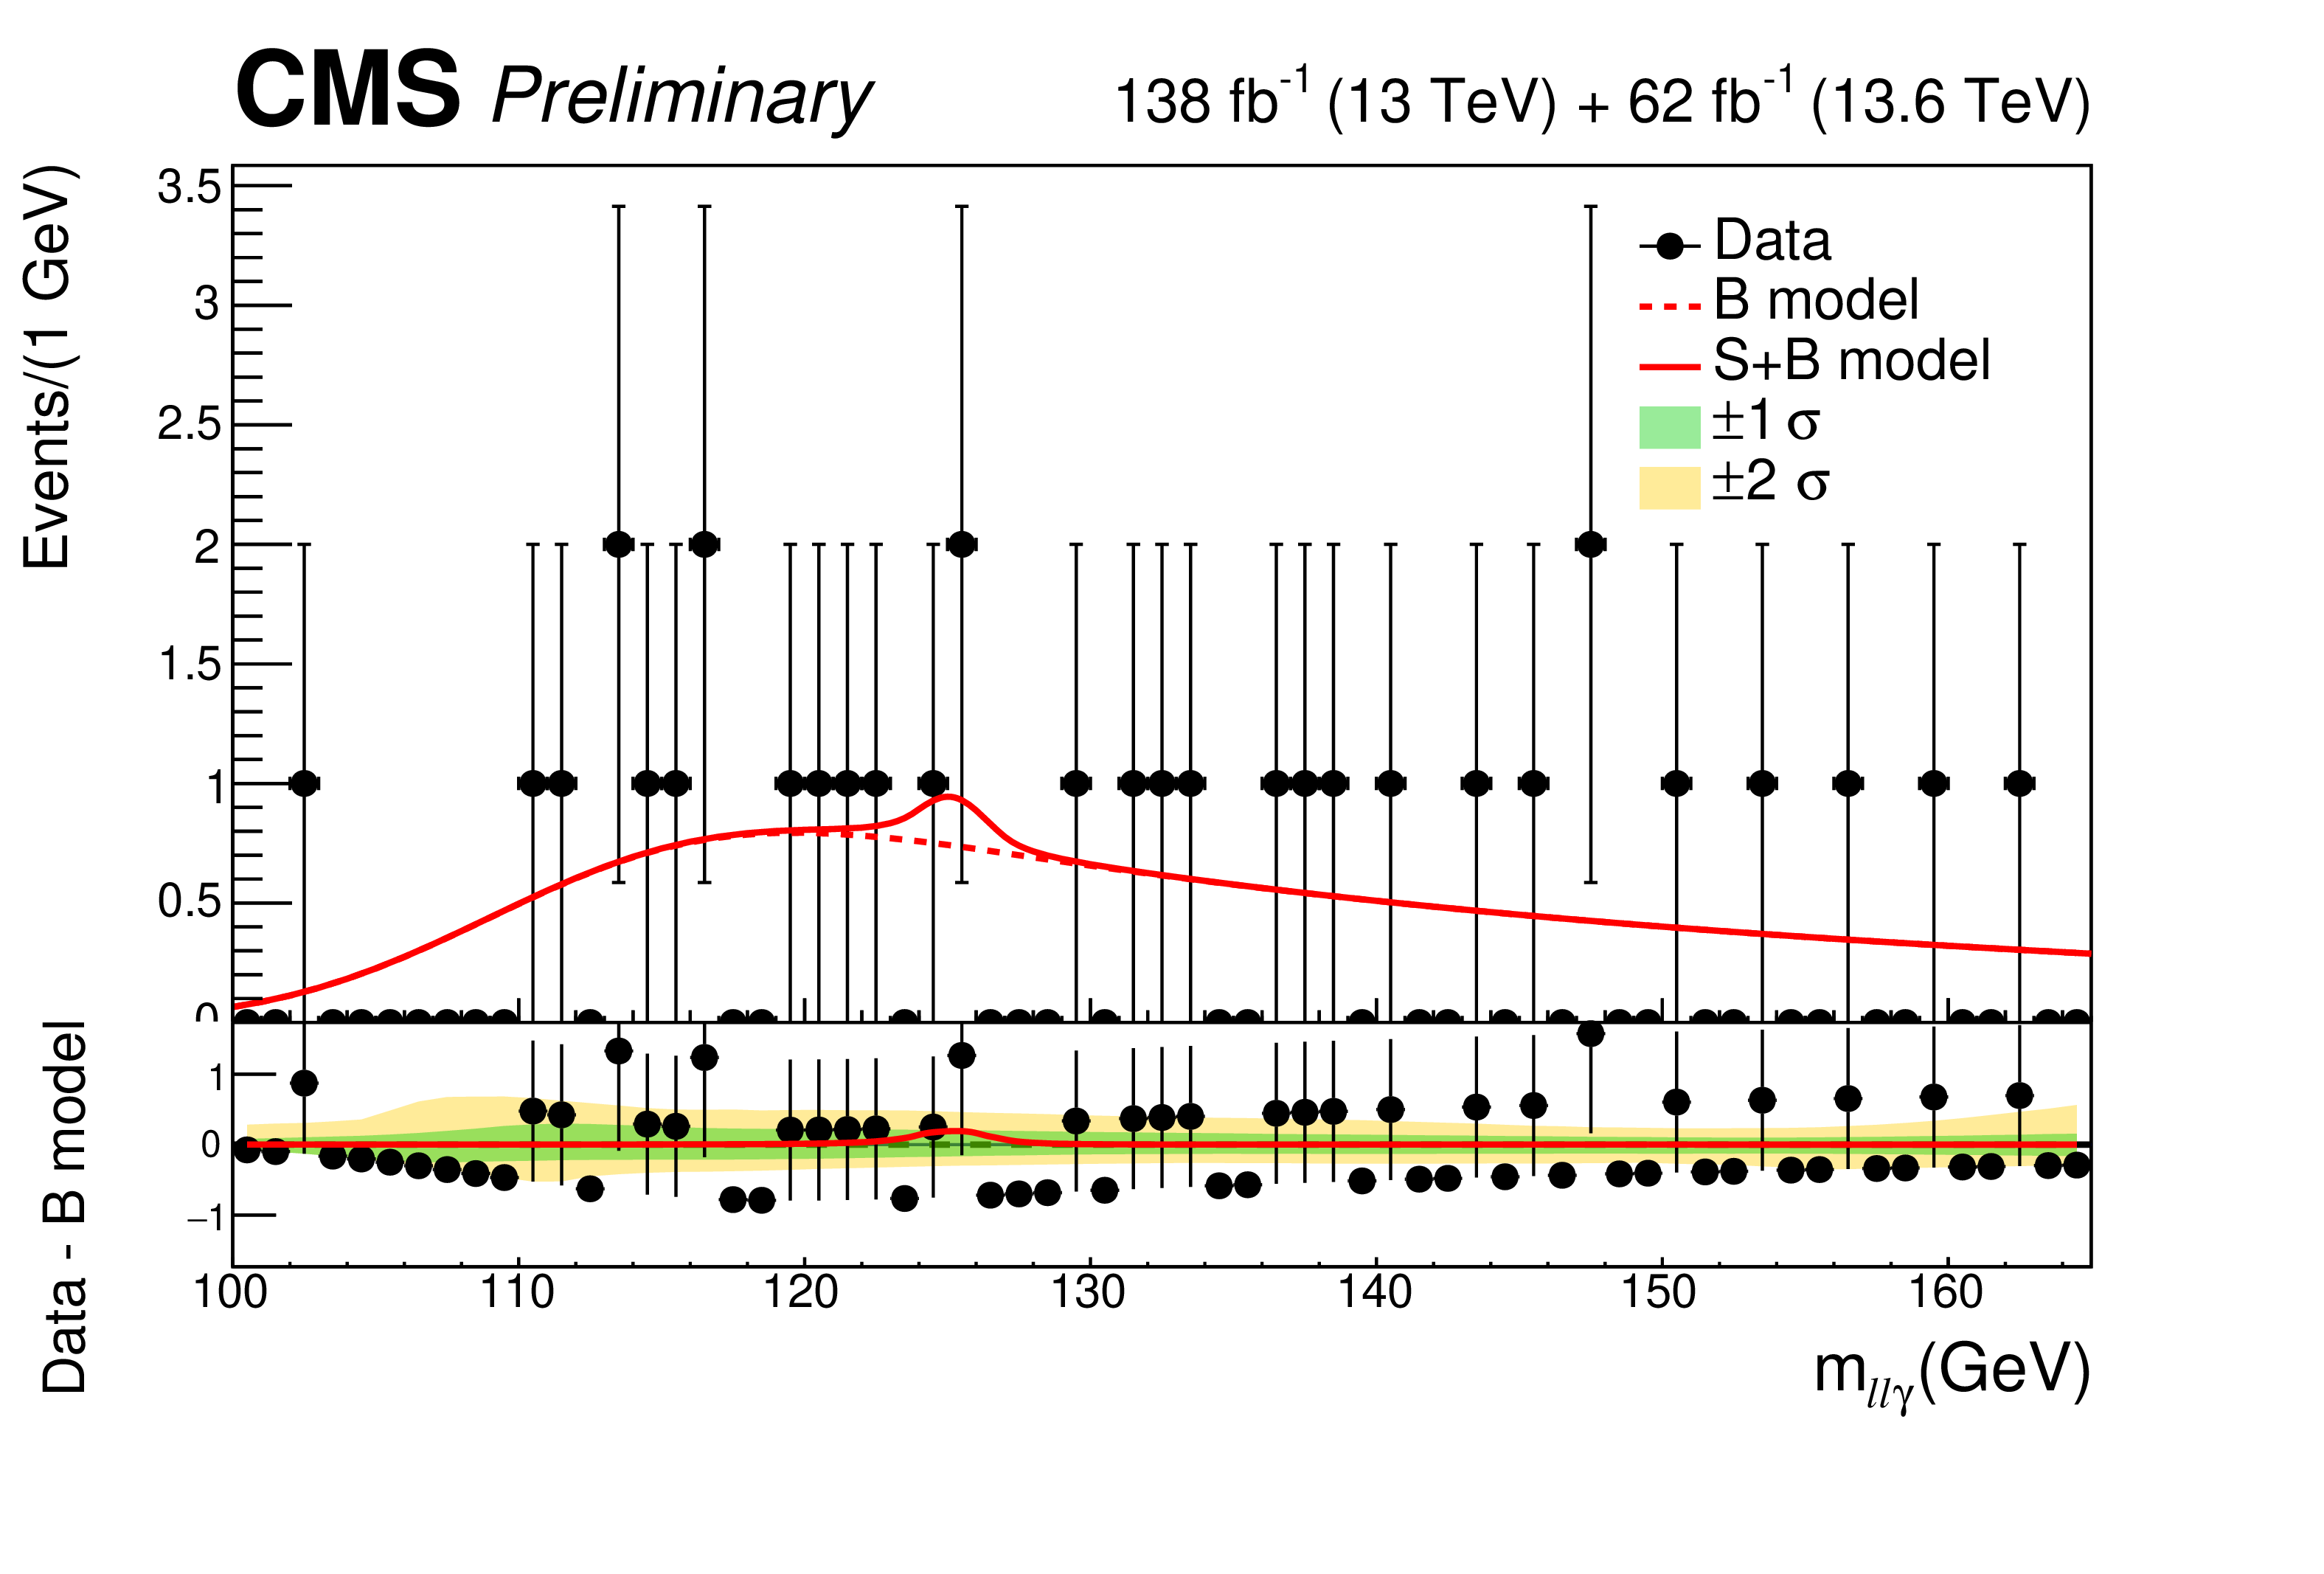
Figure 6:
Distributions of $ m_{\ell \ell \gamma} $ in each of the ttH, VH, and untagged categories with the results of the simultaneous fit to all categories superimposed. |
png pdf |
Figure 6-a:
Distributions of $ m_{\ell \ell \gamma} $ in each of the ttH, VH, and untagged categories with the results of the simultaneous fit to all categories superimposed. |
png pdf |
Figure 6-b:
Distributions of $ m_{\ell \ell \gamma} $ in each of the ttH, VH, and untagged categories with the results of the simultaneous fit to all categories superimposed. |
png pdf |
Figure 6-c:
Distributions of $ m_{\ell \ell \gamma} $ in each of the ttH, VH, and untagged categories with the results of the simultaneous fit to all categories superimposed. |
png pdf |
Figure 6-d:
Distributions of $ m_{\ell \ell \gamma} $ in each of the ttH, VH, and untagged categories with the results of the simultaneous fit to all categories superimposed. |
png pdf |
Figure 6-e:
Distributions of $ m_{\ell \ell \gamma} $ in each of the ttH, VH, and untagged categories with the results of the simultaneous fit to all categories superimposed. |
png pdf |
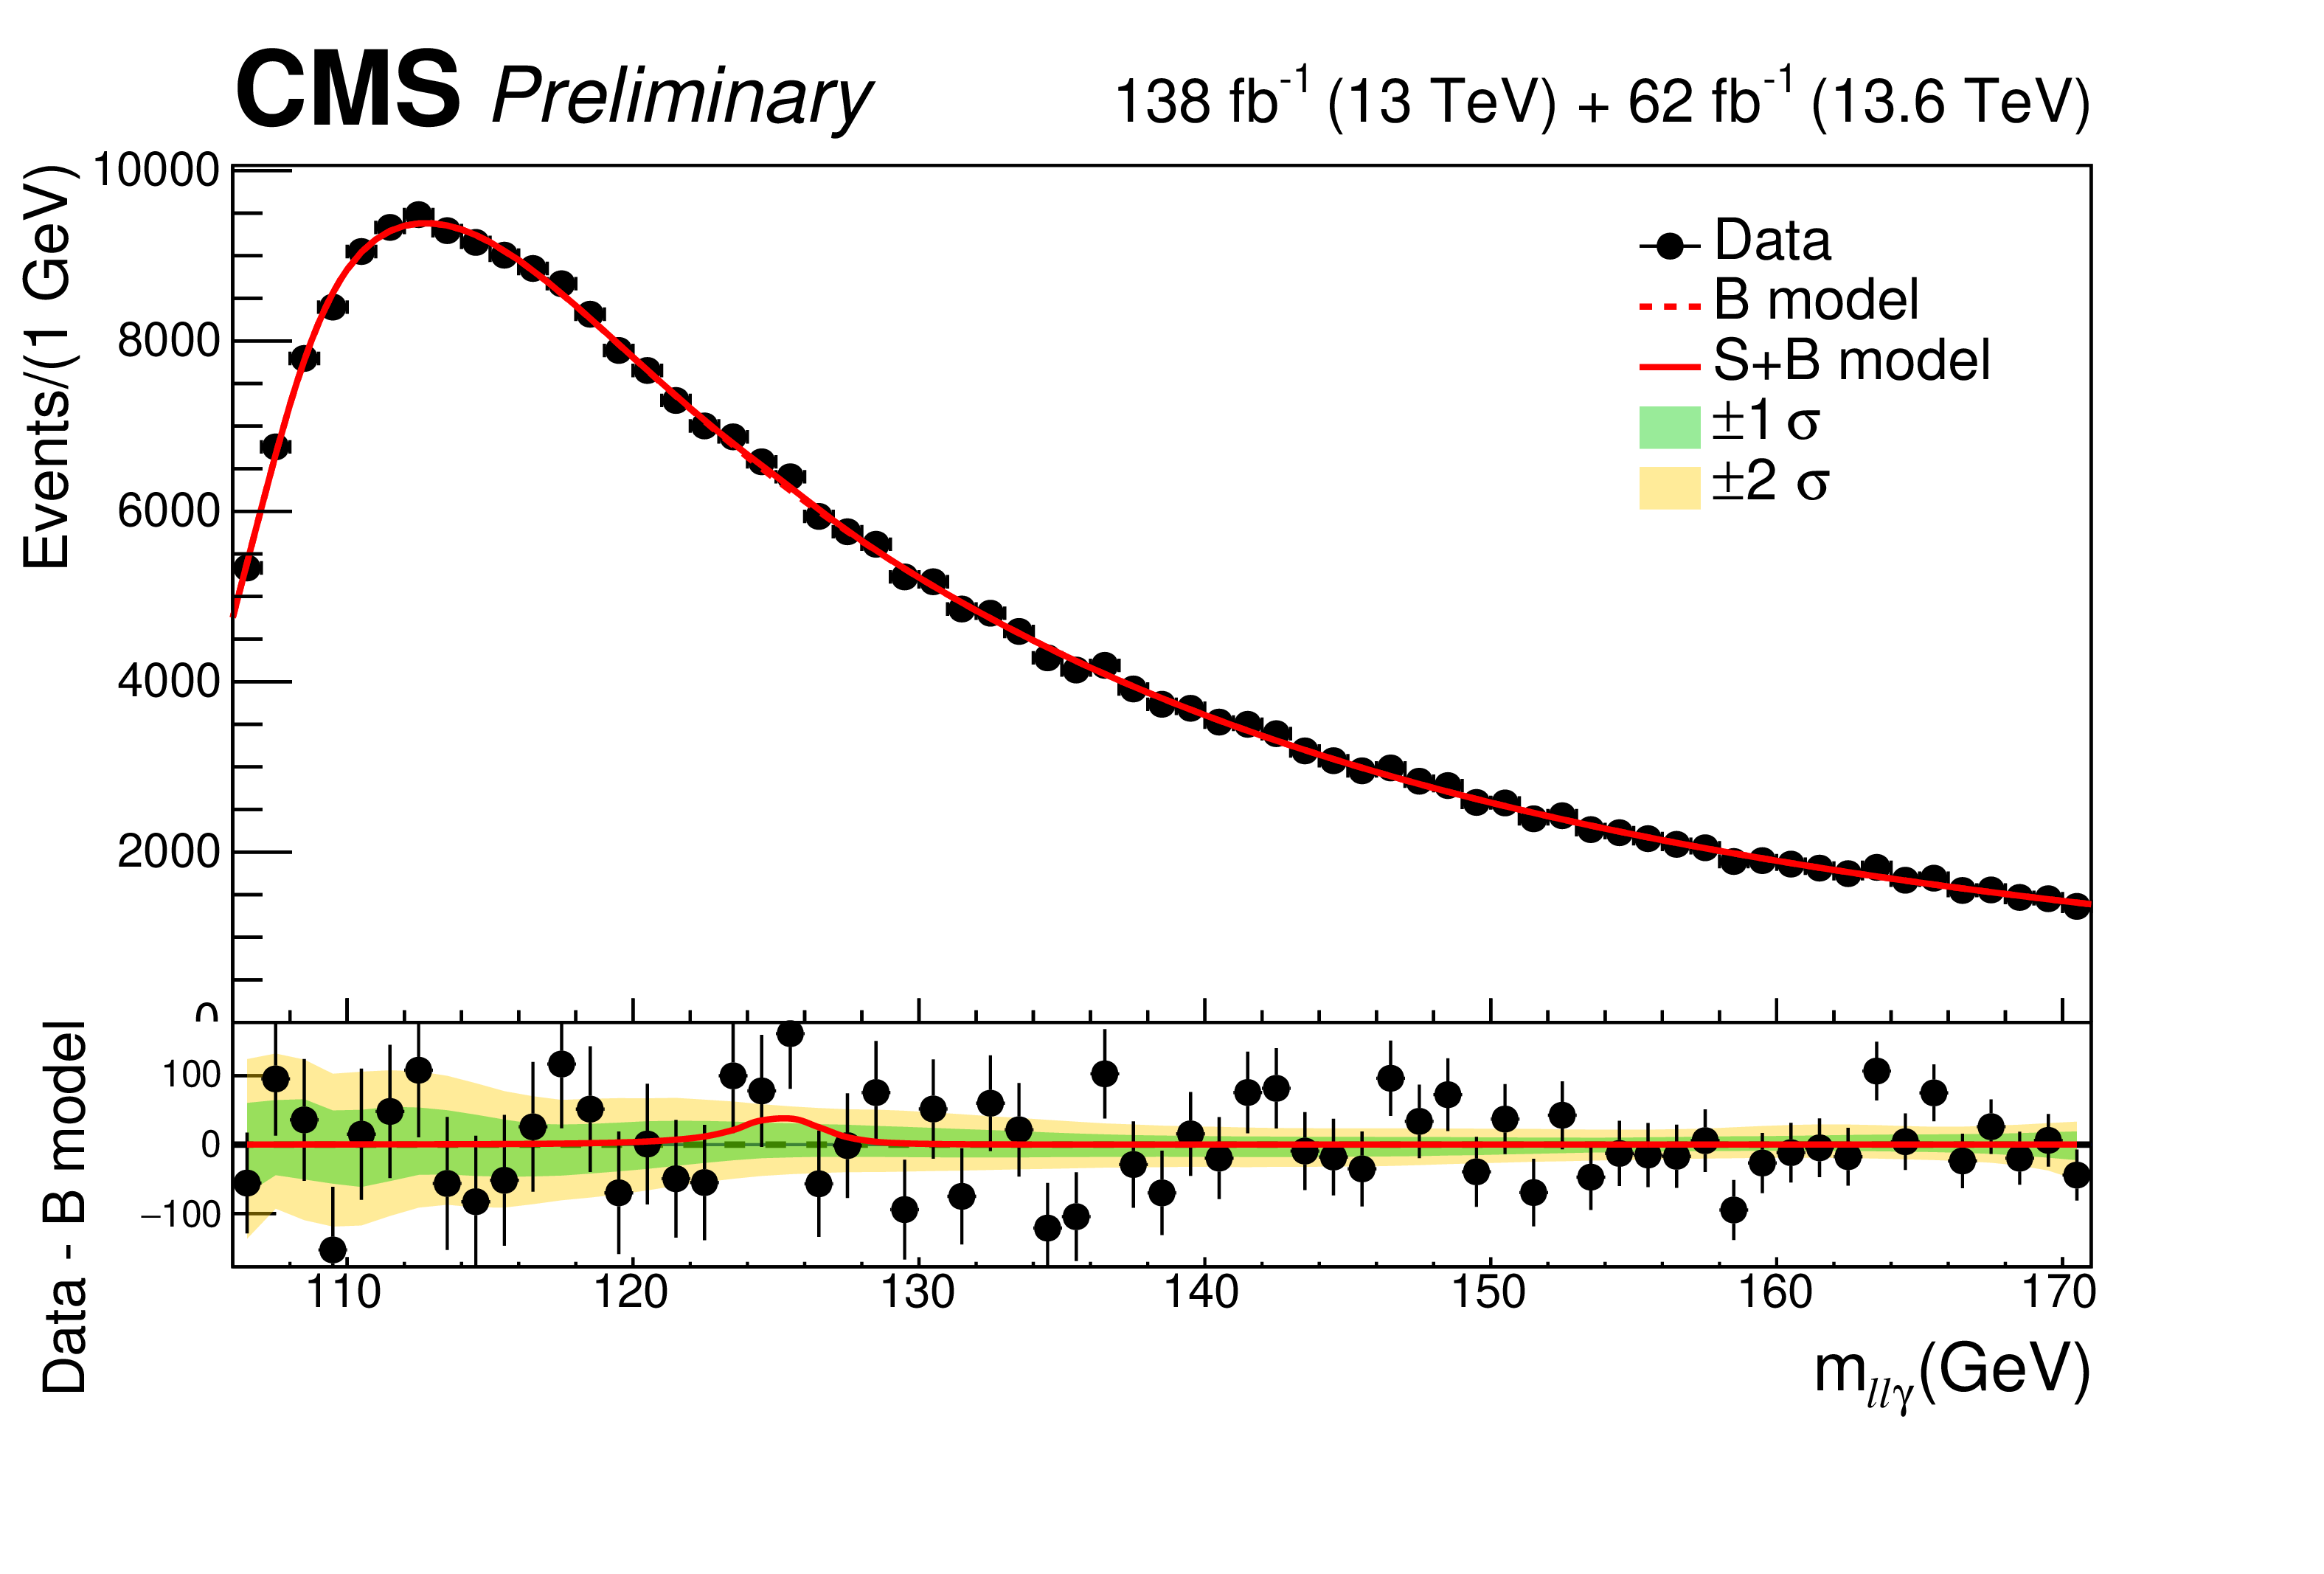
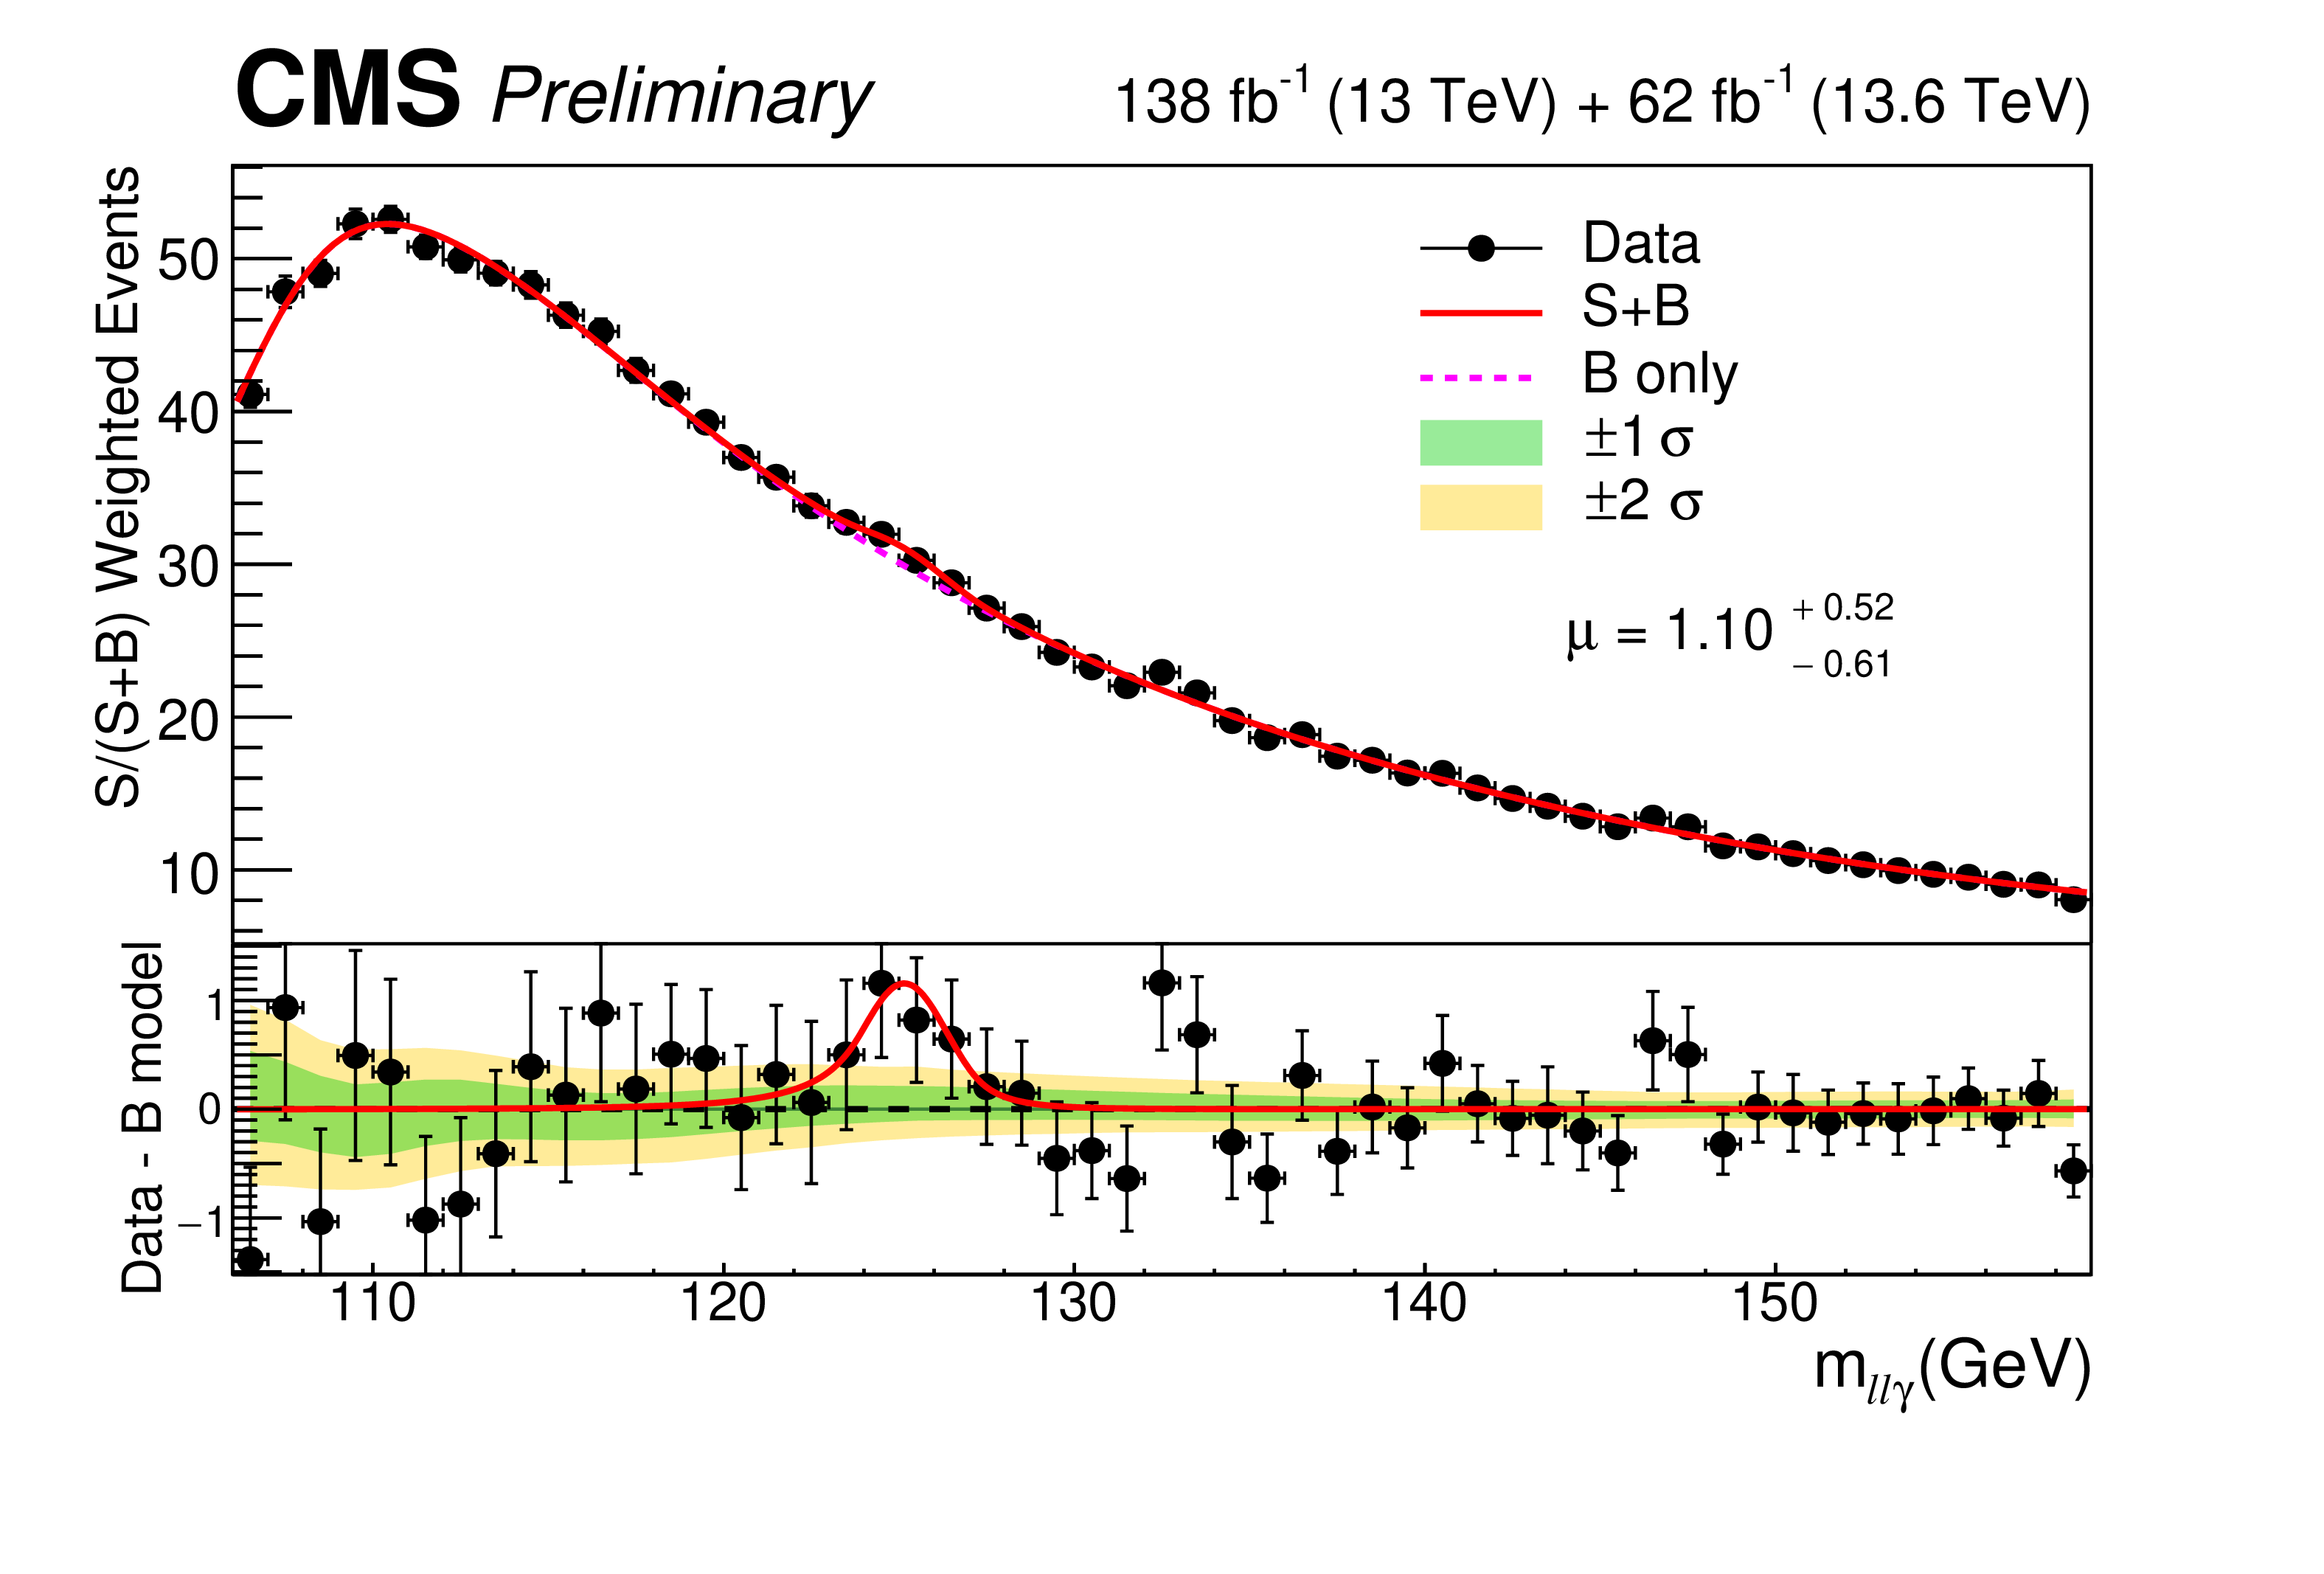
Figure 7:
Distribution of $ m_{\ell \ell \gamma} $ using the combined data from all 13 event categories, together with the signal-plus-background function obtained from the simultaneous fit. The histogram is obtained by weighting the $ m_{\ell \ell \gamma} $ distribution from each category by the factor S/(S+B). |
png pdf |
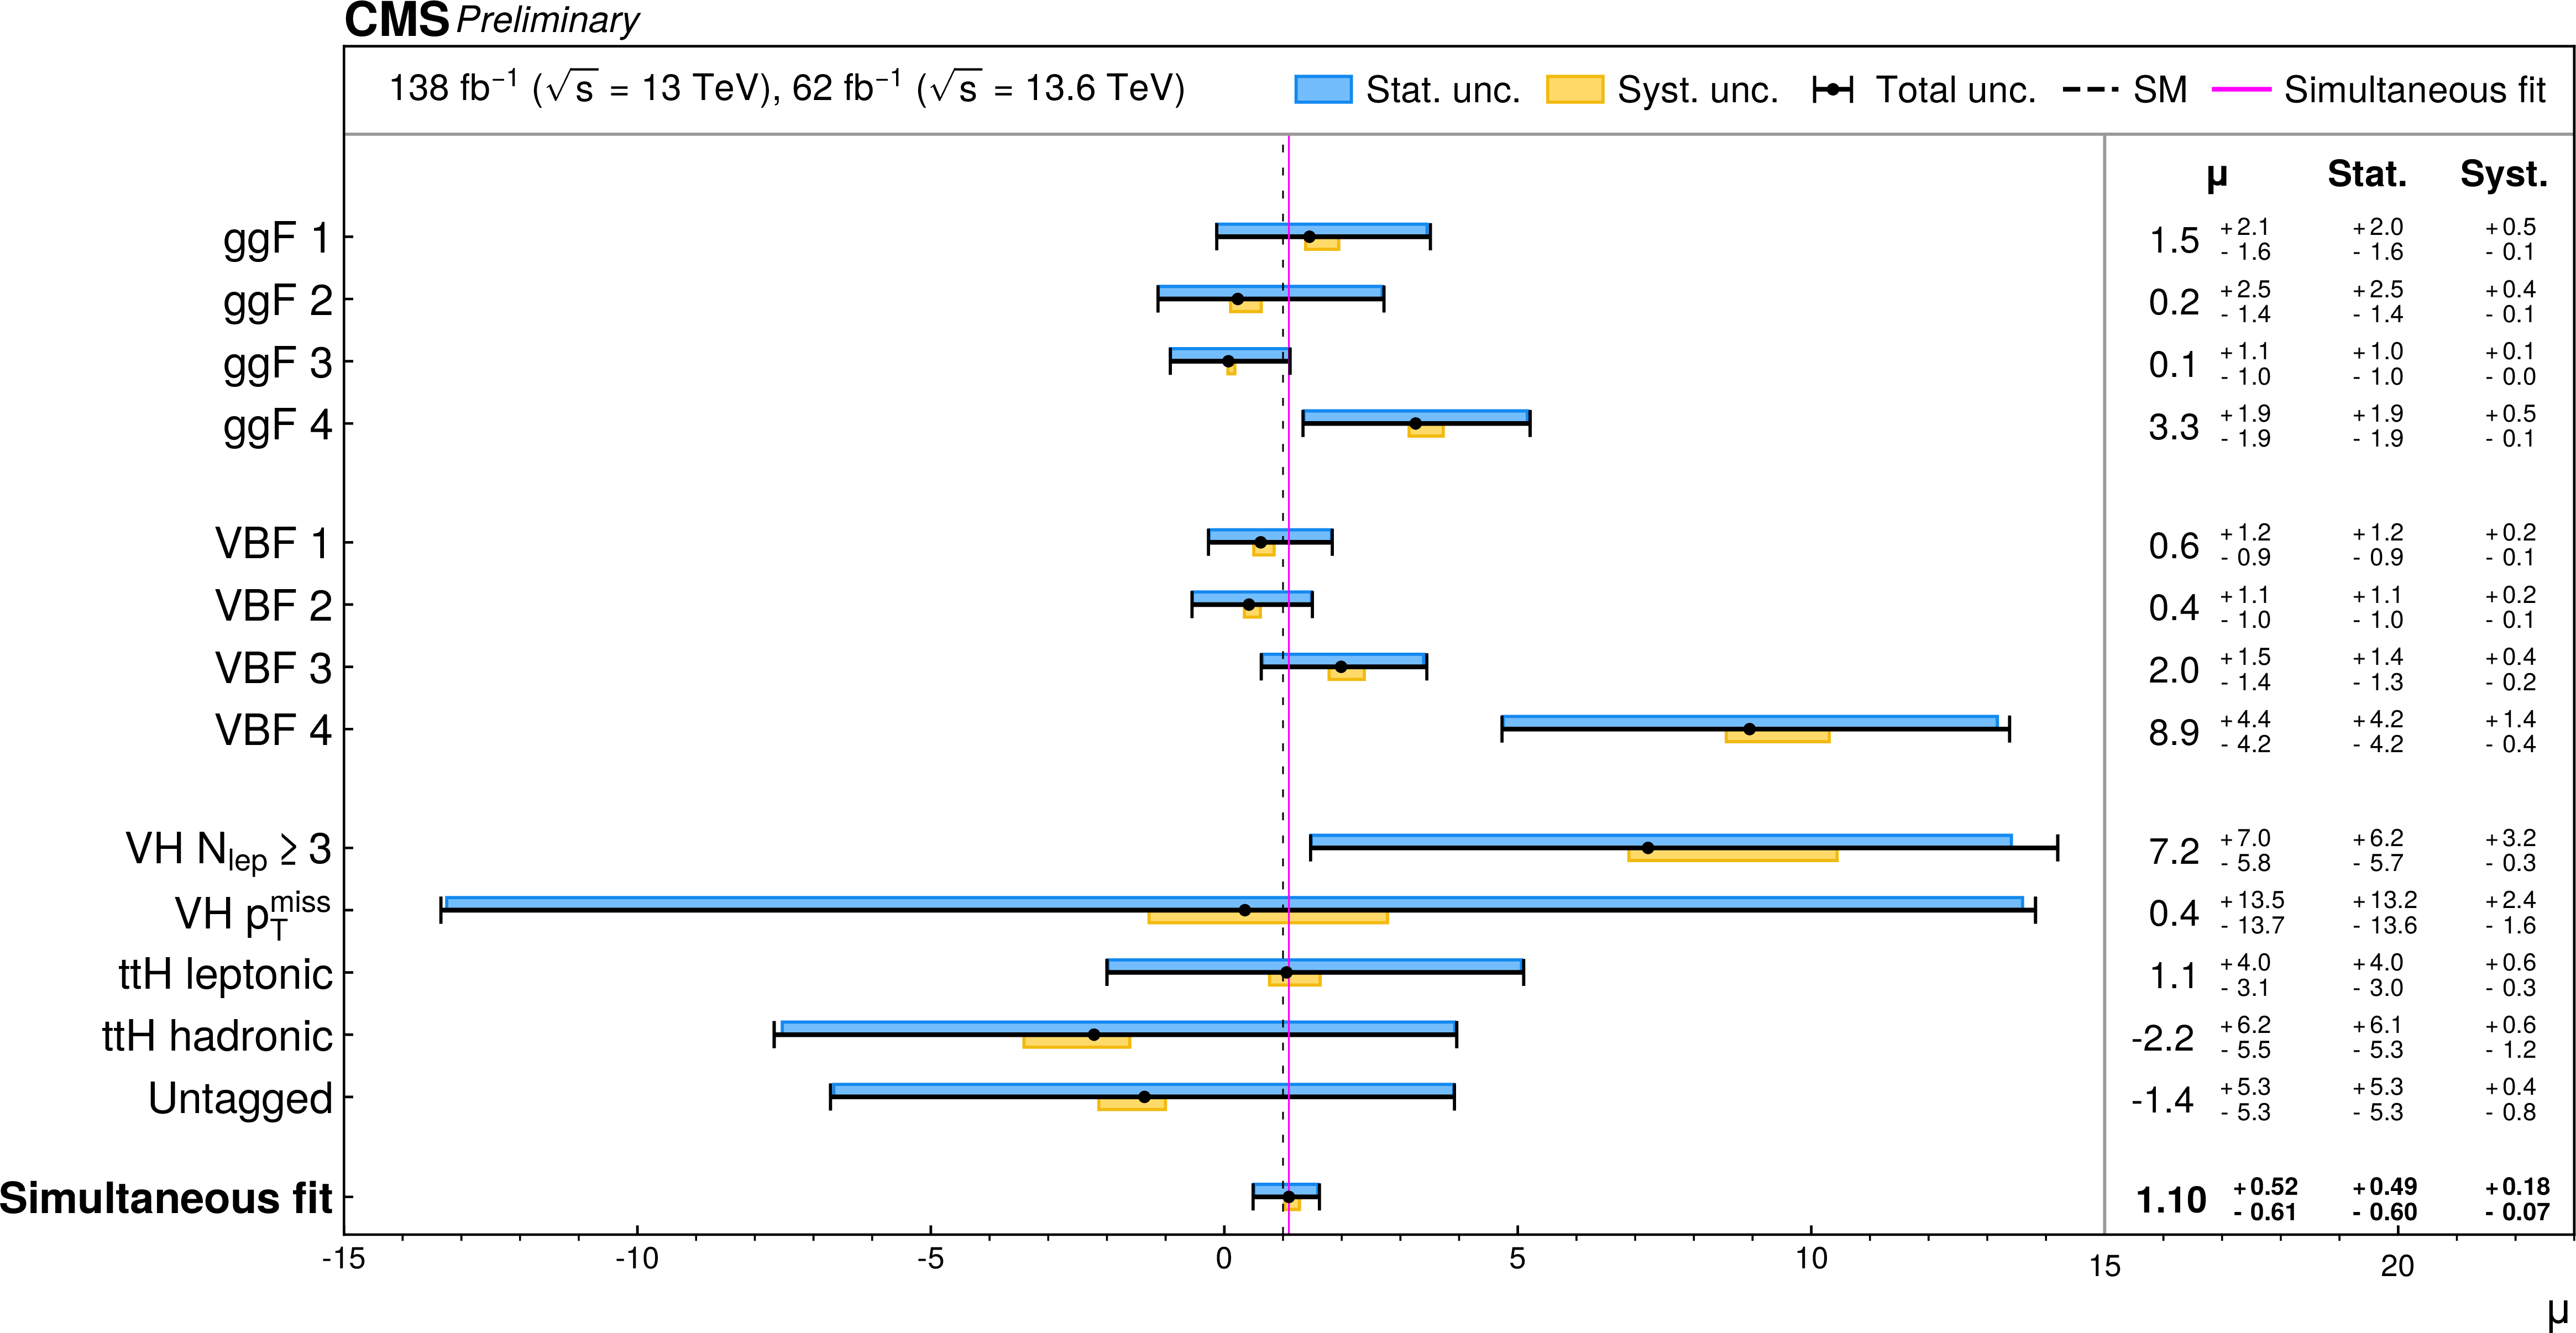
Figure 8:
Signal strengths ($ \mu $) obtained from separate fits to the $ m_{\ell \ell \gamma} $ distribution in each category and, at the bottom of the figure, from the simultaneous fit to all categories. |
png pdf |
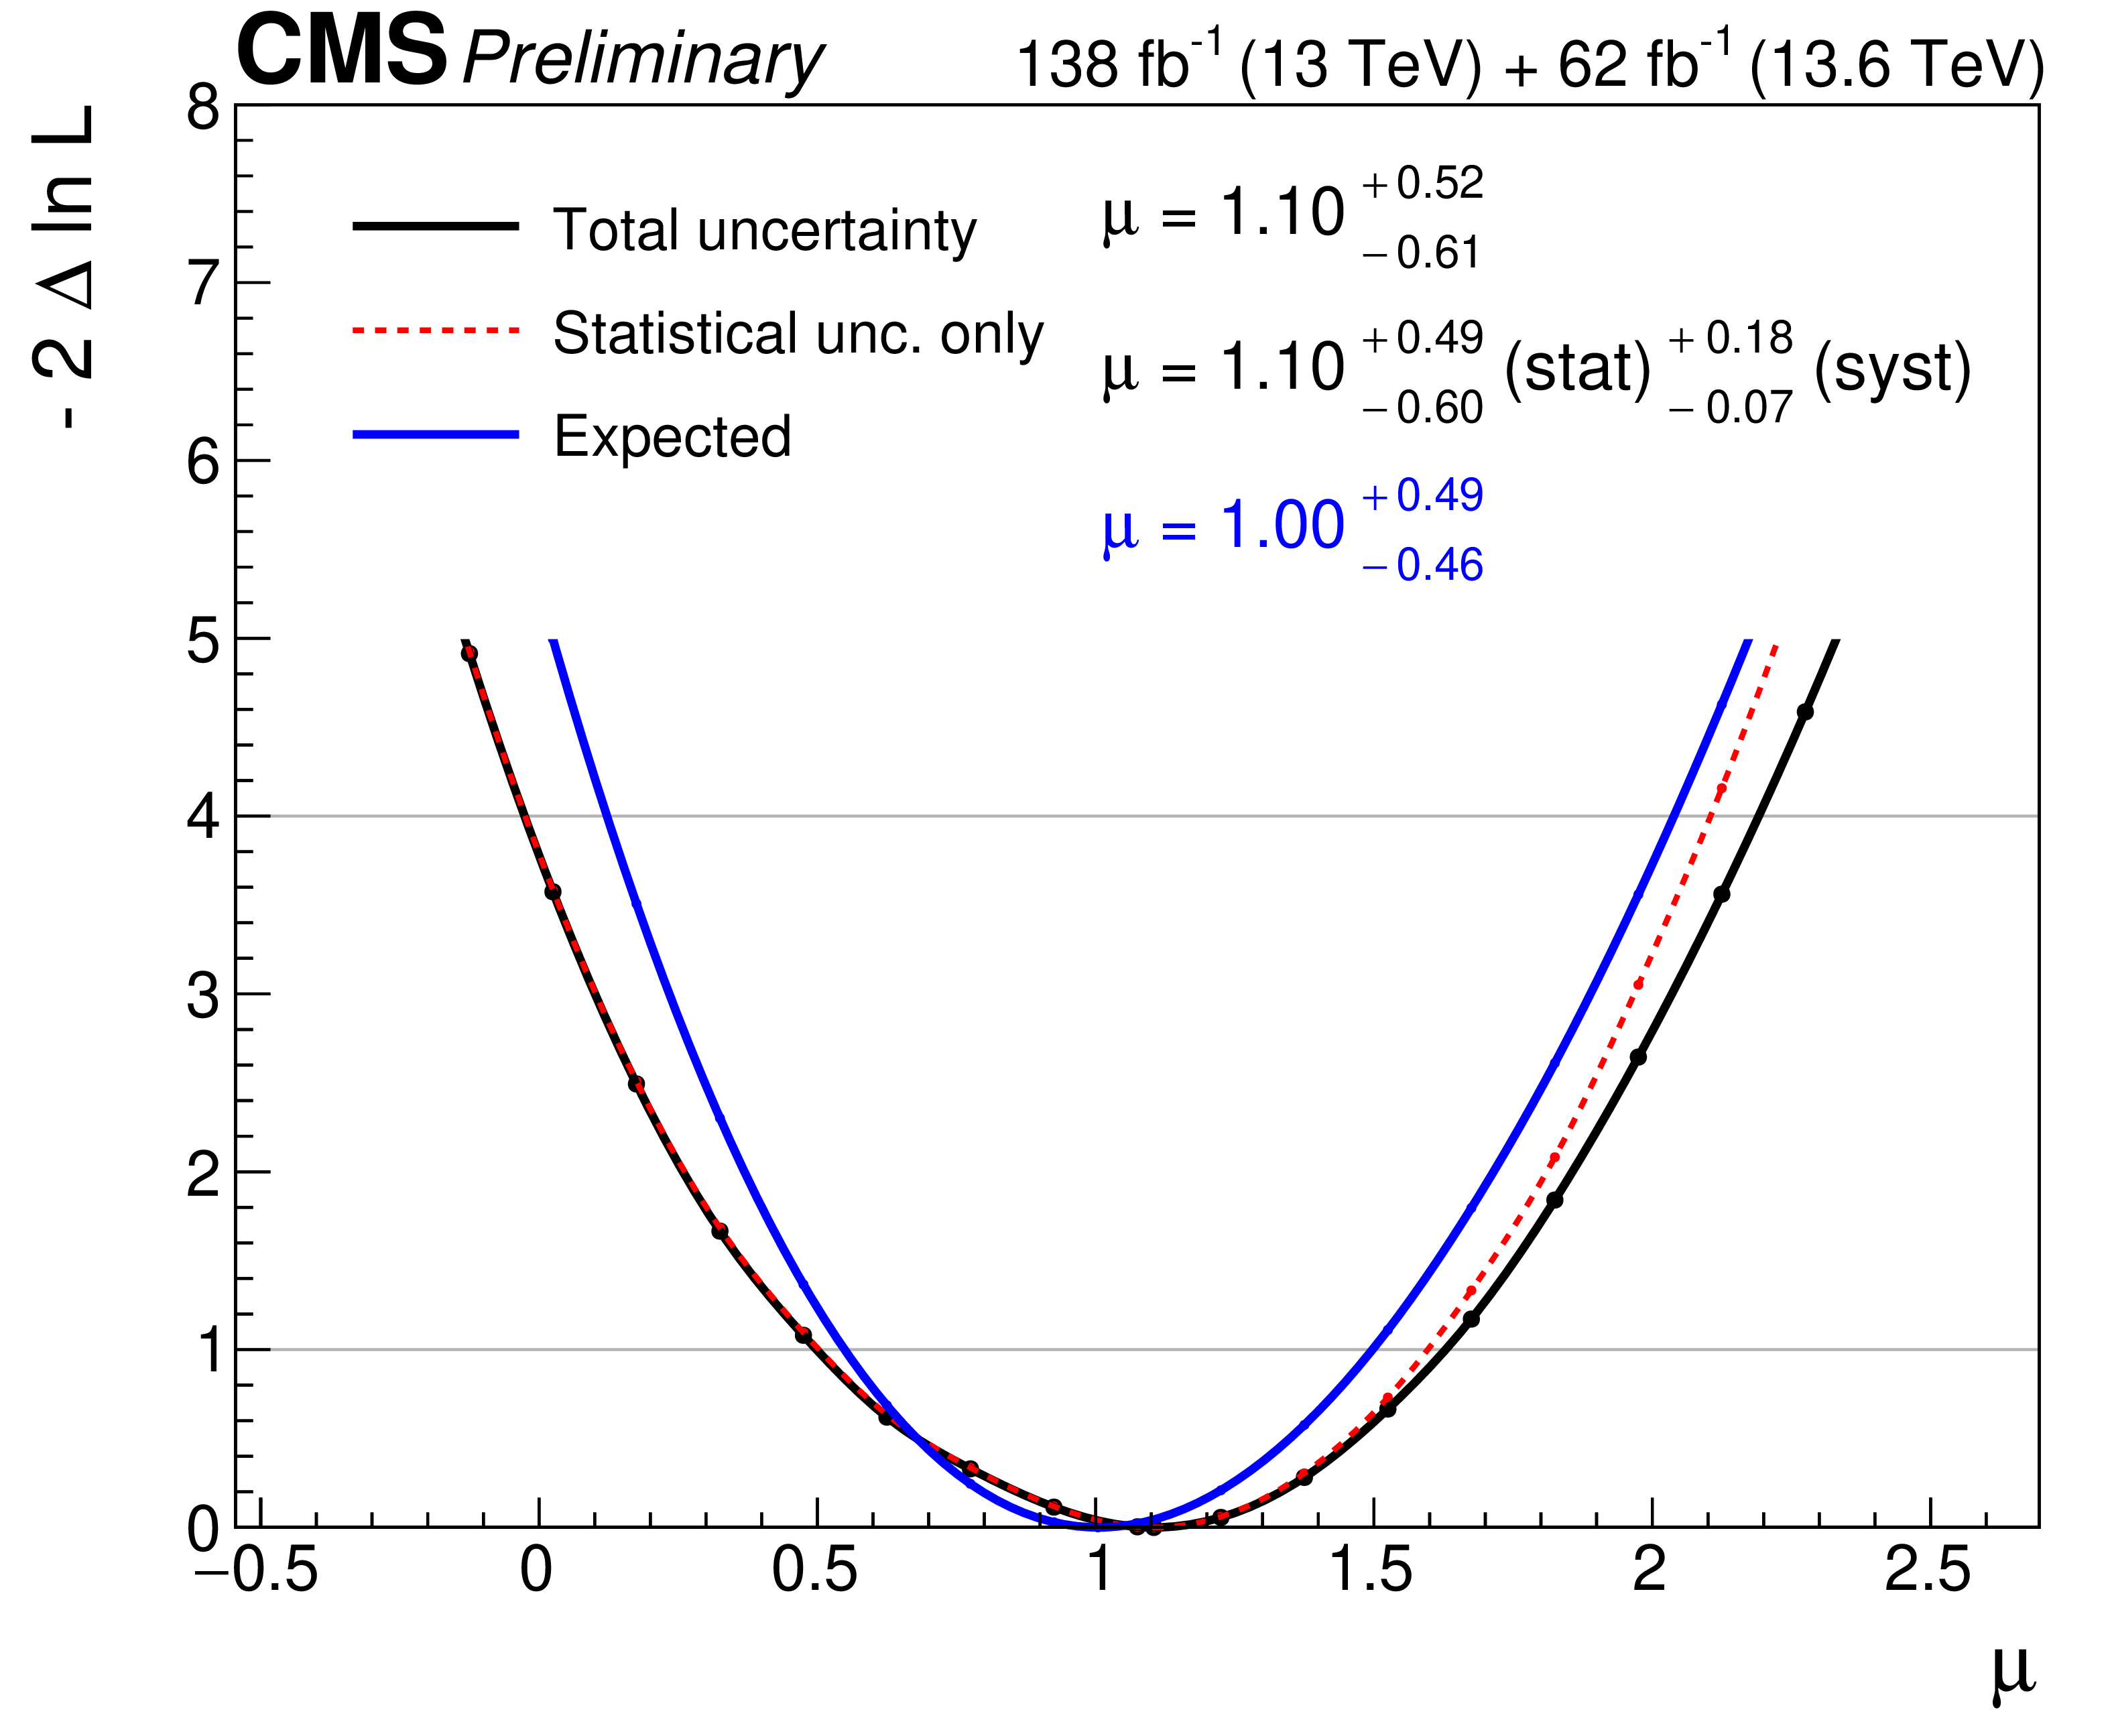
Figure 9:
The negative log-likelihood as a function of the signal strength $ \mu $ for three considered scenarios: (dashed red line) observed result including only statistical uncertainties, (solid black line) observed result including both statistical and systematic uncertainties, and (solid blue line) expected result using the background model from the full range fit and including both statistical and systematic uncertainties. |
| Tables | |
png pdf |
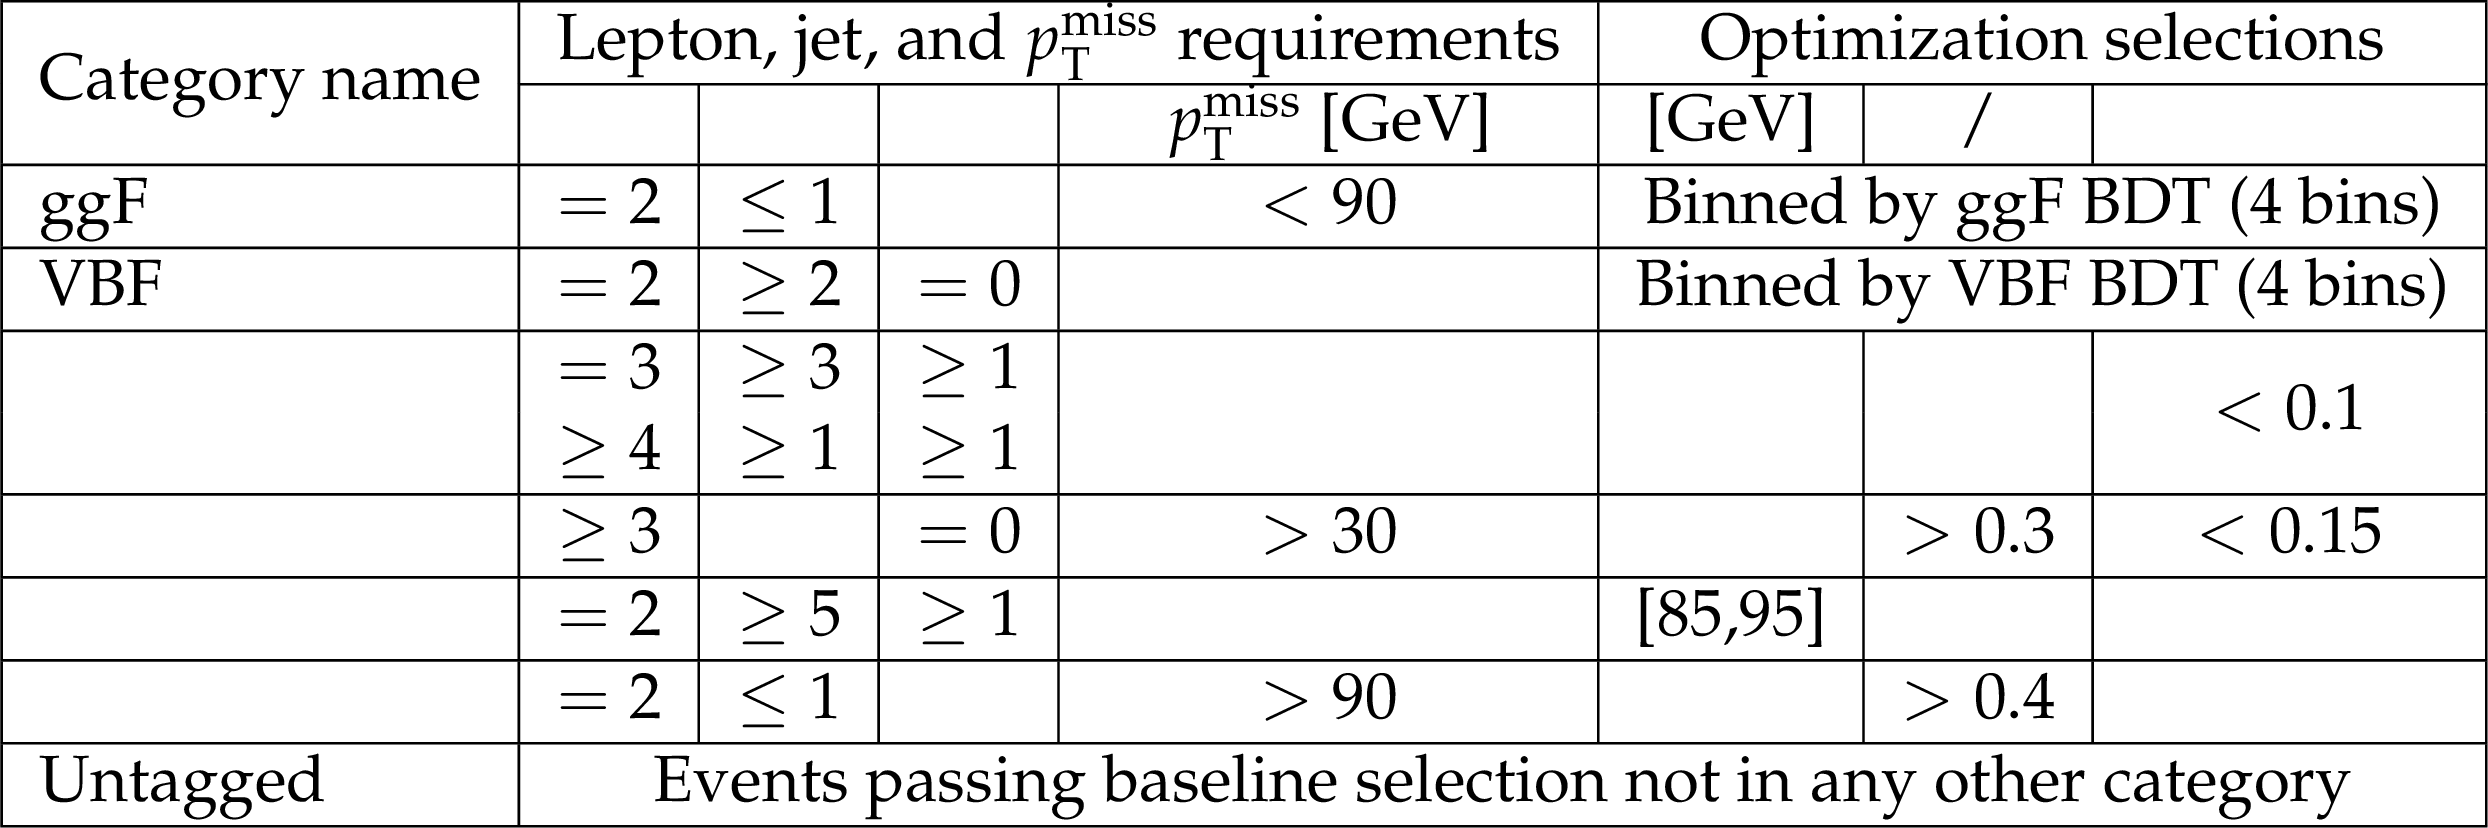
Table 1:
Primary event categories. Each event is assigned to one of these non-overlapping categories after the baseline selection is applied. In the case of the ggF and VBF categories, a further secondary categorization is subsequently applied using a Boosted Decision Tree analyzer (BDT). After the secondary categorization, a total of 13 $ m_{\ell \ell \gamma} $ distributions are used in the final fit. |
png pdf |
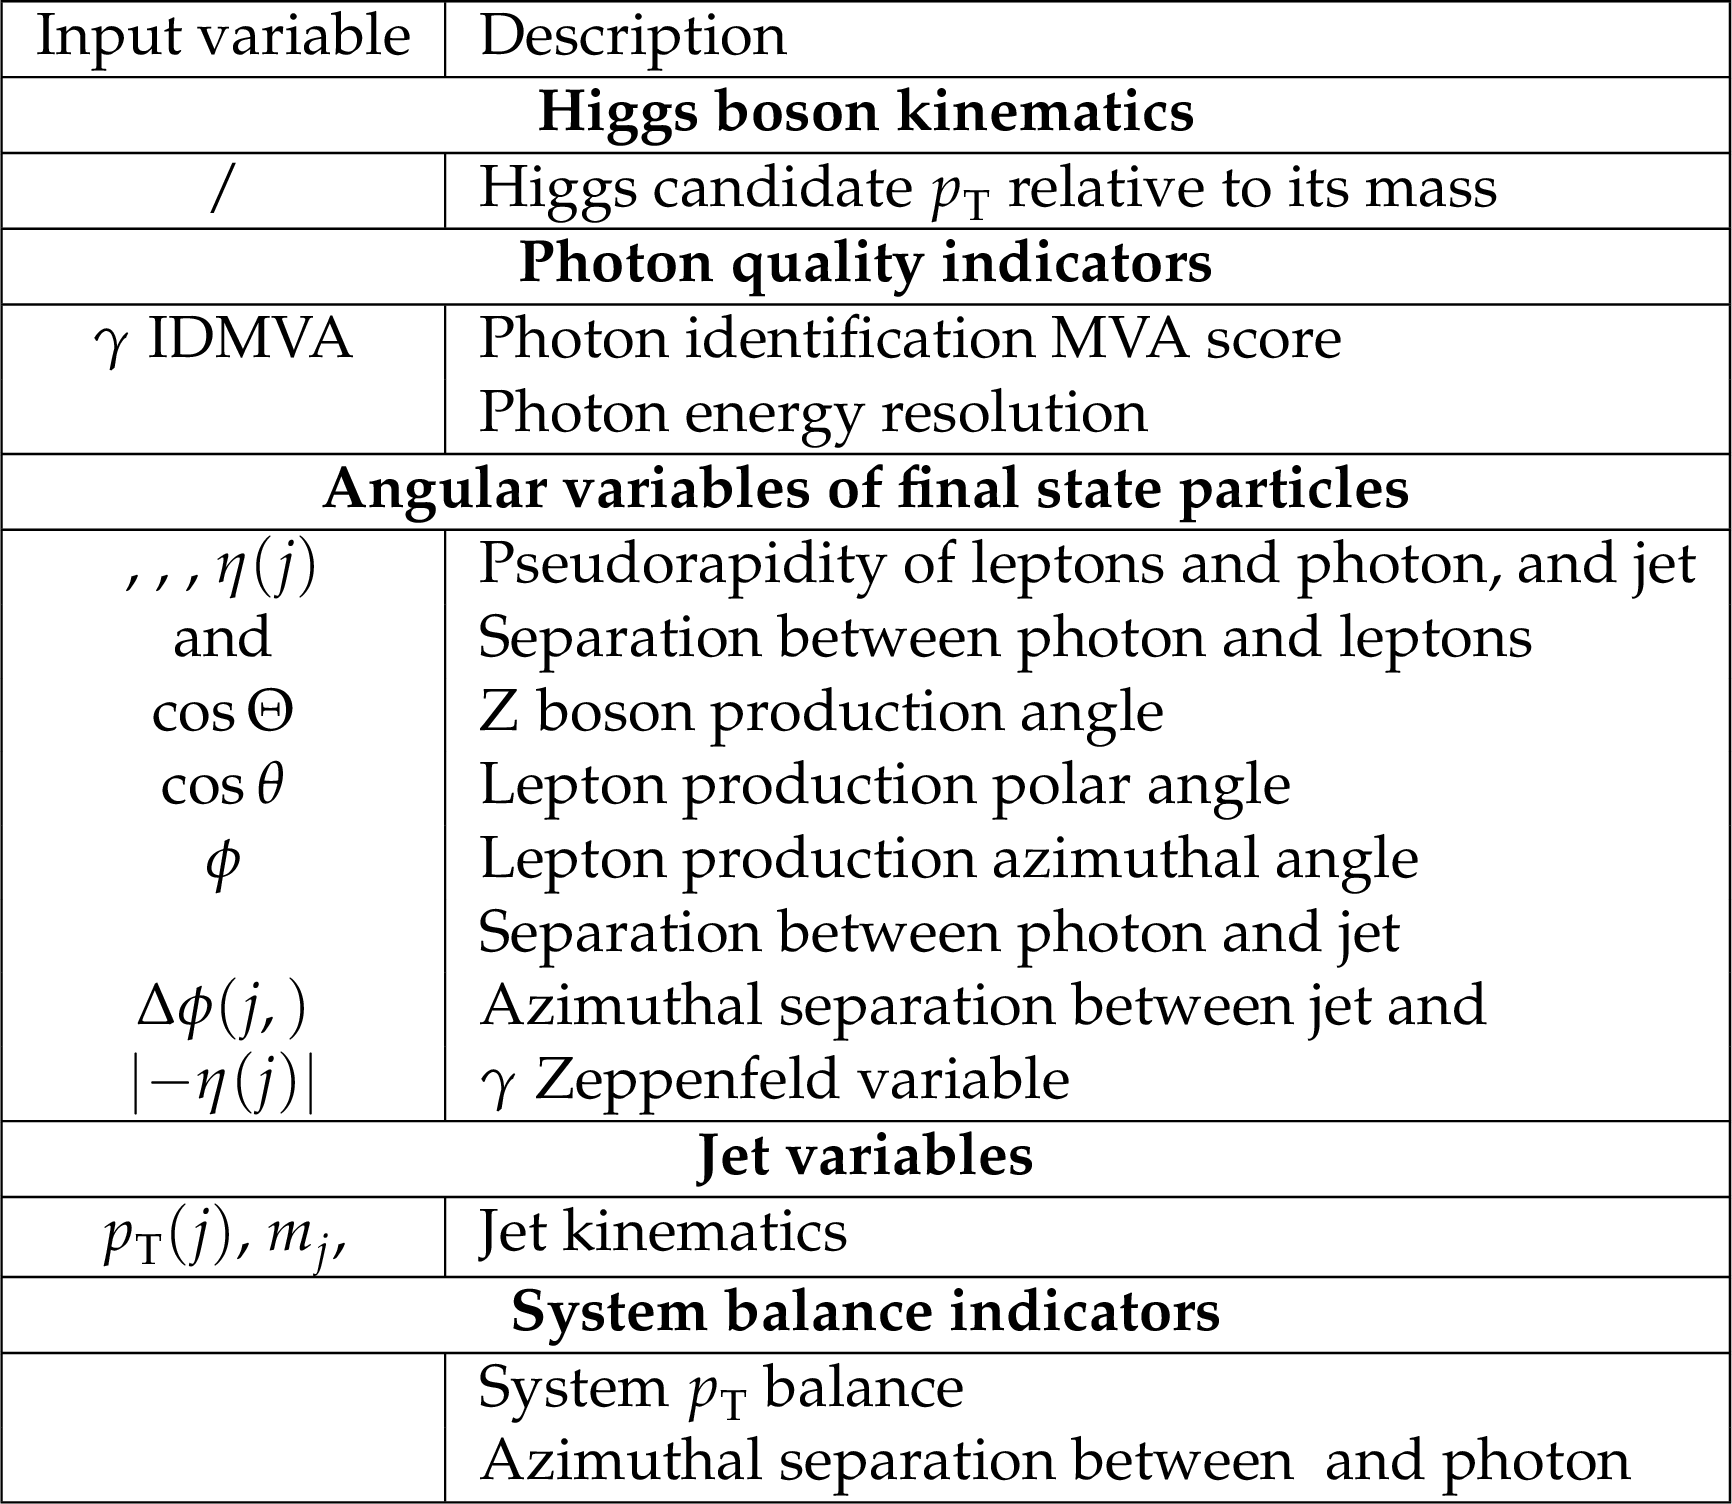
Table 2:
Input variables for the BDT used in the ggF event category. |
png pdf |
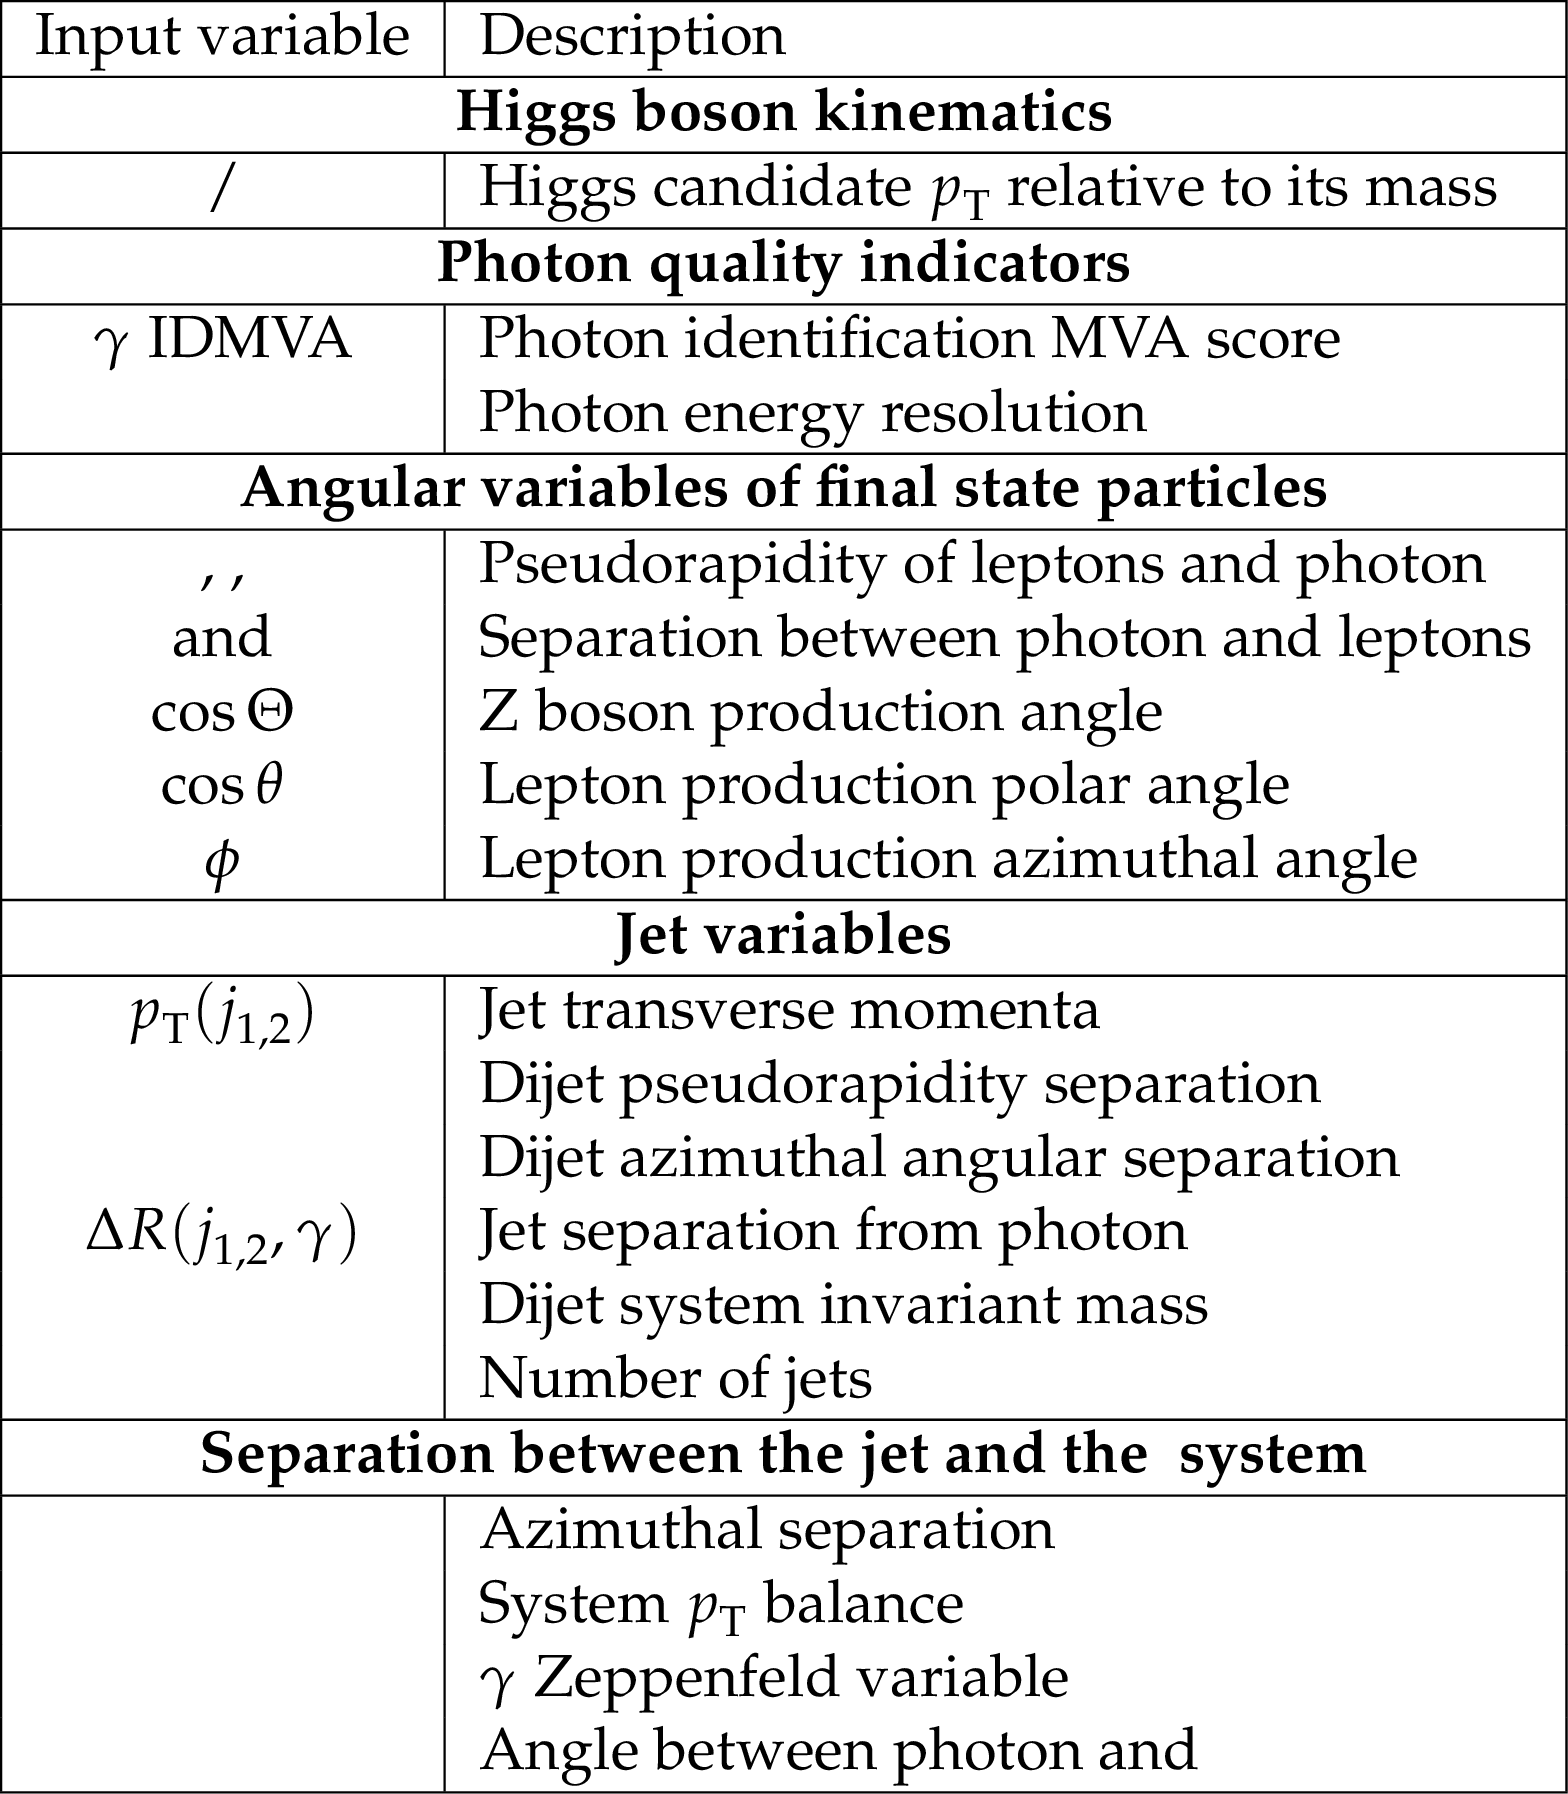
Table 3:
Input variables for the BDT used in the VBF event category. |
png pdf |
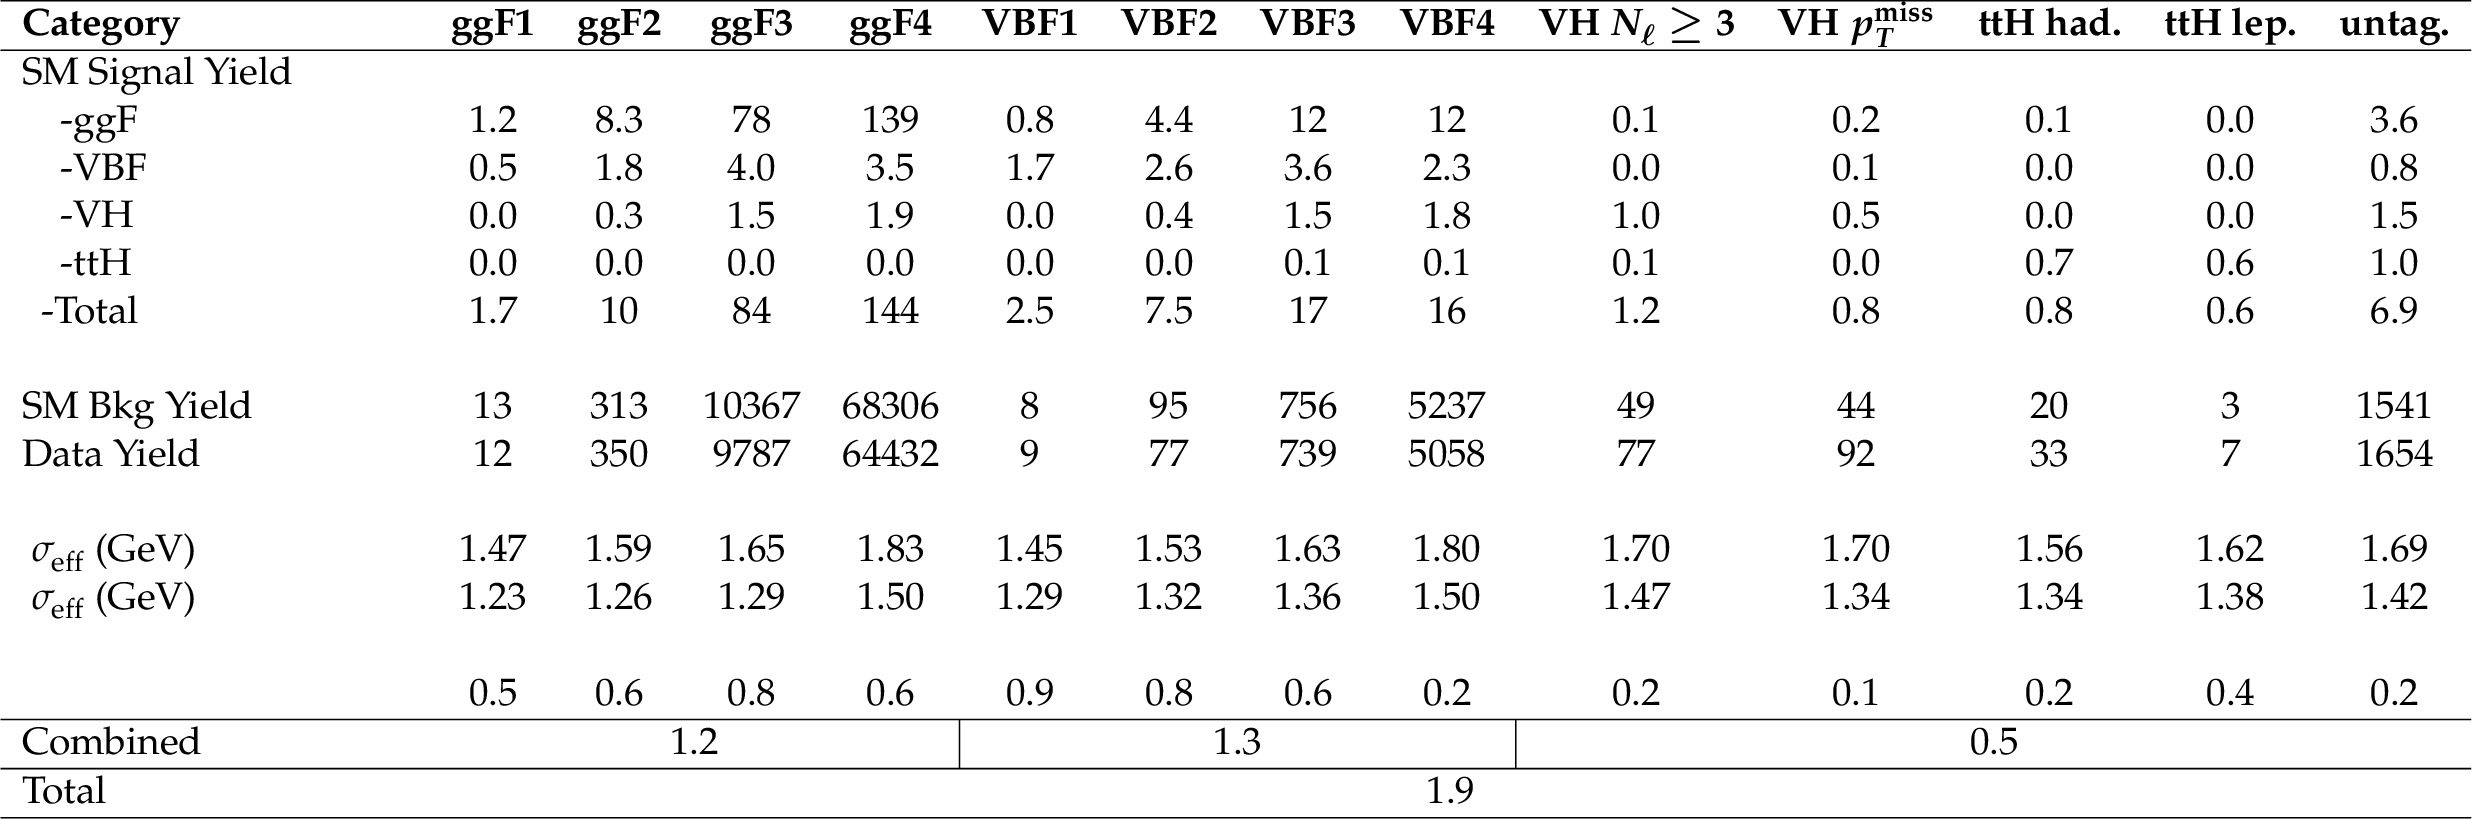
Table 4:
Summary of event categories and expected event yields. All yields are shown within the mass window 120 $ \text{GeV} < m_{\ell \ell \gamma} < $ 130 GeV. The uncertainty $ \sigma_{\textrm{eff}} $ refers to the effective standard deviation corresponding to 68.3% of signal events, after applying the Z-line-shape-constrained fit. Expected significance is estimated using a cut-and-count method, defined by $ Z_{\text{cc}} = \sqrt{2[(N_{S} + N_{B})\times\text{ln}(1+N_{S}/N_{B}) - N_{S}]} $. The expected significance values are added in quadrature to obtain the combined significance values. Because this method does not use the full event distribution information, the values obtained are lower than the expected significance using the fitting described in Section 6. |
png pdf |
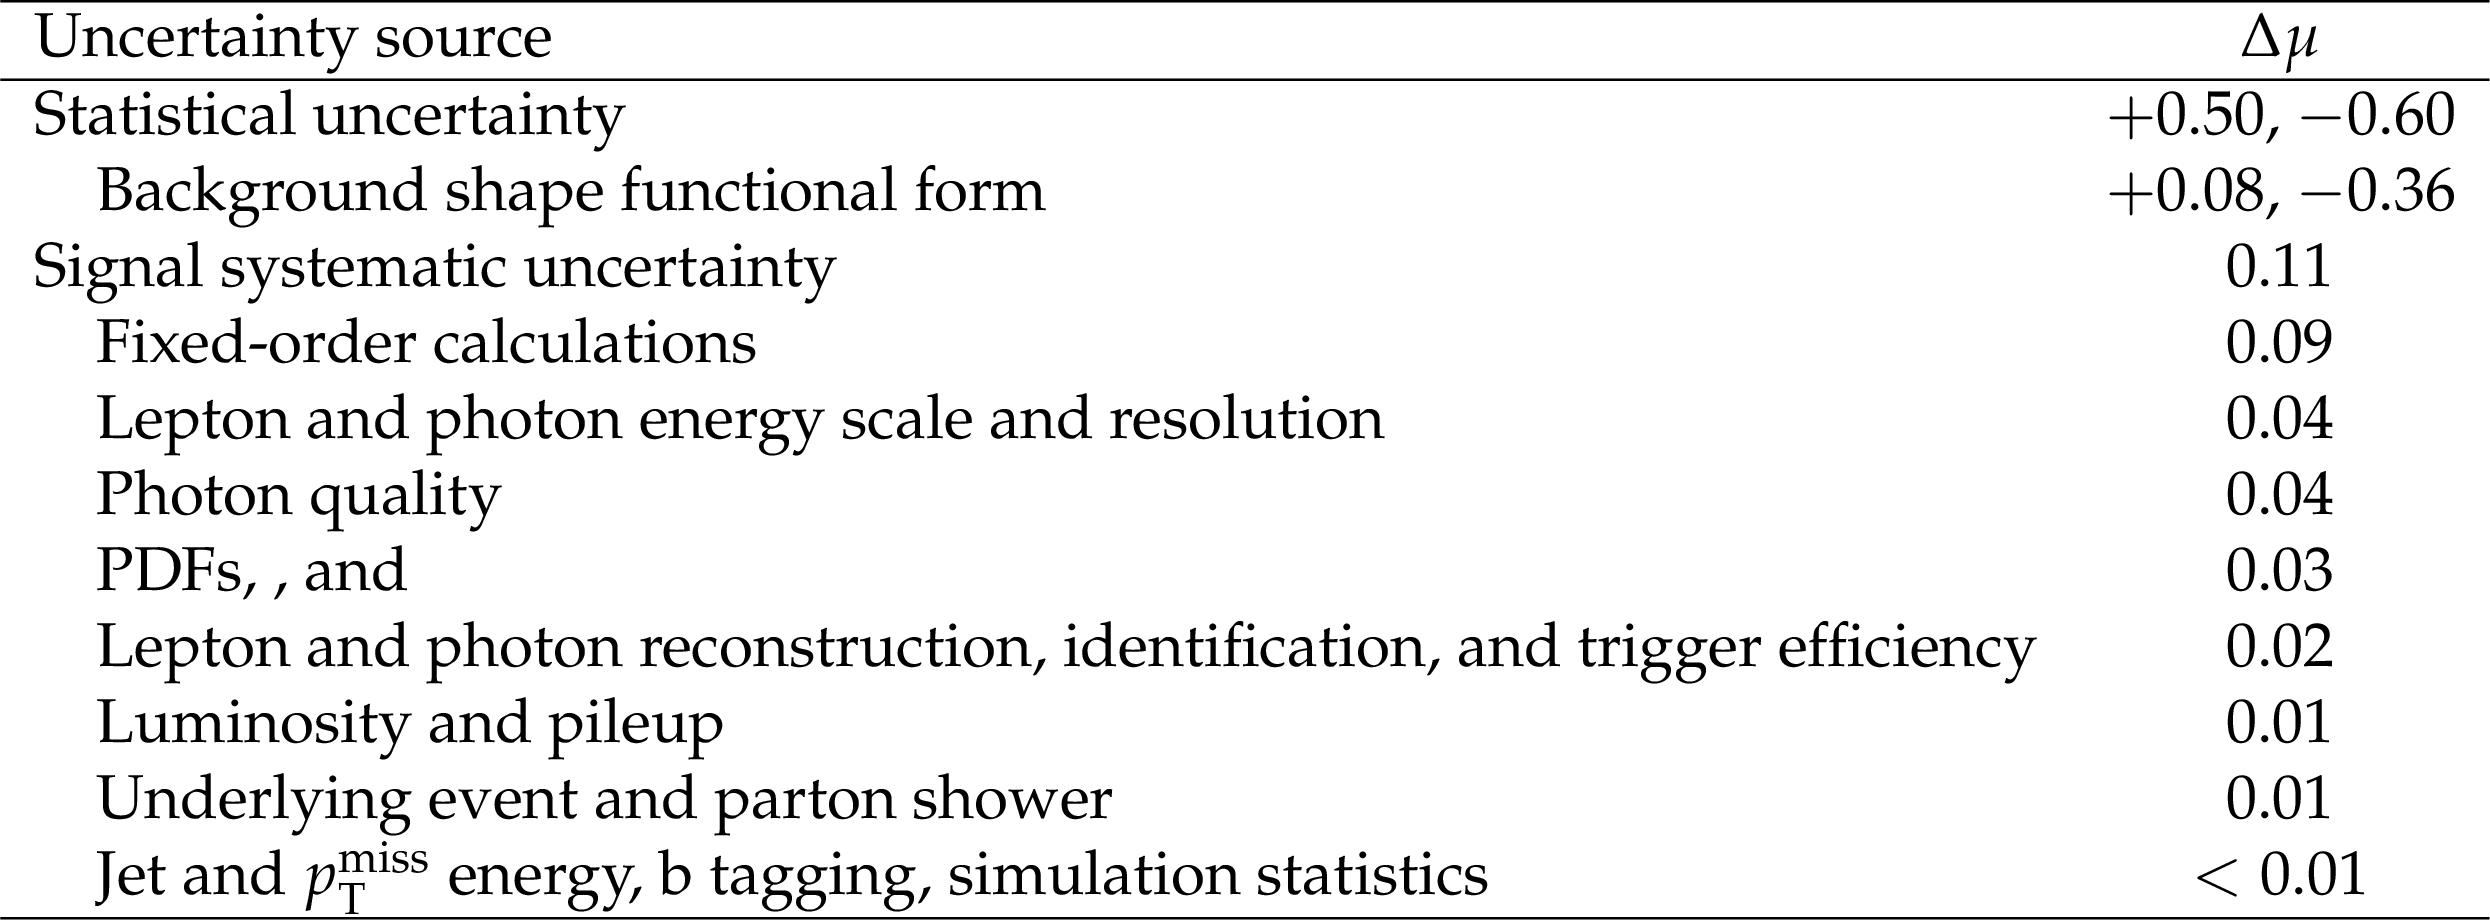
Table 5:
Breakdown of uncertainty sources in the analysis. The statistical uncertainty is quantified by performing the analysis with the signal systematic nuisance parameters frozen. The background shape functional form component of the statistical uncertainty is quantified by comparing a fit with the background functional form frozen to one where it is allowed to float. The sources of signal systematic uncertainty are quantified using the impact on the best fit signal strength when the auxilliary measurements are pulled by one standard deviation. |
| Summary |
| This note describes a search for the rare Higgs boson decay $ \mathrm{H}\to\mathrm{Z}\gamma $, where $ \mathrm{Z}\to \ell^{+}\ell^{-} $ and $ \ell^{\pm} = \mathrm{e}^{\pm} $ or $ \mu^{\pm} $. The standard model branching fraction, not including those for the secondary Z decays, is predicted to be${\cal B}(\mathrm{H}\to\mathrm{Z}\gamma) = (1.6 \pm 0.1) \times 10^{-3}$. The search is performed using a sample of proton-proton (pp) collision data at the center-of-mass energies of $13$ and 13.6 TeV, recorded by the CMS experiment at the LHC and corresponding to a total integrated luminosity of 200 $ \mathrm{fb}^{-1}$. Measurement of the $ \mathrm{H}\to\mathrm{Z}\gamma $ signal is complicated by the presence of large nonresonant backgrounds from other SM processes that can produce the same set of reconstructed objects in the detector. In most channels, the dominant background arises from the $pp \to \mathrm{Z}\gamma $ background. Another substantial background arises from $pp \to \mathrm{Z} $ produced with a reconstructed photon candidate that is problematic in some way. The analysis design separately considers and optimizes sensitivity to Higgs boson production via gluon-gluon fusion (ggF), vector-boson fusion (VBF), and associated-production processes. The analysis procedure involves (i) a common baseline selection, (ii) a primary event categorization assigning events according to object multiplicity and kinematic features, (iii) a secondary event categorization using Boosted Decision Trees (BDTs), and (iv) a Z-line-shape-constrained fit. There are 4 categories for ggF, 4 for VBF, 1 each for the four associated production categories, and 1 for the untagged category. The signal is then extracted from a simultaneous maximum-likelihood fit to the invariant mass distributions of the $\ell^{+}\ell^{-}\gamma$ system in the various event categories. The fit methodology employs the discrete profiling method and includes an extensive series of validation tests. The simultaneous maximimum likelihood fit to all 13 event categories yields the signal strength $\mu$, defined as the ratio of the measured value of $\sigma(pp \to H){\cal B}(H \to Z\gamma)$ to the corresponding value predicted in the standard model. We obtain an observed (expected) signal strength of $\mu = 1.10 ^{+0.52}_{-0.61}$ $(1.00^{+0.49}_{-0.46})$ for a Higgs boson mass of $m_{H} = 125.38$ GeV. The signal has an observed (expected) significance of 1.9 (2.3) standard deviations, and the $p$-value associated with the compatibility of the 13 separate event categories is $p=0.75$. |
| Additional Figures | |
png pdf |
Additional Figure 1:
Improvement of $m_{\ell\ell\gamma}$ resolution due to Z-line-shape constrained fit is shown using simulated signal samples in events with the Z boson decaying to (left) electrons and (right) muons. Each plot shows the distribution in $m_{\ell\ell\gamma}$ before the refit (blue) and (red) after the refit. |
png pdf |
Additional Figure 1-a:
Improvement of $m_{\ell\ell\gamma}$ resolution due to Z-line-shape constrained fit is shown using simulated signal samples in events with the Z boson decaying to (left) electrons and (right) muons. Each plot shows the distribution in $m_{\ell\ell\gamma}$ before the refit (blue) and (red) after the refit. |
png pdf |
Additional Figure 1-b:
Improvement of $m_{\ell\ell\gamma}$ resolution due to Z-line-shape constrained fit is shown using simulated signal samples in events with the Z boson decaying to (left) electrons and (right) muons. Each plot shows the distribution in $m_{\ell\ell\gamma}$ before the refit (blue) and (red) after the refit. |
png pdf |
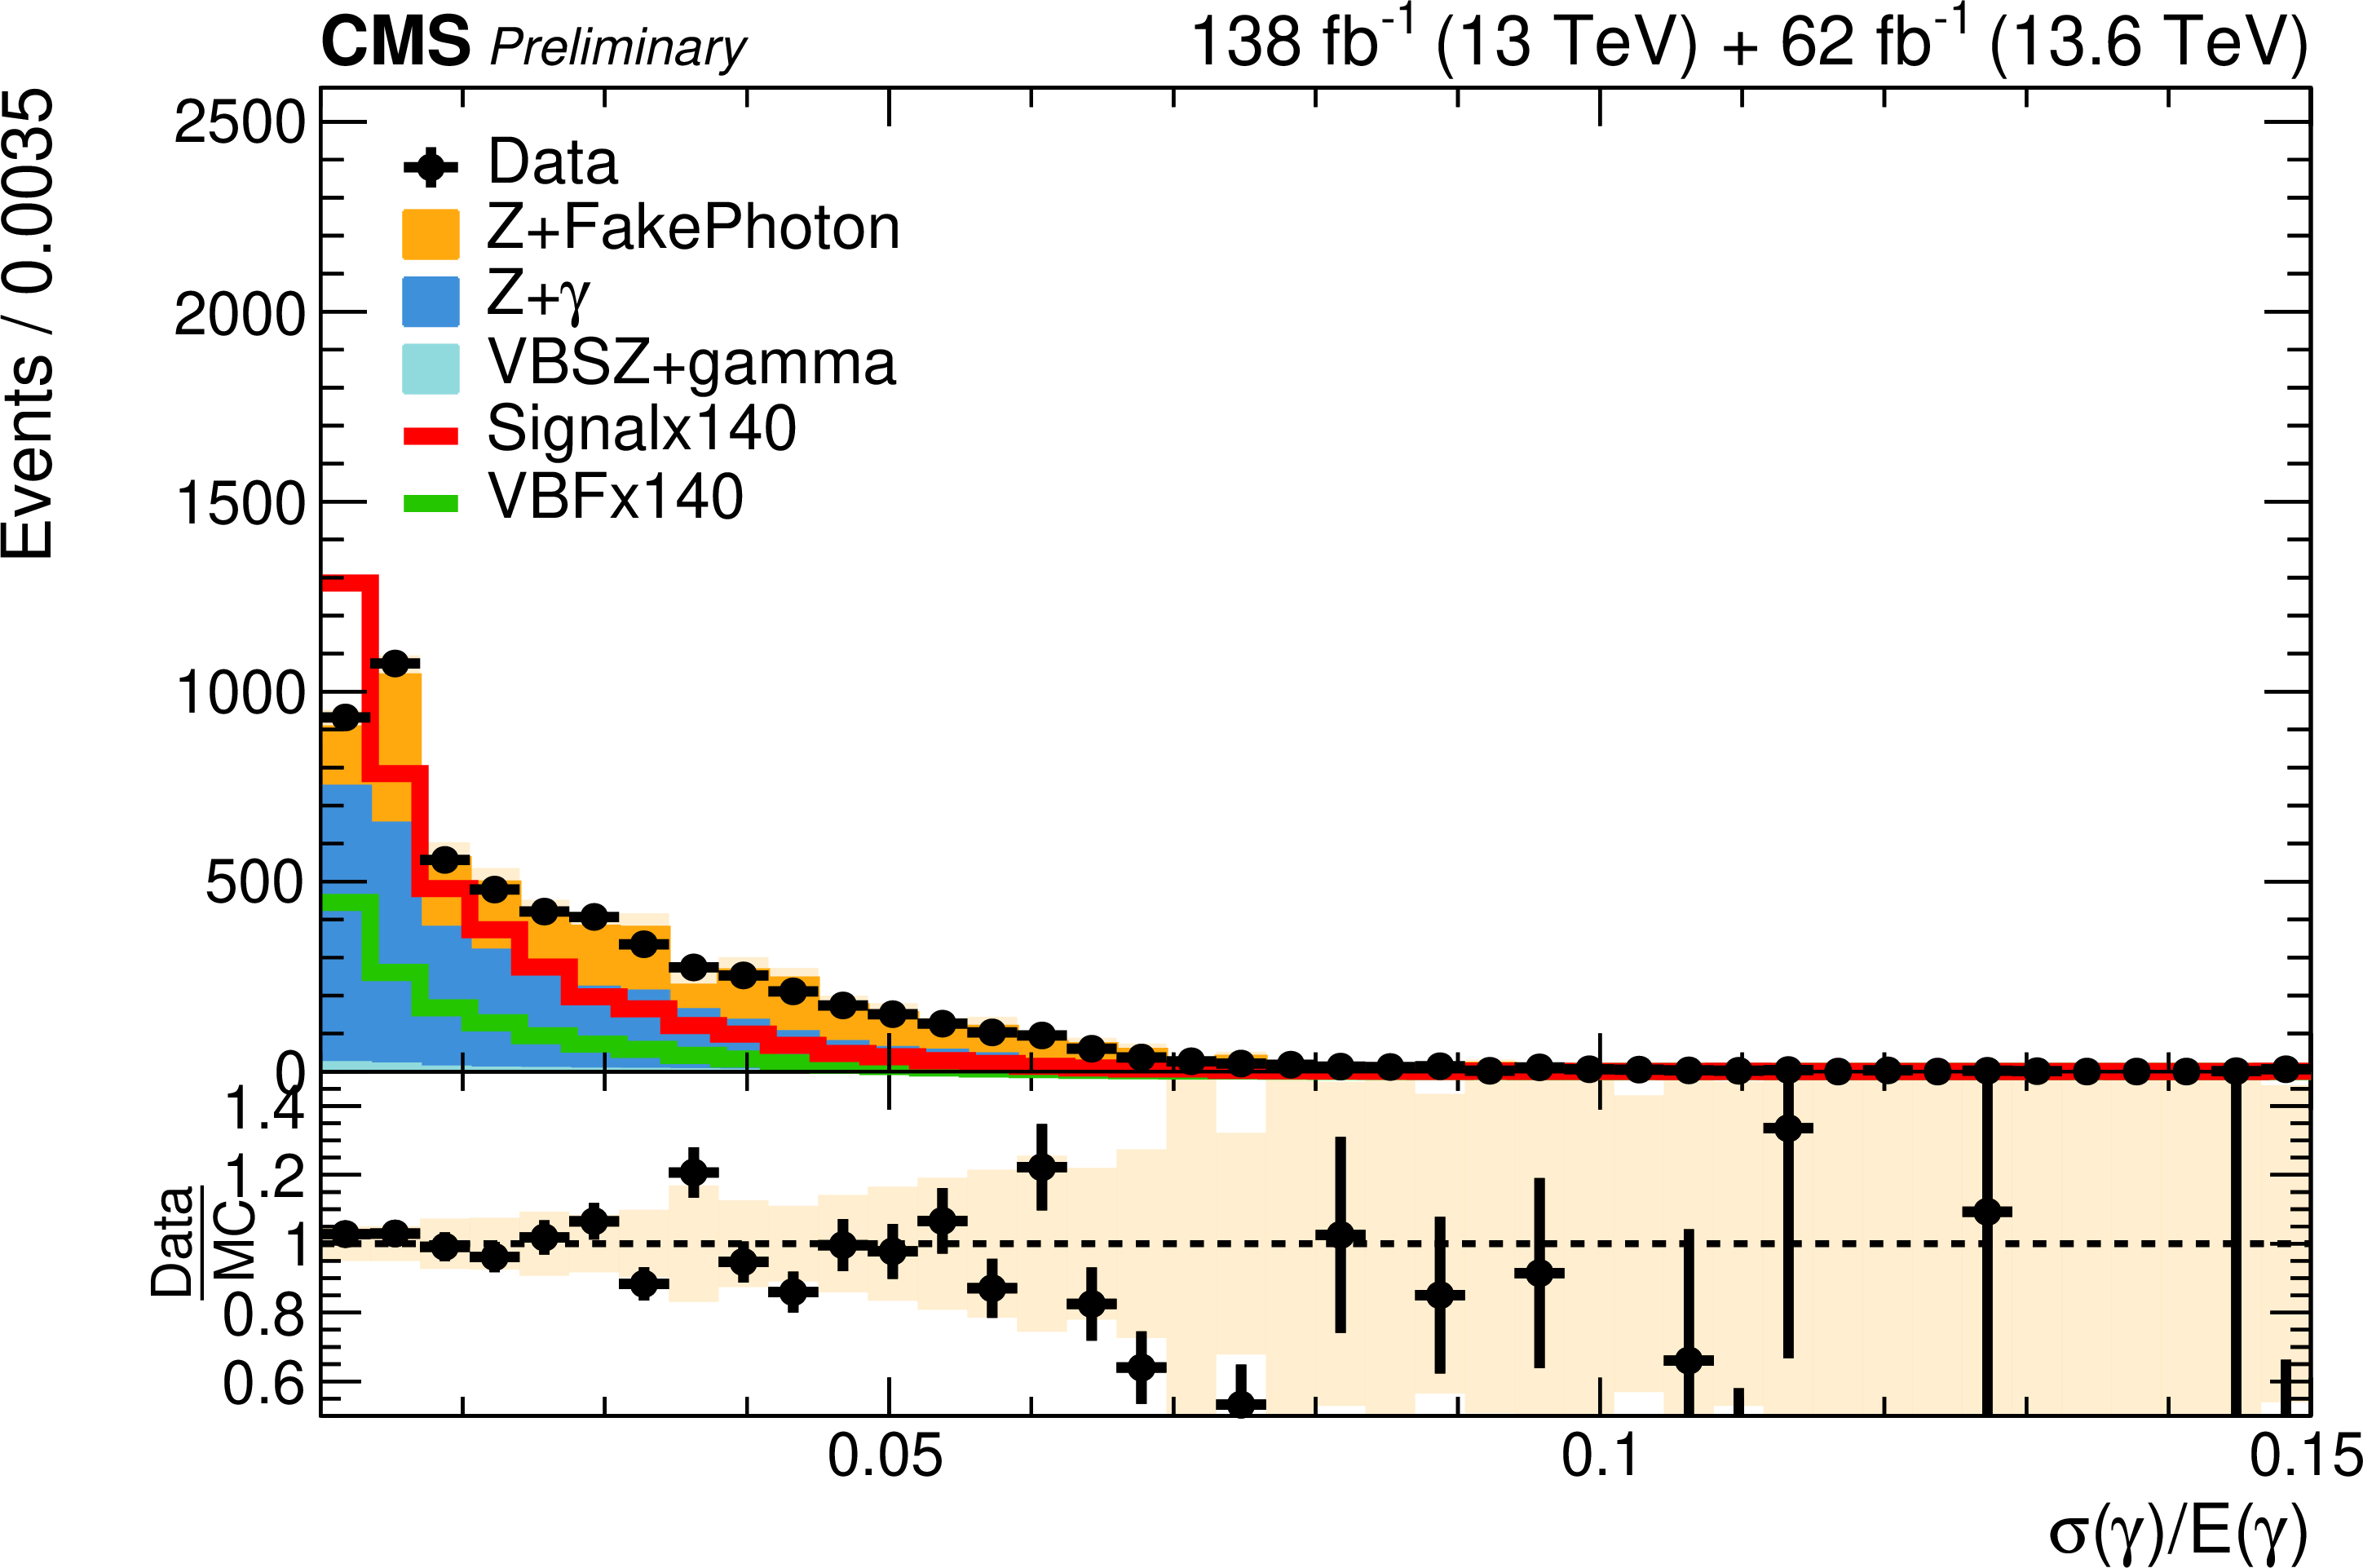
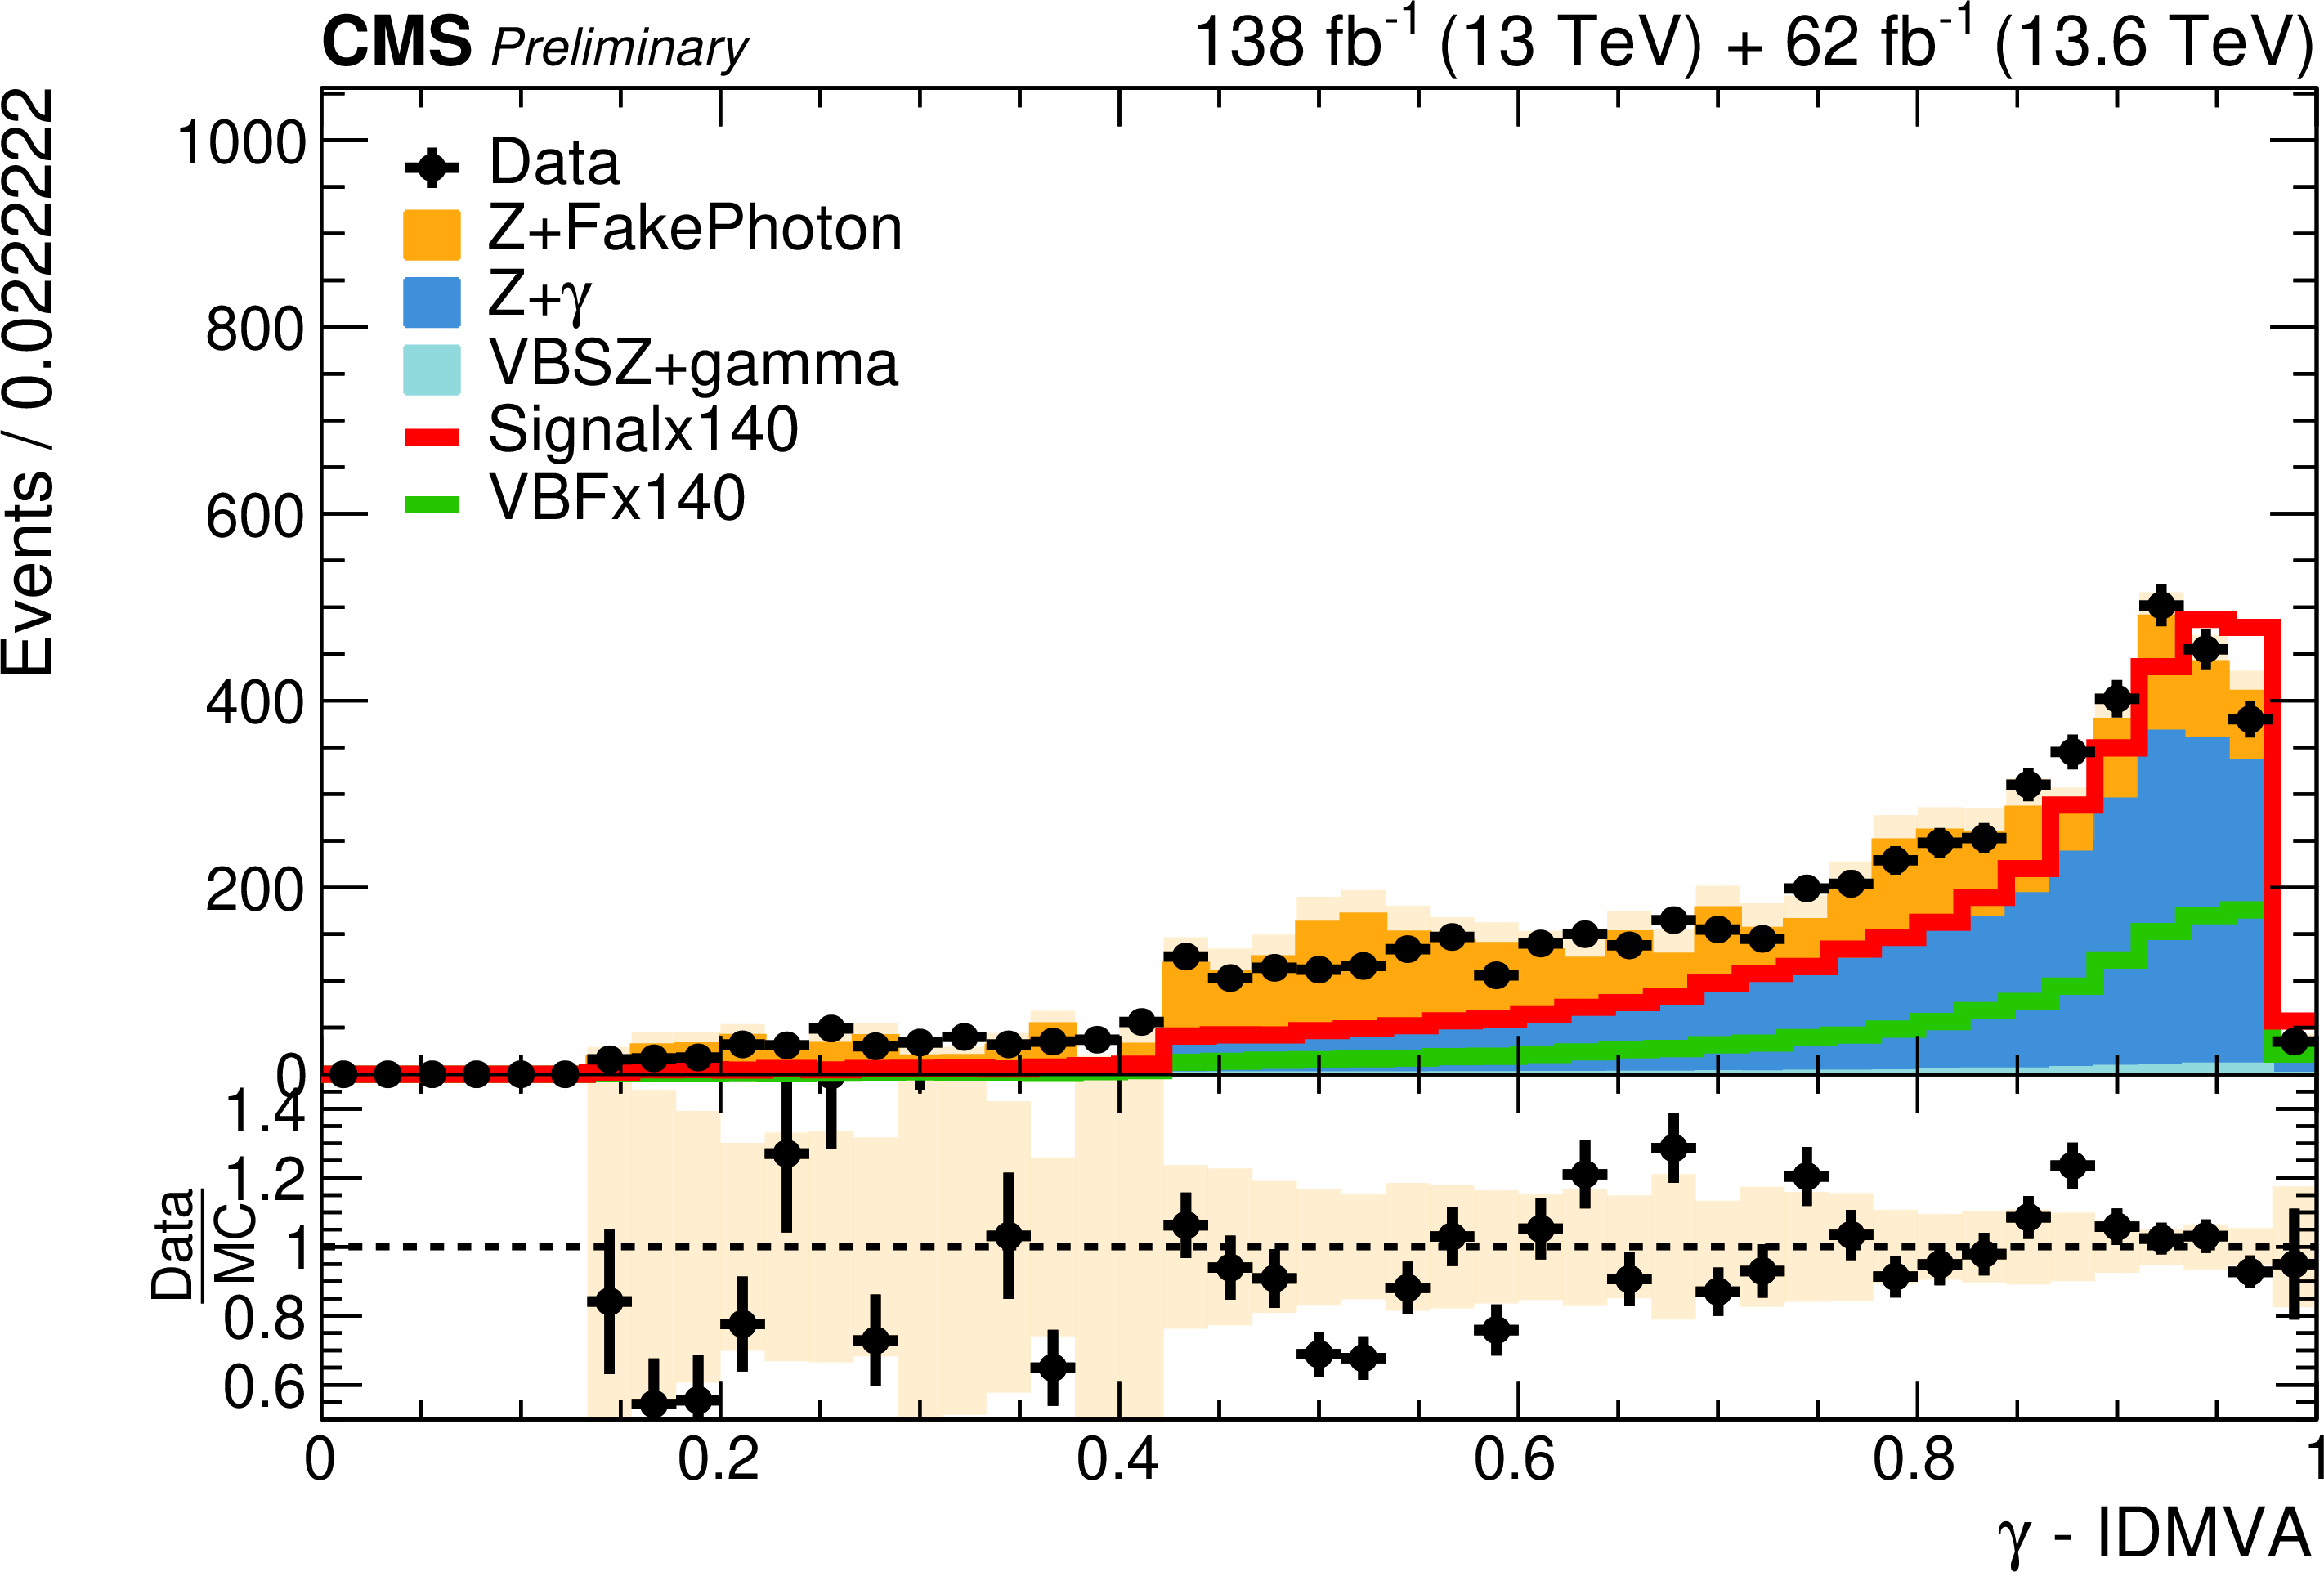
Additional Figure 2:
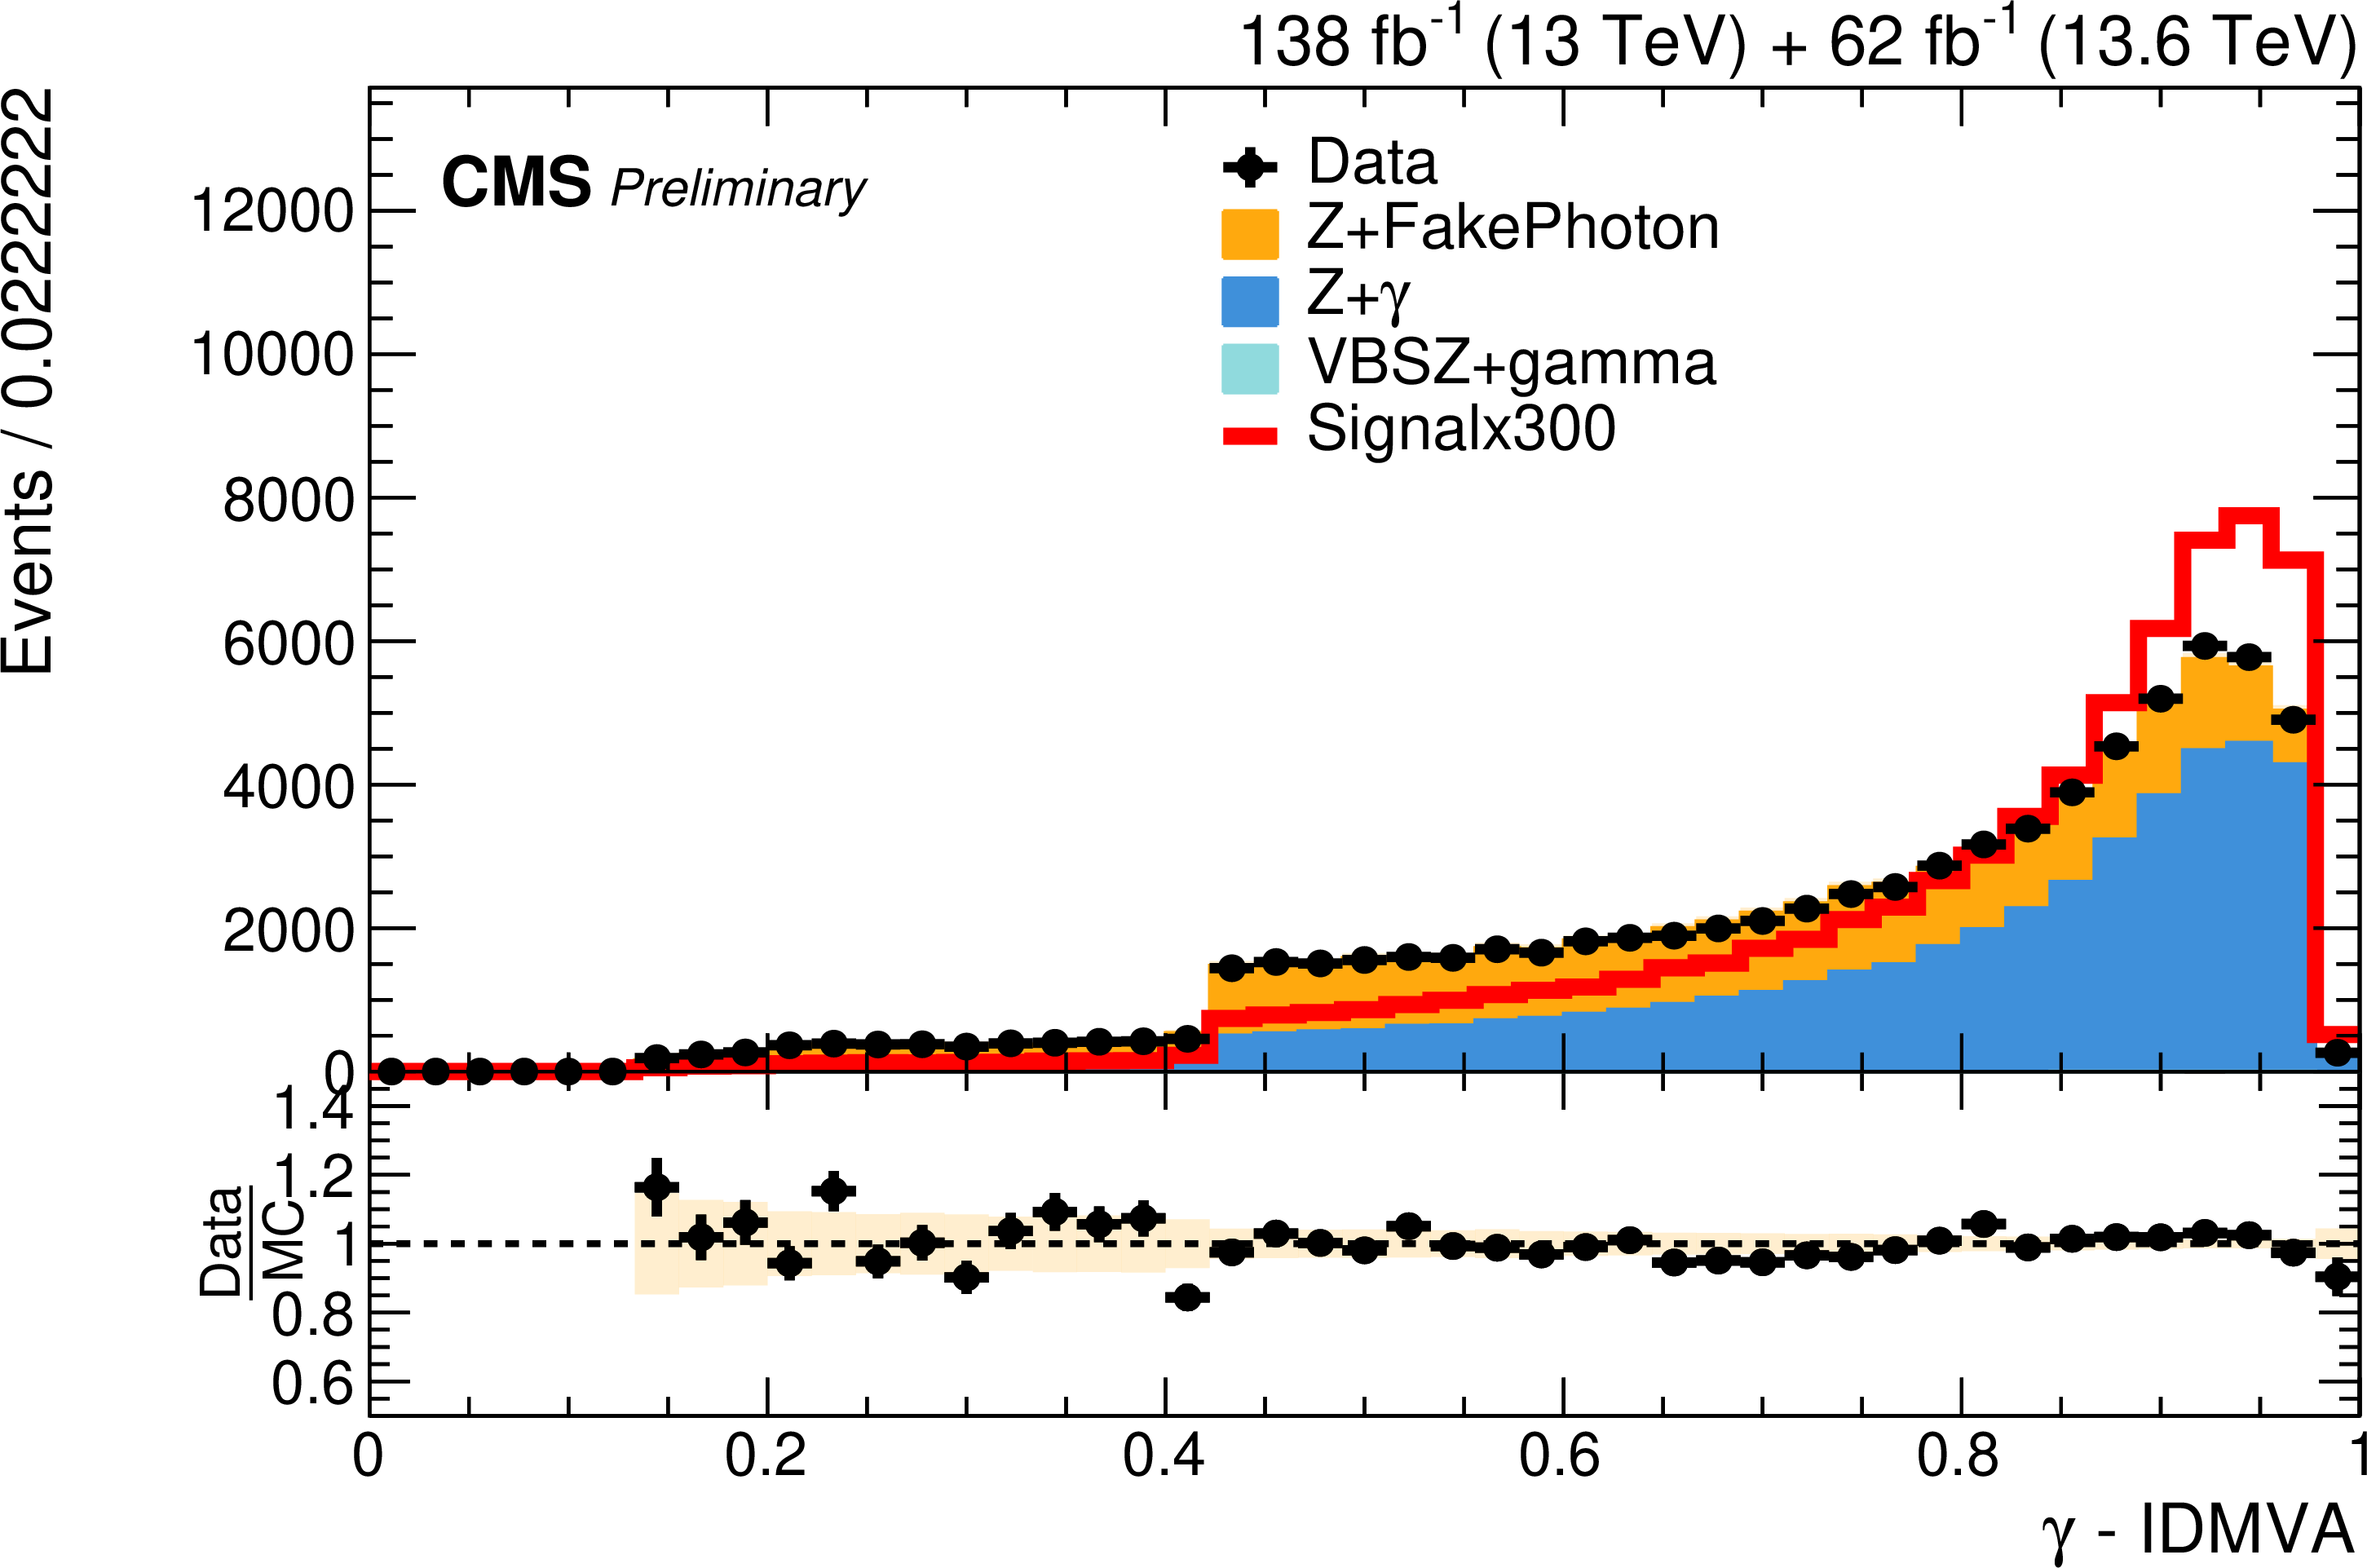
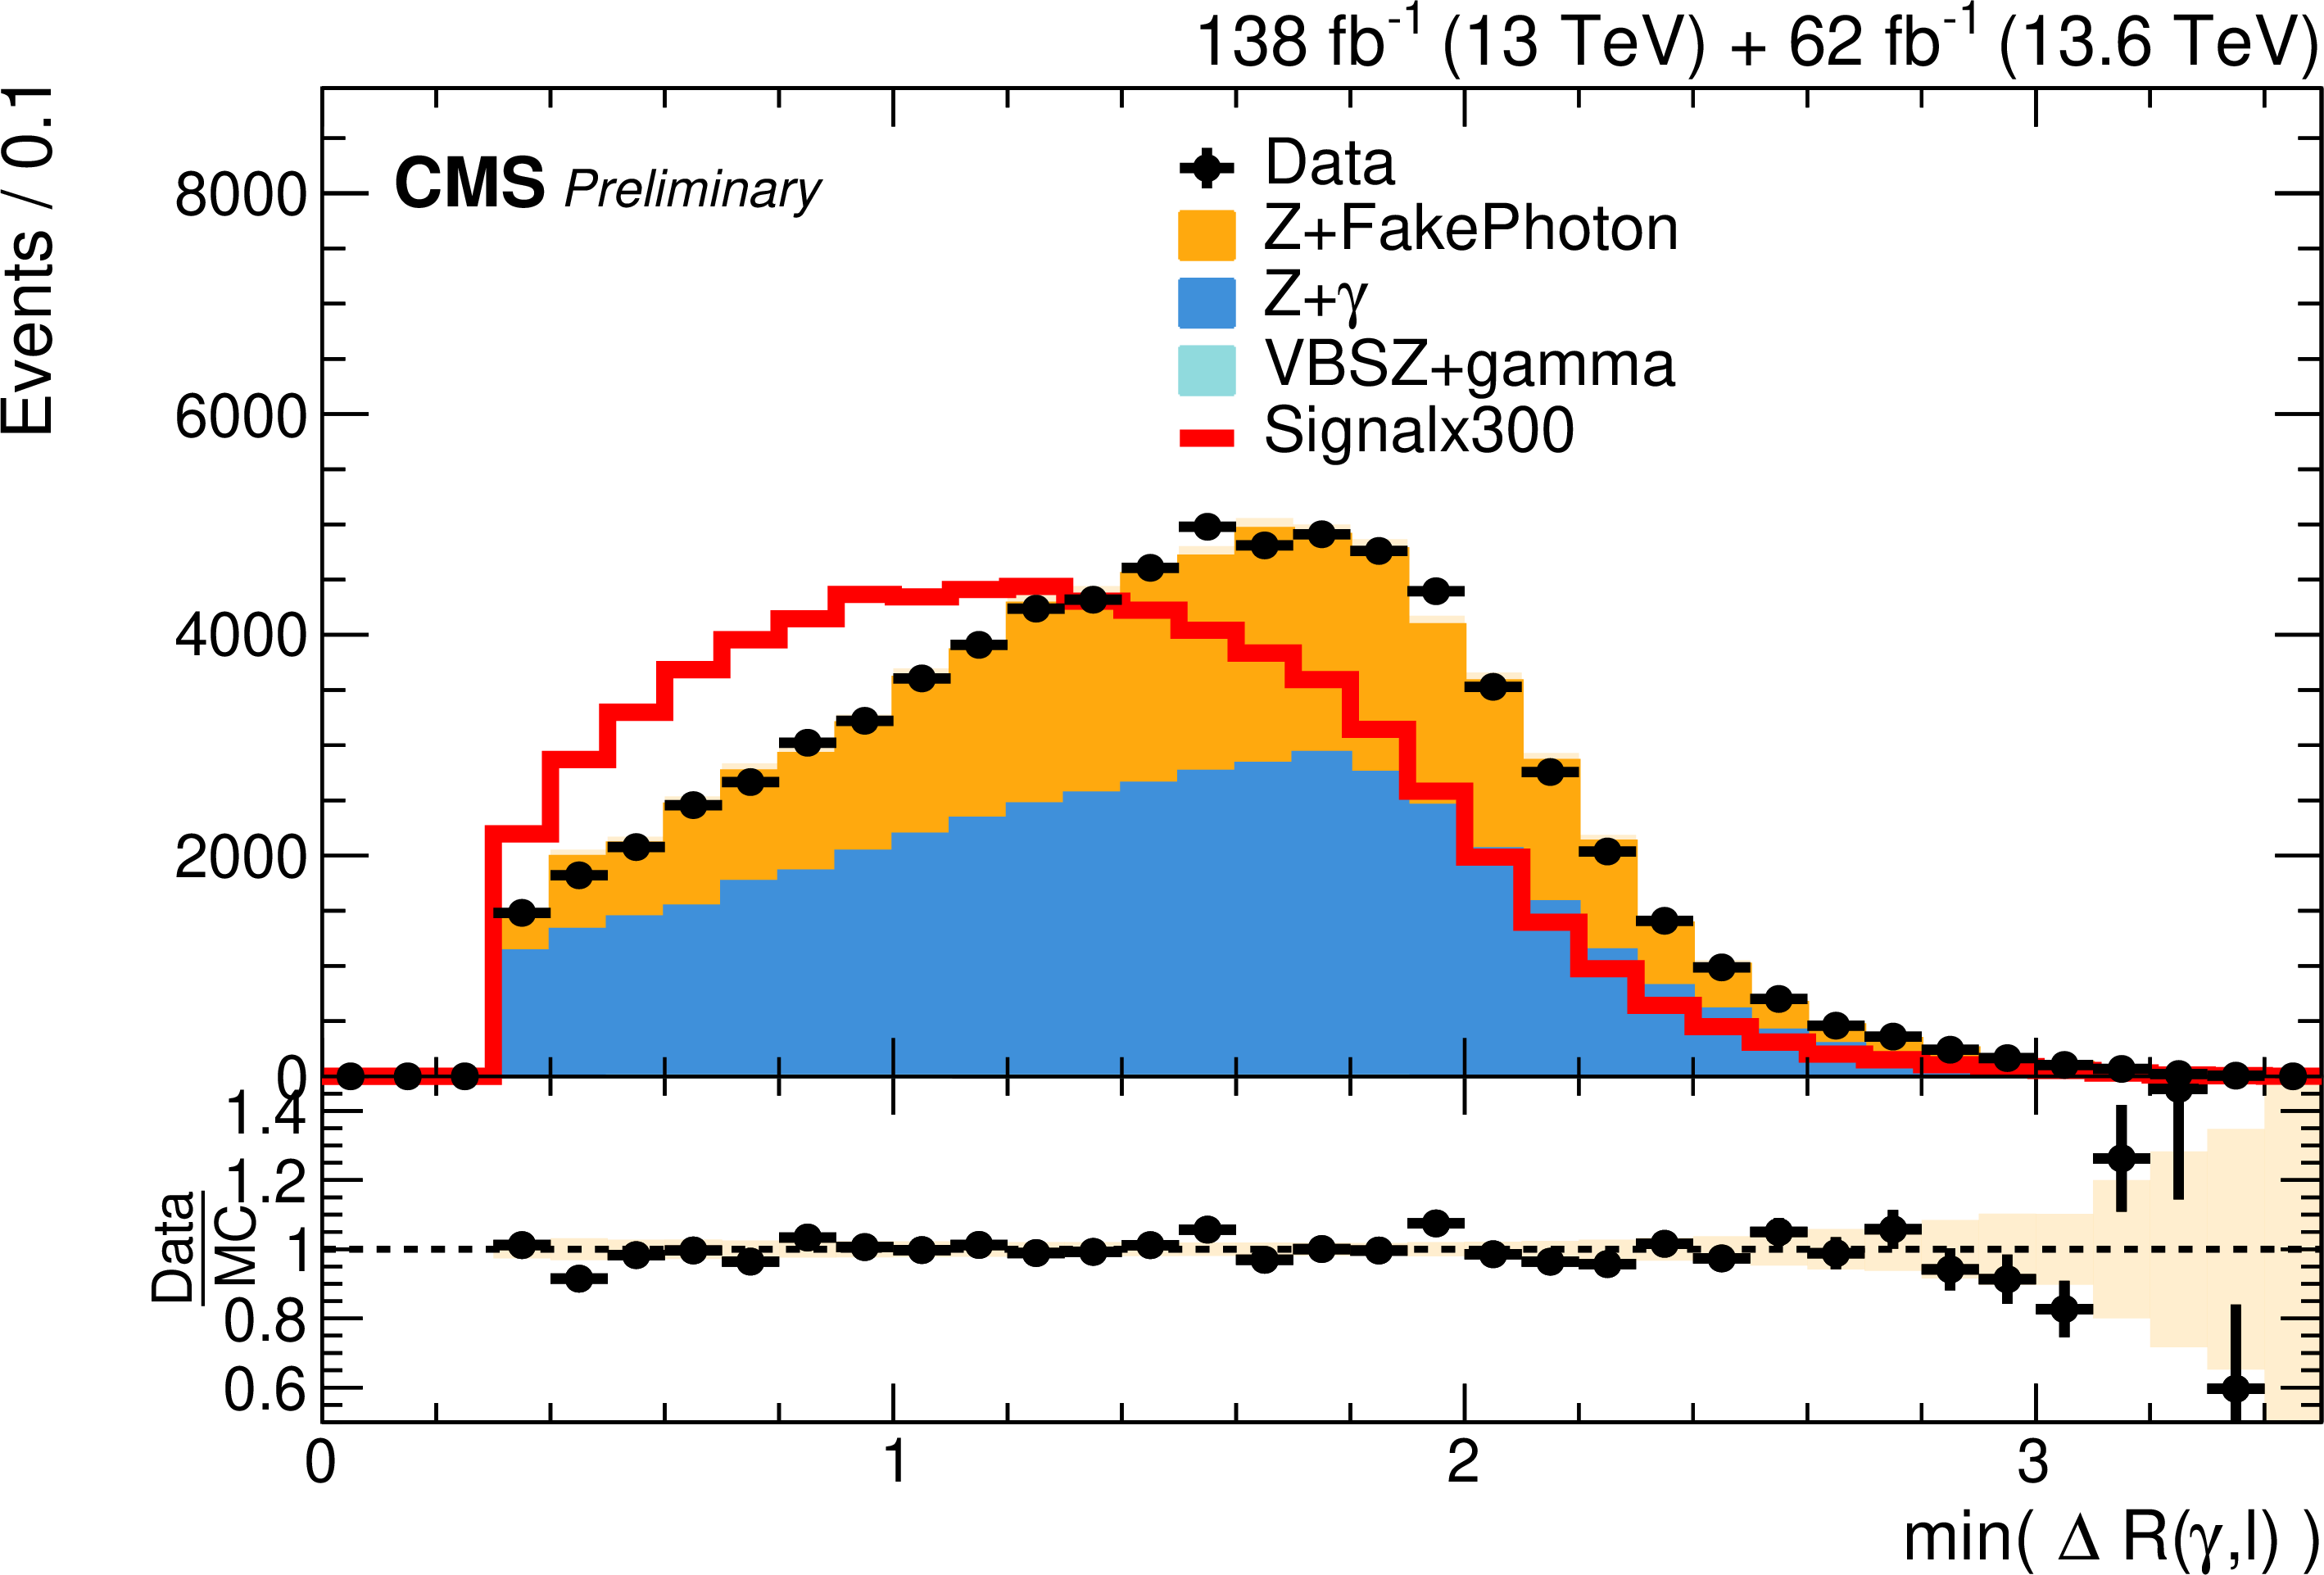
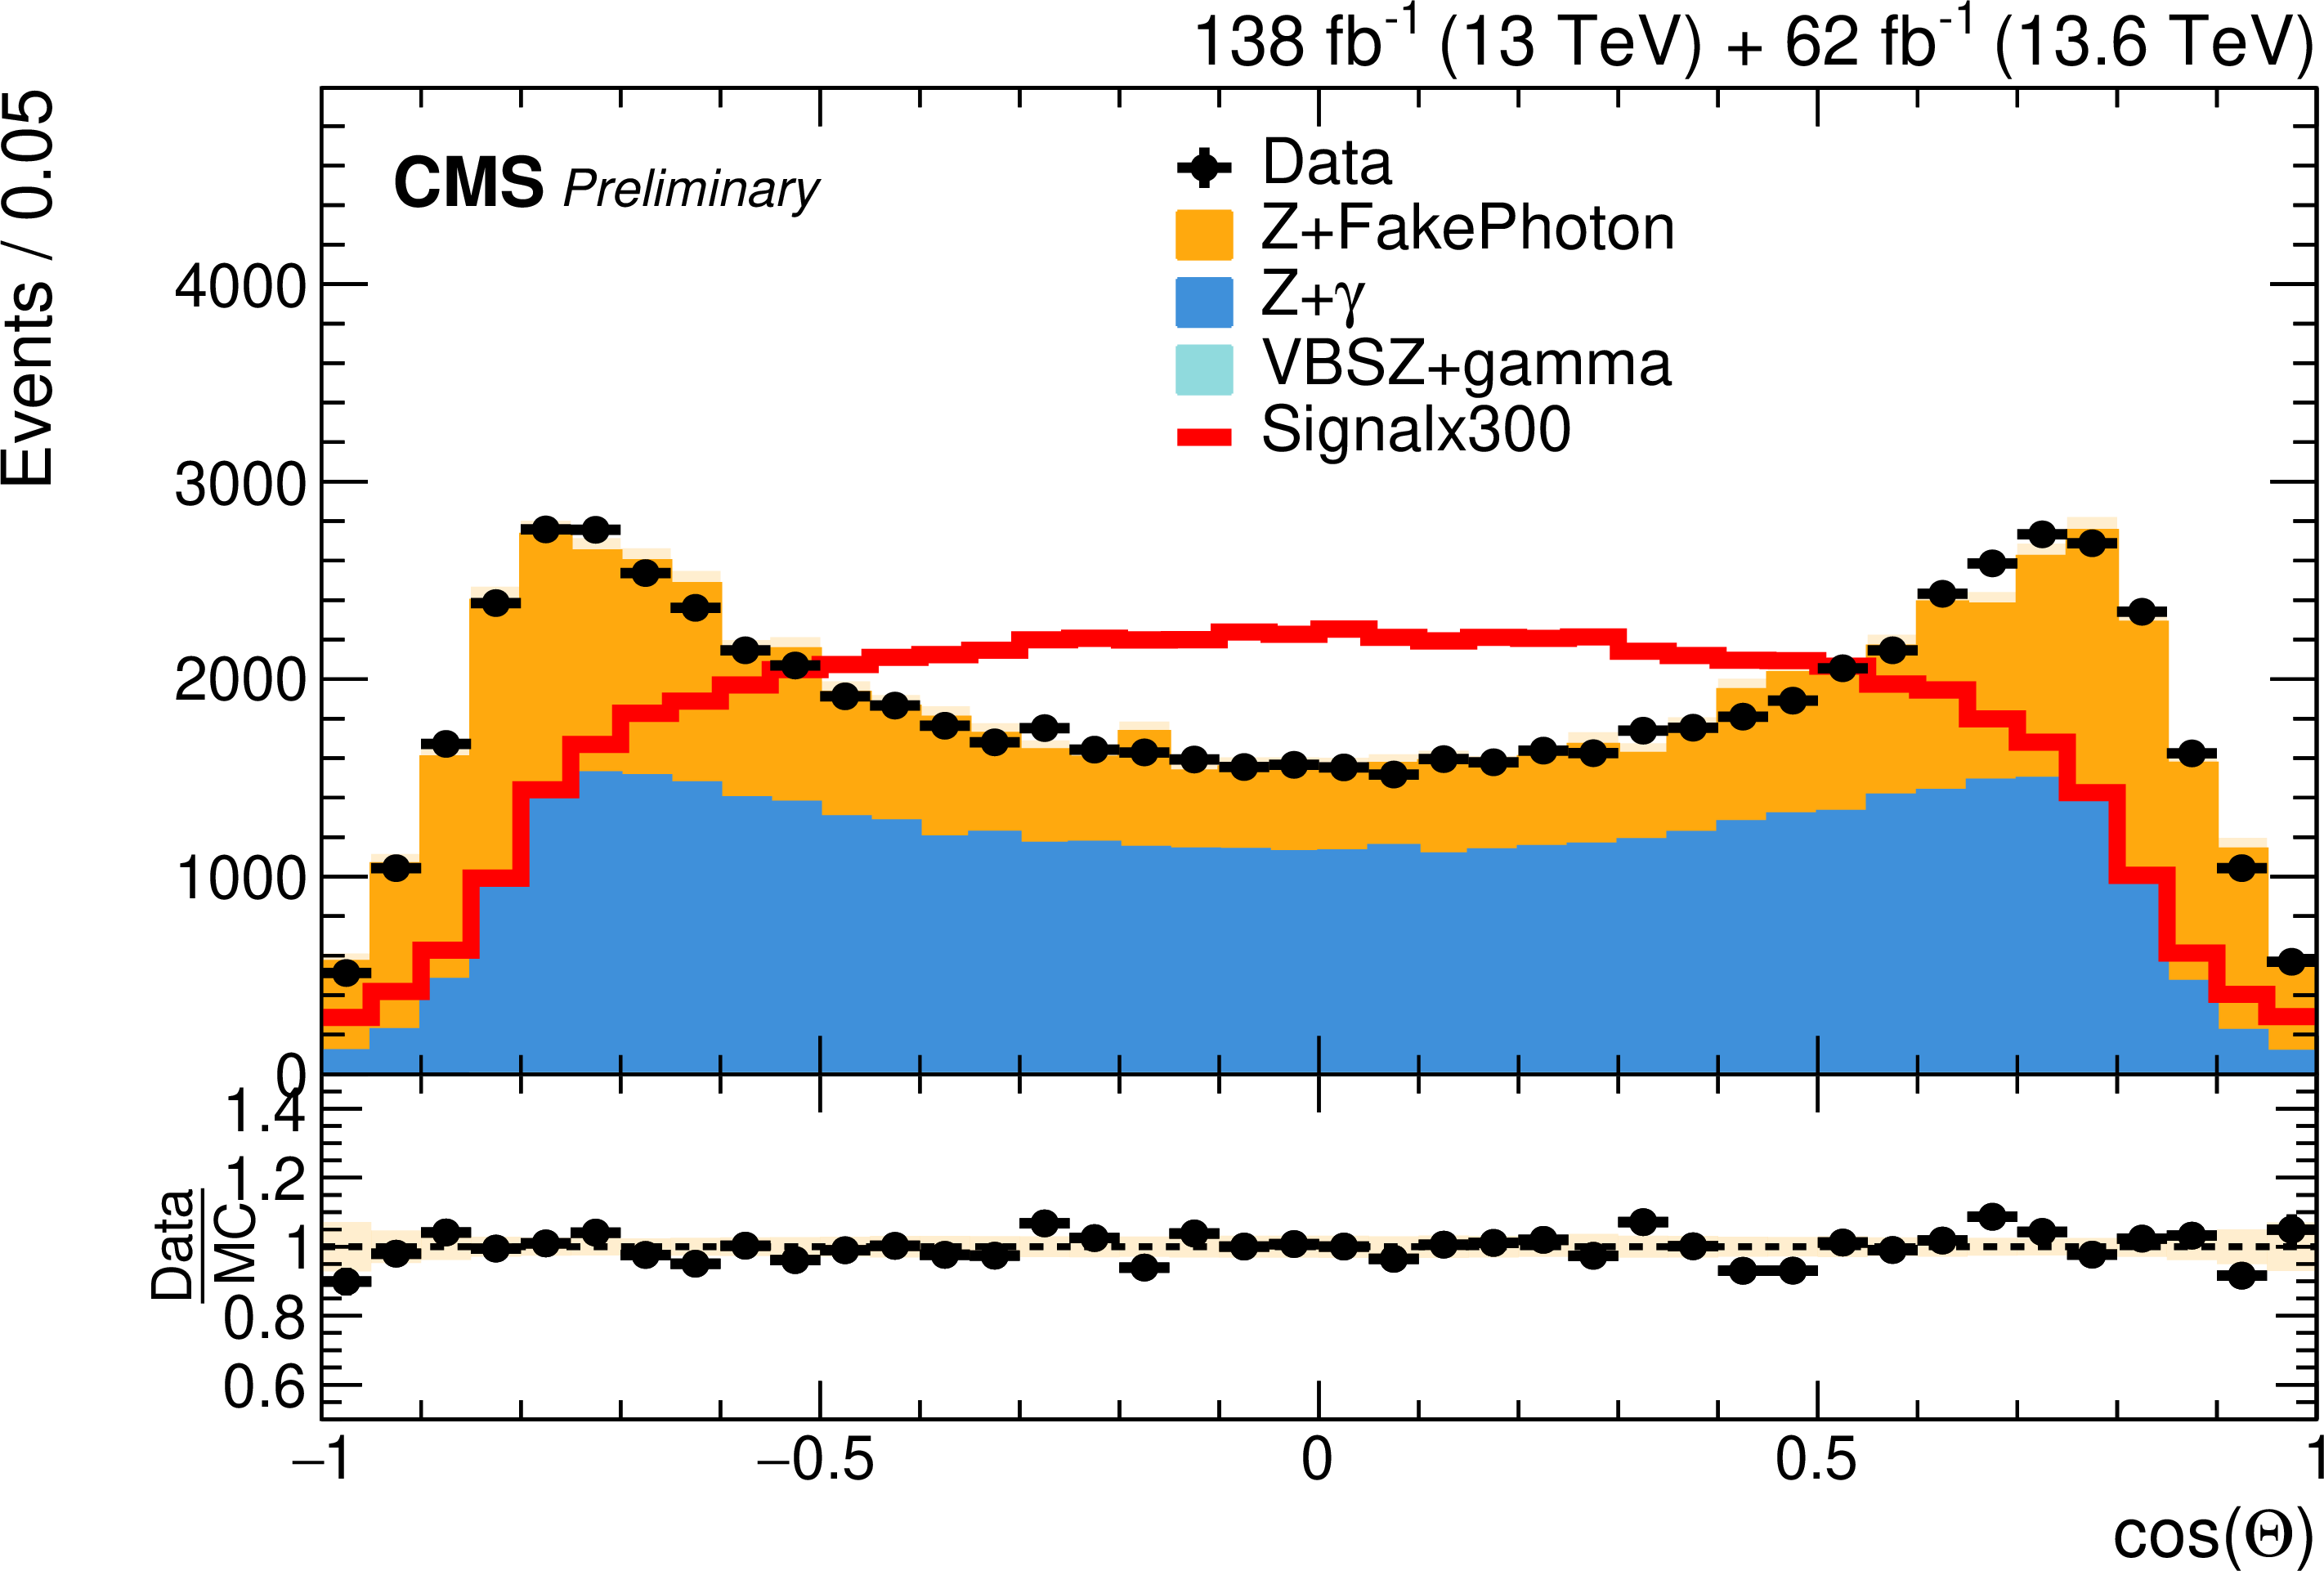
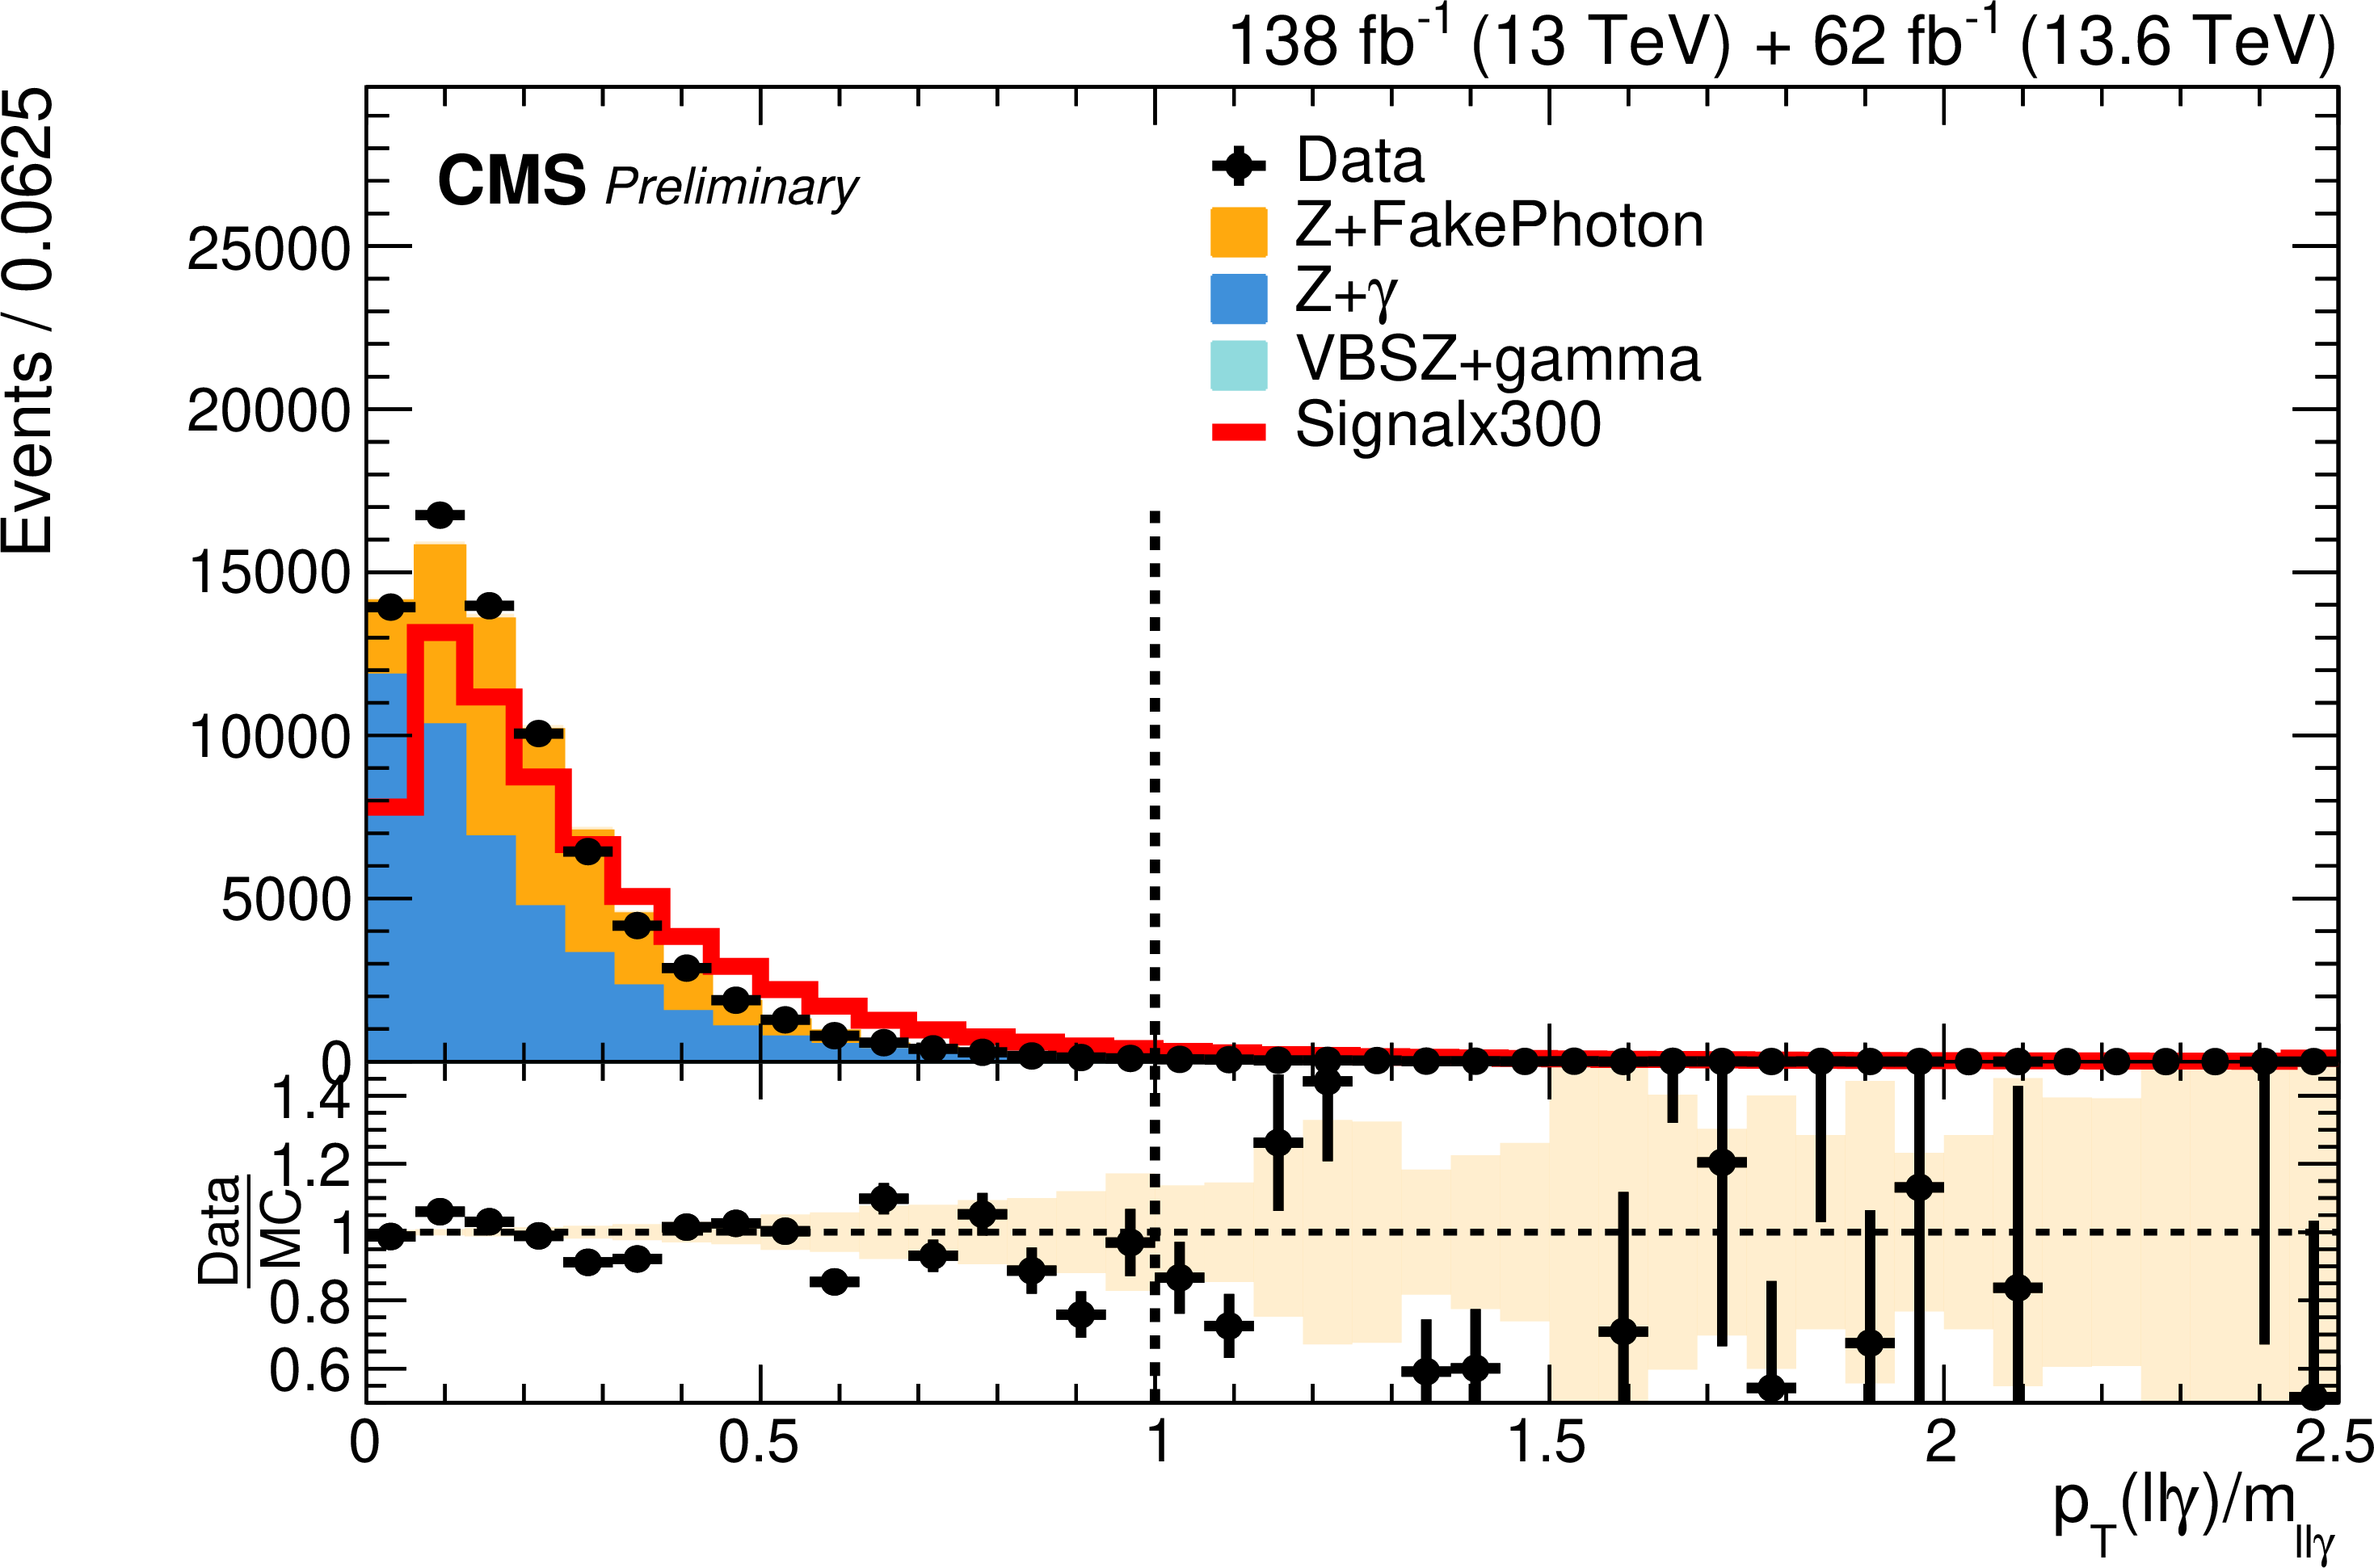
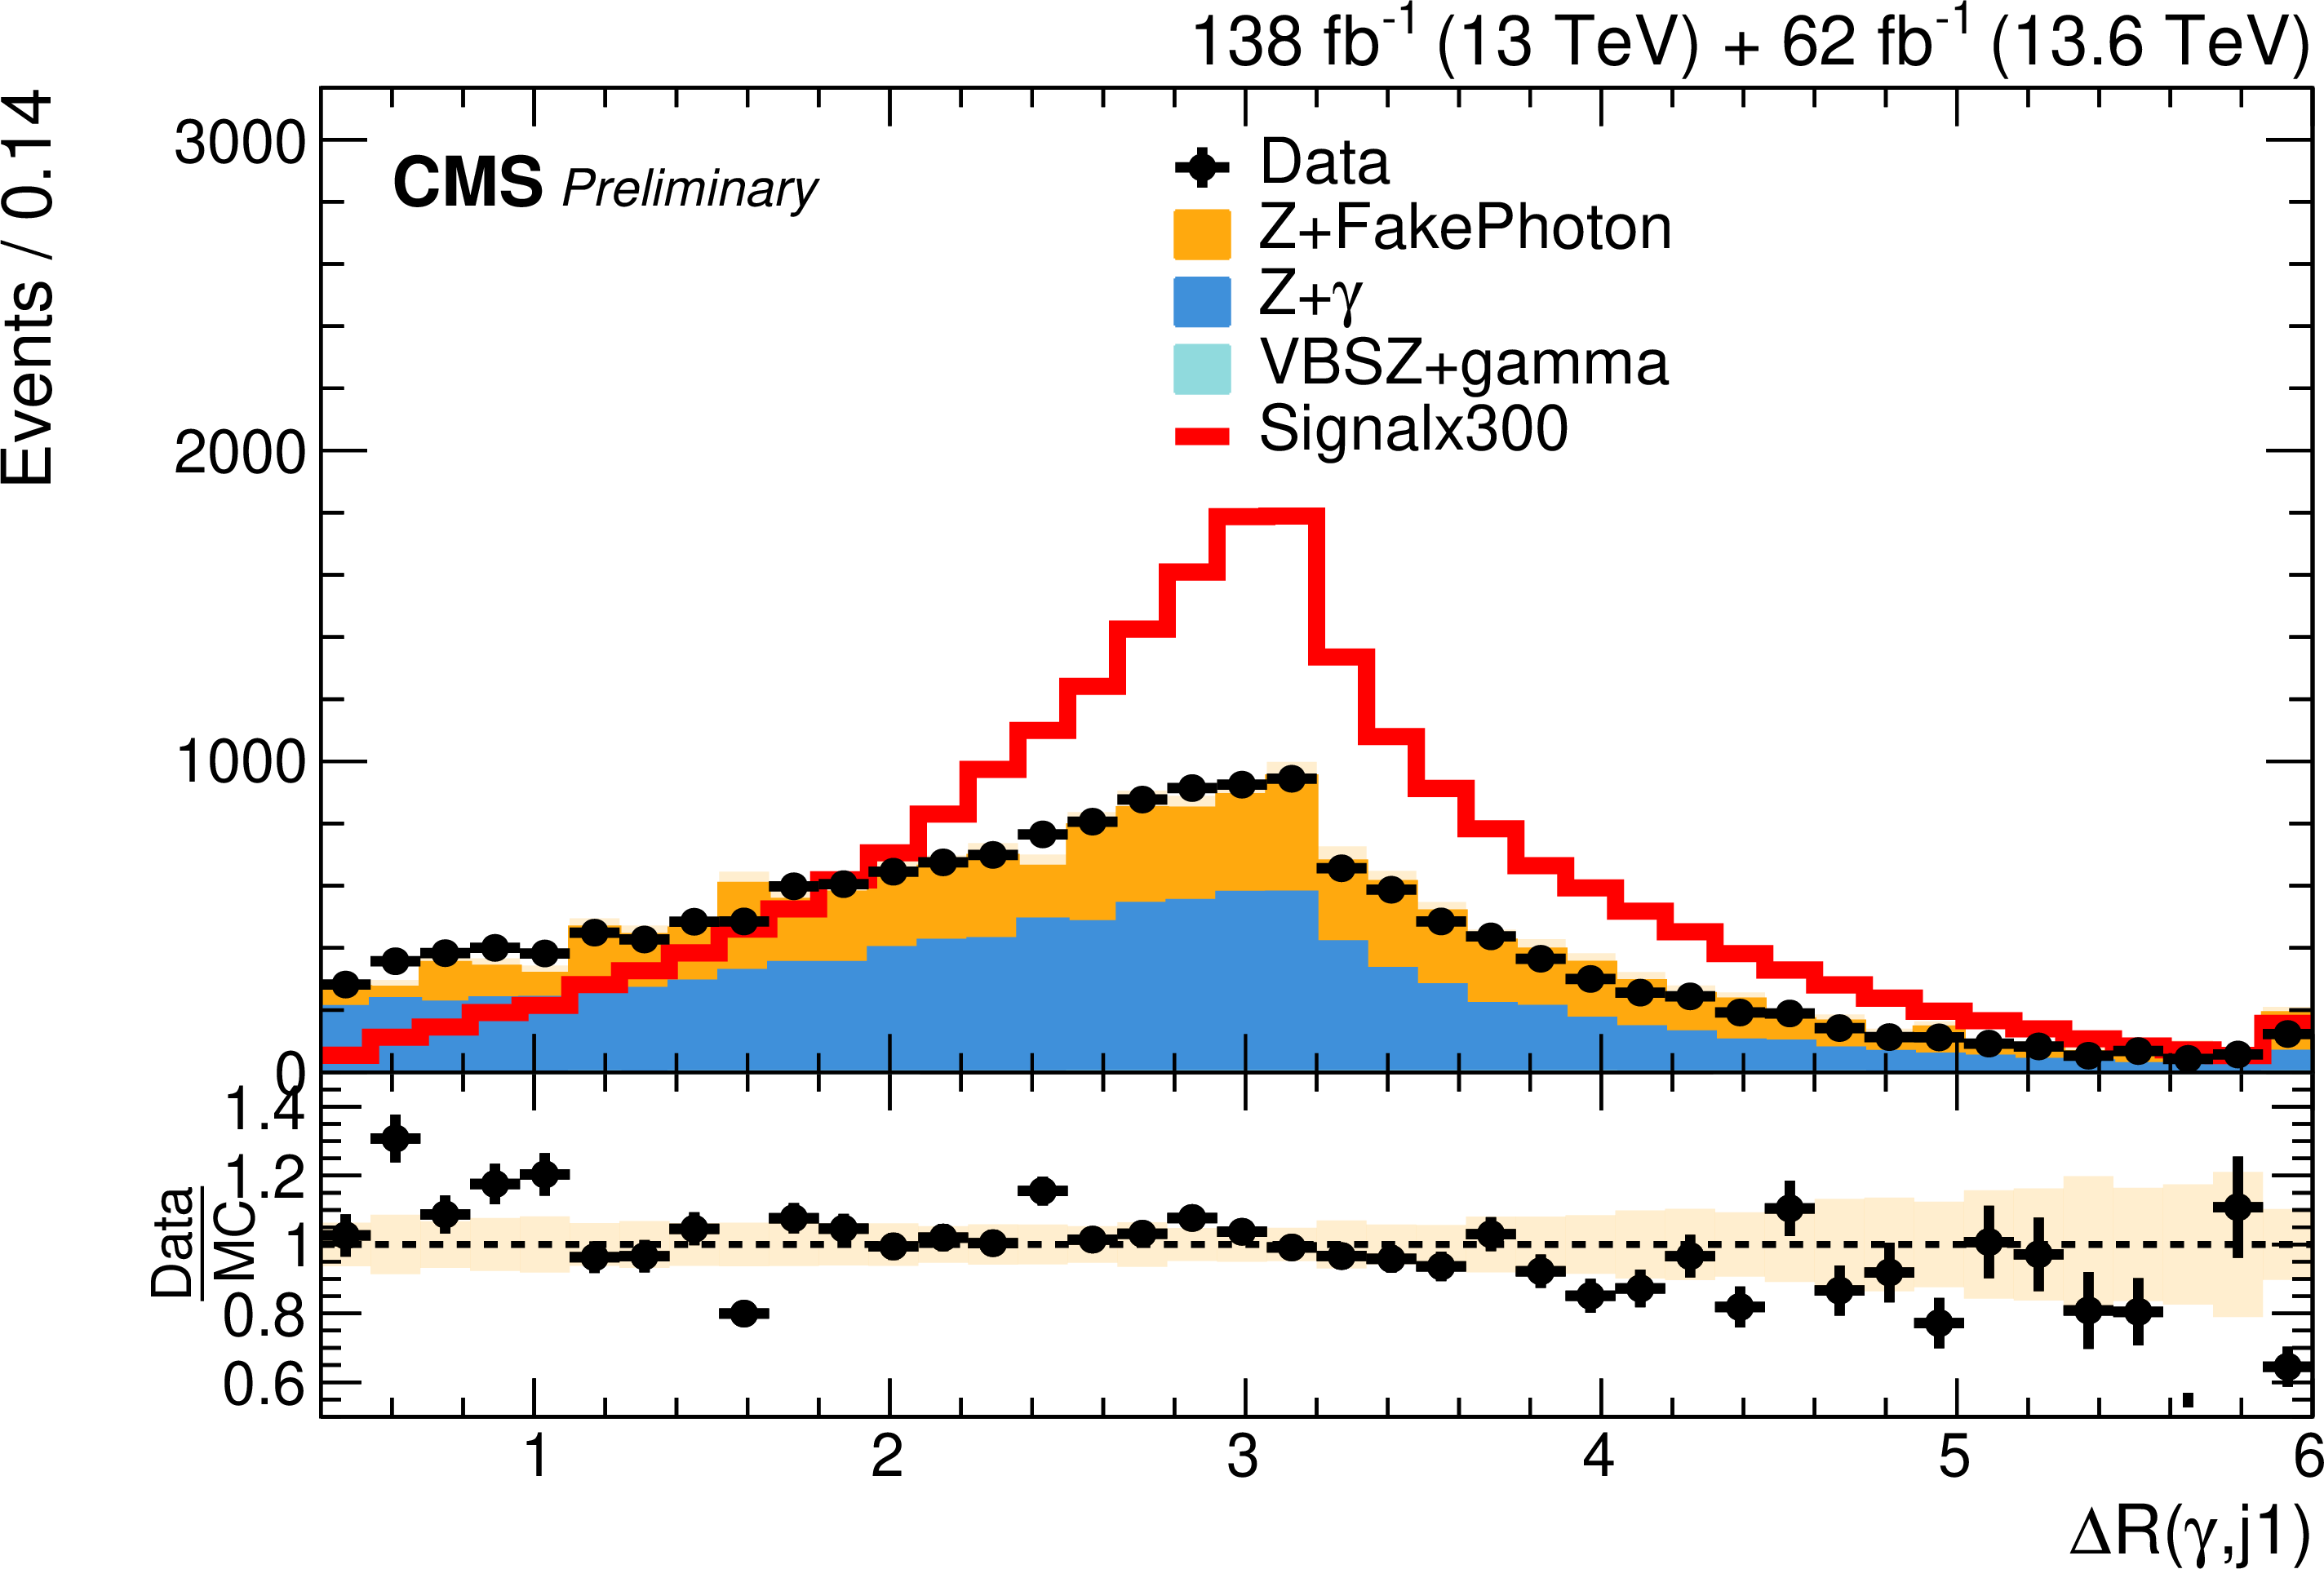
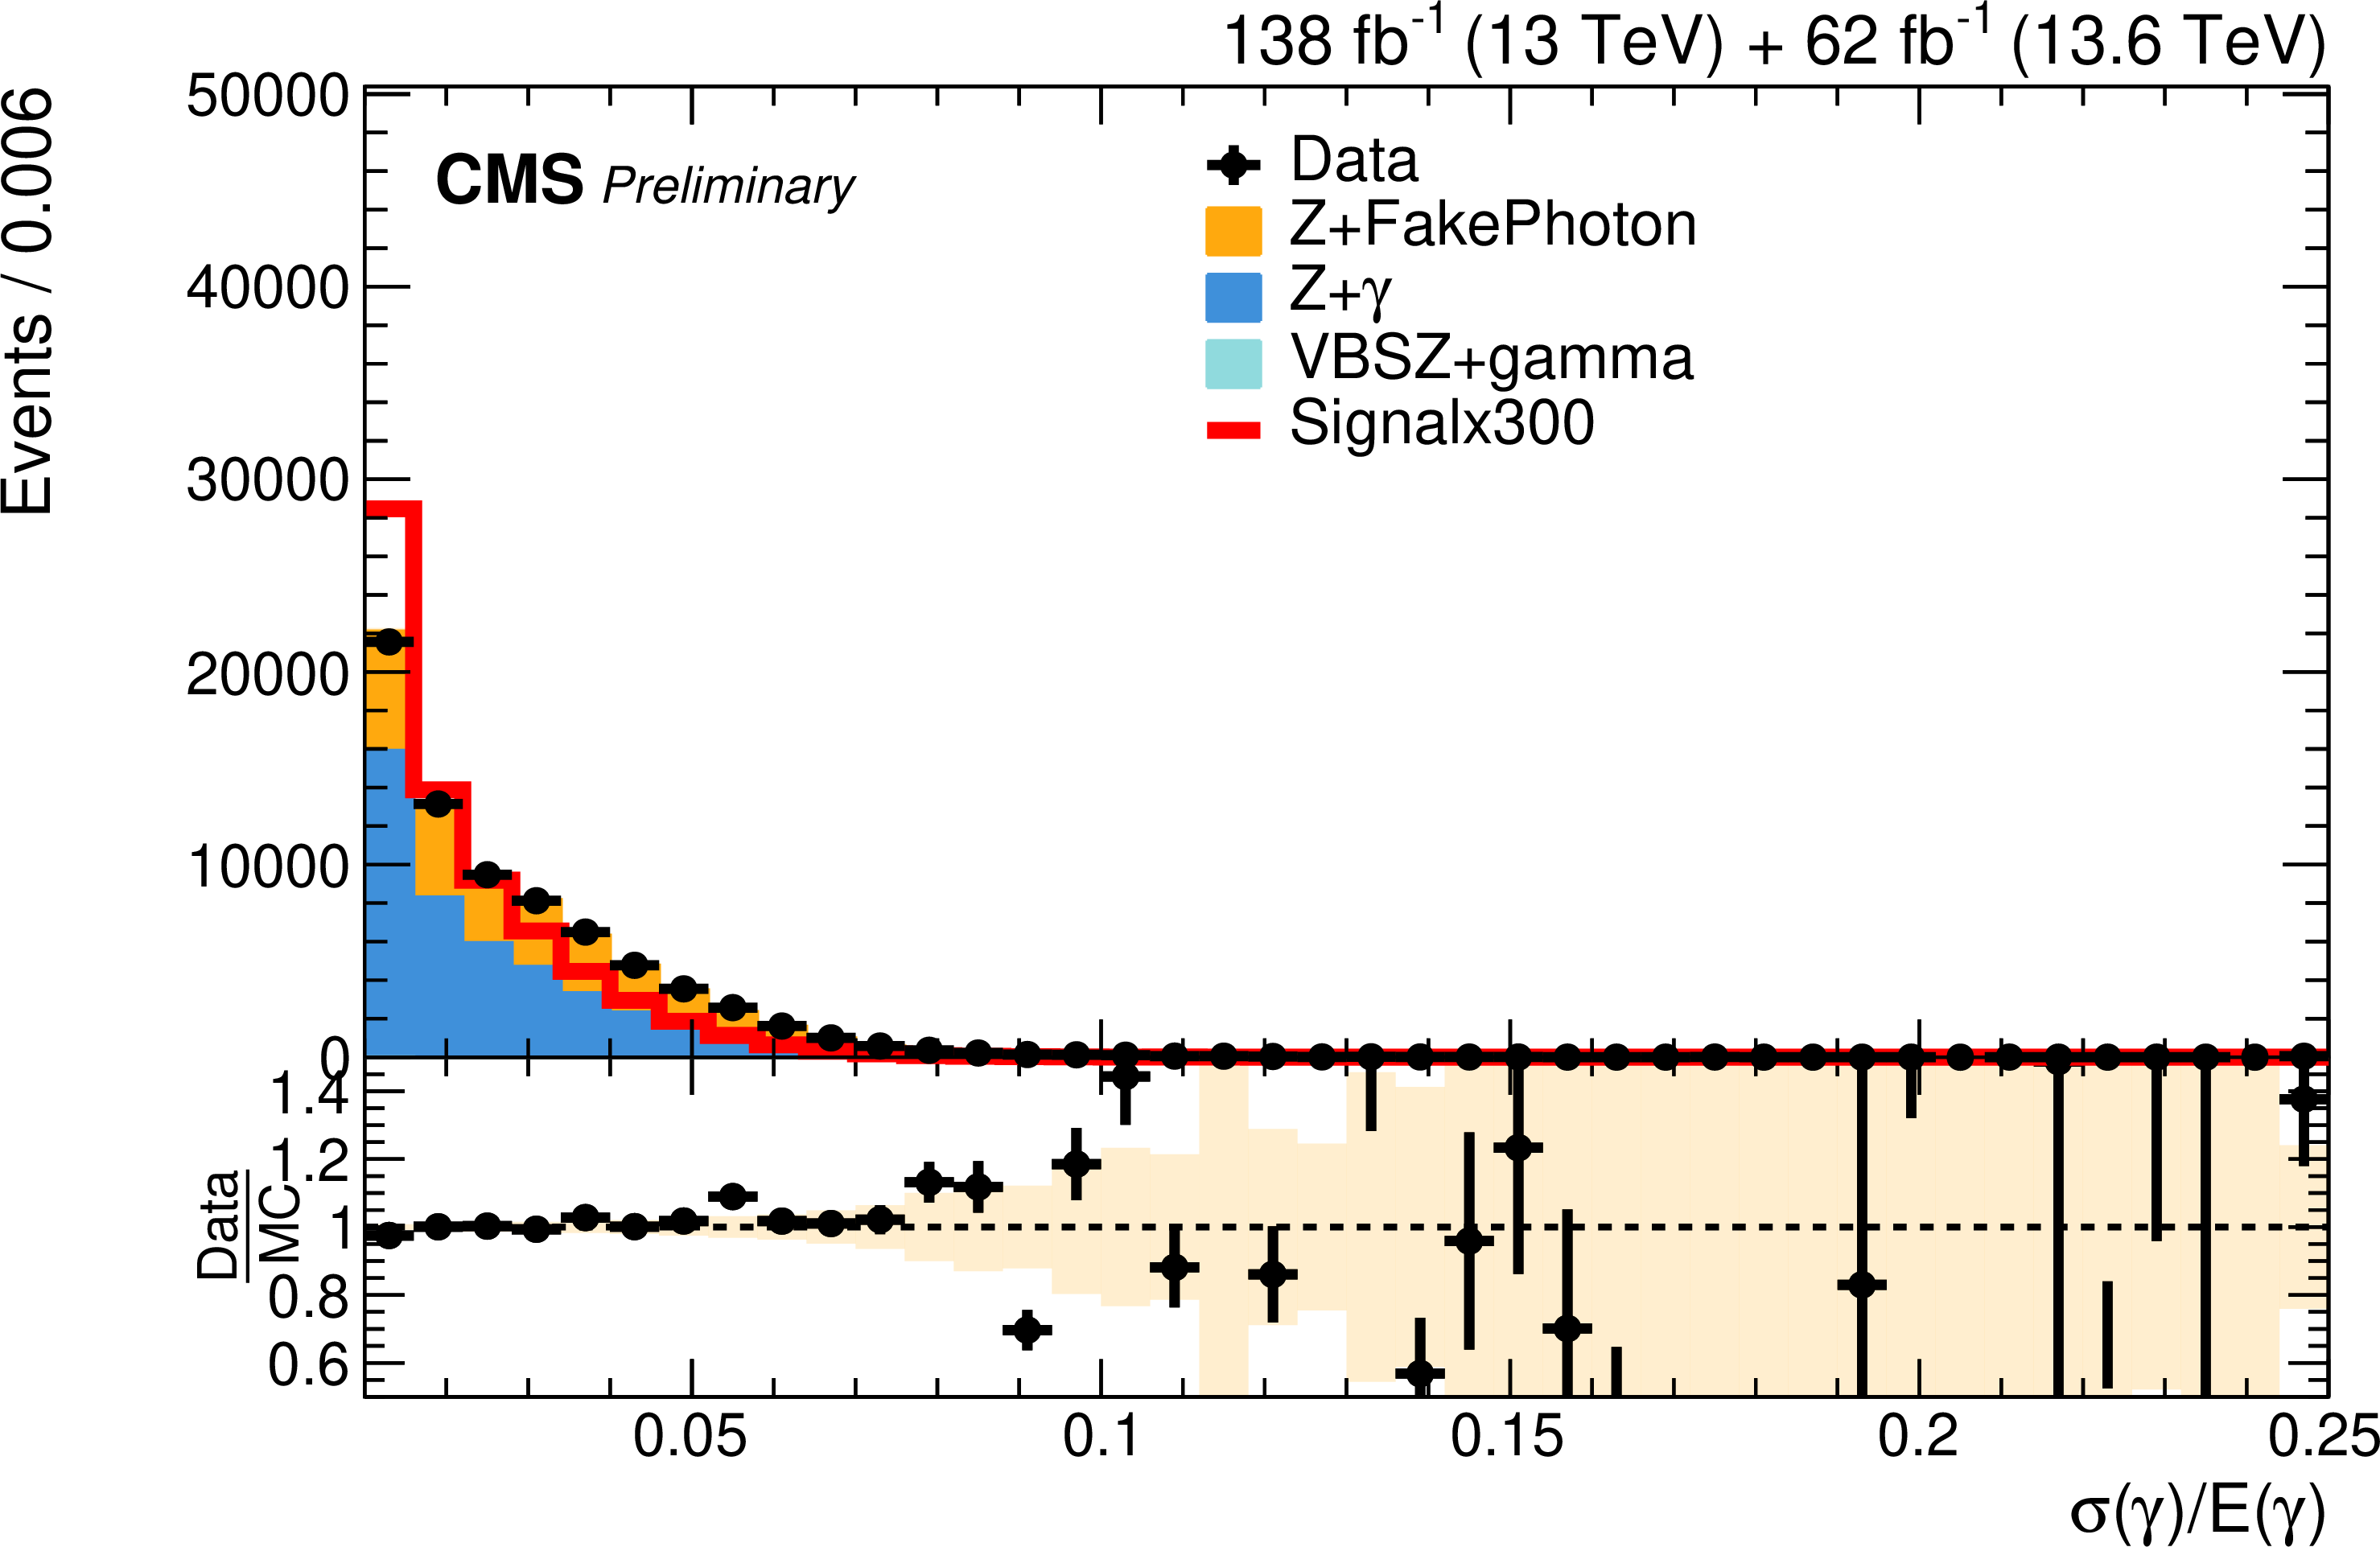
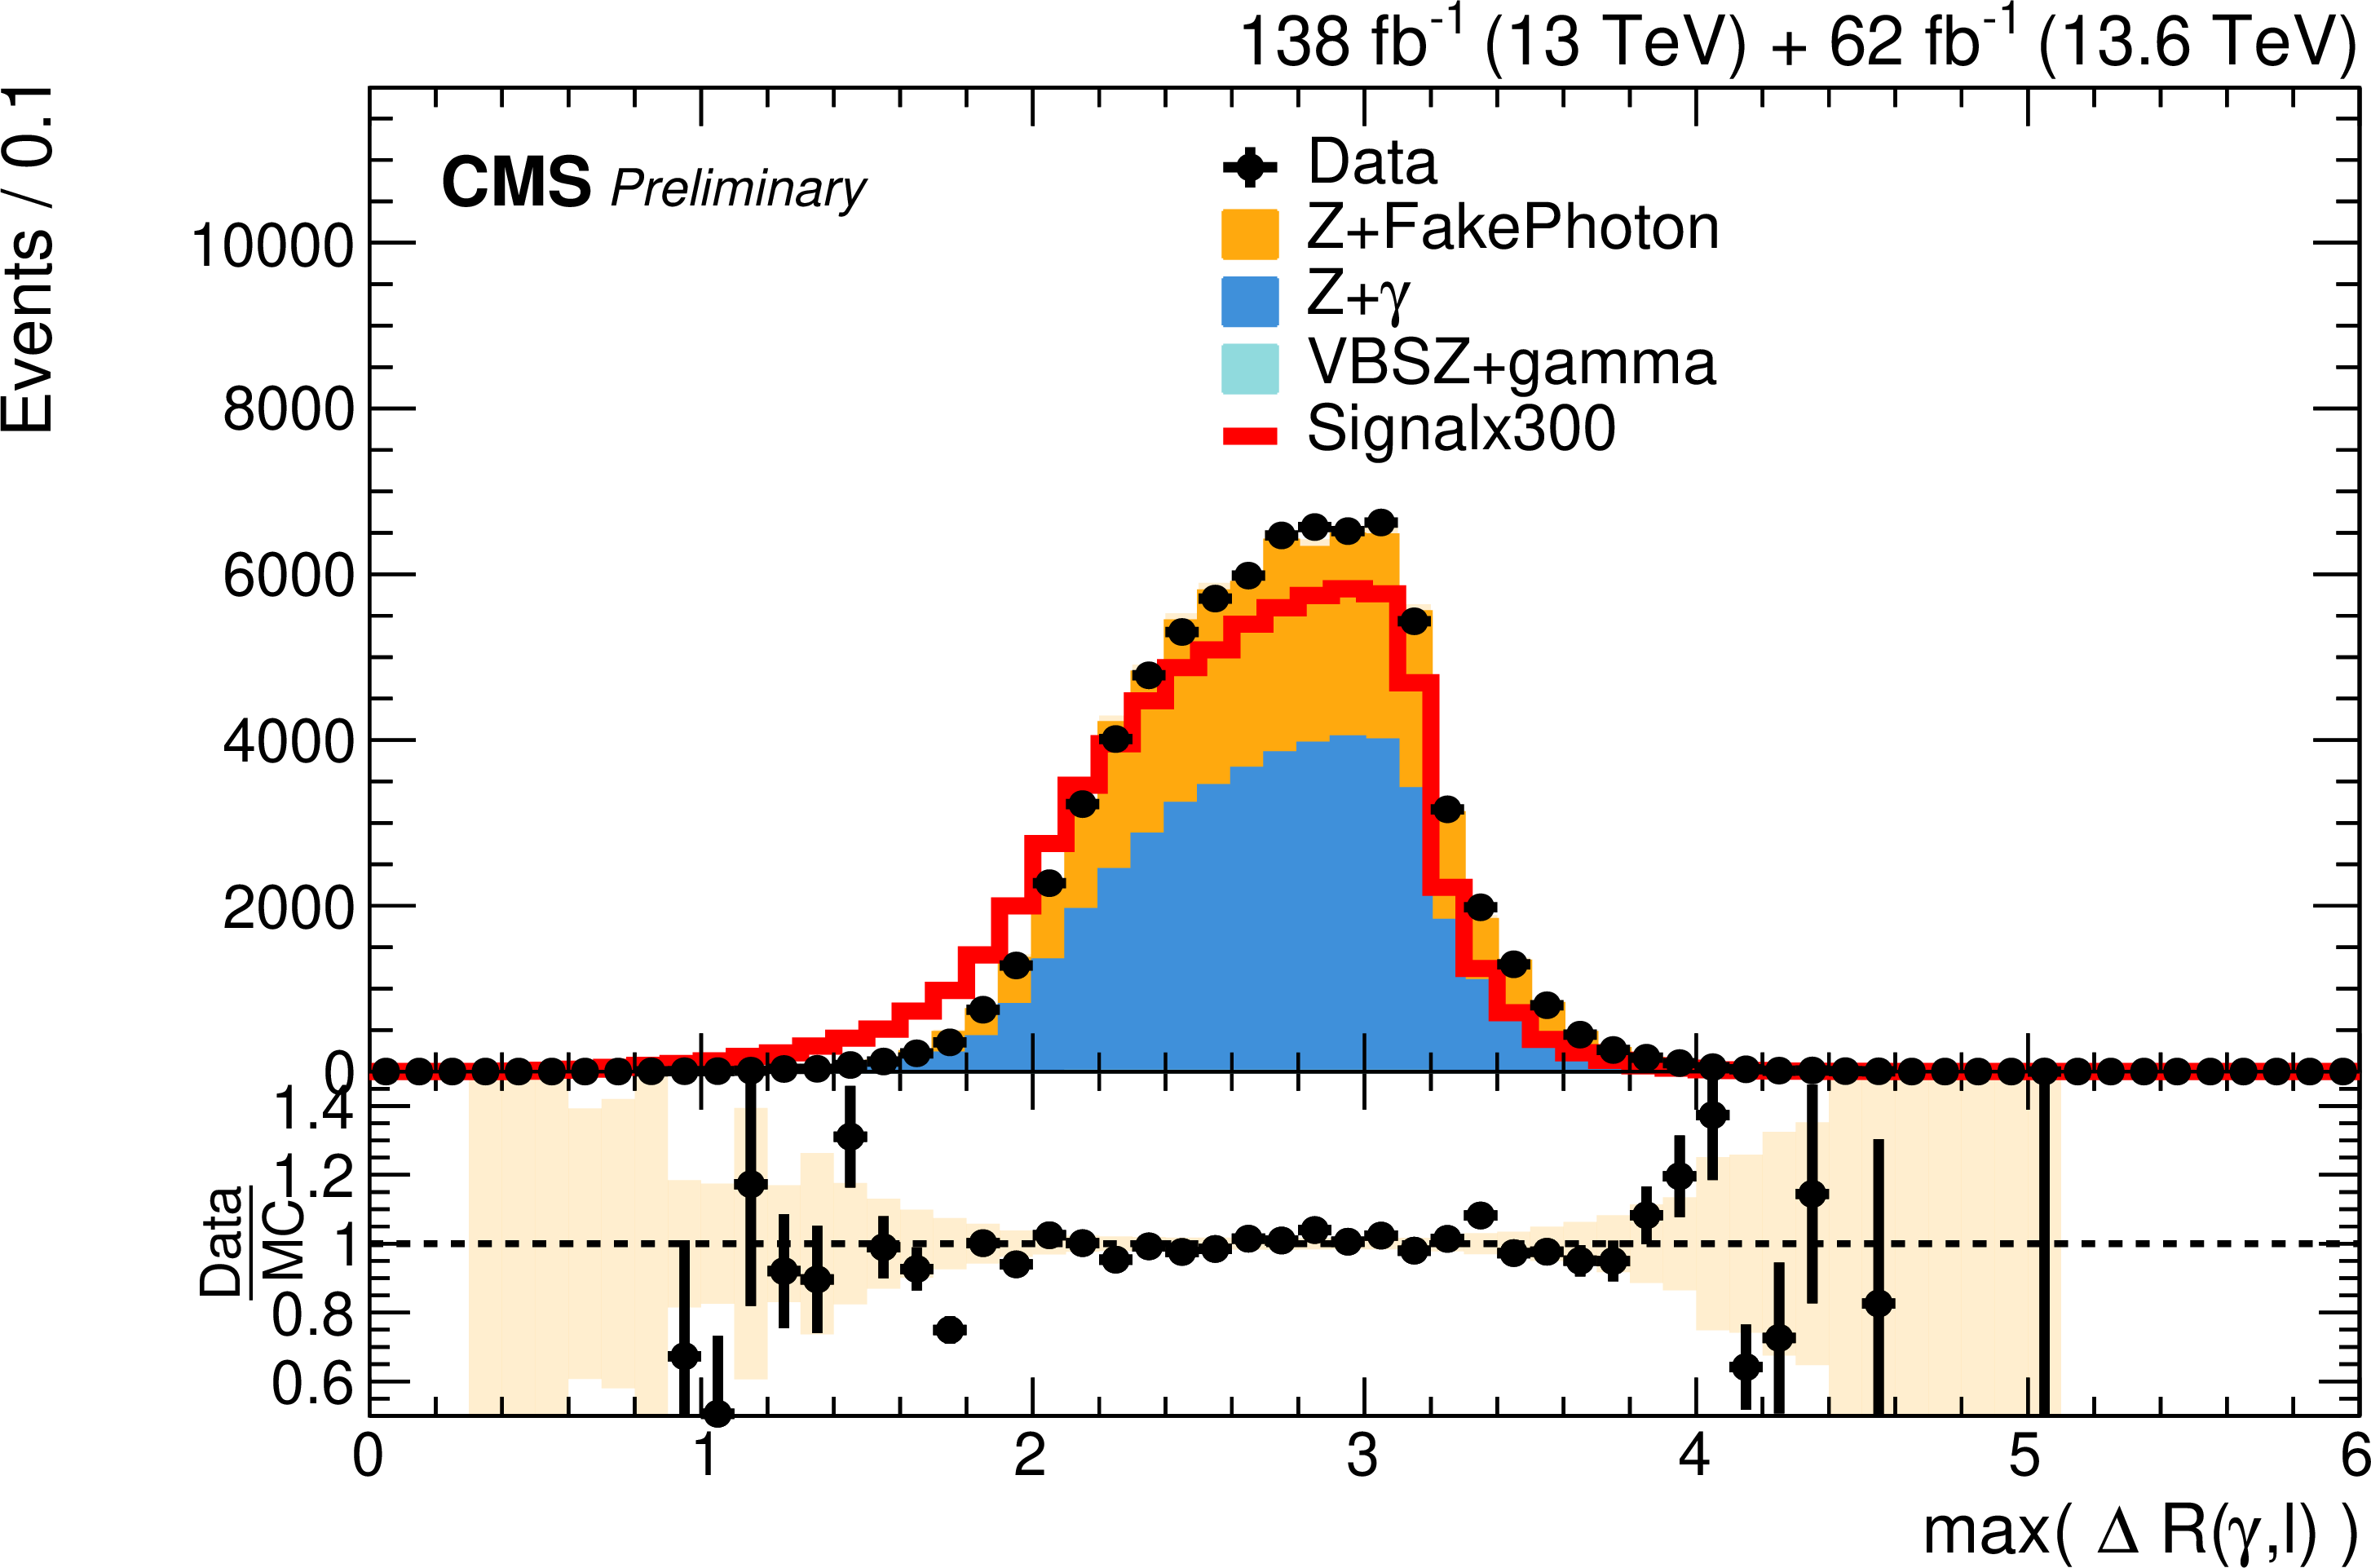
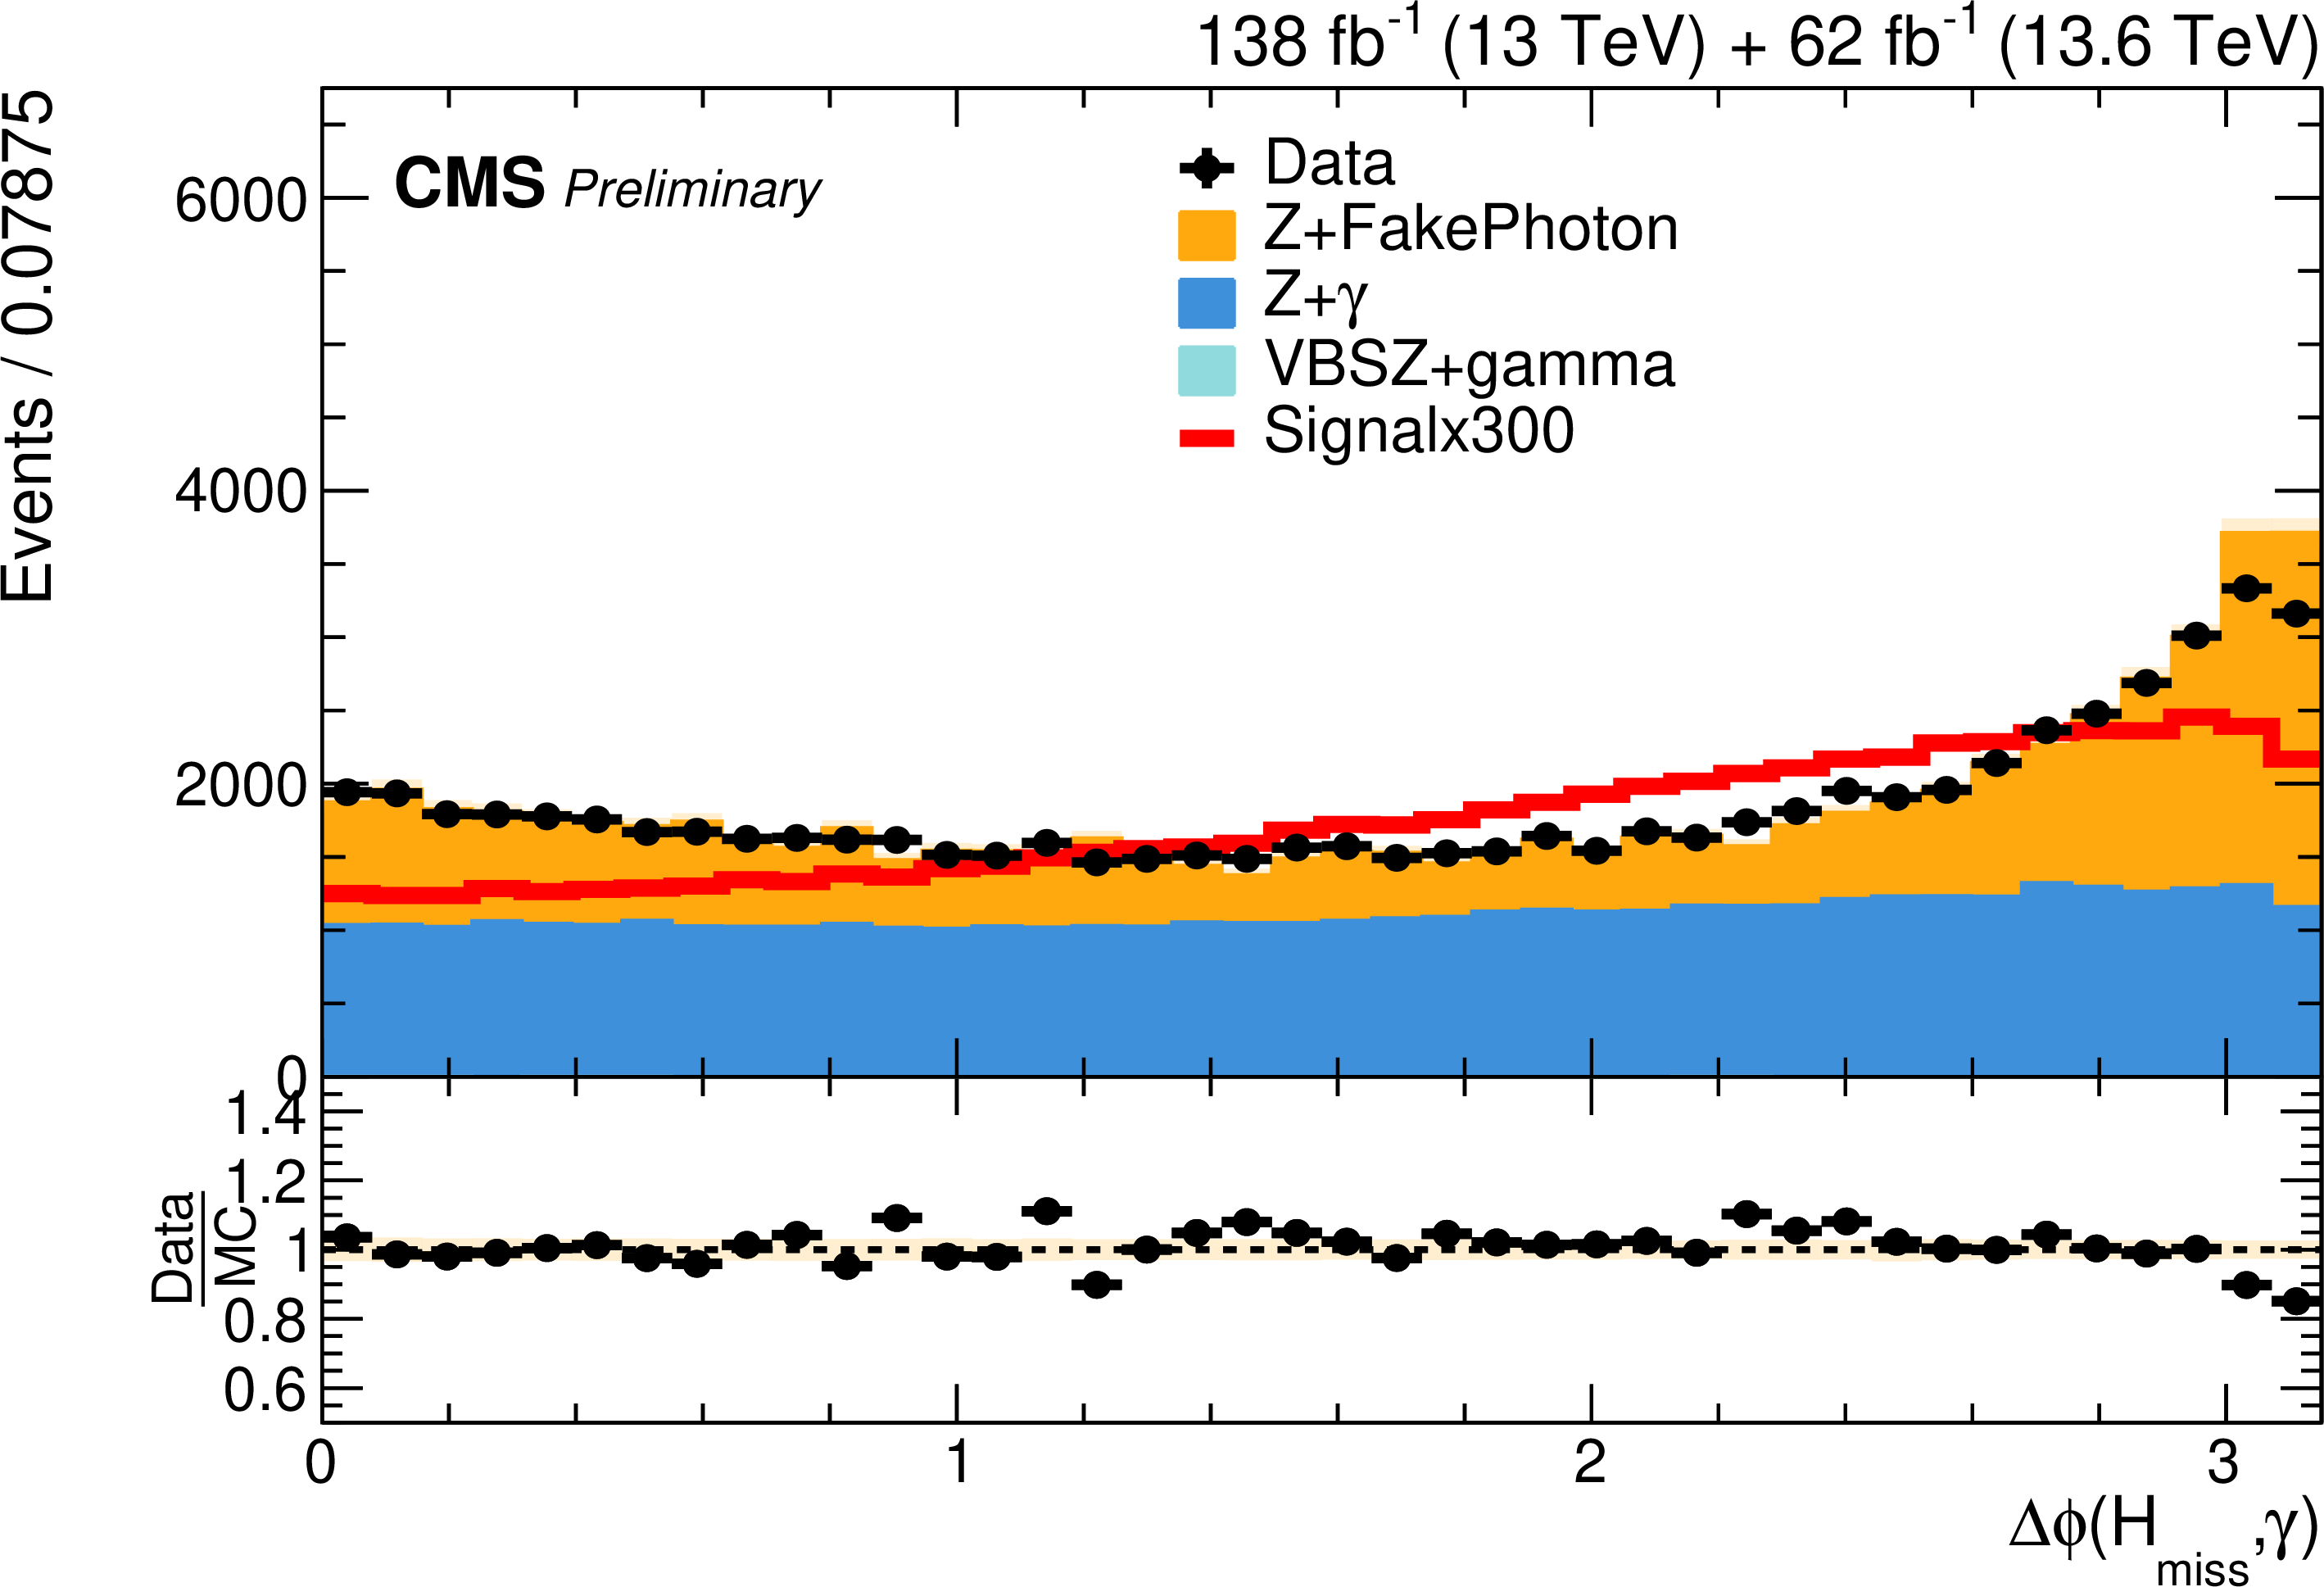
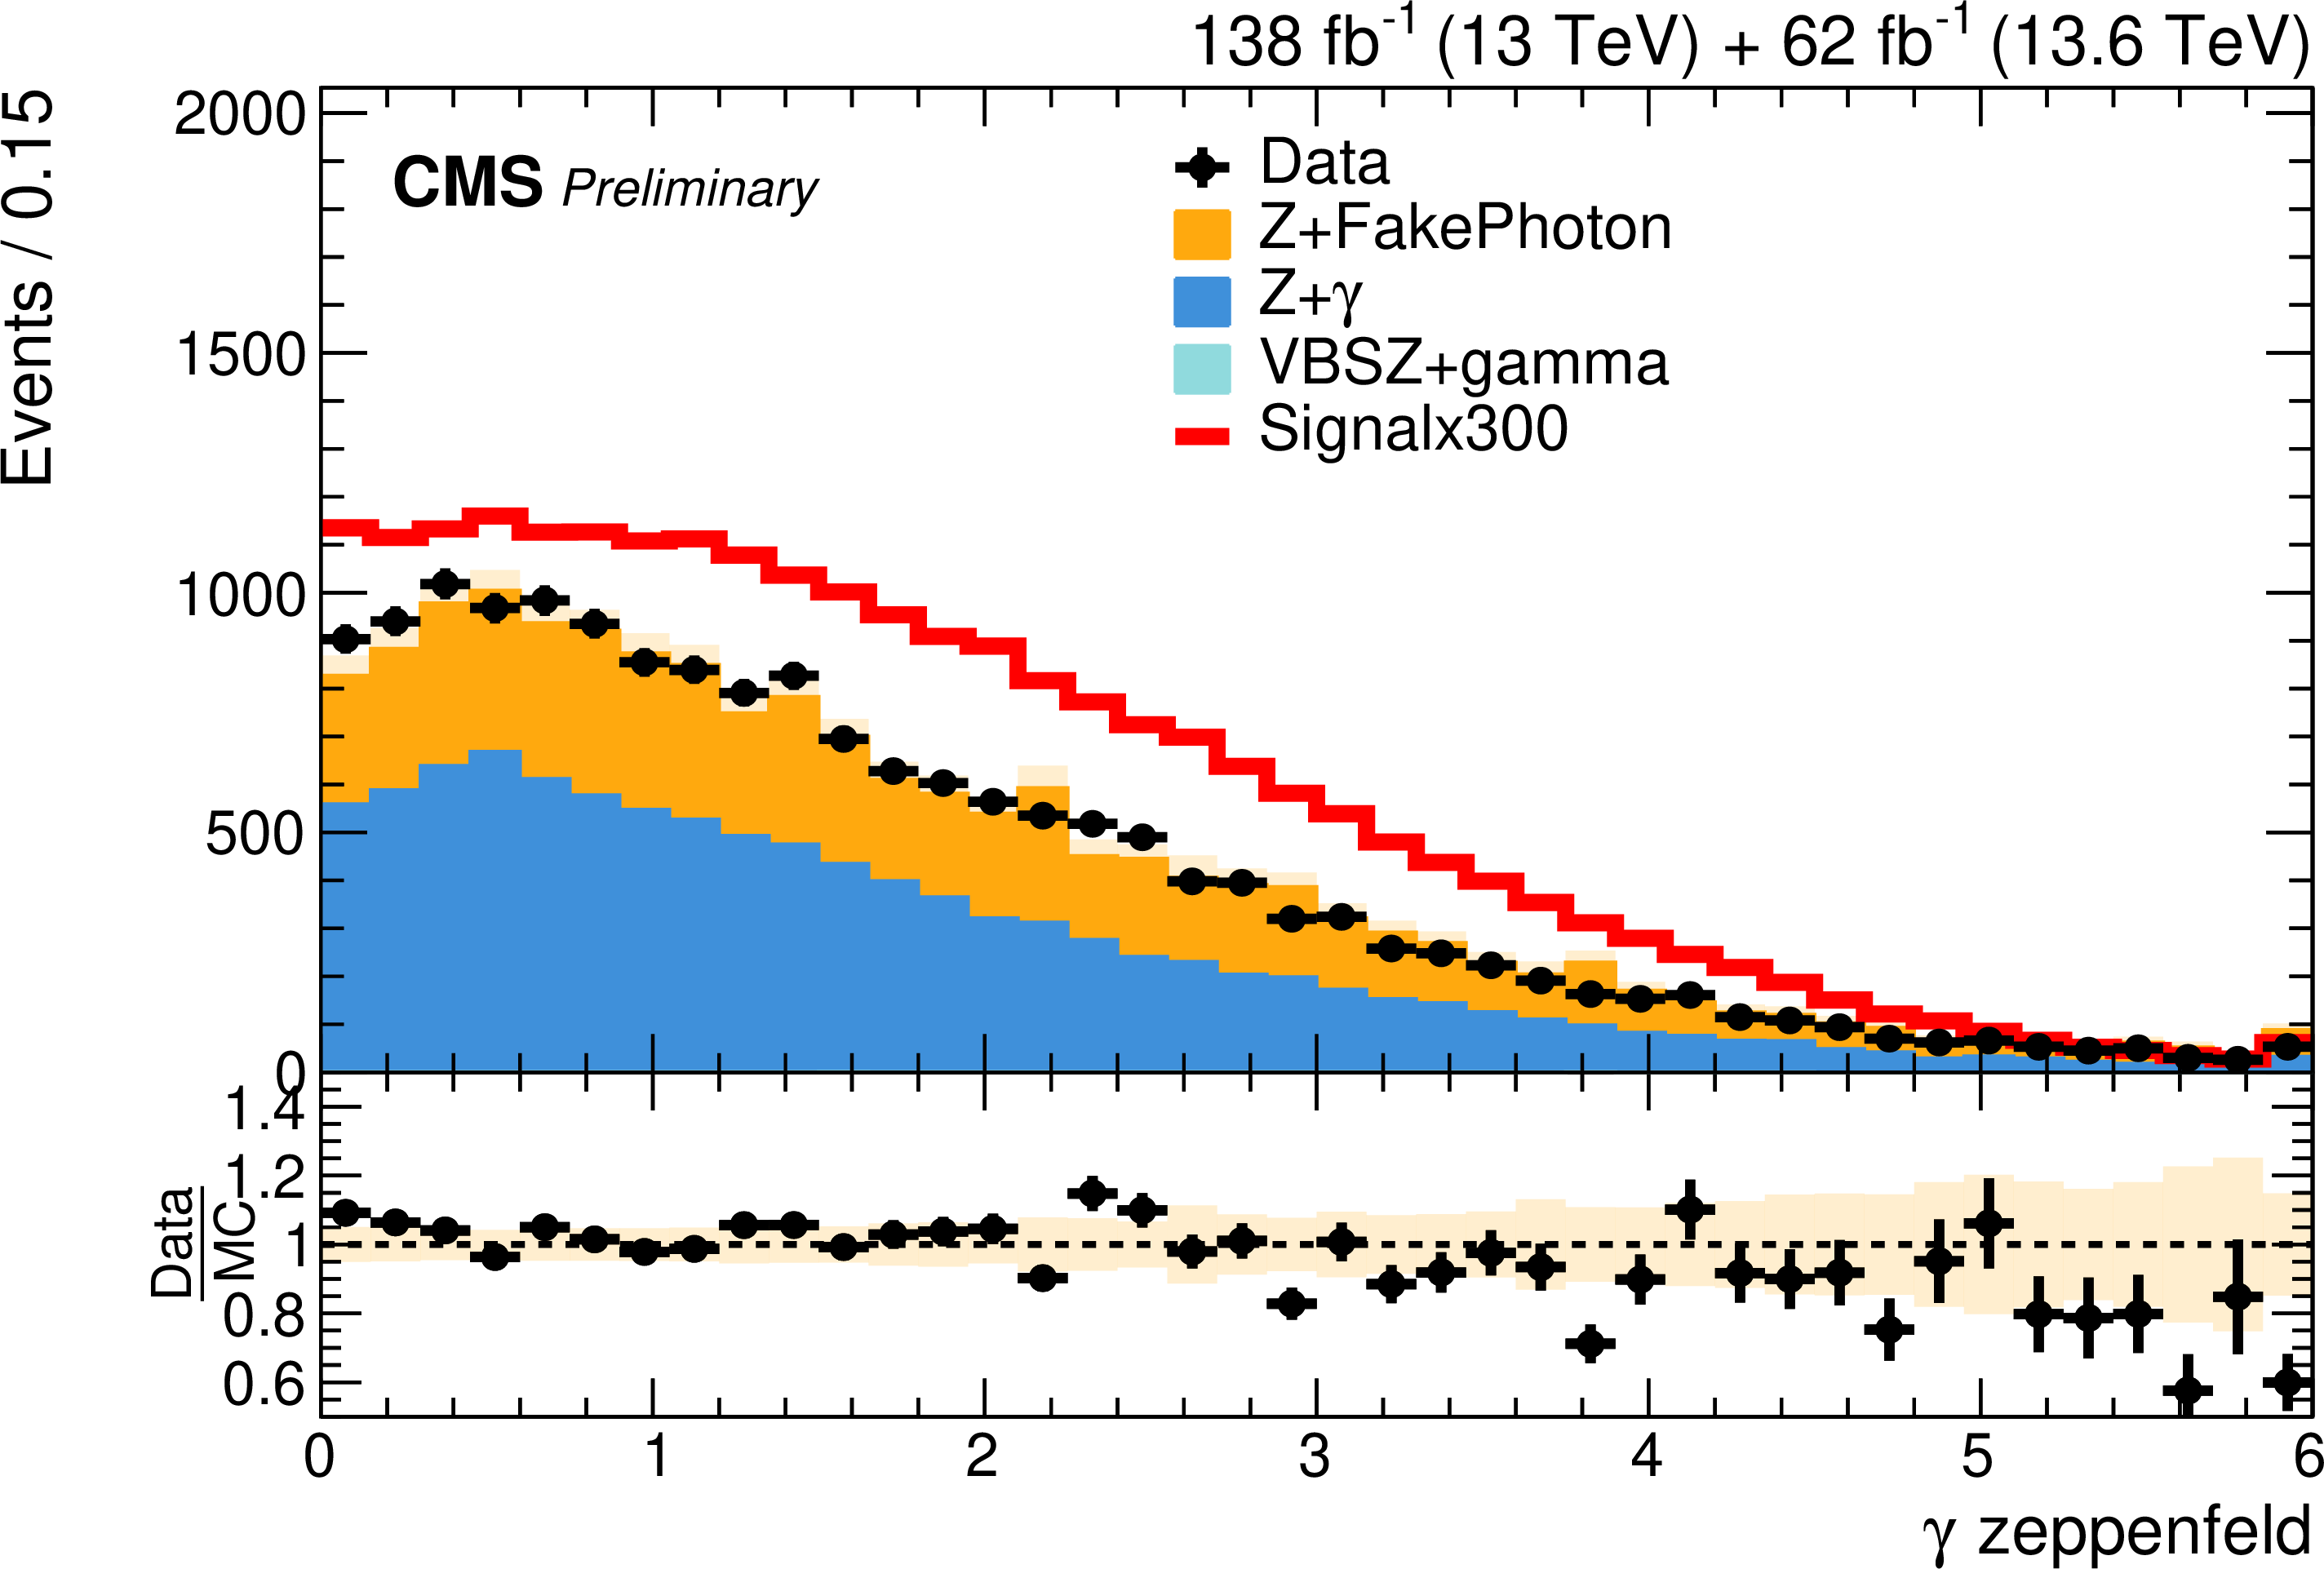
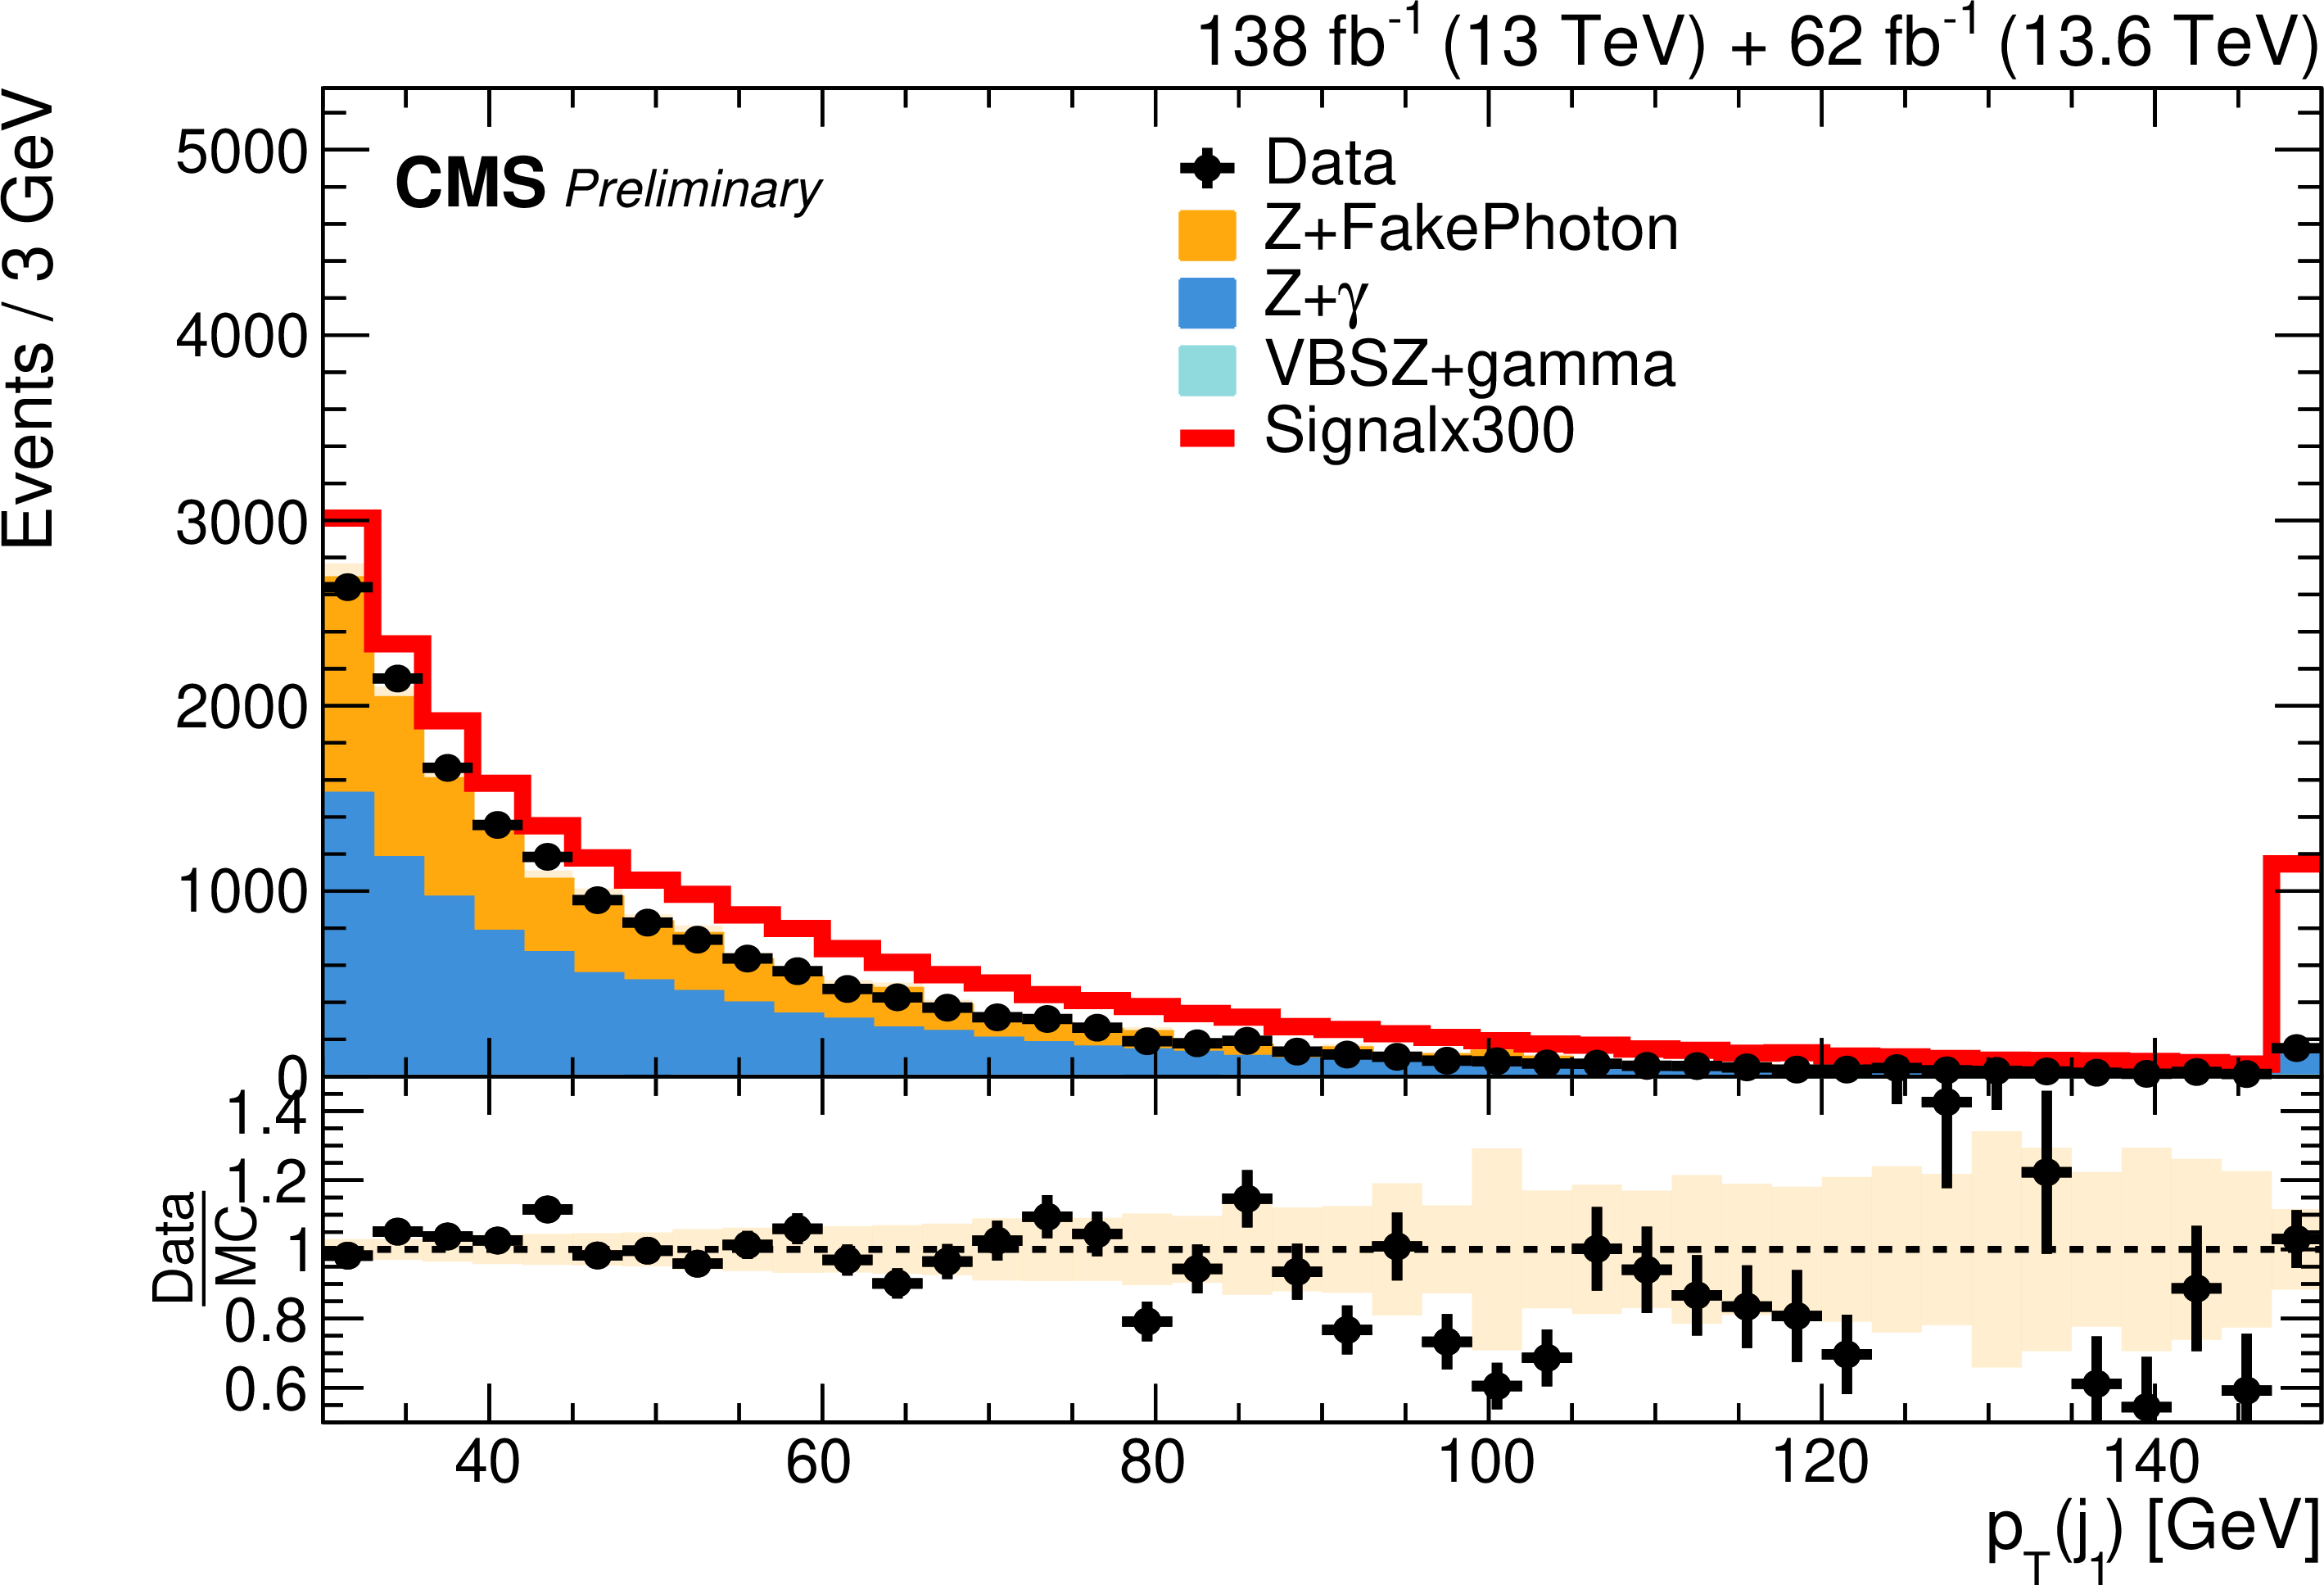
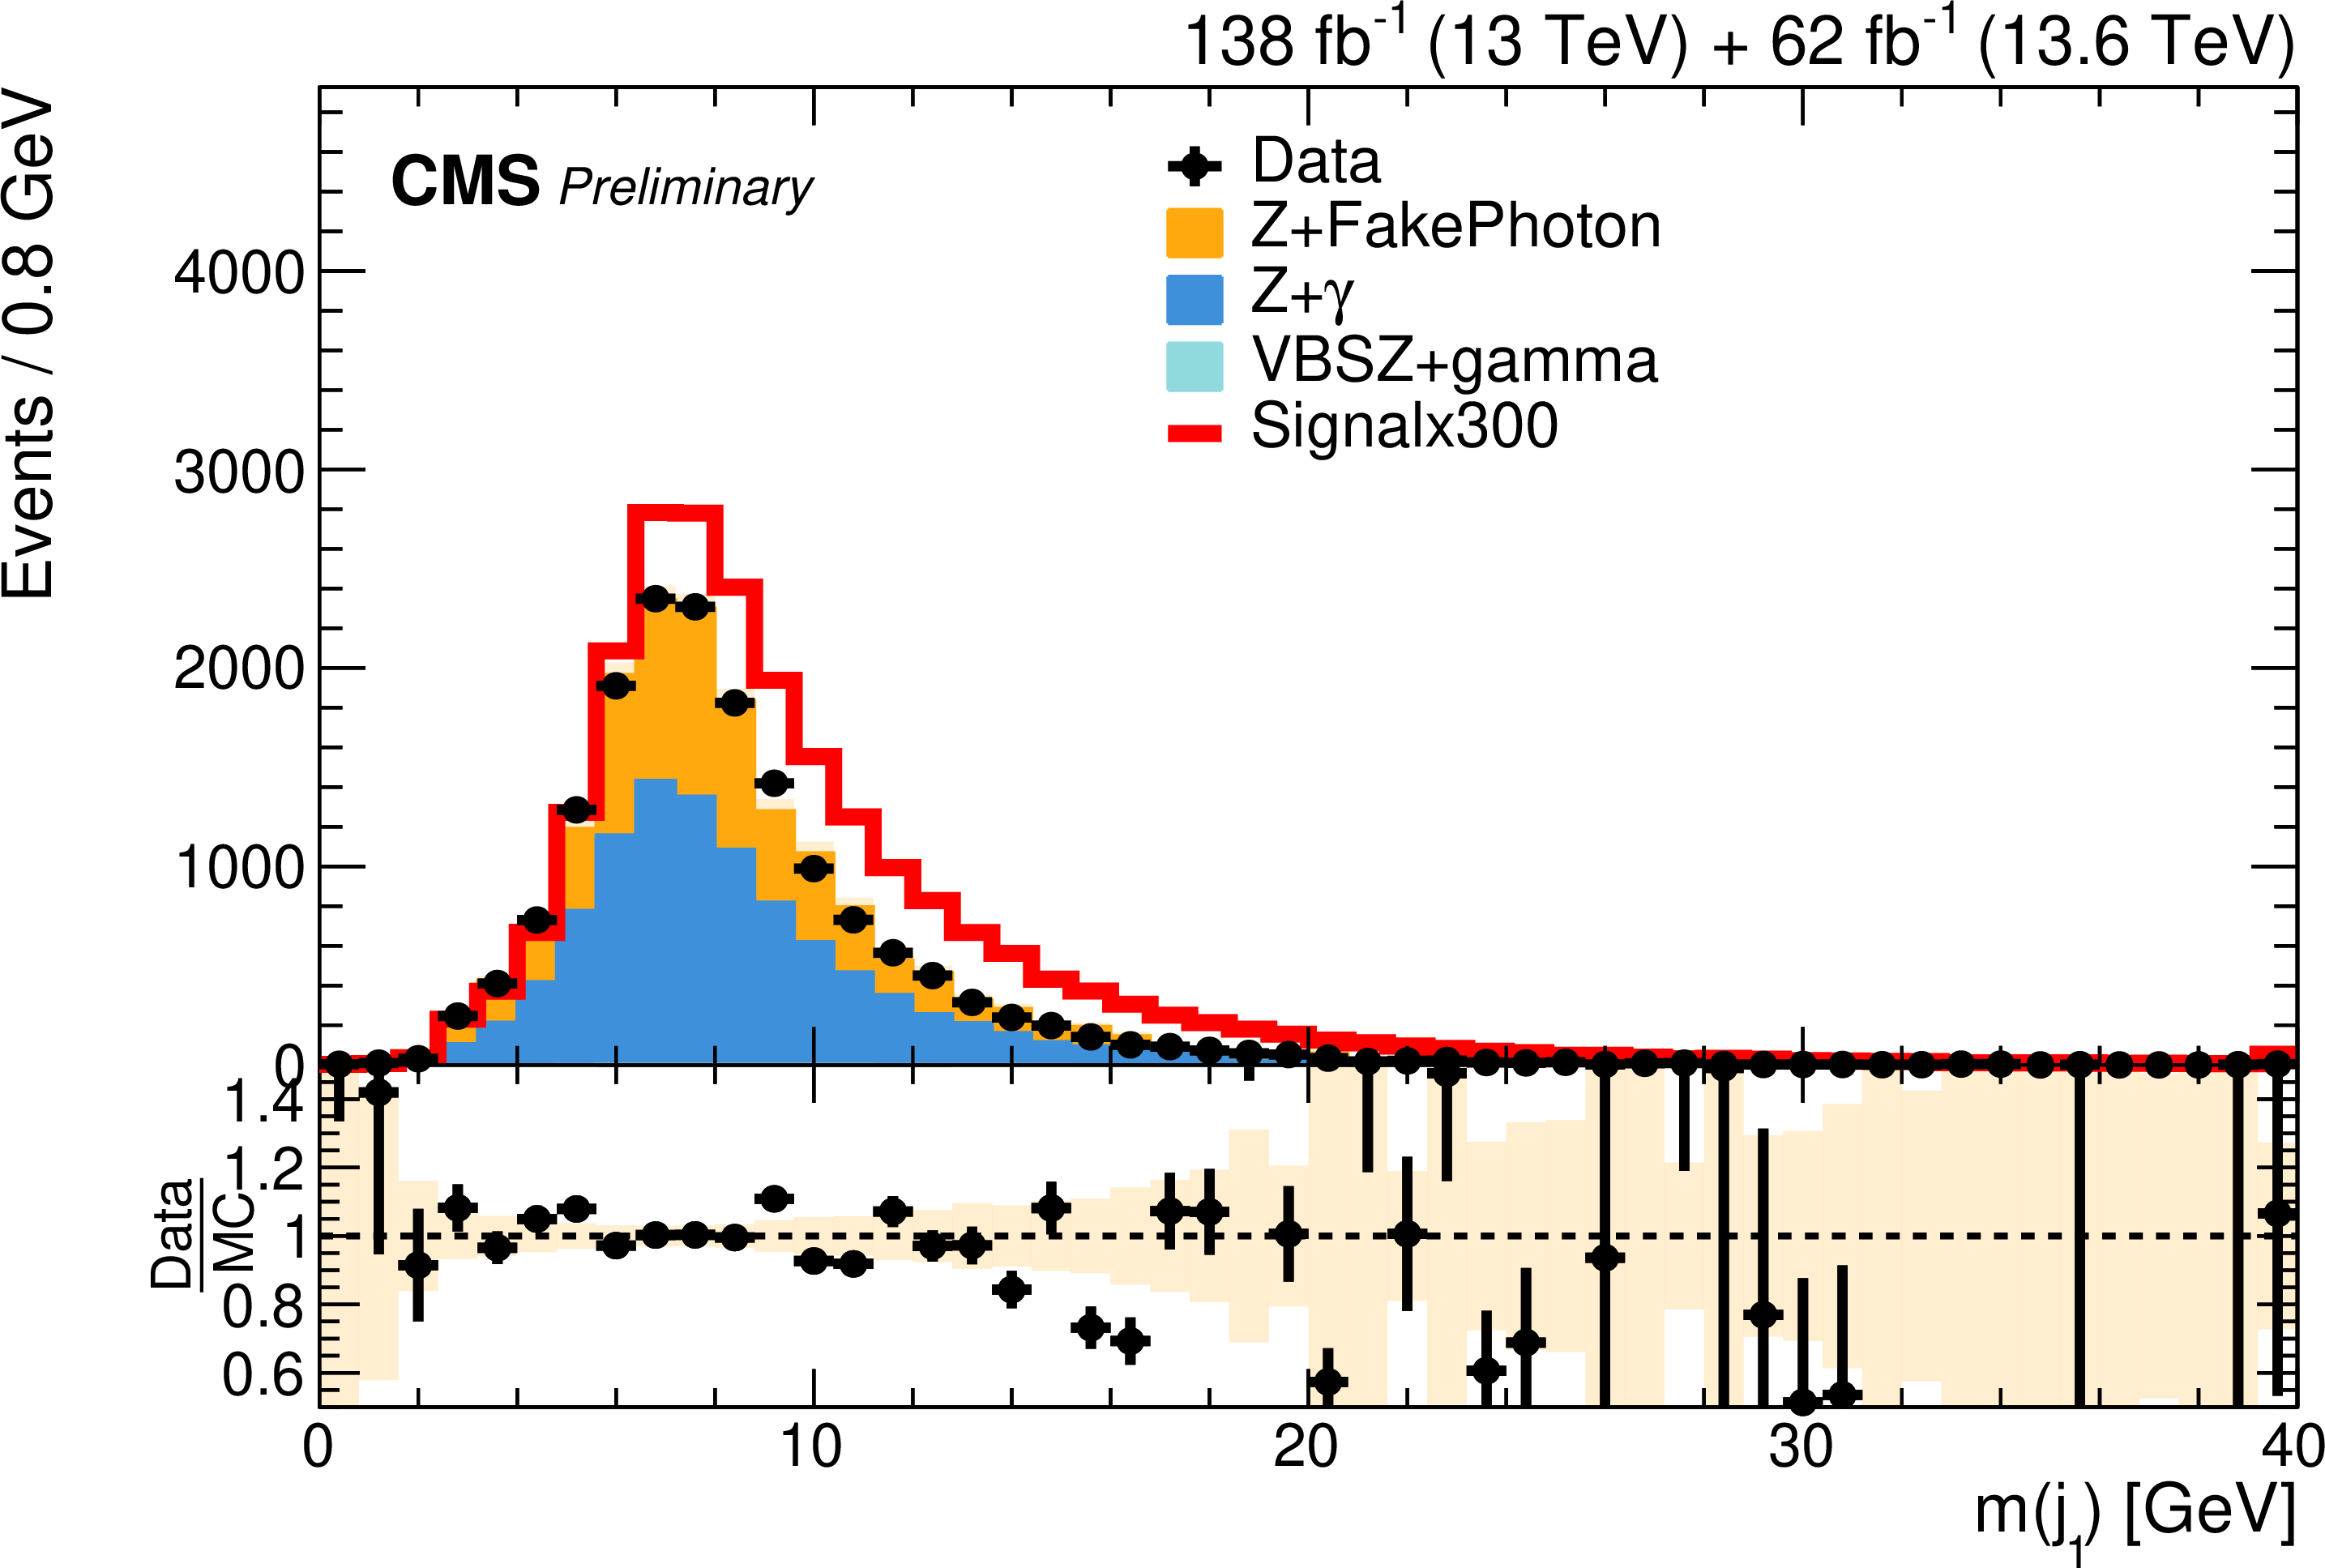
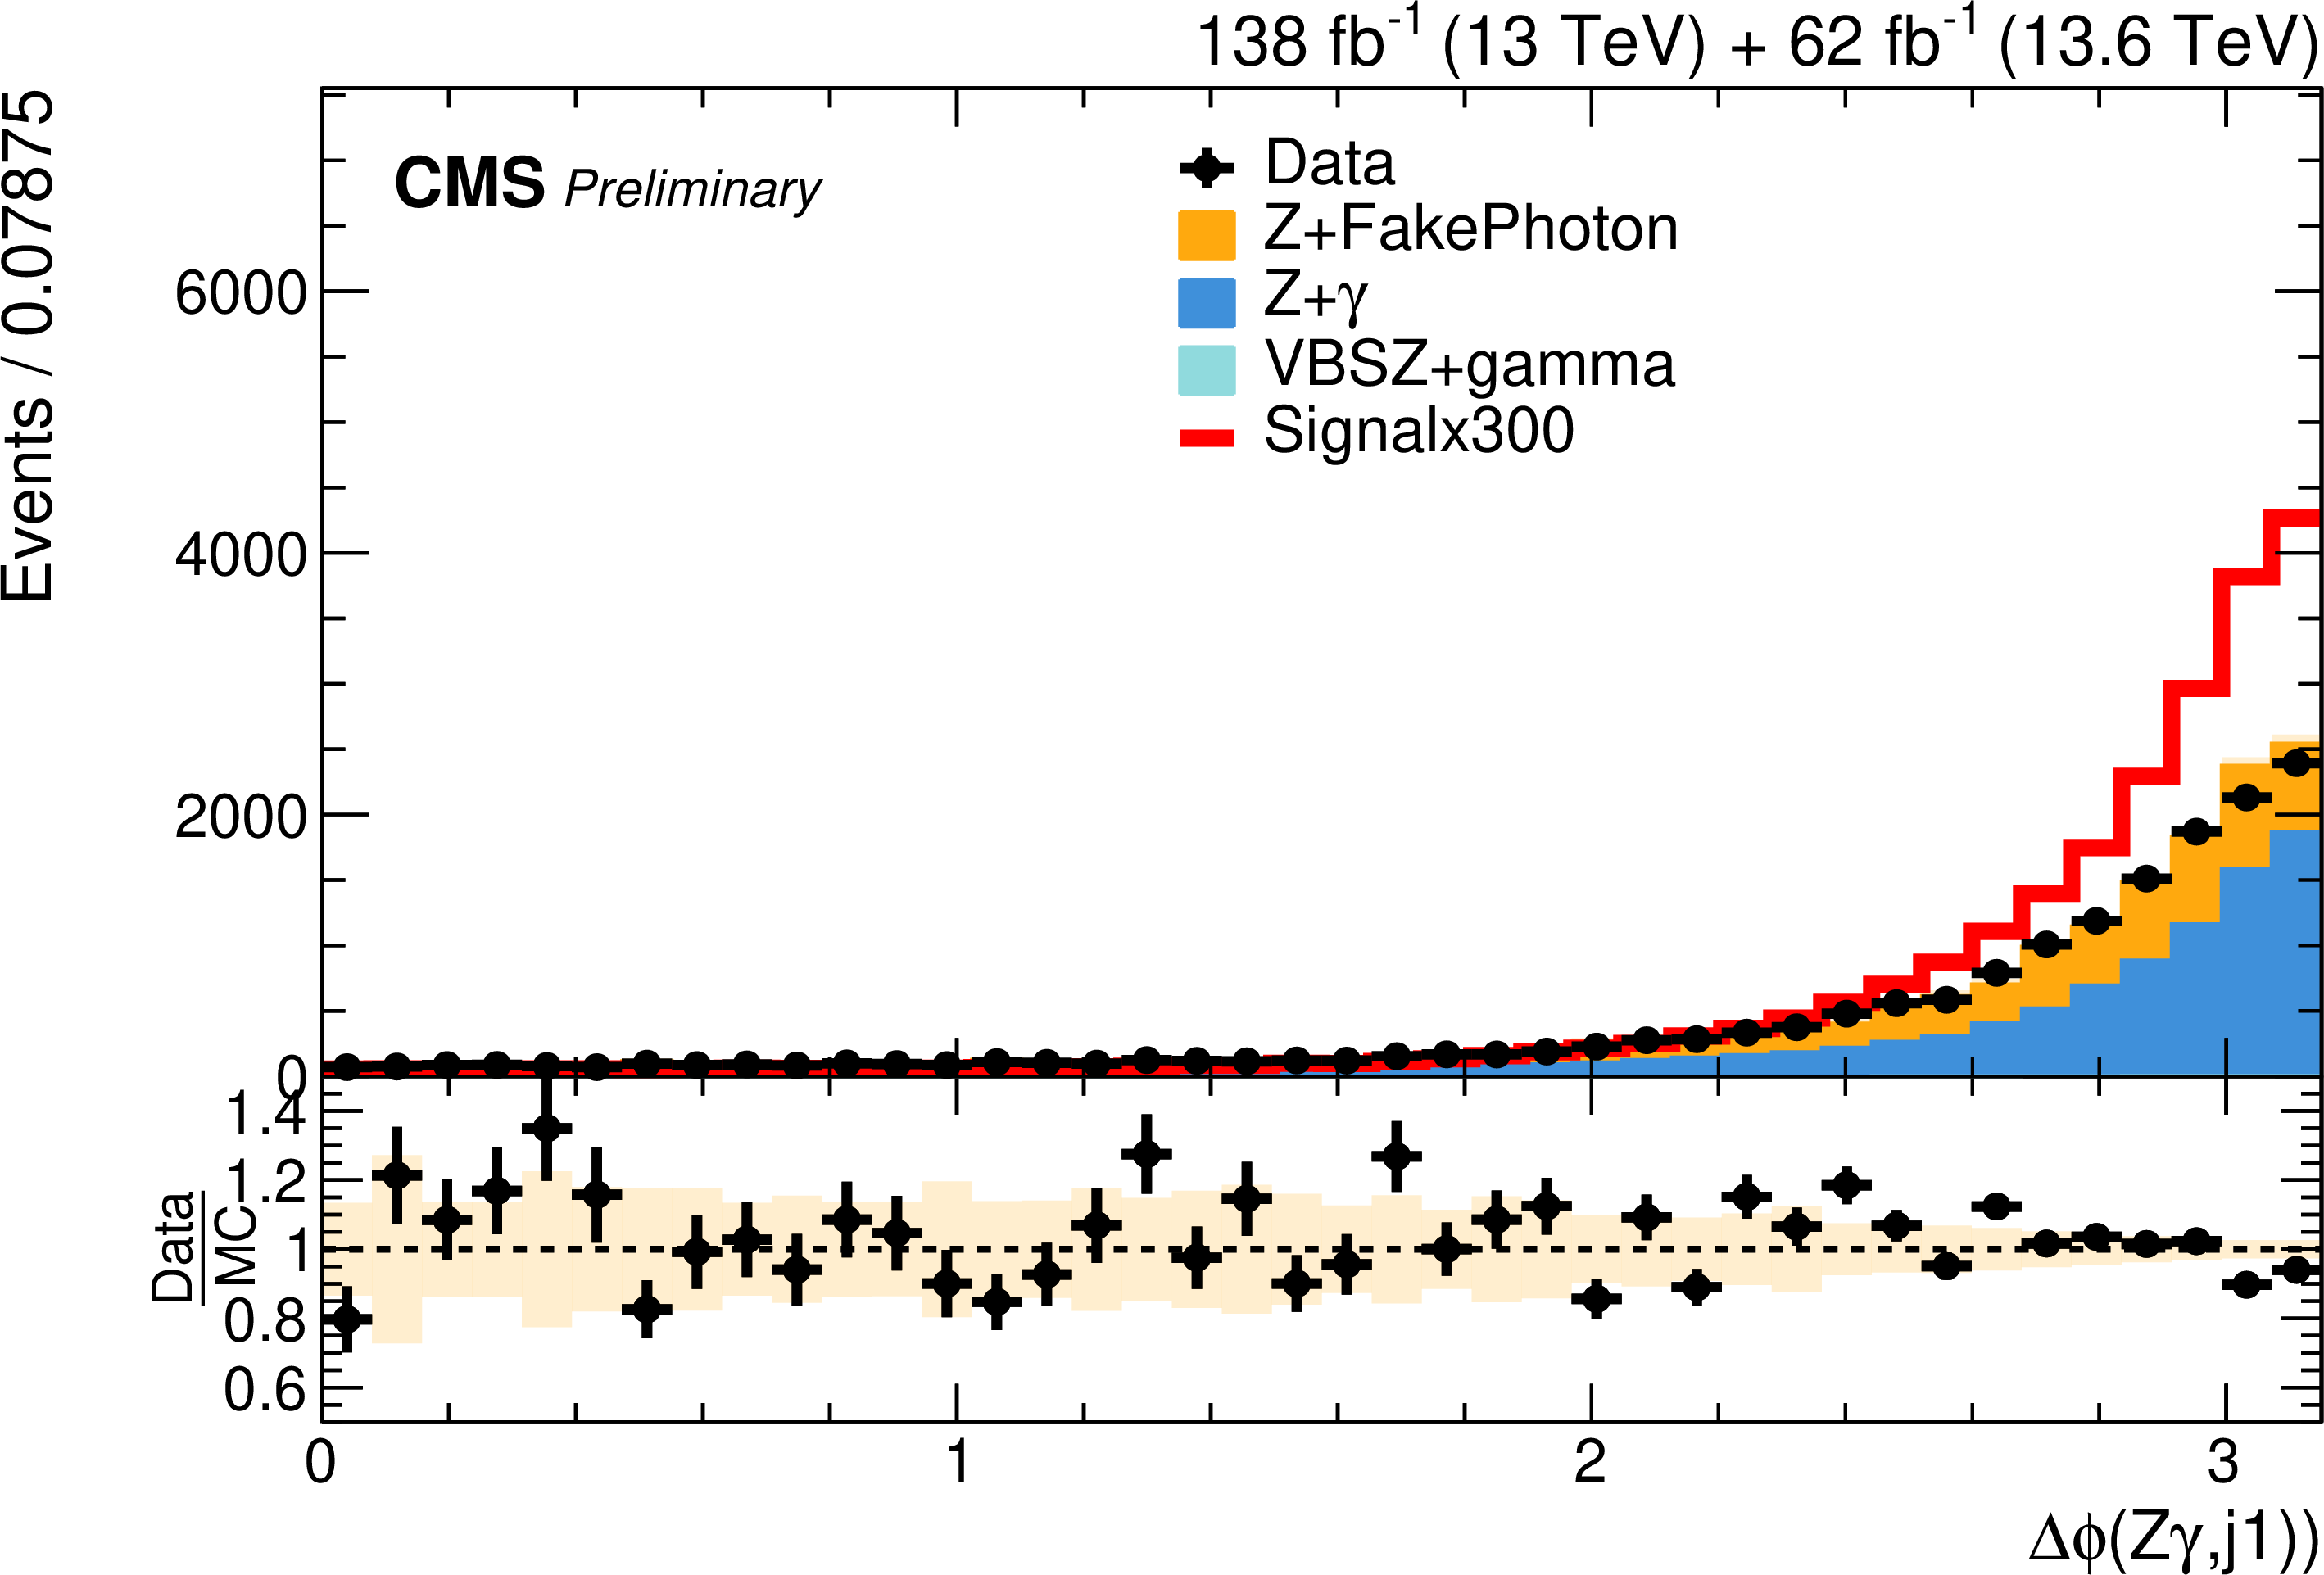
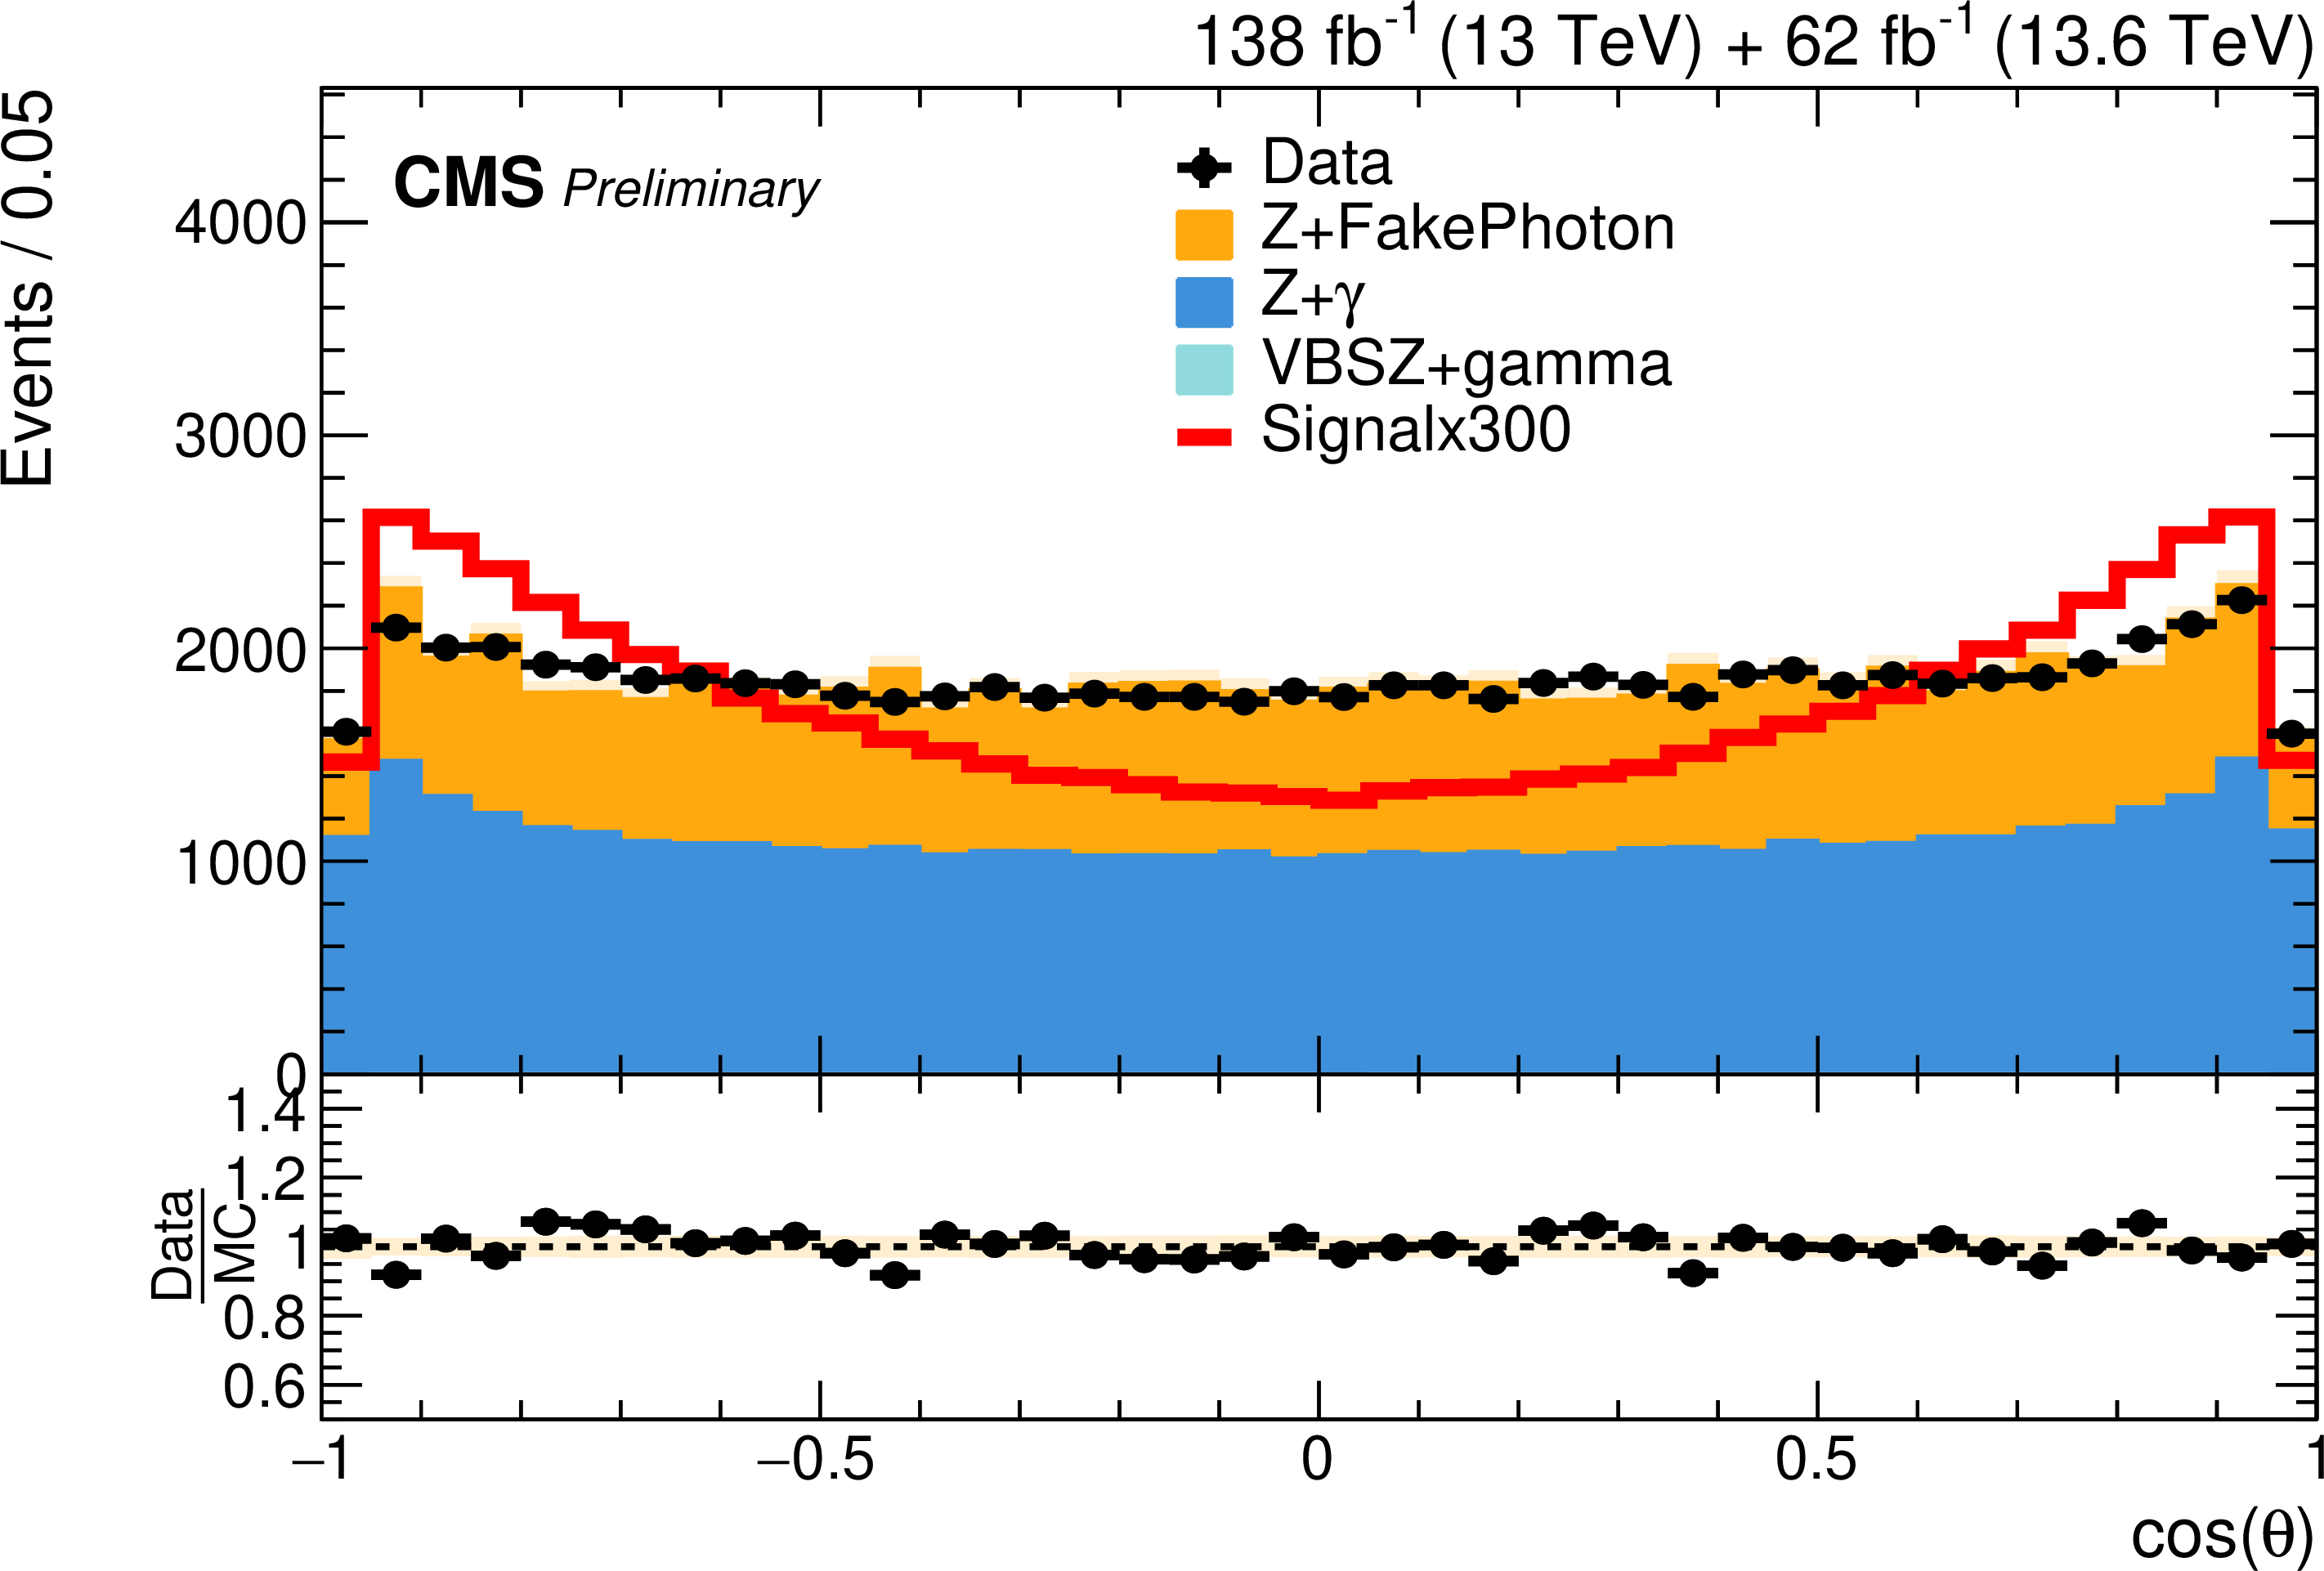
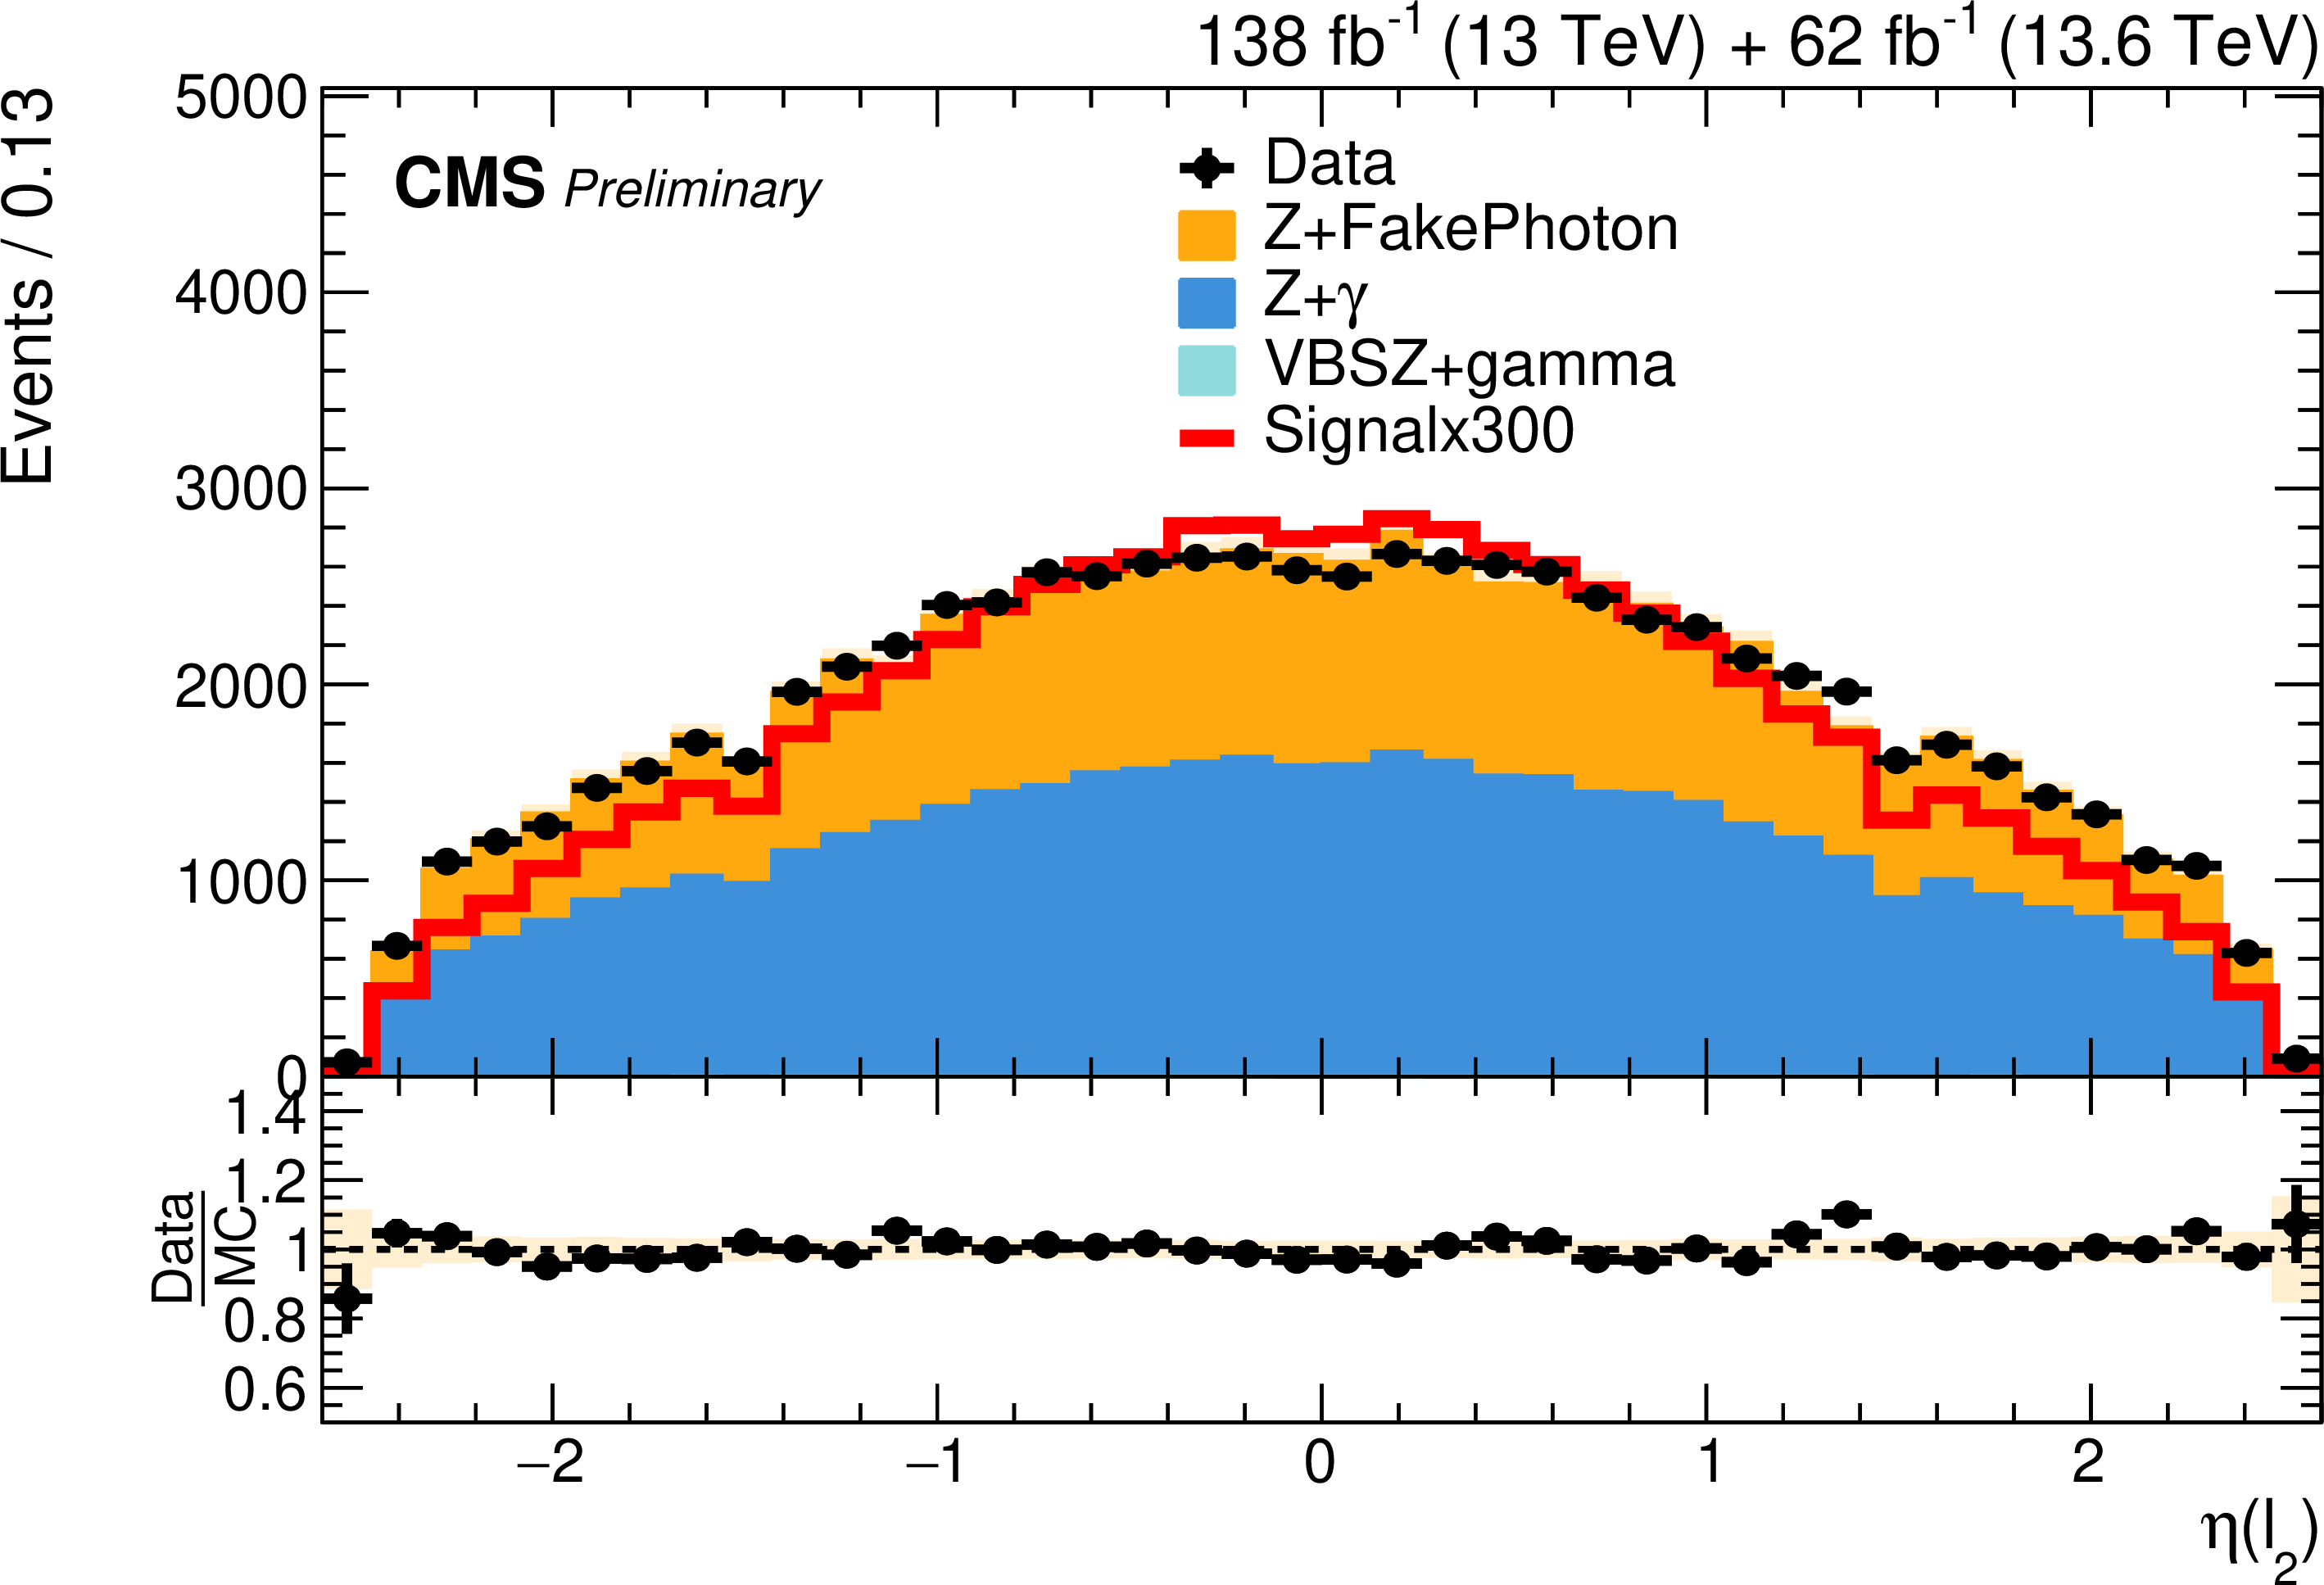
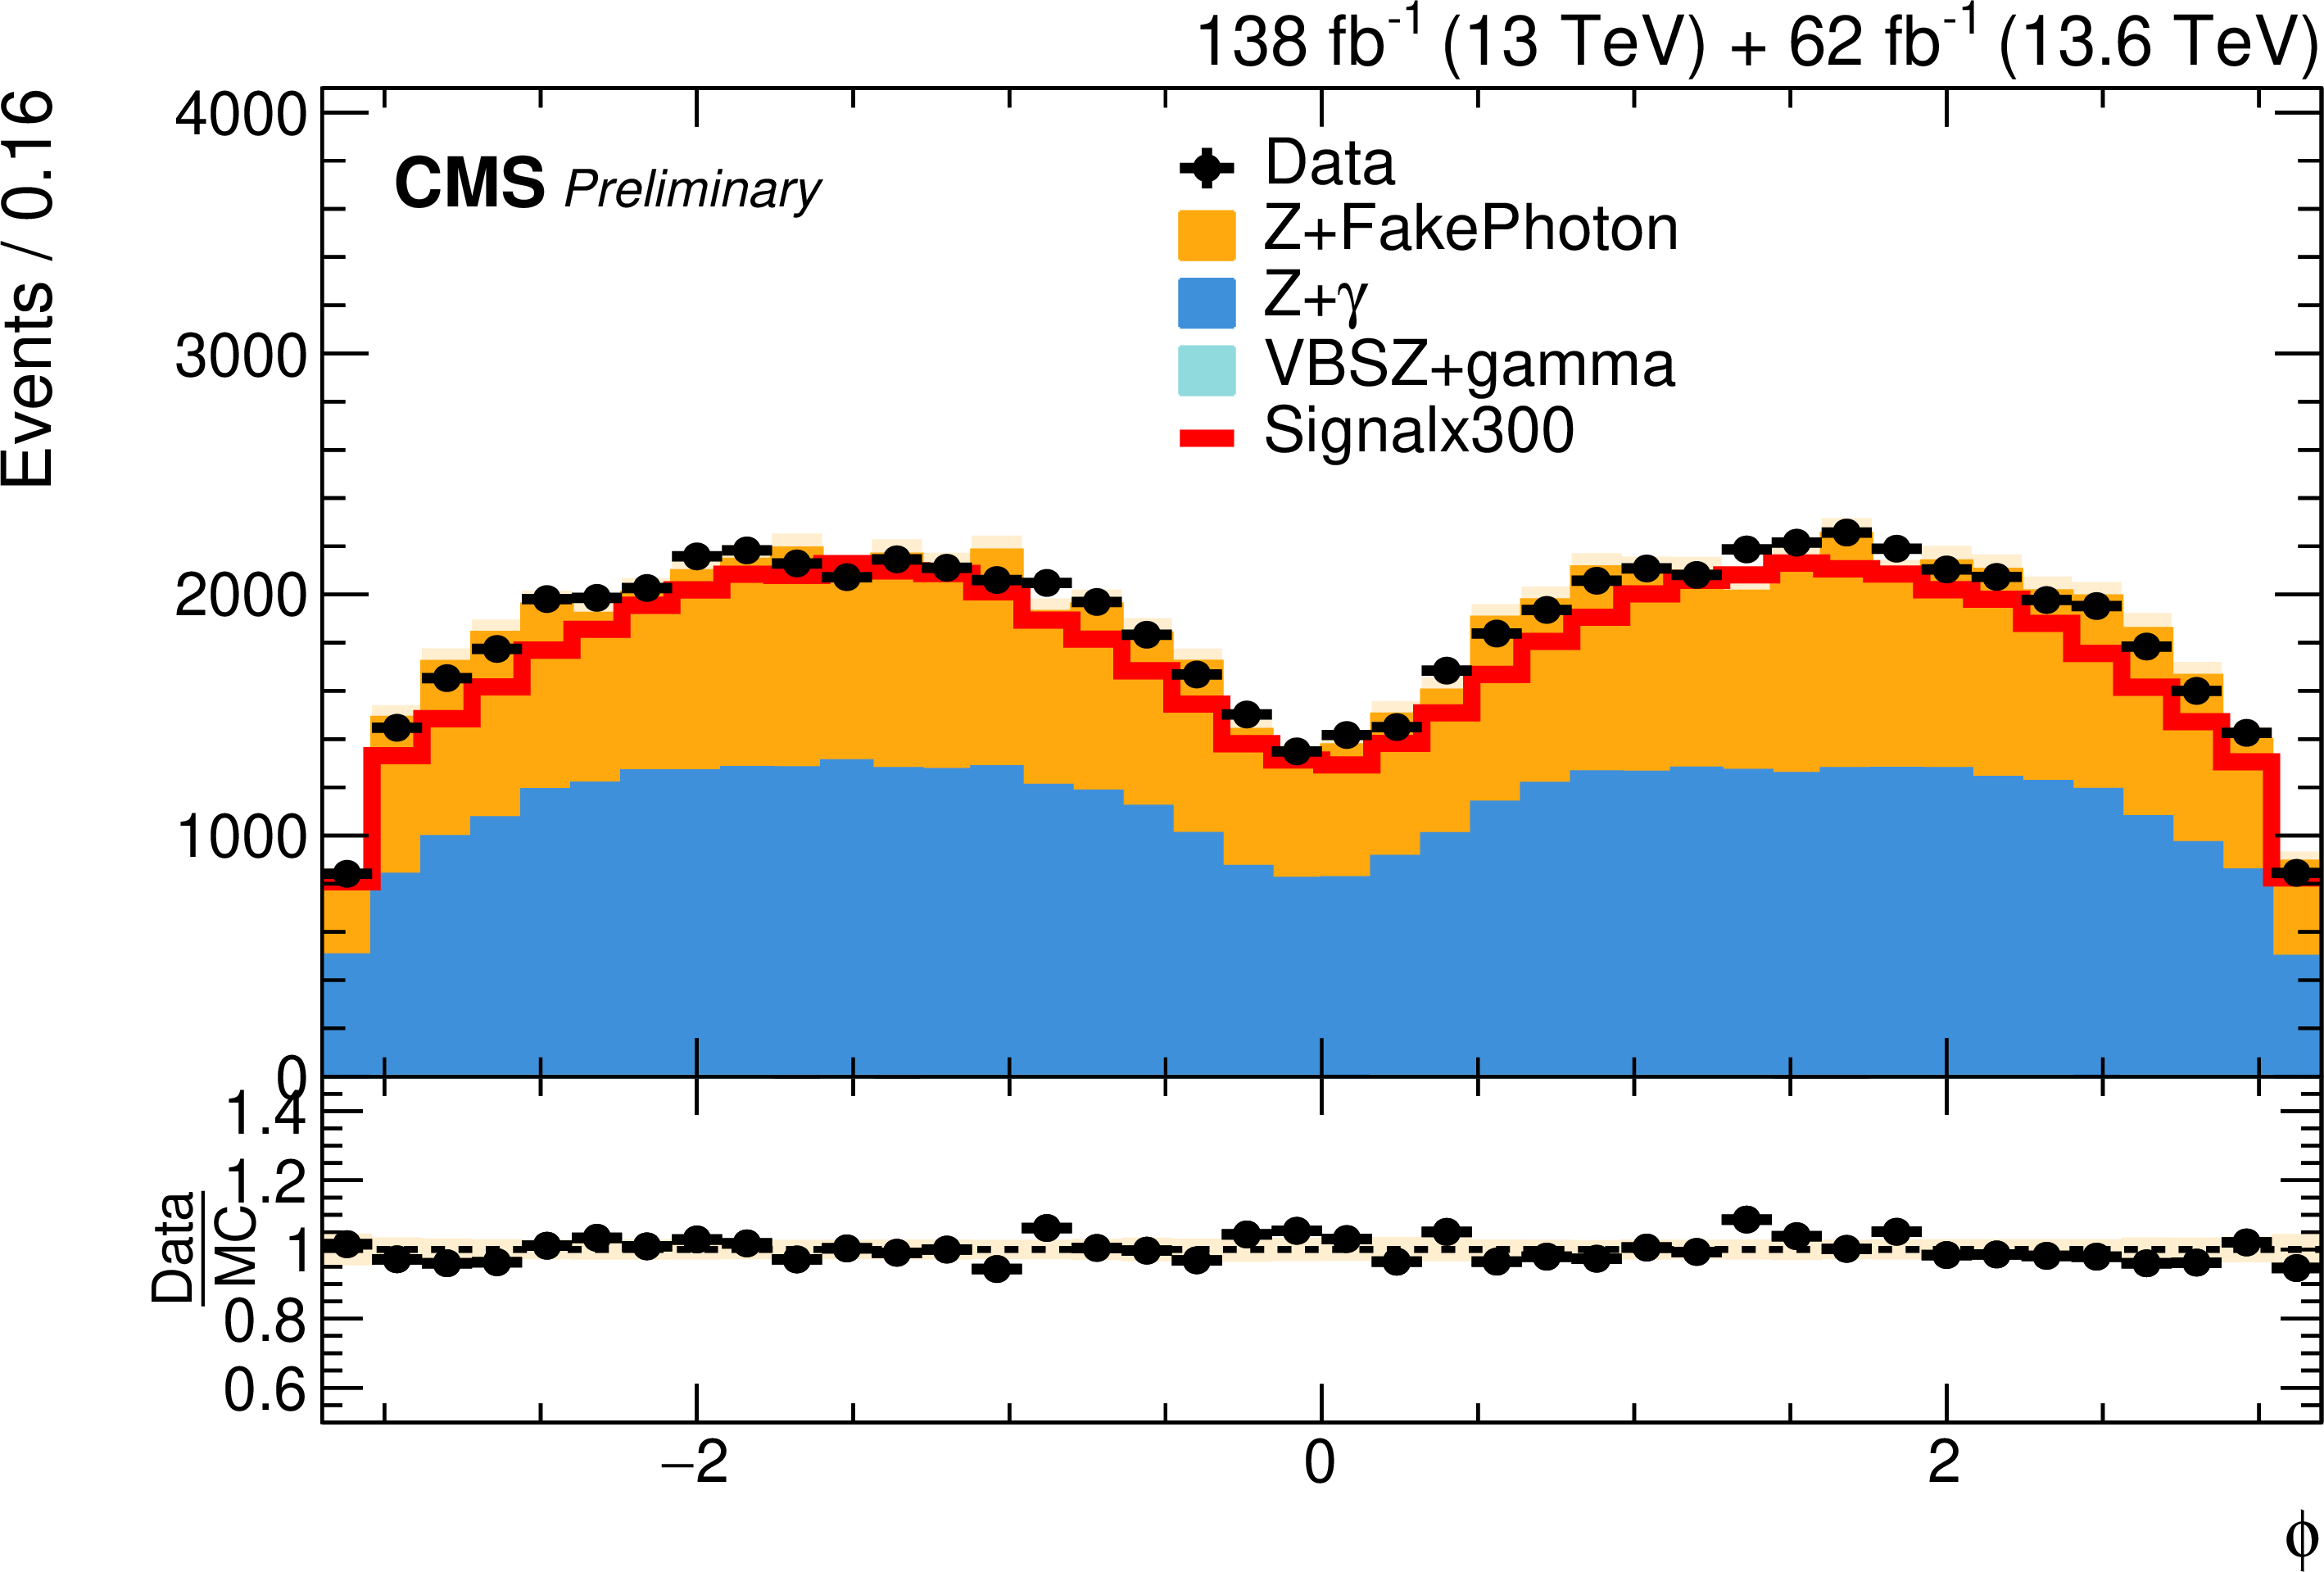
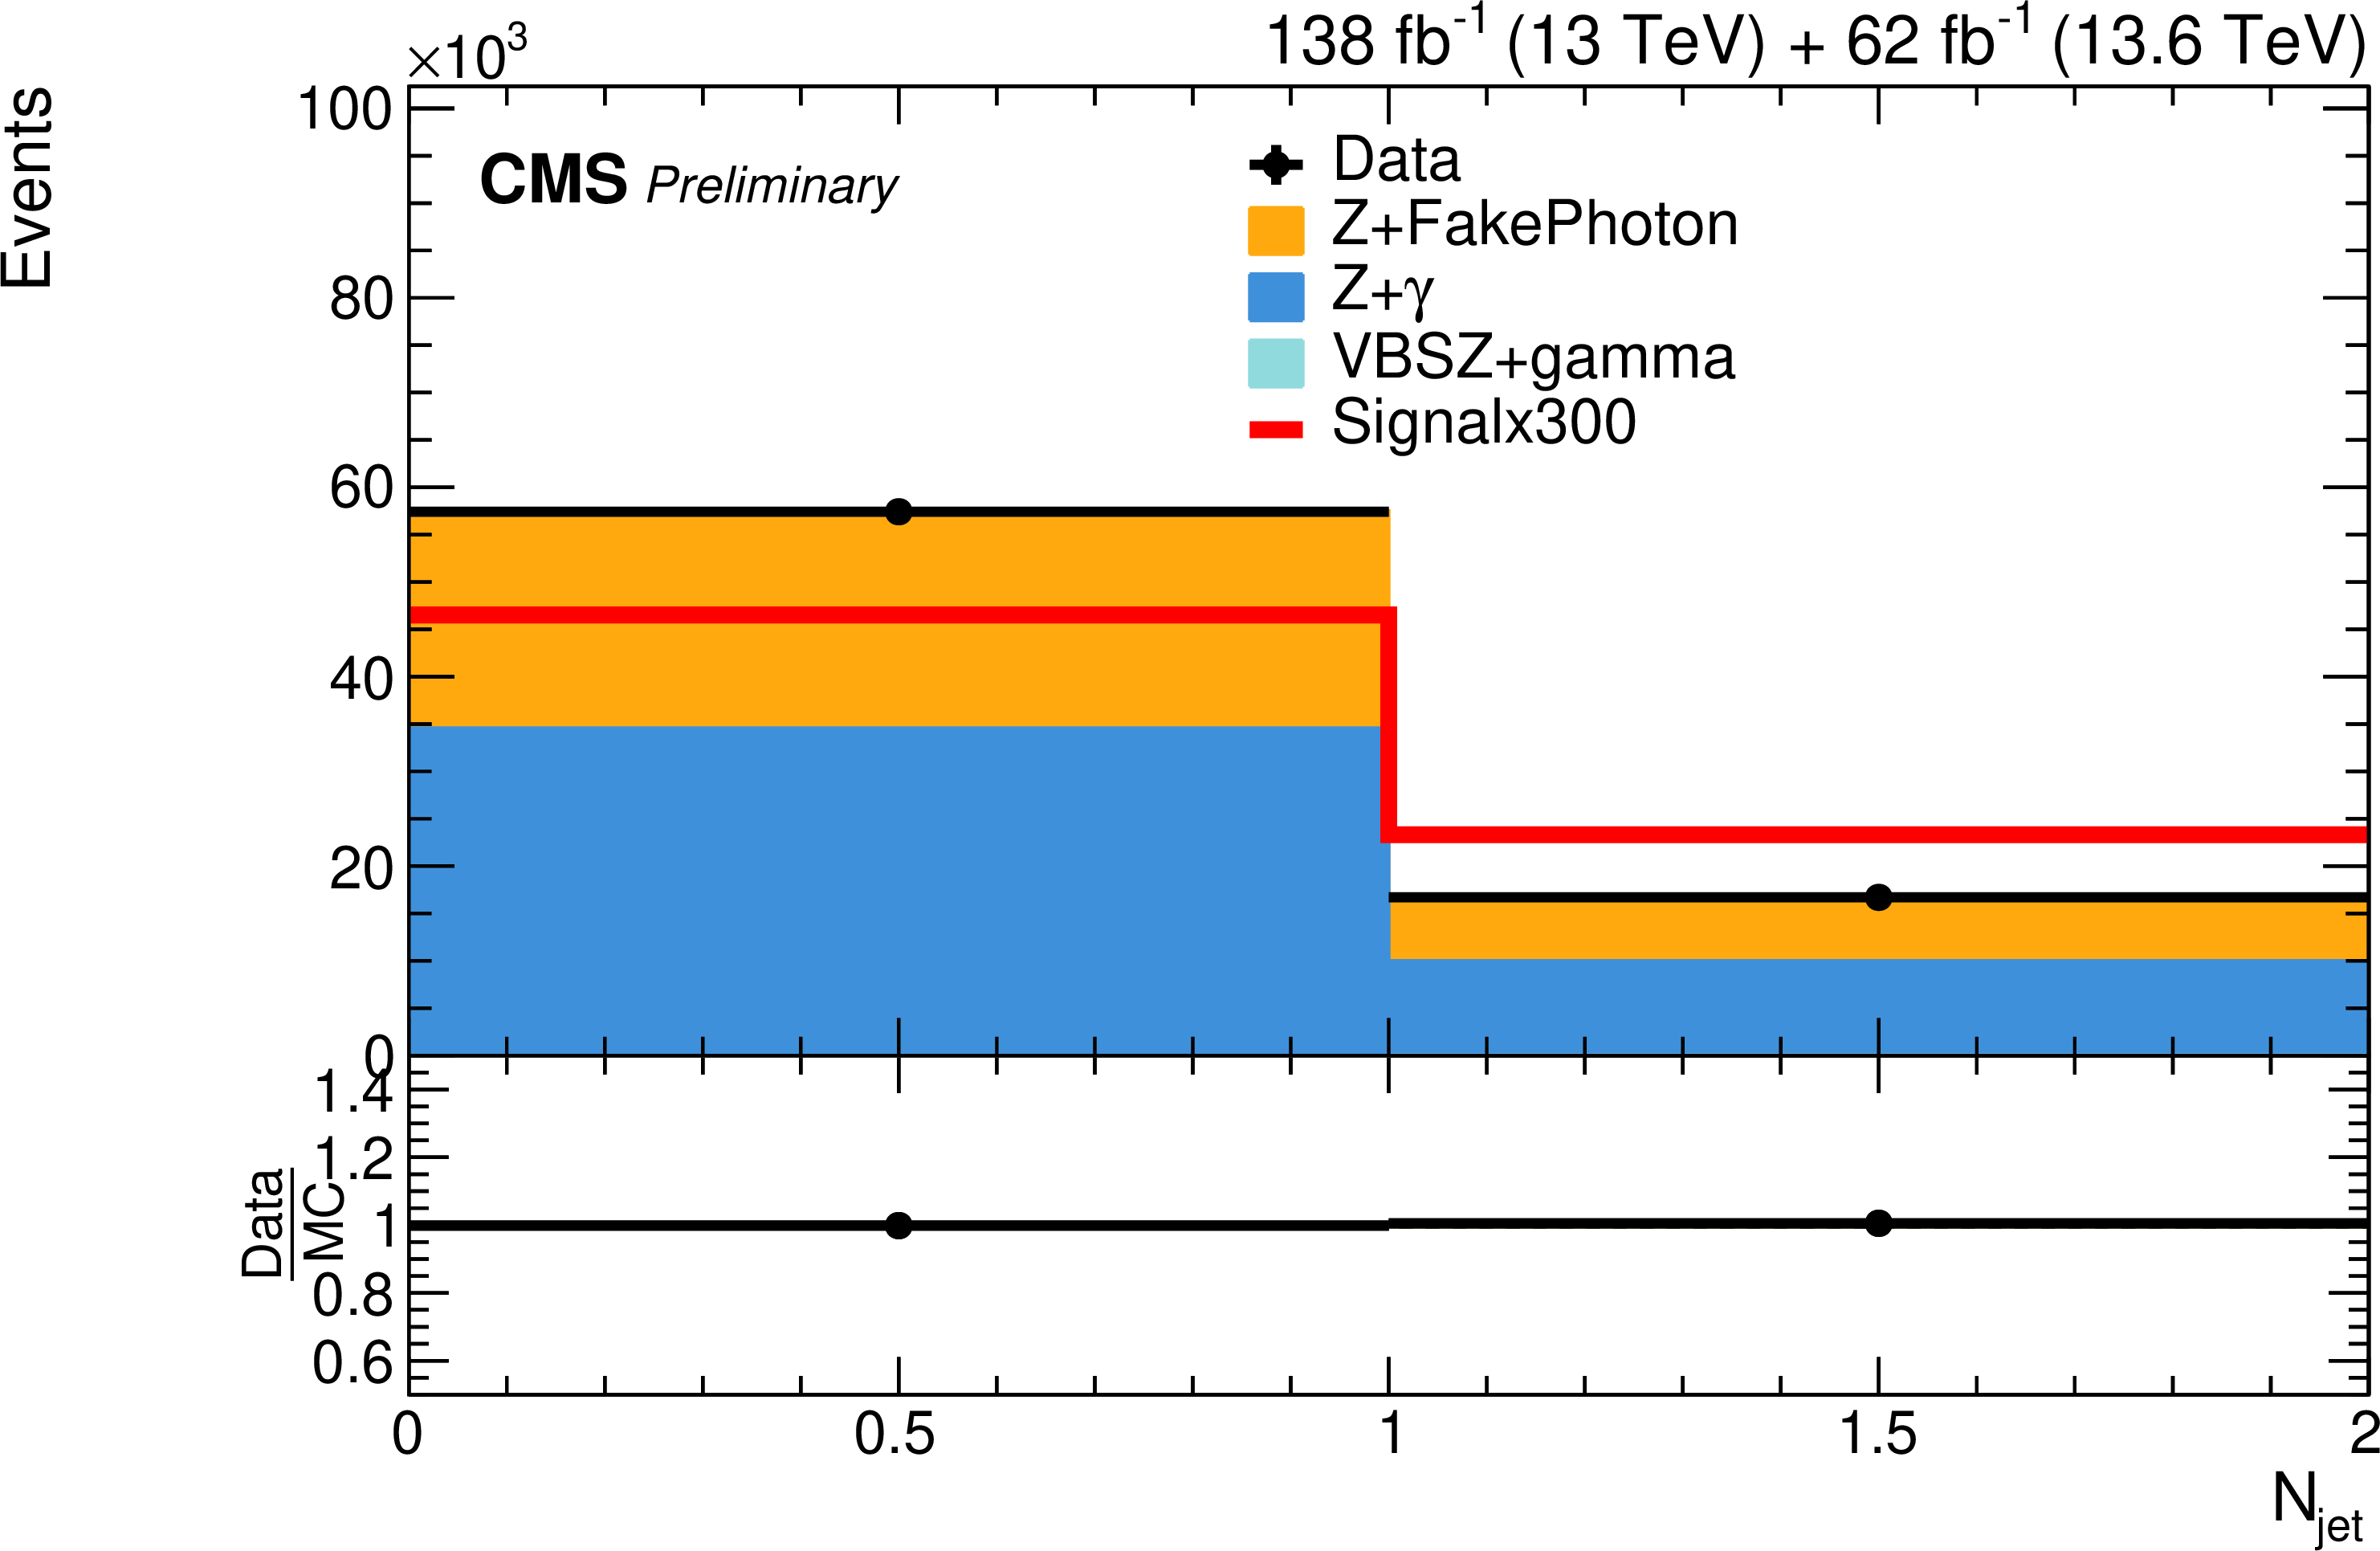
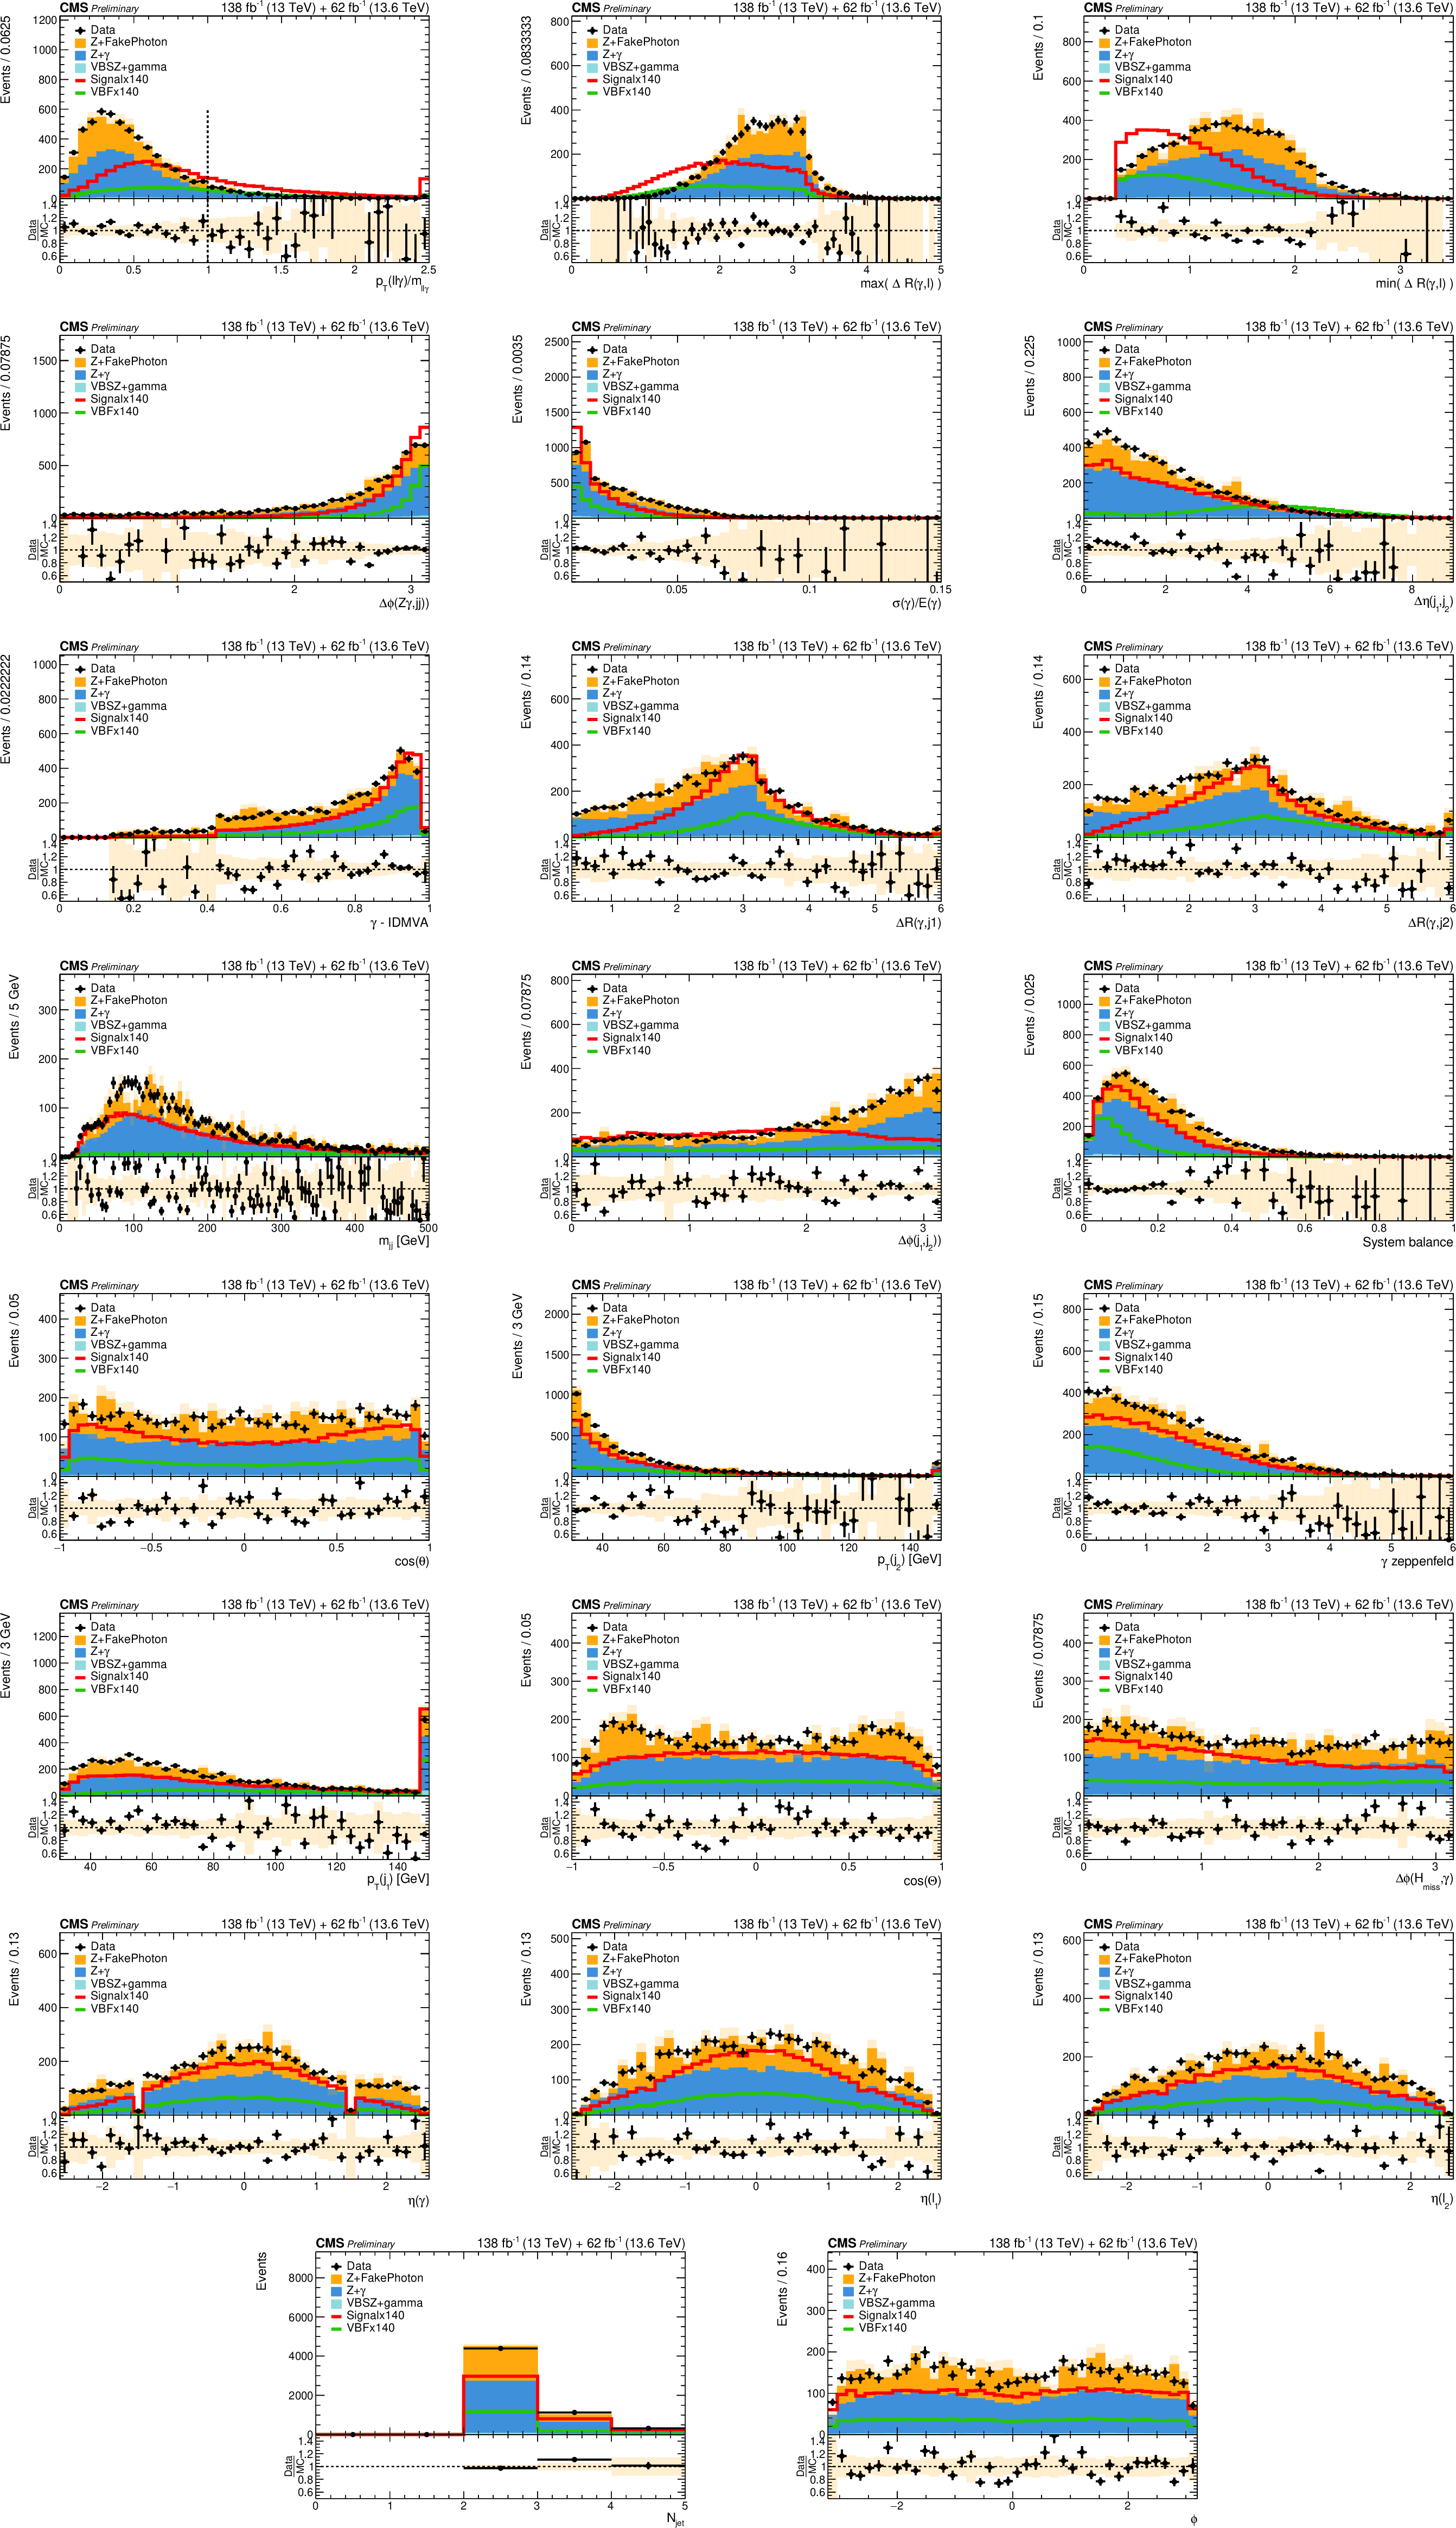
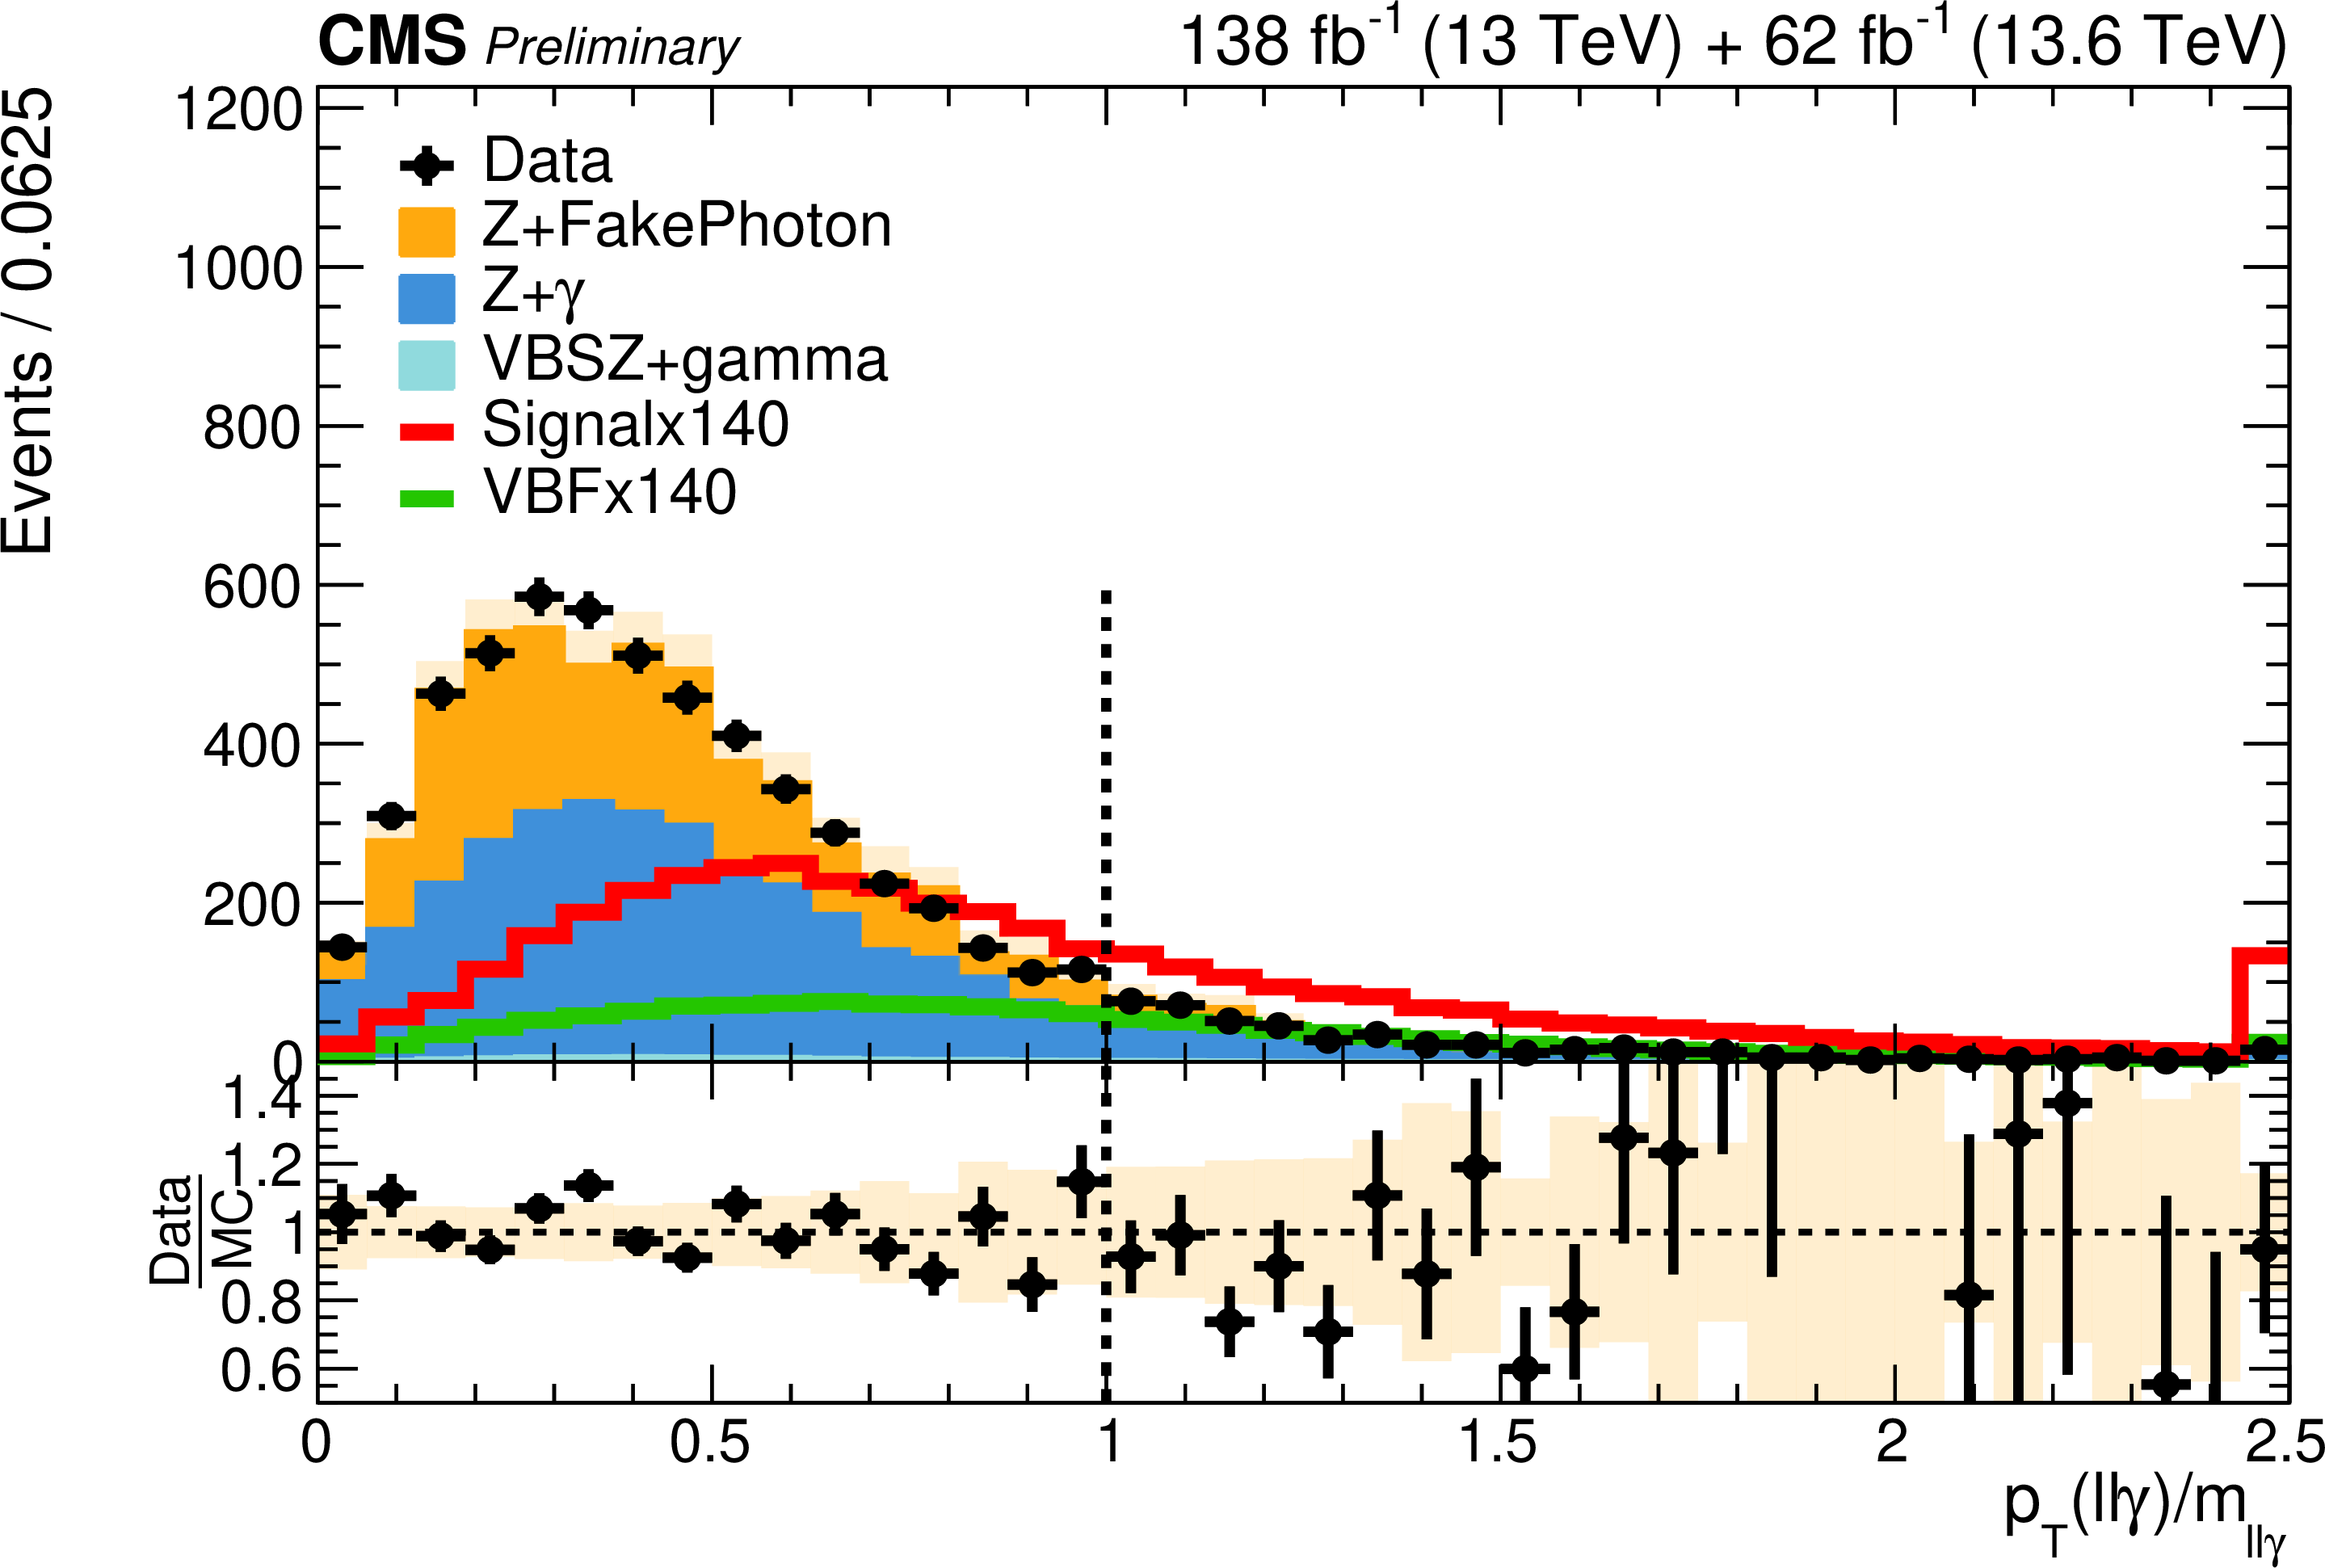
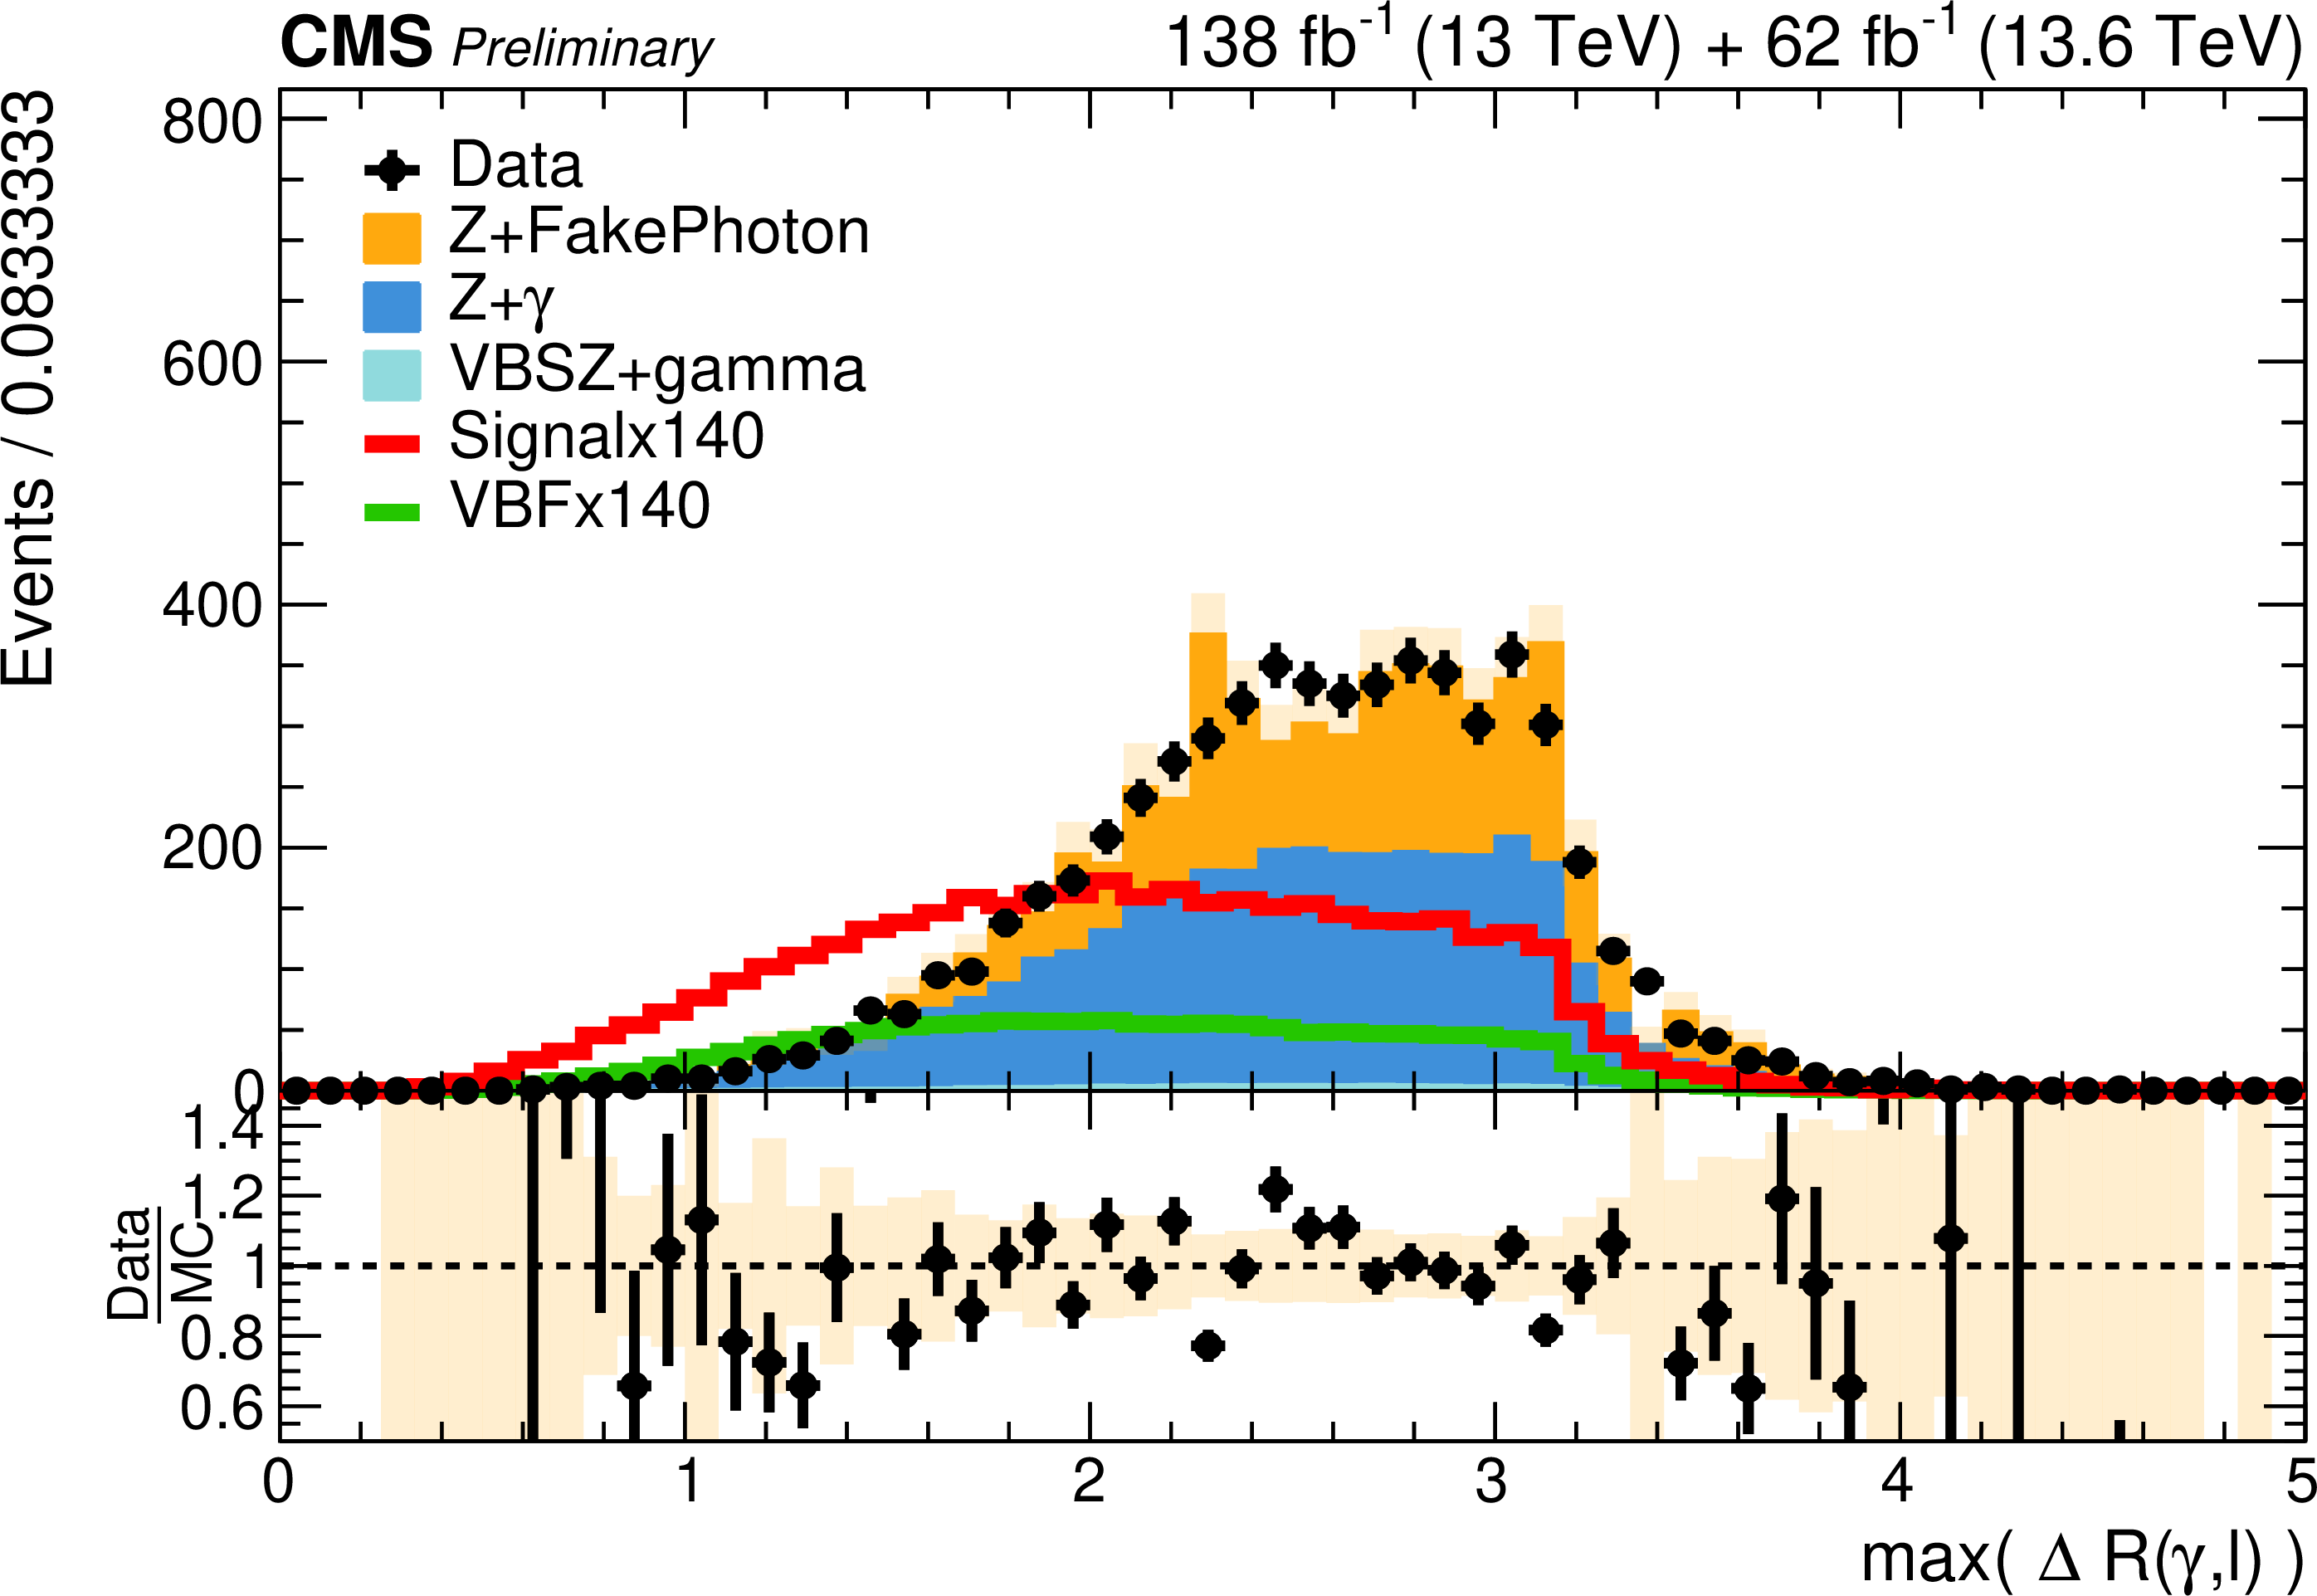
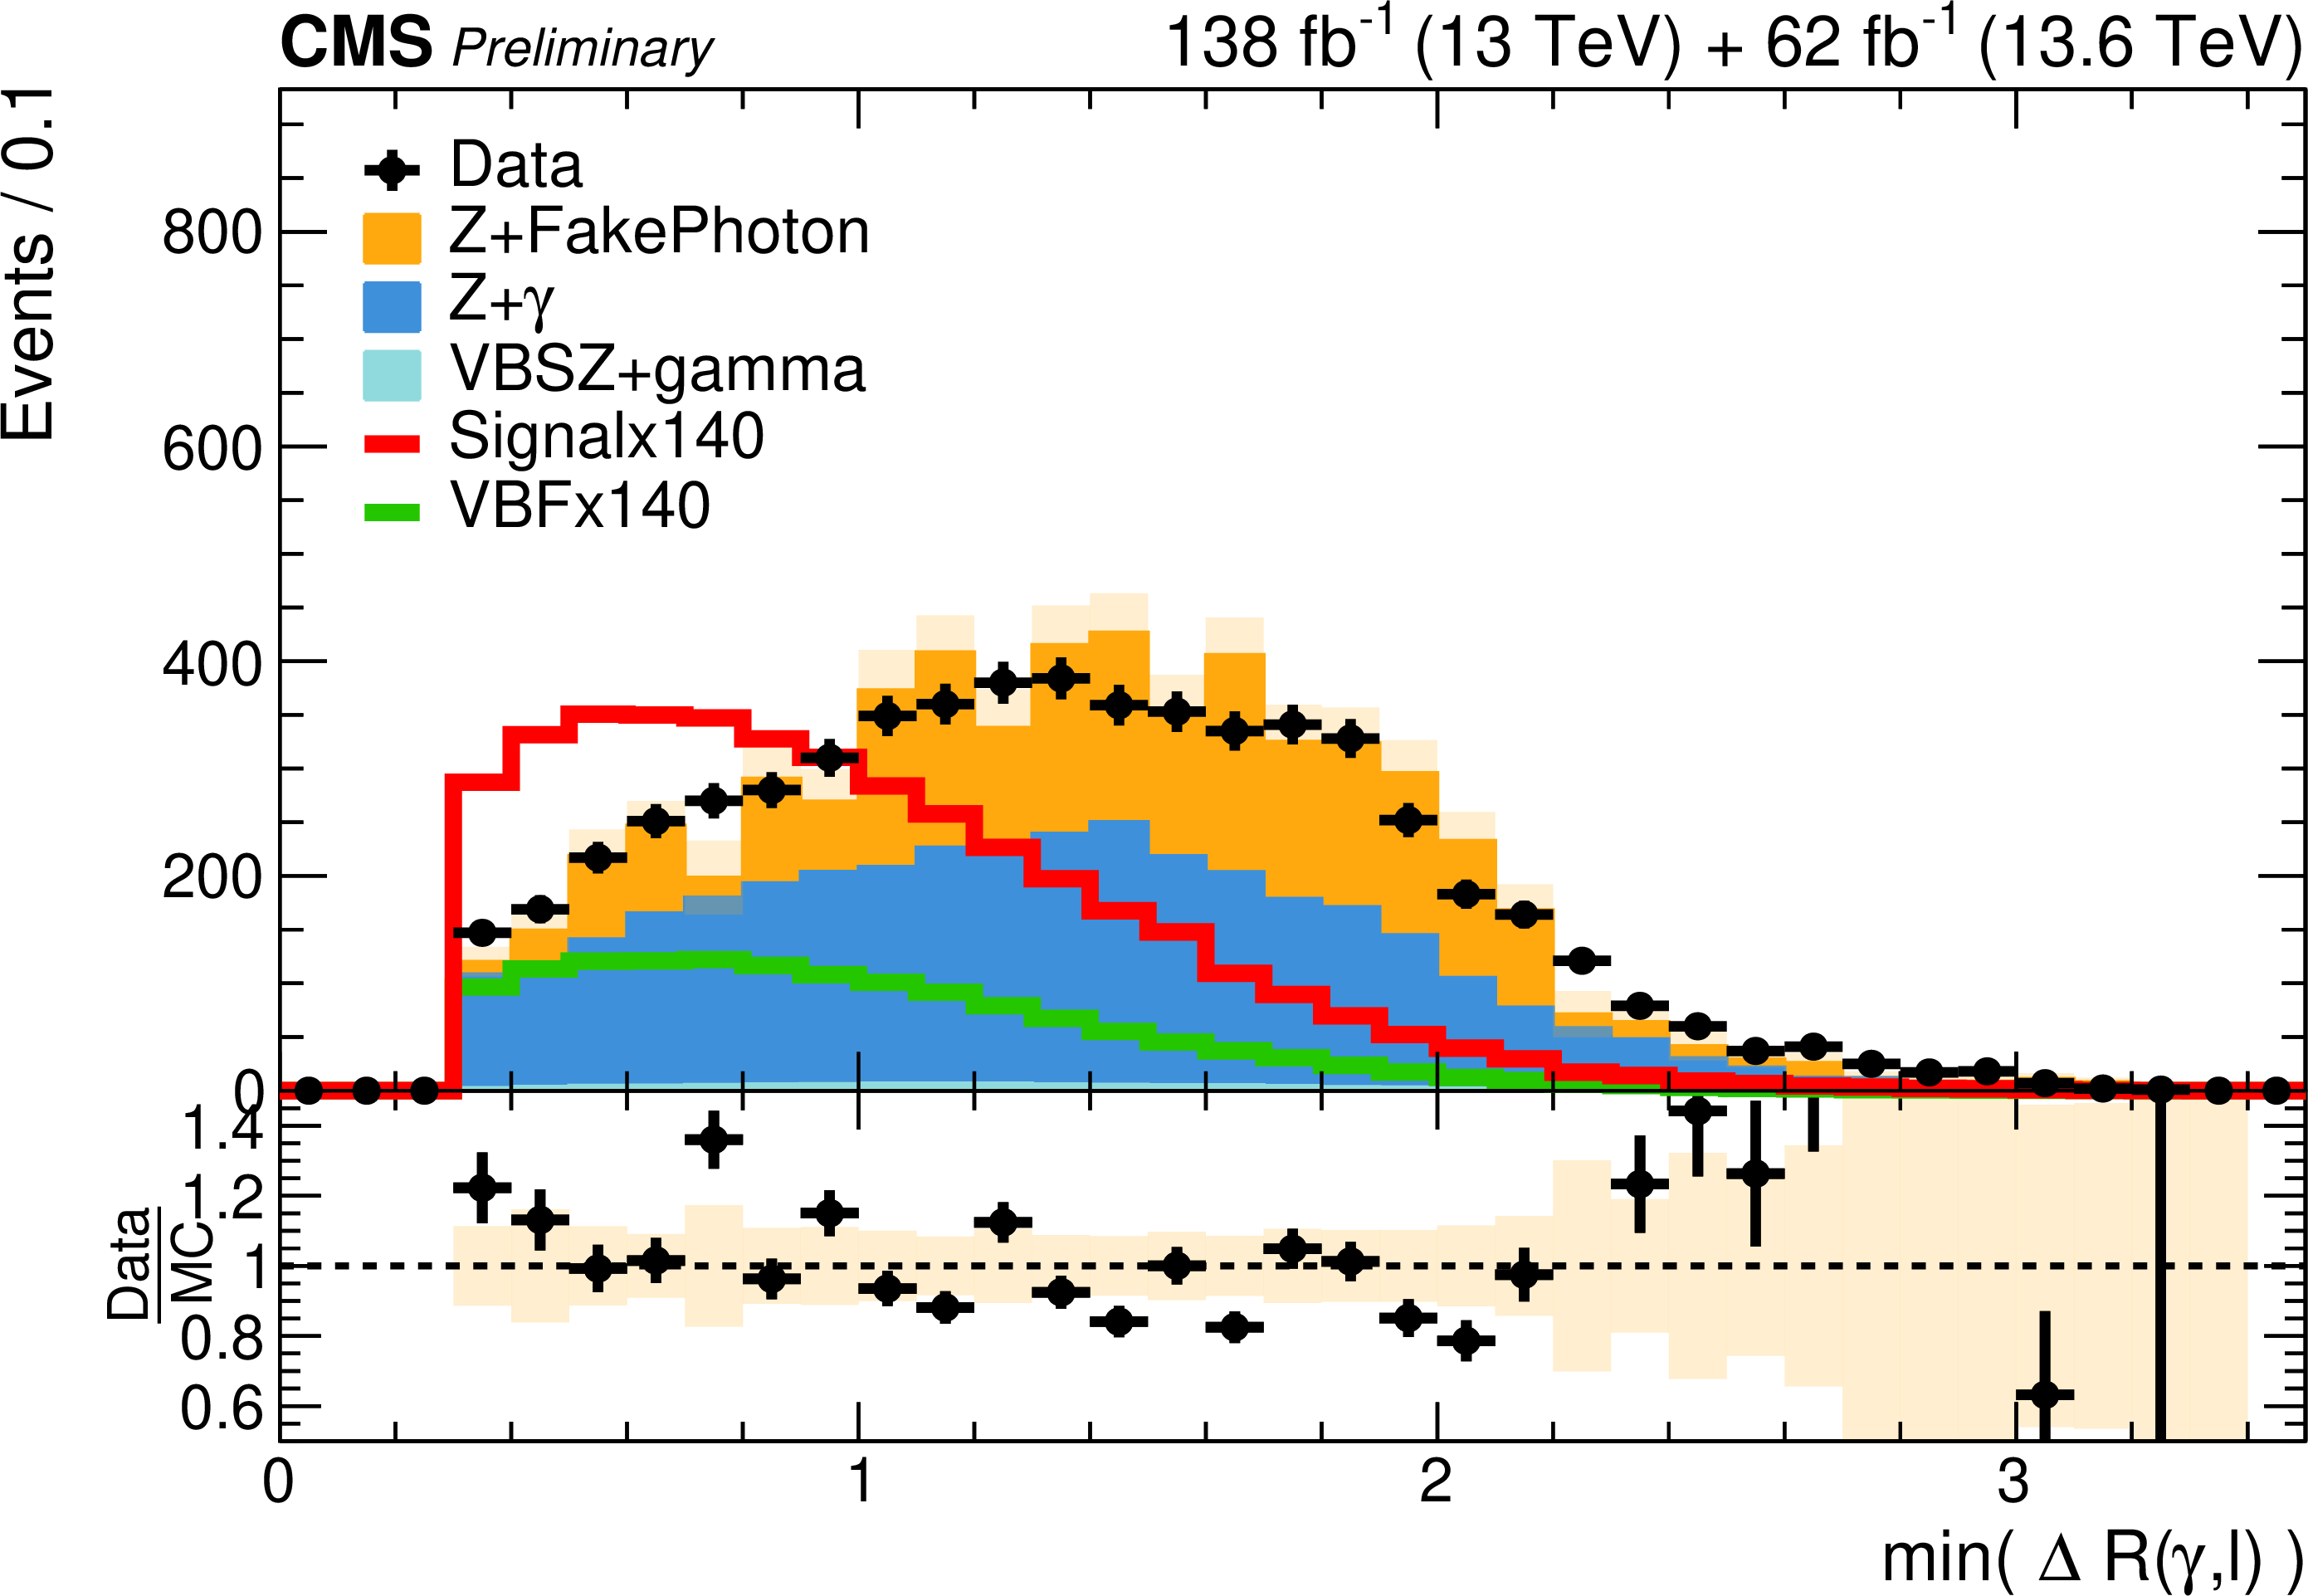
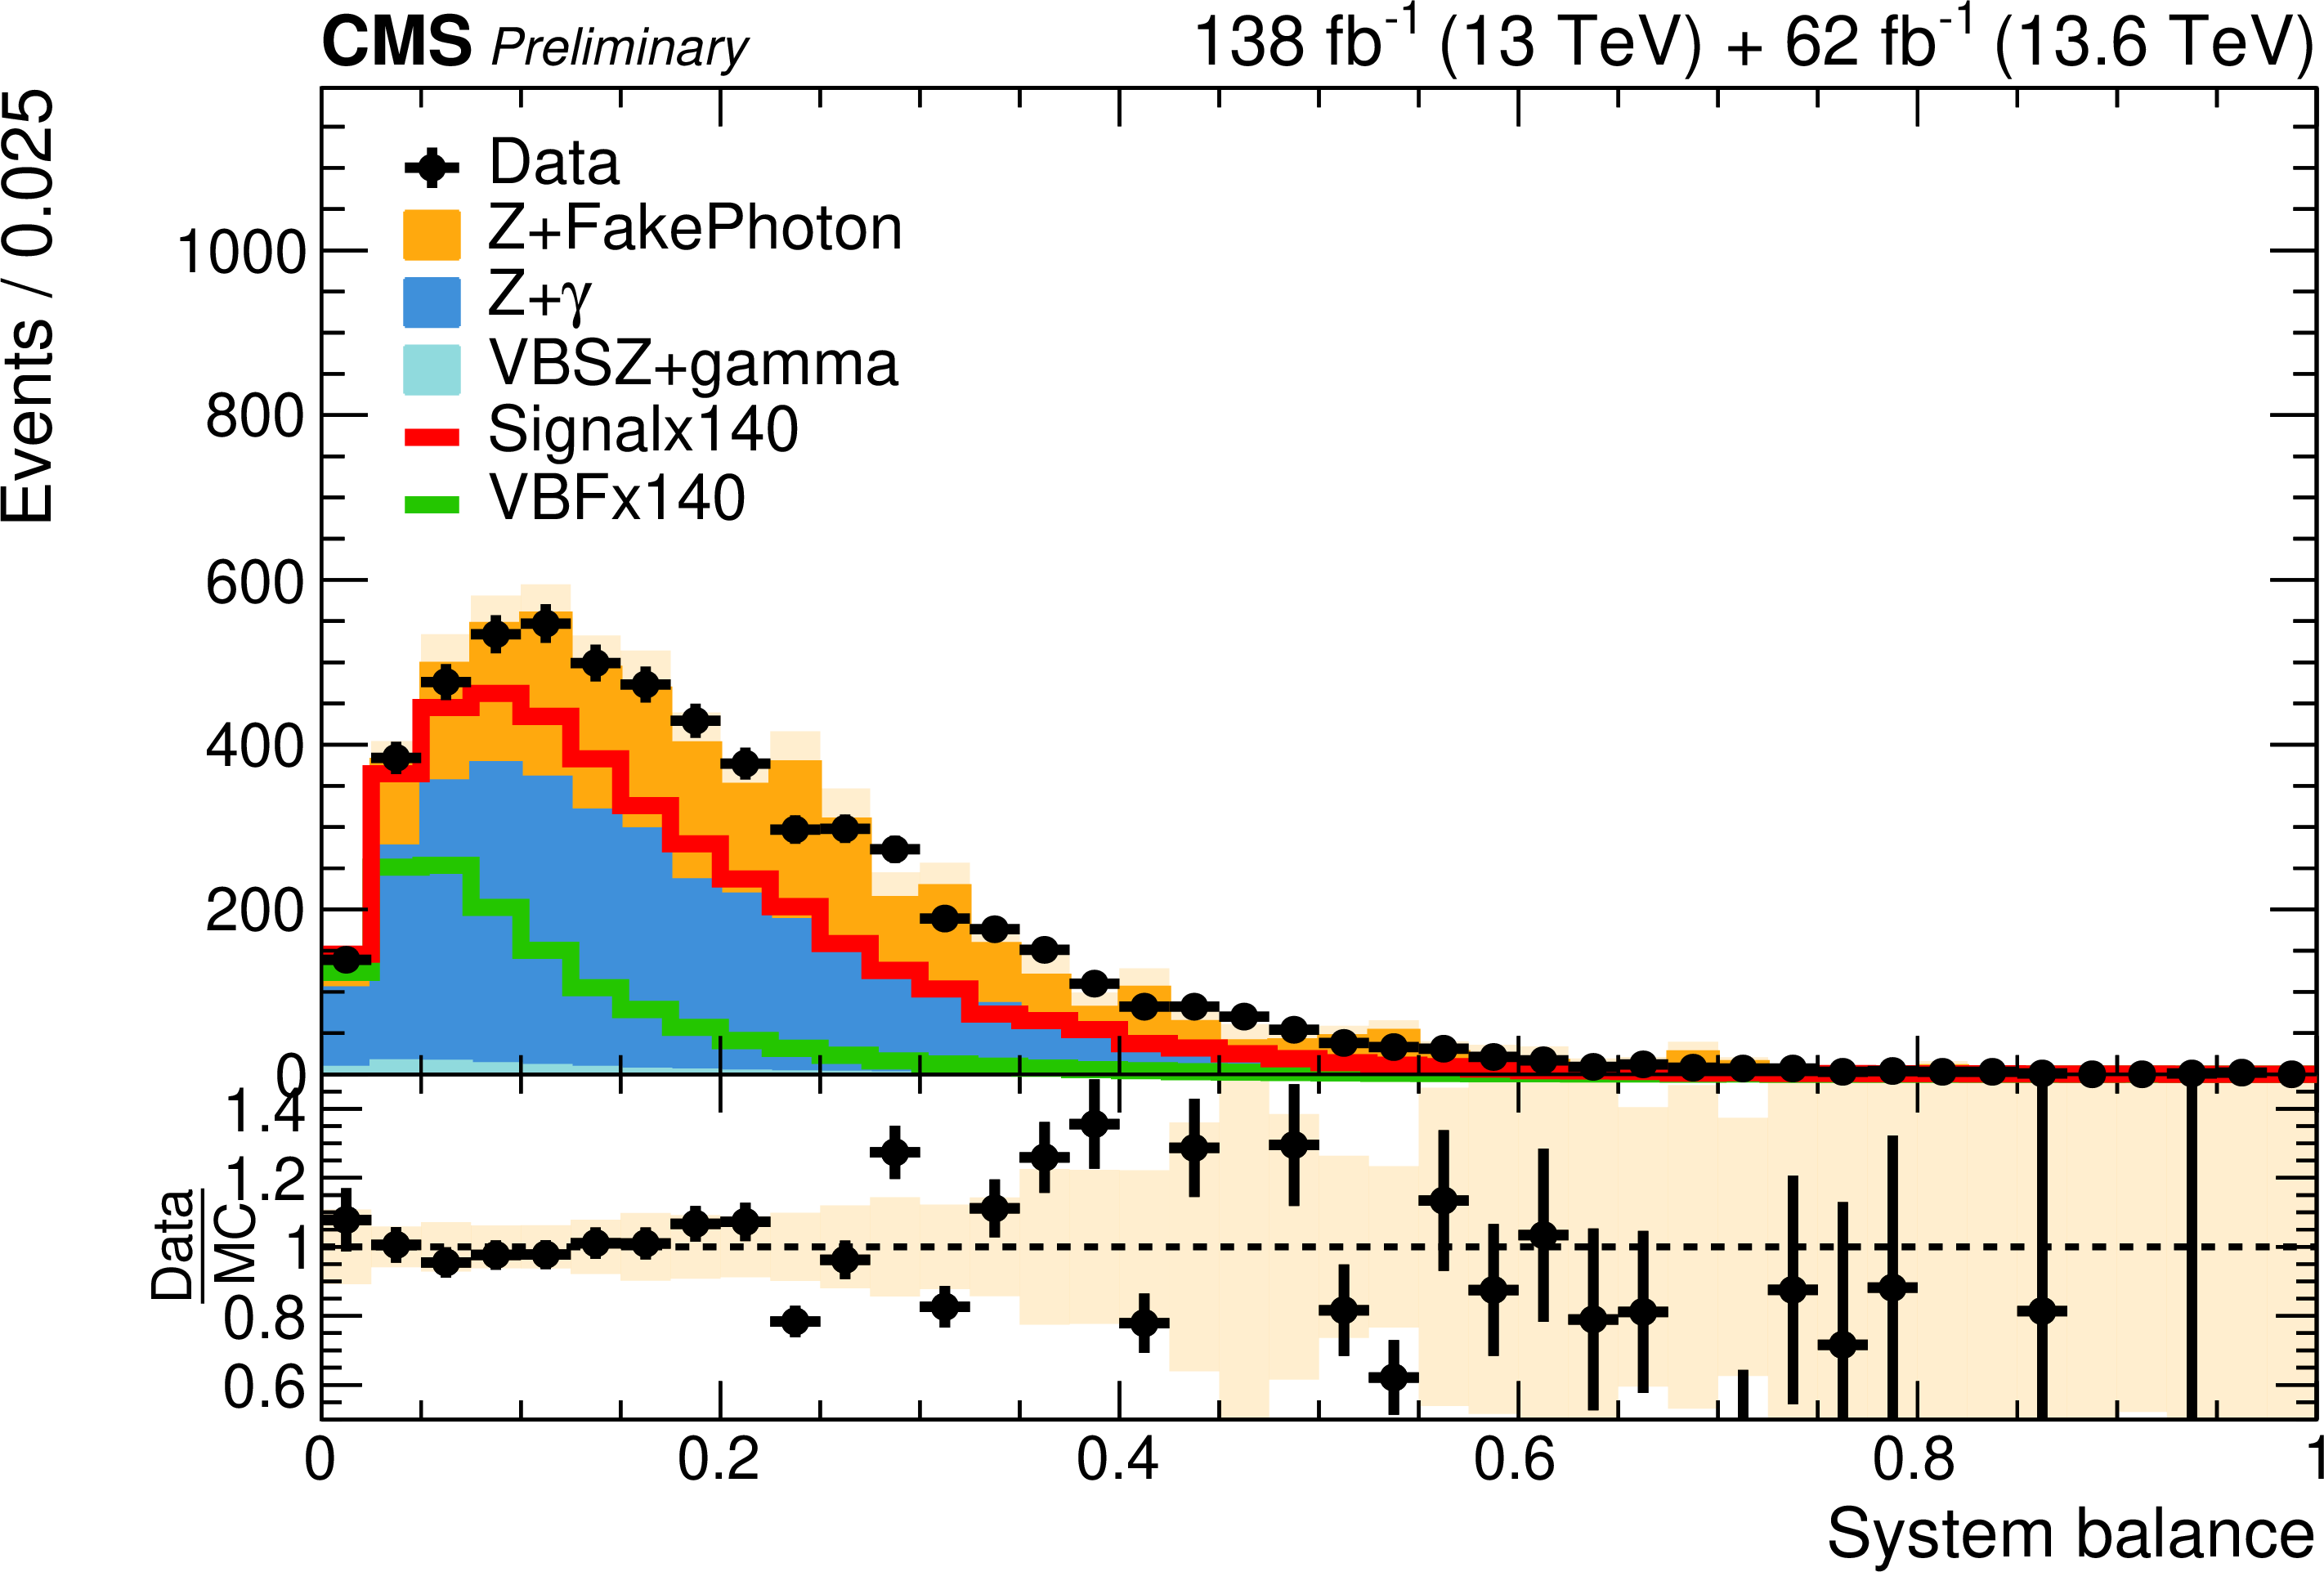
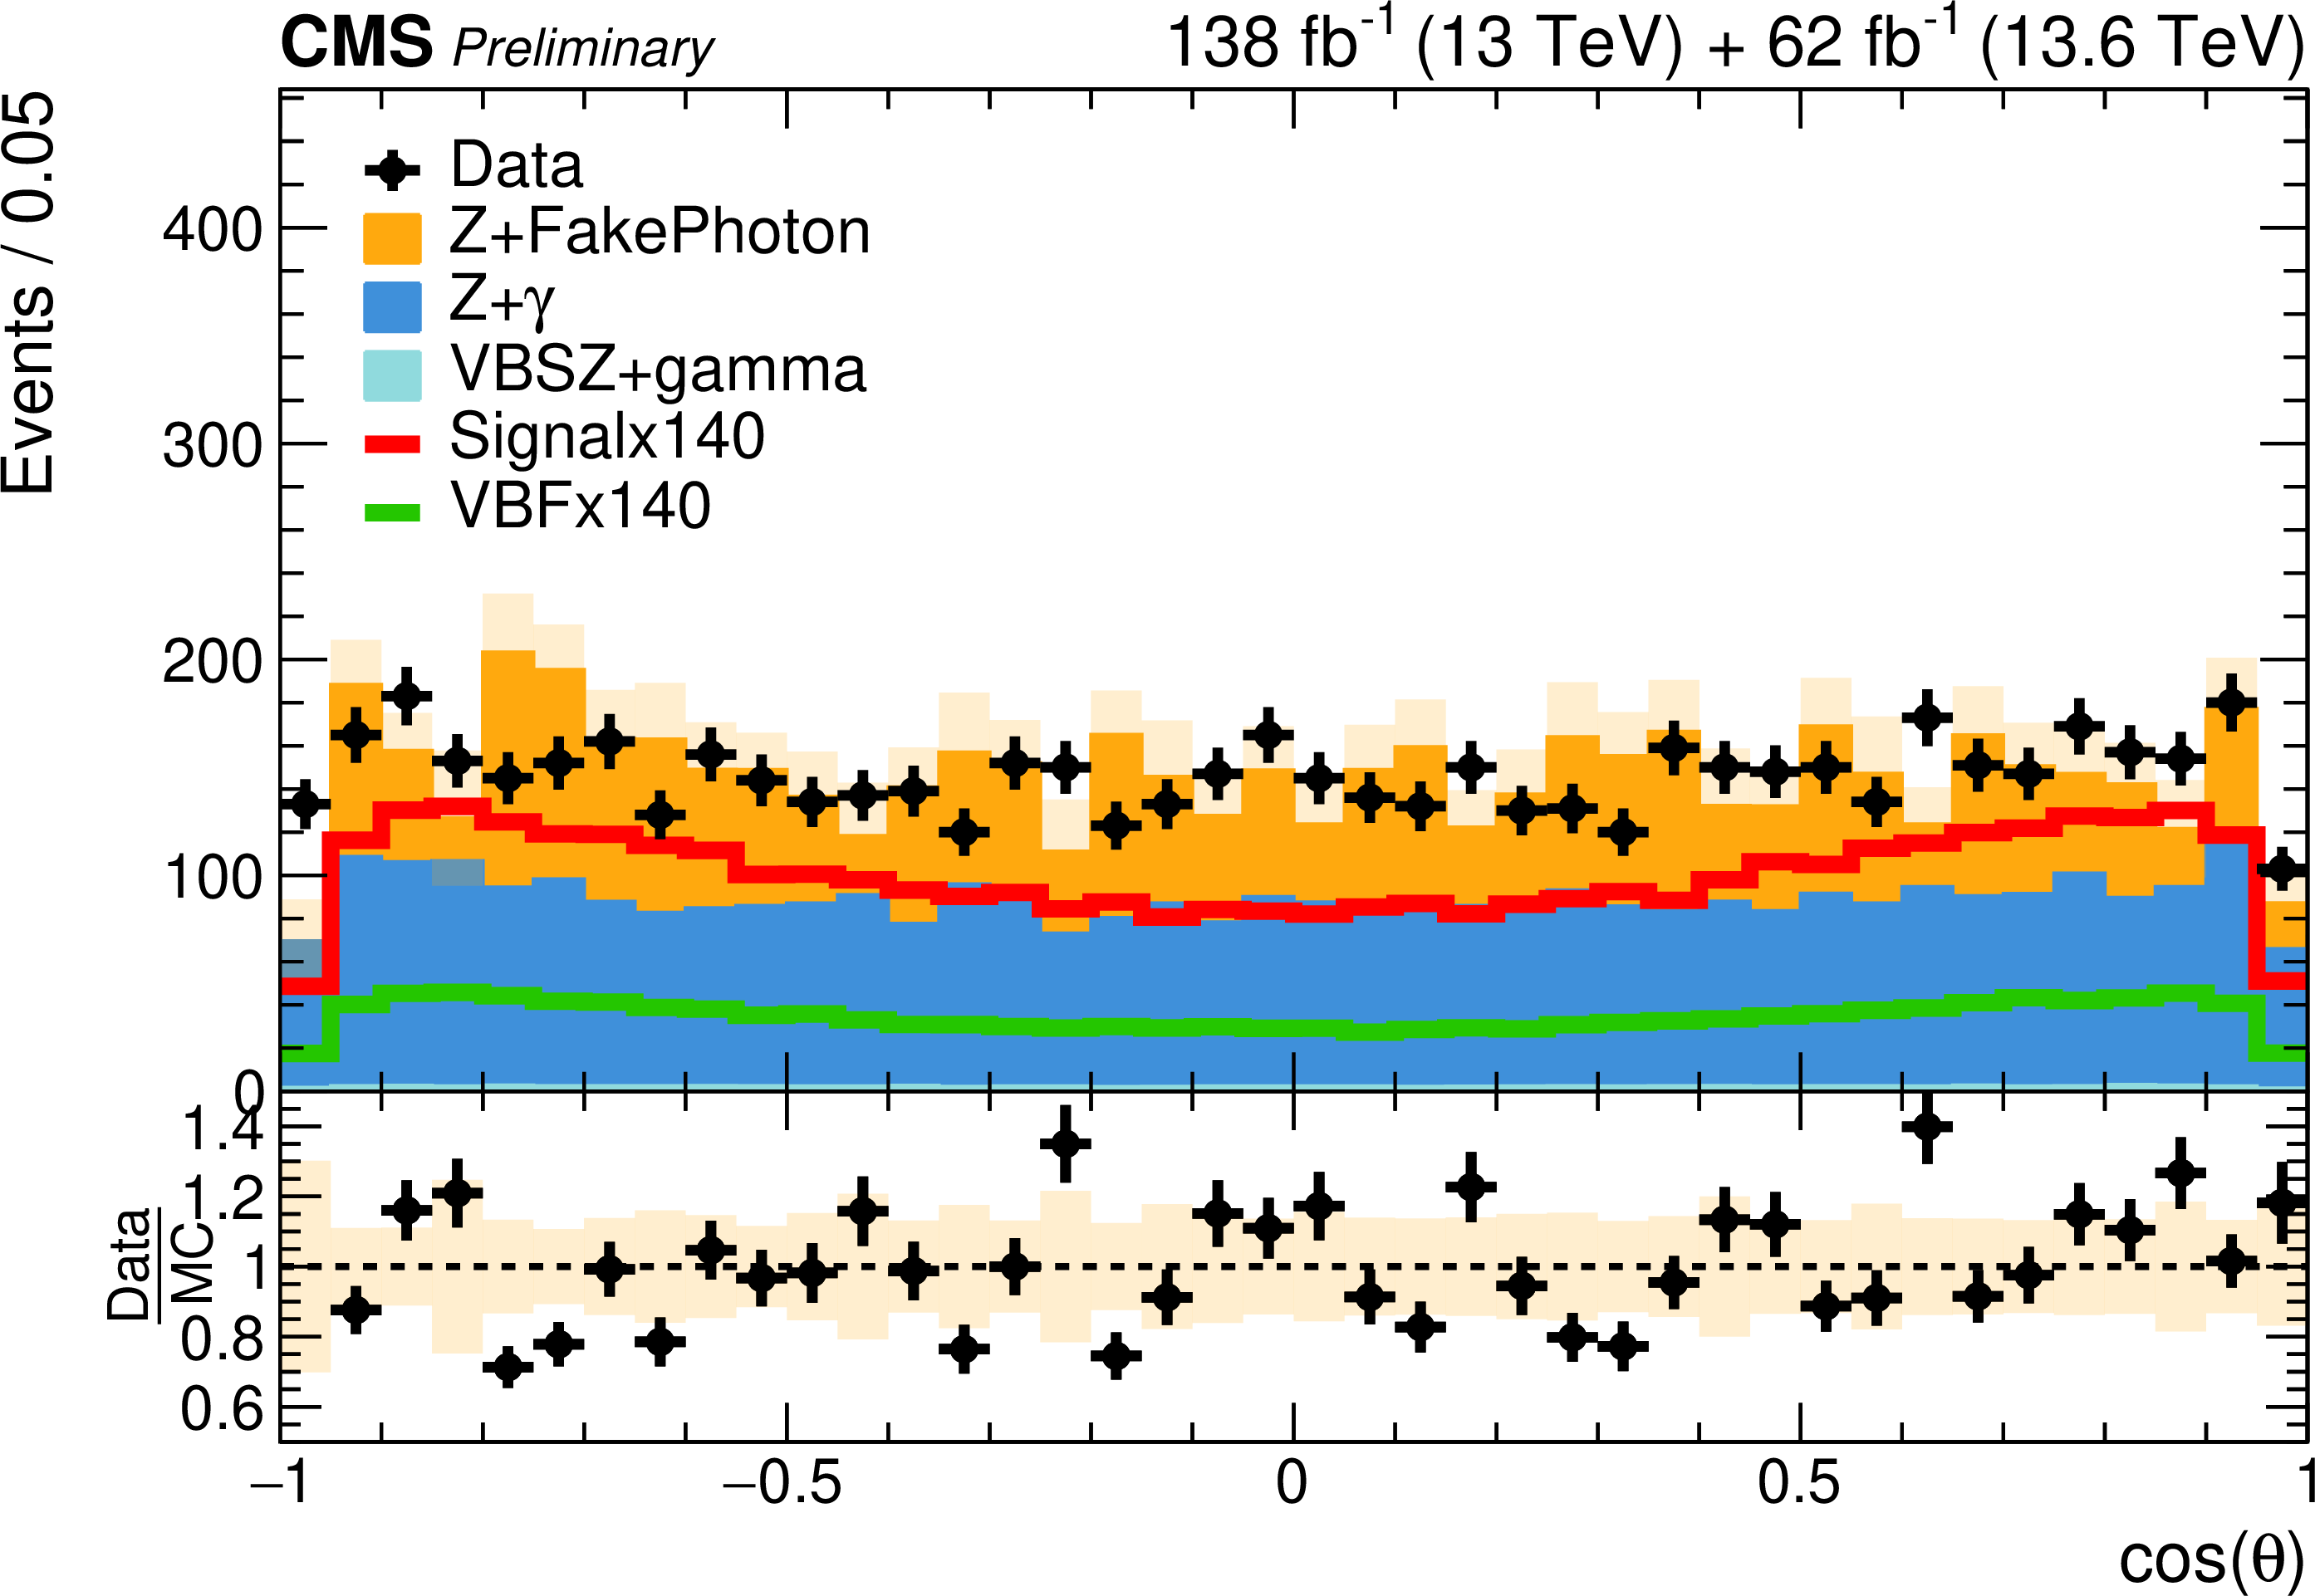
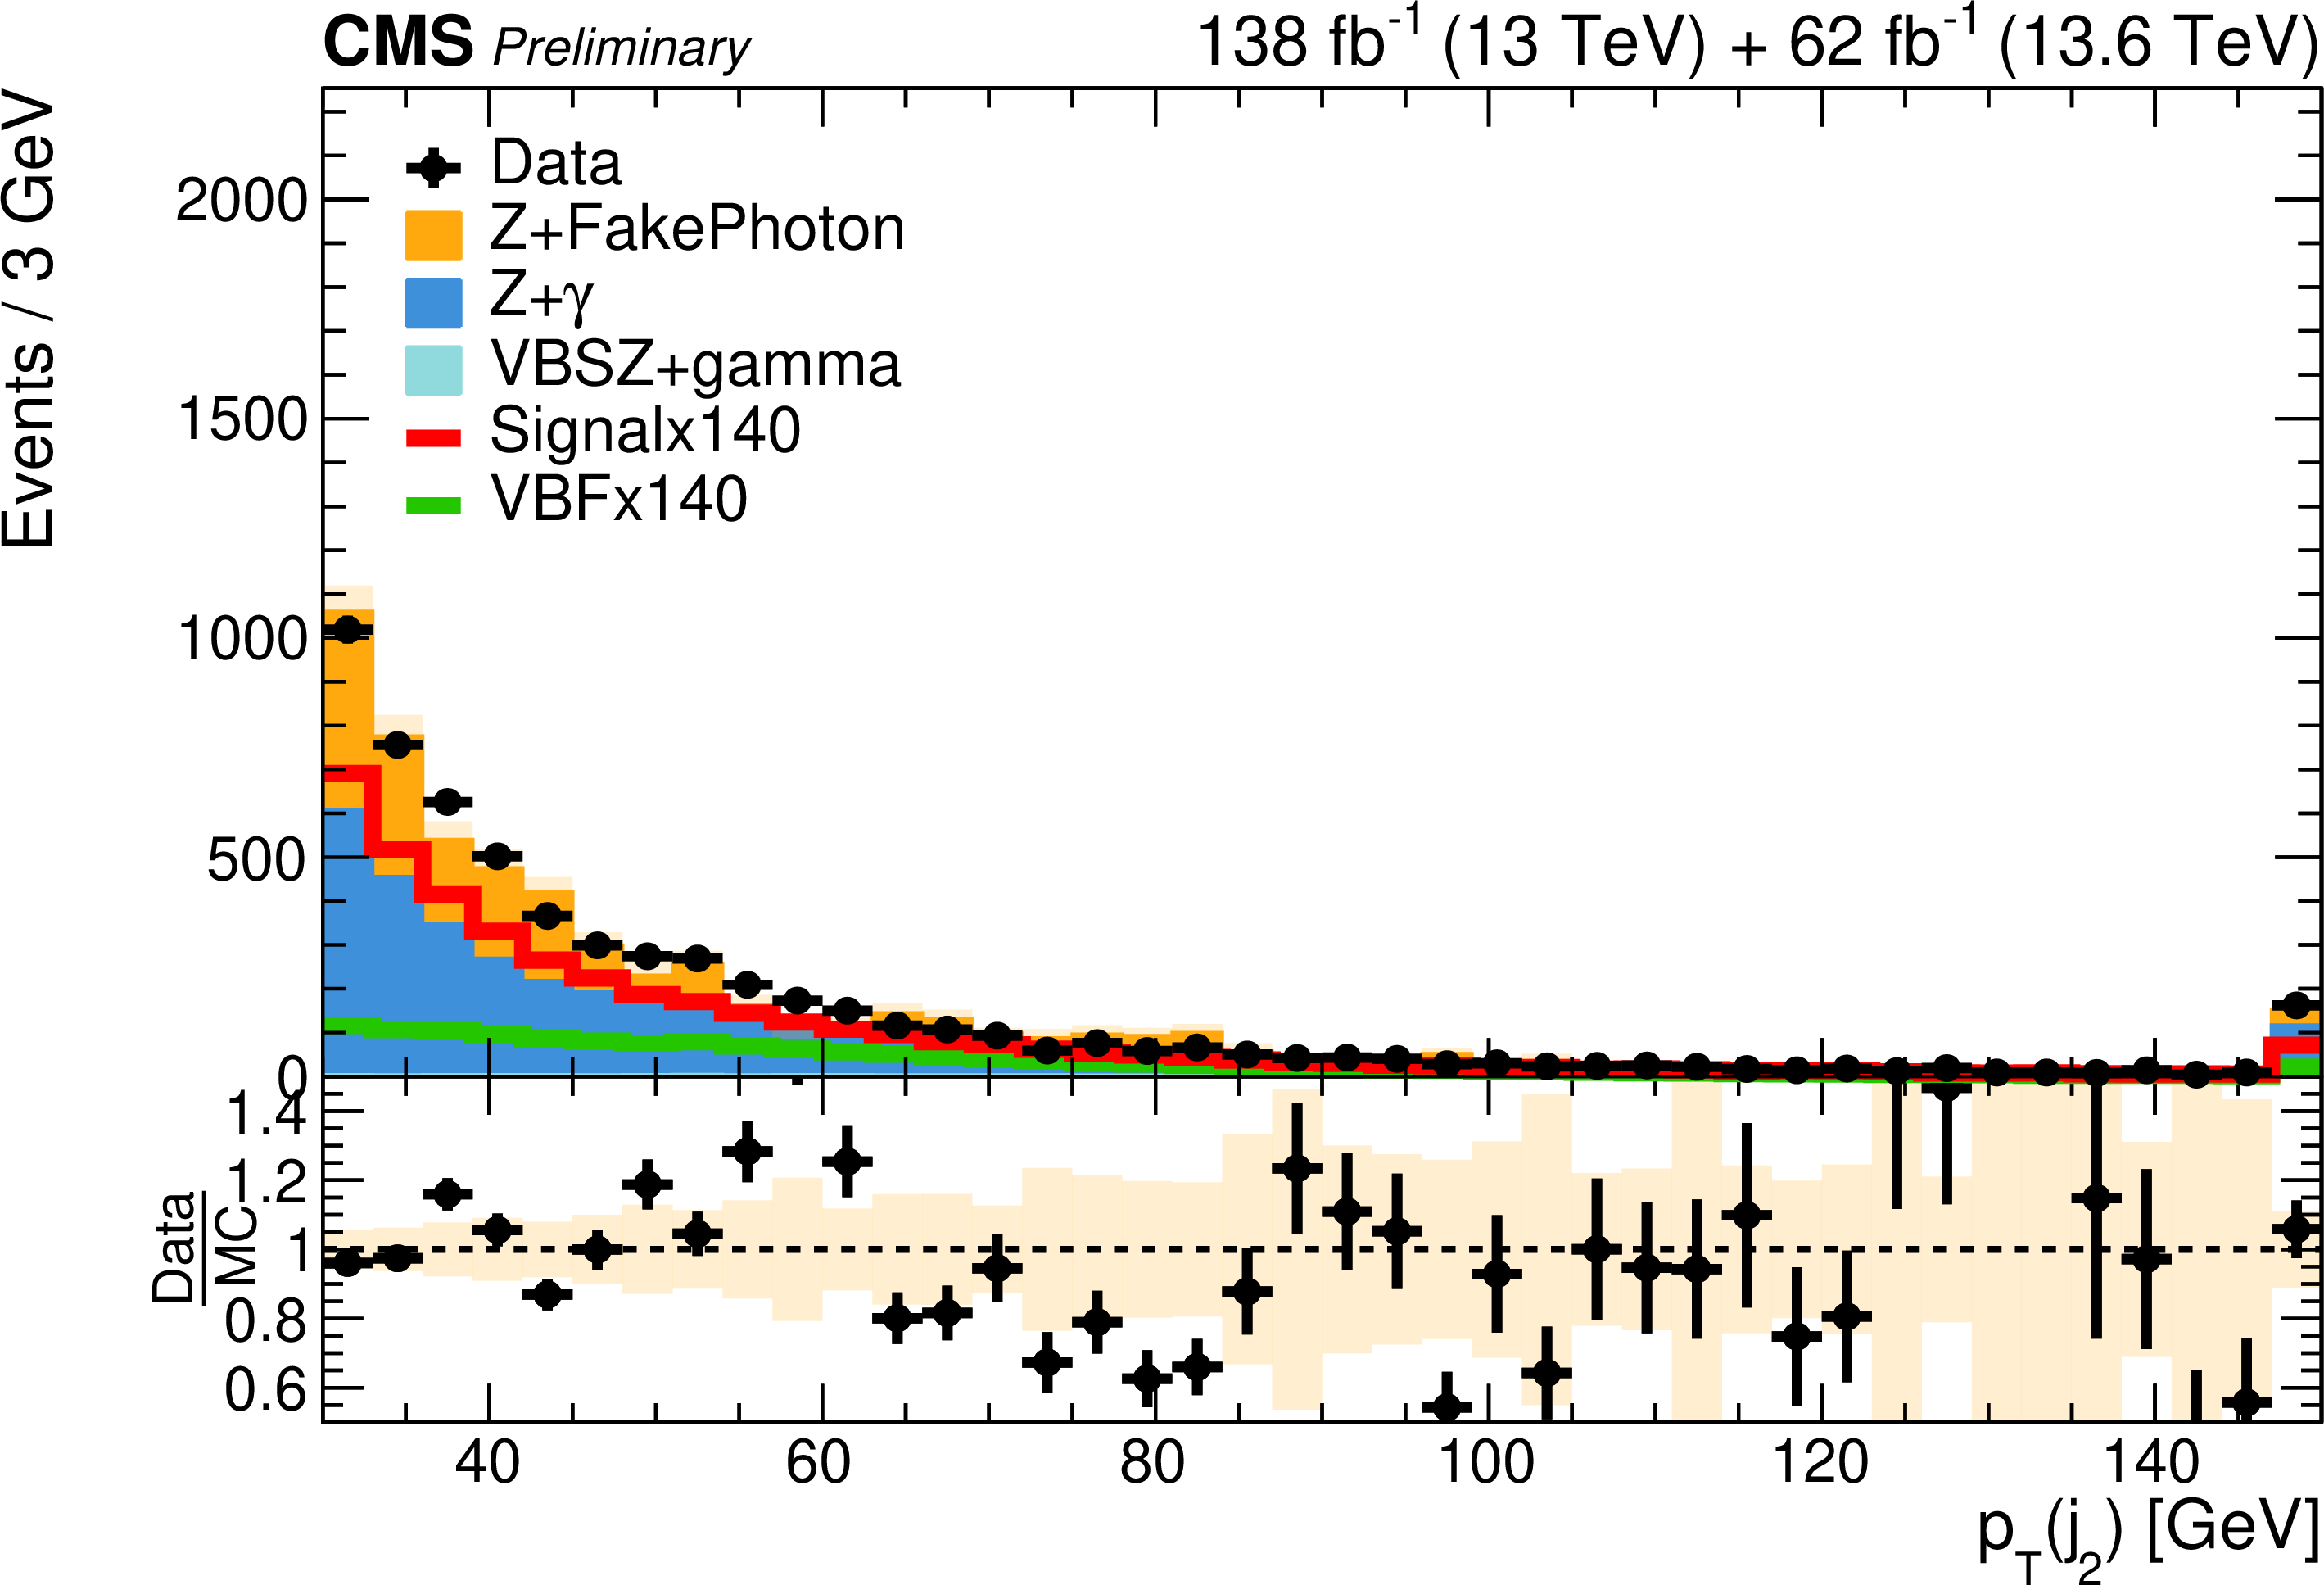
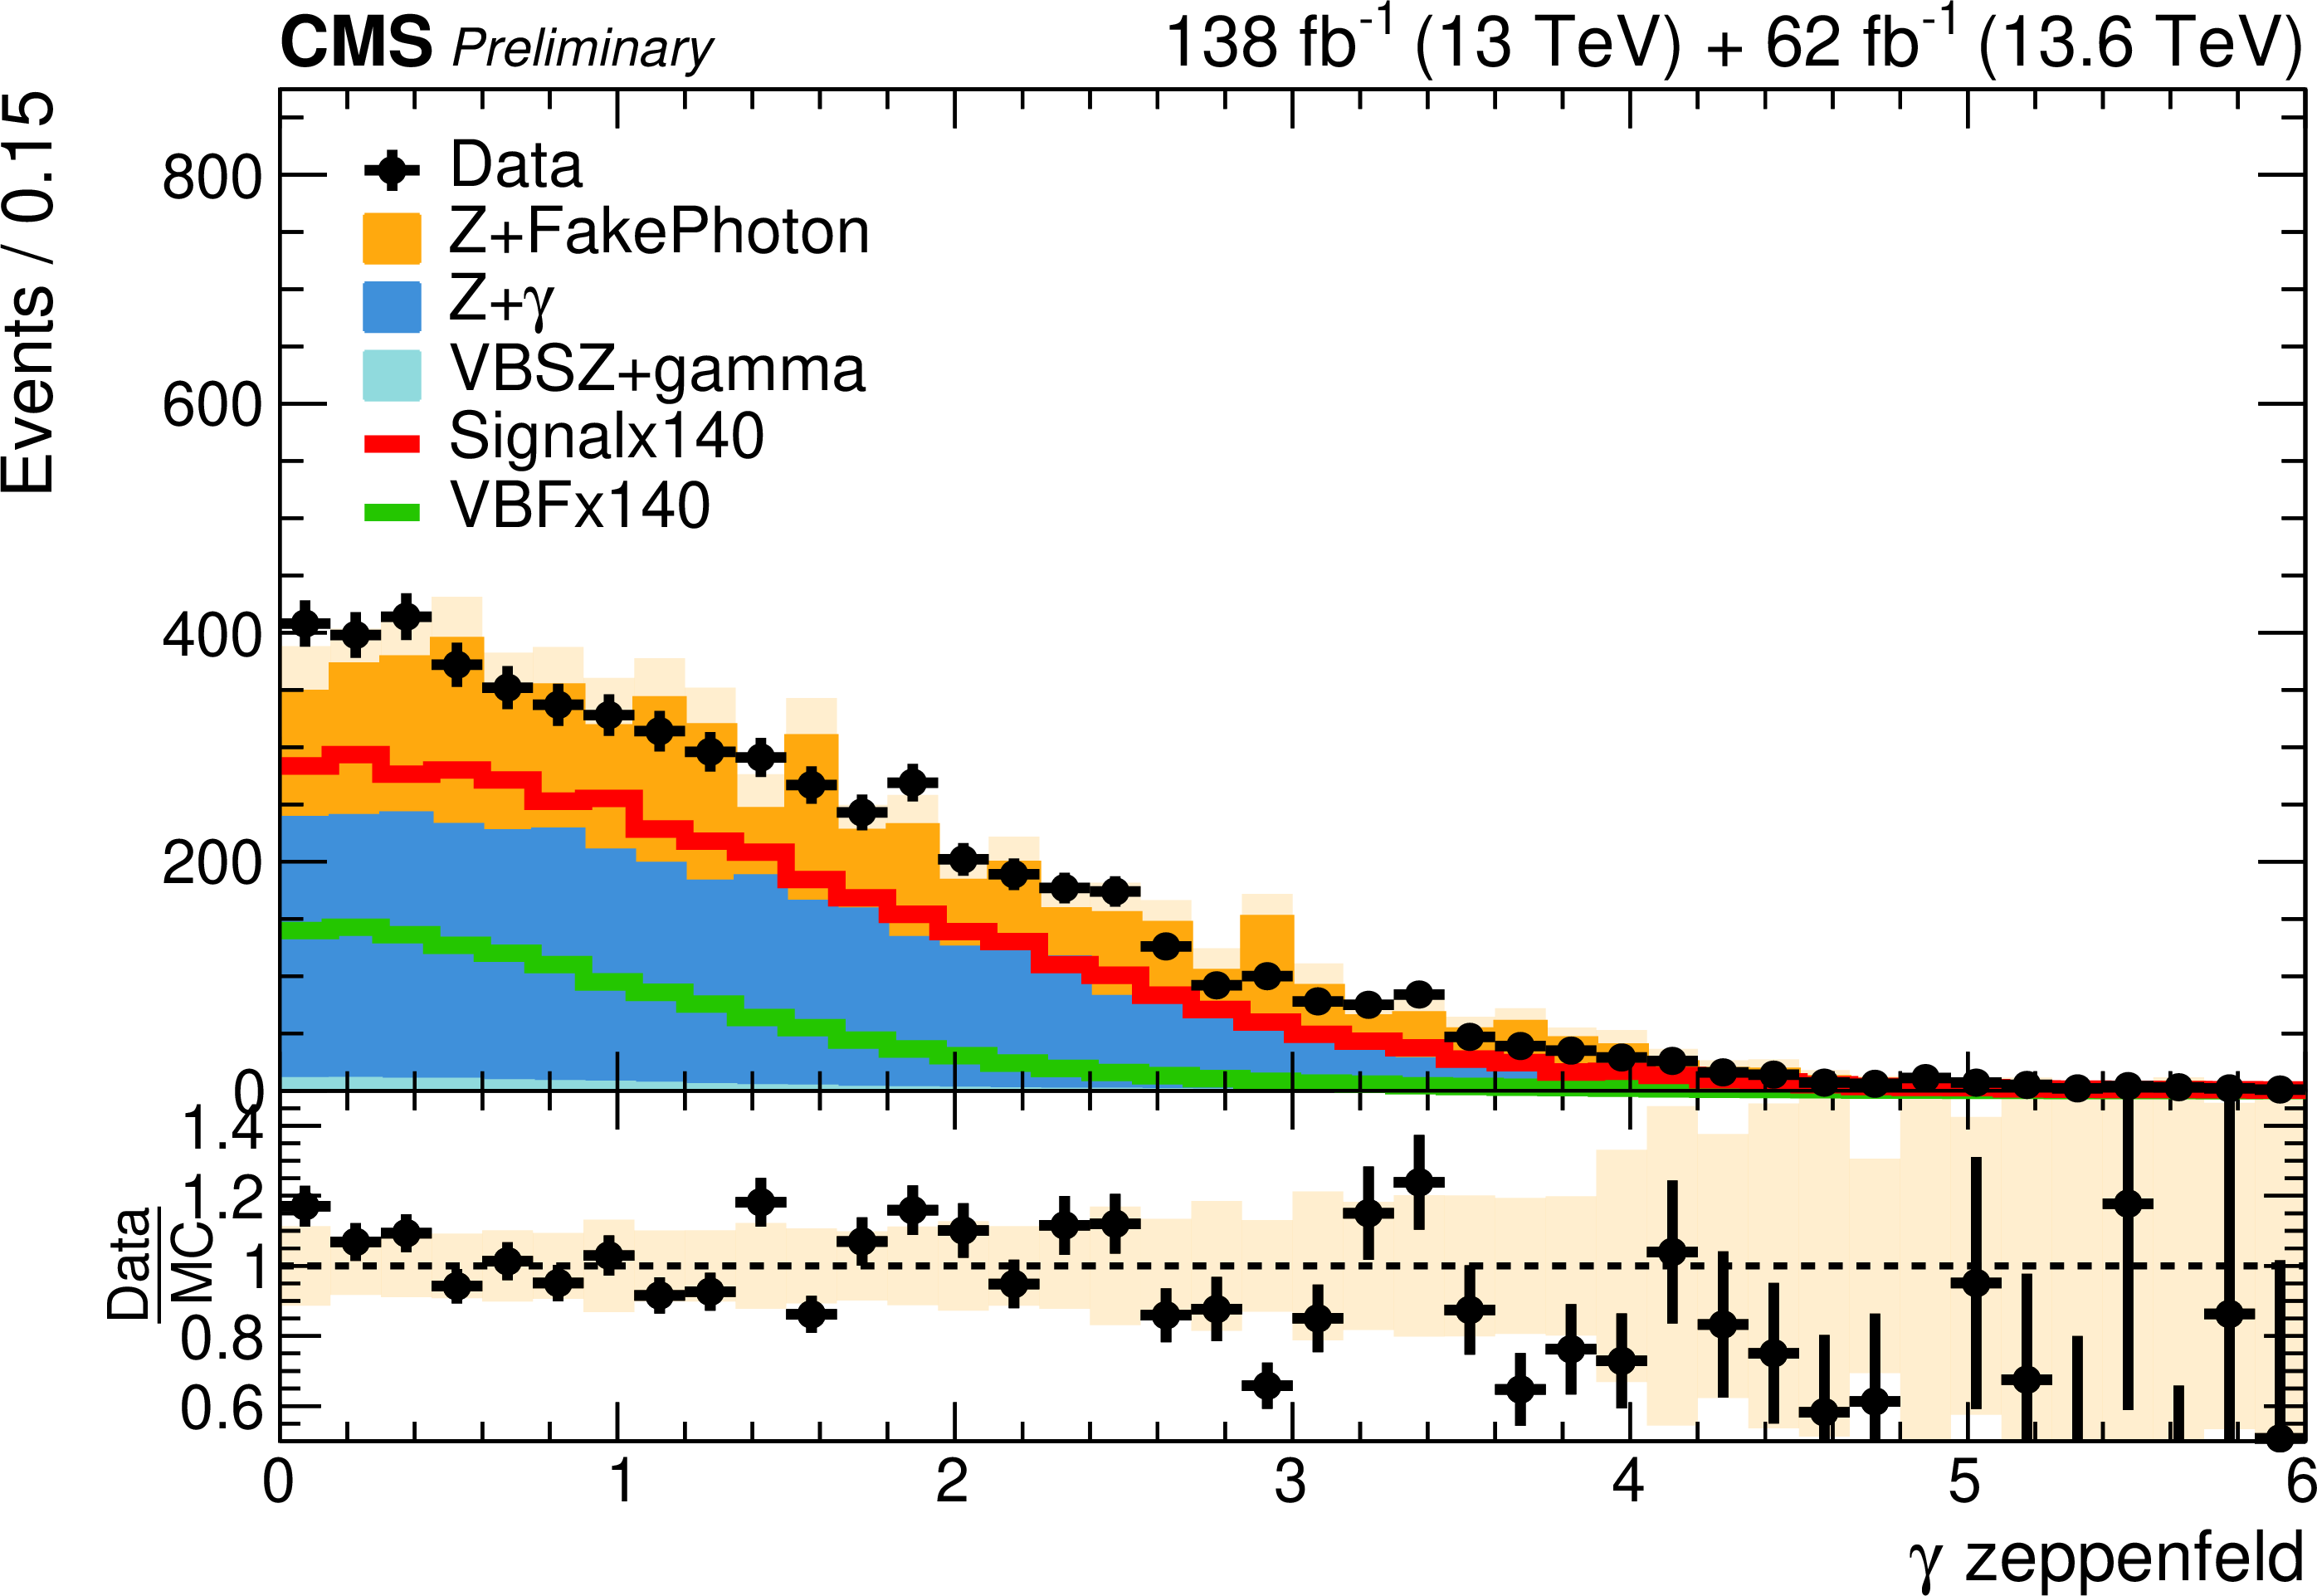
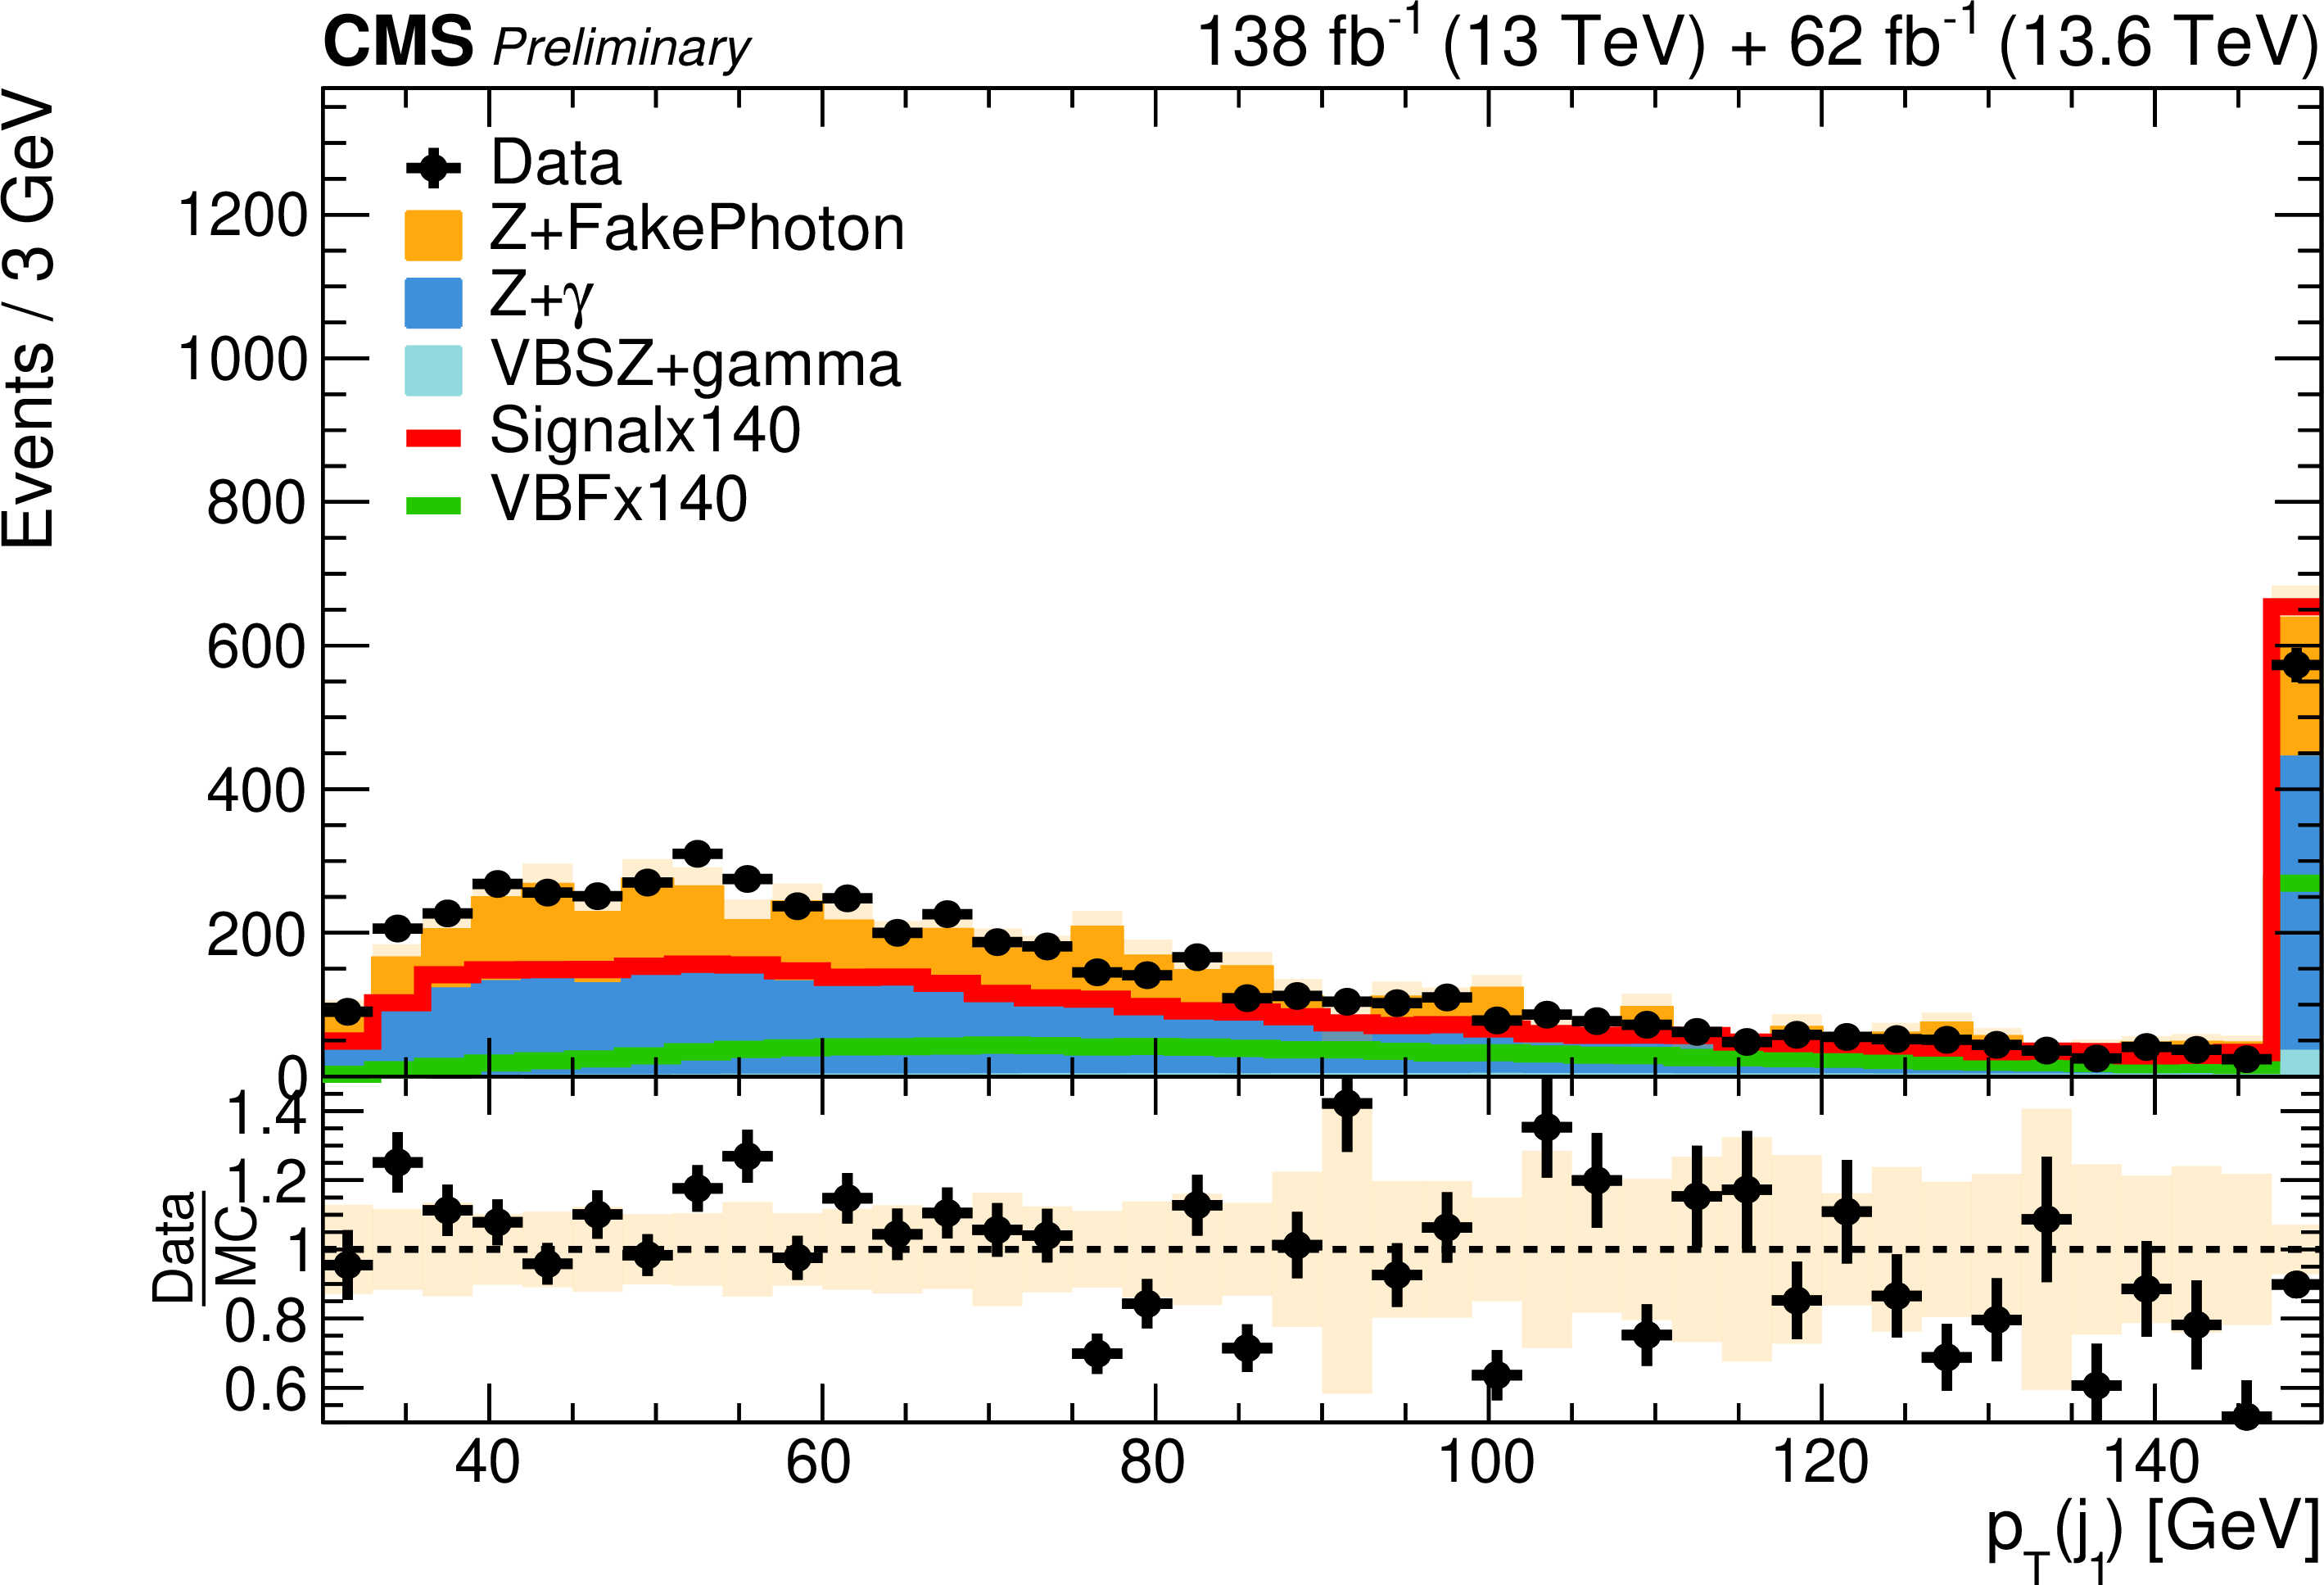
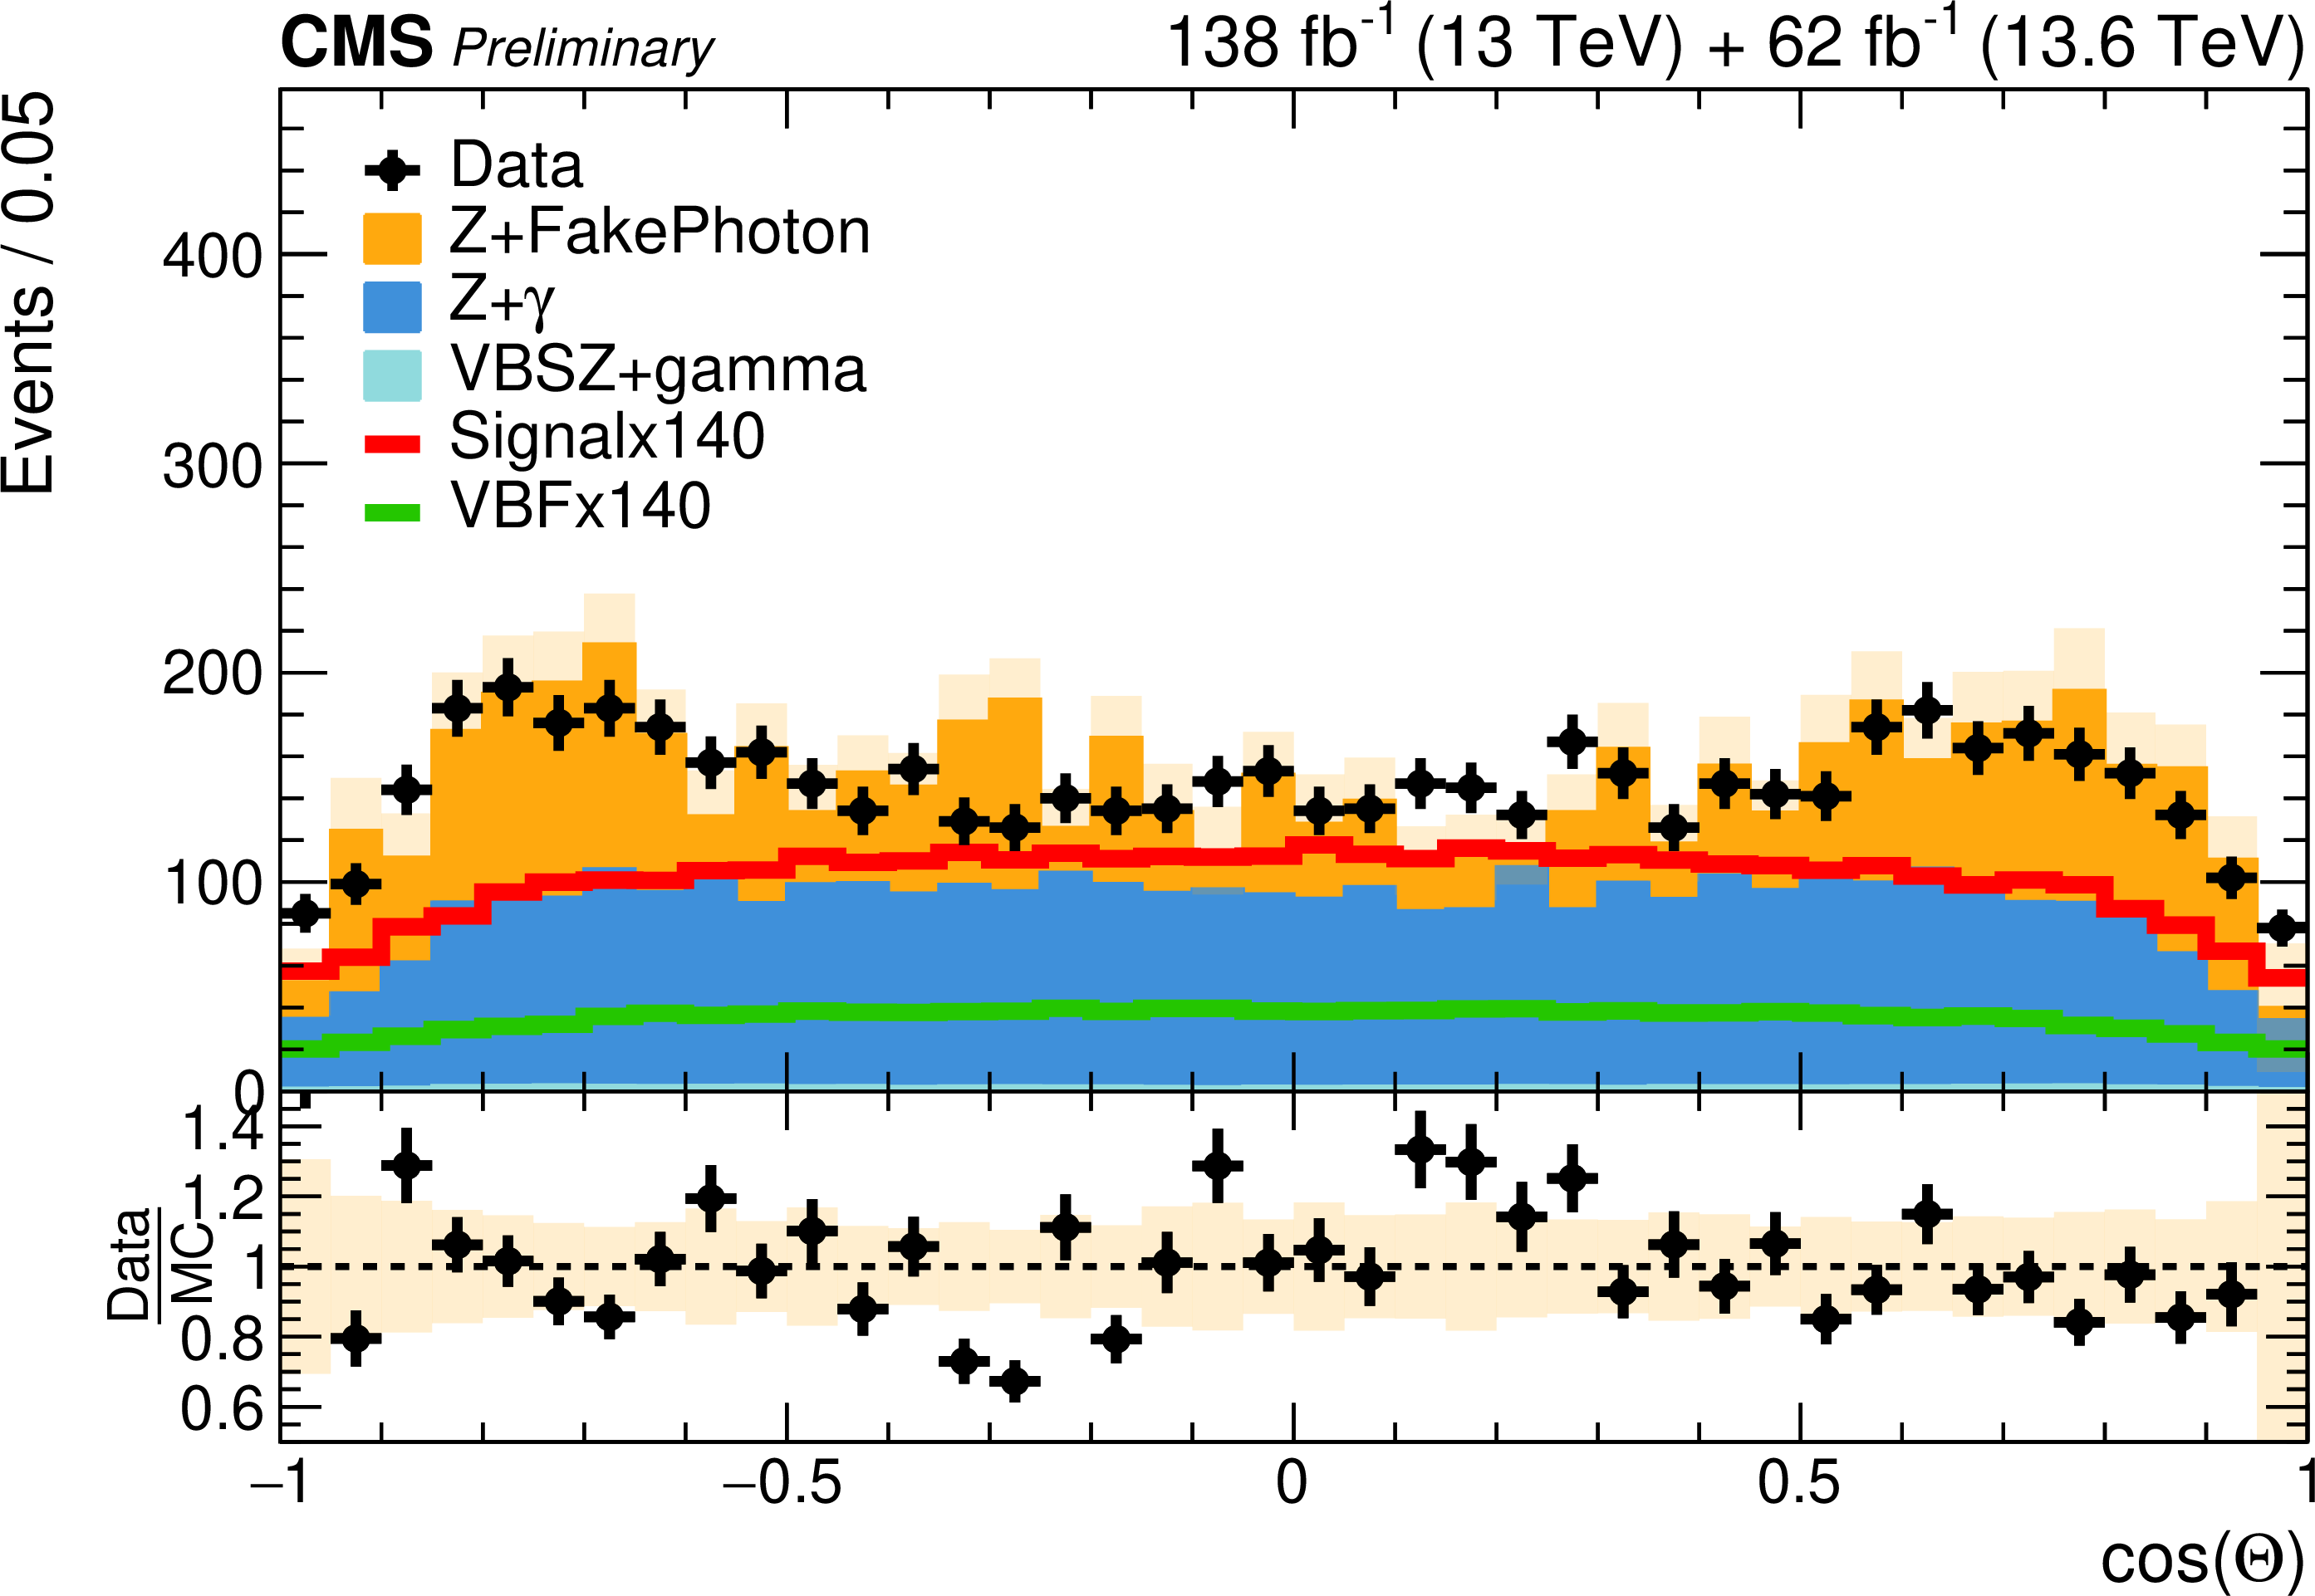
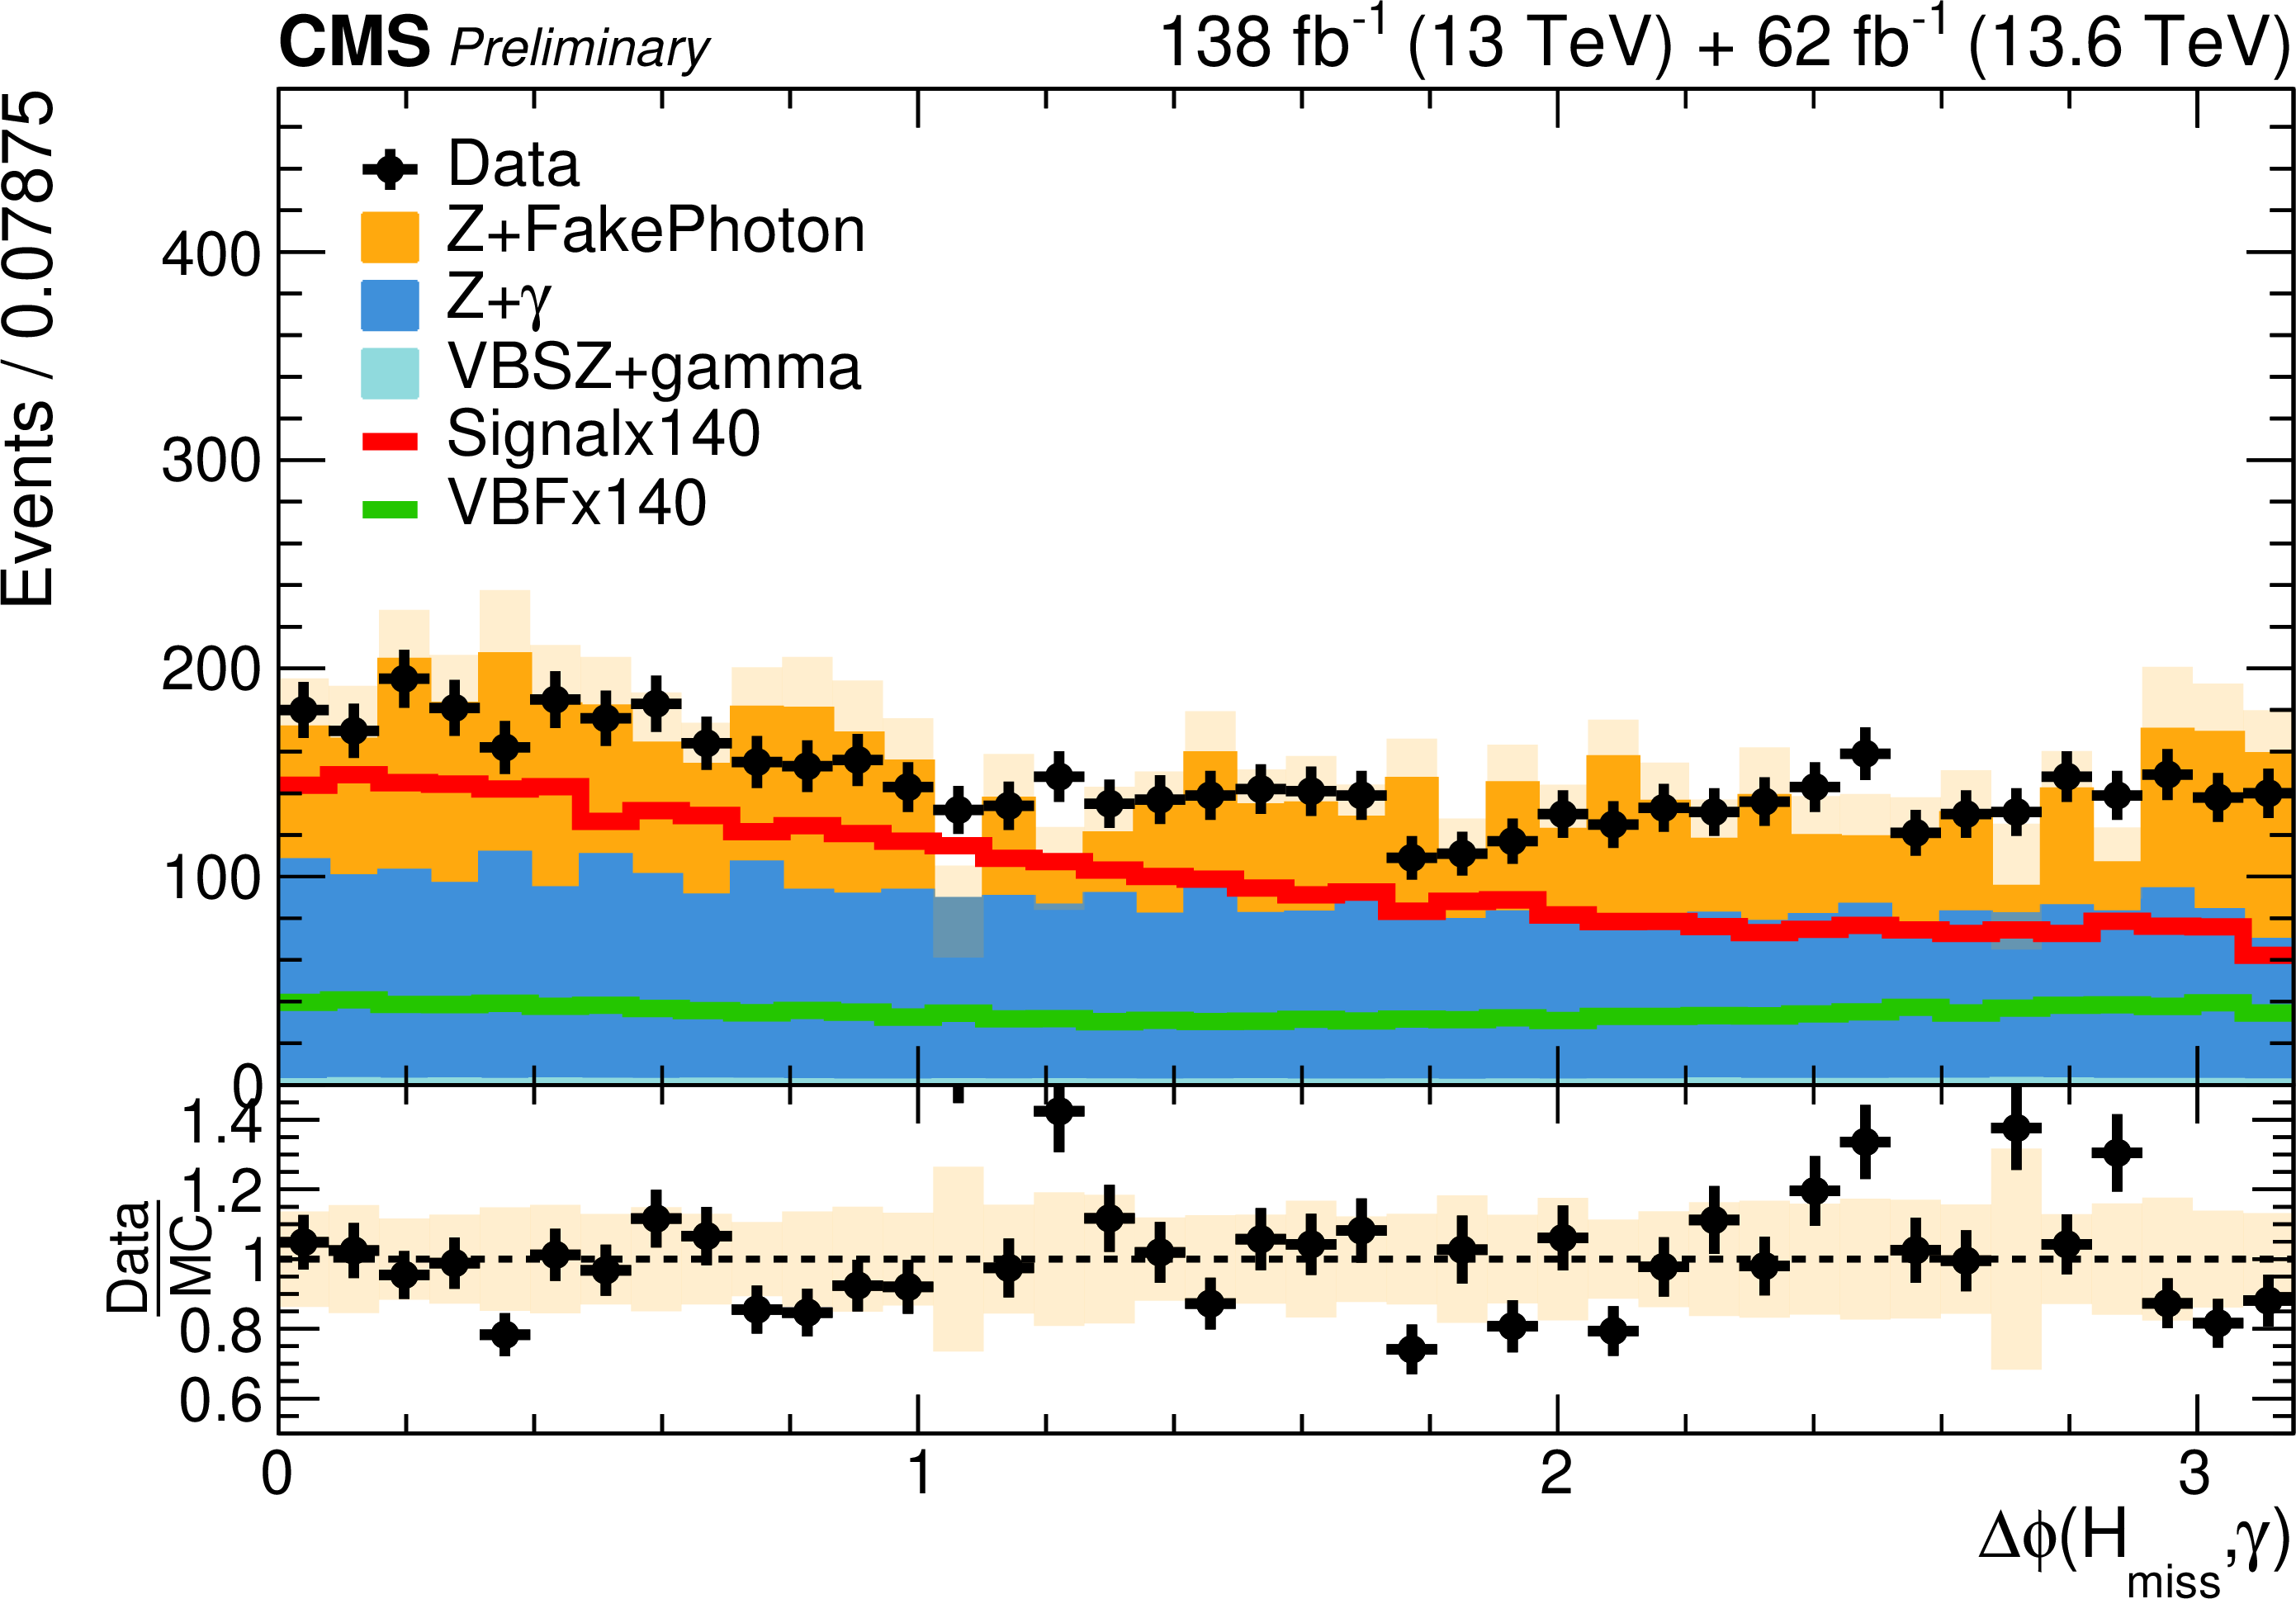
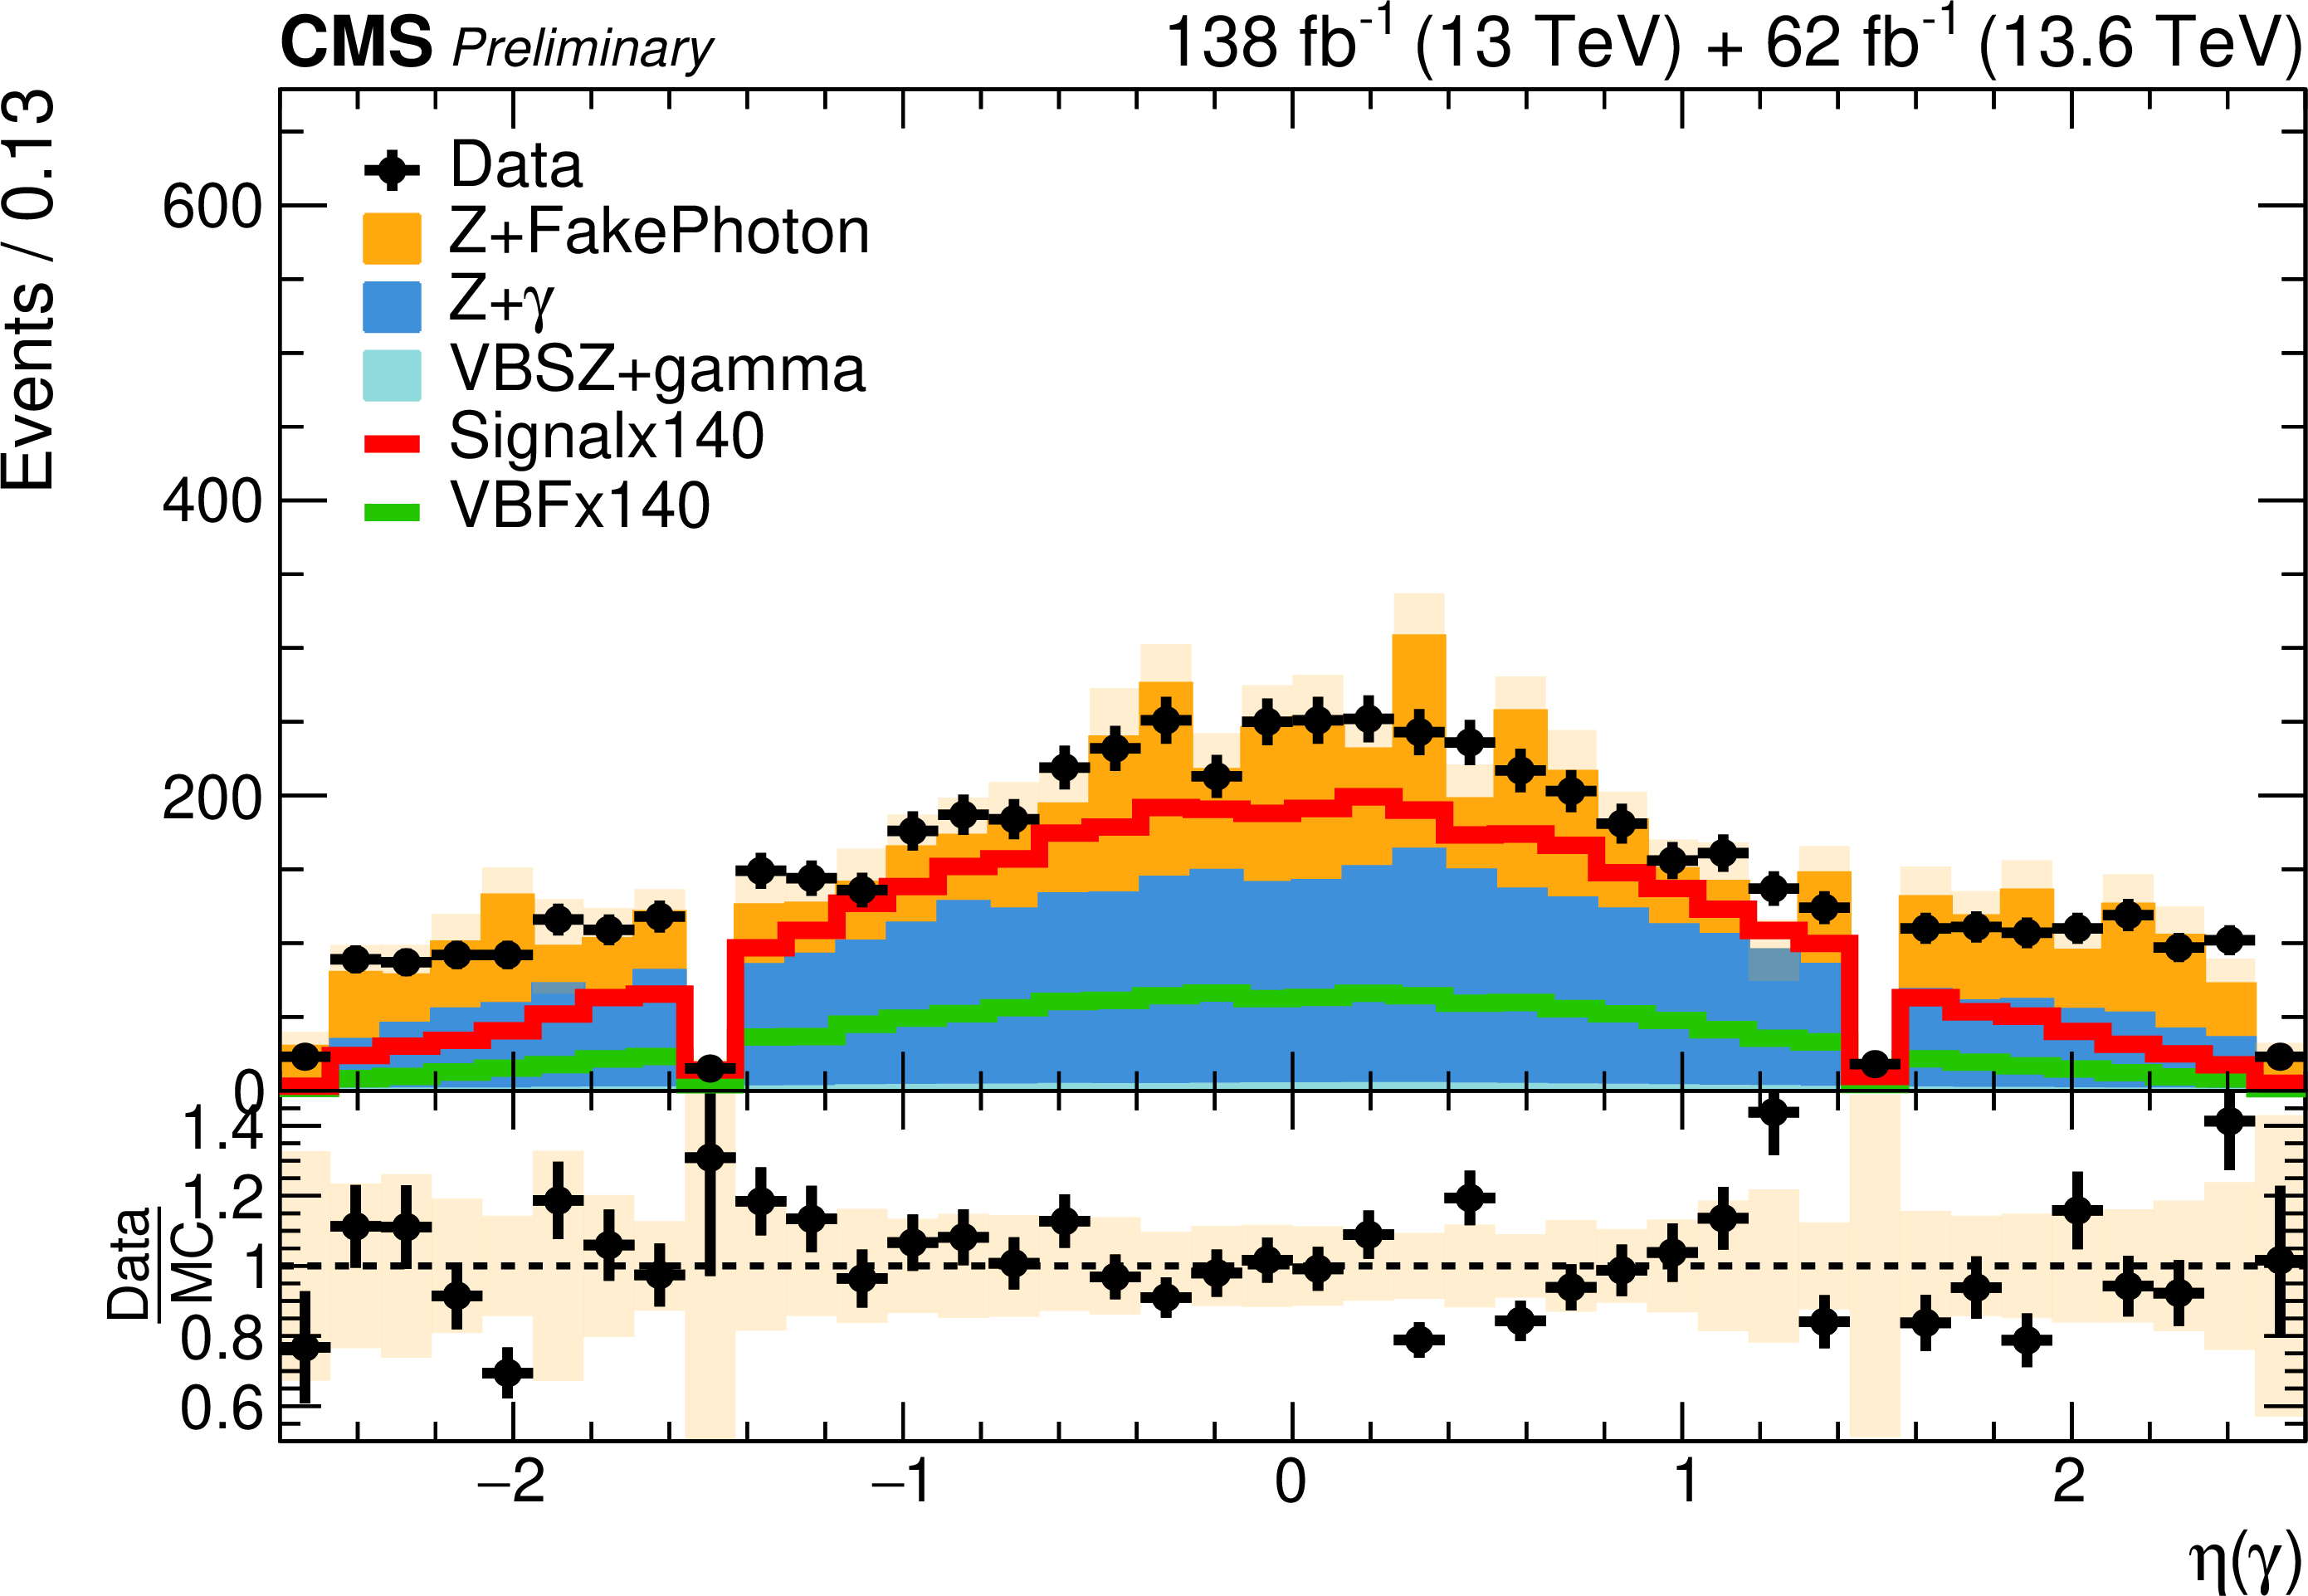
Distribution of data, simulation, and scaled signal events in the variables provided to the ggF BDT, ordered by importance. Overall good agreement is observed between data and simulation. |
png pdf |
Additional Figure 2-a:
Distribution of data, simulation, and scaled signal events in the variables provided to the ggF BDT, ordered by importance. Overall good agreement is observed between data and simulation. |
png pdf |
Additional Figure 2-b:
Distribution of data, simulation, and scaled signal events in the variables provided to the ggF BDT, ordered by importance. Overall good agreement is observed between data and simulation. |
png pdf |
Additional Figure 2-c:
Distribution of data, simulation, and scaled signal events in the variables provided to the ggF BDT, ordered by importance. Overall good agreement is observed between data and simulation. |
png pdf |
Additional Figure 2-d:
Distribution of data, simulation, and scaled signal events in the variables provided to the ggF BDT, ordered by importance. Overall good agreement is observed between data and simulation. |
png pdf |
Additional Figure 2-e:
Distribution of data, simulation, and scaled signal events in the variables provided to the ggF BDT, ordered by importance. Overall good agreement is observed between data and simulation. |
png pdf |
Additional Figure 2-f:
Distribution of data, simulation, and scaled signal events in the variables provided to the ggF BDT, ordered by importance. Overall good agreement is observed between data and simulation. |
png pdf |
Additional Figure 2-g:
Distribution of data, simulation, and scaled signal events in the variables provided to the ggF BDT, ordered by importance. Overall good agreement is observed between data and simulation. |
png pdf |
Additional Figure 2-h:
Distribution of data, simulation, and scaled signal events in the variables provided to the ggF BDT, ordered by importance. Overall good agreement is observed between data and simulation. |
png pdf |
Additional Figure 2-i:
Distribution of data, simulation, and scaled signal events in the variables provided to the ggF BDT, ordered by importance. Overall good agreement is observed between data and simulation. |
png pdf |
Additional Figure 2-j:
Distribution of data, simulation, and scaled signal events in the variables provided to the ggF BDT, ordered by importance. Overall good agreement is observed between data and simulation. |
png pdf |
Additional Figure 2-k:
Distribution of data, simulation, and scaled signal events in the variables provided to the ggF BDT, ordered by importance. Overall good agreement is observed between data and simulation. |
png pdf |
Additional Figure 2-l:
Distribution of data, simulation, and scaled signal events in the variables provided to the ggF BDT, ordered by importance. Overall good agreement is observed between data and simulation. |
png pdf |
Additional Figure 2-m:
Distribution of data, simulation, and scaled signal events in the variables provided to the ggF BDT, ordered by importance. Overall good agreement is observed between data and simulation. |
png pdf |
Additional Figure 2-n:
Distribution of data, simulation, and scaled signal events in the variables provided to the ggF BDT, ordered by importance. Overall good agreement is observed between data and simulation. |
png pdf |
Additional Figure 2-o:
Distribution of data, simulation, and scaled signal events in the variables provided to the ggF BDT, ordered by importance. Overall good agreement is observed between data and simulation. |
png pdf |
Additional Figure 2-p:
Distribution of data, simulation, and scaled signal events in the variables provided to the ggF BDT, ordered by importance. Overall good agreement is observed between data and simulation. |
png pdf |
Additional Figure 2-q:
Distribution of data, simulation, and scaled signal events in the variables provided to the ggF BDT, ordered by importance. Overall good agreement is observed between data and simulation. |
png pdf |
Additional Figure 2-r:
Distribution of data, simulation, and scaled signal events in the variables provided to the ggF BDT, ordered by importance. Overall good agreement is observed between data and simulation. |
png pdf |
Additional Figure 2-s:
Distribution of data, simulation, and scaled signal events in the variables provided to the ggF BDT, ordered by importance. Overall good agreement is observed between data and simulation. |
png pdf |
Additional Figure 2-t:
Distribution of data, simulation, and scaled signal events in the variables provided to the ggF BDT, ordered by importance. Overall good agreement is observed between data and simulation. |
png pdf |
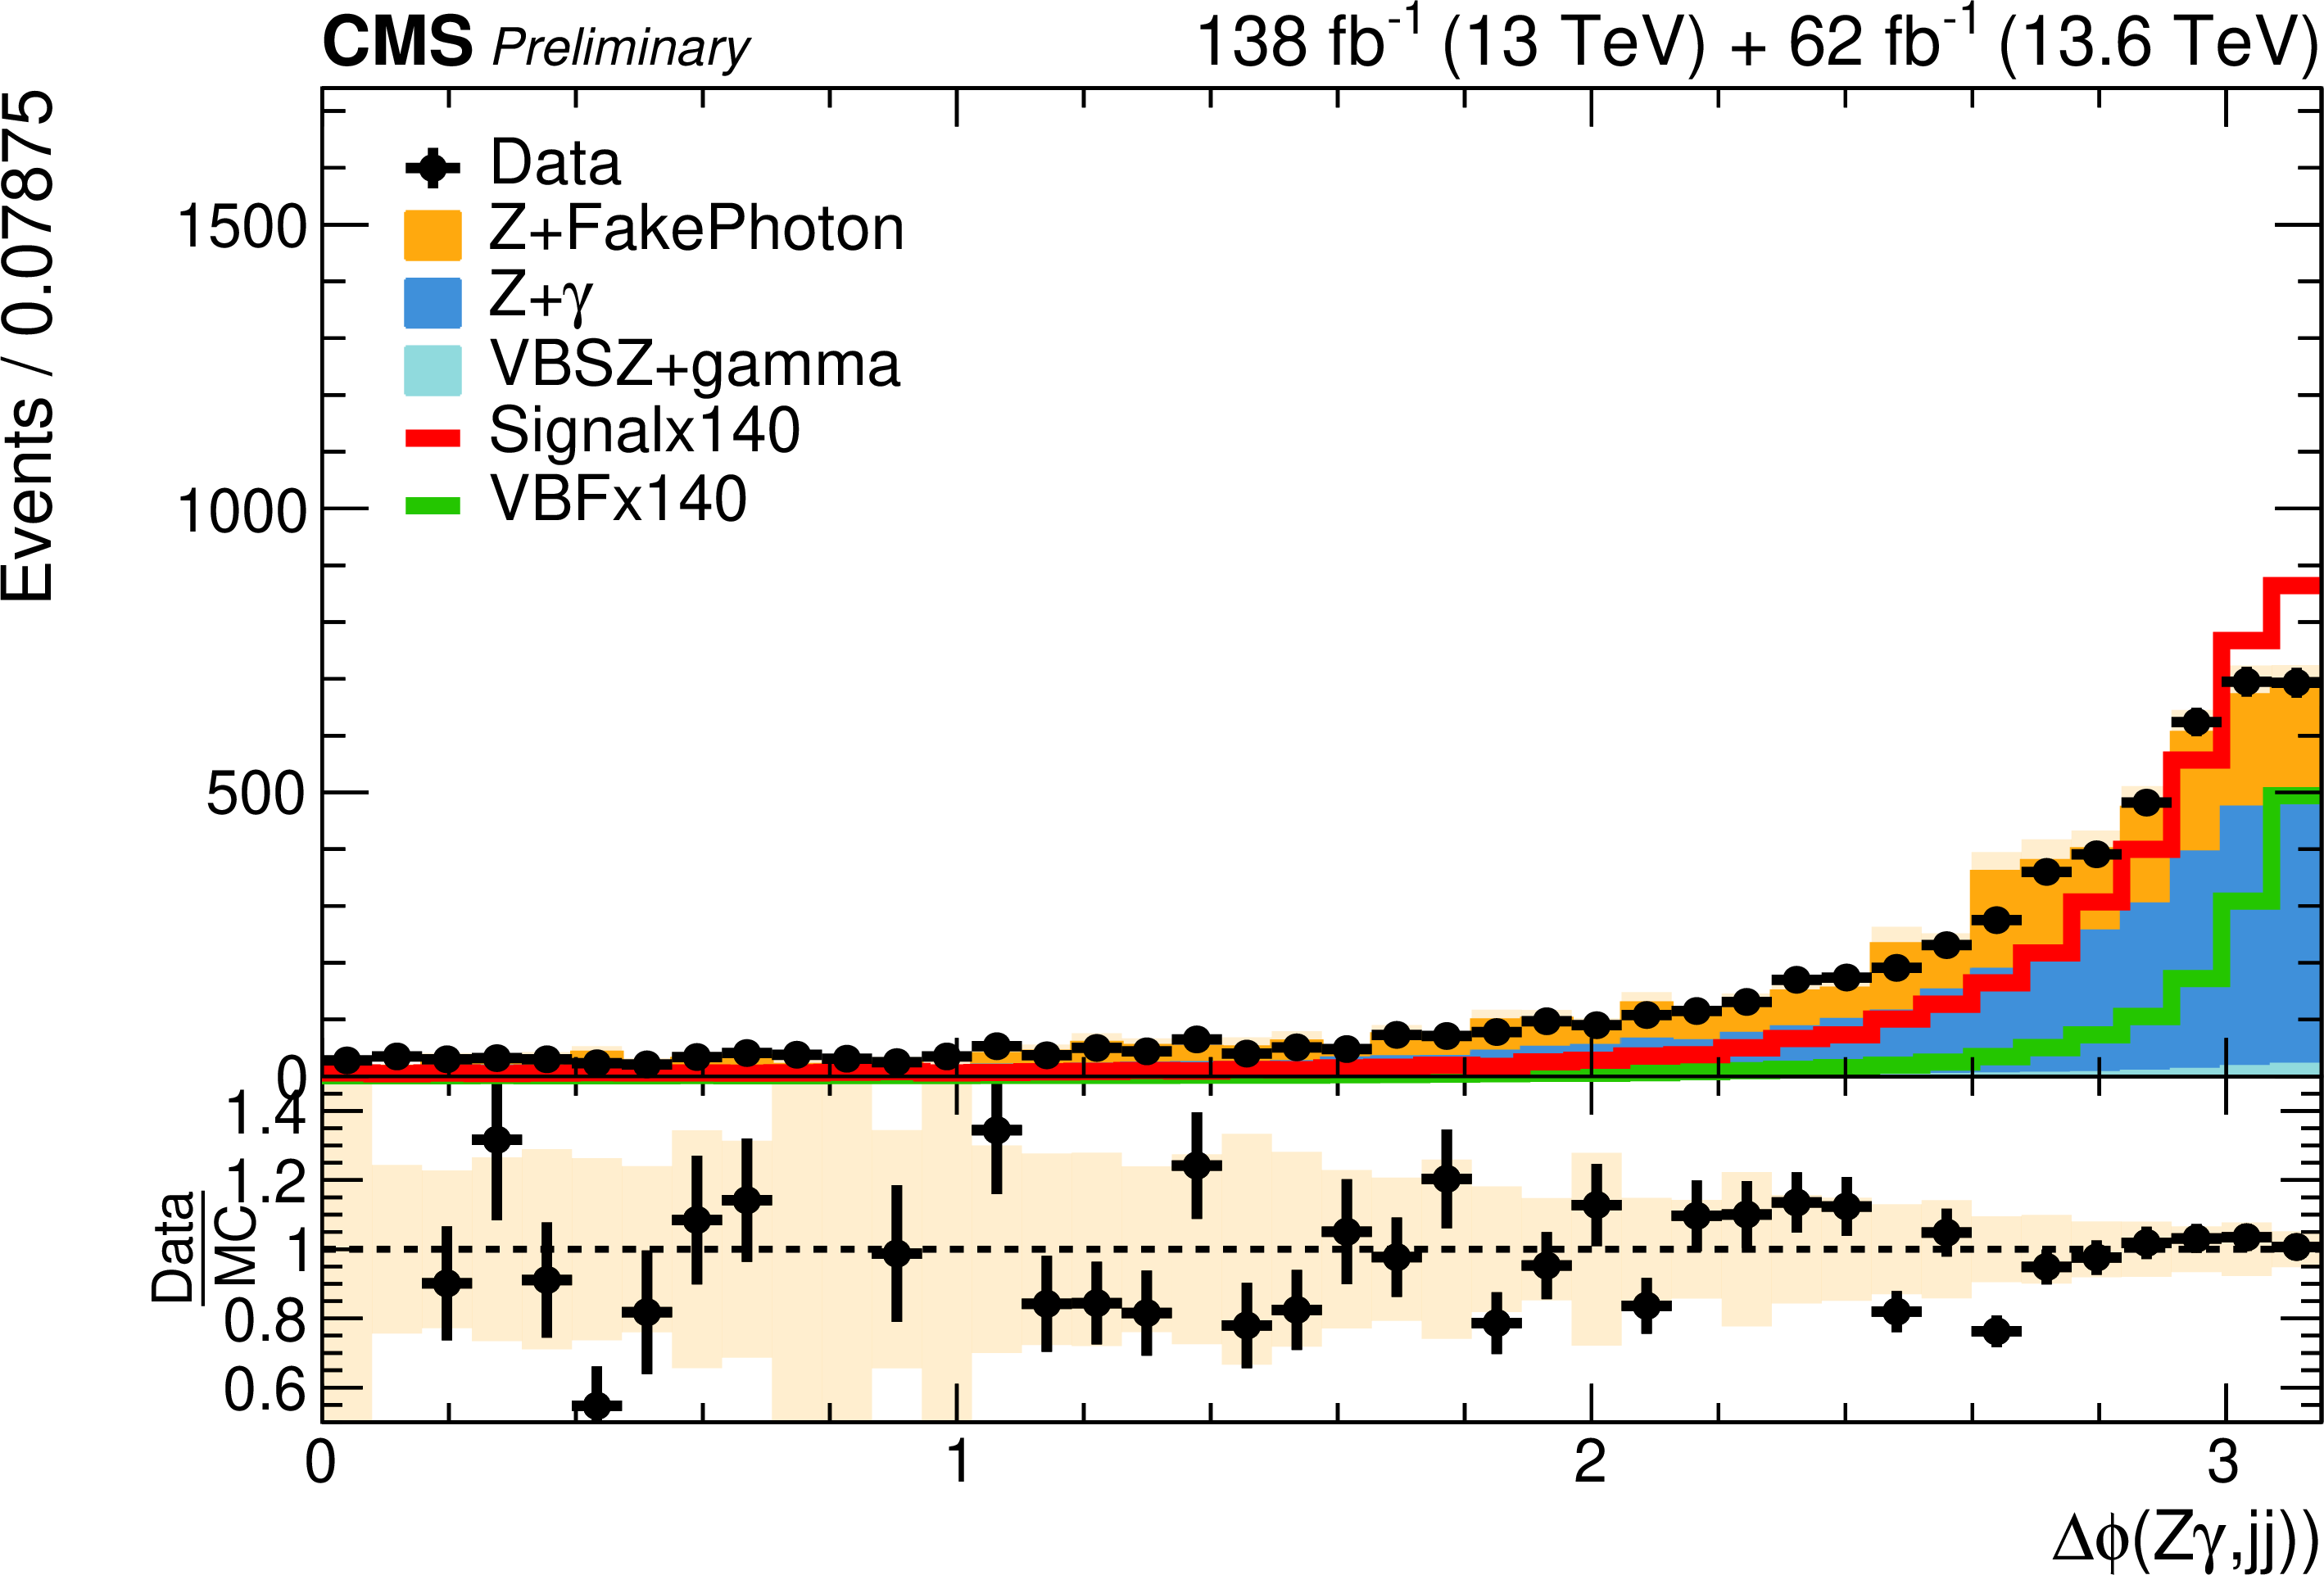
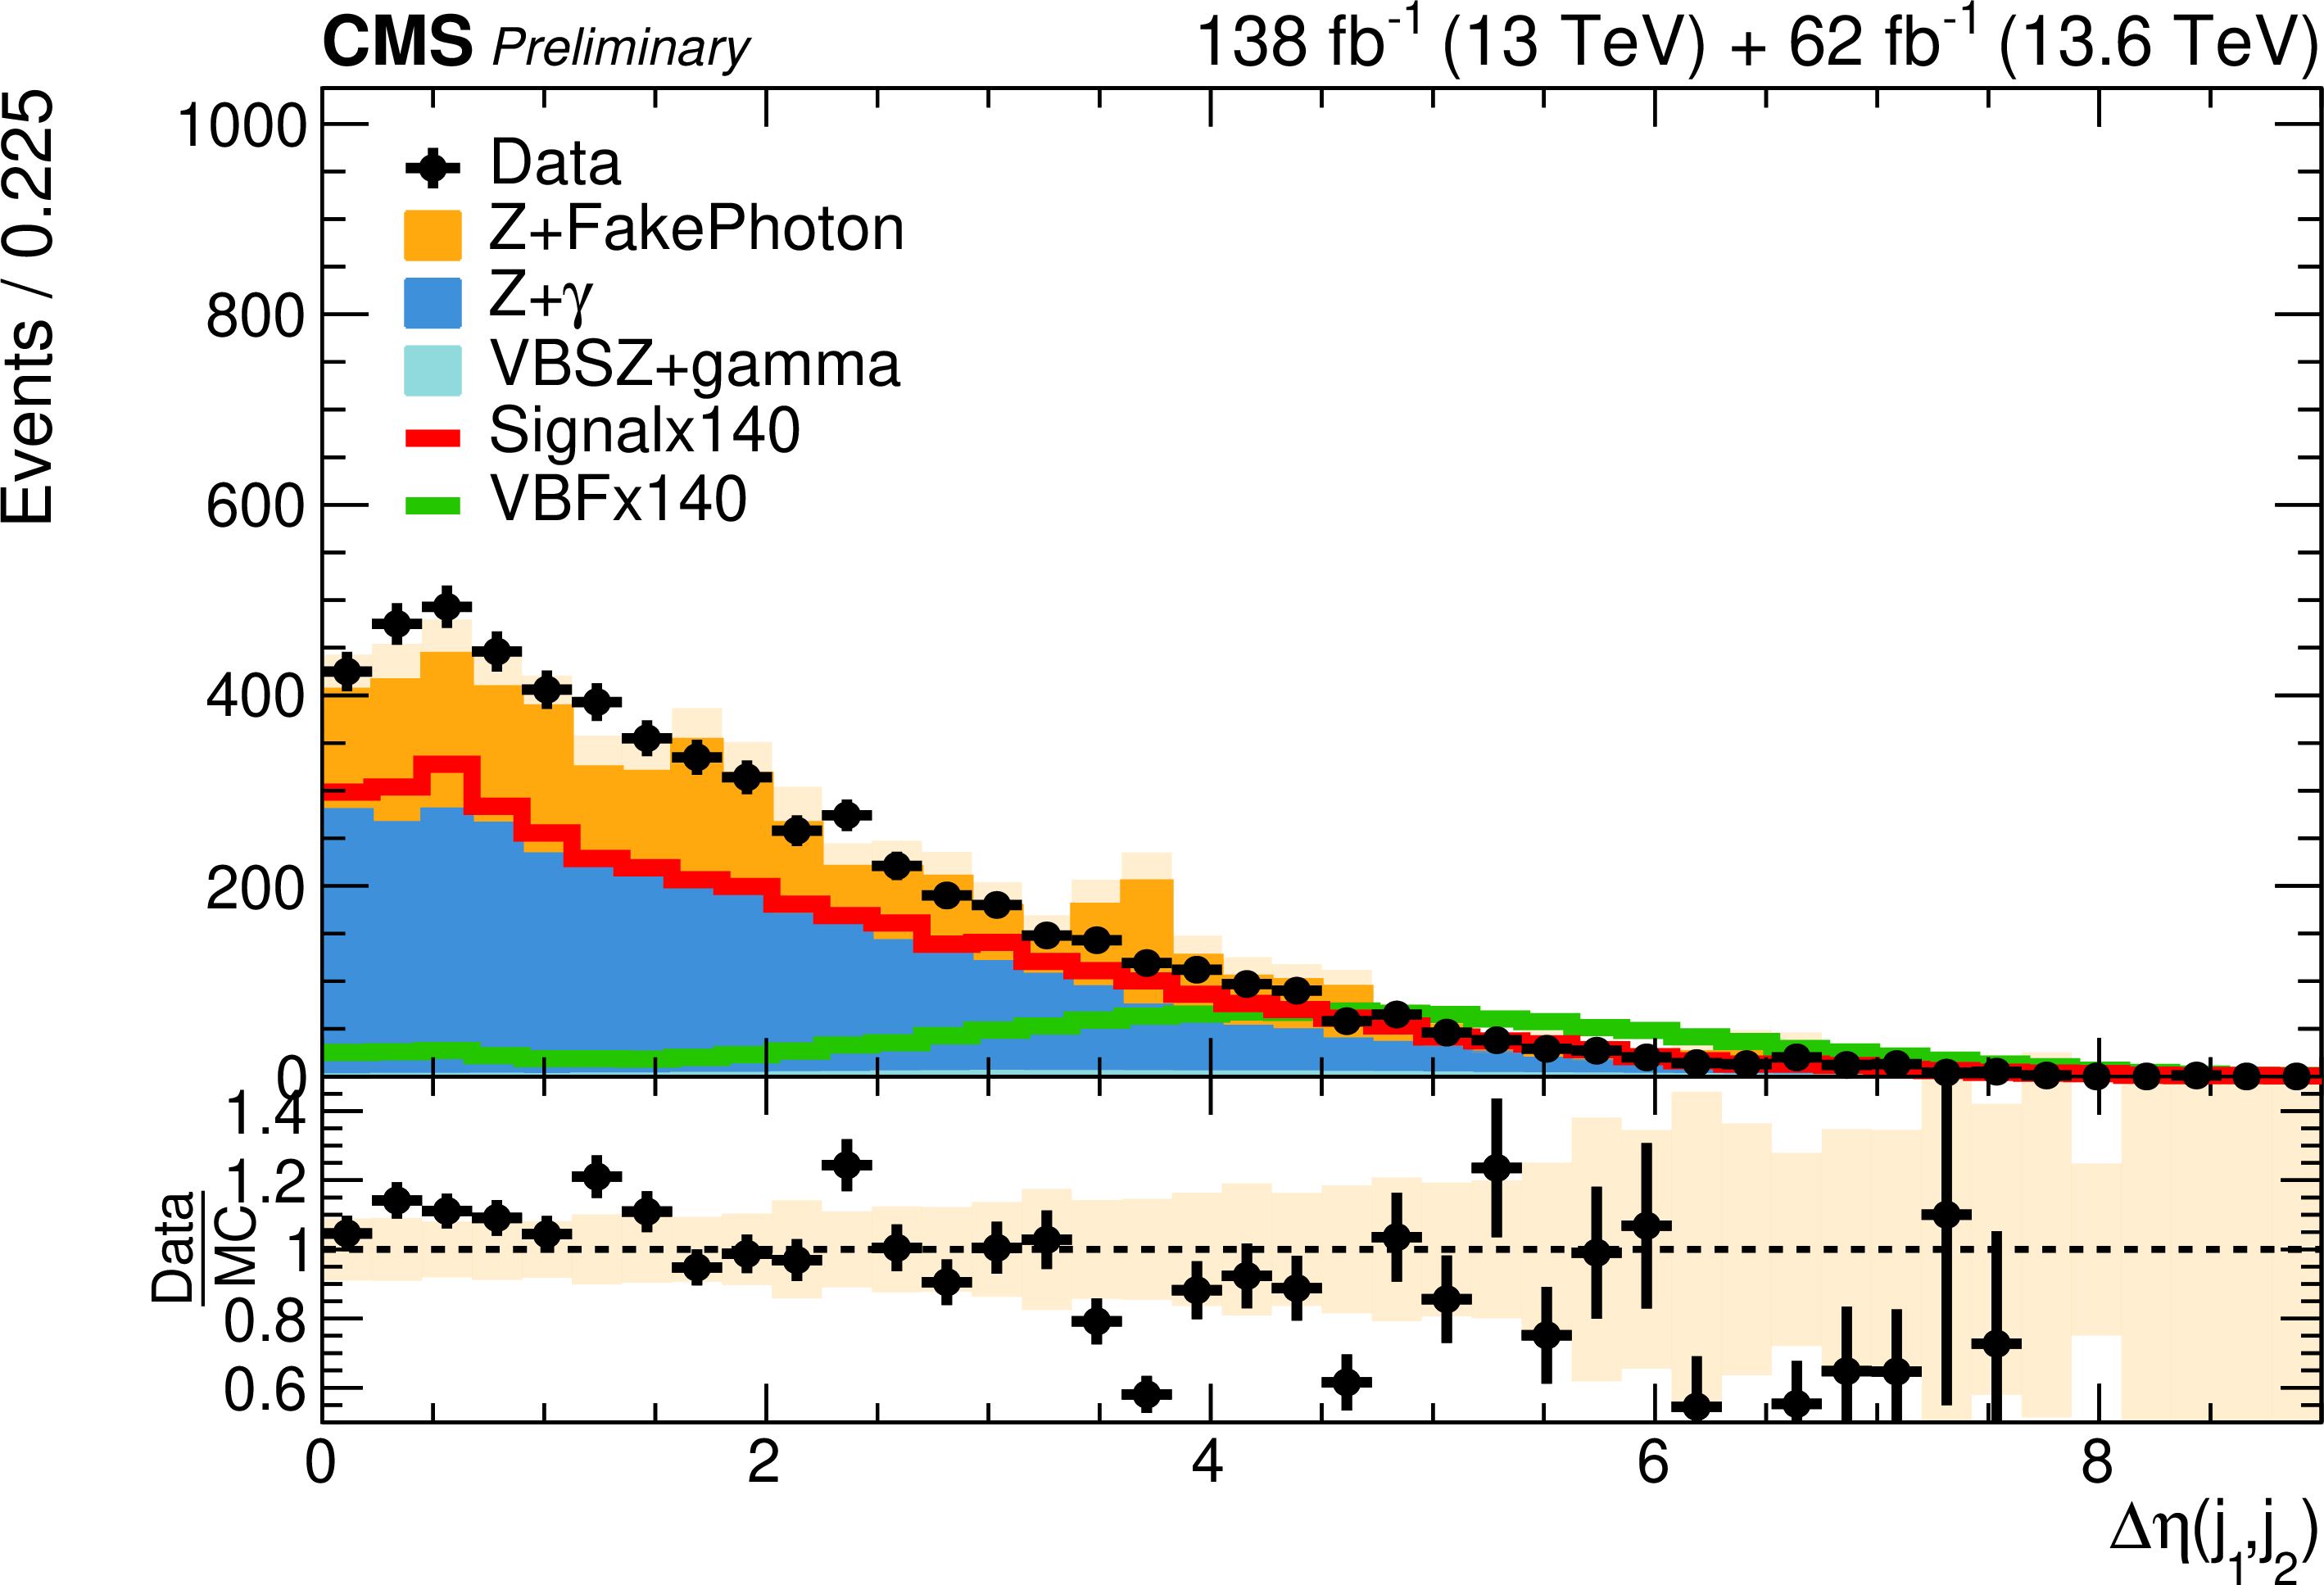
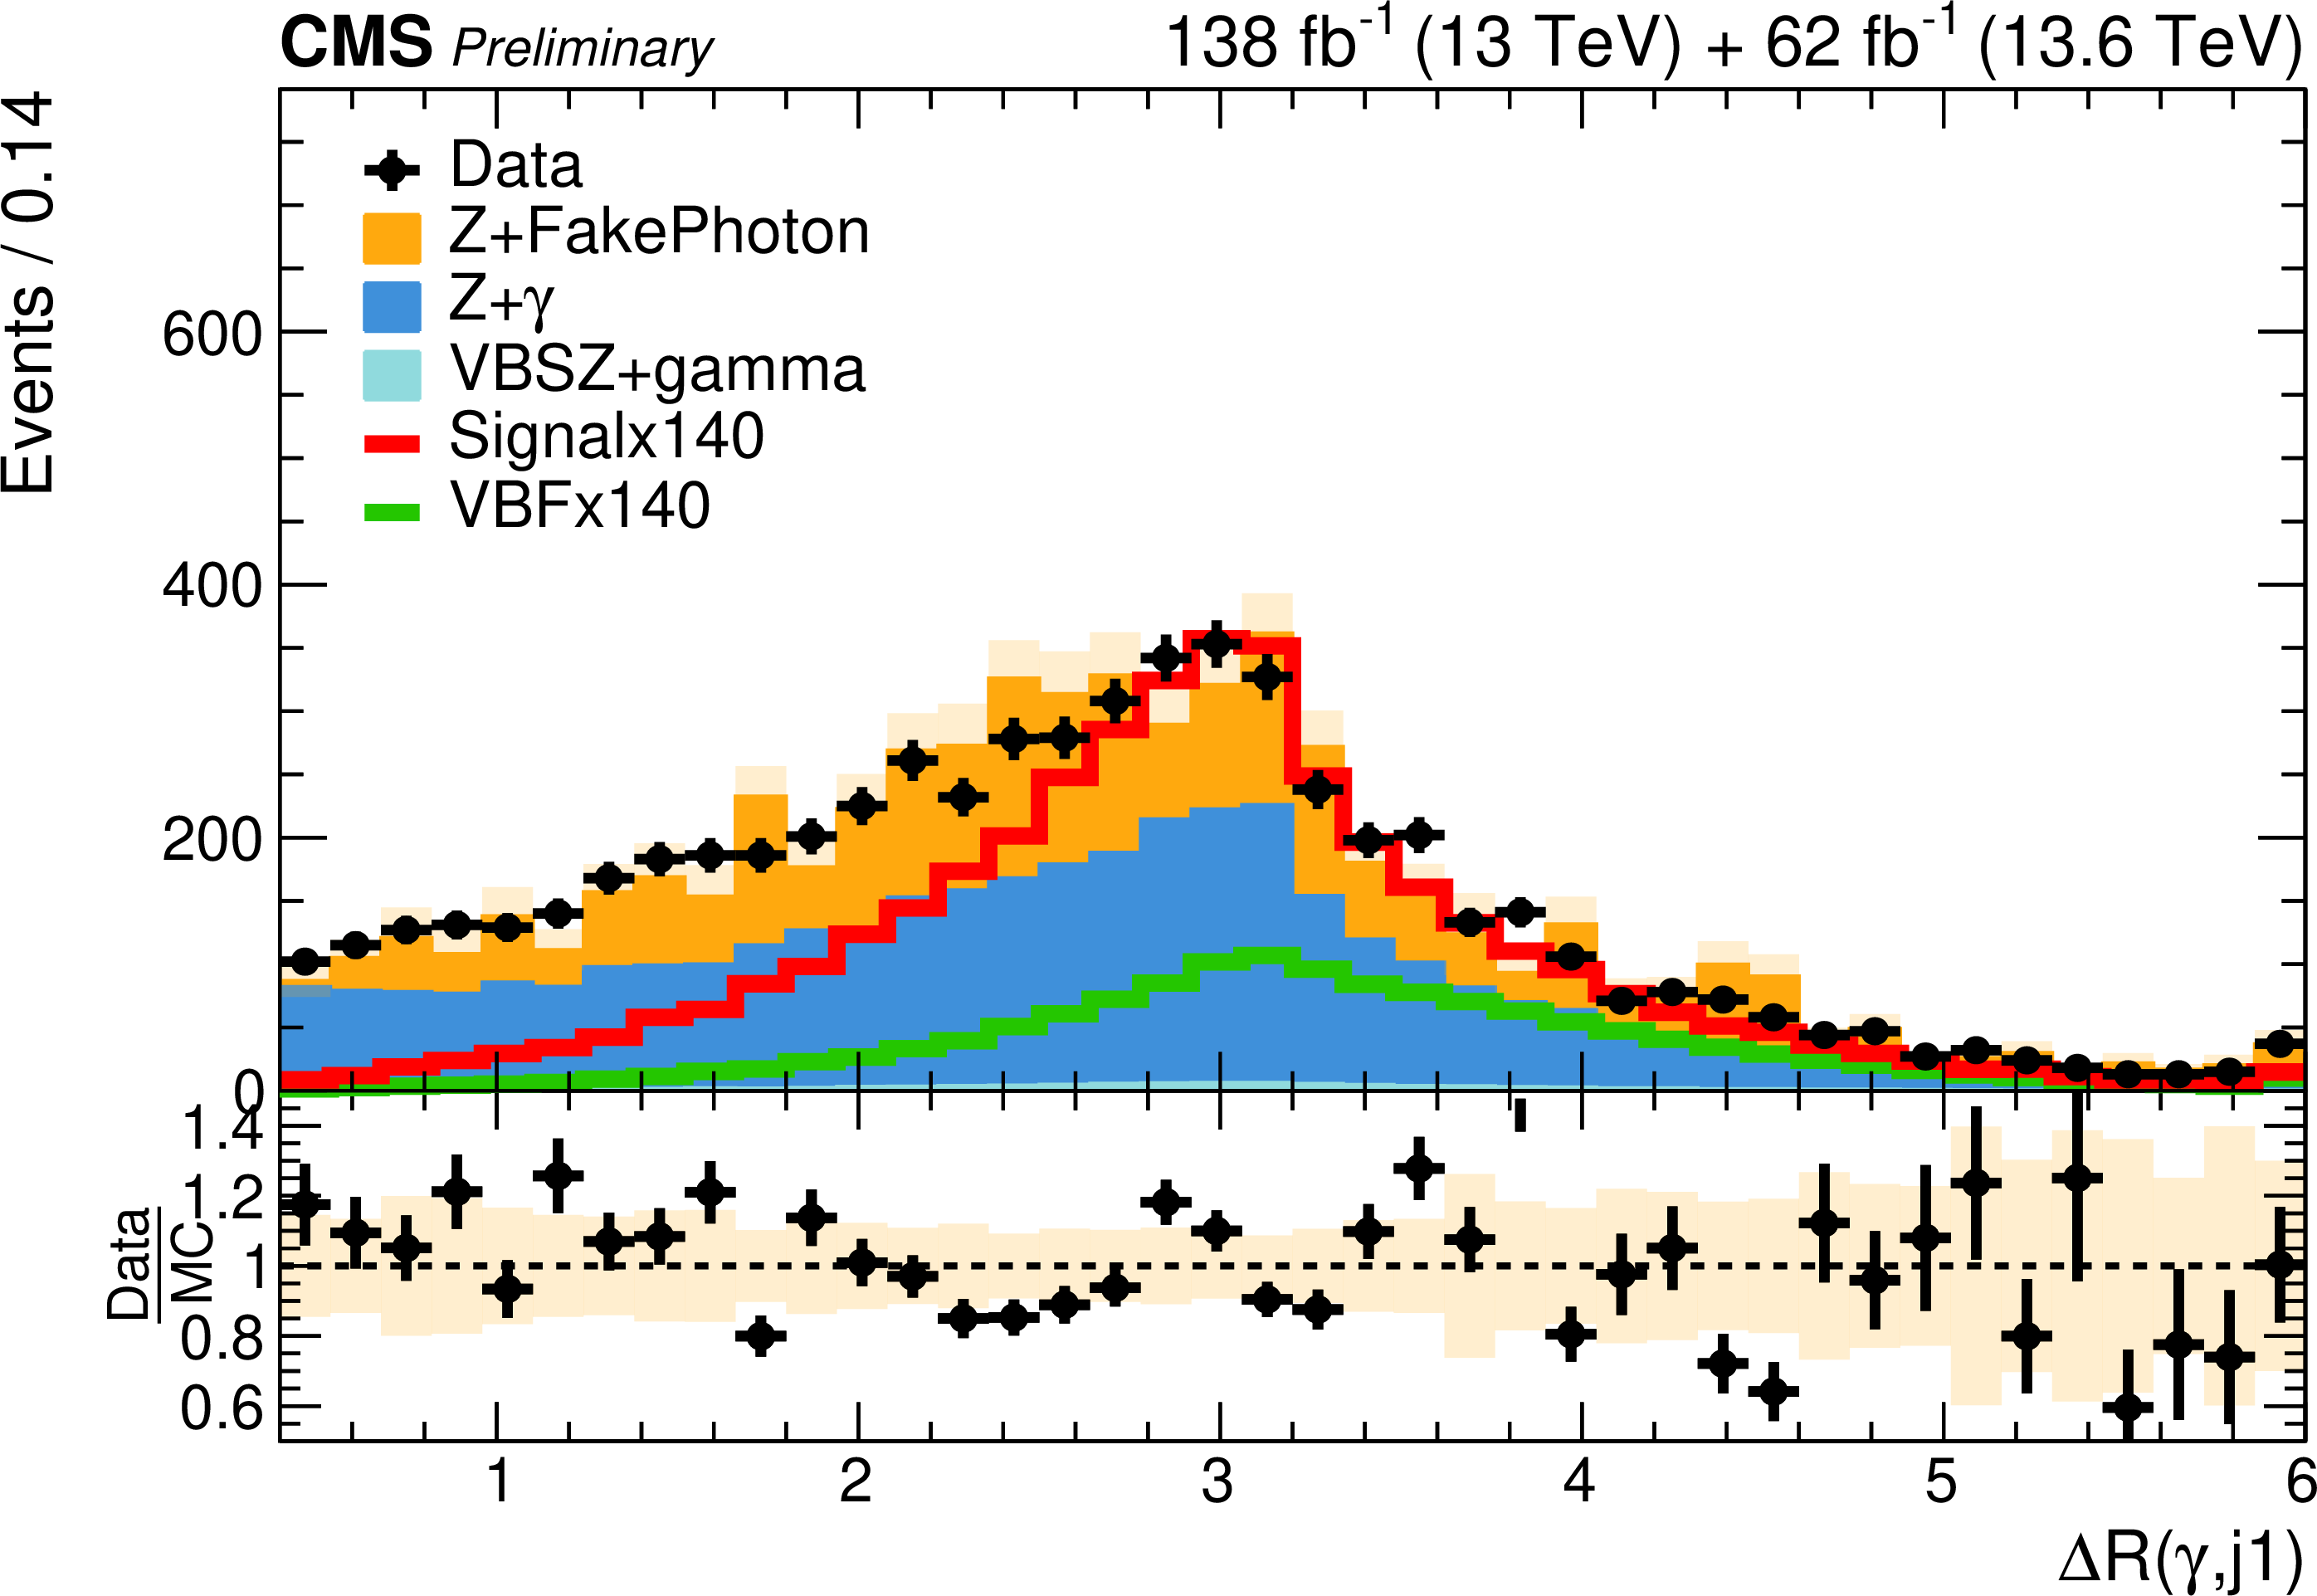
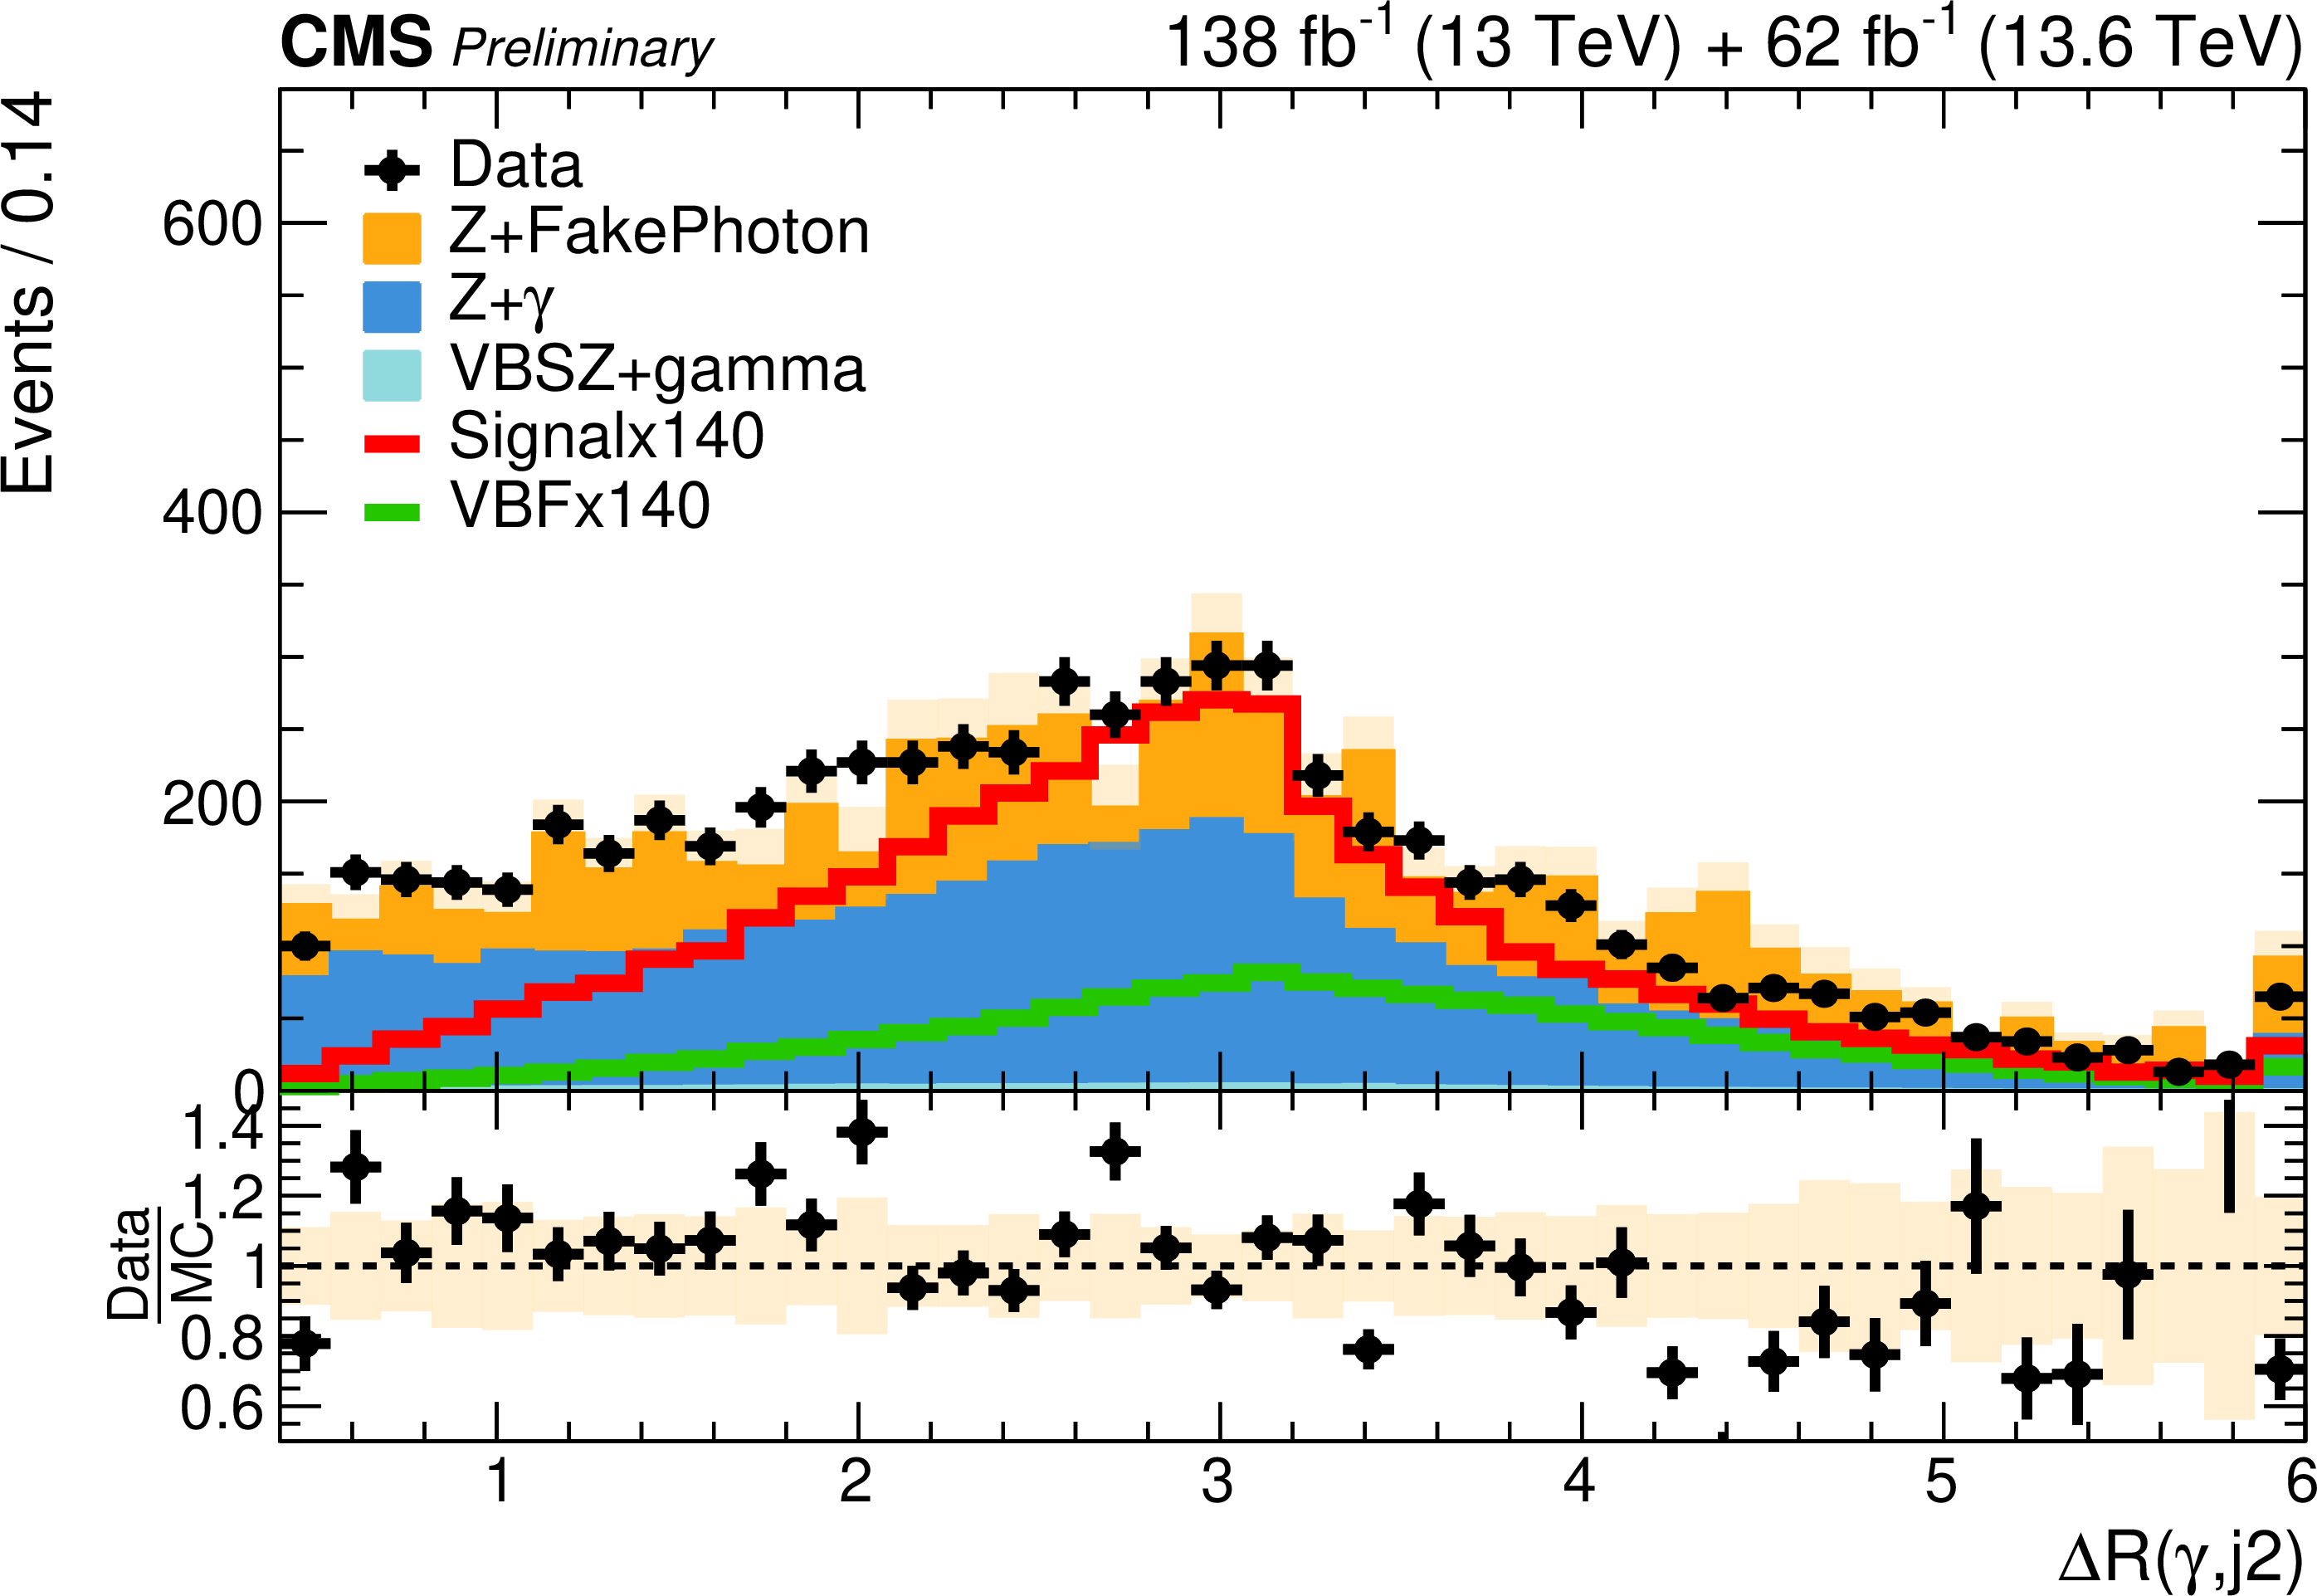
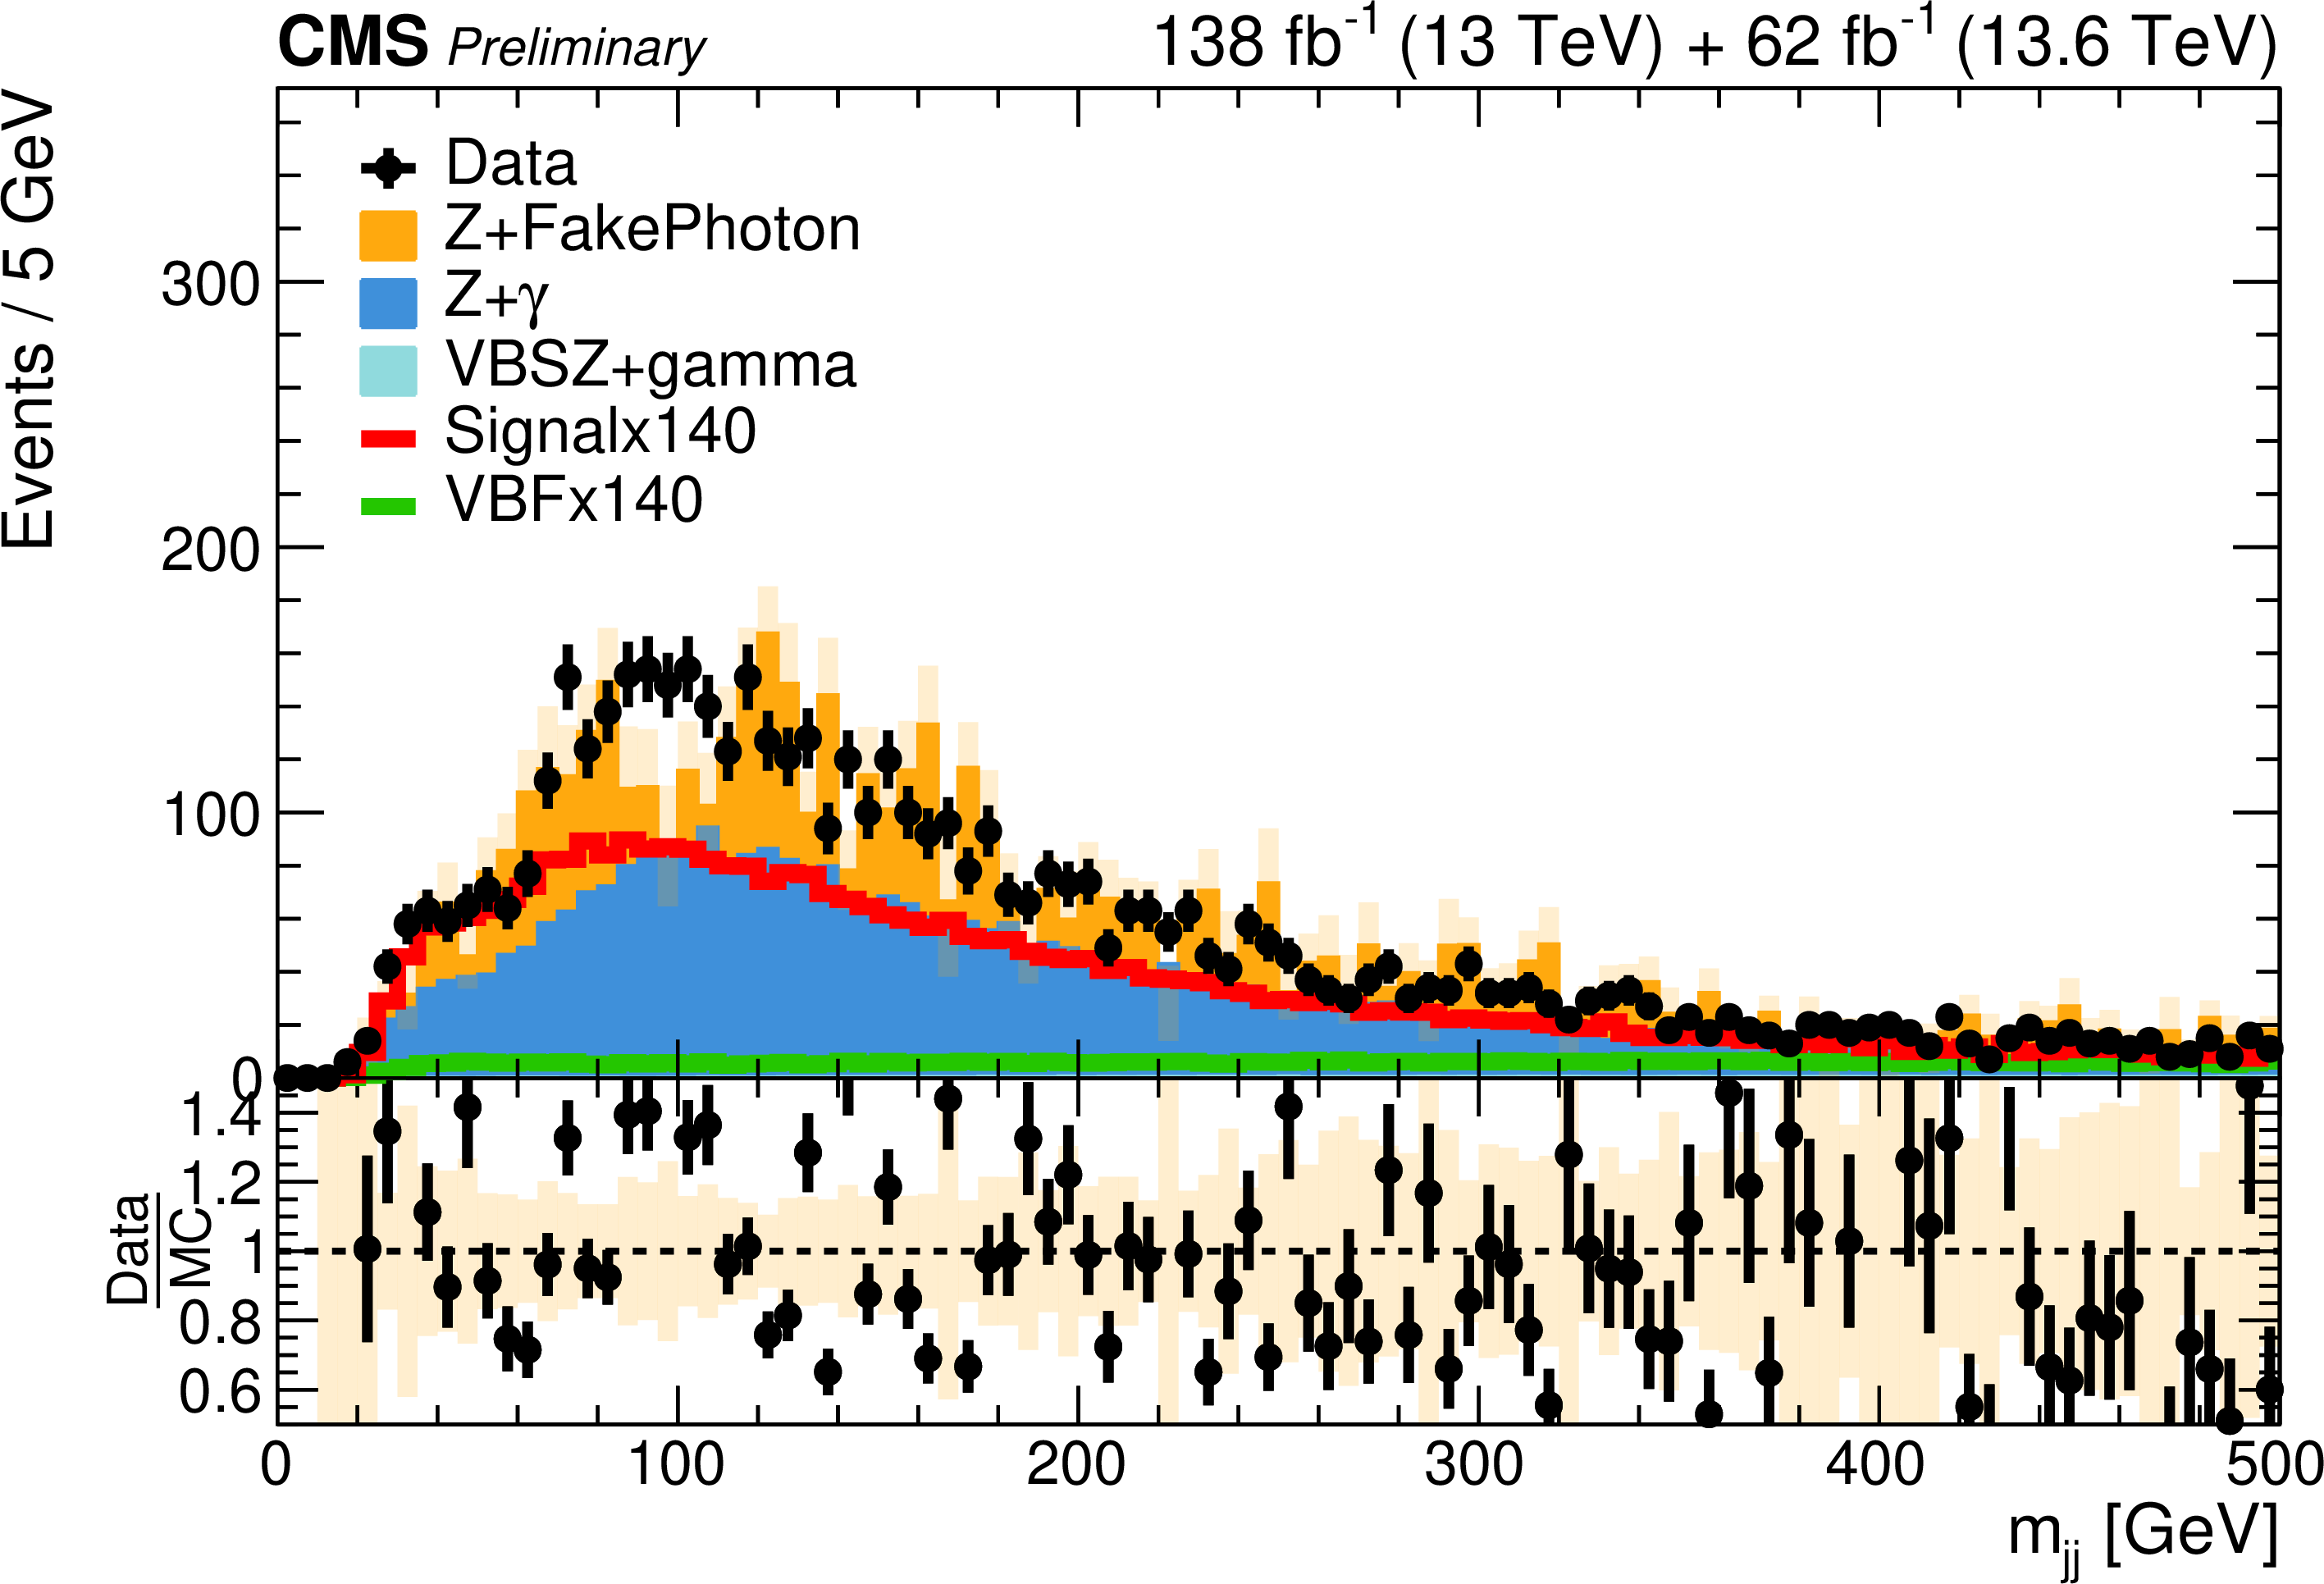
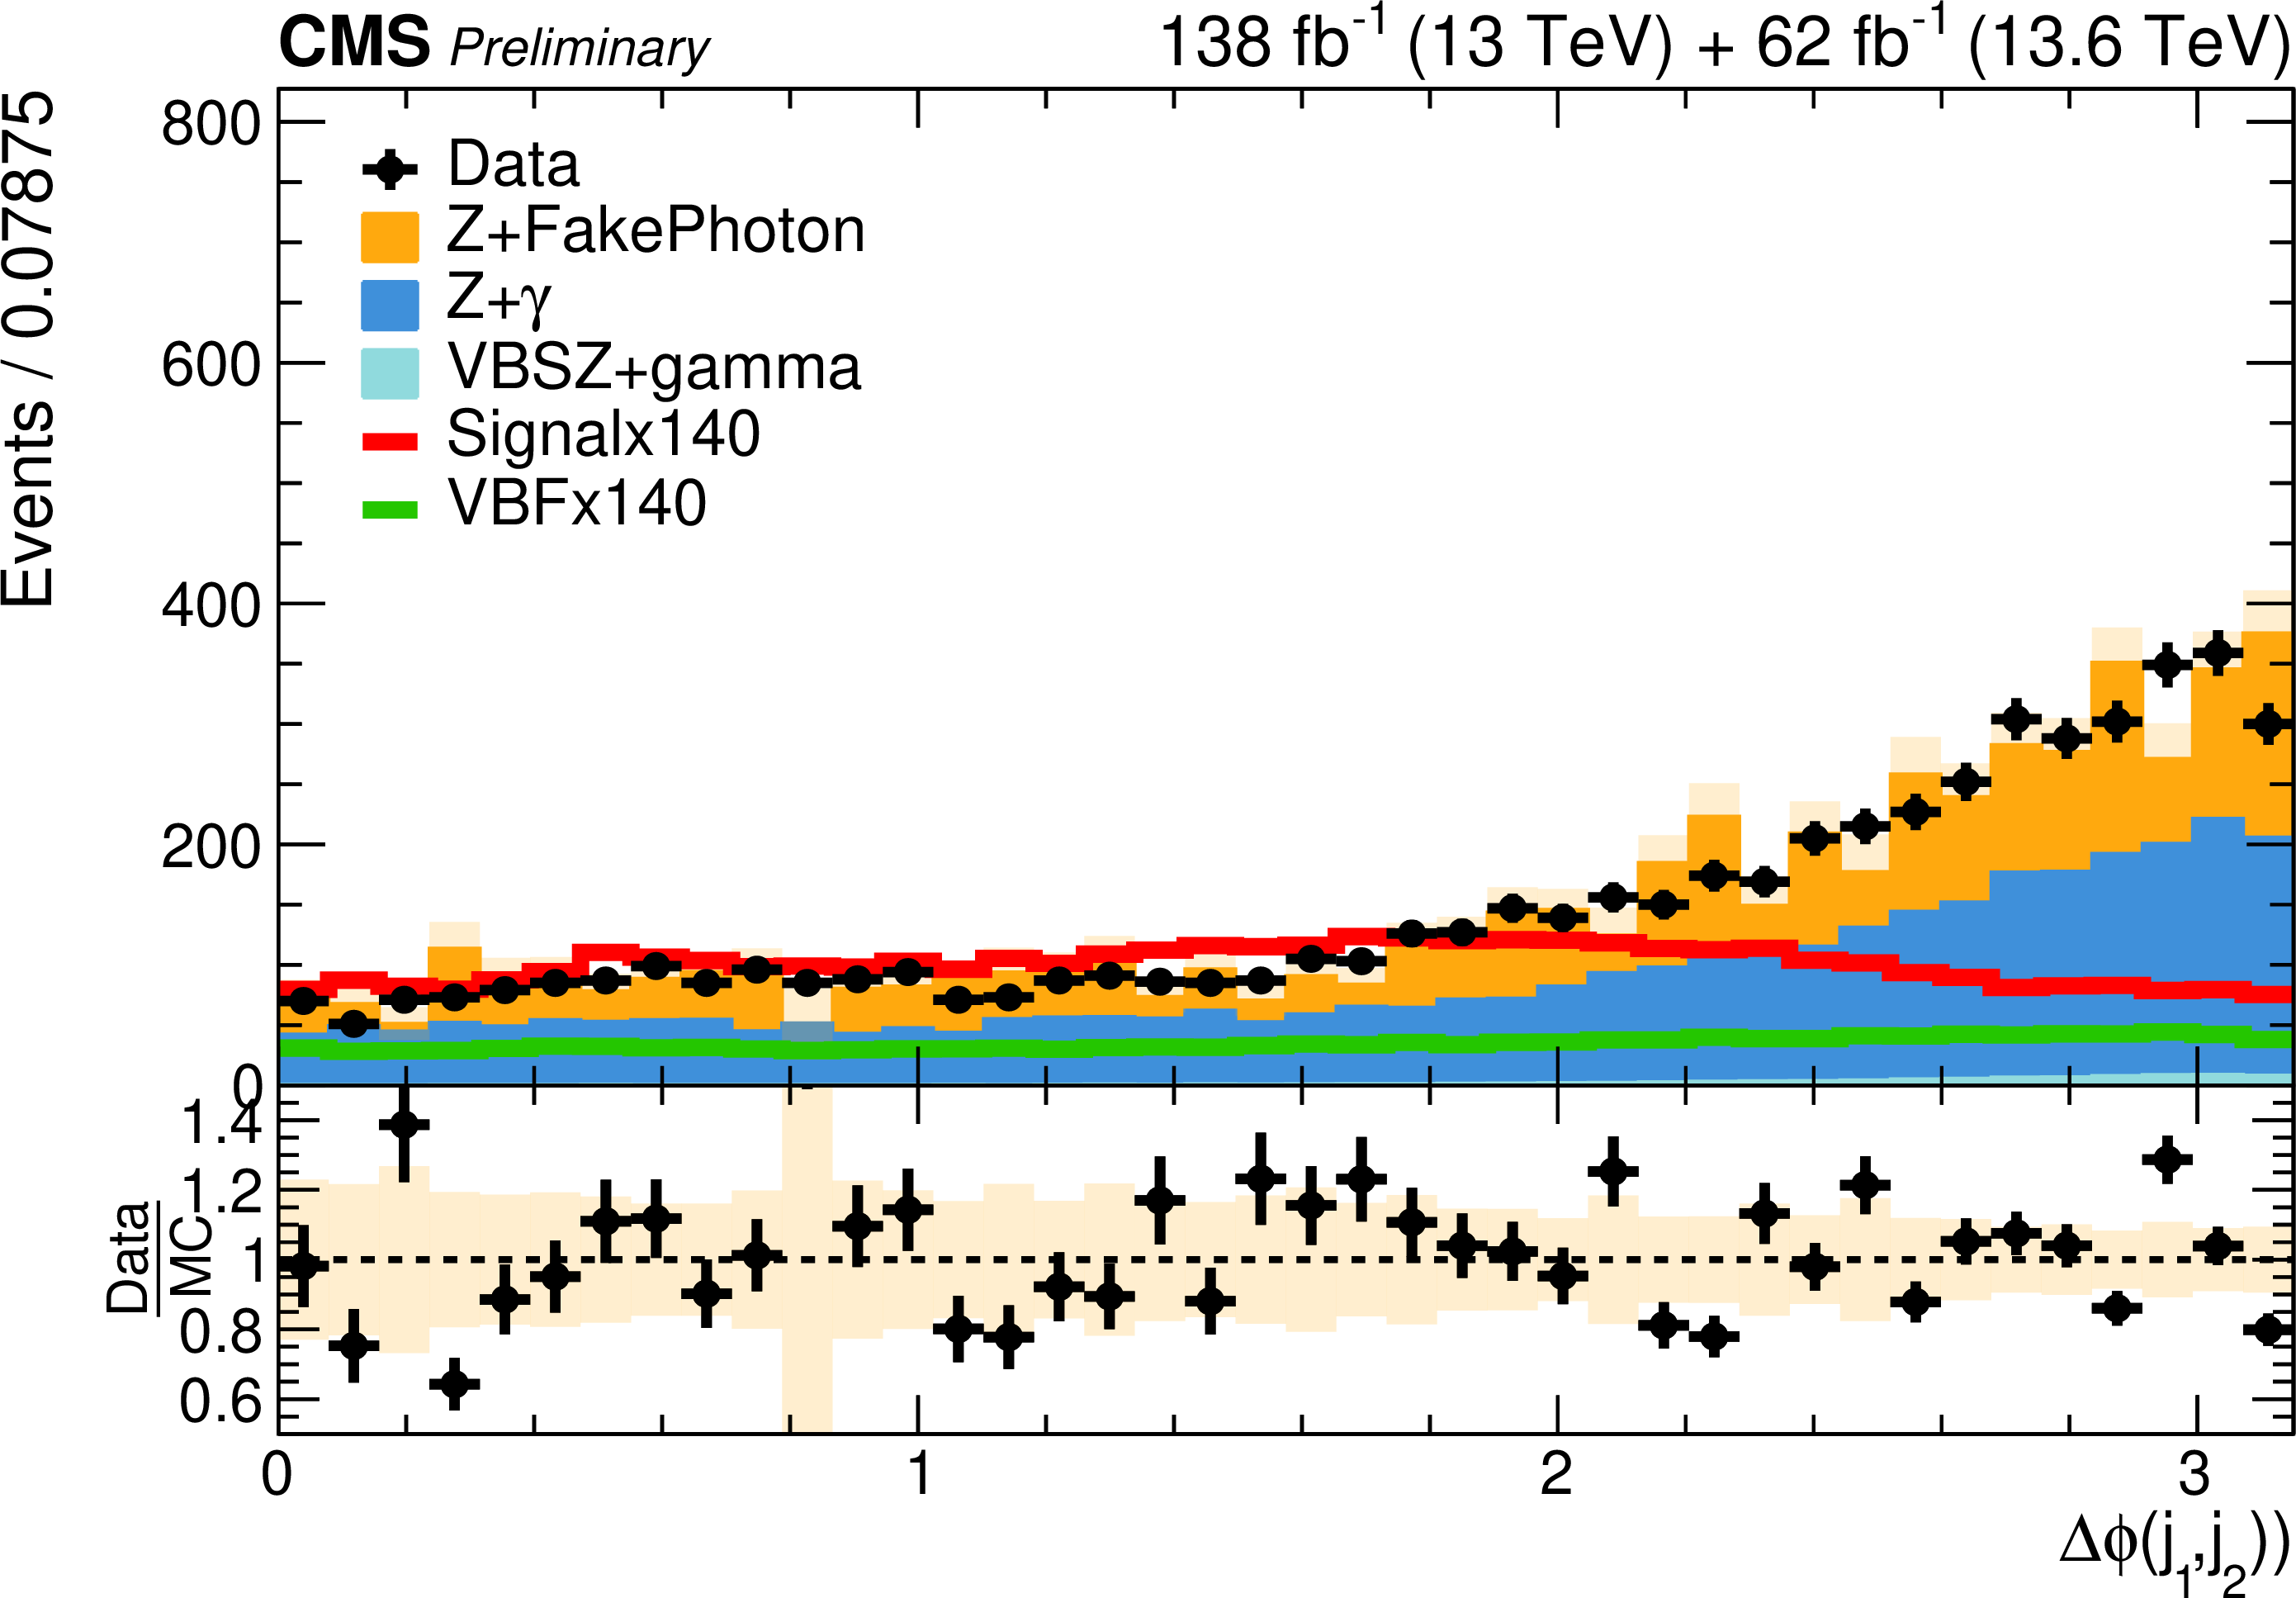
Additional Figure 3:
Distribution of data, simulation, and scaled signal events in the variables provided to the VBF BDT, ordered by importance. Overall good agreement is observed between data and simulation. |
png pdf |
Additional Figure 3-a:
Distribution of data, simulation, and scaled signal events in the variables provided to the VBF BDT, ordered by importance. Overall good agreement is observed between data and simulation. |
png pdf |
Additional Figure 3-b:
Distribution of data, simulation, and scaled signal events in the variables provided to the VBF BDT, ordered by importance. Overall good agreement is observed between data and simulation. |
png pdf |
Additional Figure 3-c:
Distribution of data, simulation, and scaled signal events in the variables provided to the VBF BDT, ordered by importance. Overall good agreement is observed between data and simulation. |
png pdf |
Additional Figure 3-d:
Distribution of data, simulation, and scaled signal events in the variables provided to the VBF BDT, ordered by importance. Overall good agreement is observed between data and simulation. |
png pdf |
Additional Figure 3-e:
Distribution of data, simulation, and scaled signal events in the variables provided to the VBF BDT, ordered by importance. Overall good agreement is observed between data and simulation. |
png pdf |
Additional Figure 3-f:
Distribution of data, simulation, and scaled signal events in the variables provided to the VBF BDT, ordered by importance. Overall good agreement is observed between data and simulation. |
png pdf |
Additional Figure 3-g:
Distribution of data, simulation, and scaled signal events in the variables provided to the VBF BDT, ordered by importance. Overall good agreement is observed between data and simulation. |
png pdf |
Additional Figure 3-h:
Distribution of data, simulation, and scaled signal events in the variables provided to the VBF BDT, ordered by importance. Overall good agreement is observed between data and simulation. |
png pdf |
Additional Figure 3-i:
Distribution of data, simulation, and scaled signal events in the variables provided to the VBF BDT, ordered by importance. Overall good agreement is observed between data and simulation. |
png pdf |
Additional Figure 3-j:
Distribution of data, simulation, and scaled signal events in the variables provided to the VBF BDT, ordered by importance. Overall good agreement is observed between data and simulation. |
png pdf |
Additional Figure 3-k:
Distribution of data, simulation, and scaled signal events in the variables provided to the VBF BDT, ordered by importance. Overall good agreement is observed between data and simulation. |
png pdf |
Additional Figure 3-l:
Distribution of data, simulation, and scaled signal events in the variables provided to the VBF BDT, ordered by importance. Overall good agreement is observed between data and simulation. |
png pdf |
Additional Figure 3-m:
Distribution of data, simulation, and scaled signal events in the variables provided to the VBF BDT, ordered by importance. Overall good agreement is observed between data and simulation. |
png pdf |
Additional Figure 3-n:
Distribution of data, simulation, and scaled signal events in the variables provided to the VBF BDT, ordered by importance. Overall good agreement is observed between data and simulation. |
png pdf |
Additional Figure 3-o:
Distribution of data, simulation, and scaled signal events in the variables provided to the VBF BDT, ordered by importance. Overall good agreement is observed between data and simulation. |
png pdf |
Additional Figure 3-p:
Distribution of data, simulation, and scaled signal events in the variables provided to the VBF BDT, ordered by importance. Overall good agreement is observed between data and simulation. |
png pdf |
Additional Figure 3-q:
Distribution of data, simulation, and scaled signal events in the variables provided to the VBF BDT, ordered by importance. Overall good agreement is observed between data and simulation. |
png pdf |
Additional Figure 3-r:
Distribution of data, simulation, and scaled signal events in the variables provided to the VBF BDT, ordered by importance. Overall good agreement is observed between data and simulation. |
png pdf |
Additional Figure 3-s:
Distribution of data, simulation, and scaled signal events in the variables provided to the VBF BDT, ordered by importance. Overall good agreement is observed between data and simulation. |
png pdf |
Additional Figure 3-t:
Distribution of data, simulation, and scaled signal events in the variables provided to the VBF BDT, ordered by importance. Overall good agreement is observed between data and simulation. |
png pdf |
Additional Figure 3-u:
Distribution of data, simulation, and scaled signal events in the variables provided to the VBF BDT, ordered by importance. Overall good agreement is observed between data and simulation. |
png pdf |
Additional Figure 3-v:
Distribution of data, simulation, and scaled signal events in the variables provided to the VBF BDT, ordered by importance. Overall good agreement is observed between data and simulation. |
png pdf |
Additional Figure 3-w:
Distribution of data, simulation, and scaled signal events in the variables provided to the VBF BDT, ordered by importance. Overall good agreement is observed between data and simulation. |
png pdf |
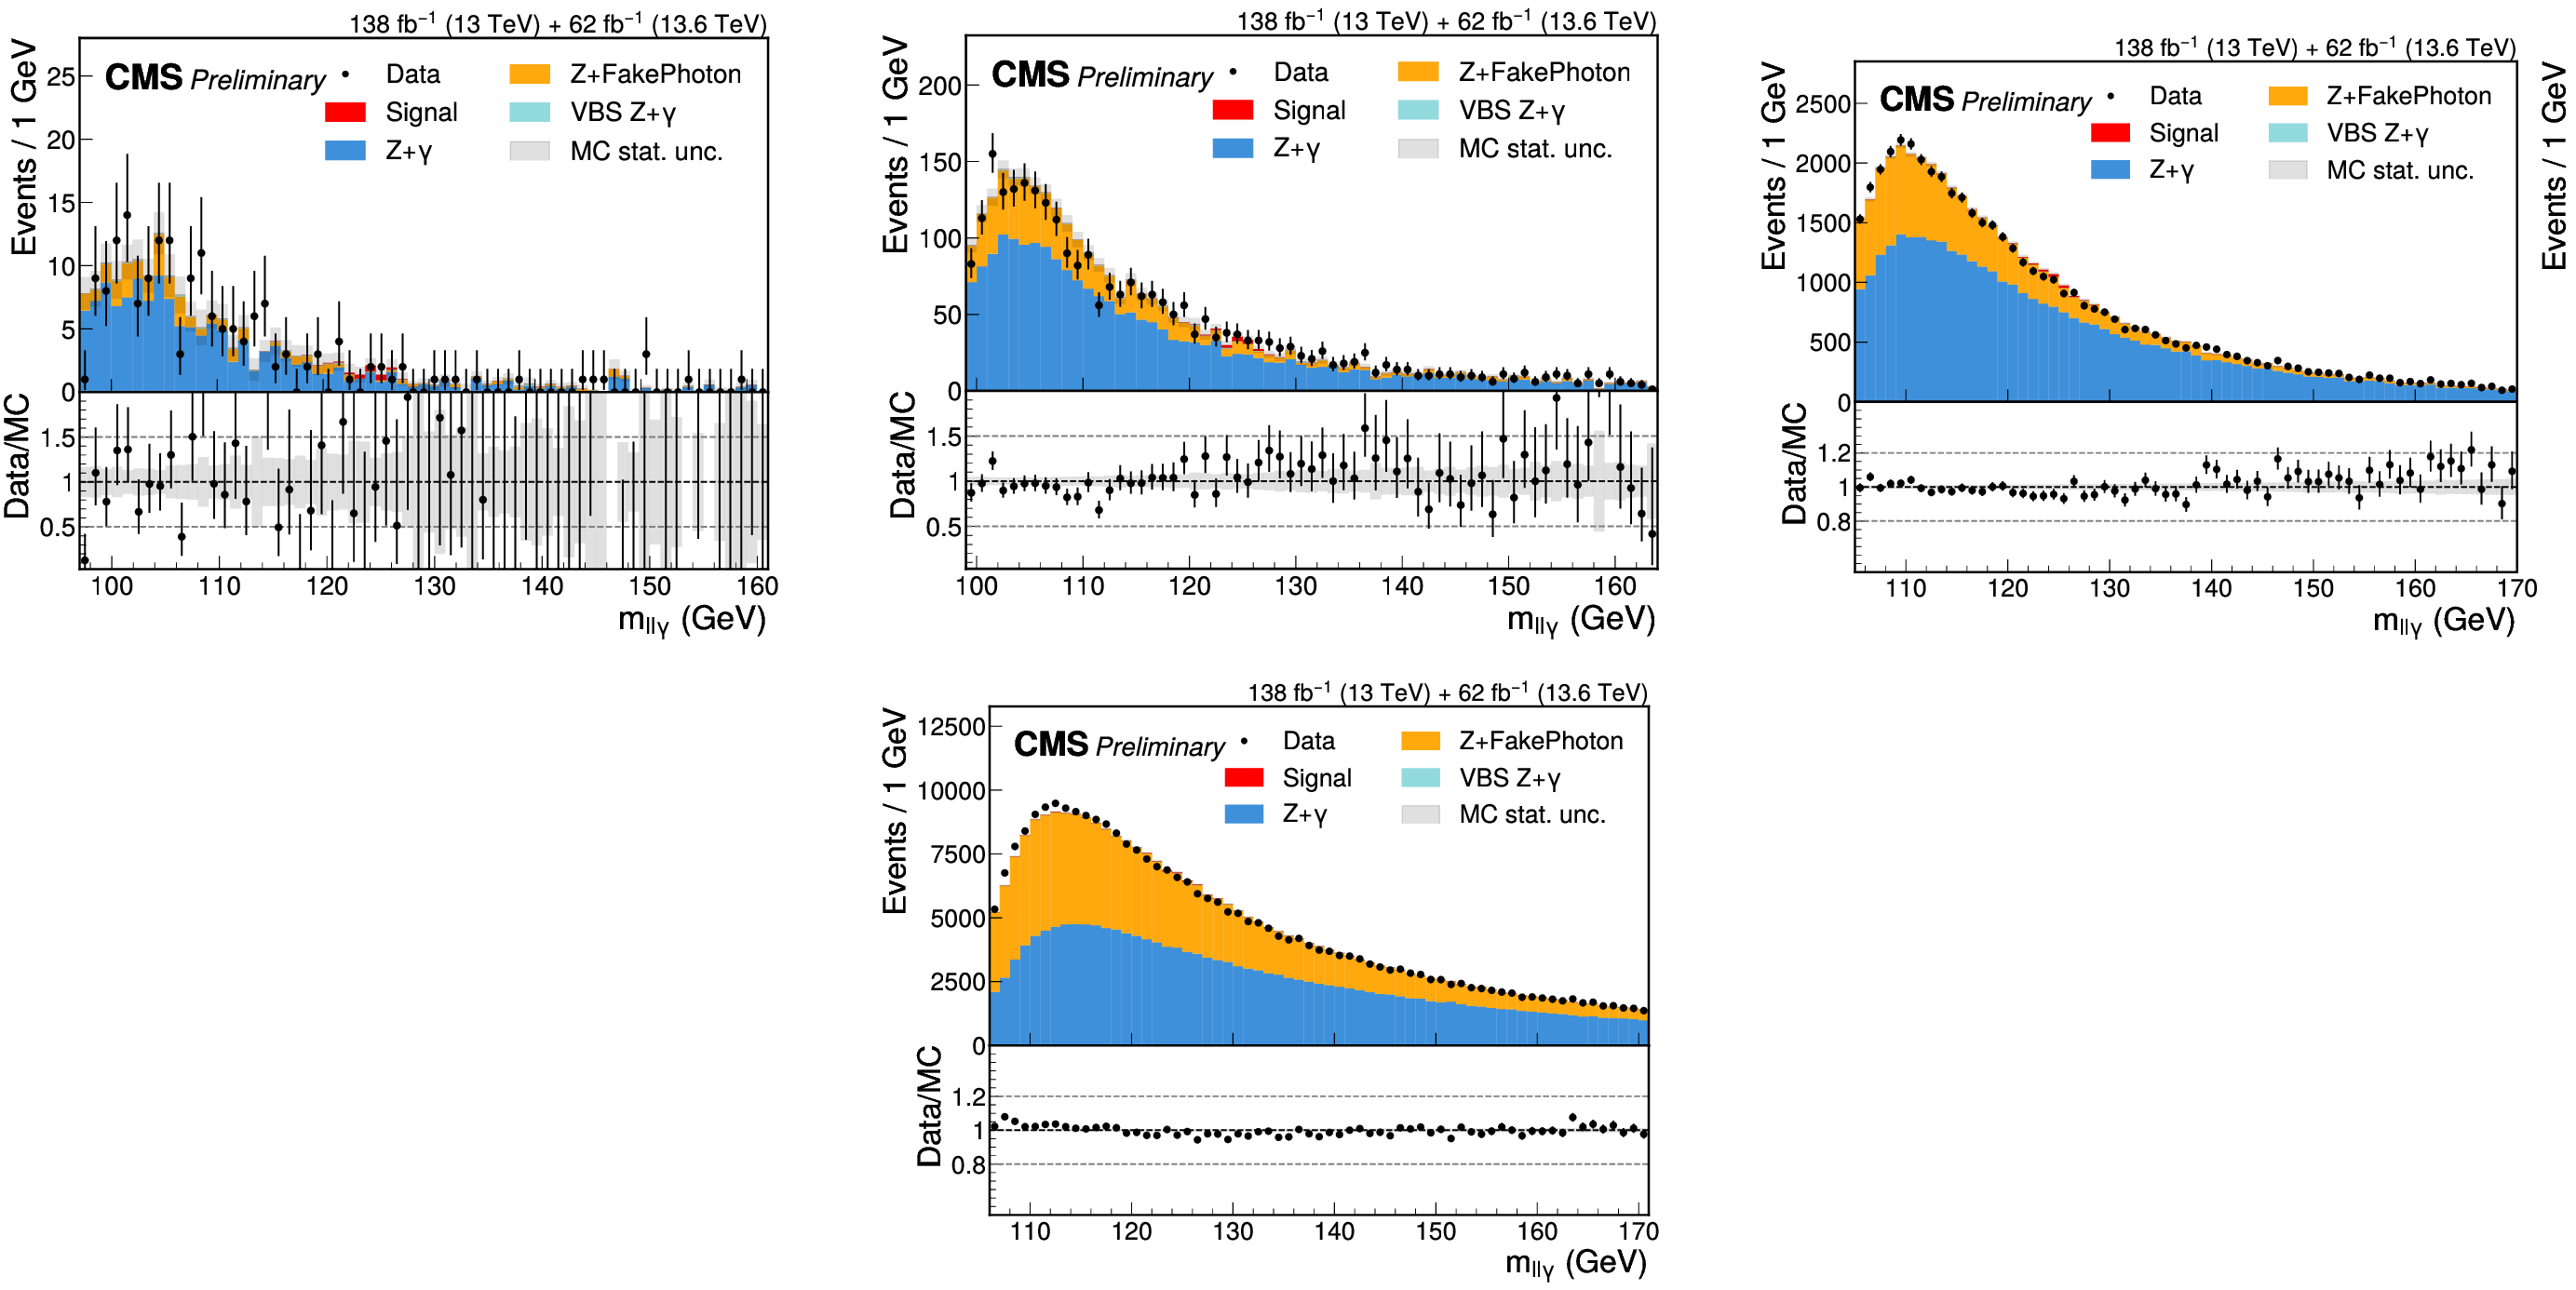
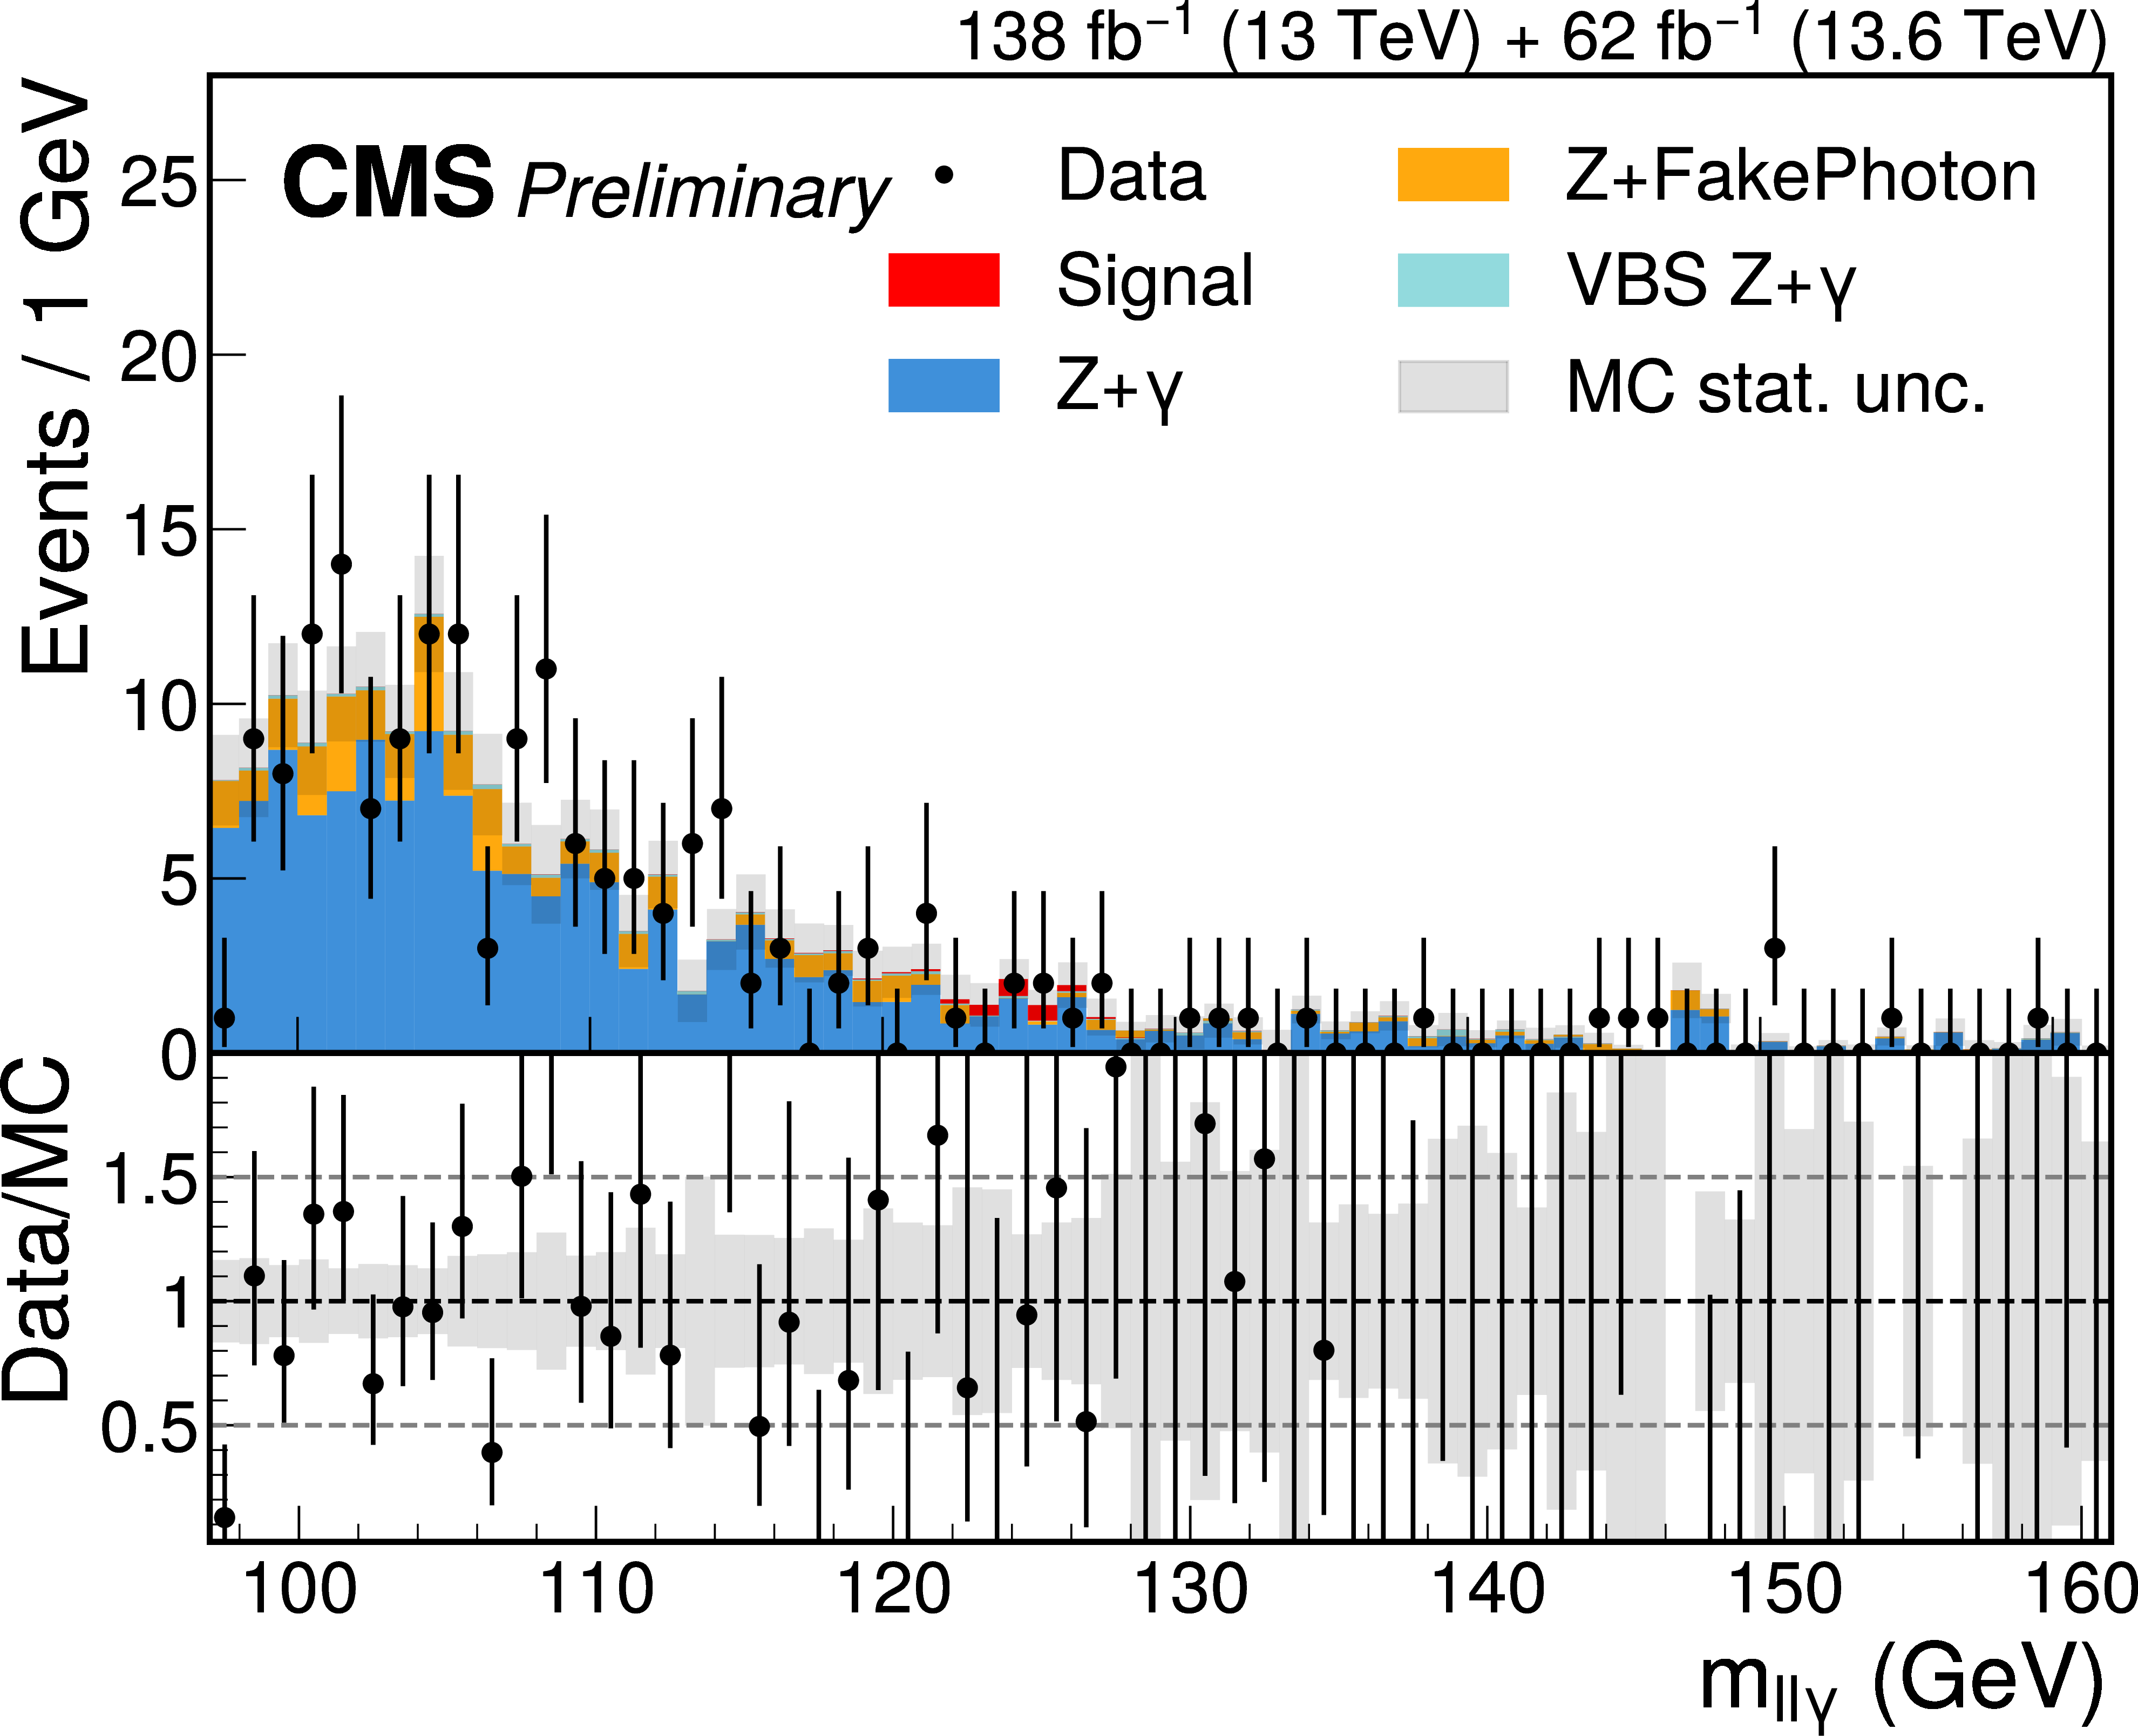
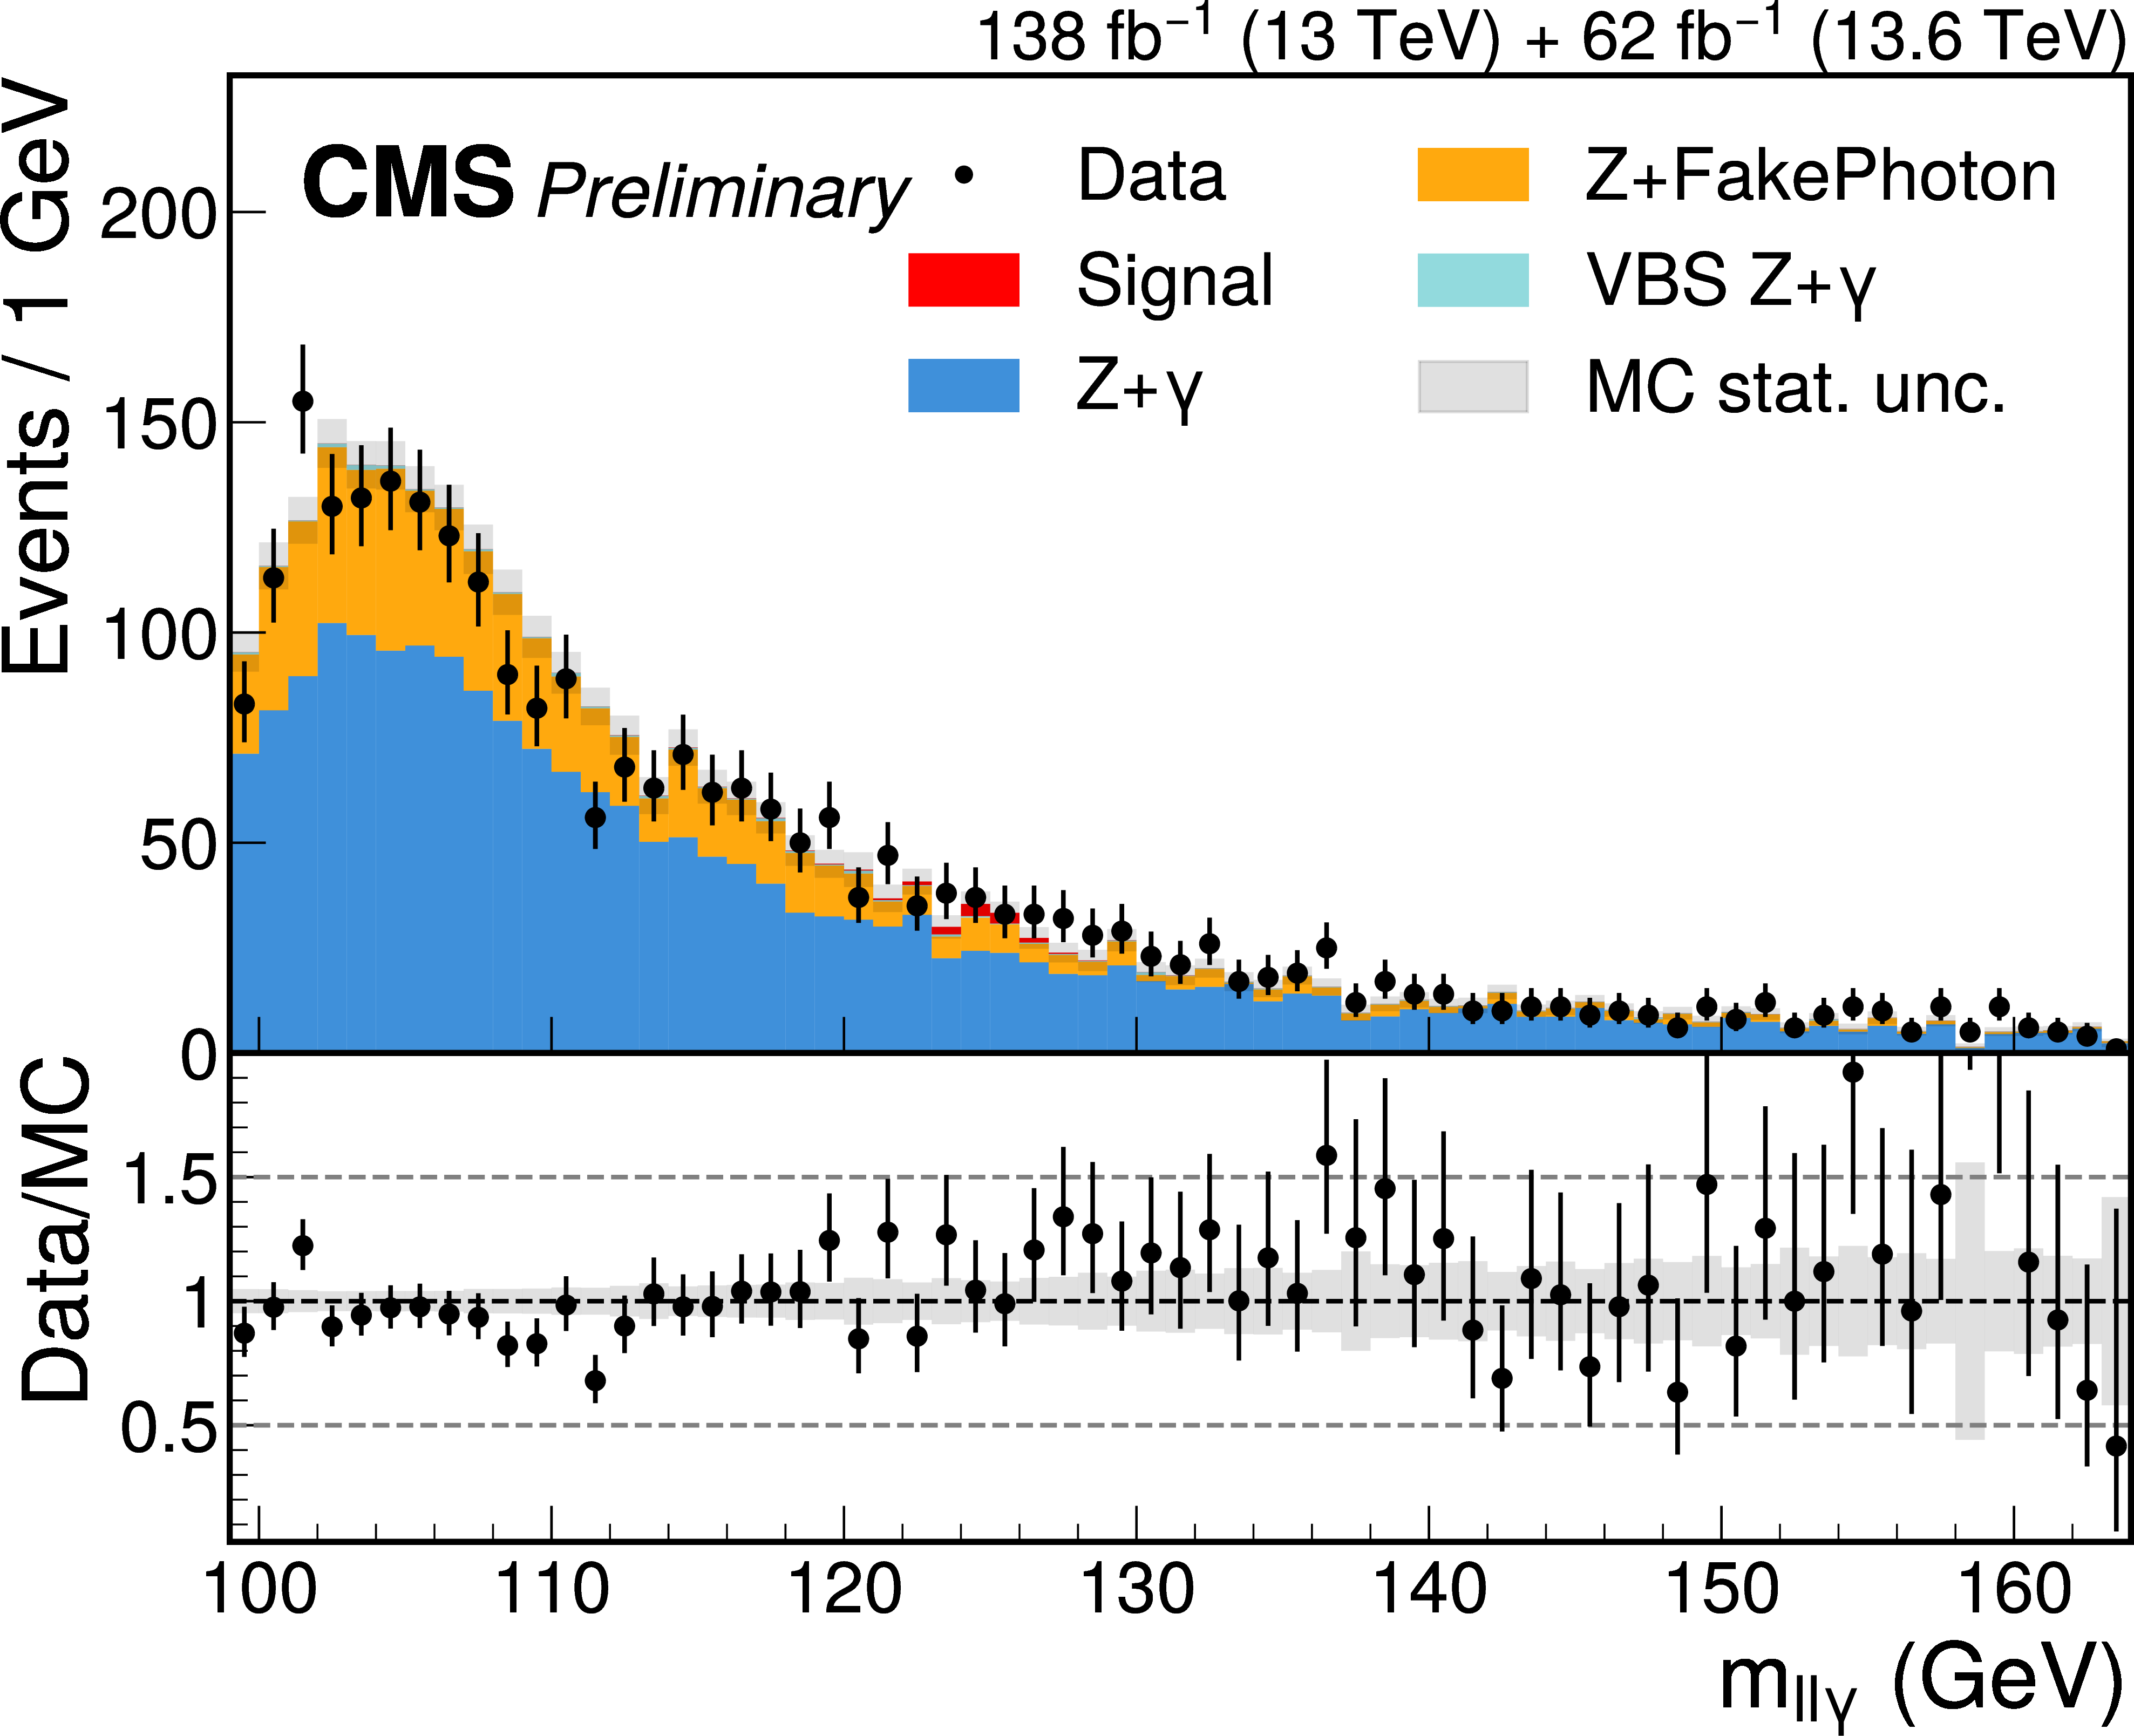
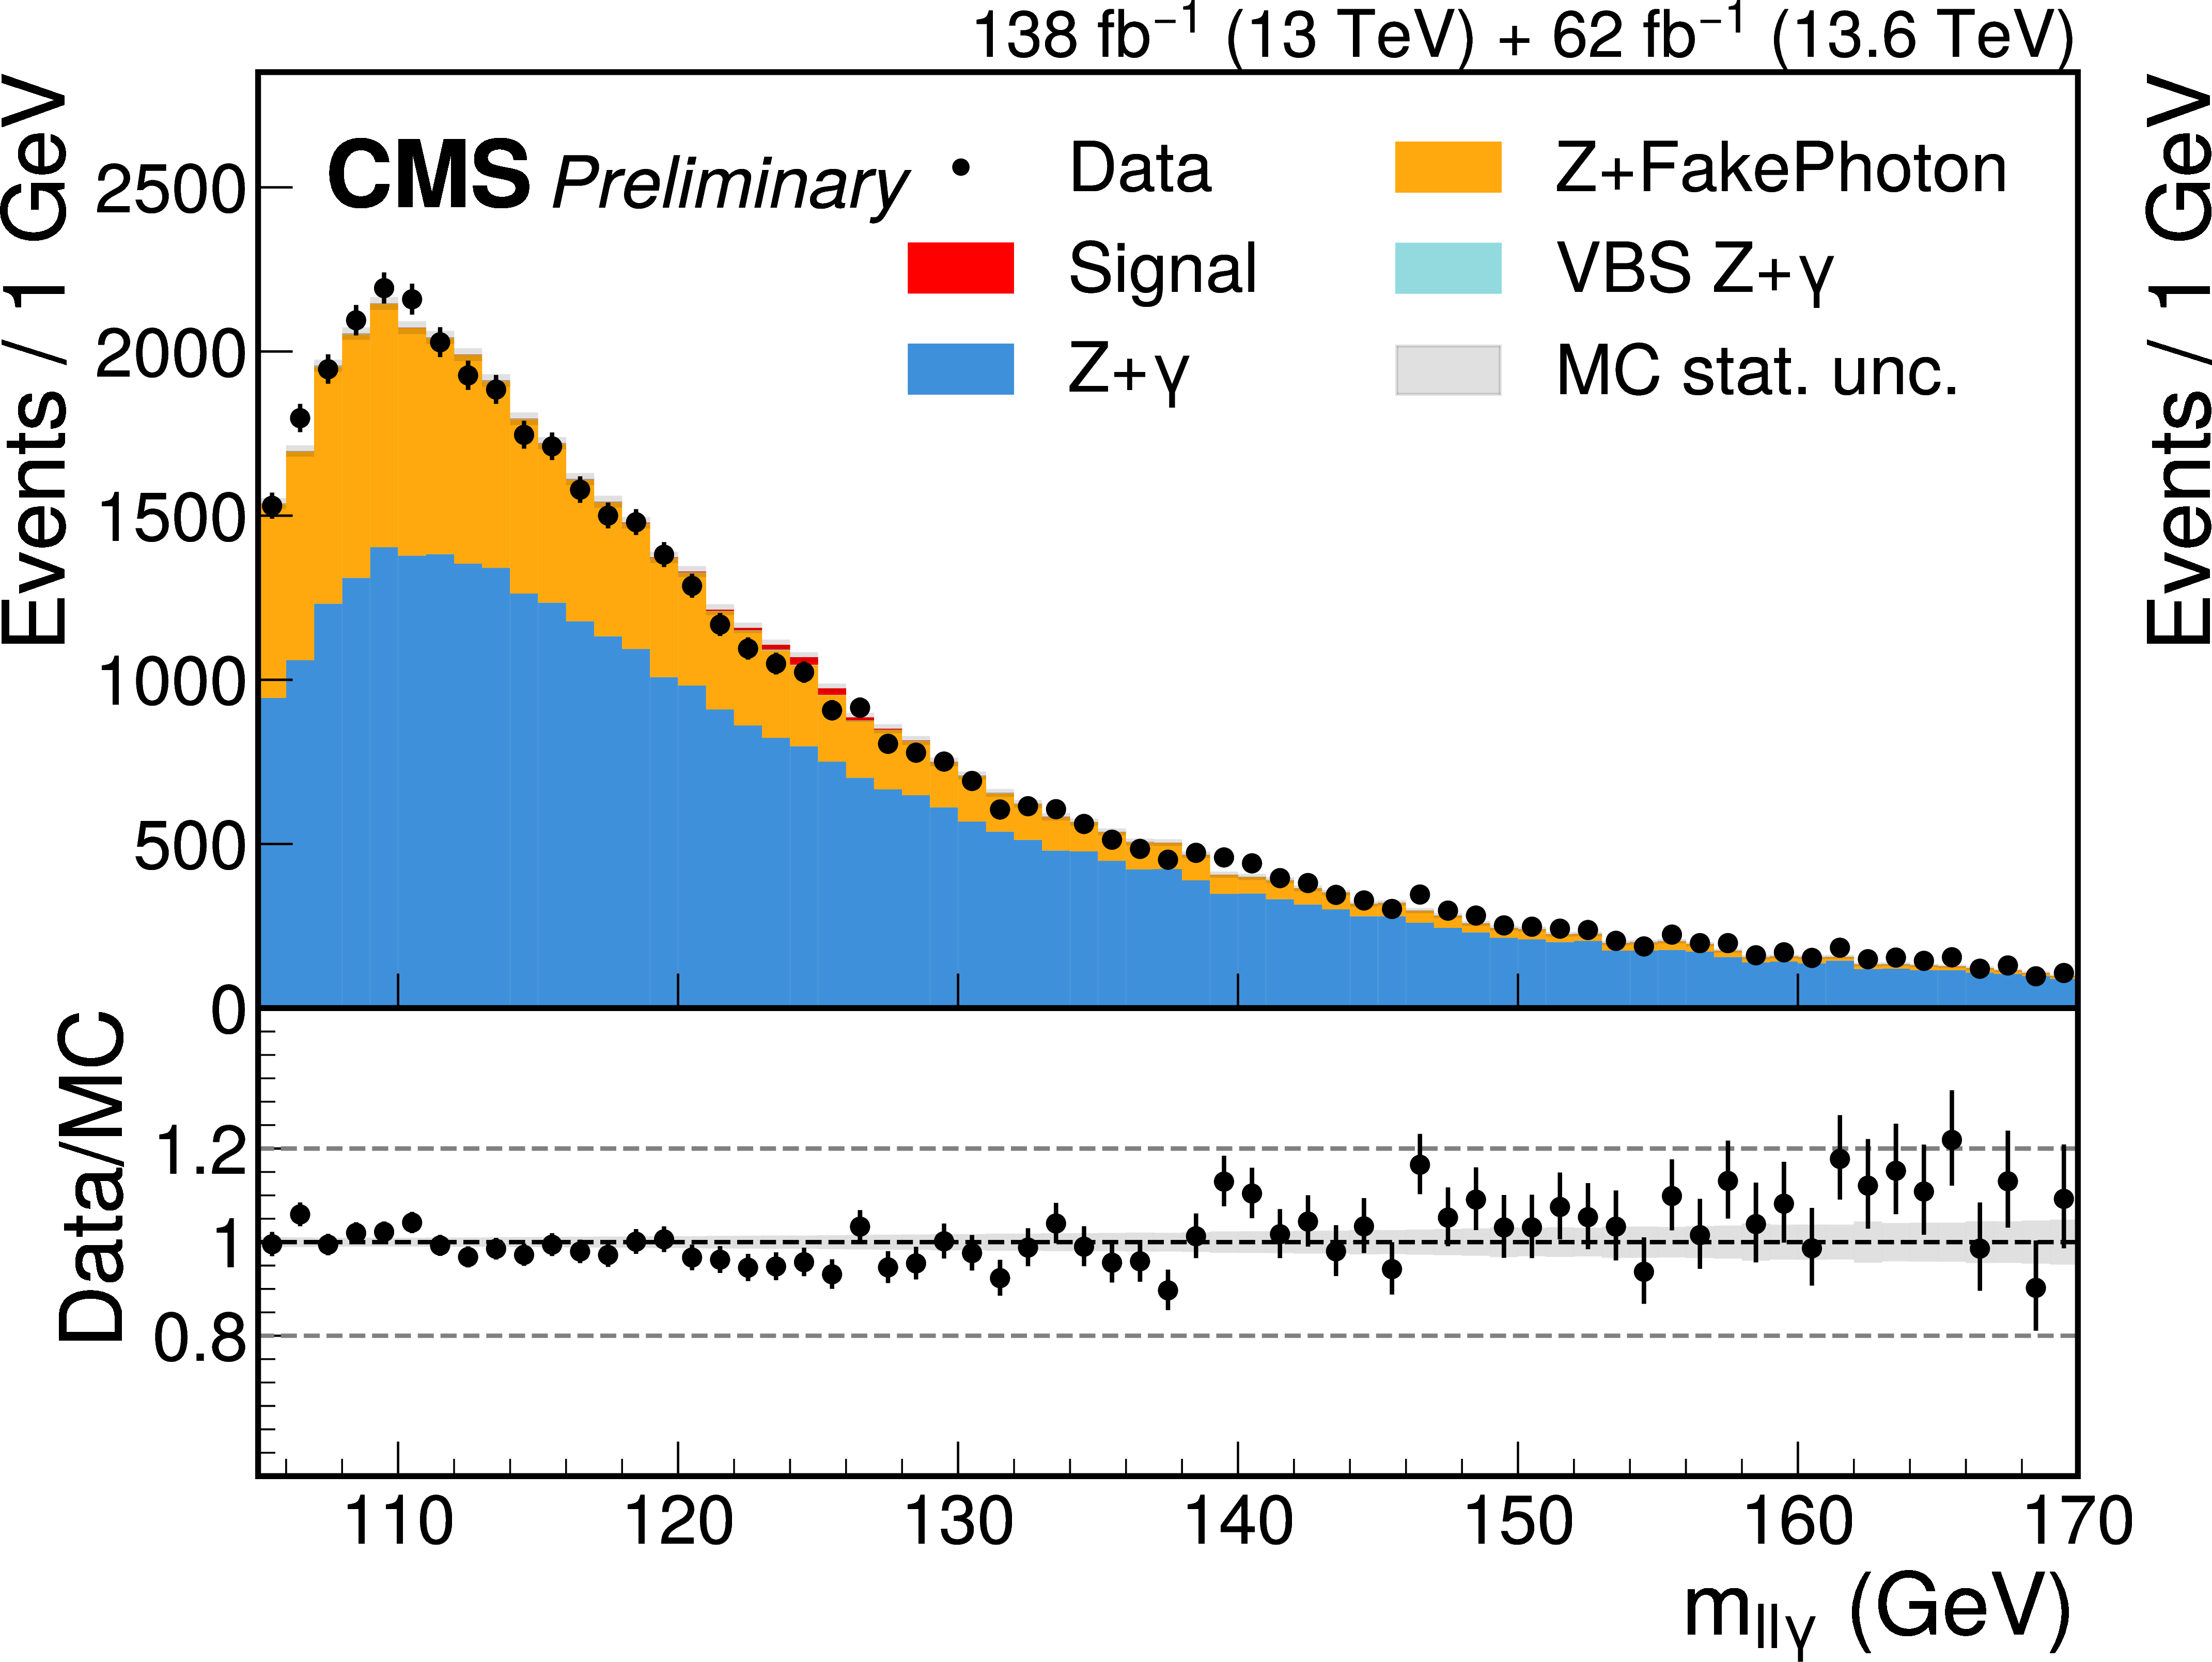
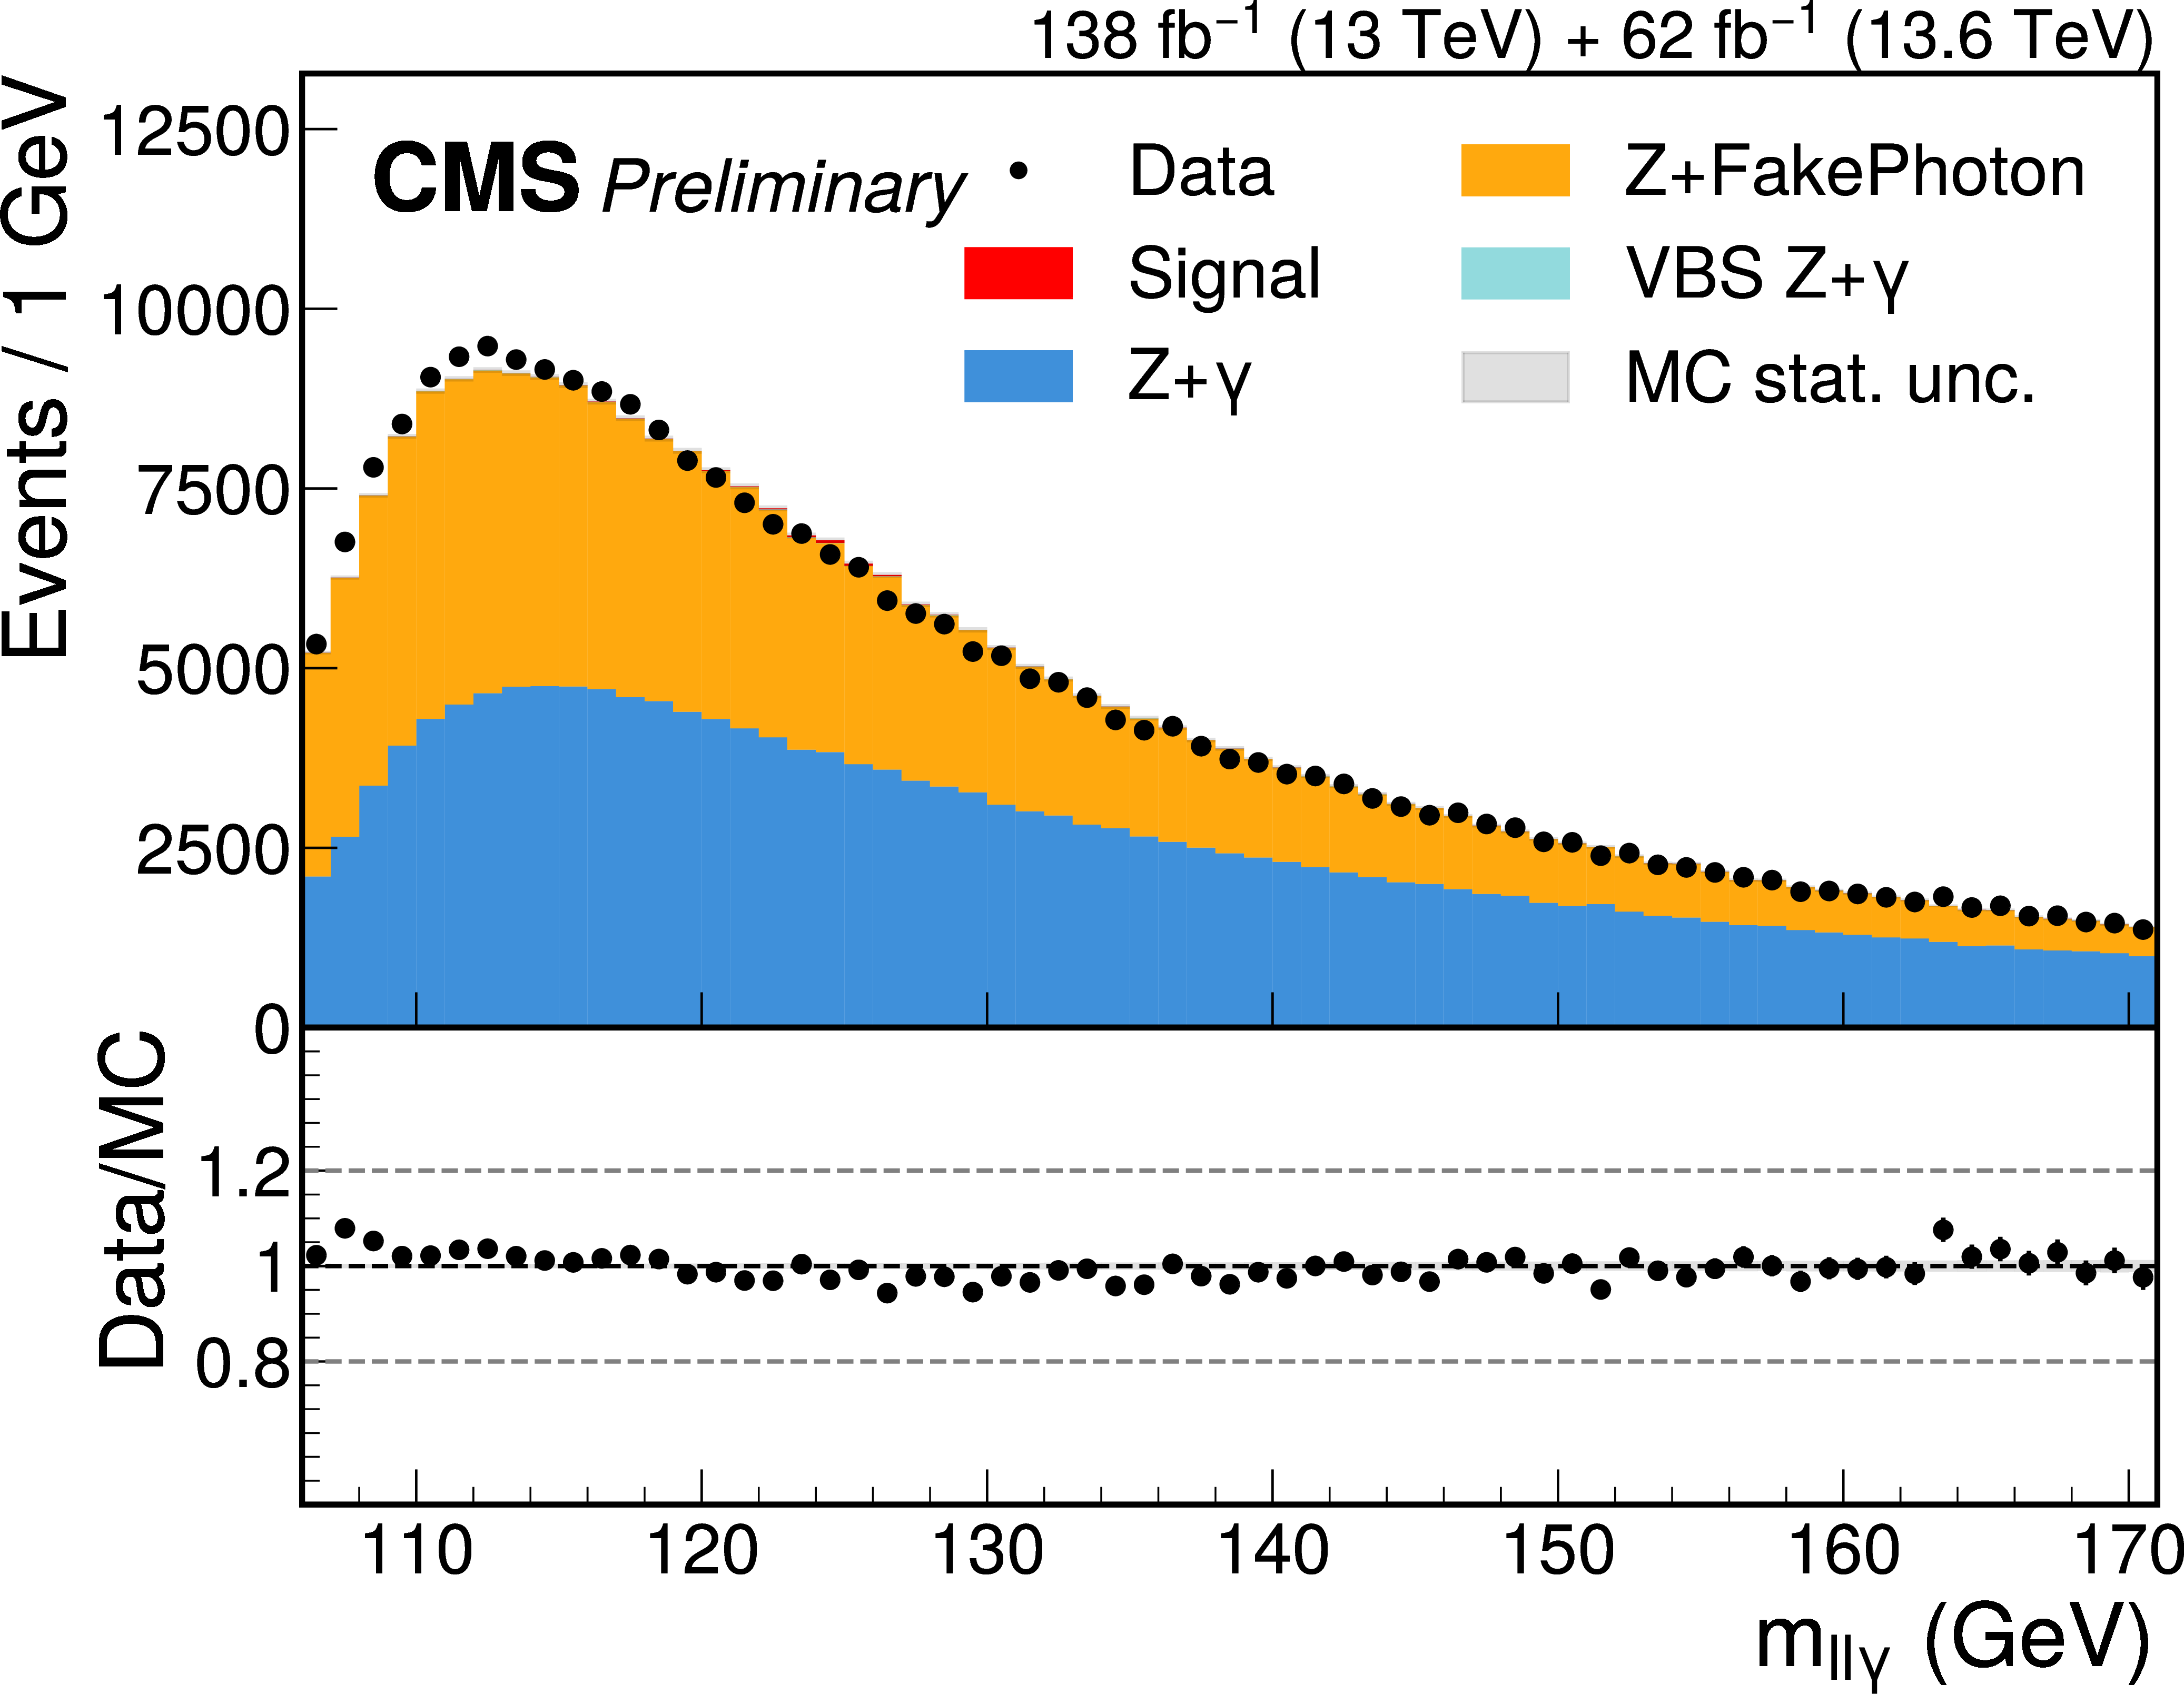
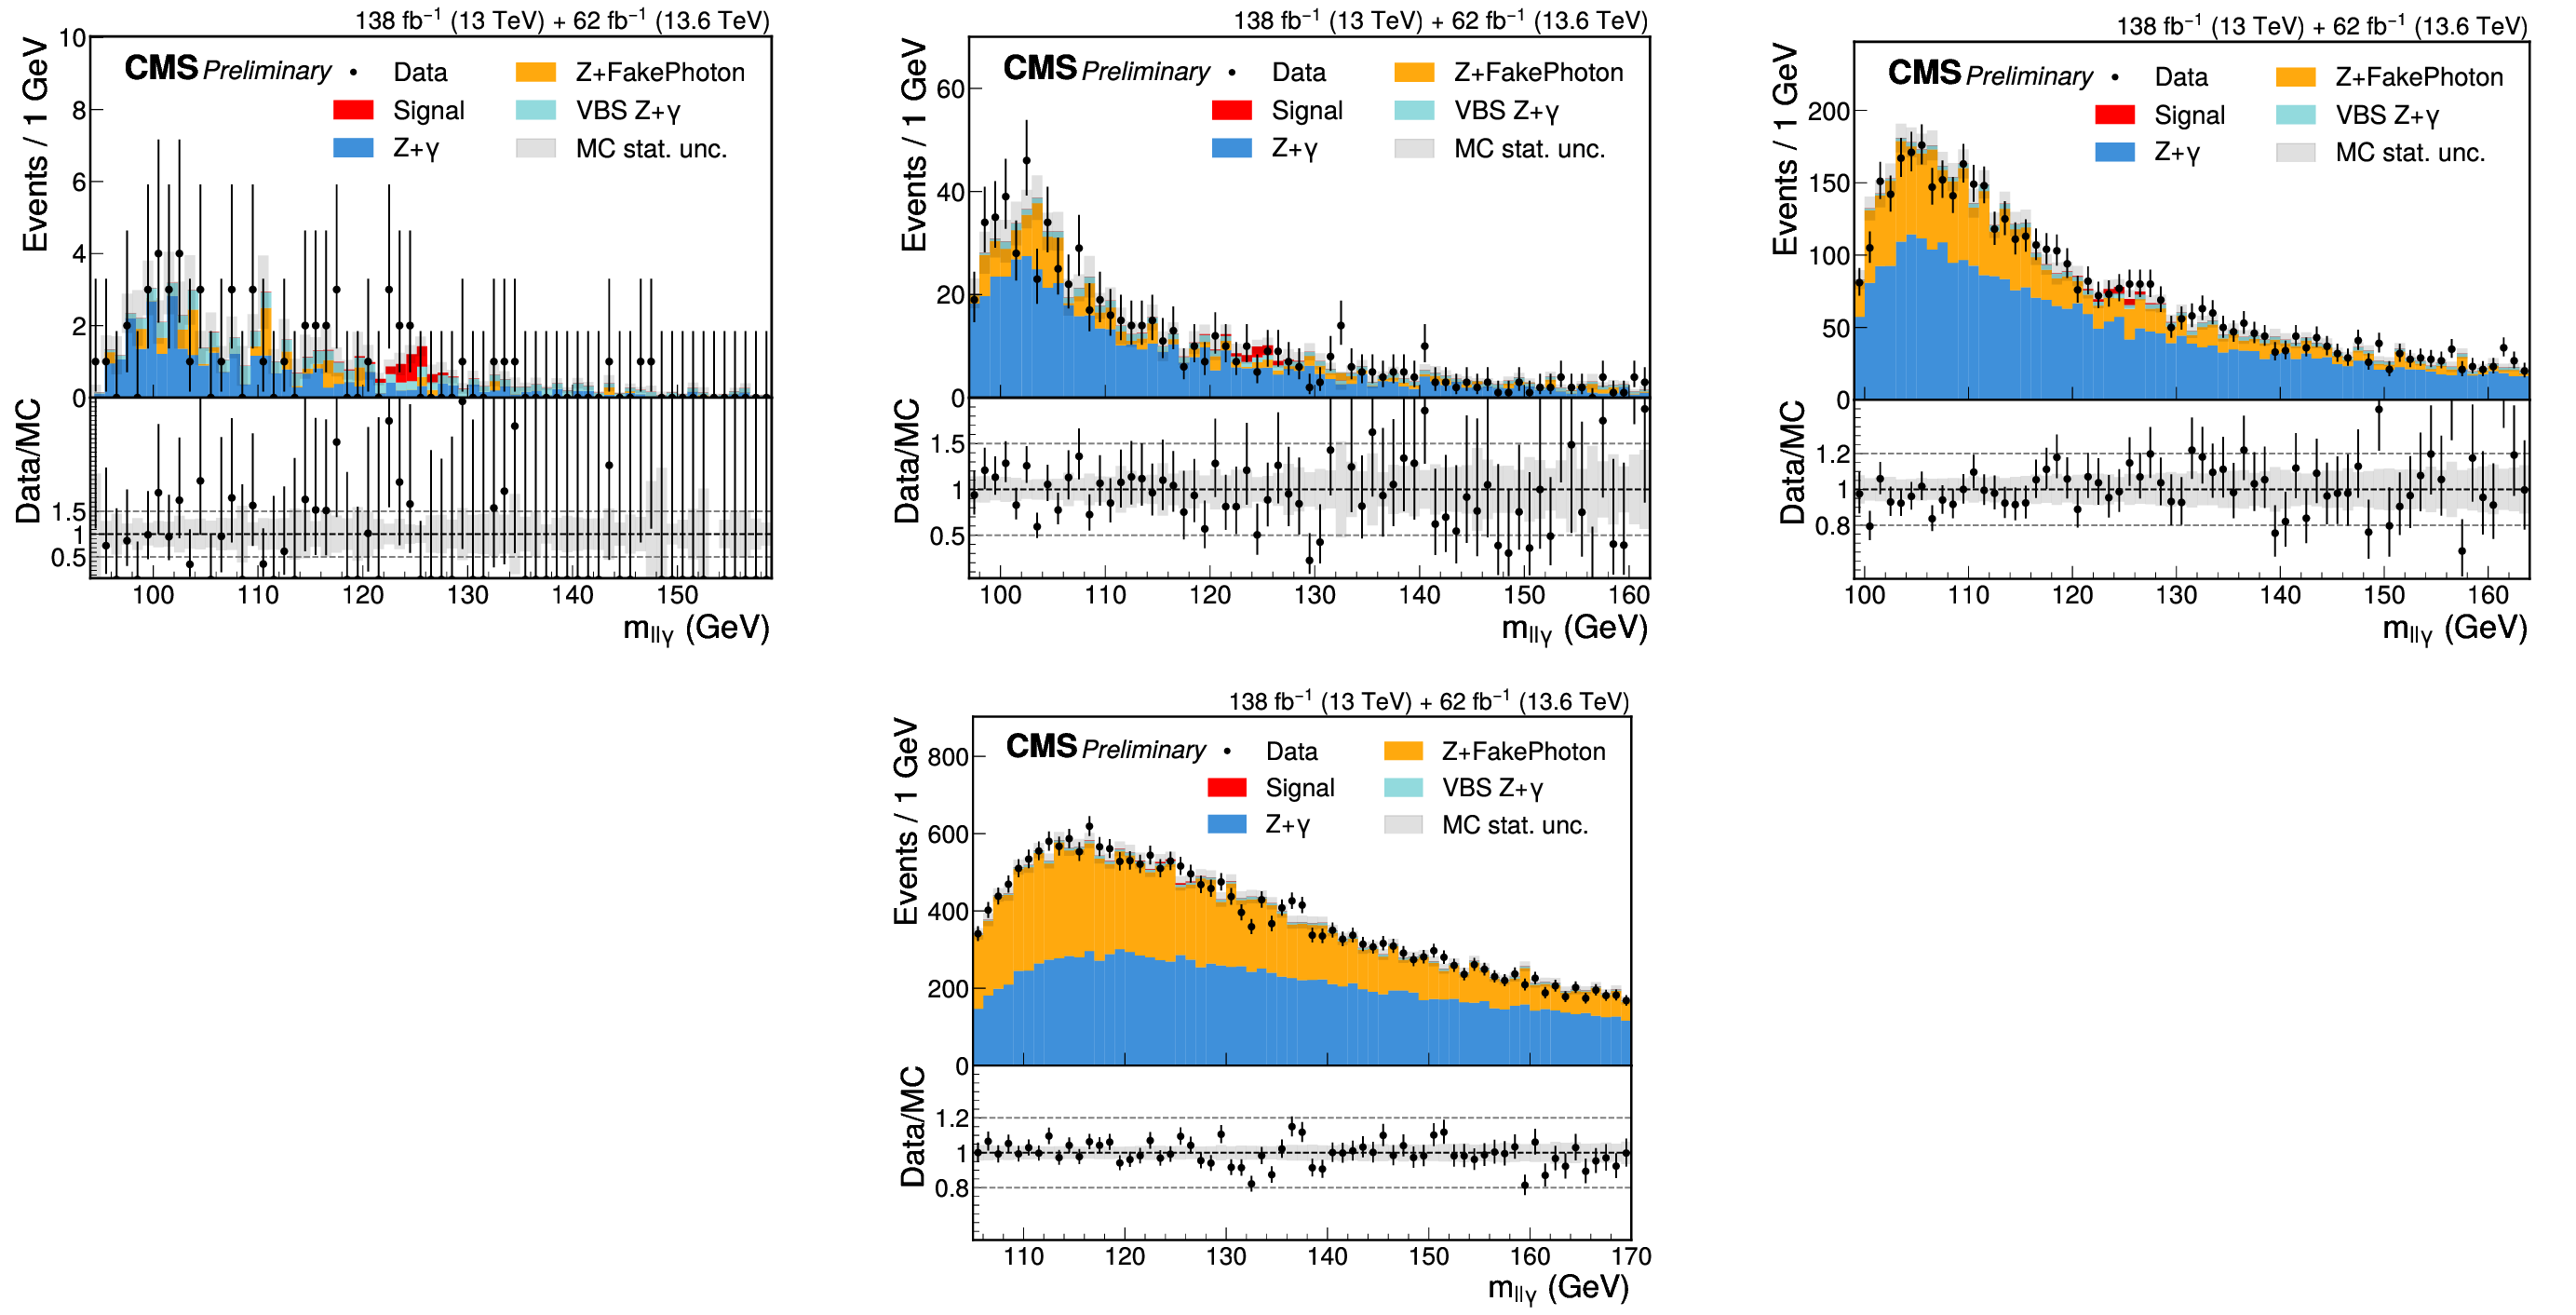
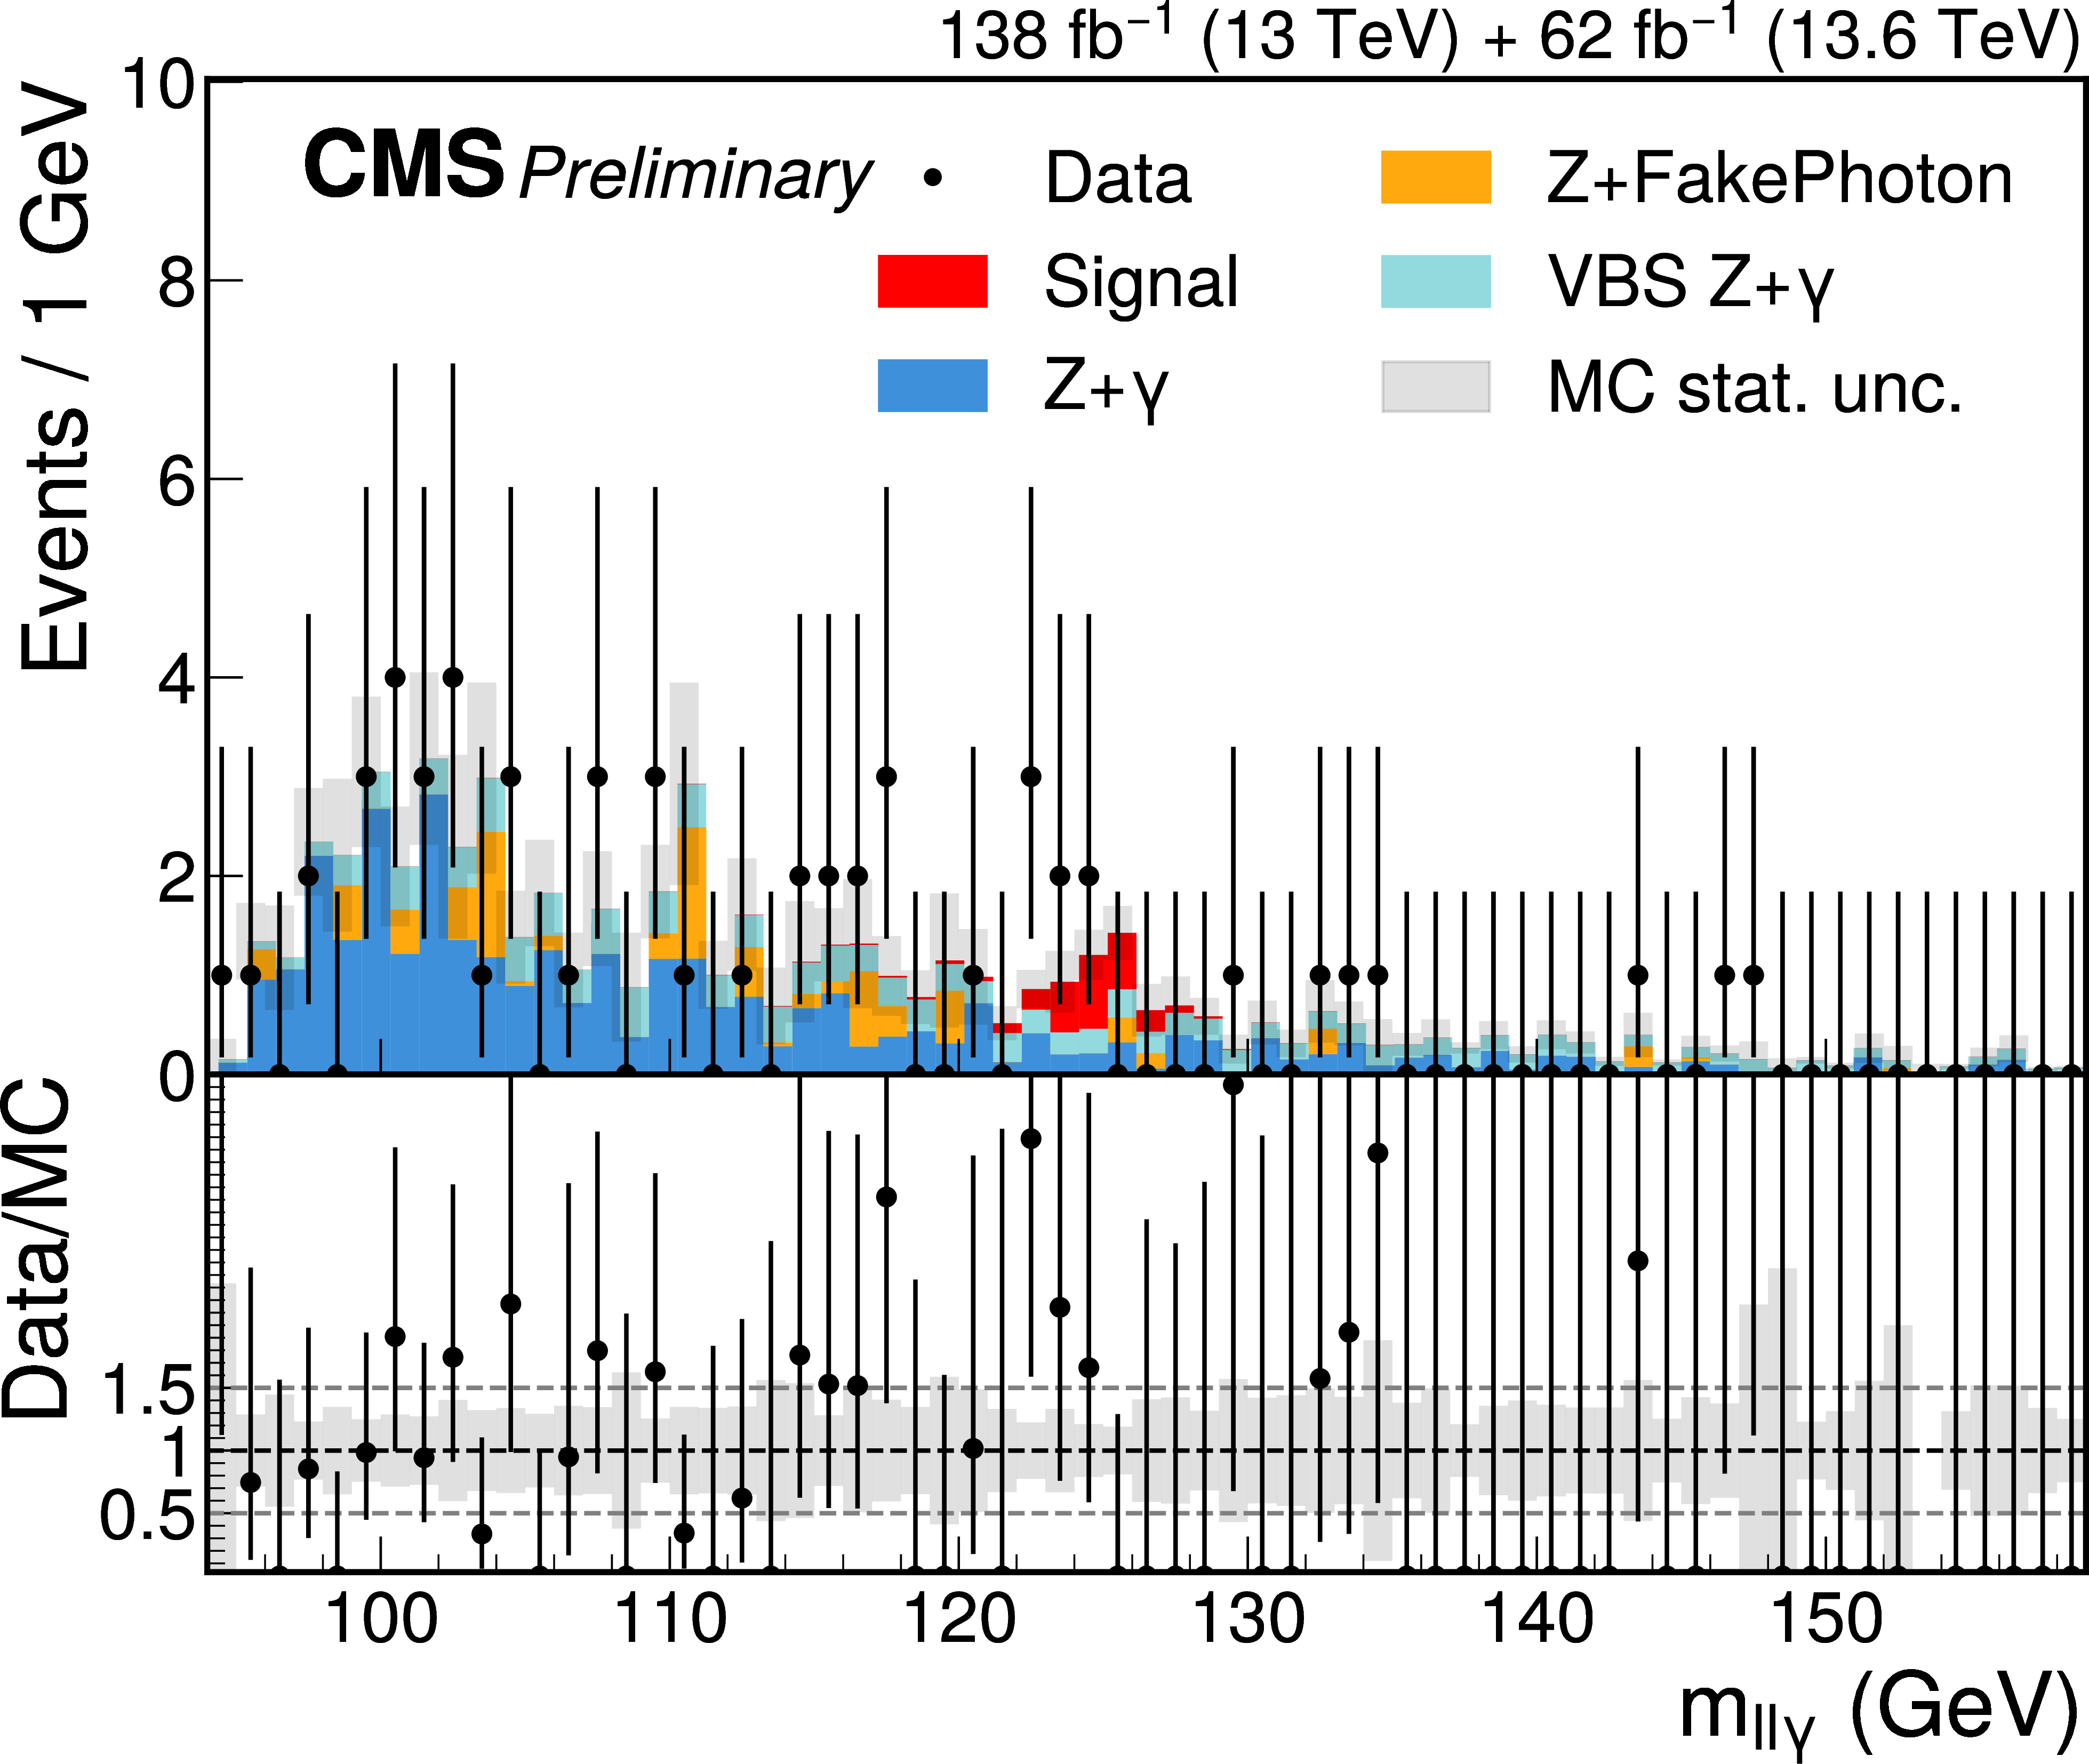
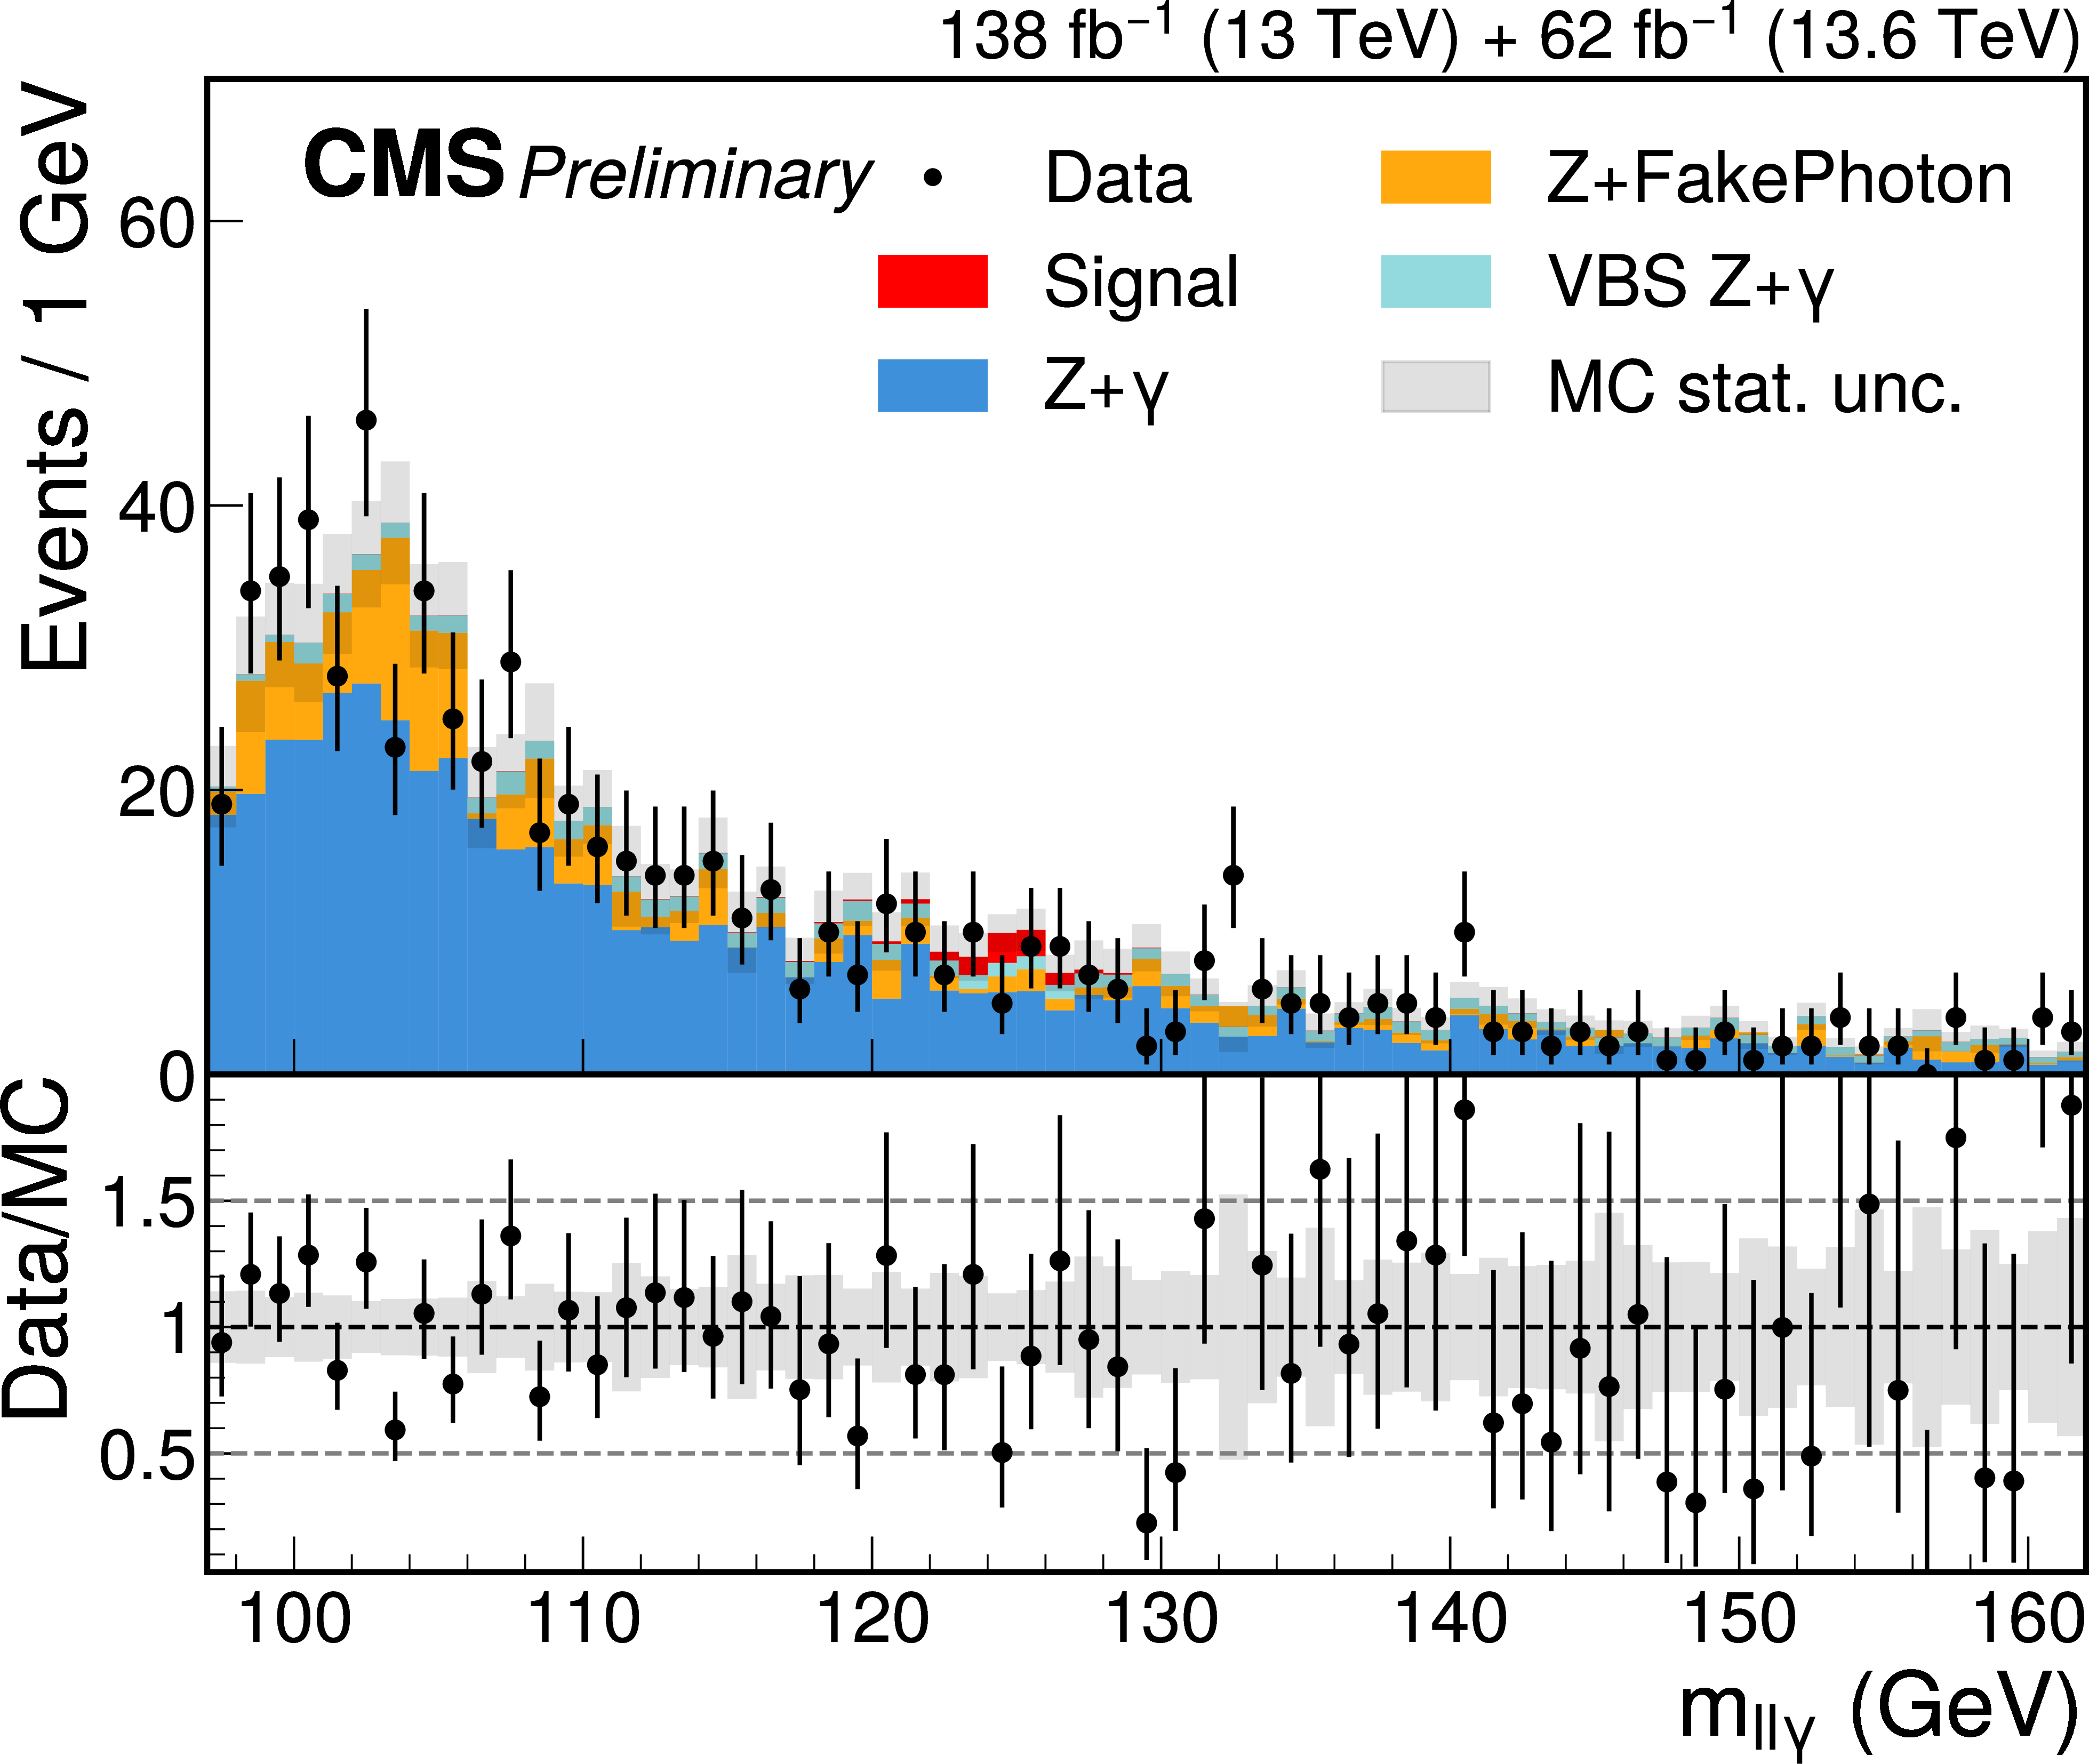
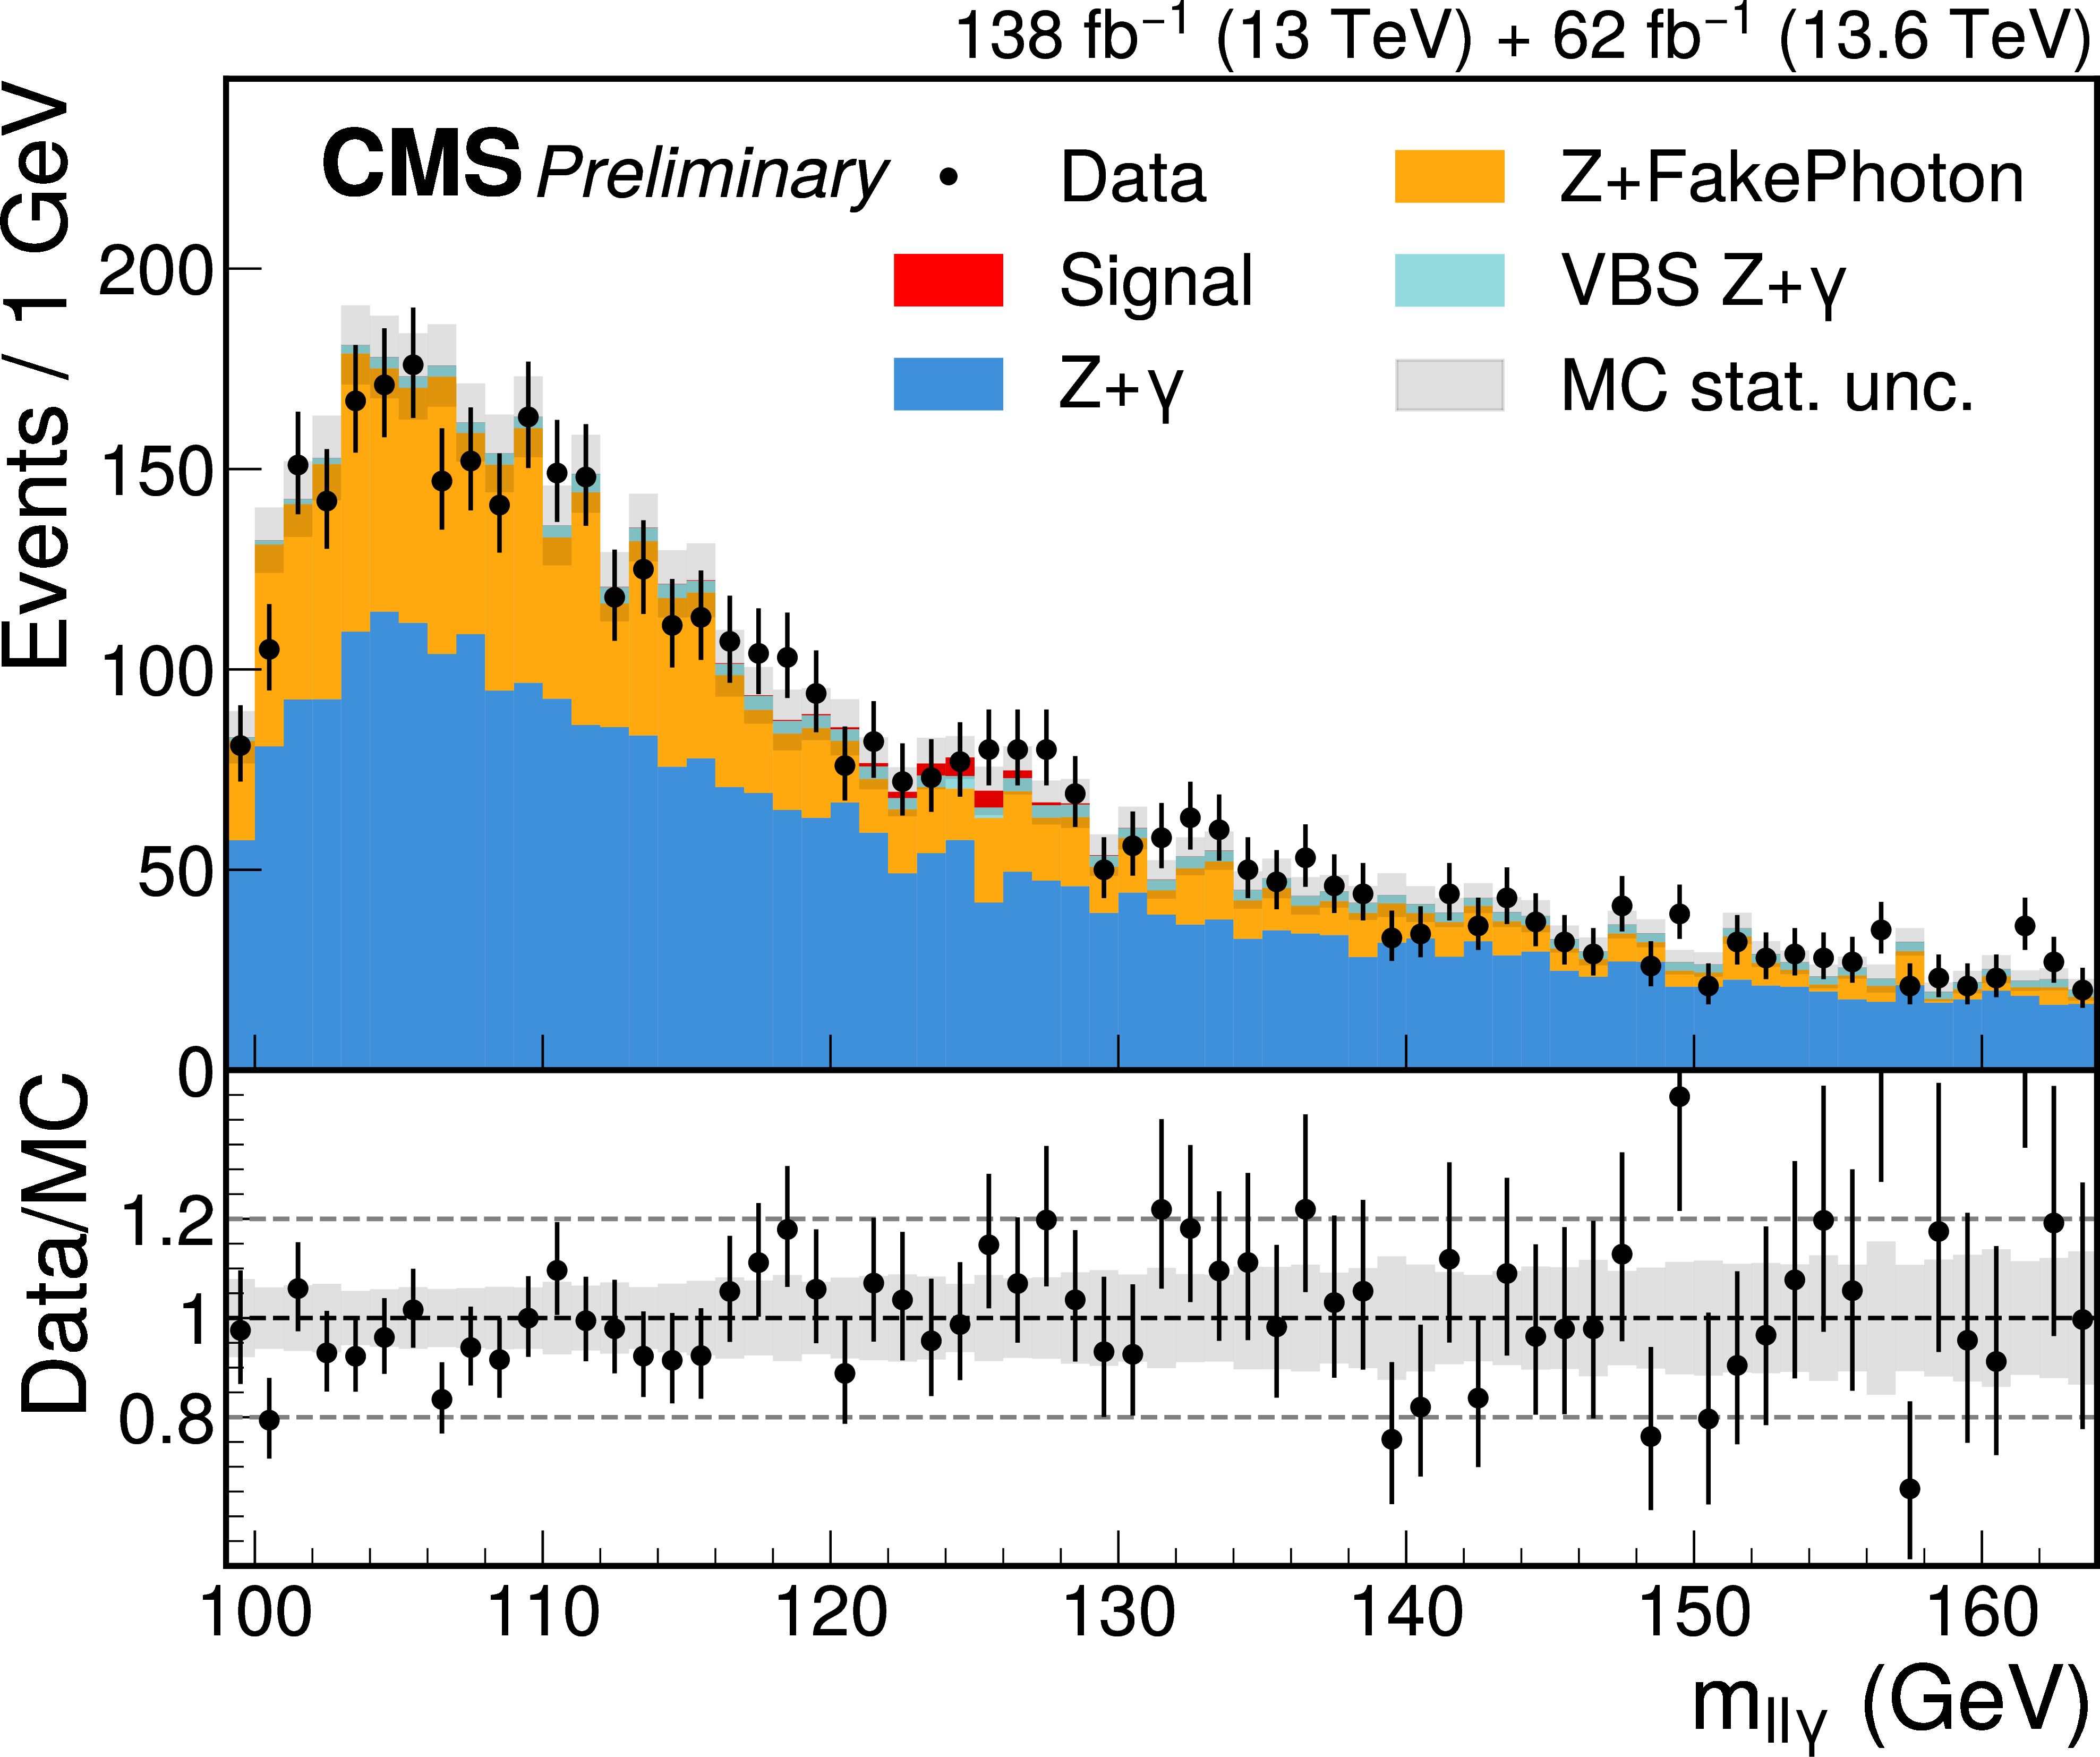
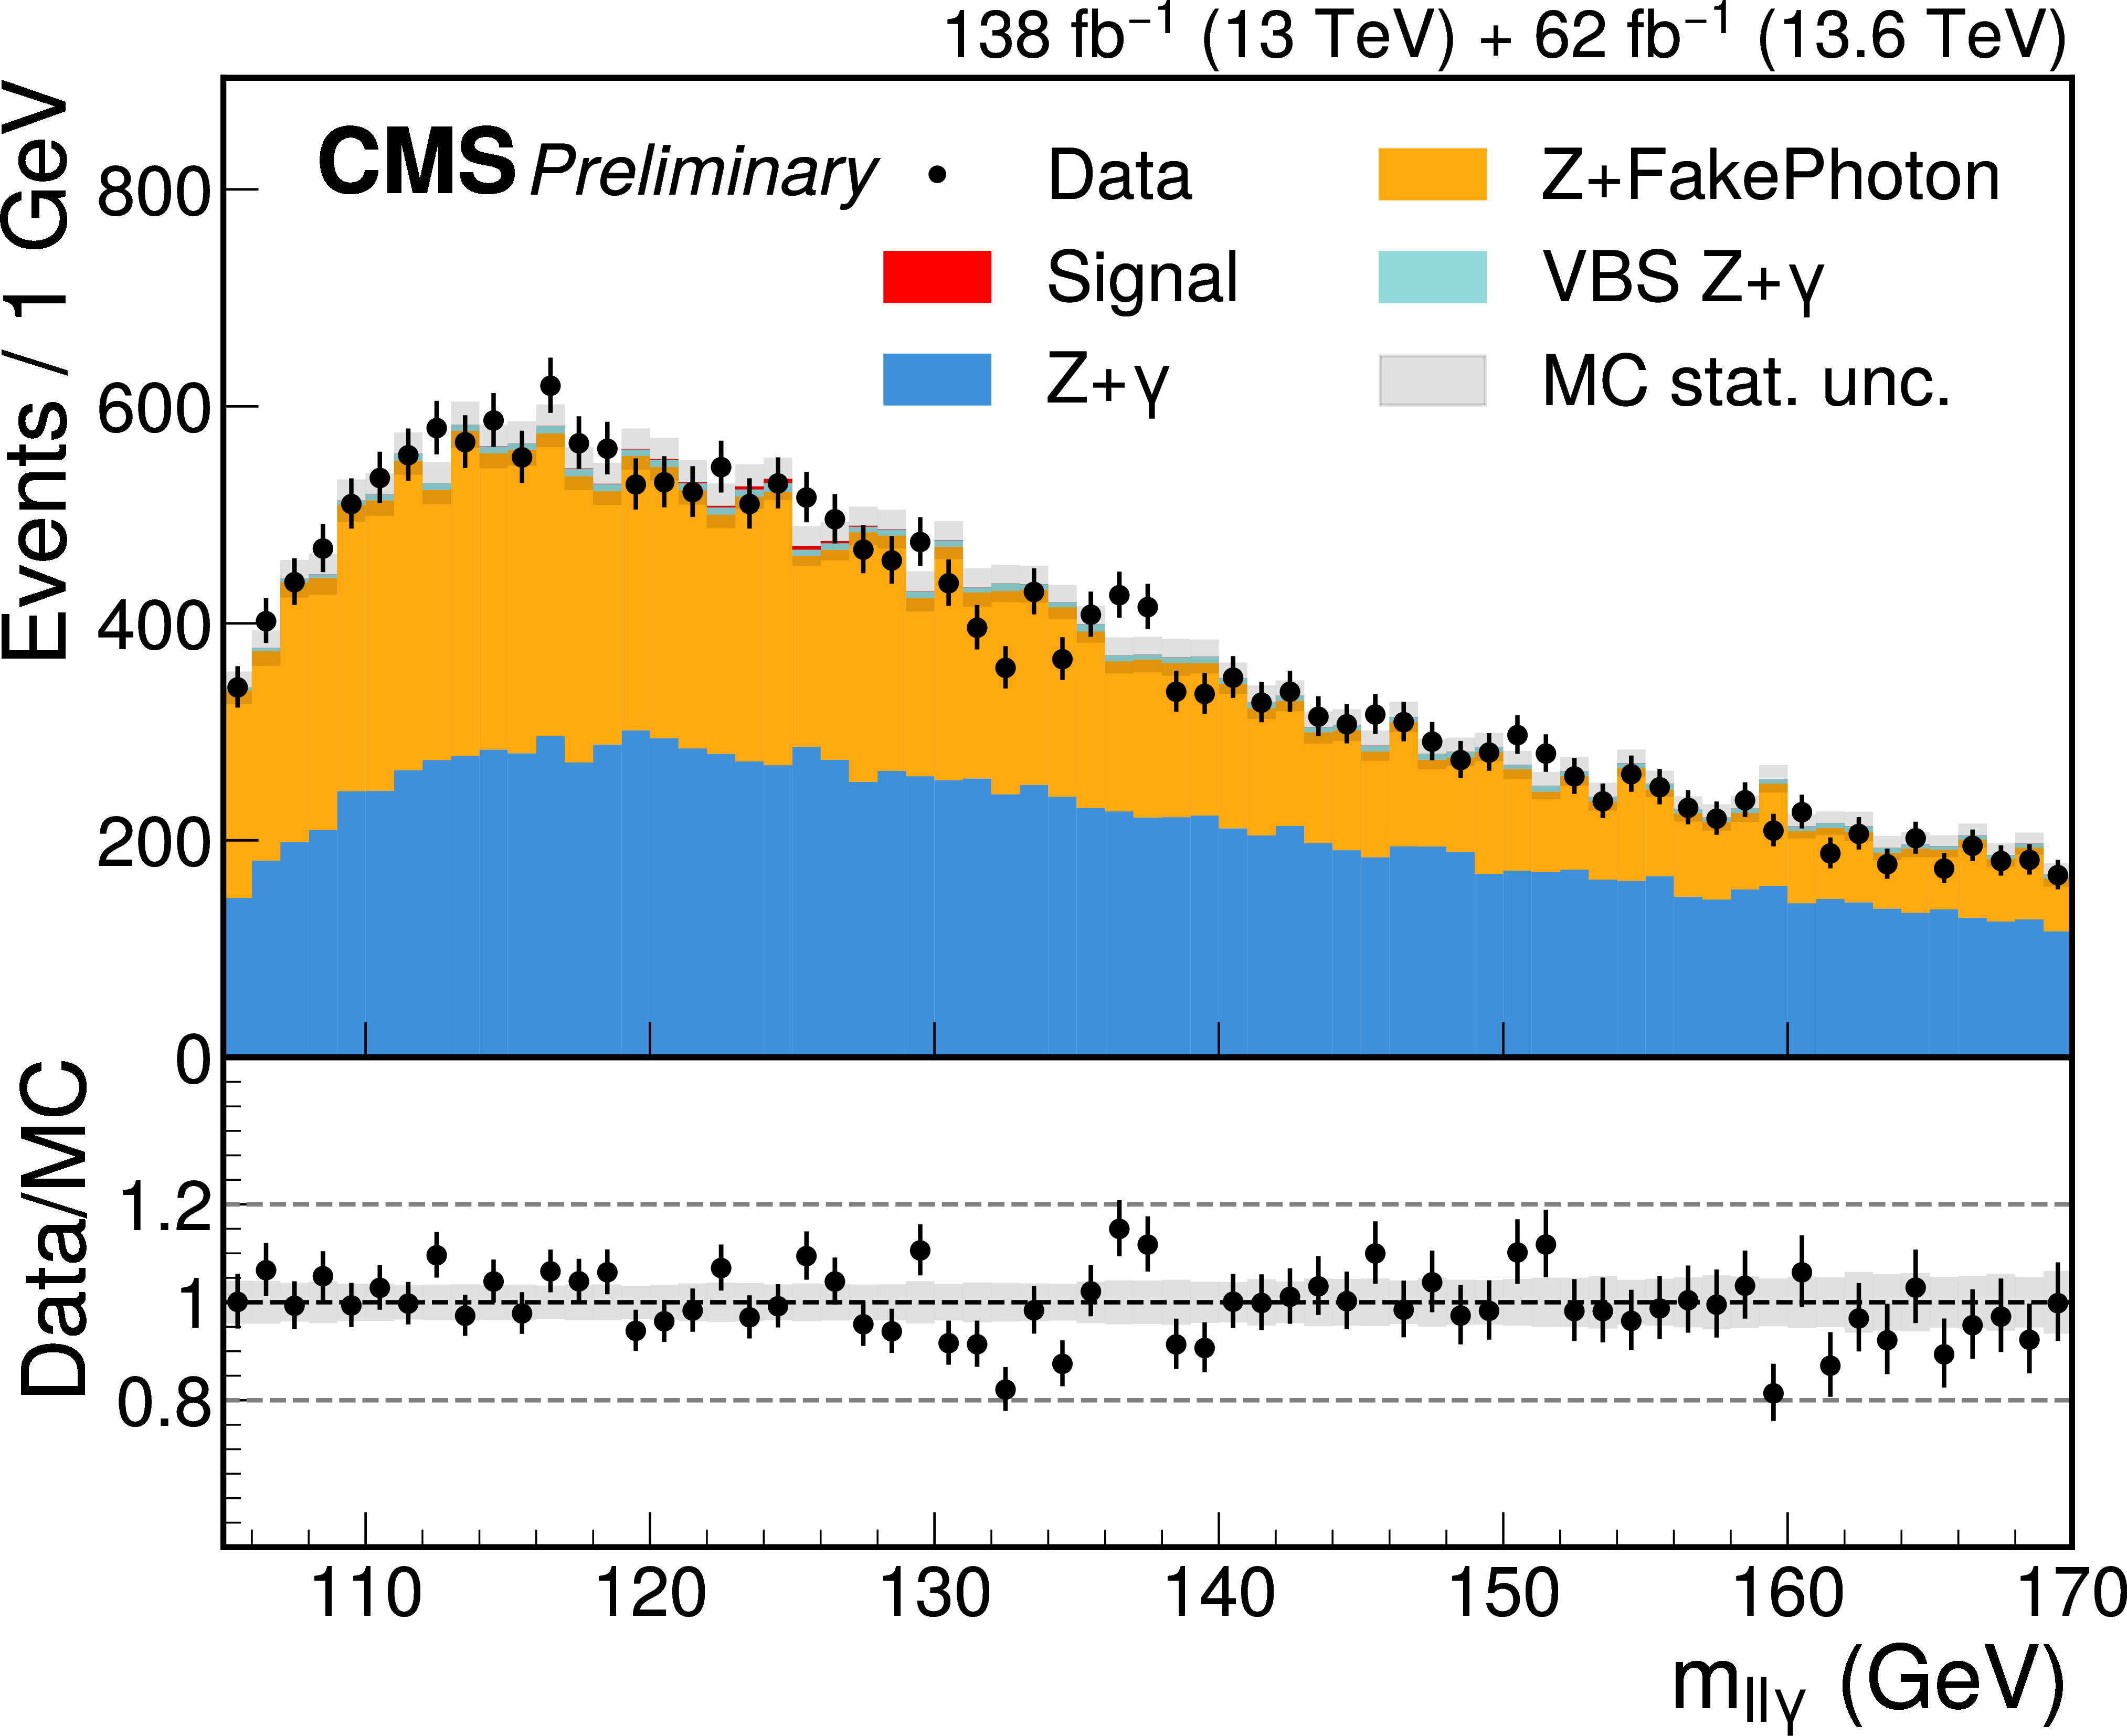
Additional Figure 4:
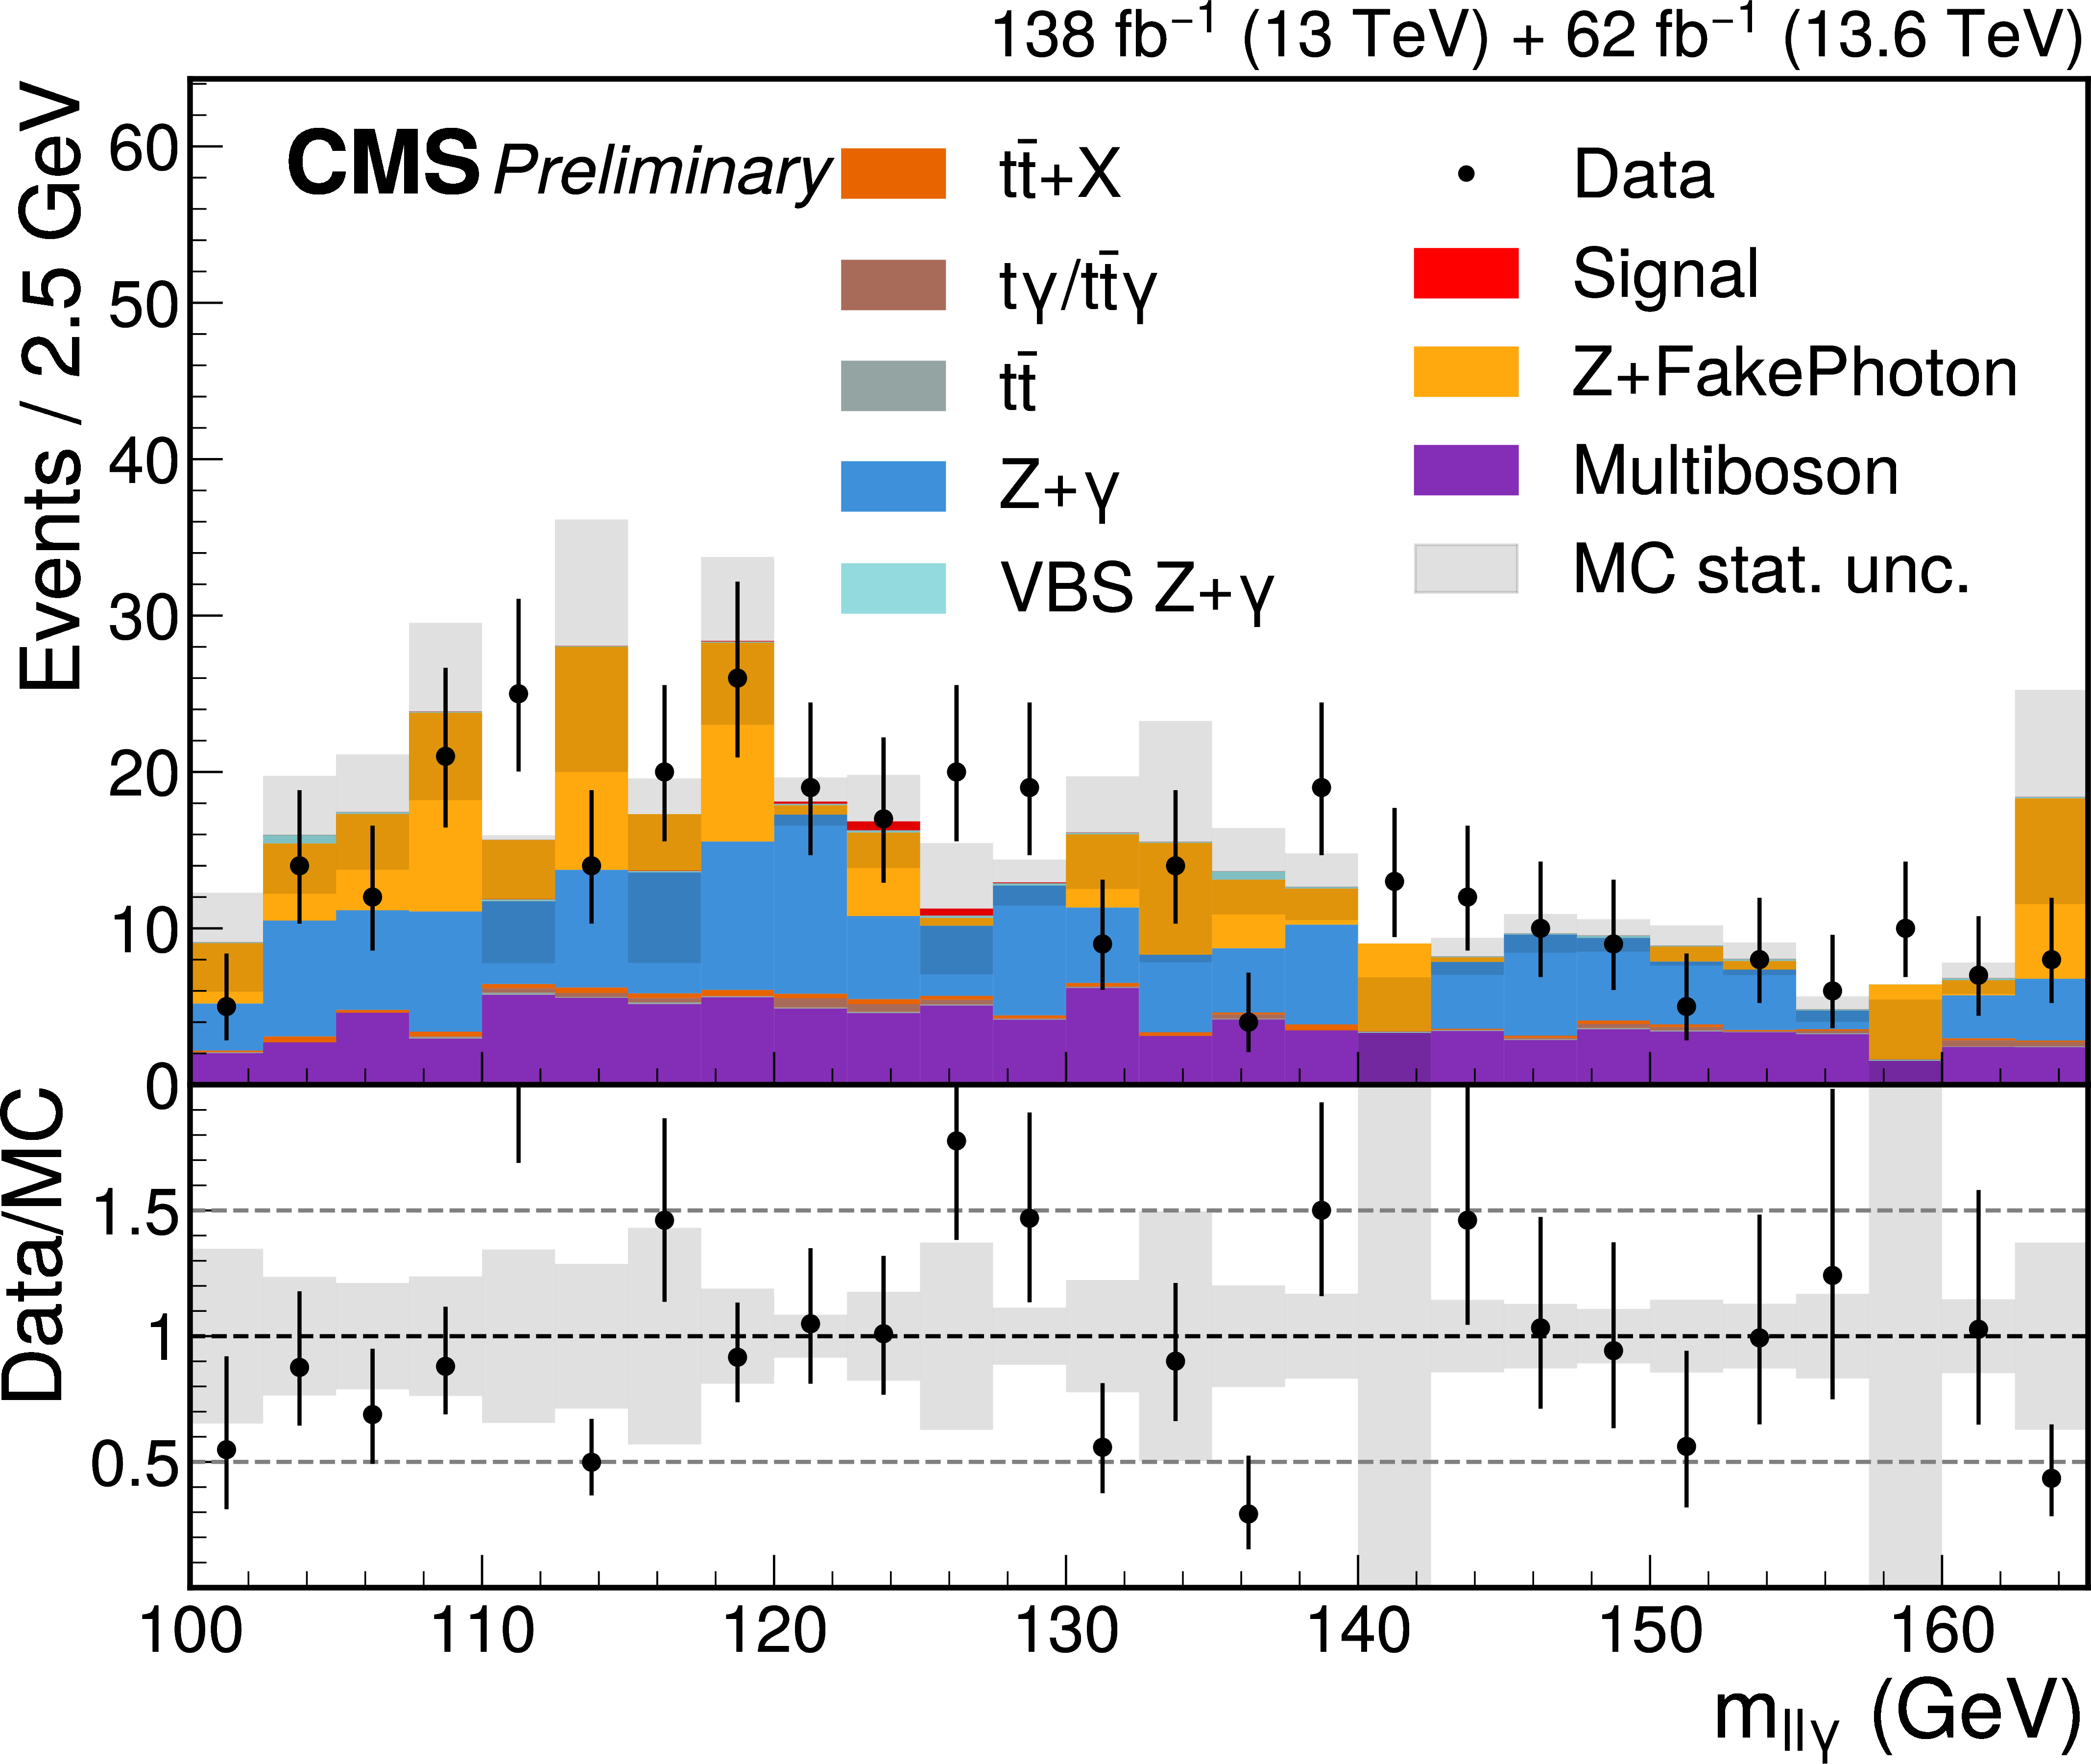
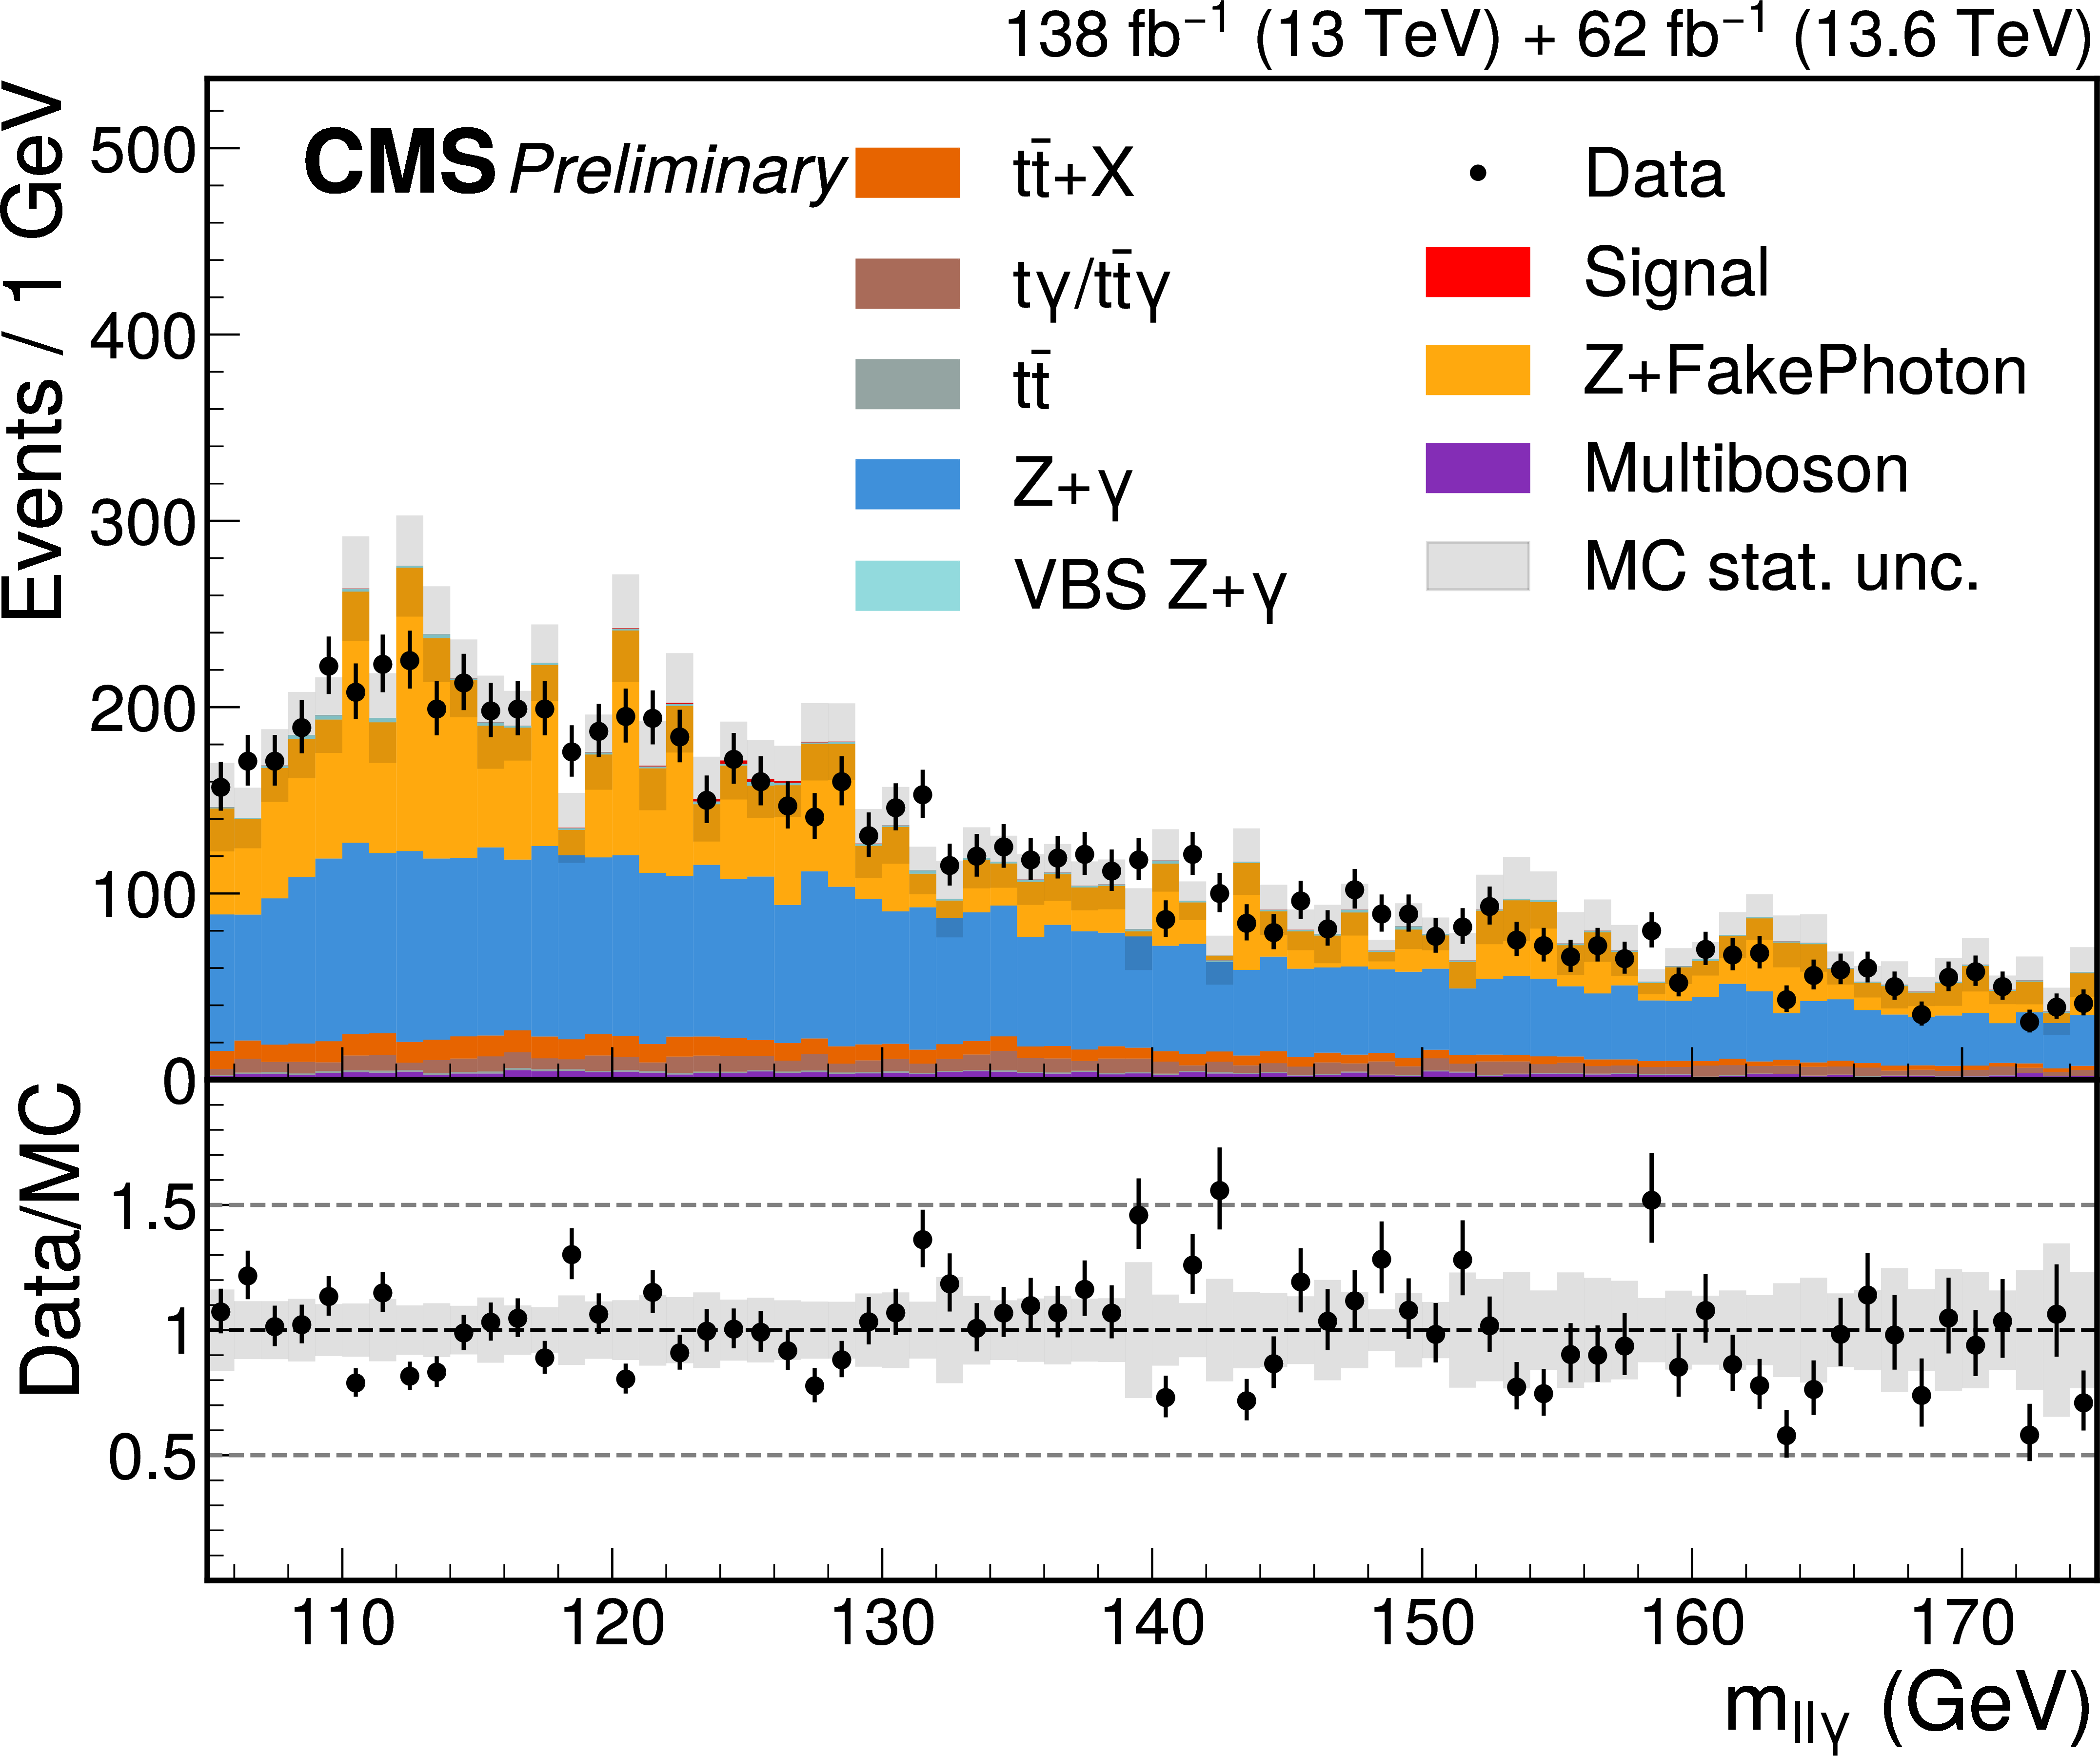
Distribution in $m_{\ell\ell\gamma}$ of data, simulated signal, and selected simulated background events for the (top-left) ggF1, (top-right) ggF2, (bottom-left) ggF3, and (bottom-right) ggF4 categories. The simulated events are displayed as stacked histograms. While only the signal simulation is used in the statistical procedure, overall good agreement is observed between all simulated samples and data. |
png pdf |
Additional Figure 4-a:
Distribution in $m_{\ell\ell\gamma}$ of data, simulated signal, and selected simulated background events for the (top-left) ggF1, (top-right) ggF2, (bottom-left) ggF3, and (bottom-right) ggF4 categories. The simulated events are displayed as stacked histograms. While only the signal simulation is used in the statistical procedure, overall good agreement is observed between all simulated samples and data. |
png pdf |
Additional Figure 4-b:
Distribution in $m_{\ell\ell\gamma}$ of data, simulated signal, and selected simulated background events for the (top-left) ggF1, (top-right) ggF2, (bottom-left) ggF3, and (bottom-right) ggF4 categories. The simulated events are displayed as stacked histograms. While only the signal simulation is used in the statistical procedure, overall good agreement is observed between all simulated samples and data. |
png pdf |
Additional Figure 4-c:
Distribution in $m_{\ell\ell\gamma}$ of data, simulated signal, and selected simulated background events for the (top-left) ggF1, (top-right) ggF2, (bottom-left) ggF3, and (bottom-right) ggF4 categories. The simulated events are displayed as stacked histograms. While only the signal simulation is used in the statistical procedure, overall good agreement is observed between all simulated samples and data. |
png pdf |
Additional Figure 4-d:
Distribution in $m_{\ell\ell\gamma}$ of data, simulated signal, and selected simulated background events for the (top-left) ggF1, (top-right) ggF2, (bottom-left) ggF3, and (bottom-right) ggF4 categories. The simulated events are displayed as stacked histograms. While only the signal simulation is used in the statistical procedure, overall good agreement is observed between all simulated samples and data. |
png pdf |
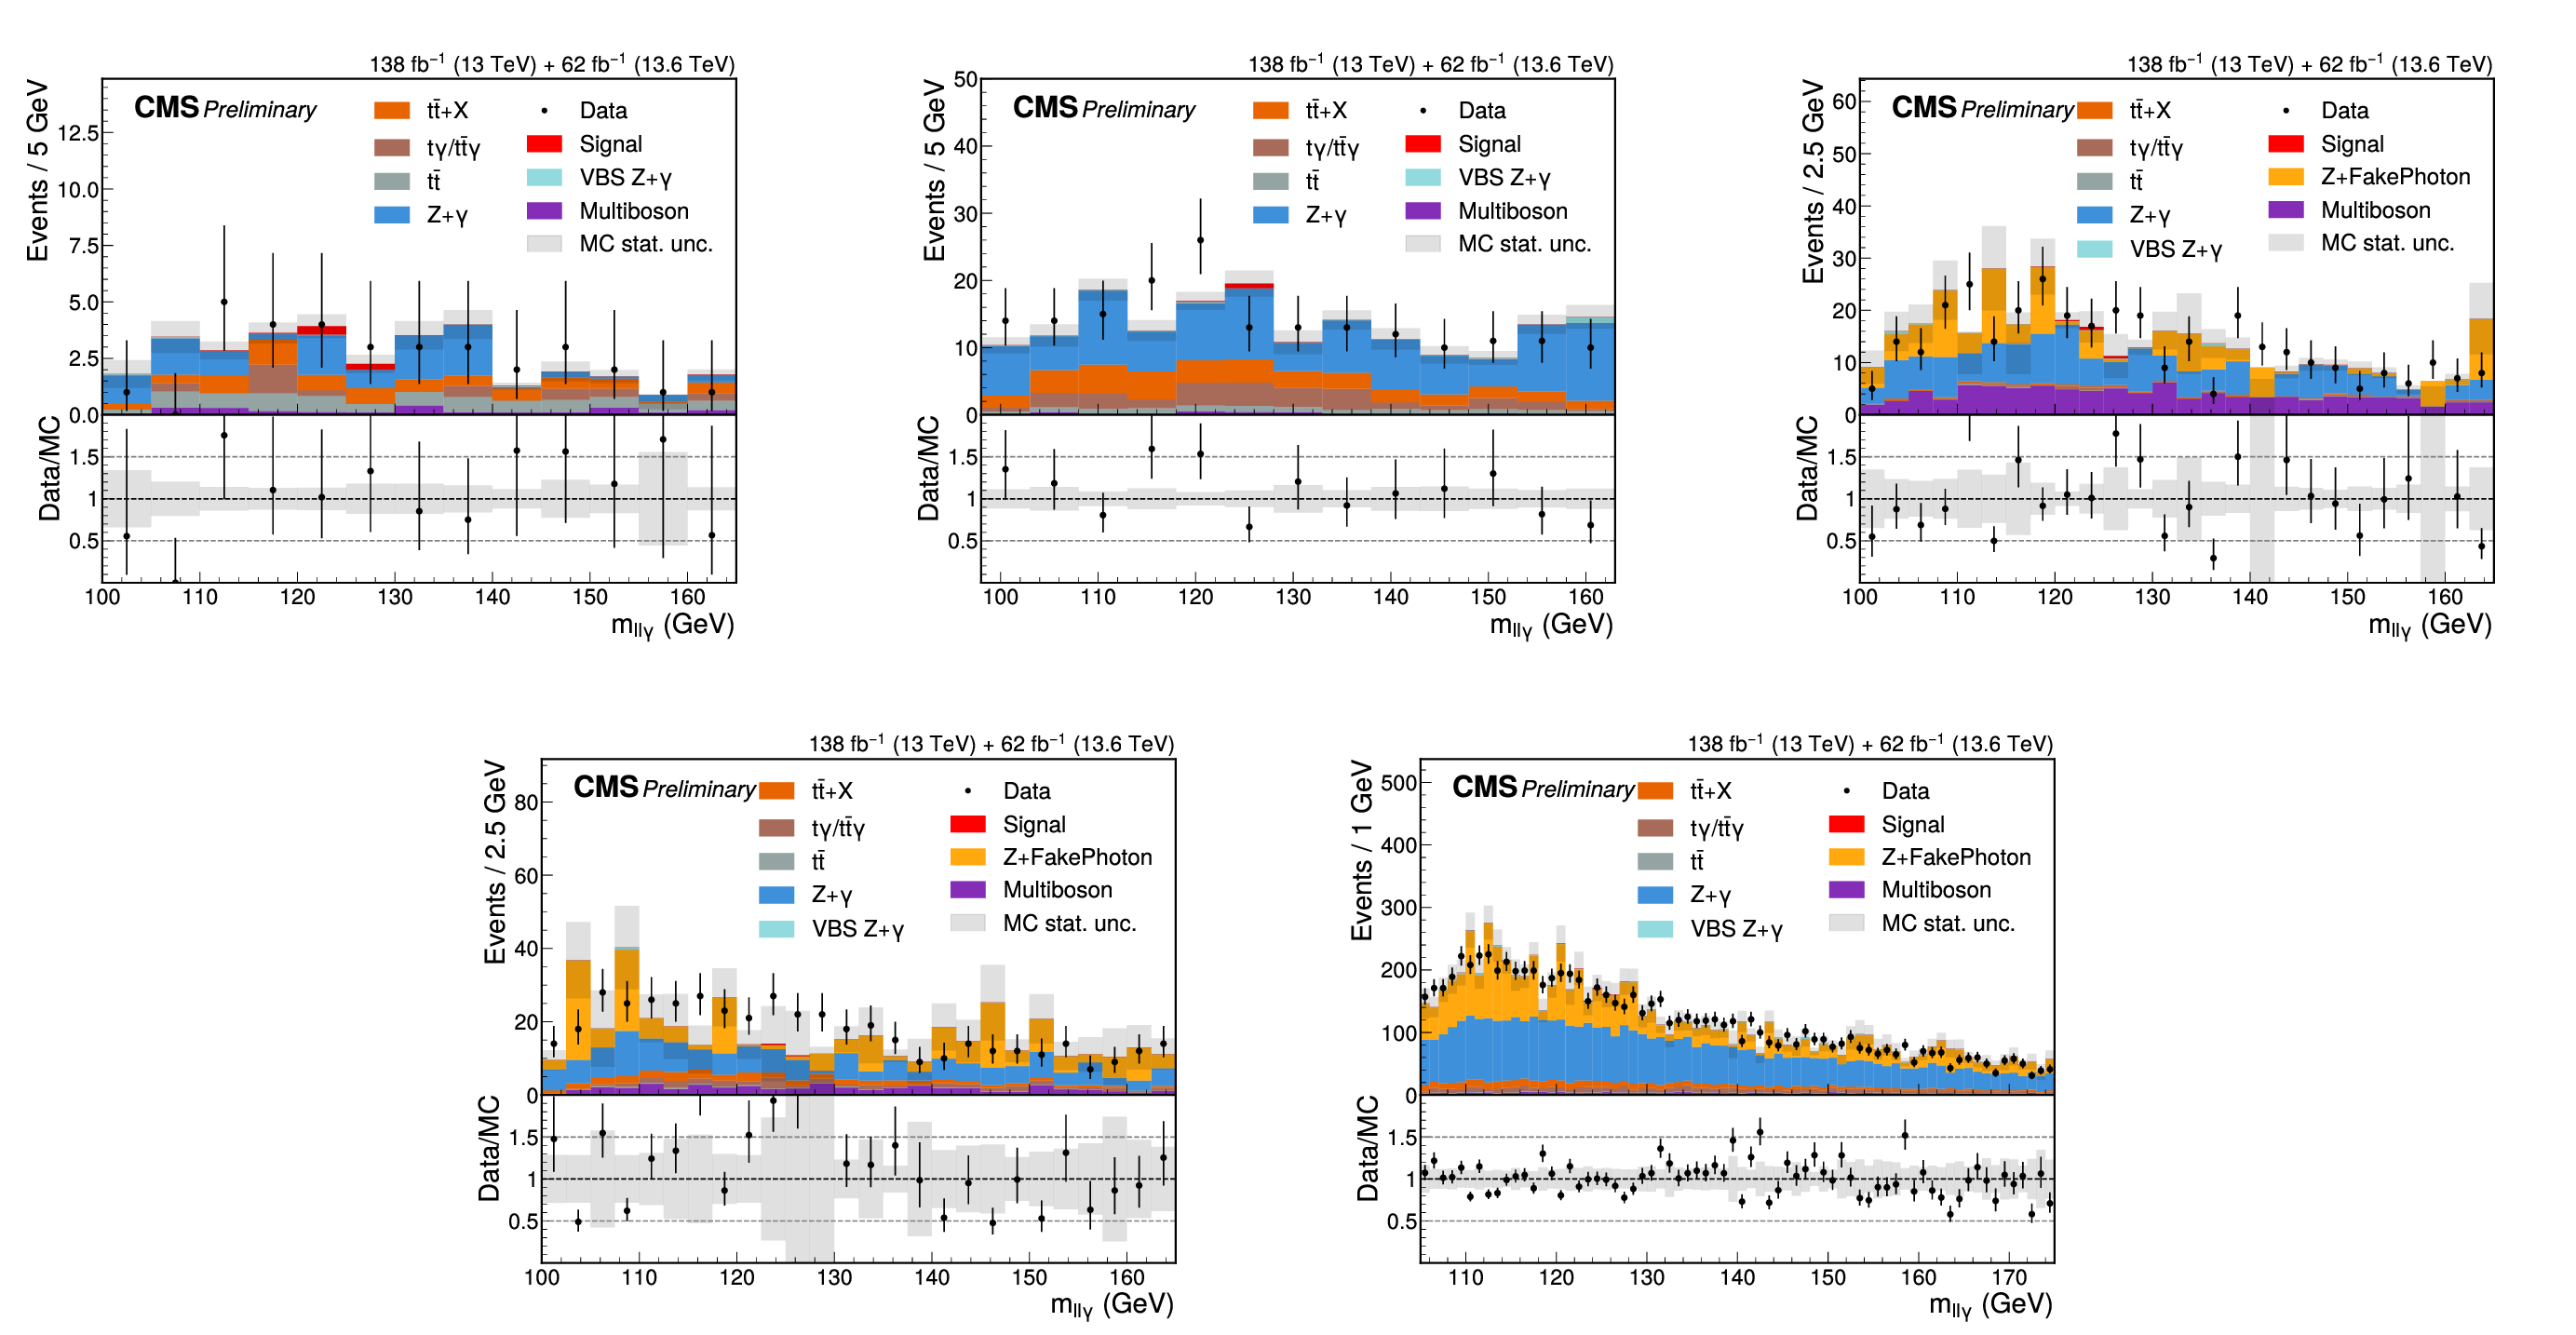
Additional Figure 5:
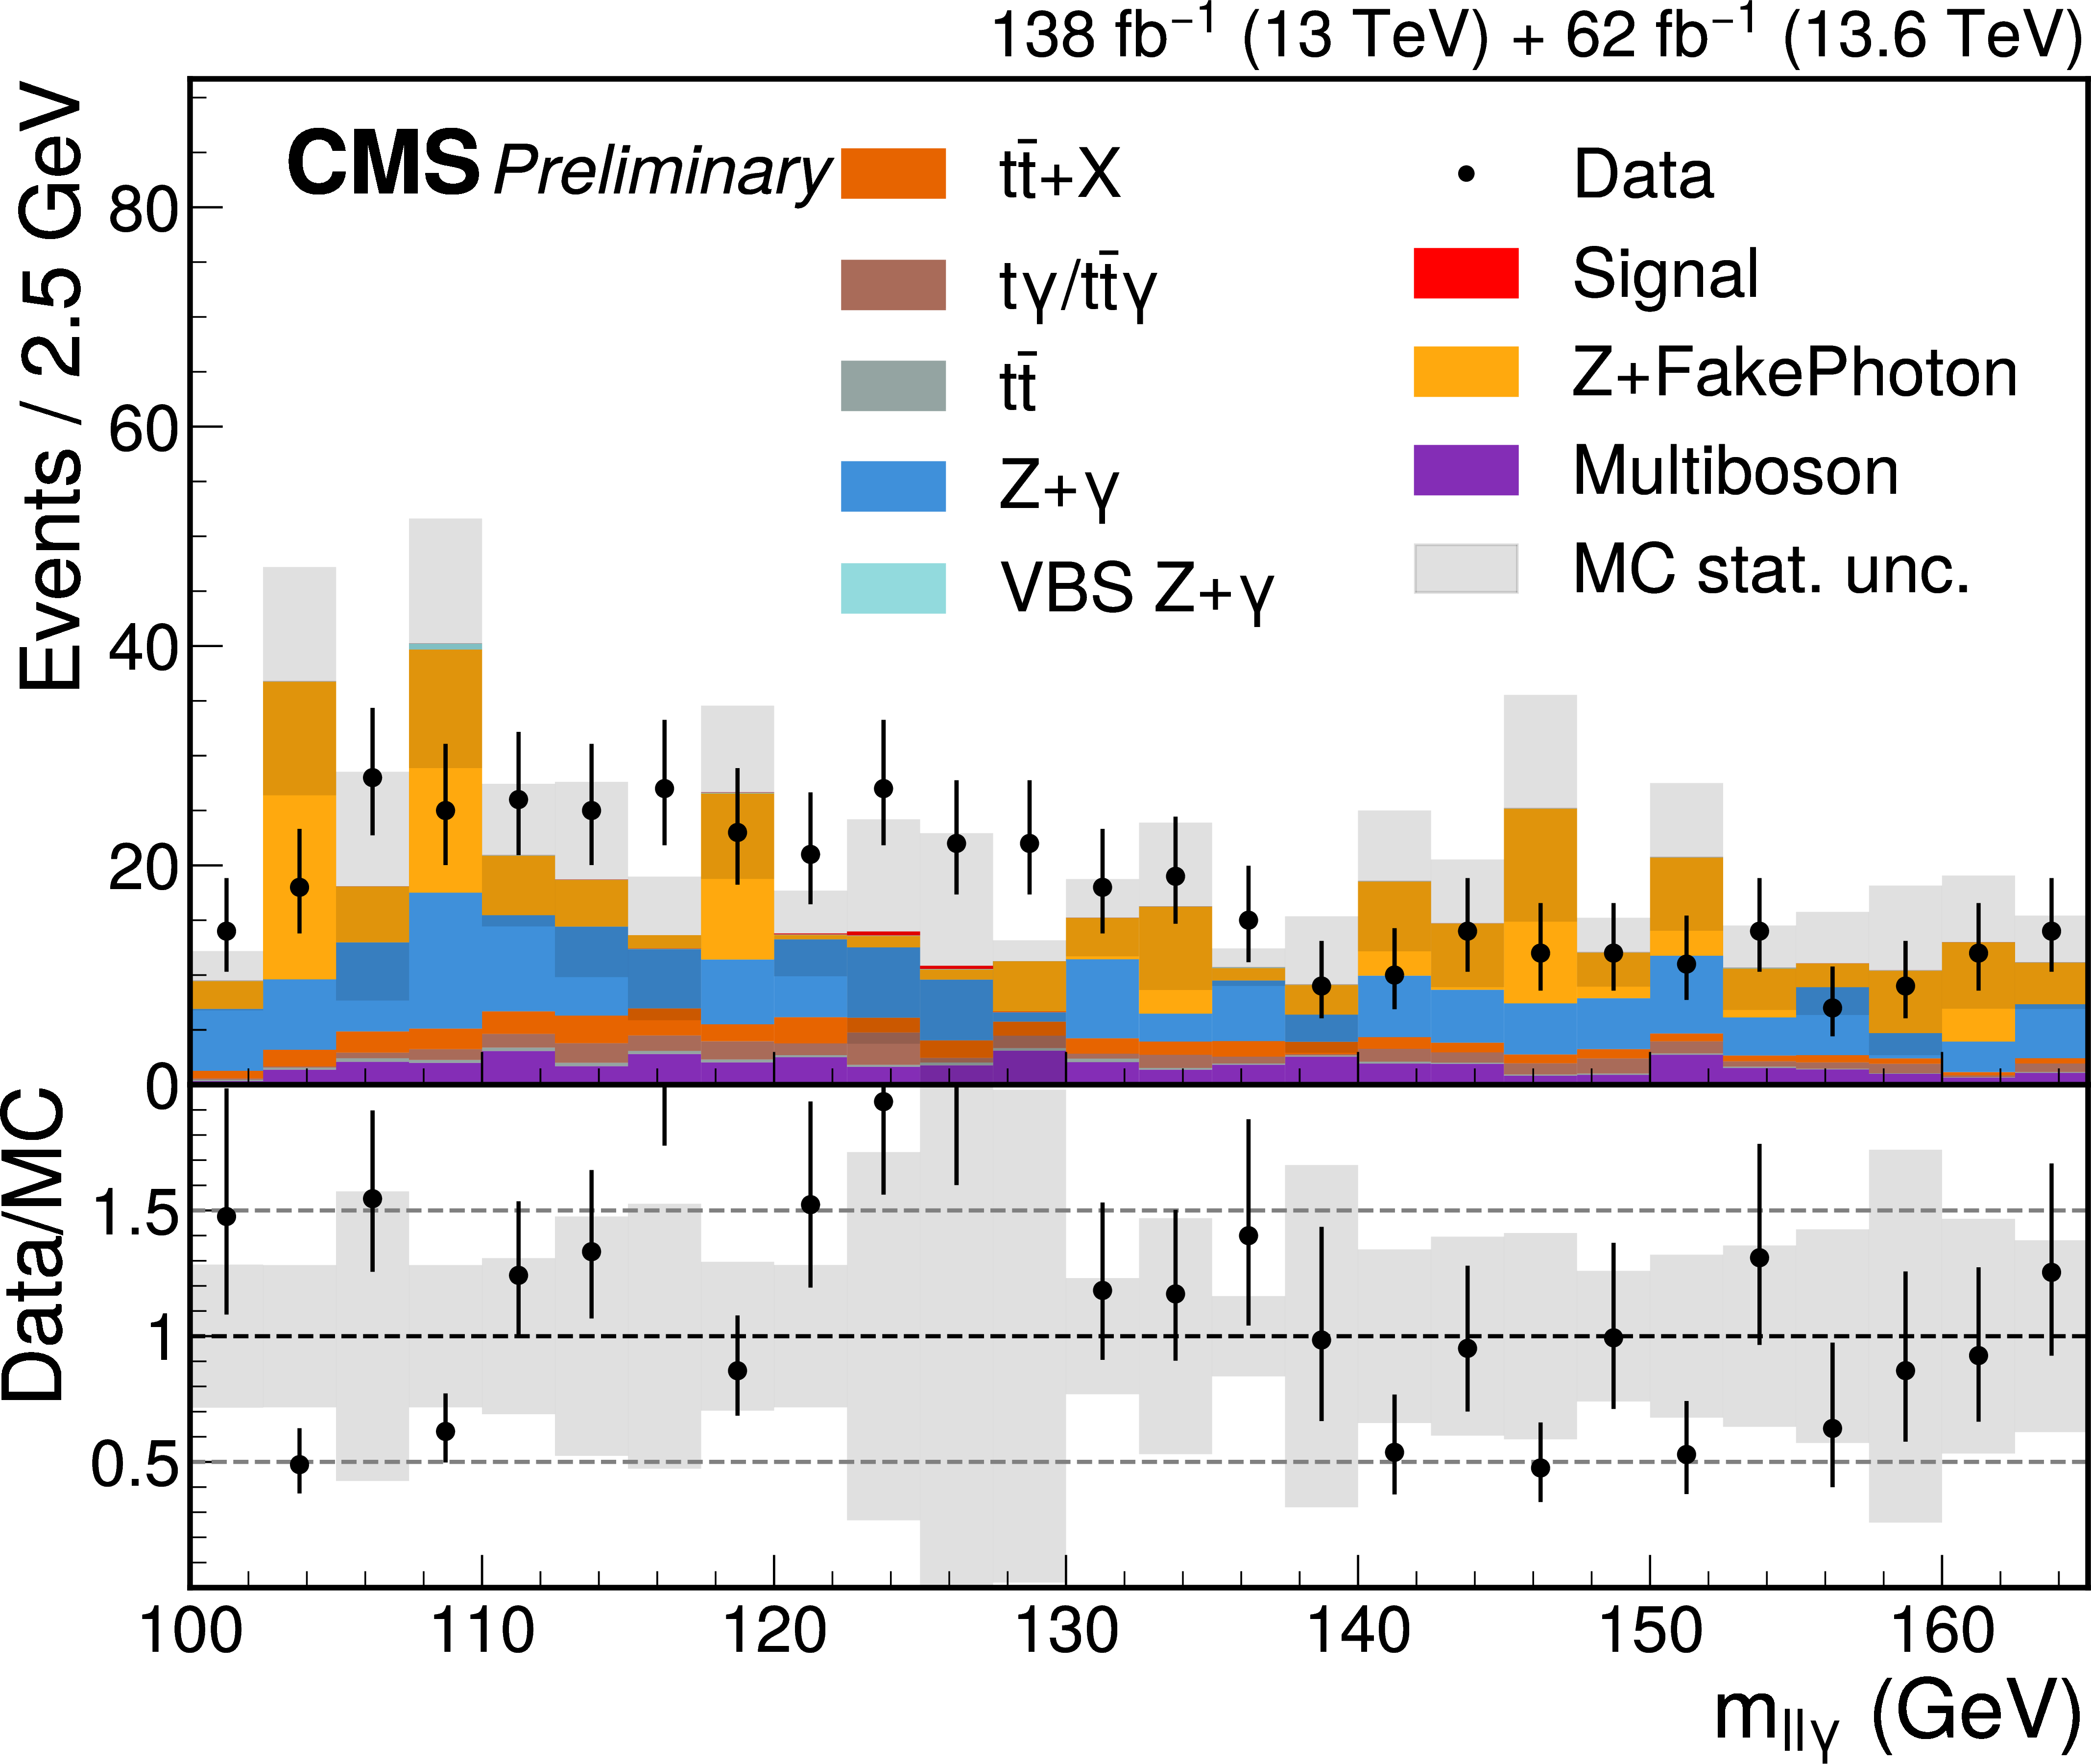
Distribution in $m_{\ell\ell\gamma}$ of data, simulated signal, and selected simulated background events for the (top-left) VBF1, (top-right) VBF2, (bottom-left) VBF3, and (bottom-right) VBF4 categories. The simulated events are displayed as stacked histograms. While only the signal simulation is used in the statistical procedure, overall good agreement is observed between all simulated samples and data. |
png pdf |
Additional Figure 5-a:
Distribution in $m_{\ell\ell\gamma}$ of data, simulated signal, and selected simulated background events for the (top-left) VBF1, (top-right) VBF2, (bottom-left) VBF3, and (bottom-right) VBF4 categories. The simulated events are displayed as stacked histograms. While only the signal simulation is used in the statistical procedure, overall good agreement is observed between all simulated samples and data. |
png pdf |
Additional Figure 5-b:
Distribution in $m_{\ell\ell\gamma}$ of data, simulated signal, and selected simulated background events for the (top-left) VBF1, (top-right) VBF2, (bottom-left) VBF3, and (bottom-right) VBF4 categories. The simulated events are displayed as stacked histograms. While only the signal simulation is used in the statistical procedure, overall good agreement is observed between all simulated samples and data. |
png pdf |
Additional Figure 5-c:
Distribution in $m_{\ell\ell\gamma}$ of data, simulated signal, and selected simulated background events for the (top-left) VBF1, (top-right) VBF2, (bottom-left) VBF3, and (bottom-right) VBF4 categories. The simulated events are displayed as stacked histograms. While only the signal simulation is used in the statistical procedure, overall good agreement is observed between all simulated samples and data. |
png pdf |
Additional Figure 5-d:
Distribution in $m_{\ell\ell\gamma}$ of data, simulated signal, and selected simulated background events for the (top-left) VBF1, (top-right) VBF2, (bottom-left) VBF3, and (bottom-right) VBF4 categories. The simulated events are displayed as stacked histograms. While only the signal simulation is used in the statistical procedure, overall good agreement is observed between all simulated samples and data. |
png pdf |
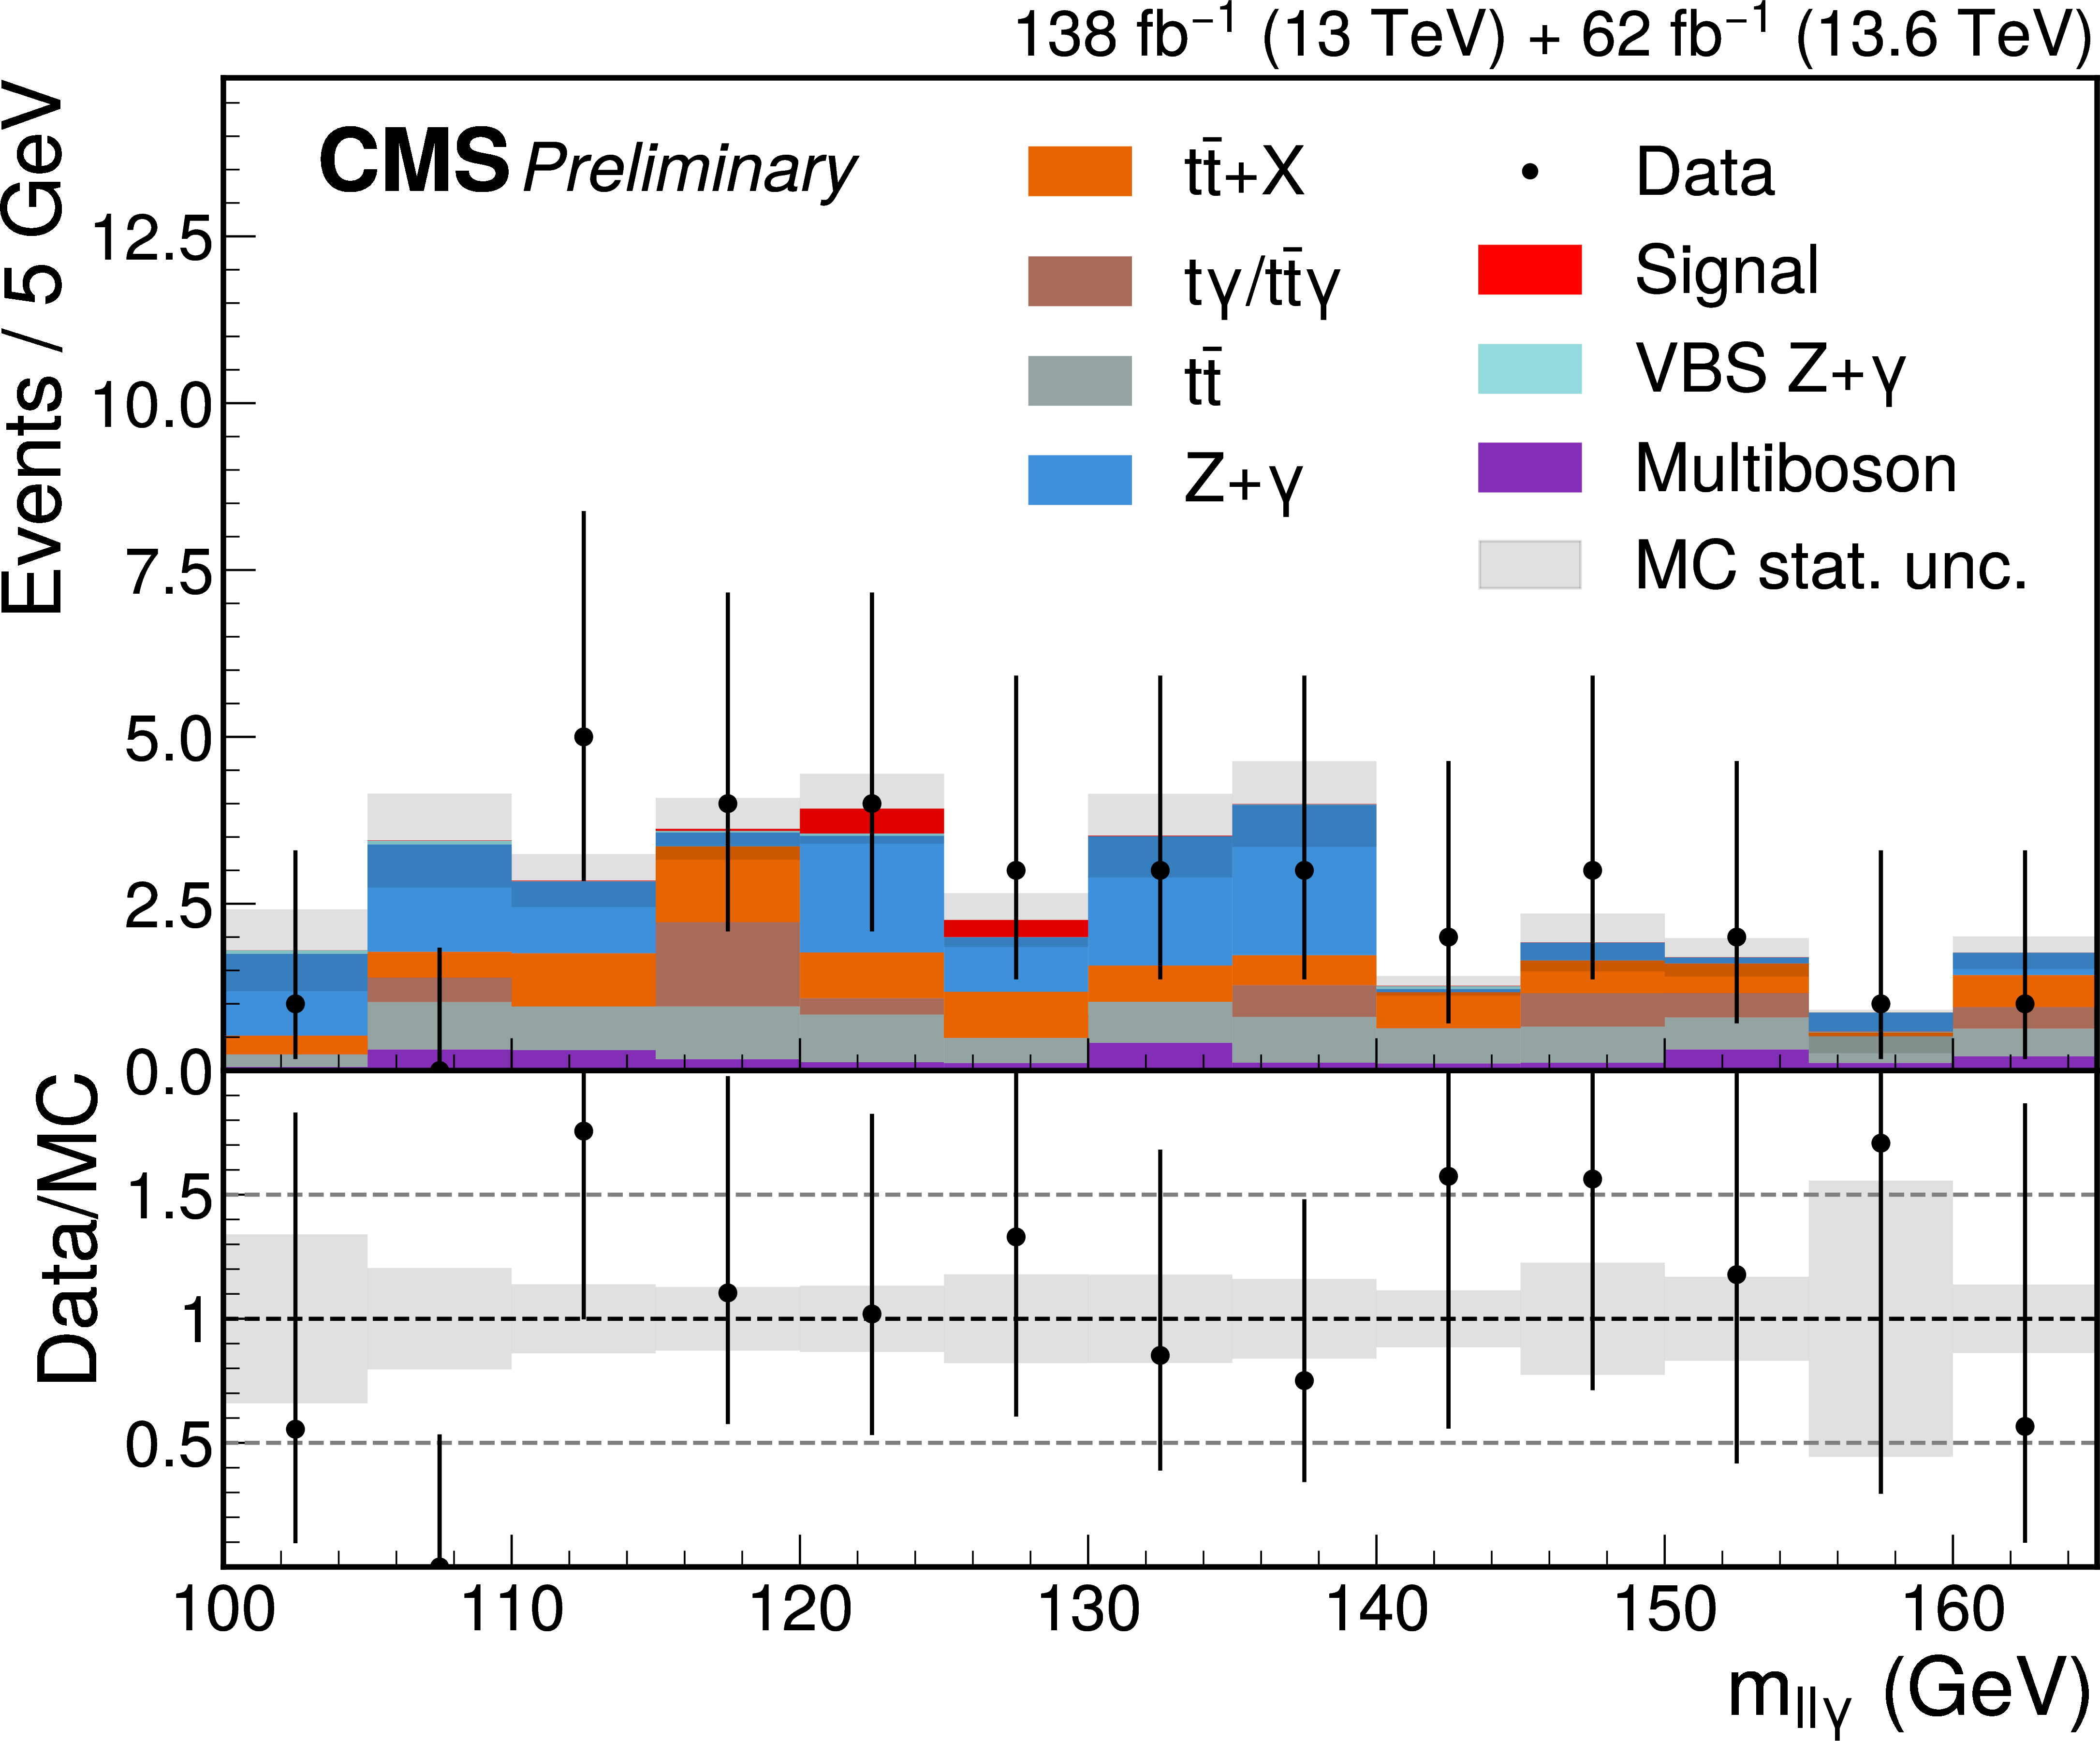
Additional Figure 6:
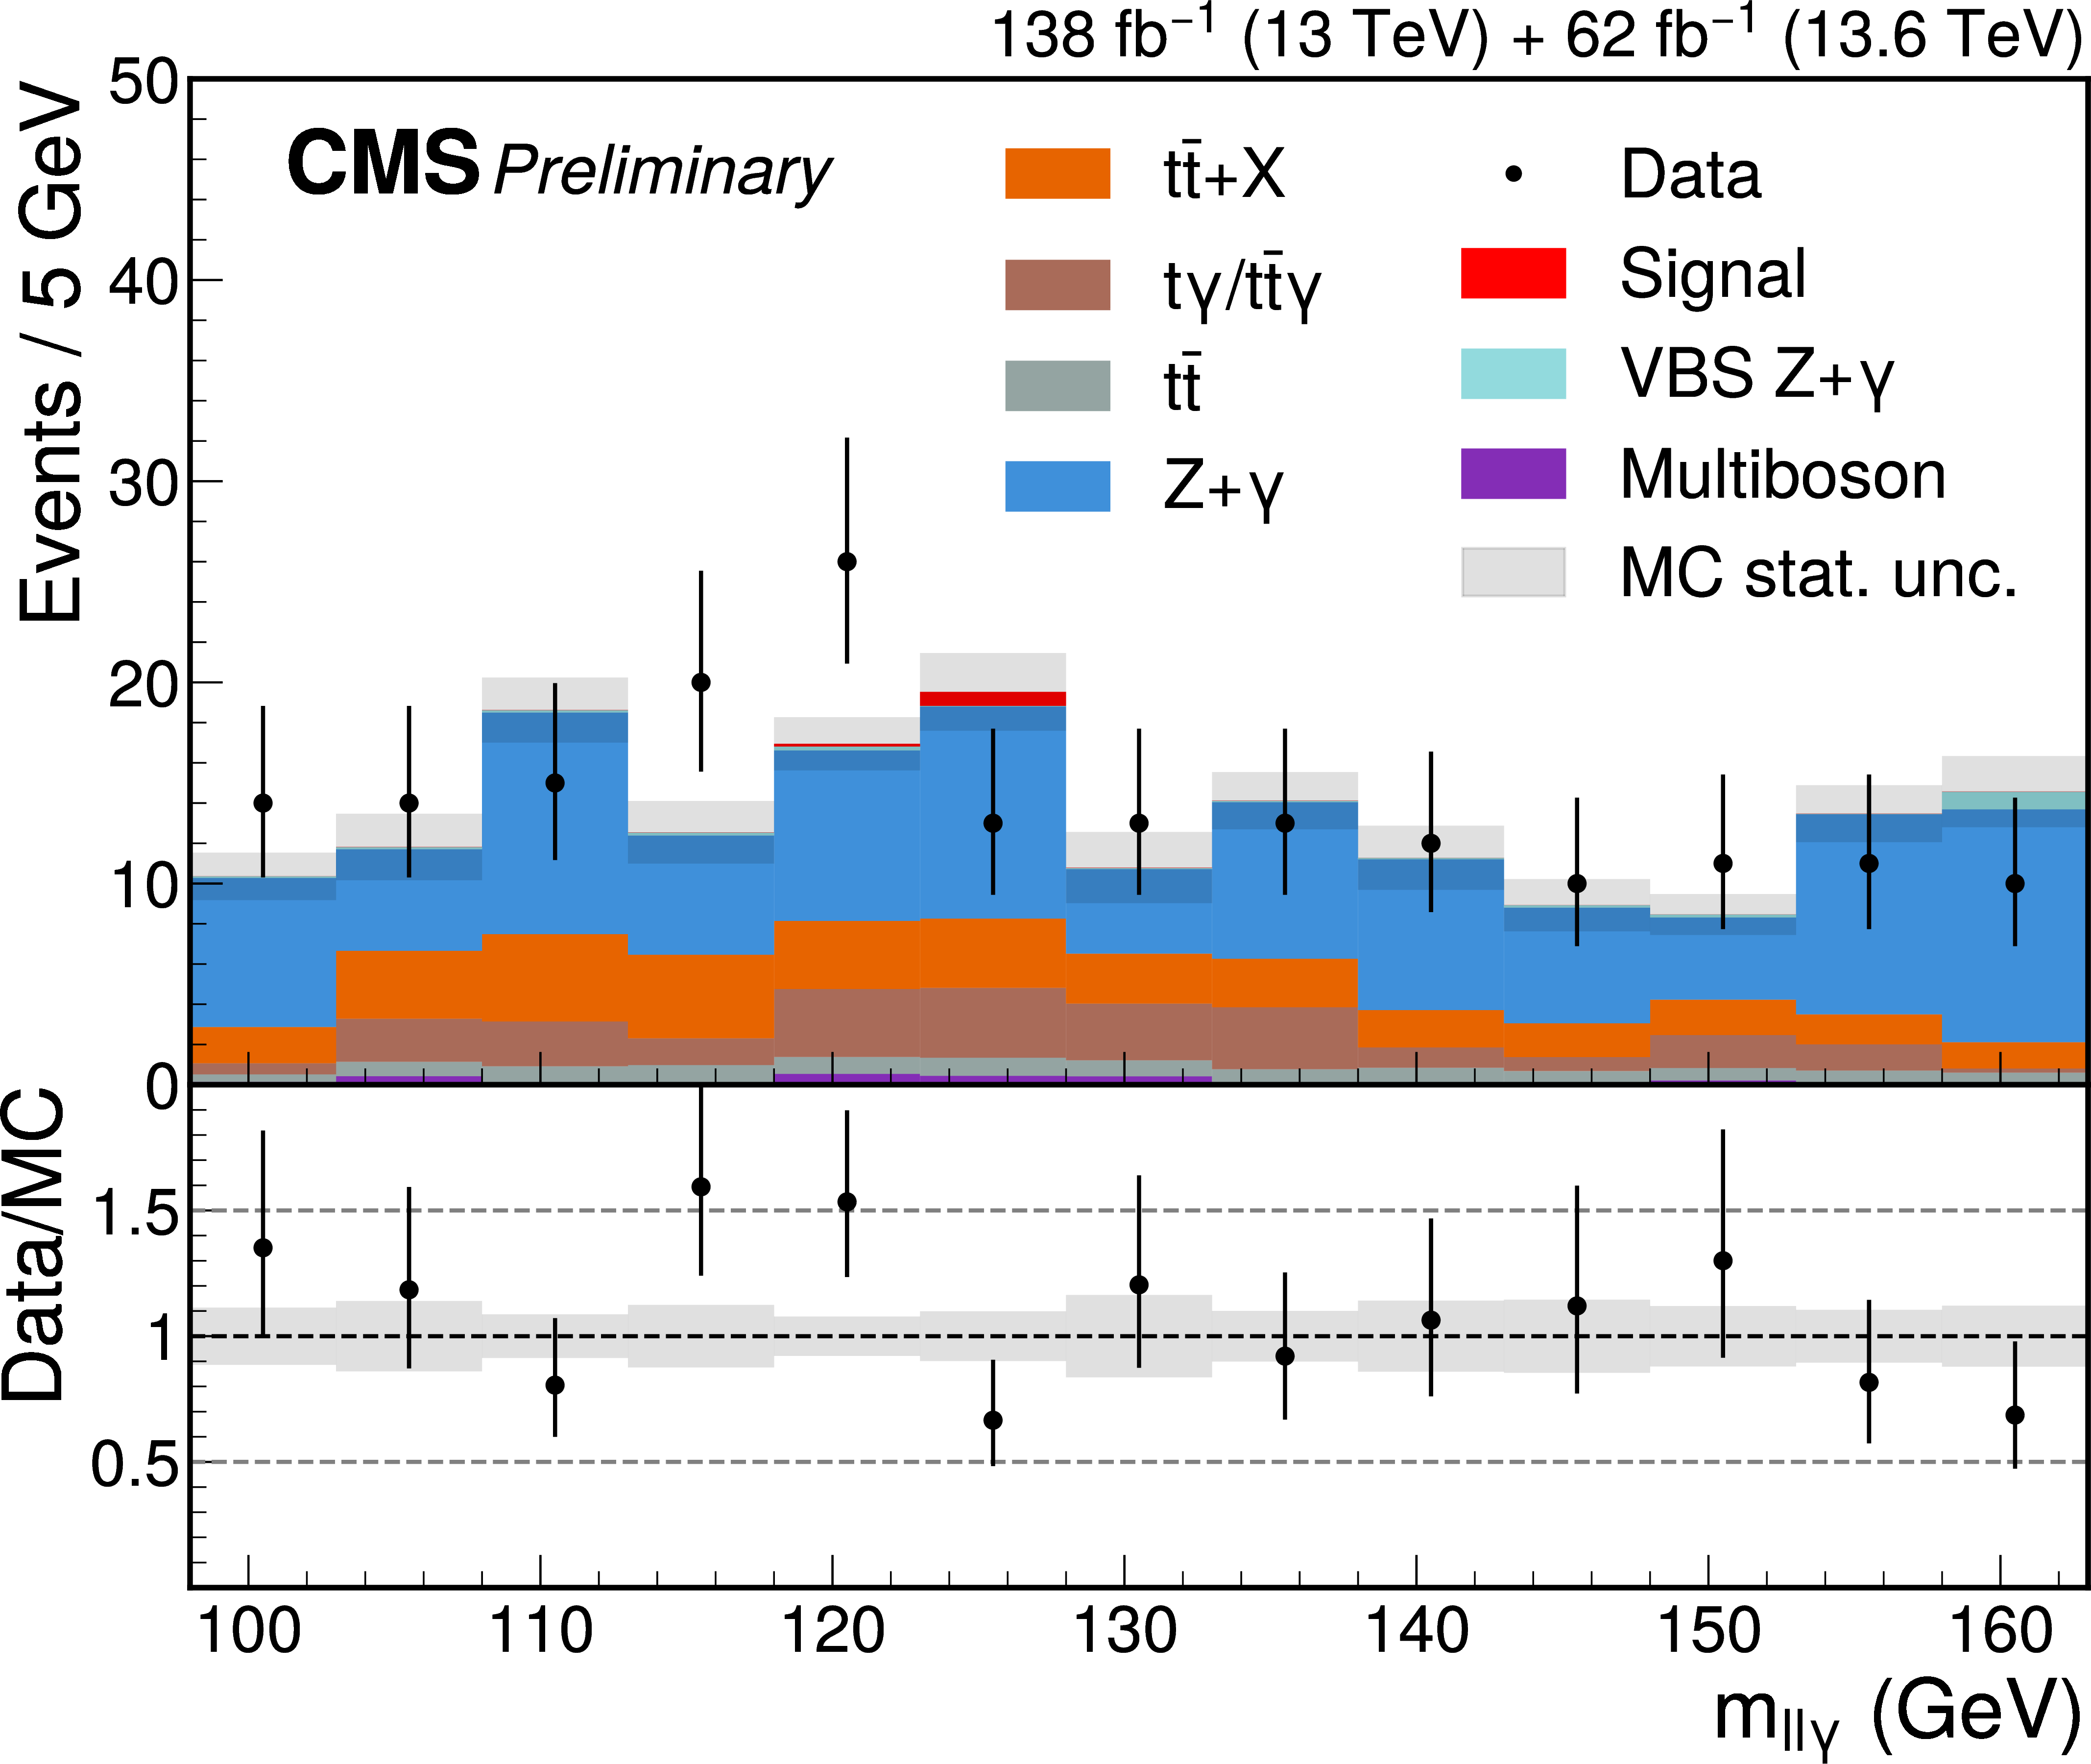
Distribution in $m_{\ell\ell\gamma}$ of data, simulated signal, and selected simulated background events for the (top-left) $\mathrm{t\bar{t}H}$ leptonic, (top-center) $\mathrm{t\bar{t}H}$ hadronic, (top-right) $\mathrm{VH} N_{\ell}\geq 3$, (bottom-left) $\mathrm{VH} p_\mathrm{T}^\mathrm{miss}$, and (bottom-right) untagged categories. The simulated events are displayed as stacked histograms. While only the signal simulation is used in the statistical procedure, overall good agreement is observed between all simulated samples and data. |
png pdf |
Additional Figure 6-a:
Distribution in $m_{\ell\ell\gamma}$ of data, simulated signal, and selected simulated background events for the (top-left) $\mathrm{t\bar{t}H}$ leptonic, (top-center) $\mathrm{t\bar{t}H}$ hadronic, (top-right) $\mathrm{VH} N_{\ell}\geq 3$, (bottom-left) $\mathrm{VH} p_\mathrm{T}^\mathrm{miss}$, and (bottom-right) untagged categories. The simulated events are displayed as stacked histograms. While only the signal simulation is used in the statistical procedure, overall good agreement is observed between all simulated samples and data. |
png pdf |
Additional Figure 6-b:
Distribution in $m_{\ell\ell\gamma}$ of data, simulated signal, and selected simulated background events for the (top-left) $\mathrm{t\bar{t}H}$ leptonic, (top-center) $\mathrm{t\bar{t}H}$ hadronic, (top-right) $\mathrm{VH} N_{\ell}\geq 3$, (bottom-left) $\mathrm{VH} p_\mathrm{T}^\mathrm{miss}$, and (bottom-right) untagged categories. The simulated events are displayed as stacked histograms. While only the signal simulation is used in the statistical procedure, overall good agreement is observed between all simulated samples and data. |
png pdf |
Additional Figure 6-c:
Distribution in $m_{\ell\ell\gamma}$ of data, simulated signal, and selected simulated background events for the (top-left) $\mathrm{t\bar{t}H}$ leptonic, (top-center) $\mathrm{t\bar{t}H}$ hadronic, (top-right) $\mathrm{VH} N_{\ell}\geq 3$, (bottom-left) $\mathrm{VH} p_\mathrm{T}^\mathrm{miss}$, and (bottom-right) untagged categories. The simulated events are displayed as stacked histograms. While only the signal simulation is used in the statistical procedure, overall good agreement is observed between all simulated samples and data. |
png pdf |
Additional Figure 6-d:
Distribution in $m_{\ell\ell\gamma}$ of data, simulated signal, and selected simulated background events for the (top-left) $\mathrm{t\bar{t}H}$ leptonic, (top-center) $\mathrm{t\bar{t}H}$ hadronic, (top-right) $\mathrm{VH} N_{\ell}\geq 3$, (bottom-left) $\mathrm{VH} p_\mathrm{T}^\mathrm{miss}$, and (bottom-right) untagged categories. The simulated events are displayed as stacked histograms. While only the signal simulation is used in the statistical procedure, overall good agreement is observed between all simulated samples and data. |
png pdf |
Additional Figure 6-e:
Distribution in $m_{\ell\ell\gamma}$ of data, simulated signal, and selected simulated background events for the (top-left) $\mathrm{t\bar{t}H}$ leptonic, (top-center) $\mathrm{t\bar{t}H}$ hadronic, (top-right) $\mathrm{VH} N_{\ell}\geq 3$, (bottom-left) $\mathrm{VH} p_\mathrm{T}^\mathrm{miss}$, and (bottom-right) untagged categories. The simulated events are displayed as stacked histograms. While only the signal simulation is used in the statistical procedure, overall good agreement is observed between all simulated samples and data. |
png pdf |
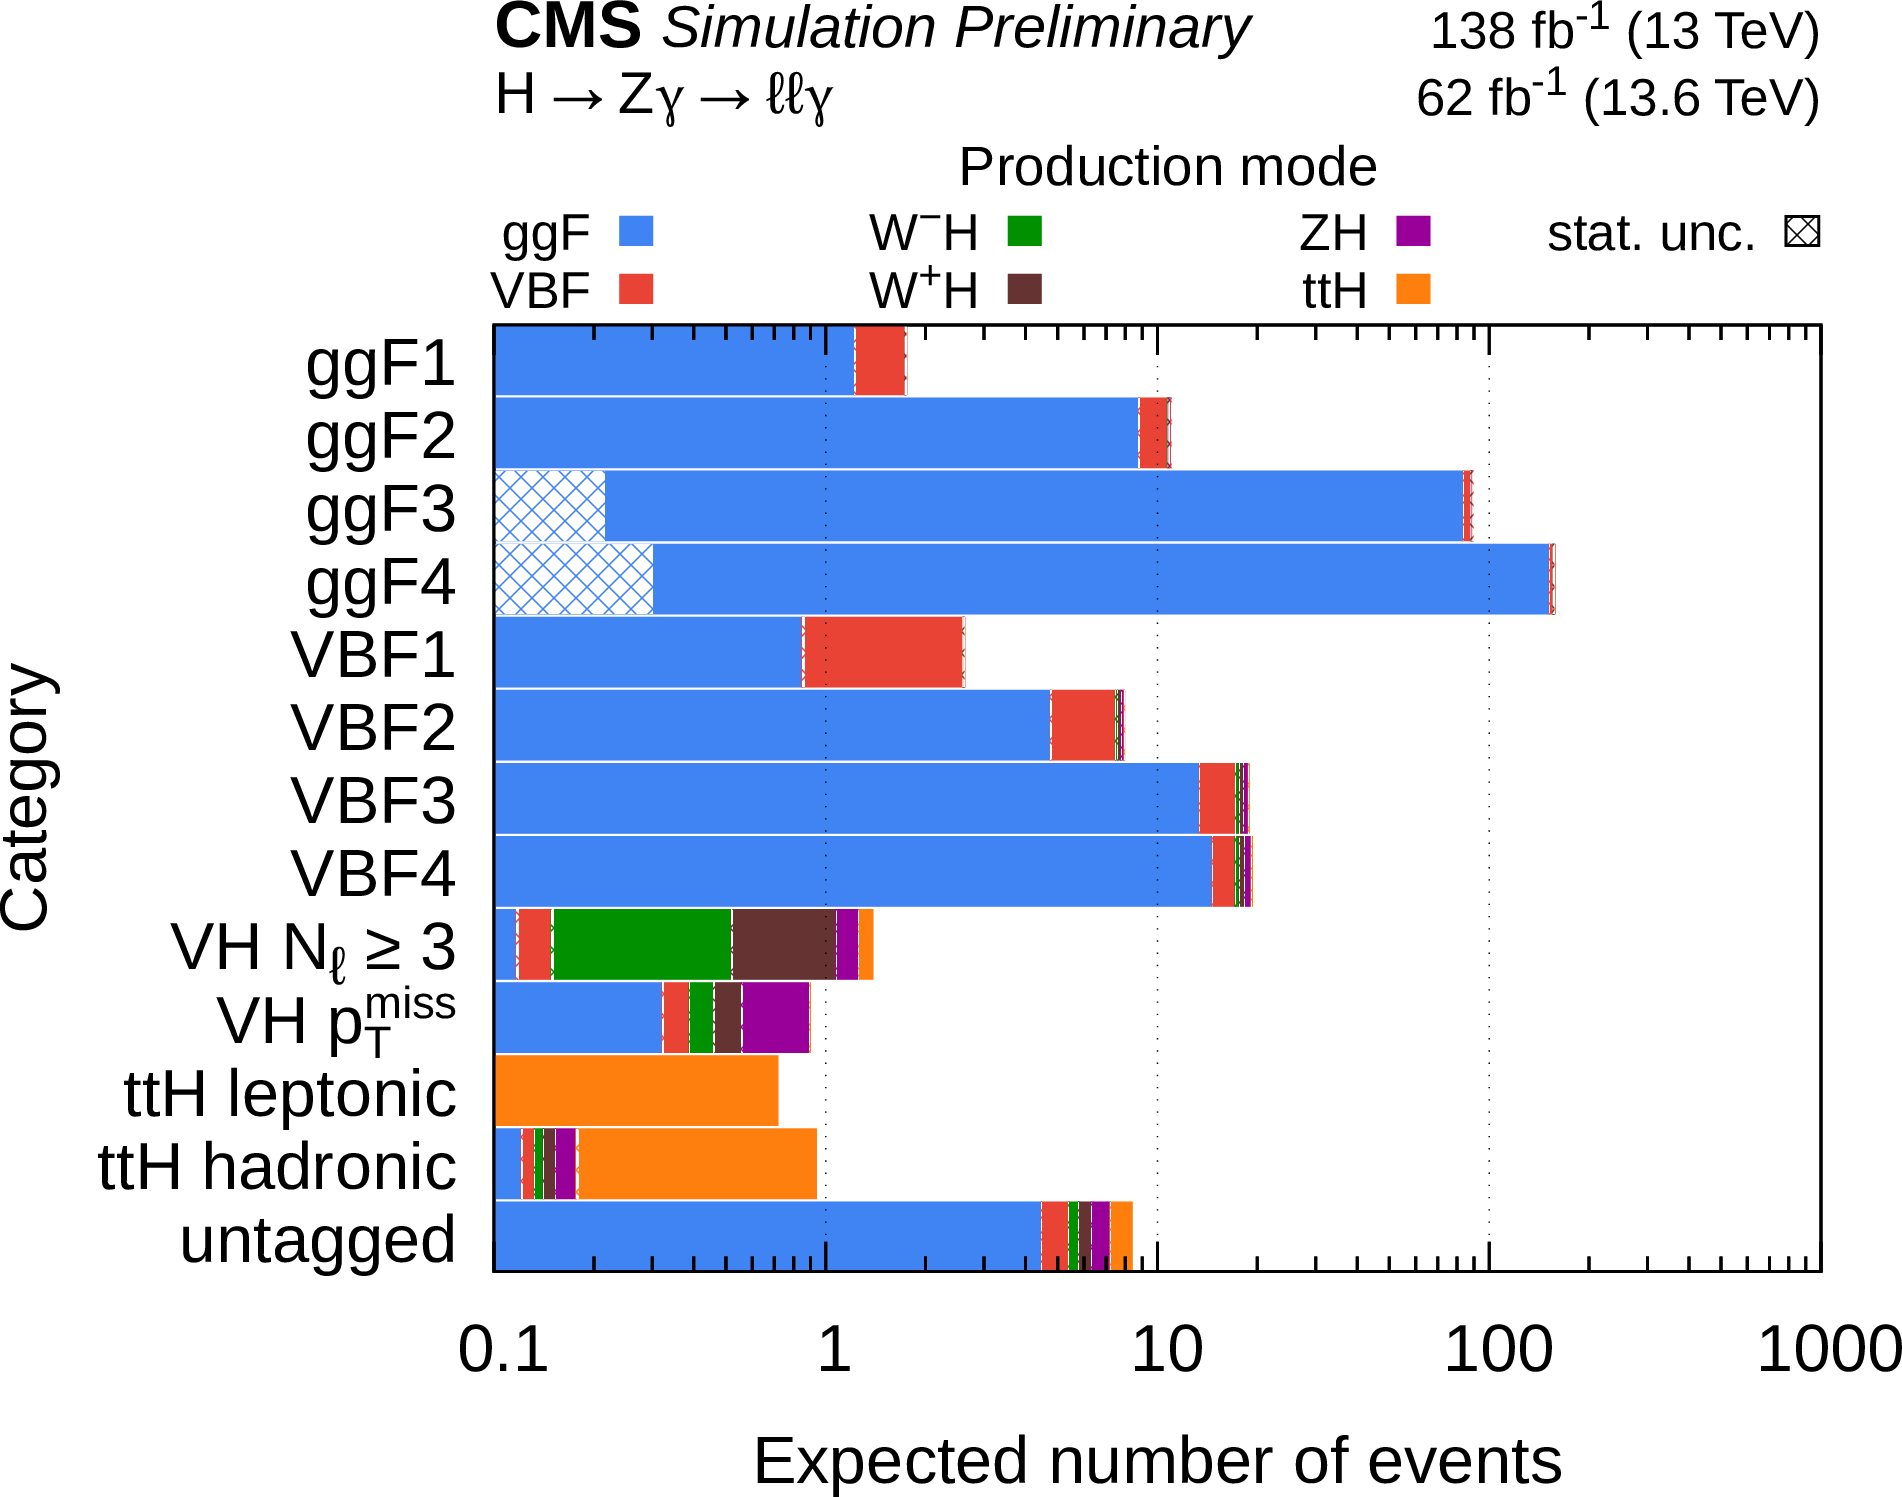
Additional Figure 7:
Fraction of signal events in each category attributable to each production mode expressed as the absolute number of events. The ggF categories predominantly consist of ggF signal events. The VBF categories also consist of mostly ggF and VBF signal events, with the VBF fraction increasing with BDT score. The $\mathrm{t\bar{t}H}$ categories predominantly consist of $\mathrm{t\bar{t}H}$ signal events. The majority of signal events in the VH categories are WH and ZH events, though there is nonnegligible contribution from other production modes. The signal events in the untagged category consist of about 50% ggF production and 50% other production modes. The number of signal events varies from about 1 event to about 150 events with the $\mathrm{t\bar{t}H}$ leptonic category being the smallest and the ggF4 category being the largest. |
png pdf |
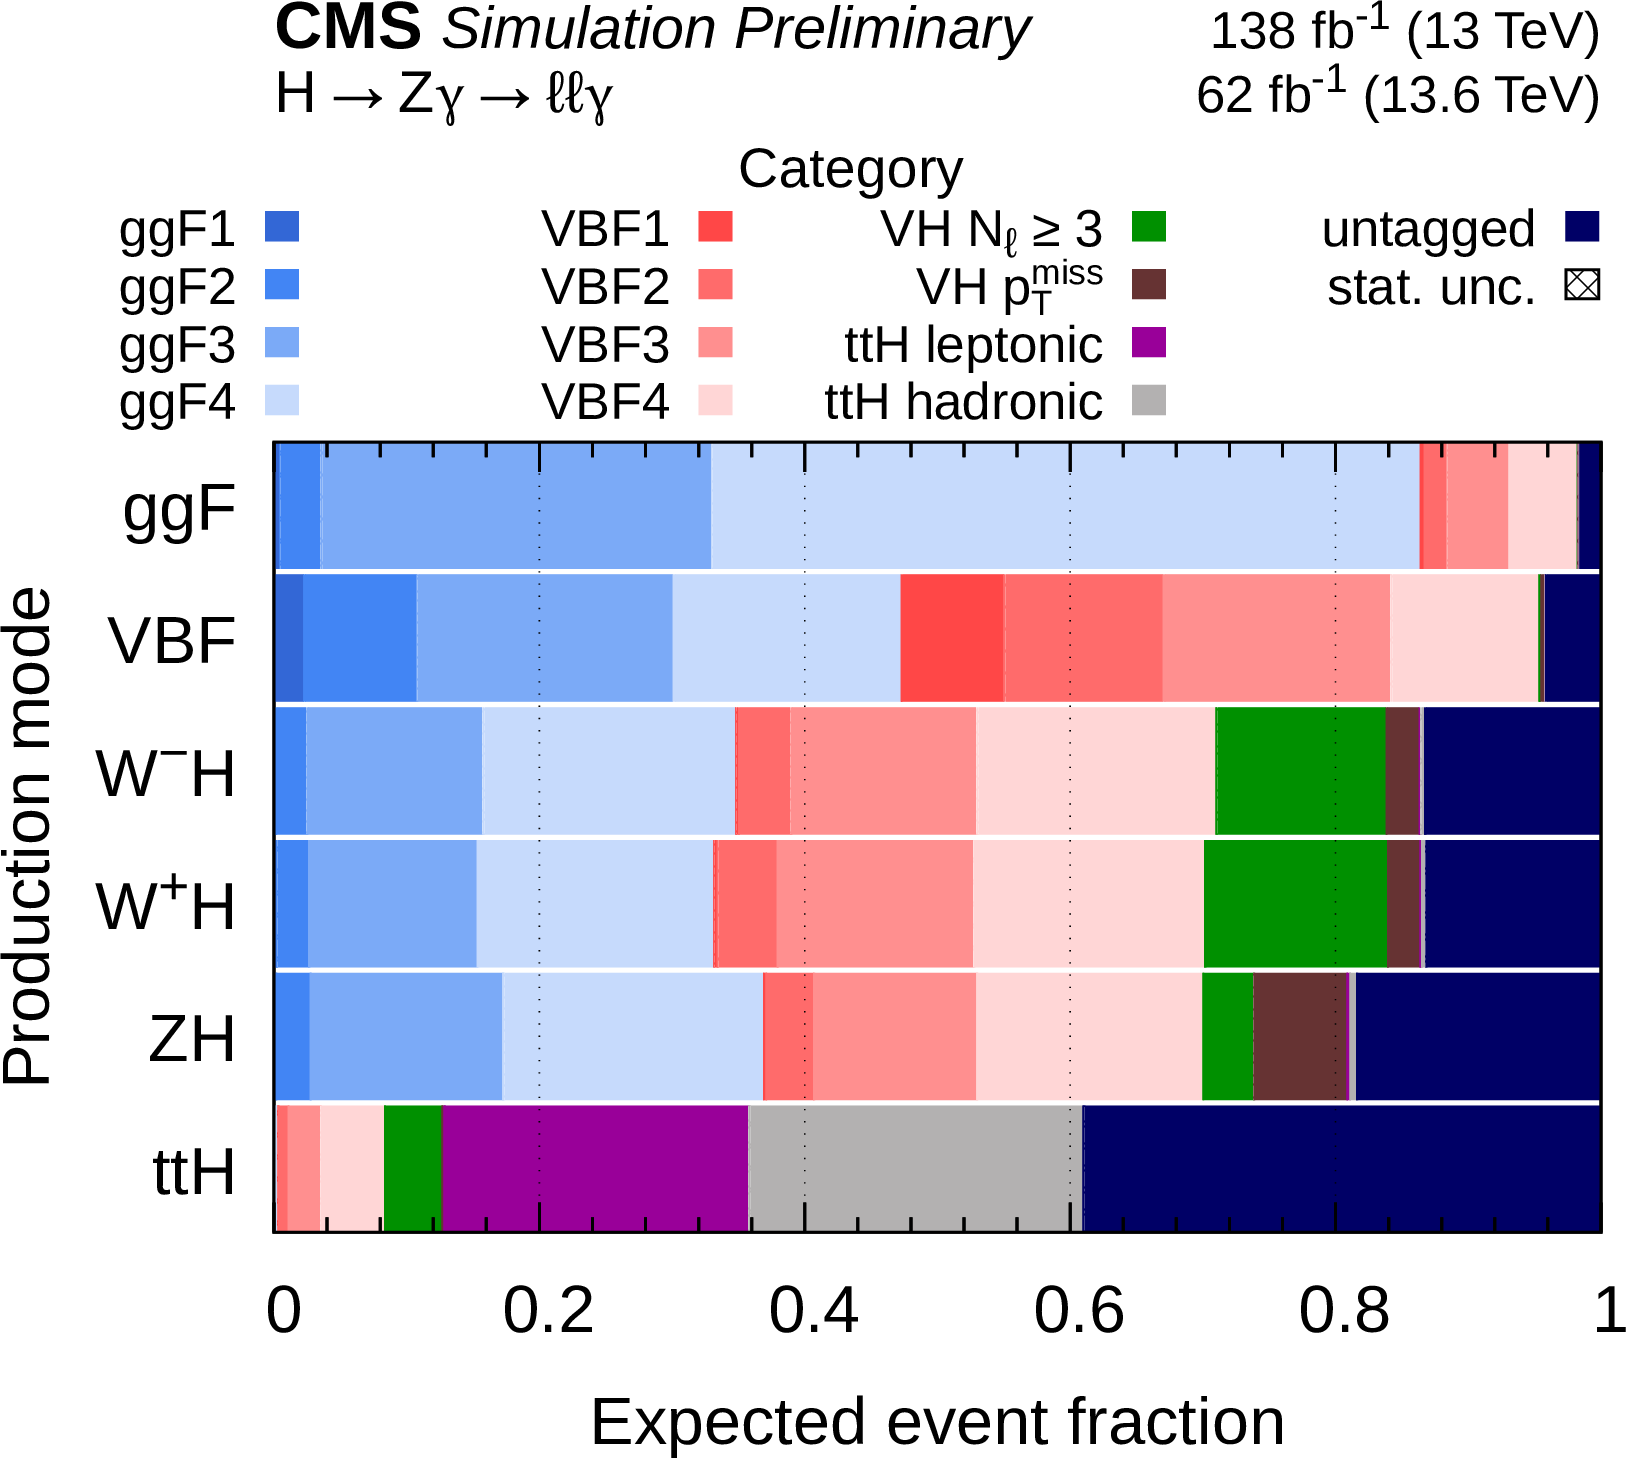
Additional Figure 8:
Fraction of signal events in each production mode assigned to each analysis category. ggF events are predominantly assigned to the ggF categories. VBF events are approximately evenly split between the ggF and VBF categories. WH and ZH events (including hadronically decaying W and Z bosons) are split with about one third of events in the ggF categories, about one third of events in the VBF categories, and about one third in the VH and untagged categories. $\mathrm{t\bar{t}H}$ events are most commonly assigned to the $\mathrm{t\bar{t}H}$ or untagged categories. |
png pdf |
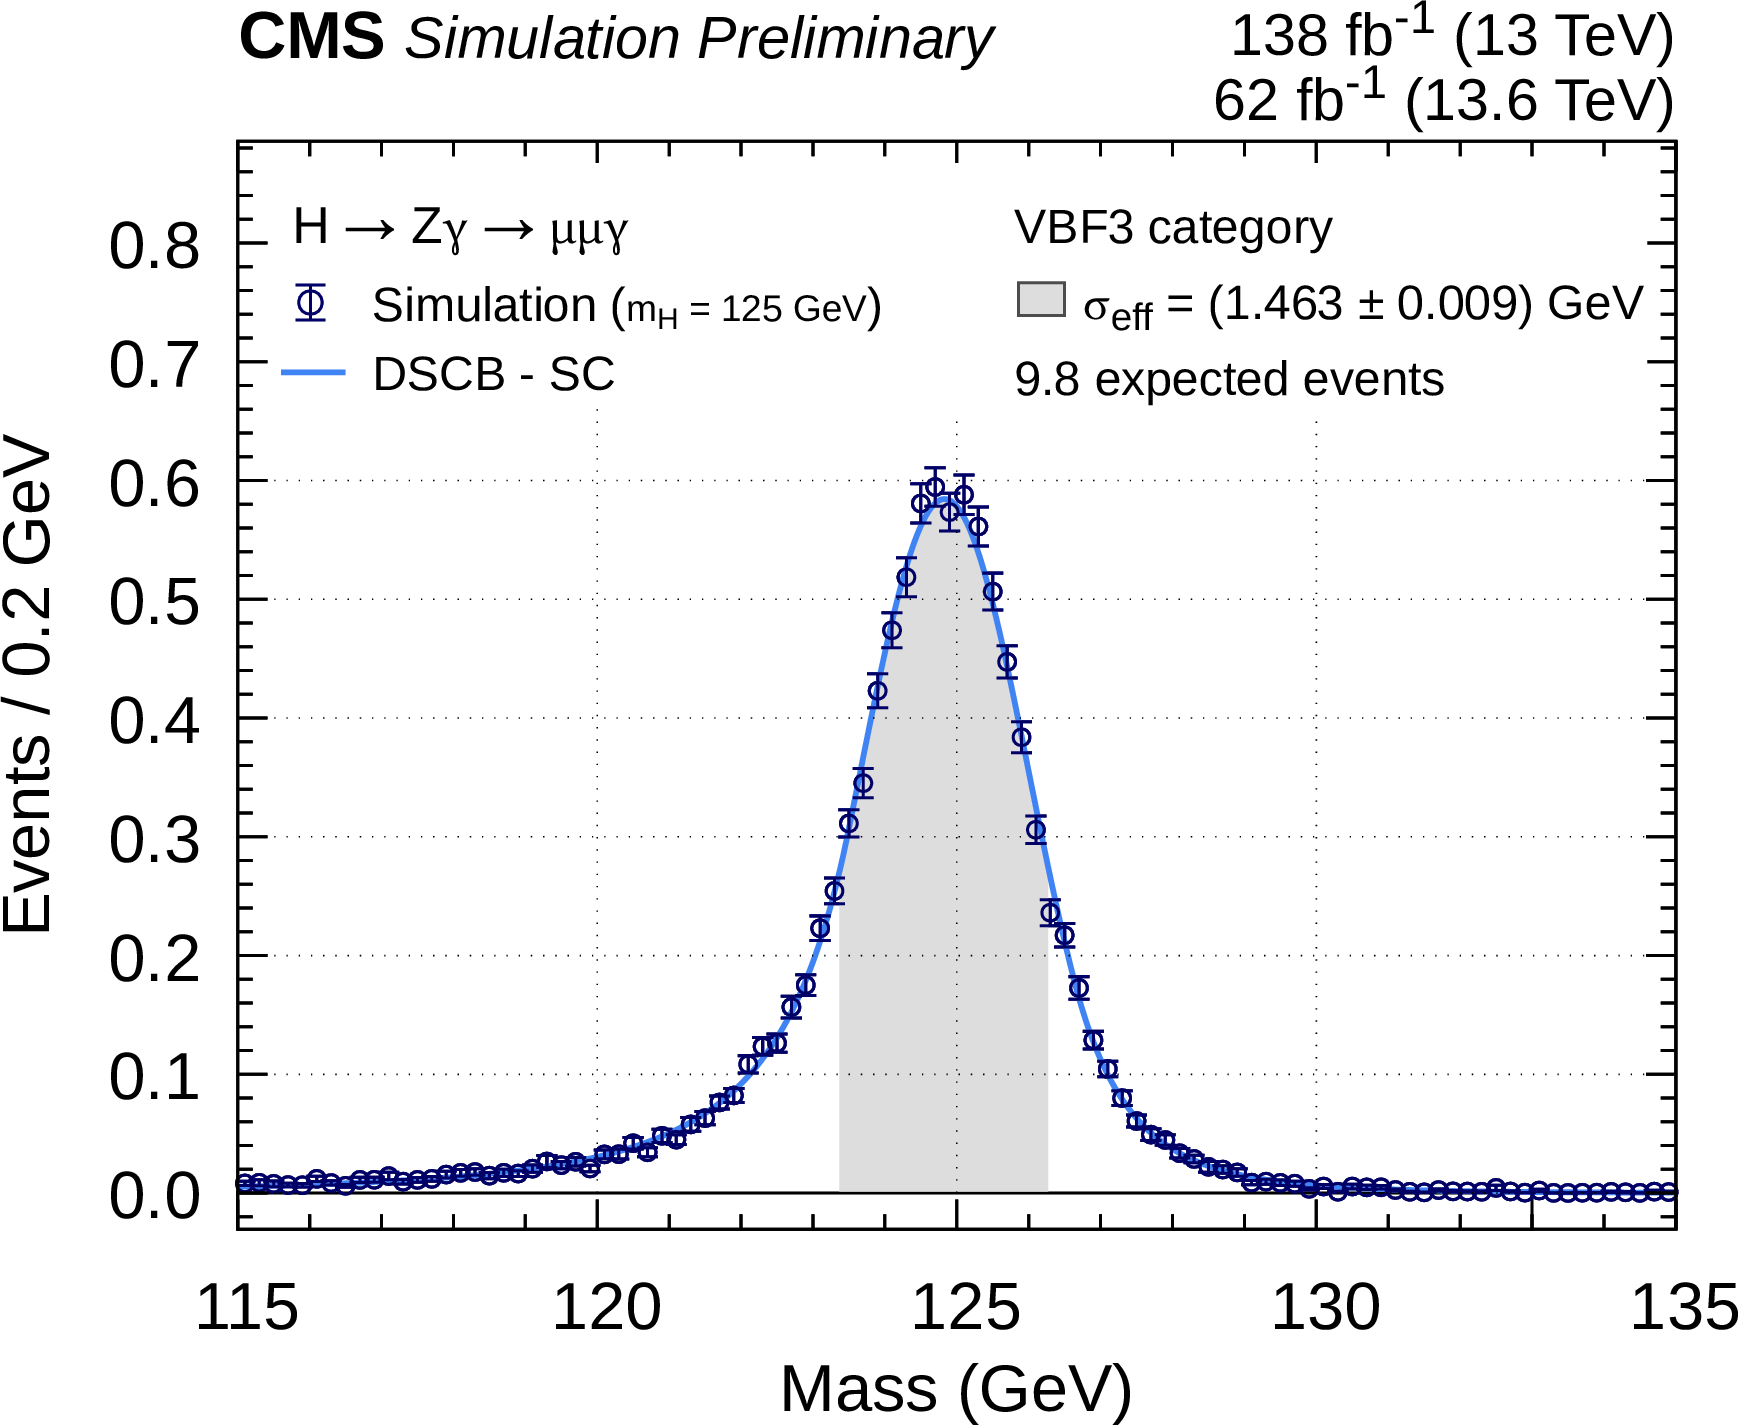
Additional Figure 9:
Example signal model used for muon channel events in the VBF2 category. The distribution of signal in $m_{\ell\ell\gamma}$ is modeled using a symmetric core double-sided Crystal Ball function fit to simulation as shown. |
png pdf |
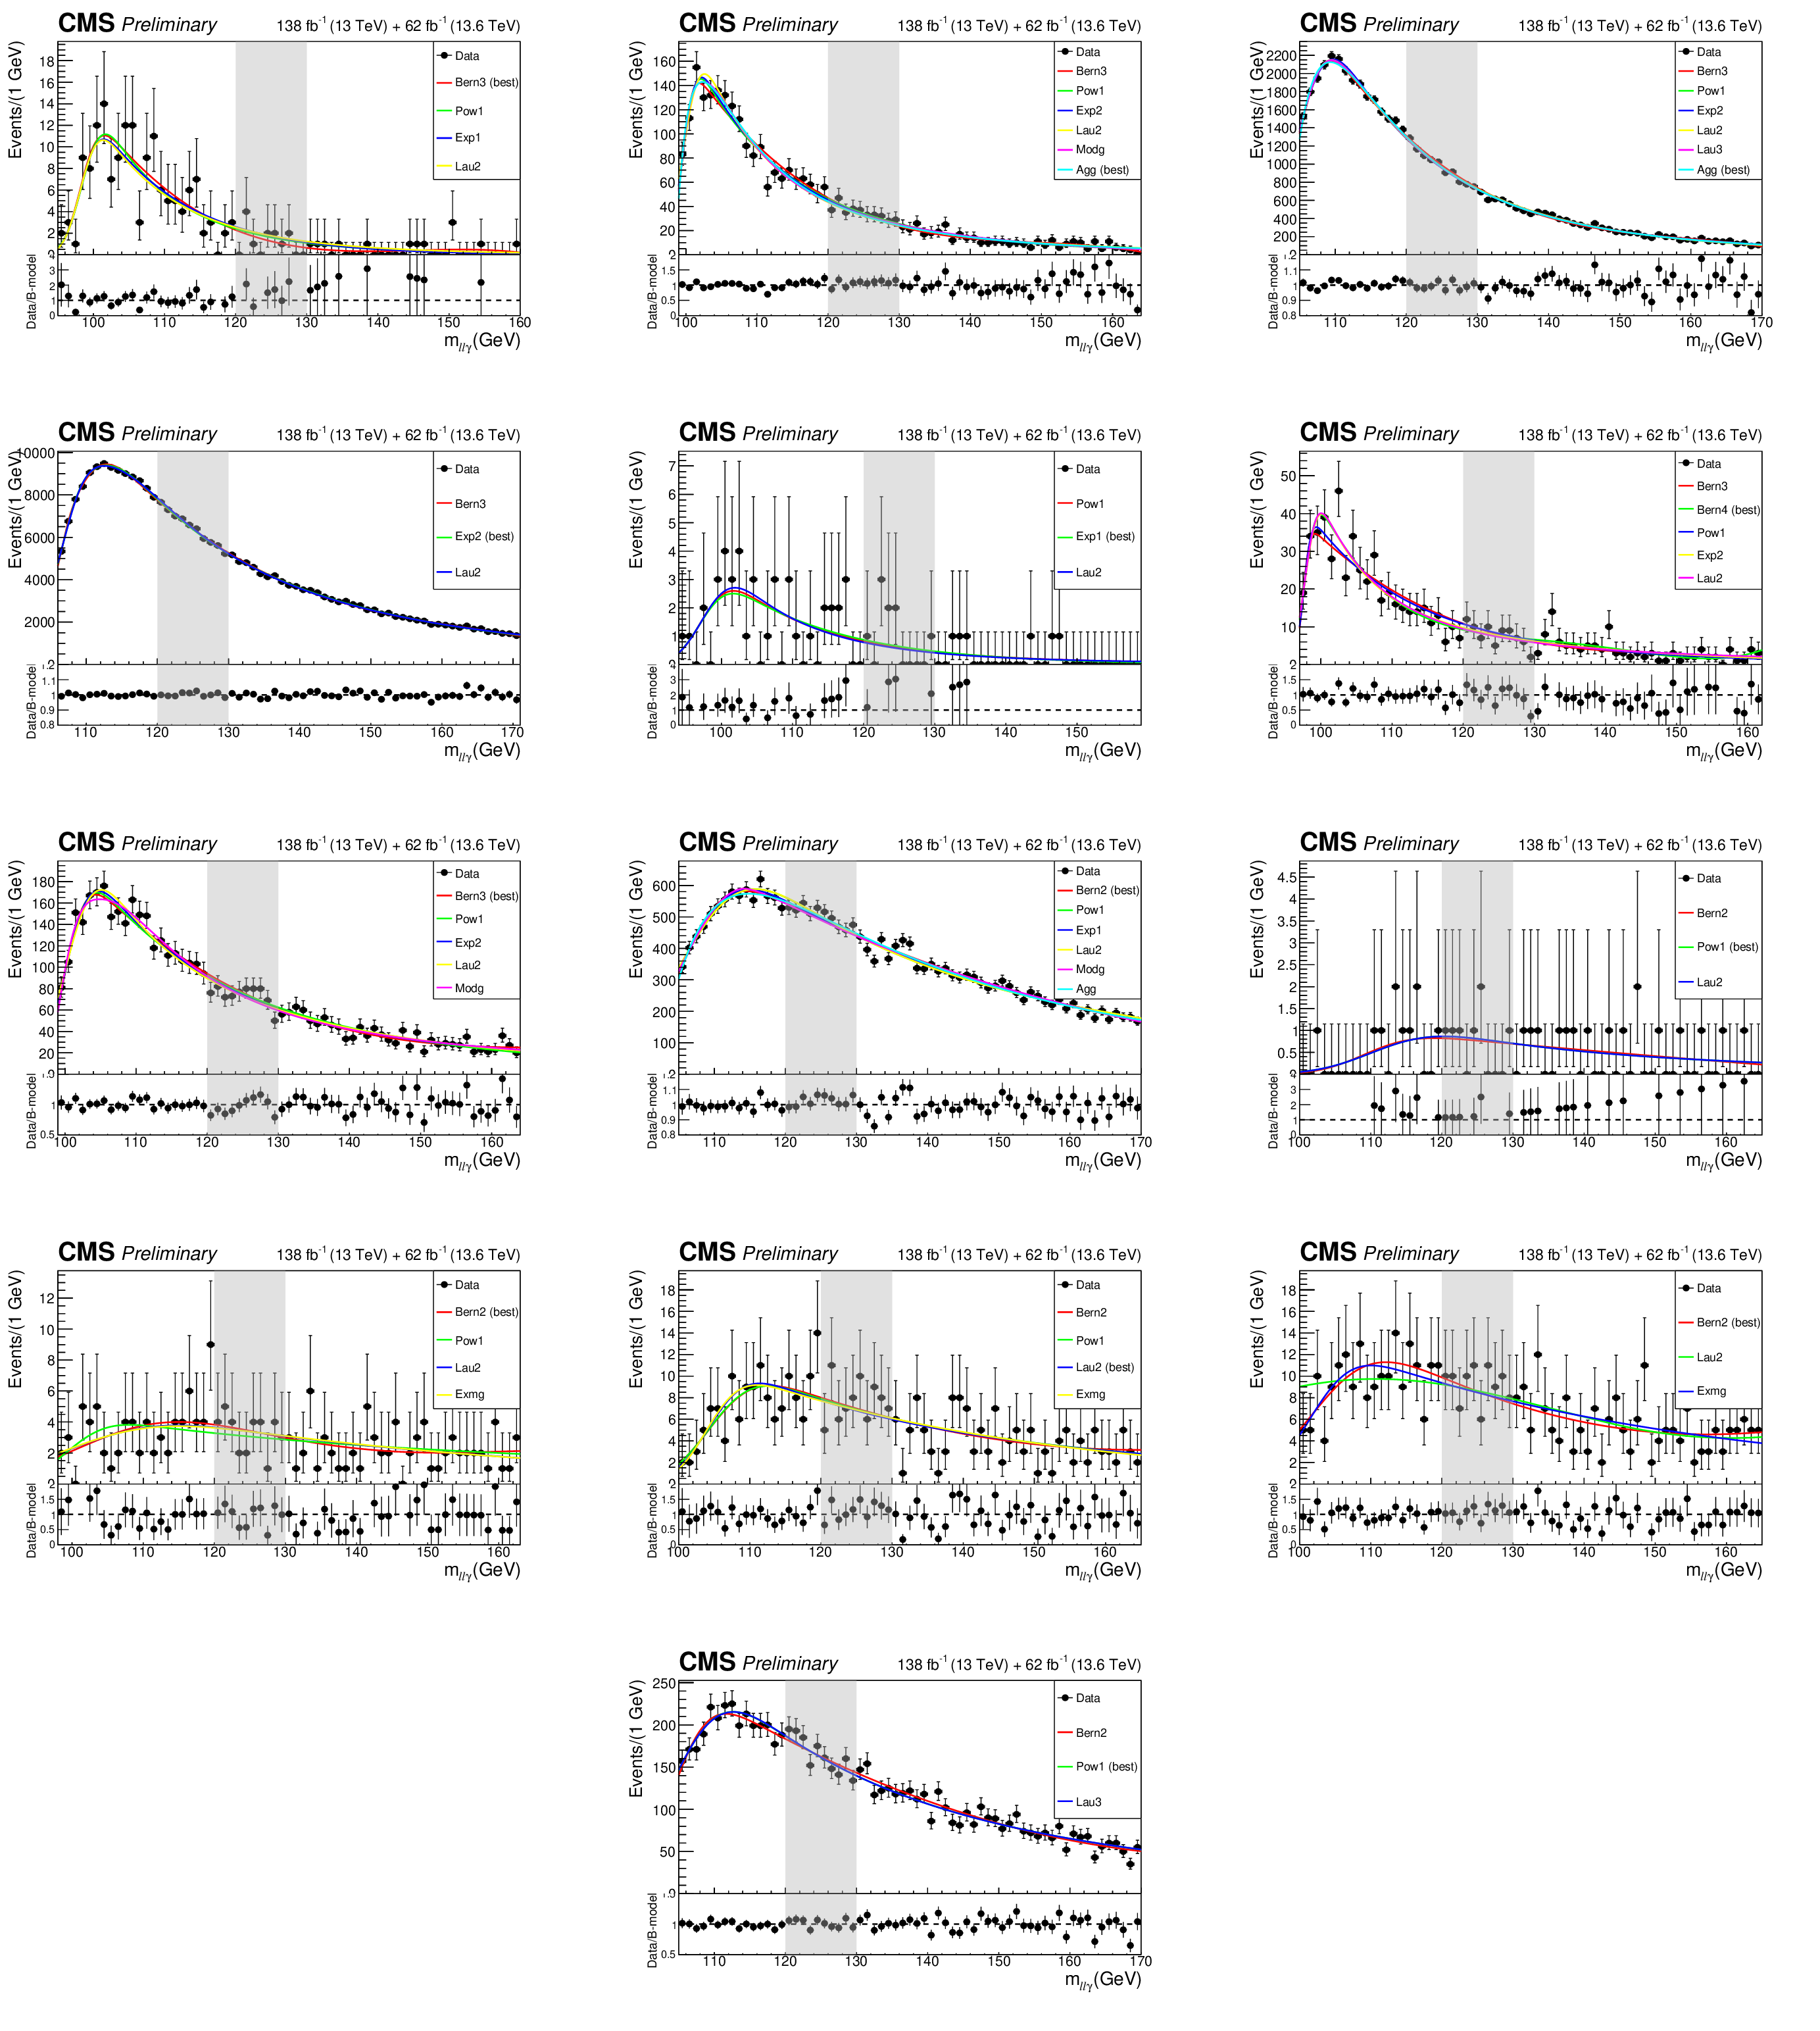
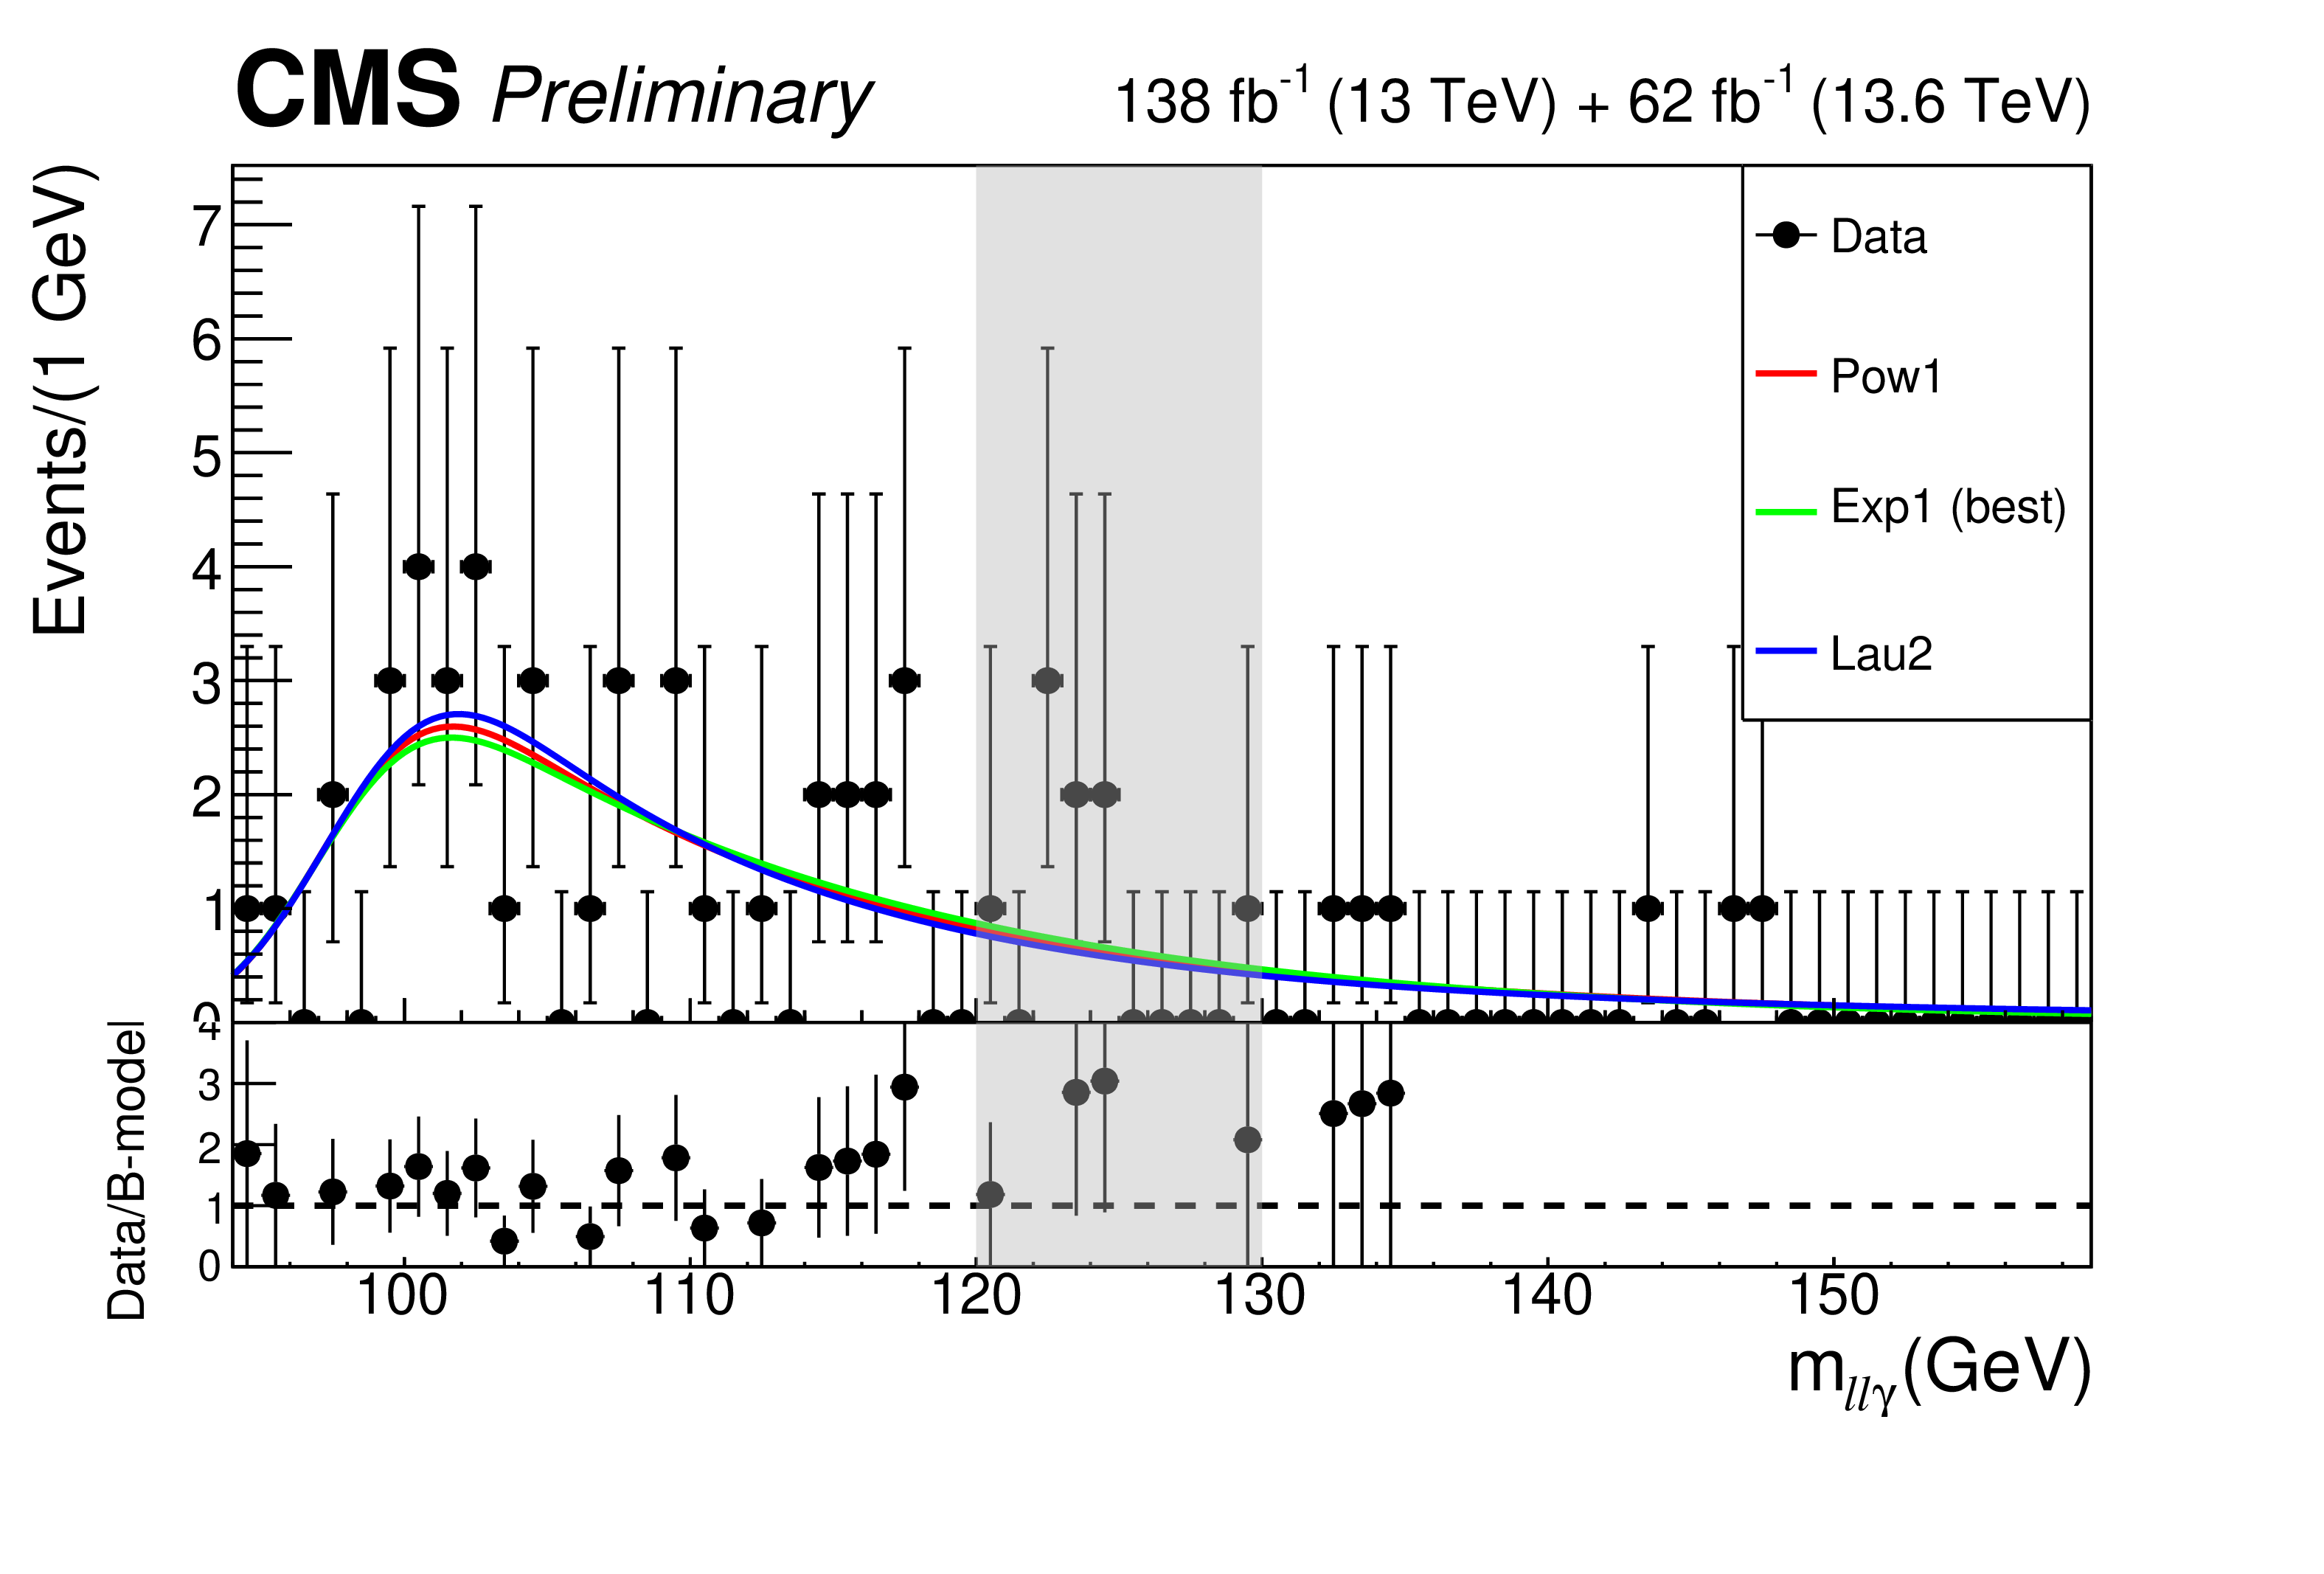
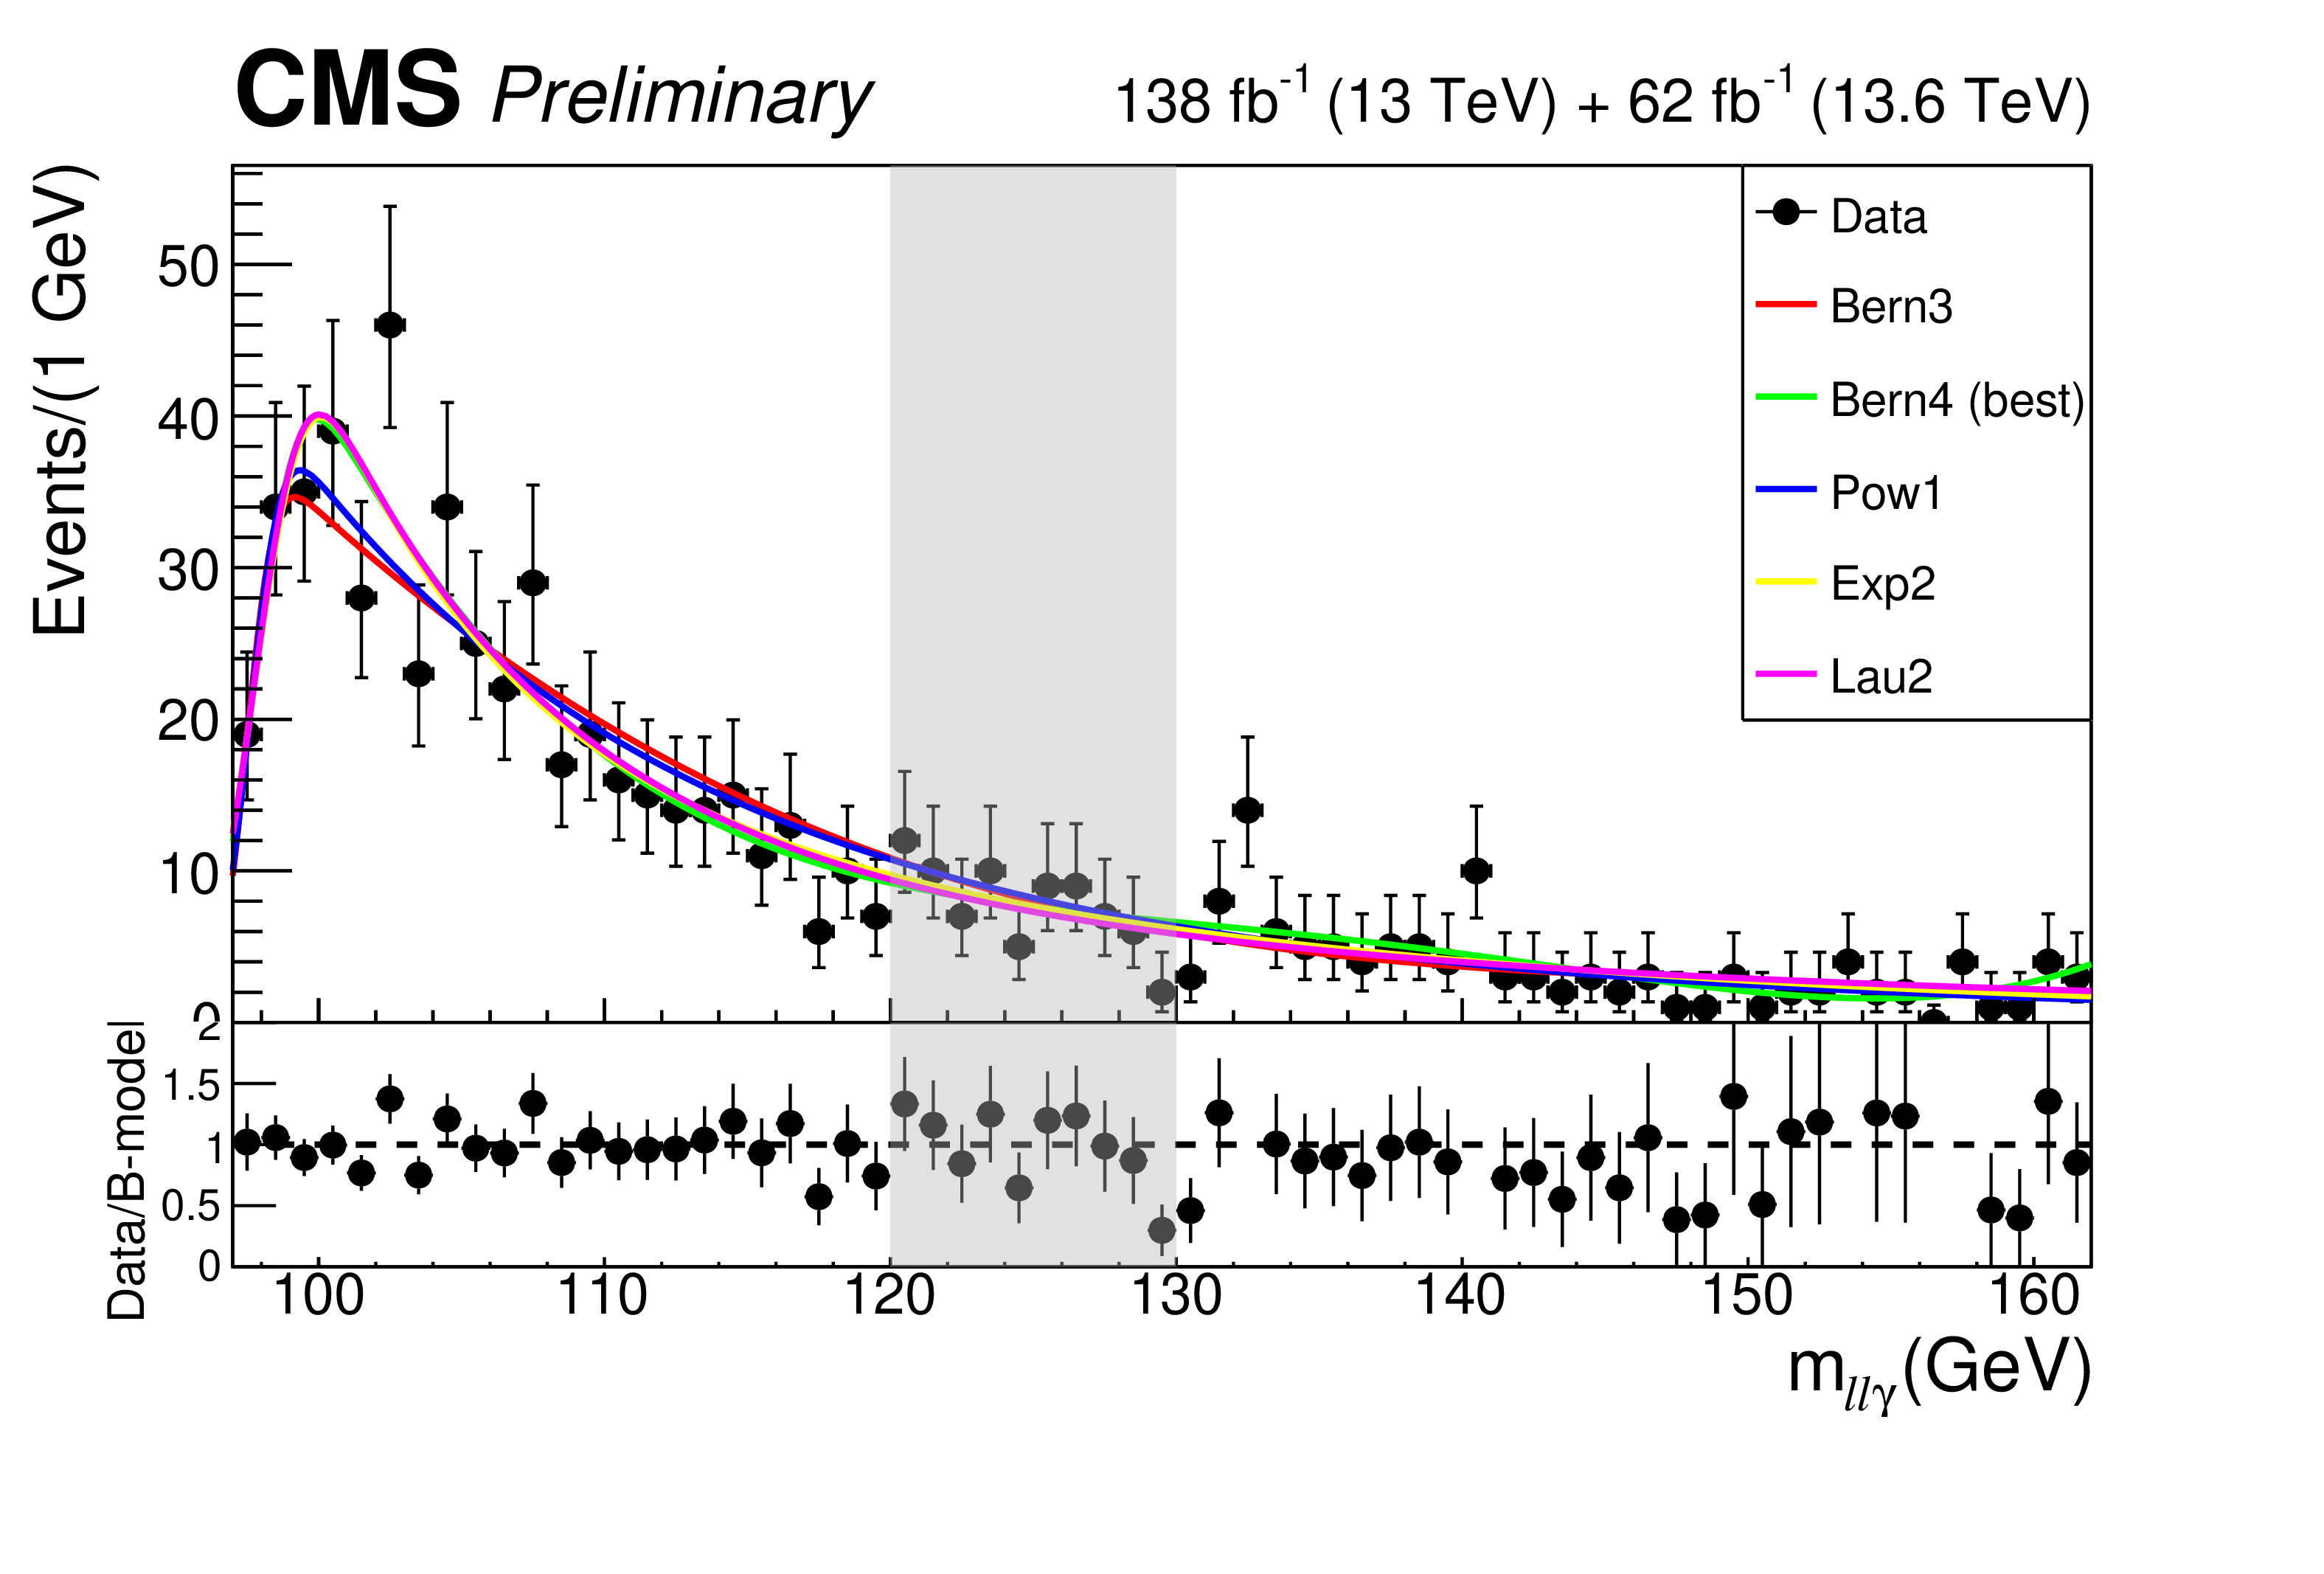
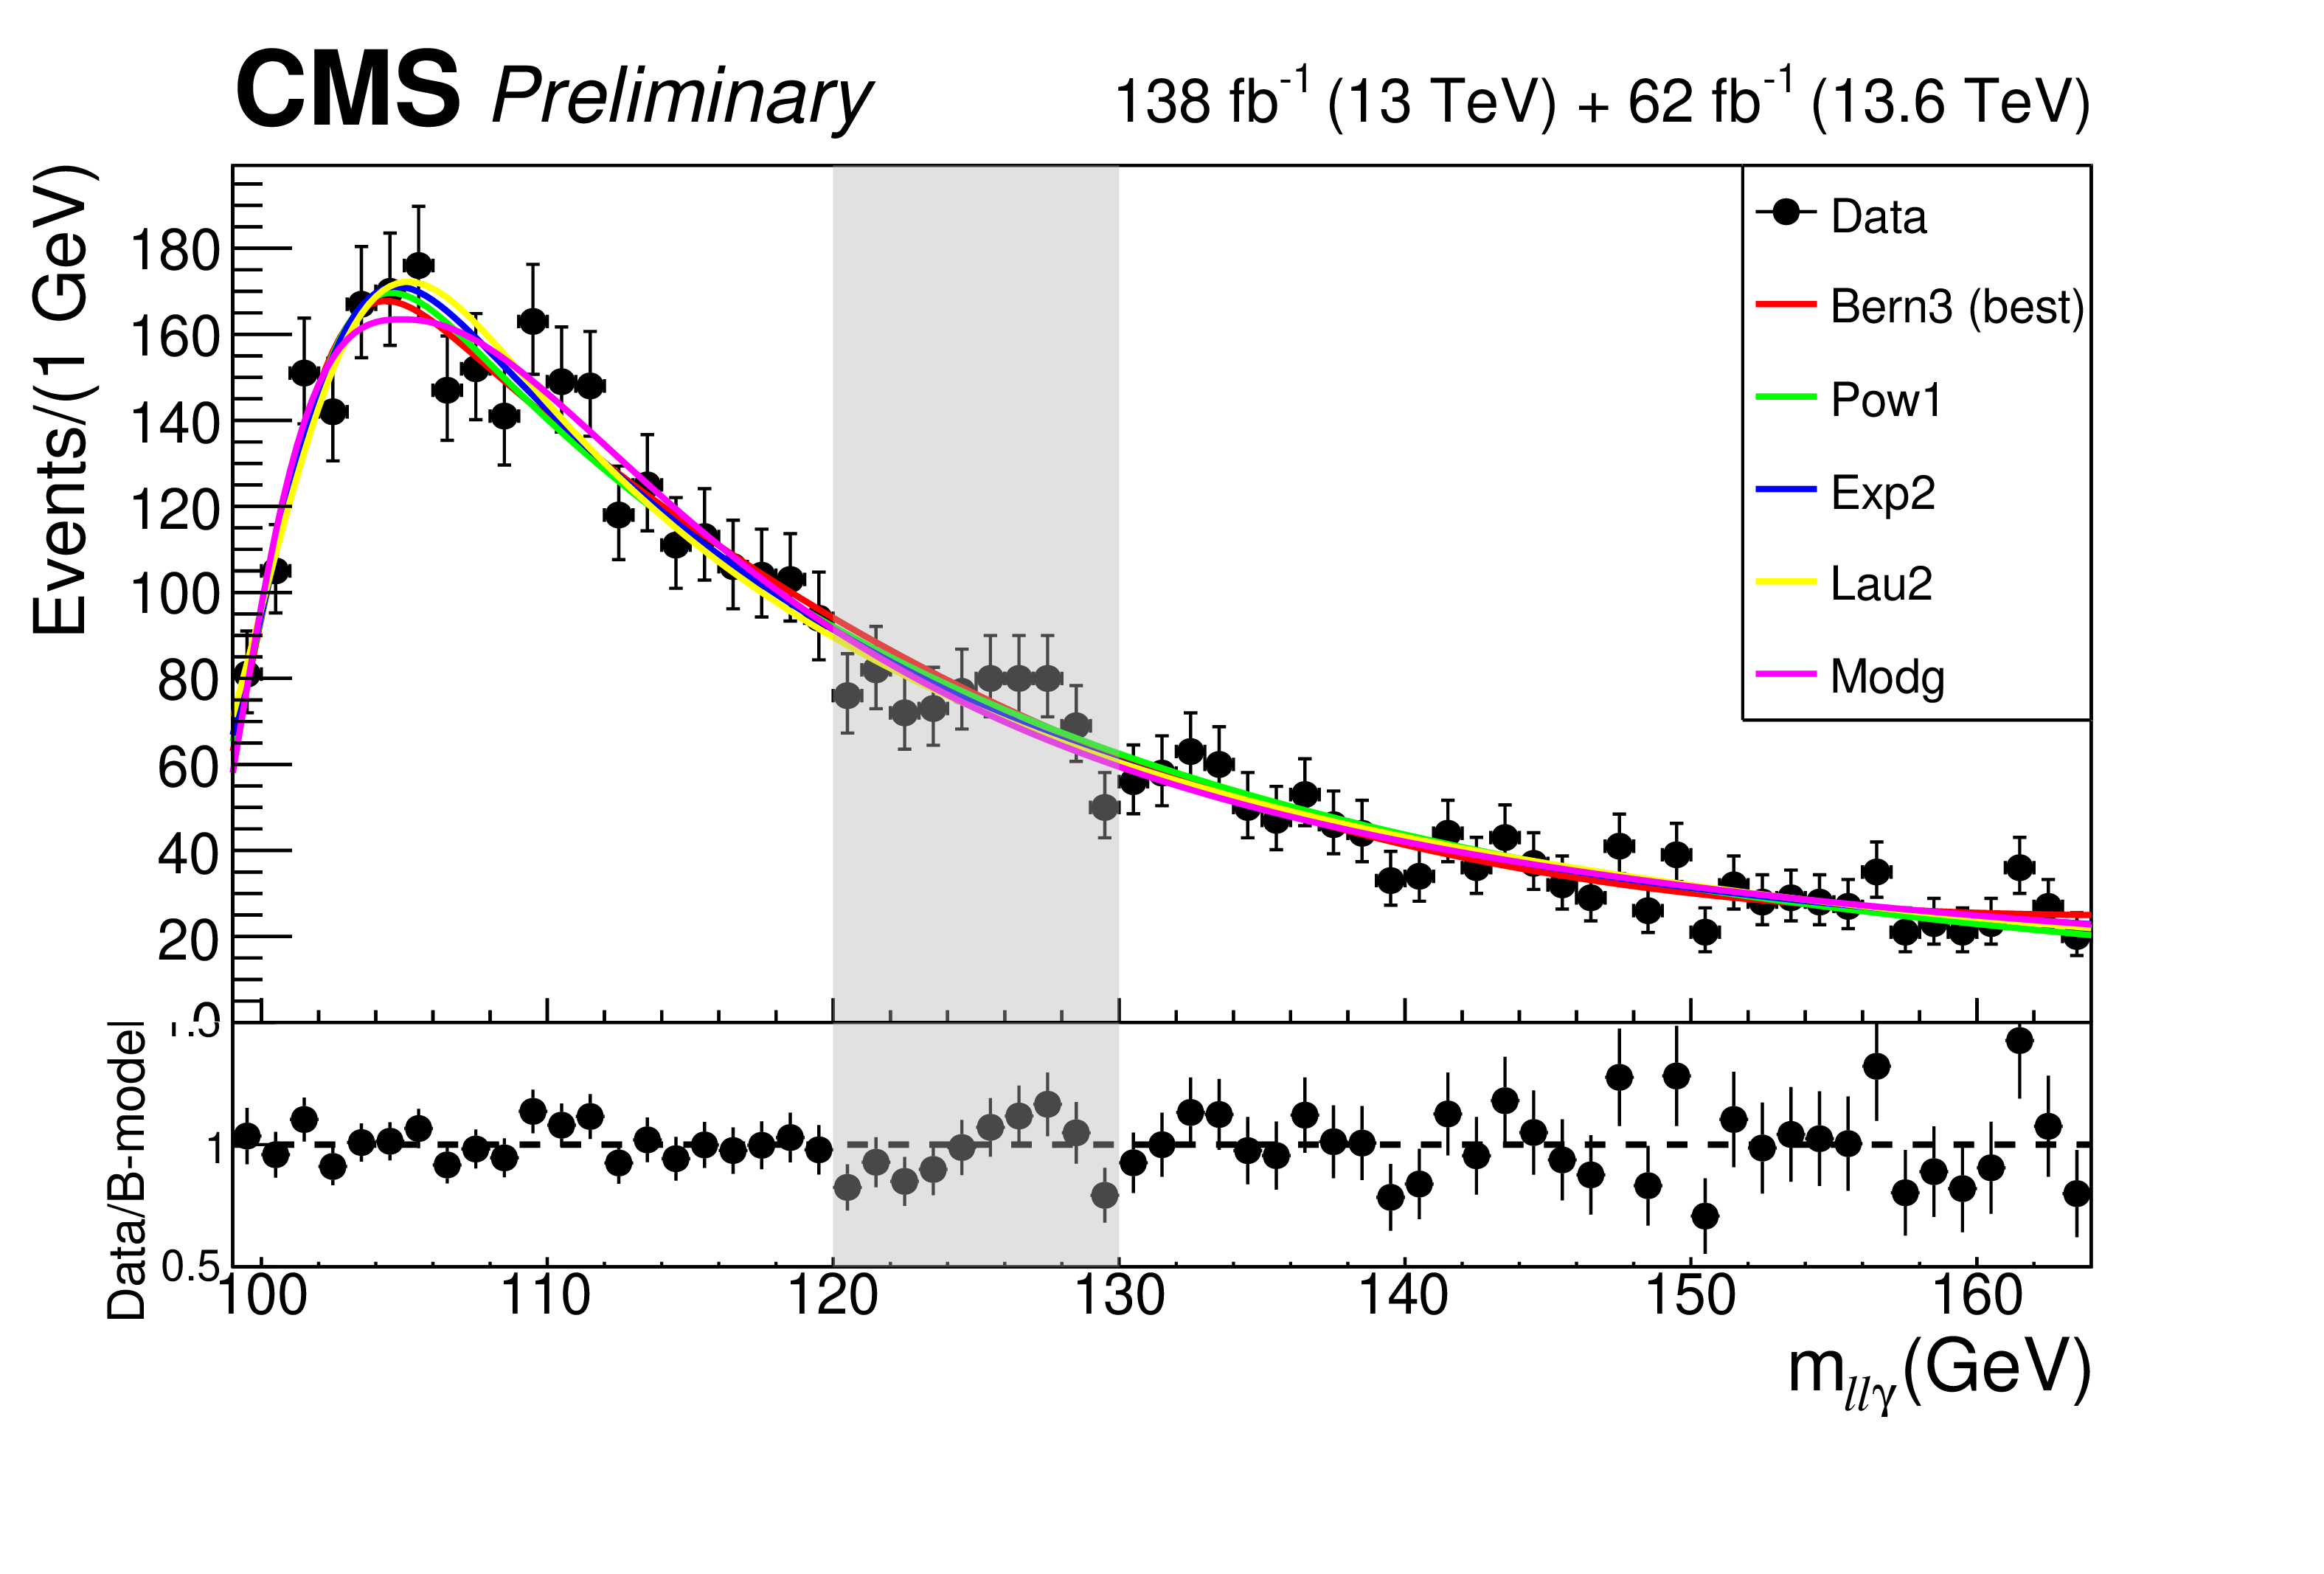
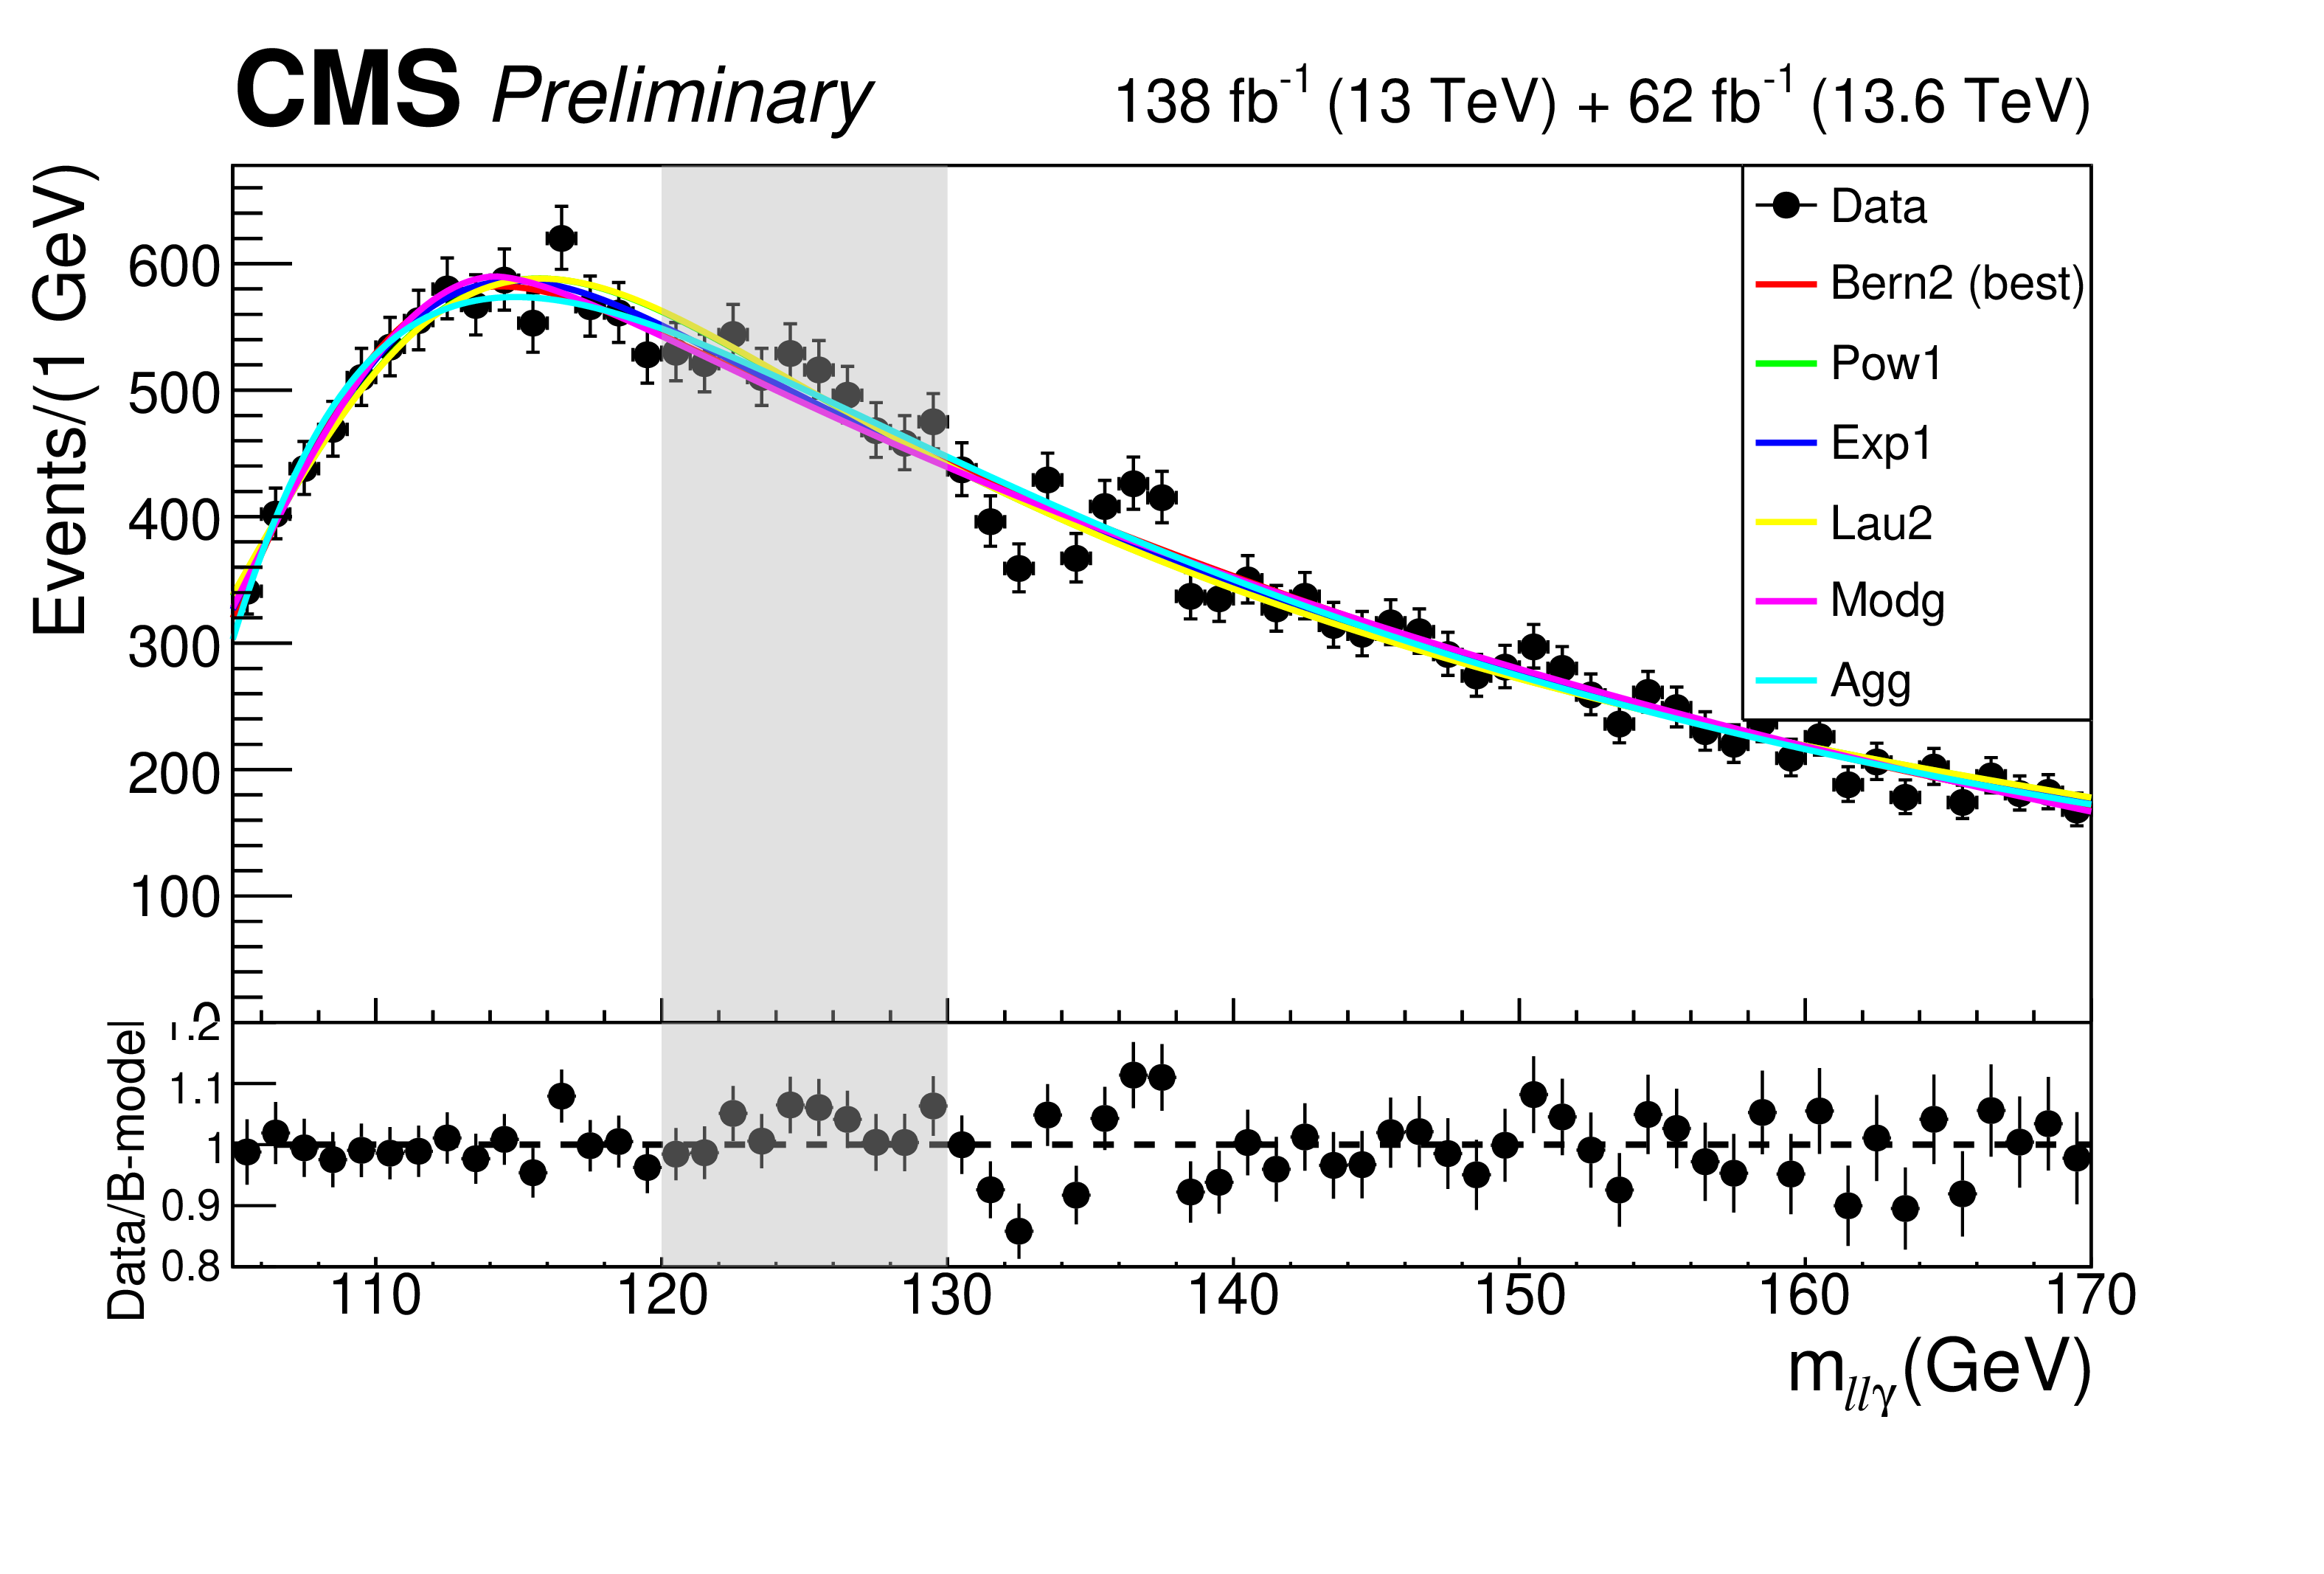
Additional Figure 10:
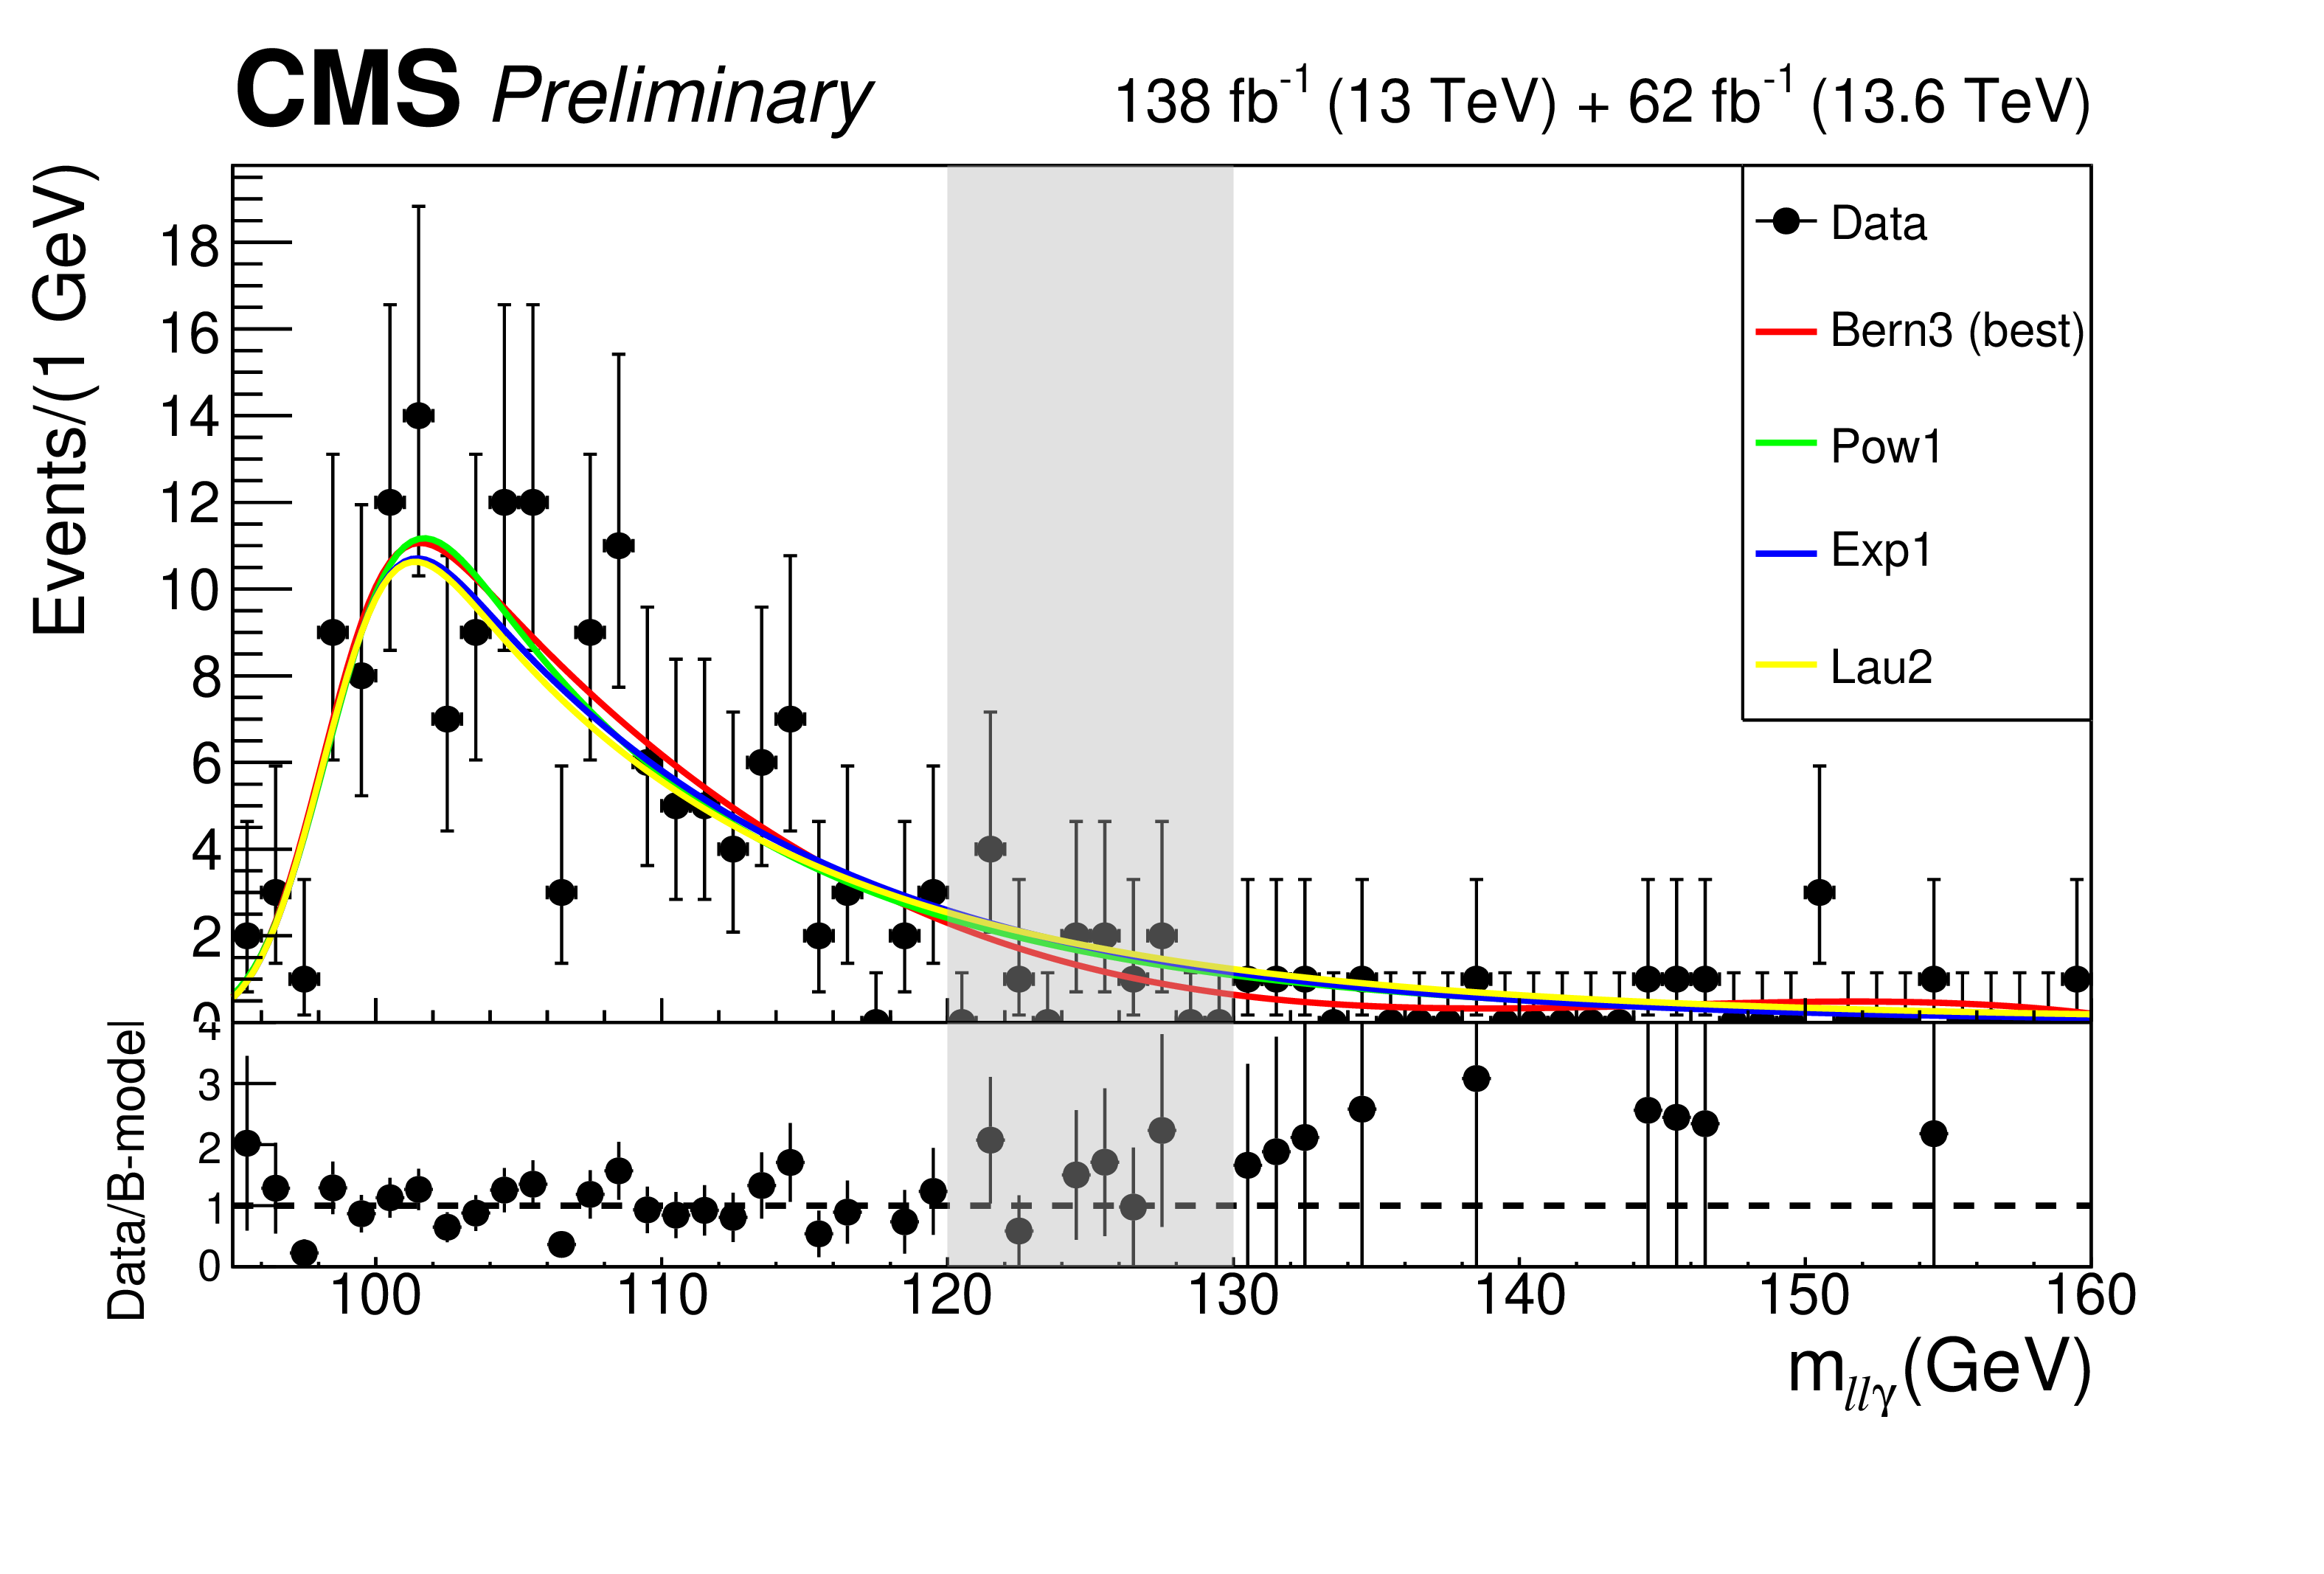
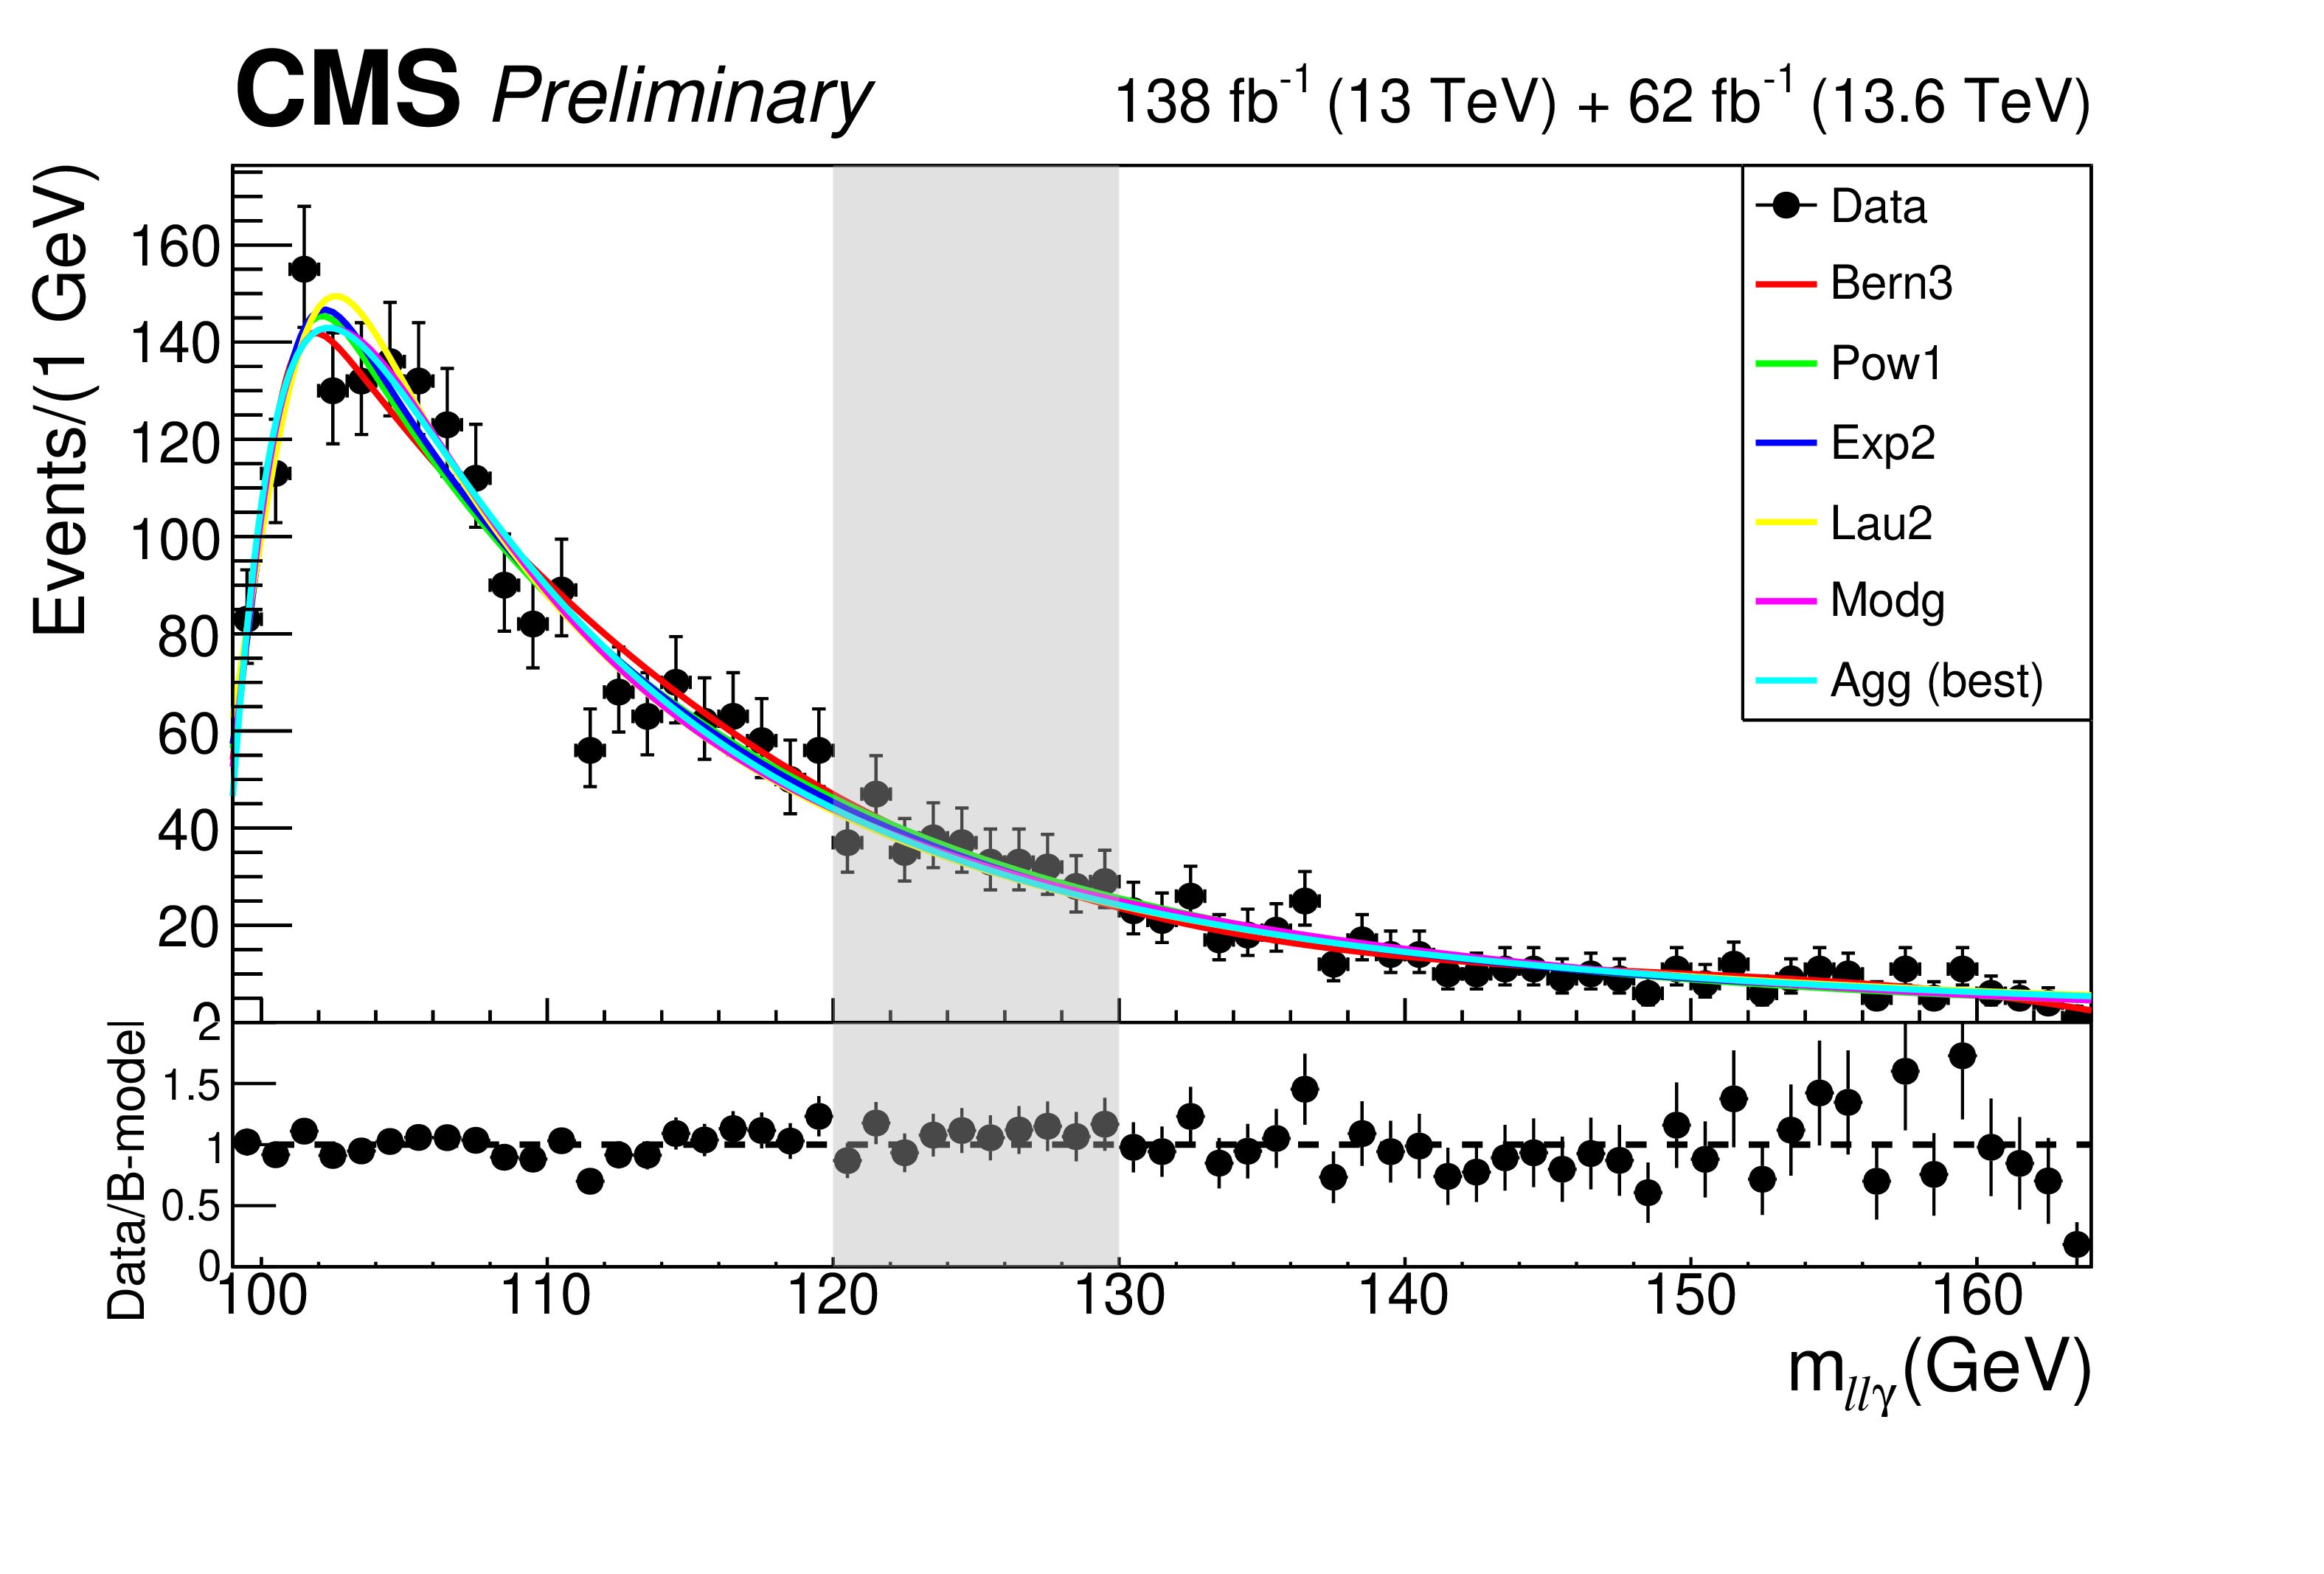
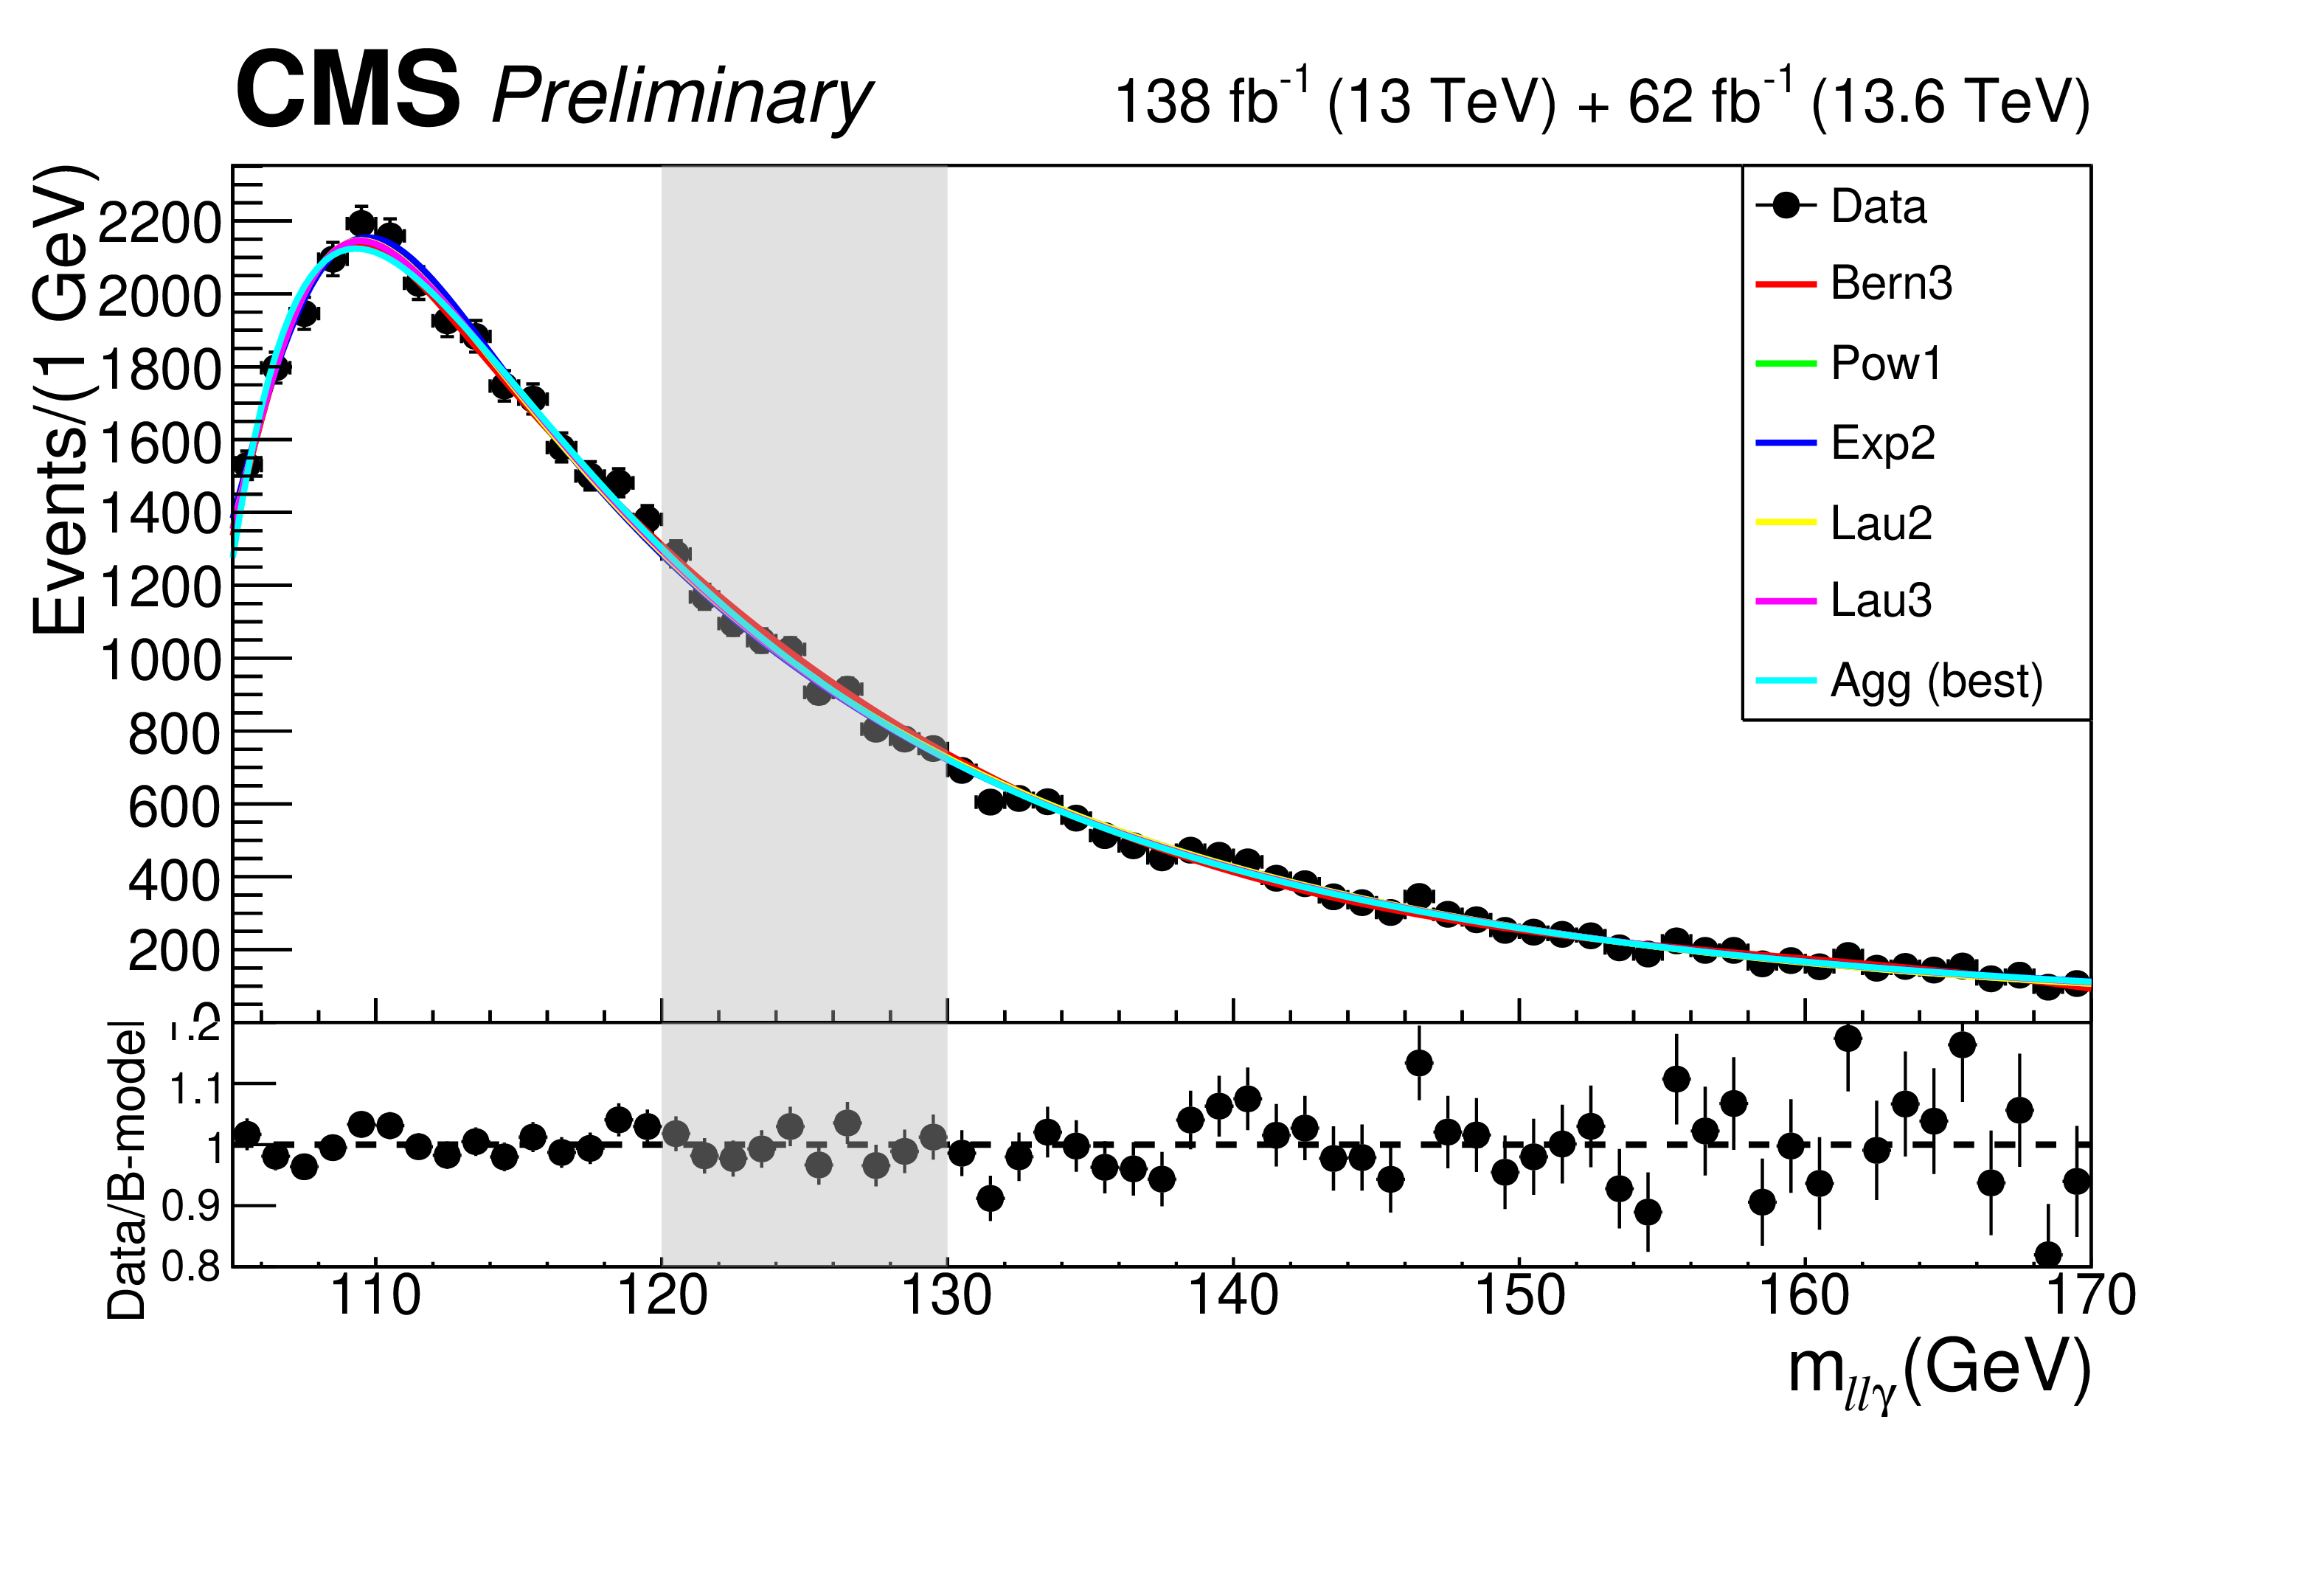
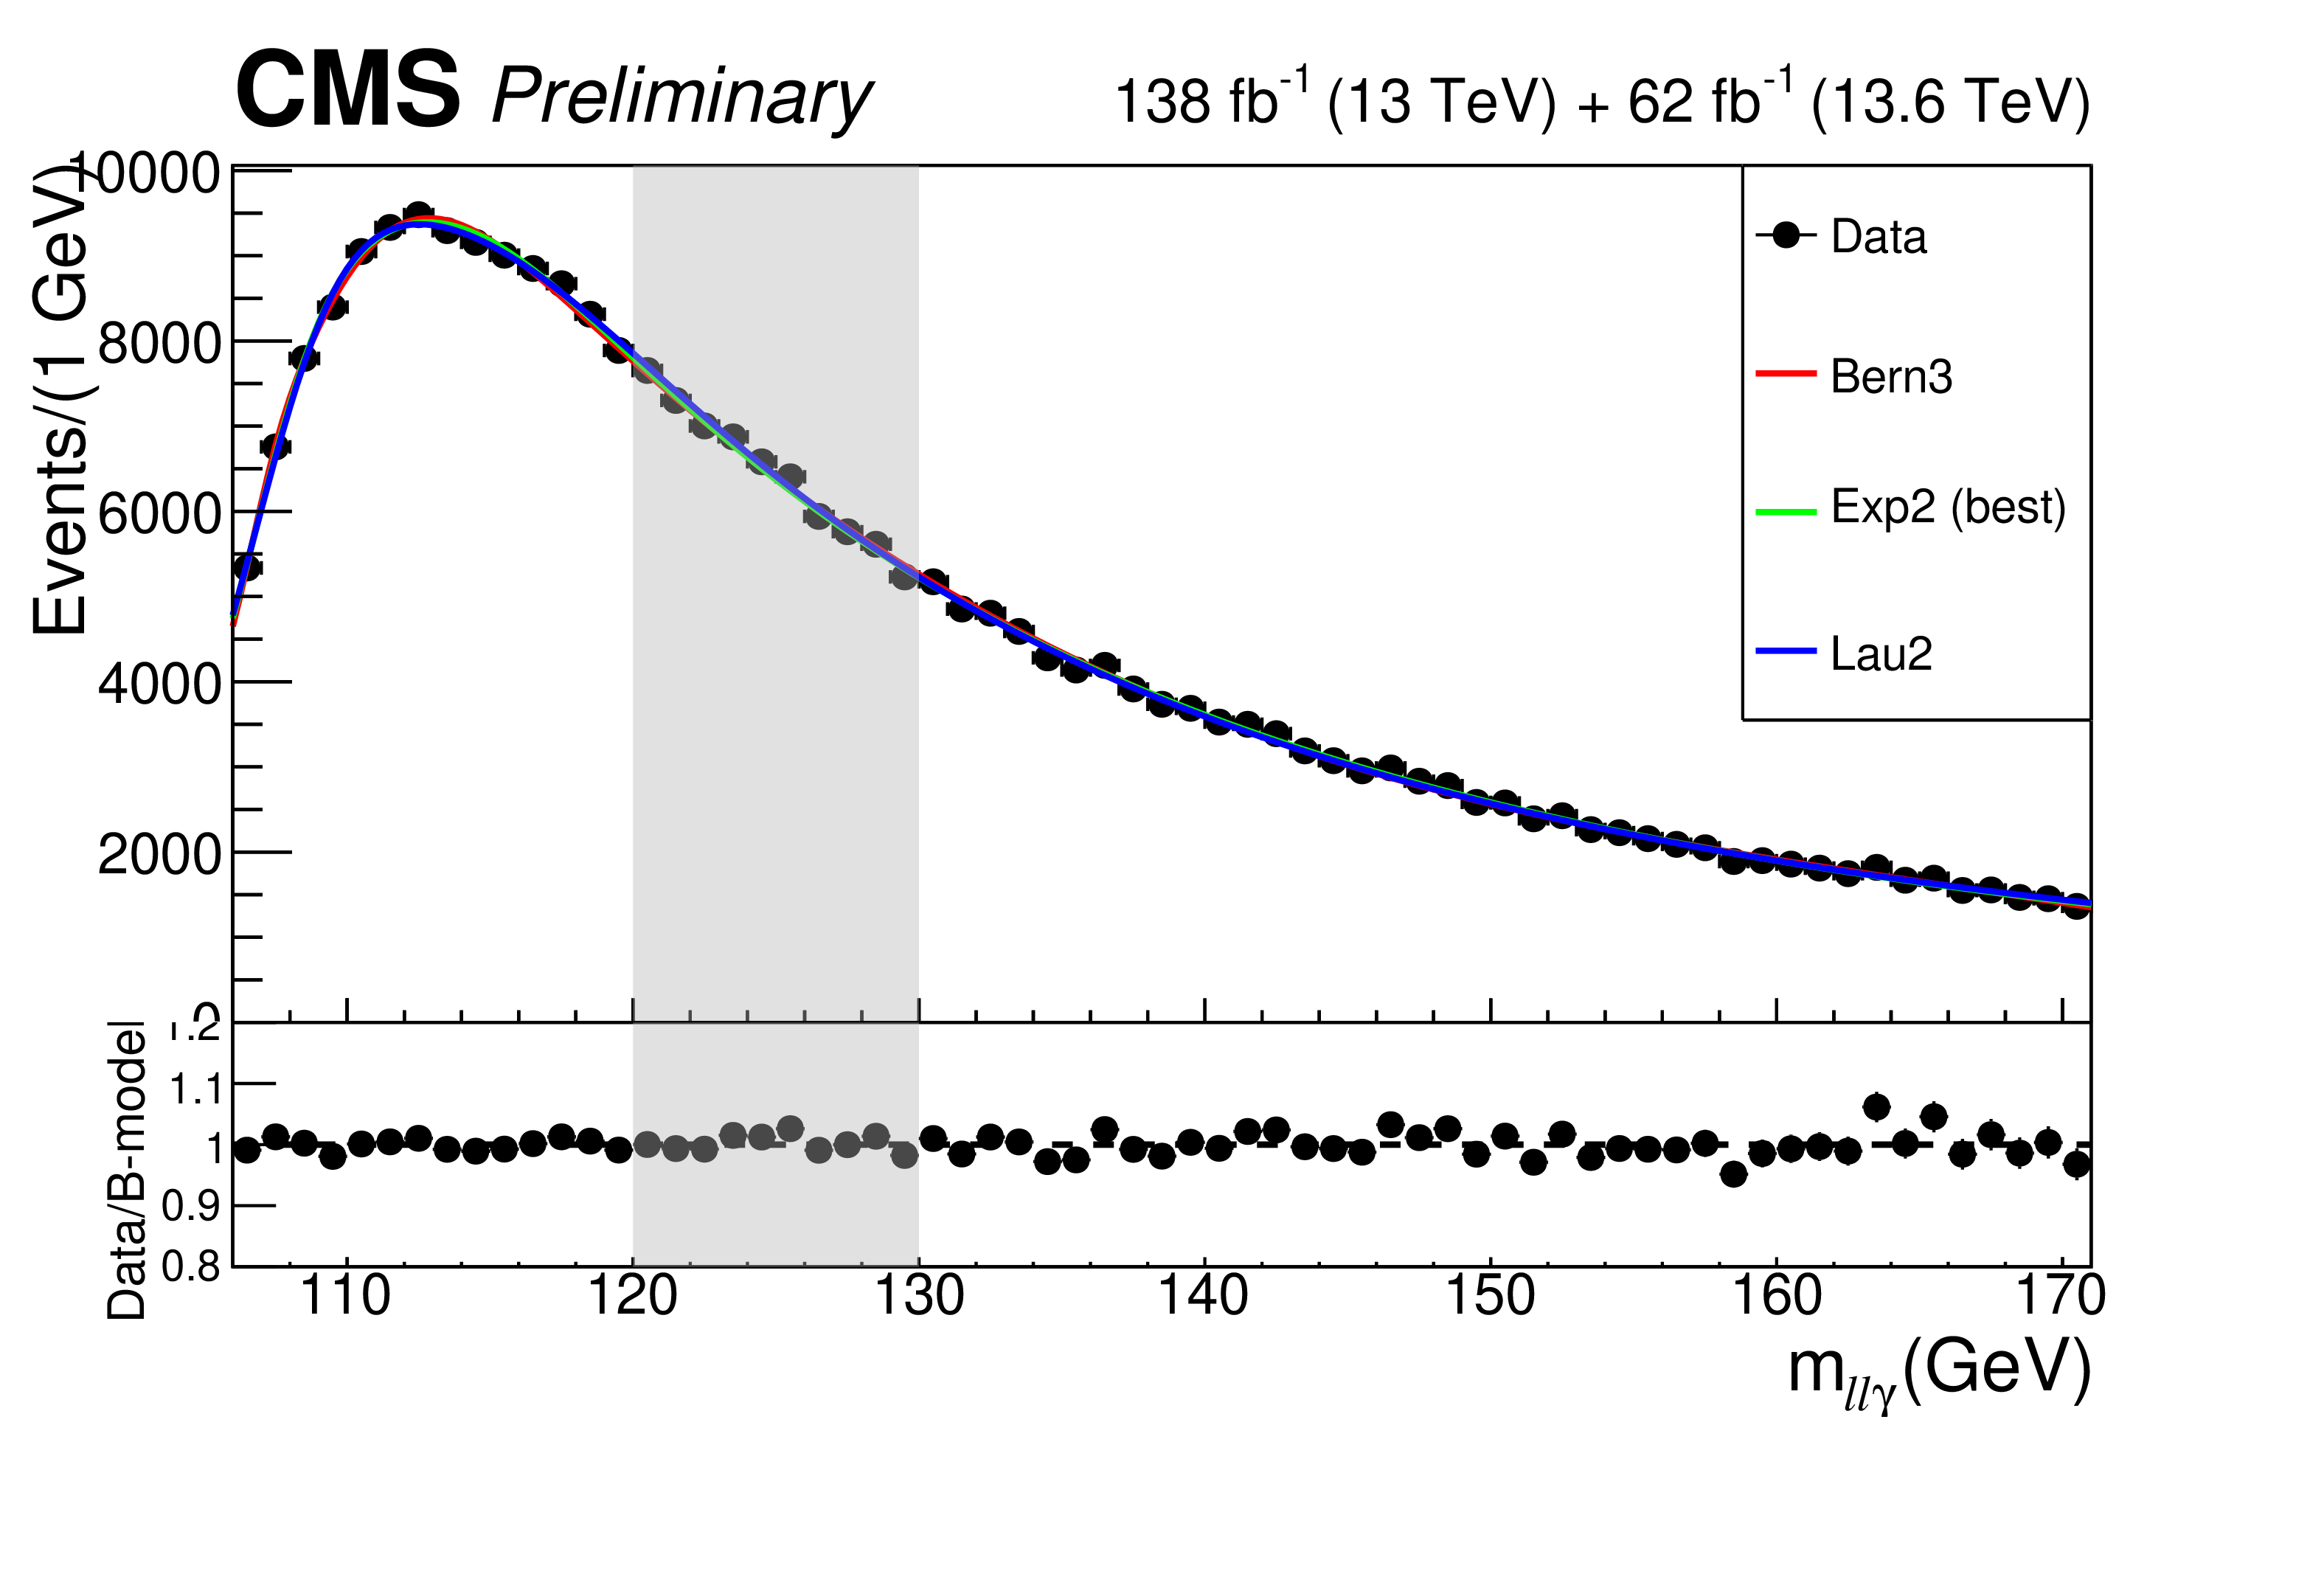
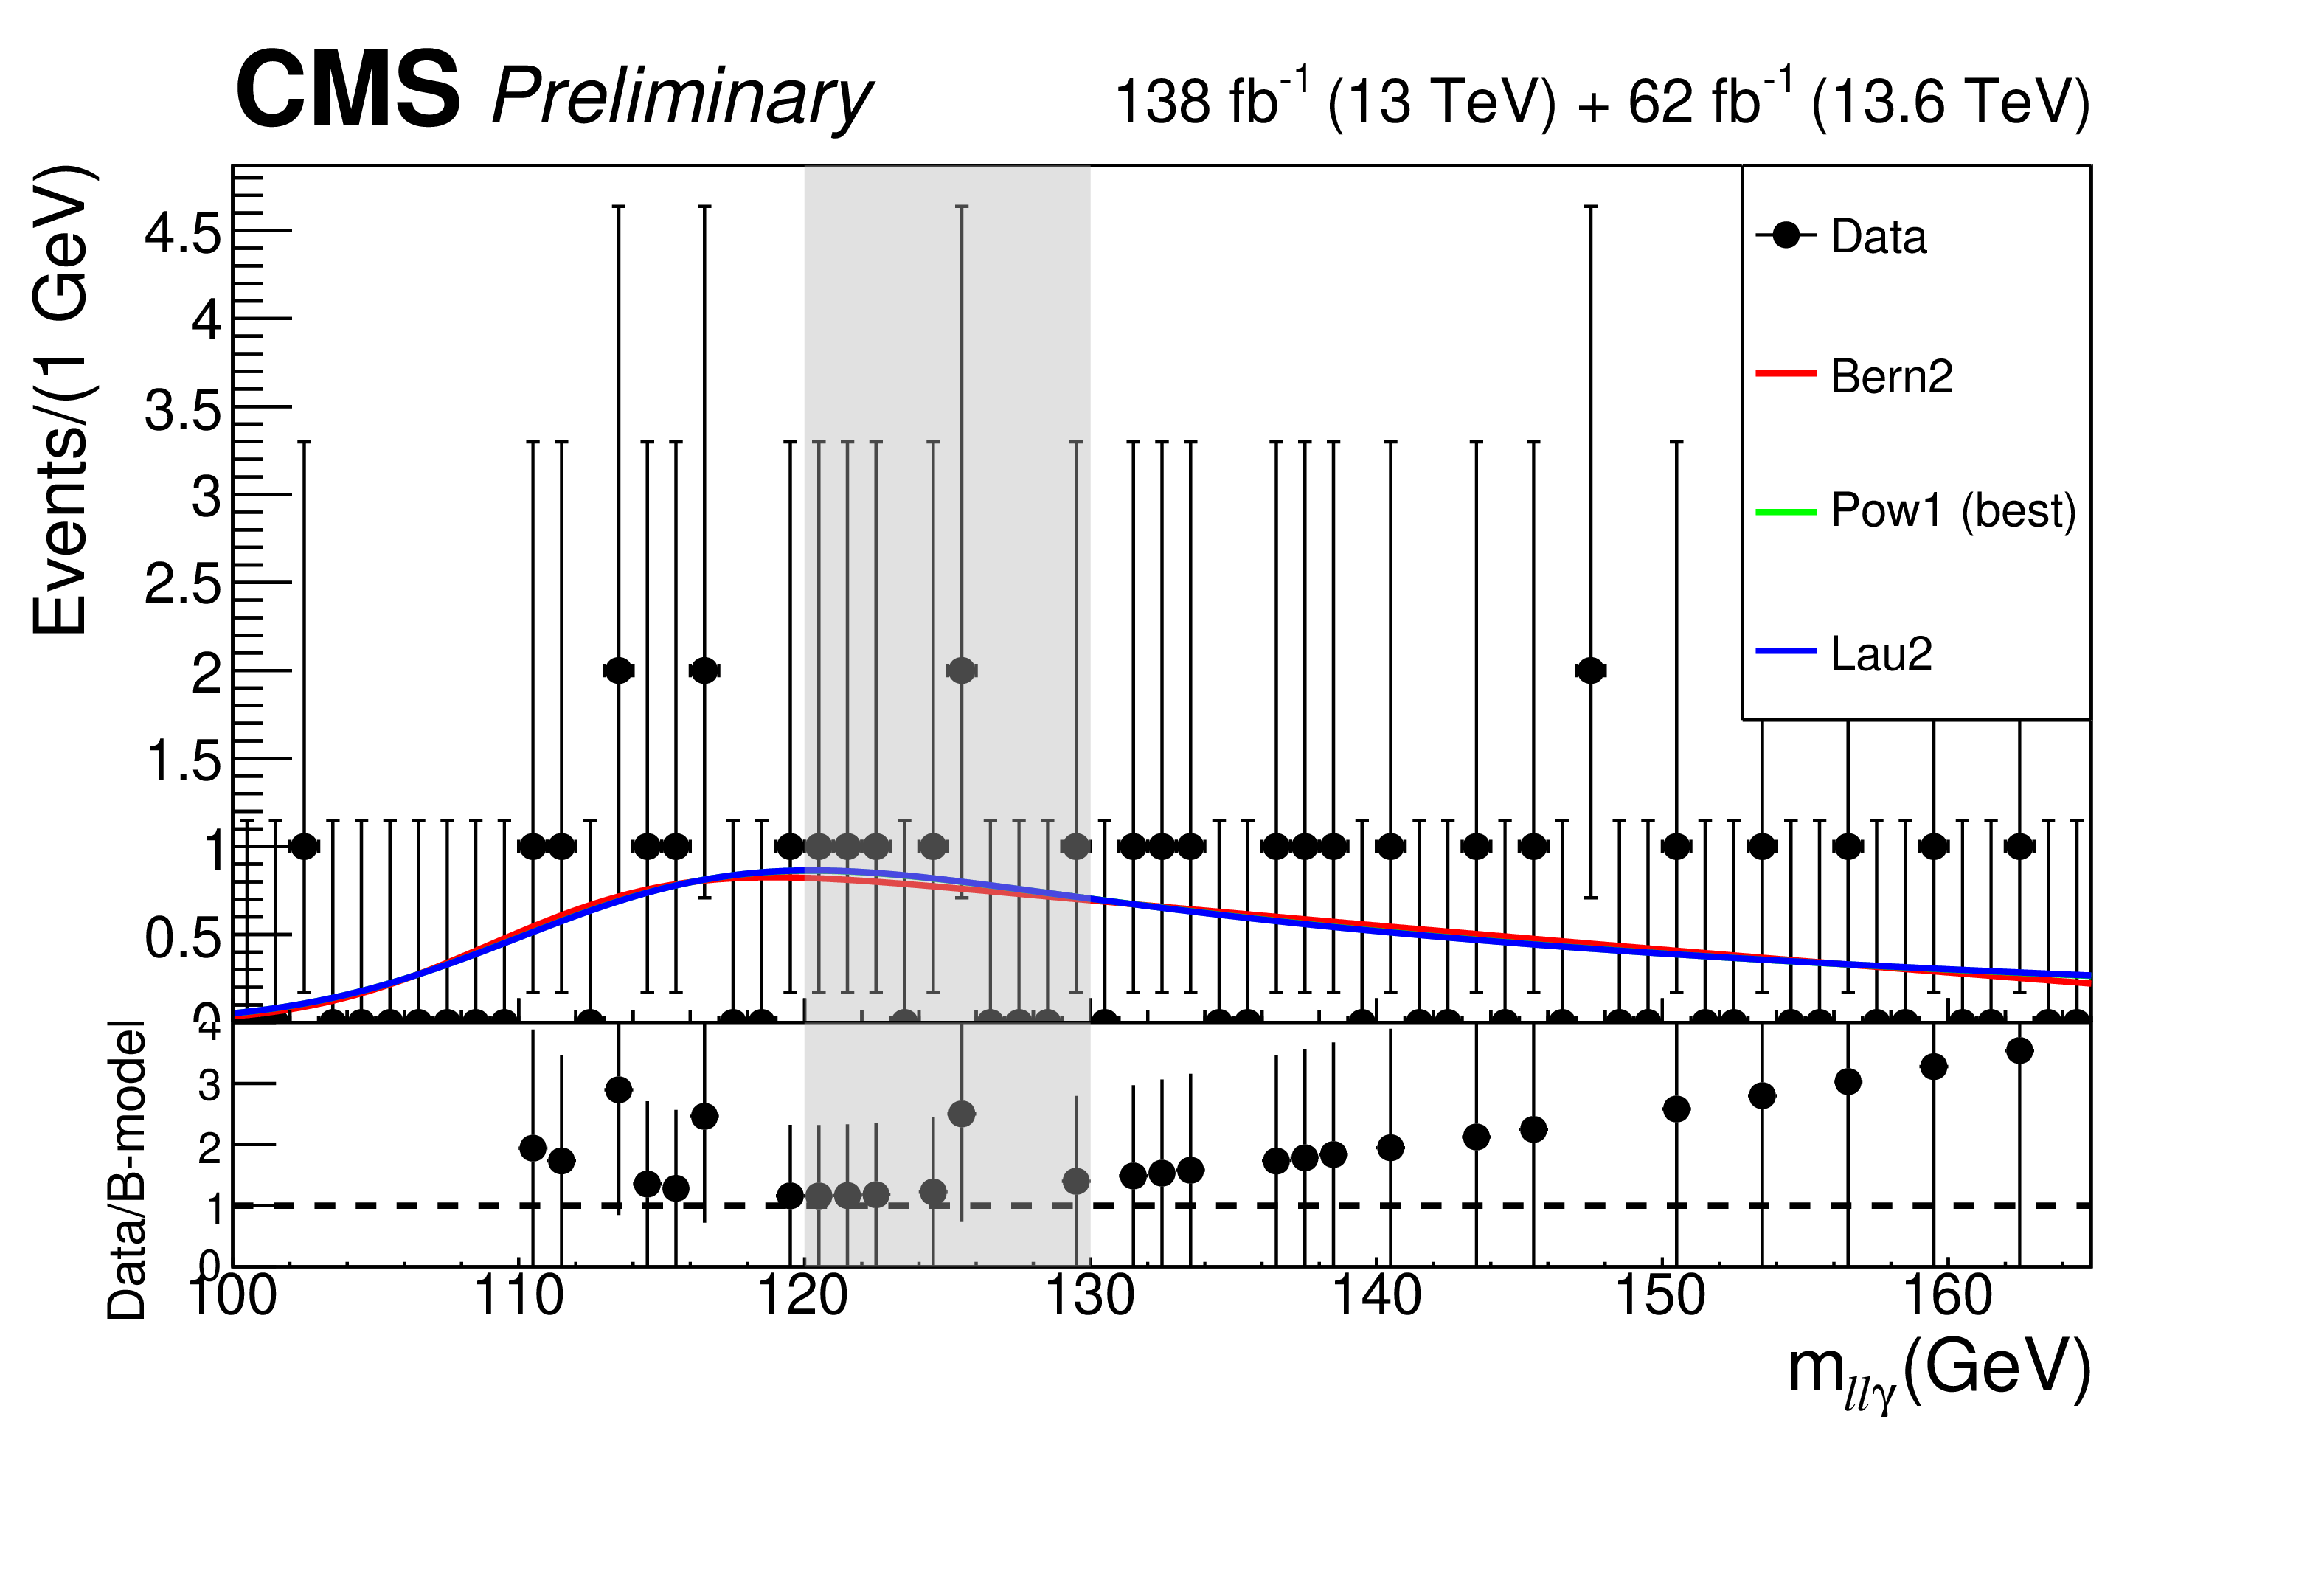
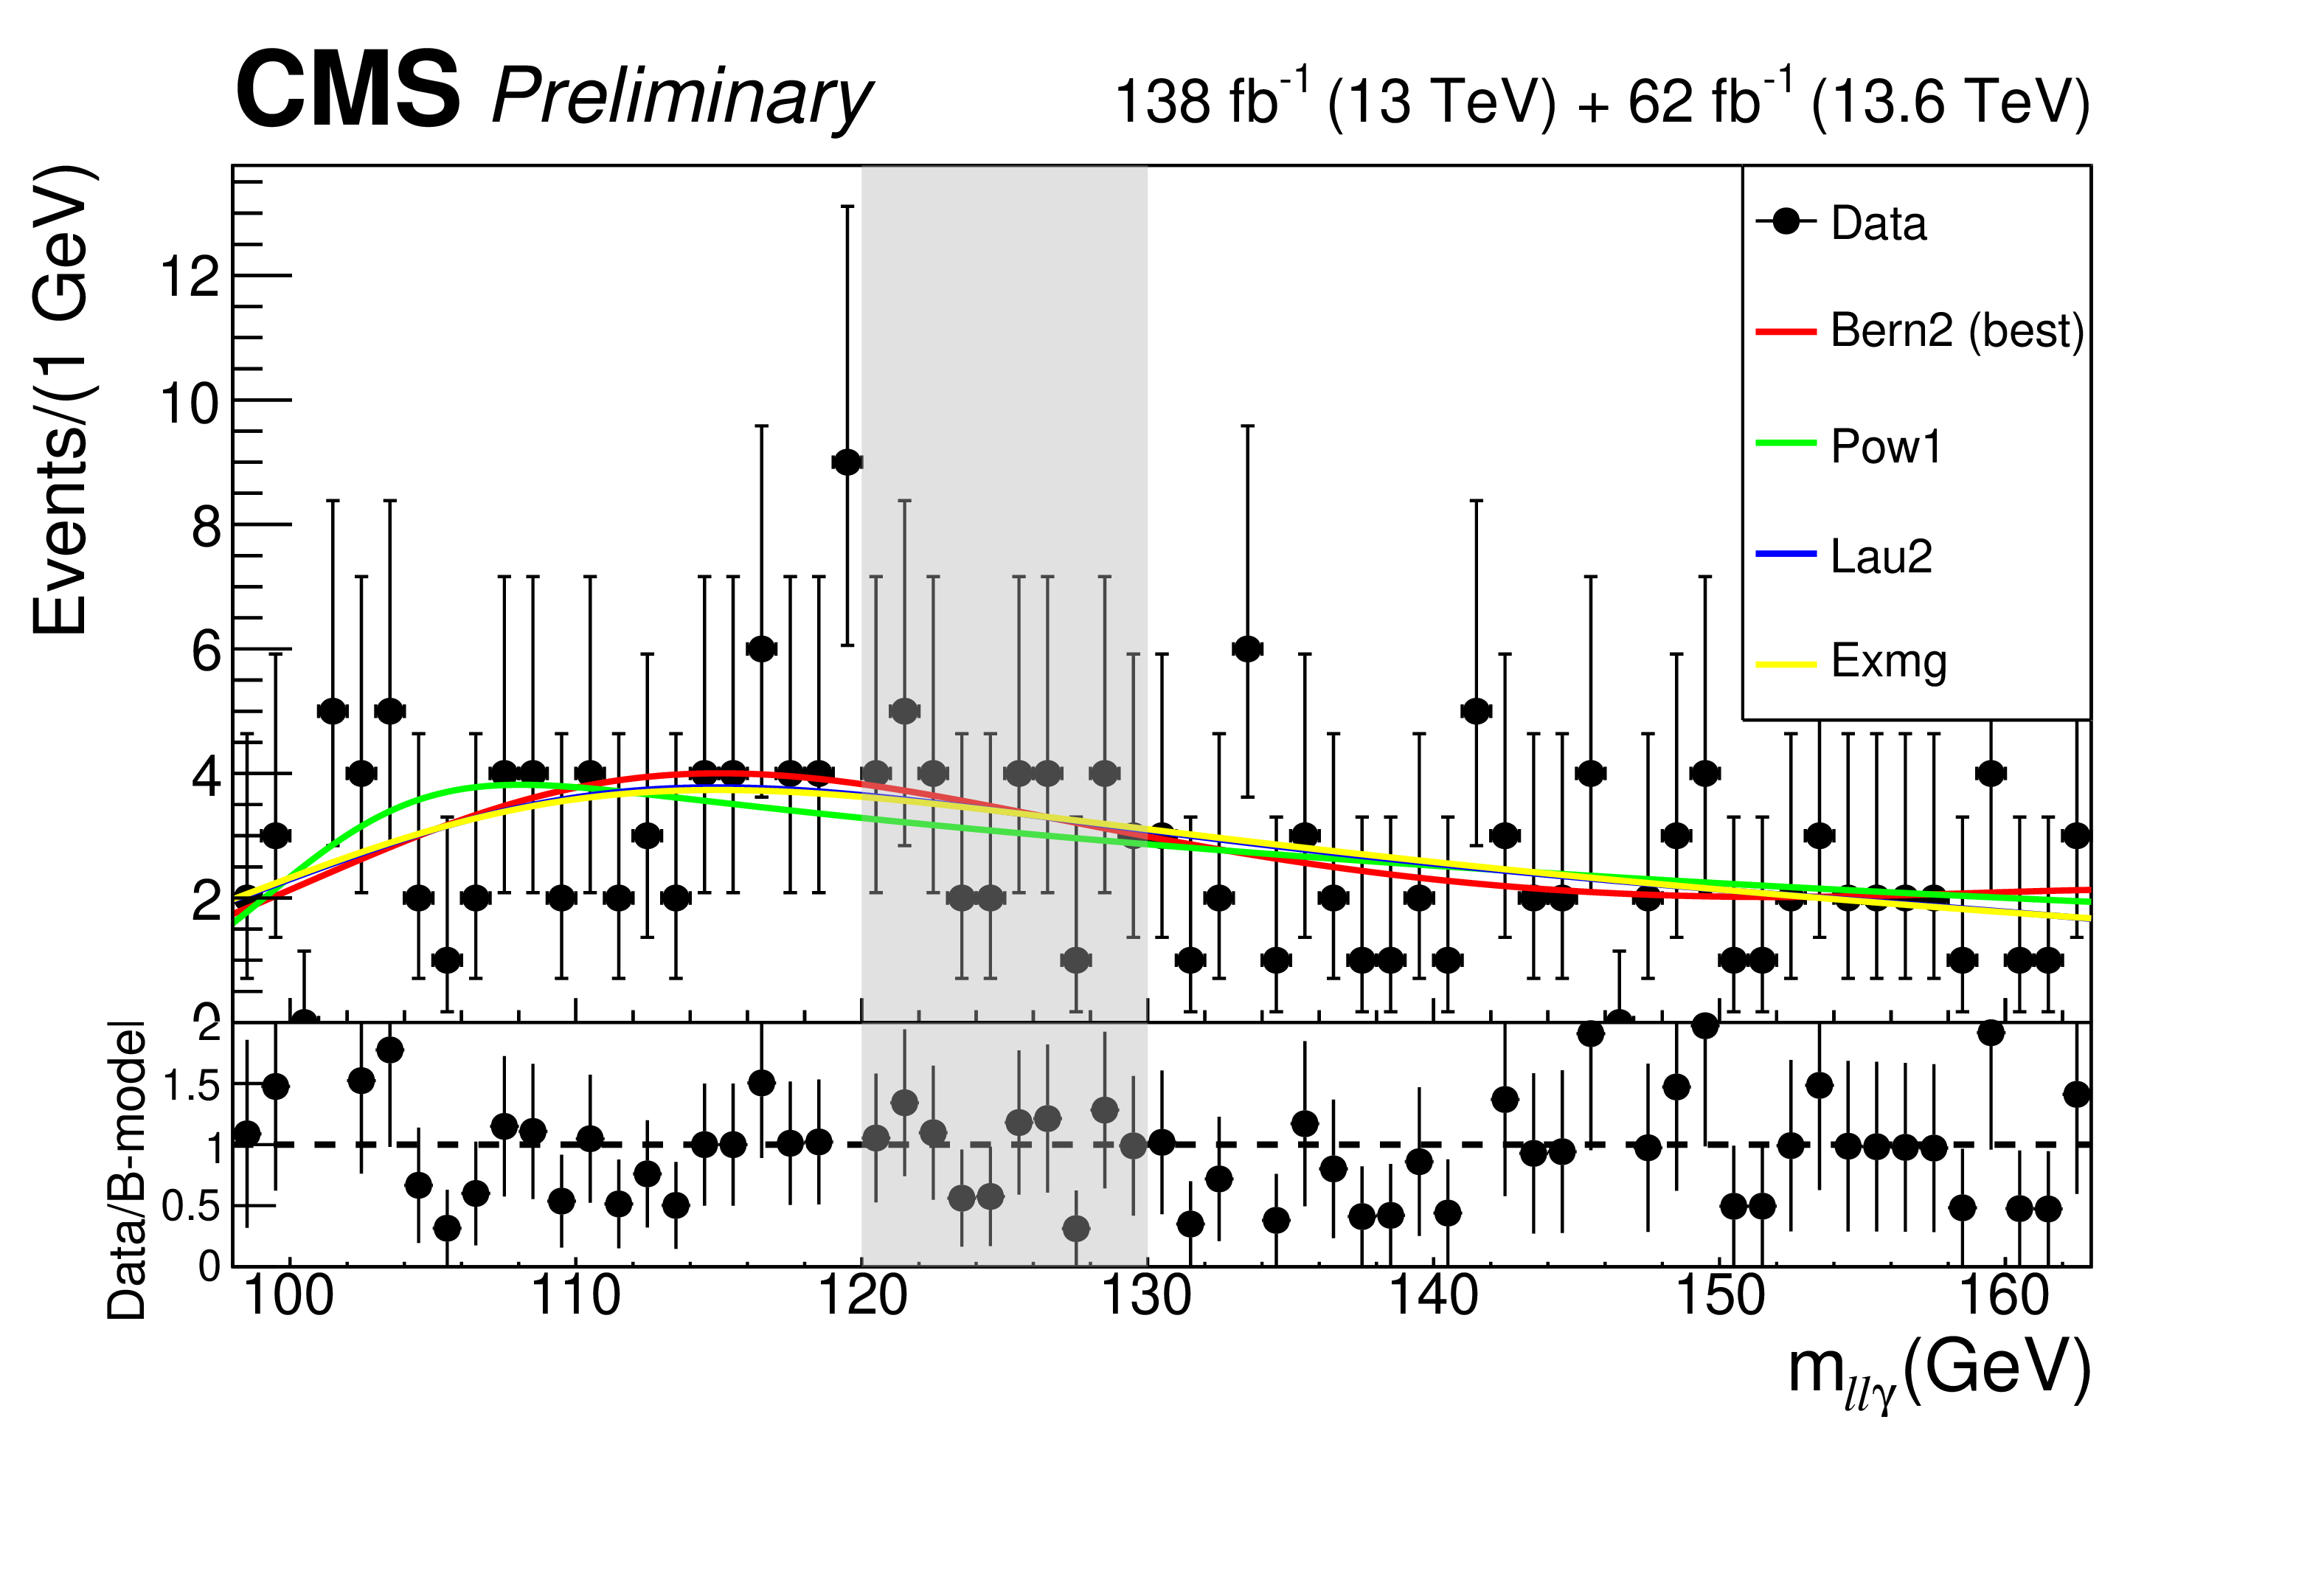
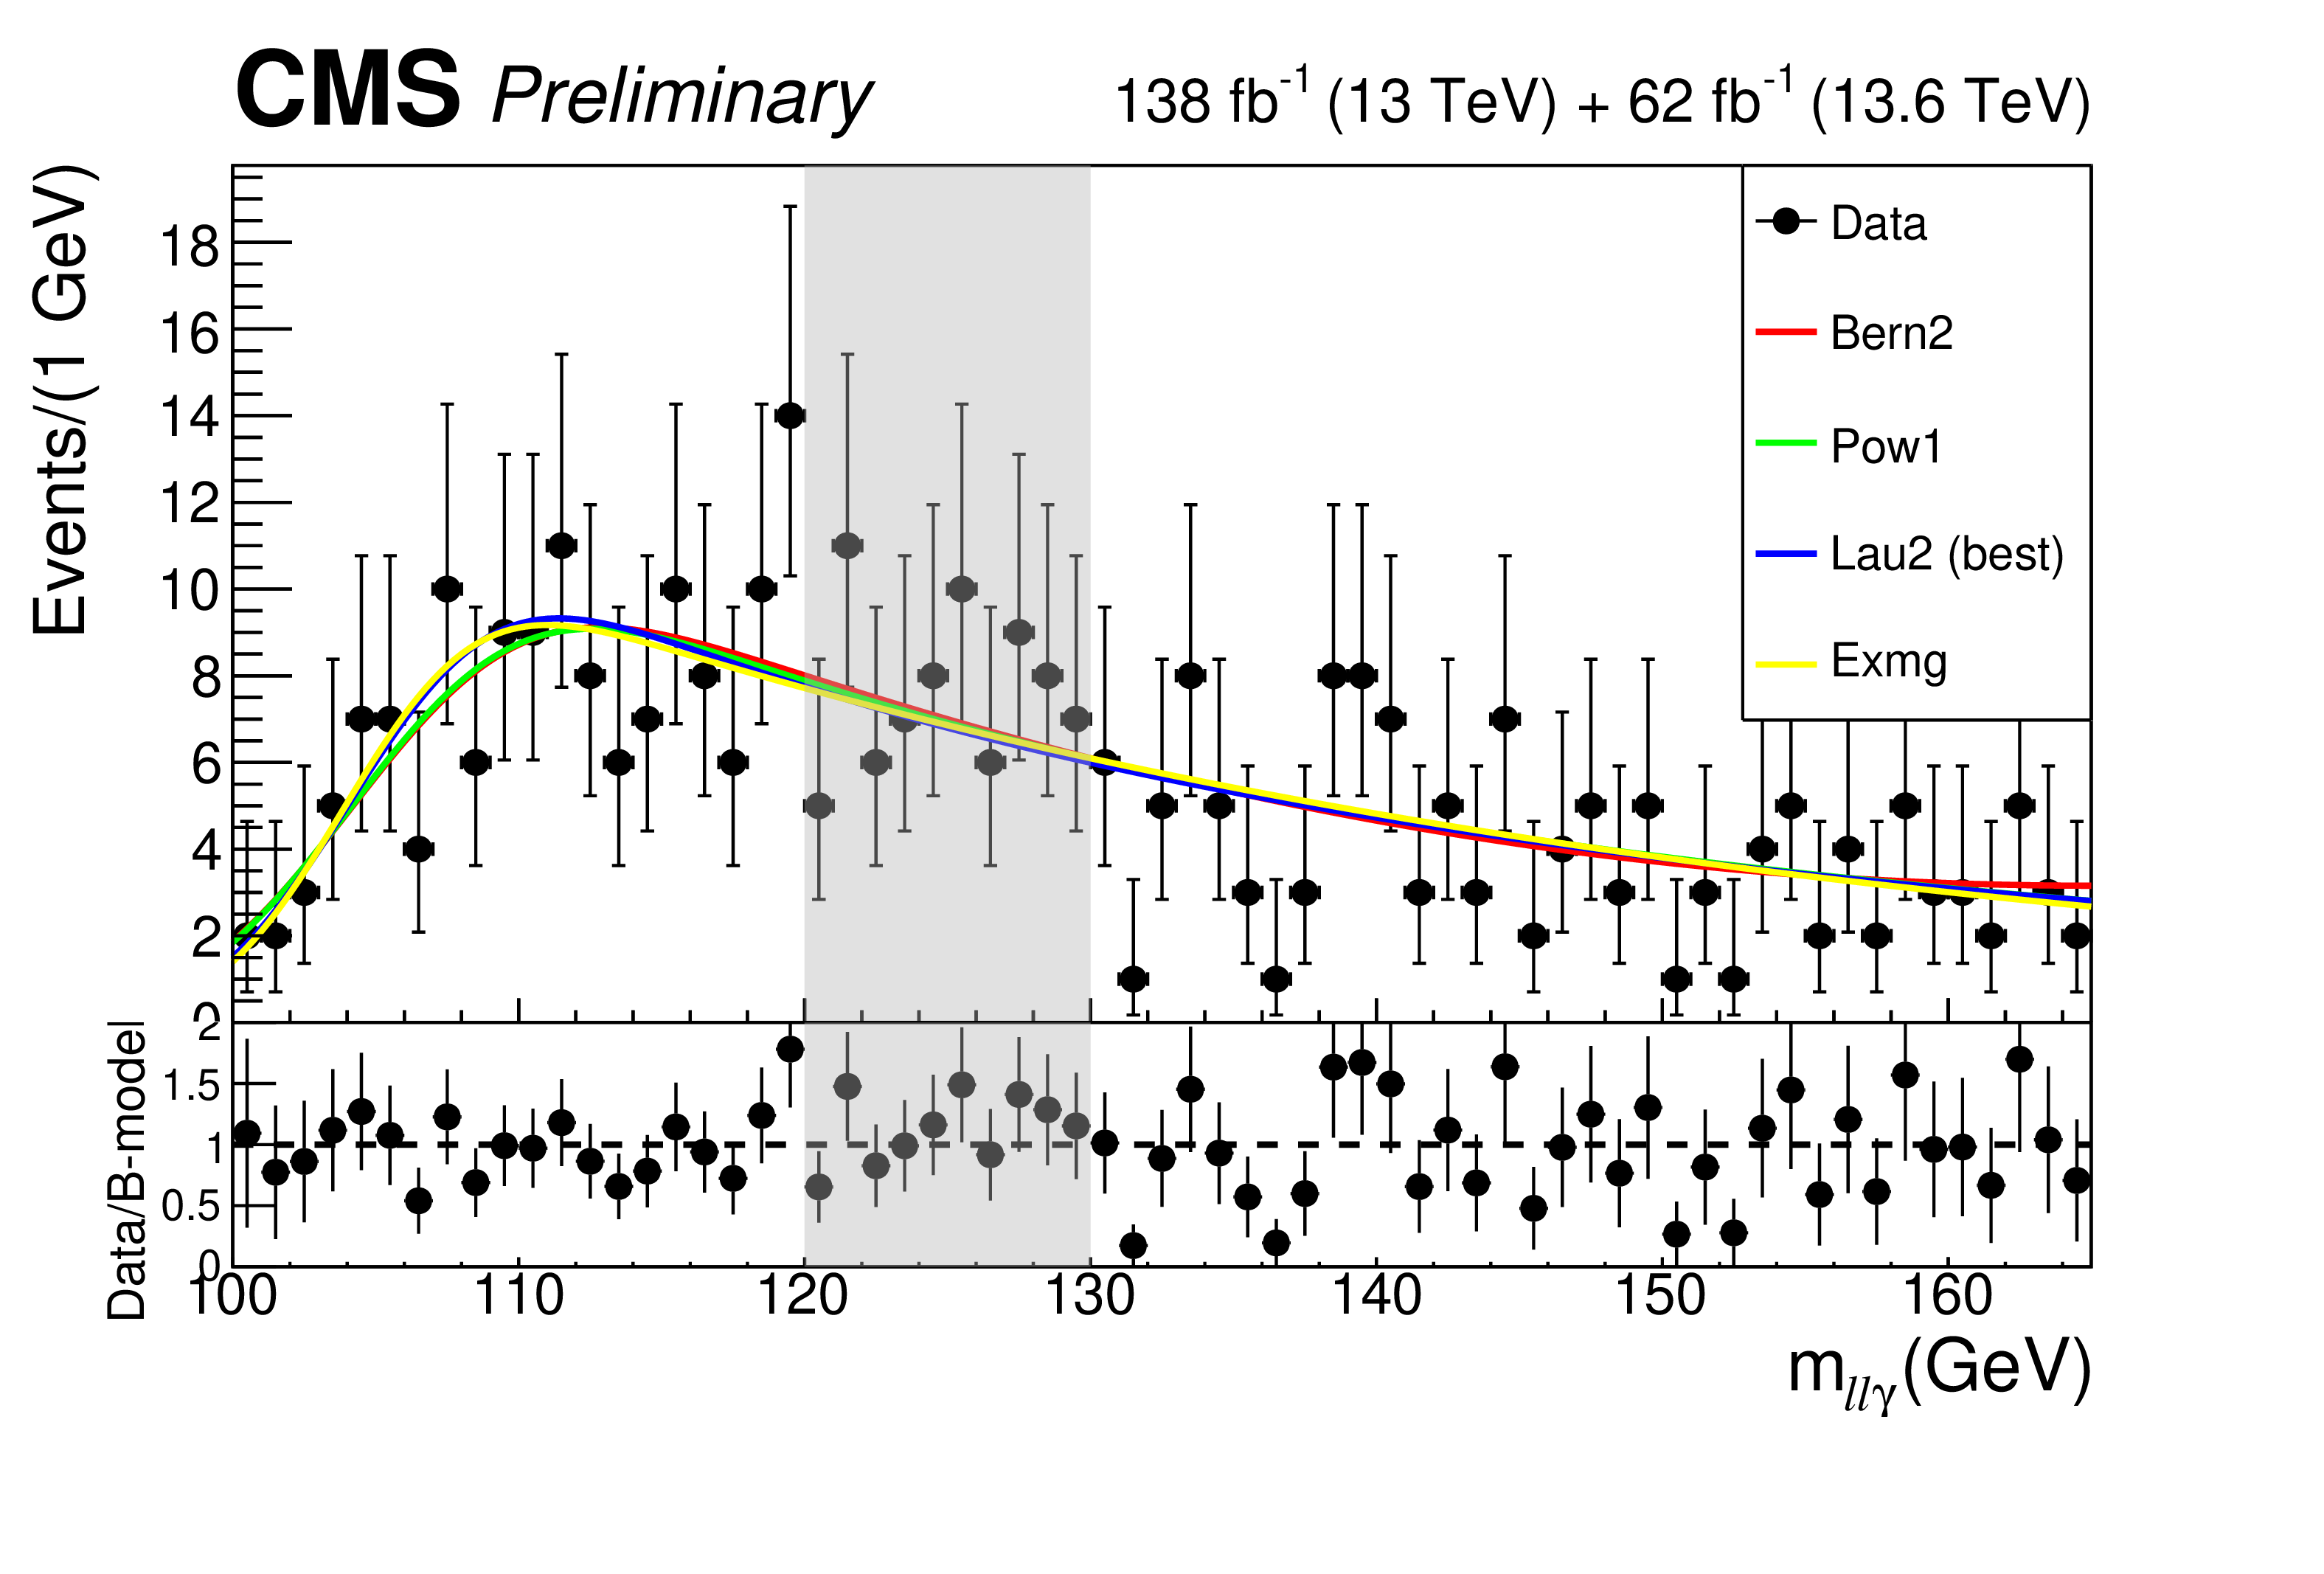
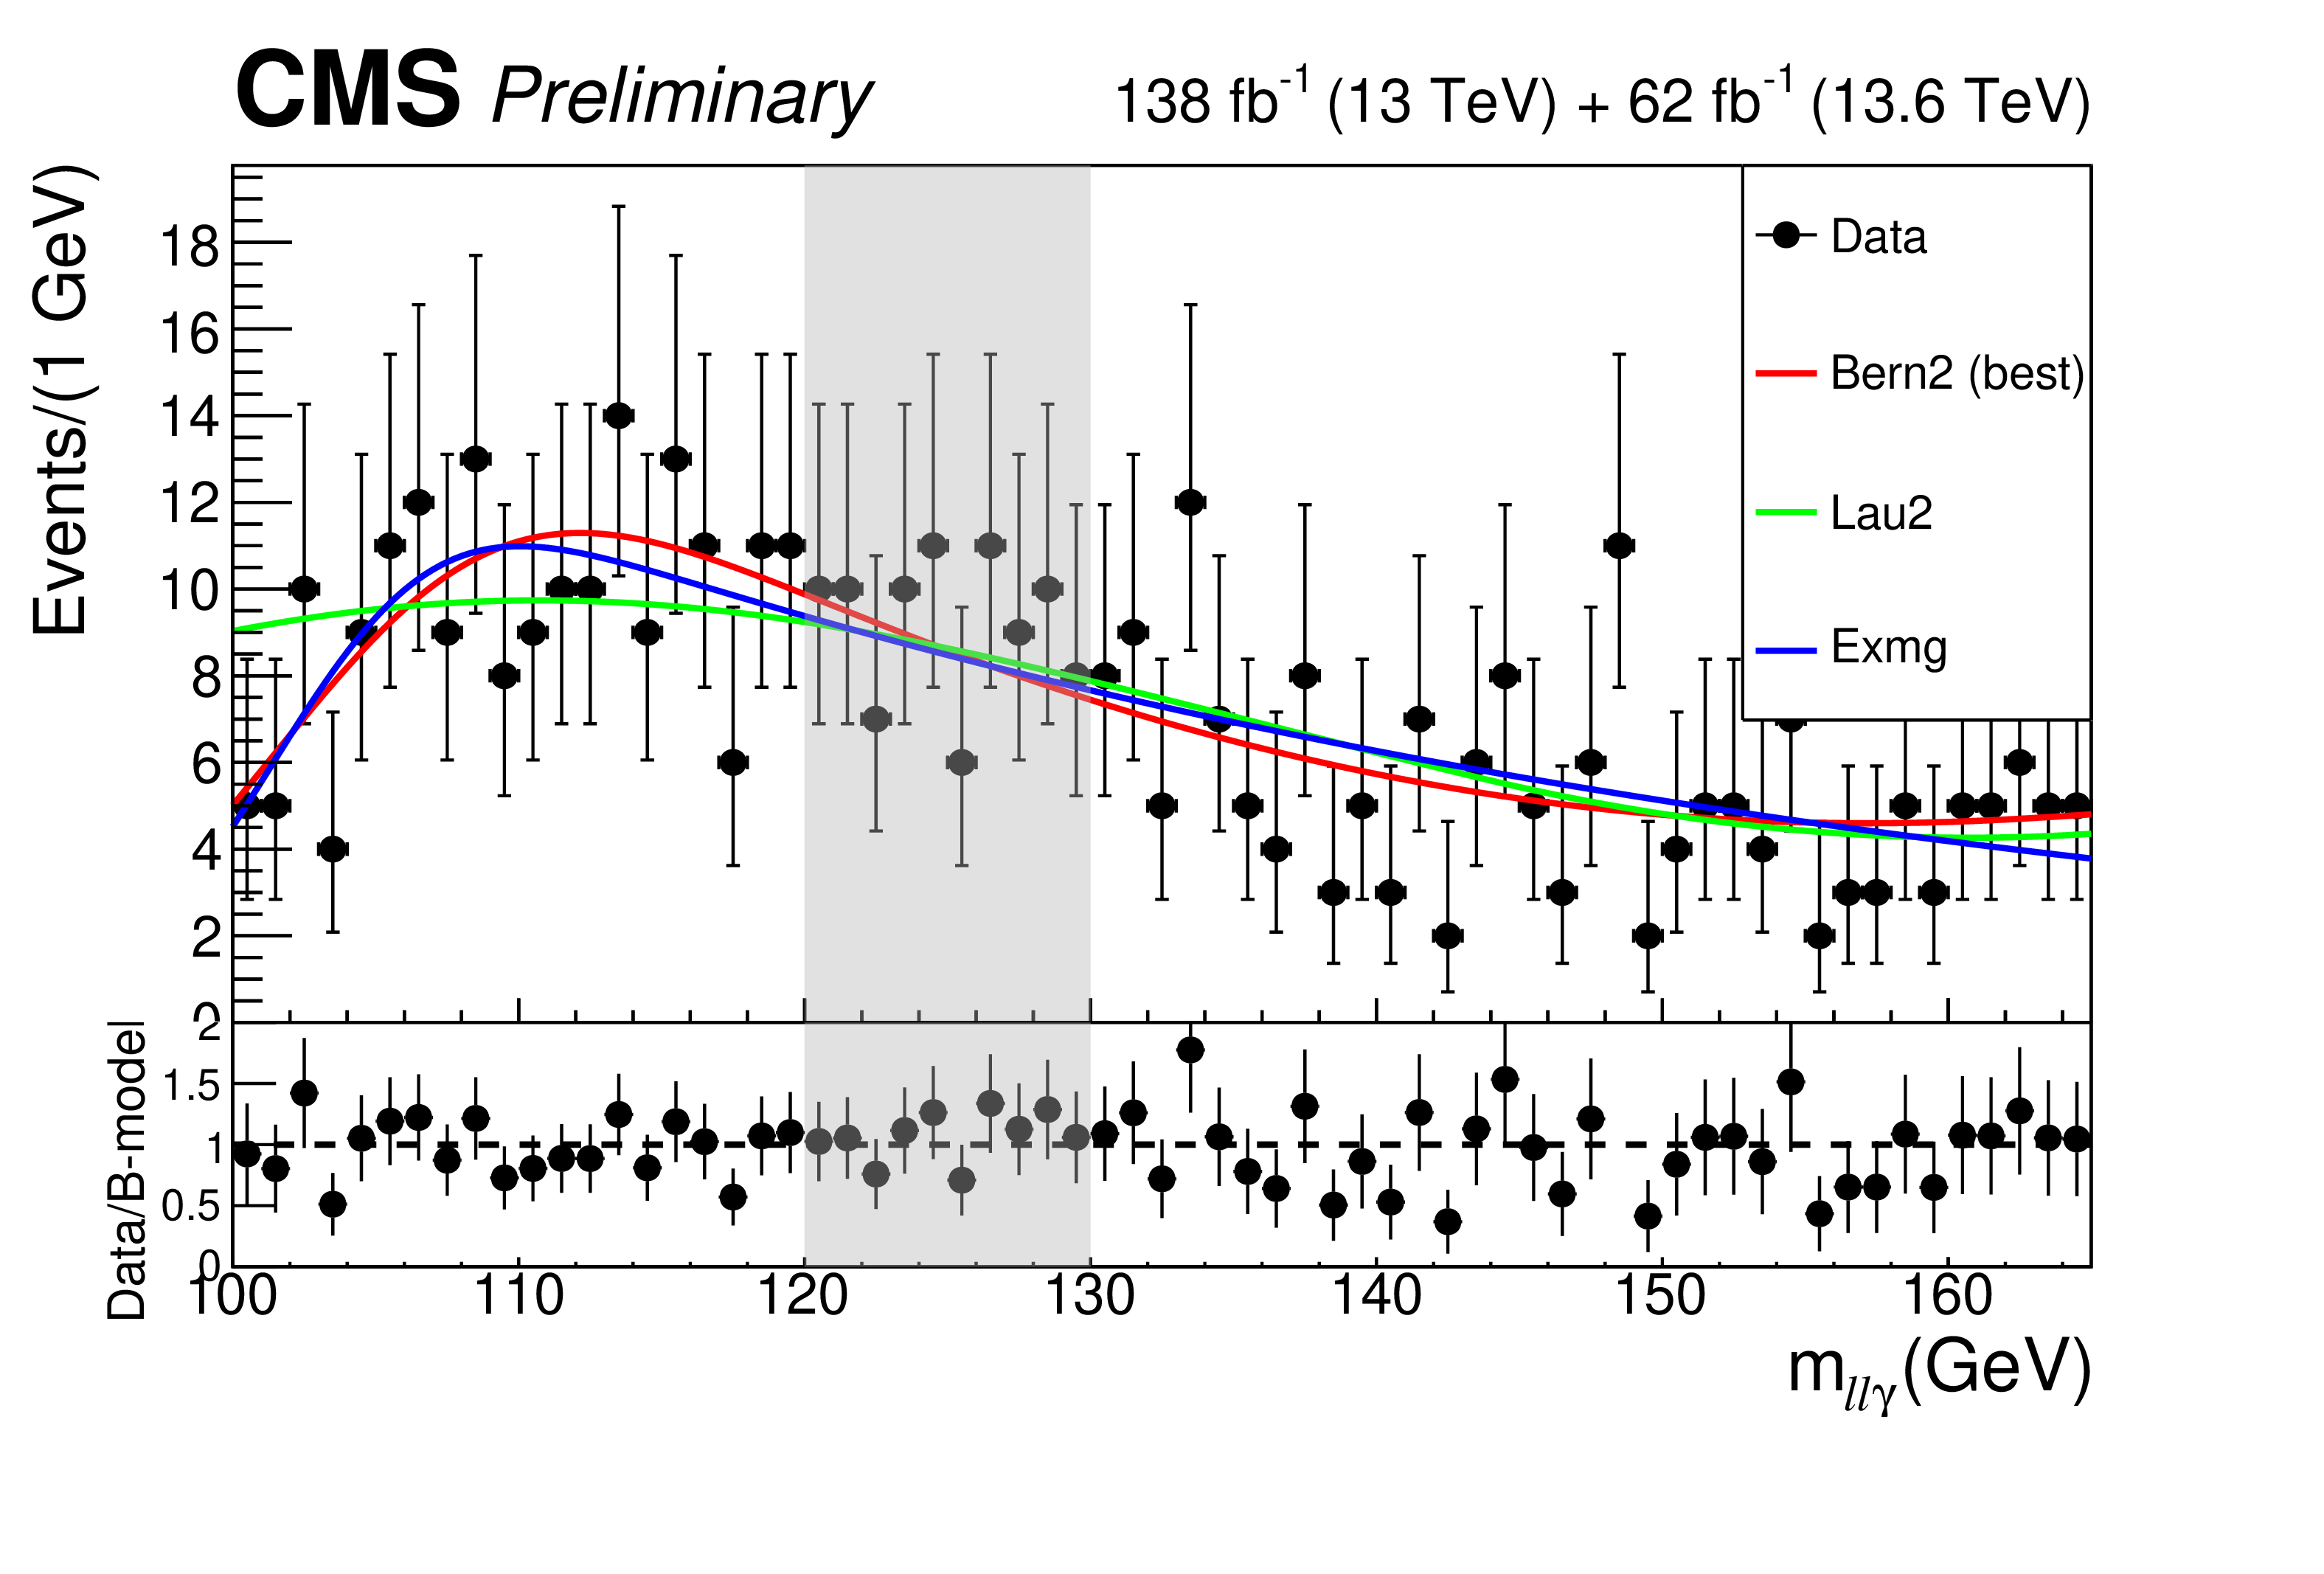
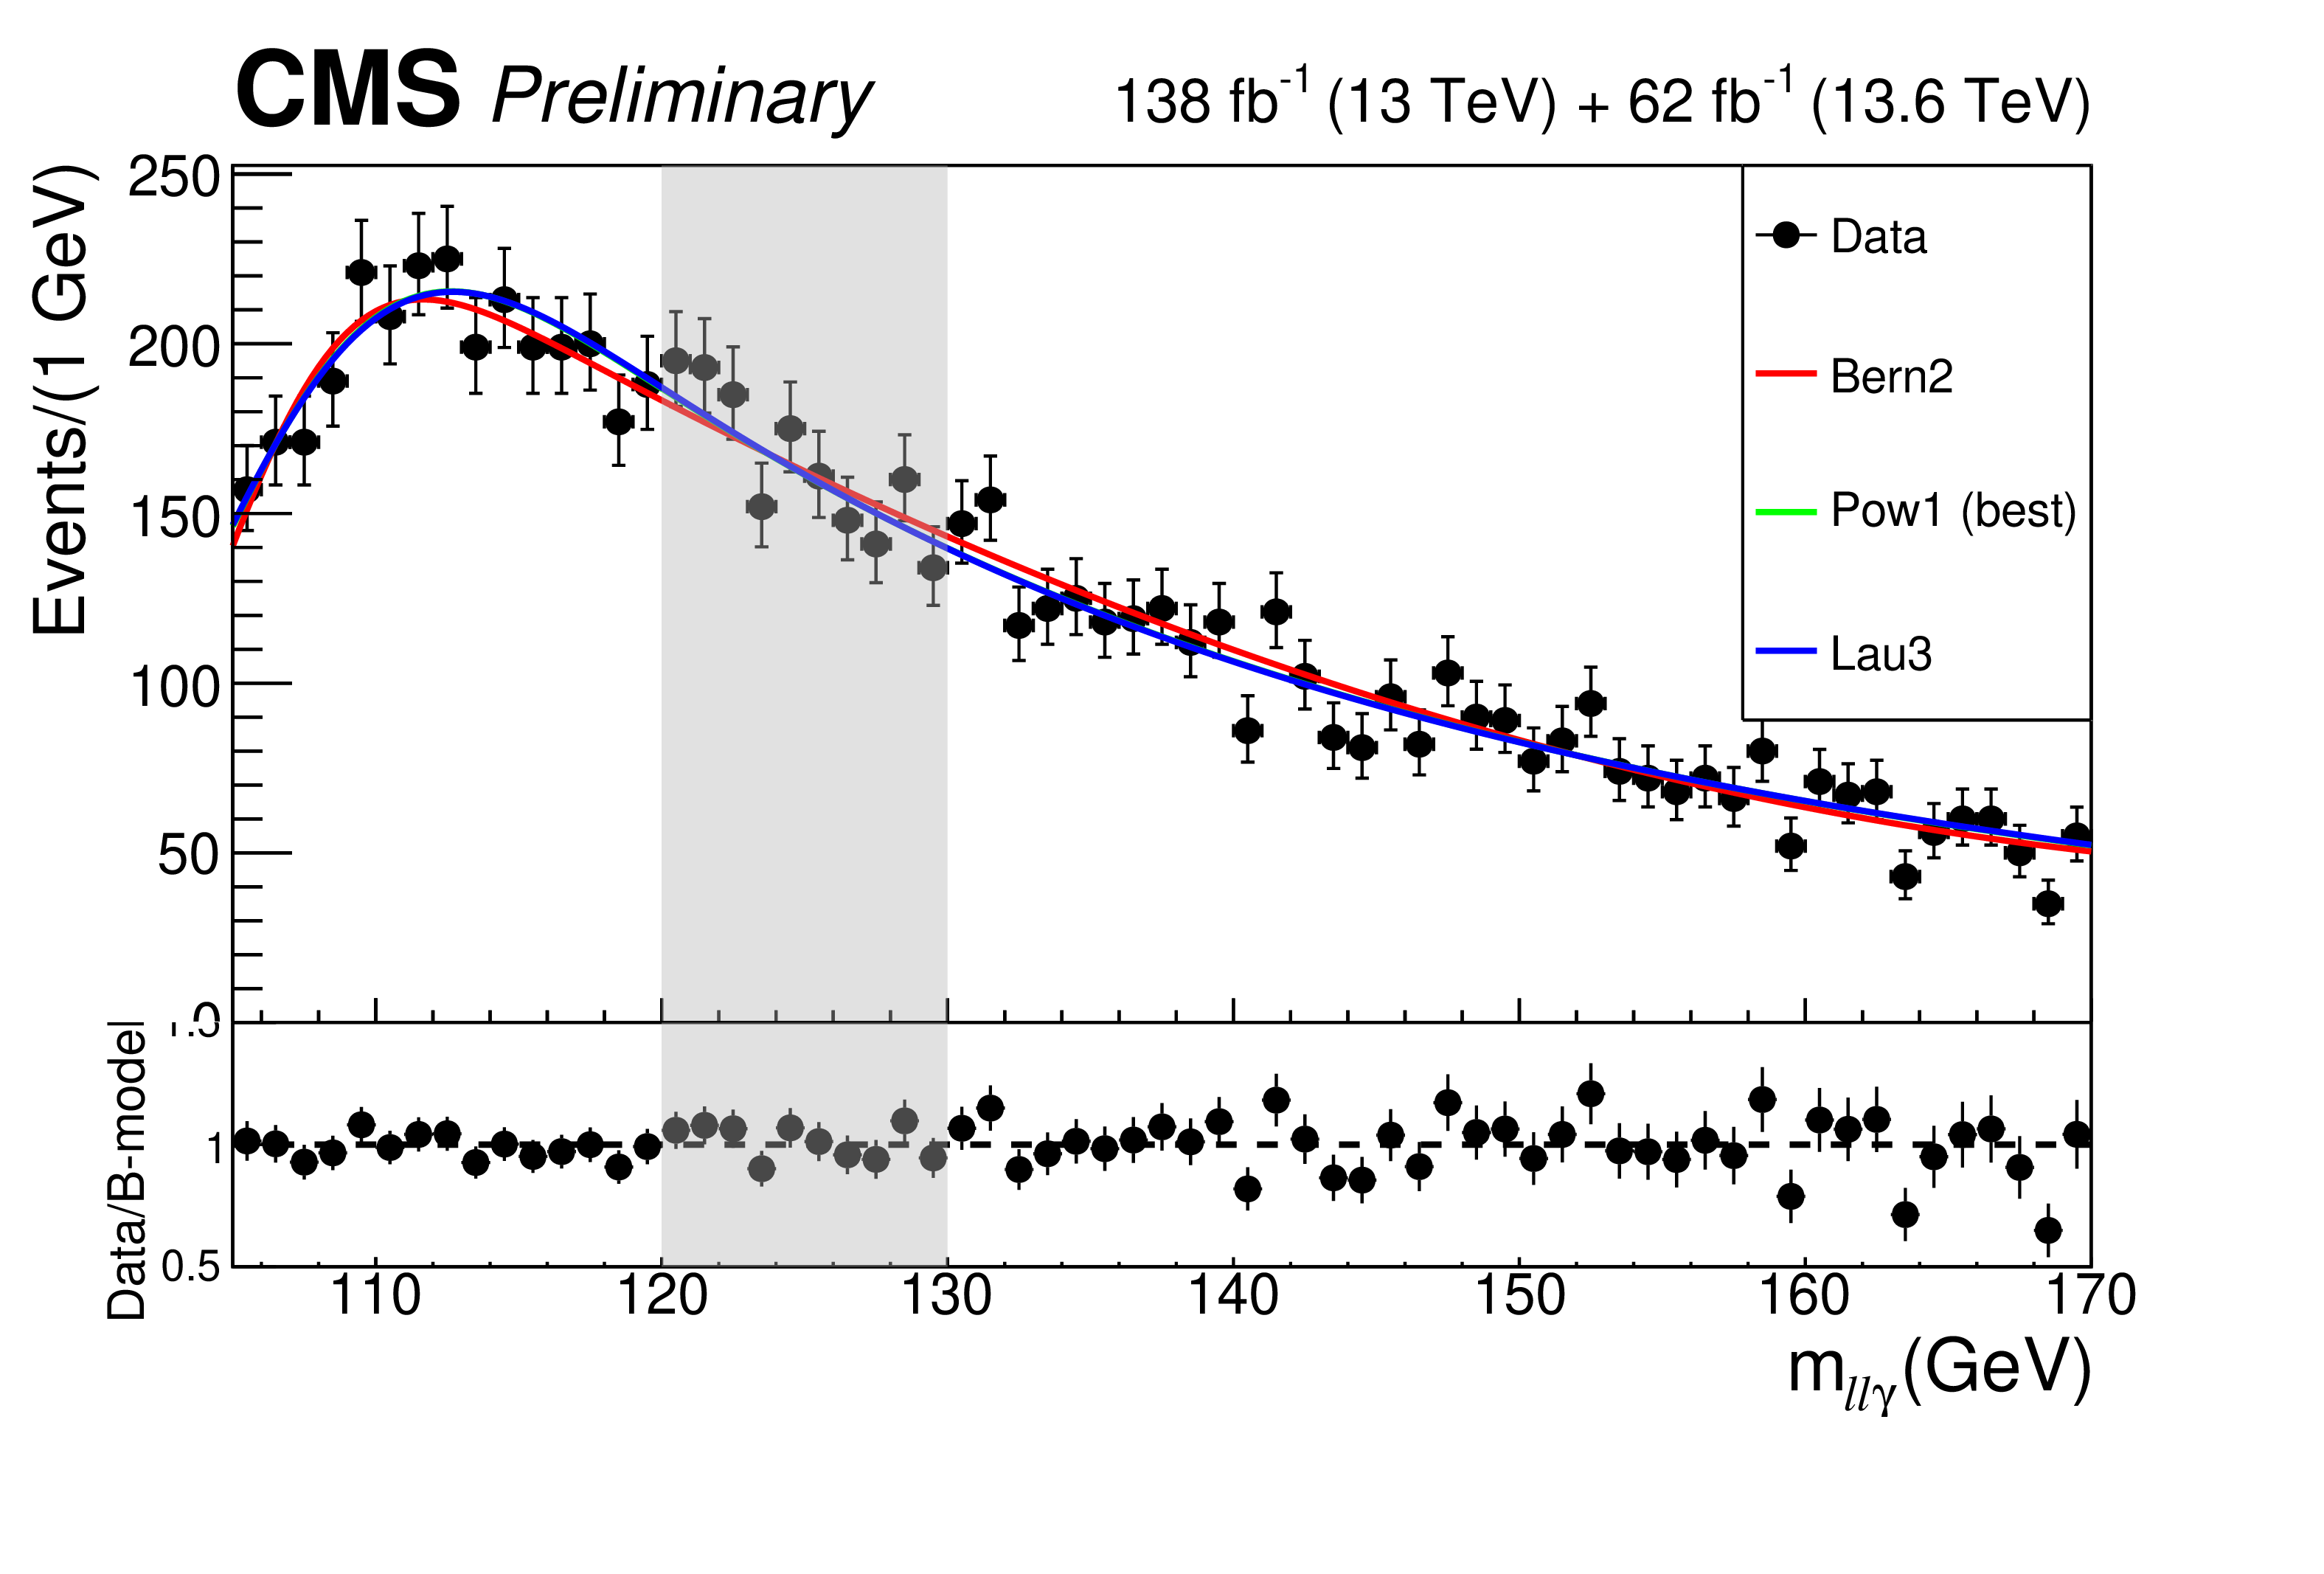
The collection of empirical background models that pass the various validation tests and enter the envelope used in the final fit for each analysis category. The data in the shaded region from 120--130 GeV were blinded and not used in the function selection process. |
png pdf |
Additional Figure 10-a:
The collection of empirical background models that pass the various validation tests and enter the envelope used in the final fit for each analysis category. The data in the shaded region from 120--130 GeV were blinded and not used in the function selection process. |
png pdf |
Additional Figure 10-b:
The collection of empirical background models that pass the various validation tests and enter the envelope used in the final fit for each analysis category. The data in the shaded region from 120--130 GeV were blinded and not used in the function selection process. |
png pdf |
Additional Figure 10-c:
The collection of empirical background models that pass the various validation tests and enter the envelope used in the final fit for each analysis category. The data in the shaded region from 120--130 GeV were blinded and not used in the function selection process. |
png pdf |
Additional Figure 10-d:
The collection of empirical background models that pass the various validation tests and enter the envelope used in the final fit for each analysis category. The data in the shaded region from 120--130 GeV were blinded and not used in the function selection process. |
png pdf |
Additional Figure 10-e:
The collection of empirical background models that pass the various validation tests and enter the envelope used in the final fit for each analysis category. The data in the shaded region from 120--130 GeV were blinded and not used in the function selection process. |
png pdf |
Additional Figure 10-f:
The collection of empirical background models that pass the various validation tests and enter the envelope used in the final fit for each analysis category. The data in the shaded region from 120--130 GeV were blinded and not used in the function selection process. |
png pdf |
Additional Figure 10-g:
The collection of empirical background models that pass the various validation tests and enter the envelope used in the final fit for each analysis category. The data in the shaded region from 120--130 GeV were blinded and not used in the function selection process. |
png pdf |
Additional Figure 10-h:
The collection of empirical background models that pass the various validation tests and enter the envelope used in the final fit for each analysis category. The data in the shaded region from 120--130 GeV were blinded and not used in the function selection process. |
png pdf |
Additional Figure 10-i:
The collection of empirical background models that pass the various validation tests and enter the envelope used in the final fit for each analysis category. The data in the shaded region from 120--130 GeV were blinded and not used in the function selection process. |
png pdf |
Additional Figure 10-j:
The collection of empirical background models that pass the various validation tests and enter the envelope used in the final fit for each analysis category. The data in the shaded region from 120--130 GeV were blinded and not used in the function selection process. |
png pdf |
Additional Figure 10-k:
The collection of empirical background models that pass the various validation tests and enter the envelope used in the final fit for each analysis category. The data in the shaded region from 120--130 GeV were blinded and not used in the function selection process. |
png pdf |
Additional Figure 10-l:
The collection of empirical background models that pass the various validation tests and enter the envelope used in the final fit for each analysis category. The data in the shaded region from 120--130 GeV were blinded and not used in the function selection process. |
png pdf |
Additional Figure 10-m:
The collection of empirical background models that pass the various validation tests and enter the envelope used in the final fit for each analysis category. The data in the shaded region from 120--130 GeV were blinded and not used in the function selection process. |
png pdf |
Additional Figure 11:
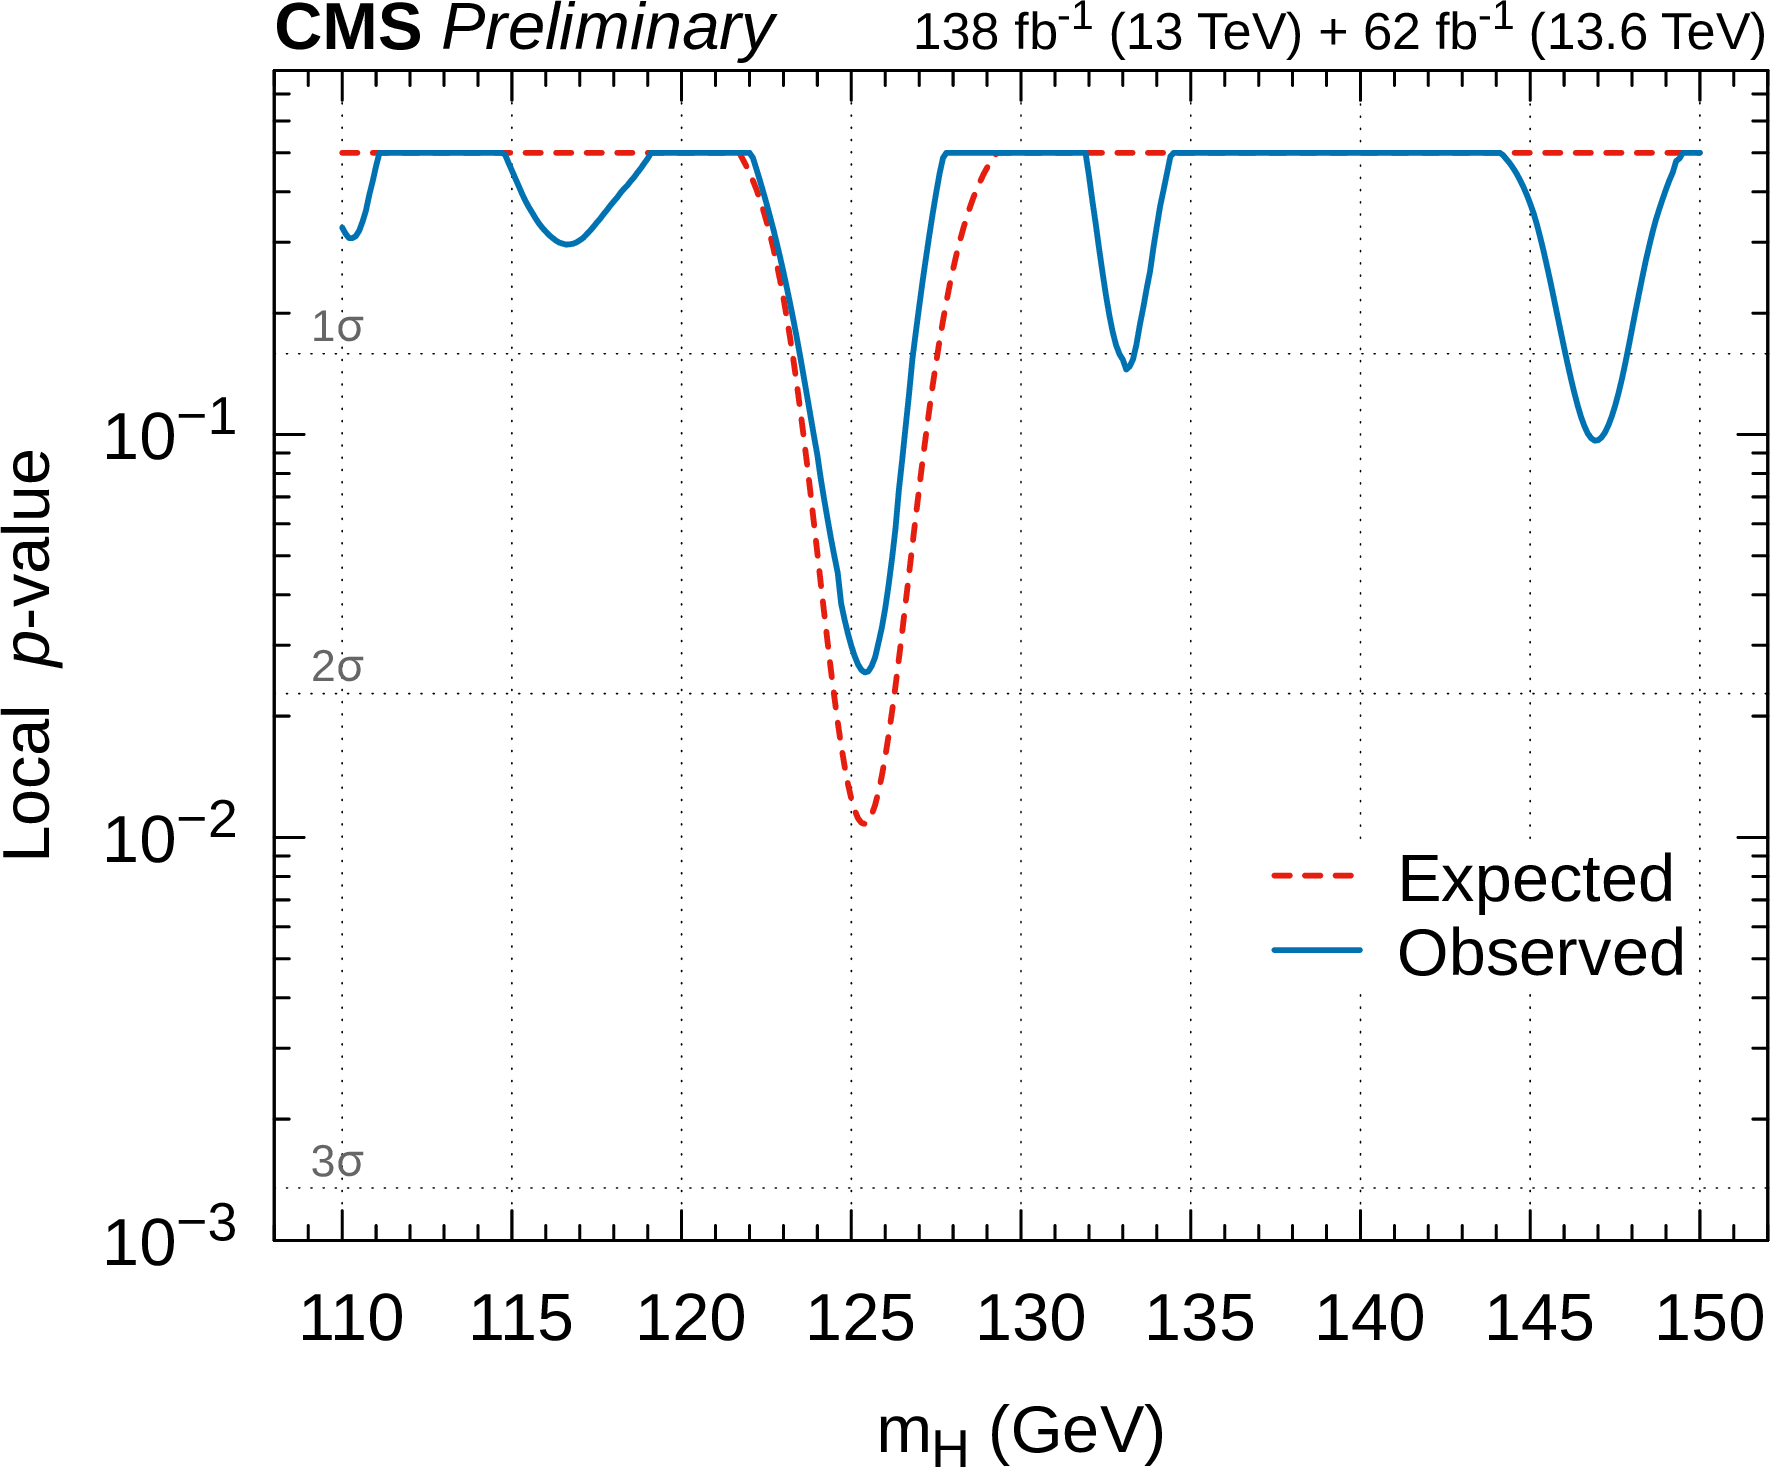
Local $p$-value as a function of mass. The expected $p$-value for a Higgs mass of 125.38 GeV is shown as a dashed line while the observed $p$-value is shown as a solid line. As no bias tests were performed for other Higgs mass hypotheses, $p$-values far from 125.38 GeV should be considered to be estimates. |
| References | ||||
| 1 | ATLAS Collaboration | Observation of a new particle in the search for the Standard Model Higgs boson with the ATLAS detector at the LHC | PLB 716 (2012) 1 | 1207.7214 |
| 2 | CMS Collaboration | Observation of a New Boson at a Mass of 125 GeV with the CMS Experiment at the LHC | PLB 716 (2012) 30 | CMS-HIG-12-028 1207.7235 |
| 3 | CMS Collaboration | Observation of a New Boson with Mass Near 125 GeV in $ pp $ Collisions at $ \sqrt{s} = $ 7 and 8 TeV | JHEP 06 (2013) 081 | CMS-HIG-12-036 1303.4571 |
| 4 | ATLAS, CMS Collaboration | Measurements of the Higgs boson production and decay rates and constraints on its couplings from a combined ATLAS and CMS analysis of the LHC pp collision data at $ \sqrt{s}= $ 7 and 8 TeV | JHEP 08 (2016) 045 | 1606.02266 |
| 5 | ATLAS Collaboration | A detailed map of Higgs boson interactions by the ATLAS experiment ten years after the discovery | [Erratum: Nature 612, E24], 2022 Nature 607 (2022) 52 |
2207.00092 |
| 6 | CMS Collaboration | A portrait of the Higgs boson by the CMS experiment ten years after the discovery. | [Erratum: Nature 623], 2022 Nature 607 (2022) 60 |
CMS-HIG-22-001 2207.00043 |
| 7 | R. N. Cahn, M. S. Chanowitz, and N. Fleishon | Higgs Particle Production by $ Z\to H\gamma $ | PLB 82 (1979) 113 | |
| 8 | L. Bergstrom and G. Hulth | Induced Higgs Couplings to Neutral Bosons in $ e^+ e^- $ Collisions | [Erratum: Nucl.Phys.B 276, 744], 1985 NPB 259 (1985) 137 |
|
| 9 | M. Spira, A. Djouadi, and P. M. Zerwas | QCD corrections to the H Z gamma coupling | PLB 276 (1992) 350 | |
| 10 | A. Djouadi, J. Kalinowski, and M. Spira | HDECAY: A Program for Higgs boson decays in the standard model and its supersymmetric extension | Comput. Phys. Commun. 108 (1998) 56 | hep-ph/9704448 |
| 11 | LHC Higgs Cross Section Working Group | Handbook of LHC Higgs cross sections: 4. Deciphering the nature of the Higgs sector | CERN Report CERN-2017-002-M, 2016 link |
1610.07922 |
| 12 | I. Low, J. Lykken, and G. Shaughnessy | Singlet scalars as Higgs imposters at the Large Hadron Collider | PRD 84 (2011) 035027 | 1105.4587 |
| 13 | I. Low, J. Lykken, and G. Shaughnessy | Have We Observed the Higgs (Imposter)? | PRD 86 (2012) 093012 | 1207.1093 |
| 14 | C.-W. Chiang and K. Yagyu | Higgs boson decays to $\gamma\gamma$ and $Z\gamma$ in models with Higgs extensions | PRD 87 (2013) 033003 | 1207.1065 |
| 15 | M. Carena, I. Low, and C. E. M. Wagner | Implications of a Modified Higgs to Diphoton Decay Width | JHEP 08 (2012) 060 | 1206.1082 |
| 16 | C.-S. Chen, C.-Q. Geng, D. Huang, and L.-H. Tsai | New Scalar Contributions to $ h\to Z\gamma $ | PRD 87 (2013) 075019 | 1301.4694 |
| 17 | A. Azatov, R. Contino, A. Di Iura, and J. Galloway | New Prospects for Higgs Compositeness in $ h \to Z\gamma $ | PRD 88 (2013) 075019 | 1308.2676 |
| 18 | S. Dawson and P. P. Giardino | Higgs decays to $ ZZ $ and $ Z\gamma $ in the standard model effective field theory: An NLO analysis | PRD 97 (2018) 093003 | 1801.01136 |
| 19 | Q.-H. Cao, L.-X. Xu, B. Yan, and S.-H. Zhu | Signature of pseudo Nambu-Goldstone Higgs boson in its decay | PLB 789 (2019) 233 | 1810.07661 |
| 20 | R. Boto et al. | New physics interpretations for nonstandard values of $h \rightarrow Z\gamma$ | PRD 109 (2024) 095002 | 2312.13050 |
| 21 | S.-P. He | Scalar leptoquark contributions to the $gg \rightarrow Zh$ process | PRD 113 (2026) 015039 | 2508.19642 |
| 22 | E. A. Reyes R., C. A. L. A., O. R. Torrijo G., and D. G. Melo P. | Rare Higgs boson decay into a photon and a Z boson in radiatively driven natural supersymmetry | PRD 112 (2025) 095012 | 2507.09395 |
| 23 | A. Kachanovich, J. Kimus, S. Lowette, and M. H. G. Tytgat | On new physics off the Z peak in H $ \rightarrow \ell^{+} \ell^{-} \gamma$ | JHEP 06 (2025) 043 | 2503.08659 |
| 24 | K. Mantzaropoulos | Disentangling SMEFT and UV contributions in $h \rightarrow Z\gamma$ and $h \rightarrow \gamma\gamma$ decays | PRD 110 (2024) 055041 | 2407.09145 |
| 25 | S. Israr and M. Rehman | Higgs decay to $ Z\gamma $ in the minimal supersymmetric standard model and its nonholomorphic extension | Eur. Phys. J. Plus 140 (2025) 397 | 2407.01210 |
| 26 | W.-L. Sang, F. Feng, and Y. Jia | Next-to-leading-order electroweak correction to $H \rightarrow Z\gamma$ | PRD 110 (2024) L051302 | 2405.03464 |
| 27 | A. I. Hern \'a ndez-Ju \'a rez, R. Gait \'a n, and R. Martinez | $H \rightarrow Z\gamma$ decay and CP violation | PRD 111 (2025) 015001 | 2405.03094 |
| 28 | Z.-Q. Chen, L.-B. Chen, C.-F. Qiao, and R. Zhu | Two-loop electroweak corrections to the Higgs boson rare decay process $H \rightarrow Z\gamma$ | PRD 110 (2024) L051301 | 2404.11441 |
| 29 | X.-G. He, Z.-L. Huang, M.-W. Li, and C.-W. Liu | The SM expected branching ratio for $h \rightarrow \gamma\gamma$ and an excess for $h \rightarrow Z\gamma$ | JHEP 10 (2024) 135 | 2402.08190 |
| 30 | K. Cheung and C. J. Ouseph | Interpretation of excess in $H\rightarrow Z\gamma$ using a light axionlike particle | PRD 110 (2024) 055016 | 2402.05678 |
| 31 | F. Buccioni et al. | Interference effects in $gg \rightarrow H \rightarrow Z\gamma$ beyond leading order | PLB 851 (2024) 138596 | 2312.12384 |
| 32 | ATLAS Collaboration | Search for Higgs boson decays to a photon and a Z boson in pp collisions at $ \sqrt{s} = $ 7 and 8 TeV with the ATLAS detector | PLB 732 (2014) 8 | 1402.3051 |
| 33 | ATLAS Collaboration | A search for the $ Z\gamma $ decay mode of the Higgs boson in $ pp $ collisions at $ \sqrt{s} = $ 13 TeV with the ATLAS detector | PLB 809 (2020) 135754 | 2005.05382 |
| 34 | CMS Collaboration | Search for a Higgs Boson Decaying into a Z and a Photon in $ pp $ Collisions at $ \sqrt{s} = $ 7 and 8 TeV | PLB 726 (2013) 587 | CMS-HIG-13-006 1307.5515 |
| 35 | CMS Collaboration | Search for the decay of a Higgs boson in the $ \ell\ell\gamma $ channel in proton-proton collisions at $ \sqrt{s} = $ 13 TeV | JHEP 11 (2018) 152 | CMS-HIG-17-007 1806.05996 |
| 36 | CMS Collaboration | Search for Higgs boson decays to a Z boson and a photon in proton-proton collisions at $ \sqrt{s} = $ 13 TeV | JHEP 05 (2023) 233 | CMS-HIG-19-014 2204.12945 |
| 37 | ATLAS, CMS Collaboration | Evidence for the Higgs Boson Decay to a Z Boson and a Photon at the LHC | PRL 132 (2024) 021803 | 2309.03501 |
| 38 | ATLAS Collaboration | Search for the Higgs boson decay to a $ Z $ boson and a photon in $ pp $ collisions at $ \sqrt{s}= $ 13 TeV and 13.6 TeV with the ATLAS detector | 2507.12598 | |
| 39 | CMS Collaboration | The CMS experiment at the CERN LHC | JINST 3 (2008) S08004 | |
| 40 | CMS Collaboration | Development of the CMS detector for the CERN LHC Run 3 | JINST 19 (2024) P05064 | CMS-PRF-21-001 2309.05466 |
| 41 | CMS Collaboration | Performance of the CMS Level-1 trigger in proton-proton collisions at $ \sqrt{s} = $ 13 TeV | JINST 15 (2020) P10017 | CMS-TRG-17-001 2006.10165 |
| 42 | CMS Collaboration | The CMS trigger system | JINST 12 (2017) P01020 | CMS-TRG-12-001 1609.02366 |
| 43 | CMS Collaboration | Performance of the CMS high-level trigger during LHC Run 2 | JINST 19 (2024) P11021 | CMS-TRG-19-001 2410.17038 |
| 44 | CMS Collaboration | Electron and photon reconstruction and identification with the CMS experiment at the CERN LHC | JINST 16 (2021) P05014 | CMS-EGM-17-001 2012.06888 |
| 45 | CMS Collaboration | Performance of the CMS muon detector and muon reconstruction with proton-proton collisions at $ \sqrt{s}= $ 13 TeV | JINST 13 (2018) P06015 | CMS-MUO-16-001 1804.04528 |
| 46 | CMS Collaboration | Description and performance of track and primary-vertex reconstruction with the CMS tracker | JINST 9 (2014) P10009 | CMS-TRK-11-001 1405.6569 |
| 47 | CMS Collaboration | Particle-flow reconstruction and global event description with the CMS detector | JINST 12 (2017) P10003 | CMS-PRF-14-001 1706.04965 |
| 48 | CMS Collaboration | Performance of reconstruction and identification of $ \tau $ leptons decaying to hadrons and $ \nu_\tau $ in pp collisions at $ \sqrt{s}= $ 13 TeV | JINST 13 (2018) P10005 | CMS-TAU-16-003 1809.02816 |
| 49 | CMS Collaboration | Jet energy scale and resolution in the CMS experiment in pp collisions at 8 TeV | JINST 12 (2017) P02014 | CMS-JME-13-004 1607.03663 |
| 50 | CMS Collaboration | Performance of missing transverse momentum reconstruction in proton-proton collisions at $ \sqrt{s} = $ 13 TeV using the CMS detector | JINST 14 (2019) P07004 | CMS-JME-17-001 1903.06078 |
| 51 | CMS Collaboration | Pileup mitigation at CMS in 13 TeV data | JINST 15 (2020) P09018 | CMS-JME-18-001 2003.00503 |
| 52 | P. Nason | A new method for combining NLO QCD with shower MonteCarlo algorithms | JHEP 11 (2004) 040 | hep-ph/0409146 |
| 53 | S. Frixione, P. Nason, and C. Oleari | Matching NLO QCD computations with parton shower simulations: the POWHEG method | JHEP 11 (2007) 070 | 0709.2092 |
| 54 | S. Alioli, P. Nason, C. Oleari, and E. Re | A general framework for implementing NLO calculations in shower Monte Carlo programs: the POWHEG BOX | JHEP 06 (2010) 043 | 1002.2581 |
| 55 | E. Re | Single-top Wt-channel production matched with parton showers using the POWHEG method | EPJC 71 (2011) 1547 | 1009.2450 |
| 56 | S. Alioli, S.-O. Moch, and P. Uwer | Hadronic top-quark pair-production with one jet and parton showering | JHEP 01 (2012) 137 | 1110.5251 |
| 57 | T. Melia, P. Nason, R. Rontsch, and G. Zanderighi | W+W-, WZ and ZZ production in the POWHEG BOX | JHEP 11 (2011) 078 | 1107.5051 |
| 58 | P. Nason and G. Zanderighi | $ W^+ W^- $, $ W Z $ and $ Z Z $ production in the POWHEG-BOX-V2 | EPJC 74 (2014) 2702 | 1311.1365 |
| 59 | S. Alioli, P. Nason, C. Oleari, and E. Re | NLO Higgs boson production via gluon fusion matched with shower in POWHEG | JHEP 04 (2009) 002 | 0812.0578 |
| 60 | E. Bagnaschi, G. Degrassi, P. Slavich, and A. Vicini | Higgs production via gluon fusion in the POWHEG approach in the SM and in the MSSM | JHEP 02 (2012) 088 | 1111.2854 |
| 61 | P. Nason and C. Oleari | NLO Higgs boson production via vector-boson fusion matched with shower in POWHEG | JHEP 02 (2010) 037 | 0911.5299 |
| 62 | G. Luisoni, P. Nason, C. Oleari, and F. Tramontano | $ HW^{\pm} $/HZ + 0 and 1 jet at NLO with the POWHEG BOX interfaced to GoSam and their merging within MiNLO | JHEP 10 (2013) 083 | 1306.2542 |
| 63 | H. B. Hartanto, B. Jager, L. Reina, and D. Wackeroth | Higgs boson production in association with top quarks in the POWHEG BOX | PRD 91 (2015) 094003 | 1501.04498 |
| 64 | P. F. Monni et al. | MiNNLO$ _{PS} $: a new method to match NNLO QCD to parton showers | [Erratum: JHEP 02, 031 ()], 2020 JHEP 05 (2020) 143 |
1908.06987 |
| 65 | P. F. Monni, E. Re, and M. Wiesemann | MiNNLO$ _{\text {PS}} $: optimizing 2 $ \rightarrow $ 1 hadronic processes | EPJC 80 (2020) 1075 | 2006.04133 |
| 66 | J. Alwall et al. | The automated computation of tree-level and next-to-leading order differential cross sections, and their matching to parton shower simulations | JHEP 07 (2014) 079 | 1405.0301 |
| 67 | J. Alwall et al. | Comparative study of various algorithms for the merging of parton showers and matrix elements in hadronic collisions | EPJC 53 (2008) 473 | 0706.2569 |
| 68 | P. Artoisenet, R. Frederix, O. Mattelaer, and R. Rietkerk | Automatic spin-entangled decays of heavy resonances in Monte Carlo simulations | JHEP 03 (2013) 015 | 1212.3460 |
| 69 | R. Frederix and S. Frixione | Merging meets matching in MC@NLO | JHEP 12 (2012) 061 | 1209.6215 |
| 70 | T. Sjöstrand et al. | An introduction to PYTHIA 8.2 | Comput. Phys. Commun. 191 (2015) 159 | 1410.3012 |
| 71 | NNPDF Collaboration | Parton distributions from high-precision collider data | EPJC 77 (2017) 663 | 1706.00428 |
| 72 | CMS Collaboration | Extraction and validation of a new set of CMS PYTHIA8 tunes from underlying-event measurements | EPJC 80 (2020) 4 | CMS-GEN-17-001 1903.12179 |
| 73 | GEANT4 Collaboration | GEANT 4---a simulation toolkit | NIM A 506 (2003) 250 | |
| 74 | A. Karlberg et al. | Ad interim recommendations for the Higgs boson production cross sections at $ \sqrt{s} = $ 13.6 TeV | 2402.09955 | |
| 75 | Y. Li and F. Petriello | Combining QCD and electroweak corrections to dilepton production in FEWZ | PRD 86 (2012) 094034 | 1208.5967 |
| 76 | M. Czakon and A. Mitov | Top++: A Program for the Calculation of the Top-Pair Cross-Section at Hadron Colliders | Comput. Phys. Commun. 185 (2014) 2930 | 1112.5675 |
| 77 | CMS Collaboration | Technical proposal for the Phase-II upgrade of the Compact Muon Solenoid | CMS Technical Proposal CERN-LHCC-2015-010, CMS-TDR-15-02, 2015 CDS |
|
| 78 | K. Rehermann and B. Tweedie | Efficient Identification of Boosted Semileptonic Top Quarks at the LHC | JHEP 03 (2011) 059 | 1007.2221 |
| 79 | M. Cacciari and G. P. Salam | Pileup subtraction using jet areas | PLB 659 (2008) 119 | 0707.1378 |
| 80 | D. Bertolini, P. Harris, M. Low, and N. Tran | Pileup Per Particle Identification | JHEP 10 (2014) 059 | 1407.6013 |
| 81 | E. Bols et al. | Jet Flavour Classification Using DeepJet | JINST 15 (2020) P12012 | 2008.10519 |
| 82 | CMS Collaboration | Performance summary of AK4 jet b tagging with data from proton-proton collisions at 13 TeV with the CMS detector | CMS Detector Performance Summary CMS-DP-2023-005, 2023 CDS |
|
| 83 | CMS Collaboration | A first look at early 2022 proton-proton collisions at $ \sqrt{s}\ =\ $ 13.6 TeV for heavy-flavor jet tagging | CMS Detector Performance Summary CMS-DP-2023-012, 2023 CDS |
|
| 84 | CMS Collaboration | Identification of heavy-flavour jets with the CMS detector in pp collisions at 13 TeV | JINST 13 (2018) P05011 | CMS-BTV-16-002 1712.07158 |
| 85 | CMS Collaboration | Jet energy scale and resolution measurement with Run 2 Legacy Data Collected by CMS at 13 TeV | CMS Detector Performance Summary CMS-DP-2021-033, 2021 CDS |
|
| 86 | T. Chen and C. Guestrin | XGBoost: A scalable tree boosting system | in nd ACM SIGKDD International Conference on Knowledge Discovery and Data Mining, KDD '16, ACM, New York, NY, USA, 2016 Proceedings of the 2 (2016) 785 |
|
| 87 | M. Oreglia | A Study of the Reactions $ \psi^\prime \to \gamma \gamma \psi $ | other thesis, Stanford University, 1980 link |
|
| 88 | CMS Collaboration | A measurement of the Higgs boson mass in the diphoton decay channel | PLB 805 (2020) 135425 | CMS-HIG-19-004 2002.06398 |
| 89 | P. D. Dauncey, M. Kenzie, N. Wardle, and G. J. Davies | Handling uncertainties in background shapes: the discrete profiling method | JINST 10 (2015) P04015 | 1408.6865 |
| 90 | A. Kolmogorov | Sulla determinazione empirica di una legge di distribuzione | G. Ist. Ital. Attuari 4 (1933) 83 | |
| 91 | N. Smirnov | Table for estimating the goodness of fit of empirical distributions | Annals of Mathematical Statistics 19 (1948) 279 | |
| 92 | R. A. Fisher | On the Mathematical Foundations of Theoretical Statistics | Phil. Trans. Roy. Soc. Lond. A 222 (1922) 309 | |
| 93 | CMS Collaboration | Precision luminosity measurement in proton-proton collisions at $ \sqrt{s} = $ 13 TeV in 2015 and 2016 at CMS | EPJC 81 (2021) 800 | CMS-LUM-17-003 2104.01927 |
| 94 | CMS Collaboration | Precision luminosity measurement in proton-proton collisions at 13 TeV with the CMS detector | CMS Physics Analysis Summary, 2025 CMS-PAS-LUM-20-001 |
CMS-PAS-LUM-20-001 |
| 95 | CMS Collaboration | Luminosity measurement in proton-proton collisions at 13.6 TeV in 2022 at CMS | CMS Physics Analysis Summary, 2024 CMS-PAS-LUM-22-001 |
CMS-PAS-LUM-22-001 |
| 96 | CMS Collaboration | Measurement of the offline integrated luminosity for the CMS proton-proton collision dataset recorded in 2023 | CMS Detector Performance Summary CMS-DP-2024-068, 2024 CDS |
|
|
|
Compact Muon Solenoid LHC, CERN |
|

|

|

|

|

|